VANGUARD WHITEHALL FUNDS Form NPORT-P Filed 2020-09-29
56
Business Address PO BOX 2600 V26 VALLEY FORGE PA 19482 6106691000 Mailing Address PO BOX 2600 V26 VALLEY FORGE PA 19482 SECURITIES AND EXCHANGE COMMISSION FORM NPORT-P Filing Date: 2020-09-29 | Period of Report: 2020-07-31 SEC Accession No. 0001752724-20-201146 (HTML Version on secdatabase.com) FILER VANGUARD WHITEHALL FUNDS CIK:1004655| IRS No.: 000000000 | State of Incorp.:DE | Fiscal Year End: 1031 Type: NPORT-P | Act: 40 | File No.: 811-07443 | Film No.: 201208543 Copyright © 2020 www.secdatabase.com . All Rights Reserved. Please Consider the Environment Before Printing This Document
-
Upload
khangminh22 -
Category
Documents
-
view
0 -
download
0
Transcript of VANGUARD WHITEHALL FUNDS Form NPORT-P Filed 2020-09-29

Business AddressPO BOX 2600V26VALLEY FORGE PA 194826106691000
Mailing AddressPO BOX 2600V26VALLEY FORGE PA 19482
SECURITIES AND EXCHANGE COMMISSION
FORM NPORT-P
Filing Date: 2020-09-29 | Period of Report: 2020-07-31SEC Accession No. 0001752724-20-201146
(HTML Version on secdatabase.com)
FILERVANGUARD WHITEHALL FUNDSCIK:1004655| IRS No.: 000000000 | State of Incorp.:DE | Fiscal Year End: 1031Type: NPORT-P | Act: 40 | File No.: 811-07443 | Film No.: 201208543
Copyright © 2020 www.secdatabase.com. All Rights Reserved.Please Consider the Environment Before Printing This Document

Vanguard International High Dividend Yield Index Fund
Schedule of Investments (unaudited)As of July 31, 2020
The fund files its complete schedule of portfolio holdings with the Securities and Exchange Commission
(SEC) for the first and third quarters of each fiscal year as an exhibit to its reports on Form N-PORT. The
fund’s Form N-PORT reports are available on the SEC’s website at www.sec.gov.
Market
Value
Shares ($000)
Common Stocks (99.1%)
Australia (6.8%)
Commonwealth Bank of Australia 314,744 16,013
BHP Group Ltd. 523,324 13,779
Westpac Banking Corp. 642,112 7,711
National Australia Bank Ltd. 568,404 7,096
Wesfarmers Ltd. 200,505 6,666
Woolworths Group Ltd. 223,895 6,198
Macquarie Group Ltd. 56,899 5,000
Rio Tinto Ltd. 66,027 4,833
Transurban Group 483,835 4,786
Fortescue Metals Group Ltd. 280,926 3,497
Coles Group Ltd. 225,599 2,925
Amcor plc 283,250 2,909
Sonic Healthcare Ltd. 84,247 1,929
QBE Insurance Group Ltd. 259,105 1,815
Telstra Corp. Ltd. 738,258 1,768
APA Group 209,163 1,639
Insurance Australia Group Ltd. 410,473 1,494
Suncorp Group Ltd. 224,342 1,370
AGL Energy Ltd. 111,547 1,321
Origin Energy Ltd. 312,390 1,196
Magellan Financial Group Ltd. 24,351 1,058
Aurizon Holdings Ltd. 325,940 1,039
Medibank Pvt Ltd. 489,075 977
Tabcorp Holdings Ltd. 339,763 859
Ampol Ltd. 44,387 832
Atlas Arteria Ltd. 168,337 787
JB Hi-Fi Ltd. 20,242 663
Boral Ltd. 216,177 553
Coca-Cola Amatil Ltd. 91,215 532
Alumina Ltd. 442,153 480
Bendigo & Adelaide Bank Ltd. 92,065 452
Incitec Pivot Ltd. 337,117 442
AusNet Services 321,513 411
Crown Resorts Ltd. 63,380 405
Downer EDI Ltd. 124,413 364
Copyright © 2020 www.secdatabase.com. All Rights Reserved.Please Consider the Environment Before Printing This Document

Metcash Ltd. 179,579 346
Bank of Queensland Ltd. 78,636 333
Worley Ltd. 55,550 322
Challenger Ltd. 98,011 302
Orora Ltd. 168,314 275
Star Entertainment Grp Ltd. 151,762 274
CIMIC Group Ltd. 16,692 257
CSR Ltd. 83,095 207
IOOF Holdings Ltd. 58,887 191
Perpetual Ltd. 8,154 177
Copyright © 2020 www.secdatabase.com. All Rights Reserved.Please Consider the Environment Before Printing This Document

Whitehaven Coal Ltd. 163,028 161
Platinum Asset Management Ltd. 55,866 149
Adbri Ltd. 76,451 120
106,913
Austria (0.1%)
* OMV AG 25,304 799
voestalpine AG 20,385 452
* Raiffeisen Bank International AG 22,736 391
* Telekom Austria AG Class A 23,095 174
1,816
Belgium (0.3%)
Groupe Bruxelles Lambert SA 19,046 1,652
Ageas SA/NV 32,187 1,205
Solvay SA Class A 12,306 955
Proximus SADP 24,841 511
Telenet Group Holding NV 7,735 300
4,623
Brazil (2.4%)
Vale SA 583,610 6,792
B3 SA - Brasil Bolsa Balcao 365,294 4,442
Petroleo Brasileiro SA Preference Shares 815,344 3,470
Itau Unibanco Holding SA ADR 591,734 3,018
Banco Bradesco SA ADR 409,699 1,729
Itau Unibanco Holding SA Preference Shares 329,932 1,701
Itausa - Investimentos Itau SA Preference Shares 804,270 1,645
Ambev SA ADR 582,381 1,561
Banco Bradesco SA Preference Shares 337,479 1,452
Banco do Brasil SA 151,732 977
Jbs SA 173,168 715
Banco BTG Pactual SA (BVMF) 42,924 711
Telefonica Brasil SA ADR 66,039 666
BB Seguridade Participacoes SA 119,325 637
Banco Bradesco SA 158,039 628
Ccr SA 196,478 563
Petrobras Distribuidora SA 126,120 549
Ambev SA 195,946 522
Hypera SA 73,617 510
TIM Participacoes SA 149,167 450
Banco Santander Brasil SA 67,758 388
Centrais Eletricas Brasileiras SA Preference Shares 47,800 352
YDUQS Participacoes SA 52,642 342
Bradespar SA Preference Shares 38,415 317
Cia Energetica de Minas Gerais ADR 127,978 297
Engie Brasil Energia SA 32,516 288
Klabin SA 68,164 270
Cia Siderurgica Nacional SA 110,700 260
Copyright © 2020 www.secdatabase.com. All Rights Reserved.Please Consider the Environment Before Printing This Document

Cyrela Brazil Realty SA Empreendimentos e Participacoes 47,900 252
Cia de Saneamento do Parana 40,600 239
Cia Paranaense de Energia Preference Shares 17,750 226
Transmissora Alianca de Energia Eletrica SA 40,419 224
Qualicorp Consultoria e Corretora de Seguros SA 41,700 224
Cielo SA 201,884 208
Fleury SA 39,463 194
EDP - Energias do Brasil SA 53,276 190
Porto Seguro SA 17,209 178
CPFL Energia SA 28,800 173
Copyright © 2020 www.secdatabase.com. All Rights Reserved.Please Consider the Environment Before Printing This Document
Cia Energetica de Sao Paulo Preference Shares 26,000 159
Cia de Transmissao de Energia Eletrica Paulista Preference Shares 35,408 153
Odontoprev SA 43,500 115
Telefonica Brasil SA Preference Shares 10,580 107
Banco do Estado do Rio Grande do Sul SA Preference Shares 38,086 104
CVC Brasil Operadora e Agencia de Viagens SA 22,700 90
*,§ Banco BTG Pactual SA 5,940 63
Cia Energetica de Minas Gerais Preference Shares 26,457 61
* Via Varejo SA 16,104 60
*,§ Banco BTG Pactual SA Preferred Subscription Receipt 11,880 43
* CVC Brasil Operadora e Agencia de Viagens SA Rights Exp. 08/13/2020 3,573 11
Cia Energetica de Minas Gerais 957 2
38,328
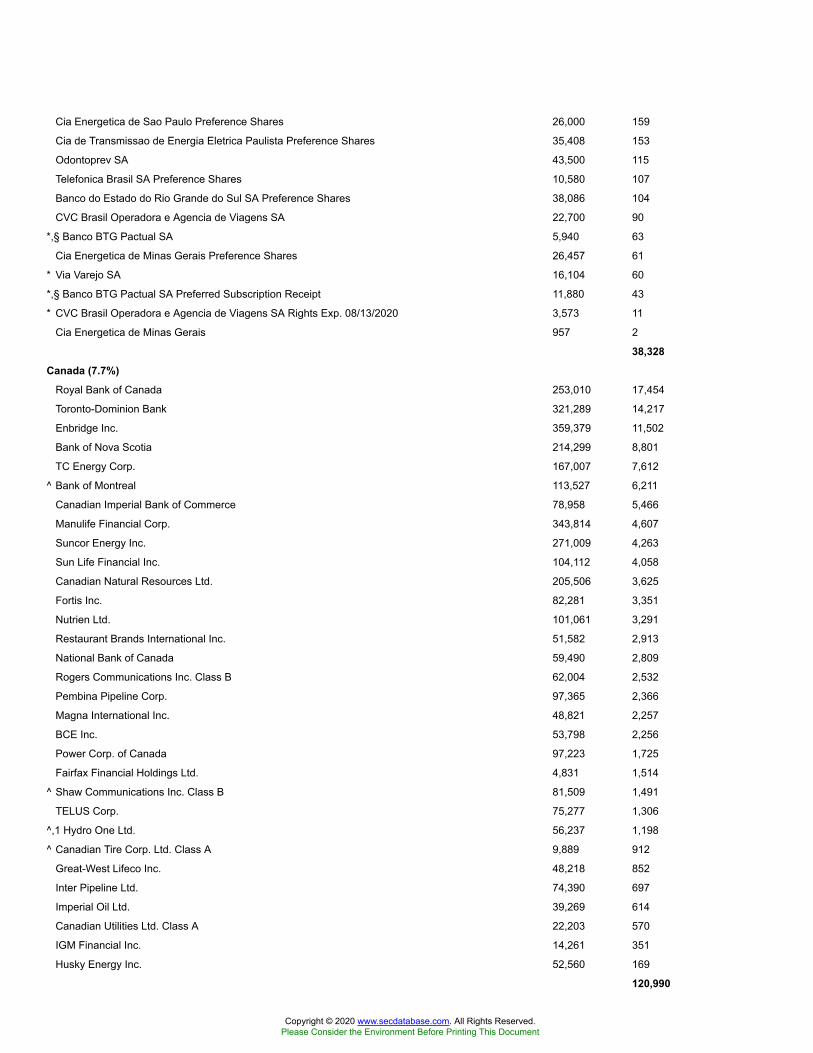
Canada (7.7%)
Royal Bank of Canada 253,010 17,454
Toronto-Dominion Bank 321,289 14,217
Enbridge Inc. 359,379 11,502
Bank of Nova Scotia 214,299 8,801
TC Energy Corp. 167,007 7,612
^ Bank of Montreal 113,527 6,211
Canadian Imperial Bank of Commerce 78,958 5,466
Manulife Financial Corp. 343,814 4,607
Suncor Energy Inc. 271,009 4,263
Sun Life Financial Inc. 104,112 4,058
Canadian Natural Resources Ltd. 205,506 3,625
Fortis Inc. 82,281 3,351
Nutrien Ltd. 101,061 3,291
Restaurant Brands International Inc. 51,582 2,913
National Bank of Canada 59,490 2,809
Rogers Communications Inc. Class B 62,004 2,532
Pembina Pipeline Corp. 97,365 2,366
Magna International Inc. 48,821 2,257
BCE Inc. 53,798 2,256
Power Corp. of Canada 97,223 1,725
Fairfax Financial Holdings Ltd. 4,831 1,514
^ Shaw Communications Inc. Class B 81,509 1,491
TELUS Corp. 75,277 1,306
^,1 Hydro One Ltd. 56,237 1,198
^ Canadian Tire Corp. Ltd. Class A 9,889 912
Great-West Lifeco Inc. 48,218 852
Inter Pipeline Ltd. 74,390 697
Imperial Oil Ltd. 39,269 614
Canadian Utilities Ltd. Class A 22,203 570
IGM Financial Inc. 14,261 351
Husky Energy Inc. 52,560 169
120,990
Copyright © 2020 www.secdatabase.com. All Rights Reserved.Please Consider the Environment Before Printing This Document
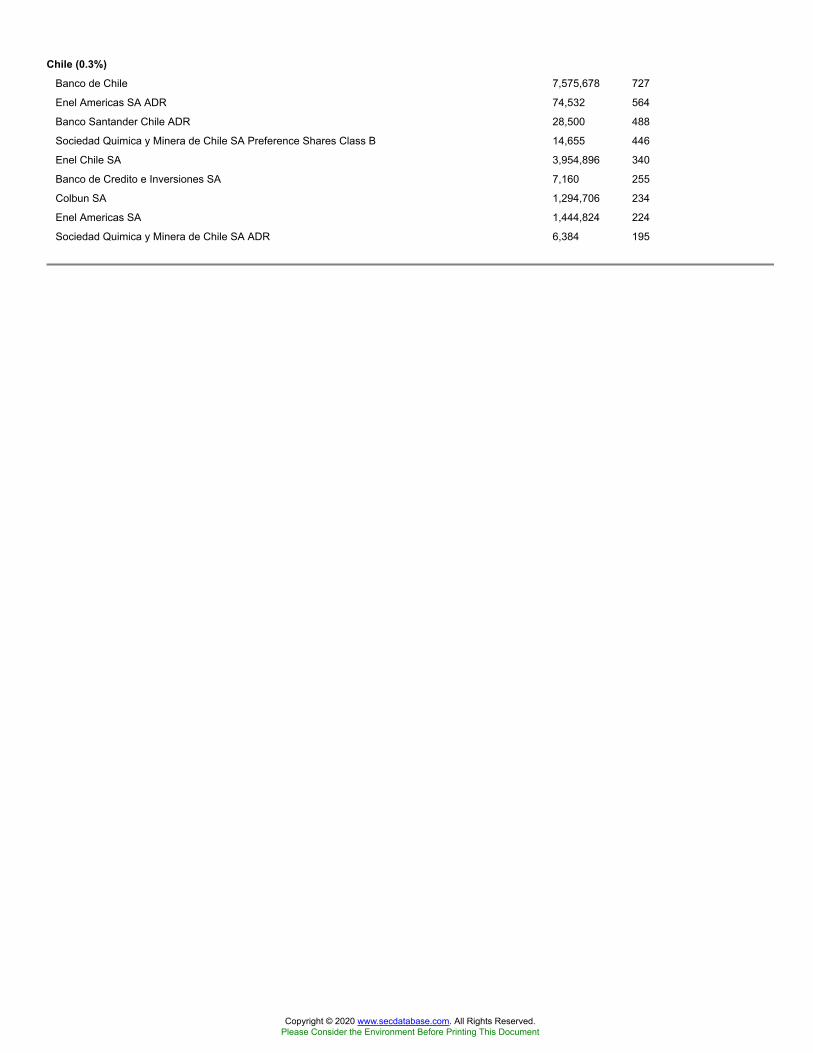
Chile (0.3%)
Banco de Chile 7,575,678 727
Enel Americas SA ADR 74,532 564
Banco Santander Chile ADR 28,500 488
Sociedad Quimica y Minera de Chile SA Preference Shares Class B 14,655 446
Enel Chile SA 3,954,896 340
Banco de Credito e Inversiones SA 7,160 255
Colbun SA 1,294,706 234
Enel Americas SA 1,444,824 224
Sociedad Quimica y Minera de Chile SA ADR 6,384 195
Copyright © 2020 www.secdatabase.com. All Rights Reserved.Please Consider the Environment Before Printing This Document

Aguas Andinas SA Class A 456,848 161
Engie Energia Chile SA 91,249 131
Embotelladora Andina SA Preference Shares 38,870 98
Itau CorpBanca Chile SA 27,283,485 96
Enel Chile SA ADR 21,294 89
AES Gener SA 476,901 82
4,130
China (7.9%)
China Construction Bank Corp. Class H 16,661,000 12,148
Ping An Insurance Group Co. of China Ltd. 966,500 10,198
Industrial & Commercial Bank of China Ltd. Class H 14,455,000 8,470
China Mobile Ltd. 936,919 6,396
Bank of China Ltd. Class H 14,060,000 4,682
China Merchants Bank Co. Ltd. Class H 694,928 3,243
China Life Insurance Co. Ltd. Class H 1,310,000 3,005
CNOOC Ltd. 2,823,000 2,980
China Overseas Land & Investment Ltd. 682,000 2,078
Sunac China Holdings Ltd. 440,554 2,077
China Resources Land Ltd. 492,000 2,051
Agricultural Bank of China Ltd. Class H 5,659,000 2,009
China Petroleum & Chemical Corp. Class H 4,714,000 2,008
Country Garden Holdings Co. Ltd. 1,336,000 1,716
Anhui Conch Cement Co. Ltd. Class H 217,828 1,647
1 Longfor Group Holdings Ltd. 308,000 1,522
China Pacific Insurance Group Co. Ltd. Class H 478,000 1,385
China Merchants Bank Co. Ltd. Class A 231,000 1,151
China Vanke Co. Ltd. Class H 351,905 1,109
China Evergrande Group 386,000 1,084
Hengan International Group Co. Ltd. 127,343 1,069
China National Building Material Co. Ltd. Class H 686,000 1,065
Shimao Group Holdings Ltd. 250,000 1,061
China Shenhua Energy Co. Ltd. Class H 630,000 1,043
1 Postal Savings Bank of China Co. Ltd. Class H 1,674,000 922
PICC Property & Casualty Co. Ltd. Class H 1,166,000 921
CITIC Securities Co. Ltd. Class H 372,500 869
Guangdong Investment Ltd. 524,000 847
CITIC Ltd. 884,000 830
China CITIC Bank Corp. Ltd. Class H 1,736,320 758
Bank of Communications Co. Ltd. Class H 1,357,000 753
Weichai Power Co. Ltd. Class H 350,000 750
China Minsheng Banking Corp. Ltd. Class H 1,185,600 747
China Jinmao Holdings Group Ltd. 1,044,000 711
China Telecom Corp. Ltd. Class H 2,380,000 707
Agricultural Bank of China Ltd. Class A 1,509,456 699
Zijin Mining Group Co. Ltd. Class H 1,028,000 646
Gree Electric Appliances Inc. of Zhuhai Class A 75,600 616
Copyright © 2020 www.secdatabase.com. All Rights Reserved.Please Consider the Environment Before Printing This Document

Industrial Bank Co. Ltd. Class A 262,200 588
China Unicom Hong Kong Ltd. 1,022,000 568
Great Wall Motor Co. Ltd. Class H 576,500 563
Guangzhou Automobile Group Co. Ltd. Class H 578,000 552
Shanghai Pudong Development Bank Co. Ltd. Class A 372,000 552
CIFI Holdings Group Co. Ltd. 596,000 536
China Resources Cement Holdings Ltd. 386,000 528
Sinopharm Group Co. Ltd. Class H 214,800 512
New China Life Insurance Co. Ltd. Class H 127,600 499
* Haitong Securities Co. Ltd. Class H 535,600 498
China Communications Construction Co. Ltd. Class H 822,000 479
Copyright © 2020 www.secdatabase.com. All Rights Reserved.Please Consider the Environment Before Printing This Document

China Yangtze Power Co. Ltd. Class A 177,800 468
Kunlun Energy Co. Ltd. 546,000 457
1 Huatai Securities Co. Ltd. Class H 243,200 440
Beijing Enterprises Water Group Ltd. 1,026,000 436
1 CGN Power Co. Ltd. Class H 2,070,000 436
China Resources Power Holdings Co. Ltd. 330,000 421
China Vanke Co. Ltd. Class A 108,800 418
Fosun International Ltd. 360,000 411
1 People's Insurance Co. Group of China Ltd. Class H 1,255,000 408
Kingboard Holdings Ltd. 136,000 398
China State Construction Engineering Corp. Ltd. Class A 546,600 394
KWG Group Holdings Ltd. 220,500 393
Industrial & Commercial Bank of China Ltd. Class A 552,400 393
1 China Galaxy Securities Co. Ltd. Class H 642,000 384
Sinotruk Hong Kong Ltd. 122,000 381
Anhui Conch Cement Co. Ltd. Class A 42,900 378
Dongfeng Motor Group Co. Ltd. Class H 524,000 375
China Everbright International Ltd. 576,000 356
* Seazen Group Ltd. 370,479 351
Huaneng Power International Inc. Class H 792,000 338
Poly Developments and Holdings Group Co. Ltd. Class A 148,000 330
Agile Group Holdings Ltd. 260,000 330
Far East Horizon Ltd. 393,000 324
Logan Group Co. Ltd. 186,000 322
China Cinda Asset Management Co. Ltd. Class H 1,675,000 316
SAIC Motor Corp. Ltd. Class A 120,600 314
China Minsheng Banking Corp. Ltd. Class A 390,600 310
Nine Dragons Paper Holdings Ltd. 293,000 308
China Railway Group Ltd. Class H 598,000 303
Henan Shuanghui Investment & Development Co. Ltd. Class A 38,100 298
Bank of Communications Co. Ltd. Class A 435,000 297
China Pacific Insurance Group Co. Ltd. Class A 69,600 294
China Lesso Group Holdings Ltd. 148,000 286
Yanzhou Coal Mining Co. Ltd. Class H 364,000 285
Shenzhen International Holdings Ltd. 167,500 273
China Aoyuan Group Ltd. 216,000 272
China Merchants Port Holdings Co. Ltd. 238,000 272
Beijing Enterprises Holdings Ltd. 77,500 271
China Medical System Holdings Ltd. 220,000 267
China Everbright Bank Co. Ltd. Class A 489,700 265
1 Fuyao Glass Industry Group Co. Ltd. Class H 94,400 264
CRRC Corp. Ltd. Class H 597,000 260
* Zoomlion Heavy Industry Science and Technology Co. Ltd. Class H 245,200 253
Bank of China Ltd. Class A 528,700 252
China Everbright Ltd. 154,000 247
Jiangsu Expressway Co. Ltd. Class H 230,000 247
Copyright © 2020 www.secdatabase.com. All Rights Reserved.Please Consider the Environment Before Printing This Document

China Communications Services Corp. Ltd. Class H 380,000 246
China Railway Construction Corp. Ltd. Class H 303,000 242
Shanghai Pharmaceuticals Holding Co. Ltd. Class H 136,300 242
Guangzhou R&F Properties Co. Ltd. Class H 208,400 241
GF Securities Co. Ltd. Class H 199,600 240
China Hongqiao Group Ltd. 407,000 234
1 Dali Foods Group Co. Ltd. 382,000 233
China Merchants Shekou Industrial Zone Holdings Co. Ltd. Class A 94,600 231
1 China Huarong Asset Management Co. Ltd. Class H 2,028,000 231
Yangzijiang Shipbuilding Holdings Ltd. 339,700 228
Kingboard Laminates Holdings Ltd. 198,000 223
Copyright © 2020 www.secdatabase.com. All Rights Reserved.Please Consider the Environment Before Printing This Document

Times China Holdings Ltd. 125,000 222
China Everbright Bank Co. Ltd. Class H 576,000 216
Bank of Shanghai Co. Ltd. Class A 180,641 214
Yuexiu Property Co. Ltd. 1,160,000 213
1 BAIC Motor Corp. Ltd. Class H 418,000 204
Shenzhen Investment Ltd. 646,000 203
China Traditional Chinese Medicine Holdings Co. Ltd. 396,000 203
Zhejiang Expressway Co. Ltd. Class H 262,000 195
China State Construction International Holdings Ltd. 328,000 194
Bank of Beijing Co. Ltd. Class A 273,200 189
Daqin Railway Co. Ltd. Class A 197,400 183
*,1 China Merchants Securities Co. Ltd. Class H 149,200 183
Chongqing Rural Commercial Bank Co. Ltd. Class H 448,000 182
Huaxia Bank Co. Ltd. Class A 197,500 180
Baoshan Iron & Steel Co. Ltd. Class A 247,000 174
Shanghai Lujiazui Finance & Trade Zone Development Co. Ltd. Class B 206,362 173
COSCO SHIPPING Ports Ltd. 330,000 172
Greentown China Holdings Ltd. 145,500 170
Citic Pacific Special Steel Group Co. Ltd. Class A 60,800 170
Huaxin Cement Co. Ltd. Class B 93,040 169
Lee & Man Paper Manufacturing Ltd. 273,000 169
China Petroleum & Chemical Corp. Class A 289,200 166
COSCO SHIPPING Energy Transportation Co. Ltd. Class A 156,800 161
China Power International Development Ltd. 831,370 156
China Shenhua Energy Co. Ltd. Class A 69,300 152
Hopson Development Holdings Ltd. 116,000 152
Seazen Holdings Co. Ltd. 30,800 150
Bosideng International Holdings Ltd. 518,000 150
Sinopec Shanghai Petrochemical Co. Ltd. Class H 650,000 145
1 Guotai Junan Securities Co. Ltd. Class H 86,400 143
Inner Mongolia Yitai Coal Co. Ltd. Class B 191,900 140
Huadian Fuxin Energy Corp. Ltd. Class H 436,000 137
China Reinsurance Group Corp. Class H 1,242,000 136
China National Nuclear Power Co. Ltd. Class A 217,800 135
Sino-Ocean Group Holding Ltd. 541,500 131
BBMG Corp. Class A 281,200 130
Lao Feng Xiang Co. Ltd. Class B 38,200 127
China Fortune Land Development Co. Ltd. Class A 49,920 124
Shanghai Industrial Holdings Ltd. 85,000 124
Shenzhen Expressway Co. Ltd. Class H 130,000 124
Bank of Nanjing Co. Ltd. Class A 110,800 123
Huayu Automotive Systems Co. Ltd. Class A 40,700 122
1 Sinopec Engineering Group Co. Ltd. Class H 273,000 121
Shaanxi Coal Industry Co. Ltd. Class A 102,100 118
Gemdale Corp. Class A 57,400 115
Shenzhen Overseas Chinese Town Co. Ltd. Class A 109,600 113
Copyright © 2020 www.secdatabase.com. All Rights Reserved.Please Consider the Environment Before Printing This Document

Poly Property Group Co. Ltd. 354,000 111
Greenland Holdings Corp. Ltd. Class A 94,900 111
Yanlord Land Group Ltd. 123,800 110
* SDIC Power Holdings Co. Ltd. Class A 89,100 110
Livzon Pharmaceutical Group Inc. Class H 23,400 110
Bank of Hangzhou Co. Ltd. Class A 76,800 104
1 Legend Holdings Corp. Class H 79,100 103
Shanghai International Port Group Co. Ltd. Class A 158,200 102
Fuyao Glass Industry Group Co. Ltd. Class A 29,000 101
Hengli Petrochemical Co. Ltd. Class A 42,900 100
Zhejiang Longsheng Group Co. Ltd. Class A 47,200 100
Copyright © 2020 www.secdatabase.com. All Rights Reserved.Please Consider the Environment Before Printing This Document

Jiangxi Zhengbang Technology Co. Ltd. Class A 32,200 100
1 China Railway Signal & Communication Corp. Ltd. Class H 221,000 96
* Chongqing Changan Automobile Co. Ltd. Class B 172,300 95
Huadian Power International Corp. Ltd. Class H 312,000 95
Lomon Billions Group Co. Ltd. Class A 27,100 92
Metallurgical Corp. of China Ltd. Class H 528,000 89
Wens Foodstuffs Group Co. Ltd. 26,100 89
Zoomlion Heavy Industry Science and Technology Co. Ltd. Class A 74,500 88
Metallurgical Corp. of China Ltd. Class A 209,700 84
Zhejiang Chint Electrics Co. Ltd. Class A 18,500 84
Yantai Changyu Pioneer Wine Co. Ltd. Class B 41,400 84
Beijing Jingneng Clean Energy Co. Ltd. Class H 302,000 83
Jinke Properties Group Co. Ltd. Class A 66,500 83
GD Power Development Co. Ltd. Class A 279,100 82
Sichuan Chuantou Energy Co. Ltd. Class A 59,400 81
Weifu High-Technology Group Co. Ltd. Class B 47,500 80
Sinotrans Ltd. Class H 375,000 78
China Merchants Energy Shipping Co. Ltd. Class A 83,700 75
Angang Steel Co. Ltd. Class H 267,000 75
1 Red Star Macalline Group Corp. Ltd. Class H 106,872 73
Datang International Power Generation Co. Ltd. Class H 556,000 73
1 Shenwan Hongyuan Group Co. Ltd. Class H 220,800 70
Xinjiang Goldwind Science & Technology Co. Ltd. Class H 69,800 70
RiseSun Real Estate Development Co. Ltd. Class A 58,800 69
China National Chemical Engineering Co. Ltd. Class A 81,300 67
* Jiangsu Zhongnan Construction Group Co. Ltd. Class A 49,400 67
Bank of Changsha Co. Ltd. Class A 53,300 65
Sichuan Swellfun Co. Ltd. Class A 7,075 65
Zhengzhou Yutong Bus Co. Ltd. Class A 31,800 62
China CITIC Bank Corp. Ltd. Class A 82,800 61
1 Qingdao Port International Co. Ltd. Class H 107,000 61
Shenergy Co. Ltd. Class A 74,100 60
China Gezhouba Group Co. Ltd. Class A 62,600 60
China Zhongwang Holdings Ltd. 275,600 58
China Communications Construction Co. Ltd. Class A 49,900 57
China BlueChemical Ltd. Class H 372,000 55
Bank of Jiangsu Co. Ltd. Class A 63,200 55
Shanghai Construction Group Co. Ltd. Class A 121,100 54
Yango Group Co. Ltd. Class A 54,400 54
Huaneng Power International Inc. Class A 78,600 53
Xiamen C & D Inc. Class A 39,100 53
Hunan Valin Steel Co. Ltd. Class A 80,500 52
China South Publishing & Media Group Co. Ltd. Class A 33,100 51
Guangshen Railway Co. Ltd. Class H 264,000 50
Zhejiang Weixing New Building Materials Co. Ltd. Class A 24,900 49
Shenzhen Jinjia Group Co. Ltd. Class A 29,400 48
Copyright © 2020 www.secdatabase.com. All Rights Reserved.Please Consider the Environment Before Printing This Document

Financial Street Holdings Co. Ltd. Class A 48,800 48
Shanghai Tunnel Engineering Co. Ltd. Class A 55,300 48
Shanxi Lu'an Environmental Energy Development Co. Ltd. Class A 52,100 48
Tangshan Jidong Cement Co. Ltd. Class A 17,300 48
China Construction Bank Corp. Class A 53,900 47
China Coal Energy Co. Ltd. Class H 189,000 47
China South City Holdings Ltd. 454,000 46
Shanghai Jinjiang International Hotels Co. Ltd. Class B 29,200 46
Huaibei Mining Holdings Co. Ltd. Class A 33,800 45
Shanghai AJ Group Co. Ltd. Class A 35,400 44
Anhui Expressway Co. Ltd. Class H 92,000 44
Copyright © 2020 www.secdatabase.com. All Rights Reserved.Please Consider the Environment Before Printing This Document

Jiayuan International Group Ltd. 92,000 43
Chongqing Rural Commercial Bank Co. Ltd. Class A 58,700 43
Maanshan Iron & Steel Co. Ltd. Class H 158,000 43
Shandong Chenming Paper Holdings Ltd. Class H 89,000 42
1 Everbright Securities Co. Ltd. Class H 37,400 42
Huadian Power International Corp. Ltd. Class A 74,000 38
Huolinhe Opencut Coal Industry Corp. Ltd. of Inner Mongolia Class A 22,900 38
Sichuan Expressway Co. Ltd. Class H 168,000 38
Beijing Capital Development Co. Ltd. Class A 39,400 38
* Polaris Bay Group Co. Ltd. Class A 19,600 38
Zhejiang Runtu Co. Ltd. Class A 27,500 38
Shanghai Lujiazui Finance & Trade Zone Development Co. Ltd. Class A 20,800 37
China Machinery Engineering Corp. Class H 154,000 37
Sansteel Minguang Co. Ltd. Fujian Class A 36,500 37
Huafa Industrial Co. Ltd. Zhuhai Class A 35,200 36
Chinese Universe Publishing and Media Group Co. Ltd. Class A 19,500 35
Sinoma International Engineering Co. Class A 41,200 35
Pingdingshan Tianan Coal Mining Co. Ltd. Class A 48,500 35
Zhejiang Medicine Co. Ltd. Class A 12,600 34
Shanghai Shimao Co. Ltd. Class A 54,300 34
1 Orient Securities Co. Ltd. Class H 49,200 33
CIMC Enric Holdings Ltd. 76,000 33
Guangxi Guiguan Electric Power Co. Ltd. Class A 51,300 33
Shenzhen Expressway Co. Ltd. Class A 25,400 33
Guangxi Liugong Machinery Co. Ltd. Class A 30,900 32
Sinopec Shanghai Petrochemical Co. Ltd. Class A 61,800 32
Inner Mongolia MengDian HuaNeng Thermal Power Corp. Ltd. Class A 85,400 31
* Jiangsu Expressway Co. Ltd. Class A 21,800 31
Maanshan Iron & Steel Co. Ltd. Class A 78,400 30
* Guizhou Panjiang Refined Coal Co. Ltd. Class A 33,200 30
Fujian Funeng Co. Ltd. Class A 23,900 30
Jiangling Motors Corp. Ltd. Class A 14,000 30
Chongqing Water Group Co. Ltd. Class A 39,200 30
Hangzhou Binjiang Real Estate Group Co. Ltd. Class A 44,100 30
MYS Group Co. Ltd. 39,400 30
Rainbow Digital Commercial Co. Ltd. Class A 18,800 29
Bank of Chengdu Co. Ltd. Class A 24,400 29
Jointo Energy Investment Co. Ltd. Hebei Class A 35,400 28
Shandong Chenming Paper Holdings Ltd. Class A 35,800 28
Liuzhou Iron & Steel Co. Ltd. Class A 38,900 28
Dongfang Electric Corp. Ltd. Class H 47,200 27
Sichuan Languang Development Co. Ltd. Class A 35,000 27
Zhejiang Semir Garment Co. Ltd. Class A 24,400 26
Nanjing Iron & Steel Co. Ltd. Class A 54,500 26
North Huajin Chemical Industries Co. Ltd. Class A 33,200 25
* China Merchants Securities Co. Ltd. Class H Rights Exp. 08/11/2020 44,760 7
Copyright © 2020 www.secdatabase.com. All Rights Reserved.Please Consider the Environment Before Printing This Document

123,735
Colombia (0.2%)
Ecopetrol SA ADR 41,279 481
Bancolombia SA ADR 16,700 466
Bancolombia SA 59,649 428
Interconexion Electrica SA ESP 77,250 397
Grupo Energia Bogota SA ESP 457,010 280
Grupo Argos SA Colombia 51,909 142
Grupo Aval Acciones y Valores Preference Shares 592,640 138
Cementos Argos SA 77,830 76
Grupo Aval Acciones y Valores SA ADR 7,552 35
Copyright © 2020 www.secdatabase.com. All Rights Reserved.Please Consider the Environment Before Printing This Document

Ecopetrol SA 54,855 31
2,474
Czech Republic (0.1%)
Cez AS 28,273 570
* Komercni banka AS 14,065 326
1 Moneta Money Bank AS 95,021 216
1,112
Denmark (0.1%)
Pandora A/S 17,195 1,094
Tryg A/S 21,489 632
1,726
Egypt (0.0%)
Egypt Kuwait Holding Co. SAE 151,933 159
Eastern Co. SAE 172,285 128
ElSewedy Electric Co. 129,404 55
Telecom Egypt Co. 63,313 51
Talaat Moustafa Group 109,529 40
433
Finland (1.5%)
Kone Oyj Class B 69,457 5,515
* Nordea Bank Abp 574,454 4,424
Sampo Oyj Class A 89,550 3,237
UPM-Kymmene Oyj 94,389 2,520
Fortum Oyj 76,669 1,556
Elisa Oyj 25,345 1,503
Stora Enso Oyj 101,939 1,278
Kesko Oyj Class B 47,904 1,016
Orion Oyj Class B 18,326 800
Wartsila OYJ Abp 86,986 727
Metso Outotec Oyj 107,316 693
Nokian Renkaat Oyj 23,921 571
* Neles Oyj 18,883 269
24,109
France (4.9%)
Sanofi 193,257 20,292
TOTAL SA 421,336 15,945
Schneider Electric SE 93,341 10,703
Danone SA 106,344 7,118
Orange SA 338,232 3,964
* Engie SA 161,031 2,145
* Societe Generale SA 136,883 2,107
Veolia Environnement SA 89,037 2,040
Carrefour SA 101,573 1,614
* Peugeot SA 96,348 1,549
* Bouygues SA 37,705 1,332
* Publicis Groupe SA 38,209 1,222
Copyright © 2020 www.secdatabase.com. All Rights Reserved.Please Consider the Environment Before Printing This Document

Engie 66,418 885
Engie Loyalty Line 2021 65,712 875
Suez SA 65,972 870
Rubis SCA 16,275 768
*,1 Amundi SA 10,058 765
* Scor SE 27,825 716
* Rexel SA 53,590 636
TechnipFMC plc 80,295 629
SES SA Class A 65,132 461
Copyright © 2020 www.secdatabase.com. All Rights Reserved.Please Consider the Environment Before Printing This Document

Eutelsat Communications SA 32,262 326
Imerys SA 6,144 228
^,1 ALD SA 15,026 150
77,340
Germany (6.4%)
Siemens AG 135,684 17,291
Allianz SE 73,780 15,307
Bayer AG 174,517 11,594
Deutsche Telekom AG 573,077 9,567
BASF SE 162,544 8,967
Muenchener Rueckversicherungs-Gesellschaft AG in Muenchen 24,408 6,470
Vonovia SE 95,876 6,197
* Volkswagen AG Preference Shares 31,994 4,683
E. ON SE 383,376 4,501
Rwe AG 101,951 3,843
Bayerische Motoren Werke AG 56,713 3,627
Hannover Rueck SE 10,643 1,800
HeidelbergCement AG 26,476 1,469
1 Covestro AG 30,447 1,182
Evonik Industries AG 34,080 921
Uniper SE 19,776 683
Bayerische Motoren Werke AG Preference Shares 10,118 514
Telefonica Deutschland Holding AG 115,841 316
Hochtief AG 3,720 304
Metro AG 29,156 266
Talanx AG 6,504 237
* Volkswagen AG 487 76
99,815
Greece (0.1%)
Hellenic Telecommunications Organization SA 41,052 604
Jumbo SA 17,479 341
Opap SA 36,397 330
Mytilineos SA 20,388 191
Motor Oil Hellas Corinth Refineries SA 9,390 128
Hellenic Petroleum SA 11,760 73
1,667
Hong Kong (2.4%)
CK Hutchison Holdings Ltd. 475,500 3,105
Sun Hung Kai Properties Ltd. 253,000 3,077
CLP Holdings Ltd. 291,500 2,756
CK Asset Holdings Ltd. 470,500 2,613
Hang Seng Bank Ltd. 128,800 2,027
BOC Hong Kong Holdings Ltd. 640,000 1,784
Sands China Ltd. 427,600 1,630
Jardine Matheson Holdings Ltd. 36,700 1,501
Power Assets Holdings Ltd. 244,599 1,362
Copyright © 2020 www.secdatabase.com. All Rights Reserved.Please Consider the Environment Before Printing This Document

1 WH Group Ltd. 1,499,639 1,335
New World Development Co. Ltd. 255,750 1,249
Wharf Real Estate Investment Co. Ltd. 303,000 1,072
Hang Lung Properties Ltd. 362,576 890
Henderson Land Development Co. Ltd. 233,587 874
Lenovo Group Ltd. 1,334,000 804
Hongkong Land Holdings Ltd. 196,400 748
Xinyi Solar Holdings Ltd. 680,800 747
Sino Land Co. Ltd. 600,000 727
Want Want China Holdings Ltd. 938,000 694
Copyright © 2020 www.secdatabase.com. All Rights Reserved.Please Consider the Environment Before Printing This Document

Tingyi Cayman Islands Holding Corp. 320,000 597
CK Infrastructure Holdings Ltd. 110,472 576
Xinyi Glass Holdings Ltd. 372,000 546
Bank of East Asia Ltd. 218,780 498
Swire Pacific Ltd. Class A 92,788 457
Wynn Macau Ltd. 259,200 455
PCCW Ltd. 754,000 425
Swire Properties Ltd. 177,098 409
Hysan Development Co. Ltd. 108,000 298
NagaCorp Ltd. 270,000 289
Kerry Properties Ltd. 111,000 264
Wharf Holdings Ltd. 153,000 260
1 BOC Aviation Ltd. 38,300 222
Chow Tai Fook Jewellery Group Ltd. 203,200 219
Dairy Farm International Holdings Ltd. 49,900 214
Yue Yuen Industrial Holdings Ltd. 131,000 208
NWS Holdings Ltd. 262,000 203
SITC International Holdings Co. Ltd. 187,000 188
Uni-President China Holdings Ltd. 171,000 186
VTech Holdings Ltd. 30,000 163
Shougang Fushan Resources Group Ltd. 700,000 160
Haitong International Securities Group Ltd. 480,000 130
Cafe de Coral Holdings Ltd. 62,000 124
Swire Pacific Ltd. Class B 110,000 97
Shui On Land Ltd. 642,500 95
First Pacific Co. Ltd. 424,000 88
Nexteer Automotive Group Ltd. 137,612 87
Guotai Junan International Holdings Ltd. 584,000 83
Dah Sing Financial Holdings Ltd. 27,600 76
Towngas China Co. Ltd. 157,185 76
Lifestyle International Holdings Ltd. 92,500 75
Television Broadcasts Ltd. 55,600 65
Dah Sing Banking Group Ltd. 28,000 25
36,853
Hungary (0.0%)
* MOL Hungarian Oil & Gas plc 80,031 471
Magyar Telekom Telecommunications plc 73,542 93
564
India (1.2%)
Infosys Ltd. 638,232 8,207
ITC Ltd. 518,876 1,345
Bharat Petroleum Corp. Ltd. 178,874 987
Power Grid Corp. of India Ltd. 328,293 781
Hero MotoCorp Ltd. 17,285 616
Oil & Natural Gas Corp. Ltd. 538,910 564
NTPC Ltd. 438,610 509
Copyright © 2020 www.secdatabase.com. All Rights Reserved.Please Consider the Environment Before Printing This Document

Coal India Ltd. 269,432 465
Indian Oil Corp. Ltd. 388,961 459
Vedanta Ltd. 285,848 437
Bharti Infratel Ltd. 157,518 404
Hindustan Petroleum Corp. Ltd. 113,817 327
Petronet LNG Ltd. 88,436 293
GAIL India Ltd. 185,774 240
Mphasis Ltd. 11,767 182
* Federal Bank Ltd. 249,558 179
REC Ltd. 123,280 165
Copyright © 2020 www.secdatabase.com. All Rights Reserved.Please Consider the Environment Before Printing This Document
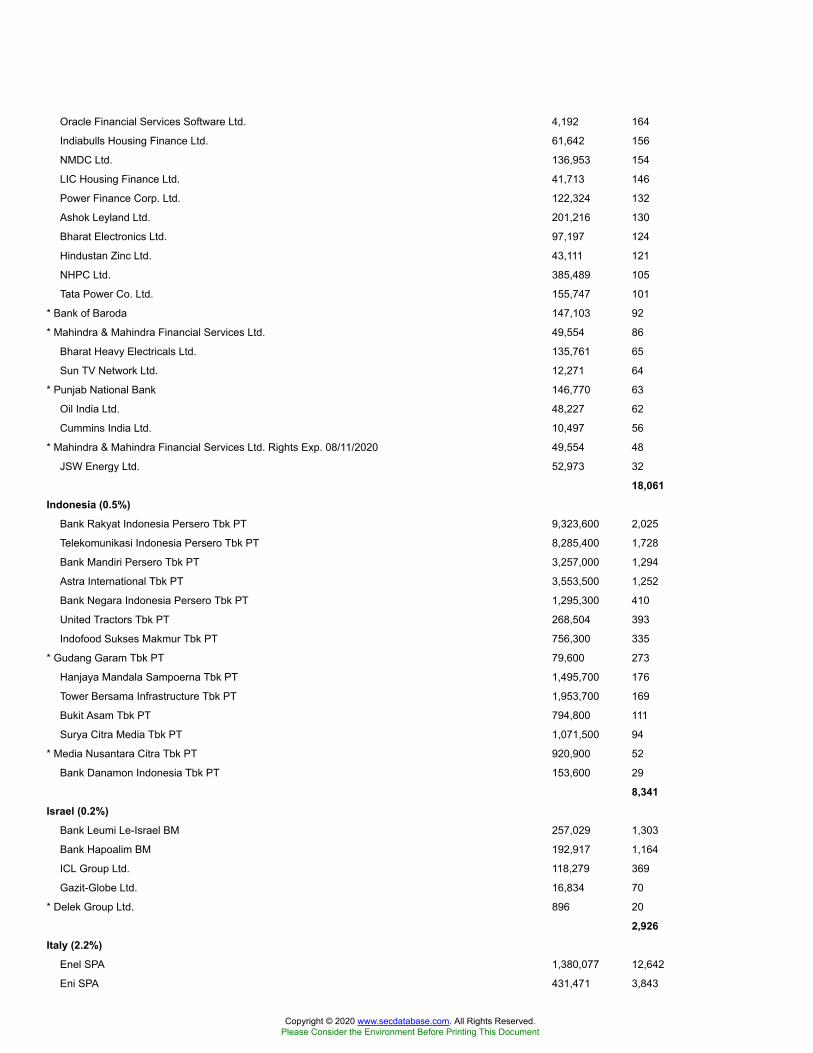
Oracle Financial Services Software Ltd. 4,192 164
Indiabulls Housing Finance Ltd. 61,642 156
NMDC Ltd. 136,953 154
LIC Housing Finance Ltd. 41,713 146
Power Finance Corp. Ltd. 122,324 132
Ashok Leyland Ltd. 201,216 130
Bharat Electronics Ltd. 97,197 124
Hindustan Zinc Ltd. 43,111 121
NHPC Ltd. 385,489 105
Tata Power Co. Ltd. 155,747 101
* Bank of Baroda 147,103 92
* Mahindra & Mahindra Financial Services Ltd. 49,554 86
Bharat Heavy Electricals Ltd. 135,761 65
Sun TV Network Ltd. 12,271 64
* Punjab National Bank 146,770 63
Oil India Ltd. 48,227 62
Cummins India Ltd. 10,497 56
* Mahindra & Mahindra Financial Services Ltd. Rights Exp. 08/11/2020 49,554 48
JSW Energy Ltd. 52,973 32
18,061
Indonesia (0.5%)
Bank Rakyat Indonesia Persero Tbk PT 9,323,600 2,025
Telekomunikasi Indonesia Persero Tbk PT 8,285,400 1,728
Bank Mandiri Persero Tbk PT 3,257,000 1,294
Astra International Tbk PT 3,553,500 1,252
Bank Negara Indonesia Persero Tbk PT 1,295,300 410
United Tractors Tbk PT 268,504 393
Indofood Sukses Makmur Tbk PT 756,300 335
* Gudang Garam Tbk PT 79,600 273
Hanjaya Mandala Sampoerna Tbk PT 1,495,700 176
Tower Bersama Infrastructure Tbk PT 1,953,700 169
Bukit Asam Tbk PT 794,800 111
Surya Citra Media Tbk PT 1,071,500 94
* Media Nusantara Citra Tbk PT 920,900 52
Bank Danamon Indonesia Tbk PT 153,600 29
8,341
Israel (0.2%)
Bank Leumi Le-Israel BM 257,029 1,303
Bank Hapoalim BM 192,917 1,164
ICL Group Ltd. 118,279 369
Gazit-Globe Ltd. 16,834 70
* Delek Group Ltd. 896 20
2,926
Italy (2.2%)
Enel SPA 1,380,077 12,642
Eni SPA 431,471 3,843
Copyright © 2020 www.secdatabase.com. All Rights Reserved.Please Consider the Environment Before Printing This Document

Assicurazioni Generali SPA 224,288 3,368
Snam SPA 387,192 2,061
* Fiat Chrysler Automobiles NV 195,454 1,987
Terna Rete Elettrica Nazionale SPA 246,106 1,837
* FinecoBank Banca Fineco SPA 107,811 1,572
* Atlantia SPA 87,139 1,396
Mediobanca Banca di Credito Finanziario SPA 136,714 1,104
1 Poste Italiane SPA 81,359 748
* Unione di Banche Italiane SPA 166,996 711
Italgas SPA 86,332 554
Copyright © 2020 www.secdatabase.com. All Rights Reserved.Please Consider the Environment Before Printing This Document

Tenaris SA 84,957 501
Telecom Italia SPA (Bearer) 1,062,090 427
A2A SPA 284,529 409
Banca Mediolanum SPA 45,622 340
UnipolSai Assicurazioni SPA 88,557 227
33,727
Japan (12.3%)
Toyota Motor Corp. 436,413 25,907
Takeda Pharmaceutical Co. Ltd. 270,300 9,803
KDDI Corp. 300,800 9,565
Mitsubishi UFJ Financial Group Inc. 2,215,300 8,301
Honda Motor Co. Ltd. 303,200 7,392
Sumitomo Mitsui Financial Group Inc. 230,654 6,146
NTT DOCOMO Inc. 200,600 5,523
Mizuho Financial Group Inc. 4,523,400 5,514
ITOCHU Corp. 239,784 5,258
Nippon Telegraph & Telephone Corp. 220,300 5,113
Tokio Marine Holdings Inc. 115,434 4,874
Mitsui & Co. Ltd. 294,012 4,396
Softbank Corp. 323,800 4,334
Mitsubishi Corp. 213,600 4,304
Japan Tobacco Inc. 211,300 3,612
Komatsu Ltd. 163,200 3,206
Bridgestone Corp. 101,900 3,002
Canon Inc. 177,500 2,856
Daiwa House Industry Co. Ltd. 115,100 2,540
Nomura Holdings Inc. 535,400 2,520
ORIX Corp. 222,500 2,406
Dai-ichi Life Holdings Inc. 192,100 2,266
Sumitomo Corp. 201,238 2,236
MS&AD Insurance Group Holdings Inc. 86,100 2,164
Subaru Corp. 108,809 2,055
Sompo Holdings Inc. 59,500 1,961
ENEOS Holdings Inc. 538,205 1,887
Sekisui House Ltd. 103,002 1,881
Sumitomo Mitsui Trust Holdings Inc. 65,700 1,687
Japan Post Holdings Co. Ltd. 238,974 1,632
Asahi Kasei Corp. 220,300 1,585
Sumitomo Electric Industries Ltd. 132,400 1,479
Chubu Electric Power Co. Inc. 124,000 1,474
Marubeni Corp. 281,900 1,298
Resona Holdings Inc. 390,300 1,280
Mitsubishi Chemical Holdings Corp. 229,800 1,235
Kansai Electric Power Co. Inc. 128,900 1,226
Taisei Corp. 35,400 1,216
Daiwa Securities Group Inc. 272,214 1,209
Copyright © 2020 www.secdatabase.com. All Rights Reserved.Please Consider the Environment Before Printing This Document

Mitsubishi Heavy Industries Ltd. 50,700 1,179
Toyota Tsusho Corp. 38,900 987
AGC Inc. 32,900 925
Daito Trust Construction Co. Ltd. 11,600 910
Inpex Corp. 159,100 908
Kajima Corp. 80,000 879
Idemitsu Kosan Co. Ltd. 42,053 876
SBI Holdings Inc. 40,700 857
Sumitomo Chemical Co. Ltd. 278,400 803
T&D Holdings Inc. 95,300 784
Tohoku Electric Power Co. Inc. 82,800 782
Copyright © 2020 www.secdatabase.com. All Rights Reserved.Please Consider the Environment Before Printing This Document

Ricoh Co. Ltd. 118,900 766
Yamaha Motor Co. Ltd. 49,900 728
Shimizu Corp. 96,600 692
Kyushu Electric Power Co. Inc. 82,100 690
Tosoh Corp. 48,800 655
Chugoku Electric Power Co. Inc. 53,435 652
LIXIL Group Corp. 48,500 647
Tokyo Century Corp. 10,700 602
Concordia Financial Group Ltd. 198,700 589
Mitsui Chemicals Inc. 30,800 586
Kuraray Co. Ltd. 59,700 585
Haseko Corp. 49,286 582
Japan Post Bank Co. Ltd. 75,248 561
NSK Ltd. 81,500 549
Seiko Epson Corp. 50,100 532
Marui Group Co. Ltd. 36,000 523
Showa Denko KK 24,900 516
Mitsubishi Gas Chemical Co. Inc. 32,100 510
Chiba Bank Ltd. 108,300 496
Sojitz Corp. 223,800 469
NGK Spark Plug Co. Ltd. 32,700 440
Japan Post Insurance Co. Ltd. 32,800 436
Fukuoka Financial Group Inc. 28,900 420
Kyowa Exeo Corp. 17,200 406
Electric Power Development Co. Ltd. 28,900 394
Amada Co. Ltd. 57,600 387
Nikon Corp. 55,300 387
Denka Co. Ltd. 16,000 385
Sumitomo Heavy Industries Ltd. 19,500 380
Mebuki Financial Group Inc. 168,500 375
Iida Group Holdings Co. Ltd. 24,000 371
DIC Corp. 15,200 366
Aozora Bank Ltd. 22,100 354
Nomura Real Estate Holdings Inc. 19,000 314
Mitsubishi UFJ Lease & Finance Co. Ltd. 72,700 309
Seven Bank Ltd. 120,500 296
Sumitomo Rubber Industries Ltd. 34,500 287
Aica Kogyo Co. Ltd. 8,900 286
Sanwa Holdings Corp. 32,300 277
Hachijuni Bank Ltd. 73,000 271
IHI Corp. 21,700 270
Ube Industries Ltd. 15,900 260
Toda Corp. 40,100 257
Penta-Ocean Construction Co. Ltd. 48,900 257
JTEKT Corp. 38,600 257
J Front Retailing Co. Ltd. 42,500 246
Copyright © 2020 www.secdatabase.com. All Rights Reserved.Please Consider the Environment Before Printing This Document

Credit Saison Co. Ltd. 25,800 242
Gunma Bank Ltd. 73,000 230
Yamaguchi Financial Group Inc. 38,200 226
Yokohama Rubber Co. Ltd. 17,500 224
Ushio Inc. 18,900 222
H.U. Group Holdings Inc. 9,700 218
Hiroshima Bank Ltd. 47,400 218
Kaneka Corp. 9,100 215
Nippon Electric Glass Co. Ltd. 12,900 211
Pola Orbis Holdings Inc. 12,600 209
Mitsubishi Motors Corp. 104,100 205
Copyright © 2020 www.secdatabase.com. All Rights Reserved.Please Consider the Environment Before Printing This Document

Sankyo Co. Ltd. 8,200 205
Konica Minolta Inc. 77,200 204
Hitachi Capital Corp. 8,200 197
Kyudenko Corp. 6,900 196
DMG Mori Co. Ltd. 17,000 183
Heiwa Corp. 10,300 173
Hokuhoku Financial Group Inc. 20,300 171
Matsui Securities Co. Ltd. 19,700 161
Shikoku Electric Power Co. Inc. 23,800 160
Japan Steel Works Ltd. 10,500 150
Wacoal Holdings Corp. 8,500 144
AEON Financial Service Co. Ltd. 19,000 143
Cosmo Energy Holdings Co. Ltd. 9,900 143
NTN Corp. 78,300 137
Nisshinbo Holdings Inc. 21,800 130
Citizen Watch Co. Ltd. 43,800 119
Yamato Kogyo Co. Ltd. 5,300 108
Toyota Boshoku Corp. 8,800 103
Noevir Holdings Co. Ltd. 2,300 95
Tokai Rika Co. Ltd. 7,500 94
SKY Perfect JSAT Holdings Inc. 22,700 84
H2O Retailing Corp. 13,500 78
Fuji Media Holdings Inc. 6,500 57
192,506
Kuwait (0.3%)
National Bank of Kuwait SAKP 1,139,587 2,983
Mobile Telecommunications Co. KSC 374,434 676
Ahli United Bank BSC 933,180 575
Gulf Bank KSCP 317,721 199
Boubyan Petrochemicals Co. KSCP 65,339 115
Burgan Bank SAK 112,684 66
4,614
Malaysia (0.8%)
Public Bank Bhd. (Local) 548,600 2,202
Malayan Banking Bhd. 1,068,197 1,934
Tenaga Nasional Bhd. 692,733 1,870
CIMB Group Holdings Bhd. 1,248,600 1,060
DiGi.Com Bhd. 662,200 664
Maxis Bhd. 489,200 611
MISC Bhd. 254,200 473
Petronas Gas Bhd. 104,732 417
Hong Leong Bank Bhd. 102,800 365
Genting Bhd. 386,700 351
Gamuda Bhd. 407,300 343
Sime Darby Bhd. 617,400 317
RHB Bank Bhd. 263,900 313
Copyright © 2020 www.secdatabase.com. All Rights Reserved.Please Consider the Environment Before Printing This Document

Genting Malaysia Bhd. 488,300 263
AMMB Holdings Bhd. 356,500 244
Westports Holdings Bhd. 203,500 188
YTL Corp. Bhd. 842,368 155
Alliance Bank Malaysia Bhd. 203,500 103
British American Tobacco Malaysia Bhd. 26,200 66
1 Astro Malaysia Holdings Bhd. 288,500 54
IOI Properties Group Bhd. 218,500 48
12,041
Copyright © 2020 www.secdatabase.com. All Rights Reserved.Please Consider the Environment Before Printing This Document

Mexico (0.6%)
Wal-Mart de Mexico SAB de CV 922,135 2,164
* Grupo Financiero Banorte SAB de CV 512,746 1,841
Grupo Mexico SAB de CV Class B 562,900 1,422
Grupo Aeroportuario del Pacifico SAB de CV C lass B 74,254 493
Coca-Cola Femsa SAB de CV 89,900 371
Industrias Penoles SAB de CV 23,640 353
* Promotora y Operadora de Infraestructura SAB de CV 39,790 292
Alfa SAB de CV Class A 515,700 279
* Grupo Aeroportuario del Sureste SAB de CV Class B 27,990 278
Orbia Advance Corp. SAB de CV 174,500 276
* Grupo Financiero Inbursa SAB de CV 367,800 264
Infraestructura Energetica Nova SAB de CV 86,800 258
Kimberly-Clark de Mexico SAB de CV Class A 155,100 254
* Grupo Aeroportuario del Centro Norte SAB de CV 59,400 245
1 GMexico Transportes SAB de CV 203,900 238
* Regional SAB de CV 40,000 104
*,1 Banco del Bajio SA 112,000 86
Banco Santander Mexico SA Institucion de Banca Multiple Grupo Financiero
Santander 111,500 71
Grupo Lala SAB de CV 76,600 42
9,331
Netherlands (1.8%)
Unilever NV 257,708 15,228
Koninklijke Ahold Delhaize NV 192,835 5,554
ING Groep NV 690,750 4,816
^ Koninklijke KPN NV 586,414 1,545
Aegon NV 312,840 917
ASR Nederland NV 24,821 802
28,862
New Zealand (0.2%)
Spark New Zealand Ltd. 324,477 1,063
Meridian Energy Ltd. 217,647 707
Contact Energy Ltd. 133,039 517
Mercury NZ Ltd. 117,389 365
SKYCITY Entertainment Group Ltd. 124,271 206
2,858
Norway (0.6%)
Equinor ASA 174,632 2,618
Telenor ASA 114,467 1,769
Mowi ASA 75,642 1,374
Orkla ASA 135,684 1,335
Yara International ASA 30,588 1,290
* Salmar ASA 9,061 431
^ Aker BP ASA 19,186 365
Leroy Seafood Group ASA 47,729 277
Copyright © 2020 www.secdatabase.com. All Rights Reserved.Please Consider the Environment Before Printing This Document

^ Aker ASA 3,980 170
9,629
Pakistan (0.0%)
Habib Bank Ltd. 125,375 92
Pakistan Petroleum Ltd. 146,680 87
Oil & Gas Development Co. Ltd. 119,600 82
Fauji Fertilizer Co. Ltd. 112,299 75
336
Copyright © 2020 www.secdatabase.com. All Rights Reserved.Please Consider the Environment Before Printing This Document

Philippines (0.1%)
PLDT Inc. 16,100 436
Manila Electric Co. 45,990 248
Globe Telecom Inc. 5,405 227
Metro Pacific Investments Corp. 2,371,000 151
Aboitiz Power Corp. 256,300 134
DMCI Holdings Inc. 702,800 51
Semirara Mining & Power Corp. 185,720 38
1,285
Poland (0.2%)
* Powszechna Kasa Oszczednosci Bank Polski SA 152,772 885
Polski Koncern Naftowy ORLEN SA 54,051 770
Powszechny Zaklad Ubezpieczen SA 103,414 745
* Cyfrowy Polsat SA 47,867 356
Grupa Lotos SA 16,698 216
* Santander Bank Polska SA 4,895 196
3,168
Portugal (0.2%)
EDP - Energias de Portugal SA 455,934 2,292
Galp Energia SGPS SA 91,176 955
* EDP - Energias de Portugal SA Rights Exp. 08/06/2020 455,934 46
3,293
Qatar (0.6%)
Qatar National Bank QPSC 787,253 3,920
Qatar Islamic Bank SAQ 207,103 917
Industries Qatar QSC 359,043 771
Masraf Al Rayan QSC 656,416 713
Commercial Bank PSQC 367,642 416
Qatar Electricity & Water Co. QSC 88,187 411
Qatar Fuel QSC 81,698 364
Qatar Gas Transport Co. Ltd. 465,810 360
Barwa Real Estate Co. 348,664 302
Qatar International Islamic Bank QSC 127,033 287
Ooredoo QPSC 154,022 285
* Doha Bank QPSC 289,407 189
Qatar Insurance Co. SAQ 299,825 164
Vodafone Qatar QSC 222,839 78
9,177
Russia (1.9%)
* Sberbank of Russia PJSC 1,828,630 5,476
Lukoil PJSC ADR 56,592 3,839
Gazprom PJSC ADR 714,105 3,452
Novatek PJSC 190,317 2,810
Tatneft PJSC ADR 39,461 1,756
MMC Norilsk Nickel PJSC 4,667 1,236
MMC Norilsk Nickel PJSC ADR 43,805 1,144
Copyright © 2020 www.secdatabase.com. All Rights Reserved.Please Consider the Environment Before Printing This Document

Lukoil PJSC 15,726 1,080
Gazprom PJSC 417,435 1,027
Rosneft Oil Co. PJSC GDR 178,391 846
Surgutneftegas OAO Preference Shares 1,371,177 692
Mobile TeleSystems PJSC ADR 74,376 659
Polyus PJSC 2,731 623
* AK Transneft OAO Preference Shares 286 520
Inter RAO UES PJSC 6,483,000 506
Polyus PJSC GDR 4,270 488
Moscow Exchange MICEX-RTS PJSC 255,716 460
Copyright © 2020 www.secdatabase.com. All Rights Reserved.Please Consider the Environment Before Printing This Document
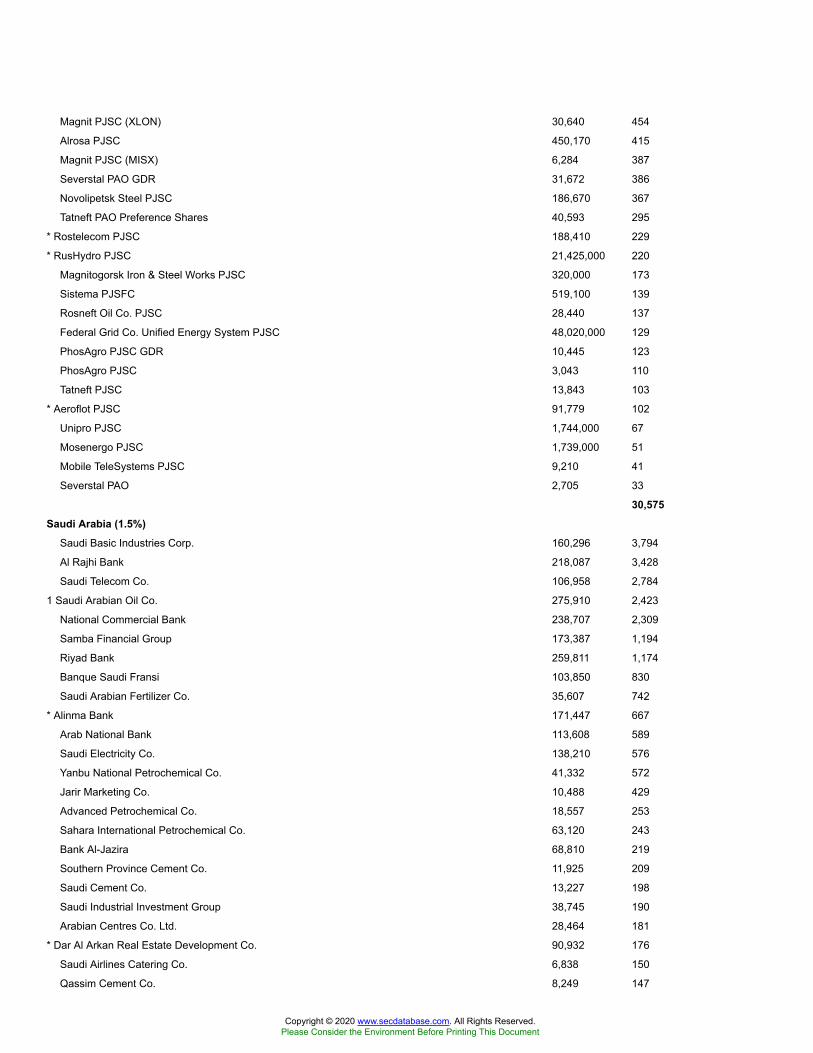
Magnit PJSC (XLON) 30,640 454
Alrosa PJSC 450,170 415
Magnit PJSC (MISX) 6,284 387
Severstal PAO GDR 31,672 386
Novolipetsk Steel PJSC 186,670 367
Tatneft PAO Preference Shares 40,593 295
* Rostelecom PJSC 188,410 229
* RusHydro PJSC 21,425,000 220
Magnitogorsk Iron & Steel Works PJSC 320,000 173
Sistema PJSFC 519,100 139
Rosneft Oil Co. PJSC 28,440 137
Federal Grid Co. Unified Energy System PJSC 48,020,000 129
PhosAgro PJSC GDR 10,445 123
PhosAgro PJSC 3,043 110
Tatneft PJSC 13,843 103
* Aeroflot PJSC 91,779 102
Unipro PJSC 1,744,000 67
Mosenergo PJSC 1,739,000 51
Mobile TeleSystems PJSC 9,210 41
Severstal PAO 2,705 33
30,575
Saudi Arabia (1.5%)
Saudi Basic Industries Corp. 160,296 3,794
Al Rajhi Bank 218,087 3,428
Saudi Telecom Co. 106,958 2,784
1 Saudi Arabian Oil Co. 275,910 2,423
National Commercial Bank 238,707 2,309
Samba Financial Group 173,387 1,194
Riyad Bank 259,811 1,174
Banque Saudi Fransi 103,850 830
Saudi Arabian Fertilizer Co. 35,607 742
* Alinma Bank 171,447 667
Arab National Bank 113,608 589
Saudi Electricity Co. 138,210 576
Yanbu National Petrochemical Co. 41,332 572
Jarir Marketing Co. 10,488 429
Advanced Petrochemical Co. 18,557 253
Sahara International Petrochemical Co. 63,120 243
Bank Al-Jazira 68,810 219
Southern Province Cement Co. 11,925 209
Saudi Cement Co. 13,227 198
Saudi Industrial Investment Group 38,745 190
Arabian Centres Co. Ltd. 28,464 181
* Dar Al Arkan Real Estate Development Co. 90,932 176
Saudi Airlines Catering Co. 6,838 150
Qassim Cement Co. 8,249 147
Copyright © 2020 www.secdatabase.com. All Rights Reserved.Please Consider the Environment Before Printing This Document

National Petrochemical Co. 21,060 135
* Seera Group Holding 28,116 124
Yanbu Cement Co. 11,677 97
23,833
Singapore (1.3%)
DBS Group Holdings Ltd. 316,578 4,573
Oversea-Chinese Banking Corp. Ltd. 610,800 3,826
United Overseas Bank Ltd. 228,645 3,219
Singapore Telecommunications Ltd. (Ordinary Shares) 1,313,688 2,384
Keppel Corp. Ltd. 254,312 1,002
Copyright © 2020 www.secdatabase.com. All Rights Reserved.Please Consider the Environment Before Printing This Document

CapitaLand Ltd. 450,000 908
Singapore Exchange Ltd. 146,032 871
Singapore Technologies Engineering Ltd. 273,600 655
Venture Corp. Ltd. 46,400 606
Genting Singapore Ltd. 1,008,900 541
ComfortDelGro Corp. Ltd. 380,900 379
Jardine Cycle & Carriage Ltd. 15,700 230
Singapore Press Holdings Ltd. 286,700 224
SATS Ltd. 108,800 218
Sembcorp Industries Ltd. 151,100 191
Singapore Post Ltd. 281,700 146
Golden Agri-Resources Ltd. 1,185,700 136
Hutchison Port Holdings Trust 893,200 97
StarHub Ltd. 107,500 96
Olam International Ltd. 78,000 76
Frasers Property Ltd. 72,500 61
SIA Engineering Co. Ltd. 47,400 61
Singapore Telecommunications Ltd. 8,800 16
20,516
South Africa (1.0%)
FirstRand Ltd. 822,341 1,873
Standard Bank Group Ltd. 226,905 1,443
Impala Platinum Holdings Ltd. 128,887 1,151
MTN Group Ltd. 318,462 1,114
Sanlam Ltd. 312,404 1,106
Anglo American Platinum Ltd. 10,640 817
* Sasol Ltd. 98,989 800
Vodacom Group Ltd. 104,788 786
Old Mutual Ltd. 822,887 553
* MultiChoice Group 78,054 481
Bidvest Group Ltd. 56,725 438
Nedbank Group Ltd. 62,191 382
NEPI Rockcastle plc 66,556 345
Mr Price Group Ltd. 46,281 342
SPAR Group Ltd. 35,371 341
Exxaro Resources Ltd. 42,927 339
Kumba Iron Ore Ltd. 9,590 310
Tiger Brands Ltd. 29,901 308
Woolworths Holdings Ltd. 158,301 293
Life Healthcare Group Holdings Ltd. 253,127 258
AVI Ltd. 57,372 236
Rand Merchant Investment Holdings Ltd. 125,707 233
African Rainbow Minerals Ltd. 19,430 222
Netcare Ltd. 265,681 211
Foschini Group Ltd. 41,217 169
Momentum Metropolitan Holdings 161,434 157
Copyright © 2020 www.secdatabase.com. All Rights Reserved.Please Consider the Environment Before Printing This Document

Truworths International Ltd. 79,746 153
Pick n Pay Stores Ltd. 56,828 149
Barloworld Ltd. 35,411 137
Santam Ltd. 7,512 116
Coronation Fund Managers Ltd. 50,185 115
Investec Ltd. 47,127 92
Liberty Holdings Ltd. 21,815 88
Distell Group Holdings Ltd. 15,365 61
* Sappi Ltd. 40,063 57
Reunert Ltd. 30,570 56
MAS Real Estate Inc. 57,423 39
Copyright © 2020 www.secdatabase.com. All Rights Reserved.Please Consider the Environment Before Printing This Document

* Foschini Group Ltd. Rights Exp. 08/07/2020 16,486 26
Tsogo Sun Gaming Ltd. 105,750 20
RMB Holdings Ltd. 196,694 16
15,833
South Korea (1.8%)
Samsung Electronics Co. Ltd. Preference Shares 146,341 6,112
Hyundai Motor Co. 25,726 2,744
Shinhan Financial Group Co. Ltd. 82,685 2,075
KB Financial Group Inc. 68,905 2,039
Posco 12,120 1,956
KT&G Corp. 19,883 1,350
Hana Financial Group Inc. 51,064 1,267
LG Corp. 16,099 1,000
Samsung Fire & Marine Insurance Co. Ltd. 6,060 872
SK Telecom Co. Ltd. ADR 38,965 791
Woori Financial Group Inc. 96,628 691
Korea Zinc Co. Ltd. 1,700 591
Mirae Asset Daewoo Co. Ltd. 79,398 527
Samsung Life Insurance Co. Ltd. 10,960 438
Industrial Bank of Korea 53,530 365
Hyundai Heavy Industries Holdings Co. Ltd. 1,802 358
DB Insurance Co. Ltd. 8,675 343
Kangwon Land Inc. 17,811 342
Hyundai Motor Co. 2nd Preference Shares 4,831 281
Korea Investment Holdings Co. Ltd. 6,603 270
Samsung Securities Co. Ltd. 10,759 262
GS Holdings Corp. 8,638 254
BNK Financial Group Inc. 54,555 236
GS Engineering & Construction Corp. 9,817 223
Hyundai Marine & Fire Insurance Co. Ltd. 11,183 219
Cheil Worldwide Inc. 13,341 215
Hyundai Motor Co. Preference Shares 3,429 199
NH Investment & Securities Co. Ltd. 24,405 180
Samsung Card Co. Ltd. 5,849 139
Lotte Shopping Co. Ltd. 1,870 123
DGB Financial Group Inc. 28,091 122
KEPCO Plant Service & Engineering Co. Ltd. 4,297 106
LOTTE Fine Chemical Co. Ltd. 2,636 97
Doosan Bobcat Inc. 4,110 93
LS Corp. 2,602 92
Korea Gas Corp. 4,128 88
Posco International Corp. 7,507 88
KCC Corp. 759 86
Ssangyong Cement Industrial Co. Ltd. 19,061 81
LG Electronics Inc. Preference Shares 3,020 68
Hanwha Life Insurance Co. Ltd. 45,162 56
Copyright © 2020 www.secdatabase.com. All Rights Reserved.Please Consider the Environment Before Printing This Document

Hanwha Corp. Preference Shares 3,489 35
27,474
Spain (2.5%)
* Iberdrola SA 1,045,337 13,511
Banco Santander SA (XMAD) 2,838,963 6,088
Banco Bilbao Vizcaya Argentaria SA 1,185,236 3,690
Telefonica SA 834,688 3,496
* Repsol SA 243,349 1,919
Endesa SA 56,078 1,600
Red Electrica Corp. SA 76,282 1,487
Copyright © 2020 www.secdatabase.com. All Rights Reserved.Please Consider the Environment Before Printing This Document

CaixaBank SA 636,042 1,368
Enagas SA 44,063 1,112
ACS Actividades de Construccion y Servicios SA 44,822 1,040
^ Naturgy Energy Group SA 53,415 994
Bankinter SA 121,540 632
Acciona SA 3,563 396
Banco de Sabadell SA 991,975 340
Mapfre SA 179,741 325
* Iberdrola SA (XMAD) 23,598 304
Bankia SA 206,066 263
Zardoya Otis SA 33,009 219
Banco Santander SA (XMEX) 77,341 177
* Ferrovial SA 1,219 30
38,991
Sweden (1.7%)
Investor AB Class B 80,393 4,770
* Volvo AB Class B 267,430 4,622
* Swedbank AB Class A 177,502 2,882
* Skandinaviska Enskilda Banken AB Class A 257,887 2,495
Hennes & Mauritz AB Class B 155,461 2,423
Telia Co. AB 456,079 1,777
Tele2 AB 94,429 1,340
Boliden AB 48,461 1,323
* Skanska AB Class B 63,578 1,283
SKF AB 68,139 1,262
Castellum AB 47,697 1,026
Lundin Energy AB 33,745 787
25,990
Switzerland (5.3%)
Novartis AG 381,450 31,419
Zurich Insurance Group AG 26,414 9,768
ABB Ltd. 316,950 7,960
UBS Group AG 594,984 7,009
LafargeHolcim Ltd. 90,940 4,302
SWISS RE AG 51,577 4,070
SGS SA-REG 1,047 2,742
Swisscom AG 4,514 2,399
Swiss Life Holding AG 5,913 2,161
Julius Baer Group Ltd. 38,556 1,693
Roche Holding AG (Bearer) 4,732 1,631
Adecco Group AG 27,707 1,309
Baloise Holding AG 8,151 1,244
Swiss Prime Site AG 13,295 1,213
PSP Swiss Property AG 7,507 834
Clariant AG 34,999 662
Helvetia Holding AG 5,822 528
Copyright © 2020 www.secdatabase.com. All Rights Reserved.Please Consider the Environment Before Printing This Document

Banque Cantonale Vaudoise 4,937 517
DKSH Holding AG 6,311 405
OC Oerlikon Corp. AG 33,215 279
Sulzer AG 3,306 274
82,419
Taiwan (7.7%)
Taiwan Semiconductor Manufacturing Co. Ltd. 4,259,953 61,998
Hon Hai Precision Industry Co. Ltd. 2,115,000 5,653
Delta Electronics Inc. 384,802 2,630
Formosa Plastics Corp. 867,879 2,324
Copyright © 2020 www.secdatabase.com. All Rights Reserved.Please Consider the Environment Before Printing This Document

CTBC Financial Holding Co. Ltd. 3,214,120 2,129
Mega Financial Holding Co. Ltd. 1,926,000 2,126
Nan Ya Plastics Corp. 1,004,000 2,094
Uni-President Enterprises Corp. 854,000 2,084
Cathay Financial Holding Co. Ltd. 1,474,388 1,993
Fubon Financial Holding Co. Ltd. 1,310,000 1,866
Chunghwa Telecom Co. Ltd. ADR 42,473 1,566
Formosa Chemicals & Fibre Corp. 612,000 1,408
First Financial Holding Co. Ltd. 1,740,751 1,403
Taiwan Cement Corp. 857,478 1,317
* Quanta Computer Inc. 471,000 1,316
Yuanta Financial Holding Co. Ltd. 2,019,000 1,242
United Microelectronics Corp. ADR 314,236 1,163
Hua Nan Financial Holdings Co. Ltd. 1,608,708 1,103
Realtek Semiconductor Corp. 84,000 1,072
Yageo Corp. 80,000 1,062
Taiwan Mobile Co. Ltd. 290,000 1,039
Novatek Microelectronics Corp. 101,000 1,001
Catcher Technology Co. Ltd. 129,672 957
Chailease Holding Co. Ltd. 225,494 944
Asustek Computer Inc. 125,268 924
Chunghwa Telecom Co. Ltd. 227,000 848
Shanghai Commercial & Savings Bank Ltd. 571,000 825
Taishin Financial Holding Co. Ltd. 1,801,310 821
ASE Technology Holding Co. Ltd. 317,171 813
Pegatron Corp. 356,000 747
Accton Technology Corp. 94,000 736
ASE Technology Holding Co. Ltd. ADR 144,834 726
SinoPac Financial Holdings Co. Ltd. 1,867,641 679
Formosa Petrochemical Corp. 243,000 677
Lite-On Technology Corp. 378,194 640
Far EasTone Telecommunications Co. Ltd. 285,000 614
Far Eastern New Century Corp. 700,000 612
Wistron Corp. 493,656 578
Asia Cement Corp. 411,000 560
Globalwafers Co. Ltd. 37,000 530
Vanguard International Semiconductor Corp. 159,000 515
Walsin Technology Corp. 83,000 497
Zhen Ding Technology Holding Ltd. 104,000 479
Compal Electronics Inc. 722,000 459
Inventec Corp. 531,994 453
Pou Chen Corp. 488,000 442
Eclat Textile Co. Ltd. 36,200 428
Cheng Shin Rubber Industry Co. Ltd. 340,994 396
Foxconn Technology Co. Ltd. 210,190 389
* Feng TAY Enterprise Co. Ltd. 64,400 386
Copyright © 2020 www.secdatabase.com. All Rights Reserved.Please Consider the Environment Before Printing This Document

Wiwynn Corp. 14,000 375
Synnex Technology International Corp. 235,000 351
Chicony Electronics Co. Ltd. 111,370 330
Acer Inc. 468,000 323
Nanya Technology Corp. 151,000 312
Teco Electric and Machinery Co. Ltd. 304,000 283
United Microelectronics Corp. 365,000 277
Taiwan Fertilizer Co. Ltd. 141,000 269
Formosa Taffeta Co. Ltd. 176,000 182
Taiwan Secom Co. Ltd. 53,000 156
Eva Airways Corp. 383,000 142
Copyright © 2020 www.secdatabase.com. All Rights Reserved.Please Consider the Environment Before Printing This Document

Transcend Information Inc. 52,000 117
Taiwan Semiconductor Manufacturing Co. Ltd. ADR 173 14
120,395
Thailand (0.8%)
PTT PCL (Foreign) 2,519,100 3,160
Advanced Info Service PCL (Foreign) 197,304 1,171
Siam Cement PCL NVDR 79,400 974
* Siam Cement PCL (Foreign) 70,450 864
Siam Commercial Bank PCL (Foreign) 379,200 817
PTT Exploration & Production PCL (Foreign) 242,430 711
* Intouch Holdings PCL (Foreign) 334,106 610
PTT Global Chemical PCL 346,799 525
Kasikornbank PCL (Foreign) 183,100 477
Digital Telecommunications Infrastructure Fund 929,897 450
Krung Thai Bank PCL (Foreign) 1,245,100 394
Kasikornbank PCL 126,300 329
Delta Electronics Thailand PCL 82,300 301
Ratchaburi Electricity Generating Holding PCL (Foreign) 137,000 263
Bangkok Bank PCL (Foreign) 81,900 262
Thai Oil PCL (Foreign) 181,500 246
TMB Bank PCL 7,825,600 239
Thai Union Frozen Products PCL (Foreign) 523,100 225
Land & Houses PCL (Foreign) 845,800 201
Banpu PCL 921,100 165
IRPC PCL (Foreign) 1,931,900 158
Intouch Holdings PCL NVDR 65,000 119
Land & Houses PCL 345,100 82
Siam City Cement PCL (Foreign) 16,332 79
Siam Commercial Bank PCL 30,700 66
Bangkok Life Assurance PCL 47,700 25
12,913
Turkey (0.1%)
Turkcell Iletisim Hizmetleri AS 188,052 399
* Akbank TAS 491,208 369
* Tupras Turkiye Petrol Rafinerileri AS 22,269 264
Eregli Demir ve Celik Fabrikalari TAS 240,303 262
Haci Omer Sabanci Holding AS (Bearer) 149,449 179
Ford Otomotiv Sanayi AS 11,710 139
Enka Insaat ve Sanayi AS 137,729 129
* Petkim Petrokimya Holding AS 192,894 108
Turkiye Sise ve Cam Fabrikalari AS 123,662 102
TAV Havalimanlari Holding AS 34,939 83
Tofas Turk Otomobil Fabrikasi AS 22,707 83
Tekfen Holding AS 36,475 80
Anadolu Efes Biracilik Ve Malt Sanayii AS 24,472 68
Coca-Cola Icecek AS 8,432 54
Copyright © 2020 www.secdatabase.com. All Rights Reserved.Please Consider the Environment Before Printing This Document

Iskenderun Demir ve Celik AS 20,117 20
2,339
United Arab Emirates (0.4%)
First Abu Dhabi Bank PJSC 773,663 2,346
Emirates Telecommunications Group Co. PJSC 309,635 1,400
§ Abu Dhabi Commercial Bank PJSC 479,351 663
Dubai Islamic Bank PJSC 331,130 338
Aldar Properties PJSC 667,381 317
Abu Dhabi Islamic Bank PJSC 169,827 172
Dana Gas PJSC 637,959 125
Copyright © 2020 www.secdatabase.com. All Rights Reserved.Please Consider the Environment Before Printing This Document

Dubai Investments PJSC 388,932 123
Air Arabia PJSC 365,852 115
* DAMAC Properties Dubai Co. PJSC 265,462 66
5,665
United Kingdom (10.1%)
GlaxoSmithKline plc 874,678 17,424
British American Tobacco plc 400,745 13,244
BP plc 3,521,060 12,752
Rio Tinto plc 192,585 11,723
Unilever plc 193,413 11,517
Royal Dutch Shell plc Class A 726,682 10,621
Royal Dutch Shell plc Class B 660,233 9,267
BHP Group plc 368,883 7,977
National Grid plc 622,531 7,303
Vodafone Group plc 4,752,986 7,143
Anglo American plc 218,662 5,293
Tesco plc 1,714,645 4,839
BAE Systems plc 568,958 3,646
SSE plc 183,765 3,117
Legal & General Group plc 1,049,277 2,905
Imperial Brands plc 166,774 2,779
BT Group plc 1,540,741 1,980
3i Group plc 169,609 1,952
Polymetal International plc 60,051 1,485
United Utilities Group plc 120,691 1,415
Severn Trent plc 42,092 1,341
Standard Life Aberdeen plc 400,528 1,304
Berkeley Group Holdings plc 20,631 1,197
Kingfisher plc 374,549 1,184
St. James's Place plc 94,583 1,157
Admiral Group plc 36,760 1,146
Pennon Group plc 73,905 1,021
Johnson Matthey plc 33,573 980
Wm Morrison Supermarkets plc 395,960 961
M&G plc 457,063 957
Pearson plc 131,486 903
Intermediate Capital Group plc 48,637 851
Phoenix Group Holdings plc 93,693 805
Schroders plc 19,872 767
Bellway plc 21,918 726
Tate & Lyle plc 84,012 715
J Sainsbury plc 291,362 710
1 Quilter plc 326,162 621
G4S plc 267,488 497
Ashmore Group plc 83,547 427
Evraz plc 100,632 373
Copyright © 2020 www.secdatabase.com. All Rights Reserved.Please Consider the Environment Before Printing This Document

^ Tui AG 76,340 289
Carnival plc 23,287 252
Investec plc 125,186 245
Babcock International Group plc 47,460 179
* Ninety One plc 58,931 166
British American Tobacco plc ADR 4,220 142
158,298
Total Common Stocks (Cost $1,734,743) 1,552,024
Copyright © 2020 www.secdatabase.com. All Rights Reserved.Please Consider the Environment Before Printing This Document

Market
Value
Coupon Shares ($000)
Temporary Cash Investments (0.9%)
Money Market Fund (0.9%)
2,3 Vanguard Market Liquidity Fund 0.194% 131,121 13,112
Face
Maturity Amount
Date ($000)
U.S. Government and Agency Obligations (0.0%)
4 United States Cash Management Bill 0.116% 9/29/20 250,000 250
4 United States Cash Management Bill 0.140% 10/13/20 150,000 150
400
Total Temporary Cash Investments (Cost $13,510) 13,512
Total Investments (100.0%) (Cost $1,748,253) 1,565,536
Other Assets and Liabilities -Net (0.0%) 286
Net Assets (100%) 1,565,822
Cost is in $000.
* Non-income-producing security.
§ Security value determined using significant unobservable inputs.
^ Includes partial security positions on loan to broker-dealers. The total value of securities on loan is $11,294,000.
1 Security exempt from registration under Rule 144A of the Securities Act of 1933. Such securities may be sold in
transactions exempt from registration, normally to qualified institutional buyers. At July 31, 2020, the aggregate
value of these securities was $15,207,000, representing 1.0% of net assets.
2 Affiliated money market fund available only to Vanguard funds and certain trusts and accounts managed by
Vanguard. Rate shown is the 7-day yield.
3 Collateral of $12,288,000 was received for securities on loan.
4 Securities with a value of $400,000 have been segregated as initial margin for open futures contracts.
ADR—American Depositary Receipt.
GDR—Global Depositary Receipt.
NVDR —Non-Voting Depository Receipt
Derivative Financial Instruments Outstanding as of Period End
Futures Contracts
($000)
Value and
Number of Unrealized
Long (Short) Notional Appreciation
Expiration Contracts Amount (Depreciation)
Long Futures Contracts
E-mini S&P 500 IndexSeptember
202036 5,874 312
Copyright © 2020 www.secdatabase.com. All Rights Reserved.Please Consider the Environment Before Printing This Document

MSCI EAFE IndexSeptember
202045 4,081 67
MSCI Emerging Market IndexSeptember
202052 2,780 162
541
Forward Currency Contracts
Copyright © 2020 www.secdatabase.com. All Rights Reserved.Please Consider the Environment Before Printing This Document

International High Dividend Yield Index Fund
Contract Unrealized Unrealized
Settlement Contract Amount (000) Appreciation (Depreciation)
Counterparty Date Receive Deliver ($000) ($000)
Bank of
Montreal 10/6/20 JPY 212,384 USD 1,983 25 —
Royal Bank of
Canada 10/6/20 EUR 976 USD 1,150 2 —
Goldman
Sachs
International 10/6/20 USD 2,298 JPY 245,218 — (20)
Bank of
America, N.A. 10/6/20 USD 1,978 EUR 1,761 — (100)
Goldman
Sachs
International 10/6/20 USD 1,731 HKD 13,427 — (1)
Standard
Chartered
Bank 10/6/20 USD 1,727 CHF 1,634 — (63)
Barclays Bank
plc 10/6/20 USD 1,264 HKD 9,796 — —
27 (184)
CHF—Swiss franc.
EUR—euro.
HKD—Hong Kong dollar.
JPY—Japanese yen.
USD—U.S. dollar.
A. Security Valuation: Securities are valued as of the close of trading on the New York Stock
Exchange (generally 4 p.m., Eastern time) on the valuation date. Equity securities are valued at the
latest quoted sales prices or official closing prices taken from the primary market in which each
security trades; such securities not traded on the valuation date are valued at the mean of the latest
quoted bid and asked prices. Securities for which market quotations are not readily available, or
whose values have been affected by events occurring before the fund's pricing time but after the
close of the securities’ primary markets, are valued at their fair values calculated according to
procedures adopted by the board of trustees. These procedures include obtaining quotations from an
independent pricing service, monitoring news to identify significant market- or security-specific events,
and evaluating changes in the values of foreign market proxies (for example, ADRs, futures contracts,
or exchange-traded funds), between the time the foreign markets close and the fund's pricing time.
When fair-value pricing is employed, the prices of securities used by a fund to calculate its net asset
Copyright © 2020 www.secdatabase.com. All Rights Reserved.Please Consider the Environment Before Printing This Document

value may differ from quoted or published prices for the same securities. Investments in Vanguard
Market Liquidity Fund are valued at that fund’s net asset value. Temporary cash investments are
valued using the latest bid prices or using valuations based on a matrix system (which considers such
factors as security prices, yields, maturities, and ratings), both as furnished by independent pricing
services.
B. Foreign Currency: Securities and other assets and liabilities denominated in foreign currencies are
translated into U.S. dollars using exchange rates obtained from an independent third party as of the
fund's pricing time on the valuation date. Realized gains (losses) and unrealized appreciation
(depreciation) on investment securities include the effects of changes in exchange rates since the
securities were purchased, combined with the effects of changes in security prices. Fluctuations in the
value of other assets and liabilities resulting from changes in exchange rates are recorded as
unrealized foreign currency gains (losses) until the assets or liabilities are settled in cash, at which
time they are recorded as realized foreign currency gains (losses).
Copyright © 2020 www.secdatabase.com. All Rights Reserved.Please Consider the Environment Before Printing This Document

International High Dividend Yield Index Fund
C. Futures Contracts: The fund uses index futures contracts to a limited extent, with the objectives of
maintaining full exposure to the stock market, maintaining liquidity, and minimizing transaction costs.
The fund may purchase futures contracts to immediately invest incoming cash in the market, or sell
futures in response to cash outflows, thereby simulating a fully invested position in the underlying
index while maintaining a cash balance for liquidity. The primary risks associated with the use of
futures contracts are imperfect correlation between changes in market values of stocks held by the
fund and the prices of futures contracts, and the possibility of an illiquid market. Counterparty risk
involving futures is mitigated because a regulated clearinghouse is the counterparty instead of the
clearing broker. To further mitigate counterparty risk, the fund trades futures contracts on an
exchange, monitors the financial strength of its clearing brokers and clearinghouse, and has entered
into clearing agreements with its clearing brokers. The clearinghouse imposes initial margin
requirements to secure the fund’s performance and requires daily settlement of variation margin
representing changes in the market value of each contract. Any assets pledged as initial margin for
open contracts are noted in the Schedule of Investments.
Futures contracts are valued at their quoted daily settlement prices. The notional amounts of the
contracts are not recorded in the Schedule of Investments. Fluctuations in the value of the contracts
are recorded as an asset (liability).
D. Forward Currency Contracts: The fund enters into forward currency contracts to provide the
appropriate currency exposure related to any open futures contracts. The fund's risks in using these
contracts include movement in the values of the foreign currencies relative to the U.S. dollar and the
ability of the counterparties to fulfill their obligations under the contracts. The fund mitigates its
counterparty risk by entering into forward currency contracts only with a diverse group of prequalified
counterparties, monitoring their financial strength, entering into master netting arrangements with its
counterparties, and requiring its counterparties to transfer collateral as security for their performance.
In the absence of a default, the collateral pledged or received by the fund cannot be repledged,
resold, or rehypothecated. The master netting arrangements provide that, in the event of a
counterparty’s default (including bankruptcy), the f und may terminate the forward currency contracts,
determine the net amount owed by either party in accordance with its master netting arrangements,
and sell or retain any collateral held up to the net amount owed to the fund under the master netting
arrangements. The forward currency contracts contain provisions whereby a counterparty may
terminate open contracts if the fund's net assets decline below a certain level, triggering a payment by
the fund if the fund is in a net liability position at the time of the termination. The payment amount
would be reduced by any collateral the fund has pledged. Any assets pledged as collateral for open
contracts are noted in the Schedule of Investments. The value of collateral received or pledged is
compared daily to the value of the forward currency contracts exposure with each counterparty, and
any difference, if in excess of a specified minimum transfer amount, is adjusted and settled within two
business days.
Forward currency contracts are valued at their quoted daily prices obtained from an independent third
party, adjusted for currency risk based on the expiration date of each contract. The notional amounts
of the contracts are not recorded in the Schedule of Investments. Fluctuations in the value of the
contracts are recorded as an asset (liability).
Copyright © 2020 www.secdatabase.com. All Rights Reserved.Please Consider the Environment Before Printing This Document

E. Various inputs may be used to determine the value of the fund's investments and derivatives.
These inputs are summarized in three broad levels for financial statement purposes. The inputs or
methodologies used to value securities are not necessarily an indication of the risk associated with
investing in those securities.
Level 1—Quoted prices in active markets for identical securities.
Copyright © 2020 www.secdatabase.com. All Rights Reserved.Please Consider the Environment Before Printing This Document

International High Dividend Yield Index Fund
Level 2—Other significant observable inputs (including quoted prices for similar securities, interest
rates, prepayment speeds, credit risk, etc.).
Level 3—Significant unobservable inputs (including the fund's own assumptions used to determine
the fair value of investments). Any investments and derivatives valued with significant unobservable
inputs are noted on the Schedule of Investments.
The following table summarizes the market value of the fund's investments and derivative as of July
31, 2020, based on the inputs used to value them:
Level 1 Level 2 Level 3 Total
($000) ($000) ($000) ($000)
Investments
Assets
Common Stocks—North and South America 175,147 — 106 175,253
Common Stocks—Other 5,238 1,370,870 663 1,376,771
Temporary Cash Investments 13,112 400 13,512
Total 193,497 1,371,270 769 1,565,536
Derivative Financial Instruments
Assets
Futures Contracts1 26 — — 26
Forward Currency Contracts — 27 — 27
Total 26 27 — 53
Liabilities
Futures Contracts1 109 — — 109
Forward Currency Contracts — 184 — 184
Total 109 184 — 293
1 Represents variation margin on the last day of the reporting period.
Copyright © 2020 www.secdatabase.com. All Rights Reserved.Please Consider the Environment Before Printing This Document