TRANSAMERICA SERIES TRUST Form NPORT-EX Filed ...
490
Business Address 1801 CALIFORNIA STREET SUITE 5200 DENVER CO 80202 720-493-4256 Mailing Address 1801 CALIFORNIA STREET SUITE 5200 DENVER CO 80202 SECURITIES AND EXCHANGE COMMISSION FORM NPORT-EX Filing Date: 2019-05-29 | Period of Report: 2019-03-31 SEC Accession No. 0001752724-19-040126 (HTML Version on secdatabase.com) FILER TRANSAMERICA SERIES TRUST CIK:778207| IRS No.: 000000000 | State of Incorp.:DE | Fiscal Year End: 1231 Type: NPORT-EX | Act: 40 | File No.: 811-04419 | Film No.: 19861914 Copyright © 2021 www.secdatabase.com . All Rights Reserved. Please Consider the Environment Before Printing This Document
-
Upload
khangminh22 -
Category
Documents
-
view
0 -
download
0
Transcript of TRANSAMERICA SERIES TRUST Form NPORT-EX Filed ...

Business Address1801 CALIFORNIA STREETSUITE 5200DENVER CO 80202720-493-4256
Mailing Address1801 CALIFORNIA STREETSUITE 5200DENVER CO 80202
SECURITIES AND EXCHANGE COMMISSION
FORM NPORT-EX
Filing Date: 2019-05-29 | Period of Report: 2019-03-31SEC Accession No. 0001752724-19-040126
(HTML Version on secdatabase.com)
FILERTRANSAMERICA SERIES TRUSTCIK:778207| IRS No.: 000000000 | State of Incorp.:DE | Fiscal Year End: 1231Type: NPORT-EX | Act: 40 | File No.: 811-04419 | Film No.: 19861914
Copyright © 2021 www.secdatabase.com. All Rights Reserved.Please Consider the Environment Before Printing This Document

Transamerica 60/40 Allocation VPSCHEDULE OF INVESTMENTSAt March 31, 2019(unaudited)
SECURITY VALUATION:
Valuation Inputs (C)
Level 1 -Unadjusted
QuotedPrices
Level 2 -Other
SignificantObservable
Inputs
Level 3 -Significant
UnobservableInputs Value
ASSETSInvestmentsInvestment Companies $13,739,070 $ � $ � $13,739,070Total Investments $ 13,739,070 $ �� $ �� $ 13,739,070
FOOTNOTES TO SCHEDULE OF INVESTMENTS:
(A) Affiliated investment in the Class I2 shares of Transamerica Funds and/or investment in the Initial Class shares of Transamerica Series Trust. The Portfolio�stransactions and earnings from investments of TAM are as follows:
Affiliated InvestmentsValue
December 31, 2018Purchases
at CostProceeds
from Sales
NetRealized
Gain (Loss)
Net Change inUnrealized
Appreciation(Depreciation)
ValueMarch 31, 2019
Shares as ofMarch 31, 2019
DividendIncome
Net CapitalGain
DistributionsTransamerica Core Bond $ 3,265,454 $2,471,759 $(339,579 ) $ 1,271 $ 96,723 $5,495,628 557,366 $33,419 $ �Transamerica International Equity Index
VP 1,222,192 816,542 (117,944 ) (8,616 ) 148,686 2,060,860 196,835 � �Transamerica U.S. Equity Index VP 3,726,289 2,377,984 (501,554 ) 13,861 566,002 6,182,582 506,769 � �
Total $ 8,213,935 $ 5,666,285 $ (959,077) $ 6,516 $ 811,411 $ 13,739,070 1,260,970 $ 33,419 $ ��
(B) Percentage rounds to less than 0.1% or (0.1)%.(C) There were no transfers in or out of Level 3 during the period ended March 31, 2019. Please reference the Security Valuation section of the Notes to Schedules of
Investments for more information regarding security valuation and pricing inputs.
The notes are an integral part of this report.Transamerica Series Trust Page 1
Shares ValueINVESTMENT COMPANIES - 100.0%International Equity Fund - 15.0%Transamerica International Equity Index VP (A) 196,835 $ 2,060,860U.S. Equity Fund - 45.0%Transamerica U.S. Equity Index VP (A) 506,769 6,182,582U.S. Fixed Income Fund - 40.0%Transamerica Core Bond (A) 557,366 5,495,628Total Investment Companies
(Cost $13,357,327) 13,739,070Total Investments
(Cost $13,357,327) 13,739,070Net Other Assets (Liabilities) - (0.0)% (B) (6,606 )Net Assets - 100.0% $ 13,732,464
Copyright © 2021 www.secdatabase.com. All Rights Reserved.Please Consider the Environment Before Printing This Document

Transamerica Aegon High Yield Bond VPSCHEDULE OF INVESTMENTSAt March 31, 2019(unaudited)
Principal ValueCORPORATE DEBT SECURITIES - 92.6%Aerospace & Defense - 1.2%Bombardier, Inc.
6.13%, 01/15/2023 (A) $ 1,105,000 $ 1,120,1947.50%, 03/15/2025 (A) 309,000 317,8847.88%, 04/15/2027 (A) 322,000 332,159
Triumph Group, Inc.5.25%, 06/01/2022 (B) 935,000 897,6007.75%, 08/15/2025 (B) 491,000 468,905
3,136,742Airlines - 1.3%American Airlines Group, Inc.
5.50%, 10/01/2019 (A) 404,000 409,010American Airlines Pass-Through Trust
5.60%, 01/15/2022 (A) 383,937 389,6965.63%, 07/15/2022 (A) 265,874 271,058
Continental Airlines Pass-Through Trust5.50%, 04/29/2022 228,974 233,1876.90%, 10/19/2023 504,144 520,831
United Airlines Pass-Through Trust4.63%, 03/03/2024 199,743 202,780
United Continental Holdings, Inc.4.25%, 10/01/2022 407,000 408,144
US Airways Pass-Through Trust5.38%, 05/15/2023 419,599 432,8026.75%, 12/03/2022 463,128 486,339
3,353,847Auto Components - 1.0%Goodyear Tire & Rubber Co.
5.00%, 05/31/2026 (B) 1,664,000 1,586,624Panther BF Aggregator 2, LP / Panther Finance
Co., Inc.6.25%, 05/15/2026 (A) (C) 428,000 436,5608.50%, 05/15/2027 (A) (C) 482,000 483,205
2,506,389Banks - 3.6%Barclays PLC
Fixed until 09/15/2023 (D),7.75% (E), 1,041,000 1,042,770
Fixed until 06/15/2024 (D),8.00% (B) (E) 285,000 291,413
BNP Paribas SAFixed until 03/14/2022 (D),
6.75% (A) (E) 680,000 695,300Fixed until 03/30/2021 (D),
7.63% (A) (E) 475,000 498,156CIT Group, Inc.
4.75%, 02/16/2024 394,000 408,7755.00%, 08/15/2022 390,000 406,087
Citigroup, Inc.Fixed until 03/27/2020 (D),
5.88% (E) 1,151,000 1,162,510Intesa Sanpaolo SpA
5.71%, 01/15/2026 (A) 1,125,000 1,098,182Lloyds Banking Group PLC
Fixed until 06/27/2024 (D),7.50% (E) 1,075,000 1,107,250
Fixed until 09/27/2025 (D),7.50% (E) 200,000 202,940
Royal Bank of Scotland Group PLCFixed until 08/15/2021 (D),
8.63% (E) 690,000 734,850
Principal ValueCORPORATE DEBT SECURITIES (continued)Banks (continued)Societe Generale SA
Fixed until 09/13/2021 (D),7.38% (A) (E)
$920,000
$948,750
UniCredit SpA6.57%, 01/14/2022 (A) 665,000 695,868
9,292,851Beverages - 0.4%Cott Holdings, Inc.
5.50%, 04/01/2025 (A) 1,012,000 1,020,855Building Products - 2.4%Associated Materials LLC / AMH New Finance, Inc.
9.00%, 01/01/2024 (A) 2,326,000 2,285,295Builders FirstSource, Inc.
5.63%, 09/01/2024 (A) 1,082,000 1,065,770Griffon Corp.
5.25%, 03/01/2022 1,549,000 1,523,829NCI Building Systems, Inc.
8.00%, 04/15/2026 (A) 1,679,000 1,507,7756,382,669
Capital Markets - 1.4%Credit Suisse Group AG
Fixed until 12/18/2024 (D),6.25% (A) (E) 166,000 165,493
Fixed until 09/12/2025 (D),7.25% (A) (E) 465,000 466,743
Fixed until 07/17/2023 (D),7.50% (A) (E) 345,000 354,919
Fixed until 12/11/2023 (D),7.50% (A) (E) 1,432,000 1,514,260
Goldman Sachs Capital II3-Month LIBOR + 0.77%,
4.00% (E), 04/29/2019 (D) 169,000 130,130Goldman Sachs Group, Inc.
Fixed until 05/10/2019 (D),5.70% (E) 1,040,000 1,040,000
3,671,545Chemicals - 1.9%Eagle Intermediate Global Holding BV / Ruyi US
Finance LLC7.50%, 05/01/2025 (A) 536,000 528,630
Hexion, Inc.6.63%, 04/15/2020 1,125,000 947,8137.88%, 02/15/2023 682,000 170,50010.00%, 04/15/2020 458,000 382,43013.75%, 02/01/2022 (A) 323,000 111,435
NOVA Chemicals Corp.4.88%, 06/01/2024 (A) 590,000 579,6755.25%, 06/01/2027 (A) 1,449,000 1,421,831
Olin Corp.5.13%, 09/15/2027 (B) 825,000 834,281
4,976,595Commercial Services & Supplies - 1.2%Ashtead Capital, Inc.
5.25%, 08/01/2026 (A) 725,000 741,313Avis Budget Car Rental LLC / Avis Budget Finance,
Inc.5.50%, 04/01/2023 (B) 972,000 979,2906.38%, 04/01/2024 (A) (B) 312,000 317,070
Garda World Security Corp.8.75%, 05/15/2025 (A) 1,080,000 1,026,000
Copyright © 2021 www.secdatabase.com. All Rights Reserved.Please Consider the Environment Before Printing This Document

The notes are an integral part of this report.Transamerica Series Trust Page 1
3,063,673
Copyright © 2021 www.secdatabase.com. All Rights Reserved.Please Consider the Environment Before Printing This Document

Transamerica Aegon High Yield Bond VPSCHEDULE OF INVESTMENTS (continued)At March 31, 2019(unaudited)
Principal ValueCORPORATE DEBT SECURITIES (continued)Communications Equipment - 1.2%CommScope Finance LLC
5.50%, 03/01/2024 (A) $236,000
$241,379
6.00%, 03/01/2026 (A) 317,000 327,8958.25%, 03/01/2027 (A) 316,000 327,850
CommScope Technologies LLC5.00%, 03/15/2027 (A) 13,000 11,5276.00%, 06/15/2025 (A) 1,661,000 1,614,824
Nokia OYJ3.38%, 06/12/2022 677,000 669,384
3,192,859Construction & Engineering - 1.8%Abengoa Abenewco 2 SAU
PIK Rate 1.25%, Cash Rate 0.25%, 03/31/2023 (A) (F) 299,318 1,485
Ashton Woods USA LLC / Ashton Woods FinanceCo.6.75%, 08/01/2025 (A) 625,000 568,7509.88%, 04/01/2027 (A) 994,000 1,013,880
Weekley Homes LLC / Weekley Finance Corp.6.00%, 02/01/2023 845,000 813,312
William Lyon Homes, Inc.5.88%, 01/31/2025 1,005,000 949,7256.00%, 09/01/2023 365,000 353,1387.00%, 08/15/2022 940,000 942,350
4,642,640Construction Materials - 0.0% (G)Summit Materials LLC / Summit Materials Finance
Corp.6.50%, 03/15/2027 (A) 93,000 93,930
Consumer Finance - 2.3%Ally Financial, Inc.
5.75%, 11/20/2025 (B) 257,000 273,7337.50%, 09/15/2020 641,000 679,4608.00%, 03/15/2020 294,000 307,230
Altice Financing SA7.50%, 05/15/2026 (A) 1,156,000 1,140,972
Navient Corp.4.88%, 06/17/2019, MTN 183,000 183,2295.00%, 10/26/2020 489,000 495,7245.88%, 10/25/2024 1,069,000 1,034,2576.50%, 06/15/2022 325,000 338,7116.63%, 07/26/2021 279,000 291,5556.75%, 06/15/2026 (B) 407,000 389,703
Springleaf Finance Corp.6.00%, 06/01/2020 375,000 387,0007.13%, 03/15/2026 492,000 500,915
6,022,489Containers & Packaging - 3.2%ARD Finance SA
PIK Rate 7.88%, Cash Rate,7.13%, 09/15/2023 (F) 660,000 657,525
Ardagh Packaging Finance PLC / Ardagh HoldingsUSA, Inc.6.00%, 02/15/2025 (A) 810,000 810,0007.25%, 05/15/2024 (A) 950,000 1,000,778
BWAY Holding Co.5.50%, 04/15/2024 (A) 888,000 881,6077.25%, 04/15/2025 (A) (B) 217,000 209,268
Principal ValueCORPORATE DEBT SECURITIES (continued)Containers & Packaging (continued)Crown Americas LLC / Crown Americas Capital Corp.
VI4.75%, 02/01/2026 (B) $
689,000$692,307
Flex Acquisition Co., Inc.6.88%, 01/15/2025 (A) 522,000 498,5107.88%, 07/15/2026 (A) 313,000 302,045
Greif, Inc.6.50%, 03/01/2027 (A) 796,000 813,910
OI European Group BV4.00%, 03/15/2023 (A) 381,000 373,856
Owens-Brockway Glass Container, Inc.5.88%, 08/15/2023 (A) 693,000 725,8486.38%, 08/15/2025 (A) 178,000 187,345
Reynolds Group Issuer, Inc. / Reynolds Group IssuerLLC5.13%, 07/15/2023 (A) 341,000 346,5415.75%, 10/15/2020 439,975 440,5256.88%, 02/15/2021 177,774 178,4407.00%, 07/15/2024 (A) (B) 177,000 182,332
8,300,837Diversified Financial Services - 2.7%Avation Capital SA
6.50%, 05/15/2021 (A) 562,000 561,297DAE Funding LLC
4.50%, 08/01/2022 (A) 227,000 228,7035.00%, 08/01/2024 (A) 367,000 371,5875.25%, 11/15/2021 (A) 312,000 318,2405.75%, 11/15/2023 (A) 311,000 319,553
Dana Financing Luxembourg Sarl5.75%, 04/15/2025 (A) 1,963,000 1,963,000
ILFC E-Capital Trust I1.55% + Max of 3-Month LIBOR, 10-Year CMT, or
30-Year CMT,4.57% (E), 12/21/2065 (A) 1,578,000 1,246,620
ILFC E-Capital Trust II1.80% + Max of 3-Month LIBOR, 15-Year CMT or
30-Year CMT,4.85% (E), 12/21/2065 (A) 137,000 107,545
Ladder Capital Finance Holdings LLLP / LadderCapital Finance Corp.5.25%, 03/15/2022 (A) 1,052,000 1,067,780
Travelport Corporate Finance PLC6.00%, 03/15/2026 (A) 708,000 764,640
6,948,965Diversified Telecommunication Services - 5.7%CenturyLink, Inc.
6.45%, 06/15/2021 783,000 815,2996.75%, 12/01/2023 (B) 123,000 128,3817.50%, 04/01/2024 (B) 242,000 255,9157.60%, 09/15/2039 1,622,000 1,423,3057.65%, 03/15/2042 (B) 1,203,000 1,055,632
Frontier Communications Corp.7.63%, 04/15/2024 1,182,000 647,1458.50%, 04/01/2026 (A) 259,000 240,8708.75%, 04/15/2022 (B) 389,000 276,1909.00%, 08/15/2031 1,091,000 610,96010.50%, 09/15/2022 405,000 308,81211.00%, 09/15/2025 357,000 234,951
Copyright © 2021 www.secdatabase.com. All Rights Reserved.Please Consider the Environment Before Printing This Document

The notes are an integral part of this report.Transamerica Series Trust Page 2
Copyright © 2021 www.secdatabase.com. All Rights Reserved.Please Consider the Environment Before Printing This Document

Transamerica Aegon High Yield Bond VPSCHEDULE OF INVESTMENTS (continued)At March 31, 2019(unaudited)
Principal ValueCORPORATE DEBT SECURITIES (continued)Diversified Telecommunication Services (continued)Hughes Satellite Systems Corp.
5.25%, 08/01/2026 $118,000 $ 117,115
6.50%, 06/15/2019 33,000 33,1686.63%, 08/01/2026 620,000 607,6007.63%, 06/15/2021 1,673,000 1,798,492
Intelsat Jackson Holdings SA8.00%, 02/15/2024 (A) 185,000 192,8638.50%, 10/15/2024 (A) 995,000 967,6379.50%, 09/30/2022 (A) 355,000 408,250
Level 3 Parent LLC5.75%, 12/01/2022 954,000 963,826
Sprint Capital Corp.6.90%, 05/01/2019 590,000 591,4758.75%, 03/15/2032 687,000 724,854
UPCB Finance IV, Ltd.5.38%, 01/15/2025 (A) 1,020,000 1,035,300
Virgin Media Finance PLC5.75%, 01/15/2025 (A) 667,000 677,8396.00%, 10/15/2024 (A) 200,000 206,746
Virgin Media Secured Finance PLC5.25%, 01/15/2026 (A) 400,000 402,5005.50%, 08/15/2026 04/12/2016 (A) 245,000 249,288
14,974,413Electric Utilities - 0.3%Elwood Energy LLC
8.16%, 07/05/2026 809,701 878,526Energy Equipment & Services - 3.1%CSI Compressco, LP / CSI Compressco Finance, Inc.
7.25%, 08/15/2022 1,003,000 877,6257.50%, 04/01/2025 (A) 240,000 229,200
Exterran Energy Solutions, LP / EES Finance Corp.8.13%, 05/01/2025 554,000 565,080
Genesis Energy, LP / Genesis Energy Finance Corp.6.50%, 10/01/2025 598,000 581,5556.75%, 08/01/2022 894,000 915,232
KCA Deutag UK Finance PLC9.63%, 04/01/2023 (A) 1,030,000 861,338
Noble Holding International, Ltd.6.05%, 03/01/2041 (B) 527,000 329,3758.95%, 04/01/2045 359,000 280,020
NuStar Logistics, LP4.80%, 09/01/2020 1,323,000 1,339,5375.63%, 04/28/2027 496,000 495,3806.75%, 02/01/2021 461,000 479,440
USA Compression Partners, LP / USA CompressionFinance Corp.6.88%, 09/01/2027 (A) 568,000 577,230
Weatherford International LLC9.88%, 03/01/2025 70,000 49,525
Weatherford International, Ltd.9.88%, 02/15/2024 868,000 624,960
8,205,497Entertainment - 0.3%Netflix, Inc.
5.88%, 11/15/2028 (A) 687,000 725,644Equity Real Estate Investment Trusts - 2.5%CBL & Associates, LP
5.25%, 12/01/2023 (B) 1,214,000 940,8505.95%, 12/15/2026 (B) 316,000 230,680
Iron Mountain US Holdings, Inc.
Principal ValueCORPORATE DEBT SECURITIES (continued)Equity Real Estate Investment Trusts (continued)Iron Mountain, Inc.
4.38%, 06/01/2021 (A) $309,000 $ 310,545
5.25%, 03/15/2028 (A) 1,565,000 1,512,181iStar, Inc.
5.25%, 09/15/2022 404,000 396,4256.00%, 04/01/2022 707,000 709,651
MGM Growth Properties Operating Partnership, LP /MGP Finance Co-Issuer, Inc.5.75%, 02/01/2027 (A) 480,000 496,800
SBA Communications Corp.4.00%, 10/01/2022 415,000 416,4944.88%, 07/15/2022 1,065,000 1,079,644
6,411,600Food & Staples Retailing - 1.0%Albertsons Cos. LLC / Safeway, Inc. / New Albertsons
LP5.75%, 03/15/2025 801,000 759,9496.63%, 06/15/2024 786,000 793,8607.50%, 03/15/2026 (A) 320,000 329,200
Rite Aid Corp.6.13%, 04/01/2023 (A) 891,000 735,075
2,618,084Food Products - 1.8%Darling Ingredients, Inc.
5.25%, 04/15/2027 (A) (C) 48,000 48,630JBS USA LUX SA / JBS USA Finance, Inc.
5.75%, 06/15/2025 (A) 336,000 344,4007.25%, 06/01/2021 (A) 748,000 753,236
Pilgrim�s Pride Corp.5.88%, 09/30/2027 (A) 1,501,000 1,512,257
Post Holdings, Inc.5.00%, 08/15/2026 (A) 692,000 672,9705.63%, 01/15/2028 (A) 413,000 409,9038.00%, 07/15/2025 (A) 918,000 979,965
4,721,361Health Care Providers & Services - 5.2%CHS / Community Health Systems, Inc.
5.13%, 08/01/2021 (B) 427,000 419,7846.25%, 03/31/2023 435,000 409,2928.00%, 03/15/2026 (A) 1,429,000 1,371,8408.13%, 06/30/2024 (A) 186,000 138,626
DaVita HealthCare Partners, Inc.5.13%, 07/15/2024 562,000 554,975
DaVita, Inc.5.75%, 08/15/2022 415,000 422,781
Encompass Health Corp.5.75%, 11/01/2024 - 09/15/2025 1,641,000 1,664,429
HCA, Inc.5.25%, 04/15/2025 - 06/15/2026 1,336,000 1,434,0035.88%, 03/15/2022 - 02/01/2029 2,213,000 2,384,1047.50%, 02/15/2022 - 11/06/2033 1,461,000 1,615,795
Tenet Healthcare Corp.4.38%, 10/01/2021 515,000 523,9615.13%, 05/01/2025 284,000 285,4346.00%, 10/01/2020 341,000 353,3616.75%, 06/15/2023 (B) 369,000 380,0708.13%, 04/01/2022 1,512,000 1,626,685
13,585,140
Copyright © 2021 www.secdatabase.com. All Rights Reserved.Please Consider the Environment Before Printing This Document

The notes are an integral part of this report.Transamerica Series Trust Page 3
5.38%, 06/01/2026 (A) 324,000 318,330
Copyright © 2021 www.secdatabase.com. All Rights Reserved.Please Consider the Environment Before Printing This Document

Transamerica Aegon High Yield Bond VPSCHEDULE OF INVESTMENTS (continued)At March 31, 2019(unaudited)
Principal ValueCORPORATE DEBT SECURITIES (continued)Hotels, Restaurants & Leisure - 7.7%Boyd Gaming Corp.
6.00%, 08/15/2026 $ 337,000 $ 345,4256.38%, 04/01/2026 405,000 419,1756.88%, 05/15/2023 1,208,000 1,254,810
Boyne USA, Inc.7.25%, 05/01/2025 (A) 788,000 843,160
GLP Capital, LP / GLP Financing II, Inc.5.25%, 06/01/2025 689,000 721,728
Hilton Domestic Operating Co., Inc.5.13%, 05/01/2026 (A) 847,000 861,221
International Game Technology PLC6.25%, 02/15/2022 - 01/15/2027 (A) 1,114,000 1,154,2256.50%, 02/15/2025 (A) (B) 578,000 601,120
Marriott Ownership Resorts, Inc. / ILG LLC6.50%, 09/15/2026 (A) 786,000 823,492
MGM Resorts International5.50%, 04/15/2027 (C) 478,000 483,0795.75%, 06/15/2025 1,504,000 1,556,6406.63%, 12/15/2021 694,000 741,712
NCL Corp., Ltd.4.75%, 12/15/2021 (A) 827,000 836,304
Rivers Pittsburgh Borrower, LP / Rivers PittsburghFinance Corp.6.13%, 08/15/2021 (A) 891,000 891,000
Scientific Games International, Inc.5.00%, 10/15/2025 (A) 703,000 688,9408.25%, 03/15/2026 (A) 970,000 990,03010.00%, 12/01/2022 2,303,000 2,420,108
Viking Cruises, Ltd.5.88%, 09/15/2027 (A) 2,116,000 2,058,8686.25%, 05/15/2025 (A) 723,000 733,845
Wyndham Destinations, Inc.5.40%, 04/01/2024 1,162,000 1,179,4305.75%, 04/01/2027 446,000 442,387
20,046,699Household Durables - 2.8%Beazer Homes USA, Inc.
5.88%, 10/15/2027 (B) 664,000 579,3406.75%, 03/15/2025 783,000 740,914
Century Communities, Inc.5.88%, 07/15/2025 1,507,000 1,431,6506.88%, 05/15/2022 716,000 728,530
KB Home7.00%, 12/15/2021 502,000 537,1407.63%, 05/15/2023 (B) 1,209,000 1,316,299
Lennar Corp.4.75%, 11/29/2027 512,000 512,2395.00%, 06/15/2027 398,000 398,995
Meritage Homes Corp.5.13%, 06/06/2027 408,000 395,6377.15%, 04/15/2020 627,000 648,945
7,289,689Independent Power & Renewable Electricity Producers - 1.0%Calpine Corp.
5.88%, 01/15/2024 (A) 825,000 845,6256.00%, 01/15/2022 (A) 683,000 690,684
Vistra Energy Corp.7.63%, 11/01/2024 955,000 1,009,931
2,546,240Insurance - 1.3%Genworth Holdings, Inc.
Principal ValueCORPORATE DEBT SECURITIES (continued)Insurance (continued)Hartford Financial Services Group, Inc.
3-Month LIBOR + 2.13%,4.81% (E), 02/12/2067 (A)
$1,692,000
$1,459,350
Lincoln National Corp.3-Month LIBOR + 2.36%,
5.04% (E), 05/17/2066 1,714,000 1,474,0403,521,455
IT Services - 0.5%First Data Corp.
5.00%, 01/15/2024 (A) 394,000 404,1955.75%, 01/15/2024 (A) 803,000 825,685
1,229,880Leisure Products - 0.3%Mattel, Inc.
2.35%, 08/15/2021 286,000 269,5553.15%, 03/15/2023 228,000 204,0605.45%, 11/01/2041 200,000 148,0006.75%, 12/31/2025 (A) 192,000 188,880
810,495Machinery - 1.4%Colfax Corp.
6.00%, 02/15/2024 (A) 363,000 377,9746.38%, 02/15/2026 (A) 158,000 168,170
Meritor, Inc.6.25%, 02/15/2024 1,713,000 1,760,107
Novelis Corp.5.88%, 09/30/2026 (A) 523,000 521,0396.25%, 08/15/2024 (A) 770,000 787,325
3,614,615Media - 7.9%Altice France SA
7.38%, 05/01/2026 (A) 1,566,000 1,534,680Altice Luxembourg SA
7.63%, 02/15/2025 (A) 225,000 197,438Cablevision Systems Corp.
8.00%, 04/15/2020 383,000 400,235CCO Holdings LLC / CCO Holdings Capital Corp.
5.00%, 02/01/2028 (A) 773,000 762,2945.13%, 02/15/2023 780,000 793,6505.25%, 03/15/2021 425,000 426,8625.50%, 05/01/2026 (A) 1,522,000 1,571,4655.75%, 01/15/2024 61,000 62,6015.75%, 02/15/2026 (A) 291,000 304,459
Clear Channel Worldwide Holdings, Inc.6.50%, 11/15/2022 2,312,000 2,363,9349.25%, 02/15/2024 (A) 796,000 843,760
CSC Holdings LLC5.38%, 07/15/2023 (A) 340,000 346,3756.50%, 02/01/2029 (A) 251,000 267,3156.63%, 10/15/2025 (A) 852,000 903,1207.50%, 04/01/2028 (A) 297,000 318,2507.75%, 07/15/2025 (A) (B) 800,000 858,00010.88%, 10/15/2025 (A) 483,000 557,623
DISH DBS Corp.5.00%, 03/15/2023 (B) 1,422,000 1,279,8005.88%, 07/15/2022 219,000 211,9486.75%, 06/01/2021 605,000 623,7557.75%, 07/01/2026 (B) 2,137,000 1,859,190
Copyright © 2021 www.secdatabase.com. All Rights Reserved.Please Consider the Environment Before Printing This Document

The notes are an integral part of this report.Transamerica Series Trust Page 4
4.90%, 08/15/2023 698,000 588,065
Copyright © 2021 www.secdatabase.com. All Rights Reserved.Please Consider the Environment Before Printing This Document

Transamerica Aegon High Yield Bond VPSCHEDULE OF INVESTMENTS (continued)At March 31, 2019(unaudited)
Principal ValueCORPORATE DEBT SECURITIES (continued)Media (continued)Unitymedia GmbH
6.13%, 01/15/2025 (A) $525,000 $ 544,898
Univision Communications, Inc.5.13%, 05/15/2023 (A) 1,377,000 1,303,8476.75%, 09/15/2022 (A) 399,000 404,985
Ziggo Bond Co. BV6.00%, 01/15/2027 (A) 500,000 480,000
Ziggo BV5.50%, 01/15/2027 (A) 1,450,000 1,431,875
20,652,359Metals & Mining - 3.2%Cleveland-Cliffs, Inc.
4.88%, 01/15/2024 (A) 634,000 626,0755.75%, 03/01/2025 384,000 367,680
Constellium NV5.75%, 05/15/2024 (A) 695,000 693,2636.63%, 03/01/2025 (A) (B) 1,024,000 1,044,480
First Quantum Minerals, Ltd.7.00%, 02/15/2021 (A) 103,000 104,7387.25%, 04/01/2023 (A) 996,000 973,590
Freeport-McMoRan, Inc.4.55%, 11/14/2024 239,000 235,4155.45%, 03/15/2043 910,000 796,2596.88%, 02/15/2023 877,000 929,620
New Gold, Inc.6.25%, 11/15/2022 (A) 682,000 600,1606.38%, 05/15/2025 (A) 571,000 462,510
Teck Resources, Ltd.6.00%, 08/15/2040 1,183,000 1,222,2616.25%, 07/15/2041 (B) 134,000 142,6318.50%, 06/01/2024 (A) 146,000 156,540
8,355,222Oil, Gas & Consumable Fuels - 9.7%Brazos Valley Longhorn LLC / Brazos Valley
Longhorn Finance Corp.6.88%, 02/01/2025 520,000 522,600
Callon Petroleum Co.6.13%, 10/01/2024 1,093,000 1,098,4656.38%, 07/01/2026 235,000 235,588
Carrizo Oil & Gas, Inc.6.25%, 04/15/2023 (B) 345,000 339,3948.25%, 07/15/2025 839,000 864,170
Cheniere Corpus Christi Holdings LLC5.88%, 03/31/2025 520,000 565,500
Cheniere Energy Partners, LP5.63%, 10/01/2026 (A) 656,000 672,400
Chesapeake Energy Corp.7.00%, 10/01/2024 490,000 488,7757.50%, 10/01/2026 331,000 325,1418.00%, 06/15/2027 (B) 1,061,000 1,045,085
Continental Resources, Inc.5.00%, 09/15/2022 477,000 480,399
CrownRock, LP / CrownRock Finance, Inc.5.63%, 10/15/2025 (A) 570,000 547,200
DCP Midstream Operating, LP5.38%, 07/15/2025 161,000 167,843
DCP Midstream, LPFixed until 12/15/2022 (D),
7.38% (E) 718,000 704,537Denbury Resources, Inc.
Principal ValueCORPORATE DEBT SECURITIES (continued)Oil, Gas & Consumable Fuels (continued)EP Energy LLC / Everest Acquisition Finance, Inc.
7.75%, 05/15/2026 (A) $485,000 $ 394,063
8.00%, 11/29/2024 (A) 215,000 119,3259.38%, 05/01/2024 (A) 331,000 117,505
Gulfport Energy Corp.6.00%, 10/15/2024 217,000 196,9586.38%, 05/15/2025 - 01/15/2026 1,045,000 937,625
HighPoint Operating Corp.8.75%, 06/15/2025 431,000 409,450
Kinder Morgan, Inc.7.75%, 01/15/2032, MTN 245,000 319,7808.05%, 10/15/2030, MTN 134,000 171,256
Oasis Petroleum, Inc.6.25%, 05/01/2026 (A) (B) 432,000 411,4806.88%, 03/15/2022 (B) 1,104,000 1,115,040
Parsley Energy LLC / Parsley Finance Corp.5.25%, 08/15/2025 (A) 240,000 236,4005.38%, 01/15/2025 (A) 505,000 503,7375.63%, 10/15/2027 (A) 227,000 225,865
PDC Energy, Inc.6.13%, 09/15/2024 993,000 993,000
Shelf Drilling Holdings, Ltd.8.25%, 02/15/2025 (A) 793,000 753,350
SM Energy Co.6.13%, 11/15/2022 701,000 701,0006.63%, 01/15/2027 (B) 467,000 443,6506.75%, 09/15/2026 (B) 118,000 113,133
Southwestern Energy Co.7.50%, 04/01/2026 709,000 723,180
Summit Midstream Holdings LLC / SummitMidstream Finance Corp.5.75%, 04/15/2025 343,000 323,278
Summit Midstream Partners, LPFixed until 12/15/2022 (D),
9.50% (E) 672,000 621,600Targa Resources Partners, LP / Targa Resources
Partners Finance Corp.5.00%, 01/15/2028 450,000 443,8135.13%, 02/01/2025 991,000 1,010,8206.50%, 07/15/2027 (A) 255,000 275,0816.75%, 03/15/2024 1,043,000 1,092,5426.88%, 01/15/2029 (A) 32,000 34,760
Ultra Resources, Inc.6.88%, 04/15/2022 (A) 118,000 37,7607.13%, 04/15/2025 (A) 587,000 120,335
Whiting Petroleum Corp.5.75%, 03/15/2021 845,000 854,7176.63%, 01/15/2026 (B) 511,000 500,780
WPX Energy, Inc.5.25%, 09/15/2024 476,000 480,7606.00%, 01/15/2022 334,000 346,5258.25%, 08/01/2023 726,000 816,750
25,216,356Paper & Forest Products - 0.5%Boise Cascade Co.
5.63%, 09/01/2024 (A) 375,000 369,375Norbord, Inc.
6.25%, 04/15/2023 (A) 1,018,000 1,043,4501,412,825
Pharmaceuticals - 2.4%
Copyright © 2021 www.secdatabase.com. All Rights Reserved.Please Consider the Environment Before Printing This Document

The notes are an integral part of this report.Transamerica Series Trust Page 5
7.50%, 02/15/2024 (A) (B) 328,000 280,0309.00%, 05/15/2021 (A) 768,000 746,880
Diamondback Energy, Inc.5.38%, 05/31/2025 275,000 287,031
Bausch Health Americas, Inc.8.50%, 01/31/2027 (A) 176,000 186,5609.25%, 04/01/2026 (A) 415,000 454,135
Copyright © 2021 www.secdatabase.com. All Rights Reserved.Please Consider the Environment Before Printing This Document

Transamerica Aegon High Yield Bond VPSCHEDULE OF INVESTMENTS (continued)At March 31, 2019(unaudited)
The notes are an integral part of this report.Transamerica Series Trust Page 6
Principal ValueCORPORATE DEBT SECURITIES (continued)Pharmaceuticals (continued)Bausch Health Cos., Inc.
5.50%, 11/01/2025 (A) $172,000
$175,655
5.75%, 08/15/2027 (A) 106,000 108,6825.88%, 05/15/2023 (A) 1,575,000 1,594,6876.13%, 04/15/2025 (A) 931,000 921,6906.50%, 03/15/2022 (A) 125,000 129,375
Endo Dac / Endo Finance LLC6.00%, 07/15/2023 (A) 1,243,000 957,110
Endo Finance LLC / Endo Finco, Inc.5.38%, 01/15/2023 (A) 462,000 378,840
Par Pharmaceutical, Inc.7.50%, 04/01/2027 (A) 380,000 385,320
Teva Pharmaceutical Finance Netherlands III BV2.20%, 07/21/2021 164,000 156,3536.75%, 03/01/2028 749,000 755,077
6,203,484Real Estate Management & Development - 0.2%Realogy Group LLC / Realogy Co-Issuer Corp.
4.88%, 06/01/2023 (A) (B) 479,000 446,6679.38%, 04/01/2027 (A) 126,000 128,993
575,660Road & Rail - 1.0%Avolon Holdings Funding, Ltd.
5.13%, 10/01/2023 (A) 647,000 658,3225.25%, 05/15/2024 (A) 161,000 165,830
Hertz Corp.5.50%, 10/15/2024 (A) (B) 1,115,000 935,2066.25%, 10/15/2022 (B) 668,000 631,260
Park Aerospace Holdings, Ltd.5.25%, 08/15/2022 (A) 183,000 187,557
2,578,175Semiconductors & Semiconductor Equipment - 0.3%NXP BV / NXP Funding LLC
3.88%, 09/01/2022 (A) 899,000 911,703Software - 0.9%Infor US, Inc.
6.50%, 05/15/2022 1,648,000 1,670,660Sophia, LP / Sophia Finance, Inc.
9.00%, 09/30/2023 (A) 612,000 634,9502,305,610
Specialty Retail - 0.9%L Brands, Inc.
5.25%, 02/01/2028 157,000 139,9266.75%, 07/01/2036 1,119,000 939,9606.88%, 11/01/2035 773,000 667,679
PetSmart, Inc.5.88%, 06/01/2025 (A) 845,000 707,688
2,455,253Technology Hardware, Storage & Peripherals - 2.0%Dell International LLC / EMC Corp.
5.88%, 06/15/2021 (A) 858,000 874,0847.13%, 06/15/2024 (A) 693,000 734,8248.35%, 07/15/2046 (A) 560,000 675,901
Diebold Nixdorf, Inc.8.50%, 04/15/2024 528,000 469,920
Principal ValueCORPORATE DEBT SECURITIES (continued)Technology Hardware, Storage & Peripherals (continued)Seagate HDD Cayman
4.75%, 01/01/2025 $167,000 $ 162,253
4.88%, 03/01/2024 (B) 748,000 743,6034.88%, 06/01/2027 128,000 122,0205.75%, 12/01/2034 (B) 700,000 641,167
Western Digital Corp.4.75%, 02/15/2026 (B) 865,000 826,075
5,249,847Trading Companies & Distributors - 1.1%United Rentals North America, Inc.
4.63%, 10/15/2025 483,000 476,9635.50%, 07/15/2025 - 05/15/2027 1,727,000 1,763,9206.50%, 12/15/2026 (B) 609,000 640,972
2,881,855Wireless Telecommunication Services - 2.0%Sprint Communications, Inc.
11.50%, 11/15/2021 955,000 1,100,637Sprint Corp.
7.13%, 06/15/2024 1,338,000 1,358,0707.63%, 03/01/2026 734,000 743,909
T-Mobile USA, Inc.4.00%, 04/15/2022 (B) 360,000 364,0504.50%, 02/01/2026 412,000 411,7756.50%, 01/15/2024 273,000 283,579
Wind Tre SpA5.00%, 01/20/2026 (A) 1,205,000 1,096,851
5,358,871Total Corporate Debt Securities
(Cost $244,023,047) 241,943,444
LOAN ASSIGNMENTS - 2.3%IT Services - 0.6%First Data Corp.
Term Loan,1-Month LIBOR + 2.00%,
4.49% (E), 07/08/2022 (C) 1,532,571 1,528,500Machinery - 0.2%Cortes NP Acquisition Corp.
Term Loan B,3-Month LIBOR + 4.00%,
6.63% (E), 11/30/2023 507,705 475,550Software - 1.0%Avaya, Inc.
Term Loan B,1-Month LIBOR + 4.25%,
6.78% (E), 12/15/2024 1,288,737 1,281,327Infor, Inc.
Term Loan B6,1-Month LIBOR + 2.75%,
5.25% (E), 02/01/2022 1,300,000 1,292,6882,574,015
Copyright © 2021 www.secdatabase.com. All Rights Reserved.Please Consider the Environment Before Printing This Document

Transamerica Aegon High Yield Bond VPSCHEDULE OF INVESTMENTS (continued)At March 31, 2019(unaudited)
The notes are an integral part of this report.Transamerica Series Trust Page 7
Principal ValueLOAN ASSIGNMENTS (continued)Wireless Telecommunication Services - 0.5%Sprint Communications, Inc.
1st Lien Term Loan B,1-Month LIBOR + 2.50%,
5.00% (E), 02/02/2024 $ 1,122,137 $ 1,085,668Term Loan B,1-Month LIBOR + 3.00%,
5.50% (E), 02/02/2024 196,680 192,2541,277,922
Total Loan Assignments(Cost $5,917,635) 5,855,987
Shares ValueCOMMON STOCK - 0.2%Electric Utilities - 0.2%Homer City Generation LLC (H) (I) (J) (K) 39,132 560,762Total Common Stock
(Cost $2,125,325) 560,762
PREFERRED STOCKS - 1.4%Banks - 1.0%GMAC Capital Trust I,
Series 2, 3-Month LIBOR + 5.79%,8.47% (E) 104,375 2,717,925
Building Products - 0.4%Associated Materials Group, Inc.,
PIK Rate 0.00%, Cash Rate0.00% (F) (H) (J) (K) 1,488,904 923,120
Total Preferred Stocks(Cost $3,939,325) 3,641,045
WARRANT - 0.0%Building Products - 0.0%Associated Materials Group, Inc., (H) (I) (J) (K) (L)
Exercise Price $0,Expiration Date 11/17/2023 15,911 0
Total Warrant(Cost $0) 0
OTHER INVESTMENT COMPANY - 8.7%Securities Lending Collateral - 8.7%State Street Navigator Securities Lending Trust -
Government Money Market Portfolio,2.41% (M) 22,814,860 22,814,860
Total Other Investment Company(Cost $22,814,860) 22,814,860
Principal ValueREPURCHASE AGREEMENT - 2.9%Fixed Income Clearing Corp., 1.45% (M), dated
03/29/2019, to be repurchased at $7,606,648on 04/01/2019. Collateralized by a U.S.Government Obligation, 2.75%, due 09/15/2021, and with a value of $7,760,731. $ 7,605,729 $ 7,605,729
Total Repurchase Agreement(Cost $7,605,729) 7,605,729
Total Investments(Cost $286,425,921) 282,421,827
Net Other Assets (Liabilities) - (8.1)% (21,207,665 )Net Assets - 100.0% $ 261,214,162
Copyright © 2021 www.secdatabase.com. All Rights Reserved.Please Consider the Environment Before Printing This Document

Transamerica Aegon High Yield Bond VPSCHEDULE OF INVESTMENTS (continued)At March 31, 2019(unaudited)
SECURITY VALUATION:
Valuation Inputs (N)
Level 1 -Unadjusted
QuotedPrices
Level 2 -Other
SignificantObservable
Inputs
Level 3 -Significant
UnobservableInputs (O) Value
ASSETSInvestmentsCorporate Debt Securities $� $241,943,444 $� $241,943,444Loan Assignments � 5,855,987 � 5,855,987Common Stock � � 560,762 560,762Preferred Stocks 2,717,925 � 923,120 3,641,045Warrant � � 0 0Other Investment Company 22,814,860 � � 22,814,860Repurchase Agreement � 7,605,729 � 7,605,729Total Investments $ 25,532,785 $ 255,405,160 $ 1,483,882 $ 282,421,827
FOOTNOTES TO SCHEDULE OF INVESTMENTS:
(A) Securities are registered pursuant to Rule 144A of the Securities Act of 1933. Unless otherwise indicated, the securities are deemed to be liquid for purposes ofcompliance limitations on holdings of illiquid securities and may be resold as transactions exempt from registration, normally to qualified institutional buyers. AtMarch 31, 2019, the total value of 144A securities is $110,517,744, representing 42.3% of the Portfolio�s net assets.
(B) All or a portion of the securities are on loan. The total value of all securities on loan is $22,347,490. The amount of securities on loan indicated may notcorrespond with the securities on loan identified because securities with pending sales are in the process of recall from the brokers.
(C) When-issued, delayed-delivery and/or forward commitment (including TBAs) securities. Securities to be settled and delivered after March 31, 2019. Securities maydisplay a coupon rate of 0.00%, as the rate is to be determined at time of settlement.
(D) Perpetual maturity. The date displayed is the next call date.(E) Floating or variable rate securities. The rates disclosed are as of March 31, 2019. For securities based on a published reference rate and spread, the reference
rate and spread are indicated within the description. Variable rate securities with a floor or ceiling feature are disclosed at the inherent rate, where applicable.Certain variable rate securities are not based on a published reference rate and spread, but are determined by the issuer or agent and are based on current marketconditions; these securities do not indicate a reference rate and spread in the description.
(F) Payment in-kind. Securities pay interest or dividends in the form of additional bonds or preferred stock. If the securities make a cash payment in addition toin-kind, the cash rate is disclosed separately.
(G) Percentage rounds to less than 0.1% or (0.1)%.(H) Fair valued as determined in good faith in accordance with procedures established by the Board. At March 31, 2019, the total value of securities is $1,483,882,
representing 0.6% of the Portfolio�s net assets.(I) Non-income producing securities.(J) Securities are Level 3 of the fair value hierarchy.(K) Restricted securities. At March 31, 2019, the value of such securities held by the Portfolio are as follows:
Investments DescriptionAcquisition
DateAcquisition
Cost ValueValue as Percentage
of Net AssetsCommon
Stock Homer City Generation LLC 01/10/2011 - 04/01/2013 $2,125,325 $560,762 0.2 %Preferred
Stocks Associated Materials Group, Inc., 0.00% 11/04/2016 - 12/31/2018 1,444,101 923,120 0.4Warrant Associated Materials Group, Inc., 11/17/2023 11/04/2016 0 0 0.0Total $ 3,569,426 $ 1,483,882 0.6 %
(L) Security deemed worthless.(M) Rates disclosed reflect the yields at March 31, 2019.(N) There were no transfers in or out of Level 3 during the period ended March 31, 2019. Please reference the Security Valuation section of the Notes to Schedules of
Investments for more information regarding security valuation and pricing inputs.(O) Level 3 securities were not considered significant to the Portfolio.
PORTFOLIO ABBREVIATIONS:
CMT Constant Maturity Treasury
Copyright © 2021 www.secdatabase.com. All Rights Reserved.Please Consider the Environment Before Printing This Document

LIBOR London Interbank Offered RateMTN Medium Term Note
The notes are an integral part of this report.Transamerica Series Trust Page 8
Copyright © 2021 www.secdatabase.com. All Rights Reserved.Please Consider the Environment Before Printing This Document

Transamerica Aegon U.S. Government Securities VPSCHEDULE OF INVESTMENTSAt March 31, 2019(unaudited)
The notes are an integral part of this report.Transamerica Series Trust Page 1
Principal ValueASSET-BACKED SECURITIES - 4.8%Access to Loans for Learning Student Loan Corp.
Series 2012-1, Class A,1-Month LIBOR + 0.70%,
3.19% (A), 07/25/2036 $ 3,591,844 $ 3,598,372Edsouth Indenture No. 3 LLC
Series 2012-2, Class A,1-Month LIBOR + 0.73%,
3.22% (A), 04/25/2039 (B) 2,089,395 2,074,599Navient Student Loan Trust
Series 2017-1A, Class A2,1-Month LIBOR + 0.75%,
3.24% (A), 07/26/2066 (B) 3,851,007 3,864,590SBA Small Business Investment Cos.
Series 2012-10B, Class 1,2.25%, 09/10/2022 2,638,640 2,625,813
SLM Student Loan TrustSeries 2006-2, Class A6,3-Month LIBOR + 0.17%,
2.94% (A), 01/25/2041 4,727,693 4,616,884South Carolina Student Loan Corp.
Series 2010-1, Class A2,3-Month LIBOR + 1.00%,
3.77% (A), 07/25/2025 1,845,840 1,845,840Total Asset-Backed Securities
(Cost $18,500,400) 18,626,098
CORPORATE DEBT SECURITIES - 5.1%Banks - 0.3%Barclays Bank PLC
10.18%, 06/12/2021 (B) 304,000 344,128Cooperatieve Rabobank UA
Fixed until 06/30/2019 (C), 11.00% (A) (B) 295,000 300,531ING Bank NV
5.80%, 09/25/2023 (B) 316,000 340,692985,351
Beverages - 0.1%Constellation Brands, Inc.
4.25%, 05/01/2023 210,000 220,004Building Products - 0.1%Owens Corning
4.20%, 12/15/2022 316,000 324,142Capital Markets - 0.5%Goldman Sachs Group, Inc.
4.00%, 03/03/2024 1,645,000 1,696,618Morgan Stanley
3.75%, 02/25/2023, MTN 316,000 324,1172,020,735
Consumer Finance - 0.2%Discover Financial Services
3.85%, 11/21/2022 485,000 496,811Ford Motor Credit Co. LLC
4.25%, 09/20/2022 298,000 295,901792,712
Principal ValueCORPORATE DEBT SECURITIES (continued)Diversified Financial Services - 3.4%Aviation Capital Group LLC
2.88%, 01/20/2022 (B) $ 208,000 $ 204,8357.13%, 10/15/2020 (B) 1,403,000 1,480,730
Portmarnock Leasing LLC1.74%, 10/22/2024 1,513,703 1,476,863
Private Export Funding Corp.3.27%, 11/08/2021 (B) 10,000,000 10,186,569
13,348,997Diversified Telecommunication Services - 0.1%AT&T, Inc.
2.45%, 06/30/2020 422,000 420,407Electrical Equipment - 0.1%Siemens Financieringsmaatschappij NV
2.15%, 05/27/2020 (B) 263,000 261,539Food & Staples Retailing - 0.1%Walgreens Boots Alliance, Inc.
3.30%, 11/18/2021 263,000 265,977Health Care Equipment & Supplies - 0.0% (D)Abbott Laboratories
3.40%, 11/30/2023 184,000 187,787Insurance - 0.1%Fidelity National Financial, Inc.
5.50%, 09/01/2022 369,000 391,066Oil, Gas & Consumable Fuels - 0.1%BP Capital Markets PLC
4.74%, 03/11/2021 263,000 273,181Total Corporate Debt Securities
(Cost $19,121,461) 19,491,898
MORTGAGE-BACKED SECURITIES - 7.1%COMM Mortgage Trust
Series 2012-CR4, Class A3,2.85%, 10/15/2045 2,560,000 2,543,354Series 2013-CR9, Class A4,4.23% (A), 07/10/2045 3,000,000 3,165,852Series 2013-WWP, Class A2,3.42%, 03/10/2031 (B) 5,000,000 5,130,723
Eleven Madison Mortgage TrustSeries 2015-11MD, Class A,3.55% (A), 09/10/2035 (B) 5,000,000 5,134,564
GS Mortgage Securities TrustSeries 2014-GC18, Class A4,4.07%, 01/10/2047 3,000,000 3,140,008
JPMBB Commercial Mortgage Securities TrustSeries 2013-C12, Class A5,3.66%, 07/15/2045 4,535,000 4,674,308
Morgan Stanley Bank of America Merrill LynchTrustSeries 2013-C11, Class A4,4.17% (A), 08/15/2046 3,500,000 3,686,560
Total Mortgage-Backed Securities(Cost $27,083,747) 27,475,369
Copyright © 2021 www.secdatabase.com. All Rights Reserved.Please Consider the Environment Before Printing This Document

Transamerica Aegon U.S. Government Securities VPSCHEDULE OF INVESTMENTS (continued)At March 31, 2019(unaudited)
The notes are an integral part of this report.Transamerica Series Trust Page 2
Principal ValueMUNICIPAL GOVERNMENT OBLIGATIONS - 1.3%Texas - 0.9%North Texas Higher Education Authority, Inc.,
Revenue Bonds,Series 1,1-Month LIBOR + 1.00%,
3.49% (A), 12/01/2034$3,419,668
$3,423,908
Vermont - 0.4%Vermont Student Assistance Corp., Certificate of
Obligation,1-Month LIBOR + 0.70%,
3.20% (A), 07/28/2034 1,688,425 1,686,838Total Municipal Government Obligations
(Cost $5,099,475) 5,110,746
U.S. GOVERNMENT AGENCY OBLIGATIONS - 30.7%Federal Home Loan Banks
3.25%, 11/16/2028 6,000,000 6,312,123Federal Home Loan Mortgage Corp. Multifamily
Structured Pass-Through Certificates2.31%, 08/25/2022 5,150,000 5,123,7233.01%, 07/25/2025 5,000,000 5,078,2603.11%, 02/25/2023 10,000,000 10,191,4463.31%, 09/25/2025 15,000,000 15,496,9783.53%, 06/25/2020 5,500,000 5,530,4123.97% (A), 01/25/2021 2,945,000 3,006,3874.08% (A), 11/25/2020 3,618,720 3,679,2354.22%, 03/25/2020 1,927,227 1,948,190
Federal Home Loan Mortgage Corp. REMIC4.00%, 02/15/2029 61,567 61,561
Federal National Mortgage Association1.88%, 12/28/2020 4,000,000 3,970,6602.38%, 01/19/2023 28,500,000 28,576,7562.63%, 09/06/2024 4,000,000 4,058,3422.88%, 09/12/2023 2,000,000 2,046,806
Government National Mortgage Association3.98% (A), 10/20/2061 351,677 354,0064.18% (A), 10/20/2061 120,907 121,9604.25% (A), 09/20/2061 306,807 316,8024.61% (A), 06/20/2062 3,377,632 3,398,1344.67% (A), 12/20/2061 355,078 356,4304.85% (A), 08/20/2061 686,748 695,5365.00% (A), 07/20/2061 676,002 679,723
Overseas Private Investment Corp.5.14%, 12/15/2023 8,933 9,524
Tennessee Valley AuthoritySeries A,2.88%, 02/01/2027 6,000,000 6,076,2563.50%, 12/15/2042 5,000,000 5,131,2914.88%, 01/15/2048 5,000,000 6,391,269
Total U.S. Government Agency Obligations(Cost $118,692,248) 118,611,810
U.S. GOVERNMENT OBLIGATIONS - 44.0%U.S. Treasury - 44.0%U.S. Treasury Bond
2.50%, 02/15/2045 - 02/15/2046 6,967,000 6,555,5262.75%, 11/15/2047 4,400,000 4,336,5782.88%, 11/15/2046 5,350,000 5,416,4573.00%, 05/15/2042 - 02/15/2048 7,650,000 7,940,906
Principal ValueU.S. GOVERNMENT OBLIGATIONS (continued)U.S. Treasury (continued)U.S. Treasury Bond (continued)
3.38%, 05/15/2044 - 11/15/2048 $7,500,000 $ 8,301,504
3.50%, 02/15/2039 1,414,500 1,602,7503.63%, 08/15/2043 2,750,000 3,159,4924.38%, 05/15/2040 11,481,700 14,605,5305.25%, 11/15/2028 2,000,000 2,482,969
U.S. Treasury Note1.13%, 02/28/2021 - 07/31/2021 35,000,000 34,203,4771.25%, 03/31/2021 4,362,000 4,275,7821.38%, 01/31/2021 1,700,000 1,671,3131.63%, 02/15/2026 1,000,000 955,5082.00%, 02/15/2025 8,000,000 7,869,0632.25%, 11/15/2027 3,000,000 2,968,1252.38%, 01/31/2023 5,850,000 5,879,7072.50%, 01/31/2025 4,500,000 4,551,8552.63%, 12/15/2021 5,000,000 5,050,0002.75%, 11/30/2020 - 02/15/2028 7,650,000 7,731,4162.88%, 10/15/2021 - 08/15/2028 28,750,000 29,411,7383.00%, 10/31/2025 8,500,000 8,852,9493.13%, 11/15/2028 1,977,000 2,097,087
Total U.S. Government Obligations(Cost $167,463,554) 169,919,732
SHORT-TERM U.S. GOVERNMENT AGENCY OBLIGATION - 3.8%Federal Home Loan Bank Discount Notes
2.47% (E), 11/26/2019 15,000,000 14,759,000Total Short-Term U.S. Government Agency Obligation
(Cost $14,759,000) 14,759,000
REPURCHASE AGREEMENT - 2.7%Fixed Income Clearing Corp., 1.45% (E), dated
03/29/2019, to be repurchased at $10,489,977on 04/01/2019. Collateralized by a U.S.Government Obligation, 2.75%, due 09/15/2021, and with a value of $10,700,786. 10,488,710 10,488,710
Total Repurchase Agreement(Cost $10,488,710) 10,488,710
Total Investments(Cost $381,208,595) 384,483,363
Net Other Assets (Liabilities) - 0.5% 1,913,864Net Assets - 100.0% $ 386,397,227
Copyright © 2021 www.secdatabase.com. All Rights Reserved.Please Consider the Environment Before Printing This Document

Transamerica Aegon U.S. Government Securities VPSCHEDULE OF INVESTMENTS (continued)At March 31, 2019(unaudited)
FUTURES CONTRACTS:
DescriptionLong/Short
Number ofContracts
ExpirationDate
NotionalAmount Value
UnrealizedAppreciation
UnrealizedDepreciation
2-Year U.S. Treasury Note Long 117 06/28/2019 $ 24,844,602 $ 24,931,969 $87,367 $�5-Year U.S. Treasury Note Long 91 06/28/2019 10,438,595 10,540,359 101,764 �10-Year U.S. Treasury Bond Long 6 06/19/2019 778,517 796,688 18,171 �10-Year U.S. Treasury Note Long 79 06/19/2019 9,651,790 9,813,281 161,491 �U.S. Treasury Bond Long 32 06/19/2019 5,159,839 5,376,000 216,161 �U.S. Treasury Bond Short (28 ) 06/19/2019 (4,065,204 ) (4,190,375 ) � (125,171 )Total $ 584,954 $ (125,171)
SECURITY VALUATION:
Valuation Inputs (F)
Level 1 -Unadjusted
QuotedPrices
Level 2 -Other
SignificantObservable
Inputs
Level 3 -Significant
UnobservableInputs Value
ASSETSInvestmentsAsset-Backed Securities $� $18,626,098 $ � $18,626,098Corporate Debt Securities � 19,491,898 � 19,491,898Mortgage-Backed Securities � 27,475,369 � 27,475,369Municipal Government Obligations � 5,110,746 � 5,110,746U.S. Government Agency Obligations � 118,611,810 � 118,611,810U.S. Government Obligations � 169,919,732 � 169,919,732Short-Term U.S. Government Agency Obligation � 14,759,000 � 14,759,000Repurchase Agreement � 10,488,710 � 10,488,710Total Investments $�� $ 384,483,363 $ �� $ 384,483,363Other Financial InstrumentsFutures Contracts (G) $584,954 $� $ � $584,954Total Other Financial Instruments $ 584,954 $�� $ �� $584,954LIABILITIESOther Financial InstrumentsFutures Contracts (G) $(125,171 ) $� $ � $(125,171 )Total Other Financial Instruments $(125,171 ) $�� $ �� $(125,171 )
FOOTNOTES TO SCHEDULE OF INVESTMENTS:
(A) Floating or variable rate securities. The rates disclosed are as of March 31, 2019. For securities based on a published reference rate and spread, the referencerate and spread are indicated within the description. Variable rate securities with a floor or ceiling feature are disclosed at the inherent rate, where applicable.Certain variable rate securities are not based on a published reference rate and spread, but are determined by the issuer or agent and are based on current marketconditions; these securities do not indicate a reference rate and spread in the description.
(B) Securities are registered pursuant to Rule 144A of the Securities Act of 1933. Unless otherwise indicated, the securities are deemed to be liquid for purposes ofcompliance limitations on holdings of illiquid securities and may be resold as transactions exempt from registration, normally to qualified institutional buyers. AtMarch 31, 2019, the total value of 144A securities is $29,323,500, representing 7.6% of the Portfolio�s net assets.
(C) Perpetual maturity. The date displayed is the next call date.(D) Percentage rounds to less than 0.1% or (0.1)%.(E) Rates disclosed reflect the yields at March 31, 2019.(F) There were no transfers in or out of Level 3 during the period ended March 31, 2019. Please reference the Security Valuation section of the Notes to Schedules of
Investments for more information regarding security valuation and pricing inputs.(G) Futures contracts and/or forward foreign currency contracts are valued at unrealized appreciation (depreciation).
Copyright © 2021 www.secdatabase.com. All Rights Reserved.Please Consider the Environment Before Printing This Document

PORTFOLIO ABBREVIATIONS:
LIBOR London Interbank Offered RateMTN Medium Term Note
The notes are an integral part of this report.Transamerica Series Trust Page 3
Copyright © 2021 www.secdatabase.com. All Rights Reserved.Please Consider the Environment Before Printing This Document

Transamerica American Funds Managed Risk VPSCHEDULE OF INVESTMENTSAt March 31, 2019(unaudited)
SECURITY VALUATION:
Valuation Inputs (B)
Level 1 -Unadjusted
QuotedPrices
Level 2 -Other
SignificantObservable
Inputs
Level 3 -Significant
UnobservableInputs Value
ASSETSInvestmentsInvestment Company $810,449,879 $� $ � $810,449,879Repurchase Agreement � 43,625,921 � 43,625,921Total Investments $ 810,449,879 $ 43,625,921 $ �� $ 854,075,800
FOOTNOTES TO SCHEDULE OF INVESTMENTS:
(A) Rate disclosed reflects the yield at March 31, 2019.(B) There were no transfers in or out of Level 3 during the period ended March 31, 2019. Please reference the Security Valuation section of the Notes to Schedules of
Investments for more information regarding security valuation and pricing inputs.
The notes are an integral part of this report.Transamerica Series Trust Page 1
Shares ValueINVESTMENT COMPANY - 95.0%U.S. Mixed Allocation Fund - 95.0%American Funds Insurance Series - Asset
Allocation Fund 34,753,425 $ 810,449,879Total Investment Company
(Cost $763,692,702) 810,449,879
Principal ValueREPURCHASE AGREEMENT - 5.1%Fixed Income Clearing Corp., 1.45% (A),
dated 03/29/2019, to be repurchased at$43,631,192 on 04/01/2019.Collateralized by a U.S. GovernmentObligation, 2.75%, due 08/15/2021, andwith a value of $44,499,379. $ 43,625,921 43,625,921
Total Repurchase Agreement(Cost $43,625,921) 43,625,921
Total Investments(Cost $807,318,623) 854,075,800
Net Other Assets (Liabilities) - (0.1)% (811,621 )Net Assets - 100.0% $ 853,264,179
Copyright © 2021 www.secdatabase.com. All Rights Reserved.Please Consider the Environment Before Printing This Document

Transamerica Barrow Hanley Dividend Focused VPSCHEDULE OF INVESTMENTSAt March 31, 2019(unaudited)
The notes are an integral part of this report.Transamerica Series Trust Page 1
Shares ValueCOMMON STOCKS - 98.3%Aerospace & Defense - 3.4%United Technologies Corp. 217,246 $ 28,000,837Airlines - 1.0%Southwest Airlines Co. 148,593 7,713,463Banks - 12.8%Bank of America Corp. 747,452 20,622,201JPMorgan Chase & Co. 282,200 28,567,106US Bancorp 559,342 26,954,691Wells Fargo & Co. 585,488 28,290,780
104,434,778Building Products - 3.5%Johnson Controls International PLC 765,336 28,271,512Capital Markets - 2.7%State Street Corp. 336,034 22,114,397Chemicals - 6.2%DowDuPont, Inc. 459,148 24,477,180Linde PLC 146,053 25,695,104
50,172,284Consumer Finance - 2.5%American Express Co. 185,388 20,262,908Diversified Telecommunication Services - 5.7%AT&T, Inc. 644,234 20,203,178Verizon Communications, Inc. 447,334 26,450,860
46,654,038Electric Utilities - 7.7%Entergy Corp. 342,336 32,737,592Exelon Corp. 588,501 29,501,555
62,239,147Energy Equipment & Services - 2.6%Schlumberger, Ltd. 489,899 21,344,899Equity Real Estate Investment Trusts - 3.0%HCP, Inc. 789,866 24,722,806Health Care Providers & Services - 4.0%Cardinal Health, Inc. 235,496 11,339,132CVS Health Corp. 391,787 21,129,073
32,468,205Household Durables - 1.3%Whirlpool Corp. 78,757 10,466,018Industrial Conglomerates - 3.3%General Electric Co. 2,710,818 27,081,072Insurance - 3.0%Chubb, Ltd. 174,621 24,460,910IT Services - 2.5%International Business Machines Corp. 142,202 20,064,702Machinery - 3.2%Stanley Black & Decker, Inc. 185,416 25,248,097Wabtec Corp. 14,559 1,073,289
26,321,386Multi-Utilities - 3.7%Dominion Energy, Inc. 389,918 29,891,114
Shares ValueCOMMON STOCKS (continued)Multiline Retail - 2.7%Target Corp. 277,459 $ 22,268,859Oil, Gas & Consumable Fuels - 10.6%BP PLC, ADR 571,364 24,980,034ConocoPhillips 179,251 11,963,212Occidental Petroleum Corp. 180,328 11,937,714Phillips 66 258,166 24,569,658Valero Energy Corp. 151,970 12,891,615
86,342,233Pharmaceuticals - 8.0%Johnson & Johnson 150,896 21,093,752Pfizer, Inc. 574,049 24,379,861Sanofi, ADR 435,548 19,286,065
64,759,678Specialty Retail - 2.6%Lowe�s Cos., Inc. 193,635 21,197,223Tobacco - 2.3%Philip Morris International, Inc. 209,333 18,502,944Total Common Stocks
(Cost $739,728,473) 799,755,413
Principal ValueREPURCHASE AGREEMENT - 1.0%Fixed Income Clearing Corp., 1.45% (A), dated
03/29/2019, to be repurchased at $7,930,751on 04/01/2019. Collateralized by a U.S.Government Obligation, 2.75%, due 09/15/2021, and with a value of $8,090,220. $ 7,929,793 7,929,793
Total Repurchase Agreement(Cost $7,929,793) 7,929,793
Total Investments(Cost $747,658,266) 807,685,206
Net Other Assets (Liabilities) - 0.7% 5,411,714Net Assets - 100.0% $ 813,096,920
Copyright © 2021 www.secdatabase.com. All Rights Reserved.Please Consider the Environment Before Printing This Document

Transamerica Barrow Hanley Dividend Focused VPSCHEDULE OF INVESTMENTS (continued)At March 31, 2019(unaudited)
SECURITY VALUATION:
Valuation Inputs (B)
Level 1 -Unadjusted
QuotedPrices
Level 2 -Other
SignificantObservable
Inputs
Level 3 -Significant
UnobservableInputs Value
ASSETSInvestmentsCommon Stocks $799,755,413 $� $ � $799,755,413Repurchase Agreement � 7,929,793 � 7,929,793Total Investments $ 799,755,413 $ 7,929,793 $ �� $ 807,685,206
FOOTNOTES TO SCHEDULE OF INVESTMENTS:
(A) Rate disclosed reflects the yield at March 31, 2019.(B) There were no transfers in or out of Level 3 during the period ended March 31, 2019. Please reference the Security Valuation section of the Notes to Schedules of
Investments for more information regarding security valuation and pricing inputs.
PORTFOLIO ABBREVIATION:
ADR American Depositary Receipt
The notes are an integral part of this report.Transamerica Series Trust Page 2
Copyright © 2021 www.secdatabase.com. All Rights Reserved.Please Consider the Environment Before Printing This Document

Transamerica BlackRock Equity Smart Beta 100 VPSCHEDULE OF INVESTMENTSAt March 31, 2019(unaudited)
SECURITY VALUATION:
Valuation Inputs (A)
Level 1 -Unadjusted
QuotedPrices
Level 2 -Other
SignificantObservable
Inputs
Level 3 -Significant
UnobservableInputs Value
ASSETSInvestmentsExchange-Traded Funds $58,040,035 $ � $ � $58,040,035Total Investments $ 58,040,035 $ �� $ �� $ 58,040,035
FOOTNOTES TO SCHEDULE OF INVESTMENTS:
(A) There were no transfers in or out of Level 3 during the period ended March 31, 2019. Please reference the Security Valuation section of the Notes to Schedules ofInvestments for more information regarding security valuation and pricing inputs.
The notes are an integral part of this report.Transamerica Series Trust Page 1
Shares ValueEXCHANGE-TRADED FUNDS - 99.9%International Equity Funds - 24.4%iShares Edge MSCI Min Vol EAFE ETF 154,644 $ 11,134,368iShares Edge MSCI Min Vol Emerging Markets
ETF 51,586 3,057,50214,191,870
U.S. Equity Funds - 75.5%iShares Edge MSCI Min Vol USA ETF 162,071 9,529,775iShares Edge MSCI USA Momentum Factor ETF 84,616 9,492,223iShares Edge MSCI USA Quality Factor ETF 108,272 9,587,486iShares Edge MSCI USA Size Factor ETF 68,686 6,043,681iShares Edge MSCI USA Value Factor ETF 115,139 9,195,000
43,848,165Total Exchange-Traded Funds
(Cost $50,835,819) 58,040,035Total Investments
(Cost $50,835,819) 58,040,035Net Other Assets (Liabilities) - 0.1% 61,422Net Assets - 100.0% $ 58,101,457
Copyright © 2021 www.secdatabase.com. All Rights Reserved.Please Consider the Environment Before Printing This Document

Transamerica BlackRock Global Allocation Managed Risk ��Balanced VPSCHEDULE OF INVESTMENTSAt March 31, 2019(unaudited)
SECURITY VALUATION:
Valuation Inputs (C)
Level 1 -Unadjusted
QuotedPrices
Level 2 -Other
SignificantObservable
Inputs
Level 3 -Significant
UnobservableInputs Value
ASSETSInvestmentsInvestment Company $234,241,727 $� $ � $234,241,727Repurchase Agreement � 12,568,156 � 12,568,156Total Investments $ 234,241,727 $ 12,568,156 $ �� $ 246,809,883
FOOTNOTES TO SCHEDULE OF INVESTMENTS:
(A) Affiliated investment in the Class I2 shares of Transamerica Funds and/or investment in the Initial Class shares of Transamerica Series Trust. The Portfolio�stransactions and earnings from investments of TAM are as follows:
Affiliated InvestmentsValue
December 31, 2018Purchases
at CostProceeds
from Sales
NetRealized
Gain (Loss)
Net Change inUnrealized
Appreciation(Depreciation)
ValueMarch 31, 2019
Shares as ofMarch 31, 2019
DividendIncome
Net CapitalGain
DistributionsTransamerica Blackrock Global Allocation
VP $ 217,594,398 $346,969 $ � $ � $16,300,360 $234,241,727 25,911,695 $ � $ �
(B) Rate disclosed reflects the yield at March 31, 2019.(C) There were no transfers in or out of Level 3 during the period ended March 31, 2019. Please reference the Security Valuation section of the Notes to Schedules of
Investments for more information regarding security valuation and pricing inputs.
The notes are an integral part of this report.Transamerica Series Trust Page 1
Shares ValueINVESTMENT COMPANY - 95.0%International Mixed Allocation Fund - 95.0%Transamerica Blackrock Global
Allocation VP (A) 25,911,695 $ 234,241,727Total Investment Company
(Cost $239,205,618) 234,241,727
Principal ValueREPURCHASE AGREEMENT - 5.1%Fixed Income Clearing Corp., 1.45% (B),
dated 03/29/2019, to be repurchased at$12,569,675 on 04/01/2019.Collateralized by a U.S. GovernmentObligation, 2.75%, due 08/15/2021, andwith a value of $12,824,350. $ 12,568,156 12,568,156
Total Repurchase Agreement(Cost $12,568,156) 12,568,156
Total Investments(Cost $251,773,774) 246,809,883
Net Other Assets (Liabilities) - (0.1)% (284,535 )Net Assets - 100.0% $ 246,525,348
Copyright © 2021 www.secdatabase.com. All Rights Reserved.Please Consider the Environment Before Printing This Document

Transamerica BlackRock Global Allocation Managed Risk ��Growth VPSCHEDULE OF INVESTMENTSAt March 31, 2019(unaudited)
FUTURES CONTRACTS:
DescriptionLong/Short
Number ofContracts
ExpirationDate
NotionalAmount Value
UnrealizedAppreciation
UnrealizedDepreciation
E-Mini Russell 2000® Index Long 3 06/21/2019 $230,817 $231,570 $753 $�EUR Currency Long 53 06/17/2019 7,552,448 7,478,631 � (73,817 )EURO STOXX 50® Index Long 130 06/21/2019 4,731,642 4,771,477 39,835 �FTSE 100 Index Long 12 06/21/2019 1,116,103 1,127,114 11,011 �GBP Currency Long 22 06/17/2019 1,817,124 1,795,200 � (21,924 )JPY Currency Long 48 06/17/2019 5,436,907 5,447,100 10,193 �MSCI Emerging Markets Index Long 83 06/21/2019 4,377,917 4,388,210 10,293 �Nikkei 225 Index Long 27 06/13/2019 5,234,551 5,167,103 � (67,448 )S&P 500® E-Mini Index Long 135 06/21/2019 18,909,950 19,155,150 245,200 �S&P Midcap 400® E-Mini Index Long 12 06/21/2019 2,264,229 2,281,200 16,971 �
Total $ 334,256 $ (163,189)
The notes are an integral part of this report.Transamerica Series Trust Page 1
Shares ValueINVESTMENT COMPANY - 95.5%International Mixed Allocation Fund - 95.5%Transamerica Blackrock Global Allocation
VP (A) 20,921,132 $ 189,127,031Total Investment Company
(Cost $192,605,370) 189,127,031
Principal ValueREPURCHASE AGREEMENT - 3.4%Fixed Income Clearing Corp., 1.45% (B), dated
03/29/2019, to be repurchased at $6,713,784on 04/01/2019. Collateralized by a U.S.Government Obligation, 2.75%, due 08/15/2021, and with a value of $6,848,792. $ 6,712,972 6,712,972
Total Repurchase Agreement(Cost $6,712,972) 6,712,972
Total Investments(Cost $199,318,342) 195,840,003
Net Other Assets (Liabilities) - 1.1% 2,083,987Net Assets - 100.0% $ 197,923,990
Copyright © 2021 www.secdatabase.com. All Rights Reserved.Please Consider the Environment Before Printing This Document

Transamerica BlackRock Global Allocation Managed Risk ��Growth VPSCHEDULE OF INVESTMENTS (continued)At March 31, 2019(unaudited)
SECURITY VALUATION:
Valuation Inputs (C)
Level 1 -Unadjusted
QuotedPrices
Level 2 -Other
SignificantObservable
Inputs
Level 3 -Significant
UnobservableInputs Value
ASSETSInvestmentsInvestment Company $189,127,031 $� $ � $189,127,031Repurchase Agreement � 6,712,972 � 6,712,972Total Investments $ 189,127,031 $ 6,712,972 $ �� $ 195,840,003Other Financial InstrumentsFutures Contracts (D) $334,256 $� $ � $334,256Total Other Financial Instruments $334,256 $�� $ �� $334,256LIABILITIESOther Financial InstrumentsFutures Contracts (D) $(163,189 ) $� $ � $(163,189 )Total Other Financial Instruments $(163,189 ) $�� $ �� $(163,189 )
FOOTNOTES TO SCHEDULE OF INVESTMENTS:
(A) Affiliated investment in the Class I2 shares of Transamerica Funds and/or investment in the Initial Class shares of Transamerica Series Trust. The Portfolio�stransactions and earnings from investments of TAM are as follows:
Affiliated InvestmentsValue
December 31, 2018Purchases
at CostProceeds
from Sales
NetRealized
Gain (Loss)
Net Change inUnrealized
Appreciation(Depreciation)
ValueMarch 31, 2019
Shares as ofMarch 31, 2019
DividendIncome
Net CapitalGain
DistributionsTransamerica Blackrock Global
Allocation VP $ 179,673,168 $ 75,059 $ (3,987,356) $(653,966 ) $14,020,126 $189,127,031 20,921,132 $ � $ �
(B) Rate disclosed reflects the yield at March 31, 2019.(C) There were no transfers in or out of Level 3 during the period ended March 31, 2019. Please reference the Security Valuation section of the Notes to Schedules of
Investments for more information regarding security valuation and pricing inputs.(D) Futures contracts and/or forward foreign currency contracts are valued at unrealized appreciation (depreciation).
CURRENCY ABBREVIATIONS:
EUR EuroGBP Pound SterlingJPY Japanese Yen
PORTFOLIO ABBREVIATIONS:
FTSE Financial Times Stock ExchangeSTOXX Deutsche Börse Group & SIX Group Index
The notes are an integral part of this report.Transamerica Series Trust Page 2
Copyright © 2021 www.secdatabase.com. All Rights Reserved.Please Consider the Environment Before Printing This Document

Transamerica BlackRock Global Allocation VPCONSOLIDATED SCHEDULE OF INVESTMENTSAt March 31, 2019(unaudited)
The notes are an integral part of this report.Transamerica Series Trust Page 1
Shares ValueCOMMON STOCKS - 54.8%Australia - 0.2%AGL Energy, Ltd. 16,583 $ 256,336BHP Group, Ltd. 997 27,248Newcrest Mining, Ltd. 147,724 2,675,779Quintis Pty, Ltd. (A) (B) (C) 1,725,383 232,771Stockland, REIT 42,572 116,379
3,308,513Belgium - 0.0% (D)Anheuser-Busch InBev SA 276 23,146Brazil - 0.5%Azul SA, ADR (E) 168,405 4,919,110B3 SA - Brasil Bolsa Balcao 357 2,929Banco Santander Brasil SA 2,497 28,042Notre Dame Intermedica Participacoes SA 425,534 3,564,819Petrobras Distribuidora SA 15,505 91,675TIM Participacoes SA 5,705 17,179Vale SA 923 12,006
8,635,760Canada - 1.7%Canadian National Railway Co. 1,616 144,664Canadian Pacific Railway, Ltd. 680 140,106Enbridge, Inc. 222,293 8,051,021Goldcorp, Inc. 992 11,350Husky Energy, Inc. 414 4,105Imperial Oil, Ltd. 4,558 124,425Manulife Financial Corp. 12,658 214,069Nutrien, Ltd. 2,566 135,333Suncor Energy, Inc. 241,230 7,818,065Teck Resources, Ltd., Class B 5,982 138,409TransCanada Corp. (F) 187,603 8,425,886Wheaton Precious Metals Corp. 116,466 2,772,315
27,979,748Chile - 0.0% (D)Cia Cervecerias Unidas SA, ADR 11,309 333,163China - 1.6%Agile Group Holdings, Ltd. 54,000 87,364Agricultural Bank of China, Ltd., H Shares 101,000 46,576Alibaba Group Holding, Ltd., ADR (E) 19,983 3,645,898Angang Steel Co., Ltd., Class H (F) 40,000 29,249Angel Yeast Co., Ltd., A Shares 178,550 718,961Anhui Conch Cement Co., Ltd., A Shares 6,300 35,793Anhui Conch Cement Co., Ltd., H Shares 18,500 113,004BAIC Motor Corp., Ltd., H Shares (G) 7,000 4,574Baidu, Inc., ADR (E) 818 134,847Bank of China, Ltd., Class H 31,000 14,059Beijing Capital International Airport Co., Ltd.,
Class H 250,000 237,263CGN Power Co., Ltd., H Shares (G) 46,000 12,833China CITIC Bank Corp., Ltd., Class H 124,000 78,981China Communications Services Corp., Ltd.,
H Shares 32,000 28,535China Construction Bank Corp., H Shares 51,000 43,724China Hongqiao Group, Ltd. 52,500 39,526China Longyuan Power Group Corp., Ltd.,
H Shares 5,000 3,478
Shares ValueCOMMON STOCKS (continued)China (continued)China Petroleum & Chemical Corp., A Shares 132,800 $ 113,430China Petroleum & Chemical Corp., H Shares 330,000 260,218China Shenhua Energy Co., Ltd., Class H 51,000 116,294CNOOC, Ltd. 102,000 191,008Country Garden Holdings Co., Ltd. 25,000 39,045Country Garden Services Holdings Co., Ltd. (E) 12,149 22,627Daqin Railway Co., Ltd., A Shares 3,600 4,468Dongfeng Motor Group Co., Ltd., Class H 26,000 26,033Fosun International, Ltd. 84,500 143,166Industrial & Commercial Bank of China, Ltd., Class H 292,000 213,887Jiangsu Expressway Co., Ltd., H Shares 6,000 8,484Jiangsu Yanghe Brewery Joint-Stock Co., Ltd., A Shares 33,200 644,318Kweichow Moutai Co., Ltd., A Shares 19,100 2,427,191Logan Property Holdings Co., Ltd. 4,000 6,624Luzhou Laojiao Co., Ltd., A Shares 54,500 539,956New Oriental Education & Technology Group, Inc.,
ADR (E) 25,257 2,275,403PetroChina Co., Ltd., Class H 38,000 24,640Sany Heavy Industry Co., Ltd., A Shares 22,400 42,599SINA Corp. (E) 1,144 67,771Sinopec Shanghai Petrochemical Co., Ltd., Class H 260,000 123,873TAL Education Group, ADR (E) 60,853 2,195,576Tencent Holdings, Ltd. 190,200 8,746,833Tencent Music Entertainment Group, ADR (E) (F) 1,431 25,901Tingyi Holding Corp. 20,000 32,968Tsingtao Brewery Co., Ltd., Class H 12,000 56,561Want Want China Holdings, Ltd. 729,000 605,492Wuliangye Yibin Co., Ltd., A Shares 40,000 565,459Yanzhou Coal Mining Co., Ltd., H Shares 52,000 51,073Yum China Holdings, Inc. 15,161 680,880Zhejiang Expressway Co., Ltd., H Shares 56,000 64,204Zijin Mining Group Co., Ltd., A Shares 13,200 6,894Zijin Mining Group Co., Ltd., H Shares 180,000 74,523
25,672,064Czech Republic - 0.1%CEZ AS 28,028 658,332Denmark - 0.1%Carlsberg A/S, Class B 2,366 295,492Danske Bank A/S 1,159 20,340Novo Nordisk A/S, Class B 31,037 1,624,740
1,940,572Finland - 0.0% (D)Nokia OYJ 24,649 140,296France - 2.3%Cie de Saint-Gobain 17,966 651,155Cie Generale des Etablissements Michelin SCA 395 46,702Danone SA 175,309 13,508,089Dassault Aviation SA 1,762 2,599,129Eiffage SA 12,340 1,185,740Engie SA 8,843 131,733Kering SA 549 314,818L�Oreal SA 166 44,653Natixis SA 12,253 65,576Publicis Groupe SA 2,348 125,715
Copyright © 2021 www.secdatabase.com. All Rights Reserved.Please Consider the Environment Before Printing This Document

Transamerica BlackRock Global Allocation VPCONSOLIDATED SCHEDULE OF INVESTMENTS (continued)At March 31, 2019(unaudited)
Shares ValueCOMMON STOCKS (continued)France (continued)Safran SA 51,825 $ 7,106,968Sanofi 17,266 1,525,047Societe Generale SA 9,714 280,862Sodexo SA 65,451 7,206,876TOTAL SA, ADR 2,532 140,906Unibail-Rodamco-Westfield, REIT (F) 18,248 2,991,442Vivendi SA 235 6,809
37,932,220Germany - 1.1%adidas AG 763 185,387Allianz SE 792 176,157Bayer AG 75,894 4,903,725Deutsche Boerse AG 128 16,412Evonik Industries AG 5,524 150,452Fresenius SE & Co. KGaA 105,160 5,869,852Knorr-Bremse AG (E) 53,264 5,289,571SAP SE 1,598 184,633Vonovia SE 8,705 451,331
17,227,520Hong Kong - 1.0%Beijing Enterprises Holdings, Ltd. 15,500 87,867China Mobile, Ltd. 21,000 214,014China Resources Beer Holdings Co., Ltd. 16,000 67,364China Resources Cement Holdings, Ltd. 148,000 152,714China Resources Gas Group, Ltd. 16,000 75,415China Resources Power Holdings Co., Ltd. 2,000 3,006CITIC, Ltd. 54,000 80,622CK Asset Holdings, Ltd. 3,500 31,121CK Infrastructure Holdings, Ltd. 96,000 788,183CLP Holdings, Ltd. 69,500 805,674Hang Lung Properties, Ltd. 396,000 966,549HKT Trust & HKT, Ltd. 336,000 540,172Hongkong Land Holdings, Ltd. 23,500 167,085Hysan Development Co., Ltd. 16,000 85,708I-CABLE Communications, Ltd. (E) 70,516 934Jardine Matheson Holdings, Ltd. 16,100 1,003,996Link REIT 59,000 689,966Power Assets Holdings, Ltd. 30,500 211,559Sino Land Co., Ltd. 218,000 421,562Sun Hung Kai Properties, Ltd. 469,500 8,056,312Swire Pacific, Ltd., Class A 45,000 578,985WH Group, Ltd. (G) 119,000 127,338Wharf Real Estate Investment Co., Ltd. 74,000 550,997
15,707,143Indonesia - 0.0% (D)Bank Central Asia Tbk PT 300,500 585,595Ireland - 0.0% (D)Accenture PLC, Class A 1,907 335,670Medtronic PLC 2,867 261,126
596,796Italy - 0.5%Enel SpA 665,549 4,258,491Eni SpA 8,025 141,818RAI Way SpA (G) 329,080 1,701,761Snam SpA 50,880 261,345Telecom Italia SpA (E) 2,376,970 1,478,234Telecom Italia SpA 201,584 114,511UniCredit SpA 6,542 83,864
8,040,024
Shares ValueCOMMON STOCKS (continued)Japan - 7.0%Aeon Co., Ltd. 2,900 $ 60,614AGC, Inc. 100 3,501Ajinomoto Co., Inc. 322,300 5,144,353Alfresa Holdings Corp. 17,100 486,015Alps Alpine Co., Ltd. 9,520 198,423Astellas Pharma, Inc. 242,800 3,633,347Canon Marketing Japan, Inc. 15,800 310,355Daicel Corp. (F) 61,400 665,910Daikin Industries, Ltd. 22,700 2,656,492Daiwa House Industry Co., Ltd. 1,300 41,277Denso Corp. 121,500 4,732,613Dowa Holdings Co., Ltd. (F) 9,100 298,872East Japan Railway Co. 92,600 8,923,288Eisai Co., Ltd. 700 39,241Exedy Corp. 11,000 238,004Fujitsu, Ltd. 400 28,823GS Yuasa Corp. 20,300 397,648Hino Motors, Ltd. 29,300 246,392Hitachi Chemical Co., Ltd. (F) 21,300 471,241Hitachi, Ltd. 9,200 297,591Hoya Corp. 78,900 5,203,285Japan Airlines Co., Ltd. 236,200 8,309,517Japan Aviation Electronics Industry, Ltd. 29,200 406,002JFE Holdings, Inc. 1,900 32,204Kajima Corp. 900 13,269Kamigumi Co., Ltd. 14,600 337,764KDDI Corp. 28,800 619,760Keyence Corp. 900 560,074Kinden Corp. 59,500 984,598Koito Manufacturing Co., Ltd. 88,600 5,012,379Kuraray Co., Ltd. 23,600 299,818Kyowa Hakko Kirin Co., Ltd. 2,400 52,188Kyudenko Corp. 8,300 259,866Mabuchi Motor Co., Ltd. 16,100 559,280Maeda Road Construction Co., Ltd. 15,800 306,363Medipal Holdings Corp. 19,700 467,482Mitsubishi Electric Corp. 369,900 4,747,656Mitsubishi Estate Co., Ltd. 34,600 626,097Mitsubishi Heavy Industries, Ltd. 2,900 120,312Mitsubishi Motors Corp. 2,400 12,733Mitsubishi Tanabe Pharma Corp. 1,000 13,345Mitsubishi UFJ Financial Group, Inc. 20,100 99,747Mitsui & Co., Ltd. 2,800 43,416Murata Manufacturing Co., Ltd. 95,400 4,744,607Nichias Corp. 17,700 350,071Nippo Corp. 14,400 268,173Nippon Telegraph & Telephone Corp. 12,700 538,916Nippon Television Holdings, Inc. 36,600 548,191Nitto Denko Corp. 44,400 2,329,568Okumura Corp. (F) 17,900 567,703Olympus Corp. 170,000 1,843,725Ono Pharmaceutical Co., Ltd. 5,900 115,466Oracle Corp. 1,500 100,559Otsuka Holdings Co., Ltd. 1,900 74,557Panasonic Corp. 6,700 57,684Rohm Co., Ltd. 32,500 2,023,369Seino Holdings Co., Ltd. 21,700 288,798Seven & i Holdings Co., Ltd. 8,200 308,970Shimamura Co., Ltd. 3,300 278,995Shin-Etsu Chemical Co., Ltd. 71,900 6,020,319Shionogi & Co., Ltd. 400 24,730Shiseido Co., Ltd. 2,000 144,131
Copyright © 2021 www.secdatabase.com. All Rights Reserved.Please Consider the Environment Before Printing This Document

The notes are an integral part of this report.Transamerica Series Trust Page 2
Sony Corp. 6,900 289,186Stanley Electric Co., Ltd. 10,000 268,429Subaru Corp. (F) 272,700 6,206,675
Copyright © 2021 www.secdatabase.com. All Rights Reserved.Please Consider the Environment Before Printing This Document

Transamerica BlackRock Global Allocation VPCONSOLIDATED SCHEDULE OF INVESTMENTS (continued)At March 31, 2019(unaudited)
Shares ValueCOMMON STOCKS (continued)Japan (continued)Sumitomo Chemical Co., Ltd. 24,300 $ 112,916Sumitomo Mitsui Financial Group, Inc. 600 20,983Suzuken Co., Ltd. 8,000 462,691Suzuki Motor Corp. 166,100 7,340,592Sysmex Corp. 2,200 132,798T&D Holdings, Inc. 3,100 32,558Takeda Pharmaceutical Co., Ltd. 900 36,713Toagosei Co., Ltd. 47,100 497,221Toda Corp. 76,000 466,300Tokyo Gas Co., Ltd. 215,600 5,823,320Tokyo Steel Manufacturing Co., Ltd. 79,700 691,793Toray Industries, Inc. 357,200 2,278,306Toshiba Corp. 5,800 184,472Toyota Industries Corp. 84,300 4,221,465TV Asahi Holdings Corp. 26,600 466,094Ube Industries, Ltd. 125,600 2,578,183Unicharm Corp. 2,000 66,101Yahoo Japan Corp. (F) 14,300 34,966Yamato Kogyo Co., Ltd. 11,800 321,537ZOZO, Inc. 188,500 3,547,875
114,670,861Macau - 0.0% (D)Sands China, Ltd. 2,000 10,051Malaysia - 0.0% (D)Malaysia Airports Holdings Bhd. 129,600 229,836Mexico - 0.0% (D)America Movil SAB de CV, Series L 197,588 141,191Cemex SAB de CV (E) 45,390 21,186Grupo Financiero Banorte SAB de CV, Class O 2,175 11,816Grupo Televisa SAB 2,825 6,244
180,437Netherlands - 2.4%ABN AMRO Group NV, CVA (G) 293,445 6,616,357Adyen NV (E) (G) 75 58,724ASML Holding NV 1,183 221,880Koninklijke Ahold Delhaize NV 3,963 105,469Koninklijke Philips NV 300,199 12,229,015NXP Semiconductors NV 2,827 249,879Royal Dutch Shell PLC, Class A 436,602 13,703,441Royal Dutch Shell PLC, Class A, ADR 80,989 5,069,101Royal Dutch Shell PLC, Class A 6,717 211,146Royal Dutch Shell PLC, Class B 6,718 212,447
38,677,459Norway - 0.0% (D)Equinor ASA 2,715 59,447Peru - 0.0% (D)Southern Copper Corp. 3,110 123,405Portugal - 0.0% (D)Jeronimo Martins SGPS SA 29,098 429,225Republic of Korea - 0.6%Coway Co., Ltd. 6,928 576,774Doosan Bobcat, Inc. 8,062 219,466E-MART, Inc. 520 78,795Hana Financial Group, Inc. 3,745 120,093Industrial Bank of Korea 6,004 74,316KB Financial Group, Inc. 1,532 56,483KT&G Corp. 45,073 4,109,819
Shares ValueCOMMON STOCKS (continued)Republic of Korea (continued)LG Chem, Ltd. 2,345 $ 756,118LG Electronics, Inc. 2,577 170,498NCSoft Corp. 1,217 531,787POSCO 2,902 646,821S-Oil Corp. 5,626 444,093Samsung Electro-Mechanics Co., Ltd. 73 6,721Samsung Electronics Co., Ltd. 5,448 214,301Samsung SDS Co., Ltd. 268 55,484Shinhan Financial Group Co., Ltd. 6,059 224,190SK Telecom Co., Ltd. 2,826 626,147
8,911,906Republic of South Africa - 0.0% (D)Aspen Pharmacare Holdings, Ltd. 4,616 29,746Kumba Iron Ore, Ltd. (F) 244 7,277Multichoice Group, Ltd. (E) 37 309Old Mutual, Ltd. (F) 53,708 81,406
118,738Singapore - 0.5%CapitaLand, Ltd. 2,550,900 6,870,160ComfortDelGro Corp., Ltd. 326,800 619,720Genting Singapore, Ltd. 219,000 168,058Singapore Telecommunications, Ltd. 257,800 574,474United Overseas Bank, Ltd. 28,800 535,305
8,767,717Spain - 0.5%Banco Bilbao Vizcaya Argentaria SA 12,384 70,751CaixaBank SA 25,114 78,430Cellnex Telecom SA (E) (G) 260,452 7,642,960
7,792,141Sweden - 0.0% (D)Sandvik AB 4,529 73,557Telefonaktiebolaget LM Ericsson, B Shares (F) 11,343 104,215
177,772Switzerland - 1.2%Chubb, Ltd. 29,710 4,161,777Glencore PLC (E) 35,548 147,209Nestle SA 151,145 14,404,881Roche Holding AG 289 79,626Swiss Re AG 740 72,294
18,865,787Taiwan - 0.9%Cathay Financial Holding Co., Ltd. 444,000 647,549Cheng Shin Rubber Industry Co., Ltd. 212,000 288,555Chunghwa Telecom Co., Ltd. 1,014,000 3,602,570Far EasTone Telecommunications Co., Ltd. 614,000 1,480,190Formosa Chemicals & Fibre Corp. 136,000 494,216Formosa Petrochemical Corp. 106,000 397,236Formosa Plastics Corp. 154,000 547,136Fubon Financial Holding Co., Ltd. 520,000 776,107Globalwafers Co., Ltd. 5,000 49,155Hon Hai Precision Industry Co., Ltd. 260,520 621,282MediaTek, Inc. 6,000 54,996Nan Ya Plastics Corp. 194,000 496,637Taiwan Mobile Co., Ltd. 490,000 1,772,684
Copyright © 2021 www.secdatabase.com. All Rights Reserved.Please Consider the Environment Before Printing This Document

The notes are an integral part of this report.Transamerica Series Trust Page 3
Copyright © 2021 www.secdatabase.com. All Rights Reserved.Please Consider the Environment Before Printing This Document

Transamerica BlackRock Global Allocation VPCONSOLIDATED SCHEDULE OF INVESTMENTS (continued)At March 31, 2019(unaudited)
Shares ValueCOMMON STOCKS (continued)Taiwan (continued)Taiwan Semiconductor Manufacturing Co., Ltd. 322,000 $ 2,564,884Uni-President Enterprises Corp. 343,000 832,446
14,625,643Thailand - 0.2%Advanced Info Service PCL 134,600 780,413Intouch Holdings PCL, F Shares (F) 355,300 638,163PTT Global Chemical PCL 304,400 645,057Siam Cement PCL 43,900 661,232Thai Oil PCL 203,700 446,105
3,170,970Turkey - 0.0% (D)Turkiye Is Bankasi AS, Class C 5,885 5,805United Arab Emirates - 0.2%NMC Health PLC (F) 114,093 3,394,033United Kingdom - 1.5%Barclays PLC 14,713 29,641Berkeley Group Holdings PLC 11,233 539,716Diageo PLC 1,034 42,260Experian PLC 1,498 40,563Fiat Chrysler Automobiles NV (E) 3,964 59,016GlaxoSmithKline PLC 11,914 247,782GW Pharmaceuticals PLC, ADR (E) 5,979 1,007,880HSBC Holdings PLC 667,795 5,421,272Kingfisher PLC 1,321,307 4,040,757Liberty Global PLC, Class A (E) 135,169 3,368,412Liberty Global PLC, Series C (E) 3,930 95,145National Grid PLC 17,990 199,352Rio Tinto, Ltd. 1,078 74,944Rolls-Royce Holdings PLC 4,804 56,513SSE PLC 2,228 34,445Vodafone Group PLC 5,457,614 9,937,358WPP PLC 256 2,703
25,197,759United States - 30.7%Abbott Laboratories 7,358 588,199AbbVie, Inc. 4,629 373,051Adobe, Inc. (E) 1,626 433,313AES Corp. 7,837 141,693Agilent Technologies, Inc. 451 36,251Air Products & Chemicals, Inc. 60,909 11,631,183Allergan PLC 1,025 150,070Alliance Data Systems Corp. 423 74,017Ally Financial, Inc. 3,028 83,240Alphabet, Inc., Class A (E) 219 257,739Alphabet, Inc., Class C (E) 19,947 23,404,015Altria Group, Inc. 161,466 9,272,992Amazon.com, Inc. (E) 8,005 14,254,904American Airlines Group, Inc. 3,180 100,997American Electric Power Co., Inc. 31 2,596American Tower Corp., REIT 2,545 501,518American Water Works Co., Inc. 8,353 870,884Ameriprise Financial, Inc. 3,165 405,437Amgen, Inc. 2,659 505,157Anadarko Petroleum Corp. 5,222 237,497Anthem, Inc. 51,585 14,803,863Apple, Inc. 102,516 19,472,914AT&T, Inc. 763 23,928Autodesk, Inc. (E) 1,034 161,118Automatic Data Processing, Inc. 837 133,702Bank of America Corp. 9,851 271,789
Shares ValueCOMMON STOCKS (continued)United States (continued)Bank of New York Mellon Corp. 2,625 $ 132,379Baxter International, Inc. 6,659 541,443BB&T Corp. 147 6,840Berkshire Hathaway, Inc., Class B (E) 5,105 1,025,543Biogen, Inc. (E) 12,182 2,879,581Boeing Co. 1,354 516,443Booking Holdings, Inc. (E) 119 207,644Bristol-Myers Squibb Co. 6,373 304,056Broadcom, Inc. 15 4,511Capital One Financial Corp. 1,297 105,952Cardinal Health, Inc. 2,148 103,426Carnival Corp. 3,766 191,012Caterpillar, Inc. 1,137 154,052CenterPoint Energy, Inc. 3,061 93,973CH Robinson Worldwide, Inc. 6,695 582,398Charles Schwab Corp. 126,681 5,416,880Charter Communications, Inc., Class A (E) 33,712 11,695,030Chevron Corp. 3,319 408,834Cisco Systems, Inc. 11,818 638,054Citigroup, Inc. 39,834 2,478,471Cloudera, Inc. (E) 260,216 2,846,763CMS Energy Corp. 15,499 860,814Cognizant Technology Solutions Corp., Class A 1,247 90,345Colgate-Palmolive Co. 161,121 11,043,233Comcast Corp., Class A 464,424 18,567,672ConocoPhillips 1,920 128,141Corning, Inc. 8,039 266,091Costco Wholesale Corp. 756 183,058CSX Corp. 7,000 523,740Cummins, Inc. 576 90,933CVS Health Corp. 133,777 7,214,594DaVita, Inc. (E) 87,187 4,733,382Dell Technologies, Inc., C Shares (E) 106 6,221Delta Air Lines, Inc. 2,057 106,244Devon Energy Corp. 3,033 95,721Discover Financial Services 2,111 150,219Dollar Tree, Inc. (E) 77,244 8,113,710Domo, Inc., Class B (E) (F) 73,159 2,950,502Dover Corp. 61,478 5,766,636DowDuPont, Inc. 105,468 5,622,499Dropbox, Inc., Class A (E) 220,496 4,806,813DXC Technology Co. 4,107 264,121Eaton Corp. PLC 1,506 121,323eBay, Inc. 3,936 146,183Edwards Lifesciences Corp. (E) 695 132,974Emerson Electric Co. 111,909 7,662,409Equinix, Inc., REIT 12,873 5,833,529Equity Residential, REIT 62,971 4,742,976Estee Lauder Cos., Inc., Class A 77 12,747Eversource Energy 11,648 826,426Exelon Corp. 11,339 568,424Expedia Group, Inc. 1,821 216,699Exxon Mobil Corp. 219,396 17,727,197Facebook, Inc., Class A (E) 36,591 6,099,354Fidelity National Information Services, Inc. 1,322 149,518Fieldwood Energy, Inc. (A) (C) 9,869 345,415Fifth Third Bancorp 6,176 155,759FirstEnergy Corp. 20,700 861,327FleetCor Technologies, Inc. (E) 35,243 8,690,571Fortune Brands Home & Security, Inc. 5,502 261,950General Electric Co. 10,659 106,483General Motors Co. 4,200 155,820
Copyright © 2021 www.secdatabase.com. All Rights Reserved.Please Consider the Environment Before Printing This Document

The notes are an integral part of this report.Transamerica Series Trust Page 4
Gilead Sciences, Inc. 105,746 6,874,547Global Payments, Inc. 3,297 450,106Goldman Sachs Group, Inc. 2,115 406,059Hartford Financial Services Group, Inc. 10,024 498,393
Copyright © 2021 www.secdatabase.com. All Rights Reserved.Please Consider the Environment Before Printing This Document

Transamerica BlackRock Global Allocation VPCONSOLIDATED SCHEDULE OF INVESTMENTS (continued)At March 31, 2019(unaudited)
Shares ValueCOMMON STOCKS (continued)United States (continued)HCA Healthcare, Inc. 33,643 $ 4,386,374Helmerich & Payne, Inc. 2,243 124,621Hewlett Packard Enterprise Co. 9,707 149,779Home Depot, Inc. 1,254 240,630HP, Inc. 3,768 73,212Humana, Inc. 660 175,560Huntsman Corp. 4,215 94,795Illumina, Inc. (E) 448 139,189Intel Corp. 10,698 574,483International Business Machines Corp. 2,593 365,872Intuit, Inc. 2,128 556,280Intuitive Surgical, Inc. (E) 123 70,181Johnson & Johnson 137,708 19,250,201JPMorgan Chase & Co. 119,218 12,068,438KAR Auction Services, Inc. 57,386 2,944,476KeyCorp 362 5,702KLA-Tencor Corp. 1,518 181,264Kohl�s Corp. 1,872 128,737Kroger Co. 839 20,639Lear Corp. 639 86,719Liberty Broadband Corp., Class A (E) 10,228 937,294Liberty Broadband Corp., Class C (E) 43,958 4,032,707Liberty Media Corp. - Liberty SiriusXM, Class A (E) 36,677 1,400,328Liberty Media Corp. - Liberty SiriusXM, Class C (E) 61,458 2,350,154Lockheed Martin Corp. 58 17,409Lowe�s Cos., Inc. 10,006 1,095,357Marathon Petroleum Corp. 90,861 5,438,031Marsh & McLennan Cos., Inc. 122,297 11,483,688Masco Corp. 13,144 516,691Mastercard, Inc., Class A 2,662 626,768McDonald�s Corp. 1,116 211,928McKesson Corp. 1,488 174,185Merck & Co., Inc. 9,976 829,704MetLife, Inc. 3,153 134,223Micron Technology, Inc. (E) 3,437 142,051Microsoft Corp. 138,670 16,354,740Mondelez International, Inc., Class A 10,218 510,083Monster Beverage Corp. (E) 379 20,686Morgan Stanley 97,835 4,128,637Mylan NV (E) 2,598 73,627Newmont Mining Corp. 135,855 4,859,533NextEra Energy, Inc. 49,030 9,478,480NIKE, Inc., Class B 3,826 322,187Norfolk Southern Corp. 1,311 245,013Northrop Grumman Corp. 592 159,603NRG Energy, Inc. 3,232 137,295Occidental Petroleum Corp. 1,695 112,209Omnicom Group, Inc. 8,269 603,554ONEOK, Inc. 118,310 8,262,770Oracle Corp. 45,993 2,470,284Packaging Corp. of America 1,499 148,971Paychex, Inc. 2,527 202,665PayPal Holdings, Inc. (E) 2,144 222,633PepsiCo, Inc. 6,762 828,683Pfizer, Inc. 262,016 11,127,820Philip Morris International, Inc. 81,267 7,183,190Phillips 66 4,940 470,140Procter & Gamble Co. 3,808 396,222Progressive Corp. 764 55,077Prudential Financial, Inc. 1,429 131,297PVH Corp. 967 117,926QUALCOMM, Inc. 91,850 5,238,206
Shares ValueCOMMON STOCKS (continued)United States (continued)Ross Stores, Inc. 1,802 $ 167,766Royal Caribbean Cruises, Ltd. 2,259 258,927Schlumberger, Ltd. 10,599 461,798Sempra Energy 29,675 3,734,896Starbucks Corp. 4,626 343,897State Street Corp. 1,037 68,245Stryker Corp. 3,199 631,866SunTrust Banks, Inc. 89,190 5,284,508Symantec Corp. 5,309 122,054Sysco Corp. 1,530 102,143Target Corp. 1,865 149,685Thermo Fisher Scientific, Inc. 2,269 621,071Travelers Cos., Inc. 5,238 718,444Union Pacific Corp. 1,825 305,140United Continental Holdings, Inc. (E) 2,450 195,461United Parcel Service, Inc., Class B 474 52,965United Technologies Corp. 71,078 9,161,243UnitedHealth Group, Inc. 17,058 4,217,761US Bancorp 11,724 564,980Valero Energy Corp. 1,849 156,851VeriSign, Inc. (E) 1,222 221,866Verizon Communications, Inc. 206,728 12,223,827VF Corp. 1,371 119,154Visa, Inc., Class A 4,547 710,196Vistra Energy Corp. 32,198 838,114VMware, Inc., Class A 1,956 353,078Vornado Realty Trust, REIT 3,912 263,825Walmart, Inc. 4,300 419,379Walt Disney Co. 1,658 184,088Waste Management, Inc. 936 97,260Wells Fargo & Co. 275,580 13,316,026Welltower, Inc., REIT 18,551 1,439,558Western Digital Corp. 106,550 5,120,793Weyerhaeuser Co., REIT 28,336 746,370Williams Cos., Inc. 546,852 15,705,589Wyndham Destinations, Inc. 2,674 108,270Xcel Energy, Inc. 16,832 946,127Yum! Brands, Inc. 2,266 226,169Zoetis, Inc. 1,393 140,233Zynga, Inc., Class A (E) 800,153 4,264,816
503,303,359Total Common Stocks
(Cost $843,516,223) 897,493,243
CONVERTIBLE PREFERRED STOCKS - 0.3%United States - 0.3%Mandatory Exchangeable Trust,
5.75% (G) 23,910 4,854,184Wells Fargo & Co.,
Series L, Class A, 7.50% 505 652,637Total Convertible Preferred Stocks
(Cost $2,993,854) 5,506,821
PREFERRED STOCKS - 1.0%Brazil - 0.0% (D)Braskem SA,
3.87% (H) 3,526 45,839Itau Unibanco Holding SA,
4.20% (H) 79,653 700,436746,275
Copyright © 2021 www.secdatabase.com. All Rights Reserved.Please Consider the Environment Before Printing This Document

The notes are an integral part of this report.Transamerica Series Trust Page 5
Raytheon Co. 55,873 10,173,356Reinsurance Group of America, Inc. 1,234 175,203Rockwell Automation, Inc. 826 144,930
Copyright © 2021 www.secdatabase.com. All Rights Reserved.Please Consider the Environment Before Printing This Document

Transamerica BlackRock Global Allocation VPCONSOLIDATED SCHEDULE OF INVESTMENTS (continued)At March 31, 2019(unaudited)
Shares ValuePREFERRED STOCKS (continued)Germany - 0.3%Henkel AG & Co. KGaA,
1.98% (H)42,343
$4,322,343
Republic of Korea - 0.0% (D)Samsung Electronics Co., Ltd.,
2.82% (H) 3,963 126,560United States - 0.7%Citigroup Capital XIII,
3-Month LIBOR + 6.37%,9.12% (I) 54,607 1,493,501
GMAC Capital Trust I,Series 2, 3-Month LIBOR + 5.79%,
8.47% (I) 59,570 1,551,203Palantir Technologies, Inc.,
0.00% (A) (B) (C) 212,750 1,350,963Uber Technologies, Inc.,
0.00% (A) (B) (C) 129,064 6,631,30811,026,975
Total Preferred Stocks(Cost $11,397,546) 16,222,153
EXCHANGE-TRADED FUNDS - 1.4%United States - 1.4%iShares Gold Trust (E) 1,406,634 17,414,129SPDR Gold Shares (E) (J) 39,743 4,849,043Total Exchange-Traded Funds
(Cost $22,500,507) 22,263,172
MASTER LIMITED PARTNERSHIP - 0.2%United States - 0.2%NextEra Energy Partners, LP 54,843 2,557,878Total Master Limited Partnership
(Cost $1,460,156) 2,557,878
Principal ValueCONVERTIBLE BONDS - 0.1%India - 0.0% (D)REI Agro, Ltd.
5.50%, 11/13/2014 (C) (E) (G) (K) $ 697,000 425.50%, 11/13/2014 (E) (K) (L) 259,000 15
57Netherlands - 0.0% (D)Bio City Development Co. BV
8.00%, 07/06/2020 (A) (B) (C) (E) (G) (K) 2,400,000 438,000Singapore - 0.1%CapitaLand, Ltd.
1.95%, 10/17/2023 (G) SGD 1,250,000 899,638Total Convertible Bonds
(Cost $3,317,373) 1,337,695
Principal ValueCORPORATE DEBT SECURITIES - 5.3%Australia - 0.1%Quintis Australia Pty, Ltd.
PIK Rate 12.00%, Cash Rate 12.00%, 10/01/2028 (A) (B) (C) (F) (G) (M) (N) $ 3,364,040
$2,166,542
PIK Rate 8.00%, Cash Rate 7.50%, 10/01/2026 (A) (B) (C) (F) (G) (M) (N) 181,840 170,697
2,337,239Cayman Islands - 0.1%Baidu, Inc.
4.38%, 05/14/2024 945,000 979,744Chile - 0.0% (D)Inversiones Alsacia SA
8.00%, 12/31/2018 (C) (G) (O) 944,802 23,620France - 0.1%Danone SA
2.59%, 11/02/2023 (G) 1,294,000 1,266,265Japan - 0.3%Sumitomo Mitsui Financial Group, Inc.
3.94%, 10/16/2023 3,579,000 3,712,624Takeda Pharmaceutical Co., Ltd.
3.80%, 11/26/2020 (G) 885,000 897,8364,610,460
Luxembourg - 0.1%Allergan Funding SCS
3.45%, 03/15/2022 1,105,000 1,114,951Intelsat Jackson Holdings SA
8.00%, 02/15/2024 (G) 339,000 353,4071,468,358
Netherlands - 0.1%ING Groep NV
4.10%, 10/02/2023 1,635,000 1,680,502Fixed until 04/16/2020 (P),
6.00% (F) (I) 595,000 593,0362,273,538
Switzerland - 0.1%UBS Group Funding Switzerland AG
4.13%, 09/24/2025 (G) 765,000 789,810United Kingdom - 0.4%HSBC Holdings PLC
Fixed until 03/13/2022, 3.26% (I), 03/13/2023 1,127,000 1,129,755Fixed until 03/11/2024, 3.80% (I), 03/11/2025 665,000 674,100Fixed until 09/17/2024 (P),
6.38% (I) 2,307,000 2,321,419Lloyds Bank PLC
Fixed until 01/21/2029, 13.00% (I), 01/22/2029 (P), MTN GBP 1,265,000 2,793,827
6,919,101United States - 4.0%Allergan Sales LLC
5.00%, 12/15/2021 (G) $ 571,000 594,240Altria Group, Inc.
3.49%, 02/14/2022 320,000 325,0223.80%, 02/14/2024 662,000 673,7754.40%, 02/14/2026 1,040,000 1,068,951
American Express Co.3.70%, 08/03/2023 2,492,000 2,553,711Fixed until 03/15/2020 (P),
4.90% (I) 802,000 797,629
Copyright © 2021 www.secdatabase.com. All Rights Reserved.Please Consider the Environment Before Printing This Document

The notes are an integral part of this report.Transamerica Series Trust Page 6
Copyright © 2021 www.secdatabase.com. All Rights Reserved.Please Consider the Environment Before Printing This Document

Transamerica BlackRock Global Allocation VPCONSOLIDATED SCHEDULE OF INVESTMENTS (continued)At March 31, 2019(unaudited)
Principal ValueCORPORATE DEBT SECURITIES (continued)United States (continued)Apple, Inc.
3.20%, 05/11/2027 $ 1,954,000 $ 1,970,2063.35%, 02/09/2027 2,033,000 2,074,785
AvalonBay Communities, Inc.3.50%, 11/15/2024, MTN 244,000 249,598
Bank of America Corp.3.30%, 01/11/2023, MTN 1,164,000 1,178,778Fixed until 07/23/2023,
3.86% (I), 07/23/2024, MTN 265,000 272,5294.00%, 01/22/2025, MTN 650,000 662,8924.13%, 01/22/2024, MTN 1,046,000 1,096,034
Becton Dickinson and Co.2.89%, 06/06/2022 1,631,000 1,623,3873.13%, 11/08/2021 1,129,000 1,133,5933.36%, 06/06/2024 518,000 517,998
BP Capital Markets America, Inc.3.79%, 02/06/2024 966,000 1,002,488
Broadcom, Inc.3.13%, 04/15/2021 (G) 1,955,000 1,952,693
Capital One Financial Corp.3.20%, 01/30/2023 837,000 838,0753.30%, 10/30/2024 607,000 600,989
Cigna Corp.3.40%, 09/17/2021 (G) 1,579,000 1,595,0573.75%, 07/15/2023 (G) 1,344,000 1,378,008
Citigroup, Inc.Fixed until 03/27/2020 (P),
5.88% (I) 2,617,000 2,643,170Fixed until 08/15/2020 (P),
5.95% (I) 1,060,000 1,070,600Comcast Corp.
3.70%, 04/15/2024 2,306,000 2,382,156CVS Health Corp.
3.70%, 03/09/2023 3,577,000 3,634,520eBay, Inc.
2.75%, 01/30/2023 624,000 616,249Edgewell Personal Care Co.
4.70%, 05/19/2021 106,000 107,458Energy Transfer Operating, LP
4.05%, 03/15/2025 358,000 363,001Enterprise Products Operating LLC
3.35%, 03/15/2023 1,597,000 1,620,8713.75%, 02/15/2025 355,000 366,4493.90%, 02/15/2024 363,000 376,858
Gilead Sciences, Inc.3.25%, 09/01/2022 1,165,000 1,186,7163.70%, 04/01/2024 1,288,000 1,329,977
Goldman Sachs Group, Inc.Fixed until 06/05/2022,
2.91% (I), 06/05/2023 1,164,000 1,150,5513.63%, 02/20/2024 1,357,000 1,370,877Fixed until 05/10/2020 (P),
5.38% (I) 1,236,000 1,246,815Hughes Satellite Systems Corp.
7.63%, 06/15/2021 203,000 218,227Marsh & McLennan Cos., Inc.
3.88%, 03/15/2024 667,000 691,816McDonald�s Corp.
3.35%, 04/01/2023, MTN 735,000 750,099Morgan Stanley
Fixed until 07/15/2019 (P),5.45% (I) 872,000 874,180
Principal ValueCORPORATE DEBT SECURITIES (continued)United States (continued)Prudential Financial, Inc.
Fixed until 06/15/2023, 5.63% (I), 06/15/2043 $ 441,000 $ 458,640
Fixed until 09/15/2022, 5.88% (I), 09/15/2042 664,000 702,180
QUALCOMM, Inc.2.60%, 01/30/2023 586,000 579,1332.90%, 05/20/2024 1,516,000 1,490,228
Simon Property Group, LP2.75%, 06/01/2023 466,000 465,197
Starbucks Corp.3.10%, 03/01/2023 1,167,000 1,178,942
TransDigm, Inc.6.25%, 03/15/2026 (G) 2,994,000 3,118,251
USB Capital IX3-Month LIBOR + 1.02%, 3.81% (I), 04/
29/2019 (P) 318,000 249,630Verizon Communications, Inc.
3.50%, 11/01/2024 1,294,000 1,324,972Vistra Operations Co. LLC
5.63%, 02/15/2027 (G) 1,036,000 1,077,440Walgreen Co.
3.10%, 09/15/2022 1,188,000 1,195,735Wells Fargo & Co.
3.07%, 01/24/2023 232,000 232,3073.75%, 01/24/2024, MTN 746,000 767,692
Wells Fargo Bank NA3.55%, 08/14/2023 2,062,000 2,115,679
Williams Cos., Inc.3.70%, 01/15/2023 938,000 954,9154.55%, 06/24/2024 541,000 571,075
66,244,874Total Corporate Debt Securities
(Cost $87,826,380) 86,913,009
FOREIGN GOVERNMENT OBLIGATIONS - 2.0%Argentina - 0.8%Argentina Republic Government International
Bond3.38%, 01/15/2023 EUR 1,347,000 1,210,2195.25%, 01/15/2028 250,000 205,9535.88%, 01/11/2028 $ 6,661,000 5,108,9876.88%, 01/26/2027 4,887,000 3,953,5837.82%, 12/31/2033 EUR 2,815,666 2,732,333
13,211,075Australia - 0.2%Australia Government Bond
3.00%, 03/21/2047 (L) AUD 4,965,000 3,947,338Canada - 0.2%Canada Government Bond
0.75%, 03/01/2021 CAD 3,899,000 2,873,680Germany - 0.8%Bundesrepublik Deutschland Bundesanleihe
0.50%, 02/15/2028 (L) EUR 10,990,168 13,067,917Total Foreign Government Obligations
(Cost $35,448,548) 33,100,010
Copyright © 2021 www.secdatabase.com. All Rights Reserved.Please Consider the Environment Before Printing This Document

The notes are an integral part of this report.Transamerica Series Trust Page 7
NBCUniversal Enterprise, Inc.5.25%, 03/19/2021 (G) (P) 886,000 899,290
NextEra Energy Capital Co.2.90%, 04/01/2022 1,070,000 1,070,936
Northrop Grumman Corp.2.55%, 10/15/2022 1,164,000 1,151,142
Philip Morris International, Inc.3.60%, 11/15/2023 467,000 480,462
Copyright © 2021 www.secdatabase.com. All Rights Reserved.Please Consider the Environment Before Printing This Document

Transamerica BlackRock Global Allocation VPCONSOLIDATED SCHEDULE OF INVESTMENTS (continued)At March 31, 2019(unaudited)
Principal ValueLOAN ASSIGNMENTS - 0.1%United States - 0.1%Fieldwood Energy LLC
1st Lien Term Loan,1-Month LIBOR + 5.25%,
7.75% (I), 04/11/2022 $ 249,657 $ 237,4242nd Lien Term Loan,1-Month LIBOR + 7.25%,
9.75% (I), 04/11/2023 337,037 275,247Hilton Worldwide Finance LLC
Term Loan B2,1-Month LIBOR + 1.75%,
4.24% (I), 10/25/2023 1,452,061 1,446,355Total Loan Assignments
(Cost $2,044,248) 1,959,026
U.S. GOVERNMENT OBLIGATIONS - 25.0%U.S. Treasury - 24.1%U.S. Treasury Note
1.50%, 11/30/2019 4,500,000 4,471,8752.13%, 03/31/2024 (Q) 30,658,600 30,488,5412.38%, 02/29/2024 52,412,400 52,754,3092.50%, 01/31/2024 82,424,400 83,383,8712.63%, 12/31/2023 36,245,600 36,861,4922.63%, 01/31/2026 (J) 50,721,800 51,698,5912.88%, 09/30/2023 - 11/30/2025 104,913,700 107,793,3943.00%, 10/31/2025 (J) 25,808,800 26,880,470
394,332,543U.S. Treasury Inflation-Protected Securities - 0.9%U.S. Treasury Inflation-Indexed Bond
0.63%, 04/15/2023 14,950,991 15,054,380Total U.S. Government Obligations
(Cost $401,411,349) 409,386,923
SHORT-TERM FOREIGN GOVERNMENT OBLIGATIONS - 4.0%Japan - 4.0%Japan Treasury Discount Bill
0.00% (H) (R), 04/04/2019 - 05/27/2019 JPY 7,319,100,000 66,049,520Total Short-Term Foreign Government Obligations
(Cost $66,763,185) 66,049,520
SHORT-TERM U.S. GOVERNMENT OBLIGATIONS - 5.6%U.S. Treasury Bill
2.39% (H), 04/18/2019 $ 1,000,000 998,7562.40% (H), 04/23/2019 18,000,000 17,971,6322.41% (H), 04/25/2019 20,000,000 19,965,8822.41% (H), 04/02/2019 (F) 1,000,000 999,8022.43% (H), 04/16/2019 - 04/30/2019 (F) 8,000,000 7,986,3122.44% (H), 04/18/2019 30,000,000 29,962,0562.46% (H), 04/11/2019 14,000,000 13,988,702
Total Short-Term U.S. Government Obligations(Cost $91,873,142) 91,873,142
Shares ValueOTHER INVESTMENT COMPANY - 2.0%Securities Lending Collateral - 2.0%
State Street Navigator SecuritiesLending Trust - Government MoneyMarket Portfolio, 2.41% (H) 31,994,751 31,994,751
Total Other Investment Company(Cost $31,994,751) 31,994,751
Principal ValueREPURCHASE AGREEMENTS - 0.2%
Fixed Income Clearing Corp., 1.45% (H),dated 03/29/2019, to be repurchased at$1,746,802 on 04/01/2019.Collateralized by a U.S. GovernmentObligation, 2.75%, due 09/15/2021,and with a value of $1,784,309. $ 1,746,591 $ 1,746,591
State Street Bank & Trust Co., 0.05% (H),dated 03/29/2019, to be repurchased at$780,022 on 04/01/2019. Collateralizedby a U.S. Government AgencyObligation, 3.50%, due 08/01/2047,and with a value of $798,476. 780,018 780,018
Total Repurchase Agreements(Cost $2,526,609) 2,526,609
Total Investments Excluding Purchased Options/Swaptions(Cost $1,605,073,871) 1,669,183,952
Total Purchased Options/Swaptions - 0.1%(Cost $8,747,192) 3,197,055
Total Investments(Cost $1,613,821,063) 1,672,381,007
Shares ValueSECURITIES SOLD SHORT - (0.1)%COMMON STOCKS - (0.1)%Electronic Equipment, Instruments & Components - (0.1)%Yaskawa Electric Corp. (44,300 ) (1,388,996 )Semiconductors & Semiconductor Equipment - (0.0)% (D)Sumco Corp. (90,800 ) (1,008,525 )Total Common Stocks
(Proceeds $(2,829,690)) (2,397,521 )Total Securities Sold Short
(Proceeds $(2,829,690)) (2,397,521 )Net Other Assets (Liabilities) - (2.0)% (32,185,469 )Net Assets - 100.0% $ 1,637,798,017
Copyright © 2021 www.secdatabase.com. All Rights Reserved.Please Consider the Environment Before Printing This Document

The notes are an integral part of this report.Transamerica Series Trust Page 8
Copyright © 2021 www.secdatabase.com. All Rights Reserved.Please Consider the Environment Before Printing This Document

Transamerica BlackRock Global Allocation VPCONSOLIDATED SCHEDULE OF INVESTMENTS (continued)At March 31, 2019(unaudited)
OVER-THE-COUNTER OPTIONS PURCHASED: (S)
Description CounterpartyExercise
PriceExpiration
DateNotionalAmount
Number ofContracts
PremiumsPaid Value
Call - Alphabet, Inc. JPM USD 1,225.00 01/17/2020 USD 3,423,719 2,918 $230,522 $228,060Call - Anadarko Petroleum Corp. CSI USD 67.50 01/17/2020 USD 1,390,187 30,567 158,948 22,028Call - BP PLC BOA USD 45.00 01/17/2020 USD 6,269,448 143,400 245,214 277,584Call - BP PLC UBS USD 52.00 06/21/2019 USD 7,154,865 163,652 239,926 1,869Call - ConocoPhillips UBS USD 75.00 06/21/2019 USD 5,752,588 86,194 372,229 45,249Call - CVS Health Corp. JPM USD 78.50 01/17/2020 USD 1,163,000 21,565 116,891 11,168Call - EURO STOXX Banks Index UBS EUR 134.92 06/18/2021 EUR 3,222,783 30,800 330,385 23,779Call - EURO STOXX Banks Index BCLY EUR 136.97 03/19/2021 EUR 3,127,983 29,894 301,026 22,242Call - Facebook, Inc. UBS USD 165.00 09/20/2019 USD 8,008,954 48,047 630,521 724,127Call - Halliburton Co. CITI USD 50.00 01/17/2020 USD 1,839,981 62,798 269,033 6,157Call - Johnson & Johnson BOA USD 155.00 01/17/2020 USD 3,058,885 21,882 85,121 50,748Call - JPMorgan Chase & Co. CITI USD 114.50 01/17/2020 USD 2,179,077 21,526 176,490 49,700Call - Occidental Petroleum Corp. UBS USD 92.50 06/21/2019 USD 5,031,266 76,001 308,015 98Call - Royal Dutch Shell PLC UBS USD 77.00 06/21/2019 USD 5,846,782 93,414 163,089 322Call - Schlumberger, Ltd. CSI USD 45.00 01/17/2020 USD 1,734,783 39,816 135,374 140,074Call - Schlumberger, Ltd. UBS USD 70.00 01/17/2020 USD 2,219,630 50,944 191,835 5,323Call - SPDR Gold Shares MSCS USD 120.00 05/17/2019 USD 3,161,645 25,913 96,523 81,169Call - SPDR Gold Shares SG USD 123.00 04/18/2019 USD 5,863,557 48,058 73,534 24,487Call - SPDR Gold Shares SG USD 124.00 06/21/2019 USD 6,553,035 53,709 142,525 79,309Call - SPDR Gold Shares JPM USD 125.00 06/28/2019 USD 5,363,926 43,963 130,840 65,420Call - SPDR Gold Shares SG USD 126.00 09/20/2019 USD 8,459,685 69,336 231,929 168,288Call - SPDR Gold Shares MSCS USD 128.00 07/19/2019 USD 3,224,358 26,427 91,321 29,531Call - Sumitomo Mitsui Financial Group,
Inc. MSCS JPY 4,756.33 03/13/2020 JPY 258,033,072 66,572 208,350 30,341Call - Sumitomo Mitsui Financial Group,
Inc. MSCS JPY 4,816.24 09/11/2020 JPY 208,617,948 53,823 152,062 34,976Call - Sumitomo Mitsui Financial Group,
Inc. MSCS JPY 4,894.87 12/11/2020 JPY 208,412,520 53,770 185,794 33,944Call - Suncor Energy, Inc. UBS USD 45.00 06/21/2019 USD 4,776,400 110,284 213,389 301Call - TOPIX Banks Index BOA JPY 191.28 12/13/2019 JPY 1,708,701 1,275,169 161,110 6,499Call - TOPIX Banks Index MSCS JPY 191.28 12/13/2019 JPY 3,229,994 2,410,479 351,749 12,284Call - TOPIX Banks Index MSCS JPY 192.04 04/10/2020 JPY 2,055,269 1,533,806 233,427 15,842Call - TOPIX Banks Index BNP JPY 194.04 03/13/2020 JPY 2,306,718 1,721,457 261,262 14,465Call - TOTAL SA UBS USD 70.00 09/20/2019 USD 6,228,070 111,915 298,425 4,647Put - S&P 500® Index BCLY USD 2,450.00 04/18/2019 USD 16,371,494 5,776 403,235 846Put - S&P 500® Index GSC USD 2,775.00 05/17/2019 USD 19,727,424 6,960 252,216 221,571Total $ 7,442,310 $ 2,432,448
OVER-THE-COUNTER FOREIGN EXCHANGE OPTIONS PURCHASED: (S)
Description CounterpartyExercise
PriceExpiration
DateNotional Amount/
Number of ContractsPremiums
Paid ValueCall - GBP vs. USD UBS GBP 1.32 05/15/2019 GBP 24,468,900 $ 791,535 $ 370,865
OVER-THE-COUNTER INTEREST RATE SWAPTIONS PURCHASED: (S)
Description Counterparty Floating Rate IndexPay/Receive
Floating RateExercise
RateExpiration
DateNotional Amount/
Number of ContractsPremiums
Paid ValueCall - 5-Year GSI 3-Month USD-LIBOR Receive 0.50 % 02/27/2020 USD 132,283,000 $171,968 $52,363Call - 5-Year (A) GSI 3-Month USD-LIBOR Receive 0.50 08/27/2020 USD 133,874,000 341,379 341,379Total $ 513,347 $ 393,742
The notes are an integral part of this report.Transamerica Series Trust Page 9
Copyright © 2021 www.secdatabase.com. All Rights Reserved.Please Consider the Environment Before Printing This Document

Transamerica BlackRock Global Allocation VPCONSOLIDATED SCHEDULE OF INVESTMENTS (continued)At March 31, 2019(unaudited)
OVER-THE-COUNTER OPTIONS WRITTEN: (S)
Description CounterpartyExercise
PriceExpiration
DateNotionalAmount
Number ofContracts
Premiums(Received) Value
Call - Alphabet, Inc. JPM USD 1,350.00 01/17/2020 USD 3,423,719 2,918 $(135,993 ) $(101,267 )Call - Anadarko Petroleum Corp. CSI USD 76.00 01/17/2020 USD 1,390,187 30,567 (94,758 ) (9,567 )Call - Apple, Inc. UBS USD 181.25 04/05/2019 USD 1,812,313 9,541 (32,187 ) (84,872 )Call - Charter Communications, Inc. CSI USD 352.40 04/05/2019 USD 1,681,820 4,848 (35,016 ) (12,190 )Call - Comcast Corp. CITI USD 37.50 01/17/2020 USD 2,212,773 55,347 (166,041 ) (259,552 )Call - Comcast Corp. NOMI USD 38.32 04/05/2019 USD 1,776,431 44,433 (30,214 ) (75,422 )Call - ConocoPhillips UBS USD 85.00 06/21/2019 USD 5,752,588 86,194 (112,518 ) (1,057 )Call - CVS Health Corp. JPM USD 87.50 01/17/2020 USD 1,163,000 21,565 (53,912 ) (4,842 )Call - Dollar Tree, Inc. CITI USD 103.80 04/05/2019 USD 1,741,563 16,580 (38,751 ) (32,333 )Call - Johnson & Johnson BOA USD 170.00 01/17/2020 USD 3,058,885 21,882 (31,981 ) (10,906 )Call - JPMorgan Chase & Co. CITI USD 107.41 04/05/2019 USD 1,590,627 15,713 (22,792 ) (109 )Call - JPMorgan Chase & Co. CITI USD 125.50 01/17/2020 USD 2,179,077 21,526 (95,791 ) (14,642 )Call - Microsoft Corp. CITI USD 110.49 04/05/2019 USD 1,822,291 15,451 (28,632 ) (115,187 )Call - Raytheon Co. CITI USD 182.86 04/05/2019 USD 1,659,477 9,114 (25,986 ) (13,571 )Call - S&P 500® Index GSC USD 2,950.00 05/17/2019 USD 19,727,424 6,960 (54,984 ) (46,100 )Call - Sumitomo Mitsui Financial Group,
Inc. MSCS JPY 5,679.90 03/13/2020 JPY 258,033,072 66,572 (81,650 ) (5,855 )Call - TOPIX Banks Index MSCS JPY 221.29 12/13/2019 JPY 3,229,994 2,410,479 (165,113 ) (1,918 )Call - TOPIX Banks Index BOA JPY 221.29 12/13/2019 JPY 1,708,701 1,275,169 (63,754 ) (1,014 )Call - TOPIX Banks Index MSCS JPY 233.87 04/10/2020 JPY 2,055,269 1,533,806 (84,330 ) (2,380 )Call - TOPIX Banks Index BNP JPY 237.47 03/13/2020 JPY 2,306,718 1,721,457 (83,223 ) (1,866 )Call - TOTAL SA UBS USD 75.00 09/20/2019 USD 6,228,070 111,915 (119,080 ) (953 )Call - Verizon Communications, Inc. NOMI USD 56.15 04/05/2019 USD 1,717,372 29,044 (22,073 ) (87,861 )Put - Alphabet, Inc. JPM USD 860.00 01/17/2020 USD 3,423,719 2,918 (112,343 ) (33,829 )Put - Anadarko Petroleum Corp. CSI USD 46.00 01/17/2020 USD 1,390,187 30,567 (87,880 ) (180,581 )Put - BP PLC BOA USD 36.00 01/17/2020 USD 6,269,448 143,400 (163,476 ) (135,001 )Put - CVS Health Corp. JPM USD 56.00 01/17/2020 USD 1,163,000 21,565 (61,460 ) (151,226 )Put - EURO STOXX Banks Index UBS EUR 106.38 06/18/2021 EUR 2,120,131 20,262 (326,711 ) (670,561 )Put - EURO STOXX Banks Index BCLY EUR 110.23 03/19/2021 EUR 2,085,391 19,930 (315,966 ) (664,257 )Put - Facebook, Inc. UBS USD 155.00 01/17/2020 USD 18,016,522 108,084 (1,230,803 ) (1,176,860 )Put - Halliburton Co. CITI USD 35.00 01/17/2020 USD 1,839,981 62,798 (107,008 ) (436,132 )Put - Johnson & Johnson BOA USD 109.00 01/17/2020 USD 3,058,885 21,882 (60,176 ) (42,375 )Put - JPMorgan Chase & Co. CITI USD 87.25 01/17/2020 USD 2,179,077 21,526 (81,153 ) (70,764 )Put - S&P 500® Index GSC USD 2,550.00 05/17/2019 USD 19,727,424 6,960 (56,724 ) (42,035 )Put - Schlumberger, Ltd. CSI USD 33.00 01/17/2020 USD 1,734,783 39,816 (85,206 ) (46,134 )Put - Schlumberger, Ltd. UBS USD 52.50 01/17/2020 USD 2,219,630 50,944 (125,985 ) (540,607 )Put - SPDR Gold Shares SG USD 118.00 09/20/2019 USD 5,856,724 48,002 (44,642 ) (56,163 )Put - SPDR Gold Shares JPM USD 119.00 06/28/2019 USD 2,682,024 21,982 (36,570 ) (17,937 )Put - SPDR Gold Shares MSCS USD 120.00 07/19/2019 USD 3,224,358 26,427 (20,740 ) (34,671 )Put - Sumitomo Mitsui Financial Group,
Inc. MSCS JPY 3,786.60 12/11/2020 JPY 138,939,096 35,846 (110,368 ) (145,192 )Put - Sumitomo Mitsui Financial Group,
Inc. MSCS JPY 3,820.96 09/11/2020 JPY 139,078,632 35,882 (92,404 ) (131,800 )Put - Sumitomo Mitsui Financial Group,
Inc. MSCS JPY 3,832.77 03/13/2020 JPY 258,033,072 66,572 (148,097 ) (189,170 )Put - TOPIX Banks Index BNP JPY 155.80 03/13/2020 JPY 2,306,718 1,721,457 (151,586 ) (269,396 )Put - TOPIX Banks Index MSCS JPY 156.59 12/13/2019 JPY 3,229,994 2,410,479 (205,255 ) (356,569 )Put - TOPIX Banks Index BOA JPY 156.59 12/13/2019 JPY 1,708,701 1,275,169 (98,233 ) (188,648 )Put - TOPIX Banks Index MSCS JPY 157.82 04/10/2020 JPY 2,055,269 1,533,806 (145,396 ) (271,410 )Total $ (5,446,961) $ (6,734,782)
The notes are an integral part of this report.Transamerica Series Trust Page 10
Copyright © 2021 www.secdatabase.com. All Rights Reserved.Please Consider the Environment Before Printing This Document

Transamerica BlackRock Global Allocation VPCONSOLIDATED SCHEDULE OF INVESTMENTS (continued)At March 31, 2019(unaudited)
OVER-THE-COUNTER FOREIGN EXCHANGE OPTIONS WRITTEN: (S)
Description CounterpartyExercise
PriceExpiration
DateNotional Amount/
Number of ContractsPremiums(Received) Value
Call - USD vs. ZAR MSCS USD 15.00 04/11/2019 USD 6,525,000 $ (85,086) $ (23,333)
Premiums(Received) Value
TOTAL WRITTEN OPTIONS AND SWAPTIONS $ (5,532,047) $ (6,758,115)
CENTRALLY CLEARED SWAP AGREEMENTS:
Credit Default Swap Agreements on Credit Indices �� Sell Protection (T)
Reference ObligationFixed RateReceivable
PaymentFrequency
MaturityDate
NotionalAmount (U) Value (V)
PremiumsPaid
(Received)
Net UnrealizedAppreciation
(Depreciation)North America High Yield Index - Series 32 5.00% Quarterly 06/20/2024 USD 2,779,579 $ 188,605 $ 170,213 $ 18,392
Interest Rate Swap Agreements
Floating Rate Index
Pay/Receive
Fixed RateFixedRate
PaymentFrequency
MaturityDate
NotionalAmount Value
PremiumsPaid
(Received)
Net UnrealizedAppreciation
(Depreciation)3-Month USD-LIBOR Receive 3.20% Semi-Annually/Quarterly 10/29/2028 USD 41,733,059 $3,241,411 $767 $3,240,6446-Month EUR-EURIBOR Pay 0.84 Semi-Annually/Annually 02/15/2028 EUR 5,634,380 (271,718 ) 117 (271,835 )6-Month EUR-EURIBOR Pay 0.84 Semi-Annually/Annually 02/15/2028 EUR 6,488,098 (313,151 ) 134 (313,285 )6-Month EUR-EURIBOR Pay 0.99 Semi-Annually/Annually 10/29/2028 EUR 33,024,998 (2,149,770) 691 (2,150,461)Total $506,772 $ 1,709 $505,063
The notes are an integral part of this report.Transamerica Series Trust Page 11
Copyright © 2021 www.secdatabase.com. All Rights Reserved.Please Consider the Environment Before Printing This Document

Transamerica BlackRock Global Allocation VPCONSOLIDATED SCHEDULE OF INVESTMENTS (continued)At March 31, 2019(unaudited)
OVER-THE-COUNTER SWAP AGREEMENTS: (S)
Total Return Swap Agreements (W)
Reference Entity CounterpartyPay/
ReceivePayment
FrequencyMaturity
DateNotionalAmount
Number ofShares or Units Value
PremiumsPaid
(Received)
Net UnrealizedAppreciation
(Depreciation)EURO STOXX Banks Net
Return Index Futures BNP Receive Annually 04/30/2019 USD 2,500,116 11,490 $71,248 $ � $ 71,248S&P 500® Annual Dividend
Futures GSI Receive Annually 12/18/2020 USD 455,763 9,500 106,163 � 106,163S&P 500® Annual Dividend
Futures BNP Receive Annually 12/17/2021 USD 582,600 12,000 138,000 � 138,000SGX Nikkei Stock Average
Dividend Point IndexFutures BNP Pay Annually 03/31/2021 JPY 30,620,000 80,000 53,884 � 53,884
SGX Nikkei Stock AverageDividend Point IndexFutures BNP Pay Maturity 03/31/2021 JPY 25,290,000 60,000 19,435 � 19,435
SGX Nikkei Stock AverageDividend Point IndexFutures BNP Pay Annually 04/01/2021 JPY 65,960,000 170,000 106,451 � 106,451
SGX Nikkei Stock AverageDividend Point IndexFutures BNP Pay Annually 03/31/2022 JPY 35,775,000 90,000 49,535 � 49,535
SGX Nikkei Stock AverageDividend Point IndexFutures BNP Pay Annually 03/31/2022 JPY 31,880,000 80,000 43,310 � 43,310
SGX Nikkei Stock AverageDividend Point IndexFutures BNP Pay Maturity 03/31/2022 JPY 25,560,000 60,000 17,595 � 17,595
SGX Nikkei Stock AverageDividend Point IndexFutures BNP Pay Annually 04/01/2022 JPY 66,810,000 170,000 100,469 � 100,469
Total $ 706,090 $ �� $ 706,090
Total Return Swap Agreements (continued)
Reference Entity CounterpartyExpiration
DateNotionalAmount
Notional Amount as aPercentage of Net
Assets Value
Net UnrealizedAppreciation
(Depreciation)Contracts for DifferenceEquity Securities Short (X) CITI 04/22/2019 USD 3,415,725 0.2 % $3,456,446 $(40,721 )Equity Securities Short (Y) JPM 04/08/2019 USD 3,847,994 0.2 3,965,774 (117,780 )
$ 7,422,220 $ (158,501 )
ValueOTC Swap Agreements, at value (Assets) $ 706,090
FUTURES CONTRACTS:
DescriptionLong/Short
Number ofContracts
ExpirationDate
NotionalAmount Value
UnrealizedAppreciation
UnrealizedDepreciation
CAC 40 Index Long 15 04/18/2019 $888,616 $899,027 $10,411 $�DAX® Index Long 2 06/21/2019 649,413 646,941 � (2,472 )EURO STOXX 50® Index Short (658 ) 06/21/2019 (23,641,373) (24,151,014) � (509,641)NASDAQ-100 E-Mini Index Long 7 06/21/2019 1,012,891 1,036,070 23,179 �Nikkei 225 Index Short (26 ) 06/13/2019 (2,509,947 ) (2,493,729 ) 16,218 �
Copyright © 2021 www.secdatabase.com. All Rights Reserved.Please Consider the Environment Before Printing This Document

The notes are an integral part of this report.Transamerica Series Trust Page 12
Copyright © 2021 www.secdatabase.com. All Rights Reserved.Please Consider the Environment Before Printing This Document

Transamerica BlackRock Global Allocation VPCONSOLIDATED SCHEDULE OF INVESTMENTS (continued)At March 31, 2019(unaudited)
FUTURES CONTRACTS (continued):
DescriptionLong/Short
Number ofContracts
ExpirationDate
NotionalAmount Value
UnrealizedAppreciation
UnrealizedDepreciation
S&P 500® E-Mini Index Short (13 ) 06/21/2019 $(1,832,116 ) $(1,844,570 ) $� $(12,454 )SGX CNX Nifty Index Long 707 04/25/2019 16,376,922 16,509,157 132,235 �
Total $182,043 $ (524,567)
FORWARD FOREIGN CURRENCY CONTRACTS: (S)
Counterparty Settlement DateCurrencyPurchased
CurrencySold
UnrealizedAppreciation
UnrealizedDepreciation
BCLY 05/02/2019 NOK 26,070,000 USD 3,104,905 $� $(78,480 )BCLY 05/10/2019 INR 1,308,498,000 USD 17,995,627 781,924 �BCLY 05/16/2019 GBP 6,197,000 USD 8,024,565 65,628 �BCLY 06/14/2019 ZAR 67,474,000 USD 4,679,747 � (45,439 )BNP 04/04/2019 USD 12,376,028 JPY 1,336,850,000 310,112 �BNP 05/10/2019 USD 6,296,090 INR 453,443,400 � (211,032 )BNP 06/13/2019 USD 3,844,826 AUD 5,464,000 � (40,274 )BOA 04/25/2019 EUR 3,494,000 USD 3,999,648 � (71,953 )BOA 04/26/2019 USD 2,657,560 AUD 3,722,000 13,392 �BOA 05/17/2019 JPY 1,369,515,000 USD 12,485,379 � (80,598 )BOA 05/20/2019 JPY 1,053,850,000 USD 9,602,365 � (54,858 )BOA 05/23/2019 USD 4,073,753 EUR 3,552,000 71,008 �BOA 05/23/2019 EUR 3,552,000 USD 4,040,297 � (37,552 )CITI 05/10/2019 USD 617,224 INR 44,400,000 � (19,937 )CITI 05/13/2019 USD 9,708,635 JPY 1,052,450,000 178,362 �DUB 05/10/2019 INR 83,133,000 USD 1,149,834 43,163 �GSI 04/22/2019 USD 16,112,565 JPY 1,758,100,000 218,487 �GSI 04/26/2019 JPY 896,124,000 USD 8,252,119 � (147,670 )GSI 05/10/2019 INR 68,675,000 USD 991,854 � (6,336 )GSI 05/28/2019 USD 9,615,952 JPY 1,059,600,000 11,110 �JPM 04/12/2019 GBP 5,492,000 USD 7,030,844 126,580 �JPM 05/09/2019 USD 9,734,257 JPY 1,058,250,000 154,076 �JPM 05/10/2019 USD 617,619 INR 44,400,600 � (19,551 )JPM 05/10/2019 JPY 887,003,000 USD 8,139,679 � (109,225 )JPM 05/13/2019 JPY 560,557,251 USD 5,034,078 41,948 �JPM 05/20/2019 USD 9,677,423 JPY 1,053,850,000 129,916 �JPM 05/23/2019 GBP 3,215,000 USD 4,197,416 1,295 �JPM 06/03/2019 USD 351,119 EUR 307,245 4,584 �JPM 06/03/2019 EUR 307,245 USD 350,271 � (3,736 )JPM 06/20/2019 SEK 71,856,274 EUR 6,882,000 2,940 �MSCS 04/25/2019 JPY 880,727,848 USD 8,072,000 � (107,542 )MSCS 05/28/2019 JPY 1,059,600,000 USD 9,539,715 65,127 �MSCS 06/05/2019 EUR 7,178,000 USD 8,169,408 � (72,150 )MSCS 06/13/2019 EUR 7,158,000 USD 8,088,003 � (7,967 )UBS 05/10/2019 USD 1,154,531 INR 80,113,000 4,872 �UBS 05/13/2019 JPY 491,892,749 USD 4,431,626 22,621 �
Total $ 2,247,145 $ (1,114,300)
INVESTMENTS BY INDUSTRY:
IndustryPercentage of
Total Investments ValueU.S. Government Obligations 24.5 % $ 409,386,923Oil, Gas & Consumable Fuels 6.1 101,123,973Banks 4.6 76,505,983Health Care Providers & Services 3.4 56,661,622
Copyright © 2021 www.secdatabase.com. All Rights Reserved.Please Consider the Environment Before Printing This Document

Media 2.9 49,183,693Pharmaceuticals 2.9 47,890,871Interactive Media & Services 2.4 39,725,269Software 2.4 39,322,408Food Products 2.2 37,150,933Chemicals 2.2 35,996,620Aerospace & Defense 2.0 34,060,057Foreign Government Obligations 2.0 33,100,010Technology Hardware, Storage & Peripherals 1.7 29,208,771Diversified Telecommunication Services 1.7 28,664,733Health Care Equipment & Supplies 1.5 25,347,590
The notes are an integral part of this report.Transamerica Series Trust Page 13
Copyright © 2021 www.secdatabase.com. All Rights Reserved.Please Consider the Environment Before Printing This Document

Transamerica BlackRock Global Allocation VPCONSOLIDATED SCHEDULE OF INVESTMENTS (continued)At March 31, 2019(unaudited)
INVESTMENTS BY INDUSTRY (continued):
IndustryPercentage of
Total Investments ValueTobacco 1.4 % $ 23,114,211Internet & Direct Marketing Retail 1.4 22,635,452International Commodity Funds 1.3 22,263,172Electric Utilities 1.3 21,588,440Insurance 1.3 21,210,878Capital Markets 1.2 20,928,971Real Estate Management & Development 1.2 19,879,855Equity Real Estate Investment Trusts 1.1 18,040,358Wireless Telecommunication Services 1.0 16,227,099Household Products 0.9 15,827,899Auto Components 0.9 14,894,866Semiconductors & Semiconductor Equipment 0.9 14,318,207Automobiles 0.8 13,805,443Electrical Equipment 0.8 13,633,246Airlines 0.8 13,631,329Biotechnology 0.8 13,149,029Metals & Mining 0.8 12,990,894Hotels, Restaurants & Leisure 0.8 12,781,464IT Services 0.8 12,681,081Machinery 0.7 12,003,518Road & Rail 0.7 11,194,937Multiline Retail 0.5 8,392,132Gas Utilities 0.4 5,986,602Specialty Retail 0.3 5,915,180Beverages 0.3 5,844,279Electronic Equipment, Instruments & Components 0.3 5,711,795Multi-Utilities 0.3 5,277,104Consumer Finance 0.3 5,129,815Entertainment 0.3 5,013,401Diversified Consumer Services 0.3 4,470,979Building Products 0.3 4,439,860Construction & Engineering 0.2 4,052,012Independent Power & Renewable Electricity Producers 0.2 3,694,297Commercial Services & Supplies 0.2 3,064,363Food & Staples Retailing 0.2 2,904,027Paper & Forest Products 0.1 2,570,010Over-the-Counter Options Purchased 0.1 2,432,448Household Durables 0.1 1,633,858Industrial Conglomerates 0.1 1,518,739Textiles, Apparel & Luxury Goods 0.1 1,059,472Diversified Financial Services 0.1 1,025,543Construction Materials 0.1 983,929Transportation Infrastructure 0.1 901,171Communications Equipment 0.1 882,565Water Utilities 0.1 870,884Life Sciences Tools & Services 0.0 (D) 796,511Air Freight & Logistics 0.0 (D) 635,363Energy Equipment & Services 0.0 (D) 586,419Over-the-Counter Interest Rate Swaptions Purchased 0.0 (D) 393,742Over-the-Counter Foreign Exchange Options Purchased 0.0 (D) 370,865Distributors 0.0 (D) 310,355Personal Products 0.0 (D) 308,989Containers & Packaging 0.0 (D) 148,971Trading Companies & Distributors 0.0 (D) 43,416Professional Services 0.0 (D) 40,563Investments and Securities Sold Short 88.5 1,477,539,464Short-Term Investments 11.5 192,444,022Total Investments and Securities Sold Short 100.0 % $ 1,669,983,486
Copyright © 2021 www.secdatabase.com. All Rights Reserved.Please Consider the Environment Before Printing This Document

The notes are an integral part of this report.Transamerica Series Trust Page 14
Copyright © 2021 www.secdatabase.com. All Rights Reserved.Please Consider the Environment Before Printing This Document
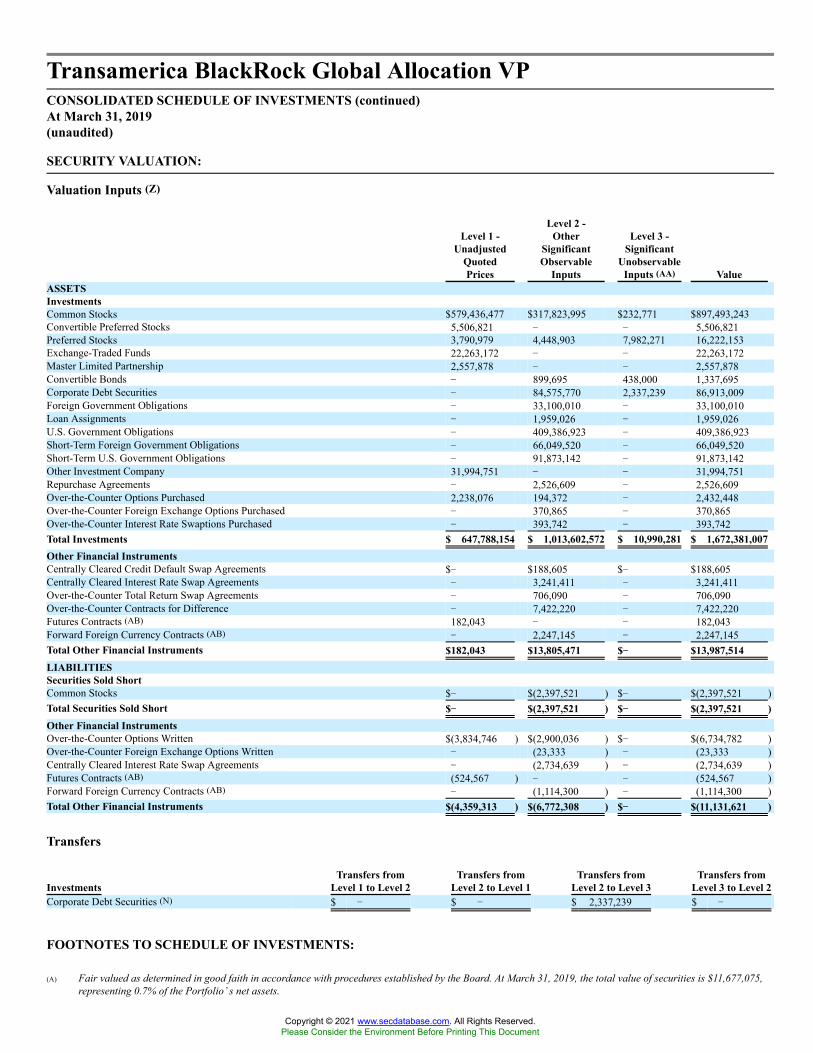
Transamerica BlackRock Global Allocation VPCONSOLIDATED SCHEDULE OF INVESTMENTS (continued)At March 31, 2019(unaudited)
SECURITY VALUATION:
Valuation Inputs (Z)
Level 1 -Unadjusted
QuotedPrices
Level 2 -Other
SignificantObservable
Inputs
Level 3 -Significant
UnobservableInputs (AA) Value
ASSETSInvestmentsCommon Stocks $579,436,477 $317,823,995 $232,771 $897,493,243Convertible Preferred Stocks 5,506,821 � � 5,506,821Preferred Stocks 3,790,979 4,448,903 7,982,271 16,222,153Exchange-Traded Funds 22,263,172 � � 22,263,172Master Limited Partnership 2,557,878 � � 2,557,878Convertible Bonds � 899,695 438,000 1,337,695Corporate Debt Securities � 84,575,770 2,337,239 86,913,009Foreign Government Obligations � 33,100,010 � 33,100,010Loan Assignments � 1,959,026 � 1,959,026U.S. Government Obligations � 409,386,923 � 409,386,923Short-Term Foreign Government Obligations � 66,049,520 � 66,049,520Short-Term U.S. Government Obligations � 91,873,142 � 91,873,142Other Investment Company 31,994,751 � � 31,994,751Repurchase Agreements � 2,526,609 � 2,526,609Over-the-Counter Options Purchased 2,238,076 194,372 � 2,432,448Over-the-Counter Foreign Exchange Options Purchased � 370,865 � 370,865Over-the-Counter Interest Rate Swaptions Purchased � 393,742 � 393,742Total Investments $ 647,788,154 $ 1,013,602,572 $ 10,990,281 $ 1,672,381,007Other Financial InstrumentsCentrally Cleared Credit Default Swap Agreements $� $188,605 $� $188,605Centrally Cleared Interest Rate Swap Agreements � 3,241,411 � 3,241,411Over-the-Counter Total Return Swap Agreements � 706,090 � 706,090Over-the-Counter Contracts for Difference � 7,422,220 � 7,422,220Futures Contracts (AB) 182,043 � � 182,043Forward Foreign Currency Contracts (AB) � 2,247,145 � 2,247,145Total Other Financial Instruments $182,043 $13,805,471 $�� $13,987,514LIABILITIESSecurities Sold ShortCommon Stocks $� $(2,397,521 ) $� $(2,397,521 )Total Securities Sold Short $�� $(2,397,521 ) $�� $(2,397,521 )Other Financial InstrumentsOver-the-Counter Options Written $(3,834,746 ) $(2,900,036 ) $� $(6,734,782 )Over-the-Counter Foreign Exchange Options Written � (23,333 ) � (23,333 )Centrally Cleared Interest Rate Swap Agreements � (2,734,639 ) � (2,734,639 )Futures Contracts (AB) (524,567 ) � � (524,567 )Forward Foreign Currency Contracts (AB) � (1,114,300 ) � (1,114,300 )Total Other Financial Instruments $(4,359,313 ) $(6,772,308 ) $�� $(11,131,621 )
Transfers
InvestmentsTransfers from
Level 1 to Level 2Transfers from
Level 2 to Level 1Transfers from
Level 2 to Level 3Transfers from
Level 3 to Level 2Corporate Debt Securities (N) $ � $ � $ 2,337,239 $ �
FOOTNOTES TO SCHEDULE OF INVESTMENTS:
(A) Fair valued as determined in good faith in accordance with procedures established by the Board. At March 31, 2019, the total value of securities is $11,677,075,representing 0.7% of the Portfolio�s net assets.
Copyright © 2021 www.secdatabase.com. All Rights Reserved.Please Consider the Environment Before Printing This Document

(B) Securities are Level 3 of the fair value hierarchy.(C) Restricted securities. At March 31, 2019, the value of such securities held by the Portfolio are as follows:
Investments DescriptionAcquisition
DateAcquisition
Cost ValueValue as Percentage
of Net AssetsCommon Stocks Quintis Pty, Ltd. 10/25/2018 $1,059,498 $232,771 0.0 %(D)Common Stocks Fieldwood Energy, Inc. 04/11/2018 765,274 345,415 0.0 (D)Preferred Stocks Palantir Technologies, Inc., 0.00% 05/02/2014 1,304,158 1,350,963 0.1Preferred Stocks Uber Technologies, Inc., 0.00% 05/02/2014 2,002,180 6,631,308 0.4
The notes are an integral part of this report.Transamerica Series Trust Page 15
Copyright © 2021 www.secdatabase.com. All Rights Reserved.Please Consider the Environment Before Printing This Document

Transamerica BlackRock Global Allocation VPCONSOLIDATED SCHEDULE OF INVESTMENTS (continued)At March 31, 2019(unaudited)
FOOTNOTES TO SCHEDULE OF INVESTMENTS (continued):
Investments DescriptionAcquisition
DateAcquisition
Cost ValueValue as Percentage
of Net AssetsConvertible Bonds REI Agro, Ltd.
5.50%, 11/13/2014 05/02/2014 $395,548 $42 0.0 %(D)Convertible Bonds Bio City Development Co. BV
8.00%, 07/06/2020 05/02/2014 1,734,480 438,000 0.0 (D)Corporate Debt Securities Quintis Australia Pty, Ltd.
PIK Rate 12.00%, CashRate 12.00%, 10/01/2028 07/20/2016 3,287,680 2,166,542 0.1
Corporate Debt Securities Quintis Australia Pty, Ltd.PIK Rate 8.00%, CashRate 7.50%, 10/01/2026 07/20/2016 177,733 170,697 0.0 (D)
Corporate Debt Securities Inversiones Alsacia SA8.00%, 12/31/2018 05/02/2014 - 03/26/2015 631,526 23,620 0.0 (D)
Total $ 11,358,077 $ 11,359,358 0.6 %
(D) Percentage rounds to less than 0.1% or (0.1)%.(E) Non-income producing securities.(F) All or a portion of the securities are on loan. The total value of all securities on loan is $30,745,549. The amount of securities on loan indicated may not
correspond with the securities on loan identified because securities with pending sales are in the process of recall from the brokers.(G) Securities are registered pursuant to Rule 144A of the Securities Act of 1933. Unless otherwise indicated, the securities are deemed to be liquid for purposes of
compliance limitations on holdings of illiquid securities and may be resold as transactions exempt from registration, normally to qualified institutional buyers. AtMarch 31, 2019, the total value of 144A securities is $38,639,567, representing 2.4% of the Portfolio�s net assets.
(H) Rates disclosed reflect the yields at March 31, 2019.(I) Floating or variable rate securities. The rates disclosed are as of March 31, 2019. For securities based on a published reference rate and spread, the reference
rate and spread are indicated within the description. Variable rate securities with a floor or ceiling feature are disclosed at the inherent rate, where applicable.Certain variable rate securities are not based on a published reference rate and spread, but are determined by the issuer or agent and are based on currentmarket conditions; these securities do not indicate a reference rate and spread in the description.
(J) All or a portion of these securities have been segregated by the custodian as collateral for open over-the-counter options and/or swaptions, swap agreements andforward foreign currency contracts. The total value of such securities is $4,546,129.
(K) Securities in default; no interest payments received and/or dividends declared during the last 12 months. At March 31, 2019, the total value of such securities is$438,057, representing less than 0.1% of the Portfolio�s net assets.
(L) Securities are exempt from registration under Regulation S of the Securities Act of 1933, which exempts from registration securities offered and sold outside theUnited States. Securities may not be offered or sold in the United States except pursuant to an exemption from, or in a transaction not subject to, the registrationrequirements of the Securities Act of 1933. At March 31, 2019, the total value of Regulation S securities is $17,015,270, representing 1.0% of the Portfolio�s netassets.
(M) Payment in-kind. Securities pay interest or dividends in the form of additional bonds or preferred stock. If the securities make a cash payment in addition toin-kind, the cash rate is disclosed separately.
(N) Transferred from Level 2 to 3 due to utilizing significant unobservable inputs. As of prior reporting period the security utilized significant observable inputs.(O) Security in default; partial receipt of interest payments and/or dividends declared at last payment date. At March 31, 2019, the value of this security is $23,620,
representing less than 0.1% of the Portfolio�s net assets.(P) Perpetual maturity. The date displayed is the next call date.(Q) When-issued, delayed-delivery and/or forward commitment (including TBAs) security. Security to be settled and delivered after March 31, 2019. Security may
display a coupon rate of 0.00%, as the rate is to be determined at time of settlement.(R) Percentage rounds to less than 0.01% or (0.01)%.(S) Securities with a total value of $20,552 have been segregated as collateral for open over-the-counter options and/or swaptions, swap agreements and forward
foreign currency contracts.(T) If the Portfolio is a seller of protection and a credit event occurs, as defined under the terms of that particular swap agreement, the Portfolio will either (a) pay to
the buyer of protection an amount equal to the notional amount of the swap and take delivery of the referenced obligation or underlying securities comprising thereferenced obligation or (b) pay a net settlement amount in the form of cash or securities equal to the notional amount of the swap agreement less the recoveryvalue of the referenced obligation or underlying securities comprising the referenced obligation.
(U) The maximum potential amount the Portfolio could be required to pay as a seller of credit protection or receive as a buyer of credit protection if a credit eventoccurs as defined under the terms of that particular swap agreement.
(V) The quoted market prices and resulting values for credit default swap agreements on asset-backed securities and credit indices serve as an indicator of thecurrent status of the payment/performance risk and represent the likelihood of an expected liability (or profit) for the credit derivative had the notional amount ofthe swap agreement been closed/sold as of the period ended. Increasing market values, in absolute terms when compared to the notional amount of the swapagreement, represent a deterioration of the referenced entity�s credit soundness and a greater likelihood or risk of default or other credit event occurring asdefined under the terms of the agreement.
(W) At the termination date, a net cash flow is exchanged where the total return is equivalent to the return of the reference entity less a financing rate, if any. As areceiver, the Portfolio would receive payments based on any positive total return and would owe payments in the event of a negative total return. As the payer, thePortfolio would owe payments on any net positive total return and would receive payment in the event of a negative total return.
Copyright © 2021 www.secdatabase.com. All Rights Reserved.Please Consider the Environment Before Printing This Document

(X) The Portfolio receives or pays the total return on a portfolio of short positions underlying the total return swap. In addition, the Portfolio pays or receives avariable rate of interest, based on a specific benchmark, plus or minus a spread in a range of (175) - 175 basis points. The benchmark and spread are determinedbased upon the country and/or currency of the individual underlying positions. The specified benchmark used in determining the variable rate of interest is the1-Month USD-LIBOR.
(Y) The Portfolio receives or pays the total return on a portfolio of short positions underlying the total return swap. In addition, the Portfolio pays or receives avariable rate of interest, based on a specific benchmark, plus or minus a spread in a range of 0 - 250 basis points. The benchmark and spread are determinedbased upon the country and/or currency of the individual underlying positions. The specified benchmarks used in determining the variable rate of interest are the1-Month USD-LIBOR and Federal Funds Rate.
(Z) The Fund recognizes transfers in and out of Level 3 as of March 31, 2019. Please reference the Security Valuation section of the Notes to Schedules ofInvestments for more information regarding security valuation and pricing inputs.
(AA) Level 3 securities were not considered significant to the Portfolio.(AB) Futures contracts and/or forward foreign currency contracts are valued at unrealized appreciation (depreciation).
The notes are an integral part of this report.Transamerica Series Trust Page 16
Copyright © 2021 www.secdatabase.com. All Rights Reserved.Please Consider the Environment Before Printing This Document

Transamerica BlackRock Global Allocation VPCONSOLIDATED SCHEDULE OF INVESTMENTS (continued)At March 31, 2019(unaudited)
CURRENCY ABBREVIATIONS:
AUD Australian DollarCAD Canadian DollarEUR EuroGBP Pound SterlingINR Indian RupeeJPY Japanese YenNOK Norwegian KroneSEK Swedish KronaSGD Singapore DollarUSD United States DollarZAR South African Rand
COUNTERPARTY ABBREVIATIONS:
BCLY Barclays Bank PLCBNP BNP ParibasBOA Bank of America, N.A.CITI Citibank N.A.CSI Credit Suisse InternationalDUB Deutsche Bank AGGSC Goldman Sachs & Co.GSI Goldman Sachs InternationalJPM JPMorgan Chase Bank, N.A.MSCS Morgan Stanley Capital Services Inc.NOMI Nomura International PLCSG Societe GeneraleUBS UBS AG
PORTFOLIO ABBREVIATIONS:
ADR American Depositary ReceiptCAC Cotation Assistée en Continu (French Stock Market Index)CNX Nifty CRISIL NSE Index (National Stock Exchange of India�s Benchmark Index)CVA Commanditaire Vennootschap op Aandelen (Dutch Certificate)DAX Deutscher Aktienindex (Frankfurt Stock Index)EURIBOR Euro Interbank Offer RateLIBOR London Interbank Offered RateMTN Medium Term NoteNASDAQ National Association of Securities Dealers Automated QuotationsREIT Real Estate Investment TrustSGX Singapore ExchangeSPDR Standard & Poor�s Depositary ReceiptSTOXX Deutsche Börse Group & SIX Group IndexTOPIX Tokyo Price Index
The notes are an integral part of this report.Transamerica Series Trust Page 17
Copyright © 2021 www.secdatabase.com. All Rights Reserved.Please Consider the Environment Before Printing This Document

Transamerica BlackRock Global Real Estate Securities VPSCHEDULE OF INVESTMENTSAt March 31, 2019(unaudited)
Shares ValueCOMMON STOCKS - 96.9%Australia - 2.4%Aveo Group 840,212 $ 1,175,287Centuria Capital Group 1,919,369 1,907,987LendLease Group 544,906 4,789,950NEXTDC, Ltd. (A) (B) 1,576,108 7,061,616Scentre Group, REIT 2,279,286 6,651,651Stockland, REIT 756,745 2,068,707
23,655,198Canada - 1.6%Canadian Apartment Properties, REIT 125,484 4,823,671RioCan, REIT 525,103 10,401,075
15,224,746China - 1.9%China Vanke Co., Ltd., H Shares 2,618,702 11,008,626GDS Holdings, Ltd., ADR (A) (B) 214,817 7,666,819
18,675,445France - 2.9%Gecina SA, REIT 60,691 8,972,963Unibail-Rodamco-Westfield, REIT (B) 120,188 19,702,730
28,675,693Germany - 5.6%alstria office AG, REIT 403,765 6,567,391Deutsche Wohnen SE 130,920 6,348,738Godewind Immobilien AG (A) (C) 1,098,845 4,574,905LEG Immobilien AG 118,182 14,509,862Vonovia SE 432,335 22,415,402
54,416,298Hong Kong - 8.3%CK Asset Holdings, Ltd. 2,077,000 18,468,220Kerry Properties, Ltd. 725,500 3,239,355Link REIT 1,633,500 19,102,708MTR Corp., Ltd. 828,500 5,129,345Sun Hung Kai Properties, Ltd. 866,500 14,868,572Swire Properties, Ltd. 1,182,600 5,084,459Wharf Real Estate Investment Co., Ltd. 1,292,000 9,620,112Wheelock & Co., Ltd. 683,000 5,002,898
80,515,669Ireland - 0.5%Glenveagh Properties PLC (A) (C) 4,406,017 4,364,184Japan - 15.3%Activia Properties, Inc., REIT 2,450 10,168,727Comforia Residential Inc., REIT 2,188 5,991,681Daito Trust Construction Co., Ltd. 41,300 5,749,878Daiwa House Industry Co., Ltd. 372,700 11,833,721Daiwa House Investment Corp., REIT 5,683 12,598,693GLP J-REIT 6,653 7,125,427Hulic, Inc., REIT 3,793 6,461,413Ichigo Office Investment, REIT 6,223 5,963,030Invincible Investment Corp., REIT 13,669 6,684,650Japan Rental Housing Investments, Inc., REIT 10,418 8,290,784Kenedix Office Investment Corp., REIT 1,608 11,157,196Mitsubishi Estate Co., Ltd. 766,900 13,877,271
Shares ValueCOMMON STOCKS (continued)Japan (continued)Mitsui Fudosan Co., Ltd. 787,200 $ 19,763,458Mitsui Fudosan Logistics Park, Inc., REIT 2,237 7,155,251Sumitomo Realty & Development Co., Ltd. 229,800 9,508,822Tokyu Fudosan Holdings Corp. 1,177,000 7,030,353
149,360,355Norway - 0.9%Entra ASA (C) 570,335 8,609,629Singapore - 3.4%Ascendas, REIT 8,429,200 18,099,223City Developments, Ltd. 789,200 5,270,068Mapletree Commercial Trust, REIT 6,818,200 9,508,503
32,877,794Spain - 1.4%Aedas Homes SAU (A) (C) 198,417 5,056,889Inmobiliaria Colonial Socimi SA, REIT 865,046 8,893,401
13,950,290Sweden - 1.0%Castellum AB 377,854 7,329,651Fabege AB 155,896 2,263,664
9,593,315United Kingdom - 4.5%Assura PLC, REIT 7,273,265 5,437,537Big Yellow Group PLC, REIT 549,043 7,090,225Derwent London PLC, REIT 137,368 5,766,427Grainger PLC 1,741,569 5,366,812Land Securities Group PLC, REIT 282,953 3,366,171PRS PLC, REIT (B) 3,618,540 4,646,985Segro PLC, REIT 1,381,185 12,113,954
43,788,111United States - 47.2%Alexandria Real Estate Equities, Inc., REIT 155,362 22,148,407American Homes 4 Rent Trust, Class A, REIT 353,120 8,022,886AvalonBay Communities, Inc., REIT 150,239 30,157,474Boston Properties, Inc., REIT 193,892 25,958,261CareTrust, Inc., REIT 49,707 1,166,126Crown Castle International Corp., REIT 39,014 4,993,792CyrusOne, Inc., REIT 199,927 10,484,172Douglas Emmett, Inc., REIT 119,984 4,849,753EPR Properties, REIT 245,742 18,897,560Equinix, Inc., REIT 16,186 7,334,848Equity Residential, REIT 243,767 18,360,530Extra Space Storage, Inc., REIT 198,093 20,187,658Federal Realty Investment Trust, REIT 92,369 12,733,067Highwoods Properties, Inc., REIT 250,156 11,702,298Hilton Worldwide Holdings, Inc. 62,217 5,170,855Host Hotels & Resorts, Inc., REIT 1,143,064 21,603,910Hudson Pacific Properties, Inc., REIT 207,709 7,149,344Invitation Homes, Inc., REIT 263,406 6,408,668Marriott International, Inc., Class A 39,936 4,995,594Omega Healthcare Investors, Inc., REIT 339,320 12,945,058Prologis, Inc., REIT 433,478 31,188,742Regency Centers Corp., REIT 254,905 17,203,538Rexford Industrial Realty, Inc., REIT 455,276 16,303,433Simon Property Group, Inc., REIT 219,082 39,918,931SL Green Realty Corp., REIT 52,105 4,685,282Spirit Realty Capital, Inc., REIT 327,916 13,028,103STAG Industrial, Inc., REIT 163,755 4,855,336
Copyright © 2021 www.secdatabase.com. All Rights Reserved.Please Consider the Environment Before Printing This Document

The notes are an integral part of this report.Transamerica Series Trust Page 1
Copyright © 2021 www.secdatabase.com. All Rights Reserved.Please Consider the Environment Before Printing This Document

Transamerica BlackRock Global Real Estate Securities VPSCHEDULE OF INVESTMENTS (continued)At March 31, 2019(unaudited)
OVER-THE-COUNTER SWAP AGREEMENTS:
Total Return Swap Agreements
Reference Entity CounterpartyExpiration
DateNotionalAmount
Notional Amount as aPercentage of Net
Assets Value
Net UnrealizedAppreciation
(Depreciation)Contracts for DifferenceEquity Securities Long (E) GSI 04/22/2019 USD 8,948,204 1.0 % $9,215,040 $ 266,836Equity Securities Long (F) JPM 04/15/2019 USD 10,915,629 1.1 11,028,452 112,823
$20,243,492 $379,659
The notes are an integral part of this report.Transamerica Series Trust Page 2
Shares ValueCOMMON STOCKS (continued)United States (continued)Sun Communities, Inc., REIT 165,431 $ 19,606,882UDR, Inc., REIT 411,002 18,684,151Ventas, Inc., REIT 269,228 17,179,439VEREIT, Inc. 1,012,097 8,471,252VICI Properties, Inc., REIT 486,858 10,652,453Welltower, Inc., REIT 36,927 2,865,535
459,913,338Total Common Stocks
(Cost $878,748,766) 943,620,065
OTHER INVESTMENT COMPANY - 1.9%Securities Lending Collateral - 1.9%State Street Navigator Securities Lending Trust -
Government Money Market Portfolio,2.41% (D) 18,500,716 18,500,716
Total Other Investment Company(Cost $18,500,716) 18,500,716
Principal ValueREPURCHASE AGREEMENT - 2.9%Fixed Income Clearing Corp., 1.45% (D),
dated 03/29/2019, to be repurchased at$28,590,834 on 04/01/2019. Collateralizedby a U.S. Government Obligation, 2.75%,due 09/15/2021, and with a value of$29,162,302. $ 28,587,380 $ 28,587,380
Total Repurchase Agreement(Cost $28,587,380) 28,587,380
Total Investments(Cost $925,836,862) 990,708,161
Net Other Assets (Liabilities) - (1.7)% (16,479,118 )Net Assets - 100.0% $ 974,229,043
Copyright © 2021 www.secdatabase.com. All Rights Reserved.Please Consider the Environment Before Printing This Document

Transamerica BlackRock Global Real Estate Securities VPSCHEDULE OF INVESTMENTS (continued)At March 31, 2019(unaudited)
FORWARD FOREIGN CURRENCY CONTRACTS:
Counterparty Settlement DateCurrencyPurchased
CurrencySold
UnrealizedAppreciation
UnrealizedDepreciation
BOA 04/15/2019 USD 574,586 AUD 809,000 $� $(21 )BOA 04/15/2019 USD 196,300 GBP 151,000 � (519 )BOA 04/15/2019 USD 972,163 JPY 107,212,000 3,553 �BOA 04/15/2019 CHF 561,000 USD 577,097 � (12,899 )BOA 04/15/2019 ILS 3,617,000 USD 993,939 3,714 (942 )BOA 04/15/2019 NZD 583,000 USD 393,471 3,665 �BOA 04/15/2019 NOK 2,434,000 USD 282,038 1,564 (1,228 )BOA 04/15/2019 SEK 23,063,000 USD 2,520,017 � (36,636 )BOA 04/15/2019 EUR 6,018,000 USD 6,838,600 � (79,317 )BOA 04/15/2019 SGD 3,145,000 USD 2,331,906 � (10,624 )BOA 04/15/2019 GBP 1,853,000 USD 2,407,868 7,408 �BOA 04/15/2019 ZAR 2,091,000 USD 150,195 � (5,538 )BOA 04/15/2019 AUD 4,565,000 USD 3,226,131 16,240 �BOA 04/15/2019 JPY 187,631,000 USD 1,683,673 11,486 �BOA 04/15/2019 USD 2,233,437 ZAR 32,300,000 � (1,099 )CITI 04/15/2019 USD 263,962 CAD 345,000 5,696 �CITI 04/15/2019 USD 532,908 EUR 471,000 3,892 �CITI 04/15/2019 USD 5,313,999 HKD 41,614,000 10,314 �CITI 04/15/2019 USD 4,769 JPY 518,000 89 �CITI 04/15/2019 USD 7,199,019 SGD 9,752,000 1,200 �CITI 04/15/2019 SGD 1,889,000 USD 1,398,674 � (4,429 )CITI 04/15/2019 SEK 7,085,000 USD 797,698 � (34,798 )CITI 04/15/2019 CAD 185,000 USD 139,774 � (1,284 )CITI 04/15/2019 EUR 6,096,000 USD 6,964,811 � (117,921 )CITI 04/15/2019 HKD 78,906,000 USD 10,079,570 � (23,038 )CITI 04/15/2019 AUD 4,412,000 USD 3,194,773 � (61,073 )CITI 04/15/2019 ZAR 2,513,000 USD 182,766 � (8,915 )CITI 04/15/2019 JPY 151,959,000 USD 1,376,368 � (3,490 )GSI 04/15/2019 USD 9,013,561 EUR 7,879,000 164,045 �GSI 04/15/2019 USD 1,446,939 GBP 1,089,000 27,492 �GSI 04/15/2019 USD 10,417,447 JPY 1,136,716,000 157,409 (9,658 )GSI 04/15/2019 USD 371,749 NOK 3,184,000 2,366 �GSI 04/15/2019 SEK 20,491,000 USD 2,256,581 � (50,147 )GSI 04/15/2019 AUD 5,717,000 USD 4,085,377 7,545 (32,322 )GSI 04/15/2019 CHF 923,000 USD 926,142 2,474 (354 )GSI 04/15/2019 CAD 135,000 USD 102,927 � (1,866 )GSI 04/15/2019 NZD 297,000 USD 205,042 � (2,728 )GSI 04/15/2019 ILS 1,323,000 USD 368,122 � (3,552 )GSI 04/15/2019 EUR 1,292,000 USD 1,464,064 � (12,919 )GSI 04/15/2019 GBP 1,193,000 USD 1,563,315 � (8,310 )GSI 04/15/2019 JPY 74,189,000 USD 670,290 � (27 )HSBC 04/15/2019 USD 286,106 AUD 400,000 1,999 �HSBC 04/15/2019 USD 629,031 EUR 556,000 4,544 �HSBC 04/15/2019 USD 184,871 GBP 141,000 1,086 �HSBC 04/15/2019 USD 16,150,189 HKD 126,387,000 42,225 �HSBC 04/15/2019 USD 564,225 NOK 4,803,000 7,019 �HSBC 04/15/2019 USD 194,386 SEK 1,741,000 6,918 �HSBC 04/15/2019 USD 1,480,833 SGD 2,005,000 969 �HSBC 04/15/2019 ZAR 24,920,000 USD 1,801,653 � (77,670 )HSBC 04/15/2019 HKD 149,878,000 USD 19,154,321 � (52,441 )HSBC 04/15/2019 NZD 267,000 USD 182,639 � (760 )
The notes are an integral part of this report.Transamerica Series Trust Page 3
Copyright © 2021 www.secdatabase.com. All Rights Reserved.Please Consider the Environment Before Printing This Document

Transamerica BlackRock Global Real Estate Securities VPSCHEDULE OF INVESTMENTS (continued)At March 31, 2019(unaudited)
FORWARD FOREIGN CURRENCY CONTRACTS (continued):
Counterparty Settlement DateCurrencyPurchased
CurrencySold
UnrealizedAppreciation
UnrealizedDepreciation
HSBC 04/15/2019 SGD 2,882,000 USD 2,126,222 $944 $�HSBC 04/15/2019 CAD 1,275,000 USD 963,611 � (9,150 )HSBC 04/15/2019 ILS 3,308,000 USD 909,823 3,511 (1,772 )HSBC 04/15/2019 GBP 3,904,000 USD 5,092,257 � (3,624 )JPM 04/15/2019 USD 11,683,876 AUD 16,378,000 60,196 (9,082 )JPM 04/15/2019 USD 11,940,092 EUR 10,476,000 173,685 �JPM 04/15/2019 USD 7,940,929 GBP 6,131,000 � (50,468 )JPM 04/15/2019 USD 864,543 JPY 93,971,000 15,559 �JPM 04/15/2019 USD 5,721,768 NOK 48,684,000 73,834 �JPM 04/15/2019 USD 1,036,504 SEK 9,496,000 13,992 �JPM 04/15/2019 USD 580,854 SGD 785,000 1,456 �JPM 04/15/2019 ILS 9,140,000 USD 2,512,169 6,477 �JPM 04/15/2019 SEK 6,272,000 USD 705,381 � (30,024 )JPM 04/15/2019 AUD 23,422,000 USD 16,860,967 � (225,080 )JPM 04/15/2019 EUR 20,761,000 USD 23,792,107 � (473,817 )JPM 04/15/2019 CHF 6,945,000 USD 7,093,630 2,249 (111,289 )JPM 04/15/2019 NZD 2,492,000 USD 1,706,226 � (8,691 )JPM 04/15/2019 SGD 5,109,000 USD 3,784,376 � (13,492 )JPM 04/15/2019 JPY 4,524,483,000 USD 41,586,668 � (710,084 )JPM 04/15/2019 GBP 9,604,000 USD 12,438,127 84,600 (4,480 )JPM 04/15/2019 ZAR 2,720,000 USD 201,783 � (13,612 )JPM 04/15/2019 CAD 185,000 USD 139,634 � (1,143 )SSB 04/15/2019 USD 2,315,470 AUD 3,260,000 1,667 (1,669 )SSB 04/15/2019 USD 1,354,515 CAD 1,797,000 9,286 �SSB 04/15/2019 USD 29,701,258 EUR 25,966,000 536,828 �SSB 04/15/2019 USD 15,897,102 GBP 12,231,000 30,457 (75,744 )SSB 04/15/2019 USD 6,951,142 HKD 54,416,000 15,849 �SSB 04/15/2019 USD 56,727,034 JPY 6,242,954,000 453,871 (129,001 )SSB 04/15/2019 USD 724,120 NOK 6,153,000 10,297 �SSB 04/15/2019 USD 3,757,988 SEK 34,228,000 72,380 �SSB 04/15/2019 USD 6,180,856 SGD 8,366,000 6,315 (291 )SSB 04/15/2019 NZD 535,000 USD 362,920 1,519 �SSB 04/15/2019 SGD 7,614,000 USD 5,618,630 6,542 (5,381 )SSB 04/15/2019 ZAR 5,232,000 USD 376,350 � (14,396 )SSB 04/15/2019 SEK 21,814,000 USD 2,410,952 � (62,060 )SSB 04/15/2019 JPY 1,098,566,000 USD 10,061,290 � (136,261 )SSB 04/15/2019 ILS 2,674,000 USD 739,749 267 (3,160 )SSB 04/15/2019 AUD 5,622,000 USD 3,993,775 4,690 (5,341 )Total $ 2,081,383 $ (2,755,637)
INVESTMENTS BY INDUSTRY:
IndustryPercentage of
Total Investments ValueEquity Real Estate Investment Trusts 69.1 % $ 684,557,063Real Estate Management & Development 22.5 222,766,602IT Services 1.5 14,728,435Hotels, Restaurants & Leisure 1.0 10,166,449Road & Rail 0.5 5,129,345Household Durables 0.4 4,364,184Capital Markets 0.2 1,907,987Investments 95.2 943,620,065Short-Term Investments 4.8 47,088,096Total Investments 100.0 % $ 990,708,161
Copyright © 2021 www.secdatabase.com. All Rights Reserved.Please Consider the Environment Before Printing This Document

The notes are an integral part of this report.Transamerica Series Trust Page 4
Copyright © 2021 www.secdatabase.com. All Rights Reserved.Please Consider the Environment Before Printing This Document

Transamerica BlackRock Global Real Estate Securities VPSCHEDULE OF INVESTMENTS (continued)At March 31, 2019(unaudited)
SECURITY VALUATION:
Valuation Inputs (G)
Level 1 -Unadjusted
QuotedPrices
Level 2 -Other
SignificantObservable
Inputs
Level 3 -Significant
UnobservableInputs Value
ASSETSInvestmentsCommon Stocks $482,804,903 $460,815,162 $ � $943,620,065Other Investment Company 18,500,716 � � 18,500,716Repurchase Agreement � 28,587,380 � 28,587,380Total Investments $ 501,305,619 $ 489,402,542 $ �� $ 990,708,161Other Financial InstrumentsOver-the-Counter Contracts for Difference $� $20,243,492 $ � $20,243,492Forward Foreign Currency Contracts (H) � 2,081,383 � 2,081,383Total Other Financial Instruments $�� $22,324,875 $ �� $22,324,875LIABILITIESOther Financial InstrumentsForward Foreign Currency Contracts (H) $� $(2,755,637 ) $ � $(2,755,637 )Total Other Financial Instruments $�� $(2,755,637 ) $ �� $(2,755,637 )
FOOTNOTES TO SCHEDULE OF INVESTMENTS:
(A) Non-income producing securities.(B) All or a portion of the securities are on loan. The total value of all securities on loan is $17,619,773. The amount of securities on loan indicated may not
correspond with the securities on loan identified because securities with pending sales are in the process of recall from the brokers.(C) Securities are registered pursuant to Rule 144A of the Securities Act of 1933. Unless otherwise indicated, the securities are deemed to be liquid for purposes of
compliance limitations on holdings of illiquid securities and may be resold as transactions exempt from registration, normally to qualified institutional buyers. AtMarch 31, 2019, the total value of 144A securities is $22,605,607, representing 2.3% of the Portfolio�s net assets.
(D) Rates disclosed reflect the yields at March 31, 2019.(E) The Portfolio receives or pays the total return on a portfolio of long positions underlying the total return swap. In addition, the Portfolio pays or receives a
variable rate of interest, based on a specific benchmark, with an average spread of 30 basis points. The benchmark and spread are determined based upon thecountry and/or currency of the individual underlying positions. The specified benchmark used in determining the variable rate of interest is the 1-MonthAUD-LIBOR.
Related Values of Underlying Positions of Total Return Swap
Reference Entity Shares
Value as aPercentage of Total
Basket Value ValueScentre Group 3,157,669 100.0 % $ 9,215,040
(F) The Portfolio receives or pays the total return on a portfolio of long positions underlying the total return swap. In addition, the Portfolio pays or receives avariable rate of interest, based on a specific benchmark, with an average spread of 18 basis points. The benchmark and spread are determined based upon thecountry and/or currency of the individual underlying positions. The specified benchmark used in determining the variable rate of interest is the 1-MonthUSD-LIBOR.
Related Values of Underlying Positions of Total Return Swap
Reference Entity Shares
Value as aPercentage of Total
Basket Value ValueCareTrust, Inc., REIT 470,096 100.0 % $ 11,028,452
(G) There were no transfers in or out of Level 3 during the period ended March 31, 2019. Please reference the Security Valuation section of the Notes to Schedules ofInvestments for more information regarding security valuation and pricing inputs.
(H) Futures contracts and/or forward foreign currency contracts are valued at unrealized appreciation (depreciation).
CURRENCY ABBREVIATIONS:
Copyright © 2021 www.secdatabase.com. All Rights Reserved.Please Consider the Environment Before Printing This Document

AUD Australian DollarCAD Canadian DollarCHF Swiss FrancEUR EuroGBP Pound SterlingHKD Hong Kong DollarILS Israel New ShekelJPY Japanese YenNOK Norwegian KroneNZD New Zealand DollarSEK Swedish KronaSGD Singapore DollarUSD United States DollarZAR South African Rand
The notes are an integral part of this report.Transamerica Series Trust Page 5
Copyright © 2021 www.secdatabase.com. All Rights Reserved.Please Consider the Environment Before Printing This Document

Transamerica BlackRock Global Real Estate Securities VPSCHEDULE OF INVESTMENTS (continued)At March 31, 2019(unaudited)
COUNTERPARTY ABBREVIATIONS:
BOA Bank of America, N.A.CITI Citibank N.A.GSI Goldman Sachs InternationalHSBC HSBC Bank USAJPM JPMorgan Chase Bank, N.A.SSB State Street Bank & Trust Co.
PORTFOLIO ABBREVIATIONS:
ADR American Depositary ReceiptLIBOR London Interbank Offered RateREIT Real Estate Investment Trust
The notes are an integral part of this report.Transamerica Series Trust Page 6
Copyright © 2021 www.secdatabase.com. All Rights Reserved.Please Consider the Environment Before Printing This Document

Transamerica BlackRock Smart Beta 40 VPSCHEDULE OF INVESTMENTSAt March 31, 2019(unaudited)
The notes are an integral part of this report.Transamerica Series Trust Page 1
Shares ValueCOMMON STOCK - 0.0%Banks - 0.0%Banco Espirito Santo SA (A) (B) (C) (D) 8,203 $ 0Total Common Stock
(Cost $9,697) 0
PREFERRED STOCK - 0.0% (E)Aerospace & Defense - 0.0% (E)Rolls-Royce Holdings PLC,
0.00% (A) (C) (D) (F) (G) 285,200 371Total Preferred Stock
(Cost $368) 371
EXCHANGE-TRADED FUNDS - 99.9%International Equity Funds - 10.0%iShares Edge MSCI Min Vol EAFE ETF 363,500 26,172,000iShares Edge MSCI Min Vol Emerging
Markets ETF 125,500 7,438,38533,610,385
U.S. Equity Funds - 30.3%iShares Edge MSCI Min Vol USA ETF (H) 372,800 21,920,640iShares Edge MSCI USA Momentum Factor
ETF (H) 195,400 21,919,972iShares Edge MSCI USA Quality Factor
ETF (H) 246,250 21,805,437iShares Edge MSCI USA Size Factor ETF (H) 162,600 14,307,174iShares Edge MSCI USA Value Factor
ETF (H) 275,300 21,985,458101,938,681
U.S. Fixed Income Funds - 59.6%iShares Broad USD Investment Grade
Corporate Bond ETF (H) 614,000 33,941,920iShares Core U.S. Aggregate Bond ETF 1,526,170 166,459,362
200,401,282Total Exchange-Traded Funds
(Cost $321,412,788) 335,950,348
OTHER INVESTMENT COMPANY - 4.6%Securities Lending Collateral - 4.6%State Street Navigator Securities Lending
Trust - Government Money MarketPortfolio, 2.41% (F) 15,460,358 15,460,358
Total Other Investment Company(Cost $15,460,358) 15,460,358
Total Investments(Cost $336,883,211) 351,411,077
Net Other Assets (Liabilities) - (4.5)% (15,176,963 )Net Assets - 100.0% $ 336,234,114
Copyright © 2021 www.secdatabase.com. All Rights Reserved.Please Consider the Environment Before Printing This Document

Transamerica BlackRock Smart Beta 40 VPSCHEDULE OF INVESTMENTS (continued)At March 31, 2019(unaudited)
SECURITY VALUATION:
Valuation Inputs (I)
Level 1 -Unadjusted
QuotedPrices
Level 2 -Other
SignificantObservable
Inputs
Level 3 -Significant
UnobservableInputs (J) Value
ASSETSInvestmentsCommon Stock $� $ � $ 0 $0Preferred Stock � � 371 371Exchange-Traded Funds 335,950,348 � � 335,950,348Other Investment Company 15,460,358 � � 15,460,358Total Investments $ 351,410,706 $ �� $ 371 $ 351,411,077
Transfers
InvestmentsTransfers from
Level 1 to Level 2Transfers from
Level 2 to Level 1Transfers from
Level 2 to Level 3Transfers from
Level 3 to Level 2Preferred Stocks (G) $ � $ � $ 371 $ �
FOOTNOTES TO SCHEDULE OF INVESTMENTS:
(A) Fair valued as determined in good faith in accordance with procedures established by the Board. At March 31, 2019, the total value of securities is $371,representing less than 0.1% of the Portfolio�s net assets.
(B) Security deemed worthless.(C) Non-income producing securities.(D) Securities are Level 3 of the fair value hierarchy.(E) Percentage rounds to less than 0.1% or (0.1)%.(F) Rates disclosed reflect the yields at March 31, 2019.(G) Transferred from Level 2 to 3 due to utilizing significant unobservable inputs. As of prior reporting period the security utilized significant observable inputs.(H) All or a portion of the securities are on loan. The total value of all securities on loan is $15,141,984. The amount of securities on loan indicated may not
correspond with the securities on loan identified because securities with pending sales are in the process of recall from the brokers.(I) The Portfolio recognizes transfers in and out of Level 3 as of March 31, 2019. Please reference the Security Valuation section of the Notes to Schedules of
Investments for more information regarding security valuation and pricing inputs.(J) Level 3 securities were not considered significant to the Portfolio.
The notes are an integral part of this report.Transamerica Series Trust Page 2
Copyright © 2021 www.secdatabase.com. All Rights Reserved.Please Consider the Environment Before Printing This Document

Transamerica BlackRock Smart Beta 50 VPSCHEDULE OF INVESTMENTSAt March 31, 2019(unaudited)
SECURITY VALUATION:
Valuation Inputs (A)
Level 1 -Unadjusted
QuotedPrices
Level 2 -Other
SignificantObservable
Inputs
Level 3 -Significant
UnobservableInputs Value
ASSETSInvestmentsExchange-Traded Funds $183,759,833 $ � $ � $183,759,833Total Investments $ 183,759,833 $ �� $ �� $ 183,759,833
FOOTNOTES TO SCHEDULE OF INVESTMENTS:
(A) There were no transfers in or out of Level 3 during the period ended March 31, 2019. Please reference the Security Valuation section of the Notes to Schedules ofInvestments for more information regarding security valuation and pricing inputs.
The notes are an integral part of this report.Transamerica Series Trust Page 1
Shares ValueEXCHANGE-TRADED FUNDS - 99.2%International Equity Funds - 12.4%iShares Edge MSCI Min Vol EAFE ETF 249,945 $ 17,996,040iShares Edge MSCI Min Vol Emerging Markets
ETF 84,929 5,033,74223,029,782
U.S. Equity Funds - 37.3%iShares Edge MSCI Min Vol USA ETF 257,252 15,126,418iShares Edge MSCI USA Momentum Factor ETF 134,760 15,117,377iShares Edge MSCI USA Quality Factor ETF 162,717 14,408,590iShares Edge MSCI USA Size Factor ETF 106,274 9,351,049iShares Edge MSCI USA Value Factor ETF 189,441 15,128,758
69,132,192U.S. Fixed Income Fund - 49.5%iShares Core U.S. Aggregate Bond ETF 839,808 91,597,859Total Exchange-Traded Funds
(Cost $174,614,634) 183,759,833Total Investments
(Cost $174,614,634) 183,759,833Net Other Assets (Liabilities) - 0.8% 1,399,634Net Assets - 100.0% $ 185,159,467
Copyright © 2021 www.secdatabase.com. All Rights Reserved.Please Consider the Environment Before Printing This Document

Transamerica BlackRock Smart Beta 75 VPSCHEDULE OF INVESTMENTSAt March 31, 2019(unaudited)
SECURITY VALUATION:
Valuation Inputs (A)
Level 1 -Unadjusted
QuotedPrices
Level 2 -Other
SignificantObservable
Inputs
Level 3 -Significant
UnobservableInputs Value
ASSETSInvestmentsExchange-Traded Funds $95,927,678 $ � $ � $95,927,678Total Investments $ 95,927,678 $ �� $ �� $ 95,927,678
FOOTNOTES TO SCHEDULE OF INVESTMENTS:
(A) There were no transfers in or out of Level 3 during the period ended March 31, 2019. Please reference the Security Valuation section of the Notes to Schedules ofInvestments for more information regarding security valuation and pricing inputs.
The notes are an integral part of this report.Transamerica Series Trust Page 1
Shares ValueEXCHANGE-TRADED FUNDS - 99.6%International Equity Funds - 18.9%iShares Edge MSCI Min Vol EAFE ETF 195,609 $ 14,083,848iShares Edge MSCI Min Vol Emerging Markets
ETF 68,884 4,082,75518,166,603
U.S. Equity Funds - 56.0%iShares Edge MSCI Min Vol USA ETF 201,501 11,848,259iShares Edge MSCI USA Momentum Factor ETF 105,609 11,847,218iShares Edge MSCI USA Quality Factor ETF 134,301 11,892,353iShares Edge MSCI USA Size Factor ETF 77,467 6,816,321iShares Edge MSCI USA Value Factor ETF 145,229 11,597,988
54,002,139U.S. Fixed Income Fund - 24.7%iShares Core U.S. Aggregate Bond ETF 217,832 23,758,936Total Exchange-Traded Funds
(Cost $90,590,142) 95,927,678Total Investments
(Cost $90,590,142) 95,927,678Net Other Assets (Liabilities) - 0.4% 431,668Net Assets - 100.0% $ 96,359,346
Copyright © 2021 www.secdatabase.com. All Rights Reserved.Please Consider the Environment Before Printing This Document

Transamerica BlackRock Tactical Allocation VPSCHEDULE OF INVESTMENTSAt March 31, 2019(unaudited)
The notes are an integral part of this report.Transamerica Series Trust Page 1
Shares ValueEXCHANGE-TRADED FUNDS - 8.3%U.S. Equity Fund - 3.8%SPDR S&P 500 ETF Trust 191,231 $ 54,018,933U.S. Fixed Income Funds - 4.5%SPDR Portfolio Long Term Treasury ETF 288,394 10,494,658Vanguard Extended Duration Treasury ETF (A) 204,322 24,349,053Vanguard Total Bond Market ETF 366,550 29,756,529
64,600,240Total Exchange-Traded Funds
(Cost $114,359,279) 118,619,173
INVESTMENT COMPANIES - 91.5%International Alternative Fund - 0.0% (B)Transamerica Global Allocation Liquidating
Trust (C) (D) (E) (F) 79,640 410,402International Equity Funds - 10.0%Transamerica Greystone International Growth
VP (D) 10,337,052 92,930,101Transamerica TS&W International Equity
VP (D) 3,841,249 49,436,876142,366,977
U.S. Equity Funds - 37.2%Transamerica Barrow Hanley Dividend
Focused VP (D) 3,163,103 78,413,328Transamerica Jennison Growth VP (D) 5,199,156 58,282,539Transamerica JPMorgan Enhanced Index
VP (D) 9,546,419 208,684,730Transamerica JPMorgan Mid Cap Value VP (D) 1,287,949 21,315,555Transamerica Large Cap Value (D) 3,784,822 42,541,396Transamerica Morgan Stanley Capital Growth
VP (D) 755,011 14,632,120Transamerica T. Rowe Price Small Cap VP (D) 3,084,299 49,903,956Transamerica WMC US Growth VP (D) 1,833,083 57,888,758
531,662,382U.S. Fixed Income Funds - 18.8%Transamerica JPMorgan Core Bond VP (D) 20,507,621 264,138,154Transamerica Short-Term Bond (D) 361,623 3,605,379
267,743,533U.S. Mixed Allocation Fund - 25.5%Transamerica PIMCO Total Return VP (D) 31,768,210 363,428,323Total Investment Companies
(Cost $1,276,055,472) 1,305,611,617
OTHER INVESTMENT COMPANY - 0.0% (B)Securities Lending Collateral - 0.0% (B)State Street Navigator Securities Lending
Trust - Government Money MarketPortfolio, 2.41% (G) 48,700 48,700
Total Other Investment Company(Cost $48,700) 48,700
Principal ValueREPURCHASE AGREEMENT - 0.3%Fixed Income Clearing Corp., 1.45% (G),
dated 03/29/2019, to be repurchased at$3,759,517 on 04/01/2019. Collateralizedby a U.S. Government Obligation, 2.75%,due 09/15/2021, and with a value of$3,837,278. $ 3,759,062 $ 3,759,062
Total Repurchase Agreement(Cost $3,759,062) 3,759,062
Total Investments(Cost $1,394,222,513) 1,428,038,552
Net Other Assets (Liabilities) - (0.1)% (1,213,851 )Net Assets - 100.0% $ 1,426,824,701
Copyright © 2021 www.secdatabase.com. All Rights Reserved.Please Consider the Environment Before Printing This Document

Transamerica BlackRock Tactical Allocation VPSCHEDULE OF INVESTMENTS (continued)At March 31, 2019(unaudited)
SECURITY VALUATION:
Valuation Inputs (H)
Level 1 -Unadjusted
QuotedPrices
Level 2 -Other
SignificantObservable
Inputs
Level 3 -Significant
UnobservableInputs Value
ASSETSInvestmentsExchange-Traded Funds $118,619,173 $� $ � $118,619,173Investment Companies 1,305,201,215 � � 1,305,201,215Other Investment Company 48,700 � � 48,700Repurchase Agreement � 3,759,062 � 3,759,062Total $ 1,423,869,088 $ 3,759,062 $ �� $ 1,427,628,150Investment Companies Measured at Net Asset Value (E) 410,402Total Investments $1,428,038,552
FOOTNOTES TO SCHEDULE OF INVESTMENTS:
(A) All or a portion of the security is on loan. The value of the security on loan is $47,668. The amount on loan indicated may not correspond with the security on loanidentified because a security with pending sales are in the process of recall from the brokers.
(B) Percentage rounds to less than 0.1% or (0.1)%.(C) Non-income producing security.(D) Affiliated investment in the Class I2 shares and liquidating trusts of Transamerica Funds and/or investment in the Initial Class shares of Transamerica Series
Trust. The Portfolio�s transactions and earnings from investments of TAM are as follows:
Affiliated InvestmentsValue
December 31, 2018Purchases
at CostProceeds
from Sales
NetRealized
Gain (Loss)
Net Change inUnrealized
Appreciation(Depreciation)
ValueMarch 31, 2019
Shares as ofMarch 31, 2019
DividendIncome
Net CapitalGain
DistributionsTransamerica Barrow Hanley
Dividend Focused VP $71,221,406 $7,200,000 $(7,600,000 ) $913,950 $6,677,972 $78,413,328 3,163,103 $� $ �Transamerica Global Allocation
Liquidating Trust 400,774 � � � 9,628 410,402 79,640 � �Transamerica Greystone
International Growth VP 88,601,873 11,200,000 (16,300,000 ) (2,922,637 ) 12,350,865 92,930,101 10,337,052 � �Transamerica Jennison Growth
VP 52,831,088 3,700,000 (6,500,000 ) (537,585 ) 8,789,036 58,282,539 5,199,156 � �Transamerica JPMorgan Core
Bond VP 277,954,693 13,600,000 (35,100,000 ) (819,993 ) 8,503,454 264,138,154 20,507,621 � �Transamerica JPMorgan
Enhanced Index VP 187,583,281 18,000,000 (19,700,000 ) 2,637,011 20,164,438 208,684,730 9,546,419 � �Transamerica JPMorgan Mid
Cap Value VP 18,260,676 1,400,000 (900,000 ) (61,644 ) 2,616,523 21,315,555 1,287,949 � �Transamerica Large Cap Value 38,899,374 3,198,143 (4,200,000 ) (1,178,803 ) 5,822,682 42,541,396 3,784,822 198,143 �Transamerica Morgan Stanley
Capital Growth VP 13,407,701 700,000 (1,800,000 ) (625,944 ) 2,950,363 14,632,120 755,011 � �Transamerica PIMCO Total
Return VP 373,798,456 26,000,000 (47,200,000 ) (1,302,926 ) 12,132,793 363,428,323 31,768,210 � �Transamerica Short-Term Bond 1,460,661 23,129,245 (21,200,000 ) 162,035 53,438 3,605,379 361,623 129,245 �Transamerica T. Rowe Price
Small Cap VP 45,625,735 2,300,000 (5,100,000 ) (1,359,510 ) 8,437,731 49,903,956 3,084,299 � �Transamerica TS&W
International Equity VP 49,196,451 7,200,000 (10,400,000 ) (1,426,032 ) 4,866,457 49,436,876 3,841,249 � �Transamerica WMC US Growth
VP 52,228,462 3,300,000 (5,900,000 ) (920,020 ) 9,180,316 57,888,758 1,833,083 � �
Total $ 1,271,470,631 $ 120,927,388 $ (181,900,000) $ (7,442,098) $ 102,555,696 $ 1,305,611,617 95,549,237 $ 327,388 $ ��
(E) Certain investments are measured at fair value using the net asset value per share, or its equivalent, practical expedient and have not been classified in the fairvalue levels. The fair value amount presented is intended to permit reconciliation to the Total Investments amount presented within the Schedule of Investments.
(F) Restricted security. At March 31, 2019, the value of such security held by the Portfolio is as follows:
Copyright © 2021 www.secdatabase.com. All Rights Reserved.Please Consider the Environment Before Printing This Document

Investments DescriptionAcquisition
DateAcquisition
Cost ValueValue as Percentage
of Net AssetsInvestment
Companies Transamerica Global Allocation Liquidating Trust 07/31/2014 $ 819,372 $ 410,402 0.0 %(B)
(G) Rates disclosed reflect the yields at March 31, 2019.(H) There were no transfers in or out of Level 3 during the period ended March 31, 2019. Please reference the Security Valuation section of the Notes to Schedules of
Investments for more information regarding security valuation and pricing inputs.
The notes are an integral part of this report.Transamerica Series Trust Page 2
Copyright © 2021 www.secdatabase.com. All Rights Reserved.Please Consider the Environment Before Printing This Document

Transamerica Greystone International Growth VPSCHEDULE OF INVESTMENTSAt March 31, 2019(unaudited)
The notes are an integral part of this report.Transamerica Series Trust Page 1
Shares ValueCOMMON STOCKS - 96.8%Australia - 3.2%Northern Star Resources, Ltd. 931,793 $ 5,921,494Westpac Banking Corp. (A) 502,426 9,246,894
15,168,388China - 8.8%ANTA Sports Products, Ltd. 2,194,600 14,928,966NetEase, Inc., ADR 30,698 7,412,032Ping An Insurance Group Co. of China, Ltd.,
H Shares 787,600 8,819,170Tencent Holdings, Ltd. 243,500 11,197,969
42,358,137Finland - 2.2%Neste OYJ (A) 97,400 10,379,555France - 8.7%AXA SA 572,304 14,399,660TOTAL SA 236,809 13,154,521Vinci SA 148,466 14,442,503
41,996,684Germany - 3.6%Bayerische Motoren Werke AG 123,607 9,532,613Henkel AG & Co. KGaA 80,176 7,622,199
17,154,812Ireland - 5.0%Kingspan Group PLC 286,259 13,249,045Smurfit Kappa Group PLC 379,346 10,587,223
23,836,268Israel - 1.8%Nice, Ltd., ADR (A) (B) 71,525 8,762,528Italy - 2.9%Enel SpA 2,205,100 14,109,252Japan - 23.4%Asahi Group Holdings, Ltd. 288,600 12,837,661Haseko Corp. 869,700 10,923,237Isuzu Motors, Ltd. 419,600 5,504,813Koito Manufacturing Co., Ltd. 168,700 9,543,887Minebea Mitsumi, Inc. 611,500 9,175,535Nidec Corp. 43,100 5,454,096Nippon Telegraph & Telephone Corp. 258,900 10,986,256Nitori Holdings Co., Ltd. 55,500 7,160,967Open House Co., Ltd. 153,300 5,249,242SoftBank Group Corp. 137,200 13,301,579Sumitomo Mitsui Financial Group, Inc. 367,700 12,859,381Takeda Pharmaceutical Co., Ltd. 228,336 9,314,329
112,310,983Luxembourg - 2.2%Aroundtown SA 1,258,794 10,378,586Netherlands - 2.6%Euronext NV (C) 197,007 12,486,085
Shares ValueCOMMON STOCKS (continued)Norway - 5.3%DNB ASA 693,716 $ 12,772,492Equinor ASA 578,738 12,671,919
25,444,411Republic of Korea - 1.5%Samsung Electronics Co., Ltd. 183,900 7,233,843Spain - 1.9%Banco Santander SA 1,977,431 9,193,263Sweden - 1.8%Epiroc AB, Class B (B) 891,823 8,537,129Switzerland - 5.6%Roche Holding AG 61,317 16,894,119Swiss Life Holding AG (B) 22,822 10,050,160
26,944,279Taiwan - 1.7%Taiwan Semiconductor Manufacturing Co.,
Ltd., ADR 195,650 8,013,824United Kingdom - 14.6%Ashtead Group PLC 389,290 9,392,742Beazley PLC 1,401,827 9,402,917British American Tobacco PLC 249,599 10,383,379Compass Group PLC 669,812 15,742,393GlaxoSmithKline PLC 771,511 16,045,512Rio Tinto PLC, ADR 158,155 9,307,422
70,274,365Total Common Stocks
(Cost $492,001,487) 464,582,392
OTHER INVESTMENT COMPANY - 2.8%Securities Lending Collateral - 2.8%State Street Navigator Securities Lending
Trust - Government Money Market Portfolio,2.41% (D) 13,528,820 13,528,820
Total Other Investment Company(Cost $13,528,820) 13,528,820
Principal ValueREPURCHASE AGREEMENT - 2.1%Fixed Income Clearing Corp., 1.45% (D),
dated 03/29/2019, to be repurchased at$9,963,398 on 04/01/2019. Collateralized bya U.S. Government Obligation, 2.75%, due09/15/2021, and with a value of $10,163,465. $ 9,962,195 9,962,195
Total Repurchase Agreement(Cost $9,962,195) 9,962,195
Total Investments(Cost $515,492,502) 488,073,407
Net Other Assets (Liabilities) - (1.7)% (8,176,956 )Net Assets - 100.0% $ 479,896,451
Copyright © 2021 www.secdatabase.com. All Rights Reserved.Please Consider the Environment Before Printing This Document

Transamerica Greystone International Growth VPSCHEDULE OF INVESTMENTS (continued)At March 31, 2019(unaudited)
INVESTMENTS BY INDUSTRY:
IndustryPercentage of
Total Investments ValueBanks 9.0 % $ 44,072,030Insurance 8.7 42,671,907Pharmaceuticals 8.7 42,253,960Oil, Gas & Consumable Fuels 7.4 36,205,995Machinery 3.6 17,712,664Hotels, Restaurants & Leisure 3.2 15,742,393Real Estate Management & Development 3.2 15,627,828Metals & Mining 3.1 15,228,916Automobiles 3.1 15,037,426Textiles, Apparel & Luxury Goods 3.1 14,928,966Construction & Engineering 3.0 14,442,503Electric Utilities 2.9 14,109,252Wireless Telecommunication Services 2.7 13,301,579Building Products 2.7 13,249,045Beverages 2.6 12,837,661Capital Markets 2.6 12,486,085Interactive Media & Services 2.3 11,197,969Diversified Telecommunication Services 2.3 10,986,256Household Durables 2.2 10,923,237Containers & Packaging 2.2 10,587,223Tobacco 2.1 10,383,379Auto Components 2.0 9,543,887Trading Companies & Distributors 1.9 9,392,742Software 1.8 8,762,528Semiconductors & Semiconductor Equipment 1.6 8,013,824Household Products 1.6 7,622,199Entertainment 1.5 7,412,032Technology Hardware, Storage & Peripherals 1.5 7,233,843Specialty Retail 1.5 7,160,967Electrical Equipment 1.1 5,454,096Investments 95.2 464,582,392Short-Term Investments 4.8 23,491,015Total Investments 100.0 % $ 488,073,407
SECURITY VALUATION:
Valuation Inputs (F)
Level 1 -Unadjusted
QuotedPrices
Level 2 -Other
SignificantObservable
Inputs
Level 3 -Significant
UnobservableInputs Value
ASSETSInvestmentsCommon Stocks $33,495,806 $431,086,586 $ � $464,582,392Other Investment Company 13,528,820 � � 13,528,820Repurchase Agreement � 9,962,195 � 9,962,195Total Investments $ 47,024,626 $ 441,048,781 $ �� $ 488,073,407
FOOTNOTES TO SCHEDULE OF INVESTMENTS:
(A) All or a portion of the securities are on loan. The total value of all securities on loan is $12,941,194. The amount of securities on loan indicated may notcorrespond with the securities on loan identified because securities with pending sales are in the process of recall from the brokers.
(B) Non-income producing securities.
Copyright © 2021 www.secdatabase.com. All Rights Reserved.Please Consider the Environment Before Printing This Document

(C) Security is registered pursuant to Rule 144A of the Securities Act of 1933. Unless otherwise indicated, the security is deemed to be liquid for purposes ofcompliance limitations on holdings of illiquid securities and may be resold as transactions exempt from registration, normally to qualified institutional buyers. AtMarch 31, 2019, the value of the 144A security is $12,486,085, representing 2.6% of the Portfolio�s net assets.
(D) Rates disclosed reflect the yields at March 31, 2019.(E) There were no transfers in or out of Level 3 during the period ended March 31, 2019. Please reference the Security Valuation section of the Notes to Schedules of
Investments for more information regarding security valuation and pricing inputs.
PORTFOLIO ABBREVIATION:
ADR American Depositary Receipt
The notes are an integral part of this report.Transamerica Series Trust Page 2
Copyright © 2021 www.secdatabase.com. All Rights Reserved.Please Consider the Environment Before Printing This Document

Transamerica International Equity Index VPSCHEDULE OF INVESTMENTSAt March 31, 2019(unaudited)
Shares ValueCOMMON STOCKS - 96.8%Australia - 6.6%AGL Energy, Ltd. 1,059 $ 16,370Alumina, Ltd. 2,812 4,832Amcor, Ltd. 2,105 23,003AMP, Ltd. 4,669 6,962APA Group 2,185 15,484Aristocrat Leisure, Ltd. 971 16,899ASX, Ltd. 308 15,274Aurizon Holdings, Ltd. 2,751 8,888AusNet Services 4,586 5,780Australia & New Zealand Banking Group, Ltd. 5,450 100,730Bank of Queensland, Ltd. 662 4,277Bendigo & Adelaide Bank, Ltd. 896 6,158BHP Group, Ltd. 5,598 152,992BlueScope Steel, Ltd. 767 7,597Boral, Ltd. 1,731 5,641Brambles, Ltd. 2,892 24,149Caltex Australia, Ltd. 494 9,193Challenger, Ltd. 812 4,774CIMIC Group, Ltd. 164 5,620Coca-Cola Amatil, Ltd. 1,220 7,493Cochlear, Ltd. 98 12,058Coles Group, Ltd. (A) 1,745 14,683Commonwealth Bank of Australia 3,364 168,731Computershare, Ltd. 637 7,725Crown Resorts, Ltd. 641 5,239CSL, Ltd. 861 119,177Dexus, REIT 1,764 15,957Domino�s Pizza Enterprises, Ltd. 103 3,175Flight Centre Travel Group, Ltd. 90 2,687Fortescue Metals Group, Ltd. 2,524 12,742Goodman Group, REIT 2,963 28,087GPT Group, REIT 3,094 13,643Harvey Norman Holdings, Ltd. 895 2,555Incitec Pivot, Ltd. 2,924 6,478Insurance Australia Group, Ltd. 4,234 23,089LendLease Group 741 6,514Macquarie Group, Ltd. 585 53,758Medibank Pvt, Ltd. 3,546 6,949Mirvac Group, REIT 6,814 13,305National Australia Bank, Ltd. 5,196 93,232Newcrest Mining, Ltd. 1,337 24,218Oil Search, Ltd. 2,544 14,180Orica, Ltd. 677 8,475Origin Energy, Ltd. 3,012 15,398QBE Insurance Group, Ltd. 2,138 18,688Ramsay Health Care, Ltd. 264 12,063REA Group, Ltd. 98 5,198Santos, Ltd. 3,006 14,578Scentre Group, REIT 9,257 27,015SEEK, Ltd. 597 7,435Sonic Healthcare, Ltd. 718 12,521South32, Ltd. 8,152 21,590Stockland, REIT 4,445 12,151Suncorp Group, Ltd. 2,360 23,091Sydney Airport 2,078 10,963Tabcorp Holdings, Ltd. 3,579 11,741Telstra Corp., Ltd. 7,674 18,090TPG Telecom, Ltd. 570 2,813Transurban Group 4,729 44,323Treasury Wine Estates, Ltd. 1,263 13,389
Shares ValueCOMMON STOCKS (continued)Australia (continued)Vicinity Centres, REIT 4,488 $ 8,285Washington H Soul Pattinson & Co., Ltd. 164 3,064Wesfarmers, Ltd. 2,155 53,020Westpac Banking Corp. 6,527 120,126Woodside Petroleum, Ltd. 1,630 40,068Woolworths Group, Ltd. 2,384 51,460WorleyParsons, Ltd. 489 4,917
1,650,760Austria - 0.2%Andritz AG 84 3,603Erste Group Bank AG 472 17,346OMV AG 232 12,588Raiffeisen Bank International AG 269 6,038Verbund AG 104 4,991voestalpine AG 151 4,585
49,151Belgium - 1.0%Ageas 312 15,049Anheuser-Busch InBev SA 1,448 121,432Colruyt SA 90 6,653Groupe Bruxelles Lambert SA 139 13,506KBC Group NV 474 33,115Proximus SADP 287 8,277Solvay SA 137 14,812Telenet Group Holding NV 47 2,261UCB SA 230 19,753Umicore SA 365 16,210
251,068Chile - 0.0% (B)Antofagasta PLC 773 9,726China - 0.1%BeiGene, Ltd., ADR (A) 100 13,200Minth Group, Ltd. 1,000 3,147Yangzijiang Shipbuilding Holdings, Ltd. 6,500 7,194
23,541Denmark - 1.7%AP Moller - Maersk A/S, Class A 6 7,257AP Moller - Maersk A/S, Class B 12 15,221Carlsberg A/S, Class B 194 24,229Chr Hansen Holding A/S 159 16,116Coloplast A/S, Class B 216 23,699Danske Bank A/S 1,248 21,902Demant A/S (A) 129 3,815DSV A/S 327 27,043Genmab A/S (A) 112 19,437H. Lundbeck A/S 89 3,851ISS A/S 215 6,542Novo Nordisk A/S, Class B 3,453 180,759Novozymes A/S, Class B 399 18,345Orsted A/S (C) 343 25,995Pandora A/S 194 9,083Tryg A/S 137 3,759Vestas Wind Systems A/S 356 29,955
437,008Finland - 1.1%Elisa OYJ 200 9,023Fortum OYJ 757 15,480Kone OYJ, Class B 590 29,756
Copyright © 2021 www.secdatabase.com. All Rights Reserved.Please Consider the Environment Before Printing This Document

The notes are an integral part of this report.Transamerica Series Trust Page 1
Copyright © 2021 www.secdatabase.com. All Rights Reserved.Please Consider the Environment Before Printing This Document

Transamerica International Equity Index VPSCHEDULE OF INVESTMENTS (continued)At March 31, 2019(unaudited)
Shares ValueCOMMON STOCKS (continued)Finland (continued)Metso OYJ 140 $ 4,815Neste OYJ 234 24,937Nokia OYJ 10,163 57,845Nokian Renkaat OYJ 215 7,197Nordea Bank Abp 5,772 43,923Orion OYJ, Class B 162 6,073Sampo OYJ, Class A 756 34,270Stora Enso OYJ, Class R 1,025 12,527UPM-Kymmene OYJ 929 27,095Wartsila OYJ Abp 643 10,376
283,317France - 10.8%Accor SA 309 12,517Aeroports de Paris 42 8,122Air Liquide SA 814 103,500Airbus SE 1,106 146,273Alstom SA 285 12,347Amundi SA (C) 90 5,664Arkema SA 126 11,994Atos SE 175 16,882AXA SA 3,496 87,962BioMerieux 80 6,614BNP Paribas SA 2,137 102,144Bollore SA 1,026 4,636Bouygues SA 339 12,112Bureau Veritas SA 497 11,652Capgemini SE 274 33,226Carrefour SA 1,012 18,901Casino Guichard Perrachon SA 102 4,422Cie de Saint-Gobain 851 30,843Cie Generale des Etablissements Michelin SCA 310 36,652CNP Assurances 203 4,468Covivio, REIT 86 9,126Credit Agricole SA 2,094 25,298Danone SA 1,112 85,683Dassault Aviation SA 3 4,425Dassault Systemes SE 238 35,441Edenred 439 19,979Eiffage SA 128 12,299Electricite de France SA 1,114 15,233Engie SA 3,180 47,372EssilorLuxottica SA 520 56,803Eurazeo SE 66 4,960Eutelsat Communications SA 235 4,111Faurecia SA 98 4,120Gecina SA, REIT 85 12,567Getlink SE 652 9,885Hermes International 54 35,630ICADE, REIT 67 5,667Iliad SA 37 3,715Imerys SA 59 2,941Ingenico Group SA 91 6,494Ipsen SA 63 8,636JCDecaux SA 76 2,312Kering SA 144 82,575Klepierre SA, REIT 371 12,976L�Oreal SA 479 128,849Legrand SA 456 30,517LVMH Moet Hennessy Louis Vuitton SE 528 194,210Natixis SA 1,188 6,358Orange SA 3,791 61,662
Shares ValueCOMMON STOCKS (continued)France (continued)Remy Cointreau SA 22 $ 2,934Renault SA 330 21,807Rexel SA 604 6,813Safran SA 602 82,555Sanofi 2,141 189,107Sartorius Stedim Biotech 42 5,319Schneider Electric SE 992 77,828SCOR SE 288 12,264SEB SA 38 6,394Societe BIC SA 43 3,832Societe Generale SA 1,389 40,160Sodexo SA 139 15,305Suez 480 6,359Teleperformance 88 15,814Thales SA 171 20,477TOTAL SA 4,589 254,915Ubisoft Entertainment SA (A) 117 10,416Unibail-Rodamco SE 1,861 15,289Unibail-Rodamco-Westfield, REIT 155 25,410Valeo SA 429 12,440Veolia Environnement SA 837 18,712Vinci SA 965 93,873Vivendi SA 1,887 54,675Wendel SA 53 6,677
2,715,686Germany - 7.8%1&1 Drillisch AG 54 1,923adidas AG 340 82,610Allianz SE 807 179,493Axel Springer SE 68 3,512BASF SE 1,745 128,272Bayer AG 1,772 114,494Bayerische Motoren Werke AG 598 46,118Beiersdorf AG 186 19,350Brenntag AG 251 12,924Commerzbank AG (A) 1,533 11,866Continental AG 200 30,108Covestro AG (C) 350 19,246Daimler AG 1,728 101,281Delivery Hero SE (A) (C) 97 3,504Deutsche Bank AG 3,418 27,836Deutsche Boerse AG 324 41,542Deutsche Lufthansa AG 303 6,650Deutsche Post AG 1,880 61,158Deutsche Telekom AG 6,334 105,121Deutsche Wohnen SE 647 31,375E.ON SE 3,764 41,851Evonik Industries AG 279 7,599Fraport AG Frankfurt Airport Services Worldwide 52 3,980Fresenius Medical Care AG & Co. KGaA 392 31,616Fresenius SE & Co. KGaA 793 44,264GEA Group AG 226 5,920Hannover Rueck SE 89 12,779HeidelbergCement AG 244 17,561Henkel AG & Co. KGaA 189 17,968HOCHTIEF AG 28 4,052HUGO BOSS AG 114 7,785Infineon Technologies AG 2,054 40,748Innogy SE (A) 209 8,944KION Group AG 76 3,972LANXESS AG 128 6,826
Copyright © 2021 www.secdatabase.com. All Rights Reserved.Please Consider the Environment Before Printing This Document

The notes are an integral part of this report.Transamerica Series Trust Page 2
Pernod Ricard SA 383 68,741Peugeot SA 1,067 26,021Publicis Groupe SA 388 20,774
Merck KGaA 210 23,945METRO AG 335 5,558MTU Aero Engines AG 95 21,505
Copyright © 2021 www.secdatabase.com. All Rights Reserved.Please Consider the Environment Before Printing This Document

Transamerica International Equity Index VPSCHEDULE OF INVESTMENTS (continued)At March 31, 2019(unaudited)
Shares ValueCOMMON STOCKS (continued)Germany (continued)Muenchener Rueckversicherungs-Gesellschaft AG 270 $ 63,906OSRAM Licht AG 121 4,164ProSiebenSat.1 Media SE 414 5,907Puma SE 13 7,539RWE AG 941 25,228SAP SE 1,868 215,829Siemens AG 1,454 156,480Siemens Healthineers AG (C) 215 8,960Symrise AG 224 20,182Telefonica Deutschland Holding AG 1,061 3,331thyssenkrupp AG 639 8,777TUI AG 766 7,339Uniper SE 368 11,100United Internet AG 146 5,328Volkswagen AG 49 7,976Vonovia SE 890 46,144Wirecard AG 204 25,561Zalando SE (A) (C) 183 7,133
1,966,140Hong Kong - 3.8%AIA Group, Ltd. 23,000 228,976ASM Pacific Technology, Ltd. 300 3,346Bank of East Asia, Ltd. 2,258 7,335BOC Hong Kong Holdings, Ltd. 6,500 26,911CK Asset Holdings, Ltd. 4,500 40,013CK Hutchison Holdings, Ltd. 5,000 52,516CK Infrastructure Holdings, Ltd. 1,000 8,210CLP Holdings, Ltd. 3,000 34,777Dairy Farm International Holdings, Ltd. 500 4,195Galaxy Entertainment Group, Ltd. 4,000 27,236Hang Lung Group, Ltd. 1,000 3,210Hang Lung Properties, Ltd. 3,000 7,322Hang Seng Bank, Ltd. 1,400 34,545Henderson Land Development Co., Ltd. 2,210 14,048HK Electric Investments & HK Electric Investments,
Ltd. 4,500 4,597HKT Trust & HKT, Ltd. 8,000 12,861Hong Kong & China Gas Co., Ltd. 15,910 38,144Hong Kong Exchanges & Clearing, Ltd. 2,217 77,271Hongkong Land Holdings, Ltd. 2,000 14,220Hysan Development Co., Ltd. 1,000 5,357Jardine Matheson Holdings, Ltd. 400 24,944Jardine Strategic Holdings, Ltd. 400 14,972Kerry Properties, Ltd. 500 2,233Link REIT 3,700 43,269Melco Resorts & Entertainment, Ltd., ADR 500 11,295MTR Corp., Ltd. 2,515 15,571New World Development Co., Ltd. 10,114 16,775NWS Holdings, Ltd. 2,000 4,372PCCW, Ltd. 7,000 4,352Power Assets Holdings, Ltd. 2,500 17,341Shangri-La Asia, Ltd. 2,000 2,843Sino Land Co., Ltd. 6,255 12,096SJM Holdings, Ltd. 4,000 4,566Sun Hung Kai Properties, Ltd. 2,850 48,904Swire Pacific, Ltd., Class A 1,000 12,866Swire Properties, Ltd. 2,200 9,459Techtronic Industries Co., Ltd. 2,500 16,799WH Group, Ltd. (C) 16,000 17,121Wharf Holdings, Ltd. 1,300 3,925Wharf Real Estate Investment Co., Ltd. 2,300 17,126
Shares ValueCOMMON STOCKS (continued)Hong Kong (continued)Wheelock & Co., Ltd. 2,000 $ 14,650Yue Yuen Industrial Holdings, Ltd. 1,000 3,440
964,009Ireland - 0.6%AerCap Holdings NV (A) 200 9,308AIB Group PLC 1,173 5,266Bank of Ireland Group PLC 1,652 9,840CRH PLC 1,556 48,262DCC PLC 179 15,469James Hardie Industries PLC, CDI 808 10,407Kerry Group PLC, Class A 267 29,801Kingspan Group PLC 233 10,784Paddy Power Betfair PLC 144 11,105Ryanair Holdings PLC, ADR (A) 38 2,848Smurfit Kappa Group PLC 358 9,991
163,081Isle of Man - 0.0% (B)GVC Holdings PLC 829 6,036Israel - 0.5%Azrieli Group, Ltd. 79 4,679Bank Hapoalim BM 1,983 13,178Bank Leumi Le-Israel BM 2,428 15,907Bezeq Israeli Telecommunication Corp., Ltd. 4,051 2,914Check Point Software Technologies, Ltd. (A) 250 31,623Elbit Systems, Ltd. 22 2,850Israel Chemicals, Ltd. 877 4,582Mizrahi Tefahot Bank, Ltd. 232 4,782Nice, Ltd. (A) 97 11,847Teva Pharmaceutical Industries, Ltd., ADR (A) 1,715 26,891Wix.com, Ltd. (A) 100 12,083
131,336Italy - 2.0%Assicurazioni Generali SpA 2,044 37,832Atlantia SpA 807 20,902Davide Campari-Milano SpA 969 9,511Enel SpA 15,456 98,895Eni SpA 4,834 85,427Ferrari NV 222 29,759Intesa Sanpaolo SpA 26,869 65,435Leonardo SpA 693 8,053Mediobanca Banca di Credito Finanziario SpA 1,036 10,764Moncler SpA 287 11,564Pirelli & C SpA (A) (C) 452 2,909Poste Italiane SpA (C) 988 9,611Prysmian SpA 285 5,392Recordati SpA 139 5,412Snam SpA 4,105 21,085Telecom Italia SpA 9,060 5,146Telecom Italia SpA (A) 18,294 11,377Terna Rete Elettrica Nazionale SpA 2,600 16,473UniCredit SpA 3,628 46,509
502,056Japan - 23.4%ABC-Mart, Inc. 100 5,946Acom Co., Ltd. 600 2,138Aeon Co., Ltd. 1,100 22,992AEON Financial Service Co., Ltd. 200 4,066
Copyright © 2021 www.secdatabase.com. All Rights Reserved.Please Consider the Environment Before Printing This Document

The notes are an integral part of this report.Transamerica Series Trust Page 3
Copyright © 2021 www.secdatabase.com. All Rights Reserved.Please Consider the Environment Before Printing This Document

Transamerica International Equity Index VPSCHEDULE OF INVESTMENTS (continued)At March 31, 2019(unaudited)
Shares ValueCOMMON STOCKS (continued)Japan (continued)Aeon Mall Co., Ltd. 200 $ 3,284AGC, Inc. 300 10,503Air Water, Inc. 200 2,895Aisin Seiki Co., Ltd. 300 10,706Ajinomoto Co., Inc. 700 11,173Alfresa Holdings Corp. 400 11,369Alps Alpine Co., Ltd. 300 6,253Amada Holdings Co., Ltd. 500 4,940ANA Holdings, Inc. 200 7,325Aozora Bank, Ltd. 100 2,469Asahi Group Holdings, Ltd. 600 26,690Asahi Intecc Co., Ltd. 200 9,384Asahi Kasei Corp. 2,317 23,875Asics Corp. 200 2,680Astellas Pharma, Inc. 3,600 53,872Bandai Namco Holdings, Inc. 400 18,731Bank of Kyoto, Ltd. 100 4,178Benesse Holdings, Inc. 100 2,594Bridgestone Corp. 1,100 42,341Brother Industries, Ltd. 300 5,544Calbee, Inc. 100 2,691Canon, Inc. 1,900 55,082Casio Computer Co., Ltd. 300 3,911Central Japan Railway Co. 300 69,593Chiba Bank, Ltd. 1,000 5,423Chubu Electric Power Co., Inc. 1,200 18,715Chugai Pharmaceutical Co., Ltd. 400 27,465Chugoku Electric Power Co., Inc. 400 4,984Coca-Cola Bottlers Japan Holdings, Inc. 200 5,073Concordia Financial Group, Ltd. 1,900 7,320Credit Saison Co., Ltd. 200 2,638CyberAgent, Inc. 200 8,148Dai Nippon Printing Co., Ltd. 500 11,942Dai-ichi Life Holdings, Inc. 1,800 24,979Daicel Corp. 600 6,507Daifuku Co., Ltd. 200 10,394Daiichi Sankyo Co., Ltd. 1,000 46,016Daikin Industries, Ltd. 500 58,513Daito Trust Construction Co., Ltd. 117 16,289Daiwa House Industry Co., Ltd. 1,100 34,926Daiwa House Investment Corp., REIT 2 4,434Daiwa Securities Group, Inc. 2,700 13,131DeNA Co., Ltd. 200 3,008Denso Corp. 800 31,161Dentsu, Inc. 400 16,873Disco Corp. 100 14,229East Japan Railway Co. 600 57,818Eisai Co., Ltd. 500 28,029Electric Power Development Co., Ltd. 300 7,298FamilyMart UNY Holdings Co., Ltd. 400 10,181FANUC Corp. 400 68,140Fast Retailing Co., Ltd. 100 46,946Fuji Electric Co., Ltd. 200 5,666FUJIFILM Holdings Corp. 700 31,795Fujitsu, Ltd. 400 28,823Fukuoka Financial Group, Inc. 200 4,432Hakuhodo DY Holdings, Inc. 400 6,417Hamamatsu Photonics KK 200 7,724Hankyu Hanshin Holdings, Inc. 400 14,978Hikari Tsushin, Inc. 40 7,568Hino Motors, Ltd. 500 4,205Hirose Electric Co., Ltd. 100 10,494
Shares ValueCOMMON STOCKS (continued)Japan (continued)Hitachi, Ltd. 1,700 $ 54,990Honda Motor Co., Ltd. 3,100 83,772Hoshizaki Corp. 100 6,190Hoya Corp. 700 46,164Hulic Co., Ltd. 500 4,899Idemitsu Kosan Co., Ltd. 200 6,686IHI Corp. 300 7,198Iida Group Holdings Co., Ltd. 200 3,618Inpex Corp. 1,700 16,190Isetan Mitsukoshi Holdings, Ltd. 400 4,039Isuzu Motors, Ltd. 800 10,495ITOCHU Corp. 2,400 43,364J. Front Retailing Co., Ltd. 400 4,753Japan Airlines Co., Ltd. 200 7,036Japan Airport Terminal Co., Ltd. 100 4,218Japan Exchange Group, Inc. 800 14,242Japan Post Bank Co., Ltd. 700 7,636Japan Post Holdings Co., Ltd. 3,000 35,081Japan Prime Realty Investment Corp., REIT 1 4,114Japan Real Estate Investment Corp., REIT 2 11,784Japan Retail Fund Investment Corp., REIT 5 10,047Japan Tobacco, Inc. 2,100 52,012JFE Holdings, Inc. 800 13,560JGC Corp. 300 3,982JSR Corp. 200 3,097JTEKT Corp. 500 6,145JXTG Holdings, Inc. 5,700 26,049Kajima Corp. 800 11,795Kakaku.com, Inc. 200 3,838Kamigumi Co., Ltd. 200 4,627Kaneka Corp. 200 7,480Kansai Electric Power Co., Inc. 1,100 16,198Kansai Paint Co., Ltd. 300 5,714Kao Corp. 900 70,795Kawasaki Heavy Industries, Ltd. 300 7,390KDDI Corp. 3,200 68,862Keihan Holdings Co., Ltd. 200 8,400Keikyu Corp. 200 3,389Keio Corp. 200 12,903Keisei Electric Railway Co., Ltd. 300 10,882Keyence Corp. 200 124,461Kikkoman Corp. 300 14,698Kintetsu Group Holdings Co., Ltd. 300 13,967Kirin Holdings Co., Ltd. 1,400 33,380Kobayashi Pharmaceutical Co., Ltd. 100 8,427Kobe Steel, Ltd. 500 3,749Koito Manufacturing Co., Ltd. 200 11,315Komatsu, Ltd. 1,700 39,428Konami Holdings Corp. 100 4,335Konica Minolta, Inc. 800 7,861Kose Corp. 100 18,343Kubota Corp. 1,600 23,091Kuraray Co., Ltd. 600 7,622Kurita Water Industries, Ltd. 100 2,551Kyocera Corp. 600 35,189Kyowa Hakko Kirin Co., Ltd. 500 10,873Kyushu Electric Power Co., Inc. 600 7,076Kyushu Railway Co. 300 9,853Lawson, Inc. 100 5,540LINE Corp. (A) 100 3,523Lion Corp. 300 6,307LIXIL Group Corp. 300 4,001
Copyright © 2021 www.secdatabase.com. All Rights Reserved.Please Consider the Environment Before Printing This Document

The notes are an integral part of this report.Transamerica Series Trust Page 4
Hisamitsu Pharmaceutical Co., Inc. 100 4,593Hitachi Chemical Co., Ltd. 200 4,425Hitachi Construction Machinery Co., Ltd. 100 2,650Hitachi High-Technologies Corp. 100 4,092Hitachi Metals, Ltd. 100 1,160
M3, Inc. 600 10,053Makita Corp. 300 10,435Marubeni Corp. 2,900 20,017Marui Group Co., Ltd. 300 6,050Maruichi Steel Tube, Ltd. 100 2,910
Copyright © 2021 www.secdatabase.com. All Rights Reserved.Please Consider the Environment Before Printing This Document

Transamerica International Equity Index VPSCHEDULE OF INVESTMENTS (continued)At March 31, 2019(unaudited)
Shares ValueCOMMON STOCKS (continued)Japan (continued)Mazda Motor Corp. 1,100 $ 12,292McDonald�s Holdings Co. Japan, Ltd. 100 4,620Mebuki Financial Group, Inc. 1,700 4,341Medipal Holdings Corp. 400 9,492MEIJI Holdings Co., Ltd. 231 18,738Minebea Mitsumi, Inc. 600 9,003MISUMI Group, Inc. 400 9,932Mitsubishi Chemical Holdings Corp. 2,400 16,878Mitsubishi Corp. 2,600 72,114Mitsubishi Electric Corp. 3,500 44,922Mitsubishi Estate Co., Ltd. 2,200 39,810Mitsubishi Gas Chemical Co., Inc. 400 5,699Mitsubishi Heavy Industries, Ltd. 500 20,743Mitsubishi Materials Corp. 100 2,636Mitsubishi Motors Corp. 800 4,244Mitsubishi Tanabe Pharma Corp. 300 4,003Mitsubishi UFJ Financial Group, Inc. 22,300 110,665Mitsubishi UFJ Lease & Finance Co., Ltd. 800 4,071Mitsui & Co., Ltd. 3,100 48,068Mitsui Chemicals, Inc. 300 7,230Mitsui Fudosan Co., Ltd. 1,600 40,170Mitsui O.S.K. Lines, Ltd. 100 2,148Mizuho Financial Group, Inc. 45,800 70,789MonotaRO Co., Ltd. 200 4,441MS&AD Insurance Group Holdings, Inc. 900 27,366Murata Manufacturing Co., Ltd. 1,000 49,734Nabtesco Corp. 100 2,910Nagoya Railroad Co., Ltd. 200 5,531NEC Corp. 400 13,516Nexon Co., Ltd. (A) 800 12,516NGK Insulators, Ltd. 300 4,353NGK Spark Plug Co., Ltd. 300 5,560NH Foods, Ltd. 200 7,191Nidec Corp. 450 56,945Nikon Corp. 600 8,451Nintendo Co., Ltd. 200 56,952Nippon Building Fund, Inc., REIT 2 13,534Nippon Electric Glass Co., Ltd. 100 2,648Nippon Express Co., Ltd. 100 5,558Nippon Paint Holdings Co., Ltd. 200 7,850Nippon Prologis, Inc., REIT 2 4,255Nippon Steel & Sumitomo Metal Corp. 1,500 26,446Nippon Telegraph & Telephone Corp. 1,200 50,921Nippon Yusen KK 200 2,927Nissan Chemical Corp. 200 9,149Nissan Motor Co., Ltd. 4,400 36,056Nisshin Seifun Group, Inc. 400 9,167Nissin Foods Holdings Co., Ltd. 100 6,857Nitori Holdings Co., Ltd. 200 25,805Nitto Denko Corp. 300 15,740Nomura Holdings, Inc. 6,300 22,749Nomura Real Estate Holdings, Inc. 200 3,835Nomura Real Estate Master Fund, Inc., REIT 5 7,363Nomura Research Institute, Ltd. 200 9,077NSK, Ltd. 600 5,614NTT Data Corp. 900 9,915NTT DOCOMO, Inc. 2,500 55,299Obayashi Corp. 1,200 12,062OBIC Co., Ltd. 100 10,069Odakyu Electric Railway Co., Ltd. 500 12,104OJI Holdings Corp. 1,600 9,918Olympus Corp. 2,000 21,691
Shares ValueCOMMON STOCKS (continued)Japan (continued)ORIX Corp. 2,400 $ 34,420Osaka Gas Co., Ltd. 600 11,824Otsuka Corp. 200 7,462Otsuka Holdings Co., Ltd. 700 27,468Pan Pacific International Holdings Corp. 200 13,227Panasonic Corp. 4,000 34,438Park24 Co., Ltd. 200 4,336Persol Holdings Co., Ltd. 200 3,234Pigeon Corp. 200 8,166Pola Orbis Holdings, Inc. 100 3,185Rakuten, Inc. 1,200 11,347Recruit Holdings Co., Ltd. 2,000 57,042Renesas Electronics Corp. (A) 1,100 5,082Resona Holdings, Inc. 3,400 14,716Ricoh Co., Ltd. 1,200 12,527Rinnai Corp. 100 7,065Rohm Co., Ltd. 200 12,452Ryohin Keikaku Co., Ltd. 45 11,385Sankyo Co., Ltd. 100 3,808Santen Pharmaceutical Co., Ltd. 600 8,927SBI Holdings, Inc. 300 6,675Secom Co., Ltd. 400 34,222Sega Sammy Holdings, Inc. 300 3,535Seibu Holdings, Inc. 200 3,495Seiko Epson Corp. 300 4,588Sekisui Chemical Co., Ltd. 600 9,631Sekisui House, Ltd. 1,100 18,183Seven & i Holdings Co., Ltd. 1,400 52,751Seven Bank, Ltd. 1,300 3,836SG Holdings Co., Ltd. 200 5,820Sharp Corp. 300 3,297Shimadzu Corp. 300 8,662Shimano, Inc. 119 19,327Shimizu Corp. 900 7,812Shin-Etsu Chemical Co., Ltd. 700 58,612Shinsei Bank, Ltd. (A) 200 2,842Shionogi & Co., Ltd. 500 30,912Shiseido Co., Ltd. 700 50,446Shizuoka Bank, Ltd. 1,000 7,606Showa Denko KK 200 7,020Showa Shell Sekiyu KK (A) (D) 300 4,112SMC Corp. 100 37,472Softbank Corp. 3,200 36,005SoftBank Group Corp. 1,600 155,120Sohgo Security Services Co., Ltd. 100 4,349Sompo Holdings, Inc. 500 18,488Sony Corp. 2,400 100,586Sony Financial Holdings, Inc. 200 3,768Stanley Electric Co., Ltd. 300 8,053Subaru Corp. 1,200 27,312Sumco Corp. 200 2,221Sumitomo Chemical Co., Ltd. 2,397 11,138Sumitomo Corp. 2,100 29,009Sumitomo Dainippon Pharma Co., Ltd. 200 4,939Sumitomo Electric Industries, Ltd. 1,300 17,225Sumitomo Heavy Industries, Ltd. 100 3,235Sumitomo Metal Mining Co., Ltd. 300 8,851Sumitomo Mitsui Financial Group, Inc. 2,500 87,431Sumitomo Mitsui Trust Holdings, Inc. 600 21,525Sumitomo Realty & Development Co., Ltd. 600 24,827Sumitomo Rubber Industries, Ltd. 200 2,396Sundrug Co., Ltd. 100 2,752
Copyright © 2021 www.secdatabase.com. All Rights Reserved.Please Consider the Environment Before Printing This Document

The notes are an integral part of this report.Transamerica Series Trust Page 5
Omron Corp. 300 14,021Ono Pharmaceutical Co., Ltd. 700 13,699Oracle Corp. 100 6,704Oriental Land Co., Ltd. 400 45,367
Suntory Beverage & Food, Ltd. 200 9,384Suzuken Co., Ltd. 100 5,784Suzuki Motor Corp. 600 26,516Sysmex Corp. 300 18,109T&D Holdings, Inc. 900 9,452
Copyright © 2021 www.secdatabase.com. All Rights Reserved.Please Consider the Environment Before Printing This Document

Transamerica International Equity Index VPSCHEDULE OF INVESTMENTS (continued)At March 31, 2019(unaudited)
Shares ValueCOMMON STOCKS (continued)Japan (continued)Taiheiyo Cement Corp. 200 $ 6,659Taisei Corp. 400 18,551Taisho Pharmaceutical Holdings Co., Ltd. 100 9,519Taiyo Nippon Sanso Corp. 300 4,564Takashimaya Co., Ltd. 500 6,650Takeda Pharmaceutical Co., Ltd. 2,674 109,078TDK Corp. 200 15,646Teijin, Ltd. 400 6,590Terumo Corp. 1,200 36,597THK Co., Ltd. 100 2,467Tobu Railway Co., Ltd. 400 11,531Toho Co., Ltd. 200 8,021Toho Gas Co., Ltd. 200 8,969Tohoku Electric Power Co., Inc. 700 8,918Tokio Marine Holdings, Inc. 1,200 58,056Tokyo Century Corp. 100 4,344Tokyo Electric Power Co. Holdings, Inc. (A) 2,300 14,527Tokyo Electron, Ltd. 300 43,310Tokyo Gas Co., Ltd. 600 16,206Tokyu Corp. 900 15,697Tokyu Fudosan Holdings Corp. 800 4,778Toppan Printing Co., Ltd. 500 7,539Toray Industries, Inc. 2,200 14,032Toshiba Corp. 1,200 38,167Tosoh Corp. 500 7,764TOTO, Ltd. 200 8,472Toyo Seikan Group Holdings, Ltd. 300 6,136Toyo Suisan Kaisha, Ltd. 100 3,803Toyoda Gosei Co., Ltd. 100 2,115Toyota Industries Corp. 300 15,023Toyota Motor Corp. 4,300 251,684Toyota Tsusho Corp. 400 13,011Trend Micro, Inc. 200 9,727Tsuruha Holdings, Inc. 100 8,121Unicharm Corp. 700 23,135United Urban Investment Corp., REIT 4 6,312USS Co., Ltd. 400 7,413Welcia Holdings Co., Ltd. 100 3,388West Japan Railway Co. 300 22,572Yahoo Japan Corp. 4,000 9,781Yakult Honsha Co., Ltd. 200 13,967Yamada Denki Co., Ltd. 1,000 4,926Yamaguchi Financial Group, Inc. 500 4,232Yamaha Corp. 200 9,979Yamaha Motor Co., Ltd. 400 7,835Yamato Holdings Co., Ltd. 500 12,898Yamazaki Baking Co., Ltd. 200 3,241Yaskawa Electric Corp. 400 12,542Yokogawa Electric Corp. 300 6,201Yokohama Rubber Co., Ltd. 200 3,710ZOZO, Inc. 300 5,646
5,885,482Luxembourg - 0.3%ArcelorMittal 1,205 24,409Aroundtown SA 1,177 9,704Eurofins Scientific SE 15 6,209Millicom International Cellular SA, SDR (A) 90 5,465RTL Group SA 68 3,715SES SA 489 7,605Tenaris SA 867 12,172
69,279
Shares ValueCOMMON STOCKS (continued)Macau (continued)Sands China, Ltd. 4,000 $ 20,102Wynn Macau, Ltd. 2,000 4,713
27,325Mexico - 0.0% (B)Fresnillo PLC 276 3,130Netherlands - 4.8%ABN AMRO Group NV, CVA (C) 761 17,158Adyen NV (A) (C) 19 14,877Akzo Nobel NV 384 34,025ASML Holding NV 779 146,107EXOR NV 190 12,340Heineken Holding NV 178 17,831Heineken NV 493 52,028ING Groep NV 7,016 84,872Koninklijke Ahold Delhaize NV 2,129 56,660Koninklijke DSM NV 329 35,858Koninklijke KPN NV 5,117 16,221Koninklijke Philips NV 1,760 71,696Koninklijke Vopak NV 78 3,733NN Group NV 509 21,143NXP Semiconductors NV 631 55,774QIAGEN NV (A) 373 15,121Randstad NV 223 10,874Royal Dutch Shell PLC, Class A 8,563 269,175Royal Dutch Shell PLC, Class B 7,117 225,064Wolters Kluwer NV 526 35,816
1,196,373New Zealand - 0.2%a2 Milk Co., Ltd. (A) 1,372 13,370Auckland International Airport, Ltd. 1,746 9,679Fisher & Paykel Healthcare Corp., Ltd. 821 8,778Fletcher Building, Ltd. 1,208 4,072Meridian Energy, Ltd. 2,326 6,629Ryman Healthcare, Ltd. 466 3,888Spark New Zealand, Ltd. 3,372 8,726
55,142Norway - 0.7%AKER BP ASA 123 4,378DNB ASA 1,744 32,110Equinor ASA 2,221 48,631Gjensidige Forsikring ASA 344 5,943Marine Harvest ASA (A) 667 14,887Norsk Hydro ASA 2,342 9,490Orkla ASA 1,202 9,226Schibsted ASA, B Shares 119 4,263Telenor ASA 1,335 26,731Yara International ASA 302 12,353
168,012Portugal - 0.1%EDP - Energias de Portugal SA 4,718 18,550Galp Energia SGPS SA 738 11,821Jeronimo Martins SGPS SA 306 4,514
34,885Republic of South Africa - 0.0% (B)Investec PLC 1,215 6,999Singapore - 1.2%Ascendas, REIT 4,700 10,092CapitaLand Commercial Trust, REIT 5,863 8,393
Copyright © 2021 www.secdatabase.com. All Rights Reserved.Please Consider the Environment Before Printing This Document

The notes are an integral part of this report.Transamerica Series Trust Page 6
Macau - 0.1%MGM China Holdings, Ltd. 1,200 2,510
Copyright © 2021 www.secdatabase.com. All Rights Reserved.Please Consider the Environment Before Printing This Document

Transamerica International Equity Index VPSCHEDULE OF INVESTMENTS (continued)At March 31, 2019(unaudited)
Shares ValueCOMMON STOCKS (continued)Singapore (continued)CapitaLand Mall Trust, REIT 4,600 $ 8,078CapitaLand, Ltd. 3,800 10,234City Developments, Ltd. 700 4,674ComfortDelGro Corp., Ltd. 2,900 5,499DBS Group Holdings, Ltd. 3,400 63,296Genting Singapore, Ltd. 7,700 5,909Golden Agri-Resources, Ltd. 9,700 2,004Jardine Cycle & Carriage, Ltd. 300 7,192Keppel Corp., Ltd. 2,000 9,179Oversea-Chinese Banking Corp., Ltd. 6,076 49,541SATS, Ltd. 800 3,016Sembcorp Industries, Ltd. 2,600 4,892Singapore Airlines, Ltd. 800 5,702Singapore Exchange, Ltd. 1,000 5,394Singapore Press Holdings, Ltd. 1,800 3,201Singapore Technologies Engineering, Ltd. 1,900 5,243Singapore Telecommunications, Ltd. 13,700 30,529Suntec Real Estate Investment Trust 4,400 6,331United Overseas Bank, Ltd. 2,400 44,609UOL Group, Ltd. 600 3,077Venture Corp., Ltd. 300 3,971Wilmar International, Ltd. 3,700 9,037
309,093Spain - 3.0%ACS Actividades de Construccion y Servicios SA 468 20,558Aena SME SA (C) 109 19,624Amadeus IT Group SA 834 66,797Banco Bilbao Vizcaya Argentaria SA 12,031 68,734Banco de Sabadell SA 10,538 10,495Banco Santander SA 30,854 143,443Bankia SA 1,931 5,004Bankinter SA 1,270 9,673CaixaBank SA 6,163 19,247Enagas SA 437 12,716Endesa SA 555 14,157Ferrovial SA 895 20,963Grifols SA 479 13,411Iberdrola SA 11,806 103,643Industria de Diseno Textil SA 1,972 57,957Mapfre SA 1,487 4,097Naturgy Energy Group SA 598 16,723Red Electrica Corp. SA 684 14,578Repsol SA 2,652 45,397Siemens Gamesa Renewable Energy SA (A) 301 4,793Telefonica SA 8,431 70,638
742,648Sweden - 2.3%Alfa Laval AB 530 12,165Assa Abloy AB, B Shares 1,814 39,159Atlas Copco AB, A Shares 1,169 31,390Atlas Copco AB, B Shares 711 17,597Boliden AB 438 12,465Electrolux AB, Series B 402 10,330Epiroc AB, Class A (A) 1,261 12,730Epiroc AB, Class B (A) 526 5,035Essity AB, Class B 1,099 31,691Hennes & Mauritz AB, B Shares 1,591 26,524Hexagon AB, B Shares 429 22,379Husqvarna AB, B Shares 925 7,555ICA Gruppen AB 173 6,941Industrivarden AB, Class C 330 6,912
Shares ValueCOMMON STOCKS (continued)Sweden (continued)L E Lundbergforetagen AB, B Shares 90 $ 2,846Lundin Petroleum AB 294 9,955Sandvik AB 2,145 34,838Securitas AB, B Shares 521 8,420Skandinaviska Enskilda Banken AB, Class A 2,718 23,528Skanska AB, Class B 600 10,900SKF AB, Class B 685 11,376Svenska Handelsbanken AB, A Shares 2,902 30,620Swedbank AB, Class A 1,512 21,361Swedish Match AB 302 15,393Tele2 AB, Class B 774 10,311Telefonaktiebolaget LM Ericsson, B Shares 5,838 53,637Telia Co. AB 5,239 23,639Volvo AB, Class B 2,866 44,390
591,225Switzerland - 9.3%ABB, Ltd. 3,328 62,533Adecco Group AG 273 14,564Baloise Holding AG 89 14,703Barry Callebaut AG 4 7,223Chocoladefabriken Lindt & Spruengli AG 2 13,598Cie Financiere Richemont SA 942 68,624Clariant AG (A) 354 7,441Coca-Cola HBC AG (A) 381 12,976Credit Suisse Group AG (A) 4,450 51,863Dufry AG (A) 33 3,467EMS-Chemie Holding AG 14 7,592Ferguson PLC 420 26,717Geberit AG 64 26,159Givaudan SA 16 40,878Glencore PLC (A) 21,384 88,554Julius Baer Group, Ltd. (A) 369 14,908Keuhne & Nagel International AG 87 11,935LafargeHolcim, Ltd. (A) 880 43,472Lonza Group AG (A) 130 40,315Nestle SA 5,676 540,951Novartis AG 4,049 389,468Pargesa Holding SA 52 4,073Partners Group Holding AG 32 23,267Roche Holding AG 1,319 363,412Schindler Holding AG 112 23,199SGS SA 10 24,886Sika AG 222 31,012Sonova Holding AG 102 20,180STMicroelectronics NV 1,255 18,534Straumann Holding AG 18 14,687Swatch Group AG 154 21,682Swiss Life Holding AG (A) 57 25,101Swiss Prime Site AG (A) 138 12,092Swiss Re AG 531 51,876Swisscom AG 42 20,541Temenos AG (A) 94 13,858UBS Group AG (A) 6,950 84,245Vifor Pharma AG 85 11,494Zurich Insurance Group AG 273 90,365
2,342,445United Arab Emirates - 0.0% (B)NMC Health PLC 113 3,361United Kingdom - 15.1%3i Group PLC 1,473 18,893Admiral Group PLC 346 9,779
Copyright © 2021 www.secdatabase.com. All Rights Reserved.Please Consider the Environment Before Printing This Document

The notes are an integral part of this report.Transamerica Series Trust Page 7
Investor AB, B Shares 823 37,063Kinnevik AB, B Shares 389 10,075
Copyright © 2021 www.secdatabase.com. All Rights Reserved.Please Consider the Environment Before Printing This Document

Transamerica International Equity Index VPSCHEDULE OF INVESTMENTS (continued)At March 31, 2019(unaudited)
Shares ValueCOMMON STOCKS (continued)United Kingdom (continued)Anglo American PLC 1,802 $ 48,196Ashtead Group PLC 767 18,506Associated British Foods PLC 588 18,679AstraZeneca PLC 2,407 192,332Auto Trader Group PLC (C) 1,724 11,712Aviva PLC 7,087 38,066Babcock International Group PLC 278 1,787BAE Systems PLC 5,804 36,467Barclays PLC 29,215 58,857Barratt Developments PLC 1,566 12,221Berkeley Group Holdings PLC 193 9,273BHP Group PLC 3,807 91,661BP PLC 38,113 277,241British American Tobacco PLC 4,359 181,335British Land Co. PLC, REIT 1,658 12,719BT Group PLC 15,244 44,266Bunzl PLC 492 16,225Burberry Group PLC 757 19,270Centrica PLC 8,479 12,612CNH Industrial NV 1,865 18,962Coca-Cola European Partners PLC (A) 347 17,954Compass Group PLC 2,858 67,171ConvaTec Group PLC (C) 1,709 3,151Croda International PLC 217 14,239Diageo PLC 4,432 181,140Direct Line Insurance Group PLC 1,910 8,782easyJet PLC 170 2,474Experian PLC 1,565 42,377Fiat Chrysler Automobiles NV (A) 1,824 27,155G4S PLC 2,134 5,100GlaxoSmithKline PLC 9,428 196,079Hammerson PLC, REIT 1,118 4,890Hargreaves Lansdown PLC 510 12,378HSBC Holdings PLC 38,071 309,067Imperial Brands PLC 1,722 58,863Informa PLC 1,846 17,893InterContinental Hotels Group PLC 284 17,071Intertek Group PLC 261 16,511ITV PLC 6,169 10,212J Sainsbury PLC 2,648 8,129John Wood Group PLC 1,252 8,274Johnson Matthey PLC 327 13,382Kingfisher PLC 3,441 10,523Land Securities Group PLC, REIT 1,354 16,108Legal & General Group PLC 10,065 36,090Lloyds Banking Group PLC 128,106 103,682London Stock Exchange Group PLC 536 33,167Marks & Spencer Group PLC 2,779 10,095Meggitt PLC 1,318 8,631Melrose Industries PLC 7,264 17,328Merlin Entertainments PLC (C) 959 4,288Micro Focus International PLC 738 19,191Mondi PLC 541 11,965National Grid PLC 6,458 71,563Next PLC 214 15,553Pearson PLC 1,294 14,093Persimmon PLC 583 16,477Prudential PLC 4,669 93,497Reckitt Benckiser Group PLC 1,210 100,578RELX PLC 3,742 80,003Rio Tinto PLC 2,114 122,828Rio Tinto, Ltd. 673 46,788
Shares ValueCOMMON STOCKS (continued)United Kingdom (continued)Schroders PLC 239 $ 8,411Segro PLC, REIT 1,998 17,524Severn Trent PLC 328 8,442Smith & Nephew PLC 1,587 31,480Smiths Group PLC 592 11,065SSE PLC 1,639 25,339St. James�s Place PLC 985 13,188Standard Chartered PLC 4,805 37,005Standard Life Aberdeen PLC 4,625 15,900Taylor Wimpey PLC 5,762 13,167Tesco PLC 17,687 53,468Unilever NV, CVA 2,933 170,361Unilever PLC 2,038 116,661United Utilities Group PLC 1,162 12,326Vodafone Group PLC 48,146 87,665Weir Group PLC 293 5,946Whitbread PLC 278 18,386WM Morrison Supermarkets PLC 2,970 8,802WPP PLC 2,305 24,341
3,795,335United States - 0.1%Carnival PLC 293 14,368Total Common Stocks
(Cost $25,646,125) 24,398,017
PREFERRED STOCKS - 0.5%Germany - 0.5%Bayerische Motoren Werke AG,
6.38% (E) 103 6,771FUCHS PETROLUB SE,
2.41% (E) 93 3,829Henkel AG & Co. KGaA,
1.98% (E) 324 33,074Porsche Automobil Holding SE,
2.95% (E) 248 15,562Sartorius AG,
0.39% (E) 63 10,805Volkswagen AG,
2.66% (E) 353 55,563Total Preferred Stocks
(Cost $146,660) 125,604Total Investments
(Cost $25,792,785) 24,523,621Net Other Assets (Liabilities) - 2.7% 674,428Net Assets - 100.0% $ 25,198,049
Copyright © 2021 www.secdatabase.com. All Rights Reserved.Please Consider the Environment Before Printing This Document

The notes are an integral part of this report.Transamerica Series Trust Page 8
Rolls-Royce Holdings PLC (A) 2,878 33,856Royal Bank of Scotland Group PLC 8,742 28,123Royal Mail PLC 1,327 4,119RSA Insurance Group PLC 1,466 9,696Sage Group PLC 1,781 16,265
Copyright © 2021 www.secdatabase.com. All Rights Reserved.Please Consider the Environment Before Printing This Document

Transamerica International Equity Index VPSCHEDULE OF INVESTMENTS (continued)At March 31, 2019(unaudited)
FUTURES CONTRACTS:
DescriptionLong/Short
Number ofContracts
ExpirationDate
NotionalAmount Value
UnrealizedAppreciation
UnrealizedDepreciation
MSCI EAFE Index Long 5 06/21/2019 $ 464,901 $ 466,600 $ 1,699 $ �
INVESTMENTS BY INDUSTRY:
IndustryPercentage of
Total Investments ValueBanks 10.4 % $ 2,555,384Pharmaceuticals 8.6 2,111,099Oil, Gas & Consumable Fuels 5.9 1,456,581Insurance 5.5 1,348,514Food Products 3.5 853,106Chemicals 3.3 817,127Automobiles 3.3 798,219Metals & Mining 3.1 753,892Beverages 2.5 604,185Textiles, Apparel & Luxury Goods 2.5 603,495Personal Products 2.4 586,417Machinery 2.4 584,097Capital Markets 2.3 557,213Diversified Telecommunication Services 2.2 546,222Real Estate Management & Development 2.1 523,515Electric Utilities 2.0 494,457Wireless Telecommunication Services 1.7 420,650Equity Real Estate Investment Trusts 1.6 388,725Electronic Equipment, Instruments & Components 1.6 385,501Aerospace & Defense 1.5 370,335Software 1.5 360,485Food & Staples Retailing 1.4 350,111Health Care Equipment & Supplies 1.4 347,868Hotels, Restaurants & Leisure 1.4 342,488Semiconductors & Semiconductor Equipment 1.4 341,803Industrial Conglomerates 1.4 340,456Electrical Equipment 1.4 340,043Road & Rail 1.3 326,872Trading Companies & Distributors 1.3 320,517Professional Services 1.3 320,208Tobacco 1.3 307,603Household Durables 1.1 281,396Multi-Utilities 1.0 249,011Auto Components 1.0 246,178IT Services 1.0 242,497Construction & Engineering 1.0 234,579Household Products 0.9 220,919Specialty Retail 0.8 197,075Building Products 0.8 188,434Diversified Financial Services 0.7 168,923Biotechnology 0.7 165,225Media 0.6 155,638Entertainment 0.6 149,923Transportation Infrastructure 0.6 139,339Construction Materials 0.6 139,015Health Care Providers & Services 0.5 134,358Commercial Services & Supplies 0.5 132,197Technology Hardware, Storage & Peripherals 0.5 130,913Multiline Retail 0.5 127,327Communications Equipment 0.5 111,482Gas Utilities 0.4 107,350Air Freight & Logistics 0.4 88,631
Copyright © 2021 www.secdatabase.com. All Rights Reserved.Please Consider the Environment Before Printing This Document

Life Sciences Tools & Services 0.3 66,964Paper & Forest Products 0.3 61,505Leisure Products 0.2 55,380Marine 0.2 39,488
The notes are an integral part of this report.Transamerica Series Trust Page 9
Copyright © 2021 www.secdatabase.com. All Rights Reserved.Please Consider the Environment Before Printing This Document

Transamerica International Equity Index VPSCHEDULE OF INVESTMENTS (continued)At March 31, 2019(unaudited)
INVESTMENTS BY INDUSTRY (continued):
IndustryPercentage of
Total Investments ValueContainers & Packaging 0.2 % $ 39,130Interactive Media & Services 0.1 34,052Airlines 0.1 32,035Internet & Direct Marketing Retail 0.1 27,630Energy Equipment & Services 0.1 25,363Independent Power & Renewable Electricity Producers 0.1 25,027Water Utilities 0.1 20,768Health Care Technology 0.0 (B) 10,053Consumer Finance 0.0 (B) 8,842Distributors 0.0 (B) 7,192Diversified Consumer Services 0.0 (B) 2,594Investments 100.0 24,523,621Total Investments 100.0 % $ 24,523,621
SECURITY VALUATION:
Valuation Inputs (F)
Level 1 -Unadjusted
QuotedPrices
Level 2 -Other
SignificantObservable
Inputs
Level 3 -Significant
UnobservableInputs Value
ASSETSInvestmentsCommon Stocks $180,976 $24,217,041 $ � $24,398,017Preferred Stocks � 125,604 � 125,604Total Investments $ 180,976 $ 24,342,645 $ �� $ 24,523,621Other Financial InstrumentsFutures Contracts (G) $1,699 $� $ � $1,699Total Other Financial Instruments $1,699 $�� $ �� $1,699
FOOTNOTES TO SCHEDULE OF INVESTMENTS:
(A) Non-income producing securities.(B) Percentage rounds to less than 0.1% or (0.1)%.(C) Securities are registered pursuant to Rule 144A of the Securities Act of 1933. Unless otherwise indicated, the securities are deemed to be liquid for purposes of
compliance limitations on holdings of illiquid securities and may be resold as transactions exempt from registration, normally to qualified institutional buyers. AtMarch 31, 2019, the total value of 144A securities is $170,953, representing 0.7% of the Portfolio�s net assets.
(D) Fair valued as determined in good faith in accordance with procedures established by the Board. At March 31, 2019, the value of the security is $4,112,representing less than 0.1% of the Portfolio�s net assets.
(E) Rates disclosed reflect the yields at March 31, 2019.(F) There were no transfers in or out of Level 3 during the period ended March 31, 2019. Please reference the Security Valuation section of the Notes to Schedules of
Investments for more information regarding security valuation and pricing inputs.(G) Futures contracts and/or forward foreign currency contracts are valued at unrealized appreciation (depreciation).
PORTFOLIO ABBREVIATIONS:
ADR American Depositary ReceiptCDI CHESS Depositary InterestsCVA Commanditaire Vennootschap op Aandelen (Dutch Certificate)EAFE Europe, Australasia and Far EastREIT Real Estate Investment TrustSDR Swedish Depositary Receipt
Copyright © 2021 www.secdatabase.com. All Rights Reserved.Please Consider the Environment Before Printing This Document

The notes are an integral part of this report.Transamerica Series Trust Page 10
Copyright © 2021 www.secdatabase.com. All Rights Reserved.Please Consider the Environment Before Printing This Document

Transamerica Janus Balanced VPSCHEDULE OF INVESTMENTSAt March 31, 2019(unaudited)
The notes are an integral part of this report.Transamerica Series Trust Page 1
Shares ValueCOMMON STOCKS - 58.1%Aerospace & Defense - 3.6%Boeing Co. 61,763 $ 23,557,644General Dynamics Corp. 80,872 13,690,012
37,247,656Air Freight & Logistics - 0.5%United Parcel Service, Inc., Class B 48,805 5,453,471Airlines - 0.5%Delta Air Lines, Inc. 96,915 5,005,660Automobiles - 0.8%General Motors Co. 208,645 7,740,729Banks - 2.3%Bank of America Corp. 260,926 7,198,948US Bancorp 346,466 16,696,197
23,895,145Biotechnology - 0.9%AbbVie, Inc. 113,423 9,140,760Capital Markets - 2.3%CME Group, Inc. 48,584 7,995,955Morgan Stanley 154,108 6,503,357TD Ameritrade Holding Corp. 184,782 9,237,252
23,736,564Chemicals - 1.3%LyondellBasell Industries NV, Class A 154,279 12,971,778Consumer Finance - 1.5%American Express Co. 50,267 5,494,183Synchrony Financial 295,668 9,431,809
14,925,992Electronic Equipment, Instruments & Components - 0.6%Corning, Inc. 170,289 5,636,566Entertainment - 0.7%Walt Disney Co. 66,957 7,434,236Equity Real Estate Investment Trusts - 1.1%Crown Castle International Corp. 45,022 5,762,816MGM Growth Properties LLC, Class A 81,684 2,634,309Outfront Media, Inc. 117,879 2,758,369
11,155,494Food & Staples Retailing - 3.1%Costco Wholesale Corp. 67,692 16,390,941Kroger Co. 245,124 6,030,050Sysco Corp. 147,917 9,874,939
32,295,930Food Products - 0.5%Hershey Co. 43,444 4,988,674
Shares ValueCOMMON STOCKS (continued)Health Care Equipment & Supplies - 1.9%Abbott Laboratories 144,965 $ 11,588,502Medtronic PLC 84,425 7,689,429
19,277,931Health Care Providers & Services - 1.2%UnitedHealth Group, Inc. 50,238 12,421,848Hotels, Restaurants & Leisure - 2.9%Hilton Worldwide Holdings, Inc. 76,744 6,378,194McDonald�s Corp. 94,740 17,991,126Norwegian Cruise Line Holdings, Ltd. (A) 57,297 3,149,043Six Flags Entertainment Corp. 53,099 2,620,436
30,138,799Household Products - 0.3%Clorox Co. 21,780 3,494,819Industrial Conglomerates - 0.5%Honeywell International, Inc. 29,732 4,725,009Insurance - 0.6%Progressive Corp. 81,067 5,844,120Interactive Media & Services - 2.2%Alphabet, Inc., Class C (A) 19,630 23,032,075Internet & Direct Marketing Retail - 0.7%Amazon.com, Inc. (A) 4,255 7,577,091IT Services - 3.7%Accenture PLC, Class A 67,777 11,930,107Mastercard, Inc., Class A 112,233 26,425,260
38,355,367Leisure Products - 0.4%Hasbro, Inc. 52,373 4,452,752Machinery - 1.3%Deere & Co. 36,397 5,817,696Parker-Hannifin Corp. 19,901 3,415,410Stanley Black & Decker, Inc. 32,898 4,479,721
13,712,827Media - 1.4%Comcast Corp., Class A 348,552 13,935,109Oil, Gas & Consumable Fuels - 1.3%Anadarko Petroleum Corp. 111,780 5,083,755Suncor Energy, Inc. 114,311 3,704,725Suncor Energy, Inc. 128,584 4,169,979
12,958,459Personal Products - 0.7%Estee Lauder Cos., Inc., Class A 41,694 6,902,442Pharmaceuticals - 3.6%Allergan PLC 38,489 5,635,174Bristol-Myers Squibb Co. 89,207 4,256,066Eli Lilly & Co. 88,002 11,419,140Merck & Co., Inc. 194,130 16,145,792
37,456,172Real Estate Management & Development - 0.5%CBRE Group, Inc., Class A (A) 93,706 4,633,762
Copyright © 2021 www.secdatabase.com. All Rights Reserved.Please Consider the Environment Before Printing This Document

Transamerica Janus Balanced VPSCHEDULE OF INVESTMENTS (continued)At March 31, 2019(unaudited)
The notes are an integral part of this report.Transamerica Series Trust Page 2
Shares ValueCOMMON STOCKS (continued)Road & Rail - 1.4%CSX Corp. 186,689 $ 13,968,071Semiconductors & Semiconductor Equipment - 3.0%Intel Corp. 256,792 13,789,730Lam Research Corp. 39,548 7,079,487NVIDIA Corp. 11,076 1,988,807Texas Instruments, Inc. 75,628 8,021,862
30,879,886Software - 5.0%Adobe, Inc. (A) 49,008 13,060,142Microsoft Corp. 297,820 35,124,891salesforce.com, Inc. (A) 19,522 3,091,699
51,276,732Specialty Retail - 1.6%Home Depot, Inc. 84,140 16,145,625Technology Hardware, Storage & Peripherals - 1.7%Apple, Inc. 93,732 17,804,393Textiles, Apparel & Luxury Goods - 0.9%NIKE, Inc., Class B 111,304 9,372,910Tobacco - 1.6%Altria Group, Inc. 290,769 16,698,864Total Common Stocks(Cost $465,142,783) 596,693,718
MASTER LIMITED PARTNERSHIP - 0.6%Capital Markets - 0.6%Blackstone Group, LP 176,981 6,189,026Total Master Limited Partnership
(Cost $5,062,827) 6,189,026
Principal ValueASSET-BACKED SECURITIES - 1.9%AmeriCredit Automobile Receivables Trust
Series 2015-3, Class D,3.34%, 08/08/2021 $ 1,244,000 1,248,743
Applebee�s Funding LLC / IHOP FundingLLCSeries 2014-1, Class A2,4.28%, 09/05/2044 (B) 1,504,950 1,511,253
Atrium IXSeries 9A, Class AR,3-Month LIBOR + 1.24%,
3.87% (C), 05/28/2030 (B) 521,400 521,161Bean Creek CLO, Ltd.
Series 2015-1A, Class AR,3-Month LIBOR + 1.02%,
3.78% (C), 04/20/2031 (B) 739,000 729,001Carlyle Global Market Strategies CLO, Ltd.
Series 2014-2RA, Class A1,3-Month LIBOR + 1.05%,
3.73% (C), 05/15/2031 (B) 541,745 535,409Series 2016-1A, Class A2R,3-Month LIBOR + 1.45%,
4.21% (C), 04/20/2027 (B) 501,000 495,703Series 2016-2A, Class A2R,3-Month LIBOR + 1.50%,
4.29% (C), 07/15/2027 (B) 461,000 456,741
Principal ValueASSET-BACKED SECURITIES (continued)Carlyle US CLO, Ltd.
Series 2018-1A, Class A1,3-Month LIBOR + 1.02%,
3.78% (C), 04/20/2031 (B)$627,000
$620,040
Credit Acceptance Auto Loan TrustSeries 2018-2A, Class B,3.94%, 07/15/2027 (B) 314,000 319,601
DB Master Finance LLCSeries 2019-1A, Class A23,4.35%, 05/20/2049 (B) (D) 318,000 319,989Series 2019-1A, Class A2I,3.79%, 05/20/2049 (B) (D) 397,000 398,072Series 2019-1A, Class A2II,4.02%, 05/20/2049 (B) (D) 161,000 161,725
Drive Auto Receivables TrustSeries 2017-1, Class E,5.17%, 09/16/2024 1,590,000 1,640,528Series 2017-2, Class E,5.27%, 11/15/2024 1,400,000 1,447,103Series 2017-AA, Class D,4.16%, 05/15/2024 (B) 353,000 357,292Series 2019-1, Class D,4.09%, 06/15/2026 148,000 151,121
Dryden 41 Senior Loan FundSeries 2015-41A, Class AR,3-Month LIBOR + 0.97%,
3.76% (C), 04/15/2031 (B) 687,000 677,324Dryden 55 CLO, Ltd.
Series 2018-55A, Class A1,3-Month LIBOR + 1.02%,
3.81% (C), 04/15/2031 (B) 417,000 412,887Dryden Senior Loan Fund
Series 2018-64A, Class A,3-Month LIBOR + 0.97%,
3.75% (C), 04/18/2031 978,000 963,254LCM XIV, LP
Series 14A, Class AR,3-Month LIBOR + 1.04%,
3.82% (C), 07/20/2031 (B) 308,889 306,340LCM XVIII, LP
Series 18A, Class A1R,3-Month LIBOR + 1.02%,
3.78% (C), 04/20/2031 (B) 607,000 599,723Magnetite VIII, Ltd.
Series 2014-8A, Class AR2,3-Month LIBOR + 0.98%,
3.77% (C), 04/15/2031 (B) 520,000 515,162Magnetite XV, Ltd.
Series 2015-15A, Class AR,3-Month LIBOR + 1.01%,
3.78% (C), 07/25/2031 (B) 694,000 686,356Octagon Investment Partners 36, Ltd.
Series 2018-1A, Class A1,3-Month LIBOR + 0.97%,
3.76%, 04/15/2031 (C) 507,000 499,204
Copyright © 2021 www.secdatabase.com. All Rights Reserved.Please Consider the Environment Before Printing This Document

Transamerica Janus Balanced VPSCHEDULE OF INVESTMENTS (continued)At March 31, 2019(unaudited)
Principal ValueASSET-BACKED SECURITIES (continued)Octagon Loan Funding, Ltd.
Series 2014-1A, Class ARR,3-Month LIBOR + 1.18%,
3.86% (C), 11/18/2031 (B)$587,204 $ 582,354
OneMain Direct Auto Receivables TrustSeries 2018-1A, Class C,3.85%, 10/14/2025 (B) 148,000 149,682Series 2018-1A, Class D,4.40%, 01/14/2028 (B) 147,000 150,200
Sounds Point CLO IV-R, Ltd.Series 2013-3RA, Class A,3-Month LIBOR + 1.15%,
3.93% (C), 04/18/2031 (B) 698,000 690,136Towd Point Mortgage Trust
Series 2015-3, Class A1A,3.50% (C), 03/25/2054 (B) 29,369 29,334Series 2018-3, Class A1,3.75% (C), 05/25/2058 (B) 301,813 305,218Series 2018-4, Class A1,3.00% (C), 06/25/2058 (B) 515,981 510,258
Voya CLO, Ltd.Series 2015-2A, Class BR,3-Month LIBOR + 1.50%,
4.27% (C), 07/23/2027 (B) 250,000 247,196Series 2018-1A, Class A1,3-Month LIBOR + 0.95%,
3.71% (C), 04/19/2031 (B) 708,000 696,061Series 2018-2A, Class A1,3-Month LIBOR + 1.00%,
3.79% (C), 07/15/2031 (B) 359,099 354,328Total Asset-Backed Securities
(Cost $19,363,007) 19,288,499
CORPORATE DEBT SECURITIES - 13.1%Aerospace & Defense - 0.3%Boeing Co.
2.25%, 06/15/2026 123,000 116,3663.20%, 03/01/2029 134,000 133,9813.25%, 03/01/2028 152,000 152,637
Huntington Ingalls Industries, Inc.5.00%, 11/15/2025 (B) 1,451,000 1,487,275
Northrop Grumman Corp.2.55%, 10/15/2022 935,000 924,672
2,814,931Automobiles - 0.1%General Motors Co.
5.00%, 10/01/2028 775,000 772,993Banks - 2.3%Bank of America Corp.
2.50%, 10/21/2022, MTN 2,974,000 2,936,335Fixed until 04/24/2027,
3.71% (C), 04/24/2028 3,285,000 3,299,715Fixed until 03/05/2028,
3.97% (C), 03/05/2029, MTN 804,000 818,629Fixed until 02/07/2029,
3.97% (C), 02/07/2030, MTN 1,090,000 1,110,969Bank of Montreal
3.30%, 02/05/2024 1,074,000 1,084,740Citigroup, Inc.
Fixed until 01/10/2027,3.89% (C), 01/10/2028 4,037,000 4,099,510
Principal ValueCORPORATE DEBT SECURITIES (continued)Banks (continued)Citizens Financial Group, Inc.
3.75%, 07/01/2024 $188,000 $ 186,455
4.30%, 12/03/2025 783,000 801,8674.35%, 08/01/2025 177,000 181,043
First Republic Bank4.63%, 02/13/2047 776,000 787,950
JPMorgan Chase & Co.2.30%, 08/15/2021, MTN 1,058,000 1,045,725Fixed until 02/01/2027,
3.78% (C), 02/01/2028 1,204,000 1,226,521Fixed until 01/29/2026,
3.96% (C), 01/29/2027 1,725,000 1,781,383Fixed until 12/05/2028,
4.45% (C), 12/05/2029 3,236,000 3,444,370SVB Financial Group
5.38%, 09/15/2020 517,000 534,97723,340,189
Beverages - 0.1%Anheuser-Busch InBev Worldwide, Inc.
4.75%, 01/23/2029 939,000 1,000,409Biotechnology - 0.1%AbbVie, Inc.
3.75%, 11/14/2023 792,000 813,041Building Products - 0.0% (E)Masonite International Corp.
5.63%, 03/15/2023 (B) 219,000 223,927Capital Markets - 0.9%Cboe Global Markets, Inc.
3.65%, 01/12/2027 943,000 954,395E*TRADE Financial Corp.
2.95%, 08/24/2022 913,000 910,9243.80%, 08/24/2027 729,000 707,7844.50%, 06/20/2028 261,000 265,139
Goldman Sachs Capital I6.35%, 02/15/2034 2,229,000 2,684,246
Morgan Stanley3.95%, 04/23/2027 1,599,000 1,598,516Fixed until 01/23/2029,
4.43% (C), 01/23/2030, MTN 773,000 814,144Raymond James Financial, Inc.
4.95%, 07/15/2046 819,000 866,1605.63%, 04/01/2024 396,000 438,191
9,239,499Chemicals - 0.1%CF Industries, Inc.
4.50%, 12/01/2026 (B) 385,000 389,767Nutrien, Ltd.
4.20%, 04/01/2029 (D) 192,000 197,7075.00%, 04/01/2049 (D) 233,000 243,521
830,995Consumer Finance - 0.1%General Motors Financial Co., Inc.
4.35%, 01/17/2027 357,000 346,968Synchrony Financial
4.38%, 03/19/2024 213,000 215,747562,715
Copyright © 2021 www.secdatabase.com. All Rights Reserved.Please Consider the Environment Before Printing This Document

The notes are an integral part of this report.Transamerica Series Trust Page 3
Copyright © 2021 www.secdatabase.com. All Rights Reserved.Please Consider the Environment Before Printing This Document

Transamerica Janus Balanced VPSCHEDULE OF INVESTMENTS (continued)At March 31, 2019(unaudited)
The notes are an integral part of this report.Transamerica Series Trust Page 4
Principal ValueCORPORATE DEBT SECURITIES (continued)Containers & Packaging - 0.2%Ball Corp.
4.38%, 12/15/2020 $702,000
$713,513
WRKCo, Inc.3.38%, 09/15/2027 68,000 65,6214.00%, 03/15/2028 (F) 140,000 141,6254.65%, 03/15/2026 221,000 234,1764.90%, 03/15/2029 918,000 993,549
2,148,484Diversified Financial Services - 0.1%GE Capital International Funding Unlimited Co.
4.42%, 11/15/2035 1,030,000 952,221Diversified Telecommunication Services - 1.0%AT&T, Inc.
4.35%, 03/01/2029 1,022,000 1,044,0464.50%, 03/09/2048 658,000 617,3964.75%, 05/15/2046 691,000 675,2364.85%, 03/01/2039 618,000 621,7635.15%, 11/15/2046 558,000 572,6945.25%, 03/01/2037 259,000 271,358
BellSouth LLC4.33%, 04/26/2021 (B) 1,883,000 1,885,052
Verizon Communications, Inc.2.63%, 08/15/2026 896,000 854,4653.88%, 02/08/2029 320,000 327,6594.33%, 09/21/2028 1,937,000 2,048,4484.52%, 09/15/2048 238,000 244,2504.86%, 08/21/2046 322,000 343,0725.01%, 08/21/2054 484,000 517,680
10,023,119Electric Utilities - 0.4%Duke Energy Corp.
1.80%, 09/01/2021 360,000 351,5882.40%, 08/15/2022 399,000 394,295
PPL WEM, Ltd. / Western Power Distribution, Ltd.5.38%, 05/01/2021 (B) 2,144,000 2,213,401
Southern Co.2.95%, 07/01/2023 687,000 683,997
Vistra Operations Co. LLC5.50%, 09/01/2026 (B) 390,000 405,6005.63%, 02/15/2027 (B) 579,000 602,160
4,651,041Electronic Equipment, Instruments & Components - 0.3%Trimble, Inc.
4.75%, 12/01/2024 1,217,000 1,250,2064.90%, 06/15/2028 1,793,000 1,831,826
3,082,032Energy Equipment & Services - 0.0% (E)NuStar Logistics, LP
5.63%, 04/28/2027 483,000 482,396Entertainment - 0.1%Viacom, Inc.
5.85%, 09/01/2043 963,000 1,047,260Equity Real Estate Investment Trusts - 0.7%Alexandria Real Estate Equities, Inc.
2.75%, 01/15/2020 688,000 686,814
Principal ValueCORPORATE DEBT SECURITIES (continued)Equity Real Estate Investment Trusts (continued)Alexandria Real Estate Equities, Inc. (continued)
4.60%, 04/01/2022 $1,414,000
$1,478,599
Crown Castle International Corp.3.20%, 09/01/2024 611,000 606,3304.30%, 02/15/2029 306,000 315,3955.20%, 02/15/2049 368,000 387,2335.25%, 01/15/2023 808,000 867,114
Reckson Operating Partnership, LP7.75%, 03/15/2020 1,330,000 1,386,483
Senior Housing Properties Trust6.75%, 04/15/2020 - 12/15/2021 122,000 127,080
Ventas Realty, LP3.50%, 04/15/2024 973,000 984,483
6,839,531Food & Staples Retailing - 0.0% (E)Sysco Corp.
2.50%, 07/15/2021 258,000 255,789Food Products - 0.6%Campbell Soup Co.
3.95%, 03/15/2025 491,000 494,1364.15%, 03/15/2028 737,000 734,1834.80%, 03/15/2048 1,715,000 1,598,116
General Mills, Inc.4.20%, 04/17/2028 (F) 1,000,000 1,039,127
Kraft Heinz Foods Co.4.00%, 06/15/2023 274,000 281,468
Mars, Inc.2.70%, 04/01/2025 (B) 397,000 395,0893.20%, 04/01/2030 (B) 484,000 483,3763.95%, 04/01/2049 (B) 648,000 654,9194.20%, 04/01/2059 (B) 414,000 424,394
6,104,808Health Care Equipment & Supplies - 0.1%Becton Dickinson and Co.
2.89%, 06/06/2022 457,000 454,867Boston Scientific Corp.
3.75%, 03/01/2026 474,000 483,2634.00%, 03/01/2029 246,000 254,0624.70%, 03/01/2049 395,000 419,480
1,611,672Health Care Providers & Services - 0.5%Aetna, Inc.
2.80%, 06/15/2023 475,000 466,455Centene Corp.
4.75%, 05/15/2022 53,000 53,9285.38%, 06/01/2026 (B) 1,427,000 1,489,4316.13%, 02/15/2024 569,000 596,198
Cigna Corp.3.40%, 09/17/2021 (B) (F) 154,000 155,5663.75%, 07/15/2023 (B) 627,000 642,865
CVS Health Corp.4.10%, 03/25/2025 1,111,000 1,140,6024.30%, 03/25/2028 578,000 585,6594.75%, 12/01/2022 460,000 483,830
5,614,534
Copyright © 2021 www.secdatabase.com. All Rights Reserved.Please Consider the Environment Before Printing This Document

Transamerica Janus Balanced VPSCHEDULE OF INVESTMENTS (continued)At March 31, 2019(unaudited)
Principal ValueCORPORATE DEBT SECURITIES (continued)Hotels, Restaurants & Leisure - 0.2%MGM Resorts International
6.63%, 12/15/2021 $411,000 $ 439,256
6.75%, 10/01/2020 1,014,000 1,062,1657.75%, 03/15/2022 148,000 163,170
1,664,591Household Durables - 0.1%MDC Holdings, Inc.
5.50%, 01/15/2024 569,000 584,647Independent Power & Renewable Electricity Producers - 0.1%NRG Energy, Inc.
6.63%, 01/15/2027 475,000 511,2197.25%, 05/15/2026 911,000 1,002,273
1,513,492Insurance - 0.0% (E)Brown & Brown, Inc.
4.50%, 03/15/2029 486,000 491,191IT Services - 0.2%Total System Services, Inc.
3.80%, 04/01/2021 587,000 595,9794.80%, 04/01/2026 1,249,000 1,312,225
1,908,204Machinery - 0.2%Wabtec Corp.
4.40%, 03/15/2024 255,000 259,2384.95%, 09/15/2028 1,543,000 1,565,925
1,825,163Media - 1.1%CCO Holdings LLC / CCO Holdings Capital Corp.
5.25%, 03/15/2021 713,000 716,123Charter Communications Operating LLC / Charter
Communications Operating Capital4.91%, 07/23/2025 691,000 729,1285.05%, 03/30/2029 3,511,000 3,699,531
Comcast Corp.3.15%, 03/01/2026 478,000 475,5794.15%, 10/15/2028 557,000 586,2644.25%, 10/15/2030 622,000 660,8014.60%, 10/15/2038 506,000 541,6614.95%, 10/15/2058 521,000 574,662
CSC Holdings LLC6.50%, 02/01/2029 (B) 1,386,000 1,476,090
Fox Corp.4.03%, 01/25/2024 (B) 362,000 375,280
UBM PLC5.75%, 11/03/2020 (B) 471,000 486,976
Warner Media LLC3.60%, 07/15/2025 578,000 576,550
10,898,645Metals & Mining - 0.5%Freeport-McMoRan, Inc.
3.55%, 03/01/2022 996,000 984,7953.88%, 03/15/2023 1,121,000 1,104,869
Hudbay Minerals, Inc.7.25%, 01/15/2023 (B) 1,043,000 1,079,505
Reliance Steel & Aluminum Co.4.50%, 04/15/2023 644,000 668,004
Principal ValueCORPORATE DEBT SECURITIES (continued)Metals & Mining (continued)Steel Dynamics, Inc.
5.50%, 10/01/2024 $978,000
$1,009,785
Teck Resources, Ltd.8.50%, 06/01/2024 (B) 775,000 830,950
5,677,908Multiline Retail - 0.0% (E)Target Corp.
3.38%, 04/15/2029 276,000 279,424Oil, Gas & Consumable Fuels - 1.1%Cheniere Energy Partners, LP
5.63%, 10/01/2026 (B) 540,000 553,500Continental Resources, Inc.
4.50%, 04/15/2023 987,000 1,021,7245.00%, 09/15/2022 1,192,000 1,200,495
Energy Transfer Operating, LP4.25%, 03/15/2023 508,000 521,1914.95%, 06/15/2028 78,000 81,8105.50%, 06/01/2027 327,000 354,2835.88%, 01/15/2024 458,000 499,9336.00%, 06/15/2048 832,000 898,1906.13%, 12/15/2045 255,000 277,317
EnLink Midstream Partners, LP4.15%, 06/01/2025 920,000 885,500
EQM Midstream Partners, LP4.00%, 08/01/2024 165,000 160,8625.50%, 07/15/2028 971,000 980,843
Kinder Morgan Energy Partners, LP5.00%, 10/01/2021 436,000 454,445
Kinder Morgan, Inc.4.30%, 03/01/2028 234,000 241,7215.20%, 03/01/2048 146,000 153,3955.55%, 06/01/2045 219,000 238,848
NGPL PipeCo LLC4.38%, 08/15/2022 (B) 822,000 832,2754.88%, 08/15/2027 (B) 252,000 254,520
Plains All American Pipeline, LP / PAA Finance Corp.4.65%, 10/15/2025 1,079,000 1,124,137
Tallgrass Energy Partners, LP / Tallgrass EnergyFinance Corp.4.75%, 10/01/2023 (B) 665,000 668,9505.50%, 09/15/2024 (B) 310,000 317,750
11,721,689Paper & Forest Products - 0.2%Georgia-Pacific LLC
3.16%, 11/15/2021 (B) 1,045,000 1,049,7483.60%, 03/01/2025 (B) 831,000 851,471
1,901,219Pharmaceuticals - 0.7%Allergan Finance LLC
3.25%, 10/01/2022 606,000 606,003Allergan Funding SCS
3.45%, 03/15/2022 1,120,000 1,130,0863.80%, 03/15/2025 724,000 733,438
Allergan, Inc.2.80%, 03/15/2023 48,000 46,955
Elanco Animal Health, Inc.3.91%, 08/27/2021 (B) 146,000 148,4294.27%, 08/28/2023 (B) 371,000 382,3664.90%, 08/28/2028 (B) 346,000 367,325
Copyright © 2021 www.secdatabase.com. All Rights Reserved.Please Consider the Environment Before Printing This Document

The notes are an integral part of this report.Transamerica Series Trust Page 5
Copyright © 2021 www.secdatabase.com. All Rights Reserved.Please Consider the Environment Before Printing This Document

Transamerica Janus Balanced VPSCHEDULE OF INVESTMENTS (continued)At March 31, 2019(unaudited)
The notes are an integral part of this report.Transamerica Series Trust Page 6
Principal ValueCORPORATE DEBT SECURITIES (continued)Pharmaceuticals (continued)ELI Lilly & Co.
3.38%, 03/15/2029 $2,053,000
$2,106,098
GlaxoSmithKline Capital PLC3.38%, 06/01/2029 1,168,000 1,178,900
Teva Pharmaceutical Finance Co., BV3.65%, 11/10/2021 301,000 294,980
6,994,580Professional Services - 0.4%IHS Markit, Ltd.
4.75%, 02/15/2025 (B) 767,000 798,4395.00%, 11/01/2022 (B) 94,000 98,070
Verisk Analytics, Inc.4.13%, 09/12/2022 177,000 183,0215.50%, 06/15/2045 909,000 1,012,7425.80%, 05/01/2021 1,531,000 1,617,380
3,709,652Real Estate Management & Development - 0.1%Jones Lang LaSalle, Inc.
4.40%, 11/15/2022 711,000 729,964Semiconductors & Semiconductor Equipment - 0.1%Marvell Technology Group, Ltd.
4.20%, 06/22/2023 358,000 365,0164.88%, 06/22/2028 405,000 418,672
783,688Wireless Telecommunication Services - 0.1%T-Mobile USA, Inc.
6.38%, 03/01/2025 1,222,000 1,272,469Total Corporate Debt Securities
(Cost $132,043,039) 134,368,112
LOAN ASSIGNMENTS - 0.4%Commercial Services & Supplies - 0.0% (E)Aramark Services, Inc.
Term Loan B2,1-Month LIBOR + 1.75%,
4.25% (C), 03/28/2024 393,879 390,433Hotels, Restaurants & Leisure - 0.1%KFC Holding Co.
Term Loan B,1-Month LIBOR + 1.75%,
4.23% (C), 04/03/2025 1,411,044 1,398,404Independent Power & Renewable Electricity Producers - 0.1%NRG Energy, Inc.
Term Loan B,1-Month LIBOR + 1.75%,
4.25% (C), 06/30/2023 (D) 767,971 758,610Oil, Gas & Consumable Fuels - 0.2%TEX Operations Co. LLC
Term Loan B,1-Month LIBOR + 2.00%,
4.50% (C), 08/04/2023 (D) 1,673,650 1,652,730
Principal ValueLOAN ASSIGNMENTS (continued)Trading Companies & Distributors - 0.0% (E)HD Supply, Inc.
Term Loan B5,1-Month LIBOR + 1.75%,
4.25% (C), 10/17/2023$509,440
$502,913
Total Loan Assignments(Cost $4,764,782) 4,703,090
MORTGAGE-BACKED SECURITIES - 1.6%Angel Oak Mortgage Trust LLC
Series 2018-AOMT, Class A1,3.67% (C), 07/27/2048 (B) 191,720 192,460
Arroyo Mortgage TrustSeries 2018-1, Class A1,3.76%, 04/25/2048 313,123 316,473
BAMLL Commercial Mortgage Securities TrustSeries 2018-DSNY, Class A,1-Month LIBOR + 0.85%,
3.33% (C), 09/15/2034 (B) 874,000 869,614BBCMS Mortgage Trust
Series 2018-TALL, Class A,1-Month LIBOR + 0.72%,
3.21% (C), 03/15/2037 (B) 1,549,000 1,534,445BBCMS Trust
Series 2015-SRCH, Class A2,4.20%, 08/10/2035 (B) 715,000 763,100
BX Commercial Mortgage TrustSeries 2018-IND, Class A,1-Month LIBOR + 0.75%,
3.23% (C), 11/15/2035 (B) 1,174,315 1,171,374BXP Trust
Series 2017-GM, Class A,3.38%, 06/13/2039 (B) 324,000 329,058
CSMLT TrustSeries 2015-2, Class A6,3.50% (C), 08/25/2045 (B) 370,053 371,006
Government National Mortgage Association1-Month LIBOR + 0.40%,
2.89% (C), 02/20/2049 976,106 974,0981-Month LIBOR + 0.45%,
2.94% (C), 02/20/2049 894,336 893,8792.99%, 02/20/2049 401,245 400,880
JPMorgan Mortgage TrustSeries 2018-8, Class A13,4.00% (C), 01/25/2049 (B) 221,343 221,351
Mello Warehouse Securitization TrustSeries 2018-W1, Class A,1-Month LIBOR + 0.85%,
3.34% (C), 11/25/2051 (B) 1,654,000 1,653,855New Residential Mortgage Loan Trust
Series 2018-2A, Class A1,4.50% (C), 02/25/2058 (B) 352,881 363,032
Sequoia Mortgage TrustSeries 2018-7, Class A19,4.00% (C), 09/25/2048 (B) 216,985 218,086Series 2018-7, Class A4,4.00% (C), 09/25/2048 (B) 284,003 288,757Series 2018-CH2, Class A12,4.00% (C), 06/25/2048 (B) 749,612 759,077
Copyright © 2021 www.secdatabase.com. All Rights Reserved.Please Consider the Environment Before Printing This Document

Transamerica Janus Balanced VPSCHEDULE OF INVESTMENTS (continued)At March 31, 2019(unaudited)
Principal ValueMORTGAGE-BACKED SECURITIES (continued)Sequoia Mortgage Trust (continued)
Series 2018-CH3, Class A11,4.00% (C), 08/25/2048 (B) $ 365,288 $ 369,934Series 2019-1, Class A4,4.00% (C), 02/25/2049 (B) 168,096 170,200
Station Place Securitization TrustSeries 2017-LD1, Class A,1-Month LIBOR + 0.80%,
3.29% (C), 11/25/2050 (B) 1,110,000 1,106,470Series 2017-LD1, Class B,1-Month LIBOR + 1.00%,
3.49% (C), 11/25/2050 (B) 220,000 219,374Series 2018-7, Class A,1-Month LIBOR + 0.85%,
3.33% (C), 09/24/2019 (B) 1,523,000 1,523,000Wachovia Bank Commercial Mortgage Trust
Series 2007-C34, Class AJ,5.88% (C), 05/15/2046 43,987 44,248
Wells Fargo Mortgage-Backed Securities TrustSeries 2018-1, Class A17,3.50% (C), 07/25/2047 (B) 175,119 172,704Series 2019-1, Class A3,4.00% (C), 11/25/2048 (B) 381,992 387,274
WinWater Mortgage Loan TrustSeries 2015-5, Class A5,3.50% (C), 08/20/2045 (B) 1,149,689 1,149,077
Total Mortgage-Backed Securities(Cost $16,480,881) 16,462,826
U.S. GOVERNMENT AGENCY OBLIGATIONS - 10.8%Federal Home Loan Mortgage Corp.
3.00%, 01/01/2045 - 08/01/2047 9,365,046 9,337,7563.50%, 02/01/2043 - 11/01/2048 13,257,405 13,524,6274.00%, 05/01/2046 - 01/01/2049 10,830,016 11,210,9174.50%, 05/01/2038 - 12/01/2048 2,957,218 3,110,6254.50%, 03/01/2039 - 09/01/2048 (D) 2,884,120 3,023,1635.00%, 09/01/2048 89,493 94,8026.00%, 04/01/2040 93,299 105,559
Federal National Mortgage Association3.00%, 02/01/2043 - 02/01/2057 8,591,575 8,561,5343.50%, 10/01/2042 - 02/01/2057 17,484,152 17,816,4554.00%, 10/01/2046 - 02/01/2049 17,351,906 17,943,2114.00%, 02/01/2049 (D) 190,575 196,1684.50%, 11/01/2038 - 02/01/2049 9,029,475 9,496,9734.50%, 03/01/2048 - 08/01/2048 (D) 948,387 992,0915.00%, 07/01/2044 937,151 1,013,8006.00%, 02/01/2037 3,892 4,397
Federal National Mortgage AssociationConnecticut Avenue Securities1-Month LIBOR + 3.00%,
5.49% (C), 07/25/2024 939,409 997,271Government National Mortgage Association
1-Month LIBOR + 0.35%,2.84% (C), 10/20/2048 253,568 252,151
1-Month LIBOR + 0.45%,2.94% (C), 02/20/2049 802,893 803,277
4.00%, 01/15/2045 - 12/15/2047 2,712,000 2,818,4274.50%, 10/20/2041 - 12/20/2048 3,651,967 3,839,2975.00%, 12/20/2048 5,676,370 5,954,128
Total U.S. Government Agency Obligations(Cost $110,810,776) 111,096,629
Principal ValueU.S. GOVERNMENT OBLIGATIONS - 12.7%U.S. Treasury - 12.7%U.S. Treasury Bond
2.75%, 11/15/2047 $ 7,008,000 $ 6,906,9863.00%, 02/15/2048 - 02/15/2049 8,945,000 9,260,4903.13%, 05/15/2048 2,230,500 2,365,1143.38%, 11/15/2048 3,647,000 3,897,690
U.S. Treasury Note2.25%, 03/31/2021 9,004,000 8,999,7772.25%, 08/15/2027 - 11/15/2027 3,159,000 3,127,2962.38%, 02/29/2024 609,000 612,9732.50%, 12/31/2020 - 01/31/2024 14,641,000 14,747,0912.63%, 12/31/2023 - 02/15/2029 12,553,500 12,774,2482.75%, 05/31/2023 - 02/15/2028 8,680,000 8,872,5512.88%, 10/15/2021 - 08/15/2028 36,546,000 37,678,2683.13%, 11/15/2028 20,075,000 21,294,399
Total U.S. Government Obligations(Cost $126,932,973) 130,536,883
Shares ValueOTHER INVESTMENT COMPANY - 0.0% (E)Securities Lending Collateral - 0.0% (E)State Street Navigator Securities Lending
Trust - Government Money MarketPortfolio, 2.41% (G) 204,205 204,205
Total Other Investment Company(Cost $204,205) 204,205
Principal ValueREPURCHASE AGREEMENT - 1.1%Fixed Income Clearing Corp., 1.45% (G),
dated 03/29/2019, to be repurchased at$11,094,329 on 04/01/2019.Collateralized by a U.S. GovernmentObligation, 2.75%, due 09/15/2021, andwith a value of $11,319,211. $ 11,092,989 11,092,989
Total Repurchase Agreement(Cost $11,092,989) 11,092,989
Total Investments(Cost $891,898,262) 1,030,635,977
Net Other Assets (Liabilities) - (0.3)% (3,494,074 )Net Assets - 100.0% $ 1,027,141,903
Copyright © 2021 www.secdatabase.com. All Rights Reserved.Please Consider the Environment Before Printing This Document

The notes are an integral part of this report.Transamerica Series Trust Page 7
Copyright © 2021 www.secdatabase.com. All Rights Reserved.Please Consider the Environment Before Printing This Document

Transamerica Janus Balanced VPSCHEDULE OF INVESTMENTS (continued)At March 31, 2019(unaudited)
SECURITY VALUATION:
Valuation Inputs (H)
Level 1 -Unadjusted
QuotedPrices
Level 2 -Other
SignificantObservable
Inputs
Level 3 -Significant
UnobservableInputs Value
ASSETSInvestmentsCommon Stocks $596,693,718 $� $ � $596,693,718Master Limited Partnership 6,189,026 � � 6,189,026Asset-Backed Securities � 19,288,499 � 19,288,499Corporate Debt Securities � 134,368,112 � 134,368,112Loan Assignments � 4,703,090 � 4,703,090Mortgage-Backed Securities � 16,462,826 � 16,462,826U.S. Government Agency Obligations � 111,096,629 � 111,096,629U.S. Government Obligations � 130,536,883 � 130,536,883Other Investment Company 204,205 � � 204,205Repurchase Agreement � 11,092,989 � 11,092,989Total Investments $ 603,086,949 $ 427,549,028 $�� $ 1,030,635,977
FOOTNOTES TO SCHEDULE OF INVESTMENTS:
(A) Non-income producing securities.(B) Securities are registered pursuant to Rule 144A of the Securities Act of 1933. Unless otherwise indicated, the securities are deemed to be liquid for purposes of
compliance limitations on holdings of illiquid securities and may be resold as transactions exempt from registration, normally to qualified institutional buyers. AtMarch 31, 2019, the total value of 144A securities is $49,196,260, representing 4.8% of the Portfolio�s net assets.
(C) Floating or variable rate securities. The rates disclosed are as of March 31, 2019. For securities based on a published reference rate and spread, the referencerate and spread are indicated within the description. Variable rate securities with a floor or ceiling feature are disclosed at the inherent rate, where applicable.Certain variable rate securities are not based on a published reference rate and spread, but are determined by the issuer or agent and are based on current marketconditions; these securities do not indicate a reference rate and spread in the description.
(D) When-issued, delayed-delivery and/or forward commitment (including TBAs) securities. Securities to be settled and delivered after March 31, 2019. Securities maydisplay a coupon rate of 0.00%, as the rate is to be determined at time of settlement.
(E) Percentage rounds to less than 0.1% or (0.1)%.(F) All or a portion of the securities are on loan. The total value of all securities on loan is $199,980. The amount of securities on loan indicated may not correspond
with the securities on loan identified because securities with pending sales are in the process of recall from the brokers.(G) Rates disclosed reflect the yields at March 31, 2019.(H) There were no transfers in or out of Level 3 during the period ended March 31, 2019. Please reference the Security Valuation section of the Notes to Schedules of
Investments for more information regarding security valuation and pricing inputs.
PORTFOLIO ABBREVIATIONS:
LIBOR London Interbank Offered RateMTN Medium Term Note
The notes are an integral part of this report.Transamerica Series Trust Page 8
Copyright © 2021 www.secdatabase.com. All Rights Reserved.Please Consider the Environment Before Printing This Document

Transamerica Janus Mid-Cap Growth VPSCHEDULE OF INVESTMENTSAt March 31, 2019(unaudited)
The notes are an integral part of this report.Transamerica Series Trust Page 1
Shares ValueCOMMON STOCKS - 97.4%Aerospace & Defense - 3.1%Harris Corp. 88,661 $ 14,160,048Teledyne Technologies, Inc. (A) 83,358 19,756,680
33,916,728Airlines - 0.6%Ryanair Holdings PLC, ADR (A) 84,037 6,297,733Auto Components - 0.4%Visteon Corp. (A) 67,735 4,561,952Banks - 0.5%SVB Financial Group (A) 24,037 5,344,867Biotechnology - 2.7%Alkermes PLC (A) 90,000 3,284,100Celgene Corp. (A) 107,612 10,152,116Neurocrine Biosciences, Inc. (A) 113,453 9,995,209Sage Therapeutics, Inc. (A) 18,196 2,894,074Sarepta Therapeutics, Inc. (A) 31,206 3,719,443
30,044,942Capital Markets - 5.5%Cboe Global Markets, Inc. 67,698 6,461,097LPL Financial Holdings, Inc. 310,154 21,602,226MSCI, Inc. 42,148 8,380,708TD Ameritrade Holding Corp. 485,248 24,257,548
60,701,579Commercial Services & Supplies - 2.6%Cimpress NV (A) 126,182 10,110,963Edenred 190,740 8,680,465Ritchie Bros Auctioneers, Inc. 304,963 10,368,742
29,160,170Consumer Finance - 0.6%Synchrony Financial 200,250 6,387,975Containers & Packaging - 1.6%Sealed Air Corp. 376,341 17,334,266Diversified Consumer Services - 1.6%frontdoor, Inc. (A) 137,129 4,719,980ServiceMaster Global Holdings, Inc. (A) 274,259 12,807,896
17,527,876Electrical Equipment - 2.6%AMETEK, Inc. 51,109 4,240,514Sensata Technologies Holding PLC (A) 537,657 24,205,318
28,445,832Electronic Equipment, Instruments & Components - 5.3%Belden, Inc. 114,308 6,138,340Dolby Laboratories, Inc., Class A 137,216 8,640,492Flex, Ltd. (A) 851,594 8,515,940National Instruments Corp. 356,807 15,827,958TE Connectivity, Ltd. 242,767 19,603,435
58,726,165
Shares ValueCOMMON STOCKS (continued)Entertainment - 0.5%Liberty Media Corp. - Liberty Formula One,
Class C (A) 155,703 $ 5,457,390Equity Real Estate Investment Trusts - 4.0%Crown Castle International Corp. 179,143 22,930,304Lamar Advertising Co., Class A 272,766 21,619,433
44,549,737Health Care Equipment & Supplies - 8.2%Boston Scientific Corp. (A) 582,735 22,365,369Cooper Cos., Inc. 75,908 22,481,672ICU Medical, Inc. (A) 37,625 9,004,791STERIS PLC (A) 146,191 18,716,834Teleflex, Inc. 29,511 8,917,044Varian Medical Systems, Inc. (A) 63,295 8,970,168
90,455,878Hotels, Restaurants & Leisure - 3.2%Aramark 257,405 7,606,318Dunkin� Brands Group, Inc. 201,638 15,143,014Norwegian Cruise Line Holdings, Ltd. (A) 222,034 12,202,988
34,952,320Industrial Conglomerates - 1.1%Carlisle Cos., Inc. 97,940 12,009,403Insurance - 4.9%Aon PLC 129,353 22,080,557Intact Financial Corp. 180,602 15,282,280WR Berkley Corp. 195,861 16,593,344
53,956,181Internet & Direct Marketing Retail - 0.5%Wayfair, Inc., Class A (A) 39,390 5,847,446IT Services - 11.5%Amdocs, Ltd. 273,749 14,812,558Broadridge Financial Solutions, Inc. 146,539 15,194,629Euronet Worldwide, Inc. (A) 41,550 5,924,615Fidelity National Information Services, Inc. 153,667 17,379,738Gartner, Inc. (A) 72,261 10,960,548Global Payments, Inc. 178,844 24,415,783GoDaddy, Inc., Class A (A) 153,679 11,555,124WEX, Inc. (A) 139,721 26,825,035
127,068,030Life Sciences Tools & Services - 5.1%IQVIA Holdings, Inc. (A) 101,274 14,568,265PerkinElmer, Inc. 231,342 22,292,115Waters Corp. (A) 78,423 19,739,853
56,600,233Machinery - 2.7%Middleby Corp. (A) 61,559 8,004,517Rexnord Corp. (A) 411,829 10,353,381Wabtec Corp. 149,667 11,033,451
29,391,349Media - 0.9%Omnicom Group, Inc. 131,450 9,594,536
Copyright © 2021 www.secdatabase.com. All Rights Reserved.Please Consider the Environment Before Printing This Document

Transamerica Janus Mid-Cap Growth VPSCHEDULE OF INVESTMENTS (continued)At March 31, 2019(unaudited)
The notes are an integral part of this report.Transamerica Series Trust Page 2
Shares ValueCOMMON STOCKS (continued)Pharmaceuticals - 1.1%Catalent, Inc. (A) 233,322 $ 9,470,540Elanco Animal Health, Inc. (A) 85,162 2,731,145
12,201,685Professional Services - 4.2%CoStar Group, Inc. (A) 41,626 19,415,199IHS Markit, Ltd. (A) 160,824 8,745,609Verisk Analytics, Inc. 137,258 18,255,314
46,416,122Road & Rail - 0.9%Lyft, Inc., Class A (A) 14,051 1,100,053Old Dominion Freight Line, Inc. 62,912 9,083,863
10,183,916Semiconductors & Semiconductor Equipment - 7.3%KLA-Tencor Corp. 137,078 16,368,484Lam Research Corp. 75,118 13,446,873Microchip Technology, Inc. (B) 268,913 22,309,022ON Semiconductor Corp. (A) 950,201 19,545,635Xilinx, Inc. 71,420 9,055,342
80,725,356Software - 10.6%Atlassian Corp. PLC, Class A (A) 154,486 17,362,682Constellation Software, Inc. 32,912 27,891,525Intuit, Inc. 29,081 7,602,064Nice, Ltd., ADR (A) 189,232 23,182,812SS&C Technologies Holdings, Inc. 427,097 27,201,808Ultimate Software Group, Inc. (A) 42,574 14,054,955
117,295,846Specialty Retail - 0.5%Williams-Sonoma, Inc. (B) 101,620 5,718,157Textiles, Apparel & Luxury Goods - 2.6%Carter�s, Inc. 54,747 5,517,950Gildan Activewear, Inc. 473,005 17,013,990Lululemon Athletica, Inc. (A) 36,459 5,974,536
28,506,476Trading Companies & Distributors - 0.5%Ferguson PLC 88,151 5,607,430Total Common Stocks
(Cost $789,551,295) 1,074,987,576
CONVERTIBLE PREFERRED STOCK - 0.1%Electronic Equipment, Instruments & Components - 0.1%Belden, Inc.,
6.75% 7,900 572,434Total Convertible Preferred Stock
(Cost $790,000) 572,434
Shares ValueOTHER INVESTMENT COMPANY - 2.0%Securities Lending Collateral - 2.0%State Street Navigator Securities Lending
Trust - Government Money MarketPortfolio, 2.41% (C) 22,263,802 $ 22,263,802
Total Other Investment Company(Cost $22,263,802) 22,263,802
Principal ValueREPURCHASE AGREEMENT - 2.6%Fixed Income Clearing Corp., 1.45% (C),
dated 03/29/2019, to be repurchased at$29,217,312 on 04/01/2019.Collateralized by a U.S. GovernmentObligation, 2.75%, due 09/15/2021, andwith a value of $29,801,004. $ 29,213,782 29,213,782
Total Repurchase Agreement(Cost $29,213,782) 29,213,782
Total Investments(Cost $841,818,879) 1,127,037,594
Net Other Assets (Liabilities) - (2.1)% (22,929,887 )Net Assets - 100.0% $ 1,104,107,707
Copyright © 2021 www.secdatabase.com. All Rights Reserved.Please Consider the Environment Before Printing This Document

Transamerica Janus Mid-Cap Growth VPSCHEDULE OF INVESTMENTS (continued)At March 31, 2019(unaudited)
SECURITY VALUATION:
Valuation Inputs (D)
Level 1 -Unadjusted
QuotedPrices
Level 2 -Other
SignificantObservable
Inputs
Level 3 -Significant
UnobservableInputs Value
ASSETSInvestmentsCommon Stocks $1,060,699,681 $14,287,895 $ � $1,074,987,576Convertible Preferred Stock 572,434 � � 572,434Other Investment Company 22,263,802 � � 22,263,802Repurchase Agreement � 29,213,782 � 29,213,782Total Investments $ 1,083,535,917 $ 43,501,677 $ �� $ 1,127,037,594
FOOTNOTES TO SCHEDULE OF INVESTMENTS:
(A) Non-income producing securities.(B) All or a portion of the securities are on loan. The total value of all securities on loan is $21,792,005. The amount of securities on loan indicated may not
correspond with the securities on loan identified because securities with pending sales are in the process of recall from the brokers.(C) Rates disclosed reflect the yields at March 31, 2019.(D) There were no transfers in or out of Level 3 during the period ended March 31, 2019. Please reference the Security Valuation section of the Notes to Schedules of
Investments for more information regarding security valuation and pricing inputs.
PORTFOLIO ABBREVIATION:
ADR American Depositary Receipt
The notes are an integral part of this report.Transamerica Series Trust Page 3
Copyright © 2021 www.secdatabase.com. All Rights Reserved.Please Consider the Environment Before Printing This Document

Transamerica Jennison Growth VPSCHEDULE OF INVESTMENTSAt March 31, 2019(unaudited)
The notes are an integral part of this report.Transamerica Series Trust Page 1
Shares ValueCOMMON STOCKS - 98.8%Aerospace & Defense - 5.0%Airbus SE 54,193 $ 7,167,260Boeing Co. 100,665 38,395,644Safran SA 104,204 14,289,909
59,852,813Automobiles - 1.7%Tesla, Inc. (A) (B) 72,171 20,197,776Banks - 0.9%JPMorgan Chase & Co. 111,744 11,311,845Beverages - 0.3%Constellation Brands, Inc., Class A 20,551 3,603,207Biotechnology - 4.4%Alexion Pharmaceuticals, Inc. (A) 137,486 18,585,357BioMarin Pharmaceutical, Inc. (A) 149,683 13,296,341Sage Therapeutics, Inc. (A) 29,655 4,716,628Vertex Pharmaceuticals, Inc. (A) 84,814 15,601,535
52,199,861Capital Markets - 1.2%S&P Global, Inc. 65,751 13,843,873Entertainment - 3.6%Netflix, Inc. (A) 120,017 42,793,262Equity Real Estate Investment Trusts - 1.8%American Tower Corp. 45,617 8,989,286Crown Castle International Corp. 95,430 12,215,040
21,204,326Food & Staples Retailing - 1.9%Costco Wholesale Corp. 94,384 22,854,142Health Care Equipment & Supplies - 3.3%Danaher Corp. 63,858 8,430,533Edwards Lifesciences Corp. (A) 64,944 12,425,736Intuitive Surgical, Inc. (A) 31,697 18,085,674
38,941,943Health Care Providers & Services - 1.0%UnitedHealth Group, Inc. 48,007 11,870,211Hotels, Restaurants & Leisure - 2.1%Chipotle Mexican Grill, Inc. (A) 17,192 12,211,649Marriott International, Inc., Class A 106,876 13,369,119
25,580,768Interactive Media & Services - 12.1%Alphabet, Inc., Class A (A) 30,442 35,826,885Alphabet, Inc., Class C (A) 30,640 35,950,218Facebook, Inc., Class A (A) 199,114 33,190,313Tencent Holdings, Ltd. 856,269 39,377,717
144,345,133Internet & Direct Marketing Retail - 9.1%Alibaba Group Holding, Ltd., ADR (A) 182,172 33,237,281Amazon.com, Inc. (A) 42,150 75,058,613
108,295,894
Shares ValueCOMMON STOCKS (continued)IT Services - 13.0%Adyen NV (A) (C) 19,264 $ 15,083,359FleetCor Technologies, Inc. (A) 68,419 16,871,441Mastercard, Inc., Class A 201,428 47,426,223PayPal Holdings, Inc. (A) 187,878 19,509,251Square, Inc., Class A (A) 187,192 14,024,425Visa, Inc., Class A 267,087 41,716,319
154,631,018Life Sciences Tools & Services - 1.8%Illumina, Inc. (A) 68,508 21,284,751Personal Products - 1.9%Estee Lauder Cos., Inc., Class A 133,654 22,126,420Pharmaceuticals - 3.5%AstraZeneca PLC, ADR 542,126 21,918,154Bristol-Myers Squibb Co. 171,363 8,175,729Merck & Co., Inc. 145,843 12,129,762
42,223,645Road & Rail - 1.6%Lyft, Inc., Class A (A) 6,828 534,564Union Pacific Corp. 108,955 18,217,276
18,751,840Semiconductors & Semiconductor Equipment - 3.4%Broadcom, Inc. 59,792 17,980,052NVIDIA Corp. 123,082 22,100,604
40,080,656Software - 15.6%Adobe, Inc. (A) 124,739 33,241,696Microsoft Corp. 464,411 54,772,633Red Hat, Inc. (A) 62,489 11,416,740salesforce.com, Inc. (A) 282,856 44,795,905ServiceNow, Inc. (A) 39,854 9,823,612Splunk, Inc. (A) 106,131 13,223,923Workday, Inc., Class A (A) 100,795 19,438,316
186,712,825Specialty Retail - 2.0%Home Depot, Inc. 75,180 14,426,290Lowe�s Cos., Inc. 86,232 9,439,817
23,866,107Technology Hardware, Storage & Peripherals - 2.8%Apple, Inc. 173,727 32,999,444Textiles, Apparel & Luxury Goods - 4.8%Kering SA, ADR 299,660 17,192,993Lululemon Athletica, Inc. (A) 99,923 16,374,382NIKE, Inc., Class B 286,902 24,160,017
57,727,392Total Common Stocks
(Cost $917,614,299) 1,177,299,152
Copyright © 2021 www.secdatabase.com. All Rights Reserved.Please Consider the Environment Before Printing This Document

Transamerica Jennison Growth VPSCHEDULE OF INVESTMENTS (continued)At March 31, 2019(unaudited)
SECURITY VALUATION:
Valuation Inputs (E)
Level 1 -Unadjusted
QuotedPrices
Level 2 -Other
SignificantObservable
Inputs
Level 3 -Significant
UnobservableInputs Value
ASSETSInvestmentsCommon Stocks $1,101,380,907 $75,918,245 $ � $1,177,299,152Other Investment Company 18,448,154 � � 18,448,154Repurchase Agreement � 19,244,859 � 19,244,859Total Investments $ 1,119,829,061 $ 95,163,104 $ �� $ 1,214,992,165
FOOTNOTES TO SCHEDULE OF INVESTMENTS:
(A) Non-income producing securities.(B) All or a portion of the security is on loan. The value of the security on loan is $18,083,714. The amount on loan indicated may not correspond with the security on
loan identified because a security with pending sales are in the process of recall from the brokers.(C) Security is registered pursuant to Rule 144A of the Securities Act of 1933. Unless otherwise indicated, the security is deemed to be liquid for purposes of
compliance limitations on holdings of illiquid securities and may be resold as transactions exempt from registration, normally to qualified institutional buyers. AtMarch 31, 2019, the value of the 144A security is $15,083,359, representing 1.3% of the Portfolio�s net assets.
(D) Rates disclosed reflect the yields at March 31, 2019.(E) There were no transfers in or out of Level 3 during the period ended March 31, 2019. Please reference the Security Valuation section of the Notes to Schedules of
Investments for more information regarding security valuation and pricing inputs.
PORTFOLIO ABBREVIATION:
ADR American Depositary Receipt
The notes are an integral part of this report.Transamerica Series Trust Page 2
Shares ValueOTHER INVESTMENT COMPANY - 1.5%Securities Lending Collateral - 1.5%State Street Navigator Securities Lending
Trust - Government Money MarketPortfolio, 2.41% (D) 18,448,154 $ 18,448,154
Total Other Investment Company(Cost $18,448,154) 18,448,154
Principal ValueREPURCHASE AGREEMENT - 1.6%Fixed Income Clearing Corp., 1.45% (D),
dated 03/29/2019, to be repurchased at$19,247,184 on 04/01/2019.Collateralized by a U.S. GovernmentObligation, 2.75%, due 09/15/2021, andwith a value of $19,632,469. $ 19,244,859 19,244,859
Total Repurchase Agreement(Cost $19,244,859) 19,244,859
Total Investments(Cost $955,307,312) 1,214,992,165
Net Other Assets (Liabilities) - (1.9)% (22,164,160 )Net Assets - 100.0% $ 1,192,828,005
Copyright © 2021 www.secdatabase.com. All Rights Reserved.Please Consider the Environment Before Printing This Document

Transamerica JPMorgan Asset Allocation �� Conservative VPSCHEDULE OF INVESTMENTSAt March 31, 2019(unaudited)
FUTURES CONTRACTS:
DescriptionLong/Short
Number ofContracts
ExpirationDate
NotionalAmount Value
UnrealizedAppreciation
UnrealizedDepreciation
5-Year U.S. Treasury Note Long 1,758 06/28/2019 $ 201,682,309 $ 203,625,844 $ 1,943,535 $�10-Year U.S. Treasury Note Long 478 06/19/2019 58,537,379 59,376,562 839,183 �CAD Currency Long 136 06/18/2019 10,229,085 10,204,080 � (25,005 )E-Mini Russell 2000® Index Long 46 06/21/2019 3,590,513 3,550,740 � (39,773 )EURO STOXX 50® Index Short (258 ) 06/21/2019 (9,322,653 ) (9,469,547 ) � (146,894 )German Euro Bund Index Short (195 ) 06/06/2019 (35,604,286 ) (36,385,429 ) � (781,143 )MSCI EAFE Index Long 105 06/21/2019 9,763,772 9,798,600 34,828 �MSCI Emerging Markets Index Long 254 06/21/2019 13,281,551 13,428,980 147,429 �S&P 500® E-Mini Index Long 427 06/21/2019 59,633,242 60,587,030 953,788 �S&P/ASX 200 Index Short (118 ) 06/20/2019 (12,869,984 ) (12,926,065 ) � (56,081 )TOPIX Index Short (77 ) 06/13/2019 (11,018,151 ) (11,060,543 ) � (42,392 )U.K. Gilt Short (211 ) 06/26/2019 (35,522,527 ) (35,553,059 ) � (30,532 )U.S. Treasury Bond Short (355 ) 06/19/2019 (56,908,436 ) (59,640,000 ) � (2,731,564 )Total $ 3,918,763 $ (3,853,384)
The notes are an integral part of this report.Transamerica Series Trust Page 1
Shares ValueINVESTMENT COMPANIES - 98.8%International Alternative Fund - 6.0%Transamerica Unconstrained Bond (A) 7,870,865 $ 77,134,474International Equity Funds - 11.1%Transamerica Emerging Markets Equity (A) 2,537,933 25,125,541Transamerica International Equity (A) 4,242,591 71,360,373Transamerica International Growth (A) 4,248,726 29,486,155Transamerica International Small Cap Value (A) 1,481,365 17,287,527
143,259,596U.S. Alternative Fund - 2.6%Transamerica BlackRock Global Real Estate
Securities VP (A) 2,674,105 33,265,861U.S. Equity Funds - 23.2%Transamerica Jennison Growth VP (A) 2,894,801 32,450,720Transamerica JPMorgan Enhanced Index VP (A) 5,189,492 113,442,298Transamerica JPMorgan Mid Cap Value VP (A) 1,091,117 18,057,988Transamerica Large Cap Value (A) 5,280,890 59,357,209Transamerica Mid Cap Value Opportunities (A) 1,706,661 19,097,534Transamerica T. Rowe Price Small Cap VP (A) 1,449,356 23,450,574Transamerica WMC US Growth VP (A) 1,074,663 33,937,859
299,794,182U.S. Fixed Income Funds - 39.6%Transamerica Core Bond (A) 14,026,596 138,302,236Transamerica Floating Rate (A) 4,239,639 41,251,683Transamerica High Yield Bond (A) 1,638,837 14,847,865Transamerica Intermediate Bond (A) 31,317,731 315,995,905
510,397,689
Shares ValueINVESTMENT COMPANIES (continued)U.S. Mixed Allocation Fund - 16.3%Transamerica PIMCO Total Return VP (A) 18,350,058 $ 209,924,664Total Investment Companies
(Cost $1,268,128,596) 1,273,776,466
Principal ValueU.S. GOVERNMENT OBLIGATION - 0.7%U.S. Treasury - 0.7%U.S. Treasury Note
2.00%, 01/31/2020 (B) $ 9,500,000 9,468,457Total U.S. Government Obligation
(Cost $9,452,033) 9,468,457
REPURCHASE AGREEMENT - 0.4%Fixed Income Clearing Corp., 1.45% (C),
dated 03/29/2019, to be repurchased at$5,592,037 on 04/01/2019. Collateralizedby a U.S. Government Obligation, 2.75%,due 09/15/2021, and with a value of$5,707,762. 5,591,361 5,591,361
Total Repurchase Agreement(Cost $5,591,361) 5,591,361
Total Investments(Cost $1,283,171,990) 1,288,836,284
Net Other Assets (Liabilities) - 0.1% 1,058,473Net Assets - 100.0% $ 1,289,894,757
Copyright © 2021 www.secdatabase.com. All Rights Reserved.Please Consider the Environment Before Printing This Document

Transamerica JPMorgan Asset Allocation �� Conservative VPSCHEDULE OF INVESTMENTS (continued)At March 31, 2019(unaudited)
SECURITY VALUATION:
Valuation Inputs (D)
Level 1 -Unadjusted
QuotedPrices
Level 2 -Other
SignificantObservable
Inputs
Level 3 -Significant
UnobservableInputs Value
ASSETSInvestmentsInvestment Companies $1,273,776,466 $� $ � $1,273,776,466U.S. Government Obligation � 9,468,457 � 9,468,457Repurchase Agreement � 5,591,361 � 5,591,361Total Investments $ 1,273,776,466 $ 15,059,818 $ �� $ 1,288,836,284Other Financial InstrumentsFutures Contracts (E) $3,918,763 $� $ � $3,918,763Total Other Financial Instruments $3,918,763 $�� $ �� $3,918,763LIABILITIESOther Financial InstrumentsFutures Contracts (E) $(3,853,384 ) $� $ � $(3,853,384 )Total Other Financial Instruments $(3,853,384 ) $�� $ �� $(3,853,384 )
FOOTNOTES TO SCHEDULE OF INVESTMENTS:(A) Affiliated investment in the Class I2 shares of Transamerica Funds and/or investment in the Initial Class shares of Transamerica Series Trust. The Portfolio�s
transactions and earnings from investments of TAM are as follows:
Affiliated InvestmentsValue
December 31, 2018Purchases
at CostProceeds
from Sales
NetRealized
Gain (Loss)
Net Change inUnrealized
Appreciation(Depreciation)
ValueMarch 31, 2019
Shares as ofMarch 31, 2019
DividendIncome
Net CapitalGain
DistributionsTransamerica BlackRock Global
Real Estate Securities VP $� $ 31,270,460 $� $� $1,995,401 $33,265,861 2,674,105 $� $ �Transamerica Core Bond 141,692,657 987,032 (7,378,376 ) (624,339 ) 3,625,262 138,302,236 14,026,596 987,032 �Transamerica Emerging Markets
Equity 23,171,332 � � � 1,954,209 25,125,541 2,537,933 � �Transamerica Floating Rate 39,732,984 556,675 � � 962,024 41,251,683 4,239,639 556,675 �Transamerica High Yield Bond 13,868,912 218,833 � � 760,120 14,847,865 1,638,837 218,833 �Transamerica Intermediate Bond 321,774,405 2,272,161 (15,961,503 ) (328,043 ) 8,238,885 315,995,905 31,317,731 2,272,161 �Transamerica International Equity 66,014,709 � � � 5,345,664 71,360,373 4,242,591 � �Transamerica International
Growth 35,296,736 � (9,719,723 ) (1,997,174 ) 5,906,316 29,486,155 4,248,726 � �Transamerica International Small
Cap Value 16,087,621 � � � 1,199,906 17,287,527 1,481,365 � �Transamerica Jennison Growth
VP 34,459,129 � (7,177,656 ) (272,638 ) 5,441,885 32,450,720 2,894,801 � �Transamerica JPMorgan
Enhanced Index VP 105,434,357 � (5,906,043 ) 997,722 12,916,262 113,442,298 5,189,492 � �Transamerica JPMorgan Mid Cap
Value VP 15,755,731 � � � 2,302,257 18,057,988 1,091,117 � �Transamerica Large Cap Value 52,244,478 276,465 � � 6,836,266 59,357,209 5,280,890 276,465 �Transamerica Mid Cap Value
Opportunities 16,776,476 � � � 2,321,058 19,097,534 1,706,661 � �Transamerica PIMCO Total
Return VP 216,811,161 � (12,876,420 ) (506,537 ) 6,496,460 209,924,664 18,350,058 � �Transamerica T. Rowe Price
Small Cap VP 19,986,614 � � � 3,463,960 23,450,574 1,449,356 � �Transamerica Unconstrained
Bond 77,406,431 924,019 (3,524,614 ) (112,795 ) 2,441,433 77,134,474 7,870,865 924,019 �Transamerica WMC US Growth
VP 28,865,449 � � � 5,072,410 33,937,859 1,074,663 � �
Total $ 1,225,379,182 $ 36,505,645 $ (62,544,335) $ (2,843,804) $ 77,279,778 $ 1,273,776,466 111,315,426 $ 5,235,185 $ ��
Copyright © 2021 www.secdatabase.com. All Rights Reserved.Please Consider the Environment Before Printing This Document

The notes are an integral part of this report.Transamerica Series Trust Page 2
Copyright © 2021 www.secdatabase.com. All Rights Reserved.Please Consider the Environment Before Printing This Document

Transamerica JPMorgan Asset Allocation �� Conservative VPSCHEDULE OF INVESTMENTS (continued)At March 31, 2019(unaudited)
FOOTNOTES TO SCHEDULE OF INVESTMENTS (continued):
(B) All or a portion of the security has been segregated by the custodian as collateral to cover margin requirements for open futures contracts. The value of thesecurity is $8,167,790.
(C) Rate disclosed reflects the yield at March 31, 2019.(D) There were no transfers in or out of Level 3 during the period ended March 31, 2019. Please reference the Security Valuation section of the Notes to Schedules of
Investments for more information regarding security valuation and pricing inputs.(E) Futures contracts and/or forward foreign currency contracts are valued at unrealized appreciation (depreciation).
CURRENCY ABBREVIATIONS:
CAD Canadian Dollar
PORTFOLIO ABBREVIATIONS:
ASX Australian Securities ExchangeEAFE Europe, Australasia and Far EastSTOXX Deutsche Börse Group & SIX Group IndexTOPIX Tokyo Price Index
The notes are an integral part of this report.Transamerica Series Trust Page 3
Copyright © 2021 www.secdatabase.com. All Rights Reserved.Please Consider the Environment Before Printing This Document

Transamerica JPMorgan Asset Allocation �� Growth VPSCHEDULE OF INVESTMENTSAt March 31, 2019(unaudited)
FUTURES CONTRACTS:
DescriptionLong/Short
Number ofContracts
ExpirationDate
NotionalAmount Value
UnrealizedAppreciation
UnrealizedDepreciation
5-Year U.S. Treasury Note Short (171 ) 06/28/2019 $ (19,624,563) $ (19,806,609) $� $(182,046 )CAD Currency Long 241 06/18/2019 18,126,540 18,082,230 � (44,310 )E-Mini Russell 2000® Index Long 335 06/21/2019 25,706,605 25,858,650 152,045 �EURO STOXX 50® Index Short (125 ) 06/21/2019 (4,508,583 ) (4,587,959 ) � (79,376 )MSCI EAFE Index Short (252 ) 06/21/2019 (23,110,958 ) (23,516,640 ) � (405,682 )MSCI Emerging Markets Index Long 1,054 06/21/2019 55,129,482 55,724,980 595,498 �S&P 500® E-Mini Index Long 472 06/21/2019 65,519,711 66,972,080 1,452,369 �
Total $ 2,199,912 $ (711,414)
The notes are an integral part of this report.Transamerica Series Trust Page 1
Shares ValueINVESTMENT COMPANIES - 98.5%International Alternative Fund - 1.6%Transamerica Unconstrained Bond (A) 1,578,429 $ 15,468,609International Equity Funds - 27.0%Transamerica Emerging Markets Equity (A) 2,909,577 28,804,812Transamerica International Equity (A) 6,441,935 108,353,346Transamerica International Growth (A) 13,718,726 95,207,957Transamerica International Small Cap Value (A) 1,808,246 21,102,230
253,468,345U.S. Alternative Fund - 12.1%Transamerica BlackRock Global Real Estate
Securities VP (A) 9,138,403 113,681,730U.S. Equity Funds - 53.2%Transamerica Janus Mid-Cap Growth VP (A) 705,951 25,576,589Transamerica Jennison Growth VP (A) 7,262,065 81,407,749Transamerica JPMorgan Enhanced Index VP (A) 4,207,417 91,974,125Transamerica JPMorgan Mid Cap Value VP (A) 446,868 7,395,672Transamerica Large Cap Value (A) 13,312,653 149,634,217Transamerica Mid Cap Value Opportunities (A) 1,566,975 17,534,452Transamerica Small Cap Value (A) 1,847,176 17,751,361Transamerica Small Company Growth
Liquidating Trust (A) (B) (C) (D) 3,075 1,912Transamerica T. Rowe Price Small Cap VP (A) 1,713,825 27,729,684Transamerica WMC US Growth VP (A) 2,569,545 81,146,222
500,151,983U.S. Fixed Income Funds - 4.6%Transamerica Floating Rate (A) 2,818,116 27,420,272Transamerica High Yield Bond (A) 1,752,208 15,875,001
43,295,273Total Investment Companies
(Cost $895,696,931) 926,065,940
Principal ValueU.S. GOVERNMENT OBLIGATION - 0.8%U.S. Treasury - 0.8%U.S. Treasury Note
2.00%, 01/31/2020 (E) $ 7,630,000 $ 7,604,666Total U.S. Government Obligation
(Cost $7,590,270) 7,604,666
REPURCHASE AGREEMENT - 0.6%Fixed Income Clearing Corp., 1.45% (F), dated
03/29/2019, to be repurchased at $5,566,699on 04/01/2019. Collateralized by a U.S.Government Obligation, 2.75%, due 09/15/2021, and with a value of $5,682,416. 5,566,027 5,566,027
Total Repurchase Agreement(Cost $5,566,027) 5,566,027
Total Investments(Cost $908,853,228) 939,236,633
Net Other Assets (Liabilities) - 0.1% 484,518Net Assets - 100.0% $ 939,721,151
Copyright © 2021 www.secdatabase.com. All Rights Reserved.Please Consider the Environment Before Printing This Document

Transamerica JPMorgan Asset Allocation �� Growth VPSCHEDULE OF INVESTMENTS (continued)At March 31, 2019(unaudited)
SECURITY VALUATION:
Valuation Inputs (G)
Level 1 -Unadjusted
QuotedPrices
Level 2 -Other
SignificantObservable
Inputs
Level 3 -Significant
UnobservableInputs Value
ASSETSInvestmentsInvestment Companies $926,064,028 $� $ � $926,064,028U.S. Government Obligation � 7,604,666 � 7,604,666Repurchase Agreement � 5,566,027 � 5,566,027Total $ 926,064,028 $ 13,170,693 $ �� $ 939,234,721Investment Companies Measured at Net Asset Value (D) 1,912Total Investments 939,236,633Other Financial InstrumentsFutures Contracts (H) $2,199,912 $� $ � $2,199,912Total Other Financial Instruments $2,199,912 $�� $ �� $2,199,912LIABILITIESOther Financial InstrumentsFutures Contracts (H) $(711,414 ) $� $ � $(711,414 )Total Other Financial Instruments $(711,414 ) $�� $ �� $(711,414 )
FOOTNOTES TO SCHEDULE OF INVESTMENTS:
(A) Affiliated investment in the Class I2 shares and liquidating trusts of Transamerica Funds and/or investment in the Initial Class shares of Transamerica SeriesTrust. The Portfolio�s transactions and earnings from investments of TAM are as follows:
Affiliated InvestmentsValue
December 31, 2018Purchases
at CostProceeds
from Sales
NetRealized
Gain (Loss)
Net Change inUnrealized
Appreciation(Depreciation)
ValueMarch 31, 2019
Shares as ofMarch 31, 2019
DividendIncome
Net CapitalGain
DistributionsTransamerica BlackRock Global
Real Estate Securities VP $ 69,872,984 $ 28,977,304 $� $� $14,831,442 $113,681,730 9,138,403 $� $ �Transamerica Emerging Markets
Equity 26,564,438 � � � 2,240,374 28,804,812 2,909,577 � �Transamerica Floating Rate 26,410,782 370,026 � � 639,464 27,420,272 2,818,116 370,026 �Transamerica High Yield Bond 26,256,619 239,611 (11,433,711) (638,904) 1,451,386 15,875,001 1,752,208 239,611 �Transamerica International Equity 100,236,508 � � � 8,116,838 108,353,346 6,441,935 � �Transamerica International Growth 72,751,719 12,536,123 � � 9,920,115 95,207,957 13,718,726 � �Transamerica International Small
Cap Value 19,637,551 � � � 1,464,679 21,102,230 1,808,246 � �
The notes are an integral part of this report.Transamerica Series Trust Page 2
Copyright © 2021 www.secdatabase.com. All Rights Reserved.Please Consider the Environment Before Printing This Document

Transamerica JPMorgan Asset Allocation �� Growth VPSCHEDULE OF INVESTMENTS (continued)At March 31, 2019(unaudited)
FOOTNOTES TO SCHEDULE OF INVESTMENTS (continued):
Affiliated InvestmentsValue
December 31, 2018Purchases
at CostProceeds
from Sales
NetRealized
Gain (Loss)
Net Change inUnrealized
Appreciation(Depreciation)
ValueMarch 31, 2019
Shares as ofMarch 31, 2019
DividendIncome
Net CapitalGain
DistributionsTransamerica Janus Mid-Cap
Growth VP $21,587,968 $� $� $� $3,988,621 $25,576,589 705,951 $� $ �Transamerica Jennison Growth VP 77,261,159 � (8,455,940 ) (38,588 ) 12,641,118 81,407,749 7,262,065 � �Transamerica JPMorgan Enhanced
Index VP 90,937,525 � (10,577,394 ) 1,640,962 9,973,032 91,974,125 4,207,417 � �Transamerica JPMorgan Mid Cap
Value VP 6,452,780 � � � 942,892 7,395,672 446,868 � �Transamerica Large Cap Value 132,924,352 696,943 (1,374,200 ) 196,512 17,190,610 149,634,217 13,312,653 696,943 �Transamerica Mid Cap Value
Opportunities 15,403,366 � � � 2,131,086 17,534,452 1,566,975 � �Transamerica Small Cap Value 15,811,826 � � � 1,939,535 17,751,361 1,847,176 � �Transamerica Small Company
Growth Liquidating Trust 1,912 � � � � 1,912 3,075 � �Transamerica T. Rowe Price Small
Cap VP 26,420,019 � (3,198,575 ) 951,692 3,556,548 27,729,684 1,713,825 � �Transamerica Unconstrained Bond 26,805,852 184,297 (11,904,675 ) (824,238 ) 1,207,373 15,468,609 1,578,429 184,297 �Transamerica WMC US Growth
VP 77,569,313 � (9,220,004 ) 1,360,370 11,436,543 81,146,222 2,569,545 � �
Total $ 832,906,673 $ 43,004,304 $ (56,164,499) $ 2,647,806 $ 103,671,656 $ 926,065,940 73,801,190 $ 1,490,877 $ ��
(B) Non-income producing security.(C) Restricted security. At March 31, 2019, the value of such security held by the Portfolio is as follows:
Investments DescriptionAcquisition
DateAcquisition
Cost ValueValue as Percentage
of Net AssetsInvestment
Companies Transamerica Small Company Growth Liquidating Trust 10/26/2012 $ 30,750 $ 1,912 0.0 %(I)
(D) Certain investments are measured at fair value using the net asset value per share, or its equivalent, practical expedient and have not been classified in the fairvalue levels. The fair value amount presented is intended to permit reconciliation to the Total Investments amount presented within the Schedule of Investments.
(E) All or a portion of the security has been segregated by the custodian as collateral to cover margin requirements for open futures contracts. The value of thesecurity is $7,604,666.
(F) Rate disclosed reflects the yield at March 31, 2019.(G) There were no transfers in or out of Level 3 during the period ended March 31, 2019. Please reference the Security Valuation section of the Notes to Schedules of
Investments for more information regarding security valuation and pricing inputs.(H) Futures contracts and/or forward foreign currency contracts are valued at unrealized appreciation (depreciation).(I) Percentage rounds to less than 0.1% or (0.1)%.
CURRENCY ABBREVIATIONS:
CAD Canadian Dollar
PORTFOLIO ABBREVIATIONS:
EAFE Europe, Australasia and Far EastSTOXX Deutsche Börse Group & SIX Group Index
The notes are an integral part of this report.Transamerica Series Trust Page 3
Copyright © 2021 www.secdatabase.com. All Rights Reserved.Please Consider the Environment Before Printing This Document

Transamerica JPMorgan Asset Allocation �� Moderate Growth VPSCHEDULE OF INVESTMENTSAt March 31, 2019(unaudited)
FUTURES CONTRACTS:
DescriptionLong/Short
Number ofContracts
ExpirationDate
NotionalAmount Value
UnrealizedAppreciation
UnrealizedDepreciation
5-Year U.S. Treasury Note Long 7,027 06/28/2019 $806,185,254 $813,924,234 $7,738,980 $�10-Year U.S. Treasury Note Long 1,964 06/19/2019 241,050,981 243,965,625 2,914,644 �CAD Currency Long 970 06/18/2019 72,957,445 72,779,100 � (178,345 )E-Mini Russell 2000® Index Short (999 ) 06/21/2019 (76,450,950 ) (77,112,810 ) � (661,860 )EURO STOXX 50® Index Short (1,912 ) 06/21/2019 (69,205,119 ) (70,177,416 ) � (972,297 )German Euro Bund Index Short (713 ) 06/06/2019 (130,183,877) (133,040,055 ) � (2,856,178 )MSCI EAFE Index Long 938 06/21/2019 87,230,342 87,534,160 303,818 �MSCI Emerging Markets Index Long 1,684 06/21/2019 88,055,636 89,033,080 977,444 �S&P 500® E-Mini Index Long 2,276 06/21/2019 317,891,870 322,941,640 5,049,770 �S&P/ASX 200 Index Short (436 ) 06/20/2019 (47,553,496 ) (47,760,716 ) � (207,220 )TOPIX Index Short (393 ) 06/13/2019 (56,686,486 ) (56,451,863 ) 234,623 �U.K. Gilt Short (774 ) 06/26/2019 (130,305,384 ) (130,417,383 ) � (111,999 )U.S. Treasury Bond Short (1,271 ) 06/19/2019 (203,764,612 ) (213,528,000) � (9,763,388 )Total $ 17,219,279 $ (14,751,287)
The notes are an integral part of this report.Transamerica Series Trust Page 1
Shares ValueINVESTMENT COMPANIES - 98.6%International Alternative Funds - 4.0%Transamerica Global Allocation Liquidating
Trust (A) (B) (C) (D) 70,452 $ 363,053Transamerica Unconstrained Bond (D) 19,469,517 190,801,267
191,164,320International Equity Funds - 20.1%Transamerica Emerging Markets Equity (D) 14,848,204 146,997,218Transamerica International Equity (D) 27,042,561 454,855,872Transamerica International Growth (D) 34,088,895 236,576,928Transamerica International Small Cap
Value (D) 9,893,369 115,455,618953,885,636
U.S. Alternative Fund - 8.4%Transamerica BlackRock Global Real Estate
Securities VP (D) 32,135,243 399,762,428U.S. Equity Funds - 46.0%Transamerica Janus Mid-Cap Growth VP (D) 4,671,053 169,232,241Transamerica Jennison Growth VP (D) 21,919,541 245,718,055Transamerica JPMorgan Enhanced Index
VP (D) 31,490,013 688,371,685Transamerica JPMorgan Mid Cap Value VP (D) 4,971,976 82,286,204Transamerica Large Cap Value (D) 41,305,484 464,273,644Transamerica Mid Cap Value Opportunities (D) 7,734,737 86,551,710Transamerica Small Cap Value (D) 7,741,102 74,391,989Transamerica Small Company Growth
Liquidating Trust (A) (B) (C) (D) 16,244 10,102Transamerica T. Rowe Price Small Cap VP (D) 8,334,203 134,847,410Transamerica WMC US Growth VP (D) 7,407,408 233,925,945
2,179,608,985
Shares ValueINVESTMENT COMPANIES (continued)U.S. Fixed Income Funds - 14.6%Transamerica Core Bond (D) 12,219,261 $ 120,481,913Transamerica Floating Rate (D) 10,748,703 104,584,880Transamerica High Yield Bond (D) 20,463,860 185,402,570Transamerica Intermediate Bond (D) 27,694,959 279,442,134
689,911,497U.S. Mixed Allocation Fund - 5.5%Transamerica PIMCO Total Return VP (D) 22,759,795 260,372,052Total Investment Companies
(Cost $4,494,579,996) 4,674,704,918
Principal ValueU.S. GOVERNMENT OBLIGATION - 0.9%U.S. Treasury - 0.9%U.S. Treasury Note
2.00%, 01/31/2020 (E) $ 45,358,000 45,207,397Total U.S. Government Obligation
(Cost $45,119,847) 45,207,397
REPURCHASE AGREEMENT - 0.4%Fixed Income Clearing Corp., 1.45% (F),
dated 03/29/2019, to be repurchased at$19,533,701 on 04/01/2019. Collateralizedby a U.S. Government Obligation, 2.75%,due 09/15/2021, and with a value of$19,926,475. 19,531,341 19,531,341
Total Repurchase Agreement(Cost $19,531,341) 19,531,341
Total Investments(Cost $4,559,231,184) 4,739,443,656
Net Other Assets (Liabilities) - 0.1% 3,636,627Net Assets - 100.0% $ 4,743,080,283
Copyright © 2021 www.secdatabase.com. All Rights Reserved.Please Consider the Environment Before Printing This Document

Transamerica JPMorgan Asset Allocation �� Moderate Growth VPSCHEDULE OF INVESTMENTS (continued)At March 31, 2019(unaudited)
SECURITY VALUATION:
Valuation Inputs (G)
Level 1 -Unadjusted
QuotedPrices
Level 2 -Other
SignificantObservable
Inputs
Level 3 -Significant
UnobservableInputs Value
ASSETSInvestmentsInvestment Companies $4,674,331,763 $� $ � $4,674,331,763U.S. Government Obligation � 45,207,397 � 45,207,397Repurchase Agreement � 19,531,341 � 19,531,341Total $ 4,674,331,763 $ 64,738,738 $ �� $ 4,739,070,501Investment Companies Measured at Net Asset Value (C) 373,155Total Investments 4,739,443,656Other Financial InstrumentsFutures Contracts (H) $17,219,279 $� $ � $17,219,279Total Other Financial Instruments $17,219,279 $�� $ �� $17,219,279LIABILITIESOther Financial InstrumentsFutures Contracts (H) $(14,751,287 ) $� $ � $(14,751,287 )Total Other Financial Instruments $(14,751,287 ) $�� $ �� $(14,751,287 )
FOOTNOTES TO SCHEDULE OF INVESTMENTS:
(A) Non-income producing securities.(B) Restricted securities. At March 31, 2019, the value of such securities held by the Portfolio are as follows:
Investments DescriptionAcquisition
DateAcquisition
Cost ValueValue as Percentage
of Net AssetsInvestment
Companies Transamerica Global Allocation Liquidating Trust 07/31/2014 $724,839 $363,053 0.0 %(I)Investment
Companies Transamerica Small Company Growth Liquidating Trust 10/26/2012 162,437 10,102 0.0 (I)
Total $ 887,276 $ 373,155 0.0 %(I)
(C) Certain investments are measured at fair value using the net asset value per share, or its equivalent, practical expedient and have not been classified in the fairvalue levels. The fair value amount presented is intended to permit reconciliation to the Total Investments amount presented within the Schedule of Investments.
(D) Affiliated investment in the Class I2 shares and liquidating trusts of Transamerica Funds and/or investment in the Initial Class shares of Transamerica SeriesTrust. The Portfolio�s transactions and earnings from investments of TAM are as follows:
The notes are an integral part of this report.Transamerica Series Trust Page 2
Copyright © 2021 www.secdatabase.com. All Rights Reserved.Please Consider the Environment Before Printing This Document

Transamerica JPMorgan Asset Allocation �� Moderate Growth VPSCHEDULE OF INVESTMENTS (continued)At March 31, 2019(unaudited)
FOOTNOTES TO SCHEDULE OF INVESTMENTS (continued):
Affiliated InvestmentsValue
December 31, 2018Purchases
at CostProceeds
from Sales
NetRealized
Gain (Loss)
Net Change inUnrealized
Appreciation(Depreciation)
ValueMarch 31, 2019
Shares as ofMarch 31, 2019
DividendIncome
Net CapitalGain
DistributionsTransamerica BlackRock
Global Real EstateSecurities VP $187,597,015 $171,969,834 $� $� $40,195,579 $399,762,428 32,135,243 $� $ �
Transamerica Core Bond 126,329,428 845,229 (9,250,165 ) (268,399 ) 2,825,820 120,481,913 12,219,261 845,230 �Transamerica Emerging
Markets Equity 135,564,101 � � � 11,433,117 146,997,218 14,848,204 � �Transamerica Floating Rate 107,550,845 1,456,180 (7,011,839 ) (151,646 ) 2,741,340 104,584,880 10,748,703 1,456,180 �Transamerica Global
Allocation LiquidatingTrust 354,536 � � � 8,517 363,053 70,452 � �
Transamerica High YieldBond 182,078,848 2,798,021 (9,349,112 ) 667,794 9,207,019 185,402,570 20,463,860 2,798,020 �
Transamerica IntermediateBond 301,452,288 1,984,490 (30,932,628 ) (572,987 ) 7,510,971 279,442,134 27,694,959 1,984,490 �
Transamerica InternationalEquity 420,782,245 � � � 34,073,627 454,855,872 27,042,561 � �
Transamerica InternationalGrowth 278,842,667 � (73,302,559 ) (17,251,677 ) 48,288,497 236,576,928 34,088,895 � �
Transamerica InternationalSmall Cap Value 107,441,989 � � � 8,013,629 115,455,618 9,893,369 � �
Transamerica Janus Mid-CapGrowth VP 142,840,793 � � � 26,391,448 169,232,241 4,671,053 � �
Transamerica JennisonGrowth VP 245,344,151 � (37,935,717 ) 5,991,897 32,317,724 245,718,055 21,919,541 � �
Transamerica JPMorganEnhanced Index VP 681,680,724 � (79,353,654 ) 10,490,471 75,554,144 688,371,685 31,490,013 � �
Transamerica JPMorgan MidCap Value VP 71,795,334 � � � 10,490,870 82,286,204 4,971,976 � �
Transamerica Large Cap Value 448,711,092 2,162,421 (44,642,537 ) 3,685,823 54,356,845 464,273,644 41,305,484 2,162,421 �Transamerica Mid Cap Value
Opportunities 76,032,467 � � � 10,519,243 86,551,710 7,734,737 � �Transamerica PIMCO Total
Return VP 262,273,415 � (9,217,535 ) (462,529 ) 7,778,701 260,372,052 22,759,795 � �Transamerica Small Cap Value 66,263,833 � � � 8,128,156 74,391,989 7,741,102 � �Transamerica Small Company
Growth Liquidating Trust 10,100 � � � 2 10,102 16,244 � �Transamerica T. Rowe Price
Small Cap VP 114,928,664 � � � 19,918,746 134,847,410 8,334,203 � �Transamerica Unconstrained
Bond 201,895,920 2,284,244 (19,216,558 ) (661,850 ) 6,499,511 190,801,267 19,469,517 2,284,244 �Transamerica WMC US
Growth VP 232,676,761 � (36,523,927 ) 5,572,962 32,200,149 233,925,945 7,407,408 � �
Total $ 4,392,447,216 $ 183,500,419 $ (356,736,231) $ 7,039,859 $ 448,453,655 $ 4,674,704,918 367,026,580 $ 11,530,585 $ ��
(E) All or a portion of the security has been segregated by the custodian as collateral to cover margin requirements for open futures contracts. The value of thesecurity is $39,645,925.
(F) Rate disclosed reflects the yield at March 31, 2019.(G) There were no transfers in or out of Level 3 during the period ended March 31, 2019. Please reference the Security Valuation section of the Notes to Schedules of
Investments for more information regarding security valuation and pricing inputs.(H) Futures contracts and/or forward foreign currency contracts are valued at unrealized appreciation (depreciation).(I) Percentage rounds to less than 0.1% or (0.1)%.
CURRENCY ABBREVIATIONS:
CAD Canadian Dollar
The notes are an integral part of this report.Transamerica Series Trust Page 3
Copyright © 2021 www.secdatabase.com. All Rights Reserved.Please Consider the Environment Before Printing This Document

Transamerica JPMorgan Asset Allocation �� Moderate Growth VPSCHEDULE OF INVESTMENTS (continued)At March 31, 2019(unaudited)
PORTFOLIO ABBREVIATIONS:
ASX Australian Securities ExchangeEAFE Europe, Australasia and Far EastSTOXX Deutsche Börse Group & SIX Group IndexTOPIX Tokyo Price Index
The notes are an integral part of this report.Transamerica Series Trust Page 4
Copyright © 2021 www.secdatabase.com. All Rights Reserved.Please Consider the Environment Before Printing This Document

Transamerica JPMorgan Asset Allocation �� Moderate VPSCHEDULE OF INVESTMENTSAt March 31, 2019(unaudited)
FUTURES CONTRACTS:
DescriptionLong/Short
Number ofContracts
ExpirationDate
NotionalAmount Value
UnrealizedAppreciation
UnrealizedDepreciation
5-Year U.S. Treasury Note Long 9,649 06/28/2019 $ 1,106,999,021 $ 1,117,625,578 $10,626,557 $�10-Year U.S. Treasury Note Long 2,238 06/19/2019 274,072,501 278,001,563 3,929,062 �CAD Currency Long 779 06/18/2019 58,591,595 58,448,370 � (143,225 )E-Mini Russell 2000® Index Short (519 ) 06/21/2019 (39,718,016 ) (40,061,610 ) � (343,594 )EURO STOXX 50® Index Short (2,477 ) 06/21/2019 (89,500,966 ) (90,914,989 ) � (1,414,023 )German Euro Bund Index Short (955 ) 06/06/2019 (174,369,710 ) (178,195,306 ) � (3,825,596 )MSCI EAFE Index Long 1,251 06/21/2019 115,917,469 116,743,320 825,851 �MSCI Emerging Markets Index Long 1,752 06/21/2019 91,611,327 92,628,240 1,016,913 �S&P 500® E-Mini Index Long 2,214 06/21/2019 309,907,257 314,144,460 4,237,203 �S&P/ASX 200 Index Short (567 ) 06/20/2019 (61,841,363 ) (62,110,839 ) � (269,476 )TOPIX Index Short (468 ) 06/13/2019 (67,504,518 ) (67,225,120 ) 279,398 �U.K. Gilt Short (1,012 ) 06/26/2019 (170,373,447 ) (170,519,886 ) � (146,439 )U.S. Treasury Bond Short (1,420 ) 06/19/2019 (227,654,265 ) (238,560,000 ) � (10,905,735 )Total $ 20,914,984 $ (17,048,088)
The notes are an integral part of this report.Transamerica Series Trust Page 1
Shares ValueINVESTMENT COMPANIES - 98.2%International Alternative Funds - 5.1%Transamerica Global Allocation Liquidating
Trust (A) (B) (C) (D) 36,728 $ 189,265Transamerica Unconstrained Bond (D) 32,101,935 314,598,963
314,788,228International Equity Funds - 14.6%Transamerica Emerging Markets Equity (D) 15,279,646 151,268,500Transamerica International Equity (D) 25,265,919 424,972,753Transamerica International Growth (D) 32,633,005 226,473,054Transamerica International Small Cap
Value (D) 8,700,125 101,530,458904,244,765
U.S. Alternative Fund - 3.3%Transamerica BlackRock Global Real Estate
Securities VP (D) 16,318,407 203,000,978U.S. Equity Funds - 37.0%Transamerica Janus Mid-Cap Growth VP (D) 4,905,612 177,730,335Transamerica Jennison Growth VP (D) 24,128,819 270,484,062Transamerica JPMorgan Enhanced Index
VP (D) 33,233,786 726,490,572Transamerica JPMorgan Mid Cap Value VP (D) 3,597,396 59,536,905Transamerica Large Cap Value (D) 44,818,642 503,761,537Transamerica Mid Cap Value Opportunities (D) 8,947,216 100,119,351Transamerica Small Cap Value (D) 5,922,516 56,915,380Transamerica Small Company Growth
Liquidating Trust (A) (B) (C) (D) 5,959 3,706Transamerica T. Rowe Price Small Cap VP (D) 8,320,633 134,627,845Transamerica WMC US Growth VP (D) 8,365,883 264,194,585
2,293,864,278
Shares ValueINVESTMENT COMPANIES (continued)U.S. Fixed Income Funds - 27.3%Transamerica Core Bond (D) 37,656,113 $ 371,289,275Transamerica Floating Rate (D) 16,776,371 163,234,087Transamerica High Yield Bond (D) 23,789,210 215,530,240Transamerica Intermediate Bond (D) 93,184,444 940,231,039
1,690,284,641U.S. Mixed Allocation Fund - 10.9%Transamerica PIMCO Total Return VP (D) 58,833,583 673,056,192Total Investment Companies
(Cost $5,945,472,154) 6,079,239,082
Principal ValueU.S. GOVERNMENT OBLIGATION - 0.9%U.S. Treasury - 0.9%U.S. Treasury Note
2.00%, 01/31/2020 (E) $ 53,851,000 53,672,198Total U.S. Government Obligation
(Cost $53,559,802) 53,672,198
REPURCHASE AGREEMENT - 0.9%Fixed Income Clearing Corp., 1.45% (F),
dated 03/29/2019, to be repurchased at$53,956,613 on 04/01/2019. Collateralizedby a U.S. Government Obligation, 2.75%,due 09/15/2021, and with a value of$55,029,715. 53,950,094 53,950,094
Total Repurchase Agreement(Cost $53,950,094) 53,950,094
Total Investments(Cost $6,052,982,050) 6,186,861,374
Net Other Assets (Liabilities) - 0.0% (G) 2,937,276Net Assets - 100.0% $ 6,189,798,650
Copyright © 2021 www.secdatabase.com. All Rights Reserved.Please Consider the Environment Before Printing This Document

Transamerica JPMorgan Asset Allocation �� Moderate VPSCHEDULE OF INVESTMENTS (continued)At March 31, 2019(unaudited)
SECURITY VALUATION:
Valuation Inputs (H)
Level 1 -Unadjusted
QuotedPrices
Level 2 -Other
SignificantObservable
Inputs
Level 3 -Significant
UnobservableInputs Value
ASSETSInvestmentsInvestment Companies $6,079,046,111 $� $ � $6,079,046,111U.S. Government Obligation � 53,672,198 � 53,672,198Repurchase Agreement � 53,950,094 � 53,950,094Total $ 6,079,046,111 $ 107,622,292 $ �� $ 6,186,668,403Investment Companies Measured at Net Asset Value (C) 192,971Total Investments 6,186,861,374Other Financial InstrumentsFutures Contracts (I) $20,914,984 $� $ � $20,914,984Total Other Financial Instruments $20,914,984 $�� $ �� $20,914,984LIABILITIESOther Financial InstrumentsFutures Contracts (I) $(17,048,088 ) $� $ � $(17,048,088 )Total Other Financial Instruments $(17,048,088 ) $�� $ �� $(17,048,088 )
FOOTNOTES TO SCHEDULE OF INVESTMENTS:
(A) Non-income producing securities.(B) Restricted securities. At March 31, 2019, the value of such securities held by the Portfolio are as follows:
Investments DescriptionAcquisition
DateAcquisition
Cost ValueValue as Percentage
of Net AssetsInvestment
Companies Transamerica Global Allocation Liquidating Trust 07/31/2014 $377,870 $189,265 0.0 %(G)Investment
Companies Transamerica Small Company Growth Liquidating Trust 10/26/2012 59,594 3,706 0.0 (G)
Total $ 437,464 $ 192,971 0.0 %(G)
(C) Certain investments are measured at fair value using the net asset value per share, or its equivalent, practical expedient and have not been classified in the fairvalue levels. The fair value amount presented is intended to permit reconciliation to the Total Investments amount presented within the Schedule of Investments.
(D) Affiliated investment in the Class I2 shares and liquidating trusts of Transamerica Funds and/or investment in the Initial Class shares of Transamerica SeriesTrust. The Portfolio�s transactions and earnings from investments of TAM are as follows:
The notes are an integral part of this report.Transamerica Series Trust Page 2
Copyright © 2021 www.secdatabase.com. All Rights Reserved.Please Consider the Environment Before Printing This Document

Transamerica JPMorgan Asset Allocation �� Moderate VPSCHEDULE OF INVESTMENTS (continued)At March 31, 2019(unaudited)
FOOTNOTES TO SCHEDULE OF INVESTMENTS (continued):
Affiliated InvestmentsValue
December 31, 2018Purchases
at CostProceeds
from Sales
NetRealized
Gain (Loss)
Net Change inUnrealized
Appreciation(Depreciation)
ValueMarch 31, 2019
Shares as ofMarch 31, 2019
DividendIncome
Net CapitalGain
DistributionsTransamerica BlackRock
Global Real EstateSecurities VP $� $191,778,014 $� $� $11,222,964 $203,000,978 16,318,407 $� $ �
Transamerica Core Bond 384,860,185 2,660,089 (24,280,798 ) (2,253,634 ) 10,303,433 371,289,275 37,656,113 2,660,089 �Transamerica Emerging
Markets Equity 139,503,172 � � � 11,765,328 151,268,500 15,279,646 � �Transamerica Floating Rate 157,224,550 2,202,778 � � 3,806,759 163,234,087 16,776,371 2,202,778 �Transamerica Global
Allocation LiquidatingTrust 184,825 � � � 4,440 189,265 36,728 � �
Transamerica High YieldBond 201,319,851 3,176,556 � � 11,033,833 215,530,240 23,789,210 3,176,557 �
Transamerica IntermediateBond 971,445,954 6,813,281 (61,746,715 ) (742,105 ) 24,460,624 940,231,039 93,184,444 6,813,281 �
Transamerica InternationalEquity 393,137,695 � � � 31,835,058 424,972,753 25,265,919 � �
Transamerica InternationalGrowth 258,208,140 � (60,789,830 ) (12,545,845 ) 41,600,589 226,473,054 32,633,005 � �
Transamerica InternationalSmall Cap Value 94,483,357 � � � 7,047,101 101,530,458 8,700,125 � �
Transamerica Janus Mid-CapGrowth VP 150,013,625 � � � 27,716,710 177,730,335 4,905,612 � �
Transamerica JennisonGrowth VP 287,788,619 � (60,421,516 ) 4,843,542 38,273,417 270,484,062 24,128,819 � �
Transamerica JPMorganEnhanced Index VP 606,860,882 53,301,486 (18,196,189 ) 2,953,648 81,570,745 726,490,572 33,233,786 � �
Transamerica JPMorgan MidCap Value VP 51,946,400 � � � 7,590,505 59,536,905 3,597,396 � �
Transamerica Large CapValue 451,426,090 2,346,342 (9,185,137 ) (275,334 ) 59,449,576 503,761,537 44,818,642 2,346,342 �
Transamerica Mid Cap ValueOpportunities 87,951,136 � � � 12,168,215 100,119,351 8,947,216 � �
Transamerica PIMCO TotalReturn VP 702,557,944 � (48,903,255 ) (4,212,113 ) 23,613,616 673,056,192 58,833,583 � �
Transamerica Small CapValue 50,696,738 � � � 6,218,642 56,915,380 5,922,516 � �
Transamerica Small CompanyGrowth Liquidating Trust 3,706 � � � � 3,706 5,959 � �
Transamerica T. Rowe PriceSmall Cap VP 114,741,532 � � � 19,886,313 134,627,845 8,320,633 � �
Transamerica UnconstrainedBond 310,230,362 3,697,626 (8,673,043 ) (245,299 ) 9,589,317 314,598,963 32,101,935 3,697,625 �
Transamerica WMC USGrowth VP 264,066,865 � (42,005,789 ) 5,850,839 36,282,670 264,194,585 8,365,883 � �
Total $ 5,678,651,628 $ 265,976,172 $ (334,202,272) $ (6,626,301) $ 475,439,855 $ 6,079,239,082 502,821,948 $ 20,896,672 $ ��
(E) All or a portion of the security has been segregated by the custodian as collateral to cover margin requirements for open futures contracts. The value of thesecurity is $46,396,436.
(F) Rate disclosed reflects the yield at March 31, 2019.(G) Percentage rounds to less than 0.1% or (0.1)%.(H) There were no transfers in or out of Level 3 during the period ended March 31, 2019. Please reference the Security Valuation section of the Notes to Schedules of
Investments for more information regarding security valuation and pricing inputs.(I) Futures contracts and/or forward foreign currency contracts are valued at unrealized appreciation (depreciation).
CURRENCY ABBREVIATIONS:
CAD Canadian Dollar
The notes are an integral part of this report.Transamerica Series Trust Page 3
Copyright © 2021 www.secdatabase.com. All Rights Reserved.Please Consider the Environment Before Printing This Document

Transamerica JPMorgan Asset Allocation �� Moderate VPSCHEDULE OF INVESTMENTS (continued)At March 31, 2019(unaudited)
PORTFOLIO ABBREVIATIONS:
ASX Australian Securities ExchangeEAFE Europe, Australasia and Far EastSTOXX Deutsche Börse Group & SIX Group IndexTOPIX Tokyo Price Index
The notes are an integral part of this report.Transamerica Series Trust Page 4
Copyright © 2021 www.secdatabase.com. All Rights Reserved.Please Consider the Environment Before Printing This Document

Transamerica JPMorgan Core Bond VPSCHEDULE OF INVESTMENTSAt March 31, 2019(unaudited)
Principal ValueASSET-BACKED SECURITIES - 13.4%Ally Auto Receivables Trust
Series 2016-2, Class A4,1.60%, 01/15/2021 $ 237,468 $ 236,574
American Credit Acceptance Receivables TrustSeries 2016-3, Class C,4.26%, 08/12/2022 (A) 289,000 291,601Series 2016-4, Class C,2.91%, 02/13/2023 (A) 173,231 173,204Series 2018-2, Class B,3.46%, 08/10/2022 (A) 549,000 550,740
American Homes 4 Rent TrustSeries 2014-SFR2, Class A,3.79%, 10/17/2036 (A) 462,753 475,553Series 2014-SFR2, Class E,6.23%, 10/17/2036 (A) 150,000 164,430Series 2014-SFR3, Class E,6.42%, 12/17/2036 (A) 175,000 193,918Series 2015-SFR1, Class A,3.47%, 04/17/2052 (A) 882,146 892,298Series 2015-SFR1, Class D,4.41%, 04/17/2052 (A) 1,200,000 1,229,073Series 2015-SFR1, Class E,5.64%, 04/17/2052 (A) 292,500 315,897Series 2015-SFR2, Class D,5.04%, 10/17/2052 (A) 700,000 745,035Series 2015-SFR2, Class E,6.07%, 10/17/2052 (A) 430,000 473,592
American Tower Trust #1Series 2013-2A, Class 2A,3.07%, 03/15/2048 (A) 350,000 349,032
AmeriCredit Automobile Receivables TrustSeries 2016-4, Class B,1.83%, 12/08/2021 500,000 496,457Series 2017-1, Class B,2.30%, 02/18/2022 269,000 267,227Series 2017-1, Class C,2.71%, 08/18/2022 144,000 143,631Series 2017-1, Class D,3.13%, 01/18/2023 323,000 323,699
Anchor Assets IX LLCSeries 2016-1, Class A,5.13%, 02/15/2020 (A) 984,698 984,698
ARIVOSeries 2018-1, Class A,5.17%, 09/15/2019 (B) (C) 629,365 629,365
Axis Equipment Finance Receivables IV LLCSeries 2016-1A, Class A,2.21%, 11/20/2021 (A) 64,529 64,385
B2R Mortgage TrustSeries 2015-1, Class A1,2.52%, 05/15/2048 (A) 51,076 50,709Series 2015-2, Class A,3.34%, 11/15/2048 (A) 549,198 548,229Series 2016-1, Class A,2.57%, 06/15/2049 (A) 517,616 510,977
BCC Funding XIII LLCSeries 2016-1, Class A2,2.20%, 12/20/2021 (A) 70,105 69,989
Business Jet Securities LLCSeries 2018-1, Class A,4.34%, 02/15/2033 (A) 597,881 601,207Series 2018-2, Class A,4.45%, 06/15/2033 (A) 762,352 771,595
Principal ValueASSET-BACKED SECURITIES (continued)BXG Receivables Note Trust
Series 2012-A, Class A,2.66%, 12/02/2027 (A) $ 21,417 $ 21,366
Cabela�s Credit Card Master Note TrustSeries 2015-1A, Class A1,2.26%, 03/15/2023 600,000 597,239Series 2016-1, Class A1,1.78%, 06/15/2022 300,000 299,383
Camillo TrustSeries 2016-SFR1,5.00%, 12/05/2023 1,086,923 1,084,546
Capital Auto Receivables Asset TrustSeries 2018-1, Class A3,2.79%, 01/20/2022 (A) 1,320,000 1,320,402
Capital One Multi-Asset Execution TrustSeries 2016-A4, Class A4,1.33%, 06/15/2022 200,000 199,061Series 2016-A6, Class A6,1.82%, 09/15/2022 350,000 348,266
CarMax Auto Owner TrustSeries 2015-1, Class A4,1.83%, 07/15/2020 66,523 66,498Series 2016-2, Class A3,1.52%, 02/16/2021 31,702 31,577Series 2016-4, Class A4,1.60%, 06/15/2022 200,000 196,455
Carnow Auto Receivables TrustSeries 2018-1A, Class B,4.26%, 09/15/2023 (A) 1,560,000 1,573,113
Chase Funding Loan Acquisition TrustSeries 2003-C2, Class 1A,4.75%, 12/25/2019 2,831 2,820
Chase Funding TrustSeries 2003-6, Class 1A7,5.04% (D), 11/25/2034 38,587 39,627
CIG Auto Receivables TrustSeries 2017-1A, Class A,2.71%, 05/15/2023 (A) 172,257 171,888
Citibank Credit Card Issuance TrustSeries 2014-A6, Class A6,2.15%, 07/15/2021 130,000 129,818
CLUB Credit TrustSeries 2017-P2, Class A,2.61%, 01/15/2024 (A) 295,623 294,387
CNH Equipment TrustSeries 2015-B, Class A4,1.89%, 04/15/2022 107,177 107,138
Colony American Finance, Ltd.Series 2016-2, Class A,2.55%, 11/15/2048 (A) 237,291 233,340
Consumer Loan Underlying Bond Credit TrustSeries 2017-P1, Class A,2.42%, 09/15/2023 (A) 65,357 65,327
CPS Auto Receivables TrustSeries 2014-C, Class C,3.77%, 08/17/2020 (A) 48,455 48,518Series 2014-D, Class C,4.35%, 11/16/2020 (A) 69,971 70,277Series 2015-C, Class D,4.63%, 08/16/2021 (A) 344,000 348,023Series 2016-C, Class C,3.27%, 06/15/2022 (A) 700,000 700,851Series 2017-C, Class C,
Copyright © 2021 www.secdatabase.com. All Rights Reserved.Please Consider the Environment Before Printing This Document

The notes are an integral part of this report.Transamerica Series Trust Page 1
2.86%, 06/15/2023 (A) 767,000 765,250
Copyright © 2021 www.secdatabase.com. All Rights Reserved.Please Consider the Environment Before Printing This Document

Transamerica JPMorgan Core Bond VPSCHEDULE OF INVESTMENTS (continued)At March 31, 2019(unaudited)
Principal ValueASSET-BACKED SECURITIES (continued)Credit Acceptance Auto Loan Trust
Series 2017-1A, Class A,2.56%, 10/15/2025 (A) $
364,441$363,876
Series 2017-1A, Class B,3.04%, 12/15/2025 (A) 250,000 249,522Series 2017-1A, Class C,3.48%, 02/17/2026 (A) 250,000 249,504Series 2017-2A, Class B,3.02%, 04/15/2026 (A) 1,260,000 1,255,066Series 2018-1A, Class A,3.01%, 02/16/2027 (A) 413,000 413,317Series 2019-1A, Class A,3.33%, 02/15/2028 (A) 825,000 830,448
Diamond Resorts Owner TrustSeries 2017-1A, Class A,3.27%, 10/22/2029 (A) 301,450 302,602Series 2018-1, Class A,3.70%, 01/21/2031 (A) 600,743 610,138
Discover Card Execution Note TrustSeries 2012-A6, Class A6,1.67%, 01/18/2022 220,000 219,385Series 2014-A4, Class A4,2.12%, 12/15/2021 200,000 199,748
Drive Auto Receivables TrustSeries 2015-AA, Class D,4.12%, 07/15/2022 (A) 253,545 254,367Series 2015-BA, Class D,3.84%, 07/15/2021 (A) 196,650 196,900Series 2015-DA, Class D,4.59%, 01/17/2023 (A) 286,000 288,080Series 2016-CA, Class D,4.18%, 03/15/2024 (A) 648,000 656,304Series 2017-3, Class D,3.53%, 12/15/2023 (A) 1,520,000 1,527,713Series 2017-AA, Class C,2.98%, 01/18/2022 (A) 185,808 185,872Series 2017-AA, Class D,4.16%, 05/15/2024 (A) 372,000 376,523Series 2018-4, Class C,3.66%, 11/15/2024 944,000 951,118Series 2019-1, Class D,4.09%, 06/15/2026 340,000 347,170
DT Asset TrustSeries 2017, Class B,5.84%, 12/16/2022 600,000 599,776
DT Auto Owner TrustSeries 2016-4A, Class D,3.77%, 10/17/2022 (A) 331,800 334,017Series 2017-1A, Class D,3.55%, 11/15/2022 (A) 339,000 339,992Series 2017-2A, Class C,3.03%, 01/17/2023 (A) 534,903 534,937Series 2017-3A, Class D,3.58%, 05/15/2023 (A) 305,000 306,247
Engs Commercial Finance TrustSeries 2016-1A, Class A2,2.63%, 02/22/2022 (A) 82,827 82,600
Exeter Automobile Receivables TrustSeries 2016-1A, Class C,5.52%, 10/15/2021 (A) 445,000 449,699Series 2016-3A, Class B,2.84%, 08/16/2021 (A) 173,873 173,793
Principal ValueASSET-BACKED SECURITIES (continued)Exeter Automobile Receivables Trust (continued)
Series 2018-4A, Class B,3.64%, 11/15/2022 (A) $
353,000$355,932
First Investors Auto Owner TrustSeries 2017-3A, Class A2,2.41%, 12/15/2022 (A) 625,000 622,476
Flagship Credit Auto TrustSeries 2014-2, Class C,3.95%, 12/15/2020 (A) 36,176 36,219Series 2015-3, Class B,3.68%, 03/15/2022 (A) 171,152 171,615Series 2015-3, Class C,4.65%, 03/15/2022 (A) 126,000 128,168Series 2016-1, Class A,2.77%, 12/15/2020 (A) 9,693 9,692Series 2016-1, Class C,6.22%, 06/15/2022 (A) 600,000 620,966Series 2016-4, Class C,2.71%, 11/15/2022 (A) 423,000 421,441
Fort Cre LLC1-Month LIBOR + 2.83%,
4.96% (D), 11/21/2035 1,535,000 1,535,688Foundation Finance Trust
Series 2019-1A, Class A,3.86%, 11/15/2034 (A) 600,000 599,907
Freedom Financial TrustSeries 2018-1, Class A,3.61%, 07/18/2024 (A) 348,781 349,100Series 2018-2, Class A,3.99%, 10/20/2025 (A) 819,600 822,000
GLS Auto Receivables Issuer TrustSeries 2019-1A, Class A,3.37%, 01/17/2023 (A) 436,958 437,485
GLS Auto Receivables TrustSeries 2016-1A, Class B,4.39%, 01/15/2021 (A) 47,130 47,191
Gold Key Resorts LLCSeries 2014-A, Class A,3.22%, 03/17/2031 (A) 85,359 85,004
Goodgreen TrustSeries 2017, Class R1,5.00%, 10/20/2051 1,383,663 1,351,562Series 2017-1A, Class A,3.74%, 10/15/2052 (A) 188,015 190,022Series 2017-2A, Class A,3.26%, 10/15/2053 (A) 814,567 812,319
Headlands Residential LLCSeries 2018,4.25%, 06/25/2023 1,160,000 1,160,279
Hero Funding TrustSeries 2017-1A, Class A2,4.46%, 09/20/2047 (A) 617,721 637,722Series 2017-3A, Class A2,3.95%, 09/20/2048 (A) 738,749 754,691
Hilton Grand Vacations TrustSeries 2017-AA, Class A,2.66%, 12/26/2028 (A) 217,666 215,963
Hyundai Auto Lease Securitization TrustSeries 2016-C, Class A4,1.65%, 07/15/2020 (A) 30,554 30,541
Kabbage Funding LLCSeries 2019-1, Class A,
Copyright © 2021 www.secdatabase.com. All Rights Reserved.Please Consider the Environment Before Printing This Document
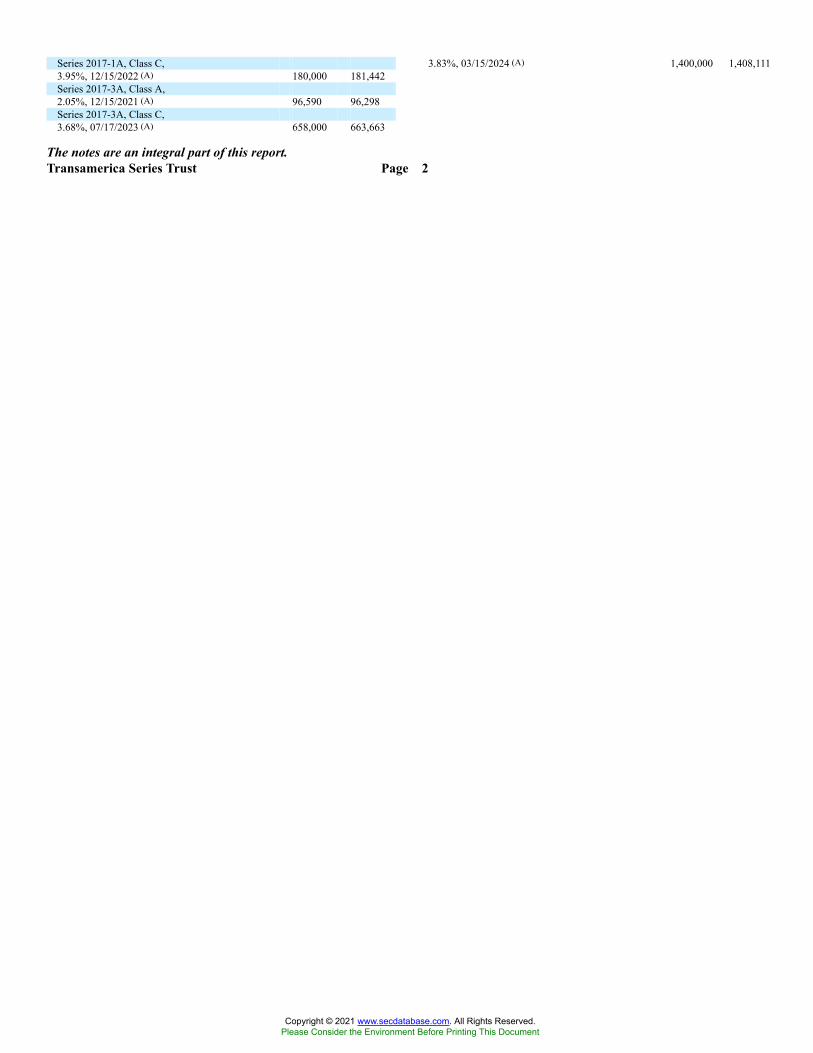
The notes are an integral part of this report.Transamerica Series Trust Page 2
Series 2017-1A, Class C,3.95%, 12/15/2022 (A) 180,000 181,442Series 2017-3A, Class A,2.05%, 12/15/2021 (A) 96,590 96,298Series 2017-3A, Class C,3.68%, 07/17/2023 (A) 658,000 663,663
3.83%, 03/15/2024 (A) 1,400,000 1,408,111
Copyright © 2021 www.secdatabase.com. All Rights Reserved.Please Consider the Environment Before Printing This Document

Transamerica JPMorgan Core Bond VPSCHEDULE OF INVESTMENTS (continued)At March 31, 2019(unaudited)
Principal ValueASSET-BACKED SECURITIES (continued)KGS-Alpha SBA COOF Trust, Interest Only STRIPS
Series 2012-2, Class A,0.88% (D), 08/25/2038 (A) $ 782,927 $ 18,756Series 2013-2, Class A,1.63% (D), 03/25/2039 (A) 729,022 30,244Series 2014-2, Class A,3.11% (D), 04/25/2040 (A) 300,137 24,546
LV Tower 52Series 2013-1, Class A,5.75%, 07/15/2019 (A) 829,116 829,116
Mariner Finance Issuance TrustSeries 2017-AA, Class A,3.62%, 02/20/2029 (A) 1,150,551 1,151,780
Marlette Funding TrustSeries 2017-1A, Class A,2.83%, 03/15/2024 (A) 14,922 14,921Series 2018-1A, Class A,2.61%, 03/15/2028 (A) 291,311 290,799
Mercedes-Benz Auto Receivables TrustSeries 2015-1, Class A4,1.75%, 12/15/2021 88,979 88,727
New Residential Advanced Receivables TrustSeries 2016-T2, Class AT2,2.58%, 10/15/2049 (A) 267,500 266,664Series 2016-T2, Class CT2,3.51%, 10/15/2049 (A) 187,500 186,751
OnDeck Asset Securitization Trust LLCSeries 2018-1A, Class A,3.50%, 04/18/2022 (A) 351,000 352,278
OneMain Financial Issuance TrustSeries 2015-1A, Class A,3.19%, 03/18/2026 (A) 43,792 43,800Series 2016-1A, Class A,3.66%, 02/20/2029 (A) 450,048 451,968
Oportun Funding IX LLCSeries 2018-B, Class A,3.91%, 07/08/2024 (A) 1,165,000 1,172,965
Oportun Funding VI LLCSeries 2017-A, Class A,3.23%, 06/08/2023 (A) 405,000 402,926
Oportun Funding VII LLCSeries 2017-B, Class A,3.22%, 10/10/2023 (A) 309,000 307,282
Oportun Funding VIII LLCSeries 2018-A, Class A,3.61%, 03/08/2024 (A) 655,000 656,553
Pretium Mortgage Credit Partners I LLCSeries 2018-NPL4, Class A1,4.83% (D), 09/25/2058 (A) 741,286 747,586
Progress Residential TrustSeries 2015-SFR2, Class A,2.74%, 06/12/2032 (A) 1,385,070 1,375,843Series 2015-SFR2, Class B,3.14%, 06/12/2032 (A) 327,000 325,103Series 2015-SFR3, Class A,3.07%, 11/12/2032 (A) 1,734,237 1,728,424Series 2015-SFR3, Class D,4.67%, 11/12/2032 (A) 300,000 301,489Series 2015-SFR3, Class E,5.66%, 11/12/2032 (A) 200,000 201,858Series 2018-SFR2, Class E,4.66%, 08/17/2035 (A) 642,000 652,417
Prosper Marketplace Issuance Trust
Principal ValueASSET-BACKED SECURITIES (continued)Renew
Series 2017-1A, Class A,3.67%, 09/20/2052 (A) $
250,863$255,799
Rice Park Financing TrustSeries 2016-A, Class A,4.63%, 10/31/2041 (A) 872,980 873,154
Santander Drive Auto Receivables TrustSeries 2015-5, Class E,4.67%, 02/15/2023 (A) 1,560,000 1,573,624Series 2019-1, Class C,3.42%, 04/15/2025 730,000 735,502
Santander Retail Auto Lease TrustSeries 2018-A, Class A3,2.93%, 05/20/2021 (A) 619,000 619,809
SART4.75%, 06/15/2025 1,689,348 1,709,941
Saxon Asset Securities TrustSeries 2003-1, Class AF6,4.67% (D), 06/25/2033 4,300 4,337
Securitized Asset-Backed Receivables LLC TrustSeries 2006-CB1, Class AF2,3.34% (D), 01/25/2036 19,973 17,146
SoFi Consumer Loan Program LLCSeries 2016-2A, Class A,3.09%, 10/27/2025 (A) 98,226 98,221
SpringCastle America Funding LLCSeries 2016-AA, Class A,3.05%, 04/25/2029 (A) 332,128 331,700
Springleaf Funding TrustSeries 2015-AA, Class A,3.16%, 11/15/2024 (A) 96,494 96,500
Synchrony Card Funding LLCSeries 2019-A1, Class A,2.95%, 03/17/2025 1,593,000 1,602,875
Synchrony Card Issuance TrustSeries 2018-A1, Class A1,3.38%, 09/15/2024 750,000 762,907
Toyota Auto Receivables Owner TrustSeries 2016-A, Class A4,1.47%, 09/15/2021 220,000 218,690Series 2016-B, Class A3,1.30%, 04/15/2020 29,190 29,138
Tricolor Auto Securitization TrustSeries 2018-1A, Class A,5.05%, 12/15/2020 (A) 503,787 507,525Series 2018-2A, Class A,3.96%, 10/15/2021 (A) 1,241,721 1,244,348
Tricon American Homes TrustSeries 2016-SFR1, Class A,2.59%, 11/17/2033 (A) 377,923 373,099
Upgrade Receivables TrustSeries 2018-1A, Class A,3.76%, 11/15/2024 (A) 302,051 302,901
US Auto Funding LLCSeries 2018-1A, Class A,5.50%, 07/15/2023 (A) 770,602 780,516
Vericrest Opportunity Loan TrustSeries 2018-NPL2, Class A1,4.34% (D), 05/25/2048 (A) 537,404 538,608
Verizon Owner TrustSeries 2016-1A, Class A,1.42%, 01/20/2021 (A) 26,616 26,551
Copyright © 2021 www.secdatabase.com. All Rights Reserved.Please Consider the Environment Before Printing This Document

The notes are an integral part of this report.Transamerica Series Trust Page 3
Series 2017-3A, Class A,2.36%, 11/15/2023 (A) 77,248 77,194
Purchasing Power Funding LLCSeries 2018-A, Class A,3.34%, 08/15/2022 (A) 1,550,000 1,549,014
Series 2017-3A, Class A1A,2.06%, 04/20/2022 (A) 1,033,000 1,026,142
Copyright © 2021 www.secdatabase.com. All Rights Reserved.Please Consider the Environment Before Printing This Document

Transamerica JPMorgan Core Bond VPSCHEDULE OF INVESTMENTS (continued)At March 31, 2019(unaudited)
Principal ValueASSET-BACKED SECURITIES (continued)Veros Automobile Receivables Trust
Series 2018-1, Class B,4.05%, 02/15/2024 (A) $
1,250,000$1,261,139
VM DEBT LLCSeries 2017-1, Class A,7.00%, 10/02/2024 (A) 955,000 955,000
VOLT LXIV LLCSeries 2017-NP11, Class A1,3.38% (D), 10/25/2047 (A) 1,056,924 1,055,423
VOLT LXIX LLCSeries 2018-NPL5, Class A1A,4.21% (D), 08/25/2048 (A) 454,078 455,299
VOLT LXVII LLCSeries 2018-NPL3, Class A1,4.38% (D), 06/25/2048 (A) 672,168 673,440
VOLT LXVIII LLCSeries 2018-NPL4, Class A1A,4.34% (D), 07/27/2048 (A) 553,336 555,371
VOLT LXX LLCSeries 2018-NPL6, Class A1A,4.11% (D), 09/25/2048 (A) 462,215 464,028
VOLT LXXII LLCSeries 2018-NPL8, Class A1A,4.21% (D), 10/26/2048 (A) 1,463,983 1,473,332
VOLT LXXV LLCSeries 2019-NPL1, Class A1A,4.34% (D), 01/25/2049 (A) 1,061,500 1,069,444
VSE Voi Mortgage LLCSeries 2018-A, Class A,3.56%, 02/20/2036 (A) 378,655 384,791
Westgate Resorts LLCSeries 2017-1A, Class A,3.05%, 12/20/2030 (A) 253,357 251,873
Westlake Automobile Receivables TrustSeries 2016-2A, Class D,4.10%, 06/15/2021 (A) 170,000 170,947Series 2016-3A, Class C,2.46%, 01/18/2022 (A) 658,160 657,750Series 2017-1A, Class C,2.70%, 10/17/2022 (A) 247,000 246,544
World Financial Network Credit Card Master Trust3.14%, 12/15/2025 730,000 736,406
World Omni Auto Receivables TrustSeries 2015-B, Class A4,1.84%, 01/17/2022 80,000 79,675Series 2016-B, Class A4,1.48%, 11/15/2022 150,000 147,371
Total Asset-Backed Securities(Cost $83,870,938) 83,928,366
CORPORATE DEBT SECURITIES - 24.5%Aerospace & Defense - 0.3%Airbus Finance BV
2.70%, 04/17/2023 (A) 43,000 42,756Airbus SE
3.15%, 04/10/2027 (A) 164,000 163,861BAE Systems Holdings, Inc.
6.38%, 06/01/2019 (A) 30,000 30,151Harris Corp.
3.83%, 04/27/2025 200,000 204,921Lockheed Martin Corp.
4.50%, 05/15/2036 100,000 108,455
Principal ValueCORPORATE DEBT SECURITIES (continued)Aerospace & Defense (continued)Northrop Grumman Systems Corp.
7.75%, 02/15/2031 $40,000 $ 54,741
Precision Castparts Corp.3.25%, 06/15/2025 113,000 115,8774.20%, 06/15/2035 170,000 175,319
Rockwell Collins, Inc.3.20%, 03/15/2024 70,000 69,700
United Technologies Corp.3.65%, 08/16/2023 64,000 65,6943.95%, 08/16/2025 60,000 62,3154.15%, 05/15/2045 163,000 158,5974.45%, 11/16/2038 60,000 62,0314.50%, 06/01/2042 86,000 88,8915.70%, 04/15/2040 265,000 309,319
1,896,576Air Freight & Logistics - 0.0% (E)FedEx Corp.
3.90%, 02/01/2035 96,000 89,968Airlines - 0.7%Air Canada Pass-Through Trust
3.30%, 07/15/2031 (A) 155,904 151,4803.55%, 07/15/2031 (A) 221,189 215,4004.13%, 11/15/2026 (A) 192,667 196,385
American Airlines Pass-Through Trust3.00%, 04/15/2030 388,235 375,3173.38%, 11/01/2028 207,021 203,7093.65%, 02/15/2029 - 12/15/2029 146,679 146,4453.70%, 04/15/2027 - 04/01/2028 364,962 358,7754.95%, 07/15/2024 102,122 105,748
British Airways Pass-Through Trust4.13%, 03/20/2033 (A) 305,267 309,938
Continental Airlines Pass-Through Trust5.98%, 10/19/2023 34,194 35,968
Delta Air Lines Pass-Through Trust3.63%, 01/30/2029 339,480 346,4674.75%, 11/07/2021 45,409 46,0495.30%, 10/15/2020 9,619 9,625
Southwest Airlines Co.2.75%, 11/06/2019 163,000 162,846
Spirit Airlines Pass-Through Trust3.38%, 08/15/2031 145,775 143,742
United Airlines Pass-Through Trust3.45%, 01/07/2030 127,999 125,4463.65%, 07/07/2027 149,954 148,0574.15%, 02/25/2033 335,000 346,8444.55%, 08/25/2031 300,000 307,531
US Airways Pass-Through Trust5.90%, 04/01/2026 327,512 355,253
4,091,025Automobiles - 0.0% (E)General Motors Co.
6.60%, 04/01/2036 240,000 251,079Banks - 4.2%ABN AMRO Bank NV
2.45%, 06/04/2020 (A) 319,000 317,7104.75%, 07/28/2025 (A) 200,000 207,770
AIB Group PLC4.75%, 10/12/2023 (A) 290,000 299,476
Australia & New Zealand Banking Group, Ltd.4.88%, 01/12/2021 (A) 100,000 103,465
Copyright © 2021 www.secdatabase.com. All Rights Reserved.Please Consider the Environment Before Printing This Document

The notes are an integral part of this report.Transamerica Series Trust Page 4
Northrop Grumman Corp.3.25%, 01/15/2028 150,000 147,4953.85%, 04/15/2045 38,000 36,453
Copyright © 2021 www.secdatabase.com. All Rights Reserved.Please Consider the Environment Before Printing This Document

Transamerica JPMorgan Core Bond VPSCHEDULE OF INVESTMENTS (continued)At March 31, 2019(unaudited)
Principal ValueCORPORATE DEBT SECURITIES (continued)Banks (continued)Bank of America Corp.
Fixed until 04/24/2022,2.88% (D), 04/24/2023 $ 395,000 $ 393,792
Fixed until 12/20/2022,3.00% (D), 12/20/2023 237,000 236,056
Fixed until 10/01/2024,3.09% (D), 10/01/2025, MTN 198,000 196,359
3.25%, 10/21/2027, MTN 942,000 922,260Fixed until 01/23/2025,
3.37% (D), 01/23/2026 200,000 200,140Fixed until 12/20/2027,
3.42% (D), 12/20/2028 430,000 420,475Fixed until 03/05/2023,
3.55% (D), 03/05/2024 126,000 127,955Fixed until 04/24/2027,
3.71% (D), 04/24/2028 700,000 703,1363.95%, 04/21/2025, MTN 368,000 374,317Fixed until 03/05/2028,
3.97% (D), 03/05/2029, MTN 300,000 305,4584.00%, 01/22/2025, MTN 400,000 407,9344.25%, 10/22/2026, MTN 284,000 291,765
Bank of Montreal2.35%, 09/11/2022, MTN 150,000 148,346Fixed until 12/15/2027,
3.80% (D), 12/15/2032 110,000 106,370Barclays PLC
3.65%, 03/16/2025 200,000 195,0083.68%, 01/10/2023 478,000 477,431Fixed until 02/15/2022,
4.61% (D), 02/15/2023 300,000 306,188BB&T Corp.
3.75%, 12/06/2023, MTN 300,000 311,2935.25%, 11/01/2019 30,000 30,405
BNZ International Funding, Ltd.2.10%, 09/14/2021 (A) 310,000 303,0272.65%, 11/03/2022 (A) 250,000 246,007
BPCE SA4.00%, 09/12/2023 (A) 250,000 253,6484.63%, 07/11/2024 (A) 200,000 203,056
Canadian Imperial Bank of Commerce2.25%, 07/21/2020 (A) 234,000 232,952
Citigroup, Inc.2.35%, 08/02/2021 154,000 152,1982.65%, 10/26/2020 350,000 349,1252.70%, 03/30/2021 108,000 107,9062.75%, 04/25/2022 350,000 348,526Fixed until 01/24/2022,
3.14% (D), 01/24/2023 213,000 213,7363.20%, 10/21/2026 162,000 158,6683.40%, 05/01/2026 150,000 149,112Fixed until 07/24/2027,
3.67% (D), 07/24/2028 200,000 199,4843.70%, 01/12/2026 400,000 406,3293.88%, 03/26/2025 100,000 100,750Fixed until 03/20/2029,
3.98% (D), 03/20/2030 400,000 406,6444.40%, 06/10/2025 100,000 103,5294.45%, 09/29/2027 48,000 49,3174.75%, 05/18/2046 140,000 145,0585.30%, 05/06/2044 34,000 37,4625.50%, 09/13/2025 115,000 126,0505.88%, 01/30/2042 45,000 55,268
Principal ValueCORPORATE DEBT SECURITIES (continued)Banks (continued)Commonwealth Bank of Australia (continued)
3.45%, 03/16/2023 (A) $230,000
$233,966
4.50%, 12/09/2025 (A) 200,000 205,174Compass Bank
3.50%, 06/11/2021 250,000 251,963Cooperatieve Rabobank UA
4.38%, 08/04/2025 504,000 519,530Credit Agricole SA
4.13%, 01/10/2027 (A) (F) 250,000 255,252Danske Bank A/S
2.00%, 09/08/2021 (A) 200,000 192,6702.70%, 03/02/2022 (A) 200,000 194,730
Discover Bank4.20%, 08/08/2023 250,000 259,913
Fifth Third Bancorp3.95%, 03/14/2028 (F) 160,000 165,259
Fifth Third Bank2.88%, 10/01/2021 204,000 204,160
HSBC Holdings PLC3.60%, 05/25/2023 229,000 233,0134.00%, 03/30/2022 56,000 57,709Fixed until 03/13/2027,
4.04% (D), 03/13/2028 (F) 650,000 654,9694.38%, 11/23/2026 200,000 204,8664.88%, 01/14/2022 160,000 168,205
Industrial & Commercial Bank of China, Ltd.2.45%, 10/20/2021 250,000 245,504
ING Groep NV4.10%, 10/02/2023 580,000 596,141
KeyCorp4.15%, 10/29/2025, MTN 175,000 184,227
Lloyds Banking Group PLC4.38%, 03/22/2028 200,000 204,7954.58%, 12/10/2025 200,000 202,331
Macquarie Bank, Ltd.2.40%, 01/21/2020 (A) 150,000 149,5462.60%, 06/24/2019 (A) 187,000 186,925
Mitsubishi UFJ Financial Group, Inc.3.41%, 03/07/2024 250,000 254,5413.76%, 07/26/2023 345,000 354,362
Mizuho Bank, Ltd.3.60%, 09/25/2024 (A) 300,000 306,613
National Australia Bank, Ltd.3.38%, 01/14/2026 600,000 602,695
NatWest Markets PLC3.63%, 09/29/2022 (A) 210,000 209,907
Nordea Bank Abp4.88%, 01/27/2020 (A) 100,000 101,679
PNC Financial Services Group, Inc.3.90%, 04/29/2024 91,000 94,0174.38%, 08/11/2020 92,000 94,1685.13%, 02/08/2020 65,000 66,2906.70%, 06/10/2019 25,000 25,184
Royal Bank of Canada4.65%, 01/27/2026, MTN 225,000 238,537
Royal Bank of Scotland Group PLC3.88%, 09/12/2023 200,000 200,829Fixed until 03/22/2024,
4.27% (D), 03/22/2025 200,000 202,127Santander UK Group Holdings PLC
3.13%, 01/08/2021 150,000 149,925
Copyright © 2021 www.secdatabase.com. All Rights Reserved.Please Consider the Environment Before Printing This Document

The notes are an integral part of this report.Transamerica Series Trust Page 5
8.13%, 07/15/2039 28,000 42,091Citizens Financial Group, Inc.
2.38%, 07/28/2021 39,000 38,4724.30%, 12/03/2025 58,000 59,398
Commonwealth Bank of Australia2.85%, 05/18/2026 (A) 230,000 223,792
4.75%, 09/15/2025 (A) 200,000 198,527Societe Generale SA
3.88%, 03/28/2024 (A) (F) 270,000 270,8634.25%, 04/14/2025 (A) 200,000 201,417
Standard Chartered PLC3.05%, 01/15/2021 (A) 200,000 199,228
Copyright © 2021 www.secdatabase.com. All Rights Reserved.Please Consider the Environment Before Printing This Document

Transamerica JPMorgan Core Bond VPSCHEDULE OF INVESTMENTS (continued)At March 31, 2019(unaudited)
Principal ValueCORPORATE DEBT SECURITIES (continued)Banks (continued)Standard Chartered PLC (continued)
Fixed until 01/20/2022,4.25% (D), 01/20/2023 (A)
$300,000 $ 304,764
5.20%, 01/26/2024 (A) 200,000 210,812Sumitomo Mitsui Financial Group, Inc.
2.44%, 10/19/2021 119,000 117,6192.63%, 07/14/2026 107,000 102,4202.78%, 07/12/2022 - 10/18/2022 385,000 383,1373.10%, 01/17/2023 155,000 155,511
SunTrust Banks, Inc.2.70%, 01/27/2022 76,000 75,7562.90%, 03/03/2021 59,000 59,147
US Bancorp2.38%, 07/22/2026, MTN 100,000 95,5423.95%, 11/17/2025, MTN 150,000 158,214
US Bank NA2.80%, 01/27/2025 250,000 249,033
Wells Fargo & Co.3.00%, 04/22/2026 213,000 208,1203.30%, 09/09/2024, MTN 700,000 705,4853.50%, 03/08/2022, MTN 150,000 152,7993.75%, 01/24/2024, MTN 215,000 221,2524.10%, 06/03/2026, MTN 258,000 263,7654.65%, 11/04/2044, MTN 184,000 188,9984.75%, 12/07/2046, MTN 143,000 150,0554.90%, 11/17/2045, MTN 112,000 119,272
Wells Fargo Bank NA3.63%, 10/22/2021 390,000 397,309
Westpac Banking Corp.2.00%, 03/03/2020 (A) 304,000 302,1702.85%, 05/13/2026 150,000 145,573Fixed until 11/23/2026,
4.32% (D), 11/23/2031, MTN 180,000 178,39926,081,623
Beverages - 0.4%Anheuser-Busch Cos. LLC / Anheuser-Busch InBev
Worldwide, Inc.4.70%, 02/01/2036 (A) 1,027,000 1,025,959
Anheuser-Busch InBev Worldwide, Inc.4.75%, 01/23/2029 - 04/15/2058 290,000 303,347
Coca-Cola Femsa SAB de CV3.88%, 11/26/2023 150,000 154,735
Constellation Brands, Inc.4.40%, 11/15/2025 100,000 104,9865.25%, 11/15/2048 55,000 58,328
Diageo Investment Corp.8.00%, 09/15/2022 100,000 116,779
Keurig Dr. Pepper, Inc.3.13%, 12/15/2023 110,000 108,6243.43%, 06/15/2027 50,000 48,3484.42%, 05/25/2025 (A) 86,000 89,1184.99%, 05/25/2038 (A) 124,000 126,527
Molson Coors Brewing Co.1.45%, 07/15/2019 155,000 154,372
PepsiCo, Inc.4.60%, 07/17/2045 78,000 88,648
2,379,771Biotechnology - 0.2%AbbVie, Inc.
4.50%, 05/14/2035 200,000 195,636Amgen, Inc.
Principal ValueCORPORATE DEBT SECURITIES (continued)Biotechnology (continued)Gilead Sciences, Inc.
3.50%, 02/01/2025 $ 65,000 $ 66,3373.65%, 03/01/2026 72,000 73,4113.70%, 04/01/2024 374,000 386,1894.00%, 09/01/2036 49,000 48,0904.60%, 09/01/2035 65,000 68,225
1,169,395Building Products - 0.1%Johnson Controls International PLC
3.75%, 12/01/2021 66,000 67,0734.95% (G), 07/02/2064 120,000 111,1695.25%, 12/01/2041 100,000 106,755
Masco Corp.6.50%, 08/15/2032 130,000 147,890
432,887Capital Markets - 2.3%Bank of New York Mellon Corp.
2.20%, 08/16/2023, MTN 200,000 194,511Fixed until 05/16/2022,
2.66% (D), 05/16/2023, MTN 451,000 448,6443.25%, 09/11/2024, MTN 150,000 152,011
CME Group, Inc.5.30%, 09/15/2043 32,000 39,192
Credit Suisse Group AG4.28%, 01/09/2028 (A) 300,000 303,446
Credit Suisse Group Funding Guernsey, Ltd.3.80%, 06/09/2023 250,000 253,894
Daiwa Securities Group, Inc.3.13%, 04/19/2022 (A) 122,000 121,500
Deutsche Bank AG3.30%, 11/16/2022 200,000 193,6583.70%, 05/30/2024 267,000 256,2844.25%, 10/14/2021 200,000 200,898
Goldman Sachs Group, Inc.Fixed until 10/31/2021,
2.88% (D), 10/31/2022 595,000 589,706Fixed until 06/05/2022,
2.91% (D), 06/05/2023 160,000 158,1513.00%, 04/26/2022 120,000 119,740Fixed until 09/29/2024,
3.27% (D), 09/29/2025 403,000 397,8233.50%, 01/23/2025 - 11/16/2026 417,000 412,812Fixed until 06/05/2027,
3.69% (D), 06/05/2028 488,000 483,3413.75%, 05/22/2025 745,000 752,5693.85%, 01/26/2027 1,590,000 1,596,2044.25%, 10/21/2025 100,000 102,362
Intercontinental Exchange, Inc.4.00%, 10/15/2023 88,000 92,374
Invesco Finance PLC3.75%, 01/15/2026 94,000 95,0094.00%, 01/30/2024 71,000 73,388
Macquarie Group, Ltd.Fixed until 11/28/2027,
3.76% (D), 11/28/2028 (A) 515,000 501,589Fixed until 01/15/2029,
5.03% (D), 01/15/2030 (A) 700,000 742,6976.00%, 01/14/2020 (A) 300,000 306,7906.25%, 01/14/2021 (A) (F) 175,000 184,464
Morgan Stanley3.13%, 01/23/2023, MTN 400,000 401,220
Copyright © 2021 www.secdatabase.com. All Rights Reserved.Please Consider the Environment Before Printing This Document

The notes are an integral part of this report.Transamerica Series Trust Page 6
4.66%, 06/15/2051 100,000 100,5764.95%, 10/01/2041 100,000 105,881
Celgene Corp.5.70%, 10/15/2040 114,000 125,050
Fixed until 07/22/2027,3.59% (D), 07/22/2028 356,000 353,309
Copyright © 2021 www.secdatabase.com. All Rights Reserved.Please Consider the Environment Before Printing This Document
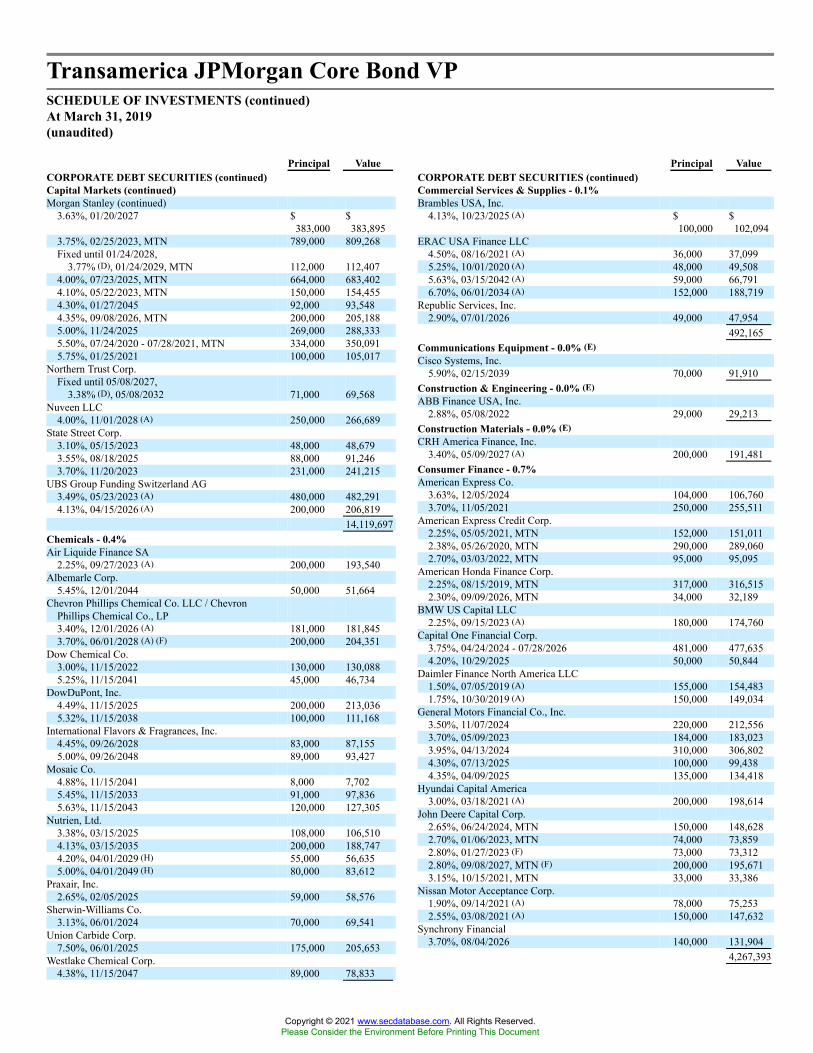
Transamerica JPMorgan Core Bond VPSCHEDULE OF INVESTMENTS (continued)At March 31, 2019(unaudited)
Principal ValueCORPORATE DEBT SECURITIES (continued)Capital Markets (continued)Morgan Stanley (continued)
3.63%, 01/20/2027 $383,000
$383,895
3.75%, 02/25/2023, MTN 789,000 809,268Fixed until 01/24/2028,
3.77% (D), 01/24/2029, MTN 112,000 112,4074.00%, 07/23/2025, MTN 664,000 683,4024.10%, 05/22/2023, MTN 150,000 154,4554.30%, 01/27/2045 92,000 93,5484.35%, 09/08/2026, MTN 200,000 205,1885.00%, 11/24/2025 269,000 288,3335.50%, 07/24/2020 - 07/28/2021, MTN 334,000 350,0915.75%, 01/25/2021 100,000 105,017
Northern Trust Corp.Fixed until 05/08/2027,
3.38% (D), 05/08/2032 71,000 69,568Nuveen LLC
4.00%, 11/01/2028 (A) 250,000 266,689State Street Corp.
3.10%, 05/15/2023 48,000 48,6793.55%, 08/18/2025 88,000 91,2463.70%, 11/20/2023 231,000 241,215
UBS Group Funding Switzerland AG3.49%, 05/23/2023 (A) 480,000 482,2914.13%, 04/15/2026 (A) 200,000 206,819
14,119,697Chemicals - 0.4%Air Liquide Finance SA
2.25%, 09/27/2023 (A) 200,000 193,540Albemarle Corp.
5.45%, 12/01/2044 50,000 51,664Chevron Phillips Chemical Co. LLC / Chevron
Phillips Chemical Co., LP3.40%, 12/01/2026 (A) 181,000 181,8453.70%, 06/01/2028 (A) (F) 200,000 204,351
Dow Chemical Co.3.00%, 11/15/2022 130,000 130,0885.25%, 11/15/2041 45,000 46,734
DowDuPont, Inc.4.49%, 11/15/2025 200,000 213,0365.32%, 11/15/2038 100,000 111,168
International Flavors & Fragrances, Inc.4.45%, 09/26/2028 83,000 87,1555.00%, 09/26/2048 89,000 93,427
Mosaic Co.4.88%, 11/15/2041 8,000 7,7025.45%, 11/15/2033 91,000 97,8365.63%, 11/15/2043 120,000 127,305
Nutrien, Ltd.3.38%, 03/15/2025 108,000 106,5104.13%, 03/15/2035 200,000 188,7474.20%, 04/01/2029 (H) 55,000 56,6355.00%, 04/01/2049 (H) 80,000 83,612
Praxair, Inc.2.65%, 02/05/2025 59,000 58,576
Sherwin-Williams Co.3.13%, 06/01/2024 70,000 69,541
Union Carbide Corp.7.50%, 06/01/2025 175,000 205,653
Westlake Chemical Corp.4.38%, 11/15/2047 89,000 78,833
Principal ValueCORPORATE DEBT SECURITIES (continued)Commercial Services & Supplies - 0.1%Brambles USA, Inc.
4.13%, 10/23/2025 (A) $100,000
$102,094
ERAC USA Finance LLC4.50%, 08/16/2021 (A) 36,000 37,0995.25%, 10/01/2020 (A) 48,000 49,5085.63%, 03/15/2042 (A) 59,000 66,7916.70%, 06/01/2034 (A) 152,000 188,719
Republic Services, Inc.2.90%, 07/01/2026 49,000 47,954
492,165Communications Equipment - 0.0% (E)Cisco Systems, Inc.
5.90%, 02/15/2039 70,000 91,910Construction & Engineering - 0.0% (E)ABB Finance USA, Inc.
2.88%, 05/08/2022 29,000 29,213Construction Materials - 0.0% (E)CRH America Finance, Inc.
3.40%, 05/09/2027 (A) 200,000 191,481Consumer Finance - 0.7%American Express Co.
3.63%, 12/05/2024 104,000 106,7603.70%, 11/05/2021 250,000 255,511
American Express Credit Corp.2.25%, 05/05/2021, MTN 152,000 151,0112.38%, 05/26/2020, MTN 290,000 289,0602.70%, 03/03/2022, MTN 95,000 95,095
American Honda Finance Corp.2.25%, 08/15/2019, MTN 317,000 316,5152.30%, 09/09/2026, MTN 34,000 32,189
BMW US Capital LLC2.25%, 09/15/2023 (A) 180,000 174,760
Capital One Financial Corp.3.75%, 04/24/2024 - 07/28/2026 481,000 477,6354.20%, 10/29/2025 50,000 50,844
Daimler Finance North America LLC1.50%, 07/05/2019 (A) 155,000 154,4831.75%, 10/30/2019 (A) 150,000 149,034
General Motors Financial Co., Inc.3.50%, 11/07/2024 220,000 212,5563.70%, 05/09/2023 184,000 183,0233.95%, 04/13/2024 310,000 306,8024.30%, 07/13/2025 100,000 99,4384.35%, 04/09/2025 135,000 134,418
Hyundai Capital America3.00%, 03/18/2021 (A) 200,000 198,614
John Deere Capital Corp.2.65%, 06/24/2024, MTN 150,000 148,6282.70%, 01/06/2023, MTN 74,000 73,8592.80%, 01/27/2023 (F) 73,000 73,3122.80%, 09/08/2027, MTN (F) 200,000 195,6713.15%, 10/15/2021, MTN 33,000 33,386
Nissan Motor Acceptance Corp.1.90%, 09/14/2021 (A) 78,000 75,2532.55%, 03/08/2021 (A) 150,000 147,632
Synchrony Financial3.70%, 08/04/2026 140,000 131,904
4,267,393
Copyright © 2021 www.secdatabase.com. All Rights Reserved.Please Consider the Environment Before Printing This Document

The notes are an integral part of this report.Transamerica Series Trust Page 7
2,393,958
Copyright © 2021 www.secdatabase.com. All Rights Reserved.Please Consider the Environment Before Printing This Document

Transamerica JPMorgan Core Bond VPSCHEDULE OF INVESTMENTS (continued)At March 31, 2019(unaudited)
Principal ValueCORPORATE DEBT SECURITIES (continued)Containers & Packaging - 0.1%International Paper Co.
3.00%, 02/15/2027 (F) $ 143,000 $ 137,6587.30%, 11/15/2039 120,000 151,7958.70%, 06/15/2038 50,000 70,079
WRKCo, Inc.3.75%, 03/15/2025 100,000 100,895
460,427Diversified Consumer Services - 0.3%President & Fellows of Harvard College
3.30%, 07/15/2056 214,000 200,770SART
4.75%, 07/15/2024 1,393,481 1,410,8991,611,669
Diversified Financial Services - 0.7%AerCap Ireland Capital DAC / AerCap Global
Aviation Trust3.30%, 01/23/2023 157,000 154,0913.50%, 01/15/2025 180,000 173,593
Aircastle, Ltd.4.40%, 09/25/2023 175,000 178,201
Aviation Capital Group LLC3.50%, 11/01/2027 (A) 150,000 142,3854.13%, 08/01/2025 (A) 250,000 249,177
Blackstone Holdings Finance Co. LLC4.45%, 07/15/2045 (A) 44,000 42,9275.88%, 03/15/2021 (A) 170,000 179,280
Brookfield Finance, Inc.3.90%, 01/25/2028 84,000 81,2344.70%, 09/20/2047 123,000 118,221
Carlyle Investment Management LLC3-Month LIBOR + 2.00%,
2.00% (D), 07/15/2019 (B) (C) 7,184 7,166CDP Financial, Inc.
4.40%, 11/25/2019 (A) 250,000 252,833China Southern Power Grid International Finance
BVI Co., Ltd.3.50%, 05/08/2027 (A) 240,000 239,652
GE Capital International Funding Unlimited Co.4.42%, 11/15/2035 1,431,000 1,322,940
Jefferies Group LLC6.45%, 06/08/2027 56,000 61,139
Mitsubishi UFJ Lease & Finance Co., Ltd.2.65%, 09/19/2022 (A) 200,000 196,596
National Rural Utilities Cooperative Finance Corp.2.95%, 02/07/2024 57,000 57,2043.90%, 11/01/2028 260,000 274,922
ORIX Corp.2.90%, 07/18/2022 101,000 100,990
Private Export Funding Corp.3.55%, 01/15/2024 150,000 157,181
Protective Life Global Funding2.00%, 09/14/2021 (A) 200,000 195,5732.70%, 11/25/2020 (A) 250,000 249,572
Voya Financial, Inc.3.65%, 06/15/2026 95,000 94,304
4,529,181Diversified Telecommunication Services - 0.7%AT&T, Inc.
3.95%, 01/15/2025 295,000 301,0304.13%, 02/17/2026 185,000 189,111
Principal ValueCORPORATE DEBT SECURITIES (continued)Diversified Telecommunication Services (continued)AT&T, Inc. (continued)
4.30%, 02/15/2030 - 12/15/2042 $744,000
$739,095
4.35%, 06/15/2045 49,000 44,9604.50%, 05/15/2035 525,000 517,2374.90%, 08/15/2037 374,000 378,0685.25%, 03/01/2037 100,000 104,7725.35%, 09/01/2040 203,000 213,2376.38%, 03/01/2041 100,000 117,520
British Telecommunications PLC9.63%, 12/15/2030 150,000 215,221
Centel Capital Corp.9.00%, 10/15/2019 40,000 41,187
Deutsche Telekom International Finance BV2.82%, 01/19/2022 (A) 150,000 149,552
GTP Acquisition Partners I LLC2.35%, 06/15/2045 (A) 39,000 38,5583.48%, 06/15/2050 (A) 226,000 228,231
Qwest Corp.6.75%, 12/01/2021 148,000 157,479
Verizon Communications, Inc.4.27%, 01/15/2036 330,000 333,7774.40%, 11/01/2034 568,000 590,8905.25%, 03/16/2037 183,000 205,863
4,565,788Electric Utilities - 1.5%AEP Transmission Co. LLC
4.00%, 12/01/2046 93,000 93,602Alabama Power Co.
3.75%, 03/01/2045 52,000 50,3284.10%, 01/15/2042 66,000 65,4965.60%, 03/15/2033 100,000 117,342
Ameren Illinois Co.4.50%, 03/15/2049 620,000 691,625
Appalachian Power Co.6.70%, 08/15/2037 50,000 61,905
Ausgrid Finance Pty, Ltd.3.85%, 05/01/2023 (A) 400,000 408,763
Baltimore Gas & Electric Co.2.80%, 08/15/2022 95,000 94,8573.50%, 08/15/2046 94,000 88,317
Berkshire Hathaway Energy Co.3.50%, 02/01/2025 104,000 106,4736.13%, 04/01/2036 74,000 92,943
Commonwealth Edison Co.3.65%, 06/15/2046 81,000 78,964
Connecticut Light & Power Co.4.00%, 04/01/2048 118,000 122,517
Duke Energy Carolinas LLC3.95%, 11/15/2028 300,000 319,4306.00%, 12/01/2028 - 01/15/2038 148,000 182,009
Duke Energy Corp.2.65%, 09/01/2026 149,000 141,934
Duke Energy Indiana LLC3.75%, 05/15/2046 100,000 97,326
Duke Energy Progress LLC3.70%, 10/15/2046 124,000 121,0314.10%, 05/15/2042 - 03/15/2043 107,000 110,6344.15%, 12/01/2044 65,000 67,687
Duquesne Light Holdings, Inc.3.62%, 08/01/2027 (A) 230,000 224,789
Copyright © 2021 www.secdatabase.com. All Rights Reserved.Please Consider the Environment Before Printing This Document

The notes are an integral part of this report.Transamerica Series Trust Page 8
Electricite de France SA2.35%, 10/13/2020 (A) 80,000 79,5356.00%, 01/22/2114 (A) 150,000 156,435
Enel Finance International NV3.50%, 04/06/2028 (A) 200,000 187,9613.63%, 05/25/2027 (A) 220,000 210,532
Copyright © 2021 www.secdatabase.com. All Rights Reserved.Please Consider the Environment Before Printing This Document

Transamerica JPMorgan Core Bond VPSCHEDULE OF INVESTMENTS (continued)At March 31, 2019(unaudited)
Principal ValueCORPORATE DEBT SECURITIES (continued)Electric Utilities (continued)Entergy Arkansas LLC
3.50%, 04/01/2026 $57,000
$58,054
Entergy Corp.2.95%, 09/01/2026 78,000 74,947
Entergy Louisiana LLC2.40%, 10/01/2026 118,000 111,4363.05%, 06/01/2031 (F) 94,000 89,756
Entergy Mississippi LLC2.85%, 06/01/2028 83,000 80,041
Exelon Corp.3.40%, 04/15/2026 63,000 62,9863.50%, 06/01/2022 130,000 131,324
FirstEnergy Corp.4.85%, 07/15/2047 53,000 56,837
Florida Power & Light Co.4.95%, 06/01/2035 60,000 68,5025.95%, 02/01/2038 50,000 64,487
Fortis, Inc.3.06%, 10/04/2026 500,000 477,474
Hydro-Quebec9.40%, 02/01/2021 250,000 279,942
Indiana Michigan Power Co.3.20%, 03/15/2023 125,000 126,060
Jersey Central Power & Light Co.6.15%, 06/01/2037 70,000 82,971
John Sevier Combined Cycle Generation LLC4.63%, 01/15/2042 61,938 68,814
Kansas City Power & Light Co.3.15%, 03/15/2023 71,000 72,0865.30%, 10/01/2041 100,000 116,792
Korea Southern Power Co., Ltd.3.00%, 01/29/2021 (A) 200,000 200,378
Massachusetts Electric Co.4.00%, 08/15/2046 (A) 105,000 102,511
Mid-Atlantic Interstate Transmission LLC4.10%, 05/15/2028 (A) 110,000 112,817
Nevada Power Co.5.38%, 09/15/2040 92,000 105,6965.45%, 05/15/2041 50,000 58,112
New England Power Co.3.80%, 12/05/2047 (A) 95,000 91,031
New York State Electric & Gas Corp.3.25%, 12/01/2026 (A) 95,000 94,802
NextEra Energy Capital Holdings, Inc.2.40%, 09/15/2019 53,000 52,938
Niagara Mohawk Power Corp.3.51%, 10/01/2024 (A) 141,000 144,7744.88%, 08/15/2019 (A) 40,000 40,326
Northern States Power Co.6.25%, 06/01/2036 40,000 51,928
Ohio Power Co.5.38%, 10/01/2021 50,000 53,254
Oncor Electric Delivery Co. LLC5.75%, 03/15/2029 50,000 59,728
PacifiCorp2.95%, 02/01/2022 100,000 100,8693.60%, 04/01/2024 105,000 108,682
Pennsylvania Electric Co.3.25%, 03/15/2028 (A) 38,000 36,672
PPL Capital Funding, Inc.3.40%, 06/01/2023 70,000 70,306
Principal ValueCORPORATE DEBT SECURITIES (continued)Electric Utilities (continued)Southern California Edison Co.
1.85%, 02/01/2022 $30,000 $ 28,930
5.55%, 01/15/2036 70,000 74,9146.05%, 03/15/2039 60,000 69,430
Southern Co.3.25%, 07/01/2026 91,000 89,131
Southern Power Co.5.15%, 09/15/2041 130,000 135,064
Southwestern Public Service Co.4.50%, 08/15/2041 100,000 107,325
Toledo Edison Co.6.15%, 05/15/2037 200,000 245,766
Tri-State Generation & Transmission Association, Inc.4.25%, 06/01/2046 62,000 59,646
Tucson Electric Power Co.4.85%, 12/01/2048 350,000 387,843
Virginia Electric & Power Co.4.45%, 02/15/2044 28,000 29,7154.60%, 12/01/2048 300,000 331,140
Wisconsin Electric Power Co.3.10%, 06/01/2025 82,000 81,570
Xcel Energy, Inc.6.50%, 07/01/2036 71,000 90,651
9,295,228Electrical Equipment - 0.0% (E)Eaton Corp.
4.00%, 11/02/2032 21,000 21,5945.80%, 03/15/2037 100,000 116,0247.63%, 04/01/2024 75,000 86,758
224,376Electronic Equipment, Instruments & Components - 0.0% (E)Arrow Electronics, Inc.
3.25%, 09/08/2024 66,000 63,9833.88%, 01/12/2028 155,000 149,2164.50%, 03/01/2023 30,000 31,025
244,224Energy Equipment & Services - 0.1%Baker Hughes a GE Co. LLC
5.13%, 09/15/2040 100,000 104,934Halliburton Co.
3.50%, 08/01/2023 157,000 160,2567.45%, 09/15/2039 50,000 67,6007.60%, 08/15/2096 (A) 50,000 66,454
Schlumberger Holdings Corp.3.63%, 12/21/2022 (A) 220,000 226,082
Schlumberger Investment SA3.30%, 09/14/2021 (A) 41,000 41,464
Texas Eastern Transmission, LP2.80%, 10/15/2022 (A) 81,000 79,8153.50%, 01/15/2028 (A) 37,000 36,144
782,749Entertainment - 0.1%Viacom, Inc.
3.88%, 04/01/2024 128,000 130,3334.38%, 03/15/2043 93,000 83,6106.88%, 04/30/2036 150,000 176,003
Walt Disney Co.6.55%, 03/15/2033 (A) 100,000 132,4626.65%, 11/15/2037 (A) 50,000 68,968
Copyright © 2021 www.secdatabase.com. All Rights Reserved.Please Consider the Environment Before Printing This Document

The notes are an integral part of this report.Transamerica Series Trust Page 9
Progress Energy, Inc.3.15%, 04/01/2022 54,000 54,379
Public Service Electric & Gas Co.1.80%, 06/01/2019, MTN 30,000 29,956
7.30%, 04/30/2028 (A) 50,000 65,207
Copyright © 2021 www.secdatabase.com. All Rights Reserved.Please Consider the Environment Before Printing This Document

Transamerica JPMorgan Core Bond VPSCHEDULE OF INVESTMENTS (continued)At March 31, 2019(unaudited)
Principal ValueCORPORATE DEBT SECURITIES (continued)Entertainment (continued)Walt Disney Co. (continued)
8.88%, 04/26/2023 (A) $ 80,000 $ 97,7209.50%, 07/15/2024 (A) 70,000 90,924
845,227Equity Real Estate Investment Trusts - 1.2%Alexandria Real Estate Equities, Inc.
3.80%, 04/15/2026 43,000 43,586American Tower Corp.
3.38%, 10/15/2026 100,000 97,4623.50%, 01/31/2023 141,000 142,9355.00%, 02/15/2024 86,000 92,553
AvalonBay Communities, Inc.2.85%, 03/15/2023, MTN 330,000 328,8493.45%, 06/01/2025, MTN 50,000 50,901
Boston Properties, LP3.20%, 01/15/2025 100,000 99,2113.65%, 02/01/2026 74,000 74,495
Brixmor Operating Partnership, LP3.85%, 02/01/2025 200,000 199,061
Crown Castle International Corp.4.00%, 03/01/2027 47,000 47,3255.25%, 01/15/2023 70,000 75,121
Digital Realty Trust, LP3.70%, 08/15/2027 77,000 76,240
Duke Realty, LP3.25%, 06/30/2026 43,000 42,372
EPR Properties4.50%, 06/01/2027 137,000 138,045
Equity Commonwealth5.88%, 09/15/2020 1,012,000 1,035,538
ERP Operating, LP2.85%, 11/01/2026 138,000 134,3633.00%, 04/15/2023 50,000 50,2793.50%, 03/01/2028 92,000 93,4604.63%, 12/15/2021 46,000 48,096
GAIF Bond Issuer Pty, Ltd.3.40%, 09/30/2026 (A) 174,000 167,798
Goodman US Finance Three LLC3.70%, 03/15/2028 (A) 108,000 104,930
HCP, Inc.3.40%, 02/01/2025 95,000 94,3843.88%, 08/15/2024 225,000 229,3114.20%, 03/01/2024 30,000 31,046
Liberty Property, LP3.25%, 10/01/2026 53,000 51,447
National Retail Properties, Inc.4.00%, 11/15/2025 204,000 209,148
Office Properties Income Trust3.60%, 02/01/2020 150,000 150,2093.75%, 08/15/2019 860,000 861,5554.00%, 07/15/2022 196,000 195,519
Realty Income Corp.3.25%, 10/15/2022 390,000 396,5443.88%, 04/15/2025 160,000 165,6494.65%, 03/15/2047 75,000 81,738
Scentre Group Trust 1 / Scentre Group Trust 22.38%, 11/05/2019 (A) 188,000 187,4423.50%, 02/12/2025 (A) 300,000 299,635
Senior Housing Properties Trust3.25%, 05/01/2019 170,000 170,0194.75%, 02/15/2028 150,000 139,047
Principal ValueCORPORATE DEBT SECURITIES (continued)Equity Real Estate Investment Trusts (continued)UDR, Inc.
2.95%, 09/01/2026, MTN $72,000 $ 68,900
Ventas Realty, LP3.50%, 02/01/2025 54,000 54,0123.85%, 04/01/2027 98,000 98,3814.13%, 01/15/2026 45,000 46,194
Welltower, Inc.4.50%, 01/15/2024 73,000 76,965
7,151,931Food & Staples Retailing - 0.2%CK Hutchison International 16, Ltd.
1.88%, 10/03/2021 (A) 241,000 234,035CVS Pass-Through Trust
5.93%, 01/10/2034 (A) 215,827 239,6508.35%, 07/10/2031 (A) 264,559 326,632
Kroger Co.5.40%, 07/15/2040 12,000 12,278
Sysco Corp.3.55%, 03/15/2025 105,000 106,4633.75%, 10/01/2025 75,000 76,751
Walgreens Boots Alliance, Inc.3.80%, 11/18/2024 100,000 101,9184.50%, 11/18/2034 185,000 183,941
1,281,668Food Products - 0.3%Campbell Soup Co.
3.95%, 03/15/2025 250,000 251,596Cargill, Inc.
3.30%, 03/01/2022 (A) 70,000 70,661ConAgra Brands, Inc.
4.60%, 11/01/2025 85,000 89,2135.30%, 11/01/2038 185,000 187,266
General Mills, Inc.4.00%, 04/17/2025 165,000 170,7314.20%, 04/17/2028 (F) 110,000 114,3044.55%, 04/17/2038 (F) 45,000 44,554
Kellogg Co.3.40%, 11/15/2027 48,000 46,120
Kraft Heinz Foods Co.5.00%, 07/15/2035 - 06/04/2042 444,000 435,2216.88%, 01/26/2039 162,000 183,227
McCormick & Co., Inc.3.15%, 08/15/2024 90,000 89,7693.40%, 08/15/2027 132,000 129,566
Mead Johnson Nutrition Co.4.60%, 06/01/2044 70,000 76,433
1,888,661Gas Utilities - 0.2%Atmos Energy Corp.
4.13%, 10/15/2044 75,000 78,2444.15%, 01/15/2043 138,000 142,717
Boston Gas Co.4.49%, 02/15/2042 (A) 26,000 27,165
Brooklyn Union Gas Co.4.27%, 03/15/2048 (A) 150,000 153,745
CenterPoint Energy Resources Corp.5.85%, 01/15/2041 100,000 119,708
Dominion Energy Gas Holdings LLC2.80%, 11/15/2020 59,000 58,990
KeySpan Gas East Corp.
Copyright © 2021 www.secdatabase.com. All Rights Reserved.Please Consider the Environment Before Printing This Document

The notes are an integral part of this report.Transamerica Series Trust Page 10
Simon Property Group, LP3.75%, 02/01/2024 200,000 207,838
SITE Centers Corp.3.63%, 02/01/2025 198,000 194,328
2.74%, 08/15/2026 (A) 90,000 86,139
Copyright © 2021 www.secdatabase.com. All Rights Reserved.Please Consider the Environment Before Printing This Document

Transamerica JPMorgan Core Bond VPSCHEDULE OF INVESTMENTS (continued)At March 31, 2019(unaudited)
Principal ValueCORPORATE DEBT SECURITIES (continued)Gas Utilities (continued)Korea Gas Corp.
1.88%, 07/18/2021 (A) $200,000
$195,285
Southern Co. Gas Capital Corp.2.45%, 10/01/2023 48,000 46,6403.25%, 06/15/2026 39,000 38,0393.50%, 09/15/2021 75,000 75,9333.95%, 10/01/2046 59,000 55,3364.40%, 06/01/2043 63,000 63,0235.88%, 03/15/2041 146,000 173,462
Southwest Gas Corp.3.80%, 09/29/2046 111,000 104,127
1,418,553Health Care Equipment & Supplies - 0.1%Abbott Laboratories
3.88%, 09/15/2025 129,000 134,944Becton Dickinson and Co.
3.73%, 12/15/2024 19,000 19,291Boston Scientific Corp.
3.75%, 03/01/2026 195,000 198,811Covidien International Finance SA
2.95%, 06/15/2023 85,000 85,728Medtronic, Inc.
3.13%, 03/15/2022 72,000 73,1564.38%, 03/15/2035 255,000 278,416
Zimmer Biomet Holdings, Inc.3.70%, 03/19/2023 73,000 73,664
864,010Health Care Providers & Services - 0.7%Aetna, Inc.
2.80%, 06/15/2023 75,000 73,6514.50%, 05/15/2042 26,000 24,6026.75%, 12/15/2037 50,000 60,456
Anthem, Inc.3.30%, 01/15/2023 28,000 28,3274.63%, 05/15/2042 50,000 51,6034.65%, 01/15/2043 - 08/15/2044 184,000 190,428
CVS Health Corp.2.75%, 12/01/2022 100,000 98,6164.00%, 12/05/2023 223,000 229,1484.10%, 03/25/2025 949,000 974,2864.30%, 03/25/2028 254,000 257,3664.78%, 03/25/2038 375,000 371,3605.05%, 03/25/2048 209,000 210,548
Express Scripts Holding Co.3.00%, 07/15/2023 76,000 75,5353.50%, 06/15/2024 150,000 151,1744.50%, 02/25/2026 285,000 298,3504.80%, 07/15/2046 93,000 94,541
HCA, Inc.5.25%, 06/15/2026 250,000 267,867
Laboratory Corp. of America Holdings3.20%, 02/01/2022 249,000 250,806
Magellan Health, Inc.4.90%, 09/22/2024 333,000 316,849
Providence St. Joseph Health Obligated Group2.75%, 10/01/2026 84,000 79,775
Quest Diagnostics, Inc.3.45%, 06/01/2026 39,000 38,701
Texas Health Resources4.33%, 11/15/2055 250,000 266,230
Principal ValueCORPORATE DEBT SECURITIES (continued)Health Care Providers & Services (continued)UnitedHealth Group, Inc.
2.88%, 03/15/2023 $50,000 $ 50,287
4.63%, 07/15/2035 140,000 156,9424,617,448
Hotels, Restaurants & Leisure - 0.0% (E)McDonald�s Corp.
4.70%, 12/09/2035, MTN 105,000 112,5396.30%, 10/15/2037, MTN 63,000 78,046
190,585Household Products - 0.0% (E)Procter & Gamble Co.
2.70%, 02/02/2026 (F) 200,000 199,008Independent Power & Renewable Electricity Producers - 0.0% (E)Exelon Generation Co. LLC
6.25%, 10/01/2039 150,000 166,471Industrial Conglomerates - 0.1%General Electric Co.
4.38%, 09/16/2020, MTN 700,000 713,321Roper Technologies, Inc.
3.00%, 12/15/2020 42,000 42,083755,404
Insurance - 1.3%AIG SunAmerica Global Financing X
6.90%, 03/15/2032 (A) 200,000 263,862Allstate Corp.
3.15%, 06/15/2023 41,000 41,5005.35%, 06/01/2033 50,000 59,032
American Financial Group, Inc.3.50%, 08/15/2026 200,000 192,986
American International Group, Inc.3.75%, 07/10/2025 81,000 81,0554.20%, 04/01/2028 55,000 55,9154.70%, 07/10/2035 100,000 100,260
Aon PLC3.50%, 06/14/2024 100,000 101,431
Assurant, Inc.4.20%, 09/27/2023 225,000 229,226
Athene Global Funding2.75%, 04/20/2020 (A) 246,000 245,3093.00%, 07/01/2022 (A) 150,000 149,6474.00%, 01/25/2022 (A) 191,000 195,747
Athene Holding, Ltd.4.13%, 01/12/2028 250,000 240,313
Berkshire Hathaway Finance Corp.4.30%, 05/15/2043 83,000 87,8374.40%, 05/15/2042 221,000 236,091
Chubb INA Holdings, Inc.3.15%, 03/15/2025 300,000 302,5953.35%, 05/03/2026 50,000 50,881
CNA Financial Corp.3.45%, 08/15/2027 150,000 146,416
Dai-ichi Life Insurance Co., Ltd.Fixed until 07/24/2026 (I),
4.00% (A) (D) 207,000 201,307Great-West Lifeco Finance, LP
4.15%, 06/03/2047 (A) 200,000 199,639Guardian Life Insurance Co. of America
4.85%, 01/24/2077 (A) 42,000 44,109Harborwalk Funding Trust
Copyright © 2021 www.secdatabase.com. All Rights Reserved.Please Consider the Environment Before Printing This Document

The notes are an integral part of this report.Transamerica Series Trust Page 11
Fixed until 02/15/2049,5.08% (D), 02/15/2069 (A) 290,000 304,512
Copyright © 2021 www.secdatabase.com. All Rights Reserved.Please Consider the Environment Before Printing This Document

Transamerica JPMorgan Core Bond VPSCHEDULE OF INVESTMENTS (continued)At March 31, 2019(unaudited)
Principal ValueCORPORATE DEBT SECURITIES (continued)Insurance (continued)Hartford Financial Services Group, Inc.
4.30%, 04/15/2043 $200,000
$199,413
Jackson National Life Global Funding3.05%, 04/29/2026 (A) 245,000 240,1773.25%, 01/30/2024 (A) 58,000 58,2983.88%, 06/11/2025 (A) 400,000 413,454
Liberty Mutual Group, Inc.4.57%, 02/01/2029 (A) 47,000 48,8806.50%, 03/15/2035 (A) 230,000 268,799
Lincoln National Corp.4.00%, 09/01/2023 150,000 156,7586.15%, 04/07/2036 8,000 9,555
Manulife Financial Corp.Fixed until 02/24/2027,
4.06% (D), 02/24/2032 270,000 262,470Massachusetts Mutual Life Insurance Co.
5.38%, 12/01/2041 (A) 26,000 30,1837.63%, 11/15/2023 (A) 250,000 288,107
MassMutual Global Funding II2.50%, 10/17/2022 (A) (F) 100,000 99,227
Metropolitan Life Global Funding I3.00%, 09/19/2027 (A) 350,000 342,9073.88%, 04/11/2022 (A) 200,000 206,070
New York Life Global Funding3.00%, 01/10/2028 (A) 162,000 160,315
OneBeacon US Holdings, Inc.4.60%, 11/09/2022 200,000 204,446
Pacific Life Insurance Co.Fixed until 10/24/2047,
4.30% (D), 10/24/2067 (A) 124,000 110,633Principal Life Global Funding II
2.38%, 11/21/2021 (A) 300,000 297,068Progressive Corp.
Fixed until 03/15/2023 (I),5.38% (D) 140,000 138,775
Prudential Financial, Inc.3.91%, 12/07/2047 126,000 121,384
Prudential Insurance Co. of America8.30%, 07/01/2025 (A) 450,000 569,167
Reliance Standard Life Global Funding II2.50%, 01/15/2020 (A) 100,000 99,5633.05%, 01/20/2021 (A) 101,000 100,904
Teachers Insurance & Annuity Association of America4.27%, 05/15/2047 (A) 100,000 102,6094.90%, 09/15/2044 (A) 100,000 111,763
Torchmark Corp.4.55%, 09/15/2028 135,000 142,523
8,313,118Internet & Direct Marketing Retail - 0.2%Amazon.com, Inc.
2.80%, 08/22/2024 197,000 197,3463.88%, 08/22/2037 230,000 239,0594.25%, 08/22/2057 300,000 322,6244.80%, 12/05/2034 157,000 182,781
Booking Holdings, Inc.2.75%, 03/15/2023 143,000 142,288
1,084,098IT Services - 0.1%DXC Technology Co.
4.25%, 04/15/2024 86,000 87,260
Principal ValueCORPORATE DEBT SECURITIES (continued)IT Services (continued)IBM Credit LLC
2.65%, 02/05/2021 $200,000
$199,742
3.00%, 02/06/2023 (F) 300,000 302,252Western Union Co.
3.60%, 03/15/2022 (F) 200,000 203,185792,439
Life Sciences Tools & Services - 0.0% (E)Thermo Fisher Scientific, Inc.
2.95%, 09/19/2026 77,000 74,2833.00%, 04/15/2023 57,000 57,0114.15%, 02/01/2024 34,000 35,531
166,825Machinery - 0.2%Caterpillar Financial Services Corp.
1.93%, 10/01/2021 118,000 115,7922.85%, 06/01/2022, MTN 46,000 46,3353.25%, 12/01/2024, MTN 130,000 133,145
Caterpillar, Inc.2.60%, 06/26/2022 35,000 34,941
Illinois Tool Works, Inc.3.50%, 03/01/2024 100,000 103,3334.88%, 09/15/2041 280,000 326,992
Ingersoll-Rand Luxembourg Finance SA2.63%, 05/01/2020 80,000 79,806
nVent Finance Sarl4.55%, 04/15/2028 187,000 188,201
Parker-Hannifin Corp.4.10%, 03/01/2047 58,000 59,1474.45%, 11/21/2044, MTN 85,000 90,710
Xylem, Inc.3.25%, 11/01/2026 33,000 32,403
1,210,805Media - 1.1%CBS Corp.
3.70%, 08/15/2024 287,000 291,7304.00%, 01/15/2026 83,000 84,321
Charter Communications Operating LLC / CharterCommunications Operating Capital4.91%, 07/23/2025 517,000 545,5275.38%, 04/01/2038 105,000 105,5646.38%, 10/23/2035 92,000 102,5816.83%, 10/23/2055 125,000 141,514
Comcast Corp.3.15%, 03/01/2026 208,000 206,9463.20%, 07/15/2036 200,000 181,8543.95%, 10/15/2025 197,000 206,0274.00%, 11/01/2049 150,000 145,9334.20%, 08/15/2034 767,000 798,0884.25%, 01/15/2033 223,000 235,3664.60%, 10/15/2038 235,000 251,5624.95%, 10/15/2058 300,000 330,9006.50%, 11/15/2035 486,000 615,180
Cox Communications, Inc.3.25%, 12/15/2022 (A) 55,000 55,3824.80%, 02/01/2035 (A) 350,000 331,000
Discovery Communications LLC4.38%, 06/15/2021 80,000 82,1896.35%, 06/01/2040 200,000 219,478
Fox Corp.4.71%, 01/25/2029 (A) 135,000 144,746
Copyright © 2021 www.secdatabase.com. All Rights Reserved.Please Consider the Environment Before Printing This Document

The notes are an integral part of this report.Transamerica Series Trust Page 12
SES SA3.60%, 04/04/2023 (A) 100,000 98,607
Copyright © 2021 www.secdatabase.com. All Rights Reserved.Please Consider the Environment Before Printing This Document

Transamerica JPMorgan Core Bond VPSCHEDULE OF INVESTMENTS (continued)At March 31, 2019(unaudited)
Principal ValueCORPORATE DEBT SECURITIES (continued)Media (continued)Time Warner Cable LLC
6.55%, 05/01/2037 $300,000
$331,419
7.30%, 07/01/2038 100,000 116,467Time Warner Entertainment Co., LP
8.38%, 07/15/2033 225,000 293,357Warner Media LLC
3.55%, 06/01/2024 425,000 428,9213.60%, 07/15/2025 260,000 259,348
6,604,007Metals & Mining - 0.1%Anglo American Capital PLC
4.00%, 09/11/2027 (A) 200,000 194,416Barrick Gold Corp.
6.45%, 10/15/2035 40,000 47,337BHP Billiton Finance USA, Ltd.
5.00%, 09/30/2043 50,000 58,720Nucor Corp.
6.40%, 12/01/2037 210,000 263,935Vale Canada, Ltd.
7.20%, 09/15/2032 220,000 239,529Vale Overseas, Ltd.
6.25%, 08/10/2026 40,000 43,480847,417
Multi-Utilities - 0.4%CMS Energy Corp.
2.95%, 02/15/2027 97,000 92,5263.00%, 05/15/2026 73,000 71,2813.88%, 03/01/2024 100,000 102,497
Consolidated Edison Co. of New York, Inc.4.65%, 12/01/2048 350,000 385,343
Consumers Energy Co.3.25%, 08/15/2046 48,000 43,931
Delmarva Power & Light Co.4.00%, 06/01/2042 47,000 46,5034.15%, 05/15/2045 150,000 153,610
Dominion Energy, Inc.1.60%, 08/15/2019 60,000 59,7162.75%, 09/15/2022 93,000 92,1972.85%, 08/15/2026 61,000 58,5535.25%, 08/01/2033 100,000 112,219
DTE Electric Co.3.70%, 03/15/2045 123,000 121,579
NiSource, Inc.5.80%, 02/01/2042 118,000 135,8676.25%, 12/15/2040 260,000 326,480
Public Service Co. of Colorado3.55%, 06/15/2046 53,000 48,9276.50%, 08/01/2038 45,000 60,418
Public Service Co. of Oklahoma4.40%, 02/01/2021 30,000 30,8016.63%, 11/15/2037 150,000 188,953
San Diego Gas & Electric Co.3.95%, 11/15/2041 44,000 40,8186.00%, 06/01/2026 50,000 56,422
Sempra Energy4.05%, 12/01/2023 72,000 73,654
WEC Energy Group, Inc.3.55%, 06/15/2025 144,000 146,447
2,448,742
Principal ValueCORPORATE DEBT SECURITIES (continued)Multiline Retail - 0.0% (E)Dollar General Corp.
4.13%, 05/01/2028 $ 85,000 $ 87,120Nordstrom, Inc.
4.00%, 10/15/2021 35,000 35,806122,926
Oil, Gas & Consumable Fuels - 2.5%Anadarko Finance Co.
7.50%, 05/01/2031 100,000 124,817Andeavor Logistics, LP / Tesoro Logistics Finance
Corp.5.25%, 01/15/2025 107,000 111,074
Apache Corp.2.63%, 01/15/2023 58,000 56,5313.25%, 04/15/2022 (F) 12,000 12,0094.75%, 04/15/2043 57,000 53,5946.00%, 01/15/2037 56,000 61,144
APT Pipelines, Ltd.4.25%, 07/15/2027 (A) 191,000 193,549
BP Capital Markets America, Inc.3.79%, 02/06/2024 1,000,000 1,037,773
BP Capital Markets PLC3.54%, 11/04/2024 300,000 308,7913.81%, 02/10/2024 116,000 120,592
Buckeye Partners, LP3.95%, 12/01/2026 23,000 21,8674.88%, 02/01/2021 300,000 307,3665.85%, 11/15/2043 100,000 99,438
Canadian Natural Resources, Ltd.3.80%, 04/15/2024 100,000 102,0585.85%, 02/01/2035 70,000 78,4076.45%, 06/30/2033 264,000 316,1537.20%, 01/15/2032 20,000 25,118
Cenovus Energy, Inc.6.75%, 11/15/2039 219,000 244,074
Chevron Corp.2.36%, 12/05/2022 60,000 59,5632.90%, 03/03/2024 54,000 54,618
CNOOC Finance Pty, Ltd.2.63%, 05/05/2020 230,000 229,307
CNOOC Finance USA LLC3.50%, 05/05/2025 235,000 237,550
Ecopetrol SA4.13%, 01/16/2025 100,000 101,0015.38%, 06/26/2026 116,000 124,9905.88%, 09/18/2023 71,000 77,550
Enable Midstream Partners, LP4.95%, 05/15/2028 80,000 81,000
Enbridge, Inc.3.70%, 07/15/2027 65,000 64,8114.50%, 06/10/2044 100,000 100,529Fixed until 03/01/2028,
6.25% (D), 03/01/2078 150,000 149,179Encana Corp.
6.50%, 05/15/2019 40,000 40,0987.20%, 11/01/2031 110,000 135,5378.13%, 09/15/2030 100,000 128,315
Energy Transfer Operating, LP3.60%, 02/01/2023 94,000 94,7844.05%, 03/15/2025 123,000 124,7184.75%, 01/15/2026 87,000 90,9374.90%, 02/01/2024 199,000 209,816
Copyright © 2021 www.secdatabase.com. All Rights Reserved.Please Consider the Environment Before Printing This Document

The notes are an integral part of this report.Transamerica Series Trust Page 13
6.05%, 06/01/2041 225,000 240,7856.50%, 02/01/2042 39,000 43,324
Copyright © 2021 www.secdatabase.com. All Rights Reserved.Please Consider the Environment Before Printing This Document

Transamerica JPMorgan Core Bond VPSCHEDULE OF INVESTMENTS (continued)At March 31, 2019(unaudited)
Principal ValueCORPORATE DEBT SECURITIES (continued)Oil, Gas & Consumable Fuels (continued)Eni SpA
4.00%, 09/12/2023 (A) $ 200,000 $ 205,2025.70%, 10/01/2040 (A) 125,000 135,626
Eni USA, Inc.7.30%, 11/15/2027 70,000 85,199
EnLink Midstream Partners, LP2.70%, 04/01/2019 131,000 131,000
Enterprise Products Operating LLC3.75%, 02/15/2025 110,000 113,5473.90%, 02/15/2024 158,000 164,0324.95%, 10/15/2054 46,000 47,7985.10%, 02/15/2045 39,000 42,7125.75%, 03/01/2035 200,000 220,1966.65%, 10/15/2034 100,000 125,8897.55%, 04/15/2038 300,000 404,380
EOG Resources, Inc.2.63%, 03/15/2023 36,000 35,739
EQT Corp.3.90%, 10/01/2027 116,000 108,497
Equinor ASA2.65%, 01/15/2024 214,000 213,0143.25%, 11/10/2024 107,000 109,509
Kerr-McGee Corp.7.88%, 09/15/2031 100,000 126,784
Kinder Morgan, Inc.4.30%, 03/01/2028 375,000 387,374
Magellan Midstream Partners, LP3.20%, 03/15/2025 68,000 66,5844.20%, 12/01/2042 73,000 69,3114.25%, 02/01/2021 167,000 171,010
Marathon Petroleum Corp.3.63%, 09/15/2024 145,000 146,285
MPLX, LP4.13%, 03/01/2027 104,000 104,6554.50%, 04/15/2038 140,000 132,9794.80%, 02/15/2029 195,000 205,2735.20%, 03/01/2047 54,000 54,793
Noble Energy, Inc.3.90%, 11/15/2024 120,000 121,1206.00%, 03/01/2041 200,000 221,317
Occidental Petroleum Corp.3.00%, 02/15/2027 78,000 77,5834.63%, 06/15/2045 39,000 42,649
ONEOK Partners, LP3.38%, 10/01/2022 30,000 30,2554.90%, 03/15/2025 200,000 212,7315.00%, 09/15/2023 65,000 69,0856.65%, 10/01/2036 210,000 240,228
Petro-Canada6.80%, 05/15/2038 50,000 64,4077.88%, 06/15/2026 168,000 203,517
Petroleos Mexicanos4.63%, 09/21/2023 (F) 208,000 204,8824.88%, 01/18/2024 (F) 44,000 43,3185.35%, 02/12/2028 99,000 91,8726.35%, 02/12/2048 153,000 134,8926.38%, 02/04/2021 - 01/23/2045 218,000 209,7746.50%, 03/13/2027 650,000 654,5506.75%, 09/21/2047 201,000 184,518
Phillips 663.90%, 03/15/2028 140,000 142,4404.30%, 04/01/2022 17,000 17,733
Principal ValueCORPORATE DEBT SECURITIES (continued)Oil, Gas & Consumable Fuels (continued)Plains All American Pipeline, LP / PAA Finance Corp.
(continued)4.30%, 01/31/2043 $
100,000 $ 86,1714.65%, 10/15/2025 50,000 52,092
Shell International Finance BV3.50%, 11/13/2023 525,000 542,736
Southern Natural Gas Co. LLC4.80%, 03/15/2047 (A) 69,000 69,1208.00%, 03/01/2032 56,000 76,241
Spectra Energy Partners, LP3.50%, 03/15/2025 125,000 124,9985.95%, 09/25/2043 63,000 74,064
Suncor Energy, Inc.5.95%, 12/01/2034 140,000 168,867
Sunoco Logistics Partners Operations, LP4.95%, 01/15/2043 198,000 184,6955.30%, 04/01/2044 50,000 49,0045.35%, 05/15/2045 133,000 130,0975.50%, 02/15/2020 180,000 183,0615.95%, 12/01/2025 147,000 162,5866.10%, 02/15/2042 150,000 160,770
TC PipeLines, LP3.90%, 05/25/2027 70,000 69,224
Total Capital International SA3.75%, 04/10/2024 29,000 30,200
TransCanada PipeLines, Ltd.4.88%, 01/15/2026 162,000 175,1766.20%, 10/15/2037 100,000 118,789
Valero Energy Corp.7.50%, 04/15/2032 65,000 82,939
Western Midstream Operating, LP4.00%, 07/01/2022 69,000 69,9795.45%, 04/01/2044 168,000 160,567
Williams Cos., Inc.3.90%, 01/15/2025 68,000 69,4074.85%, 03/01/2048 133,000 132,501
15,566,167Personal Products - 0.0% (E)Unilever Capital Corp.
3.38%, 03/22/2025 (F) 100,000 102,073Pharmaceuticals - 0.5%Allergan Funding SCS
3.45%, 03/15/2022 139,000 140,2523.85%, 06/15/2024 302,000 305,743
Allergan, Inc.3.38%, 09/15/2020 67,000 67,314
AstraZeneca PLC6.45%, 09/15/2037 100,000 127,393
Baxalta, Inc.3.60%, 06/23/2022 20,000 20,1035.25%, 06/23/2045 9,000 9,861
Bayer US Finance II LLC4.70%, 07/15/2064 (A) 97,000 80,630
Bayer US Finance LLC3.38%, 10/08/2024 (A) 200,000 195,537
ELI Lilly & Co.4.15%, 03/15/2059 170,000 174,879
Johnson & Johnson3.40%, 01/15/2038 247,000 243,0434.38%, 12/05/2033 46,000 51,584
Copyright © 2021 www.secdatabase.com. All Rights Reserved.Please Consider the Environment Before Printing This Document

The notes are an integral part of this report.Transamerica Series Trust Page 14
Phillips 66 Partners, LP3.55%, 10/01/2026 34,000 33,4084.90%, 10/01/2046 72,000 73,286
Plains All American Pipeline, LP / PAA FinanceCorp.3.60%, 11/01/2024 250,000 249,163
Merck & Co., Inc.3.70%, 02/10/2045 20,000 19,8003.90%, 03/07/2039 290,000 298,420
Mylan NV2.50%, 06/07/2019 89,000 88,9333.95%, 06/15/2026 70,000 66,782
Copyright © 2021 www.secdatabase.com. All Rights Reserved.Please Consider the Environment Before Printing This Document

Transamerica JPMorgan Core Bond VPSCHEDULE OF INVESTMENTS (continued)At March 31, 2019(unaudited)
Principal ValueCORPORATE DEBT SECURITIES (continued)Pharmaceuticals (continued)Mylan, Inc.
5.40%, 11/29/2043 $50,000 $ 45,915
Pfizer, Inc.3.90%, 03/15/2039 300,000 310,876
Shire Acquisitions Investments Ireland DAC2.40%, 09/23/2021 210,000 207,4082.88%, 09/23/2023 111,000 109,5443.20%, 09/23/2026 189,000 182,764
Teva Pharmaceutical Finance Netherlands III BV1.70%, 07/19/2019 74,000 73,658
2,820,439Real Estate Management & Development - 0.1%Ontario Teachers� Cadillac Fairview Properties Trust
3.88%, 03/20/2027 (A) 325,000 333,302Road & Rail - 0.3%Burlington Northern Santa Fe LLC
3.00%, 03/15/2023 50,000 50,5543.05%, 03/15/2022 87,000 88,0293.45%, 09/15/2021 22,000 22,3813.75%, 04/01/2024 124,000 129,4464.38%, 09/01/2042 88,000 93,8705.15%, 09/01/2043 154,000 181,4536.15%, 05/01/2037 70,000 89,5696.70%, 08/01/2028 50,000 62,785
Canadian Pacific Railway Co.2.90%, 02/01/2025 208,000 203,8546.13%, 09/15/2115 57,000 70,0057.13%, 10/15/2031 50,000 66,368
CSX Corp.4.75%, 11/15/2048 200,000 216,4305.50%, 04/15/2041 37,000 42,703
JB Hunt Transport Services, Inc.3.88%, 03/01/2026 185,000 187,837
Norfolk Southern Corp.3.95%, 10/01/2042 35,000 34,0764.05%, 08/15/2052 150,000 145,546
Ryder System, Inc.2.50%, 05/11/2020, MTN 113,000 112,6622.65%, 03/02/2020, MTN 79,000 78,872
Union Pacific Corp.4.10%, 09/15/2067 80,000 73,051
Union Pacific Railroad Co. Pass-Through Trust4.70%, 01/02/2024 23,947 24,847
1,974,338Semiconductors & Semiconductor Equipment - 0.3%Analog Devices, Inc.
3.13%, 12/05/2023 73,000 73,5224.50%, 12/05/2036 140,000 139,812
Broadcom Corp. / Broadcom Cayman Finance, Ltd.3.63%, 01/15/2024 422,000 420,915
Broadcom, Inc.4.75%, 04/15/2029 800,000 796,200
Intel Corp.3.70%, 07/29/2025 107,000 112,1574.00%, 12/15/2032 221,000 241,853
Principal ValueCORPORATE DEBT SECURITIES (continued)Semiconductors & Semiconductor Equipment (continued)QUALCOMM, Inc.
3.25%, 05/20/2027 $157,000
$153,405
1,937,864Software - 0.4%Microsoft Corp.
3.30%, 02/06/2027 139,000 142,7013.50%, 02/12/2035 185,000 187,5053.95%, 08/08/2056 88,000 91,7804.00%, 02/12/2055 57,000 59,6794.10%, 02/06/2037 250,000 271,9114.20%, 11/03/2035 103,000 113,2414.50%, 02/06/2057 170,000 194,6074.75%, 11/03/2055 109,000 131,213
Oracle Corp.2.95%, 11/15/2024 500,000 500,9063.90%, 05/15/2035 240,000 245,3504.30%, 07/08/2034 200,000 214,4216.13%, 07/08/2039 82,000 105,208
VMware, Inc.2.95%, 08/21/2022 288,000 284,945
2,543,467Specialty Retail - 0.2%AutoZone, Inc.
2.50%, 04/15/2021 100,000 99,408Home Depot, Inc.
3.90%, 12/06/2028 (F) 500,000 531,3074.20%, 04/01/2043 121,000 126,705
Lowe�s Cos., Inc.3.13%, 09/15/2024 75,000 75,4623.38%, 09/15/2025 119,000 119,5134.65%, 04/15/2042 54,000 54,750
O�Reilly Automotive, Inc.3.60%, 09/01/2027 124,000 123,497
1,130,642Technology Hardware, Storage & Peripherals - 0.5%Apple, Inc.
2.45%, 08/04/2026 259,000 250,2222.85%, 05/11/2024 199,000 199,5942.90%, 09/12/2027 274,000 270,1143.00%, 02/09/2024 - 06/20/2027 604,000 608,1703.20%, 05/13/2025 - 05/11/2027 335,000 339,5983.35%, 02/09/2027 276,000 281,6733.45%, 05/06/2024 - 02/09/2045 205,000 201,5043.75%, 09/12/2047 350,000 348,2463.85%, 08/04/2046 181,000 183,0374.50%, 02/23/2036 85,000 95,295
Dell International LLC / EMC Corp.6.02%, 06/15/2026 (A) 340,000 365,687
3,143,140Tobacco - 0.0% (E)BAT Capital Corp.
4.39%, 08/15/2037 68,000 60,842Trading Companies & Distributors - 0.2%Air Lease Corp.
3.25%, 03/01/2025 194,000 186,7933.63%, 04/01/2027 70,000 65,867
BOC Aviation, Ltd.2.38%, 09/15/2021 (A) 200,000 195,1362.75%, 09/18/2022 (A) 200,000 195,654
Copyright © 2021 www.secdatabase.com. All Rights Reserved.Please Consider the Environment Before Printing This Document

The notes are an integral part of this report.Transamerica Series Trust Page 15
Copyright © 2021 www.secdatabase.com. All Rights Reserved.Please Consider the Environment Before Printing This Document

Transamerica JPMorgan Core Bond VPSCHEDULE OF INVESTMENTS (continued)At March 31, 2019(unaudited)
Principal ValueCORPORATE DEBT SECURITIES (continued)Trading Companies & Distributors (continued)International Lease Finance Corp.
5.88%, 08/15/2022 $200,000 $ 215,625
8.63%, 01/15/2022 200,000 227,1561,086,231
Transportation Infrastructure - 0.1%Penske Truck Leasing Co., LP / PTL Finance Corp.
2.70%, 03/14/2023 (A) 100,000 97,7144.13%, 08/01/2023 (A) 277,000 285,087
382,801Water Utilities - 0.1%American Water Capital Corp.
3.40%, 03/01/2025 183,000 186,6314.00%, 12/01/2046 86,000 85,790
272,421Wireless Telecommunication Services - 0.2%America Movil SAB de CV
6.13%, 03/30/2040 100,000 124,737Crown Castle Towers LLC
3.22%, 05/15/2042 (A) 125,000 125,286Sprint Spectrum Co. LLC / Sprint Spectrum Co. II
LLC3.36%, 03/20/2023 (A) 270,000 269,919
Vodafone Group PLC4.13%, 05/30/2025 (F) 170,000 173,2495.00%, 05/30/2038 147,000 145,1885.25%, 05/30/2048 172,000 170,517
1,008,896Total Corporate Debt Securities
(Cost $151,212,229) 153,023,749
FOREIGN GOVERNMENT OBLIGATIONS - 1.1%Colombia - 0.1%Colombia Government International Bond
4.00%, 02/26/2024 200,000 206,2025.00%, 06/15/2045 200,000 209,8407.38%, 09/18/2037 100,000 130,750
546,792Israel - 0.8%Israel Government AID Bond
5.50%, 09/18/2033 100,000 129,372Series 2007-Z,Zero Coupon, 08/15/2025 1,000,000 840,989
Israel Government AID Bond, Principal OnlySTRIPSSeries 2,11/01/2024 3,480,000 3,002,160Series 2004-Z,08/15/2023 1,000,000 894,243
4,866,764Mexico - 0.2%Mexico Government International Bond
3.75%, 01/11/2028 210,000 207,4174.13%, 01/21/2026 200,000 204,2004.35%, 01/15/2047 104,000 97,344
Principal ValueFOREIGN GOVERNMENT OBLIGATIONS (continued)Mexico (continued)Mexico Government International Bond (continued)
5.55%, 01/21/2045 (F) $448,000
$490,659
4.75%, 03/08/2044, MTN 60,000 58,9501,058,570
Panama - 0.0% (E)Panama Government International Bond
4.50%, 04/16/2050 200,000 208,800Peru - 0.0% (E)Peru Government International Bond
5.63%, 11/18/2050 36,000 46,188Supranational - 0.0% (E)African Development Bank
8.80%, 09/01/2019 225,000 230,640Total Foreign Government Obligations
(Cost $6,911,637) 6,957,754
MORTGAGE-BACKED SECURITIES - 4.0%Alternative Loan Trust
Series 2004-2CB, Class 1A9,5.75%, 03/25/2034 211,038 221,184Series 2005-28CB, Class 1A4,5.50%, 08/25/2035 155,829 149,490Series 2005-54CB, Class 1A11,5.50%, 11/25/2035 51,781 48,408
Alternative Loan Trust, Interest Only STRIPSSeries 2005-20CB, Class 3A8,(1.00) * 1-Month LIBOR + 4.75%, 2.26% (D), 07/25/
2035 266,101 24,087Series 2005-22T1, Class A2,(1.00) * 1-Month LIBOR + 5.07%, 2.58% (D), 06/25/
2035 563,639 60,759Series 2005-J1, Class 1A4,(1.00) * 1-Month LIBOR + 5.10%, 2.61% (D), 02/25/
2035 40,824 578BAMLL Commercial Mortgage Securities Trust
Series 2012-PARK, Class A,2.96%, 12/10/2030 (A) 100,000 101,024Series 2014-520M, Class C,4.21% (D), 08/15/2046 (A) 200,000 187,764
Banc of America Funding TrustSeries 2005-E, Class 4A1,4.71% (D), 03/20/2035 34,827 35,108
Banc of America Funding Trust, Principal Only STRIPSSeries 2004-1,03/25/2034 18,564 15,929Series 2005-7, Class 30,11/25/2035 20,805 17,555Series 2005-8, Class 30,01/25/2036 5,874 4,468
Banc of America Mortgage TrustSeries 2003-J, Class 3A2,4.76% (D), 11/25/2033 73,954 74,693
BB-UBS TrustSeries 2012-SHOW, Class A,3.43%, 11/05/2036 (A) 550,000 558,966Series 2012-TFT, Class A,2.89%, 06/05/2030 (A) 67,000 66,649
BCAP LLC TrustSeries 2010-RR7, Class 2A1,4.32% (D), 07/26/2045 (A) 51,397 51,181
Copyright © 2021 www.secdatabase.com. All Rights Reserved.Please Consider the Environment Before Printing This Document

The notes are an integral part of this report.Transamerica Series Trust Page 16
Copyright © 2021 www.secdatabase.com. All Rights Reserved.Please Consider the Environment Before Printing This Document

Transamerica JPMorgan Core Bond VPSCHEDULE OF INVESTMENTS (continued)At March 31, 2019(unaudited)
Principal ValueMORTGAGE-BACKED SECURITIES (continued)Bear Stearns Alt-A Trust
Series 2004-6, Class 1A,1-Month LIBOR + 0.64%,
3.13% (D), 07/25/2034$116,325
$115,721
Bear Stearns ARM TrustSeries 2006-1, Class A1,1-Year CMT + 2.25%,
4.91% (D), 02/25/2036 50,199 50,635Bear Stearns Commercial Mortgage Securities Trust
Series 2005-PWR9, Class C,5.06% (D), 09/11/2042 65,528 65,521
CD Mortgage TrustSeries 2006-CD3, Class AM,5.65%, 10/15/2048 276,293 285,423
Chase Mortgage Finance TrustSeries 2007-A1, Class 1A3,4.62% (D), 02/25/2037 68,502 69,645Series 2007-A2, Class 2A1,4.51% (D), 07/25/2037 30,802 31,421
CHL Mortgage Pass-Through TrustSeries 2004-3, Class A26,5.50%, 04/25/2034 55,525 56,783Series 2004-3, Class A4,5.75%, 04/25/2034 33,315 33,956Series 2004-7, Class 2A1,4.08% (D), 06/25/2034 17,184 17,751Series 2004-8, Class 2A1,4.50%, 06/25/2019 260 262Series 2004-HYB1, Class 2A,4.17% (D), 05/20/2034 12,610 12,665Series 2005-22, Class 2A1,4.05% (D), 11/25/2035 104,748 91,970
Citigroup Mortgage Loan Trust, Inc.Series 2003-1, Class 2A5,5.25%, 10/25/2033 13,857 14,108
COMM Mortgage TrustSeries 2013-SFS, Class A2,2.99% (D), 04/12/2035 (A) 125,000 125,427Series 2014-TWC, Class A,1-Month LIBOR + 0.85%, 3.35% (D), 02/13/
2032 (A) 2,015,000 2,015,002Series 2014-TWC, Class B,1-Month LIBOR + 1.60%, 4.10% (D), 02/13/
2032 (A) 500,000 500,000Series 2015-CR25, Class A4,3.76%, 08/10/2048 422,000 438,018Series 2018-HOME, Class A,3.82% (D), 04/10/2033 (A) 1,160,000 1,205,081
Commercial Mortgage TrustSeries 2006-GG7, Class AM,5.61% (D), 07/10/2038 13,618 13,695
Credit Suisse First Boston Mortgage Securities Corp.Series 2003-21, Class 1A4,5.25%, 09/25/2033 21,251 21,991Series 2004-5, Class 3A1,5.25%, 08/25/2019 2,359 2,227
CSFB Mortgage-Backed Pass-Through CertificatesSeries 2003-27, Class 5A4,5.25%, 11/25/2033 32,161 32,862
Federal Home Loan Mortgage Corp.Series K070, Class A2,3.30% (D), 11/25/2027 553,000 569,036
Principal ValueMORTGAGE-BACKED SECURITIES (continued)Federal Home Loan Mortgage Corp. (continued)
Series K077, Class AM,3.85% (D), 05/25/2028 $
1,340,000$1,428,022
Series W5FX, Class AFX,2.97% (D), 04/25/2028 465,000 470,477
GMAC Commercial Mortgage Securities, Inc. TrustSeries 2004-C3, Class B,4.97%, 12/10/2041 1,289 1,287
GS Mortgage Securities Corp. IISeries 2013-KING, Class A,2.71%, 12/10/2027 (A) 119,127 118,933
GS Mortgage Securities Corp. TrustSeries 2012-ALOH, Class A,3.55%, 04/10/2034 (A) 750,000 763,902
GS Mortgage Securities TrustSeries 2011-GC5, Class D,5.39% (D), 08/10/2044 (A) 103,000 99,888
GSMPS Mortgage Loan TrustSeries 2005-RP2, Class 1AF,1-Month LIBOR + 0.35%, 2.84% (D), 03/25/2035
(A) 145,039 134,868Series 2005-RP3, Class 1AF,1-Month LIBOR + 0.35%, 2.84% (D), 09/25/2035
(A) 90,085 79,944GSR Mortgage Loan Trust
Series 2004-6F, Class 2A4,5.50%, 05/25/2034 51,038 52,240Series 2004-8F, Class 2A3,6.00%, 09/25/2034 22,842 23,464Series 2005-7F, Class 3A9,6.00%, 09/25/2035 47,769 49,954Series 2006-1F, Class 2A4,6.00%, 02/25/2036 66,805 55,358
Headlands Residential LLCSeries 2017-RPL1, Class A,3.88% (D), 08/25/2022 (A) 1,135,000 1,123,423
Impac Secured Assets TrustSeries 2006-1, Class 2A1,1-Month LIBOR + 0.35%,
2.84% (D), 05/25/2036 83,464 82,363Series 2006-2, Class 2A1,1-Month LIBOR + 0.35%,
2.84% (D), 08/25/2036 19,182 18,846Independence Plaza Trust
Series 2018-INDP, Class A,3.76%, 07/10/2035 (A) 765,000 788,903
JPMorgan Chase Commercial Mortgage SecuritiesTrust, Interest Only STRIPSSeries 2006-LDP8, Class X,0.29% (D), 05/15/2045 91,593 108
JPMorgan Mortgage TrustSeries 2006-A2, Class 5A3,4.63% (D), 11/25/2033 25,658 26,301
Ladder Capital Commercial Mortgage TrustSeries 2013-GCP, Class A2,3.99%, 02/15/2036 (A) 154,000 160,381
MASTR Adjustable Rate Mortgages TrustSeries 2004-13, Class 2A1,4.73% (D), 04/21/2034 30,798 31,648Series 2004-13, Class 3A7,4.47% (D), 11/21/2034 17,655 18,140Series 2004-3, Class 4A2,
Copyright © 2021 www.secdatabase.com. All Rights Reserved.Please Consider the Environment Before Printing This Document

The notes are an integral part of this report.Transamerica Series Trust Page 17
4.17% (D), 04/25/2034 15,214 14,266MASTR Alternative Loan Trust
Series 2004-10, Class 1A1,4.50%, 09/25/2019 2,059 2,058Series 2004-5, Class 5A1,4.75%, 06/25/2019 48 48
Copyright © 2021 www.secdatabase.com. All Rights Reserved.Please Consider the Environment Before Printing This Document

Transamerica JPMorgan Core Bond VPSCHEDULE OF INVESTMENTS (continued)At March 31, 2019(unaudited)
Principal ValueMORTGAGE-BACKED SECURITIES (continued)MASTR Resecuritization Trust, Principal Only
STRIPSSeries 2005, Class 3,05/28/2035 (A) $ 12,604 $ 9,100
Merrill Lynch Mortgage Investors TrustSeries 2003-E, Class A1,1-Month LIBOR + 0.62%,
3.11% (D), 10/25/2028 247,970 247,275Series 2004-1, Class 2A1,4.31% (D), 12/25/2034 54,249 54,290Series 2004-A, Class A1,1-Month LIBOR + 0.46%,
2.95% (D), 04/25/2029 166,929 164,342Morgan Stanley Bank of America Merrill Lynch Trust
Series 2014-C14, Class A3,3.67%, 02/15/2047 296,986 300,510
Morgan Stanley Capital I TrustSeries 2011-C3, Class A3,4.05%, 07/15/2049 36,101 36,126
Nomura Asset Acceptance Corp. Alternative LoanTrustSeries 2003-A1, Class A2,6.00%, 05/25/2033 9,189 9,341Series 2003-A1, Class A5,7.00%, 04/25/2033 10,096 10,539
PHH Alternative Mortgage Trust, Interest OnlySTRIPSSeries 2007-2, Class 2X,6.00%, 05/25/2037 153,981 36,022
RALI TrustSeries 2002-QS16, Class A3,(2.09) * 1-Month LIBOR + 16.62%,
11.43% (D), 10/25/2017 52 55Series 2004-QS3, Class CB,5.00%, 03/25/2019 841 838
RBS Commercial Funding, Inc.Series 2013-SMV, Class A,3.26%, 03/11/2031 (A) 160,000 160,803
Seasoned Credit Risk Transfer TrustSeries 2019-1, Class MT,3.50%, 07/25/2058 1,492,316 1,504,921
Seasoned Loans Structured TransactionSeries 2018-2, Class A1,3.50%, 11/25/2028 2,422,749 2,474,196
Sequoia Mortgage TrustSeries 2003-1, Class 1A,1-Month LIBOR + 0.76%,
3.25% (D), 04/20/2033 105,895 103,753Series 2004-11, Class A1,1-Month LIBOR + 0.60%,
3.09% (D), 12/20/2034 80,497 79,241Series 2004-8, Class A1,1-Month LIBOR + 0.70%,
3.19% (D), 09/20/2034 207,428 204,317Series 2004-9, Class A1,1-Month LIBOR + 0.68%,
3.17% (D), 10/20/2034 137,731 134,478Structured Adjustable Rate Mortgage Loan Trust
Series 2004-1, Class 4A4,4.57% (D), 02/25/2034 218,188 218,601
Principal ValueMORTGAGE-BACKED SECURITIES (continued)Structured Asset Mortgage Investments II Trust
Series 2003-AR4, Class A1,1-Month LIBOR + 0.70%,
3.18% (D), 01/19/2034$252,553
$246,696
Series 2004-AR1, Class 1A1,1-Month LIBOR + 0.70%,
3.18% (D), 03/19/2034 217,643 214,814Series 2004-AR5, Class 1A1,1-Month LIBOR + 0.66%,
3.14% (D), 10/19/2034 38,505 38,023Series 2005-AR5, Class A3,1-Month LIBOR + 0.25%,
2.73% (D), 07/19/2035 118,788 117,279Thornburg Mortgage Securities Trust
Series 2004-4, Class 3A,4.07% (D), 12/25/2044 80,906 81,309
TIAA Seasoned Commercial Mortgage TrustSeries 2007-C4, Class C,5.48% (D), 08/15/2039 240,000 240,073
UBS-BAMLL TrustSeries 2012-WRM, Class A,3.66%, 06/10/2030 (A) 231,000 234,365
UBS-Barclays Commercial Mortgage TrustSeries 2012-C2, Class A4,3.53%, 05/10/2063 130,000 132,840Series 2013-C6, Class A4,3.24%, 04/10/2046 286,000 290,810
UBS-Barclays Commercial Mortgage Trust, InterestOnly STRIPSSeries 2012-C2, Class XA,1.32% (D), 05/10/2063 (A) 743,940 27,021
V.M. Jog Engineering, Ltd.Series 2017, Class A,1-Month LIBOR + 4.60%,
6.56% (D), 12/15/2020 1,200,000 1,200,000VNDO Mortgage Trust
Series 2012-6AVE, Class A,3.00%, 11/15/2030 (A) 544,235 547,884Series 2013-PENN, Class A,3.81%, 12/13/2029 (A) 400,000 405,259
Wachovia Bank Commercial Mortgage Trust, InterestOnly STRIPSSeries 2006-C24, Class XC,0.08% (D), 03/15/2045 (A) 580,777 3
WaMu Mortgage Pass-Through Certificates TrustSeries 2003-AR11, Class A6,4.30% (D), 10/25/2033 74,989 75,732Series 2003-AR6, Class A1,4.23% (D), 06/25/2033 22,473 22,774Series 2003-S3, Class 1A4,5.50%, 06/25/2033 45,428 46,638Series 2003-S9, Class A8,5.25%, 10/25/2033 44,710 45,354Series 2004-AR3, Class A2,4.05% (D), 06/25/2034 13,175 13,416
Washington Mutual Mortgage Pass-ThroughCertificates TrustSeries 2005-4, Class CB7,5.50%, 06/25/2035 127,691 122,559
Washington Mutual Mortgage Pass-ThroughCertificates Trust, Interest Only STRIPSSeries 2005-2, Class 1A4,
Copyright © 2021 www.secdatabase.com. All Rights Reserved.Please Consider the Environment Before Printing This Document

The notes are an integral part of this report.Transamerica Series Trust Page 18
(1.00) * 1-Month LIBOR + 5.05%, 2.56% (D), 04/25/2035 403,292 41,362
Series 2005-3, Class CX,5.50%, 05/25/2035 145,898 28,139
Copyright © 2021 www.secdatabase.com. All Rights Reserved.Please Consider the Environment Before Printing This Document

Transamerica JPMorgan Core Bond VPSCHEDULE OF INVESTMENTS (continued)At March 31, 2019(unaudited)
Principal ValueMORTGAGE-BACKED SECURITIES (continued)Washington Mutual MSC Mortgage Pass-Through
Certificates Trust, Principal Only STRIPSSeries 2003-MS7, Class P,03/25/2033 $ 2,137 $ 1,905
Wells Fargo Commercial Mortgage TrustSeries 2013-120B, Class A,2.71% (D), 03/18/2028 (A) 400,000 398,071Series 2014-LC16, Class A2,2.82%, 08/15/2050 228,561 228,268Series 2016-C35, Class A4,2.93%, 07/15/2048 1,103,000 1,084,735
Wells Fargo Mortgage-Backed Securities TrustSeries 2003-G, Class A1,4.46% (D), 06/25/2033 70,483 71,399Series 2003-K, Class 1A1,4.68% (D), 11/25/2033 9,361 9,516Series 2004-EE, Class 3A1,4.66% (D), 12/25/2034 60,298 62,503Series 2004-I, Class 1A1,4.84% (D), 07/25/2034 67,513 69,139Series 2004-P, Class 2A1,4.64% (D), 09/25/2034 66,193 68,026Series 2004-V, Class 1A1,4.65% (D), 10/25/2034 20,767 21,167Series 2005-AR16, Class 2A1,5.02% (D), 02/25/2034 47,980 49,255Series 2005-AR3, Class 1A1,2.48% (D), 03/25/2035 221,739 228,632Series 2005-AR8, Class 2A1,4.90% (D), 06/25/2035 14,736 15,214
Total Mortgage-Backed Securities(Cost $24,720,361) 25,160,793
MUNICIPAL GOVERNMENT OBLIGATIONS - 0.1%California - 0.0% (E)City of Los Angeles Department of Airports,
Revenue Bonds,Series C,6.58%, 05/15/2039 65,000 84,018
New York - 0.1%Port Authority of New York & New Jersey,
Revenue Bonds4.46%, 10/01/2062 225,000 252,0745.65%, 11/01/2040 155,000 200,578
452,652Ohio - 0.0% (E)Ohio State University, Revenue Bonds
Series A,4.05%, 12/01/2056 106,000 110,1804.80%, 06/01/2111 130,000 150,290
260,470Total Municipal Government Obligations
(Cost $707,855) 797,140
U.S. GOVERNMENT AGENCY OBLIGATIONS - 28.9%Federal Home Loan Banks
5.50%, 07/15/2036 150,000 200,042Federal Home Loan Mortgage Corp.
3.00%, 08/15/2042 - 01/15/2044 2,749,491 2,733,041
Principal ValueU.S. GOVERNMENT AGENCY OBLIGATIONS (continued)Federal Home Loan Mortgage Corp. (continued)
1-Month LIBOR + 0.55%, 3.03% (D), 07/15/2042- 03/15/2044
$1,607,325
$1,617,427
3.50%, 01/01/2032 - 06/01/2043 2,535,860 2,589,7274.00%, 06/01/2042 - 01/01/2046 2,337,588 2,420,0461-Year CMT + 2.25%,
4.13% (D), 05/01/2036 21,110 22,3006-Month LIBOR + 1.73%, 4.29% (D), 10/01/2036 22,317 23,20712-Month LIBOR + 1.94%, 4.46% (D), 06/01/2036 89,167 93,9934.50%, 05/01/2041 244,493 258,8796-Month LIBOR + 1.73%, 4.51% (D), 07/01/2036 32,904 34,2116-Month LIBOR + 1.66%, 4.54% (D), 08/01/2036 25,045 25,98812-Month LIBOR + 1.69%, 4.61% (D), 12/01/2036 4,233 4,4381-Year CMT + 2.25%,
4.63% (D), 02/01/2036 71,593 75,20912-Month LIBOR + 1.67%, 4.63% (D), 11/01/2036 24,132 25,2686-Month LIBOR + 1.90%, 4.70% (D), 03/01/2037 21,094 22,0031-Year CMT + 2.37%,
4.71% (D), 09/01/2034 36,172 38,0781-Year CMT + 2.36%,
4.73% (D), 10/01/2036 25,453 26,8771-Year CMT + 2.25%,
4.95% (D), 01/01/2035 25,727 27,0266-Month LIBOR + 2.11%, 4.99% (D), 02/01/2037 41,764 43,9245.50%, 06/01/2020 - 08/01/2038 29,852 32,7916.00%, 10/01/2019 - 12/01/2034 104,939 111,4636.50%, 09/01/2019 - 11/01/2036 23,453 27,3177.00%, 01/01/2031 58,637 65,743
Federal Home Loan Mortgage Corp. MultifamilyStructured Pass-Through Certificates2.27%, 01/25/2023 1,500,000 1,475,3342.36%, 08/25/2022 703,587 698,0362.60%, 09/25/2020 43,819 43,6802.62%, 01/25/2023 1,250,000 1,247,4092.72%, 07/25/2026 896,000 880,7932.77%, 05/25/2025 750,000 747,8252.81%, 09/25/2024 591,000 592,0902.84%, 09/25/2022 574,000 578,3602.93%, 01/25/2023 652,408 661,6903.04%, 07/25/2024 2,500,000 2,534,6513.08%, 01/25/2031 1,179,000 1,181,8871-Month LIBOR + 0.70%, 3.19% (D), 09/25/2022 229,126 229,2703.39%, 03/25/2024 857,000 885,7403.49%, 01/25/2024 1,300,000 1,348,4503.69%, 01/25/2029 1,045,000 1,106,466
Federal Home Loan Mortgage Corp. REMIC1-Month LIBOR + 0.35%, 2.83% (D), 06/15/2043 993,465 987,4151-Month LIBOR + 0.40%, 2.88% (D), 10/15/2041 313,306 313,5791-Month LIBOR + 0.40%, 2.91% (D), 07/15/2037 208,650 208,0151-Month LIBOR + 0.44%, 2.92% (D), 02/15/2037 8,156 8,1701-Month LIBOR + 0.45%, 2.93% (D), 08/15/2039 170,427 171,181
Copyright © 2021 www.secdatabase.com. All Rights Reserved.Please Consider the Environment Before Printing This Document

The notes are an integral part of this report.Transamerica Series Trust Page 19
Copyright © 2021 www.secdatabase.com. All Rights Reserved.Please Consider the Environment Before Printing This Document

Transamerica JPMorgan Core Bond VPSCHEDULE OF INVESTMENTS (continued)At March 31, 2019(unaudited)
Principal ValueU.S. GOVERNMENT AGENCY OBLIGATIONS (continued)Federal Home Loan Mortgage Corp. REMIC
(continued)1-Month LIBOR + 0.55%,
3.03% (D), 08/15/2037$498,677
$502,437
1-Month LIBOR + 0.68%,3.16% (D), 11/15/2037 270,325 274,076
4.00%, 12/15/2041 326,738 344,7685.00%, 12/15/2022 - 05/15/2041 575,093 636,9915.50%, 12/15/2022 - 05/15/2038 550,688 605,051(3.62) * 1-Month LIBOR + 27.21%, 5.50% (D), 05/
15/2041 80,414 82,8726.00%, 05/15/2027 - 04/15/2036 998,897 1,098,6076.38%, 03/15/2032 81,339 91,3836.40%, 11/15/2023 20,230 21,0906.50%, 08/15/2031 - 07/15/2036 434,373 489,8607.00%, 03/15/2024 - 05/15/2032 662,948 743,400(1.25) * 1-Month LIBOR + 10.13%, 7.02% (D), 07/
15/2032 43,470 49,0477.25%, 09/15/2030 - 12/15/2030 169,840 194,4677.50%, 02/15/2023 - 08/15/2030 65,738 71,6598.00%, 01/15/2030 134,415 156,365(2.00) * 1-Month LIBOR + 13.29%, 8.32% (D), 07/
15/2033 32,468 38,123(3.33) * 1-Month LIBOR + 17.50%, 9.22% (D), 02/
15/2040 76,951 93,415(1.83) * 1-Month LIBOR + 14.76%,
10.20% (D), 09/15/2033 6,983 8,389(3.67) * 1-Month LIBOR + 24.49%,
15.39% (D), 06/15/2034 34,141 38,948Federal Home Loan Mortgage Corp. REMIC, Interest
Only STRIPS1.48% (D), 01/15/2040 94,965 3,981(1.00) * 1-Month LIBOR + 6.00%, 3.52% (D), 11/
15/2037 - 02/15/2039 107,582 13,748(1.00) * 1-Month LIBOR + 6.20%, 3.72% (D), 06/
15/2038 220,020 30,822(1.00) * 1-Month LIBOR + 6.37%, 3.89% (D), 10/
15/2037 435,698 61,774(1.00) * 1-Month LIBOR + 6.42%, 3.94% (D), 11/
15/2037 48,816 4,885(1.00) * 1-Month LIBOR + 6.80%, 4.32% (D), 04/
15/2038 39,474 5,390(1.00) * 1-Month LIBOR + 7.10%, 4.62% (D), 07/
15/2036 13,970 791(1.00) * 1-Month LIBOR + 8.00%, 5.52% (D), 03/
15/2032 27,909 4,674Federal Home Loan Mortgage Corp. REMIC,
Principal Only STRIPS04/15/2020 - 01/15/2040 196,780 173,183
Federal Home Loan Mortgage Corp. Structured Pass-Through Certificates12-MTA + 1.20%,
3.60% (D), 10/25/2044 178,338 180,2213.90% (D), 08/25/2028 860,000 925,7335.44% (D), 07/25/2032 146,112 157,4586.50%, 02/25/2043 136,332 158,0457.00%, 02/25/2043 41,208 47,5917.50% (D), 08/25/2042 61,156 73,936
Federal Home Loan Mortgage Corp., Interest OnlySTRIPS5.00%, 09/15/2035 42,036 8,335
Federal National Mortgage AssociationZero Coupon, 10/09/2019 675,000 666,341
Principal ValueU.S. GOVERNMENT AGENCY OBLIGATIONS (continued)Federal National Mortgage Association (continued)
2.49%, 05/25/2026 $1,000,000
$977,422
2.51%, 06/01/2023 886,716 888,8272.52%, 05/01/2023 1,000,000 999,7422.57%, 08/01/2028 2,850,000 2,764,8312.65%, 08/01/2022 500,000 501,6552.67%, 07/01/2022 1,500,000 1,505,5842.70%, 07/01/2026 1,500,000 1,493,5192.71%, 04/01/2023 1,291,589 1,297,3981-Month LIBOR + 0.26%,
2.75% (D), 11/25/2046 132,290 130,3122.77%, 06/01/2023 739,596 744,6821-Month LIBOR + 0.35%,
2.84% (D), 09/25/2042 469,078 466,7911-Month LIBOR + 0.35%,
2.85% (D), 01/01/2023 581,641 581,5102.90%, 06/25/2027 1,345,315 1,332,6992.92%, 12/01/2024 1,000,000 1,016,5212.97%, 06/01/2030 1,321,000 1,301,6022.98%, 08/25/2029 733,000 719,6951-Month LIBOR + 0.50%,
2.98% (D), 08/25/2019 13,728 13,6941-Month LIBOR + 0.48%,
2.99% (D), 09/01/2024 911,312 906,4503.00%, 01/01/2043 573,887 574,2653.02% (D), 08/25/2024 636,000 647,1723.03%, 12/01/2021 430,792 436,6671-Month LIBOR + 0.55%,
3.04% (D), 08/25/2042 416,446 419,8263.04% (D), 03/25/2028 546,000 549,5743.08%, 01/01/2028 2,000,000 2,024,0663.08% (D), 06/25/2027 1,016,000 1,027,6963.09% (D), 04/25/2027 - 02/25/2030 1,559,000 1,566,3133.10%, 09/01/2025 - 01/01/2028 2,992,582 3,044,2083.12%, 11/01/2026 978,208 999,1033.16%, 01/01/2030 2,000,000 2,019,8923.18% (D), 04/25/2029 937,000 948,9653.24%, 10/01/2026 - 12/01/2026 1,922,941 1,980,3653.26%, 04/01/2029 2,000,000 2,043,5333.29%, 08/01/2026 2,500,000 2,587,8153.30%, 12/01/2026 - 03/01/2029 2,180,876 2,246,2393.33%, 05/01/2028 2,073,265 2,136,6293.34%, 02/01/2027 - 07/01/2030 2,000,000 2,054,0323.36%, 12/01/2027 1,044,647 1,073,7103.38%, 12/01/2023 1,470,150 1,518,5143.38% (D), 07/25/2028 997,000 1,027,9801-Month LIBOR + 0.93%,
3.41% (D), 11/25/2022 274,737 275,2493.42%, 05/01/2024 600,000 623,1123.45%, 01/01/2024 966,849 1,001,6883.50%, 12/01/2027 - 01/01/2044 6,019,847 6,179,6583.55% (D), 09/25/2028 1,000,000 1,045,2583.57%, 07/01/2028 1,193,201 1,249,4963.59%, 10/01/2020 59,942 60,4743.63% (D), 11/25/2028 1,710,000 1,799,9663.64% (D), 08/25/2030 1,100,000 1,150,5633.66%, 10/01/2028 1,192,583 1,256,2183.67%, 09/01/2028 1,142,000 1,205,1243.74%, 07/01/2023 481,859 505,9203.76%, 06/25/2021 - 12/01/2035 2,108,712 2,193,4143.80%, 02/01/2031 1,397,963 1,492,3643.81%, 12/01/2028 730,000 779,980
Copyright © 2021 www.secdatabase.com. All Rights Reserved.Please Consider the Environment Before Printing This Document

The notes are an integral part of this report.Transamerica Series Trust Page 20
1.94%, 07/01/2019 911,221 908,7152.34%, 01/01/2023 901,338 897,6512.38%, 12/01/2022 - 10/01/2026 1,917,797 1,889,9712.39% (D), 01/25/2023 728,750 722,0382.46%, 02/01/2023 860,334 860,453
3.82%, 09/01/2028 1,795,099 1,915,1953.86%, 07/01/2021 871,678 896,6513.92%, 08/01/2021 1,373,050 1,413,4863.94%, 07/01/2021 500,000 514,7063.97%, 06/01/2021 - 07/01/2021 889,970 915,3903.98%, 08/01/2021 900,367 927,355
Copyright © 2021 www.secdatabase.com. All Rights Reserved.Please Consider the Environment Before Printing This Document

Transamerica JPMorgan Core Bond VPSCHEDULE OF INVESTMENTS (continued)At March 31, 2019(unaudited)
Principal ValueU.S. GOVERNMENT AGENCY OBLIGATIONS (continued)Federal National Mortgage Association (continued)
3.99%, 07/01/2021 $200,447
$206,343
4.00%, 07/01/2042 - 03/01/2048 3,522,313 3,660,7734.02%, 08/01/2021 - 11/01/2028 1,496,383 1,562,2574.05%, 08/01/2021 728,130 751,5354.06%, 07/01/2021 959,211 989,2774.23%, 03/01/2020 794,527 803,5844.25%, 04/01/2021 500,000 513,4804.26%, 06/01/2021 295,963 304,7154.38%, 04/01/2020 134,052 136,0964.45%, 07/01/2026 443,896 490,6981-Year CMT + 2.23%,
4.64% (D), 01/01/2036 23,836 25,03712-Month LIBOR + 1.79%,
4.91% (D), 01/01/2038 7,085 7,3045.00%, 04/01/2019 - 06/01/2048 1,535,309 1,633,6185.50%, 07/01/2022 - 05/01/2036 185,289 196,1966.00%, 12/01/2032 - 11/01/2037 306,756 333,0336.50%, 08/01/2020 - 10/01/2036 55,445 62,5548.00%, 11/01/2037 3,716 4,073
Federal National Mortgage Association REMIC1-Month LIBOR + 0.25%,
2.74% (D), 06/27/2036 26,579 26,0861-Month LIBOR + 0.30%,
2.79% (D), 08/25/2041 192,604 191,7511-Month LIBOR + 0.35%,
2.84% (D), 04/25/2035 - 08/25/2036 73,387 73,5661-Month LIBOR + 0.40%,
2.89% (D), 10/25/2042 455,919 453,8311-Month LIBOR + 0.50%,
2.99% (D), 05/25/2035 - 10/25/2042 950,366 952,2743.00%, 01/25/2046 493,525 495,9214.00%, 10/25/2025 - 04/25/2033 750,092 776,674(1.33) * 1-Month LIBOR + 7.47%, 4.15% (D), 08/
25/2033 48,488 49,5074.50%, 07/25/2029 1,000,000 1,066,8465.00%, 09/25/2023 - 08/25/2040 1,240,196 1,374,5255.36% (D), 12/25/2042 104,757 111,4225.50%, 04/25/2023 - 07/25/2038 1,214,949 1,299,9195.75%, 06/25/2033 169,647 185,8285.88% (D), 12/25/2042 56,822 61,5966.00% (D), 07/25/2023 55,629 58,6116.00%, 11/25/2032 - 11/25/2039 368,489 407,3456.50%, 02/25/2022 - 05/25/2044 408,637 458,1886.50% (D), 10/25/2042 19,707 22,085(1.88) * 1-Month LIBOR + 11.28%, 6.61% (D), 07/
25/2035 73,999 85,3697.00%, 03/25/2031 - 11/25/2041 745,781 855,964(2.50) * 1-Month LIBOR + 13.75%, 7.53% (D), 07/
25/2033 21,219 24,1488.00%, 05/25/2022 7,037 7,399(1.67) * 1-Month LIBOR + 12.50%, 8.36% (D), 09/
25/2033 8,883 10,348(2.00) * 1-Month LIBOR + 14.00%, 9.03% (D), 03/
25/2038 5,557 6,237(2.75) * 1-Month LIBOR + 16.50%, 9.66% (D), 05/
25/2034 19,874 23,593(1.83) * 1-Month LIBOR + 14.48%, 9.93% (D), 12/
25/2032 5,840 6,925(6.67) * 1-Month LIBOR + 54.00%,
10.00% (D), 03/25/2032 3,730 4,616
Principal ValueU.S. GOVERNMENT AGENCY OBLIGATIONS (continued)Federal National Mortgage Association REMIC
(continued)(2.75) * 1-Month LIBOR + 19.53%, 12.69% (D), 04/
25/2034 - 05/25/2034$114,857
$151,928
(2.75) * 1-Month LIBOR + 19.80%, 12.96% (D), 08/25/2032 1,839 1,843
(4.00) * 1-Month LIBOR + 24.00%, 14.06% (D), 05/25/2034 9,951 12,866
(3.50) * 1-Month LIBOR + 23.10%, 14.40% (D), 06/25/2035 45,586 51,821
(3.67) * 1-Month LIBOR + 24.57%, 15.45% (D), 03/25/2036 18,770 27,553
(4.00) * 1-Month LIBOR + 26.20%, 16.26% (D), 10/25/2036 6,915 9,869
(4.00) * 1-Month LIBOR + 26.56%, 16.62% (D), 12/25/2036 8,889 12,078
(3.25) * 1-Month LIBOR + 25.19%, 17.11% (D), 02/25/2032 2,561 3,428
Federal National Mortgage Association REMIC,Interest Only STRIPS0.90% (D), 08/25/2042 293,676 6,8741.46% (D), 04/25/2041 65,051 3,5201.55% (D), 01/25/2038 36,415 1,375(1.00) * 1-Month LIBOR + 5.85%, 3.36% (D), 09/25/
2038 127,842 14,270(1.00) * 1-Month LIBOR + 5.91%, 3.42% (D), 02/25/
2038 77,950 11,050(1.00) * 1-Month LIBOR + 6.10%, 3.61% (D), 06/25/
2037 37,754 5,182(1.00) * 1-Month LIBOR + 6.18%, 3.69% (D), 12/25/
2039 13,627 1,598(1.00) * 1-Month LIBOR + 6.20%, 3.71% (D), 03/25/
2038 11,403 1,537(1.00) * 1-Month LIBOR + 6.42%, 3.93% (D), 04/25/
2040 19,825 2,609(1.00) * 1-Month LIBOR + 6.50%, 4.01% (D), 06/25/
2023 8,426 251(1.00) * 1-Month LIBOR + 6.53%, 4.04% (D), 01/25/
2041 286,675 54,671(1.00) * 1-Month LIBOR + 6.54%, 4.05% (D), 09/25/
2037 48,770 8,329(1.00) * 1-Month LIBOR + 6.55%, 4.06% (D), 02/25/
2039 33,367 5,522(1.00) * 1-Month LIBOR + 6.58%, 4.09% (D), 06/25/
2036 31,415 5,027(1.00) * 1-Month LIBOR + 6.70%, 4.21% (D), 03/25/
2036 552,400 99,533(1.00) * 1-Month LIBOR + 7.15%, 4.66% (D), 07/25/
2037 83,898 16,7916.50%, 05/25/2033 24,084 5,2967.00%, 06/25/2033 31,178 7,216
Federal National Mortgage Association REMIC,Principal Only STRIPS12/25/2032 - 12/25/2043 1,851,944 1,528,986
Federal National Mortgage Association, Principal OnlySTRIPS09/25/2024 - 01/25/2033 49,941 45,19105/15/2030, MTN 400,000 286,939
FREMF Mortgage Trust3.58% (D), 11/25/2049 (A) 529,000 522,3863.68% (D), 01/25/2048 (A) 760,000 767,3103.84% (D), 07/25/2049 (A) 420,000 421,8254.07% (D), 11/25/2047 (A) 490,000 491,285
Copyright © 2021 www.secdatabase.com. All Rights Reserved.Please Consider the Environment Before Printing This Document

The notes are an integral part of this report.Transamerica Series Trust Page 21
(2.00) * 1-Month LIBOR + 15.50%,10.54% (D), 11/25/2031 19,588 24,675
(2.50) * 1-Month LIBOR + 17.38%,11.16% (D), 07/25/2035 62,205 79,949
Government National Mortgage Association1.65%, 01/20/2063 852,166 843,0442.00%, 05/16/2049 126,210 120,6232.07% (D), 07/16/2048 42,028 40,520
Copyright © 2021 www.secdatabase.com. All Rights Reserved.Please Consider the Environment Before Printing This Document

Transamerica JPMorgan Core Bond VPSCHEDULE OF INVESTMENTS (continued)At March 31, 2019(unaudited)
Principal ValueU.S. GOVERNMENT AGENCY OBLIGATIONS (continued)Government National Mortgage Association
(continued)2.50%, 09/16/2056 $ 51,992 $ 51,1401-Month LIBOR + 0.30%,
2.81% (D), 08/20/2060 9,404 9,3921-Month LIBOR + 0.34%,
2.85% (D), 12/20/2062 262,277 261,2181-Month LIBOR + 0.40%,
2.91% (D), 12/20/2060 635,891 634,4761-Month LIBOR + 0.41%,
2.92% (D), 03/20/2063 647,563 646,2251-Month LIBOR + 0.43%,
2.94% (D), 04/20/2060 48,259 48,2101-Month LIBOR + 0.45%,
2.96% (D), 03/20/2060 - 08/20/2067 1,596,800 1,595,2131-Month LIBOR + 0.47%,
2.98% (D), 01/20/2061 - 08/20/2065 2,995,163 2,992,9031-Month LIBOR + 0.48%,
2.99% (D), 02/20/2065 1,111,795 1,111,1341-Month LIBOR + 0.50%,
3.01% (D), 06/20/2064 - 07/20/2064 3,091,748 3,092,2281-Month LIBOR + 0.52%,
3.02% (D), 10/20/2062 322,094 322,2461-Month LIBOR + 0.52%,
3.03% (D), 09/20/2065 547,297 547,8071-Month LIBOR + 0.55%,
3.06% (D), 07/20/2062 8,336 8,3421-Month LIBOR + 0.58%,
3.09% (D), 09/20/2062 - 05/20/2066 815,418 816,3251-Month LIBOR + 0.65%,
3.16% (D), 01/20/2064 - 03/20/2064 2,296,922 2,306,1181-Month LIBOR + 0.66%,
3.17% (D), 12/20/2065 440,948 443,8491-Month LIBOR + 0.70%,
3.21% (D), 05/20/2061 12,019 12,0483.50%, 11/20/2039 - 06/20/2046 1,733,372 1,764,2511-Month LIBOR + 1.00%,
3.51% (D), 12/20/2066 470,788 478,2364.50%, 05/20/2048 - 10/20/2048 5,381,929 5,670,4324.76% (D), 10/20/2043 778,845 844,8975.00%, 04/16/2023 53,051 53,1625.48%, 01/20/2038 335,148 372,9115.50%, 01/16/2033 - 09/20/2039 1,314,965 1,445,1475.56%, 07/20/2040 247,372 274,9815.86% (D), 12/20/2038 98,253 109,8766.00%, 09/20/2038 - 08/20/2039 190,069 210,0216.50%, 10/16/2024 - 06/20/2033 957,885 1,026,9097.33%, 11/20/2030 13,909 13,887(2.00) * 1-Month LIBOR + 13.40%, 8.42% (D), 10/
20/2037 23,217 25,6729.00%, 05/16/2027 8,207 8,198(2.41) * 1-Month LIBOR + 16.43%,
10.45% (D), 06/17/2035 15,786 18,158(2.20) * 1-Month LIBOR + 16.72%,
11.26% (D), 05/18/2034 904 1,026(3.00) * 1-Month LIBOR + 20.21%,
12.74% (D), 09/20/2037 10,129 12,484(2.75) * 1-Month LIBOR + 19.66%,
12.84% (D), 04/16/2034 37,295 50,836(3.50) * 1-Month LIBOR + 23.28%,
14.57% (D), 04/20/2037 35,193 45,554(4.91) * 1-Month LIBOR + 29.46%,
17.25% (D), 09/20/2034 18,898 26,577
Principal ValueU.S. GOVERNMENT AGENCY OBLIGATIONS (continued)Government National Mortgage Association, Interest
Only STRIPS (continued)(1.00) * 1-Month LIBOR + 6.00%, 3.51% (D), 11/
20/2037 $ 61,114 $ 7,182(1.00) * 1-Month LIBOR + 6.08%, 3.59% (D), 06/
20/2039 42,191 4,758(1.00) * 1-Month LIBOR + 6.10%, 3.61% (D), 10/
20/2034 82,100 10,906(1.00) * 1-Month LIBOR + 6.10%, 3.62% (D), 02/
16/2039 23,547 2,893(1.00) * 1-Month LIBOR + 6.20%, 3.71% (D), 03/
20/2037 - 06/20/2038 135,023 15,647(1.00) * 1-Month LIBOR + 6.27%, 3.79% (D), 04/
20/2039 53,355 5,444(1.00) * 1-Month LIBOR + 6.30%, 3.81% (D), 09/
20/2035 - 03/20/2039 170,525 19,699(1.00) * 1-Month LIBOR + 6.40%, 3.92% (D), 05/
16/2038 - 06/16/2039 173,512 22,534(1.00) * 1-Month LIBOR + 6.47%, 3.99% (D), 06/
16/2037 52,299 6,664(1.00) * 1-Month LIBOR + 6.55%, 4.06% (D), 11/
20/2037 - 12/20/2037 56,966 7,302(1.00) * 1-Month LIBOR + 6.75%, 4.26% (D), 07/
20/2037 107,811 18,286(1.00) * 1-Month LIBOR + 6.78%, 4.29% (D), 08/
20/2037 75,791 8,100(1.00) * 1-Month LIBOR + 6.81%, 4.33% (D), 04/
16/2037 35,477 5,839(1.00) * 1-Month LIBOR + 7.95%, 5.47% (D), 04/
16/2032 60,778 4585.50%, 10/16/2037 89,837 9,4336.50%, 03/20/2039 29,892 7,485
Government National Mortgage Association,Principal Only STRIPS02/17/2033 - 01/20/2038 153,716 138,078
Residual Funding Corp., Principal Only STRIPS10/15/2019 - 01/15/2021 8,265,000 8,009,902
Resolution Funding Corp., Principal Only STRIPS01/15/2026 - 10/15/2027 335,000 272,451
Tennessee Valley Authority4.25%, 09/15/2065 397,000 472,9114.63%, 09/15/2060 257,000 328,8305.88%, 04/01/2036 550,000 736,939
Tennessee Valley Authority, Principal Only STRIPS05/01/2019 - 03/15/2032 1,250,000 1,022,39301/15/2038 150,000 79,311
Vendee Mortgage TrustSeries 1997-1, Class 2Z,7.50%, 02/15/2027 265,936 294,162
Total U.S. Government Agency Obligations(Cost $180,379,392) 181,063,444
U.S. GOVERNMENT OBLIGATIONS - 26.7%U.S. Treasury - 26.5%U.S. Treasury Bond
2.25%, 08/15/2046 2,650,000 2,363,0552.50%, 02/15/2045 - 02/15/2046 8,250,000 7,768,9652.75%, 08/15/2042 - 11/15/2042 8,248,000 8,207,1182.88%, 05/15/2043 - 08/15/2045 5,570,000 5,654,8993.00%, 02/15/2048 240,000 248,3163.13%, 02/15/2043 - 05/15/2048 2,299,000 2,436,576
Copyright © 2021 www.secdatabase.com. All Rights Reserved.Please Consider the Environment Before Printing This Document

The notes are an integral part of this report.Transamerica Series Trust Page 22
Government National Mortgage Association, InterestOnly STRIPS(1.00) * 1-Month LIBOR + 5.70%, 3.21% (D), 12/
20/2038 39,516 3,793(1.00) * 1-Month LIBOR + 5.83%, 3.34% (D), 02/
20/2038 67,171 7,550
Copyright © 2021 www.secdatabase.com. All Rights Reserved.Please Consider the Environment Before Printing This Document

Transamerica JPMorgan Core Bond VPSCHEDULE OF INVESTMENTS (continued)At March 31, 2019(unaudited)
Principal ValueU.S. GOVERNMENT OBLIGATIONS (continued)U.S. Treasury (continued)U.S. Treasury Bond (continued)
3.63%, 08/15/2043 - 02/15/2044 $1,999,000
$2,297,819
3.75%, 11/15/2043 2,848,000 3,338,7243.88%, 08/15/2040 1,020,000 1,214,5574.25%, 05/15/2039 - 11/15/2040 1,400,000 1,753,3344.38%, 05/15/2040 - 05/15/2041 4,100,000 5,225,6605.25%, 02/15/2029 130,000 162,1195.38%, 02/15/2031 42,400 55,107
U.S. Treasury Bond, Principal Only STRIPS05/15/2022 - 11/15/2041 69,854,260 53,857,20008/15/2031 (F) 1,000,000 725,582
U.S. Treasury Note1.00%, 11/30/2019 400,000 396,2501.13%, 07/31/2021 3,000,000 2,922,5391.25%, 07/31/2023 3,000,000 2,877,6561.38%, 05/31/2021 - 09/30/2023 7,500,000 7,277,5191.50%, 08/15/2026 142,000 133,9401.63%, 08/15/2022 - 02/15/2026 6,409,500 6,246,0231.75%, 09/30/2022 - 05/15/2023 5,588,000 5,486,0572.00%, 02/28/2021 - 11/15/2026 19,945,500 19,717,0462.13%, 02/29/2024 - 05/15/2025 3,683,000 3,654,4792.25%, 11/15/2024 - 02/15/2027 591,000 587,8192.50%, 05/31/2020 369,000 369,4612.63%, 08/15/2020 - 05/15/2021 17,982,000 18,043,2922.75%, 05/31/2023 184,000 187,7162.88%, 04/30/2025 - 05/15/2028 1,623,500 1,684,7433.63%, 02/15/2021 1,000,000 1,023,945
165,917,516U.S. Treasury Inflation-Protected Securities - 0.2%U.S. Treasury Inflation-Indexed Bond
2.13%, 02/15/2040 232,874 290,3462.50%, 01/15/2029 117,218 138,873
U.S. Treasury Inflation-Indexed Note0.13%, 04/15/2019 - 01/15/2022 467,212 465,3151.38%, 01/15/2020 352,628 355,544
1,250,078Total U.S. Government Obligations
(Cost $162,592,980) 167,167,594
Shares ValueOTHER INVESTMENT COMPANY - 0.8%Securities Lending Collateral - 0.8%State Street Navigator Securities Lending Trust -
Government Money Market Portfolio,2.41% (J) 4,775,545 4,775,545
Total Other Investment Company(Cost $4,775,545) 4,775,545
Principal ValueREPURCHASE AGREEMENT - 1.2%Fixed Income Clearing Corp., 1.45% (J), dated
03/29/2019, to be repurchased at $7,779,432on 04/01/2019. Collateralized by a U.S.Government Obligation, 2.75%, due 09/15/2021, and with a value of $7,938,148. $ 7,778,492 7,778,492
Total Repurchase Agreement(Cost $7,778,492) 7,778,492
ValueTotal Investments
(Cost $622,949,429) $ 630,652,877Net Other Assets (Liabilities) - (0.7)% (4,227,667 )Net Assets - 100.0% $ 626,425,210
Copyright © 2021 www.secdatabase.com. All Rights Reserved.Please Consider the Environment Before Printing This Document

The notes are an integral part of this report.Transamerica Series Trust Page 23
Copyright © 2021 www.secdatabase.com. All Rights Reserved.Please Consider the Environment Before Printing This Document

Transamerica JPMorgan Core Bond VPSCHEDULE OF INVESTMENTS (continued)At March 31, 2019(unaudited)
SECURITY VALUATION:
Valuation Inputs (K)
Level 1 -Unadjusted
QuotedPrices
Level 2 -Other
SignificantObservable
Inputs
Level 3 -Significant
UnobservableInputs (L) Value
ASSETSInvestmentsAsset-Backed Securities $� $83,299,001 $629,365 $83,928,366Corporate Debt Securities � 153,016,583 7,166 153,023,749Foreign Government Obligations � 6,957,754 � 6,957,754Mortgage-Backed Securities � 25,160,793 � 25,160,793Municipal Government Obligations � 797,140 � 797,140U.S. Government Agency Obligations � 181,063,444 � 181,063,444U.S. Government Obligations � 167,167,594 � 167,167,594Other Investment Company 4,775,545 � � 4,775,545Repurchase Agreement � 7,778,492 � 7,778,492Total Investments $ 4,775,545 $ 625,240,801 $ 636,531 $ 630,652,877
FOOTNOTES TO SCHEDULE OF INVESTMENTS:
(A) Securities are registered pursuant to Rule 144A of the Securities Act of 1933. Unless otherwise indicated, the securities are deemed to be liquid for purposes ofcompliance limitations on holdings of illiquid securities and may be resold as transactions exempt from registration, normally to qualified institutional buyers. AtMarch 31, 2019, the total value of 144A securities is $107,974,277, representing 17.2% of the Portfolio�s net assets.
(B) Fair valued as determined in good faith in accordance with procedures established by the Board. At March 31, 2019, the total value of securities is $636,531,representing 0.1% of the Portfolio�s net assets.
(C) Securities are Level 3 of the fair value hierarchy.(D) Floating or variable rate securities. The rates disclosed are as of March 31, 2019. For securities based on a published reference rate and spread, the reference
rate and spread are indicated within the description. Variable rate securities with a floor or ceiling feature are disclosed at the inherent rate, where applicable.Certain variable rate securities are not based on a published reference rate and spread, but are determined by the issuer or agent and are based on current marketconditions; these securities do not indicate a reference rate and spread in the description.
(E) Percentage rounds to less than 0.1% or (0.1)%.(F) All or a portion of the securities are on loan. The total value of all securities on loan is $4,676,108. The amount of securities on loan indicated may not correspond
with the securities on loan identified because securities with pending sales are in the process of recall from the brokers.(G) Step bond. Coupon rate changes in increments to maturity. The rate disclosed is as of March 31, 2019; the maturity date disclosed is the ultimate maturity date.(H) When-issued, delayed-delivery and/or forward commitment (including TBAs) securities. Securities to be settled and delivered after March 31, 2019. Securities may
display a coupon rate of 0.00%, as the rate is to be determined at time of settlement.(I) Perpetual maturity. The date displayed is the next call date.(J) Rates disclosed reflect the yields at March 31, 2019.(K) There were no transfers in or out of Level 3 during the period ended March 31, 2019. Please reference the Security Valuation section of the Notes to Schedules of
Investments for more information regarding security valuation and pricing inputs.(L) Level 3 securities were not considered significant to the Portfolio.
PORTFOLIO ABBREVIATIONS:
CMT Constant Maturity TreasuryLIBOR London Interbank Offered RateMTA Month Treasury AverageMTN Medium Term NoteSTRIPS Separate Trading of Registered Interest and Principal of Securities
The notes are an integral part of this report.Transamerica Series Trust Page 24
Copyright © 2021 www.secdatabase.com. All Rights Reserved.Please Consider the Environment Before Printing This Document
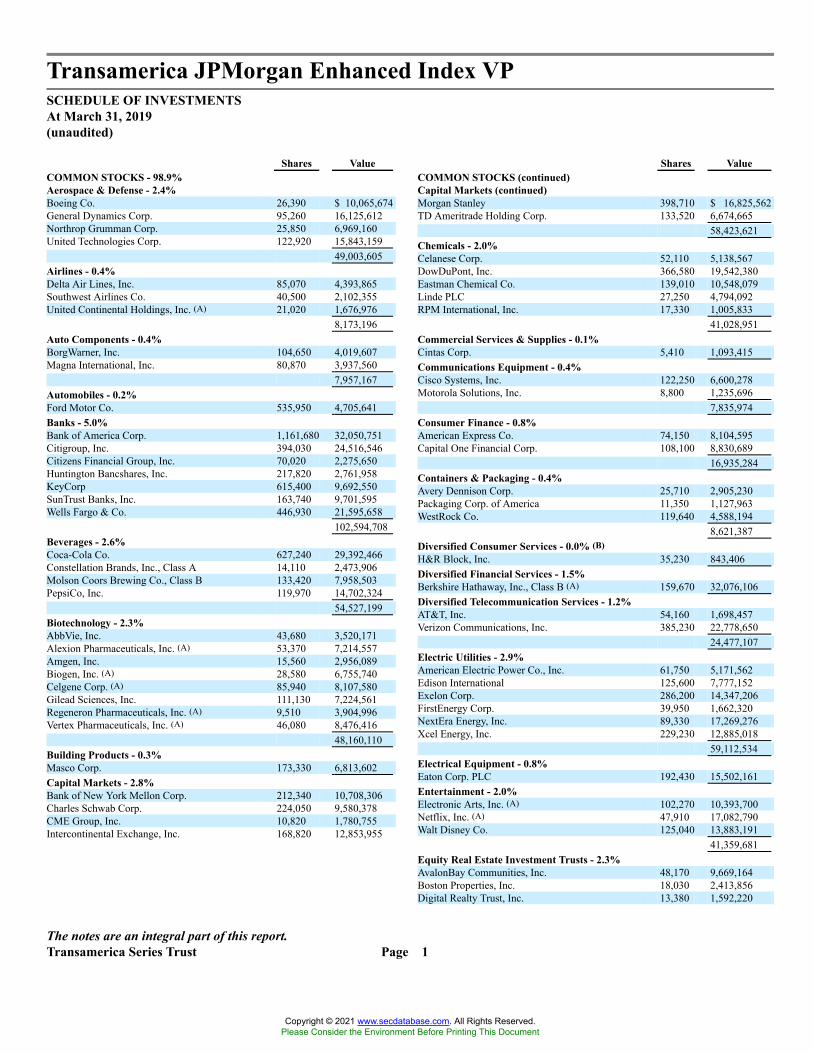
Transamerica JPMorgan Enhanced Index VPSCHEDULE OF INVESTMENTSAt March 31, 2019(unaudited)
The notes are an integral part of this report.Transamerica Series Trust Page 1
Shares ValueCOMMON STOCKS - 98.9%Aerospace & Defense - 2.4%Boeing Co. 26,390 $ 10,065,674General Dynamics Corp. 95,260 16,125,612Northrop Grumman Corp. 25,850 6,969,160United Technologies Corp. 122,920 15,843,159
49,003,605Airlines - 0.4%Delta Air Lines, Inc. 85,070 4,393,865Southwest Airlines Co. 40,500 2,102,355United Continental Holdings, Inc. (A) 21,020 1,676,976
8,173,196Auto Components - 0.4%BorgWarner, Inc. 104,650 4,019,607Magna International, Inc. 80,870 3,937,560
7,957,167Automobiles - 0.2%Ford Motor Co. 535,950 4,705,641Banks - 5.0%Bank of America Corp. 1,161,680 32,050,751Citigroup, Inc. 394,030 24,516,546Citizens Financial Group, Inc. 70,020 2,275,650Huntington Bancshares, Inc. 217,820 2,761,958KeyCorp 615,400 9,692,550SunTrust Banks, Inc. 163,740 9,701,595Wells Fargo & Co. 446,930 21,595,658
102,594,708Beverages - 2.6%Coca-Cola Co. 627,240 29,392,466Constellation Brands, Inc., Class A 14,110 2,473,906Molson Coors Brewing Co., Class B 133,420 7,958,503PepsiCo, Inc. 119,970 14,702,324
54,527,199Biotechnology - 2.3%AbbVie, Inc. 43,680 3,520,171Alexion Pharmaceuticals, Inc. (A) 53,370 7,214,557Amgen, Inc. 15,560 2,956,089Biogen, Inc. (A) 28,580 6,755,740Celgene Corp. (A) 85,940 8,107,580Gilead Sciences, Inc. 111,130 7,224,561Regeneron Pharmaceuticals, Inc. (A) 9,510 3,904,996Vertex Pharmaceuticals, Inc. (A) 46,080 8,476,416
48,160,110Building Products - 0.3%Masco Corp. 173,330 6,813,602Capital Markets - 2.8%Bank of New York Mellon Corp. 212,340 10,708,306Charles Schwab Corp. 224,050 9,580,378CME Group, Inc. 10,820 1,780,755Intercontinental Exchange, Inc. 168,820 12,853,955
Shares ValueCOMMON STOCKS (continued)Capital Markets (continued)Morgan Stanley 398,710 $ 16,825,562TD Ameritrade Holding Corp. 133,520 6,674,665
58,423,621Chemicals - 2.0%Celanese Corp. 52,110 5,138,567DowDuPont, Inc. 366,580 19,542,380Eastman Chemical Co. 139,010 10,548,079Linde PLC 27,250 4,794,092RPM International, Inc. 17,330 1,005,833
41,028,951Commercial Services & Supplies - 0.1%Cintas Corp. 5,410 1,093,415Communications Equipment - 0.4%Cisco Systems, Inc. 122,250 6,600,278Motorola Solutions, Inc. 8,800 1,235,696
7,835,974Consumer Finance - 0.8%American Express Co. 74,150 8,104,595Capital One Financial Corp. 108,100 8,830,689
16,935,284Containers & Packaging - 0.4%Avery Dennison Corp. 25,710 2,905,230Packaging Corp. of America 11,350 1,127,963WestRock Co. 119,640 4,588,194
8,621,387Diversified Consumer Services - 0.0% (B)H&R Block, Inc. 35,230 843,406Diversified Financial Services - 1.5%Berkshire Hathaway, Inc., Class B (A) 159,670 32,076,106Diversified Telecommunication Services - 1.2%AT&T, Inc. 54,160 1,698,457Verizon Communications, Inc. 385,230 22,778,650
24,477,107Electric Utilities - 2.9%American Electric Power Co., Inc. 61,750 5,171,562Edison International 125,600 7,777,152Exelon Corp. 286,200 14,347,206FirstEnergy Corp. 39,950 1,662,320NextEra Energy, Inc. 89,330 17,269,276Xcel Energy, Inc. 229,230 12,885,018
59,112,534Electrical Equipment - 0.8%Eaton Corp. PLC 192,430 15,502,161Entertainment - 2.0%Electronic Arts, Inc. (A) 102,270 10,393,700Netflix, Inc. (A) 47,910 17,082,790Walt Disney Co. 125,040 13,883,191
41,359,681Equity Real Estate Investment Trusts - 2.3%AvalonBay Communities, Inc. 48,170 9,669,164Boston Properties, Inc. 18,030 2,413,856Digital Realty Trust, Inc. 13,380 1,592,220
Copyright © 2021 www.secdatabase.com. All Rights Reserved.Please Consider the Environment Before Printing This Document

Transamerica JPMorgan Enhanced Index VPSCHEDULE OF INVESTMENTS (continued)At March 31, 2019(unaudited)
The notes are an integral part of this report.Transamerica Series Trust Page 2
Shares ValueCOMMON STOCKS (continued)Equity Real Estate Investment Trusts (continued)Equinix, Inc. 7,620 $ 3,453,079Equity Residential 36,790 2,771,023Federal Realty Investment Trust 32,710 4,509,074Host Hotels & Resorts, Inc. 148,850 2,813,265Mid-America Apartment Communities, Inc. 9,600 1,049,568Prologis, Inc. 124,270 8,941,226Public Storage 9,350 2,036,243Ventas, Inc. 48,970 3,124,776Vornado Realty Trust 90,450 6,099,948
48,473,442Food Products - 1.0%Mondelez International, Inc., Class A 397,090 19,822,733Health Care Equipment & Supplies - 3.4%Baxter International, Inc. 43,200 3,512,592Becton Dickinson and Co. 13,990 3,493,723Boston Scientific Corp. (A) 470,150 18,044,357Danaher Corp. 51,310 6,773,946Intuitive Surgical, Inc. (A) 7,020 4,005,472Medtronic PLC 207,580 18,906,386Zimmer Biomet Holdings, Inc. 129,040 16,478,408
71,214,884Health Care Providers & Services - 2.9%Anthem, Inc. 38,010 10,908,110Cigna Corp. (A) 93,860 15,094,565CVS Health Corp. 113,150 6,102,179McKesson Corp. 4,630 541,988UnitedHealth Group, Inc. 113,450 28,051,647
60,698,489Hotels, Restaurants & Leisure - 1.1%Hilton Worldwide Holdings, Inc. 79,640 6,618,881Royal Caribbean Cruises, Ltd. 18,470 2,117,031Yum! Brands, Inc. 134,600 13,434,426
22,170,338Household Durables - 0.3%Lennar Corp., Class A 106,670 5,236,430Household Products - 0.5%Procter & Gamble Co. 104,850 10,909,643Industrial Conglomerates - 1.0%Honeywell International, Inc. 135,430 21,522,536Insurance - 2.3%Allstate Corp. 39,820 3,750,248American International Group, Inc. 196,740 8,471,624Everest Re Group, Ltd. 11,620 2,509,455Hartford Financial Services Group, Inc. 155,920 7,752,342Lincoln National Corp. 109,320 6,417,084Marsh & McLennan Cos., Inc. 31,770 2,983,203MetLife, Inc. 280,140 11,925,560Prudential Financial, Inc. 40,870 3,755,136
47,564,652Interactive Media & Services - 4.4%Alphabet, Inc., Class A (A) 31,350 36,895,501Alphabet, Inc., Class C (A) 30,420 35,692,090Facebook, Inc., Class A (A) 111,220 18,539,262
91,126,853
Shares ValueCOMMON STOCKS (continued)Internet & Direct Marketing Retail - 4.0%Amazon.com, Inc. (A) 40,370 $ 71,888,877Booking Holdings, Inc. (A) 2,350 4,100,539Expedia Group, Inc. 60,960 7,254,240
83,243,656IT Services - 4.7%Alliance Data Systems Corp. 18,000 3,149,640Automatic Data Processing, Inc. 157,440 25,149,466Fidelity National Information Services, Inc. 95,140 10,760,334First Data Corp., Class A (A) 84,080 2,208,782Mastercard, Inc., Class A 55,440 13,053,348PayPal Holdings, Inc. (A) 189,430 19,670,411Visa, Inc., Class A 151,970 23,736,194
97,728,175Life Sciences Tools & Services - 0.8%Agilent Technologies, Inc. 28,160 2,263,501Illumina, Inc. (A) 12,990 4,035,863Thermo Fisher Scientific, Inc. 33,620 9,202,466
15,501,830Machinery - 2.5%Caterpillar, Inc. 50,250 6,808,373Cummins, Inc. 58,220 9,191,191Deere & Co. 26,070 4,167,029Ingersoll-Rand PLC 75,960 8,199,882PACCAR, Inc. 144,430 9,841,460Snap-on, Inc. 40,240 6,298,365Stanley Black & Decker, Inc. 60,250 8,204,242
52,710,542Media - 2.6%Charter Communications, Inc., Class A (A) 46,140 16,006,427Comcast Corp., Class A 709,390 28,361,412Discovery, Inc., Class A (A) (C) 188,334 5,088,785Discovery, Inc., Class C (A) 116,443 2,959,981DISH Network Corp., Class A (A) 51,140 1,620,627
54,037,232Metals & Mining - 0.2%Freeport-McMoRan, Inc. 168,750 2,175,187Newmont Mining Corp. 41,340 1,478,732
3,653,919Multi-Utilities - 0.4%Public Service Enterprise Group, Inc. 24,870 1,477,527Sempra Energy 51,280 6,454,101
7,931,628Multiline Retail - 0.3%Dollar General Corp. 49,220 5,871,946Oil, Gas & Consumable Fuels - 5.4%Chevron Corp. 237,280 29,228,150Concho Resources, Inc. 19,840 2,201,446Diamondback Energy, Inc. 81,070 8,231,037EOG Resources, Inc. 170,520 16,230,094Exxon Mobil Corp. 116,380 9,403,504Marathon Petroleum Corp. 244,490 14,632,727Occidental Petroleum Corp. 147,960 9,794,952ONEOK, Inc. 111,770 7,806,017Parsley Energy, Inc., Class A (A) 50,490 974,457
Copyright © 2021 www.secdatabase.com. All Rights Reserved.Please Consider the Environment Before Printing This Document

Transamerica JPMorgan Enhanced Index VPSCHEDULE OF INVESTMENTS (continued)At March 31, 2019(unaudited)
The notes are an integral part of this report.Transamerica Series Trust Page 3
Shares ValueCOMMON STOCKS (continued)Oil, Gas & Consumable Fuels (continued)Phillips 66 10,300 $ 980,251Pioneer Natural Resources Co. 78,910 12,016,415
111,499,050Personal Products - 0.3%Estee Lauder Cos., Inc., Class A 33,160 5,489,638Pharmaceuticals - 5.1%Allergan PLC 36,110 5,286,865Bristol-Myers Squibb Co. 13,490 643,608Eli Lilly & Co. 131,062 17,006,605Johnson & Johnson 178,050 24,889,610Merck & Co., Inc. 316,440 26,318,315Mylan NV (A) 45,250 1,282,385Nektar Therapeutics (A) 16,520 555,072Pfizer, Inc. 666,730 28,316,023Zoetis, Inc. 11,360 1,143,611
105,442,094Road & Rail - 2.2%CSX Corp. 28,810 2,155,564Lyft, Inc., Class A (A) 10,000 782,900Norfolk Southern Corp. 107,230 20,040,215Union Pacific Corp. 137,740 23,030,128
46,008,807Semiconductors & Semiconductor Equipment - 4.1%Analog Devices, Inc. 226,760 23,871,025Broadcom, Inc. 30,030 9,030,321Intel Corp. 81,260 4,363,662Marvell Technology Group, Ltd. 85,000 1,690,650NVIDIA Corp. 90,910 16,323,800Teradyne, Inc. 66,770 2,660,117Texas Instruments, Inc. 263,130 27,910,199
85,849,774Software - 7.4%Adobe, Inc. (A) 21,490 5,726,870Intuit, Inc. 9,190 2,402,358Microsoft Corp. 838,720 98,918,637Oracle Corp. 454,680 24,420,863salesforce.com, Inc. (A) 134,210 21,254,838Workday, Inc., Class A (A) 4,010 773,328
153,496,894Specialty Retail - 4.7%Advance Auto Parts, Inc. 29,790 5,080,089AutoZone, Inc. (A) 15,220 15,587,106Best Buy Co., Inc. 121,310 8,620,289Home Depot, Inc. 139,620 26,791,682Lowe�s Cos., Inc. 132,420 14,496,017O�Reilly Automotive, Inc. (A) 19,650 7,630,095Ross Stores, Inc. 174,830 16,276,673TJX Cos., Inc. 59,120 3,145,775
97,627,726Technology Hardware, Storage & Peripherals - 4.2%Apple, Inc. 395,200 75,068,240Hewlett Packard Enterprise Co. 459,250 7,086,227HP, Inc. 290,960 5,653,353
87,807,820
Shares ValueCOMMON STOCKS (continued)Textiles, Apparel & Luxury Goods - 0.4%NIKE, Inc., Class B 35,900 $ 3,023,139PVH Corp. 49,170 5,996,282
9,019,421Tobacco - 1.5%Altria Group, Inc. 120,910 6,943,861Philip Morris International, Inc. 262,690 23,219,169
30,163,030Trading Companies & Distributors - 0.1%HD Supply Holdings, Inc. (A) 50,390 2,184,407Wireless Telecommunication Services - 0.3%T-Mobile US, Inc. (A) 93,730 6,476,743Total Common Stocks
(Cost $1,775,207,340) 2,049,729,187
OTHER INVESTMENT COMPANY - 0.1%Securities Lending Collateral - 0.1%State Street Navigator Securities Lending
Trust - Government Money MarketPortfolio, 2.41% (D) 2,284,741 2,284,741
Total Other Investment Company(Cost $2,284,741) 2,284,741
Principal ValueREPURCHASE AGREEMENT - 1.0%Fixed Income Clearing Corp., 1.45% (D),
dated 03/29/2019, to be repurchased at$20,761,731 on 04/01/2019.Collateralized by a U.S. GovernmentObligation, 2.75%, due 09/15/2021, andwith a value of $21,178,533. $ 20,759,222 20,759,222
Total Repurchase Agreement(Cost $20,759,222) 20,759,222
Total Investments(Cost $1,798,251,303) 2,072,773,150
Net Other Assets (Liabilities) - (0.0)% (B) (472,632 )Net Assets - 100.0% $ 2,072,300,518
Copyright © 2021 www.secdatabase.com. All Rights Reserved.Please Consider the Environment Before Printing This Document

Transamerica JPMorgan Enhanced Index VPSCHEDULE OF INVESTMENTS (continued)At March 31, 2019(unaudited)
FUTURES CONTRACTS:
DescriptionLong/Short
Number ofContracts
ExpirationDate
NotionalAmount Value
UnrealizedAppreciation
UnrealizedDepreciation
S&P 500® E-Mini Index Long 138 06/21/2019 $ 19,117,045 $ 19,580,820 $ 463,775 $ �
SECURITY VALUATION:
Valuation Inputs (E)
Level 1 -Unadjusted
QuotedPrices
Level 2 -Other
SignificantObservable
Inputs
Level 3 -Significant
UnobservableInputs Value
ASSETSInvestmentsCommon Stocks $2,049,729,187 $� $ � $2,049,729,187Other Investment Company 2,284,741 � � 2,284,741Repurchase Agreement � 20,759,222 � 20,759,222Total Investments $ 2,052,013,928 $ 20,759,222 $ �� $ 2,072,773,150Other Financial InstrumentsFutures Contracts (F) $463,775 $� $ � $463,775Total Other Financial Instruments $463,775 $�� $ �� $463,775
FOOTNOTES TO SCHEDULE OF INVESTMENTS:
(A) Non-income producing securities.(B) Percentage rounds to less than 0.1% or (0.1)%.(C) All or a portion of the security is on loan. The value of the security on loan is $2,224,638. The amount on loan indicated may not correspond with the security on
loan identified because a security with pending sales are in the process of recall from the brokers.(D) Rates disclosed reflect the yields at March 31, 2019.(E) There were no transfers in or out of Level 3 during the period ended March 31, 2019. Please reference the Security Valuation section of the Notes to Schedules of
Investments for more information regarding security valuation and pricing inputs.(F) Futures contracts and/or forward foreign currency contracts are valued at unrealized appreciation (depreciation).
The notes are an integral part of this report.Transamerica Series Trust Page 4
Copyright © 2021 www.secdatabase.com. All Rights Reserved.Please Consider the Environment Before Printing This Document

Transamerica JPMorgan International Moderate Growth VPSCHEDULE OF INVESTMENTSAt March 31, 2019(unaudited)
FUTURES CONTRACTS:
DescriptionLong/Short
Number ofContracts
ExpirationDate
NotionalAmount Value
UnrealizedAppreciation
UnrealizedDepreciation
5-Year U.S. Treasury Note Long 827 06/28/2019 $94,879,220 $95,789,859 $910,639 $�10-Year U.S. Treasury Note Long 269 06/19/2019 32,942,584 33,414,844 472,260 �CAD Currency Long 258 06/18/2019 19,409,760 19,357,740 � (52,020 )EURO STOXX 50® Index Short (172 ) 06/21/2019 (6,236,179 ) (6,313,031 ) � (76,852 )German Euro Bund Index Short (97 ) 06/06/2019 (17,710,850) (18,099,418) � (388,568 )KOSPI 200 Index Short (118 ) 06/20/2019 (12,869,984 ) (12,926,065 ) � (56,081 )MSCI EAFE Index Long 222 06/21/2019 20,643,850 20,717,040 73,190 �MSCI Emerging Markets Index Long 102 06/21/2019 5,333,536 5,392,740 59,204 �S&P 500® E-Mini Index Long 156 06/21/2019 21,731,429 22,134,840 403,411 �S&P/TSX 60 Index Long 134 06/20/2019 19,051,853 19,194,283 142,430 �TOPIX Index Short (85 ) 06/13/2019 (12,260,436 ) (12,209,691 ) 50,745 �U.K. Gilt Short (104 ) 06/26/2019 (17,508,734 ) (17,523,783 ) � (15,049 )U.S. Treasury Bond Short (147 ) 06/19/2019 (23,569,036 ) (24,696,000 ) � (1,126,964 )Total $ 2,111,879 $ (1,715,534)
The notes are an integral part of this report.Transamerica Series Trust Page 1
Shares ValueINVESTMENT COMPANIES - 98.0%International Alternative Fund - 8.0%Transamerica Unconstrained Bond (A) 5,219,367 $ 51,149,797International Equity Funds - 56.1%Transamerica Emerging Markets Equity (A) 1,406,701 13,926,342Transamerica International Equity (A) 8,214,040 138,160,159Transamerica International Growth (A) 23,450,789 162,748,475Transamerica International Small Cap Value (A) 3,686,176 43,017,671
357,852,647U.S. Alternative Fund - 4.1%Transamerica BlackRock Global Real Estate
Securities VP (A) 2,090,521 26,006,083U.S. Equity Funds - 11.1%Transamerica Jennison Growth VP (A) 3,200,232 35,874,598Transamerica Large Cap Value (A) 3,128,292 35,162,003
71,036,601U.S. Fixed Income Funds - 13.7%Transamerica Core Bond (A) 495,298 4,883,638Transamerica Floating Rate (A) 2,641,980 25,706,466Transamerica High Yield Bond (A) 1,279,076 11,588,428Transamerica Intermediate Bond (A) 4,502,717 45,432,419
87,610,951U.S. Mixed Allocation Fund - 5.0%Transamerica PIMCO Total Return VP (A) 2,778,013 31,780,466Total Investment Companies
(Cost $642,506,000) 625,436,545
Principal ValueU.S. GOVERNMENT OBLIGATION - 1.1%U.S. Treasury - 1.1%U.S. Treasury Note
2.00%, 01/31/2020 (B) $ 7,170,000 $ 7,146,193Total U.S. Government Obligation
(Cost $7,131,515) 7,146,193
REPURCHASE AGREEMENT - 0.7%Fixed Income Clearing Corp., 1.45% (C), dated
03/29/2019, to be repurchased at $4,478,941on 04/01/2019. Collateralized by a U.S.Government Obligation, 2.75%, due 09/15/2021, and with a value of $4,572,292. 4,478,400 4,478,400
Total Repurchase Agreement(Cost $4,478,400) 4,478,400
Total Investments(Cost $654,115,915) 637,061,138
Net Other Assets (Liabilities) - 0.2% 1,087,256Net Assets - 100.0% $ 638,148,394
Copyright © 2021 www.secdatabase.com. All Rights Reserved.Please Consider the Environment Before Printing This Document

Transamerica JPMorgan International Moderate Growth VPSCHEDULE OF INVESTMENTS (continued)At March 31, 2019(unaudited)
SECURITY VALUATION:
Valuation Inputs (D)
Level 1 -Unadjusted
QuotedPrices
Level 2 -Other
SignificantObservable
Inputs
Level 3 -Significant
UnobservableInputs Value
ASSETSInvestmentsInvestment Companies $625,436,545 $� $ � $625,436,545U.S. Government Obligation � 7,146,193 � 7,146,193Repurchase Agreement � 4,478,400 � 4,478,400Total Investments $ 625,436,545 $ 11,624,593 $ �� $ 637,061,138Other Financial InstrumentsFutures Contracts (E) $2,111,879 $� $ � $2,111,879Total Other Financial Instruments $2,111,879 $�� $ �� $2,111,879LIABILITIESOther Financial InstrumentsFutures Contracts (E) $(1,715,534 ) $� $ � $(1,715,534 )Total Other Financial Instruments $(1,715,534 ) $�� $ �� $(1,715,534 )
FOOTNOTES TO SCHEDULE OF INVESTMENTS:
(A) Affiliated investment in the Class I2 shares of Transamerica Funds and/or investment in the Initial Class shares of Transamerica Series Trust. The Portfolio�stransactions and earnings from investments of TAM are as follows:
Affiliated InvestmentsValue
December 31, 2018Purchases
at CostProceeds
from Sales
NetRealized
Gain (Loss)
Net Change inUnrealized
Appreciation(Depreciation)
ValueMarch 31, 2019
Shares as ofMarch 31, 2019
DividendIncome
Net CapitalGain
DistributionsTransamerica BlackRock Global
Real Estate Securities VP $� $ 24,938,591 $� $� $1,067,492 $26,006,083 2,090,521 $� $ �Transamerica Core Bond 6,329,241 34,261 (1,583,526 ) (52,539 ) 156,201 4,883,638 495,298 34,261 �Transamerica Emerging Markets
Equity 12,843,183 � � � 1,083,159 13,926,342 1,406,701 � �Transamerica Floating Rate 25,993,874 349,883 (1,260,165 ) (36,451 ) 659,325 25,706,466 2,641,980 349,883 �Transamerica High Yield Bond 12,041,674 174,008 (1,260,165 ) (52,566 ) 685,477 11,588,428 1,279,076 174,008 �Transamerica Intermediate Bond 45,569,946 322,643 (1,583,525 ) (62,698 ) 1,186,053 45,432,419 4,502,717 322,643 �Transamerica International Equity 152,016,794 6,316,437 (32,629,307 ) 2,032,515 10,423,720 138,160,159 8,214,040 � �Transamerica International Growth 160,247,102 6,316,442 (23,532,263 ) (1,512,563 ) 21,229,757 162,748,475 23,450,789 � �Transamerica International Small
Cap Value 40,031,869 � � � 2,985,802 43,017,671 3,686,176 � �Transamerica Jennison Growth VP 39,631,255 11,866,679 (20,506,243 ) (1,250,037 ) 6,132,944 35,874,598 3,200,232 � �Transamerica Large Cap Value 21,355,304 12,923,062 (1,906,609 ) (165,736 ) 2,955,982 35,162,003 3,128,292 163,772 �Transamerica PIMCO Total Return
VP 30,891,502 � � � 888,964 31,780,466 2,778,013 � �Transamerica Unconstrained Bond 48,905,447 750,841 � � 1,493,509 51,149,797 5,219,367 591,743 �
Total $ 595,857,191 $ 63,992,847 $ (84,261,803) $ (1,100,075) $ 50,948,385 $ 625,436,545 62,093,202 $ 1,636,310 $ ��
(B) All or a portion of the security has been segregated by the custodian as collateral to cover margin requirements for open futures contracts. The value of thesecurity is $6,184,397.
(C) Rate disclosed reflects the yield at March 31, 2019.(D) There were no transfers in or out of Level 3 during the period ended March 31, 2019. Please reference the Security Valuation section of the Notes to Schedules of
Investments for more information regarding security valuation and pricing inputs.(E) Futures contracts and/or forward foreign currency contracts are valued at unrealized appreciation (depreciation).
The notes are an integral part of this report.Transamerica Series Trust Page 2
Copyright © 2021 www.secdatabase.com. All Rights Reserved.Please Consider the Environment Before Printing This Document

Transamerica JPMorgan International Moderate Growth VPSCHEDULE OF INVESTMENTS (continued)At March 31, 2019(unaudited)
CURRENCY ABBREVIATIONS:
CAD Canadian Dollar
PORTFOLIO ABBREVIATIONS:
EAFE Europe, Australasia and Far EastKOSPI Korean Composite Stock Price IndexSTOXX Deutsche Börse Group & SIX Group IndexTOPIX Tokyo Price IndexTSX Toronto Stock Exchange
The notes are an integral part of this report.Transamerica Series Trust Page 3
Copyright © 2021 www.secdatabase.com. All Rights Reserved.Please Consider the Environment Before Printing This Document

Transamerica JPMorgan Mid Cap Value VPSCHEDULE OF INVESTMENTSAt March 31, 2019(unaudited)
The notes are an integral part of this report.Transamerica Series Trust Page 1
Shares ValueCOMMON STOCKS - 95.6%Auto Components - 0.7%BorgWarner, Inc. 80,851 $ 3,105,487Banks - 7.9%Citizens Financial Group, Inc. 123,266 4,006,145Comerica, Inc. 31,025 2,274,753Fifth Third Bancorp 226,262 5,706,328First Republic Bank 42,283 4,247,750Huntington Bancshares, Inc. 246,856 3,130,134M&T Bank Corp. 51,324 8,058,894SunTrust Banks, Inc. 111,096 6,582,438Zions Bancorp NA 36,311 1,648,883
35,655,325Beverages - 1.5%Constellation Brands, Inc., Class A 19,362 3,394,740Keurig Dr. Pepper, Inc. 63,862 1,786,220Molson Coors Brewing Co., Class B 28,319 1,689,228
6,870,188Building Products - 0.6%Fortune Brands Home & Security, Inc. 59,645 2,839,698Capital Markets - 4.7%Ameriprise Financial, Inc. 34,876 4,467,616Invesco, Ltd. 109,556 2,115,526Northern Trust Corp. 49,500 4,475,295Raymond James Financial, Inc. 48,302 3,883,964T. Rowe Price Group, Inc. 59,961 6,003,295
20,945,696Chemicals - 0.9%Sherwin-Williams Co. 9,177 3,952,626Communications Equipment - 0.4%CommScope Holding Co., Inc. (A) 81,646 1,774,168Construction Materials - 0.7%Martin Marietta Materials, Inc. 16,155 3,250,063Consumer Finance - 0.8%Ally Financial, Inc. 124,633 3,426,161Containers & Packaging - 3.2%Ball Corp. 114,633 6,632,666Silgan Holdings, Inc. 149,626 4,433,418WestRock Co. 83,620 3,206,827
14,272,911Distributors - 0.7%Genuine Parts Co. 27,803 3,114,770Electric Utilities - 3.3%Edison International 29,446 1,823,296Evergy, Inc. 71,927 4,175,362Xcel Energy, Inc. 159,526 8,966,957
14,965,615Electrical Equipment - 2.4%Acuity Brands, Inc. 28,955 3,474,889
Shares ValueCOMMON STOCKS (continued)Electrical Equipment (continued)AMETEK, Inc. 62,330 $ 5,171,520Hubbell, Inc. 19,972 2,356,297
11,002,706Electronic Equipment, Instruments & Components - 4.0%Amphenol Corp., Class A 49,829 4,705,851Arrow Electronics, Inc. (A) 68,580 5,284,775CDW Corp. 54,829 5,283,870Keysight Technologies, Inc. (A) 30,821 2,687,591
17,962,087Equity Real Estate Investment Trusts - 11.5%American Campus Communities, Inc. 53,721 2,556,045American Homes 4 Rent Trust, Class A 108,835 2,472,731AvalonBay Communities, Inc. 29,188 5,858,907Boston Properties, Inc. 42,267 5,658,706Brixmor Property Group, Inc. 194,481 3,572,616Essex Property Trust, Inc. 12,154 3,515,423Federal Realty Investment Trust 36,197 4,989,756JBG SMITH Properties 45,865 1,896,518Kimco Realty Corp. 159,008 2,941,648Outfront Media, Inc. 145,081 3,394,895Rayonier, Inc. 108,588 3,422,694Regency Centers Corp. 40,734 2,749,138Vornado Realty Trust 65,183 4,395,942Weyerhaeuser Co. 83,075 2,188,196WP Carey, Inc. 26,704 2,091,724
51,704,939Food & Staples Retailing - 0.6%Kroger Co. 118,654 2,918,888Food Products - 1.5%Conagra Brands, Inc. 97,143 2,694,747Post Holdings, Inc. (A) 35,695 3,905,033
6,599,780Gas Utilities - 1.1%National Fuel Gas Co. 81,441 4,964,643Health Care Equipment & Supplies - 1.3%Zimmer Biomet Holdings, Inc. 45,794 5,847,894Health Care Providers & Services - 5.1%AmerisourceBergen Corp. 58,820 4,677,367Cigna Corp. (A) 25,033 4,025,807Convetrus, Inc. (A) (B) 13,801 439,562Henry Schein, Inc. (A) 42,557 2,558,101Humana, Inc. 8,233 2,189,978Laboratory Corp. of America Holdings (A) 29,550 4,520,559Universal Health Services, Inc., Class B 34,534 4,619,613
23,030,987Hotels, Restaurants & Leisure - 1.0%Hilton Worldwide Holdings, Inc. 52,337 4,349,728Household Durables - 1.3%Mohawk Industries, Inc. (A) 35,935 4,533,200Newell Brands, Inc. 92,302 1,415,913
5,949,113Household Products - 0.6%Energizer Holdings, Inc. 55,519 2,494,469
Copyright © 2021 www.secdatabase.com. All Rights Reserved.Please Consider the Environment Before Printing This Document

Transamerica JPMorgan Mid Cap Value VPSCHEDULE OF INVESTMENTS (continued)At March 31, 2019(unaudited)
The notes are an integral part of this report.Transamerica Series Trust Page 2
Shares ValueCOMMON STOCKS (continued)Industrial Conglomerates - 0.7%Carlisle Cos., Inc. 24,663 $ 3,024,177Insurance - 7.6%Alleghany Corp. (A) 4,370 2,676,188Hartford Financial Services Group, Inc. 112,300 5,583,556Lincoln National Corp. 49,992 2,934,530Loews Corp. 164,495 7,884,245Marsh & McLennan Cos., Inc. 47,398 4,450,672Principal Financial Group, Inc. 34,868 1,750,025Progressive Corp. 63,198 4,555,944Unum Group 43,896 1,485,002WR Berkley Corp. 33,579 2,844,813
34,164,975Interactive Media & Services - 0.2%Match Group, Inc. (B) 15,111 855,434Internet & Direct Marketing Retail - 1.3%Expedia Group, Inc. 48,567 5,779,473IT Services - 0.9%Jack Henry & Associates, Inc. 28,653 3,975,317Machinery - 2.8%IDEX Corp. 28,678 4,351,600Middleby Corp. (A) 28,870 3,753,966Snap-on, Inc. 28,577 4,472,872
12,578,438Media - 1.8%CBS Corp., Class B 52,617 2,500,886DISH Network Corp., Class A (A) 80,303 2,544,802Liberty Broadband Corp., Class C (A) 17,525 1,607,743Liberty Media Corp. - Liberty SiriusXM, Class C (A) 43,203 1,652,083
8,305,514Multi-Utilities - 5.4%CMS Energy Corp. 166,577 9,251,686Sempra Energy 46,457 5,847,078WEC Energy Group, Inc. 114,621 9,064,229
24,162,993Multiline Retail - 1.6%Kohl�s Corp. 64,625 4,444,261Nordstrom, Inc. 65,603 2,911,461
7,355,722Oil, Gas & Consumable Fuels - 6.1%Cabot Oil & Gas Corp. 148,379 3,872,692Diamondback Energy, Inc. 66,052 6,706,259EQT Corp. 124,691 2,586,091Equitrans Midstream Corp. (A) 115,113 2,507,161PBF Energy, Inc., Class A 96,619 3,008,716Williams Cos., Inc. 299,286 8,595,494
27,276,413Personal Products - 1.1%Coty, Inc., Class A 214,430 2,465,945Edgewell Personal Care Co. (A) 52,419 2,300,670
4,766,615
Shares ValueCOMMON STOCKS (continued)Real Estate Management & Development - 1.4%CBRE Group, Inc., Class A (A) 104,359 $ 5,160,553Cushman & Wakefield PLC (A) 73,300 1,304,740
6,465,293Semiconductors & Semiconductor Equipment - 0.9%Analog Devices, Inc. 36,728 3,866,357Software - 1.2%Synopsys, Inc. (A) 46,660 5,372,899Specialty Retail - 4.2%AutoZone, Inc. (A) 6,779 6,942,509Best Buy Co., Inc. 60,252 4,281,507Gap, Inc. 126,325 3,307,189Tiffany & Co. 43,060 4,544,983
19,076,188Textiles, Apparel & Luxury Goods - 1.8%PVH Corp. 38,006 4,634,832Ralph Lauren Corp. 26,474 3,433,148
8,067,980Trading Companies & Distributors - 0.8%MSC Industrial Direct Co., Inc., Class A 45,425 3,757,102Total Common Stocks
(Cost $357,483,118) 429,848,832
OTHER INVESTMENT COMPANY - 0.3%Securities Lending Collateral - 0.3%State Street Navigator Securities Lending
Trust - Government Money MarketPortfolio, 2.41% (C) 1,307,897 1,307,897
Total Other Investment Company(Cost $1,307,897) 1,307,897
Principal ValueREPURCHASE AGREEMENT - 4.3%Fixed Income Clearing Corp., 1.45% (C),
dated 03/29/2019, to be repurchased at$19,358,174 on 04/01/2019. Collateralizedby a U.S. Government Obligation, 2.75%,due 09/15/2021, and with a value of$19,743,989. $ 19,355,836 19,355,836
Total Repurchase Agreement(Cost $19,355,836) 19,355,836
Total Investments(Cost $378,146,851) 450,512,565
Net Other Assets (Liabilities) - (0.2)% (1,007,884 )Net Assets - 100.0% $ 449,504,681
Copyright © 2021 www.secdatabase.com. All Rights Reserved.Please Consider the Environment Before Printing This Document

Transamerica JPMorgan Mid Cap Value VPSCHEDULE OF INVESTMENTS (continued)At March 31, 2019(unaudited)
SECURITY VALUATION:
Valuation Inputs (D)
Level 1 -Unadjusted
QuotedPrices
Level 2 -Other
SignificantObservable
Inputs
Level 3 -Significant
UnobservableInputs Value
ASSETSInvestmentsCommon Stocks $429,848,832 $� $ � $429,848,832Other Investment Company 1,307,897 � � 1,307,897Repurchase Agreement � 19,355,836 � 19,355,836Total Investments $ 431,156,729 $ 19,355,836 $ �� $ 450,512,565
FOOTNOTES TO SCHEDULE OF INVESTMENTS:
(A) Non-income producing securities.(B) All or a portion of the securities are on loan. The total value of all securities on loan is $1,281,964. The amount of securities on loan indicated may not correspond
with the securities on loan identified because securities with pending sales are in the process of recall from the brokers.(C) Rates disclosed reflect the yields at March 31, 2019.(D) There were no transfers in or out of Level 3 during the period ended March 31, 2019. Please reference the Security Valuation section of the Notes to Schedules of
Investments for more information regarding security valuation and pricing inputs.
The notes are an integral part of this report.Transamerica Series Trust Page 3
Copyright © 2021 www.secdatabase.com. All Rights Reserved.Please Consider the Environment Before Printing This Document

Transamerica JPMorgan Tactical Allocation VPSCHEDULE OF INVESTMENTSAt March 31, 2019(unaudited)
Principal ValueASSET-BACKED SECURITIES - 9.7%Cayman Islands - 0.1%Goodgreen Trust
Series 2017-2A, Class A,3.26%, 10/15/2053 (A) $ 802,977 $ 800,761
Hero Funding TrustSeries 2017-3A, Class A2,3.95%, 09/20/2048 (A) 728,833 744,561
RenewSeries 2017-1A, Class A,3.67%, 09/20/2052 (A) 220,103 224,434
1,769,756United States - 9.6%Aames Mortgage Investment Trust
Series 2005-3, Class M1,1-Month LIBOR + 0.53%,
3.02% (B), 08/25/2035 (A) 302,443 302,531Academic Loan Funding Trust
Series 2013-1A, Class A,1-Month LIBOR + 0.80%,
3.29% (B), 12/26/2044 (A) 170,809 170,085Accredited Mortgage Loan Trust
Series 2005-4, Class A2D,1-Month LIBOR + 0.32%,
2.81% (B), 12/25/2035 182,873 181,888ACE Securities Corp. Home Equity Loan Trust
Series 2002-HE3, Class M1,1-Month LIBOR + 1.80%,
4.29% (B), 10/25/2032 252,293 253,187Series 2003-HE1, Class M1,1-Month LIBOR + 0.98%,
3.46% (B), 11/25/2033 609,636 600,719Series 2004-HE4, Class M2,1-Month LIBOR + 0.98%,
3.46% (B), 12/25/2034 239,860 235,308American Credit Acceptance Receivables Trust
Series 2016-3, Class C,4.26%, 08/12/2022 (A) 289,000 291,601Series 2016-4, Class C,2.91%, 02/13/2023 (A) 161,834 161,809
American Homes 4 Rent TrustSeries 2014-SFR2, Class E,6.23%, 10/17/2036 (A) 150,000 164,430Series 2014-SFR3, Class E,6.42%, 12/17/2036 (A) 175,000 193,918Series 2015-SFR1, Class A,3.47%, 04/17/2052 (A) 232,144 234,815Series 2015-SFR1, Class E,5.64%, 04/17/2052 (A) 292,500 315,897Series 2015-SFR2, Class D,5.04%, 10/17/2052 (A) 700,000 745,035Series 2015-SFR2, Class E,6.07%, 10/17/2052 (A) 400,000 440,551
American Tower Trust #1Series 2013-2A, Class 2A,3.07%, 03/15/2048 (A) 450,000 448,756
Principal ValueASSET-BACKED SECURITIES (continued)United States (continued)AmeriCredit Automobile Receivables Trust
Series 2016-4, Class B,1.83%, 12/08/2021 $
500,000$496,457
Series 2017-1, Class B,2.30%, 02/18/2022 235,000 233,451Series 2017-1, Class C,2.71%, 08/18/2022 127,000 126,675Series 2017-1, Class D,3.13%, 01/18/2023 284,000 284,615
Ameriquest Mortgage Securities, Inc. Asset-BackedPass-Through CertificatesSeries 2003-10, Class M2,1-Month LIBOR + 2.55%,
5.04% (B), 12/25/2033 280,197 280,197Anchor Assets IX LLC
Series 2016-1, Class A,5.13%, 02/15/2020 (A) 984,698 984,698
Argent Securities, Inc. Asset-Backed Pass-ThroughCertificatesSeries 2003-W9, Class M2,1-Month LIBOR + 2.58%,
4.60% (B), 01/25/2034 351,933 347,644Series 2003-W9, Class M3B,1-Month LIBOR + 3.12%,
4.60% (B), 01/25/2034 96,010 94,230ARIVO
Series 2018-1, Class A,5.17%, 09/15/2019 (C) (D) 944,047 944,047
Asset-Backed Securities Corp. Home Equity Loan TrustSeries 2003-HE6, Class M1,1-Month LIBOR + 0.98%,
3.46% (B), 11/25/2033 496,988 491,250Series 2003-HE6, Class M2,1-Month LIBOR + 2.48%,
4.96% (B), 11/25/2033 573,422 572,072Series 2003-HE6, Class M3,1-Month LIBOR + 3.00%,
5.49% (B), 11/25/2033 555,225 555,295Series 2004-HE1, Class M1,1-Month LIBOR + 1.05%,
3.53% (B), 01/15/2034 443,007 441,354Series 2004-HE3, Class M2,1-Month LIBOR + 1.68%,
4.17% (B), 06/25/2034 779,163 777,699Axis Equipment Finance Receivables IV LLC
Series 2016-1A, Class A,2.21%, 11/20/2021 (A) 51,596 51,482
B2R Mortgage TrustSeries 2015-1, Class A1,2.52%, 05/15/2048 (A) 51,076 50,709Series 2015-2, Class A,3.34%, 11/15/2048 (A) 549,198 548,229
Bayview Financial Acquisition TrustSeries 2004-C, Class M3,1-Month LIBOR + 1.95%,
4.45% (B), 05/28/2044 571,041 575,090BCC Funding XIII LLC
Series 2016-1, Class A2,2.20%, 12/20/2021 (A) 65,088 64,981
Bear Stearns Asset-Backed Securities I TrustSeries 2004-FR2, Class M3,
Copyright © 2021 www.secdatabase.com. All Rights Reserved.Please Consider the Environment Before Printing This Document

The notes are an integral part of this report.Transamerica Series Trust Page 1
1-Month LIBOR + 1.80%,4.29% (B), 06/25/2034 137,362 135,174
Series 2004-HE6, Class M2,1-Month LIBOR + 1.88%,
4.36% (B), 08/25/2034 410,770 409,075
Copyright © 2021 www.secdatabase.com. All Rights Reserved.Please Consider the Environment Before Printing This Document

Transamerica JPMorgan Tactical Allocation VPSCHEDULE OF INVESTMENTS (continued)At March 31, 2019(unaudited)
Principal ValueASSET-BACKED SECURITIES (continued)United States (continued)Bear Stearns Asset-Backed Securities Trust
Series 2003-2, Class M1,1-Month LIBOR + 1.80%,
4.29% (B), 03/25/2043$603,287
$603,024
Business Jet Securities LLCSeries 2018-1, Class A,4.34%, 02/15/2033 (A) 1,574,217 1,582,973Series 2018-2, Class A,4.45%, 06/15/2033 (A) 1,548,121 1,566,891
BXG Receivables Note TrustSeries 2012-A, Class A,2.66%, 12/02/2027 (A) 15,018 14,982
Camillo TrustSeries 2016-SFR1,5.00%, 12/05/2023 1,009,286 1,007,079
Capital Auto Receivables Asset TrustSeries 2018-1, Class A3,2.79%, 01/20/2022 (A) 1,785,000 1,785,544
CarMax Auto Owner TrustSeries 2016-3, Class C,2.20%, 06/15/2022 850,000 840,556Series 2017-3, Class D,3.46%, 10/16/2023 906,000 905,663
CarNow Auto Receivables TrustSeries 2017-1A, Class A,2.92%, 09/15/2022 (A) 137,123 136,736
Centex Home Equity Loan TrustSeries 2004-A, Class M1,1-Month LIBOR + 0.60%,
3.09% (B), 01/25/2034 976,167 969,218Chase Funding Trust
Series 2003-2, Class 2A2,1-Month LIBOR + 0.56%,
3.05% (B), 02/25/2033 258,024 249,639Series 2003-5, Class 2A2,1-Month LIBOR + 0.60%,
3.09% (B), 07/25/2033 576,894 560,809CHEC Loan Trust
Series 2004-1, Class M2,1-Month LIBOR + 0.98%,
3.46% (B), 07/25/2034 (A) 255,498 248,279CIG Auto Receivables Trust
Series 2017-1A, Class A,2.71%, 05/15/2023 (A) 170,090 169,726
CLUB Credit TrustSeries 2017-P2, Class A,2.61%, 01/15/2024 (A) 291,970 290,749
Colony American Finance, Ltd.Series 2016-2, Class A,2.55%, 11/15/2048 237,291 233,340
COOF Securitization Trust, Ltd., Interest OnlySTRIPSSeries 2014-1, Class A,3.00%, 06/25/2040 (A) 178,217 16,011
Countrywide Asset-Backed CertificatesSeries 2004-BC1, Class M1,1-Month LIBOR + 0.75%,
3.24% (B), 02/25/2034 663,229 662,021Countrywide Partnership Trust
Series 2004-EC1, Class M2,1-Month LIBOR + 0.95%,
3.43% (B), 01/25/2035 296,861 296,763
Principal ValueASSET-BACKED SECURITIES (continued)United States (continued)CPS Auto Receivables Trust (continued)
Series 2014-D, Class C,4.35%, 11/16/2020 (A) $ 69,971 $ 70,277Series 2015-A, Class C,4.00%, 02/16/2021 (A) 100,000 100,510Series 2016-C, Class C,3.27%, 06/15/2022 (A) 560,000 560,681Series 2017-C, Class C,2.86%, 06/15/2023 (A) 1,150,000 1,147,376Series 2017-C, Class D,3.79%, 06/15/2023 (A) 791,000 796,921
Credit Acceptance Auto Loan TrustSeries 2017-1A, Class A,2.56%, 10/15/2025 (A) 319,997 319,501Series 2017-1A, Class B,3.04%, 12/15/2025 (A) 250,000 249,522Series 2017-1A, Class C,3.48%, 02/17/2026 (A) 250,000 249,504Series 2017-2A, Class B,3.02%, 04/15/2026 (A) 1,380,000 1,374,596Series 2017-2A, Class C,3.35%, 06/15/2026 (A) 250,000 249,784Series 2018-1A, Class A,3.01%, 02/16/2027 (A) 559,000 559,429
Credit-Based Asset Servicing & Securitization LLCSeries 2003-CB6, Class M1,1-Month LIBOR + 1.05%,
3.54% (B), 12/25/2033 721,162 705,638Series 2004-CB2, Class M1,1-Month LIBOR + 0.78%,
3.27% (B), 07/25/2033 775,376 751,296CWABS, Inc. Asset-Backed Certificates Trust
Series 2004-6, Class M5,1-Month LIBOR + 1.91%,
4.39% (B), 08/25/2034 271,590 271,551Diamond Resorts Owner Trust
Series 2017-1A, Class A,3.27%, 10/22/2029 (A) 385,856 387,331Series 2018-1, Class A,3.70%, 01/21/2031 (A) 836,859 849,948
Drive Auto Receivables TrustSeries 2015-AA, Class D,4.12%, 07/15/2022 (A) 253,545 254,367Series 2015-BA, Class D,3.84%, 07/15/2021 (A) 196,650 196,900Series 2015-DA, Class D,4.59%, 01/17/2023 (A) 286,000 288,080Series 2016-CA, Class D,4.18%, 03/15/2024 (A) 602,000 609,715Series 2017-1, Class C,2.84%, 04/15/2022 508,310 508,076Series 2017-1, Class D,3.84%, 03/15/2023 1,130,000 1,138,740Series 2017-2, Class C,2.75%, 09/15/2023 855,868 855,438Series 2017-3, Class D,3.53%, 12/15/2023 (A) 1,500,000 1,507,612Series 2017-AA, Class C,2.98%, 01/18/2022 (A) 173,154 173,214Series 2017-AA, Class D,4.16%, 05/15/2024 (A) 346,000 350,207Series 2018-3, Class C,
Copyright © 2021 www.secdatabase.com. All Rights Reserved.Please Consider the Environment Before Printing This Document

The notes are an integral part of this report.Transamerica Series Trust Page 2
CPS Auto Receivables TrustSeries 2014-C, Class C,3.77%, 08/17/2020 (A) 48,455 48,518
3.72%, 09/16/2024 545,000 550,021Series 2018-4, Class C,3.66%, 11/15/2024 1,259,000 1,268,494
Copyright © 2021 www.secdatabase.com. All Rights Reserved.Please Consider the Environment Before Printing This Document

Transamerica JPMorgan Tactical Allocation VPSCHEDULE OF INVESTMENTS (continued)At March 31, 2019(unaudited)
Principal ValueASSET-BACKED SECURITIES (continued)United States (continued)Drive Auto Receivables Trust (continued)
Series 2019-1, Class D,4.09%, 06/15/2026 $
435,000$444,173
DT Asset TrustSeries 2017, Class B,5.84%, 12/16/2022 600,000 599,776
DT Auto Owner TrustSeries 2016-4A, Class D,3.77%, 10/17/2022 (A) 309,600 311,669Series 2017-1A, Class D,3.55%, 11/15/2022 (A) 315,000 315,922Series 2017-2A, Class C,3.03%, 01/17/2023 (A) 469,859 469,889Series 2017-3A, Class D,3.58%, 05/15/2023 (A) 302,000 303,234
Engs Commercial Finance TrustSeries 2016-1A, Class A2,2.63%, 02/22/2022 (A) 82,827 82,600
Exeter Automobile Receivables TrustSeries 2016-1A, Class C,5.52%, 10/15/2021 (A) 445,000 449,699Series 2016-3A, Class B,2.84%, 08/16/2021 (A) 161,046 160,972Series 2017-1A, Class C,3.95%, 12/15/2022 (A) 165,000 166,322Series 2017-3A, Class A,2.05%, 12/15/2021 (A) 95,264 94,976Series 2017-3A, Class C,3.68%, 07/17/2023 (A) 910,000 917,831Series 2018-4A, Class B,3.64%, 11/15/2022 (A) 509,000 513,227
First Franklin Mortgage Loan TrustSeries 2006-FF2, Class A4,1-Month LIBOR + 0.20%,
2.69% (B), 02/25/2036 66,390 66,321First Investors Auto Owner Trust
Series 2017-2A, Class B,2.65%, 11/15/2022 (A) 667,000 663,768Series 2017-2A, Class C,3.00%, 08/15/2023 (A) 1,500,000 1,494,931Series 2017-3A, Class A2,2.41%, 12/15/2022 (A) 615,000 612,516
Flagship Credit Auto TrustSeries 2014-2, Class C,3.95%, 12/15/2020 (A) 36,176 36,219Series 2015-3, Class B,3.68%, 03/15/2022 (A) 171,152 171,615Series 2015-3, Class C,4.65%, 03/15/2022 (A) 126,000 128,168Series 2016-1, Class A,2.77%, 12/15/2020 (A) 9,693 9,692Series 2016-1, Class C,6.22%, 06/15/2022 (A) 600,000 620,966Series 2016-4, Class C,2.71%, 11/15/2022 (A) 423,000 421,441
Fort Cre LLC1-Month LIBOR + 2.83%,
4.96% (B), 11/21/2035 (A) 2,075,000 2,075,930Foundation Finance Trust
Series 2019-1A, Class A,3.86%, 11/15/2034 (A) 750,000 749,884
Principal ValueASSET-BACKED SECURITIES (continued)United States (continued)GLS Auto Receivables Trust
Series 2016-1A, Class B,4.39%, 01/15/2021 (A) $ 62,840 $ 62,921Series 2017-1A, Class B,2.98%, 12/15/2021 (A) 800,000 799,008
GMAT TrustSeries 2013-1A, Class A,6.97% (B), 11/25/2043 (A) 9,413 9,418
Gold Key Resorts LLCSeries 2014-A, Class A,3.22%, 03/17/2031 (A) 85,359 85,004
Golden Bear LLCSeries 2016-R, Class R,5.65%, 09/20/2047 (A) 220,398 224,540
Goodgreen TrustSeries 2017, Class R1,5.00%, 10/20/2051 1,365,964 1,334,274Series 2017-1A, Class A,3.74%, 10/15/2052 (A) 165,179 166,942
Headlands Residential LLCSeries 2018,4.25%, 06/25/2023 1,565,000 1,565,376Hero Funding TrustSeries 2016-3A, Class A1,3.08%, 09/20/2042 (A) 196,718 194,249Series 2017-1A, Class A2,4.46%, 09/20/2047 (A) 540,756 558,265
Hilton Grand Vacations TrustSeries 2017-AA, Class A,2.66%, 12/26/2028 (A) 163,250 161,972
Home Equity Asset TrustSeries 2003-3, Class M1,1-Month LIBOR + 1.29%,
3.78% (B), 08/25/2033 800,559 797,836Series 2004-3, Class M1,1-Month LIBOR + 0.86%,
3.34% (B), 08/25/2034 753,956 746,319Home Equity Mortgage Loan Asset-Backed Trust
Series 2004-B, Class M8,1-Month LIBOR + 3.30%,
5.28% (B), 11/25/2034 238,456 220,047Series 2004-C, Class M1,1-Month LIBOR + 0.84%,
3.33% (B), 03/25/2035 785,859 785,758Kabbage Funding LLC
Series 2019-1, Class A,3.83%, 03/15/2024 (A) 1,810,000 1,820,487
KGS-Alpha SBA COOF Trust, Interest Only STRIPSSeries 2012-2, Class A,0.88% (B), 08/25/2038 (A) 782,927 18,756Series 2013-2, Class A,1.63% (B), 03/25/2039 (A) 729,022 30,244Series 2014-2, Class A,3.11% (B), 04/25/2040 (A) 300,137 24,546
Lendmark Funding TrustSeries 2017-1A, Class A,2.83%, 12/22/2025 (A) 454,000 450,098Series 2017-1A, Class B,3.77%, 12/22/2025 (A) 1,930,000 1,931,836Series 2017-1A, Class C,5.41%, 12/22/2025 (A) 1,200,000 1,230,192
Long Beach Mortgage Loan Trust
Copyright © 2021 www.secdatabase.com. All Rights Reserved.Please Consider the Environment Before Printing This Document

The notes are an integral part of this report.Transamerica Series Trust Page 3
Freedom Financial TrustSeries 2018-1, Class A,3.61%, 07/18/2024 (A) 470,804 471,234Series 2018-2, Class A,3.99%, 10/20/2025 (A) 1,191,297 1,194,785
Series 2004-3, Class M2,1-Month LIBOR + 0.90%,
3.39% (B), 07/25/2034 671,231 668,611
Copyright © 2021 www.secdatabase.com. All Rights Reserved.Please Consider the Environment Before Printing This Document

Transamerica JPMorgan Tactical Allocation VPSCHEDULE OF INVESTMENTS (continued)At March 31, 2019(unaudited)
Principal ValueASSET-BACKED SECURITIES (continued)United States (continued)Long Beach Mortgage Loan Trust (continued)
Series 2004-3, Class M4,1-Month LIBOR + 1.61%,
4.10% (B), 07/25/2034$205,747
$205,834
Series 2004-4, Class M1,1-Month LIBOR + 0.90%,
3.39% (B), 10/25/2034 633,501 632,985LV Tower 52
Series 2013-1, Class A,5.75%, 07/15/2019 (A) 829,116 829,116
Mariner Finance Issuance TrustSeries 2017-AA, Class A,3.62%, 02/20/2029 (A) 686,818 687,551
Marlette Funding TrustSeries 2017-1A, Class A,2.83%, 03/15/2024 (A) 13,678 13,678Series 2017-2A, Class A,2.39%, 07/15/2024 (A) 51,507 51,495Series 2018-1A, Class A,2.61%, 03/15/2028 (A) 291,311 290,799
Master Asset-Backed Securities TrustSeries 2004-OPT2, Class M1,1-Month LIBOR + 0.90%,
3.39% (B), 09/25/2034 138,908 135,589Series 2005-NC1, Class M2,1-Month LIBOR + 0.75%,
3.24% (B), 12/25/2034 171,829 171,312Meritage Mortgage Loan Trust
Series 2003-1, Class M2,1-Month LIBOR + 2.33%,
4.81% (B), 11/25/2033 500,540 499,189Morgan Stanley ABS Capital I, Inc. Trust
Series 2004-HE8, Class M1,1-Month LIBOR + 0.96%,
3.45% (B), 09/25/2034 839,690 838,258Series 2004-NC2, Class M1,1-Month LIBOR + 0.83%,
3.31% (B), 12/25/2033 254,278 252,724Series 2004-NC7, Class M2,1-Month LIBOR + 0.93%,
3.42% (B), 07/25/2034 270,326 270,494Series 2004-NC8, Class M4,1-Month LIBOR + 1.50%,
3.99% (B), 09/25/2034 563,289 550,431Morgan Stanley Dean Witter Capital I, Inc. Trust
Series 2002-AM3, Class A3,1-Month LIBOR + 0.98%,
3.47% (B), 02/25/2033 667,427 664,145New Century Home Equity Loan Trust
Series 2004-2, Class M3,1-Month LIBOR + 1.01%,
3.49% (B), 08/25/2034 422,927 421,765Series 2004-2, Class M5,1-Month LIBOR + 2.03%,
4.51% (B), 08/25/2034 252,188 253,097Series 2004-4, Class M1,1-Month LIBOR + 0.77%,
3.25% (B), 02/25/2035 822,078 812,510New Residential Advanced Receivables Trust
Series 2016-T2, Class AT2,2.58%, 10/15/2049 (A) 250,000 249,218Series 2016-T2, Class CT2,
Principal ValueASSET-BACKED SECURITIES (continued)United States (continued)NovaStar Mortgage Funding Trust
Series 2003-3, Class M1,1-Month LIBOR + 1.13%,
3.61% (B), 12/25/2033$253,878
$253,090
Ocwen Master Advance Receivables TrustSeries 2018-T2, Class CT2,4.19%, 08/15/2050 (A) 927,000 932,284
OnDeck Asset Securitization Trust LLCSeries 2018-1A, Class A,3.50%, 04/18/2022 (A) 312,000 313,136
OneMain Direct Auto Receivables TrustSeries 2017-2A, Class C,2.82%, 07/15/2024 (A) 1,315,000 1,307,703
OneMain Financial Issuance TrustSeries 2015-1A, Class A,3.19%, 03/18/2026 (A) 54,692 54,702Series 2016-1A, Class A,3.66%, 02/20/2029 (A) 413,884 415,649
Oportun Funding IX LLCSeries 2018-B, Class A,3.91%, 07/08/2024 (A) 1,456,000 1,465,954
Oportun Funding VI LLCSeries 2017-A, Class A,3.23%, 06/08/2023 (A) 357,000 355,172Series 2017-A, Class B,3.97% (B), 06/08/2023 (A) 1,000,000 995,386
Oportun Funding VII LLCSeries 2017-B, Class A,3.22%, 10/10/2023 (A) 308,000 306,287
Oportun Funding VIII LLCSeries 2018-A, Class A,3.61%, 03/08/2024 (A) 655,000 656,553
Option One Mortgage Acceptance Corp. Asset-BackedCertificatesSeries 2003-6, Class A2,1-Month LIBOR + 0.66%,
3.15% (B), 11/25/2033 445,917 439,334Option One Mortgage Loan Trust
Series 2004-1, Class M2,1-Month LIBOR + 1.65%,
4.14% (B), 01/25/2034 591,407 574,403Park Place Securities, Inc. Asset-Backed Pass-Through
CertificatesSeries 2005-WCH1, Class M4,1-Month LIBOR + 1.25%,
3.73% (B), 01/25/2036 500,000 499,818Pretium Mortgage Credit Partners I LLC
Series 2018-NPL2, Class A1,3.70% (B), 03/27/2033 (A) 732,037 730,357Series 2018-NPL4, Class A1,4.83% (B), 09/25/2058 (A) 926,607 934,483Series 2018-NPL4, Class A2,6.05% (B), 09/25/2058 (A) 1,000,000 1,005,265
Progress Residential TrustSeries 2015-SFR2, Class A,2.74%, 06/12/2032 (A) 1,385,070 1,375,843Series 2015-SFR2, Class B,3.14%, 06/12/2032 (A) 327,000 325,103Series 2015-SFR3, Class A,3.07%, 11/12/2032 (A) 1,660,987 1,655,420Series 2015-SFR3, Class D,4.67%, 11/12/2032 (A) 250,000 251,241
Copyright © 2021 www.secdatabase.com. All Rights Reserved.Please Consider the Environment Before Printing This Document

The notes are an integral part of this report.Transamerica Series Trust Page 4
3.51%, 10/15/2049 (A) 187,500 186,751Nissan Auto Receivables Owner Trust
Series 2017-C, Class A3,2.12%, 04/18/2022 645,000 641,585
Series 2015-SFR3, Class E,5.66%, 11/12/2032 (A) 200,000 201,858Series 2017-SFR1, Class A,2.77%, 08/17/2034 (A) 167,462 166,004
Copyright © 2021 www.secdatabase.com. All Rights Reserved.Please Consider the Environment Before Printing This Document

Transamerica JPMorgan Tactical Allocation VPSCHEDULE OF INVESTMENTS (continued)At March 31, 2019(unaudited)
Principal ValueASSET-BACKED SECURITIES (continued)United States (continued)Progress Residential Trust (continued)
Series 2017-SFR1, Class C,3.32%, 08/17/2034 (A) $
2,000,000$1,978,839
Series 2018-SFR2, Class A,3.71%, 08/17/2035 (A) 2,400,000 2,438,056Series 2018-SFR2, Class E,4.66%, 08/17/2035 (A) 771,000 783,510
Prosper Marketplace Issuance TrustSeries 2017-3A, Class A,2.36%, 11/15/2023 (A) 76,199 76,146
Purchasing Power Funding LLCSeries 2018-A, Class A,3.34%, 08/15/2022 (A) 2,090,000 2,088,670
RAMP TrustSeries 2005-RS6, Class M4,1-Month LIBOR + 0.98%,
3.46% (B), 06/25/2035 1,250,000 1,259,133Series 2006-RZ3, Class M1,1-Month LIBOR + 0.35%,
2.84% (B), 08/25/2036 1,100,000 1,088,967RASC Trust
Series 2005-EMX1, Class M1,1-Month LIBOR + 0.65%,
3.13% (B), 03/25/2035 471,038 470,376Series 2005-KS9, Class M3,1-Month LIBOR + 0.46%,
2.95% (B), 10/25/2035 736,429 737,505Renaissance Home Equity Loan Trust
Series 2003-2, Class A,1-Month LIBOR + 0.88%,
3.37% (B), 08/25/2033 823,339 813,179Rice Park Financing Trust
Series 2016-A, Class A,4.63%, 10/31/2041 (A) 825,589 825,754
Santander Drive Auto Receivables TrustSeries 2015-5, Class E,4.67%, 02/15/2023 (A) 1,560,000 1,573,624
Santander Retail Auto Lease TrustSeries 2018-A, Class A3,2.93%, 05/20/2021 (A) 839,000 840,097
SART4.75%, 06/15/2025 2,158,611 2,184,925
Securitized Asset-Backed Receivables LLC TrustSeries 2004-NC1, Class M2,1-Month LIBOR + 1.73%,
4.21% (B), 02/25/2034 358,912 358,625Series 2004-OP2, Class M1,1-Month LIBOR + 0.98%,
3.46% (B), 08/25/2034 532,262 527,824SoFi Consumer Loan Program LLC
Series 2016-2A, Class A,3.09%, 10/27/2025 (A) 93,714 93,710
Soundview Home Loan TrustSeries 2005-OPT1, Class M2,1-Month LIBOR + 0.68%,
3.16% (B), 06/25/2035 745,642 741,622Specialty Underwriting & Residential Finance
TrustSeries 2003-BC4, Class M1,1-Month LIBOR + 0.90%,
3.39% (B), 11/25/2034 545,446 536,539
Principal ValueASSET-BACKED SECURITIES (continued)United States (continued)Structured Asset Investment Loan Trust
Series 2003-BC12, Class M1,1-Month LIBOR + 0.98%,
3.46% (B), 11/25/2033$129,268
$122,575
Series 2004-6, Class M2,1-Month LIBOR + 1.95%,
4.44% (B), 07/25/2034 28,347 27,823Structured Asset Securities Corp. Mortgage Loan Trust
Series 2006-BC6, Class A4,1-Month LIBOR + 0.17%,
2.66% (B), 01/25/2037 313,455 306,542Synchrony Card Funding LLC
Series 2019-A1, Class A,2.95%, 03/17/2025 2,027,000 2,039,565
Synchrony Card Issuance TrustSeries 2018-A1, Class A1,3.38%, 09/15/2024 1,000,000 1,017,210
Tricolor Auto Securitization TrustSeries 2018-1A, Class A,5.05%, 12/15/2020 (A) 679,527 684,568
Tricon American Homes TrustSeries 2016-SFR1, Class A,2.59%, 11/17/2033 (A) 350,150 345,680
United Auto Credit Securitization TrustSeries 2018-2, Class B,3.56%, 08/10/2022 (A) 2,000,000 2,006,305Series 2018-2, Class C,3.78%, 05/10/2023 (A) 1,075,000 1,079,681
Upgrade Receivables TrustSeries 2018-1A, Class A,3.76%, 11/15/2024 (A) 402,734 403,868
Upstart Securitization TrustSeries 2018-2, Class A,3.33%, 12/22/2025 (A) 1,349,478 1,349,559
US Auto Funding LLCSeries 2018-1A, Class A,5.50%, 07/15/2023 (A) 1,054,508 1,068,075
Vericrest Opportunity Loan TrustSeries 2018-NPL2, Class A1,4.34% (B), 05/25/2048 (A) 727,160 728,788Series 2019-NPL3, Class A1,3.97% (B), 03/25/2049 (A) 500,000 500,545Series 2019-NPL3, Class A2,6.17% (B), 03/25/2049 (A) 1,100,000 1,103,274
Verizon Owner TrustSeries 2016-1A, Class A,1.42%, 01/20/2021 (A) 26,616 26,551Series 2017-3A, Class A1A,2.06%, 04/20/2022 (A) 1,019,000 1,012,235
VM DEBT LLCSeries 2017-1, Class A,7.00%, 10/02/2024 (A) 840,000 840,000
VOLT LXIV LLCSeries 2017-NP11, Class A1,3.38% (B), 10/25/2047 (A) 1,045,115 1,043,631
VOLT LXIX LLCSeries 2018-NPL5, Class A1A,4.21% (B), 08/25/2048 (A) 605,437 607,065
VOLT LXVII LLCSeries 2018-NPL3, Class A1,4.38% (B), 06/25/2048 (A) 909,020 910,740
VOLT LXVIII LLC
Copyright © 2021 www.secdatabase.com. All Rights Reserved.Please Consider the Environment Before Printing This Document

The notes are an integral part of this report.Transamerica Series Trust Page 5
SpringCastle America Funding LLCSeries 2016-AA, Class A,3.05%, 04/25/2029 (A) 290,612 290,237
Springleaf Funding TrustSeries 2015-AA, Class A,3.16%, 11/15/2024 (A) 96,494 96,500
Series 2018-NPL4, Class A1A,4.34% (B), 07/27/2048 (A) 738,341 741,058
VOLT LXX LLCSeries 2018-NPL6, Class A1A,4.11% (B), 09/25/2048 (A) 615,681 618,096
Copyright © 2021 www.secdatabase.com. All Rights Reserved.Please Consider the Environment Before Printing This Document

Transamerica JPMorgan Tactical Allocation VPSCHEDULE OF INVESTMENTS (continued)At March 31, 2019(unaudited)
Principal ValueASSET-BACKED SECURITIES (continued)United States (continued)VOLT LXXII LLC
Series 2018-NPL8, Class A1A,4.21% (B), 10/26/2048 (A) $
1,983,461$1,996,127
VOLT LXXV LLCSeries 2019-NPL1, Class A1A,4.34% (B), 01/25/2049 (A) 2,206,158 2,222,670
VSE Voi Mortgage LLCSeries 2018-A, Class A,3.56%, 02/20/2036 (A) 527,413 535,960
Wells Fargo Home Equity Trust Mortgage Pass-Through CertificatesSeries 2004-1, Class 1A,1-Month LIBOR + 0.30%,
2.79% (B), 04/25/2034 702,148 684,798Westgate Resorts LLC
Series 2017-1A, Class A,3.05%, 12/20/2030 (A) 253,357 251,873
Westlake Automobile Receivables TrustSeries 2016-2A, Class D,4.10%, 06/15/2021 (A) 180,000 181,002Series 2016-3A, Class C,2.46%, 01/18/2022 (A) 658,160 657,750Series 2017-1A, Class C,2.70%, 10/17/2022 (A) 216,000 215,602Series 2017-2A, Class C,2.59%, 12/15/2022 (A) 1,231,000 1,225,749
World Financial Network Credit Card MasterTrust3.14%, 12/15/2025 935,000 943,205
140,348,242Total Asset-Backed Securities
(Cost $140,232,961) 142,117,998
CORPORATE DEBT SECURITIES - 13.4%Australia - 0.4%APT Pipelines, Ltd.
4.25%, 07/15/2027 (A) 216,000 218,883Australia & New Zealand Banking Group, Ltd.
4.40%, 05/19/2026 (A) 200,000 203,132BHP Billiton Finance USA, Ltd.
4.13%, 02/24/2042 70,000 73,4715.00%, 09/30/2043 55,000 64,592
Commonwealth Bank of Australia2.50%, 09/18/2022 (A) 300,000 295,6752.85%, 05/18/2026 (A) 250,000 243,2523.45%, 03/16/2023 (A) 250,000 254,3114.50%, 12/09/2025 (A) 200,000 205,174
GAIF Bond Issuer Pty, Ltd.3.40%, 09/30/2026 (A) 184,000 177,441
Macquarie Bank, Ltd.2.60%, 06/24/2019 (A) 182,000 181,9272.85%, 07/29/2020 (A) 150,000 150,0764.00%, 07/29/2025 (A) 150,000 153,763
Macquarie Group, Ltd.Fixed until 11/28/2027, 3.76% (B), 11/28/
2028 (A) 475,000 462,631Fixed until 01/15/2029, 5.03% (B), 01/15/
2030 (A) 960,000 1,018,5556.00%, 01/14/2020 (A) 360,000 368,1476.25%, 01/14/2021 (A) (E) 80,000 84,327
Principal ValueCORPORATE DEBT SECURITIES (continued)Australia (continued)Scentre Group Trust 1 / Scentre Group Trust 2
3.50%, 02/12/2025 (A) $300,000
$299,635
Westpac Banking Corp.2.00%, 03/03/2020 (A) 304,000 302,1702.50%, 06/28/2022 220,000 217,8132.85%, 05/13/2026 250,000 242,622Fixed until 11/23/2026, 4.32% (B), 11/23/2031, MTN 330,000 327,065
6,348,255Bermuda - 0.0% (F)Aircastle, Ltd.
4.40%, 09/25/2023 245,000 249,482Athene Holding, Ltd.
4.13%, 01/12/2028 270,000 259,538509,020
Canada - 0.7%Air Canada Pass-Through Trust
3.30%, 07/15/2031 (A) 169,546 164,7343.55%, 07/15/2031 (A) 777,571 757,2203.75%, 06/15/2029 (A) 1,319,170 1,333,6814.13%, 11/15/2026 (A) 199,520 203,371
Anadarko Finance Co.7.50%, 05/01/2031 190,000 237,151
Bank of Montreal2.35%, 09/11/2022, MTN 397,000 392,623Fixed until 12/15/2027,
3.80% (B), 12/15/2032 117,000 113,139Bank of Nova Scotia
2.45%, 09/19/2022 200,000 198,223Barrick Gold Corp.
6.45%, 10/15/2035 180,000 213,016Brookfield Finance, Inc.
3.90%, 01/25/2028 118,000 114,1154.70%, 09/20/2047 147,000 141,289
Canadian Imperial Bank of Commerce2.25%, 07/21/2020 (A) 200,000 199,1052.55%, 06/16/2022 120,000 119,709
Canadian Natural Resources, Ltd.3.80%, 04/15/2024 100,000 102,0585.85%, 02/01/2035 150,000 168,0146.45%, 06/30/2033 110,000 131,7317.20%, 01/15/2032 50,000 62,794
Canadian Pacific Railway Co.2.90%, 02/01/2025 173,000 169,5526.13%, 09/15/2115 17,000 20,8797.13%, 10/15/2031 150,000 199,105
CDP Financial, Inc.4.40%, 11/25/2019 (A) 250,000 252,833
Cenovus Energy, Inc.6.75%, 11/15/2039 250,000 278,623
CNOOC Nexen Finance ULC4.25%, 04/30/2024 209,000 218,392
Enbridge, Inc.3.70%, 07/15/2027 54,000 53,8434.50%, 06/10/2044 100,000 100,529Fixed until 03/01/2028,
6.25% (B), 03/01/2078 160,000 159,124Encana Corp.
7.20%, 11/01/2031 100,000 123,2168.13%, 09/15/2030 100,000 128,315
Fortis, Inc.
Copyright © 2021 www.secdatabase.com. All Rights Reserved.Please Consider the Environment Before Printing This Document

The notes are an integral part of this report.Transamerica Series Trust Page 6
National Australia Bank, Ltd.3.38%, 01/14/2026 800,000 803,593
3.06%, 10/04/2026 480,000 458,375
Copyright © 2021 www.secdatabase.com. All Rights Reserved.Please Consider the Environment Before Printing This Document

Transamerica JPMorgan Tactical Allocation VPSCHEDULE OF INVESTMENTS (continued)At March 31, 2019(unaudited)
Principal ValueCORPORATE DEBT SECURITIES (continued)Canada (continued)Hydro-Quebec
8.40%, 01/15/2022 $ 40,000 $ 45,9749.40%, 02/01/2021 220,000 246,349
Manulife Financial Corp.Fixed until 02/24/2027,
4.06% (B), 02/24/2032 400,000 388,845Nutrien, Ltd.
3.38%, 03/15/2025 120,000 118,3444.13%, 03/15/2035 200,000 188,7474.20%, 04/01/2029 (G) 65,000 66,9325.00%, 04/01/2049 (G) 95,000 99,289
Ontario Teachers� Cadillac Fairview Properties Trust3.13%, 03/20/2022 (A) 200,000 201,7803.88%, 03/20/2027 (A) 201,000 206,135
Petro-Canada5.35%, 07/15/2033 50,000 56,0427.88%, 06/15/2026 86,000 104,182
Royal Bank of Canada3.70%, 10/05/2023, MTN 400,000 413,2644.65%, 01/27/2026, MTN 103,000 109,197
Suncor Energy, Inc.5.95%, 12/01/2034 300,000 361,857
TransCanada PipeLines, Ltd.2.50%, 08/01/2022 30,000 29,7063.75%, 10/16/2023 35,000 36,0554.88%, 01/15/2026 162,000 175,1766.20%, 10/15/2037 100,000 118,789
Vale Canada, Ltd.7.20%, 09/15/2032 140,000 152,428
9,933,850Cayman Islands - 0.0% (F)CK Hutchison International 16, Ltd.
1.88%, 10/03/2021 (A) 200,000 194,220Hutchison Whampoa International 12 II, Ltd.
3.25%, 11/08/2022 (A) 200,000 200,985Vale Overseas, Ltd.
6.25%, 08/10/2026 42,000 45,6546.88%, 11/21/2036 159,000 181,896
622,755China - 0.0% (F)Industrial & Commercial Bank of China, Ltd.
2.45%, 10/20/2021 250,000 245,504Colombia - 0.0% (F)Ecopetrol SA
4.13%, 01/16/2025 107,000 108,0715.38%, 06/26/2026 116,000 124,9905.88%, 09/18/2023 62,000 67,720
300,781Denmark - 0.0% (F)Danske Bank A/S
2.70%, 03/02/2022 (A) 200,000 194,730Finland - 0.1%Nordea Bank Abp
3.75%, 08/30/2023 (A) 1,000,000 1,007,6684.25%, 09/21/2022 (A) 200,000 204,7394.88%, 01/27/2020 (A) 200,000 203,358
1,415,765
Principal ValueCORPORATE DEBT SECURITIES (continued)France - 0.2%Air Liquide Finance SA
2.25%, 09/27/2023 (A) $200,000
$193,540
BNP Paribas SA3.80%, 01/10/2024 (A) 300,000 302,366
BPCE SA3.38%, 12/02/2026, MTN 270,000 265,7324.63%, 07/11/2024 (A) 200,000 203,056
Credit Agricole SA4.13%, 01/10/2027 (A) (E) 250,000 255,252
Electricite de France SA6.00%, 01/22/2114 (A) 350,000 365,015
Societe Generale SA3.88%, 03/28/2024 (A) (E) 360,000 361,1504.25%, 09/14/2023 - 04/14/2025 (A) 400,000 406,538
Total Capital International SA2.75%, 06/19/2021 300,000 300,684
2,653,333Germany - 0.1%Deutsche Bank AG
3.70%, 05/30/2024 233,000 223,6494.25%, 10/14/2021 503,000 505,258
728,907Guernsey, Channel Islands - 0.0% (F)Credit Suisse Group Funding Guernsey, Ltd.
3.75%, 03/26/2025 350,000 352,649Ireland - 0.3%AerCap Ireland Capital DAC / AerCap Global Aviation
Trust3.30%, 01/23/2023 150,000 147,2213.50%, 01/15/2025 200,000 192,880
AIB Group PLC4.75%, 10/12/2023 (A) 525,000 542,155
GE Capital International Funding Unlimited Co.2.34%, 11/15/2020 779,000 769,3483.37%, 11/15/2025 250,000 242,5834.42%, 11/15/2035 1,260,000 1,164,853
Johnson Controls International PLC3.63% (H), 07/02/2024 23,000 23,2663.75%, 12/01/2021 36,000 36,5854.95% (H), 07/02/2064 147,000 136,1825.00%, 03/30/2020 60,000 61,2485.25%, 12/01/2041 75,000 80,066
Shire Acquisitions Investments Ireland DAC2.88%, 09/23/2023 134,000 132,2433.20%, 09/23/2026 265,000 256,257
3,784,887Italy - 0.0% (F)Eni SpA
4.00%, 09/12/2023 (A) 200,000 205,202Japan - 0.4%Dai-ichi Life Insurance Co., Ltd.
Fixed until 07/24/2026 (I),4.00% (A) (B) 221,000 214,922
Daiwa Securities Group, Inc.3.13%, 04/19/2022 (A) 171,000 170,300
Mitsubishi UFJ Financial Group, Inc.2.67%, 07/25/2022 170,000 168,566
Copyright © 2021 www.secdatabase.com. All Rights Reserved.Please Consider the Environment Before Printing This Document

The notes are an integral part of this report.Transamerica Series Trust Page 7
Copyright © 2021 www.secdatabase.com. All Rights Reserved.Please Consider the Environment Before Printing This Document

Transamerica JPMorgan Tactical Allocation VPSCHEDULE OF INVESTMENTS (continued)At March 31, 2019(unaudited)
Principal ValueCORPORATE DEBT SECURITIES (continued)Japan (continued)Mitsubishi UFJ Financial Group, Inc. (continued)
3.00%, 02/22/2022 $74,000 $ 74,154
3.41%, 03/07/2024 420,000 427,628Mitsubishi UFJ Lease & Finance Co., Ltd.
2.65%, 09/19/2022 (A) 200,000 196,596Mitsubishi UFJ Trust & Banking Corp.
2.45%, 10/16/2019 (A) 300,000 299,451Mizuho Bank, Ltd.
3.60%, 09/25/2024 (A) 230,000 235,070MUFG Bank, Ltd.
4.10%, 09/09/2023 (A) 200,000 208,296ORIX Corp.
2.90%, 07/18/2022 126,000 125,9873.25%, 12/04/2024 300,000 299,618
Sumitomo Life Insurance Co.Fixed until 09/14/2027,
4.00% (B), 09/14/2077 (A) 200,000 194,500Sumitomo Mitsui Financial Group, Inc.
2.06%, 07/14/2021 101,000 99,2542.44%, 10/19/2021 127,000 125,5262.63%, 07/14/2026 134,000 128,2642.78%, 07/12/2022 - 10/18/2022 455,000 452,7892.85%, 01/11/2022 250,000 250,2173.10%, 01/17/2023 172,000 172,5673.94%, 10/16/2023 800,000 829,868
Sumitomo Mitsui Trust Bank, Ltd.2.05%, 10/18/2019 (A) 350,000 348,509
5,022,082Luxembourg - 0.1%Allergan Funding SCS
3.45%, 03/15/2022 269,000 271,4223.85%, 06/15/2024 164,000 166,033
Covidien International Finance SA2.95%, 06/15/2023 68,000 68,582
Ingersoll-Rand Luxembourg Finance SA2.63%, 05/01/2020 60,000 59,855
nVent Finance Sarl4.55%, 04/15/2028 187,000 188,201
Schlumberger Investment SA2.40%, 08/01/2022 (A) 70,000 69,2653.30%, 09/14/2021 (A) 23,000 23,260
846,618Mexico - 0.2%America Movil SAB de CV
3.13%, 07/16/2022 200,000 201,3425.00%, 03/30/2020 150,000 152,929
Coca-Cola Femsa SAB de CV3.88%, 11/26/2023 150,000 154,735
Mexico City Airport Trust5.50%, 07/31/2047 (A) 200,000 184,000
Petroleos Mexicanos4.63%, 09/21/2023 (E) 233,000 229,5074.88%, 01/18/2024 65,000 63,9925.35%, 02/12/2028 85,000 78,8806.35%, 02/12/2048 159,000 140,1826.38%, 02/04/2021 - 01/23/2045 279,000 260,7356.50%, 03/13/2027 750,000 755,2506.63%, 06/15/2035 100,000 94,2506.75%, 09/21/2047 209,000 191,862
2,507,664
Principal ValueCORPORATE DEBT SECURITIES (continued)Netherlands - 0.4%ABN AMRO Bank NV
2.45%, 06/04/2020 (A) $200,000
$199,191
4.75%, 07/28/2025 (A) 300,000 311,655Airbus Finance BV
2.70%, 04/17/2023 (A) 64,000 63,637Airbus SE
3.15%, 04/10/2027 (A) 188,000 187,8403.95%, 04/10/2047 (A) 150,000 153,835
Cooperatieve Rabobank UA3.88%, 09/26/2023 (A) 280,000 288,2734.38%, 08/04/2025 567,000 584,4714.63%, 12/01/2023 250,000 261,146
Deutsche Telekom International Finance BV2.82%, 01/19/2022 (A) 150,000 149,552
EDP Finance BV3.63%, 07/15/2024 (A) 200,000 198,502
Enel Finance International NV3.50%, 04/06/2028 (A) 200,000 187,9613.63%, 05/25/2027 (A) 220,000 210,5324.63%, 09/14/2025 (A) 200,000 206,850
Heineken NV3.40%, 04/01/2022 (A) 150,000 152,964
ING Bank NV1.65%, 08/15/2019 (A) 220,000 219,118
ING Groep NV3.95%, 03/29/2027 271,000 272,0294.10%, 10/02/2023 480,000 493,358
Mylan NV3.95%, 06/15/2026 97,000 92,541
Shell International Finance BV2.13%, 05/11/2020 140,000 139,2874.13%, 05/11/2035 256,000 272,634
Siemens Financieringsmaatschappij NV2.35%, 10/15/2026 (A) 350,000 330,6663.13%, 03/16/2024 (A) 250,000 252,668
5,228,710New Zealand - 0.1%ANZ New Zealand International, Ltd.
3.45%, 07/17/2027 (A) 222,000 220,801BNZ International Funding, Ltd.
2.65%, 11/03/2022 (A) 550,000 541,216762,017
Norway - 0.0% (F)Equinor ASA
2.45%, 01/17/2023 58,000 57,5852.65%, 01/15/2024 143,000 142,3423.15%, 01/23/2022 51,000 51,9663.25%, 11/10/2024 61,000 62,430
314,323Republic of Korea - 0.0% (F)Korea Gas Corp.
1.88%, 07/18/2021 (A) 200,000 195,285Korea Southern Power Co., Ltd.
3.00%, 01/29/2021 (A) 200,000 200,378395,663
Singapore - 0.0% (F)BOC Aviation, Ltd.
2.75%, 09/18/2022 (A) 210,000 205,437
Copyright © 2021 www.secdatabase.com. All Rights Reserved.Please Consider the Environment Before Printing This Document

The notes are an integral part of this report.Transamerica Series Trust Page 8
Copyright © 2021 www.secdatabase.com. All Rights Reserved.Please Consider the Environment Before Printing This Document

Transamerica JPMorgan Tactical Allocation VPSCHEDULE OF INVESTMENTS (continued)At March 31, 2019(unaudited)
Principal ValueCORPORATE DEBT SECURITIES (continued)Spain - 0.0% (F)Telefonica Emisiones SA
4.10%, 03/08/2027 $163,000
$165,329
5.13%, 04/27/2020 102,000 104,357269,686
Sweden - 0.0% (F)Swedbank AB
2.80%, 03/14/2022 (A) 300,000 292,098Switzerland - 0.1%Credit Suisse AG
5.30%, 08/13/2019, MTN 100,000 100,899Credit Suisse Group AG
3.57%, 01/09/2023 (A) 250,000 250,8584.28%, 01/09/2028 (A) 580,000 586,663
UBS Group Funding Switzerland AGFixed until 08/15/2022,
2.86% (B), 08/15/2023 (A) 200,000 197,0394.13%, 09/24/2025 - 04/15/2026 (A) 400,000 413,305
1,548,764United Kingdom - 0.5%Anglo American Capital PLC
4.00%, 09/11/2027 (A) 250,000 243,020Aon PLC
3.50%, 06/14/2024 200,000 202,862AstraZeneca PLC
6.45%, 09/15/2037 120,000 152,872Barclays PLC
3.65%, 03/16/2025 200,000 195,0083.68%, 01/10/2023 250,000 249,702Fixed until 05/16/2023,
4.34% (B), 05/16/2024 500,000 505,533Fixed until 02/15/2022,
4.61% (B), 02/15/2023 400,000 408,250BP Capital Markets PLC
3.54%, 11/04/2024 230,000 236,7403.81%, 02/10/2024 92,000 95,642
HSBC Bank PLC4.75%, 01/19/2021 (A) 240,000 247,364
HSBC Holdings PLC2.65%, 01/05/2022 403,000 399,381Fixed until 03/13/2027,
4.04% (B), 03/13/2028 (E) 700,000 705,3514.25%, 08/18/2025 200,000 204,2394.38%, 11/23/2026 200,000 204,8664.88%, 01/14/2022 100,000 105,128
Invesco Finance PLC3.75%, 01/15/2026 62,000 62,6654.00%, 01/30/2024 74,000 76,489
Lloyds Banking Group PLC4.38%, 03/22/2028 221,000 226,2984.58%, 12/10/2025 200,000 202,331
NatWest Markets PLC3.63%, 09/29/2022(A) 510,000 509,773
Royal Bank of Scotland Group PLCFixed until 03/22/2024,
4.27% (B), 03/22/2025 245,000 247,605Santander UK Group Holdings PLC
Fixed until 11/03/2027,3.82% (B), 11/03/2028 500,000 484,688
Standard Chartered PLC4.05%, 04/12/2026 (A) 200,000 201,503
Principal ValueCORPORATE DEBT SECURITIES (continued)United Kingdom (continued)Vodafone Group PLC
4.13%, 05/30/2025 (E) $188,000
$191,593
5.00%, 05/30/2038 156,000 154,0775.25%, 05/30/2048 187,000 185,3876.25%, 11/30/2032 180,000 206,924
7,482,202United States - 9.8%ABB Finance USA, Inc.
2.88%, 05/08/2022 23,000 23,169Abbott Laboratories
3.88%, 09/15/2025 129,000 134,944AbbVie, Inc.
4.50%, 05/14/2035 200,000 195,636Aetna, Inc.
2.80%, 06/15/2023 84,000 82,4894.50%, 05/15/2042 10,000 9,4626.75%, 12/15/2037 70,000 84,639
AIG SunAmerica Global Financing X6.90%, 03/15/2032 (A) 150,000 197,897
Air Lease Corp.3.25%, 03/01/2025 145,000 139,613
Alabama Power Co.3.55%, 12/01/2023 76,000 78,6663.75%, 03/01/2045 25,000 24,1964.10%, 01/15/2042 31,000 30,7634.15%, 08/15/2044 24,000 24,8606.00%, 03/01/2039 38,000 47,549
Albemarle Corp.5.45%, 12/01/2044 100,000 103,327
Alexandria Real Estate Equities, Inc.3.80%, 04/15/2026 60,000 60,818
Allergan, Inc.2.80%, 03/15/2023 129,000 126,1913.38%, 09/15/2020 97,000 97,455
Allstate Corp.3.15%, 06/15/2023 110,000 111,342
Amazon.com, Inc.2.80%, 08/22/2024 335,000 335,5883.88%, 08/22/2037 300,000 311,8174.25%, 08/22/2057 350,000 376,3954.80%, 12/05/2034 117,000 136,212
American Airlines Pass-Through Trust3.00%, 04/15/2030 438,954 424,3493.65%, 02/15/2029 - 12/15/2029 567,878 569,5573.70%, 04/15/2027 - 04/01/2028 441,828 434,8164.95%, 07/15/2024 204,244 211,495
American Express Co.3.40%, 02/27/2023 103,000 104,5703.63%, 12/05/2024 21,000 21,557
American Express Credit Corp.2.25%, 05/05/2021, MTN 97,000 96,3692.38%, 05/26/2020, MTN 216,000 215,3002.60%, 09/14/2020, MTN 75,000 74,8702.70%, 03/03/2022, MTN 60,000 60,060
American Honda Finance Corp.2.25%, 08/15/2019, MTN 140,000 139,7862.30%, 09/09/2026, MTN 40,000 37,8692.90%, 02/16/2024, MTN 70,000 69,892
American International Group, Inc.3.75%, 07/10/2025 69,000 69,047
Copyright © 2021 www.secdatabase.com. All Rights Reserved.Please Consider the Environment Before Printing This Document

The notes are an integral part of this report.Transamerica Series Trust Page 9
Fixed until 01/20/2022,4.25% (B), 01/20/2023 (A) 350,000 355,558
5.20%, 01/26/2024 (A) 210,000 221,353
3.88%, 01/15/2035 74,000 67,7574.13%, 02/15/2024 145,000 149,5104.20%, 04/01/2028 55,000 55,9154.50%, 07/16/2044 60,000 57,456
American Tower Corp.3.38%, 10/15/2026 113,000 110,132
Copyright © 2021 www.secdatabase.com. All Rights Reserved.Please Consider the Environment Before Printing This Document

Transamerica JPMorgan Tactical Allocation VPSCHEDULE OF INVESTMENTS (continued)At March 31, 2019(unaudited)
Principal ValueCORPORATE DEBT SECURITIES (continued)United States (continued)American Water Capital Corp.
3.40%, 03/01/2025 $ 59,000 $ 60,1713.85%, 03/01/2024 200,000 207,5914.00%, 12/01/2046 91,000 90,778
Ameriprise Financial, Inc.2.88%, 09/15/2026 190,000 185,890
Amgen, Inc.3.63%, 05/15/2022 30,000 30,7254.56%, 06/15/2048 100,000 100,142
Analog Devices, Inc.3.13%, 12/05/2023 85,000 85,6084.50%, 12/05/2036 140,000 139,812
Andeavor Logistics, LP / Tesoro Logistics FinanceCorp.5.25%, 01/15/2025 134,000 139,102
Anheuser-Busch Cos. LLC / Anheuser-Busch InBevWorldwide, Inc.4.70%, 02/01/2036 (A) 1,127,000 1,125,858
Anheuser-Busch InBev Worldwide, Inc.4.75%, 01/23/2029 - 04/15/2058 355,000 372,597
ANR Pipeline Co.9.63%, 11/01/2021 70,000 81,409
Anthem, Inc.3.30%, 01/15/2023 21,000 21,2453.50%, 08/15/2024 208,000 210,5994.10%, 03/01/2028 105,000 108,0434.63%, 05/15/2042 50,000 51,6034.65%, 08/15/2044 97,000 100,519
Apache Corp.3.25%, 04/15/2022 (E) 12,000 12,0094.75%, 04/15/2043 23,000 21,6265.10%, 09/01/2040 90,000 88,4926.00%, 01/15/2037 89,000 97,176
Appalachian Power Co.5.80%, 10/01/2035 25,000 28,8336.70%, 08/15/2037 55,000 68,095
Apple, Inc.2.45%, 08/04/2026 185,000 178,7302.75%, 01/13/2025 300,000 298,7742.85%, 05/11/2024 236,000 236,7042.90%, 09/12/2027 299,000 294,7593.00%, 02/09/2024 - 06/20/2027 721,000 726,0783.20%, 05/13/2025 - 05/11/2027 267,000 270,1243.35%, 02/09/2027 410,000 418,4273.45%, 02/09/2045 156,000 148,4203.75%, 09/12/2047 420,000 417,8963.85%, 08/04/2046 129,000 130,4524.50%, 02/23/2036 85,000 95,2954.65%, 02/23/2046 40,000 45,193
Arizona Public Service Co.2.20%, 01/15/2020 83,000 82,6805.05%, 09/01/2041 23,000 25,849
Arrow Electronics, Inc.3.25%, 09/08/2024 132,000 127,9673.88%, 01/12/2028 111,000 106,858
Assurant, Inc.4.20%, 09/27/2023 250,000 254,696
AT&T, Inc.3.95%, 01/15/2025 237,000 241,8444.13%, 02/17/2026 216,000 220,8004.30%, 02/15/2030 - 12/15/2042 1,234,000 1,240,0804.35%, 06/15/2045 110,000 100,931
Principal ValueCORPORATE DEBT SECURITIES (continued)United States (continued)Athene Global Funding
2.75%, 04/20/2020 (A) $281,000
$280,210
4.00%, 01/25/2022 (A) 236,000 241,865Atmos Energy Corp.
4.13%, 10/15/2044 75,000 78,244AvalonBay Communities, Inc.
2.85%, 03/15/2023, MTN 170,000 169,4073.45%, 06/01/2025, MTN 70,000 71,2623.90%, 10/15/2046, MTN 34,000 33,623
Avangrid, Inc.3.15%, 12/01/2024 108,000 106,749
Aviation Capital Group LLC2.88%, 01/20/2022 (A) 150,000 147,7183.88%, 05/01/2023 (A) 100,000 100,307
BAE Systems Holdings, Inc.6.38%, 06/01/2019 (A) 80,000 80,403
Baker Hughes a GE Co. LLC5.13%, 09/15/2040 115,000 120,674
Baltimore Gas & Electric Co.3.50%, 08/15/2046 141,000 132,4755.20%, 06/15/2033 200,000 227,087
Bank of America Corp.Fixed until 07/21/2020, 2.37% (B), 07/21/2021, MTN 200,000 198,636Fixed until 04/24/2022,
2.88% (B), 04/24/2023 340,000 338,960Fixed until 12/20/2022,
3.00% (B), 12/20/2023 958,000 954,185Fixed until 10/01/2024, 3.09% (B), 10/01/2025, MTN 161,000 159,665Fixed until 01/20/2022, 3.12% (B), 01/20/2023, MTN 351,000 352,0183.30%, 01/11/2023, MTN 528,000 534,703Fixed until 01/23/2025,
3.37% (B), 01/23/2026 1,650,000 1,651,157Fixed until 12/20/2027,
3.42% (B), 12/20/2028 296,000 289,443Fixed until 05/17/2021, 3.50% (B), 05/17/2022, MTN 190,000 192,224Fixed until 03/05/2023,
3.55% (B), 03/05/2024 115,000 116,784Fixed until 04/24/2027,
3.71% (B), 04/24/2028 800,000 803,5843.95%, 04/21/2025, MTN 338,000 343,802Fixed until 03/05/2028, 3.97% (B), 03/05/2029, MTN 400,000 407,2784.00%, 01/22/2025, MTN 378,000 385,4974.25%, 10/22/2026, MTN 142,000 145,8835.88%, 02/07/2042, MTN 20,000 24,970
Bank of New York Mellon Corp.2.60%, 02/07/2022, MTN 100,000 99,943Fixed until 05/16/2022, 2.66% (B), 05/16/2023, MTN 301,000 299,4272.80%, 05/04/2026, MTN 51,000 50,0813.25%, 09/11/2024, MTN 190,000 192,5484.15%, 02/01/2021, MTN 55,000 56,546
BAT Capital Corp.4.39%, 08/15/2037 171,000 153,001
Baxalta, Inc.3.60%, 06/23/2022 20,000 20,1035.25%, 06/23/2045 9,000 9,861
Bayer US Finance II LLC4.70%, 07/15/2064 (A) 18,000 14,962
Bayer US Finance LLC3.38%, 10/08/2024 (A) 200,000 195,537
BB&T Corp.2.45%, 01/15/2020, MTN 56,000 55,887
Copyright © 2021 www.secdatabase.com. All Rights Reserved.Please Consider the Environment Before Printing This Document

The notes are an integral part of this report.Transamerica Series Trust Page 10
4.50%, 05/15/2035 285,000 280,7864.90%, 08/15/2037 936,000 946,1815.35%, 09/01/2040 79,000 82,9846.38%, 03/01/2041 205,000 240,917
2.63%, 06/29/2020, MTN 270,000 269,7466.85%, 04/30/2019, MTN 60,000 60,194
Copyright © 2021 www.secdatabase.com. All Rights Reserved.Please Consider the Environment Before Printing This Document

Transamerica JPMorgan Tactical Allocation VPSCHEDULE OF INVESTMENTS (continued)At March 31, 2019(unaudited)
Principal ValueCORPORATE DEBT SECURITIES (continued)United States (continued)Becton Dickinson and Co.
3.73%, 12/15/2024 $ 13,000 $ 13,199Berkshire Hathaway Energy Co.
2.40%, 02/01/2020 45,000 44,9063.50%, 02/01/2025 71,000 72,6883.75%, 11/15/2023 293,000 304,5906.13%, 04/01/2036 122,000 153,230
Berkshire Hathaway Finance Corp.4.40%, 05/15/2042 62,000 66,234
BlackRock, Inc.3.50%, 03/18/2024 40,000 41,582
Blackstone Holdings Finance Co. LLC4.45%, 07/15/2045 (A) 33,000 32,1955.88%, 03/15/2021 (A) 120,000 126,551
BMW US Capital LLC2.25%, 09/15/2023 (A) 180,000 174,760
Booking Holdings, Inc.3.55%, 03/15/2028 250,000 248,832
Boston Gas Co.4.49%, 02/15/2042 (A) 24,000 25,075
Boston Properties, LP3.20%, 01/15/2025 190,000 188,5013.65%, 02/01/2026 74,000 74,495
Boston Scientific Corp.3.75%, 03/01/2026 235,000 239,593
BP Capital Markets America, Inc.3.22%, 04/14/2024 830,000 840,7453.25%, 05/06/2022 227,000 230,489
British Airways Pass-Through Trust4.13%, 03/20/2033 (A) 636,220 645,954
Brixmor Operating Partnership, LP3.85%, 02/01/2025 150,000 149,295
Broadcom Corp. / Broadcom Cayman Finance, Ltd.3.63%, 01/15/2024 361,000 360,0723.88%, 01/15/2027 100,000 95,532
Broadcom, Inc.4.75%, 04/15/2029 (A) 1,200,000 1,194,300
Brooklyn Union Gas Co.4.27%, 03/15/2048 (A) 160,000 163,995
Buckeye Partners, LP3.95%, 12/01/2026 23,000 21,8684.88%, 02/01/2021 220,000 225,4025.85%, 11/15/2043 100,000 99,438
Bunge, Ltd. Finance Corp.3.50%, 11/24/2020 55,000 55,266
Burlington Northern Santa Fe LLC5.15%, 09/01/2043 231,000 272,1795.40%, 06/01/2041 60,000 71,9696.15%, 05/01/2037 200,000 255,9127.95%, 08/15/2030 200,000 282,426
Campbell Soup Co.3.95%, 03/15/2025 270,000 271,724
Capital One Bank USA NA3.38%, 02/15/2023 300,000 299,756
Capital One Financial Corp.3.20%, 02/05/2025 175,000 171,3183.75%, 04/24/2024 - 07/28/2026 260,000 257,3774.20%, 10/29/2025 100,000 101,688
Cardinal Health, Inc.4.90%, 09/15/2045 60,000 57,189
Cargill, Inc.3.30%, 03/01/2022 (A) 110,000 111,039
Principal ValueCORPORATE DEBT SECURITIES (continued)United States (continued)Carlyle Investment Management LLC
3-Month LIBOR + 2.00%,2.00% (B), 07/15/2019 (C) (D) $ 7,184
$7,166
Caterpillar Financial Services Corp.2.10%, 06/09/2019, MTN 43,000 42,9412.75%, 08/20/2021, MTN 60,000 60,0952.85%, 06/01/2022, MTN 77,000 77,5613.75%, 11/24/2023, MTN 121,000 126,613
Caterpillar, Inc.2.60%, 06/26/2022 31,000 30,948
CBS Corp.3.70%, 08/15/2024 173,000 175,8514.00%, 01/15/2026 83,000 84,3214.85%, 07/01/2042 100,000 99,4734.90%, 08/15/2044 68,000 66,951
Celgene Corp.5.70%, 10/15/2040 114,000 125,050
Centel Capital Corp.9.00%, 10/15/2019 25,000 25,742
CenterPoint Energy Houston Electric LLC3.00%, 02/01/2027 137,000 135,116
CenterPoint Energy Resources Corp.4.50%, 01/15/2021 130,000 133,187
Charter Communications Operating LLC / CharterCommunications Operating Capital4.91%, 07/23/2025 803,000 847,3085.38%, 04/01/2038 114,000 114,6126.38%, 10/23/2035 89,000 99,2366.83%, 10/23/2055 120,000 135,853
Chevron Corp.2.36%, 12/05/2022 50,000 49,6362.41%, 03/03/2022 200,000 199,6702.57%, 05/16/2023 200,000 200,2782.90%, 03/03/2024 161,000 162,842
Chevron Phillips Chemical Co. LLC / Chevron PhillipsChemical Co., LP3.40%, 12/01/2026 (A) 95,000 95,443
Chubb INA Holdings, Inc.2.88%, 11/03/2022 91,000 91,7273.15%, 03/15/2025 131,000 132,1333.35%, 05/03/2026 63,000 64,110
Cisco Systems, Inc.1.85%, 09/20/2021 200,000 196,2402.95%, 02/28/2026 117,000 117,327
Citigroup, Inc.2.75%, 04/25/2022 750,000 746,8422.90%, 12/08/2021 300,000 299,921Fixed until 01/24/2022,
3.14% (B), 01/24/2023 231,000 231,7983.20%, 10/21/2026 194,000 190,0103.40%, 05/01/2026 250,000 248,520Fixed until 10/27/2027,
3.52% (B), 10/27/2028 750,000 736,894Fixed until 07/24/2027,
3.67% (B), 07/24/2028 450,000 448,8403.88%, 03/26/2025 100,000 100,750Fixed until 01/24/2038,
3.88% (B), 01/24/2039 100,000 97,310Fixed until 03/20/2029,
3.98% (B), 03/20/2030 600,000 609,9664.30%, 11/20/2026 250,000 254,0824.40%, 06/10/2025 243,000 251,575
Copyright © 2021 www.secdatabase.com. All Rights Reserved.Please Consider the Environment Before Printing This Document

The notes are an integral part of this report.Transamerica Series Trust Page 11
4.45%, 09/29/2027 48,000 49,3174.75%, 05/18/2046 150,000 155,4205.50%, 09/13/2025 115,000 126,050
Copyright © 2021 www.secdatabase.com. All Rights Reserved.Please Consider the Environment Before Printing This Document

Transamerica JPMorgan Tactical Allocation VPSCHEDULE OF INVESTMENTS (continued)At March 31, 2019(unaudited)
Principal ValueCORPORATE DEBT SECURITIES (continued)United States (continued)Citizens Bank NA
3.70%, 03/29/2023 $270,000
$277,023
Citizens Financial Group, Inc.2.38%, 07/28/2021 39,000 38,4724.30%, 12/03/2025 60,000 61,446
Cleveland Electric Illuminating Co.3.50%, 04/01/2028 (A) 167,000 163,9795.50%, 08/15/2024 100,000 109,590
CME Group, Inc.3.00%, 09/15/2022 - 03/15/2025 226,000 228,018
CMS Energy Corp.2.95%, 02/15/2027 78,000 74,4023.88%, 03/01/2024 100,000 102,497
CNA Financial Corp.3.45%, 08/15/2027 160,000 156,177
Comcast Corp.3.00%, 02/01/2024 117,000 117,1563.15%, 03/01/2026 309,000 307,4353.20%, 07/15/2036 200,000 181,8543.38%, 02/15/2025 77,000 78,4323.95%, 10/15/2025 291,000 304,3344.00%, 11/01/2049 23,000 22,3764.20%, 08/15/2034 378,000 393,3214.25%, 01/15/2033 589,000 621,6624.60%, 10/15/2038 350,000 374,6674.95%, 10/15/2058 440,000 485,3206.50%, 11/15/2035 210,000 265,8197.05%, 03/15/2033 90,000 119,554
Commonwealth Edison Co.3.65%, 06/15/2046 81,000 78,9643.75%, 08/15/2047 150,000 147,517
ConAgra Brands, Inc.4.60%, 11/01/2025 115,000 120,6995.30%, 11/01/2038 260,000 263,184
Connecticut Light & Power Co.3.20%, 03/15/2027 130,000 129,9114.00%, 04/01/2048 124,000 128,746
ConocoPhillips Co.4.95%, 03/15/2026 (E) 150,000 167,151
Consolidated Edison Co. of New York, Inc.4.20%, 03/15/2042 25,000 25,633
Constellation Brands, Inc.4.40%, 11/15/2025 120,000 125,9835.25%, 11/15/2048 70,000 74,235
Consumers Energy Co.3.25%, 08/15/2046 52,000 47,5924.35%, 08/31/2064 32,000 33,3895.65%, 04/15/2020 110,000 113,117
Continental Airlines Pass-Through Trust4.00%, 04/29/2026 31,435 31,9604.15%, 10/11/2025 364,649 372,452
Costco Wholesale Corp.2.75%, 05/18/2024 142,000 142,950
Cox Communications, Inc.3.25%, 12/15/2022 (A) 140,000 140,9723.35%, 09/15/2026 (A) 67,000 65,2884.60%, 08/15/2047 (A) 118,000 112,5824.80%, 02/01/2035 (A) 250,000 236,428
CRH America Finance, Inc.3.40%, 05/09/2027 (A) 200,000 191,481
Crown Castle International Corp.
Principal ValueCORPORATE DEBT SECURITIES (continued)United States (continued)CSX Corp.
3.40%, 08/01/2024 $100,000
$101,876
4.25%, 06/01/2021 23,000 23,6244.75%, 05/30/2042 27,000 28,8746.00%, 10/01/2036, MTN 70,000 84,136
CVS Health Corp.2.75%, 12/01/2022 80,000 78,8934.00%, 12/05/2023 138,000 141,8054.10%, 03/25/2025 1,038,000 1,065,6574.30%, 03/25/2028 278,000 281,6844.78%, 03/25/2038 410,000 406,0205.05%, 03/25/2048 229,000 230,696
CVS Pass-Through Trust4.70%, 01/10/2036 (A) 212,064 219,3645.93%, 01/10/2034 (A) 205,397 228,0696.20%, 10/10/2025 (A) 84,857 91,681
Daimler Finance North America LLC2.88%, 03/10/2021 (A) 250,000 249,404
Danaher Corp.2.40%, 09/15/2020 56,000 55,734
Dell International LLC / EMC Corp.6.02%, 06/15/2026 (A) 423,000 454,958
Delmarva Power & Light Co.4.00%, 06/01/2042 47,000 46,5034.15%, 05/15/2045 140,000 143,369
Delta Air Lines Pass-Through Trust3.63%, 01/30/2029 254,610 259,8504.75%, 11/07/2021 15,278 15,4936.82%, 02/10/2024 682,582 746,335
Diageo Investment Corp.8.00%, 09/15/2022 40,000 46,712
Digital Realty Trust, LP3.70%, 08/15/2027 89,000 88,121
Discover Bank4.20%, 08/08/2023 350,000 363,878
Discovery Communications LLC3.30%, 05/15/2022 190,000 190,8453.95%, 03/20/2028 105,000 102,0184.38%, 06/15/2021 137,000 140,7496.35%, 06/01/2040 50,000 54,870
Dollar General Corp.4.13%, 05/01/2028 100,000 102,494
Dominion Energy Gas Holdings LLC2.80%, 11/15/2020 59,000 58,9904.60%, 12/15/2044 250,000 262,756
Dominion Energy, Inc.2.75%, 09/15/2022 132,000 130,8602.85%, 08/15/2026 61,000 58,5534.90%, 08/01/2041 11,000 11,7145.25%, 08/01/2033 90,000 100,9986.30%, 03/15/2033 50,000 61,048
Dow Chemical Co.3.00%, 11/15/2022 38,000 38,0265.25%, 11/15/2041 17,000 17,6558.85%, 09/15/2021 190,000 214,179
DowDuPont, Inc.4.49%, 11/15/2025 280,000 298,2515.32%, 11/15/2038 145,000 161,193
DTE Electric Co.3.70%, 03/15/2045 123,000 121,579
Duke Energy Carolinas LLC
Copyright © 2021 www.secdatabase.com. All Rights Reserved.Please Consider the Environment Before Printing This Document

The notes are an integral part of this report.Transamerica Series Trust Page 12
4.00%, 03/01/2027 47,000 47,3254.88%, 04/15/2022 100,000 105,4025.25%, 01/15/2023 80,000 85,853
Crown Castle Towers LLC3.22%, 05/15/2042 (A) 104,000 104,238
3.90%, 06/15/2021 100,000 102,7166.00%, 12/01/2028 100,000 120,756
Duke Energy Indiana LLC3.75%, 05/15/2046 100,000 97,326
Duke Energy Ohio, Inc.3.80%, 09/01/2023 136,000 141,671
Copyright © 2021 www.secdatabase.com. All Rights Reserved.Please Consider the Environment Before Printing This Document

Transamerica JPMorgan Tactical Allocation VPSCHEDULE OF INVESTMENTS (continued)At March 31, 2019(unaudited)
Principal ValueCORPORATE DEBT SECURITIES (continued)United States (continued)Duke Energy Progress LLC
2.80%, 05/15/2022 $32,000
$32,180
3.00%, 09/15/2021 67,000 67,5123.25%, 08/15/2025 106,000 108,3543.70%, 10/15/2046 113,000 110,2954.15%, 12/01/2044 65,000 67,6874.20%, 08/15/2045 130,000 135,9074.38%, 03/30/2044 44,000 47,4645.70%, 04/01/2035 100,000 118,569
Duke Realty, LP3.25%, 06/30/2026 36,000 35,4743.63%, 04/15/2023 146,000 148,817
Duquesne Light Holdings, Inc.3.62%, 08/01/2027 (A) 250,000 244,336
DXC Technology Co.4.25%, 04/15/2024 99,000 100,451
Eaton Corp.4.00%, 11/02/2032 21,000 21,5945.80%, 03/15/2037 130,000 150,831
Ecolab, Inc.2.25%, 01/12/2020 80,000 79,7873.25%, 01/14/2023 66,000 66,869
Eli Lilly & Co.4.15%, 03/15/2059 205,000 210,883
Enable Midstream Partners, LP4.95%, 05/15/2028 95,000 96,188
Energy Transfer Operating, LP3.60%, 02/01/2023 176,000 177,4684.05%, 03/15/2025 118,000 119,6484.75%, 01/15/2026 96,000 100,3444.90%, 02/01/2024 120,000 126,5226.05%, 06/01/2041 325,000 347,8016.50%, 02/01/2042 36,000 39,991
Eni USA, Inc.7.30%, 11/15/2027 150,000 182,569
Entergy Arkansas LLC3.50%, 04/01/2026 61,000 62,128
Entergy Corp.2.95%, 09/01/2026 65,000 62,456
Entergy Louisiana LLC2.40%, 10/01/2026 118,000 111,4363.05%, 06/01/2031 107,000 102,169
Entergy Mississippi LLC2.85%, 06/01/2028 91,000 87,756
Enterprise Products Operating LLC3.75%, 02/15/2025 78,000 80,5154.95%, 10/15/2054 35,000 36,3685.10%, 02/15/2045 65,000 71,1865.75%, 03/01/2035 100,000 110,0986.88%, 03/01/2033 400,000 513,4477.55%, 04/15/2038 120,000 161,752
EOG Resources, Inc.2.63%, 03/15/2023 47,000 46,6594.10%, 02/01/2021 80,000 81,886
EPR Properties4.50%, 06/01/2027 157,000 158,1984.95%, 04/15/2028 115,000 119,556
EQT Corp.3.90%, 10/01/2027 161,000 150,587
ERAC USA Finance LLC4.50%, 08/16/2021 - 02/15/2045 (A) 285,000 287,567
Principal ValueCORPORATE DEBT SECURITIES (continued)United States (continued)Evergy, Inc.
4.85%, 06/01/2021 $ 74,000 $ 76,244Exelon Corp.
3.40%, 04/15/2026 63,000 62,9863.50%, 06/01/2022 300,000 303,054
Express Scripts Holding Co.3.00%, 07/15/2023 51,000 50,6883.05%, 11/30/2022 130,000 130,0473.50%, 06/15/2024 90,000 90,7044.50%, 02/25/2026 144,000 150,7454.80%, 07/15/2046 62,000 63,028
FedEx Corp.3.90%, 02/01/2035 223,000 208,989
Fifth Third Bancorp3.95%, 03/14/2028 210,000 216,903
FirstEnergy Corp.4.85%, 07/15/2047 66,000 70,778
Florida Power & Light Co.4.95%, 06/01/2035 70,000 79,9195.13%, 06/01/2041 30,000 35,2285.63%, 04/01/2034 100,000 121,361
Fox Corp.4.71%, 01/25/2029 (A) 160,000 171,551
General Electric Co.2.10%, 12/11/2019 86,000 85,3892.20%, 01/09/2020, MTN 172,000 170,8932.70%, 10/09/2022 34,000 33,3893.45%, 05/15/2024, MTN 292,000 290,6104.38%, 09/16/2020, MTN 104,000 105,9794.65%, 10/17/2021, MTN 222,000 230,0725.50%, 01/08/2020, MTN 60,000 61,3016.00%, 08/07/2019, MTN 101,000 101,962
General Mills, Inc.4.00%, 04/17/2025 185,000 191,4264.20%, 04/17/2028 (E) 115,000 119,5004.55%, 04/17/2038 45,000 44,554
General Motors Co.6.60%, 04/01/2036 200,000 209,232
General Motors Financial Co., Inc.3.45%, 04/10/2022 145,000 145,0093.50%, 11/07/2024 240,000 231,8793.70%, 05/09/2023 205,000 203,9113.95%, 04/13/2024 360,000 356,2864.30%, 07/13/2025 105,000 104,4104.35%, 04/09/2025 235,000 233,986
Gilead Sciences, Inc.3.25%, 09/01/2022 120,000 122,2373.50%, 02/01/2025 20,000 20,4113.70%, 04/01/2024 484,000 499,7744.00%, 09/01/2036 58,000 56,9234.60%, 09/01/2035 42,000 44,084
Glencore Funding LLC4.63%, 04/29/2024 (A) 220,000 226,943
Goldman Sachs Group, Inc.Fixed until 10/31/2021,
2.88% (B), 10/31/2022 865,000 857,304Fixed until 07/24/2022,
2.91% (B), 07/24/2023 250,000 247,209Fixed until 06/05/2022,
2.91% (B), 06/05/2023 681,000 673,1323.00%, 04/26/2022 160,000 159,653
Copyright © 2021 www.secdatabase.com. All Rights Reserved.Please Consider the Environment Before Printing This Document

The notes are an integral part of this report.Transamerica Series Trust Page 13
5.25%, 10/01/2020 (A) 8,000 8,2515.63%, 03/15/2042 (A) 37,000 41,8866.70%, 06/01/2034 (A) 44,000 54,629
ERP Operating, LP2.38%, 07/01/2019 32,000 31,9692.85%, 11/01/2026 96,000 93,4703.00%, 04/15/2023 150,000 150,8383.50%, 03/01/2028 98,000 99,555
Fixed until 09/29/2024,3.27% (B), 09/29/2025 484,000 477,782
3.50%, 01/23/2025 - 11/16/2026 1,202,000 1,194,141Fixed until 06/05/2027,
3.69% (B), 06/05/2028 523,000 518,007
Copyright © 2021 www.secdatabase.com. All Rights Reserved.Please Consider the Environment Before Printing This Document

Transamerica JPMorgan Tactical Allocation VPSCHEDULE OF INVESTMENTS (continued)At March 31, 2019(unaudited)
Principal ValueCORPORATE DEBT SECURITIES (continued)United States (continued)Goldman Sachs Group, Inc. (continued)
3.75%, 05/22/2025 $399,000
$403,054
3.85%, 01/26/2027 1,490,000 1,495,813Fixed until 05/01/2028,
4.22% (B), 05/01/2029 350,000 357,7005.38%, 03/15/2020, MTN 606,000 620,117
Goodman US Finance Three LLC3.70%, 03/15/2028 (A) 151,000 146,707
Great-West Lifeco Finance, LP4.15%, 06/03/2047 (A) 200,000 199,639
GTP Acquisition Partners I LLC2.35%, 06/15/2045 (A) 39,000 38,5583.48%, 06/15/2050 (A) 36,000 36,355
Guardian Life Insurance Co. of America4.85%, 01/24/2077 (A) 44,000 46,210
Halliburton Co.3.50%, 08/01/2023 107,000 109,2194.85%, 11/15/2035 157,000 164,5847.60%, 08/15/2096 (A) 40,000 53,1638.75%, 02/15/2021 100,000 109,787
Harborwalk Funding TrustFixed until 02/15/2049,
5.08% (B), 02/15/2069 (A) 400,000 420,016Harris Corp.
3.83%, 04/27/2025 200,000 204,921Hartford Financial Services Group, Inc.
4.30%, 04/15/2043 210,000 209,383HCA, Inc.
5.25%, 06/15/2026 320,000 342,870HCP, Inc.
3.40%, 02/01/2025 38,000 37,7543.88%, 08/15/2024 360,000 366,8974.20%, 03/01/2024 27,000 27,942
Home Depot, Inc.3.75%, 02/15/2024 110,000 115,5094.20%, 04/01/2043 103,000 107,856
Huntington Bancshares, Inc.2.30%, 01/14/2022 271,000 266,913
Hyundai Capital America2.00%, 07/01/2019 (A) 64,000 63,859
IBM Credit LLC3.00%, 02/06/2023 (E) 300,000 302,252
Illinois Tool Works, Inc.3.50%, 03/01/2024 100,000 103,3334.88%, 09/15/2041 192,000 224,223
Indiana Michigan Power Co.3.20%, 03/15/2023 120,000 121,018
Intel Corp.3.70%, 07/29/2025 104,000 109,0133.73%, 12/08/2047 34,000 34,1984.00%, 12/15/2032 181,000 198,078
Intercontinental Exchange, Inc.4.00%, 10/15/2023 115,000 120,716
International Business Machines Corp.1.80%, 05/17/2019 100,000 99,8962.25%, 02/19/2021 279,000 276,6487.00%, 10/30/2025 50,000 61,395
International Flavors & Fragrances, Inc.4.45%, 09/26/2028 110,000 115,5075.00%, 09/26/2048 126,000 132,267
International Lease Finance Corp.
Principal ValueCORPORATE DEBT SECURITIES (continued)United States (continued)ITC Holdings Corp.
2.70%, 11/15/2022 $200,000
$196,389
Jackson National Life Global Funding2.50%, 06/27/2022 (A) (E) 100,000 98,8713.05%, 04/29/2026 (A) 81,000 79,4053.25%, 01/30/2024 (A) 29,000 29,149
JB Hunt Transport Services, Inc.3.88%, 03/01/2026 215,000 218,296
Jersey Central Power & Light Co.6.15%, 06/01/2037 80,000 94,824
John Deere Capital Corp.1.70%, 01/15/2020 30,000 29,7632.45%, 09/11/2020, MTN 33,000 32,8792.70%, 01/06/2023, MTN 15,000 14,9712.75%, 03/15/2022, MTN 25,000 25,0492.80%, 09/08/2027, MTN 100,000 97,8363.15%, 10/15/2021, MTN 20,000 20,2343.35%, 06/12/2024, MTN 166,000 169,662
John Sevier Combined Cycle Generation LLC4.63%, 01/15/2042 70,017 77,790
Johnson & Johnson3.40%, 01/15/2038 278,000 273,546
Kansas City Power & Light Co.3.15%, 03/15/2023 47,000 47,7195.30%, 10/01/2041 60,000 70,075
Kellogg Co.3.40%, 11/15/2027 119,000 114,340
Kerr-McGee Corp.7.88%, 09/15/2031 100,000 126,784
Keurig Dr. Pepper, Inc.3.43%, 06/15/2027 550,000 531,8264.42%, 05/25/2025 (A) 112,000 116,0604.99%, 05/25/2038 (A) 162,000 165,302
KeyCorp2.90%, 09/15/2020, MTN 84,000 84,1974.15%, 10/29/2025, MTN 130,000 136,8545.10%, 03/24/2021, MTN 141,000 147,115
KeySpan Gas East Corp.2.74%, 08/15/2026 (A) 97,000 92,839
Kimberly-Clark Corp.2.40%, 06/01/2023 100,000 98,584
Kinder Morgan, Inc.4.30%, 03/01/2028 410,000 423,529
Kraft Heinz Foods Co.2.80%, 07/02/2020 350,000 349,5535.00%, 07/15/2035 - 06/04/2042 705,000 694,1886.88%, 01/26/2039 75,000 84,827
Kroger Co.4.00%, 02/01/2024 95,000 98,1218.00%, 09/15/2029 125,000 156,594
Laboratory Corp. of America Holdings3.20%, 02/01/2022 138,000 139,001
Legg Mason, Inc.3.95%, 07/15/2024 115,000 116,343
Liberty Mutual Group, Inc.4.57%, 02/01/2029 (A) 100,000 103,999
Liberty Mutual Insurance Co.8.50%, 05/15/2025 (A) 220,000 268,237
Liberty Property, LP3.25%, 10/01/2026 54,000 52,418
Lincoln National Corp.
Copyright © 2021 www.secdatabase.com. All Rights Reserved.Please Consider the Environment Before Printing This Document

The notes are an integral part of this report.Transamerica Series Trust Page 14
5.88%, 08/15/2022 150,000 161,7198.63%, 01/15/2022 360,000 408,881
International Paper Co.3.00%, 02/15/2027 (E) 150,000 144,3967.30%, 11/15/2039 100,000 126,4968.70%, 06/15/2038 70,000 98,111
4.00%, 09/01/2023 100,000 104,5054.20%, 03/15/2022 206,000 213,703
Lockheed Martin Corp.4.50%, 05/15/2036 150,000 162,683
Copyright © 2021 www.secdatabase.com. All Rights Reserved.Please Consider the Environment Before Printing This Document

Transamerica JPMorgan Tactical Allocation VPSCHEDULE OF INVESTMENTS (continued)At March 31, 2019(unaudited)
Principal ValueCORPORATE DEBT SECURITIES (continued)United States (continued)Lowe�s Cos., Inc.
2.50%, 04/15/2026 $150,000
$141,557
3.13%, 09/15/2024 50,000 50,3083.38%, 09/15/2025 179,000 179,7714.65%, 04/15/2042 43,000 43,597
Magellan Health, Inc.4.90%, 09/22/2024 375,000 356,812
Magellan Midstream Partners, LP3.20%, 03/15/2025 59,000 57,7714.20%, 12/01/2042 75,000 71,2104.25%, 02/01/2021 234,000 239,6205.15%, 10/15/2043 62,000 67,326
Marathon Petroleum Corp.3.63%, 09/15/2024 96,000 96,851
Marsh & McLennan Cos., Inc.2.35%, 03/06/2020 191,000 190,366
Martin Marietta Materials, Inc.3.45%, 06/01/2027 156,000 149,388
Masco Corp.6.50%, 08/15/2032 250,000 284,403
Massachusetts Electric Co.4.00%, 08/15/2046 (A) 113,000 110,322
Massachusetts Mutual Life Insurance Co.5.38%, 12/01/2041 (A) 33,000 38,3097.63%, 11/15/2023 (A) 250,000 288,107
MassMutual Global Funding II2.50%, 10/17/2022 (A) (E) 100,000 99,227
McCormick & Co., Inc.3.15%, 08/15/2024 105,000 104,7303.40%, 08/15/2027 66,000 64,783
McDonald�s Corp.4.70%, 12/09/2035, MTN 39,000 41,8006.30%, 10/15/2037, MTN 71,000 87,956
Mead Johnson Nutrition Co.4.13%, 11/15/2025 238,000 252,5404.60%, 06/01/2044 70,000 76,433
Medco Health Solutions, Inc.4.13%, 09/15/2020 90,000 91,554
Medtronic, Inc.3.13%, 03/15/2022 57,000 57,9154.38%, 03/15/2035 159,000 173,601
Merck & Co., Inc.2.80%, 05/18/2023 18,000 18,1823.70%, 02/10/2045 20,000 19,8003.90%, 03/07/2039 400,000 411,613
Metropolitan Life Global Funding I3.00%, 01/10/2023 - 09/19/2027 (A) 320,000 317,5863.88%, 04/11/2022 (A) 300,000 309,104
Microsoft Corp.2.38%, 02/12/2022 - 05/01/2023 176,000 175,5443.30%, 02/06/2027 167,000 171,4463.50%, 02/12/2035 68,000 68,9213.95%, 08/08/2056 88,000 91,7804.00%, 02/12/2055 71,000 74,3374.10%, 02/06/2037 266,000 289,3134.50%, 02/06/2057 233,000 266,726
MidAmerican Energy Co.3.10%, 05/01/2027 193,000 194,024
Morgan StanleyFixed until 07/22/2027,
3.59% (B), 07/22/2028 711,000 705,625
Principal ValueCORPORATE DEBT SECURITIES (continued)United States (continued)Morgan Stanley (continued)
4.00%, 07/23/2025, MTN $871,000
$896,450
4.30%, 01/27/2045 69,000 70,1615.00%, 11/24/2025 334,000 358,0055.50%, 07/28/2021, MTN 620,000 656,0337.30%, 05/13/2019, MTN 470,000 472,420
Mosaic Co.4.88%, 11/15/2041 13,000 12,5155.45%, 11/15/2033 255,000 274,156
MPLX, LP4.13%, 03/01/2027 104,000 104,6554.50%, 04/15/2038 165,000 156,7265.20%, 03/01/2047 81,000 82,190
MUFG Union Bank NA2.25%, 05/06/2019 250,000 249,846
National Retail Properties, Inc.3.50%, 10/15/2027 100,000 98,4113.60%, 12/15/2026 124,000 123,553
National Rural Utilities Cooperative Finance Corp.2.95%, 02/07/2024 61,000 61,2183.05%, 04/25/2027 92,000 90,127
Nevada Power Co.5.38%, 09/15/2040 80,000 91,9095.45%, 05/15/2041 40,000 46,4896.65%, 04/01/2036 100,000 129,778
New England Power Co.3.80%, 12/05/2047 (A) 112,000 107,321
New York Life Global Funding2.35%, 07/14/2026 (A) 75,000 71,3393.00%, 01/10/2028 (A) 137,000 135,575
New York State Electric & Gas Corp.3.25%, 12/01/2026 (A) 83,000 82,827
NextEra Energy Capital Holdings, Inc.2.40%, 09/15/2019 106,000 105,8753.55%, 05/01/2027 45,000 45,189
Niagara Mohawk Power Corp.3.51%, 10/01/2024 (A) 141,000 144,774
NiSource, Inc.3.85%, 02/15/2023 50,000 51,0155.65%, 02/01/2045 89,000 103,4145.80%, 02/01/2042 67,000 77,1456.25%, 12/15/2040 100,000 125,569
Nissan Motor Acceptance Corp.1.90%, 09/14/2021 (A) 78,000 75,253
Noble Energy, Inc.6.00%, 03/01/2041 57,000 63,075
Nordstrom, Inc.4.00%, 10/15/2021 21,000 21,484
Norfolk Southern Corp.3.25%, 12/01/2021 11,000 11,0973.85%, 01/15/2024 125,000 129,9453.95%, 10/01/2042 25,000 24,3404.05%, 08/15/2052 127,000 123,229
Northern States Power Co.6.25%, 06/01/2036 70,000 90,874
Northern Trust Corp.Fixed until 05/08/2027,
3.38% (B), 05/08/2032 280,000 274,351Northrop Grumman Corp.
3.20%, 02/01/2027 112,000 110,2483.25%, 01/15/2028 75,000 73,748
Copyright © 2021 www.secdatabase.com. All Rights Reserved.Please Consider the Environment Before Printing This Document

The notes are an integral part of this report.Transamerica Series Trust Page 15
3.63%, 01/20/2027 564,000 565,318Fixed until 04/24/2023,
3.74% (B), 04/24/2024 815,000 831,2383.75%, 02/25/2023, MTN 284,000 291,296Fixed until 01/24/2028,
3.77% (B), 01/24/2029, MTN 221,000 221,8043.88%, 01/27/2026, MTN 360,000 368,083
3.85%, 04/15/2045 44,000 42,208Northrop Grumman Systems Corp.
7.75%, 02/15/2031 80,000 109,482Novartis Capital Corp.
2.40%, 09/21/2022 80,000 79,6353.00%, 11/20/2025 165,000 167,526
Copyright © 2021 www.secdatabase.com. All Rights Reserved.Please Consider the Environment Before Printing This Document

Transamerica JPMorgan Tactical Allocation VPSCHEDULE OF INVESTMENTS (continued)At March 31, 2019(unaudited)
Principal ValueCORPORATE DEBT SECURITIES (continued)United States (continued)Nucor Corp.
6.40%, 12/01/2037 $200,000
$251,367
O�Reilly Automotive, Inc.3.60%, 09/01/2027 142,000 141,425
Occidental Petroleum Corp.4.63%, 06/15/2045 26,000 28,433
Office Properties Income Trust, REIT,3.60%, 02/01/2020 370,000 370,5153.75%, 08/15/2019 940,000 941,7004.00%, 07/15/2022 251,000 250,384
Ohio Power Co.6.60%, 03/01/2033 65,000 83,355
Oncor Electric Delivery Co. LLC5.75%, 03/15/2029 50,000 59,728
OneBeacon US Holdings, Inc.4.60%, 11/09/2022 250,000 255,557
ONEOK Partners, LP3.38%, 10/01/2022 30,000 30,2554.90%, 03/15/2025 450,000 478,6445.00%, 09/15/2023 65,000 69,0856.65%, 10/01/2036 220,000 251,668
Oracle Corp.2.50%, 05/15/2022 - 10/15/2022 341,000 339,4102.95%, 11/15/2024 - 05/15/2025 600,000 599,8453.80%, 11/15/2037 160,000 160,1283.90%, 05/15/2035 130,000 132,8984.30%, 07/08/2034 573,000 614,3166.13%, 07/08/2039 65,000 83,397
Pacific Life Insurance Co.Fixed until 10/24/2047,
4.30% (B), 10/24/2067 (A) 124,000 110,633PacifiCorp
6.25%, 10/15/2037 20,000 25,543Parker-Hannifin Corp.
3.30%, 11/21/2024, MTN 37,000 37,6384.10%, 03/01/2047 67,000 68,3254.45%, 11/21/2044, MTN 37,000 39,485
Pennsylvania Electric Co.3.25%, 03/15/2028 (A) 56,000 54,042
Penske Truck Leasing Co., LP / PTL Finance Corp.2.50%, 06/15/2019 (A) 26,000 25,9652.70%, 03/14/2023 (A) 150,000 146,5714.13%, 08/01/2023 (A) 184,000 189,3714.88%, 07/11/2022 (A) 100,000 104,622
PepsiCo, Inc.4.60%, 07/17/2045 39,000 44,324
Pfizer, Inc.3.00%, 12/15/2026 210,000 210,2133.90%, 03/15/2039 385,000 398,958
Phillips 663.90%, 03/15/2028 105,000 106,8304.30%, 04/01/2022 16,000 16,690
Phillips 66 Partners, LP3.55%, 10/01/2026 34,000 33,4084.90%, 10/01/2046 74,000 75,321
Plains All American Pipeline, LP / PAA Finance Corp.3.60%, 11/01/2024 175,000 174,4144.30%, 01/31/2043 121,000 104,2674.65%, 10/15/2025 100,000 104,183
PNC Financial Services Group, Inc.5.13%, 02/08/2020 100,000 101,984
Principal ValueCORPORATE DEBT SECURITIES (continued)United States (continued)PPL Electric Utilities Corp.
4.13%, 06/15/2044 $ 42,000 $ 43,619Praxair, Inc.
2.65%, 02/05/2025 65,000 64,532Precision Castparts Corp.
3.25%, 06/15/2025 106,000 108,6994.20%, 06/15/2035 160,000 165,006
President & Fellows of Harvard College3.30%, 07/15/2056 214,000 200,770
Private Export Funding Corp.2.80%, 05/15/2022 400,000 404,0793.55%, 01/15/2024 1,505,000 1,577,046
Procter & Gamble Co.2.70%, 02/02/2026 250,000 248,760
Progress Energy, Inc.3.15%, 04/01/2022 22,000 22,1557.00%, 10/30/2031 110,000 142,812
Progressive Corp.Fixed until 03/15/2023 (I),
5.38% (B) 150,000 148,687Protective Life Global Funding
2.00%, 09/14/2021 (A) 210,000 205,3522.26%, 04/08/2020 (A) 200,000 198,938
Providence St. Joseph Health Obligated Group2.75%, 10/01/2026 84,000 79,775
Prudential Financial, Inc.2.35%, 08/15/2019, MTN 200,000 199,6313.91%, 12/07/2047 184,000 177,259
Prudential Insurance Co. of America8.30%, 07/01/2025 (A) 300,000 379,445
PSEG Power LLC4.15%, 09/15/2021 113,000 116,245
Public Service Co. of Colorado3.55%, 06/15/2046 43,000 39,695
Public Service Co. of New Hampshire3.50%, 11/01/2023 40,000 41,297
Public Service Co. of Oklahoma5.15%, 12/01/2019 110,000 111,8116.63%, 11/15/2037 80,000 100,775
Public Service Electric & Gas Co.2.25%, 09/15/2026, MTN 93,000 87,4653.65%, 09/01/2042, MTN 49,000 48,085
QUALCOMM, Inc.2.90%, 05/20/2024 250,000 245,7503.25%, 05/20/2027 201,000 196,397
Quest Diagnostics, Inc.3.45%, 06/01/2026 39,000 38,7014.75%, 01/30/2020 160,000 162,435
Qwest Corp.6.75%, 12/01/2021 67,000 71,291
Realty Income Corp.3.88%, 04/15/2025 175,000 181,1794.65%, 03/15/2047 113,000 123,151
Regions Financial Corp.3.80%, 08/14/2023 170,000 174,747
Reliance Standard Life Global Funding II3.05%, 01/20/2021 (A) 104,000 103,9013.85%, 09/19/2023 (A) 355,000 362,277
Republic Services, Inc.2.90%, 07/01/2026 49,000 47,9545.25%, 11/15/2021 80,000 84,8995.50%, 09/15/2019 100,000 101,177
Copyright © 2021 www.secdatabase.com. All Rights Reserved.Please Consider the Environment Before Printing This Document

The notes are an integral part of this report.Transamerica Series Trust Page 16
PPL Capital Funding, Inc.4.20%, 06/15/2022 50,000 51,297
Reynolds American, Inc.5.70%, 08/15/2035 150,000 155,624
Rockwell Collins, Inc.3.20%, 03/15/2024 80,000 79,6584.35%, 04/15/2047 50,000 49,299
Copyright © 2021 www.secdatabase.com. All Rights Reserved.Please Consider the Environment Before Printing This Document

Transamerica JPMorgan Tactical Allocation VPSCHEDULE OF INVESTMENTS (continued)At March 31, 2019(unaudited)
Principal ValueCORPORATE DEBT SECURITIES (continued)United States (continued)Roper Technologies, Inc.
3.00%, 12/15/2020 $ 46,000 $ 46,091Ryder System, Inc.
2.88%, 09/01/2020, MTN 144,000 144,139San Diego Gas & Electric Co.
3.95%, 11/15/2041 33,000 30,6146.00%, 06/01/2026 75,000 84,633
SART4.75%, 07/15/2024 1,950,873 1,975,259
Schlumberger Holdings Corp.3.63%, 12/21/2022 (A) 154,000 158,258
Sempra Energy4.05%, 12/01/2023 96,000 98,206
Senior Housing Properties Trust3.25%, 05/01/2019 190,000 190,0224.75%, 02/15/2028 150,000 139,047
Sherwin-Williams Co.3.13%, 06/01/2024 82,000 81,462
Simon Property Group, LP3.75%, 02/01/2024 250,000 259,7984.13%, 12/01/2021 27,000 27,9284.38%, 03/01/2021 60,000 61,668
SITE Centers Corp.3.63%, 02/01/2025 87,000 85,386
Southern California Edison Co.1.85%, 02/01/2022 33,000 31,8243.65%, 03/01/2028 150,000 147,2533.90%, 12/01/2041 50,000 44,5244.05%, 03/15/2042 75,000 70,331
Southern Co.3.25%, 07/01/2026 48,000 47,014
Southern Co. Gas Capital Corp.2.45%, 10/01/2023 48,000 46,6403.25%, 06/15/2026 42,000 40,9653.50%, 09/15/2021 182,000 184,2653.95%, 10/01/2046 49,000 45,9574.40%, 06/01/2043 79,000 79,0295.25%, 08/15/2019 230,000 231,733
Southern Natural Gas Co. LLC4.80%, 03/15/2047 (A) 77,000 77,1348.00%, 03/01/2032 140,000 190,603
Southern Power Co.5.15%, 09/15/2041 165,000 171,428
Southwest Gas Corp.3.80%, 09/29/2046 100,000 93,808
Southwestern Public Service Co.4.50%, 08/15/2041 70,000 75,1276.00%, 10/01/2036 97,000 114,103
Spectra Energy Partners, LP3.50%, 03/15/2025 125,000 124,998
Spirit Airlines Pass-Through Trust3.38%, 08/15/2031 167,689 165,350
Sprint Spectrum Co. LLC / Sprint Spectrum Co. IILLC3.36%, 03/20/2023 (A) 336,875 336,774
State Street Corp.3.10%, 05/15/2023 72,000 73,0193.55%, 08/18/2025 118,000 122,3533.70%, 11/20/2023 231,000 241,215
Sunoco Logistics Partners Operations, LP4.95%, 01/15/2043 309,000 288,2365.30%, 04/01/2044 50,000 49,004
Principal ValueCORPORATE DEBT SECURITIES (continued)United States (continued)Synchrony Financial
3.70%, 08/04/2026 $170,000
$160,169
Sysco Corp.3.25%, 07/15/2027 350,000 344,0513.75%, 10/01/2025 78,000 79,820
Tampa Electric Co.4.45%, 06/15/2049 350,000 361,247
Target Corp.3.50%, 07/01/2024 77,000 80,290
TC PipeLines, LP3.90%, 05/25/2027 81,000 80,102
TD Ameritrade Holding Corp.2.95%, 04/01/2022 112,000 112,983
Teachers Insurance & Annuity Association of America4.27%, 05/15/2047 (A) 200,000 205,219
Texas Eastern Transmission, LP2.80%, 10/15/2022 (A) 129,000 127,113
Texas Health Resources4.33%, 11/15/2055 250,000 266,230
Texas Instruments, Inc.1.65%, 08/03/2019 37,000 36,861
Thermo Fisher Scientific, Inc.2.95%, 09/19/2026 83,000 80,0724.15%, 02/01/2024 86,000 89,872
Time Warner Cable LLC6.55%, 05/01/2037 100,000 110,473
Time Warner Entertainment Co., LP8.38%, 07/15/2033 330,000 430,257
Toledo Edison Co.6.15%, 05/15/2037 130,000 159,748
Torchmark Corp.4.55%, 09/15/2028 190,000 200,588
Toyota Motor Credit Corp.2.13%, 07/18/2019, MTN (E) 90,000 89,873
Tri-State Generation & Transmission Association, Inc.4.25%, 06/01/2046 68,000 65,418
TWDC Enterprises 18 Corp.3.00%, 02/13/2026 400,000 402,381
UDR, Inc.2.95%, 09/01/2026, MTN 74,000 70,814
Unilever Capital Corp.3.38%, 03/22/2025 110,000 112,280
Union Carbide Corp.7.50%, 06/01/2025 40,000 47,0067.75%, 10/01/2096 40,000 49,283
Union Electric Co.2.95%, 06/15/2027 107,000 105,736
Union Pacific Corp.4.10%, 09/15/2067 90,000 82,183
United Airlines Pass-Through Trust2.88%, 04/07/2030 426,212 408,4823.45%, 01/07/2030 150,099 147,1063.50%, 09/01/2031 234,839 231,5993.65%, 07/07/2027 89,607 88,4733.75%, 03/03/2028 280,505 282,3284.15%, 02/25/2033 450,000 465,9104.30%, 02/15/2027 207,611 215,1624.55%, 08/25/2031 400,000 410,042
United Technologies Corp.3.95%, 08/16/2025 95,000 98,6654.15%, 05/15/2045 198,000 192,652
Copyright © 2021 www.secdatabase.com. All Rights Reserved.Please Consider the Environment Before Printing This Document

The notes are an integral part of this report.Transamerica Series Trust Page 17
5.35%, 05/15/2045 93,000 90,9705.95%, 12/01/2025 36,000 39,8176.10%, 02/15/2042 100,000 107,180
SunTrust Banks, Inc.4.00%, 05/01/2025 53,000 55,452
4.45%, 11/16/2038 70,000 72,3694.50%, 06/01/2042 71,000 73,3875.70%, 04/15/2040 320,000 373,517
Copyright © 2021 www.secdatabase.com. All Rights Reserved.Please Consider the Environment Before Printing This Document

Transamerica JPMorgan Tactical Allocation VPSCHEDULE OF INVESTMENTS (continued)At March 31, 2019(unaudited)
Principal ValueCORPORATE DEBT SECURITIES (continued)United States (continued)UnitedHealth Group, Inc.
2.75%, 02/15/2023 $111,000
$111,003
2.88%, 03/15/2023 150,000 150,8603.10%, 03/15/2026 80,000 79,9003.38%, 11/15/2021 37,000 37,5724.63%, 07/15/2035 143,000 160,305
US Bancorp2.38%, 07/22/2026, MTN 100,000 95,5422.63%, 01/24/2022, MTN 37,000 37,0413.00%, 03/15/2022, MTN 33,000 33,330
US Bank NA2.13%, 10/28/2019 250,000 249,406
Valero Energy Corp.7.50%, 04/15/2032 60,000 76,559
Ventas Realty, LP3.50%, 02/01/2025 45,000 45,0103.85%, 04/01/2027 123,000 123,4784.13%, 01/15/2026 68,000 69,804
Verizon Communications, Inc.4.02%, 12/03/2029 (A) 115,000 118,3094.33%, 09/21/2028 1,000,000 1,057,5364.40%, 11/01/2034 811,000 843,6824.50%, 08/10/2033 600,000 634,1965.25%, 03/16/2037 206,000 231,736
Viacom, Inc.3.88%, 04/01/2024 56,000 57,0216.88%, 04/30/2036 330,000 387,208
Virginia Electric & Power Co.2.75%, 03/15/2023 145,000 144,7013.45%, 02/15/2024 21,000 21,5714.45%, 02/15/2044 21,000 22,286
VMware, Inc.2.95%, 08/21/2022 319,000 315,616
Voya Financial, Inc.3.13%, 07/15/2024 350,000 345,6443.65%, 06/15/2026 50,000 49,634
Walgreens Boots Alliance, Inc.3.80%, 11/18/2024 100,000 101,9184.50%, 11/18/2034 195,000 193,884
Walt Disney Co.6.55%, 03/15/2033 (A) 50,000 66,2316.65%, 11/15/2037 (A) 100,000 137,9369.50%, 07/15/2024 (A) 80,000 103,913
Warner Media LLC3.55%, 06/01/2024 385,000 388,5523.60%, 07/15/2025 305,000 304,235
WEC Energy Group, Inc.3.55%, 06/15/2025 144,000 146,446
Wells Fargo & Co.2.50%, 03/04/2021 71,000 70,6563.30%, 09/09/2024, MTN 300,000 302,3513.50%, 03/08/2022, MTN 400,000 407,4633.75%, 01/24/2024, MTN 255,000 262,4154.10%, 06/03/2026, MTN 70,000 71,5644.30%, 07/22/2027, MTN 63,000 65,5894.65%, 11/04/2044, MTN 123,000 126,3414.75%, 12/07/2046, MTN 143,000 150,0554.90%, 11/17/2045, MTN 90,000 95,8445.38%, 11/02/2043 200,000 224,874
Welltower, Inc.4.50%, 01/15/2024 172,000 181,342
Principal ValueCORPORATE DEBT SECURITIES (continued)United States (continued)Williams Cos., Inc.
3.90%, 01/15/2025 $ 78,000 $ 79,6144.85%, 03/01/2048 146,000 145,453
Wisconsin Electric Power Co.3.10%, 06/01/2025 110,000 109,4233.65%, 12/15/2042 40,000 37,7464.25%, 12/15/2019 140,000 141,465
WRKCo, Inc.3.00%, 09/15/2024 200,000 196,5523.75%, 03/15/2025 250,000 252,236
WW Grainger, Inc.4.60%, 06/15/2045 291,000 310,214
Xcel Energy, Inc.6.50%, 07/01/2036 48,000 61,285
Xylem, Inc.3.25%, 11/01/2026 33,000 32,403
Zimmer Biomet Holdings, Inc.3.70%, 03/19/2023 80,000 80,728
143,400,742Virgin Islands, British - 0.0% (F)China Southern Power Grid International Finance
BVI Co., Ltd.3.50%, 05/08/2027 (A) 360,000 359,478
CNOOC Finance, Ltd.3.00%, 05/09/2023 200,000 197,950
557,428Total Corporate Debt Securities
(Cost $194,266,688) 196,129,072
FOREIGN GOVERNMENT OBLIGATIONS - 0.6%Canada - 0.0% (F)Province of Ontario
1.65%, 09/27/2019 87,000 86,616Colombia - 0.1%Colombia Government International Bond
4.00%, 02/26/2024 200,000 206,2025.00%, 06/15/2045 200,000 209,8407.38%, 09/18/2037 100,000 130,750
546,792Israel - 0.4%Israel Government AID Bond
Series 2007-Z,Zero Coupon, 08/15/2025 1,000,000 840,989Series 2008-Z,Zero Coupon, 08/15/2024 1,000,000 868,441Series 2009-Z,Zero Coupon, 11/15/2024 1,000,000 861,803
Israel Government AID Bond, Principal OnlySTRIPSSeries 2,11/01/2024 3,300,000 2,846,876
5,418,109Mexico - 0.1%Mexico Government International Bond
3.75%, 01/11/2028 1,151,000 1,136,8434.13%, 01/21/2026 200,000 204,2004.35%, 01/15/2047 100,000 93,6005.55%, 01/21/2045 (E) 119,000 130,331
Copyright © 2021 www.secdatabase.com. All Rights Reserved.Please Consider the Environment Before Printing This Document

The notes are an integral part of this report.Transamerica Series Trust Page 18
Western Midstream Operating, LP4.65%, 07/01/2026 200,000 202,5955.45%, 04/01/2044 52,000 49,699
Western Union Co.3.60%, 03/15/2022 (E) 230,000 233,663
Westlake Chemical Corp.3.60%, 07/15/2022 150,000 150,2934.38%, 11/15/2047 95,000 84,148
Copyright © 2021 www.secdatabase.com. All Rights Reserved.Please Consider the Environment Before Printing This Document

Transamerica JPMorgan Tactical Allocation VPSCHEDULE OF INVESTMENTS (continued)At March 31, 2019(unaudited)
Principal ValueFOREIGN GOVERNMENT OBLIGATIONS (continued)Mexico (continued)Mexico Government International Bond (continued)
4.75%, 03/08/2044, MTN $212,000
$208,290
5.75%, 10/12/2110, MTN 70,000 71,5751,844,839
Panama - 0.0% (F)Panama Government International Bond
4.50%, 04/16/2050 200,000 208,800Peru - 0.0% (F)Peru Government International Bond
5.63%, 11/18/2050 35,000 44,905Supranational - 0.0% (F)African Development Bank
8.80%, 09/01/2019 130,000 133,259Total Foreign Government Obligations
(Cost $8,233,221) 8,283,320
MORTGAGE-BACKED SECURITIES - 4.6%Cayman Islands - 0.1%BXMT, Ltd.
Series 2017-FL1, Class D,1-Month LIBOR + 2.70%,
5.18% (B), 06/15/2035 (A) 580,000 579,817TPG Real Estate Finance Issuer, Ltd.
Series 2018-FL1, Class B,1-Month LIBOR + 1.30%,
3.78% (B), 02/15/2035 (A) 500,000 498,1401,077,957
United States - 4.5%Alternative Loan Trust
Series 2004-27CB, Class A1,6.00%, 12/25/2034 310,316 306,642Series 2004-28CB, Class 3A1,6.00%, 01/25/2035 295,241 293,532Series 2006-41CB, Class 2A13,5.75%, 01/25/2037 614,985 509,087
Arroyo Mortgage TrustSeries 2019-1, Class A1,3.81%, 01/25/2049 (A) 736,856 741,759
BAMLL Commercial Mortgage Securities TrustSeries 2012-PARK, Class A,2.96%, 12/10/2030 (A) 100,000 101,024Series 2014-520M, Class C,4.21% (B), 08/15/2046 (A) 150,000 140,823
Banc of America Funding TrustSeries 2005-E, Class 4A1,4.71% (B), 03/20/2035 23,218 23,405
Banc of America Mortgage TrustSeries 2003-J, Class 3A2,4.76% (B), 11/25/2033 52,824 53,352
BB-UBS TrustSeries 2012-SHOW, Class A,3.43%, 11/05/2036 (A) 900,000 914,672
BCAP LLC TrustSeries 2007-AA2, Class 2A12,5.50%, 04/25/2037 1,509,797 1,149,589
Bear Stearns Alt-A TrustSeries 2004-6, Class 1A,1-Month LIBOR + 0.64%,
3.13% (B), 07/25/2034 119,977 119,354
Principal ValueMORTGAGE-BACKED SECURITIES (continued)United States (continued)Bear Stearns ARM Trust
Series 2003-4, Class 3A1,4.46% (B), 07/25/2033 $ 20,729 $ 20,972Series 2006-1, Class A1,1-Year CMT + 2.25%,
4.91% (B), 02/25/2036 188,245 189,880Bear Stearns Commercial Mortgage Securities Trust,
Interest Only STRIPSSeries 2005-PWR8, Class X1,0.21% (B), 06/11/2041 (A) 21,816 94
CD Commercial Mortgage Trust, Interest Only STRIPSSeries 2007-CD4, Class XC,0.61% (B), 12/11/2049 (A) 24,129 254
Chase Mortgage Finance TrustSeries 2007-A1, Class 1A3,4.62% (B), 02/25/2037 34,251 34,822Series 2007-A1, Class 8A1,4.69% (B), 02/25/2037 332,909 341,860Series 2007-A2, Class 2A1,4.51% (B), 07/25/2037 15,401 15,710
CHL Mortgage Pass-Through TrustSeries 2004-3, Class A26,5.50%, 04/25/2034 27,763 28,391Series 2004-3, Class A4,5.75%, 04/25/2034 22,210 22,637Series 2004-HYB6, Class A3,4.27% (B), 11/20/2034 307,296 310,550Series 2005-15, Class A3,5.75%, 08/25/2035 257,867 227,350Series 2005-HYB3, Class 2A2A,3.89% (B), 06/20/2035 673,184 678,100Series 2006-HYB2, Class 2A1B,4.22% (B), 04/20/2036 608,170 558,724Series 2007-2, Class A16,6.00%, 03/25/2037 646,953 525,307
Citicorp Mortgage Securities, Inc.Series 2004-3, Class A5,5.25%, 05/25/2034 57,350 58,635
Colt Funding LLCSeries 2018-2, Class A1,3.47% (B), 07/27/2048 (A) 797,492 798,341
COMM Mortgage TrustSeries 2013-300P, Class A1,4.35%, 08/10/2030 (A) 500,000 527,587Series 2013-SFS, Class A2,2.99% (B), 04/12/2035 (A) 156,000 156,534Series 2014-CR19, Class A5,3.80%, 08/10/2047 750,000 780,412Series 2014-TWC, Class A,1-Month LIBOR + 0.85%,
3.35% (B), 02/13/2032 (A) 665,000 665,001Series 2014-TWC, Class B,1-Month LIBOR + 1.60%,
4.10% (B), 02/13/2032 (A) 500,000 500,000Series 2015-CR25, Class A4,3.76%, 08/10/2048 437,000 453,588Series 2018-HOME, Class A,3.82% (B), 04/10/2033 (A) 1,565,000 1,625,821
Commercial Mortgage TrustSeries 2006-GG7, Class AM,5.61% (B), 07/10/2038 13,618 13,695
Connecticut Avenue Securities Trust
Copyright © 2021 www.secdatabase.com. All Rights Reserved.Please Consider the Environment Before Printing This Document

The notes are an integral part of this report.Transamerica Series Trust Page 19
Series 2019-R02, Class 1M2,1-Month LIBOR + 2.30%,
4.79% (B), 08/25/2031 (A) 500,000 503,269
Copyright © 2021 www.secdatabase.com. All Rights Reserved.Please Consider the Environment Before Printing This Document

Transamerica JPMorgan Tactical Allocation VPSCHEDULE OF INVESTMENTS (continued)At March 31, 2019(unaudited)
Principal ValueMORTGAGE-BACKED SECURITIES (continued)United States (continued)Credit Suisse First Boston Mortgage Securities
Corp.Series 2003-21, Class 1A4,5.25%, 09/25/2033 $ 21,251 $ 21,991Series 2003-AR26, Class 2A1,4.45% (B), 11/25/2033 284,180 283,240
CSFB Mortgage-Backed Pass-Through CertificatesSeries 2004-4, Class 2A4,5.50%, 09/25/2034 67,135 70,924
CSMC OA LLCSeries 2014-USA, Class D,4.37%, 09/15/2037 (A) 600,000 576,030
Ellington Financial Mortgage TrustSeries 2018-1, Class A1FX,4.14%, 10/25/2058 (A) 916,089 922,405
Federal Home Loan Mortgage Corp.Series 2018-1, Class A1,3.50%, 06/25/2028 5,577,516 5,693,960Series 4506, Class CA,3.00%, 05/15/2040 969,003 980,168Series 4753, Class JW,3.00%, 02/15/2048 567,000 550,183Series K033, Class X1,0.30% (B), 07/25/2023 27,840,813 336,676Series K070, Class A2,3.30% (B), 11/25/2027 546,000 561,833Series K070, Class AM,3.36% (B), 12/25/2027 1,360,000 1,399,470Series W5FX, Class AFX,2.97% (B), 04/25/2028 629,000 636,409
Federal Home Loan Mortgage Corp. REMICSeries 4125, Class KP,2.50%, 05/15/2041 956,753 949,683
Federal National Mortgage AssociationSeries 2018-17, Class Z,3.50%, 03/25/2048 2,292,313 2,383,883Series 2018-C05, Class 1M2,1-Month LIBOR + 2.35%,
4.84% (B), 01/25/2031 700,000 702,906Federal National Mortgage Association REMIC
Series 2013-74, Class YT,3.00%, 02/25/2041 916,512 921,272Series 2017-112, Class AY,3.50%, 01/25/2048 1,870,000 1,947,106
GS Mortgage Securities Corp. TrustSeries 2012-ALOH, Class A,3.55%, 04/10/2034 (A) 700,000 712,975
GS Mortgage Securities TrustSeries 2011-GC5, Class D,5.39% (B), 08/10/2044 (A) 103,000 99,888
GSMPS Mortgage Loan TrustSeries 2005-RP3, Class 1AF,1-Month LIBOR + 0.35%,
2.84% (B), 09/25/2035 (A) 54,231 48,126GSR Mortgage Loan Trust
Series 2003-10, Class 1A1,4.41% (B), 10/25/2033 18,327 18,571Series 2004-6F, Class 2A4,5.50%, 05/25/2034 43,747 44,778Series 2004-8F, Class 2A3,6.00%, 09/25/2034 11,421 11,732
Principal ValueMORTGAGE-BACKED SECURITIES (continued)United States (continued)Headlands Residential LLC
Series 2017-RPL1, Class A,3.88% (B), 08/25/2022 (A) $
1,120,000$1,108,576
Homeward Opportunities Fund I TrustSeries 2018-1, Class A1,3.77% (B), 06/25/2048 (A) 614,771 620,678Series 2018-2, Class A1,3.99% (B), 11/25/2058 (A) 1,185,677 1,201,595
Impac CMB TrustSeries 2004-10, Class 3A1,1-Month LIBOR + 0.70%,
3.19% (B), 03/25/2035 536,191 503,872Series 2004-4, Class 1A2,1-Month LIBOR + 0.62%,
3.11% (B), 09/25/2034 226,186 225,190Series 2005-4, Class 1A1A,1-Month LIBOR + 0.54%,
3.03% (B), 05/25/2035 627,646 615,035Series 2005-4, Class 2A1,1-Month LIBOR + 0.60%,
3.09% (B), 05/25/2035 33,273 32,844Series 2005-4, Class 2B1,1-Month LIBOR + 2.48%,
4.96% (B), 05/25/2035 483,976 467,186Series 2005-8, Class 1AM,1-Month LIBOR + 0.70%,
3.19% (B), 02/25/2036 812,957 773,619Series 2007-A, Class M3,1-Month LIBOR + 2.25%,
4.74% (B), 05/25/2037 (A) 702,582 668,168Impac Secured Assets CMN Owner Trust
Series 2003-3, Class A1,4.89% (B), 08/25/2033 41,825 42,649
Impac Secured Assets TrustSeries 2006-1, Class 2A1,1-Month LIBOR + 0.35%,
2.84% (B), 05/25/2036 60,439 59,642Series 2006-2, Class 2A1,1-Month LIBOR + 0.35%,
2.84% (B), 08/25/2036 14,386 14,134Independence Plaza Trust
Series 2018-INDP, Class A,3.76%, 07/10/2035 (A) 1,035,000 1,067,340
JPMorgan Alternative Loan TrustSeries 2007-A2, Class 12A3,1-Month LIBOR + 0.19%,
2.68% (B), 06/25/2037 307,569 307,298JPMorgan Chase Commercial Mortgage Securities
TrustSeries 2006-LDP9, Class A3SF,1-Month LIBOR + 0.16%,
2.64% (B), 05/15/2047 7,409 7,441JPMorgan Chase Commercial Mortgage Securities
Trust, Interest Only STRIPSSeries 2006-LDP8, Class X,0.29% (B), 05/15/2045 61,062 72
JPMorgan Mortgage TrustSeries 2004-A1, Class 1A1,4.17% (B), 02/25/2034 11,570 11,576Series 2006-A2, Class 5A3,4.63% (B), 11/25/2033 22,451 23,013
Copyright © 2021 www.secdatabase.com. All Rights Reserved.Please Consider the Environment Before Printing This Document

The notes are an integral part of this report.Transamerica Series Trust Page 20
Ladder Capital Commercial Mortgage TrustSeries 2013-GCP, Class A2,3.99%, 02/15/2036 (A) 192,000 199,955
Copyright © 2021 www.secdatabase.com. All Rights Reserved.Please Consider the Environment Before Printing This Document

Transamerica JPMorgan Tactical Allocation VPSCHEDULE OF INVESTMENTS (continued)At March 31, 2019(unaudited)
Principal ValueMORTGAGE-BACKED SECURITIES (continued)United States (continued)LB-UBS Commercial Mortgage Trust
Series 2006-C6, Class AJ,5.45% (B), 09/15/2039 $
494,766$341,549
MASTR Adjustable Rate Mortgages TrustSeries 2004-13, Class 2A1,4.73% (B), 04/21/2034 36,958 37,977Series 2004-13, Class 3A7,4.47% (B), 11/21/2034 17,655 18,140Series 2004-13, Class 3A7B,1-Year CMT + 2.00%,
4.55% (B), 11/21/2034 264,823 269,375MASTR Alternative Loan Trust
Series 2004-4, Class 1A1,5.50%, 05/25/2034 34,679 36,539Series 2004-5, Class 5A1,4.75%, 06/25/2019 48 48
MASTR Alternative Loan Trust, Principal OnlySTRIPSSeries 2003-8, Class 15,07/25/2033 1,725 1,682
MASTR Asset Securitization TrustSeries 2003-11, Class 9A6,5.25%, 12/25/2033 55,359 55,798
MASTR Seasoned Securitization TrustSeries 2004-2, Class A2,6.50% (B), 08/25/2032 67,817 69,744
Merrill Lynch Mortgage Investors TrustSeries 2003-E, Class A1,1-Month LIBOR + 0.62%,
3.11% (B), 10/25/2028 318,819 317,925Series 2003-H, Class A1,1-Month LIBOR + 0.64%,
3.13% (B), 01/25/2029 72,501 71,776Series 2004-A, Class A1,1-Month LIBOR + 0.46%,
2.95% (B), 04/25/2029 74,191 73,041ML-CFC Commercial Mortgage Trust, Interest Only
STRIPSSeries 2006-4, Class XC,0.24% (B), 12/12/2049 (A) 36,641 2
Morgan Stanley Bank of America Merrill Lynch TrustSeries 2014-C14, Class A3,3.67%, 02/15/2047 254,559 257,580
Morgan Stanley Capital I TrustSeries 2006-HQ10, Class AJ,5.39% (B), 11/12/2041 11,576 11,533Series 2006-HQ8, Class D,5.60% (B), 03/12/2044 264,762 267,307Series 2007-T27, Class C,5.95% (B), 06/11/2042 (A) 1,000,000 1,043,683
Morgan Stanley Capital I Trust, Interest Only STRIPSSeries 2006-IQ12, Class X1,0.63% (B), 12/15/2043 (A) 112,255 5Series 2007-HQ11, Class X,0.40% (B), 02/12/2044 (A) 51,150 15
MortgageIT TrustSeries 2005-5, Class A1,1-Month LIBOR + 0.26%,
2.75% (B), 12/25/2035 213,585 212,198New Residential Mortgage Loan Trust
Series 2018-NQM1, Class A1,
Principal ValueMORTGAGE-BACKED SECURITIES (continued)United States (continued)Opteum Mortgage Acceptance Corp. Asset-Backed
Pass-Through CertificatesSeries 2005-5, Class 1APT,1-Month LIBOR + 0.28%,
2.77% (B), 12/25/2035$733,273
$677,719
Opteum Mortgage Acceptance Corp. TrustSeries 2006-1, Class 1AC1,1-Month LIBOR + 0.30%,
2.79% (B), 04/25/2036 588,410 563,115Provident Funding Mortgage Loan Trust
Series 2005-1, Class 2A1,4.70% (B), 05/25/2035 11,275 11,272
PRPM LLCSeries 2019-1A, Class A1,4.50% (B), 01/25/2024 (A) 882,450 889,398
RALI TrustSeries 2004-QA4, Class NB3,5.38% (B), 09/25/2034 19,537 19,781Series 2006-QH1, Class A1,1-Month LIBOR + 0.19%,
2.68% (B), 12/25/2036 106,189 102,198RBS Commercial Funding, Inc.
Series 2013-SMV, Class A,3.26%, 03/11/2031 (A) 160,000 160,803
Seasoned Credit Risk Transfer TrustSeries 2018-4, Class MA,3.50%, 03/25/2058 1,445,679 1,468,876Series 2019-1, Class MT,3.50%, 07/25/2058 1,890,267 1,906,234
Sequoia Mortgage TrustSeries 2003-1, Class 1A,1-Month LIBOR + 0.76%,
3.25% (B), 04/20/2033 117,883 115,500Series 2003-2, Class A1,1-Month LIBOR + 0.66%,
3.15% (B), 06/20/2033 34,944 35,122Series 2004-11, Class A1,1-Month LIBOR + 0.60%,
3.09% (B), 12/20/2034 40,249 39,621Series 2004-5, Class A2,1-Month LIBOR + 0.52%,
3.01% (B), 06/20/2034 142,626 135,710Series 2004-8, Class A1,1-Month LIBOR + 0.70%,
3.19% (B), 09/20/2034 207,428 204,317Series 2004-9, Class A1,1-Month LIBOR + 0.68%,
3.17% (B), 10/20/2034 137,731 134,478Series 2007-3, Class 1A1,1-Month LIBOR + 0.20%,
2.69% (B), 07/20/2036 273,911 262,167Series 2010, Class 1A,1-Month LIBOR + 0.80%,
3.29% (B), 10/20/2027 56,001 54,575Series 2018-2, Class A4,3.50% (B), 02/25/2048 (A) 905,165 906,816
Structured Adjustable Rate Mortgage Loan TrustSeries 2004-1, Class 4A4,4.57% (B), 02/25/2034 363,647 364,334Series 2004-12, Class 9A,4.50% (B), 09/25/2034 432,357 436,225Series 2004-18, Class 4A1,
Copyright © 2021 www.secdatabase.com. All Rights Reserved.Please Consider the Environment Before Printing This Document

The notes are an integral part of this report.Transamerica Series Trust Page 21
3.99% (B), 11/25/2048 (A) 552,043 563,299Series 2019-NQM1, Class A1,3.67% (B), 01/25/2049 (A) 902,032 906,585
4.39% (B), 12/25/2034 182,191 180,253Series 2004-4, Class 5A,4.50% (B), 04/25/2034 5,918 6,101
Copyright © 2021 www.secdatabase.com. All Rights Reserved.Please Consider the Environment Before Printing This Document

Transamerica JPMorgan Tactical Allocation VPSCHEDULE OF INVESTMENTS (continued)At March 31, 2019(unaudited)
Principal ValueMORTGAGE-BACKED SECURITIES (continued)United States (continued)Structured Asset Mortgage Investments II Trust
Series 2004-AR5, Class 1A1,1-Month LIBOR + 0.66%,
3.14% (B), 10/19/2034 $ 33,482 $ 33,064Series 2005-AR5, Class A3,1-Month LIBOR + 0.25%,
2.73% (B), 07/19/2035 118,788 117,279Structured Asset Securities Corp.
Series 2003-37A, Class 2A,4.45% (B), 12/25/2033 6,371 6,405
Structured Asset Securities Corp. Mortgage Pass-Through CertificatesSeries 2003-26A, Class 3A5,4.62% (B), 09/25/2033 338,188 340,683
Thornburg Mortgage Securities TrustSeries 2003-4, Class A1,1-Month LIBOR + 0.64%,
3.13% (B), 09/25/2043 71,103 70,697Series 2004-3, Class A,1-Month LIBOR + 0.74%,
3.23% (B), 09/25/2044 84,243 82,928Series 2004-4, Class 3A,4.07% (B), 12/25/2044 121,358 121,964
UBS-BAMLL TrustSeries 2012-WRM, Class A,3.66%, 06/10/2030 (A) 174,000 176,534
UBS-Barclays Commercial Mortgage TrustSeries 2012-C2, Class A4,3.53%, 05/10/2063 104,000 106,272Series 2013-C6, Class A4,3.24%, 04/10/2046 286,000 290,810
UBS-Barclays Commercial Mortgage Trust, InterestOnly STRIPSSeries 2012-C2, Class XA,1.32% (B), 05/10/2063 (A) 529,930 19,248
V.M. Jog Engineering, Ltd.Series 2017, Class A,1-Month LIBOR + 4.60%,
6.56% (B), 12/15/2020 1,185,000 1,185,000Velocity Commercial Capital Loan Trust
Series 2018-2, Class A,4.05% (B), 10/26/2048 (A) 916,194 931,012
Verus Securitization TrustSeries 2018-2, Class A1,3.68% (B), 06/01/2058 (A) 401,639 405,435
VNDO Mortgage TrustSeries 2012-6AVE, Class A,3.00%, 11/15/2030 (A) 544,235 547,884Series 2013-PENN, Class A,3.81%, 12/13/2029 (A) 400,000 405,259
Wachovia Bank Commercial Mortgage TrustSeries 2007-C34, Class B,5.95% (B), 05/15/2046 500,000 503,460
Wachovia Bank Commercial Mortgage Trust, InterestOnly STRIPSSeries 2006-C24, Class XC,0.08% (B), 03/15/2045 (A) 435,583 2
WaMu Mortgage Pass-Through Certificates TrustSeries 2003-AR10, Class A7,4.48% (B), 10/25/2033 27,300 27,704Series 2003-AR11, Class A6,4.30% (B), 10/25/2033 53,564 54,094
Principal ValueMORTGAGE-BACKED SECURITIES (continued)United States (continued)WaMu Mortgage Pass-Through Certificates Trust
(continued)Series 2003-AR6, Class A1,4.23% (B), 06/25/2033 $ 52,436 $ 53,139Series 2003-AR7, Class A7,4.15% (B), 08/25/2033 49,631 51,040Series 2003-S3, Class 1A4,5.50%, 06/25/2033 28,392 29,149Series 2004-AR10, Class A3,1-Month LIBOR + 0.55%,
3.04% (B), 07/25/2044 932,854 941,149Series 2004-CB2, Class 7A,5.50%, 08/25/2019 646 644Series 2004-CB3, Class 3A,5.50%, 10/25/2019 874 873Series 2005-AR10, Class 1A3,4.12% (B), 09/25/2035 205,821 206,294Series 2005-AR10, Class 1A4,4.12% (B), 09/25/2035 1,023,428 1,026,702Series 2006-AR17, Class 1A1A,12-MTA + 0.81%,
3.14% (B), 12/25/2046 297,927 293,489Wells Fargo Commercial Mortgage Trust
Series 2013-120B, Class A,2.71% (B), 03/18/2028 (A) 400,000 398,071
Wells Fargo Mortgage-Backed Securities TrustSeries 2003-G, Class A1,4.46% (B), 06/25/2033 52,862 53,549Series 2003-M, Class A1,4.90% (B), 12/25/2033 306,782 314,693Series 2004-EE, Class 3A2,4.66% (B), 12/25/2034 141,493 146,866Series 2004-I, Class 1A1,4.84% (B), 07/25/2034 121,523 124,450Series 2004-P, Class 2A1,4.64% (B), 09/25/2034 41,371 42,516Series 2004-R, Class 2A1,4.74% (B), 09/25/2034 16,601 16,939Series 2005-AR14, Class A1,4.54% (B), 08/25/2035 206,750 210,347Series 2005-AR16, Class 6A3,4.53% (B), 10/25/2035 155,479 157,717Series 2005-AR3, Class 1A1,2.48% (B), 03/25/2035 221,739 228,632Series 2005-AR4, Class 2A2,5.09% (B), 04/25/2035 127,711 128,986Series 2005-AR8, Class 2A1,4.90% (B), 06/25/2035 14,736 15,214Series 2005-AR9, Class 2A1,4.67% (B), 10/25/2033 18,230 18,505Series 2005-AR9, Class 3A1,4.63% (B), 06/25/2034 380,392 393,243Series 2006-AR6, Class 7A1,4.81% (B), 03/25/2036 253,641 258,100
WFRBS Commercial Mortgage TrustSeries 2011-C3, Class A4,4.38%, 03/15/2044 (A) 100,000 102,512Series 2012-C6, Class A4,3.44%, 04/15/2045 200,000 202,847
65,329,034
Copyright © 2021 www.secdatabase.com. All Rights Reserved.Please Consider the Environment Before Printing This Document

The notes are an integral part of this report.Transamerica Series Trust Page 22
Series 2003-AR5, Class A7,4.13% (B), 06/25/2033 41,851 42,353
Total Mortgage-Backed Securities(Cost $65,209,787) 66,406,991
Copyright © 2021 www.secdatabase.com. All Rights Reserved.Please Consider the Environment Before Printing This Document

Transamerica JPMorgan Tactical Allocation VPSCHEDULE OF INVESTMENTS (continued)At March 31, 2019(unaudited)
Principal ValueMUNICIPAL GOVERNMENT OBLIGATIONS - 0.0% (F)California - 0.0% (F)City of Los Angeles Department of Airports,
Revenue Bonds,Series C,6.58%, 05/15/2039 $ 25,000 $ 32,315
State of California, General Obligation Unlimited,7.30%, 10/01/2039 80,000 115,762
148,077New York - 0.0% (F)Port Authority of New York & New Jersey,
Revenue Bonds4.46%, 10/01/2062 170,000 190,4565.65%, 11/01/2040 40,000 51,762
242,218Ohio - 0.0% (F)Ohio State University, Revenue Bonds
Series A,4.05%, 12/01/2056 114,000 118,4954.80%, 06/01/2111 91,000 105,203
223,698Total Municipal Government Obligations
(Cost $553,889) 613,993
U.S. GOVERNMENT AGENCY OBLIGATIONS - 24.8%Federal Home Loan Banks
5.50%, 07/15/2036 250,000 333,403Federal Home Loan Mortgage Corp.
2.13% (B), 05/25/2028 4,531,000 705,1642.50%, 06/01/2028 - 01/01/2033 12,207,538 12,166,6033.00%, 07/01/2033 - 06/01/2045 8,187,041 8,126,9221-Month LIBOR + 0.55%, 3.03% (B), 07/15/
2042 - 03/15/2044 1,469,928 1,479,2053.50%, 01/01/2032 - 04/01/2048 15,299,238 15,613,2894.00%, 12/01/2040 - 01/01/2046 1,382,716 1,433,0034.00%, 12/01/2047 (G) 1,482,655 1,530,4634.50%, 05/01/2041 - 12/01/2048 1,420,585 1,492,9771-Year CMT + 2.43%,
4.57% (B), 12/01/2031 28,053 29,58612-Month LIBOR + 1.84%,
4.58% (B), 07/01/2040 72,186 75,4921-Year CMT + 2.25%,
4.63% (B), 02/01/2036 35,796 37,6045.00%, 02/01/2034 254,449 266,9846.00%, 01/01/2024 - 01/01/2034 82,170 87,7406.50%, 12/01/2027 - 11/01/2037 331,651 381,967
Federal Home Loan Mortgage Corp. MultifamilyStructured Pass-Through Certificates2.60%, 09/25/2020 43,819 43,6802.62%, 01/25/2023 1,750,000 1,746,3732.72%, 07/25/2026 840,000 825,7432.74%, 09/25/2025 700,000 693,7052.77%, 05/25/2025 750,000 747,8252.81%, 09/25/2024 1,478,000 1,480,7262.84%, 09/25/2022 534,000 538,0563.12%, 06/25/2027 1,634,000 1,661,1921-Month LIBOR + 0.70%,
3.19% (B), 09/25/2022 229,126 229,2703.24%, 04/25/2027 602,000 617,806
Principal ValueU.S. GOVERNMENT AGENCY OBLIGATIONS (continued)Federal Home Loan Mortgage Corp. Multifamily
Structured Pass-Through Certificates (continued)3.33%, 05/25/2027 $ 322,000 $ 330,9733.39%, 03/25/2024 714,000 737,9443.49%, 01/25/2024 1,000,000 1,037,2703.69%, 01/25/2029 1,305,000 1,381,7593.77%, 12/25/2028 760,000 808,9643.78%, 08/25/2028 635,541 667,464
Federal Home Loan Mortgage Corp. REMIC2.25%, 03/15/2042 2,439,010 2,356,4712.50%, 11/15/2043 3,007,066 2,963,6941-Month LIBOR + 0.35%,
2.83% (B), 06/15/2043 993,465 987,4151-Month LIBOR + 0.40%,
2.88% (B), 04/15/2039 318,622 320,3171-Month LIBOR + 0.40%,
2.91% (B), 07/15/2037 104,325 104,0081-Month LIBOR + 0.45%,
2.93% (B), 05/15/2039 - 11/15/2039 476,486 477,6443.00%, 04/15/2025 - 01/15/2046 15,544,540 15,743,6733.50%, 05/15/2021 - 02/15/2042 4,532,461 4,639,3874.00%, 12/15/2024 - 12/15/2041 2,302,824 2,415,9474.50%, 06/15/2025 500,000 520,0305.00%, 07/15/2020 - 05/15/2041 486,874 528,9695.30%, 01/15/2033 53,543 58,6275.50%, 11/15/2023 - 07/15/2037 982,180 1,077,889(3.62) * 1-Month LIBOR + 27.21%,
5.50% (B), 05/15/2041 53,609 55,248(3.67) * 1-Month LIBOR + 27.50%,
5.50% (B), 05/15/2041 113,800 123,9435.72%, 10/15/2038 31,923 34,5885.75%, 06/15/2035 - 08/15/2035 1,154,778 1,291,3715.85%, 09/15/2035 316,672 355,1486.00%, 04/15/2036 97,201 109,6096.50%, 02/15/2032 44,333 49,594(4.44) * 1-Month LIBOR + 24.43%,
13.40% (B), 06/15/2035 60,339 70,062Federal Home Loan Mortgage Corp. REMIC,
Interest Only STRIPS(1.00) * 1-Month LIBOR + 6.37%,
3.89% (B), 10/15/2037 290,465 41,1834.50%, 12/15/2024 1,986 435.00%, 10/15/2039 94,426 10,581
Federal Home Loan Mortgage Corp. REMIC,Principal Only STRIPS04/15/2020 - 01/15/2040 246,177 218,170
Federal Home Loan Mortgage Corp. STRIPS2.50%, 05/15/2028 2,076,674 2,067,765
Federal Home Loan Mortgage Corp. StructuredPass-Through Certificates1-Month LIBOR + 0.40%,
2.89% (B), 03/25/2043 547,042 544,1383.90% (B), 08/25/2028 1,125,000 1,210,988
Federal National Mortgage AssociationZero Coupon, 10/09/2019 450,000 444,2272.00%, 12/01/2020 500,000 494,9352.01%, 06/01/2020 2,000,000 1,982,4702.22%, 12/01/2022 1,375,042 1,363,7362.38%, 12/01/2022 917,797 915,2562.39%, 06/01/2025 403,358 395,2112.40%, 01/01/2023 882,694 880,9102.45%, 11/01/2022 - 02/01/2023 3,000,000 2,999,4862.49% (B), 12/25/2026 1,500,000 1,460,896
Copyright © 2021 www.secdatabase.com. All Rights Reserved.Please Consider the Environment Before Printing This Document

The notes are an integral part of this report.Transamerica Series Trust Page 23
2.49%, 05/25/2026 1,000,000 977,4222.50%, 04/01/2023 - 11/01/2031 1,940,010 1,937,6292.52%, 05/01/2023 1,000,000 999,7422.53%, 10/01/2022 - 09/25/2024 2,264,597 2,255,779
Copyright © 2021 www.secdatabase.com. All Rights Reserved.Please Consider the Environment Before Printing This Document

Transamerica JPMorgan Tactical Allocation VPSCHEDULE OF INVESTMENTS (continued)At March 31, 2019(unaudited)
Principal ValueU.S. GOVERNMENT AGENCY OBLIGATIONS (continued)Federal National Mortgage Association (continued)
2.57%, 01/01/2023 $1,908,549
$1,915,932
2.59%, 10/01/2028 2,435,000 2,351,9502.64%, 04/01/2023 906,792 908,7752.67%, 07/01/2022 1,000,000 1,003,7222.69%, 12/01/2028 2,010,000 1,956,9252.70%, 07/01/2026 1,000,000 995,6801-Month LIBOR + 0.22%,
2.71% (B), 03/25/2045 64,342 64,0802.72%, 10/25/2024 1,000,000 1,003,9952.75%, 03/01/2022 78,243 78,7932.77%, 06/01/2023 739,596 744,6822.81%, 06/01/2023 - 05/01/2027 1,972,225 1,983,8552.86%, 05/01/2022 875,153 882,6062.87%, 02/01/2032 650,000 622,4932.90%, 06/25/2027 1,183,518 1,172,4192.92%, 08/25/2021 - 12/01/2024 1,265,946 1,284,1392.93%, 06/01/2030 800,000 792,0352.94%, 02/01/2027 - 12/01/2028 4,253,230 4,252,7942.96% (B), 09/25/2027 1,500,000 1,504,7972.98%, 07/01/2022 - 04/01/2023 2,395,887 2,431,2191-Month LIBOR + 0.50%,
2.98% (B), 08/25/2019 9,610 9,5861-Month LIBOR + 0.50%,
2.99% (B), 08/25/2042 245,362 246,6581-Month LIBOR + 0.48%,
2.99% (B), 09/01/2024 911,312 906,4503.02% (B), 08/25/2024 955,000 971,7753.04%, 12/01/2024 1,000,000 1,022,8153.04% (B), 03/25/2028 740,000 744,8443.05%, 01/01/2025 - 12/01/2029 6,676,000 6,695,7383.06%, 08/01/2032 1,140,000 1,114,0233.06% (B), 05/25/2027 930,000 937,1443.08%, 12/01/2024 - 12/01/2029 2,154,322 2,179,6163.08% (B), 06/25/2027 1,001,000 1,012,5243.09%, 09/01/2029 2,385,000 2,393,4493.09% (B), 04/25/2027 - 02/25/2030 1,696,000 1,702,9003.10%, 09/01/2025 992,582 1,017,0833.10% (B), 07/25/2024 820,000 834,2263.11%, 01/01/2022 - 12/01/2024 1,651,723 1,688,5943.12%, 05/01/2022 - 11/01/2026 1,855,759 1,891,9973.12% (B), 04/25/2028 2,500,000 2,523,0173.13%, 06/01/2030 500,000 500,0723.14%, 12/01/2026 922,382 945,3903.15%, 12/01/2024 2,369,241 2,434,7813.18% (B), 04/25/2029 823,000 833,5093.20%, 06/01/2030 500,000 507,1693.21%, 03/01/2029 4,000,000 4,090,4023.24%, 10/01/2026 - 01/01/2033 1,872,941 1,897,3083.26%, 07/01/2022 1,270,132 1,300,6293.28%, 08/01/2020 3,601,141 3,610,1073.29%, 08/01/2026 4,000,000 4,140,6983.30%, 12/01/2026 - 12/01/2029 4,955,876 5,090,9063.32%, 04/01/2029 3,000,000 3,080,5723.34%, 02/01/2027 - 07/01/2030 4,634,488 4,770,3453.35%, 08/01/2023 657,917 680,9693.38%, 12/01/2023 1,470,150 1,518,5143.38% (B), 07/25/2028 1,342,000 1,383,7011-Month LIBOR + 0.93%,
3.41% (B), 11/25/2022 274,737 275,2493.45%, 01/01/2024 - 04/01/2029 3,081,849 3,196,3013.48% (B), 01/25/2024 1,452,714 1,498,501
Principal ValueU.S. GOVERNMENT AGENCY OBLIGATIONS (continued)Federal National Mortgage Association (continued)
3.63%, 10/01/2029 $ 467,923 $ 494,7283.63% (B), 11/25/2028 1,980,000 2,084,1713.66%, 10/01/2028 1,590,110 1,674,9583.67%, 07/01/2023 925,000 965,9523.73%, 07/01/2022 804,466 825,5433.76%, 11/01/2023 981,425 1,035,0123.77%, 12/01/2025 996,036 1,056,8393.82%, 05/01/2022 674,585 693,4153.95%, 09/01/2021 154,181 158,6274.00%, 01/01/2035 - 09/01/2047 14,852,856 15,463,6434.02%, 11/01/2028 366,663 397,5384.04%, 10/01/2020 400,000 408,2784.13%, 08/01/2021 439,442 454,1434.25%, 04/01/2021 1,050,000 1,080,2594.30%, 04/01/2021 410,578 424,4104.33%, 04/01/2021 352,651 361,8674.36%, 05/01/2021 928,914 962,7514.48%, 12/01/2019 - 02/01/2021 728,865 746,1494.50%, 05/01/2039 - 09/01/2040 681,099 721,7825.00%, 06/01/2033 - 06/01/2048 2,335,223 2,487,5985.50%, 03/01/2024 - 03/01/2035 314,704 341,1096.00%, 08/01/2021 - 09/01/2037 672,193 728,4777.00%, 11/01/2037 - 12/01/2037 25,767 28,232
Federal National Mortgage Association REMIC2.75%, 10/25/2047 167,250 141,1331-Month LIBOR + 0.29%,
2.78% (B), 07/25/2036 89,659 89,5191-Month LIBOR + 0.40%,
2.89% (B), 05/25/2027 126,009 126,6181-Month LIBOR + 0.50%, 2.99% (B), 05/25/
2035 - 10/25/2042 801,993 804,0993.00%, 05/25/2026 - 01/25/2048 8,620,148 8,594,1851-Month LIBOR + 0.60%,
3.09% (B), 04/25/2040 23,983 24,1471-Month LIBOR + 0.65%,
3.14% (B), 02/25/2024 57,008 57,3681-Month LIBOR + 0.90%,
3.39% (B), 03/25/2038 132,422 135,6233.50%, 04/25/2031 - 02/25/2058 1,458,781 1,482,4351-Month LIBOR + 1.25%,
3.74% (B), 07/25/2023 98,782 100,5444.00%, 05/25/2033 131,166 137,2515.00%, 10/25/2025 80,152 83,8275.25%, 05/25/2039 36,936 38,5745.50%, 03/25/2023 - 07/25/2040 656,994 702,5606.00%, 03/25/2029 19,074 20,7996.50%, 01/25/2032 - 07/25/2036 85,661 96,8067.00%, 11/25/2041 84,716 96,351(3.50) * 1-Month LIBOR + 23.10%,
14.40% (B), 06/25/2035 49,730 56,532Federal National Mortgage Association REMIC,
Interest Only STRIPS(1.00) * 1-Month LIBOR + 6.53%,
4.04% (B), 01/25/2041 286,675 54,671(1.00) * 1-Month LIBOR + 6.60%,
4.11% (B), 08/25/2035 - 06/25/2036 318,029 38,750(1.00) * 1-Month LIBOR + 6.70%,
4.21% (B), 03/25/2036 276,200 49,7675.00%, 08/25/2019 1,168 5
Federal National Mortgage Association REMIC,Principal Only STRIPS12/25/2034 - 12/25/2043 1,335,743 1,099,323
Copyright © 2021 www.secdatabase.com. All Rights Reserved.Please Consider the Environment Before Printing This Document

The notes are an integral part of this report.Transamerica Series Trust Page 24
3.50%, 08/01/2032 - 07/01/2047 27,022,071 27,584,9603.51% (B), 12/25/2023 1,731,425 1,791,5933.56%, 01/01/2021 447,210 453,5133.58%, 01/01/2032 1,695,586 1,768,3633.59%, 12/01/2020 1,275,851 1,295,9083.61%, 05/01/2030 520,000 543,559
Federal National Mortgage Association, PrincipalOnly STRIPS09/25/2024 - 08/25/2032 29,751 27,08205/15/2030, MTN 400,000 286,939
Copyright © 2021 www.secdatabase.com. All Rights Reserved.Please Consider the Environment Before Printing This Document

Transamerica JPMorgan Tactical Allocation VPSCHEDULE OF INVESTMENTS (continued)At March 31, 2019(unaudited)
Principal ValueU.S. GOVERNMENT AGENCY OBLIGATIONS (continued)FREMF Mortgage Trust
3.58% (B), 11/25/2049 (A)$ 491,000
$484,861
3.68% (B), 01/25/2048 (A) 2,300,000 2,322,1243.68% (B), 01/25/2048 (A) 1,000,000 978,8723.83% (B), 11/25/2047 (A) 1,000,000 992,4593.84% (B), 07/25/2049 (A) 440,000 441,9124.07% (B), 11/25/2047 (A) 455,000 456,1931-Month LIBOR + 2.50%,
4.99% (B), 11/25/2024 (A) 818,394 824,543Government National Mortgage Association
1.65%, 01/20/2063 - 04/20/2063 1,401,803 1,383,6782.50%, 04/16/2045 - 08/20/2046 6,691,890 5,966,0231-Month LIBOR + 0.34%,
2.85% (B), 12/20/2062 524,555 522,4361-Month LIBOR + 0.41%,
2.92% (B), 03/20/2063 323,781 323,1131-Month LIBOR + 0.45%, 2.96% (B), 03/20/
2060 - 02/20/2063 600,753 600,1001-Month LIBOR + 0.47%,
2.98% (B), 03/20/2063 - 08/20/2065 1,919,821 1,918,5031-Month LIBOR + 0.48%,
2.99% (B), 04/20/2063 - 02/20/2065 2,169,594 2,168,5143.00%, 09/20/2047 341,000 315,8541-Month LIBOR + 0.50%,
3.01% (B), 02/20/2061 - 06/20/2067 5,329,264 5,330,1471-Month LIBOR + 0.52%,
3.02% (B), 10/20/2062 289,884 290,0221-Month LIBOR + 0.52%,
3.03% (B), 09/20/2065 547,297 547,8071-Month LIBOR + 0.55%,
3.06% (B), 04/20/2062 - 07/20/2062 71,048 71,0701-Month LIBOR + 0.56%,
3.07% (B), 03/20/2067 1,386,830 1,390,4961-Month LIBOR + 0.58%,
3.09% (B), 05/20/2066 674,085 674,9171-Month LIBOR + 0.60%,
3.11% (B), 04/20/2064 - 11/20/2065 2,913,673 2,924,8581-Month LIBOR + 0.65%,
3.16% (B), 05/20/2061 - 03/20/2064 2,310,334 2,319,5551-Month LIBOR + 0.69%,
3.20% (B), 02/20/2064 547,474 551,5801-Month LIBOR + 0.70%,
3.21% (B), 09/20/2063 1,062,050 1,067,2803.50%, 02/20/2048 5,207,601 5,335,7671-Month LIBOR + 1.00%,
3.51% (B), 12/20/2066 443,835 450,8563.99% (B), 11/16/2042 172,828 180,6284.00%, 09/16/2025 500,000 516,3564.25%, 12/20/2044 688,626 726,8284.50%, 05/20/2048 8,438,329 8,798,3944.60% (B), 10/20/2041 474,575 504,8864.76% (B), 11/20/2042 431,526 462,3065.00%, 04/20/2041 - 11/20/2048 10,506,818 11,038,4885.23% (B), 07/20/2060 137,089 138,8735.50%, 01/16/2033 - 07/20/2037 637,733 703,5505.86% (B), 12/20/2038 98,253 109,8766.00%, 02/15/2024 - 09/20/2038 430,373 461,383(3.50) * 1-Month LIBOR + 23.28%,
14.57% (B), 04/20/2037 43,991 56,943Government National Mortgage Association,
Interest Only STRIPS1.62%, 06/20/2067 2,915,971 275,268
Principal ValueU.S. GOVERNMENT AGENCY OBLIGATIONS (continued)Government National Mortgage Association,
Principal Only STRIPS02/17/2033 - 01/20/2038 $ 38,618 $ 35,800
Residual Funding Corp., Principal Only STRIPS10/15/2019 - 10/15/2020 6,075,000 5,895,492
Tennessee Valley Authority4.25%, 09/15/2065 264,000 314,4804.63%, 09/15/2060 155,000 198,3225.88%, 04/01/2036 625,000 837,430
Tennessee Valley Authority, Principal OnlySTRIPS07/15/2028 1,000,000 757,099
Total U.S. Government Agency Obligations(Cost $359,159,078) 362,451,202
U.S. GOVERNMENT OBLIGATIONS - 14.0%U.S. Treasury - 13.8%U.S. Treasury Bond
2.50%, 02/15/2045 2,800,000 2,641,8442.75%, 08/15/2042 - 11/15/2047 2,809,100 2,788,1732.88%, 05/15/2043 3,580,000 3,634,9593.00%, 02/15/2048 11,270,000 11,660,4883.13%, 02/15/2043 - 05/15/2048 3,384,000 3,587,1043.38%, 05/15/2044 2,100,000 2,321,2383.63%, 08/15/2043 - 02/15/2044 5,270,000 6,058,0173.75%, 11/15/2043 2,973,000 3,485,2623.88%, 08/15/2040 2,160,000 2,572,0034.25%, 05/15/2039 - 11/15/2040 1,750,000 2,191,0274.38%, 02/15/2038 - 05/15/2041 4,923,000 6,245,4464.50%, 02/15/2036 - 08/15/2039 17,289,000 22,035,7634.75%, 02/15/2037 450,000 590,5025.38%, 02/15/2031 29,000 37,6918.75%, 08/15/2020 1,000,000 1,085,547
U.S. Treasury Bond, Principal Only STRIPS05/15/2021 - 02/15/2035 67,993,000 56,428,41508/15/2022 - 08/15/2031 (E) 3,560,000 3,004,729
U.S. Treasury Note1.38%, 01/31/2021 245,000 240,8661.63%, 08/15/2022 - 02/15/2026 2,684,400 2,615,9011.75%, 11/30/2021 - 05/15/2023 6,759,000 6,649,0312.00%, 01/31/2020 (J) 7,582,000 7,556,8252.00%, 02/28/2021 - 11/15/2026 8,506,000 8,430,0502.13%, 01/31/2021 - 05/15/2025 10,605,000 10,549,5572.25%, 11/15/2024 - 02/15/2027 830,000 825,1832.50%, 08/15/2023 - 05/15/2024 1,511,000 1,527,2592.63%, 11/15/2020 - 05/15/2021 789,700 793,9142.75%, 05/31/2023 - 02/15/2024 2,209,000 2,258,6422.88%, 04/30/2025 - 05/15/2028 24,068,300 24,921,0213.13%, 05/15/2021 3,350,000 3,407,0553.63%, 02/15/2021 1,750,000 1,791,904
201,935,416U.S. Treasury Inflation-Protected Securities - 0.2%U.S. Treasury Inflation-Indexed Bond
2.50%, 01/15/2029 58,609 69,436U.S. Treasury Inflation-Indexed Note
0.13%, 04/15/2019 - 01/15/2022 2,034,523 2,025,6061.38%, 01/15/2020 88,448 89,179
2,184,221Total U.S. Government Obligations
(Cost $200,115,112) 204,119,637
Copyright © 2021 www.secdatabase.com. All Rights Reserved.Please Consider the Environment Before Printing This Document

The notes are an integral part of this report.Transamerica Series Trust Page 25
(1.00) * 1-Month LIBOR + 6.60%,4.11% (B), 05/20/2041 95,301 14,585
7.50%, 04/20/2031 6,135 584
Copyright © 2021 www.secdatabase.com. All Rights Reserved.Please Consider the Environment Before Printing This Document

Transamerica JPMorgan Tactical Allocation VPSCHEDULE OF INVESTMENTS (continued)At March 31, 2019(unaudited)
The notes are an integral part of this report.Transamerica Series Trust Page 26
Shares ValueCOMMON STOCKS - 26.8%Australia - 0.2%Australia & New Zealand Banking Group, Ltd. 43,111 $ 796,803BHP Group, Ltd. 32,688 893,357Commonwealth Bank of Australia (E) 2,690 134,925CSL, Ltd. 2,488 344,382Dexus, REIT 47,604 430,627Goodman Group, REIT 43,981 416,903Macquarie Group, Ltd. 683 62,764National Australia Bank, Ltd. 4,195 75,271Westpac Banking Corp. 7,818 143,886
3,298,918Austria - 0.0% (F)Erste Group Bank AG 13,556 498,163Belgium - 0.1%Anheuser-Busch InBev SA 12,442 1,043,412Bermuda - 0.0% (F)Everest Re Group, Ltd. 618 133,463RenaissanceRe Holdings, Ltd. 475 68,163Third Point Reinsurance, Ltd. (K) 1,000 10,380
212,006Brazil - 0.1%Ambev SA 21,028 90,388B3 SA - Brasil Bolsa Balcao 17,112 140,380Cielo SA 20,100 48,718Engie Brasil Energia SA 6,171 67,315Equatorial Energia SA 4,633 94,663Kroton Educacional SA 30,989 83,896Lojas Renner SA 12,395 138,660Raia Drogasil SA 6,238 104,037TIM Participacoes SA, ADR 3,193 48,151Vale SA, ADR 22,409 292,662
1,108,870Canada - 0.0% (F)Lululemon Athletica, Inc. (K) 2,440 399,843Magna International, Inc. 4,293 209,026Mercer International, Inc. 575 7,768
616,637Chile - 0.0% (F)Cencosud SA 17,714 30,560Cia Cervecerias Unidas SA, ADR 1,442 42,481
73,041China - 0.7%3SBio, Inc. (A) 23,000 45,23951job, Inc., ADR (K) 1,284 99,998AAC Technologies Holdings, Inc. 7,500 44,379Alibaba Group Holding, Ltd., ADR (K) 8,916 1,626,724ANTA Sports Products, Ltd. 22,000 149,657Baidu, Inc., ADR (K) 1,481 244,143Bank of China, Ltd., Class H 630,000 285,709Baoshan Iron & Steel Co., Ltd., A Shares 57,500 61,862BOE Technology Group Co., Ltd., A Shares 65,900 38,244China Conch Venture Holdings, Ltd. 27,500 98,440
Shares ValueCOMMON STOCKS (continued)China (continued)China Construction Bank Corp., H Shares 708,000 $ 606,990China Life Insurance Co., Ltd., Class H 78,000 209,657China Longyuan Power Group Corp., Ltd., H Shares 123,000 85,552China Merchants Bank Co., Ltd., Class H 45,000 218,696China Oilfield Services, Ltd., Class H 68,000 73,458China Petroleum & Chemical Corp., H Shares 172,000 135,629China Railway Group, Ltd., H Shares 70,000 63,848China Shenhua Energy Co., Ltd., Class H 55,500 126,555China Vanke Co., Ltd., H Shares 34,800 146,294Chongqing Rural Commercial Bank Co., Ltd., H Shares 86,000 49,628CNOOC, Ltd. 39,000 73,032Country Garden Holdings Co., Ltd. 107,000 167,112CSPC Pharmaceutical Group, Ltd. 44,000 81,835Ctrip.com International, Ltd., ADR (K) 3,355 146,580ENN Energy Holdings, Ltd. 10,300 99,589Focus Media Information Technology Co., Ltd., A
Shares 28,600 26,684Fosun International, Ltd. 33,000 55,911Geely Automobile Holdings, Ltd. 73,000 139,491Greentown Service Group Co., Ltd. 40,000 35,465Guangdong Haid Group Co., Ltd., A Shares 10,400 43,642Hangzhou Robam Appliances Co., Ltd., A Shares 15,400 73,790Huayu Automotive Systems Co., Ltd., A Shares 10,200 30,933Industrial & Commercial Bank of China, Ltd., Class H 548,000 401,404Inner Mongolia Yili Industrial Group Co., Ltd., A
Shares 8,900 38,552Jiangsu Hengrui Medicine Co., Ltd., A Shares 8,500 82,746Kingdee International Software Group Co., Ltd. 81,000 93,692Kweichow Moutai Co., Ltd., A Shares 600 76,247Luxshare Precision Industry Co., Ltd., A Shares 36,700 135,437Midea Group Co., Ltd., A Shares 12,500 90,641NetEase, Inc., ADR 345 83,300PetroChina Co., Ltd., Class H 260,000 168,587PICC Property & Casualty Co., Ltd., Class H 104,000 118,177Pinduoduo, Inc., ADR (K) 2,720 67,456Ping An Bank Co., Ltd., A Shares 53,400 101,870Ping An Insurance Group Co. of China, Ltd., H Shares 43,500 487,092Postal Savings Bank of China Co., Ltd., H Shares (A) 186,000 106,388SAIC Motor Corp., Ltd., A Shares 15,300 59,354Shanghai International Airport Co., Ltd., A Shares 5,900 54,565Shenzhou International Group Holdings, Ltd. 9,800 131,333Sinopharm Group Co., Ltd., Class H 24,400 101,641Sunny Optical Technology Group Co., Ltd. 11,400 136,147Tencent Holdings, Ltd. 39,100 1,798,113Wuxi Biologics Cayman, Inc. (A) (K) 15,000 145,893Yum China Holdings, Inc. 4,361 195,853
10,059,254Colombia - 0.0% (F)Bancolombia SA 10,018 124,438
Copyright © 2021 www.secdatabase.com. All Rights Reserved.Please Consider the Environment Before Printing This Document

Transamerica JPMorgan Tactical Allocation VPSCHEDULE OF INVESTMENTS (continued)At March 31, 2019(unaudited)
Shares ValueCOMMON STOCKS (continued)Czech Republic - 0.0% (F)Komercni banka as 2,046 $ 83,577Moneta Money Bank AS (A) 17,537 60,511
144,088Denmark - 0.1%Chr Hansen Holding A/S 2,895 293,441Novo Nordisk A/S, Class B 20,261 1,060,632
1,354,073Finland - 0.1%Cargotec OYJ, B Shares 6,231 229,679Nokia OYJ 31,569 179,683Outokumpu OYJ (E) 76,355 277,339Wartsila OYJ Abp (E) 35,135 566,952
1,253,653France - 0.7%Air Liquide SA 8,035 1,021,653Airbus SE 6,003 793,923Alstom SA 11,240 486,939AXA SA 14,993 377,237BNP Paribas SA 16,183 773,512Capgemini SE 3,634 440,663Orange SA 25,689 417,841Pernod Ricard SA 4,796 860,786Renault SA 8,067 533,086Sanofi 11,607 1,025,207Schneider Electric SE 9,494 744,854Sodexo SA 4,371 481,295Thales SA 1,889 226,202TOTAL SA 22,087 1,226,912Unibail-Rodamco-Westfield, REIT 1,354 221,965Vinci SA 1,714 166,735
9,798,810Germany - 0.4%adidas AG 1,533 372,475Allianz SE 674 149,911BASF SE 2,124 156,132Bayer AG 5,530 357,309Brenntag AG 9,398 483,887Daimler AG 14,043 823,081Deutsche Bank AG 10,638 86,635Deutsche Boerse AG 3,594 460,808Deutsche Post AG 15,665 509,594Deutsche Telekom AG 39,131 649,430Infineon Technologies AG 21,263 421,819RWE AG 16,313 437,349SAP SE 11,239 1,298,557Siemens AG 2,797 301,015
6,508,002Hong Kong - 0.3%AIA Group, Ltd. 99,600 991,566China Everbright International, Ltd. 93,000 94,541China Mobile, Ltd. 28,000 285,352China Overseas Land & Investment, Ltd. 56,000 212,587China Resources Land, Ltd. 38,000 170,396China State Construction International Holdings, Ltd. 30,000 28,089China Unicom Hong Kong, Ltd. 110,000 139,428CK Asset Holdings, Ltd. 37,500 333,442CK Hutchison Holdings, Ltd. 46,000 483,150
Shares ValueCOMMON STOCKS (continued)Hong Kong (continued)Far East Horizon, Ltd. 73,000 $ 77,371Haier Electronics Group Co., Ltd. 17,000 49,376Hong Kong Exchanges & Clearing, Ltd. 22,100 770,267
3,635,565Hungary - 0.0% (F)MOL Hungarian Oil & Gas PLC 8,202 93,888OTP Bank Nyrt 4,015 176,659Richter Gedeon Nyrt 3,817 71,977
342,524Indonesia - 0.1%Astra International Tbk PT 283,800 145,986Bank Central Asia Tbk PT 102,100 198,966Bank Rakyat Indonesia Persero Tbk PT 581,900 168,359Telekomunikasi Indonesia Persero Tbk PT 577,800 160,274Unilever Indonesia Tbk PT 19,600 67,753United Tractors Tbk PT 14,100 26,784
768,122Ireland - 0.1%CRH PLC 4,122 127,850Endo International PLC (K) 3,375 27,101Jazz Pharmaceuticals PLC (K) 2,161 308,915Medtronic PLC 11,044 1,005,887Ryanair Holdings PLC, ADR (K) 6,181 463,204STERIS PLC (K) 1,000 128,030
2,060,987Israel - 0.0% (F)SolarEdge Technologies, Inc. (K) 500 18,840Teva Pharmaceutical Industries, Ltd., ADR (K) 10,314 161,724
180,564Italy - 0.1%Assicurazioni Generali SpA 22,584 418,005Enel SpA 154,585 989,106UniCredit SpA 4,195 53,777
1,460,888Japan - 1.2%Asahi Group Holdings, Ltd. 6,700 298,033Bridgestone Corp. 14,300 550,427Central Japan Railway Co. 2,100 487,151Daicel Corp. 42,200 457,678Daikin Industries, Ltd. 6,500 760,670DMG Mori Co., Ltd. 30,200 373,038Electric Power Development Co., Ltd. 5,300 128,925Hitachi, Ltd. 7,600 245,836Honda Motor Co., Ltd. 25,700 694,501Japan Airlines Co., Ltd. 8,500 299,030Japan Tobacco, Inc. 17,500 433,434Kao Corp. 9,000 707,949Keyence Corp. 300 186,691Kyowa Hakko Kirin Co., Ltd. 10,500 228,323Mabuchi Motor Co., Ltd. 13,800 479,383Marui Group Co., Ltd. (E) 16,800 338,789Mitsubishi Corp. 18,600 515,893Mitsubishi UFJ Financial Group, Inc. 133,800 663,990Mitsui Fudosan Co., Ltd. 17,500 439,355NGK Spark Plug Co., Ltd. 17,000 315,059Nintendo Co., Ltd. 2,300 654,949Nippon Telegraph & Telephone Corp. 15,200 645,002
Copyright © 2021 www.secdatabase.com. All Rights Reserved.Please Consider the Environment Before Printing This Document

The notes are an integral part of this report.Transamerica Series Trust Page 27
Copyright © 2021 www.secdatabase.com. All Rights Reserved.Please Consider the Environment Before Printing This Document

Transamerica JPMorgan Tactical Allocation VPSCHEDULE OF INVESTMENTS (continued)At March 31, 2019(unaudited)
The notes are an integral part of this report.Transamerica Series Trust Page 28
Shares ValueCOMMON STOCKS (continued)Japan (continued)Nomura Research Institute, Ltd. 5,500 $ 249,617Olympus Corp. 9,600 104,116Otsuka Corp. 10,400 388,018Otsuka Holdings Co., Ltd. 14,900 584,680Panasonic Corp. 41,100 353,854Persol Holdings Co., Ltd. 13,900 224,748Renesas Electronics Corp. (K) 72,100 333,079Seven & i Holdings Co., Ltd. 17,200 648,084Sony Corp. 6,500 272,422Sumitomo Electric Industries, Ltd. 17,200 227,900Sumitomo Mitsui Financial Group, Inc. 17,400 608,521T&D Holdings, Inc. 39,100 410,651Tokio Marine Holdings, Inc. 10,800 522,508Tokyo Gas Co., Ltd. 7,000 189,069Tokyu Corp. 33,800 589,510Toray Industries, Inc. 50,500 322,101Toyota Motor Corp. (E) 19,400 1,135,503West Japan Railway Co. 3,500 263,345Yamato Holdings Co., Ltd. 6,900 177,994
17,509,826Luxembourg - 0.0% (F)ArcelorMittal 17,318 350,803Malaysia - 0.0% (F)AirAsia Group Bhd. 61,200 39,876CIMB Group Holdings Bhd. 48,900 61,686Petronas Chemicals Group Bhd. 50,200 112,635Public Bank Bhd. 28,200 159,978Tenaga Nasional Bhd. 27,400 84,969
459,144Mexico - 0.1%Alfa SAB de CV, Class A 54,476 57,759America Movil SAB de CV, Series L 278,209 198,800Banco Santander Mexico SA Institucion de Banca
Multiple Grupo Financiero Santand, B Shares 45,401 62,007Cemex SAB de CV, ADR (K) 7,844 36,396Fomento Economico Mexicano SAB de CV, ADR 2,024 186,775Grupo Aeroportuario del Pacifico SAB de CV, B
Shares 13,058 115,765Grupo Aeroportuario del Sureste SAB de CV, Class B 5,460 88,237Grupo Financiero Banorte SAB de CV, Class O 31,637 171,874Grupo Mexico SAB de CV, Series B 48,892 133,853Wal-Mart de Mexico SAB de CV 66,685 178,271
1,229,737Netherlands - 0.3%Akzo Nobel NV 6,349 562,566ASML Holding NV 4,045 758,667Heineken NV 2,894 305,416ING Groep NV 46,094 557,597Koninklijke Philips NV 5,150 209,792Royal Dutch Shell PLC, Class A 29,064 913,616Royal Dutch Shell PLC, Class B 28,148 890,138
4,197,792Peru - 0.0% (F)Credicorp, Ltd. 777 186,441
Shares ValueCOMMON STOCKS (continued)Philippines - 0.0% (F)Ayala Corp. 3,250 $ 58,180Ayala Land, Inc. 73,500 62,848Bank of the Philippine Islands 16,970 27,212Jollibee Foods Corp. 10,700 64,595Security Bank Corp. 8,320 27,411Universal Robina Corp. 20,300 58,762
299,008Poland - 0.0% (F)CCC SA 1,162 65,131CD Projekt SA (K) 1,515 78,919Dino Polska SA (A) (K) 2,900 91,394Polski Koncern Naftowy Orlen SA 3,415 86,847
322,291Puerto Rico - 0.0% (F)EVERTEC, Inc. 2,550 70,916First BanCorp 8,500 97,410OFG Bancorp 3,400 67,286
235,612Republic of Korea - 0.3%BGF retail Co., Ltd. 396 76,228Daelim Industrial Co., Ltd. 688 58,429Hana Financial Group, Inc. 4,143 132,856Hankook Tire Co., Ltd. 1,396 46,058HDC Hyundai Development Co-Engineering &
Construction, E Shares 707 31,579Hyundai Glovis Co., Ltd. 399 45,169Hyundai Heavy Industries Holdings Co., Ltd. 174 51,046Hyundai Mobis Co., Ltd. 737 135,375Hyundai Motor Co. 1,068 112,436Industrial Bank of Korea 5,712 70,702KB Financial Group, Inc. 4,626 170,556Kia Motors Corp. 2,882 89,753Korea Electric Power Corp. (K) 2,080 54,790KT&G Corp. 1,548 141,149LG Chem, Ltd. 413 133,167LG Corp. 1,913 130,612LG Uplus Corp. 6,616 90,051Lotte Chemical Corp. 429 109,792Mando Corp. 1,851 46,638NAVER Corp. 1,621 177,080NCSoft Corp. 345 150,753POSCO 812 180,985S-Oil Corp. 1,299 102,538Samsung Electronics Co., Ltd. 37,969 1,493,539Samsung Fire & Marine Insurance Co., Ltd. 410 108,722Samsung SDI Co., Ltd. 621 117,350Shinhan Financial Group Co., Ltd. 4,754 175,903SK Holdings Co., Ltd. 459 109,382SK Hynix, Inc. 2,665 174,207SK Innovation Co., Ltd. 367 58,036Woori Financial Group, Inc. 5,113 61,936
4,636,817Republic of South Africa - 6.7%Absa Group, Ltd. 10,696 112,751AngloGold Ashanti, Ltd., ADR 9,122 119,498Bid Corp., Ltd. 6,260 12,928,909Capitec Bank Holdings, Ltd. 1,264 11,826,301
Copyright © 2021 www.secdatabase.com. All Rights Reserved.Please Consider the Environment Before Printing This Document

Transamerica JPMorgan Tactical Allocation VPSCHEDULE OF INVESTMENTS (continued)At March 31, 2019(unaudited)
Shares ValueCOMMON STOCKS (continued)Republic of South Africa (continued)Clicks Group, Ltd. 6,405 $ 8,177,181FirstRand, Ltd. 40,613 177,215Growthpoint Properties, Ltd., REIT 47,055 7,963,844Hyprop Investments, Ltd., REIT 5,637 2,753,501Mr Price Group, Ltd. 7,394 9,711,935MTN Group, Ltd. 5,173 31,772Naspers, Ltd., N Shares 2,757 636,695Netcare, Ltd. 24,409 3,950,101Pick n Pay Stores, Ltd. 12,693 5,842,101Redefine Properties, Ltd., REIT 92,389 6,211,025Sanlam, Ltd. 19,641 100,405Sappi, Ltd. 9,748 4,502,845Shoprite Holdings, Ltd. 4,186 4,601,518SPAR Group, Ltd. 5,761 7,661,237Vodacom Group, Ltd. 13,471 10,403,351
97,712,185Russian Federation - 1.0%Alrosa PJSC (K) 68,018 6,295,746Gazprom PJSC, ADR 14,786 66,833Lukoil PJSC, ADR 4,057 362,736Magnit PJSC, GDR 5,903 65,412Magnitogorsk Iron & Steel Works (K) 49,201 2,236,186MMC Norilsk Nickel PJSC, ADR 6,591 138,576Mobile TeleSystems PJSC, ADR 11,296 85,398Moscow Exchange PJSC (K) 58,149 5,296,792Novatek PJSC, GDR 553 95,116Rosneft Oil Co. PJSC, GDR 6,490 40,700Sberbank of Russia PJSC, ADR 23,258 306,540Severstal PJSC, GDR 3,714 58,115Tatneft PJSC, ADR 1,127 77,752X5 Retail Group NV, GDR 2,661 66,312
15,192,214Singapore - 0.1%BOC Aviation, Ltd. (A) 7,900 64,458DBS Group Holdings, Ltd. 38,600 718,597Kulicke & Soffa Industries, Inc. 4,050 89,546United Overseas Bank, Ltd. 3,500 65,054
937,655Spain - 0.2%Banco Santander SA 76,245 354,470Bankia SA 119,774 310,364Iberdrola SA 130,304 1,143,915Industria de Diseno Textil SA 25,225 741,359Telefonica SA 19,132 160,295
2,710,403Sweden - 0.1%Lundin Petroleum AB 12,196 412,948Spotify Technology SA (K) 2,550 353,940Svenska Handelsbanken AB, A Shares (E) 54,769 577,892
1,344,780Switzerland - 0.6%Cie Financiere Richemont SA (E) 8,029 584,909Credit Suisse Group AG (K) 54,586 636,174Ferguson PLC 8,817 560,864LafargeHolcim, Ltd. (K) 13,218 652,969Nestle SA 22,200 2,115,772Novartis AG 14,323 1,377,712Roche Holding AG 5,750 1,584,246
Shares ValueCOMMON STOCKS (continued)Switzerland (continued)Swiss Re AG 5,964 $ 582,654Zurich Insurance Group AG 554 183,378
8,278,678Taiwan - 0.3%Asustek Computer, Inc. 10,000 72,355Catcher Technology Co., Ltd. 16,000 123,035Chailease Holding Co., Ltd. 27,000 110,381Chicony Electronics Co., Ltd. 15,000 34,896China Life Insurance Co., Ltd. 102,000 86,543CTBC Financial Holding Co., Ltd. 240,000 159,245Delta Electronics, Inc. 34,000 175,403E.Sun Financial Holding Co., Ltd. 178,000 137,165Formosa Chemicals & Fibre Corp. 27,000 98,117Formosa Plastics Corp. 52,000 184,747Fubon Financial Holding Co., Ltd. 88,000 131,341Globalwafers Co., Ltd. 8,000 78,649Hon Hai Precision Industry Co., Ltd. 44,000 104,930Inventec Corp. 104,000 79,129Largan Precision Co., Ltd. 1,000 149,251Mega Financial Holding Co., Ltd. 75,000 68,258Nan Ya Plastics Corp. 63,000 161,279Quanta Computer, Inc. 51,000 95,644Taiwan Mobile Co., Ltd. 14,000 50,648Taiwan Semiconductor Manufacturing Co., Ltd., ADR 33,043 1,353,441Uni-President Enterprises Corp. 39,000 94,651Vanguard International Semiconductor Corp. 40,000 86,306Yuanta Financial Holding Co., Ltd. 149,000 84,845
3,720,259Thailand - 0.1%Fabrinet (K) 1,450 75,922Kasikornbank PCL 26,200 155,210Minor International PCL 74,400 90,260PTT Exploration & Production PCL 12,800 50,619PTT PCL 122,100 183,718Siam Cement PCL 7,800 117,485Siam Commercial Bank PCL 27,500 114,385Thai Oil PCL 26,100 57,159
844,758Turkey - 0.0% (F)BIM Birlesik Magazalar AS 1,926 26,323Ford Otomotiv Sanayi AS 3,612 31,601Tofas Turk Otomobil Fabrikasi AS 12,326 37,826Turkcell Iletisim Hizmetleri AS 19,929 43,214
138,964United Kingdom - 0.9%3i Group PLC 49,748 638,094AstraZeneca PLC 3,908 312,270Aviva PLC 73,760 396,187Avon Products, Inc. (K) 5,325 15,655Barratt Developments PLC 52,357 408,609BP PLC 152,492 1,109,254British American Tobacco PLC 24,814 1,032,268Burberry Group PLC 18,405 468,525Cardtronics PLC, Class A (K) 525 18,679Delphi Technologies PLC 1,175 22,630Diageo PLC 2,696 110,188Dixons Carphone PLC 127,447 243,595Ensco PLC, Class A 2,000 7,860GlaxoSmithKline PLC 42,854 891,257
Copyright © 2021 www.secdatabase.com. All Rights Reserved.Please Consider the Environment Before Printing This Document

The notes are an integral part of this report.Transamerica Series Trust Page 29
Copyright © 2021 www.secdatabase.com. All Rights Reserved.Please Consider the Environment Before Printing This Document

Transamerica JPMorgan Tactical Allocation VPSCHEDULE OF INVESTMENTS (continued)At March 31, 2019(unaudited)
Shares ValueCOMMON STOCKS (continued)United Kingdom (continued)HSBC Holdings PLC 84,145 $ 683,103InterContinental Hotels Group PLC 12,733 765,356ITV PLC 233,788 387,016Janus Henderson Group PLC 1,865 46,588Linde PLC 1,443 253,867LivaNova PLC (K) 500 48,625Lloyds Banking Group PLC 395,227 319,874Mondi, Ltd. 1,382 30,533nVent Electric PLC 1,950 52,611Prudential PLC 43,234 865,768Rio Tinto PLC 3,439 199,814Rio Tinto, Ltd. 10,584 735,810Standard Chartered PLC 73,417 565,413Taylor Wimpey PLC 142,901 326,550Travelport Worldwide, Ltd. 3,400 53,482Unilever NV, CVA 15,537 902,455Vodafone Group PLC 378,844 689,808Whitbread PLC 3,700 244,712
12,846,456United States - 11.9%8x8, Inc. (K) 1,225 24,745Aaron�s, Inc. 775 40,765AbbVie, Inc. 2,329 187,694Abercrombie & Fitch Co., Class A 3,025 82,915ABM Industries, Inc. 822 29,880Acadia Healthcare Co., Inc. (E) (K) 6,257 183,393ACI Worldwide, Inc. (K) 1,450 47,661Acorda Therapeutics, Inc. (K) 1,575 20,932Actuant Corp., Class A 675 16,450Acuity Brands, Inc. 451 54,125Adient PLC 925 11,988Adobe, Inc. (K) 1,138 303,266Adtalem Global Education, Inc. (K) 650 30,108ADTRAN, Inc. 2,650 36,305Advance Auto Parts, Inc. 1,591 271,313Advanced Energy Industries, Inc. (K) 500 24,840Advanced Micro Devices, Inc. (K) 9,310 237,591AdvanSix, Inc. (K) 900 25,713AECOM (K) 3,425 101,620Aegion Corp. (K) 300 5,271Aerojet Rocketdyne Holdings, Inc. (K) 700 24,871AGCO Corp. 1,900 132,145Agilent Technologies, Inc. 1,500 120,570Agree Realty Corp., REIT 625 43,337AK Steel Holding Corp. (E) (K) 3,700 10,175Akorn, Inc. (K) 12,875 45,320Alarm.com Holdings, Inc. (K) 400 25,960Albany International Corp., Class A 325 23,267Alexion Pharmaceuticals, Inc. (K) 2,839 383,776Alleghany Corp. (K) 200 122,480Allegheny Technologies, Inc. (K) 1,475 37,716Allegiant Travel Co. 150 19,421Allergan PLC 1,923 281,546ALLETE, Inc. 1,350 111,010Alliance Data Systems Corp. 962 168,331Allscripts Healthcare Solutions, Inc. (K) 2,225 21,227Allstate Corp. 2,118 199,473Alphabet, Inc., Class A (K) 1,672 1,967,760Alphabet, Inc., Class C (K) 3,447 4,044,400Altria Group, Inc. 6,431 369,332Amazon.com, Inc. (K) 3,429 6,106,192
Shares ValueCOMMON STOCKS (continued)United States (continued)American Axle & Manufacturing Holdings, Inc. (K) 1,625 $ 23,254American Campus Communities, Inc., REIT 2,375 113,002American Eagle Outfitters, Inc. 3,275 72,607American Electric Power Co., Inc. 3,279 274,616American Equity Investment Life Holding Co. 1,025 27,696American Express Co. 3,937 430,314American Financial Group, Inc. 1,600 153,936American International Group, Inc. 10,462 450,494American Public Education, Inc. (K) 925 27,861American States Water Co. 25 1,783Ameris Bancorp 375 12,881Amgen, Inc. 835 158,633AMN Healthcare Services, Inc. (K) 550 25,900Amphenol Corp., Class A 3,164 298,808Analog Devices, Inc. 12,056 1,269,135Anixter International, Inc. (K) 350 19,639Anthem, Inc. 3,037 871,558Apergy Corp. (K) 925 37,981Apogee Enterprises, Inc. 325 12,184Apple, Inc. 30,531 5,799,363Applied Industrial Technologies, Inc. 450 26,762Applied Materials, Inc. 7,940 314,900AptarGroup, Inc. 200 21,278ArcBest Corp. 1,750 53,882Archrock, Inc. 1,575 15,404Arista Networks, Inc. (K) 1,129 355,025Arlo Technologies, Inc. (K) 159 657Armada Hoffler Properties, Inc., REIT 5,800 90,422ARMOUR Residential, Inc., REIT 750 14,648Arrow Electronics, Inc. (K) 1,750 134,855ASGN, Inc. (K) 575 36,507Ashland Global Holdings, Inc. 750 58,597Assertio Therapeutics, Inc. (K) 5,075 25,730Associated Banc-Corp. 4,125 88,069AT&T, Inc. 2,893 90,724ATN International, Inc. 125 7,049Automatic Data Processing, Inc. 8,369 1,336,864AutoNation, Inc. (K) 750 26,790AutoZone, Inc. (K) 813 832,610AvalonBay Communities, Inc., REIT 2,565 514,872Avanos Medical, Inc. (K) 550 23,474Avery Dennison Corp. 4,822 544,886Avis Budget Group, Inc. (K) 825 28,760Avista Corp. 250 10,155Avnet, Inc. 2,275 98,667Axcelis Technologies, Inc. (K) 3,350 67,402Axon Enterprise, Inc. (K) 675 36,727Ball Corp. 6,010 347,739BancorpSouth Bank 1,225 34,570Bank of America Corp. 61,775 1,704,372Bank of New York Mellon Corp. 11,289 569,304Bank OZK 625 18,113Banner Corp. 1,650 89,380Barnes Group, Inc. 575 29,561Baxter International, Inc. 2,293 186,444Becton Dickinson and Co. 744 185,799Bel Fuse, Inc., Class B 850 21,488Belden, Inc. 450 24,165Bemis Co., Inc. 275 15,257Benchmark Electronics, Inc. 550 14,438Berkshire Hathaway, Inc., Class B (K) 8,495 1,706,561Best Buy Co., Inc. 6,457 458,834
Copyright © 2021 www.secdatabase.com. All Rights Reserved.Please Consider the Environment Before Printing This Document

The notes are an integral part of this report.Transamerica Series Trust Page 30
AMC Networks, Inc., Class A (K) 950 53,922Amedisys, Inc. (K) 350 43,141American Assets Trust, Inc., REIT 1,725 79,108
Big Lots, Inc. 650 24,713Bio-Rad Laboratories, Inc., Class A (K) 250 76,420Bio-Techne Corp. 450 89,347
Copyright © 2021 www.secdatabase.com. All Rights Reserved.Please Consider the Environment Before Printing This Document

Transamerica JPMorgan Tactical Allocation VPSCHEDULE OF INVESTMENTS (continued)At March 31, 2019(unaudited)
Shares ValueCOMMON STOCKS (continued)United States (continued)Biogen, Inc. (K) 1,523 $ 360,007BioTelemetry, Inc. (K) 1,050 65,751Black Hills Corp. 800 59,256BlackRock, Inc. 663 283,346Blucora, Inc. (K) 1,425 47,566Boeing Co. 3,196 1,219,018Boise Cascade Co. 2,125 56,865Booking Holdings, Inc. (K) 126 219,859Booz Allen Hamilton Holding Corp. 2,400 139,536BorgWarner, Inc. 5,484 210,640Boston Private Financial Holdings, Inc. 875 9,590Boston Properties, Inc., REIT 962 128,793Boston Scientific Corp. (K) 25,005 959,692Bottomline Technologies de, Inc. (K) 400 20,036Boyd Gaming Corp. 1,000 27,360Brink�s Co. 575 43,361Brinker International, Inc. 450 19,971Bristol-Myers Squibb Co. 717 34,208Brixmor Property Group, Inc., REIT 6,050 111,138Broadcom, Inc. 1,596 479,933Brookline Bancorp, Inc. 825 11,880Brown & Brown, Inc. 1,975 58,282Brunswick Corp. 1,025 51,588C&J Energy Services, Inc. (K) 750 11,640Cabot Corp. 1,425 59,323Cabot Microelectronics Corp. 250 27,990CACI International, Inc., Class A (K) 300 54,606Caleres, Inc. 1,325 32,714Callaway Golf Co. 1,175 18,718Camden Property Trust, REIT 1,600 162,400Cantel Medical Corp. 125 8,361Capital One Financial Corp. 5,747 469,472CareTrust, Inc., REIT 1,100 25,806Carlisle Cos., Inc. 750 91,965Carpenter Technology Corp. 200 9,170Carrizo Oil & Gas, Inc. (K) 975 12,158Cars.com, Inc. (K) 400 9,120Casey�s General Stores, Inc. 425 54,727Catalent, Inc. (K) 8,260 335,273Caterpillar, Inc. 2,679 362,978Cathay General Bancorp 900 30,519Cato Corp., Class A 1,325 19,849CBRE Group, Inc., Class A (K) 7,443 368,056CDK Global, Inc. 2,175 127,933Celanese Corp. 2,771 273,248Celgene Corp. (K) 4,568 430,945Central Garden & Pet Co., Class A (K) 525 12,206Charles River Laboratories International, Inc. (K) 625 90,781Charles Schwab Corp. 19,622 839,037Charter Communications, Inc., Class A (K) 2,450 849,929Chatham Lodging Trust, REIT 475 9,139Cheesecake Factory, Inc. (E) 575 28,129Chemed Corp. 325 104,023Chemours Co. 2,800 104,048Chesapeake Energy Corp. (K) 8,600 26,660Chesapeake Lodging Trust, REIT 675 18,772Chevron Corp. 12,617 1,554,162Chico�s FAS, Inc. 2,400 10,248Children�s Place, Inc. (E) 200 19,456Ciena Corp. (K) 2,900 108,286Cigna Corp. (K) 4,992 802,813Cinemark Holdings, Inc. 1,250 49,987
Shares ValueCOMMON STOCKS (continued)United States (continued)Citizens Financial Group, Inc. 3,721 $ 120,932Clean Harbors, Inc. (K) 625 44,706CME Group, Inc. 572 94,140CNO Financial Group, Inc. 1,975 31,956CNX Resources Corp. (K) 2,350 25,310Coca-Cola Co. 32,865 1,540,054Coca-Cola Consolidated, Inc. 75 21,587Cognex Corp. 1,150 58,489Coherent, Inc. (K) 275 38,973Cohu, Inc. 1,900 28,025Columbia Banking System, Inc. 700 22,883Comcast Corp., Class A 37,242 1,488,935Comfort Systems USA, Inc. 1,125 58,939Commerce Bancshares, Inc. 1,744 101,257Commercial Metals Co. 2,125 36,295Community Health Systems, Inc. (E) (K) 1,700 6,341CommVault Systems, Inc. (K) 575 37,226Concho Resources, Inc. 3,661 406,225CONMED Corp. 275 22,875Consol Energy, Inc. (K) 1,168 39,969Constellation Brands, Inc., Class A 744 130,446Cooper Tire & Rubber Co. 600 17,934Cooper-Standard Holdings, Inc. (K) 200 9,392Copart, Inc. (K) 6,707 406,377Core-Mark Holding Co., Inc. 1,800 66,834CoreCivic, Inc., REIT 4,875 94,819CoreLogic, Inc. (K) 975 36,329CoreSite Realty Corp., REIT 550 58,861Corning, Inc. 10,331 341,956Corporate Office Properties Trust, REIT 3,075 83,947Cousins Properties, Inc., REIT 13,192 127,435Cracker Barrel Old Country Store, Inc. (E) 175 28,282Crane Co. 1,750 148,085Cree, Inc. (K) 775 44,345Crocs, Inc. (K) 875 22,531Cross Country Healthcare, Inc. (K) 2,925 20,563CSX Corp. 1,534 114,774Cullen/Frost Bankers, Inc. 725 70,376Cummins, Inc. 3,091 487,976Curtiss-Wright Corp. 500 56,670Customers Bancorp, Inc. (K) 3,875 70,951CVS Health Corp. 6,011 324,173Cypress Semiconductor Corp. 4,300 64,156CyrusOne, Inc., REIT 900 47,196Dana, Inc. 4,725 83,821Danaher Corp. 2,725 359,754Darling Ingredients, Inc. (K) 1,800 38,970Deckers Outdoor Corp. (K) 700 102,893Deere & Co. 3,515 561,838Delta Air Lines, Inc. 4,521 233,510Denbury Resources, Inc. (K) 11,575 23,729Designer Brands, Inc. 975 21,665DexCom, Inc. (K) 2,100 250,110Diamondback Energy, Inc. 4,316 438,203DiamondRock Hospitality Co., REIT 6,750 73,102Dick�s Sporting Goods, Inc. 975 35,890Diebold Nixdorf, Inc. (K) 1,025 11,347Digi International, Inc. (K) 1,550 19,639Digital Realty Trust, Inc., REIT 710 84,490Dillard�s, Inc., Class A (E) 225 16,205Dime Community Bancshares, Inc. 850 15,921Dine Brands Global, Inc. 200 18,258
Copyright © 2021 www.secdatabase.com. All Rights Reserved.Please Consider the Environment Before Printing This Document

The notes are an integral part of this report.Transamerica Series Trust Page 31
Cintas Corp. 286 57,803Cirrus Logic, Inc. (K) 700 29,449Cisco Systems, Inc. 6,503 351,097Citigroup, Inc. 20,952 1,303,633
Diplomat Pharmacy, Inc. (K) 625 3,631Discovery, Inc., Class A (E) (K) 10,266 277,387Discovery, Inc., Class C (K) 5,923 150,563DISH Network Corp., Class A (K) 2,725 86,355DocuSign, Inc. (K) 3,320 172,109
Copyright © 2021 www.secdatabase.com. All Rights Reserved.Please Consider the Environment Before Printing This Document

Transamerica JPMorgan Tactical Allocation VPSCHEDULE OF INVESTMENTS (continued)At March 31, 2019(unaudited)
Shares ValueCOMMON STOCKS (continued)United States (continued)Dollar General Corp. 2,610 $ 311,373Domino�s Pizza, Inc. 500 129,050Domtar Corp. 1,950 96,817Donnelley Financial Solutions, Inc. (K) 287 4,271Douglas Emmett, Inc., REIT 2,050 82,861DowDuPont, Inc. 19,498 1,039,438Dunkin� Brands Group, Inc. 950 71,345DXP Enterprises, Inc. (K) 150 5,838E.I. Paso Electric Co. 1,200 70,584Eagle Pharmaceuticals, Inc. (K) 1,525 76,997East West Bancorp, Inc. 10,516 504,453Eastman Chemical Co. 7,282 552,558Eaton Corp. PLC 10,236 824,612Echo Global Logistics, Inc. (K) 325 8,054Edgewell Personal Care Co. (K) 675 29,626Edison International 6,673 413,192Electronic Arts, Inc. (K) 5,442 553,070Eli Lilly & Co. 6,966 903,908EMCOR Group, Inc. 1,675 122,409Emergent BioSolutions, Inc. (K) 200 10,104Encompass Health Corp. 750 43,800Encore Wire Corp. 1,525 87,260Energizer Holdings, Inc. 700 31,451EnerSys 516 33,623Enova International, Inc. (K) 400 9,128Ensign Group, Inc. 925 47,351EOG Resources, Inc. 12,043 1,146,253ePlus, Inc. (K) 500 44,270EPR Properties, REIT 250 19,225EQT Corp. 2,925 60,664Equinix, Inc., REIT 401 181,717Equitrans Midstream Corp. (K) 2,425 52,816Equity Residential, REIT 1,958 147,477Era Group, Inc. (K) 1,000 11,540Estee Lauder Cos., Inc., Class A 1,768 292,692Evercore, Inc., Class A 1,225 111,475Evolent Health, Inc., Class A (K) 9,532 119,913EW Scripps Co., Class A 300 6,300Exact Sciences Corp. (K) 4,047 350,551Exelixis, Inc. (K) 12,480 297,024Exelon Corp. 15,216 762,778ExlService Holdings, Inc. (K) 400 24,008Expedia Group, Inc. 3,240 385,560Express, Inc. (K) 825 3,531Exterran Corp. (K) 337 5,678Extreme Networks, Inc. (K) 5,350 40,072Exxon Mobil Corp. 6,190 500,152Facebook, Inc., Class A (K) 7,619 1,270,011FactSet Research Systems, Inc. 450 111,721Fair Isaac Corp. (K) 1,430 388,431Federal Realty Investment Trust, REIT 1,740 239,859Federal Signal Corp. 675 17,543Federated Investors, Inc., Class B 1,150 33,707Fidelity National Information Services, Inc. 5,063 572,625Fifth Third Bancorp 899 22,666First American Financial Corp. 2,300 118,450First Commonwealth Financial Corp. 1,250 15,750First Data Corp., Class A (K) 4,477 117,611First Financial Bancorp 550 13,233First Horizon National Corp. 3,000 41,940First Industrial Realty Trust, Inc., REIT 1,475 52,156First Midwest Bancorp, Inc. 4,175 85,420
Shares ValueCOMMON STOCKS (continued)United States (continued)Flowers Foods, Inc. 2,925 $ 62,361FNB Corp. 3,725 39,485Ford Motor Co. 28,497 250,204Forrester Research, Inc. 100 4,835Fortune Brands Home & Security, Inc. 4,771 227,147Forward Air Corp. 350 22,656Fossil Group, Inc. (K) 625 8,575Freeport-McMoRan, Inc. 8,976 115,701Frontier Communications Corp. (E) (K) 825 1,642FTI Consulting, Inc. (K) 500 38,410Fulton Financial Corp. 2,325 35,991FutureFuel Corp. 1,225 16,415G-III Apparel Group, Ltd. (K) 500 19,980GameStop Corp., Class A 4,200 42,672Gannett Co., Inc. 3,875 40,843General Dynamics Corp. 5,072 858,588Genesco, Inc. (K) 150 6,833Gentex Corp. 3,125 64,625Geo Group, Inc., REIT 3,587 68,870Getty Realty Corp., REIT 2,952 94,553Gibraltar Industries, Inc. (K) 350 14,214Gilead Sciences, Inc. 5,908 384,079Global Payments, Inc. 5,419 739,802Globus Medical, Inc., Class A (K) 875 43,234GoDaddy, Inc., Class A (K) 4,484 337,152Graham Holdings Co., Class B 50 34,159Green Dot Corp., Class A (K) 550 33,358Greenbrier Cos., Inc. 1,625 52,374Greif, Inc., Class A 600 24,750Group 1 Automotive, Inc. 250 16,175Guess?, Inc. 700 13,720Gulfport Energy Corp. (K) 1,725 13,835H&R Block, Inc. 1,866 44,672Haemonetics Corp. (K) 700 61,236Hancock Whitney Corp. 2,450 98,980Hanmi Financial Corp. 1,575 33,500Hanover Insurance Group, Inc. 1,375 156,984Harsco Corp. (K) 975 19,656Hartford Financial Services Group, Inc. 8,289 412,129Haverty Furniture Cos., Inc. 200 4,376Hawaiian Electric Industries, Inc. 2,175 88,675Hawaiian Holdings, Inc. 600 15,750Hawkins, Inc. 125 4,604HB Fuller Co. 375 18,240HCI Group, Inc. 75 3,205HD Supply Holdings, Inc. (K) 2,679 116,135HealthEquity, Inc. (K) 500 36,990HealthStream, Inc. (K) 350 9,821Heidrick & Struggles International, Inc. 1,450 55,578Helen of Troy, Ltd. (K) 725 84,071Helix Energy Solutions Group, Inc. (K) 1,000 7,910Herman Miller, Inc. 1,150 40,457Hersha Hospitality Trust, REIT 450 7,713Hewlett Packard Enterprise Co. 24,421 376,816HFF, Inc., Class A 400 19,100Hibbett Sports, Inc. (K) 2,575 58,736Highwoods Properties, Inc., REIT 2,175 101,746Hill-Rom Holdings, Inc. 1,075 113,799Hillenbrand, Inc. 775 32,186Hilton Worldwide Holdings, Inc. 6,744 560,494HMS Holdings Corp. (K) 1,875 55,519HNI Corp. 475 17,238
Copyright © 2021 www.secdatabase.com. All Rights Reserved.Please Consider the Environment Before Printing This Document

The notes are an integral part of this report.Transamerica Series Trust Page 32
First Republic Bank 3,052 306,604First Solar, Inc. (K) 1,400 73,976FirstCash, Inc. 531 45,931FirstEnergy Corp. 2,118 88,130Five Below, Inc. (K) 675 83,869
Home Depot, Inc. 11,160 2,141,492Honeywell International, Inc. 7,199 1,144,065Hospitality Properties Trust, REIT 4,575 120,368Host Hotels & Resorts, Inc., REIT 7,911 149,518HP, Inc. 15,468 300,543
Copyright © 2021 www.secdatabase.com. All Rights Reserved.Please Consider the Environment Before Printing This Document

Transamerica JPMorgan Tactical Allocation VPSCHEDULE OF INVESTMENTS (continued)At March 31, 2019(unaudited)
Shares ValueCOMMON STOCKS (continued)United States (continued)Hub Group, Inc., Class A (K) 2,025 $ 82,721Hubbell, Inc. 650 76,687Huntington Bancshares, Inc. 11,587 146,923ICU Medical, Inc. (K) 175 41,883IDACORP, Inc. 975 97,051IDEX Corp. 700 106,218Illumina, Inc. (K) 2,035 632,254Independence Realty Trust, Inc., REIT 1,100 11,869Ingersoll-Rand PLC 4,042 436,334Ingevity Corp. (K) 475 50,165Ingredion, Inc. 825 78,119Innophos Holdings, Inc. 250 7,535Innospec, Inc. 275 22,921Insight Enterprises, Inc. (K) 800 44,048Insperity, Inc. 475 58,738Insteel Industries, Inc. 225 4,707Integer Holdings Corp. (K) 1,000 75,420Integra LifeSciences Holdings Corp. (K) 800 44,576Intel Corp. 4,328 232,414Intercept Pharmaceuticals, Inc. (K) 802 89,712Intercontinental Exchange, Inc. 8,976 683,433InterDigital, Inc. 375 24,743Interface, Inc. 725 11,107International Bancshares Corp. 625 23,769INTL. FCStone, Inc. (K) 175 6,783Intuit, Inc. 2,711 708,683Intuitive Surgical, Inc. (K) 1,108 632,203Invesco Mortgage Capital, Inc., REIT 1,475 23,305ITT, Inc. 2,300 133,400j2 Global, Inc. 550 47,630Jabil, Inc. 3,075 81,764JBG SMITH Properties, REIT 1,100 45,485JetBlue Airways Corp. (K) 4,425 72,393John B Sanfilippo & Son, Inc. 100 7,187John Wiley & Sons, Inc., Class A 700 30,954Johnson & Johnson 9,468 1,323,532Jones Lang LaSalle, Inc. 925 142,616Kaiser Aluminum Corp. 200 20,946Kaman Corp. 1,150 67,206KB Home 4,075 98,493KBR, Inc. 5,300 101,177Kelly Services, Inc., Class A 2,925 64,525Kemet Corp. 825 14,000Kemper Corp. 550 41,877Kennametal, Inc. 850 31,238KeyCorp 32,756 515,907Kilroy Realty Corp., REIT 1,050 79,758Kite Realty Group Trust, REIT 2,300 36,777KLX Energy Services Holdings, Inc. (K) 240 6,034Korn Ferry 1,675 75,006Kraton Corp. (K) 725 23,331La-Z-Boy, Inc. 525 17,320Landstar System, Inc. 925 101,186Lannett Co., Inc. (E) (K) 4,225 33,251Lantheus Holdings, Inc. (K) 1,775 43,452LegacyTexas Financial Group, Inc. 425 15,891Legg Mason, Inc. 2,450 67,056Leidos Holdings, Inc. 1,725 110,555LendingTree, Inc. (K) 100 35,156Lennar Corp., Class A 5,667 278,193Lennox International, Inc. 2,128 562,643LHC Group, Inc. (K) 725 80,373
Shares ValueCOMMON STOCKS (continued)United States (continued)Live Nation Entertainment, Inc. (K) 2,625 $ 166,792LogMeIn, Inc. 525 42,052Louisiana-Pacific Corp. 4,000 97,520Lowe�s Cos., Inc. 7,039 770,559LSC Communications, Inc. 2,387 15,587Lumentum Holdings, Inc. (K) 1,400 79,156Lyft, Inc., Class A (K) 2,280 178,501Mack-Cali Realty Corp., REIT 1,050 23,310Magellan Health, Inc. (K) 750 49,440ManpowerGroup, Inc. 1,550 128,169ManTech International Corp., Class A 375 20,258Marathon Petroleum Corp. 12,998 777,930MarineMax, Inc. (K) 275 5,269MarketAxess Holdings, Inc. 125 30,760Marriott Vacations Worldwide Corp. 650 60,775Marsh & McLennan Cos., Inc. 1,694 159,067Marvell Technology Group, Ltd. 4,518 89,863Masco Corp. 9,222 362,517Masimo Corp. (K) 900 124,452MasTec, Inc. (K) 800 38,480Mastercard, Inc., Class A 7,391 1,740,211Matador Resources Co. (K) 600 11,598Materion Corp. 225 12,839Matrix Service Co. (K) 700 13,706Matson, Inc. 525 18,947MAXIMUS, Inc. 750 53,235McDermott International, Inc. (K) 3,699 27,521McKesson Corp. 252 29,499MDC Holdings, Inc. 591 17,174MDU Resources Group, Inc. 2,250 58,117Medical Properties Trust, Inc., REIT 4,375 80,981Medicines Co. (E) (K) 3,000 83,850Medifast, Inc. (E) 150 19,133MEDNAX, Inc. (K) 2,400 65,208Merck & Co., Inc. 16,830 1,399,751Mercury General Corp. 450 22,532Meredith Corp. (E) 1,775 98,086Meta Financial Group, Inc. 375 7,380Methode Electronics, Inc. 1,875 53,962MetLife, Inc. 14,899 634,250Michaels Cos., Inc. (K) 1,200 13,704Microsoft Corp. 65,539 7,729,670MicroStrategy, Inc., Class A (K) 450 64,912Mid-America Apartment Communities, Inc., REIT 509 55,649Minerals Technologies, Inc. 425 24,986MKS Instruments, Inc. 900 83,745Molina Healthcare, Inc. (K) 925 131,313Molson Coors Brewing Co., Class B 7,099 423,455Momenta Pharmaceuticals, Inc. (K) 5,400 78,462Mondelez International, Inc., Class A 21,112 1,053,911Monotype Imaging Holdings, Inc. 1,125 22,376Moog, Inc., Class A 650 56,517Morgan Stanley 21,204 894,809Motorola Solutions, Inc. 469 65,857Movado Group, Inc. 175 6,367MSA Safety, Inc. 350 36,190MSC Industrial Direct Co., Inc., Class A 525 43,423Mueller Industries, Inc. 700 21,938Murphy Oil Corp. 2,200 64,460Murphy USA, Inc. (K) 375 32,108Mylan NV (K) 2,404 68,129MYR Group, Inc. (K) 1,000 34,630
Copyright © 2021 www.secdatabase.com. All Rights Reserved.Please Consider the Environment Before Printing This Document

The notes are an integral part of this report.Transamerica Series Trust Page 33
Liberty Property Trust, REIT 1,725 83,524Life Storage, Inc., REIT 575 55,930Lincoln Electric Holdings, Inc. 750 62,902Lincoln National Corp. 5,816 341,399Littelfuse, Inc. 250 45,620
Myriad Genetics, Inc. (K) 775 25,730Nanometrics, Inc. (K) 300 9,264Nasdaq, Inc. 3,938 344,536National Fuel Gas Co. 1,200 73,152
Copyright © 2021 www.secdatabase.com. All Rights Reserved.Please Consider the Environment Before Printing This Document

Transamerica JPMorgan Tactical Allocation VPSCHEDULE OF INVESTMENTS (continued)At March 31, 2019(unaudited)
Shares ValueCOMMON STOCKS (continued)United States (continued)National Instruments Corp. 1,375 $ 60,995National Storage Affiliates Trust, REIT 1,225 34,925Nautilus, Inc. (K) 450 2,502Navient Corp. 2,800 32,396Navigant Consulting, Inc. 550 10,709Navigators Group, Inc. 150 10,481NBT Bancorp, Inc. 375 13,504NCR Corp. (K) 1,625 44,346Nektar Therapeutics (K) 882 29,635Netflix, Inc. (K) 4,573 1,630,549NETGEAR, Inc. (K) 1,675 55,476New Jersey Resources Corp. 1,050 52,279New Media Investment Group, Inc. 900 9,450New York Community Bancorp, Inc. 3,050 35,289New York Times Co., Class A 5,385 176,897Newmont Mining Corp. 2,198 78,622Newpark Resources, Inc. (K) 1,050 9,618Nexteer Automotive Group, Ltd. 25,000 30,892NextEra Energy, Inc. 4,749 918,077NextGen Healthcare, Inc. (K) 575 9,677NIC, Inc. 800 13,672NIKE, Inc., Class B 1,907 160,588Nordson Corp. 1,512 200,370Norfolk Southern Corp. 5,702 1,065,647Northrop Grumman Corp. 1,374 370,430NorthWestern Corp. 500 35,205NOW, Inc. (K) 3,775 52,699Nu Skin Enterprises, Inc., Class A 600 28,716NuVasive, Inc. (K) 550 31,235NVIDIA Corp. 7,508 1,348,136NVR, Inc. (K) 65 179,855O�Reilly Automotive, Inc. (K) 2,222 862,803Oasis Petroleum, Inc. (K) 3,200 19,328Occidental Petroleum Corp. 7,870 520,994Oceaneering International, Inc. (K) 1,225 19,318Office Depot, Inc. 16,875 61,256OGE Energy Corp. 4,250 183,260Oil States International, Inc. (K) 750 12,720Old Dominion Freight Line, Inc. 2,434 351,445Old Republic International Corp. 6,350 132,842Omega Healthcare Investors, Inc., REIT 2,400 91,560Omnicell, Inc. (K) 475 38,399ONEOK, Inc. 5,942 414,989Opus Bank 225 4,455Oracle Corp. 24,178 1,298,600OraSure Technologies, Inc. (K) 625 6,969Orion Group Holdings, Inc. (K) 1,825 5,329Orthofix Medical, Inc. (K) 550 31,026Oshkosh Corp. 4,396 330,271OSI Systems, Inc. (K) 200 17,520Owens & Minor, Inc. 6,114 25,067Owens-Illinois, Inc. 2,725 51,720PACCAR, Inc. 7,682 523,451Pacific Premier Bancorp, Inc. 2,600 68,978Packaging Corp. of America 607 60,324PacWest Bancorp 1,400 52,654Palo Alto Networks, Inc. (K) 1,745 423,826Par Pacific Holdings, Inc. (K) 2,550 45,415Parker-Hannifin Corp. 2,013 345,471Parsley Energy, Inc., Class A (K) 2,691 51,936Patrick Industries, Inc. (K) 300 13,596Patterson Cos., Inc. 2,325 50,801
Shares ValueCOMMON STOCKS (continued)United States (continued)Penn National Gaming, Inc. (K) 975 $ 19,598PepsiCo, Inc. 6,371 780,766Perficient, Inc. (K) 1,800 49,302Perspecta, Inc. 6,700 135,474Pfizer, Inc. 35,458 1,505,901PGT Innovations, Inc. (K) 500 6,925Philip Morris International, Inc. 13,966 1,234,455Phillips 66 547 52,058Photronics, Inc. (K) 675 6,379Pinnacle Financial Partners, Inc. 850 46,495Pioneer Energy Services Corp. (K) 825 1,460Pioneer Natural Resources Co. 4,190 638,053Piper Jaffray Cos. 325 23,670Pitney Bowes, Inc. 2,050 14,084Plexus Corp. (K) 400 24,380PNM Resources, Inc. 950 44,973Polaris Industries, Inc. 650 54,879PolyOne Corp. 950 27,845Pool Corp. 32 5,279Post Holdings, Inc. (K) 1,300 142,220PotlatchDeltic Corp. 1,465 55,362PRA Health Sciences, Inc. (K) 675 74,446Primerica, Inc. 500 61,075Procter & Gamble Co. 5,576 580,183Progress Software Corp. 550 24,404Progressive Corp. 7,536 543,270Prologis, Inc., REIT 6,606 475,302ProPetro Holding Corp. (K) 3,025 68,183Prudential Financial, Inc. 2,175 199,839PS Business Parks, Inc., REIT 250 39,208PTC, Inc. (K) 450 41,481Public Service Enterprise Group, Inc. 1,321 78,481Public Storage, REIT 499 108,672PVH Corp. 2,610 318,289QEP Resources, Inc. (K) 2,600 20,254Qualys, Inc. (K) 375 31,028QuinStreet, Inc. (K) 1,525 20,420R.R. Donnelley & Sons Co. 2,183 10,304Rambus, Inc. (K) 3,875 40,494Range Resources Corp. (E) 2,375 26,695Raven Industries, Inc. 375 14,389Rayonier Advanced Materials, Inc. 1,000 13,560Rayonier, Inc., REIT 1,550 48,856Red Robin Gourmet Burgers, Inc. (K) 150 4,322Regal Beloit Corp. 1,525 124,852Regeneron Pharmaceuticals, Inc. (K) 504 206,952REGENXBIO, Inc. (K) 1,000 57,310Reinsurance Group of America, Inc. 750 106,485Reliance Steel & Aluminum Co. 1,425 128,620Renewable Energy Group, Inc. (E) (K) 1,675 36,783Rent-A-Center, Inc. (K) 2,925 61,045Resources Connection, Inc. 1,350 22,329Revance Therapeutics, Inc. (K) 4,471 70,463REX American Resources Corp. (K) 75 6,046RH (E) (K) 225 23,164Ross Stores, Inc. 16,697 1,554,491Rowan Cos. PLC, Class A (K) 1,375 14,836Royal Caribbean Cruises, Ltd. 985 112,901Royal Gold, Inc. 150 13,640RPM International, Inc. 2,452 142,314Rudolph Technologies, Inc. (K) 2,175 49,590S&P Global, Inc. 2,324 489,318
Copyright © 2021 www.secdatabase.com. All Rights Reserved.Please Consider the Environment Before Printing This Document

The notes are an integral part of this report.Transamerica Series Trust Page 34
Patterson-UTI Energy, Inc. 2,550 35,751PayPal Holdings, Inc. (K) 17,356 1,802,247PBF Energy, Inc., Class A 3,050 94,977PDC Energy, Inc. (K) 725 29,493Pebblebrook Hotel Trust, REIT 629 19,537
Sabra Health Care, Inc., REIT 1,491 29,030Sabre Corp. 5,975 127,805Safety Insurance Group, Inc. 150 13,071Sage Therapeutics, Inc. (K) 870 138,373SailPoint Technologies Holding, Inc. (K) 7,650 219,708
Copyright © 2021 www.secdatabase.com. All Rights Reserved.Please Consider the Environment Before Printing This Document

Transamerica JPMorgan Tactical Allocation VPSCHEDULE OF INVESTMENTS (continued)At March 31, 2019(unaudited)
Shares ValueCOMMON STOCKS (continued)United States (continued)salesforce.com, Inc. (K) 11,955 $ 1,893,313Sally Beauty Holdings, Inc. (E) (K) 1,525 28,075Sanderson Farms, Inc. 225 29,664Sanmina Corp. (K) 3,300 95,205Saul Centers, Inc., REIT 125 6,421ScanSource, Inc. (K) 1,050 37,611Schweitzer-Mauduit International, Inc. 2,000 77,440Science Applications International Corp. 588 45,247Scotts Miracle-Gro Co. 475 37,326SEI Investments Co. 1,550 80,987Select Medical Holdings Corp. (K) 2,350 33,112Selective Insurance Group, Inc. 600 37,968Sempra Energy 2,723 342,717Semtech Corp. (K) 800 40,728Seneca Foods Corp., Class A (K) 350 8,610Senior Housing Properties Trust, REIT 2,750 32,395ServiceNow, Inc. (K) 2,148 529,461Signature Bank 1,175 150,482Signet Jewelers, Ltd. 725 19,691Silgan Holdings, Inc. 2,525 74,816Skechers U.S.A., Inc., Class A (K) 1,575 52,936SkyWest, Inc. 975 52,933SLM Corp. 5,000 49,550SM Energy Co. 1,225 21,425SMART Global Holdings, Inc. (K) 1,525 29,280Snap-on, Inc. 2,141 335,109Sonoco Products Co. 700 43,071Southwest Airlines Co. 2,151 111,658Southwest Gas Holdings, Inc. 575 47,299Southwestern Energy Co. (K) 5,775 27,085Spark Therapeutics, Inc. (K) 498 56,712SpartanNash Co. 1,900 30,153Spectrum Pharmaceuticals, Inc. (K) 4,325 46,234Spire, Inc. 625 51,431Splunk, Inc. (K) 2,561 319,101Spok Holdings, Inc. 1,000 13,620Sprouts Farmers Market, Inc. (K) 225 4,847SPS Commerce, Inc. (K) 225 23,864SPX Corp. (K) 425 14,786SPX FLOW, Inc. (K) 500 15,950SRC Energy, Inc. (K) 2,950 15,104Stamps.com, Inc. (K) 175 14,247Standex International Corp. 150 11,010Stanley Black & Decker, Inc. 5,508 750,024Steel Dynamics, Inc. 4,575 161,360Stepan Co. 775 67,828Steven Madden, Ltd. 950 32,148Stewart Information Services Corp. 275 11,740Stifel Financial Corp. 1,725 91,011Strategic Education, Inc. 271 35,585Summit Hotel Properties, Inc., REIT 1,225 13,977SunCoke Energy, Inc. (K) 750 6,368SunTrust Banks, Inc. 8,701 515,534Sykes Enterprises, Inc. (K) 2,325 65,751Synaptics, Inc. (K) 400 15,900Syneos Health, Inc. (K) 625 32,350SYNNEX Corp. 625 59,619Synopsys, Inc. (K) 1,845 212,452Synovus Financial Corp. 1,325 45,527T-Mobile US, Inc. (K) 4,980 344,118Tailored Brands, Inc. (E) 525 4,116Take-Two Interactive Software, Inc. (K) 4,367 412,114
Shares ValueCOMMON STOCKS (continued)United States (continued)Teladoc Health, Inc. (E) (K) 5,575 $ 309,970Teledyne Technologies, Inc. (K) 425 100,729Telephone & Data Systems, Inc. 2,425 74,520Tenet Healthcare Corp. (K) 1,500 43,260Teradata Corp. (K) 1,850 80,752Teradyne, Inc. 5,948 236,968Terex Corp. 2,075 66,670Tesla, Inc. (K) 908 254,113Tetra Tech, Inc. 1,950 116,200TETRA Technologies, Inc. (K) 1,550 3,627Texas Capital Bancshares, Inc. (K) 600 32,754Texas Instruments, Inc. 13,989 1,483,813Texas Roadhouse, Inc. 775 48,197TherapeuticsMD, Inc. (E) (K) 24,651 120,050Thermo Fisher Scientific, Inc. 1,786 488,864Thor Industries, Inc. 1,325 82,640Timken Co. 2,425 105,778TiVo Corp. 2,225 20,737TJX Cos., Inc. 3,139 167,026Toll Brothers, Inc. 3,550 128,510TopBuild Corp. (K) 425 27,549Toro Co. 900 61,956Tractor Supply Co. 4,180 408,637Transocean, Ltd. (K) 5,925 51,607TreeHouse Foods, Inc. (K) 1,625 104,894TRI Pointe Group, Inc. (K) 1,750 22,120Trimble, Inc. (K) 2,300 92,920Triumph Group, Inc. 525 10,007TrueBlue, Inc. (K) 2,550 60,282TrustCo Bank Corp. 4,875 37,830Trustmark Corp. 725 24,382TTM Technologies, Inc. (K) 1,000 11,730Tupperware Brands Corp. 1,750 44,765Tyler Technologies, Inc. (K) 300 61,320U.S. Steel Corp. 2,100 40,929UGI Corp. 4,150 229,993Ultimate Software Group, Inc. (K) 375 123,799Ultra Clean Holdings, Inc. (K) 925 9,574UMB Financial Corp. 425 27,217Umpqua Holdings Corp. 6,225 102,712UniFirst Corp. 200 30,700Union Pacific Corp. 7,327 1,225,074Unisys Corp. (K) 3,375 39,386Unit Corp. (K) 650 9,256United Community Banks, Inc. 3,150 78,529United Continental Holdings, Inc. (K) 1,122 89,513United Insurance Holdings Corp. 1,125 17,888United Natural Foods, Inc. (K) 600 7,932United Technologies Corp. 6,534 842,167United Therapeutics Corp. (K) 525 61,619UnitedHealth Group, Inc. 10,561 2,611,313Uniti Group, Inc., REIT (E) 625 6,994Universal Corp. 250 14,408Universal Display Corp. 325 49,676Universal Forest Products, Inc. 1,700 50,813Universal Insurance Holdings, Inc. 425 13,175Urban Edge Properties, REIT 1,975 37,525Urban Outfitters, Inc. (K) 1,725 51,129Urstadt Biddle Properties, Inc., Class A, REIT 375 7,740US Concrete, Inc. (E) (K) 150 6,213Valley National Bancorp 3,800 36,404Valmont Industries, Inc. 250 32,525
Copyright © 2021 www.secdatabase.com. All Rights Reserved.Please Consider the Environment Before Printing This Document

The notes are an integral part of this report.Transamerica Series Trust Page 35
Taubman Centers, Inc., REIT 750 39,660TCF Financial Corp. 6,550 135,519TD Ameritrade Holding Corp. 11,759 587,832Tech Data Corp. (K) 1,525 156,175TEGNA, Inc. 6,525 92,002
Valvoline, Inc. 2,300 42,688Varex Imaging Corp. (K) 450 15,246Veeco Instruments, Inc. (K) 83 900Veeva Systems, Inc., Class A (K) 2,472 313,598
Copyright © 2021 www.secdatabase.com. All Rights Reserved.Please Consider the Environment Before Printing This Document

Transamerica JPMorgan Tactical Allocation VPSCHEDULE OF INVESTMENTS (continued)At March 31, 2019(unaudited)
Shares ValueCOMMON STOCKS (continued)United States (continued)Ventas, Inc., REIT 2,610 $ 166,544Veritex Holdings, Inc. 221 5,353Veritiv Corp. (K) 800 21,056Verizon Communications, Inc. 20,144 1,191,115Versum Materials, Inc. 1,300 65,403Vertex Pharmaceuticals, Inc. (K) 4,486 825,200Viad Corp. 600 33,774Viavi Solutions, Inc. (K) 2,550 31,569Virtusa Corp. (K) 300 16,035Visa, Inc., Class A 14,173 2,213,681Vishay Intertechnology, Inc. 3,100 57,257Vonage Holdings Corp. (K) 7,325 73,543Vornado Realty Trust, REIT 4,809 324,319Vulcan Materials Co. 2,460 291,264Wabash National Corp. 4,450 60,297WageWorks, Inc. (K) 1,375 51,920Walker & Dunlop, Inc. 850 43,273Walt Disney Co. 6,651 738,461Waste Connections, Inc. 11,637 1,030,922Watsco, Inc. 375 53,704Watts Water Technologies, Inc., Class A 325 26,267Wayfair, Inc., Class A (K) 1,466 217,628Webster Financial Corp. 1,075 54,470Weingarten Realty Investors, REIT 500 14,685Wells Fargo & Co. 23,769 1,148,518Wendy�s Co. 2,200 39,358West Pharmaceutical Services, Inc. 875 96,425WestRock Co. 6,354 243,676WEX, Inc. (K) 475 91,195Williams-Sonoma, Inc. (E) 875 49,236Winnebago Industries, Inc. 350 10,903Wintrust Financial Corp. 1,550 104,361Wolverine World Wide, Inc. 1,150 41,089Woodward, Inc. 675 64,051Workday, Inc., Class A (K) 211 40,691World Fuel Services Corp. 800 23,112World Wrestling Entertainment, Inc., Class A 475 41,220Worthington Industries, Inc. 1,325 49,449WPX Energy, Inc. (K) 5,975 78,332WR Berkley Corp. 1,000 84,720WW Grainger, Inc. 900 270,837Wyndham Destinations, Inc. 2,850 115,396Xcel Energy, Inc. 12,195 685,481Xilinx, Inc. 3,240 410,800Yelp, Inc. (K) 875 30,188Yum! Brands, Inc. 7,053 703,960Zebra Technologies Corp., Class A (K) 2,340 490,300Zimmer Biomet Holdings, Inc. 6,858 875,767Zoetis, Inc. 607 61,107Zumiez, Inc. (K) 975 24,268
173,876,336Total Common Stocks
(Cost $265,453,999) 391,572,174
CONTINGENT VALUE RIGHT - 0.0%United States - 0.0%A. Schulman, Inc. (C) (D) (L) 1,325 0Total Contingent Value Right
(Cost $574) 0
Shares ValuePREFERRED STOCKS - 0.1%Brazil - 0.1%Banco Bradesco SA,
2.66% (M) 19,643 $ 215,427Gerdau SA,
2.83% (M) 28,306 109,454Itau Unibanco Holding SA,
4.20% (M) 35,482 312,014Petroleo Brasileiro SA,
3.08% (M) 55,289 396,238Telefonica Brasil SA,
9.14% (M) 11,027 133,7771,166,910
Germany - 0.0% (F)Henkel AG & Co. KGaA,
1.98% (M) 4,736 483,447Total Preferred Stocks
(Cost $1,816,442) 1,650,357
EXCHANGE-TRADED FUND - 0.2%United States - 0.2%iShares MSCI India ETF 90,468 3,188,997Total Exchange-Traded Fund
(Cost $3,189,413) 3,188,997
INVESTMENT COMPANIES - 4.2%United States - 4.2%JPMorgan High Yield Fund 2,857,559 20,517,274JPMorgan Value Advantage Fund 1,177,380 40,443,003Total Investment Companies
(Cost $55,822,927) 60,960,277
Principal ValueOTHER INVESTMENT COMPANY - 0.6%Securities Lending Collateral - 0.6%State Street Navigator Securities Lending
Trust - Government Money MarketPortfolio, 2.41% (M) 8,447,117 8,447,117
Total Other Investment Company(Cost $8,447,117) 8,447,117
REPURCHASE AGREEMENT - 1.1%Fixed Income Clearing Corp., 1.45% (M),
dated 03/29/2019, to be repurchased at$16,547,502 on 04/01/2019.Collateralized by a U.S. GovernmentObligation, 2.75%, due 09/15/2021, andwith a value of $16,879,970. $ 16,545,503 16,545,503
Total Repurchase Agreement(Cost $16,545,503) 16,545,503
Total Investments(Cost $1,319,046,711) 1,462,486,638
Net Other Assets (Liabilities) - (0.1)% (1,648,673 )Net Assets - 100.0% $ 1,460,837,965
Copyright © 2021 www.secdatabase.com. All Rights Reserved.Please Consider the Environment Before Printing This Document

The notes are an integral part of this report.Transamerica Series Trust Page 36
Copyright © 2021 www.secdatabase.com. All Rights Reserved.Please Consider the Environment Before Printing This Document

Transamerica JPMorgan Tactical Allocation VPSCHEDULE OF INVESTMENTS (continued)At March 31, 2019(unaudited)
FUTURES CONTRACTS:
DescriptionLong/Short
Number ofContracts
ExpirationDate
NotionalAmount Value
UnrealizedAppreciation
UnrealizedDepreciation
3-Year Australia Treasury Bond Long 209 06/17/2019 $16,778,193 $16,864,535 $86,342 $�10-Year Australia Treasury Bond Long 140 06/17/2019 13,517,846 13,773,485 255,639 �10-Year Canada Government Bond Short (131) 06/19/2019 (13,503,175 ) (13,629,842 ) � (126,667 )10-Year U.S. Treasury Note Long 966 06/19/2019 118,298,499 119,995,089 1,696,590 �E-Mini Russell 2000® Index Long 3 06/21/2019 227,754 231,570 3,816 �EURO STOXX 50® Index Long 31 06/21/2019 1,121,316 1,137,814 16,498 �EURO STOXX 50® Index Short (373) 06/21/2019 (13,453,667 ) (13,690,246 ) � (236,579 )FTSE 100 Index Long 8 06/21/2019 737,404 751,409 14,005 �MSCI EAFE Index Long 21 06/21/2019 1,918,128 1,959,720 41,592 �MSCI Emerging Markets Index Long 129 06/21/2019 6,909,602 6,820,230 � (89,372 )S&P 500® E-Mini Index Long 87 06/21/2019 12,333,012 12,344,430 11,418 �S&P Midcap 400® E-Mini Index Long 2 06/21/2019 374,134 380,200 6,066 �S&P/ASX 200 Index Long 16 06/20/2019 1,756,115 1,752,687 � (3,428 )S&P/ASX 200 Index Short (108) 06/20/2019 (11,849,673 ) (11,830,636 ) 19,037 �S&P/TSX 60 Index Long 36 06/20/2019 5,113,676 5,156,673 42,997 �TOPIX Index Long 6 06/13/2019 870,185 861,861 � (8,324 )U.K. Gilt Short (81) 06/26/2019 (13,381,226 ) (13,648,331 ) � (267,105 )Total $2,194,000 $ (731,475 )
INVESTMENTS BY INDUSTRY:
IndustryPercentage of
Total Investments ValueU.S. Government Agency Obligations 24.8 % $ 362,451,202U.S. Government Obligations 14.0 204,119,637Asset-Backed Securities 9.7 142,117,998Banks 4.9 72,297,466Mortgage-Backed Securities 4.5 66,406,991Food & Staples Retailing 2.9 42,445,898U.S. Equity Funds 2.8 40,443,003Capital Markets 2.3 33,146,903Oil, Gas & Consumable Fuels 2.1 30,347,327Equity Real Estate Investment Trusts 2.0 29,630,657U.S. Fixed Income Funds 1.4 20,517,274Specialty Retail 1.4 19,910,549Software 1.4 19,883,153Insurance 1.3 19,141,242Pharmaceuticals 1.2 17,803,421Electric Utilities 1.2 17,450,061Health Care Providers & Services 1.0 15,183,329Metals & Mining 1.0 14,258,277Wireless Telecommunication Services 0.9 13,802,016Semiconductors & Semiconductor Equipment 0.9 12,874,844IT Services 0.9 12,496,493Technology Hardware, Storage & Peripherals 0.8 12,173,507Media 0.8 11,092,994Internet & Direct Marketing Retail 0.7 10,829,785Diversified Telecommunication Services 0.7 10,591,337Airlines 0.7 9,983,007Diversified Financial Services 0.7 9,731,966Interactive Media & Services 0.6 9,561,235Chemicals 0.6 9,232,609Beverages 0.6 8,820,630Machinery 0.6 8,485,265Foreign Government Obligations 0.6 8,283,320Aerospace & Defense 0.5 6,998,106Food Products 0.5 6,796,101
Copyright © 2021 www.secdatabase.com. All Rights Reserved.Please Consider the Environment Before Printing This Document

Road & Rail 0.5 6,703,036Health Care Equipment & Supplies 0.4 6,554,178Entertainment 0.4 6,068,744Biotechnology 0.4 5,831,649
The notes are an integral part of this report.Transamerica Series Trust Page 37
Copyright © 2021 www.secdatabase.com. All Rights Reserved.Please Consider the Environment Before Printing This Document

Transamerica JPMorgan Tactical Allocation VPSCHEDULE OF INVESTMENTS (continued)At March 31, 2019(unaudited)
INVESTMENTS BY INDUSTRY (continued):
IndustryPercentage of
Total Investments ValueConsumer Finance 0.4 % $ 5,199,754Paper & Forest Products 0.3 4,869,788Automobiles 0.3 4,609,710Hotels, Restaurants & Leisure 0.3 3,959,223Electronic Equipment, Instruments & Components 0.3 3,948,489Tobacco 0.2 3,533,671Industrial Conglomerates 0.2 3,513,934Trading Companies & Distributors 0.2 3,508,626Electrical Equipment 0.2 3,369,203International Equity Funds 0.2 3,188,997Multi-Utilities 0.2 3,103,154Textiles, Apparel & Luxury Goods 0.2 2,937,269Commercial Services & Supplies 0.2 2,896,044Building Products 0.2 2,637,166Gas Utilities 0.2 2,475,580Household Durables 0.2 2,473,292Real Estate Management & Development 0.2 2,469,721Diversified Consumer Services 0.2 2,432,310Containers & Packaging 0.1 2,245,308Personal Products 0.1 2,108,506Auto Components 0.1 2,036,592Life Sciences Tools & Services 0.1 1,920,869Communications Equipment 0.1 1,660,475Construction Materials 0.1 1,573,046Household Products 0.1 1,522,384Energy Equipment & Services 0.1 1,452,584Air Freight & Logistics 0.1 1,055,177Multiline Retail 0.1 1,034,008Professional Services 0.1 931,754Transportation Infrastructure 0.1 909,096Health Care Technology 0.1 878,124Construction & Engineering 0.1 771,052Municipal Government Obligations 0.0 (F) 613,993Independent Power & Renewable Electricity Producers 0.0 (F) 398,037Water Utilities 0.0 (F) 360,323Thrifts & Mortgage Finance 0.0 (F) 174,849Leisure Products 0.0 (F) 127,687Distributors 0.0 (F) 72,113Mortgage Real Estate Investment Trusts 0.0 (F) 37,953Marine 0.0 (F) 18,947Investments 98.3 1,437,494,018Short-Term Investments 1.7 24,992,620Total Investments 100.0 % $ 1,462,486,638
The notes are an integral part of this report.Transamerica Series Trust Page 38
Copyright © 2021 www.secdatabase.com. All Rights Reserved.Please Consider the Environment Before Printing This Document

Transamerica JPMorgan Tactical Allocation VPSCHEDULE OF INVESTMENTS (continued)At March 31, 2019(unaudited)
SECURITY VALUATION:
Valuation Inputs (N)
Level 1 -Unadjusted
QuotedPrices
Level 2 -Other
SignificantObservable
Inputs
Level 3 -Significant
UnobservableInputs (O) Value
ASSETSInvestmentsAsset-Backed Securities $� $141,173,951 $944,047 $142,117,998Corporate Debt Securities � 196,121,906 7,166 196,129,072Foreign Government Obligations � 8,283,320 � 8,283,320Mortgage-Backed Securities � 66,406,991 � 66,406,991Municipal Government Obligations � 613,993 � 613,993U.S. Government Agency Obligations � 362,451,202 � 362,451,202U.S. Government Obligations � 204,119,637 � 204,119,637Common Stocks 311,542,799 80,029,375 � 391,572,174Contingent Value Right � � 0 0Preferred Stocks 1,166,910 483,447 � 1,650,357Exchange-Traded Fund 3,188,997 � � 3,188,997Investment Companies 60,960,277 � � 60,960,277Other Investment Company 8,447,117 � � 8,447,117Repurchase Agreement � 16,545,503 � 16,545,503Total Investments $ 385,306,100 $ 1,076,229,325 $ 951,213 $ 1,462,486,638Other Financial InstrumentsFutures Contracts (P) $2,194,000 $� $� $2,194,000Total Other Financial Instruments $2,194,000 $�� $�� $2,194,000LIABILITIESOther Financial InstrumentsFutures Contracts (P) $(731,475 ) $� $� $(731,475 )Total Other Financial Instruments $(731,475 ) $�� $�� $(731,475 )
FOOTNOTES TO SCHEDULE OF INVESTMENTS:
(A) Securities are registered pursuant to Rule 144A of the Securities Act of 1933. Unless otherwise indicated, the securities are deemed to be liquid for purposes ofcompliance limitations on holdings of illiquid securities and may be resold as transactions exempt from registration, normally to qualified institutional buyers. AtMarch 31, 2019, the total value of 144A securities is $160,424,287, representing 11.0% of the Portfolio�s net assets.
(B) Floating or variable rate securities. The rates disclosed are as of March 31, 2019. For securities based on a published reference rate and spread, the referencerate and spread are indicated within the description. Variable rate securities with a floor or ceiling feature are disclosed at the inherent rate, where applicable.Certain variable rate securities are not based on a published reference rate and spread, but are determined by the issuer or agent and are based on current marketconditions; these securities do not indicate a reference rate and spread in the description.
(C) Fair valued as determined in good faith in accordance with procedures established by the Board. At March 31, 2019, the total value of securities is $951,213,representing 0.1% of the Portfolio�s net assets.
(D) Securities are Level 3 of the fair value hierarchy.(E) All or a portion of the securities are on loan. The total value of all securities on loan is $8,164,605. The amount of securities on loan indicated may not
correspond with the securities on loan identified because securities with pending sales are in the process of recall from the brokers.(F) Percentage rounds to less than 0.1% or (0.1)%.(G) When-issued, delayed-delivery and/or forward commitment (including TBAs) securities. Securities to be settled and delivered after March 31, 2019. Securities
may display a coupon rate of 0.00%, as the rate is to be determined at time of settlement.(H) Step bonds. Coupon rates change in increments to maturity. The rates disclosed are as of March 31, 2019; the maturity dates disclosed are the ultimate maturity
dates.(I) Perpetual maturity. The date displayed is the next call date.(J) All or a portion of the security has been segregated by the custodian as collateral to cover margin requirements for open futures contracts. The value of the
security is $7,556,825.(K) Non-income producing securities.(L) Security deemed worthless.(M) Rates disclosed reflect the yields at March 31, 2019.(N) There were no transfers in or out of Level 3 during the period ended March 31, 2019. Please reference the Security Valuation section of the Notes to Schedules of
Investments for more information regarding security valuation and pricing inputs.(O) Level 3 securities were not considered significant to the Portfolio.
Copyright © 2021 www.secdatabase.com. All Rights Reserved.Please Consider the Environment Before Printing This Document

(P) Futures contracts and/or forward foreign currency contracts are valued at unrealized appreciation (depreciation).
PORTFOLIO ABBREVIATIONS:
ADR American Depositary ReceiptASX Australian Securities ExchangeCMT Constant Maturity TreasuryCVA Commanditaire Vennootschap op Aandelen (Dutch Certificate)EAFE Europe, Australasia and Far EastFTSE Financial Times Stock ExchangeGDR Global Depositary ReceiptLIBOR London Interbank Offered RateMTA Month Treasury Average
The notes are an integral part of this report.Transamerica Series Trust Page 39
Copyright © 2021 www.secdatabase.com. All Rights Reserved.Please Consider the Environment Before Printing This Document

Transamerica JPMorgan Tactical Allocation VPSCHEDULE OF INVESTMENTS (continued)At March 31, 2019(unaudited)
PORTFOLIO ABBREVIATIONS (continued):
MTN Medium Term NoteREIT Real Estate Investment TrustSTOXX Deutsche Börse Group & SIX Group IndexSTRIPS Separate Trading of Registered Interest and Principal of SecuritiesTOPIX Tokyo Price IndexTSX Toronto Stock Exchange
The notes are an integral part of this report.Transamerica Series Trust Page 40
Copyright © 2021 www.secdatabase.com. All Rights Reserved.Please Consider the Environment Before Printing This Document

Transamerica Legg Mason Dynamic Allocation �� Balanced VPSCHEDULE OF INVESTMENTSAt March 31, 2019(unaudited)
EXCHANGE-TRADED OPTIONS PURCHASED:
DescriptionExercise
PriceExpiration
DateNotionalAmount
Number ofContracts
PremiumsPaid Value
Put - S&P 500® Index USD 2,100.00 06/19/2020 USD 7,936,320 28 $194,124 $98,420Put - S&P 500® Index USD 2,150.00 06/19/2020 USD 7,369,440 26 201,838 103,610Put - S&P 500® Index USD 2,200.00 06/19/2020 USD 6,519,120 23 199,414 103,615Put - S&P 500® Index USD 2,250.00 06/19/2020 USD 15,022,320 53 401,381 268,975Put - S&P 500® Index USD 2,300.00 06/19/2020 USD 81,063,840 286 1,777,140 1,663,090Put - S&P 500® Index USD 2,350.00 06/19/2020 USD 72,560,640 256 1,783,682 1,642,240Put - S&P 500® Index USD 2,400.00 06/19/2020 USD 64,907,760 229 1,783,173 1,647,655Put - S&P 500® Index USD 2,475.00 06/19/2020 USD 48,184,800 170 1,539,281 1,444,150Total $ 7,880,033 $ 6,971,755
The notes are an integral part of this report.Transamerica Series Trust Page 1
Shares ValueEXCHANGE-TRADED FUNDS - 99.2%International Equity Fund - 4.9%iShares MSCI EAFE ETF 835,522 $ 54,191,957U.S. Equity Funds - 43.9%iShares Core S&P 500 ETF 1,224,315 348,391,076SPDR S&P 500 ETF Trust 307,992 87,001,580Vanguard Small-Cap ETF (A) 348,896 53,311,309
488,703,965U.S. Fixed Income Funds - 50.4%iShares 20+ Year Treasury Bond ETF (A) 857,032 108,363,126iShares Core U.S. Aggregate Bond ETF 819,590 89,392,682Vanguard Total Bond Market ETF 4,470,773 362,937,352
560,693,160Total Exchange-Traded Funds
(Cost $1,005,470,171) 1,103,589,082
OTHER INVESTMENT COMPANY - 7.5%Securities Lending Collateral - 7.5%State Street Navigator Securities Lending Trust
- Government Money Market Portfolio,2.41% (B) 83,496,081 83,496,081
Total Other Investment Company(Cost $83,496,081) 83,496,081
Principal ValueREPURCHASE AGREEMENT - 0.3%Fixed Income Clearing Corp., 1.45% (B), dated
03/29/2019, to be repurchased at $3,081,018 on04/01/2019. Collateralized by a U.S.Government Obligation, 2.75%, due 08/15/2021, and with a value of $3,142,626. $ 3,080,645 $ 3,080,645
Total Repurchase Agreement(Cost $3,080,645) 3,080,645
Total Investments Excluding Purchased Options(Cost $1,092,046,897) 1,190,165,808
Total Purchased Options - 0.6%(Cost $7,880,033) 6,971,755
Total Investments(Cost $1,099,926,930) 1,197,137,563
Net Other Assets (Liabilities) - (7.6)% (84,129,237 )Net Assets - 100.0% $ 1,113,008,326
Copyright © 2021 www.secdatabase.com. All Rights Reserved.Please Consider the Environment Before Printing This Document

Transamerica Legg Mason Dynamic Allocation �� Balanced VPSCHEDULE OF INVESTMENTS (continued)At March 31, 2019(unaudited)
SECURITY VALUATION:
Valuation Inputs (C)
Level 1 -Unadjusted
QuotedPrices
Level 2 -Other
SignificantObservable
Inputs
Level 3 -Significant
UnobservableInputs Value
ASSETSInvestmentsExchange-Traded Funds $1,103,589,082 $� $ � $1,103,589,082Other Investment Company 83,496,081 � � 83,496,081Repurchase Agreement � 3,080,645 � 3,080,645Exchange-Traded Options Purchased 6,971,755 � � 6,971,755Total Investments $ 1,194,056,918 $ 3,080,645 $ �� $ 1,197,137,563
FOOTNOTES TO SCHEDULE OF INVESTMENTS:
(A) All or a portion of the securities are on loan. The total value of all securities on loan is $81,834,541. The amount of securities on loan indicated may notcorrespond with the securities on loan identified because securities with pending sales are in the process of recall from the brokers.
(B) Rates disclosed reflect the yields at March 31, 2019.(C) There were no transfers in or out of Level 3 during the period ended March 31, 2019. Please reference the Security Valuation section of the Notes to Schedules of
Investments for more information regarding security valuation and pricing inputs.
The notes are an integral part of this report.Transamerica Series Trust Page 2
Copyright © 2021 www.secdatabase.com. All Rights Reserved.Please Consider the Environment Before Printing This Document

Transamerica Legg Mason Dynamic Allocation �� Growth VPSCHEDULE OF INVESTMENTSAt March 31, 2019(unaudited)
EXCHANGE-TRADED OPTIONS PURCHASED:
DescriptionExercise
PriceExpiration
DateNotionalAmount
Number ofContracts
PremiumsPaid Value
Put - S&P 500® Index USD 2,100.00 06/19/2020 USD 4,818,480 17 $117,861 $59,755Put - S&P 500® Index USD 2,150.00 06/19/2020 USD 4,251,600 15 116,445 59,775Put - S&P 500® Index USD 2,200.00 06/19/2020 USD 4,251,600 15 130,053 67,575Put - S&P 500® Index USD 2,250.00 06/19/2020 USD 9,636,960 34 261,260 172,550Put - S&P 500® Index USD 2,300.00 06/19/2020 USD 51,586,080 182 1,133,404 1,058,330Put - S&P 500® Index USD 2,350.00 06/19/2020 USD 46,767,600 165 1,148,105 1,058,475Put - S&P 500® Index USD 2,400.00 06/19/2020 USD 41,098,800 145 1,129,680 1,043,275Put - S&P 500® Index USD 2,475.00 06/19/2020 USD 31,461,840 111 1,004,196 942,945Total $ 5,041,004 $ 4,462,680
The notes are an integral part of this report.Transamerica Series Trust Page 1
Shares ValueEXCHANGE-TRADED FUNDS - 98.9%International Equity Fund - 6.9%iShares MSCI EAFE ETF 527,315 $ 34,201,651U.S. Equity Funds - 61.8%iShares Core S&P 500 ETF 772,205 219,738,655SPDR S&P 500 ETF Trust 194,717 55,003,658Vanguard Small-Cap ETF 221,718 33,878,510
308,620,823U.S. Fixed Income Funds - 30.2%iShares 20+ Year Treasury Bond ETF (A) 231,114 29,222,054iShares Core U.S. Aggregate Bond ETF 222,749 24,295,233Vanguard Total Bond Market ETF 1,196,408 97,124,402
150,641,689Total Exchange-Traded Funds
(Cost $447,031,019) 493,464,163
OTHER INVESTMENT COMPANY - 3.6%Securities Lending Collateral - 3.6%State Street Navigator Securities Lending Trust -
Government Money Market Portfolio,2.41% (B) 18,189,258 18,189,258
Total Other Investment Company(Cost $18,189,258) 18,189,258
Principal ValueREPURCHASE AGREEMENT - 0.3%Fixed Income Clearing Corp., 1.45% (B), dated
03/29/2019, to be repurchased at $1,458,932on 04/01/2019. Collateralized by a U.S.Government Obligation, 2.75%, due 08/15/2021, and with a value of $1,492,620. $ 1,458,756 $ 1,458,756
Total Repurchase Agreement(Cost $1,458,756) 1,458,756
Total Investments Excluding Purchased Options(Cost $466,679,033) 513,112,177
Total Purchased Options - 0.9%(Cost $5,041,004) 4,462,680
Total Investments(Cost $471,720,037) 517,574,857
Net Other Assets (Liabilities) - (3.7)% (18,355,787 )Net Assets - 100.0% $ 499,219,070
Copyright © 2021 www.secdatabase.com. All Rights Reserved.Please Consider the Environment Before Printing This Document

Transamerica Legg Mason Dynamic Allocation �� Growth VPSCHEDULE OF INVESTMENTS (continued)At March 31, 2019(unaudited)
SECURITY VALUATION:
Valuation Inputs (C)
Level 1 -Unadjusted
QuotedPrices
Level 2 -Other
SignificantObservable
Inputs
Level 3 -Significant
UnobservableInputs Value
ASSETSInvestmentsExchange-Traded Funds $493,464,163 $� $ � $493,464,163Other Investment Company 18,189,258 � � 18,189,258Repurchase Agreement � 1,458,756 � 1,458,756Exchange-Traded Options Purchased 4,462,680 � � 4,462,680Total Investments $ 516,116,101 $ 1,458,756 $ �� $ 517,574,857
FOOTNOTES TO SCHEDULE OF INVESTMENTS:
(A) All or a portion of the security is on loan. The value of the security on loan is $17,828,293. The amount on loan indicated may not correspond with the security onloan identified because a security with pending sales are in the process of recall from the brokers.
(B) Rates disclosed reflect the yields at March 31, 2019.(C) There were no transfers in or out of Level 3 during the period ended March 31, 2019. Please reference the Security Valuation section of the Notes to Schedules of
Investments for more information regarding security valuation and pricing inputs.
The notes are an integral part of this report.Transamerica Series Trust Page 2
Copyright © 2021 www.secdatabase.com. All Rights Reserved.Please Consider the Environment Before Printing This Document

Transamerica Levin Large Cap Value VPSCHEDULE OF INVESTMENTSAt March 31, 2019(unaudited)
The notes are an integral part of this report.Transamerica Series Trust Page 1
Shares ValueCOMMON STOCKS - 96.7%Aerospace & Defense - 1.6%Textron, Inc. 1,730 $ 87,642Auto Components - 1.7%Goodyear Tire & Rubber Co. 5,054 91,730Automobiles - 3.5%General Motors Co. 5,101 189,247Banks - 12.1%Bank of America Corp. 7,270 200,579Citigroup, Inc. 2,949 183,487JPMorgan Chase & Co. 2,614 264,615
648,681Beverages - 1.6%Cott Corp. 5,975 87,295Chemicals - 6.2%DowDuPont, Inc. 6,259 333,667Communications Equipment - 5.9%CommScope Holding Co., Inc. (A) 6,860 149,068Nokia OYJ, ADR 29,809 170,507
319,575Containers & Packaging - 0.3%WestRock Co. 468 17,948Diversified Telecommunication Services - 4.7%AT&T, Inc. 7,967 249,845Electric Utilities - 0.9%Evergy, Inc. 850 49,343Electrical Equipment - 3.8%Eaton Corp. PLC 1,502 121,001Emerson Electric Co. 1,191 81,548
202,549Food & Staples Retailing - 3.5%Walmart, Inc. 1,944 189,598Food Products - 5.0%Kraft Heinz Co. 4,319 141,015TreeHouse Foods, Inc. (A) 1,992 128,584
269,599Health Care Providers & Services - 4.9%Cigna Corp. (A) 441 70,922Quest Diagnostics, Inc. 2,119 190,540
261,462Hotels, Restaurants & Leisure - 0.0% (B)Royal Caribbean Cruises, Ltd. 9 1,032Insurance - 8.1%American International Group, Inc. 7,145 307,664Lincoln National Corp. 2,203 129,316
436,980
Shares ValueCOMMON STOCKS (continued)Life Sciences Tools & Services - 3.8%Bio-Rad Laboratories, Inc., Class A (A) 540 $ 165,067Fluidigm Corp. (A) (C) 3,019 40,123
205,190Machinery - 1.0%Wabtec Corp. 747 55,069Multi-Utilities - 3.6%CenterPoint Energy, Inc. 6,229 191,230Oil, Gas & Consumable Fuels - 8.4%EOG Resources, Inc. 1,178 112,122Exxon Mobil Corp. 1,344 108,595Occidental Petroleum Corp. 3,485 230,707
451,424Pharmaceuticals - 8.2%Johnson & Johnson 1,105 154,468Pfizer, Inc. 6,722 285,483
439,951Semiconductors & Semiconductor Equipment - 2.9%Intel Corp. 2,890 155,193Specialty Retail - 2.3%Lowe�s Cos., Inc. 1,120 122,607Technology Hardware, Storage & Peripherals - 2.7%Apple, Inc. 758 143,982Total Common Stocks
(Cost $5,098,327) 5,200,839Total Investments
(Cost $5,098,327) 5,200,839Net Other Assets (Liabilities) - 3.3% 175,349Net Assets - 100.0% $ 5,376,188
Copyright © 2021 www.secdatabase.com. All Rights Reserved.Please Consider the Environment Before Printing This Document

Transamerica Levin Large Cap Value VPSCHEDULE OF INVESTMENTS (continued)At March 31, 2019(unaudited)
SECURITY VALUATION:
Valuation Inputs (D)
Level 1 -Unadjusted
QuotedPrices
Level 2 -Other
SignificantObservable
Inputs
Level 3 -Significant
UnobservableInputs Value
ASSETSInvestmentsCommon Stocks $5,200,839 $ � $ � $ 5,200,839Total Investments $ 5,200,839 $ �� $ �� $5,200,839
FOOTNOTES TO SCHEDULE OF INVESTMENTS:
(A) Non-income producing securities.(B) Percentage rounds to less than 0.1% or (0.1)%.(C) Restricted security. At March 31, 2019, the value of such security held by the Portfolio is as follows:
Investments DescriptionAcquisition
DateAcquisition
Cost ValueValue as Percentage
of Net AssetsCommon Stocks Fluidigm Corp. 11/29/2017 - 12/24/2018 $ 20,665 $ 40,123 0.7 %
(D) There were no transfers in or out of Level 3 during the period ended March 31, 2019. Please reference the Security Valuation section of the Notes to Schedules ofInvestments for more information regarding security valuation and pricing inputs.
PORTFOLIO ABBREVIATION:
ADR American Depositary Receipt
The notes are an integral part of this report.Transamerica Series Trust Page 2
Copyright © 2021 www.secdatabase.com. All Rights Reserved.Please Consider the Environment Before Printing This Document

Transamerica Madison Balanced Allocation VPSCHEDULE OF INVESTMENTSAt March 31, 2019(unaudited)
The notes are an integral part of this report.Transamerica Series Trust Page 1
Shares ValueEXCHANGE-TRADED FUNDS - 9.6%International Equity Fund - 5.5%Vanguard FTSE All-World ex-US ETF 110,527 $ 5,542,929U.S. Fixed Income Fund - 4.1%iShares 20+ Year Treasury Bond ETF 33,190 4,196,544Total Exchange-Traded Funds
(Cost $9,432,466) 9,739,473
INVESTMENT COMPANIES - 89.3%International Equity Funds - 6.3%Transamerica International Equity (A) 180,884 3,042,470Transamerica International Growth (A) 488,324 3,388,969
6,431,439International Fixed Income Fund - 2.3%Transamerica Inflation Opportunities (A) 240,194 2,401,942U.S. Equity Funds - 37.4%Madison Dividend Income Fund 299,517 7,781,460Madison Investors Fund 495,859 10,784,940Madison Mid Cap Fund 452,086 4,629,363Transamerica JPMorgan Enhanced Index
VP (A) 5,282 115,458Transamerica Large Cap Value (A) 358,766 4,032,525Transamerica Small/Mid Cap Value VP (A) 13,223 255,868Transamerica WMC US Growth VP (A) 331,852 10,479,899
38,079,513U.S. Fixed Income Funds - 43.3%Madison Core Bond Fund 1,403,610 13,867,669Transamerica Core Bond (A) 1,937,542 19,104,166Transamerica Short-Term Bond (A) 1,115,227 11,118,814
44,090,649Total Investment Companies
(Cost $90,897,011) 91,003,543
Principal ValueREPURCHASE AGREEMENT - 1.2%Fixed Income Clearing Corp., 1.45% (B),
dated 03/29/2019, to be repurchased at$1,223,689 on 04/01/2019. Collateralizedby a U.S. Government Obligation, 2.75%,due 08/15/2021, and with a value of$1,248,927. $ 1,223,541 1,223,541
Total Repurchase Agreement(Cost $1,223,541) 1,223,541
Total Investments(Cost $101,553,018) 101,966,557
Net Other Assets (Liabilities) - (0.1)% (64,582 )Net Assets - 100.0% $ 101,901,975
Copyright © 2021 www.secdatabase.com. All Rights Reserved.Please Consider the Environment Before Printing This Document

Transamerica Madison Balanced Allocation VPSCHEDULE OF INVESTMENTS (continued)At March 31, 2019(unaudited)
SECURITY VALUATION:
Valuation Inputs (C)
Level 1 -Unadjusted
QuotedPrices
Level 2 -Other
SignificantObservable
Inputs
Level 3 -Significant
UnobservableInputs Value
ASSETSInvestmentsExchange-Traded Funds $9,739,473 $� $ � $9,739,473Investment Companies 91,003,543 � � 91,003,543Repurchase Agreement � 1,223,541 � 1,223,541Total Investments $ 100,743,016 $ 1,223,541 $ �� $ 101,966,557
FOOTNOTES TO SCHEDULE OF INVESTMENTS:
(A) Affiliated investment in the Class I2 shares of Transamerica Funds and/or investment in the Initial Class shares of Transamerica Series Trust. The Portfolio�stransactions and earnings from investments of TAM are as follows:
Affiliated InvestmentsValue
December 31, 2018Purchases
at CostProceeds
from Sales
NetRealized
Gain (Loss)
Net Change inUnrealized
Appreciation(Depreciation)
ValueMarch 31, 2019
Shares as ofMarch 31, 2019
DividendIncome
Net CapitalGain
DistributionsTransamerica Core Bond $ 16,723,196 $1,982,255 $� $� $398,715 $19,104,166 1,937,542 $132,255 $ �Transamerica Inflation
Opportunities 3,032,071 � (725,176 ) (20,499 ) 115,546 2,401,942 240,194 � �Transamerica International Equity 4,047,318 250,000 (1,536,936 ) (239,875 ) 521,963 3,042,470 180,884 � �Transamerica International Growth 4,110,598 250,000 (1,391,887 ) (521,072 ) 941,330 3,388,969 488,324 � �Transamerica JPMorgan Enhanced
Index VP 101,937 � � � 13,521 115,458 5,282 � �Transamerica Large Cap Value 3,340,614 868,782 (650,978 ) (70,949 ) 545,056 4,032,525 358,766 18,782 �Transamerica Short-Term Bond 12,594,254 84,886 (1,699,798 ) (25,345 ) 164,817 11,118,814 1,115,227 84,886 �Transamerica Small/Mid Cap Value
VP 470,423 � (272,716 ) (22,263 ) 80,424 255,868 13,223 � �Transamerica WMC US Growth VP 9,127,191 625,000 (766,677 ) 33,632 1,460,753 10,479,899 331,852 � �
Total $ 53,547,602 $ 4,060,923 $ (7,044,168) $ (866,371) $ 4,242,125 $ 53,940,111 4,671,294 $ 235,923 $ ��
(B) Rate disclosed reflects the yield at March 31, 2019.(C) There were no transfers in or out of Level 3 during the period ended March 31, 2019. Please reference the Security Valuation section of the Notes to Schedules of
Investments for more information regarding security valuation and pricing inputs.
The notes are an integral part of this report.Transamerica Series Trust Page 2
Copyright © 2021 www.secdatabase.com. All Rights Reserved.Please Consider the Environment Before Printing This Document

Transamerica Madison Conservative Allocation VPSCHEDULE OF INVESTMENTSAt March 31, 2019(unaudited)
The notes are an integral part of this report.Transamerica Series Trust Page 1
Shares ValueEXCHANGE-TRADED FUNDS - 9.6%International Equity Fund - 4.4%Vanguard FTSE All-World ex-US ETF 56,473 $ 2,832,121U.S. Fixed Income Fund - 5.2%iShares 20+ Year Treasury Bond ETF 26,028 3,290,980Total Exchange-Traded Funds
(Cost $5,955,666) 6,123,101
INVESTMENT COMPANIES - 89.4%International Equity Funds - 2.1%Transamerica International Equity (A) 38,918 654,603Transamerica International Growth (A) 95,370 661,869
1,316,472International Fixed Income Fund - 5.1%Transamerica Inflation Opportunities (A) 324,122 3,241,219U.S. Equity Funds - 22.4%Madison Dividend Income Fund 146,143 3,796,786Madison Investors Fund 210,879 4,586,625Madison Mid Cap Fund 94,763 970,375Transamerica Large Cap Value (A) 85,621 962,379Transamerica Small/Mid Cap Value VP (A) 3,043 58,890Transamerica WMC US Growth VP (A) 125,214 3,954,245
14,329,300U.S. Fixed Income Funds - 59.8%Madison Core Bond Fund 1,230,597 12,158,301Transamerica Core Bond (A) 1,488,625 14,677,844Transamerica Short-Term Bond (A) 1,141,569 11,381,440
38,217,585Total Investment Companies
(Cost $57,258,847) 57,104,576
Principal ValueREPURCHASE AGREEMENT - 1.1%Fixed Income Clearing Corp., 1.45% (B), dated
03/29/2019, to be repurchased at $698,552 on04/01/2019. Collateralized by a U.S.Government Obligation, 2.75%, due 08/15/2021, and with a value of $715,849. $ 698,467 698,467
Total Repurchase Agreement(Cost $698,467) 698,467
Total Investments(Cost $63,912,980) 63,926,144
Net Other Assets (Liabilities) - (0.1)% (35,677 )Net Assets - 100.0% $ 63,890,467
Copyright © 2021 www.secdatabase.com. All Rights Reserved.Please Consider the Environment Before Printing This Document

Transamerica Madison Conservative Allocation VPSCHEDULE OF INVESTMENTS (continued)At March 31, 2019(unaudited)
SECURITY VALUATION:
Valuation Inputs (C)
Level 1 -Unadjusted
QuotedPrices
Level 2 -Other
SignificantObservable
Inputs
Level 3 -Significant
UnobservableInputs Value
ASSETSInvestmentsExchange-Traded Funds $6,123,101 $� $ � $6,123,101Investment Companies 57,104,576 � � 57,104,576Repurchase Agreement � 698,467 � 698,467Total Investments $ 63,227,677 $ 698,467 $ �� $ 63,926,144
FOOTNOTES TO SCHEDULE OF INVESTMENTS:
(A) Affiliated investment in the Class I2 shares of Transamerica Funds and/or investment in the Initial Class shares of Transamerica Series Trust. The Portfolio�stransactions and earnings from investments of TAM are as follows:
Affiliated InvestmentsValue
December 31, 2018Purchases
at CostProceeds
from Sales
NetRealized
Gain (Loss)
Net Change inUnrealized
Appreciation(Depreciation)
ValueMarch 31, 2019
Shares as ofMarch 31, 2019
DividendIncome
Net CapitalGain
DistributionsTransamerica Core Bond $ 13,188,643 $1,353,371 $(175,000 ) $(6,128 ) $316,958 $14,677,844 1,488,625 $103,370 $ �Transamerica Inflation
Opportunities 4,114,038 � (999,748 ) (34,161 ) 161,090 3,241,219 324,122 � �Transamerica International Equity 1,139,867 � (550,511 ) (83,365 ) 148,612 654,603 38,918 � �Transamerica International Growth 1,131,190 � (564,600 ) (210,518 ) 305,797 661,869 95,370 � �Transamerica Large Cap Value 618,285 514,482 (273,056 ) (35,349 ) 138,017 962,379 85,621 2,958 �Transamerica Short-Term Bond 12,284,892 259,163 (1,300,304 ) (16,634 ) 154,323 11,381,440 1,141,569 84,164 �Transamerica Small/Mid Cap Value
VP 140,864 � (99,170 ) (8,096 ) 25,292 58,890 3,043 � �Transamerica WMC US Growth VP 3,115,619 675,000 (358,326 ) (23,117 ) 545,069 3,954,245 125,214 � �
Total $ 35,733,398 $ 2,802,016 $ (4,320,715) $ (417,368) $ 1,795,158 $ 35,592,489 3,302,482 $ 190,492 $ ��
(B) Rate disclosed reflects the yield at March 31, 2019.(C) There were no transfers in or out of Level 3 during the period ended March 31, 2019. Please reference the Security Valuation section of the Notes to Schedules of
Investments for more information regarding security valuation and pricing inputs.
The notes are an integral part of this report.Transamerica Series Trust Page 2
Copyright © 2021 www.secdatabase.com. All Rights Reserved.Please Consider the Environment Before Printing This Document

Transamerica Madison Diversified Income VPSCHEDULE OF INVESTMENTSAt March 31, 2019(unaudited)
The notes are an integral part of this report.Transamerica Series Trust Page 1
Shares ValueCOMMON STOCKS - 42.0%Aerospace & Defense - 0.9%United Technologies Corp. 10,500 $ 1,353,345Air Freight & Logistics - 1.0%United Parcel Service, Inc., Class B 14,500 1,620,230Banks - 2.2%US Bancorp 34,500 1,662,555Wells Fargo & Co. 35,500 1,715,360
3,377,915Beverages - 1.2%PepsiCo, Inc. 15,000 1,838,250Biotechnology - 0.4%Amgen, Inc. 3,500 664,930Capital Markets - 1.4%BlackRock, Inc. 3,500 1,495,795Northern Trust Corp. 8,000 723,280
2,219,075Chemicals - 1.2%Linde PLC 10,500 1,847,265Communications Equipment - 1.4%Cisco Systems, Inc. 40,500 2,186,595Diversified Telecommunication Services - 1.6%Verizon Communications, Inc. 42,500 2,513,025Electric Utilities - 0.9%NextEra Energy, Inc. 7,500 1,449,900Electrical Equipment - 0.6%Emerson Electric Co. 12,500 855,875Food Products - 2.1%Hershey Co. 10,000 1,148,300Nestle SA, ADR 21,500 2,049,380
3,197,680Health Care Equipment & Supplies - 1.1%Medtronic PLC 19,000 1,730,520Hotels, Restaurants & Leisure - 2.4%McDonald�s Corp. 10,300 1,955,970Starbucks Corp. 24,000 1,784,160
3,740,130Household Products - 1.6%Procter & Gamble Co. 24,000 2,497,200Industrial Conglomerates - 0.7%3M Co. 5,500 1,142,790Insurance - 2.1%Chubb, Ltd. 10,500 1,470,840Travelers Cos., Inc. 13,000 1,783,080
3,253,920
Shares ValueCOMMON STOCKS (continued)IT Services - 1.7%Accenture PLC, Class A 5,100 $ 897,702Automatic Data Processing, Inc. 5,400 862,596Paychex, Inc. 11,500 922,300
2,682,598Machinery - 1.0%Caterpillar, Inc. 11,800 1,598,782Media - 1.6%Comcast Corp., Class A 63,500 2,538,730Multi-Utilities - 0.7%Dominion Energy, Inc. 14,000 1,073,240Oil, Gas & Consumable Fuels - 2.8%Chevron Corp. 15,000 1,847,700Exxon Mobil Corp. 30,000 2,424,000
4,271,700Pharmaceuticals - 4.6%Johnson & Johnson 18,000 2,516,220Merck & Co., Inc. 22,000 1,829,740Novartis AG, ADR 15,900 1,528,626Pfizer, Inc. 31,000 1,316,570
7,191,156Road & Rail - 0.8%Union Pacific Corp. 7,000 1,170,400Semiconductors & Semiconductor Equipment - 2.3%Analog Devices, Inc. 14,500 1,526,415Texas Instruments, Inc. 19,000 2,015,330
3,541,745Software - 0.9%Microsoft Corp. 12,300 1,450,662Specialty Retail - 1.6%Home Depot, Inc. 6,500 1,247,285TJX Cos., Inc. 24,000 1,277,040
2,524,325Trading Companies & Distributors - 1.2%Fastenal Co. 28,000 1,800,680Total Common Stocks
(Cost $52,317,035) 65,332,663
Principal ValueASSET-BACKED SECURITIES - 3.1%American Express Credit Account Master Trust
Series 2017-1, Class B,2.10%, 09/15/2022 $ 500,000 496,630
BMW Floorplan Master Owner TrustSeries 2018-1, Class A2,1-Month LIBOR + 0.32%,
2.80% (A), 05/15/2023 (B) 175,000 174,959CarMax Auto Owner Trust
Series 2018-3, Class A3,3.13%, 06/15/2023 200,000 202,082
Chesapeake Funding II LLCSeries 2017-4A, Class A1,2.12%, 11/15/2029 (B) 363,669 360,119
Copyright © 2021 www.secdatabase.com. All Rights Reserved.Please Consider the Environment Before Printing This Document

Transamerica Madison Diversified Income VPSCHEDULE OF INVESTMENTS (continued)At March 31, 2019(unaudited)
Principal ValueASSET-BACKED SECURITIES (continued)Chesapeake Funding II LLC (continued)
Series 2018-1A, Class A1,3.04%, 04/15/2030 (B) $
441,529$442,936
Series 2018-2A, Class A1,3.23%, 08/15/2030 145,797 146,806Series 2018-3A, Class B,3.62%, 01/15/2031 (B) 100,000 101,965
CNH Equipment TrustSeries 2019-A, Class A4,3.22%, 01/15/2026 130,000 131,651
Dell Equipment Finance TrustSeries 2017-2, Class A2A,1.97%, 02/24/2020 (B) 77,232 77,113
Enterprise Fleet Financing LLCSeries 2017-3, Class A2,2.13%, 05/22/2023 (B) 515,080 512,478Series 2017-3, Class A3,2.36%, 05/20/2023 (B) 105,000 103,563
Evergreen Credit Card TrustSeries 2019-1, Class B,3.59%, 01/15/2023 (B) 110,000 110,838
John Deere Owner TrustSeries 2018-B, Class A3,3.08%, 11/15/2022 200,000 201,451
Nissan Auto Receivables Owner TrustSeries 2015-C, Class A3,1.37%, 05/15/2020 72,663 72,569
Synchrony Credit Card Master Note TrustSeries 2017-1, Class B,2.19%, 06/15/2023 500,000 495,795
Verizon Owner TrustSeries 2017-1A, Class A,2.06%, 09/20/2021 (B) 750,000 747,677Series 2018-A, Class A1A,3.23%, 04/20/2023 360,000 364,327
Total Asset-Backed Securities(Cost $4,713,238) 4,742,959
CORPORATE DEBT SECURITIES - 18.6%Aerospace & Defense - 0.2%Northrop Grumman Corp.
2.93%, 01/15/2025 250,000 246,562Banks - 3.1%Bank of America Corp.
Fixed until 07/21/2022,2.82% (A), 07/21/2023, MTN 500,000 496,673
Fixed until 10/01/2024,3.09% (A), 10/01/2025, MTN 300,000 297,513
Bank of Montreal1.90%, 08/27/2021, MTN 250,000 245,6553.30%, 02/05/2024 165,000 166,650
Citigroup, Inc.Fixed until 04/23/2028,
4.08% (A), 04/23/2029 400,000 410,400Fifth Third Bank
3.35%, 07/26/2021 250,000 253,567Huntington National Bank
3.55%, 10/06/2023 500,000 511,900JPMorgan Chase & Co.
2.97%, 01/15/2023 250,000 249,8963.13%, 01/23/2025 400,000 400,297
Principal ValueCORPORATE DEBT SECURITIES (continued)Banks (continued)Regions Financial Corp.
2.75%, 08/14/2022 $300,000
$297,658
3.20%, 02/08/2021 250,000 251,898Zions Bancorp NA
3.50%, 08/27/2021 250,000 252,6094,866,278
Beverages - 0.1%Anheuser-Busch Cos. LLC / Anheuser-Busch InBev
Worldwide, Inc.4.90%, 02/01/2046 (B) 200,000 200,877
Biotechnology - 0.1%AbbVie, Inc.
3.75%, 11/14/2023 225,000 230,977Capital Markets - 1.1%Bank of New York Mellon Corp.
2.20%, 08/16/2023, MTN 100,000 97,256Cboe Global Markets, Inc.
3.65%, 01/12/2027 235,000 237,840Goldman Sachs Group, Inc.
Fixed until 09/29/2024,3.27% (A), 09/29/2025 500,000 493,576
Intercontinental Exchange, Inc.2.35%, 09/15/2022 300,000 295,461
Morgan Stanley3.88%, 01/27/2026, MTN 250,000 255,6134.30%, 01/27/2045 250,000 254,206
Nasdaq, Inc.3.85%, 06/30/2026 100,000 101,378
1,735,330Chemicals - 0.3%DowDuPont, Inc.
4.73%, 11/15/2028 175,000 189,069Nutrien, Ltd.
4.20%, 04/01/2029 (C) 350,000 360,404549,473
Consumer Finance - 0.8%American Express Co.
2.50%, 08/01/2022 200,000 197,6634.20%, 11/06/2025 400,000 422,995
Capital One Financial Corp.3.30%, 10/30/2024 500,000 495,049
General Motors Financial Co., Inc.3.20%, 07/06/2021 50,000 49,775
Synchrony Financial3.70%, 08/04/2026 100,000 94,217
1,259,699Containers & Packaging - 0.3%WRKCo, Inc.
3.75%, 03/15/2025 500,000 504,473Diversified Financial Services - 0.2%Berkshire Hathaway, Inc.
3.13%, 03/15/2026 100,000 101,024National Rural Utilities Cooperative Finance Corp.
4.30%, 03/15/2049 150,000 158,902259,926
Copyright © 2021 www.secdatabase.com. All Rights Reserved.Please Consider the Environment Before Printing This Document

The notes are an integral part of this report.Transamerica Series Trust Page 2
KeyCorp5.10%, 03/24/2021, MTN 750,000 782,525
PNC Bank NA2.45%, 07/28/2022 250,000 249,037
Copyright © 2021 www.secdatabase.com. All Rights Reserved.Please Consider the Environment Before Printing This Document

Transamerica Madison Diversified Income VPSCHEDULE OF INVESTMENTS (continued)At March 31, 2019(unaudited)
The notes are an integral part of this report.Transamerica Series Trust Page 3
Principal ValueCORPORATE DEBT SECURITIES (continued)Diversified Telecommunication Services - 1.0%AT&T, Inc.
3.00%, 02/15/2022 $400,000
$401,572
4.75%, 05/15/2046 75,000 73,289Verizon Communications, Inc.
3.88%, 02/08/2029 250,000 255,9834.33%, 09/21/2028 478,000 505,5024.40%, 11/01/2034 300,000 312,090
1,548,436Electric Utilities - 0.3%Duke Energy Corp.
3.75%, 09/01/2046 250,000 233,717PacifiCorp
4.15%, 02/15/2050 200,000 207,309441,026
Electrical Equipment - 0.1%Emerson Electric Co.
5.00%, 04/15/2019 175,000 175,144Energy Equipment & Services - 0.2%Schlumberger Holdings Corp.
4.00%, 12/21/2025 (B) 300,000 309,287Equity Real Estate Investment Trusts - 1.1%Boston Properties, LP
2.75%, 10/01/2026 500,000 473,721Brixmor Operating Partnership, LP
3.65%, 06/15/2024 250,000 249,374Simon Property Group, LP
3.38%, 03/15/2022 750,000 762,942Welltower, Inc.
4.50%, 01/15/2024 200,000 210,8631,696,900
Food & Staples Retailing - 0.3%Walgreens Boots Alliance, Inc.
3.45%, 06/01/2026 250,000 244,6634.50%, 11/18/2034 300,000 298,283
542,946Food Products - 0.5%Bunge, Ltd. Finance Corp.
3.25%, 08/15/2026 175,000 157,115ConAgra Brands, Inc.
4.60%, 11/01/2025 250,000 262,390Mars, Inc.
3.95%, 04/01/2049 (B) 300,000 303,204722,709
Health Care Providers & Services - 0.7%Cigna Corp.
4.38%, 10/15/2028 (B) 50,000 51,8644.90%, 12/15/2048 (B) 100,000 103,190
CVS Health Corp.5.13%, 07/20/2045 250,000 254,072
Humana, Inc.2.50%, 12/15/2020 250,000 248,096
UnitedHealth Group, Inc.2.88%, 03/15/2023 500,000 502,866
1,160,088
Principal ValueCORPORATE DEBT SECURITIES (continued)Hotels, Restaurants & Leisure - 0.3%Marriott International, Inc.
3.13%, 06/15/2026 $175,000
$168,818
McDonald�s Corp.4.88%, 12/09/2045, MTN 250,000 270,419
439,237Industrial Conglomerates - 0.1%Carlisle Cos., Inc.
3.50%, 12/01/2024 200,000 199,837Insurance - 0.6%Aflac, Inc.
3.63%, 11/15/2024 300,000 310,9684.75%, 01/15/2049 250,000 276,098
American International Group, Inc.4.75%, 04/01/2048 300,000 298,376
885,442Internet & Direct Marketing Retail - 0.2%Amazon.com, Inc.
2.80%, 08/22/2024 300,000 300,526IT Services - 0.5%Fidelity National Information Services, Inc.
3.00%, 08/15/2026 220,000 210,7714.75%, 05/15/2048 300,000 297,743
Fiserv, Inc.3.80%, 10/01/2023 250,000 256,238
764,752Media - 0.9%Comcast Corp.
4.15%, 10/15/2028 350,000 368,3885.15%, 03/01/2020 475,000 485,416
Discovery Communications LLC5.00%, 09/20/2037 250,000 243,065
Omnicom Group, Inc. / Omnicom Capital, Inc.3.60%, 04/15/2026 260,000 257,879
1,354,748Metals & Mining - 0.1%Glencore Funding LLC
4.88%, 03/12/2029 (B) 150,000 150,847Oil, Gas & Consumable Fuels - 2.5%BP Capital Markets America, Inc.
3.12%, 05/04/2026 200,000 199,547ConocoPhillips Co.
4.15%, 11/15/2034 129,000 132,137Energy Transfer Operating, LP
5.25%, 04/15/2029 100,000 107,234Enterprise Products Operating LLC
3.75%, 02/15/2025 500,000 516,1255.20%, 09/01/2020 300,000 310,000
Exxon Mobil Corp.4.11%, 03/01/2046 225,000 243,593
Kinder Morgan, Inc.5.55%, 06/01/2045 450,000 490,783
Marathon Oil Corp.2.70%, 06/01/2020 250,000 248,834
Marathon Petroleum Corp.3.80%, 04/01/2028 (B) 300,000 297,017
Copyright © 2021 www.secdatabase.com. All Rights Reserved.Please Consider the Environment Before Printing This Document

Transamerica Madison Diversified Income VPSCHEDULE OF INVESTMENTS (continued)At March 31, 2019(unaudited)
The notes are an integral part of this report.Transamerica Series Trust Page 4
Principal ValueCORPORATE DEBT SECURITIES (continued)Oil, Gas & Consumable Fuels (continued)MPLX, LP
4.80%, 02/15/2029 $150,000 $ 157,902
Phillips 664.65%, 11/15/2034 400,000 429,514
Valero Energy Corp.6.63%, 06/15/2037 250,000 306,302
Valero Energy Partners, LP4.50%, 03/15/2028 400,000 413,735
3,852,723Pharmaceuticals - 0.4%Shire Acquisitions Investments Ireland DAC
1.90%, 09/23/2019 200,000 199,136Zoetis, Inc.
3.00%, 09/12/2027 500,000 480,468679,604
Road & Rail - 0.3%Norfolk Southern Corp.
3.25%, 12/01/2021 400,000 403,535Semiconductors & Semiconductor Equipment - 1.0%Analog Devices, Inc.
5.30%, 12/15/2045 175,000 195,517Intel Corp.
3.30%, 10/01/2021 925,000 942,6253.73%, 12/08/2047 400,000 402,333
1,540,475Software - 0.8%Citrix Systems, Inc.
4.50%, 12/01/2027 70,000 68,882Oracle Corp.
4.00%, 07/15/2046 325,000 326,668salesforce.com, Inc.
3.25%, 04/11/2023 500,000 512,3013.70%, 04/11/2028 300,000 314,021
1,221,872Technology Hardware, Storage & Peripherals - 0.1%Dell International LLC / EMC Corp.
8.35%, 07/15/2046 (B) 75,000 90,522Tobacco - 0.1%Altria Group, Inc.
5.95%, 02/14/2049 150,000 160,958Trading Companies & Distributors - 0.3%Air Lease Corp.
3.63%, 04/01/2027 200,000 188,1903.75%, 02/01/2022 300,000 302,592
490,782Total Corporate Debt Securities
(Cost $28,286,671) 28,985,991
MORTGAGE-BACKED SECURITIES - 0.4%Citigroup Commercial Mortgage Trust
Series 2014-GC23, Class A2,2.85%, 07/10/2047 29,720 29,693
Federal Home Loan Mortgage Corp.Series K006, Class A1,3.40%, 07/25/2019 106,198 106,126
Principal ValueMORTGAGE-BACKED SECURITIES (continued)Wells Fargo Commercial Mortgage Trust
Series 2015-C26, Class A2,2.66%, 02/15/2048 $
496,320$493,994
WFRBS Commercial Mortgage TrustSeries 2014-LC14, Class A2,2.86%, 03/15/2047 15,017 15,000
Total Mortgage-Backed Securities(Cost $644,075) 644,813
MUNICIPAL GOVERNMENT OBLIGATIONS - 1.5%California - 0.4%Palomar Community College District, General
Obligation Unlimited,Series B1,7.19%, 08/01/2045 425,000 449,778
Rancho Water District Financing Authority, RevenueBonds,Series A,6.34%, 08/01/2040 185,000 194,091
643,869Massachusetts - 0.3%University of Massachusetts Building Authority,
Revenue Bonds,6.57%, 05/01/2039 500,000 501,485
New York - 0.6%Metropolitan Transportation Authority, Revenue Bonds,
6.55%, 11/15/2031 340,000 425,741New York City Transitional Finance Authority Future
Tax Secured Revenue, Revenue Bonds,6.27%, 08/01/2039 500,000 506,090
931,831Oregon - 0.2%Washington County School District No. 1, General
Obligation Limited,4.36%, 06/30/2034 200,000 213,542
Total Municipal Government Obligations(Cost $2,466,525) 2,290,727
U.S. GOVERNMENT AGENCY OBLIGATIONS - 10.9%Federal Farm Credit Banks
3.47%, 05/07/2024 275,000 275,232Federal Home Loan Mortgage Corp.
2.85%, 06/28/2023, MTN 500,000 500,2442.98%, 11/25/2025 350,000 353,2713.00%, 09/01/2042 - 10/01/2046 1,528,204 1,526,8073.50%, 11/01/2040 - 12/01/2047 2,036,928 2,075,7754.00%, 04/01/2033 - 03/01/2047 1,028,697 1,062,9154.50%, 02/01/2025 - 05/01/2048 751,808 788,0035.50%, 01/01/2037 51,164 56,185
Federal Home Loan Mortgage Corp. MultifamilyStructured Pass-Through Certificates2.65%, 08/25/2026 500,000 494,5863.12%, 06/25/2027 750,000 762,481
Federal Home Loan Mortgage Corp. REMIC5.00%, 07/15/2036 193,441 208,718
Copyright © 2021 www.secdatabase.com. All Rights Reserved.Please Consider the Environment Before Printing This Document

Transamerica Madison Diversified Income VPSCHEDULE OF INVESTMENTS (continued)At March 31, 2019(unaudited)
The notes are an integral part of this report.Transamerica Series Trust Page 5
Principal ValueU.S. GOVERNMENT AGENCY OBLIGATIONS (continued)Federal National Mortgage Association
2.40% (A), 03/25/2023 $316,620 $ 314,044
3.00%, 09/01/2030 - 03/01/2043 1,470,039 1,478,8903.14% (A), 11/25/2027 500,000 504,0793.50%, 12/01/2031 - 12/01/2047 2,568,632 2,620,9434.00%, 02/01/2035 - 11/01/2048 2,801,617 2,901,7814.50%, 03/01/2039 - 07/01/2041 121,821 128,7925.00%, 07/01/2035 5,184 5,576
Federal National Mortgage Association REMIC2.50%, 04/25/2040 84,403 84,3203.50%, 04/25/2031 400,000 413,991
FREMF Mortgage TrustSeries 2015-K721, Class B,3.57% (A), 11/25/2047 (B) 250,000 252,399
Government National Mortgage Association3.50%, 12/15/2042 107,668 110,5494.00%, 12/15/2039 11,840 12,3044.50%, 08/15/2040 8,610 9,054
Total U.S. Government Agency Obligations(Cost $17,051,325) 16,940,939
U.S. GOVERNMENT OBLIGATIONS - 19.6%U.S. Treasury - 19.6%U.S. Treasury Bond
2.50%, 02/15/2045 1,250,000 1,179,3952.75%, 08/15/2042 - 11/15/2042 1,550,000 1,542,8673.00%, 05/15/2047 - 02/15/2048 2,000,000 2,070,9763.38%, 11/15/2048 275,000 306,0563.75%, 08/15/2041 600,000 702,1174.38%, 05/15/2041 500,000 637,676
U.S. Treasury Note1.50%, 08/15/2026 1,750,000 1,650,6741.63%, 08/15/2022 2,725,000 2,671,1392.00%, 07/31/2020 - 08/15/2025 9,250,000 9,166,2412.13%, 03/31/2024 2,000,000 1,988,9062.25%, 11/15/2025 500,000 497,7342.38%, 05/15/2027 1,000,000 1,001,0162.63%, 11/15/2020 2,000,000 2,008,7502.88%, 05/15/2028 1,500,000 1,558,0663.13%, 05/15/2021 3,500,000 3,559,609
Total U.S. Government Obligations(Cost $30,169,578) 30,541,222
REPURCHASE AGREEMENT - 4.4%Fixed Income Clearing Corp., 1.45% (D), dated
03/29/2019, to be repurchased at $6,836,111on 04/01/2019. Collateralized by a U.S.Government Obligation, 2.75%, due 08/15/2021, and with a value of $6,975,716. 6,835,285 6,835,285
Total Repurchase Agreement(Cost $6,835,285) 6,835,285
Total Investments(Cost $142,483,732) 156,314,599
Net Other Assets (Liabilities) - (0.5)% (705,365 )Net Assets - 100.0% $ 155,609,234
Copyright © 2021 www.secdatabase.com. All Rights Reserved.Please Consider the Environment Before Printing This Document

Transamerica Madison Diversified Income VPSCHEDULE OF INVESTMENTS (continued)At March 31, 2019(unaudited)
SECURITY VALUATION:
Valuation Inputs (E)
Level 1 -Unadjusted
QuotedPrices
Level 2 -Other
SignificantObservable
Inputs
Level 3 -Significant
UnobservableInputs Value
ASSETSInvestmentsCommon Stocks $65,332,663 $� $ � $65,332,663Asset-Backed Securities � 4,742,959 � 4,742,959Corporate Debt Securities � 28,985,991 � 28,985,991Mortgage-Backed Securities � 644,813 � 644,813Municipal Government Obligations � 2,290,727 � 2,290,727U.S. Government Agency Obligations � 16,940,939 � 16,940,939U.S. Government Obligations � 30,541,222 � 30,541,222Repurchase Agreement � 6,835,285 � 6,835,285Total Investments $ 65,332,663 $ 90,981,936 $�� $ 156,314,599
FOOTNOTES TO SCHEDULE OF INVESTMENTS:
(A) Floating or variable rate securities. The rates disclosed are as of March 31, 2019. For securities based on a published reference rate and spread, the referencerate and spread are indicated within the description. Variable rate securities with a floor or ceiling feature are disclosed at the inherent rate, where applicable.Certain variable rate securities are not based on a published reference rate and spread, but are determined by the issuer or agent and are based on current marketconditions; these securities do not indicate a reference rate and spread in the description.
(B) Securities are registered pursuant to Rule 144A of the Securities Act of 1933. Unless otherwise indicated, the securities are deemed to be liquid for purposes ofcompliance limitations on holdings of illiquid securities and may be resold as transactions exempt from registration, normally to qualified institutional buyers. AtMarch 31, 2019, the total value of 144A securities is $4,390,855, representing 2.8% of the Portfolio�s net assets.
(C) When-issued, delayed-delivery and/or forward commitment (including TBAs) security. Security to be settled and delivered after March 31, 2019. Security maydisplay a coupon rate of 0.00%, as the rate is to be determined at time of settlement.
(D) Rate disclosed reflects the yield at March 31, 2019.(E) There were no transfers in or out of Level 3 during the period ended March 31, 2019. Please reference the Security Valuation section of the Notes to Schedules of
Investments for more information regarding security valuation and pricing inputs.
PORTFOLIO ABBREVIATIONS:
ADR American Depositary ReceiptLIBOR London Interbank Offered RateMTN Medium Term Note
The notes are an integral part of this report.Transamerica Series Trust Page 6
Copyright © 2021 www.secdatabase.com. All Rights Reserved.Please Consider the Environment Before Printing This Document

Transamerica Managed Risk �� Balanced ETF VPSCHEDULE OF INVESTMENTSAt March 31, 2019(unaudited)
The notes are an integral part of this report.Transamerica Series Trust Page 1
Shares ValueEXCHANGE-TRADED FUNDS - 99.3%International Equity Funds - 17.2%DeltaShares® S&P International Managed
Risk ETF (A) (B) 2,483,049 $ 119,186,352Vanguard FTSE Developed Markets ETF 18,064,761 738,306,782Vanguard FTSE Emerging Markets
ETF (A) 3,928,053 166,942,2521,024,435,386
U.S. Equity Funds - 37.0%DeltaShares® S&P 400 Managed Risk
ETF (B) 920,383 47,238,658DeltaShares® S&P 500 Managed Risk
ETF (A) (B) 3,726,403 205,101,966DeltaShares® S&P 600 Managed Risk
ETF (B) 311,845 16,343,547iShares Core S&P Total US Stock
Market ETF (A) 7,692,728 495,411,683Schwab U.S. Broad Market ETF (A) 7,319,913 498,120,080Vanguard Total Stock Market ETF (A) 6,468,768 936,095,417
2,198,311,351U.S. Fixed Income Funds - 45.1%iShares Core U.S. Aggregate Bond ETF 10,907,017 1,189,628,344Vanguard Total Bond Market ETF 18,352,966 1,489,893,780
2,679,522,124Total Exchange-Traded Funds
(Cost $5,610,021,083) 5,902,268,861
OTHER INVESTMENT COMPANY - 0.2%Securities Lending Collateral - 0.2%State Street Navigator Securities Lending
Trust - Government Money MarketPortfolio, 2.41% (C) 9,479,664 9,479,664
Total Other Investment Company(Cost $9,479,664) 9,479,664
Principal ValueREPURCHASE AGREEMENT - 0.6%Fixed Income Clearing Corp., 1.45% (C),
dated 03/29/2019, to be repurchased at$37,257,566 on 04/01/2019.Collateralized by a U.S. GovernmentObligation, 2.75%, due 09/15/2021, andwith a value of $38,002,743. $ 37,253,065 37,253,065
Total Repurchase Agreement(Cost $37,253,065) 37,253,065
Total Investments(Cost $5,656,753,812) 5,949,001,590
Net Other Assets (Liabilities) - (0.1)% (3,626,735 )Net Assets - 100.0% $ 5,945,374,855
Copyright © 2021 www.secdatabase.com. All Rights Reserved.Please Consider the Environment Before Printing This Document

Transamerica Managed Risk �� Balanced ETF VPSCHEDULE OF INVESTMENTS (continued)At March 31, 2019(unaudited)
SECURITY VALUATION:
Valuation Inputs (D)
Level 1 -Unadjusted
QuotedPrices
Level 2 -Other
SignificantObservable
Inputs
Level 3 -Significant
UnobservableInputs Value
ASSETSInvestmentsExchange-Traded Funds $5,902,268,861 $� $ � $5,902,268,861Other Investment Company 9,479,664 � � 9,479,664Repurchase Agreement � 37,253,065 � 37,253,065Total Investments $ 5,911,748,525 $ 37,253,065 $ �� $ 5,949,001,590
FOOTNOTES TO SCHEDULE OF INVESTMENTS:
(A) All or a portion of the securities are on loan. The total value of all securities on loan is $9,265,968. The amount of securities on loan indicated may not correspondwith the securities on loan identified because securities with pending sales are in the process of recall from the brokers.
(B) Affiliated investment in the shares of DeltaShares® Exchange-Traded Funds. The Portfolio�s transactions and earnings from investments of TAM are as follows:
Affiliated InvestmentsValue
December 31, 2018Purchases
at CostProceeds
from Sales
NetRealized
Gain (Loss)
Net Change inUnrealized
Appreciation(Depreciation)
ValueMarch 31, 2019
Shares as ofMarch 31, 2019
DividendIncome
Net CapitalGain
DistributionsDeltaShares® S&P 400 Managed Risk
ETF $52,405,330 $ � $(8,455,645 ) $325,848 $2,963,125 $47,238,658 920,383 $224,253 $ �DeltaShares® S&P 500 Managed Risk
ETF 198,081,868 � (8,208,358 ) 698,413 14,530,043 205,101,966 3,726,403 1,147,590 �DeltaShares® S&P 600 Managed Risk
ETF 16,980,357 � (1,312,671 ) 92,543 583,318 16,343,547 311,845 72,656 �DeltaShares® S&P International Managed
Risk ETF 112,766,180 � � � 6,420,172 119,186,352 2,483,049 1,040,455 �
Total $ 380,233,735 $ �� $ (17,976,674) $ 1,116,804 $ 24,496,658 $ 387,870,523 7,441,680 $ 2,484,954 $ ��
(C) Rates disclosed reflect the yields at March 31, 2019.(D) There were no transfers in or out of Level 3 during the period ended March 31, 2019. Please reference the Security Valuation section of the Notes to Schedules of
Investments for more information regarding security valuation and pricing inputs.
The notes are an integral part of this report.Transamerica Series Trust Page 2
Copyright © 2021 www.secdatabase.com. All Rights Reserved.Please Consider the Environment Before Printing This Document

Transamerica Managed Risk �� Conservative ETF VPSCHEDULE OF INVESTMENTSAt March 31, 2019(unaudited)
The notes are an integral part of this report.Transamerica Series Trust Page 1
Shares ValueEXCHANGE-TRADED FUNDS - 99.3%International Equity Funds - 6.8%DeltaShares® S&P International Managed
Risk ETF (A) 200,067 $ 9,603,216Vanguard FTSE Developed Markets ETF 857,187 35,033,233Vanguard FTSE Emerging Markets ETF 186,091 7,908,867
52,545,316U.S. Equity Funds - 17.9%DeltaShares® S&P 400 Managed Risk ETF
(A) 84,966 4,360,880DeltaShares® S&P 500 Managed Risk ETF
(A) 344,945 18,985,842DeltaShares® S&P 600 Managed Risk ETF
(A) 29,007 1,520,234iShares Core S&P Total US Stock Market
ETF 479,129 30,855,907Schwab U.S. Broad Market ETF 456,094 31,037,197Vanguard Total Stock Market ETF 353,106 51,097,969
137,858,029U.S. Fixed Income Funds - 74.6%iShares Core U.S. Aggregate Bond ETF 1,786,808 194,887,149Schwab U.S. Aggregate Bond ETF (B) 3,413,142 177,073,807Vanguard Total Bond Market ETF 2,480,713 201,384,281
573,345,237Total Exchange-Traded Funds
(Cost $751,578,523) 763,748,582
OTHER INVESTMENT COMPANY - 0.1%Securities Lending Collateral - 0.1%State Street Navigator Securities Lending
Trust - Government Money MarketPortfolio, 2.41% (C) 455,800 455,800
Total Other Investment Company(Cost $455,800) 455,800
Principal ValueREPURCHASE AGREEMENT - 0.7%Fixed Income Clearing Corp., 1.45% (C),
dated 03/29/2019, to be repurchased at$5,230,856 on 04/01/2019. Collateralizedby a U.S. Government Obligation, 2.75%,due 09/15/2021, and with a value of$5,337,720. $ 5,230,224 5,230,224
Total Repurchase Agreement(Cost $5,230,224) 5,230,224
Total Investments(Cost $757,264,547) 769,434,606
Net Other Assets (Liabilities) - (0.1)% (841,466 )Net Assets - 100.0% $ 768,593,140
Copyright © 2021 www.secdatabase.com. All Rights Reserved.Please Consider the Environment Before Printing This Document

Transamerica Managed Risk �� Conservative ETF VPSCHEDULE OF INVESTMENTS (continued)At March 31, 2019(unaudited)
SECURITY VALUATION:
Valuation Inputs (D)
Level 1 -Unadjusted
QuotedPrices
Level 2 -Other
SignificantObservable
Inputs
Level 3 -Significant
UnobservableInputs Value
ASSETSInvestmentsExchange-Traded Funds $763,748,582 $� $ � $763,748,582Other Investment Company 455,800 � � 455,800Repurchase Agreement � 5,230,224 � 5,230,224Total Investments $ 764,204,382 $ 5,230,224 $ �� $ 769,434,606
FOOTNOTES TO SCHEDULE OF INVESTMENTS:
(A) Affiliated investment in the shares of DeltaShares® Exchange-Traded Funds. The Portfolio�s transactions and earnings from investments of TAM are as follows:
Affiliated InvestmentsValue
December 31, 2018Purchases
at CostProceeds
from Sales
NetRealized
Gain (Loss)
Net Change inUnrealized
Appreciation(Depreciation)
ValueMarch 31, 2019
Shares as ofMarch 31, 2019
DividendIncome
Net CapitalGain
DistributionsDeltaShares® S&P 400 Managed Risk
ETF $ 4,633,507 $ � $ (563,710 ) $ 21,724 $ 269,359 $ 4,360,880 84,966 $ 19,828 $ �DeltaShares® S&P 500 Managed Risk
ETF 19,006,166 � (1,477,504 ) 125,714 1,331,466 18,985,842 344,945 110,112 �DeltaShares® S&P 600 Managed Risk
ETF 1,563,063 � (105,013 ) 7,403 54,781 1,520,234 29,007 6,688 �DeltaShares® S&P International
Managed Risk ETF 9,085,923 � � � 517,293 9,603,216 200,067 83,833 �
Total $ 34,288,659 $ �� $ (2,146,227) $ 154,841 $ 2,172,899 $ 34,470,172 658,985 $ 220,461 $ ��
(B) All or a portion of the security is on loan. The value of the security on loan is $446,168. The amount on loan indicated may not correspond with the security onloan identified because a security with pending sales are in the process of recall from the brokers.
(C) Rates disclosed reflect the yields at March 31, 2019.(D) There were no transfers in or out of Level 3 during the period ended March 31, 2019. Please reference the Security Valuation section of the Notes to Schedules of
Investments for more information regarding security valuation and pricing inputs.
The notes are an integral part of this report.Transamerica Series Trust Page 2
Copyright © 2021 www.secdatabase.com. All Rights Reserved.Please Consider the Environment Before Printing This Document

Transamerica Managed Risk �� Growth ETF VPSCHEDULE OF INVESTMENTSAt March 31, 2019(unaudited)
The notes are an integral part of this report.Transamerica Series Trust Page 1
Shares ValueEXCHANGE-TRADED FUNDS - 99.2%International Equity Funds - 24.5%DeltaShares® S&P International Managed
Risk ETF (A) (B) 1,725,681 $ 82,832,688Vanguard FTSE Developed Markets ETF 12,402,275 506,880,979Vanguard FTSE Emerging Markets ETF 2,668,059 113,392,508
703,106,175U.S. Equity Funds - 56.1%DeltaShares® S&P 400 Managed Risk
ETF (B) 674,838 34,636,060DeltaShares® S&P 500 Managed Risk
ETF (A) (B) 2,765,608 152,219,618DeltaShares® S&P 600 Managed Risk
ETF (B) 231,763 12,146,513iShares Core S&P Total US Stock Market
ETF (A) 5,180,497 333,624,007Schwab U.S. Broad Market ETF (A) 4,879,038 332,018,536Vanguard Total Stock Market ETF (A) 5,120,120 740,932,565
1,605,577,299U.S. Fixed Income Funds - 18.6%iShares Core U.S. Aggregate Bond ETF 2,437,533 265,861,724Vanguard Total Bond Market ETF 3,282,630 266,483,904
532,345,628Total Exchange-Traded Funds
(Cost $2,764,724,716) 2,841,029,102
OTHER INVESTMENT COMPANY - 1.4%Securities Lending Collateral - 1.4%State Street Navigator Securities Lending
Trust - Government Money MarketPortfolio, 2.41% (C) 41,336,360 41,336,360
Total Other Investment Company(Cost $41,336,360) 41,336,360
Principal Value
REPURCHASE AGREEMENT - 0.6%Fixed Income Clearing Corp., 1.45% (C),
dated 03/29/2019, to be repurchased at$17,139,596 on 04/01/2019.Collateralized by a U.S. GovernmentObligation, 2.75%, due 09/15/2021, andwith a value of $17,483,188. $ 17,137,525 17,137,525
Total Repurchase Agreement(Cost $17,137,525) 17,137,525
Total Investments(Cost $2,823,198,601) 2,899,502,987
Net Other Assets (Liabilities) - (1.2)% (35,636,657 )Net Assets - 100.0% $ 2,863,866,330
Copyright © 2021 www.secdatabase.com. All Rights Reserved.Please Consider the Environment Before Printing This Document
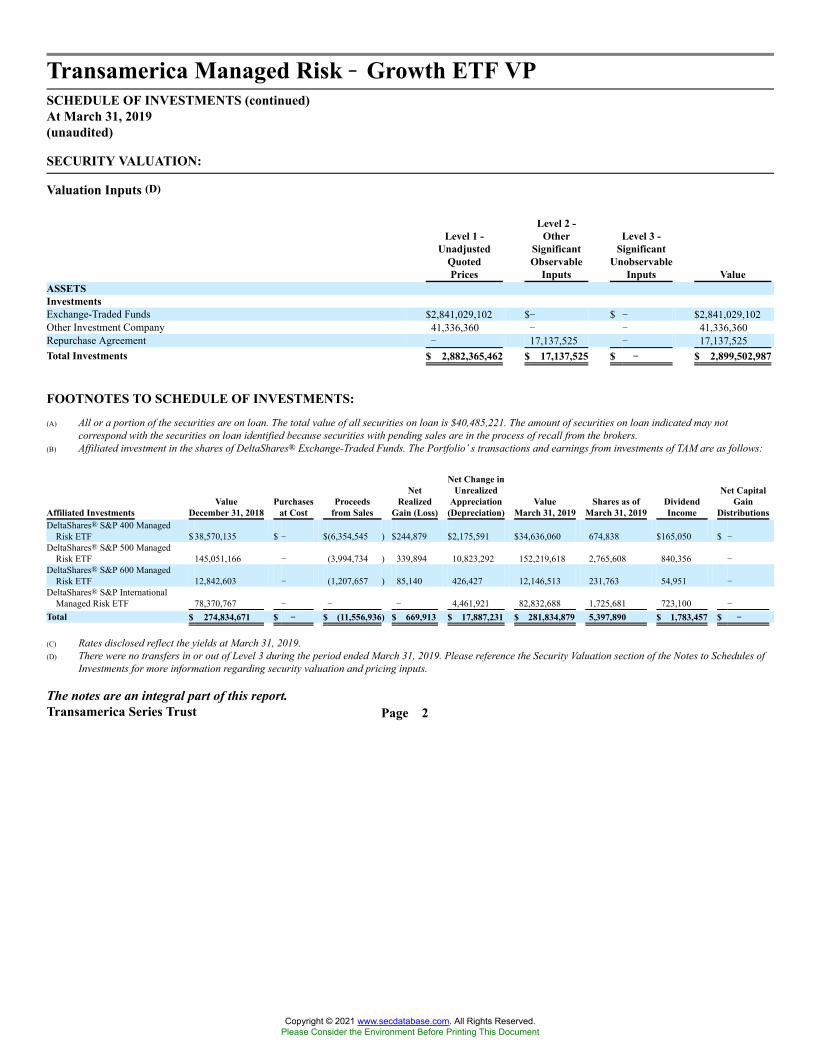
Transamerica Managed Risk �� Growth ETF VPSCHEDULE OF INVESTMENTS (continued)At March 31, 2019(unaudited)
SECURITY VALUATION:
Valuation Inputs (D)
Level 1 -Unadjusted
QuotedPrices
Level 2 -Other
SignificantObservable
Inputs
Level 3 -Significant
UnobservableInputs Value
ASSETSInvestmentsExchange-Traded Funds $2,841,029,102 $� $ � $2,841,029,102Other Investment Company 41,336,360 � � 41,336,360Repurchase Agreement � 17,137,525 � 17,137,525Total Investments $ 2,882,365,462 $ 17,137,525 $ �� $ 2,899,502,987
FOOTNOTES TO SCHEDULE OF INVESTMENTS:
(A) All or a portion of the securities are on loan. The total value of all securities on loan is $40,485,221. The amount of securities on loan indicated may notcorrespond with the securities on loan identified because securities with pending sales are in the process of recall from the brokers.
(B) Affiliated investment in the shares of DeltaShares® Exchange-Traded Funds. The Portfolio�s transactions and earnings from investments of TAM are as follows:
Affiliated InvestmentsValue
December 31, 2018Purchases
at CostProceeds
from Sales
NetRealized
Gain (Loss)
Net Change inUnrealized
Appreciation(Depreciation)
ValueMarch 31, 2019
Shares as ofMarch 31, 2019
DividendIncome
Net CapitalGain
DistributionsDeltaShares® S&P 400 Managed
Risk ETF $38,570,135 $ � $(6,354,545 ) $244,879 $2,175,591 $34,636,060 674,838 $165,050 $ �DeltaShares® S&P 500 Managed
Risk ETF 145,051,166 � (3,994,734 ) 339,894 10,823,292 152,219,618 2,765,608 840,356 �DeltaShares® S&P 600 Managed
Risk ETF 12,842,603 � (1,207,657 ) 85,140 426,427 12,146,513 231,763 54,951 �DeltaShares® S&P International
Managed Risk ETF 78,370,767 � � � 4,461,921 82,832,688 1,725,681 723,100 �
Total $ 274,834,671 $ �� $ (11,556,936) $ 669,913 $ 17,887,231 $ 281,834,879 5,397,890 $ 1,783,457 $ ��
(C) Rates disclosed reflect the yields at March 31, 2019.(D) There were no transfers in or out of Level 3 during the period ended March 31, 2019. Please reference the Security Valuation section of the Notes to Schedules of
Investments for more information regarding security valuation and pricing inputs.
The notes are an integral part of this report.Transamerica Series Trust Page 2
Copyright © 2021 www.secdatabase.com. All Rights Reserved.Please Consider the Environment Before Printing This Document

Transamerica Market Participation Strategy VPSCHEDULE OF INVESTMENTSAt March 31, 2019(unaudited)
OVER-THE-COUNTER OPTIONS PURCHASED:
Description CounterpartyExercise
PriceExpiration
DateNotionalAmount
Number ofContracts
PremiumsPaid Value
Call - S&P 500® - Flexible ExchangeOption GSC USD 2,850.00 07/20/2023 USD 198,408,000 700 $35,921,229 $28,230,659
Call - S&P 500® - Flexible ExchangeOption GSC USD 2,900.00 01/22/2024 USD 198,408,000 700 36,395,829 28,378,186
Total $ 72,317,058 $ 56,608,845
FUTURES CONTRACTS:
DescriptionLong/Short
Number ofContracts
ExpirationDate
NotionalAmount Value
UnrealizedAppreciation
UnrealizedDepreciation
S&P 500® E-Mini Index Long 31 06/21/2019 $ 4,265,806 $ 4,398,590 $ 132,784 $ �
The notes are an integral part of this report.Transamerica Series Trust Page 1
Principal ValueU.S. GOVERNMENT AGENCY OBLIGATIONS - 33.1%Federal Home Loan Banks
1.88%, 11/29/2021 $ 29,000,000 $ 28,691,4432.25%, 12/08/2023 1,000,000 996,6353.25%, 11/16/2028 15,000,000 15,780,308
Federal Home Loan Mortgage Corp.2.38%, 01/13/2022 25,000,000 25,069,5232.75%, 06/19/2023 22,000,000 22,383,747
Federal National Mortgage Association2.50%, 02/05/2024 43,000,000 43,403,7546.25%, 05/15/2029 4,500,000 5,917,239
Total U.S. Government Agency Obligations(Cost $141,105,305) 142,242,649
U.S. GOVERNMENT OBLIGATIONS - 51.9%U.S. Treasury - 51.9%U.S. Treasury Bond, Principal Only STRIPS
05/15/2023 - 08/15/2034 257,500,000 222,913,455Total U.S. Government Obligations
(Cost $221,467,109) 222,913,455SHORT-TERM U.S. GOVERNMENT OBLIGATION - 0.1%U.S. Treasury Bill
2.45% (A), 06/20/2019 (B) 500,000 497,374Total Short-Term U.S. Government Obligation
(Cost $497,267) 497,374
Principal ValueREPURCHASE AGREEMENT - 1.6%Fixed Income Clearing Corp., 1.45% (A), dated
03/29/2019, to be repurchased at $6,690,212on 04/01/2019. Collateralized by a U.S.Government Obligation, 2.75%, due 08/15/2021, and with a value of $6,823,407. $ 6,689,403 $ 6,689,403
Total Repurchase Agreement(Cost $6,689,403) 6,689,403
Total Investments Excluding Purchased Options(Cost $369,759,084) 372,342,881
Total Purchased Options - 13.2%(Cost $72,317,058) 56,608,845
Total Investments(Cost $442,076,142) 428,951,726
Net Other Assets (Liabilities) - 0.1% 280,843Net Assets - 100.0% $ 429,232,569
Copyright © 2021 www.secdatabase.com. All Rights Reserved.Please Consider the Environment Before Printing This Document

Transamerica Market Participation Strategy VPSCHEDULE OF INVESTMENTS (continued)At March 31, 2019(unaudited)
SECURITY VALUATION:
Valuation Inputs (C)
Level 1 -Unadjusted
QuotedPrices
Level 2 -Other
SignificantObservable
Inputs
Level 3 -Significant
UnobservableInputs Value
ASSETSInvestmentsU.S. Government Agency Obligations $� $142,242,649 $ � $142,242,649U.S. Government Obligations � 222,913,455 � 222,913,455Short-Term U.S. Government Obligation � 497,374 � 497,374Repurchase Agreement � 6,689,403 � 6,689,403Over-the-Counter Options Purchased 56,608,845 � � 56,608,845Total Investments $56,608,845 $372,342,881 $ �� $ 428,951,726Other Financial InstrumentsFutures Contracts (D) $132,784 $� $ � $132,784Total Other Financial Instruments $ 132,784 $�� $ �� $132,784
FOOTNOTES TO SCHEDULE OF INVESTMENTS:
(A) Rates disclosed reflect the yields at March 31, 2019.(B) All or a portion of the security has been segregated by the custodian as collateral to cover margin requirements for open futures contracts. The value of the
security is $497,373.(C) There were no transfers in or out of Level 3 during the period ended March 31, 2019. Please reference the Security Valuation section of the Notes to Schedules of
Investments for more information regarding security valuation and pricing inputs.(D) Futures contracts and/or forward foreign currency contracts are valued at unrealized appreciation (depreciation).
COUNTERPARTY ABBREVIATION:
GSC Goldman Sachs & Co.
PORTFOLIO ABBREVIATION:
STRIPS Separate Trading of Registered Interest and Principal of Securities
The notes are an integral part of this report.Transamerica Series Trust Page 2
Copyright © 2021 www.secdatabase.com. All Rights Reserved.Please Consider the Environment Before Printing This Document

Transamerica Morgan Stanley Capital Growth VPSCHEDULE OF INVESTMENTSAt March 31, 2019(unaudited)
The notes are an integral part of this report.Transamerica Series Trust Page 1
Shares ValueCOMMON STOCKS - 96.4%Biotechnology - 1.4%Alnylam Pharmaceuticals, Inc. (A) 31,285 $ 2,923,583Bluebird Bio, Inc. (A) 4,599 723,561Editas Medicine, Inc. (A) 27,817 680,126Intellia Therapeutics, Inc. (A) (B) 37,199 635,359Intrexon Corp. (A) (B) 60,275 317,047Moderna, Inc. (A) (B) 67,474 1,373,096
6,652,772Entertainment - 8.3%Netflix, Inc. (A) 45,100 16,080,856Spotify Technology SA (A) 160,955 22,340,554
38,421,410Health Care Equipment & Supplies - 10.2%DexCom, Inc. (A) 106,204 12,648,897Intuitive Surgical, Inc. (A) 40,759 23,256,270LivaNova PLC (A) 48,519 4,718,473Penumbra, Inc. (A) (B) 44,112 6,484,905
47,108,545Health Care Providers & Services - 3.0%Convetrus, Inc. (A) (B) 149,872 4,773,423Guardant Health, Inc. (A) (B) 19,603 1,503,550HealthEquity, Inc. (A) 99,976 7,396,225
13,673,198Health Care Technology - 7.7%Veeva Systems, Inc., Class A (A) 279,904 35,508,621Interactive Media & Services - 13.6%Alphabet, Inc., Class C (A) 23,190 27,209,059Facebook, Inc., Class A (A) 38,884 6,481,574IAC/InterActiveCorp (A) 12,148 2,552,416Twitter, Inc. (A) 627,753 20,640,519Zillow Group, Inc., Class C (A) (B) 169,369 5,883,879
62,767,447Internet & Direct Marketing Retail - 14.0%Amazon.com, Inc. (A) 22,340 39,781,955Farfetch, Ltd., Class A (A) (B) 260,798 7,018,074MercadoLibre, Inc. (A) 21,341 10,835,466Wayfair, Inc., Class A (A) 45,663 6,778,672
64,414,167IT Services - 17.1%Adyen NV (A) (C) 9,760 7,641,901MongoDB, Inc. (A) 72,356 10,637,779Okta, Inc. (A) 88,405 7,313,746Shopify, Inc., Class A (A) 93,400 19,298,308Square, Inc., Class A (A) 215,390 16,137,019Twilio, Inc., Class A (A) 139,204 17,982,373
79,011,126Life Sciences Tools & Services - 4.9%Illumina, Inc. (A) 72,329 22,471,897Pharmaceuticals - 0.1%Nektar Therapeutics (A) 9,489 318,830
Shares ValueCOMMON STOCKS (continued)Semiconductors & Semiconductor Equipment - 1.8%NVIDIA Corp. 45,237 $ 8,122,756Software - 14.3%Coupa Software, Inc. (A) 76,411 6,951,873Elastic NV (A) 79,129 6,320,033salesforce.com, Inc. (A) 42,531 6,735,634ServiceNow, Inc. (A) 91,735 22,611,760Workday, Inc., Class A (A) 119,561 23,057,339
65,676,639Total Common Stocks
(Cost $334,433,270) 444,147,408
OTHER INVESTMENT COMPANY - 3.4%Securities Lending Collateral - 3.4%State Street Navigator Securities Lending
Trust - Government Money MarketPortfolio, 2.41% (D) 15,786,306 15,786,306
Total Other Investment Company(Cost $15,786,306) 15,786,306
Principal ValueREPURCHASE AGREEMENT - 3.6%Fixed Income Clearing Corp., 1.45% (D),
dated 03/29/2019, to be repurchased at$16,587,700 on 04/01/2019. Collateralizedby a U.S. Government Obligation, 2.75%,due 09/15/2021, and with a value of$16,920,522. $ 16,585,696 16,585,696
Total Repurchase Agreement(Cost $16,585,696) 16,585,696
Total Investments Excluding Purchased Options(Cost $366,805,272) 476,519,410
Total Purchased Options - 0.0% (E)(Cost $1,275,669) 172,450
Total Investments(Cost $368,080,941) 476,691,860
Net Other Assets (Liabilities) - (3.4)% (15,703,609 )Net Assets - 100.0% $ 460,988,251
Copyright © 2021 www.secdatabase.com. All Rights Reserved.Please Consider the Environment Before Printing This Document

Transamerica Morgan Stanley Capital Growth VPSCHEDULE OF INVESTMENTS (continued)At March 31, 2019(unaudited)
OVER-THE-COUNTER FOREIGN EXCHANGE OPTIONS PURCHASED:
Description CounterpartyExercise
PriceExpiration
DateNotional Amount/
Number of ContractsPremiums
Paid ValueCall - USD vs. CNH BNP USD 1.00 01/17/2020 USD 79,645,315 $407,715 $139,857Call - USD vs. CNH RBS USD 7.78 07/03/2019 USD 87,635,978 426,999 5,521Call - USD vs. CNH RBS USD 8.00 10/21/2019 USD 74,992,337 440,955 27,072Total $ 1,275,669 $ 172,450
SECURITY VALUATION:
Valuation Inputs (F)
Level 1 -Unadjusted
QuotedPrices
Level 2 -Other
SignificantObservable
Inputs
Level 3 -Significant
UnobservableInputs Value
ASSETSInvestmentsCommon Stocks $436,505,507 $7,641,901 $ � $444,147,408Other Investment Company 15,786,306 � � 15,786,306Repurchase Agreement � 16,585,696 � 16,585,696Over-the-Counter Foreign Exchange Options Purchased � 172,450 � 172,450Total Investments $ 452,291,813 $ 24,400,047 $ �� $ 476,691,860
FOOTNOTES TO SCHEDULE OF INVESTMENTS:
(A) Non-income producing securities.(B) All or a portion of the securities are on loan. The total value of all securities on loan is $15,436,260. The amount of securities on loan indicated may not
correspond with the securities on loan identified because securities with pending sales are in the process of recall from the brokers.(C) Security is registered pursuant to Rule 144A of the Securities Act of 1933. Unless otherwise indicated, the security is deemed to be liquid for purposes of
compliance limitations on holdings of illiquid securities and may be resold as transactions exempt from registration, normally to qualified institutional buyers. AtMarch 31, 2019, the value of the 144A security is $7,641,901, representing 1.7% of the Portfolio�s net assets.
(D) Rates disclosed reflect the yields at March 31, 2019.(E) Percentage rounds to less than 0.1% or (0.1)%.(F) There were no transfers in or out of Level 3 during the period ended March 31, 2019. Please reference the Security Valuation section of the Notes to Schedules of
Investments for more information regarding security valuation and pricing inputs.
CURRENCY ABBREVIATIONS:
CNH Chinese Yuan Renminbi (offshore)USD United States Dollar
COUNTERPARTY ABBREVIATIONS:
BNP BNP ParibasRBS Royal Bank of Scotland PLC
The notes are an integral part of this report.Transamerica Series Trust Page 2
Copyright © 2021 www.secdatabase.com. All Rights Reserved.Please Consider the Environment Before Printing This Document

Transamerica Multi-Managed Balanced VPSCHEDULE OF INVESTMENTSAt March 31, 2019(unaudited)
The notes are an integral part of this report.Transamerica Series Trust Page 1
Shares ValueCOMMON STOCKS - 60.2%Aerospace & Defense - 1.4%Boeing Co. 13,290 $ 5,069,072General Dynamics Corp. 47,760 8,084,813Northrop Grumman Corp. 12,960 3,494,016United Technologies Corp. 61,640 7,944,779
24,592,680Airlines - 0.2%Delta Air Lines, Inc. 42,630 2,201,839Southwest Airlines Co. 20,300 1,053,773United Continental Holdings, Inc. (A) 10,520 839,286
4,094,898Auto Components - 0.2%BorgWarner, Inc. 51,660 1,984,260Magna International, Inc. 40,510 1,972,432
3,956,692Automobiles - 0.1%Ford Motor Co. 268,670 2,358,923Banks - 3.0%Bank of America Corp. 582,310 16,065,933Citigroup, Inc. 197,520 12,289,694Citizens Financial Group, Inc. 35,110 1,141,075Huntington Bancshares, Inc. 109,210 1,384,783KeyCorp 308,600 4,860,450SunTrust Banks, Inc. 82,060 4,862,055Wells Fargo & Co. 224,080 10,827,546
51,431,536Beverages - 1.6%Coca-Cola Co. 309,810 14,517,696Constellation Brands, Inc., Class A 7,060 1,237,830Molson Coors Brewing Co., Class B 66,900 3,990,585PepsiCo, Inc. 60,080 7,362,804
27,108,915Biotechnology - 1.4%AbbVie, Inc. 21,870 1,762,503Alexion Pharmaceuticals, Inc. (A) 26,740 3,614,713Amgen, Inc. 7,820 1,485,644Biogen, Inc. (A) 14,300 3,380,234Celgene Corp. (A) 43,070 4,063,224Gilead Sciences, Inc. 55,700 3,621,057Regeneron Pharmaceuticals, Inc. (A) 4,740 1,946,339Vertex Pharmaceuticals, Inc. (A) 23,090 4,247,405
24,121,119Building Products - 0.2%Masco Corp. 86,880 3,415,253Capital Markets - 1.7%Bank of New York Mellon Corp. 106,450 5,368,273Charles Schwab Corp. 112,330 4,803,231CME Group, Inc. 5,440 895,315Intercontinental Exchange, Inc. 84,620 6,442,967
Shares ValueCOMMON STOCKS (continued)Capital Markets (continued)Morgan Stanley 199,890 $ 8,435,358TD Ameritrade Holding Corp. 66,950 3,346,831
29,291,975Chemicals - 1.2%Celanese Corp. 26,120 2,575,693DowDuPont, Inc. 183,780 9,797,312Eastman Chemical Co. 68,620 5,206,886Linde PLC 13,650 2,401,444RPM International, Inc. 8,700 504,948
20,486,283Commercial Services & Supplies - 0.0% (B)Cintas Corp. 2,720 549,739Communications Equipment - 0.2%Cisco Systems, Inc. 61,290 3,309,047Motorola Solutions, Inc. 4,390 616,444
3,925,491Consumer Finance - 0.5%American Express Co. 37,110 4,056,123Capital One Financial Corp. 54,210 4,428,415
8,484,538Containers & Packaging - 0.3%Avery Dennison Corp. 12,890 1,456,570Packaging Corp. of America 5,700 566,466WestRock Co. 59,950 2,299,082
4,322,118Diversified Consumer Services - 0.0% (B)H&R Block, Inc. 17,640 422,302Diversified Financial Services - 0.9%Berkshire Hathaway, Inc., Class B (A) 80,060 16,083,253Diversified Telecommunication Services - 0.7%AT&T, Inc. 27,260 854,874Verizon Communications, Inc. 190,000 11,234,700
12,089,574Electric Utilities - 1.7%American Electric Power Co., Inc. 31,020 2,597,925Edison International 62,900 3,894,768Exelon Corp. 143,460 7,191,650FirstEnergy Corp. 20,020 833,032NextEra Energy, Inc. 44,760 8,653,003Xcel Energy, Inc. 114,930 6,460,215
29,630,593Electrical Equipment - 0.5%Eaton Corp. PLC 96,480 7,772,429Entertainment - 1.2%Electronic Arts, Inc. (A) 51,260 5,209,554Netflix, Inc. (A) 24,000 8,557,440Walt Disney Co. 62,650 6,956,029
20,723,023Equity Real Estate Investment Trusts - 1.4%AvalonBay Communities, Inc. 24,130 4,843,615Boston Properties, Inc. 9,050 1,211,614Digital Realty Trust, Inc. 6,700 797,300
Copyright © 2021 www.secdatabase.com. All Rights Reserved.Please Consider the Environment Before Printing This Document

Transamerica Multi-Managed Balanced VPSCHEDULE OF INVESTMENTS (continued)At March 31, 2019(unaudited)
The notes are an integral part of this report.Transamerica Series Trust Page 2
Shares ValueCOMMON STOCKS (continued)Equity Real Estate Investment Trusts (continued)Equinix, Inc. 3,810 $ 1,726,540Equity Residential 18,460 1,390,407Federal Realty Investment Trust 16,390 2,259,361Host Hotels & Resorts, Inc. 74,620 1,410,318Mid-America Apartment Communities, Inc. 4,800 524,784Prologis, Inc. 62,280 4,481,046Public Storage 4,640 1,010,499Ventas, Inc. 24,570 1,567,812Vornado Realty Trust 45,340 3,057,730
24,281,026Food Products - 0.6%Mondelez International, Inc., Class A 199,040 9,936,077Health Care Equipment & Supplies - 2.1%Baxter International, Inc. 21,600 1,756,296Becton Dickinson and Co. 7,000 1,748,110Boston Scientific Corp. (A) 235,700 9,046,166Danaher Corp. 25,720 3,395,554Intuitive Surgical, Inc. (A) 3,510 2,002,736Medtronic PLC 104,020 9,474,142Zimmer Biomet Holdings, Inc. 64,690 8,260,913
35,683,917Health Care Providers & Services - 1.8%Anthem, Inc. 19,060 5,469,839Cigna Corp. (A) 47,070 7,569,797CVS Health Corp. 56,700 3,057,831McKesson Corp. 2,330 272,750UnitedHealth Group, Inc. 56,890 14,066,621
30,436,838Hotels, Restaurants & Leisure - 0.6%Hilton Worldwide Holdings, Inc. 39,910 3,316,920Royal Caribbean Cruises, Ltd. 9,270 1,062,527Yum! Brands, Inc. 66,480 6,635,369
11,014,816Household Durables - 0.2%Lennar Corp., Class A 53,450 2,623,861Household Products - 0.3%Procter & Gamble Co. 52,550 5,467,827Industrial Conglomerates - 0.6%Honeywell International, Inc. 67,880 10,787,490Insurance - 1.4%Allstate Corp. 19,960 1,879,833American International Group, Inc. 98,630 4,247,008Everest Re Group, Ltd. 5,840 1,261,206Hartford Financial Services Group, Inc. 78,150 3,885,618Lincoln National Corp. 54,810 3,217,347Marsh & McLennan Cos., Inc. 15,930 1,495,827MetLife, Inc. 140,490 5,980,659Prudential Financial, Inc. 20,470 1,880,784
23,848,282Interactive Media & Services - 2.7%Alphabet, Inc., Class A (A) 15,720 18,500,711Alphabet, Inc., Class C (A) 15,260 17,904,711Facebook, Inc., Class A (A) 55,750 9,292,967
45,698,389
Shares ValueCOMMON STOCKS (continued)Internet & Direct Marketing Retail - 2.4%Amazon.com, Inc. (A) 20,190 $ 35,953,342Booking Holdings, Inc. (A) 1,160 2,024,096Expedia Group, Inc. 30,540 3,634,260
41,611,698IT Services - 2.9%Alliance Data Systems Corp. 9,040 1,581,819Automatic Data Processing, Inc. 78,850 12,595,499Fidelity National Information Services, Inc. 47,710 5,396,001First Data Corp., Class A (A) 42,150 1,107,281Mastercard, Inc., Class A 27,730 6,529,028PayPal Holdings, Inc. (A) 94,950 9,859,608Visa, Inc., Class A 76,200 11,901,678
48,970,914Life Sciences Tools & Services - 0.5%Agilent Technologies, Inc. 14,100 1,133,358Illumina, Inc. (A) 6,510 2,022,592Thermo Fisher Scientific, Inc. 16,840 4,609,445
7,765,395Machinery - 1.6%Caterpillar, Inc. 25,200 3,414,348Cummins, Inc. 29,190 4,608,225Deere & Co. 13,070 2,089,109Ingersoll-Rand PLC 38,090 4,111,816PACCAR, Inc. 72,390 4,932,655Snap-on, Inc. 20,160 3,155,443Stanley Black & Decker, Inc. 30,190 4,110,972
26,422,568Media - 1.6%Charter Communications, Inc., Class A (A) 23,130 8,024,028Comcast Corp., Class A 350,950 14,030,981Discovery, Inc., Class A (A) (C) 96,720 2,613,374Discovery, Inc., Class C (A) 55,918 1,421,436DISH Network Corp., Class A (A) 25,640 812,532
26,902,351Metals & Mining - 0.1%Freeport-McMoRan, Inc. 84,590 1,090,365Newmont Mining Corp. 20,700 740,439
1,830,804Multi-Utilities - 0.2%Public Service Enterprise Group, Inc. 12,420 737,872Sempra Energy 25,700 3,234,602
3,972,474Multiline Retail - 0.2%Dollar General Corp. 24,680 2,944,324Oil, Gas & Consumable Fuels - 3.3%Chevron Corp. 118,960 14,653,493Concho Resources, Inc. 9,940 1,102,942Diamondback Energy, Inc. 40,660 4,128,210EOG Resources, Inc. 85,460 8,134,083Exxon Mobil Corp. 58,320 4,712,256Marathon Petroleum Corp. 122,560 7,335,216Occidental Petroleum Corp. 74,200 4,912,040ONEOK, Inc. 56,020 3,912,437Parsley Energy, Inc., Class A (A) 25,320 488,676
Copyright © 2021 www.secdatabase.com. All Rights Reserved.Please Consider the Environment Before Printing This Document
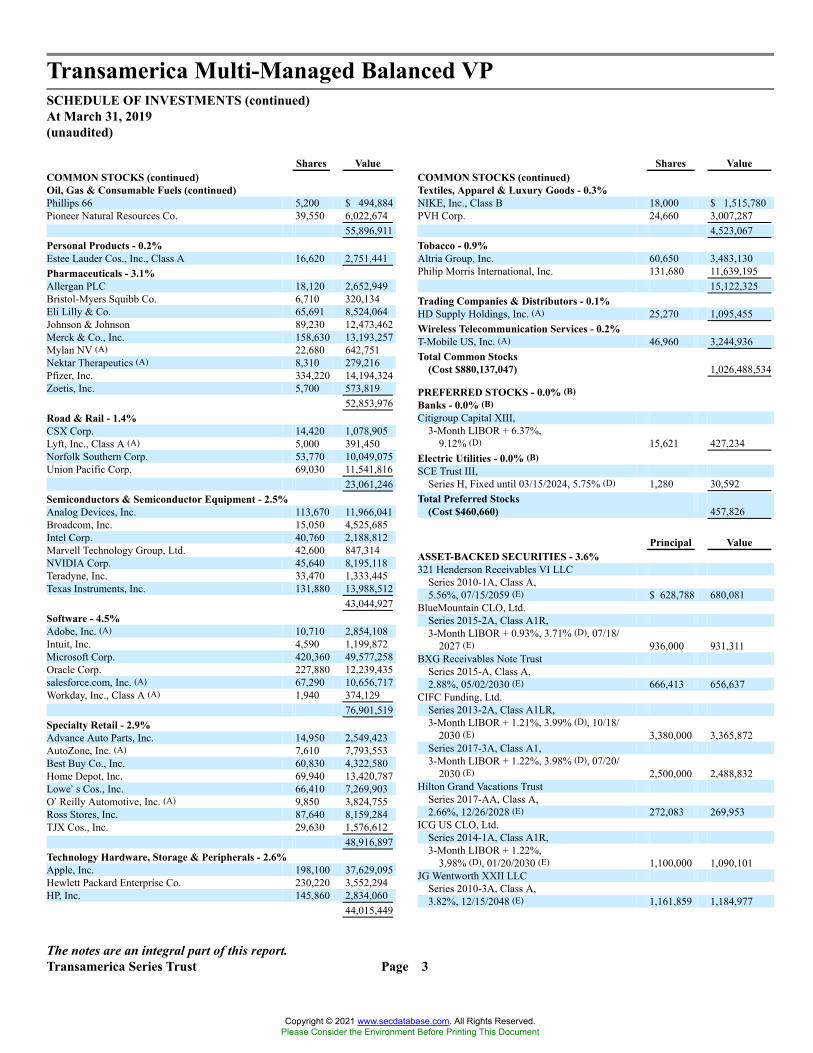
Transamerica Multi-Managed Balanced VPSCHEDULE OF INVESTMENTS (continued)At March 31, 2019(unaudited)
The notes are an integral part of this report.Transamerica Series Trust Page 3
Shares ValueCOMMON STOCKS (continued)Oil, Gas & Consumable Fuels (continued)Phillips 66 5,200 $ 494,884Pioneer Natural Resources Co. 39,550 6,022,674
55,896,911Personal Products - 0.2%Estee Lauder Cos., Inc., Class A 16,620 2,751,441Pharmaceuticals - 3.1%Allergan PLC 18,120 2,652,949Bristol-Myers Squibb Co. 6,710 320,134Eli Lilly & Co. 65,691 8,524,064Johnson & Johnson 89,230 12,473,462Merck & Co., Inc. 158,630 13,193,257Mylan NV (A) 22,680 642,751Nektar Therapeutics (A) 8,310 279,216Pfizer, Inc. 334,220 14,194,324Zoetis, Inc. 5,700 573,819
52,853,976Road & Rail - 1.4%CSX Corp. 14,420 1,078,905Lyft, Inc., Class A (A) 5,000 391,450Norfolk Southern Corp. 53,770 10,049,075Union Pacific Corp. 69,030 11,541,816
23,061,246Semiconductors & Semiconductor Equipment - 2.5%Analog Devices, Inc. 113,670 11,966,041Broadcom, Inc. 15,050 4,525,685Intel Corp. 40,760 2,188,812Marvell Technology Group, Ltd. 42,600 847,314NVIDIA Corp. 45,640 8,195,118Teradyne, Inc. 33,470 1,333,445Texas Instruments, Inc. 131,880 13,988,512
43,044,927Software - 4.5%Adobe, Inc. (A) 10,710 2,854,108Intuit, Inc. 4,590 1,199,872Microsoft Corp. 420,360 49,577,258Oracle Corp. 227,880 12,239,435salesforce.com, Inc. (A) 67,290 10,656,717Workday, Inc., Class A (A) 1,940 374,129
76,901,519Specialty Retail - 2.9%Advance Auto Parts, Inc. 14,950 2,549,423AutoZone, Inc. (A) 7,610 7,793,553Best Buy Co., Inc. 60,830 4,322,580Home Depot, Inc. 69,940 13,420,787Lowe�s Cos., Inc. 66,410 7,269,903O�Reilly Automotive, Inc. (A) 9,850 3,824,755Ross Stores, Inc. 87,640 8,159,284TJX Cos., Inc. 29,630 1,576,612
48,916,897Technology Hardware, Storage & Peripherals - 2.6%Apple, Inc. 198,100 37,629,095Hewlett Packard Enterprise Co. 230,220 3,552,294HP, Inc. 145,860 2,834,060
44,015,449
Shares ValueCOMMON STOCKS (continued)Textiles, Apparel & Luxury Goods - 0.3%NIKE, Inc., Class B 18,000 $ 1,515,780PVH Corp. 24,660 3,007,287
4,523,067Tobacco - 0.9%Altria Group, Inc. 60,650 3,483,130Philip Morris International, Inc. 131,680 11,639,195
15,122,325Trading Companies & Distributors - 0.1%HD Supply Holdings, Inc. (A) 25,270 1,095,455Wireless Telecommunication Services - 0.2%T-Mobile US, Inc. (A) 46,960 3,244,936Total Common Stocks
(Cost $880,137,047) 1,026,488,534
PREFERRED STOCKS - 0.0% (B)Banks - 0.0% (B)Citigroup Capital XIII,
3-Month LIBOR + 6.37%,9.12% (D) 15,621 427,234
Electric Utilities - 0.0% (B)SCE Trust III,
Series H, Fixed until 03/15/2024, 5.75% (D) 1,280 30,592Total Preferred Stocks
(Cost $460,660) 457,826
Principal ValueASSET-BACKED SECURITIES - 3.6%321 Henderson Receivables VI LLC
Series 2010-1A, Class A,5.56%, 07/15/2059 (E) $ 628,788 680,081
BlueMountain CLO, Ltd.Series 2015-2A, Class A1R,3-Month LIBOR + 0.93%, 3.71% (D), 07/18/
2027 (E) 936,000 931,311BXG Receivables Note Trust
Series 2015-A, Class A,2.88%, 05/02/2030 (E) 666,413 656,637
CIFC Funding, Ltd.Series 2013-2A, Class A1LR,3-Month LIBOR + 1.21%, 3.99% (D), 10/18/
2030 (E) 3,380,000 3,365,872Series 2017-3A, Class A1,3-Month LIBOR + 1.22%, 3.98% (D), 07/20/
2030 (E) 2,500,000 2,488,832Hilton Grand Vacations Trust
Series 2017-AA, Class A,2.66%, 12/26/2028 (E) 272,083 269,953
ICG US CLO, Ltd.Series 2014-1A, Class A1R,3-Month LIBOR + 1.22%,
3.98% (D), 01/20/2030 (E) 1,100,000 1,090,101JG Wentworth XXII LLC
Series 2010-3A, Class A,3.82%, 12/15/2048 (E) 1,161,859 1,184,977
Copyright © 2021 www.secdatabase.com. All Rights Reserved.Please Consider the Environment Before Printing This Document

Transamerica Multi-Managed Balanced VPSCHEDULE OF INVESTMENTS (continued)At March 31, 2019(unaudited)
Principal ValueASSET-BACKED SECURITIES (continued)JGWPT XXVIII LLC
Series 2013-1A, Class A,3.22%, 04/15/2067 (E) $
1,572,336$1,564,456
Laurel Road Prime Student Loan TrustSeries 2018-B, Class A2FX,3.54%, 05/26/2043 (E) 1,035,000 1,051,905
Longfellow Place CLO, Ltd.Series 2013-1A, Class ARR,3-Month LIBOR + 1.34%, 4.13% (D), 04/15/
2029 (E) 395,000 393,502MVW Owner Trust
Series 2014-1A, Class A,2.25%, 09/22/2031 (E) 182,150 180,061
New Residential Advanced Receivables TrustSeries 2016-T2, Class AT2,2.58%, 10/15/2049 (E) 344,000 342,924Series 2017-T1, Class AT1,3.21%, 02/15/2051 (E) 2,600,000 2,607,028
New Residential Mortgage Loan TrustSeries 2018-1A, Class A1A,4.00% (D), 12/25/2057 (E) 1,563,983 1,596,348
NRZ Advance Receivables TrustSeries 2016-T3, Class AT3,2.83%, 10/16/2051 (E) 140,000 139,212Series 2016-T4, Class AT4,3.11%, 12/15/2050 (E) 1,300,000 1,301,091
Octagon Investment Partners 33, Ltd.Series 2017-1A, Class A1,3-Month LIBOR + 1.19%, 3.95% (D), 01/20/
2031 (E) 1,400,000 1,395,169Ocwen Master Advance Receivables Trust
Series 2016-T2, Class AT2,2.72%, 08/16/2049 (E) 1,000,000 998,060Series 2018-T1, Class AT1,3.30%, 08/15/2049 (E) 2,965,000 2,965,593Series 2018-T2, Class AT2,3.60%, 08/15/2050 (E) 2,935,000 2,951,319
Orange Lake Timeshare TrustSeries 2015-AA, Class A,2.88%, 09/08/2027 (E) 242,585 240,080Series 2016-A, Class A,2.61%, 03/08/2029 (E) 1,499,656 1,483,092Series 2018-A, Class A,3.10%, 11/08/2030 (E) 264,545 265,294Series 2018-A, Class B,3.35%, 11/08/2030 (E) 216,444 217,014
Palmer Square CLO, Ltd.Series 2015-2A, Class A1AR,3-Month LIBOR + 1.27%, 4.05% (D), 07/20/
2030 (E) 915,000 914,085SBA Tower Trust
Series 2014-1A, Class C,2.90% (D), 10/15/2044 (E) 3,405,000 3,401,076
Sierra Timeshare Conduit Receivables FundingLLCSeries 2017-1A, Class A,2.91%, 03/20/2034 (E) 316,199 313,514
Sierra Timeshare Receivables Funding LLCSeries 2015-1A, Class A,2.40%, 03/22/2032 (E) 61,818 61,552Series 2015-1A, Class B,3.05%, 03/22/2032 (E) 64,394 64,167
Principal ValueASSET-BACKED SECURITIES (continued)Sierra Timeshare Receivables Funding LLC
(continued)Series 2015-3A, Class A,2.58%, 09/20/2032 (E) $ 39,117 $ 38,905Series 2016-2A, Class A,2.33%, 07/20/2033 (E) 303,252 299,004Series 2019-1A, Class A,3.20%, 01/20/2036 (E) 950,000 955,728
SolarCity LMC Series III LLCSeries 2014-2, Class A,4.02%, 07/20/2044 (E) 521,603 523,255
SpringCastle America Funding LLCSeries 2016-AA, Class A,3.05%, 04/25/2029 (E) 663,823 662,968
SPS Servicer Advance Receivables TrustSeries 2016-T2, Class AT2,2.75%, 11/15/2049 (E) 600,000 598,784
Towd Point Mortgage TrustSeries 2015-3, Class A1B,3.00% (D), 03/25/2054 (E) 1,098,410 1,091,341Series 2015-4, Class A1B,2.75% (D), 04/25/2055 (E) 1,460,361 1,447,363Series 2015-5, Class A1B,2.75% (D), 05/25/2055 (E) 624,037 617,953Series 2015-6, Class A1B,2.75% (D), 04/25/2055 (E) 449,613 444,808Series 2016-1, Class A1B,2.75% (D), 02/25/2055 (E) 721,882 715,528Series 2016-2, Class A1A,2.75% (D), 08/25/2055 (E) 1,532,744 1,515,272Series 2016-3, Class A1,2.25% (D), 04/25/2056 (E) 709,061 697,591Series 2016-4, Class A1,2.25% (D), 07/25/2056 (E) 1,006,841 986,959Series 2017-1, Class A1,2.75% (D), 10/25/2056 (E) 1,283,535 1,269,192Series 2017-2, Class A1,2.75% (D), 04/25/2057 (E) 1,072,675 1,061,613Series 2017-3, Class A1,2.75% (D), 07/25/2057 (E) 786,316 773,872Series 2017-6, Class A1,2.75% (D), 10/25/2057 (E) 1,908,443 1,873,325Series 2018-1, Class A1,3.00% (D), 01/25/2058 (E) 1,693,094 1,675,368Series 2018-4, Class A1,3.00% (D), 06/25/2058 (E) 1,888,473 1,867,527Series 2019-1, Class A1,3.75% (D), 03/25/2058 (E) 783,800 795,857
VB-S1 Issuer LLCSeries 2018-1A, Class C,3.41%, 02/15/2048 (E) 3,055,000 3,049,572
VSE VOI Mortgage LLCSeries 2016-A, Class A,2.54%, 07/20/2033 (E) 369,835 365,705
Welk Resorts LLCSeries 2017-AA, Class A,2.82%, 06/15/2033 (E) 1,264,531 1,255,629
Wellfleet CLO, Ltd.Series 2016-2A, Class A1R,3-Month LIBOR + 1.14%,
3.90% (D), 10/20/2028 (E) 1,125,000 1,116,388
Copyright © 2021 www.secdatabase.com. All Rights Reserved.Please Consider the Environment Before Printing This Document

The notes are an integral part of this report.Transamerica Series Trust Page 4
Total Asset-Backed Securities(Cost $61,118,382) 60,813,813
Copyright © 2021 www.secdatabase.com. All Rights Reserved.Please Consider the Environment Before Printing This Document

Transamerica Multi-Managed Balanced VPSCHEDULE OF INVESTMENTS (continued)At March 31, 2019(unaudited)
Principal ValueCORPORATE DEBT SECURITIES - 12.9%Aerospace & Defense - 0.1%Boeing Co.
3.50%, 03/01/2039 $1,455,000
$1,389,869
United Technologies Corp.4.13%, 11/16/2028 892,000 926,713
2,316,582Air Freight & Logistics - 0.1%FedEx Corp.
4.90%, 01/15/2034 1,261,000 1,351,9365.10%, 01/15/2044 215,000 223,776
1,575,712Airlines - 0.6%American Airlines Pass-Through Trust
3.20%, 12/15/2029 752,908 735,6673.70%, 04/01/2028 2,038,473 2,042,753
Delta Air Lines Pass-Through Trust4.75%, 11/07/2021 867,857 880,0946.82%, 02/10/2024 2,047,746 2,239,005
Northwest Airlines Pass-Through Trust7.03%, 05/01/2021 561,152 572,768
United Airlines Pass-Through Trust3.75%, 03/03/2028 2,143,858 2,157,793
US Airways Pass-Through Trust5.38%, 05/15/2023 1,133,532 1,169,199
9,797,279Auto Components - 0.0% (B)BorgWarner, Inc.
3.38%, 03/15/2025 780,000 773,855Automobiles - 0.1%Ford Motor Co.
4.35%, 12/08/2026 (C) 1,030,000 956,014General Motors Co.
4.88%, 10/02/2023 330,000 343,1846.25%, 10/02/2043 893,000 888,586
2,187,784Banks - 1.9%Bank of America Corp.
Fixed until 01/23/2025,3.37% (D), 01/23/2026 3,512,000 3,514,463
Fixed until 12/20/2027,3.42% (D), 12/20/2028 410,000 400,918
Bank One Corp.8.00%, 04/29/2027 750,000 951,645
Barclays Bank PLC10.18%, 06/12/2021 (E) 2,135,000 2,416,816
CIT Group, Inc.4.13%, 03/09/2021 125,000 126,563
Citigroup, Inc.Fixed until 01/10/2027,
3.89% (D), 01/10/2028 1,978,000 2,008,628Fixed until 06/01/2023,
4.04% (D), 06/01/2024 1,346,000 1,390,8594.50%, 01/14/2022 685,000 714,436
Commerzbank AG8.13%, 09/19/2023 (E) 1,685,000 1,921,347
Cooperatieve Rabobank UAFixed until 06/30/2019 (F),
11.00% (D) (E) 2,438,000 2,483,713
Principal ValueCORPORATE DEBT SECURITIES (continued)Banks (continued)Discover Bank
3.45%, 07/27/2026 $1,078,000
$1,043,985
Fifth Third Bancorp3.95%, 03/14/2028 (C) 1,381,000 1,426,393
First Horizon National Corp.3.50%, 12/15/2020 1,034,000 1,039,372
HSBC Holdings PLC4.25%, 03/14/2024 200,000 204,5455.25%, 03/14/2044 (C) 201,000 219,851
Huntington National Bank3.55%, 10/06/2023 1,218,000 1,246,989
Intesa Sanpaolo SpA5.02%, 06/26/2024 (E) 615,000 594,452
JPMorgan Chase & Co.3.38%, 05/01/2023 1,517,000 1,532,5434.85%, 02/01/2044 1,010,000 1,118,8456.40%, 05/15/2038 613,000 795,206Fixed until 02/01/2024 (F),
6.75% (C) (D) 66,000 72,3588.75%, 09/01/2030 175,000 239,217
Lloyds Banking Group PLCFixed until 11/07/2022,
2.91% (D), 11/07/2023 1,358,000 1,324,737Royal Bank of Scotland Group PLC
Fixed until 06/25/2023,4.52% (D), 06/25/2024 665,000 680,017
6.40%, 10/21/2019 185,000 188,308Toronto-Dominion Bank
Fixed until 09/15/2026,3.63% (D), 09/15/2031 (C) 1,910,000 1,885,211
Wells Fargo & Co.Fixed until 06/15/2024 (F),
5.90% (D) 178,000 182,8954.10%, 06/03/2026, MTN 668,000 682,9264.15%, 01/24/2029, MTN 964,000 1,007,702
Wells Fargo Bank NA2.60%, 01/15/2021 635,000 633,1745.95%, 08/26/2036 431,000 520,403
32,568,517Beverages - 0.4%Anheuser-Busch Cos. LLC / Anheuser-Busch InBev
Worldwide, Inc.3.65%, 02/01/2026 (E) 999,000 1,001,950
Anheuser-Busch InBev Worldwide, Inc.4.44%, 10/06/2048 1,419,000 1,335,7974.75%, 01/23/2029 1,264,000 1,346,663
Constellation Brands, Inc.3.70%, 12/06/2026 1,332,000 1,327,361
Pernod Ricard SA4.45%, 01/15/2022 (E) 711,000 738,5445.75%, 04/07/2021 (E) 1,761,000 1,854,790
7,605,105Biotechnology - 0.2%AbbVie, Inc.
3.20%, 05/14/2026 1,384,000 1,341,370Biogen, Inc.
4.05%, 09/15/2025 1,532,000 1,567,153Gilead Sciences, Inc.
4.15%, 03/01/2047 (C) 311,000 300,0763,208,599
Copyright © 2021 www.secdatabase.com. All Rights Reserved.Please Consider the Environment Before Printing This Document

The notes are an integral part of this report.Transamerica Series Trust Page 5
Copyright © 2021 www.secdatabase.com. All Rights Reserved.Please Consider the Environment Before Printing This Document

Transamerica Multi-Managed Balanced VPSCHEDULE OF INVESTMENTS (continued)At March 31, 2019(unaudited)
Principal ValueCORPORATE DEBT SECURITIES (continued)Building Products - 0.1%Owens Corning
4.20%, 12/15/2022 $1,680,000
$1,723,286
4.40%, 01/30/2048 745,000 612,9262,336,212
Capital Markets - 1.2%Ameriprise Financial, Inc.
3.00%, 03/22/2022 515,000 517,9593.70%, 10/15/2024 1,100,000 1,137,074
Bank of New York Mellon Corp.2.50%, 04/15/2021, MTN 652,000 650,416
Charles Schwab Corp.3.20%, 03/02/2027 (C) 1,063,000 1,069,1453.85%, 05/21/2025 2,110,000 2,217,527
Credit Suisse Group Funding Guernsey, Ltd.3.75%, 03/26/2025 1,088,000 1,096,2363.80%, 06/09/2023 1,515,000 1,538,598
Goldman Sachs Group, Inc.3.63%, 02/20/2024 1,572,000 1,588,0765.25%, 07/27/2021 2,516,000 2,643,0026.75%, 10/01/2037 1,031,000 1,256,867
Lazard Group LLC4.50%, 09/19/2028 1,477,000 1,520,405
Morgan Stanley5.00%, 11/24/2025 976,000 1,046,1455.75%, 01/25/2021 948,000 995,5594.35%, 09/08/2026, MTN 627,000 643,266
UBS AG7.63%, 08/17/2022 1,521,000 1,674,895
UBS Group Funding Switzerland AG4.25%, 03/23/2028 (E) 1,014,000 1,054,496
20,649,666Chemicals - 0.1%Syngenta Finance NV
3.93%, 04/23/2021 (E) 845,000 848,928Commercial Services & Supplies - 0.2%CK Hutchison International 17 II, Ltd.
2.25%, 09/29/2020 (E) 595,000 588,758ERAC USA Finance LLC
2.70%, 11/01/2023 (E) 615,000 595,9513.85%, 11/15/2024 (E) 720,000 731,203
Hutchison Whampoa International 11, Ltd.4.63%, 01/13/2022 (E) 600,000 624,403
2,540,315Communications Equipment - 0.1%Nokia OYJ
3.38%, 06/12/2022 (C) 1,142,000 1,129,153Construction & Engineering - 0.3%SBA Tower Trust
2.88%, 07/15/2046 (E) 1,477,000 1,463,4683.17%, 04/09/2047 (E) 1,490,000 1,481,9723.45%, 03/15/2048 (E) 1,660,000 1,670,193
4,615,633Construction Materials - 0.2%LafargeHolcim Finance US LLC
4.75%, 09/22/2046 (E) 1,290,000 1,197,530Martin Marietta Materials, Inc.
4.25%, 07/02/2024 1,905,000 1,975,2083,172,738
Principal ValueCORPORATE DEBT SECURITIES (continued)Consumer Finance - 0.3%Ally Financial, Inc.
4.13%, 03/30/2020 $1,500,000
$1,509,885
American Express Co.4.05%, 12/03/2042 300,000 309,213
BMW US Capital LLC2.80%, 04/11/2026 (E) 1,775,000 1,702,526
Capital One Financial Corp.3.30%, 10/30/2024 1,133,000 1,121,780
4,643,404Containers & Packaging - 0.1%International Paper Co.
4.75%, 02/15/2022 525,000 549,144Reynolds Group Issuer, Inc. / Reynolds Group Issuer
LLC5.13%, 07/15/2023 (E) 650,000 660,5625.75%, 10/15/2020 1,254,994 1,256,563
2,466,269Diversified Consumer Services - 0.0% (B)President & Fellows of Harvard College
3.62%, 10/01/2037 95,000 96,912Diversified Financial Services - 0.2%AerCap Ireland Capital DAC / AerCap Global
Aviation Trust4.45%, 04/03/2026 (G) 485,000 485,822
Aviation Capital Group LLC7.13%, 10/15/2020 (E) 1,811,000 1,911,335
AXA Equitable Holdings, Inc.4.35%, 04/20/2028 1,696,000 1,721,733
4,118,890Diversified Telecommunication Services - 0.5%AT&T, Inc.
3.40%, 05/15/2025 2,055,000 2,033,456GTP Acquisition Partners I LLC
2.35%, 06/15/2045 (E) 210,000 207,620Hughes Satellite Systems Corp.
7.63%, 06/15/2021 1,155,000 1,241,637Sprint Capital Corp.
6.88%, 11/15/2028 175,000 168,219Verizon Communications, Inc.
5.15%, 09/15/2023 2,331,000 2,562,2515.50%, 03/16/2047 1,977,000 2,313,869
8,527,052Electric Utilities - 0.5%Appalachian Power Co.
3.40%, 06/01/2025 550,000 557,242Cleveland Electric Illuminating Co.
5.95%, 12/15/2036 114,000 133,217Duke Energy Corp.
3.75%, 04/15/2024 - 09/01/2046 3,320,000 3,187,376Duke Energy Progress LLC
3.60%, 09/15/2047 1,050,000 1,003,821Entergy Arkansas LLC
3.70%, 06/01/2024 267,000 277,078Niagara Mohawk Power Corp.
4.88%, 08/15/2019 (E) 347,000 349,828Oncor Electric Delivery Co. LLC
4.10%, 06/01/2022 1,512,000 1,571,8235.30%, 06/01/2042 75,000 90,617
Copyright © 2021 www.secdatabase.com. All Rights Reserved.Please Consider the Environment Before Printing This Document

The notes are an integral part of this report.Transamerica Series Trust Page 6
Copyright © 2021 www.secdatabase.com. All Rights Reserved.Please Consider the Environment Before Printing This Document

Transamerica Multi-Managed Balanced VPSCHEDULE OF INVESTMENTS (continued)At March 31, 2019(unaudited)
Principal ValueCORPORATE DEBT SECURITIES (continued)Electric Utilities (continued)PacifiCorp
3.60%, 04/01/2024 $966,000
$999,876
5.75%, 04/01/2037 150,000 183,521Public Service Electric & Gas Co.
3.00%, 05/15/2025, MTN 560,000 560,7848,915,183
Electronic Equipment, Instruments & Components - 0.2%Arrow Electronics, Inc.
3.25%, 09/08/2024 360,000 349,0013.88%, 01/12/2028 1,415,000 1,362,198
Keysight Technologies, Inc.4.55%, 10/30/2024 1,750,000 1,818,277
3,529,476Energy Equipment & Services - 0.1%Schlumberger Holdings Corp.
3.00%, 12/21/2020 (E) 1,352,000 1,357,696Schlumberger Investment SA
3.65%, 12/01/2023 (C) 132,000 136,819Weatherford International, Ltd.
5.95%, 04/15/2042 155,000 86,7541,581,269
Equity Real Estate Investment Trusts - 0.7%American Tower Trust #1
3.65%, 03/15/2048 (E) 775,000 779,091CBL & Associates, LP
5.25%, 12/01/2023 (C) 1,036,000 802,900EPR Properties
4.75%, 12/15/2026 (C) 1,347,000 1,383,308HCP, Inc.
3.40%, 02/01/2025 2,683,000 2,665,617Hospitality Properties Trust
5.00%, 08/15/2022 1,250,000 1,293,975Kilroy Realty, LP
4.25%, 08/15/2029 1,120,000 1,142,1324.38%, 10/01/2025 674,000 695,632
Realty Income Corp.3.88%, 07/15/2024 965,000 1,001,241
VEREIT Operating Partnership, LP3.95%, 08/15/2027 1,399,000 1,378,1634.63%, 11/01/2025 482,000 498,514
11,640,573Food & Staples Retailing - 0.1%Sysco Corp.
3.30%, 07/15/2026 1,023,000 1,016,622Walmart, Inc.
3.63%, 12/15/2047 1,540,000 1,521,4082,538,030
Food Products - 0.1%Kraft Heinz Foods Co.
2.80%, 07/02/2020 880,000 878,8774.88%, 02/15/2025 (E) 535,000 547,021
1,425,898Health Care Equipment & Supplies - 0.2%Abbott Laboratories
3.75%, 11/30/2026 896,000 931,412
Principal ValueCORPORATE DEBT SECURITIES (continued)Health Care Equipment & Supplies (continued)Boston Scientific Corp.
4.70%, 03/01/2049 $1,051,000
$1,116,135
Edwards Lifesciences Corp.4.30%, 06/15/2028 1,027,000 1,077,065
3,124,612Health Care Providers & Services - 0.3%Cigna Corp.
4.13%, 11/15/2025 (E) 827,000 855,931Coventry Health Care, Inc.
5.45%, 06/15/2021 222,000 232,063CVS Health Corp.
2.13%, 06/01/2021 1,337,000 1,314,1754.10%, 03/25/2025 508,000 521,535
HCA Healthcare, Inc.6.25%, 02/15/2021 645,000 677,798
HCA, Inc.5.25%, 04/15/2025 742,000 796,744
Quest Diagnostics, Inc.4.20%, 06/30/2029 1,475,000 1,515,903
5,914,149Household Durables - 0.1%D.R. Horton, Inc.
4.38%, 09/15/2022 842,000 863,623Whirlpool Corp.
4.75%, 02/26/2029 672,000 689,4111,553,034
Industrial Conglomerates - 0.1%General Electric Co.
6.88%, 01/10/2039, MTN 1,419,000 1,677,928Insurance - 0.3%Allstate Corp.
3.28%, 12/15/2026 997,000 1,010,994Athene Global Funding
3.00%, 07/01/2022 (E) 997,000 994,653CNA Financial Corp.
5.88%, 08/15/2020 1,454,000 1,511,976Fidelity National Financial, Inc.
5.50%, 09/01/2022 255,000 270,249Lincoln National Corp.
3.63%, 12/12/2026 1,047,000 1,052,0174,839,889
Interactive Media & Services - 0.1%Baidu, Inc.
4.38%, 05/14/2024 1,213,000 1,257,597Internet & Direct Marketing Retail - 0.0% (B)Booking Holdings, Inc.
3.60%, 06/01/2026 630,000 640,217IT Services - 0.1%DXC Technology Co.
4.75%, 04/15/2027 823,000 835,916Life Sciences Tools & Services - 0.1%Thermo Fisher Scientific, Inc.
5.30%, 02/01/2044 1,236,000 1,422,338Machinery - 0.0% (B)Doosan Heavy Industries & Construction Co., Ltd.
2.13%, 04/27/2020 (E) 580,000 574,850
Copyright © 2021 www.secdatabase.com. All Rights Reserved.Please Consider the Environment Before Printing This Document

The notes are an integral part of this report.Transamerica Series Trust Page 7
Copyright © 2021 www.secdatabase.com. All Rights Reserved.Please Consider the Environment Before Printing This Document

Transamerica Multi-Managed Balanced VPSCHEDULE OF INVESTMENTS (continued)At March 31, 2019(unaudited)
Principal ValueCORPORATE DEBT SECURITIES (continued)Media - 0.3%Clear Channel Worldwide Holdings, Inc.
6.50%, 11/15/2022 $1,240,000
$1,266,350
NBCUniversal Enterprise, Inc.5.25%, 03/19/2021 (E) (F) 473,000 480,095
NBCUniversal Media LLC4.38%, 04/01/2021 1,440,000 1,487,5704.45%, 01/15/2043 1,294,000 1,340,182
4,574,197Metals & Mining - 0.1%Anglo American Capital PLC
4.00%, 09/11/2027 (E) 800,000 777,6644.75%, 04/10/2027 (E) 365,000 371,952
Freeport-McMoRan, Inc.3.88%, 03/15/2023 185,000 182,338
1,331,954Multi-Utilities - 0.2%CMS Energy Corp.
3.88%, 03/01/2024 87,000 89,1724.88%, 03/01/2044 201,000 220,052
Dominion Energy, Inc.2.58%, 07/01/2020 833,000 828,399
DTE Electric Co.4.30%, 07/01/2044 1,519,000 1,617,153
Public Service Enterprise Group, Inc.2.65%, 11/15/2022 650,000 644,512
3,399,288Oil, Gas & Consumable Fuels - 1.3%Anadarko Petroleum Corp.
5.55%, 03/15/2026 2,142,000 2,332,931BP Capital Markets PLC
3.12%, 05/04/2026 2,307,000 2,301,770Energy Transfer Operating, LP
4.90%, 02/01/2024 659,000 694,8195.15%, 02/01/2043 800,000 765,2435.95%, 10/01/2043 740,000 780,4557.60%, 02/01/2024 581,000 667,317
Enterprise Products Operating LLC4.25%, 02/15/2048 1,642,000 1,600,327
EOG Resources, Inc.2.45%, 04/01/2020 371,000 369,480
Exxon Mobil Corp.3.04%, 03/01/2026 1,950,000 1,978,484
Kinder Morgan Energy Partners, LP4.15%, 02/01/2024 1,295,000 1,341,135
Nexen, Inc.5.88%, 03/10/2035 10,000 12,051
Petrobras Global Finance BV6.25%, 03/17/2024 (C) 670,000 719,413
Petroleos Mexicanos3.50%, 01/30/2023 1,515,000 1,446,9776.50%, 01/23/2029 656,000 650,0966.88%, 08/04/2026 790,000 823,417
Petronas Capital, Ltd.5.25%, 08/12/2019 (E) 1,490,000 1,502,757
Sabine Pass Liquefaction LLC4.20%, 03/15/2028 670,000 674,707
Shell International Finance BV2.50%, 09/12/2026 1,826,000 1,764,4483.75%, 09/12/2046 266,000 266,536
Principal ValueCORPORATE DEBT SECURITIES (continued)Oil, Gas & Consumable Fuels (continued)TransCanada PipeLines, Ltd.
3.75%, 10/16/2023 $160,000 $ 164,821
4.63%, 03/01/2034 145,000 152,532Western Midstream Operating, LP
5.38%, 06/01/2021 259,000 268,475Williams Cos., Inc.
5.40%, 03/04/2044 128,000 136,4047.88%, 09/01/2021 109,000 120,461
21,535,056Pharmaceuticals - 0.3%AstraZeneca PLC
4.00%, 01/17/2029 (C) 345,000 362,242Bayer US Finance LLC
3.00%, 10/08/2021 (E) 992,000 983,880Merck & Co., Inc.
3.40%, 03/07/2029 667,000 684,276Mylan, Inc.
4.55%, 04/15/2028 1,102,000 1,071,366Takeda Pharmaceutical Co., Ltd.
5.00%, 11/26/2028 (E) 1,871,000 2,028,2705,130,034
Road & Rail - 0.0% (B)Burlington Northern Santa Fe LLC
3.00%, 03/15/2023 508,000 513,6273.75%, 04/01/2024 48,000 50,108
563,735Semiconductors & Semiconductor Equipment - 0.3%Intel Corp.
2.88%, 05/11/2024 1,548,000 1,557,804KLA-Tencor Corp.
4.10%, 03/15/2029 980,000 997,391Lam Research Corp.
3.75%, 03/15/2026 1,116,000 1,136,207NXP BV / NXP Funding LLC
4.88%, 03/01/2024 (E) 537,000 566,975QUALCOMM, Inc.
3.25%, 05/20/2027 700,000 683,9714,942,348
Software - 0.1%Microsoft Corp.
3.30%, 02/06/2027 1,571,000 1,612,823Technology Hardware, Storage & Peripherals - 0.2%Apple, Inc.
2.85%, 02/23/2023 1,376,000 1,388,584Dell International LLC / EMC Corp.
6.02%, 06/15/2026 (E) 1,015,000 1,091,684Western Digital Corp.
4.75%, 02/15/2026 (C) 1,485,000 1,418,1753,898,443
Tobacco - 0.1%Altria Group, Inc.
4.40%, 02/14/2026 689,000 708,180BAT Capital Corp.
2.30%, 08/14/2020 486,000 481,020RJ Reynolds Tobacco Co.
8.13%, 06/23/2019 450,000 455,0831,644,283
Copyright © 2021 www.secdatabase.com. All Rights Reserved.Please Consider the Environment Before Printing This Document

The notes are an integral part of this report.Transamerica Series Trust Page 8
Copyright © 2021 www.secdatabase.com. All Rights Reserved.Please Consider the Environment Before Printing This Document

Transamerica Multi-Managed Balanced VPSCHEDULE OF INVESTMENTS (continued)At March 31, 2019(unaudited)
Principal ValueCORPORATE DEBT SECURITIES (continued)Wireless Telecommunication Services - 0.3%America Movil SAB de CV
3.13%, 07/16/2022 $1,016,000
$1,022,814
4.38%, 07/16/2042 250,000 260,595Crown Castle Towers LLC
3.22%, 05/15/2042 (E) 3,306,000 3,313,5593.72%, 07/15/2043 (E) 40,000 40,510
Sprint Corp.7.25%, 09/15/2021 330,000 346,5007.88%, 09/15/2023 200,000 209,500
5,193,478Total Corporate Debt Securities
(Cost $219,647,290) 220,475,203
FOREIGN GOVERNMENT OBLIGATIONS - 0.4%Brazil - 0.0% (B)Brazil Government International Bond
4.25%, 01/07/2025 (C) 480,000 488,645Colombia - 0.1%Colombia Government International Bond
4.00%, 02/26/2024 305,000 314,4584.50%, 01/28/2026 1,125,000 1,185,750
1,500,208Indonesia - 0.1%Indonesia Government International Bond
4.75%, 01/08/2026 (E) 1,160,000 1,225,2215.38%, 10/17/2023 (E) 400,000 432,871
1,658,092Mexico - 0.1%Mexico Government International Bond
3.75%, 01/11/2028 1,883,000 1,859,839Panama - 0.0% (B)Panama Government International Bond
3.88%, 03/17/2028 550,000 571,180Peru - 0.0% (B)Peru Government International Bond
7.35%, 07/21/2025 160,000 201,360Poland - 0.0% (B)Republic of Poland Government International
Bond3.00%, 03/17/2023 (C) 405,000 407,495
Qatar - 0.0% (B)Qatar Government International Bond
3.88%, 04/23/2023 (E) 200,000 205,694Saudi Arabia - 0.1%Saudi Arabia Government International Bond
2.38%, 10/26/2021 (E) 705,000 692,722Total Foreign Government Obligations
(Cost $7,464,602) 7,585,235
MORTGAGE-BACKED SECURITIES - 3.8%Aventura Mall Trust
Series 2013-AVM, Class A,3.74% (D), 12/05/2032 (E) 1,300,000 1,314,854
Principal ValueMORTGAGE-BACKED SECURITIES (continued)BB-UBS Trust
Series 2012-TFT, Class A,2.89%, 06/05/2030 (E) $
1,630,000$1,621,466
Series 2012-TFT, Class C,3.47% (D), 06/05/2030 (E) 1,390,000 1,359,695
BB-UBS Trust, Interest Only STRIPSSeries 2012-SHOW, Class XA,0.60% (D), 11/05/2036 (E) 3,935,000 126,408
BBCMS TrustSeries 2013-TYSN, Class B,4.04%, 09/05/2032 (E) 755,000 762,437Series 2015-MSQ, Class B,3.89%, 09/15/2032 (E) 1,150,000 1,166,909
BCAP LLC TrustSeries 2010-RR1, Class 12A1,5.25% (D), 08/26/2036 (E) 10,234 10,176
Caesars Palace Las Vegas TrustSeries 2017-VICI, Class A,3.53%, 10/15/2034 (E) 1,800,000 1,836,478
CGRBS Commercial Mortgage TrustSeries 2013-VN05, Class B,3.58% (D), 03/13/2035 (E) 2,550,000 2,600,961
Citigroup Commercial Mortgage TrustSeries 2014-GC19, Class A3,3.75%, 03/10/2047 102,652 106,660Series 2014-GC19, Class A4,4.02%, 03/10/2047 285,000 299,497
Citigroup Mortgage Loan TrustSeries 2015-A, Class A1,3.50% (D), 06/25/2058 (E) 407,636 408,942
Citigroup Mortgage Loan Trust, Inc.Series 2018-RP1, Class A1,3.00% (D), 09/25/2064 (E) 1,065,340 1,054,645
COMM Mortgage TrustSeries 2013-CR11, Class AM,4.72% (D), 08/10/2050 1,648,000 1,753,329Series 2013-GAM, Class A1,1.71%, 02/10/2028 (E) 80,047 78,987Series 2013-GAM, Class A2,3.37%, 02/10/2028 (E) 170,000 169,793Series 2013-WWP, Class B,3.73%, 03/10/2031 (E) 1,900,000 1,969,656Series 2014-UBS2, Class A5,3.96%, 03/10/2047 890,000 931,490Series 2015-3BP, Class A,3.18%, 02/10/2035 (E) 3,500,000 3,536,228Series 2016-GCT, Class C,3.46% (D), 08/10/2029 (E) 690,000 686,808
Commercial Mortgage Pass-Through CertificatesSeries 2012-LTRT, Class A2,3.40%, 10/05/2030 (E) 1,690,000 1,685,377
Core Industrial TrustSeries 2015-CALW, Class B,3.25%, 02/10/2034 (E) 1,135,000 1,140,655
Credit Suisse Mortgage Capital CertificatesSeries 2009-11R, Class 5A1,3.78% (D), 08/26/2036 (E) 49,294 49,429
CSMC TrustSeries 2014-4R, Class 21A1,1-Month LIBOR + 0.33%, 3.15% (D), 12/27/
2035 (E) 620,106 614,698
Copyright © 2021 www.secdatabase.com. All Rights Reserved.Please Consider the Environment Before Printing This Document

The notes are an integral part of this report.Transamerica Series Trust Page 9
Copyright © 2021 www.secdatabase.com. All Rights Reserved.Please Consider the Environment Before Printing This Document

Transamerica Multi-Managed Balanced VPSCHEDULE OF INVESTMENTS (continued)At March 31, 2019(unaudited)
Principal ValueMORTGAGE-BACKED SECURITIES (continued)Deutsche Alt-A Securities Mortgage Loan Trust
Series 2007-RMP1, Class A2,1-Month LIBOR + 0.15%,
2.64% (D), 12/25/2036$138,349
$123,571
GS Mortgage Securities Corp. IISeries 2013-KING, Class E,3.44% (D), 12/10/2027 (E) 440,000 436,936
GS Mortgage Securities TrustSeries 2013-G1, Class A2,3.56% (D), 04/10/2031 (E) 1,830,837 1,847,167
Houston Galleria Mall TrustSeries 2015-HGLR, Class A1A2,3.09%, 03/05/2037 (E) 800,000 797,863
Jefferies Resecuritization TrustSeries 2009-R7, Class 1A1,4.25% (D), 02/26/2036 (E) 46,842 46,928
JPMorgan Chase Commercial Mortgage SecuritiesTrustSeries 2010-C1, Class B,5.95%, 06/15/2043 (E) 420,000 425,031Series 2012-WLDN, Class A,3.91%, 05/05/2030 (E) 5,383,886 5,483,081
Mill City Mortgage Loan TrustSeries 2016-1, Class A1,2.50% (D), 04/25/2057 (E) 424,677 420,842
Morgan Stanley Bank of America Merrill Lynch TrustSeries 2012-C6, Class AS,3.48%, 11/15/2045 2,010,000 2,031,571Series 2013-C11, Class B,4.37% (D), 08/15/2046 945,000 975,759
Morgan Stanley Capital Barclays Bank TrustSeries 2016-MART, Class A,2.20%, 09/13/2031 (E) 4,890,000 4,821,959
Morgan Stanley Resecuritization TrustSeries 2014-R3, Class 2A,3.00% (D), 07/26/2048 (E) 610,489 596,904
Motel 6 TrustSeries 2017-MTL6, Class C,1-Month LIBOR + 1.40%, 3.88% (D), 08/15/
2034 (E) 4,117,912 4,115,301Nationstar Mortgage Loan Trust
Series 2013-A, Class A,3.75% (D), 12/25/2052 (E) 303,386 306,323
New Residential Mortgage Loan TrustSeries 2014-1A, Class A,3.75% (D), 01/25/2054 (E) 268,882 271,559Series 2014-2A, Class A3,3.75% (D), 05/25/2054 (E) 991,749 999,237Series 2014-3A, Class AFX3,3.75% (D), 11/25/2054 (E) 265,418 267,952Series 2015-2A, Class A1,3.75% (D), 08/25/2055 (E) 581,571 588,100Series 2016-2A, Class A1,3.75% (D), 11/26/2035 (E) 632,237 639,206Series 2016-3A, Class A1B,3.25% (D), 09/25/2056 (E) 672,909 670,839Series 2016-4A, Class A1,3.75% (D), 11/25/2056 (E) 1,244,325 1,257,122Series 2017-1A, Class A1,4.00% (D), 02/25/2057 (E) 1,529,629 1,556,736Series 2017-2A, Class A3,4.00% (D), 03/25/2057 (E) 1,462,902 1,494,975
Principal ValueMORTGAGE-BACKED SECURITIES (continued)New Residential Mortgage Loan Trust (continued)
Series 2017-3A, Class A1,4.00% (D), 04/25/2057 (E) $
2,288,454$2,337,886
Series 2017-4A, Class A1,4.00% (D), 05/25/2057 (E) 904,539 924,095
One Market Plaza TrustSeries 2017-1MKT, Class A,3.61%, 02/10/2032 (E) 2,169,000 2,219,603
Palisades Center TrustSeries 2016-PLSD, Class A,2.71%, 04/13/2033 (E) 1,911,000 1,891,576
Provident Funding Mortgage Loan TrustSeries 2005-1, Class 3A1,1-Month LIBOR + 0.58%, 3.07% (D), 05/25/2035 218,091 216,979
UBS-BAMLL TrustSeries 2012-WRM, Class A,3.66%, 06/10/2030 (E) 916,000 929,343
Waldorf Astoria Boca Raton TrustSeries 2016-BOCA, Class C,1-Month LIBOR + 2.50%,
4.98% (D), 06/15/2029 (E) 915,000 915,263Total Mortgage-Backed Securities
(Cost $65,286,733) 64,895,285
MUNICIPAL GOVERNMENT OBLIGATIONS - 0.3%California - 0.3%Los Angeles Community College District, General
Obligation Unlimited,6.60%, 08/01/2042 55,000 79,246
State of California, General Obligation Unlimited7.30%, 10/01/2039 765,000 1,106,9787.60%, 11/01/2040 660,000 1,024,6447.70%, 11/01/2030 580,000 626,8937.95%, 03/01/2036 1,525,000 1,597,788
University of California, Revenue Bonds,Series AD,4.86%, 05/15/2112 50,000 56,252
4,491,801Georgia - 0.0% (B)Municipal Electric Authority of Georgia, Revenue
Bonds,Series A,6.64%, 04/01/2057 50,000 56,270
New Jersey - 0.0% (B)New Jersey Turnpike Authority, Revenue Bonds,
Series F,7.41%, 01/01/2040 71,000 106,643
New York - 0.0% (B)Metropolitan Transportation Authority, Revenue
Bonds,Series E,6.81%, 11/15/2040 60,000 81,825
New York City Water & Sewer System, RevenueBonds,Series CC,5.88%, 06/15/2044 55,000 75,187
Copyright © 2021 www.secdatabase.com. All Rights Reserved.Please Consider the Environment Before Printing This Document

The notes are an integral part of this report.Transamerica Series Trust Page 10
Copyright © 2021 www.secdatabase.com. All Rights Reserved.Please Consider the Environment Before Printing This Document

Transamerica Multi-Managed Balanced VPSCHEDULE OF INVESTMENTS (continued)At March 31, 2019(unaudited)
Principal ValueMUNICIPAL GOVERNMENT OBLIGATIONS (continued)New York (continued) (B)New York State Dormitory Authority, Revenue
Bonds,Series H,5.39%, 03/15/2040 $ 55,000 $ 66,467
Port Authority of New York & New Jersey,Revenue Bonds,Series 181,4.96%, 08/01/2046 95,000 115,825
339,304Total Municipal Government Obligations
(Cost $5,082,401) 4,994,018
U.S. GOVERNMENT AGENCY OBLIGATIONS - 7.1%Federal Home Loan Mortgage Corp.
5.00%, 02/01/2024 - 08/01/2035 599,612 651,8055.50%, 07/01/2037 - 06/01/2041 131,385 143,5726.00%, 12/01/2037 56,349 63,581
Federal Home Loan Mortgage Corp. MultifamilyStructured Pass-Through Certificates2.89%, 06/25/2027 5,908,862 5,946,3513.01%, 07/25/2025 7,159,000 7,271,0533.06% (D), 08/25/2024 3,640,000 3,710,6933.49%, 01/25/2024 2,260,000 2,344,2293.53% (D), 07/25/2023 1,852,000 1,918,117
Federal National Mortgage Association2.50%, TBA (G) 4,196,000 4,170,9653.00%, TBA (G) 40,561,000 40,569,1043.33% (D), 10/25/2023 236,254 242,7073.50%, 07/01/2028 - 01/01/2029 494,653 507,5393.50%, TBA (G) 25,460,000 25,805,0874.00%, 06/01/2042 151,432 157,6314.00%, TBA (G) 14,441,000 14,854,0434.50%, 02/01/2025 - 06/01/2026 274,769 282,51312-Month LIBOR + 1.52%,
4.60% (D), 02/01/2043 63,403 65,5765.00%, 04/01/2039 - 11/01/2039 1,949,392 2,116,0965.00%, TBA (G) 6,604,000 6,981,7715.50%, 04/01/2037 - 12/01/2041 993,412 1,103,6496.00%, 08/01/2036 - 06/01/2041 1,828,662 2,019,5406.50%, 05/01/2040 141,435 161,720
Government National Mortgage Association,Interest Only STRIPS0.78% (D), 02/16/2053 753,650 36,371
Total U.S. Government Agency Obligations(Cost $119,631,742) 121,123,713
U.S. GOVERNMENT OBLIGATIONS - 9.5%U.S. Treasury - 8.7%U.S. Treasury Bond
2.25%, 08/15/2046 4,306,000 3,839,7412.50%, 02/15/2045 - 05/15/2046 12,009,000 11,310,9422.75%, 08/15/2042 - 11/15/2047 9,134,600 9,038,4312.88%, 08/15/2045 5,077,000 5,144,6273.00%, 05/15/2042 - 08/15/2048 3,296,900 3,423,4373.13%, 02/15/2042 - 05/15/2048 3,152,000 3,349,4683.50%, 02/15/2039 8,413,500 9,533,2193.63%, 02/15/2044 8,879,700 10,214,7774.50%, 02/15/2036 5,950,600 7,536,3424.75%, 02/15/2037 7,403,000 9,714,4135.25%, 02/15/2029 3,464,000 4,319,852
U.S. Treasury Note
Principal ValueU.S. GOVERNMENT OBLIGATIONS (continued)U.S. Treasury (continued)U.S. Treasury Note (continued)
1.38%, 09/30/2019 $6,580,000
$6,544,273
1.50%, 08/15/2026 5,308,000 5,006,7301.63%, 02/15/2026 - 05/15/2026 6,615,000 6,313,7412.25%, 11/15/2027 2,300,200 2,275,7602.38%, 01/31/2023 - 02/29/2024 6,346,000 6,378,5992.50%, 12/31/2020 - 05/15/2024 11,414,900 11,509,4692.63%, 12/15/2021 - 02/15/2029 1,872,700 1,902,1332.88%, 09/30/2023 - 08/15/2028 11,993,300 12,409,7163.13%, 11/15/2028 7,531,600 7,989,086
147,236,354U.S. Treasury Inflation-Protected Securities - 0.8%U.S. Treasury Inflation-Indexed Bond
1.75%, 01/15/2028 1,644,566 1,815,6292.50%, 01/15/2029 4,831,843 5,724,484
U.S. Treasury Inflation-Indexed Note0.63%, 01/15/2024 6,360,386 6,420,582
13,960,695Total U.S. Government Obligations
(Cost $159,049,710) 161,197,049
COMMERCIAL PAPER - 4.6%Banks - 0.3%Bedford Row Funding Corp.
2.61% (H), 04/26/2019 4,700,000 4,690,976Sumitomo Mitsui Banking Corp.
2.77% (H), 04/11/2019 1,000,000 999,0975,690,073
Capital Markets - 0.4%Cedar Springs Capital Co. LLC
2.65% (H), 06/05/2019 3,750,000 3,731,854Intercontinental Exchange, Inc.
2.63% (H), 04/18/2019 3,000,000 2,995,9156,727,769
Diversified Financial Services - 3.3%Atlantic Asset Securitization LLC
2.61% (H), 06/24/2019 5,000,000 4,969,422Barton Capital Corp.
2.61% (H), 04/29/2019 4,000,000 3,991,467CAFCO LLC
2.74% (H), 04/24/2019 1,200,000 1,197,767Cancara Asset Securitisation LLC
2.64% (H), 06/19/2019 4,000,000 3,976,690Chariot Funding LLC
2.59% (H), 06/21/2019 500,000 497,072Ciesco LLC
2.63% (H), 05/08/2019 6,000,000 5,983,230Fairway Finance Corp.
2.83% (H), 04/01/2019 6,000,000 5,999,077Gotham Funding Corp.
2.60% (H), 05/20/2019 7,000,000 6,974,712Le Fayette Asset Securitization LLC
2.81% (H), 04/08/2019 2,800,000 2,798,0752.84% (H), 04/08/2019 2,000,000 1,998,610
LMA SA / LMA Americas LLC2.60% (H), 06/10/2019 6,000,000 5,969,400
Sheffield Receivable2.67% (H), 05/20/2019 5,900,000 5,878,101
Victory Receivables
Copyright © 2021 www.secdatabase.com. All Rights Reserved.Please Consider the Environment Before Printing This Document

The notes are an integral part of this report.Transamerica Series Trust Page 11
1.00%, 11/30/2019 6,783,000 6,719,4091.13%, 06/30/2021 - 09/30/2021 2,832,000 2,762,189
2.84% (H), 04/01/2019 6,000,000 5,999,07356,232,696
Copyright © 2021 www.secdatabase.com. All Rights Reserved.Please Consider the Environment Before Printing This Document

Transamerica Multi-Managed Balanced VPSCHEDULE OF INVESTMENTS (continued)At March 31, 2019(unaudited)
FUTURES CONTRACTS:
DescriptionLong/Short
Number ofContracts
ExpirationDate
NotionalAmount Value
UnrealizedAppreciation
UnrealizedDepreciation
S&P 500® E-Mini Index Long 94 06/21/2019 $ 13,007,778 $ 13,337,660 $ 329,882 $ �
The notes are an integral part of this report.Transamerica Series Trust Page 12
Principal ValueCOMMERCIAL PAPER (continued)Equity Real Estate Investment Trusts - 0.2%Simon Property Group, Inc.
2.62% (H), 05/08/2019 $3,000,000
$2,991,647
Health Care Providers & Services - 0.4%United Healthcare Co.
2.78% (H), 06/11/2019 6,000,000 5,966,907Total Commercial Paper
(Cost $77,609,092) 77,609,092
SHORT-TERM U.S. GOVERNMENT OBLIGATIONS - 0.9%U.S. Treasury Bill
2.41% (H), 05/09/2019 629,000 627,3522.42% (H), 04/04/2019 14,339,000 14,334,277
Total Short-Term U.S. Government Obligations(Cost $14,961,629) 14,961,629
Shares ValueOTHER INVESTMENT COMPANY - 0.7%Securities Lending Collateral - 0.7%State Street Navigator Securities Lending Trust -
Government Money Market Portfolio, 2.41% (H) 11,769,218 11,769,218Total Other Investment Company
(Cost $11,769,218) 11,769,218
Principal ValueREPURCHASE AGREEMENT - 1.5%Fixed Income Clearing Corp., 1.45% (H),
dated 03/29/2019, to be repurchased at$25,743,741 on 04/01/2019.Collateralized by a U.S. GovernmentObligation, 2.75%, due 08/15/2021, andwith a value of $26,257,934. $ 25,740,630 $ 25,740,630
Total Repurchase Agreement(Cost $25,740,630) 25,740,630
Total Investments(Cost $1,647,959,136) 1,798,111,245
Net Other Assets (Liabilities) - (5.5)% (94,543,148 )Net Assets - 100.0% $ 1,703,568,097
Copyright © 2021 www.secdatabase.com. All Rights Reserved.Please Consider the Environment Before Printing This Document

Transamerica Multi-Managed Balanced VPSCHEDULE OF INVESTMENTS (continued)At March 31, 2019(unaudited)
SECURITY VALUATION:
Valuation Inputs (I)
Level 1 -Unadjusted
QuotedPrices
Level 2 -Other
SignificantObservable
Inputs
Level 3 -Significant
UnobservableInputs Value
ASSETSInvestmentsCommon Stocks $1,026,488,534 $� $ � $1,026,488,534Preferred Stocks 457,826 � � 457,826Asset-Backed Securities � 60,813,813 � 60,813,813Corporate Debt Securities � 220,475,203 � 220,475,203Foreign Government Obligations � 7,585,235 � 7,585,235Mortgage-Backed Securities � 64,895,285 � 64,895,285Municipal Government Obligations � 4,994,018 � 4,994,018U.S. Government Agency Obligations � 121,123,713 � 121,123,713U.S. Government Obligations � 161,197,049 � 161,197,049Commercial Paper � 77,609,092 � 77,609,092Short-Term U.S. Government Obligations � 14,961,629 � 14,961,629Other Investment Company 11,769,218 � � 11,769,218Repurchase Agreement � 25,740,630 � 25,740,630Total Investments $ 1,038,715,578 $ 759,395,667 $ �� $ 1,798,111,245Other Financial InstrumentsFutures Contracts (J) $329,882 $� $ � $329,882Total Other Financial Instruments $329,882 $�� $ �� $329,882
FOOTNOTES TO SCHEDULE OF INVESTMENTS:
(A) Non-income producing securities.(B) Percentage rounds to less than 0.1% or (0.1)%.(C) All or a portion of the securities are on loan. The total value of all securities on loan is $11,508,936. The amount of securities on loan indicated may not
correspond with the securities on loan identified because securities with pending sales are in the process of recall from the brokers.(D) Floating or variable rate securities. The rates disclosed are as of March 31, 2019. For securities based on a published reference rate and spread, the reference
rate and spread are indicated within the description. Variable rate securities with a floor or ceiling feature are disclosed at the inherent rate, where applicable.Certain variable rate securities are not based on a published reference rate and spread, but are determined by the issuer or agent and are based on current marketconditions; these securities do not indicate a reference rate and spread in the description.
(E) Securities are registered pursuant to Rule 144A of the Securities Act of 1933. Unless otherwise indicated, the securities are deemed to be liquid for purposes ofcompliance limitations on holdings of illiquid securities and may be resold as transactions exempt from registration, normally to qualified institutional buyers. AtMarch 31, 2019, the total value of 144A securities is $164,193,723, representing 9.6% of the Portfolio�s net assets.
(F) Perpetual maturity. The date displayed is the next call date.(G) When-issued, delayed-delivery and/or forward commitment (including TBAs) securities. Securities to be settled and delivered after March 31, 2019. Securities may
display a coupon rate of 0.00%, as the rate is to be determined at time of settlement.(H) Rates disclosed reflect the yields at March 31, 2019.(I) There were no transfers in or out of Level 3 during the period ended March 31, 2019. Please reference the Security Valuation section of the Notes to Schedules of
Investments for more information regarding security valuation and pricing inputs.(J) Futures contracts and/or forward foreign currency contracts are valued at unrealized appreciation (depreciation).
PORTFOLIO ABBREVIATIONS:
LIBOR London Interbank Offered RateMTN Medium Term NoteSTRIPS Separate Trading of Registered Interest and Principal of SecuritiesTBA To Be Announced
The notes are an integral part of this report.Transamerica Series Trust Page 13
Copyright © 2021 www.secdatabase.com. All Rights Reserved.Please Consider the Environment Before Printing This Document

Transamerica Multi-Manager Alternative Strategies VPSCHEDULE OF INVESTMENTSAt March 31, 2019(unaudited)
The notes are an integral part of this report.Transamerica Series Trust Page 1
Shares ValueEXCHANGE-TRADED FUND - 2.5%International Fixed Income Fund - 2.5%iShares JPMorgan EM Local Currency Bond ETF 1,964 $ 86,102Total Exchange-Traded Fund
(Cost $88,868) 86,102
INVESTMENT COMPANIES - 93.7%International Alternative Funds - 30.2%Transamerica Global Multifactor Macro (A) (B) 47,812 437,483Transamerica Unconstrained Bond (B) 61,044 598,234
1,035,717International Equity Funds - 7.3%Transamerica Emerging Markets Equity (B) 12,439 123,149Transamerica Global Real Estate Securities (B) 8,841 126,426
249,575International Fixed Income Funds - 16.6%Transamerica Emerging Markets Debt (B) 22,249 229,385Transamerica Inflation Opportunities (B) 34,038 340,381
569,766U.S. Alternative Funds - 31.9%Transamerica Event Driven (B) 38,178 389,413Transamerica Long/Short Strategy (B) 59,655 365,091Transamerica Managed Futures Strategy (A) (B) 46,916 339,203
1,093,707U.S. Fixed Income Funds - 5.0%Transamerica Core Bond (B) 5,125 50,535Transamerica High Yield Bond (B) 13,322 120,701
171,236U.S. Mixed Allocation Fund - 2.7%Transamerica MLP & Energy Income (B) 12,999 93,205Total Investment Companies
(Cost $3,283,214) 3,213,206
Principal ValueREPURCHASE AGREEMENT - 3.0%Fixed Income Clearing Corp., 1.45% (C), dated 03/
29/2019, to be repurchased at $103,201 on 04/01/2019. Collateralized by a U.S. GovernmentObligation, 1.13%, due 08/31/2021, and with avalue of $107,272. $ 103,189 103,189
Total Repurchase Agreement(Cost $103,189) 103,189
Total Investments(Cost $3,475,271) 3,402,497
Net Other Assets (Liabilities) - 0.8% 27,247Net Assets - 100.0% $ 3,429,744
Copyright © 2021 www.secdatabase.com. All Rights Reserved.Please Consider the Environment Before Printing This Document

Transamerica Multi-Manager Alternative Strategies VPSCHEDULE OF INVESTMENTS (continued)At March 31, 2019(unaudited)
SECURITY VALUATION:
Valuation Inputs (D)
Level 1 -Unadjusted
QuotedPrices
Level 2 -Other
SignificantObservable
Inputs
Level 3 -Significant
UnobservableInputs Value
ASSETSInvestmentsExchange-Traded Fund $86,102 $� $ � $86,102Investment Companies 3,213,206 � � 3,213,206Repurchase Agreement � 103,189 � 103,189Total Investments $ 3,299,308 $ 103,189 $ �� $ 3,402,497
FOOTNOTES TO SCHEDULE OF INVESTMENTS:
(A) Non-income producing securities.(B) Affiliated investment in the Class I2 shares of Transamerica Funds and/or investment in the Initial Class shares of Transamerica Series Trust. The Portfolio�s
transactions and earnings from investments of TAM are as follows:
Affiliated InvestmentsValue
December 31, 2018Purchases
at CostProceeds
from Sales
NetRealized
Gain (Loss)
Net Change inUnrealized
Appreciation(Depreciation)
ValueMarch 31, 2019
Shares as ofMarch 31, 2019
DividendIncome
Net CapitalGain
DistributionsTransamerica Core Bond $ 34,531 $15,250 $� $� $ 754 $50,535 5,125 $249 $ �Transamerica Emerging Markets Debt 217,715 2,797 � � 8,873 229,385 22,249 2,201 �Transamerica Emerging Markets Equity 192,304 � (80,000 ) (17,372 ) 28,217 123,149 12,439 � �Transamerica Event Driven 359,994 9,999 � � 19,420 389,413 38,178 � �Transamerica Global Multifactor Macro 432,224 � � � 5,259 437,483 47,812 � �Transamerica Global Real Estate Securities 109,783 325 � � 16,318 126,426 8,841 325 �Transamerica High Yield Bond 83,121 31,745 � � 5,835 120,701 13,322 1,745 �Transamerica Inflation Opportunities 328,127 � � � 12,254 340,381 34,038 � �Transamerica Long/Short Strategy 350,177 � � � 14,914 365,091 59,655 � �Transamerica Managed Futures Strategy 335,918 � � � 3,285 339,203 46,916 � �Transamerica MLP & Energy Income 78,204 4,243 � � 10,758 93,205 12,999 1,273 �Transamerica Unconstrained Bond 586,367 7,038 (13,044 ) 306 17,567 598,234 61,044 7,036 �
Total $ 3,108,465 $ 71,397 $ (93,044) $ (17,066 ) $ 143,454 $ 3,213,206 362,618 $ 12,829 $ ��
(C) Rate disclosed reflects the yield at March 31, 2019.(D) There were no transfers in or out of Level 3 during the period ended March 31, 2019. Please reference the Security Valuation section of the Notes to Schedules of
Investments for more information regarding security valuation and pricing inputs.
The notes are an integral part of this report.Transamerica Series Trust Page 2
Copyright © 2021 www.secdatabase.com. All Rights Reserved.Please Consider the Environment Before Printing This Document

Transamerica PIMCO Tactical �� Balanced VPSCHEDULE OF INVESTMENTSAt March 31, 2019(unaudited)
The notes are an integral part of this report.Transamerica Series Trust Page 1
Principal ValueASSET-BACKED SECURITIES - 2.7%Ameriquest Mortgage Securities, Inc.
Asset-Backed Pass-Through CertificatesSeries 2004-R3, Class M1,1-Month LIBOR + 0.78%,
3.27% (A), 05/25/2034 $ 388,811 $ 389,389Avery Point IV CLO, Ltd.
Series 2014-1A, Class AR,3-Month LIBOR + 1.10%,
3.87% (A), 04/25/2026 (B) 482,496 482,500Crown Point CLO, Ltd.
Series 2018-5A, Class A,3-Month LIBOR + 0.94%,
3.71% (A), 07/17/2028 (B) 900,000 892,809CVP Cascade CLO-1, Ltd.
Series 2013-CLO1, Class A1R,3-Month LIBOR + 1.15%,
3.93% (A), 01/16/2026 (B) 1,208,889 1,208,876Dryden XXV Senior Loan Fund
Series 2012-25A, Class ARR,3-Month LIBOR + 0.90%,
3.69% (A), 10/15/2027 (B) 1,400,000 1,395,589FFMLT Trust
Series 2005-FF2, Class M4,1-Month LIBOR + 0.89%,
3.37% (A), 03/25/2035 258,247 259,559Figueroa CLO, Ltd.
Series 2013-2A, Class A1RR,3-Month LIBOR + 0.85%,
3.48% (A), 06/20/2027 (B) 500,000 497,672Flagship CLO, Ltd.
Series 2014-8A, Class ARR,3-Month LIBOR + 0.85%,
3.63% (A), 01/16/2026 (B) 400,000 398,678Flagship VII, Ltd.
Series 2013-7A, Class A1R,3-Month LIBOR + 1.12%,
3.88% (A), 01/20/2026 (B) 458,917 458,915Ford Credit Auto Owner Trust
Series 2016-2, Class A,2.03%, 12/15/2027 (B) 2,200,000 2,163,953
Gallatin CLO IX, Ltd.Series 2018-1A, Class A,3-Month LIBOR + 1.05%,
3.81% (A), 01/21/2028 (B) 500,000 498,478Halcyon Loan Advisors Funding, Ltd.
Series 2014-3A, Class AR,3-Month LIBOR + 1.10%,
3.86% (A), 10/22/2025 (B) 1,022,547 1,022,156Loomis Sayles CLO II, Ltd.
Series 2015-2A, Class A1R,3-Month LIBOR + 0.90%,
3.69% (A), 04/15/2028 (B) 1,600,000 1,584,814
Principal ValueASSET-BACKED SECURITIES (continued)Mountain View CLO, Ltd.
Series 2014-1A, Class ARR,3-Month LIBOR + 0.80%,
3.59% (A), 10/15/2026 (B)$772,761 $ 768,928
Northstar Education Finance, Inc.Series 2012-1, Class A,1-Month LIBOR + 0.70%,
3.19% (A), 12/26/2031 (B) 36,585 36,540Oaktree CLO, Ltd.
Series 2014-2A, Class A1AR,3-Month LIBOR + 1.22%,
3.98% (A), 10/20/2026 (B) 617,994 618,007Palmer Square Loan Funding, Ltd.
Series 2018-4A, Class A1,3-Month LIBOR + 0.90%,
3.58% (A), 11/15/2026 (B) 684,196 681,446PHEAA Student Loan Trust
Series 2016-2A, Class A,1-Month LIBOR + 0.95%,
3.44% (A), 11/25/2065 (B) 489,806 491,596SMB Private Education Loan Trust
Series 2016-B, Class A2B,1-Month LIBOR + 1.45%,
3.93% (A), 02/17/2032 (B) 1,412,287 1,435,894Zais CLO 1, Ltd.
Series 2014-1A, Class A1AR,3-Month LIBOR + 1.15%,
3.94% (A), 04/15/2028 (B) 700,000 697,988Total Asset-Backed Securities
(Cost $15,911,173) 15,983,787
CERTIFICATES OF DEPOSIT - 0.2%Banks - 0.2%Barclays Bank PLC
3-Month LIBOR + 0.40%,3.17% (A), 10/25/2019 500,000 500,000
Lloyds Bank Corporate Markets PLC3-Month LIBOR + 0.50%,
3.30% (A), 10/26/2020 800,000 800,000Total Certificates of Deposit
(Cost $1,300,000) 1,300,000
CORPORATE DEBT SECURITIES - 31.9%Aerospace & Defense - 0.0% (C)United Technologies Corp.
3.95%, 08/16/2025 100,000 103,858Airlines - 0.8%American Airlines Pass-Through Trust
3.00%, 04/15/2030 553,304 534,8933.25%, 04/15/2030 184,314 176,964
British Airways Pass-Through Trust3.80%, 03/20/2033 (B) 395,095 402,483
Continental Airlines Pass-Through Trust5.50%, 04/29/2022 27,259 27,761
Norwegian Air Shuttle Pass-Through Trust4.88%, 11/10/2029 (B) 1,719,747 1,658,180
Copyright © 2021 www.secdatabase.com. All Rights Reserved.Please Consider the Environment Before Printing This Document

Transamerica PIMCO Tactical �� Balanced VPSCHEDULE OF INVESTMENTS (continued)At March 31, 2019(unaudited)
Principal ValueCORPORATE DEBT SECURITIES (continued)Airlines (continued)United Airlines Pass-Through Trust
2.88%, 04/07/2030 $ 852,424 $ 816,9633.10%, 04/07/2030 852,424 809,718
4,426,962Banks - 8.2%AIB Group PLC
4.75%, 10/12/2023 (B) 700,000 722,873Bank of America Corp.
2.63%, 10/19/2020, MTN 950,000 947,634Fixed until 12/20/2027,
3.42% (A), 12/20/2028 4,954,000 4,844,264Bank of Ireland Group PLC
4.50%, 11/25/2023 (B) 700,000 711,397Bank of Montreal
1.75%, 06/15/2021 (B) 1,600,000 1,571,450Barclays PLC
3.65%, 03/16/2025 1,200,000 1,170,0474.34%, 01/10/2028 600,000 596,337Fixed until 02/15/2022,
4.61% (A), 02/15/2023 700,000 714,438BNP Paribas SA
3.38%, 01/09/2025 (B) 1,400,000 1,371,702BPCE SA
3-Month LIBOR + 1.24%,3.84% (A), 09/12/2023 (B) 1,200,000 1,194,600
Citigroup, Inc.3-Month LIBOR + 0.95%,
3.73% (A), 07/24/2023 100,000 100,1674.40%, 06/10/2025 1,200,000 1,242,345
Dexia Credit Local SA1.88%, 09/15/2021 (B) 2,500,000 2,460,905
HSBC Holdings PLCFixed until 09/28/2026 (D),
5.88% (A) GBP 200,000 262,118HSBC USA, Inc.
2.38%, 11/13/2019 $ 550,000 548,6082.75%, 08/07/2020 1,770,000 1,771,6993-Month LIBOR + 0.61%,
3.30% (A), 11/13/2019 460,000 461,299ING Groep NV
3-Month LIBOR + 1.00%,3.60% (A), 10/02/2023 1,500,000 1,495,096
JPMorgan Chase & Co.3.25%, 09/23/2022 200,000 202,7993.90%, 07/15/2025 215,000 223,3833-Month LIBOR + 3.47%,
6.22% (A), 04/30/2019 (D) 400,000 402,000Lloyds Banking Group PLC
4.38%, 03/22/2028 400,000 409,5894.55%, 08/16/2028 (E) 1,400,000 1,449,764
Manufacturers & Traders Trust Co.2.25%, 07/25/2019 750,000 749,055
Mitsubishi UFJ Financial Group, Inc.3-Month LIBOR + 1.88%,
4.51% (A), 03/01/2021 987,000 1,010,842Mitsubishi UFJ Trust & Banking Corp.
2.65%, 10/19/2020 (B) 200,000 199,422Mizuho Financial Group, Inc.
3-Month LIBOR + 1.00%,3.60% (A), 09/11/2024 (E) 600,000 604,491
MUFG Bank, Ltd.
Principal ValueCORPORATE DEBT SECURITIES (continued)Banks (continued)Royal Bank of Scotland Group PLC
Fixed until 05/18/2028,4.89% (A), 05/18/2029 $ 600,000 $ 622,924
Fixed until 08/15/2021 (D),8.63% (A) 1,000,000 1,065,000
Santander UK Group Holdings PLC2.88%, 10/16/2020 1,660,000 1,655,8873.13%, 01/08/2021 200,000 199,900
Santander UK PLC2.38%, 03/16/2020 3,400,000 3,388,341
Sberbank of Russia Via SB Capital SA5.18%, 06/28/2019 (F) 400,000 401,595
Stichting AK Rabobank Certificaten6.50%, 12/29/2049 (D) (F) EUR 700,000 915,494
Sumitomo Mitsui Banking Corp.2.65%, 07/23/2020, MTN $ 1,790,000 1,787,547
Sumitomo Mitsui Financial Group, Inc.2.63%, 07/14/2026 (E) 400,000 382,8783-Month LIBOR + 0.80%,
3.58% (A), 10/16/2023 200,000 199,999Swedbank AB
2.20%, 03/04/2020 (B) 1,190,000 1,180,494UniCredit SpA
6.57%, 01/14/2022 (B) 600,000 627,8517.83%, 12/04/2023 (B) 700,000 776,657
Wells Fargo & Co.2.50%, 03/04/2021 300,000 298,5462.55%, 12/07/2020, MTN 160,000 159,4823.00%, 02/19/2025, MTN 500,000 494,272Fixed until 05/22/2027,
3.58% (A), 05/22/2028, MTN 500,000 501,926Wells Fargo Bank NA
3.55%, 08/14/2023 1,400,000 1,436,446Westpac Banking Corp.
2.25%, 11/09/2020 (B) (E) 2,400,000 2,388,00647,864,501
Beverages - 0.2%Anheuser-Busch InBev Worldwide, Inc.
4.38%, 04/15/2038 600,000 575,8755.55%, 01/23/2049 200,000 219,509
Bacardi, Ltd.4.70%, 05/15/2028 (B) 300,000 299,945
Pernod Ricard SA5.75%, 04/07/2021 (B) 200,000 210,652
1,305,981Biotechnology - 0.3%AbbVie, Inc.
4.25%, 11/14/2028 1,200,000 1,225,636Amgen, Inc.
4.40%, 05/01/2045 500,000 490,1354.56%, 06/15/2048 200,000 200,283
1,916,054Building Products - 0.2%Fortune Brands Home & Security, Inc.
4.00%, 09/21/2023 - 06/15/2025 740,000 759,515Masco Corp.
4.45%, 04/01/2025 40,000 41,075Owens Corning
3.40%, 08/15/2026 400,000 376,9894.20%, 12/01/2024 50,000 50,520
Copyright © 2021 www.secdatabase.com. All Rights Reserved.Please Consider the Environment Before Printing This Document

The notes are an integral part of this report.Transamerica Series Trust Page 2
2.30%, 03/05/2020 (B) 350,000 348,608National Australia Bank, Ltd.
1.38%, 07/12/2019 1,600,000 1,594,324
1,228,099
Copyright © 2021 www.secdatabase.com. All Rights Reserved.Please Consider the Environment Before Printing This Document

Transamerica PIMCO Tactical �� Balanced VPSCHEDULE OF INVESTMENTS (continued)At March 31, 2019(unaudited)
Principal ValueCORPORATE DEBT SECURITIES (continued)Capital Markets - 2.9%Brighthouse Holdings LLC
6.50% (G), 07/27/2037 (B) (D) $300,000 $ 276,000
Charles Schwab Corp.Fixed until 12/01/2027 (D),
5.00% (A) 800,000 750,000Credit Suisse Group AG
Fixed until 01/12/2028,3.87% (A), 01/12/2029 (B) 600,000 588,102
Credit Suisse Group Funding Guernsey, Ltd.3.75%, 03/26/2025 2,900,000 2,921,952
Deutsche Bank AG3-Month LIBOR + 1.29%,
4.03% (A), 02/04/2021 900,000 892,5054.25%, 10/14/2021 600,000 602,694
Goldman Sachs Group, Inc.3.75%, 05/22/2025 140,000 141,4223.85%, 07/08/2024, MTN 4,700,000 4,791,269
Lazard Group LLC3.75%, 02/13/2025 81,000 81,606
Moody�s Corp.5.25%, 07/15/2044 100,000 112,942
Morgan StanleyFixed until 04/24/2023,
3.74% (A), 04/24/2024 600,000 611,9544.00%, 07/23/2025, MTN 140,000 144,0915.50%, 07/24/2020, MTN 4,100,000 4,239,627
S&P Global, Inc.4.40%, 02/15/2026 80,000 86,020
UBS Group Funding Switzerland AG4.13%, 09/24/2025 (B) 800,000 825,945
17,066,129Chemicals - 0.3%Huntsman International LLC
5.13%, 11/15/2022 200,000 208,750International Flavors & Fragrances, Inc.
3.40%, 09/25/2020 600,000 603,606SASOL Financing LLC
5.88%, 03/27/2024 800,000 848,4121,660,768
Commercial Services & Supplies - 0.2%ERAC USA Finance LLC
4.50%, 02/15/2045 (B) 40,000 39,3337.00%, 10/15/2037 (B) 300,000 384,852
RELX Capital, Inc.4.00%, 03/18/2029 600,000 612,200
1,036,385Consumer Finance - 1.3%American Express Credit Corp.
3-Month LIBOR + 0.49%,3.17% (A), 08/15/2019, MTN 700,000 701,008
Daimler Finance North America LLC1.50%, 07/05/2019 (B) 800,000 797,3313.40%, 02/22/2022 (B) 500,000 504,420
Discover Financial Services4.50%, 01/30/2026 300,000 308,118
Ford Motor Credit Co. LLC3-Month LIBOR + 0.93%,
3.53% (A), 09/24/2020, MTN 900,000 896,1193-Month LIBOR + 0.81%,
3.61% (A), 04/05/2021 200,000 195,269
Principal ValueCORPORATE DEBT SECURITIES (continued)Consumer Finance (continued)Ford Motor Credit Co. LLC (continued)
5.75%, 02/01/2021 $500,000
$514,920
General Motors Financial Co., Inc.3-Month LIBOR + 1.55%,
4.35% (A), 01/14/2022 200,000 200,554Nissan Motor Acceptance Corp.
2.55%, 03/08/2021 (B) 200,000 196,842Synchrony Financial
2.70%, 02/03/2020 41,000 40,9455.15%, 03/19/2029 100,000 101,690
Toyota Motor Credit Corp.1.40%, 05/20/2019, MTN 800,000 798,710
Volkswagen Group of America Finance LLC2.13%, 05/23/2019 (B) 2,100,000 2,097,568
7,353,494Diversified Consumer Services - 0.6%Nationwide Building Society
3.90%, 07/21/2025 (B) 3,200,000 3,257,784Diversified Financial Services - 0.8%AerCap Ireland Capital DAC / AerCap Global Aviation
Trust4.45%, 10/01/2025 1,300,000 1,307,2424.63%, 07/01/2022 150,000 154,762
AXA Equitable Holdings, Inc.4.35%, 04/20/2028 300,000 304,552
Helios Leasing I LLC1.56%, 09/28/2024 96,582 93,520
ORIX Corp.3.25%, 12/04/2024 900,000 898,854
Protective Life Global Funding2.70%, 11/25/2020 (B) 1,590,000 1,587,280
Tagua Leasing LLC1.58%, 11/16/2024 100,917 97,934
Voya Financial, Inc.Fixed until 01/23/2028,
4.70% (A), 01/23/2048 300,000 259,5004,703,644
Diversified Telecommunication Services - 1.0%AT&T, Inc.
3.40%, 05/15/2025 50,000 49,4763-Month LIBOR + 0.93%,
3.53% (A), 06/30/2020 170,000 171,2183-Month LIBOR + 1.18%,
3.78% (A), 06/12/2024 2,400,000 2,380,7654.30%, 02/15/2030 61,000 61,7004.35%, 03/01/2029 800,000 817,257
Verizon Communications, Inc.3.38%, 02/15/2025 133,000 134,5664.02%, 12/03/2029 (B) 871,000 896,0604.33%, 09/21/2028 1,041,000 1,100,895
5,611,937Electric Utilities - 1.7%AEP Texas, Inc.
3.95%, 06/01/2028 800,000 833,460Appalachian Power Co.
3.40%, 06/01/2025 1,430,000 1,448,828Duke Energy Corp.
3.75%, 04/15/2024 200,000 206,2403.95%, 10/15/2023 500,000 518,292
Copyright © 2021 www.secdatabase.com. All Rights Reserved.Please Consider the Environment Before Printing This Document

The notes are an integral part of this report.Transamerica Series Trust Page 3
Duke Energy Florida LLC3.80%, 07/15/2028 800,000 835,179
Copyright © 2021 www.secdatabase.com. All Rights Reserved.Please Consider the Environment Before Printing This Document

Transamerica PIMCO Tactical �� Balanced VPSCHEDULE OF INVESTMENTS (continued)At March 31, 2019(unaudited)
Principal ValueCORPORATE DEBT SECURITIES (continued)Electric Utilities (continued)Electricite de France SA
3.63%, 10/13/2025 (B) $1,500,000
$1,526,455
Entergy Louisiana LLC3.30%, 12/01/2022 150,000 152,880
Entergy Mississippi LLC2.85%, 06/01/2028 1,300,000 1,253,657
IPALCO Enterprises, Inc.3.70%, 09/01/2024 600,000 603,060
NextEra Energy Capital Holdings, Inc.3.20%, 02/25/2022 600,000 605,140
Pacific Gas & Electric Co.3.50%, 06/15/2025 (H) 40,000 35,6004.25%, 08/01/2023 (B) (H) 400,000 370,000
Southwestern Electric Power Co.6.20%, 03/15/2040 1,000,000 1,227,403
SP Group Treasury Pte, Ltd.3.38%, 02/27/2029 (B) 400,000 404,748
10,020,942Electronic Equipment, Instruments & Components - 0.1%Arrow Electronics, Inc.
3.25%, 09/08/2024 500,000 484,723Energy Equipment & Services - 0.4%Energy Transfer Partners, LP / Regency Energy
Finance Corp.4.50%, 11/01/2023 1,900,000 1,979,410
Odebrecht Drilling Norbe VIII / IX, Ltd.6.35%, 12/01/2021 (F) 287,500 282,828
2,262,238Equity Real Estate Investment Trusts - 2.7%Alexandria Real Estate Equities, Inc.
3.95%, 01/15/2027 300,000 302,6324.30%, 01/15/2026 800,000 829,2934.50%, 07/30/2029 700,000 737,034
American Tower Corp.3.38%, 10/15/2026 1,400,000 1,364,4703.50%, 01/31/2023 100,000 101,3734.00%, 06/01/2025 1,250,000 1,286,726
Brixmor Operating Partnership, LP3-Month LIBOR + 1.05%,
3.79% (A), 02/01/2022 800,000 796,995Crown Castle International Corp.
4.45%, 02/15/2026 390,000 407,2505.25%, 01/15/2023 1,600,000 1,717,057
Digital Realty Trust, LP3.95%, 07/01/2022 1,830,000 1,877,707
Essex Portfolio, LP4.00%, 03/01/2029 700,000 716,293
Federal Realty Investment Trust3.63%, 08/01/2046 250,000 228,731
National Retail Properties, Inc.4.80%, 10/15/2048 700,000 747,397
Prologis, LP3.75%, 11/01/2025 40,000 41,811
Unibail-Rodamco SE3-Month LIBOR + 0.77%,
3.55% (A), 04/16/2019, MTN (F) 600,000 600,165VEREIT Operating Partnership, LP
4.63%, 11/01/2025 800,000 827,409Welltower, Inc.
3.95%, 09/01/2023 300,000 311,144
Principal ValueCORPORATE DEBT SECURITIES (continued)Equity Real Estate Investment Trusts (continued)Weyerhaeuser Co.
4.00%, 11/15/2029 $1,500,000
$1,543,530
WP Carey, Inc.4.60%, 04/01/2024 800,000 831,689
15,902,013Food & Staples Retailing - 0.0% (C)CVS Pass-Through Trust
4.16%, 08/11/2036 (B) 85,965 84,658Food Products - 0.1%Kraft Heinz Foods Co.
3.50%, 07/15/2022 100,000 100,9494.38%, 06/01/2046 500,000 432,521
533,470Gas Utilities - 0.3%Brooklyn Union Gas Co.
3.87%, 03/04/2029 (B) 700,000 721,121Southern California Gas Co.
4.13%, 06/01/2048 900,000 925,0211,646,142
Health Care Equipment & Supplies - 0.5%Boston Scientific Corp.
3.38%, 05/15/2022 1,430,000 1,449,193Zimmer Biomet Holdings, Inc.
2.70%, 04/01/2020 1,640,000 1,635,9753.15%, 04/01/2022 80,000 80,2213.55%, 04/01/2025 80,000 78,882
3,244,271Health Care Providers & Services - 0.5%Aetna, Inc.
3.50%, 11/15/2024 50,000 50,032AHS Hospital Corp.
5.02%, 07/01/2045 600,000 702,374CHRISTUS Health
4.34%, 07/01/2028 600,000 641,291Hackensack Meridian Health, Inc.
4.50%, 07/01/2057 300,000 327,071HCA, Inc.
5.88%, 03/15/2022 (E) 200,000 214,558Humana, Inc.
4.80%, 03/15/2047 400,000 421,357Northwell Healthcare, Inc.
3.98%, 11/01/2046 700,000 676,5943,033,277
Hotels, Restaurants & Leisure - 0.1%McDonald�s Corp.
3.80%, 04/01/2028, MTN (E) 700,000 722,444Industrial Conglomerates - 0.1%General Electric Co.
5.55%, 01/05/2026, MTN 400,000 423,468Insurance - 2.2%Berkshire Hathaway Finance Corp.
4.20%, 08/15/2048 600,000 621,644Chubb INA Holdings, Inc.
3.35%, 05/03/2026 90,000 91,586First American Financial Corp.
4.30%, 02/01/2023 100,000 101,7134.60%, 11/15/2024 50,000 51,848
Copyright © 2021 www.secdatabase.com. All Rights Reserved.Please Consider the Environment Before Printing This Document

The notes are an integral part of this report.Transamerica Series Trust Page 4
4.95%, 09/01/2048 600,000 633,307
Copyright © 2021 www.secdatabase.com. All Rights Reserved.Please Consider the Environment Before Printing This Document

Transamerica PIMCO Tactical �� Balanced VPSCHEDULE OF INVESTMENTS (continued)At March 31, 2019(unaudited)
Principal ValueCORPORATE DEBT SECURITIES (continued)Insurance (continued)Great-West Lifeco Finance, LP
4.05%, 05/17/2028 (B) $300,000 $ 315,374
Jackson National Life Global Funding2.30%, 04/16/2019 (B) 300,000 299,9472.60%, 12/09/2020 (B) 1,580,000 1,575,104
Marsh & McLennan Cos., Inc.3.75%, 03/14/2026 50,000 51,494
Meiji Yasuda Life Insurance Co.Fixed until 04/26/2028,
5.10% (A), 04/26/2048 (B) 900,000 937,919MetLife, Inc.
4.05%, 03/01/2045 40,000 39,958Metropolitan Life Global Funding I
2.00%, 04/14/2020 (B) 250,000 248,0952.50%, 12/03/2020 (B) 1,820,000 1,812,975
Pacific Life Insurance Co.Fixed until 10/24/2047,
4.30% (A), 10/24/2067 (B) 1,500,000 1,338,305Pricoa Global Funding I
2.20%, 05/16/2019 (B) 200,000 199,8602.55%, 11/24/2020 (B) 1,590,000 1,583,212
Principal Life Global Funding II2.20%, 04/08/2020 (B) 1,300,000 1,292,2093.00%, 04/18/2026 (B) 500,000 493,595
Reliance Standard Life Global Funding II2.50%, 04/24/2019 (B) 100,000 99,975
RenaissanceRe Holdings, Ltd.3.60%, 04/15/2029 400,000 393,198
Teachers Insurance & Annuity Association ofAmerica4.27%, 05/15/2047 (B) 1,200,000 1,231,312
Travelers Cos., Inc.3.75%, 05/15/2046 100,000 97,887
XLIT, Ltd.4.45%, 03/31/2025 40,000 41,643
12,918,853IT Services - 0.1%Fidelity National Information Services, Inc.
3.88%, 06/05/2024 28,000 28,5974.50%, 10/15/2022 819,000 854,592
883,189Life Sciences Tools & Services - 0.0% (C)Thermo Fisher Scientific, Inc.
3.30%, 02/15/2022 110,000 111,416Machinery - 0.2%Wabtec Corp.
4.40%, 03/15/2024 900,000 914,959Marine - 0.1%AP Moller - Maersk A/S
3.88%, 09/28/2025 (B) 450,000 439,764Media - 0.6%Charter Communications Operating LLC / Charter
Communications Operating Capital4.20%, 03/15/2028 800,000 793,812
Comcast Corp.4.40%, 08/15/2035 50,000 52,2074.75%, 03/01/2044 1,600,000 1,734,379
Principal ValueCORPORATE DEBT SECURITIES (continued)Media (continued)Cox Communications, Inc.
3.25%, 12/15/2022 (B) $100,000
$100,694
Discovery Communications LLC5.00%, 09/20/2037 500,000 486,130
SES SA3.60%, 04/04/2023 (B) 200,000 197,213
Sky, Ltd.3.13%, 11/26/2022 (B) 80,000 80,8363.75%, 09/16/2024 (B) 200,000 207,137
3,652,408Metals & Mining - 0.1%Indonesia Asahan Aluminium Persero PT
5.23%, 11/15/2021 (B) (E) 700,000 727,943Multi-Utilities - 0.3%CenterPoint Energy, Inc.
Fixed until 09/01/2023 (D),6.13% (A) 1,000,000 1,016,250
E.ON International Finance BV6.65%, 04/30/2038 (B) 666,000 830,922
1,847,172Oil, Gas & Consumable Fuels - 2.0%Antero Midstream Partners, LP / Antero Midstream
Finance Corp.5.75%, 03/01/2027 (B) 700,000 710,500
APT Pipelines, Ltd.4.25%, 07/15/2027 (B) 500,000 506,673
Dolphin Energy, Ltd. LLC5.50%, 12/15/2021 (F) 400,000 421,000
Energy Transfer Operating, LP4.05%, 03/15/2025 400,000 405,5884.75%, 01/15/2026 100,000 104,5257.50%, 07/01/2038 150,000 182,092
Eni SpA4.75%, 09/12/2028 (B) 400,000 415,354
Enterprise Products Operating LLC4.80%, 02/01/2049 1,000,000 1,063,725
ONEOK, Inc.4.35%, 03/15/2029 1,200,000 1,221,102
Petrobras Global Finance BV5.75%, 02/01/2029 700,000 693,350
Pioneer Natural Resources Co.7.50%, 01/15/2020 650,000 672,610
Plains All American Pipeline, LP / PAA Finance Corp.3.60%, 11/01/2024 100,000 99,665
Sabine Pass Liquefaction LLC5.75%, 05/15/2024 1,700,000 1,873,451
Shell International Finance BV4.00%, 05/10/2046 800,000 831,780
Sinopec Group Overseas Development, Ltd.4.13%, 09/12/2025 (B) (E) 900,000 937,440
Valero Energy Corp.4.00%, 04/01/2029 800,000 807,299
Woodside Finance, Ltd.3.65%, 03/05/2025 (B) 40,000 39,7433.70%, 03/15/2028 (B) 700,000 674,932
11,660,829Pharmaceuticals - 0.6%Baxalta, Inc.
3.60%, 06/23/2022 15,000 15,077
Copyright © 2021 www.secdatabase.com. All Rights Reserved.Please Consider the Environment Before Printing This Document

The notes are an integral part of this report.Transamerica Series Trust Page 5
Copyright © 2021 www.secdatabase.com. All Rights Reserved.Please Consider the Environment Before Printing This Document

Transamerica PIMCO Tactical �� Balanced VPSCHEDULE OF INVESTMENTS (continued)At March 31, 2019(unaudited)
The notes are an integral part of this report.Transamerica Series Trust Page 6
Principal ValueCORPORATE DEBT SECURITIES (continued)Pharmaceuticals (continued)Bayer US Finance II LLC
4.63%, 06/25/2038 (B) $1,600,000
$1,494,298
Eli Lilly & Co.3.88%, 03/15/2039 200,000 204,773
Mylan, Inc.4.55%, 04/15/2028 400,000 388,881
Shire Acquisitions Investments Ireland DAC2.88%, 09/23/2023 300,000 296,0663.20%, 09/23/2026 500,000 483,503
Zoetis, Inc.3.90%, 08/20/2028 800,000 816,268
3,698,866Professional Services - 0.1%IHS Markit, Ltd.
4.75%, 08/01/2028 500,000 523,155Road & Rail - 0.5%Burlington Northern Santa Fe LLC
4.13%, 06/15/2047 1,300,000 1,349,599JB Hunt Transport Services, Inc.
3.88%, 03/01/2026 500,000 507,666Kansas City Southern
4.95%, 08/15/2045 500,000 537,515Union Pacific Corp.
4.10%, 09/15/2067 300,000 273,9422,668,722
Semiconductors & Semiconductor Equipment - 0.2%Broadcom, Inc.
3.13%, 04/15/2021 (B) 900,000 898,938KLA-Tencor Corp.
4.10%, 03/15/2029 500,000 508,8731,407,811
Software - 0.4%Microsoft Corp.
4.10%, 02/06/2037 800,000 870,114Oracle Corp.
2.95%, 05/15/2025 1,250,000 1,248,3802,118,494
Specialty Retail - 0.1%QVC, Inc.
4.45%, 02/15/2025 300,000 299,4904.85%, 04/01/2024 100,000 102,246
401,736Technology Hardware, Storage & Peripherals - 0.6%Apple, Inc.
2.90%, 09/12/2027 400,000 394,3273-Month LIBOR + 0.30%,
3.03% (A), 05/06/2019 400,000 400,1723.35%, 02/09/2027 400,000 408,2213.75%, 09/12/2047 300,000 298,4974.65%, 02/23/2046 400,000 451,927
Dell International LLC / EMC Corp.5.30%, 10/01/2029 (B) 100,000 100,8788.10%, 07/15/2036 (B) 1,100,000 1,292,332
3,346,354
Principal ValueCORPORATE DEBT SECURITIES (continued)Tobacco - 0.1%BAT Capital Corp.
4.39%, 08/15/2037 $ 500,000 $ 447,370BAT International Finance PLC
3.50%, 06/15/2022 (B) 50,000 50,207Imperial Brands Finance PLC
3.75%, 07/21/2022 (B) 200,000 202,660Reynolds American, Inc.
4.00%, 06/12/2022 50,000 51,0674.85%, 09/15/2023 100,000 105,484
856,788Trading Companies & Distributors - 0.1%Air Lease Corp.
4.25%, 02/01/2024, MTN 500,000 511,095GATX Corp.
3.25%, 09/15/2026 400,000 380,427891,522
Transportation Infrastructure - 0.1%Penske Truck Leasing Co., LP / PTL Finance
Corp.3.95%, 03/10/2025 (B) 600,000 602,819
Sydney Airport Finance Co. Pty, Ltd.3.38%, 04/30/2025 (B) 50,000 49,165
651,984Wireless Telecommunication Services - 0.2%Sprint Spectrum Co. LLC / Sprint Spectrum
Co. II LLC4.74%, 09/20/2029 (B) 600,000 606,7505.15%, 09/20/2029 (B) 600,000 610,500
1,217,250Total Corporate Debt Securities
(Cost $185,225,980) 186,832,457
FOREIGN GOVERNMENT OBLIGATIONS - 3.2%Canada - 0.5%Province of Ontario
1.65%, 09/27/2019 1,200,000 1,194,709Province of Quebec
2.50%, 04/20/2026 1,700,000 1,681,4382,876,147
Indonesia - 0.2%Indonesia Government International Bond
4.45%, 02/11/2024 (E) 1,300,000 1,354,701Japan - 1.1%Japan Finance Organization for
Municipalities2.13%, 04/13/2021 - 10/25/2023 (B) 3,900,000 3,820,282
Tokyo Metropolitan Government2.00%, 05/17/2021 (B) 2,600,000 2,560,891
6,381,173Kuwait - 0.2%Kuwait International Government Bond
3.50%, 03/20/2027 (B) 800,000 817,000Peru - 0.1%Peru Government International Bond
5.94%, 02/12/2029 (B) PEN 1,900,000 602,475
Copyright © 2021 www.secdatabase.com. All Rights Reserved.Please Consider the Environment Before Printing This Document

Transamerica PIMCO Tactical �� Balanced VPSCHEDULE OF INVESTMENTS (continued)At March 31, 2019(unaudited)
The notes are an integral part of this report.Transamerica Series Trust Page 7
Principal ValueFOREIGN GOVERNMENT OBLIGATIONS (continued)Qatar - 0.8%Qatar Government International Bond
2.38%, 06/02/2021 (F)$ 4,100,000
$4,044,896
4.50%, 01/20/2022 (F) 700,000 726,9504,771,846
Republic of Korea - 0.2%Export-Import Bank of Korea
3-Month LIBOR + 0.70%,3.35% (A), 05/26/201902/16/2017 800,000 800,495
1.93%, 02/24/2020, MTN02/16/2017 (F) (I) CAD 400,000 297,563
1,098,058United Arab Emirates - 0.1%Abu Dhabi Government International Bond
3.13%, 10/11/2027 (B) $ 700,000 694,750Total Foreign Government Obligations
(Cost $18,619,435) 18,596,150
LOAN ASSIGNMENT - 0.2%Capital Markets - 0.2%Zephyrus Capital Aviation Partners LLC
Term Loan,TBD, 10/15/2038 (J) (K) (L) 1,330,000 1,310,296
Total Loan Assignment(Cost $1,310,460) 1,310,296
MORTGAGE-BACKED SECURITIES - 3.2%Aggregator of Loans Backed by Assets PLC
Series 2015-1, Class A,1-Month GBP LIBOR + 1.25%,
1.98% (A), 04/24/2049 (F) GBP 383,376 500,726Bear Stearns Alt-A Trust
Series 2005-5, Class 1A1,1-Month LIBOR + 0.44%,
2.93% (A), 07/25/2035 $ 14,165 14,164BX Trust
Series 2017-APPL, Class A,1-Month LIBOR + 0.88%,
3.36% (A), 07/15/2034 (B) 2,462,217 2,456,789CHL Mortgage Pass-Through Trust
Series 2005-9, Class 1A1,1-Month LIBOR + 0.60%,
3.09% (A), 05/25/2035 54,489 49,912COMM Mortgage Trust
Series 2018-HOME, Class A,3.82% (A), 04/10/2033 (B) 700,000 727,204
DBUBS Mortgage TrustSeries 2017-BRBK, Class A,3.45%, 10/10/2034 (B) 1,600,000 1,633,346
Dukinfield PLCSeries 1, Class A,3-Month GBP LIBOR + 1.00%,
1.87% (A), 08/15/2045 (F) GBP 204,822 267,247
Principal ValueMORTGAGE-BACKED SECURITIES (continued)Eurosail PLC
Series 2006-4X, Class A3C,3-Month GBP LIBOR + 0.16%,
1.00% (A), 12/10/2044 (F) GBP 243,916 $ 314,166Federal Home Loan Mortgage Corp.
Series W5FX, Class AFX,2.97% (A), 04/25/2028 $ 1,700,000 1,720,025
Independence Plaza TrustSeries 2018-INDP, Class A,3.76%, 07/10/2035 (B) 900,000 928,122
La Hipotecaria El Salvadorian Mortgage TrustSeries 2016-1A, Class A,3.36%, 01/15/2046 (B) (K) 1,138,279 1,149,190
Merrill Lynch Mortgage Investors TrustSeries 2003-B, Class A1,1-Month LIBOR + 0.68%,
3.17% (A), 04/25/2028 427,714 412,796Morgan Stanley Bank of America Merrill Lynch
TrustSeries 2015-C25, Class A4,3.37%, 10/15/2048 1,600,000 1,628,276
Morgan Stanley Bank of America Merrill LynchTrust, Interest Only STRIPSSeries 2013-C8, Class XA,0.99% (A), 12/15/2048 1,800,241 53,764
MortgageIT TrustSeries 2005-2, Class 1A1,1-Month LIBOR + 0.52%,
3.01% (A), 05/25/2035 102,216 102,328Southern Pacific Financing PLC
Series 2005-B, Class A,3-Month GBP LIBOR + 0.18%,
1.02% (A), 06/10/2043 (F) GBP 379,428 490,284Structured Adjustable Rate Mortgage Loan Trust
Series 2005-4, Class 6A1,1-Month LIBOR + 0.24%,
2.73% (A), 03/25/2035 $ 484,568 451,767Towd Point Mortgage Funding PLC
Series 2019-GR4A, Class A1,3-Month GBP LIBOR + 1.03%,
0.00% (A), 10/20/2051 (B) (M) GBP 2,000,000 2,604,899Uropa Securities PLC
Series 2008-1, Class A,3-Month GBP LIBOR + 0.20%,
1.04% (A), 06/10/2059 (F) 712,701 887,919Series 2008-1, Class B,3-Month GBP LIBOR + 0.75%,
1.59% (A), 06/10/2059 (F) 137,042 165,041Series 2008-1, Class M1,3-Month GBP LIBOR + 0.35%,
1.19% (A), 06/10/2059 (F) 164,304 200,844Series 2008-1, Class M2,3-Month GBP LIBOR + 0.55%,
1.39% (A), 06/10/2059 (F) 128,938 157,284Worldwide Plaza Trust
Series 2017-WWP, Class A,3.53%, 11/10/2036 (B) $ 1,500,000 1,522,194
Total Mortgage-Backed Securities(Cost $18,469,012) 18,438,287
Copyright © 2021 www.secdatabase.com. All Rights Reserved.Please Consider the Environment Before Printing This Document

Transamerica PIMCO Tactical �� Balanced VPSCHEDULE OF INVESTMENTS (continued)At March 31, 2019(unaudited)
Principal ValueMUNICIPAL GOVERNMENT OBLIGATIONS - 0.6%California - 0.2%Bay Area Toll Authority, Revenue Bonds,
Series S1,6.92%, 04/01/2040 $ 200,000 $ 278,096
Los Angeles Community College District, GeneralObligation Unlimited,6.60%, 08/01/2042 200,000 288,168
State of California, General Obligation Unlimited,7.35%, 11/01/2039 300,000 436,662
1,002,926Florida - 0.0% (C)County of Miami-Dade Aviation Revenue,
Revenue Bonds,Series C,3.86%, 10/01/2029 200,000 207,992
Maryland - 0.1%County of Baltimore, General Obligation
Unlimited,3.30%, 07/01/2046 450,000 426,168
Michigan - 0.1%Michigan Tobacco Settlement Finance Authority,
Revenue Bonds,Series A,7.31%, 06/01/2034 380,000 377,366
New York - 0.2%Port Authority of New York & New Jersey,
Revenue Bonds,4.46%, 10/01/2062 800,000 896,264
Utah - 0.0% (C)Utah State Board of Regents, Revenue Bonds,
Series 1,1-Month LIBOR + 0.75%,
3.24% (A), 12/26/2031 46,608 46,638West Virginia - 0.0% (C)Tobacco Settlement Finance Authority, Revenue
Bonds,Series A,7.47%, 06/01/2047 225,000 224,494
Total Municipal Government Obligations(Cost $3,024,288) 3,181,848
U.S. GOVERNMENT AGENCY OBLIGATIONS - 13.6%Federal Home Loan Mortgage Corp.
2.38%, 01/13/2022 (N) 10,800,000 10,830,0344.50%, 08/01/2048 2,042,314 2,150,936
Federal Home Loan Mortgage Corp. MultifamilyStructured Pass-Through Certificates1-Month LIBOR + 0.67%,
3.16% (A), 02/25/2023 686,588 687,234Federal Home Loan Mortgage Corp. REMIC
1-Month LIBOR + 0.35%,2.86% (A), 01/15/2038 1,363,146 1,356,023
1-Month LIBOR + 0.40%,2.88% (A), 02/15/2041 - 09/15/2045 1,088,688 1,089,766
Principal ValueU.S. GOVERNMENT AGENCY OBLIGATIONS (continued)Federal Home Loan Mortgage Corp. REMIC,
Interest Only STRIPS1.59% (A), 01/15/2038 $
1,363,146 $ 77,435Federal Home Loan Mortgage Corp., Interest Only
STRIPS(1.00) * 1-Month LIBOR + 5.89%,
3.41% (A), 09/15/2043 1,609,763 274,003Federal National Mortgage Association
3.50%, 06/01/2045 350,777 356,8313.50%, TBA (M) 29,200,000 29,568,4043.70%, 09/01/2034 925,613 971,7264.50%, 04/01/2028 - 10/01/2041 539,917 570,0594.50%, TBA (M) 21,400,000 22,279,1555.50%, TBA (M) 700,000 747,362
Federal National Mortgage Association REMIC1-Month LIBOR + 0.55%,
3.04% (A), 02/25/2041 388,758 390,9581-Month LIBOR + 0.57%,
3.06% (A), 06/25/2041 976,618 983,7721-Month LIBOR + 0.75%,
3.24% (A), 05/25/2040 806,918 815,2071-Month LIBOR + 0.85%,
3.34% (A), 11/25/2039 2,568,030 2,621,161Federal National Mortgage Association REMIC,
Interest Only STRIPS3.00%, 03/25/2028 820,119 66,840
Government National Mortgage Association1-Month LIBOR + 0.80%,
3.31% (A), 05/20/2066 - 06/20/2066 3,951,223 3,978,992Total U.S. Government Agency Obligations
(Cost $79,519,026) 79,815,898
U.S. GOVERNMENT OBLIGATIONS - 37.3%U.S. Treasury - 35.1%U.S. Treasury Bond
2.75%, 08/15/2047 (N) 4,700,000 4,632,9882.88%, 11/15/2046 (N) 1,598,000 1,617,8503.00%, 05/15/2042 - 11/15/2045 6,170,000 6,419,5063.00%, 02/15/2048 - 08/15/2048 (N) 3,420,000 3,539,0413.13%, 08/15/2044 7,700,000 8,161,6993.13%, 05/15/2048 (N) 2,510,000 2,661,4823.38%, 05/15/2044 - 11/15/2048 (N) 6,194,000 6,861,4314.25%, 05/15/2039 - 11/15/2040 (N) 9,470,000 11,849,4494.38%, 05/15/2040 - 05/15/2041 (N) 4,720,000 6,018,9384.50%, 08/15/2039 (N) 32,800,000 42,349,1566.25%, 05/15/2030 730,000 999,359
U.S. Treasury Note1.38%, 05/31/2021 (N) (O) 740,000 725,9811.75%, 01/31/2023 400,000 392,8591.88%, 03/31/2022 - 04/30/2022 (N) 27,900,000 27,614,0401.88%, 07/31/2022 (N) (O) 1,100,000 1,087,2382.00%, 06/30/2024 1,000,000 986,8752.13%, 03/31/2024 - 05/15/2025 1,890,000 1,874,1952.25%, 02/15/2027 - 08/15/2027 (N) 62,580,000 62,062,2402.63%, 02/15/2029 (N) 6,405,000 6,522,5922.75%, 04/30/2023 - 05/31/2023 (N) 4,500,000 4,590,0352.88%, 05/15/2028 (N) 3,230,000 3,355,0363.00%, 09/30/2025 - 10/31/2025 1,220,000 1,270,4953.13%, 11/15/2028 (N) 550,000 583,408
206,175,893
Copyright © 2021 www.secdatabase.com. All Rights Reserved.Please Consider the Environment Before Printing This Document

The notes are an integral part of this report.Transamerica Series Trust Page 8
Copyright © 2021 www.secdatabase.com. All Rights Reserved.Please Consider the Environment Before Printing This Document

Transamerica PIMCO Tactical �� Balanced VPSCHEDULE OF INVESTMENTS (continued)At March 31, 2019(unaudited)
The notes are an integral part of this report.Transamerica Series Trust Page 9
Principal ValueU.S. GOVERNMENT OBLIGATIONS (continued)U.S. Treasury Inflation-Protected Securities - 2.2%U.S. Treasury Inflation-Indexed Bond
1.00%, 02/15/2046 - 02/15/2048 (N)$ 3,136,506
$3,196,965
U.S. Treasury Inflation-Indexed Note0.13%, 04/15/2022 724,381 716,8900.50%, 01/15/2028 (N) 6,407,296 6,390,4890.75%, 07/15/2028 (N) 2,406,216 2,459,060
12,763,404Total U.S. Government Obligations
(Cost $209,833,559) 218,939,297
COMMERCIAL PAPER - 0.5%Construction Materials - 0.1%CRH America Finance, Inc.
2.77% (P), 04/26/2019 600,000 598,772Consumer Finance - 0.1%Nissan Motor Acceptance Corp.
2.76% (P), 04/29/2019 300,000 299,320Health Care Equipment & Supplies - 0.1%Boston Scientific Corp.
2.95% (P), 05/20/2019 400,000 398,357Multi-Utilities - 0.1%NiSource, Inc.
3.03% (P), 05/24/2019 400,000 398,185Oil, Gas & Consumable Fuels - 0.1%Energy Transfer Partners, LP
3.25% (P), 04/22/2019 1,300,000 1,297,342Total Commercial Paper
(Cost $2,991,976) 2,991,976
SHORT-TERM U.S. GOVERNMENT OBLIGATIONS - 0.1%U.S. Treasury Bill
2.43% (P), 05/23/2019 (Q) 838,000 835,004Total Short-Term U.S. Government Obligations
(Cost $835,004) 835,004
Shares ValueOTHER INVESTMENT COMPANY - 0.6%Securities Lending Collateral - 0.6%State Street Navigator Securities Lending
Trust - Government Money Market Portfolio,2.41% (P) 3,768,235 3,768,235
Total Other Investment Company(Cost $3,768,235) 3,768,235
Principal ValueREPURCHASE AGREEMENTS - 60.2%Bank of Nova Scotia, 2.75% (P), dated 03/29/
2019, to be repurchased at $72,616,638 on04/01/2019. Collateralized by a U.S.Government Obligation, 2.50%, due 03/31/2023, and with a value of $73,208,553. $ 72,600,000 72,600,000
Principal ValueREPURCHASE AGREEMENTS (continued)Fixed Income Clearing Corp., 1.45% (P), dated
03/29/2019, to be repurchased at $9,448,314on 04/01/2019. Collateralized by a U.S.Government Obligation, 2.75%, due 09/15/2021, and with a value of $9,636,283. $ 9,447,173 $ 9,447,173
HSBC Bank PLC, 2.90% (P), dated 03/28/2019, to be repurchased at $50,028,194 on04/04/2019. Collateralized by a U.S.Government Obligation, 2.13%, due 03/31/2024, and Cash with a total value of$50,016,236. 50,000,000 50,000,000
HSBC Bank PLC, 2.95% (P), dated 03/29/2019, to be repurchased at $48,311,874 on04/01/2019. Collateralized by U.S.Government Obligations, 2.50% - 2.75%,due 08/31/2023 - 05/15/2024, and Cash witha total value of $51,630,748. 48,300,000 48,300,000
JPMorgan Securities LLC, 2.51% (P), dated 04/01/2019, to be repurchased at $100,027,889on 04/02/2019. Collateralized by a U.S.Government Obligation, 3.00%, due 11/15/2045, and with a value of $100,849,369. 100,000,000 100,000,000
RBC Capital Markets LLC, 2.95% (P), dated03/29/2019, to be repurchased at$72,617,848 on 04/01/2019. Collateralizedby U.S. Government Obligations, 2.13% -3.00%, due 05/15/2025 - 09/30/2025, andwith a total value of $73,821,068. 72,600,000 72,600,000
Total Repurchase Agreements(Cost $352,947,173) 352,947,173
Total Investments Excluding PurchasedOptions/Swaptions(Cost $893,755,321) 904,940,408
Total Purchased Options/Swaptions - 0.7%(Cost $9,036,063) 3,932,705
Total Investments(Cost $902,791,384) 908,873,113
Net Other Assets (Liabilities) - (55.0)% (322,501,785 )Net Assets - 100.0% $ 586,371,328
Copyright © 2021 www.secdatabase.com. All Rights Reserved.Please Consider the Environment Before Printing This Document

Transamerica PIMCO Tactical �� Balanced VPSCHEDULE OF INVESTMENTS (continued)At March 31, 2019(unaudited)
The notes are an integral part of this report.Transamerica Series Trust Page 10
Principal ValueREVERSE REPURCHASE AGREEMENTS - (30.7)%Bank of Nova Scotia, 2.63% (P), dated 03/11/
2019, to be repurchased at $(2,122,380) on04/04/2019. Collateralized by U.S.Government Obligations, 3.00% - 3.38%,due 05/15/2047 - 11/15/2048, and with atotal value of $(2,241,871). $ (2,118,665) $ (2,118,665)
Bank of Nova Scotia, 2.64% (P), dated 01/09/2019, to be repurchased at $(42,639,878)on 04/09/2019. Collateralized by U.S.Government Obligations, 2.25% - 3.00%,due 02/15/2027 - 05/15/2047, and with atotal value of $(43,751,787). (42,360,300 ) (42,360,300 )
Deutsche Bank Securities, Inc., 2.46% (P),dated 03/26/2019, to be repurchased at$(6,555,378) on 04/09/2019. Collateralizedby a U.S. Government Obligation, 2.63%,due 02/15/2029, and with a value of$(6,544,368). (6,549,113 ) (6,549,113 )
Deutsche Bank Securities, Inc., 2.65% (P),dated 03/21/2019, to be repurchased at$(1,657,896) on 04/22/2019. Collateralizedby a U.S. Government Obligation, 2.88%,due 05/15/2028, and with a value of$(1,679,628). (1,654,000 ) (1,654,000 )
RBS Securities, Inc., 2.67% (P), dated 02/14/2019, to be repurchased at $(1,083,926) on04/12/2019. Collateralized by a U.S.Government Obligation, 3.00%, due 08/15/2048, and Cash with a total value of$(1,147,202). (1,079,363 ) (1,079,363 )
RBS Securities, Inc., 2.75% (P), dated 03/15/2019, to be repurchased at $(13,777,612)on 04/15/2019. Collateralized by U.S.Government Obligations, 3.13% - 4.38%,due 11/15/2028 - 08/15/2044, and Cashwith a total value of $(14,716,435). (13,745,063 ) (13,745,063 )
Royal Bank of Canada, 2.64% (P), dated 03/05/2019, to be repurchased at$(49,127,476) on 06/05/2019.Collateralized by U.S. GovernmentObligations, 1.88% - 4.50%, due 03/31/2022 - 08/15/2047, and with a total valueof $(51,326,959). (48,798,250 ) (48,798,250 )
Wood Gundy, Inc., 2.65% (P), dated 03/20/2019, to be repurchased at $(7,223,011) on04/18/2019. Collateralized by U.S.Government Obligations, 3.00% - 3.13%,due 05/15/2042 - 08/15/2044, and Cashwith a total value of $(7,696,504). (7,207,625 ) (7,207,625 )
Wood Gundy, Inc., 2.65% (P), dated 03/19/2019, to be repurchased at $(2,054,151) on04/18/2019. Collateralized by a U.S.Government Obligation, 3.38%, due 05/15/2044, and Cash with a total value of$(2,187,993). (2,049,625 ) (2,049,625 )
Principal ValueREVERSE REPURCHASE AGREEMENTS (continued)Wood Gundy, Inc., 2.65% (P), dated 03/08/
2019, to be repurchased at $(30,350,073)on 04/18/2019. Collateralized by U.S.Government Obligations, 4.25% -4.50%, due 05/15/2039 - 08/15/2039,and Cash with a total value of$(32,172,983). $ (30,258,750) $ (30,258,750 )
Wood Gundy, Inc., 2.70% (P), dated 03/07/2019, to be repurchased at $(18,790,113)on 04/08/2019. Collateralized by a U.S.Government Obligation, 2.25%, due 08/15/2027, and Cash with a total value of$(19,814,501). (18,745,125 ) (18,745,125 )
Wood Gundy, Inc., 2.70% (P), dated 03/26/2019, to be repurchased at $(5,523,707)on 04/10/2019. Collateralized by U.S.Government Obligations, 2.75% -3.13%, due 05/31/2023 - 08/15/2044,and Cash with a total value of$(5,744,355). (5,517,500 ) (5,517,500 )
Total Reverse Repurchase Agreements $ (180,083,379)
Copyright © 2021 www.secdatabase.com. All Rights Reserved.Please Consider the Environment Before Printing This Document

Transamerica PIMCO Tactical �� Balanced VPSCHEDULE OF INVESTMENTS (continued)At March 31, 2019(unaudited)
EXCHANGE-TRADED OPTIONS PURCHASED:
DescriptionExercise
PriceExpiration
DateNotionalAmount
Number ofContracts
PremiumsPaid Value
Put - S&P 500® Index USD 2,100.00 12/20/2019 USD 305,264,880 1,077 $ 7,752,148 $ 1,744,740
OVER-THE-COUNTER INTEREST RATE SWAPTIONS PURCHASED:
Description Counterparty Floating Rate IndexPay/Receive
Floating RateExercise
RateExpiration
DateNotional Amount/
Number of ContractsPremiums
Paid ValueCall - 1-Year DUB 3-Month USD-LIBOR Receive 3.02 % 07/09/2020 USD 69,200,000 $256,040 $583,361Call - 1-Year MSC 3-Month USD-LIBOR Receive 3.04 06/22/2020 USD 145,300,000 525,986 1,238,860Call - 1-Year GSB 3-Month USD-LIBOR Receive 3.04 06/22/2020 USD 42,400,000 154,022 361,511Put - 10-Year MLI 3-Month USD-LIBOR Pay 3.40 05/16/2019 USD 14,400,000 183,600 38Put - 30-Year MLI 3-Month USD-LIBOR Pay 3.60 10/01/2019 USD 8,800,000 164,267 4,195Total $ 1,283,915 $ 2,187,965
OVER-THE-COUNTER INTEREST RATE SWAPTIONS WRITTEN:
Description Counterparty Floating Rate IndexPay/Receive
Floating RateExercise
RateExpiration
DateNotional Amount/
Number of ContractsPremiums(Received) Value
Call - 1-Year DUB 3-Month USD-LIBOR Receive 2.96 % 07/09/2021 USD 69,200,000 $(331,296 ) $(589,846 )Call - 1-Year GSB 3-Month USD-LIBOR Receive 3.02 06/21/2021 USD 42,400,000 (205,894 ) (379,444 )Call - 1-Year MSC 3-Month USD-LIBOR Receive 3.02 06/21/2021 USD 145,300,000 (682,910 ) (1,304,833 )Put - 5-Year MLI 3-Month USD-LIBOR Pay 3.60 10/01/2019 USD 35,700,000 (159,634 ) (1,454 )Total $ (1,379,734) $ (2,275,577)
Premiums(Received) Value
TOTAL WRITTEN OPTIONS AND SWAPTIONS $ (1,379,734) $ (2,275,577)
CENTRALLY CLEARED SWAP AGREEMENTS:
Credit Default Swap Agreements on Credit Indices - Sell Protection (R)
Reference ObligationFixed RateReceivable
PaymentFrequency
MaturityDate
NotionalAmount (S) Value (T)
PremiumsPaid
(Received)
Net UnrealizedAppreciation
(Depreciation)North America Investment Grade Index -
Series 31 1.00% Quarterly 12/20/2023 USD 23,000,000 $ (512,518) $ (218,059) $ (294,459 )
The notes are an integral part of this report.Transamerica Series Trust Page 11
Copyright © 2021 www.secdatabase.com. All Rights Reserved.Please Consider the Environment Before Printing This Document

Transamerica PIMCO Tactical �� Balanced VPSCHEDULE OF INVESTMENTS (continued)At March 31, 2019(unaudited)
CENTRALLY CLEARED SWAP AGREEMENTS (continued):
Interest Rate Swap Agreements
Floating Rate Index
Pay/Receive
Fixed RateFixedRate
PaymentFrequency
MaturityDate
NotionalAmount Value
PremiumsPaid
(Received)
Net UnrealizedAppreciation
(Depreciation)3-Month USD-LIBOR Pay 1.50% Semi-Annually/Quarterly 06/21/2027 USD 15,400,000 $ 961,583 $ 1,069,508 $ (107,925 )3-Month USD-LIBOR Pay 1.75 Semi-Annually/Quarterly 12/21/2026 USD500,000 19,644 21,895 (2,251 )3-Month USD-LIBOR Receive 2.25 Semi-Annually/Quarterly 12/16/2022 USD700,000 2,636 2,679 (43 )3-Month USD-LIBOR Pay 2.25 Semi-Annually/Quarterly 06/20/2028 USD71,200,000 454,126 4,052,352 (3,598,226 )3-Month USD-LIBOR Pay 2.50 Semi-Annually/Quarterly 12/20/2027 USD2,100,000 (30,877 ) 21,606 (52,483 )3-Month USD-LIBOR Pay 3.00 Semi-Annually/Quarterly 02/04/2023 USD32,000,000 (492,521 ) � (492,521 )3-Month USD-LIBOR Receive 3.22 Semi-Annually/Quarterly 11/15/2028 USD1,100,000 85,787 � 85,7876-Month EUR-EURIBOR Receive 2.04 Semi-Annually/Annually 02/03/2037 EUR5,100,000 293,836 (70,602 ) 364,4386-Month GBP-LIBOR Pay 1.50 Semi-Annually 09/18/2029 GBP8,700,000 (284,687 ) (61,326 ) (223,361 )6-Month GBP-LIBOR Pay 2.04 Semi-Annually 02/01/2037 GBP4,600,000 (278,968 ) (78,880 ) (200,088 )6-Month JPY-LIBOR Pay 0.75 Semi-Annually 03/20/2038 JPY 480,000,000 (314,364 ) 63,382 (377,746 )Total $ 416,195 $ 5,020,614 $ (4,604,419)
OVER-THE-COUNTER SWAP AGREEMENTS:
Credit Default Swap Agreements on Credit Indices - Sell Protection (R)
Reference Obligation CounterpartyFixed RateReceivable
PaymentFrequency
MaturityDate
NotionalAmount (S) Value (T)
PremiumsPaid
(Received)
Net UnrealizedAppreciation
(Depreciation)North America CMBS Basket Index -
Series AAA8 GSI 0.50 % Monthly 10/17/2057 USD 3,200,000 $31,996 $(137,012 ) $ 169,008North America CMBS Basket Index -
Series AAA9 GSI 0.50 Monthly 09/17/2058 USD 1,700,000 14,886 (100,557 ) 115,443Total $ 46,882 $ (237,569) $ 284,451
Total Return Swap Agreements (U)
Reference Entity CounterpartyPay/
ReceivePayment
FrequencyMaturity
DateNotionalAmount
Number ofShares or Units Value
PremiumsPaid
(Received)
Net UnrealizedAppreciation
(Depreciation)iShares MSCI EAFE
ETF CITI Receive Quarterly 05/23/2019 USD 55,090,491 9,580 $200,196 $(43,878 ) $ 244,074iShares MSCI EAFE
ETF GSI Receive Quarterly 08/14/2019 USD 3,350,690 598 93,975 � 93,975Total $ 294,171 $ (43,878) $ 338,049
ValueOTC Swap Agreements, at value (Assets) $ 341,053
The notes are an integral part of this report.Transamerica Series Trust Page 12
Copyright © 2021 www.secdatabase.com. All Rights Reserved.Please Consider the Environment Before Printing This Document

Transamerica PIMCO Tactical �� Balanced VPSCHEDULE OF INVESTMENTS (continued)At March 31, 2019(unaudited)
FUTURES CONTRACTS:
DescriptionLong/Short
Number ofContracts
ExpirationDate
NotionalAmount Value
UnrealizedAppreciation
UnrealizedDepreciation
90-Day Eurodollar Long 213 06/17/2019 $51,663,010 $51,894,788 $231,778 $�90-Day Eurodollar Long 627 12/16/2019 151,832,445 152,940,975 1,108,530 �90-Day Eurodollar Short (213 ) 06/15/2020 (51,591,264 ) (52,065,188 ) � (473,924 )90-Day Eurodollar Short (627 ) 12/14/2020 (151,793,689) (153,387,713) � (1,594,024 )2-Year U.S. Treasury Note Long 459 06/28/2019 97,827,771 97,810,031 � (17,740 )5-Year U.S. Treasury Note Short (771 ) 06/28/2019 (89,324,877 ) (89,303,484 ) 21,393 �10-Year U.S. Treasury Note Long 6 06/19/2019 734,165 745,313 11,148 �10-Year U.S. Treasury Note Short (32 ) 06/19/2019 (4,153,458 ) (4,249,000 ) � (95,542 )E-Mini Russell 2000® Index Long 380 06/21/2019 29,269,312 29,332,200 62,888 �Euro OAT Index Short (35 ) 06/06/2019 (6,237,118 ) (6,386,629 ) � (149,511 )German Euro Bund Index Short (9 ) 06/06/2019 (1,643,578 ) (1,679,327 ) � (35,749 )S&P 500® E-Mini Index Long 1,858 06/21/2019 258,089,972 263,631,620 5,541,648 �U.S. Treasury Bond Long 92 06/19/2019 14,820,215 15,456,000 635,785 �U.S. Treasury Bond Short (266 ) 06/19/2019 (38,792,816 ) (39,808,563 ) � (1,015,747 )Total $ 7,613,170 $ (3,382,237)
FORWARD FOREIGN CURRENCY CONTRACTS:
Counterparty Settlement DateCurrencyPurchased
CurrencySold
UnrealizedAppreciation
UnrealizedDepreciation
BNP 06/19/2019 INR 22,584,360 USD 312,889 $9,783 $�CITI 04/02/2019 USD 2,373,359 GBP 1,799,000 30,010 �CITI 04/24/2019 MXN 30,163,000 USD 1,559,456 � (11,478 )CITI 05/15/2019 USD 132,132 JPY 14,600,000 � (94 )CITI 05/15/2019 RUB 90,328,281 USD 1,359,066 7,794 �CITI 06/11/2019 COP 933,568,500 USD 299,063 � (7,359 )GSB 04/02/2019 USD 293,308 CAD 385,000 5,194 �HSBC 04/01/2019 USD 138,123 DKK 895,000 3,634 �HSBC 04/24/2019 USD 1,562,689 MXN 30,163,000 14,711 �JPM 04/02/2019 USD 313,991 GBP 238,000 3,976 �JPM 04/02/2019 EUR 402,000 USD 458,408 � (7,387 )JPM 05/15/2019 USD 277,023 JPY 30,400,000 1,704 �JPM 07/01/2019 USD 135,705 DKK 895,000 105 �SCB 04/02/2019 GBP 1,649,000 USD 2,183,091 � (35,130 )SCB 05/03/2019 USD 2,186,399 GBP 1,649,000 35,077 �SCB 06/19/2019 IDR 4,725,480,000 USD 331,078 � (2,602 )Total $ 111,988 $ (64,050 )
The notes are an integral part of this report.Transamerica Series Trust Page 13
Copyright © 2021 www.secdatabase.com. All Rights Reserved.Please Consider the Environment Before Printing This Document

Transamerica PIMCO Tactical �� Balanced VPSCHEDULE OF INVESTMENTS (continued)At March 31, 2019(unaudited)
SECURITY VALUATION:
Valuation Inputs (V)
Level 1 -Unadjusted
QuotedPrices
Level 2 -Other
SignificantObservable
Inputs
Level 3 -Significant
UnobservableInputs(W) Value
ASSETSInvestmentsAsset-Backed Securities $� $15,983,787 $� $15,983,787Certificates of Deposit � 1,300,000 � 1,300,000Corporate Debt Securities � 186,832,457 � 186,832,457Foreign Government Obligations � 18,596,150 � 18,596,150Loan Assignment � � 1,310,296 1,310,296Mortgage-Backed Securities � 18,438,287 � 18,438,287Municipal Government Obligations � 3,181,848 � 3,181,848U.S. Government Agency Obligations � 79,815,898 � 79,815,898U.S. Government Obligations � 218,939,297 � 218,939,297Commercial Paper � 2,991,976 � 2,991,976Short-Term U.S. Government Obligations � 835,004 � 835,004Other Investment Company 3,768,235 � � 3,768,235Repurchase Agreements � 352,947,173 � 352,947,173Exchange-Traded Options Purchased 1,744,740 � � 1,744,740Over-the-Counter Interest Rate Swaptions Purchased � 2,187,965 � 2,187,965Total Investments $5,512,975 $902,049,842 $ 1,310,296 $908,873,113Other Financial InstrumentsCentrally Cleared Interest Rate Swap Agreements $� $1,817,612 $� $1,817,612Over-the-Counter Credit Default Swap Agreements � 46,882 � 46,882Over-the-Counter Total Return Swap Agreements � 294,171 � 294,171Futures Contracts (X) 7,613,170 � � 7,613,170Forward Foreign Currency Contracts (X) � 111,988 � 111,988Total Other Financial Instruments $7,613,170 $2,270,653 $�� $9,883,823LIABILITIESOther Financial InstrumentsReverse Repurchase Agreements $� $(180,083,379 ) $� $(180,083,379 )Over-the-Counter Interest Rate Swaptions Written � (2,275,577 ) � (2,275,577 )Centrally Cleared Credit Default Swap Agreements � (512,518 ) � (512,518 )Centrally Cleared Interest Rate Swap Agreements � (1,401,417 ) � (1,401,417 )Futures Contracts (X) (3,382,237 ) � � (3,382,237 )Forward Foreign Currency Contracts (X) � (64,050 ) � (64,050 )Total Other Financial Instruments $ (3,382,237) $ (184,336,941) $�� $ (187,719,178)
FOOTNOTES TO SCHEDULE OF INVESTMENTS:
(A) Floating or variable rate securities. The rates disclosed are as of March 31, 2019. For securities based on a published reference rate and spread, the referencerate and spread are indicated within the description. Variable rate securities with a floor or ceiling feature are disclosed at the inherent rate, where applicable.Certain variable rate securities are not based on a published reference rate and spread, but are determined by the issuer or agent and are based on current marketconditions; these securities do not indicate a reference rate and spread in the description.
(B) Securities are registered pursuant to Rule 144A of the Securities Act of 1933. Unless otherwise indicated, the securities are deemed to be liquid for purposes ofcompliance limitations on holdings of illiquid securities and may be resold as transactions exempt from registration, normally to qualified institutional buyers. AtMarch 31, 2019, the total value of 144A securities is $88,741,285, representing 15.1% of the Portfolio�s net assets.
(C) Percentage rounds to less than 0.1% or (0.1)%.(D) Perpetual maturity. The date displayed is the next call date.(E) All or a portion of the securities are on loan. The total value of all securities on loan is $3,691,682. The amount of securities on loan indicated may not correspond
with the securities on loan identified because securities with pending sales are in the process of recall from the brokers.(F) Securities are exempt from registration under Regulation S of the Securities Act of 1933, which exempts from registration securities offered and sold outside the
United States. Securities may not be offered or sold in the United States except pursuant to an exemption from, or in a transaction not subject to, the registrationrequirements of the Securities Act of 1933. At March 31, 2019, the total value of Regulation S securities is $10,674,002, representing 1.8% of the Portfolio�s netassets.
Copyright © 2021 www.secdatabase.com. All Rights Reserved.Please Consider the Environment Before Printing This Document

(G) Step bond. Coupon rate changes in increments to maturity. The rate disclosed is as of March 31, 2019; the maturity date disclosed is the ultimate maturity date.(H) Securities in default; partial receipt of interest payments and/or dividends declared at last payment date. At March 31, 2019, the total value of such securities is
$405,600, representing 0.1% of the Portfolio�s net assets.(I) Restricted security. At March 31, 2019, the value of such security held by the Portfolio is as follows:
Investments DescriptionAcquisition
DateAcquisition
Cost ValueValue as Percentage
of Net AssetsForeign Government
ObligationsExport-Import Bank of Korea
1.93%, 02/24/2020, MTN 02/16/2017 $ 306,244 $ 297,563 0.1 %
(J) All or a portion of the security represents an unsettled loan commitment at March 31, 2019 where the rate will be determined at time of settlement.(K) Fair valued as determined in good faith in accordance with procedures established by the Board. At March 31, 2019, the total value of securities is $2,459,486,
representing 0.4% of the Portfolio�s net assets.(L) Security is Level 3 of the fair value hierarchy.
The notes are an integral part of this report.Transamerica Series Trust Page 14
Copyright © 2021 www.secdatabase.com. All Rights Reserved.Please Consider the Environment Before Printing This Document

Transamerica PIMCO Tactical �� Balanced VPSCHEDULE OF INVESTMENTS (continued)At March 31, 2019(unaudited)
FOOTNOTES TO SCHEDULE OF INVESTMENTS (continued):
(M) When-issued, delayed-delivery and/or forward commitment (including TBAs) securities. Securities to be settled and delivered after March 31, 2019. Securitiesmay display a coupon rate of 0.00%, as the rate is to be determined at time of settlement.
(N) Securities are subject to sale-buyback transactions.(O) All or a portion of these securities have been segregated by the custodian as collateral for centrally cleared swap agreements. The total value of such securities is
$1,813,219.(P) Rates disclosed reflect the yields at March 31, 2019.(Q) All or a portion of the security has been segregated by the custodian as collateral for open over-the-counter swaptions, swap agreements and forward foreign
currency contracts. The value of the security is $444,405.(R) If the Portfolio is a seller of protection and a credit event occurs, as defined under the terms of that particular swap agreement, the Portfolio will either (a) pay to
the buyer of protection an amount equal to the notional amount of the swap and take delivery of the referenced obligation or underlying securities comprising thereferenced obligation or (b) pay a net settlement amount in the form of cash or securities equal to the notional amount of the swap agreement less the recoveryvalue of the referenced obligation or underlying securities comprising the referenced obligation.
(S) The maximum potential amount the Portfolio could be required to pay as a seller of credit protection or receive as a buyer of credit protection if a credit eventoccurs as defined under the terms of that particular swap agreement.
(T) The quoted market prices and resulting values for credit default swap agreements on asset-backed securities and credit indices serve as an indicator of the currentstatus of the payment/performance risk and represent the likelihood of an expected liability (or profit) for the credit derivative had the notional amount of the swapagreement been closed/sold as of the period ended. Increasing market values, in absolute terms when compared to the notional amount of the swap agreement,represent a deterioration of the referenced entity�s credit soundness and a greater likelihood or risk of default or other credit event occurring as defined under theterms of the agreement.
(U) At the termination date, a net cash flow is exchanged where the total return is equivalent to the return of the reference entity less a financing rate, if any. As areceiver, the Portfolio would receive payments based on any positive total return and would owe payments in the event of a negative total return. As the payer, thePortfolio would owe payments on any net positive total return and would receive payment in the event of a negative total return.
(V) There were no transfers in or out of Level 3 during the period ended March 31, 2019. Please reference the Security Valuation section of the Notes to Schedules ofInvestments for more information regarding security valuation and pricing inputs.
(W) Level 3 securities were not considered significant to the Portfolio.(X) Futures contracts and/or forward foreign currency contracts are valued at unrealized appreciation (depreciation).
CURRENCY ABBREVIATIONS:
CAD Canadian DollarCOP Columbian PesoDKK Danish KroneEUR EuroGBP Pound SterlingIDR Indonesian RupiahINR Indian RupeeJPY Japanese YenMXN Mexican PesoPEN Peruvian SolRUB Russian RubleUSD United States Dollar
COUNTERPARTY ABBREVIATIONS:
BNP BNP ParibasCITI Citibank N.A.DUB Deutsche Bank AGGSB Goldman Sachs BankGSI Goldman Sachs InternationalHSBC HSBC Bank USAJPM JPMorgan Chase Bank, N.A.MLI Merrill Lynch InternationalMSC Morgan Stanley & Co.SCB Standard Chartered Bank
PORTFOLIO ABBREVIATIONS:
CMBS Commercial Mortgage-Backed SecuritiesEAFE Europe, Australasia and Far EastETF Exchange-Traded FundEURIBOR Euro Interbank Offer Rate
Copyright © 2021 www.secdatabase.com. All Rights Reserved.Please Consider the Environment Before Printing This Document

LIBOR London Interbank Offered RateMTN Medium Term NoteOAT Obligations Assimilables du Tresor (Treasury Obligations)STRIPS Separate Trading of Registered Interest and Principal of SecuritiesTBA To Be AnnouncedTBD To Be Determined
The notes are an integral part of this report.Transamerica Series Trust Page 15
Copyright © 2021 www.secdatabase.com. All Rights Reserved.Please Consider the Environment Before Printing This Document

Transamerica PIMCO Tactical �� Conservative VPSCHEDULE OF INVESTMENTSAt March 31, 2019(unaudited)
The notes are an integral part of this report.Transamerica Series Trust Page 1
Principal ValueASSET-BACKED SECURITIES - 3.5%Avery Point IV CLO, Ltd.
Series 2014-1A, Class AR,3-Month LIBOR + 1.10%,
3.87% (A), 04/25/2026 (B) $ 275,712 $ 275,714Bear Stearns Asset-Backed Securities Trust
Series 2005-SD1, Class 2M2,1-Month LIBOR + 1.20%,
3.69% (A), 01/25/2045 346,384 344,297Crown Point CLO, Ltd.
Series 2018-5A, Class A,3-Month LIBOR + 0.94%,
3.71% (A), 07/17/2028 (B) 600,000 595,206CVP Cascade CLO-1, Ltd.
Series 2013-CLO1, Class A1R,3-Month LIBOR + 1.15%,
3.93% (A), 01/16/2026 (B) 805,926 805,917Dryden XXV Senior Loan Fund
Series 2012-25A, Class ARR,3-Month LIBOR + 0.90%,
3.69% (A), 10/15/2027 (B) 900,000 897,164FFMLT Trust
Series 2005-FF2, Class M4,1-Month LIBOR + 0.89%,
3.37% (A), 03/25/2035 193,685 194,670Figueroa CLO, Ltd.
Series 2013-2A, Class A1RR,3-Month LIBOR + 0.85%,
3.48% (A), 06/20/2027 (B) 300,000 298,603Flagship CLO, Ltd.
Series 2014-8A, Class ARR,3-Month LIBOR + 0.85%,
3.63% (A), 01/16/2026 (B) 300,000 299,009Flagship VII, Ltd.
Series 2013-7A, Class A1R,3-Month LIBOR + 1.12%,
3.88% (A), 01/20/2026 (B) 286,823 286,822Ford Credit Auto Owner Trust
Series 2016-2, Class A,2.03%, 12/15/2027 (B) 1,200,000 1,180,338
Gallatin CLO IX, Ltd.Series 2018-1A, Class A,3-Month LIBOR + 1.05%,
3.81% (A), 01/21/2028 (B) 300,000 299,087Halcyon Loan Advisors Funding, Ltd.
Series 2014-3A, Class AR,3-Month LIBOR + 1.10%,
3.86% (A), 10/22/2025 (B) 629,260 629,019Loomis Sayles CLO II, Ltd.
Series 2015-2A, Class A1R,3-Month LIBOR + 0.90%,
3.69% (A), 04/15/2028 (B) 1,000,000 990,509
Principal ValueASSET-BACKED SECURITIES (continued)Mountain View CLO, Ltd.
Series 2014-1A, Class ARR,3-Month LIBOR + 0.80%,
3.59% (A), 10/15/2026 (B)$482,976
$480,580
Northstar Education Finance, Inc.Series 2012-1, Class A,1-Month LIBOR + 0.70%,
3.19% (A), 12/26/2031 (B) 24,390 24,360Oaktree CLO, Ltd.
Series 2014-2A, Class A1AR,3-Month LIBOR + 1.22%,
3.98% (A), 10/20/2026 (B) 264,855 264,860Palmer Square Loan Funding, Ltd.
Series 2018-4A, Class A1,3-Month LIBOR + 0.90%,
3.58% (A), 11/15/2026 (B) 488,712 486,747PHEAA Student Loan Trust
Series 2016-2A, Class A,1-Month LIBOR + 0.95%,
3.44% (A), 11/25/2065 (B) 306,129 307,247SMB Private Education Loan Trust
Series 2016-B, Class A2B,1-Month LIBOR + 1.45%,
3.93% (A), 02/17/2032 (B) 743,309 755,734Zais CLO 1, Ltd.
Series 2014-1A, Class A1AR,3-Month LIBOR + 1.15%,
3.94% (A), 04/15/2028 (B) 500,000 498,563Total Asset-Backed Securities
(Cost $9,849,786) 9,914,446
CERTIFICATE OF DEPOSIT - 0.1%Banks - 0.1%Lloyds Bank Corporate Markets PLC
3-Month LIBOR + 0.50%,3.30% (A), 10/26/2020 400,000 400,000
Total Certificate of Deposit(Cost $400,000) 400,000
CORPORATE DEBT SECURITIES - 38.2%Aerospace & Defense - 0.0% (C)United Technologies Corp.
3.95%, 08/16/2025 100,000 103,858Airlines - 0.9%American Airlines Pass-Through Trust
3.00%, 04/15/2030 368,869 356,5953.25%, 04/15/2030 92,157 88,482
British Airways Pass-Through Trust3.80%, 03/20/2033 (B) 197,547 201,242
Continental Airlines Pass-Through Trust5.50%, 04/29/2022 27,259 27,760
Norwegian Air Shuttle Pass-Through Trust4.88%, 11/10/2029 (B) 995,643 959,999
Copyright © 2021 www.secdatabase.com. All Rights Reserved.Please Consider the Environment Before Printing This Document

Transamerica PIMCO Tactical �� Conservative VPSCHEDULE OF INVESTMENTS (continued)At March 31, 2019(unaudited)
Principal ValueCORPORATE DEBT SECURITIES (continued)Airlines (continued)United Airlines Pass-Through Trust
2.88%, 04/07/2030$ 473,569
$453,869
3.10%, 04/07/2030 473,569 449,8432,537,790
Banks - 9.1%AIB Group PLC
4.75%, 10/12/2023 (B) 400,000 413,070Bank of America Corp.
2.63%, 10/19/2020, MTN 560,000 558,605Fixed until 12/20/2027,
3.42% (A), 12/20/2028 2,260,000 2,209,939Bank of Ireland Group PLC
4.50%, 11/25/2023 (B) 400,000 406,512Bank of Montreal
1.75%, 06/15/2021 (B) 900,000 883,9412.55%, 11/06/2022, MTN 200,000 199,337
Barclays PLC3.25%, 02/12/2027, MTN (D) GBP 400,000 526,9173.65%, 03/16/2025 $ 500,000 487,5204.34%, 01/10/2028 400,000 397,558Fixed until 02/15/2022,
4.61% (A), 02/15/2023 400,000 408,250BNP Paribas SA
3.38%, 01/09/2025 (B) 900,000 881,808BPCE SA
3-Month LIBOR + 1.24%,3.84% (A), 09/12/2023 (B) 800,000 796,400
Citigroup, Inc.4.40%, 06/10/2025 300,000 310,586
Dexia Credit Local SA1.88%, 09/15/2021 (B) 1,400,000 1,378,107
HSBC USA, Inc.2.38%, 11/13/2019 180,000 179,5442.75%, 08/07/2020 1,650,000 1,651,5833-Month LIBOR + 0.61%,
3.30% (A), 11/13/2019 100,000 100,282ING Groep NV
3-Month LIBOR + 1.00%, 3.60% (A), 10/02/2023 900,000 897,058
JPMorgan Chase & Co.3.25%, 09/23/2022 200,000 202,7993.90%, 07/15/2025 100,000 103,8993-Month LIBOR + 3.47%, 6.22% (A), 04/30/
2019 (E) 200,000 201,000Lloyds Banking Group PLC
4.38%, 03/22/2028 200,000 204,7954.55%, 08/16/2028 1,000,000 1,035,546
Manufacturers & Traders Trust Co.2.25%, 07/25/2019 250,000 249,685
Mitsubishi UFJ Financial Group, Inc.3-Month LIBOR + 1.88%,
4.51% (A), 03/01/2021 535,000 547,924Mitsubishi UFJ Trust & Banking Corp.
2.65%, 10/19/2020 (B) 200,000 199,422Mizuho Financial Group, Inc.
3-Month LIBOR + 1.00%, 3.60% (A), 09/11/2024 (F) 400,000 402,994
MUFG Bank, Ltd.2.30%, 03/05/2020 (B) 200,000 199,204
National Australia Bank, Ltd.
Principal ValueCORPORATE DEBT SECURITIES (continued)Banks (continued)Royal Bank of Scotland Group PLC (continued)
Fixed until 08/15/2021 (E),8.63% (A) $ 600,000 $ 639,000
Santander UK Group Holdings PLC2.88%, 10/16/2020 860,000 857,8693.13%, 01/08/2021 100,000 99,950
Santander UK PLC2.38%, 03/16/2020 1,700,000 1,694,171
Sberbank of Russia Via SB Capital SA5.18%, 06/28/2019 (D) 400,000 401,595
Stichting AK Rabobank Certificaten6.50%, 12/29/2049 (D) (E) EUR 400,000 523,140
Sumitomo Mitsui Banking Corp.2.65%, 07/23/2020, MTN $ 860,000 858,822
Sumitomo Mitsui Financial Group, Inc.2.63%, 07/14/2026 (F) 200,000 191,4393-Month LIBOR + 0.80%, 3.58% (A), 10/16/
2023 400,000 399,998Swedbank AB
2.20%, 03/04/2020 (B) 450,000 446,405UniCredit SpA
6.57%, 01/14/2022 (B) 400,000 418,5677.83%, 12/04/2023 (B) 400,000 443,804
Wells Fargo & Co.2.55%, 12/07/2020, MTN 80,000 79,7413.00%, 02/19/2025, MTN 200,000 197,709Fixed until 05/22/2027, 3.58% (A), 05/22/
2028, MTN 300,000 301,156Wells Fargo Bank NA
3.55%, 08/14/2023 1,000,000 1,026,033Westpac Banking Corp.
2.25%, 11/09/2020 (B) 700,000 696,50226,223,695
Beverages - 0.3%Anheuser-Busch InBev Worldwide, Inc.
4.38%, 04/15/2038 400,000 383,9165.55%, 01/23/2049 200,000 219,510
Bacardi, Ltd.4.70%, 05/15/2028 (B) 150,000 149,973
753,399Biotechnology - 0.6%AbbVie, Inc.
2.90%, 11/06/2022 350,000 349,2823.20%, 11/06/2022 1,000,000 1,009,026
Amgen, Inc.4.40%, 05/01/2045 300,000 294,0814.56%, 06/15/2048 100,000 100,142
1,752,531Building Products - 0.3%Fortune Brands Home & Security, Inc.
4.00%, 06/15/2025 410,000 418,686Masco Corp.
4.45%, 04/01/2025 20,000 20,538Owens Corning
3.40%, 08/15/2026 300,000 282,7414.20%, 12/01/2024 20,000 20,208
742,173Capital Markets - 3.1%Brighthouse Holdings LLC
6.50% (G), 07/27/2037 (B) (E) 200,000 184,000
Copyright © 2021 www.secdatabase.com. All Rights Reserved.Please Consider the Environment Before Printing This Document

The notes are an integral part of this report.Transamerica Series Trust Page 2
1.38%, 07/12/2019 500,000 498,226Royal Bank of Scotland Group PLC
Fixed until 05/18/2028,4.89% (A), 05/18/2029 400,000 415,283
Charles Schwab Corp.Fixed until 12/01/2027 (E),
5.00% (A) 500,000 468,750
Copyright © 2021 www.secdatabase.com. All Rights Reserved.Please Consider the Environment Before Printing This Document

Transamerica PIMCO Tactical �� Conservative VPSCHEDULE OF INVESTMENTS (continued)At March 31, 2019(unaudited)
Principal ValueCORPORATE DEBT SECURITIES (continued)Capital Markets (continued)Credit Suisse Group AG
Fixed until 01/12/2028,3.87% (A), 01/12/2029 (B)
$400,000
$392,068
4.28%, 01/09/2028 (B) 400,000 404,595Credit Suisse Group Funding Guernsey, Ltd.
3.75%, 03/26/2025 900,000 906,813Deutsche Bank AG
3-Month LIBOR + 1.29%,4.03% (A), 02/04/2021 800,000 793,338
4.25%, 10/14/2021 400,000 401,796Goldman Sachs Group, Inc.
3.75%, 05/22/2025 60,000 60,6103.85%, 07/08/2024, MTN 2,300,000 2,344,664
Intercontinental Exchange, Inc.2.75%, 12/01/2020 40,000 40,052
Lazard Group LLC3.75%, 02/13/2025 30,000 30,225
Morgan StanleyFixed until 04/24/2023,
3.74% (A), 04/24/2024 400,000 407,9694.00%, 07/23/2025, MTN 60,000 61,7535.50%, 07/24/2020, MTN 1,900,000 1,964,705
S&P Global, Inc.4.40%, 02/15/2026 40,000 43,010
UBS Group Funding Switzerland AG4.13%, 09/24/2025 (B) 400,000 412,972
8,917,320Chemicals - 0.4%Huntsman International LLC
4.50%, 05/01/2029 300,000 299,272International Flavors & Fragrances, Inc.
3.40%, 09/25/2020 400,000 402,404SASOL Financing LLC
5.88%, 03/27/2024 400,000 424,2061,125,882
Commercial Services & Supplies - 0.3%ERAC USA Finance LLC
4.50%, 02/15/2045 (B) 15,000 14,7507.00%, 10/15/2037 (B) 300,000 384,852
RELX Capital, Inc.4.00%, 03/18/2029 300,000 306,100
705,702Consumer Finance - 1.1%American Express Credit Corp.
3-Month LIBOR + 0.49%, 3.17% (A), 08/15/2019, MTN 100,000 100,144
Daimler Finance North America LLC1.50%, 07/05/2019 (B) 200,000 199,3333.40%, 02/22/2022 (B) 300,000 302,652
Discover Financial Services4.50%, 01/30/2026 200,000 205,412
Ford Motor Credit Co. LLC3-Month LIBOR + 0.93%, 3.53% (A), 09/24/
2020, MTN 400,000 398,2753-Month LIBOR + 2.55%,
5.35% (A), 01/07/2021 200,000 201,8955.75%, 02/01/2021 400,000 411,936
Nissan Motor Acceptance Corp.2.55%, 03/08/2021 (B) 200,000 196,842
Synchrony Financial2.70%, 02/03/2020 15,000 14,980
Principal ValueCORPORATE DEBT SECURITIES (continued)Consumer Finance (continued)Toyota Motor Credit Corp.
1.40%, 05/20/2019, MTN $200,000
$199,678
Volkswagen Group of America Finance LLC2.13%, 05/23/2019 (B) 700,000 699,189
3,032,026Diversified Consumer Services - 0.7%Nationwide Building Society
3.90%, 07/21/2025 (B) 1,900,000 1,934,309Diversified Financial Services - 1.2%AerCap Ireland Capital DAC / AerCap Global Aviation
Trust4.45%, 12/16/2021 - 10/01/2025 1,300,000 1,313,281
AXA Equitable Holdings, Inc.4.35%, 04/20/2028 200,000 203,035
Helios Leasing I LLC1.56%, 09/28/2024 96,582 93,520
ORIX Corp.3.25%, 12/04/2024 600,000 599,236
Protective Life Global Funding2.70%, 11/25/2020 (B) 830,000 828,580
Tagua Leasing LLC1.58%, 11/16/2024 100,917 97,934
Voya Financial, Inc.Fixed until 01/23/2028,
4.70% (A), 01/23/2048 200,000 173,0003,308,586
Diversified Telecommunication Services - 1.2%AT&T, Inc.
3.40%, 05/15/2025 230,000 227,5893-Month LIBOR + 0.93%,
3.53% (A), 06/30/2020 40,000 40,2873-Month LIBOR + 1.18%,
3.78% (A), 06/12/2024 1,000,000 991,9854.13%, 02/17/2026 150,000 153,3334.30%, 02/15/2030 227,000 229,6064.35%, 03/01/2029 500,000 510,785
Verizon Communications, Inc.3.38%, 02/15/2025 93,000 94,0954.02%, 12/03/2029 (B) 610,000 627,5504.33%, 09/21/2028 617,000 652,500
3,527,730Electric Utilities - 2.2%AEP Texas, Inc.
3.95%, 06/01/2028 500,000 520,913Appalachian Power Co.
3.40%, 06/01/2025 650,000 658,558Duke Energy Corp.
3.75%, 04/15/2024 100,000 103,1203.95%, 10/15/2023 300,000 310,975
Duke Energy Florida LLC3.80%, 07/15/2028 500,000 521,987
Electricite de France SA3.63%, 10/13/2025 (B) 800,000 814,109
Entergy Louisiana LLC3.30%, 12/01/2022 100,000 101,920
Entergy Mississippi LLC2.85%, 06/01/2028 1,100,000 1,060,787
IPALCO Enterprises, Inc.3.70%, 09/01/2024 300,000 301,530
Copyright © 2021 www.secdatabase.com. All Rights Reserved.Please Consider the Environment Before Printing This Document

The notes are an integral part of this report.Transamerica Series Trust Page 3
5.15%, 03/19/2029 100,000 101,690 NextEra Energy Capital Holdings, Inc.3.20%, 02/25/2022 400,000 403,427
Copyright © 2021 www.secdatabase.com. All Rights Reserved.Please Consider the Environment Before Printing This Document

Transamerica PIMCO Tactical �� Conservative VPSCHEDULE OF INVESTMENTS (continued)At March 31, 2019(unaudited)
Principal ValueCORPORATE DEBT SECURITIES (continued)Electric Utilities (continued)Niagara Mohawk Power Corp.
4.12%, 11/28/2042 (B) $200,000 $ 196,673
Pacific Gas & Electric Co.3.50%, 06/15/2025 (H) 20,000 17,8004.25%, 08/01/2023 (B) (H) 300,000 277,500
Southwestern Electric Power Co.6.20%, 03/15/2040 600,000 736,442
SP Group Treasury Pte, Ltd.3.38%, 02/27/2029 (B) 250,000 252,967
6,278,708Electronic Equipment, Instruments & Components - 0.1%Arrow Electronics, Inc.
3.25%, 09/08/2024 300,000 290,834Energy Equipment & Services - 0.4%Energy Transfer Partners, LP / Regency Energy
Finance Corp.5.88%, 03/01/2022 850,000 908,575
Odebrecht Drilling Norbe VIII / IX, Ltd.6.35%, 12/01/2021 (D) 172,500 169,697
1,078,272Equity Real Estate Investment Trusts - 3.5%Alexandria Real Estate Equities, Inc.
3.95%, 01/15/2027 100,000 100,8774.30%, 01/15/2026 1,090,000 1,129,9114.50%, 07/30/2029 200,000 210,581
American Tower Corp.3.38%, 10/15/2026 600,000 584,7734.00%, 06/01/2025 300,000 308,8144.40%, 02/15/2026 670,000 699,240
AvalonBay Communities, Inc.3.45%, 06/01/2025, MTN 600,000 610,816
Brixmor Operating Partnership, LP3-Month LIBOR + 1.05%,
3.79% (A), 02/01/2022 600,000 597,747Crown Castle International Corp.
4.45%, 02/15/2026 200,000 208,8465.25%, 01/15/2023 900,000 965,844
Digital Realty Trust, LP3.95%, 07/01/2022 860,000 882,420
Essex Portfolio, LP4.00%, 03/01/2029 500,000 511,638
Federal Realty Investment Trust3.63%, 08/01/2046 150,000 137,239
Kilroy Realty, LP4.38%, 10/01/2025 590,000 608,936
Mid-America Apartments, LP4.00%, 11/15/2025 580,000 596,955
National Retail Properties, Inc.4.80%, 10/15/2048 500,000 533,855
Prologis, LP3.75%, 11/01/2025 20,000 20,906
Unibail-Rodamco SE3-Month LIBOR + 0.77%,
3.55% (A), 04/16/2019, MTN (D) 200,000 200,055VEREIT Operating Partnership, LP
4.63%, 11/01/2025 500,000 517,130Welltower, Inc.
4.95%, 09/01/2048 300,000 316,653WP Carey, Inc.
4.60%, 04/01/2024 400,000 415,845
Principal ValueCORPORATE DEBT SECURITIES (continued)Food Products - 0.1%Kraft Heinz Foods Co.
3.50%, 07/15/2022 $ 50,000 $ 50,4754.38%, 06/01/2046 300,000 259,512
309,987Gas Utilities - 0.3%Brooklyn Union Gas Co.
3.87%, 03/04/2029 (B) 200,000 206,035Southern California Gas Co.
4.13%, 06/01/2048 500,000 513,900719,935
Health Care Equipment & Supplies - 0.8%Boston Scientific Corp.
3.38%, 05/15/2022 650,000 658,724Zimmer Biomet Holdings, Inc.
2.70%, 04/01/2020 1,620,000 1,616,0243.15%, 04/01/2022 30,000 30,0833.55%, 04/01/2025 30,000 29,581
2,334,412Health Care Providers & Services - 0.6%Aetna, Inc.
3.50%, 11/15/2024 20,000 20,013AHS Hospital Corp.
5.02%, 07/01/2045 400,000 468,249CHRISTUS Health
4.34%, 07/01/2028 300,000 320,645Hackensack Meridian Health, Inc.
4.50%, 07/01/2057 200,000 218,047HCA, Inc.
5.88%, 03/15/2022 200,000 214,558Humana, Inc.
4.80%, 03/15/2047 200,000 210,679Northwell Healthcare, Inc.
3.98%, 11/01/2046 400,000 386,6251,838,816
Hotels, Restaurants & Leisure - 0.1%McDonald�s Corp.
3.80%, 04/01/2028, MTN (F) 400,000 412,825Industrial Conglomerates - 0.3%General Electric Co.
Fixed until 01/21/2021 (E),5.00% (A) 800,000 747,200
5.55%, 01/05/2026, MTN 100,000 105,867853,067
Insurance - 2.4%Berkshire Hathaway Finance Corp.
4.20%, 08/15/2048 200,000 207,215Chubb INA Holdings, Inc.
3.35%, 05/03/2026 40,000 40,705First American Financial Corp.
4.60%, 11/15/2024 20,000 20,739Great-West Lifeco Finance, LP
4.05%, 05/17/2028 (B) 200,000 210,249Jackson National Life Global Funding
2.60%, 12/09/2020 (B) 820,000 817,459Marsh & McLennan Cos., Inc.
3.75%, 03/14/2026 20,000 20,598
Copyright © 2021 www.secdatabase.com. All Rights Reserved.Please Consider the Environment Before Printing This Document

The notes are an integral part of this report.Transamerica Series Trust Page 4
10,159,081
Copyright © 2021 www.secdatabase.com. All Rights Reserved.Please Consider the Environment Before Printing This Document

Transamerica PIMCO Tactical �� Conservative VPSCHEDULE OF INVESTMENTS (continued)At March 31, 2019(unaudited)
Principal ValueCORPORATE DEBT SECURITIES (continued)Insurance (continued)Meiji Yasuda Life Insurance Co.
Fixed until 04/26/2028,5.10% (A), 04/26/2048 (B)
$600,000
$625,279
MetLife, Inc.4.05%, 03/01/2045 20,000 19,979
Metropolitan Life Global Funding I2.00%, 04/14/2020 (B) 150,000 148,8572.30%, 04/10/2019 (B) 100,000 99,9922.50%, 12/03/2020 (B) 950,000 946,333
Pacific Life Insurance Co.Fixed until 10/24/2047,
4.30% (A), 10/24/2067 (B) 1,000,000 892,203Pricoa Global Funding I
2.55%, 11/24/2020 (B) 830,000 826,457Principal Life Global Funding II
2.20%, 04/08/2020 (B) 600,000 596,4043.00%, 04/18/2026 (B) 300,000 296,157
RenaissanceRe Holdings, Ltd.3.60%, 04/15/2029 300,000 294,898
Teachers Insurance & Annuity Association ofAmerica4.27%, 05/15/2047 (B) 800,000 820,875
Travelers Cos., Inc.3.75%, 05/15/2046 100,000 97,887
XLIT, Ltd.4.45%, 03/31/2025 20,000 20,822
7,003,108IT Services - 0.2%Fidelity National Information Services, Inc.
4.50%, 10/15/2022 424,000 442,426Life Sciences Tools & Services - 0.0% (C)Thermo Fisher Scientific, Inc.
3.30%, 02/15/2022 40,000 40,515Machinery - 0.2%Wabtec Corp.
4.40%, 03/15/2024 600,000 609,973Marine - 0.1%AP Moller - Maersk A/S
3.88%, 09/28/2025 (B) 300,000 293,176Media - 0.7%Charter Communications Operating LLC / Charter
Communications Operating Capital4.20%, 03/15/2028 500,000 496,133
Comcast Corp.3-Month LIBOR + 0.63%,
3.42% (A), 04/15/2024 700,000 700,6474.40%, 08/15/2035 20,000 20,8834.75%, 03/01/2044 500,000 541,993
Discovery Communications LLC5.00%, 09/20/2037 300,000 291,678
Sky, Ltd.3.13%, 11/26/2022 (B) 80,000 80,836
2,132,170Metals & Mining - 0.2%Indonesia Asahan Aluminium Persero PT
5.23%, 11/15/2021 (B) 500,000 519,959
Principal ValueCORPORATE DEBT SECURITIES (continued)Multi-Utilities - 0.6%CenterPoint Energy, Inc.
Fixed until 09/01/2023 (E),6.13% (A)
$500,000
$508,125
DTE Electric Co.3.70%, 06/01/2046 (F) 1,000,000 969,795
E.ON International Finance BV6.65%, 04/30/2038 (B) 300,000 374,289
1,852,209Oil, Gas & Consumable Fuels - 2.5%Antero Midstream Partners, LP / Antero Midstream
Finance Corp.5.75%, 03/01/2027 (B) 400,000 406,000
APT Pipelines, Ltd.4.25%, 07/15/2027 (B) 300,000 304,004
BP Capital Markets America, Inc.3.79%, 02/06/2024 200,000 207,555
Concho Resources, Inc.3.75%, 10/01/2027 300,000 297,551
Dolphin Energy, Ltd. LLC5.50%, 12/15/2021 (D) 400,000 421,000
Energy Transfer Operating, LP4.05%, 03/15/2025 200,000 202,7944.75%, 01/15/2026 40,000 41,8107.50%, 07/01/2038 100,000 121,395
Eni SpA4.75%, 09/12/2028 (B) 200,000 207,677
Enterprise Products Operating LLC3.70%, 02/15/2026 870,000 892,240
ONEOK, Inc.4.35%, 03/15/2029 700,000 712,309
Petrobras Global Finance BV5.75%, 02/01/2029 400,000 396,200
Sabine Pass Liquefaction LLC5.75%, 05/15/2024 1,000,000 1,102,030
Shell International Finance BV4.00%, 05/10/2046 400,000 415,890
Sinopec Group Overseas Development, Ltd.4.13%, 09/12/2025 (B) 500,000 520,800
Valero Energy Corp.4.00%, 04/01/2029 500,000 504,562
Woodside Finance, Ltd.3.65%, 03/05/2025 (B) 20,000 19,8723.70%, 03/15/2028 (B) 500,000 482,094
7,255,783Pharmaceuticals - 0.7%Baxalta, Inc.
3.60%, 06/23/2022 6,000 6,031Bayer US Finance II LLC
4.63%, 06/25/2038 (B) 1,000,000 933,937Eli Lilly & Co.
3.88%, 03/15/2039 100,000 102,386Mylan, Inc.
4.55%, 04/15/2028 200,000 194,440Shire Acquisitions Investments Ireland DAC
2.88%, 09/23/2023 200,000 197,3773.20%, 09/23/2026 300,000 290,102
Zoetis, Inc.3.90%, 08/20/2028 400,000 408,134
2,132,407
Copyright © 2021 www.secdatabase.com. All Rights Reserved.Please Consider the Environment Before Printing This Document

The notes are an integral part of this report.Transamerica Series Trust Page 5
Copyright © 2021 www.secdatabase.com. All Rights Reserved.Please Consider the Environment Before Printing This Document

Transamerica PIMCO Tactical �� Conservative VPSCHEDULE OF INVESTMENTS (continued)At March 31, 2019(unaudited)
Principal ValueCORPORATE DEBT SECURITIES (continued)Professional Services - 0.1%IHS Markit, Ltd.
4.75%, 08/01/2028 $300,000
$313,893
Road & Rail - 0.7%Burlington Northern Santa Fe LLC
4.13%, 06/15/2047 800,000 830,522JB Hunt Transport Services, Inc.
3.88%, 03/01/2026 300,000 304,600Kansas City Southern
4.95%, 08/15/2045 500,000 537,515Union Pacific Corp.
4.10%, 09/15/2067 200,000 182,6281,855,265
Semiconductors & Semiconductor Equipment - 0.3%Broadcom, Inc.
3.13%, 04/15/2021 (B) 600,000 599,292KLA-Tencor Corp.
4.10%, 03/15/2029 300,000 305,324904,616
Software - 0.3%Microsoft Corp.
4.10%, 02/06/2037 500,000 543,821Oracle Corp.
2.95%, 05/15/2025 290,000 289,624833,445
Specialty Retail - 0.1%QVC, Inc.
4.45%, 02/15/2025 100,000 99,8304.85%, 04/01/2024 100,000 102,246
202,076Technology Hardware, Storage & Peripherals - 0.7%Apple, Inc.
2.90%, 09/12/2027 300,000 295,7453-Month LIBOR + 0.30%,
3.03% (A), 05/06/2019 100,000 100,0433.35%, 02/09/2027 300,000 306,1663.75%, 09/12/2047 200,000 198,9984.65%, 02/23/2046 200,000 225,963
Dell International LLC / EMC Corp.5.30%, 10/01/2029 (B) 200,000 201,7568.10%, 07/15/2036 (B) 600,000 704,909
2,033,580Tobacco - 0.1%BAT Capital Corp.
4.39%, 08/15/2037 400,000 357,896BAT International Finance PLC
3.50%, 06/15/2022 (B) 20,000 20,083Reynolds American, Inc.
4.00%, 06/12/2022 20,000 20,427398,406
Trading Companies & Distributors - 0.2%Air Lease Corp.
4.25%, 02/01/2024, MTN 300,000 306,657GATX Corp.
3.25%, 09/15/2026 250,000 237,767544,424
Principal ValueCORPORATE DEBT SECURITIES (continued)Transportation Infrastructure - 0.2%Penske Truck Leasing Co., LP / PTL Finance
Corp.3.95%, 03/10/2025 (B) $ 400,000 $ 401,880
Sydney Airport Finance Co. Pty, Ltd.3.38%, 04/30/2025 (B) 20,000 19,6663.90%, 03/22/2023 (B) 200,000 202,320
623,866Water Utilities - 0.0% (C)American Water Capital Corp.
3.40%, 03/01/2025 20,000 20,397Wireless Telecommunication Services - 0.3%Sprint Spectrum Co. LLC / Sprint Spectrum
Co. II LLC4.74%, 09/20/2029 (B) 400,000 404,5005.15%, 09/20/2029 (B) 400,000 407,000
811,500Total Corporate Debt Securities
(Cost $109,016,855) 109,764,132
FOREIGN GOVERNMENT OBLIGATIONS - 3.7%Canada - 0.7%Province of Ontario
1.65%, 09/27/2019 1,200,000 1,194,709Province of Quebec
2.50%, 04/20/2026 900,000 890,1732,084,882
Indonesia - 0.3%Indonesia Government International Bond
4.45%, 02/11/2024 800,000 833,663Japan - 1.1%Japan Finance Organization for
Municipalities2.13%, 04/13/2021 - 10/25/2023 (B) 1,800,000 1,758,754
Tokyo Metropolitan Government2.00%, 05/17/2021 (B) 1,500,000 1,477,437
3,236,191Kuwait - 0.2%Kuwait International Government Bond
3.50%, 03/20/2027 (B) 500,000 510,625Peru - 0.1%Peru Government International Bond
5.94%, 02/12/2029 (B) PEN 1,200,000 380,510Qatar - 1.0%Qatar Government International Bond
2.38%, 06/02/2021 (D) $ 2,800,000 2,762,3684.50%, 01/20/2022 (D) 200,000 207,700
2,970,068Republic of Korea - 0.1%Export-Import Bank of Korea
3-Month LIBOR + 0.70%, 3.35% (A), 05/26/2019 200,000 200,124
Copyright © 2021 www.secdatabase.com. All Rights Reserved.Please Consider the Environment Before Printing This Document

The notes are an integral part of this report.Transamerica Series Trust Page 6
Copyright © 2021 www.secdatabase.com. All Rights Reserved.Please Consider the Environment Before Printing This Document

Transamerica PIMCO Tactical �� Conservative VPSCHEDULE OF INVESTMENTS (continued)At March 31, 2019(unaudited)
Principal ValueFOREIGN GOVERNMENT OBLIGATIONS (continued)United Arab Emirates - 0.2%Abu Dhabi Government International Bond
3.13%, 10/11/2027 (B) $ 500,000 $ 496,250Total Foreign Government Obligations
(Cost $10,713,628) 10,712,313
LOAN ASSIGNMENT - 0.3%Capital Markets - 0.3%Zephyrus Capital Aviation Partners LLC
Term Loan,TBD, 10/15/2038 (I) (J) (K) 855,000 842,333
Total Loan Assignment(Cost $842,438) 842,333
MORTGAGE-BACKED SECURITIES - 3.6%Aggregator of Loans Backed by Assets PLC
Series 2015-1, Class A,1-Month GBP LIBOR + 1.25%,
1.98% (A), 04/24/2049 (D) GBP 219,072 286,129Banc of America Mortgage Trust
Series 2004-D, Class 2A2,4.18% (A), 05/25/2034 $ 12,515 12,683
Bear Stearns Alt-A TrustSeries 2005-5, Class 1A1,1-Month LIBOR + 0.44%, 2.93% (A), 07/25/
2035 10,860 10,859BX Trust
Series 2017-APPL, Class A,1-Month LIBOR + 0.88%, 3.36% (A), 07/15/
2034 (B) 1,528,272 1,524,904CHL Mortgage Pass-Through Trust
Series 2004-J3, Class A7,5.50%, 05/25/2034 164,617 169,072
COMM Mortgage TrustSeries 2018-HOME, Class A,3.82% (A), 04/10/2033 (B) 400,000 415,545
DBUBS Mortgage TrustSeries 2017-BRBK, Class A,3.45%, 10/10/2034 (B) 1,000,000 1,020,841
Eurosail PLCSeries 2006-4X, Class A3C,3-Month GBP LIBOR + 0.16%,
1.00% (A), 12/10/2044 (D) GBP 121,958 157,083Federal Home Loan Mortgage Corp.
Series W5FX, Class AFX,2.97% (A), 04/25/2028 $ 1,000,000 1,011,779
Independence Plaza TrustSeries 2018-INDP, Class A,3.76%, 07/10/2035 (B) 600,000 618,748
La Hipotecaria El Salvadorian Mortgage TrustSeries 2016-1A, Class A,3.36%, 01/15/2046 (B) (J) 569,139 574,595
Merrill Lynch Mortgage Investors TrustSeries 2003-B, Class A1,1-Month LIBOR + 0.68%, 3.17% (A), 04/25/
2028 230,307 222,275Morgan Stanley Bank of America Merrill
Lynch TrustSeries 2015-C25, Class A4,3.37%, 10/15/2048 900,000 915,905
Principal ValueMORTGAGE-BACKED SECURITIES (continued)Morgan Stanley Bank of America Merrill Lynch
Trust, Interest Only STRIPSSeries 2013-C8, Class XA,0.99% (A), 12/15/2048 $ 1,656,222 $ 49,462
MortgageIT TrustSeries 2005-2, Class 1A1,1-Month LIBOR + 0.52%, 3.01% (A), 05/25/
2035 54,115 54,174Southern Pacific Financing PLC
Series 2005-B, Class A,3-Month GBP LIBOR + 0.18%,
1.02% (A), 06/10/2043 (D) GBP 112,960 145,962Towd Point Mortgage Funding PLC
Series 2019-GR4A, Class A1,3-Month GBP LIBOR + 1.03%,
0.00% (A), 10/20/2051 (B) (L) 1,200,000 1,562,940Uropa Securities PLC
Series 2008-1, Class A,3-Month GBP LIBOR + 0.20%,
1.04% (A), 06/10/2059 (D) 407,678 507,906Series 2008-1, Class B,3-Month GBP LIBOR + 0.75%,
1.59% (A), 06/10/2059 (D) 78,836 94,943Series 2008-1, Class M1,3-Month GBP LIBOR + 0.35%,
1.19% (A), 06/10/2059 (D) 94,309 115,283Series 2008-1, Class M2,3-Month GBP LIBOR + 0.55%,
1.39% (A), 06/10/2059 (D) 73,679 89,877Worldwide Plaza Trust
Series 2017-WWP, Class A,3.53%, 11/10/2036 (B) $ 900,000 913,316
Total Mortgage-Backed Securities(Cost $10,500,353) 10,474,281
MUNICIPAL GOVERNMENT OBLIGATIONS - 0.8%California - 0.3%Bay Area Toll Authority, Revenue Bonds,
Series S1,6.92%, 04/01/2040 200,000 278,096
Los Angeles Community College District,General Obligation Unlimited,6.60%, 08/01/2042 200,000 288,168
State of California, General ObligationUnlimited,7.35%, 11/01/2039 300,000 436,662
1,002,926Florida - 0.1%County of Miami-Dade Aviation Revenue,
Revenue Bonds,Series C,3.86%, 10/01/2029 200,000 207,992
Maryland - 0.1%County of Baltimore, General Obligation
Unlimited,3.30%, 07/01/2046 200,000 189,408
Michigan - 0.1%Michigan Tobacco Settlement Finance Authority,
Revenue Bonds,Series A,7.31%, 06/01/2034 235,000 233,371
Copyright © 2021 www.secdatabase.com. All Rights Reserved.Please Consider the Environment Before Printing This Document

The notes are an integral part of this report.Transamerica Series Trust Page 7
Copyright © 2021 www.secdatabase.com. All Rights Reserved.Please Consider the Environment Before Printing This Document

Transamerica PIMCO Tactical �� Conservative VPSCHEDULE OF INVESTMENTS (continued)At March 31, 2019(unaudited)
Principal ValueMUNICIPAL GOVERNMENT OBLIGATIONS (continued)New York - 0.1%Port Authority of New York & New Jersey,
Revenue Bonds,4.46%, 10/01/2062 $ 500,000 $ 560,165
Utah - 0.0% (C)Utah State Board of Regents, Revenue Bonds,
Series 1,1-Month LIBOR + 0.75%, 3.24% (A), 12/26/
2031 31,072 31,092West Virginia - 0.1%Tobacco Settlement Finance Authority, Revenue
Bonds,Series A,7.47%, 06/01/2047 190,000 189,573
Total Municipal Government Obligations(Cost $2,283,281) 2,414,527
U.S. GOVERNMENT AGENCY OBLIGATIONS - 16.4%Federal Home Loan Mortgage Corp.
2.38%, 01/13/2022 7,500,000 7,520,8574.50%, 08/01/2048 1,267,376 1,334,783
Federal Home Loan Mortgage Corp. MultifamilyStructured Pass-Through Certificates1-Month LIBOR + 0.67%, 3.16% (A), 02/25/
2023 205,976 206,170Federal Home Loan Mortgage Corp. REMIC
1-Month LIBOR + 0.35%, 2.86% (A), 01/15/2038 752,080 748,151
1-Month LIBOR + 0.40%, 2.88% (A), 02/15/2041 - 09/15/2045 335,222 335,545
Federal Home Loan Mortgage Corp. REMIC,Interest Only STRIPS1.59% (A), 01/15/2038 752,080 42,723
Federal Home Loan Mortgage Corp., InterestOnly STRIPS(1.00) * 1-Month LIBOR + 5.89%,
3.41% (A), 09/15/2043 977,356 166,359Federal National Mortgage Association
3.50%, 06/01/2045 280,622 285,4653.50%, TBA (L) 23,900,000 24,201,5363.70%, 09/01/2034 462,806 485,8634.00%, 09/01/2048 - 10/01/2048 483,417 497,9414.50%, TBA (L) 6,600,000 6,871,1415.50%, TBA (L) 500,000 533,830
Federal National Mortgage Association REMIC1-Month LIBOR + 0.55%, 3.04% (A), 02/25/
2041 302,367 304,0791-Month LIBOR + 0.57%, 3.06% (A), 06/25/
2041 280,415 282,4691-Month LIBOR + 0.75%, 3.24% (A), 05/25/
2040 258,706 261,3641-Month LIBOR + 0.85%, 3.34% (A), 11/25/
2039 780,239 796,381
Principal ValueU.S. GOVERNMENT AGENCY OBLIGATIONS (continued)Federal National Mortgage Association REMIC,
Interest Only STRIPS3.00%, 03/25/2028 $ 512,574 $ 41,775
Government National Mortgage Association1-Month LIBOR + 0.80%, 3.31% (A), 05/20/
2066 - 06/20/2066 2,195,375 2,210,805Total U.S. Government Agency Obligations
(Cost $47,093,220) 47,127,237
U.S. GOVERNMENT OBLIGATIONS - 48.7%U.S. Treasury - 45.9%U.S. Treasury Bond
2.75%, 08/15/2047 1,500,000 1,478,6132.88%, 11/15/2046 (M) 1,700,000 1,721,1173.00%, 05/15/2042 1,700,000 1,768,7973.00%, 02/15/2048 - 08/15/2048 (M) 3,000,000 3,104,4883.13%, 08/15/2044 - 05/15/2048 (M) 7,910,000 8,385,1933.38%, 05/15/2044 2,660,000 2,940,2353.38%, 11/15/2048 (M) 1,049,000 1,167,4634.25%, 05/15/2039 (M) 3,400,000 4,250,7974.25%, 11/15/2040 5,120,000 6,412,6004.38%, 05/15/2040 - 05/15/2041 (M) 2,360,000 3,009,6334.50%, 08/15/2039 (M) 16,630,000 21,471,5396.25%, 05/15/2030 270,000 369,626
U.S. Treasury Bond, Principal Only STRIPS08/15/2044 300,000 146,015
U.S. Treasury Note1.25%, 04/30/2019 (M) (N) 704,000 703,2611.88%, 03/31/2022 - 07/31/2022 (M) 18,600,000 18,408,6212.00%, 12/31/2021 (M) (N) 2,200,000 2,186,4222.00%, 11/15/2026 (M) 1,875,000 1,829,3702.13%, 12/31/2022 (M) 100,000 99,5902.13%, 05/15/2025 820,000 811,4482.25%, 02/15/2027 - 08/15/2027 (M) 42,050,000 41,702,4122.63%, 02/15/2029 (M) 4,790,000 4,877,9412.75%, 04/30/2023 - 05/31/2023 (M) 2,500,000 2,550,0662.88%, 05/15/2028 (M) 1,540,000 1,599,6153.00%, 09/30/2025 - 10/31/2025 770,000 801,8643.13%, 11/15/2028 90,000 95,467
131,892,193U.S. Treasury Inflation-Protected Securities - 2.8%U.S. Treasury Inflation-Indexed Bond
1.00%, 02/15/2046 - 02/15/2048 (M) 1,882,735 1,918,987U.S. Treasury Inflation-Indexed Note
0.13%, 04/15/2022 413,932 409,6510.50%, 01/15/2028 (M) 3,968,850 3,958,4400.75%, 07/15/2028 (M) 1,503,885 1,536,913
7,823,991Total U.S. Government Obligations
(Cost $135,089,749) 139,716,184
COMMERCIAL PAPER - 0.5%Multi-Utilities - 0.1%NiSource, Inc.
3.03% (O), 05/24/2019 300,000 298,639Oil, Gas & Consumable Fuels - 0.4%Energy Transfer Partners, LP
3.25% (O), 04/22/2019 1,100,000 1,097,751Total Commercial Paper
(Cost $1,396,390) 1,396,390
Copyright © 2021 www.secdatabase.com. All Rights Reserved.Please Consider the Environment Before Printing This Document

The notes are an integral part of this report.Transamerica Series Trust Page 8
Copyright © 2021 www.secdatabase.com. All Rights Reserved.Please Consider the Environment Before Printing This Document

Transamerica PIMCO Tactical �� Conservative VPSCHEDULE OF INVESTMENTS (continued)At March 31, 2019(unaudited)
The notes are an integral part of this report.Transamerica Series Trust Page 9
Principal ValueSHORT-TERM U.S. GOVERNMENT OBLIGATIONS - 0.1%U.S. Treasury Bill
2.38% (O), 04/18/2019 (P) $ 217,000 $ 216,7332.46% (O), 06/20/2019 (P) 107,000 106,412
Total Short-Term U.S. Government Obligations(Cost $323,145) 323,145
Shares ValueOTHER INVESTMENT COMPANY - 0.7%Securities Lending Collateral - 0.7%State Street Navigator Securities Lending
Trust - Government Money MarketPortfolio, 2.41% (O) 2,019,600 2,019,600
Total Other Investment Company(Cost $2,019,600) 2,019,600
Principal ValueREPURCHASE AGREEMENTS - 30.4%BNP Paribas, 3.25% (O), dated 03/29/2019,
to be repurchased at $49,613,433 on 04/01/2019. Collateralized by U.S.Government Obligations, 0.63% - 1.88%,due 02/28/2022 - 04/15/2023, and with atotal value of $50,596,636. $ 49,600,000 49,600,000
Fixed Income Clearing Corp., 1.45% (O),dated 03/29/2019, to be repurchased at$3,624,998 on 04/01/2019. Collateralizedby a U.S. Government Obligation, 2.75%,due 09/15/2021, and with a value of$3,700,414. 3,624,560 3,624,560
RBC Capital Markets LLC, 2.95% (O), dated03/29/2019, to be repurchased at$24,806,097 on 04/01/2019.Collateralized by U.S. GovernmentObligations, 2.00% - 2.13%, due 02/15/2025 - 05/15/2025, and with a total valueof $25,341,625. 24,800,000 24,800,000
Toronto-Dominion Securities, Inc., 3.25%(O), dated 03/29/2019, to be repurchasedat $9,302,519 on 04/01/2019.Collateralized by a U.S. GovernmentObligation, 2.00% due 01/15/2026, andwith a value of $9,501,740. 9,300,000 9,300,000
Total Repurchase Agreements(Cost $87,324,560) 87,324,560
Total Investments Excluding PurchasedOptions/Swaptions(Cost $416,853,005) 422,429,148
Total Purchased Options/Swaptions - 0.7%(Cost $3,344,596) 1,876,577
Total Investments(Cost $420,197,601) 424,305,725
Net Other Assets (Liabilities) - (47.7)% (137,103,928 )Net Assets - 100.0% $ 287,201,797
Principal ValueREVERSE REPURCHASE AGREEMENTS - (38.0)%Bank of Nova Scotia, 2.63% (O), dated 03/11/
2019, to be repurchased at $(1,133,593) on04/04/2019. Collateralized byU.S. Government Obligations, 3.00% -3.38%, due 05/15/2047 - 11/15/2048 andwith a total value of $(1,190,466). $ (1,131,609) $ (1,131,609)
Bank of Nova Scotia, 2.64% (O), dated 01/09/2019, to be repurchased at $(37,948,254) on04/09/2019. Collateralized by U.S.Government Obligations, 1.88% - 3.00%,due 03/31/2022 - 05/15/2047, and with atotal value of $(38,545,457). (37,699,438 ) (37,699,438 )
Deutsche Bank Securities, Inc., 2.46% (O),dated 03/26/2019, to be repurchased at$(4,902,461) on 04/09/2019. Collateralizedby a U.S. Government Obligation, 2.63%,due 02/15/2029, and with a value of$(4,894,227). (4,897,775 ) (4,897,775 )
Deutsche Bank Securities, Inc., 2.65% (O),dated 02/21/2019, to be repurchased at$(4,981,656) on 04/22/2019. Collateralizedby a U.S. Government Obligation, 2.25%,due 08/15/2027, and with a value of$(5,066,552). (4,959,750 ) (4,959,750 )
Deutsche Bank Securities, Inc., 2.65% (O),dated 03/21/2019, to be repurchased at$(2,363,554) on 04/22/2019. Collateralizedby U.S. Government Obligations, 3.00% -3.13%, due 08/15/2044 - 02/15/2048, andwith a total value of $(2,442,331). (2,358,000 ) (2,358,000 )
JPMorgan Securities LLC, 2.50% (O), dated01/22/2019, to be repurchased at $(768,033)on 04/22/2019. Collateralized by a U.S.Government Obligation, 3.00%, due 08/15/2048, and with a value of $(800,107). (763,263 ) (763,263 )
RBS Securities, Inc., 2.75% (O), dated 03/15/2019, to be repurchased at $(7,884,226) on04/15/2019. Collateralized by U.S.Government Obligations, 3.13% - 4.25%,due 11/15/2040 - 08/15/2044, and Cash witha total value of $(8,390,104). (7,865,600 ) (7,865,600 )
Royal Bank of Canada, 2.64% (O), dated 03/05/2019, to be repurchased at $(29,861,390)on 06/05/2019. Collateralized by U.S.Government Obligations, 1.88% - 4.50%,due 04/30/2022 - 08/15/2044, and with atotal value of $(32,335,250). (29,661,275 ) (29,661,275 )
Wood Gundy, Inc., 2.65% (O), dated 03/08/2019, to be repurchased at $(2,329,760) on04/18/2019. Collateralized by a U.S.Government Obligation, 2.25%, due 02/15/2027, and Cash with a total value of$(2,298,870). (2,322,750 ) (2,322,750 )
Copyright © 2021 www.secdatabase.com. All Rights Reserved.Please Consider the Environment Before Printing This Document

Transamerica PIMCO Tactical �� Conservative VPSCHEDULE OF INVESTMENTS (continued)At March 31, 2019(unaudited)
EXCHANGE-TRADED OPTIONS PURCHASED:
DescriptionExercise
PriceExpiration
DateNotionalAmount
Number ofContracts
PremiumsPaid Value
Put - S&P 500® Index USD 2,100.00 12/20/2019 USD 90,984,240 321 $ 2,555,492 $ 520,020
OVER-THE-COUNTER INTEREST RATE SWAPTIONS PURCHASED:
Description Counterparty Floating Rate IndexPay/Receive
Floating RateExercise
RateExpiration
DateNotional Amount/
Number of ContractsPremiums
Paid ValueCall - 1-Year DUB 3-Month USD-LIBOR Receive 3.02 % 07/09/2020 USD 42,900,000 $158,730 $361,650Call - 1-Year MSC 3-Month USD-LIBOR Receive 3.04 06/22/2020 USD 90,100,000 326,162 768,213Call - 1-Year GSB 3-Month USD-LIBOR Receive 3.04 06/22/2020 USD 26,300,000 95,537 224,240Put - 10-Year MLI 3-Month USD-LIBOR Pay 3.40 05/16/2019 USD 8,900,000 113,475 23Put - 30-Year MLI 3-Month USD-LIBOR Pay 3.60 10/01/2019 USD 5,100,000 95,200 2,431Total $ 789,104 $ 1,356,557
OVER-THE-COUNTER INTEREST RATE SWAPTIONS WRITTEN:
Description Counterparty Floating Rate IndexPay/Receive
Floating RateExercise
RateExpiration
DateNotional Amount/
Number of ContractsPremiums(Received) Value
Call - 1-Year DUB 3-Month USD-LIBOR Receive 2.96 % 07/09/2021 USD 42,900,000 $(205,383 ) $(365,672 )Call - 1-Year GSB 3-Month USD-LIBOR Receive 3.02 06/21/2021 USD 26,300,000 (127,713 ) (235,362 )Call - 1-Year MSC 3-Month USD-LIBOR Receive 3.02 06/21/2021 USD 90,100,000 (423,470 ) (809,122 )Put - 5-Year MLI 3-Month USD-LIBOR Pay 3.60 10/01/2019 USD 21,200,000 (94,797 ) (863 )Total $ (851,363) $ (1,411,019)
Premiums(Received) Value
TOTAL WRITTEN OPTIONS AND SWAPTIONS $ (851,363) $ (1,411,019)
Principal ValueREVERSE REPURCHASE AGREEMENTS (continued)Wood Gundy, Inc., 2.65% (O), dated 03/19/
2019, to be repurchased at $(1,645,626)on 04/18/2019. Collateralized by a U.S.Government Obligation, 3.13%, due 08/15/2044, and Cash with a total value of$(1,734,223). $ (1,642,000) $ (1,642,000)
Wood Gundy, Inc., 2.70% (O), dated 03/07/2019, to be repurchased at $(13,863,280)on 04/08/2019. Collateralized by U.S.Government Obligations, 2.25% - 4.25%,due 08/15/2027�05/15/2048, and Cashwith a total value of $(14,699,099). (13,830,088 ) (13,830,088 )
Wood Gundy, Inc., 2.70% (O), dated 03/26/2019, to be repurchased at $(1,884,618)on 04/10/2019. Collateralized by a U.S.Government Obligation, 2.25%, due 02/15/2027, and Cash with a total value of$(1,863,146). (1,882,500 ) (1,882,500 )
Total Reverse Repurchase Agreements (109,014,048 )
Copyright © 2021 www.secdatabase.com. All Rights Reserved.Please Consider the Environment Before Printing This Document

The notes are an integral part of this report.Transamerica Series Trust Page 10
Copyright © 2021 www.secdatabase.com. All Rights Reserved.Please Consider the Environment Before Printing This Document

Transamerica PIMCO Tactical �� Conservative VPSCHEDULE OF INVESTMENTS (continued)At March 31, 2019(unaudited)
CENTRALLY CLEARED SWAP AGREEMENTS:
Credit Default Swap Agreements on Credit Indices �� Sell Protection (Q)
Reference ObligationFixed RateReceivable
PaymentFrequency
MaturityDate
NotionalAmount (R) Value (S)
PremiumsPaid
(Received)
Net UnrealizedAppreciation
(Depreciation)North America Investment Grade Index - Series 31 1.00% Quarterly 12/20/2023 USD 13,500,000 $ (300,841) $ (135,247) $ (165,594 )
Interest Rate Swap Agreements
Floating Rate Index
Pay/Receive
Fixed Rate Fixed RatePayment
FrequencyMaturity
DateNotionalAmount Value
PremiumsPaid
(Received)
Net UnrealizedAppreciation
(Depreciation)3-Month USD-LIBOR Pay 1.50 % Semi-Annually/Quarterly 06/21/2027 USD9,300,000 $580,696 $619,074 $(38,378 )3-Month USD-LIBOR Pay 1.75 Semi-Annually/Quarterly 12/21/2026 USD100,000 3,929 4,415 (486 )3-Month USD-LIBOR Receive 2.25 Semi-Annually/Quarterly 12/16/2022 USD500,000 1,882 370 1,5123-Month USD-LIBOR Pay 2.25 Semi-Annually/Quarterly 06/20/2028 USD46,000,000 293,397 2,609,635 (2,316,238 )3-Month USD-LIBOR Pay 2.50 Semi-Annually/Quarterly 12/20/2027 USD1,500,000 (22,056 ) 22,623 (44,679 )3-Month USD-LIBOR Pay 3.00 Semi-Annually/Quarterly 02/04/2023 USD19,800,000 (304,747 ) � (304,747 )3-Month USD-LIBOR Receive 3.22 Semi-Annually/Quarterly 11/15/2028 USD1,000,000 77,988 � 77,9886-Month EUR-EURIBOR Receive 2.04 Semi-Annually/Annually 02/03/2037 EUR3,200,000 184,367 30,652 153,7156-Month GBP-LIBOR Pay 1.50 Semi-Annually 09/18/2029 GBP5,400,000 (176,702 ) (38,064 ) (138,638 )6-Month GBP-LIBOR Pay 2.04 Semi-Annually 02/01/2037 GBP2,900,000 (175,871 ) (136,245 ) (39,626 )6-Month JPY-LIBOR Pay 0.75 Semi-Annually 03/20/2038 JPY 290,000,000 (189,930 ) 38,293 (228,223 )Total $ 272,953 $ 3,150,753 $ (2,877,800)
OVER-THE-COUNTER SWAP AGREEMENTS:
Credit Default Swap Agreements on Credit Indices �� Sell Protection (Q)
Reference Obligation CounterpartyFixed RateReceivable
PaymentFrequency
MaturityDate
NotionalAmount (R) Value (S)
PremiumsPaid
(Received)
Net UnrealizedAppreciation
(Depreciation)North America CMBS Basket Index -
Series AAA8 GSI 0.50 % Monthly 10/17/2057 USD 1,700,000 $16,998 $(72,822 ) $ 89,820North America CMBS Basket Index -
Series AAA9 GSI 0.50 Monthly 09/17/2058 USD 900,000 7,881 (53,236 ) 61,117Total $ 24,879 $ (126,058) $ 150,937
The notes are an integral part of this report.Transamerica Series Trust Page 11
Copyright © 2021 www.secdatabase.com. All Rights Reserved.Please Consider the Environment Before Printing This Document

Transamerica PIMCO Tactical �� Conservative VPSCHEDULE OF INVESTMENTS (continued)At March 31, 2019(unaudited)
OVER-THE-COUNTER SWAP AGREEMENTS (continued):
Total Return Swap Agreements (S)
Reference Entity CounterpartyPay/
ReceivePayment
FrequencyMaturity
DateNotionalAmount
Number ofShares or Units Value
PremiumsPaid
(Received)
Net UnrealizedAppreciation
(Depreciation)iShares MSCI EAFE ETF CITI Receive Quarterly 05/23/2019 USD 13,234,980 2,302 $51,061 $(7,704 ) $ 58,765iShares MSCI EAFE ETF GSI Receive Quarterly 08/14/2019 USD 1,002,966 179 28,130 � 28,130Total $ 79,191 $ (7,704) $ 86,895
ValueOTC Swap Agreements, at value (Assets) $ 104,070
FUTURES CONTRACTS:
DescriptionLong/Short
Number ofContracts
ExpirationDate
NotionalAmount Value
UnrealizedAppreciation
UnrealizedDepreciation
90-Day Eurodollar Long 132 06/17/2019 $32,016,556 $32,160,150 $143,594 $�90-Day Eurodollar Long 390 12/16/2019 94,441,235 95,130,750 689,515 �90-Day Eurodollar Short (132 ) 06/15/2020 (31,972,114) (32,265,750 ) � (293,636 )90-Day Eurodollar Short (390 ) 12/14/2020 (94,417,127 ) (95,408,625 ) � (991,498 )2-Year U.S. Treasury Note Long 157 06/28/2019 33,461,787 33,455,719 � (6,068 )5-Year U.S. Treasury Note Short (327 ) 06/28/2019 (37,815,698 ) (37,875,797 ) � (60,099 )10-Year U.S. Treasury Note Long 5 06/19/2019 611,804 621,094 9,290 �10-Year U.S. Treasury Note Short (70 ) 06/19/2019 (9,087,251 ) (9,294,687 ) � (207,436 )E-Mini Russell 2000® Index Long 186 06/21/2019 14,326,816 14,357,340 30,524 �Euro OAT Index Short (23 ) 06/06/2019 (4,098,672 ) (4,196,928 ) � (98,256 )German Euro Bund Index Short (5 ) 06/06/2019 (913,100 ) (932,960 ) � (19,860 )S&P 500® E-Mini Index Long 712 06/21/2019 98,899,451 101,025,680 2,126,229 �U.S. Treasury Bond Long 66 06/19/2019 10,631,893 11,088,000 456,107 �U.S. Treasury Bond Short (158 ) 06/19/2019 (23,042,404 ) (23,645,688 ) � (603,284 )Total $ 3,455,259 $ (2,280,137)
FORWARD FOREIGN CURRENCY CONTRACTS:
Counterparty Settlement DateCurrencyPurchased
CurrencySold
UnrealizedAppreciation
UnrealizedDepreciation
BNP 06/19/2019 INR 14,061,960 USD 194,818 $ 6,091 $�CITI 04/02/2019 USD 37,299 EUR 33,000 275 �CITI 04/02/2019 USD 1,359,290 GBP 1,031,000 16,326 �CITI 04/24/2019 MXN 18,748,000 USD 969,290 � (7,134 )CITI 05/15/2019 RUB 56,072,759 USD 843,662 4,838 �CITI 06/11/2019 COP 581,278,500 USD 186,209 � (4,582 )HSBC 04/24/2019 USD 971,299 MXN 18,748,000 9,144 �JPM 04/02/2019 USD 195,255 GBP 148,000 2,473 �JPM 04/02/2019 EUR 287,000 USD 327,271 � (5,274 )JPM 05/15/2019 USD 167,672 JPY 18,400,000 1,031 �SCB 04/02/2019 GBP 1,063,000 USD 1,407,293 � (22,646 )SCB 05/03/2019 USD 1,409,425 GBP 1,063,000 22,612 �SCB 06/19/2019 IDR 2,942,280,000 USD 206,143 � (1,620 )Total $ 62,790 $ (41,256 )
The notes are an integral part of this report.Transamerica Series Trust Page 12
Copyright © 2021 www.secdatabase.com. All Rights Reserved.Please Consider the Environment Before Printing This Document
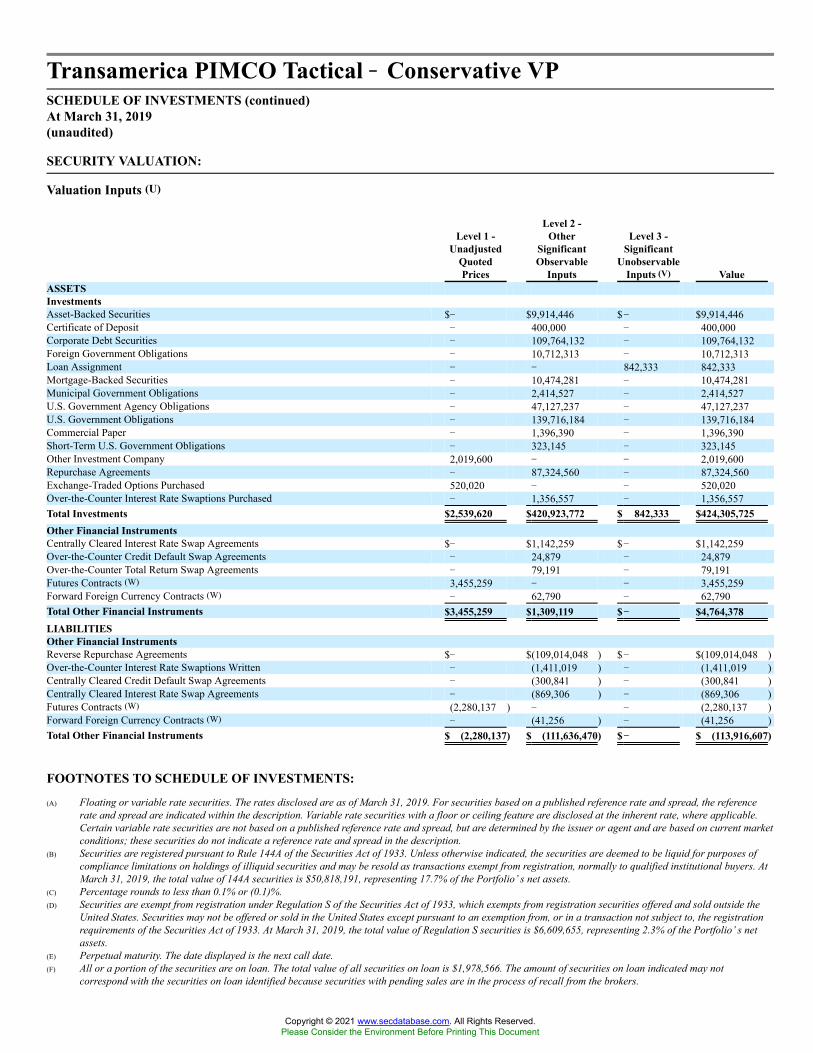
Transamerica PIMCO Tactical �� Conservative VPSCHEDULE OF INVESTMENTS (continued)At March 31, 2019(unaudited)
SECURITY VALUATION:
Valuation Inputs (U)
Level 1 -Unadjusted
QuotedPrices
Level 2 -Other
SignificantObservable
Inputs
Level 3 -Significant
UnobservableInputs (V) Value
ASSETSInvestmentsAsset-Backed Securities $� $9,914,446 $� $9,914,446Certificate of Deposit � 400,000 � 400,000Corporate Debt Securities � 109,764,132 � 109,764,132Foreign Government Obligations � 10,712,313 � 10,712,313Loan Assignment � � 842,333 842,333Mortgage-Backed Securities � 10,474,281 � 10,474,281Municipal Government Obligations � 2,414,527 � 2,414,527U.S. Government Agency Obligations � 47,127,237 � 47,127,237U.S. Government Obligations � 139,716,184 � 139,716,184Commercial Paper � 1,396,390 � 1,396,390Short-Term U.S. Government Obligations � 323,145 � 323,145Other Investment Company 2,019,600 � � 2,019,600Repurchase Agreements � 87,324,560 � 87,324,560Exchange-Traded Options Purchased 520,020 � � 520,020Over-the-Counter Interest Rate Swaptions Purchased � 1,356,557 � 1,356,557Total Investments $2,539,620 $420,923,772 $ 842,333 $424,305,725Other Financial InstrumentsCentrally Cleared Interest Rate Swap Agreements $� $1,142,259 $� $1,142,259Over-the-Counter Credit Default Swap Agreements � 24,879 � 24,879Over-the-Counter Total Return Swap Agreements � 79,191 � 79,191Futures Contracts (W) 3,455,259 � � 3,455,259Forward Foreign Currency Contracts (W) � 62,790 � 62,790Total Other Financial Instruments $3,455,259 $1,309,119 $�� $4,764,378LIABILITIESOther Financial InstrumentsReverse Repurchase Agreements $� $(109,014,048 ) $� $(109,014,048 )Over-the-Counter Interest Rate Swaptions Written � (1,411,019 ) � (1,411,019 )Centrally Cleared Credit Default Swap Agreements � (300,841 ) � (300,841 )Centrally Cleared Interest Rate Swap Agreements � (869,306 ) � (869,306 )Futures Contracts (W) (2,280,137 ) � � (2,280,137 )Forward Foreign Currency Contracts (W) � (41,256 ) � (41,256 )Total Other Financial Instruments $ (2,280,137) $ (111,636,470) $�� $ (113,916,607)
FOOTNOTES TO SCHEDULE OF INVESTMENTS:
(A) Floating or variable rate securities. The rates disclosed are as of March 31, 2019. For securities based on a published reference rate and spread, the referencerate and spread are indicated within the description. Variable rate securities with a floor or ceiling feature are disclosed at the inherent rate, where applicable.Certain variable rate securities are not based on a published reference rate and spread, but are determined by the issuer or agent and are based on current marketconditions; these securities do not indicate a reference rate and spread in the description.
(B) Securities are registered pursuant to Rule 144A of the Securities Act of 1933. Unless otherwise indicated, the securities are deemed to be liquid for purposes ofcompliance limitations on holdings of illiquid securities and may be resold as transactions exempt from registration, normally to qualified institutional buyers. AtMarch 31, 2019, the total value of 144A securities is $50,818,191, representing 17.7% of the Portfolio�s net assets.
(C) Percentage rounds to less than 0.1% or (0.1)%.(D) Securities are exempt from registration under Regulation S of the Securities Act of 1933, which exempts from registration securities offered and sold outside the
United States. Securities may not be offered or sold in the United States except pursuant to an exemption from, or in a transaction not subject to, the registrationrequirements of the Securities Act of 1933. At March 31, 2019, the total value of Regulation S securities is $6,609,655, representing 2.3% of the Portfolio�s netassets.
(E) Perpetual maturity. The date displayed is the next call date.(F) All or a portion of the securities are on loan. The total value of all securities on loan is $1,978,566. The amount of securities on loan indicated may not
correspond with the securities on loan identified because securities with pending sales are in the process of recall from the brokers.
Copyright © 2021 www.secdatabase.com. All Rights Reserved.Please Consider the Environment Before Printing This Document

(G) Step bond. Coupon rate changes in increments to maturity. The rate disclosed is as of March 31, 2019; the maturity date disclosed is the ultimate maturity date.(H) Securities in default; partial receipt of interest payments and/or dividends declared at last payment date. At March 31, 2019, the total value of such securities is
$295,300, representing 0.1% of the Portfolio�s net assets.(I) Security is Level 3 of the fair value hierarchy.(J) Fair valued as determined in good faith in accordance with procedures established by the Board. At March 31, 2019, the total value of securities is $1,416,928,
representing 0.5% of the Portfolio�s net assets.(K) All or a portion of the security represents an unsettled loan commitment at March 31, 2019 where the rate will be determined at time of settlement.(L) When-issued, delayed-delivery and/or forward commitment (including TBAs) securities. Securities to be settled and delivered after March 31, 2019. Securities
may display a coupon rate of 0.00%, as the rate is to be determined at time of settlement.(M) Securities are subject to sale-buyback transactions.(N) All or a portion of these securities have been segregated by the custodian as collateral for centrally cleared swap agreements. The total value of such securities is
$1,622,552.(O) Rates disclosed reflect the yields at March 31, 2019.
The notes are an integral part of this report.Transamerica Series Trust Page 13
Copyright © 2021 www.secdatabase.com. All Rights Reserved.Please Consider the Environment Before Printing This Document

Transamerica PIMCO Tactical �� Conservative VPSCHEDULE OF INVESTMENTS (continued)At March 31, 2019(unaudited)
FOOTNOTES TO SCHEDULE OF INVESTMENTS (continued):
(P) All or a portion of these securities have been segregated by the custodian as collateral for open over-the-counter swaptions, swap agreements and forward foreigncurrency contracts. The total value of such securities is $323,145.
(Q) If the Portfolio is a seller of protection and a credit event occurs, as defined under the terms of that particular swap agreement, the Portfolio will either (a) pay tothe buyer of protection an amount equal to the notional amount of the swap and take delivery of the referenced obligation or underlying securities comprising thereferenced obligation or (b) pay a net settlement amount in the form of cash or securities equal to the notional amount of the swap agreement less the recoveryvalue of the referenced obligation or underlying securities comprising the referenced obligation.
(R) The maximum potential amount the Portfolio could be required to pay as a seller of credit protection or receive as a buyer of credit protection if a credit eventoccurs as defined under the terms of that particular swap agreement.
(S) The quoted market prices and resulting values for credit default swap agreements on asset-backed securities and credit indices serve as an indicator of the currentstatus of the payment/performance risk and represent the likelihood of an expected liability (or profit) for the credit derivative had the notional amount of the swapagreement been closed/sold as of the period ended. Increasing market values, in absolute terms when compared to the notional amount of the swap agreement,represent a deterioration of the referenced entity�s credit soundness and a greater likelihood or risk of default or other credit event occurring as defined under theterms of the agreement.
(T) At the termination date, a net cash flow is exchanged where the total return is equivalent to the return of the reference entity less a financing rate, if any. As areceiver, the Portfolio would receive payments based on any positive total return and would owe payments in the event of a negative total return. As the payer, thePortfolio would owe payments on any net positive total return and would receive payment in the event of a negative total return.
(U) There were no transfers in or out of Level 3 during the period ended March 31, 2019. Please reference the Security Valuation section of the Notes to Schedules ofInvestments for more information regarding security valuation and pricing inputs.
(V) Level 3 securities were not considered significant to the Portfolio.(W) Futures contracts and/or forward foreign currency contracts are valued at unrealized appreciation (depreciation).
CURRENCY ABBREVIATIONS:
COP Columbian PesoEUR EuroGBP Pound SterlingIDR Indonesian RupiahINR Indian RupeeJPY Japanese YenMXN Mexican PesoPEN Peruvian SolRUB Russian RubleUSD United States Dollar
COUNTERPARTY ABBREVIATIONS:
BNP BNP ParibasCITI Citibank N.A.DUB Deutsche Bank AGGSB Goldman Sachs BankGSI Goldman Sachs InternationalHSBC HSBC Bank USAJPM JPMorgan Chase Bank, N.A.MLI Merrill Lynch InternationalMSC Morgan Stanley & Co.SCB Standard Chartered Bank
PORTFOLIO ABBREVIATIONS:
CMBS Commercial Mortgage-Backed SecuritiesEAFE Europe, Australasia and Far EastETF Exchange-Traded FundEURIBOR Euro Interbank Offer RateLIBOR London Interbank Offered RateMTN Medium Term NoteOAT Obligations Assimilables du Tresor (Treasury Obligations)STRIPS Separate Trading of Registered Interest and Principal of SecuritiesTBA To Be AnnouncedTBD To Be Determined
Copyright © 2021 www.secdatabase.com. All Rights Reserved.Please Consider the Environment Before Printing This Document

The notes are an integral part of this report.Transamerica Series Trust Page 14
Copyright © 2021 www.secdatabase.com. All Rights Reserved.Please Consider the Environment Before Printing This Document

Transamerica PIMCO Tactical �� Growth VPSCHEDULE OF INVESTMENTSAt March 31, 2019(unaudited)
The notes are an integral part of this report.Transamerica Series Trust Page 1
Principal ValueASSET-BACKED SECURITIES - 1.6%Avery Point IV CLO, Ltd.
Series 2014-1A, Class AR,3-Month LIBOR + 1.10%,
3.87% (A), 04/25/2026 (B) $ 172,320 $ 172,322Crown Point CLO, Ltd.
Series 2018-5A, Class A,3-Month LIBOR + 0.94%,
3.71% (A), 07/17/2028 400,000 396,804CVP Cascade CLO-1, Ltd.
Series 2013-CLO1, Class A1R,3-Month LIBOR + 1.15%,
3.93% (A), 01/16/2026 (B) 470,124 470,118Dryden XXV Senior Loan Fund
Series 2012-25A, Class ARR,3-Month LIBOR + 0.90%,
3.69% (A), 10/15/2027 (B) 500,000 498,424FFMLT Trust
Series 2005-FF2, Class M4,1-Month LIBOR + 0.89%,
3.37% (A), 03/25/2035 193,685 194,669Figueroa CLO, Ltd.
Series 2013-2A, Class A1RR,3-Month LIBOR + 0.85%,
3.48% (A), 06/20/2027 (B) 200,000 199,069Flagship CLO, Ltd.
Series 2014-8A, Class ARR,3-Month LIBOR + 0.85%,
3.63% (A), 01/16/2026 (B) 300,000 299,009Flagship VII, Ltd.
Series 2013-7A, Class A1R,3-Month LIBOR + 1.12%,
3.88% (A), 01/20/2026 (B) 143,411 143,411Ford Credit Auto Owner Trust
Series 2016-2, Class A,2.03%, 12/15/2027 (B) 700,000 688,531
Halcyon Loan Advisors Funding, Ltd.Series 2014-3A, Class AR,3-Month LIBOR + 1.10%,
3.86% (A), 10/22/2025 (B) 393,287 393,137Loomis Sayles CLO II, Ltd.
Series 2015-2A, Class A1R,3-Month LIBOR + 0.90%,
3.69% (A), 04/15/2028 (B) 600,000 594,305Morgan Stanley Home Equity Loan Trust
Series 2005-3, Class M2,1-Month LIBOR + 0.71%,
3.19% (A), 08/25/2035 33,792 33,872Mountain View CLO, Ltd.
Series 2014-1A, Class ARR,3-Month LIBOR + 0.80%,
3.59% (A), 10/15/2026 (B) 289,785 288,348
Principal ValueASSET-BACKED SECURITIES (continued)Northstar Education Finance, Inc.
Series 2012-1, Class A,1-Month LIBOR + 0.70%,
3.19% (A), 12/26/2031 (B)$36,585 $ 36,540
Oaktree CLO, Ltd.Series 2014-2A, Class A1AR,3-Month LIBOR + 1.22%,
3.98% (A), 10/20/2026 (B) 529,709 529,720Palmer Square Loan Funding, Ltd.
Series 2018-4A, Class A1,3-Month LIBOR + 0.90%,
3.58% (A), 11/15/2026 (B) 293,227 292,048PHEAA Student Loan Trust
Series 2016-2A, Class A,1-Month LIBOR + 0.95%,
3.44% (A), 11/25/2065 (B) 183,677 184,348SMB Private Education Loan Trust
Series 2016-B, Class A2B,1-Month LIBOR + 1.45%,
3.93% (A), 02/17/2032 (B) 445,986 453,440Zais CLO 1, Ltd.
Series 2014-1A, Class A1AR,3-Month LIBOR + 1.15%,
3.94% (A), 04/15/2028 (B) 300,000 299,138Total Asset-Backed Securities
(Cost $6,140,184) 6,167,253
CERTIFICATES OF DEPOSIT - 0.2%Banks - 0.2%Barclays Bank PLC
3-Month LIBOR + 0.40%,3.17% (A) (C), 10/25/2019 300,000 300,000
Lloyds Bank Corporate Markets PLC3-Month LIBOR + 0.50%,
3.30% (A) (C), 10/26/2020 200,000 200,000Total Certificates of Deposit
(Cost $500,000) 500,000
CORPORATE DEBT SECURITIES - 19.0%Aerospace & Defense - 0.0% (D)United Technologies Corp.
3.95%, 08/16/2025 100,000 103,858Airlines - 0.4%American Airlines Pass-Through Trust
3.00%, 04/15/2030 184,435 178,2983.25%, 04/15/2030 92,157 88,482
British Airways Pass-Through Trust3.80%, 03/20/2033 (B) 197,547 201,241
Norwegian Air Shuttle Pass-Through Trust4.88%, 11/10/2029 (B) 633,591 610,909
United Airlines Pass-Through Trust2.88%, 04/07/2030 284,141 272,3213.10%, 04/07/2030 284,141 269,906
1,621,157
Copyright © 2021 www.secdatabase.com. All Rights Reserved.Please Consider the Environment Before Printing This Document

Transamerica PIMCO Tactical �� Growth VPSCHEDULE OF INVESTMENTS (continued)At March 31, 2019(unaudited)
Principal ValueCORPORATE DEBT SECURITIES (continued)Auto Components - 0.1%Aptiv Corp.
4.15%, 03/15/2024$ 240,000
$247,411
Banks - 4.8%AIB Group PLC
4.75%, 10/12/2023 (B) 200,000 206,535Bank of America Corp.
2.63%, 10/19/2020, MTN 290,000 289,278Fixed until 12/20/2027,
3.42% (A), 12/20/2028 1,440,000 1,408,103Bank of Ireland Group PLC
4.50%, 11/25/2023 (B) 300,000 304,884Bank of Montreal
1.75%, 06/15/2021 (B) 500,000 491,0782.55%, 11/06/2022, MTN 80,000 79,735
Barclays PLC3.65%, 03/16/2025 300,000 292,5124.34%, 01/10/2028 200,000 198,779Fixed until 02/15/2022,
4.61% (A), 02/15/2023 200,000 204,125BNP Paribas SA
3.38%, 01/09/2025 (B) 500,000 489,894BPCE SA
3-Month LIBOR + 1.24%,3.84% (A), 09/12/2023 (B) 400,000 398,200
Citigroup, Inc.4.40%, 06/10/2025 750,000 776,466
Dexia Credit Local SA1.88%, 09/15/2021 (B) 800,000 787,490
HSBC Holdings PLC3-Month LIBOR + 1.38%,
3.98% (A), 09/12/2026 200,000 200,298Fixed until 09/28/2026 (E),
5.88% (A) GBP 200,000 262,118HSBC USA, Inc.
2.38%, 11/13/2019 $ 120,000 119,6962.75%, 08/07/2020 500,000 500,4803-Month LIBOR + 0.61%,
3.30% (A), 11/13/2019 240,000 240,678ING Groep NV
3-Month LIBOR + 1.00%,3.60% (A), 10/02/2023 500,000 498,365
JPMorgan Chase & Co.3.25%, 09/23/2022 100,000 101,3993.90%, 07/15/2025 50,000 51,9503-Month LIBOR + 3.47%,
6.22% (A), 04/30/2019 (E) 200,000 201,000Lloyds Banking Group PLC
4.38%, 03/22/2028 200,000 204,7954.55%, 08/16/2028 (F) 600,000 621,327
Manufacturers & Traders Trust Co.2.25%, 07/25/2019 250,000 249,685
Mitsubishi UFJ Financial Group, Inc.3-Month LIBOR + 0.86%,
3.62% (A), 07/26/2023 200,000 200,5313-Month LIBOR + 1.88%,
4.51% (A), 03/01/2021 329,000 336,947Mizuho Financial Group, Inc.
3-Month LIBOR + 1.00%,3.60% (A), 09/11/2024 (F) 200,000 201,497
National Australia Bank, Ltd.
Principal ValueCORPORATE DEBT SECURITIES (continued)Banks (continued)Royal Bank of Scotland Group PLC
3.88%, 09/12/2023 $ 300,000 $ 301,243Fixed until 05/18/2028,
4.89% (A), 05/18/2029 300,000 311,462Fixed until 08/15/2021 (E),
8.63% (A) 300,000 319,500Santander UK Group Holdings PLC
2.88%, 10/16/2020 490,000 488,7863.13%, 01/08/2021 60,000 59,970
Santander UK PLC2.38%, 03/16/2020 1,000,000 996,571
Sberbank of Russia Via SB Capital SA5.18%, 06/28/2019 (G) 200,000 200,798
Stichting AK Rabobank Certificaten6.50%, 12/29/2049 (E) (G) EUR 200,000 261,570
Sumitomo Mitsui Banking Corp.2.65%, 07/23/2020, MTN $ 500,000 499,315
Sumitomo Mitsui Financial Group, Inc.2.63%, 07/14/2026 (F) 100,000 95,7193-Month LIBOR + 0.80%,
3.58% (A), 10/16/2023 300,000 299,999Swedbank AB
2.20%, 03/04/2020 (B) 280,000 277,763UniCredit SpA
7.83%, 12/04/2023 (B) 350,000 388,328Wells Fargo & Co.
2.55%, 12/07/2020, MTN 50,000 49,8383.00%, 02/19/2025, MTN 100,000 98,854Fixed until 05/22/2027,
3.58% (A), 05/22/2028, MTN 200,000 200,771Wells Fargo Bank NA
3.55%, 08/14/2023 600,000 615,620Westpac Banking Corp.
2.25%, 11/09/2020 (B) (F) 1,900,000 1,890,50518,569,845
Beverages - 0.1%Anheuser-Busch InBev Worldwide, Inc.
4.38%, 04/15/2038 200,000 191,9585.55%, 01/23/2049 100,000 109,755
Bacardi, Ltd.4.70%, 05/15/2028 (B) 100,000 99,982
401,695Biotechnology - 0.3%AbbVie, Inc.
2.90%, 11/06/2022 710,000 708,5443.20%, 11/06/2022 100,000 100,902
Amgen, Inc.4.40%, 05/01/2045 200,000 196,0544.56%, 06/15/2048 100,000 100,142
1,105,642Building Products - 0.1%Fortune Brands Home & Security, Inc.
4.00%, 06/15/2025 250,000 255,297Masco Corp.
4.45%, 04/01/2025 10,000 10,269Owens Corning
3.40%, 08/15/2026 200,000 188,4944.20%, 12/01/2024 10,000 10,104
464,164Capital Markets - 1.3%
Copyright © 2021 www.secdatabase.com. All Rights Reserved.Please Consider the Environment Before Printing This Document

The notes are an integral part of this report.Transamerica Series Trust Page 2
1.38%, 07/12/2019 1,300,000 1,295,388 Brighthouse Holdings LLC6.50% (H), 07/27/2037 (B) (E) 100,000 92,000
Charles Schwab Corp.Fixed until 12/01/2027 (E),
5.00% (A) 300,000 281,250
Copyright © 2021 www.secdatabase.com. All Rights Reserved.Please Consider the Environment Before Printing This Document

Transamerica PIMCO Tactical �� Growth VPSCHEDULE OF INVESTMENTS (continued)At March 31, 2019(unaudited)
Principal ValueCORPORATE DEBT SECURITIES (continued)Capital Markets (continued)Credit Suisse Group AG
Fixed until 01/12/2028,3.87% (A), 01/12/2029 (B)
$250,000
$245,043
4.28%, 01/09/2028 (B) 600,000 606,893Deutsche Bank AG
3-Month LIBOR + 1.29%,4.03% (A), 02/04/2021 300,000 297,502
4.25%, 10/14/2021 200,000 200,898Goldman Sachs Group, Inc.
3.75%, 05/22/2025 40,000 40,4063.85%, 07/08/2024, MTN 1,400,000 1,427,186
Intercontinental Exchange, Inc.2.75%, 12/01/2020 30,000 30,039
Lazard Group LLC3.75%, 02/13/2025 19,000 19,142
Morgan StanleyFixed until 04/24/2023,
3.74% (A), 04/24/2024 200,000 203,9854.00%, 07/23/2025, MTN 40,000 41,1695.50%, 07/24/2020, MTN 1,200,000 1,240,866
S&P Global, Inc.4.40%, 02/15/2026 30,000 32,258
UBS Group Funding Switzerland AG4.13%, 09/24/2025 (B) 400,000 412,972
5,171,609Chemicals - 0.1%International Flavors & Fragrances, Inc.
3.40%, 09/25/2020 200,000 201,202SASOL Financing LLC
5.88%, 03/27/2024 300,000 318,154519,356
Commercial Services & Supplies - 0.1%ERAC USA Finance LLC
4.50%, 02/15/2045 (B) 9,000 8,8507.00%, 10/15/2037 (B) 100,000 128,284
RELX Capital, Inc.4.00%, 03/18/2029 200,000 204,067
341,201Consumer Finance - 1.1%American Express Credit Corp.
3-Month LIBOR + 0.49%,3.17% (A), 08/15/2019, MTN 400,000 400,576
Daimler Finance North America LLC1.50%, 07/05/2019 (B) 700,000 697,6653.40%, 02/22/2022 (B) 200,000 201,768
Discover Financial Services4.50%, 01/30/2026 100,000 102,706
Ford Motor Credit Co. LLC3-Month LIBOR + 0.93%,
3.53% (A), 09/24/2020, MTN 300,000 298,7065.75%, 02/01/2021 200,000 205,968
Nissan Motor Acceptance Corp.2.55%, 03/08/2021 (B) 100,000 98,421
Synchrony Financial2.70%, 02/03/2020 9,000 8,988
Toyota Motor Credit Corp.1.40%, 05/20/2019, MTN 600,000 599,033
Volkswagen Group of America Finance LLC2.13%, 05/23/2019 (B) 1,800,000 1,797,915
4,411,746
Principal ValueCORPORATE DEBT SECURITIES (continued)Diversified Consumer Services - 0.1%Nationwide Building Society
3.90%, 07/21/2025 (B) $300,000
$305,417
Diversified Financial Services - 0.4%AerCap Ireland Capital DAC / AerCap Global Aviation
Trust4.45%, 10/01/2025 700,000 703,899
Helios Leasing I LLC1.56%, 09/28/2024 48,291 46,760
ORIX Corp.3.25%, 12/04/2024 300,000 299,618
Protective Life Global Funding2.70%, 11/25/2020 (B) 510,000 509,128
Tagua Leasing LLC1.58%, 11/16/2024 50,458 48,967
Voya Financial, Inc.Fixed until 01/23/2028,
4.70% (A), 01/23/2048 200,000 173,0001,781,372
Diversified Telecommunication Services - 0.6%AT&T, Inc.
3.40%, 05/15/2025 170,000 168,2183-Month LIBOR + 0.93%,
3.53% (A), 06/30/2020 100,000 100,7173-Month LIBOR + 1.18%,
3.78% (A), 06/12/2024 800,000 793,5884.35%, 03/01/2029 300,000 306,471
Verizon Communications, Inc.3.38%, 02/15/2025 93,000 94,0954.02%, 12/03/2029 (B) 610,000 627,5504.52%, 09/15/2048 100,000 102,626
2,193,265Electric Utilities - 1.0%AEP Texas, Inc.
3.95%, 06/01/2028 300,000 312,548Appalachian Power Co.
3.40%, 06/01/2025 370,000 374,872Duke Energy Corp.
3.75%, 04/15/2024 100,000 103,1203.95%, 10/15/2023 200,000 207,317
Duke Energy Florida LLC3.80%, 07/15/2028 300,000 313,192
Electricite de France SA3.63%, 10/13/2025 (B) 500,000 508,818
Entergy Mississippi LLC2.85%, 06/01/2028 700,000 675,046
IPALCO Enterprises, Inc.3.70%, 09/01/2024 200,000 201,020
NextEra Energy Capital Holdings, Inc.3.20%, 02/25/2022 200,000 201,713
Niagara Mohawk Power Corp.4.12%, 11/28/2042 (B) 100,000 98,337
Pacific Gas & Electric Co.2.45%, 08/15/2022 (I) 500,000 443,7503.50%, 06/15/2025 (I) 10,000 8,900
Southwestern Electric Power Co.6.20%, 03/15/2040 400,000 490,961
3,939,594Electronic Equipment, Instruments & Components - 0.1%Arrow Electronics, Inc.
Copyright © 2021 www.secdatabase.com. All Rights Reserved.Please Consider the Environment Before Printing This Document

The notes are an integral part of this report.Transamerica Series Trust Page 3
3.25%, 09/08/2024 200,000 193,889
Copyright © 2021 www.secdatabase.com. All Rights Reserved.Please Consider the Environment Before Printing This Document

Transamerica PIMCO Tactical �� Growth VPSCHEDULE OF INVESTMENTS (continued)At March 31, 2019(unaudited)
Principal ValueCORPORATE DEBT SECURITIES (continued)Energy Equipment & Services - 0.1%Energy Transfer Partners, LP / Regency Energy
Finance Corp.5.88%, 03/01/2022 $
255,000$272,573
Odebrecht Drilling Norbe VIII / IX, Ltd.6.35%, 12/01/2021 (G) 115,000 113,131
385,704Equity Real Estate Investment Trusts - 1.9%Alexandria Real Estate Equities, Inc.
3.95%, 01/15/2027 100,000 100,8774.30%, 01/15/2026 550,000 570,1394.50%, 07/30/2029 200,000 210,581
American Tower Corp.3.38%, 10/15/2026 400,000 389,8484.00%, 06/01/2025 760,000 782,3304.40%, 02/15/2026 400,000 417,457
AvalonBay Communities, Inc.3.45%, 06/01/2025, MTN 360,000 366,490
Brixmor Operating Partnership, LP3-Month LIBOR + 1.05%,
3.79% (A), 02/01/2022 400,000 398,498Crown Castle International Corp.
4.45%, 02/15/2026 120,000 125,3085.25%, 01/15/2023 600,000 643,896
Digital Realty Trust, LP3.95%, 07/01/2022 500,000 513,035
Essex Portfolio, LP4.00%, 03/01/2029 300,000 306,983
Federal Realty Investment Trust3.63%, 08/01/2046 100,000 91,492
Kilroy Realty, LP4.38%, 10/01/2025 350,000 361,233
Mid-America Apartments, LP4.00%, 11/15/2025 350,000 360,232
National Retail Properties, Inc.4.80%, 10/15/2048 300,000 320,313
Prologis, LP3.75%, 11/01/2025 10,000 10,453
Unibail-Rodamco SE3-Month LIBOR + 0.77%,
3.55% (A), 04/16/2019, MTN (G) 500,000 500,137VEREIT Operating Partnership, LP
4.63%, 11/01/2025 300,000 310,278Welltower, Inc.
4.95%, 09/01/2048 300,000 316,653WP Carey, Inc.
4.60%, 04/01/2024 300,000 311,8837,408,116
Food Products - 0.1%Kraft Heinz Foods Co.
3.50%, 07/15/2022 50,000 50,4754.38%, 06/01/2046 250,000 216,260
266,735Gas Utilities - 0.1%Brooklyn Union Gas Co.
3.87%, 03/04/2029 (B) 100,000 103,017Southern California Gas Co.
4.13%, 06/01/2048 300,000 308,341411,358
Principal ValueCORPORATE DEBT SECURITIES (continued)Health Care Equipment & Supplies - 0.2%Boston Scientific Corp.
3.38%, 05/15/2022 $370,000
$374,966
Zimmer Biomet Holdings, Inc.2.70%, 04/01/2020 510,000 508,7483.15%, 04/01/2022 20,000 20,0553.55%, 04/01/2025 20,000 19,721
923,490Health Care Providers & Services - 0.2%Aetna, Inc.
3.50%, 11/15/2024 10,000 10,006AHS Hospital Corp.
5.02%, 07/01/2045 200,000 234,125CHRISTUS Health
4.34%, 07/01/2028 200,000 213,764Hackensack Meridian Health, Inc.
4.50%, 07/01/2057 100,000 109,024HCA, Inc.
5.88%, 03/15/2022 (F) 100,000 107,279Humana, Inc.
4.80%, 03/15/2047 100,000 105,339Northwell Healthcare, Inc.
3.98%, 11/01/2046 200,000 193,312972,849
Hotels, Restaurants & Leisure - 0.1%McDonald�s Corp.
3.80%, 04/01/2028, MTN (F) 300,000 309,619Industrial Conglomerates - 0.1%General Electric Co.
5.55%, 01/05/2026, MTN 200,000 211,734Insurance - 1.1%Berkshire Hathaway Finance Corp.
4.20%, 08/15/2048 300,000 310,822Chubb INA Holdings, Inc.
3.35%, 05/03/2026 20,000 20,352First American Financial Corp.
4.60%, 11/15/2024 10,000 10,370Great-West Lifeco Finance, LP
4.05%, 05/17/2028 (B) 100,000 105,125Jackson National Life Global Funding
2.60%, 12/09/2020 (B) 510,000 508,420Marsh & McLennan Cos., Inc.
3.75%, 03/14/2026 10,000 10,299Meiji Yasuda Life Insurance Co.
Fixed until 04/26/2028,5.10% (A), 04/26/2048 (B) 400,000 416,853
MetLife, Inc.4.05%, 03/01/2045 10,000 9,989
Metropolitan Life Global Funding I2.00%, 04/14/2020 (B) 150,000 148,8572.30%, 04/10/2019 (B) 300,000 299,976
Pacific Life Insurance Co.Fixed until 10/24/2047,
4.30% (A), 10/24/2067 (B) 600,000 535,322Pricoa Global Funding I
2.55%, 11/24/2020 (B) 510,000 507,823Principal Life Global Funding II
2.20%, 04/08/2020 (B) 300,000 298,2023.00%, 04/18/2026 (B) 200,000 197,438
Copyright © 2021 www.secdatabase.com. All Rights Reserved.Please Consider the Environment Before Printing This Document

The notes are an integral part of this report.Transamerica Series Trust Page 4
Copyright © 2021 www.secdatabase.com. All Rights Reserved.Please Consider the Environment Before Printing This Document

Transamerica PIMCO Tactical �� Growth VPSCHEDULE OF INVESTMENTS (continued)At March 31, 2019(unaudited)
Principal ValueCORPORATE DEBT SECURITIES (continued)Insurance (continued)Reliance Standard Life Global Funding II
2.50%, 04/24/2019 (B) $100,000 $ 99,976
RenaissanceRe Holdings, Ltd.3.60%, 04/15/2029 100,000 98,299
Teachers Insurance & Annuity Association of America4.27%, 05/15/2047 (B) 400,000 410,437
Travelers Cos., Inc.3.75%, 05/15/2046 100,000 97,887
XLIT, Ltd.4.45%, 03/31/2025 10,000 10,411
4,096,858IT Services - 0.1%Fidelity National Information Services, Inc.
4.50%, 10/15/2022 242,000 252,517Life Sciences Tools & Services - 0.0% (D)Thermo Fisher Scientific, Inc.
3.30%, 02/15/2022 20,000 20,257Machinery - 0.1%Wabtec Corp.
4.40%, 03/15/2024 400,000 406,648Marine - 0.1%AP Moller - Maersk A/S
3.88%, 09/28/2025 (B) 200,000 195,451Media - 0.3%Charter Communications Operating LLC / Charter
Communications Operating Capital4.20%, 03/15/2028 300,000 297,680
Comcast Corp.4.40%, 08/15/2035 10,000 10,4414.75%, 03/01/2044 700,000 758,791
Discovery Communications LLC5.00%, 09/20/2037 200,000 194,452
Sky, Ltd.3.13%, 11/26/2022 (B) 40,000 40,418
1,301,782Metals & Mining - 0.1%Indonesia Asahan Aluminium Persero PT
5.23%, 11/15/2021 (B) 300,000 311,975Multi-Utilities - 0.3%CenterPoint Energy, Inc.
Fixed until 09/01/2023 (E),6.13% (A) 500,000 508,125
DTE Electric Co.3.70%, 06/01/2046 (F) 600,000 581,877
E.ON International Finance BV6.65%, 04/30/2038 (B) 240,000 299,431
1,389,433Oil, Gas & Consumable Fuels - 1.3%Antero Midstream Partners, LP / Antero Midstream
Finance Corp.5.75%, 03/01/2027 (B) 200,000 203,000
APT Pipelines, Ltd.4.25%, 07/15/2027 (B) 200,000 202,669
BP Capital Markets America, Inc.3.79%, 02/06/2024 200,000 207,554
Concho Resources, Inc.3.75%, 10/01/2027 200,000 198,368
Principal ValueCORPORATE DEBT SECURITIES (continued)Oil, Gas & Consumable Fuels (continued)Dolphin Energy, Ltd. LLC
5.50%, 12/15/2021 (G) $200,000
$210,500
Energy Transfer Operating, LP4.05%, 03/15/2025 100,000 101,3974.75%, 01/15/2026 400,000 418,0997.50%, 07/01/2038 50,000 60,697
Eni SpA4.75%, 09/12/2028 (B) 200,000 207,677
Enterprise Products Operating LLC3.70%, 02/15/2026 520,000 533,293
ONEOK, Inc.4.35%, 03/15/2029 400,000 407,034
Petrobras Global Finance BV5.75%, 02/01/2029 200,000 198,100
Sabine Pass Liquefaction LLC5.75%, 05/15/2024 600,000 661,218
Shell International Finance BV4.00%, 05/10/2046 200,000 207,945
Sinopec Group Overseas Development, Ltd.4.13%, 09/12/2025 (B) (F) 500,000 520,800
Valero Energy Corp.4.00%, 04/01/2029 400,000 403,650
Woodside Finance, Ltd.3.65%, 03/05/2025 (B) 10,000 9,9363.70%, 03/15/2028 (B) 300,000 289,257
5,041,194Paper & Forest Products - 0.1%Georgia-Pacific LLC
5.40%, 11/01/2020 (B) 220,000 228,692Pharmaceuticals - 0.4%Baxalta, Inc.
3.60%, 06/23/2022 3,000 3,016Bayer US Finance II LLC
4.63%, 06/25/2038 (B) 600,000 560,362Eli Lilly & Co.
3.88%, 03/15/2039 100,000 102,386EMD Finance LLC
2.40%, 03/19/2020 (B) 250,000 248,857Mylan, Inc.
4.55%, 04/15/2028 100,000 97,220Shire Acquisitions Investments Ireland DAC
2.88%, 09/23/2023 100,000 98,6893.20%, 09/23/2026 200,000 193,401
Zoetis, Inc.3.90%, 08/20/2028 200,000 204,067
1,507,998Professional Services - 0.1%IHS Markit, Ltd.
4.75%, 08/01/2028 200,000 209,262Road & Rail - 0.3%Burlington Northern Santa Fe LLC
4.13%, 06/15/2047 400,000 415,261JB Hunt Transport Services, Inc.
3.88%, 03/01/2026 200,000 203,067Kansas City Southern
4.95%, 08/15/2045 300,000 322,509Union Pacific Corp.
4.10%, 09/15/2067 100,000 91,3141,032,151
Copyright © 2021 www.secdatabase.com. All Rights Reserved.Please Consider the Environment Before Printing This Document

The notes are an integral part of this report.Transamerica Series Trust Page 5
Copyright © 2021 www.secdatabase.com. All Rights Reserved.Please Consider the Environment Before Printing This Document

Transamerica PIMCO Tactical �� Growth VPSCHEDULE OF INVESTMENTS (continued)At March 31, 2019(unaudited)
The notes are an integral part of this report.Transamerica Series Trust Page 6
Principal ValueCORPORATE DEBT SECURITIES (continued)Semiconductors & Semiconductor Equipment - 0.1%Broadcom, Inc.
3.13%, 04/15/2021 $300,000
$299,646
KLA-Tencor Corp.4.10%, 03/15/2029 200,000 203,549
503,195Software - 0.3%Microsoft Corp.
4.10%, 02/06/2037 300,000 326,293Oracle Corp.
2.95%, 05/15/2025 760,000 759,0151,085,308
Specialty Retail - 0.1%QVC, Inc.
4.45%, 02/15/2025 100,000 99,8304.85%, 04/01/2024 100,000 102,246
202,076Technology Hardware, Storage & Peripherals - 0.3%Apple, Inc.
2.90%, 09/12/2027 200,000 197,1633-Month LIBOR + 0.30%,
3.03% (A), 05/06/2019 300,000 300,1293.35%, 02/09/2027 200,000 204,1113.75%, 09/12/2047 100,000 99,4994.65%, 02/23/2046 100,000 112,982
Dell International LLC / EMC Corp.8.10%, 07/15/2036 (B) 400,000 469,939
1,383,823Tobacco - 0.1%BAT Capital Corp.
4.39%, 08/15/2037 100,000 89,474BAT International Finance PLC
3.50%, 06/15/2022 (B) 10,000 10,042Reynolds American, Inc.
4.00%, 06/12/2022 10,000 10,2134.85%, 09/15/2023 100,000 105,484
215,213Trading Companies & Distributors - 0.1%Air Lease Corp.
4.25%, 02/01/2024, MTN 100,000 102,219GATX Corp.
3.25%, 09/15/2026 150,000 142,660244,879
Transportation Infrastructure - 0.1%Penske Truck Leasing Co., LP / PTL Finance Corp.
3.95%, 03/10/2025 (B) 200,000 200,940Sydney Airport Finance Co. Pty, Ltd.
3.38%, 04/30/2025 (B) 10,000 9,8333.90%, 03/22/2023 (B) 100,000 101,160
311,933Water Utilities - 0.1%American Water Capital Corp.
3.40%, 03/01/2025 260,000 265,158
Principal ValueCORPORATE DEBT SECURITIES (continued)Wireless Telecommunication Services - 0.1%Sprint Spectrum Co. LLC / Sprint Spectrum
Co. II LLC4.74%, 09/20/2029 (B) $ 200,000 $ 202,2505.15%, 09/20/2029 (B) 200,000 203,500
405,750Total Corporate Debt Securities
(Cost $72,365,821) 72,872,379
FOREIGN GOVERNMENT OBLIGATIONS - 2.1%Canada - 0.3%Province of Ontario
1.65%, 09/27/2019 600,000 597,355Province of Quebec
2.50%, 04/20/2026 600,000 593,4481,190,803
Indonesia - 0.1%Indonesia Government International Bond
4.45%, 02/11/2024 500,000 521,039Japan - 0.7%Japan Finance Organization for Municipalities
2.13%, 04/13/2021 - 10/25/2023 (B) 2,000,000 1,965,682Tokyo Metropolitan Government
2.00%, 05/17/2021 (B) 900,000 886,4622,852,144
Kuwait - 0.1%Kuwait International Government Bond
3.50%, 03/20/2027 (B) 300,000 306,375Peru - 0.1%Peru Government International Bond
5.94%, 02/12/2029 (B) PEN 600,000 190,255Qatar - 0.5%Qatar Government International Bond
2.38%, 06/02/2021 (G) $ 1,600,000 1,578,4964.50%, 01/20/2022 (G) 200,000 207,700
1,786,196Republic of Korea - 0.2%Export-Import Bank of Korea
3-Month LIBOR + 0.70%,3.35% (A), 05/26/2019 600,000 600,372
1.93%, 02/24/2020, MTN 02/16/2017 (G) (J) CAD 300,000 223,172823,544
United Arab Emirates - 0.1%Abu Dhabi Government International Bond
3.13%, 10/11/2027 (B) $ 300,000 297,750Total Foreign Government Obligations
(Cost $7,985,443) 7,968,106
LOAN ASSIGNMENT - 0.1%Capital Markets - 0.1%Zephyrus Capital Aviation Partners LLC
Term Loan,TBD, 10/15/2038 (K) (L) (M) 475,000 467,963
Total Loan Assignment(Cost $468,046) 467,963
Copyright © 2021 www.secdatabase.com. All Rights Reserved.Please Consider the Environment Before Printing This Document

Transamerica PIMCO Tactical �� Growth VPSCHEDULE OF INVESTMENTS (continued)At March 31, 2019(unaudited)
The notes are an integral part of this report.Transamerica Series Trust Page 7
Principal ValueMORTGAGE-BACKED SECURITIES - 1.7%Aggregator of Loans Backed by Assets PLC
Series 2015-1, Class A,1-Month GBP LIBOR + 1.25%,
1.98% (A), 04/24/2049 (G) GBP 109,536$143,065
Bear Stearns Alt-A TrustSeries 2005-5, Class 1A1,1-Month LIBOR + 0.44%,
2.93% (A), 07/25/2035 $ 10,388 10,387BX Trust
Series 2017-APPL, Class A,1-Month LIBOR + 0.88%,
3.36% (A), 07/15/2034 (B) 849,040 847,169COMM Mortgage Trust
Series 2018-HOME, Class A,3.82% (A), 04/10/2033 (B) 300,000 311,659
Credit Suisse First Boston Mortgage SecuritiesCorp.Series 2004-AR7, Class 2A1,4.39% (A), 11/25/2034 50,828 51,782
DBUBS Mortgage TrustSeries 2017-BRBK, Class A,3.45%, 10/10/2034 (B) 600,000 612,505
Eurosail PLCSeries 2006-4X, Class A3C,3-Month GBP LIBOR + 0.16%,
1.00% (A), 12/10/2044 (G) GBP 73,175 94,250Federal Home Loan Mortgage Corp.
Series W5FX, Class AFX,2.97% (A), 04/25/2028 $ 600,000 607,068
Independence Plaza TrustSeries 2018-INDP, Class A,3.76%, 07/10/2035 (B) 400,000 412,498
La Hipotecaria El Salvadorian Mortgage TrustSeries 2016-1A, Class A,3.36%, 01/15/2046 (B) (K) 325,223 328,340
MASTR Alternative Loan TrustSeries 2003-9, Class 4A1,5.25%, 11/25/2033 144,896 150,509
Merrill Lynch Mortgage Investors TrustSeries 2003-B, Class A1,1-Month LIBOR + 0.68%,
3.17% (A), 04/25/2028 148,055 142,891Morgan Stanley Bank of America Merrill Lynch
TrustSeries 2015-C25, Class A4,3.37%, 10/15/2048 500,000 508,836
Morgan Stanley Bank of America Merrill LynchTrust, Interest Only STRIPSSeries 2013-C8, Class XA,0.99% (A), 12/15/2048 720,096 21,505
MortgageIT TrustSeries 2005-2, Class 1A1,1-Month LIBOR + 0.52%,
3.01% (A), 05/25/2035 36,076 36,116
Principal ValueMORTGAGE-BACKED SECURITIES - 1.7%Southern Pacific Financing PLC
Series 2005-B, Class A,3-Month GBP LIBOR + 0.18%,
1.02% (A), 06/10/2043 (G) GBP 298,329$385,490
Towd Point Mortgage Funding PLCSeries 2019-GR4A, Class A1,3-Month GBP LIBOR + 1.03%,
0.00% (A), 10/20/2051 (B) (N) 700,000 911,715Uropa Securities PLC
Series 2008-1, Class A,3-Month GBP LIBOR + 0.20%,
1.04% (A), 06/10/2059 (G) 240,633 299,793Series 2008-1, Class B,3-Month GBP LIBOR + 0.75%,
1.59% (A), 06/10/2059 (G) 46,418 55,901Series 2008-1, Class M1,3-Month GBP LIBOR + 0.35%,
1.19% (A), 06/10/2059 (G) 55,259 67,548Series 2008-1, Class M2,3-Month GBP LIBOR + 0.55%,
1.39% (A), 06/10/2059 (G) 43,470 53,027WaMu Mortgage Pass-Through Certificates Trust
Series 2005-AR4, Class A5,3.93% (A), 04/25/2035 $ 32,466 32,976
Worldwide Plaza TrustSeries 2017-WWP, Class A,3.53%, 11/10/2036 (B) 500,000 507,398
Total Mortgage-Backed Securities(Cost $6,607,015) 6,592,428
MUNICIPAL GOVERNMENT OBLIGATIONS - 0.4%California - 0.2%Bay Area Toll Authority, Revenue Bonds,
Series S1,6.92%, 04/01/2040 100,000 139,048
Los Angeles Community College District, GeneralObligation Unlimited,6.60%, 08/01/2042 100,000 144,084
State of California, General Obligation Unlimited,7.35%, 11/01/2039 150,000 218,331
501,463Florida - 0.1%County of Miami-Dade Aviation Revenue, Revenue
Bonds,Series C,3.86%, 10/01/2029 200,000 207,992
Maryland - 0.0% (D)County of Baltimore, General Obligation
Unlimited,3.30%, 07/01/2046 100,000 94,704
Michigan - 0.0% (D)Michigan Tobacco Settlement Finance Authority,
Revenue Bonds,Series A,7.31%, 06/01/2034 95,000 94,342
Copyright © 2021 www.secdatabase.com. All Rights Reserved.Please Consider the Environment Before Printing This Document

Transamerica PIMCO Tactical �� Growth VPSCHEDULE OF INVESTMENTS (continued)At March 31, 2019(unaudited)
Principal ValueMUNICIPAL GOVERNMENT OBLIGATIONS (continued)New York - 0.1%Port Authority of New York & New Jersey,
Revenue Bonds,4.46%, 10/01/2062 $
300,000$336,099
Utah - 0.0% (D)Utah State Board of Regents, Revenue Bonds,
Series 1,1-Month LIBOR + 0.75%,
3.24% (A), 12/26/2031 46,608 46,638West Virginia - 0.0% (D)Tobacco Settlement Finance Authority, Revenue
Bonds,Series A,7.47%, 06/01/2047 100,000 99,775
Total Municipal Government Obligations(Cost $1,305,591) 1,381,013
U.S. GOVERNMENT AGENCY OBLIGATIONS - 9.0%Federal Home Loan Mortgage Corp.
2.38%, 01/13/2022 4,500,000 4,512,5144.50%, 08/01/2048 791,384 833,475
Federal Home Loan Mortgage Corp. MultifamilyStructured Pass-Through Certificates1-Month LIBOR + 0.67%,
3.16% (A), 02/25/2023 549,271 549,787Federal Home Loan Mortgage Corp. REMIC
1-Month LIBOR + 0.35%,2.86% (A), 01/15/2038 470,050 467,594
1-Month LIBOR + 0.40%,2.88% (A), 02/15/2041 - 09/15/2045 885,962 886,851
Federal Home Loan Mortgage Corp. REMIC,Interest Only STRIPS1.59% (A), 01/15/2038 470,050 26,702
Federal Home Loan Mortgage Corp., Interest OnlySTRIPS(1.00) * 1-Month LIBOR + 5.89%,
3.41% (A), 09/15/2043 574,915 97,858Federal National Mortgage Association
3.50%, 06/01/2045 280,622 285,4653.50%, TBA (N) 11,150,000 11,290,6753.70%, 09/01/2034 277,684 291,5184.50%, 03/01/2039 - 02/01/2041 232,392 245,5594.50%, TBA (N) 8,950,000 9,317,6845.50%, TBA (N) 300,000 320,298
Federal National Mortgage Association REMIC1-Month LIBOR + 0.55%,
3.04% (A), 02/25/2041 172,781 173,7591-Month LIBOR + 0.57%,
3.06% (A), 06/25/2041 754,220 759,7451-Month LIBOR + 0.75%,
3.24% (A), 05/25/2040 615,968 622,2951-Month LIBOR + 0.85%,
3.34% (A), 11/25/2039 2,027,392 2,069,337Federal National Mortgage Association REMIC,
Interest Only STRIPS3.00%, 03/25/2028 307,545 25,065
Principal ValueU.S. GOVERNMENT AGENCY OBLIGATIONS (continued)Government National Mortgage Association
1-Month LIBOR + 0.80%,3.31% (A), 05/20/2066 - 06/20/2066
$1,405,582
$1,415,464
U.S. Treasury Note3.00%, 09/30/2025 300,000 312,375
Total U.S. Government Agency Obligations(Cost $34,360,793) 34,504,020
U.S. GOVERNMENT OBLIGATIONS - 21.9%U.S. Treasury - 20.6%U.S. Treasury Bond
2.75%, 08/15/2047 400,000 394,2972.88%, 11/15/2046 (O) 1,200,000 1,214,9063.00%, 05/15/2042 2,500,000 2,601,1723.00%, 02/15/2048 - 08/15/2048 (O) 1,670,000 1,728,1783.13%, 08/15/2044 2,900,000 3,073,8873.13%, 05/15/2048 (O) 1,520,000 1,611,7343.38%, 05/15/2044 1,430,000 1,580,6533.38%, 11/15/2048 (O) 769,000 855,8434.25%, 05/15/2039 - 11/15/2040 (O) 5,750,000 7,196,5294.38%, 05/15/2040 - 05/15/2041 (O) 2,010,000 2,563,0964.50%, 08/15/2039 (O) 9,860,000 12,730,5706.25%, 05/15/2030 (O) 800,000 1,095,187
U.S. Treasury Note1.25%, 04/30/2019 (C) (O) (P) 86,000 85,9101.63%, 05/31/2023 (O) 330,000 321,9301.88%, 03/31/2022 - 07/31/2022 (O) 9,900,000 9,798,1992.00%, 06/30/2024 400,000 394,7502.13%, 12/31/2022 (O) 600,000 597,5392.13%, 03/31/2024 - 05/15/2025 1,010,000 1,002,3962.25%, 02/15/2027 - 08/15/2027 (O) 22,350,000 22,163,0102.38%, 02/29/2024 560,000 563,6532.63%, 02/15/2029 (O) 3,990,000 4,063,2542.75%, 04/30/2023 - 05/31/2023 (O) 1,900,000 1,937,9492.88%, 05/15/2028 (O) 1,120,000 1,163,3563.00%, 10/31/2025 120,000 124,983
78,862,981
U.S. Treasury Inflation-Protected Securities - 1.3%U.S. Treasury Inflation-Indexed Bond
1.00%, 02/15/2046 (O) 743,491 757,2691.00%, 02/15/2048 408,224 416,567
U.S. Treasury Inflation-Indexed Note0.13%, 04/15/2022 310,449 307,2380.50%, 01/15/2028 (O) 2,540,472 2,533,8090.75%, 07/15/2028 902,331 922,148
4,937,031Total U.S. Government Obligations
(Cost $81,337,279) 83,800,012
COMMERCIAL PAPER - 0.3%Multi-Utilities - 0.1%NiSource, Inc.
3.03% (C), 05/24/2019 300,000 298,639Oil, Gas & Consumable Fuels - 0.2%Energy Transfer Partners, LP
3.25% (C), 04/22/2019 700,000 698,569Total Commercial Paper
(Cost $997,208) 997,208
Copyright © 2021 www.secdatabase.com. All Rights Reserved.Please Consider the Environment Before Printing This Document

The notes are an integral part of this report.Transamerica Series Trust Page 8
Copyright © 2021 www.secdatabase.com. All Rights Reserved.Please Consider the Environment Before Printing This Document

Transamerica PIMCO Tactical �� Growth VPSCHEDULE OF INVESTMENTS (continued)At March 31, 2019(unaudited)
The notes are an integral part of this report.Transamerica Series Trust Page 9
Principal ValueSHORT-TERM U.S. GOVERNMENT OBLIGATIONS - 0.4%U.S. Treasury Bill
2.41% (C), 04/11/2019 (Q) (R) $ 579,000 $ 578,5422.42% (C), 04/18/2019 (R) 17,000 16,9792.43% (C), 05/23/2019 902,000 898,775
Total Short-Term U.S. Government Obligations(Cost $1,494,296) 1,494,296
Shares ValueOTHER INVESTMENT COMPANY - 1.1%Securities Lending Collateral - 1.1%State Street Navigator Securities Lending Trust -
Government Money Market Portfolio,2.41% (C) 4,243,993 4,243,993
Total Other Investment Company(Cost $4,243,993) 4,243,993
Principal ValueREPURCHASE AGREEMENTS - 87.5%Fixed Income Clearing Corp., 1.45% (C), dated
03/29/2019, to be repurchased at $8,630,978on 04/01/2019. Collateralized by a U.S.Government Obligation, 2.75%, due 09/15/2021, and with a value of $8,804,957. $ 8,629,935 8,629,935
HSBC Bank PLC, 2.90% (C), dated 03/28/2019,to be repurchased at $25,014,097 on 04/04/2019. Collateralized by a U.S. GovernmentObligation, 2.50%, due 05/15/2024, and with avalue of $25,734,592. 25,000,000 25,000,000
HSBC Bank PLC, 2.95% (C), dated 03/29/2019,to be repurchased at $10,102,483 on 04/01/2019. Collateralized by a U.S. GovernmentObligation, 2.13%, due 03/31/2024, and with avalue of $10,424,197. 10,100,000 10,100,000
JPMorgan Securities LLC, 2.51% (C), dated 04/01/2019, to be repurchased at $100,027,889 on04/02/2019. Collateralized by a U.S.Government Obligation, 3.00%, due 11/15/2045, and with a value of $108,697,835. 100,000,000 100,000,000
JPMorgan Securities LLC, 3.50% (C), dated 03/29/2019, to be repurchased at $39,211,433 on04/01/2019. Collateralized by a U.S.Government Obligation, 1.63%, due 05/15/2026, and with a value of $32,129,012. 39,200,000 39,200,000
Principal ValueREPURCHASE AGREEMENTS (continued)Merrill Lynch Pierce Fenner & Smith,
3.47% (C), dated 03/29/2019, to berepurchased at $85,824,810 on 04/01/2019.Collateralized by a U.S. GovernmentObligation, 3.00%, due 11/15/2045, andwith a value of $87,467,529. $ 85,800,000 $ 85,800,000
RBC Capital Markets LLC, 2.95% (C), dated03/29/2019, to be repurchased at$66,516,348 on 04/01/2019. Collateralizedby U.S. Government Obligations, 3.00% ,due 09/30/2025 -10/31/2025, and with atotal value of $67,585,814. 66,500,000 66,500,000
Total Repurchase Agreements(Cost $335,229,935) 335,229,935
Total Investments Excluding PurchasedOptions/Swaptions(Cost $553,035,604) 556,218,606
Total Purchased Options/Swaptions - 0.5%(Cost $6,375,997) 2,174,566
Total Investments(Cost $559,411,601) 558,393,172
Net Other Assets (Liabilities) - (45.8)% (175,333,764 )Net Assets - 100.0% $ 383,059,408
Copyright © 2021 www.secdatabase.com. All Rights Reserved.Please Consider the Environment Before Printing This Document

Transamerica PIMCO Tactical �� Growth VPSCHEDULE OF INVESTMENTS (continued)At March 31, 2019(unaudited)
The notes are an integral part of this report.Transamerica Series Trust Page 10
Principal ValueREVERSE REPURCHASE AGREEMENTS - (16.7)%Bank of Nova Scotia, 2.63% (C), dated 03/11/
2019, to be repurchased at $(831,014) on 04/04/2019. Collateralized by U.S. GovernmentObligations, 3.00% - 3.88%, due 05/15/2047- 11/15/2048, and with a total value of$(877,105) $ (829,559 ) $ (829,559 )
Bank of Nova Scotia, 2.64% (C), dated 01/09/2019, to be repurchased at $(17,363,598) on04/09/2019. Collateralized by U.S.Government Obligations, 1.88% - 3.00%, due03/31/2022 - 05/15/2047, and with a totalvalue of $(17,761,764). (17,249,750) (17,249,750)
Deutsche Bank Securities, Inc., 2.46% (C), dated03/26/2019, to be repurchased at$(4,083,678) on 04/09/2019. Collateralizedby a U.S. Government Obligation, 2.63%,due 02/15/2029, and with a value of$(4,076,819). (4,079,775 ) (4,079,775 )
Deutsche Bank Securities, Inc., 2.65% (C), dated03/21/2019, to be repurchased at$(1,917,945) on 04/22/2019. Collateralizedby a U.S. Government Obligation, 2.25%,due 02/15/2027, and with a value of$(1,940,905). (1,913,438 ) (1,913,438 )
RBS Securities, Inc., 2.67% (C), dated 02/14/2019, to be repurchased at $(628,069) on 04/12/2019. Collateralized by a U.S.Government Obligation, 3.00%, due 08/15/2048, and with a value of $(644,242). (625,425 ) (625,425 )
RBS Securities, Inc., 2.75% (C), dated 03/15/2019, to be repurchased at $(4,210,322) on04/15/2019. Collateralized by a U.S.Government Obligation, 4.25%, due 11/15/2040, and with a value of $(4,377,963). (4,200,375 ) (4,200,375 )
RBS Securities, Inc., 2.90% (C), dated 03/27/2019, to be repurchased at $(4,519,347) on04/03/2019. Collateralized by U.S.Government Obligations, 3.13% - 4.25%, due05/15/2039 - 05/15/2048, and with a totalvalue of $(4,543,588). (4,516,800 ) (4,516,800 )
Royal Bank of Canada, 2.64% (C), dated 03/05/2019, to be repurchased at $(13,742,218) on06/05/2019. Collateralized by U.S.Government Obligations, 1.88% - 4.50%, due03/31/2022 - 08/15/2044, and with a totalvalue of $(14,495,618) (13,650,125) (13,650,125)
Wood Gundy, Inc., 2.65% (C), dated 03/20/2019, to be repurchased at $(2,539,785) on04/18/2019. Collateralized by U.S.Government Obligation, 3.00%, due 05/15/2042, and Cash with a total value of$(2,685,079). (2,534,375 ) (2,534,375 )
Principal ValueREVERSE REPURCHASE AGREEMENTS (continued)Wood Gundy, Inc., 2.65% (C), dated 03/08/
2019, to be repurchased at $(5,722,920) on04/18/2019. Collateralized by U.S.Government Obligation, 4.50%, due 08/15/2039, and Cash with a total value of$(6,014,615). $ (5,705,700) $ (5,705,700 )
Wood Gundy, Inc., 2.70% (C), dated 03/07/2019, to be repurchased at $(7,788,648) on04/08/2019. Collateralized by U.S.Government Obligation, 2.25%, due 08/15/2027, and Cash with a total value of$(8,122,236). (7,770,000 ) (7,770,000 )
Wood Gundy, Inc., 2.70% (C), dated 03/26/2019, to be repurchased at $(897,008) on04/10/2019. Collateralized by U.S.Government Obligation, 4.38%, due 05/15/2041, and Cash with a total value of$(919,924). (896,000 ) (896,000 )
Total Reverse Repurchase Agreements $ (63,971,322)
Copyright © 2021 www.secdatabase.com. All Rights Reserved.Please Consider the Environment Before Printing This Document

Transamerica PIMCO Tactical �� Growth VPSCHEDULE OF INVESTMENTS (continued)At March 31, 2019(unaudited)
EXCHANGE-TRADED OPTIONS PURCHASED:
DescriptionExercise
PriceExpiration
DateNotionalAmount
Number ofContracts
PremiumsPaid Value
Put - S&P 500® Index USD 2,100.00 12/20/2019 USD 232,987,680 822 $ 5,889,742 $ 1,331,640
OVER-THE-COUNTER INTEREST RATE SWAPTIONS PURCHASED:
Description Counterparty Floating Rate IndexPay/Receive
Floating RateExercise
RateExpiration
DateNotional Amount/
Number of ContractsPremiums
Paid ValueCall - 1-Year DUB 3-Month USD-LIBOR Receive 3.02 % 07/09/2020 USD 26,700,000 $98,790 $225,083Call - 1-Year MSC 3-Month USD-LIBOR Receive 3.04 06/22/2020 USD 56,000,000 202,720 477,468Call - 1-Year GSB 3-Month USD-LIBOR Receive 3.04 06/22/2020 USD 16,300,000 59,211 138,977Put - 10-Year MLI 3-Month USD-LIBOR Pay 3.40 05/16/2019 USD 5,600,000 71,400 15Put - 30-Year MLI 3-Month USD-LIBOR Pay 3.60 10/01/2019 USD 2,900,000 54,134 1,383Total $ 486,255 $ 842,926
OVER-THE-COUNTER INTEREST RATE SWAPTIONS WRITTEN:
Description Counterparty Floating Rate IndexPay/Receive
Floating RateExercise
RateExpiration
DateNotional Amount/
Number of ContractsPremiums(Received) Value
Call - 1-Year DUB 3-Month USD-LIBOR Receive 2.96 % 07/09/2021 USD 26,700,000 $(127,826 ) $(227,585 )Call - 1-Year GSB 3-Month USD-LIBOR Receive 3.02 06/21/2021 USD 16,300,000 (79,153 ) (145,871 )Call - 1-Year MSC 3-Month USD-LIBOR Receive 3.02 06/21/2021 USD 56,000,000 (263,200 ) (502,895 )Put - 5-Year MLI 3-Month USD-LIBOR Pay 3.60 10/01/2019 USD 12,100,000 (54,106 ) (493 )Total $ (524,285) $ (876,844)
Premiums(Received) Value
TOTAL WRITTEN OPTIONS AND SWAPTIONS $ (524,285) $ (876,844)
The notes are an integral part of this report.Transamerica Series Trust Page 11
Copyright © 2021 www.secdatabase.com. All Rights Reserved.Please Consider the Environment Before Printing This Document

Transamerica PIMCO Tactical �� Growth VPSCHEDULE OF INVESTMENTS (continued)At March 31, 2019(unaudited)
CENTRALLY CLEARED SWAP AGREEMENTS:
Credit Default Swap Agreements on Credit Indices �� Sell Protection (S)
Reference ObligationFixed RateReceivable
PaymentFrequency
MaturityDate
NotionalAmount (T) Value (U)
PremiumsPaid
(Received)
Net UnrealizedAppreciation
(Depreciation)North America Investment Grade Index - Series 31 1.00% Quarterly 12/20/2023 USD 8,100,000 $ (180,501) $ (79,493) $ (101,008 )
Interest Rate Swap Agreements
Floating Rate Index
Pay/ReceiveFixedRate Fixed Rate
PaymentFrequency
MaturityDate
NotionalAmount Value
PremiumsPaid
(Received)
Net UnrealizedAppreciation
(Depreciation)3-Month USD-LIBOR Pay 1.50 % Semi-Annually/Quarterly 06/21/2027 USD 5,300,000 $330,935 $328,177 $2,7583-Month USD-LIBOR Pay 1.75 Semi-Annually/Quarterly 12/21/2026 USD 200,000 7,858 7,859 (1 )3-Month USD-LIBOR Receive 2.25 Quarterly/Semi-Annually 12/16/2022 USD 200,000 753 1,130 (377 )3-Month USD-LIBOR Pay 2.25 Semi-Annually/Quarterly 06/20/2028 USD 27,200,000 173,486 1,531,999 (1,358,513 )3-Month USD-LIBOR Pay 2.50 Semi-Annually/Quarterly 12/20/2027 USD 900,000 (13,233 ) 18,596 (31,829 )3-Month USD-LIBOR Pay 3.00 Semi-Annually/Quarterly 02/04/2023 USD 12,400,000 (190,852 ) � (190,852 )3-Month USD-LIBOR Receive 3.22 Quarterly/Semi-Annually 11/15/2028 USD 600,000 46,793 � 46,7936-Month
EUR-EURIBOR Receive 2.04 Semi-Annually/Annually 02/03/2037 EUR 1,800,000 103,707 (19,177 ) 122,8846-Month GBP-LIBOR Pay 1.50 Semi-Annually 09/18/2029 GBP 3,300,000 (107,985 ) (23,262 ) (84,723 )6-Month GBP-LIBOR Pay 2.04 Semi-Annually 02/01/2037 GBP 1,600,000 (97,032 ) (39,207 ) (57,825 )6-Month JPY-LIBOR Pay 0.75 Semi-Annually 03/20/2038 JPY 180,000,000 (117,886) 23,767 (141,653 )Total $ 136,544 $ 1,829,882 $ (1,693,338)
OVER-THE-COUNTER SWAP AGREEMENTS:
Credit Default Swap Agreements on Credit Indices �� Sell Protection (S)
Reference Obligation CounterpartyFixed RateReceivable
PaymentFrequency
MaturityDate
NotionalAmount (T) Value (U)
PremiumsPaid
(Received)
Net UnrealizedAppreciation
(Depreciation)North America CMBS Basket Index -
Series AAA8 GSI 0.50 % Monthly 10/17/2057 USD 900,000 $8,999 $(38,538 ) $ 47,537North America CMBS Basket Index -
Series AAA9 GSI 0.50 Monthly 09/17/2058 USD 600,000 5,254 (35,491 ) 40,745Total $ 14,253 $ (74,029) $ 88,282
The notes are an integral part of this report.Transamerica Series Trust Page 12
Copyright © 2021 www.secdatabase.com. All Rights Reserved.Please Consider the Environment Before Printing This Document

Transamerica PIMCO Tactical �� Growth VPSCHEDULE OF INVESTMENTS (continued)At March 31, 2019(unaudited)
OVER-THE-COUNTER SWAP AGREEMENTS (continued):
Total Return Swap Agreements (V)
Reference Entity CounterpartyPay/
ReceivePayment
FrequencyMaturity
DateNotionalAmount
Number ofShares or Units Value
PremiumsPaid
(Received)
Net UnrealizedAppreciation
(Depreciation)iShares MSCI EAFE
ETF CITI Receive Quarterly 05/23/2019 USD 53,642,715 9,331 $211,530 $(26,854 ) $ 238,384iShares MSCI EAFE
ETF GSI Receive Quarterly 08/14/2019 USD 3,417,928 610 95,861 � 95,861Total $ 307,391 $ (26,854) $ 334,245
ValueOTC Swap Agreements, at value (Assets) $ 321,644
FUTURES CONTRACTS:
DescriptionLong/Short
Number ofContracts
ExpirationDate
NotionalAmount Value
UnrealizedAppreciation
UnrealizedDepreciation
90-Day Eurodollar Long 83 06/17/2019 $20,131,610 $20,221,913 $90,303 $�90-Day Eurodollar Long 245 12/16/2019 59,328,465 59,761,625 433,160 �90-Day Eurodollar Short (83 ) 06/15/2020 (20,103,662 ) (20,288,313 ) � (184,651 )90-Day Eurodollar Short (245 ) 12/14/2020 (59,313,322 ) (59,936,188 ) � (622,866 )2-Year U.S. Treasury Note Long 181 06/28/2019 38,576,965 38,569,969 � (6,996 )5-Year U.S. Treasury Note Short (301 ) 06/28/2019 (34,873,374 ) (34,864,266 ) 9,108 �10-Year U.S. Treasury Note Long 2 06/19/2019 245,065 248,438 3,373 �10-Year U.S. Treasury Note Short (10 ) 06/19/2019 (1,302,515 ) (1,327,813 ) � (25,298 )sE-Mini Russell 2000® Index Long 248 06/21/2019 19,102,160 19,143,120 40,960 �Euro OAT Index Short (10 ) 06/06/2019 (1,776,673 ) (1,824,751 ) � (48,078 )German Euro Bund Index Short (4 ) 06/06/2019 (730,480 ) (746,368 ) � (15,888 )S&P 500® E-Mini Index Long 1,621 06/21/2019 225,235,754 230,003,690 4,767,936 �U.S. Treasury Bond Long 35 06/19/2019 5,687,002 5,880,000 192,998 �U.S. Treasury Bond Short (97 ) 06/19/2019 (14,140,645 ) (14,516,656 ) � (376,011 )Total $ 5,537,838 $ (1,279,788)
FORWARD FOREIGN CURRENCY CONTRACTS:
Counterparty Settlement DateCurrencyPurchased
CurrencySold
UnrealizedAppreciation
UnrealizedDepreciation
BNP 06/19/2019 INR 8,806,480 USD 122,007 $ 3,815 $�CITI 04/02/2019 USD 1,097,132 GBP 831,000 14,685 �CITI 04/24/2019 MXN 11,737,000 USD 606,814 � (4,466 )CITI 05/15/2019 RUB 35,153,542 USD 528,915 3,033 �CITI 06/11/2019 COP 364,033,000 USD 116,616 � (2,870 )GSB 04/02/2019 USD 220,171 CAD 289,000 3,899 �HSBC 04/01/2019 USD 110,344 DKK 715,000 2,903 �HSBC 04/24/2019 USD 608,072 MXN 11,737,000 5,724 �JPM 04/02/2019 EUR 264,000 USD 301,044 � (4,851 )JPM 05/15/2019 USD 103,884 JPY 11,400,000 639 �JPM 07/01/2019 USD 108,412 DKK 715,000 84 �SCB 04/02/2019 GBP 526,000 USD 696,365 � (11,206 )SCB 05/03/2019 USD 697,420 GBP 526,000 11,189 �SCB 06/19/2019 IDR 1,842,640,000 USD 129,100 � (1,015 )Total $ 45,971 $ (24,408 )
Copyright © 2021 www.secdatabase.com. All Rights Reserved.Please Consider the Environment Before Printing This Document

The notes are an integral part of this report.Transamerica Series Trust Page 13
Copyright © 2021 www.secdatabase.com. All Rights Reserved.Please Consider the Environment Before Printing This Document

Transamerica PIMCO Tactical �� Growth VPSCHEDULE OF INVESTMENTS (continued)At March 31, 2019(unaudited)
SECURITY VALUATION:
Valuation Inputs (W)
Level 1 -Unadjusted
QuotedPrices
Level 2 -Other
SignificantObservable
Inputs
Level 3 -Significant
UnobservableInputs (X) Value
ASSETSInvestmentsAsset-Backed Securities $� $6,167,253 $� $6,167,253Certificates of Deposit � 500,000 � 500,000Corporate Debt Securities � 72,872,379 � 72,872,379Foreign Government Obligations � 7,968,106 � 7,968,106Loan Assignment � � 467,963 467,963Mortgage-Backed Securities � 6,592,428 � 6,592,428Municipal Government Obligations � 1,381,013 � 1,381,013U.S. Government Agency Obligations � 34,504,020 � 34,504,020U.S. Government Obligations � 83,800,012 � 83,800,012Commercial Paper � 997,208 � 997,208Short-Term U.S. Government Obligations � 1,494,296 � 1,494,296Other Investment Company 4,243,993 � � 4,243,993Repurchase Agreements � 335,229,935 � 335,229,935Exchange-Traded Options Purchased 1,331,640 � � 1,331,640Over-the-Counter Interest Rate Swaptions Purchased � 842,926 � 842,926Total Investments $5,575,633 $ 552,349,576 $ 467,963 $ 558,393,172Other Financial InstrumentsCentrally Cleared Interest Rate Swap Agreements $� $663,532 $� $663,532Over-the-Counter Credit Default Swap Agreements � 14,253 � 14,253Over-the-Counter Total Return Swap Agreements � 307,391 � 307,391Futures Contracts (Y) 5,537,838 � � 5,537,838Forward Foreign Currency Contracts (Y) � 45,971 � 45,971Total Other Financial Instruments $5,537,838 $1,031,147 $�� $6,568,985LIABILITIESOther Financial InstrumentsReverse Repurchase Agreements $� $(63,971,322 ) $� $(63,971,322 )Over-the-Counter Interest Rate Swaptions Written � (876,844 ) � (876,844 )Centrally Cleared Credit Default Swap Agreements � (180,501 ) � (180,501 )Centrally Cleared Interest Rate Swap Agreements � (526,988 ) � (526,988 )Futures Contracts (Y) (1,279,788 ) � � (1,279,788 )Forward Foreign Currency Contracts (Y) � (24,408 ) � (24,408 )Total Other Financial Instruments $ (1,279,788) $(65,580,063 ) $�� $(66,859,851 )
FOOTNOTES TO SCHEDULE OF INVESTMENTS:
(A) Floating or variable rate securities. The rates disclosed are as of March 31, 2019. For securities based on a published reference rate and spread, the referencerate and spread are indicated within the description. Variable rate securities with a floor or ceiling feature are disclosed at the inherent rate, where applicable.Certain variable rate securities are not based on a published reference rate and spread, but are determined by the issuer or agent and are based on current marketconditions; these securities do not indicate a reference rate and spread in the description.
(B) Securities are registered pursuant to Rule 144A of the Securities Act of 1933. Unless otherwise indicated, the securities are deemed to be liquid for purposes ofcompliance limitations on holdings of illiquid securities and may be resold as transactions exempt from registration, normally to qualified institutional buyers. AtMarch 31, 2019, the total value of 144A securities is $33,753,221, representing 8.8% of the Portfolio�s net assets.
(C) Rates disclosed reflect the yields at March 31, 2019.(D) Percentage rounds to less than 0.1% or (0.1)%.(E) Perpetual maturity. The date displayed is the next call date.(F) All or a portion of the securities are on loan. The total value of all securities on loan is $4,157,089. The amount of securities on loan indicated may not correspond
with the securities on loan identified because securities with pending sales are in the process of recall from the brokers.
Copyright © 2021 www.secdatabase.com. All Rights Reserved.Please Consider the Environment Before Printing This Document

(G) Securities are exempt from registration under Regulation S of the Securities Act of 1933, which exempts from registration securities offered and sold outside theUnited States. Securities may not be offered or sold in the United States except pursuant to an exemption from, or in a transaction not subject to, the registrationrequirements of the Securities Act of 1933. At March 31, 2019, the total value of Regulation S securities is $4,394,578, representing 1.1% of the Portfolio�s netassets.
(H) Step bond. Coupon rate changes in increments to maturity. The rate disclosed is as of March 31, 2019; the maturity date disclosed is the ultimate maturity date.(I) Securities in default; partial receipt of interest payments and/or dividends declared at last payment date. At March 31, 2019, the total value of such securities is
$452,650, representing 0.1% of the Portfolio�s net assets.(J) Restricted security. At March 31, 2019, the value of such security held by the Portfolio is as follows:
Investments DescriptionAcquisition
DateAcquisition
Cost ValueValue as Percentage
of Net AssetsForeign Government Obligations Export-Import Bank of Korea
1.93%, 02/24/2020, MTN 02/16/2017 $ 229,683 $ 223,172 0.1 %
(K) Fair valued as determined in good faith in accordance with procedures established by the Board. At March 31, 2019, the total value of securities is $796,303,representing 0.2% of the Portfolio�s net assets.
(L) Security is Level 3 of the fair value hierarchy.
The notes are an integral part of this report.Transamerica Series Trust Page 14
Copyright © 2021 www.secdatabase.com. All Rights Reserved.Please Consider the Environment Before Printing This Document

Transamerica PIMCO Tactical �� Growth VPSCHEDULE OF INVESTMENTS (continued)At March 31, 2019(unaudited)
FOOTNOTES TO SCHEDULE OF INVESTMENTS (continued):
(M) All or a portion of the security represents an unsettled loan commitment at March 31, 2019 where the rate will be determined at time of settlement.(N) When-issued, delayed-delivery and/or forward commitment (including TBAs) securities. Securities to be settled and delivered after March 31, 2019. Securities
may display a coupon rate of 0.00%, as the rate is to be determined at time of settlement.(O) Securities are subject to sale-buyback transactions.(P) All or a portion of the security has been segregated by the custodian as collateral for centrally cleared swap agreements. The value of the security is $85,910.(Q) All or a portion of the security has been segregated by the custodian as collateral to cover margin requirements for open futures contracts. The value of the
security is $569,550.(R) All or a portion of these securities have been segregated by the custodian as collateral for open over-the-counter swaptions, swap agreements and forward foreign
currency contracts. The total value of such securities is $24,972.(S) If the Portfolio is a seller of protection and a credit event occurs, as defined under the terms of that particular swap agreement, the Portfolio will either (a) pay to
the buyer of protection an amount equal to the notional amount of the swap and take delivery of the referenced obligation or underlying securities comprising thereferenced obligation or (b) pay a net settlement amount in the form of cash or securities equal to the notional amount of the swap agreement less the recoveryvalue of the referenced obligation or underlying securities comprising the referenced obligation.
(T) The maximum potential amount the Portfolio could be required to pay as a seller of credit protection or receive as a buyer of credit protection if a credit eventoccurs as defined under the terms of that particular swap agreement.
(U) The quoted market prices and resulting values for credit default swap agreements on asset-backed securities and credit indices serve as an indicator of the currentstatus of the payment/performance risk and represent the likelihood of an expected liability (or profit) for the credit derivative had the notional amount of the swapagreement been closed/sold as of the period ended. Increasing market values, in absolute terms when compared to the notional amount of the swap agreement,represent a deterioration of the referenced entity�s credit soundness and a greater likelihood or risk of default or other credit event occurring as defined under theterms of the agreement.
(V) At the termination date, a net cash flow is exchanged where the total return is equivalent to the return of the reference entity less a financing rate, if any. As areceiver, the Portfolio would receive payments based on any positive total return and would owe payments in the event of a negative total return. As the payer, thePortfolio would owe payments on any net positive total return and would receive payment in the event of a negative total return.
(W) There were no transfers in or out of Level 3 during the period ended March 31, 2019. Please reference the Security Valuation section of the Notes to Schedules ofInvestments for more information regarding security valuation and pricing inputs.
(X) Level 3 securities were not considered significant to the Portfolio.(Y) Futures contracts and/or forward foreign currency contracts are valued at unrealized appreciation (depreciation).
CURRENCY ABBREVIATIONS:
CAD Canadian DollarCOP Columbian PesoDKK Danish KroneEUR EuroGBP Pound SterlingIDR Indonesian RupiahINR Indian RupeeJPY Japanese YenMXN Mexican PesoPEN Peruvian SolRUB Russian RubleUSD United States Dollar
COUNTERPARTY ABBREVIATIONS:
BNP BNP ParibasCITI Citibank N.A.DUB Deutsche Bank AGGSB Goldman Sachs BankGSI Goldman Sachs InternationalHSBC HSBC Bank USAJPM JPMorgan Chase Bank, N.A.MLI Merrill Lynch InternationalMSC Morgan Stanley & Co.SCB Standard Chartered Bank
PORTFOLIO ABBREVIATIONS:
CMBS Commercial Mortgage-Backed SecuritiesEAFE Europe, Australasia and Far EastETF Exchange-Traded Fund
Copyright © 2021 www.secdatabase.com. All Rights Reserved.Please Consider the Environment Before Printing This Document

EURIBOR Euro Interbank Offer RateLIBOR London Interbank Offered RateMTN Medium Term NoteOAT Obligations Assimilables du Tresor (Treasury Obligations)STRIPS Separate Trading of Registered Interest and Principal of SecuritiesTBA To Be AnnouncedTBD To Be Determined
The notes are an integral part of this report.Transamerica Series Trust Page 15
Copyright © 2021 www.secdatabase.com. All Rights Reserved.Please Consider the Environment Before Printing This Document

Transamerica PIMCO Total Return VPSCHEDULE OF INVESTMENTSAt March 31, 2019(unaudited)
The notes are an integral part of this report.Transamerica Series Trust Page 1
Principal ValueASSET-BACKED SECURITIES - 13.9%ABFC Trust
Series 2004-OPT4, Class A1,1-Month LIBOR + 0.62%,
3.11% (A), 04/25/2034 $ 183,432 $ 183,625Adams Mill CLO, Ltd.
Series 2014-1A, Class A1R,3-Month LIBOR + 1.10%,
3.89% (A), 07/15/2026 (B) 3,815,703 3,815,188Ally Auto Receivables Trust
Series 2018-3, Class A2,2.72%, 05/17/2021 6,599,958 6,600,374
AmeriCredit Automobile Receivables TrustSeries 2018-1, Class A2B,1-Month LIBOR + 0.23%,
2.71% (A), 07/19/2021 2,476,308 2,476,212Ameriquest Mortgage Securities Trust
Series 2006-R1, Class M1,1-Month LIBOR + 0.39%,
2.88% (A), 03/25/2036 191,168 190,324Apex Credit CLO, Ltd.
Series 2016-1A, Class ASR,3-Month LIBOR + 1.05%,
3.61% (A), 10/27/2028 (B) 6,700,000 6,778,812Apidos CLO XVI
Series 2013-16A, Class A1R,3-Month LIBOR + 0.98%,
3.74% (A), 01/19/2025 (B) 1,348,177 1,348,187Argent Securities, Inc. Asset-Backed
Pass-Through CertificatesSeries 2005-W4, Class A2D,1-Month LIBOR + 0.38%,
2.87% (A), 02/25/2036 2,794,421 2,139,768Aurium CLO
Series 2A, Class AR,3-Month LIBOR + 0.68%,
0.68% (A), 10/13/2029 (B) (C) EUR 3,600,000 4,025,431B&M CLO, Ltd.
Series 2014-1A, Class A1R,3-Month LIBOR + 0.73%,
3.51% (A), 04/16/2026 (B) $ 3,384,563 3,370,429Barings Euro CLO
Series 2016-1A, Class A1R,3-Month LIBOR + 0.68%,
0.68% (A), 07/27/2030 (B) (C) EUR 6,000,000 6,696,035Bear Stearns Asset-Backed Securities I Trust
Series 2005-AQ1, Class M2,1-Month LIBOR + 0.65%,
3.14% (A), 03/25/2035 $ 728,105 731,543Series 2005-HE6, Class M2,1-Month LIBOR + 1.01%,
3.49% (A), 06/25/2035 253,657 256,194Series 2006-HE10, Class 21A3,1-Month LIBOR + 0.24%,
2.73% (A), 12/25/2036 13,329,542 11,392,689Series 2007-HE3, Class 1A2,1-Month LIBOR + 0.20%,
2.69% (A), 04/25/2037 726,274 1,004,789
Principal ValueASSET-BACKED SECURITIES (continued)Bear Stearns Asset-Backed Securities Trust
Series 2002-2, Class A1,1-Month LIBOR + 0.66%,
3.15% (A), 10/25/2032 $ 6,914 $ 6,928Series 2004-1, Class M1,1-Month LIBOR + 0.98%,
3.46% (A), 06/25/2034 2,245,858 2,257,343Series 2006-SD3, Class 21A1,4.33% (A), 07/25/2036 82,263 82,292
Benefit Street Partners CLO VII, Ltd.Series 2015-VIIA, Class A1AR,3-Month LIBOR + 0.78%,
3.56% (A), 07/18/2027 (B) 4,500,000 4,470,592Cent CLO 19, Ltd.
Series 2013-19A, Class A1A,3-Month LIBOR + 1.33%,
4.08% (A), 10/29/2025 (B) 4,854,365 4,859,117Chase Issuance Trust
Series 2017-A1, Class A,1-Month LIBOR + 0.30%,
2.78% (A), 01/15/2022 7,000,000 7,009,508Chesapeake Funding II LLC
Series 2018-2A, Class A1,3.23%, 08/15/2030 (B) 7,775,859 7,829,664
CIFC Funding, Ltd.Series 2015-2A, Class AR,3-Month LIBOR + 0.78%,
3.57% (A), 04/15/2027 (B) 8,500,000 8,447,002Series 2015-5A, Class A1R,3-Month LIBOR + 0.86%,
3.63% (A), 10/25/2027 (B) 8,200,000 8,163,092CIT Mortgage Loan Trust
Series 2007-1, Class 1A,1-Month LIBOR + 1.35%,
3.84% (A), 10/25/2037 (B) 4,511,127 4,551,419Citigroup Mortgage Loan Trust
Series 2007-AMC1, Class A1,1-Month LIBOR + 0.16%,
2.65% (A), 12/25/2036 (B) 9,061,403 5,979,677Series 2007-AMC4, Class A2C,1-Month LIBOR + 0.17%,
2.66% (A), 05/25/2037 657,916 653,675Series 2007-FS1, Class 1A1,4.58% (A), 10/25/2037 (B) 3,318,422 3,346,335
Citigroup Mortgage Loan Trust Asset-BackedPass-Through CertificateSeries 2004-OPT1, Class M3,1-Month LIBOR + 0.95%,
3.43% (A), 10/25/2034 4,631,000 4,623,192Countrywide Asset-Backed Certificates
Series 2003-3, Class M1,1-Month LIBOR + 1.05%,
3.54% (A), 08/25/2033 545,003 532,924Series 2004-9, Class MV4,1-Month LIBOR + 1.58%,
4.06% (A), 11/25/2034 2,500,000 2,352,271Series 2006-20, Class 1A,1-Month LIBOR + 0.14%,
2.63% (A), 04/25/2047 4,158,871 4,021,935
Copyright © 2021 www.secdatabase.com. All Rights Reserved.Please Consider the Environment Before Printing This Document

Transamerica PIMCO Total Return VPSCHEDULE OF INVESTMENTS (continued)At March 31, 2019(unaudited)
Principal ValueASSET-BACKED SECURITIES (continued)Countrywide Asset-Backed Certificates
(continued)Series 2006-24, Class 1A,1-Month LIBOR + 0.14%,
2.63% (A), 06/25/2047 $ 10,229,368 $ 9,105,292Series 2006-24, Class 2A3,1-Month LIBOR + 0.15%,
2.64% (A), 06/25/2047 3,166,510 3,133,633Series 2007-2, Class 2A3,1-Month LIBOR + 0.14%,
2.63% (A), 08/25/2037 5,054,923 4,951,926CSMC Trust
Series 2017-1A, Class A,4.50% (A), 03/25/2021 (B) 2,825,971 2,835,786
CWABS Asset-Backed Certificates TrustSeries 2004-13, Class MV4,1-Month LIBOR + 0.85%,
3.34% (A), 04/25/2035 257,027 257,651CWABS, Inc. Asset-Backed Certificates Trust
Series 2003-BC1, Class A1,1-Month LIBOR + 0.80%,
3.29% (A), 03/25/2033 21,018 20,787Dryden XXV Senior Loan Fund
Series 2012-25A, Class ARR,3-Month LIBOR + 0.90%,
3.69% (A), 10/15/2027 (B) 7,100,000 7,077,628Emerson Park CLO, Ltd.
Series 2013-1A, Class A1AR,3-Month LIBOR + 0.98%,
3.77% (A), 07/15/2025 (B) 368,733 368,737Ford Credit Auto Owner Trust
Series 2014-2, Class A,2.31%, 04/15/2026 (B) 6,820,000 6,801,401
Gallatin CLO IX, Ltd.Series 2018-1A, Class A,3-Month LIBOR + 1.05%,
3.81% (A), 01/21/2028 (B) 6,700,000 6,679,605GSAMP Trust
Series 2005-HE1, Class M2,1-Month LIBOR + 1.32%,
3.81% (A), 12/25/2034 3,386,341 2,658,688Series 2007-HS1, Class A1,1-Month LIBOR + 0.85%,
3.34% (A), 02/25/2047 1,146,290 1,147,166Halcyon Loan Advisors Funding, Ltd.
Series 2014-3A, Class AR,3-Month LIBOR + 1.10%,
3.86% (A), 10/22/2025 (B) 5,899,312 5,897,052Home Equity Asset Trust
Series 2002-1, Class A4,1-Month LIBOR + 0.60%,
3.09% (A), 11/25/2032 1,283 1,244Series 2004-4, Class M1,1-Month LIBOR + 0.78%,
3.27% (A), 10/25/2034 3,884,852 3,855,050Home Equity Mortgage Loan Asset-Backed
TrustSeries 2007-A, Class 1A,1-Month LIBOR + 0.22%,
2.71% (A), 04/25/2037 1,554,241 1,221,105Hyundai Auto Lease Securitization Trust
Series 2017-B, Class A2A,1.69%, 12/16/2019 (B) 75,953 75,913
Principal ValueASSET-BACKED SECURITIES (continued)KVK CLO, Ltd.
Series 2013-1A, Class AR,3-Month LIBOR + 0.90%,
3.70% (A), 01/14/2028 (B)$7,000,000
$6,952,211
LoanCore Issuer, Ltd.Series 2018-CRE1, Class A,1-Month LIBOR + 1.13%,
3.61% (A), 05/15/2028 (B) 6,600,000 6,603,012Master Asset-Backed Securities Trust
Series 2007-HE2, Class A1,1-Month LIBOR + 1.15%,
3.64% (A), 08/25/2037 3,352,245 2,984,523Monarch Grove CLO Trust
Series 2018-1A, Class A1,3-Month LIBOR + 0.88%,
3.65% (A), 01/25/2028 (B) 5,700,000 5,660,670Morgan Stanley ABS Capital I, Inc. Trust
Series 2004-HE9, Class M2,1-Month LIBOR + 0.93%,
3.42% (A), 11/25/2034 1,509,225 1,497,117Series 2005-WMC6, Class M3,1-Month LIBOR + 0.77%,
3.25% (A), 07/25/2035 3,604,104 3,617,019Series 2007-HE5, Class A2C,1-Month LIBOR + 0.25%,
2.74% (A), 03/25/2037 2,870,107 1,486,294Mountain Hawk III CLO, Ltd.
Series 2014-3A, Class AR,3-Month LIBOR + 1.20%,
3.98% (A), 04/18/2025 (B) 3,808,949 3,809,052Navient Private Education Loan Trust
Series 2018-BA, Class A1,1-Month LIBOR + 0.35%,
2.83% (A), 12/15/2059 (B) 3,012,281 3,011,687Navient Student Loan Trust
Series 2017-3A, Class A1,1-Month LIBOR + 0.30%,
2.79% (A), 07/26/2066 (B) 1,999,614 1,999,309Series 2018-2A, Class A1,1-Month LIBOR + 0.24%,
2.73% (A), 03/25/2067 (B) 2,589,328 2,588,928New Century Home Equity Loan Trust
Series 2005-C, Class A2C,1-Month LIBOR + 0.25%,
2.74% (A), 12/25/2035 111,189 111,158Nissan Master Owner Trust Receivables
Series 2016-A, Class A1,1-Month LIBOR + 0.64%,
3.12% (A), 06/15/2021 7,000,000 7,005,566OCP CLO, Ltd.
Series 2015-9A, Class A1R,3-Month LIBOR + 0.80%,
3.59% (A), 07/15/2027 (B) 7,000,000 6,957,489Octagon Investment Partners XXIII, Ltd.
Series 2015-1A, Class A1R,3-Month LIBOR + 0.85%,
3.64% (A), 07/15/2027 (B) 4,100,000 4,070,111OneMain Direct Auto Receivables Trust
Series 2018-1A, Class A,3.43%, 12/16/2024 (B) 6,700,000 6,771,140
Copyright © 2021 www.secdatabase.com. All Rights Reserved.Please Consider the Environment Before Printing This Document

The notes are an integral part of this report.Transamerica Series Trust Page 2
Copyright © 2021 www.secdatabase.com. All Rights Reserved.Please Consider the Environment Before Printing This Document

Transamerica PIMCO Total Return VPSCHEDULE OF INVESTMENTS (continued)At March 31, 2019(unaudited)
Principal ValueASSET-BACKED SECURITIES (continued)Option One Mortgage Loan Trust
Series 2007-2, Class 1A1,1-Month LIBOR + 0.14%,
2.63% (A), 03/25/2037$5,690,020
$4,193,307
Series 2007-5, Class 1A1,1-Month LIBOR + 0.22%,
2.71% (A), 05/25/2037 8,421,772 5,742,836RASC Trust
Series 2005-KS11, Class M2,1-Month LIBOR + 0.42%,
2.91% (A), 12/25/2035 7,100,000 7,077,319Series 2006-EMX1, Class M1,1-Month LIBOR + 0.41%,
2.90% (A), 01/25/2036 1,736,542 1,725,924Series 2006-KS9, Class AI3,1-Month LIBOR + 0.16%,
2.65% (A), 11/25/2036 1,425,232 1,357,552SLM Student Loan Trust
Series 2003-11, Class A6,3-Month LIBOR + 0.55%,
3.16% (A), 12/15/2025 (B) 5,935,434 5,957,201Series 2005-3, Class A5,3-Month LIBOR + 0.09%,
2.86% (A), 10/25/2024 2,425,567 2,422,895Series 2007-3, Class A3,3-Month LIBOR + 0.04%,
2.81% (A), 04/25/2019 39,852 39,825Sofi Professional Loan Program LLC
Series 2018-A, Class A2A,2.39%, 02/25/2042 (B) 4,539,974 4,521,715
Sofi Professional Loan Program TrustSeries 2018-B, Class A1FX,2.64%, 08/25/2047 (B) 5,598,811 5,590,527
Soundview Home Loan TrustSeries 2005-3, Class M3,1-Month LIBOR + 0.83%,
3.31% (A), 06/25/2035 105,554 104,739Series 2006-OPT2, Class A3,1-Month LIBOR + 0.18%,
2.67% (A), 05/25/2036 1,958,408 1,953,785Series 2007-WMC1, Class 3A1,1-Month LIBOR + 0.11%,
2.60% (A), 02/25/2037 1,251,110 462,053SpringCastle America Funding LLC
Series 2016-AA, Class A,3.05%, 04/25/2029 (B) 2,983,959 2,980,116
Structured Asset Investment Loan TrustSeries 2005-9, Class M1,1-Month LIBOR + 0.42%,
2.91% (A), 11/25/2035 6,000,000 5,865,026TICP CLO I, Ltd.
Series 2015-1A, Class AR,3-Month LIBOR + 0.80%,
3.56% (A), 07/20/2027 (B) 7,100,000 7,055,277TICP CLO III, Ltd.
Series 2018-3R, Class A,3-Month LIBOR + 0.84%,
3.60% (A), 04/20/2028 (B) 5,500,000 5,453,750Tralee CLO V, Ltd.
Series 2018-5A, Class A1,3-Month LIBOR + 1.11%,
3.87% (A), 10/20/2028 (B) 7,900,000 7,819,278
Principal ValueASSET-BACKED SECURITIES (continued)Trillium Credit Card Trust II
Series 2018-1A, Class A,1-Month LIBOR + 0.25%,
2.73% (A), 02/27/2023 (B)$11,100,000
$11,097,905
U.S. Small Business AdministrationSeries 2003-20I, Class 1,5.13%, 09/01/2023 26,743 27,656Series 2004-20C, Class 1,4.34%, 03/01/2024 204,359 209,448Series 2008-20L, Class 1,6.22%, 12/01/2028 617,433 664,584
Venture XII CLO, Ltd.Series 2012-12A, Class ARR,3-Month LIBOR + 0.80%,
3.43% (A), 02/28/2026 (B) 8,400,000 8,361,108Venture XVI CLO, Ltd.
Series 2014-16A, Class ARR,3-Month LIBOR + 0.85%,
3.64% (A), 01/15/2028 (B) 7,000,000 6,945,827Venture XX CLO, Ltd.
Series 2015-20A, Class AR,3-Month LIBOR + 0.82%,
3.61% (A), 04/15/2027 (B) 5,700,000 5,672,064Voya CLO, Ltd.
Series 2014-3A, Class A1R,3-Month LIBOR + 0.72%,
3.49% (A), 07/25/2026 (B) 6,345,167 6,315,795Wachovia Mortgage Loan Trust
Series 2005-WMC1, Class M2,1-Month LIBOR + 0.69%,
3.18% (A), 10/25/2035 1,651,000 1,536,176WaMu Asset-Backed Certificates Trust
Series 2007-HE2, Class 2A3,1-Month LIBOR + 0.25%,
2.74% (A), 04/25/2037 4,354,238 2,215,935Westlake Automobile Receivables Trust
Series 2018-3A, Class A1,2.53%, 09/16/2019 (B) 148,038 148,011Series 2018-3A, Class A2A,2.98%, 01/18/2022 (B) 5,300,000 5,306,237
Total Asset-Backed Securities(Cost $348,402,011) 360,234,387
CERTIFICATE OF DEPOSIT - 0.5%Banks - 0.5%Barclays Bank PLC
3-Month LIBOR + 0.40%,3.17% (A), 10/25/2019 13,500,000 13,500,000
Total Certificate of Deposit(Cost $13,500,000) 13,500,000
CORPORATE DEBT SECURITIES - 47.5%Aerospace & Defense - 0.3%United Technologies Corp.
3.65%, 08/16/2023 6,900,000 7,082,593Airlines - 0.2%Latam Airlines Pass-Through Trust
4.20%, 08/15/2029 4,797,915 4,723,068
Copyright © 2021 www.secdatabase.com. All Rights Reserved.Please Consider the Environment Before Printing This Document

The notes are an integral part of this report.Transamerica Series Trust Page 3
Copyright © 2021 www.secdatabase.com. All Rights Reserved.Please Consider the Environment Before Printing This Document

Transamerica PIMCO Total Return VPSCHEDULE OF INVESTMENTS (continued)At March 31, 2019(unaudited)
Principal ValueCORPORATE DEBT SECURITIES (continued)Auto Components - 0.0% (D)ZF North America Capital, Inc.
4.50%, 04/29/2022 (B) $ 800,000 $ 798,062Automobiles - 0.1%Volkswagen International Finance NV
4.00%, 08/12/2020 (B) 1,400,000 1,418,774Banks - 17.4%AIB Group PLC
4.75%, 10/12/2023 (B) 6,600,000 6,815,660Banco Bilbao Vizcaya Argentaria SA
Fixed until 02/18/2020 (E),6.75% (A) (F) EUR 3,600,000 4,135,608
Banco do Nordeste do Brasil SA4.38%, 05/03/2019 (F) $ 2,900,000 2,881,875
Banco Espirito Santo SA2.63%, 05/08/2017, MTN (F) (G) (H) EUR 1,600,000 493,5704.00%, 01/21/2019, MTN (F) (G) (H) 800,000 251,272
Banco Santander SA3.85%, 04/12/2023 $ 6,800,000 6,857,906
Bank of America Corp.Fixed until 12/20/2022,
3.00% (A), 12/20/2023 16,197,000 16,132,4993-Month LIBOR + 1.00%,
3.78% (A), 04/24/2023 8,500,000 8,567,0304.10%, 07/24/2023 4,100,000 4,286,818
Banque Federative du Credit Mutuel SA3-Month LIBOR + 0.96%,
3.72% (A), 07/20/2023 (B) 8,000,000 8,044,126Barclays Bank PLC
7.63%, 11/21/2022 3,100,000 3,371,25010.18%, 06/12/2021 (B) 5,520,000 6,248,629
Barclays PLC3-Month LIBOR + 1.43%,
4.11% (A), 02/15/2023 5,400,000 5,367,7303-Month LIBOR + 1.63%,
4.41% (A), 01/10/2023 5,200,000 5,193,368Fixed until 02/15/2022,
4.61% (A), 02/15/2023 8,100,000 8,267,0703-Month LIBOR + 2.11%,
4.81% (A), 08/10/2021 5,200,000 5,299,349Fixed until 09/15/2019 (E),
6.50% (A) EUR 1,700,000 1,923,040Fixed until 09/15/2023 (E),
7.75% (A) $ 6,500,000 6,511,050Fixed until 09/15/2022 (E),
7.88% (A) (F) GBP 3,000,000 4,078,295CitiBank NA
3.05%, 05/01/2020 $ 9,500,000 9,531,5303-Month LIBOR + 0.32%,
3.06% (A), 05/01/2020 1,600,000 1,601,578Citigroup, Inc.
2.05%, 06/07/2019 500,000 499,4102.70%, 10/27/2022 6,800,000 6,736,7222.75%, 04/25/2022 8,400,000 8,364,6352.90%, 12/08/2021 3,700,000 3,699,0213-Month LIBOR + 1.38%,
3.98% (A), 03/30/2021 (I) 1,100,000 1,118,5853-Month LIBOR + 1.43%,
4.06% (A), 09/01/2023 4,300,000 4,371,482Cooperatieve Rabobank UA
3-Month LIBOR + 0.43%,3.19% (A), 04/26/2021 3,700,000 3,710,420
Principal ValueCORPORATE DEBT SECURITIES (continued)Banks (continued)HSBC Holdings PLC
3-Month LIBOR + 0.65%,3.25% (A), 09/11/2021 $ 6,500,000
$6,494,387
3-Month LIBOR + 1.50%,4.30% (A), 01/05/2022 2,900,000 2,967,173
Fixed until 07/04/2029 (E),4.75% (A), MTN (F) EUR 5,200,000 5,708,915
ING Bank NV2.63%, 12/05/2022 (B) $ 3,600,000 3,600,259
ING Groep NV4.63%, 01/06/2026 (B) 900,000 944,296
JPMorgan Chase & Co.2.40%, 06/07/2021 7,500,000 7,444,7022.55%, 10/29/2020 800,000 797,8723.90%, 07/15/2025 7,100,000 7,376,850
JPMorgan Chase Bank NAFixed until 04/26/2020,
3.09% (A), 04/26/2021 17,200,000 17,233,008Lloyds Bank PLC
7.50% (J), 04/02/2032, MTN (F) 9,600,000 7,376,534Fixed until 12/16/2024 (E),
12.00% (A) (B) (I) 9,800,000 11,759,451Lloyds Banking Group PLC
4.05%, 08/16/2023 5,100,000 5,200,390Fixed until 06/27/2023 (E),
7.63% (A) (F) GBP 2,500,000 3,439,099Mitsubishi UFJ Financial Group, Inc.
3.46%, 03/02/2023 $ 4,900,000 4,967,080Mizuho Financial Group, Inc.
Fixed until 09/11/2023,3.92% (A), 09/11/2024 8,100,000 8,335,715
National Australia Bank, Ltd.2.25%, 03/16/2021 (B) (I) 6,000,000 5,955,115
Natwest Markets PLC0.63%, 03/02/2022, MTN (F) EUR 5,800,000 6,456,113
Regions BankFixed until 08/13/2020,
3.37% (A), 08/13/2021 $ 6,800,000 6,831,866Royal Bank of Canada
2.30%, 03/22/2021 6,000,000 5,966,825Royal Bank of Scotland Group PLC
2.50%, 03/22/2023, MTN (F) EUR 6,900,000 8,093,040Fixed until 05/15/2022,
3.50% (A), 05/15/2023 $ 5,000,000 4,964,4843.88%, 09/12/2023 4,200,000 4,217,408Fixed until 06/25/2023,
4.52% (A), 06/25/2024 5,000,000 5,112,913Fixed until 08/15/2021 (E),
8.63% (A) 3,800,000 4,047,000Santander UK PLC
2.13%, 11/03/2020 4,160,000 4,114,3493.75%, 11/15/2021 8,100,000 8,243,202
Skandinaviska Enskilda Banken AB3-Month LIBOR + 0.43%,
3.11% (A), 05/17/2021 (B) 6,700,000 6,699,2763.25%, 05/17/2021 (B) 6,800,000 6,841,480
Societe Generale SA4.25%, 09/14/2023 (B) 6,500,000 6,666,414
Standard Chartered PLCFixed until 01/20/2022,
4.25% (A), 01/20/2023 (B) 6,700,000 6,806,389Sumitomo Mitsui Banking Corp.
Copyright © 2021 www.secdatabase.com. All Rights Reserved.Please Consider the Environment Before Printing This Document

The notes are an integral part of this report.Transamerica Series Trust Page 4
4.38%, 08/04/2025 7,400,000 7,628,018Fixed until 06/29/2021 (E),
6.63% (A) (F) EUR 2,000,000 2,441,687
2.51%, 01/17/2020 7,100,000 7,089,9413-Month LIBOR + 0.37%,
3.15% (A), 10/16/2020 7,900,000 7,906,403Sumitomo Mitsui Financial Group, Inc.
3-Month LIBOR + 1.68%,4.28% (A), 03/09/2021 6,000,000 6,127,656
Svenska Handelsbanken AB3.35%, 05/24/2021, MTN 7,000,000 7,079,2303.90%, 11/20/2023 7,100,000 7,385,626
Copyright © 2021 www.secdatabase.com. All Rights Reserved.Please Consider the Environment Before Printing This Document

Transamerica PIMCO Total Return VPSCHEDULE OF INVESTMENTS (continued)At March 31, 2019(unaudited)
Principal ValueCORPORATE DEBT SECURITIES (continued)Banks (continued)Synchrony Bank
3.65%, 05/24/2021 $6,900,000
$6,963,610
Toronto-Dominion Bank2.50%, 01/18/2022 (B) 9,800,000 9,773,9303.35%, 10/22/2021 (B) 8,100,000 8,248,271
UniCredit SpA6.57%, 01/14/2022 (B) 7,000,000 7,324,9277.83%, 12/04/2023 (B) 12,500,000 13,868,875
Wells Fargo & Co.2.10%, 07/26/2021 4,000,000 3,936,7962.63%, 07/22/2022, MTN 5,400,000 5,360,2663-Month LIBOR + 1.23%, 3.97% (A), 10/31/
2023 2,000,000 2,032,036Wells Fargo Bank NA
3-Month LIBOR + 0.51%, 3.27% (A), 10/22/2021 5,800,000 5,811,275
3.55%, 08/14/2023 8,000,000 8,208,2623.63%, 10/22/2021 4,000,000 4,074,960
450,282,902Beverages - 0.4%Constellation Brands, Inc.
4.25%, 05/01/2023 700,000 733,346Keurig Dr. Pepper, Inc.
4.06%, 05/25/2023 (B) 6,700,000 6,892,471Molson Coors Brewing Co.
2.10%, 07/15/2021 2,400,000 2,354,5409,980,357
Biotechnology - 0.6%AbbVie, Inc.
3.38%, 11/14/2021 8,200,000 8,301,7733.75%, 11/14/2023 2,700,000 2,771,730
Celgene Corp.2.25%, 08/15/2021 3,800,000 3,740,005
14,813,508Capital Markets - 5.7%Blackstone CQP Holdco, LP
6.00%, 08/18/2021 (B) 5,900,000 5,870,5006.50%, 03/20/2021 (B) 9,700,000 9,675,750
Credit Suisse Group AG3-Month LIBOR + 1.24%, 3.84% (A), 06/12/
2024 (B) 6,600,000 6,562,662Fixed until 06/12/2023, 4.21% (A), 06/12/
2024 (B) 6,700,000 6,863,369Credit Suisse Group Funding Guernsey, Ltd.
3.45%, 04/16/2021 3,700,000 3,738,5953.75%, 03/26/2025 6,825,000 6,876,6623.80%, 06/09/2023 5,600,000 5,687,2273-Month LIBOR + 2.29%, 5.07% (A), 04/16/
2021 5,300,000 5,462,646Deutsche Bank AG
2.70%, 07/13/2020 7,000,000 6,927,1313.15%, 01/22/2021 8,200,000 8,076,6823.30%, 11/16/2022 4,500,000 4,357,3143.38%, 05/12/2021 6,400,000 6,301,3513.70%, 05/30/2024 8,200,000 7,870,8884.25%, 10/14/2021 4,100,000 4,118,4075.00%, 02/14/2022 5,300,000 5,417,494
Principal ValueCORPORATE DEBT SECURITIES (continued)Capital Markets (continued)Goldman Sachs Group, Inc.
3-Month LIBOR + 0.75%, 3.40% (A), 02/23/2023 $ 7,100,000
$7,037,996
3-Month LIBOR + 0.78%, 3.52% (A), 10/31/2022 4,900,000 4,878,834
3.75%, 05/22/2025 10,700,000 10,808,708Morgan Stanley
Fixed until 04/24/2023, 3.74% (A), 04/24/2024 1,800,000 1,835,862
3-Month LIBOR + 1.18%, 3.94% (A), 01/20/2022 2,700,000 2,726,585
UBS AG2.45%, 12/01/2020 (B) 4,300,000 4,275,6583-Month LIBOR + 0.58%,
3.17% (A), 06/08/2020 (B) 9,200,000 9,233,1203-Month LIBOR + 0.85%,
3.48% (A), 06/01/2020 500,000 503,278UBS Group Funding Switzerland AG
3.00%, 04/15/2021 (B) 11,000,000 10,995,5774.13%, 09/24/2025 (B) 2,200,000 2,271,348
148,373,644Chemicals - 0.4%Sasol Financing LLC
5.88%, 03/27/2024 5,300,000 5,620,727Syngenta Finance NV
4.44%, 04/24/2023 (B) 5,000,000 5,100,94310,721,670
Construction & Engineering - 0.1%Odebrecht Offshore Drilling Finance, Ltd.
6.72%, 12/01/2022 (B) 868,868 827,597PIK Rate 1.00%, Cash Rate 6.72%, 12/01/
2026 (B) (K) 3,388,929 838,082Odebrecht Oil & Gas Finance, Ltd.
Zero Coupon, 04/29/2019 (B) (E) 500,930 2,5051,668,184
Consumer Finance - 5.8%Ally Financial, Inc.
8.00%, 03/15/2020 9,140,000 9,551,300Altice Financing SA
6.63%, 02/15/2023 (B) 1,000,000 1,022,500American Express Co.
3.38%, 05/17/2021 6,600,000 6,684,6233.40%, 02/27/2023 8,300,000 8,426,476
Capital One Financial Corp.2.40%, 10/30/2020 6,900,000 6,860,4933-Month LIBOR + 0.45%,
3.20% (A), 10/30/2020 7,000,000 7,002,9404.25%, 04/30/2025 6,000,000 6,227,649
Daimler Finance North America LLC2.25%, 03/02/2020 (B) 1,200,000 1,192,7803.35%, 05/04/2021 (B) 6,800,000 6,841,8363.40%, 02/22/2022 (B) 8,000,000 8,070,714
Ford Motor Credit Co. LLC3-Month EURIBOR + 0.37%,
0.06% (A), 12/01/2021, MTN EUR 800,000 855,8833.20%, 01/15/2021 $ 6,500,000 6,406,7793-Month LIBOR + 0.93%,
3.53% (A), 09/24/2020, MTN 14,500,000 14,437,4725.60%, 01/07/2022 6,500,000 6,704,0355.75%, 02/01/2021 6,500,000 6,693,955
General Motors Financial Co., Inc.
Copyright © 2021 www.secdatabase.com. All Rights Reserved.Please Consider the Environment Before Printing This Document

The notes are an integral part of this report.Transamerica Series Trust Page 5
3-Month EURIBOR + 0.55%,0.24% (A), 03/26/2022, MTN (F) EUR 1,900,000 2,088,465
3.20%, 07/13/2020 $ 7,000,000 7,011,635
Copyright © 2021 www.secdatabase.com. All Rights Reserved.Please Consider the Environment Before Printing This Document

Transamerica PIMCO Total Return VPSCHEDULE OF INVESTMENTS (continued)At March 31, 2019(unaudited)
Principal ValueCORPORATE DEBT SECURITIES (continued)Consumer Finance (continued)General Motors Financial Co., Inc.
(continued)3-Month LIBOR + 0.85%,
3.65% (A), 04/09/2021 $ 4,100,000$4,068,552
3-Month LIBOR + 0.93%,3.73% (A), 04/13/2020 8,400,000 8,412,012
4.20%, 11/06/2021 6,400,000 6,511,336Springleaf Finance Corp.
6.88%, 03/15/2025 5,600,000 5,775,000Volkswagen Group of America Finance LLC
3-Month LIBOR + 0.77%,3.46% (A), 11/13/2020 (B) 6,700,000 6,719,675
4.63%, 11/13/2025 (B) 6,700,000 6,932,0074.75%, 11/13/2028 (B) 6,700,000 6,741,327
151,239,444Diversified Consumer Services - 0.1%Nationwide Building Society
2.35%, 01/21/2020 (B) 1,300,000 1,294,579Fixed until 06/20/2019 (E),
6.88% (A), MTN (F) GBP 1,500,000 1,960,7123,255,291
Diversified Financial Services - 2.0%AerCap Ireland Capital DAC / AerCap
Global Aviation Trust3.30%, 01/23/2023 $ 7,500,000 7,361,0374.13%, 07/03/2023 5,400,000 5,470,714
Aircastle, Ltd.5.13%, 03/15/2021 2,400,000 2,476,521
Aviation Capital Group LLC2.88%, 01/20/2022 (B) 1,100,000 1,083,2624.13%, 08/01/2025 (B) 5,300,000 5,282,554
GE Capital European Funding Unlimited Co.3-Month EURIBOR + 0.23%,
0.00% (A), 05/17/2021, MTN EUR 900,000 1,000,439Jefferies Finance LLC / JFIN Co-Issuer Corp.
7.38%, 04/01/2020 (B) $ 200,000 200,000NTT Finance Corp.
1.90%, 07/21/2021, MTN (F) 3,400,000 3,330,738Tayarra, Ltd.
3.63%, 02/15/2022 3,599,784 3,643,962Washington Prime Group, LP
5.95%, 08/15/2024 (I) 22,800,000 21,375,12051,224,347
Diversified Telecommunication Services - 1.1%AT&T, Inc.
3-Month LIBOR + 0.75%,3.38% (A), 06/01/2021 7,900,000 7,932,794
3-Month LIBOR + 0.65%,3.44% (A), 01/15/2020 (I) 5,400,000 5,418,322
3-Month LIBOR + 0.95%,3.74% (A), 07/15/2021 7,000,000 7,082,425
3-Month LIBOR + 1.18%,3.78% (A), 06/12/2024 6,700,000 6,646,301
Sprint Capital Corp.6.90%, 05/01/2019 500,000 501,250
27,581,092Electric Utilities - 2.0%Duke Energy Corp.
3.05%, 08/15/2022 7,060,000 7,116,221Emera US Finance, LP
Principal ValueCORPORATE DEBT SECURITIES (continued)Electric Utilities (continued)FirstEnergy Corp.
3.90%, 07/15/2027$ 3,100,000
$3,145,148
Florida Power & Light Co.3.70%, 12/01/2047 3,000,000 2,984,871
Jersey Central Power & Light Co.4.70%, 04/01/2024 (B) 4,700,000 5,002,794
Mississippi Power Co.3-Month LIBOR + 0.65%,
3.26% (A), 03/27/2020 8,100,000 8,096,898NextEra Energy Capital Holdings, Inc.
3-Month LIBOR + 0.32%,2.93% (A), 09/03/2019 11,100,000 11,103,125
3.20%, 02/25/2022 6,700,000 6,757,396Progress Energy, Inc.
4.40%, 01/15/2021 4,400,000 4,505,424Southern Co.
2.75%, 06/15/2020 1,800,000 1,799,79651,714,666
Equity Real Estate Investment Trusts - 1.9%Alexandria Real Estate Equities, Inc.
4.30%, 01/15/2026 4,100,000 4,250,126American Tower Corp.
3.38%, 05/15/2024 7,800,000 7,854,952AvalonBay Communities, Inc.
3.45%, 06/01/2025, MTN 5,500,000 5,599,148CBL & Associates, LP
5.95%, 12/15/2026 (I) 7,100,000 5,183,000Crown Castle International Corp.
5.25%, 01/15/2023 4,000,000 4,292,642Digital Realty Trust, LP
3.70%, 08/15/2027 1,600,000 1,584,205HCP, Inc.
4.00%, 12/01/2022 3,000,000 3,081,710Hospitality Properties Trust
4.25%, 02/15/2021 1,900,000 1,914,462Unibail-Rodamco SE
1.00%, 03/14/2025, MTN (F) EUR 4,900,000 5,654,196WEA Finance LLC / Westfield UK & Europe
Finance PLC3.25%, 10/05/2020 (B) $ 4,200,000 4,226,236
Welltower, Inc.4.25%, 04/15/2028 5,900,000 6,079,691
49,720,368Food Products - 1.2%Campbell Soup Co.
3.30%, 03/15/2021 2,900,000 2,918,105Conagra Brands, Inc.
3.80%, 10/22/2021 2,761,000 2,812,736Kraft Heinz Foods Co.
3.38%, 06/15/2021 8,000,000 8,065,492Mondelez International Holdings
Netherlands BV2.00%, 10/28/2021 (B) 2,600,000 2,534,256
Mondelez International, Inc.3.63%, 05/07/2023 6,800,000 6,962,858
Tyson Foods, Inc.3-Month LIBOR + 0.45%,
3.09% (A), 08/21/2020 8,800,000 8,786,41132,079,858
Gas Utilities - 0.3%
Copyright © 2021 www.secdatabase.com. All Rights Reserved.Please Consider the Environment Before Printing This Document

The notes are an integral part of this report.Transamerica Series Trust Page 6
2.70%, 06/15/2021 1,214,000 1,202,993 CenterPoint Energy Resources Corp.3.55%, 04/01/2023 6,900,000 7,022,970
Copyright © 2021 www.secdatabase.com. All Rights Reserved.Please Consider the Environment Before Printing This Document

Transamerica PIMCO Total Return VPSCHEDULE OF INVESTMENTS (continued)At March 31, 2019(unaudited)
The notes are an integral part of this report.Transamerica Series Trust Page 7
Principal ValueCORPORATE DEBT SECURITIES (continued)Health Care Equipment & Supplies - 0.3%Becton Dickinson and Co.
2.13%, 06/06/2019$ 7,000,000
$6,990,343
Zimmer Biomet Holdings, Inc.2.70%, 04/01/2020 2,000,000 1,995,091
8,985,434Health Care Providers & Services - 0.9%Centene Corp.
5.38%, 06/01/2026 (B) 700,000 730,625CVS Health Corp.
2.80%, 07/20/2020 8,100,000 8,090,0693.13%, 03/09/2020 7,000,000 7,019,2693.50%, 07/20/2022 1,500,000 1,519,297
HCA, Inc.5.38%, 09/01/2026 5,300,000 5,584,8755.88%, 02/01/2029 100,000 107,7456.50%, 02/15/2020 1,100,000 1,131,970
24,183,850Hotels, Restaurants & Leisure - 0.9%Marriott International, Inc.
4.15%, 12/01/2023 (I) 7,000,000 7,278,577Marriott Ownership Resorts, Inc. / ILG LLC
6.50%, 09/15/2026 (B) 4,000,000 4,190,800McDonald�s Corp.
3-Month LIBOR + 0.43%,3.19% (A), 10/28/2021, MTN 6,600,000 6,600,559
Wynn Las Vegas LLC / Wynn Las VegasCapital Corp.5.50%, 03/01/2025 (B) 6,200,000 6,122,500
24,192,436Household Products - 0.2%Reckitt Benckiser Treasury Services PLC
2.38%, 06/24/2022 (B) 5,400,000 5,315,287Industrial Conglomerates - 0.1%General Electric Co.
0.38%, 05/17/2022 EUR 900,000 998,1602.20%, 01/09/2020, MTN $ 400,000 397,425
1,395,585Insurance - 0.5%Allstate Corp.
3-Month LIBOR + 0.63%,3.23% (A), 03/29/2023 5,600,000 5,574,687
Ambac LSNI LLC3-Month LIBOR + 5.00%,
7.59% (A), 02/12/2023 (B) 6,124,329 6,170,261American International Group, Inc.
3.75%, 07/10/2025 2,200,000 2,201,48413,946,432
IT Services - 0.2%DXC Technology Co.
3-Month LIBOR + 0.95%,3.58% (A), 03/01/2021 5,231,000 5,231,088
Machinery - 0.2%Wabtec Corp.
3-Month LIBOR + 1.30%,3.91% (A), 09/15/2021 6,600,000 6,592,214
Principal ValueCORPORATE DEBT SECURITIES (continued)Media - 0.6%Charter Communications Operating LLC /
Charter Communications Operating Capital3-Month LIBOR + 1.65%,
4.39% (A), 02/01/2024 $ 3,500,000$3,500,029
Discovery Communications LLC2.80%, 06/15/2020 (B) 500,000 497,806
Time Warner Cable LLC4.00%, 09/01/2021 2,400,000 2,439,219
Virgin Media Receivables Financing Notes IDAC5.50%, 09/15/2024 (F) GBP 5,650,000 7,394,170
Warner Media LLC3.40%, 06/15/2022 $ 2,100,000 2,123,341
15,954,565Oil, Gas & Consumable Fuels - 0.6%Andeavor Logistics, LP / Tesoro Logistics
Finance Corp.5.50%, 10/15/2019 6,100,000 6,161,200
BP Capital Markets America, Inc.3.79%, 02/06/2024 1,600,000 1,660,436
Enbridge, Inc.3-Month LIBOR + 0.70%,
3.31% (A), 06/15/2020 5,300,000 5,298,032Petrobras Global Finance BV
6.00%, 01/27/2028 3,736,000 3,780,83216,900,500
Pharmaceuticals - 1.1%Allergan Funding SCS
3.45%, 03/15/2022 300,000 302,702Allergan Sales LLC
5.00%, 12/15/2021 (B) 1,200,000 1,248,841Baxalta, Inc.
2.88%, 06/23/2020 2,456,000 2,452,513Bayer US Finance II LLC
3.50%, 06/25/2021 (B) (I) 2,000,000 2,008,0143.88%, 12/15/2023 (B) 13,800,000 13,904,4804.25%, 12/15/2025 (B) 3,800,000 3,840,729
Shire Acquisitions Investments Ireland DAC1.90%, 09/23/2019 5,300,000 5,277,1042.40%, 09/23/2021 900,000 888,893
29,923,276Semiconductors & Semiconductor Equipment - 0.6%Broadcom Corp. / Broadcom Cayman Finance,
Ltd.3.00%, 01/15/2022 5,959,000 5,930,1723.63%, 01/15/2024 5,000,000 4,987,143
Microchip Technology, Inc.3.92%, 06/01/2021 (B) 4,600,000 4,640,369
15,557,684Software - 0.3%VMware, Inc.
2.95%, 08/21/2022 7,100,000 7,024,689Technology Hardware, Storage & Peripherals - 0.3%Dell International LLC / EMC Corp.
5.45%, 06/15/2023 (B) 6,500,000 6,928,595
Copyright © 2021 www.secdatabase.com. All Rights Reserved.Please Consider the Environment Before Printing This Document

Transamerica PIMCO Total Return VPSCHEDULE OF INVESTMENTS (continued)At March 31, 2019(unaudited)
Principal ValueCORPORATE DEBT SECURITIES (continued)Tobacco - 0.6%BAT Capital Corp.
3.56%, 08/15/2027 $ 4,300,000 $ 4,071,214BAT International Finance PLC
2.75%, 06/15/2020 (B) 5,200,000 5,180,033Imperial Tobacco Finance PLC
2.95%, 07/21/2020 (B) 6,200,000 6,181,05515,432,302
Trading Companies & Distributors - 0.3%Air Lease Corp.
3.88%, 04/01/2021 1,800,000 1,825,4774.25%, 02/01/2024, MTN 5,000,000 5,110,949
6,936,426Wireless Telecommunication Services - 0.2%Sprint Spectrum Co. LLC / Sprint
Spectrum Co. II LLC3.36%, 03/20/2023 (B) 4,500,000 4,498,650
Total Corporate Debt Securities(Cost $1,228,133,153) 1,232,699,811
FOREIGN GOVERNMENT OBLIGATIONS - 2.4%Brazil - 0.4%Brazil Letras do Tesouro Nacional
Zero Coupon, 01/01/2020 BRL 46,400,000 11,295,227Greece - 0.1%Hellenic Republic Government Bond
4.75%, 04/17/2019 (F) EUR 3,300,000 3,706,511Japan - 1.1%Japan Bank for International Cooperation
2.88%, 07/21/2027 $ 8,500,000 8,505,886Japan Finance Organization for
Municipalities2.63%, 04/20/2022 (B) 8,400,000 8,384,2103.38%, 09/27/2023 (B) 10,500,000 10,798,735
27,688,831Kuwait - 0.1%Kuwait International Government Bond
2.75%, 03/20/2022 (B) 1,300,000 1,298,700Peru - 0.1%Corp. Financiera de Desarrollo SA
3.25%, 07/15/2019 (B) 2,100,000 2,096,430Qatar - 0.6%Qatar Government International Bond
4.50%, 04/23/2028 (B) 7,300,000 7,800,6925.10%, 04/23/2048 (B) 6,900,000 7,555,500
15,356,192Total Foreign Government Obligations
(Cost $60,896,785) 61,441,891
LOAN ASSIGNMENT - 0.1%Hotels, Restaurants & Leisure - 0.1%Wyndham Hotels & Resorts, Inc.
Term Loan B,1-Month LIBOR + 1.75%,
4.25% (A), 05/30/2025 (L) 4,278,500 4,216,997Total Loan Assignment
(Cost $4,278,500) 4,216,997
Principal ValueMORTGAGE-BACKED SECURITIES - 6.2%Adjustable Rate Mortgage Trust
Series 2005-10, Class 1A21,4.34% (A), 01/25/2036 $
128,501$119,713
Series 2005-4, Class 1A1,3.24% (A), 08/25/2035 92,309 71,914Series 2005-5, Class 2A1,4.19% (A), 09/25/2035 85,327 79,752
Alternative Loan TrustSeries 2003-J3, Class 2A1,6.25%, 12/25/2033 33,198 33,945Series 2005-14, Class 2A1,1-Month LIBOR + 0.21%,
2.70% (A), 05/25/2035 162,098 151,949Series 2005-56, Class 5A2,1-Month LIBOR + 0.77%,
3.26% (A), 11/25/2035 360,068 346,695Series 2005-62, Class 2A1,12-MTA + 1.00%,
3.40% (A), 12/25/2035 15,343 13,880Series 2005-80CB, Class 1A1,6.00%, 02/25/2036 4,221,966 3,948,259Series 2005-J12, Class 2A1,1-Month LIBOR + 0.54%,
3.03% (A), 08/25/2035 4,188,312 2,782,015Series 2006-OA12, Class A1B,1-Month LIBOR + 0.19%,
2.68% (A), 09/20/2046 2,973,491 2,518,265Series 2006-OA21, Class A1,1-Month LIBOR + 0.19%,
2.68% (A), 03/20/2047 2,216,238 1,877,598Series 2007-9T1, Class 1A10,6.00%, 05/25/2037 993,155 683,874Series 2007-HY4, Class 1A1,3.66% (A), 06/25/2037 1,274,938 1,083,247
American Home Mortgage Assets TrustSeries 2007-1, Class A1,12-MTA + 0.70%,
3.10% (A), 02/25/2047 3,577,902 2,188,894Ashford Hospitality Trust
Series 2018-AHT1, Class A,1-Month LIBOR + 1.00%,
3.48% (A), 05/15/2035 (B) 7,500,000 7,490,521Banc of America Funding Trust
Series 2005-D, Class A1,4.63% (A), 05/25/2035 2,907,545 3,038,617Series 2006-D, Class 5A1,4.17% (A), 05/20/2036 270,278 254,357Series 2006-J, Class 4A1,4.66% (A), 01/20/2047 56,930 54,379
BBCMS TrustSeries 2015-STP, Class A,3.32%, 09/10/2028 (B) 5,968,448 5,996,852
BCAP LLC TrustSeries 2013-RR12, Class 1A3,1-Month LIBOR + 0.50%,
2.99% (A), 05/26/2035 (B) 55,937 55,630Bear Stearns Alt-A Trust
Series 2005-8, Class 21A1,4.46% (A), 10/25/2035 1,984,777 1,884,960
Copyright © 2021 www.secdatabase.com. All Rights Reserved.Please Consider the Environment Before Printing This Document

The notes are an integral part of this report.Transamerica Series Trust Page 8
Copyright © 2021 www.secdatabase.com. All Rights Reserved.Please Consider the Environment Before Printing This Document

Transamerica PIMCO Total Return VPSCHEDULE OF INVESTMENTS (continued)At March 31, 2019(unaudited)
Principal ValueMORTGAGE-BACKED SECURITIES (continued)Bear Stearns Alt-A Trust (continued)
Series 2006-6, Class 31A1,4.10% (A), 11/25/2036
$ 3,273,337$3,000,296
Series 2006-6, Class 32A1,3.96% (A), 11/25/2036 579,534 479,423Series 2006-8, Class 3A1,1-Month LIBOR + 0.16%, 2.65% (A), 02/
25/2034 339,113 338,332Series 2006-R1, Class 2E21,3.91% (A), 08/25/2036 499,747 410,877
Bear Stearns ARM TrustSeries 2003-5, Class 2A1,4.35% (A), 08/25/2033 286,552 287,927Series 2003-8, Class 2A1,4.89% (A), 01/25/2034 25,139 25,752Series 2003-8, Class 4A1,4.74% (A), 01/25/2034 73,741 74,743Series 2003-9, Class 2A1,4.68% (A), 02/25/2034 51,004 51,926Series 2004-10, Class 22A1,4.43% (A), 01/25/2035 69,274 67,646Series 2006-4, Class 1A1,4.72% (A), 10/25/2036 204,777 196,747
Bear Stearns Structured Products, Inc. TrustSeries 2007-R6, Class 1A1,4.34% (A), 01/26/2036 257,899 232,050Series 2007-R6, Class 2A1,3.74% (A), 12/26/2046 200,808 182,894
Business Mortgage Finance 7 PLCSeries 7X, Class A1,3-Month GBP LIBOR + 2.00%,
2.87% (A), 02/15/2041 (F) GBP 1,998,847 2,566,684BX Trust
Series 2017-SLCT, Class A,1-Month LIBOR + 0.92%,
3.40% (A), 07/15/2034 (B) $ 3,210,050 3,204,994CHL Mortgage Pass-Through Trust
Series 2002-30, Class M,4.70% (A), 10/19/2032 27,443 25,545Series 2004-12, Class 11A1,3.92% (A), 08/25/2034 28,360 26,937Series 2005-HY10, Class 5A1,3.87% (A), 02/20/2036 85,945 73,409Series 2006-OA5, Class 2A2,1-Month LIBOR + 0.30%,
2.79% (A), 04/25/2046 37,427 2,228Citigroup Commercial Mortgage Trust
Series 2016-P5, Class AAB,2.84%, 10/10/2049 7,200,000 7,176,882Series 2017-1500, Class A,1-Month LIBOR + 0.85%,
3.33% (A), 07/15/2032 (B) 6,800,000 6,808,524Citigroup Mortgage Loan Trust, Inc.
Series 2005-6, Class A1,1-Year CMT + 2.10%,
4.68% (A), 09/25/2035 147,251 149,339Series 2005-6, Class A2,1-Year CMT + 2.15%,
4.24% (A), 09/25/2035 99,836 101,233Credit Suisse First Boston Mortgage Securities
Corp.Series 2003-AR15, Class 2A1,
Principal ValueMORTGAGE-BACKED SECURITIES (continued)Deutsche Alt-A Securities, Inc. Mortgage Loan
TrustSeries 2005-AR1, Class 2A1,3.53% (A), 08/25/2035 $ 82,556 $ 76,629
Eurosail PLCSeries 2007-3X, Class A3C,3-Month GBP LIBOR + 0.95%,
1.79% (A), 06/13/2045 (F) GBP 1,840,856 2,369,678First Horizon Mortgage Pass-Through Trust
Series 2005-AR3, Class 2A1,4.30% (A), 08/25/2035 $ 24,538 20,170
GS Mortgage Securities Corp. TrustSeries 2016-RENT, Class A,3.20%, 02/10/2029 (B) 6,000,000 6,025,546
GS Mortgage Securities TrustSeries 2016-GS3, Class AAB,2.78%, 10/10/2049 4,400,000 4,380,288Series 2016-GS3, Class WMA,3.60% (A), 10/10/2049 (B) 2,000,000 1,974,035
GSR Mortgage Loan TrustSeries 2004-12, Class 1A1,1-Month LIBOR + 0.34%,
2.83% (A), 12/25/2034 241,728 230,676Series 2005-8F, Class 2A6,5.50%, 11/25/2035 3,270,019 3,227,269Series 2005-AR6, Class 2A1,4.52% (A), 09/25/2035 130,275 132,761Series 2006-AR1, Class 2A1,4.41% (A), 01/25/2036 2,600 2,610
HarborView Mortgage Loan TrustSeries 2006-7, Class 2A1A,1-Month LIBOR + 0.20%,
2.68% (A), 09/19/2046 287,643 259,229Hilton USA Trust
Series 2016-SFP, Class A,2.83%, 11/05/2035 (B) 8,600,000 8,538,698
IndyMac INDX Mortgage Loan TrustSeries 2006-AR35, Class 2A1A,1-Month LIBOR + 0.17%,
2.66% (A), 01/25/2037 6,042,666 5,713,446Series 2006-R1, Class A3,3.77% (A), 12/25/2035 3,241,766 2,992,409
MASTR Alternative Loan TrustSeries 2006-2, Class 2A1,1-Month LIBOR + 0.40%,
2.89% (A), 03/25/2036 223,830 43,838Merrill Lynch Mortgage Investors Trust
Series 2005-3, Class 4A,1-Month LIBOR + 0.25%,
2.74% (A), 11/25/2035 5,059 4,932Morgan Stanley Bank of America Merrill Lynch
TrustSeries 2015-C20, Class ASB,3.07%, 02/15/2048 6,000,000 6,049,070Series 2015-C27, Class ASB,3.56%, 12/15/2047 5,300,000 5,448,341
Morgan Stanley Mortgage Loan TrustSeries 2007-14AR, Class 1A3,4.32% (A), 10/25/2037 994,209 946,079
NACC Reperforming Loan REMIC TrustSeries 2004-R1, Class A1,6.50%, 03/25/2034 (B) 374,009 363,993
RALI Trust
Copyright © 2021 www.secdatabase.com. All Rights Reserved.Please Consider the Environment Before Printing This Document

The notes are an integral part of this report.Transamerica Series Trust Page 9
4.02% (A), 06/25/2033 190,024 190,042CSMC Trust
Series 2008-3R, Class 1A2,3.94% (A), 07/26/2037 (B) 876,994 751,430
Series 2005-QA13, Class 2A1,4.83% (A), 12/25/2035 1,821,423 1,640,689
Copyright © 2021 www.secdatabase.com. All Rights Reserved.Please Consider the Environment Before Printing This Document

Transamerica PIMCO Total Return VPSCHEDULE OF INVESTMENTS (continued)At March 31, 2019(unaudited)
Principal ValueMORTGAGE-BACKED SECURITIES (continued)RALI Trust (continued)
Series 2005-QO3, Class A1,1-Month LIBOR + 0.80%,
3.29% (A), 10/25/2045$211,220
$190,983
Series 2007-QO2, Class A1,1-Month LIBOR + 0.15%,
2.64% (A), 02/25/2047 3,809,705 2,159,548RBSSP Resecuritization Trust
Series 2009-6, Class 2A1,1-Month LIBOR + 0.15%,
4.58% (A), 01/26/2036 (B) 1,294,083 1,304,963Reperforming Loan REMIC Trust
Series 2003-R4, Class 2A,4.97% (A), 01/25/2034 (B) 299,408 285,323Series 2004-R1, Class 2A,6.50%, 11/25/2034 (B) 161,570 159,691Series 2005-R2, Class 1AF1,1-Month LIBOR + 0.34%,
2.83% (A), 06/25/2035 (B) 321,945 309,081Series 2006-R1, Class AF1,1-Month LIBOR + 0.34%,
2.83% (A), 01/25/2036 (B) 3,085,925 3,014,747Residential Asset Securitization Trust
Series 2007-A2, Class 2A2,6.50%, 04/25/2037 4,016,075 1,959,710
RFMSI TrustSeries 2003-S9, Class A1,6.50%, 03/25/2032 3,697 3,777Series 2005-SA4, Class 1A21,4.49% (A), 09/25/2035 401,526 331,286
RMAC Securities No. 1 PLCSeries 2007-NS1X, Class A2B,3-Month LIBOR + 0.15%,
2.75% (A), 06/12/2044 (F) 7,434,514 6,985,477Sequoia Mortgage Trust
Series 2004-12, Class A1,1-Month LIBOR + 0.54%,
3.03% (A), 01/20/2035 467,154 462,342Series 2010, Class 2A1,1-Month LIBOR + 0.76%,
3.25% (A), 10/20/2027 10,789 10,355Structured Adjustable Rate Mortgage Loan Trust
Series 2004-12, Class 3A1,4.60% (A), 09/25/2034 60,863 61,392Series 2004-20, Class 3A1,4.10% (A), 01/25/2035 67,115 66,517Series 2005-1, Class 1A1,4.30% (A), 02/25/2035 207,901 207,107Series 2005-17, Class 3A1,4.29% (A), 08/25/2035 39,447 39,368Series 2005-18, Class 3A1,4.35% (A), 09/25/2035 1,066,036 927,028Series 2006-8, Class 1A2,3.89% (A), 09/25/2036 3,010,658 2,314,407
Structured Asset Mortgage Investments II TrustSeries 2005-AR5, Class A1,1-Month LIBOR + 0.25%,
2.73% (A), 07/19/2035 52,889 51,683Series 2005-AR5, Class A2,1-Month LIBOR + 0.25%,
2.73% (A), 07/19/2035 31,942 31,661Series 2005-AR5, Class A3,
Principal ValueMORTGAGE-BACKED SECURITIES (continued)Structured Asset Mortgage Investments Trust
Series 2002-AR3, Class A1,1-Month LIBOR + 0.66%,
3.14% (A), 09/19/2032 $ 12,442 $ 12,162Towd Point Mortgage Funding PLC
Series 2019-GR4A, Class A1,3-Month GBP LIBOR + 1.03%,
0.00% (A), 10/20/2051 (B) (L) GBP 15,500,000 20,187,970WaMu Mortgage Pass-Through Certificates
TrustSeries 2003-AR9, Class 2A,4.38% (A), 09/25/2033 $ 743,354 756,203Series 2005-AR13, Class A1A1,1-Month LIBOR + 0.29%,
2.78% (A), 10/25/2045 2,068,309 2,029,268Series 2006-AR10, Class 1A1,3.86% (A), 09/25/2036 606,039 574,394Series 2006-AR7, Class 2A,12-MTA + 0.98%,
3.38% (A), 07/25/2046 134,146 128,872Series 2007-HY1, Class 1A1,3.90% (A), 02/25/2037 325,742 298,382Series 2007-HY4, Class 2A2,3.27% (A), 04/25/2037 2,719,060 2,499,652
Wells Fargo Mortgage-Backed SecuritiesTrustSeries 2004-CC, Class A1,4.99% (A), 01/25/2035 67,068 68,588Series 2005-AR2, Class 1A1,5.09% (A), 03/25/2035 1,099,729 1,118,077Series 2006-AR8, Class 2A4,4.67% (A), 04/25/2036 143,040 143,197
Total Mortgage-Backed Securities(Cost $159,248,706) 160,459,165
MUNICIPAL GOVERNMENT OBLIGATIONS - 0.3%California - 0.1%Metropolitan Water District of Southern
California, Revenue Bonds,Series A,6.95%, 07/01/2040 3,000,000 3,154,230
Illinois - 0.1%State of Illinois, General Obligation
Unlimited,6.63%, 02/01/2035 2,000,000 2,170,660
Kentucky - 0.0% (D)Kentucky State Property & Building
Commission, Revenue BondsSeries C,4.30%, 11/01/2019 500,000 504,0054.40%, 11/01/2020 600,000 613,830
1,117,835West Virginia - 0.1%Tobacco Settlement Finance Authority,
Revenue Bonds,Series A,7.47%, 06/01/2047 2,195,000 2,190,061
Total Municipal Government Obligations(Cost $8,658,555) 8,632,786
Copyright © 2021 www.secdatabase.com. All Rights Reserved.Please Consider the Environment Before Printing This Document

The notes are an integral part of this report.Transamerica Series Trust Page 10
1-Month LIBOR + 0.25%,2.73% (A), 07/19/2035 83,151 82,095
Series 2005-AR8, Class A1A,1-Month LIBOR + 0.28%,
2.77% (A), 02/25/2036 151,264 142,297
Copyright © 2021 www.secdatabase.com. All Rights Reserved.Please Consider the Environment Before Printing This Document

Transamerica PIMCO Total Return VPSCHEDULE OF INVESTMENTS (continued)At March 31, 2019(unaudited)
Principal ValueU.S. GOVERNMENT AGENCY OBLIGATIONS - 63.6%Federal Home Loan Mortgage Corp.
3.00%, TBA (L) $32,000,000
$31,858,125
3.50%, 03/01/2048 365,761 371,6763.50%, TBA (L) 28,620,000 29,029,8154.00%, 08/01/2048 1,925,216 1,986,4654.00%, TBA (L) 39,000,000 40,144,86312-Month LIBOR + 1.35%,
4.09% (A), 09/01/2035 40,816 42,1021-Year CMT + 2.22%,
4.29% (A), 08/01/2023 8,966 9,16512-Month LIBOR + 1.87%,
4.62% (A), 09/01/2035 319,880 335,957Federal Home Loan Mortgage Corp.
Multifamily Structured Pass-ThroughCertificates, Interest Only STRIPS1.26% (A), 08/25/2022 17,180,376 613,717
Federal Home Loan Mortgage Corp. REMIC1-Month LIBOR + 0.35%,
2.83% (A), 12/15/2029 17,785 17,8041-Month LIBOR + 0.40%,
2.88% (A), 06/15/2041 5,306,210 5,304,875Federal Home Loan Mortgage Corp. Structured
Pass-Through Certificates12-MTA + 1.20%,
3.60% (A), 10/25/2044 668,768 675,82712-MTA + 1.40%,
3.80% (A), 07/25/2044 330,929 332,5776.50%, 07/25/2043 46,188 53,200
Federal National Mortgage Association3.00%, TBA (L) 221,000,000 219,762,5783.50%, 02/01/2026 78,297 80,2093.50%, TBA (L) 390,000,000 394,885,30612-MTA + 1.20%,
3.53% (A), 06/01/2043 79,179 79,6441-Year CMT + 1.71%,
3.86% (A), 08/01/2035 9,361 9,7214.00%, 12/01/2040 - 03/01/2041 354,917 367,2914.00%, TBA (L) 608,600,000 625,711,92612-Month LIBOR + 1.36%,
4.23% (A), 12/01/2034 4,884 5,0486-Month LIBOR + 1.75%,
4.25% (A), 05/01/2035 414,793 433,2166-Month LIBOR + 1.38%,
4.26% (A), 08/01/2035 236,400 243,2781-Year CMT + 2.16%,
4.28% (A), 07/01/2032 3,284 3,3331-Year CMT + 2.04%,
4.29% (A), 09/01/2035 460,538 483,2931-Year CMT + 2.24%,
4.42% (A), 01/01/2036 3,054,259 3,206,4676-Month LIBOR + 1.61%,
4.48% (A), 08/01/2036 47,415 49,0844.50%, 02/01/2020 - 07/01/2041 49,869 52,7724.50%, TBA (L) 73,000,000 75,998,9881-Year CMT + 2.22%,
4.50% (A), 01/01/2028 15,915 16,6971-Year CMT + 2.18%,
4.53% (A), 10/01/2035 3,863 4,0325.00%, 12/01/2022 - 06/01/2037 214,220 225,2895.00%, TBA (L) 11,000,000 11,237,9555.50%, 01/01/2025 - 09/01/2027 98,143 102,285
Principal ValueU.S. GOVERNMENT AGENCY OBLIGATIONS (continued)Federal National Mortgage Association REMIC
1-Month LIBOR + 0.45%,2.96% (A), 09/25/2046
$4,113,186 $ 4,110,366
Government National Mortgage Association1-Month LIBOR + 0.37%,
2.88% (A), 06/20/2061 - 10/20/2066 3,228,538 3,226,5663.00%, TBA (L) 7,000,000 7,034,8271-Month LIBOR + 0.58%,
3.09% (A), 06/20/2065 4,643,334 4,634,8561-Month LIBOR + 0.60%,
3.11% (A), 04/20/2065 - 10/20/2065 41,902,103 41,878,8491-Month LIBOR + 0.62%,
3.13% (A), 09/20/2065 5,929,426 5,928,1591-Month LIBOR + 0.68%,
3.19% (A), 03/20/2062 449,140 449,3311-Month LIBOR + 0.70%,
3.21% (A), 10/20/2065 977,032 978,2431-Month LIBOR + 0.75%,
3.26% (A), 08/20/2067 3,729,080 3,767,2691-Month LIBOR + 0.77%,
3.28% (A), 10/20/2066 7,534,437 7,579,0461-Month LIBOR + 0.78%,
3.29% (A), 09/20/2066 11,073,733 11,141,2571-Month LIBOR + 0.80%,
3.31% (A), 06/20/2066 5,712,676 5,753,1921-Month LIBOR + 0.95%,
3.46% (A), 12/20/2066 2,770,179 2,806,2453.50%, TBA (L) 5,000,000 5,108,10512-Month LIBOR + 0.80%,
3.63% (A), 09/20/2067 4,956,925 5,061,3894.00%, TBA (L) 16,000,000 16,517,3015.00%, 12/20/2048 - 03/20/2049 9,592,523 10,055,7005.00%, TBA (L) 67,250,000 70,217,301
Total U.S. Government Agency Obligations(Cost $1,640,111,649) 1,649,982,582
U.S. GOVERNMENT OBLIGATIONS - 24.3%U.S. Treasury - 20.0%U.S. Treasury Bond
2.75%, 08/15/2042 (M) 9,600,000 9,559,5002.75%, 11/15/2042 (N) 17,700,000 17,612,1912.88%, 05/15/2043 13,800,000 14,011,8522.88%, 08/15/2045 (N) 24,500,000 24,826,3483.00%, 11/15/2044 - 02/15/2048 (N) 70,500,000 73,108,2693.13%, 02/15/2043 4,500,000 4,768,0663.13%, 08/15/2044 (N) 54,900,000 58,191,8563.38%, 05/15/2044 (N) 35,800,000 39,571,5863.63%, 08/15/2043 14,800,000 17,003,8123.63%, 02/15/2044 (M) 9,300,000 10,698,2703.75%, 11/15/2043 (N) 12,400,000 14,536,5784.25%, 05/15/2039 2,000,000 2,500,4694.38%, 11/15/2039 - 05/15/2040 1,800,000 2,288,6334.50%, 08/15/2039 (M) 3,100,000 4,002,5124.63%, 02/15/2040 1,100,000 1,444,051
U.S. Treasury Note1.75%, 09/30/2022 (M) (O) (P) 5,600,000 5,508,5631.88%, 07/31/2022 (M) (N) (O) 32,500,000 32,122,9491.88%, 08/31/2022 (O) 2,300,000 2,272,6872.00%, 10/31/2022 200,000 198,3982.13%, 09/30/2024 (N) 65,900,000 65,385,1562.25%, 10/31/2024 (N) 14,500,000 14,476,777
Copyright © 2021 www.secdatabase.com. All Rights Reserved.Please Consider the Environment Before Printing This Document

The notes are an integral part of this report.Transamerica Series Trust Page 11
Copyright © 2021 www.secdatabase.com. All Rights Reserved.Please Consider the Environment Before Printing This Document

Transamerica PIMCO Total Return VPSCHEDULE OF INVESTMENTS (continued)At March 31, 2019(unaudited)
Principal ValueU.S. GOVERNMENT OBLIGATIONS (continued)U.S. Treasury (continued)U.S. Treasury Note (continued)
2.25%, 08/15/2027 (N) (O) (P) (Q) $ 81,200,000 $ 80,422,8912.63%, 02/15/2029 (N) 22,800,000 23,218,594
517,730,008
U.S. Treasury Inflation-Protected Securities - 4.3%U.S. Treasury Inflation-Indexed
Bond0.88%, 01/15/2029 28,704,672 29,616,9670.88%, 02/15/2047 (N) 2,919,168 2,886,5101.00%, 02/15/2048 14,083,728 14,371,577
U.S. Treasury Inflation-IndexedNote0.38%, 01/15/2027 7,917,984 7,845,7070.75%, 07/15/2028 (N) 56,245,299 57,480,536
112,201,297Total U.S. Government Obligations
(Cost $618,279,133) 629,931,305
SHORT-TERM FOREIGN GOVERNMENT OBLIGATIONS - 11.9%Japan - 11.9%Japan Treasury Discount Bill
0.00% (R) (S), 05/13/2019 - 06/03/2019 JPY 34,190,000,000 308,564,484
Total Short-Term Foreign Government Obligations(Cost $311,840,326) 308,564,484
Shares ValueOTHER INVESTMENT COMPANY - 0.9%Securities Lending Collateral - 0.9%State Street Navigator Securities
Lending Trust - GovernmentMoney Market Portfolio,2.41% (R) 22,855,760 22,855,760
Total Other Investment Company(Cost $22,855,760) 22,855,760
Principal ValueREPURCHASE AGREEMENT - 0.3%Fixed Income Clearing Corp.,
1.45% (R), dated 03/29/2019, tobe repurchased at $6,651,542 on04/01/2019. Collateralized by aU.S. Government Obligation,2.75%, due 09/15/2021, and witha value of $6,787,471. $ 6,650,739 6,650,739
Total Repurchase Agreement(Cost $6,650,739) 6,650,739
Total Investments Excluding Purchased Options/Swaptions(Cost $4,422,855,317) 4,459,169,907
Total Purchased Options/Swaptions - 0.0% (D)(Cost $616,803) 136,049
Total Investments(Cost $4,423,472,120) 4,459,305,956
Net Other Assets (Liabilities) - (71.9)% (1,865,337,485 )Net Assets - 100.0% $ 2,593,968,471
Principal ValueREVERSE REPURCHASE AGREEMENTS - (11.4)%Bank of Montreal, 2.64% (R), dated 03/08/
2019, to be repurchased at $(14,998,649)on 04/16/2019. Collateralized by U.S.Government Obligations, 2.75% - 3.88%,due 05/31/2023 - 05/15/2045, and with atotal value of $(16,011,417). $ (14,955,875) $ (14,955,875)
Bank of Montreal, 2.65% (R), dated 02/27/2019, to be repurchased at $(24,411,656)on 04/26/2019. Collateralized by U.S.Government Obligations, 2.13% - 3.88%,due 05/31/2023 - 11/15/2044, and with atotal value of $(25,395,893). (24,307,875 ) (24,307,875 )
Bank of Montreal, 2.66% (R), dated 02/01/2019, to be repurchased at $(40,001,964)on 05/01/2019. Collateralized by U.S.Government Obligations, 2.13% - 3.88%,due 05/31/2023 - 08/15/2040, and with atotal value of $(41,118,374). (39,740,625 ) (39,740,625 )
Bank of Nova Scotia, 2.64% (R), dated 01/09/2019, to be repurchased at $(68,985,066)on 04/09/2019. Collateralized by U.S.Government Obligations, 2.25% - 3.00%,due 08/15/2027 - 05/15/2047, and with atotal value of $(70,844,014). (68,532,750 ) (68,532,750 )
Bank of Nova Scotia, 2.64% (R), dated 03/07/2019, to be repurchased at $(7,904,082) on04/09/2019. Collateralized by U.S.Government Obligations, 3.00% - 3.13%,due 08/15/2044 - 05/15/2047, and with atotal value of $(8,206,723). (7,885,000 ) (7,885,000 )
Credit Agricole Securities, Inc., 2.65% (R),dated 03/05/2019, to be repurchased at$(5,587,972) on 04/05/2019. Collateralizedby a U.S. Government Obligation, 2.88%,due 08/15/2045 and Cash with a total valueof $(6,096,259). (5,575,250 ) (5,575,250 )
Credit Agricole Securities, Inc., 2.67% (R),dated 03/12/2019, to be repurchased at$(9,675,762) on 04/03/2019. Collateralizedby a U.S. Government Obligation, 3.00%,due 05/15/2045, and Cash with a totalvalue of $(10,397,545). (9,660,000 ) (9,660,000 )
Deutsche Bank Securities, Inc., 2.47% (R),dated 03/28/2019, to be repurchased at$(8,624,640) on 04/04/2019. Collateralizedby a U.S. Government Obligation, 2.63%,due 02/15/2029, and with a value of$(8,582,777). (8,620,500 ) (8,620,500 )
Copyright © 2021 www.secdatabase.com. All Rights Reserved.Please Consider the Environment Before Printing This Document

The notes are an integral part of this report.Transamerica Series Trust Page 12
Copyright © 2021 www.secdatabase.com. All Rights Reserved.Please Consider the Environment Before Printing This Document

Transamerica PIMCO Total Return VPSCHEDULE OF INVESTMENTS (continued)At March 31, 2019(unaudited)
EXCHANGE-TRADED OPTIONS PURCHASED:
DescriptionExercise
PriceExpiration
DateNotionalAmount
Number ofContracts
PremiumsPaid Value
Call - 10-Year Canada Government Bond Futures CAD 160.00 05/17/2019 CAD 21,412,160 154 $1,396 $576Call - U.S. Treasury Note Futures USD 189.00 05/24/2019 USD 35,469,420 237 2,038 237Call - U.S. Treasury Note Futures USD 190.00 05/24/2019 USD 143,972,920 962 8,273 962Call - U.S. Treasury Note Futures USD 191.00 05/24/2019 USD 107,605,540 719 6,184 719Put - 5-Year U.S. Treasury Note Futures USD 108.25 05/24/2019 USD 371,698,470 3,209 27,598 3,209Put - 5-Year U.S. Treasury Note Futures USD 108.50 05/24/2019 USD 163,088,640 1,408 12,109 1,408Put - 5-Year U.S. Treasury Note Futures USD 108.75 05/24/2019 USD 46,795,320 404 3,474 404Put - 10-Year U.S. Treasury Note Futures USD 112.00 05/24/2019 USD 67,575,680 544 4,678 544Put - 10-Year U.S. Treasury Note Futures USD 112.50 05/24/2019 USD 1,490,640 12 103 12Total $ 65,853 $ 8,071
OVER-THE-COUNTER OPTIONS PURCHASED:
Description CounterpartyExercise
PriceExpiration
DateNotionalAmount
Number ofContracts
PremiumsPaid Value
Put - Federal National Mortgage Association,3.50%, TBA JPM USD 70.00 05/06/2019 USD 55,000,000 55,000,000 $2,148 $1
Put - Federal National Mortgage Association,4.00%, TBA (T) JPM USD 71.00 05/06/2019 USD 40,000,000 40,000,000 1,563 0
Put - Federal National Mortgage Association,4.50%, TBA (T) JPM USD 72.00 05/06/2019 USD 1,000,000 1,000,000 39 0
Total $ 3,750 $ 1
The notes are an integral part of this report.Transamerica Series Trust Page 13
Principal ValueREVERSE REPURCHASE AGREEMENTS (continued)Royal Bank of Canada, 2.70% (R), dated
02/21/2019, to be repurchased at$(66,174,044) on 04/04/2019.Collateralized by U.S. GovernmentObligations, 3.13% - 3.38%, due 05/15/2044 - 08/15/2044, and with a totalvalue of $(70,976,809). $ (65,966,250) $ (65,966,250 )
Standard Chartered Bank, 2.64% (R),dated 03/07/2019, to be repurchased at$(51,779,772) on 04/25/2019.Collateralized by U.S. GovernmentObligations, 2.75% - 3.38%, due 11/15/2042 - 08/15/2045, and Cash with atotal value of $(56,556,475). (51,594,376 ) (51,594,376 )
Total Reverse Repurchase Agreements $ (296,838,501)
Copyright © 2021 www.secdatabase.com. All Rights Reserved.Please Consider the Environment Before Printing This Document

Transamerica PIMCO Total Return VPSCHEDULE OF INVESTMENTS (continued)At March 31, 2019(unaudited)
OVER-THE-COUNTER INTEREST RATE SWAPTIONS PURCHASED:
Description Counterparty Floating Rate IndexPay/Receive
Floating RateExercise
RateExpiration
DateNotional Amount/
Number of ContractsPremiums
Paid ValuePut - 30-Year GSB 3-Month USD-LIBOR Pay 2.94 % 12/12/2019 USD 2,300,000 $110,400 $26,302Put - 30-Year MLI 3-Month USD-LIBOR Pay 2.95 12/09/2019 USD 9,100,000 436,800 101,675Total $ 547,200 $ 127,977
EXCHANGE-TRADED OPTIONS WRITTEN:
DescriptionExercise
PriceExpiration
DateNotionalAmount
Number ofContracts
Premiums(Received) Value
Put - 10-Year U.S. Treasury Note Futures USD 122.50 04/26/2019 USD 70,556,960 568 $ (215,592) $ (26,625)
OVER-THE-COUNTER CREDIT DEFAULT SWAPTIONS WRITTEN:
Description CounterpartyPay/Receive
Floating RateExercise
RateExpiration
DateNotional Amount/
Number of ContractsPremiums(Received) Value
Put - North America Investment GradeIndex - Series 31 GSB Pay 2.40 % 09/18/2019 USD 8,500,000 $ (14,450) $ (155)
OVER-THE-COUNTER INTEREST RATE SWAPTIONS WRITTEN:
Description Counterparty Floating Rate IndexPay/Receive
Floating RateExercise
RateExpiration
DateNotional Amount/
Number of ContractsPremiums(Received) Value
Put - 5-Year MLI 3-Month USD-LIBOR Pay 2.75 % 12/09/2019 USD 40,100,000 $(438,001 ) $(81,858 )Put - 5-Year GSB 3-Month USD-LIBOR Pay 2.75 12/12/2019 USD 10,100,000 (110,182 ) (20,961 )Total $ (548,183) $ (102,819)
Premiums(Received) Value
TOTAL WRITTEN OPTIONS AND SWAPTIONS $ (778,225) $ (129,599)
CENTRALLY CLEARED SWAP AGREEMENTS:
Credit Default Swap Agreements on Corporate and Sovereign Issues �� Sell Protection (U)
Reference ObligationFixed RateReceivable
PaymentFrequency
MaturityDate
Implied CreditSpread at
March 31, 2019 (V)Notional
Amount (W) Value (X)
PremiumsPaid
(Received)
Net UnrealizedAppreciation
(Depreciation)General Electric Co.,
2.70%, 10/09/2022 1.00 % Quarterly 12/20/2023 0.92 % USD 7,400,000 $32,247 $(217,477 ) $ 249,724MetLife, Inc., 4.75%, 02/08/
2021 1.00 Quarterly 12/20/2021 0.32 USD 4,500,000 85,823 76,008 9,815Tesco PLC, 6.00%, 12/14/2029 1.00 Quarterly 06/20/2022 0.74 EUR 9,700,000 101,473 31,791 69,682Total $ 219,543 $ (109,678) $ 329,221
The notes are an integral part of this report.Transamerica Series Trust Page 14
Copyright © 2021 www.secdatabase.com. All Rights Reserved.Please Consider the Environment Before Printing This Document

Transamerica PIMCO Total Return VPSCHEDULE OF INVESTMENTS (continued)At March 31, 2019(unaudited)
Credit Default Swap Agreements on Credit Indices �� Sell Protection (U)
Reference ObligationFixed RateReceivable
PaymentFrequency
MaturityDate
NotionalAmount (W) Value (X)
Premiums Paid(Received)
Net UnrealizedAppreciation
(Depreciation)North America Investment Grade Index -
Series 28 1.00 % Quarterly 06/20/2022 USD 10,200,000 $195,257 $156,439 $38,818North America Investment Grade Index -
Series 31 1.00 Quarterly 12/20/2023 USD 16,200,000 (361,045 ) (272,575 ) (88,470 )Total $ (165,788) $ (116,136 ) $ (49,652 )
Interest Rate Swap Agreements
Floating Rate Index
Pay/Receive
Fixed Rate Fixed RatePayment
FrequencyMaturity
DateNotionalAmount Value
PremiumsPaid
(Received)
Net UnrealizedAppreciation
(Depreciation)3-Month CAD-CDOR Pay 1.75 % Semi-Annually 12/16/2046 CAD 1,900,000 $183,334 $246,805 $(63,471 )3-Month USD-LIBOR Pay 2.25 Semi-Annually 06/20/2028 USD 49,600,000 316,358 2,536,206 (2,219,848 )3-Month USD-LIBOR Pay 2.50 Quarterly 12/20/2027 USD 30,000,000 (441,112 ) 630,151 (1,071,263 )3-Month USD-LIBOR Receive 2.80 Semi-Annually 08/22/2023 USD 92,700,000 1,979,253 (1,152 ) 1,980,4053-Month USD-LIBOR Pay 2.91 Semi-Annually 08/22/2048 USD 12,500,000 (761,656 ) � (761,656 )3-Month USD-LIBOR Pay 2.93 Quarterly 08/22/2048 USD 4,600,000 (304,861 ) � (304,861 )3-Month USD-LIBOR Pay 2.94 Quarterly 08/22/2048 USD 4,000,000 (273,643 ) � (273,643 )6-Month EUR-EURIBOR Receive 0.75 Annually 09/18/2029 EUR 115,000,000 2,602,606 1,002,752 1,599,8546-Month EUR-EURIBOR Receive 1.00 Annually 06/19/2029 EUR 50,900,000 2,807,604 257,012 2,550,5926-Month EUR-EURIBOR Receive 1.25 Semi-Annually 09/18/2049 EUR 9,300,000 450,557 70,122 380,4356-Month EUR-EURIBOR Receive 1.50 Semi-Annually 07/04/2042 EUR 25,400,000 3,212,369 � 3,212,3696-Month GBP-LIBOR Pay 1.25 Semi-Annually 09/18/2024 GBP 31,400,000 (318,173 ) 83,966 (402,139 )6-Month GBP-LIBOR Pay 1.50 Semi-Annually 06/19/2029 GBP 9,000,000 (310,597 ) (67,809 ) (242,788 )6-Month GBP-LIBOR Pay 1.50 Semi-Annually 09/18/2029 GBP 23,500,000 (768,982 ) (165,651 ) (603,331 )6-Month GBP-LIBOR Pay 1.50 Semi-Annually 09/18/2049 GBP 13,600,000 (559,539 ) 218,843 (778,382 )6-Month GBP-LIBOR Pay 1.75 Semi-Annually 06/19/2049 GBP 12,200,000 (1,534,739 ) (841,750 ) (692,989 )6-Month JPY-LIBOR Pay 0.30 Semi-Annually 03/18/2026 JPY 10,270,000,000 (2,024,882 ) (536,092 ) (1,488,790 )6-Month JPY-LIBOR Pay 0.30 Semi-Annually 03/18/2026 JPY 12,240,000,000 (2,403,394 ) (521,102 ) (1,882,292 )6-Month JPY-LIBOR Pay 0.30 Semi-Annually 09/20/2027 JPY 2,830,000,000 (582,442 ) (29,230 ) (553,212 )6-Month JPY-LIBOR Pay 0.30 Semi-Annually 03/20/2028 JPY 1,710,000,000 (350,129 ) 108,697 (458,826 )6-Month JPY-LIBOR Receive 0.38 Semi-Annually 06/18/2028 JPY 7,090,000,000 1,979,941 266,737 1,713,2046-Month JPY-LIBOR Pay 0.40 Semi-Annually 06/18/2028 JPY 1,050,000,000 (310,418 ) (806 ) (309,612 )6-Month JPY-LIBOR Pay 0.45 Semi-Annually 03/20/2029 JPY 1,160,000,000 (384,875 ) (79,532 ) (305,343 )6-Month JPY-LIBOR Pay 0.71 Semi-Annually 10/31/2038 JPY 930,000,000 (553,466 ) 58,206 (611,672 )6-Month JPY-LIBOR Pay 0.75 Semi-Annually 03/20/2038 JPY 2,850,000,000 (1,866,537 ) 85,654 (1,952,191 )6-Month JPY-LIBOR Pay 0.75 Semi-Annually 12/20/2038 JPY 3,970,000,000 (2,642,583 ) 234,700 (2,877,283 )6-Month JPY-LIBOR Pay 0.79 Semi-Annually 11/12/2038 JPY 470,000,000 (345,827 ) 1,577 (347,404 )6-Month JPY-LIBOR Pay 0.80 Semi-Annually 10/22/2038 JPY 320,000,000 (245,352 ) � (245,352 )6-Month JPY-LIBOR Pay 1.00 Semi-Annually 03/21/2048 JPY 120,000,000 (147,573 ) (3,667 ) (143,906 )Total $ (3,598,758) $ 3,554,637 $ (7,153,395)
OVER-THE-COUNTER SWAP AGREEMENTS:
Credit Default Swap Agreements on Corporate and Sovereign Issues �� Sell Protection (U)
Reference Obligation CounterpartyFixed RateReceivable
PaymentFrequency
MaturityDate
Implied CreditSpread at
March 31, 2019 (V)Notional
Amount (W) Value (X)
PremiumsPaid
(Received)
Net UnrealizedAppreciation
(Depreciation)Brazil Government
International Bond,4.25%, 01/07/2025 HSBC 1.00 % Quarterly 09/20/2019 0.61 % USD 7,700,000 $ 7,490 $ 11,197 $ (3,707 )
Copyright © 2021 www.secdatabase.com. All Rights Reserved.Please Consider the Environment Before Printing This Document

Petrobras Global FinanceBV, 8.38%, 12/10/2018 GSI 1.00 Quarterly 12/20/2019 0.43 USD 900,000 2,658 (13,969 ) 16,627
Petrobras Global FinanceBV, 8.38%, 12/10/2018 HSBC 1.00 Quarterly 03/20/2020 0.51 USD 100,000 386 (3,430 ) 3,816
The notes are an integral part of this report.Transamerica Series Trust Page 15
Copyright © 2021 www.secdatabase.com. All Rights Reserved.Please Consider the Environment Before Printing This Document

Transamerica PIMCO Total Return VPSCHEDULE OF INVESTMENTS (continued)At March 31, 2019(unaudited)
OVER-THE-COUNTER SWAP AGREEMENTS (continued):
Credit Default Swap Agreements on Corporate and Sovereign Issues �� Sell Protection (continued) (U)
Reference Obligation CounterpartyFixed RateReceivable
PaymentFrequency
MaturityDate
Implied CreditSpread at
March 31, 2019 (V)Notional
Amount (W) Value (X)
PremiumsPaid
(Received)
Net UnrealizedAppreciation
(Depreciation)Petrobras Global
Finance BV, 8.38%,12/10/2018 BNP 1.00 % Quarterly 03/20/2020 0.51 % USD 200,000 $772 $(7,237 ) $ 8,009
PetrobrasInternationalFinance Co. SA,8.38%, 12/10/2018 BCI 1.00 Quarterly 12/20/2019 0.43 USD 1,400,000 4,134 (26,357 ) 30,491
PetrobrasInternationalFinance Co. SA,8.38%, 12/10/2018 BNP 1.00 Quarterly 12/20/2019 0.43 USD 1,000,000 2,953 (13,403 ) 16,356
Republic of SouthAfrica GovernmentInternational Bond,5.50%, 03/09/2020 GSI 1.00 Quarterly 06/20/2024 1.98 USD 6,400,000 (298,077 ) (266,537 ) (31,540 )
Total $ (279,684) $ (319,736) $ 40,052
Credit Default Swap Agreements on Credit Indices �� Sell Protection (U)
Reference Obligation Counterparty
FixedRate
ReceivablePayment
FrequencyMaturity
DateNotional
Amount (W) Value (X)
PremiumsPaid
(Received)
Net UnrealizedAppreciation
(Depreciation)Home Equity ABS Index - Series
6-2 BCI 0.11 % Monthly 05/25/2046 USD 5,284,403 $ (382,582) $ (1,074,932) $ 692,350
ValueOTC Swap Agreements, at value (Assets) $18,393OTC Swap Agreements, at value (Liabilities) $ (680,659)
FUTURES CONTRACTS:
DescriptionLong/Short
Number ofContracts
ExpirationDate
NotionalAmount Value
UnrealizedAppreciation
UnrealizedDepreciation
90-Day Eurodollar Short (238 ) 03/16/2020 $(57,765,332 ) $(58,122,575 ) $� $(357,243 )90-Day Eurodollar Short (1,228 ) 06/15/2020 (298,844,748) (300,169,250) � (1,324,502 )90-Day Eurodollar Short (660 ) 09/14/2020 (160,659,565 ) (161,436,000 ) � (776,435 )90-Day Eurodollar Short (388 ) 12/14/2020 (94,204,187 ) (94,919,350 ) � (715,163 )3-Month EUR-EURIBOR Long 2,350 06/17/2019 660,956,161 661,038,331 82,170 �5-Year U.S. Treasury Note Long 5,335 06/28/2019 612,040,420 617,943,047 5,902,627 �10-Year Australian Treasury Bond Short (901 ) 06/17/2019 (87,289,083 ) (88,642,216 ) � (1,353,133 )10-Year Canada Government Bond Short (171 ) 06/19/2019 (17,429,233 ) (17,791,626 ) � (362,393 )10-Year Japan Government Bond Short (5 ) 06/13/2019 (6,878,176 ) (6,915,095 ) � (36,919 )10-Year U.S. Treasury Note Long 1,813 06/19/2019 222,348,254 225,208,594 2,860,340 �Euro OAT Index Short (966 ) 06/06/2019 (171,435,900 ) (176,270,966 ) � (4,835,066 )Euro-BTP Italy Government Bond Short (1,797 ) 06/06/2019 (254,743,809 ) (260,983,719 ) � (6,239,910 )German Euro Bund Index Long 870 06/06/2019 159,746,139 162,334,990 2,588,851 �German Euro BUXL Index Short (156 ) 06/06/2019 (31,890,564 ) (33,539,167 ) � (1,648,603 )OTC Call Options Exercise Price EUR 159.00
on German Euro Bund Futures Long 734 05/24/2019 8,736 8,234 � (502 )OTC Call Options Exercise Price EUR 165.00
on German Euro Bund Futures Long 697 05/24/2019 8,491 7,819 � (672 )
Copyright © 2021 www.secdatabase.com. All Rights Reserved.Please Consider the Environment Before Printing This Document

OTC Call Options Exercise Price EUR 165.50on German Euro Bund Futures Short (317 ) 04/26/2019 (143,256 ) (444,494 ) � (301,238 )
OTC Call Options Exercise Price EUR 166.00on German Euro Bund Futures Short (176 ) 04/26/2019 (100,568 ) (183,608 ) � (83,040 )
OTC Call Options Exercise Price EUR 175.00on German Euro Bund Futures Long 908 05/24/2019 10,806 10,185 � (621 )
OTC Put Options Exercise Price EUR 145.50 onGerman Euro Bund Futures Long 697 05/24/2019 8,296 7,819 � (477 )
U.K. Gilt Short (191 ) 06/26/2019 (31,675,400 ) (32,183,101 ) � (507,701 )U.S. Treasury Bond Short (2,124 ) 06/19/2019 (309,857,110 ) (317,869,875 ) � (8,012,765 )Total $ 11,433,988 $ (26,556,383)
The notes are an integral part of this report.Transamerica Series Trust Page 16
Copyright © 2021 www.secdatabase.com. All Rights Reserved.Please Consider the Environment Before Printing This Document

Transamerica PIMCO Total Return VPSCHEDULE OF INVESTMENTS (continued)At March 31, 2019(unaudited)
FORWARD FOREIGN CURRENCY CONTRACTS:
Counterparty Settlement DateCurrencyPurchased
CurrencySold
UnrealizedAppreciation
UnrealizedDepreciation
BCLY 04/24/2019 USD 8,280,153 MXN 162,118,355 $� $(39,832 )BCLY 05/15/2019 USD 43,496,306 GBP 32,531,000 1,029,237 �BCLY 05/20/2019 USD 40,748,523 JPY 4,435,000,000 568,997 �BNP 04/02/2019 USD 11,309,570 BRL 44,070,000 55,596 �BNP 04/02/2019 USD 316,633 CAD 422,000 831 �BNP 04/02/2019 BRL 44,070,000 USD 11,763,607 � (509,633 )BNP 04/24/2019 USD 2,558,204 MXN 50,074,335 � (11,633 )BNP 05/13/2019 USD 161,491,017 JPY 17,430,000,000 3,656,774 �BNP 05/15/2019 JPY 2,168,800,000 USD 19,508,378 133,481 �BNP 05/20/2019 USD 50,827,544 JPY 5,533,000,000 700,527 �BNP 06/19/2019 USD 313,141 THB 9,785,669 4,145 �BNP 01/03/2020 USD 12,106,032 BRL 46,400,000 522,707 �BOA 04/02/2019 USD 6,903,746 CAD 9,199,000 19,702 �BOA 04/15/2019 RUB 37,744,233 USD 569,895 3,945 �BOA 05/15/2019 USD 3,459,204 GBP 2,638,000 15,470 �BOA 05/15/2019 EUR 1,099,000 USD 1,248,956 � (11,374 )CITI 04/15/2019 USD 9,387,667 MXN 180,783,000 96,333 �CITI 04/15/2019 MXN 180,783,000 USD 9,314,582 � (23,248 )CITI 04/24/2019 MXN 212,192,690 USD 10,970,566 � (80,745 )CITI 05/15/2019 USD 1,697,794 AUD 2,391,000 � (1,430 )CITI 05/15/2019 USD 27,202,484 EUR 23,938,000 245,942 �CITI 05/15/2019 EUR 19,091,000 USD 21,606,620 � (108,278 )CITI 05/15/2019 GBP 46,407,000 USD 61,152,102 � (570,833 )CITI 05/15/2019 JPY 818,300,000 USD 7,374,937 36,043 �CITI 06/26/2019 USD 9,159,692 MXN 180,783,000 � (25,769 )CITI 06/26/2019 MXN 180,783,000 USD 9,285,351 � (99,890 )CITI 08/14/2019 MXN 31,942,808 USD 1,625,241 � (14,550 )GSB 04/02/2019 USD 11,222,676 BRL 44,070,000 15,202 (46,500 )GSB 04/02/2019 USD 7,374,250 CAD 9,826,000 20,993 �GSB 04/02/2019 GBP 32,913,000 USD 43,774,116 � (902,172 )GSB 04/02/2019 BRL 44,070,000 USD 11,309,570 � (55,595 )GSB 05/20/2019 USD 27,196,294 JPY 2,962,000,000 361,625 �HSBC 04/02/2019 CAD 57,535,000 USD 43,602,812 � (546,670 )HSBC 05/15/2019 USD 1,735,393 AUD 2,442,000 6,379 (6,454 )HSBC 08/14/2019 USD 1,618,342 MXN 31,942,808 9,999 (2,348 )JPM 04/02/2019 USD 4,969,957 CAD 6,625,000 12,158 �JPM 04/15/2019 USD 376,521 RUB 24,919,229 � (2,335 )JPM 05/15/2019 USD 52,657,210 EUR 46,342,000 471,563 �JPM 05/15/2019 USD 4,675,678 JPY 513,100,000 28,759 �JPM 05/15/2019 USD 100,906 NOK 870,000 � (144 )JPM 05/15/2019 JPY 6,195,300,000 USD 56,025,528 214,087 (131,533 )JPM 06/14/2019 USD 188,726 ILS 678,000 1,112 �SCB 04/02/2019 USD 43,573,116 GBP 32,913,000 701,172 �SCB 05/03/2019 GBP 32,913,000 USD 43,639,149 � (700,113 )UBS 04/02/2019 USD 23,435,516 CAD 31,463,000 � (109,725 )UBS 05/03/2019 CAD 31,463,000 USD 23,453,597 110,169 �UBS 05/15/2019 USD 24,531,838 GBP 18,939,000 � (191,774 )UBS 06/03/2019 USD 34,845,837 JPY 3,830,000,000 115,497 �
Total $ 9,158,445 $ (4,192,578)
The notes are an integral part of this report.Transamerica Series Trust Page 17
Copyright © 2021 www.secdatabase.com. All Rights Reserved.Please Consider the Environment Before Printing This Document

Transamerica PIMCO Total Return VPSCHEDULE OF INVESTMENTS (continued)At March 31, 2019(unaudited)
SECURITY VALUATION:
Valuation Inputs (Y)
Level 1 -Unadjusted
QuotedPrices
Level 2 -Other
SignificantObservable
Inputs
Level 3 -Significant
UnobservableInputs Value
ASSETSInvestmentsAsset-Backed Securities $� $360,234,387 $ � $360,234,387Certificate of Deposit � 13,500,000 � 13,500,000Corporate Debt Securities � 1,232,699,811 � 1,232,699,811Foreign Government Obligations � 61,441,891 � 61,441,891Loan Assignment � 4,216,997 � 4,216,997Mortgage-Backed Securities � 160,459,165 � 160,459,165Municipal Government Obligations � 8,632,786 � 8,632,786U.S. Government Agency Obligations � 1,649,982,582 � 1,649,982,582U.S. Government Obligations � 629,931,305 � 629,931,305Short-Term Foreign Government Obligations � 308,564,484 � 308,564,484Other Investment Company 22,855,760 � � 22,855,760Repurchase Agreement � 6,650,739 � 6,650,739Exchange-Traded Options Purchased 8,071 � � 8,071Over-the-Counter Options Purchased � 1 � 1Over-the-Counter Interest Rate Swaptions Purchased � 127,977 � 127,977Total Investments $22,863,831 $ 4,436,442,125 $ �� $ 4,459,305,956Other Financial InstrumentsCentrally Cleared Credit Default Swap Agreements $� $414,800 $ � $414,800Centrally Cleared Interest Rate Swap Agreements � 13,532,022 � 13,532,022Over-the-Counter Credit Default Swap Agreements � 18,393 � 18,393Futures Contracts (Z) 11,433,988 � � 11,433,988Forward Foreign Currency Contracts (Z) � 9,158,445 � 9,158,445Total Other Financial Instruments $11,433,988 $23,123,660 $ �� $34,557,648LIABILITIESOther Financial InstrumentsReverse Repurchase Agreements $� $(296,838,501 ) $ � $(296,838,501 )Exchange-Traded Options Written (26,625 ) � � (26,625 )Over-the-Counter Credit Default Swaptions Written � (155 ) � (155 )Over-the-Counter Interest Rate Swaptions Written � (102,819 ) � (102,819 )Centrally Cleared Credit Default Swap Agreements � (361,045 ) � (361,045 )Centrally Cleared Interest Rate Swap Agreements � (17,130,780 ) � (17,130,780 )Over-the-Counter Credit Default Swap Agreements � (680,659 ) � (680,659 )Futures Contracts (Z) (26,556,383 ) � � (26,556,383 )Forward Foreign Currency Contracts (Z) � (4,192,578 ) � (4,192,578 )Total Other Financial Instruments $ (26,583,008) $(319,306,537 ) $ �� $(345,889,545 )
InvestmentsTransfers from
Level 1 to Level 2Transfers from
Level 2 to Level 1Transfers from
Level 2 to Level 3Transfers from
Level 3 to Level 2Asset-Backed Securities (C) $ � $ � $ � $ 10,721,466
FOOTNOTES TO SCHEDULE OF INVESTMENTS:
(A) Floating or variable rate securities. The rates disclosed are as of March 31, 2019. For securities based on a published reference rate and spread, the referencerate and spread are indicated within the description. Variable rate securities with a floor or ceiling feature are disclosed at the inherent rate, where applicable.Certain variable rate securities are not based on a published reference rate and spread, but are determined by the issuer or agent and are based on current marketconditions; these securities do not indicate a reference rate and spread in the description.
(B) Securities are registered pursuant to Rule 144A of the Securities Act of 1933. Unless otherwise indicated, the securities are deemed to be liquid for purposes ofcompliance limitations on holdings of illiquid securities and may be resold as transactions exempt from registration, normally to qualified institutional buyers. AtMarch 31, 2019, the total value of 144A securities is $649,297,868, representing 25.0% of the Portfolio�s net assets.
(C) Transferred from Level 3 to 2 due to utilizing observable inputs. As of prior reporting period the security utilized significant unobservable inputs.
Copyright © 2021 www.secdatabase.com. All Rights Reserved.Please Consider the Environment Before Printing This Document

(D) Percentage rounds to less than 0.1% or (0.1)%.(E) Perpetual maturity. The date displayed is the next call date.(F) Securities are exempt from registration under Regulation S of the Securities Act of 1933, which exempts from registration securities offered and sold outside the
United States. Securities may not be offered or sold in the United States except pursuant to an exemption from, or in a transaction not subject to, the registrationrequirements of the Securities Act of 1933. At March 31, 2019, the total value of Regulation S securities is $81,412,639, representing 3.1% of the Portfolio�s netassets.
(G) Securities in default; no interest payments received and/or dividends declared during the last 12 months. At March 31, 2019, the total value of such securities is$744,842, representing less than 0.1% of the Portfolio�s net assets.
(H) Non-income producing securities.
The notes are an integral part of this report.Transamerica Series Trust Page 18
Copyright © 2021 www.secdatabase.com. All Rights Reserved.Please Consider the Environment Before Printing This Document

Transamerica PIMCO Total Return VPSCHEDULE OF INVESTMENTS (continued)At March 31, 2019(unaudited)
FOOTNOTES TO SCHEDULE OF INVESTMENTS (continued):
(I) All or a portion of the securities are on loan. The total value of all securities on loan is $22,384,951. The amount of securities on loan indicated may notcorrespond with the securities on loan identified because securities with pending sales are in the process of recall from the brokers.
(J) Step bond. Coupon rate changes in increments to maturity. The rate disclosed is as of March 31, 2019; the maturity date disclosed is the ultimate maturity date.(K) Payment in-kind. Security pays interest or dividends in the form of additional bonds or preferred stock. If the security makes a cash payment in addition to in-kind,
the cash rate is disclosed separately.(L) When-issued, delayed-delivery and/or forward commitment (including TBAs) securities. Securities to be settled and delivered after March 31, 2019. Securities
may display a coupon rate of 0.00%, as the rate is to be determined at time of settlement.(M) All or a portion of these securities have been segregated by the custodian as collateral for centrally cleared swap agreements. The total value of such securities is
$19,851,116.(N) Securities are subject to sale-buyback transactions.(O) All or a portion of these securities have been segregated by the custodian as collateral to cover margin requirements for open futures contracts. The total value of
such securities is $13,687,108.(P) All or a portion of these securities have been segregated by the custodian as collateral for open over-the-counter options and/or swaptions, swap agreements and
forward foreign currency contracts. The total value of such securities is $1,102,675.(Q) All or a portion of the security has been segregated by the custodian as collateral for open TBA commitment transactions. The value of the security is $278,311.(R) Rates disclosed reflect the yields at March 31, 2019.(S) Percentage rounds to less than 0.01% or (0.01)%.(T) Securities deemed worthless.(U) If the Portfolio is a seller of protection and a credit event occurs, as defined under the terms of that particular swap agreement, the Portfolio will either (a) pay to
the buyer of protection an amount equal to the notional amount of the swap and take delivery of the referenced obligation or underlying securities comprising thereferenced obligation or (b) pay a net settlement amount in the form of cash or securities equal to the notional amount of the swap agreement less the recoveryvalue of the referenced obligation or underlying securities comprising the referenced obligation.
(V) Implied credit spreads, represented in absolute terms, utilized in determining the market value of credit default swap agreements on corporate issues or sovereignissues of an emerging country as of period end serve as an indicator of the current status of the payment/performance risk and represent the likelihood of risk ofdefault for the credit derivative. The implied credit spread of a particular referenced entity reflects the cost of buying/selling protection and may include thereferenced entity�s credit soundness and a greater likelihood or risk of default or other credit event occurring as defined under the terms of the agreement. Acredit spread identified as �Defaulted� indicates a credit event has occurred for the referenced entity or obligation.
(W) The maximum potential amount the Portfolio could be required to pay as a seller of credit protection or receive as a buyer of credit protection if a credit eventoccurs as defined under the terms of that particular swap agreement.
(X) The quoted market prices and resulting values for credit default swap agreements on asset-backed securities and credit indices serve as an indicator of the currentstatus of the payment/performance risk and represent the likelihood of an expected liability (or profit) for the credit derivative had the notional amount of the swapagreement been closed/sold as of the period ended. Increasing market values, in absolute terms when compared to the notional amount of the swap agreement,represent a deterioration of the referenced entity�s credit soundness and a greater likelihood or risk of default or other credit event occurring as defined under theterms of the agreement.
(Y) The Fund recognizes transfers in and out of Level 3 as of March 31, 2019. Please reference the Security Valuation section of the Notes to Schedules of Investmentsfor more information regarding security valuation and pricing inputs.
(Z) Futures contracts and/or forward foreign currency contracts are valued at unrealized appreciation (depreciation).
CURRENCY ABBREVIATIONS:
AUD Australian DollarBRL Brazilian RealCAD Canadian DollarEUR EuroGBP Pound SterlingILS Israel New ShekelJPY Japanese YenMXN Mexican PesoNOK Norwegian KroneRUB Russian RubleTHB Thai BahtUSD United States Dollar
COUNTERPARTY ABBREVIATIONS:
BCI Barclays Capital, Inc.BCLY Barclays Bank PLCBNP BNP ParibasBOA Bank of America, N.A.CITI Citibank N.A.GSB Goldman Sachs BankGSI Goldman Sachs International
Copyright © 2021 www.secdatabase.com. All Rights Reserved.Please Consider the Environment Before Printing This Document

HSBC HSBC Bank USAJPM JPMorgan Chase Bank, N.A.MLI Merrill Lynch InternationalSCB Standard Chartered BankUBS UBS AG
The notes are an integral part of this report.Transamerica Series Trust Page 19
Copyright © 2021 www.secdatabase.com. All Rights Reserved.Please Consider the Environment Before Printing This Document

Transamerica PIMCO Total Return VPSCHEDULE OF INVESTMENTS (continued)At March 31, 2019(unaudited)
PORTFOLIO ABBREVIATIONS:
ABS Asset-Backed SecuritiesBTP Buoni del Tesoro Poliennali (Italian Treasury Bonds)BUXL Bundesanleihen (German Long-Term Debt)CDOR Canadian Dollar Offered RateCMT Constant Maturity TreasuryEURIBOR Euro Interbank Offer RateLIBOR London Interbank Offered RateMTA Month Treasury AverageMTN Medium Term NoteOAT Obligations Assimilables du Tresor (Treasury Obligations)OTC Over-the-CounterSTRIPS Separate Trading of Registered Interest and Principal of SecuritiesTBA To Be Announced
The notes are an integral part of this report.Transamerica Series Trust Page 20
Copyright © 2021 www.secdatabase.com. All Rights Reserved.Please Consider the Environment Before Printing This Document

Transamerica PineBridge Inflation Opportunities VPSCHEDULE OF INVESTMENTSAt March 31, 2019(unaudited)
Principal ValueASSET-BACKED SECURITY - 0.2%STORE Master Funding I-VII
Series 2018-1A, Class A1,3.96%, 10/20/2048 (A) $ 396,556 $ 411,150
Total Asset-Backed Security(Cost $396,454) 411,150
CORPORATE DEBT SECURITIES - 20.7%Banks - 11.0%BAC Capital Trust XIV
3-Month LIBOR + 0.40%,4.00% (B), 04/15/2019 (C) 779,000 615,410
Bank of America Corp.CPI-YoY + 1.10%,
3.01% (B), 11/19/2024, MTN 5,000,000 4,987,5004.18%, 11/25/2027, MTN 152,000 154,355Fixed until 04/24/2037,
4.24% (B), 04/24/2038 891,000 911,394Barclays Bank PLC
CPI-YoY + 1.00%,2.91% (B), 05/22/2023, MTN 2,600,000 2,537,600
BBVA Bancomer SAFixed until 01/18/2028, 5.13% (B), 01/18/
2033 (A) 334,000 307,113Citigroup, Inc.
1.38*CPI-YoY, Zero Coupon (B),03/27/2025, MTN 1,000,000 942,900
CPI-YoY + 2.50%,4.05% (B), 03/30/2020, MTN 2,000,000 1,968,200
4.65%, 07/23/2048 865,000 927,349Corestates Capital II
3-Month LIBOR + 0.65%,3.44% (B), 01/15/2027 (A) 244,000 224,785
Credit Agricole SAFixed until 01/10/2028,
4.00% (B), 01/10/2033 (A) 751,000 724,806Danske Bank A/S
5.38%, 01/12/2024 (A) 200,000 208,012HSBC Holdings PLC
Fixed until 05/22/2027 (C),6.00% (B), 336,000 333,144
Regions Financial Corp.3.80%, 08/14/2023 387,000 397,807
Royal Bank of Scotland Group PLCFixed until 03/08/2022,
2.00% (B), 03/08/2023, MTN (D) EUR 400,000 458,783Fixed until 03/22/2024,
4.27% (B), 03/22/2025 $ 300,000 303,190Fixed until 06/25/2023,
4.52% (B), 06/25/2024 (E) 1,133,000 1,158,586Fixed until 08/15/2021 (C),
8.63% (B), 234,000 249,210SunTrust Capital III
3-Month LIBOR + 0.65%,3.26% (B), 03/15/2028 239,000 221,075
UniCredit SpAFixed until 06/19/2027,
5.86% (B), 06/19/2032 (A) 241,000 221,6496.57%, 01/14/2022 (A) 350,000 366,246Fixed until 04/02/2029,
7.30% (B), 04/02/2034 (A) (F) 211,000 212,637
Principal ValueCORPORATE DEBT SECURITIES (continued)Banks (continued)Wachovia Capital Trust II
3-Month LIBOR + 0.50%,3.29% (B), 01/15/2027
$354,000 $ 325,680
18,757,431Building Products - 0.5%Masco Corp.
3.50%, 11/15/2027 827,000 784,045Capital Markets - 0.4%Goldman Sachs Group, Inc.
Fixed until 11/10/2022 (C),5.00% (B), 759,000 701,126
Chemicals - 0.4%DowDuPont, Inc.
4.49%, 11/15/2025 596,000 634,848RPM International, Inc.
4.25%, 01/15/2048 111,000 96,644731,492
Consumer Finance - 1.3%Navient Corp.
CPI-YoY + 2.15%,4.06% (B), 12/15/2020, MTN 189,000 184,984
CPI-YoY + 2.25%,4.16% (B), 05/03/2019, MTN 2,000,000 2,040,000
2,224,984Electric Utilities - 0.2%FirstEnergy Corp.
3.90%, 07/15/2027 268,000 271,903Equity Real Estate Investment Trusts - 0.3%Alexandria Real Estate Equities, Inc.
3.80%, 04/15/2026 473,000 479,446Health Care Providers & Services - 0.6%CVS Health Corp.
4.78%, 03/25/2038 932,000 922,953Insurance - 0.5%Hartford Financial Services Group, Inc.
3-Month LIBOR + 2.13%,4.81% (B), 02/12/2067 (A) 1,051,000 906,487
Machinery - 0.1%CNH Industrial NV
3.85%, 11/15/2027, MTN 197,000 188,715Metals & Mining - 1.2%Anglo American Capital PLC
4.00%, 09/11/2027 (A) 229,000 222,607Glencore Funding LLC
4.00%, 04/16/2025 (A) 248,000 248,828Newcrest Finance Pty, Ltd.
4.20%, 10/01/2022 (A) 1,050,000 1,068,5755.75%, 11/15/2041 (A) 515,000 538,331
2,078,341
Copyright © 2021 www.secdatabase.com. All Rights Reserved.Please Consider the Environment Before Printing This Document

The notes are an integral part of this report.Transamerica Series Trust Page 1
Copyright © 2021 www.secdatabase.com. All Rights Reserved.Please Consider the Environment Before Printing This Document

Transamerica PineBridge Inflation Opportunities VPSCHEDULE OF INVESTMENTS (continued)At March 31, 2019(unaudited)
Principal ValueCORPORATE DEBT SECURITIES (continued)Multi-Utilities - 0.6%National Grid PLC
1.25%, 10/06/2021, MTN (D) GBP 520,000 $ 866,836WEC Energy Group, Inc.
3-Month LIBOR + 2.11%,4.80% (B), 05/15/2067 $ 242,000 214,170
1,081,006Oil, Gas & Consumable Fuels - 3.0%Andeavor Logistics, LP
Fixed until 02/15/2023 (C),6.88% (B), 381,000 382,905
Andeavor Logistics, LP / Tesoro LogisticsFinance Corp.4.25%, 12/01/2027 380,000 381,832
Enable Midstream Partners, LP4.95%, 05/15/2028 260,000 263,251
Enbridge, Inc.Fixed until 07/15/2027,
5.50% (B), 07/15/2077 874,000 825,930Energy Transfer Operating, LP
5.80%, 06/15/2038 318,000 340,397Fixed until 02/15/2023 (C),
6.25% (B), 755,000 713,475EnLink Midstream Partners, LP
4.85%, 07/15/2026 406,000 403,036Fixed until 12/15/2022 (C),
6.00% (B), 142,000 117,505Enterprise Products Operating LLC
4.15%, 10/16/2028 (E) 444,000 466,590Fixed until 08/16/2027,
5.25% (B), 08/16/2077 278,000 257,150Marathon Petroleum Corp.
3.80%, 04/01/2028 (A) 755,000 747,493Noble Energy, Inc.
3.85%, 01/15/2028 260,000 256,1045,155,668
Transportation Infrastructure - 0.6%Heathrow Funding, Ltd.
1.37%, 03/28/2032 (D) GBP 590,515 946,397Total Corporate Debt Securities
(Cost $35,434,560) 35,229,994
FOREIGN GOVERNMENT OBLIGATIONS - 21.8%Australia - 2.4%Australia Government Bond
0.75%, 11/21/2027 (D) AUD 5,300,000 4,017,999Canada - 3.3%Canada Government Real Return Bond
4.25%, 12/01/2021 CAD 4,662,939 3,882,764Canadian Government Real Return Bond
4.00%, 12/01/2031 1,534,869 1,683,4695,566,233
France - 1.4%France Government Bond OAT
2.10%, 07/25/2023 (D) EUR 1,918,178 2,470,945Japan - 1.0%Japanese Government CPI Linked Bond
0.10%, 03/10/2028 JPY 186,060,050 1,750,640
Principal ValueFOREIGN GOVERNMENT OBLIGATIONS (continued)Mexico - 1.1%Mexican Udibonos
Series S,4.50%, 12/04/2025
MXN 19,953,732$1,066,601
Mexico UdibonosSeries S,2.50%, 12/10/2020 17,586,722 884,453
1,951,054New Zealand - 2.2%New Zealand Government Inflation-Linked
Bond2.00%, 09/20/2025 (D) NZD 4,750,000 3,785,175
Spain - 8.5%Spain Government Inflation-Linked Bond
0.30%, 11/30/2021 EUR 7,274,680 8,574,7580.55%, 11/30/2019 (D) 2,608,600 3,001,1671.00%, 11/30/2030 (D) 2,289,276 2,860,388
14,436,313United Kingdom - 1.9%U.K. Gilt Inflation-Linked
0.13%, 08/10/2028 (D) GBP 1,927,341 3,155,604Total Foreign Government Obligations
(Cost $37,350,302) 37,133,963
MORTGAGE-BACKED SECURITIES - 1.0%BX Trust
Series 2018-MCSF, Class A,1-Month LIBOR + 0.58%,
3.06% (B), 04/15/2035 (A) $ 900,000 885,905DBCG Mortgage Trust
Series 2017-BBG, Class A,1-Month LIBOR + 0.70%,
3.18% (B), 06/15/2034 (A) 900,000 896,056Total Mortgage-Backed Securities
(Cost $1,793,878) 1,781,961
U.S. GOVERNMENT AGENCY OBLIGATION - 0.0% (G)Federal National Mortgage Association
1-Month LIBOR + 1.60%,4.09% (B), 01/25/2024 31,557 31,615
Total U.S. Government Agency Obligation(Cost $31,588) 31,615
U.S. GOVERNMENT OBLIGATIONS - 54.8%U.S. Treasury Inflation-Protected Securities - 54.8%U.S. Treasury Inflation-Indexed Bond
0.63%, 02/15/2043 2,736,550 2,572,3220.75%, 02/15/2042 - 02/15/2045 5,490,944 5,296,5251.00%, 02/15/2046 2,601,581 2,649,7921.38%, 02/15/2044 2,601,335 2,872,5812.00%, 01/15/2026 2,535,960 2,797,0702.38%, 01/15/2025 - 01/15/2027 7,093,326 7,961,1172.50%, 01/15/2029 586,090 694,3653.63%, 04/15/2028 933,594 1,184,730
U.S. Treasury Inflation-Indexed Note0.13%, 04/15/2020 - 07/15/2024 34,829,091 34,497,0690.25%, 01/15/2025 1,381,289 1,366,269
Copyright © 2021 www.secdatabase.com. All Rights Reserved.Please Consider the Environment Before Printing This Document

The notes are an integral part of this report.Transamerica Series Trust Page 2
Copyright © 2021 www.secdatabase.com. All Rights Reserved.Please Consider the Environment Before Printing This Document

Transamerica PineBridge Inflation Opportunities VPSCHEDULE OF INVESTMENTS (continued)At March 31, 2019(unaudited)
FORWARD FOREIGN CURRENCY CONTRACTS:
CounterpartySettlement
DateCurrencyPurchased
CurrencySold
UnrealizedAppreciation
UnrealizedDepreciation
JPMS 04/11/2019 USD 3,804,746 AUD 5,300,000 $40,614 $�JPMS 04/11/2019 USD 5,594,279 CAD 7,394,225 59,538 �JPMS 04/11/2019 USD 17,521,573 EUR 15,180,500 476,926 �JPMS 04/11/2019 USD 6,907,729 GBP 5,400,000 � (129,445 )JPMS 04/11/2019 USD 1,791,359 JPY 193,539,385 43,479 �JPMS 04/11/2019 USD 1,838,831 MXN 36,000,000 � (12,583 )JPMS 04/11/2019 USD 3,673,849 NZD 5,375,000 21,018 (8,333 )JPMS 04/11/2019 GBP 1,743,500 USD 2,302,167 � (30,072 )Total $ 641,575 $ (180,433 )
The notes are an integral part of this report.Transamerica Series Trust Page 3
Principal ValueU.S. GOVERNMENT OBLIGATIONS (continued)U.S. Treasury Inflation-Protected Securities (continued)U.S. Treasury Inflation-Indexed Note (continued)
0.38%, 07/15/2025 - 01/15/2027 $10,454,520
$10,394,076
0.50%, 01/15/2028 5,580,877 5,566,2380.63%, 01/15/2024 - 01/15/2026 7,171,388 7,247,8530.75%, 07/15/2028 5,313,727 5,430,4251.25%, 07/15/2020 2,654,154 2,693,151
Total U.S. Government Obligations(Cost $92,241,260) 93,223,583
Shares ValuePREFERRED STOCKS - 0.3%Banks - 0.3%Banco Santander SA,
3-Month LIBOR + 0.52%, 4.00% (B) 3,500 80,990US Bancorp,
Series A, 3-Month LIBOR +1.02%, 3.81% (B) 500 397,345
Total Preferred Stocks(Cost $500,925) 478,335
SHORT-TERM INVESTMENT COMPANIES - 0.6%
Principal ValueMoney Market Funds - 0.6%State Street Institutional U.S. Government
Money Market Fund2.38%, 12/31/2049 $ 952,389 952,389
Total Short-Term Investment Companies(Cost $952,389) 952,389
Shares ValueOTHER INVESTMENT COMPANY - 1.0%Securities Lending Collateral - 1.0%State Street Navigator Securities Lending Trust -
Government Money Market Portfolio,2.41% (H) 1,662,263 $ 1,662,263
Total Other Investment Company(Cost $1,662,263) 1,662,263
Total Investments(Cost $170,363,619) 170,905,253
Net Other Assets (Liabilities) - (0.4)% (678,502 )Net Assets - 100.0% $ 170,226,751
Copyright © 2021 www.secdatabase.com. All Rights Reserved.Please Consider the Environment Before Printing This Document

Transamerica PineBridge Inflation Opportunities VPSCHEDULE OF INVESTMENTS (continued)At March 31, 2019(unaudited)
SECURITY VALUATION:
Valuation Inputs
Level 1 -Unadjusted
QuotedPrices
Level 2 -Other
SignificantObservable
Inputs
Level 3 -Significant
UnobservableInputs Value
ASSETSInvestmentsAsset-Backed Security $� $411,150 $ � $411,150Corporate Debt Securities � 35,229,994 � 35,229,994Foreign Government Obligations � 37,133,963 � 37,133,963Mortgage-Backed Securities � 1,781,961 � 1,781,961U.S. Government Agency Obligation � 31,615 � 31,615U.S. Government Obligations � 93,223,583 � 93,223,583Preferred Stocks 478,335 � � 478,335Short-Term Investment Companies 952,389 � � 952,389Other Investment Company 1,662,263 � � 1,662,263Total Investments $ 3,092,987 $ 167,812,266 $ �� $ 170,905,253Other Financial InstrumentsForward Foreign Currency Contracts (I) $� $641,575 $ � $641,575Total Other Financial Instruments $�� $641,575 $ �� $641,575LIABILITIESOther Financial InstrumentsForward Foreign Currency Contracts (I) $� $(180,433 ) $ � $(180,433 )Total Other Financial Instruments $�� $(180,433 ) $ �� $(180,433 )
Transfers
InvestmentsTransfers from
Level 1 to Level 2Transfers from
Level 2 to Level 1Transfers from
Level 2 to Level 3Transfers from
Level 3 to Level 2**!**Corporate Debt Securities $ � $ � $ � $ 2,537,600
FOOTNOTES TO SCHEDULE OF INVESTMENTS:
(A) Securities are registered pursuant to Rule 144A of the Securities Act of 1933. Unless otherwise indicated, the securities are deemed to be liquid for purposes ofcompliance limitations on holdings of illiquid securities and may be resold as transactions exempt from registration, normally to qualified institutional buyers. AtMarch 31, 2019, the total value of 144A securities is $8,190,680, representing 4.8% of the Portfolio�s net assets.
(B) Floating or variable rate securities. The rates disclosed are as of March 31, 2019. For securities based on a published reference rate and spread, the referencerate and spread are indicated within the description. Variable rate securities with a floor or ceiling feature are disclosed at the inherent rate, where applicable.Certain variable rate securities are not based on a published reference rate and spread, but are determined by the issuer or agent and are based on current marketconditions; these securities do not indicate a reference rate and spread in the description.
(C) Perpetual maturity. The date displayed is the next call date.(D) Securities are exempt from registration under Regulation S of the Securities Act of 1933, which exempts from registration securities offered and sold outside the
United States. Securities may not be offered or sold in the United States except pursuant to an exemption from, or in a transaction not subject to, the registrationrequirements of the Securities Act of 1933. At March 31, 2019, the total value of Regulation S securities is $21,563,294, representing 12.7% of the Portfolio�s netassets.
The notes are an integral part of this report.Transamerica Series Trust Page 4
Copyright © 2021 www.secdatabase.com. All Rights Reserved.Please Consider the Environment Before Printing This Document

Transamerica PineBridge Inflation Opportunities VPSCHEDULE OF INVESTMENTS (continued)At March 31, 2019(unaudited)
FOOTNOTES TO SCHEDULE OF INVESTMENTS (continued):
(E) All or a portion of the securities are on loan. The total value of all securities on loan is $1,629,487. The amount of securities on loan indicated may not correspondwith the securities on loan identified because securities with pending sales are in the process of recall from the brokers.
(F) When-issued, delayed-delivery and/or forward commitment (including TBAs) security. Security to be settled and delivered after March 31, 2019. Security maydisplay a coupon rate of 0.00%, as the rate is to be determined at time of settlement.
(G) Percentage rounds to less than 0.1% or (0.1)%.(H) Rate disclosed reflects the yield at March 31, 2019.(I) Futures contracts and/or forward foreign currency contracts are valued at unrealized appreciation (depreciation).
CURRENCY ABBREVIATIONS:
AUD Australian DollarCAD Canadian DollarEUR EuroGBP Pound SterlingJPY Japanese YenMXN Mexican PesoNZD New Zealand DollarUSD United States Dollar
COUNTERPARTY ABBREVIATION:
JPMS JPMorgan Securities LLC
PORTFOLIO ABBREVIATIONS:
CPI-YoY US Consumer Price Index Urban Consumers Year Over YearLIBOR London Interbank Offered RateMTN Medium Term NoteOAT Obligations Assimilables du Tresor (Treasury Obligations)
The notes are an integral part of this report.Transamerica Series Trust Page 5
Copyright © 2021 www.secdatabase.com. All Rights Reserved.Please Consider the Environment Before Printing This Document

Transamerica ProFund UltraBear VPSCHEDULE OF INVESTMENTSAt March 31, 2019(unaudited)
FUTURES CONTRACTS:
DescriptionLong/Short
Number ofContracts
ExpirationDate
NotionalAmount Value
UnrealizedAppreciation
UnrealizedDepreciation
S&P 500® E-Mini Index Short (299 ) 06/21/2019 $ (41,679,534) $ (42,567,000) $ � $ (887,466)
SECURITY VALUATION:
Valuation Inputs (B)
Level 1 -Unadjusted
QuotedPrices
Level 2 -Other
SignificantObservable
Inputs
Level 3 -Significant
UnobservableInputs Value
ASSETSInvestmentsShort-Term Investment Companies $15,453,758 $� $ � $15,453,758Repurchase Agreement � 3,863,440 � 3,863,440Total Investments $ 15,453,758 $ 3,863,440 $ �� $ 19,317,198LIABILITIESOther Financial InstrumentsFutures Contracts (C) $(887,466 ) $� $ � $(887,466 )Total Other Financial Instruments $(887,466 ) $�� $ �� $(887,466 )
FOOTNOTES TO SCHEDULE OF INVESTMENTS:
(A) Rate disclosed reflects the yield at March 31, 2019.(B) There were no transfers in or out of Level 3 during the period ended March 31, 2019. Please reference the Security Valuation section of the Notes to Schedules of
Investments for more information regarding security valuation and pricing inputs.(C) Futures contracts and/or forward foreign currency contracts are valued at unrealized appreciation (depreciation).
The notes are an integral part of this report.Transamerica Series Trust Page 1
Shares ValueSHORT-TERM INVESTMENT COMPANIES - 72.7%Money Market Funds - 72.7%BlackRock Liquidity Funds T-Fund Portfolio 3,863,439 $ 3,863,439Dreyfus Treasury & Agency Cash Management 3,863,440 3,863,440State Street Institutional U.S. Government Money
Market Fund 3,863,440 3,863,440UBS Select Treasury Preferred 3,863,439 3,863,439Total Short-Term Investment Companies
(Cost $15,453,758) 15,453,758
Principal ValueREPURCHASE AGREEMENT - 18.2%Fixed Income Clearing Corp., 1.45% (A),
dated 03/29/2019, to be repurchased at$3,863,906 on 04/01/2019. Collateralized by aU.S. Government Obligation, 2.75%, due 09/15/2021, and with a value of $3,943,729. $ 3,863,440 $ 3,863,440
Total Repurchase Agreement(Cost $3,863,440) 3,863,440
Total Investments(Cost $19,317,198) 19,317,198
Net Other Assets (Liabilities) - 9.1% 1,935,248Net Assets - 100.0% $ 21,252,446
Copyright © 2021 www.secdatabase.com. All Rights Reserved.Please Consider the Environment Before Printing This Document

Transamerica QS Investors Active Asset Allocation �� Conservative VPSCHEDULE OF INVESTMENTSAt March 31, 2019(unaudited)
SECURITY VALUATION:
Valuation Inputs (C)
Level 1 -Unadjusted
QuotedPrices
Level 2 -Other
SignificantObservable
Inputs
Level 3 -Significant
UnobservableInputs Value
ASSETSInvestmentsExchange-Traded Funds $361,108,262 $� $ � $361,108,262Other Investment Company 51,136,600 � � 51,136,600Repurchase Agreement � 19,849,926 � 19,849,926Total Investments $ 412,244,862 $ 19,849,926 $ �� $ 432,094,788
FOOTNOTES TO SCHEDULE OF INVESTMENTS:
(A) All or a portion of the securities are on loan. The total value of all securities on loan is $50,113,557. The amount of securities on loan indicated may notcorrespond with the securities on loan identified because securities with pending sales are in the process of recall from the brokers.
(B) Rates disclosed reflect the yields at March 31, 2019.(C) There were no transfers in or out of Level 3 during the period ended March 31, 2019. Please reference the Security Valuation section of the Notes to Schedules of
Investments for more information regarding security valuation and pricing inputs.
The notes are an integral part of this report.Transamerica Series Trust Page 1
Shares ValueEXCHANGE-TRADED FUNDS - 93.2%International Equity Funds - 8.3%iShares Edge MSCI Min Vol EAFE ETF 159,640 $ 11,494,080Vanguard FTSE All-World ex-US ETF 307,723 15,432,309Vanguard Total International Stock ETF (A) 99,159 5,146,352
32,072,741International Fixed Income Fund - 4.4%Vanguard Total International Bond ETF 305,035 17,011,802U.S. Equity Funds - 19.9%iShares Core S&P 500 ETF 54,886 15,618,360iShares Edge MSCI Min Vol USA ETF (A) 148,484 8,730,859iShares Russell 1000 ETF (A) 297,055 46,729,722Vanguard Small-Cap Growth ETF (A) 17,003 3,055,779Vanguard Small-Cap Value ETF (A) 23,478 3,022,323
77,157,043U.S. Fixed Income Funds - 60.6%iShares Core U.S. Aggregate Bond ETF 501,161 54,661,630iShares TIPS Bond ETF 34,224 3,869,708SPDR Bloomberg Barclays Convertible Securities
ETF 233,361 12,193,112Vanguard Total Bond Market ETF 2,021,954 164,142,226
234,866,676Total Exchange-Traded Funds
(Cost $354,131,830) 361,108,262
Shares ValueOTHER INVESTMENT COMPANY - 13.2%Securities Lending Collateral - 13.2%State Street Navigator Securities Lending
Trust - Government Money MarketPortfolio, 2.41% (B) 51,136,600 $ 51,136,600
Total Other Investment Company(Cost $51,136,600) 51,136,600
Principal ValueREPURCHASE AGREEMENT - 5.1%Fixed Income Clearing Corp., 1.45% (B),
dated 03/29/2019, to be repurchased at$19,852,324 on 04/01/2019. Collateralizedby a U.S. Government Obligation, 2.75%,due 08/15/2021, and with a value of$20,251,914. $ 19,849,926 19,849,926
Total Repurchase Agreement(Cost $19,849,926) 19,849,926
Total Investments(Cost $425,118,356) 432,094,788
Net Other Assets (Liabilities) - (11.5)% (44,681,972 )Net Assets - 100.0% $ 387,412,816
Copyright © 2021 www.secdatabase.com. All Rights Reserved.Please Consider the Environment Before Printing This Document

Transamerica QS Investors Active Asset Allocation �� ModerateGrowth VPSCHEDULE OF INVESTMENTSAt March 31, 2019(unaudited)
SECURITY VALUATION:
Valuation Inputs (C)
Level 1 -Unadjusted
QuotedPrices
Level 2 -Other
SignificantObservable
Inputs
Level 3 -Significant
UnobservableInputs Value
ASSETSInvestmentsExchange-Traded Funds $434,326,757 $� $ � $434,326,757Short-Term U.S. Government Obligations � 120,845,468 � 120,845,468Other Investment Company 82,209,951 � � 82,209,951Repurchase Agreement � 77,469,716 � 77,469,716Total Investments $ 516,536,708 $ 198,315,184 $ �� $ 714,851,892
FOOTNOTES TO SCHEDULE OF INVESTMENTS:
(A) All or a portion of the securities are on loan. The total value of all securities on loan is $80,558,369. The amount of securities on loan indicated may notcorrespond with the securities on loan identified because securities with pending sales are in the process of recall from the brokers.
(B) Rates disclosed reflect the yields at March 31, 2019.
Shares ValueEXCHANGE-TRADED FUNDS - 68.7%International Equity Funds - 11.6%iShares Edge MSCI Min Vol EAFE ETF (A) 102,601 $ 7,387,272Vanguard FTSE All-World ex-US ETF 986,097 49,452,765Vanguard Total International Stock ETF (A) 315,457 16,372,218
73,212,255International Fixed Income Fund - 3.8%Vanguard Total International Bond ETF (A) 433,384 24,169,825U.S. Equity Funds - 26.7%iShares Core S&P 500 ETF 133,529 37,997,012iShares Edge MSCI Min Vol USA ETF (A) 49,911 2,934,767iShares Russell 1000 ETF (A) 727,304 114,412,192Vanguard Small-Cap Growth ETF (A) 36,781 6,610,282Vanguard Small-Cap Value ETF (A) 50,992 6,564,200
168,518,453U.S. Fixed Income Funds - 26.6%iShares Core U.S. Aggregate Bond ETF 345,314 37,663,398iShares TIPS Bond ETF 71,560 8,091,289SPDR Bloomberg Barclays Convertible
Securities ETF (A) 217,953 11,388,044Vanguard Total Bond Market ETF 1,370,824 111,283,493
168,426,224Total Exchange-Traded Funds
(Cost $428,751,744) 434,326,757
Principal ValueSHORT-TERM U.S. GOVERNMENT OBLIGATIONS - 19.1%U.S. Treasury Bill
2.48% (B), 06/27/2019 $ 121,535,000 120,845,468Total Short-Term U.S. Government Obligations
(Cost $120,807,883) 120,845,468
Shares ValueOTHER INVESTMENT COMPANY - 13.0%Securities Lending Collateral - 13.0%State Street Navigator Securities Lending
Trust -Government Money MarketPortfolio, 2.41% (B) 82,209,951 $ 82,209,951
Total Other Investment Company(Cost $82,209,951) 82,209,951
Principal ValueREPURCHASE AGREEMENT - 12.3%Fixed Income Clearing Corp., 1.45% (B),
dated 03/29/2019, to be repurchased at$77,479,077 on 04/01/2019. Collateralizedby a U.S. Government Obligation, 2.75%,due 08/15/2021, and with a value of$79,022,571. $ 77,469,716 77,469,716
Total Repurchase Agreement(Cost $77,469,716) 77,469,716
Total Investments(Cost $709,239,294) 714,851,892
Net Other Assets (Liabilities) - (13.1)% (82,937,343 )Net Assets - 100.0% $ 631,914,549
Copyright © 2021 www.secdatabase.com. All Rights Reserved.Please Consider the Environment Before Printing This Document

(C) There were no transfers in or out of Level 3 during the period ended March 31, 2019. Please reference the Security Valuation section of the Notes to Schedules ofInvestments for more information regarding security valuation and pricing inputs.
The notes are an integral part of this report.Transamerica Series Trust Page 1
Copyright © 2021 www.secdatabase.com. All Rights Reserved.Please Consider the Environment Before Printing This Document

Transamerica QS Investors Active Asset Allocation �� Moderate VPSCHEDULE OF INVESTMENTSAt March 31, 2019(unaudited)
SECURITY VALUATION:
Valuation Inputs (C)
Level 1 -Unadjusted
QuotedPrices
Level 2 -Other
SignificantObservable
Inputs
Level 3 -Significant
UnobservableInputs Value
ASSETSInvestmentsExchange-Traded Funds $1,225,009,936 $� $ � $1,225,009,936Short-Term U.S. Government Obligations � 95,042,695 � 95,042,695Other Investment Company 172,004,911 � � 172,004,911Repurchase Agreement � 139,597,638 � 139,597,638Total Investments $ 1,397,014,847 $ 234,640,333 $ �� $ 1,631,655,180
FOOTNOTES TO SCHEDULE OF INVESTMENTS:
(A) All or a portion of the securities are on loan. The total value of all securities on loan is $168,498,689. The amount of securities on loan indicated may notcorrespond with the securities on loan identified because securities with pending sales are in the process of recall from the brokers.
(B) Rates disclosed reflect the yields at March 31, 2019.(C) There were no transfers in or out of Level 3 during the period ended March 31, 2019. Please reference the Security Valuation section of the Notes to Schedules of
Investments for more information regarding security valuation and pricing inputs.
Shares ValueEXCHANGE-TRADED FUNDS - 84.0%International Equity Funds - 10.3%iShares Edge MSCI Min Vol EAFE ETF (A) 433,424 $ 31,206,528Vanguard FTSE All-World ex-US ETF (A) 1,773,161 88,924,024Vanguard Total International Stock ETF (A) 565,022 29,324,642
149,455,194International Fixed Income Fund - 4.5%Vanguard Total International Bond ETF (A) 1,177,836 65,687,914U.S. Equity Funds - 23.3%iShares Core S&P 500 ETF 259,863 73,946,615iShares Edge MSCI Min Vol USA ETF (A) 300,066 17,643,881iShares Russell 1000 ETF (A) 1,411,292 222,010,344Vanguard Small-Cap Growth ETF (A) 73,801 13,263,516Vanguard Small-Cap Value ETF (A) 102,924 13,249,407
340,113,763U.S. Fixed Income Funds - 45.9%iShares Core U.S. Aggregate Bond ETF (A) 1,413,327 154,151,576iShares TIPS Bond ETF 168,689 19,073,665SPDR Bloomberg Barclays Convertible
Securities ETF (A) 718,399 37,536,348Vanguard Total Bond Market ETF 5,653,997 458,991,476
669,753,065Total Exchange-Traded Funds
(Cost $1,206,047,227) 1,225,009,936
Principal ValueSHORT-TERM U.S. GOVERNMENT OBLIGATIONS - 6.5%U.S. Treasury Bill
2.49% (B), 06/27/2019 $ 95,585,000 95,042,695Total Short-Term U.S. Government Obligations
(Cost $95,012,427) 95,042,695
Shares ValueOTHER INVESTMENT COMPANY - 11.8%Securities Lending Collateral - 11.8%State Street Navigator Securities Lending
Trust - Government Money MarketPortfolio, 2.41% (B) 172,004,911 $ 172,004,911
Total Other Investment Company(Cost $172,004,911) 172,004,911
Principal ValueREPURCHASE AGREEMENT - 9.6%Fixed Income Clearing Corp., 1.45% (B),
dated 03/29/2019, to be repurchased at$139,614,506 on 04/01/2019.Collateralized by a U.S. GovernmentObligation, 2.75%, due 08/15/2021,and with a value of $142,392,936. $ 139,597,638 139,597,638
Total Repurchase Agreement(Cost $139,597,638) 139,597,638
Total Investments(Cost $1,612,662,203) 1,631,655,180
Net Other Assets (Liabilities) - (11.9)% (173,286,815 )Net Assets - 100.0% $ 1,458,368,365
Copyright © 2021 www.secdatabase.com. All Rights Reserved.Please Consider the Environment Before Printing This Document

The notes are an integral part of this report.Transamerica Series Trust Page 1
Copyright © 2021 www.secdatabase.com. All Rights Reserved.Please Consider the Environment Before Printing This Document

Transamerica Small/Mid Cap Value VPSCHEDULE OF INVESTMENTSAt March 31, 2019(unaudited)
The notes are an integral part of this report.Transamerica Series Trust Page 1
Shares ValueCOMMON STOCKS - 96.2%Aerospace & Defense - 1.1%Aerojet Rocketdyne Holdings, Inc. (A) 44,000 $ 1,563,320Cubic Corp. 28,000 1,574,720Curtiss-Wright Corp. 11,000 1,246,740Elbit Systems, Ltd. (B) 10,700 1,380,300
5,765,080Airlines - 1.7%Alaska Air Group, Inc. 102,500 5,752,300JetBlue Airways Corp. (A) 198,400 3,245,824
8,998,124Auto Components - 0.8%Dana, Inc. 54,500 966,830Gentex Corp. 22,000 454,960Stoneridge, Inc. (A) 47,300 1,365,078Visteon Corp. (A) 17,500 1,178,625
3,965,493Banks - 5.9%Bank of Princeton 26,300 834,499Berkshire Hills Bancorp, Inc. 72,112 1,964,331CIT Group, Inc. 130,200 6,245,694Evans Bancorp, Inc. 3,000 106,950First Citizens BancShares, Inc., Class A 11,507 4,685,650First Community Bankshares, Inc. 64,754 2,145,948First Republic Bank 5,200 522,392Hanmi Financial Corp. 56,000 1,191,120Hope Bancorp, Inc. 75,972 993,714Lakeland Bancorp, Inc. 136,000 2,030,480Sandy Spring Bancorp, Inc. 68,700 2,148,936Sterling Bancorp 101,500 1,890,945Umpqua Holdings Corp. 100,000 1,650,000Union Bankshares Corp. 37,000 1,196,210United Community Banks, Inc. 61,000 1,520,730Washington Trust Bancorp, Inc. 22,803 1,097,964Webster Financial Corp. 15,600 790,452
31,016,015Beverages - 1.5%Molson Coors Brewing Co., Class B 135,400 8,076,610Biotechnology - 0.6%United Therapeutics Corp. (A) 26,600 3,122,042Building Products - 1.2%American Woodmark Corp. (A) 11,000 908,930Continental Building Products, Inc. (A) 107,500 2,664,925Gibraltar Industries, Inc. (A) 10,900 442,649Insteel Industries, Inc. 18,300 382,836JELD-WEN Holding, Inc. (A) 20,800 367,328Masonite International Corp. (A) 11,500 573,735PGT Innovations, Inc. (A) 68,500 948,725
6,289,128Capital Markets - 1.8%E*TRADE Financial Corp. 98,300 4,564,069Legg Mason, Inc. 46,000 1,259,020Piper Jaffray Cos. 24,500 1,784,335
Shares ValueCOMMON STOCKS (continued)Capital Markets (continued)Stifel Financial Corp. 30,000 $ 1,582,800Waddell & Reed Financial, Inc., Class A (B) 7,500 129,675
9,319,899Chemicals - 1.5%Chase Corp. 6,800 629,272Huntsman Corp. 30,000 674,700Methanex Corp. 22,000 1,250,920PPG Industries, Inc. 37,900 4,277,773Trinseo SA 26,500 1,200,450
8,033,115Commercial Services & Supplies - 1.0%Knoll, Inc. 48,500 917,135Stericycle, Inc. (A) 47,600 2,590,392Tetra Tech, Inc. 28,500 1,698,315
5,205,842Communications Equipment - 0.6%KVH Industries, Inc. (A) 196,282 2,000,114NETGEAR, Inc. (A) 27,000 894,240
2,894,354Construction & Engineering - 1.8%Comfort Systems USA, Inc. 39,500 2,069,405EMCOR Group, Inc. 34,500 2,521,260Granite Construction, Inc. 33,500 1,445,525Jacobs Engineering Group, Inc. 21,800 1,639,142KBR, Inc. 98,800 1,886,092
9,561,424Construction Materials - 0.2%US Concrete, Inc. (A) 31,000 1,284,020Consumer Finance - 0.6%Ally Financial, Inc. 117,400 3,227,326Distributors - 1.1%LKQ Corp. (A) 197,700 5,610,726Diversified Consumer Services - 0.3%American Public Education, Inc. (A) 33,000 993,960K12, Inc. (A) 16,800 573,384
1,567,344Diversified Financial Services - 1.0%Jefferies Financial Group, Inc. 270,700 5,086,453Diversified Telecommunication Services - 0.8%Zayo Group Holdings, Inc. (A) 146,600 4,166,372Electric Utilities - 3.6%Alliant Energy Corp. 104,100 4,906,233FirstEnergy Corp. 158,800 6,607,668PPL Corp. 223,100 7,081,194
18,595,095Electrical Equipment - 0.5%LSI Industries, Inc. 113,500 298,505Regal Beloit Corp. 27,350 2,239,145
2,537,650
Copyright © 2021 www.secdatabase.com. All Rights Reserved.Please Consider the Environment Before Printing This Document

Transamerica Small/Mid Cap Value VPSCHEDULE OF INVESTMENTS (continued)At March 31, 2019(unaudited)
The notes are an integral part of this report.Transamerica Series Trust Page 2
Shares ValueCOMMON STOCKS (continued)Electronic Equipment, Instruments & Components - 1.0%Coherent, Inc. (A) 4,500 $ 637,740Control4 Corp. (A) 96,000 1,625,280Daktronics, Inc. 20,500 152,725Methode Electronics, Inc. 55,400 1,594,412Vishay Intertechnology, Inc. 78,500 1,449,895
5,460,052Energy Equipment & Services - 0.2%Helmerich & Payne, Inc. 20,500 1,138,980Entertainment - 1.4%Lions Gate Entertainment Corp., Class B 67,579 1,020,443Viacom, Inc., Class B 229,700 6,447,679
7,468,122Equity Real Estate Investment Trusts - 7.0%Apple Hospitality, Inc., REIT 104,500 1,703,350Brandywine Realty Trust 101,000 1,601,860Chatham Lodging Trust 20,000 384,800Colony Capital, Inc. 768,000 4,085,760Community Healthcare Trust, Inc. 73,400 2,634,326DiamondRock Hospitality Co. 195,500 2,117,265Gaming and Leisure Properties, Inc. 90,600 3,494,442JBG SMITH Properties 139,100 5,751,785Lexington Realty Trust 211,500 1,916,190Outfront Media, Inc. 44,500 1,041,300Physicians Realty Trust 110,000 2,069,100Piedmont Office Realty Trust, Inc., Class A 40,000 834,000Sabra Health Care, Inc., REIT 67,000 1,304,490Summit Hotel Properties, Inc. 180,500 2,059,505Uniti Group, Inc. (B) 148,804 1,665,117VEREIT, Inc. 496,700 4,157,379
36,820,669Food & Staples Retailing - 1.9%Casey�s General Stores, Inc. 32,970 4,245,547US Foods Holding Corp. (A) 167,300 5,840,443
10,085,990Food Products - 3.4%General Mills, Inc. 96,100 4,973,175J.M. Smucker Co. 31,800 3,704,700Kellogg Co. 61,000 3,500,180Post Holdings, Inc. (A) 48,968 5,357,099
17,535,154Health Care Equipment & Supplies - 1.7%Meridian Bioscience, Inc. 111,500 1,963,515OraSure Technologies, Inc. (A) 111,500 1,243,225Zimmer Biomet Holdings, Inc. 43,900 5,606,030
8,812,770Health Care Providers & Services - 4.2%AmerisourceBergen Corp. 74,300 5,908,336AMN Healthcare Services, Inc. (A) 26,800 1,262,012Cardinal Health, Inc. 100,092 4,819,430Cross Country Healthcare, Inc. (A) 161,500 1,135,345Encompass Health Corp. 32,000 1,868,800Laboratory Corp. of America Holdings (A) 46,900 7,174,762
22,168,685Health Care Technology - 0.2%Omnicell, Inc. (A) 10,900 881,156
Shares ValueCOMMON STOCKS (continued)Hotels, Restaurants & Leisure - 2.1%Aramark 193,400 $ 5,714,970Bloomin� Brands, Inc. 42,000 858,900Churchill Downs, Inc. 20,000 1,805,200Stars Group, Inc. (A) (B) 151,100 2,645,761
11,024,831Household Durables - 0.9%Helen of Troy, Ltd. (A) 12,750 1,478,490La-Z-Boy, Inc. 44,000 1,451,560NVR, Inc. (A) 700 1,936,900
4,866,950Household Products - 0.3%Spectrum Brands Holdings, Inc. (B) 24,000 1,314,720Insurance - 8.3%Alleghany Corp. 9,300 5,695,320Allstate Corp. 63,200 5,952,176Arch Capital Group, Ltd. (A) 177,000 5,720,640Fidelity National Financial, Inc. 165,800 6,059,990Loews Corp. 122,200 5,857,046Markel Corp. (A) 4,200 4,184,208Selective Insurance Group, Inc. 46,133 2,919,296United Fire Group, Inc. 48,239 2,108,527Willis Towers Watson PLC 28,600 5,023,590
43,520,793Interactive Media & Services - 0.3%IAC/InterActiveCorp (A) 6,250 1,313,188Internet & Direct Marketing Retail - 0.9%Liberty Expedia Holdings, Inc., Class A (A) 111,200 4,759,360IT Services - 1.5%Leidos Holdings, Inc. 125,800 8,062,522Leisure Products - 0.2%MasterCraft Boat Holdings, Inc. (A) 51,900 1,171,383Machinery - 2.8%Altra Industrial Motion Corp. 38,300 1,189,215Columbus McKinnon Corp. 45,263 1,554,784Douglas Dynamics, Inc. 37,000 1,408,590Gencor Industries, Inc. (A) 86,000 1,062,960Mueller Industries, Inc. 34,000 1,065,560Oshkosh Corp. 17,000 1,277,210Trinity Industries, Inc. 233,700 5,078,301Watts Water Technologies, Inc., Class A 22,000 1,778,040
14,414,660Media - 4.7%Discovery, Inc., Class C (A) 199,144 5,062,240DISH Network Corp., Class A (A) 170,200 5,393,638GCI Liberty, Inc., Class A (A) 61,700 3,431,137Liberty Media Corp. - Liberty SiriusXM, Class C (A) 83,044 3,175,603MSG Networks, Inc., Class A (A) 114,500 2,490,375News Corp., Class A 392,000 4,876,480
24,429,473Metals & Mining - 0.8%Commercial Metals Co. 90,000 1,537,200Kaiser Aluminum Corp. 15,750 1,649,497
Copyright © 2021 www.secdatabase.com. All Rights Reserved.Please Consider the Environment Before Printing This Document

Transamerica Small/Mid Cap Value VPSCHEDULE OF INVESTMENTS (continued)At March 31, 2019(unaudited)
The notes are an integral part of this report.Transamerica Series Trust Page 3
Shares ValueCOMMON STOCKS (continued)Metals & Mining (continued)Schnitzer Steel Industries, Inc., Class A 20,000 $ 480,000TimkenSteel Corp. (A) 29,700 322,542
3,989,239Mortgage Real Estate Investment Trusts - 1.5%Annaly Capital Management, Inc. 793,389 7,925,956Multi-Utilities - 1.5%CenterPoint Energy, Inc. 157,600 4,838,320NorthWestern Corp. 45,000 3,168,450
8,006,770Multiline Retail - 0.5%Dollar Tree, Inc. (A) 24,000 2,520,960Oil, Gas & Consumable Fuels - 4.5%Antero Resources Corp. (A) 611,200 5,396,896Callon Petroleum Co. (A) (B) 128,500 970,175Delek US Holdings, Inc. 34,944 1,272,660Diamondback Energy, Inc. 14,609 1,483,252EQT Corp. 205,100 4,253,774Gulfport Energy Corp. (A) 83,500 669,670Magnolia Oil & Gas Corp. (A) (B) 105,000 1,260,000REX American Resources Corp. (A) 19,400 1,563,834Whiting Petroleum Corp. (A) 34,500 901,830Williams Cos., Inc. 198,600 5,703,792
23,475,883Paper & Forest Products - 0.6%Domtar Corp. 37,000 1,837,050Mercer International, Inc. 34,700 468,797P.H. Glatfelter Co. 46,500 656,580
2,962,427Personal Products - 0.5%Coty, Inc., Class A (B) 213,900 2,459,850Professional Services - 2.7%ASGN, Inc. (A) 30,500 1,936,445FTI Consulting, Inc. (A) 12,500 960,250Heidrick & Struggles International, Inc. 45,500 1,744,015ICF International, Inc. 31,000 2,358,480ManpowerGroup, Inc. 39,600 3,274,524Nielsen Holdings PLC 168,800 3,995,496
14,269,210Real Estate Management & Development - 0.2%Newmark Group, Inc., Class A 148,000 1,234,320Road & Rail - 0.3%AMERCO 4,000 1,486,040Semiconductors & Semiconductor Equipment - 3.4%Applied Materials, Inc. 65,400 2,593,764AXT, Inc. (A) 136,000 605,200Brooks Automation, Inc. 35,000 1,026,550Cohu, Inc. 105,121 1,550,535Entegris, Inc. 50,600 1,805,914KLA-Tencor Corp. 11,615 1,386,947MKS Instruments, Inc. 20,400 1,898,220Qorvo, Inc. (A) 54,600 3,916,458Silicon Motion Technology Corp., ADR 35,500 1,407,220Universal Display Corp. (B) 12,150 1,857,127
18,047,935
Shares ValueCOMMON STOCKS (continued)Software - 1.6%CDK Global, Inc. 121,800 $ 7,164,276LogMeIn, Inc. 10,500 841,050TiVo Corp. 48,817 454,974
8,460,300Specialty Retail - 2.8%Abercrombie & Fitch Co., Class A 62,500 1,713,125American Eagle Outfitters, Inc. 124,500 2,760,165Foot Locker, Inc. 88,500 5,363,100L Brands, Inc. 62,000 1,709,960Urban Outfitters, Inc. (A) 58,500 1,733,940Williams-Sonoma, Inc. (B) 27,400 1,541,798
14,822,088Technology Hardware, Storage & Peripherals - 0.8%NCR Corp. (A) 151,300 4,128,977Textiles, Apparel & Luxury Goods - 1.1%Capri Holdings, Ltd. (A) 53,500 2,447,625Deckers Outdoor Corp. (A) 11,200 1,646,288Steven Madden, Ltd. 51,000 1,725,840
5,819,753Thrifts & Mortgage Finance - 1.7%Dime Community Bancshares, Inc. 79,000 1,479,670Oritani Financial Corp. 27,500 457,325Provident Financial Services, Inc. 58,500 1,514,565TrustCo Bank Corp. 110,000 853,600United Financial Bancorp, Inc. 153,081 2,196,712Washington Federal, Inc. 86,000 2,484,540
8,986,412Trading Companies & Distributors - 1.1%AerCap Holdings NV (A) 118,400 5,510,336Total Common Stocks
(Cost $456,329,637) 503,678,026
OTHER INVESTMENT COMPANY - 2.2%Securities Lending Collateral - 2.2%State Street Navigator Securities Lending Trust -
Government Money Market Portfolio,2.41% (C) 11,555,481 11,555,481
Total Other Investment Company(Cost $11,555,481) 11,555,481
Principal ValueREPURCHASE AGREEMENT - 1.5%Fixed Income Clearing Corp., 1.45% (C), dated
03/29/2019, to be repurchased at $7,985,331on 04/01/2019. Collateralized by a U.S.Government Obligation, 2.75%, due 09/15/2021, and with a value of $8,145,979. $ 7,984,366 7,984,366
Total Repurchase Agreement(Cost $7,984,366) 7,984,366
Total Investments(Cost $475,869,484) 523,217,873
Net Other Assets (Liabilities) - 0.1% 561,789Net Assets - 100.0% $ 523,779,662
Copyright © 2021 www.secdatabase.com. All Rights Reserved.Please Consider the Environment Before Printing This Document

Transamerica Small/Mid Cap Value VPSCHEDULE OF INVESTMENTS (continued)At March 31, 2019(unaudited)
SECURITY VALUATION:
Valuation Inputs (D)
Level 1 -Unadjusted
QuotedPrices
Level 2 -Other
SignificantObservable
Inputs
Level 3 -Significant
UnobservableInputs Value
ASSETSInvestmentsCommon Stocks $503,678,026 $� $ � $503,678,026Other Investment Company 11,555,481 � � 11,555,481Repurchase Agreement � 7,984,366 � 7,984,366Total Investments $ 515,233,507 $ 7,984,366 $ �� $ 523,217,873
FOOTNOTES TO SCHEDULE OF INVESTMENTS:
(A) Non-income producing securities.(B) All or a portion of the securities are on loan. The total value of all securities on loan is $11,280,590. The amount of securities on loan indicated may not
correspond with the securities on loan identified because securities with pending sales are in the process of recall from the brokers.(C) Rates disclosed reflect the yields at March 31, 2019.(D) There were no transfers in or out of Level 3 during the period ended March 31, 2019. Please reference the Security Valuation section of the Notes to Schedules of
Investments for more information regarding security valuation and pricing inputs.
PORTFOLIO ABBREVIATION:
ADR American Depositary Receipt
The notes are an integral part of this report.Transamerica Series Trust Page 4
Copyright © 2021 www.secdatabase.com. All Rights Reserved.Please Consider the Environment Before Printing This Document

Transamerica T. Rowe Price Small Cap VPSCHEDULE OF INVESTMENTSAt March 31, 2019(unaudited)
The notes are an integral part of this report.Transamerica Series Trust Page 1
Shares ValueCOMMON STOCKS - 99.7%Aerospace & Defense - 4.4%Aerojet Rocketdyne Holdings, Inc. (A) 156,474 $ 5,559,521BWX Technologies, Inc. 39,114 1,939,272Curtiss-Wright Corp. 40,386 4,577,349HEICO Corp., Class A 119,115 10,012,807Hexcel Corp. 71,366 4,935,673Moog, Inc., Class A 51,899 4,512,618Teledyne Technologies, Inc. (A) 38,526 9,131,047
40,668,287Air Freight & Logistics - 0.3%XPO Logistics, Inc. (A) (B) 53,251 2,861,709Airlines - 0.0% (C)Hawaiian Holdings, Inc. 8,600 225,750Auto Components - 0.6%Cooper-Standard Holdings, Inc. (A) 20,344 955,354LCI Industries 23,000 1,766,860Visteon Corp. (A) 35,457 2,388,029
5,110,243Banks - 1.6%Ameris Bancorp 72,831 2,501,745Carolina Financial Corp. 71,227 2,463,742CenterState Bank Corp. 135,381 3,223,422First Bancorp 94,400 3,281,344Signature Bank 16,116 2,063,976Western Alliance Bancorp (A) 33,100 1,358,424
14,892,653Beverages - 0.7%Boston Beer Co., Inc., Class A (A) 12,739 3,754,565Coca-Cola Consolidated, Inc. 10,600 3,050,998
6,805,563Biotechnology - 8.1%Abeona Therapeutics, Inc. (A) (B) 30,018 220,933ACADIA Pharmaceuticals, Inc. (A) 83,400 2,239,290Acceleron Pharma, Inc. (A) 33,461 1,558,279Agios Pharmaceuticals, Inc. (A) (B) 42,848 2,889,669Aimmune Therapeutics, Inc. (A) (B) 37,586 840,047Alkermes PLC (A) 28,920 1,055,291Alnylam Pharmaceuticals, Inc. (A) 4,700 439,215Amicus Therapeutics, Inc. (A) 74,937 1,019,143Array BioPharma, Inc. (A) (B) 164,204 4,003,294Bluebird Bio, Inc. (A) (B) 13,500 2,123,955Blueprint Medicines Corp. (A) 28,549 2,285,348CRISPR Therapeutics AG (A) (B) 19,112 682,681Emergent BioSolutions, Inc. (A) 68,295 3,450,263Enanta Pharmaceuticals, Inc. (A) 9,793 935,427Exact Sciences Corp. (A) 66,366 5,748,623Exelixis, Inc. (A) 30,000 714,000FibroGen, Inc. (A) 49,484 2,689,455Genomic Health, Inc. (A) 37,500 2,626,875Global Blood Therapeutics, Inc. (A) 26,394 1,397,034GlycoMimetics, Inc. (A) 36,800 458,528Immunomedics, Inc. (A) (B) 76,604 1,471,563Insmed, Inc. (A) 78,900 2,293,623Ionis Pharmaceuticals, Inc. (A) 17,400 1,412,358Ironwood Pharmaceuticals, Inc. (A) (B) 79,491 1,075,513
Shares ValueCOMMON STOCKS (continued)Biotechnology (continued)Ligand Pharmaceuticals, Inc. (A) (B) 28,633 $ 3,599,454Madrigal Pharmaceuticals, Inc. (A) (B) 4,229 529,725Mirati Therapeutics, Inc. (A) 11,400 835,620Neurocrine Biosciences, Inc. (A) 24,583 2,165,762PTC Therapeutics, Inc. (A) 28,500 1,072,740Repligen Corp. (A) 49,472 2,922,806Sage Therapeutics, Inc. (A) 37,626 5,984,415Sarepta Therapeutics, Inc. (A) (B) 26,839 3,198,940Seattle Genetics, Inc. (A) 21,275 1,558,181Spark Therapeutics, Inc. (A) 25,534 2,907,812Ultragenyx Pharmaceutical, Inc. (A) 36,168 2,508,613uniQure NV (A) 25,485 1,520,180Xencor, Inc. (A) 47,153 1,464,572
73,899,227Building Products - 1.2%AAON, Inc. 22,450 1,036,741Lennox International, Inc. 23,438 6,197,007Patrick Industries, Inc. (A) 67,118 3,041,788Resideo Technologies, Inc. (A) 31,300 603,777
10,879,313Capital Markets - 2.2%Cboe Global Markets, Inc. 48,064 4,587,228E*TRADE Financial Corp. 44,548 2,068,364FactSet Research Systems, Inc. 7,150 1,775,130MarketAxess Holdings, Inc. 26,800 6,594,944MSCI, Inc. 27,927 5,553,005
20,578,671Chemicals - 3.2%AdvanSix, Inc. (A) 60,626 1,732,085Chase Corp. 31,200 2,887,248Ingevity Corp. (A) 64,012 6,760,307Innospec, Inc. 52,218 4,352,370Minerals Technologies, Inc. 29,653 1,743,300NewMarket Corp. 5,800 2,514,648PolyOne Corp. 78,337 2,296,058Quaker Chemical Corp. 18,100 3,625,973Scotts Miracle-Gro Co. 30,800 2,420,264Stepan Co. 16,200 1,417,824
29,750,077Commercial Services & Supplies - 2.4%Advanced Disposal Services, Inc. (A) 116,470 3,261,160Casella Waste Systems, Inc., Class A (A) 160,984 5,724,591Healthcare Services Group, Inc. (B) 42,644 1,406,825Rollins, Inc. 135,582 5,642,923UniFirst Corp. 19,000 2,916,500US Ecology, Inc. 45,950 2,572,281
21,524,280Communications Equipment - 0.8%EchoStar Corp., Class A (A) 26,900 980,505NetScout Systems, Inc. (A) 25,200 707,364Plantronics, Inc. 33,400 1,540,074Ubiquiti Networks, Inc. (B) 25,400 3,802,634
7,030,577Construction Materials - 0.3%Eagle Materials, Inc. 26,600 2,242,380
Copyright © 2021 www.secdatabase.com. All Rights Reserved.Please Consider the Environment Before Printing This Document

Transamerica T. Rowe Price Small Cap VPSCHEDULE OF INVESTMENTS (continued)At March 31, 2019(unaudited)
Shares ValueCOMMON STOCKS (continued)Consumer Finance - 0.6%Green Dot Corp., Class A (A) 31,200 $ 1,892,280PRA Group, Inc. (A) 50,800 1,361,948SLM Corp. 211,547 2,096,431
5,350,659Containers & Packaging - 0.7%Berry Global Group, Inc. (A) 105,874 5,703,432Graphic Packaging Holding Co. 69,385 876,333
6,579,765Distributors - 0.8%Pool Corp. 41,907 6,913,398Diversified Consumer Services - 3.3%Bright Horizons Family Solutions, Inc. (A) 68,321 8,684,282frontdoor, Inc. (A) 62,900 2,165,018Grand Canyon Education, Inc. (A) 45,400 5,198,754Service Corp. International 139,372 5,595,786ServiceMaster Global Holdings, Inc. (A) 118,901 5,552,677Sotheby�s (A) 24,000 906,000Strategic Education, Inc. 13,344 1,752,200Weight Watchers International, Inc. (A) 31,000 624,650
30,479,367Electrical Equipment - 0.5%Atkore International Group, Inc. (A) 112,032 2,412,049Generac Holdings, Inc. (A) 44,017 2,254,991
4,667,040Electronic Equipment, Instruments & Components - 3.4%Cognex Corp. 63,912 3,250,564Coherent, Inc. (A) 28,396 4,024,281ePlus, Inc. (A) 12,400 1,097,896Littelfuse, Inc. 25,669 4,684,079Novanta, Inc. (A) 67,706 5,736,729OSI Systems, Inc. (A) 42,000 3,679,200Tech Data Corp. (A) 13,065 1,337,987Zebra Technologies Corp., Class A (A) 34,180 7,161,736
30,972,472Energy Equipment & Services - 0.6%Apergy Corp. (A) 79,290 3,255,647Computer Modelling Group, Ltd. 21,300 98,024Dril-Quip, Inc. (A) 12,009 550,613Exterran Corp. (A) 61,649 1,038,786RPC, Inc. (B) 76,755 875,775
5,818,845Entertainment - 1.3%Live Nation Entertainment, Inc. (A) 103,390 6,569,401Take-Two Interactive Software, Inc. (A) 58,269 5,498,845
12,068,246Equity Real Estate Investment Trusts - 3.2%Americold Realty Trust 109,672 3,346,093CoreSite Realty Corp. 40,743 4,360,316CubeSmart 88,885 2,847,875CyrusOne, Inc. 73,663 3,862,888Empire State Realty Trust, Inc., Class A 42,914 678,041Equity Lifestyle Properties, Inc. 37,960 4,338,828First Industrial Realty Trust, Inc. 108,383 3,832,423PS Business Parks, Inc. 14,800 2,321,084Terreno Realty Corp. 83,938 3,528,753
29,116,301
Shares ValueCOMMON STOCKS (continued)Food & Staples Retailing - 1.5%Casey�s General Stores, Inc. 42,984 $ 5,535,050Performance Food Group Co. (A) 139,778 5,540,800Sprouts Farmers Market, Inc. (A) 141,900 3,056,526
14,132,376Food Products - 1.4%J&J Snack Foods Corp. 27,337 4,342,209John B Sanfilippo & Son, Inc. 21,646 1,555,698Post Holdings, Inc. (A) 44,206 4,836,136TreeHouse Foods, Inc. (A) 36,392 2,349,104
13,083,147Health Care Equipment & Supplies - 5.0%Avanos Medical, Inc. (A) 35,800 1,527,944Cantel Medical Corp. 51,300 3,431,457Cooper Cos., Inc. 10,339 3,062,102Globus Medical, Inc., Class A (A) 65,751 3,248,757Haemonetics Corp. (A) 42,600 3,726,648ICU Medical, Inc. (A) 27,785 6,649,784Inogen, Inc. (A) 15,390 1,467,744LivaNova PLC (A) 39,200 3,812,200Masimo Corp. (A) 46,210 6,389,919Natus Medical, Inc. (A) 23,060 585,263NuVasive, Inc. (A) 55,905 3,174,845Penumbra, Inc. (A) (B) 25,555 3,756,840West Pharmaceutical Services, Inc. 41,935 4,621,237
45,454,740Health Care Providers & Services - 4.1%Addus HomeCare Corp. (A) 39,500 2,511,805BioTelemetry, Inc. (A) 51,037 3,195,937Chemed Corp. 18,400 5,889,288CorVel Corp. (A) 20,400 1,330,896Encompass Health Corp. 52,602 3,071,957Ensign Group, Inc. 94,700 4,847,693Molina Healthcare, Inc. (A) 59,584 8,458,545US Physical Therapy, Inc. 31,456 3,303,824WellCare Health Plans, Inc. (A) 17,102 4,613,264
37,223,209Health Care Technology - 1.0%Omnicell, Inc. (A) 56,021 4,528,738Tabula Rasa HealthCare, Inc. (A) (B) 29,380 1,657,619Veeva Systems, Inc., Class A (A) 25,551 3,241,400
9,427,757Hotels, Restaurants & Leisure - 5.2%Boyd Gaming Corp. 143,600 3,928,896Cheesecake Factory, Inc. 37,268 1,823,150Choice Hotels International, Inc. 30,357 2,359,953Churchill Downs, Inc. 65,700 5,930,082Denny�s Corp. (A) 197,605 3,626,052Domino�s Pizza, Inc. 15,597 4,025,586Hilton Grand Vacations, Inc. (A) 93,221 2,875,868Marriott Vacations Worldwide Corp. 10,644 995,214Papa John�s International, Inc. (B) 56,700 3,002,265Penn National Gaming, Inc. (A) 150,656 3,028,185Ruth�s Hospitality Group, Inc. 113,269 2,898,554Six Flags Entertainment Corp. 38,388 1,894,448Texas Roadhouse, Inc. 81,659 5,078,373Vail Resorts, Inc. 29,610 6,434,253
47,900,879
Copyright © 2021 www.secdatabase.com. All Rights Reserved.Please Consider the Environment Before Printing This Document

The notes are an integral part of this report.Transamerica Series Trust Page 2
Copyright © 2021 www.secdatabase.com. All Rights Reserved.Please Consider the Environment Before Printing This Document

Transamerica T. Rowe Price Small Cap VPSCHEDULE OF INVESTMENTS (continued)At March 31, 2019(unaudited)
The notes are an integral part of this report.Transamerica Series Trust Page 3
Shares ValueCOMMON STOCKS (continued)Household Durables - 0.5%Helen of Troy, Ltd. (A) 42,124 $ 4,884,699Independent Power & Renewable Electricity Producers - 0.3%Ormat Technologies, Inc. 57,011 3,144,157Insurance - 1.1%Heritage Insurance Holdings, Inc. 36,785 537,061Primerica, Inc. 60,138 7,345,857Universal Insurance Holdings, Inc. 66,100 2,049,100
9,932,018Internet & Direct Marketing Retail - 0.5%Liberty Expedia Holdings, Inc., Class A (A) 46,535 1,991,698Shutterfly, Inc. (A) 25,208 1,024,453Stamps.com, Inc. (A) 23,009 1,873,163
4,889,314IT Services - 5.6%Booz Allen Hamilton Holding Corp. 134,253 7,805,469Broadridge Financial Solutions, Inc. 43,243 4,483,867Cardtronics PLC, Class A (A) 71,500 2,543,970CoreLogic, Inc. (A) 86,400 3,219,264Euronet Worldwide, Inc. (A) 66,862 9,533,853Gartner, Inc. (A) 21,156 3,208,942GTT Communications, Inc. (A) (B) 44,300 1,537,210Jack Henry & Associates, Inc. 14,369 1,993,555MAXIMUS, Inc. 84,613 6,005,831Science Applications International Corp. 41,563 3,198,273Travelport Worldwide, Ltd. 122,167 1,921,687WEX, Inc. (A) 30,966 5,945,162
51,397,083Leisure Products - 0.3%Brunswick Corp. 57,864 2,912,295Life Sciences Tools & Services - 2.6%Bio-Rad Laboratories, Inc., Class A (A) 12,868 3,933,490Bruker Corp. 35,800 1,376,152Cambrex Corp. (A) 52,767 2,049,998Charles River Laboratories International, Inc. (A) 45,987 6,679,612Medpace Holdings, Inc. (A) 24,400 1,438,868PRA Health Sciences, Inc. (A) 62,279 6,868,751Syneos Health, Inc. (A) 29,900 1,547,624
23,894,495Machinery - 3.6%Chart Industries, Inc. (A) 12,600 1,140,552Douglas Dynamics, Inc. 59,427 2,262,386Graco, Inc. 91,235 4,517,957IDEX Corp. 14,800 2,245,752John Bean Technologies Corp. 33,982 3,122,606Lincoln Electric Holdings, Inc. 21,344 1,790,121Lydall, Inc. (A) 57,163 1,341,044Middleby Corp. (A) 12,500 1,625,375Milacron Holdings Corp. (A) 63,121 714,530Nordson Corp. 23,352 3,094,607Standex International Corp. 9,700 711,980Toro Co. 86,884 5,981,094Woodward, Inc. 42,149 3,999,519
32,547,523
Shares ValueCOMMON STOCKS (continued)Media - 2.0%Cable One, Inc. 8,357 $ 8,201,393GCI Liberty, Inc., Class A (A) 65,334 3,633,224Gray Television, Inc. (A) 112,987 2,413,402MSG Networks, Inc., Class A (A) 114,300 2,486,025Nexstar Media Group, Inc., Class A 18,100 1,961,497
18,695,541Metals & Mining - 0.2%Worthington Industries, Inc. 36,041 1,345,050Oil, Gas & Consumable Fuels - 1.8%Centennial Resource Development, Inc., Class A (A)
(B) 202,100 1,776,459Matador Resources Co. (A) 166,197 3,212,588PBF Energy, Inc., Class A 108,600 3,381,804PDC Energy, Inc. (A) 69,056 2,809,198WPX Energy, Inc. (A) 392,349 5,143,695
16,323,744Personal Products - 0.1%Nu Skin Enterprises, Inc., Class A 15,298 732,162Pharmaceuticals - 2.2%Aerie Pharmaceuticals, Inc. (A) 28,923 1,373,843Assertio Therapeutics, Inc. (A) 85,100 431,457Catalent, Inc. (A) 112,556 4,568,648Innoviva, Inc. (A) 64,409 903,658Jazz Pharmaceuticals PLC (A) 8,100 1,157,895MyoKardia, Inc. (A) 30,120 1,565,939Nektar Therapeutics (A) 32,400 1,088,640Pacira Pharmaceuticals, Inc. (A) 23,900 909,634Phibro Animal Health Corp., Class A 49,400 1,630,200Prestige Consumer Healthcare, Inc. (A) 88,552 2,648,591Supernus Pharmaceuticals, Inc. (A) 63,027 2,208,466TherapeuticsMD, Inc. (A) (B) 143,568 699,176Theravance Biopharma, Inc. (A) (B) 39,581 897,301WaVe Life Sciences, Ltd. (A) 12,852 499,300
20,582,748Professional Services - 2.3%ASGN, Inc. (A) 74,500 4,730,005Exponent, Inc. 89,804 5,183,487Insperity, Inc. 54,470 6,735,760TransUnion 72,424 4,840,820
21,490,072Real Estate Management & Development - 0.1%Kennedy-Wilson Holdings, Inc. 41,800 894,102Road & Rail - 1.0%Landstar System, Inc. 39,386 4,308,435Old Dominion Freight Line, Inc. 31,891 4,604,741
8,913,176Semiconductors & Semiconductor Equipment - 4.5%Advanced Energy Industries, Inc. (A) 42,100 2,091,528Cabot Microelectronics Corp. 23,013 2,576,535Cirrus Logic, Inc. (A) 58,480 2,460,254Entegris, Inc. 113,800 4,061,522Ichor Holdings, Ltd. (A) 36,900 833,202Integrated Device Technology, Inc. (A) 82,140 4,024,039MaxLinear, Inc. (A) 152,885 3,903,154Mellanox Technologies, Ltd. (A) 62,636 7,413,597MKS Instruments, Inc. 58,400 5,434,120
Copyright © 2021 www.secdatabase.com. All Rights Reserved.Please Consider the Environment Before Printing This Document

Transamerica T. Rowe Price Small Cap VPSCHEDULE OF INVESTMENTS (continued)At March 31, 2019(unaudited)
The notes are an integral part of this report.Transamerica Series Trust Page 4
Shares ValueCOMMON STOCKS (continued)Semiconductors & Semiconductor Equipment (continued)Monolithic Power Systems, Inc. 15,900 $ 2,154,291Nanometrics, Inc. (A) 62,901 1,942,383Versum Materials, Inc. 95,318 4,795,448
41,690,073Software - 9.2%ACI Worldwide, Inc. (A) 121,598 3,996,926Aspen Technology, Inc. (A) 60,400 6,297,304Blackbaud, Inc. 61,701 4,919,421Ceridian HCM Holding, Inc. (A) (B) 26,400 1,354,320CommVault Systems, Inc. (A) 53,300 3,450,642CyberArk Software, Ltd. (A) 22,400 2,666,720Descartes Systems Group, Inc. (A) 49,600 1,804,448Envestnet, Inc. (A) 76,309 4,989,846Fair Isaac Corp. (A) 40,800 11,082,504Fortinet, Inc. (A) 36,898 3,098,325j2 Global, Inc. 29,976 2,595,922LogMeIn, Inc. 22,177 1,776,378Manhattan Associates, Inc. (A) 51,956 2,863,295Pegasystems, Inc. 65,667 4,268,355Proofpoint, Inc. (A) 41,622 5,054,159PTC, Inc. (A) 38,275 3,528,189Qualys, Inc. (A) 50,861 4,208,239RealPage, Inc. (A) 80,770 4,901,931SS&C Technologies Holdings, Inc. 102,082 6,501,603Tyler Technologies, Inc. (A) 23,220 4,746,168
84,104,695Specialty Retail - 1.5%Aaron�s, Inc. 22,544 1,185,814Burlington Stores, Inc. (A) 51,808 8,117,277Children�s Place, Inc. (B) 14,713 1,431,281Murphy USA, Inc. (A) 39,853 3,412,214
14,146,586Technology Hardware, Storage & Peripherals - 0.2%NCR Corp. (A) 69,807 1,905,033Textiles, Apparel & Luxury Goods - 0.7%Carter�s, Inc. 27,022 2,723,547Steven Madden, Ltd. 119,228 4,034,676
6,758,223Thrifts & Mortgage Finance - 0.3%MGIC Investment Corp. (A) 110,000 1,450,900Radian Group, Inc. 82,358 1,708,105
3,159,005Trading Companies & Distributors - 0.7%Beacon Roofing Supply, Inc. (A) 39,445 1,268,551Univar, Inc. (A) 84,733 1,877,683Watsco, Inc. 20,294 2,906,304
6,052,538Total Common Stocks
(Cost $722,050,267) 916,051,263
Shares ValueOTHER INVESTMENT COMPANY - 3.0%Securities Lending Collateral - 3.0%State Street Navigator Securities Lending
Trust - Government Money Market Portfolio,2.41% (D) 27,228,863 $ 27,228,863
Total Other Investment Company(Cost $27,228,863) 27,228,863
Principal ValueREPURCHASE AGREEMENT - 0.4%Fixed Income Clearing Corp., 1.45% (D), dated
03/29/2019, to be repurchased at $3,225,922on 04/01/2019. Collateralized by a U.S.Government Obligation, 2.75%, due 09/15/2021, and with a value of $3,294,889. $ 3,225,532 3,225,532
Total Repurchase Agreement(Cost $3,225,532) 3,225,532
Total Investments(Cost $752,504,662) 946,505,658
Net Other Assets (Liabilities) - (3.1)% (28,572,452 )Net Assets - 100.0% $ 917,933,206
Copyright © 2021 www.secdatabase.com. All Rights Reserved.Please Consider the Environment Before Printing This Document

Transamerica T. Rowe Price Small Cap VPSCHEDULE OF INVESTMENTS (continued)At March 31, 2019(unaudited)
SECURITY VALUATION:
Valuation Inputs (E)
Level 1 -Unadjusted
QuotedPrices
Level 2 -Other
SignificantObservable
Inputs
Level 3 -Significant
UnobservableInputs Value
ASSETSInvestmentsCommon Stocks $916,051,263 $� $ � $916,051,263Other Investment Company 27,228,863 � � 27,228,863Repurchase Agreement � 3,225,532 � 3,225,532Total Investments $ 943,280,126 $ 3,225,532 $ �� $ 946,505,658
FOOTNOTES TO SCHEDULE OF INVESTMENTS:
(A) Non-income producing securities.(B) All or a portion of the securities are on loan. The total value of all securities on loan is $26,609,539. The amount of securities on loan indicated may not
correspond with the securities on loan identified because securities with pending sales are in the process of recall from the brokers.(C) Percentage rounds to less than 0.1% or (0.1)%.(D) Rates disclosed reflect the yields at March 31, 2019.(E) There were no transfers in or out of Level 3 during the period ended March 31, 2019. Please reference the Security Valuation section of the Notes to Schedules of
Investments for more information regarding security valuation and pricing inputs.
The notes are an integral part of this report.Transamerica Series Trust Page 5
Copyright © 2021 www.secdatabase.com. All Rights Reserved.Please Consider the Environment Before Printing This Document

Transamerica Torray Concentrated Growth VPSCHEDULE OF INVESTMENTSAt March 31, 2019(unaudited)
The notes are an integral part of this report.Transamerica Series Trust Page 1
Shares ValueCOMMON STOCKS - 97.9%Biotechnology - 5.6%BioMarin Pharmaceutical, Inc. (A) 85,798 $ 7,621,436Genmab A/S, ADR (A) (B) 272,124 4,745,843
12,367,279Capital Markets - 3.5%Charles Schwab Corp. 182,228 7,792,069Chemicals - 5.3%Albemarle Corp. 63,223 5,183,021Sherwin-Williams Co. 15,442 6,651,024
11,834,045Electronic Equipment, Instruments & Components - 3.0%Amphenol Corp., Class A 71,487 6,751,232Equity Real Estate Investment Trusts - 4.6%American Tower Corp. 51,576 10,163,567Health Care Equipment & Supplies - 9.3%Cooper Cos., Inc. 32,632 9,664,619Danaher Corp. 84,003 11,090,076
20,754,695Health Care Providers & Services - 2.8%Centene Corp. (A) 118,715 6,303,767Health Care Technology - 1.9%Cerner Corp. (A) 75,556 4,322,559Industrial Conglomerates - 3.9%Roper Technologies, Inc. 25,656 8,773,582Interactive Media & Services - 5.9%Alphabet, Inc., Class A (A) 6,367 7,493,259Facebook, Inc., Class A (A) 33,568 5,595,450
13,088,709Internet & Direct Marketing Retail - 2.8%Amazon.com, Inc. (A) 3,527 6,280,705IT Services - 11.4%Accenture PLC, Class A 39,188 6,897,872Fiserv, Inc. (A) 101,519 8,962,097Visa, Inc., Class A 61,263 9,568,668
25,428,637Life Sciences Tools & Services - 3.8%Lonza Group AG, ADR (B) 273,687 8,473,350Oil, Gas & Consumable Fuels - 1.9%EOG Resources, Inc. 43,996 4,187,539Pharmaceuticals - 3.0%Roche Holding AG, ADR (B) 193,152 6,642,497Professional Services - 4.5%Verisk Analytics, Inc. 74,892 9,960,636Software - 14.7%Adobe, Inc. (A) 30,133 8,030,143Check Point Software Technologies, Ltd. (A) 53,887 6,816,167
Shares ValueCOMMON STOCKS (continued)Software (continued)Microsoft Corp. 78,227 $ 9,226,092SS&C Technologies Holdings, Inc. 136,518 8,694,832
32,767,234Specialty Retail - 3.5%O�Reilly Automotive, Inc. (A) 19,799 7,687,952Technology Hardware, Storage & Peripherals - 4.0%Apple, Inc. 47,094 8,945,505Textiles, Apparel & Luxury Goods - 2.5%NIKE, Inc., Class B 66,492 5,599,291Total Common Stocks
(Cost $143,626,630) 218,124,850
OTHER INVESTMENT COMPANY - 0.4%Securities Lending Collateral - 0.4%State Street Navigator Securities Lending
Trust - Government Money Market Portfolio,2.41% (C) 927,730 927,730
Total Other Investment Company(Cost $927,730) 927,730
Principal ValueREPURCHASE AGREEMENT - 2.1%Fixed Income Clearing Corp., 1.45% (C), dated
03/29/2019, to be repurchased at $4,714,120on 04/01/2019. Collateralized by a U.S.Government Obligation, 2.75%, due 09/15/2021, and with a value of $4,810,538. $ 4,713,551 4,713,551
Total Repurchase Agreement(Cost $4,713,551) 4,713,551
Total Investments(Cost $149,267,911) 223,766,131
Net Other Assets (Liabilities) - (0.4)% (887,796 )Net Assets - 100.0% $ 222,878,335
Copyright © 2021 www.secdatabase.com. All Rights Reserved.Please Consider the Environment Before Printing This Document

Transamerica Torray Concentrated Growth VPSCHEDULE OF INVESTMENTS (continued)At March 31, 2019(unaudited)
SECURITY VALUATION:
Valuation Inputs (D)
Level 1 -Unadjusted
QuotedPrices
Level 2 -Other
SignificantObservable
Inputs
Level 3 -Significant
UnobservableInputs Value
ASSETSInvestmentsCommon Stocks $218,124,850 $� $ � $218,124,850Other Investment Company 927,730 � � 927,730Repurchase Agreement � 4,713,551 � 4,713,551Total Investments $ 219,052,580 $ 4,713,551 $ �� $ 223,766,131
FOOTNOTES TO SCHEDULE OF INVESTMENTS:
(A) Non-income producing securities.(B) All or a portion of the securities are on loan. The total value of all securities on loan is $904,655. The amount of securities on loan indicated may not correspond
with the securities on loan identified because securities with pending sales are in the process of recall from the brokers.(C) Rates disclosed reflect the yields at March 31, 2019.(D) There were no transfers in or out of Level 3 during the period ended March 31, 2019. Please reference the Security Valuation section of the Notes to Schedules of
Investments for more information regarding security valuation and pricing inputs.
PORTFOLIO ABBREVIATION:
ADR American Depositary Receipt
The notes are an integral part of this report.Transamerica Series Trust Page 2
Copyright © 2021 www.secdatabase.com. All Rights Reserved.Please Consider the Environment Before Printing This Document

Transamerica TS&W International Equity VPSCHEDULE OF INVESTMENTSAt March 31, 2019(unaudited)
The notes are an integral part of this report.Transamerica Series Trust Page 1
Shares ValueCOMMON STOCKS - 97.9%Australia - 3.7%BHP Group PLC, ADR 25,400 $ 1,226,312Challenger, Ltd. 135,977 799,438Macquarie Group, Ltd. 21,200 1,948,166Qantas Airways, Ltd. 456,000 1,832,610Santos, Ltd. 178,500 865,661
6,672,187Belgium - 2.0%Groupe Bruxelles Lambert SA 19,100 1,855,871KBC Group NV 26,000 1,816,428
3,672,299Brazil - 0.9%Embraer SA, ADR 82,100 1,560,721China - 0.8%Baidu, Inc., ADR (A) 8,500 1,401,225Denmark - 1.0%AP Moller - Maersk A/S, Class B (B) 1,400 1,775,821France - 9.2%Airbus SE 4,200 555,468Arkema SA 15,193 1,446,248Engie SA 188,600 2,809,545Publicis Groupe SA 15,300 819,179Rexel SA 60,800 685,775Sanofi 32,968 2,911,952TOTAL SA 36,100 2,005,322Veolia Environnement SA 142,000 3,174,621Vivendi SA 77,800 2,254,240
16,662,350Germany - 12.1%Allianz SE 11,741 2,611,441Bayer AG 24,626 1,591,155Deutsche Boerse AG 11,100 1,423,198Fresenius SE & Co. KGaA 37,300 2,082,022HeidelbergCement AG 38,500 2,770,903Infineon Technologies AG 101,100 2,005,637Merck KGaA 16,400 1,870,025SAP SE 23,100 2,668,981Siemens AG 24,507 2,637,461Talanx AG (A) 25,800 994,418TUI AG 118,100 1,132,693
21,787,934Hong Kong - 3.8%China Mobile, Ltd. 176,500 1,798,737CK Asset Holdings, Ltd. 241,900 2,150,921CK Hutchison Holdings, Ltd. 279,000 2,930,407
6,880,065Ireland - 3.1%AIB Group PLC 320,300 1,437,905DCC PLC 19,800 1,711,067Ryanair Holdings PLC, ADR (A) 7,585 568,420Smurfit Kappa Group PLC 66,721 1,862,126
5,579,518
Shares ValueCOMMON STOCKS (continued)Italy - 2.7%Eni SpA 131,696 $ 2,327,339Mediobanca Banca di Credito Finanziario SpA 152,118 1,580,453Prysmian SpA 52,335 990,090
4,897,882Japan - 23.4%Astellas Pharma, Inc. 130,200 1,948,360Daiwa Securities Group, Inc. 359,500 1,748,358Denka Co., Ltd. 25,760 741,446FANUC Corp. 9,500 1,618,334Fujitsu, Ltd. 13,910 1,002,303Hitachi, Ltd. 71,640 2,317,327Japan Airlines Co., Ltd. 62,300 2,191,714JXTG Holdings, Inc. 527,500 2,410,708Kirin Holdings Co., Ltd. 700 16,690Kuraray Co., Ltd. 125,700 1,596,911Kyocera Corp. 15,900 932,509MS&AD Insurance Group Holdings, Inc. 71,500 2,174,096Nippon Telegraph & Telephone Corp. 42,300 1,794,973ORIX Corp. (B) 204,200 2,928,592Resona Holdings, Inc. 291,300 1,260,819Sega Sammy Holdings, Inc. 117,100 1,379,885Seven & i Holdings Co., Ltd. 71,900 2,709,144SoftBank Group Corp. 13,700 1,328,219Sony Corp. 70,500 2,954,728Square Enix Holdings Co., Ltd. 38,900 1,361,833Sumitomo Mitsui Financial Group, Inc. 90,200 3,154,518Toshiba Corp. 84,250 2,679,611Toyota Industries Corp. 39,500 1,978,029
42,229,107Luxembourg - 1.0%ArcelorMittal 87,500 1,772,450Netherlands - 5.7%ASML Holding NV 7,800 1,462,942EXOR NV 6,000 389,696Heineken Holding NV 29,343 2,939,356Koninklijke Philips NV 83,865 3,416,355NXP Semiconductors NV 22,900 2,024,131
10,232,480Norway - 0.8%Marine Harvest ASA (A) 60,900 1,359,225Republic of Korea - 0.7%Samsung Electronics Co., Ltd. 30,000 1,180,072Singapore - 1.4%DBS Group Holdings, Ltd. 131,800 2,453,653Spain - 1.2%Siemens Gamesa Renewable Energy SA (A) (B) 140,400 2,235,624Sweden - 0.7%Investor AB, B Shares 26,078 1,174,412Switzerland - 7.5%ABB, Ltd. 123,700 2,324,305Glencore PLC (A) 206,300 854,317Nestle SA 40,079 3,819,731
Copyright © 2021 www.secdatabase.com. All Rights Reserved.Please Consider the Environment Before Printing This Document

Transamerica TS&W International Equity VPSCHEDULE OF INVESTMENTS (continued)At March 31, 2019(unaudited)
The notes are an integral part of this report.Transamerica Series Trust Page 2
Shares ValueCOMMON STOCKS (continued)Switzerland (continued)Novartis AG 41,880 $ 4,028,387UBS Group AG (A) 205,300 2,488,547
13,515,287United Kingdom - 14.9%Aviva PLC 492,660 2,646,226Barratt Developments PLC 152,600 1,190,933British Land Co. PLC, REIT 263,100 2,018,353HSBC Holdings PLC 291,900 2,376,118IG Group Holdings PLC 80,800 547,237Imperial Brands PLC 89,399 3,055,907Inchcape PLC 163,387 1,215,107Informa PLC 184,304 1,786,427Inmarsat PLC 28,800 208,183Persimmon PLC 38,600 1,090,958Savills PLC 45,000 530,130TechnipFMC PLC 73,100 1,719,312Tesco PLC 860,000 2,599,768Unilever PLC 32,093 1,837,089Vodafone Group PLC 1,344,444 2,447,997Whitbread PLC 24,300 1,607,163
26,876,908United States - 1.3%Allergan PLC 16,400 2,401,124Total Common Stocks
(Cost $178,410,467) 176,320,344
OTHER INVESTMENT COMPANY - 3.9%Securities Lending Collateral - 3.9%State Street Navigator Securities Lending
Trust - Government Money MarketPortfolio, 2.41% (C) 6,993,435 6,993,435
Total Other Investment Company(Cost $6,993,435) 6,993,435
Principal ValueREPURCHASE AGREEMENT - 1.3%Fixed Income Clearing Corp., 1.45% (C),
dated 03/29/2019, to be repurchased at$2,404,408 on 04/01/2019. Collateralizedby a U.S. Government Obligation, 2.75%,due 09/15/2021, and with a value of$2,453,425. $ 2,404,118 2,404,118
Total Repurchase Agreement(Cost $2,404,118) 2,404,118
Total Investments(Cost $187,808,020) 185,717,897
Net Other Assets (Liabilities) - (3.1)% (5,594,745 )Net Assets - 100.0% $ 180,123,152
Copyright © 2021 www.secdatabase.com. All Rights Reserved.Please Consider the Environment Before Printing This Document

Transamerica TS&W International Equity VPSCHEDULE OF INVESTMENTS (continued)At March 31, 2019(unaudited)
INVESTMENTS BY INDUSTRY:
IndustryPercentage of
Total Investments ValuePharmaceuticals 7.9 % $ 14,751,003Banks 7.6 14,079,894Industrial Conglomerates 5.4 9,958,546Insurance 4.5 8,426,181Capital Markets 4.4 8,155,506Oil, Gas & Consumable Fuels 4.1 7,609,030Diversified Financial Services 3.8 7,148,009Multi-Utilities 3.2 5,984,166Wireless Telecommunication Services 3.0 5,574,953Electrical Equipment 3.0 5,550,019Semiconductors & Semiconductor Equipment 3.0 5,492,710Food & Staples Retailing 2.9 5,308,912Household Durables 2.8 5,236,619Food Products 2.8 5,178,956Airlines 2.5 4,592,744Metals & Mining 2.1 3,853,079Chemicals 2.0 3,784,605Entertainment 1.9 3,616,073Health Care Equipment & Supplies 1.8 3,416,355Electronic Equipment, Instruments & Components 1.8 3,249,836Tobacco 1.6 3,055,907Beverages 1.6 2,956,046Construction Materials 1.5 2,770,903Hotels, Restaurants & Leisure 1.5 2,739,856Real Estate Management & Development 1.4 2,681,051Software 1.4 2,668,981Media 1.4 2,605,606Aerospace & Defense 1.1 2,116,189Health Care Providers & Services 1.1 2,082,022Equity Real Estate Investment Trusts 1.1 2,018,353Diversified Telecommunication Services 1.1 2,003,156Auto Components 1.1 1,978,029Containers & Packaging 1.0 1,862,126Personal Products 1.0 1,837,089Marine 1.0 1,775,821Energy Equipment & Services 0.9 1,719,312Machinery 0.9 1,618,334Interactive Media & Services 0.8 1,401,225Leisure Products 0.7 1,379,885Distributors 0.7 1,215,107Technology Hardware, Storage & Peripherals 0.6 1,180,072IT Services 0.5 1,002,303Trading Companies & Distributors 0.4 685,775Investments 94.9 176,320,344Short-Term Investments 5.1 9,397,553Total Investments 100.0 % $ 185,717,897
SECURITY VALUATION:
Valuation Inputs (D)
Level 1 -Unadjusted
QuotedPrices
Level 2 -Other
SignificantObservable
Inputs
Level 3 -Significant
UnobservableInputs Value
ASSETSInvestments
Copyright © 2021 www.secdatabase.com. All Rights Reserved.Please Consider the Environment Before Printing This Document

Common Stocks $10,901,245 $165,419,099 $ � $176,320,344Other Investment Company 6,993,435 � � 6,993,435Repurchase Agreement � 2,404,118 � 2,404,118Total Investments $ 17,894,680 $ 167,823,217 $ �� $ 185,717,897
The notes are an integral part of this report.Transamerica Series Trust Page 3
Copyright © 2021 www.secdatabase.com. All Rights Reserved.Please Consider the Environment Before Printing This Document

Transamerica TS&W International Equity VPSCHEDULE OF INVESTMENTS (continued)At March 31, 2019(unaudited)
FOOTNOTES TO SCHEDULE OF INVESTMENTS:
(A) Non-income producing securities.(B) All or a portion of the securities are on loan. The total value of all securities on loan is $6,646,981. The amount of securities on loan indicated may not correspond
with the securities on loan identified because securities with pending sales are in the process of recall from the brokers.(C) Rates disclosed reflect the yields at March 31, 2019.(D) There were no transfers in or out of Level 3 during the period ended March 31, 2019. Please reference the Security Valuation section of the Notes to Schedules of
Investments for more information regarding security valuation and pricing inputs.
PORTFOLIO ABBREVIATIONS:
ADR American Depositary ReceiptREIT Real Estate Investment Trust
The notes are an integral part of this report.Transamerica Series Trust Page 4
Copyright © 2021 www.secdatabase.com. All Rights Reserved.Please Consider the Environment Before Printing This Document

Transamerica U.S. Equity Index VPSCHEDULE OF INVESTMENTSAt March 31, 2019(unaudited)
Shares ValueCOMMON STOCKS - 97.6%Aerospace & Defense - 2.5%Arconic, Inc. 1,478 $ 28,245Boeing Co. 1,926 734,615General Dynamics Corp. 1,008 170,634Harris Corp. 427 68,196Huntington Ingalls Industries, Inc. 145 30,044L3 Technologies, Inc. 288 59,435Lockheed Martin Corp. 912 273,746Northrop Grumman Corp. 632 170,387Raytheon Co. 1,049 191,002Textron, Inc. 815 41,288TransDigm Group, Inc. (A) 182 82,626United Technologies Corp. 3,007 387,572
2,237,790Air Freight & Logistics - 0.6%CH Robinson Worldwide, Inc. 484 42,103Expeditors International of Washington, Inc. 579 43,946FedEx Corp. 893 161,999United Parcel Service, Inc., Class B 2,584 288,737
536,785Airlines - 0.4%Alaska Air Group, Inc. 420 23,570American Airlines Group, Inc. 1,373 43,607Delta Air Lines, Inc. 2,237 115,541Southwest Airlines Co. 1,805 93,698United Continental Holdings, Inc. (A) 763 60,872
337,288Auto Components - 0.1%Aptiv PLC 940 74,721BorgWarner, Inc. 705 27,079
101,800Automobiles - 0.4%Ford Motor Co. 14,144 124,184General Motors Co. 4,874 180,826Harley-Davidson, Inc. 500 17,830
322,840Banks - 5.2%Bank of America Corp. 32,992 910,249BB&T Corp. 2,845 132,378Citigroup, Inc. 8,718 542,434Citizens Financial Group, Inc. 1,562 50,765Comerica, Inc. 561 41,132Fifth Third Bancorp 2,783 70,187First Republic Bank 579 58,166Huntington Bancshares, Inc. 3,550 45,014JPMorgan Chase & Co. 12,026 1,217,392KeyCorp 3,545 55,834M&T Bank Corp. 503 78,981People�s United Financial, Inc. 1,302 21,405PNC Financial Services Group, Inc. 1,686 206,805Regions Financial Corp. 3,453 48,860SunTrust Banks, Inc. 1,607 95,215SVB Financial Group (A) 186 41,359US Bancorp 5,587 269,238
Shares ValueCOMMON STOCKS (continued)Banks (continued)Wells Fargo & Co. 15,008 $ 725,187Zions Bancorp NA 662 30,061
4,640,662Beverages - 1.8%Brown-Forman Corp., Class B 563 29,715Coca-Cola Co. 14,104 660,913Constellation Brands, Inc., Class A 603 105,724Molson Coors Brewing Co., Class B 664 39,608Monster Beverage Corp. (A) 1,463 79,851PepsiCo, Inc. 5,149 631,010
1,546,821Biotechnology - 2.3%AbbVie, Inc. 5,471 440,908Alexion Pharmaceuticals, Inc. (A) 810 109,496Amgen, Inc. 2,308 438,474Biogen, Inc. (A) 731 172,794Celgene Corp. (A) 2,610 246,227Gilead Sciences, Inc. 4,735 307,822Incyte Corp. (A) 626 53,842Regeneron Pharmaceuticals, Inc. (A) 284 116,616Vertex Pharmaceuticals, Inc. (A) 951 174,937
2,061,116Building Products - 0.3%A.O. Smith Corp. 500 26,660Allegion PLC 312 28,301Fortune Brands Home & Security, Inc. 500 23,805Johnson Controls International PLC 3,304 122,050Masco Corp. 1,025 40,293
241,109Capital Markets - 2.6%Affiliated Managers Group, Inc. 205 21,958Ameriprise Financial, Inc. 476 60,976Bank of New York Mellon Corp. 3,268 164,805BlackRock, Inc. 452 193,171Cboe Global Markets, Inc. 398 37,985Charles Schwab Corp. 4,409 188,529CME Group, Inc. 1,330 218,891E*TRADE Financial Corp. 898 41,694Franklin Resources, Inc. 1,000 33,140Goldman Sachs Group, Inc. 1,272 244,211Intercontinental Exchange, Inc. 2,116 161,112Invesco, Ltd. 1,363 26,320Moody�s Corp. 602 109,016Morgan Stanley 4,827 203,699MSCI, Inc. 297 59,055Nasdaq, Inc. 395 34,559Northern Trust Corp. 790 71,424Raymond James Financial, Inc. 434 34,898S&P Global, Inc. 925 194,759State Street Corp. 1,373 90,357T. Rowe Price Group, Inc. 857 85,803
2,276,362Chemicals - 1.9%Air Products & Chemicals, Inc. 817 156,014Albemarle Corp. 388 31,808Celanese Corp. 466 45,952CF Industries Holdings, Inc. 792 32,377DowDuPont, Inc. 8,362 445,778Eastman Chemical Co. 495 37,561
Copyright © 2021 www.secdatabase.com. All Rights Reserved.Please Consider the Environment Before Printing This Document

The notes are an integral part of this report.Transamerica Series Trust Page 1
Copyright © 2021 www.secdatabase.com. All Rights Reserved.Please Consider the Environment Before Printing This Document

Transamerica U.S. Equity Index VPSCHEDULE OF INVESTMENTS (continued)At March 31, 2019(unaudited)
The notes are an integral part of this report.Transamerica Series Trust Page 2
Shares ValueCOMMON STOCKS (continued)Chemicals (continued)Ecolab, Inc. 943 $ 166,477FMC Corp. 478 36,720International Flavors & Fragrances, Inc. 340 43,789Linde PLC 2,044 359,601LyondellBasell Industries NV, Class A 1,136 95,515Mosaic Co. 1,258 34,356PPG Industries, Inc. 855 96,504Sherwin-Williams Co. 296 127,490
1,709,942Commercial Services & Supplies - 0.4%Cintas Corp. 300 60,633Copart, Inc. (A) 691 41,868Republic Services, Inc. 781 62,777Rollins, Inc. 531 22,100Waste Management, Inc. 1,452 150,877
338,255Communications Equipment - 1.2%Arista Networks, Inc. (A) 177 55,659Cisco Systems, Inc. 16,168 872,910F5 Networks, Inc. (A) 200 31,386Juniper Networks, Inc. 1,165 30,838Motorola Solutions, Inc. 595 83,550
1,074,343Construction & Engineering - 0.1%Fluor Corp. 486 17,885Jacobs Engineering Group, Inc. 400 30,076Quanta Services, Inc. 492 18,568
66,529Construction Materials - 0.1%Martin Marietta Materials, Inc. 221 44,461Vulcan Materials Co. 478 56,595
101,056Consumer Finance - 0.7%American Express Co. 2,568 280,682Capital One Financial Corp. 1,742 142,304Discover Financial Services 1,227 87,313Synchrony Financial 2,444 77,964
588,263Containers & Packaging - 0.3%Avery Dennison Corp. 291 32,883Ball Corp. 1,209 69,953International Paper Co. 1,449 67,045Packaging Corp. of America 336 33,392Sealed Air Corp. 500 23,030WestRock Co. 907 34,783
261,086Distributors - 0.1%Genuine Parts Co. 493 55,231LKQ Corp. (A) 1,028 29,174
84,405Diversified Consumer Services - 0.0% (B)H&R Block, Inc. 709 16,973
Shares ValueCOMMON STOCKS (continued)Diversified Financial Services - 1.6%Berkshire Hathaway, Inc., Class B (A) 7,127 $ 1,431,743Jefferies Financial Group, Inc. 815 15,314
1,447,057Diversified Telecommunication Services - 2.0%AT&T, Inc. 26,755 839,037CenturyLink, Inc. 3,198 38,344Verizon Communications, Inc. 15,176 897,357
1,774,738Electric Utilities - 2.0%Alliant Energy Corp. 794 37,421American Electric Power Co., Inc. 1,836 153,765Duke Energy Corp. 2,701 243,090Edison International 1,185 73,375Entergy Corp. 687 65,698Evergy, Inc. 882 51,200Eversource Energy 1,152 81,734Exelon Corp. 3,607 180,819FirstEnergy Corp. 1,886 78,477NextEra Energy, Inc. 1,774 342,950Pinnacle West Capital Corp. 382 36,512PPL Corp. 2,617 83,064Southern Co. 3,846 198,761Xcel Energy, Inc. 1,864 104,775
1,731,641Electrical Equipment - 0.5%AMETEK, Inc. 798 66,210Eaton Corp. PLC 1,533 123,498Emerson Electric Co. 2,288 156,659Rockwell Automation, Inc. 434 76,150
422,517Electronic Equipment, Instruments & Components - 0.4%Amphenol Corp., Class A 1,080 101,995Corning, Inc. 2,853 94,434FLIR Systems, Inc. 467 22,220IPG Photonics Corp. (A) 123 18,669Keysight Technologies, Inc. (A) 661 57,639TE Connectivity, Ltd. 1,228 99,161
394,118Energy Equipment & Services - 0.5%Baker Hughes a GE Co. 1,865 51,698Halliburton Co. 3,166 92,764Helmerich & Payne, Inc. 400 22,224National Oilwell Varco, Inc. 1,359 36,204Schlumberger, Ltd. 5,149 224,342TechnipFMC PLC 1,451 34,127
461,359Entertainment - 1.8%Activision Blizzard, Inc. 2,764 125,845Electronic Arts, Inc. (A) 1,085 110,269Netflix, Inc. (A) 1,598 569,783Take-Two Interactive Software, Inc. (A) 385 36,332Viacom, Inc., Class B 1,256 35,256Walt Disney Co. 6,402 710,802
1,588,287
Copyright © 2021 www.secdatabase.com. All Rights Reserved.Please Consider the Environment Before Printing This Document

Transamerica U.S. Equity Index VPSCHEDULE OF INVESTMENTS (continued)At March 31, 2019(unaudited)
Shares ValueCOMMON STOCKS (continued)Equity Real Estate Investment Trusts - 2.9%Alexandria Real Estate Equities, Inc. 409 $ 58,307American Tower Corp. 1,637 322,587Apartment Investment & Management Co., Class A 587 29,520AvalonBay Communities, Inc. 502 100,766Boston Properties, Inc. 579 77,517Crown Castle International Corp. 1,545 197,760Digital Realty Trust, Inc. 755 89,845Duke Realty Corp. 1,206 36,879Equinix, Inc. 311 140,933Equity Residential 1,341 101,004Essex Property Trust, Inc. 238 68,839Extra Space Storage, Inc. 450 45,860Federal Realty Investment Trust 264 36,392HCP, Inc. 1,735 54,306Host Hotels & Resorts, Inc. 2,690 50,841Iron Mountain, Inc. 1,017 36,063Kimco Realty Corp. 1,508 27,898Macerich Co. 386 16,733Mid-America Apartment Communities, Inc. 386 42,201Prologis, Inc. 2,346 168,795Public Storage 543 118,255Realty Income Corp. 1,104 81,210Regency Centers Corp. 594 40,089SBA Communications Corp. (A) 421 84,057Simon Property Group, Inc. 1,149 209,359SL Green Realty Corp. 276 24,818UDR, Inc. 925 42,051Ventas, Inc. 1,294 82,570Vornado Realty Trust 581 39,183Welltower, Inc. 1,400 108,640Weyerhaeuser Co. 2,621 69,037
2,602,315Food & Staples Retailing - 1.5%Costco Wholesale Corp. 1,634 395,657Kroger Co. 2,886 70,996Sysco Corp. 1,711 114,226Walgreens Boots Alliance, Inc. 2,982 188,671Walmart, Inc. 5,278 514,763
1,284,313Food Products - 1.1%Archer-Daniels-Midland Co. 2,033 87,683Campbell Soup Co. 691 26,348Conagra Brands, Inc. 1,633 45,299General Mills, Inc. 2,163 111,935Hershey Co. 490 56,267Hormel Foods Corp. 915 40,955J.M. Smucker Co. 402 46,833Kellogg Co. 886 50,839Kraft Heinz Co. 2,262 73,854Lamb Weston Holdings, Inc. 520 38,969McCormick & Co., Inc. 444 66,880Mondelez International, Inc., Class A 5,364 267,771Tyson Foods, Inc., Class A 1,074 74,568
988,201Gas Utilities - 0.0% (B)Atmos Energy Corp. 400 41,172Health Care Equipment & Supplies - 3.4%Abbott Laboratories 6,512 520,569ABIOMED, Inc. (A) 153 43,695
Shares ValueCOMMON STOCKS (continued)Health Care Equipment & Supplies (continued)Align Technology, Inc. (A) 263 $ 74,779Baxter International, Inc. 1,775 144,325Becton Dickinson and Co. 999 249,480Boston Scientific Corp. (A) 5,152 197,734Cooper Cos., Inc. 167 49,460Danaher Corp. 2,332 307,871DENTSPLY SIRONA, Inc. 788 39,077Edwards Lifesciences Corp. (A) 774 148,089Hologic, Inc. (A) 904 43,754IDEXX Laboratories, Inc. (A) 311 69,540Intuitive Surgical, Inc. (A) 426 243,067Medtronic PLC 4,973 452,941ResMed, Inc. 485 50,425Stryker Corp. 1,150 227,148Teleflex, Inc. 156 47,137Varian Medical Systems, Inc. (A) 331 46,909Zimmer Biomet Holdings, Inc. 741 94,626
3,050,626Health Care Providers & Services - 2.7%AmerisourceBergen Corp. 552 43,895Anthem, Inc. 954 273,779Cardinal Health, Inc. 1,082 52,098Centene Corp. (A) 1,499 79,597Cigna Corp. (A) 1,412 227,078CVS Health Corp. 4,817 259,781DaVita, Inc. (A) 436 23,670HCA Healthcare, Inc. 995 129,728Henry Schein, Inc. (A) 515 30,957Humana, Inc. 505 134,330Laboratory Corp. of America Holdings (A) 338 51,707McKesson Corp. 718 84,049Quest Diagnostics, Inc. 475 42,712UnitedHealth Group, Inc. 3,524 871,344Universal Health Services, Inc., Class B 296 39,596WellCare Health Plans, Inc. (A) 177 47,746
2,392,067Health Care Technology - 0.1%Cerner Corp. (A) 1,174 67,165Hotels, Restaurants & Leisure - 1.8%Carnival Corp. 1,403 71,160Chipotle Mexican Grill, Inc. (A) 92 65,349Darden Restaurants, Inc. 436 52,961Hilton Worldwide Holdings, Inc. 1,062 88,263Marriott International, Inc., Class A 1,020 127,592McDonald�s Corp. 2,802 532,100MGM Resorts International 1,728 44,341Norwegian Cruise Line Holdings, Ltd. (A) 769 42,264Royal Caribbean Cruises, Ltd. 620 71,064Starbucks Corp. 4,615 343,079Wynn Resorts, Ltd. 329 39,256Yum! Brands, Inc. 1,110 110,789
1,588,218Household Durables - 0.3%D.R. Horton, Inc. 1,199 49,615Garmin, Ltd. 400 34,540Leggett & Platt, Inc. 455 19,210Lennar Corp., Class A 969 47,568Mohawk Industries, Inc. (A) 225 28,384Newell Brands, Inc. 1,300 19,942
Copyright © 2021 www.secdatabase.com. All Rights Reserved.Please Consider the Environment Before Printing This Document

The notes are an integral part of this report.Transamerica Series Trust Page 3
Copyright © 2021 www.secdatabase.com. All Rights Reserved.Please Consider the Environment Before Printing This Document

Transamerica U.S. Equity Index VPSCHEDULE OF INVESTMENTS (continued)At March 31, 2019(unaudited)
Shares ValueCOMMON STOCKS (continued)Household Durables (continued)PulteGroup, Inc. 880 $ 24,605Whirlpool Corp. 216 28,704
252,568Household Products - 1.7%Church & Dwight Co., Inc. 892 63,537Clorox Co. 463 74,293Colgate-Palmolive Co. 3,202 219,465Kimberly-Clark Corp. 1,282 158,840Procter & Gamble Co. 9,188 956,011
1,472,146Independent Power & Renewable Electricity Producers - 0.1%AES Corp. 2,248 40,644NRG Energy, Inc. 994 42,225
82,869Industrial Conglomerates - 1.5%3M Co. 2,136 443,818General Electric Co. 32,306 322,737Honeywell International, Inc. 2,704 429,719Roper Technologies, Inc. 375 128,239
1,324,513Insurance - 2.3%Aflac, Inc. 2,795 139,750Allstate Corp. 1,237 116,501American International Group, Inc. 3,238 139,428Aon PLC 894 152,606Arthur J. Gallagher & Co. 649 50,687Assurant, Inc. 222 21,070Brighthouse Financial, Inc. (A) 409 14,843Chubb, Ltd. 1,703 238,556Cincinnati Financial Corp. 552 47,417Everest Re Group, Ltd. 145 31,314Hartford Financial Services Group, Inc. 1,263 62,796Lincoln National Corp. 684 40,151Loews Corp. 927 44,431Marsh & McLennan Cos., Inc. 1,879 176,438MetLife, Inc. 3,563 151,677Principal Financial Group, Inc. 882 44,268Progressive Corp. 2,173 156,652Prudential Financial, Inc. 1,523 139,933Torchmark Corp. 338 27,699Travelers Cos., Inc. 953 130,713Unum Group 700 23,681Willis Towers Watson PLC 469 82,380
2,032,991Interactive Media & Services - 4.7%Alphabet, Inc., Class A (A) 1,097 1,291,048Alphabet, Inc., Class C (A) 1,129 1,324,667Facebook, Inc., Class A (A) 8,744 1,457,537TripAdvisor, Inc. (A) 317 16,310Twitter, Inc. (A) 2,645 86,968
4,176,530Internet & Direct Marketing Retail - 3.6%Amazon.com, Inc. (A) 1,511 2,690,713Booking Holdings, Inc. (A) 167 291,400eBay, Inc. 3,111 115,543Expedia Group, Inc. 400 47,600
3,145,256
Shares ValueCOMMON STOCKS (continued)IT Services - 5.0%Accenture PLC, Class A 2,365 $ 416,287Akamai Technologies, Inc. (A) 554 39,727Alliance Data Systems Corp. 159 27,822Automatic Data Processing, Inc. 1,618 258,459Broadridge Financial Solutions, Inc. 409 42,409Cognizant Technology Solutions Corp., Class A 2,141 155,116DXC Technology Co. 943 60,644Fidelity National Information Services, Inc. 1,168 132,101Fiserv, Inc. (A) 1,418 125,181FleetCor Technologies, Inc. (A) 312 76,936Gartner, Inc. (A) 317 48,083Global Payments, Inc. 573 78,226International Business Machines Corp. 3,300 465,630Jack Henry & Associates, Inc. 274 38,015Mastercard, Inc., Class A 3,309 779,104Paychex, Inc. 1,160 93,032PayPal Holdings, Inc. (A) 4,351 451,808Total System Services, Inc. 561 53,301VeriSign, Inc. (A) 381 69,174Visa, Inc., Class A 6,428 1,003,989Western Union Co. 1,400 25,858
4,440,902Leisure Products - 0.1%Hasbro, Inc. 400 34,008Mattel, Inc. (A) 1,189 15,457
49,465Life Sciences Tools & Services - 1.0%Agilent Technologies, Inc. 1,152 92,598Illumina, Inc. (A) 547 169,947IQVIA Holdings, Inc. (A) 574 82,570Mettler-Toledo International, Inc. (A) 90 65,070PerkinElmer, Inc. 377 36,328Thermo Fisher Scientific, Inc. 1,493 408,664Waters Corp. (A) 251 63,179
918,356Machinery - 1.5%Caterpillar, Inc. 2,137 289,542Cummins, Inc. 541 85,408Deere & Co. 1,185 189,410Dover Corp. 511 47,932Flowserve Corp. 472 21,306Fortive Corp. 1,069 89,678Illinois Tool Works, Inc. 1,124 161,328Ingersoll-Rand PLC 878 94,780PACCAR, Inc. 1,258 85,720Parker-Hannifin Corp. 484 83,064Pentair PLC 544 24,214Snap-on, Inc. 198 30,991Stanley Black & Decker, Inc. 531 72,306Wabtec Corp. 474 34,943Xylem, Inc. 652 51,534
1,362,156Media - 1.3%CBS Corp., Class B 1,223 58,129Charter Communications, Inc., Class A (A) 644 223,410Comcast Corp., Class A 16,555 661,869Discovery, Inc., Class A (A) 551 14,888Discovery, Inc., Class C (A) 1,281 32,563
Copyright © 2021 www.secdatabase.com. All Rights Reserved.Please Consider the Environment Before Printing This Document

The notes are an integral part of this report.Transamerica Series Trust Page 4
Copyright © 2021 www.secdatabase.com. All Rights Reserved.Please Consider the Environment Before Printing This Document

Transamerica U.S. Equity Index VPSCHEDULE OF INVESTMENTS (continued)At March 31, 2019(unaudited)
Shares ValueCOMMON STOCKS (continued)Media (continued)DISH Network Corp., Class A (A) 821 $ 26,017Fox Corp., Class A (A) 1,220 44,786Fox Corp., Class B (A) 545 19,555Interpublic Group of Cos., Inc. 1,299 27,292News Corp., Class A 1,327 16,508News Corp., Class B 400 4,996Omnicom Group, Inc. 811 59,195
1,189,208Metals & Mining - 0.2%Freeport-McMoRan, Inc. 5,089 65,597Newmont Mining Corp. 1,872 66,961Nucor Corp. 1,073 62,610
195,168Multi-Utilities - 1.1%Ameren Corp. 886 65,165CenterPoint Energy, Inc. 1,765 54,186CMS Energy Corp. 958 53,207Consolidated Edison, Inc. 1,164 98,719Dominion Energy, Inc. 2,970 227,680DTE Energy Co. 661 82,453NiSource, Inc. 1,268 36,341Public Service Enterprise Group, Inc. 1,832 108,839Sempra Energy 992 124,853WEC Energy Group, Inc. 1,144 90,468
941,911Multiline Retail - 0.5%Dollar General Corp. 953 113,693Dollar Tree, Inc. (A) 863 90,650Kohl�s Corp. 555 38,167Macy�s, Inc. 1,044 25,087Nordstrom, Inc. 400 17,752Target Corp. 1,943 155,945
441,294Oil, Gas & Consumable Fuels - 4.8%Anadarko Petroleum Corp. 1,815 82,546Apache Corp. 1,273 44,122Cabot Oil & Gas Corp. 1,500 39,150Chevron Corp. 6,979 859,673Cimarex Energy Co. 349 24,395Concho Resources, Inc. 729 80,890ConocoPhillips 4,212 281,109Devon Energy Corp. 1,547 48,823Diamondback Energy, Inc. 544 55,232EOG Resources, Inc. 2,156 205,208Exxon Mobil Corp. 15,562 1,257,410Hess Corp. 861 51,858HollyFrontier Corp. 560 27,591Kinder Morgan, Inc. 7,248 145,033Marathon Oil Corp. 2,783 46,504Marathon Petroleum Corp. 2,507 150,044Noble Energy, Inc. 1,613 39,890Occidental Petroleum Corp. 2,787 184,500ONEOK, Inc. 1,492 104,201Phillips 66 1,561 148,560Pioneer Natural Resources Co. 612 93,195Valero Energy Corp. 1,511 128,178Williams Cos., Inc. 4,383 125,880
4,223,992
Shares ValueCOMMON STOCKS (continued)Personal Products - 0.2%Coty, Inc., Class A 1,485 $ 17,078Estee Lauder Cos., Inc., Class A 790 130,784
147,862Pharmaceuticals - 4.7%Allergan PLC 1,163 170,275Bristol-Myers Squibb Co. 6,061 289,170Eli Lilly & Co. 3,205 415,881Johnson & Johnson 9,781 1,367,286Merck & Co., Inc. 9,461 786,871Mylan NV (A) 1,872 53,053Nektar Therapeutics (A) 601 20,194Perrigo Co. PLC 433 20,853Pfizer, Inc. 20,391 866,006Zoetis, Inc. 1,781 179,293
4,168,882Professional Services - 0.3%Equifax, Inc. 409 48,467IHS Markit, Ltd. (A) 1,275 69,334Nielsen Holdings PLC 1,198 28,357Robert Half International, Inc. 412 26,846Verisk Analytics, Inc. 594 79,002
252,006Real Estate Management & Development - 0.1%CBRE Group, Inc., Class A (A) 1,099 54,346Road & Rail - 1.0%CSX Corp. 2,880 215,482JB Hunt Transport Services, Inc. 285 28,868Kansas City Southern 342 39,665Norfolk Southern Corp. 995 185,955Union Pacific Corp. 2,681 448,263
918,233Semiconductors & Semiconductor Equipment - 3.8%Advanced Micro Devices, Inc. (A) 3,198 81,613Analog Devices, Inc. 1,371 144,325Applied Materials, Inc. 3,535 140,198Broadcom, Inc. 1,470 442,044Intel Corp. 16,517 886,963KLA-Tencor Corp. 580 69,258Lam Research Corp. 554 99,171Maxim Integrated Products, Inc. 927 49,288Microchip Technology, Inc. 831 68,940Micron Technology, Inc. (A) 4,170 172,346NVIDIA Corp. 2,248 403,651Qorvo, Inc. (A) 400 28,692QUALCOMM, Inc. 4,495 256,350Skyworks Solutions, Inc. 613 50,560Texas Instruments, Inc. 3,482 369,336Xilinx, Inc. 916 116,140
3,378,875Software - 6.3%Adobe, Inc. (A) 1,808 481,814ANSYS, Inc. (A) 300 54,813Autodesk, Inc. (A) 793 123,565Cadence Design Systems, Inc. (A) 1,016 64,526Citrix Systems, Inc. 429 42,754Fortinet, Inc. (A) 513 43,077Intuit, Inc. 962 251,476
Copyright © 2021 www.secdatabase.com. All Rights Reserved.Please Consider the Environment Before Printing This Document

The notes are an integral part of this report.Transamerica Series Trust Page 5
Copyright © 2021 www.secdatabase.com. All Rights Reserved.Please Consider the Environment Before Printing This Document

Transamerica U.S. Equity Index VPSCHEDULE OF INVESTMENTS (continued)At March 31, 2019(unaudited)
FUTURES CONTRACTS:
DescriptionLong/Short
Number ofContracts
ExpirationDate
NotionalAmount Value
UnrealizedAppreciation
UnrealizedDepreciation
S&P 500® E-Mini Index Long 6 06/21/2019 $ 841,650 $ 851,340 $ 9,690 $ �
The notes are an integral part of this report.Transamerica Series Trust Page 6
Shares ValueCOMMON STOCKS (continued)Software (continued)Microsoft Corp. 28,089 $ 3,312,817Oracle Corp. 9,449 507,506Red Hat, Inc. (A) 640 116,928salesforce.com, Inc. (A) 2,837 449,296Symantec Corp. 2,321 53,360Synopsys, Inc. (A) 543 62,526
5,564,458Specialty Retail - 2.3%Advance Auto Parts, Inc. 254 43,315AutoZone, Inc. (A) 90 92,171Best Buy Co., Inc. 849 60,330CarMax, Inc. (A) 588 41,042Foot Locker, Inc. 405 24,543Gap, Inc. 732 19,164Home Depot, Inc. 4,140 794,424L Brands, Inc. 781 21,540Lowe�s Cos., Inc. 2,973 325,454O�Reilly Automotive, Inc. (A) 292 113,384Ross Stores, Inc. 1,341 124,847Tiffany & Co. 400 42,220TJX Cos., Inc. 4,597 244,606Tractor Supply Co. 443 43,308Ulta Salon Cosmetics & Fragrance, Inc. (A) 212 73,931
2,064,279Technology Hardware, Storage & Peripherals - 3.9%Apple, Inc. 16,400 3,115,180Hewlett Packard Enterprise Co. 5,002 77,181HP, Inc. 5,719 111,120NetApp, Inc. 869 60,256Seagate Technology PLC 870 41,664Western Digital Corp. 985 47,339Xerox Corp. 676 21,619
3,474,359
Shares ValueCOMMON STOCKS (continued)Textiles, Apparel & Luxury Goods - 0.7%Capri Holdings, Ltd. (A) 500 $ 22,875Hanesbrands, Inc. 1,230 21,992NIKE, Inc., Class B 4,669 393,177PVH Corp. 245 29,878Ralph Lauren Corp. 208 26,973Tapestry, Inc. 1,030 33,465Under Armour, Inc., Class A (A) 660 13,952Under Armour, Inc., Class C (A) 680 12,832VF Corp. 1,176 102,206
657,350Tobacco - 1.0%Altria Group, Inc. 6,954 399,368Philip Morris International, Inc. 5,764 509,480
908,848Trading Companies & Distributors - 0.2%Fastenal Co. 1,036 66,625United Rentals, Inc. (A) 283 32,333WW Grainger, Inc. 159 47,848
146,806Water Utilities - 0.1%American Water Works Co., Inc. 654 68,186Total Common Stocks
(Cost $82,247,360) 86,431,034Total Investments
(Cost $82,247,360) 86,431,034Net Other Assets (Liabilities) - 2.4% 2,138,345Net Assets - 100.0% $ 88,569,379
Copyright © 2021 www.secdatabase.com. All Rights Reserved.Please Consider the Environment Before Printing This Document

Transamerica U.S. Equity Index VPSCHEDULE OF INVESTMENTS (continued)At March 31, 2019(unaudited)
SECURITY VALUATION:
Valuation Inputs (C)
Level 1 -Unadjusted
QuotedPrices
Level 2 -Other
SignificantObservable
Inputs
Level 3 -Significant
UnobservableInputs Value
ASSETSInvestmentsCommon Stocks $86,431,034 $ � $ � $86,431,034Total Investments $ 86,431,034 $ �� $ �� $ 86,431,034Other Financial InstrumentsFutures Contracts (D) $9,690 $ � $ � $9,690Total Other Financial Instruments $9,690 $ �� $ �� $9,690
FOOTNOTES TO SCHEDULE OF INVESTMENTS:
(A) Non-income producing securities.(B) Percentage rounds to less than 0.1% or (0.1)%.(C) There were no transfers in or out of Level 3 during the period ended March 31, 2019. Please reference the Security Valuation section of the Notes to Schedules of
Investments for more information regarding security valuation and pricing inputs.(D) Futures contracts and/or forward foreign currency contracts are valued at unrealized appreciation (depreciation).
The notes are an integral part of this report.Transamerica Series Trust Page 7
Copyright © 2021 www.secdatabase.com. All Rights Reserved.Please Consider the Environment Before Printing This Document

Transamerica WMC US Growth II VPSCHEDULE OF INVESTMENTSAt March 31, 2019(unaudited)
The notes are an integral part of this report.Transamerica Series Trust Page 1
Shares ValueCOMMON STOCKS - 95.5%Banks - 0.6%SVB Financial Group (A) 298 $ 66,263Beverages - 2.0%Constellation Brands, Inc., Class A 682 119,575Monster Beverage Corp. (A) 2,094 114,291
233,866Biotechnology - 1.5%Seattle Genetics, Inc. (A) 1,083 79,319Vertex Pharmaceuticals, Inc. (A) 533 98,045
177,364Building Products - 1.0%Fortune Brands Home & Security, Inc. 2,495 118,787Capital Markets - 1.5%BlackRock, Inc. 159 67,952Intercontinental Exchange, Inc. 1,338 101,875
169,827Chemicals - 1.7%PPG Industries, Inc. 1,172 132,284Sherwin-Williams Co. 150 64,606
196,890Commercial Services & Supplies - 0.9%Copart, Inc. (A) 1,633 98,943Consumer Finance - 0.7%Capital One Financial Corp. 1,024 83,651Diversified Telecommunication Services - 1.3%Verizon Communications, Inc. 2,625 155,216Electrical Equipment - 1.7%AMETEK, Inc. 1,343 111,429Eaton Corp. PLC 1,003 80,801
192,230Electronic Equipment, Instruments & Components - 0.9%CDW Corp. 1,018 98,105Entertainment - 2.2%Activision Blizzard, Inc. 1,340 61,010Electronic Arts, Inc. (A) 679 69,007Netflix, Inc. (A) 359 128,005
258,022Equity Real Estate Investment Trusts - 1.2%American Tower Corp. 719 141,686Food & Staples Retailing - 1.6%Costco Wholesale Corp. 768 185,964Health Care Equipment & Supplies - 4.7%Baxter International, Inc. 2,234 181,646Boston Scientific Corp. (A) 3,316 127,268
Shares ValueCOMMON STOCKS (continued)Health Care Equipment & Supplies (continued)Edwards Lifesciences Corp. (A) 639 $ 122,260Teleflex, Inc. 368 111,195
542,369Health Care Providers & Services - 2.4%UnitedHealth Group, Inc. 1,122 277,426Hotels, Restaurants & Leisure - 1.1%Hilton Worldwide Holdings, Inc. 1,533 127,408Household Products - 1.4%Colgate-Palmolive Co. 2,284 156,545Insurance - 0.8%Allstate Corp. 994 93,615Interactive Media & Services - 8.9%Alphabet, Inc., Class A (A) 464 546,077Alphabet, Inc., Class C (A) 191 224,102Facebook, Inc., Class A (A) 1,564 260,703
1,030,882Internet & Direct Marketing Retail - 7.6%Amazon.com, Inc. (A) 357 635,728Booking Holdings, Inc. (A) 93 162,277Wayfair, Inc., Class A (A) (B) 505 74,967
872,972IT Services - 10.2%EPAM Systems, Inc. (A) 629 106,383FleetCor Technologies, Inc. (A) 726 179,024Global Payments, Inc. 1,208 164,916GoDaddy, Inc., Class A (A) 2,400 180,456Mastercard, Inc., Class A 1,549 364,712PayPal Holdings, Inc. (A) 1,785 185,355
1,180,846Life Sciences Tools & Services - 1.5%Thermo Fisher Scientific, Inc. 635 173,812Machinery - 3.5%Illinois Tool Works, Inc. 904 129,751Middleby Corp. (A) 624 81,139Nordson Corp. 787 104,293Snap-on, Inc. 584 91,408
406,591Oil, Gas & Consumable Fuels - 0.6%Continental Resources, Inc. (A) 1,552 69,483Personal Products - 0.8%Estee Lauder Cos., Inc., Class A 526 87,079Pharmaceuticals - 1.4%Allergan PLC 582 85,210Bristol-Myers Squibb Co. 1,722 82,157
167,367Professional Services - 1.2%Equifax, Inc. 535 63,397IHS Markit, Ltd. (A) 1,433 77,927
141,324
Copyright © 2021 www.secdatabase.com. All Rights Reserved.Please Consider the Environment Before Printing This Document

Transamerica WMC US Growth II VPSCHEDULE OF INVESTMENTS (continued)At March 31, 2019(unaudited)
SECURITY VALUATION:
Valuation Inputs (D)
Level 1 -Unadjusted
QuotedPrices
Level 2 -Other
SignificantObservable
Inputs
Level 3 -Significant
UnobservableInputs Value
ASSETSInvestmentsCommon Stocks $11,046,912 $� $ � $11,046,912Other Investment Company 75,599 � � 75,599Repurchase Agreement � 417,830 � 417,830Total Investments $ 11,122,511 $ 417,830 $ �� $ 11,540,341
FOOTNOTES TO SCHEDULE OF INVESTMENTS:
(A) Non-income producing securities.(B) All or a portion of the security is on loan. The value of the security on loan is $74,077. The amount on loan indicated may not correspond with the security on loan
identified because a security with pending sales are in the process of recall from the brokers.(C) Rates disclosed reflect the yields at March 31, 2019.(D) There were no transfers in or out of Level 3 during the period ended March 31, 2019. Please reference the Security Valuation section of the Notes to Schedules of
Investments for more information regarding security valuation and pricing inputs.
Shares ValueCOMMON STOCKS (continued)Road & Rail - 1.4%JB Hunt Transport Services, Inc. 564 $ 57,127Norfolk Southern Corp. 548 102,416
159,543Semiconductors & Semiconductor Equipment - 3.3%Advanced Micro Devices, Inc. (A) 4,856 123,925Marvell Technology Group, Ltd. 3,956 78,685Micron Technology, Inc. (A) 2,410 99,605ON Semiconductor Corp. (A) 3,601 74,073
376,288Software - 14.2%Adobe, Inc. (A) 758 201,999DocuSign, Inc. (A) 1,418 73,509Guidewire Software, Inc. (A) 1,410 136,996Microsoft Corp. 4,976 586,870salesforce.com, Inc. (A) 1,401 221,876ServiceNow, Inc. (A) 552 136,063SS&C Technologies Holdings, Inc. 2,188 139,354Workday, Inc., Class A (A) 764 147,337
1,644,004Specialty Retail - 1.4%TJX Cos., Inc. 3,108 165,377Technology Hardware, Storage & Peripherals - 6.0%Apple, Inc. 3,101 589,035NetApp, Inc. 1,536 106,506
695,541
Shares ValueCOMMON STOCKS (continued)Textiles, Apparel & Luxury Goods - 4.3%NIKE, Inc., Class B 2,911 $ 245,135Under Armour, Inc., Class C (A) 5,597 105,615VF Corp. 1,736 150,876
501,626Total Common Stocks
(Cost $7,615,915) 11,046,912
OTHER INVESTMENT COMPANY - 0.7%Securities Lending Collateral - 0.7%State Street Navigator Securities Lending Trust -
Government Money Market Portfolio, 2.41% (C) 75,599 75,599Total Other Investment Company
(Cost $75,599) 75,599
Principal ValueREPURCHASE AGREEMENT - 3.6%Fixed Income Clearing Corp., 1.45% (C), dated 03/
29/2019, to be repurchased at $417,881 on 04/01/2019. Collateralized by a U.S. GovernmentObligation, 2.75%, due 09/15/2021, and with avalue of $430,870. $ 417,830 417,830
Total Repurchase Agreement(Cost $417,830) 417,830
Total Investments(Cost $8,109,344) 11,540,341
Net Other Assets (Liabilities) - 0.2% 19,819Net Assets - 100.0% $ 11,560,160
Copyright © 2021 www.secdatabase.com. All Rights Reserved.Please Consider the Environment Before Printing This Document

The notes are an integral part of this report.Transamerica Series Trust Page 2
Copyright © 2021 www.secdatabase.com. All Rights Reserved.Please Consider the Environment Before Printing This Document

Transamerica WMC US Growth VPSCHEDULE OF INVESTMENTSAt March 31, 2019(unaudited)
The notes are an integral part of this report.Transamerica Series Trust Page 1
Shares ValueCOMMON STOCKS - 96.2%Banks - 0.6%SVB Financial Group (A) 74,213 $ 16,502,003Beverages - 2.0%Constellation Brands, Inc., Class A 168,147 29,481,214Monster Beverage Corp. (A) 514,328 28,072,022
57,553,236Biotechnology - 1.5%Seattle Genetics, Inc. (A) 261,924 19,183,314Vertex Pharmaceuticals, Inc. (A) 132,909 24,448,610
43,631,924Building Products - 1.0%Fortune Brands Home & Security, Inc. 609,195 29,003,774Capital Markets - 1.5%BlackRock, Inc. 39,591 16,920,006Intercontinental Exchange, Inc. 333,439 25,388,045
42,308,051Chemicals - 1.7%PPG Industries, Inc. 287,874 32,492,339Sherwin-Williams Co. 37,444 16,127,505
48,619,844Commercial Services & Supplies - 0.9%Copart, Inc. (A) 400,599 24,272,293Consumer Finance - 0.7%Capital One Financial Corp. 251,129 20,514,728Diversified Telecommunication Services - 1.3%Verizon Communications, Inc. 644,689 38,120,461Electrical Equipment - 1.7%AMETEK, Inc. 329,513 27,339,694Eaton Corp. PLC 246,100 19,825,816
47,165,510Electronic Equipment, Instruments & Components - 0.9%CDW Corp. 249,811 24,074,286Entertainment - 2.3%Activision Blizzard, Inc. 332,859 15,155,070Electronic Arts, Inc. (A) 168,653 17,140,205Netflix, Inc. (A) 88,088 31,408,657
63,703,932Equity Real Estate Investment Trusts - 1.2%American Tower Corp. 176,661 34,812,817Food & Staples Retailing - 1.6%Costco Wholesale Corp. 188,516 45,647,264Health Care Equipment & Supplies - 4.7%Baxter International, Inc. 548,620 44,608,292Boston Scientific Corp. (A) 814,313 31,253,333
Shares ValueCOMMON STOCKS (continued)Health Care Equipment & Supplies (continued)Edwards Lifesciences Corp. (A) 159,191 $ 30,458,014Teleflex, Inc. 90,859 27,453,956
133,773,595Health Care Providers & Services - 2.4%UnitedHealth Group, Inc. 275,432 68,103,316Hotels, Restaurants & Leisure - 1.1%Hilton Worldwide Holdings, Inc. 376,472 31,288,588Household Products - 1.4%Colgate-Palmolive Co. 561,241 38,467,458Insurance - 0.8%Allstate Corp. 243,800 22,961,084Interactive Media & Services - 9.0%Alphabet, Inc., Class A (A) 113,839 133,975,981Alphabet, Inc., Class C (A) 46,963 55,102,157Facebook, Inc., Class A (A) 381,724 63,629,574
252,707,712Internet & Direct Marketing Retail - 7.6%Amazon.com, Inc. (A) 87,782 156,317,797Booking Holdings, Inc. (A) 22,895 39,949,714Wayfair, Inc., Class A (A) (B) 123,114 18,276,273
214,543,784IT Services - 10.3%EPAM Systems, Inc. (A) 152,882 25,856,933FleetCor Technologies, Inc. (A) 178,242 43,952,695Global Payments, Inc. 293,814 40,111,487GoDaddy, Inc., Class A (A) 589,934 44,357,137Mastercard, Inc., Class A 380,398 89,564,709PayPal Holdings, Inc. (A) 438,682 45,552,739
289,395,700Life Sciences Tools & Services - 1.5%Thermo Fisher Scientific, Inc. 157,246 43,041,375Machinery - 3.5%Illinois Tool Works, Inc. 220,811 31,693,003Middleby Corp. (A) 153,088 19,906,033Nordson Corp. 192,108 25,458,152Snap-on, Inc. 143,183 22,411,003
99,468,191Oil, Gas & Consumable Fuels - 0.6%Continental Resources, Inc. (A) 386,829 17,318,334Personal Products - 0.8%Estee Lauder Cos., Inc., Class A 130,055 21,530,605Pharmaceuticals - 1.5%Allergan PLC 142,845 20,913,937Bristol-Myers Squibb Co. 422,341 20,149,889
41,063,826Professional Services - 1.2%Equifax, Inc. 131,482 15,580,617IHS Markit, Ltd. (A) 351,624 19,121,313
34,701,930
Copyright © 2021 www.secdatabase.com. All Rights Reserved.Please Consider the Environment Before Printing This Document

Transamerica WMC US Growth VPSCHEDULE OF INVESTMENTS (continued)At March 31, 2019(unaudited)
SECURITY VALUATION:
Valuation Inputs (D)
Level 1 -Unadjusted
QuotedPrices
Level 2 -Other
SignificantObservable
Inputs
Level 3 -Significant
UnobservableInputs Value
ASSETSInvestmentsCommon Stocks $2,714,597,167 $� $ � $2,714,597,167Other Investment Company 1,521,666 � � 1,521,666Repurchase Agreement � 90,566,454 � 90,566,454Total Investments $ 2,716,118,833 $ 90,566,454 $ �� $ 2,806,685,287
FOOTNOTES TO SCHEDULE OF INVESTMENTS:
(A) Non-income producing securities.(B) All or a portion of the security is on loan. The value of the security on loan is $1,491,032. The amount on loan indicated may not correspond with the security on
loan identified because a security with pending sales are in the process of recall from the brokers.(C) Rates disclosed reflect the yields at March 31, 2019.(D) There were no transfers in or out of Level 3 during the period ended March 31, 2019. Please reference the Security Valuation section of the Notes to Schedules of
Investments for more information regarding security valuation and pricing inputs.
Shares ValueCOMMON STOCKS (continued)Road & Rail - 1.4%JB Hunt Transport Services, Inc. 140,607 $ 14,242,083Norfolk Southern Corp. 134,351 25,108,858
39,350,941Semiconductors & Semiconductor Equipment - 3.3%Advanced Micro Devices, Inc. (A) 1,173,804 29,955,478Marvell Technology Group, Ltd. 979,333 19,478,933Micron Technology, Inc. (A) 591,131 24,431,444ON Semiconductor Corp. (A) 870,412 17,904,375
91,770,230Software - 14.3%Adobe, Inc. (A) 186,145 49,605,781DocuSign, Inc. (A) 351,615 18,227,722Guidewire Software, Inc. (A) 346,259 33,642,524Microsoft Corp. 1,221,966 144,118,670salesforce.com, Inc. (A) 344,143 54,501,927ServiceNow, Inc. (A) 135,897 33,497,252SS&C Technologies Holdings, Inc. 541,706 34,501,255Workday, Inc., Class A (A) 189,061 36,460,414
404,555,545Specialty Retail - 1.4%TJX Cos., Inc. 763,193 40,609,500Technology Hardware, Storage & Peripherals - 6.1%Apple, Inc. 761,587 144,663,450NetApp, Inc. 376,832 26,129,531
170,792,981
Shares ValueCOMMON STOCKS (continued)Textiles, Apparel & Luxury Goods - 4.4%NIKE, Inc., Class B 710,776 $ 59,854,447Under Armour, Inc., Class C (A) 1,394,751 26,318,951VF Corp. 426,291 37,048,951
123,222,349Total Common Stocks
(Cost $1,934,872,844) 2,714,597,167
OTHER INVESTMENT COMPANY - 0.1%Securities Lending Collateral - 0.1%State Street Navigator Securities Lending
Trust - Government Money MarketPortfolio - (C) 1,521,666 1,521,666
Total Other Investment Company(Cost $1,521,666) 1,521,666
Principal ValueREPURCHASE AGREEMENT - 3.2%Fixed Income Clearing Corp., 1.45% (C),
dated 03/29/2019, to be repurchased at$90,577,397 on 04/01/2019. Collateralizedby a U.S. Government Obligation, 2.75%,due 09/15/2021, and with a value of$92,378,549. $ 90,566,454 90,566,454
Total Repurchase Agreement(Cost $90,566,454) 90,566,454
Total Investments(Cost $2,026,960,964) 2,806,685,287
Net Other Assets (Liabilities) - 0.5% 12,891,828Net Assets - 100.0% $ 2,819,577,115
Copyright © 2021 www.secdatabase.com. All Rights Reserved.Please Consider the Environment Before Printing This Document

The notes are an integral part of this report.Transamerica Series Trust Page 2
Copyright © 2021 www.secdatabase.com. All Rights Reserved.Please Consider the Environment Before Printing This Document

NOTES TO SCHEDULES OF INVESTMENTSAt March 31, 2019(unaudited)
1. ORGANIZATION
Transamerica Series Trust (�TST�) is an open-end management investment company registered under the Investment Company Act of1940, as amended (the �1940 Act�). TST applies investment company accounting and reporting guidance. TST serves as a fundingvehicle for variable life insurance, variable annuity, and group annuity products. The portfolios (each, a �Portfolio� and collectively, the�Portfolios�) are a series of TST and are as follows:
Portfolio PortfolioTransamerica 60/40 Allocation VP (�60/40 Allocation VP�)Transamerica Aegon High Yield Bond VP (�Aegon High Yield
Bond VP�)Transamerica Aegon U.S. Government Securities VP (�Aegon
U.S. Government Securities VP�)Transamerica American Funds Managed Risk VP (�American
Funds Managed Risk VP�)Transamerica Barrow Hanley Dividend Focused VP (�Barrow
Hanley Dividend Focused VP�)Transamerica BlackRock Equity Smart Beta 100 VP
(�BlackRock Equity Smart Beta 100 VP�)Transamerica BlackRock Global Allocation Managed Risk �
Balanced VP (�BlackRock Global Allocation Managed Risk �Balanced VP�)
Transamerica BlackRock Global Allocation Managed Risk �Growth VP (�BlackRock Global Allocation Managed Risk �Growth VP�)
Transamerica BlackRock Global Allocation VP (�BlackRockGlobal Allocation VP�)(A)
Transamerica BlackRock Global Real Estate Securities VP(�BlackRock Global Real Estate Securities VP�)
Transamerica BlackRock Smart Beta 40 VP (�BlackRock SmartBeta 40 VP�)
Transamerica BlackRock Smart Beta 50 VP (�BlackRock SmartBeta 50 VP�)
Transamerica BlackRock Smart Beta 75 VP (�BlackRock SmartBeta 75 VP�)
Transamerica BlackRock Tactical Allocation VP (�BlackRockTactical Allocation VP�)
Transamerica Greystone International Growth VP (�GreystoneInternational Growth VP�)
Transamerica International Equity Index VP (�InternationalEquity Index VP�)
Transamerica Janus Balanced VP (�Janus Balanced VP�)Transamerica Janus Mid-Cap Growth VP (�Janus Mid-Cap
Growth VP�)Transamerica Jennison Growth VP (�Jennison Growth VP�)Transamerica JPMorgan Asset Allocation � Conservative VP
(�JPMorgan Asset Allocation � Conservative VP�)Transamerica JPMorgan Asset Allocation � Growth VP
(�JPMorgan Asset Allocation � Growth VP�)Transamerica JPMorgan Asset Allocation � Moderate Growth
VP (�JPMorgan Asset Allocation � Moderate Growth VP�)Transamerica JPMorgan Asset Allocation � Moderate VP
(�JPMorgan Asset Allocation � Moderate VP�)
Transamerica Legg Mason Dynamic Allocation � Balanced VP(�Legg Mason Dynamic Allocation � Balanced VP�)
Transamerica Legg Mason Dynamic Allocation � Growth VP(�Legg Mason Dynamic Allocation � Growth VP�)
Transamerica Levin Large Cap Value VP (�Levin Large CapValue VP�)
Transamerica Madison Balanced Allocation VP (�MadisonBalanced Allocation VP�)
Transamerica Madison Conservative Allocation VP (�MadisonConservative Allocation VP�)
Transamerica Madison Diversified Income VP (�MadisonDiversified Income VP�)
Transamerica Managed Risk � Balanced ETF VP (�ManagedRisk � Balanced ETF VP�)
Transamerica Managed Risk � Conservative ETF VP (�ManagedRisk � Conservative ETF VP�)
Transamerica Managed Risk � Growth ETF VP (�Managed Risk �Growth ETF VP�)
Transamerica Market Participation Strategy VP (�MarketParticipation Strategy VP�)
Transamerica Morgan Stanley Capital Growth VP (�MorganStanley Capital Growth VP�)
Transamerica Multi-Managed Balanced VP (�Multi-ManagedBalanced VP�)
Transamerica Multi-Manager Alternative Strategies VP (�Multi-Manager Alternative Strategies VP�)
Transamerica PIMCO Tactical � Balanced VP (�PIMCOTactical � Balanced VP�)
Transamerica PIMCO Tactical � Conservative VP (�PIMCOTactical � Conservative VP�)
Transamerica PIMCO Tactical � Growth VP (�PIMCO Tactical �Growth VP�)
Transamerica PIMCO Total Return VP (�PIMCO Total ReturnVP�)
Transamerica PineBridge Inflation Opportunities VP (�PineBridgeInflation Opportunities VP�)
Transamerica ProFund UltraBear VP (�ProFund UltraBear VP�)Transamerica QS Investors Active Asset Allocation �
Conservative VP (�QS Investors Active Asset Allocation �Conservative VP�)
Transamerica QS Investors Active Asset Allocation � ModerateGrowth VP (�QS Investors Active Asset Allocation � ModerateGrowth VP�)
Transamerica QS Investors Active Asset Allocation � ModerateVP (�QS Investors Active Asset Allocation � Moderate VP�)
Copyright © 2021 www.secdatabase.com. All Rights Reserved.Please Consider the Environment Before Printing This Document

Transamerica Series Trust Page 1
Transamerica JPMorgan Core Bond VP (�JPMorgan Core BondVP�)
Transamerica JPMorgan Enhanced Index VP (�JPMorganEnhanced Index VP�)
Transamerica Small/Mid Cap Value VP (�Small/Mid Cap ValueVP�)
Transamerica T. Rowe Price Small Cap VP (�T. Rowe Price SmallCap VP�)
Transamerica Torray Concentrated Growth VP (�TorrayConcentrated Growth VP�)
Copyright © 2021 www.secdatabase.com. All Rights Reserved.Please Consider the Environment Before Printing This Document

NOTES TO SCHEDULES OF INVESTMENTS (continued)At March 31, 2019(unaudited)
1. ORGANIZATION (continued):
(A) Transamerica Cayman BlackRock Global Allocation, Ltd. is a wholly-owned subsidiary which acts as an investment vehicle forTransamerica BlackRock Global Allocation VP. Please reference the Basis for Consolidation section of the Notes to Schedule ofInvestments for more information.
Transamerica BlackRock Global Real Estate Securities VP, Transamerica Market Participation Strategy VP, and Transamerica ProFundUltraBear VP are �non-diversified� Funds, as defined under the 1940 Act.
Transamerica Asset Management, Inc. (�TAM�) serves as investment manager for the Portfolios pursuant to an investment managementagreement. TAM provides continuous and regular investment management services to the Portfolios. TAM supervises the Portfolios�investments, conducts its investment program and provides supervisory, compliance and administrative services to the Portfolios.
TAM currently acts as a �manager of managers� and hires sub-advisers to furnish day-to-day investment advice and recommendations.TAM may, in the future, determine to provide all aspects of the day-to-day management of a Portfolio without the use of a sub-adviser.When acting as a manager of managers, TAM provides investment management services that include, without limitation, the designand development of the Portfolios and their investment strategies and the ongoing review and evaluation of those investment strategiesincluding recommending changes in strategy where it believes appropriate or advisable; the selection of one or more sub-advisersfor the Portfolios employing a combination of quantitative and qualitative screens, research, analysis and due diligence; negotiationof sub-advisory agreements and fees; oversight and monitoring of sub-advisers and recommending changes to sub-advisers where itbelieves appropriate or advisable; recommending portfolio combinations and liquidations where it believes appropriate or advisable;selection and oversight of transition managers, as needed; regular supervision of the Portfolios� investments; regular review andevaluation of sub-adviser performance; daily monitoring of the sub-advisers� buying and selling of securities for the Portfolios; regularreview of holdings; ongoing trade oversight and analysis; regular monitoring to ensure adherence to investment process; regularcalls and periodic on-site visits with sub-advisers; portfolio construction and asset allocation when using multiple sub-advisers fora portfolio; risk management oversight and analysis; oversight of negotiation of investment documentation and agreements; design,development, implementation and regular monitoring of the valuation process; periodic due diligence reviews of pricing vendors andvendor methodology; design, development, implementation and regular monitoring of the compliance process; respond to regulatoryinquiries and determine appropriate litigation strategy, as needed; review of proxies voted by sub-advisers; oversight of preparation, andreview, of materials for meetings of the Portfolios� Board of Trustees (the �Board�), participation in these meetings and preparation ofregular communications with the Board; oversight of preparation, and review, of prospectuses, shareholder reports and other disclosurematerials and regulatory filings for the Portfolios; oversight of other service providers to the Portfolios, such as the custodian, the transferagent, the Portfolios� independent accounting firm and legal counsel; supervision of the performance of recordkeeping and shareholderrelations functions for the Portfolios; and oversight of cash management services. TAM uses a variety of quantitative and qualitative toolsto carry out its investment management services. TAM, not the Portfolios, is responsible for paying the sub-adviser(s) for their services,and sub-advisory fees are TAM�s expense.
TAM�s investment management services also include the provision of supervisory and administrative services to the Portfolio. Theseservices include performing certain administrative services for the Portfolio and supervising and overseeing the administrative, clerical,recordkeeping and bookkeeping services provided to the Portfolio by State Street Bank and Trust Company (�State Street�), to whomTAM has outsourced the provision of certain services as described below; to the extent agreed upon by TAM and the Portfolio from timeto time, monitoring and verifying the custodian�s daily calculation of the Net Asset Values (�NAV�); shareholder relations functions;compliance services; valuation services; assisting in due diligence and in the oversight and monitoring of certain activities of sub-advisersand certain aspects of Portfolio investments; assisting with Portfolio combinations and liquidations; oversight of the preparation andfiling, and review, of all returns and reports, in connection with federal, state and local taxes; oversight and review of regulatory reporting;supervising and coordinating the Portfolios� custodian and dividend disbursing agent and monitoring their services to the Portfolios;assisting the Portfolios in preparing reports to shareholders; acting as liaison with the Portfolios� independent public accountantsand providing, upon request, analyses, fiscal year summaries and other audit related services; assisting in the preparation of agendas
Transamerica JPMorgan International Moderate Growth VP(�JPMorgan International Moderate Growth VP�)
Transamerica JPMorgan Mid Cap Value VP (�JPMorgan MidCap Value VP�)
Transamerica JPMorgan Tactical Allocation VP (�JPMorganTactical Allocation VP�)
Transamerica TS&W International Equity VP (�TS&WInternational Equity VP�)
Transamerica U.S. Equity Index VP (�U.S. Equity Index VP�)Transamerica WMC US Growth II VP (�WMC US Growth II
VP�)Transamerica WMC US Growth VP (�WMC US Growth VP�)
Copyright © 2021 www.secdatabase.com. All Rights Reserved.Please Consider the Environment Before Printing This Document

and supporting documents for and minutes of meetings of trustees and committees of trustees; assisting in the preparation of regularcommunications with the trustees; and providing personnel and office space, telephones and other office equipment as necessary in orderfor TAM to perform supervisory and administrative services to the Portfolios.
2. BASIS FOR CONSOLIDATION
Transamerica Cayman BlackRock Global Allocation, Ltd. (the �Subsidiary�) is organized under the laws of the Cayman Islands as awholly-owned subsidiary which acts as an investment vehicle for Transamerica BlackRock Global Allocation VP. The principal purposeof investment of the Subsidiaries is to allow the Portfolio noted above to gain exposure to the commodity markets within the limitationsof the federal tax law requirements applicable to regulated investment companies.
Transamerica Series Trust Page 2
Copyright © 2021 www.secdatabase.com. All Rights Reserved.Please Consider the Environment Before Printing This Document

NOTES TO SCHEDULES OF INVESTMENTS (continued)At March 31, 2019(unaudited)
2. BASIS FOR CONSOLIDATION (continued):
At March 31, 2019, the net assets of the Subsidiary as a percentage of the Portfolio�s net assets is as follows:
Portfolio Subsidiary Value
Percentageof NetAssets
BlackRock Global Allocation VP Transamerica Cayman Blackrock Global Allocation,Ltd.
$ 27,099,751 1.65 %
3. SIGNIFICANT ACCOUNTING POLICIES
The following is a summary of significant accounting policies followed by the Portfolios.
Foreign currency denominated investments: The accounting records of the Portfolios are maintained in U.S. dollars. Securities andother assets and liabilities denominated in foreign currencies are translated into U.S. dollars based on the closing exchange rate eachday. The cost of foreign securities purchased and any realized gains or losses are translated at the prevailing exchange rates in effect onthe date of the respective transaction. The Portfolios combine fluctuations from currency exchange rates and fluctuations in value whencomputing net realized and unrealized gains or losses from investments.
Net foreign currency gains and losses resulting from changes in exchange rates include, foreign currency fluctuations between tradedate and settlement date of investment security transactions, gains and losses on forward foreign currency contracts, and the differencebetween the receivable amounts of interest and dividends recorded in the accounting records in U.S. dollars and the amounts actuallyreceived.
Foreign currency denominated assets may involve risks not typically associated with domestic transactions. These risks includerevaluation of currencies, adverse fluctuations in foreign currency values, and possible adverse political, social, and economicdevelopments, including those particular to a specific industry, country or region.
Security transactions and investment income: Security transactions are accounted for on the trade date. Security gains and losses arecalculated on the specific identification basis. Dividend income, if any, is recorded on the ex-dividend date or, in the case of foreignsecurities, as soon as the Portfolios are informed of the ex-dividend dates, net of foreign taxes. Interest income, if any, including accretionof discounts and amortization of premiums, is recorded on the accrual basis commencing on the settlement date.
4. SECURITY VALUATION
All investments in securities are recorded at their estimated fair value. The Portfolios value their investments at the official close of theNew York Stock Exchange (�NYSE�) each day the NYSE is open for business.
The Portfolios utilize various methods to measure the fair value of their investments on a recurring basis. Generally Accepted AccountingPrinciples in the United States of America establishes a hierarchy that prioritizes inputs to valuation methods. The inputs or methodologyused for valuing securities are not necessarily an indication of the risk associated with investing in those securities. The three levels(�Levels�) of inputs of the fair value hierarchy are defined as follows:
Level 1 � Unadjusted quoted prices in active markets for identical securities.
Level 2 � Inputs, other than quoted prices included in Level 1, which are observable, either directly or indirectly. These inputs mayinclude quoted prices for the identical instrument on an inactive market, prices for similar instruments, interest rates, prepayment speeds,credit risk, yield curves, default rates, and similar data.
Level 3 � Unobservable inputs based on the best information available in the circumstances, to the extent observable inputs arenot available, which may include the Portfolio�s own assumptions used in determining the fair value of investments and derivativeinstruments.
The inputs used to measure fair value may fall into different Levels of the fair value hierarchy. In such cases, for disclosure purposes,the Level in the fair value hierarchy that is assigned to the fair value measurement of a security is determined based on the lowest Levelinput that is significant to the fair value measurement in its entirety. Certain investments that are measured at fair value using NAV per
Copyright © 2021 www.secdatabase.com. All Rights Reserved.Please Consider the Environment Before Printing This Document

share, or its equivalent, using the �practical expedient� have not been classified in the fair value Levels. The hierarchy classification ofinputs used to value the Portfolios� investments at March 31, 2019, is disclosed within the Security Valuation section of each Portfolio�sSchedule of Investments or Consolidated Schedule of Investments.
The availability of observable inputs can vary from security to security and is affected by a wide variety of factors, including, but notlimited to, the type of security, whether the security is new and not yet established in the marketplace, the liquidity of markets, and othercharacteristics particular to the security. To the extent that valuation is based on models or inputs that are less observable or unobservablein the market, the determination of fair value requires more judgment. Accordingly, the degree of judgment exercised in determiningfair value is generally greatest for instruments categorized in Level 3. Due to the inherent uncertainty of valuation, the determination ofvalues may differ significantly from values that would have been realized had a ready market for investments existed, and the differencescould be material.
Transamerica Series Trust Page 3
Copyright © 2021 www.secdatabase.com. All Rights Reserved.Please Consider the Environment Before Printing This Document

NOTES TO SCHEDULES OF INVESTMENTS (continued)At March 31, 2019(unaudited)
4. SECURITY VALUATION (continued):
Fair value measurements: Descriptions of the valuation techniques applied to the Portfolios� significant categories of assets andliabilities measured at fair value on a recurring basis are as follows:
Contingent value rights (�CVR�): CVRs for which quotations are not readily available are valued at fair value as determined in goodfaith by the Valuation Committee under the supervision of the Board. CVRs are normally valued using a model that incorporates marketobservable data such as reported sales of similar securities, broker quotes, yields, bids, offers, and reference data relating to the issuer.Depending on the relative significance of observable valuation inputs, these investments may be classified in either Level 2 or Level 3 ofthe fair value hierarchy.
Equity securities: Securities are stated at the last reported sales price or closing price on the day of valuation taken from the primaryexchange where the security is principally traded. To the extent these securities are actively traded and valuation adjustments are notapplied, they are categorized in Level 1 of the fair value hierarchy. Equities traded on inactive markets or valued by reference to similarinstruments are generally categorized in Level 2 or Level 3 if inputs are unobservable.
Exchange-traded funds (�ETF�): ETFs are stated at the last reported sale price or closing price on the day of valuation taken from theprimary exchange where the ETF is principally traded. ETFs are generally categorized in Level 1 of the fair value hierarchy.
Foreign equity securities: Securities in which the primary trading market closes at the same time or after the NYSE, are valued based onquotations from the primary market in which they are traded and are categorized in Level 1. Because many foreign securities markets andexchanges close prior to the close of the NYSE, closing prices for foreign securities in those markets or on those exchanges do not reflectthe events that occur after that close. Certain foreign securities may be fair valued using a pricing service that considers the correlationof the trading patterns of the foreign security to the intraday trading in the U.S. markets for investments such as American DepositaryReceipts, financial futures, or ETFs and the movement of certain indices of securities based on a statistical analysis of their historicalrelationship; such valuations generally are categorized in Level 2.
Investment companies: Certain investment companies are valued at the NAV of the underlying Fund as the practical expedient. Theseinvestment companies are not included within the fair value hierarchy. Certain other investment companies are valued at the activelytraded NAV of the underlying portfolios and no valuation adjustments are applied. These investment companies are categorized in Level 1of the fair value hierarchy.
Securities lending collateral: Securities lending collateral is invested in a money market fund which is valued at the NAV and no valuationadjustments are applied. Securities lending collateral is categorized in Level 1 of the fair value hierarchy.
Asset-backed securities: The fair value of asset-backed securities is estimated based on models that consider the estimated cash flows ofeach tranche of the entity, establish a benchmark yield, and develop an estimated tranche specific spread to the benchmark yield basedon the unique attributes of the tranche. To the extent the inputs are observable and timely, the values would generally be categorized inLevel 2 of the fair value hierarchy; otherwise they would be categorized in Level 3.
Commercial paper: Commercial paper is valued using amortized cost, which approximates fair value. The values are generallycategorized in Level 2 of the fair value hierarchy, or Level 3 if inputs are unobservable.
Convertible bonds: The fair value of convertible bonds is estimated using various techniques, which consider recently executedtransactions in securities of the issuer or comparable issuers, broker price quotations (where observable), and models incorporatingbenchmark curves, underlying stock data, and foreign exchange rates. While most convertible bonds are categorized in Level 2 of the fairvalue hierarchy, in instances where lower relative weight is placed on transaction prices, quotations, or similar observable inputs, they arecategorized in Level 3.
Corporate debt securities: The fair value of corporate debt securities is estimated using various techniques, which consider recentlyexecuted transactions in securities of the issuer or comparable issuers, market price quotations (where observable), bond spreads,fundamental data relating to the issuer, and credit default swap spreads adjusted for any basis difference between cash and derivativeinstruments. While most corporate debt securities are categorized in Level 2 of the fair value hierarchy, in instances where lower relativeweight is placed on transaction prices, quotations, or similar observable inputs, they are categorized in Level 3.
Copyright © 2021 www.secdatabase.com. All Rights Reserved.Please Consider the Environment Before Printing This Document

Foreign government obligations: Foreign government obligations are normally valued using a model that incorporates market observabledata such as reported sales of similar securities, broker quotes, yields, bids, offers, and reference data. Certain securities are valued byprincipally using dealer quotations. Foreign government obligations generally are categorized in Level 2 of the fair value hierarchy, orLevel 3 if inputs are unobservable.
Loan assignments: Loan assignments are normally valued using an income approach, which projects future cash flows and converts thosefuture cash flows to a present value using a discount rate. The resulting present value reflects the likely fair value of the loan. To theextent the inputs are observable and timely, the values would generally be categorized in Level 2 of the fair value hierarchy; otherwiseare categorized in Level 3.
Mortgage-backed securities: The fair value of mortgage-backed securities is estimated based on models that consider issuer type, coupon,cash flows, mortgage prepayment projection tables and adjustable rate mortgage evaluations that incorporate index data, periodic lifecaps and the next coupon reset date. To the extent the inputs are observable and timely, the values would generally be categorized inLevel 2 of the fair value hierarchy; otherwise they are categorized in Level 3.
Transamerica Series Trust Page 4
Copyright © 2021 www.secdatabase.com. All Rights Reserved.Please Consider the Environment Before Printing This Document

NOTES TO SCHEDULES OF INVESTMENTS (continued)At March 31, 2019(unaudited)
4. SECURITY VALUATION (continued):
Municipal government obligations: The fair value of municipal government obligations and variable rate notes is estimated based onmodels that consider, among other factors, information received from market makers and broker-dealers, current trades, bid-want lists,offerings, market movements, the liquidity of the bond, state of issuance, benchmark yield curves, and bond or note insurance. To theextent the inputs are observable and timely, the values would generally be categorized in Level 2 of the fair value hierarchy; otherwisethey are categorized in Level 3.
Repurchase agreements: Repurchase agreements are valued at cost, which approximates fair value. To the extent the inputs are observableand timely, the values are generally categorized in Level 2 of the fair value hierarchy.
Short-term notes: The Portfolios normally value short-term government and U.S. government agency securities using a model thatincorporates market observable data such as reported sales of similar securities, broker quotes, yields, bids, offers and reference data.Certain securities are valued by principally using dealer quotations. Short-term government and U.S. government agency securitiesgenerally are categorized in Level 2 of the fair value hierarchy, or Level 3 if inputs are unobservable.
U.S. government agency obligations: U.S. government agency obligations are comprised of two main categories consisting of agencyissued debt and mortgage pass-throughs. Generally, agency issued debt securities are valued in a manner similar to U.S. governmentobligations. Mortgage pass-throughs include to be announced (�TBA�) securities and mortgage pass-through certificates. Generally, TBAsecurities and mortgage pass-throughs are valued using dealer quotations. Depending on market activity levels and whether quotations orother observable data are used, these securities are typically categorized in Level 2 of the fair value hierarchy; otherwise they would becategorized in Level 3.
U.S. government obligations: U.S. government obligations are normally valued using a model that incorporates market observable datasuch as reported sales of similar securities, broker quotes, yields, bids, offers, and reference data. Certain securities are valued byprincipally using dealer quotations. U.S. government obligations generally are categorized in Level 2 of the fair value hierarchy, orLevel 3 if inputs are unobservable.
Warrants: Warrants may be priced intrinsically using a model that incorporates the subscription or strike price, the daily market pricefor the underlying security, and a subscription ratio. If the inputs are unavailable, or if the subscription or strike price is higher than themarket price, then the warrants are priced at zero. Warrants are generally categorized in Level 2 of the fair value hierarchy, or Level 3 ifinputs are unobservable.
Restricted securities: Restricted securities for which quotations are not readily available are valued at fair value. Restricted securitiesissued by publicly traded companies are generally valued at a discount to similar publicly traded securities. Restricted securities issued bynonpublic entities may be valued by reference to comparable public entities and/or fundamental data relating to the issuer. Depending onthe relative significance of observable valuation inputs, these instruments may be classified in either Level 2 or Level 3 of the fair valuehierarchy.
Derivative instruments: Centrally cleared or listed derivatives that are actively traded are valued based on quoted prices from theexchange and are categorized in Level 1 of the fair value hierarchy. Over-the-counter (�OTC�) derivative contracts include forward,swap, swaption, and option contracts related to interest rates, foreign currencies, credit standing of reference entities, equity prices, orcommodity prices. Depending on the product and the terms of the transaction, the fair value of the OTC derivative products are modeledtaking into account the counterparties� creditworthiness and using a series of techniques, including simulation models. Many pricingmodels do not entail material subjectivity because the methodologies employed do not necessitate significant judgments and the pricinginputs are observed from actively quoted markets, as is the case of interest rate swap and option contracts. The majority of OTC derivativeproducts valued by the Portfolios using pricing models fall into this category and are categorized within Level 2 of the fair value hierarchyor Level 3 if inputs are unobservable.
5. SECURITIES AND OTHER INVESTMENTS
Contingent value rights: The Portfolios may invest in CVRs, which is a type of right given to investors of an acquired company (or acompany facing major restructuring) that ensures additional benefit if a specified event occurs. A CVR often has an expiration date thatrelates to the time the contingent event must occur. CVRs generally lack liquidity since most are non-transferable and a large number oflegal and other issues can arise when negotiating and implementing these instruments.
Copyright © 2021 www.secdatabase.com. All Rights Reserved.Please Consider the Environment Before Printing This Document

CVRs held at March 31, 2019, if any, are identified within the Schedule of Investments or Consolidated Schedule of Investments.
Loan participations and assignments: The Portfolios may invest in direct debt instruments which are interests in amounts owed tolenders or lending syndicates by corporate, governmental, or other borrowers, either in the form of participations at the time the loan isoriginated (�Participations�) or buying an interest in the loan in the secondary market from a financial institution or institutional investor(�Assignments�). Participations and Assignments in commercial loans may be secured or unsecured. These investments may includestandby financing commitments, including revolving credit facilities that obligate the Portfolios to supply additional cash to the borrowerson demand. Loan Participations and Assignments involve risks of insolvency of the lending banks or other financial intermediaries. Assuch, the Portfolios assume the credit risks associated with the corporate borrowers and may assume the credit risks associated with theinterposed banks or other financial intermediaries.
Transamerica Series Trust Page 5
Copyright © 2021 www.secdatabase.com. All Rights Reserved.Please Consider the Environment Before Printing This Document

NOTES TO SCHEDULES OF INVESTMENTS (continued)At March 31, 2019(unaudited)
5. SECURITIES AND OTHER INVESTMENTS (continued):
Each Portfolio, based on its ability to invest in Loan Participations and Assignments, may be contractually obligated to receive approvalfrom the agent banks and/or borrowers prior to the sale of these investments. The Portfolios that participate in such syndications, or thatcan buy a portion of the loans, become part lenders. Loans are often administered by agent banks acting as agents for all holders.
The agent banks administer the terms of the loans, as specified in the loan agreements. In addition, the agent banks are normallyresponsible for the collection of principal and interest payments from the corporate borrowers and the apportionment of these paymentsto the credit of all institutions that are parties to the loan agreements. Unless the Portfolios have direct recourse against the corporateborrowers under the terms of the loans or other indebtedness, the Portfolios may have to rely on the agent banks or other financialintermediaries to apply appropriate credit remedies against corporate borrowers.
The Portfolios held no unsecured loan participations at March 31, 2019. Open secured loan participations and assignments at March 31,2019, if any, are included within the Schedule of Investments or Consolidated Schedule of Investments.
Payment in-kind (��PIK��) securities: PIKs give the issuer the option of making interest payments in either cash or additional debtsecurities at each interest payment date. Those additional debt securities usually have the same terms, including maturity dates and interestrates, and associated risks as the original bonds.
PIKs held at March 31, 2019, if any, are identified within the Schedule of Investments or Consolidated Schedule of Investments.
Real estate investment trusts (��REIT��): REITs are pooled investment vehicles which invest primarily in income producing real estate,or real estate related loans or interests. Distributions received by REITs are classified at management�s estimate of the dividend income,return of capital and capital gains. Estimates are based on information available at year-end, which includes the previous fiscal year�sclassification. The actual amounts of dividend income, return of capital, and capital gains are only determined by each REIT after thefiscal year end and may differ from the estimated amounts. Upon notification from the REITs, some of the distributions received may bere-classified and recorded as a return of capital or capital gains. There are certain additional risks involved in investing in REITs. Theseinclude, but are not limited to, economic conditions, changes in zoning laws, real estate values, property taxes, and interest rates.
REITs held at March 31, 2019, if any, are identified within the Schedule of Investments or Consolidated Schedule of Investments.
Restricted securities: The Portfolios may invest in unregulated restricted securities. Restricted securities are subject to legal orcontractual restrictions on resale. Restricted securities generally may be resold in transactions exempt from registration under theSecurities Act of 1933.
Restricted securities held at March 31, 2019, if any, are identified within the Schedule of Investments or Consolidated Schedule ofInvestments.
Treasury inflation-protected securities (��TIPS��): Certain Portfolios may invest in TIPS, which are fixed income securities whoseprincipal value is periodically adjusted according to the rate of inflation/deflation. If the index measuring inflation/deflation rises or falls,the principal value of TIPS will be adjusted upward or downward, and consequently the interest payable on these securities (calculatedwith respect to a larger or smaller principal amount) will be increased or reduced, respectively. Repayment of the original bond principalupon maturity (as adjusted for inflation) is guaranteed in the case of U.S. Treasury inflation-indexed bonds and notes. For bonds andnotes that do not provide a similar guarantee, the adjusted principal value of the bond repaid at maturity may be less than the originalprincipal.
TIPS held at March 31, 2019, if any, are included within the Schedule of Investments or Consolidated Schedule of Investments.
When-issued, delayed-delivery, forward, and to be announced (��TBA��) commitment transactions: The Portfolios may purchaseor sell securities on a when-issued, delayed-delivery, forward and TBA commitment basis. When-issued and forward commitmenttransactions are made conditionally because a security, although authorized, has not yet been issued in the market. Settlement of suchtransactions normally occurs within a month or more after the purchase or sale commitment is made. The Portfolios engage in when-issued and forward commitment transactions to obtain an advantageous price and yield at the time of the transaction. The Portfoliosengage in when-issued and forward commitment transactions for the purpose of acquiring securities, but may enter into a separateagreement to sell the securities before the settlement date. Since the value of securities purchased may fluctuate prior to settlement, the
Copyright © 2021 www.secdatabase.com. All Rights Reserved.Please Consider the Environment Before Printing This Document

Portfolios may be required to pay more at settlement than the security is worth. In addition, the Portfolios are not entitled to any of theinterest earned prior to settlement.
Delayed-delivery transactions involve a commitment by the Portfolios to purchase or sell securities for a predetermined price or yield,with payment and delivery taking place beyond the customary settlement period. When delayed-delivery transactions are outstanding, thePortfolios will segregate with their custodian either cash, U.S. government securities, or other liquid assets at least equal to the value orpurchase commitments until payment is made. When purchasing a security on a delayed-delivery basis, the Portfolios assume the rightsand risks of ownership of the security, including the risk of price and yield fluctuations. These transactions also involve a risk to thePortfolios if the other party to the transaction defaults on its obligation to make payment or delivery, and the Portfolios are delayed orprevented from completing the transaction. The Portfolios may dispose of or renegotiate a delayed-delivery transaction after it is enteredinto, which may result in a realized gain or loss. When the Portfolios sell a security on a delayed-delivery basis, the Portfolios do notparticipate in future gains and losses on the security.
TBA commitments are entered into to purchase or sell securities for a fixed price at a future date, typically not to exceed 45 days. TBAsare considered securities in themselves, and involve a risk of loss if the value of the security to be purchased declines, or the value of thesecurity sold increases, prior to settlement date, in addition to the risk of decline in the value of the Portfolios� other assets. UnsettledTBA commitments are valued at the current value of the underlying securities.
Transamerica Series Trust Page 6
Copyright © 2021 www.secdatabase.com. All Rights Reserved.Please Consider the Environment Before Printing This Document

NOTES TO SCHEDULES OF INVESTMENTS (continued)At March 31, 2019(unaudited)
5. SECURITIES AND OTHER INVESTMENTS (continued):
When-issued, delayed-delivery, forward and TBA commitment transactions held at March 31, 2019, if any, are identified within theSchedule of Investments or Consolidated Schedule of Investments.
6. BORROWINGS AND OTHER FINANCING TRANSACTIONS
The Portfolios may engage in borrowing transactions as a means of raising cash to satisfy redemption requests, for other temporary oremergency purposes or, to the extent permitted by their investment policies, to raise additional cash to be invested in other securities orinstruments. When the Portfolios invest borrowing proceeds in other securities, the Portfolios will bear the risk that the market value ofthe securities in which such proceeds are invested goes down and is insufficient to repay the borrowed proceeds. The Portfolios mayborrow on a secured or on an unsecured basis. If the Portfolios enter into a secured borrowing arrangement, a portion of the Portfolios�assets will be used as collateral. The 1940 Act requires the Portfolios to maintain asset coverage of at least 300% of the amount of theirborrowings. Asset coverage means the ratio that the value of the Portfolios� total assets, minus liabilities other than borrowings, bearsto the aggregate amount of all borrowings. Although complying with this requirement has the effect of limiting the amount that thePortfolios may borrow, it does not otherwise mitigate the risks of entering into borrowing transactions.
Interfund lending: The Portfolio, along with other funds and portfolios advised by TAM, may participate in an interfund lendingprogram pursuant to exemptive relief granted by the Securities and Exchange Commission on January 18, 2017. This program allowsthe Portfolio to lend to and borrow from other funds and portfolios advised by TAM. Interfund lending transactions are subject to theconditions of the exemptive relief which place limits on the amount of lending or borrowing a Portfolio may participate in under theprogram. Interest earned or paid on an interfund lending transaction will be based on the average of certain current market rates. As ofMarch 31, 2019, the Portfolio has not utilized the program.
Repurchase agreements: In a repurchase agreement, the Portfolios purchase a security and simultaneously commit to resell that securityto the seller at an agreed-upon price on an agreed-upon date. Securities purchased subject to a repurchase agreement are held at thePortfolios� custodian, or designated sub-custodian related to tri-party repurchase agreements, and, pursuant to the terms of the repurchaseagreement, must be collateralized by securities with an aggregate market value greater than or equal to 100% of the resale price. ThePortfolios will bear the risk of value fluctuations until the securities can be sold and may encounter delays and incur costs in liquidatingthe securities. In the event of bankruptcy or insolvency of the seller, delays and costs may be incurred.
Repurchase agreements are subject to netting agreements, which are agreements between the Portfolios and their counterparties thatprovide for the net settlement of all transactions and collateral with the Portfolios, through a single payment, in the event of defaultor termination. Amounts presented within the Schedule of Investments or Consolidated Schedule of Investments are shown on a grossbasis. The value of the related collateral for each repurchase agreement, as reflected within the Schedule of Investments or ConsolidatedSchedule of Investments, exceeds the value of each repurchase agreement at March 31, 2019.
Repurchase agreements at March 31, 2019, if any, are included within the Schedule of Investments or Consolidated Schedule ofInvestments.
Reverse repurchase agreements: The Portfolios may enter into reverse repurchase agreements in which the Portfolios sell portfoliosecurities and agree to repurchase them from the buyer at a specified date and price. The Portfolios may utilize reverse repurchaseagreements when it is anticipated that the interest income to be earned from the investment of the proceeds of the transaction is greaterthan the interest expense of the transaction. Reverse repurchase agreements are considered to be a form of borrowing. Pursuant to theterms of the reverse repurchase agreements, the Portfolios� custodian must segregate assets with an aggregate market value greater thanor equal to 100% of the repurchase price. In periods of increased demand for the security, the Portfolios may receive a fee for use of thesecurity by the counterparty, which may result in interest income to the Portfolios. Reverse repurchase agreements involve leverage riskand also the risk that the market value of the securities that the Portfolios are obligated to repurchase under the agreement may declinebelow the repurchase price. The Portfolios are subject to the risk that the buyer under the agreement may file for bankruptcy, becomeinsolvent, or otherwise default on its obligations to the Portfolios. In the event of a default by the counterparty, there may be delays, costsand risks of loss involved in the Portfolios exercising their rights under the agreement, or those rights may be limited by other contractualagreements.
For the period ended March 31, 2019, the Portfolios� average borrowings are as follows. Funds not listed in the subsequent table do nothave any reverse repurchase agreements during the period.
Copyright © 2021 www.secdatabase.com. All Rights Reserved.Please Consider the Environment Before Printing This Document

Portfolio
AverageDaily
Borrowing
Numberof Days
Outstanding
WeightedAverage
Interest RatePIMCO Tactical � Balanced VP $ 117,260,223 90 2.60 %PIMCO Tactical � Conservative VP 101,761,070 90 2.59PIMCO Tactical � Growth VP 41,435,219 90 2.60PIMCO Total Return VP 275,024,277 90 2.61
Open reverse repurchase agreements at March 31, 2019, if any, are included within the Schedule of Investments or Consolidated Scheduleof Investments.
Transamerica Series Trust Page 7
Copyright © 2021 www.secdatabase.com. All Rights Reserved.Please Consider the Environment Before Printing This Document

NOTES TO SCHEDULES OF INVESTMENTS (continued)At March 31, 2019(unaudited)
6. BORROWINGS AND OTHER FINANCING TRANSACTIONS (continued):
Sale-buyback: The Portfolios may enter into sale-buyback financing transactions. The Portfolios account for sale-buyback financingtransactions as borrowing transactions and realize gains and losses on these transactions at the end of the roll period. Sale-buybackfinancing transactions involve sales by the Portfolios of securities and simultaneously contracts to repurchase the same or substantiallysimilar securities at an agreed upon price and date.
The Portfolios forgo principal and interest paid during the roll period on the securities sold in a sale-buyback financing transaction. ThePortfolios are compensated by the difference between the current sales price and the price for the future purchase (often referred to asthe �price drop�), as well as by any interest earned on the proceeds of the securities sold. Sale-buyback financing transactions may berenewed with a new sale and a repurchase price and a cash settlement made at each renewal without physical delivery of the securitiessubject to the contract. Sale-buyback financing transactions expose the Portfolios to risks such as, the buyer under the agreement may filefor bankruptcy, become insolvent, or otherwise default on its obligations to the Portfolios, the market value of the securities the Portfoliosare obligated to repurchase under the agreement may decline below the repurchase price. The Portfolios� obligations under a sale-buyback typically would be offset by liquid assets equal in value to the amount of the Portfolios� forward commitment to repurchase thesubject security. Sale-buyback financing transactions accounted for as borrowing transactions are excluded from the Portfolios� portfolioturnover rates.
For the period ended March 31, 2019, the Portfolios� average borrowings are as follows. Funds not listed in the subsequent table do nothave any sale-buybacks during the period.
Portfolio
AverageDaily
Borrowing
Numberof Days
Outstanding
WeightedAverage
Interest RatePIMCO Tactical � Balanced VP $ 7,790,078 83 2.38 %PIMCO Tactical � Conservative VP 5,649,192 84 2.40PIMCO Tactical � Growth VP 5,644,000 77 2.43PIMCO Total Return VP 1,506,595 13 1.69
Open sale-buyback financing transactions at March 31, 2019, if any, are identified within the Schedule of Investments or ConsolidatedSchedule of Investments.
Securities lending: Securities are lent to qualified financial institutions and brokers. State Street serves as securities lending agent to thePortfolios pursuant to a Securities Lending Agreement. The lending of securities exposes the Portfolios to risks such as, the borrowersmay fail to return the loaned securities, the borrowers may not be able to provide additional collateral, the Portfolios may experiencedelays in recovery of the loaned securities or delays in access to collateral, or the Funds may experience losses related to the investmentcollateral. To minimize certain risks, loan counterparties pledge cash collateral with a value of at least 102% of the current value of theloaned securities for securities traded on U.S. exchanges and a value of at least 105% for all other securities loaned. The lending agenthas agreed to indemnify the Funds in the case of default of any securities borrower.
Cash collateral received is invested in the State Street Navigator Securities Lending Trust � Government Money Market Portfolio, amoney market mutual fund registered under the 1940 Act.
The value of loaned securities and related collateral outstanding at March 31, 2019, if any, are shown on a gross basis within the Scheduleof Investments.
Short sales: A short sale is a transaction in which the Portfolios sell securities they do not own, but have borrowed, in anticipation ofa decline in the fair market value of the securities. The Portfolios are obligated to replace the borrowed securities at the market price atthe time of replacement. The Portfolios� obligation to replace the securities borrowed in connection with a short sale is fully secured bycollateral deposited with the custodian. In addition, the Portfolios consider the short sale to be a borrowing by the Portfolios that is subjectto the asset coverage requirements of the 1940 Act. Short sales represent an aggressive trading practice with a high risk/return potential,and short sales involve special considerations. Risks of short sales include that possible losses from short sales may be unlimited (e.g., ifthe price of stocks sold short rises), whereas losses from direct purchases of securities are limited to the total amount invested, and thePortfolios may be unable to replace borrowed securities sold short.
Copyright © 2021 www.secdatabase.com. All Rights Reserved.Please Consider the Environment Before Printing This Document

Open short sale transactions at March 31, 2019, if any, are included within the Schedule of Investments or Consolidated Schedule ofInvestments.
The following table reflects a breakdown of transactions accounted for as secured borrowings, the gross obligation by the type ofcollateral pledged, and the remaining contractual maturity of those transactions as of March 31, 2019. Portfolios not listed in thesubsequent table have not entered into secured borrowing transactions.
Transamerica Series Trust Page 8
Copyright © 2021 www.secdatabase.com. All Rights Reserved.Please Consider the Environment Before Printing This Document

NOTES TO SCHEDULES OF INVESTMENTS (continued)At March 31, 2019(unaudited)
6. BORROWINGS AND OTHER FINANCING TRANSACTIONS (continued):
Remaining Contractual Maturity of the AgreementsOvernight and
ContinuousLess Than
30 DaysBetween
30 & 90 DaysGreater Than
90 Days TotalAegon High Yield Bond VPSecurities Lending Transactions
Corporate Debt Securities $22,814,860 $ � $ � $ � $22,814,860Total Borrowings $ 22,814,860 $ �� $ �� $ �� $22,814,860BlackRock Global Allocation VPSecurities Lending Transactions
Common Stocks $21,373,785 $ � $ � $ � $ 21,373,785Corporate Debt Securities 2,303,224 � � � 2,303,224Short-Term U.S. Government
Obligations 8,317,742 � � � 8,317,742Total Securities Lending Transactions $31,994,751 $ � $ � $ � $31,994,751Total Borrowings $31,994,751 $ �� $ �� $ �� $31,994,751BlackRock Global Real Estate Securities VPSecurities Lending Transactions
Common Stocks $18,500,716 $ � $ � $ � $18,500,716Total Borrowings $18,500,716 $ �� $ �� $ �� $18,500,716BlackRock Smart Beta 40 VPSecurities Lending Transactions
Exchange-Traded Funds $15,460,358 $ � $ � $ � $15,460,358Total Borrowings $15,460,358 $ �� $ �� $ �� $15,460,358BlackRock Tactical Allocation VPSecurities Lending Transactions
Exchange-Traded Funds $48,700 $ � $ � $ � $48,700Total Borrowings $48,700 $ �� $ �� $ �� $48,700Greystone International Growth VPSecurities Lending Transactions
Common Stocks $13,528,820 $ � $ � $ � $13,528,820Total Borrowings $13,528,820 $ �� $ �� $ �� $13,528,820Janus Balanced VPSecurities Lending Transactions
Corporate Debt Securities $204,205 $ � $ � $ � $204,205Total Borrowings $204,205 $ �� $ �� $ �� $204,205Janus Mid-Cap Growth VPSecurities Lending Transactions
Common Stocks $22,263,802 $ � $ � $ � $22,263,802Total Borrowings $22,263,802 $ �� $ �� $ �� $22,263,802Jennison Growth VPSecurities Lending Transactions
Common Stocks $18,448,154 $ � $ � $ � $18,448,154Total Borrowings $18,448,154 $ �� $ �� $ �� $18,448,154JPMorgan Core Bond VPSecurities Lending Transactions
Corporate Debt Securities $3,540,272 $ � $ � $ � $3,540,272Foreign Government Obligations 497,975 � � � 497,975
Copyright © 2021 www.secdatabase.com. All Rights Reserved.Please Consider the Environment Before Printing This Document

U.S. Government Obligations 737,298 � � � 737,298Total Securities Lending Transactions $4,775,545 $ � $ � $ � $4,775,545Total Borrowings $4,775,545 $ �� $ �� $ �� $4,775,545
Transamerica Series Trust Page 9
Copyright © 2021 www.secdatabase.com. All Rights Reserved.Please Consider the Environment Before Printing This Document

NOTES TO SCHEDULES OF INVESTMENTS (continued)At March 31, 2019(unaudited)
6. BORROWINGS AND OTHER FINANCING TRANSACTIONS (continued):
Remaining Contractual Maturity of the AgreementsOvernight and
ContinuousLess Than
30 DaysBetween
30 & 90 DaysGreater Than
90 Days TotalJPMorgan Enhanced Index VPSecurities Lending Transactions
Common Stocks $2,284,741 $ � $ � $ � $2,284,741Total Borrowings $2,284,741 $ �� $ �� $ �� $2,284,741JPMorgan Mid Cap Value VPSecurities Lending Transactions
Common Stocks $1,307,897 $ � $ � $ � $1,307,897Total Borrowings $1,307,897 $ �� $ �� $ �� $1,307,897JPMorgan Tactical Allocation VPSecurities Lending Transactions
Corporate Debt Securities $2,205,292 $ � $ � $ � $2,205,292Foreign Government Obligations 82,973 � � � 82,973U.S. Government Obligations 1,173,776 � � � 1,173,776Common Stocks 4,985,076 � � � 4,985,076
Total Securities Lending Transactions $8,447,117 $ � $ � $ � $8,447,117Total Borrowings $8,447,117 $ �� $ �� $ �� $8,447,117Legg Mason Dynamic Allocation �� Balanced VPSecurities Lending Transactions
Exchange-Traded Funds $83,496,081 $ � $ � $ � $83,496,081Total Borrowings $83,496,081 $ �� $ �� $ �� $83,496,081Legg Mason Dynamic Allocation �� Growth VPSecurities Lending Transactions
Exchange-Traded Funds $18,189,258 $ � $ � $ � $18,189,258Total Borrowings $18,189,258 $ �� $ �� $ �� $18,189,258Managed Risk �� Balanced ETF VPSecurities Lending Transactions
Exchange-Traded Funds $9,479,664 $ � $ � $ � $9,479,664Total Borrowings $9,479,664 $ �� $ �� $ �� $9,479,664Managed Risk �� Conservative ETF VPSecurities Lending Transactions
Exchange-Traded Funds $455,800 $ � $ � $ � $455,800Total Borrowings $455,800 $ �� $ �� $ �� $455,800Managed Risk �� Growth ETF VPSecurities Lending Transactions
Exchange-Traded Funds $41,336,360 $ � $ � $ � $41,336,360Total Borrowings $ 41,336,360 $ �� $ �� $ �� $ 41,336,360Morgan Stanley Capital Growth VPSecurities Lending Transactions
Common Stocks $15,786,306 $ � $ � $ � $15,786,306Total Borrowings $15,786,306 $ �� $ �� $ �� $15,786,306Multi-Managed Balanced VPSecurities Lending Transactions
Common Stocks $2,661,640 $ � $ � $ � $2,661,640Corporate Debt Securities 8,476,794 � � � 8,476,794Foreign Government Obligations 630,784 � � � 630,784
Copyright © 2021 www.secdatabase.com. All Rights Reserved.Please Consider the Environment Before Printing This Document

Total Securities Lending Transactions $11,769,218 $ � $ � $ � $11,769,218Total Borrowings $11,769,218 $ �� $ �� $ �� $11,769,218
Transamerica Series Trust Page 10
Copyright © 2021 www.secdatabase.com. All Rights Reserved.Please Consider the Environment Before Printing This Document

NOTES TO SCHEDULES OF INVESTMENTS (continued)At March 31, 2019(unaudited)
6. BORROWINGS AND OTHER FINANCING TRANSACTIONS (continued):
Remaining Contractual Maturity of the AgreementsOvernight and
ContinuousLess Than
30 DaysBetween
30 & 90 DaysGreater Than
90 Days TotalPIMCO Tactical �� Balanced VPSecurities Lending Transactions
Corporate Debt Securities $3,232,310 $� $� $ � $3,232,310Foreign Government Obligations 535,925 � � � 535,925
Total Securities Lending Transactions $3,768,235 $� $� $ � $3,768,235Reverse Repurchase Agreements
U.S. Government Obligations $� $128,931,559 $48,798,250 $ � $177,729,809Cash 2,353,570 � � � 2,353,570
Total Reverse Repurchase Agreements $2,353,570 $128,931,559 $48,798,250 $ � $180,083,379Total Borrowings $6,121,805 $128,931,559 $48,798,250 $ �� $183,851,614PIMCO Tactical �� Conservative VPSecurities Lending Transactions
Corporate Debt Securities $2,019,600 $� $� $ � $2,019,600Reverse Repurchase Agreements
U.S. Government Obligations $� $78,784,196 $29,661,275 $ � $108,445,471Cash 568,577 � � � 568,577
Total Reverse Repurchase Agreements $568,577 $78,784,196 $29,661,275 $ � $109,014,048Total Borrowings $2,588,177 $78,784,196 $29,661,275 $ �� $111,033,648PIMCO Tactical �� Growth VPSecurities Lending Transactions
Corporate Debt Securities $4,243,993 $� $� $ � $4,243,993Reverse Repurchase Agreements
U.S. Government Obligations $� $49,977,030 $13,650,125 $ � $63,627,155Cash 344,167 � � � 344,167
Total Reverse Repurchase Agreements $344,167 $49,977,030 $13,650,125 $ � $63,971,322Total Borrowings $4,588,160 $49,977,030 $13,650,125 $ �� $68,215,315PIMCO Total Return VPSecurities Lending Transactions
Corporate Debt Securities $22,855,760 $� $� $ � $22,855,760Reverse Repurchase Agreements
U.S. Government Obligations $� $254,131,931 $39,740,625 $ � $293,872,556Cash 2,965,945 � � � 2,965,945
Total Reverse Repurchase Agreements $2,965,945 $254,131,931 $39,740,625 $ � $296,838,501Sale Buy-back Transactions
U.S. Government Obligations $14,707,920 $� $� $ � $14,707,920Total Borrowings $40,529,625 $ 254,131,931 $ 39,740,625 $ �� $ 334,402,181PineBridge Inflation Opportunities VPSecurities Lending Transactions
Corporate Debt Securities $1,662,263 $� $� $ � $1,662,263Total Borrowings $1,662,263 $�� $�� $ �� $1,662,263QS Investors Active Asset Allocation �� Conservative VPSecurities Lending Transactions
Exchange-Traded Funds $51,136,600 $� $� $ � $51,136,600Total Borrowings $ 51,136,600 $�� $�� $ �� $51,136,600
Copyright © 2021 www.secdatabase.com. All Rights Reserved.Please Consider the Environment Before Printing This Document

Transamerica Series Trust Page 11
Copyright © 2021 www.secdatabase.com. All Rights Reserved.Please Consider the Environment Before Printing This Document

NOTES TO SCHEDULES OF INVESTMENTS (continued)At March 31, 2019(unaudited)
6. BORROWINGS AND OTHER FINANCING TRANSACTIONS (continued):
Remaining Contractual Maturity of the AgreementsOvernight and
ContinuousLess Than
30 DaysBetween
30 & 90 DaysGreater Than
90 Days TotalQS Investors Active Asset Allocation �� Moderate Growth VPSecurities Lending Transactions
Exchange-Traded Funds $82,209,951 $ � $ � $ � $82,209,951Total Borrowings $82,209,951 $ �� $ �� $ �� $82,209,951QS Investors Active Asset Allocation �� Moderate VPSecurities Lending Transactions
Exchange-Traded Funds $172,004,911 $ � $ � $ � $172,004,911Total Borrowings $ 172,004,911 $ �� $ �� $ �� $ 172,004,911Small/Mid Cap Value VPSecurities Lending Transactions
Common Stocks $11,555,481 $ � $ � $ � $11,555,481Total Borrowings $11,555,481 $ �� $ �� $ �� $11,555,481T. Rowe Price Small Cap VPSecurities Lending Transactions
Common Stocks $27,228,863 $ � $ � $ � $27,228,863Total Borrowings $27,228,863 $ �� $ �� $ �� $27,228,863Torray Concentrated Growth VPSecurities Lending Transactions
Common Stocks $927,730 $ � $ � $ � $927,730Total Borrowings $927,730 $ �� $ �� $ �� $927,730TS&W International Equity VPSecurities Lending Transactions
Common Stocks $6,993,435 $ � $ � $ � $6,993,435Total Borrowings $6,993,435 $ �� $ �� $ �� $6,993,435WMC US Growth II VPSecurities Lending Transactions
Common Stocks $75,599 $ � $ � $ � $75,599Total Borrowings $75,599 $ �� $ �� $ �� $75,599WMC US Growth VPSecurities Lending Transactions
Common Stocks $1,521,666 $ � $ � $ � $1,521,666Total Borrowings $1,521,666 $ �� $ �� $ �� $1,521,666
7. RISK EXPOSURES AND THE USE OF DERIVATIVE INSTRUMENTS
The Portfolios� investment objectives allow the Portfolios to use various types of derivative contracts, including option contracts, swapagreements, futures contracts, and forward foreign currency contracts. Derivatives are investments whose value is primarily derived fromunderlying assets, indices or reference rates and may be transacted on an exchange or OTC.
Market Risk Factors: In pursuit of the Portfolios� investment objectives, the Portfolios may seek to use derivatives to increase ordecrease exposure to certain market risks, including:
Interest rate risk: Interest rate risk relates to the fluctuations in the value of fixed income securities due to changes in the prevailing levelsof market interest rates.
Foreign exchange rate risk: Foreign exchange rate risk relates to fluctuations in the value of an asset or liability due to changes in thecurrency exchange rates.
Copyright © 2021 www.secdatabase.com. All Rights Reserved.Please Consider the Environment Before Printing This Document

Equity risk: Equity risk relates to the change in value of equity securities as they relate to increases or decreases in the general market.
Credit risk: Credit risk relates to the ability of the issuer of a financial instrument to make further principal or interest payments on anobligation or commitment that it has to the Portfolios.
Transamerica Series Trust Page 12
Copyright © 2021 www.secdatabase.com. All Rights Reserved.Please Consider the Environment Before Printing This Document

NOTES TO SCHEDULES OF INVESTMENTS (continued)At March 31, 2019(unaudited)
7. RISK EXPOSURES AND THE USE OF DERIVATIVE INSTRUMENTS (continued):
Commodity risk: Commodity risk relates to the change in value of commodities or commodity indices as they relate to increases ordecreases in the commodities market. Commodities are physical assets that have tangible properties. Examples of these types of assetsare crude oil, heating oil, metals, livestock, and agricultural products.
The Portfolios are also exposed to additional risks from investing in derivatives, such as liquidity and counterparty credit risk. Liquidityrisk is the risk that the Portfolios will be unable to sell or close out the derivative in the open market in a timely manner. Counterpartycredit risk is the risk that the counterparty will not be able to fulfill its obligations to the Portfolios. Investing in derivatives may alsoinvolve greater risks than investing directly in the underlying assets, such as losses in excess of any initial investment and collateralreceived. In addition, there may be the risk that the change in value of the derivative contract does not correspond to the change in valueof the underlying instrument.
The Portfolios� exposure to market risk factors and certain other associated risks are summarized by derivative type as follows:
Option contracts: The Portfolios are subject to equity risk, interest rate risk, and foreign exchange rate risk in the normal course ofpursuing their investment objectives. The Portfolios may enter into option contracts to manage exposure to various market fluctuations.The Portfolios may purchase or write call and put options on securities and derivative instruments in which each Portfolio owns or mayinvest. Options are valued at the average of the bid and ask price established each day at the close of the board of trade or exchange onwhich they are traded. Options are marked-to-market daily to reflect the current value of the option. The primary risks associated withoptions are an imperfect correlation between the change in value of the securities held and the prices of the option contracts, the possibilityof an illiquid market, and an inability of the counterparty to meet the contract terms. Options can be traded through an exchange orthrough privately negotiated arrangements with a dealer in an OTC transaction. Options traded on an exchange are generally clearedthrough a clearinghouse such as the Options Clearing Corp.
Options on exchange-traded funds and/or securities: The Portfolios may purchase or write options on ETFs and/or securities. Purchasingor writing options on ETFs and/or securities gives the Portfolios the right, but not the obligation to buy or sell a specified ETF and/orsecurity as an underlying instrument for the option contract.
Options on foreign currency: The Portfolios may purchase or write foreign currency options. Purchasing or writing options on foreigncurrency gives the Portfolios the right, but not the obligation to buy or sell the currency and will specify the amount of currency and arate of exchange that may be exercised by a specified date.
Options on futures: The Portfolios may purchase or write options on futures. Purchasing or writing options on futures gives the Portfoliosthe right, but not obligation to buy or sell a position on a futures contract at the specified option exercise price at any time during theperiod of the option.
Options on indices: The Portfolios may purchase or write options on indices. Purchasing or writing an option on indices gives thePortfolios the right, but not the obligation to buy or sell the cash from the underlying index. The exercise of the option will result in acash transfer and gain or loss depends on the change in the underlying index.
Interest rate swaptions: The Portfolios may purchase or write interest rate swaption agreements which are options to enter into apre-defined swap agreement by some specific date in the future. The writer of the swaption becomes the counterparty to the swap if thebuyer exercises. The interest rate swaption agreement will specify whether the buyer of the swaption will be a fixed-rate receiver or afixed-rate payer upon exercise.
Purchased options: Purchasing call options tends to increase exposure to the underlying instrument. Purchasing put options tends todecrease exposure to the underlying instrument. The Portfolios pay premiums, which are treated as an investment and subsequentlymarked-to-market to reflect the current value of the option. The risk associated with purchasing put and call options is limited to thepremium paid. Premiums paid from options which expire are treated as realized losses. Premiums paid for purchasing options which areexercised or closed are added to the amounts paid or offset against the proceeds on the underlying instrument to determine the realizedgain or loss.
Written options: Writing call options tends to decrease exposure to the underlying instrument. Writing put options tends to increaseexposure to the underlying instrument. When the Portfolios write a covered call or put option, the premium received is marked-to-marketto reflect the current market value of the option written. Premiums received from written options which expire unexercised are treated as
Copyright © 2021 www.secdatabase.com. All Rights Reserved.Please Consider the Environment Before Printing This Document

realized gains. Premiums received from writing options which are exercised or closed are added to the proceeds or offset against amountspaid on the underlying instrument to determine the realized gain or loss. In writing an option, the Portfolios bear the market risk of anunfavorable change in the price of the security or currency underlying the written option. Exercise of an option written by the Portfolioscould result in the Portfolios selling or buying a security or currency at a price different from the current market value.
Open option contracts at March 31, 2019, if any, are included within the Schedule of Investments or Consolidated Schedule ofInvestments.
Swap agreements: Swap agreements are bilaterally negotiated agreements between the Portfolios and a counterparty to exchange orswap investments, cash flows, assets, foreign currencies, or market-linked returns at specified, future intervals. Swap agreements can beexecuted in a bilateral privately negotiated arrangement with a dealer in an OTC transaction or executed on a regular market. Certainswaps regardless of the venue of execution are required to be cleared through a clearinghouse (�centrally cleared swap agreements�).Centrally cleared swap agreements listed or traded on a multilateral platform, are valued at the daily settlement price determined by thecorresponding exchange. For
Transamerica Series Trust Page 13
Copyright © 2021 www.secdatabase.com. All Rights Reserved.Please Consider the Environment Before Printing This Document

NOTES TO SCHEDULES OF INVESTMENTS (continued)At March 31, 2019(unaudited)
7. RISK EXPOSURES AND THE USE OF DERIVATIVE INSTRUMENTS (continued):
centrally cleared credit default swap agreements the clearing exchange requires all members to provide applicable levels across completeterm levels. Centrally cleared interest rate swap agreements are valued using a pricing model that references the underlying rates includingbut not limited to the overnight index swap rate and London Interbank Offered Rate (�LIBOR�) forward rate to calculate the dailysettlement price. The Portfolios may enter into credit default, cross-currency, interest rate, total return, including contracts for difference(�CFD�), and other forms of swap agreements to manage exposure to credit, currency, interest rate, and commodity risks. In connectionwith these agreements, securities or cash may be identified as collateral or margin in accordance with the terms of the respective swapagreements to provide assets of value and recourse in the event of default or bankruptcy/insolvency. Centrally cleared swap agreementsare marked-to-market daily based upon values from third party vendors, which may include a registered exchange, or quotations frommarket makers to the extent available.
Credit default swap agreements: The Portfolios are subject to credit risk in the normal course of pursuing their investment objectives.The Portfolios enter into credit default swap agreements to manage their exposure to the market or certain sectors of the market to reducetheir risk exposure to defaults of corporate and sovereign issuers, or to create exposure to corporate or sovereign issuers to which theyare not otherwise exposed. Credit default swap agreements involve the exchange of a fixed rate premium for protection against the lossin value of an underlying security in the event of a defined credit event, such as payment default or bankruptcy (buy protection).
Under a credit default swap agreement, one party acts as a guarantor by receiving the fixed periodic payment in exchange for thecommitment to purchase the underlying security at par if the defined credit event occurs (sell protection). The Portfolios� maximum riskof loss from counterparty risk, either as the protection seller or as the protection buyer, is the notional amount of the contract. This risk ismitigated by having a master netting arrangement between the Portfolios and the counterparty, and by the posting of collateral.
Certain Portfolios sell credit default swap agreements, which exposes them to risk of loss from credit risk related events specifiedin the contracts. Although contract-specific, credit events are generally defined as bankruptcy, failure to pay, restructuring, obligationacceleration, obligation default, or repudiation/moratorium. If a defined credit event had occurred during the period, the swapagreements� credit-risk-related contingent features would have been triggered, and the Portfolios would have been required to paythe notional amounts for the credit default swap agreements with a sell protection less the value of the contracts� related referenceobligations.
Cross-currency swap agreements: The Portfolios are subject to foreign currency exchange rate risk in the normal course of pursuing theirinvestment objectives. The Portfolios enter into cross-currency swap agreements to gain or reduce exposure to foreign currencies or tohedge against foreign currency exchange rate and/or interest rate risk. Cross-currency swap agreements are interest rate swap agreementsin which two parties agree to exchange cash flows based on the notional amounts of two different currencies. The Portfolios with crosscurrency swap agreements can elect to pay a fixed rate and receive a floating rate, or, receive a fixed rate and pay a floating rate onthe notional amounts of two different currencies. The notional amounts are typically determined based on the spot exchange rates at theinception of the trade. Cross-currency swap agreements can also involve an exchange of notional amounts at the start, during and/or atexpiration of the contract, either at the current spot rate or another specified rate.
Interest rate swap agreements: The Portfolios are subject to interest rate risk exposure in the normal course of pursuing their investmentobjectives. Because the Portfolios hold fixed rate bonds, the value of these bonds may decrease if interest rates rise. To help hedge againstthis risk, the Portfolios enter into interest rate swap agreements. Under an interest rate swap agreement, two parties will exchange cashflows based on a notional principal amount. Portfolios with interest rate agreements can elect to pay a fixed rate and receive a floatingrate, or receive a fixed rate and pay a floating rate, on a notional principal amount. The risks of interest rate swap agreements includechanges in market conditions which will affect the value of the contract or the cash flows, and the possible inability of the counterpartyto fulfill its obligations under the agreement. The Portfolios� maximum risk of loss from counterparty credit risk is the discounted netvalue of the cash flows to be received from/paid to the counterparties over the contracts� remaining lives, to the extent that amount ispositive. This risk is mitigated by having a master netting arrangement between the Portfolios and the counterparty, and by the posting ofcollateral.
Total return swap agreements: The Portfolios are subject to commodity risk, equity risk, and other risks related to the underlyinginvestments of the swap agreement, including CFDs, in the normal course of pursuing their investment objectives. The value of thecommodity-linked investments held by the Portfolios can be affected by a variety of factors, including, but not limited to, overall marketmovements and other factors affecting the value of particular industries or commodities, such as weather, disease, embargoes, acts ofwar or terrorism, or political and regulatory developments. Commodity-linked derivatives are available from a relatively small numberof issuers, subjecting a Portfolio�s investments in commodity-linked derivatives to counterparty risk, which is the risk that the issuer
Copyright © 2021 www.secdatabase.com. All Rights Reserved.Please Consider the Environment Before Printing This Document

of the commodity-linked derivative will not fulfill its contractual obligations. Total return swap agreements on commodities involvecommitments whereby cash flows are exchanged based on the price of a commodity in exchange for either a fixed or floating price orrate. One party would receive payments based on the market value of the commodity involved and pay a fixed amount. Total return swapagreements on indices involve commitments to pay interest in exchange for a market-linked return. One counterparty pays out the totalreturn of a specific reference entity, which may be an equity, index, or bond, and in return receives a regular stream of payments.
Open OTC and centrally cleared swap agreements at March 31, 2019, if any, are listed within the Schedule of Investments or ConsolidatedSchedule of Investments.
Futures contracts: The Portfolios are subject to equity and commodity risk, interest rate risk, and foreign exchange rate risk in thenormal course of pursuing their investment objectives. The Portfolios use futures contracts to gain exposure to, or hedge against, changesin the value of equities and commodities, interest rates, or foreign currencies. A futures contract represents a commitment for the futurepurchase or sale of an asset at a specified price on a specified date. Upon entering into such contracts, the Portfolios are required todeposit with the broker, either in cash or in securities, an initial margin in an amount equal to a certain percentage of the contract amount.Subsequent payments (variation margin) are paid or received by the Portfolios, depending on the daily fluctuations in the value of thecontract, and are recorded for financial
Transamerica Series Trust Page 14
Copyright © 2021 www.secdatabase.com. All Rights Reserved.Please Consider the Environment Before Printing This Document

NOTES TO SCHEDULES OF INVESTMENTS (continued)At March 31, 2019(unaudited)
7. RISK EXPOSURES AND THE USE OF DERIVATIVE INSTRUMENTS (continued):
statement purposes as unrealized gains or losses by the Portfolios. Upon entering into such contracts, the Portfolios bear the risk ofequity and commodity prices, interest rates, or exchange rates moving unexpectedly, in which case, the Portfolios may not achieve theanticipated benefits of the futures contracts and may realize losses. With futures, there is minimal counterparty credit risk to the Portfoliossince futures are exchange-traded and the exchange�s clearinghouse, as counterparty to all exchange-traded futures, guarantees thefutures against default. Futures contracts are generally entered into on a regulated futures exchange and cleared through a clearinghouseassociated with the exchange.
Open futures contracts at March 31, 2019, if any, are listed within the Schedule of Investments or Consolidated Schedule of Investments.
Forward foreign currency contracts: The Portfolios are subject to foreign exchange rate risk exposure in the normal course of pursuingtheir investment objectives. The Portfolios may enter into forward foreign currency contracts to hedge against exchange rate risk arisingfrom investments in securities denominated in foreign currencies. Forward foreign currency contracts are marked-to-market daily, withthe change in value recorded as an unrealized gain or loss. When the contracts are settled, a realized gain or loss is incurred. Risks mayarise from changes in market value of the underlying currencies and from the possible inability of counterparties to meet the terms oftheir contracts. Forward foreign currency contracts are traded in the OTC inter-bank currency dealer market.
Open forward foreign currency contracts at March 31, 2019, if any, are listed within the Schedule of Investments or ConsolidatedSchedule of Investments.
8. RISK FACTORS
Investing in the Portfolios involves certain key risks related to the Portfolios� trading activity. Please reference the Portfolios�prospectuses for a more complete discussion of the following risk(s), as well as other risks of investing in the Portfolios.
Emerging market risk: Investments in the securities of issuers located in or principally doing business in emerging markets are subjectto heightened foreign investments risks. Emerging market countries tend to have economic, political and legal systems and regulatoryand accounting standards that are less fully developed and that can be expected to be less stable. Emerging market securities are oftenparticularly sensitive to market movements because their market prices tend to reflect speculative expectations. Low trading volumesmay result in a lack of liquidity and in extreme price volatility.
Fixed income risk: The value of fixed income securities may go up or down, sometimes rapidly and unpredictably, due to generalmarket conditions, such as real or perceived adverse economic or political conditions, inflation, changes in interest rates, lack of liquidityin the bond markets or adverse investor sentiment. In addition, the value of a fixed income security may decline if the issuer or otherobligor of the security fails to pay principal and/or interest, otherwise defaults or has its credit rating downgraded or is perceived to beless creditworthy, or the credit quality or value of any underlying assets declines. If the value of fixed-income securities owned by thePortfolio fall, the value of your investment will go down. The value of your investment will generally go down when interest rates rise.Interest rates have been at historically low levels in the U.S., so the Portfolio faces a heightened risk that interest rates may rise. A generalrise in interest rates may cause investors to move out of fixed-income securities on a large scale, which could adversely affect the priceand liquidity of fixed-income securities. A rise in rates tends to have a greater impact on the prices of longer term or duration securities.
Foreign investment risk: Investing in securities of foreign issuers or issuers with significant exposure to foreign markets involvesadditional risk. Foreign countries in which the Portfolio may invest may have markets that are less liquid, less regulated, less transparentand more volatile than U.S. markets. The value of the Portfolio�s investments may decline because of factors affecting the particularissuer as well as foreign markets and issuers generally, such as unfavorable or unsuccessful government actions, reduction of governmentor central bank support, political or financial instability or other adverse economic or political developments. Lack of information andweaker accounting standards also may affect the value of these securities.
Growth risk: Returns on growth stocks may not move in tandem with returns on other categories of stocks or the market as a whole.Growth stocks typically are particularly sensitive to market movements because their market prices tend to reflect future expectations.When it appears those expectations may not be met, the prices of growth securities typically fall. Growth stocks as a group may be out offavor and underperform the overall equity market for a long period of time, for example, while the market favors �value� stocks.
High-yield debt risk: High-yield debt securities, commonly referred to as �junk� bonds, are securities that are rated below �investmentgrade� or, if unrated, determined to be below investment grade by the sub-adviser. Changes in interest rates, the market�s perception
Copyright © 2021 www.secdatabase.com. All Rights Reserved.Please Consider the Environment Before Printing This Document

of the issuers, the creditworthiness of the issuers and negative perceptions of the junk bond market generally may significantly affectthe value of these bonds. Junk bonds are considered speculative, have a higher risk of default, tend to be less liquid and may be moredifficult to value than higher grade securities. Junk bonds tend to be volatile and more susceptible to adverse events, credit downgradesand negative sentiments.
Real estate investment trusts (��REIT��) and real estate risk: Investments in the real estate industry are subject to risks associated withdirect investment in real estate. These risks include declines in the value of real estate, adverse general and local economic conditions,increased competition, overbuilding and changes in operating expenses, property taxes or interest rates. A REIT�s performance dependson the types and locations of the properties it owns, how well it manages those properties and cash flow. REITs may have lower tradingvolumes and may be subject to more abrupt or erratic price movements than the overall securities markets. In addition to its ownexpenses, a Portfolio will indirectly bear its proportionate share of any management and other expenses paid by REITs in which it invests.U.S. REITs are subject to a number of highly technical tax-related rules and requirements; and a U.S. REIT�s failure to qualify forthe favorable U.S. federal income tax treatment generally available to U.S. REITs could result in corporate-level taxation, significantlyreducing the return on an investment to the Portfolio.
Transamerica Series Trust Page 15
Copyright © 2021 www.secdatabase.com. All Rights Reserved.Please Consider the Environment Before Printing This Document

NOTES TO SCHEDULES OF INVESTMENTS (continued)At March 31, 2019(unaudited)
8. RISK FACTORS (continued):
Small and medium capitalization risk: Small or medium capitalization companies may be more at risk than large capitalizationcompanies because, among other things, they may have limited product lines, operating history, market or financial resources, or becausethey may depend on a limited management group. The prices of securities of small and medium capitalization companies generallyare more volatile than those of large capitalization companies and are more likely to be adversely affected than large capitalizationcompanies by changes in earnings results and investor expectations or poor economic or market conditions. Securities of small andmedium capitalization companies may underperform large capitalization companies, may be harder to sell at times and at prices theportfolio managers believe appropriate and may offer greater potential for losses.
9. CHANGE IN ACCOUNTING PRINCIPLE
In March 2017, the Financial Accounting Standards Board (�FASB�) issued Accounting Standards Update No. 2017-08 (�ASU2017-08�), �Receivables � Nonrefundable Fees and Other Costs (Subtopic 310-20), Premium Amortization on Purchased Callable DebtSecurities�. ASU 2017-08 amends the amortization period for certain purchased callable debt securities held at a premium, shorteningsuch period to the earliest call date. Corresponding reclassifications has been made as a decrease to Total Investments at Cost within theSchedule of Investments and an increase in unrealized appreciation (depreciation). These reclassifications had no effect on the net assetsresulting from operations.
10. NEW ACCOUNTING PRONOUNCEMENT
In August 2018, FASB issued Accounting Standards Update No. 2018-13 (�ASU 2018-13�), �Fair Value Measurement (Topic 820:Disclosure Framework), Changes to the Disclosure Requirements for Fair Value Measurement�. ASU 2018-13 eliminates the requirementto disclose the amount of and reasons for transfers between Level 1 and Level 2 of the fair value hierarchy, the timing of transfersbetween levels of the fair value hierarchy and the valuation processes for Level 3 fair value measurements. ASU 2018-13 does noteliminate the requirement to disclose the range and weighted average used to develop significant unobservable inputs for Level 3 fairvalue measurements, or the reporting of changes in unrealized gains and losses for recurring Level 3 fair value measurements. ASU2018-13 requires that information is provided about the measurement uncertainty of Level 3 fair value measurements as of the reportingdate. The amendment is effective for fiscal years, and interim periods within those fiscal years, beginning after December 15, 2019.Management has evaluated and early adopted the disclosure requirements and the impact is reflected within the Portfolios� financialstatements.
Transamerica Series Trust Page 16
Copyright © 2021 www.secdatabase.com. All Rights Reserved.Please Consider the Environment Before Printing This Document