Columbia Funds Variable Series Trust II Form NPORT-P/A Filed ...
147
Business Address 225 FRANKLIN STREET BOSTON MA 02110 800-345-6611 Mailing Address 50606 AMERIPRISE FINANCIAL CENTER MINNEAPOLIS MN 55474 SECURITIES AND EXCHANGE COMMISSION FORM NPORT-P/A [amend] Filing Date: 2021-05-25 | Period of Report: 2021-03-31 SEC Accession No. 0001145549-21-029478 (HTML Version on secdatabase.com) FILER Columbia Funds Variable Series Trust II CIK:1413032| IRS No.: 000000000 | State of Incorp.:MA | Fiscal Year End: 1231 Type: NPORT-P/A | Act: 40 | File No.: 811-22127 | Film No.: 21959301 Copyright © 2021 www.secdatabase.com . All Rights Reserved. Please Consider the Environment Before Printing This Document
-
Upload
khangminh22 -
Category
Documents
-
view
1 -
download
0
Transcript of Columbia Funds Variable Series Trust II Form NPORT-P/A Filed ...
Business Address225 FRANKLIN STREETBOSTON MA 02110800-345-6611
Mailing Address50606 AMERIPRISEFINANCIAL CENTERMINNEAPOLIS MN 55474
SECURITIES AND EXCHANGE COMMISSION
FORM NPORT-P/A[amend]
Filing Date: 2021-05-25 | Period of Report: 2021-03-31SEC Accession No. 0001145549-21-029478
(HTML Version on secdatabase.com)
FILERColumbia Funds Variable Series Trust IICIK:1413032| IRS No.: 000000000 | State of Incorp.:MA | Fiscal Year End: 1231Type: NPORT-P/A | Act: 40 | File No.: 811-22127 | Film No.: 21959301
Copyright © 2021 www.secdatabase.com. All Rights Reserved.Please Consider the Environment Before Printing This Document
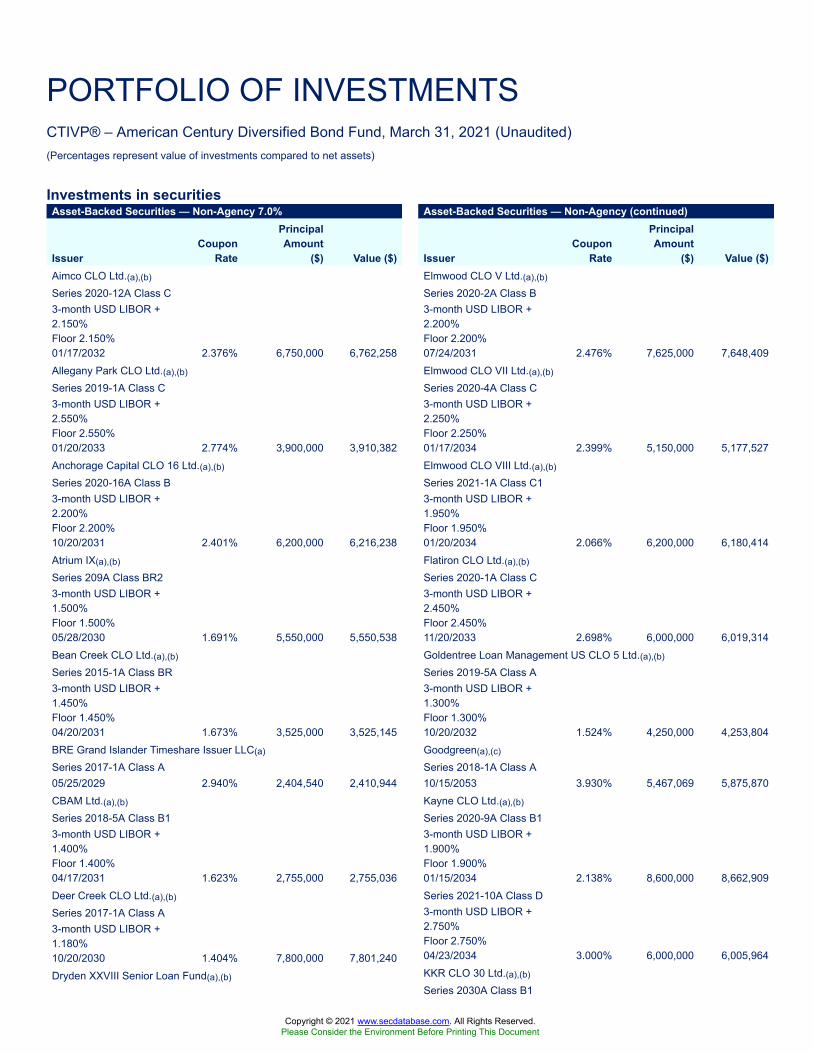
PORTFOLIO OF INVESTMENTSCTIVP® – American Century Diversified Bond Fund, March 31, 2021 (Unaudited)(Percentages represent value of investments compared to net assets)
Investments in securitiesAsset-Backed Securities — Non-Agency 7.0%
IssuerCoupon
Rate
PrincipalAmount
($) Value ($)Aimco CLO Ltd.(a),(b)
Series 2020-12A Class C3-month USD LIBOR +2.150%Floor 2.150%01/17/2032 2.376% 6,750,000 6,762,258Allegany Park CLO Ltd.(a),(b)
Series 2019-1A Class C3-month USD LIBOR +2.550%Floor 2.550%01/20/2033 2.774% 3,900,000 3,910,382Anchorage Capital CLO 16 Ltd.(a),(b)
Series 2020-16A Class B3-month USD LIBOR +2.200%Floor 2.200%10/20/2031 2.401% 6,200,000 6,216,238Atrium IX(a),(b)
Series 209A Class BR23-month USD LIBOR +1.500%Floor 1.500%05/28/2030 1.691% 5,550,000 5,550,538Bean Creek CLO Ltd.(a),(b)
Series 2015-1A Class BR3-month USD LIBOR +1.450%Floor 1.450%04/20/2031 1.673% 3,525,000 3,525,145BRE Grand Islander Timeshare Issuer LLC(a)
Series 2017-1A Class A05/25/2029 2.940% 2,404,540 2,410,944CBAM Ltd.(a),(b)
Series 2018-5A Class B13-month USD LIBOR +1.400%Floor 1.400%04/17/2031 1.623% 2,755,000 2,755,036Deer Creek CLO Ltd.(a),(b)
Series 2017-1A Class A3-month USD LIBOR +1.180%10/20/2030 1.404% 7,800,000 7,801,240Dryden XXVIII Senior Loan Fund(a),(b)
Asset-Backed Securities — Non-Agency (continued)
IssuerCoupon
Rate
PrincipalAmount
($) Value ($)Elmwood CLO V Ltd.(a),(b)
Series 2020-2A Class B3-month USD LIBOR +2.200%Floor 2.200%07/24/2031 2.476% 7,625,000 7,648,409Elmwood CLO VII Ltd.(a),(b)
Series 2020-4A Class C3-month USD LIBOR +2.250%Floor 2.250%01/17/2034 2.399% 5,150,000 5,177,527Elmwood CLO VIII Ltd.(a),(b)
Series 2021-1A Class C13-month USD LIBOR +1.950%Floor 1.950%01/20/2034 2.066% 6,200,000 6,180,414Flatiron CLO Ltd.(a),(b)
Series 2020-1A Class C3-month USD LIBOR +2.450%Floor 2.450%11/20/2033 2.698% 6,000,000 6,019,314Goldentree Loan Management US CLO 5 Ltd.(a),(b)
Series 2019-5A Class A3-month USD LIBOR +1.300%Floor 1.300%10/20/2032 1.524% 4,250,000 4,253,804Goodgreen(a),(c)
Series 2018-1A Class A10/15/2053 3.930% 5,467,069 5,875,870Kayne CLO Ltd.(a),(b)
Series 2020-9A Class B13-month USD LIBOR +1.900%Floor 1.900%01/15/2034 2.138% 8,600,000 8,662,909Series 2021-10A Class D3-month USD LIBOR +2.750%Floor 2.750%04/23/2034 3.000% 6,000,000 6,005,964KKR CLO 30 Ltd.(a),(b)
Series 2030A Class B1
Copyright © 2021 www.secdatabase.com. All Rights Reserved.Please Consider the Environment Before Printing This Document
CTIVP® – American Century Diversified Bond Fund | Quarterly Report 2021 1
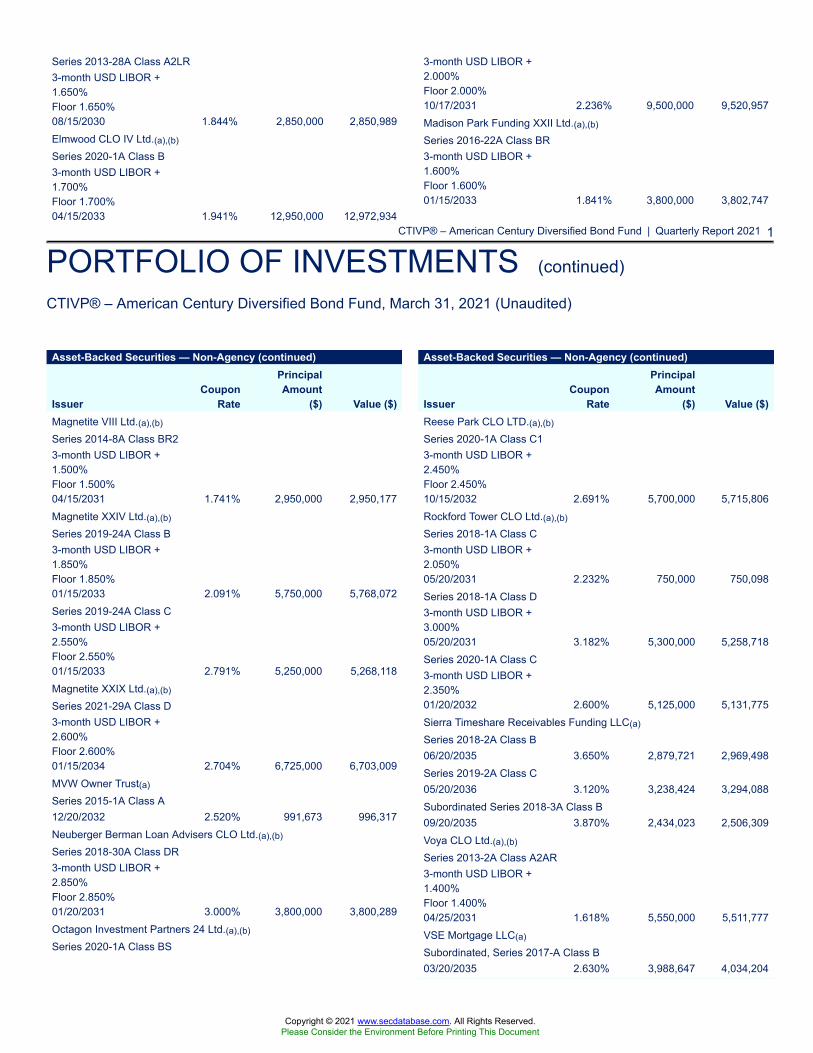
PORTFOLIO OF INVESTMENTS (continued)
CTIVP® – American Century Diversified Bond Fund, March 31, 2021 (Unaudited)
Series 2013-28A Class A2LR3-month USD LIBOR +1.650%Floor 1.650%08/15/2030 1.844% 2,850,000 2,850,989Elmwood CLO IV Ltd.(a),(b)
Series 2020-1A Class B3-month USD LIBOR +1.700%Floor 1.700%04/15/2033 1.941% 12,950,000 12,972,934
3-month USD LIBOR +2.000%Floor 2.000%10/17/2031 2.236% 9,500,000 9,520,957Madison Park Funding XXII Ltd.(a),(b)
Series 2016-22A Class BR3-month USD LIBOR +1.600%Floor 1.600%01/15/2033 1.841% 3,800,000 3,802,747
Asset-Backed Securities — Non-Agency (continued)
IssuerCoupon
Rate
PrincipalAmount
($) Value ($)Magnetite VIII Ltd.(a),(b)
Series 2014-8A Class BR23-month USD LIBOR +1.500%Floor 1.500%04/15/2031 1.741% 2,950,000 2,950,177Magnetite XXIV Ltd.(a),(b)
Series 2019-24A Class B3-month USD LIBOR +1.850%Floor 1.850%01/15/2033 2.091% 5,750,000 5,768,072Series 2019-24A Class C3-month USD LIBOR +2.550%Floor 2.550%01/15/2033 2.791% 5,250,000 5,268,118Magnetite XXIX Ltd.(a),(b)
Series 2021-29A Class D3-month USD LIBOR +2.600%Floor 2.600%01/15/2034 2.704% 6,725,000 6,703,009MVW Owner Trust(a)
Series 2015-1A Class A12/20/2032 2.520% 991,673 996,317Neuberger Berman Loan Advisers CLO Ltd.(a),(b)
Series 2018-30A Class DR3-month USD LIBOR +2.850%Floor 2.850%01/20/2031 3.000% 3,800,000 3,800,289Octagon Investment Partners 24 Ltd.(a),(b)
Series 2020-1A Class BS
Asset-Backed Securities — Non-Agency (continued)
IssuerCoupon
Rate
PrincipalAmount
($) Value ($)Reese Park CLO LTD.(a),(b)
Series 2020-1A Class C13-month USD LIBOR +2.450%Floor 2.450%10/15/2032 2.691% 5,700,000 5,715,806Rockford Tower CLO Ltd.(a),(b)
Series 2018-1A Class C3-month USD LIBOR +2.050%05/20/2031 2.232% 750,000 750,098Series 2018-1A Class D3-month USD LIBOR +3.000%05/20/2031 3.182% 5,300,000 5,258,718Series 2020-1A Class C3-month USD LIBOR +2.350%01/20/2032 2.600% 5,125,000 5,131,775Sierra Timeshare Receivables Funding LLC(a)
Series 2018-2A Class B06/20/2035 3.650% 2,879,721 2,969,498Series 2019-2A Class C05/20/2036 3.120% 3,238,424 3,294,088Subordinated Series 2018-3A Class B09/20/2035 3.870% 2,434,023 2,506,309Voya CLO Ltd.(a),(b)
Series 2013-2A Class A2AR3-month USD LIBOR +1.400%Floor 1.400%04/25/2031 1.618% 5,550,000 5,511,777VSE Mortgage LLC(a)
Subordinated, Series 2017-A Class B03/20/2035 2.630% 3,988,647 4,034,204
Copyright © 2021 www.secdatabase.com. All Rights Reserved.Please Consider the Environment Before Printing This Document

2 CTIVP® – American Century Diversified Bond Fund | Quarterly Report 2021
PORTFOLIO OF INVESTMENTS (continued)
CTIVP® – American Century Diversified Bond Fund, March 31, 2021 (Unaudited)
3-month USD LIBOR +1.900%Floor 1.900%04/21/2031 2.124% 5,600,000 5,601,114Octagon Investment Partners 31 LLC(a),(b)
Series 2017-1A Class CR3-month USD LIBOR +2.050%Floor 2.050%07/20/2030 2.274% 5,250,000 5,250,032Octagon Investment Partners 45 Ltd.(a),(b)
Series 2019-1A Class B13-month USD LIBOR +1.850%Floor 1.850%10/15/2032 2.091% 3,850,000 3,858,193Octagon Investment Partners 47 Ltd.(a),(b)
Series 2020-1A Class A13-month USD LIBOR +1.850%Floor 1.850%04/20/2031 2.074% 6,500,000 6,518,765OHA Credit Partners VII Ltd.(a),(b)
Series 2012-7A Class D1R33-month USD LIBOR +2.900%Floor 2.900%02/20/2034 3.200% 6,300,000 6,301,109
Total Asset-Backed Securities — Non-Agency(Cost $204,881,104) 206,091,087
Commercial Mortgage-Backed Securities - Non-Agency 1.9%BX Commercial Mortgage Trust(a),(c)
Subordinated Series 2020-VIVA Class E03/11/2044 3.667% 6,000,000 5,689,306FirstKey Homes Trust(a)
Subordinated Series 2020-SFR1 Class D09/17/2025 2.241% 6,450,000 6,478,406Subordinated Series 2020-SFR2 Class E10/19/2037 2.668% 21,100,000 21,318,463Tricon American Homes(a)
Series 2020-SFR1 Class C07/17/2038 2.249% 7,400,000 7,481,734Tricon American Homes LLC(a)
Series 2020-SFR1 Class D07/17/2038 2.548% 7,200,000 7,189,237
Commercial Mortgage-Backed Securities - Non-Agency (continued)
IssuerCoupon
Rate
PrincipalAmount
($) Value ($)Tricon American Homes Trust(a)
Subordinated Series 2020-SFR2 Class D11/17/2039 2.281% 7,500,000 7,273,046
Total Commercial Mortgage-Backed Securities - Non-Agency(Cost $55,625,108) 55,430,192
Convertible Bonds 0.1%Banking 0.1%Itau Unibanco Holding SA/Cayman Island(a),(d)
Subordinated04/15/2031 3.875% 1,900,000 1,844,480
Total Convertible Bonds(Cost $1,893,749) 1,844,480
Corporate Bonds & Notes 41.4%
Corporate Bonds & Notes (continued)
IssuerCoupon
Rate
PrincipalAmount
($) Value ($)Cummins, Inc.09/01/2050 2.600% 2,080,000 1,859,067Ford Motor Credit Co. LLC08/03/2022 2.979% 3,300,000 3,343,82911/01/2022 3.350% 1,720,000 1,752,65011/13/2025 3.375% 5,050,000 5,124,62502/16/2028 2.900% 2,600,000 2,497,178General Motors Co.04/01/2038 5.150% 1,970,000 2,265,371General Motors Financial Co., Inc.06/20/2025 2.750% 6,021,000 6,281,82908/20/2027 2.700% 2,989,000 3,052,548Nissan Motor Co., Ltd.(a)
09/17/2027 4.345% 1,640,000 1,786,566
Copyright © 2021 www.secdatabase.com. All Rights Reserved.Please Consider the Environment Before Printing This Document
CTIVP® – American Century Diversified Bond Fund | Quarterly Report 2021 3
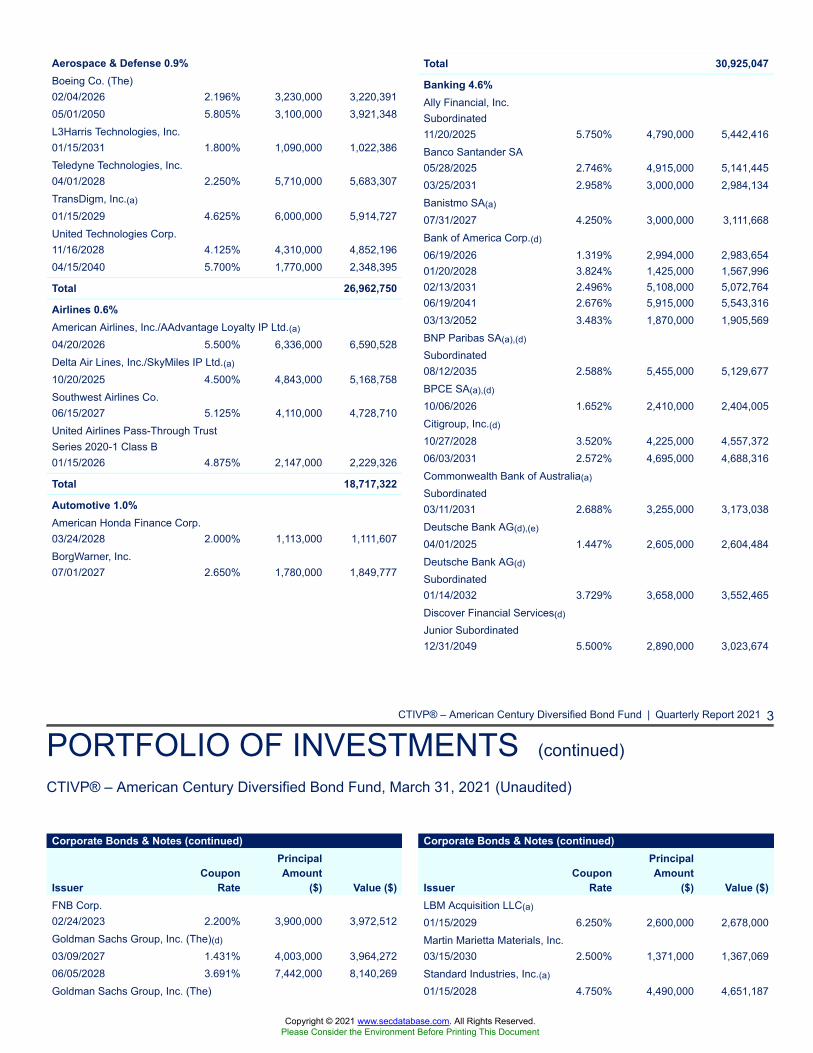
PORTFOLIO OF INVESTMENTS (continued)
CTIVP® – American Century Diversified Bond Fund, March 31, 2021 (Unaudited)
Aerospace & Defense 0.9%Boeing Co. (The)02/04/2026 2.196% 3,230,000 3,220,39105/01/2050 5.805% 3,100,000 3,921,348L3Harris Technologies, Inc.01/15/2031 1.800% 1,090,000 1,022,386Teledyne Technologies, Inc.04/01/2028 2.250% 5,710,000 5,683,307TransDigm, Inc.(a)
01/15/2029 4.625% 6,000,000 5,914,727United Technologies Corp.11/16/2028 4.125% 4,310,000 4,852,19604/15/2040 5.700% 1,770,000 2,348,395
Total 26,962,750
Airlines 0.6%American Airlines, Inc./AAdvantage Loyalty IP Ltd.(a)
04/20/2026 5.500% 6,336,000 6,590,528Delta Air Lines, Inc./SkyMiles IP Ltd.(a)
10/20/2025 4.500% 4,843,000 5,168,758Southwest Airlines Co.06/15/2027 5.125% 4,110,000 4,728,710United Airlines Pass-Through TrustSeries 2020-1 Class B01/15/2026 4.875% 2,147,000 2,229,326
Total 18,717,322
Automotive 1.0%American Honda Finance Corp.03/24/2028 2.000% 1,113,000 1,111,607BorgWarner, Inc.07/01/2027 2.650% 1,780,000 1,849,777
Total 30,925,047
Banking 4.6%Ally Financial, Inc.Subordinated11/20/2025 5.750% 4,790,000 5,442,416Banco Santander SA05/28/2025 2.746% 4,915,000 5,141,44503/25/2031 2.958% 3,000,000 2,984,134Banistmo SA(a)
07/31/2027 4.250% 3,000,000 3,111,668Bank of America Corp.(d)
06/19/2026 1.319% 2,994,000 2,983,65401/20/2028 3.824% 1,425,000 1,567,99602/13/2031 2.496% 5,108,000 5,072,76406/19/2041 2.676% 5,915,000 5,543,31603/13/2052 3.483% 1,870,000 1,905,569BNP Paribas SA(a),(d)
Subordinated08/12/2035 2.588% 5,455,000 5,129,677BPCE SA(a),(d)
10/06/2026 1.652% 2,410,000 2,404,005Citigroup, Inc.(d)
10/27/2028 3.520% 4,225,000 4,557,37206/03/2031 2.572% 4,695,000 4,688,316Commonwealth Bank of Australia(a)
Subordinated03/11/2031 2.688% 3,255,000 3,173,038Deutsche Bank AG(d),(e)
04/01/2025 1.447% 2,605,000 2,604,484Deutsche Bank AG(d)
Subordinated01/14/2032 3.729% 3,658,000 3,552,465Discover Financial Services(d)
Junior Subordinated12/31/2049 5.500% 2,890,000 3,023,674
Corporate Bonds & Notes (continued)
IssuerCoupon
Rate
PrincipalAmount
($) Value ($)FNB Corp.02/24/2023 2.200% 3,900,000 3,972,512Goldman Sachs Group, Inc. (The)(d)
03/09/2027 1.431% 4,003,000 3,964,27206/05/2028 3.691% 7,442,000 8,140,269Goldman Sachs Group, Inc. (The)
Corporate Bonds & Notes (continued)
IssuerCoupon
Rate
PrincipalAmount
($) Value ($)LBM Acquisition LLC(a)
01/15/2029 6.250% 2,600,000 2,678,000Martin Marietta Materials, Inc.03/15/2030 2.500% 1,371,000 1,367,069Standard Industries, Inc.(a)
01/15/2028 4.750% 4,490,000 4,651,187
Copyright © 2021 www.secdatabase.com. All Rights Reserved.Please Consider the Environment Before Printing This Document
4 CTIVP® – American Century Diversified Bond Fund | Quarterly Report 2021
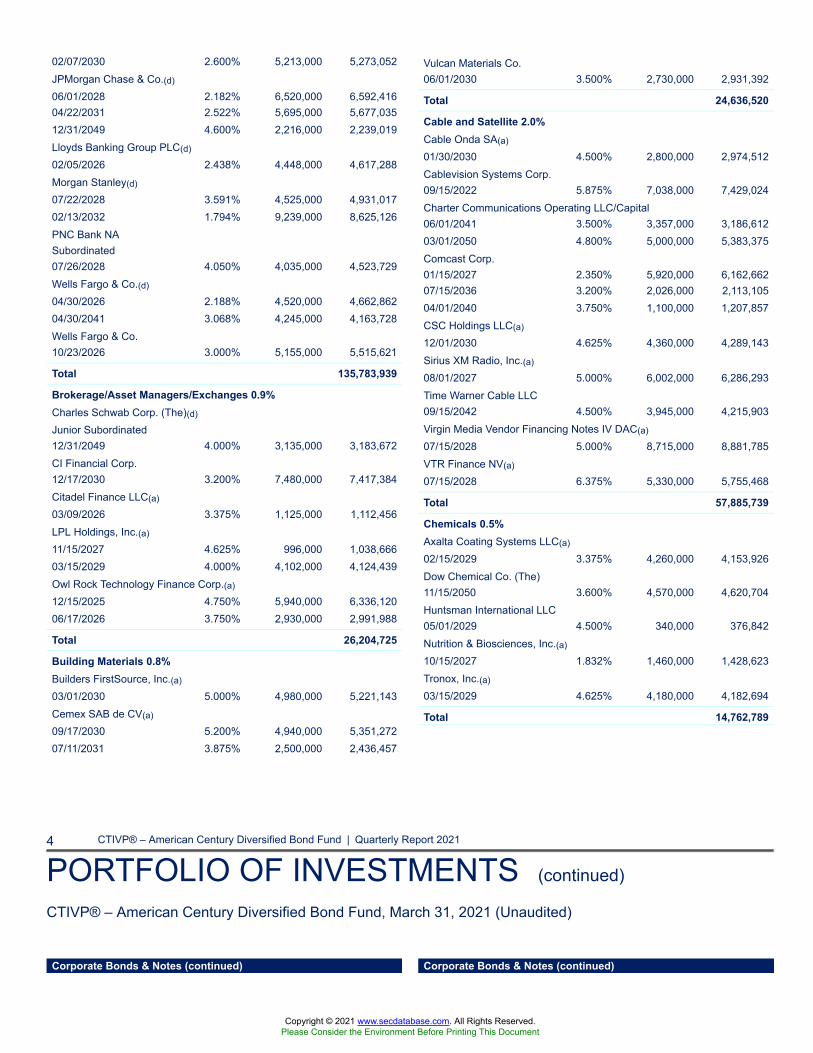
PORTFOLIO OF INVESTMENTS (continued)
CTIVP® – American Century Diversified Bond Fund, March 31, 2021 (Unaudited)
02/07/2030 2.600% 5,213,000 5,273,052JPMorgan Chase & Co.(d)
06/01/2028 2.182% 6,520,000 6,592,41604/22/2031 2.522% 5,695,000 5,677,03512/31/2049 4.600% 2,216,000 2,239,019Lloyds Banking Group PLC(d)
02/05/2026 2.438% 4,448,000 4,617,288Morgan Stanley(d)
07/22/2028 3.591% 4,525,000 4,931,01702/13/2032 1.794% 9,239,000 8,625,126PNC Bank NASubordinated07/26/2028 4.050% 4,035,000 4,523,729Wells Fargo & Co.(d)
04/30/2026 2.188% 4,520,000 4,662,86204/30/2041 3.068% 4,245,000 4,163,728Wells Fargo & Co.10/23/2026 3.000% 5,155,000 5,515,621
Total 135,783,939
Brokerage/Asset Managers/Exchanges 0.9%Charles Schwab Corp. (The)(d)
Junior Subordinated12/31/2049 4.000% 3,135,000 3,183,672CI Financial Corp.12/17/2030 3.200% 7,480,000 7,417,384Citadel Finance LLC(a)
03/09/2026 3.375% 1,125,000 1,112,456LPL Holdings, Inc.(a)
11/15/2027 4.625% 996,000 1,038,66603/15/2029 4.000% 4,102,000 4,124,439Owl Rock Technology Finance Corp.(a)
12/15/2025 4.750% 5,940,000 6,336,12006/17/2026 3.750% 2,930,000 2,991,988
Total 26,204,725
Building Materials 0.8%Builders FirstSource, Inc.(a)
03/01/2030 5.000% 4,980,000 5,221,143Cemex SAB de CV(a)
09/17/2030 5.200% 4,940,000 5,351,27207/11/2031 3.875% 2,500,000 2,436,457
Vulcan Materials Co.06/01/2030 3.500% 2,730,000 2,931,392
Total 24,636,520
Cable and Satellite 2.0%Cable Onda SA(a)
01/30/2030 4.500% 2,800,000 2,974,512Cablevision Systems Corp.09/15/2022 5.875% 7,038,000 7,429,024Charter Communications Operating LLC/Capital06/01/2041 3.500% 3,357,000 3,186,61203/01/2050 4.800% 5,000,000 5,383,375Comcast Corp.01/15/2027 2.350% 5,920,000 6,162,66207/15/2036 3.200% 2,026,000 2,113,10504/01/2040 3.750% 1,100,000 1,207,857CSC Holdings LLC(a)
12/01/2030 4.625% 4,360,000 4,289,143Sirius XM Radio, Inc.(a)
08/01/2027 5.000% 6,002,000 6,286,293Time Warner Cable LLC09/15/2042 4.500% 3,945,000 4,215,903Virgin Media Vendor Financing Notes IV DAC(a)
07/15/2028 5.000% 8,715,000 8,881,785VTR Finance NV(a)
07/15/2028 6.375% 5,330,000 5,755,468
Total 57,885,739
Chemicals 0.5%Axalta Coating Systems LLC(a)
02/15/2029 3.375% 4,260,000 4,153,926Dow Chemical Co. (The)11/15/2050 3.600% 4,570,000 4,620,704Huntsman International LLC05/01/2029 4.500% 340,000 376,842Nutrition & Biosciences, Inc.(a)
10/15/2027 1.832% 1,460,000 1,428,623Tronox, Inc.(a)
03/15/2029 4.625% 4,180,000 4,182,694
Total 14,762,789
Corporate Bonds & Notes (continued) Corporate Bonds & Notes (continued)
Copyright © 2021 www.secdatabase.com. All Rights Reserved.Please Consider the Environment Before Printing This Document
CTIVP® – American Century Diversified Bond Fund | Quarterly Report 2021 5
IssuerCoupon
Rate
PrincipalAmount
($) Value ($)
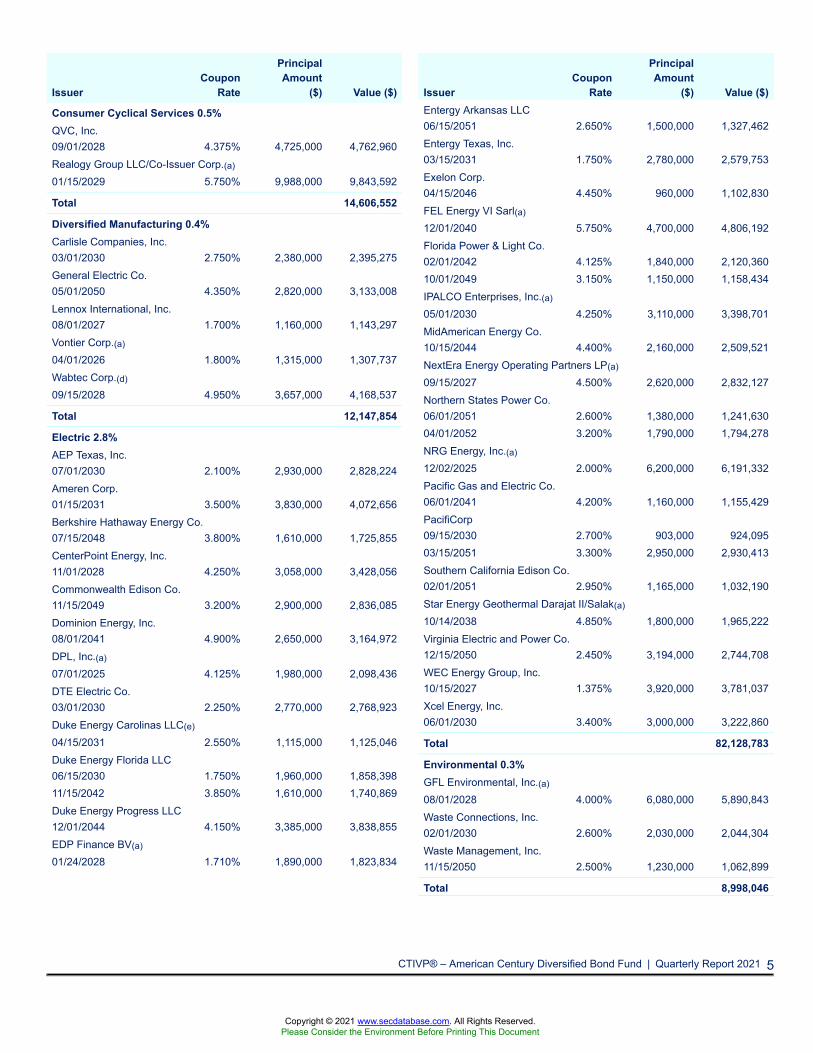
Consumer Cyclical Services 0.5%QVC, Inc.09/01/2028 4.375% 4,725,000 4,762,960Realogy Group LLC/Co-Issuer Corp.(a)
01/15/2029 5.750% 9,988,000 9,843,592
Total 14,606,552
Diversified Manufacturing 0.4%Carlisle Companies, Inc.03/01/2030 2.750% 2,380,000 2,395,275General Electric Co.05/01/2050 4.350% 2,820,000 3,133,008Lennox International, Inc.08/01/2027 1.700% 1,160,000 1,143,297Vontier Corp.(a)
04/01/2026 1.800% 1,315,000 1,307,737Wabtec Corp.(d)
09/15/2028 4.950% 3,657,000 4,168,537
Total 12,147,854
Electric 2.8%AEP Texas, Inc.07/01/2030 2.100% 2,930,000 2,828,224Ameren Corp.01/15/2031 3.500% 3,830,000 4,072,656Berkshire Hathaway Energy Co.07/15/2048 3.800% 1,610,000 1,725,855CenterPoint Energy, Inc.11/01/2028 4.250% 3,058,000 3,428,056Commonwealth Edison Co.11/15/2049 3.200% 2,900,000 2,836,085Dominion Energy, Inc.08/01/2041 4.900% 2,650,000 3,164,972DPL, Inc.(a)
07/01/2025 4.125% 1,980,000 2,098,436DTE Electric Co.03/01/2030 2.250% 2,770,000 2,768,923Duke Energy Carolinas LLC(e)
04/15/2031 2.550% 1,115,000 1,125,046Duke Energy Florida LLC06/15/2030 1.750% 1,960,000 1,858,39811/15/2042 3.850% 1,610,000 1,740,869Duke Energy Progress LLC12/01/2044 4.150% 3,385,000 3,838,855EDP Finance BV(a)
01/24/2028 1.710% 1,890,000 1,823,834
IssuerCoupon
Rate
PrincipalAmount
($) Value ($)Entergy Arkansas LLC06/15/2051 2.650% 1,500,000 1,327,462Entergy Texas, Inc.03/15/2031 1.750% 2,780,000 2,579,753Exelon Corp.04/15/2046 4.450% 960,000 1,102,830FEL Energy VI Sarl(a)
12/01/2040 5.750% 4,700,000 4,806,192Florida Power & Light Co.02/01/2042 4.125% 1,840,000 2,120,36010/01/2049 3.150% 1,150,000 1,158,434IPALCO Enterprises, Inc.(a)
05/01/2030 4.250% 3,110,000 3,398,701MidAmerican Energy Co.10/15/2044 4.400% 2,160,000 2,509,521NextEra Energy Operating Partners LP(a)
09/15/2027 4.500% 2,620,000 2,832,127Northern States Power Co.06/01/2051 2.600% 1,380,000 1,241,63004/01/2052 3.200% 1,790,000 1,794,278NRG Energy, Inc.(a)
12/02/2025 2.000% 6,200,000 6,191,332Pacific Gas and Electric Co.06/01/2041 4.200% 1,160,000 1,155,429PacifiCorp09/15/2030 2.700% 903,000 924,09503/15/2051 3.300% 2,950,000 2,930,413Southern California Edison Co.02/01/2051 2.950% 1,165,000 1,032,190Star Energy Geothermal Darajat II/Salak(a)
10/14/2038 4.850% 1,800,000 1,965,222Virginia Electric and Power Co.12/15/2050 2.450% 3,194,000 2,744,708WEC Energy Group, Inc.10/15/2027 1.375% 3,920,000 3,781,037Xcel Energy, Inc.06/01/2030 3.400% 3,000,000 3,222,860
Total 82,128,783
Environmental 0.3%GFL Environmental, Inc.(a)
08/01/2028 4.000% 6,080,000 5,890,843Waste Connections, Inc.02/01/2030 2.600% 2,030,000 2,044,304Waste Management, Inc.11/15/2050 2.500% 1,230,000 1,062,899
Total 8,998,046
Copyright © 2021 www.secdatabase.com. All Rights Reserved.Please Consider the Environment Before Printing This Document
PORTFOLIO OF INVESTMENTS (continued)
CTIVP® – American Century Diversified Bond Fund, March 31, 2021 (Unaudited)
Corporate Bonds & Notes (continued)
IssuerCoupon
Rate
PrincipalAmount
($) Value ($)
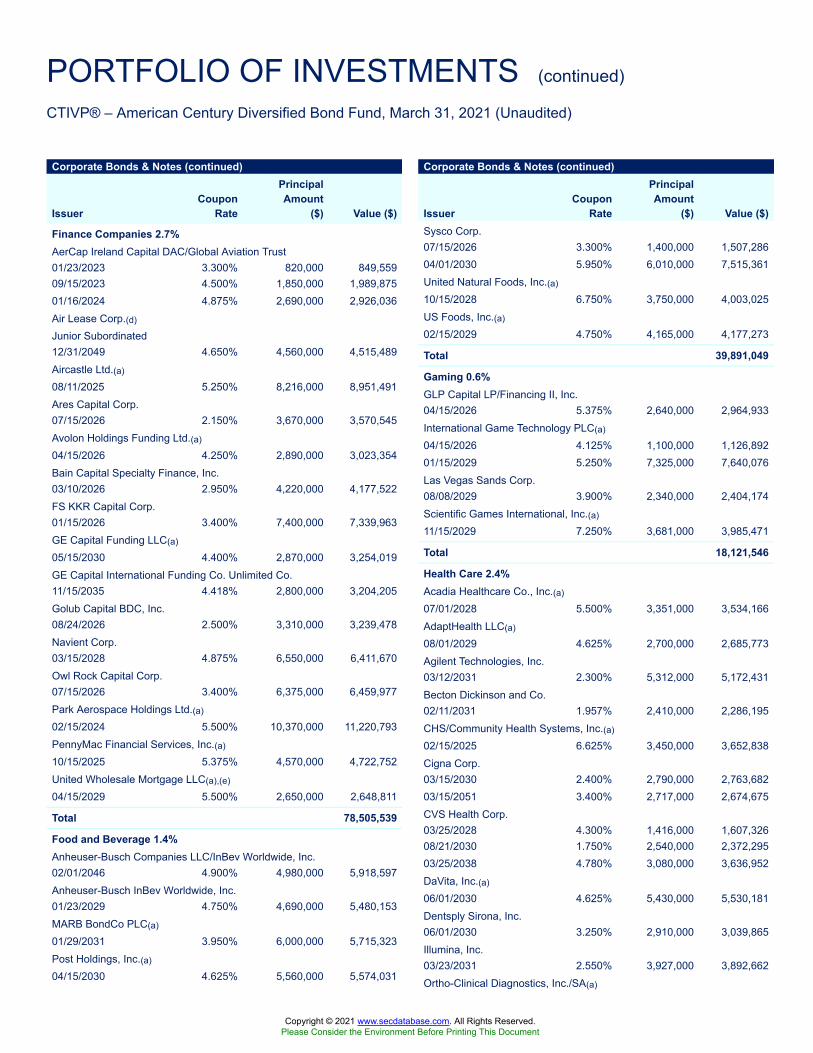
Finance Companies 2.7%AerCap Ireland Capital DAC/Global Aviation Trust01/23/2023 3.300% 820,000 849,55909/15/2023 4.500% 1,850,000 1,989,87501/16/2024 4.875% 2,690,000 2,926,036Air Lease Corp.(d)
Junior Subordinated12/31/2049 4.650% 4,560,000 4,515,489Aircastle Ltd.(a)
08/11/2025 5.250% 8,216,000 8,951,491Ares Capital Corp.07/15/2026 2.150% 3,670,000 3,570,545Avolon Holdings Funding Ltd.(a)
04/15/2026 4.250% 2,890,000 3,023,354Bain Capital Specialty Finance, Inc.03/10/2026 2.950% 4,220,000 4,177,522FS KKR Capital Corp.01/15/2026 3.400% 7,400,000 7,339,963GE Capital Funding LLC(a)
05/15/2030 4.400% 2,870,000 3,254,019GE Capital International Funding Co. Unlimited Co.11/15/2035 4.418% 2,800,000 3,204,205Golub Capital BDC, Inc.08/24/2026 2.500% 3,310,000 3,239,478Navient Corp.03/15/2028 4.875% 6,550,000 6,411,670Owl Rock Capital Corp.07/15/2026 3.400% 6,375,000 6,459,977Park Aerospace Holdings Ltd.(a)
02/15/2024 5.500% 10,370,000 11,220,793PennyMac Financial Services, Inc.(a)
10/15/2025 5.375% 4,570,000 4,722,752United Wholesale Mortgage LLC(a),(e)
04/15/2029 5.500% 2,650,000 2,648,811
Total 78,505,539
Food and Beverage 1.4%Anheuser-Busch Companies LLC/InBev Worldwide, Inc.02/01/2046 4.900% 4,980,000 5,918,597Anheuser-Busch InBev Worldwide, Inc.01/23/2029 4.750% 4,690,000 5,480,153MARB BondCo PLC(a)
01/29/2031 3.950% 6,000,000 5,715,323Post Holdings, Inc.(a)
04/15/2030 4.625% 5,560,000 5,574,031
Corporate Bonds & Notes (continued)
IssuerCoupon
Rate
PrincipalAmount
($) Value ($)Sysco Corp.07/15/2026 3.300% 1,400,000 1,507,28604/01/2030 5.950% 6,010,000 7,515,361United Natural Foods, Inc.(a)
10/15/2028 6.750% 3,750,000 4,003,025US Foods, Inc.(a)
02/15/2029 4.750% 4,165,000 4,177,273
Total 39,891,049
Gaming 0.6%GLP Capital LP/Financing II, Inc.04/15/2026 5.375% 2,640,000 2,964,933International Game Technology PLC(a)
04/15/2026 4.125% 1,100,000 1,126,89201/15/2029 5.250% 7,325,000 7,640,076Las Vegas Sands Corp.08/08/2029 3.900% 2,340,000 2,404,174Scientific Games International, Inc.(a)
11/15/2029 7.250% 3,681,000 3,985,471
Total 18,121,546
Health Care 2.4%Acadia Healthcare Co., Inc.(a)
07/01/2028 5.500% 3,351,000 3,534,166AdaptHealth LLC(a)
08/01/2029 4.625% 2,700,000 2,685,773Agilent Technologies, Inc.03/12/2031 2.300% 5,312,000 5,172,431Becton Dickinson and Co.02/11/2031 1.957% 2,410,000 2,286,195CHS/Community Health Systems, Inc.(a)
02/15/2025 6.625% 3,450,000 3,652,838Cigna Corp.03/15/2030 2.400% 2,790,000 2,763,68203/15/2051 3.400% 2,717,000 2,674,675CVS Health Corp.03/25/2028 4.300% 1,416,000 1,607,32608/21/2030 1.750% 2,540,000 2,372,29503/25/2038 4.780% 3,080,000 3,636,952DaVita, Inc.(a)
06/01/2030 4.625% 5,430,000 5,530,181Dentsply Sirona, Inc.06/01/2030 3.250% 2,910,000 3,039,865Illumina, Inc.03/23/2031 2.550% 3,927,000 3,892,662Ortho-Clinical Diagnostics, Inc./SA(a)
Copyright © 2021 www.secdatabase.com. All Rights Reserved.Please Consider the Environment Before Printing This Document
6 CTIVP® – American Century Diversified Bond Fund | Quarterly Report 2021
PORTFOLIO OF INVESTMENTS (continued)
CTIVP® – American Century Diversified Bond Fund, March 31, 2021 (Unaudited)
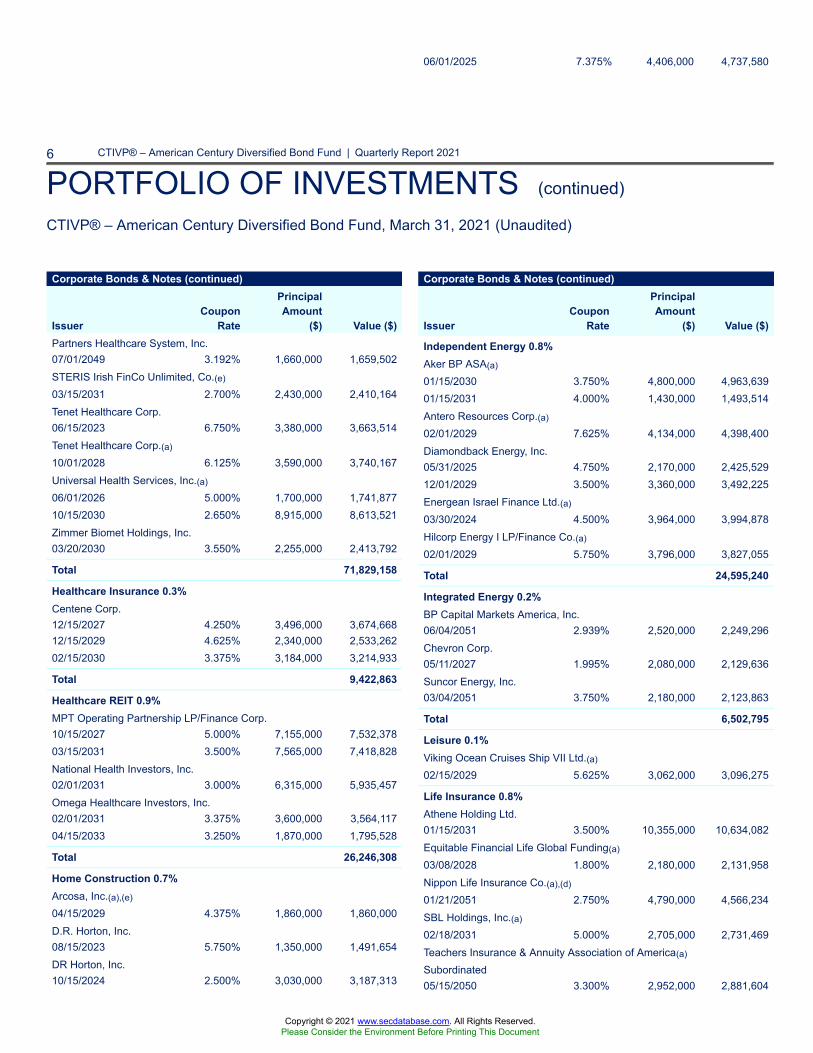
06/01/2025 7.375% 4,406,000 4,737,580
Corporate Bonds & Notes (continued)
IssuerCoupon
Rate
PrincipalAmount
($) Value ($)Partners Healthcare System, Inc.07/01/2049 3.192% 1,660,000 1,659,502STERIS Irish FinCo Unlimited, Co.(e)
03/15/2031 2.700% 2,430,000 2,410,164Tenet Healthcare Corp.06/15/2023 6.750% 3,380,000 3,663,514Tenet Healthcare Corp.(a)
10/01/2028 6.125% 3,590,000 3,740,167Universal Health Services, Inc.(a)
06/01/2026 5.000% 1,700,000 1,741,87710/15/2030 2.650% 8,915,000 8,613,521Zimmer Biomet Holdings, Inc.03/20/2030 3.550% 2,255,000 2,413,792
Total 71,829,158
Healthcare Insurance 0.3%Centene Corp.12/15/2027 4.250% 3,496,000 3,674,66812/15/2029 4.625% 2,340,000 2,533,26202/15/2030 3.375% 3,184,000 3,214,933
Total 9,422,863
Healthcare REIT 0.9%MPT Operating Partnership LP/Finance Corp.10/15/2027 5.000% 7,155,000 7,532,37803/15/2031 3.500% 7,565,000 7,418,828National Health Investors, Inc.02/01/2031 3.000% 6,315,000 5,935,457Omega Healthcare Investors, Inc.02/01/2031 3.375% 3,600,000 3,564,11704/15/2033 3.250% 1,870,000 1,795,528
Total 26,246,308
Home Construction 0.7%Arcosa, Inc.(a),(e)
04/15/2029 4.375% 1,860,000 1,860,000D.R. Horton, Inc.08/15/2023 5.750% 1,350,000 1,491,654DR Horton, Inc.10/15/2024 2.500% 3,030,000 3,187,313
Corporate Bonds & Notes (continued)
IssuerCoupon
Rate
PrincipalAmount
($) Value ($)
Independent Energy 0.8%Aker BP ASA(a)
01/15/2030 3.750% 4,800,000 4,963,63901/15/2031 4.000% 1,430,000 1,493,514Antero Resources Corp.(a)
02/01/2029 7.625% 4,134,000 4,398,400Diamondback Energy, Inc.05/31/2025 4.750% 2,170,000 2,425,52912/01/2029 3.500% 3,360,000 3,492,225Energean Israel Finance Ltd.(a)
03/30/2024 4.500% 3,964,000 3,994,878Hilcorp Energy I LP/Finance Co.(a)
02/01/2029 5.750% 3,796,000 3,827,055
Total 24,595,240
Integrated Energy 0.2%BP Capital Markets America, Inc.06/04/2051 2.939% 2,520,000 2,249,296Chevron Corp.05/11/2027 1.995% 2,080,000 2,129,636Suncor Energy, Inc.03/04/2051 3.750% 2,180,000 2,123,863
Total 6,502,795
Leisure 0.1%Viking Ocean Cruises Ship VII Ltd.(a)
02/15/2029 5.625% 3,062,000 3,096,275
Life Insurance 0.8%Athene Holding Ltd.01/15/2031 3.500% 10,355,000 10,634,082Equitable Financial Life Global Funding(a)
03/08/2028 1.800% 2,180,000 2,131,958Nippon Life Insurance Co.(a),(d)
01/21/2051 2.750% 4,790,000 4,566,234SBL Holdings, Inc.(a)
02/18/2031 5.000% 2,705,000 2,731,469Teachers Insurance & Annuity Association of America(a)
Subordinated05/15/2050 3.300% 2,952,000 2,881,604
Copyright © 2021 www.secdatabase.com. All Rights Reserved.Please Consider the Environment Before Printing This Document
CTIVP® – American Century Diversified Bond Fund | Quarterly Report 2021 7
PORTFOLIO OF INVESTMENTS (continued)
CTIVP® – American Century Diversified Bond Fund, March 31, 2021 (Unaudited)
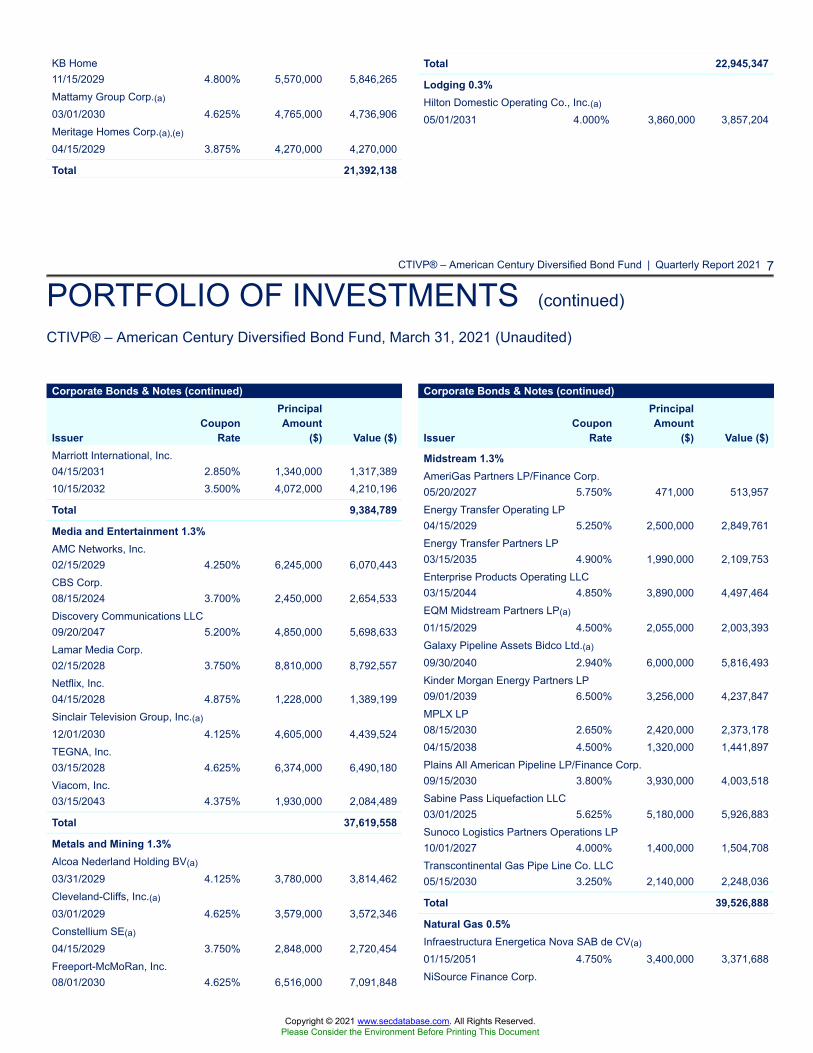
KB Home11/15/2029 4.800% 5,570,000 5,846,265Mattamy Group Corp.(a)
03/01/2030 4.625% 4,765,000 4,736,906Meritage Homes Corp.(a),(e)
04/15/2029 3.875% 4,270,000 4,270,000
Total 21,392,138
Total 22,945,347
Lodging 0.3%Hilton Domestic Operating Co., Inc.(a)
05/01/2031 4.000% 3,860,000 3,857,204
Corporate Bonds & Notes (continued)
IssuerCoupon
Rate
PrincipalAmount
($) Value ($)Marriott International, Inc.04/15/2031 2.850% 1,340,000 1,317,38910/15/2032 3.500% 4,072,000 4,210,196
Total 9,384,789
Media and Entertainment 1.3%AMC Networks, Inc.02/15/2029 4.250% 6,245,000 6,070,443CBS Corp.08/15/2024 3.700% 2,450,000 2,654,533Discovery Communications LLC09/20/2047 5.200% 4,850,000 5,698,633Lamar Media Corp.02/15/2028 3.750% 8,810,000 8,792,557Netflix, Inc.04/15/2028 4.875% 1,228,000 1,389,199Sinclair Television Group, Inc.(a)
12/01/2030 4.125% 4,605,000 4,439,524TEGNA, Inc.03/15/2028 4.625% 6,374,000 6,490,180Viacom, Inc.03/15/2043 4.375% 1,930,000 2,084,489
Total 37,619,558
Metals and Mining 1.3%Alcoa Nederland Holding BV(a)
03/31/2029 4.125% 3,780,000 3,814,462Cleveland-Cliffs, Inc.(a)
03/01/2029 4.625% 3,579,000 3,572,346Constellium SE(a)
04/15/2029 3.750% 2,848,000 2,720,454Freeport-McMoRan, Inc.08/01/2030 4.625% 6,516,000 7,091,848
Corporate Bonds & Notes (continued)
IssuerCoupon
Rate
PrincipalAmount
($) Value ($)
Midstream 1.3%AmeriGas Partners LP/Finance Corp.05/20/2027 5.750% 471,000 513,957Energy Transfer Operating LP04/15/2029 5.250% 2,500,000 2,849,761Energy Transfer Partners LP03/15/2035 4.900% 1,990,000 2,109,753Enterprise Products Operating LLC03/15/2044 4.850% 3,890,000 4,497,464EQM Midstream Partners LP(a)
01/15/2029 4.500% 2,055,000 2,003,393Galaxy Pipeline Assets Bidco Ltd.(a)
09/30/2040 2.940% 6,000,000 5,816,493Kinder Morgan Energy Partners LP09/01/2039 6.500% 3,256,000 4,237,847MPLX LP08/15/2030 2.650% 2,420,000 2,373,17804/15/2038 4.500% 1,320,000 1,441,897Plains All American Pipeline LP/Finance Corp.09/15/2030 3.800% 3,930,000 4,003,518Sabine Pass Liquefaction LLC03/01/2025 5.625% 5,180,000 5,926,883Sunoco Logistics Partners Operations LP10/01/2027 4.000% 1,400,000 1,504,708Transcontinental Gas Pipe Line Co. LLC05/15/2030 3.250% 2,140,000 2,248,036
Total 39,526,888
Natural Gas 0.5%Infraestructura Energetica Nova SAB de CV(a)
01/15/2051 4.750% 3,400,000 3,371,688NiSource Finance Corp.
Copyright © 2021 www.secdatabase.com. All Rights Reserved.Please Consider the Environment Before Printing This Document
8 CTIVP® – American Century Diversified Bond Fund | Quarterly Report 2021
PORTFOLIO OF INVESTMENTS (continued)
CTIVP® – American Century Diversified Bond Fund, March 31, 2021 (Unaudited)
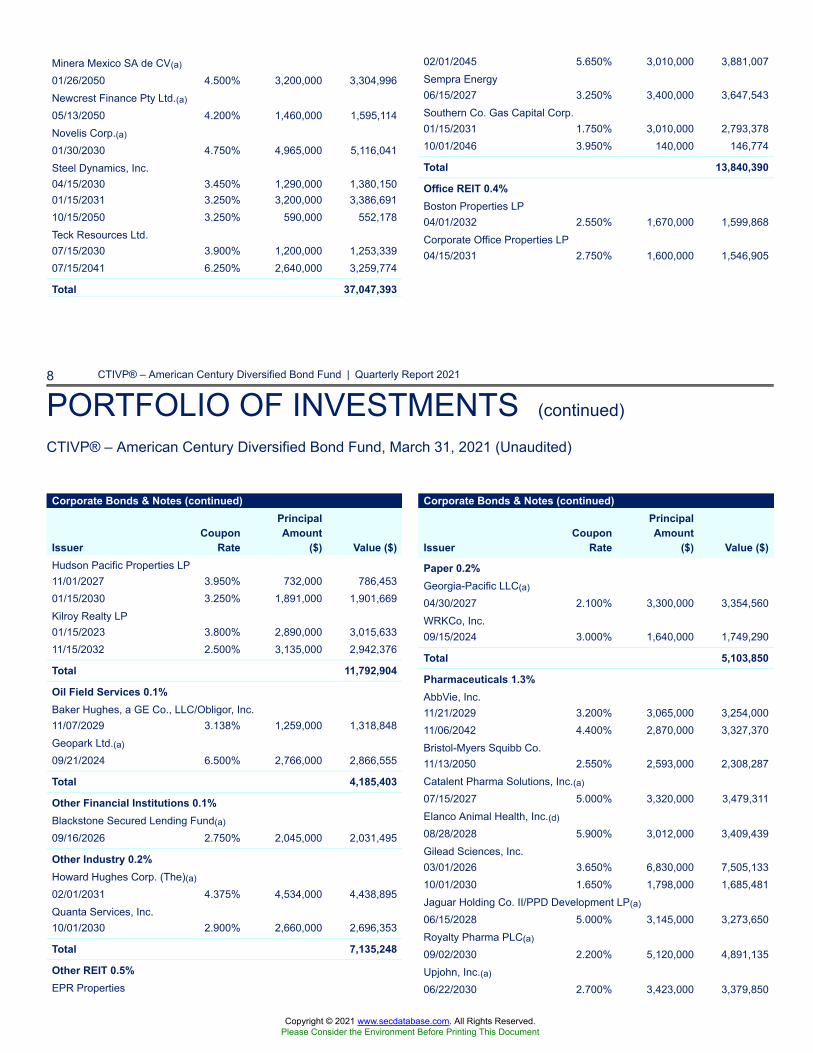
Minera Mexico SA de CV(a)
01/26/2050 4.500% 3,200,000 3,304,996Newcrest Finance Pty Ltd.(a)
05/13/2050 4.200% 1,460,000 1,595,114Novelis Corp.(a)
01/30/2030 4.750% 4,965,000 5,116,041Steel Dynamics, Inc.04/15/2030 3.450% 1,290,000 1,380,15001/15/2031 3.250% 3,200,000 3,386,69110/15/2050 3.250% 590,000 552,178Teck Resources Ltd.07/15/2030 3.900% 1,200,000 1,253,33907/15/2041 6.250% 2,640,000 3,259,774
Total 37,047,393
02/01/2045 5.650% 3,010,000 3,881,007Sempra Energy06/15/2027 3.250% 3,400,000 3,647,543Southern Co. Gas Capital Corp.01/15/2031 1.750% 3,010,000 2,793,37810/01/2046 3.950% 140,000 146,774
Total 13,840,390
Office REIT 0.4%Boston Properties LP04/01/2032 2.550% 1,670,000 1,599,868Corporate Office Properties LP04/15/2031 2.750% 1,600,000 1,546,905
Corporate Bonds & Notes (continued)
IssuerCoupon
Rate
PrincipalAmount
($) Value ($)Hudson Pacific Properties LP11/01/2027 3.950% 732,000 786,45301/15/2030 3.250% 1,891,000 1,901,669Kilroy Realty LP01/15/2023 3.800% 2,890,000 3,015,63311/15/2032 2.500% 3,135,000 2,942,376
Total 11,792,904
Oil Field Services 0.1%Baker Hughes, a GE Co., LLC/Obligor, Inc.11/07/2029 3.138% 1,259,000 1,318,848Geopark Ltd.(a)
09/21/2024 6.500% 2,766,000 2,866,555
Total 4,185,403
Other Financial Institutions 0.1%Blackstone Secured Lending Fund(a)
09/16/2026 2.750% 2,045,000 2,031,495
Other Industry 0.2%Howard Hughes Corp. (The)(a)
02/01/2031 4.375% 4,534,000 4,438,895Quanta Services, Inc.10/01/2030 2.900% 2,660,000 2,696,353
Total 7,135,248
Other REIT 0.5%EPR Properties
Corporate Bonds & Notes (continued)
IssuerCoupon
Rate
PrincipalAmount
($) Value ($)
Paper 0.2%Georgia-Pacific LLC(a)
04/30/2027 2.100% 3,300,000 3,354,560WRKCo, Inc.09/15/2024 3.000% 1,640,000 1,749,290
Total 5,103,850
Pharmaceuticals 1.3%AbbVie, Inc.11/21/2029 3.200% 3,065,000 3,254,00011/06/2042 4.400% 2,870,000 3,327,370Bristol-Myers Squibb Co.11/13/2050 2.550% 2,593,000 2,308,287Catalent Pharma Solutions, Inc.(a)
07/15/2027 5.000% 3,320,000 3,479,311Elanco Animal Health, Inc.(d)
08/28/2028 5.900% 3,012,000 3,409,439Gilead Sciences, Inc.03/01/2026 3.650% 6,830,000 7,505,13310/01/2030 1.650% 1,798,000 1,685,481Jaguar Holding Co. II/PPD Development LP(a)
06/15/2028 5.000% 3,145,000 3,273,650Royalty Pharma PLC(a)
09/02/2030 2.200% 5,120,000 4,891,135Upjohn, Inc.(a)
06/22/2030 2.700% 3,423,000 3,379,850
Copyright © 2021 www.secdatabase.com. All Rights Reserved.Please Consider the Environment Before Printing This Document
CTIVP® – American Century Diversified Bond Fund | Quarterly Report 2021 9
PORTFOLIO OF INVESTMENTS (continued)
CTIVP® – American Century Diversified Bond Fund, March 31, 2021 (Unaudited)
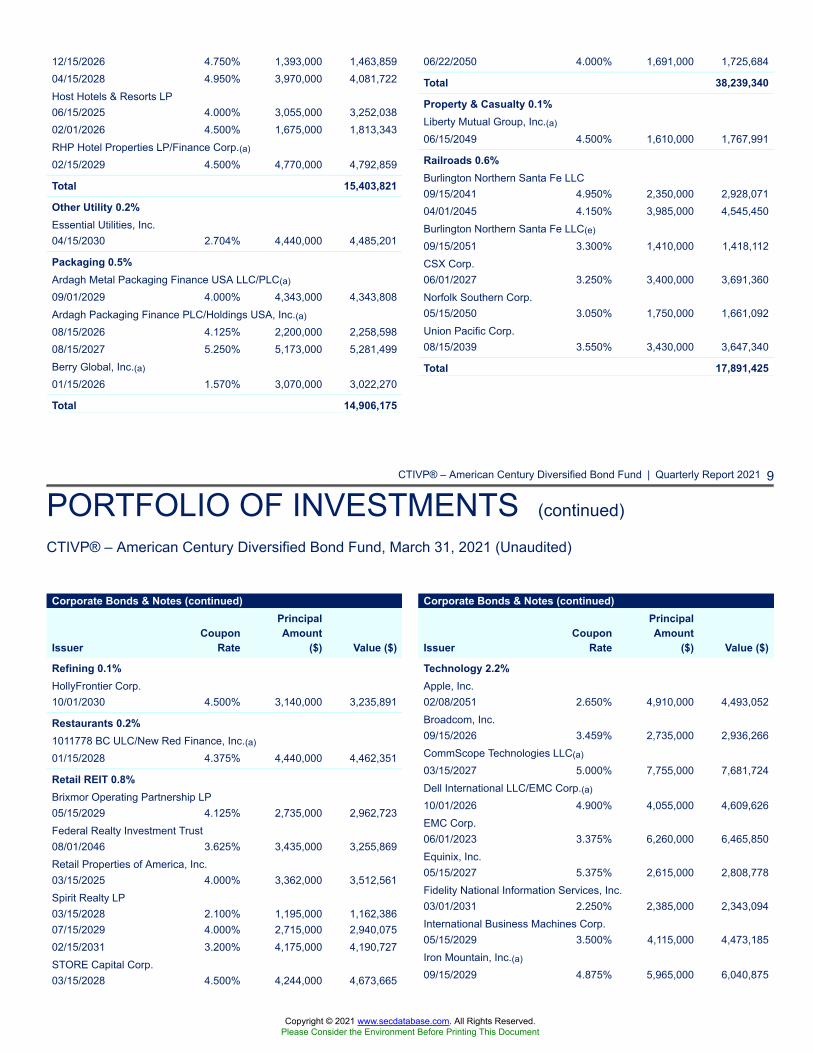
12/15/2026 4.750% 1,393,000 1,463,85904/15/2028 4.950% 3,970,000 4,081,722Host Hotels & Resorts LP06/15/2025 4.000% 3,055,000 3,252,03802/01/2026 4.500% 1,675,000 1,813,343RHP Hotel Properties LP/Finance Corp.(a)
02/15/2029 4.500% 4,770,000 4,792,859
Total 15,403,821
Other Utility 0.2%Essential Utilities, Inc.04/15/2030 2.704% 4,440,000 4,485,201
Packaging 0.5%Ardagh Metal Packaging Finance USA LLC/PLC(a)
09/01/2029 4.000% 4,343,000 4,343,808Ardagh Packaging Finance PLC/Holdings USA, Inc.(a)
08/15/2026 4.125% 2,200,000 2,258,59808/15/2027 5.250% 5,173,000 5,281,499Berry Global, Inc.(a)
01/15/2026 1.570% 3,070,000 3,022,270
Total 14,906,175
06/22/2050 4.000% 1,691,000 1,725,684
Total 38,239,340
Property & Casualty 0.1%Liberty Mutual Group, Inc.(a)
06/15/2049 4.500% 1,610,000 1,767,991
Railroads 0.6%Burlington Northern Santa Fe LLC09/15/2041 4.950% 2,350,000 2,928,07104/01/2045 4.150% 3,985,000 4,545,450Burlington Northern Santa Fe LLC(e)
09/15/2051 3.300% 1,410,000 1,418,112CSX Corp.06/01/2027 3.250% 3,400,000 3,691,360Norfolk Southern Corp.05/15/2050 3.050% 1,750,000 1,661,092Union Pacific Corp.08/15/2039 3.550% 3,430,000 3,647,340
Total 17,891,425
Corporate Bonds & Notes (continued)
IssuerCoupon
Rate
PrincipalAmount
($) Value ($)
Refining 0.1%HollyFrontier Corp.10/01/2030 4.500% 3,140,000 3,235,891
Restaurants 0.2%1011778 BC ULC/New Red Finance, Inc.(a)
01/15/2028 4.375% 4,440,000 4,462,351
Retail REIT 0.8%Brixmor Operating Partnership LP05/15/2029 4.125% 2,735,000 2,962,723Federal Realty Investment Trust08/01/2046 3.625% 3,435,000 3,255,869Retail Properties of America, Inc.03/15/2025 4.000% 3,362,000 3,512,561Spirit Realty LP03/15/2028 2.100% 1,195,000 1,162,38607/15/2029 4.000% 2,715,000 2,940,07502/15/2031 3.200% 4,175,000 4,190,727STORE Capital Corp.03/15/2028 4.500% 4,244,000 4,673,665
Corporate Bonds & Notes (continued)
IssuerCoupon
Rate
PrincipalAmount
($) Value ($)
Technology 2.2%Apple, Inc.02/08/2051 2.650% 4,910,000 4,493,052Broadcom, Inc.09/15/2026 3.459% 2,735,000 2,936,266CommScope Technologies LLC(a)
03/15/2027 5.000% 7,755,000 7,681,724Dell International LLC/EMC Corp.(a)
10/01/2026 4.900% 4,055,000 4,609,626EMC Corp.06/01/2023 3.375% 6,260,000 6,465,850Equinix, Inc.05/15/2027 5.375% 2,615,000 2,808,778Fidelity National Information Services, Inc.03/01/2031 2.250% 2,385,000 2,343,094International Business Machines Corp.05/15/2029 3.500% 4,115,000 4,473,185Iron Mountain, Inc.(a)
09/15/2029 4.875% 5,965,000 6,040,875
Copyright © 2021 www.secdatabase.com. All Rights Reserved.Please Consider the Environment Before Printing This Document
10 CTIVP® – American Century Diversified Bond Fund | Quarterly Report 2021
PORTFOLIO OF INVESTMENTS (continued)
CTIVP® – American Century Diversified Bond Fund, March 31, 2021 (Unaudited)
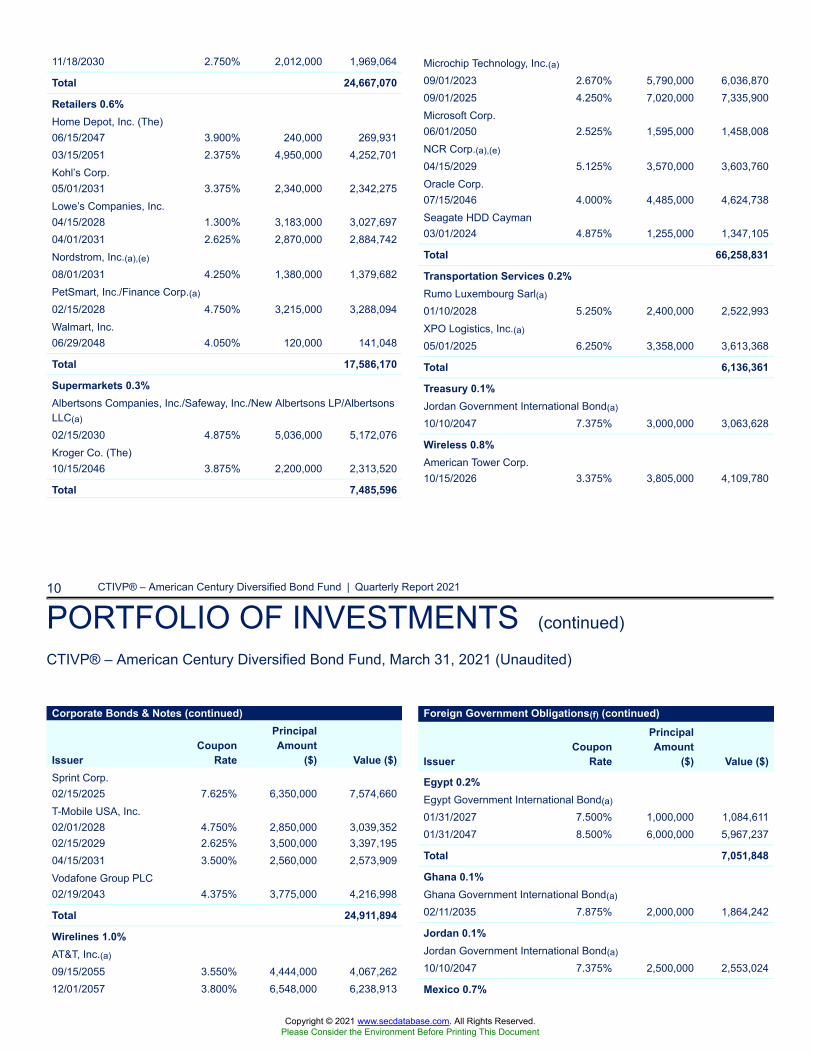
11/18/2030 2.750% 2,012,000 1,969,064
Total 24,667,070
Retailers 0.6%Home Depot, Inc. (The)06/15/2047 3.900% 240,000 269,93103/15/2051 2.375% 4,950,000 4,252,701Kohl’s Corp.05/01/2031 3.375% 2,340,000 2,342,275Lowe’s Companies, Inc.04/15/2028 1.300% 3,183,000 3,027,69704/01/2031 2.625% 2,870,000 2,884,742Nordstrom, Inc.(a),(e)
08/01/2031 4.250% 1,380,000 1,379,682PetSmart, Inc./Finance Corp.(a)
02/15/2028 4.750% 3,215,000 3,288,094Walmart, Inc.06/29/2048 4.050% 120,000 141,048
Total 17,586,170
Supermarkets 0.3%Albertsons Companies, Inc./Safeway, Inc./New Albertsons LP/AlbertsonsLLC(a)
02/15/2030 4.875% 5,036,000 5,172,076Kroger Co. (The)10/15/2046 3.875% 2,200,000 2,313,520
Total 7,485,596
Microchip Technology, Inc.(a)
09/01/2023 2.670% 5,790,000 6,036,87009/01/2025 4.250% 7,020,000 7,335,900Microsoft Corp.06/01/2050 2.525% 1,595,000 1,458,008NCR Corp.(a),(e)
04/15/2029 5.125% 3,570,000 3,603,760Oracle Corp.07/15/2046 4.000% 4,485,000 4,624,738Seagate HDD Cayman03/01/2024 4.875% 1,255,000 1,347,105
Total 66,258,831
Transportation Services 0.2%Rumo Luxembourg Sarl(a)
01/10/2028 5.250% 2,400,000 2,522,993XPO Logistics, Inc.(a)
05/01/2025 6.250% 3,358,000 3,613,368
Total 6,136,361
Treasury 0.1%Jordan Government International Bond(a)
10/10/2047 7.375% 3,000,000 3,063,628
Wireless 0.8%American Tower Corp.10/15/2026 3.375% 3,805,000 4,109,780
Corporate Bonds & Notes (continued)
IssuerCoupon
Rate
PrincipalAmount
($) Value ($)Sprint Corp.02/15/2025 7.625% 6,350,000 7,574,660T-Mobile USA, Inc.02/01/2028 4.750% 2,850,000 3,039,35202/15/2029 2.625% 3,500,000 3,397,19504/15/2031 3.500% 2,560,000 2,573,909Vodafone Group PLC02/19/2043 4.375% 3,775,000 4,216,998
Total 24,911,894
Wirelines 1.0%AT&T, Inc.(a)
09/15/2055 3.550% 4,444,000 4,067,26212/01/2057 3.800% 6,548,000 6,238,913
Foreign Government Obligations(f) (continued)
IssuerCoupon
Rate
PrincipalAmount
($) Value ($)
Egypt 0.2%Egypt Government International Bond(a)
01/31/2027 7.500% 1,000,000 1,084,61101/31/2047 8.500% 6,000,000 5,967,237
Total 7,051,848
Ghana 0.1%Ghana Government International Bond(a)
02/11/2035 7.875% 2,000,000 1,864,242
Jordan 0.1%Jordan Government International Bond(a)
10/10/2047 7.375% 2,500,000 2,553,024
Mexico 0.7%
Copyright © 2021 www.secdatabase.com. All Rights Reserved.Please Consider the Environment Before Printing This Document

CTIVP® – American Century Diversified Bond Fund | Quarterly Report 2021 11
PORTFOLIO OF INVESTMENTS (continued)
CTIVP® – American Century Diversified Bond Fund, March 31, 2021 (Unaudited)
Telefonica Emisiones SAU03/06/2048 4.895% 5,210,000 5,926,766Verizon Communications, Inc.03/22/2028 2.100% 2,365,000 2,372,66111/01/2034 4.400% 3,911,000 4,471,69311/20/2040 2.650% 4,551,000 4,159,648Verizon Communications, Inc.(a)
10/30/2056 2.987% 2,065,000 1,816,657
Total 29,053,600
Total Corporate Bonds & Notes(Cost $1,220,183,414) 1,223,531,587
Foreign Government Obligations(f) 2.7%Bermuda 0.1%Ooredoo International Finance Ltd.(a),(e)
04/08/2031 2.625% 1,900,000 1,879,518
Brazil 0.2%Brazilian Government International Bond04/07/2026 6.000% 5,600,000 6,437,154
Chile 0.1%Chile Government International Bond09/14/2021 3.250% 2,300,000 2,328,829
Colombia 0.2%Colombia Government International Bond09/18/2037 7.375% 3,000,000 3,965,645Ecopetrol SA05/28/2045 5.875% 1,750,000 1,855,119
Total 5,820,764
Dominican Republic 0.1%Dominican Republic International Bond(a)
01/25/2027 5.950% 2,400,000 2,697,750
Petroleos Mexicanos01/24/2022 4.875% 6,259,000 6,374,90901/30/2023 3.500% 3,000,000 3,035,17003/13/2027 6.500% 9,400,000 9,830,188Petroleos Mexicanos(a)
10/16/2025 6.875% 2,310,000 2,496,485
Total 21,736,752
Namibia 0.1%Namibia International Bonds(a)
10/29/2025 5.250% 2,200,000 2,305,601
Norway 0.0%Equinor ASA11/18/2049 3.250% 1,590,000 1,559,004
Pakistan 0.1%Pakistan Government International Bond(a)
12/05/2027 6.875% 2,994,000 3,128,426
Russian Federation 0.1%Russian Foreign Bond - Eurobond(a)
06/23/2047 5.250% 3,200,000 3,806,659
Serbia 0.0%Serbia International Bond(a)
09/28/2021 7.250% 200,000 206,248
Singapore 0.1%BOC Aviation Ltd.(a)
01/21/2026 1.750% 2,400,000 2,355,544
South Africa 0.1%Republic of South Africa Government International Bond06/22/2030 5.875% 3,000,000 3,207,430
Foreign Government Obligations(f) (continued)
IssuerCoupon
Rate
PrincipalAmount
($) Value ($)
Sri Lanka 0.1%Sri Lanka Government International Bond(a)
03/28/2030 7.550% 3,000,000 1,840,114
Tunisia 0.1%Banque Centrale de Tunisie International Bond(a)
01/30/2025 5.750% 3,600,000 3,136,839
Turkey 0.1%
Municipal Bonds (continued)
Issue DescriptionCoupon
Rate
PrincipalAmount
($) Value ($)Rutgers, The State University of New JerseyRevenue BondsBuild America BondsSeries 201005/01/2040 5.665% 525,000 701,484
Total 4,218,958
Hospital 0.2%Escambia County Health Facilities Authority
Copyright © 2021 www.secdatabase.com. All Rights Reserved.Please Consider the Environment Before Printing This Document
12 CTIVP® – American Century Diversified Bond Fund | Quarterly Report 2021
PORTFOLIO OF INVESTMENTS (continued)
CTIVP® – American Century Diversified Bond Fund, March 31, 2021 (Unaudited)
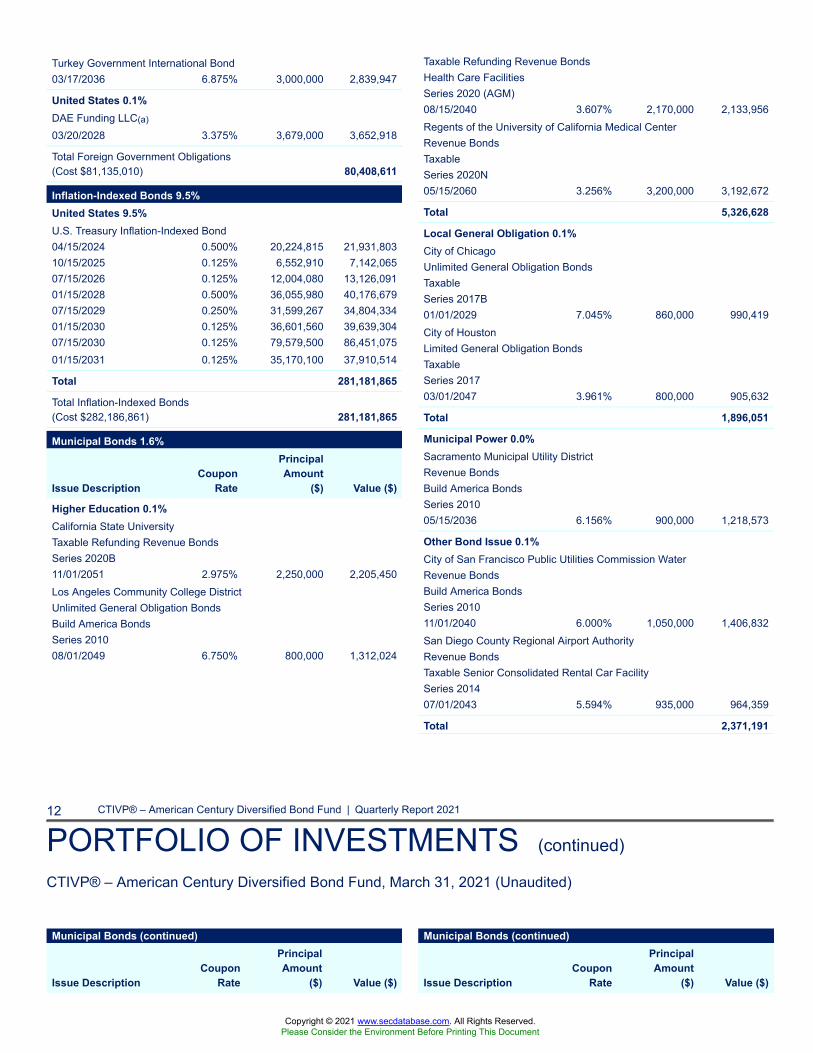
Turkey Government International Bond03/17/2036 6.875% 3,000,000 2,839,947
United States 0.1%DAE Funding LLC(a)
03/20/2028 3.375% 3,679,000 3,652,918
Total Foreign Government Obligations(Cost $81,135,010) 80,408,611
Inflation-Indexed Bonds 9.5%United States 9.5%U.S. Treasury Inflation-Indexed Bond04/15/2024 0.500% 20,224,815 21,931,80310/15/2025 0.125% 6,552,910 7,142,06507/15/2026 0.125% 12,004,080 13,126,09101/15/2028 0.500% 36,055,980 40,176,67907/15/2029 0.250% 31,599,267 34,804,33401/15/2030 0.125% 36,601,560 39,639,30407/15/2030 0.125% 79,579,500 86,451,07501/15/2031 0.125% 35,170,100 37,910,514
Total 281,181,865
Total Inflation-Indexed Bonds(Cost $282,186,861) 281,181,865
Municipal Bonds 1.6%
Issue DescriptionCoupon
Rate
PrincipalAmount
($) Value ($)
Higher Education 0.1%California State UniversityTaxable Refunding Revenue BondsSeries 2020B11/01/2051 2.975% 2,250,000 2,205,450Los Angeles Community College DistrictUnlimited General Obligation BondsBuild America BondsSeries 201008/01/2049 6.750% 800,000 1,312,024
Taxable Refunding Revenue BondsHealth Care FacilitiesSeries 2020 (AGM)08/15/2040 3.607% 2,170,000 2,133,956Regents of the University of California Medical CenterRevenue BondsTaxableSeries 2020N05/15/2060 3.256% 3,200,000 3,192,672
Total 5,326,628
Local General Obligation 0.1%City of ChicagoUnlimited General Obligation BondsTaxableSeries 2017B01/01/2029 7.045% 860,000 990,419City of HoustonLimited General Obligation BondsTaxableSeries 201703/01/2047 3.961% 800,000 905,632
Total 1,896,051
Municipal Power 0.0%Sacramento Municipal Utility DistrictRevenue BondsBuild America BondsSeries 201005/15/2036 6.156% 900,000 1,218,573
Other Bond Issue 0.1%City of San Francisco Public Utilities Commission WaterRevenue BondsBuild America BondsSeries 201011/01/2040 6.000% 1,050,000 1,406,832San Diego County Regional Airport AuthorityRevenue BondsTaxable Senior Consolidated Rental Car FacilitySeries 201407/01/2043 5.594% 935,000 964,359
Total 2,371,191
Municipal Bonds (continued)
Issue DescriptionCoupon
Rate
PrincipalAmount
($) Value ($)
Municipal Bonds (continued)
Issue DescriptionCoupon
Rate
PrincipalAmount
($) Value ($)
Copyright © 2021 www.secdatabase.com. All Rights Reserved.Please Consider the Environment Before Printing This Document
CTIVP® – American Century Diversified Bond Fund | Quarterly Report 2021 13
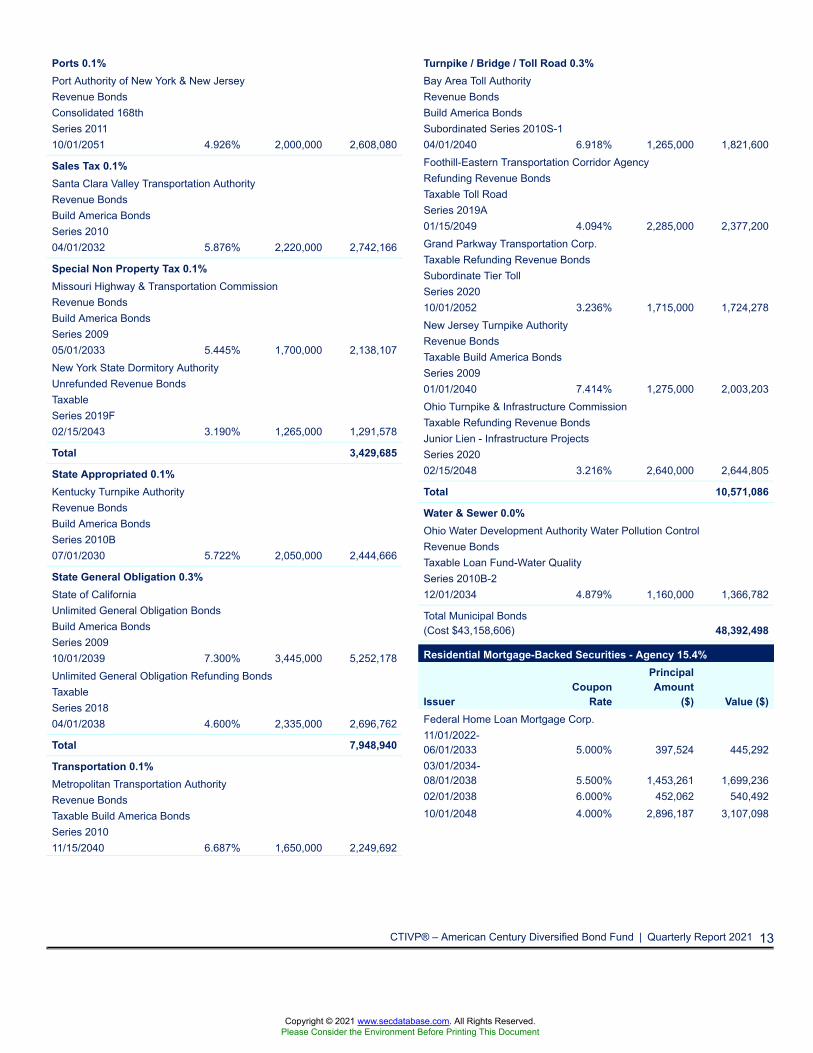
Ports 0.1%Port Authority of New York & New JerseyRevenue BondsConsolidated 168thSeries 201110/01/2051 4.926% 2,000,000 2,608,080
Sales Tax 0.1%Santa Clara Valley Transportation AuthorityRevenue BondsBuild America BondsSeries 201004/01/2032 5.876% 2,220,000 2,742,166
Special Non Property Tax 0.1%Missouri Highway & Transportation CommissionRevenue BondsBuild America BondsSeries 200905/01/2033 5.445% 1,700,000 2,138,107New York State Dormitory AuthorityUnrefunded Revenue BondsTaxableSeries 2019F02/15/2043 3.190% 1,265,000 1,291,578
Total 3,429,685
State Appropriated 0.1%Kentucky Turnpike AuthorityRevenue BondsBuild America BondsSeries 2010B07/01/2030 5.722% 2,050,000 2,444,666
State General Obligation 0.3%State of CaliforniaUnlimited General Obligation BondsBuild America BondsSeries 200910/01/2039 7.300% 3,445,000 5,252,178Unlimited General Obligation Refunding BondsTaxableSeries 201804/01/2038 4.600% 2,335,000 2,696,762
Total 7,948,940
Transportation 0.1%Metropolitan Transportation AuthorityRevenue BondsTaxable Build America BondsSeries 201011/15/2040 6.687% 1,650,000 2,249,692
Turnpike / Bridge / Toll Road 0.3%Bay Area Toll AuthorityRevenue BondsBuild America BondsSubordinated Series 2010S-104/01/2040 6.918% 1,265,000 1,821,600Foothill-Eastern Transportation Corridor AgencyRefunding Revenue BondsTaxable Toll RoadSeries 2019A01/15/2049 4.094% 2,285,000 2,377,200Grand Parkway Transportation Corp.Taxable Refunding Revenue BondsSubordinate Tier TollSeries 202010/01/2052 3.236% 1,715,000 1,724,278New Jersey Turnpike AuthorityRevenue BondsTaxable Build America BondsSeries 200901/01/2040 7.414% 1,275,000 2,003,203Ohio Turnpike & Infrastructure CommissionTaxable Refunding Revenue BondsJunior Lien - Infrastructure ProjectsSeries 202002/15/2048 3.216% 2,640,000 2,644,805
Total 10,571,086
Water & Sewer 0.0%Ohio Water Development Authority Water Pollution ControlRevenue BondsTaxable Loan Fund-Water QualitySeries 2010B-212/01/2034 4.879% 1,160,000 1,366,782
Total Municipal Bonds(Cost $43,158,606) 48,392,498
Residential Mortgage-Backed Securities - Agency 15.4%
IssuerCoupon
Rate
PrincipalAmount
($) Value ($)Federal Home Loan Mortgage Corp.11/01/2022-06/01/2033 5.000% 397,524 445,29203/01/2034-08/01/2038 5.500% 1,453,261 1,699,23602/01/2038 6.000% 452,062 540,49210/01/2048 4.000% 2,896,187 3,107,098
Copyright © 2021 www.secdatabase.com. All Rights Reserved.Please Consider the Environment Before Printing This Document

PORTFOLIO OF INVESTMENTS (continued)
CTIVP® – American Century Diversified Bond Fund, March 31, 2021 (Unaudited)
Residential Mortgage-Backed Securities - Agency (continued)
IssuerCoupon
Rate
PrincipalAmount
($) Value ($)Federal Home Loan Mortgage Corp.(b)
1-year CMT + 2.250%Cap 10.876%07/01/2036 2.634% 958,811 1,024,22312-month USD LIBOR +1.866%Cap 10.001%07/01/2036 2.823% 1,037,759 1,097,0771-year CMT + 2.135%Cap 10.685%10/01/2036 2.346% 782,782 835,9371-year CMT + 2.255%Cap 10.172%04/01/2037 2.740% 850,293 904,75912-month USD LIBOR +1.772%Cap 10.939%02/01/2038 2.909% 467,876 496,32412-month USD LIBOR +1.870%Cap 10.806%06/01/2038 2.894% 224,076 236,64412-month USD LIBOR +1.880%Cap 8.627%07/01/2040 2.630% 144,235 152,54512-month USD LIBOR +1.762%Cap 9.203%09/01/2040 2.319% 184,099 192,04612-month USD LIBOR +1.880%Cap 7.621%05/01/2041 3.660% 86,387 90,21612-month USD LIBOR +1.856%Cap 9.361%07/01/2041 3.077% 557,025 589,32512-month USD LIBOR +1.650%Cap 7.036%12/01/2042 2.043% 618,543 646,28512-month USD LIBOR +1.640%Cap 6.861%02/01/2043 2.015% 107,307 110,00512-month USD LIBOR +1.650%Cap 6.774%06/01/2043 2.835% 98,123 98,591Federal National Mortgage Association
Residential Mortgage-Backed Securities - Agency (continued)
IssuerCoupon
Rate
PrincipalAmount
($) Value ($)Federal National Mortgage Association(b)
6-month USD LIBOR +1.565%Floor 1.565, Cap 11.19906/01/2035 1.815% 2,872,776 2,988,1251-year CMT + 2.160%Floor 2.160%, Cap 9.632%03/01/2038 2.439% 992,727 1,053,96812-month USD LIBOR +1.851%Floor 1.851%, Cap 9.125%03/01/2040 2.274% 193,421 204,25712-month USD LIBOR +1.790%Floor 1.790%, Cap 8.632%08/01/2040 2.535% 286,921 301,23812-month USD LIBOR +1.772%Floor 1.772%, Cap 8.787%10/01/2040 2.321% 271,159 285,39612-month USD LIBOR +1.750%Floor 1.750%, Cap 8.236%08/01/2041 2.448% 475,202 500,53112-month USD LIBOR +1.610%Floor 1.610%, Cap 8.180%03/01/2047 3.180% 2,225,326 2,320,29112-month USD LIBOR +1.610%Floor 1.610%, Cap 8.099%04/01/2047 3.099% 2,036,846 2,124,902CMO Series 2005-106 Class UF1-month USD LIBOR +0.300%Floor 0.300%, Cap 7.000%11/25/2035 0.409% 614,697 616,890Freddie Mac Structured Agency Credit Risk Debt Notes(b)
CMO Series 2015-HQ2 Class M31-month USD LIBOR +3.250%05/25/2025 3.359% 1,507,011 1,530,396Government National Mortgage Association07/20/2039-10/20/2040 5.000% 4,952,772 5,667,45202/15/2040-06/15/2041 4.500% 10,977,883 12,524,41807/15/2040-11/20/2040 4.000% 4,881,627 5,393,463
Copyright © 2021 www.secdatabase.com. All Rights Reserved.Please Consider the Environment Before Printing This Document

14 CTIVP® – American Century Diversified Bond Fund | Quarterly Report 2021
PORTFOLIO OF INVESTMENTS (continued)
CTIVP® – American Century Diversified Bond Fund, March 31, 2021 (Unaudited)
09/01/2022-05/01/2039 6.500% 397,033 472,62907/01/2031-01/01/2042 5.000% 11,557,073 13,337,11104/01/2033-01/01/2039 5.500% 5,518,332 6,444,96107/01/2033-09/01/2049 4.500% 24,140,799 26,592,37212/01/2033-09/01/2037 6.000% 2,526,435 3,008,00903/01/2034-09/01/2049 3.500% 57,005,232 60,898,73910/01/2040-07/01/2049 4.000% 47,855,082 51,714,29612/01/2049-08/01/2050 3.000% 58,311,875 60,810,823
04/20/2042-03/20/2043 3.500% 12,375,171 13,430,62407/20/2046-02/20/2047 2.500% 14,371,017 14,939,459Government National Mortgage Association TBA(e)
04/21/2051 2.500% 88,700,000 91,456,28304/21/2051 3.000% 45,500,000 47,391,982Uniform Mortgage-Backed Security TBA(e)
04/14/2051 3.000% 17,450,000 18,175,606
Total Residential Mortgage-Backed Securities - Agency(Cost $445,747,850) 456,450,316
Residential Mortgage-Backed Securities - Non-Agency 13.5%
IssuerCoupon
Rate
PrincipalAmount
($) Value ($)Angel Oak Mortgage Trust(a),(c)
CMO Series 2019-5 Class M110/25/2049 3.304% 5,000,000 5,033,357Arroyo Mortgage Trust(a),(c)
CMO Series 2019-2 Class M104/25/2049 4.760% 7,000,000 7,297,052Arroyo Mortgage Trust(a)
CMO Series 2020-1 Class M103/25/2055 4.277% 2,850,000 2,994,196Bear Stearns Adjustable Rate Mortgage Trust(b)
CMO Series 2006-1 Class A11-year CMT + 2.250%Floor 2.250%, Cap 9.895%02/25/2036 2.360% 1,234,700 1,278,474Bellemeade Re Ltd.(a),(b)
CMO Series 2017-1 Class M21-month USD LIBOR +3.350%10/25/2027 3.459% 7,567,116 7,562,407CMO Series 2018-1A Class M21-month USD LIBOR +2.900%04/25/2028 3.018% 19,215,000 19,360,442CMO Series 2020-4A Class M2A1-month USD LIBOR +2.600%Floor 2.600%06/25/2030 2.709% 8,450,000 8,465,038
Residential Mortgage-Backed Securities - Non-Agency (continued)
IssuerCoupon
Rate
PrincipalAmount
($) Value ($)Eagle Re Ltd.(a),(b)
CMO Series 2018-1 Class M21-month USD LIBOR +3.000%Floor 3.000%11/25/2028 3.118% 8,130,000 8,200,856Subordinated CMO Series 2020-1 Class M1B1-month USD LIBOR +1.450%01/25/2030 1.559% 11,000,000 10,836,461Ellington Financial Mortgage Trust(a),(c)
CMO Series 2020-1 Class M106/25/2065 5.240% 3,700,000 3,996,031Subordinated CMO Series 2020-1 Class B105/25/2065 5.265% 4,962,000 5,284,798Fannie Mae Connecticut Avenue Securities(b)
1-month USD LIBOR +6.950%08/25/2028 7.059% 3,298,409 3,516,644CMO Series 14-C02 Class 1M21-month USD LIBOR +2.600%Floor 2.600%05/25/2024 2.709% 11,977,663 11,776,245CMO Series 2014-C02 Class 2M2
Copyright © 2021 www.secdatabase.com. All Rights Reserved.Please Consider the Environment Before Printing This Document
CTIVP® – American Century Diversified Bond Fund | Quarterly Report 2021 15
PORTFOLIO OF INVESTMENTS (continued)
CTIVP® – American Century Diversified Bond Fund, March 31, 2021 (Unaudited)
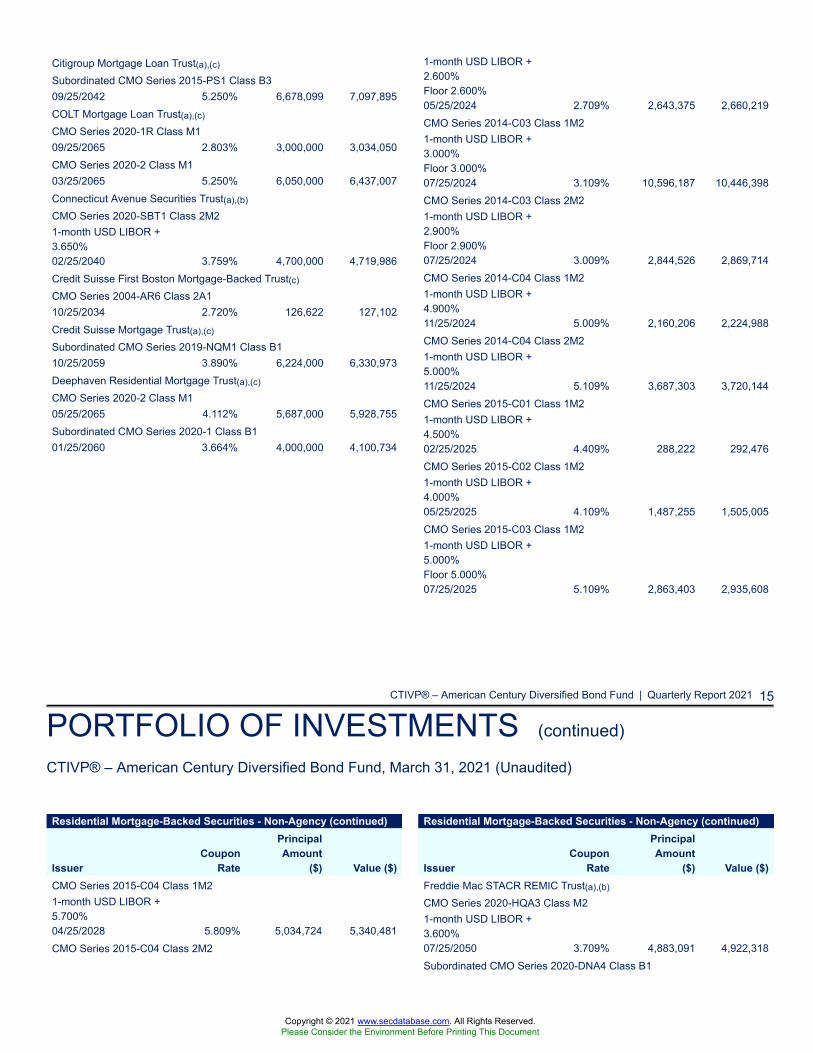
Citigroup Mortgage Loan Trust(a),(c)
Subordinated CMO Series 2015-PS1 Class B309/25/2042 5.250% 6,678,099 7,097,895COLT Mortgage Loan Trust(a),(c)
CMO Series 2020-1R Class M109/25/2065 2.803% 3,000,000 3,034,050CMO Series 2020-2 Class M103/25/2065 5.250% 6,050,000 6,437,007Connecticut Avenue Securities Trust(a),(b)
CMO Series 2020-SBT1 Class 2M21-month USD LIBOR +3.650%02/25/2040 3.759% 4,700,000 4,719,986Credit Suisse First Boston Mortgage-Backed Trust(c)
CMO Series 2004-AR6 Class 2A110/25/2034 2.720% 126,622 127,102Credit Suisse Mortgage Trust(a),(c)
Subordinated CMO Series 2019-NQM1 Class B110/25/2059 3.890% 6,224,000 6,330,973Deephaven Residential Mortgage Trust(a),(c)
CMO Series 2020-2 Class M105/25/2065 4.112% 5,687,000 5,928,755Subordinated CMO Series 2020-1 Class B101/25/2060 3.664% 4,000,000 4,100,734
1-month USD LIBOR +2.600%Floor 2.600%05/25/2024 2.709% 2,643,375 2,660,219CMO Series 2014-C03 Class 1M21-month USD LIBOR +3.000%Floor 3.000%07/25/2024 3.109% 10,596,187 10,446,398CMO Series 2014-C03 Class 2M21-month USD LIBOR +2.900%Floor 2.900%07/25/2024 3.009% 2,844,526 2,869,714CMO Series 2014-C04 Class 1M21-month USD LIBOR +4.900%11/25/2024 5.009% 2,160,206 2,224,988CMO Series 2014-C04 Class 2M21-month USD LIBOR +5.000%11/25/2024 5.109% 3,687,303 3,720,144CMO Series 2015-C01 Class 1M21-month USD LIBOR +4.500%02/25/2025 4.409% 288,222 292,476CMO Series 2015-C02 Class 1M21-month USD LIBOR +4.000%05/25/2025 4.109% 1,487,255 1,505,005CMO Series 2015-C03 Class 1M21-month USD LIBOR +5.000%Floor 5.000%07/25/2025 5.109% 2,863,403 2,935,608
Residential Mortgage-Backed Securities - Non-Agency (continued)
IssuerCoupon
Rate
PrincipalAmount
($) Value ($)CMO Series 2015-C04 Class 1M21-month USD LIBOR +5.700%04/25/2028 5.809% 5,034,724 5,340,481CMO Series 2015-C04 Class 2M2
Residential Mortgage-Backed Securities - Non-Agency (continued)
IssuerCoupon
Rate
PrincipalAmount
($) Value ($)Freddie Mac STACR REMIC Trust(a),(b)
CMO Series 2020-HQA3 Class M21-month USD LIBOR +3.600%07/25/2050 3.709% 4,883,091 4,922,318Subordinated CMO Series 2020-DNA4 Class B1
Copyright © 2021 www.secdatabase.com. All Rights Reserved.Please Consider the Environment Before Printing This Document
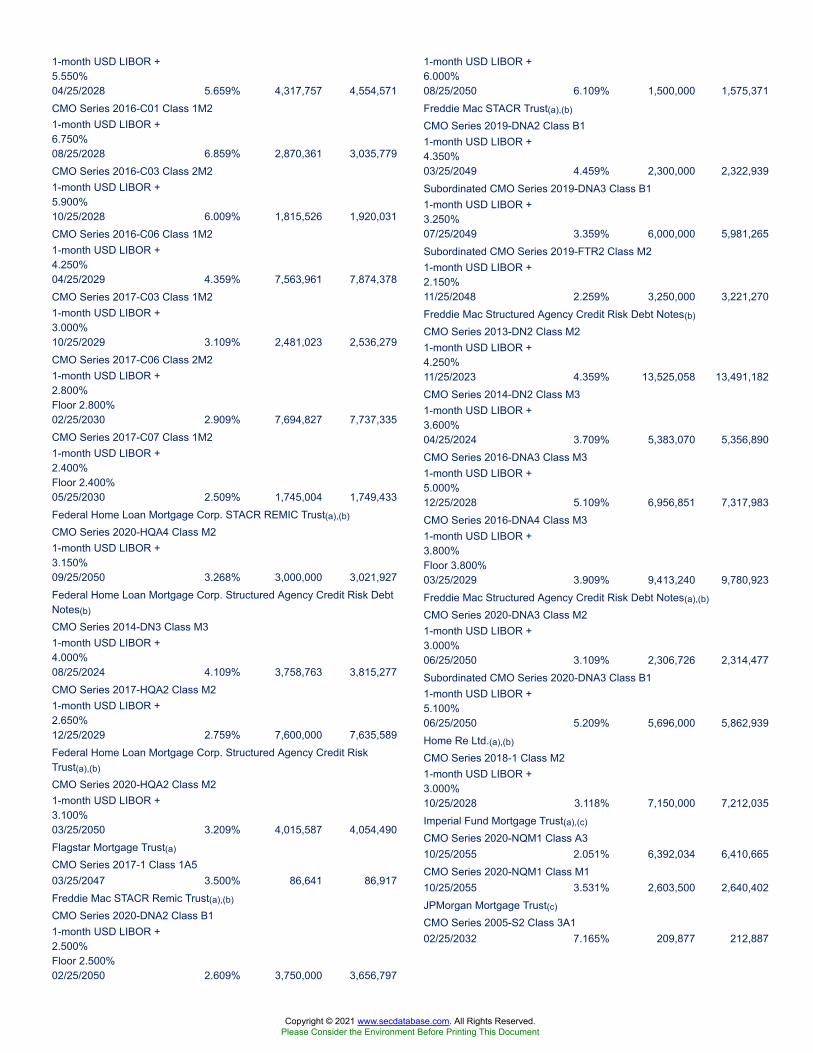
1-month USD LIBOR +5.550%04/25/2028 5.659% 4,317,757 4,554,571CMO Series 2016-C01 Class 1M21-month USD LIBOR +6.750%08/25/2028 6.859% 2,870,361 3,035,779CMO Series 2016-C03 Class 2M21-month USD LIBOR +5.900%10/25/2028 6.009% 1,815,526 1,920,031CMO Series 2016-C06 Class 1M21-month USD LIBOR +4.250%04/25/2029 4.359% 7,563,961 7,874,378CMO Series 2017-C03 Class 1M21-month USD LIBOR +3.000%10/25/2029 3.109% 2,481,023 2,536,279CMO Series 2017-C06 Class 2M21-month USD LIBOR +2.800%Floor 2.800%02/25/2030 2.909% 7,694,827 7,737,335CMO Series 2017-C07 Class 1M21-month USD LIBOR +2.400%Floor 2.400%05/25/2030 2.509% 1,745,004 1,749,433Federal Home Loan Mortgage Corp. STACR REMIC Trust(a),(b)
CMO Series 2020-HQA4 Class M21-month USD LIBOR +3.150%09/25/2050 3.268% 3,000,000 3,021,927Federal Home Loan Mortgage Corp. Structured Agency Credit Risk DebtNotes(b)
CMO Series 2014-DN3 Class M31-month USD LIBOR +4.000%08/25/2024 4.109% 3,758,763 3,815,277CMO Series 2017-HQA2 Class M21-month USD LIBOR +2.650%12/25/2029 2.759% 7,600,000 7,635,589Federal Home Loan Mortgage Corp. Structured Agency Credit RiskTrust(a),(b)
CMO Series 2020-HQA2 Class M21-month USD LIBOR +3.100%03/25/2050 3.209% 4,015,587 4,054,490Flagstar Mortgage Trust(a)
CMO Series 2017-1 Class 1A503/25/2047 3.500% 86,641 86,917Freddie Mac STACR Remic Trust(a),(b)
CMO Series 2020-DNA2 Class B11-month USD LIBOR +2.500%Floor 2.500%02/25/2050 2.609% 3,750,000 3,656,797
1-month USD LIBOR +6.000%08/25/2050 6.109% 1,500,000 1,575,371Freddie Mac STACR Trust(a),(b)
CMO Series 2019-DNA2 Class B11-month USD LIBOR +4.350%03/25/2049 4.459% 2,300,000 2,322,939Subordinated CMO Series 2019-DNA3 Class B11-month USD LIBOR +3.250%07/25/2049 3.359% 6,000,000 5,981,265Subordinated CMO Series 2019-FTR2 Class M21-month USD LIBOR +2.150%11/25/2048 2.259% 3,250,000 3,221,270Freddie Mac Structured Agency Credit Risk Debt Notes(b)
CMO Series 2013-DN2 Class M21-month USD LIBOR +4.250%11/25/2023 4.359% 13,525,058 13,491,182CMO Series 2014-DN2 Class M31-month USD LIBOR +3.600%04/25/2024 3.709% 5,383,070 5,356,890CMO Series 2016-DNA3 Class M31-month USD LIBOR +5.000%12/25/2028 5.109% 6,956,851 7,317,983CMO Series 2016-DNA4 Class M31-month USD LIBOR +3.800%Floor 3.800%03/25/2029 3.909% 9,413,240 9,780,923Freddie Mac Structured Agency Credit Risk Debt Notes(a),(b)
CMO Series 2020-DNA3 Class M21-month USD LIBOR +3.000%06/25/2050 3.109% 2,306,726 2,314,477Subordinated CMO Series 2020-DNA3 Class B11-month USD LIBOR +5.100%06/25/2050 5.209% 5,696,000 5,862,939Home Re Ltd.(a),(b)
CMO Series 2018-1 Class M21-month USD LIBOR +3.000%10/25/2028 3.118% 7,150,000 7,212,035Imperial Fund Mortgage Trust(a),(c)
CMO Series 2020-NQM1 Class A310/25/2055 2.051% 6,392,034 6,410,665CMO Series 2020-NQM1 Class M110/25/2055 3.531% 2,603,500 2,640,402JPMorgan Mortgage Trust(c)
CMO Series 2005-S2 Class 3A102/25/2032 7.165% 209,877 212,887
Copyright © 2021 www.secdatabase.com. All Rights Reserved.Please Consider the Environment Before Printing This Document
16 CTIVP® – American Century Diversified Bond Fund | Quarterly Report 2021
PORTFOLIO OF INVESTMENTS (continued)
CTIVP® – American Century Diversified Bond Fund, March 31, 2021 (Unaudited)
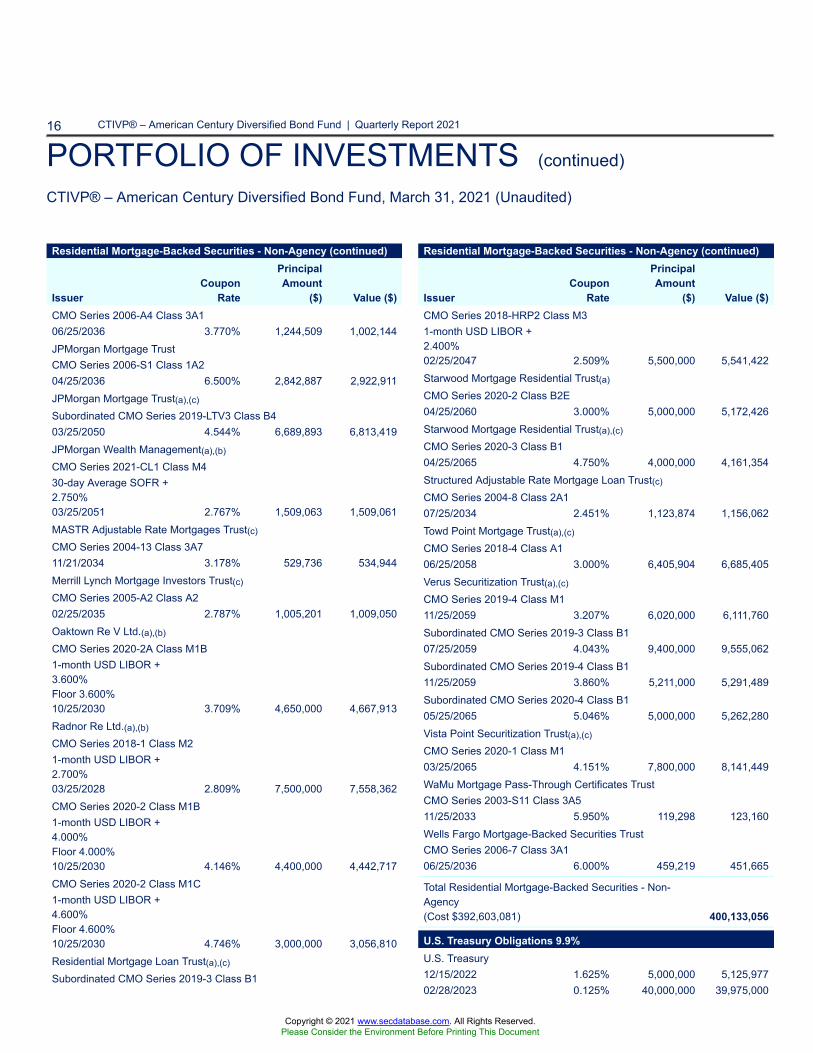
Residential Mortgage-Backed Securities - Non-Agency (continued)
IssuerCoupon
Rate
PrincipalAmount
($) Value ($)CMO Series 2006-A4 Class 3A106/25/2036 3.770% 1,244,509 1,002,144JPMorgan Mortgage TrustCMO Series 2006-S1 Class 1A204/25/2036 6.500% 2,842,887 2,922,911JPMorgan Mortgage Trust(a),(c)
Subordinated CMO Series 2019-LTV3 Class B403/25/2050 4.544% 6,689,893 6,813,419JPMorgan Wealth Management(a),(b)
CMO Series 2021-CL1 Class M430-day Average SOFR +2.750%03/25/2051 2.767% 1,509,063 1,509,061MASTR Adjustable Rate Mortgages Trust(c)
CMO Series 2004-13 Class 3A711/21/2034 3.178% 529,736 534,944Merrill Lynch Mortgage Investors Trust(c)
CMO Series 2005-A2 Class A202/25/2035 2.787% 1,005,201 1,009,050Oaktown Re V Ltd.(a),(b)
CMO Series 2020-2A Class M1B1-month USD LIBOR +3.600%Floor 3.600%10/25/2030 3.709% 4,650,000 4,667,913Radnor Re Ltd.(a),(b)
CMO Series 2018-1 Class M21-month USD LIBOR +2.700%03/25/2028 2.809% 7,500,000 7,558,362CMO Series 2020-2 Class M1B1-month USD LIBOR +4.000%Floor 4.000%10/25/2030 4.146% 4,400,000 4,442,717CMO Series 2020-2 Class M1C1-month USD LIBOR +4.600%Floor 4.600%10/25/2030 4.746% 3,000,000 3,056,810Residential Mortgage Loan Trust(a),(c)
Subordinated CMO Series 2019-3 Class B1
Residential Mortgage-Backed Securities - Non-Agency (continued)
IssuerCoupon
Rate
PrincipalAmount
($) Value ($)CMO Series 2018-HRP2 Class M31-month USD LIBOR +2.400%02/25/2047 2.509% 5,500,000 5,541,422Starwood Mortgage Residential Trust(a)
CMO Series 2020-2 Class B2E04/25/2060 3.000% 5,000,000 5,172,426Starwood Mortgage Residential Trust(a),(c)
CMO Series 2020-3 Class B104/25/2065 4.750% 4,000,000 4,161,354Structured Adjustable Rate Mortgage Loan Trust(c)
CMO Series 2004-8 Class 2A107/25/2034 2.451% 1,123,874 1,156,062Towd Point Mortgage Trust(a),(c)
CMO Series 2018-4 Class A106/25/2058 3.000% 6,405,904 6,685,405Verus Securitization Trust(a),(c)
CMO Series 2019-4 Class M111/25/2059 3.207% 6,020,000 6,111,760Subordinated CMO Series 2019-3 Class B107/25/2059 4.043% 9,400,000 9,555,062Subordinated CMO Series 2019-4 Class B111/25/2059 3.860% 5,211,000 5,291,489Subordinated CMO Series 2020-4 Class B105/25/2065 5.046% 5,000,000 5,262,280Vista Point Securitization Trust(a),(c)
CMO Series 2020-1 Class M103/25/2065 4.151% 7,800,000 8,141,449WaMu Mortgage Pass-Through Certificates TrustCMO Series 2003-S11 Class 3A511/25/2033 5.950% 119,298 123,160Wells Fargo Mortgage-Backed Securities TrustCMO Series 2006-7 Class 3A106/25/2036 6.000% 459,219 451,665
Total Residential Mortgage-Backed Securities - Non-Agency(Cost $392,603,081) 400,133,056
U.S. Treasury Obligations 9.9%U.S. Treasury12/15/2022 1.625% 5,000,000 5,125,97702/28/2023 0.125% 40,000,000 39,975,000
Copyright © 2021 www.secdatabase.com. All Rights Reserved.Please Consider the Environment Before Printing This Document
CTIVP® – American Century Diversified Bond Fund | Quarterly Report 2021 17
PORTFOLIO OF INVESTMENTS (continued)
CTIVP® – American Century Diversified Bond Fund, March 31, 2021 (Unaudited)
At March 31, 2021, securities and/or cash totaling $8,406,064 were pledged as collateral.
Investments in derivatives
Forward foreign currency exchange contracts
Currency tobe sold
Currency tobe purchased Counterparty
Settlementdate
Unrealizedappreciation
($)
Unrealizeddepreciation
($)
8,340,023 AUD 6,493,167 USD Goldman Sachs 06/16/2021 156,484 —32,598,206 BRL 5,836,220 USD Goldman Sachs 06/16/2021 74,407 —5,342,509 CHF 5,797,119 USD Goldman Sachs 06/16/2021 133,205 —
2,100,495,288 CLP 2,931,933 USD Goldman Sachs 06/16/2021 15,019 —
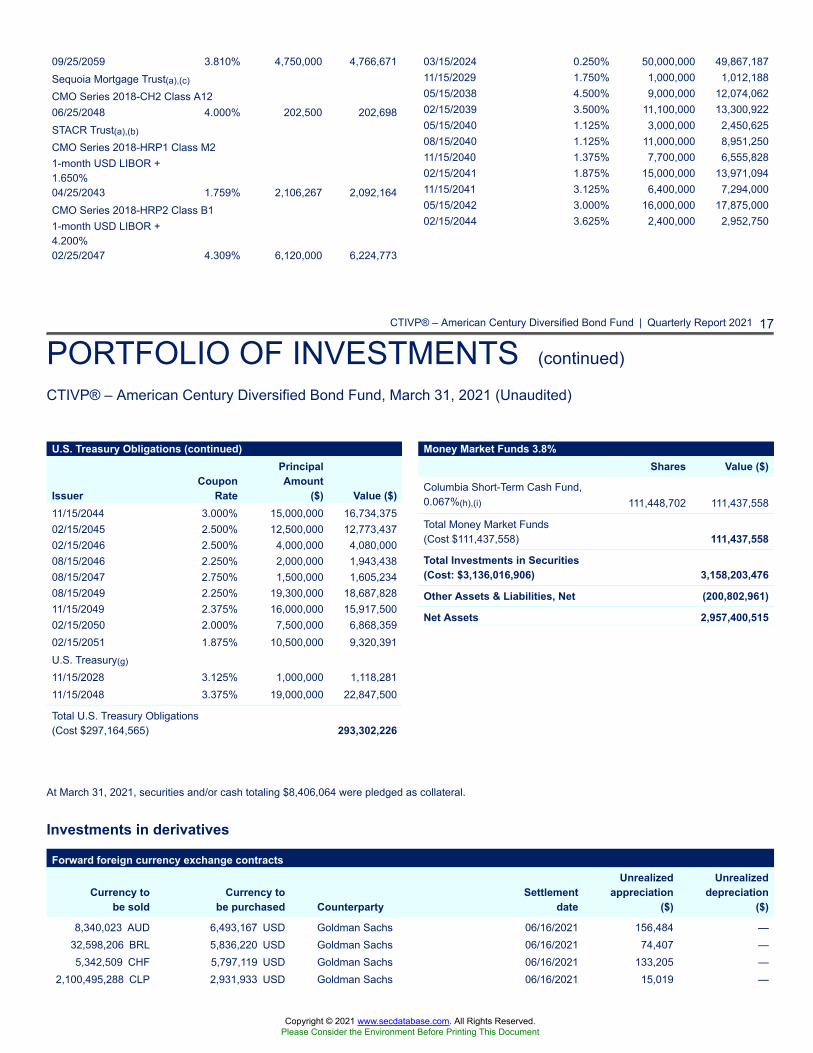
09/25/2059 3.810% 4,750,000 4,766,671Sequoia Mortgage Trust(a),(c)
CMO Series 2018-CH2 Class A1206/25/2048 4.000% 202,500 202,698STACR Trust(a),(b)
CMO Series 2018-HRP1 Class M21-month USD LIBOR +1.650%04/25/2043 1.759% 2,106,267 2,092,164CMO Series 2018-HRP2 Class B11-month USD LIBOR +4.200%02/25/2047 4.309% 6,120,000 6,224,773
03/15/2024 0.250% 50,000,000 49,867,18711/15/2029 1.750% 1,000,000 1,012,18805/15/2038 4.500% 9,000,000 12,074,06202/15/2039 3.500% 11,100,000 13,300,92205/15/2040 1.125% 3,000,000 2,450,62508/15/2040 1.125% 11,000,000 8,951,25011/15/2040 1.375% 7,700,000 6,555,82802/15/2041 1.875% 15,000,000 13,971,09411/15/2041 3.125% 6,400,000 7,294,00005/15/2042 3.000% 16,000,000 17,875,00002/15/2044 3.625% 2,400,000 2,952,750
U.S. Treasury Obligations (continued)
IssuerCoupon
Rate
PrincipalAmount
($) Value ($)11/15/2044 3.000% 15,000,000 16,734,37502/15/2045 2.500% 12,500,000 12,773,43702/15/2046 2.500% 4,000,000 4,080,00008/15/2046 2.250% 2,000,000 1,943,43808/15/2047 2.750% 1,500,000 1,605,23408/15/2049 2.250% 19,300,000 18,687,82811/15/2049 2.375% 16,000,000 15,917,50002/15/2050 2.000% 7,500,000 6,868,35902/15/2051 1.875% 10,500,000 9,320,391U.S. Treasury(g)
11/15/2028 3.125% 1,000,000 1,118,28111/15/2048 3.375% 19,000,000 22,847,500
Total U.S. Treasury Obligations(Cost $297,164,565) 293,302,226
Money Market Funds 3.8%Shares Value ($)
Columbia Short-Term Cash Fund,0.067%(h),(i) 111,448,702 111,437,558
Total Money Market Funds(Cost $111,437,558) 111,437,558
Total Investments in Securities(Cost: $3,136,016,906) 3,158,203,476
Other Assets & Liabilities, Net (200,802,961)
Net Assets 2,957,400,515
Copyright © 2021 www.secdatabase.com. All Rights Reserved.Please Consider the Environment Before Printing This Document
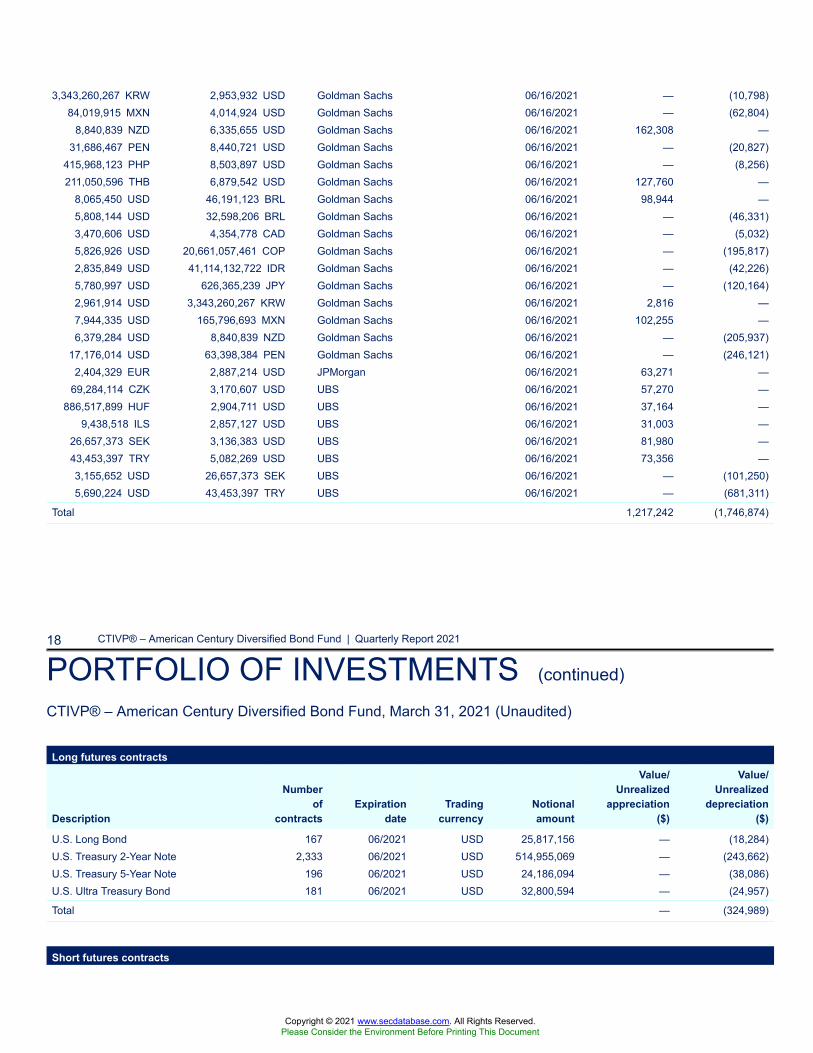
3,343,260,267 KRW 2,953,932 USD Goldman Sachs 06/16/2021 — (10,798)84,019,915 MXN 4,014,924 USD Goldman Sachs 06/16/2021 — (62,804)
8,840,839 NZD 6,335,655 USD Goldman Sachs 06/16/2021 162,308 —31,686,467 PEN 8,440,721 USD Goldman Sachs 06/16/2021 — (20,827)
415,968,123 PHP 8,503,897 USD Goldman Sachs 06/16/2021 — (8,256)211,050,596 THB 6,879,542 USD Goldman Sachs 06/16/2021 127,760 —
8,065,450 USD 46,191,123 BRL Goldman Sachs 06/16/2021 98,944 —5,808,144 USD 32,598,206 BRL Goldman Sachs 06/16/2021 — (46,331)3,470,606 USD 4,354,778 CAD Goldman Sachs 06/16/2021 — (5,032)5,826,926 USD 20,661,057,461 COP Goldman Sachs 06/16/2021 — (195,817)2,835,849 USD 41,114,132,722 IDR Goldman Sachs 06/16/2021 — (42,226)5,780,997 USD 626,365,239 JPY Goldman Sachs 06/16/2021 — (120,164)2,961,914 USD 3,343,260,267 KRW Goldman Sachs 06/16/2021 2,816 —7,944,335 USD 165,796,693 MXN Goldman Sachs 06/16/2021 102,255 —6,379,284 USD 8,840,839 NZD Goldman Sachs 06/16/2021 — (205,937)
17,176,014 USD 63,398,384 PEN Goldman Sachs 06/16/2021 — (246,121)2,404,329 EUR 2,887,214 USD JPMorgan 06/16/2021 63,271 —
69,284,114 CZK 3,170,607 USD UBS 06/16/2021 57,270 —886,517,899 HUF 2,904,711 USD UBS 06/16/2021 37,164 —
9,438,518 ILS 2,857,127 USD UBS 06/16/2021 31,003 —26,657,373 SEK 3,136,383 USD UBS 06/16/2021 81,980 —43,453,397 TRY 5,082,269 USD UBS 06/16/2021 73,356 —3,155,652 USD 26,657,373 SEK UBS 06/16/2021 — (101,250)5,690,224 USD 43,453,397 TRY UBS 06/16/2021 — (681,311)
Total 1,217,242 (1,746,874)
18 CTIVP® – American Century Diversified Bond Fund | Quarterly Report 2021
PORTFOLIO OF INVESTMENTS (continued)
CTIVP® – American Century Diversified Bond Fund, March 31, 2021 (Unaudited)
Long futures contracts
Description
Numberof
contractsExpiration
dateTrading
currencyNotionalamount
Value/Unrealized
appreciation($)
Value/Unrealized
depreciation($)
U.S. Long Bond 167 06/2021 USD 25,817,156 — (18,284)U.S. Treasury 2-Year Note 2,333 06/2021 USD 514,955,069 — (243,662)U.S. Treasury 5-Year Note 196 06/2021 USD 24,186,094 — (38,086)U.S. Ultra Treasury Bond 181 06/2021 USD 32,800,594 — (24,957)
Total — (324,989)
Short futures contracts
Copyright © 2021 www.secdatabase.com. All Rights Reserved.Please Consider the Environment Before Printing This Document
Description
Numberof
contractsExpiration
dateTrading
currencyNotionalamount
Value/Unrealized
appreciation($)
Value/Unrealized
depreciation($)
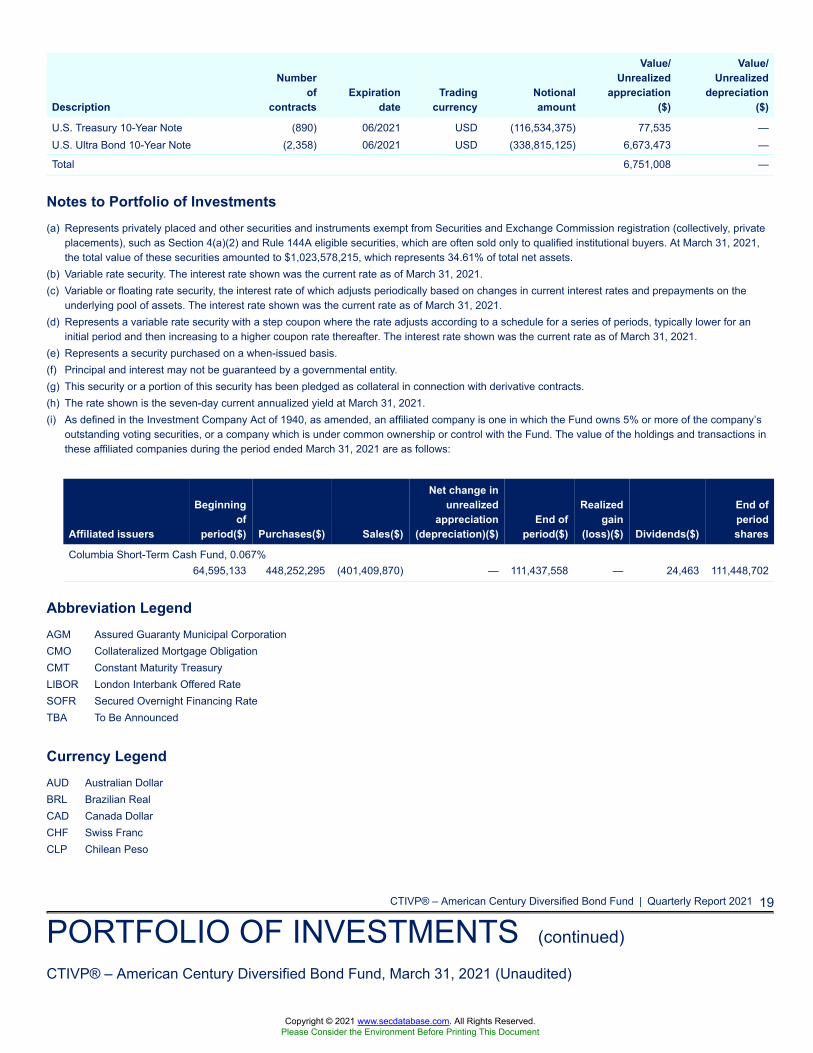
U.S. Treasury 10-Year Note (890) 06/2021 USD (116,534,375) 77,535 —U.S. Ultra Bond 10-Year Note (2,358) 06/2021 USD (338,815,125) 6,673,473 —
Total 6,751,008 —
Notes to Portfolio of Investments(a) Represents privately placed and other securities and instruments exempt from Securities and Exchange Commission registration (collectively, private
placements), such as Section 4(a)(2) and Rule 144A eligible securities, which are often sold only to qualified institutional buyers. At March 31, 2021,the total value of these securities amounted to $1,023,578,215, which represents 34.61% of total net assets.
(b) Variable rate security. The interest rate shown was the current rate as of March 31, 2021.(c) Variable or floating rate security, the interest rate of which adjusts periodically based on changes in current interest rates and prepayments on the
underlying pool of assets. The interest rate shown was the current rate as of March 31, 2021.(d) Represents a variable rate security with a step coupon where the rate adjusts according to a schedule for a series of periods, typically lower for an
initial period and then increasing to a higher coupon rate thereafter. The interest rate shown was the current rate as of March 31, 2021.(e) Represents a security purchased on a when-issued basis.(f) Principal and interest may not be guaranteed by a governmental entity.(g) This security or a portion of this security has been pledged as collateral in connection with derivative contracts.(h) The rate shown is the seven-day current annualized yield at March 31, 2021.(i) As defined in the Investment Company Act of 1940, as amended, an affiliated company is one in which the Fund owns 5% or more of the company’s
outstanding voting securities, or a company which is under common ownership or control with the Fund. The value of the holdings and transactions inthese affiliated companies during the period ended March 31, 2021 are as follows:
Affiliated issuers
Beginningof
period($) Purchases($) Sales($)
Net change inunrealized
appreciation(depreciation)($)
End ofperiod($)
Realizedgain
(loss)($) Dividends($)
End ofperiodshares
Columbia Short-Term Cash Fund, 0.067%64,595,133 448,252,295 (401,409,870) — 111,437,558 — 24,463 111,448,702
Abbreviation LegendAGM Assured Guaranty Municipal CorporationCMO Collateralized Mortgage ObligationCMT Constant Maturity TreasuryLIBOR London Interbank Offered RateSOFR Secured Overnight Financing RateTBA To Be Announced
Currency LegendAUD Australian DollarBRL Brazilian RealCAD Canada DollarCHF Swiss FrancCLP Chilean Peso
CTIVP® – American Century Diversified Bond Fund | Quarterly Report 2021 19
PORTFOLIO OF INVESTMENTS (continued)
CTIVP® – American Century Diversified Bond Fund, March 31, 2021 (Unaudited)
Copyright © 2021 www.secdatabase.com. All Rights Reserved.Please Consider the Environment Before Printing This Document
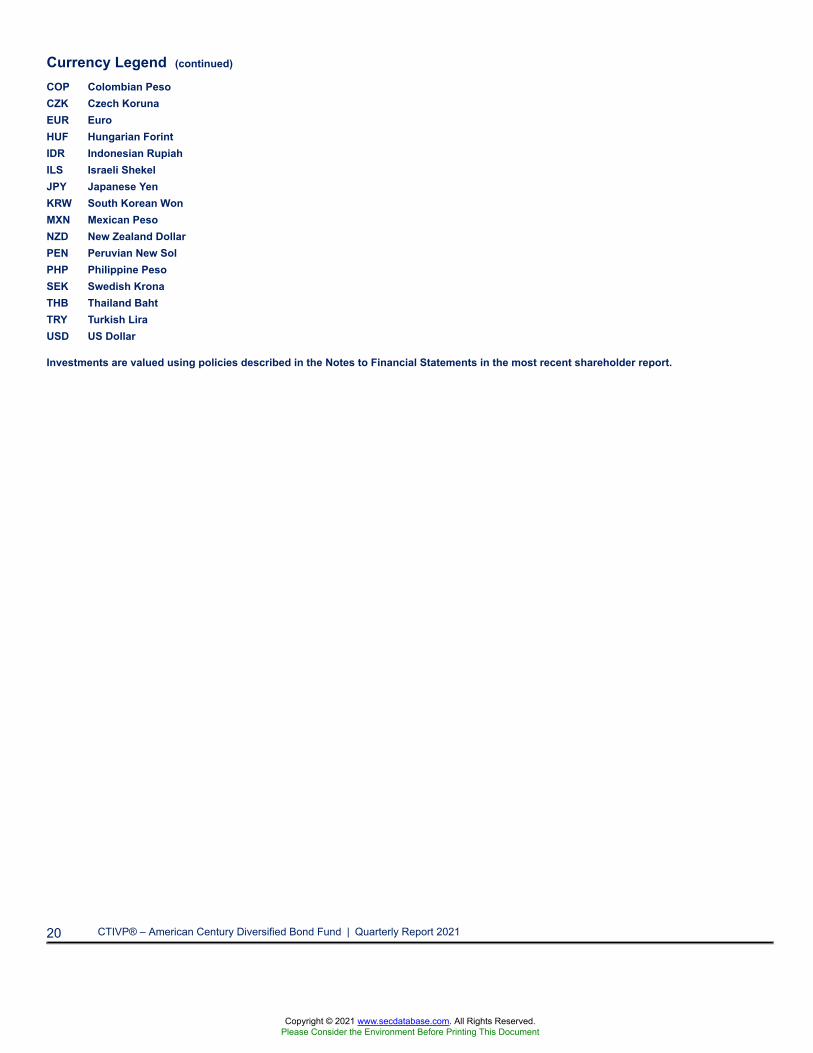
Currency Legend (continued)
COP Colombian PesoCZK Czech KorunaEUR EuroHUF Hungarian ForintIDR Indonesian RupiahILS Israeli ShekelJPY Japanese YenKRW South Korean WonMXN Mexican PesoNZD New Zealand DollarPEN Peruvian New SolPHP Philippine PesoSEK Swedish KronaTHB Thailand BahtTRY Turkish LiraUSD US Dollar
Investments are valued using policies described in the Notes to Financial Statements in the most recent shareholder report.
20 CTIVP® – American Century Diversified Bond Fund | Quarterly Report 2021
Copyright © 2021 www.secdatabase.com. All Rights Reserved.Please Consider the Environment Before Printing This Document
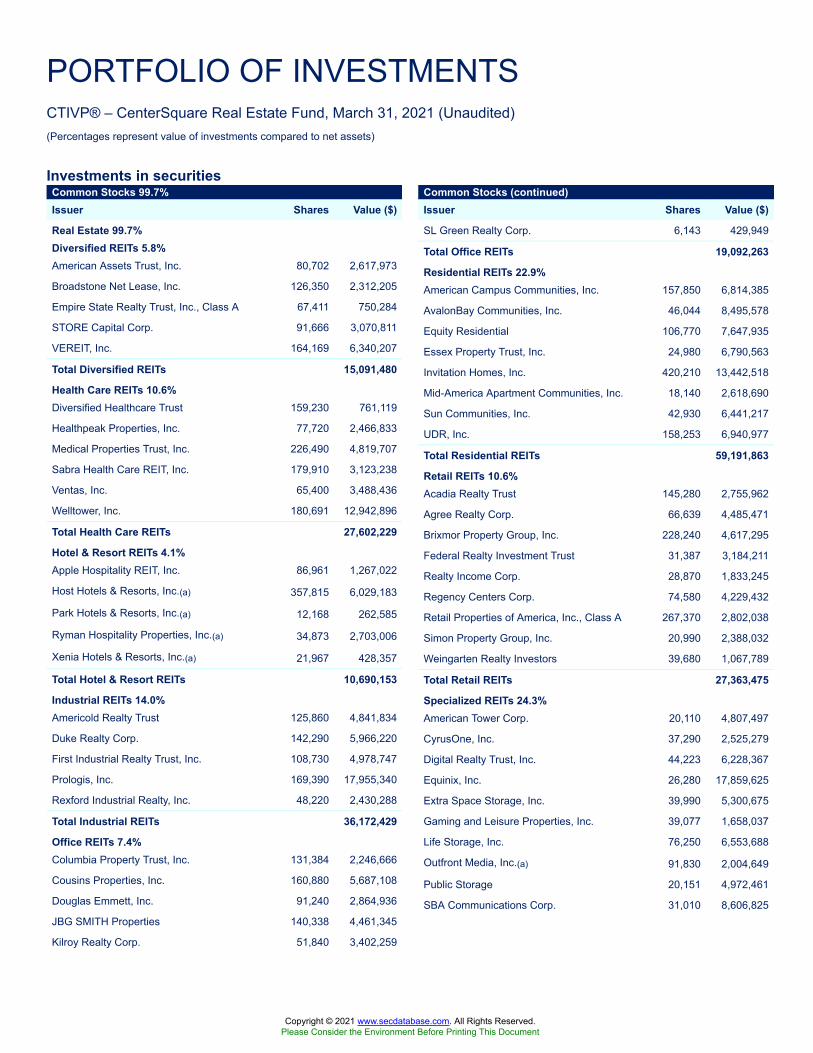
PORTFOLIO OF INVESTMENTSCTIVP® – CenterSquare Real Estate Fund, March 31, 2021 (Unaudited)(Percentages represent value of investments compared to net assets)
Investments in securitiesCommon Stocks 99.7%Issuer Shares Value ($)
Real Estate 99.7%Diversified REITs 5.8%American Assets Trust, Inc. 80,702 2,617,973
Broadstone Net Lease, Inc. 126,350 2,312,205
Empire State Realty Trust, Inc., Class A 67,411 750,284
STORE Capital Corp. 91,666 3,070,811
VEREIT, Inc. 164,169 6,340,207
Total Diversified REITs 15,091,480
Health Care REITs 10.6%Diversified Healthcare Trust 159,230 761,119
Healthpeak Properties, Inc. 77,720 2,466,833
Medical Properties Trust, Inc. 226,490 4,819,707
Sabra Health Care REIT, Inc. 179,910 3,123,238
Ventas, Inc. 65,400 3,488,436
Welltower, Inc. 180,691 12,942,896
Total Health Care REITs 27,602,229
Hotel & Resort REITs 4.1%Apple Hospitality REIT, Inc. 86,961 1,267,022
Host Hotels & Resorts, Inc.(a) 357,815 6,029,183
Park Hotels & Resorts, Inc.(a) 12,168 262,585
Ryman Hospitality Properties, Inc.(a) 34,873 2,703,006
Xenia Hotels & Resorts, Inc.(a) 21,967 428,357
Total Hotel & Resort REITs 10,690,153
Industrial REITs 14.0%Americold Realty Trust 125,860 4,841,834
Duke Realty Corp. 142,290 5,966,220
First Industrial Realty Trust, Inc. 108,730 4,978,747
Prologis, Inc. 169,390 17,955,340
Rexford Industrial Realty, Inc. 48,220 2,430,288
Total Industrial REITs 36,172,429
Office REITs 7.4%Columbia Property Trust, Inc. 131,384 2,246,666
Cousins Properties, Inc. 160,880 5,687,108
Douglas Emmett, Inc. 91,240 2,864,936
JBG SMITH Properties 140,338 4,461,345
Kilroy Realty Corp. 51,840 3,402,259
Common Stocks (continued)Issuer Shares Value ($)
SL Green Realty Corp. 6,143 429,949
Total Office REITs 19,092,263
Residential REITs 22.9%American Campus Communities, Inc. 157,850 6,814,385
AvalonBay Communities, Inc. 46,044 8,495,578
Equity Residential 106,770 7,647,935
Essex Property Trust, Inc. 24,980 6,790,563
Invitation Homes, Inc. 420,210 13,442,518
Mid-America Apartment Communities, Inc. 18,140 2,618,690
Sun Communities, Inc. 42,930 6,441,217
UDR, Inc. 158,253 6,940,977
Total Residential REITs 59,191,863
Retail REITs 10.6%Acadia Realty Trust 145,280 2,755,962
Agree Realty Corp. 66,639 4,485,471
Brixmor Property Group, Inc. 228,240 4,617,295
Federal Realty Investment Trust 31,387 3,184,211
Realty Income Corp. 28,870 1,833,245
Regency Centers Corp. 74,580 4,229,432
Retail Properties of America, Inc., Class A 267,370 2,802,038
Simon Property Group, Inc. 20,990 2,388,032
Weingarten Realty Investors 39,680 1,067,789
Total Retail REITs 27,363,475
Specialized REITs 24.3%American Tower Corp. 20,110 4,807,497
CyrusOne, Inc. 37,290 2,525,279
Digital Realty Trust, Inc. 44,223 6,228,367
Equinix, Inc. 26,280 17,859,625
Extra Space Storage, Inc. 39,990 5,300,675
Gaming and Leisure Properties, Inc. 39,077 1,658,037
Life Storage, Inc. 76,250 6,553,688
Outfront Media, Inc.(a) 91,830 2,004,649
Public Storage 20,151 4,972,461
SBA Communications Corp. 31,010 8,606,825
Copyright © 2021 www.secdatabase.com. All Rights Reserved.Please Consider the Environment Before Printing This Document
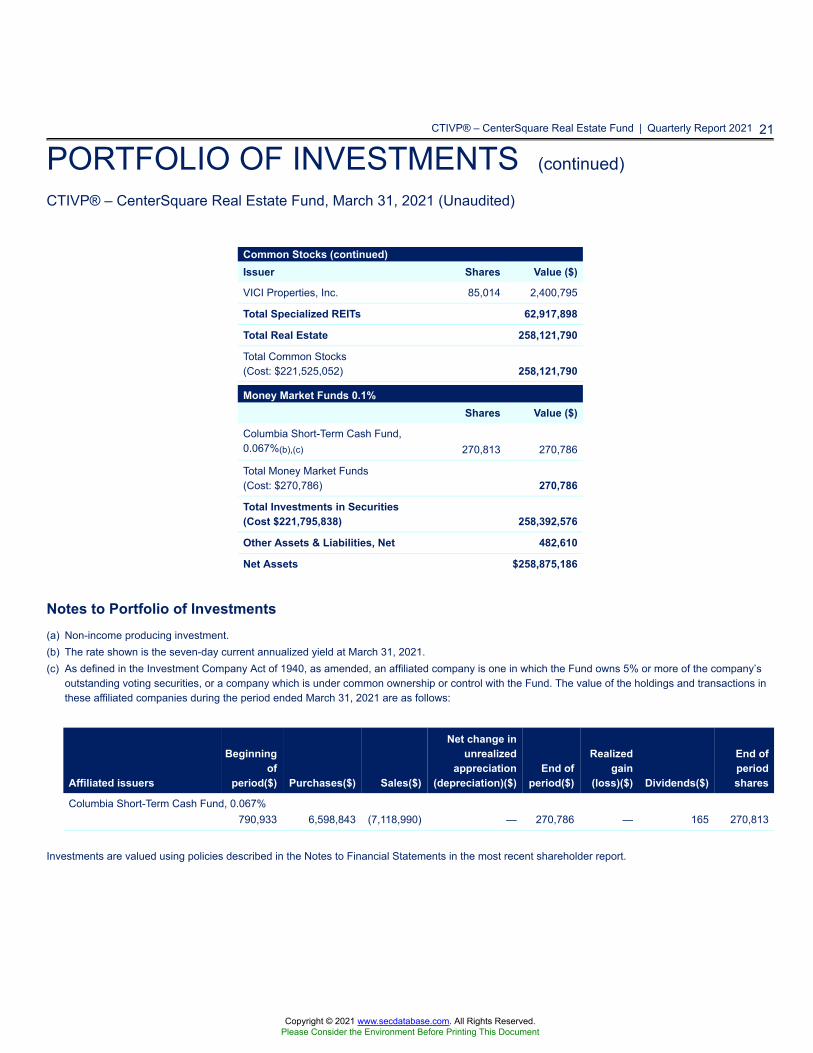
CTIVP® – CenterSquare Real Estate Fund | Quarterly Report 2021 21
PORTFOLIO OF INVESTMENTS (continued)
CTIVP® – CenterSquare Real Estate Fund, March 31, 2021 (Unaudited)
Common Stocks (continued)Issuer Shares Value ($)
VICI Properties, Inc. 85,014 2,400,795
Total Specialized REITs 62,917,898
Total Real Estate 258,121,790
Total Common Stocks(Cost: $221,525,052) 258,121,790
Money Market Funds 0.1%Shares Value ($)
Columbia Short-Term Cash Fund,0.067%(b),(c) 270,813 270,786
Total Money Market Funds(Cost: $270,786) 270,786
Total Investments in Securities(Cost $221,795,838) 258,392,576
Other Assets & Liabilities, Net 482,610
Net Assets $258,875,186
Notes to Portfolio of Investments(a) Non-income producing investment.(b) The rate shown is the seven-day current annualized yield at March 31, 2021.(c) As defined in the Investment Company Act of 1940, as amended, an affiliated company is one in which the Fund owns 5% or more of the company’s
outstanding voting securities, or a company which is under common ownership or control with the Fund. The value of the holdings and transactions inthese affiliated companies during the period ended March 31, 2021 are as follows:
Affiliated issuers
Beginningof
period($) Purchases($) Sales($)
Net change inunrealized
appreciation(depreciation)($)
End ofperiod($)
Realizedgain
(loss)($) Dividends($)
End ofperiodshares
Columbia Short-Term Cash Fund, 0.067%790,933 6,598,843 (7,118,990) — 270,786 — 165 270,813
Investments are valued using policies described in the Notes to Financial Statements in the most recent shareholder report.
Copyright © 2021 www.secdatabase.com. All Rights Reserved.Please Consider the Environment Before Printing This Document
22 CTIVP® – CenterSquare Real Estate Fund | Quarterly Report 2021
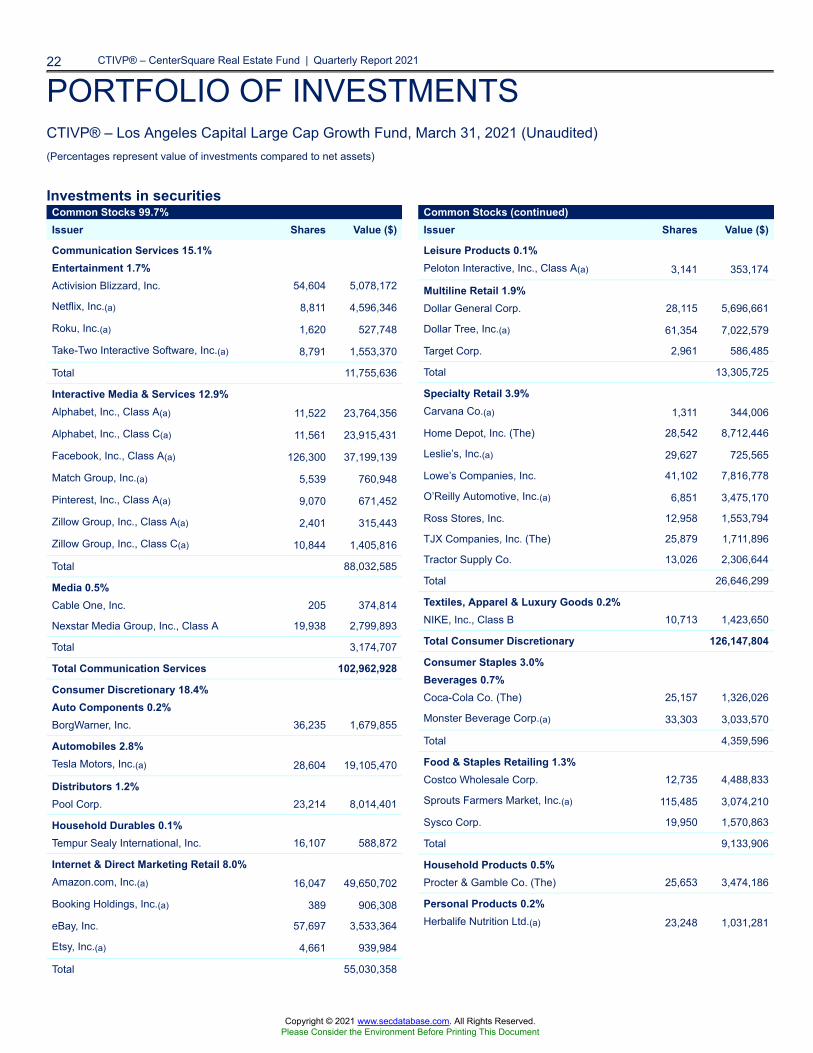
PORTFOLIO OF INVESTMENTSCTIVP® – Los Angeles Capital Large Cap Growth Fund, March 31, 2021 (Unaudited)(Percentages represent value of investments compared to net assets)
Investments in securitiesCommon Stocks 99.7%Issuer Shares Value ($)
Communication Services 15.1%Entertainment 1.7%Activision Blizzard, Inc. 54,604 5,078,172
Netflix, Inc.(a) 8,811 4,596,346
Roku, Inc.(a) 1,620 527,748
Take-Two Interactive Software, Inc.(a) 8,791 1,553,370
Total 11,755,636
Interactive Media & Services 12.9%Alphabet, Inc., Class A(a) 11,522 23,764,356
Alphabet, Inc., Class C(a) 11,561 23,915,431
Facebook, Inc., Class A(a) 126,300 37,199,139
Match Group, Inc.(a) 5,539 760,948
Pinterest, Inc., Class A(a) 9,070 671,452
Zillow Group, Inc., Class A(a) 2,401 315,443
Zillow Group, Inc., Class C(a) 10,844 1,405,816
Total 88,032,585
Media 0.5%Cable One, Inc. 205 374,814
Nexstar Media Group, Inc., Class A 19,938 2,799,893
Total 3,174,707
Total Communication Services 102,962,928
Consumer Discretionary 18.4%Auto Components 0.2%BorgWarner, Inc. 36,235 1,679,855
Automobiles 2.8%Tesla Motors, Inc.(a) 28,604 19,105,470
Distributors 1.2%Pool Corp. 23,214 8,014,401
Household Durables 0.1%Tempur Sealy International, Inc. 16,107 588,872
Internet & Direct Marketing Retail 8.0%Amazon.com, Inc.(a) 16,047 49,650,702
Booking Holdings, Inc.(a) 389 906,308
eBay, Inc. 57,697 3,533,364
Etsy, Inc.(a) 4,661 939,984
Total 55,030,358
Common Stocks (continued)Issuer Shares Value ($)
Leisure Products 0.1%Peloton Interactive, Inc., Class A(a) 3,141 353,174
Multiline Retail 1.9%Dollar General Corp. 28,115 5,696,661
Dollar Tree, Inc.(a) 61,354 7,022,579
Target Corp. 2,961 586,485
Total 13,305,725
Specialty Retail 3.9%Carvana Co.(a) 1,311 344,006
Home Depot, Inc. (The) 28,542 8,712,446
Leslie’s, Inc.(a) 29,627 725,565
Lowe’s Companies, Inc. 41,102 7,816,778
O’Reilly Automotive, Inc.(a) 6,851 3,475,170
Ross Stores, Inc. 12,958 1,553,794
TJX Companies, Inc. (The) 25,879 1,711,896
Tractor Supply Co. 13,026 2,306,644
Total 26,646,299
Textiles, Apparel & Luxury Goods 0.2%NIKE, Inc., Class B 10,713 1,423,650
Total Consumer Discretionary 126,147,804
Consumer Staples 3.0%Beverages 0.7%Coca-Cola Co. (The) 25,157 1,326,026
Monster Beverage Corp.(a) 33,303 3,033,570
Total 4,359,596
Food & Staples Retailing 1.3%Costco Wholesale Corp. 12,735 4,488,833
Sprouts Farmers Market, Inc.(a) 115,485 3,074,210
Sysco Corp. 19,950 1,570,863
Total 9,133,906
Household Products 0.5%Procter & Gamble Co. (The) 25,653 3,474,186
Personal Products 0.2%Herbalife Nutrition Ltd.(a) 23,248 1,031,281
Copyright © 2021 www.secdatabase.com. All Rights Reserved.Please Consider the Environment Before Printing This Document
CTIVP® – Los Angeles Capital Large Cap Growth Fund | Quarterly Report 2021 23
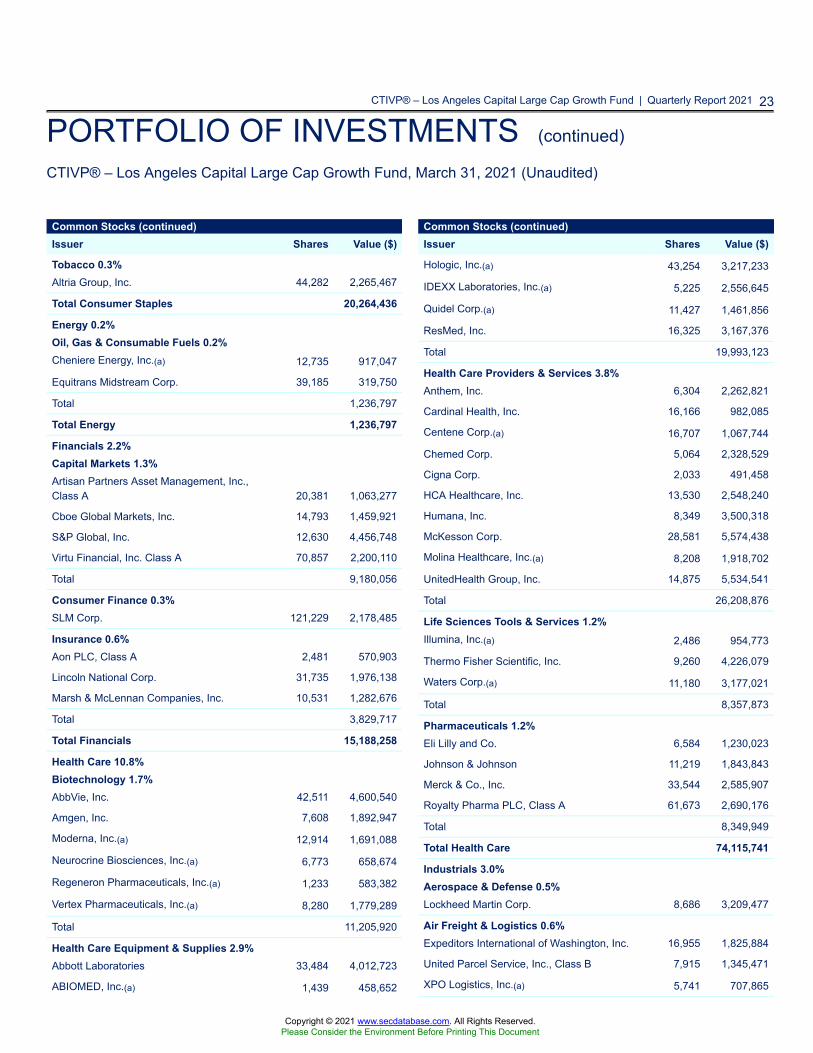
PORTFOLIO OF INVESTMENTS (continued)
CTIVP® – Los Angeles Capital Large Cap Growth Fund, March 31, 2021 (Unaudited)
Common Stocks (continued)Issuer Shares Value ($)
Tobacco 0.3%Altria Group, Inc. 44,282 2,265,467
Total Consumer Staples 20,264,436
Energy 0.2%Oil, Gas & Consumable Fuels 0.2%Cheniere Energy, Inc.(a) 12,735 917,047
Equitrans Midstream Corp. 39,185 319,750
Total 1,236,797
Total Energy 1,236,797
Financials 2.2%Capital Markets 1.3%Artisan Partners Asset Management, Inc.,Class A 20,381 1,063,277
Cboe Global Markets, Inc. 14,793 1,459,921
S&P Global, Inc. 12,630 4,456,748
Virtu Financial, Inc. Class A 70,857 2,200,110
Total 9,180,056
Consumer Finance 0.3%SLM Corp. 121,229 2,178,485
Insurance 0.6%Aon PLC, Class A 2,481 570,903
Lincoln National Corp. 31,735 1,976,138
Marsh & McLennan Companies, Inc. 10,531 1,282,676
Total 3,829,717
Total Financials 15,188,258
Health Care 10.8%Biotechnology 1.7%AbbVie, Inc. 42,511 4,600,540
Amgen, Inc. 7,608 1,892,947
Moderna, Inc.(a) 12,914 1,691,088
Neurocrine Biosciences, Inc.(a) 6,773 658,674
Regeneron Pharmaceuticals, Inc.(a) 1,233 583,382
Vertex Pharmaceuticals, Inc.(a) 8,280 1,779,289
Total 11,205,920
Health Care Equipment & Supplies 2.9%Abbott Laboratories 33,484 4,012,723
ABIOMED, Inc.(a) 1,439 458,652
Common Stocks (continued)Issuer Shares Value ($)
Hologic, Inc.(a) 43,254 3,217,233
IDEXX Laboratories, Inc.(a) 5,225 2,556,645
Quidel Corp.(a) 11,427 1,461,856
ResMed, Inc. 16,325 3,167,376
Total 19,993,123
Health Care Providers & Services 3.8%Anthem, Inc. 6,304 2,262,821
Cardinal Health, Inc. 16,166 982,085
Centene Corp.(a) 16,707 1,067,744
Chemed Corp. 5,064 2,328,529
Cigna Corp. 2,033 491,458
HCA Healthcare, Inc. 13,530 2,548,240
Humana, Inc. 8,349 3,500,318
McKesson Corp. 28,581 5,574,438
Molina Healthcare, Inc.(a) 8,208 1,918,702
UnitedHealth Group, Inc. 14,875 5,534,541
Total 26,208,876
Life Sciences Tools & Services 1.2%Illumina, Inc.(a) 2,486 954,773
Thermo Fisher Scientific, Inc. 9,260 4,226,079
Waters Corp.(a) 11,180 3,177,021
Total 8,357,873
Pharmaceuticals 1.2%Eli Lilly and Co. 6,584 1,230,023
Johnson & Johnson 11,219 1,843,843
Merck & Co., Inc. 33,544 2,585,907
Royalty Pharma PLC, Class A 61,673 2,690,176
Total 8,349,949
Total Health Care 74,115,741
Industrials 3.0%Aerospace & Defense 0.5%Lockheed Martin Corp. 8,686 3,209,477
Air Freight & Logistics 0.6%Expeditors International of Washington, Inc. 16,955 1,825,884
United Parcel Service, Inc., Class B 7,915 1,345,471
XPO Logistics, Inc.(a) 5,741 707,865
Copyright © 2021 www.secdatabase.com. All Rights Reserved.Please Consider the Environment Before Printing This Document
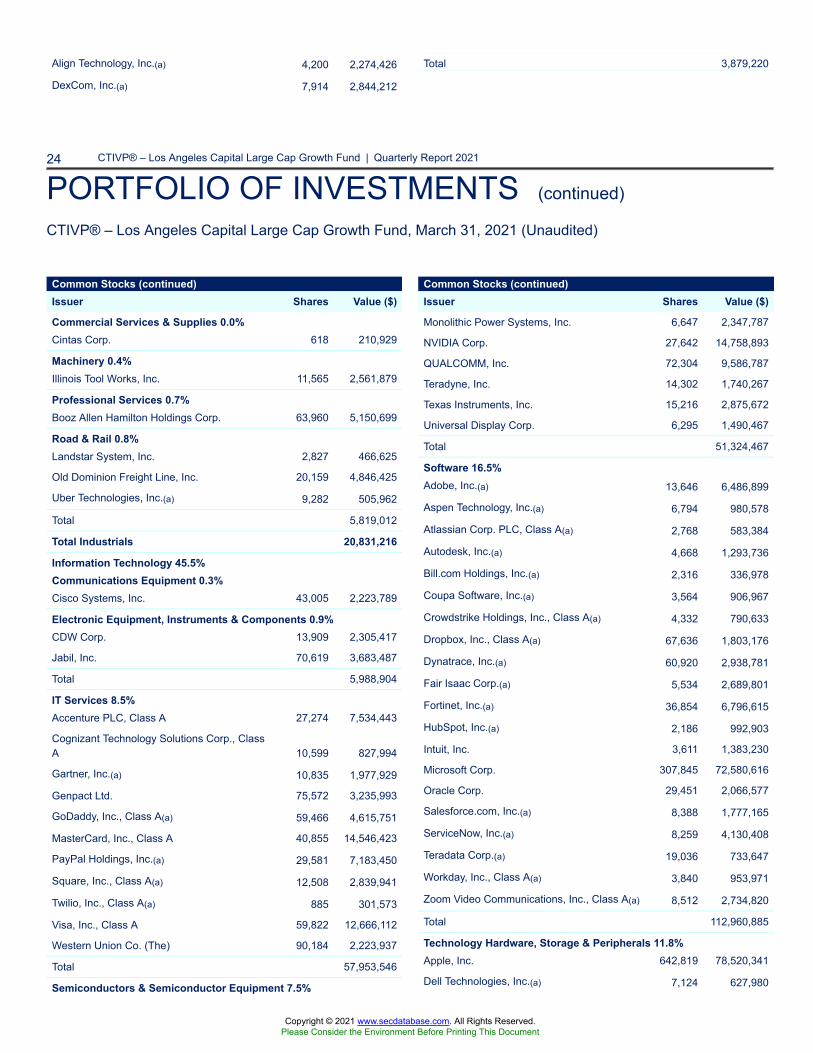
24 CTIVP® – Los Angeles Capital Large Cap Growth Fund | Quarterly Report 2021
PORTFOLIO OF INVESTMENTS (continued)
CTIVP® – Los Angeles Capital Large Cap Growth Fund, March 31, 2021 (Unaudited)
Align Technology, Inc.(a) 4,200 2,274,426
DexCom, Inc.(a) 7,914 2,844,212
Total 3,879,220
Common Stocks (continued)Issuer Shares Value ($)
Commercial Services & Supplies 0.0%Cintas Corp. 618 210,929
Machinery 0.4%Illinois Tool Works, Inc. 11,565 2,561,879
Professional Services 0.7%Booz Allen Hamilton Holdings Corp. 63,960 5,150,699
Road & Rail 0.8%Landstar System, Inc. 2,827 466,625
Old Dominion Freight Line, Inc. 20,159 4,846,425
Uber Technologies, Inc.(a) 9,282 505,962
Total 5,819,012
Total Industrials 20,831,216
Information Technology 45.5%Communications Equipment 0.3%Cisco Systems, Inc. 43,005 2,223,789
Electronic Equipment, Instruments & Components 0.9%CDW Corp. 13,909 2,305,417
Jabil, Inc. 70,619 3,683,487
Total 5,988,904
IT Services 8.5%Accenture PLC, Class A 27,274 7,534,443
Cognizant Technology Solutions Corp., ClassA 10,599 827,994
Gartner, Inc.(a) 10,835 1,977,929
Genpact Ltd. 75,572 3,235,993
GoDaddy, Inc., Class A(a) 59,466 4,615,751
MasterCard, Inc., Class A 40,855 14,546,423
PayPal Holdings, Inc.(a) 29,581 7,183,450
Square, Inc., Class A(a) 12,508 2,839,941
Twilio, Inc., Class A(a) 885 301,573
Visa, Inc., Class A 59,822 12,666,112
Western Union Co. (The) 90,184 2,223,937
Total 57,953,546
Semiconductors & Semiconductor Equipment 7.5%
Common Stocks (continued)Issuer Shares Value ($)
Monolithic Power Systems, Inc. 6,647 2,347,787
NVIDIA Corp. 27,642 14,758,893
QUALCOMM, Inc. 72,304 9,586,787
Teradyne, Inc. 14,302 1,740,267
Texas Instruments, Inc. 15,216 2,875,672
Universal Display Corp. 6,295 1,490,467
Total 51,324,467
Software 16.5%Adobe, Inc.(a) 13,646 6,486,899
Aspen Technology, Inc.(a) 6,794 980,578
Atlassian Corp. PLC, Class A(a) 2,768 583,384
Autodesk, Inc.(a) 4,668 1,293,736
Bill.com Holdings, Inc.(a) 2,316 336,978
Coupa Software, Inc.(a) 3,564 906,967
Crowdstrike Holdings, Inc., Class A(a) 4,332 790,633
Dropbox, Inc., Class A(a) 67,636 1,803,176
Dynatrace, Inc.(a) 60,920 2,938,781
Fair Isaac Corp.(a) 5,534 2,689,801
Fortinet, Inc.(a) 36,854 6,796,615
HubSpot, Inc.(a) 2,186 992,903
Intuit, Inc. 3,611 1,383,230
Microsoft Corp. 307,845 72,580,616
Oracle Corp. 29,451 2,066,577
Salesforce.com, Inc.(a) 8,388 1,777,165
ServiceNow, Inc.(a) 8,259 4,130,408
Teradata Corp.(a) 19,036 733,647
Workday, Inc., Class A(a) 3,840 953,971
Zoom Video Communications, Inc., Class A(a) 8,512 2,734,820
Total 112,960,885
Technology Hardware, Storage & Peripherals 11.8%Apple, Inc. 642,819 78,520,341
Dell Technologies, Inc.(a) 7,124 627,980
Copyright © 2021 www.secdatabase.com. All Rights Reserved.Please Consider the Environment Before Printing This Document
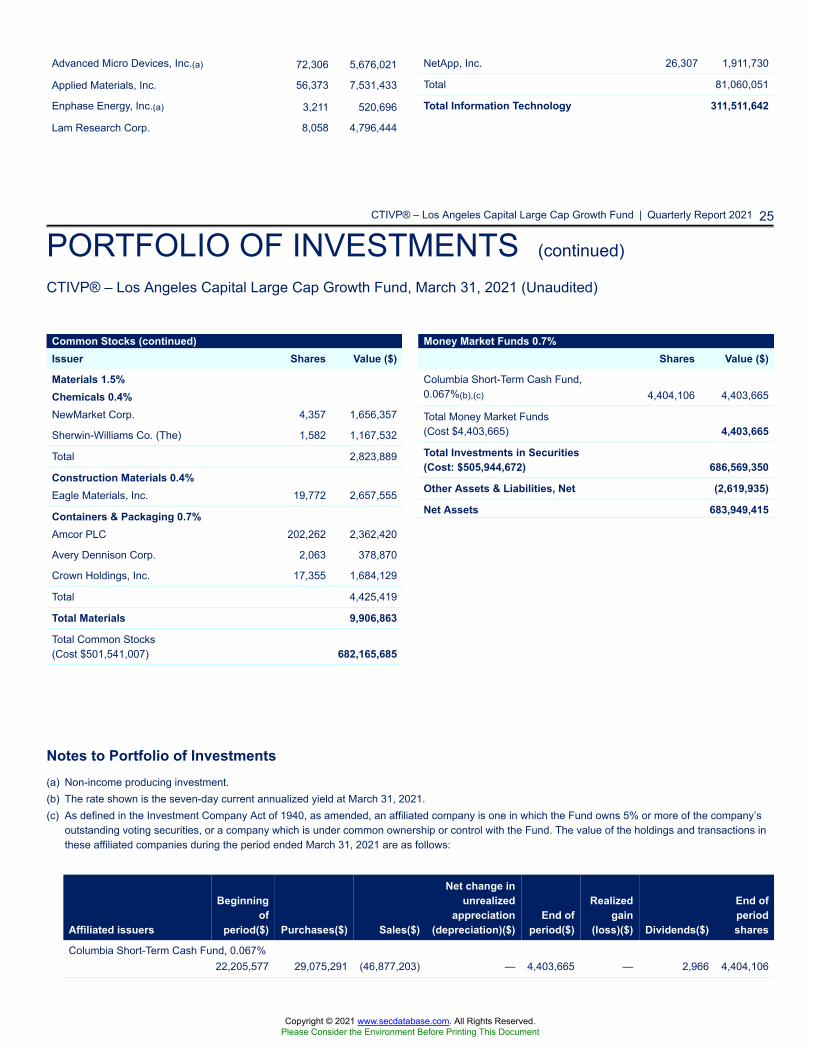
CTIVP® – Los Angeles Capital Large Cap Growth Fund | Quarterly Report 2021 25
PORTFOLIO OF INVESTMENTS (continued)
CTIVP® – Los Angeles Capital Large Cap Growth Fund, March 31, 2021 (Unaudited)
Notes to Portfolio of Investments(a) Non-income producing investment.(b) The rate shown is the seven-day current annualized yield at March 31, 2021.(c) As defined in the Investment Company Act of 1940, as amended, an affiliated company is one in which the Fund owns 5% or more of the company’s
outstanding voting securities, or a company which is under common ownership or control with the Fund. The value of the holdings and transactions inthese affiliated companies during the period ended March 31, 2021 are as follows:
Affiliated issuers
Beginningof
period($) Purchases($) Sales($)
Net change inunrealized
appreciation(depreciation)($)
End ofperiod($)
Realizedgain
(loss)($) Dividends($)
End ofperiodshares
Columbia Short-Term Cash Fund, 0.067%22,205,577 29,075,291 (46,877,203) — 4,403,665 — 2,966 4,404,106
Advanced Micro Devices, Inc.(a) 72,306 5,676,021
Applied Materials, Inc. 56,373 7,531,433
Enphase Energy, Inc.(a) 3,211 520,696
Lam Research Corp. 8,058 4,796,444
NetApp, Inc. 26,307 1,911,730
Total 81,060,051
Total Information Technology 311,511,642
Common Stocks (continued)Issuer Shares Value ($)
Materials 1.5%Chemicals 0.4%NewMarket Corp. 4,357 1,656,357
Sherwin-Williams Co. (The) 1,582 1,167,532
Total 2,823,889
Construction Materials 0.4%Eagle Materials, Inc. 19,772 2,657,555
Containers & Packaging 0.7%Amcor PLC 202,262 2,362,420
Avery Dennison Corp. 2,063 378,870
Crown Holdings, Inc. 17,355 1,684,129
Total 4,425,419
Total Materials 9,906,863
Total Common Stocks(Cost $501,541,007) 682,165,685
Money Market Funds 0.7%Shares Value ($)
Columbia Short-Term Cash Fund,0.067%(b),(c) 4,404,106 4,403,665
Total Money Market Funds(Cost $4,403,665) 4,403,665
Total Investments in Securities(Cost: $505,944,672) 686,569,350
Other Assets & Liabilities, Net (2,619,935)
Net Assets 683,949,415
Copyright © 2021 www.secdatabase.com. All Rights Reserved.Please Consider the Environment Before Printing This Document
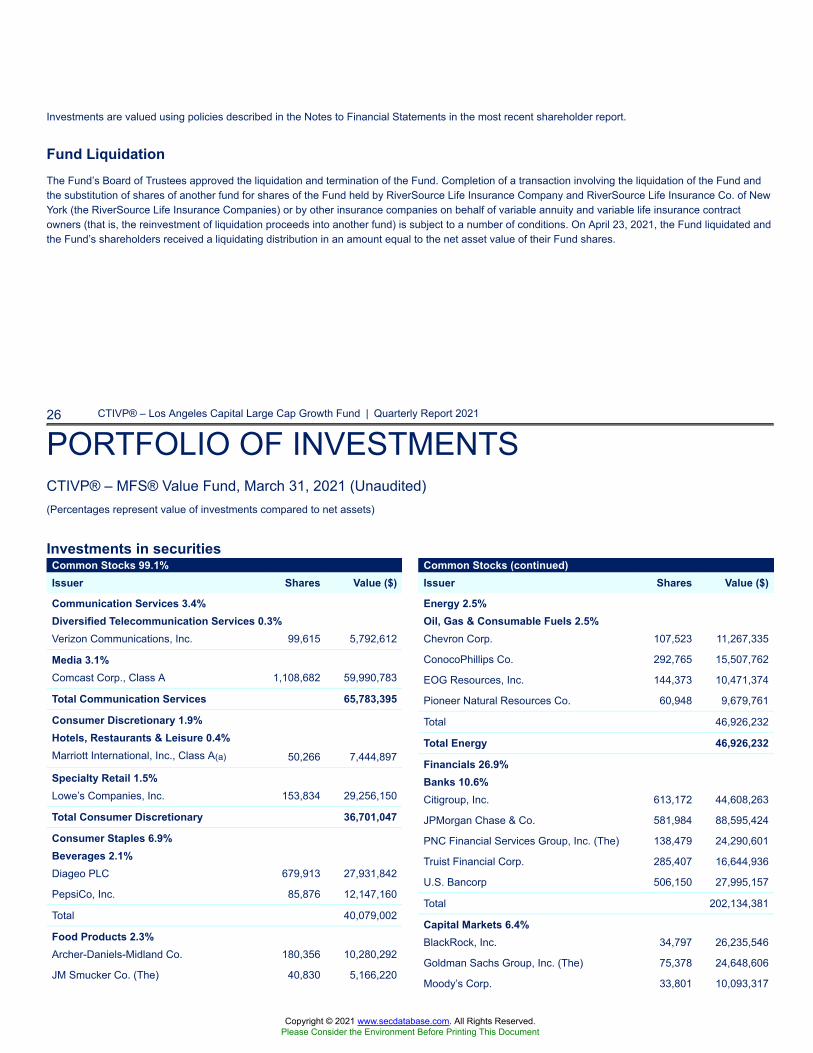
Investments are valued using policies described in the Notes to Financial Statements in the most recent shareholder report.
Fund LiquidationThe Fund’s Board of Trustees approved the liquidation and termination of the Fund. Completion of a transaction involving the liquidation of the Fund andthe substitution of shares of another fund for shares of the Fund held by RiverSource Life Insurance Company and RiverSource Life Insurance Co. of NewYork (the RiverSource Life Insurance Companies) or by other insurance companies on behalf of variable annuity and variable life insurance contractowners (that is, the reinvestment of liquidation proceeds into another fund) is subject to a number of conditions. On April 23, 2021, the Fund liquidated andthe Fund’s shareholders received a liquidating distribution in an amount equal to the net asset value of their Fund shares.
26 CTIVP® – Los Angeles Capital Large Cap Growth Fund | Quarterly Report 2021
PORTFOLIO OF INVESTMENTSCTIVP® – MFS® Value Fund, March 31, 2021 (Unaudited)(Percentages represent value of investments compared to net assets)
Investments in securitiesCommon Stocks 99.1%Issuer Shares Value ($)
Communication Services 3.4%Diversified Telecommunication Services 0.3%Verizon Communications, Inc. 99,615 5,792,612
Media 3.1%Comcast Corp., Class A 1,108,682 59,990,783
Total Communication Services 65,783,395
Consumer Discretionary 1.9%Hotels, Restaurants & Leisure 0.4%Marriott International, Inc., Class A(a) 50,266 7,444,897
Specialty Retail 1.5%Lowe’s Companies, Inc. 153,834 29,256,150
Total Consumer Discretionary 36,701,047
Consumer Staples 6.9%Beverages 2.1%Diageo PLC 679,913 27,931,842
PepsiCo, Inc. 85,876 12,147,160
Total 40,079,002
Food Products 2.3%Archer-Daniels-Midland Co. 180,356 10,280,292
JM Smucker Co. (The) 40,830 5,166,220
Common Stocks (continued)Issuer Shares Value ($)
Energy 2.5%Oil, Gas & Consumable Fuels 2.5%Chevron Corp. 107,523 11,267,335
ConocoPhillips Co. 292,765 15,507,762
EOG Resources, Inc. 144,373 10,471,374
Pioneer Natural Resources Co. 60,948 9,679,761
Total 46,926,232
Total Energy 46,926,232
Financials 26.9%Banks 10.6%Citigroup, Inc. 613,172 44,608,263
JPMorgan Chase & Co. 581,984 88,595,424
PNC Financial Services Group, Inc. (The) 138,479 24,290,601
Truist Financial Corp. 285,407 16,644,936
U.S. Bancorp 506,150 27,995,157
Total 202,134,381
Capital Markets 6.4%BlackRock, Inc. 34,797 26,235,546
Goldman Sachs Group, Inc. (The) 75,378 24,648,606
Moody’s Corp. 33,801 10,093,317
Copyright © 2021 www.secdatabase.com. All Rights Reserved.Please Consider the Environment Before Printing This Document
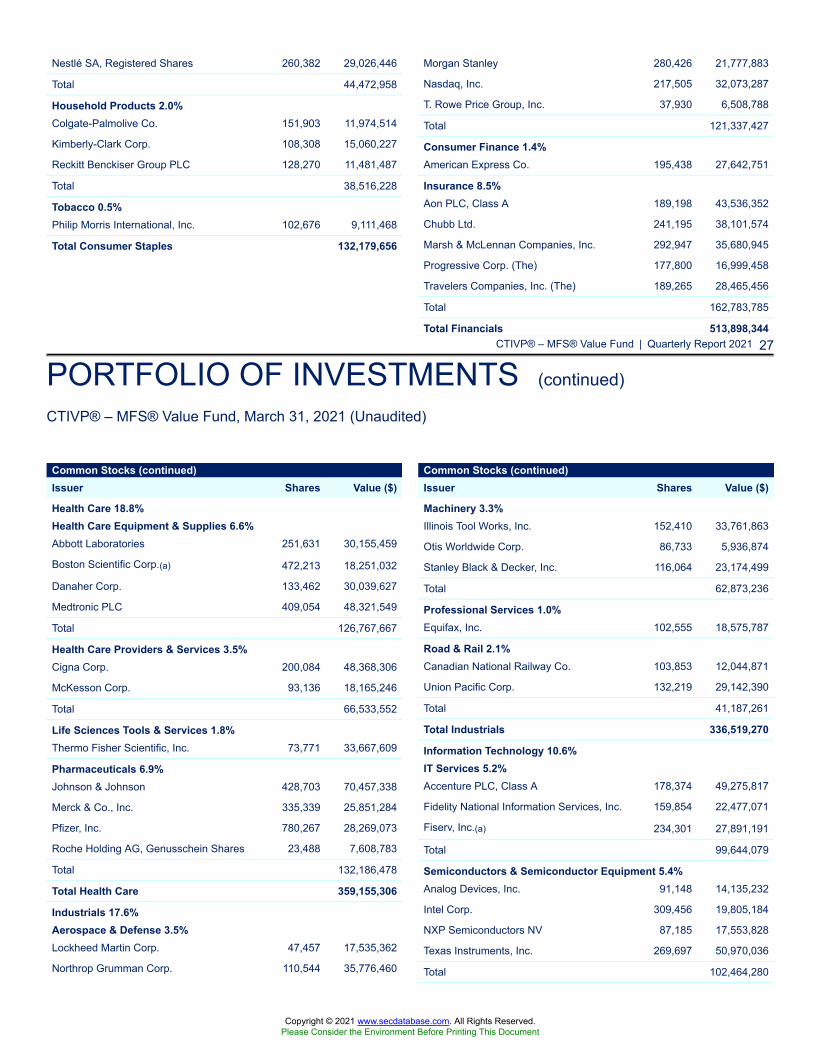
CTIVP® – MFS® Value Fund | Quarterly Report 2021 27
PORTFOLIO OF INVESTMENTS (continued)
CTIVP® – MFS® Value Fund, March 31, 2021 (Unaudited)
Nestlé SA, Registered Shares 260,382 29,026,446
Total 44,472,958
Household Products 2.0%Colgate-Palmolive Co. 151,903 11,974,514
Kimberly-Clark Corp. 108,308 15,060,227
Reckitt Benckiser Group PLC 128,270 11,481,487
Total 38,516,228
Tobacco 0.5%Philip Morris International, Inc. 102,676 9,111,468
Total Consumer Staples 132,179,656
Morgan Stanley 280,426 21,777,883
Nasdaq, Inc. 217,505 32,073,287
T. Rowe Price Group, Inc. 37,930 6,508,788
Total 121,337,427
Consumer Finance 1.4%American Express Co. 195,438 27,642,751
Insurance 8.5%Aon PLC, Class A 189,198 43,536,352
Chubb Ltd. 241,195 38,101,574
Marsh & McLennan Companies, Inc. 292,947 35,680,945
Progressive Corp. (The) 177,800 16,999,458
Travelers Companies, Inc. (The) 189,265 28,465,456
Total 162,783,785
Total Financials 513,898,344
Common Stocks (continued)Issuer Shares Value ($)
Health Care 18.8%Health Care Equipment & Supplies 6.6%Abbott Laboratories 251,631 30,155,459
Boston Scientific Corp.(a) 472,213 18,251,032
Danaher Corp. 133,462 30,039,627
Medtronic PLC 409,054 48,321,549
Total 126,767,667
Health Care Providers & Services 3.5%Cigna Corp. 200,084 48,368,306
McKesson Corp. 93,136 18,165,246
Total 66,533,552
Life Sciences Tools & Services 1.8%Thermo Fisher Scientific, Inc. 73,771 33,667,609
Pharmaceuticals 6.9%Johnson & Johnson 428,703 70,457,338
Merck & Co., Inc. 335,339 25,851,284
Pfizer, Inc. 780,267 28,269,073
Roche Holding AG, Genusschein Shares 23,488 7,608,783
Total 132,186,478
Total Health Care 359,155,306
Industrials 17.6%Aerospace & Defense 3.5%Lockheed Martin Corp. 47,457 17,535,362
Northrop Grumman Corp. 110,544 35,776,460
Common Stocks (continued)Issuer Shares Value ($)
Machinery 3.3%Illinois Tool Works, Inc. 152,410 33,761,863
Otis Worldwide Corp. 86,733 5,936,874
Stanley Black & Decker, Inc. 116,064 23,174,499
Total 62,873,236
Professional Services 1.0%Equifax, Inc. 102,555 18,575,787
Road & Rail 2.1%Canadian National Railway Co. 103,853 12,044,871
Union Pacific Corp. 132,219 29,142,390
Total 41,187,261
Total Industrials 336,519,270
Information Technology 10.6%IT Services 5.2%Accenture PLC, Class A 178,374 49,275,817
Fidelity National Information Services, Inc. 159,854 22,477,071
Fiserv, Inc.(a) 234,301 27,891,191
Total 99,644,079
Semiconductors & Semiconductor Equipment 5.4%Analog Devices, Inc. 91,148 14,135,232
Intel Corp. 309,456 19,805,184
NXP Semiconductors NV 87,185 17,553,828
Texas Instruments, Inc. 269,697 50,970,036
Total 102,464,280
Copyright © 2021 www.secdatabase.com. All Rights Reserved.Please Consider the Environment Before Printing This Document
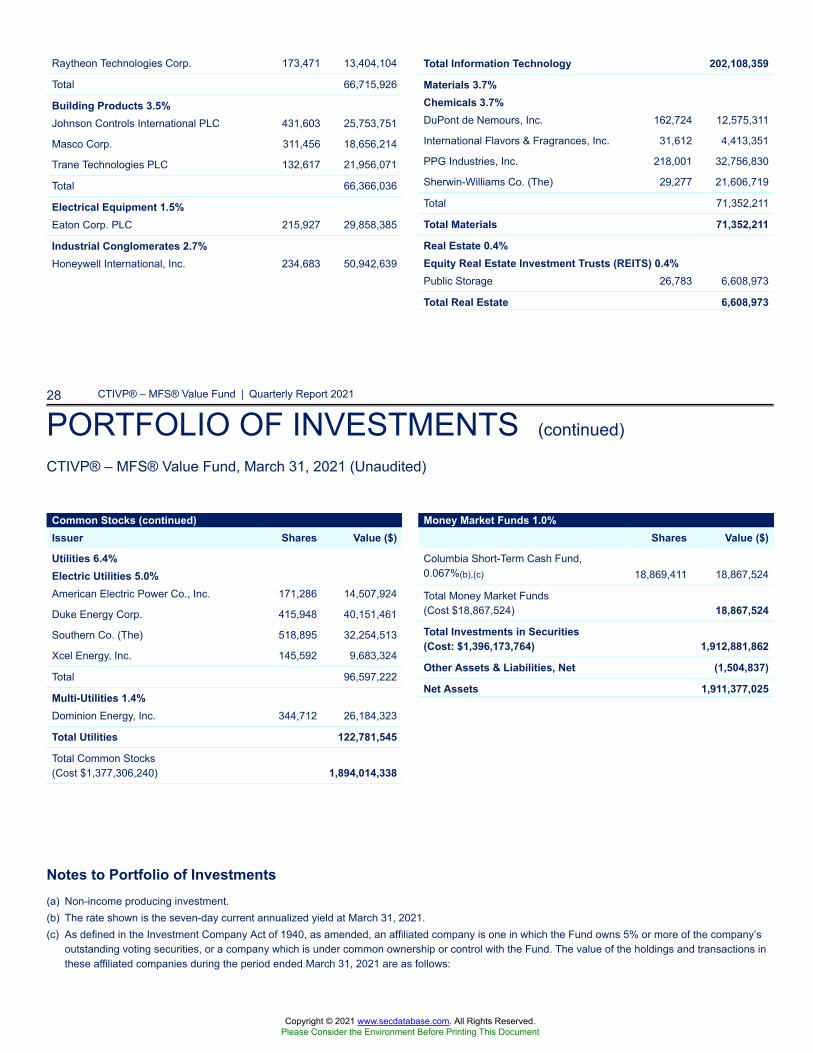
28 CTIVP® – MFS® Value Fund | Quarterly Report 2021
PORTFOLIO OF INVESTMENTS (continued)
CTIVP® – MFS® Value Fund, March 31, 2021 (Unaudited)
Notes to Portfolio of Investments(a) Non-income producing investment.(b) The rate shown is the seven-day current annualized yield at March 31, 2021.(c) As defined in the Investment Company Act of 1940, as amended, an affiliated company is one in which the Fund owns 5% or more of the company’s
outstanding voting securities, or a company which is under common ownership or control with the Fund. The value of the holdings and transactions inthese affiliated companies during the period ended March 31, 2021 are as follows:
Raytheon Technologies Corp. 173,471 13,404,104
Total 66,715,926
Building Products 3.5%Johnson Controls International PLC 431,603 25,753,751
Masco Corp. 311,456 18,656,214
Trane Technologies PLC 132,617 21,956,071
Total 66,366,036
Electrical Equipment 1.5%Eaton Corp. PLC 215,927 29,858,385
Industrial Conglomerates 2.7%Honeywell International, Inc. 234,683 50,942,639
Total Information Technology 202,108,359
Materials 3.7%Chemicals 3.7%DuPont de Nemours, Inc. 162,724 12,575,311
International Flavors & Fragrances, Inc. 31,612 4,413,351
PPG Industries, Inc. 218,001 32,756,830
Sherwin-Williams Co. (The) 29,277 21,606,719
Total 71,352,211
Total Materials 71,352,211
Real Estate 0.4%Equity Real Estate Investment Trusts (REITS) 0.4%Public Storage 26,783 6,608,973
Total Real Estate 6,608,973
Common Stocks (continued)Issuer Shares Value ($)
Utilities 6.4%Electric Utilities 5.0%American Electric Power Co., Inc. 171,286 14,507,924
Duke Energy Corp. 415,948 40,151,461
Southern Co. (The) 518,895 32,254,513
Xcel Energy, Inc. 145,592 9,683,324
Total 96,597,222
Multi-Utilities 1.4%Dominion Energy, Inc. 344,712 26,184,323
Total Utilities 122,781,545
Total Common Stocks(Cost $1,377,306,240) 1,894,014,338
Money Market Funds 1.0%Shares Value ($)
Columbia Short-Term Cash Fund,0.067%(b),(c) 18,869,411 18,867,524
Total Money Market Funds(Cost $18,867,524) 18,867,524
Total Investments in Securities(Cost: $1,396,173,764) 1,912,881,862
Other Assets & Liabilities, Net (1,504,837)
Net Assets 1,911,377,025
Copyright © 2021 www.secdatabase.com. All Rights Reserved.Please Consider the Environment Before Printing This Document
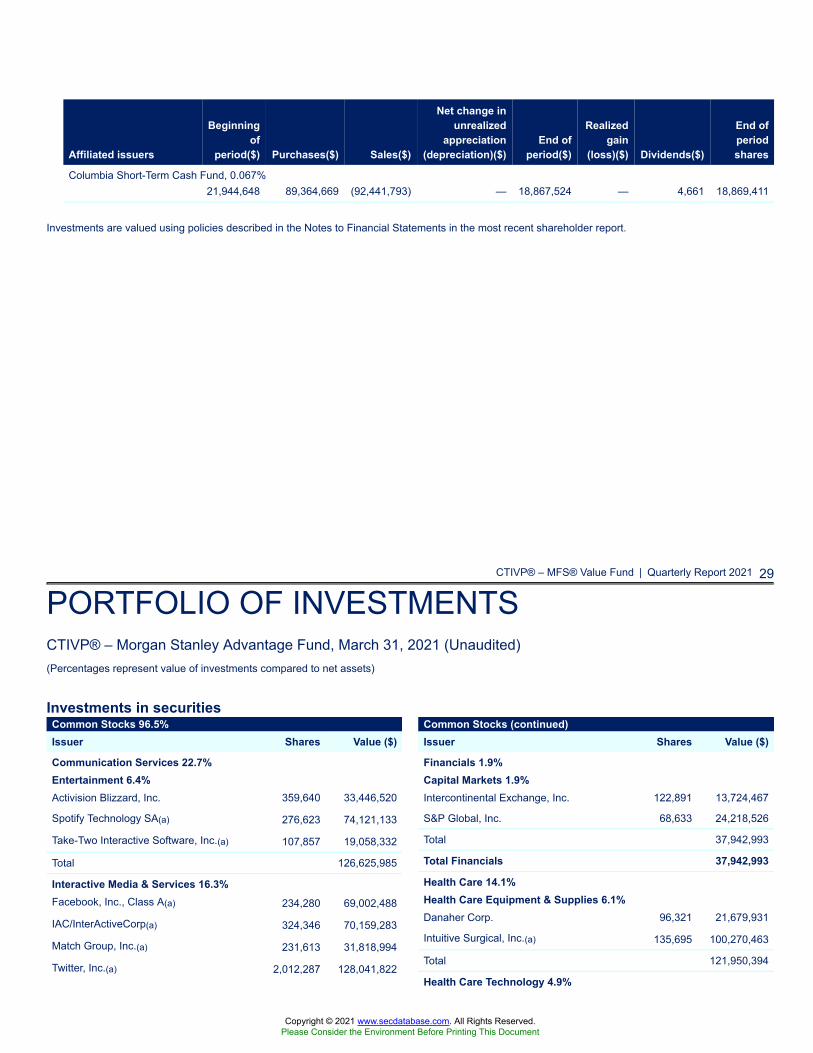
Affiliated issuers
Beginningof
period($) Purchases($) Sales($)
Net change inunrealized
appreciation(depreciation)($)
End ofperiod($)
Realizedgain
(loss)($) Dividends($)
End ofperiodshares
Columbia Short-Term Cash Fund, 0.067%21,944,648 89,364,669 (92,441,793) — 18,867,524 — 4,661 18,869,411
Investments are valued using policies described in the Notes to Financial Statements in the most recent shareholder report.
CTIVP® – MFS® Value Fund | Quarterly Report 2021 29
PORTFOLIO OF INVESTMENTSCTIVP® – Morgan Stanley Advantage Fund, March 31, 2021 (Unaudited)(Percentages represent value of investments compared to net assets)
Investments in securitiesCommon Stocks 96.5%Issuer Shares Value ($)
Communication Services 22.7%Entertainment 6.4%Activision Blizzard, Inc. 359,640 33,446,520
Spotify Technology SA(a) 276,623 74,121,133
Take-Two Interactive Software, Inc.(a) 107,857 19,058,332
Total 126,625,985
Interactive Media & Services 16.3%Facebook, Inc., Class A(a) 234,280 69,002,488
IAC/InterActiveCorp(a) 324,346 70,159,283
Match Group, Inc.(a) 231,613 31,818,994
Twitter, Inc.(a) 2,012,287 128,041,822
Common Stocks (continued)Issuer Shares Value ($)
Financials 1.9%Capital Markets 1.9%Intercontinental Exchange, Inc. 122,891 13,724,467
S&P Global, Inc. 68,633 24,218,526
Total 37,942,993
Total Financials 37,942,993
Health Care 14.1%Health Care Equipment & Supplies 6.1%Danaher Corp. 96,321 21,679,931
Intuitive Surgical, Inc.(a) 135,695 100,270,463
Total 121,950,394
Health Care Technology 4.9%
Copyright © 2021 www.secdatabase.com. All Rights Reserved.Please Consider the Environment Before Printing This Document
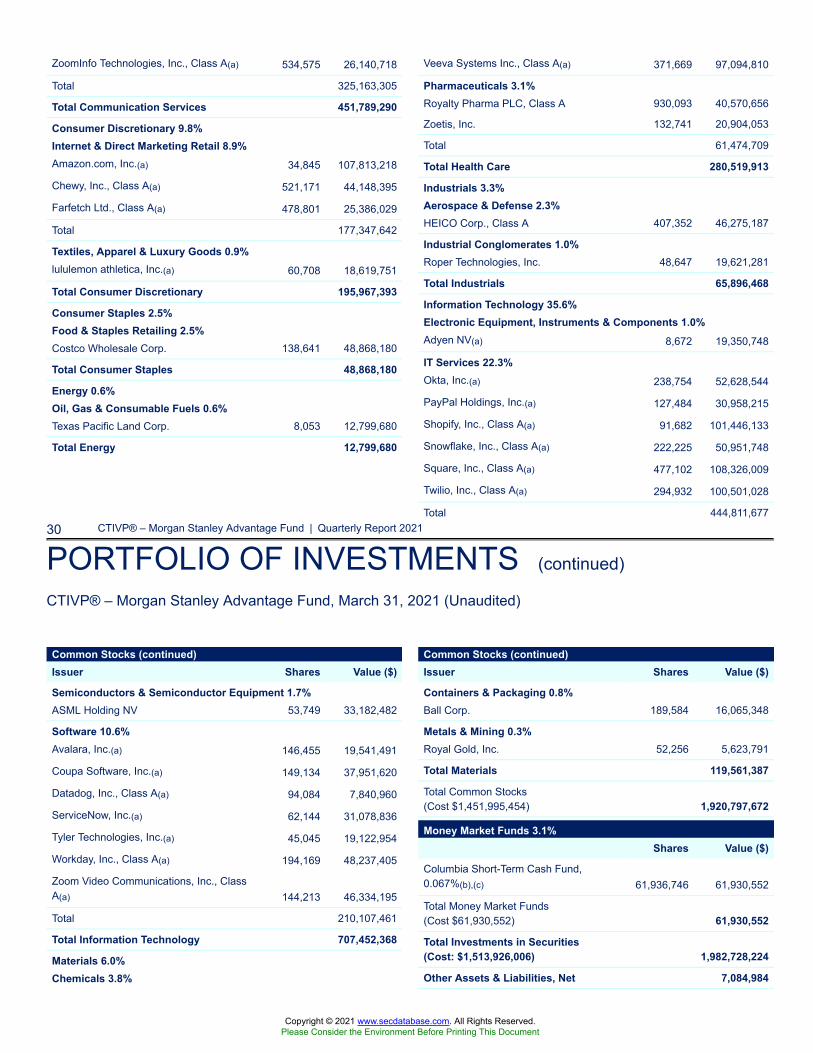
30 CTIVP® – Morgan Stanley Advantage Fund | Quarterly Report 2021
PORTFOLIO OF INVESTMENTS (continued)
CTIVP® – Morgan Stanley Advantage Fund, March 31, 2021 (Unaudited)
ZoomInfo Technologies, Inc., Class A(a) 534,575 26,140,718
Total 325,163,305
Total Communication Services 451,789,290
Consumer Discretionary 9.8%Internet & Direct Marketing Retail 8.9%Amazon.com, Inc.(a) 34,845 107,813,218
Chewy, Inc., Class A(a) 521,171 44,148,395
Farfetch Ltd., Class A(a) 478,801 25,386,029
Total 177,347,642
Textiles, Apparel & Luxury Goods 0.9%lululemon athletica, Inc.(a) 60,708 18,619,751
Total Consumer Discretionary 195,967,393
Consumer Staples 2.5%Food & Staples Retailing 2.5%Costco Wholesale Corp. 138,641 48,868,180
Total Consumer Staples 48,868,180
Energy 0.6%Oil, Gas & Consumable Fuels 0.6%Texas Pacific Land Corp. 8,053 12,799,680
Total Energy 12,799,680
Veeva Systems Inc., Class A(a) 371,669 97,094,810
Pharmaceuticals 3.1%Royalty Pharma PLC, Class A 930,093 40,570,656
Zoetis, Inc. 132,741 20,904,053
Total 61,474,709
Total Health Care 280,519,913
Industrials 3.3%Aerospace & Defense 2.3%HEICO Corp., Class A 407,352 46,275,187
Industrial Conglomerates 1.0%Roper Technologies, Inc. 48,647 19,621,281
Total Industrials 65,896,468
Information Technology 35.6%Electronic Equipment, Instruments & Components 1.0%Adyen NV(a) 8,672 19,350,748
IT Services 22.3%Okta, Inc.(a) 238,754 52,628,544
PayPal Holdings, Inc.(a) 127,484 30,958,215
Shopify, Inc., Class A(a) 91,682 101,446,133
Snowflake, Inc., Class A(a) 222,225 50,951,748
Square, Inc., Class A(a) 477,102 108,326,009
Twilio, Inc., Class A(a) 294,932 100,501,028
Total 444,811,677
Common Stocks (continued)Issuer Shares Value ($)
Semiconductors & Semiconductor Equipment 1.7%ASML Holding NV 53,749 33,182,482
Software 10.6%Avalara, Inc.(a) 146,455 19,541,491
Coupa Software, Inc.(a) 149,134 37,951,620
Datadog, Inc., Class A(a) 94,084 7,840,960
ServiceNow, Inc.(a) 62,144 31,078,836
Tyler Technologies, Inc.(a) 45,045 19,122,954
Workday, Inc., Class A(a) 194,169 48,237,405
Zoom Video Communications, Inc., ClassA(a) 144,213 46,334,195
Total 210,107,461
Total Information Technology 707,452,368
Materials 6.0%Chemicals 3.8%
Common Stocks (continued)Issuer Shares Value ($)
Containers & Packaging 0.8%Ball Corp. 189,584 16,065,348
Metals & Mining 0.3%Royal Gold, Inc. 52,256 5,623,791
Total Materials 119,561,387
Total Common Stocks(Cost $1,451,995,454) 1,920,797,672
Money Market Funds 3.1%Shares Value ($)
Columbia Short-Term Cash Fund,0.067%(b),(c) 61,936,746 61,930,552
Total Money Market Funds(Cost $61,930,552) 61,930,552
Total Investments in Securities(Cost: $1,513,926,006) 1,982,728,224
Other Assets & Liabilities, Net 7,084,984
Copyright © 2021 www.secdatabase.com. All Rights Reserved.Please Consider the Environment Before Printing This Document
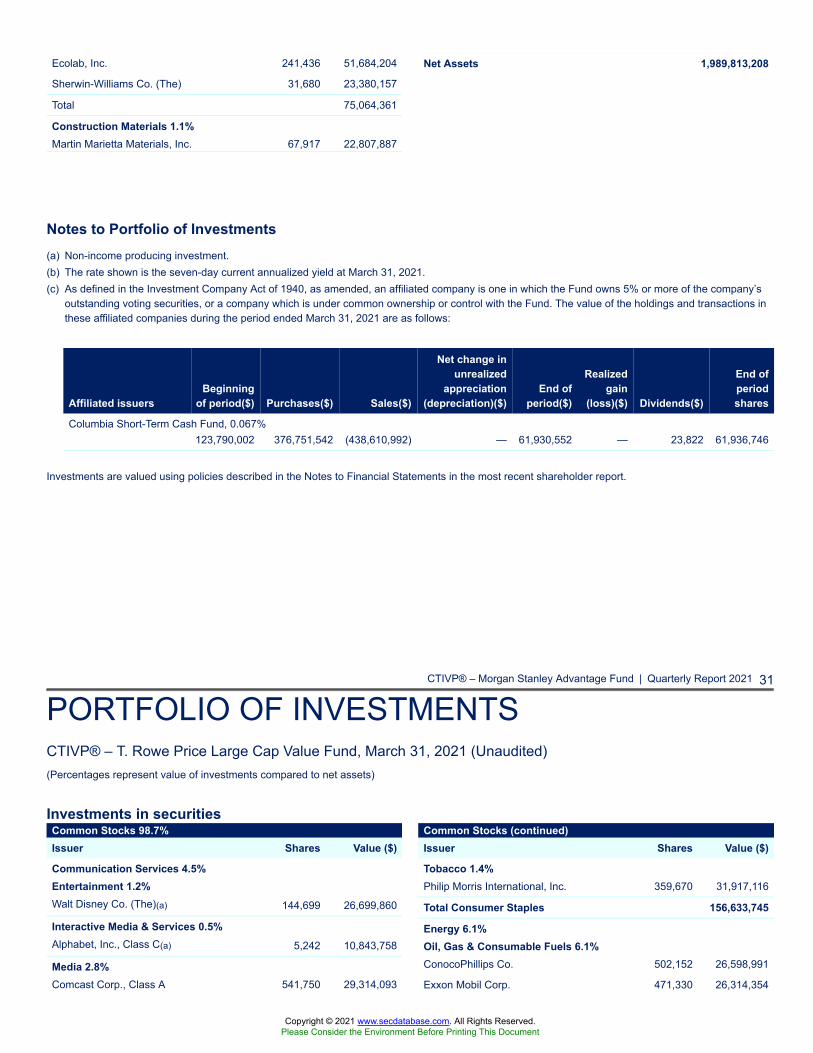
Notes to Portfolio of Investments(a) Non-income producing investment.(b) The rate shown is the seven-day current annualized yield at March 31, 2021.(c) As defined in the Investment Company Act of 1940, as amended, an affiliated company is one in which the Fund owns 5% or more of the company’s
outstanding voting securities, or a company which is under common ownership or control with the Fund. The value of the holdings and transactions inthese affiliated companies during the period ended March 31, 2021 are as follows:
Affiliated issuersBeginning
of period($) Purchases($) Sales($)
Net change inunrealized
appreciation(depreciation)($)
End ofperiod($)
Realizedgain
(loss)($) Dividends($)
End ofperiodshares
Columbia Short-Term Cash Fund, 0.067%123,790,002 376,751,542 (438,610,992) — 61,930,552 — 23,822 61,936,746
Investments are valued using policies described in the Notes to Financial Statements in the most recent shareholder report.
CTIVP® – Morgan Stanley Advantage Fund | Quarterly Report 2021 31
PORTFOLIO OF INVESTMENTSCTIVP® – T. Rowe Price Large Cap Value Fund, March 31, 2021 (Unaudited)(Percentages represent value of investments compared to net assets)
Investments in securities
Ecolab, Inc. 241,436 51,684,204
Sherwin-Williams Co. (The) 31,680 23,380,157
Total 75,064,361
Construction Materials 1.1%Martin Marietta Materials, Inc. 67,917 22,807,887
Net Assets 1,989,813,208
Common Stocks 98.7%Issuer Shares Value ($)
Communication Services 4.5%Entertainment 1.2%Walt Disney Co. (The)(a) 144,699 26,699,860
Interactive Media & Services 0.5%Alphabet, Inc., Class C(a) 5,242 10,843,758
Media 2.8%Comcast Corp., Class A 541,750 29,314,093
Common Stocks (continued)Issuer Shares Value ($)
Tobacco 1.4%Philip Morris International, Inc. 359,670 31,917,116
Total Consumer Staples 156,633,745
Energy 6.1%Oil, Gas & Consumable Fuels 6.1%ConocoPhillips Co. 502,152 26,598,991
Exxon Mobil Corp. 471,330 26,314,354
Copyright © 2021 www.secdatabase.com. All Rights Reserved.Please Consider the Environment Before Printing This Document
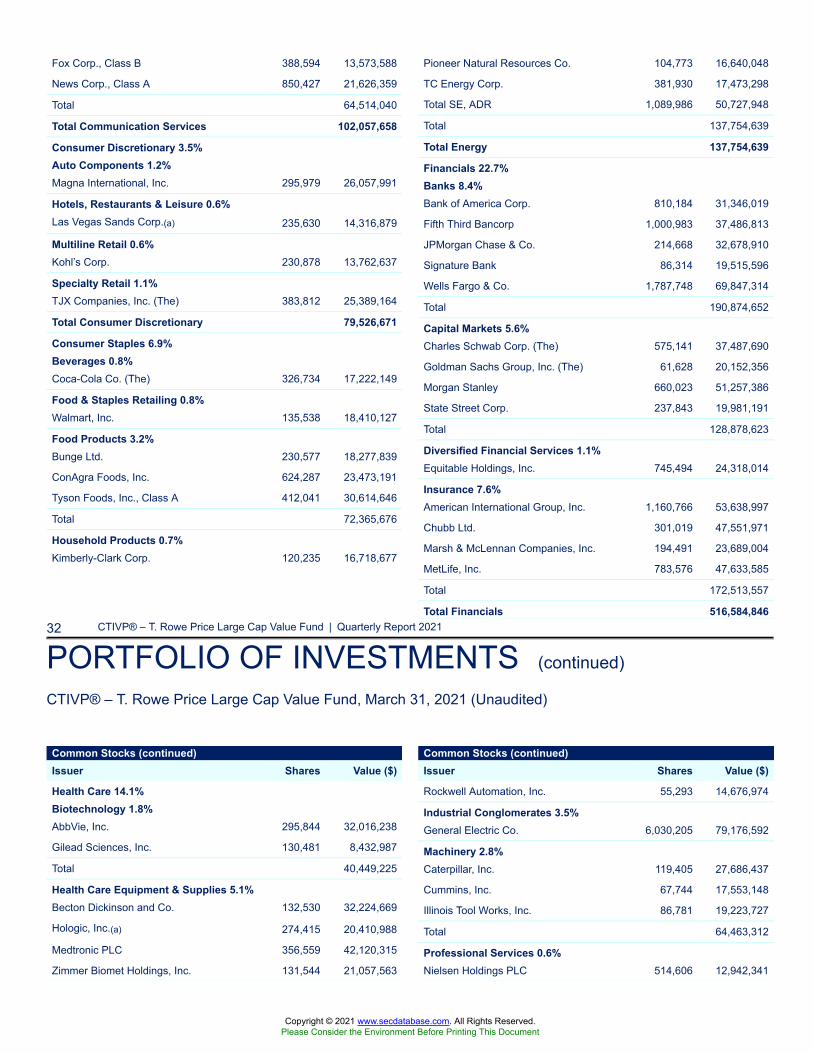
32 CTIVP® – T. Rowe Price Large Cap Value Fund | Quarterly Report 2021
PORTFOLIO OF INVESTMENTS (continued)
CTIVP® – T. Rowe Price Large Cap Value Fund, March 31, 2021 (Unaudited)
Fox Corp., Class B 388,594 13,573,588
News Corp., Class A 850,427 21,626,359
Total 64,514,040
Total Communication Services 102,057,658
Consumer Discretionary 3.5%Auto Components 1.2%Magna International, Inc. 295,979 26,057,991
Hotels, Restaurants & Leisure 0.6%Las Vegas Sands Corp.(a) 235,630 14,316,879
Multiline Retail 0.6%Kohl’s Corp. 230,878 13,762,637
Specialty Retail 1.1%TJX Companies, Inc. (The) 383,812 25,389,164
Total Consumer Discretionary 79,526,671
Consumer Staples 6.9%Beverages 0.8%Coca-Cola Co. (The) 326,734 17,222,149
Food & Staples Retailing 0.8%Walmart, Inc. 135,538 18,410,127
Food Products 3.2%Bunge Ltd. 230,577 18,277,839
ConAgra Foods, Inc. 624,287 23,473,191
Tyson Foods, Inc., Class A 412,041 30,614,646
Total 72,365,676
Household Products 0.7%Kimberly-Clark Corp. 120,235 16,718,677
Pioneer Natural Resources Co. 104,773 16,640,048
TC Energy Corp. 381,930 17,473,298
Total SE, ADR 1,089,986 50,727,948
Total 137,754,639
Total Energy 137,754,639
Financials 22.7%Banks 8.4%Bank of America Corp. 810,184 31,346,019
Fifth Third Bancorp 1,000,983 37,486,813
JPMorgan Chase & Co. 214,668 32,678,910
Signature Bank 86,314 19,515,596
Wells Fargo & Co. 1,787,748 69,847,314
Total 190,874,652
Capital Markets 5.6%Charles Schwab Corp. (The) 575,141 37,487,690
Goldman Sachs Group, Inc. (The) 61,628 20,152,356
Morgan Stanley 660,023 51,257,386
State Street Corp. 237,843 19,981,191
Total 128,878,623
Diversified Financial Services 1.1%Equitable Holdings, Inc. 745,494 24,318,014
Insurance 7.6%American International Group, Inc. 1,160,766 53,638,997
Chubb Ltd. 301,019 47,551,971
Marsh & McLennan Companies, Inc. 194,491 23,689,004
MetLife, Inc. 783,576 47,633,585
Total 172,513,557
Total Financials 516,584,846
Common Stocks (continued)Issuer Shares Value ($)
Health Care 14.1%Biotechnology 1.8%AbbVie, Inc. 295,844 32,016,238
Gilead Sciences, Inc. 130,481 8,432,987
Total 40,449,225
Health Care Equipment & Supplies 5.1%Becton Dickinson and Co. 132,530 32,224,669
Hologic, Inc.(a) 274,415 20,410,988
Medtronic PLC 356,559 42,120,315
Zimmer Biomet Holdings, Inc. 131,544 21,057,563
Common Stocks (continued)Issuer Shares Value ($)
Rockwell Automation, Inc. 55,293 14,676,974
Industrial Conglomerates 3.5%General Electric Co. 6,030,205 79,176,592
Machinery 2.8%Caterpillar, Inc. 119,405 27,686,437
Cummins, Inc. 67,744 17,553,148
Illinois Tool Works, Inc. 86,781 19,223,727
Total 64,463,312
Professional Services 0.6%Nielsen Holdings PLC 514,606 12,942,341
Copyright © 2021 www.secdatabase.com. All Rights Reserved.Please Consider the Environment Before Printing This Document
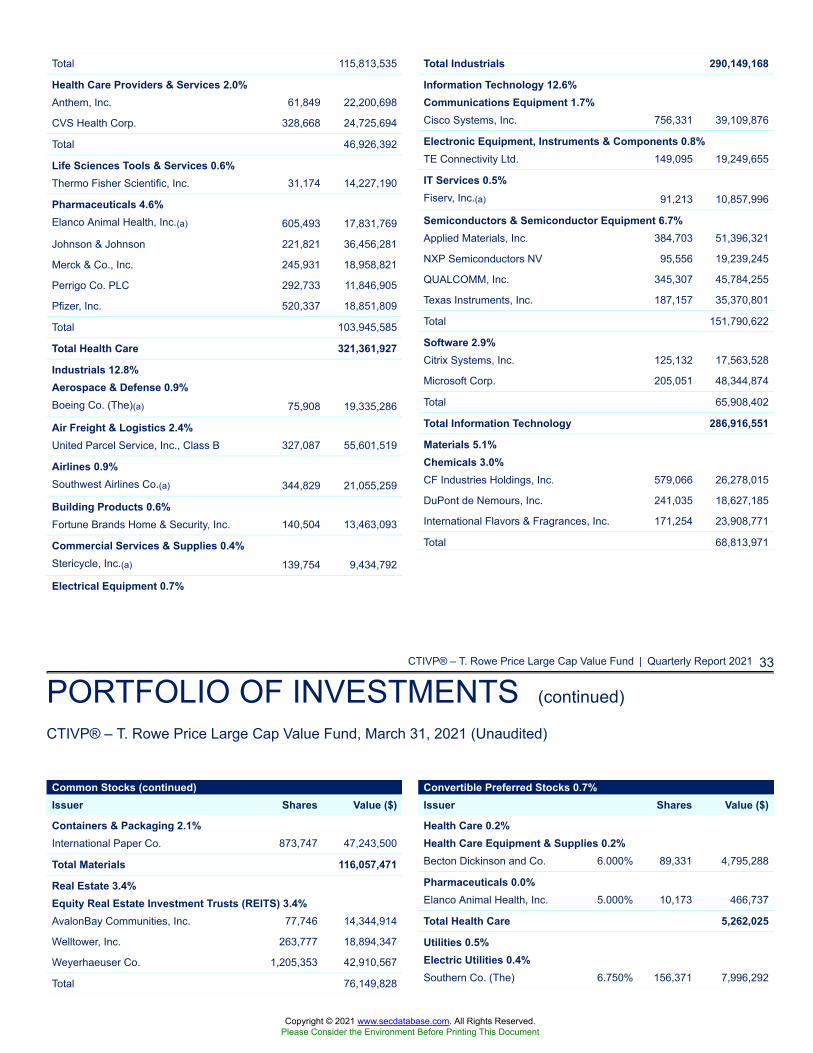
CTIVP® – T. Rowe Price Large Cap Value Fund | Quarterly Report 2021 33
PORTFOLIO OF INVESTMENTS (continued)
CTIVP® – T. Rowe Price Large Cap Value Fund, March 31, 2021 (Unaudited)
Total 115,813,535
Health Care Providers & Services 2.0%Anthem, Inc. 61,849 22,200,698
CVS Health Corp. 328,668 24,725,694
Total 46,926,392
Life Sciences Tools & Services 0.6%Thermo Fisher Scientific, Inc. 31,174 14,227,190
Pharmaceuticals 4.6%Elanco Animal Health, Inc.(a) 605,493 17,831,769
Johnson & Johnson 221,821 36,456,281
Merck & Co., Inc. 245,931 18,958,821
Perrigo Co. PLC 292,733 11,846,905
Pfizer, Inc. 520,337 18,851,809
Total 103,945,585
Total Health Care 321,361,927
Industrials 12.8%Aerospace & Defense 0.9%Boeing Co. (The)(a) 75,908 19,335,286
Air Freight & Logistics 2.4%United Parcel Service, Inc., Class B 327,087 55,601,519
Airlines 0.9%Southwest Airlines Co.(a) 344,829 21,055,259
Building Products 0.6%Fortune Brands Home & Security, Inc. 140,504 13,463,093
Commercial Services & Supplies 0.4%Stericycle, Inc.(a) 139,754 9,434,792
Electrical Equipment 0.7%
Total Industrials 290,149,168
Information Technology 12.6%Communications Equipment 1.7%Cisco Systems, Inc. 756,331 39,109,876
Electronic Equipment, Instruments & Components 0.8%TE Connectivity Ltd. 149,095 19,249,655
IT Services 0.5%Fiserv, Inc.(a) 91,213 10,857,996
Semiconductors & Semiconductor Equipment 6.7%Applied Materials, Inc. 384,703 51,396,321
NXP Semiconductors NV 95,556 19,239,245
QUALCOMM, Inc. 345,307 45,784,255
Texas Instruments, Inc. 187,157 35,370,801
Total 151,790,622
Software 2.9%Citrix Systems, Inc. 125,132 17,563,528
Microsoft Corp. 205,051 48,344,874
Total 65,908,402
Total Information Technology 286,916,551
Materials 5.1%Chemicals 3.0%CF Industries Holdings, Inc. 579,066 26,278,015
DuPont de Nemours, Inc. 241,035 18,627,185
International Flavors & Fragrances, Inc. 171,254 23,908,771
Total 68,813,971
Common Stocks (continued)Issuer Shares Value ($)
Containers & Packaging 2.1%International Paper Co. 873,747 47,243,500
Total Materials 116,057,471
Real Estate 3.4%Equity Real Estate Investment Trusts (REITS) 3.4%AvalonBay Communities, Inc. 77,746 14,344,914
Welltower, Inc. 263,777 18,894,347
Weyerhaeuser Co. 1,205,353 42,910,567
Total 76,149,828
Convertible Preferred Stocks 0.7%Issuer Shares Value ($)
Health Care 0.2%Health Care Equipment & Supplies 0.2%Becton Dickinson and Co. 6.000% 89,331 4,795,288
Pharmaceuticals 0.0%Elanco Animal Health, Inc. 5.000% 10,173 466,737
Total Health Care 5,262,025
Utilities 0.5%Electric Utilities 0.4%Southern Co. (The) 6.750% 156,371 7,996,292
Copyright © 2021 www.secdatabase.com. All Rights Reserved.Please Consider the Environment Before Printing This Document
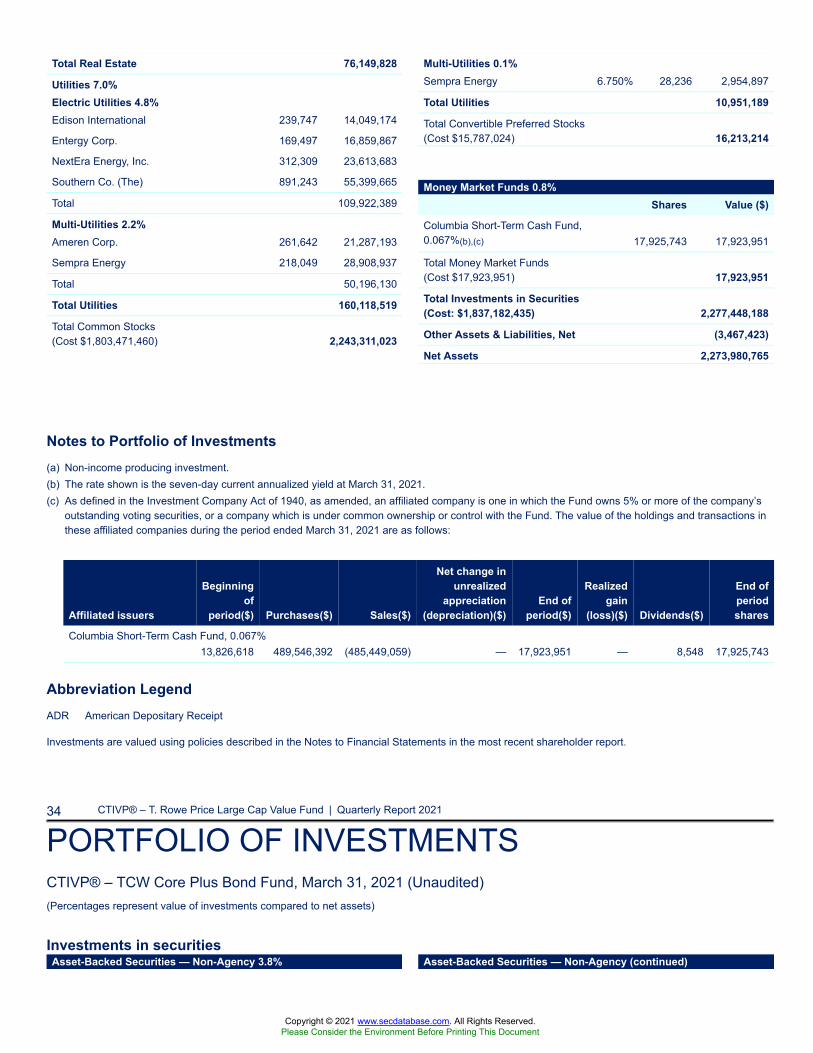
Notes to Portfolio of Investments(a) Non-income producing investment.(b) The rate shown is the seven-day current annualized yield at March 31, 2021.(c) As defined in the Investment Company Act of 1940, as amended, an affiliated company is one in which the Fund owns 5% or more of the company’s
outstanding voting securities, or a company which is under common ownership or control with the Fund. The value of the holdings and transactions inthese affiliated companies during the period ended March 31, 2021 are as follows:
Affiliated issuers
Beginningof
period($) Purchases($) Sales($)
Net change inunrealized
appreciation(depreciation)($)
End ofperiod($)
Realizedgain
(loss)($) Dividends($)
End ofperiodshares
Columbia Short-Term Cash Fund, 0.067%13,826,618 489,546,392 (485,449,059) — 17,923,951 — 8,548 17,925,743
Abbreviation LegendADR American Depositary Receipt
Investments are valued using policies described in the Notes to Financial Statements in the most recent shareholder report.
34 CTIVP® – T. Rowe Price Large Cap Value Fund | Quarterly Report 2021
PORTFOLIO OF INVESTMENTSCTIVP® – TCW Core Plus Bond Fund, March 31, 2021 (Unaudited)(Percentages represent value of investments compared to net assets)
Investments in securities
Total Real Estate 76,149,828
Utilities 7.0%Electric Utilities 4.8%Edison International 239,747 14,049,174
Entergy Corp. 169,497 16,859,867
NextEra Energy, Inc. 312,309 23,613,683
Southern Co. (The) 891,243 55,399,665
Total 109,922,389
Multi-Utilities 2.2%Ameren Corp. 261,642 21,287,193
Sempra Energy 218,049 28,908,937
Total 50,196,130
Total Utilities 160,118,519
Total Common Stocks(Cost $1,803,471,460) 2,243,311,023
Multi-Utilities 0.1%Sempra Energy 6.750% 28,236 2,954,897
Total Utilities 10,951,189
Total Convertible Preferred Stocks(Cost $15,787,024) 16,213,214
Money Market Funds 0.8%Shares Value ($)
Columbia Short-Term Cash Fund,0.067%(b),(c) 17,925,743 17,923,951
Total Money Market Funds(Cost $17,923,951) 17,923,951
Total Investments in Securities(Cost: $1,837,182,435) 2,277,448,188
Other Assets & Liabilities, Net (3,467,423)
Net Assets 2,273,980,765
Asset-Backed Securities — Non-Agency 3.8% Asset-Backed Securities — Non-Agency (continued)
Copyright © 2021 www.secdatabase.com. All Rights Reserved.Please Consider the Environment Before Printing This Document
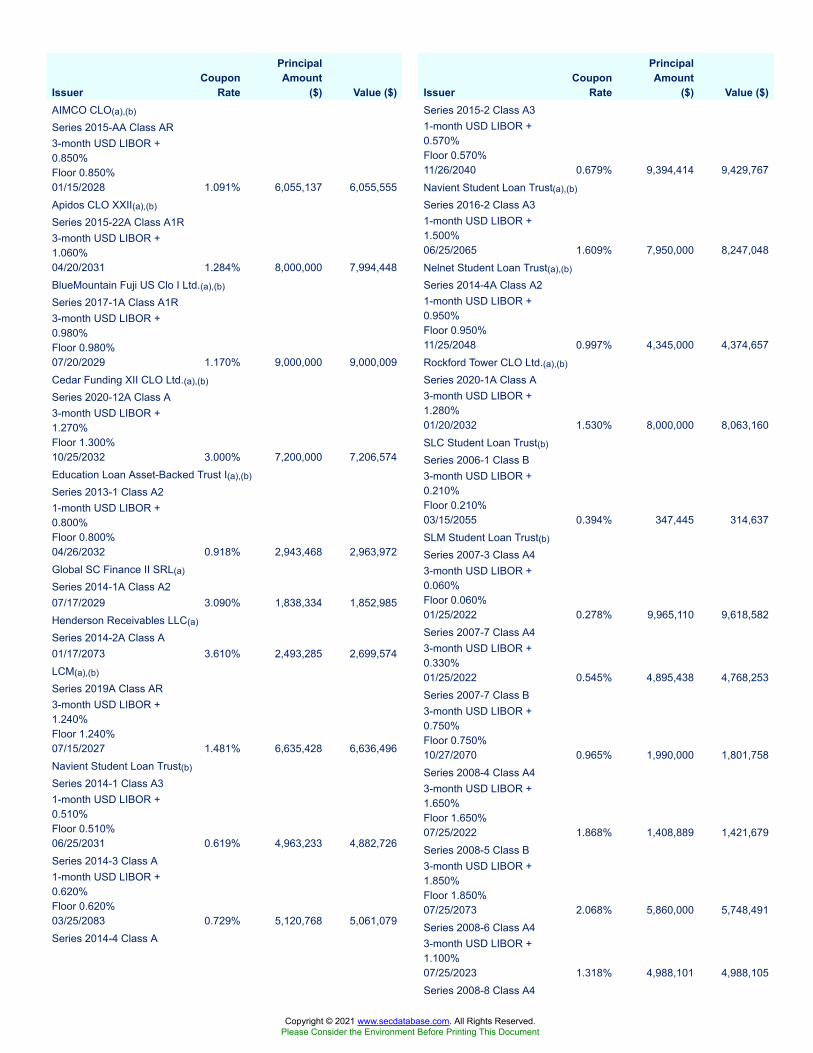
IssuerCoupon
Rate
PrincipalAmount
($) Value ($)AIMCO CLO(a),(b)
Series 2015-AA Class AR3-month USD LIBOR +0.850%Floor 0.850%01/15/2028 1.091% 6,055,137 6,055,555Apidos CLO XXII(a),(b)
Series 2015-22A Class A1R3-month USD LIBOR +1.060%04/20/2031 1.284% 8,000,000 7,994,448BlueMountain Fuji US Clo I Ltd.(a),(b)
Series 2017-1A Class A1R3-month USD LIBOR +0.980%Floor 0.980%07/20/2029 1.170% 9,000,000 9,000,009Cedar Funding XII CLO Ltd.(a),(b)
Series 2020-12A Class A3-month USD LIBOR +1.270%Floor 1.300%10/25/2032 3.000% 7,200,000 7,206,574Education Loan Asset-Backed Trust I(a),(b)
Series 2013-1 Class A21-month USD LIBOR +0.800%Floor 0.800%04/26/2032 0.918% 2,943,468 2,963,972Global SC Finance II SRL(a)
Series 2014-1A Class A207/17/2029 3.090% 1,838,334 1,852,985Henderson Receivables LLC(a)
Series 2014-2A Class A01/17/2073 3.610% 2,493,285 2,699,574LCM(a),(b)
Series 2019A Class AR3-month USD LIBOR +1.240%Floor 1.240%07/15/2027 1.481% 6,635,428 6,636,496Navient Student Loan Trust(b)
Series 2014-1 Class A31-month USD LIBOR +0.510%Floor 0.510%06/25/2031 0.619% 4,963,233 4,882,726Series 2014-3 Class A1-month USD LIBOR +0.620%Floor 0.620%03/25/2083 0.729% 5,120,768 5,061,079Series 2014-4 Class A
IssuerCoupon
Rate
PrincipalAmount
($) Value ($)Series 2015-2 Class A31-month USD LIBOR +0.570%Floor 0.570%11/26/2040 0.679% 9,394,414 9,429,767Navient Student Loan Trust(a),(b)
Series 2016-2 Class A31-month USD LIBOR +1.500%06/25/2065 1.609% 7,950,000 8,247,048Nelnet Student Loan Trust(a),(b)
Series 2014-4A Class A21-month USD LIBOR +0.950%Floor 0.950%11/25/2048 0.997% 4,345,000 4,374,657Rockford Tower CLO Ltd.(a),(b)
Series 2020-1A Class A3-month USD LIBOR +1.280%01/20/2032 1.530% 8,000,000 8,063,160SLC Student Loan Trust(b)
Series 2006-1 Class B3-month USD LIBOR +0.210%Floor 0.210%03/15/2055 0.394% 347,445 314,637SLM Student Loan Trust(b)
Series 2007-3 Class A43-month USD LIBOR +0.060%Floor 0.060%01/25/2022 0.278% 9,965,110 9,618,582Series 2007-7 Class A43-month USD LIBOR +0.330%01/25/2022 0.545% 4,895,438 4,768,253Series 2007-7 Class B3-month USD LIBOR +0.750%Floor 0.750%10/27/2070 0.965% 1,990,000 1,801,758Series 2008-4 Class A43-month USD LIBOR +1.650%Floor 1.650%07/25/2022 1.868% 1,408,889 1,421,679Series 2008-5 Class B3-month USD LIBOR +1.850%Floor 1.850%07/25/2073 2.068% 5,860,000 5,748,491Series 2008-6 Class A43-month USD LIBOR +1.100%07/25/2023 1.318% 4,988,101 4,988,105Series 2008-8 Class A4
Copyright © 2021 www.secdatabase.com. All Rights Reserved.Please Consider the Environment Before Printing This Document
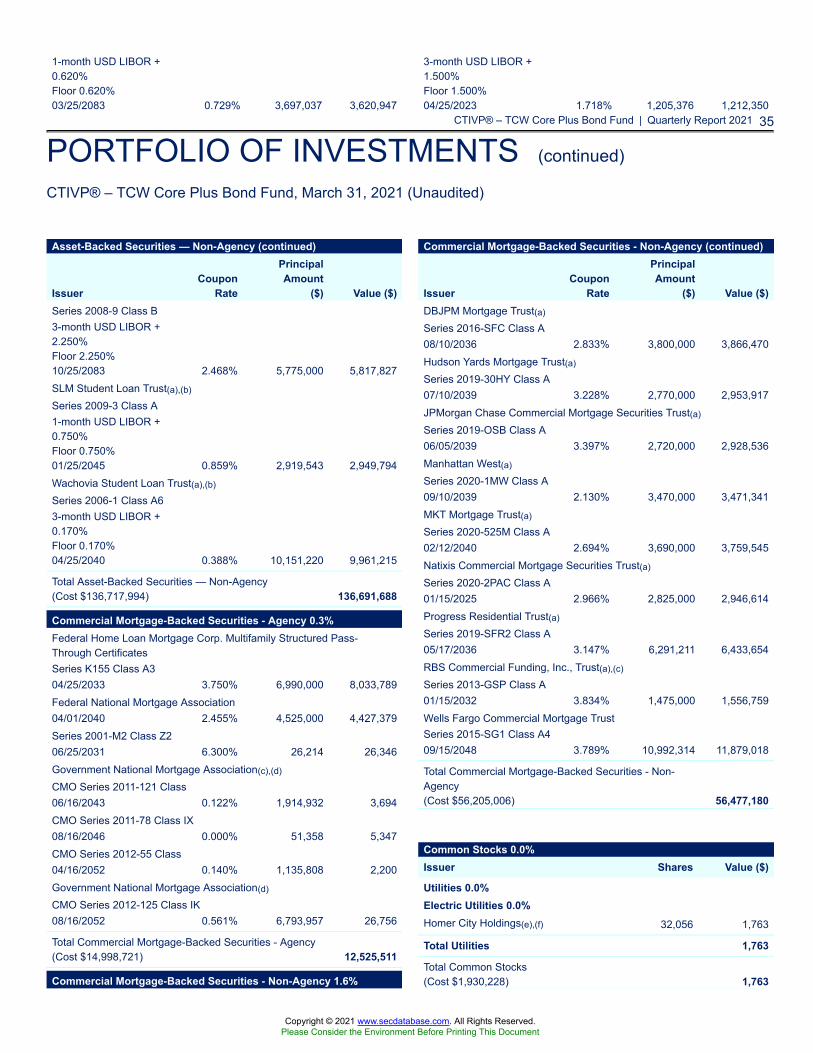
CTIVP® – TCW Core Plus Bond Fund | Quarterly Report 2021 35
PORTFOLIO OF INVESTMENTS (continued)
CTIVP® – TCW Core Plus Bond Fund, March 31, 2021 (Unaudited)
1-month USD LIBOR +0.620%Floor 0.620%03/25/2083 0.729% 3,697,037 3,620,947
3-month USD LIBOR +1.500%Floor 1.500%04/25/2023 1.718% 1,205,376 1,212,350
Asset-Backed Securities — Non-Agency (continued)
IssuerCoupon
Rate
PrincipalAmount
($) Value ($)Series 2008-9 Class B3-month USD LIBOR +2.250%Floor 2.250%10/25/2083 2.468% 5,775,000 5,817,827SLM Student Loan Trust(a),(b)
Series 2009-3 Class A1-month USD LIBOR +0.750%Floor 0.750%01/25/2045 0.859% 2,919,543 2,949,794Wachovia Student Loan Trust(a),(b)
Series 2006-1 Class A63-month USD LIBOR +0.170%Floor 0.170%04/25/2040 0.388% 10,151,220 9,961,215
Total Asset-Backed Securities — Non-Agency(Cost $136,717,994) 136,691,688
Commercial Mortgage-Backed Securities - Agency 0.3%Federal Home Loan Mortgage Corp. Multifamily Structured Pass-Through CertificatesSeries K155 Class A304/25/2033 3.750% 6,990,000 8,033,789Federal National Mortgage Association04/01/2040 2.455% 4,525,000 4,427,379Series 2001-M2 Class Z206/25/2031 6.300% 26,214 26,346Government National Mortgage Association(c),(d)
CMO Series 2011-121 Class06/16/2043 0.122% 1,914,932 3,694CMO Series 2011-78 Class IX08/16/2046 0.000% 51,358 5,347CMO Series 2012-55 Class04/16/2052 0.140% 1,135,808 2,200Government National Mortgage Association(d)
CMO Series 2012-125 Class IK08/16/2052 0.561% 6,793,957 26,756
Total Commercial Mortgage-Backed Securities - Agency(Cost $14,998,721) 12,525,511
Commercial Mortgage-Backed Securities - Non-Agency 1.6%
Commercial Mortgage-Backed Securities - Non-Agency (continued)
IssuerCoupon
Rate
PrincipalAmount
($) Value ($)DBJPM Mortgage Trust(a)
Series 2016-SFC Class A08/10/2036 2.833% 3,800,000 3,866,470Hudson Yards Mortgage Trust(a)
Series 2019-30HY Class A07/10/2039 3.228% 2,770,000 2,953,917JPMorgan Chase Commercial Mortgage Securities Trust(a)
Series 2019-OSB Class A06/05/2039 3.397% 2,720,000 2,928,536Manhattan West(a)
Series 2020-1MW Class A09/10/2039 2.130% 3,470,000 3,471,341MKT Mortgage Trust(a)
Series 2020-525M Class A02/12/2040 2.694% 3,690,000 3,759,545Natixis Commercial Mortgage Securities Trust(a)
Series 2020-2PAC Class A01/15/2025 2.966% 2,825,000 2,946,614Progress Residential Trust(a)
Series 2019-SFR2 Class A05/17/2036 3.147% 6,291,211 6,433,654RBS Commercial Funding, Inc., Trust(a),(c)
Series 2013-GSP Class A01/15/2032 3.834% 1,475,000 1,556,759Wells Fargo Commercial Mortgage TrustSeries 2015-SG1 Class A409/15/2048 3.789% 10,992,314 11,879,018
Total Commercial Mortgage-Backed Securities - Non-Agency(Cost $56,205,006) 56,477,180
Common Stocks 0.0%Issuer Shares Value ($)
Utilities 0.0%Electric Utilities 0.0%Homer City Holdings(e),(f) 32,056 1,763
Total Utilities 1,763
Total Common Stocks(Cost $1,930,228) 1,763
Copyright © 2021 www.secdatabase.com. All Rights Reserved.Please Consider the Environment Before Printing This Document
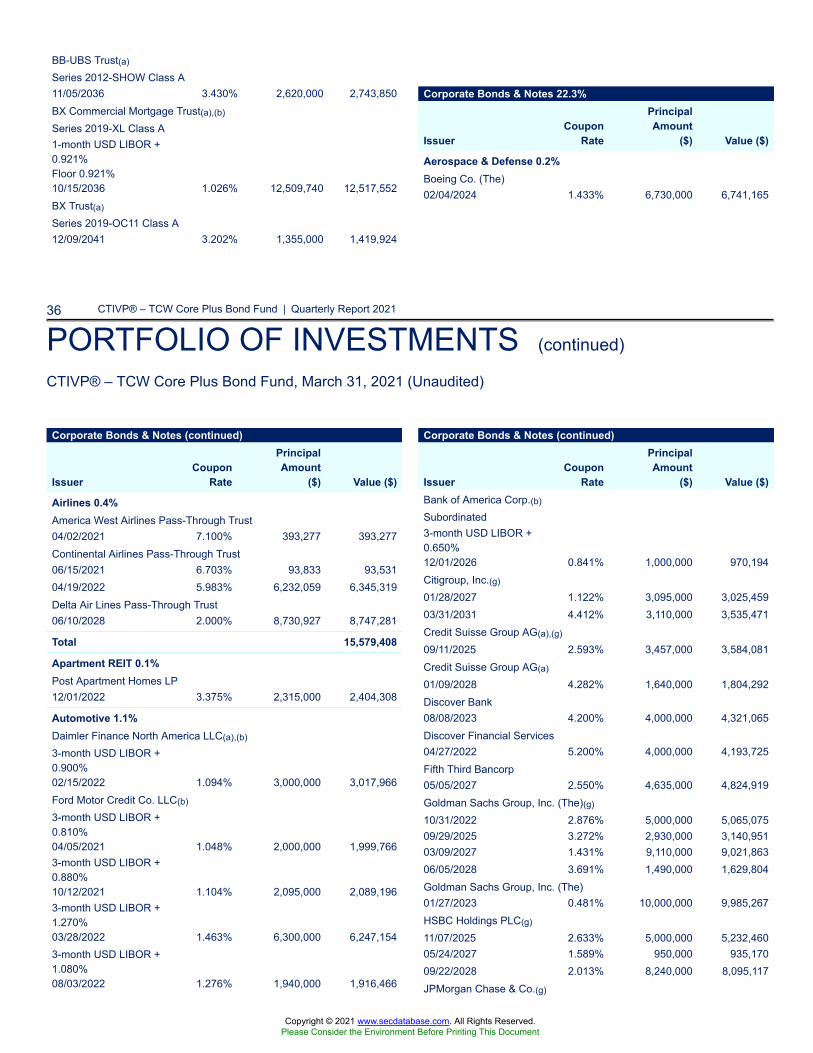
36 CTIVP® – TCW Core Plus Bond Fund | Quarterly Report 2021
PORTFOLIO OF INVESTMENTS (continued)
CTIVP® – TCW Core Plus Bond Fund, March 31, 2021 (Unaudited)
BB-UBS Trust(a)
Series 2012-SHOW Class A11/05/2036 3.430% 2,620,000 2,743,850BX Commercial Mortgage Trust(a),(b)
Series 2019-XL Class A1-month USD LIBOR +0.921%Floor 0.921%10/15/2036 1.026% 12,509,740 12,517,552BX Trust(a)
Series 2019-OC11 Class A12/09/2041 3.202% 1,355,000 1,419,924
Corporate Bonds & Notes 22.3%
IssuerCoupon
Rate
PrincipalAmount
($) Value ($)
Aerospace & Defense 0.2%Boeing Co. (The)02/04/2024 1.433% 6,730,000 6,741,165
Corporate Bonds & Notes (continued)
IssuerCoupon
Rate
PrincipalAmount
($) Value ($)
Airlines 0.4%America West Airlines Pass-Through Trust04/02/2021 7.100% 393,277 393,277Continental Airlines Pass-Through Trust06/15/2021 6.703% 93,833 93,53104/19/2022 5.983% 6,232,059 6,345,319Delta Air Lines Pass-Through Trust06/10/2028 2.000% 8,730,927 8,747,281
Total 15,579,408
Apartment REIT 0.1%Post Apartment Homes LP12/01/2022 3.375% 2,315,000 2,404,308
Automotive 1.1%Daimler Finance North America LLC(a),(b)
3-month USD LIBOR +0.900%02/15/2022 1.094% 3,000,000 3,017,966Ford Motor Credit Co. LLC(b)
3-month USD LIBOR +0.810%04/05/2021 1.048% 2,000,000 1,999,7663-month USD LIBOR +0.880%10/12/2021 1.104% 2,095,000 2,089,1963-month USD LIBOR +1.270%03/28/2022 1.463% 6,300,000 6,247,1543-month USD LIBOR +1.080%08/03/2022 1.276% 1,940,000 1,916,466
Corporate Bonds & Notes (continued)
IssuerCoupon
Rate
PrincipalAmount
($) Value ($)Bank of America Corp.(b)
Subordinated3-month USD LIBOR +0.650%12/01/2026 0.841% 1,000,000 970,194Citigroup, Inc.(g)
01/28/2027 1.122% 3,095,000 3,025,45903/31/2031 4.412% 3,110,000 3,535,471Credit Suisse Group AG(a),(g)
09/11/2025 2.593% 3,457,000 3,584,081Credit Suisse Group AG(a)
01/09/2028 4.282% 1,640,000 1,804,292Discover Bank08/08/2023 4.200% 4,000,000 4,321,065Discover Financial Services04/27/2022 5.200% 4,000,000 4,193,725Fifth Third Bancorp05/05/2027 2.550% 4,635,000 4,824,919Goldman Sachs Group, Inc. (The)(g)
10/31/2022 2.876% 5,000,000 5,065,07509/29/2025 3.272% 2,930,000 3,140,95103/09/2027 1.431% 9,110,000 9,021,86306/05/2028 3.691% 1,490,000 1,629,804Goldman Sachs Group, Inc. (The)01/27/2023 0.481% 10,000,000 9,985,267HSBC Holdings PLC(g)
11/07/2025 2.633% 5,000,000 5,232,46005/24/2027 1.589% 950,000 935,17009/22/2028 2.013% 8,240,000 8,095,117JPMorgan Chase & Co.(g)
Copyright © 2021 www.secdatabase.com. All Rights Reserved.Please Consider the Environment Before Printing This Document
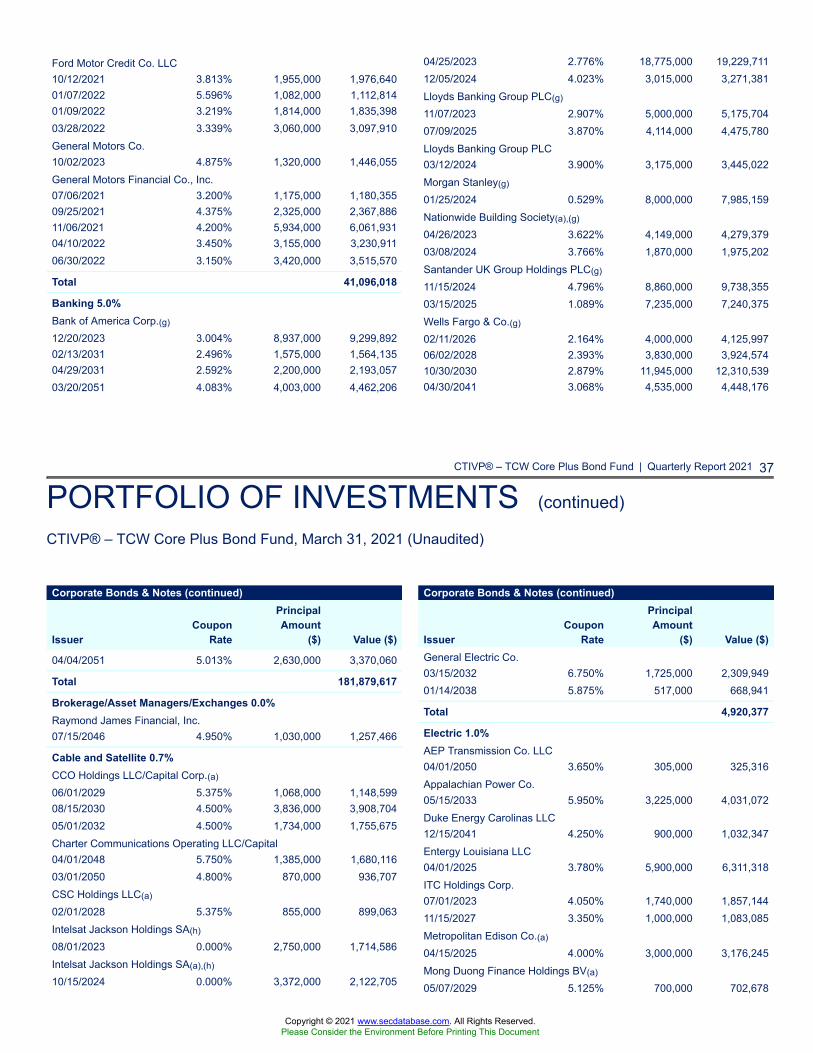
CTIVP® – TCW Core Plus Bond Fund | Quarterly Report 2021 37
PORTFOLIO OF INVESTMENTS (continued)
CTIVP® – TCW Core Plus Bond Fund, March 31, 2021 (Unaudited)
Ford Motor Credit Co. LLC10/12/2021 3.813% 1,955,000 1,976,64001/07/2022 5.596% 1,082,000 1,112,81401/09/2022 3.219% 1,814,000 1,835,39803/28/2022 3.339% 3,060,000 3,097,910General Motors Co.10/02/2023 4.875% 1,320,000 1,446,055General Motors Financial Co., Inc.07/06/2021 3.200% 1,175,000 1,180,35509/25/2021 4.375% 2,325,000 2,367,88611/06/2021 4.200% 5,934,000 6,061,93104/10/2022 3.450% 3,155,000 3,230,91106/30/2022 3.150% 3,420,000 3,515,570
Total 41,096,018
Banking 5.0%Bank of America Corp.(g)
12/20/2023 3.004% 8,937,000 9,299,89202/13/2031 2.496% 1,575,000 1,564,13504/29/2031 2.592% 2,200,000 2,193,05703/20/2051 4.083% 4,003,000 4,462,206
04/25/2023 2.776% 18,775,000 19,229,71112/05/2024 4.023% 3,015,000 3,271,381Lloyds Banking Group PLC(g)
11/07/2023 2.907% 5,000,000 5,175,70407/09/2025 3.870% 4,114,000 4,475,780Lloyds Banking Group PLC03/12/2024 3.900% 3,175,000 3,445,022Morgan Stanley(g)
01/25/2024 0.529% 8,000,000 7,985,159Nationwide Building Society(a),(g)
04/26/2023 3.622% 4,149,000 4,279,37903/08/2024 3.766% 1,870,000 1,975,202Santander UK Group Holdings PLC(g)
11/15/2024 4.796% 8,860,000 9,738,35503/15/2025 1.089% 7,235,000 7,240,375Wells Fargo & Co.(g)
02/11/2026 2.164% 4,000,000 4,125,99706/02/2028 2.393% 3,830,000 3,924,57410/30/2030 2.879% 11,945,000 12,310,53904/30/2041 3.068% 4,535,000 4,448,176
Corporate Bonds & Notes (continued)
IssuerCoupon
Rate
PrincipalAmount
($) Value ($)
04/04/2051 5.013% 2,630,000 3,370,060
Total 181,879,617
Brokerage/Asset Managers/Exchanges 0.0%Raymond James Financial, Inc.07/15/2046 4.950% 1,030,000 1,257,466
Cable and Satellite 0.7%CCO Holdings LLC/Capital Corp.(a)
06/01/2029 5.375% 1,068,000 1,148,59908/15/2030 4.500% 3,836,000 3,908,70405/01/2032 4.500% 1,734,000 1,755,675Charter Communications Operating LLC/Capital04/01/2048 5.750% 1,385,000 1,680,11603/01/2050 4.800% 870,000 936,707CSC Holdings LLC(a)
02/01/2028 5.375% 855,000 899,063Intelsat Jackson Holdings SA(h)
08/01/2023 0.000% 2,750,000 1,714,586Intelsat Jackson Holdings SA(a),(h)
10/15/2024 0.000% 3,372,000 2,122,705
Corporate Bonds & Notes (continued)
IssuerCoupon
Rate
PrincipalAmount
($) Value ($)General Electric Co.03/15/2032 6.750% 1,725,000 2,309,94901/14/2038 5.875% 517,000 668,941
Total 4,920,377
Electric 1.0%AEP Transmission Co. LLC04/01/2050 3.650% 305,000 325,316Appalachian Power Co.05/15/2033 5.950% 3,225,000 4,031,072Duke Energy Carolinas LLC12/15/2041 4.250% 900,000 1,032,347Entergy Louisiana LLC04/01/2025 3.780% 5,900,000 6,311,318ITC Holdings Corp.07/01/2023 4.050% 1,740,000 1,857,14411/15/2027 3.350% 1,000,000 1,083,085Metropolitan Edison Co.(a)
04/15/2025 4.000% 3,000,000 3,176,245Mong Duong Finance Holdings BV(a)
05/07/2029 5.125% 700,000 702,678
Copyright © 2021 www.secdatabase.com. All Rights Reserved.Please Consider the Environment Before Printing This Document
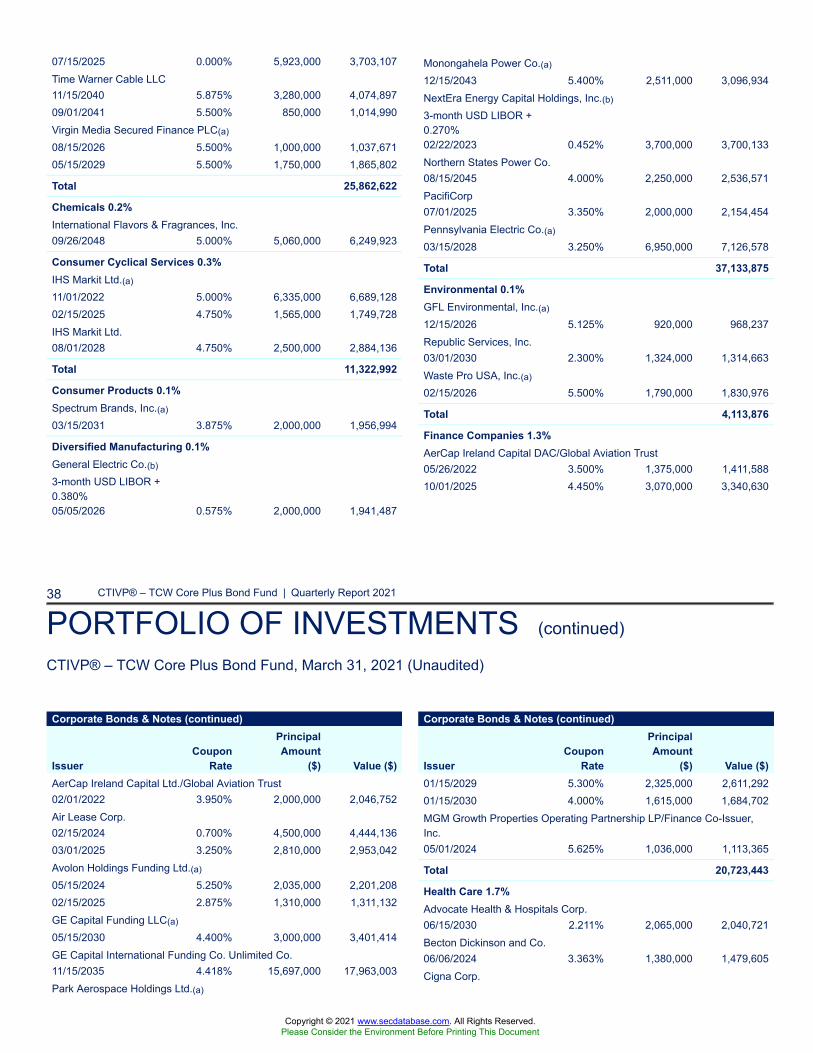
38 CTIVP® – TCW Core Plus Bond Fund | Quarterly Report 2021
PORTFOLIO OF INVESTMENTS (continued)
CTIVP® – TCW Core Plus Bond Fund, March 31, 2021 (Unaudited)
07/15/2025 0.000% 5,923,000 3,703,107Time Warner Cable LLC11/15/2040 5.875% 3,280,000 4,074,89709/01/2041 5.500% 850,000 1,014,990Virgin Media Secured Finance PLC(a)
08/15/2026 5.500% 1,000,000 1,037,67105/15/2029 5.500% 1,750,000 1,865,802
Total 25,862,622
Chemicals 0.2%International Flavors & Fragrances, Inc.09/26/2048 5.000% 5,060,000 6,249,923
Consumer Cyclical Services 0.3%IHS Markit Ltd.(a)
11/01/2022 5.000% 6,335,000 6,689,12802/15/2025 4.750% 1,565,000 1,749,728IHS Markit Ltd.08/01/2028 4.750% 2,500,000 2,884,136
Total 11,322,992
Consumer Products 0.1%Spectrum Brands, Inc.(a)
03/15/2031 3.875% 2,000,000 1,956,994
Diversified Manufacturing 0.1%General Electric Co.(b)
3-month USD LIBOR +0.380%05/05/2026 0.575% 2,000,000 1,941,487
Monongahela Power Co.(a)
12/15/2043 5.400% 2,511,000 3,096,934NextEra Energy Capital Holdings, Inc.(b)
3-month USD LIBOR +0.270%02/22/2023 0.452% 3,700,000 3,700,133Northern States Power Co.08/15/2045 4.000% 2,250,000 2,536,571PacifiCorp07/01/2025 3.350% 2,000,000 2,154,454Pennsylvania Electric Co.(a)
03/15/2028 3.250% 6,950,000 7,126,578
Total 37,133,875
Environmental 0.1%GFL Environmental, Inc.(a)
12/15/2026 5.125% 920,000 968,237Republic Services, Inc.03/01/2030 2.300% 1,324,000 1,314,663Waste Pro USA, Inc.(a)
02/15/2026 5.500% 1,790,000 1,830,976
Total 4,113,876
Finance Companies 1.3%AerCap Ireland Capital DAC/Global Aviation Trust05/26/2022 3.500% 1,375,000 1,411,58810/01/2025 4.450% 3,070,000 3,340,630
Corporate Bonds & Notes (continued)
IssuerCoupon
Rate
PrincipalAmount
($) Value ($)AerCap Ireland Capital Ltd./Global Aviation Trust02/01/2022 3.950% 2,000,000 2,046,752Air Lease Corp.02/15/2024 0.700% 4,500,000 4,444,13603/01/2025 3.250% 2,810,000 2,953,042Avolon Holdings Funding Ltd.(a)
05/15/2024 5.250% 2,035,000 2,201,20802/15/2025 2.875% 1,310,000 1,311,132GE Capital Funding LLC(a)
05/15/2030 4.400% 3,000,000 3,401,414GE Capital International Funding Co. Unlimited Co.11/15/2035 4.418% 15,697,000 17,963,003Park Aerospace Holdings Ltd.(a)
Corporate Bonds & Notes (continued)
IssuerCoupon
Rate
PrincipalAmount
($) Value ($)01/15/2029 5.300% 2,325,000 2,611,29201/15/2030 4.000% 1,615,000 1,684,702MGM Growth Properties Operating Partnership LP/Finance Co-Issuer,Inc.05/01/2024 5.625% 1,036,000 1,113,365
Total 20,723,443
Health Care 1.7%Advocate Health & Hospitals Corp.06/15/2030 2.211% 2,065,000 2,040,721Becton Dickinson and Co.06/06/2024 3.363% 1,380,000 1,479,605Cigna Corp.
Copyright © 2021 www.secdatabase.com. All Rights Reserved.Please Consider the Environment Before Printing This Document

CTIVP® – TCW Core Plus Bond Fund | Quarterly Report 2021 39
PORTFOLIO OF INVESTMENTS (continued)
CTIVP® – TCW Core Plus Bond Fund, March 31, 2021 (Unaudited)
03/15/2023 4.500% 5,335,000 5,568,87802/15/2024 5.500% 2,620,000 2,834,954
Total 47,476,737
Food and Beverage 0.8%Anheuser-Busch Companies LLC/InBev Worldwide, Inc.02/01/2046 4.900% 5,935,000 7,053,589Anheuser-Busch InBev Worldwide, Inc.04/15/2048 4.600% 1,850,000 2,121,008Bacardi Ltd.(a)
05/15/2048 5.300% 1,400,000 1,720,079Kraft Heinz Foods Co.06/04/2042 5.000% 1,414,000 1,597,33110/01/2049 4.875% 1,680,000 1,897,045Kraft Heinz Foods Co. (The)07/15/2045 5.200% 6,570,000 7,631,756Lamb Weston Holdings, Inc.(a)
11/01/2024 4.625% 926,000 960,784Pilgrim’s Pride Corp.(a),(i)
04/15/2031 4.250% 1,800,000 1,794,008Post Holdings, Inc.(a)
03/01/2027 5.750% 2,000,000 2,103,458
Total 26,879,058
Gaming 0.6%Churchill Downs, Inc.(a)
04/01/2027 5.500% 3,184,000 3,330,05501/15/2028 4.750% 465,000 482,357Colt Merger Sub, Inc.(a)
07/01/2025 6.250% 957,000 1,020,512GLP Capital LP/Financing II, Inc.11/01/2023 5.375% 4,120,000 4,505,23309/01/2024 3.350% 1,800,000 1,904,89306/01/2025 5.250% 2,185,000 2,448,42404/15/2026 5.375% 550,000 617,69506/01/2028 5.750% 870,000 1,004,915
08/15/2038 4.800% 5,000,000 6,000,75510/15/2047 3.875% 1,190,000 1,273,452CommonSpirit Health10/01/2025 1.547% 5,000,000 5,026,07010/01/2030 2.782% 1,575,000 1,601,309CVS Health Corp.07/20/2035 4.875% 1,095,000 1,297,70607/20/2045 5.125% 2,090,000 2,568,84703/25/2048 5.050% 10,975,000 13,472,196Encompass Health Corp.04/01/2031 4.625% 1,170,000 1,210,448Hartford HealthCare Corp.04/01/2044 5.746% 3,000,000 3,912,691HCA, Inc.05/01/2023 4.750% 625,000 674,47204/15/2025 5.250% 3,488,000 3,987,25906/15/2026 5.250% 2,990,000 3,438,90102/15/2027 4.500% 1,000,000 1,122,13406/15/2039 5.125% 2,000,000 2,403,89306/15/2049 5.250% 4,500,000 5,509,246Tenet Healthcare Corp.07/15/2024 4.625% 589,000 601,235Tenet Healthcare Corp.(a)
01/01/2026 4.875% 3,790,000 3,938,52711/01/2027 5.125% 390,000 407,923
Total 61,967,390
Healthcare Insurance 0.5%Anthem, Inc.08/15/2021 3.700% 2,355,000 2,363,14603/15/2051 3.600% 1,500,000 1,554,693Centene Corp.12/15/2027 4.250% 1,505,000 1,581,915Humana, Inc.04/01/2030 4.875% 1,333,000 1,567,278Molina Healthcare, Inc.11/15/2022 5.375% 1,677,000 1,759,047
Corporate Bonds & Notes (continued)
IssuerCoupon
Rate
PrincipalAmount
($) Value ($)Molina Healthcare, Inc.(a)
06/15/2028 4.375% 3,208,000 3,302,61711/15/2030 3.875% 2,000,000 2,056,649UnitedHealth Group, Inc.01/15/2047 4.200% 1,500,000 1,750,232
Corporate Bonds & Notes (continued)
IssuerCoupon
Rate
PrincipalAmount
($) Value ($)
Midstream 1.0%Enbridge Energy Partners LP10/15/2025 5.875% 2,500,000 2,942,338Energy Transfer Operating LP06/01/2027 5.500% 341,000 393,355
Copyright © 2021 www.secdatabase.com. All Rights Reserved.Please Consider the Environment Before Printing This Document
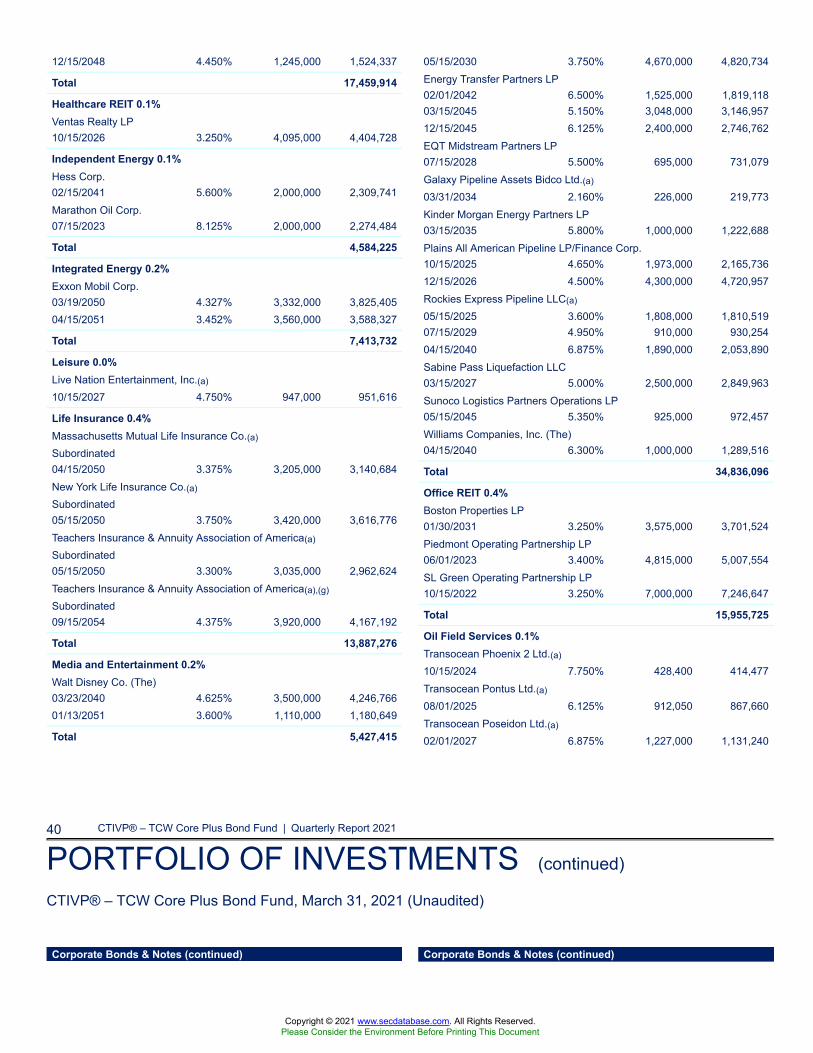
40 CTIVP® – TCW Core Plus Bond Fund | Quarterly Report 2021
PORTFOLIO OF INVESTMENTS (continued)
CTIVP® – TCW Core Plus Bond Fund, March 31, 2021 (Unaudited)
12/15/2048 4.450% 1,245,000 1,524,337
Total 17,459,914
Healthcare REIT 0.1%Ventas Realty LP10/15/2026 3.250% 4,095,000 4,404,728
Independent Energy 0.1%Hess Corp.02/15/2041 5.600% 2,000,000 2,309,741Marathon Oil Corp.07/15/2023 8.125% 2,000,000 2,274,484
Total 4,584,225
Integrated Energy 0.2%Exxon Mobil Corp.03/19/2050 4.327% 3,332,000 3,825,40504/15/2051 3.452% 3,560,000 3,588,327
Total 7,413,732
Leisure 0.0%Live Nation Entertainment, Inc.(a)
10/15/2027 4.750% 947,000 951,616
Life Insurance 0.4%Massachusetts Mutual Life Insurance Co.(a)
Subordinated04/15/2050 3.375% 3,205,000 3,140,684New York Life Insurance Co.(a)
Subordinated05/15/2050 3.750% 3,420,000 3,616,776Teachers Insurance & Annuity Association of America(a)
Subordinated05/15/2050 3.300% 3,035,000 2,962,624Teachers Insurance & Annuity Association of America(a),(g)
Subordinated09/15/2054 4.375% 3,920,000 4,167,192
Total 13,887,276
Media and Entertainment 0.2%Walt Disney Co. (The)03/23/2040 4.625% 3,500,000 4,246,76601/13/2051 3.600% 1,110,000 1,180,649
Total 5,427,415
05/15/2030 3.750% 4,670,000 4,820,734Energy Transfer Partners LP02/01/2042 6.500% 1,525,000 1,819,11803/15/2045 5.150% 3,048,000 3,146,95712/15/2045 6.125% 2,400,000 2,746,762EQT Midstream Partners LP07/15/2028 5.500% 695,000 731,079Galaxy Pipeline Assets Bidco Ltd.(a)
03/31/2034 2.160% 226,000 219,773Kinder Morgan Energy Partners LP03/15/2035 5.800% 1,000,000 1,222,688Plains All American Pipeline LP/Finance Corp.10/15/2025 4.650% 1,973,000 2,165,73612/15/2026 4.500% 4,300,000 4,720,957Rockies Express Pipeline LLC(a)
05/15/2025 3.600% 1,808,000 1,810,51907/15/2029 4.950% 910,000 930,25404/15/2040 6.875% 1,890,000 2,053,890Sabine Pass Liquefaction LLC03/15/2027 5.000% 2,500,000 2,849,963Sunoco Logistics Partners Operations LP05/15/2045 5.350% 925,000 972,457Williams Companies, Inc. (The)04/15/2040 6.300% 1,000,000 1,289,516
Total 34,836,096
Office REIT 0.4%Boston Properties LP01/30/2031 3.250% 3,575,000 3,701,524Piedmont Operating Partnership LP06/01/2023 3.400% 4,815,000 5,007,554SL Green Operating Partnership LP10/15/2022 3.250% 7,000,000 7,246,647
Total 15,955,725
Oil Field Services 0.1%Transocean Phoenix 2 Ltd.(a)
10/15/2024 7.750% 428,400 414,477Transocean Pontus Ltd.(a)
08/01/2025 6.125% 912,050 867,660Transocean Poseidon Ltd.(a)
02/01/2027 6.875% 1,227,000 1,131,240
Corporate Bonds & Notes (continued) Corporate Bonds & Notes (continued)
Copyright © 2021 www.secdatabase.com. All Rights Reserved.Please Consider the Environment Before Printing This Document
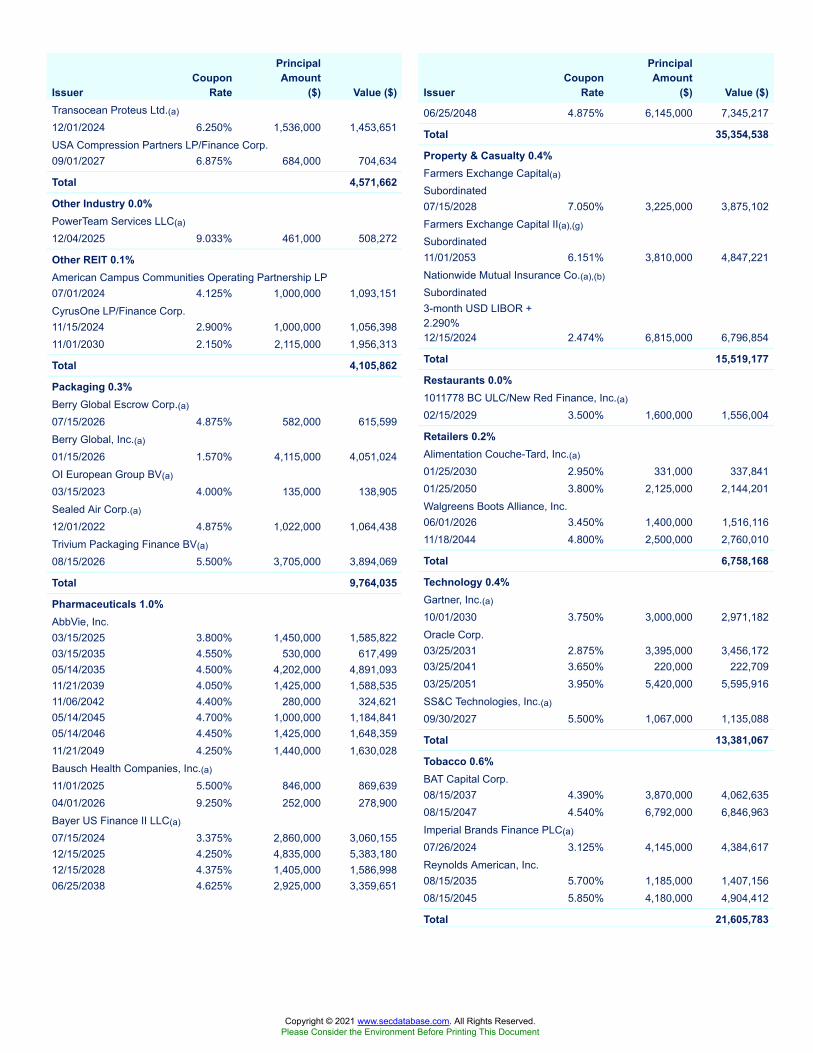
IssuerCoupon
Rate
PrincipalAmount
($) Value ($)Transocean Proteus Ltd.(a)
12/01/2024 6.250% 1,536,000 1,453,651USA Compression Partners LP/Finance Corp.09/01/2027 6.875% 684,000 704,634
Total 4,571,662
Other Industry 0.0%PowerTeam Services LLC(a)
12/04/2025 9.033% 461,000 508,272
Other REIT 0.1%American Campus Communities Operating Partnership LP07/01/2024 4.125% 1,000,000 1,093,151CyrusOne LP/Finance Corp.11/15/2024 2.900% 1,000,000 1,056,39811/01/2030 2.150% 2,115,000 1,956,313
Total 4,105,862
Packaging 0.3%Berry Global Escrow Corp.(a)
07/15/2026 4.875% 582,000 615,599Berry Global, Inc.(a)
01/15/2026 1.570% 4,115,000 4,051,024OI European Group BV(a)
03/15/2023 4.000% 135,000 138,905Sealed Air Corp.(a)
12/01/2022 4.875% 1,022,000 1,064,438Trivium Packaging Finance BV(a)
08/15/2026 5.500% 3,705,000 3,894,069
Total 9,764,035
Pharmaceuticals 1.0%AbbVie, Inc.03/15/2025 3.800% 1,450,000 1,585,82203/15/2035 4.550% 530,000 617,49905/14/2035 4.500% 4,202,000 4,891,09311/21/2039 4.050% 1,425,000 1,588,53511/06/2042 4.400% 280,000 324,62105/14/2045 4.700% 1,000,000 1,184,84105/14/2046 4.450% 1,425,000 1,648,35911/21/2049 4.250% 1,440,000 1,630,028Bausch Health Companies, Inc.(a)
11/01/2025 5.500% 846,000 869,63904/01/2026 9.250% 252,000 278,900Bayer US Finance II LLC(a)
07/15/2024 3.375% 2,860,000 3,060,15512/15/2025 4.250% 4,835,000 5,383,18012/15/2028 4.375% 1,405,000 1,586,99806/25/2038 4.625% 2,925,000 3,359,651
IssuerCoupon
Rate
PrincipalAmount
($) Value ($)
06/25/2048 4.875% 6,145,000 7,345,217
Total 35,354,538
Property & Casualty 0.4%Farmers Exchange Capital(a)
Subordinated07/15/2028 7.050% 3,225,000 3,875,102Farmers Exchange Capital II(a),(g)
Subordinated11/01/2053 6.151% 3,810,000 4,847,221Nationwide Mutual Insurance Co.(a),(b)
Subordinated3-month USD LIBOR +2.290%12/15/2024 2.474% 6,815,000 6,796,854
Total 15,519,177
Restaurants 0.0%1011778 BC ULC/New Red Finance, Inc.(a)
02/15/2029 3.500% 1,600,000 1,556,004
Retailers 0.2%Alimentation Couche-Tard, Inc.(a)
01/25/2030 2.950% 331,000 337,84101/25/2050 3.800% 2,125,000 2,144,201Walgreens Boots Alliance, Inc.06/01/2026 3.450% 1,400,000 1,516,11611/18/2044 4.800% 2,500,000 2,760,010
Total 6,758,168
Technology 0.4%Gartner, Inc.(a)
10/01/2030 3.750% 3,000,000 2,971,182Oracle Corp.03/25/2031 2.875% 3,395,000 3,456,17203/25/2041 3.650% 220,000 222,70903/25/2051 3.950% 5,420,000 5,595,916SS&C Technologies, Inc.(a)
09/30/2027 5.500% 1,067,000 1,135,088
Total 13,381,067
Tobacco 0.6%BAT Capital Corp.08/15/2037 4.390% 3,870,000 4,062,63508/15/2047 4.540% 6,792,000 6,846,963Imperial Brands Finance PLC(a)
07/26/2024 3.125% 4,145,000 4,384,617Reynolds American, Inc.08/15/2035 5.700% 1,185,000 1,407,15608/15/2045 5.850% 4,180,000 4,904,412
Total 21,605,783
Copyright © 2021 www.secdatabase.com. All Rights Reserved.Please Consider the Environment Before Printing This Document

CTIVP® – TCW Core Plus Bond Fund | Quarterly Report 2021 41
PORTFOLIO OF INVESTMENTS (continued)
CTIVP® – TCW Core Plus Bond Fund, March 31, 2021 (Unaudited)
Corporate Bonds & Notes (continued)
IssuerCoupon
Rate
PrincipalAmount
($) Value ($)
Treasury 0.1%Romanian Government International Bond(a)
02/14/2031 3.000% 1,140,000 1,141,232Saudi Government International Bond(a)
10/22/2030 3.250% 850,000 894,482
Total 2,035,714
Wireless 1.4%Sprint Corp.09/15/2023 7.875% 270,000 308,519Sprint Spectrum Co. I/II/III LLC(a)
09/20/2021 3.360% 1,166,875 1,176,28303/20/2025 4.738% 12,600,000 13,554,74803/20/2028 5.152% 2,780,000 3,170,450T-Mobile USA, Inc.03/01/2023 6.000% 2,196,000 2,210,42804/15/2024 6.000% 1,894,000 1,902,39304/15/2026 2.625% 5,424,000 5,499,977T-Mobile USA, Inc.(a)
02/15/2026 1.500% 25,000 24,76204/15/2027 3.750% 4,375,000 4,779,06604/15/2030 3.875% 3,000,000 3,255,30402/15/2031 2.550% 2,340,000 2,286,66904/15/2040 4.375% 3,000,000 3,317,391Vodafone Group PLC05/30/2048 5.250% 3,085,000 3,856,02606/19/2049 4.875% 4,340,000 5,182,900
Total 50,524,916
Wirelines 1.1%AT&T, Inc.(a)
12/01/2033 2.550% 1,780,000 1,689,55809/15/2055 3.550% 2,375,000 2,173,66012/01/2057 3.800% 9,715,000 9,256,420AT&T, Inc.05/15/2035 4.500% 620,000 698,95303/01/2037 5.250% 5,640,000 6,812,71803/01/2039 4.850% 2,796,000 3,249,13212/15/2042 4.300% 1,000,000 1,093,27405/15/2046 4.750% 3,360,000 3,852,807C&W Senior Financing DAC(a)
09/15/2027 6.875% 480,000 511,842Level 3 Financing, Inc.(a)
Corporate Bonds & Notes (continued)
IssuerCoupon
Rate
PrincipalAmount
($) Value ($)Verizon Communications, Inc.03/22/2028 2.100% 1,810,000 1,815,86303/21/2031 2.550% 7,035,000 7,025,776
Total 38,690,244
Total Corporate Bonds & Notes(Cost $777,200,187) 806,861,438
Foreign Government Obligations(j) 1.5%Azerbaijan 0.0%Southern Gas Corridor CJSC(a)
03/24/2026 6.875% 800,000 946,329
Brazil 0.0%Brazilian Government International Bond06/12/2030 3.875% 925,000 897,655
Chile 0.1%Chile Government International Bond01/27/2032 2.550% 200,000 201,810Corporación Nacional del Cobre de Chile(a)
01/14/2030 3.150% 1,904,000 1,977,036Empresa de Transporte de Pasajeros Metro SA(a)
05/07/2030 3.650% 520,000 565,055
Total 2,743,901
Colombia 0.1%Colombia Government International Bond01/30/2030 3.000% 1,400,000 1,370,69604/15/2031 3.125% 439,000 429,43005/15/2049 5.200% 1,221,000 1,343,214
Total 3,143,340
Dominican Republic 0.0%Dominican Republic International Bond(a)
01/30/2030 4.500% 300,000 302,43909/23/2032 4.875% 1,090,000 1,106,218
Total 1,408,657
Egypt 0.0%Egypt Government International Bond(a)
02/21/2023 5.577% 750,000 780,88403/01/2029 7.600% 400,000 425,898
Total 1,206,782
Indonesia 0.1%
Copyright © 2021 www.secdatabase.com. All Rights Reserved.Please Consider the Environment Before Printing This Document
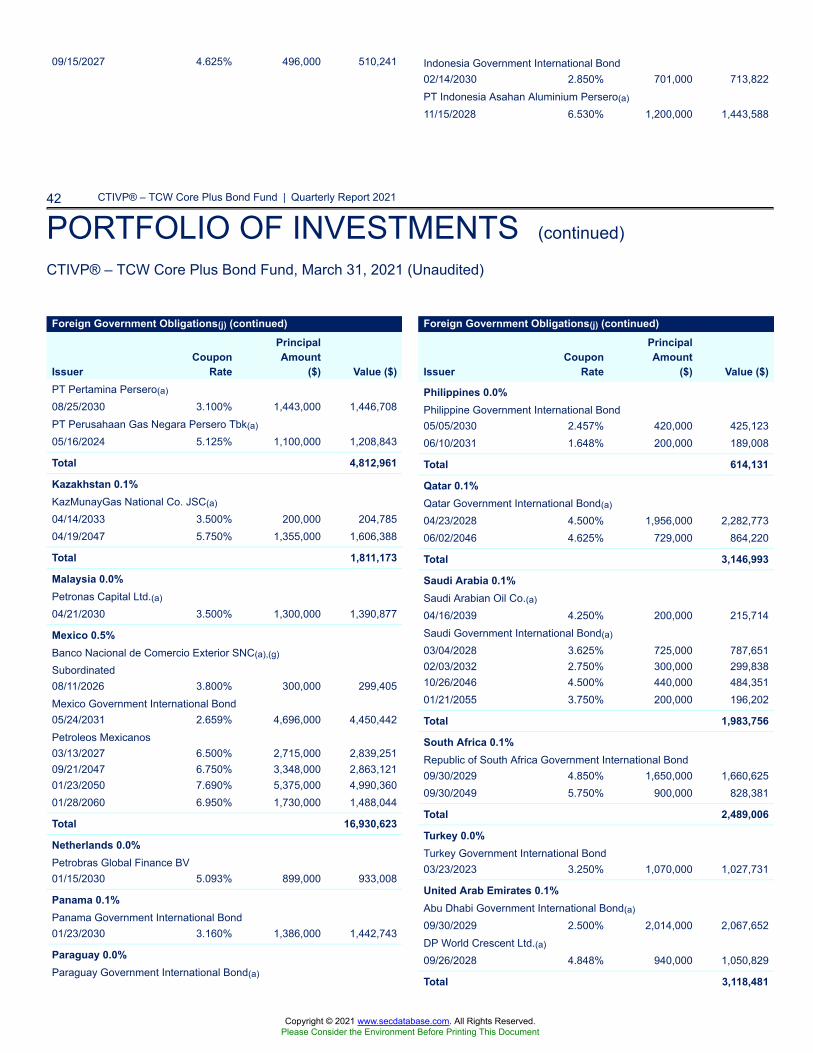
42 CTIVP® – TCW Core Plus Bond Fund | Quarterly Report 2021
PORTFOLIO OF INVESTMENTS (continued)
CTIVP® – TCW Core Plus Bond Fund, March 31, 2021 (Unaudited)
09/15/2027 4.625% 496,000 510,241 Indonesia Government International Bond02/14/2030 2.850% 701,000 713,822PT Indonesia Asahan Aluminium Persero(a)
11/15/2028 6.530% 1,200,000 1,443,588
Foreign Government Obligations(j) (continued)
IssuerCoupon
Rate
PrincipalAmount
($) Value ($)PT Pertamina Persero(a)
08/25/2030 3.100% 1,443,000 1,446,708PT Perusahaan Gas Negara Persero Tbk(a)
05/16/2024 5.125% 1,100,000 1,208,843
Total 4,812,961
Kazakhstan 0.1%KazMunayGas National Co. JSC(a)
04/14/2033 3.500% 200,000 204,78504/19/2047 5.750% 1,355,000 1,606,388
Total 1,811,173
Malaysia 0.0%Petronas Capital Ltd.(a)
04/21/2030 3.500% 1,300,000 1,390,877
Mexico 0.5%Banco Nacional de Comercio Exterior SNC(a),(g)
Subordinated08/11/2026 3.800% 300,000 299,405Mexico Government International Bond05/24/2031 2.659% 4,696,000 4,450,442Petroleos Mexicanos03/13/2027 6.500% 2,715,000 2,839,25109/21/2047 6.750% 3,348,000 2,863,12101/23/2050 7.690% 5,375,000 4,990,36001/28/2060 6.950% 1,730,000 1,488,044
Total 16,930,623
Netherlands 0.0%Petrobras Global Finance BV01/15/2030 5.093% 899,000 933,008
Panama 0.1%Panama Government International Bond01/23/2030 3.160% 1,386,000 1,442,743
Paraguay 0.0%Paraguay Government International Bond(a)
Foreign Government Obligations(j) (continued)
IssuerCoupon
Rate
PrincipalAmount
($) Value ($)
Philippines 0.0%Philippine Government International Bond05/05/2030 2.457% 420,000 425,12306/10/2031 1.648% 200,000 189,008
Total 614,131
Qatar 0.1%Qatar Government International Bond(a)
04/23/2028 4.500% 1,956,000 2,282,77306/02/2046 4.625% 729,000 864,220
Total 3,146,993
Saudi Arabia 0.1%Saudi Arabian Oil Co.(a)
04/16/2039 4.250% 200,000 215,714Saudi Government International Bond(a)
03/04/2028 3.625% 725,000 787,65102/03/2032 2.750% 300,000 299,83810/26/2046 4.500% 440,000 484,35101/21/2055 3.750% 200,000 196,202
Total 1,983,756
South Africa 0.1%Republic of South Africa Government International Bond09/30/2029 4.850% 1,650,000 1,660,62509/30/2049 5.750% 900,000 828,381
Total 2,489,006
Turkey 0.0%Turkey Government International Bond03/23/2023 3.250% 1,070,000 1,027,731
United Arab Emirates 0.1%Abu Dhabi Government International Bond(a)
09/30/2029 2.500% 2,014,000 2,067,652DP World Crescent Ltd.(a)
09/26/2028 4.848% 940,000 1,050,829
Total 3,118,481
Copyright © 2021 www.secdatabase.com. All Rights Reserved.Please Consider the Environment Before Printing This Document
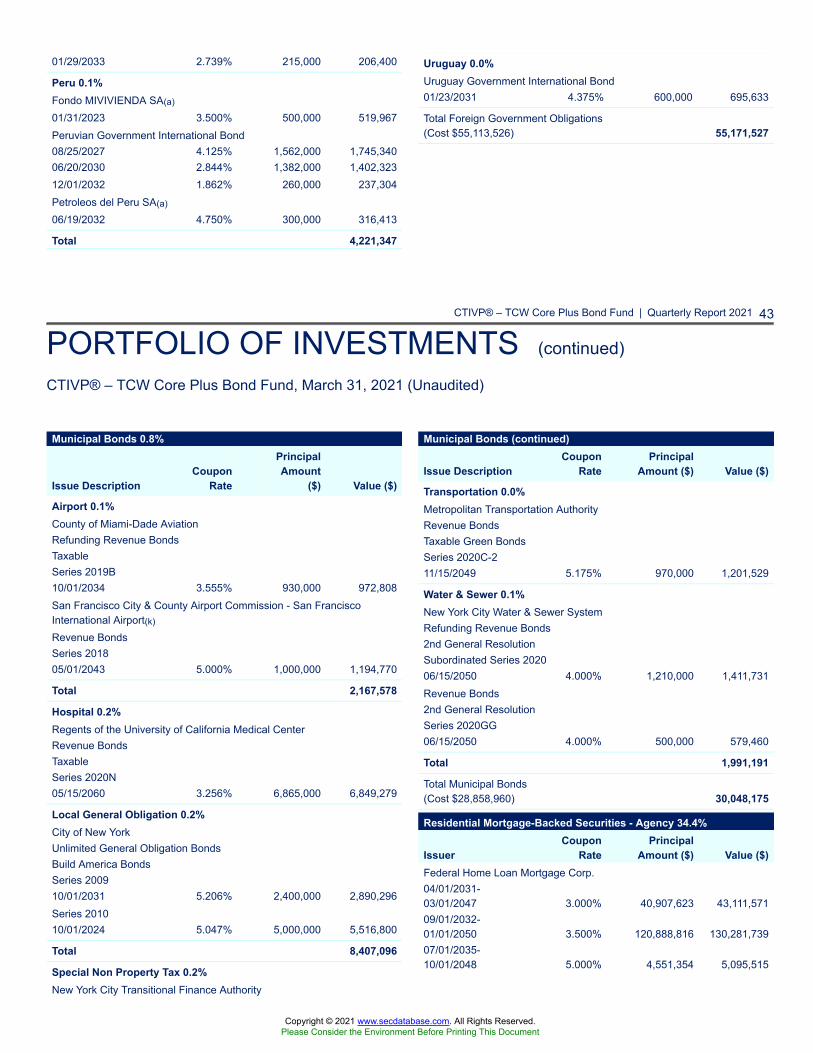
CTIVP® – TCW Core Plus Bond Fund | Quarterly Report 2021 43
PORTFOLIO OF INVESTMENTS (continued)
CTIVP® – TCW Core Plus Bond Fund, March 31, 2021 (Unaudited)
01/29/2033 2.739% 215,000 206,400
Peru 0.1%Fondo MIVIVIENDA SA(a)
01/31/2023 3.500% 500,000 519,967Peruvian Government International Bond08/25/2027 4.125% 1,562,000 1,745,34006/20/2030 2.844% 1,382,000 1,402,32312/01/2032 1.862% 260,000 237,304Petroleos del Peru SA(a)
06/19/2032 4.750% 300,000 316,413
Total 4,221,347
Uruguay 0.0%Uruguay Government International Bond01/23/2031 4.375% 600,000 695,633
Total Foreign Government Obligations(Cost $55,113,526) 55,171,527
Municipal Bonds 0.8%
Issue DescriptionCoupon
Rate
PrincipalAmount
($) Value ($)
Airport 0.1%County of Miami-Dade AviationRefunding Revenue BondsTaxableSeries 2019B10/01/2034 3.555% 930,000 972,808San Francisco City & County Airport Commission - San FranciscoInternational Airport(k)
Revenue BondsSeries 201805/01/2043 5.000% 1,000,000 1,194,770
Total 2,167,578
Hospital 0.2%Regents of the University of California Medical CenterRevenue BondsTaxableSeries 2020N05/15/2060 3.256% 6,865,000 6,849,279
Local General Obligation 0.2%City of New YorkUnlimited General Obligation BondsBuild America BondsSeries 200910/01/2031 5.206% 2,400,000 2,890,296Series 201010/01/2024 5.047% 5,000,000 5,516,800
Total 8,407,096
Special Non Property Tax 0.2%New York City Transitional Finance Authority
Municipal Bonds (continued)
Issue DescriptionCoupon
RatePrincipal
Amount ($) Value ($)
Transportation 0.0%Metropolitan Transportation AuthorityRevenue BondsTaxable Green BondsSeries 2020C-211/15/2049 5.175% 970,000 1,201,529
Water & Sewer 0.1%New York City Water & Sewer SystemRefunding Revenue Bonds2nd General ResolutionSubordinated Series 202006/15/2050 4.000% 1,210,000 1,411,731Revenue Bonds2nd General ResolutionSeries 2020GG06/15/2050 4.000% 500,000 579,460
Total 1,991,191
Total Municipal Bonds(Cost $28,858,960) 30,048,175
Residential Mortgage-Backed Securities - Agency 34.4%
IssuerCoupon
RatePrincipal
Amount ($) Value ($)Federal Home Loan Mortgage Corp.04/01/2031-03/01/2047 3.000% 40,907,623 43,111,57109/01/2032-01/01/2050 3.500% 120,888,816 130,281,73907/01/2035-10/01/2048 5.000% 4,551,354 5,095,515
Copyright © 2021 www.secdatabase.com. All Rights Reserved.Please Consider the Environment Before Printing This Document
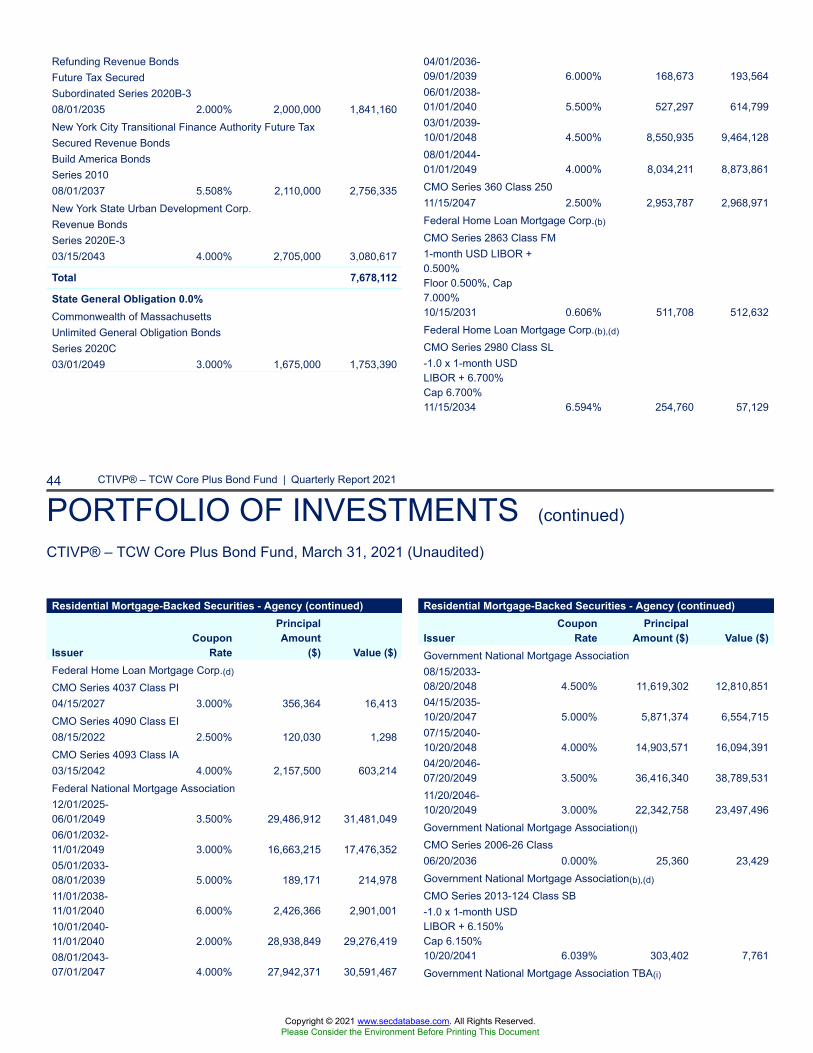
44 CTIVP® – TCW Core Plus Bond Fund | Quarterly Report 2021
PORTFOLIO OF INVESTMENTS (continued)
CTIVP® – TCW Core Plus Bond Fund, March 31, 2021 (Unaudited)
Refunding Revenue BondsFuture Tax SecuredSubordinated Series 2020B-308/01/2035 2.000% 2,000,000 1,841,160New York City Transitional Finance Authority Future TaxSecured Revenue BondsBuild America BondsSeries 201008/01/2037 5.508% 2,110,000 2,756,335New York State Urban Development Corp.Revenue BondsSeries 2020E-303/15/2043 4.000% 2,705,000 3,080,617
Total 7,678,112
State General Obligation 0.0%Commonwealth of MassachusettsUnlimited General Obligation BondsSeries 2020C03/01/2049 3.000% 1,675,000 1,753,390
04/01/2036-09/01/2039 6.000% 168,673 193,56406/01/2038-01/01/2040 5.500% 527,297 614,79903/01/2039-10/01/2048 4.500% 8,550,935 9,464,12808/01/2044-01/01/2049 4.000% 8,034,211 8,873,861CMO Series 360 Class 25011/15/2047 2.500% 2,953,787 2,968,971Federal Home Loan Mortgage Corp.(b)
CMO Series 2863 Class FM1-month USD LIBOR +0.500%Floor 0.500%, Cap7.000%10/15/2031 0.606% 511,708 512,632Federal Home Loan Mortgage Corp.(b),(d)
CMO Series 2980 Class SL-1.0 x 1-month USDLIBOR + 6.700%Cap 6.700%11/15/2034 6.594% 254,760 57,129
Residential Mortgage-Backed Securities - Agency (continued)
IssuerCoupon
Rate
PrincipalAmount
($) Value ($)Federal Home Loan Mortgage Corp.(d)
CMO Series 4037 Class PI04/15/2027 3.000% 356,364 16,413CMO Series 4090 Class EI08/15/2022 2.500% 120,030 1,298CMO Series 4093 Class IA03/15/2042 4.000% 2,157,500 603,214Federal National Mortgage Association12/01/2025-06/01/2049 3.500% 29,486,912 31,481,04906/01/2032-11/01/2049 3.000% 16,663,215 17,476,35205/01/2033-08/01/2039 5.000% 189,171 214,97811/01/2038-11/01/2040 6.000% 2,426,366 2,901,00110/01/2040-11/01/2040 2.000% 28,938,849 29,276,41908/01/2043-07/01/2047 4.000% 27,942,371 30,591,467
Residential Mortgage-Backed Securities - Agency (continued)
IssuerCoupon
RatePrincipal
Amount ($) Value ($)Government National Mortgage Association08/15/2033-08/20/2048 4.500% 11,619,302 12,810,85104/15/2035-10/20/2047 5.000% 5,871,374 6,554,71507/15/2040-10/20/2048 4.000% 14,903,571 16,094,39104/20/2046-07/20/2049 3.500% 36,416,340 38,789,53111/20/2046-10/20/2049 3.000% 22,342,758 23,497,496Government National Mortgage Association(l)
CMO Series 2006-26 Class06/20/2036 0.000% 25,360 23,429Government National Mortgage Association(b),(d)
CMO Series 2013-124 Class SB-1.0 x 1-month USDLIBOR + 6.150%Cap 6.150%10/20/2041 6.039% 303,402 7,761Government National Mortgage Association TBA(i)
Copyright © 2021 www.secdatabase.com. All Rights Reserved.Please Consider the Environment Before Printing This Document
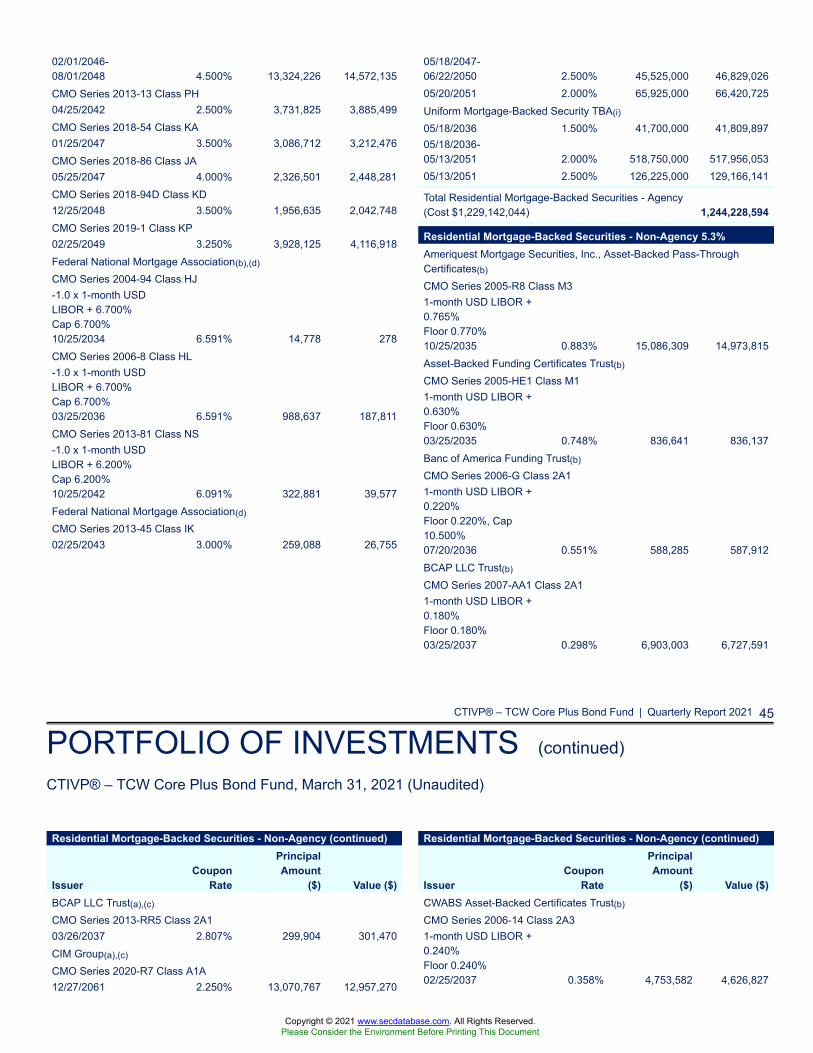
CTIVP® – TCW Core Plus Bond Fund | Quarterly Report 2021 45
PORTFOLIO OF INVESTMENTS (continued)
CTIVP® – TCW Core Plus Bond Fund, March 31, 2021 (Unaudited)
02/01/2046-08/01/2048 4.500% 13,324,226 14,572,135CMO Series 2013-13 Class PH04/25/2042 2.500% 3,731,825 3,885,499CMO Series 2018-54 Class KA01/25/2047 3.500% 3,086,712 3,212,476CMO Series 2018-86 Class JA05/25/2047 4.000% 2,326,501 2,448,281CMO Series 2018-94D Class KD12/25/2048 3.500% 1,956,635 2,042,748CMO Series 2019-1 Class KP02/25/2049 3.250% 3,928,125 4,116,918Federal National Mortgage Association(b),(d)
CMO Series 2004-94 Class HJ-1.0 x 1-month USDLIBOR + 6.700%Cap 6.700%10/25/2034 6.591% 14,778 278CMO Series 2006-8 Class HL-1.0 x 1-month USDLIBOR + 6.700%Cap 6.700%03/25/2036 6.591% 988,637 187,811CMO Series 2013-81 Class NS-1.0 x 1-month USDLIBOR + 6.200%Cap 6.200%10/25/2042 6.091% 322,881 39,577Federal National Mortgage Association(d)
CMO Series 2013-45 Class IK02/25/2043 3.000% 259,088 26,755
05/18/2047-06/22/2050 2.500% 45,525,000 46,829,02605/20/2051 2.000% 65,925,000 66,420,725Uniform Mortgage-Backed Security TBA(i)
05/18/2036 1.500% 41,700,000 41,809,89705/18/2036-05/13/2051 2.000% 518,750,000 517,956,05305/13/2051 2.500% 126,225,000 129,166,141
Total Residential Mortgage-Backed Securities - Agency(Cost $1,229,142,044) 1,244,228,594
Residential Mortgage-Backed Securities - Non-Agency 5.3%Ameriquest Mortgage Securities, Inc., Asset-Backed Pass-ThroughCertificates(b)
CMO Series 2005-R8 Class M31-month USD LIBOR +0.765%Floor 0.770%10/25/2035 0.883% 15,086,309 14,973,815Asset-Backed Funding Certificates Trust(b)
CMO Series 2005-HE1 Class M11-month USD LIBOR +0.630%Floor 0.630%03/25/2035 0.748% 836,641 836,137Banc of America Funding Trust(b)
CMO Series 2006-G Class 2A11-month USD LIBOR +0.220%Floor 0.220%, Cap10.500%07/20/2036 0.551% 588,285 587,912BCAP LLC Trust(b)
CMO Series 2007-AA1 Class 2A11-month USD LIBOR +0.180%Floor 0.180%03/25/2037 0.298% 6,903,003 6,727,591
Residential Mortgage-Backed Securities - Non-Agency (continued)
IssuerCoupon
Rate
PrincipalAmount
($) Value ($)BCAP LLC Trust(a),(c)
CMO Series 2013-RR5 Class 2A103/26/2037 2.807% 299,904 301,470CIM Group(a),(c)
CMO Series 2020-R7 Class A1A12/27/2061 2.250% 13,070,767 12,957,270
Residential Mortgage-Backed Securities - Non-Agency (continued)
IssuerCoupon
Rate
PrincipalAmount
($) Value ($)CWABS Asset-Backed Certificates Trust(b)
CMO Series 2006-14 Class 2A31-month USD LIBOR +0.240%Floor 0.240%02/25/2037 0.358% 4,753,582 4,626,827
Copyright © 2021 www.secdatabase.com. All Rights Reserved.Please Consider the Environment Before Printing This Document
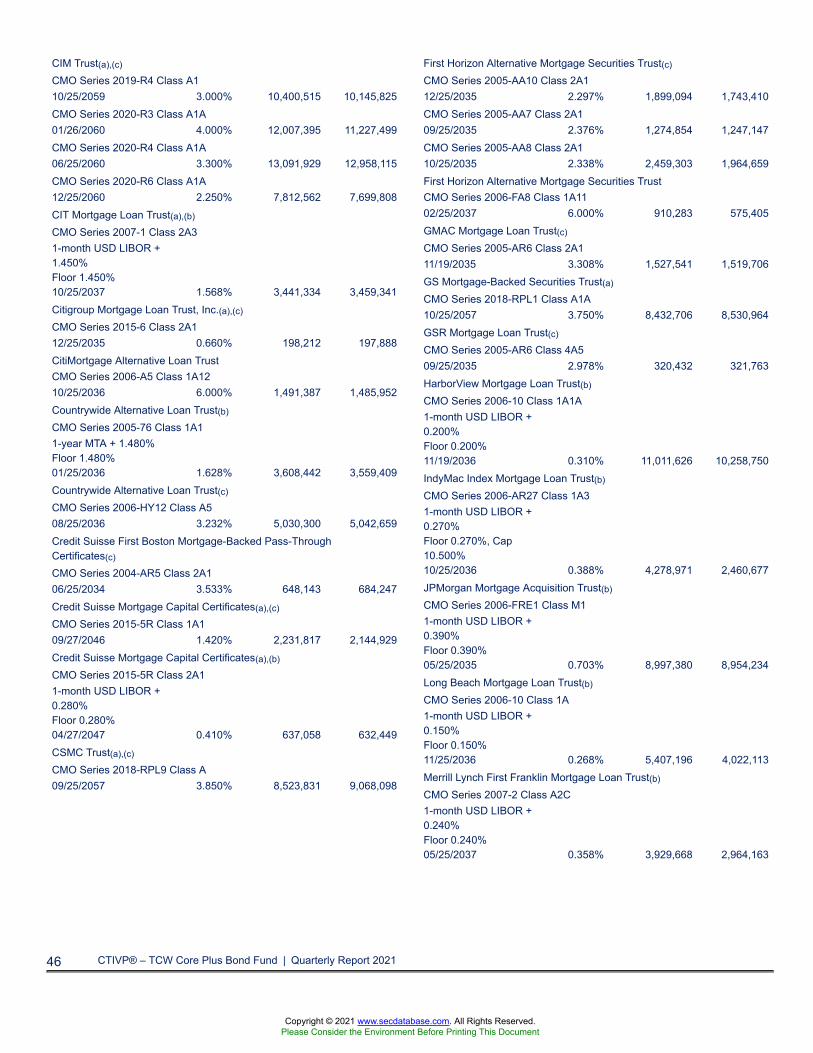
46 CTIVP® – TCW Core Plus Bond Fund | Quarterly Report 2021
CIM Trust(a),(c)
CMO Series 2019-R4 Class A110/25/2059 3.000% 10,400,515 10,145,825CMO Series 2020-R3 Class A1A01/26/2060 4.000% 12,007,395 11,227,499CMO Series 2020-R4 Class A1A06/25/2060 3.300% 13,091,929 12,958,115CMO Series 2020-R6 Class A1A12/25/2060 2.250% 7,812,562 7,699,808CIT Mortgage Loan Trust(a),(b)
CMO Series 2007-1 Class 2A31-month USD LIBOR +1.450%Floor 1.450%10/25/2037 1.568% 3,441,334 3,459,341Citigroup Mortgage Loan Trust, Inc.(a),(c)
CMO Series 2015-6 Class 2A112/25/2035 0.660% 198,212 197,888CitiMortgage Alternative Loan TrustCMO Series 2006-A5 Class 1A1210/25/2036 6.000% 1,491,387 1,485,952Countrywide Alternative Loan Trust(b)
CMO Series 2005-76 Class 1A11-year MTA + 1.480%Floor 1.480%01/25/2036 1.628% 3,608,442 3,559,409Countrywide Alternative Loan Trust(c)
CMO Series 2006-HY12 Class A508/25/2036 3.232% 5,030,300 5,042,659Credit Suisse First Boston Mortgage-Backed Pass-ThroughCertificates(c)
CMO Series 2004-AR5 Class 2A106/25/2034 3.533% 648,143 684,247Credit Suisse Mortgage Capital Certificates(a),(c)
CMO Series 2015-5R Class 1A109/27/2046 1.420% 2,231,817 2,144,929Credit Suisse Mortgage Capital Certificates(a),(b)
CMO Series 2015-5R Class 2A11-month USD LIBOR +0.280%Floor 0.280%04/27/2047 0.410% 637,058 632,449CSMC Trust(a),(c)
CMO Series 2018-RPL9 Class A09/25/2057 3.850% 8,523,831 9,068,098
First Horizon Alternative Mortgage Securities Trust(c)
CMO Series 2005-AA10 Class 2A112/25/2035 2.297% 1,899,094 1,743,410CMO Series 2005-AA7 Class 2A109/25/2035 2.376% 1,274,854 1,247,147CMO Series 2005-AA8 Class 2A110/25/2035 2.338% 2,459,303 1,964,659First Horizon Alternative Mortgage Securities TrustCMO Series 2006-FA8 Class 1A1102/25/2037 6.000% 910,283 575,405GMAC Mortgage Loan Trust(c)
CMO Series 2005-AR6 Class 2A111/19/2035 3.308% 1,527,541 1,519,706GS Mortgage-Backed Securities Trust(a)
CMO Series 2018-RPL1 Class A1A10/25/2057 3.750% 8,432,706 8,530,964GSR Mortgage Loan Trust(c)
CMO Series 2005-AR6 Class 4A509/25/2035 2.978% 320,432 321,763HarborView Mortgage Loan Trust(b)
CMO Series 2006-10 Class 1A1A1-month USD LIBOR +0.200%Floor 0.200%11/19/2036 0.310% 11,011,626 10,258,750IndyMac Index Mortgage Loan Trust(b)
CMO Series 2006-AR27 Class 1A31-month USD LIBOR +0.270%Floor 0.270%, Cap10.500%10/25/2036 0.388% 4,278,971 2,460,677JPMorgan Mortgage Acquisition Trust(b)
CMO Series 2006-FRE1 Class M11-month USD LIBOR +0.390%Floor 0.390%05/25/2035 0.703% 8,997,380 8,954,234Long Beach Mortgage Loan Trust(b)
CMO Series 2006-10 Class 1A1-month USD LIBOR +0.150%Floor 0.150%11/25/2036 0.268% 5,407,196 4,022,113Merrill Lynch First Franklin Mortgage Loan Trust(b)
CMO Series 2007-2 Class A2C1-month USD LIBOR +0.240%Floor 0.240%05/25/2037 0.358% 3,929,668 2,964,163
Copyright © 2021 www.secdatabase.com. All Rights Reserved.Please Consider the Environment Before Printing This Document
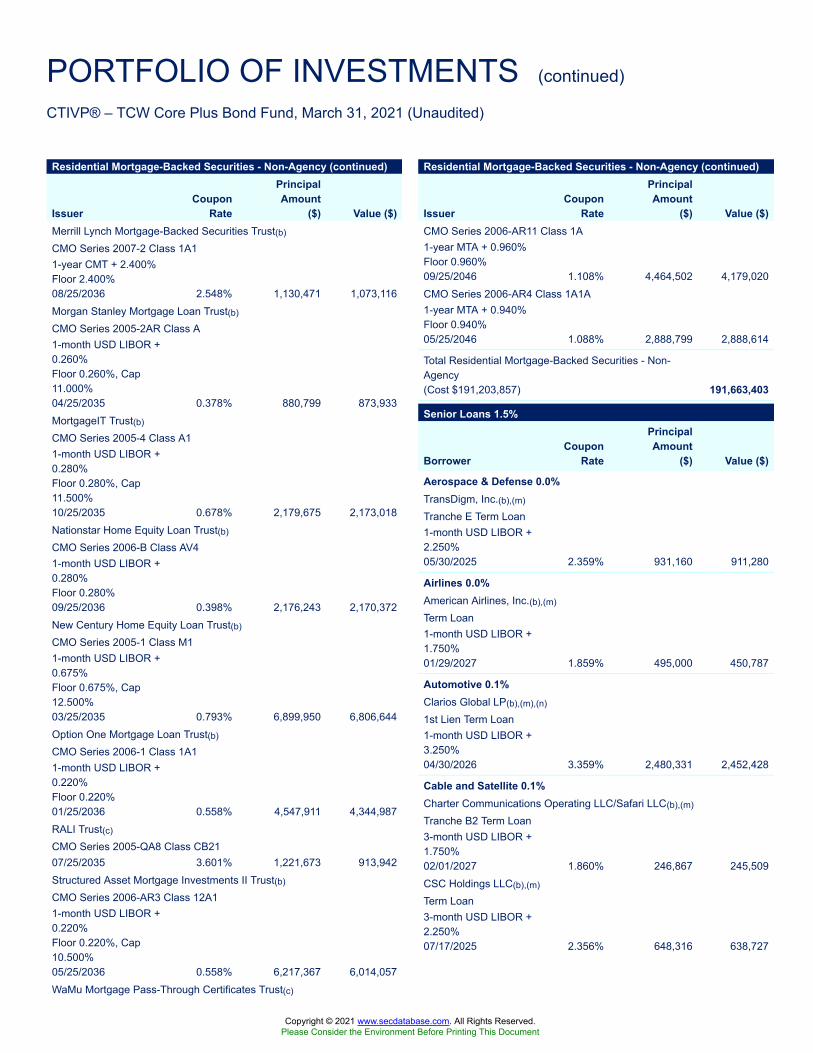
PORTFOLIO OF INVESTMENTS (continued)
CTIVP® – TCW Core Plus Bond Fund, March 31, 2021 (Unaudited)
Residential Mortgage-Backed Securities - Non-Agency (continued)
IssuerCoupon
Rate
PrincipalAmount
($) Value ($)Merrill Lynch Mortgage-Backed Securities Trust(b)
CMO Series 2007-2 Class 1A11-year CMT + 2.400%Floor 2.400%08/25/2036 2.548% 1,130,471 1,073,116Morgan Stanley Mortgage Loan Trust(b)
CMO Series 2005-2AR Class A1-month USD LIBOR +0.260%Floor 0.260%, Cap11.000%04/25/2035 0.378% 880,799 873,933MortgageIT Trust(b)
CMO Series 2005-4 Class A11-month USD LIBOR +0.280%Floor 0.280%, Cap11.500%10/25/2035 0.678% 2,179,675 2,173,018Nationstar Home Equity Loan Trust(b)
CMO Series 2006-B Class AV41-month USD LIBOR +0.280%Floor 0.280%09/25/2036 0.398% 2,176,243 2,170,372New Century Home Equity Loan Trust(b)
CMO Series 2005-1 Class M11-month USD LIBOR +0.675%Floor 0.675%, Cap12.500%03/25/2035 0.793% 6,899,950 6,806,644Option One Mortgage Loan Trust(b)
CMO Series 2006-1 Class 1A11-month USD LIBOR +0.220%Floor 0.220%01/25/2036 0.558% 4,547,911 4,344,987RALI Trust(c)
CMO Series 2005-QA8 Class CB2107/25/2035 3.601% 1,221,673 913,942Structured Asset Mortgage Investments II Trust(b)
CMO Series 2006-AR3 Class 12A11-month USD LIBOR +0.220%Floor 0.220%, Cap10.500%05/25/2036 0.558% 6,217,367 6,014,057WaMu Mortgage Pass-Through Certificates Trust(c)
Residential Mortgage-Backed Securities - Non-Agency (continued)
IssuerCoupon
Rate
PrincipalAmount
($) Value ($)CMO Series 2006-AR11 Class 1A1-year MTA + 0.960%Floor 0.960%09/25/2046 1.108% 4,464,502 4,179,020CMO Series 2006-AR4 Class 1A1A1-year MTA + 0.940%Floor 0.940%05/25/2046 1.088% 2,888,799 2,888,614
Total Residential Mortgage-Backed Securities - Non-Agency(Cost $191,203,857) 191,663,403
Senior Loans 1.5%
BorrowerCoupon
Rate
PrincipalAmount
($) Value ($)
Aerospace & Defense 0.0%TransDigm, Inc.(b),(m)
Tranche E Term Loan1-month USD LIBOR +2.250%05/30/2025 2.359% 931,160 911,280
Airlines 0.0%American Airlines, Inc.(b),(m)
Term Loan1-month USD LIBOR +1.750%01/29/2027 1.859% 495,000 450,787
Automotive 0.1%Clarios Global LP(b),(m),(n)
1st Lien Term Loan1-month USD LIBOR +3.250%04/30/2026 3.359% 2,480,331 2,452,428
Cable and Satellite 0.1%Charter Communications Operating LLC/Safari LLC(b),(m)
Tranche B2 Term Loan3-month USD LIBOR +1.750%02/01/2027 1.860% 246,867 245,509CSC Holdings LLC(b),(m)
Term Loan3-month USD LIBOR +2.250%07/17/2025 2.356% 648,316 638,727
Copyright © 2021 www.secdatabase.com. All Rights Reserved.Please Consider the Environment Before Printing This Document
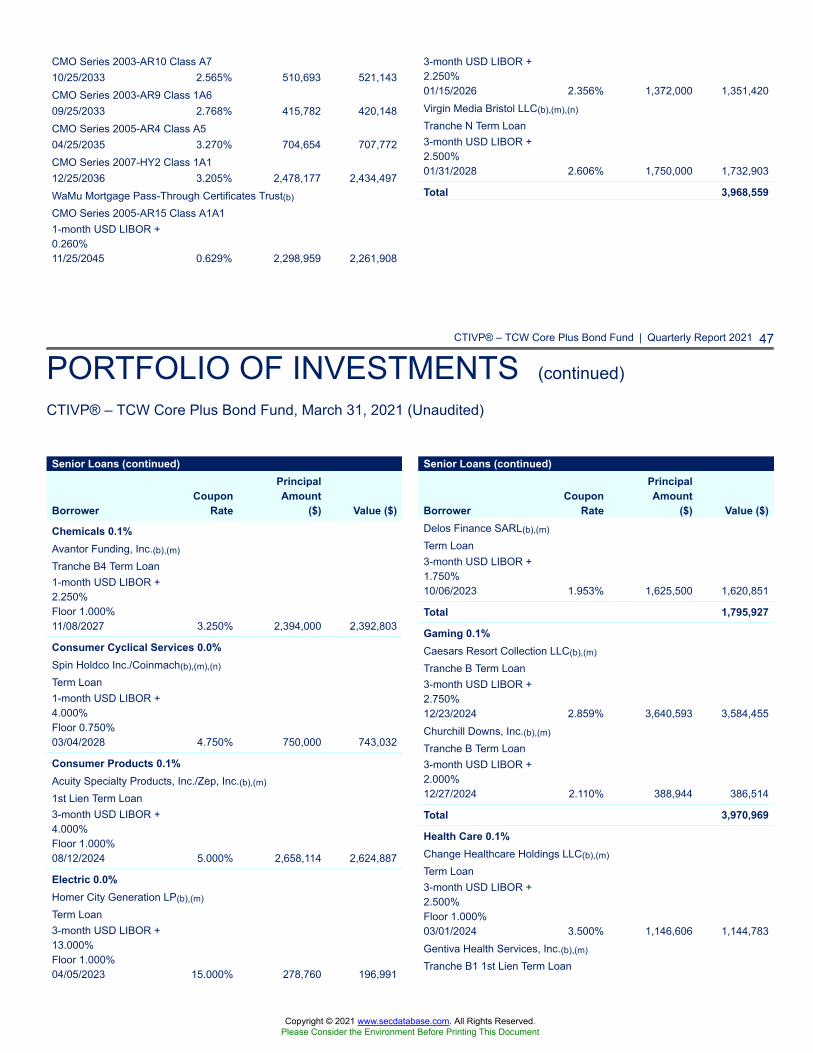
CTIVP® – TCW Core Plus Bond Fund | Quarterly Report 2021 47
PORTFOLIO OF INVESTMENTS (continued)
CTIVP® – TCW Core Plus Bond Fund, March 31, 2021 (Unaudited)
CMO Series 2003-AR10 Class A710/25/2033 2.565% 510,693 521,143CMO Series 2003-AR9 Class 1A609/25/2033 2.768% 415,782 420,148CMO Series 2005-AR4 Class A504/25/2035 3.270% 704,654 707,772CMO Series 2007-HY2 Class 1A112/25/2036 3.205% 2,478,177 2,434,497WaMu Mortgage Pass-Through Certificates Trust(b)
CMO Series 2005-AR15 Class A1A11-month USD LIBOR +0.260%11/25/2045 0.629% 2,298,959 2,261,908
3-month USD LIBOR +2.250%01/15/2026 2.356% 1,372,000 1,351,420Virgin Media Bristol LLC(b),(m),(n)
Tranche N Term Loan3-month USD LIBOR +2.500%01/31/2028 2.606% 1,750,000 1,732,903
Total 3,968,559
Senior Loans (continued)
BorrowerCoupon
Rate
PrincipalAmount
($) Value ($)
Chemicals 0.1%Avantor Funding, Inc.(b),(m)
Tranche B4 Term Loan1-month USD LIBOR +2.250%Floor 1.000%11/08/2027 3.250% 2,394,000 2,392,803
Consumer Cyclical Services 0.0%Spin Holdco Inc./Coinmach(b),(m),(n)
Term Loan1-month USD LIBOR +4.000%Floor 0.750%03/04/2028 4.750% 750,000 743,032
Consumer Products 0.1%Acuity Specialty Products, Inc./Zep, Inc.(b),(m)
1st Lien Term Loan3-month USD LIBOR +4.000%Floor 1.000%08/12/2024 5.000% 2,658,114 2,624,887
Electric 0.0%Homer City Generation LP(b),(m)
Term Loan3-month USD LIBOR +13.000%Floor 1.000%04/05/2023 15.000% 278,760 196,991
Senior Loans (continued)
BorrowerCoupon
Rate
PrincipalAmount
($) Value ($)Delos Finance SARL(b),(m)
Term Loan3-month USD LIBOR +1.750%10/06/2023 1.953% 1,625,500 1,620,851
Total 1,795,927
Gaming 0.1%Caesars Resort Collection LLC(b),(m)
Tranche B Term Loan3-month USD LIBOR +2.750%12/23/2024 2.859% 3,640,593 3,584,455Churchill Downs, Inc.(b),(m)
Tranche B Term Loan3-month USD LIBOR +2.000%12/27/2024 2.110% 388,944 386,514
Total 3,970,969
Health Care 0.1%Change Healthcare Holdings LLC(b),(m)
Term Loan3-month USD LIBOR +2.500%Floor 1.000%03/01/2024 3.500% 1,146,606 1,144,783Gentiva Health Services, Inc.(b),(m)
Tranche B1 1st Lien Term Loan
Copyright © 2021 www.secdatabase.com. All Rights Reserved.Please Consider the Environment Before Printing This Document
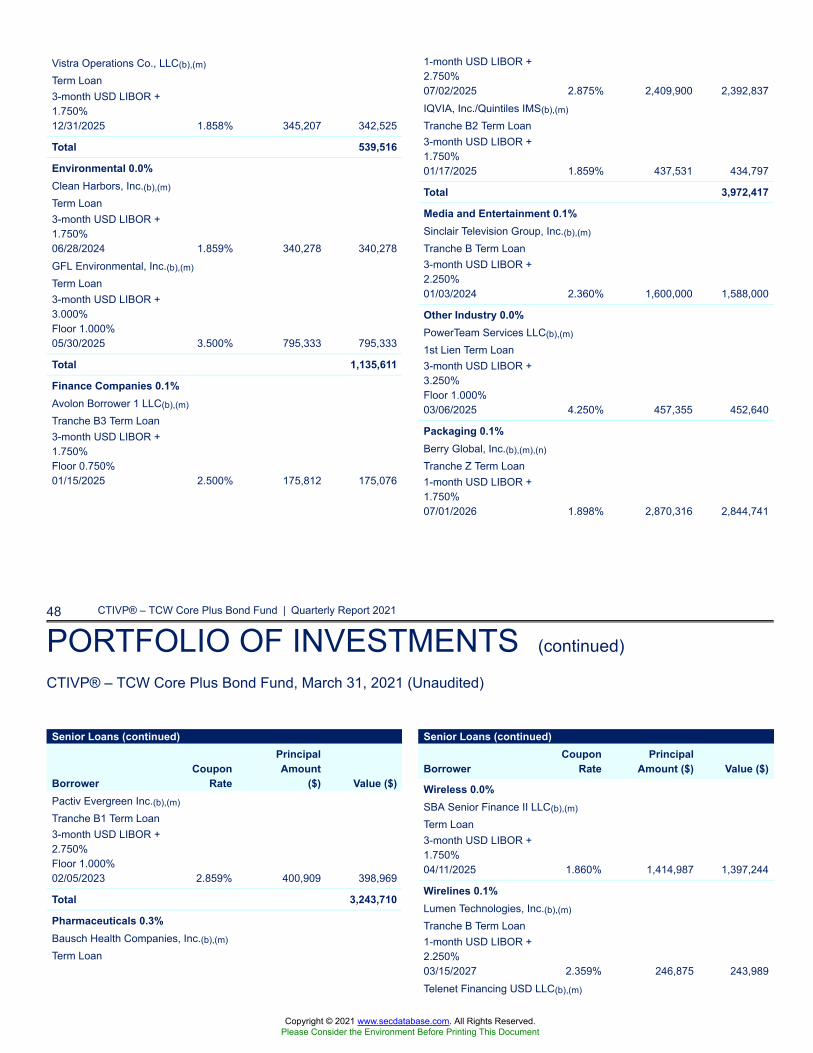
48 CTIVP® – TCW Core Plus Bond Fund | Quarterly Report 2021
PORTFOLIO OF INVESTMENTS (continued)
CTIVP® – TCW Core Plus Bond Fund, March 31, 2021 (Unaudited)
Vistra Operations Co., LLC(b),(m)
Term Loan3-month USD LIBOR +1.750%12/31/2025 1.858% 345,207 342,525
Total 539,516
Environmental 0.0%Clean Harbors, Inc.(b),(m)
Term Loan3-month USD LIBOR +1.750%06/28/2024 1.859% 340,278 340,278GFL Environmental, Inc.(b),(m)
Term Loan3-month USD LIBOR +3.000%Floor 1.000%05/30/2025 3.500% 795,333 795,333
Total 1,135,611
Finance Companies 0.1%Avolon Borrower 1 LLC(b),(m)
Tranche B3 Term Loan3-month USD LIBOR +1.750%Floor 0.750%01/15/2025 2.500% 175,812 175,076
1-month USD LIBOR +2.750%07/02/2025 2.875% 2,409,900 2,392,837IQVIA, Inc./Quintiles IMS(b),(m)
Tranche B2 Term Loan3-month USD LIBOR +1.750%01/17/2025 1.859% 437,531 434,797
Total 3,972,417
Media and Entertainment 0.1%Sinclair Television Group, Inc.(b),(m)
Tranche B Term Loan3-month USD LIBOR +2.250%01/03/2024 2.360% 1,600,000 1,588,000
Other Industry 0.0%PowerTeam Services LLC(b),(m)
1st Lien Term Loan3-month USD LIBOR +3.250%Floor 1.000%03/06/2025 4.250% 457,355 452,640
Packaging 0.1%Berry Global, Inc.(b),(m),(n)
Tranche Z Term Loan1-month USD LIBOR +1.750%07/01/2026 1.898% 2,870,316 2,844,741
Senior Loans (continued)
BorrowerCoupon
Rate
PrincipalAmount
($) Value ($)Pactiv Evergreen Inc.(b),(m)
Tranche B1 Term Loan3-month USD LIBOR +2.750%Floor 1.000%02/05/2023 2.859% 400,909 398,969
Total 3,243,710
Pharmaceuticals 0.3%Bausch Health Companies, Inc.(b),(m)
Term Loan
Senior Loans (continued)
BorrowerCoupon
RatePrincipal
Amount ($) Value ($)
Wireless 0.0%SBA Senior Finance II LLC(b),(m)
Term Loan3-month USD LIBOR +1.750%04/11/2025 1.860% 1,414,987 1,397,244
Wirelines 0.1%Lumen Technologies, Inc.(b),(m)
Tranche B Term Loan1-month USD LIBOR +2.250%03/15/2027 2.359% 246,875 243,989Telenet Financing USD LLC(b),(m)
Copyright © 2021 www.secdatabase.com. All Rights Reserved.Please Consider the Environment Before Printing This Document
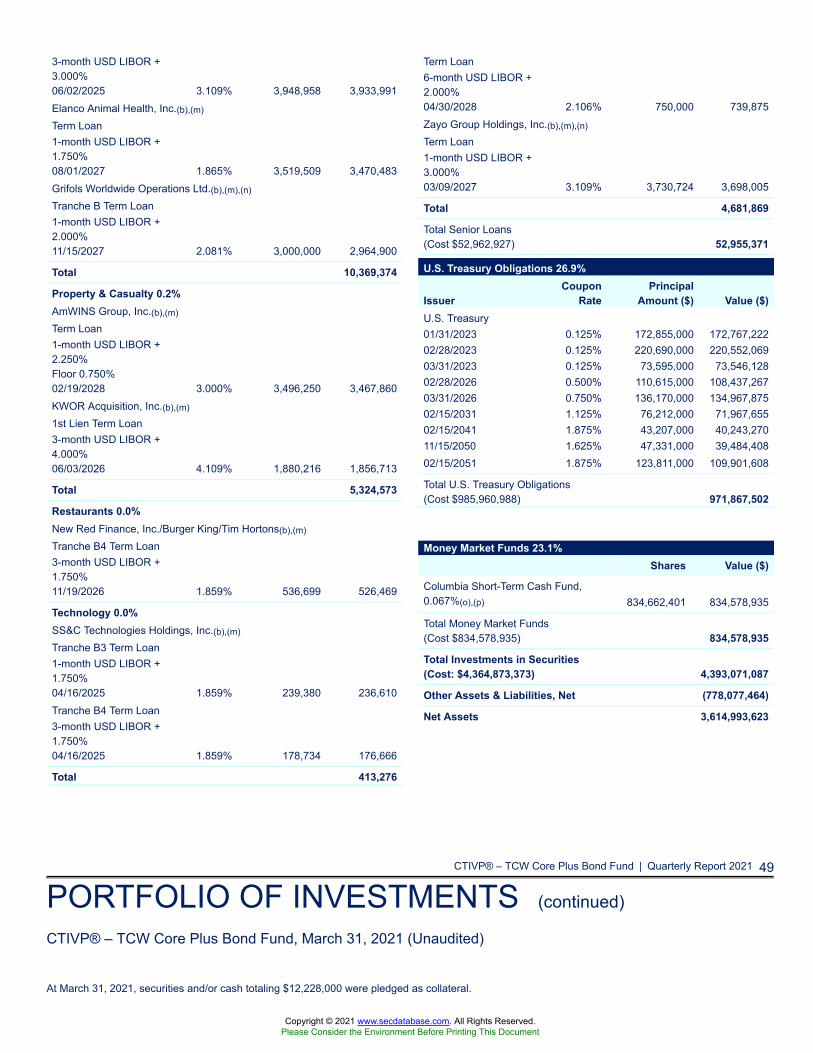
CTIVP® – TCW Core Plus Bond Fund | Quarterly Report 2021 49
PORTFOLIO OF INVESTMENTS (continued)
CTIVP® – TCW Core Plus Bond Fund, March 31, 2021 (Unaudited)
At March 31, 2021, securities and/or cash totaling $12,228,000 were pledged as collateral.
3-month USD LIBOR +3.000%06/02/2025 3.109% 3,948,958 3,933,991Elanco Animal Health, Inc.(b),(m)
Term Loan1-month USD LIBOR +1.750%08/01/2027 1.865% 3,519,509 3,470,483Grifols Worldwide Operations Ltd.(b),(m),(n)
Tranche B Term Loan1-month USD LIBOR +2.000%11/15/2027 2.081% 3,000,000 2,964,900
Total 10,369,374
Property & Casualty 0.2%AmWINS Group, Inc.(b),(m)
Term Loan1-month USD LIBOR +2.250%Floor 0.750%02/19/2028 3.000% 3,496,250 3,467,860KWOR Acquisition, Inc.(b),(m)
1st Lien Term Loan3-month USD LIBOR +4.000%06/03/2026 4.109% 1,880,216 1,856,713
Total 5,324,573
Restaurants 0.0%New Red Finance, Inc./Burger King/Tim Hortons(b),(m)
Tranche B4 Term Loan3-month USD LIBOR +1.750%11/19/2026 1.859% 536,699 526,469
Technology 0.0%SS&C Technologies Holdings, Inc.(b),(m)
Tranche B3 Term Loan1-month USD LIBOR +1.750%04/16/2025 1.859% 239,380 236,610Tranche B4 Term Loan3-month USD LIBOR +1.750%04/16/2025 1.859% 178,734 176,666
Total 413,276
Term Loan6-month USD LIBOR +2.000%04/30/2028 2.106% 750,000 739,875Zayo Group Holdings, Inc.(b),(m),(n)
Term Loan1-month USD LIBOR +3.000%03/09/2027 3.109% 3,730,724 3,698,005
Total 4,681,869
Total Senior Loans(Cost $52,962,927) 52,955,371
U.S. Treasury Obligations 26.9%
IssuerCoupon
RatePrincipal
Amount ($) Value ($)U.S. Treasury01/31/2023 0.125% 172,855,000 172,767,22202/28/2023 0.125% 220,690,000 220,552,06903/31/2023 0.125% 73,595,000 73,546,12802/28/2026 0.500% 110,615,000 108,437,26703/31/2026 0.750% 136,170,000 134,967,87502/15/2031 1.125% 76,212,000 71,967,65502/15/2041 1.875% 43,207,000 40,243,27011/15/2050 1.625% 47,331,000 39,484,40802/15/2051 1.875% 123,811,000 109,901,608
Total U.S. Treasury Obligations(Cost $985,960,988) 971,867,502
Money Market Funds 23.1%Shares Value ($)
Columbia Short-Term Cash Fund,0.067%(o),(p) 834,662,401 834,578,935
Total Money Market Funds(Cost $834,578,935) 834,578,935
Total Investments in Securities(Cost: $4,364,873,373) 4,393,071,087
Other Assets & Liabilities, Net (778,077,464)
Net Assets 3,614,993,623
Copyright © 2021 www.secdatabase.com. All Rights Reserved.Please Consider the Environment Before Printing This Document
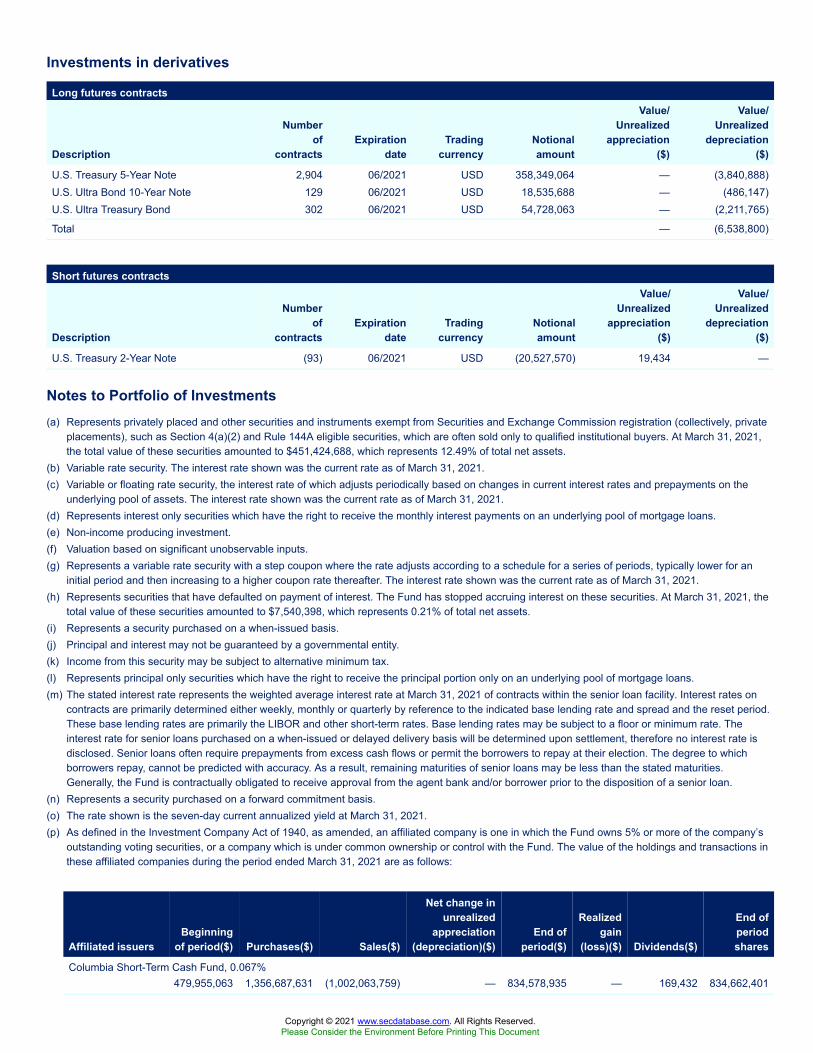
Investments in derivatives
Long futures contracts
Description
Numberof
contractsExpiration
dateTrading
currencyNotionalamount
Value/Unrealized
appreciation($)
Value/Unrealized
depreciation($)
U.S. Treasury 5-Year Note 2,904 06/2021 USD 358,349,064 — (3,840,888)U.S. Ultra Bond 10-Year Note 129 06/2021 USD 18,535,688 — (486,147)U.S. Ultra Treasury Bond 302 06/2021 USD 54,728,063 — (2,211,765)
Total — (6,538,800)
Short futures contracts
Description
Numberof
contractsExpiration
dateTrading
currencyNotionalamount
Value/Unrealized
appreciation($)
Value/Unrealized
depreciation($)
U.S. Treasury 2-Year Note (93) 06/2021 USD (20,527,570) 19,434 —
Notes to Portfolio of Investments(a) Represents privately placed and other securities and instruments exempt from Securities and Exchange Commission registration (collectively, private
placements), such as Section 4(a)(2) and Rule 144A eligible securities, which are often sold only to qualified institutional buyers. At March 31, 2021,the total value of these securities amounted to $451,424,688, which represents 12.49% of total net assets.
(b) Variable rate security. The interest rate shown was the current rate as of March 31, 2021.(c) Variable or floating rate security, the interest rate of which adjusts periodically based on changes in current interest rates and prepayments on the
underlying pool of assets. The interest rate shown was the current rate as of March 31, 2021.(d) Represents interest only securities which have the right to receive the monthly interest payments on an underlying pool of mortgage loans.(e) Non-income producing investment.(f) Valuation based on significant unobservable inputs.(g) Represents a variable rate security with a step coupon where the rate adjusts according to a schedule for a series of periods, typically lower for an
initial period and then increasing to a higher coupon rate thereafter. The interest rate shown was the current rate as of March 31, 2021.(h) Represents securities that have defaulted on payment of interest. The Fund has stopped accruing interest on these securities. At March 31, 2021, the
total value of these securities amounted to $7,540,398, which represents 0.21% of total net assets.(i) Represents a security purchased on a when-issued basis.(j) Principal and interest may not be guaranteed by a governmental entity.(k) Income from this security may be subject to alternative minimum tax.(l) Represents principal only securities which have the right to receive the principal portion only on an underlying pool of mortgage loans.(m) The stated interest rate represents the weighted average interest rate at March 31, 2021 of contracts within the senior loan facility. Interest rates on
contracts are primarily determined either weekly, monthly or quarterly by reference to the indicated base lending rate and spread and the reset period.These base lending rates are primarily the LIBOR and other short-term rates. Base lending rates may be subject to a floor or minimum rate. Theinterest rate for senior loans purchased on a when-issued or delayed delivery basis will be determined upon settlement, therefore no interest rate isdisclosed. Senior loans often require prepayments from excess cash flows or permit the borrowers to repay at their election. The degree to whichborrowers repay, cannot be predicted with accuracy. As a result, remaining maturities of senior loans may be less than the stated maturities.Generally, the Fund is contractually obligated to receive approval from the agent bank and/or borrower prior to the disposition of a senior loan.
(n) Represents a security purchased on a forward commitment basis.(o) The rate shown is the seven-day current annualized yield at March 31, 2021.(p) As defined in the Investment Company Act of 1940, as amended, an affiliated company is one in which the Fund owns 5% or more of the company’s
outstanding voting securities, or a company which is under common ownership or control with the Fund. The value of the holdings and transactions inthese affiliated companies during the period ended March 31, 2021 are as follows:
Affiliated issuersBeginning
of period($) Purchases($) Sales($)
Net change inunrealized
appreciation(depreciation)($)
End ofperiod($)
Realizedgain
(loss)($) Dividends($)
End ofperiodshares
Columbia Short-Term Cash Fund, 0.067%479,955,063 1,356,687,631 (1,002,063,759) — 834,578,935 — 169,432 834,662,401
Copyright © 2021 www.secdatabase.com. All Rights Reserved.Please Consider the Environment Before Printing This Document
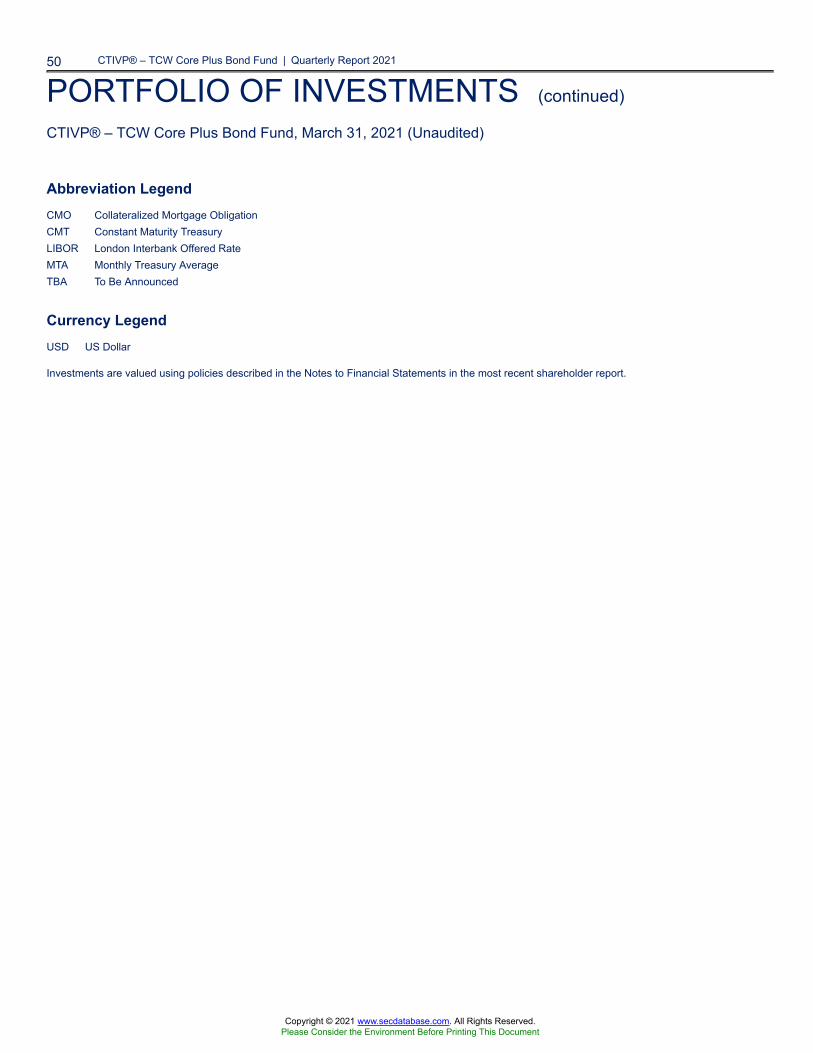
50 CTIVP® – TCW Core Plus Bond Fund | Quarterly Report 2021
PORTFOLIO OF INVESTMENTS (continued)
CTIVP® – TCW Core Plus Bond Fund, March 31, 2021 (Unaudited)
Abbreviation LegendCMO Collateralized Mortgage ObligationCMT Constant Maturity TreasuryLIBOR London Interbank Offered RateMTA Monthly Treasury AverageTBA To Be Announced
Currency LegendUSD US Dollar
Investments are valued using policies described in the Notes to Financial Statements in the most recent shareholder report.
Copyright © 2021 www.secdatabase.com. All Rights Reserved.Please Consider the Environment Before Printing This Document
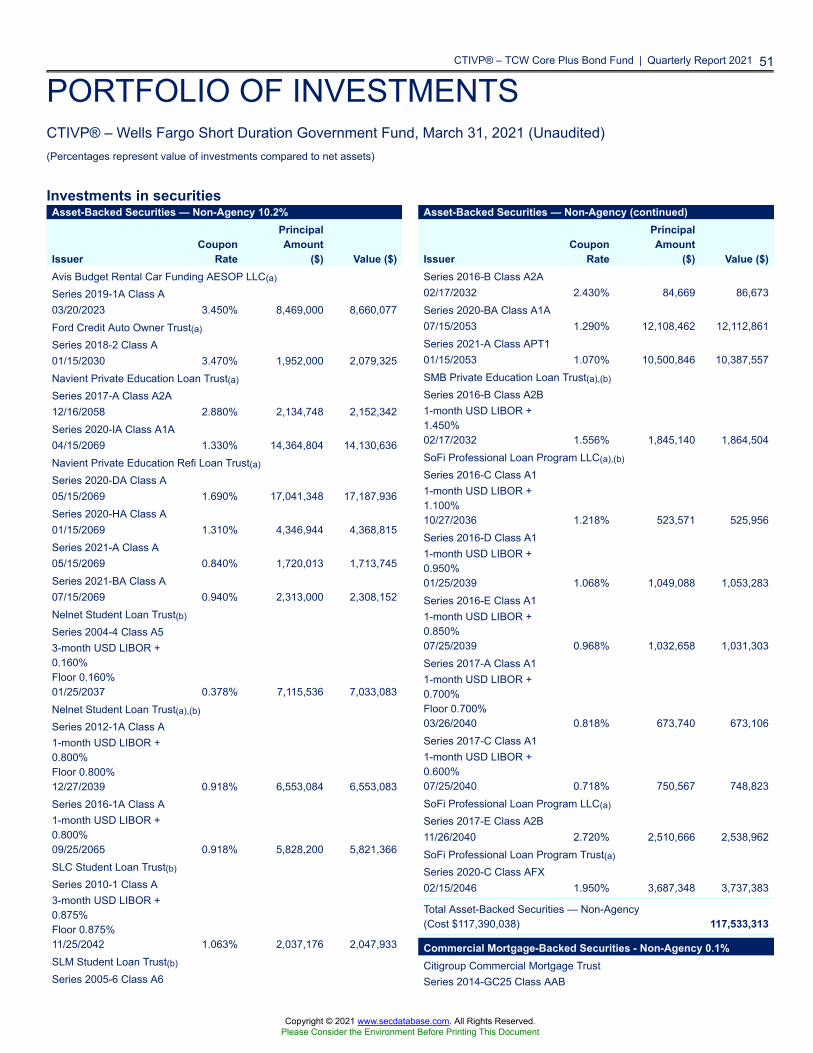
CTIVP® – TCW Core Plus Bond Fund | Quarterly Report 2021 51
PORTFOLIO OF INVESTMENTSCTIVP® – Wells Fargo Short Duration Government Fund, March 31, 2021 (Unaudited)(Percentages represent value of investments compared to net assets)
Investments in securitiesAsset-Backed Securities — Non-Agency 10.2%
IssuerCoupon
Rate
PrincipalAmount
($) Value ($)Avis Budget Rental Car Funding AESOP LLC(a)
Series 2019-1A Class A03/20/2023 3.450% 8,469,000 8,660,077Ford Credit Auto Owner Trust(a)
Series 2018-2 Class A01/15/2030 3.470% 1,952,000 2,079,325Navient Private Education Loan Trust(a)
Series 2017-A Class A2A12/16/2058 2.880% 2,134,748 2,152,342Series 2020-IA Class A1A04/15/2069 1.330% 14,364,804 14,130,636Navient Private Education Refi Loan Trust(a)
Series 2020-DA Class A05/15/2069 1.690% 17,041,348 17,187,936Series 2020-HA Class A01/15/2069 1.310% 4,346,944 4,368,815Series 2021-A Class A05/15/2069 0.840% 1,720,013 1,713,745Series 2021-BA Class A07/15/2069 0.940% 2,313,000 2,308,152Nelnet Student Loan Trust(b)
Series 2004-4 Class A53-month USD LIBOR +0.160%Floor 0.160%01/25/2037 0.378% 7,115,536 7,033,083Nelnet Student Loan Trust(a),(b)
Series 2012-1A Class A1-month USD LIBOR +0.800%Floor 0.800%12/27/2039 0.918% 6,553,084 6,553,083Series 2016-1A Class A1-month USD LIBOR +0.800%09/25/2065 0.918% 5,828,200 5,821,366SLC Student Loan Trust(b)
Series 2010-1 Class A3-month USD LIBOR +0.875%Floor 0.875%11/25/2042 1.063% 2,037,176 2,047,933SLM Student Loan Trust(b)
Series 2005-6 Class A6
Asset-Backed Securities — Non-Agency (continued)
IssuerCoupon
Rate
PrincipalAmount
($) Value ($)Series 2016-B Class A2A02/17/2032 2.430% 84,669 86,673Series 2020-BA Class A1A07/15/2053 1.290% 12,108,462 12,112,861Series 2021-A Class APT101/15/2053 1.070% 10,500,846 10,387,557SMB Private Education Loan Trust(a),(b)
Series 2016-B Class A2B1-month USD LIBOR +1.450%02/17/2032 1.556% 1,845,140 1,864,504SoFi Professional Loan Program LLC(a),(b)
Series 2016-C Class A11-month USD LIBOR +1.100%10/27/2036 1.218% 523,571 525,956Series 2016-D Class A11-month USD LIBOR +0.950%01/25/2039 1.068% 1,049,088 1,053,283Series 2016-E Class A11-month USD LIBOR +0.850%07/25/2039 0.968% 1,032,658 1,031,303Series 2017-A Class A11-month USD LIBOR +0.700%Floor 0.700%03/26/2040 0.818% 673,740 673,106Series 2017-C Class A11-month USD LIBOR +0.600%07/25/2040 0.718% 750,567 748,823SoFi Professional Loan Program LLC(a)
Series 2017-E Class A2B11/26/2040 2.720% 2,510,666 2,538,962SoFi Professional Loan Program Trust(a)
Series 2020-C Class AFX02/15/2046 1.950% 3,687,348 3,737,383
Total Asset-Backed Securities — Non-Agency(Cost $117,390,038) 117,533,313
Commercial Mortgage-Backed Securities - Non-Agency 0.1%Citigroup Commercial Mortgage TrustSeries 2014-GC25 Class AAB
Copyright © 2021 www.secdatabase.com. All Rights Reserved.Please Consider the Environment Before Printing This Document
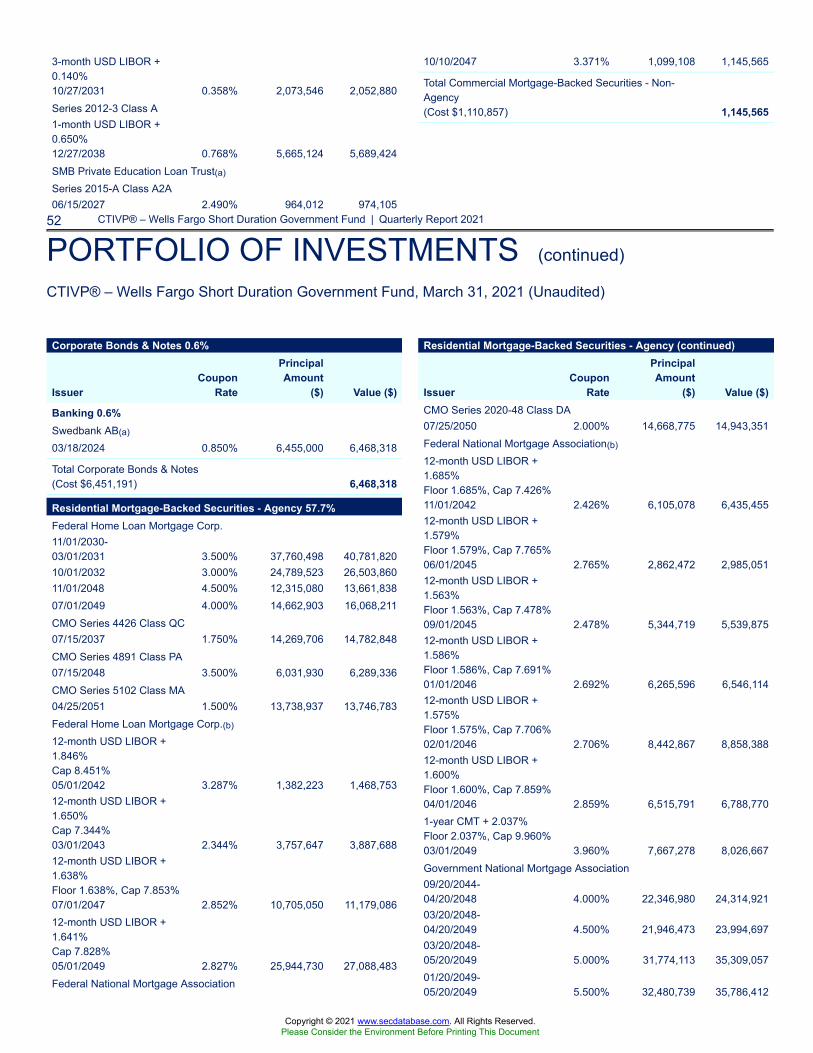
52 CTIVP® – Wells Fargo Short Duration Government Fund | Quarterly Report 2021
PORTFOLIO OF INVESTMENTS (continued)
CTIVP® – Wells Fargo Short Duration Government Fund, March 31, 2021 (Unaudited)
3-month USD LIBOR +0.140%10/27/2031 0.358% 2,073,546 2,052,880Series 2012-3 Class A1-month USD LIBOR +0.650%12/27/2038 0.768% 5,665,124 5,689,424SMB Private Education Loan Trust(a)
Series 2015-A Class A2A06/15/2027 2.490% 964,012 974,105
10/10/2047 3.371% 1,099,108 1,145,565
Total Commercial Mortgage-Backed Securities - Non-Agency(Cost $1,110,857) 1,145,565
Corporate Bonds & Notes 0.6%
IssuerCoupon
Rate
PrincipalAmount
($) Value ($)
Banking 0.6%Swedbank AB(a)
03/18/2024 0.850% 6,455,000 6,468,318
Total Corporate Bonds & Notes(Cost $6,451,191) 6,468,318
Residential Mortgage-Backed Securities - Agency 57.7%Federal Home Loan Mortgage Corp.11/01/2030-03/01/2031 3.500% 37,760,498 40,781,82010/01/2032 3.000% 24,789,523 26,503,86011/01/2048 4.500% 12,315,080 13,661,83807/01/2049 4.000% 14,662,903 16,068,211CMO Series 4426 Class QC07/15/2037 1.750% 14,269,706 14,782,848CMO Series 4891 Class PA07/15/2048 3.500% 6,031,930 6,289,336CMO Series 5102 Class MA04/25/2051 1.500% 13,738,937 13,746,783Federal Home Loan Mortgage Corp.(b)
12-month USD LIBOR +1.846%Cap 8.451%05/01/2042 3.287% 1,382,223 1,468,75312-month USD LIBOR +1.650%Cap 7.344%03/01/2043 2.344% 3,757,647 3,887,68812-month USD LIBOR +1.638%Floor 1.638%, Cap 7.853%07/01/2047 2.852% 10,705,050 11,179,08612-month USD LIBOR +1.641%Cap 7.828%05/01/2049 2.827% 25,944,730 27,088,483Federal National Mortgage Association
Residential Mortgage-Backed Securities - Agency (continued)
IssuerCoupon
Rate
PrincipalAmount
($) Value ($)CMO Series 2020-48 Class DA07/25/2050 2.000% 14,668,775 14,943,351Federal National Mortgage Association(b)
12-month USD LIBOR +1.685%Floor 1.685%, Cap 7.426%11/01/2042 2.426% 6,105,078 6,435,45512-month USD LIBOR +1.579%Floor 1.579%, Cap 7.765%06/01/2045 2.765% 2,862,472 2,985,05112-month USD LIBOR +1.563%Floor 1.563%, Cap 7.478%09/01/2045 2.478% 5,344,719 5,539,87512-month USD LIBOR +1.586%Floor 1.586%, Cap 7.691%01/01/2046 2.692% 6,265,596 6,546,11412-month USD LIBOR +1.575%Floor 1.575%, Cap 7.706%02/01/2046 2.706% 8,442,867 8,858,38812-month USD LIBOR +1.600%Floor 1.600%, Cap 7.859%04/01/2046 2.859% 6,515,791 6,788,7701-year CMT + 2.037%Floor 2.037%, Cap 9.960%03/01/2049 3.960% 7,667,278 8,026,667Government National Mortgage Association09/20/2044-04/20/2048 4.000% 22,346,980 24,314,92103/20/2048-04/20/2049 4.500% 21,946,473 23,994,69703/20/2048-05/20/2049 5.000% 31,774,113 35,309,05701/20/2049-05/20/2049 5.500% 32,480,739 35,786,412
Copyright © 2021 www.secdatabase.com. All Rights Reserved.Please Consider the Environment Before Printing This Document
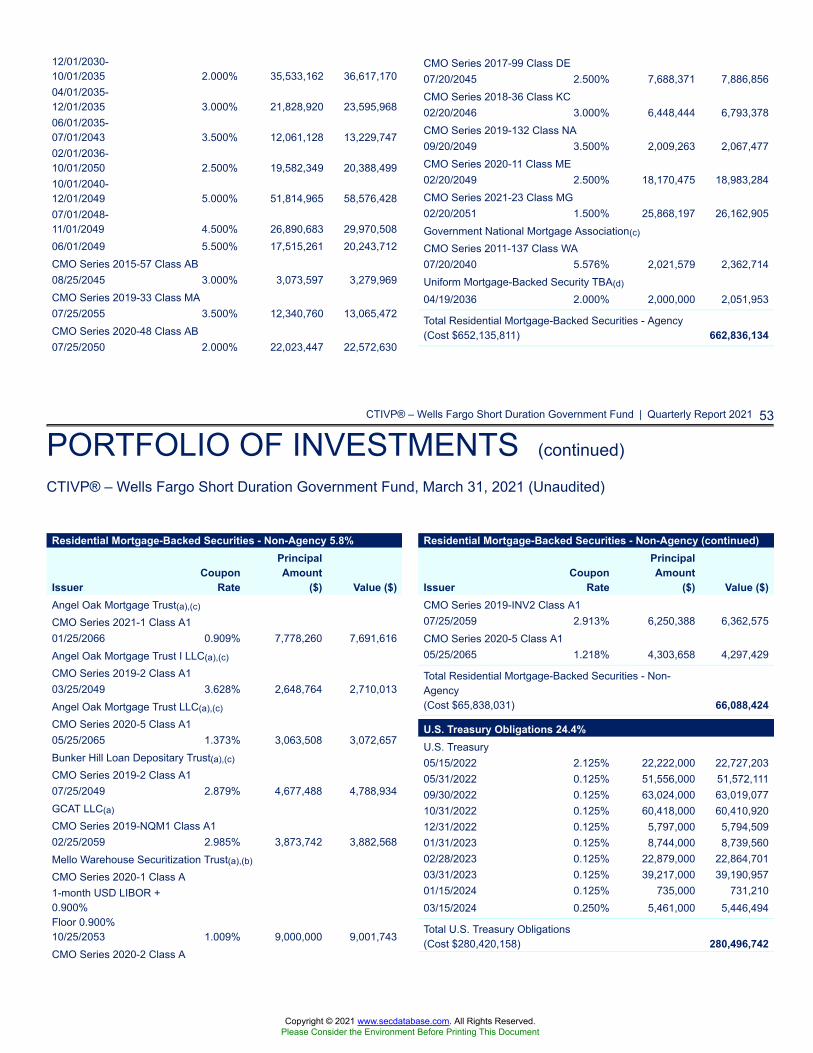
CTIVP® – Wells Fargo Short Duration Government Fund | Quarterly Report 2021 53
PORTFOLIO OF INVESTMENTS (continued)
CTIVP® – Wells Fargo Short Duration Government Fund, March 31, 2021 (Unaudited)
12/01/2030-10/01/2035 2.000% 35,533,162 36,617,17004/01/2035-12/01/2035 3.000% 21,828,920 23,595,96806/01/2035-07/01/2043 3.500% 12,061,128 13,229,74702/01/2036-10/01/2050 2.500% 19,582,349 20,388,49910/01/2040-12/01/2049 5.000% 51,814,965 58,576,42807/01/2048-11/01/2049 4.500% 26,890,683 29,970,50806/01/2049 5.500% 17,515,261 20,243,712CMO Series 2015-57 Class AB08/25/2045 3.000% 3,073,597 3,279,969CMO Series 2019-33 Class MA07/25/2055 3.500% 12,340,760 13,065,472CMO Series 2020-48 Class AB07/25/2050 2.000% 22,023,447 22,572,630
CMO Series 2017-99 Class DE07/20/2045 2.500% 7,688,371 7,886,856CMO Series 2018-36 Class KC02/20/2046 3.000% 6,448,444 6,793,378CMO Series 2019-132 Class NA09/20/2049 3.500% 2,009,263 2,067,477CMO Series 2020-11 Class ME02/20/2049 2.500% 18,170,475 18,983,284CMO Series 2021-23 Class MG02/20/2051 1.500% 25,868,197 26,162,905Government National Mortgage Association(c)
CMO Series 2011-137 Class WA07/20/2040 5.576% 2,021,579 2,362,714Uniform Mortgage-Backed Security TBA(d)
04/19/2036 2.000% 2,000,000 2,051,953
Total Residential Mortgage-Backed Securities - Agency(Cost $652,135,811) 662,836,134
Residential Mortgage-Backed Securities - Non-Agency 5.8%
IssuerCoupon
Rate
PrincipalAmount
($) Value ($)Angel Oak Mortgage Trust(a),(c)
CMO Series 2021-1 Class A101/25/2066 0.909% 7,778,260 7,691,616Angel Oak Mortgage Trust I LLC(a),(c)
CMO Series 2019-2 Class A103/25/2049 3.628% 2,648,764 2,710,013Angel Oak Mortgage Trust LLC(a),(c)
CMO Series 2020-5 Class A105/25/2065 1.373% 3,063,508 3,072,657Bunker Hill Loan Depositary Trust(a),(c)
CMO Series 2019-2 Class A107/25/2049 2.879% 4,677,488 4,788,934GCAT LLC(a)
CMO Series 2019-NQM1 Class A102/25/2059 2.985% 3,873,742 3,882,568Mello Warehouse Securitization Trust(a),(b)
CMO Series 2020-1 Class A1-month USD LIBOR +0.900%Floor 0.900%10/25/2053 1.009% 9,000,000 9,001,743CMO Series 2020-2 Class A
Residential Mortgage-Backed Securities - Non-Agency (continued)
IssuerCoupon
Rate
PrincipalAmount
($) Value ($)CMO Series 2019-INV2 Class A107/25/2059 2.913% 6,250,388 6,362,575CMO Series 2020-5 Class A105/25/2065 1.218% 4,303,658 4,297,429
Total Residential Mortgage-Backed Securities - Non-Agency(Cost $65,838,031) 66,088,424
U.S. Treasury Obligations 24.4%U.S. Treasury05/15/2022 2.125% 22,222,000 22,727,20305/31/2022 0.125% 51,556,000 51,572,11109/30/2022 0.125% 63,024,000 63,019,07710/31/2022 0.125% 60,418,000 60,410,92012/31/2022 0.125% 5,797,000 5,794,50901/31/2023 0.125% 8,744,000 8,739,56002/28/2023 0.125% 22,879,000 22,864,70103/31/2023 0.125% 39,217,000 39,190,95701/15/2024 0.125% 735,000 731,21003/15/2024 0.250% 5,461,000 5,446,494
Total U.S. Treasury Obligations(Cost $280,420,158) 280,496,742
Copyright © 2021 www.secdatabase.com. All Rights Reserved.Please Consider the Environment Before Printing This Document
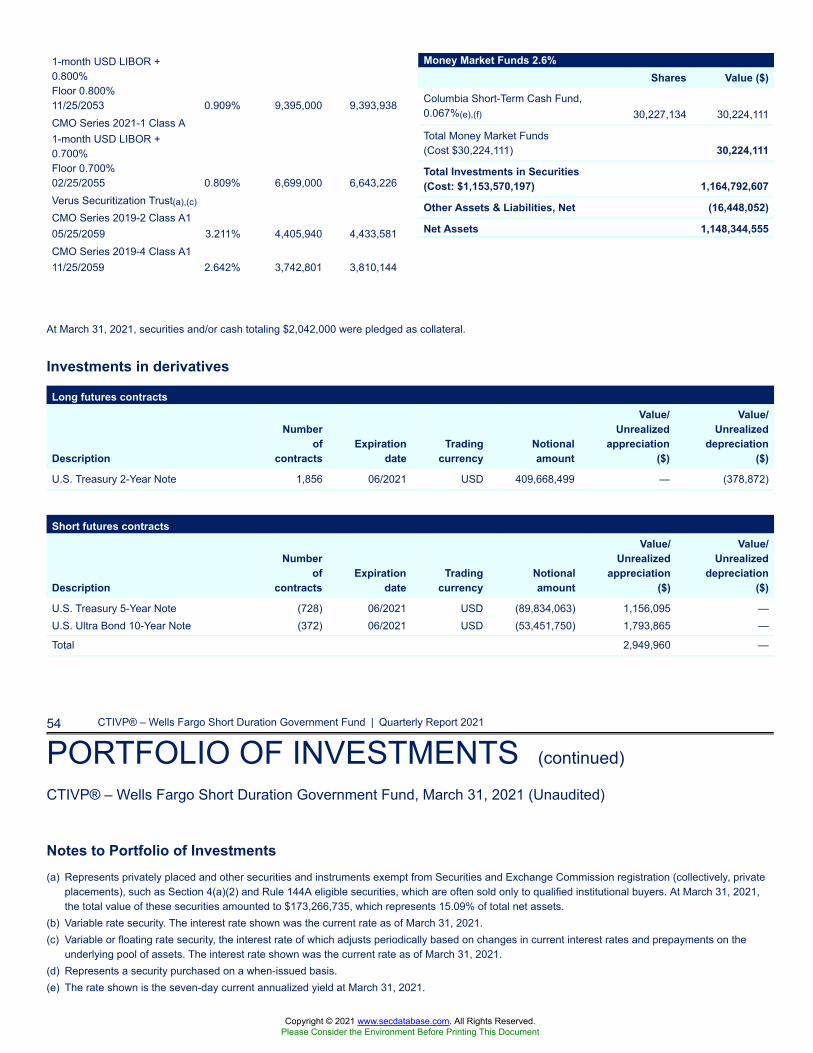
At March 31, 2021, securities and/or cash totaling $2,042,000 were pledged as collateral.
Investments in derivatives
Long futures contracts
Description
Numberof
contractsExpiration
dateTrading
currencyNotionalamount
Value/Unrealized
appreciation($)
Value/Unrealized
depreciation($)
U.S. Treasury 2-Year Note 1,856 06/2021 USD 409,668,499 — (378,872)
Short futures contracts
Description
Numberof
contractsExpiration
dateTrading
currencyNotionalamount
Value/Unrealized
appreciation($)
Value/Unrealized
depreciation($)
U.S. Treasury 5-Year Note (728) 06/2021 USD (89,834,063) 1,156,095 —U.S. Ultra Bond 10-Year Note (372) 06/2021 USD (53,451,750) 1,793,865 —
Total 2,949,960 —
54 CTIVP® – Wells Fargo Short Duration Government Fund | Quarterly Report 2021
PORTFOLIO OF INVESTMENTS (continued)
CTIVP® – Wells Fargo Short Duration Government Fund, March 31, 2021 (Unaudited)
Notes to Portfolio of Investments(a) Represents privately placed and other securities and instruments exempt from Securities and Exchange Commission registration (collectively, private
placements), such as Section 4(a)(2) and Rule 144A eligible securities, which are often sold only to qualified institutional buyers. At March 31, 2021,the total value of these securities amounted to $173,266,735, which represents 15.09% of total net assets.
(b) Variable rate security. The interest rate shown was the current rate as of March 31, 2021.(c) Variable or floating rate security, the interest rate of which adjusts periodically based on changes in current interest rates and prepayments on the
underlying pool of assets. The interest rate shown was the current rate as of March 31, 2021.(d) Represents a security purchased on a when-issued basis.(e) The rate shown is the seven-day current annualized yield at March 31, 2021.
1-month USD LIBOR +0.800%Floor 0.800%11/25/2053 0.909% 9,395,000 9,393,938CMO Series 2021-1 Class A1-month USD LIBOR +0.700%Floor 0.700%02/25/2055 0.809% 6,699,000 6,643,226Verus Securitization Trust(a),(c)
CMO Series 2019-2 Class A105/25/2059 3.211% 4,405,940 4,433,581CMO Series 2019-4 Class A111/25/2059 2.642% 3,742,801 3,810,144
Money Market Funds 2.6%Shares Value ($)
Columbia Short-Term Cash Fund,0.067%(e),(f) 30,227,134 30,224,111
Total Money Market Funds(Cost $30,224,111) 30,224,111
Total Investments in Securities(Cost: $1,153,570,197) 1,164,792,607
Other Assets & Liabilities, Net (16,448,052)
Net Assets 1,148,344,555
Copyright © 2021 www.secdatabase.com. All Rights Reserved.Please Consider the Environment Before Printing This Document
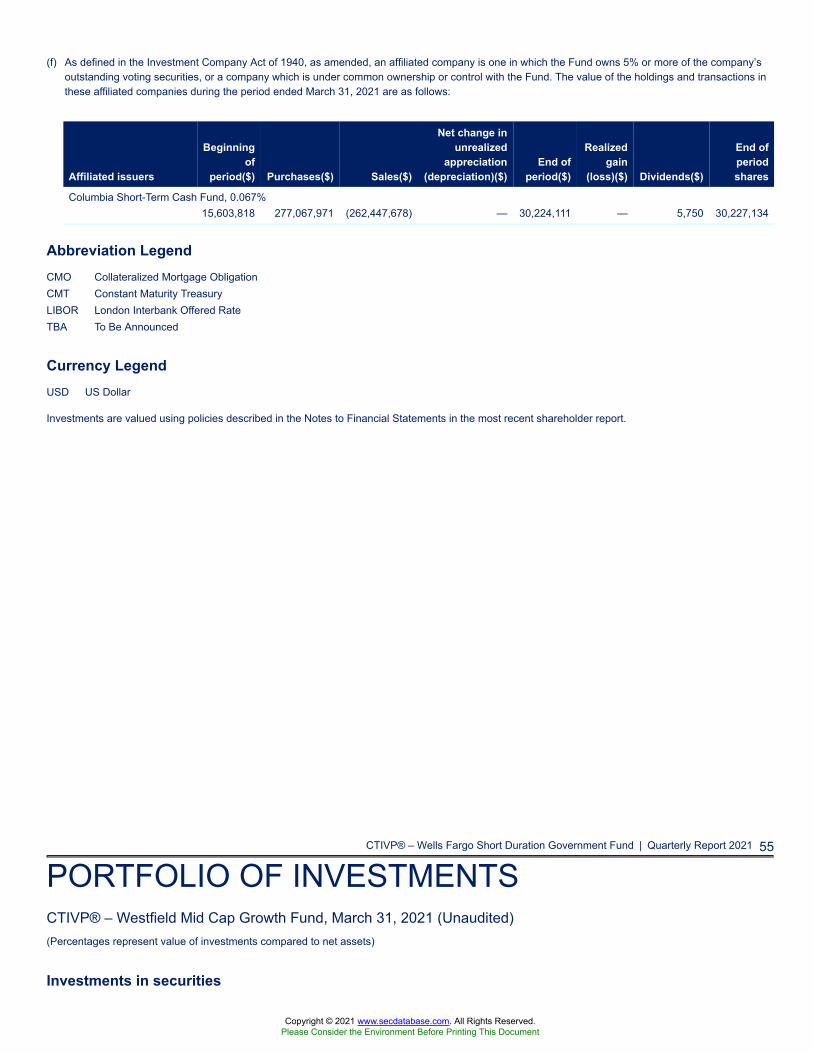
(f) As defined in the Investment Company Act of 1940, as amended, an affiliated company is one in which the Fund owns 5% or more of the company’soutstanding voting securities, or a company which is under common ownership or control with the Fund. The value of the holdings and transactions inthese affiliated companies during the period ended March 31, 2021 are as follows:
Affiliated issuers
Beginningof
period($) Purchases($) Sales($)
Net change inunrealized
appreciation(depreciation)($)
End ofperiod($)
Realizedgain
(loss)($) Dividends($)
End ofperiodshares
Columbia Short-Term Cash Fund, 0.067%15,603,818 277,067,971 (262,447,678) — 30,224,111 — 5,750 30,227,134
Abbreviation LegendCMO Collateralized Mortgage ObligationCMT Constant Maturity TreasuryLIBOR London Interbank Offered RateTBA To Be Announced
Currency LegendUSD US Dollar
Investments are valued using policies described in the Notes to Financial Statements in the most recent shareholder report.
CTIVP® – Wells Fargo Short Duration Government Fund | Quarterly Report 2021 55
PORTFOLIO OF INVESTMENTSCTIVP® – Westfield Mid Cap Growth Fund, March 31, 2021 (Unaudited)(Percentages represent value of investments compared to net assets)
Investments in securities
Copyright © 2021 www.secdatabase.com. All Rights Reserved.Please Consider the Environment Before Printing This Document
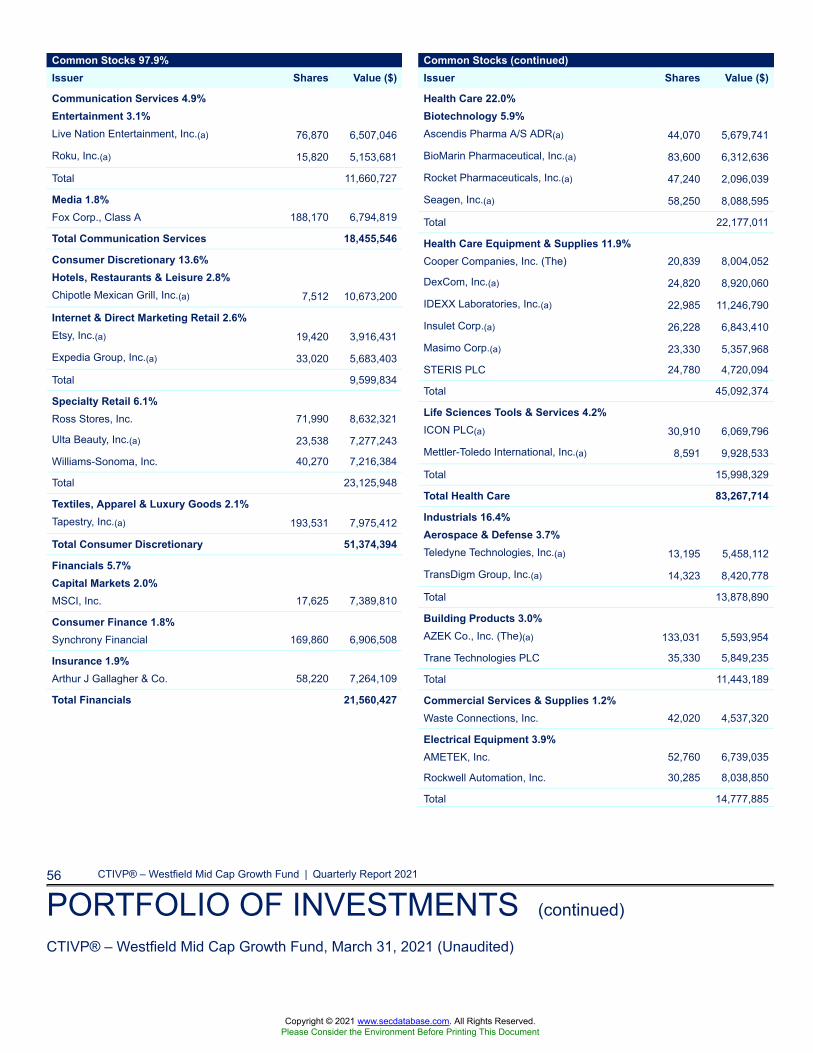
56 CTIVP® – Westfield Mid Cap Growth Fund | Quarterly Report 2021
PORTFOLIO OF INVESTMENTS (continued)
CTIVP® – Westfield Mid Cap Growth Fund, March 31, 2021 (Unaudited)
Common Stocks 97.9%Issuer Shares Value ($)
Communication Services 4.9%Entertainment 3.1%Live Nation Entertainment, Inc.(a) 76,870 6,507,046
Roku, Inc.(a) 15,820 5,153,681
Total 11,660,727
Media 1.8%Fox Corp., Class A 188,170 6,794,819
Total Communication Services 18,455,546
Consumer Discretionary 13.6%Hotels, Restaurants & Leisure 2.8%Chipotle Mexican Grill, Inc.(a) 7,512 10,673,200
Internet & Direct Marketing Retail 2.6%Etsy, Inc.(a) 19,420 3,916,431
Expedia Group, Inc.(a) 33,020 5,683,403
Total 9,599,834
Specialty Retail 6.1%Ross Stores, Inc. 71,990 8,632,321
Ulta Beauty, Inc.(a) 23,538 7,277,243
Williams-Sonoma, Inc. 40,270 7,216,384
Total 23,125,948
Textiles, Apparel & Luxury Goods 2.1%Tapestry, Inc.(a) 193,531 7,975,412
Total Consumer Discretionary 51,374,394
Financials 5.7%Capital Markets 2.0%MSCI, Inc. 17,625 7,389,810
Consumer Finance 1.8%Synchrony Financial 169,860 6,906,508
Insurance 1.9%Arthur J Gallagher & Co. 58,220 7,264,109
Total Financials 21,560,427
Common Stocks (continued)Issuer Shares Value ($)
Health Care 22.0%Biotechnology 5.9%Ascendis Pharma A/S ADR(a) 44,070 5,679,741
BioMarin Pharmaceutical, Inc.(a) 83,600 6,312,636
Rocket Pharmaceuticals, Inc.(a) 47,240 2,096,039
Seagen, Inc.(a) 58,250 8,088,595
Total 22,177,011
Health Care Equipment & Supplies 11.9%Cooper Companies, Inc. (The) 20,839 8,004,052
DexCom, Inc.(a) 24,820 8,920,060
IDEXX Laboratories, Inc.(a) 22,985 11,246,790
Insulet Corp.(a) 26,228 6,843,410
Masimo Corp.(a) 23,330 5,357,968
STERIS PLC 24,780 4,720,094
Total 45,092,374
Life Sciences Tools & Services 4.2%ICON PLC(a) 30,910 6,069,796
Mettler-Toledo International, Inc.(a) 8,591 9,928,533
Total 15,998,329
Total Health Care 83,267,714
Industrials 16.4%Aerospace & Defense 3.7%Teledyne Technologies, Inc.(a) 13,195 5,458,112
TransDigm Group, Inc.(a) 14,323 8,420,778
Total 13,878,890
Building Products 3.0%AZEK Co., Inc. (The)(a) 133,031 5,593,954
Trane Technologies PLC 35,330 5,849,235
Total 11,443,189
Commercial Services & Supplies 1.2%Waste Connections, Inc. 42,020 4,537,320
Electrical Equipment 3.9%AMETEK, Inc. 52,760 6,739,035
Rockwell Automation, Inc. 30,285 8,038,850
Total 14,777,885
Copyright © 2021 www.secdatabase.com. All Rights Reserved.Please Consider the Environment Before Printing This Document
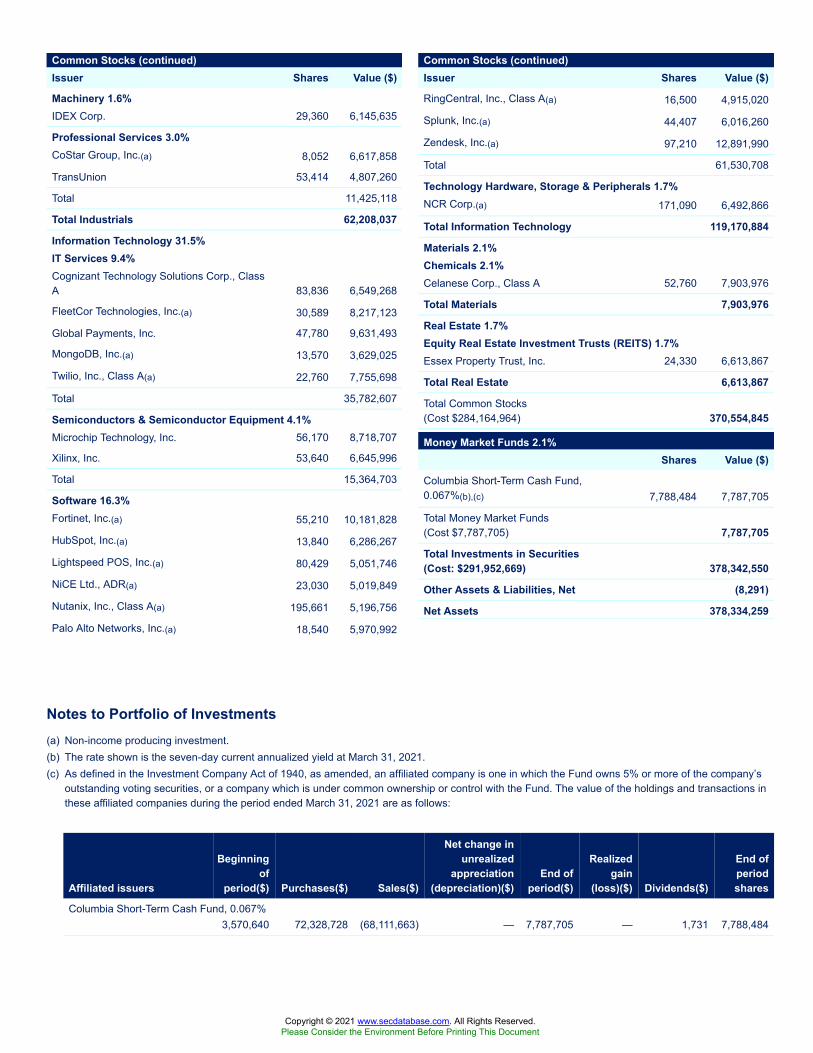
Notes to Portfolio of Investments(a) Non-income producing investment.(b) The rate shown is the seven-day current annualized yield at March 31, 2021.(c) As defined in the Investment Company Act of 1940, as amended, an affiliated company is one in which the Fund owns 5% or more of the company’s
outstanding voting securities, or a company which is under common ownership or control with the Fund. The value of the holdings and transactions inthese affiliated companies during the period ended March 31, 2021 are as follows:
Affiliated issuers
Beginningof
period($) Purchases($) Sales($)
Net change inunrealized
appreciation(depreciation)($)
End ofperiod($)
Realizedgain
(loss)($) Dividends($)
End ofperiodshares
Columbia Short-Term Cash Fund, 0.067%3,570,640 72,328,728 (68,111,663) — 7,787,705 — 1,731 7,788,484
Common Stocks (continued)Issuer Shares Value ($)
Machinery 1.6%IDEX Corp. 29,360 6,145,635
Professional Services 3.0%CoStar Group, Inc.(a) 8,052 6,617,858
TransUnion 53,414 4,807,260
Total 11,425,118
Total Industrials 62,208,037
Information Technology 31.5%IT Services 9.4%Cognizant Technology Solutions Corp., ClassA 83,836 6,549,268
FleetCor Technologies, Inc.(a) 30,589 8,217,123
Global Payments, Inc. 47,780 9,631,493
MongoDB, Inc.(a) 13,570 3,629,025
Twilio, Inc., Class A(a) 22,760 7,755,698
Total 35,782,607
Semiconductors & Semiconductor Equipment 4.1%Microchip Technology, Inc. 56,170 8,718,707
Xilinx, Inc. 53,640 6,645,996
Total 15,364,703
Software 16.3%Fortinet, Inc.(a) 55,210 10,181,828
HubSpot, Inc.(a) 13,840 6,286,267
Lightspeed POS, Inc.(a) 80,429 5,051,746
NiCE Ltd., ADR(a) 23,030 5,019,849
Nutanix, Inc., Class A(a) 195,661 5,196,756
Palo Alto Networks, Inc.(a) 18,540 5,970,992
Common Stocks (continued)Issuer Shares Value ($)
RingCentral, Inc., Class A(a) 16,500 4,915,020
Splunk, Inc.(a) 44,407 6,016,260
Zendesk, Inc.(a) 97,210 12,891,990
Total 61,530,708
Technology Hardware, Storage & Peripherals 1.7%NCR Corp.(a) 171,090 6,492,866
Total Information Technology 119,170,884
Materials 2.1%Chemicals 2.1%Celanese Corp., Class A 52,760 7,903,976
Total Materials 7,903,976
Real Estate 1.7%Equity Real Estate Investment Trusts (REITS) 1.7%Essex Property Trust, Inc. 24,330 6,613,867
Total Real Estate 6,613,867
Total Common Stocks(Cost $284,164,964) 370,554,845
Money Market Funds 2.1%Shares Value ($)
Columbia Short-Term Cash Fund,0.067%(b),(c) 7,788,484 7,787,705
Total Money Market Funds(Cost $7,787,705) 7,787,705
Total Investments in Securities(Cost: $291,952,669) 378,342,550
Other Assets & Liabilities, Net (8,291)
Net Assets 378,334,259
Copyright © 2021 www.secdatabase.com. All Rights Reserved.Please Consider the Environment Before Printing This Document
CTIVP® – Westfield Mid Cap Growth Fund | Quarterly Report 2021 57
PORTFOLIO OF INVESTMENTS (continued)
CTIVP® – Westfield Mid Cap Growth Fund, March 31, 2021 (Unaudited)
Abbreviation LegendADR American Depositary Receipt
Investments are valued using policies described in the Notes to Financial Statements in the most recent shareholder report.
Copyright © 2021 www.secdatabase.com. All Rights Reserved.Please Consider the Environment Before Printing This Document

58 CTIVP® – Westfield Mid Cap Growth Fund | Quarterly Report 2021
PORTFOLIO OF INVESTMENTSVariable Portfolio – Partners Core Bond Fund, March 31, 2021 (Unaudited)(Percentages represent value of investments compared to net assets)
Investments in securitiesAsset-Backed Securities — Agency 0.0%
IssuerCoupon
Rate
PrincipalAmount
($) Value ($)COLT Mortgage Loan TrustSeries 201911/25/2049 2.579% 895,998 903,849
Total Asset-Backed Securities — Agency(Cost $895,991) 903,849
Asset-Backed Securities — Non-Agency 7.5%Academic Loan Funding Trust(a),(b)
Series 2013-1A Class A1-month USD LIBOR +0.800%Floor 0.800%12/26/2044 0.918% 754,558 751,929American Tower Trust I(a)
Series 13 Class 2A03/15/2023 3.070% 1,900,000 1,922,141AmeriCredit Automobile Receivables TrustSeries 2017-1 Class C08/18/2022 2.710% 208,039 208,829Series 2020-1 Class A2A03/20/2023 1.100% 210,920 211,326Series 2020-2 Class A2A12/18/2023 0.600% 2,629,058 2,633,006Series 2020-3 Class A306/18/2025 0.530% 2,110,000 2,109,076Subordinated Series 2017-1 Class D01/18/2023 3.130% 1,332,000 1,348,443Avis Budget Rental Car Funding AESOP LLC(a)
Series 2017-1A Class A09/20/2023 3.070% 613,000 632,442Series 2019-3A Class A03/20/2026 2.360% 1,653,000 1,721,321Business Jet Securities LLC(a)
Series 2019-1 Class A07/15/2034 4.212% 3,243,217 3,301,798Series 2021-1A Class A04/15/2036 2.162% 2,510,000 2,502,358Capital One Multi-Asset Execution Trust(b)
Series 2016-A2 Class A21-month USD LIBOR +0.630%02/15/2024 0.736% 3,368,000 3,368,916Series 2016-A7 Class A7
Asset-Backed Securities — Non-Agency (continued)
IssuerCoupon
Rate
PrincipalAmount
($) Value ($)Carvana Auto Receivables Trust(a)
Series 2019-2A Class A303/15/2023 2.580% 629,117 630,082Series 2019-2A Class C06/17/2024 3.000% 4,000,000 4,109,254Subordinated Series 2019-3A Class D04/15/2025 3.040% 4,440,000 4,602,179Chase Funding Trust(b)
Series 2003-2 Class 2A21-month USD LIBOR +0.560%Floor 0.560%02/25/2033 0.678% 608,384 588,507Chase Funding Trust(c)
Series 2003-4 Class 1A505/25/2033 5.916% 265,639 272,193Series 2003-6 Class 1A511/25/2034 5.850% 214,339 224,569College Ave Student Loans LLC(a),(b)
Series 2017-A Class A11-month USD LIBOR +1.650%Floor 1.650%11/26/2046 1.768% 669,601 680,177College Ave Student Loans LLC(a)
Series 2021-A Class A207/25/2051 1.600% 2,127,000 2,110,093College Ave. Student Loans LLC(a)
Series 2018-A Class A212/26/2047 4.130% 588,682 622,517Series 2019-A Class A212/28/2048 3.280% 1,411,072 1,465,364Conix Mortgage Asset Trust(a),(d),(e),(f)
Series 2013-1 Class A12/25/2047 0.000% 1,078,519 17,041COOF Securitization Trust Ltd.(a),(c),(g)
CMO Series 2014-1 Class A06/25/2040 3.313% 510,146 42,382Credit Acceptance Auto Loan Trust(a)
Series 2021-2A Class A02/15/2030 0.960% 1,250,000 1,244,719Subordinated Series 2020-1A Class B04/16/2029 2.390% 3,260,000 3,363,384DataBank Issuer(a)
Copyright © 2021 www.secdatabase.com. All Rights Reserved.Please Consider the Environment Before Printing This Document
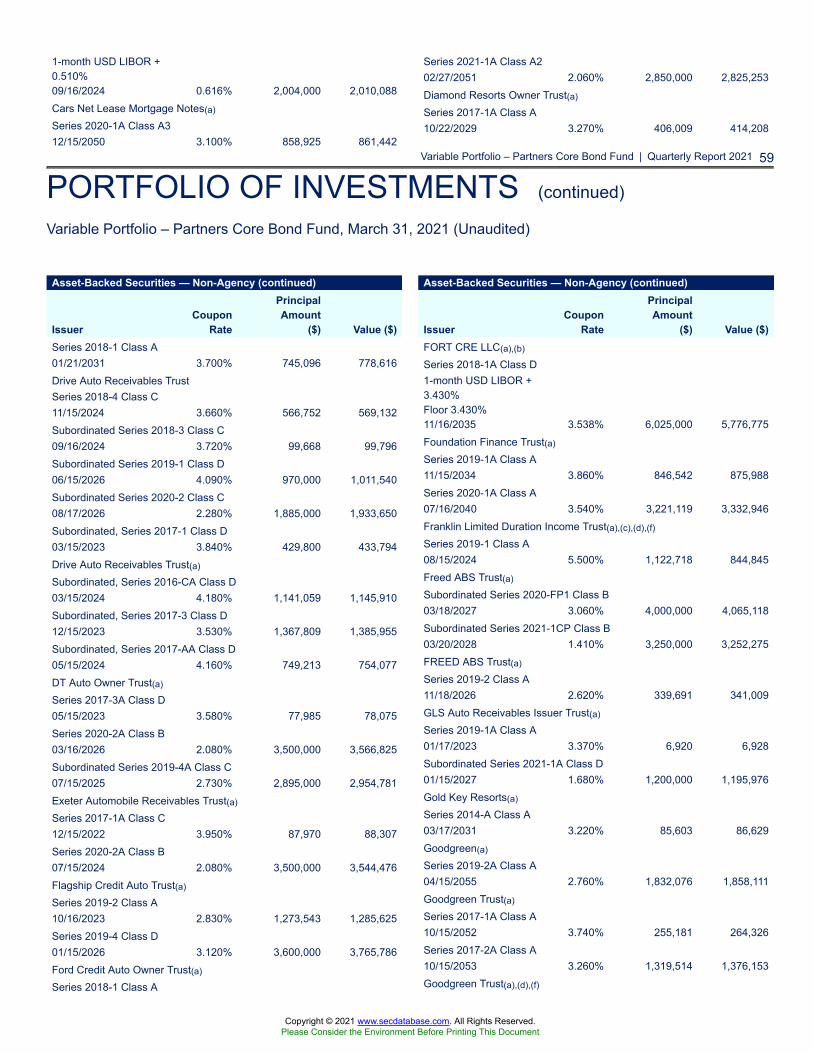
Variable Portfolio – Partners Core Bond Fund | Quarterly Report 2021 59
PORTFOLIO OF INVESTMENTS (continued)
Variable Portfolio – Partners Core Bond Fund, March 31, 2021 (Unaudited)
1-month USD LIBOR +0.510%09/16/2024 0.616% 2,004,000 2,010,088Cars Net Lease Mortgage Notes(a)
Series 2020-1A Class A312/15/2050 3.100% 858,925 861,442
Series 2021-1A Class A202/27/2051 2.060% 2,850,000 2,825,253Diamond Resorts Owner Trust(a)
Series 2017-1A Class A10/22/2029 3.270% 406,009 414,208
Asset-Backed Securities — Non-Agency (continued)
IssuerCoupon
Rate
PrincipalAmount
($) Value ($)Series 2018-1 Class A01/21/2031 3.700% 745,096 778,616Drive Auto Receivables TrustSeries 2018-4 Class C11/15/2024 3.660% 566,752 569,132Subordinated Series 2018-3 Class C09/16/2024 3.720% 99,668 99,796Subordinated Series 2019-1 Class D06/15/2026 4.090% 970,000 1,011,540Subordinated Series 2020-2 Class C08/17/2026 2.280% 1,885,000 1,933,650Subordinated, Series 2017-1 Class D03/15/2023 3.840% 429,800 433,794Drive Auto Receivables Trust(a)
Subordinated, Series 2016-CA Class D03/15/2024 4.180% 1,141,059 1,145,910Subordinated, Series 2017-3 Class D12/15/2023 3.530% 1,367,809 1,385,955Subordinated, Series 2017-AA Class D05/15/2024 4.160% 749,213 754,077DT Auto Owner Trust(a)
Series 2017-3A Class D05/15/2023 3.580% 77,985 78,075Series 2020-2A Class B03/16/2026 2.080% 3,500,000 3,566,825Subordinated Series 2019-4A Class C07/15/2025 2.730% 2,895,000 2,954,781Exeter Automobile Receivables Trust(a)
Series 2017-1A Class C12/15/2022 3.950% 87,970 88,307Series 2020-2A Class B07/15/2024 2.080% 3,500,000 3,544,476Flagship Credit Auto Trust(a)
Series 2019-2 Class A10/16/2023 2.830% 1,273,543 1,285,625Series 2019-4 Class D01/15/2026 3.120% 3,600,000 3,765,786Ford Credit Auto Owner Trust(a)
Series 2018-1 Class A
Asset-Backed Securities — Non-Agency (continued)
IssuerCoupon
Rate
PrincipalAmount
($) Value ($)FORT CRE LLC(a),(b)
Series 2018-1A Class D1-month USD LIBOR +3.430%Floor 3.430%11/16/2035 3.538% 6,025,000 5,776,775Foundation Finance Trust(a)
Series 2019-1A Class A11/15/2034 3.860% 846,542 875,988Series 2020-1A Class A07/16/2040 3.540% 3,221,119 3,332,946Franklin Limited Duration Income Trust(a),(c),(d),(f)
Series 2019-1 Class A08/15/2024 5.500% 1,122,718 844,845Freed ABS Trust(a)
Subordinated Series 2020-FP1 Class B03/18/2027 3.060% 4,000,000 4,065,118Subordinated Series 2021-1CP Class B03/20/2028 1.410% 3,250,000 3,252,275FREED ABS Trust(a)
Series 2019-2 Class A11/18/2026 2.620% 339,691 341,009GLS Auto Receivables Issuer Trust(a)
Series 2019-1A Class A01/17/2023 3.370% 6,920 6,928Subordinated Series 2021-1A Class D01/15/2027 1.680% 1,200,000 1,195,976Gold Key Resorts(a)
Series 2014-A Class A03/17/2031 3.220% 85,603 86,629Goodgreen(a)
Series 2019-2A Class A04/15/2055 2.760% 1,832,076 1,858,111Goodgreen Trust(a)
Series 2017-1A Class A10/15/2052 3.740% 255,181 264,326Series 2017-2A Class A10/15/2053 3.260% 1,319,514 1,376,153Goodgreen Trust(a),(d),(f)
Copyright © 2021 www.secdatabase.com. All Rights Reserved.Please Consider the Environment Before Printing This Document
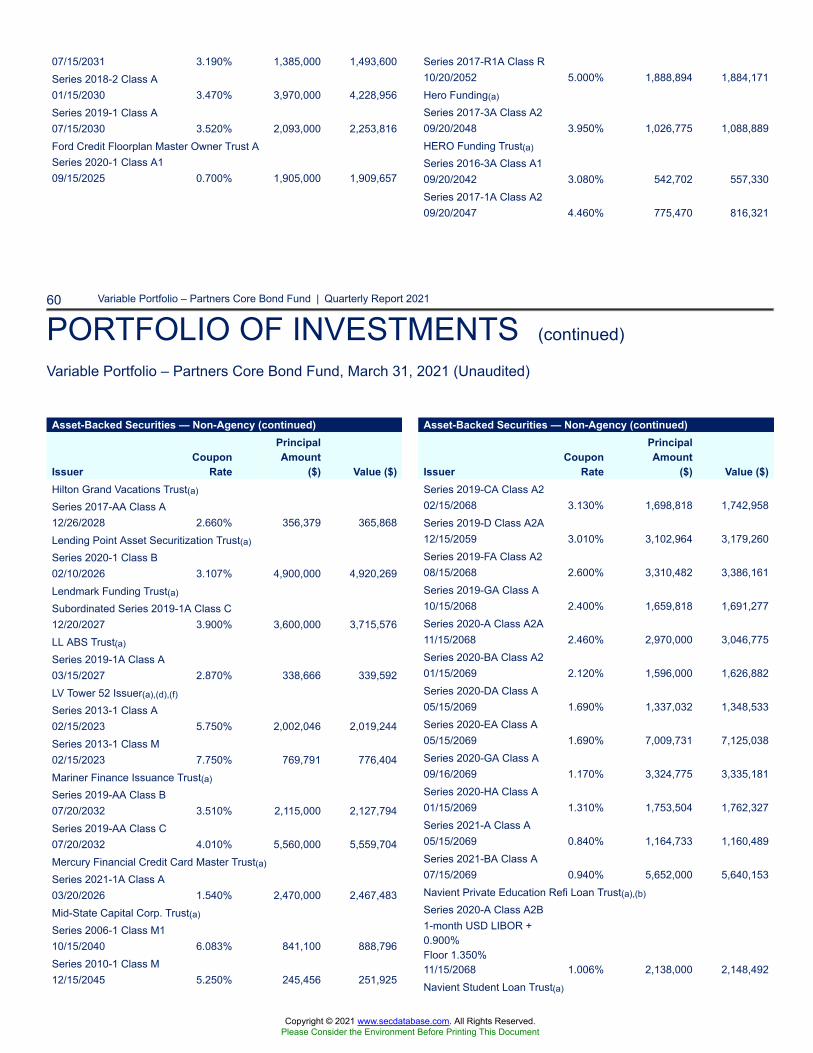
60 Variable Portfolio – Partners Core Bond Fund | Quarterly Report 2021
PORTFOLIO OF INVESTMENTS (continued)
Variable Portfolio – Partners Core Bond Fund, March 31, 2021 (Unaudited)
07/15/2031 3.190% 1,385,000 1,493,600Series 2018-2 Class A01/15/2030 3.470% 3,970,000 4,228,956Series 2019-1 Class A07/15/2030 3.520% 2,093,000 2,253,816Ford Credit Floorplan Master Owner Trust ASeries 2020-1 Class A109/15/2025 0.700% 1,905,000 1,909,657
Series 2017-R1A Class R10/20/2052 5.000% 1,888,894 1,884,171Hero Funding(a)
Series 2017-3A Class A209/20/2048 3.950% 1,026,775 1,088,889HERO Funding Trust(a)
Series 2016-3A Class A109/20/2042 3.080% 542,702 557,330Series 2017-1A Class A209/20/2047 4.460% 775,470 816,321
Asset-Backed Securities — Non-Agency (continued)
IssuerCoupon
Rate
PrincipalAmount
($) Value ($)Hilton Grand Vacations Trust(a)
Series 2017-AA Class A12/26/2028 2.660% 356,379 365,868Lending Point Asset Securitization Trust(a)
Series 2020-1 Class B02/10/2026 3.107% 4,900,000 4,920,269Lendmark Funding Trust(a)
Subordinated Series 2019-1A Class C12/20/2027 3.900% 3,600,000 3,715,576LL ABS Trust(a)
Series 2019-1A Class A03/15/2027 2.870% 338,666 339,592LV Tower 52 Issuer(a),(d),(f)
Series 2013-1 Class A02/15/2023 5.750% 2,002,046 2,019,244Series 2013-1 Class M02/15/2023 7.750% 769,791 776,404Mariner Finance Issuance Trust(a)
Series 2019-AA Class B07/20/2032 3.510% 2,115,000 2,127,794Series 2019-AA Class C07/20/2032 4.010% 5,560,000 5,559,704Mercury Financial Credit Card Master Trust(a)
Series 2021-1A Class A03/20/2026 1.540% 2,470,000 2,467,483Mid-State Capital Corp. Trust(a)
Series 2006-1 Class M110/15/2040 6.083% 841,100 888,796Series 2010-1 Class M12/15/2045 5.250% 245,456 251,925
Asset-Backed Securities — Non-Agency (continued)
IssuerCoupon
Rate
PrincipalAmount
($) Value ($)Series 2019-CA Class A202/15/2068 3.130% 1,698,818 1,742,958Series 2019-D Class A2A12/15/2059 3.010% 3,102,964 3,179,260Series 2019-FA Class A208/15/2068 2.600% 3,310,482 3,386,161Series 2019-GA Class A10/15/2068 2.400% 1,659,818 1,691,277Series 2020-A Class A2A11/15/2068 2.460% 2,970,000 3,046,775Series 2020-BA Class A201/15/2069 2.120% 1,596,000 1,626,882Series 2020-DA Class A05/15/2069 1.690% 1,337,032 1,348,533Series 2020-EA Class A05/15/2069 1.690% 7,009,731 7,125,038Series 2020-GA Class A09/16/2069 1.170% 3,324,775 3,335,181Series 2020-HA Class A01/15/2069 1.310% 1,753,504 1,762,327Series 2021-A Class A05/15/2069 0.840% 1,164,733 1,160,489Series 2021-BA Class A07/15/2069 0.940% 5,652,000 5,640,153Navient Private Education Refi Loan Trust(a),(b)
Series 2020-A Class A2B1-month USD LIBOR +0.900%Floor 1.350%11/15/2068 1.006% 2,138,000 2,148,492Navient Student Loan Trust(a)
Copyright © 2021 www.secdatabase.com. All Rights Reserved.Please Consider the Environment Before Printing This Document
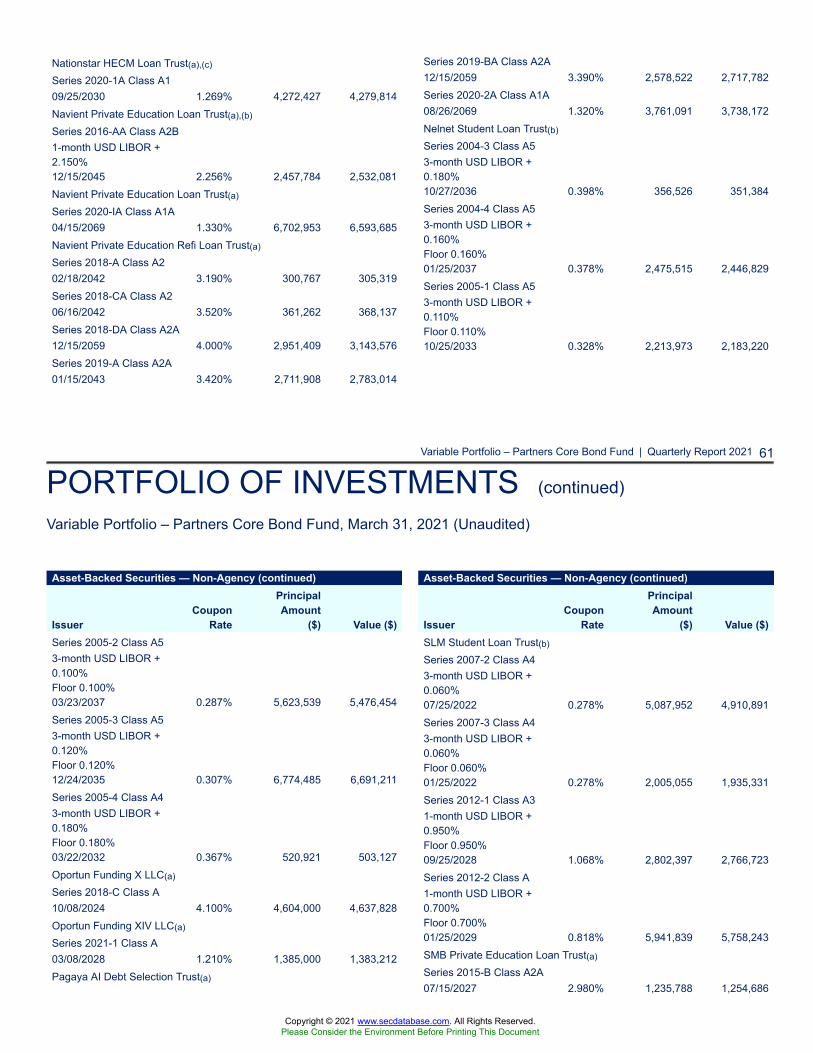
Variable Portfolio – Partners Core Bond Fund | Quarterly Report 2021 61
PORTFOLIO OF INVESTMENTS (continued)
Variable Portfolio – Partners Core Bond Fund, March 31, 2021 (Unaudited)
Nationstar HECM Loan Trust(a),(c)
Series 2020-1A Class A109/25/2030 1.269% 4,272,427 4,279,814Navient Private Education Loan Trust(a),(b)
Series 2016-AA Class A2B1-month USD LIBOR +2.150%12/15/2045 2.256% 2,457,784 2,532,081Navient Private Education Loan Trust(a)
Series 2020-IA Class A1A04/15/2069 1.330% 6,702,953 6,593,685Navient Private Education Refi Loan Trust(a)
Series 2018-A Class A202/18/2042 3.190% 300,767 305,319Series 2018-CA Class A206/16/2042 3.520% 361,262 368,137Series 2018-DA Class A2A12/15/2059 4.000% 2,951,409 3,143,576Series 2019-A Class A2A01/15/2043 3.420% 2,711,908 2,783,014
Series 2019-BA Class A2A12/15/2059 3.390% 2,578,522 2,717,782Series 2020-2A Class A1A08/26/2069 1.320% 3,761,091 3,738,172Nelnet Student Loan Trust(b)
Series 2004-3 Class A53-month USD LIBOR +0.180%10/27/2036 0.398% 356,526 351,384Series 2004-4 Class A53-month USD LIBOR +0.160%Floor 0.160%01/25/2037 0.378% 2,475,515 2,446,829Series 2005-1 Class A53-month USD LIBOR +0.110%Floor 0.110%10/25/2033 0.328% 2,213,973 2,183,220
Asset-Backed Securities — Non-Agency (continued)
IssuerCoupon
Rate
PrincipalAmount
($) Value ($)Series 2005-2 Class A53-month USD LIBOR +0.100%Floor 0.100%03/23/2037 0.287% 5,623,539 5,476,454Series 2005-3 Class A53-month USD LIBOR +0.120%Floor 0.120%12/24/2035 0.307% 6,774,485 6,691,211Series 2005-4 Class A43-month USD LIBOR +0.180%Floor 0.180%03/22/2032 0.367% 520,921 503,127Oportun Funding X LLC(a)
Series 2018-C Class A10/08/2024 4.100% 4,604,000 4,637,828Oportun Funding XIV LLC(a)
Series 2021-1 Class A03/08/2028 1.210% 1,385,000 1,383,212Pagaya AI Debt Selection Trust(a)
Asset-Backed Securities — Non-Agency (continued)
IssuerCoupon
Rate
PrincipalAmount
($) Value ($)SLM Student Loan Trust(b)
Series 2007-2 Class A43-month USD LIBOR +0.060%07/25/2022 0.278% 5,087,952 4,910,891Series 2007-3 Class A43-month USD LIBOR +0.060%Floor 0.060%01/25/2022 0.278% 2,005,055 1,935,331Series 2012-1 Class A31-month USD LIBOR +0.950%Floor 0.950%09/25/2028 1.068% 2,802,397 2,766,723Series 2012-2 Class A1-month USD LIBOR +0.700%Floor 0.700%01/25/2029 0.818% 5,941,839 5,758,243SMB Private Education Loan Trust(a)
Series 2015-B Class A2A07/15/2027 2.980% 1,235,788 1,254,686
Copyright © 2021 www.secdatabase.com. All Rights Reserved.Please Consider the Environment Before Printing This Document
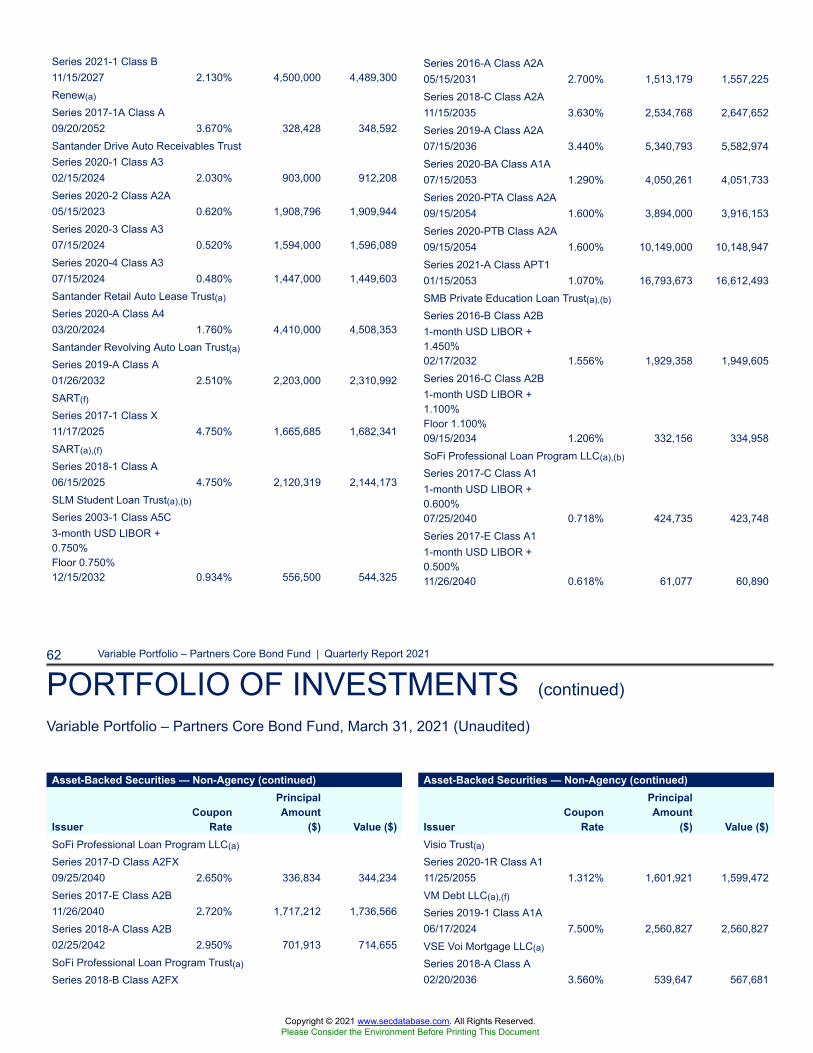
62 Variable Portfolio – Partners Core Bond Fund | Quarterly Report 2021
PORTFOLIO OF INVESTMENTS (continued)
Variable Portfolio – Partners Core Bond Fund, March 31, 2021 (Unaudited)
Series 2021-1 Class B11/15/2027 2.130% 4,500,000 4,489,300Renew(a)
Series 2017-1A Class A09/20/2052 3.670% 328,428 348,592Santander Drive Auto Receivables TrustSeries 2020-1 Class A302/15/2024 2.030% 903,000 912,208Series 2020-2 Class A2A05/15/2023 0.620% 1,908,796 1,909,944Series 2020-3 Class A307/15/2024 0.520% 1,594,000 1,596,089Series 2020-4 Class A307/15/2024 0.480% 1,447,000 1,449,603Santander Retail Auto Lease Trust(a)
Series 2020-A Class A403/20/2024 1.760% 4,410,000 4,508,353Santander Revolving Auto Loan Trust(a)
Series 2019-A Class A01/26/2032 2.510% 2,203,000 2,310,992SART(f)
Series 2017-1 Class X11/17/2025 4.750% 1,665,685 1,682,341SART(a),(f)
Series 2018-1 Class A06/15/2025 4.750% 2,120,319 2,144,173SLM Student Loan Trust(a),(b)
Series 2003-1 Class A5C3-month USD LIBOR +0.750%Floor 0.750%12/15/2032 0.934% 556,500 544,325
Series 2016-A Class A2A05/15/2031 2.700% 1,513,179 1,557,225Series 2018-C Class A2A11/15/2035 3.630% 2,534,768 2,647,652Series 2019-A Class A2A07/15/2036 3.440% 5,340,793 5,582,974Series 2020-BA Class A1A07/15/2053 1.290% 4,050,261 4,051,733Series 2020-PTA Class A2A09/15/2054 1.600% 3,894,000 3,916,153Series 2020-PTB Class A2A09/15/2054 1.600% 10,149,000 10,148,947Series 2021-A Class APT101/15/2053 1.070% 16,793,673 16,612,493SMB Private Education Loan Trust(a),(b)
Series 2016-B Class A2B1-month USD LIBOR +1.450%02/17/2032 1.556% 1,929,358 1,949,605Series 2016-C Class A2B1-month USD LIBOR +1.100%Floor 1.100%09/15/2034 1.206% 332,156 334,958SoFi Professional Loan Program LLC(a),(b)
Series 2017-C Class A11-month USD LIBOR +0.600%07/25/2040 0.718% 424,735 423,748Series 2017-E Class A11-month USD LIBOR +0.500%11/26/2040 0.618% 61,077 60,890
Asset-Backed Securities — Non-Agency (continued)
IssuerCoupon
Rate
PrincipalAmount
($) Value ($)SoFi Professional Loan Program LLC(a)
Series 2017-D Class A2FX09/25/2040 2.650% 336,834 344,234Series 2017-E Class A2B11/26/2040 2.720% 1,717,212 1,736,566Series 2018-A Class A2B02/25/2042 2.950% 701,913 714,655SoFi Professional Loan Program Trust(a)
Series 2018-B Class A2FX
Asset-Backed Securities — Non-Agency (continued)
IssuerCoupon
Rate
PrincipalAmount
($) Value ($)Visio Trust(a)
Series 2020-1R Class A111/25/2055 1.312% 1,601,921 1,599,472VM Debt LLC(a),(f)
Series 2019-1 Class A1A06/17/2024 7.500% 2,560,827 2,560,827VSE Voi Mortgage LLC(a)
Series 2018-A Class A02/20/2036 3.560% 539,647 567,681
Copyright © 2021 www.secdatabase.com. All Rights Reserved.Please Consider the Environment Before Printing This Document
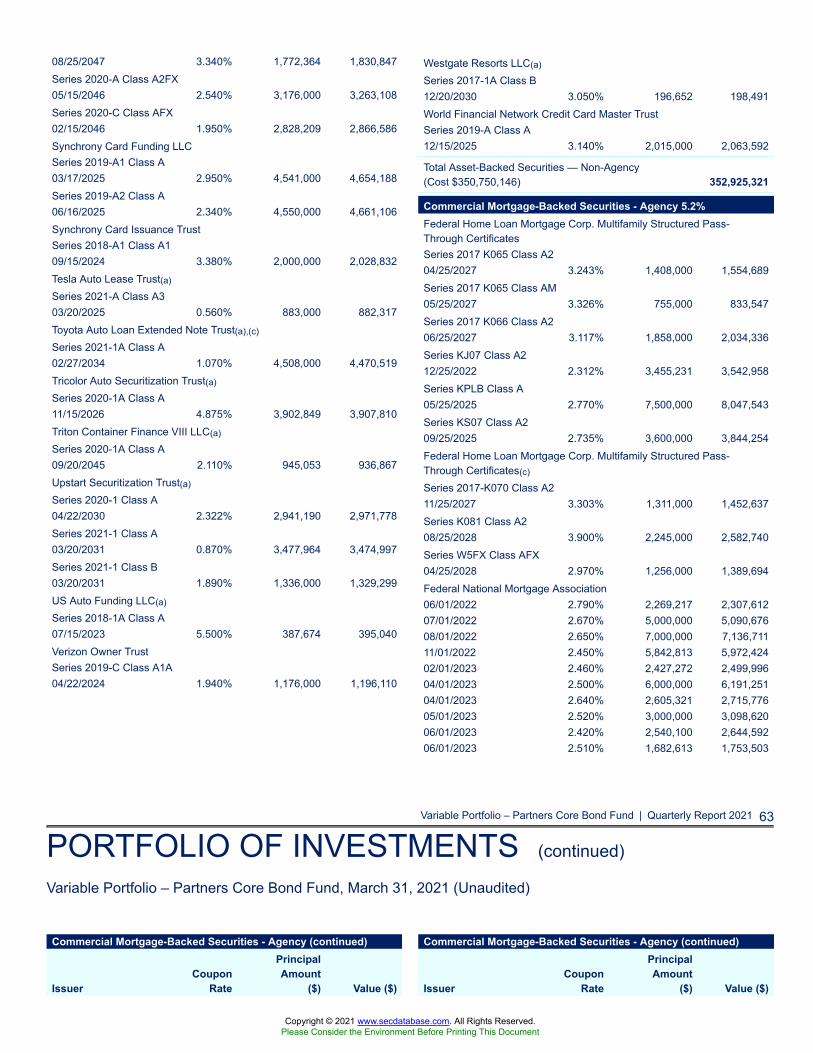
Variable Portfolio – Partners Core Bond Fund | Quarterly Report 2021 63
PORTFOLIO OF INVESTMENTS (continued)
Variable Portfolio – Partners Core Bond Fund, March 31, 2021 (Unaudited)
08/25/2047 3.340% 1,772,364 1,830,847Series 2020-A Class A2FX05/15/2046 2.540% 3,176,000 3,263,108Series 2020-C Class AFX02/15/2046 1.950% 2,828,209 2,866,586Synchrony Card Funding LLCSeries 2019-A1 Class A03/17/2025 2.950% 4,541,000 4,654,188Series 2019-A2 Class A06/16/2025 2.340% 4,550,000 4,661,106Synchrony Card Issuance TrustSeries 2018-A1 Class A109/15/2024 3.380% 2,000,000 2,028,832Tesla Auto Lease Trust(a)
Series 2021-A Class A303/20/2025 0.560% 883,000 882,317Toyota Auto Loan Extended Note Trust(a),(c)
Series 2021-1A Class A02/27/2034 1.070% 4,508,000 4,470,519Tricolor Auto Securitization Trust(a)
Series 2020-1A Class A11/15/2026 4.875% 3,902,849 3,907,810Triton Container Finance VIII LLC(a)
Series 2020-1A Class A09/20/2045 2.110% 945,053 936,867Upstart Securitization Trust(a)
Series 2020-1 Class A04/22/2030 2.322% 2,941,190 2,971,778Series 2021-1 Class A03/20/2031 0.870% 3,477,964 3,474,997Series 2021-1 Class B03/20/2031 1.890% 1,336,000 1,329,299US Auto Funding LLC(a)
Series 2018-1A Class A07/15/2023 5.500% 387,674 395,040Verizon Owner TrustSeries 2019-C Class A1A04/22/2024 1.940% 1,176,000 1,196,110
Westgate Resorts LLC(a)
Series 2017-1A Class B12/20/2030 3.050% 196,652 198,491World Financial Network Credit Card Master TrustSeries 2019-A Class A12/15/2025 3.140% 2,015,000 2,063,592
Total Asset-Backed Securities — Non-Agency(Cost $350,750,146) 352,925,321
Commercial Mortgage-Backed Securities - Agency 5.2%Federal Home Loan Mortgage Corp. Multifamily Structured Pass-Through CertificatesSeries 2017 K065 Class A204/25/2027 3.243% 1,408,000 1,554,689Series 2017 K065 Class AM05/25/2027 3.326% 755,000 833,547Series 2017 K066 Class A206/25/2027 3.117% 1,858,000 2,034,336Series KJ07 Class A212/25/2022 2.312% 3,455,231 3,542,958Series KPLB Class A05/25/2025 2.770% 7,500,000 8,047,543Series KS07 Class A209/25/2025 2.735% 3,600,000 3,844,254Federal Home Loan Mortgage Corp. Multifamily Structured Pass-Through Certificates(c)
Series 2017-K070 Class A211/25/2027 3.303% 1,311,000 1,452,637Series K081 Class A208/25/2028 3.900% 2,245,000 2,582,740Series W5FX Class AFX04/25/2028 2.970% 1,256,000 1,389,694Federal National Mortgage Association06/01/2022 2.790% 2,269,217 2,307,61207/01/2022 2.670% 5,000,000 5,090,67608/01/2022 2.650% 7,000,000 7,136,71111/01/2022 2.450% 5,842,813 5,972,42402/01/2023 2.460% 2,427,272 2,499,99604/01/2023 2.500% 6,000,000 6,191,25104/01/2023 2.640% 2,605,321 2,715,77605/01/2023 2.520% 3,000,000 3,098,62006/01/2023 2.420% 2,540,100 2,644,59206/01/2023 2.510% 1,682,613 1,753,503
Commercial Mortgage-Backed Securities - Agency (continued)
IssuerCoupon
Rate
PrincipalAmount
($) Value ($)
Commercial Mortgage-Backed Securities - Agency (continued)
IssuerCoupon
Rate
PrincipalAmount
($) Value ($)
Copyright © 2021 www.secdatabase.com. All Rights Reserved.Please Consider the Environment Before Printing This Document

07/01/2023 3.670% 6,000,000 6,404,21008/01/2023 3.590% 2,500,000 2,668,96011/01/2023 3.690% 1,161,037 1,247,73707/01/2025 3.070% 9,370,095 10,118,29909/01/2025 3.100% 2,405,051 2,603,86012/01/2025 3.765% 6,748,587 7,501,17807/01/2026 4.450% 2,547,366 2,850,15310/01/2026 3.235% 1,324,530 1,446,58812/01/2026 3.240% 1,500,000 1,643,32201/01/2027 3.710% 2,954,682 3,299,15102/01/2027 3.340% 1,000,000 1,102,53203/01/2027 2.910% 3,398,008 3,669,21405/01/2027 2.430% 2,372,737 2,493,91906/01/2027 2.370% 4,550,000 4,778,15806/01/2027 3.000% 2,000,000 2,170,78507/01/2027 3.210% 904,650 989,63408/01/2027 2.900% 3,468,087 3,744,85406/01/2028 3.570% 2,787,000 3,113,49011/01/2028 4.250% 562,173 642,75701/01/2029 4.070% 5,120,000 5,321,41002/01/2029 3.740% 1,515,000 1,714,89310/01/2029 3.199% 8,434,548 9,252,27102/01/2030 2.570% 2,560,000 2,702,86302/01/2030 2.920% 2,787,054 2,995,64202/01/2030 3.550% 1,000,000 1,121,70906/01/2030 3.130% 4,812,000 5,070,07307/01/2030 3.850% 4,500,000 5,132,36601/01/2032 2.730% 2,614,479 2,785,15701/01/2032 2.730% 1,825,000 1,917,40201/01/2032 2.780% 2,229,748 2,353,22401/01/2032 2.970% 1,619,016 1,728,07602/01/2032 2.990% 2,995,170 3,201,55004/01/2035 3.330% 2,462,072 2,701,52606/01/2036 3.150% 2,730,646 2,929,872Series 2011-M1 Class A306/25/2021 3.763% 173,632 173,566Series 2015-M10 Class A204/25/2027 3.092% 11,612,272 12,631,566Series 2017-M5 Class A204/25/2029 3.176% 1,929,000 2,141,138Series 2017-T1 Class A06/25/2027 2.898% 2,771,395 2,971,875Series 2021-M3 Class 1A111/25/2033 1.000% 9,511,951 9,313,445Federal National Mortgage Association(c)
06/01/2037 5.888% 390,474 406,997CMO Series 2013-M13 Class A204/25/2023 2.379% 1,307,538 1,354,346CMO Series 2014-M3 Class A201/25/2024 3.501% 1,198,805 1,280,165CMO Series 2015-M11 Class A204/25/2025 2.822% 2,000,000 2,137,810
Series 2017-M12 Class A206/25/2027 3.085% 2,342,888 2,554,671Series 2017-M7 Class A202/25/2027 2.961% 546,000 590,249Series 2018-M10 Class A207/25/2028 3.370% 2,683,000 2,983,128Series 2018-M3 Class A202/25/2030 3.094% 1,057,000 1,156,880Series 2018-M4 Class A203/25/2028 3.046% 1,473,000 1,613,029Federal National Mortgage Association(c),(g)
Series 2021-M3 Class X111/25/2033 2.010% 42,126,946 6,130,132FREMF Mortgage Trust(a),(c)
Subordinated, Series 2015-K44 Class B01/25/2048 3.681% 3,410,000 3,691,675Subordinated, Series 2016-K59 Class B11/25/2049 3.576% 2,383,000 2,541,047Subordinated, Series 2016-K722 Class B07/25/2049 3.847% 1,400,000 1,465,370Government National Mortgage Association(b)
CMO Series 2013-H08 Class FA1-month USD LIBOR +0.350%Floor 0.350%, Cap10.550%03/20/2063 0.470% 1,465,291 1,466,463CMO Series 2015-H15 Class FJ1-month USD LIBOR +0.440%Floor 0.440%, Cap11.000%06/20/2065 0.560% 2,840,853 2,852,805CMO Series 2015-H16 Class FG1-month USD LIBOR +0.440%Floor 0.440%, Cap11.000%07/20/2065 0.560% 2,612,589 2,623,842CMO Series 2015-H16 Class FL1-month USD LIBOR +0.440%Floor 0.440%, Cap11.000%07/20/2065 0.560% 1,463,810 1,470,269CMO Series 2015-H18 Class FA1-month USD LIBOR +0.450%Floor 0.450%, Cap11.000%06/20/2065 0.570% 832,826 835,697Government National Mortgage Association(c)
CMO Series 2014-168 Class VB06/16/2047 3.440% 3,013,879 3,122,137
Total Commercial Mortgage-Backed Securities - Agency(Cost $231,078,140) 245,618,696
Copyright © 2021 www.secdatabase.com. All Rights Reserved.Please Consider the Environment Before Printing This Document
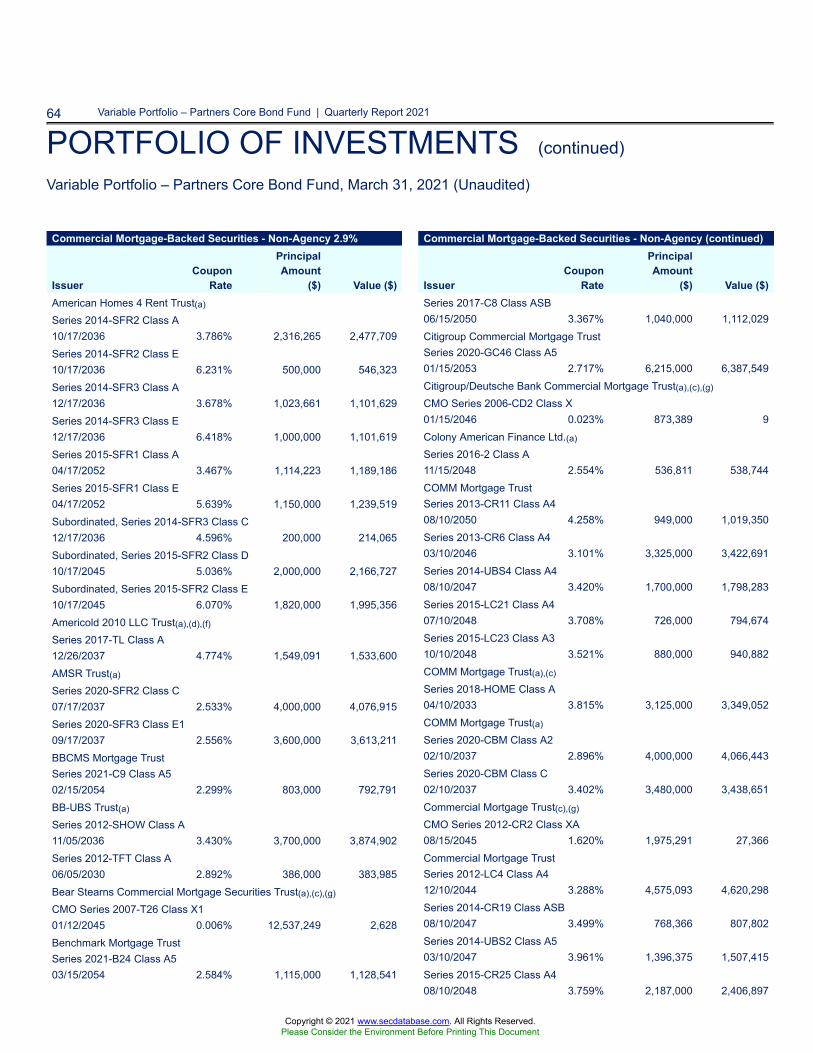
64 Variable Portfolio – Partners Core Bond Fund | Quarterly Report 2021
PORTFOLIO OF INVESTMENTS (continued)
Variable Portfolio – Partners Core Bond Fund, March 31, 2021 (Unaudited)
Commercial Mortgage-Backed Securities - Non-Agency 2.9%
IssuerCoupon
Rate
PrincipalAmount
($) Value ($)American Homes 4 Rent Trust(a)
Series 2014-SFR2 Class A10/17/2036 3.786% 2,316,265 2,477,709Series 2014-SFR2 Class E10/17/2036 6.231% 500,000 546,323Series 2014-SFR3 Class A12/17/2036 3.678% 1,023,661 1,101,629Series 2014-SFR3 Class E12/17/2036 6.418% 1,000,000 1,101,619Series 2015-SFR1 Class A04/17/2052 3.467% 1,114,223 1,189,186Series 2015-SFR1 Class E04/17/2052 5.639% 1,150,000 1,239,519Subordinated, Series 2014-SFR3 Class C12/17/2036 4.596% 200,000 214,065Subordinated, Series 2015-SFR2 Class D10/17/2045 5.036% 2,000,000 2,166,727Subordinated, Series 2015-SFR2 Class E10/17/2045 6.070% 1,820,000 1,995,356Americold 2010 LLC Trust(a),(d),(f)
Series 2017-TL Class A12/26/2037 4.774% 1,549,091 1,533,600AMSR Trust(a)
Series 2020-SFR2 Class C07/17/2037 2.533% 4,000,000 4,076,915Series 2020-SFR3 Class E109/17/2037 2.556% 3,600,000 3,613,211BBCMS Mortgage TrustSeries 2021-C9 Class A502/15/2054 2.299% 803,000 792,791BB-UBS Trust(a)
Series 2012-SHOW Class A11/05/2036 3.430% 3,700,000 3,874,902Series 2012-TFT Class A06/05/2030 2.892% 386,000 383,985Bear Stearns Commercial Mortgage Securities Trust(a),(c),(g)
CMO Series 2007-T26 Class X101/12/2045 0.006% 12,537,249 2,628Benchmark Mortgage TrustSeries 2021-B24 Class A503/15/2054 2.584% 1,115,000 1,128,541
Commercial Mortgage-Backed Securities - Non-Agency (continued)
IssuerCoupon
Rate
PrincipalAmount
($) Value ($)Series 2017-C8 Class ASB06/15/2050 3.367% 1,040,000 1,112,029Citigroup Commercial Mortgage TrustSeries 2020-GC46 Class A501/15/2053 2.717% 6,215,000 6,387,549Citigroup/Deutsche Bank Commercial Mortgage Trust(a),(c),(g)
CMO Series 2006-CD2 Class X01/15/2046 0.023% 873,389 9Colony American Finance Ltd.(a)
Series 2016-2 Class A11/15/2048 2.554% 536,811 538,744COMM Mortgage TrustSeries 2013-CR11 Class A408/10/2050 4.258% 949,000 1,019,350Series 2013-CR6 Class A403/10/2046 3.101% 3,325,000 3,422,691Series 2014-UBS4 Class A408/10/2047 3.420% 1,700,000 1,798,283Series 2015-LC21 Class A407/10/2048 3.708% 726,000 794,674Series 2015-LC23 Class A310/10/2048 3.521% 880,000 940,882COMM Mortgage Trust(a),(c)
Series 2018-HOME Class A04/10/2033 3.815% 3,125,000 3,349,052COMM Mortgage Trust(a)
Series 2020-CBM Class A202/10/2037 2.896% 4,000,000 4,066,443Series 2020-CBM Class C02/10/2037 3.402% 3,480,000 3,438,651Commercial Mortgage Trust(c),(g)
CMO Series 2012-CR2 Class XA08/15/2045 1.620% 1,975,291 27,366Commercial Mortgage TrustSeries 2012-LC4 Class A412/10/2044 3.288% 4,575,093 4,620,298Series 2014-CR19 Class ASB08/10/2047 3.499% 768,366 807,802Series 2014-UBS2 Class A503/10/2047 3.961% 1,396,375 1,507,415Series 2015-CR25 Class A408/10/2048 3.759% 2,187,000 2,406,897
Copyright © 2021 www.secdatabase.com. All Rights Reserved.Please Consider the Environment Before Printing This Document
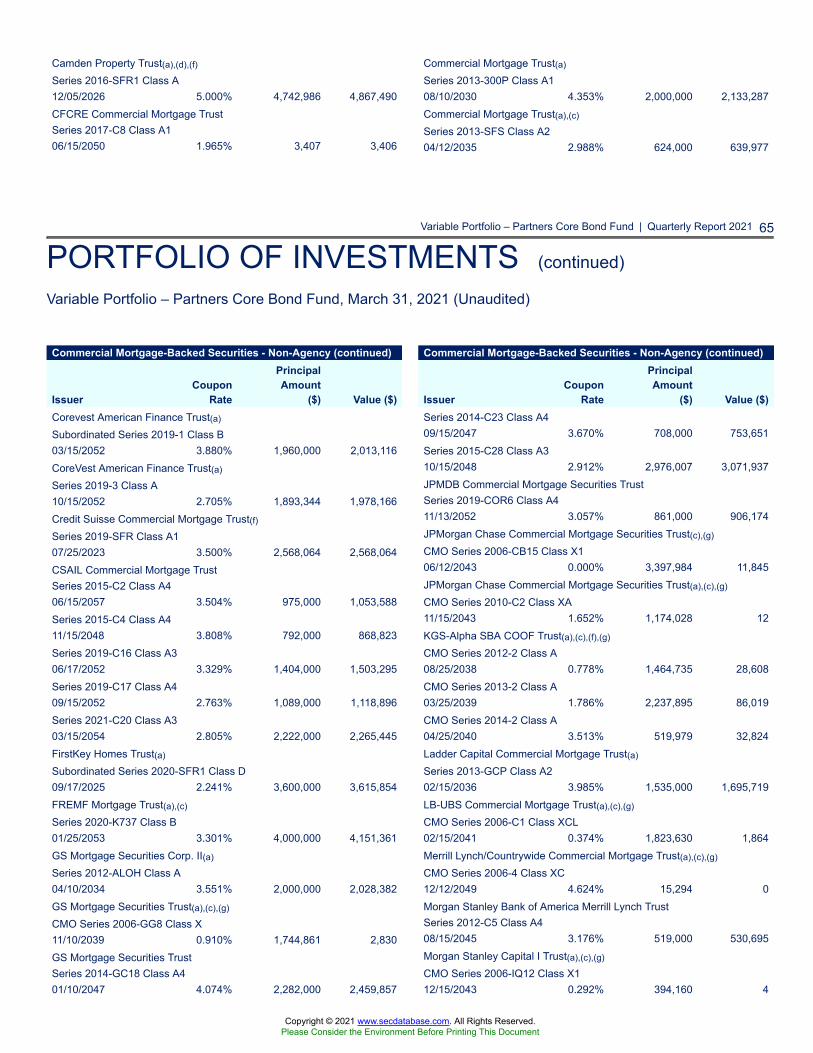
Variable Portfolio – Partners Core Bond Fund | Quarterly Report 2021 65
PORTFOLIO OF INVESTMENTS (continued)
Variable Portfolio – Partners Core Bond Fund, March 31, 2021 (Unaudited)
Camden Property Trust(a),(d),(f)
Series 2016-SFR1 Class A12/05/2026 5.000% 4,742,986 4,867,490CFCRE Commercial Mortgage TrustSeries 2017-C8 Class A106/15/2050 1.965% 3,407 3,406
Commercial Mortgage Trust(a)
Series 2013-300P Class A108/10/2030 4.353% 2,000,000 2,133,287Commercial Mortgage Trust(a),(c)
Series 2013-SFS Class A204/12/2035 2.988% 624,000 639,977
Commercial Mortgage-Backed Securities - Non-Agency (continued)
IssuerCoupon
Rate
PrincipalAmount
($) Value ($)Corevest American Finance Trust(a)
Subordinated Series 2019-1 Class B03/15/2052 3.880% 1,960,000 2,013,116CoreVest American Finance Trust(a)
Series 2019-3 Class A10/15/2052 2.705% 1,893,344 1,978,166Credit Suisse Commercial Mortgage Trust(f)Series 2019-SFR Class A107/25/2023 3.500% 2,568,064 2,568,064CSAIL Commercial Mortgage TrustSeries 2015-C2 Class A406/15/2057 3.504% 975,000 1,053,588Series 2015-C4 Class A411/15/2048 3.808% 792,000 868,823Series 2019-C16 Class A306/17/2052 3.329% 1,404,000 1,503,295Series 2019-C17 Class A409/15/2052 2.763% 1,089,000 1,118,896Series 2021-C20 Class A303/15/2054 2.805% 2,222,000 2,265,445FirstKey Homes Trust(a)
Subordinated Series 2020-SFR1 Class D09/17/2025 2.241% 3,600,000 3,615,854FREMF Mortgage Trust(a),(c)
Series 2020-K737 Class B01/25/2053 3.301% 4,000,000 4,151,361GS Mortgage Securities Corp. II(a)
Series 2012-ALOH Class A04/10/2034 3.551% 2,000,000 2,028,382GS Mortgage Securities Trust(a),(c),(g)
CMO Series 2006-GG8 Class X11/10/2039 0.910% 1,744,861 2,830GS Mortgage Securities TrustSeries 2014-GC18 Class A401/10/2047 4.074% 2,282,000 2,459,857
Commercial Mortgage-Backed Securities - Non-Agency (continued)
IssuerCoupon
Rate
PrincipalAmount
($) Value ($)Series 2014-C23 Class A409/15/2047 3.670% 708,000 753,651Series 2015-C28 Class A310/15/2048 2.912% 2,976,007 3,071,937JPMDB Commercial Mortgage Securities TrustSeries 2019-COR6 Class A411/13/2052 3.057% 861,000 906,174JPMorgan Chase Commercial Mortgage Securities Trust(c),(g)
CMO Series 2006-CB15 Class X106/12/2043 0.000% 3,397,984 11,845JPMorgan Chase Commercial Mortgage Securities Trust(a),(c),(g)
CMO Series 2010-C2 Class XA11/15/2043 1.652% 1,174,028 12KGS-Alpha SBA COOF Trust(a),(c),(f),(g)
CMO Series 2012-2 Class A08/25/2038 0.778% 1,464,735 28,608CMO Series 2013-2 Class A03/25/2039 1.786% 2,237,895 86,019CMO Series 2014-2 Class A04/25/2040 3.513% 519,979 32,824Ladder Capital Commercial Mortgage Trust(a)
Series 2013-GCP Class A202/15/2036 3.985% 1,535,000 1,695,719LB-UBS Commercial Mortgage Trust(a),(c),(g)
CMO Series 2006-C1 Class XCL02/15/2041 0.374% 1,823,630 1,864Merrill Lynch/Countrywide Commercial Mortgage Trust(a),(c),(g)
CMO Series 2006-4 Class XC12/12/2049 4.624% 15,294 0Morgan Stanley Bank of America Merrill Lynch TrustSeries 2012-C5 Class A408/15/2045 3.176% 519,000 530,695Morgan Stanley Capital I Trust(a),(c),(g)
CMO Series 2006-IQ12 Class X112/15/2043 0.292% 394,160 4
Copyright © 2021 www.secdatabase.com. All Rights Reserved.Please Consider the Environment Before Printing This Document
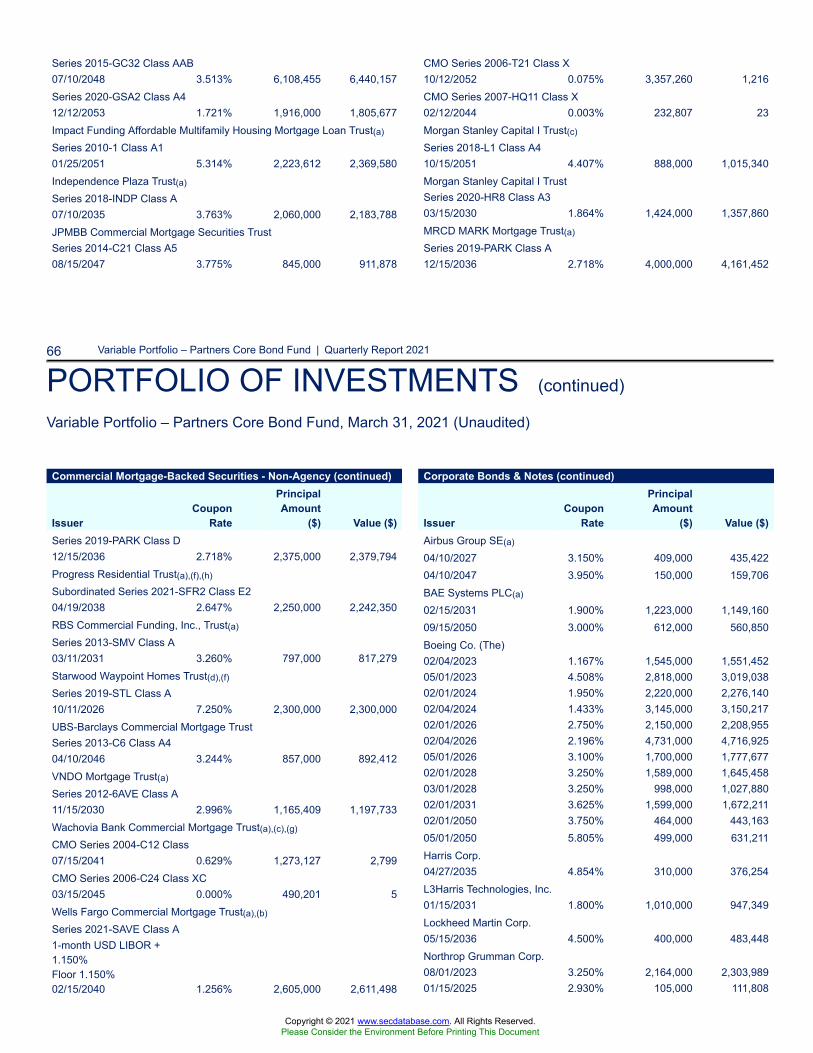
66 Variable Portfolio – Partners Core Bond Fund | Quarterly Report 2021
PORTFOLIO OF INVESTMENTS (continued)
Variable Portfolio – Partners Core Bond Fund, March 31, 2021 (Unaudited)
Series 2015-GC32 Class AAB07/10/2048 3.513% 6,108,455 6,440,157Series 2020-GSA2 Class A412/12/2053 1.721% 1,916,000 1,805,677Impact Funding Affordable Multifamily Housing Mortgage Loan Trust(a)
Series 2010-1 Class A101/25/2051 5.314% 2,223,612 2,369,580Independence Plaza Trust(a)
Series 2018-INDP Class A07/10/2035 3.763% 2,060,000 2,183,788JPMBB Commercial Mortgage Securities TrustSeries 2014-C21 Class A508/15/2047 3.775% 845,000 911,878
CMO Series 2006-T21 Class X10/12/2052 0.075% 3,357,260 1,216CMO Series 2007-HQ11 Class X02/12/2044 0.003% 232,807 23Morgan Stanley Capital I Trust(c)
Series 2018-L1 Class A410/15/2051 4.407% 888,000 1,015,340Morgan Stanley Capital I TrustSeries 2020-HR8 Class A303/15/2030 1.864% 1,424,000 1,357,860MRCD MARK Mortgage Trust(a)
Series 2019-PARK Class A12/15/2036 2.718% 4,000,000 4,161,452
Commercial Mortgage-Backed Securities - Non-Agency (continued)
IssuerCoupon
Rate
PrincipalAmount
($) Value ($)Series 2019-PARK Class D12/15/2036 2.718% 2,375,000 2,379,794Progress Residential Trust(a),(f),(h)
Subordinated Series 2021-SFR2 Class E204/19/2038 2.647% 2,250,000 2,242,350RBS Commercial Funding, Inc., Trust(a)
Series 2013-SMV Class A03/11/2031 3.260% 797,000 817,279Starwood Waypoint Homes Trust(d),(f)
Series 2019-STL Class A10/11/2026 7.250% 2,300,000 2,300,000UBS-Barclays Commercial Mortgage TrustSeries 2013-C6 Class A404/10/2046 3.244% 857,000 892,412VNDO Mortgage Trust(a)
Series 2012-6AVE Class A11/15/2030 2.996% 1,165,409 1,197,733Wachovia Bank Commercial Mortgage Trust(a),(c),(g)
CMO Series 2004-C12 Class07/15/2041 0.629% 1,273,127 2,799CMO Series 2006-C24 Class XC03/15/2045 0.000% 490,201 5Wells Fargo Commercial Mortgage Trust(a),(b)
Series 2021-SAVE Class A1-month USD LIBOR +1.150%Floor 1.150%02/15/2040 1.256% 2,605,000 2,611,498
Corporate Bonds & Notes (continued)
IssuerCoupon
Rate
PrincipalAmount
($) Value ($)Airbus Group SE(a)
04/10/2027 3.150% 409,000 435,42204/10/2047 3.950% 150,000 159,706BAE Systems PLC(a)
02/15/2031 1.900% 1,223,000 1,149,16009/15/2050 3.000% 612,000 560,850Boeing Co. (The)02/04/2023 1.167% 1,545,000 1,551,45205/01/2023 4.508% 2,818,000 3,019,03802/01/2024 1.950% 2,220,000 2,276,14002/04/2024 1.433% 3,145,000 3,150,21702/01/2026 2.750% 2,150,000 2,208,95502/04/2026 2.196% 4,731,000 4,716,92505/01/2026 3.100% 1,700,000 1,777,67702/01/2028 3.250% 1,589,000 1,645,45803/01/2028 3.250% 998,000 1,027,88002/01/2031 3.625% 1,599,000 1,672,21102/01/2050 3.750% 464,000 443,16305/01/2050 5.805% 499,000 631,211Harris Corp.04/27/2035 4.854% 310,000 376,254L3Harris Technologies, Inc.01/15/2031 1.800% 1,010,000 947,349Lockheed Martin Corp.05/15/2036 4.500% 400,000 483,448Northrop Grumman Corp.08/01/2023 3.250% 2,164,000 2,303,98901/15/2025 2.930% 105,000 111,808
Copyright © 2021 www.secdatabase.com. All Rights Reserved.Please Consider the Environment Before Printing This Document

Variable Portfolio – Partners Core Bond Fund | Quarterly Report 2021 67
PORTFOLIO OF INVESTMENTS (continued)
Variable Portfolio – Partners Core Bond Fund, March 31, 2021 (Unaudited)
WF-RBS Commercial Mortgage Trust(a)
Series 2011-C3 Class A403/15/2044 4.375% 71,459 71,399WF-RBS Commercial Mortgage TrustSeries 2012-C6 Class A404/15/2045 3.440% 894,087 900,430
Total Commercial Mortgage-Backed Securities - Non-Agency(Cost $136,327,806) 137,730,700
Convertible Bonds 0.0%Banking 0.0%Westpac Banking Corp.Subordinated07/24/2039 4.421% 525,000 595,645
Total Convertible Bonds(Cost $525,000) 595,645
Corporate Bonds & Notes 30.6%Aerospace & Defense 0.9%Airbus Finance BV(a)
04/17/2023 2.700% 589,000 613,968
01/15/2028 3.250% 1,516,000 1,623,64605/01/2040 5.150% 789,000 991,50510/15/2047 4.030% 768,000 851,694Raytheon Technologies Corp.03/15/2024 3.200% 175,000 186,88304/15/2047 4.350% 528,000 609,463United Technologies Corp.08/16/2023 3.650% 151,000 161,45508/16/2025 3.950% 1,067,000 1,185,83411/16/2028 4.125% 1,110,000 1,249,63811/16/2038 4.450% 991,000 1,152,44306/01/2042 4.500% 450,000 534,06105/15/2045 4.150% 584,000 651,21411/01/2046 3.750% 450,000 479,630
Total 40,939,747
Agencies 0.1%Crowley Conro LLC08/15/2043 4.181% 679,515 781,011Israel Government AID Bond(i)
11/01/2024 0.000% 5,000,000 4,773,064
Total 5,554,075
Corporate Bonds & Notes (continued)
IssuerCoupon
Rate
PrincipalAmount
($) Value ($)
Airlines 0.5%Air Canada Pass-Through Trust(a)
05/15/2025 4.125% 1,596,737 1,575,900Series 2017-1 Class A01/15/2030 3.550% 474,368 450,865Series 2017-1 Class AA01/15/2030 3.300% 334,848 333,154American Airlines Pass-Through TrustSeries 2015-1 Class A05/01/2027 3.375% 472,511 457,444Series 2016-3 Class AA10/15/2028 3.000% 2,673,499 2,697,369Series 2017-1 Class AA02/15/2029 3.650% 552,230 561,743British Airways Pass-Through Trust(a)
Series 2018-1 Class A09/20/2031 4.125% 563,561 563,921Series 2018-1 Class AA09/20/2031 3.800% 407,233 425,027
Corporate Bonds & Notes (continued)
IssuerCoupon
Rate
PrincipalAmount
($) Value ($)Series 2019-1 Class A08/25/2031 4.550% 843,320 885,505Series 2019-1 Class AA08/25/2031 4.150% 943,691 1,006,916
Total 25,536,215
Apartment REIT 0.2%ERP Operating LP12/01/2028 4.150% 480,000 538,782Essex Portfolio LP03/01/2028 1.700% 1,477,000 1,423,96501/15/2031 1.650% 900,000 820,08103/15/2032 2.650% 865,000 851,023Mid-America Apartments LP10/15/2023 4.300% 761,000 821,89306/15/2024 3.750% 1,741,000 1,882,93911/15/2025 4.000% 908,000 1,002,22306/01/2027 3.600% 112,000 122,15803/15/2029 3.950% 745,000 823,22102/15/2031 1.700% 700,000 643,584
Copyright © 2021 www.secdatabase.com. All Rights Reserved.Please Consider the Environment Before Printing This Document
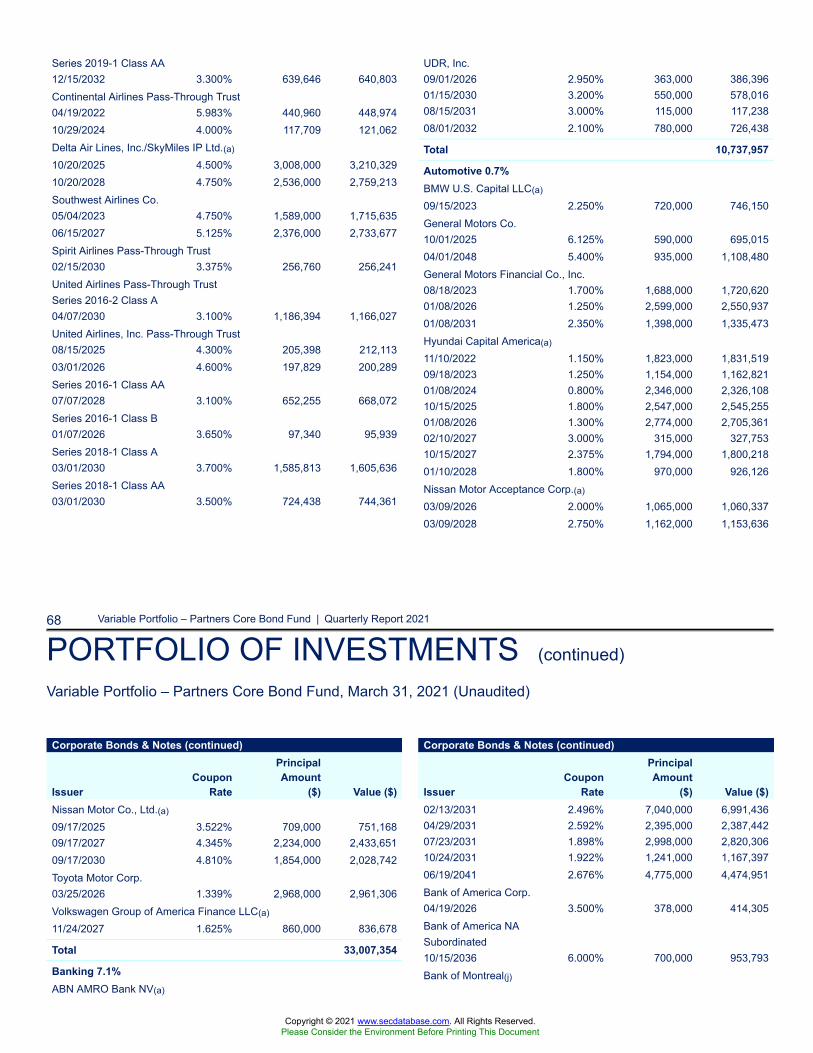
68 Variable Portfolio – Partners Core Bond Fund | Quarterly Report 2021
PORTFOLIO OF INVESTMENTS (continued)
Variable Portfolio – Partners Core Bond Fund, March 31, 2021 (Unaudited)
Series 2019-1 Class AA12/15/2032 3.300% 639,646 640,803Continental Airlines Pass-Through Trust04/19/2022 5.983% 440,960 448,97410/29/2024 4.000% 117,709 121,062Delta Air Lines, Inc./SkyMiles IP Ltd.(a)
10/20/2025 4.500% 3,008,000 3,210,32910/20/2028 4.750% 2,536,000 2,759,213Southwest Airlines Co.05/04/2023 4.750% 1,589,000 1,715,63506/15/2027 5.125% 2,376,000 2,733,677Spirit Airlines Pass-Through Trust02/15/2030 3.375% 256,760 256,241United Airlines Pass-Through TrustSeries 2016-2 Class A04/07/2030 3.100% 1,186,394 1,166,027United Airlines, Inc. Pass-Through Trust08/15/2025 4.300% 205,398 212,11303/01/2026 4.600% 197,829 200,289Series 2016-1 Class AA07/07/2028 3.100% 652,255 668,072Series 2016-1 Class B01/07/2026 3.650% 97,340 95,939Series 2018-1 Class A03/01/2030 3.700% 1,585,813 1,605,636Series 2018-1 Class AA03/01/2030 3.500% 724,438 744,361
UDR, Inc.09/01/2026 2.950% 363,000 386,39601/15/2030 3.200% 550,000 578,01608/15/2031 3.000% 115,000 117,23808/01/2032 2.100% 780,000 726,438
Total 10,737,957
Automotive 0.7%BMW U.S. Capital LLC(a)
09/15/2023 2.250% 720,000 746,150General Motors Co.10/01/2025 6.125% 590,000 695,01504/01/2048 5.400% 935,000 1,108,480General Motors Financial Co., Inc.08/18/2023 1.700% 1,688,000 1,720,62001/08/2026 1.250% 2,599,000 2,550,93701/08/2031 2.350% 1,398,000 1,335,473Hyundai Capital America(a)
11/10/2022 1.150% 1,823,000 1,831,51909/18/2023 1.250% 1,154,000 1,162,82101/08/2024 0.800% 2,346,000 2,326,10810/15/2025 1.800% 2,547,000 2,545,25501/08/2026 1.300% 2,774,000 2,705,36102/10/2027 3.000% 315,000 327,75310/15/2027 2.375% 1,794,000 1,800,21801/10/2028 1.800% 970,000 926,126Nissan Motor Acceptance Corp.(a)
03/09/2026 2.000% 1,065,000 1,060,33703/09/2028 2.750% 1,162,000 1,153,636
Corporate Bonds & Notes (continued)
IssuerCoupon
Rate
PrincipalAmount
($) Value ($)Nissan Motor Co., Ltd.(a)
09/17/2025 3.522% 709,000 751,16809/17/2027 4.345% 2,234,000 2,433,65109/17/2030 4.810% 1,854,000 2,028,742Toyota Motor Corp.03/25/2026 1.339% 2,968,000 2,961,306Volkswagen Group of America Finance LLC(a)
11/24/2027 1.625% 860,000 836,678
Total 33,007,354
Banking 7.1%ABN AMRO Bank NV(a)
Corporate Bonds & Notes (continued)
IssuerCoupon
Rate
PrincipalAmount
($) Value ($)02/13/2031 2.496% 7,040,000 6,991,43604/29/2031 2.592% 2,395,000 2,387,44207/23/2031 1.898% 2,998,000 2,820,30610/24/2031 1.922% 1,241,000 1,167,39706/19/2041 2.676% 4,775,000 4,474,951Bank of America Corp.04/19/2026 3.500% 378,000 414,305Bank of America NASubordinated10/15/2036 6.000% 700,000 953,793Bank of Montreal(j)
Copyright © 2021 www.secdatabase.com. All Rights Reserved.Please Consider the Environment Before Printing This Document
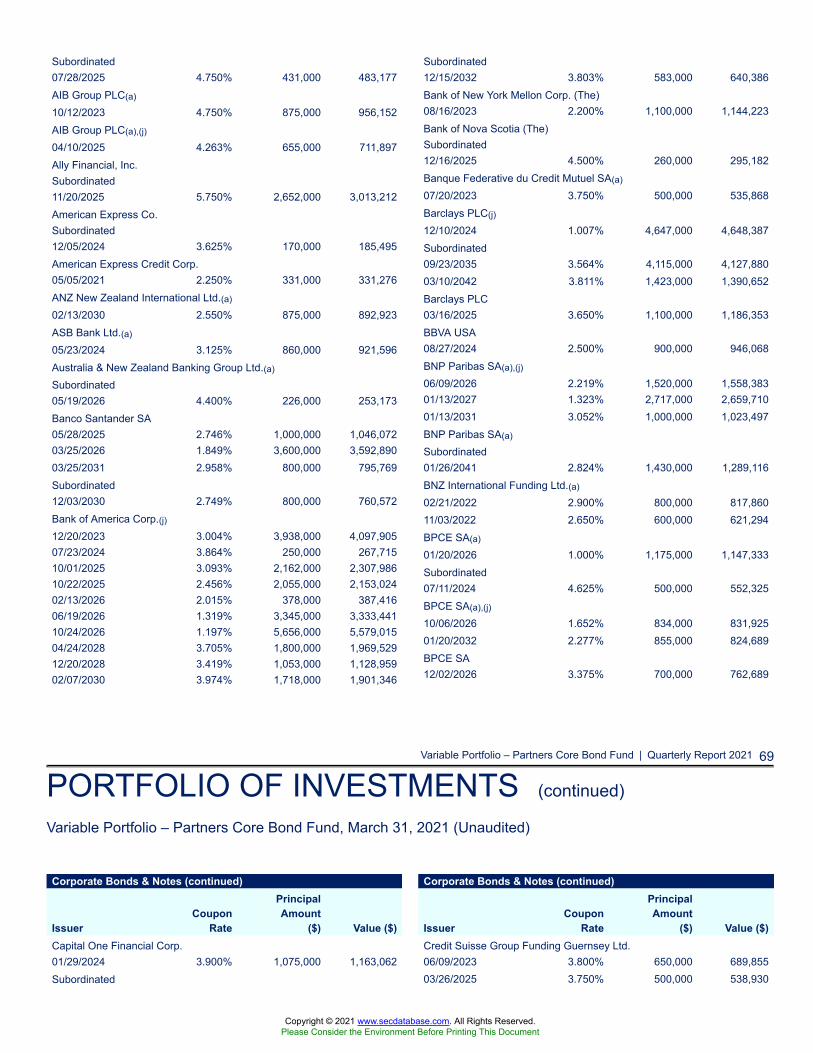
Variable Portfolio – Partners Core Bond Fund | Quarterly Report 2021 69
PORTFOLIO OF INVESTMENTS (continued)
Variable Portfolio – Partners Core Bond Fund, March 31, 2021 (Unaudited)
Subordinated07/28/2025 4.750% 431,000 483,177AIB Group PLC(a)
10/12/2023 4.750% 875,000 956,152AIB Group PLC(a),(j)
04/10/2025 4.263% 655,000 711,897Ally Financial, Inc.Subordinated11/20/2025 5.750% 2,652,000 3,013,212American Express Co.Subordinated12/05/2024 3.625% 170,000 185,495American Express Credit Corp.05/05/2021 2.250% 331,000 331,276ANZ New Zealand International Ltd.(a)
02/13/2030 2.550% 875,000 892,923ASB Bank Ltd.(a)
05/23/2024 3.125% 860,000 921,596Australia & New Zealand Banking Group Ltd.(a)
Subordinated05/19/2026 4.400% 226,000 253,173Banco Santander SA05/28/2025 2.746% 1,000,000 1,046,07203/25/2026 1.849% 3,600,000 3,592,89003/25/2031 2.958% 800,000 795,769Subordinated12/03/2030 2.749% 800,000 760,572Bank of America Corp.(j)12/20/2023 3.004% 3,938,000 4,097,90507/23/2024 3.864% 250,000 267,71510/01/2025 3.093% 2,162,000 2,307,98610/22/2025 2.456% 2,055,000 2,153,02402/13/2026 2.015% 378,000 387,41606/19/2026 1.319% 3,345,000 3,333,44110/24/2026 1.197% 5,656,000 5,579,01504/24/2028 3.705% 1,800,000 1,969,52912/20/2028 3.419% 1,053,000 1,128,95902/07/2030 3.974% 1,718,000 1,901,346
Subordinated12/15/2032 3.803% 583,000 640,386Bank of New York Mellon Corp. (The)08/16/2023 2.200% 1,100,000 1,144,223Bank of Nova Scotia (The)Subordinated12/16/2025 4.500% 260,000 295,182Banque Federative du Credit Mutuel SA(a)
07/20/2023 3.750% 500,000 535,868Barclays PLC(j)
12/10/2024 1.007% 4,647,000 4,648,387Subordinated09/23/2035 3.564% 4,115,000 4,127,88003/10/2042 3.811% 1,423,000 1,390,652Barclays PLC03/16/2025 3.650% 1,100,000 1,186,353BBVA USA08/27/2024 2.500% 900,000 946,068BNP Paribas SA(a),(j)
06/09/2026 2.219% 1,520,000 1,558,38301/13/2027 1.323% 2,717,000 2,659,71001/13/2031 3.052% 1,000,000 1,023,497BNP Paribas SA(a)
Subordinated01/26/2041 2.824% 1,430,000 1,289,116BNZ International Funding Ltd.(a)
02/21/2022 2.900% 800,000 817,86011/03/2022 2.650% 600,000 621,294BPCE SA(a)
01/20/2026 1.000% 1,175,000 1,147,333Subordinated07/11/2024 4.625% 500,000 552,325BPCE SA(a),(j)
10/06/2026 1.652% 834,000 831,92501/20/2032 2.277% 855,000 824,689BPCE SA12/02/2026 3.375% 700,000 762,689
Corporate Bonds & Notes (continued)
IssuerCoupon
Rate
PrincipalAmount
($) Value ($)Capital One Financial Corp.01/29/2024 3.900% 1,075,000 1,163,062Subordinated
Corporate Bonds & Notes (continued)
IssuerCoupon
Rate
PrincipalAmount
($) Value ($)Credit Suisse Group Funding Guernsey Ltd.06/09/2023 3.800% 650,000 689,85503/26/2025 3.750% 500,000 538,930
Copyright © 2021 www.secdatabase.com. All Rights Reserved.Please Consider the Environment Before Printing This Document
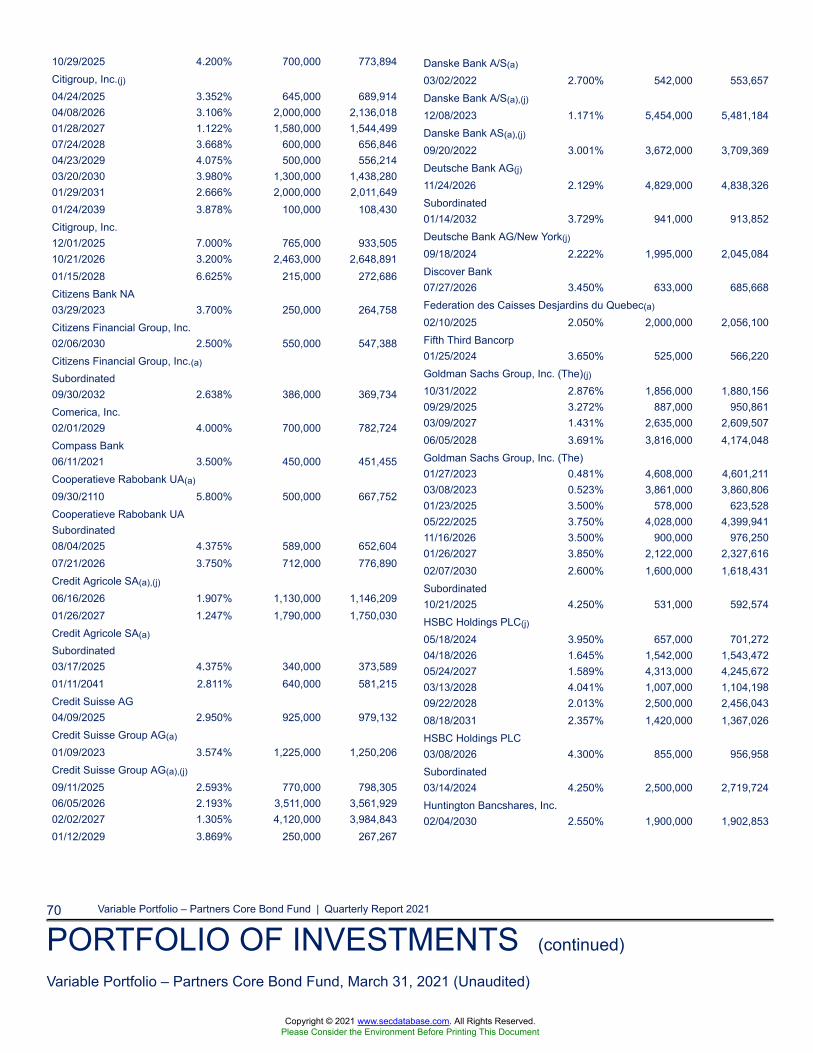
70 Variable Portfolio – Partners Core Bond Fund | Quarterly Report 2021
PORTFOLIO OF INVESTMENTS (continued)
Variable Portfolio – Partners Core Bond Fund, March 31, 2021 (Unaudited)
10/29/2025 4.200% 700,000 773,894Citigroup, Inc.(j)04/24/2025 3.352% 645,000 689,91404/08/2026 3.106% 2,000,000 2,136,01801/28/2027 1.122% 1,580,000 1,544,49907/24/2028 3.668% 600,000 656,84604/23/2029 4.075% 500,000 556,21403/20/2030 3.980% 1,300,000 1,438,28001/29/2031 2.666% 2,000,000 2,011,64901/24/2039 3.878% 100,000 108,430Citigroup, Inc.12/01/2025 7.000% 765,000 933,50510/21/2026 3.200% 2,463,000 2,648,89101/15/2028 6.625% 215,000 272,686Citizens Bank NA03/29/2023 3.700% 250,000 264,758Citizens Financial Group, Inc.02/06/2030 2.500% 550,000 547,388Citizens Financial Group, Inc.(a)
Subordinated09/30/2032 2.638% 386,000 369,734Comerica, Inc.02/01/2029 4.000% 700,000 782,724Compass Bank06/11/2021 3.500% 450,000 451,455Cooperatieve Rabobank UA(a)
09/30/2110 5.800% 500,000 667,752Cooperatieve Rabobank UASubordinated08/04/2025 4.375% 589,000 652,60407/21/2026 3.750% 712,000 776,890Credit Agricole SA(a),(j)
06/16/2026 1.907% 1,130,000 1,146,20901/26/2027 1.247% 1,790,000 1,750,030Credit Agricole SA(a)
Subordinated03/17/2025 4.375% 340,000 373,58901/11/2041 2.811% 640,000 581,215Credit Suisse AG04/09/2025 2.950% 925,000 979,132Credit Suisse Group AG(a)
01/09/2023 3.574% 1,225,000 1,250,206Credit Suisse Group AG(a),(j)
09/11/2025 2.593% 770,000 798,30506/05/2026 2.193% 3,511,000 3,561,92902/02/2027 1.305% 4,120,000 3,984,84301/12/2029 3.869% 250,000 267,267
Danske Bank A/S(a)
03/02/2022 2.700% 542,000 553,657Danske Bank A/S(a),(j)
12/08/2023 1.171% 5,454,000 5,481,184Danske Bank AS(a),(j)
09/20/2022 3.001% 3,672,000 3,709,369Deutsche Bank AG(j)
11/24/2026 2.129% 4,829,000 4,838,326Subordinated01/14/2032 3.729% 941,000 913,852Deutsche Bank AG/New York(j)
09/18/2024 2.222% 1,995,000 2,045,084Discover Bank07/27/2026 3.450% 633,000 685,668Federation des Caisses Desjardins du Quebec(a)
02/10/2025 2.050% 2,000,000 2,056,100Fifth Third Bancorp01/25/2024 3.650% 525,000 566,220Goldman Sachs Group, Inc. (The)(j)10/31/2022 2.876% 1,856,000 1,880,15609/29/2025 3.272% 887,000 950,86103/09/2027 1.431% 2,635,000 2,609,50706/05/2028 3.691% 3,816,000 4,174,048Goldman Sachs Group, Inc. (The)01/27/2023 0.481% 4,608,000 4,601,21103/08/2023 0.523% 3,861,000 3,860,80601/23/2025 3.500% 578,000 623,52805/22/2025 3.750% 4,028,000 4,399,94111/16/2026 3.500% 900,000 976,25001/26/2027 3.850% 2,122,000 2,327,61602/07/2030 2.600% 1,600,000 1,618,431Subordinated10/21/2025 4.250% 531,000 592,574HSBC Holdings PLC(j)
05/18/2024 3.950% 657,000 701,27204/18/2026 1.645% 1,542,000 1,543,47205/24/2027 1.589% 4,313,000 4,245,67203/13/2028 4.041% 1,007,000 1,104,19809/22/2028 2.013% 2,500,000 2,456,04308/18/2031 2.357% 1,420,000 1,367,026HSBC Holdings PLC03/08/2026 4.300% 855,000 956,958Subordinated03/14/2024 4.250% 2,500,000 2,719,724Huntington Bancshares, Inc.02/04/2030 2.550% 1,900,000 1,902,853
Copyright © 2021 www.secdatabase.com. All Rights Reserved.Please Consider the Environment Before Printing This Document
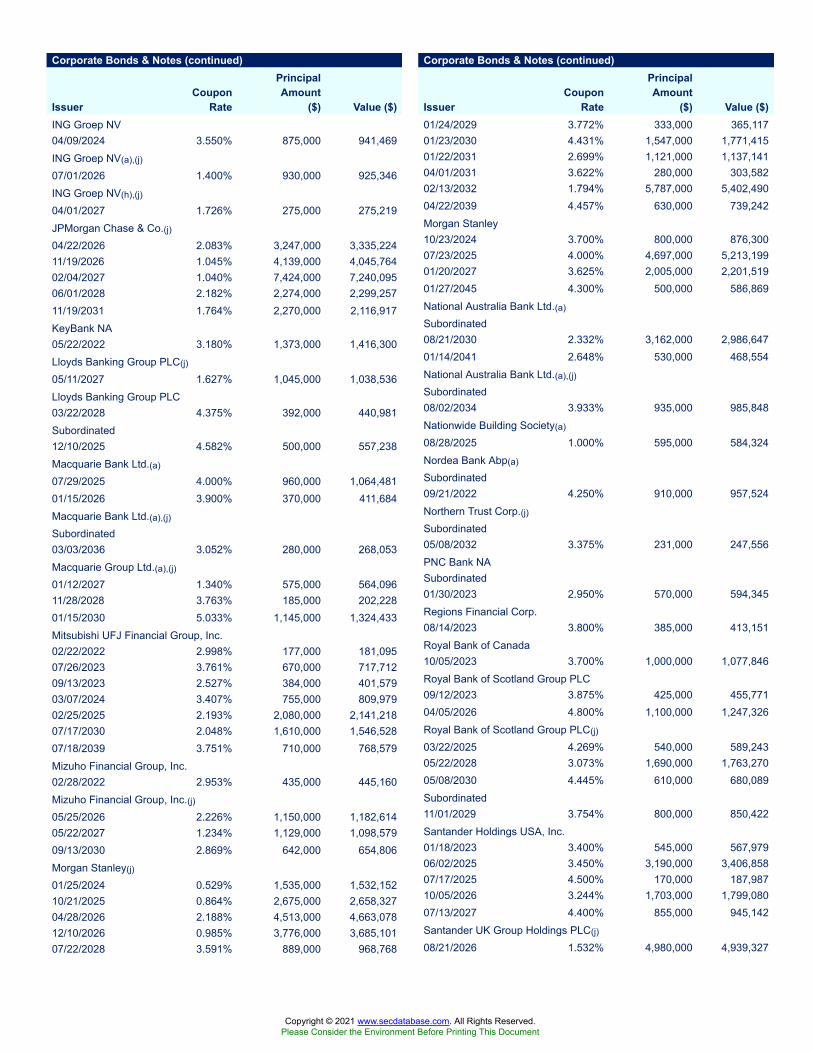
Corporate Bonds & Notes (continued)
IssuerCoupon
Rate
PrincipalAmount
($) Value ($)ING Groep NV04/09/2024 3.550% 875,000 941,469ING Groep NV(a),(j)
07/01/2026 1.400% 930,000 925,346ING Groep NV(h),(j)
04/01/2027 1.726% 275,000 275,219JPMorgan Chase & Co.(j)04/22/2026 2.083% 3,247,000 3,335,22411/19/2026 1.045% 4,139,000 4,045,76402/04/2027 1.040% 7,424,000 7,240,09506/01/2028 2.182% 2,274,000 2,299,25711/19/2031 1.764% 2,270,000 2,116,917KeyBank NA05/22/2022 3.180% 1,373,000 1,416,300Lloyds Banking Group PLC(j)
05/11/2027 1.627% 1,045,000 1,038,536Lloyds Banking Group PLC03/22/2028 4.375% 392,000 440,981Subordinated12/10/2025 4.582% 500,000 557,238Macquarie Bank Ltd.(a)
07/29/2025 4.000% 960,000 1,064,48101/15/2026 3.900% 370,000 411,684Macquarie Bank Ltd.(a),(j)
Subordinated03/03/2036 3.052% 280,000 268,053Macquarie Group Ltd.(a),(j)
01/12/2027 1.340% 575,000 564,09611/28/2028 3.763% 185,000 202,22801/15/2030 5.033% 1,145,000 1,324,433Mitsubishi UFJ Financial Group, Inc.02/22/2022 2.998% 177,000 181,09507/26/2023 3.761% 670,000 717,71209/13/2023 2.527% 384,000 401,57903/07/2024 3.407% 755,000 809,97902/25/2025 2.193% 2,080,000 2,141,21807/17/2030 2.048% 1,610,000 1,546,52807/18/2039 3.751% 710,000 768,579Mizuho Financial Group, Inc.02/28/2022 2.953% 435,000 445,160Mizuho Financial Group, Inc.(j)05/25/2026 2.226% 1,150,000 1,182,61405/22/2027 1.234% 1,129,000 1,098,57909/13/2030 2.869% 642,000 654,806Morgan Stanley(j)
01/25/2024 0.529% 1,535,000 1,532,15210/21/2025 0.864% 2,675,000 2,658,32704/28/2026 2.188% 4,513,000 4,663,07812/10/2026 0.985% 3,776,000 3,685,10107/22/2028 3.591% 889,000 968,768
Corporate Bonds & Notes (continued)
IssuerCoupon
Rate
PrincipalAmount
($) Value ($)01/24/2029 3.772% 333,000 365,11701/23/2030 4.431% 1,547,000 1,771,41501/22/2031 2.699% 1,121,000 1,137,14104/01/2031 3.622% 280,000 303,58202/13/2032 1.794% 5,787,000 5,402,49004/22/2039 4.457% 630,000 739,242Morgan Stanley10/23/2024 3.700% 800,000 876,30007/23/2025 4.000% 4,697,000 5,213,19901/20/2027 3.625% 2,005,000 2,201,51901/27/2045 4.300% 500,000 586,869National Australia Bank Ltd.(a)
Subordinated08/21/2030 2.332% 3,162,000 2,986,64701/14/2041 2.648% 530,000 468,554National Australia Bank Ltd.(a),(j)
Subordinated08/02/2034 3.933% 935,000 985,848Nationwide Building Society(a)
08/28/2025 1.000% 595,000 584,324Nordea Bank Abp(a)
Subordinated09/21/2022 4.250% 910,000 957,524Northern Trust Corp.(j)Subordinated05/08/2032 3.375% 231,000 247,556PNC Bank NASubordinated01/30/2023 2.950% 570,000 594,345Regions Financial Corp.08/14/2023 3.800% 385,000 413,151Royal Bank of Canada10/05/2023 3.700% 1,000,000 1,077,846Royal Bank of Scotland Group PLC09/12/2023 3.875% 425,000 455,77104/05/2026 4.800% 1,100,000 1,247,326Royal Bank of Scotland Group PLC(j)
03/22/2025 4.269% 540,000 589,24305/22/2028 3.073% 1,690,000 1,763,27005/08/2030 4.445% 610,000 680,089Subordinated11/01/2029 3.754% 800,000 850,422Santander Holdings USA, Inc.01/18/2023 3.400% 545,000 567,97906/02/2025 3.450% 3,190,000 3,406,85807/17/2025 4.500% 170,000 187,98710/05/2026 3.244% 1,703,000 1,799,08007/13/2027 4.400% 855,000 945,142Santander UK Group Holdings PLC(j)
08/21/2026 1.532% 4,980,000 4,939,327
Copyright © 2021 www.secdatabase.com. All Rights Reserved.Please Consider the Environment Before Printing This Document
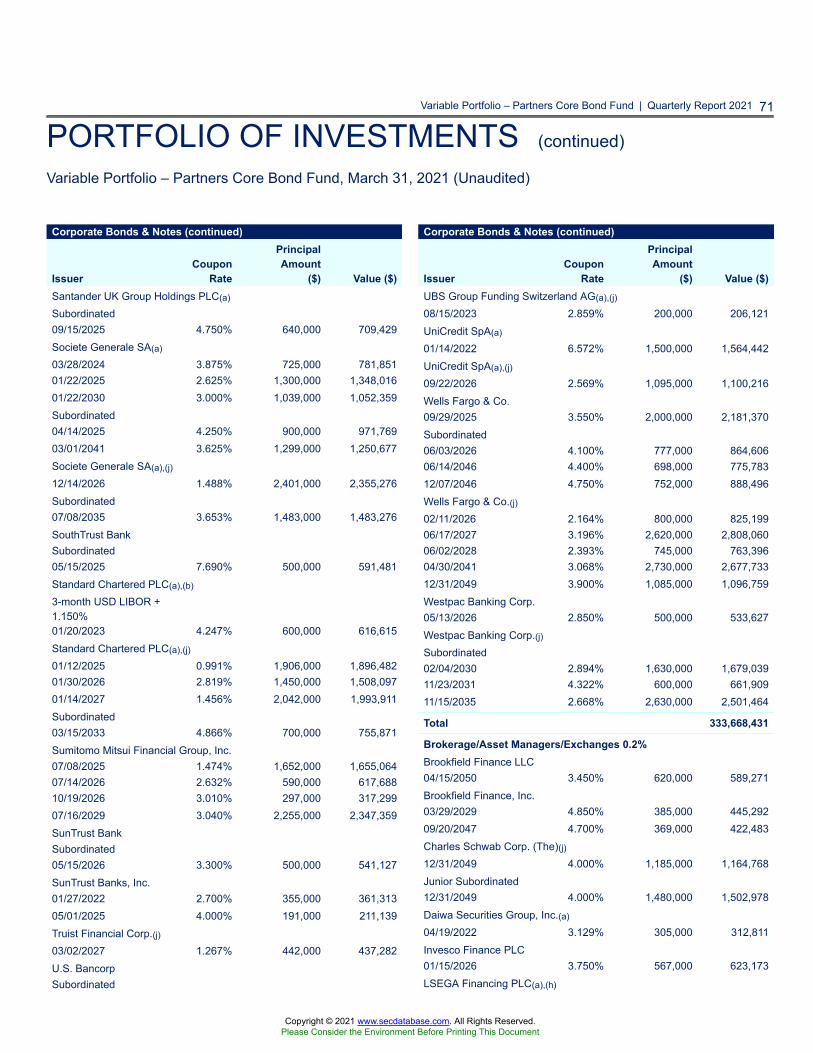
Variable Portfolio – Partners Core Bond Fund | Quarterly Report 2021 71
PORTFOLIO OF INVESTMENTS (continued)
Variable Portfolio – Partners Core Bond Fund, March 31, 2021 (Unaudited)
Corporate Bonds & Notes (continued)
IssuerCoupon
Rate
PrincipalAmount
($) Value ($)Santander UK Group Holdings PLC(a)
Subordinated09/15/2025 4.750% 640,000 709,429Societe Generale SA(a)
03/28/2024 3.875% 725,000 781,85101/22/2025 2.625% 1,300,000 1,348,01601/22/2030 3.000% 1,039,000 1,052,359Subordinated04/14/2025 4.250% 900,000 971,76903/01/2041 3.625% 1,299,000 1,250,677Societe Generale SA(a),(j)
12/14/2026 1.488% 2,401,000 2,355,276Subordinated07/08/2035 3.653% 1,483,000 1,483,276SouthTrust BankSubordinated05/15/2025 7.690% 500,000 591,481Standard Chartered PLC(a),(b)
3-month USD LIBOR +1.150%01/20/2023 4.247% 600,000 616,615Standard Chartered PLC(a),(j)
01/12/2025 0.991% 1,906,000 1,896,48201/30/2026 2.819% 1,450,000 1,508,09701/14/2027 1.456% 2,042,000 1,993,911Subordinated03/15/2033 4.866% 700,000 755,871Sumitomo Mitsui Financial Group, Inc.07/08/2025 1.474% 1,652,000 1,655,06407/14/2026 2.632% 590,000 617,68810/19/2026 3.010% 297,000 317,29907/16/2029 3.040% 2,255,000 2,347,359SunTrust BankSubordinated05/15/2026 3.300% 500,000 541,127SunTrust Banks, Inc.01/27/2022 2.700% 355,000 361,31305/01/2025 4.000% 191,000 211,139Truist Financial Corp.(j)03/02/2027 1.267% 442,000 437,282U.S. BancorpSubordinated
Corporate Bonds & Notes (continued)
IssuerCoupon
Rate
PrincipalAmount
($) Value ($)UBS Group Funding Switzerland AG(a),(j)
08/15/2023 2.859% 200,000 206,121UniCredit SpA(a)
01/14/2022 6.572% 1,500,000 1,564,442UniCredit SpA(a),(j)
09/22/2026 2.569% 1,095,000 1,100,216Wells Fargo & Co.09/29/2025 3.550% 2,000,000 2,181,370Subordinated06/03/2026 4.100% 777,000 864,60606/14/2046 4.400% 698,000 775,78312/07/2046 4.750% 752,000 888,496Wells Fargo & Co.(j)02/11/2026 2.164% 800,000 825,19906/17/2027 3.196% 2,620,000 2,808,06006/02/2028 2.393% 745,000 763,39604/30/2041 3.068% 2,730,000 2,677,73312/31/2049 3.900% 1,085,000 1,096,759Westpac Banking Corp.05/13/2026 2.850% 500,000 533,627Westpac Banking Corp.(j)Subordinated02/04/2030 2.894% 1,630,000 1,679,03911/23/2031 4.322% 600,000 661,90911/15/2035 2.668% 2,630,000 2,501,464
Total 333,668,431
Brokerage/Asset Managers/Exchanges 0.2%Brookfield Finance LLC04/15/2050 3.450% 620,000 589,271Brookfield Finance, Inc.03/29/2029 4.850% 385,000 445,29209/20/2047 4.700% 369,000 422,483Charles Schwab Corp. (The)(j)12/31/2049 4.000% 1,185,000 1,164,768Junior Subordinated12/31/2049 4.000% 1,480,000 1,502,978Daiwa Securities Group, Inc.(a)
04/19/2022 3.129% 305,000 312,811Invesco Finance PLC01/15/2026 3.750% 567,000 623,173LSEGA Financing PLC(a),(h)
Copyright © 2021 www.secdatabase.com. All Rights Reserved.Please Consider the Environment Before Printing This Document
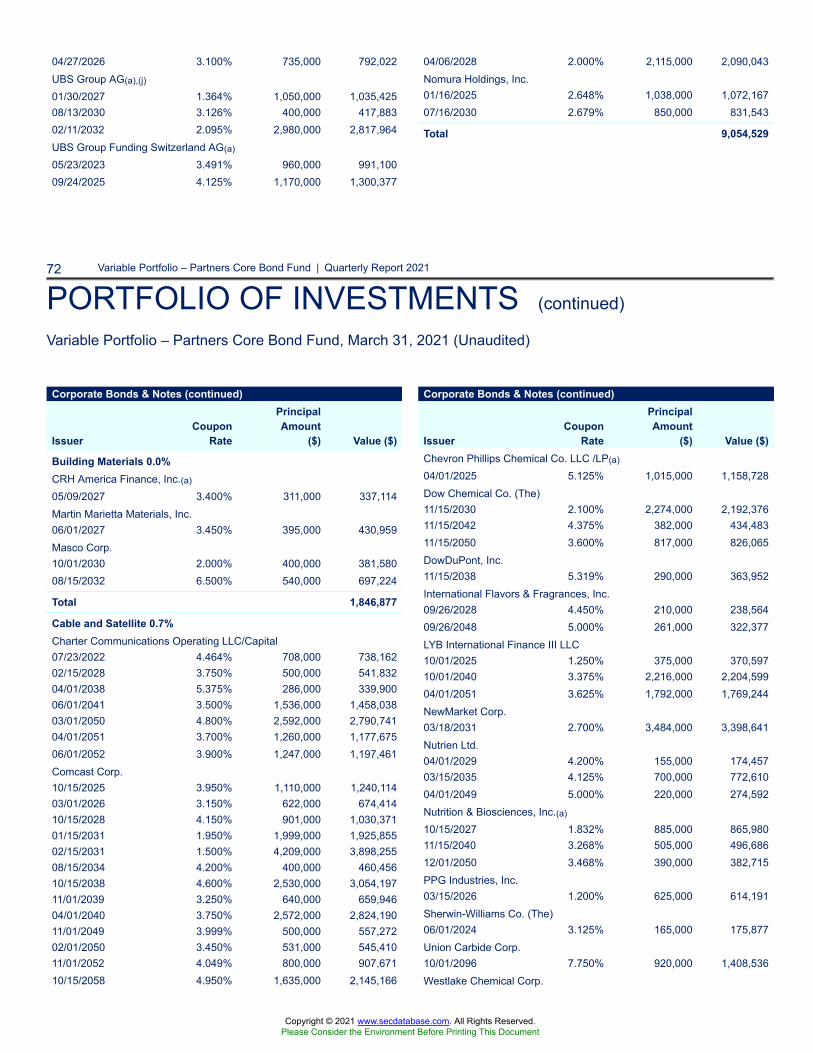
72 Variable Portfolio – Partners Core Bond Fund | Quarterly Report 2021
PORTFOLIO OF INVESTMENTS (continued)
Variable Portfolio – Partners Core Bond Fund, March 31, 2021 (Unaudited)
04/27/2026 3.100% 735,000 792,022UBS Group AG(a),(j)
01/30/2027 1.364% 1,050,000 1,035,42508/13/2030 3.126% 400,000 417,88302/11/2032 2.095% 2,980,000 2,817,964UBS Group Funding Switzerland AG(a)
05/23/2023 3.491% 960,000 991,10009/24/2025 4.125% 1,170,000 1,300,377
04/06/2028 2.000% 2,115,000 2,090,043Nomura Holdings, Inc.01/16/2025 2.648% 1,038,000 1,072,16707/16/2030 2.679% 850,000 831,543
Total 9,054,529
Corporate Bonds & Notes (continued)
IssuerCoupon
Rate
PrincipalAmount
($) Value ($)
Building Materials 0.0%CRH America Finance, Inc.(a)
05/09/2027 3.400% 311,000 337,114Martin Marietta Materials, Inc.06/01/2027 3.450% 395,000 430,959Masco Corp.10/01/2030 2.000% 400,000 381,58008/15/2032 6.500% 540,000 697,224
Total 1,846,877
Cable and Satellite 0.7%Charter Communications Operating LLC/Capital07/23/2022 4.464% 708,000 738,16202/15/2028 3.750% 500,000 541,83204/01/2038 5.375% 286,000 339,90006/01/2041 3.500% 1,536,000 1,458,03803/01/2050 4.800% 2,592,000 2,790,74104/01/2051 3.700% 1,260,000 1,177,67506/01/2052 3.900% 1,247,000 1,197,461Comcast Corp.10/15/2025 3.950% 1,110,000 1,240,11403/01/2026 3.150% 622,000 674,41410/15/2028 4.150% 901,000 1,030,37101/15/2031 1.950% 1,999,000 1,925,85502/15/2031 1.500% 4,209,000 3,898,25508/15/2034 4.200% 400,000 460,45610/15/2038 4.600% 2,530,000 3,054,19711/01/2039 3.250% 640,000 659,94604/01/2040 3.750% 2,572,000 2,824,19011/01/2049 3.999% 500,000 557,27202/01/2050 3.450% 531,000 545,41011/01/2052 4.049% 800,000 907,67110/15/2058 4.950% 1,635,000 2,145,166
Corporate Bonds & Notes (continued)
IssuerCoupon
Rate
PrincipalAmount
($) Value ($)Chevron Phillips Chemical Co. LLC /LP(a)
04/01/2025 5.125% 1,015,000 1,158,728Dow Chemical Co. (The)11/15/2030 2.100% 2,274,000 2,192,37611/15/2042 4.375% 382,000 434,48311/15/2050 3.600% 817,000 826,065DowDuPont, Inc.11/15/2038 5.319% 290,000 363,952International Flavors & Fragrances, Inc.09/26/2028 4.450% 210,000 238,56409/26/2048 5.000% 261,000 322,377LYB International Finance III LLC10/01/2025 1.250% 375,000 370,59710/01/2040 3.375% 2,216,000 2,204,59904/01/2051 3.625% 1,792,000 1,769,244NewMarket Corp.03/18/2031 2.700% 3,484,000 3,398,641Nutrien Ltd.04/01/2029 4.200% 155,000 174,45703/15/2035 4.125% 700,000 772,61004/01/2049 5.000% 220,000 274,592Nutrition & Biosciences, Inc.(a)
10/15/2027 1.832% 885,000 865,98011/15/2040 3.268% 505,000 496,68612/01/2050 3.468% 390,000 382,715PPG Industries, Inc.03/15/2026 1.200% 625,000 614,191Sherwin-Williams Co. (The)06/01/2024 3.125% 165,000 175,877Union Carbide Corp.10/01/2096 7.750% 920,000 1,408,536Westlake Chemical Corp.
Copyright © 2021 www.secdatabase.com. All Rights Reserved.Please Consider the Environment Before Printing This Document
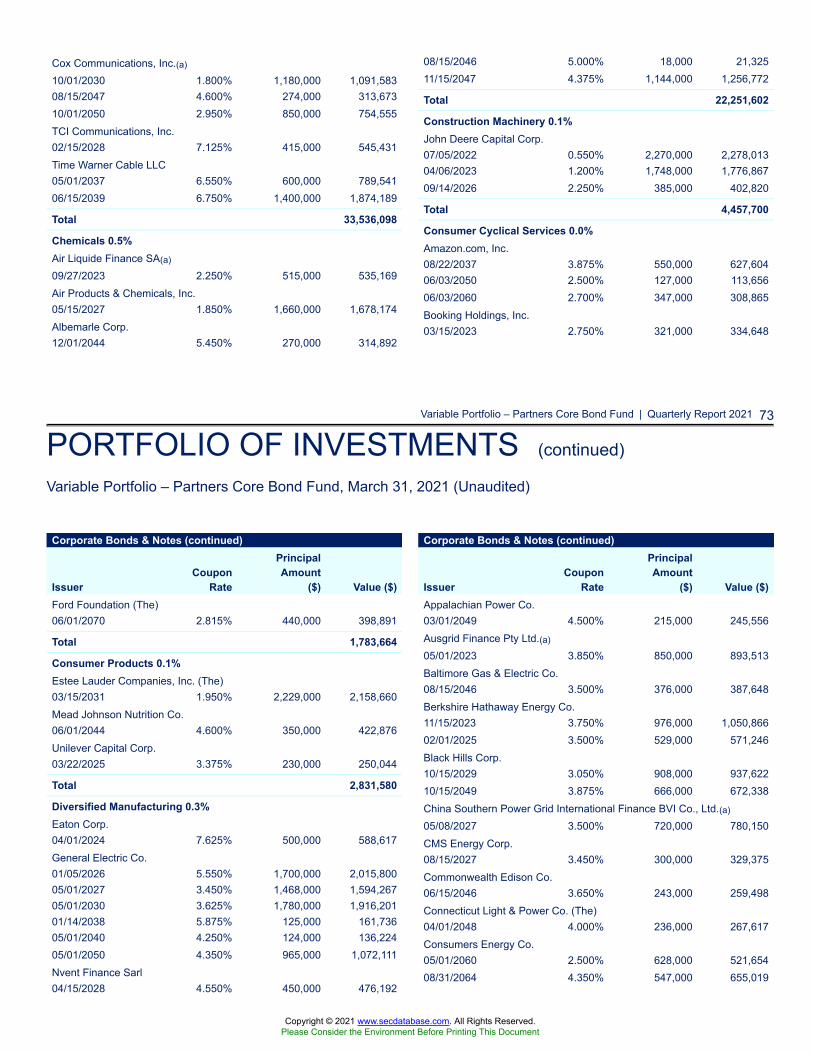
Variable Portfolio – Partners Core Bond Fund | Quarterly Report 2021 73
PORTFOLIO OF INVESTMENTS (continued)
Variable Portfolio – Partners Core Bond Fund, March 31, 2021 (Unaudited)
Cox Communications, Inc.(a)
10/01/2030 1.800% 1,180,000 1,091,58308/15/2047 4.600% 274,000 313,67310/01/2050 2.950% 850,000 754,555TCI Communications, Inc.02/15/2028 7.125% 415,000 545,431Time Warner Cable LLC05/01/2037 6.550% 600,000 789,54106/15/2039 6.750% 1,400,000 1,874,189
Total 33,536,098
Chemicals 0.5%Air Liquide Finance SA(a)
09/27/2023 2.250% 515,000 535,169Air Products & Chemicals, Inc.05/15/2027 1.850% 1,660,000 1,678,174Albemarle Corp.12/01/2044 5.450% 270,000 314,892
08/15/2046 5.000% 18,000 21,32511/15/2047 4.375% 1,144,000 1,256,772
Total 22,251,602
Construction Machinery 0.1%John Deere Capital Corp.07/05/2022 0.550% 2,270,000 2,278,01304/06/2023 1.200% 1,748,000 1,776,86709/14/2026 2.250% 385,000 402,820
Total 4,457,700
Consumer Cyclical Services 0.0%Amazon.com, Inc.08/22/2037 3.875% 550,000 627,60406/03/2050 2.500% 127,000 113,65606/03/2060 2.700% 347,000 308,865Booking Holdings, Inc.03/15/2023 2.750% 321,000 334,648
Corporate Bonds & Notes (continued)
IssuerCoupon
Rate
PrincipalAmount
($) Value ($)Ford Foundation (The)06/01/2070 2.815% 440,000 398,891
Total 1,783,664
Consumer Products 0.1%Estee Lauder Companies, Inc. (The)03/15/2031 1.950% 2,229,000 2,158,660Mead Johnson Nutrition Co.06/01/2044 4.600% 350,000 422,876Unilever Capital Corp.03/22/2025 3.375% 230,000 250,044
Total 2,831,580
Diversified Manufacturing 0.3%Eaton Corp.04/01/2024 7.625% 500,000 588,617General Electric Co.01/05/2026 5.550% 1,700,000 2,015,80005/01/2027 3.450% 1,468,000 1,594,26705/01/2030 3.625% 1,780,000 1,916,20101/14/2038 5.875% 125,000 161,73605/01/2040 4.250% 124,000 136,22405/01/2050 4.350% 965,000 1,072,111Nvent Finance Sarl04/15/2028 4.550% 450,000 476,192
Corporate Bonds & Notes (continued)
IssuerCoupon
Rate
PrincipalAmount
($) Value ($)Appalachian Power Co.03/01/2049 4.500% 215,000 245,556Ausgrid Finance Pty Ltd.(a)
05/01/2023 3.850% 850,000 893,513Baltimore Gas & Electric Co.08/15/2046 3.500% 376,000 387,648Berkshire Hathaway Energy Co.11/15/2023 3.750% 976,000 1,050,86602/01/2025 3.500% 529,000 571,246Black Hills Corp.10/15/2029 3.050% 908,000 937,62210/15/2049 3.875% 666,000 672,338China Southern Power Grid International Finance BVI Co., Ltd.(a)
05/08/2027 3.500% 720,000 780,150CMS Energy Corp.08/15/2027 3.450% 300,000 329,375Commonwealth Edison Co.06/15/2046 3.650% 243,000 259,498Connecticut Light & Power Co. (The)04/01/2048 4.000% 236,000 267,617Consumers Energy Co.05/01/2060 2.500% 628,000 521,65408/31/2064 4.350% 547,000 655,019
Copyright © 2021 www.secdatabase.com. All Rights Reserved.Please Consider the Environment Before Printing This Document
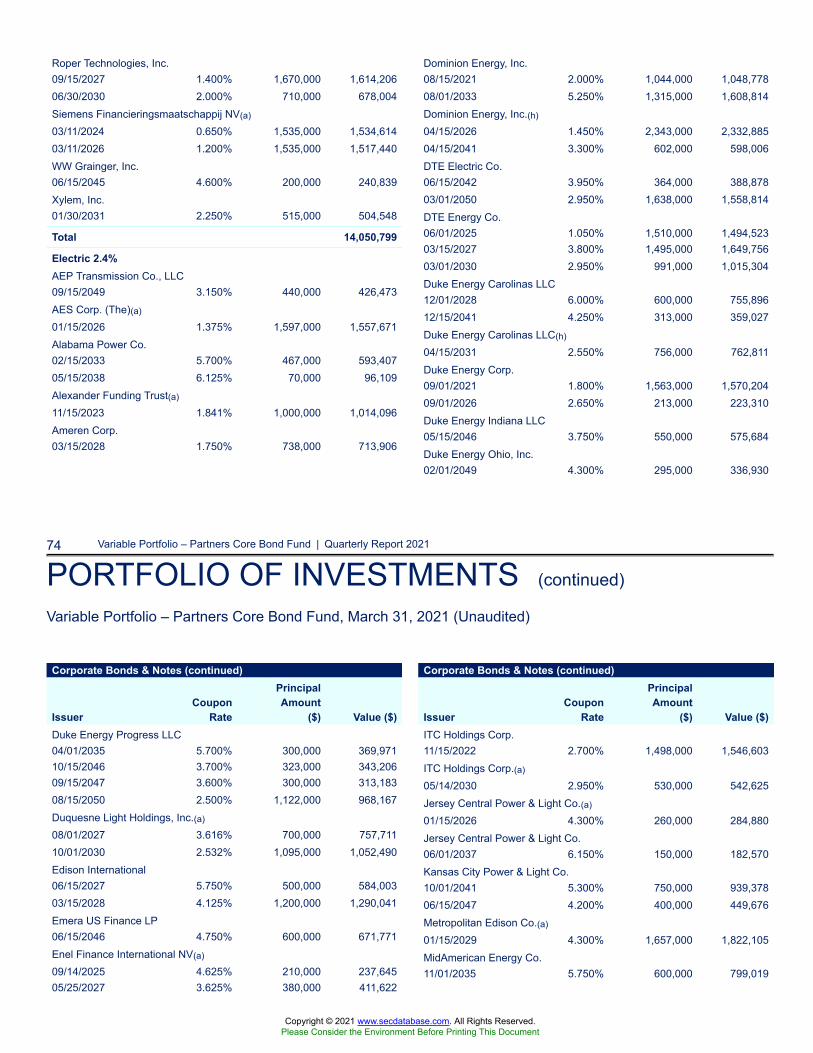
74 Variable Portfolio – Partners Core Bond Fund | Quarterly Report 2021
PORTFOLIO OF INVESTMENTS (continued)
Variable Portfolio – Partners Core Bond Fund, March 31, 2021 (Unaudited)
Roper Technologies, Inc.09/15/2027 1.400% 1,670,000 1,614,20606/30/2030 2.000% 710,000 678,004Siemens Financieringsmaatschappij NV(a)
03/11/2024 0.650% 1,535,000 1,534,61403/11/2026 1.200% 1,535,000 1,517,440WW Grainger, Inc.06/15/2045 4.600% 200,000 240,839Xylem, Inc.01/30/2031 2.250% 515,000 504,548
Total 14,050,799
Electric 2.4%AEP Transmission Co., LLC09/15/2049 3.150% 440,000 426,473AES Corp. (The)(a)
01/15/2026 1.375% 1,597,000 1,557,671Alabama Power Co.02/15/2033 5.700% 467,000 593,40705/15/2038 6.125% 70,000 96,109Alexander Funding Trust(a)
11/15/2023 1.841% 1,000,000 1,014,096Ameren Corp.03/15/2028 1.750% 738,000 713,906
Dominion Energy, Inc.08/15/2021 2.000% 1,044,000 1,048,77808/01/2033 5.250% 1,315,000 1,608,814Dominion Energy, Inc.(h)
04/15/2026 1.450% 2,343,000 2,332,88504/15/2041 3.300% 602,000 598,006DTE Electric Co.06/15/2042 3.950% 364,000 388,87803/01/2050 2.950% 1,638,000 1,558,814DTE Energy Co.06/01/2025 1.050% 1,510,000 1,494,52303/15/2027 3.800% 1,495,000 1,649,75603/01/2030 2.950% 991,000 1,015,304Duke Energy Carolinas LLC12/01/2028 6.000% 600,000 755,89612/15/2041 4.250% 313,000 359,027Duke Energy Carolinas LLC(h)
04/15/2031 2.550% 756,000 762,811Duke Energy Corp.09/01/2021 1.800% 1,563,000 1,570,20409/01/2026 2.650% 213,000 223,310Duke Energy Indiana LLC05/15/2046 3.750% 550,000 575,684Duke Energy Ohio, Inc.02/01/2049 4.300% 295,000 336,930
Corporate Bonds & Notes (continued)
IssuerCoupon
Rate
PrincipalAmount
($) Value ($)Duke Energy Progress LLC04/01/2035 5.700% 300,000 369,97110/15/2046 3.700% 323,000 343,20609/15/2047 3.600% 300,000 313,18308/15/2050 2.500% 1,122,000 968,167Duquesne Light Holdings, Inc.(a)
08/01/2027 3.616% 700,000 757,71110/01/2030 2.532% 1,095,000 1,052,490Edison International06/15/2027 5.750% 500,000 584,00303/15/2028 4.125% 1,200,000 1,290,041Emera US Finance LP06/15/2046 4.750% 600,000 671,771Enel Finance International NV(a)
09/14/2025 4.625% 210,000 237,64505/25/2027 3.625% 380,000 411,622
Corporate Bonds & Notes (continued)
IssuerCoupon
Rate
PrincipalAmount
($) Value ($)ITC Holdings Corp.11/15/2022 2.700% 1,498,000 1,546,603ITC Holdings Corp.(a)
05/14/2030 2.950% 530,000 542,625Jersey Central Power & Light Co.(a)
01/15/2026 4.300% 260,000 284,880Jersey Central Power & Light Co.06/01/2037 6.150% 150,000 182,570Kansas City Power & Light Co.10/01/2041 5.300% 750,000 939,37806/15/2047 4.200% 400,000 449,676Metropolitan Edison Co.(a)
01/15/2029 4.300% 1,657,000 1,822,105MidAmerican Energy Co.11/01/2035 5.750% 600,000 799,019
Copyright © 2021 www.secdatabase.com. All Rights Reserved.Please Consider the Environment Before Printing This Document
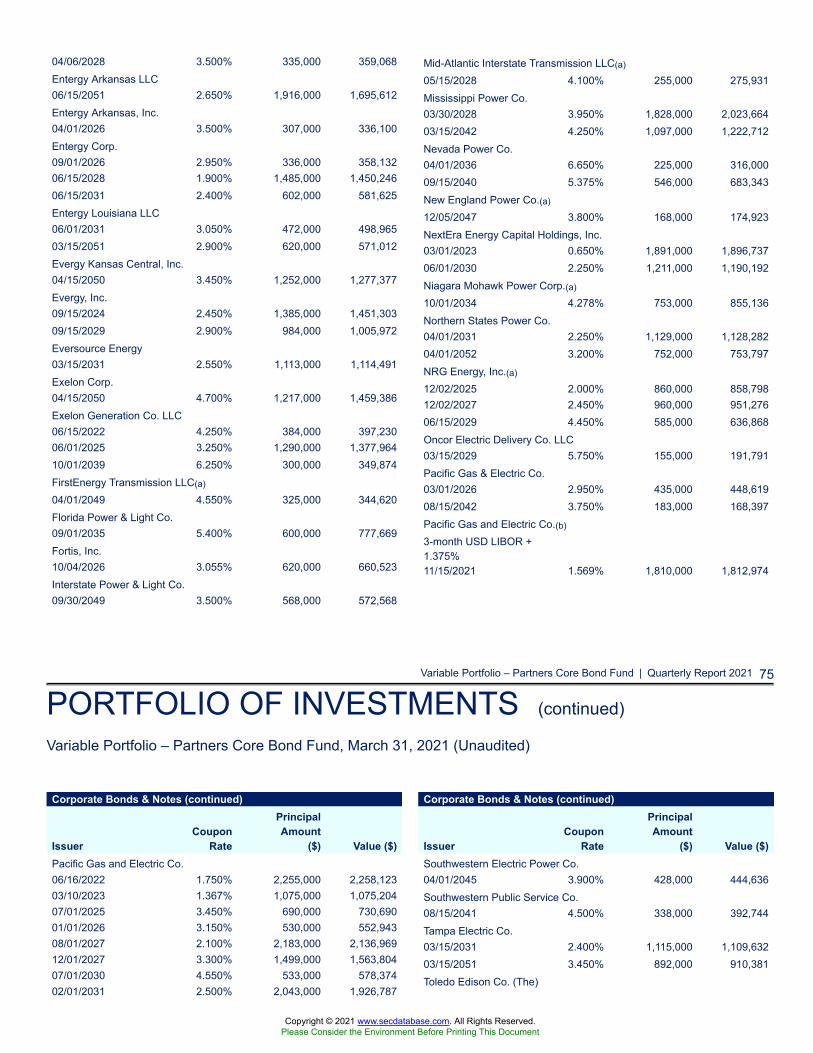
Variable Portfolio – Partners Core Bond Fund | Quarterly Report 2021 75
PORTFOLIO OF INVESTMENTS (continued)
Variable Portfolio – Partners Core Bond Fund, March 31, 2021 (Unaudited)
04/06/2028 3.500% 335,000 359,068Entergy Arkansas LLC06/15/2051 2.650% 1,916,000 1,695,612Entergy Arkansas, Inc.04/01/2026 3.500% 307,000 336,100Entergy Corp.09/01/2026 2.950% 336,000 358,13206/15/2028 1.900% 1,485,000 1,450,24606/15/2031 2.400% 602,000 581,625Entergy Louisiana LLC06/01/2031 3.050% 472,000 498,96503/15/2051 2.900% 620,000 571,012Evergy Kansas Central, Inc.04/15/2050 3.450% 1,252,000 1,277,377Evergy, Inc.09/15/2024 2.450% 1,385,000 1,451,30309/15/2029 2.900% 984,000 1,005,972Eversource Energy03/15/2031 2.550% 1,113,000 1,114,491Exelon Corp.04/15/2050 4.700% 1,217,000 1,459,386Exelon Generation Co. LLC06/15/2022 4.250% 384,000 397,23006/01/2025 3.250% 1,290,000 1,377,96410/01/2039 6.250% 300,000 349,874FirstEnergy Transmission LLC(a)
04/01/2049 4.550% 325,000 344,620Florida Power & Light Co.09/01/2035 5.400% 600,000 777,669Fortis, Inc.10/04/2026 3.055% 620,000 660,523Interstate Power & Light Co.09/30/2049 3.500% 568,000 572,568
Mid-Atlantic Interstate Transmission LLC(a)
05/15/2028 4.100% 255,000 275,931Mississippi Power Co.03/30/2028 3.950% 1,828,000 2,023,66403/15/2042 4.250% 1,097,000 1,222,712Nevada Power Co.04/01/2036 6.650% 225,000 316,00009/15/2040 5.375% 546,000 683,343New England Power Co.(a)
12/05/2047 3.800% 168,000 174,923NextEra Energy Capital Holdings, Inc.03/01/2023 0.650% 1,891,000 1,896,73706/01/2030 2.250% 1,211,000 1,190,192Niagara Mohawk Power Corp.(a)
10/01/2034 4.278% 753,000 855,136Northern States Power Co.04/01/2031 2.250% 1,129,000 1,128,28204/01/2052 3.200% 752,000 753,797NRG Energy, Inc.(a)
12/02/2025 2.000% 860,000 858,79812/02/2027 2.450% 960,000 951,27606/15/2029 4.450% 585,000 636,868Oncor Electric Delivery Co. LLC03/15/2029 5.750% 155,000 191,791Pacific Gas & Electric Co.03/01/2026 2.950% 435,000 448,61908/15/2042 3.750% 183,000 168,397Pacific Gas and Electric Co.(b)
3-month USD LIBOR +1.375%11/15/2021 1.569% 1,810,000 1,812,974
Corporate Bonds & Notes (continued)
IssuerCoupon
Rate
PrincipalAmount
($) Value ($)Pacific Gas and Electric Co.06/16/2022 1.750% 2,255,000 2,258,12303/10/2023 1.367% 1,075,000 1,075,20407/01/2025 3.450% 690,000 730,69001/01/2026 3.150% 530,000 552,94308/01/2027 2.100% 2,183,000 2,136,96912/01/2027 3.300% 1,499,000 1,563,80407/01/2030 4.550% 533,000 578,37402/01/2031 2.500% 2,043,000 1,926,787
Corporate Bonds & Notes (continued)
IssuerCoupon
Rate
PrincipalAmount
($) Value ($)Southwestern Electric Power Co.04/01/2045 3.900% 428,000 444,636Southwestern Public Service Co.08/15/2041 4.500% 338,000 392,744Tampa Electric Co.03/15/2031 2.400% 1,115,000 1,109,63203/15/2051 3.450% 892,000 910,381Toledo Edison Co. (The)
Copyright © 2021 www.secdatabase.com. All Rights Reserved.Please Consider the Environment Before Printing This Document
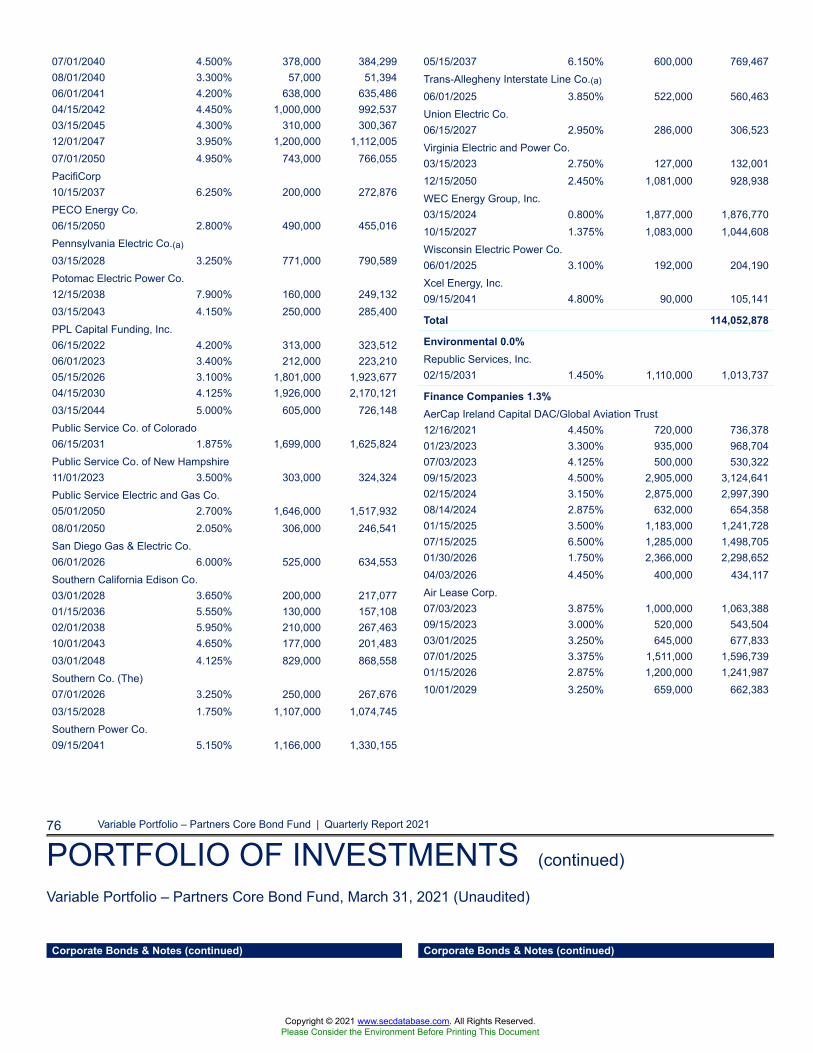
76 Variable Portfolio – Partners Core Bond Fund | Quarterly Report 2021
PORTFOLIO OF INVESTMENTS (continued)
Variable Portfolio – Partners Core Bond Fund, March 31, 2021 (Unaudited)
07/01/2040 4.500% 378,000 384,29908/01/2040 3.300% 57,000 51,39406/01/2041 4.200% 638,000 635,48604/15/2042 4.450% 1,000,000 992,53703/15/2045 4.300% 310,000 300,36712/01/2047 3.950% 1,200,000 1,112,00507/01/2050 4.950% 743,000 766,055PacifiCorp10/15/2037 6.250% 200,000 272,876PECO Energy Co.06/15/2050 2.800% 490,000 455,016Pennsylvania Electric Co.(a)
03/15/2028 3.250% 771,000 790,589Potomac Electric Power Co.12/15/2038 7.900% 160,000 249,13203/15/2043 4.150% 250,000 285,400PPL Capital Funding, Inc.06/15/2022 4.200% 313,000 323,51206/01/2023 3.400% 212,000 223,21005/15/2026 3.100% 1,801,000 1,923,67704/15/2030 4.125% 1,926,000 2,170,12103/15/2044 5.000% 605,000 726,148Public Service Co. of Colorado06/15/2031 1.875% 1,699,000 1,625,824Public Service Co. of New Hampshire11/01/2023 3.500% 303,000 324,324Public Service Electric and Gas Co.05/01/2050 2.700% 1,646,000 1,517,93208/01/2050 2.050% 306,000 246,541San Diego Gas & Electric Co.06/01/2026 6.000% 525,000 634,553Southern California Edison Co.03/01/2028 3.650% 200,000 217,07701/15/2036 5.550% 130,000 157,10802/01/2038 5.950% 210,000 267,46310/01/2043 4.650% 177,000 201,48303/01/2048 4.125% 829,000 868,558Southern Co. (The)07/01/2026 3.250% 250,000 267,67603/15/2028 1.750% 1,107,000 1,074,745Southern Power Co.09/15/2041 5.150% 1,166,000 1,330,155
05/15/2037 6.150% 600,000 769,467Trans-Allegheny Interstate Line Co.(a)
06/01/2025 3.850% 522,000 560,463Union Electric Co.06/15/2027 2.950% 286,000 306,523Virginia Electric and Power Co.03/15/2023 2.750% 127,000 132,00112/15/2050 2.450% 1,081,000 928,938WEC Energy Group, Inc.03/15/2024 0.800% 1,877,000 1,876,77010/15/2027 1.375% 1,083,000 1,044,608Wisconsin Electric Power Co.06/01/2025 3.100% 192,000 204,190Xcel Energy, Inc.09/15/2041 4.800% 90,000 105,141
Total 114,052,878
Environmental 0.0%Republic Services, Inc.02/15/2031 1.450% 1,110,000 1,013,737
Finance Companies 1.3%AerCap Ireland Capital DAC/Global Aviation Trust12/16/2021 4.450% 720,000 736,37801/23/2023 3.300% 935,000 968,70407/03/2023 4.125% 500,000 530,32209/15/2023 4.500% 2,905,000 3,124,64102/15/2024 3.150% 2,875,000 2,997,39008/14/2024 2.875% 632,000 654,35801/15/2025 3.500% 1,183,000 1,241,72807/15/2025 6.500% 1,285,000 1,498,70501/30/2026 1.750% 2,366,000 2,298,65204/03/2026 4.450% 400,000 434,117Air Lease Corp.07/03/2023 3.875% 1,000,000 1,063,38809/15/2023 3.000% 520,000 543,50403/01/2025 3.250% 645,000 677,83307/01/2025 3.375% 1,511,000 1,596,73901/15/2026 2.875% 1,200,000 1,241,98710/01/2029 3.250% 659,000 662,383
Corporate Bonds & Notes (continued) Corporate Bonds & Notes (continued)
Copyright © 2021 www.secdatabase.com. All Rights Reserved.Please Consider the Environment Before Printing This Document
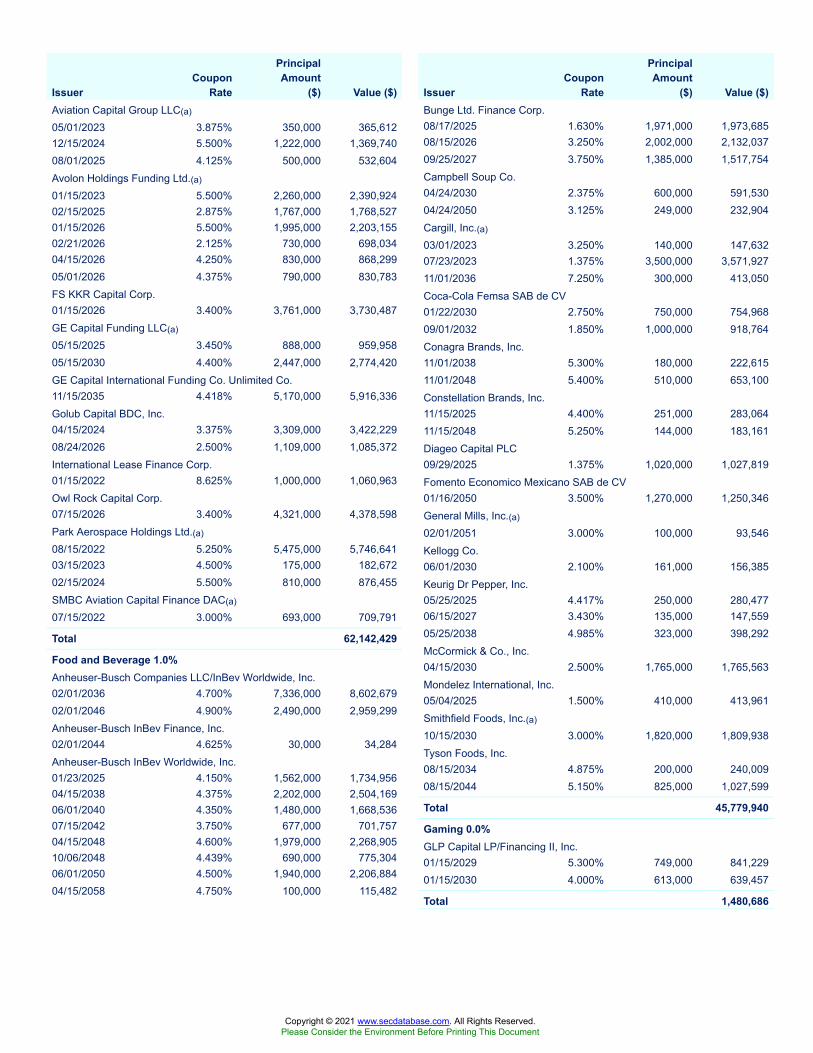
IssuerCoupon
Rate
PrincipalAmount
($) Value ($)Aviation Capital Group LLC(a)
05/01/2023 3.875% 350,000 365,61212/15/2024 5.500% 1,222,000 1,369,74008/01/2025 4.125% 500,000 532,604Avolon Holdings Funding Ltd.(a)
01/15/2023 5.500% 2,260,000 2,390,92402/15/2025 2.875% 1,767,000 1,768,52701/15/2026 5.500% 1,995,000 2,203,15502/21/2026 2.125% 730,000 698,03404/15/2026 4.250% 830,000 868,29905/01/2026 4.375% 790,000 830,783FS KKR Capital Corp.01/15/2026 3.400% 3,761,000 3,730,487GE Capital Funding LLC(a)
05/15/2025 3.450% 888,000 959,95805/15/2030 4.400% 2,447,000 2,774,420GE Capital International Funding Co. Unlimited Co.11/15/2035 4.418% 5,170,000 5,916,336Golub Capital BDC, Inc.04/15/2024 3.375% 3,309,000 3,422,22908/24/2026 2.500% 1,109,000 1,085,372International Lease Finance Corp.01/15/2022 8.625% 1,000,000 1,060,963Owl Rock Capital Corp.07/15/2026 3.400% 4,321,000 4,378,598Park Aerospace Holdings Ltd.(a)
08/15/2022 5.250% 5,475,000 5,746,64103/15/2023 4.500% 175,000 182,67202/15/2024 5.500% 810,000 876,455SMBC Aviation Capital Finance DAC(a)
07/15/2022 3.000% 693,000 709,791
Total 62,142,429
Food and Beverage 1.0%Anheuser-Busch Companies LLC/InBev Worldwide, Inc.02/01/2036 4.700% 7,336,000 8,602,67902/01/2046 4.900% 2,490,000 2,959,299Anheuser-Busch InBev Finance, Inc.02/01/2044 4.625% 30,000 34,284Anheuser-Busch InBev Worldwide, Inc.01/23/2025 4.150% 1,562,000 1,734,95604/15/2038 4.375% 2,202,000 2,504,16906/01/2040 4.350% 1,480,000 1,668,53607/15/2042 3.750% 677,000 701,75704/15/2048 4.600% 1,979,000 2,268,90510/06/2048 4.439% 690,000 775,30406/01/2050 4.500% 1,940,000 2,206,88404/15/2058 4.750% 100,000 115,482
IssuerCoupon
Rate
PrincipalAmount
($) Value ($)Bunge Ltd. Finance Corp.08/17/2025 1.630% 1,971,000 1,973,68508/15/2026 3.250% 2,002,000 2,132,03709/25/2027 3.750% 1,385,000 1,517,754Campbell Soup Co.04/24/2030 2.375% 600,000 591,53004/24/2050 3.125% 249,000 232,904Cargill, Inc.(a)
03/01/2023 3.250% 140,000 147,63207/23/2023 1.375% 3,500,000 3,571,92711/01/2036 7.250% 300,000 413,050Coca-Cola Femsa SAB de CV01/22/2030 2.750% 750,000 754,96809/01/2032 1.850% 1,000,000 918,764Conagra Brands, Inc.11/01/2038 5.300% 180,000 222,61511/01/2048 5.400% 510,000 653,100Constellation Brands, Inc.11/15/2025 4.400% 251,000 283,06411/15/2048 5.250% 144,000 183,161Diageo Capital PLC09/29/2025 1.375% 1,020,000 1,027,819Fomento Economico Mexicano SAB de CV01/16/2050 3.500% 1,270,000 1,250,346General Mills, Inc.(a)
02/01/2051 3.000% 100,000 93,546Kellogg Co.06/01/2030 2.100% 161,000 156,385Keurig Dr Pepper, Inc.05/25/2025 4.417% 250,000 280,47706/15/2027 3.430% 135,000 147,55905/25/2038 4.985% 323,000 398,292McCormick & Co., Inc.04/15/2030 2.500% 1,765,000 1,765,563Mondelez International, Inc.05/04/2025 1.500% 410,000 413,961Smithfield Foods, Inc.(a)
10/15/2030 3.000% 1,820,000 1,809,938Tyson Foods, Inc.08/15/2034 4.875% 200,000 240,00908/15/2044 5.150% 825,000 1,027,599
Total 45,779,940
Gaming 0.0%GLP Capital LP/Financing II, Inc.01/15/2029 5.300% 749,000 841,22901/15/2030 4.000% 613,000 639,457
Total 1,480,686
Copyright © 2021 www.secdatabase.com. All Rights Reserved.Please Consider the Environment Before Printing This Document
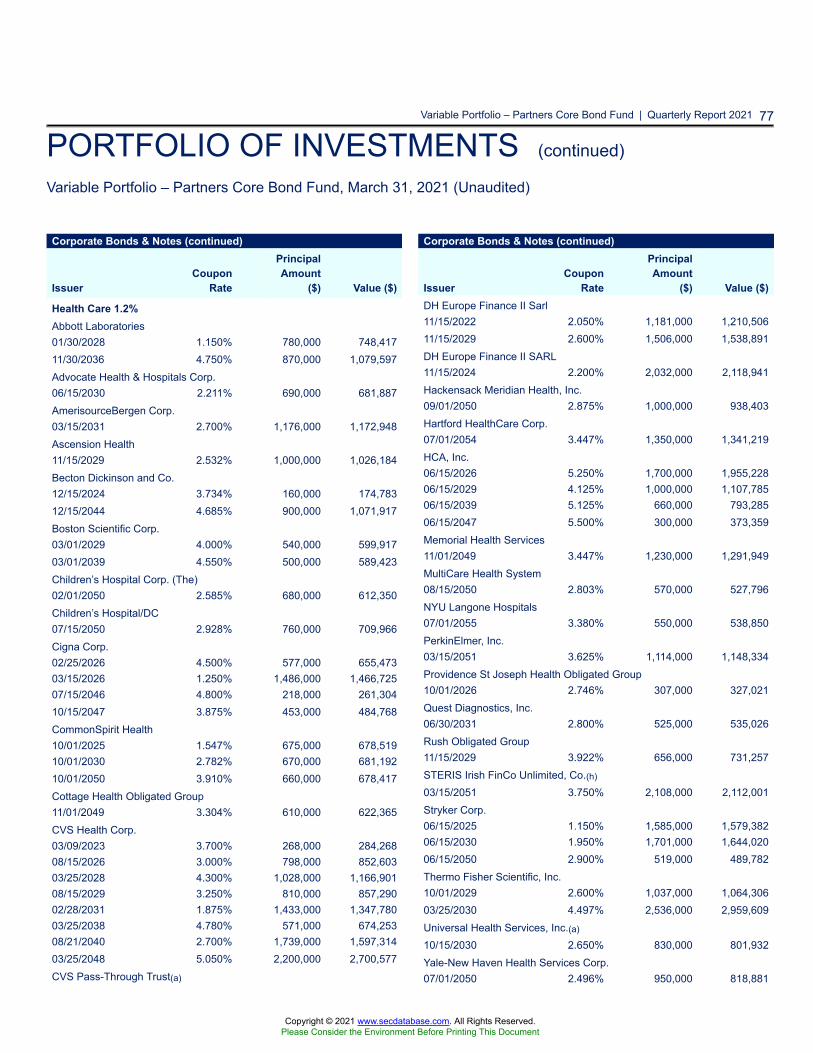
Variable Portfolio – Partners Core Bond Fund | Quarterly Report 2021 77
PORTFOLIO OF INVESTMENTS (continued)
Variable Portfolio – Partners Core Bond Fund, March 31, 2021 (Unaudited)
Corporate Bonds & Notes (continued)
IssuerCoupon
Rate
PrincipalAmount
($) Value ($)
Health Care 1.2%Abbott Laboratories01/30/2028 1.150% 780,000 748,41711/30/2036 4.750% 870,000 1,079,597Advocate Health & Hospitals Corp.06/15/2030 2.211% 690,000 681,887AmerisourceBergen Corp.03/15/2031 2.700% 1,176,000 1,172,948Ascension Health11/15/2029 2.532% 1,000,000 1,026,184Becton Dickinson and Co.12/15/2024 3.734% 160,000 174,78312/15/2044 4.685% 900,000 1,071,917Boston Scientific Corp.03/01/2029 4.000% 540,000 599,91703/01/2039 4.550% 500,000 589,423Children’s Hospital Corp. (The)02/01/2050 2.585% 680,000 612,350Children’s Hospital/DC07/15/2050 2.928% 760,000 709,966Cigna Corp.02/25/2026 4.500% 577,000 655,47303/15/2026 1.250% 1,486,000 1,466,72507/15/2046 4.800% 218,000 261,30410/15/2047 3.875% 453,000 484,768CommonSpirit Health10/01/2025 1.547% 675,000 678,51910/01/2030 2.782% 670,000 681,19210/01/2050 3.910% 660,000 678,417Cottage Health Obligated Group11/01/2049 3.304% 610,000 622,365CVS Health Corp.03/09/2023 3.700% 268,000 284,26808/15/2026 3.000% 798,000 852,60303/25/2028 4.300% 1,028,000 1,166,90108/15/2029 3.250% 810,000 857,29002/28/2031 1.875% 1,433,000 1,347,78003/25/2038 4.780% 571,000 674,25308/21/2040 2.700% 1,739,000 1,597,31403/25/2048 5.050% 2,200,000 2,700,577CVS Pass-Through Trust(a)
Corporate Bonds & Notes (continued)
IssuerCoupon
Rate
PrincipalAmount
($) Value ($)DH Europe Finance II Sarl11/15/2022 2.050% 1,181,000 1,210,50611/15/2029 2.600% 1,506,000 1,538,891DH Europe Finance II SARL11/15/2024 2.200% 2,032,000 2,118,941Hackensack Meridian Health, Inc.09/01/2050 2.875% 1,000,000 938,403Hartford HealthCare Corp.07/01/2054 3.447% 1,350,000 1,341,219HCA, Inc.06/15/2026 5.250% 1,700,000 1,955,22806/15/2029 4.125% 1,000,000 1,107,78506/15/2039 5.125% 660,000 793,28506/15/2047 5.500% 300,000 373,359Memorial Health Services11/01/2049 3.447% 1,230,000 1,291,949MultiCare Health System08/15/2050 2.803% 570,000 527,796NYU Langone Hospitals07/01/2055 3.380% 550,000 538,850PerkinElmer, Inc.03/15/2051 3.625% 1,114,000 1,148,334Providence St Joseph Health Obligated Group10/01/2026 2.746% 307,000 327,021Quest Diagnostics, Inc.06/30/2031 2.800% 525,000 535,026Rush Obligated Group11/15/2029 3.922% 656,000 731,257STERIS Irish FinCo Unlimited, Co.(h)
03/15/2051 3.750% 2,108,000 2,112,001Stryker Corp.06/15/2025 1.150% 1,585,000 1,579,38206/15/2030 1.950% 1,701,000 1,644,02006/15/2050 2.900% 519,000 489,782Thermo Fisher Scientific, Inc.10/01/2029 2.600% 1,037,000 1,064,30603/25/2030 4.497% 2,536,000 2,959,609Universal Health Services, Inc.(a)
10/15/2030 2.650% 830,000 801,932Yale-New Haven Health Services Corp.07/01/2050 2.496% 950,000 818,881
Copyright © 2021 www.secdatabase.com. All Rights Reserved.Please Consider the Environment Before Printing This Document
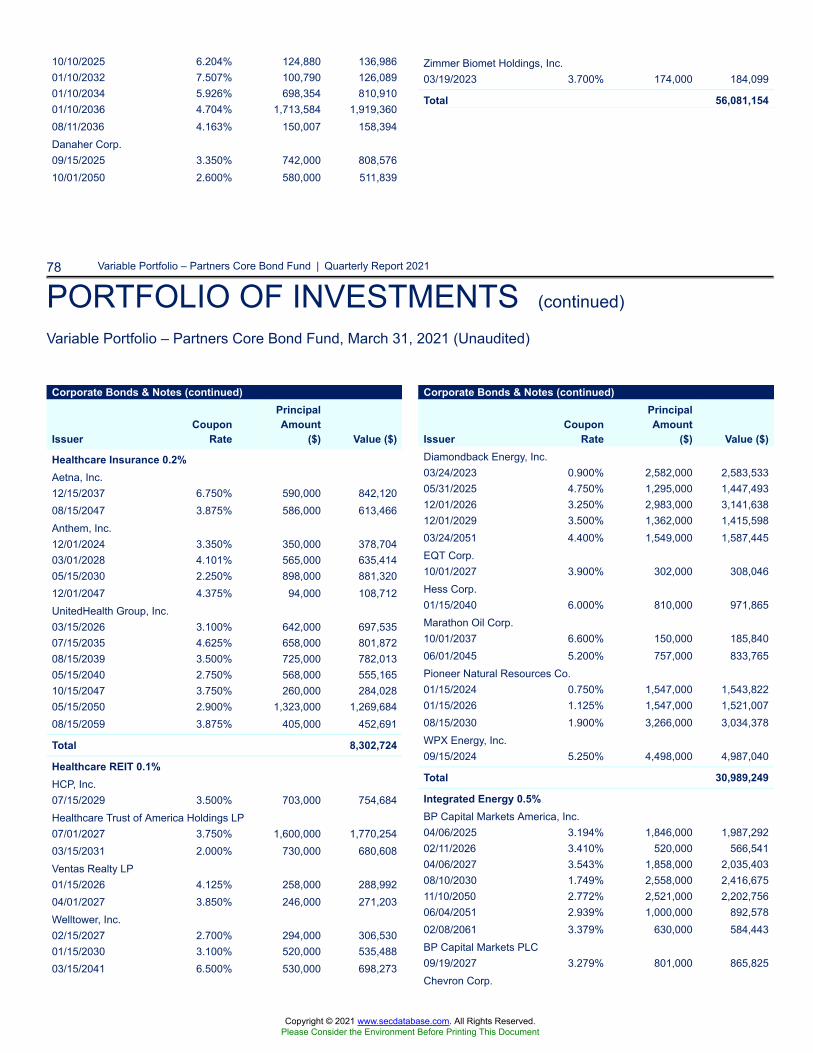
78 Variable Portfolio – Partners Core Bond Fund | Quarterly Report 2021
PORTFOLIO OF INVESTMENTS (continued)
Variable Portfolio – Partners Core Bond Fund, March 31, 2021 (Unaudited)
10/10/2025 6.204% 124,880 136,98601/10/2032 7.507% 100,790 126,08901/10/2034 5.926% 698,354 810,91001/10/2036 4.704% 1,713,584 1,919,36008/11/2036 4.163% 150,007 158,394Danaher Corp.09/15/2025 3.350% 742,000 808,57610/01/2050 2.600% 580,000 511,839
Zimmer Biomet Holdings, Inc.03/19/2023 3.700% 174,000 184,099
Total 56,081,154
Corporate Bonds & Notes (continued)
IssuerCoupon
Rate
PrincipalAmount
($) Value ($)
Healthcare Insurance 0.2%Aetna, Inc.12/15/2037 6.750% 590,000 842,12008/15/2047 3.875% 586,000 613,466Anthem, Inc.12/01/2024 3.350% 350,000 378,70403/01/2028 4.101% 565,000 635,41405/15/2030 2.250% 898,000 881,32012/01/2047 4.375% 94,000 108,712UnitedHealth Group, Inc.03/15/2026 3.100% 642,000 697,53507/15/2035 4.625% 658,000 801,87208/15/2039 3.500% 725,000 782,01305/15/2040 2.750% 568,000 555,16510/15/2047 3.750% 260,000 284,02805/15/2050 2.900% 1,323,000 1,269,68408/15/2059 3.875% 405,000 452,691
Total 8,302,724
Healthcare REIT 0.1%HCP, Inc.07/15/2029 3.500% 703,000 754,684Healthcare Trust of America Holdings LP07/01/2027 3.750% 1,600,000 1,770,25403/15/2031 2.000% 730,000 680,608Ventas Realty LP01/15/2026 4.125% 258,000 288,99204/01/2027 3.850% 246,000 271,203Welltower, Inc.02/15/2027 2.700% 294,000 306,53001/15/2030 3.100% 520,000 535,48803/15/2041 6.500% 530,000 698,273
Corporate Bonds & Notes (continued)
IssuerCoupon
Rate
PrincipalAmount
($) Value ($)Diamondback Energy, Inc.03/24/2023 0.900% 2,582,000 2,583,53305/31/2025 4.750% 1,295,000 1,447,49312/01/2026 3.250% 2,983,000 3,141,63812/01/2029 3.500% 1,362,000 1,415,59803/24/2051 4.400% 1,549,000 1,587,445EQT Corp.10/01/2027 3.900% 302,000 308,046Hess Corp.01/15/2040 6.000% 810,000 971,865Marathon Oil Corp.10/01/2037 6.600% 150,000 185,84006/01/2045 5.200% 757,000 833,765Pioneer Natural Resources Co.01/15/2024 0.750% 1,547,000 1,543,82201/15/2026 1.125% 1,547,000 1,521,00708/15/2030 1.900% 3,266,000 3,034,378WPX Energy, Inc.09/15/2024 5.250% 4,498,000 4,987,040
Total 30,989,249
Integrated Energy 0.5%BP Capital Markets America, Inc.04/06/2025 3.194% 1,846,000 1,987,29202/11/2026 3.410% 520,000 566,54104/06/2027 3.543% 1,858,000 2,035,40308/10/2030 1.749% 2,558,000 2,416,67511/10/2050 2.772% 2,521,000 2,202,75606/04/2051 2.939% 1,000,000 892,57802/08/2061 3.379% 630,000 584,443BP Capital Markets PLC09/19/2027 3.279% 801,000 865,825Chevron Corp.
Copyright © 2021 www.secdatabase.com. All Rights Reserved.Please Consider the Environment Before Printing This Document
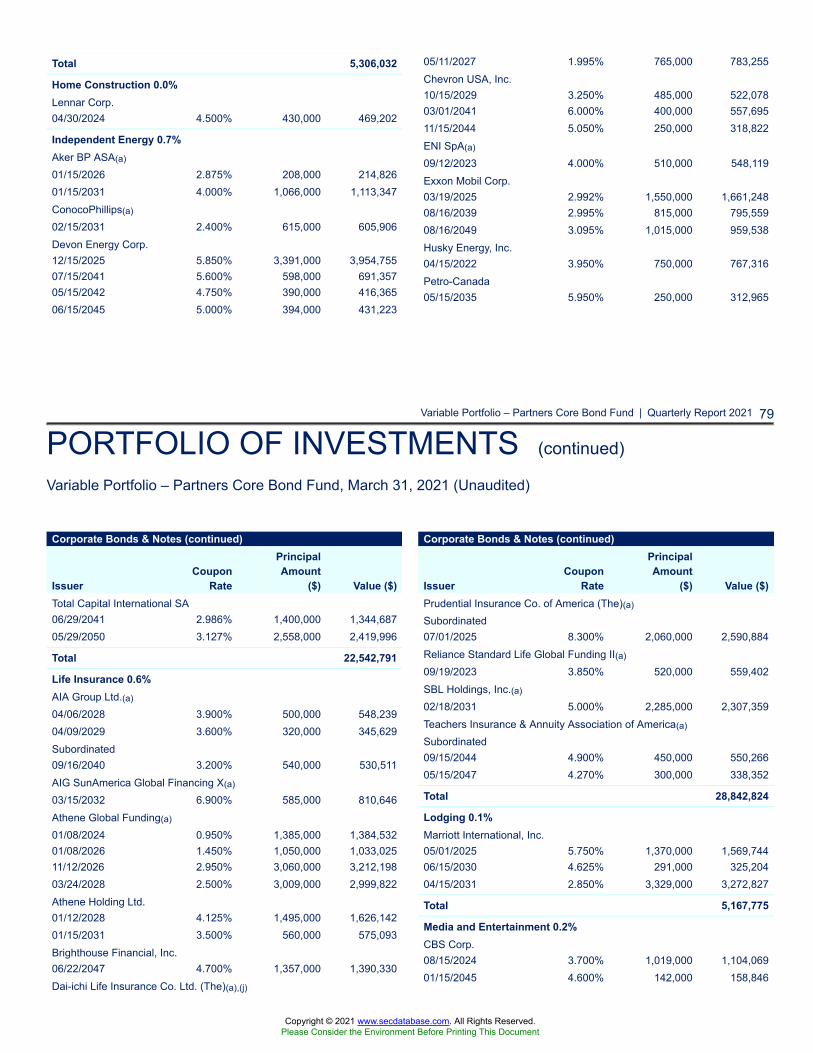
Variable Portfolio – Partners Core Bond Fund | Quarterly Report 2021 79
PORTFOLIO OF INVESTMENTS (continued)
Variable Portfolio – Partners Core Bond Fund, March 31, 2021 (Unaudited)
Total 5,306,032
Home Construction 0.0%Lennar Corp.04/30/2024 4.500% 430,000 469,202
Independent Energy 0.7%Aker BP ASA(a)
01/15/2026 2.875% 208,000 214,82601/15/2031 4.000% 1,066,000 1,113,347ConocoPhillips(a)
02/15/2031 2.400% 615,000 605,906Devon Energy Corp.12/15/2025 5.850% 3,391,000 3,954,75507/15/2041 5.600% 598,000 691,35705/15/2042 4.750% 390,000 416,36506/15/2045 5.000% 394,000 431,223
05/11/2027 1.995% 765,000 783,255Chevron USA, Inc.10/15/2029 3.250% 485,000 522,07803/01/2041 6.000% 400,000 557,69511/15/2044 5.050% 250,000 318,822ENI SpA(a)
09/12/2023 4.000% 510,000 548,119Exxon Mobil Corp.03/19/2025 2.992% 1,550,000 1,661,24808/16/2039 2.995% 815,000 795,55908/16/2049 3.095% 1,015,000 959,538Husky Energy, Inc.04/15/2022 3.950% 750,000 767,316Petro-Canada05/15/2035 5.950% 250,000 312,965
Corporate Bonds & Notes (continued)
IssuerCoupon
Rate
PrincipalAmount
($) Value ($)Total Capital International SA06/29/2041 2.986% 1,400,000 1,344,68705/29/2050 3.127% 2,558,000 2,419,996
Total 22,542,791
Life Insurance 0.6%AIA Group Ltd.(a)
04/06/2028 3.900% 500,000 548,23904/09/2029 3.600% 320,000 345,629Subordinated09/16/2040 3.200% 540,000 530,511AIG SunAmerica Global Financing X(a)
03/15/2032 6.900% 585,000 810,646Athene Global Funding(a)
01/08/2024 0.950% 1,385,000 1,384,53201/08/2026 1.450% 1,050,000 1,033,02511/12/2026 2.950% 3,060,000 3,212,19803/24/2028 2.500% 3,009,000 2,999,822Athene Holding Ltd.01/12/2028 4.125% 1,495,000 1,626,14201/15/2031 3.500% 560,000 575,093Brighthouse Financial, Inc.06/22/2047 4.700% 1,357,000 1,390,330Dai-ichi Life Insurance Co. Ltd. (The)(a),(j)
Corporate Bonds & Notes (continued)
IssuerCoupon
Rate
PrincipalAmount
($) Value ($)Prudential Insurance Co. of America (The)(a)
Subordinated07/01/2025 8.300% 2,060,000 2,590,884Reliance Standard Life Global Funding II(a)
09/19/2023 3.850% 520,000 559,402SBL Holdings, Inc.(a)
02/18/2031 5.000% 2,285,000 2,307,359Teachers Insurance & Annuity Association of America(a)
Subordinated09/15/2044 4.900% 450,000 550,26605/15/2047 4.270% 300,000 338,352
Total 28,842,824
Lodging 0.1%Marriott International, Inc.05/01/2025 5.750% 1,370,000 1,569,74406/15/2030 4.625% 291,000 325,20404/15/2031 2.850% 3,329,000 3,272,827
Total 5,167,775
Media and Entertainment 0.2%CBS Corp.08/15/2024 3.700% 1,019,000 1,104,06901/15/2045 4.600% 142,000 158,846
Copyright © 2021 www.secdatabase.com. All Rights Reserved.Please Consider the Environment Before Printing This Document

80 Variable Portfolio – Partners Core Bond Fund | Quarterly Report 2021
PORTFOLIO OF INVESTMENTS (continued)
Variable Portfolio – Partners Core Bond Fund, March 31, 2021 (Unaudited)
Junior Subordinated12/31/2049 4.000% 1,062,000 1,138,664Guardian Life Insurance Co. of America (The)(a)
Subordinated01/24/2077 4.850% 208,000 241,876Jackson National Life Global Funding(a)
06/11/2025 3.875% 279,000 306,26704/29/2026 3.050% 1,073,000 1,149,592John Hancock Life Insurance Co.(a)
Subordinated02/15/2024 7.375% 250,000 293,291Manulife Financial Corp.(j)Subordinated02/24/2032 4.061% 1,400,000 1,540,855MetLife, Inc.09/15/2023 4.368% 600,000 655,759Metropolitan Life Global Funding I(a)
01/11/2024 3.600% 800,000 864,03209/19/2027 3.000% 500,000 537,445New York Life Global Funding(a)
01/10/2028 3.000% 404,000 430,831New York Life Insurance Co.(a)
Subordinated05/15/2069 4.450% 750,000 881,782
Discovery Communications LLC09/20/2047 5.200% 365,000 428,866Discovery Communications LLC(a)
09/15/2055 4.000% 675,000 666,307Electronic Arts, Inc.02/15/2031 1.850% 1,279,000 1,207,210Grupo Televisa SAB01/31/2046 6.125% 356,000 452,569Viacom, Inc.03/15/2043 4.375% 488,000 527,06309/01/2043 5.850% 898,000 1,148,030ViacomCBS, Inc.05/19/2032 4.200% 467,000 522,098Walt Disney Co. (The)07/15/2024 9.500% 407,000 518,37804/30/2028 7.300% 350,000 460,314
Total 7,193,750
Metals and Mining 0.6%Anglo American Capital PLC(a)
09/11/2024 3.625% 245,000 264,89209/11/2027 4.000% 400,000 441,58909/10/2030 2.625% 836,000 819,317Barrick Gold Corp.10/15/2035 6.450% 780,000 1,028,392
Corporate Bonds & Notes (continued)
IssuerCoupon
Rate
PrincipalAmount
($) Value ($)BHP Billiton Finance U.S.A. Ltd.03/01/2026 6.420% 1,372,000 1,697,769Glencore Finance Canada Ltd.(a)
11/15/2021 4.950% 1,110,000 1,140,289Glencore Funding LLC(a)
05/30/2023 4.125% 547,000 584,40909/01/2025 1.625% 3,065,000 3,062,81909/01/2030 2.500% 3,095,000 2,974,038Newmont Corp.10/01/2030 2.250% 4,668,000 4,546,997Nucor Corp.06/01/2030 2.700% 831,000 849,236Nucor Corp.(a)
12/15/2055 2.979% 1,000,000 908,560Reliance Steel & Aluminum Co.08/15/2030 2.150% 4,184,000 4,020,585
Corporate Bonds & Notes (continued)
IssuerCoupon
Rate
PrincipalAmount
($) Value ($)Energy Transfer Partners LP03/15/2025 4.050% 3,564,000 3,847,27601/15/2026 4.750% 449,000 498,61506/01/2041 6.050% 1,221,000 1,387,37106/15/2048 6.000% 303,000 345,868Enterprise Products Operating LLC01/31/2030 2.800% 1,000,000 1,032,08304/15/2038 7.550% 303,000 443,69702/15/2043 4.450% 305,000 338,09201/31/2060 3.950% 1,517,000 1,519,181EQT Midstream Partners LP07/15/2028 5.500% 700,000 736,339Galaxy Pipeline Assets Bidco Ltd.(a)
09/30/2027 1.750% 2,267,000 2,267,52403/31/2034 2.160% 1,695,000 1,648,29803/31/2036 2.625% 1,070,000 1,025,360
Copyright © 2021 www.secdatabase.com. All Rights Reserved.Please Consider the Environment Before Printing This Document
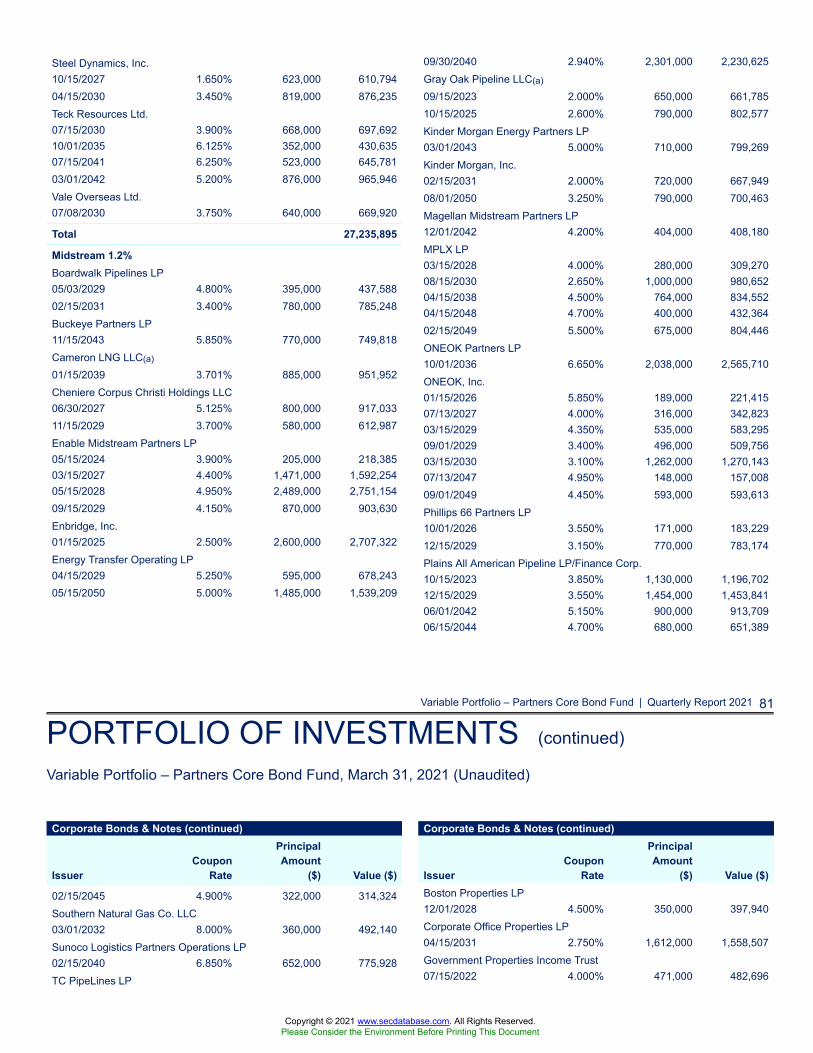
Variable Portfolio – Partners Core Bond Fund | Quarterly Report 2021 81
PORTFOLIO OF INVESTMENTS (continued)
Variable Portfolio – Partners Core Bond Fund, March 31, 2021 (Unaudited)
Steel Dynamics, Inc.10/15/2027 1.650% 623,000 610,79404/15/2030 3.450% 819,000 876,235Teck Resources Ltd.07/15/2030 3.900% 668,000 697,69210/01/2035 6.125% 352,000 430,63507/15/2041 6.250% 523,000 645,78103/01/2042 5.200% 876,000 965,946Vale Overseas Ltd.07/08/2030 3.750% 640,000 669,920
Total 27,235,895
Midstream 1.2%Boardwalk Pipelines LP05/03/2029 4.800% 395,000 437,58802/15/2031 3.400% 780,000 785,248Buckeye Partners LP11/15/2043 5.850% 770,000 749,818Cameron LNG LLC(a)
01/15/2039 3.701% 885,000 951,952Cheniere Corpus Christi Holdings LLC06/30/2027 5.125% 800,000 917,03311/15/2029 3.700% 580,000 612,987Enable Midstream Partners LP05/15/2024 3.900% 205,000 218,38503/15/2027 4.400% 1,471,000 1,592,25405/15/2028 4.950% 2,489,000 2,751,15409/15/2029 4.150% 870,000 903,630Enbridge, Inc.01/15/2025 2.500% 2,600,000 2,707,322Energy Transfer Operating LP04/15/2029 5.250% 595,000 678,24305/15/2050 5.000% 1,485,000 1,539,209
09/30/2040 2.940% 2,301,000 2,230,625Gray Oak Pipeline LLC(a)
09/15/2023 2.000% 650,000 661,78510/15/2025 2.600% 790,000 802,577Kinder Morgan Energy Partners LP03/01/2043 5.000% 710,000 799,269Kinder Morgan, Inc.02/15/2031 2.000% 720,000 667,94908/01/2050 3.250% 790,000 700,463Magellan Midstream Partners LP12/01/2042 4.200% 404,000 408,180MPLX LP03/15/2028 4.000% 280,000 309,27008/15/2030 2.650% 1,000,000 980,65204/15/2038 4.500% 764,000 834,55204/15/2048 4.700% 400,000 432,36402/15/2049 5.500% 675,000 804,446ONEOK Partners LP10/01/2036 6.650% 2,038,000 2,565,710ONEOK, Inc.01/15/2026 5.850% 189,000 221,41507/13/2027 4.000% 316,000 342,82303/15/2029 4.350% 535,000 583,29509/01/2029 3.400% 496,000 509,75603/15/2030 3.100% 1,262,000 1,270,14307/13/2047 4.950% 148,000 157,00809/01/2049 4.450% 593,000 593,613Phillips 66 Partners LP10/01/2026 3.550% 171,000 183,22912/15/2029 3.150% 770,000 783,174Plains All American Pipeline LP/Finance Corp.10/15/2023 3.850% 1,130,000 1,196,70212/15/2029 3.550% 1,454,000 1,453,84106/01/2042 5.150% 900,000 913,70906/15/2044 4.700% 680,000 651,389
Corporate Bonds & Notes (continued)
IssuerCoupon
Rate
PrincipalAmount
($) Value ($)
02/15/2045 4.900% 322,000 314,324Southern Natural Gas Co. LLC03/01/2032 8.000% 360,000 492,140Sunoco Logistics Partners Operations LP02/15/2040 6.850% 652,000 775,928TC PipeLines LP
Corporate Bonds & Notes (continued)
IssuerCoupon
Rate
PrincipalAmount
($) Value ($)Boston Properties LP12/01/2028 4.500% 350,000 397,940Corporate Office Properties LP04/15/2031 2.750% 1,612,000 1,558,507Government Properties Income Trust07/15/2022 4.000% 471,000 482,696
Copyright © 2021 www.secdatabase.com. All Rights Reserved.Please Consider the Environment Before Printing This Document
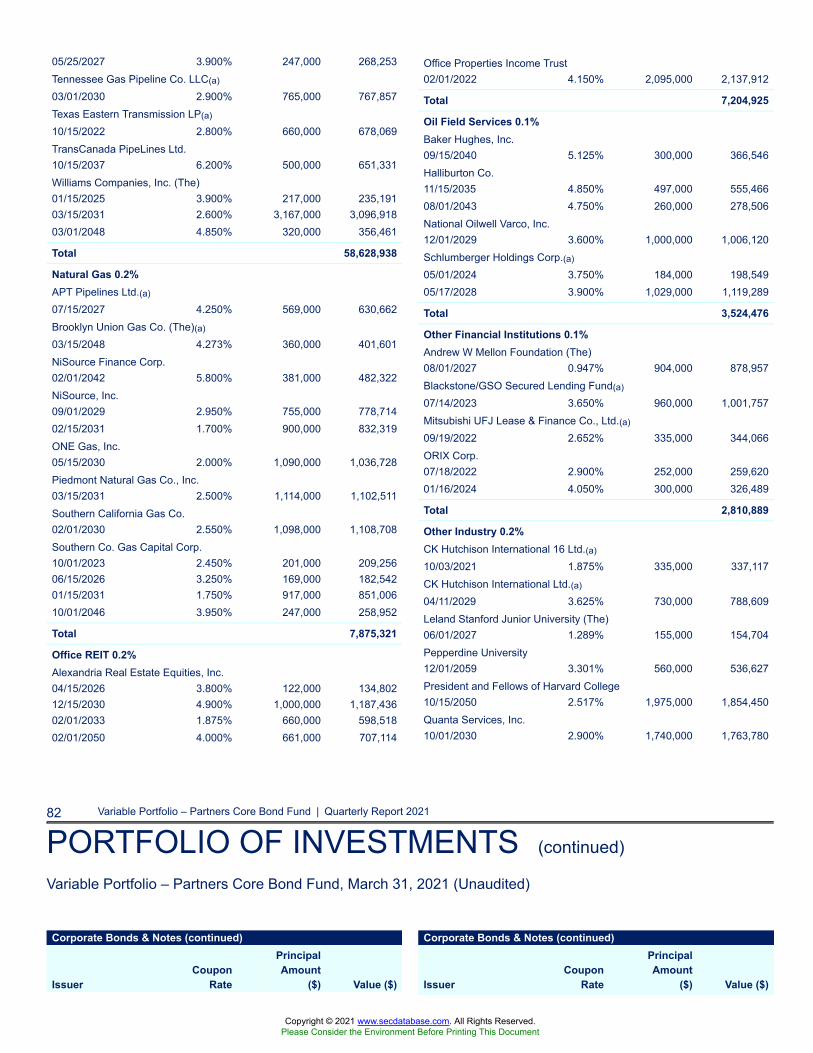
82 Variable Portfolio – Partners Core Bond Fund | Quarterly Report 2021
PORTFOLIO OF INVESTMENTS (continued)
Variable Portfolio – Partners Core Bond Fund, March 31, 2021 (Unaudited)
05/25/2027 3.900% 247,000 268,253Tennessee Gas Pipeline Co. LLC(a)
03/01/2030 2.900% 765,000 767,857Texas Eastern Transmission LP(a)
10/15/2022 2.800% 660,000 678,069TransCanada PipeLines Ltd.10/15/2037 6.200% 500,000 651,331Williams Companies, Inc. (The)01/15/2025 3.900% 217,000 235,19103/15/2031 2.600% 3,167,000 3,096,91803/01/2048 4.850% 320,000 356,461
Total 58,628,938
Natural Gas 0.2%APT Pipelines Ltd.(a)
07/15/2027 4.250% 569,000 630,662Brooklyn Union Gas Co. (The)(a)
03/15/2048 4.273% 360,000 401,601NiSource Finance Corp.02/01/2042 5.800% 381,000 482,322NiSource, Inc.09/01/2029 2.950% 755,000 778,71402/15/2031 1.700% 900,000 832,319ONE Gas, Inc.05/15/2030 2.000% 1,090,000 1,036,728Piedmont Natural Gas Co., Inc.03/15/2031 2.500% 1,114,000 1,102,511Southern California Gas Co.02/01/2030 2.550% 1,098,000 1,108,708Southern Co. Gas Capital Corp.10/01/2023 2.450% 201,000 209,25606/15/2026 3.250% 169,000 182,54201/15/2031 1.750% 917,000 851,00610/01/2046 3.950% 247,000 258,952
Total 7,875,321
Office REIT 0.2%Alexandria Real Estate Equities, Inc.04/15/2026 3.800% 122,000 134,80212/15/2030 4.900% 1,000,000 1,187,43602/01/2033 1.875% 660,000 598,51802/01/2050 4.000% 661,000 707,114
Office Properties Income Trust02/01/2022 4.150% 2,095,000 2,137,912
Total 7,204,925
Oil Field Services 0.1%Baker Hughes, Inc.09/15/2040 5.125% 300,000 366,546Halliburton Co.11/15/2035 4.850% 497,000 555,46608/01/2043 4.750% 260,000 278,506National Oilwell Varco, Inc.12/01/2029 3.600% 1,000,000 1,006,120Schlumberger Holdings Corp.(a)
05/01/2024 3.750% 184,000 198,54905/17/2028 3.900% 1,029,000 1,119,289
Total 3,524,476
Other Financial Institutions 0.1%Andrew W Mellon Foundation (The)08/01/2027 0.947% 904,000 878,957Blackstone/GSO Secured Lending Fund(a)
07/14/2023 3.650% 960,000 1,001,757Mitsubishi UFJ Lease & Finance Co., Ltd.(a)
09/19/2022 2.652% 335,000 344,066ORIX Corp.07/18/2022 2.900% 252,000 259,62001/16/2024 4.050% 300,000 326,489
Total 2,810,889
Other Industry 0.2%CK Hutchison International 16 Ltd.(a)
10/03/2021 1.875% 335,000 337,117CK Hutchison International Ltd.(a)
04/11/2029 3.625% 730,000 788,609Leland Stanford Junior University (The)06/01/2027 1.289% 155,000 154,704Pepperdine University12/01/2059 3.301% 560,000 536,627President and Fellows of Harvard College10/15/2050 2.517% 1,975,000 1,854,450Quanta Services, Inc.10/01/2030 2.900% 1,740,000 1,763,780
Corporate Bonds & Notes (continued)
IssuerCoupon
Rate
PrincipalAmount
($) Value ($)
Corporate Bonds & Notes (continued)
IssuerCoupon
Rate
PrincipalAmount
($) Value ($)
Copyright © 2021 www.secdatabase.com. All Rights Reserved.Please Consider the Environment Before Printing This Document
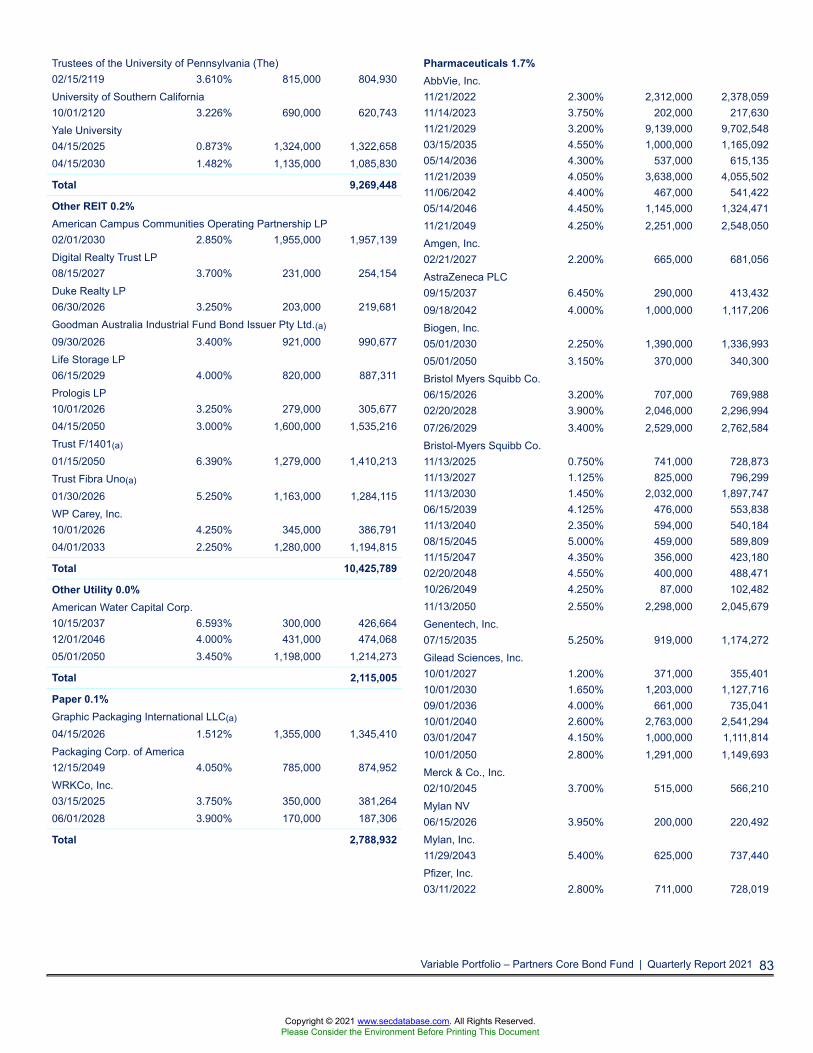
Variable Portfolio – Partners Core Bond Fund | Quarterly Report 2021 83
Trustees of the University of Pennsylvania (The)02/15/2119 3.610% 815,000 804,930University of Southern California10/01/2120 3.226% 690,000 620,743Yale University04/15/2025 0.873% 1,324,000 1,322,65804/15/2030 1.482% 1,135,000 1,085,830
Total 9,269,448
Other REIT 0.2%American Campus Communities Operating Partnership LP02/01/2030 2.850% 1,955,000 1,957,139Digital Realty Trust LP08/15/2027 3.700% 231,000 254,154Duke Realty LP06/30/2026 3.250% 203,000 219,681Goodman Australia Industrial Fund Bond Issuer Pty Ltd.(a)
09/30/2026 3.400% 921,000 990,677Life Storage LP06/15/2029 4.000% 820,000 887,311Prologis LP10/01/2026 3.250% 279,000 305,67704/15/2050 3.000% 1,600,000 1,535,216Trust F/1401(a)
01/15/2050 6.390% 1,279,000 1,410,213Trust Fibra Uno(a)
01/30/2026 5.250% 1,163,000 1,284,115WP Carey, Inc.10/01/2026 4.250% 345,000 386,79104/01/2033 2.250% 1,280,000 1,194,815
Total 10,425,789
Other Utility 0.0%American Water Capital Corp.10/15/2037 6.593% 300,000 426,66412/01/2046 4.000% 431,000 474,06805/01/2050 3.450% 1,198,000 1,214,273
Total 2,115,005
Paper 0.1%Graphic Packaging International LLC(a)
04/15/2026 1.512% 1,355,000 1,345,410Packaging Corp. of America12/15/2049 4.050% 785,000 874,952WRKCo, Inc.03/15/2025 3.750% 350,000 381,26406/01/2028 3.900% 170,000 187,306
Total 2,788,932
Pharmaceuticals 1.7%AbbVie, Inc.11/21/2022 2.300% 2,312,000 2,378,05911/14/2023 3.750% 202,000 217,63011/21/2029 3.200% 9,139,000 9,702,54803/15/2035 4.550% 1,000,000 1,165,09205/14/2036 4.300% 537,000 615,13511/21/2039 4.050% 3,638,000 4,055,50211/06/2042 4.400% 467,000 541,42205/14/2046 4.450% 1,145,000 1,324,47111/21/2049 4.250% 2,251,000 2,548,050Amgen, Inc.02/21/2027 2.200% 665,000 681,056AstraZeneca PLC09/15/2037 6.450% 290,000 413,43209/18/2042 4.000% 1,000,000 1,117,206Biogen, Inc.05/01/2030 2.250% 1,390,000 1,336,99305/01/2050 3.150% 370,000 340,300Bristol Myers Squibb Co.06/15/2026 3.200% 707,000 769,98802/20/2028 3.900% 2,046,000 2,296,99407/26/2029 3.400% 2,529,000 2,762,584Bristol-Myers Squibb Co.11/13/2025 0.750% 741,000 728,87311/13/2027 1.125% 825,000 796,29911/13/2030 1.450% 2,032,000 1,897,74706/15/2039 4.125% 476,000 553,83811/13/2040 2.350% 594,000 540,18408/15/2045 5.000% 459,000 589,80911/15/2047 4.350% 356,000 423,18002/20/2048 4.550% 400,000 488,47110/26/2049 4.250% 87,000 102,48211/13/2050 2.550% 2,298,000 2,045,679Genentech, Inc.07/15/2035 5.250% 919,000 1,174,272Gilead Sciences, Inc.10/01/2027 1.200% 371,000 355,40110/01/2030 1.650% 1,203,000 1,127,71609/01/2036 4.000% 661,000 735,04110/01/2040 2.600% 2,763,000 2,541,29403/01/2047 4.150% 1,000,000 1,111,81410/01/2050 2.800% 1,291,000 1,149,693Merck & Co., Inc.02/10/2045 3.700% 515,000 566,210Mylan NV06/15/2026 3.950% 200,000 220,492Mylan, Inc.11/29/2043 5.400% 625,000 737,440Pfizer, Inc.03/11/2022 2.800% 711,000 728,019
Copyright © 2021 www.secdatabase.com. All Rights Reserved.Please Consider the Environment Before Printing This Document
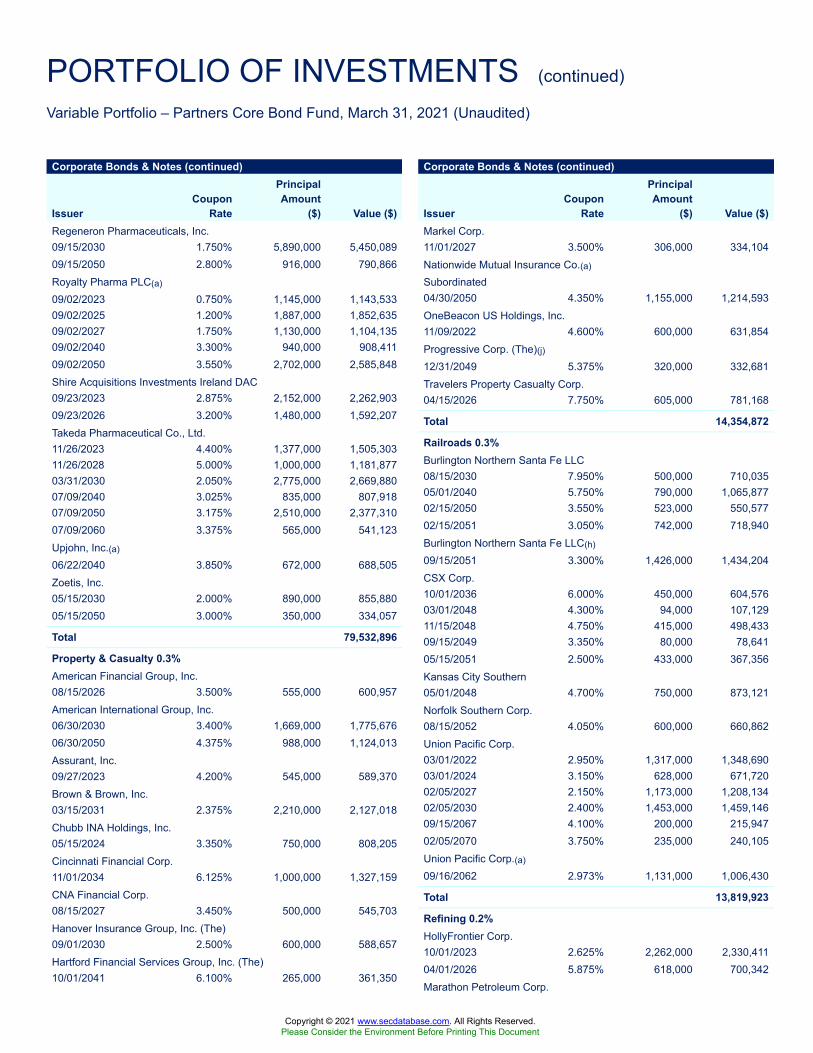
PORTFOLIO OF INVESTMENTS (continued)
Variable Portfolio – Partners Core Bond Fund, March 31, 2021 (Unaudited)
Corporate Bonds & Notes (continued)
IssuerCoupon
Rate
PrincipalAmount
($) Value ($)Regeneron Pharmaceuticals, Inc.09/15/2030 1.750% 5,890,000 5,450,08909/15/2050 2.800% 916,000 790,866Royalty Pharma PLC(a)
09/02/2023 0.750% 1,145,000 1,143,53309/02/2025 1.200% 1,887,000 1,852,63509/02/2027 1.750% 1,130,000 1,104,13509/02/2040 3.300% 940,000 908,41109/02/2050 3.550% 2,702,000 2,585,848Shire Acquisitions Investments Ireland DAC09/23/2023 2.875% 2,152,000 2,262,90309/23/2026 3.200% 1,480,000 1,592,207Takeda Pharmaceutical Co., Ltd.11/26/2023 4.400% 1,377,000 1,505,30311/26/2028 5.000% 1,000,000 1,181,87703/31/2030 2.050% 2,775,000 2,669,88007/09/2040 3.025% 835,000 807,91807/09/2050 3.175% 2,510,000 2,377,31007/09/2060 3.375% 565,000 541,123Upjohn, Inc.(a)
06/22/2040 3.850% 672,000 688,505Zoetis, Inc.05/15/2030 2.000% 890,000 855,88005/15/2050 3.000% 350,000 334,057
Total 79,532,896
Property & Casualty 0.3%American Financial Group, Inc.08/15/2026 3.500% 555,000 600,957American International Group, Inc.06/30/2030 3.400% 1,669,000 1,775,67606/30/2050 4.375% 988,000 1,124,013Assurant, Inc.09/27/2023 4.200% 545,000 589,370Brown & Brown, Inc.03/15/2031 2.375% 2,210,000 2,127,018Chubb INA Holdings, Inc.05/15/2024 3.350% 750,000 808,205Cincinnati Financial Corp.11/01/2034 6.125% 1,000,000 1,327,159CNA Financial Corp.08/15/2027 3.450% 500,000 545,703Hanover Insurance Group, Inc. (The)09/01/2030 2.500% 600,000 588,657Hartford Financial Services Group, Inc. (The)10/01/2041 6.100% 265,000 361,350
Corporate Bonds & Notes (continued)
IssuerCoupon
Rate
PrincipalAmount
($) Value ($)Markel Corp.11/01/2027 3.500% 306,000 334,104Nationwide Mutual Insurance Co.(a)
Subordinated04/30/2050 4.350% 1,155,000 1,214,593OneBeacon US Holdings, Inc.11/09/2022 4.600% 600,000 631,854Progressive Corp. (The)(j)12/31/2049 5.375% 320,000 332,681Travelers Property Casualty Corp.04/15/2026 7.750% 605,000 781,168
Total 14,354,872
Railroads 0.3%Burlington Northern Santa Fe LLC08/15/2030 7.950% 500,000 710,03505/01/2040 5.750% 790,000 1,065,87702/15/2050 3.550% 523,000 550,57702/15/2051 3.050% 742,000 718,940Burlington Northern Santa Fe LLC(h)
09/15/2051 3.300% 1,426,000 1,434,204CSX Corp.10/01/2036 6.000% 450,000 604,57603/01/2048 4.300% 94,000 107,12911/15/2048 4.750% 415,000 498,43309/15/2049 3.350% 80,000 78,64105/15/2051 2.500% 433,000 367,356Kansas City Southern05/01/2048 4.700% 750,000 873,121Norfolk Southern Corp.08/15/2052 4.050% 600,000 660,862Union Pacific Corp.03/01/2022 2.950% 1,317,000 1,348,69003/01/2024 3.150% 628,000 671,72002/05/2027 2.150% 1,173,000 1,208,13402/05/2030 2.400% 1,453,000 1,459,14609/15/2067 4.100% 200,000 215,94702/05/2070 3.750% 235,000 240,105Union Pacific Corp.(a)
09/16/2062 2.973% 1,131,000 1,006,430
Total 13,819,923
Refining 0.2%HollyFrontier Corp.10/01/2023 2.625% 2,262,000 2,330,41104/01/2026 5.875% 618,000 700,342Marathon Petroleum Corp.
Copyright © 2021 www.secdatabase.com. All Rights Reserved.Please Consider the Environment Before Printing This Document

84 Variable Portfolio – Partners Core Bond Fund | Quarterly Report 2021
PORTFOLIO OF INVESTMENTS (continued)
Variable Portfolio – Partners Core Bond Fund, March 31, 2021 (Unaudited)
04/15/2043 4.300% 430,000 489,421Liberty Mutual Group, Inc.(a)
10/15/2050 3.951% 700,000 722,943
05/01/2023 4.500% 366,000 392,63705/01/2025 4.700% 217,000 243,950
Corporate Bonds & Notes (continued)
IssuerCoupon
Rate
PrincipalAmount
($) Value ($)Phillips 6611/15/2044 4.875% 40,000 47,224Valero Energy Corp.04/15/2023 2.700% 1,270,000 1,318,65603/15/2024 1.200% 1,110,000 1,113,71609/15/2027 2.150% 1,000,000 982,16804/15/2032 7.500% 181,000 243,344
Total 7,372,448
Restaurants 0.1%McDonald’s Corp.09/01/2025 1.450% 575,000 580,68801/30/2026 3.700% 1,135,000 1,251,62212/09/2035 4.700% 283,000 335,94010/15/2037 6.300% 268,000 373,053Starbucks Corp.05/07/2022 1.300% 942,000 951,67111/15/2030 2.550% 910,000 913,07703/12/2050 3.350% 753,000 738,55811/15/2050 3.500% 1,635,000 1,638,986
Total 6,783,595
Retail REIT 0.6%Agree LP10/01/2030 2.900% 552,000 557,187Brixmor Operating Partnership LP02/01/2025 3.850% 1,000,000 1,081,24204/01/2028 2.250% 1,410,000 1,383,427DDR Corp.02/01/2025 3.625% 482,000 503,46206/01/2027 4.700% 200,000 218,517Federal Realty Investment Trust01/15/2024 3.950% 1,025,000 1,107,608National Retail Properties, Inc.11/15/2025 4.000% 728,000 799,88612/15/2026 3.600% 618,000 670,038Realty Income Corp.07/15/2024 3.875% 642,000 699,40204/15/2025 3.875% 255,000 279,604
Corporate Bonds & Notes (continued)
IssuerCoupon
Rate
PrincipalAmount
($) Value ($)Spirit Realty LP09/15/2026 4.450% 95,000 105,32903/15/2028 2.100% 1,477,000 1,436,68907/15/2029 4.000% 428,000 463,48101/15/2030 3.400% 893,000 923,90102/15/2031 3.200% 1,756,000 1,762,61502/15/2032 2.700% 591,000 562,659STORE Capital Corp.03/15/2028 4.500% 2,800,000 3,083,47303/15/2029 4.625% 946,000 1,050,28711/18/2030 2.750% 1,313,000 1,284,981VEREIT Operating Partnership LP01/15/2028 3.400% 787,000 831,75906/15/2028 2.200% 795,000 780,53512/15/2032 2.850% 1,077,000 1,043,930
Total 27,284,181
Retailers 0.5%7-Eleven, Inc.(a)
02/10/2028 1.300% 609,000 582,60302/10/2041 2.500% 619,000 561,773Alimentation Couche-Tard, Inc.(a)
01/25/2030 2.950% 440,000 449,09401/25/2050 3.800% 1,270,000 1,281,475AutoZone, Inc.01/15/2031 1.650% 840,000 771,441Costco Wholesale Corp.04/20/2030 1.600% 4,984,000 4,773,52704/20/2032 1.750% 1,600,000 1,525,019Dollar General Corp.05/01/2028 4.125% 365,000 409,372Home Depot Inc (The)06/15/2029 2.950% 420,000 445,79104/15/2030 2.700% 919,000 958,38104/15/2050 3.350% 743,000 770,340Home Depot, Inc. (The)04/15/2040 3.300% 306,000 322,70912/15/2049 3.125% 2,877,000 2,851,671
Copyright © 2021 www.secdatabase.com. All Rights Reserved.Please Consider the Environment Before Printing This Document
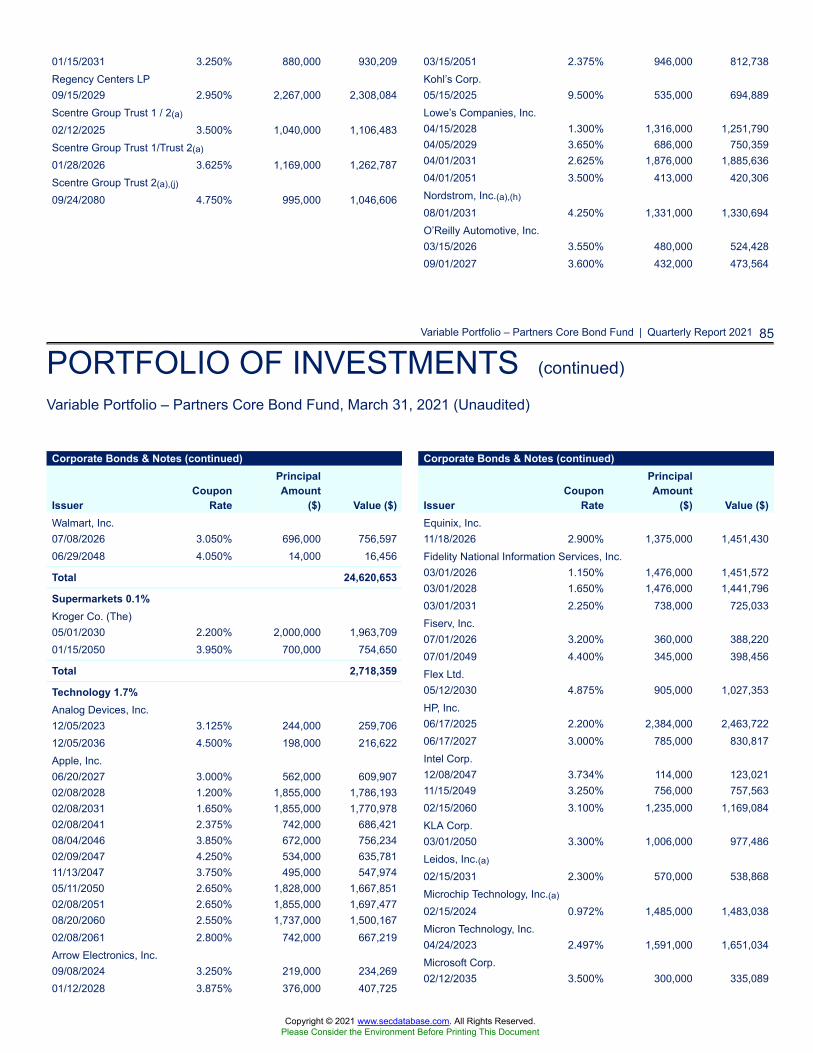
Variable Portfolio – Partners Core Bond Fund | Quarterly Report 2021 85
PORTFOLIO OF INVESTMENTS (continued)
Variable Portfolio – Partners Core Bond Fund, March 31, 2021 (Unaudited)
01/15/2031 3.250% 880,000 930,209Regency Centers LP09/15/2029 2.950% 2,267,000 2,308,084Scentre Group Trust 1 / 2(a)
02/12/2025 3.500% 1,040,000 1,106,483Scentre Group Trust 1/Trust 2(a)
01/28/2026 3.625% 1,169,000 1,262,787Scentre Group Trust 2(a),(j)
09/24/2080 4.750% 995,000 1,046,606
03/15/2051 2.375% 946,000 812,738Kohl’s Corp.05/15/2025 9.500% 535,000 694,889Lowe’s Companies, Inc.04/15/2028 1.300% 1,316,000 1,251,79004/05/2029 3.650% 686,000 750,35904/01/2031 2.625% 1,876,000 1,885,63604/01/2051 3.500% 413,000 420,306Nordstrom, Inc.(a),(h)
08/01/2031 4.250% 1,331,000 1,330,694O’Reilly Automotive, Inc.03/15/2026 3.550% 480,000 524,42809/01/2027 3.600% 432,000 473,564
Corporate Bonds & Notes (continued)
IssuerCoupon
Rate
PrincipalAmount
($) Value ($)Walmart, Inc.07/08/2026 3.050% 696,000 756,59706/29/2048 4.050% 14,000 16,456
Total 24,620,653
Supermarkets 0.1%Kroger Co. (The)05/01/2030 2.200% 2,000,000 1,963,70901/15/2050 3.950% 700,000 754,650
Total 2,718,359
Technology 1.7%Analog Devices, Inc.12/05/2023 3.125% 244,000 259,70612/05/2036 4.500% 198,000 216,622Apple, Inc.06/20/2027 3.000% 562,000 609,90702/08/2028 1.200% 1,855,000 1,786,19302/08/2031 1.650% 1,855,000 1,770,97802/08/2041 2.375% 742,000 686,42108/04/2046 3.850% 672,000 756,23402/09/2047 4.250% 534,000 635,78111/13/2047 3.750% 495,000 547,97405/11/2050 2.650% 1,828,000 1,667,85102/08/2051 2.650% 1,855,000 1,697,47708/20/2060 2.550% 1,737,000 1,500,16702/08/2061 2.800% 742,000 667,219Arrow Electronics, Inc.09/08/2024 3.250% 219,000 234,26901/12/2028 3.875% 376,000 407,725
Corporate Bonds & Notes (continued)
IssuerCoupon
Rate
PrincipalAmount
($) Value ($)Equinix, Inc.11/18/2026 2.900% 1,375,000 1,451,430Fidelity National Information Services, Inc.03/01/2026 1.150% 1,476,000 1,451,57203/01/2028 1.650% 1,476,000 1,441,79603/01/2031 2.250% 738,000 725,033Fiserv, Inc.07/01/2026 3.200% 360,000 388,22007/01/2049 4.400% 345,000 398,456Flex Ltd.05/12/2030 4.875% 905,000 1,027,353HP, Inc.06/17/2025 2.200% 2,384,000 2,463,72206/17/2027 3.000% 785,000 830,817Intel Corp.12/08/2047 3.734% 114,000 123,02111/15/2049 3.250% 756,000 757,56302/15/2060 3.100% 1,235,000 1,169,084KLA Corp.03/01/2050 3.300% 1,006,000 977,486Leidos, Inc.(a)
02/15/2031 2.300% 570,000 538,868Microchip Technology, Inc.(a)
02/15/2024 0.972% 1,485,000 1,483,038Micron Technology, Inc.04/24/2023 2.497% 1,591,000 1,651,034Microsoft Corp.02/12/2035 3.500% 300,000 335,089
Copyright © 2021 www.secdatabase.com. All Rights Reserved.Please Consider the Environment Before Printing This Document
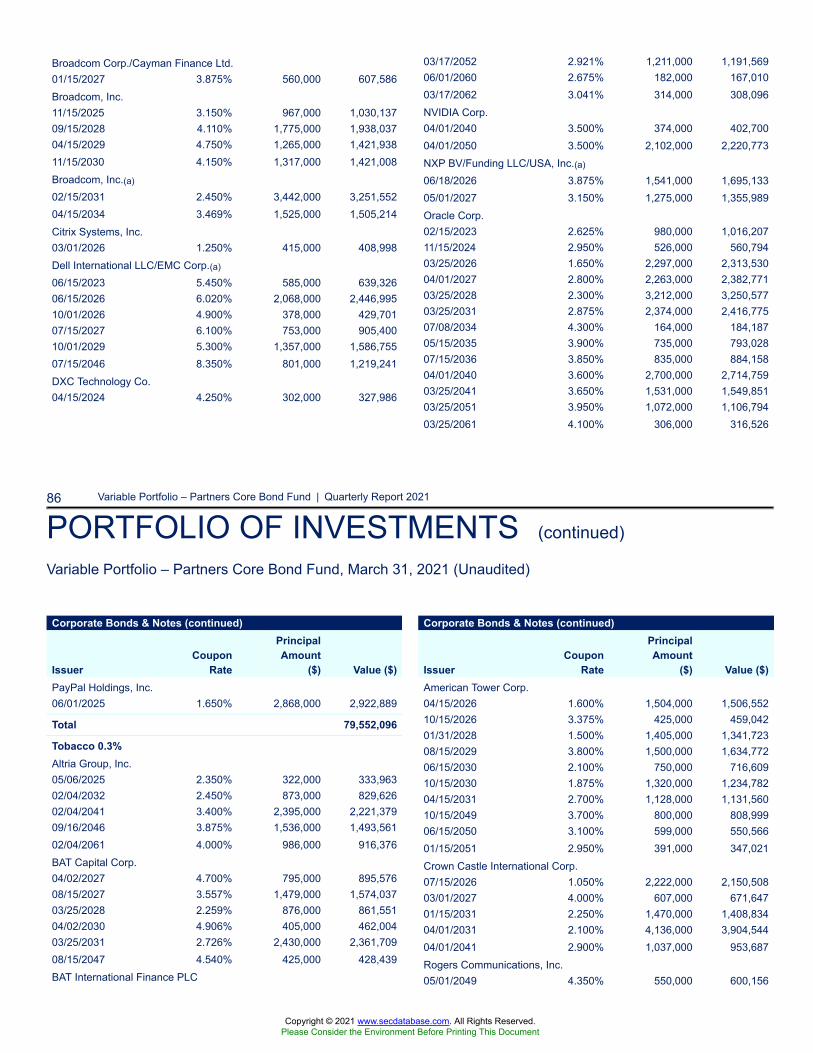
86 Variable Portfolio – Partners Core Bond Fund | Quarterly Report 2021
PORTFOLIO OF INVESTMENTS (continued)
Variable Portfolio – Partners Core Bond Fund, March 31, 2021 (Unaudited)
Broadcom Corp./Cayman Finance Ltd.01/15/2027 3.875% 560,000 607,586Broadcom, Inc.11/15/2025 3.150% 967,000 1,030,13709/15/2028 4.110% 1,775,000 1,938,03704/15/2029 4.750% 1,265,000 1,421,93811/15/2030 4.150% 1,317,000 1,421,008Broadcom, Inc.(a)
02/15/2031 2.450% 3,442,000 3,251,55204/15/2034 3.469% 1,525,000 1,505,214Citrix Systems, Inc.03/01/2026 1.250% 415,000 408,998Dell International LLC/EMC Corp.(a)
06/15/2023 5.450% 585,000 639,32606/15/2026 6.020% 2,068,000 2,446,99510/01/2026 4.900% 378,000 429,70107/15/2027 6.100% 753,000 905,40010/01/2029 5.300% 1,357,000 1,586,75507/15/2046 8.350% 801,000 1,219,241DXC Technology Co.04/15/2024 4.250% 302,000 327,986
03/17/2052 2.921% 1,211,000 1,191,56906/01/2060 2.675% 182,000 167,01003/17/2062 3.041% 314,000 308,096NVIDIA Corp.04/01/2040 3.500% 374,000 402,70004/01/2050 3.500% 2,102,000 2,220,773NXP BV/Funding LLC/USA, Inc.(a)
06/18/2026 3.875% 1,541,000 1,695,13305/01/2027 3.150% 1,275,000 1,355,989Oracle Corp.02/15/2023 2.625% 980,000 1,016,20711/15/2024 2.950% 526,000 560,79403/25/2026 1.650% 2,297,000 2,313,53004/01/2027 2.800% 2,263,000 2,382,77103/25/2028 2.300% 3,212,000 3,250,57703/25/2031 2.875% 2,374,000 2,416,77507/08/2034 4.300% 164,000 184,18705/15/2035 3.900% 735,000 793,02807/15/2036 3.850% 835,000 884,15804/01/2040 3.600% 2,700,000 2,714,75903/25/2041 3.650% 1,531,000 1,549,85103/25/2051 3.950% 1,072,000 1,106,79403/25/2061 4.100% 306,000 316,526
Corporate Bonds & Notes (continued)
IssuerCoupon
Rate
PrincipalAmount
($) Value ($)PayPal Holdings, Inc.06/01/2025 1.650% 2,868,000 2,922,889
Total 79,552,096
Tobacco 0.3%Altria Group, Inc.05/06/2025 2.350% 322,000 333,96302/04/2032 2.450% 873,000 829,62602/04/2041 3.400% 2,395,000 2,221,37909/16/2046 3.875% 1,536,000 1,493,56102/04/2061 4.000% 986,000 916,376BAT Capital Corp.04/02/2027 4.700% 795,000 895,57608/15/2027 3.557% 1,479,000 1,574,03703/25/2028 2.259% 876,000 861,55104/02/2030 4.906% 405,000 462,00403/25/2031 2.726% 2,430,000 2,361,70908/15/2047 4.540% 425,000 428,439BAT International Finance PLC
Corporate Bonds & Notes (continued)
IssuerCoupon
Rate
PrincipalAmount
($) Value ($)American Tower Corp.04/15/2026 1.600% 1,504,000 1,506,55210/15/2026 3.375% 425,000 459,04201/31/2028 1.500% 1,405,000 1,341,72308/15/2029 3.800% 1,500,000 1,634,77206/15/2030 2.100% 750,000 716,60910/15/2030 1.875% 1,320,000 1,234,78204/15/2031 2.700% 1,128,000 1,131,56010/15/2049 3.700% 800,000 808,99906/15/2050 3.100% 599,000 550,56601/15/2051 2.950% 391,000 347,021Crown Castle International Corp.07/15/2026 1.050% 2,222,000 2,150,50803/01/2027 4.000% 607,000 671,64701/15/2031 2.250% 1,470,000 1,408,83404/01/2031 2.100% 4,136,000 3,904,54404/01/2041 2.900% 1,037,000 953,687Rogers Communications, Inc.05/01/2049 4.350% 550,000 600,156
Copyright © 2021 www.secdatabase.com. All Rights Reserved.Please Consider the Environment Before Printing This Document
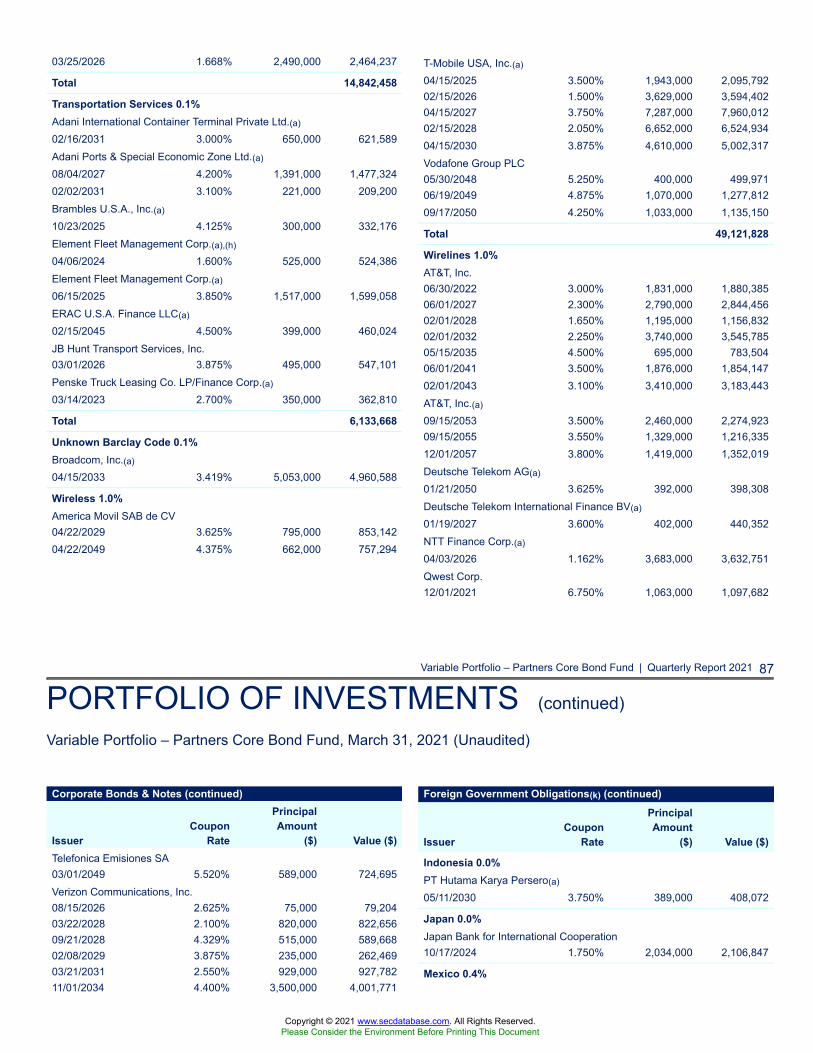
Variable Portfolio – Partners Core Bond Fund | Quarterly Report 2021 87
PORTFOLIO OF INVESTMENTS (continued)
Variable Portfolio – Partners Core Bond Fund, March 31, 2021 (Unaudited)
03/25/2026 1.668% 2,490,000 2,464,237
Total 14,842,458
Transportation Services 0.1%Adani International Container Terminal Private Ltd.(a)
02/16/2031 3.000% 650,000 621,589Adani Ports & Special Economic Zone Ltd.(a)
08/04/2027 4.200% 1,391,000 1,477,32402/02/2031 3.100% 221,000 209,200Brambles U.S.A., Inc.(a)
10/23/2025 4.125% 300,000 332,176Element Fleet Management Corp.(a),(h)
04/06/2024 1.600% 525,000 524,386Element Fleet Management Corp.(a)
06/15/2025 3.850% 1,517,000 1,599,058ERAC U.S.A. Finance LLC(a)
02/15/2045 4.500% 399,000 460,024JB Hunt Transport Services, Inc.03/01/2026 3.875% 495,000 547,101Penske Truck Leasing Co. LP/Finance Corp.(a)
03/14/2023 2.700% 350,000 362,810
Total 6,133,668
Unknown Barclay Code 0.1%Broadcom, Inc.(a)
04/15/2033 3.419% 5,053,000 4,960,588
Wireless 1.0%America Movil SAB de CV04/22/2029 3.625% 795,000 853,14204/22/2049 4.375% 662,000 757,294
T-Mobile USA, Inc.(a)
04/15/2025 3.500% 1,943,000 2,095,79202/15/2026 1.500% 3,629,000 3,594,40204/15/2027 3.750% 7,287,000 7,960,01202/15/2028 2.050% 6,652,000 6,524,93404/15/2030 3.875% 4,610,000 5,002,317Vodafone Group PLC05/30/2048 5.250% 400,000 499,97106/19/2049 4.875% 1,070,000 1,277,81209/17/2050 4.250% 1,033,000 1,135,150
Total 49,121,828
Wirelines 1.0%AT&T, Inc.06/30/2022 3.000% 1,831,000 1,880,38506/01/2027 2.300% 2,790,000 2,844,45602/01/2028 1.650% 1,195,000 1,156,83202/01/2032 2.250% 3,740,000 3,545,78505/15/2035 4.500% 695,000 783,50406/01/2041 3.500% 1,876,000 1,854,14702/01/2043 3.100% 3,410,000 3,183,443AT&T, Inc.(a)
09/15/2053 3.500% 2,460,000 2,274,92309/15/2055 3.550% 1,329,000 1,216,33512/01/2057 3.800% 1,419,000 1,352,019Deutsche Telekom AG(a)
01/21/2050 3.625% 392,000 398,308Deutsche Telekom International Finance BV(a)
01/19/2027 3.600% 402,000 440,352NTT Finance Corp.(a)
04/03/2026 1.162% 3,683,000 3,632,751Qwest Corp.12/01/2021 6.750% 1,063,000 1,097,682
Corporate Bonds & Notes (continued)
IssuerCoupon
Rate
PrincipalAmount
($) Value ($)Telefonica Emisiones SA03/01/2049 5.520% 589,000 724,695Verizon Communications, Inc.08/15/2026 2.625% 75,000 79,20403/22/2028 2.100% 820,000 822,65609/21/2028 4.329% 515,000 589,66802/08/2029 3.875% 235,000 262,46903/21/2031 2.550% 929,000 927,78211/01/2034 4.400% 3,500,000 4,001,771
Foreign Government Obligations(k) (continued)
IssuerCoupon
Rate
PrincipalAmount
($) Value ($)
Indonesia 0.0%PT Hutama Karya Persero(a)
05/11/2030 3.750% 389,000 408,072
Japan 0.0%Japan Bank for International Cooperation10/17/2024 1.750% 2,034,000 2,106,847
Mexico 0.4%
Copyright © 2021 www.secdatabase.com. All Rights Reserved.Please Consider the Environment Before Printing This Document
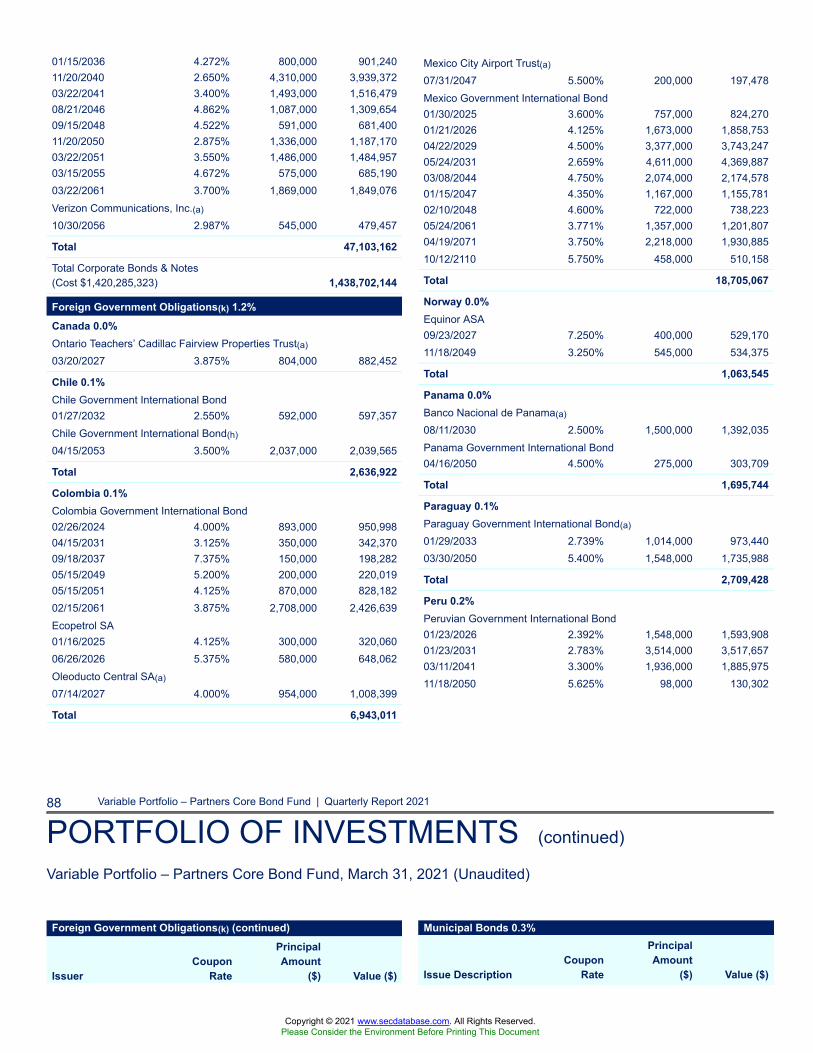
88 Variable Portfolio – Partners Core Bond Fund | Quarterly Report 2021
PORTFOLIO OF INVESTMENTS (continued)
Variable Portfolio – Partners Core Bond Fund, March 31, 2021 (Unaudited)
01/15/2036 4.272% 800,000 901,24011/20/2040 2.650% 4,310,000 3,939,37203/22/2041 3.400% 1,493,000 1,516,47908/21/2046 4.862% 1,087,000 1,309,65409/15/2048 4.522% 591,000 681,40011/20/2050 2.875% 1,336,000 1,187,17003/22/2051 3.550% 1,486,000 1,484,95703/15/2055 4.672% 575,000 685,19003/22/2061 3.700% 1,869,000 1,849,076Verizon Communications, Inc.(a)
10/30/2056 2.987% 545,000 479,457
Total 47,103,162
Total Corporate Bonds & Notes(Cost $1,420,285,323) 1,438,702,144
Foreign Government Obligations(k) 1.2%Canada 0.0%Ontario Teachers’ Cadillac Fairview Properties Trust(a)
03/20/2027 3.875% 804,000 882,452
Chile 0.1%Chile Government International Bond01/27/2032 2.550% 592,000 597,357Chile Government International Bond(h)
04/15/2053 3.500% 2,037,000 2,039,565
Total 2,636,922
Colombia 0.1%Colombia Government International Bond02/26/2024 4.000% 893,000 950,99804/15/2031 3.125% 350,000 342,37009/18/2037 7.375% 150,000 198,28205/15/2049 5.200% 200,000 220,01905/15/2051 4.125% 870,000 828,18202/15/2061 3.875% 2,708,000 2,426,639Ecopetrol SA01/16/2025 4.125% 300,000 320,06006/26/2026 5.375% 580,000 648,062Oleoducto Central SA(a)
07/14/2027 4.000% 954,000 1,008,399
Total 6,943,011
Mexico City Airport Trust(a)
07/31/2047 5.500% 200,000 197,478Mexico Government International Bond01/30/2025 3.600% 757,000 824,27001/21/2026 4.125% 1,673,000 1,858,75304/22/2029 4.500% 3,377,000 3,743,24705/24/2031 2.659% 4,611,000 4,369,88703/08/2044 4.750% 2,074,000 2,174,57801/15/2047 4.350% 1,167,000 1,155,78102/10/2048 4.600% 722,000 738,22305/24/2061 3.771% 1,357,000 1,201,80704/19/2071 3.750% 2,218,000 1,930,88510/12/2110 5.750% 458,000 510,158
Total 18,705,067
Norway 0.0%Equinor ASA09/23/2027 7.250% 400,000 529,17011/18/2049 3.250% 545,000 534,375
Total 1,063,545
Panama 0.0%Banco Nacional de Panama(a)
08/11/2030 2.500% 1,500,000 1,392,035Panama Government International Bond04/16/2050 4.500% 275,000 303,709
Total 1,695,744
Paraguay 0.1%Paraguay Government International Bond(a)
01/29/2033 2.739% 1,014,000 973,44003/30/2050 5.400% 1,548,000 1,735,988
Total 2,709,428
Peru 0.2%Peruvian Government International Bond01/23/2026 2.392% 1,548,000 1,593,90801/23/2031 2.783% 3,514,000 3,517,65703/11/2041 3.300% 1,936,000 1,885,97511/18/2050 5.625% 98,000 130,302
Foreign Government Obligations(k) (continued)
IssuerCoupon
Rate
PrincipalAmount
($) Value ($)
Municipal Bonds 0.3%
Issue DescriptionCoupon
Rate
PrincipalAmount
($) Value ($)
Copyright © 2021 www.secdatabase.com. All Rights Reserved.Please Consider the Environment Before Printing This Document
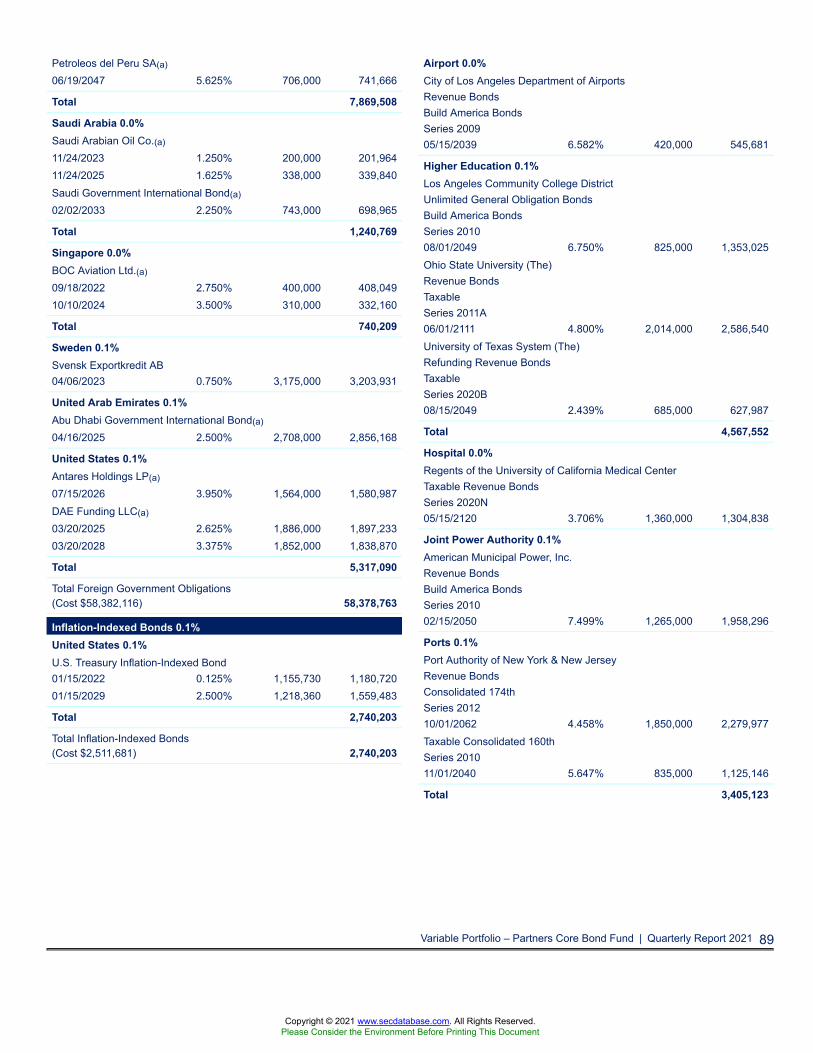
Variable Portfolio – Partners Core Bond Fund | Quarterly Report 2021 89
Petroleos del Peru SA(a)
06/19/2047 5.625% 706,000 741,666
Total 7,869,508
Saudi Arabia 0.0%Saudi Arabian Oil Co.(a)
11/24/2023 1.250% 200,000 201,96411/24/2025 1.625% 338,000 339,840Saudi Government International Bond(a)
02/02/2033 2.250% 743,000 698,965
Total 1,240,769
Singapore 0.0%BOC Aviation Ltd.(a)
09/18/2022 2.750% 400,000 408,04910/10/2024 3.500% 310,000 332,160
Total 740,209
Sweden 0.1%Svensk Exportkredit AB04/06/2023 0.750% 3,175,000 3,203,931
United Arab Emirates 0.1%Abu Dhabi Government International Bond(a)
04/16/2025 2.500% 2,708,000 2,856,168
United States 0.1%Antares Holdings LP(a)
07/15/2026 3.950% 1,564,000 1,580,987DAE Funding LLC(a)
03/20/2025 2.625% 1,886,000 1,897,23303/20/2028 3.375% 1,852,000 1,838,870
Total 5,317,090
Total Foreign Government Obligations(Cost $58,382,116) 58,378,763
Inflation-Indexed Bonds 0.1%United States 0.1%U.S. Treasury Inflation-Indexed Bond01/15/2022 0.125% 1,155,730 1,180,72001/15/2029 2.500% 1,218,360 1,559,483
Total 2,740,203
Total Inflation-Indexed Bonds(Cost $2,511,681) 2,740,203
Airport 0.0%City of Los Angeles Department of AirportsRevenue BondsBuild America BondsSeries 200905/15/2039 6.582% 420,000 545,681
Higher Education 0.1%Los Angeles Community College DistrictUnlimited General Obligation BondsBuild America BondsSeries 201008/01/2049 6.750% 825,000 1,353,025Ohio State University (The)Revenue BondsTaxableSeries 2011A06/01/2111 4.800% 2,014,000 2,586,540University of Texas System (The)Refunding Revenue BondsTaxableSeries 2020B08/15/2049 2.439% 685,000 627,987
Total 4,567,552
Hospital 0.0%Regents of the University of California Medical CenterTaxable Revenue BondsSeries 2020N05/15/2120 3.706% 1,360,000 1,304,838
Joint Power Authority 0.1%American Municipal Power, Inc.Revenue BondsBuild America BondsSeries 201002/15/2050 7.499% 1,265,000 1,958,296
Ports 0.1%Port Authority of New York & New JerseyRevenue BondsConsolidated 174thSeries 201210/01/2062 4.458% 1,850,000 2,279,977Taxable Consolidated 160thSeries 201011/01/2040 5.647% 835,000 1,125,146
Total 3,405,123
Copyright © 2021 www.secdatabase.com. All Rights Reserved.Please Consider the Environment Before Printing This Document
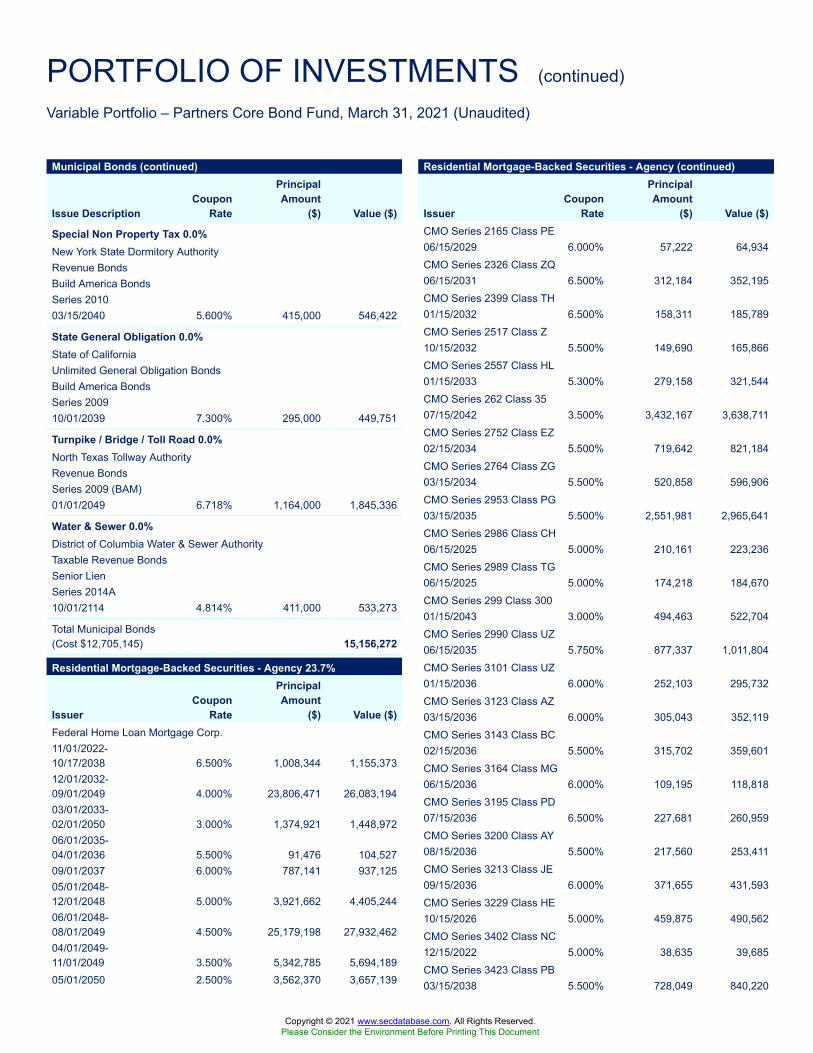
PORTFOLIO OF INVESTMENTS (continued)
Variable Portfolio – Partners Core Bond Fund, March 31, 2021 (Unaudited)
Municipal Bonds (continued)
Issue DescriptionCoupon
Rate
PrincipalAmount
($) Value ($)
Special Non Property Tax 0.0%New York State Dormitory AuthorityRevenue BondsBuild America BondsSeries 201003/15/2040 5.600% 415,000 546,422
State General Obligation 0.0%State of CaliforniaUnlimited General Obligation BondsBuild America BondsSeries 200910/01/2039 7.300% 295,000 449,751
Turnpike / Bridge / Toll Road 0.0%North Texas Tollway AuthorityRevenue BondsSeries 2009 (BAM)01/01/2049 6.718% 1,164,000 1,845,336
Water & Sewer 0.0%District of Columbia Water & Sewer AuthorityTaxable Revenue BondsSenior LienSeries 2014A10/01/2114 4.814% 411,000 533,273
Total Municipal Bonds(Cost $12,705,145) 15,156,272
Residential Mortgage-Backed Securities - Agency 23.7%
IssuerCoupon
Rate
PrincipalAmount
($) Value ($)Federal Home Loan Mortgage Corp.11/01/2022-10/17/2038 6.500% 1,008,344 1,155,37312/01/2032-09/01/2049 4.000% 23,806,471 26,083,19403/01/2033-02/01/2050 3.000% 1,374,921 1,448,97206/01/2035-04/01/2036 5.500% 91,476 104,52709/01/2037 6.000% 787,141 937,12505/01/2048-12/01/2048 5.000% 3,921,662 4,405,24406/01/2048-08/01/2049 4.500% 25,179,198 27,932,46204/01/2049-11/01/2049 3.500% 5,342,785 5,694,18905/01/2050 2.500% 3,562,370 3,657,139
Residential Mortgage-Backed Securities - Agency (continued)
IssuerCoupon
Rate
PrincipalAmount
($) Value ($)CMO Series 2165 Class PE06/15/2029 6.000% 57,222 64,934CMO Series 2326 Class ZQ06/15/2031 6.500% 312,184 352,195CMO Series 2399 Class TH01/15/2032 6.500% 158,311 185,789CMO Series 2517 Class Z10/15/2032 5.500% 149,690 165,866CMO Series 2557 Class HL01/15/2033 5.300% 279,158 321,544CMO Series 262 Class 3507/15/2042 3.500% 3,432,167 3,638,711CMO Series 2752 Class EZ02/15/2034 5.500% 719,642 821,184CMO Series 2764 Class ZG03/15/2034 5.500% 520,858 596,906CMO Series 2953 Class PG03/15/2035 5.500% 2,551,981 2,965,641CMO Series 2986 Class CH06/15/2025 5.000% 210,161 223,236CMO Series 2989 Class TG06/15/2025 5.000% 174,218 184,670CMO Series 299 Class 30001/15/2043 3.000% 494,463 522,704CMO Series 2990 Class UZ06/15/2035 5.750% 877,337 1,011,804CMO Series 3101 Class UZ01/15/2036 6.000% 252,103 295,732CMO Series 3123 Class AZ03/15/2036 6.000% 305,043 352,119CMO Series 3143 Class BC02/15/2036 5.500% 315,702 359,601CMO Series 3164 Class MG06/15/2036 6.000% 109,195 118,818CMO Series 3195 Class PD07/15/2036 6.500% 227,681 260,959CMO Series 3200 Class AY08/15/2036 5.500% 217,560 253,411CMO Series 3213 Class JE09/15/2036 6.000% 371,655 431,593CMO Series 3229 Class HE10/15/2026 5.000% 459,875 490,562CMO Series 3402 Class NC12/15/2022 5.000% 38,635 39,685CMO Series 3423 Class PB03/15/2038 5.500% 728,049 840,220
Copyright © 2021 www.secdatabase.com. All Rights Reserved.Please Consider the Environment Before Printing This Document
90 Variable Portfolio – Partners Core Bond Fund | Quarterly Report 2021
PORTFOLIO OF INVESTMENTS (continued)
Variable Portfolio – Partners Core Bond Fund, March 31, 2021 (Unaudited)
CMO Series 2017-4742 Class PA10/15/2047 3.000% 2,779,001 2,909,910CMO Series 2127 Class PG02/15/2029 6.250% 148,841 163,123
Residential Mortgage-Backed Securities - Agency (continued)
IssuerCoupon
Rate
PrincipalAmount
($) Value ($)CMO Series 3453 Class B05/15/2038 5.500% 17,117 19,493CMO Series 3461 Class Z06/15/2038 6.000% 1,319,985 1,525,520CMO Series 3501 Class CB01/15/2039 5.500% 287,213 331,376CMO Series 3684 Class CY06/15/2025 4.500% 894,018 946,502CMO Series 3704 Class CT12/15/2036 7.000% 459,515 555,382CMO Series 3704 Class DT11/15/2036 7.500% 449,293 548,326CMO Series 3704 Class ET12/15/2036 7.500% 319,151 393,606CMO Series 3707 Class B08/15/2025 4.500% 1,221,051 1,274,393CMO Series 3819 Class ZQ04/15/2036 6.000% 491,351 580,368CMO Series 3890 Class ME07/15/2041 5.000% 1,000,000 1,176,838CMO Series 4015 Class MY03/15/2042 3.500% 2,000,000 2,168,912CMO Series 4177 Class MQ03/15/2043 2.500% 1,000,000 1,009,900CMO Series 4205 Class PA05/15/2043 1.750% 3,079,225 3,149,236CMO Series 4217 Class KY06/15/2043 3.000% 1,200,000 1,257,474CMO Series 4240 Class B08/15/2033 3.000% 2,000,000 2,159,859CMO Series 4426 Class QC07/15/2037 1.750% 1,479,807 1,533,021CMO Series 4705 Class A09/15/2042 4.500% 401,996 409,677CMO Series 4763 Class CA09/15/2038 3.000% 365,741 392,948CMO Series 4767 Class KA
Residential Mortgage-Backed Securities - Agency (continued)
IssuerCoupon
Rate
PrincipalAmount
($) Value ($)CMO STRIPS Series 264 Class 3007/15/2042 3.000% 392,794 404,493Federal Home Loan Mortgage Corp.(b)
1-year CMT + 2.250%Cap 10.243%07/01/2036 2.596% 51,433 54,75512-month USD LIBOR +1.849%Cap 9.108%07/01/2040 2.547% 151,849 160,31612-month USD LIBOR +1.641%Cap 7.828%05/01/2049 2.827% 1,717,152 1,792,851CMO Series 2551 Class NS-1.8 x 1-month USDLIBOR + 14.483%Cap 14.483%01/15/2033 14.289% 98,847 129,972CMO Series 3852 Class QN-3.6 x 1-month USDLIBOR + 27.211%Cap 5.500%05/15/2041 5.500% 302,024 321,268CMO Series 3966 Class BF1-month USD LIBOR +0.500%Floor 0.500%, Cap7.000%10/15/2040 0.606% 283,255 284,361CMO Series 4048 Class FJ1-month USD LIBOR +0.400%Floor 0.400%, Cap9,999.000%07/15/2037 0.515% 528,469 527,359CMO Series 4846 Class PF
Copyright © 2021 www.secdatabase.com. All Rights Reserved.Please Consider the Environment Before Printing This Document
Variable Portfolio – Partners Core Bond Fund | Quarterly Report 2021 91
PORTFOLIO OF INVESTMENTS (continued)
Variable Portfolio – Partners Core Bond Fund, March 31, 2021 (Unaudited)
03/15/2048 3.000% 491,928 528,687CMO Series 4838 Class KZ09/15/2048 4.000% 5,326,036 5,593,132CMO Series 4880 Class DA05/15/2050 3.000% 1,928,577 2,055,108CMO Series R006 Class ZA04/15/2036 6.000% 373,695 442,027CMO Series R007 Class ZA05/15/2036 6.000% 716,044 832,175
1-month USD LIBOR +0.350%Floor 0.350%, Cap6.500%12/15/2048 0.456% 365,334 367,898Structured Pass-Through Securities1-year MTA + 1.200%Floor 1.200%10/25/2044 1.348% 509,295 516,749Federal Home Loan Mortgage Corp.(l)CMO Series 3077 Class TO04/15/2035 0.000% 83,606 81,307CMO Series 3100 Class01/15/2036 0.000% 130,070 120,486CMO Series 3117 Class OG02/15/2036 0.000% 64,554 60,333CMO Series 3181 Class OH07/15/2036 0.000% 269,146 241,494CMO Series 3316 Class JO05/15/2037 0.000% 11,014 10,260CMO Series 3607 Class TO10/15/2039 0.000% 230,279 208,441
Residential Mortgage-Backed Securities - Agency (continued)
IssuerCoupon
Rate
PrincipalAmount
($) Value ($)CMO STRIPS Series 197 Class04/01/2028 0.000% 112,722 108,528CMO STRIPS Series 310 Class09/15/2043 0.000% 1,408,196 1,209,900Federal Home Loan Mortgage Corp.(b),(g)
CMO Series 3380 Class SI-1.0 x 1-month USDLIBOR + 6.370%Cap 6.370%10/15/2037 6.264% 1,905,763 428,531CMO Series 3385 Class SN-1.0 x 1-month USDLIBOR + 6.000%Cap 6.000%11/15/2037 5.894% 37,891 5,772CMO Series 3451 Class SA-1.0 x 1-month USDLIBOR + 6.050%Cap 6.050%05/15/2038 5.944% 65,019 8,226CMO Series 3531 Class SM
Residential Mortgage-Backed Securities - Agency (continued)
IssuerCoupon
Rate
PrincipalAmount
($) Value ($)CMO Series 4272 Class W04/15/2040 5.653% 1,797,445 2,038,555Federal Home Loan Mortgage Corp.(g)
CMO Series 3714 Class IP08/15/2040 5.000% 322,435 32,866CMO Series 3800 Class AI11/15/2029 4.000% 21,392 2Federal Home Loan Mortgage Corp.(c),(g)
CMO Series 3802 Class LS01/15/2040 2.338% 485,334 22,958Federal Home Loan Mortgage Corp.(d),(f)
CMO Series 5091 Class AB03/25/2051 1.500% 5,359,000 5,364,024CMO Series 5092 Class DT11/25/2049 1.500% 5,400,000 5,447,672Federal National Mortgage Association05/01/2022 7.500% 2,121 2,13501/01/2023-11/01/2048 6.000% 569,464 640,656
Copyright © 2021 www.secdatabase.com. All Rights Reserved.Please Consider the Environment Before Printing This Document
92 Variable Portfolio – Partners Core Bond Fund | Quarterly Report 2021
PORTFOLIO OF INVESTMENTS (continued)
Variable Portfolio – Partners Core Bond Fund, March 31, 2021 (Unaudited)
-1.0 x 1-month USDLIBOR + 6.100%Cap 6.100%05/15/2039 5.994% 47,631 8,073CMO Series 3608 Class SC-1.0 x 1-month USDLIBOR + 6.250%Cap 6.250%12/15/2039 6.144% 261,587 41,904CMO Series 3740 Class SB-1.0 x 1-month USDLIBOR + 6.000%Cap 6.000%10/15/2040 5.894% 309,073 47,079CMO Series 3740 Class SC-1.0 x 1-month USDLIBOR + 6.000%Cap 6.000%10/15/2040 5.894% 423,182 81,312CMO STRIPS Series 239 Class S30-1.0 x 1-month USDLIBOR + 7.700%Cap 7.700%08/15/2036 7.594% 280,720 69,958Federal Home Loan Mortgage Corp.(c)
CMO Series 3688 Class CU11/15/2021 6.744% 2,199 2,212CMO Series 3688 Class GT11/15/2046 7.400% 324,672 386,662
02/01/2024-10/01/2038 6.500% 1,903,294 2,228,44205/01/2033-03/01/2060 3.500% 31,130,623 33,695,83209/01/2033-12/01/2049 4.000% 44,538,162 48,854,35011/01/2033-06/01/2049 5.500% 5,707,125 6,569,10705/01/2034-01/01/2059 4.500% 44,870,468 50,410,96412/01/2035-10/01/2050 2.500% 56,013,093 58,324,99301/01/2036-11/01/2049 5.000% 33,281,835 37,804,97102/01/2036 2.000% 2,367,306 2,430,86911/01/2037-01/01/2039 7.000% 499,736 601,93201/01/2043-08/01/2050 3.000% 29,229,017 30,709,251CMO Series 1999-7 Class AB03/25/2029 6.000% 129,788 146,876CMO Series 2001-60 Class PX11/25/2031 6.000% 168,569 194,596CMO Series 2002-50 Class ZA05/25/2031 6.000% 581,129 658,085CMO Series 2002-78 Class Z12/25/2032 5.500% 213,650 247,089CMO Series 2003-W19 Class 1A711/25/2033 5.620% 2,484,741 2,826,466CMO Series 2004-50 Class VZ07/25/2034 5.500% 914,282 1,041,052
Residential Mortgage-Backed Securities - Agency (continued)
IssuerCoupon
Rate
PrincipalAmount
($) Value ($)CMO Series 2004-65 Class LT08/25/2024 4.500% 92,274 96,332CMO Series 2004-W10 Class A608/25/2034 5.750% 1,736,116 1,901,257CMO Series 2005-121 Class DX01/25/2026 5.500% 224,627 239,420CMO Series 2006-105 Class ME11/25/2036 5.500% 575,019 664,894CMO Series 2006-16 Class HZ03/25/2036 5.500% 638,945 732,718CMO Series 2006-W3 Class 2A
Residential Mortgage-Backed Securities - Agency (continued)
IssuerCoupon
Rate
PrincipalAmount
($) Value ($)CMO Series 2011-46 Class B05/25/2026 3.000% 2,722,007 2,843,811CMO Series 2011-59 Class NZ07/25/2041 5.500% 1,322,657 1,481,554CMO Series 2012-151 Class NX01/25/2043 1.500% 1,107,202 1,133,170CMO Series 2012-66 Class CB06/25/2032 3.000% 3,000,000 3,250,110CMO Series 2013-100 Class WB10/25/2033 3.000% 3,000,000 3,177,920CMO Series 2013-101 Class E
Copyright © 2021 www.secdatabase.com. All Rights Reserved.Please Consider the Environment Before Printing This Document
Variable Portfolio – Partners Core Bond Fund | Quarterly Report 2021 93
PORTFOLIO OF INVESTMENTS (continued)
Variable Portfolio – Partners Core Bond Fund, March 31, 2021 (Unaudited)
09/25/2046 6.000% 185,048 208,526CMO Series 2007-104 Class ZE08/25/2037 6.000% 161,077 185,518CMO Series 2007-116 Class PB08/25/2035 5.500% 178,012 206,702CMO Series 2007-18 Class MZ03/25/2037 6.000% 238,014 266,780CMO Series 2007-42 Class B05/25/2037 6.000% 170,351 197,303CMO Series 2007-76 Class ZG08/25/2037 6.000% 354,515 411,128CMO Series 2008-80 Class GP09/25/2038 6.250% 27,420 31,582CMO Series 2009-59 Class HB08/25/2039 5.000% 370,781 421,056CMO Series 2009-60 Class HT08/25/2039 6.000% 378,207 442,940CMO Series 2009-79 Class UA03/25/2038 7.000% 30,773 35,045CMO Series 2009-W1 Class A12/25/2049 6.000% 794,853 916,066CMO Series 2010-111 Class AM10/25/2040 5.500% 1,249,838 1,474,209CMO Series 2010-2 Class LC02/25/2040 5.000% 1,200,000 1,396,682CMO Series 2011-118 Class MT11/25/2041 7.000% 546,561 652,848CMO Series 2011-118 Class NT11/25/2041 7.000% 618,550 731,818CMO Series 2011-31 Class DB04/25/2031 3.500% 2,415,513 2,612,204CMO Series 2011-39 Class ZA11/25/2032 6.000% 271,825 314,723CMO Series 2011-44 Class EB05/25/2026 3.000% 1,215,034 1,267,860
10/25/2033 3.000% 3,000,000 3,142,623CMO Series 2013-108 Class GU10/25/2033 3.000% 2,575,000 2,779,152CMO Series 2013-30 Class CA04/25/2043 1.500% 340,521 344,846CMO Series 2013-43 Class BP05/25/2043 1.750% 3,973,241 4,100,077CMO Series 2013-59 Class PY06/25/2043 2.500% 1,000,000 1,013,864CMO Series 2013-81 Class TA02/25/2043 3.000% 2,500,000 2,553,472CMO Series 2013-90 Class DL09/25/2033 3.500% 1,500,000 1,663,233CMO Series 2014-73 Class MA11/25/2044 2.500% 898,294 950,943CMO Series 2015-84 Class PA08/25/2033 1.700% 3,750,024 3,878,911CMO Series 2016-48 Class MA06/25/2038 2.000% 3,532,834 3,679,518CMO Series 2016-57 Class PC06/25/2046 1.750% 7,439,671 7,711,332CMO Series 2017-13 Class PA08/25/2046 3.000% 52,194 55,305CMO Series 2017-42 Class H11/25/2043 3.000% 852,280 882,033CMO Series 2018-14 Class KC03/25/2048 3.000% 110,413 118,161CMO Series 2018-15 Class AB03/25/2048 3.000% 58,774 63,069CMO Series 2018-8 Class KL03/25/2047 2.500% 1,485,904 1,550,749CMO Series 2019-25 Class PA05/25/2048 3.000% 2,990,414 3,220,242CMO Series 2019-35 Class A07/25/2049 3.000% 1,011,022 1,072,060
Residential Mortgage-Backed Securities - Agency (continued)
IssuerCoupon
Rate
PrincipalAmount
($) Value ($)CMO Series 2019-8 Class GA03/25/2049 3.000% 6,837,504 7,172,995CMO Series 2020-48 Class AB07/25/2050 2.000% 2,157,543 2,211,344CMO Series 2020-48 Class DA07/25/2050 2.000% 7,910,469 8,058,540
Residential Mortgage-Backed Securities - Agency (continued)
IssuerCoupon
Rate
PrincipalAmount
($) Value ($)CMO Series 2010-35 Class SJ-3.3 x 1-month USDLIBOR + 17.667%Cap 17.667%04/25/2040 17.305% 325,895 432,665CMO Series 2010-49 Class SC
Copyright © 2021 www.secdatabase.com. All Rights Reserved.Please Consider the Environment Before Printing This Document
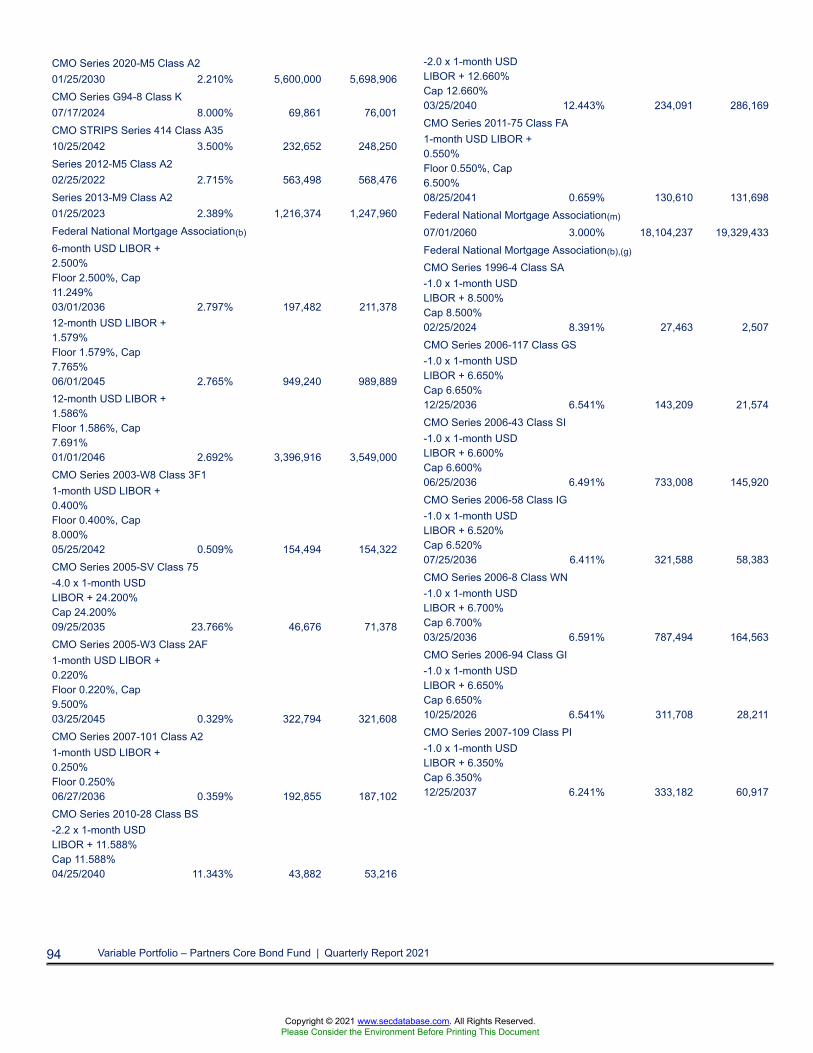
94 Variable Portfolio – Partners Core Bond Fund | Quarterly Report 2021
CMO Series 2020-M5 Class A201/25/2030 2.210% 5,600,000 5,698,906CMO Series G94-8 Class K07/17/2024 8.000% 69,861 76,001CMO STRIPS Series 414 Class A3510/25/2042 3.500% 232,652 248,250Series 2012-M5 Class A202/25/2022 2.715% 563,498 568,476Series 2013-M9 Class A201/25/2023 2.389% 1,216,374 1,247,960Federal National Mortgage Association(b)
6-month USD LIBOR +2.500%Floor 2.500%, Cap11.249%03/01/2036 2.797% 197,482 211,37812-month USD LIBOR +1.579%Floor 1.579%, Cap7.765%06/01/2045 2.765% 949,240 989,88912-month USD LIBOR +1.586%Floor 1.586%, Cap7.691%01/01/2046 2.692% 3,396,916 3,549,000CMO Series 2003-W8 Class 3F11-month USD LIBOR +0.400%Floor 0.400%, Cap8.000%05/25/2042 0.509% 154,494 154,322CMO Series 2005-SV Class 75-4.0 x 1-month USDLIBOR + 24.200%Cap 24.200%09/25/2035 23.766% 46,676 71,378CMO Series 2005-W3 Class 2AF1-month USD LIBOR +0.220%Floor 0.220%, Cap9.500%03/25/2045 0.329% 322,794 321,608CMO Series 2007-101 Class A21-month USD LIBOR +0.250%Floor 0.250%06/27/2036 0.359% 192,855 187,102CMO Series 2010-28 Class BS-2.2 x 1-month USDLIBOR + 11.588%Cap 11.588%04/25/2040 11.343% 43,882 53,216
-2.0 x 1-month USDLIBOR + 12.660%Cap 12.660%03/25/2040 12.443% 234,091 286,169CMO Series 2011-75 Class FA1-month USD LIBOR +0.550%Floor 0.550%, Cap6.500%08/25/2041 0.659% 130,610 131,698Federal National Mortgage Association(m)
07/01/2060 3.000% 18,104,237 19,329,433Federal National Mortgage Association(b),(g)
CMO Series 1996-4 Class SA-1.0 x 1-month USDLIBOR + 8.500%Cap 8.500%02/25/2024 8.391% 27,463 2,507CMO Series 2006-117 Class GS-1.0 x 1-month USDLIBOR + 6.650%Cap 6.650%12/25/2036 6.541% 143,209 21,574CMO Series 2006-43 Class SI-1.0 x 1-month USDLIBOR + 6.600%Cap 6.600%06/25/2036 6.491% 733,008 145,920CMO Series 2006-58 Class IG-1.0 x 1-month USDLIBOR + 6.520%Cap 6.520%07/25/2036 6.411% 321,588 58,383CMO Series 2006-8 Class WN-1.0 x 1-month USDLIBOR + 6.700%Cap 6.700%03/25/2036 6.591% 787,494 164,563CMO Series 2006-94 Class GI-1.0 x 1-month USDLIBOR + 6.650%Cap 6.650%10/25/2026 6.541% 311,708 28,211CMO Series 2007-109 Class PI-1.0 x 1-month USDLIBOR + 6.350%Cap 6.350%12/25/2037 6.241% 333,182 60,917
Copyright © 2021 www.secdatabase.com. All Rights Reserved.Please Consider the Environment Before Printing This Document
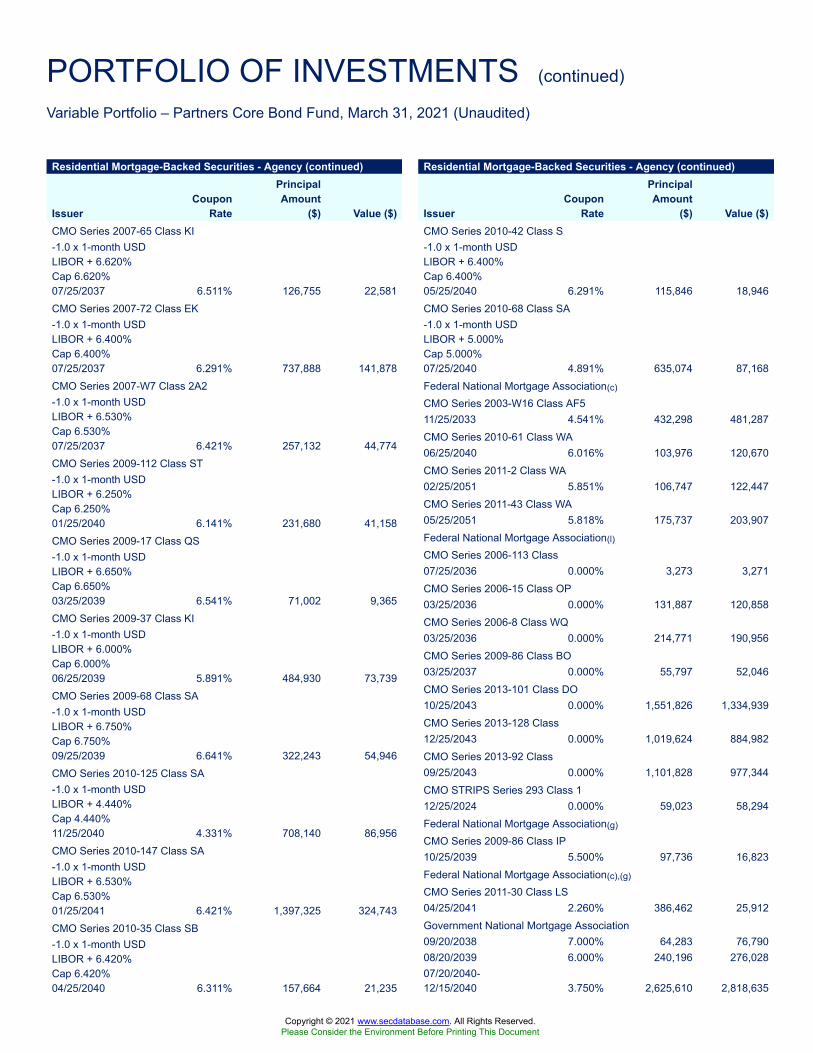
PORTFOLIO OF INVESTMENTS (continued)
Variable Portfolio – Partners Core Bond Fund, March 31, 2021 (Unaudited)
Residential Mortgage-Backed Securities - Agency (continued)
IssuerCoupon
Rate
PrincipalAmount
($) Value ($)CMO Series 2007-65 Class KI-1.0 x 1-month USDLIBOR + 6.620%Cap 6.620%07/25/2037 6.511% 126,755 22,581CMO Series 2007-72 Class EK-1.0 x 1-month USDLIBOR + 6.400%Cap 6.400%07/25/2037 6.291% 737,888 141,878CMO Series 2007-W7 Class 2A2-1.0 x 1-month USDLIBOR + 6.530%Cap 6.530%07/25/2037 6.421% 257,132 44,774CMO Series 2009-112 Class ST-1.0 x 1-month USDLIBOR + 6.250%Cap 6.250%01/25/2040 6.141% 231,680 41,158CMO Series 2009-17 Class QS-1.0 x 1-month USDLIBOR + 6.650%Cap 6.650%03/25/2039 6.541% 71,002 9,365CMO Series 2009-37 Class KI-1.0 x 1-month USDLIBOR + 6.000%Cap 6.000%06/25/2039 5.891% 484,930 73,739CMO Series 2009-68 Class SA-1.0 x 1-month USDLIBOR + 6.750%Cap 6.750%09/25/2039 6.641% 322,243 54,946CMO Series 2010-125 Class SA-1.0 x 1-month USDLIBOR + 4.440%Cap 4.440%11/25/2040 4.331% 708,140 86,956CMO Series 2010-147 Class SA-1.0 x 1-month USDLIBOR + 6.530%Cap 6.530%01/25/2041 6.421% 1,397,325 324,743CMO Series 2010-35 Class SB-1.0 x 1-month USDLIBOR + 6.420%Cap 6.420%04/25/2040 6.311% 157,664 21,235
Residential Mortgage-Backed Securities - Agency (continued)
IssuerCoupon
Rate
PrincipalAmount
($) Value ($)CMO Series 2010-42 Class S-1.0 x 1-month USDLIBOR + 6.400%Cap 6.400%05/25/2040 6.291% 115,846 18,946CMO Series 2010-68 Class SA-1.0 x 1-month USDLIBOR + 5.000%Cap 5.000%07/25/2040 4.891% 635,074 87,168Federal National Mortgage Association(c)
CMO Series 2003-W16 Class AF511/25/2033 4.541% 432,298 481,287CMO Series 2010-61 Class WA06/25/2040 6.016% 103,976 120,670CMO Series 2011-2 Class WA02/25/2051 5.851% 106,747 122,447CMO Series 2011-43 Class WA05/25/2051 5.818% 175,737 203,907Federal National Mortgage Association(l)
CMO Series 2006-113 Class07/25/2036 0.000% 3,273 3,271CMO Series 2006-15 Class OP03/25/2036 0.000% 131,887 120,858CMO Series 2006-8 Class WQ03/25/2036 0.000% 214,771 190,956CMO Series 2009-86 Class BO03/25/2037 0.000% 55,797 52,046CMO Series 2013-101 Class DO10/25/2043 0.000% 1,551,826 1,334,939CMO Series 2013-128 Class12/25/2043 0.000% 1,019,624 884,982CMO Series 2013-92 Class09/25/2043 0.000% 1,101,828 977,344CMO STRIPS Series 293 Class 112/25/2024 0.000% 59,023 58,294Federal National Mortgage Association(g)
CMO Series 2009-86 Class IP10/25/2039 5.500% 97,736 16,823Federal National Mortgage Association(c),(g)
CMO Series 2011-30 Class LS04/25/2041 2.260% 386,462 25,912Government National Mortgage Association09/20/2038 7.000% 64,283 76,79008/20/2039 6.000% 240,196 276,02807/20/2040-12/15/2040 3.750% 2,625,610 2,818,635
Copyright © 2021 www.secdatabase.com. All Rights Reserved.Please Consider the Environment Before Printing This Document
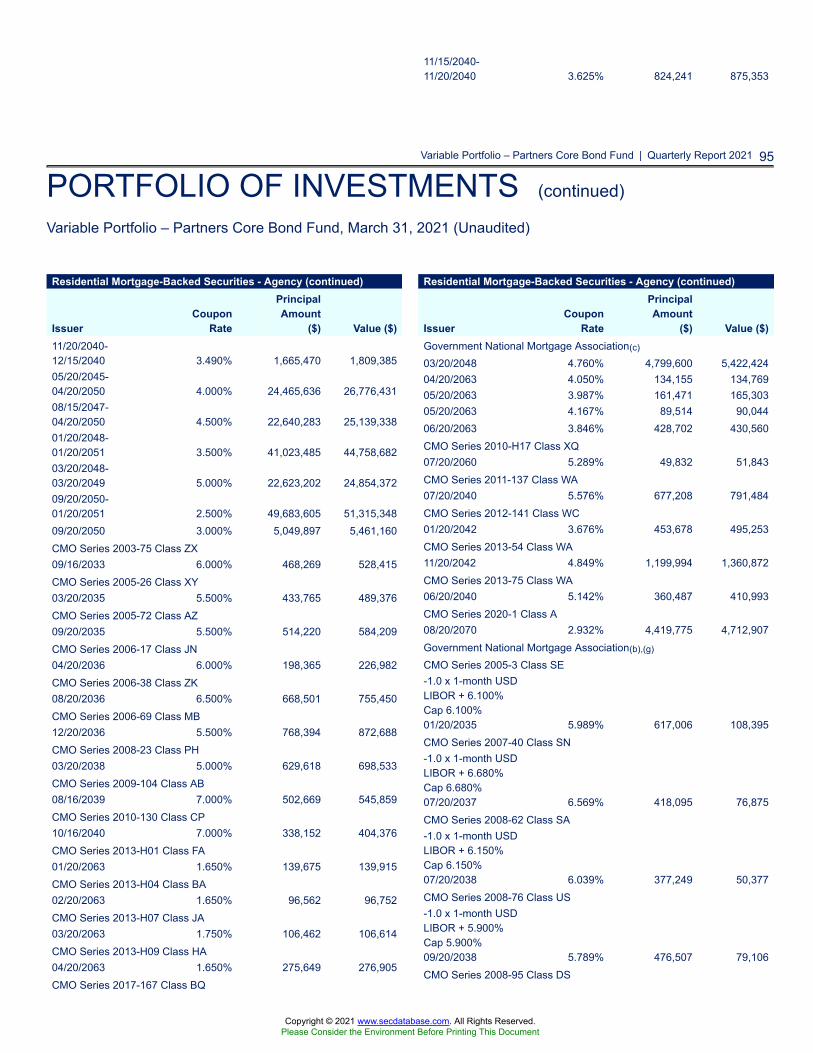
Variable Portfolio – Partners Core Bond Fund | Quarterly Report 2021 95
PORTFOLIO OF INVESTMENTS (continued)
Variable Portfolio – Partners Core Bond Fund, March 31, 2021 (Unaudited)
11/15/2040-11/20/2040 3.625% 824,241 875,353
Residential Mortgage-Backed Securities - Agency (continued)
IssuerCoupon
Rate
PrincipalAmount
($) Value ($)11/20/2040-12/15/2040 3.490% 1,665,470 1,809,38505/20/2045-04/20/2050 4.000% 24,465,636 26,776,43108/15/2047-04/20/2050 4.500% 22,640,283 25,139,33801/20/2048-01/20/2051 3.500% 41,023,485 44,758,68203/20/2048-03/20/2049 5.000% 22,623,202 24,854,37209/20/2050-01/20/2051 2.500% 49,683,605 51,315,34809/20/2050 3.000% 5,049,897 5,461,160CMO Series 2003-75 Class ZX09/16/2033 6.000% 468,269 528,415CMO Series 2005-26 Class XY03/20/2035 5.500% 433,765 489,376CMO Series 2005-72 Class AZ09/20/2035 5.500% 514,220 584,209CMO Series 2006-17 Class JN04/20/2036 6.000% 198,365 226,982CMO Series 2006-38 Class ZK08/20/2036 6.500% 668,501 755,450CMO Series 2006-69 Class MB12/20/2036 5.500% 768,394 872,688CMO Series 2008-23 Class PH03/20/2038 5.000% 629,618 698,533CMO Series 2009-104 Class AB08/16/2039 7.000% 502,669 545,859CMO Series 2010-130 Class CP10/16/2040 7.000% 338,152 404,376CMO Series 2013-H01 Class FA01/20/2063 1.650% 139,675 139,915CMO Series 2013-H04 Class BA02/20/2063 1.650% 96,562 96,752CMO Series 2013-H07 Class JA03/20/2063 1.750% 106,462 106,614CMO Series 2013-H09 Class HA04/20/2063 1.650% 275,649 276,905CMO Series 2017-167 Class BQ
Residential Mortgage-Backed Securities - Agency (continued)
IssuerCoupon
Rate
PrincipalAmount
($) Value ($)Government National Mortgage Association(c)
03/20/2048 4.760% 4,799,600 5,422,42404/20/2063 4.050% 134,155 134,76905/20/2063 3.987% 161,471 165,30305/20/2063 4.167% 89,514 90,04406/20/2063 3.846% 428,702 430,560CMO Series 2010-H17 Class XQ07/20/2060 5.289% 49,832 51,843CMO Series 2011-137 Class WA07/20/2040 5.576% 677,208 791,484CMO Series 2012-141 Class WC01/20/2042 3.676% 453,678 495,253CMO Series 2013-54 Class WA11/20/2042 4.849% 1,199,994 1,360,872CMO Series 2013-75 Class WA06/20/2040 5.142% 360,487 410,993CMO Series 2020-1 Class A08/20/2070 2.932% 4,419,775 4,712,907Government National Mortgage Association(b),(g)
CMO Series 2005-3 Class SE-1.0 x 1-month USDLIBOR + 6.100%Cap 6.100%01/20/2035 5.989% 617,006 108,395CMO Series 2007-40 Class SN-1.0 x 1-month USDLIBOR + 6.680%Cap 6.680%07/20/2037 6.569% 418,095 76,875CMO Series 2008-62 Class SA-1.0 x 1-month USDLIBOR + 6.150%Cap 6.150%07/20/2038 6.039% 377,249 50,377CMO Series 2008-76 Class US-1.0 x 1-month USDLIBOR + 5.900%Cap 5.900%09/20/2038 5.789% 476,507 79,106CMO Series 2008-95 Class DS
Copyright © 2021 www.secdatabase.com. All Rights Reserved.Please Consider the Environment Before Printing This Document
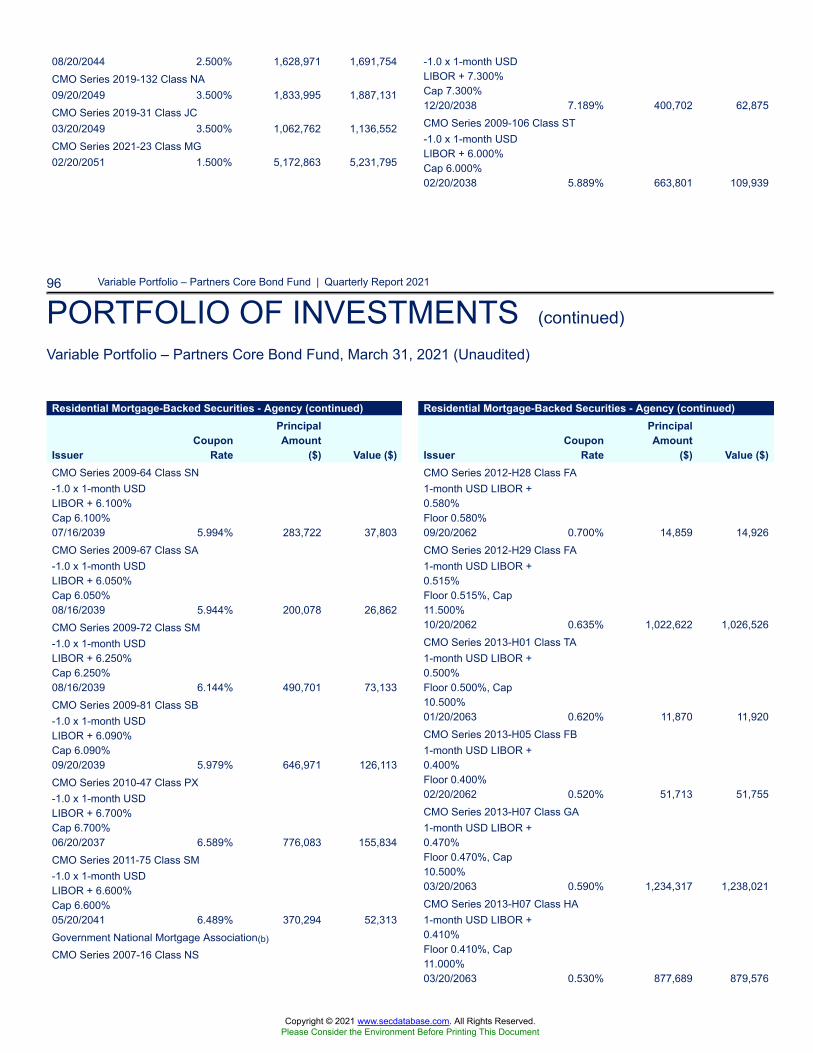
96 Variable Portfolio – Partners Core Bond Fund | Quarterly Report 2021
PORTFOLIO OF INVESTMENTS (continued)
Variable Portfolio – Partners Core Bond Fund, March 31, 2021 (Unaudited)
08/20/2044 2.500% 1,628,971 1,691,754CMO Series 2019-132 Class NA09/20/2049 3.500% 1,833,995 1,887,131CMO Series 2019-31 Class JC03/20/2049 3.500% 1,062,762 1,136,552CMO Series 2021-23 Class MG02/20/2051 1.500% 5,172,863 5,231,795
-1.0 x 1-month USDLIBOR + 7.300%Cap 7.300%12/20/2038 7.189% 400,702 62,875CMO Series 2009-106 Class ST-1.0 x 1-month USDLIBOR + 6.000%Cap 6.000%02/20/2038 5.889% 663,801 109,939
Residential Mortgage-Backed Securities - Agency (continued)
IssuerCoupon
Rate
PrincipalAmount
($) Value ($)CMO Series 2009-64 Class SN-1.0 x 1-month USDLIBOR + 6.100%Cap 6.100%07/16/2039 5.994% 283,722 37,803CMO Series 2009-67 Class SA-1.0 x 1-month USDLIBOR + 6.050%Cap 6.050%08/16/2039 5.944% 200,078 26,862CMO Series 2009-72 Class SM-1.0 x 1-month USDLIBOR + 6.250%Cap 6.250%08/16/2039 6.144% 490,701 73,133CMO Series 2009-81 Class SB-1.0 x 1-month USDLIBOR + 6.090%Cap 6.090%09/20/2039 5.979% 646,971 126,113CMO Series 2010-47 Class PX-1.0 x 1-month USDLIBOR + 6.700%Cap 6.700%06/20/2037 6.589% 776,083 155,834CMO Series 2011-75 Class SM-1.0 x 1-month USDLIBOR + 6.600%Cap 6.600%05/20/2041 6.489% 370,294 52,313Government National Mortgage Association(b)
CMO Series 2007-16 Class NS
Residential Mortgage-Backed Securities - Agency (continued)
IssuerCoupon
Rate
PrincipalAmount
($) Value ($)CMO Series 2012-H28 Class FA1-month USD LIBOR +0.580%Floor 0.580%09/20/2062 0.700% 14,859 14,926CMO Series 2012-H29 Class FA1-month USD LIBOR +0.515%Floor 0.515%, Cap11.500%10/20/2062 0.635% 1,022,622 1,026,526CMO Series 2013-H01 Class TA1-month USD LIBOR +0.500%Floor 0.500%, Cap10.500%01/20/2063 0.620% 11,870 11,920CMO Series 2013-H05 Class FB1-month USD LIBOR +0.400%Floor 0.400%02/20/2062 0.520% 51,713 51,755CMO Series 2013-H07 Class GA1-month USD LIBOR +0.470%Floor 0.470%, Cap10.500%03/20/2063 0.590% 1,234,317 1,238,021CMO Series 2013-H07 Class HA1-month USD LIBOR +0.410%Floor 0.410%, Cap11.000%03/20/2063 0.530% 877,689 879,576
Copyright © 2021 www.secdatabase.com. All Rights Reserved.Please Consider the Environment Before Printing This Document
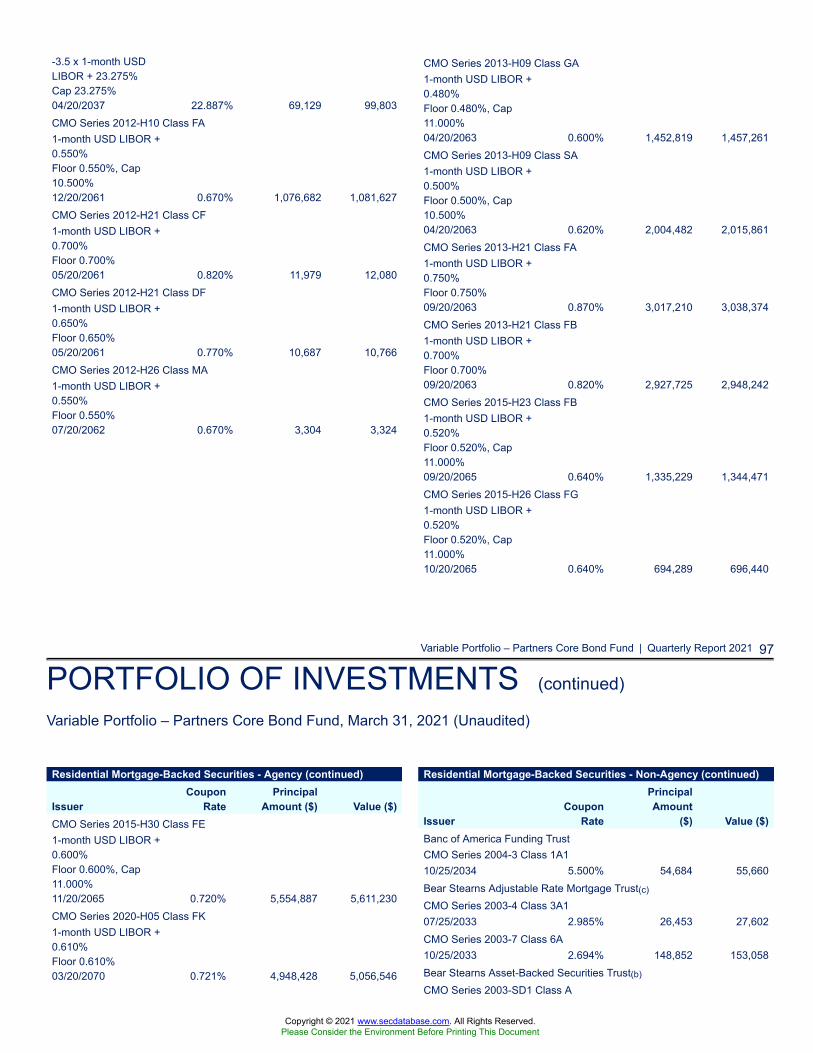
Variable Portfolio – Partners Core Bond Fund | Quarterly Report 2021 97
PORTFOLIO OF INVESTMENTS (continued)
Variable Portfolio – Partners Core Bond Fund, March 31, 2021 (Unaudited)
-3.5 x 1-month USDLIBOR + 23.275%Cap 23.275%04/20/2037 22.887% 69,129 99,803CMO Series 2012-H10 Class FA1-month USD LIBOR +0.550%Floor 0.550%, Cap10.500%12/20/2061 0.670% 1,076,682 1,081,627CMO Series 2012-H21 Class CF1-month USD LIBOR +0.700%Floor 0.700%05/20/2061 0.820% 11,979 12,080CMO Series 2012-H21 Class DF1-month USD LIBOR +0.650%Floor 0.650%05/20/2061 0.770% 10,687 10,766CMO Series 2012-H26 Class MA1-month USD LIBOR +0.550%Floor 0.550%07/20/2062 0.670% 3,304 3,324
CMO Series 2013-H09 Class GA1-month USD LIBOR +0.480%Floor 0.480%, Cap11.000%04/20/2063 0.600% 1,452,819 1,457,261CMO Series 2013-H09 Class SA1-month USD LIBOR +0.500%Floor 0.500%, Cap10.500%04/20/2063 0.620% 2,004,482 2,015,861CMO Series 2013-H21 Class FA1-month USD LIBOR +0.750%Floor 0.750%09/20/2063 0.870% 3,017,210 3,038,374CMO Series 2013-H21 Class FB1-month USD LIBOR +0.700%Floor 0.700%09/20/2063 0.820% 2,927,725 2,948,242CMO Series 2015-H23 Class FB1-month USD LIBOR +0.520%Floor 0.520%, Cap11.000%09/20/2065 0.640% 1,335,229 1,344,471CMO Series 2015-H26 Class FG1-month USD LIBOR +0.520%Floor 0.520%, Cap11.000%10/20/2065 0.640% 694,289 696,440
Residential Mortgage-Backed Securities - Agency (continued)
IssuerCoupon
RatePrincipal
Amount ($) Value ($)CMO Series 2015-H30 Class FE1-month USD LIBOR +0.600%Floor 0.600%, Cap11.000%11/20/2065 0.720% 5,554,887 5,611,230CMO Series 2020-H05 Class FK1-month USD LIBOR +0.610%Floor 0.610%03/20/2070 0.721% 4,948,428 5,056,546
Residential Mortgage-Backed Securities - Non-Agency (continued)
IssuerCoupon
Rate
PrincipalAmount
($) Value ($)Banc of America Funding TrustCMO Series 2004-3 Class 1A110/25/2034 5.500% 54,684 55,660Bear Stearns Adjustable Rate Mortgage Trust(c)
CMO Series 2003-4 Class 3A107/25/2033 2.985% 26,453 27,602CMO Series 2003-7 Class 6A10/25/2033 2.694% 148,852 153,058Bear Stearns Asset-Backed Securities Trust(b)
CMO Series 2003-SD1 Class A
Copyright © 2021 www.secdatabase.com. All Rights Reserved.Please Consider the Environment Before Printing This Document
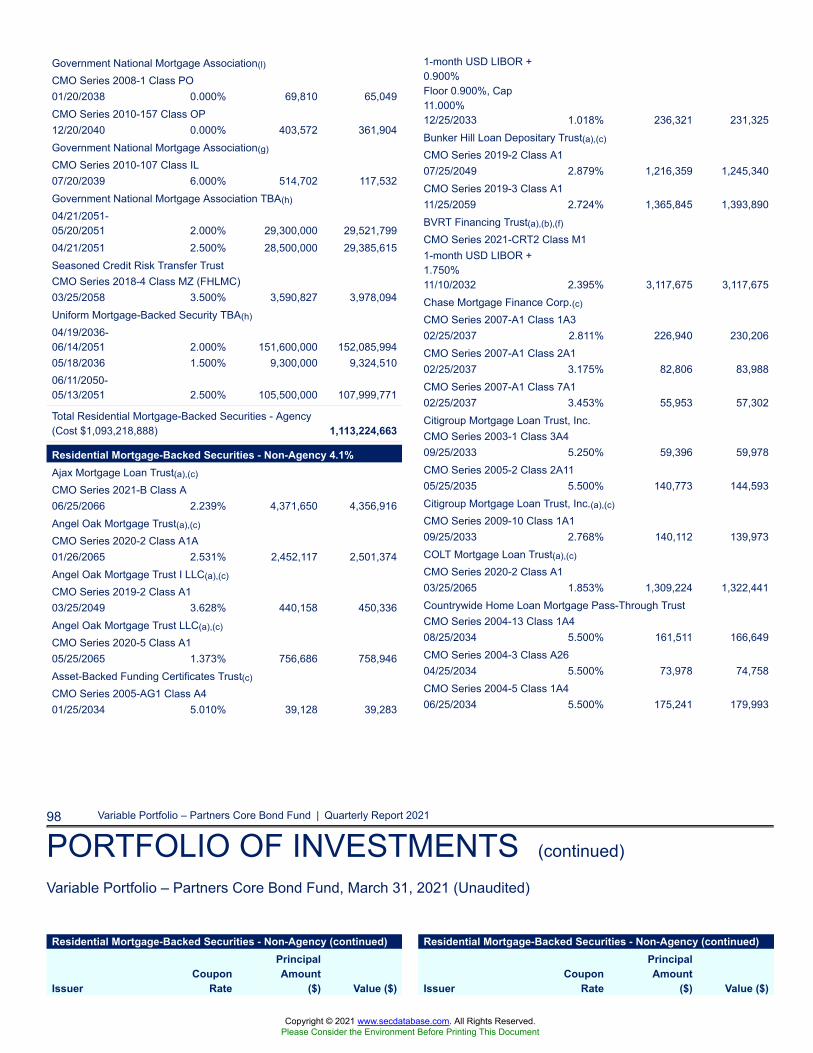
98 Variable Portfolio – Partners Core Bond Fund | Quarterly Report 2021
PORTFOLIO OF INVESTMENTS (continued)
Variable Portfolio – Partners Core Bond Fund, March 31, 2021 (Unaudited)
Government National Mortgage Association(l)
CMO Series 2008-1 Class PO01/20/2038 0.000% 69,810 65,049CMO Series 2010-157 Class OP12/20/2040 0.000% 403,572 361,904Government National Mortgage Association(g)
CMO Series 2010-107 Class IL07/20/2039 6.000% 514,702 117,532Government National Mortgage Association TBA(h)
04/21/2051-05/20/2051 2.000% 29,300,000 29,521,79904/21/2051 2.500% 28,500,000 29,385,615Seasoned Credit Risk Transfer TrustCMO Series 2018-4 Class MZ (FHLMC)03/25/2058 3.500% 3,590,827 3,978,094Uniform Mortgage-Backed Security TBA(h)
04/19/2036-06/14/2051 2.000% 151,600,000 152,085,99405/18/2036 1.500% 9,300,000 9,324,51006/11/2050-05/13/2051 2.500% 105,500,000 107,999,771
Total Residential Mortgage-Backed Securities - Agency(Cost $1,093,218,888) 1,113,224,663
Residential Mortgage-Backed Securities - Non-Agency 4.1%Ajax Mortgage Loan Trust(a),(c)
CMO Series 2021-B Class A06/25/2066 2.239% 4,371,650 4,356,916Angel Oak Mortgage Trust(a),(c)
CMO Series 2020-2 Class A1A01/26/2065 2.531% 2,452,117 2,501,374Angel Oak Mortgage Trust I LLC(a),(c)
CMO Series 2019-2 Class A103/25/2049 3.628% 440,158 450,336Angel Oak Mortgage Trust LLC(a),(c)
CMO Series 2020-5 Class A105/25/2065 1.373% 756,686 758,946Asset-Backed Funding Certificates Trust(c)
CMO Series 2005-AG1 Class A401/25/2034 5.010% 39,128 39,283
1-month USD LIBOR +0.900%Floor 0.900%, Cap11.000%12/25/2033 1.018% 236,321 231,325Bunker Hill Loan Depositary Trust(a),(c)
CMO Series 2019-2 Class A107/25/2049 2.879% 1,216,359 1,245,340CMO Series 2019-3 Class A111/25/2059 2.724% 1,365,845 1,393,890BVRT Financing Trust(a),(b),(f)
CMO Series 2021-CRT2 Class M11-month USD LIBOR +1.750%11/10/2032 2.395% 3,117,675 3,117,675Chase Mortgage Finance Corp.(c)
CMO Series 2007-A1 Class 1A302/25/2037 2.811% 226,940 230,206CMO Series 2007-A1 Class 2A102/25/2037 3.175% 82,806 83,988CMO Series 2007-A1 Class 7A102/25/2037 3.453% 55,953 57,302Citigroup Mortgage Loan Trust, Inc.CMO Series 2003-1 Class 3A409/25/2033 5.250% 59,396 59,978CMO Series 2005-2 Class 2A1105/25/2035 5.500% 140,773 144,593Citigroup Mortgage Loan Trust, Inc.(a),(c)
CMO Series 2009-10 Class 1A109/25/2033 2.768% 140,112 139,973COLT Mortgage Loan Trust(a),(c)
CMO Series 2020-2 Class A103/25/2065 1.853% 1,309,224 1,322,441Countrywide Home Loan Mortgage Pass-Through TrustCMO Series 2004-13 Class 1A408/25/2034 5.500% 161,511 166,649CMO Series 2004-3 Class A2604/25/2034 5.500% 73,978 74,758CMO Series 2004-5 Class 1A406/25/2034 5.500% 175,241 179,993
Residential Mortgage-Backed Securities - Non-Agency (continued)
IssuerCoupon
Rate
PrincipalAmount
($) Value ($)
Residential Mortgage-Backed Securities - Non-Agency (continued)
IssuerCoupon
Rate
PrincipalAmount
($) Value ($)
Copyright © 2021 www.secdatabase.com. All Rights Reserved.Please Consider the Environment Before Printing This Document
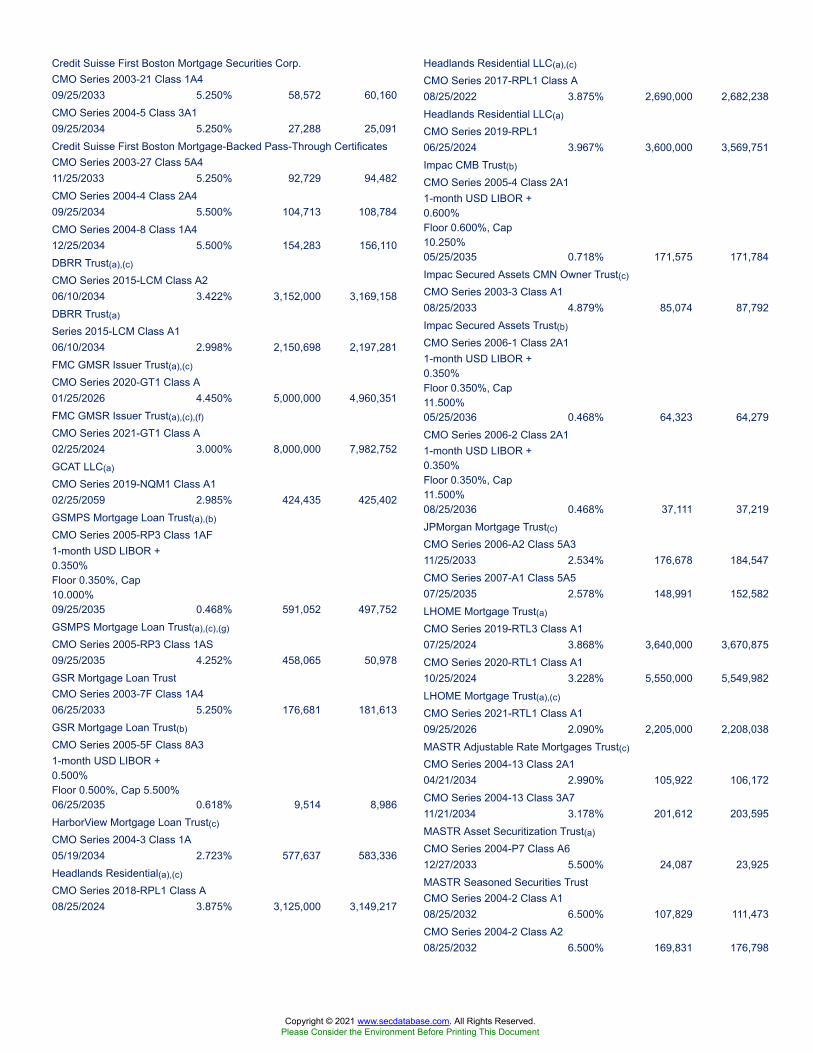
Credit Suisse First Boston Mortgage Securities Corp.CMO Series 2003-21 Class 1A409/25/2033 5.250% 58,572 60,160CMO Series 2004-5 Class 3A109/25/2034 5.250% 27,288 25,091Credit Suisse First Boston Mortgage-Backed Pass-Through CertificatesCMO Series 2003-27 Class 5A411/25/2033 5.250% 92,729 94,482CMO Series 2004-4 Class 2A409/25/2034 5.500% 104,713 108,784CMO Series 2004-8 Class 1A412/25/2034 5.500% 154,283 156,110DBRR Trust(a),(c)
CMO Series 2015-LCM Class A206/10/2034 3.422% 3,152,000 3,169,158DBRR Trust(a)
Series 2015-LCM Class A106/10/2034 2.998% 2,150,698 2,197,281FMC GMSR Issuer Trust(a),(c)
CMO Series 2020-GT1 Class A01/25/2026 4.450% 5,000,000 4,960,351FMC GMSR Issuer Trust(a),(c),(f)
CMO Series 2021-GT1 Class A02/25/2024 3.000% 8,000,000 7,982,752GCAT LLC(a)
CMO Series 2019-NQM1 Class A102/25/2059 2.985% 424,435 425,402GSMPS Mortgage Loan Trust(a),(b)
CMO Series 2005-RP3 Class 1AF1-month USD LIBOR +0.350%Floor 0.350%, Cap10.000%09/25/2035 0.468% 591,052 497,752GSMPS Mortgage Loan Trust(a),(c),(g)
CMO Series 2005-RP3 Class 1AS09/25/2035 4.252% 458,065 50,978GSR Mortgage Loan TrustCMO Series 2003-7F Class 1A406/25/2033 5.250% 176,681 181,613GSR Mortgage Loan Trust(b)
CMO Series 2005-5F Class 8A31-month USD LIBOR +0.500%Floor 0.500%, Cap 5.500%06/25/2035 0.618% 9,514 8,986HarborView Mortgage Loan Trust(c)
CMO Series 2004-3 Class 1A05/19/2034 2.723% 577,637 583,336Headlands Residential(a),(c)
CMO Series 2018-RPL1 Class A08/25/2024 3.875% 3,125,000 3,149,217
Headlands Residential LLC(a),(c)
CMO Series 2017-RPL1 Class A08/25/2022 3.875% 2,690,000 2,682,238Headlands Residential LLC(a)
CMO Series 2019-RPL106/25/2024 3.967% 3,600,000 3,569,751Impac CMB Trust(b)
CMO Series 2005-4 Class 2A11-month USD LIBOR +0.600%Floor 0.600%, Cap10.250%05/25/2035 0.718% 171,575 171,784Impac Secured Assets CMN Owner Trust(c)
CMO Series 2003-3 Class A108/25/2033 4.879% 85,074 87,792Impac Secured Assets Trust(b)
CMO Series 2006-1 Class 2A11-month USD LIBOR +0.350%Floor 0.350%, Cap11.500%05/25/2036 0.468% 64,323 64,279CMO Series 2006-2 Class 2A11-month USD LIBOR +0.350%Floor 0.350%, Cap11.500%08/25/2036 0.468% 37,111 37,219JPMorgan Mortgage Trust(c)
CMO Series 2006-A2 Class 5A311/25/2033 2.534% 176,678 184,547CMO Series 2007-A1 Class 5A507/25/2035 2.578% 148,991 152,582LHOME Mortgage Trust(a)
CMO Series 2019-RTL3 Class A107/25/2024 3.868% 3,640,000 3,670,875CMO Series 2020-RTL1 Class A110/25/2024 3.228% 5,550,000 5,549,982LHOME Mortgage Trust(a),(c)
CMO Series 2021-RTL1 Class A109/25/2026 2.090% 2,205,000 2,208,038MASTR Adjustable Rate Mortgages Trust(c)
CMO Series 2004-13 Class 2A104/21/2034 2.990% 105,922 106,172CMO Series 2004-13 Class 3A711/21/2034 3.178% 201,612 203,595MASTR Asset Securitization Trust(a)
CMO Series 2004-P7 Class A612/27/2033 5.500% 24,087 23,925MASTR Seasoned Securities TrustCMO Series 2004-2 Class A108/25/2032 6.500% 107,829 111,473CMO Series 2004-2 Class A208/25/2032 6.500% 169,831 176,798
Copyright © 2021 www.secdatabase.com. All Rights Reserved.Please Consider the Environment Before Printing This Document
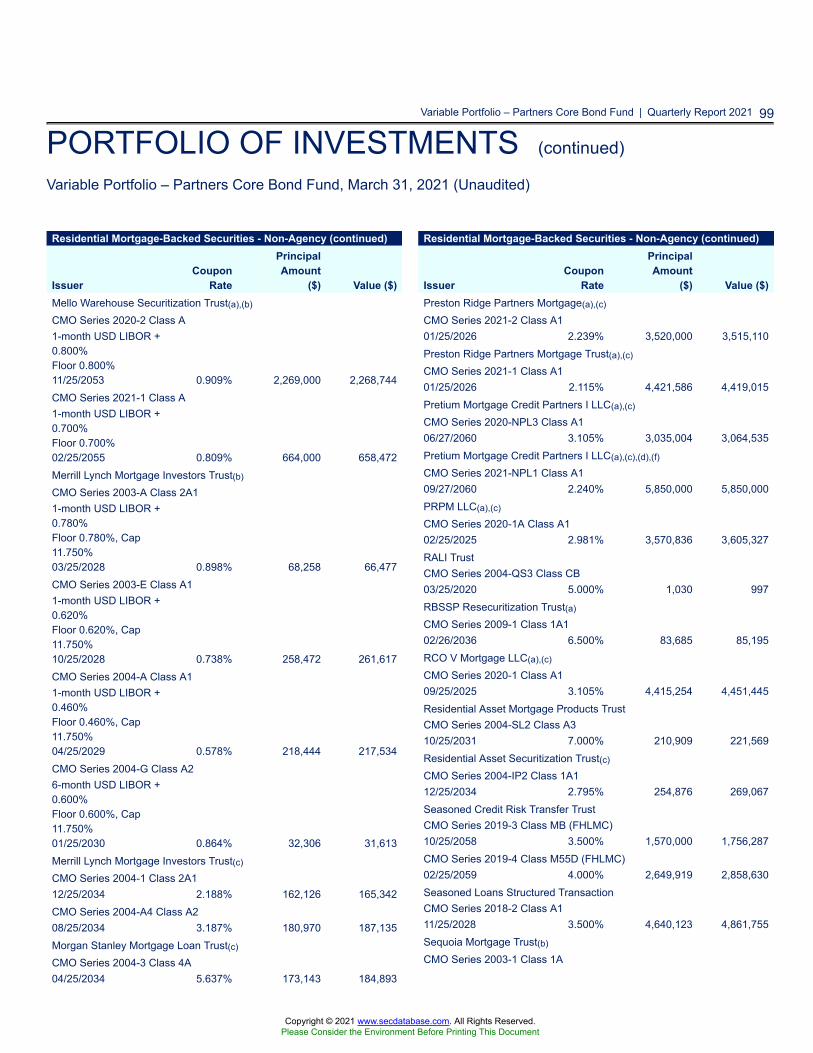
Variable Portfolio – Partners Core Bond Fund | Quarterly Report 2021 99
PORTFOLIO OF INVESTMENTS (continued)
Variable Portfolio – Partners Core Bond Fund, March 31, 2021 (Unaudited)
Residential Mortgage-Backed Securities - Non-Agency (continued)
IssuerCoupon
Rate
PrincipalAmount
($) Value ($)Mello Warehouse Securitization Trust(a),(b)
CMO Series 2020-2 Class A1-month USD LIBOR +0.800%Floor 0.800%11/25/2053 0.909% 2,269,000 2,268,744CMO Series 2021-1 Class A1-month USD LIBOR +0.700%Floor 0.700%02/25/2055 0.809% 664,000 658,472Merrill Lynch Mortgage Investors Trust(b)
CMO Series 2003-A Class 2A11-month USD LIBOR +0.780%Floor 0.780%, Cap11.750%03/25/2028 0.898% 68,258 66,477CMO Series 2003-E Class A11-month USD LIBOR +0.620%Floor 0.620%, Cap11.750%10/25/2028 0.738% 258,472 261,617CMO Series 2004-A Class A11-month USD LIBOR +0.460%Floor 0.460%, Cap11.750%04/25/2029 0.578% 218,444 217,534CMO Series 2004-G Class A26-month USD LIBOR +0.600%Floor 0.600%, Cap11.750%01/25/2030 0.864% 32,306 31,613Merrill Lynch Mortgage Investors Trust(c)
CMO Series 2004-1 Class 2A112/25/2034 2.188% 162,126 165,342CMO Series 2004-A4 Class A208/25/2034 3.187% 180,970 187,135Morgan Stanley Mortgage Loan Trust(c)
CMO Series 2004-3 Class 4A04/25/2034 5.637% 173,143 184,893
Residential Mortgage-Backed Securities - Non-Agency (continued)
IssuerCoupon
Rate
PrincipalAmount
($) Value ($)Preston Ridge Partners Mortgage(a),(c)
CMO Series 2021-2 Class A101/25/2026 2.239% 3,520,000 3,515,110Preston Ridge Partners Mortgage Trust(a),(c)
CMO Series 2021-1 Class A101/25/2026 2.115% 4,421,586 4,419,015Pretium Mortgage Credit Partners I LLC(a),(c)
CMO Series 2020-NPL3 Class A106/27/2060 3.105% 3,035,004 3,064,535Pretium Mortgage Credit Partners I LLC(a),(c),(d),(f)
CMO Series 2021-NPL1 Class A109/27/2060 2.240% 5,850,000 5,850,000PRPM LLC(a),(c)
CMO Series 2020-1A Class A102/25/2025 2.981% 3,570,836 3,605,327RALI TrustCMO Series 2004-QS3 Class CB03/25/2020 5.000% 1,030 997RBSSP Resecuritization Trust(a)
CMO Series 2009-1 Class 1A102/26/2036 6.500% 83,685 85,195RCO V Mortgage LLC(a),(c)
CMO Series 2020-1 Class A109/25/2025 3.105% 4,415,254 4,451,445Residential Asset Mortgage Products TrustCMO Series 2004-SL2 Class A310/25/2031 7.000% 210,909 221,569Residential Asset Securitization Trust(c)
CMO Series 2004-IP2 Class 1A112/25/2034 2.795% 254,876 269,067Seasoned Credit Risk Transfer TrustCMO Series 2019-3 Class MB (FHLMC)10/25/2058 3.500% 1,570,000 1,756,287CMO Series 2019-4 Class M55D (FHLMC)02/25/2059 4.000% 2,649,919 2,858,630Seasoned Loans Structured TransactionCMO Series 2018-2 Class A111/25/2028 3.500% 4,640,123 4,861,755Sequoia Mortgage Trust(b)
CMO Series 2003-1 Class 1A
Copyright © 2021 www.secdatabase.com. All Rights Reserved.Please Consider the Environment Before Printing This Document
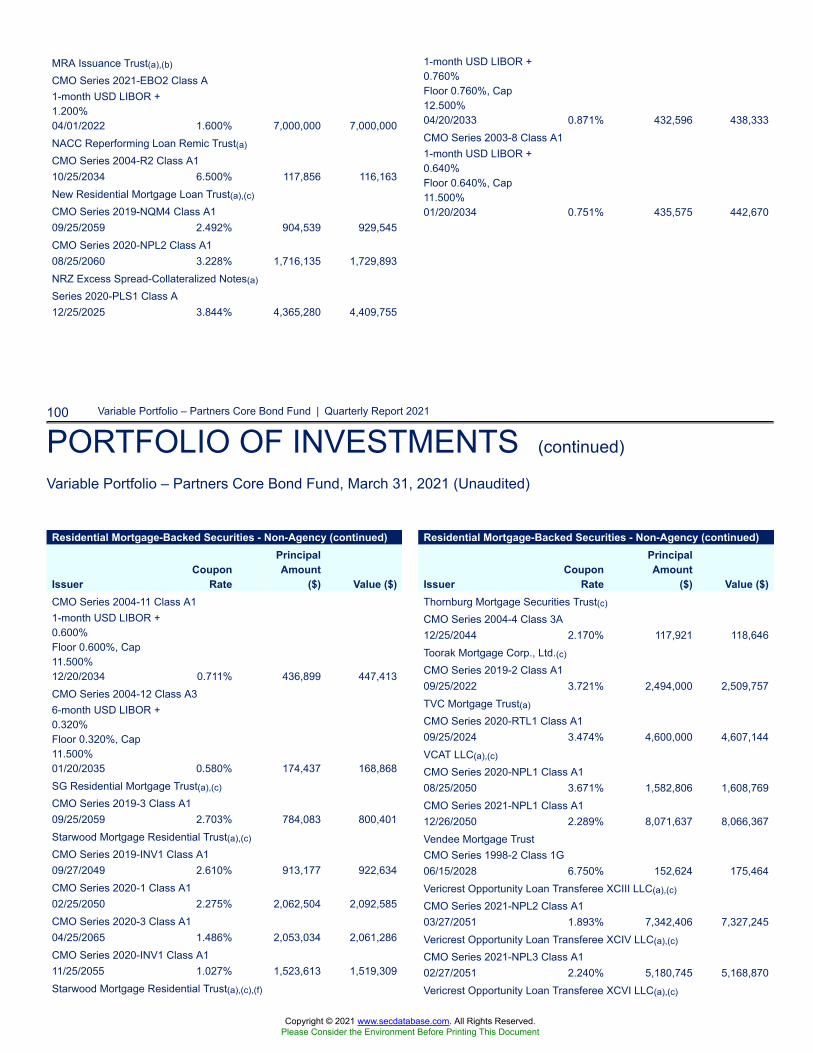
100 Variable Portfolio – Partners Core Bond Fund | Quarterly Report 2021
PORTFOLIO OF INVESTMENTS (continued)
Variable Portfolio – Partners Core Bond Fund, March 31, 2021 (Unaudited)
MRA Issuance Trust(a),(b)
CMO Series 2021-EBO2 Class A1-month USD LIBOR +1.200%04/01/2022 1.600% 7,000,000 7,000,000NACC Reperforming Loan Remic Trust(a)
CMO Series 2004-R2 Class A110/25/2034 6.500% 117,856 116,163New Residential Mortgage Loan Trust(a),(c)
CMO Series 2019-NQM4 Class A109/25/2059 2.492% 904,539 929,545CMO Series 2020-NPL2 Class A108/25/2060 3.228% 1,716,135 1,729,893NRZ Excess Spread-Collateralized Notes(a)
Series 2020-PLS1 Class A12/25/2025 3.844% 4,365,280 4,409,755
1-month USD LIBOR +0.760%Floor 0.760%, Cap12.500%04/20/2033 0.871% 432,596 438,333CMO Series 2003-8 Class A11-month USD LIBOR +0.640%Floor 0.640%, Cap11.500%01/20/2034 0.751% 435,575 442,670
Residential Mortgage-Backed Securities - Non-Agency (continued)
IssuerCoupon
Rate
PrincipalAmount
($) Value ($)CMO Series 2004-11 Class A11-month USD LIBOR +0.600%Floor 0.600%, Cap11.500%12/20/2034 0.711% 436,899 447,413CMO Series 2004-12 Class A36-month USD LIBOR +0.320%Floor 0.320%, Cap11.500%01/20/2035 0.580% 174,437 168,868SG Residential Mortgage Trust(a),(c)
CMO Series 2019-3 Class A109/25/2059 2.703% 784,083 800,401Starwood Mortgage Residential Trust(a),(c)
CMO Series 2019-INV1 Class A109/27/2049 2.610% 913,177 922,634CMO Series 2020-1 Class A102/25/2050 2.275% 2,062,504 2,092,585CMO Series 2020-3 Class A104/25/2065 1.486% 2,053,034 2,061,286CMO Series 2020-INV1 Class A111/25/2055 1.027% 1,523,613 1,519,309Starwood Mortgage Residential Trust(a),(c),(f)
Residential Mortgage-Backed Securities - Non-Agency (continued)
IssuerCoupon
Rate
PrincipalAmount
($) Value ($)Thornburg Mortgage Securities Trust(c)
CMO Series 2004-4 Class 3A12/25/2044 2.170% 117,921 118,646Toorak Mortgage Corp., Ltd.(c)
CMO Series 2019-2 Class A109/25/2022 3.721% 2,494,000 2,509,757TVC Mortgage Trust(a)
CMO Series 2020-RTL1 Class A109/25/2024 3.474% 4,600,000 4,607,144VCAT LLC(a),(c)
CMO Series 2020-NPL1 Class A108/25/2050 3.671% 1,582,806 1,608,769CMO Series 2021-NPL1 Class A112/26/2050 2.289% 8,071,637 8,066,367Vendee Mortgage TrustCMO Series 1998-2 Class 1G06/15/2028 6.750% 152,624 175,464Vericrest Opportunity Loan Transferee XCIII LLC(a),(c)
CMO Series 2021-NPL2 Class A103/27/2051 1.893% 7,342,406 7,327,245Vericrest Opportunity Loan Transferee XCIV LLC(a),(c)
CMO Series 2021-NPL3 Class A102/27/2051 2.240% 5,180,745 5,168,870Vericrest Opportunity Loan Transferee XCVI LLC(a),(c)
Copyright © 2021 www.secdatabase.com. All Rights Reserved.Please Consider the Environment Before Printing This Document
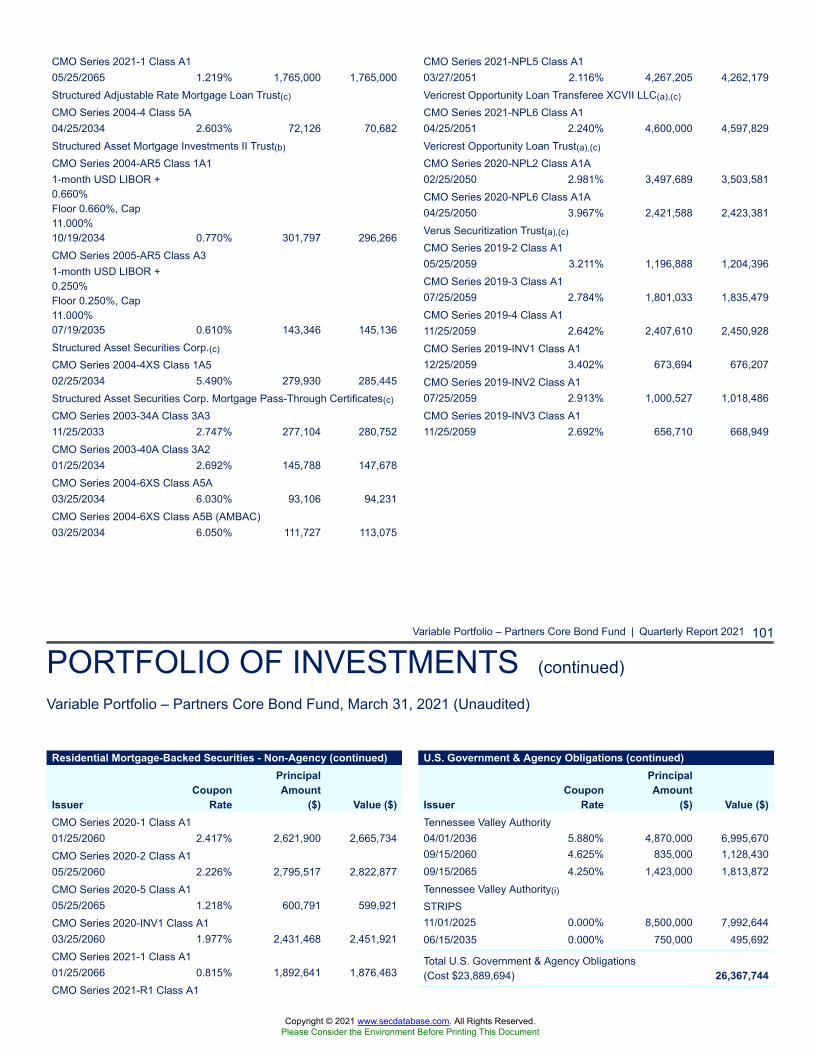
Variable Portfolio – Partners Core Bond Fund | Quarterly Report 2021 101
PORTFOLIO OF INVESTMENTS (continued)
Variable Portfolio – Partners Core Bond Fund, March 31, 2021 (Unaudited)
CMO Series 2021-1 Class A105/25/2065 1.219% 1,765,000 1,765,000Structured Adjustable Rate Mortgage Loan Trust(c)
CMO Series 2004-4 Class 5A04/25/2034 2.603% 72,126 70,682Structured Asset Mortgage Investments II Trust(b)
CMO Series 2004-AR5 Class 1A11-month USD LIBOR +0.660%Floor 0.660%, Cap11.000%10/19/2034 0.770% 301,797 296,266CMO Series 2005-AR5 Class A31-month USD LIBOR +0.250%Floor 0.250%, Cap11.000%07/19/2035 0.610% 143,346 145,136Structured Asset Securities Corp.(c)
CMO Series 2004-4XS Class 1A502/25/2034 5.490% 279,930 285,445Structured Asset Securities Corp. Mortgage Pass-Through Certificates(c)
CMO Series 2003-34A Class 3A311/25/2033 2.747% 277,104 280,752CMO Series 2003-40A Class 3A201/25/2034 2.692% 145,788 147,678CMO Series 2004-6XS Class A5A03/25/2034 6.030% 93,106 94,231CMO Series 2004-6XS Class A5B (AMBAC)03/25/2034 6.050% 111,727 113,075
CMO Series 2021-NPL5 Class A103/27/2051 2.116% 4,267,205 4,262,179Vericrest Opportunity Loan Transferee XCVII LLC(a),(c)
CMO Series 2021-NPL6 Class A104/25/2051 2.240% 4,600,000 4,597,829Vericrest Opportunity Loan Trust(a),(c)
CMO Series 2020-NPL2 Class A1A02/25/2050 2.981% 3,497,689 3,503,581CMO Series 2020-NPL6 Class A1A04/25/2050 3.967% 2,421,588 2,423,381Verus Securitization Trust(a),(c)
CMO Series 2019-2 Class A105/25/2059 3.211% 1,196,888 1,204,396CMO Series 2019-3 Class A107/25/2059 2.784% 1,801,033 1,835,479CMO Series 2019-4 Class A111/25/2059 2.642% 2,407,610 2,450,928CMO Series 2019-INV1 Class A112/25/2059 3.402% 673,694 676,207CMO Series 2019-INV2 Class A107/25/2059 2.913% 1,000,527 1,018,486CMO Series 2019-INV3 Class A111/25/2059 2.692% 656,710 668,949
Residential Mortgage-Backed Securities - Non-Agency (continued)
IssuerCoupon
Rate
PrincipalAmount
($) Value ($)CMO Series 2020-1 Class A101/25/2060 2.417% 2,621,900 2,665,734CMO Series 2020-2 Class A105/25/2060 2.226% 2,795,517 2,822,877CMO Series 2020-5 Class A105/25/2065 1.218% 600,791 599,921CMO Series 2020-INV1 Class A103/25/2060 1.977% 2,431,468 2,451,921CMO Series 2021-1 Class A101/25/2066 0.815% 1,892,641 1,876,463CMO Series 2021-R1 Class A1
U.S. Government & Agency Obligations (continued)
IssuerCoupon
Rate
PrincipalAmount
($) Value ($)Tennessee Valley Authority04/01/2036 5.880% 4,870,000 6,995,67009/15/2060 4.625% 835,000 1,128,43009/15/2065 4.250% 1,423,000 1,813,872Tennessee Valley Authority(i)
STRIPS11/01/2025 0.000% 8,500,000 7,992,64406/15/2035 0.000% 750,000 495,692
Total U.S. Government & Agency Obligations(Cost $23,889,694) 26,367,744
Copyright © 2021 www.secdatabase.com. All Rights Reserved.Please Consider the Environment Before Printing This Document
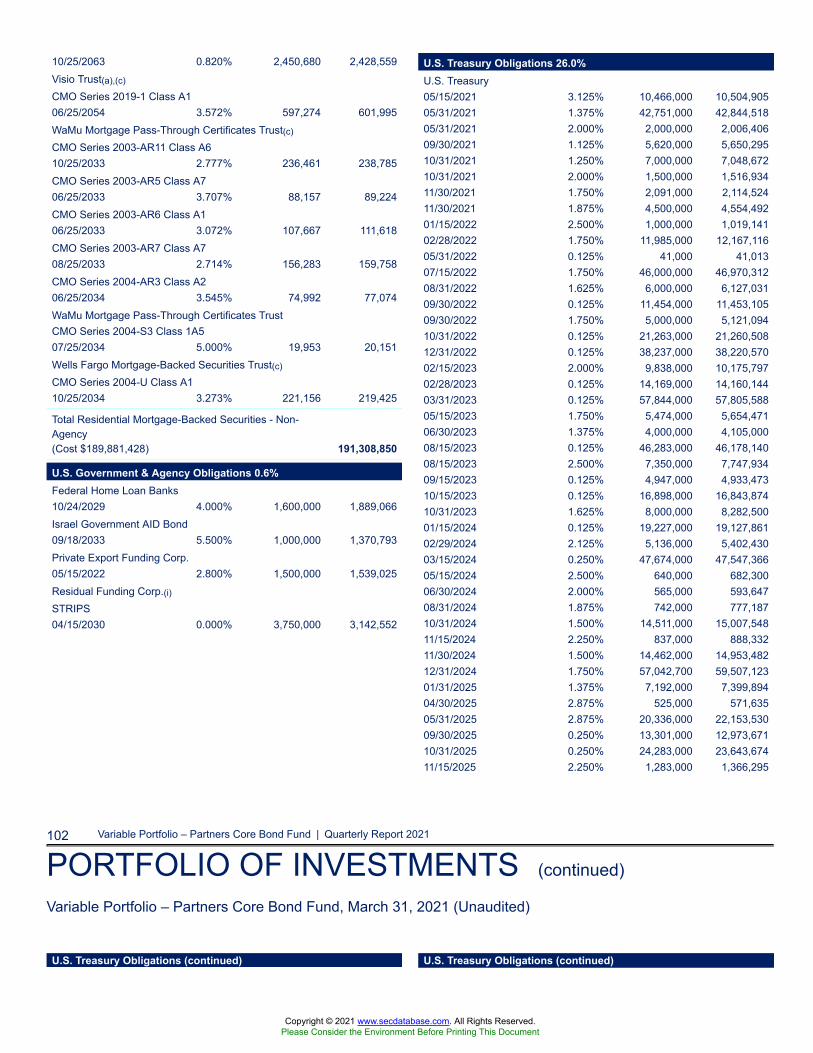
102 Variable Portfolio – Partners Core Bond Fund | Quarterly Report 2021
PORTFOLIO OF INVESTMENTS (continued)
Variable Portfolio – Partners Core Bond Fund, March 31, 2021 (Unaudited)
10/25/2063 0.820% 2,450,680 2,428,559Visio Trust(a),(c)
CMO Series 2019-1 Class A106/25/2054 3.572% 597,274 601,995WaMu Mortgage Pass-Through Certificates Trust(c)
CMO Series 2003-AR11 Class A610/25/2033 2.777% 236,461 238,785CMO Series 2003-AR5 Class A706/25/2033 3.707% 88,157 89,224CMO Series 2003-AR6 Class A106/25/2033 3.072% 107,667 111,618CMO Series 2003-AR7 Class A708/25/2033 2.714% 156,283 159,758CMO Series 2004-AR3 Class A206/25/2034 3.545% 74,992 77,074WaMu Mortgage Pass-Through Certificates TrustCMO Series 2004-S3 Class 1A507/25/2034 5.000% 19,953 20,151Wells Fargo Mortgage-Backed Securities Trust(c)
CMO Series 2004-U Class A110/25/2034 3.273% 221,156 219,425
Total Residential Mortgage-Backed Securities - Non-Agency(Cost $189,881,428) 191,308,850
U.S. Government & Agency Obligations 0.6%Federal Home Loan Banks10/24/2029 4.000% 1,600,000 1,889,066Israel Government AID Bond09/18/2033 5.500% 1,000,000 1,370,793Private Export Funding Corp.05/15/2022 2.800% 1,500,000 1,539,025Residual Funding Corp.(i)STRIPS04/15/2030 0.000% 3,750,000 3,142,552
U.S. Treasury Obligations 26.0%U.S. Treasury05/15/2021 3.125% 10,466,000 10,504,90505/31/2021 1.375% 42,751,000 42,844,51805/31/2021 2.000% 2,000,000 2,006,40609/30/2021 1.125% 5,620,000 5,650,29510/31/2021 1.250% 7,000,000 7,048,67210/31/2021 2.000% 1,500,000 1,516,93411/30/2021 1.750% 2,091,000 2,114,52411/30/2021 1.875% 4,500,000 4,554,49201/15/2022 2.500% 1,000,000 1,019,14102/28/2022 1.750% 11,985,000 12,167,11605/31/2022 0.125% 41,000 41,01307/15/2022 1.750% 46,000,000 46,970,31208/31/2022 1.625% 6,000,000 6,127,03109/30/2022 0.125% 11,454,000 11,453,10509/30/2022 1.750% 5,000,000 5,121,09410/31/2022 0.125% 21,263,000 21,260,50812/31/2022 0.125% 38,237,000 38,220,57002/15/2023 2.000% 9,838,000 10,175,79702/28/2023 0.125% 14,169,000 14,160,14403/31/2023 0.125% 57,844,000 57,805,58805/15/2023 1.750% 5,474,000 5,654,47106/30/2023 1.375% 4,000,000 4,105,00008/15/2023 0.125% 46,283,000 46,178,14008/15/2023 2.500% 7,350,000 7,747,93409/15/2023 0.125% 4,947,000 4,933,47310/15/2023 0.125% 16,898,000 16,843,87410/31/2023 1.625% 8,000,000 8,282,50001/15/2024 0.125% 19,227,000 19,127,86102/29/2024 2.125% 5,136,000 5,402,43003/15/2024 0.250% 47,674,000 47,547,36605/15/2024 2.500% 640,000 682,30006/30/2024 2.000% 565,000 593,64708/31/2024 1.875% 742,000 777,18710/31/2024 1.500% 14,511,000 15,007,54811/15/2024 2.250% 837,000 888,33211/30/2024 1.500% 14,462,000 14,953,48212/31/2024 1.750% 57,042,700 59,507,12301/31/2025 1.375% 7,192,000 7,399,89404/30/2025 2.875% 525,000 571,63505/31/2025 2.875% 20,336,000 22,153,53009/30/2025 0.250% 13,301,000 12,973,67110/31/2025 0.250% 24,283,000 23,643,67411/15/2025 2.250% 1,283,000 1,366,295
U.S. Treasury Obligations (continued) U.S. Treasury Obligations (continued)
Copyright © 2021 www.secdatabase.com. All Rights Reserved.Please Consider the Environment Before Printing This Document
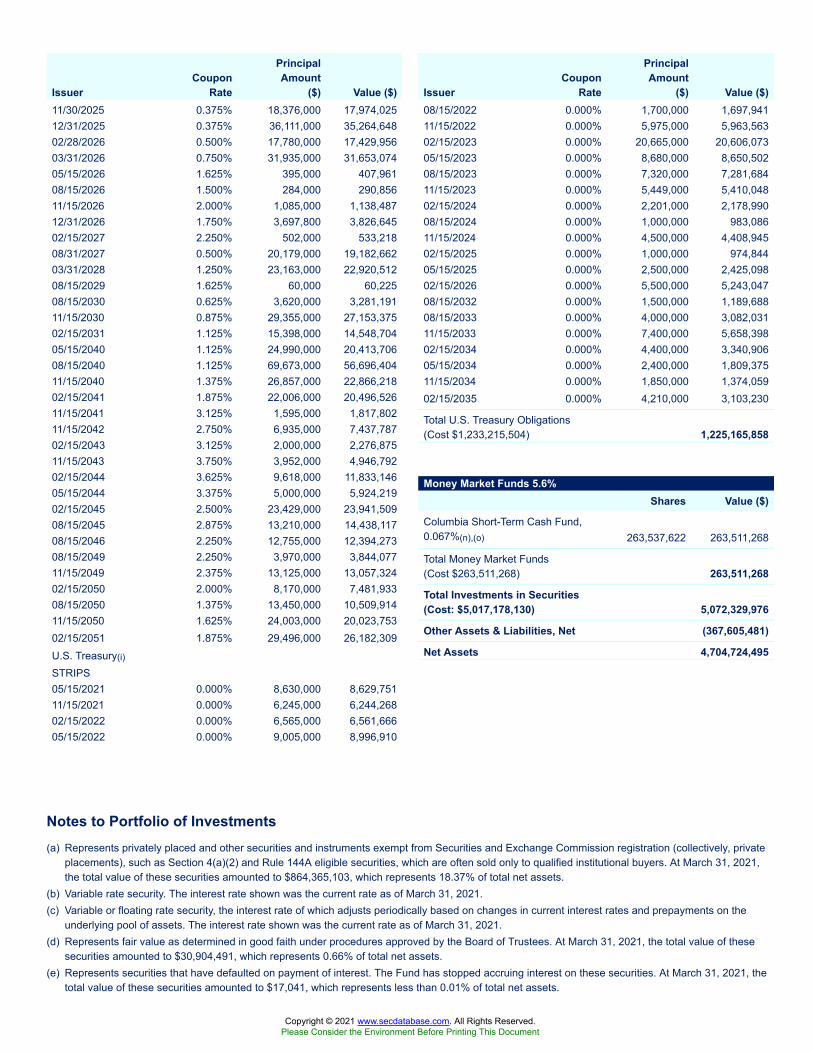
Notes to Portfolio of Investments(a) Represents privately placed and other securities and instruments exempt from Securities and Exchange Commission registration (collectively, private
placements), such as Section 4(a)(2) and Rule 144A eligible securities, which are often sold only to qualified institutional buyers. At March 31, 2021,the total value of these securities amounted to $864,365,103, which represents 18.37% of total net assets.
(b) Variable rate security. The interest rate shown was the current rate as of March 31, 2021.(c) Variable or floating rate security, the interest rate of which adjusts periodically based on changes in current interest rates and prepayments on the
underlying pool of assets. The interest rate shown was the current rate as of March 31, 2021.(d) Represents fair value as determined in good faith under procedures approved by the Board of Trustees. At March 31, 2021, the total value of these
securities amounted to $30,904,491, which represents 0.66% of total net assets.(e) Represents securities that have defaulted on payment of interest. The Fund has stopped accruing interest on these securities. At March 31, 2021, the
total value of these securities amounted to $17,041, which represents less than 0.01% of total net assets.
IssuerCoupon
Rate
PrincipalAmount
($) Value ($)11/30/2025 0.375% 18,376,000 17,974,02512/31/2025 0.375% 36,111,000 35,264,64802/28/2026 0.500% 17,780,000 17,429,95603/31/2026 0.750% 31,935,000 31,653,07405/15/2026 1.625% 395,000 407,96108/15/2026 1.500% 284,000 290,85611/15/2026 2.000% 1,085,000 1,138,48712/31/2026 1.750% 3,697,800 3,826,64502/15/2027 2.250% 502,000 533,21808/31/2027 0.500% 20,179,000 19,182,66203/31/2028 1.250% 23,163,000 22,920,51208/15/2029 1.625% 60,000 60,22508/15/2030 0.625% 3,620,000 3,281,19111/15/2030 0.875% 29,355,000 27,153,37502/15/2031 1.125% 15,398,000 14,548,70405/15/2040 1.125% 24,990,000 20,413,70608/15/2040 1.125% 69,673,000 56,696,40411/15/2040 1.375% 26,857,000 22,866,21802/15/2041 1.875% 22,006,000 20,496,52611/15/2041 3.125% 1,595,000 1,817,80211/15/2042 2.750% 6,935,000 7,437,78702/15/2043 3.125% 2,000,000 2,276,87511/15/2043 3.750% 3,952,000 4,946,79202/15/2044 3.625% 9,618,000 11,833,14605/15/2044 3.375% 5,000,000 5,924,21902/15/2045 2.500% 23,429,000 23,941,50908/15/2045 2.875% 13,210,000 14,438,11708/15/2046 2.250% 12,755,000 12,394,27308/15/2049 2.250% 3,970,000 3,844,07711/15/2049 2.375% 13,125,000 13,057,32402/15/2050 2.000% 8,170,000 7,481,93308/15/2050 1.375% 13,450,000 10,509,91411/15/2050 1.625% 24,003,000 20,023,75302/15/2051 1.875% 29,496,000 26,182,309U.S. Treasury(i)
STRIPS05/15/2021 0.000% 8,630,000 8,629,75111/15/2021 0.000% 6,245,000 6,244,26802/15/2022 0.000% 6,565,000 6,561,66605/15/2022 0.000% 9,005,000 8,996,910
IssuerCoupon
Rate
PrincipalAmount
($) Value ($)08/15/2022 0.000% 1,700,000 1,697,94111/15/2022 0.000% 5,975,000 5,963,56302/15/2023 0.000% 20,665,000 20,606,07305/15/2023 0.000% 8,680,000 8,650,50208/15/2023 0.000% 7,320,000 7,281,68411/15/2023 0.000% 5,449,000 5,410,04802/15/2024 0.000% 2,201,000 2,178,99008/15/2024 0.000% 1,000,000 983,08611/15/2024 0.000% 4,500,000 4,408,94502/15/2025 0.000% 1,000,000 974,84405/15/2025 0.000% 2,500,000 2,425,09802/15/2026 0.000% 5,500,000 5,243,04708/15/2032 0.000% 1,500,000 1,189,68808/15/2033 0.000% 4,000,000 3,082,03111/15/2033 0.000% 7,400,000 5,658,39802/15/2034 0.000% 4,400,000 3,340,90605/15/2034 0.000% 2,400,000 1,809,37511/15/2034 0.000% 1,850,000 1,374,05902/15/2035 0.000% 4,210,000 3,103,230
Total U.S. Treasury Obligations(Cost $1,233,215,504) 1,225,165,858
Money Market Funds 5.6%Shares Value ($)
Columbia Short-Term Cash Fund,0.067%(n),(o) 263,537,622 263,511,268
Total Money Market Funds(Cost $263,511,268) 263,511,268
Total Investments in Securities(Cost: $5,017,178,130) 5,072,329,976
Other Assets & Liabilities, Net (367,605,481)
Net Assets 4,704,724,495
Copyright © 2021 www.secdatabase.com. All Rights Reserved.Please Consider the Environment Before Printing This Document
(f) Valuation based on significant unobservable inputs.(g) Represents interest only securities which have the right to receive the monthly interest payments on an underlying pool of mortgage loans.
Variable Portfolio – Partners Core Bond Fund | Quarterly Report 2021 103
PORTFOLIO OF INVESTMENTS (continued)
Variable Portfolio – Partners Core Bond Fund, March 31, 2021 (Unaudited)
Notes to Portfolio of Investments (continued)
(h) Represents a security purchased on a when-issued basis.(i) Zero coupon bond.(j) Represents a variable rate security with a step coupon where the rate adjusts according to a schedule for a series of periods, typically
lower for an initial period and then increasing to a higher coupon rate thereafter. The interest rate shown was the current rate as of March31, 2021.
(k) Principal and interest may not be guaranteed by a governmental entity.(l) Represents principal only securities which have the right to receive the principal portion only on an underlying pool of mortgage loans.(m) Represents a security purchased on a forward commitment basis.(n) The rate shown is the seven-day current annualized yield at March 31, 2021.(o) As defined in the Investment Company Act of 1940, as amended, an affiliated company is one in which the Fund owns 5% or more of the
company’s outstanding voting securities, or a company which is under common ownership or control with the Fund. The value of theholdings and transactions in these affiliated companies during the period ended March 31, 2021 are as follows:
Affiliated issuersBeginning
of period($) Purchases($) Sales($)
Net change inunrealized
appreciation(depreciation)($)
End ofperiod($)
Realizedgain
(loss)($) Dividends($)
End ofperiodshares
Columbia Short-Term Cash Fund, 0.067%126,471,432 763,375,259 (626,335,423) — 263,511,268 — 40,208 263,537,622
Abbreviation LegendAID Agency for International DevelopmentAMBAC Ambac Assurance CorporationBAM Build America Mutual Assurance Co.CMO Collateralized Mortgage ObligationCMT Constant Maturity TreasuryFHLMC Federal Home Loan Mortgage CorporationLIBOR London Interbank Offered RateMTA Monthly Treasury AverageSTRIPS Separate Trading of Registered Interest and Principal SecuritiesTBA To Be Announced
Investments are valued using policies described in the Notes to Financial Statements in the most recent shareholder report.
Copyright © 2021 www.secdatabase.com. All Rights Reserved.Please Consider the Environment Before Printing This Document
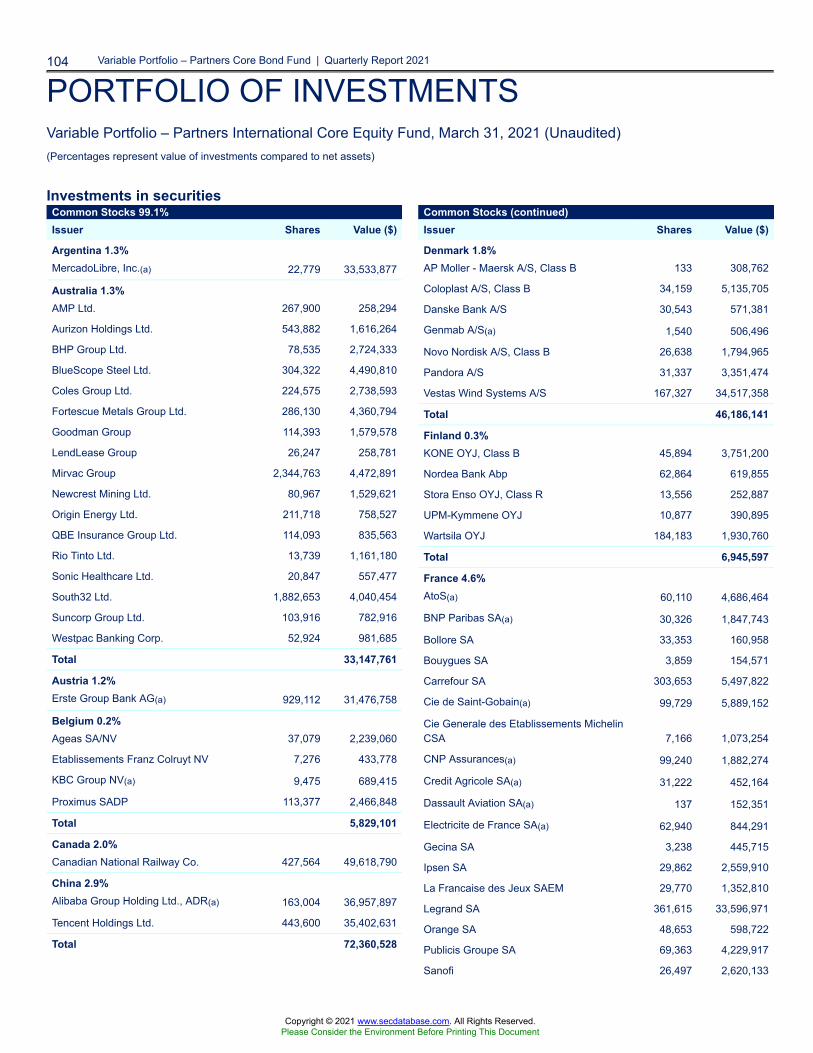
104 Variable Portfolio – Partners Core Bond Fund | Quarterly Report 2021
PORTFOLIO OF INVESTMENTSVariable Portfolio – Partners International Core Equity Fund, March 31, 2021 (Unaudited)(Percentages represent value of investments compared to net assets)
Investments in securitiesCommon Stocks 99.1%Issuer Shares Value ($)
Argentina 1.3%MercadoLibre, Inc.(a) 22,779 33,533,877
Australia 1.3%AMP Ltd. 267,900 258,294
Aurizon Holdings Ltd. 543,882 1,616,264
BHP Group Ltd. 78,535 2,724,333
BlueScope Steel Ltd. 304,322 4,490,810
Coles Group Ltd. 224,575 2,738,593
Fortescue Metals Group Ltd. 286,130 4,360,794
Goodman Group 114,393 1,579,578
LendLease Group 26,247 258,781
Mirvac Group 2,344,763 4,472,891
Newcrest Mining Ltd. 80,967 1,529,621
Origin Energy Ltd. 211,718 758,527
QBE Insurance Group Ltd. 114,093 835,563
Rio Tinto Ltd. 13,739 1,161,180
Sonic Healthcare Ltd. 20,847 557,477
South32 Ltd. 1,882,653 4,040,454
Suncorp Group Ltd. 103,916 782,916
Westpac Banking Corp. 52,924 981,685
Total 33,147,761
Austria 1.2%Erste Group Bank AG(a) 929,112 31,476,758
Belgium 0.2%Ageas SA/NV 37,079 2,239,060
Etablissements Franz Colruyt NV 7,276 433,778
KBC Group NV(a) 9,475 689,415
Proximus SADP 113,377 2,466,848
Total 5,829,101
Canada 2.0%Canadian National Railway Co. 427,564 49,618,790
China 2.9%Alibaba Group Holding Ltd., ADR(a) 163,004 36,957,897
Tencent Holdings Ltd. 443,600 35,402,631
Total 72,360,528
Common Stocks (continued)Issuer Shares Value ($)
Denmark 1.8%AP Moller - Maersk A/S, Class B 133 308,762
Coloplast A/S, Class B 34,159 5,135,705
Danske Bank A/S 30,543 571,381
Genmab A/S(a) 1,540 506,496
Novo Nordisk A/S, Class B 26,638 1,794,965
Pandora A/S 31,337 3,351,474
Vestas Wind Systems A/S 167,327 34,517,358
Total 46,186,141
Finland 0.3%KONE OYJ, Class B 45,894 3,751,200
Nordea Bank Abp 62,864 619,855
Stora Enso OYJ, Class R 13,556 252,887
UPM-Kymmene OYJ 10,877 390,895
Wartsila OYJ 184,183 1,930,760
Total 6,945,597
France 4.6%AtoS(a) 60,110 4,686,464
BNP Paribas SA(a) 30,326 1,847,743
Bollore SA 33,353 160,958
Bouygues SA 3,859 154,571
Carrefour SA 303,653 5,497,822
Cie de Saint-Gobain(a) 99,729 5,889,152
Cie Generale des Etablissements MichelinCSA 7,166 1,073,254
CNP Assurances(a) 99,240 1,882,274
Credit Agricole SA(a) 31,222 452,164
Dassault Aviation SA(a) 137 152,351
Electricite de France SA(a) 62,940 844,291
Gecina SA 3,238 445,715
Ipsen SA 29,862 2,559,910
La Francaise des Jeux SAEM 29,770 1,352,810
Legrand SA 361,615 33,596,971
Orange SA 48,653 598,722
Publicis Groupe SA 69,363 4,229,917
Sanofi 26,497 2,620,133
Copyright © 2021 www.secdatabase.com. All Rights Reserved.Please Consider the Environment Before Printing This Document
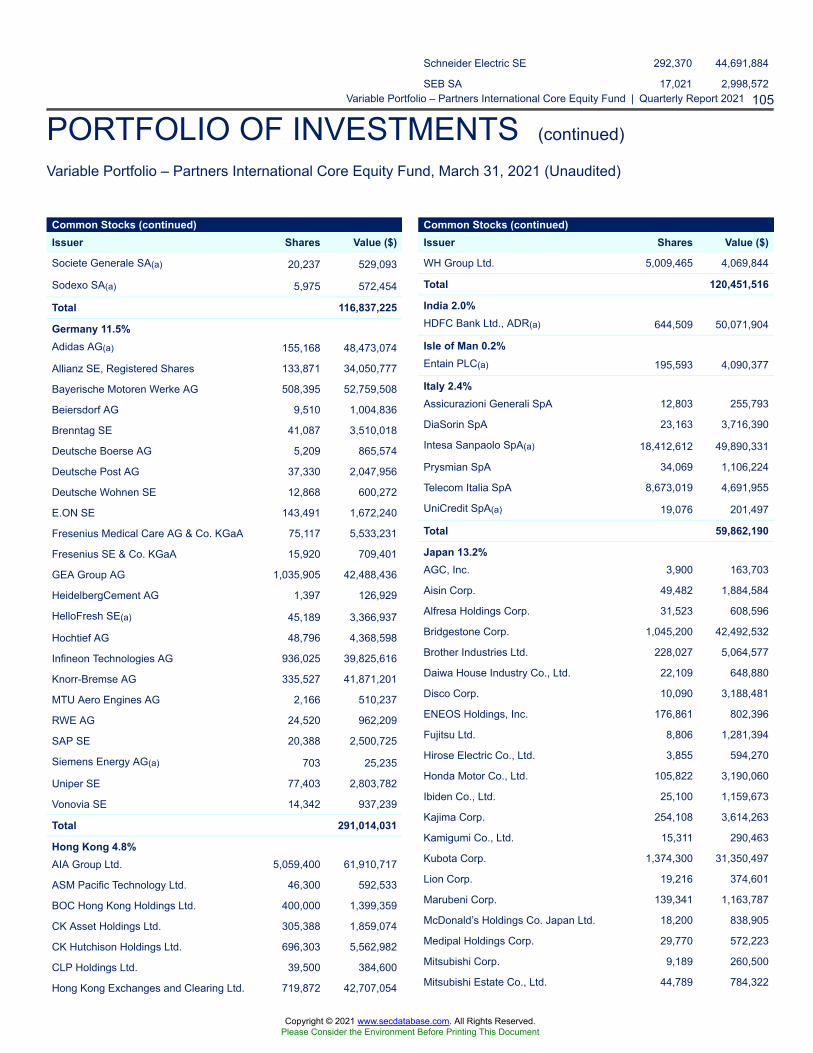
Variable Portfolio – Partners International Core Equity Fund | Quarterly Report 2021 105
PORTFOLIO OF INVESTMENTS (continued)
Variable Portfolio – Partners International Core Equity Fund, March 31, 2021 (Unaudited)
Schneider Electric SE 292,370 44,691,884
SEB SA 17,021 2,998,572
Common Stocks (continued)Issuer Shares Value ($)
Societe Generale SA(a) 20,237 529,093
Sodexo SA(a) 5,975 572,454
Total 116,837,225
Germany 11.5%Adidas AG(a) 155,168 48,473,074
Allianz SE, Registered Shares 133,871 34,050,777
Bayerische Motoren Werke AG 508,395 52,759,508
Beiersdorf AG 9,510 1,004,836
Brenntag SE 41,087 3,510,018
Deutsche Boerse AG 5,209 865,574
Deutsche Post AG 37,330 2,047,956
Deutsche Wohnen SE 12,868 600,272
E.ON SE 143,491 1,672,240
Fresenius Medical Care AG & Co. KGaA 75,117 5,533,231
Fresenius SE & Co. KGaA 15,920 709,401
GEA Group AG 1,035,905 42,488,436
HeidelbergCement AG 1,397 126,929
HelloFresh SE(a) 45,189 3,366,937
Hochtief AG 48,796 4,368,598
Infineon Technologies AG 936,025 39,825,616
Knorr-Bremse AG 335,527 41,871,201
MTU Aero Engines AG 2,166 510,237
RWE AG 24,520 962,209
SAP SE 20,388 2,500,725
Siemens Energy AG(a) 703 25,235
Uniper SE 77,403 2,803,782
Vonovia SE 14,342 937,239
Total 291,014,031
Hong Kong 4.8%AIA Group Ltd. 5,059,400 61,910,717
ASM Pacific Technology Ltd. 46,300 592,533
BOC Hong Kong Holdings Ltd. 400,000 1,399,359
CK Asset Holdings Ltd. 305,388 1,859,074
CK Hutchison Holdings Ltd. 696,303 5,562,982
CLP Holdings Ltd. 39,500 384,600
Hong Kong Exchanges and Clearing Ltd. 719,872 42,707,054
Common Stocks (continued)Issuer Shares Value ($)
WH Group Ltd. 5,009,465 4,069,844
Total 120,451,516
India 2.0%HDFC Bank Ltd., ADR(a) 644,509 50,071,904
Isle of Man 0.2%Entain PLC(a) 195,593 4,090,377
Italy 2.4%Assicurazioni Generali SpA 12,803 255,793
DiaSorin SpA 23,163 3,716,390
Intesa Sanpaolo SpA(a) 18,412,612 49,890,331
Prysmian SpA 34,069 1,106,224
Telecom Italia SpA 8,673,019 4,691,955
UniCredit SpA(a) 19,076 201,497
Total 59,862,190
Japan 13.2%AGC, Inc. 3,900 163,703
Aisin Corp. 49,482 1,884,584
Alfresa Holdings Corp. 31,523 608,596
Bridgestone Corp. 1,045,200 42,492,532
Brother Industries Ltd. 228,027 5,064,577
Daiwa House Industry Co., Ltd. 22,109 648,880
Disco Corp. 10,090 3,188,481
ENEOS Holdings, Inc. 176,861 802,396
Fujitsu Ltd. 8,806 1,281,394
Hirose Electric Co., Ltd. 3,855 594,270
Honda Motor Co., Ltd. 105,822 3,190,060
Ibiden Co., Ltd. 25,100 1,159,673
Kajima Corp. 254,108 3,614,263
Kamigumi Co., Ltd. 15,311 290,463
Kubota Corp. 1,374,300 31,350,497
Lion Corp. 19,216 374,601
Marubeni Corp. 139,341 1,163,787
McDonald’s Holdings Co. Japan Ltd. 18,200 838,905
Medipal Holdings Corp. 29,770 572,223
Mitsubishi Corp. 9,189 260,500
Mitsubishi Estate Co., Ltd. 44,789 784,322
Copyright © 2021 www.secdatabase.com. All Rights Reserved.Please Consider the Environment Before Printing This Document
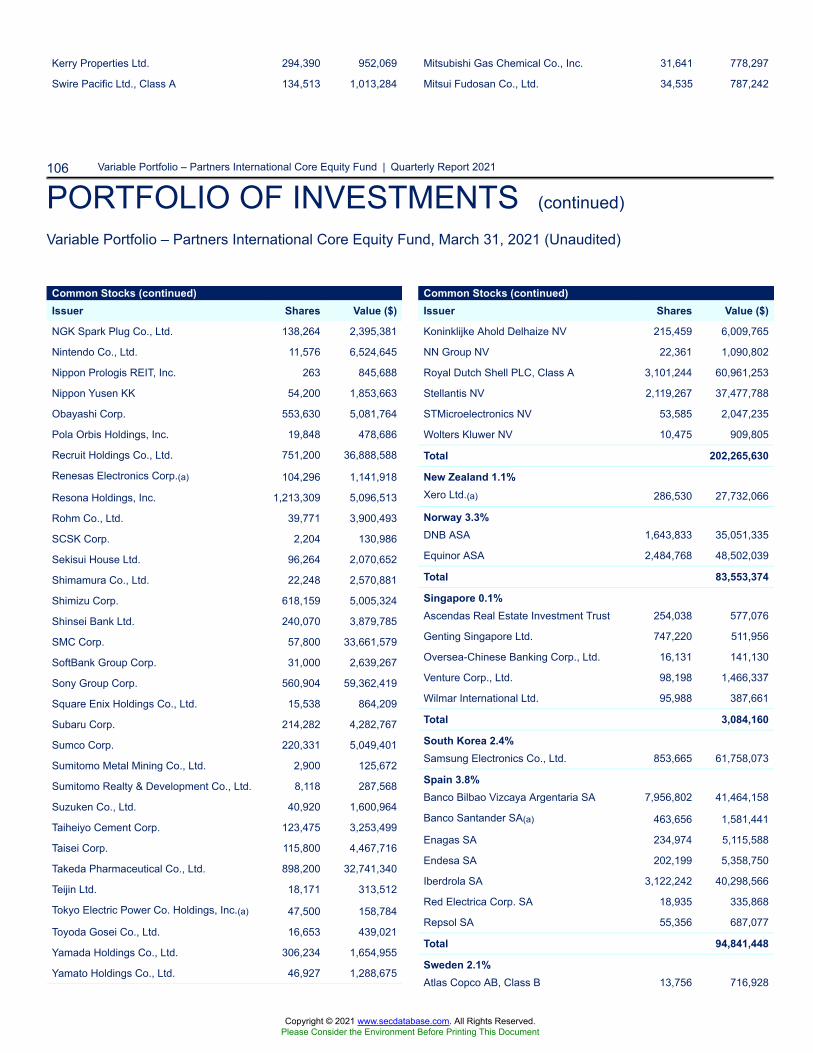
106 Variable Portfolio – Partners International Core Equity Fund | Quarterly Report 2021
PORTFOLIO OF INVESTMENTS (continued)
Variable Portfolio – Partners International Core Equity Fund, March 31, 2021 (Unaudited)
Kerry Properties Ltd. 294,390 952,069
Swire Pacific Ltd., Class A 134,513 1,013,284
Mitsubishi Gas Chemical Co., Inc. 31,641 778,297
Mitsui Fudosan Co., Ltd. 34,535 787,242
Common Stocks (continued)Issuer Shares Value ($)
NGK Spark Plug Co., Ltd. 138,264 2,395,381
Nintendo Co., Ltd. 11,576 6,524,645
Nippon Prologis REIT, Inc. 263 845,688
Nippon Yusen KK 54,200 1,853,663
Obayashi Corp. 553,630 5,081,764
Pola Orbis Holdings, Inc. 19,848 478,686
Recruit Holdings Co., Ltd. 751,200 36,888,588
Renesas Electronics Corp.(a) 104,296 1,141,918
Resona Holdings, Inc. 1,213,309 5,096,513
Rohm Co., Ltd. 39,771 3,900,493
SCSK Corp. 2,204 130,986
Sekisui House Ltd. 96,264 2,070,652
Shimamura Co., Ltd. 22,248 2,570,881
Shimizu Corp. 618,159 5,005,324
Shinsei Bank Ltd. 240,070 3,879,785
SMC Corp. 57,800 33,661,579
SoftBank Group Corp. 31,000 2,639,267
Sony Group Corp. 560,904 59,362,419
Square Enix Holdings Co., Ltd. 15,538 864,209
Subaru Corp. 214,282 4,282,767
Sumco Corp. 220,331 5,049,401
Sumitomo Metal Mining Co., Ltd. 2,900 125,672
Sumitomo Realty & Development Co., Ltd. 8,118 287,568
Suzuken Co., Ltd. 40,920 1,600,964
Taiheiyo Cement Corp. 123,475 3,253,499
Taisei Corp. 115,800 4,467,716
Takeda Pharmaceutical Co., Ltd. 898,200 32,741,340
Teijin Ltd. 18,171 313,512
Tokyo Electric Power Co. Holdings, Inc.(a) 47,500 158,784
Toyoda Gosei Co., Ltd. 16,653 439,021
Yamada Holdings Co., Ltd. 306,234 1,654,955
Yamato Holdings Co., Ltd. 46,927 1,288,675
Common Stocks (continued)Issuer Shares Value ($)
Koninklijke Ahold Delhaize NV 215,459 6,009,765
NN Group NV 22,361 1,090,802
Royal Dutch Shell PLC, Class A 3,101,244 60,961,253
Stellantis NV 2,119,267 37,477,788
STMicroelectronics NV 53,585 2,047,235
Wolters Kluwer NV 10,475 909,805
Total 202,265,630
New Zealand 1.1%Xero Ltd.(a) 286,530 27,732,066
Norway 3.3%DNB ASA 1,643,833 35,051,335
Equinor ASA 2,484,768 48,502,039
Total 83,553,374
Singapore 0.1%Ascendas Real Estate Investment Trust 254,038 577,076
Genting Singapore Ltd. 747,220 511,956
Oversea-Chinese Banking Corp., Ltd. 16,131 141,130
Venture Corp., Ltd. 98,198 1,466,337
Wilmar International Ltd. 95,988 387,661
Total 3,084,160
South Korea 2.4%Samsung Electronics Co., Ltd. 853,665 61,758,073
Spain 3.8%Banco Bilbao Vizcaya Argentaria SA 7,956,802 41,464,158
Banco Santander SA(a) 463,656 1,581,441
Enagas SA 234,974 5,115,588
Endesa SA 202,199 5,358,750
Iberdrola SA 3,122,242 40,298,566
Red Electrica Corp. SA 18,935 335,868
Repsol SA 55,356 687,077
Total 94,841,448
Sweden 2.1%Atlas Copco AB, Class B 13,756 716,928
Copyright © 2021 www.secdatabase.com. All Rights Reserved.Please Consider the Environment Before Printing This Document
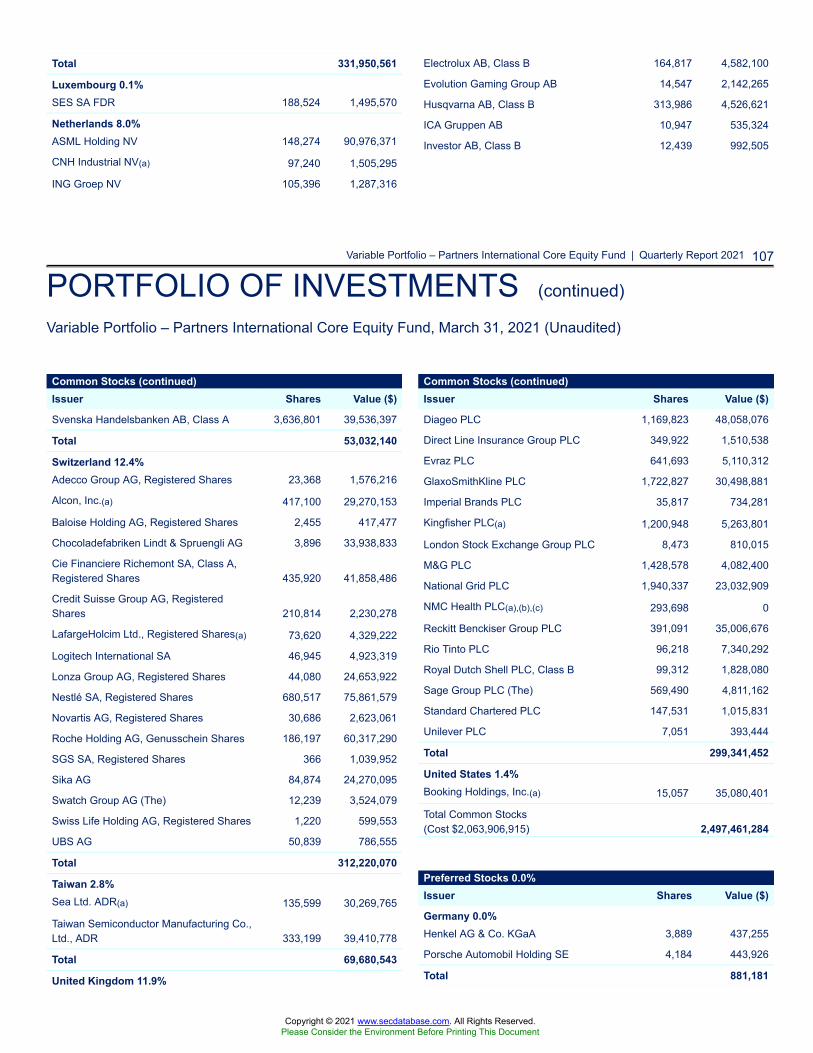
Variable Portfolio – Partners International Core Equity Fund | Quarterly Report 2021 107
PORTFOLIO OF INVESTMENTS (continued)
Variable Portfolio – Partners International Core Equity Fund, March 31, 2021 (Unaudited)
Total 331,950,561
Luxembourg 0.1%SES SA FDR 188,524 1,495,570
Netherlands 8.0%ASML Holding NV 148,274 90,976,371
CNH Industrial NV(a) 97,240 1,505,295
ING Groep NV 105,396 1,287,316
Electrolux AB, Class B 164,817 4,582,100
Evolution Gaming Group AB 14,547 2,142,265
Husqvarna AB, Class B 313,986 4,526,621
ICA Gruppen AB 10,947 535,324
Investor AB, Class B 12,439 992,505
Common Stocks (continued)Issuer Shares Value ($)
Svenska Handelsbanken AB, Class A 3,636,801 39,536,397
Total 53,032,140
Switzerland 12.4%Adecco Group AG, Registered Shares 23,368 1,576,216
Alcon, Inc.(a) 417,100 29,270,153
Baloise Holding AG, Registered Shares 2,455 417,477
Chocoladefabriken Lindt & Spruengli AG 3,896 33,938,833
Cie Financiere Richemont SA, Class A,Registered Shares 435,920 41,858,486
Credit Suisse Group AG, RegisteredShares 210,814 2,230,278
LafargeHolcim Ltd., Registered Shares(a) 73,620 4,329,222
Logitech International SA 46,945 4,923,319
Lonza Group AG, Registered Shares 44,080 24,653,922
Nestlé SA, Registered Shares 680,517 75,861,579
Novartis AG, Registered Shares 30,686 2,623,061
Roche Holding AG, Genusschein Shares 186,197 60,317,290
SGS SA, Registered Shares 366 1,039,952
Sika AG 84,874 24,270,095
Swatch Group AG (The) 12,239 3,524,079
Swiss Life Holding AG, Registered Shares 1,220 599,553
UBS AG 50,839 786,555
Total 312,220,070
Taiwan 2.8%Sea Ltd. ADR(a) 135,599 30,269,765
Taiwan Semiconductor Manufacturing Co.,Ltd., ADR 333,199 39,410,778
Total 69,680,543
United Kingdom 11.9%
Common Stocks (continued)Issuer Shares Value ($)
Diageo PLC 1,169,823 48,058,076
Direct Line Insurance Group PLC 349,922 1,510,538
Evraz PLC 641,693 5,110,312
GlaxoSmithKline PLC 1,722,827 30,498,881
Imperial Brands PLC 35,817 734,281
Kingfisher PLC(a) 1,200,948 5,263,801
London Stock Exchange Group PLC 8,473 810,015
M&G PLC 1,428,578 4,082,400
National Grid PLC 1,940,337 23,032,909
NMC Health PLC(a),(b),(c) 293,698 0
Reckitt Benckiser Group PLC 391,091 35,006,676
Rio Tinto PLC 96,218 7,340,292
Royal Dutch Shell PLC, Class B 99,312 1,828,080
Sage Group PLC (The) 569,490 4,811,162
Standard Chartered PLC 147,531 1,015,831
Unilever PLC 7,051 393,444
Total 299,341,452
United States 1.4%Booking Holdings, Inc.(a) 15,057 35,080,401
Total Common Stocks(Cost $2,063,906,915) 2,497,461,284
Preferred Stocks 0.0%Issuer Shares Value ($)
Germany 0.0%Henkel AG & Co. KGaA 3,889 437,255
Porsche Automobil Holding SE 4,184 443,926
Total 881,181
Copyright © 2021 www.secdatabase.com. All Rights Reserved.Please Consider the Environment Before Printing This Document
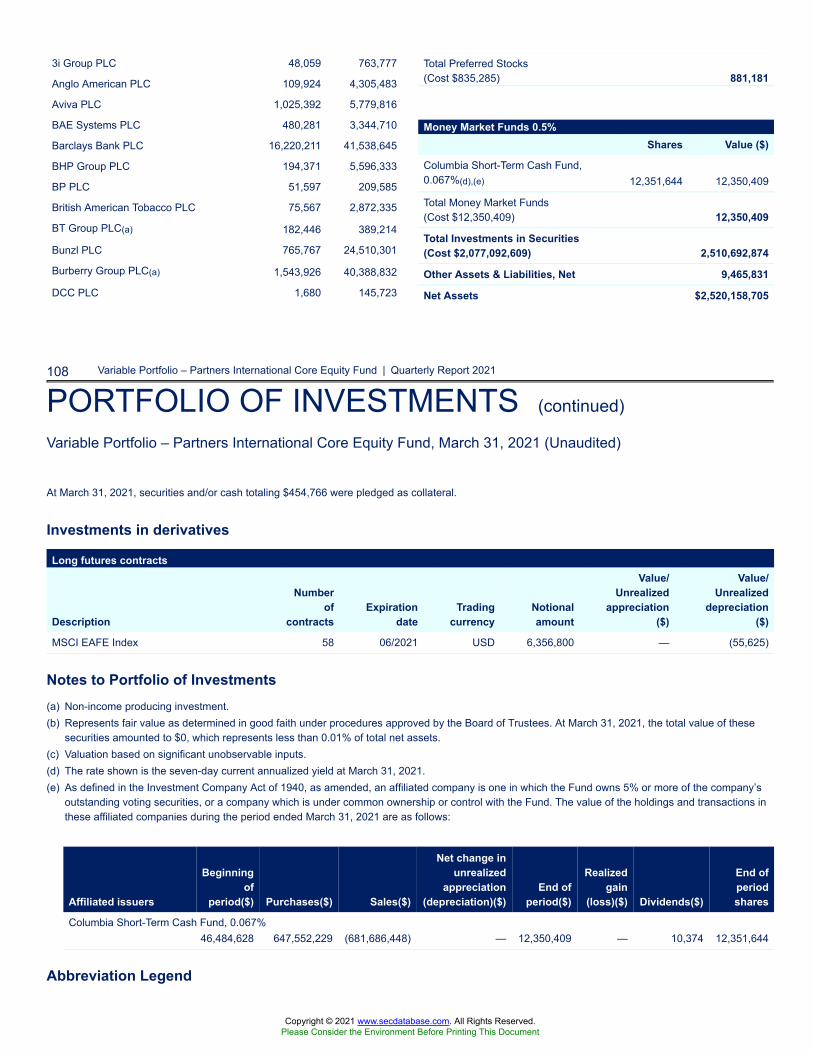
108 Variable Portfolio – Partners International Core Equity Fund | Quarterly Report 2021
PORTFOLIO OF INVESTMENTS (continued)
Variable Portfolio – Partners International Core Equity Fund, March 31, 2021 (Unaudited)
At March 31, 2021, securities and/or cash totaling $454,766 were pledged as collateral.
Investments in derivatives
Long futures contracts
Description
Numberof
contractsExpiration
dateTrading
currencyNotionalamount
Value/Unrealized
appreciation($)
Value/Unrealized
depreciation($)
MSCI EAFE Index 58 06/2021 USD 6,356,800 — (55,625)
Notes to Portfolio of Investments(a) Non-income producing investment.(b) Represents fair value as determined in good faith under procedures approved by the Board of Trustees. At March 31, 2021, the total value of these
securities amounted to $0, which represents less than 0.01% of total net assets.(c) Valuation based on significant unobservable inputs.(d) The rate shown is the seven-day current annualized yield at March 31, 2021.(e) As defined in the Investment Company Act of 1940, as amended, an affiliated company is one in which the Fund owns 5% or more of the company’s
outstanding voting securities, or a company which is under common ownership or control with the Fund. The value of the holdings and transactions inthese affiliated companies during the period ended March 31, 2021 are as follows:
Affiliated issuers
Beginningof
period($) Purchases($) Sales($)
Net change inunrealized
appreciation(depreciation)($)
End ofperiod($)
Realizedgain
(loss)($) Dividends($)
End ofperiodshares
Columbia Short-Term Cash Fund, 0.067%46,484,628 647,552,229 (681,686,448) — 12,350,409 — 10,374 12,351,644
Abbreviation Legend
3i Group PLC 48,059 763,777
Anglo American PLC 109,924 4,305,483
Aviva PLC 1,025,392 5,779,816
BAE Systems PLC 480,281 3,344,710
Barclays Bank PLC 16,220,211 41,538,645
BHP Group PLC 194,371 5,596,333
BP PLC 51,597 209,585
British American Tobacco PLC 75,567 2,872,335
BT Group PLC(a) 182,446 389,214
Bunzl PLC 765,767 24,510,301
Burberry Group PLC(a) 1,543,926 40,388,832
DCC PLC 1,680 145,723
Total Preferred Stocks(Cost $835,285) 881,181
Money Market Funds 0.5%Shares Value ($)
Columbia Short-Term Cash Fund,0.067%(d),(e) 12,351,644 12,350,409
Total Money Market Funds(Cost $12,350,409) 12,350,409
Total Investments in Securities(Cost $2,077,092,609) 2,510,692,874
Other Assets & Liabilities, Net 9,465,831
Net Assets $2,520,158,705
Copyright © 2021 www.secdatabase.com. All Rights Reserved.Please Consider the Environment Before Printing This Document
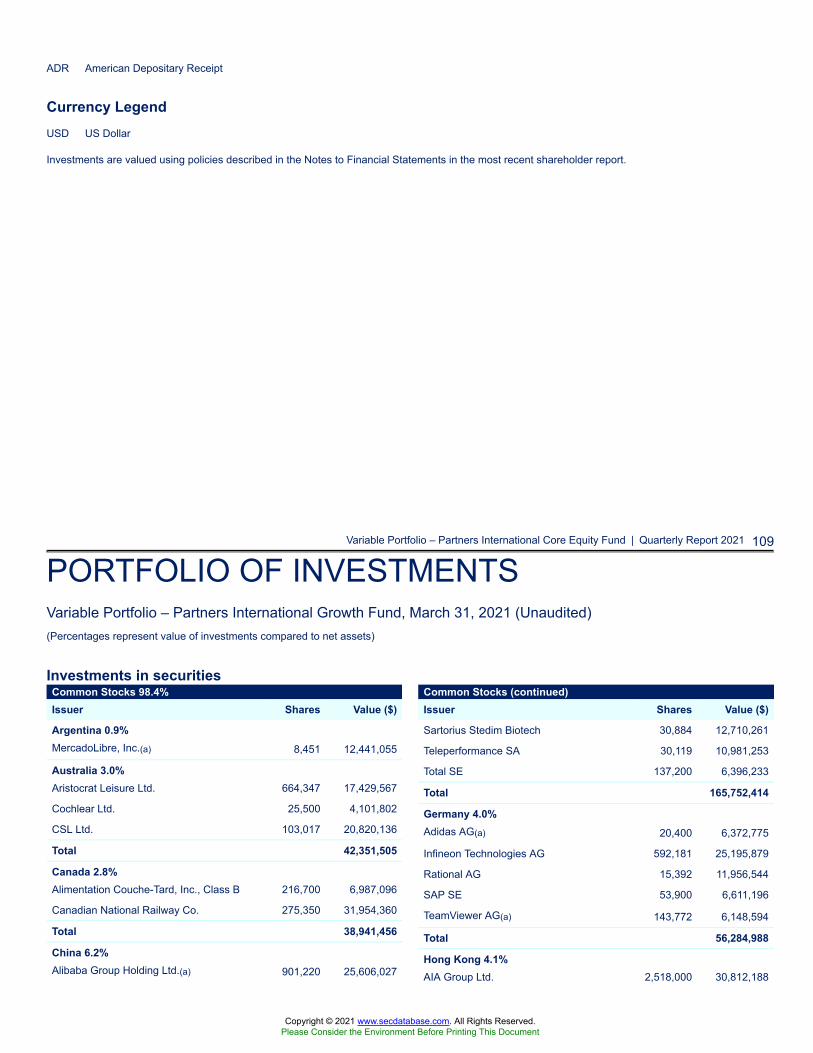
ADR American Depositary Receipt
Currency LegendUSD US Dollar
Investments are valued using policies described in the Notes to Financial Statements in the most recent shareholder report.
Variable Portfolio – Partners International Core Equity Fund | Quarterly Report 2021 109
PORTFOLIO OF INVESTMENTSVariable Portfolio – Partners International Growth Fund, March 31, 2021 (Unaudited)(Percentages represent value of investments compared to net assets)
Investments in securitiesCommon Stocks 98.4%Issuer Shares Value ($)
Argentina 0.9%MercadoLibre, Inc.(a) 8,451 12,441,055
Australia 3.0%Aristocrat Leisure Ltd. 664,347 17,429,567
Cochlear Ltd. 25,500 4,101,802
CSL Ltd. 103,017 20,820,136
Total 42,351,505
Canada 2.8%Alimentation Couche-Tard, Inc., Class B 216,700 6,987,096
Canadian National Railway Co. 275,350 31,954,360
Total 38,941,456
China 6.2%Alibaba Group Holding Ltd.(a) 901,220 25,606,027
Common Stocks (continued)Issuer Shares Value ($)
Sartorius Stedim Biotech 30,884 12,710,261
Teleperformance SA 30,119 10,981,253
Total SE 137,200 6,396,233
Total 165,752,414
Germany 4.0%Adidas AG(a) 20,400 6,372,775
Infineon Technologies AG 592,181 25,195,879
Rational AG 15,392 11,956,544
SAP SE 53,900 6,611,196
TeamViewer AG(a) 143,772 6,148,594
Total 56,284,988
Hong Kong 4.1%AIA Group Ltd. 2,518,000 30,812,188
Copyright © 2021 www.secdatabase.com. All Rights Reserved.Please Consider the Environment Before Printing This Document
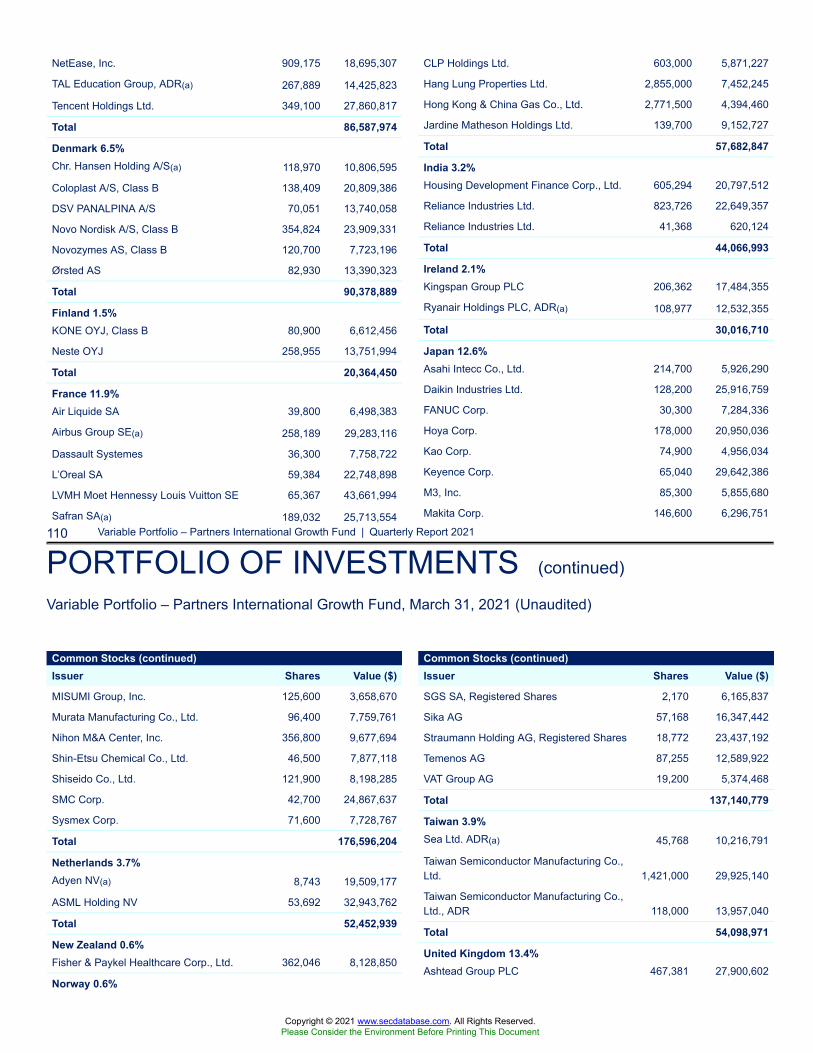
110 Variable Portfolio – Partners International Growth Fund | Quarterly Report 2021
PORTFOLIO OF INVESTMENTS (continued)
Variable Portfolio – Partners International Growth Fund, March 31, 2021 (Unaudited)
NetEase, Inc. 909,175 18,695,307
TAL Education Group, ADR(a) 267,889 14,425,823
Tencent Holdings Ltd. 349,100 27,860,817
Total 86,587,974
Denmark 6.5%Chr. Hansen Holding A/S(a) 118,970 10,806,595
Coloplast A/S, Class B 138,409 20,809,386
DSV PANALPINA A/S 70,051 13,740,058
Novo Nordisk A/S, Class B 354,824 23,909,331
Novozymes AS, Class B 120,700 7,723,196
Ørsted AS 82,930 13,390,323
Total 90,378,889
Finland 1.5%KONE OYJ, Class B 80,900 6,612,456
Neste OYJ 258,955 13,751,994
Total 20,364,450
France 11.9%Air Liquide SA 39,800 6,498,383
Airbus Group SE(a) 258,189 29,283,116
Dassault Systemes 36,300 7,758,722
L’Oreal SA 59,384 22,748,898
LVMH Moet Hennessy Louis Vuitton SE 65,367 43,661,994
Safran SA(a) 189,032 25,713,554
CLP Holdings Ltd. 603,000 5,871,227
Hang Lung Properties Ltd. 2,855,000 7,452,245
Hong Kong & China Gas Co., Ltd. 2,771,500 4,394,460
Jardine Matheson Holdings Ltd. 139,700 9,152,727
Total 57,682,847
India 3.2%Housing Development Finance Corp., Ltd. 605,294 20,797,512
Reliance Industries Ltd. 823,726 22,649,357
Reliance Industries Ltd. 41,368 620,124
Total 44,066,993
Ireland 2.1%Kingspan Group PLC 206,362 17,484,355
Ryanair Holdings PLC, ADR(a) 108,977 12,532,355
Total 30,016,710
Japan 12.6%Asahi Intecc Co., Ltd. 214,700 5,926,290
Daikin Industries Ltd. 128,200 25,916,759
FANUC Corp. 30,300 7,284,336
Hoya Corp. 178,000 20,950,036
Kao Corp. 74,900 4,956,034
Keyence Corp. 65,040 29,642,386
M3, Inc. 85,300 5,855,680
Makita Corp. 146,600 6,296,751
Common Stocks (continued)Issuer Shares Value ($)
MISUMI Group, Inc. 125,600 3,658,670
Murata Manufacturing Co., Ltd. 96,400 7,759,761
Nihon M&A Center, Inc. 356,800 9,677,694
Shin-Etsu Chemical Co., Ltd. 46,500 7,877,118
Shiseido Co., Ltd. 121,900 8,198,285
SMC Corp. 42,700 24,867,637
Sysmex Corp. 71,600 7,728,767
Total 176,596,204
Netherlands 3.7%Adyen NV(a) 8,743 19,509,177
ASML Holding NV 53,692 32,943,762
Total 52,452,939
New Zealand 0.6%Fisher & Paykel Healthcare Corp., Ltd. 362,046 8,128,850
Norway 0.6%
Common Stocks (continued)Issuer Shares Value ($)
SGS SA, Registered Shares 2,170 6,165,837
Sika AG 57,168 16,347,442
Straumann Holding AG, Registered Shares 18,772 23,437,192
Temenos AG 87,255 12,589,922
VAT Group AG 19,200 5,374,468
Total 137,140,779
Taiwan 3.9%Sea Ltd. ADR(a) 45,768 10,216,791
Taiwan Semiconductor Manufacturing Co.,Ltd. 1,421,000 29,925,140
Taiwan Semiconductor Manufacturing Co.,Ltd., ADR 118,000 13,957,040
Total 54,098,971
United Kingdom 13.4%Ashtead Group PLC 467,381 27,900,602
Copyright © 2021 www.secdatabase.com. All Rights Reserved.Please Consider the Environment Before Printing This Document
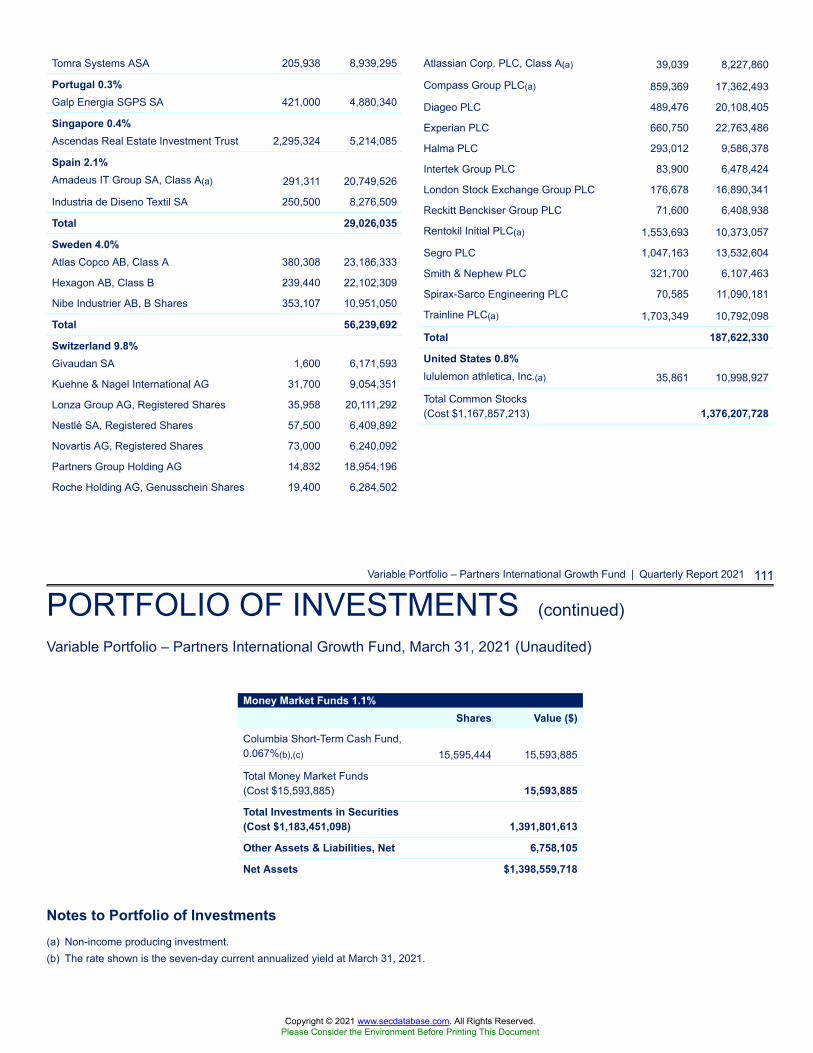
Variable Portfolio – Partners International Growth Fund | Quarterly Report 2021 111
PORTFOLIO OF INVESTMENTS (continued)
Variable Portfolio – Partners International Growth Fund, March 31, 2021 (Unaudited)
Money Market Funds 1.1%Shares Value ($)
Columbia Short-Term Cash Fund,0.067%(b),(c) 15,595,444 15,593,885
Total Money Market Funds(Cost $15,593,885) 15,593,885
Total Investments in Securities(Cost $1,183,451,098) 1,391,801,613
Other Assets & Liabilities, Net 6,758,105
Net Assets $1,398,559,718
Notes to Portfolio of Investments(a) Non-income producing investment.(b) The rate shown is the seven-day current annualized yield at March 31, 2021.
Tomra Systems ASA 205,938 8,939,295
Portugal 0.3%Galp Energia SGPS SA 421,000 4,880,340
Singapore 0.4%Ascendas Real Estate Investment Trust 2,295,324 5,214,085
Spain 2.1%Amadeus IT Group SA, Class A(a) 291,311 20,749,526
Industria de Diseno Textil SA 250,500 8,276,509
Total 29,026,035
Sweden 4.0%Atlas Copco AB, Class A 380,308 23,186,333
Hexagon AB, Class B 239,440 22,102,309
Nibe Industrier AB, B Shares 353,107 10,951,050
Total 56,239,692
Switzerland 9.8%Givaudan SA 1,600 6,171,593
Kuehne & Nagel International AG 31,700 9,054,351
Lonza Group AG, Registered Shares 35,958 20,111,292
Nestlé SA, Registered Shares 57,500 6,409,892
Novartis AG, Registered Shares 73,000 6,240,092
Partners Group Holding AG 14,832 18,954,196
Roche Holding AG, Genusschein Shares 19,400 6,284,502
Atlassian Corp. PLC, Class A(a) 39,039 8,227,860
Compass Group PLC(a) 859,369 17,362,493
Diageo PLC 489,476 20,108,405
Experian PLC 660,750 22,763,486
Halma PLC 293,012 9,586,378
Intertek Group PLC 83,900 6,478,424
London Stock Exchange Group PLC 176,678 16,890,341
Reckitt Benckiser Group PLC 71,600 6,408,938
Rentokil Initial PLC(a) 1,553,693 10,373,057
Segro PLC 1,047,163 13,532,604
Smith & Nephew PLC 321,700 6,107,463
Spirax-Sarco Engineering PLC 70,585 11,090,181
Trainline PLC(a) 1,703,349 10,792,098
Total 187,622,330
United States 0.8%lululemon athletica, Inc.(a) 35,861 10,998,927
Total Common Stocks(Cost $1,167,857,213) 1,376,207,728
Copyright © 2021 www.secdatabase.com. All Rights Reserved.Please Consider the Environment Before Printing This Document
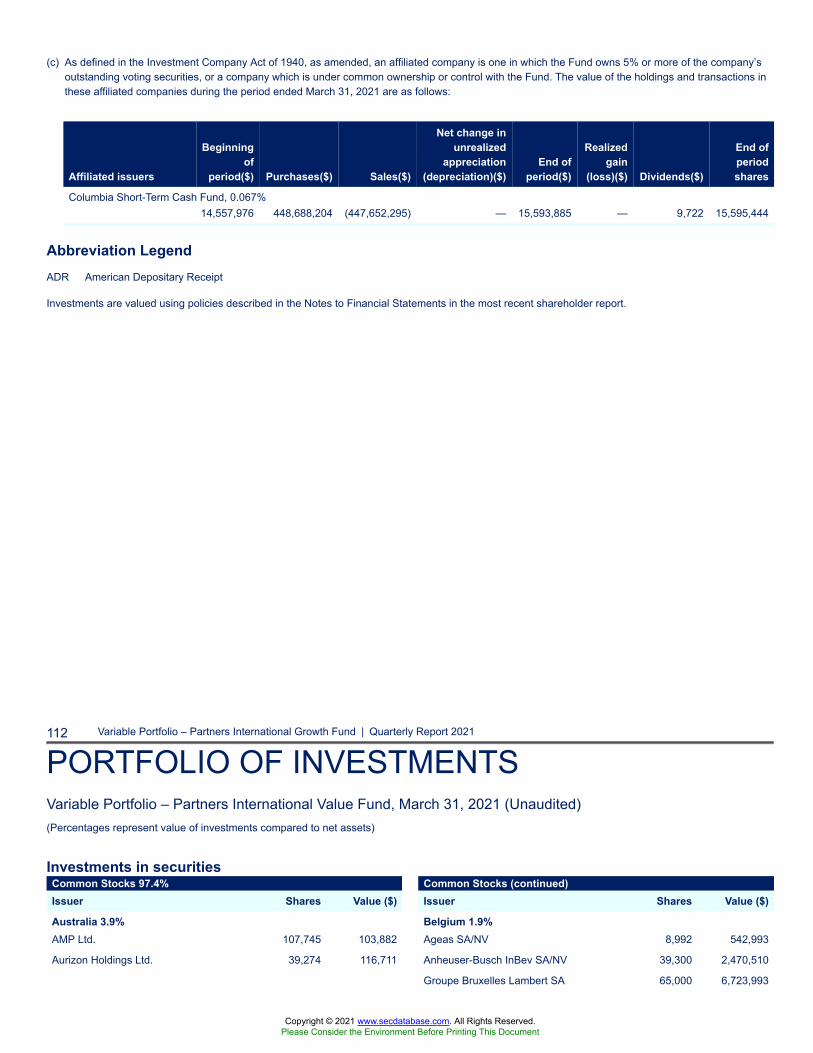
(c) As defined in the Investment Company Act of 1940, as amended, an affiliated company is one in which the Fund owns 5% or more of the company’soutstanding voting securities, or a company which is under common ownership or control with the Fund. The value of the holdings and transactions inthese affiliated companies during the period ended March 31, 2021 are as follows:
Affiliated issuers
Beginningof
period($) Purchases($) Sales($)
Net change inunrealized
appreciation(depreciation)($)
End ofperiod($)
Realizedgain
(loss)($) Dividends($)
End ofperiodshares
Columbia Short-Term Cash Fund, 0.067%14,557,976 448,688,204 (447,652,295) — 15,593,885 — 9,722 15,595,444
Abbreviation LegendADR American Depositary Receipt
Investments are valued using policies described in the Notes to Financial Statements in the most recent shareholder report.
112 Variable Portfolio – Partners International Growth Fund | Quarterly Report 2021
PORTFOLIO OF INVESTMENTSVariable Portfolio – Partners International Value Fund, March 31, 2021 (Unaudited)(Percentages represent value of investments compared to net assets)
Investments in securitiesCommon Stocks 97.4%Issuer Shares Value ($)
Australia 3.9%AMP Ltd. 107,745 103,882
Aurizon Holdings Ltd. 39,274 116,711
Common Stocks (continued)Issuer Shares Value ($)
Belgium 1.9%Ageas SA/NV 8,992 542,993
Anheuser-Busch InBev SA/NV 39,300 2,470,510
Groupe Bruxelles Lambert SA 65,000 6,723,993
Copyright © 2021 www.secdatabase.com. All Rights Reserved.Please Consider the Environment Before Printing This Document
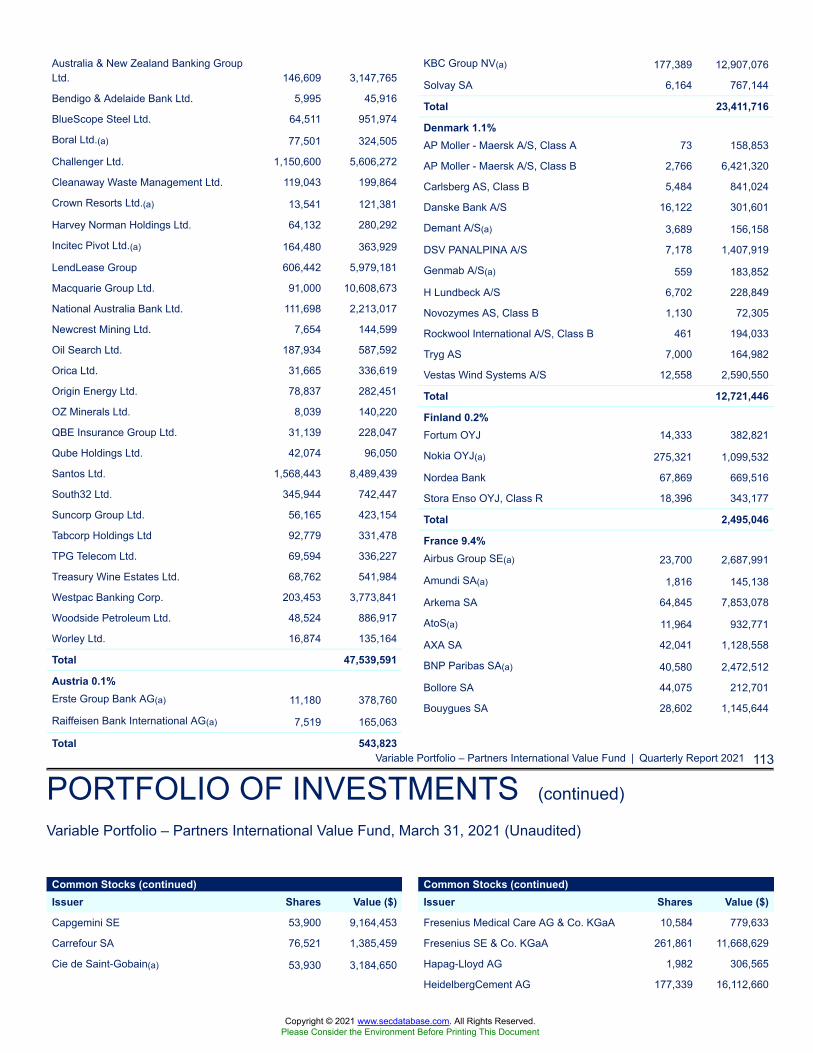
Variable Portfolio – Partners International Value Fund | Quarterly Report 2021 113
PORTFOLIO OF INVESTMENTS (continued)
Variable Portfolio – Partners International Value Fund, March 31, 2021 (Unaudited)
Australia & New Zealand Banking GroupLtd. 146,609 3,147,765
Bendigo & Adelaide Bank Ltd. 5,995 45,916
BlueScope Steel Ltd. 64,511 951,974
Boral Ltd.(a) 77,501 324,505
Challenger Ltd. 1,150,600 5,606,272
Cleanaway Waste Management Ltd. 119,043 199,864
Crown Resorts Ltd.(a) 13,541 121,381
Harvey Norman Holdings Ltd. 64,132 280,292
Incitec Pivot Ltd.(a) 164,480 363,929
LendLease Group 606,442 5,979,181
Macquarie Group Ltd. 91,000 10,608,673
National Australia Bank Ltd. 111,698 2,213,017
Newcrest Mining Ltd. 7,654 144,599
Oil Search Ltd. 187,934 587,592
Orica Ltd. 31,665 336,619
Origin Energy Ltd. 78,837 282,451
OZ Minerals Ltd. 8,039 140,220
QBE Insurance Group Ltd. 31,139 228,047
Qube Holdings Ltd. 42,074 96,050
Santos Ltd. 1,568,443 8,489,439
South32 Ltd. 345,944 742,447
Suncorp Group Ltd. 56,165 423,154
Tabcorp Holdings Ltd 92,779 331,478
TPG Telecom Ltd. 69,594 336,227
Treasury Wine Estates Ltd. 68,762 541,984
Westpac Banking Corp. 203,453 3,773,841
Woodside Petroleum Ltd. 48,524 886,917
Worley Ltd. 16,874 135,164
Total 47,539,591
Austria 0.1%Erste Group Bank AG(a) 11,180 378,760
Raiffeisen Bank International AG(a) 7,519 165,063
Total 543,823
KBC Group NV(a) 177,389 12,907,076
Solvay SA 6,164 767,144
Total 23,411,716
Denmark 1.1%AP Moller - Maersk A/S, Class A 73 158,853
AP Moller - Maersk A/S, Class B 2,766 6,421,320
Carlsberg AS, Class B 5,484 841,024
Danske Bank A/S 16,122 301,601
Demant A/S(a) 3,689 156,158
DSV PANALPINA A/S 7,178 1,407,919
Genmab A/S(a) 559 183,852
H Lundbeck A/S 6,702 228,849
Novozymes AS, Class B 1,130 72,305
Rockwool International A/S, Class B 461 194,033
Tryg AS 7,000 164,982
Vestas Wind Systems A/S 12,558 2,590,550
Total 12,721,446
Finland 0.2%Fortum OYJ 14,333 382,821
Nokia OYJ(a) 275,321 1,099,532
Nordea Bank 67,869 669,516
Stora Enso OYJ, Class R 18,396 343,177
Total 2,495,046
France 9.4%Airbus Group SE(a) 23,700 2,687,991
Amundi SA(a) 1,816 145,138
Arkema SA 64,845 7,853,078
AtoS(a) 11,964 932,771
AXA SA 42,041 1,128,558
BNP Paribas SA(a) 40,580 2,472,512
Bollore SA 44,075 212,701
Bouygues SA 28,602 1,145,644
Common Stocks (continued)Issuer Shares Value ($)
Capgemini SE 53,900 9,164,453
Carrefour SA 76,521 1,385,459
Cie de Saint-Gobain(a) 53,930 3,184,650
Common Stocks (continued)Issuer Shares Value ($)
Fresenius Medical Care AG & Co. KGaA 10,584 779,633
Fresenius SE & Co. KGaA 261,861 11,668,629
Hapag-Lloyd AG 1,982 306,565
HeidelbergCement AG 177,339 16,112,660
Copyright © 2021 www.secdatabase.com. All Rights Reserved.Please Consider the Environment Before Printing This Document
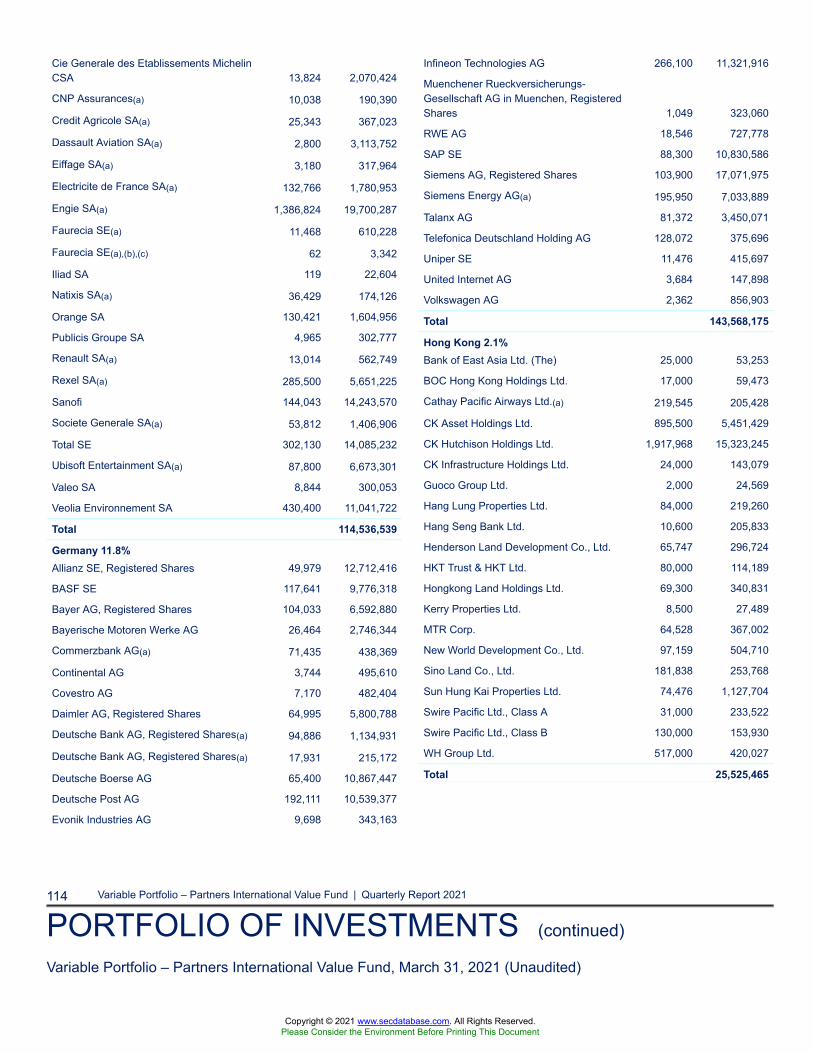
114 Variable Portfolio – Partners International Value Fund | Quarterly Report 2021
PORTFOLIO OF INVESTMENTS (continued)
Variable Portfolio – Partners International Value Fund, March 31, 2021 (Unaudited)
Cie Generale des Etablissements MichelinCSA 13,824 2,070,424
CNP Assurances(a) 10,038 190,390
Credit Agricole SA(a) 25,343 367,023
Dassault Aviation SA(a) 2,800 3,113,752
Eiffage SA(a) 3,180 317,964
Electricite de France SA(a) 132,766 1,780,953
Engie SA(a) 1,386,824 19,700,287
Faurecia SE(a) 11,468 610,228
Faurecia SE(a),(b),(c) 62 3,342
Iliad SA 119 22,604
Natixis SA(a) 36,429 174,126
Orange SA 130,421 1,604,956
Publicis Groupe SA 4,965 302,777
Renault SA(a) 13,014 562,749
Rexel SA(a) 285,500 5,651,225
Sanofi 144,043 14,243,570
Societe Generale SA(a) 53,812 1,406,906
Total SE 302,130 14,085,232
Ubisoft Entertainment SA(a) 87,800 6,673,301
Valeo SA 8,844 300,053
Veolia Environnement SA 430,400 11,041,722
Total 114,536,539
Germany 11.8%Allianz SE, Registered Shares 49,979 12,712,416
BASF SE 117,641 9,776,318
Bayer AG, Registered Shares 104,033 6,592,880
Bayerische Motoren Werke AG 26,464 2,746,344
Commerzbank AG(a) 71,435 438,369
Continental AG 3,744 495,610
Covestro AG 7,170 482,404
Daimler AG, Registered Shares 64,995 5,800,788
Deutsche Bank AG, Registered Shares(a) 94,886 1,134,931
Deutsche Bank AG, Registered Shares(a) 17,931 215,172
Deutsche Boerse AG 65,400 10,867,447
Deutsche Post AG 192,111 10,539,377
Evonik Industries AG 9,698 343,163
Infineon Technologies AG 266,100 11,321,916
Muenchener Rueckversicherungs-Gesellschaft AG in Muenchen, RegisteredShares 1,049 323,060
RWE AG 18,546 727,778
SAP SE 88,300 10,830,586
Siemens AG, Registered Shares 103,900 17,071,975
Siemens Energy AG(a) 195,950 7,033,889
Talanx AG 81,372 3,450,071
Telefonica Deutschland Holding AG 128,072 375,696
Uniper SE 11,476 415,697
United Internet AG 3,684 147,898
Volkswagen AG 2,362 856,903
Total 143,568,175
Hong Kong 2.1%Bank of East Asia Ltd. (The) 25,000 53,253
BOC Hong Kong Holdings Ltd. 17,000 59,473
Cathay Pacific Airways Ltd.(a) 219,545 205,428
CK Asset Holdings Ltd. 895,500 5,451,429
CK Hutchison Holdings Ltd. 1,917,968 15,323,245
CK Infrastructure Holdings Ltd. 24,000 143,079
Guoco Group Ltd. 2,000 24,569
Hang Lung Properties Ltd. 84,000 219,260
Hang Seng Bank Ltd. 10,600 205,833
Henderson Land Development Co., Ltd. 65,747 296,724
HKT Trust & HKT Ltd. 80,000 114,189
Hongkong Land Holdings Ltd. 69,300 340,831
Kerry Properties Ltd. 8,500 27,489
MTR Corp. 64,528 367,002
New World Development Co., Ltd. 97,159 504,710
Sino Land Co., Ltd. 181,838 253,768
Sun Hung Kai Properties Ltd. 74,476 1,127,704
Swire Pacific Ltd., Class A 31,000 233,522
Swire Pacific Ltd., Class B 130,000 153,930
WH Group Ltd. 517,000 420,027
Total 25,525,465
Copyright © 2021 www.secdatabase.com. All Rights Reserved.Please Consider the Environment Before Printing This Document
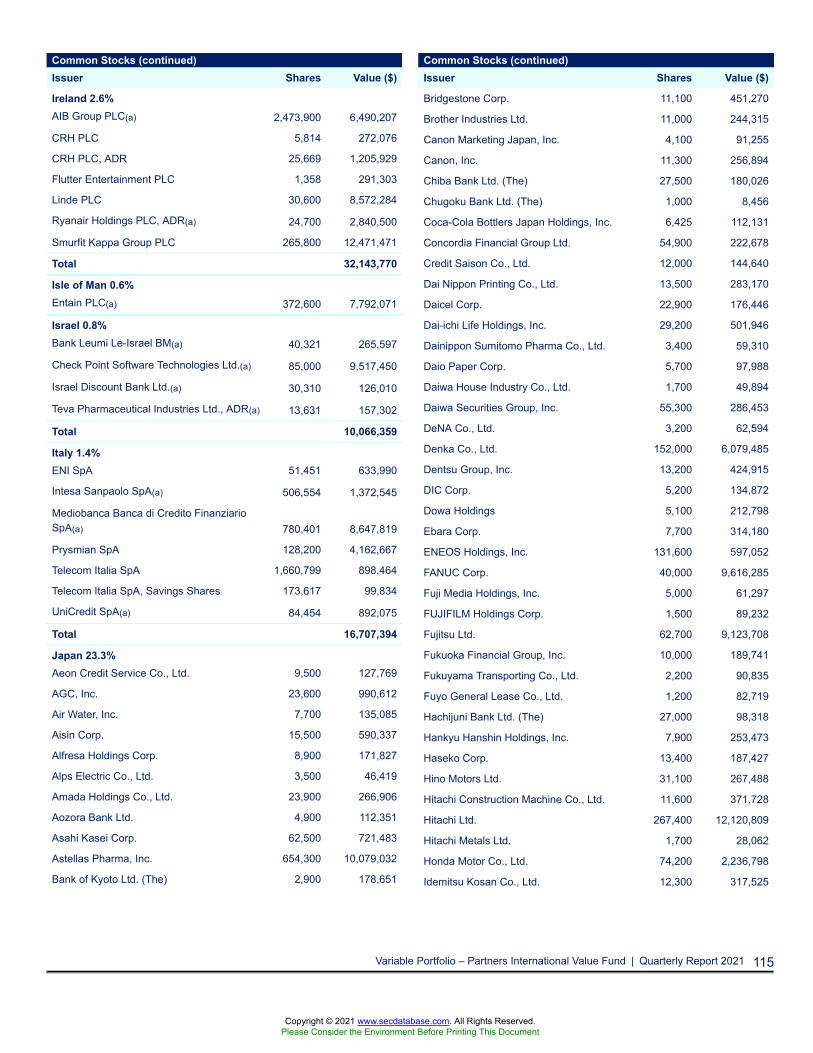
Variable Portfolio – Partners International Value Fund | Quarterly Report 2021 115
Common Stocks (continued)Issuer Shares Value ($)
Ireland 2.6%AIB Group PLC(a) 2,473,900 6,490,207
CRH PLC 5,814 272,076
CRH PLC, ADR 25,669 1,205,929
Flutter Entertainment PLC 1,358 291,303
Linde PLC 30,600 8,572,284
Ryanair Holdings PLC, ADR(a) 24,700 2,840,500
Smurfit Kappa Group PLC 265,800 12,471,471
Total 32,143,770
Isle of Man 0.6%Entain PLC(a) 372,600 7,792,071
Israel 0.8%Bank Leumi Le-Israel BM(a) 40,321 265,597
Check Point Software Technologies Ltd.(a) 85,000 9,517,450
Israel Discount Bank Ltd.(a) 30,310 126,010
Teva Pharmaceutical Industries Ltd., ADR(a) 13,631 157,302
Total 10,066,359
Italy 1.4%ENI SpA 51,451 633,990
Intesa Sanpaolo SpA(a) 506,554 1,372,545
Mediobanca Banca di Credito FinanziarioSpA(a) 780,401 8,647,819
Prysmian SpA 128,200 4,162,667
Telecom Italia SpA 1,660,799 898,464
Telecom Italia SpA, Savings Shares 173,617 99,834
UniCredit SpA(a) 84,454 892,075
Total 16,707,394
Japan 23.3%Aeon Credit Service Co., Ltd. 9,500 127,769
AGC, Inc. 23,600 990,612
Air Water, Inc. 7,700 135,085
Aisin Corp. 15,500 590,337
Alfresa Holdings Corp. 8,900 171,827
Alps Electric Co., Ltd. 3,500 46,419
Amada Holdings Co., Ltd. 23,900 266,906
Aozora Bank Ltd. 4,900 112,351
Asahi Kasei Corp. 62,500 721,483
Astellas Pharma, Inc. 654,300 10,079,032
Bank of Kyoto Ltd. (The) 2,900 178,651
Common Stocks (continued)Issuer Shares Value ($)
Bridgestone Corp. 11,100 451,270
Brother Industries Ltd. 11,000 244,315
Canon Marketing Japan, Inc. 4,100 91,255
Canon, Inc. 11,300 256,894
Chiba Bank Ltd. (The) 27,500 180,026
Chugoku Bank Ltd. (The) 1,000 8,456
Coca-Cola Bottlers Japan Holdings, Inc. 6,425 112,131
Concordia Financial Group Ltd. 54,900 222,678
Credit Saison Co., Ltd. 12,000 144,640
Dai Nippon Printing Co., Ltd. 13,500 283,170
Daicel Corp. 22,900 176,446
Dai-ichi Life Holdings, Inc. 29,200 501,946
Dainippon Sumitomo Pharma Co., Ltd. 3,400 59,310
Daio Paper Corp. 5,700 97,988
Daiwa House Industry Co., Ltd. 1,700 49,894
Daiwa Securities Group, Inc. 55,300 286,453
DeNA Co., Ltd. 3,200 62,594
Denka Co., Ltd. 152,000 6,079,485
Dentsu Group, Inc. 13,200 424,915
DIC Corp. 5,200 134,872
Dowa Holdings 5,100 212,798
Ebara Corp. 7,700 314,180
ENEOS Holdings, Inc. 131,600 597,052
FANUC Corp. 40,000 9,616,285
Fuji Media Holdings, Inc. 5,000 61,297
FUJIFILM Holdings Corp. 1,500 89,232
Fujitsu Ltd. 62,700 9,123,708
Fukuoka Financial Group, Inc. 10,000 189,741
Fukuyama Transporting Co., Ltd. 2,200 90,835
Fuyo General Lease Co., Ltd. 1,200 82,719
Hachijuni Bank Ltd. (The) 27,000 98,318
Hankyu Hanshin Holdings, Inc. 7,900 253,473
Haseko Corp. 13,400 187,427
Hino Motors Ltd. 31,100 267,488
Hitachi Construction Machine Co., Ltd. 11,600 371,728
Hitachi Ltd. 267,400 12,120,809
Hitachi Metals Ltd. 1,700 28,062
Honda Motor Co., Ltd. 74,200 2,236,798
Idemitsu Kosan Co., Ltd. 12,300 317,525
Copyright © 2021 www.secdatabase.com. All Rights Reserved.Please Consider the Environment Before Printing This Document
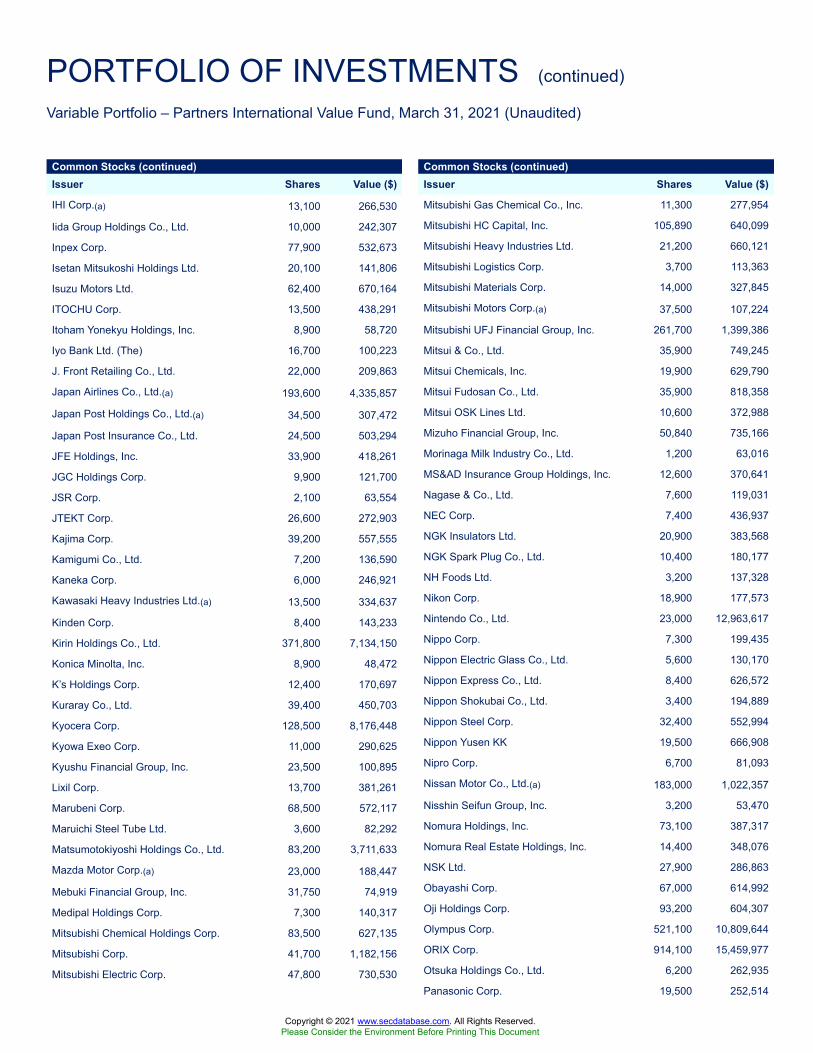
PORTFOLIO OF INVESTMENTS (continued)
Variable Portfolio – Partners International Value Fund, March 31, 2021 (Unaudited)
Common Stocks (continued)Issuer Shares Value ($)
IHI Corp.(a) 13,100 266,530
Iida Group Holdings Co., Ltd. 10,000 242,307
Inpex Corp. 77,900 532,673
Isetan Mitsukoshi Holdings Ltd. 20,100 141,806
Isuzu Motors Ltd. 62,400 670,164
ITOCHU Corp. 13,500 438,291
Itoham Yonekyu Holdings, Inc. 8,900 58,720
Iyo Bank Ltd. (The) 16,700 100,223
J. Front Retailing Co., Ltd. 22,000 209,863
Japan Airlines Co., Ltd.(a) 193,600 4,335,857
Japan Post Holdings Co., Ltd.(a) 34,500 307,472
Japan Post Insurance Co., Ltd. 24,500 503,294
JFE Holdings, Inc. 33,900 418,261
JGC Holdings Corp. 9,900 121,700
JSR Corp. 2,100 63,554
JTEKT Corp. 26,600 272,903
Kajima Corp. 39,200 557,555
Kamigumi Co., Ltd. 7,200 136,590
Kaneka Corp. 6,000 246,921
Kawasaki Heavy Industries Ltd.(a) 13,500 334,637
Kinden Corp. 8,400 143,233
Kirin Holdings Co., Ltd. 371,800 7,134,150
Konica Minolta, Inc. 8,900 48,472
K’s Holdings Corp. 12,400 170,697
Kuraray Co., Ltd. 39,400 450,703
Kyocera Corp. 128,500 8,176,448
Kyowa Exeo Corp. 11,000 290,625
Kyushu Financial Group, Inc. 23,500 100,895
Lixil Corp. 13,700 381,261
Marubeni Corp. 68,500 572,117
Maruichi Steel Tube Ltd. 3,600 82,292
Matsumotokiyoshi Holdings Co., Ltd. 83,200 3,711,633
Mazda Motor Corp.(a) 23,000 188,447
Mebuki Financial Group, Inc. 31,750 74,919
Medipal Holdings Corp. 7,300 140,317
Mitsubishi Chemical Holdings Corp. 83,500 627,135
Mitsubishi Corp. 41,700 1,182,156
Mitsubishi Electric Corp. 47,800 730,530
Common Stocks (continued)Issuer Shares Value ($)
Mitsubishi Gas Chemical Co., Inc. 11,300 277,954
Mitsubishi HC Capital, Inc. 105,890 640,099
Mitsubishi Heavy Industries Ltd. 21,200 660,121
Mitsubishi Logistics Corp. 3,700 113,363
Mitsubishi Materials Corp. 14,000 327,845
Mitsubishi Motors Corp.(a) 37,500 107,224
Mitsubishi UFJ Financial Group, Inc. 261,700 1,399,386
Mitsui & Co., Ltd. 35,900 749,245
Mitsui Chemicals, Inc. 19,900 629,790
Mitsui Fudosan Co., Ltd. 35,900 818,358
Mitsui OSK Lines Ltd. 10,600 372,988
Mizuho Financial Group, Inc. 50,840 735,166
Morinaga Milk Industry Co., Ltd. 1,200 63,016
MS&AD Insurance Group Holdings, Inc. 12,600 370,641
Nagase & Co., Ltd. 7,600 119,031
NEC Corp. 7,400 436,937
NGK Insulators Ltd. 20,900 383,568
NGK Spark Plug Co., Ltd. 10,400 180,177
NH Foods Ltd. 3,200 137,328
Nikon Corp. 18,900 177,573
Nintendo Co., Ltd. 23,000 12,963,617
Nippo Corp. 7,300 199,435
Nippon Electric Glass Co., Ltd. 5,600 130,170
Nippon Express Co., Ltd. 8,400 626,572
Nippon Shokubai Co., Ltd. 3,400 194,889
Nippon Steel Corp. 32,400 552,994
Nippon Yusen KK 19,500 666,908
Nipro Corp. 6,700 81,093
Nissan Motor Co., Ltd.(a) 183,000 1,022,357
Nisshin Seifun Group, Inc. 3,200 53,470
Nomura Holdings, Inc. 73,100 387,317
Nomura Real Estate Holdings, Inc. 14,400 348,076
NSK Ltd. 27,900 286,863
Obayashi Corp. 67,000 614,992
Oji Holdings Corp. 93,200 604,307
Olympus Corp. 521,100 10,809,644
ORIX Corp. 914,100 15,459,977
Otsuka Holdings Co., Ltd. 6,200 262,935
Panasonic Corp. 19,500 252,514
Copyright © 2021 www.secdatabase.com. All Rights Reserved.Please Consider the Environment Before Printing This Document
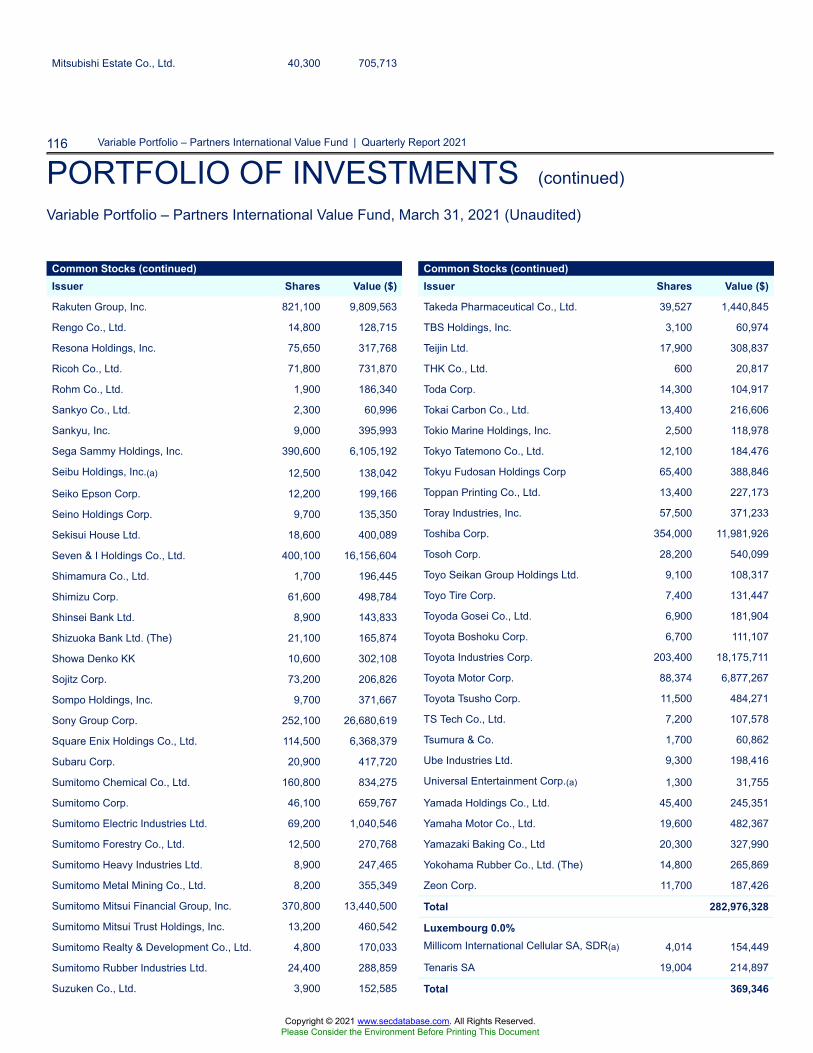
116 Variable Portfolio – Partners International Value Fund | Quarterly Report 2021
PORTFOLIO OF INVESTMENTS (continued)
Variable Portfolio – Partners International Value Fund, March 31, 2021 (Unaudited)
Mitsubishi Estate Co., Ltd. 40,300 705,713
Common Stocks (continued)Issuer Shares Value ($)
Rakuten Group, Inc. 821,100 9,809,563
Rengo Co., Ltd. 14,800 128,715
Resona Holdings, Inc. 75,650 317,768
Ricoh Co., Ltd. 71,800 731,870
Rohm Co., Ltd. 1,900 186,340
Sankyo Co., Ltd. 2,300 60,996
Sankyu, Inc. 9,000 395,993
Sega Sammy Holdings, Inc. 390,600 6,105,192
Seibu Holdings, Inc.(a) 12,500 138,042
Seiko Epson Corp. 12,200 199,166
Seino Holdings Corp. 9,700 135,350
Sekisui House Ltd. 18,600 400,089
Seven & I Holdings Co., Ltd. 400,100 16,156,604
Shimamura Co., Ltd. 1,700 196,445
Shimizu Corp. 61,600 498,784
Shinsei Bank Ltd. 8,900 143,833
Shizuoka Bank Ltd. (The) 21,100 165,874
Showa Denko KK 10,600 302,108
Sojitz Corp. 73,200 206,826
Sompo Holdings, Inc. 9,700 371,667
Sony Group Corp. 252,100 26,680,619
Square Enix Holdings Co., Ltd. 114,500 6,368,379
Subaru Corp. 20,900 417,720
Sumitomo Chemical Co., Ltd. 160,800 834,275
Sumitomo Corp. 46,100 659,767
Sumitomo Electric Industries Ltd. 69,200 1,040,546
Sumitomo Forestry Co., Ltd. 12,500 270,768
Sumitomo Heavy Industries Ltd. 8,900 247,465
Sumitomo Metal Mining Co., Ltd. 8,200 355,349
Sumitomo Mitsui Financial Group, Inc. 370,800 13,440,500
Sumitomo Mitsui Trust Holdings, Inc. 13,200 460,542
Sumitomo Realty & Development Co., Ltd. 4,800 170,033
Sumitomo Rubber Industries Ltd. 24,400 288,859
Suzuken Co., Ltd. 3,900 152,585
Common Stocks (continued)Issuer Shares Value ($)
Takeda Pharmaceutical Co., Ltd. 39,527 1,440,845
TBS Holdings, Inc. 3,100 60,974
Teijin Ltd. 17,900 308,837
THK Co., Ltd. 600 20,817
Toda Corp. 14,300 104,917
Tokai Carbon Co., Ltd. 13,400 216,606
Tokio Marine Holdings, Inc. 2,500 118,978
Tokyo Tatemono Co., Ltd. 12,100 184,476
Tokyu Fudosan Holdings Corp 65,400 388,846
Toppan Printing Co., Ltd. 13,400 227,173
Toray Industries, Inc. 57,500 371,233
Toshiba Corp. 354,000 11,981,926
Tosoh Corp. 28,200 540,099
Toyo Seikan Group Holdings Ltd. 9,100 108,317
Toyo Tire Corp. 7,400 131,447
Toyoda Gosei Co., Ltd. 6,900 181,904
Toyota Boshoku Corp. 6,700 111,107
Toyota Industries Corp. 203,400 18,175,711
Toyota Motor Corp. 88,374 6,877,267
Toyota Tsusho Corp. 11,500 484,271
TS Tech Co., Ltd. 7,200 107,578
Tsumura & Co. 1,700 60,862
Ube Industries Ltd. 9,300 198,416
Universal Entertainment Corp.(a) 1,300 31,755
Yamada Holdings Co., Ltd. 45,400 245,351
Yamaha Motor Co., Ltd. 19,600 482,367
Yamazaki Baking Co., Ltd 20,300 327,990
Yokohama Rubber Co., Ltd. (The) 14,800 265,869
Zeon Corp. 11,700 187,426
Total 282,976,328
Luxembourg 0.0%Millicom International Cellular SA, SDR(a) 4,014 154,449
Tenaris SA 19,004 214,897
Total 369,346
Copyright © 2021 www.secdatabase.com. All Rights Reserved.Please Consider the Environment Before Printing This Document

Variable Portfolio – Partners International Value Fund | Quarterly Report 2021 117
PORTFOLIO OF INVESTMENTS (continued)
Variable Portfolio – Partners International Value Fund, March 31, 2021 (Unaudited)
Suzuki Motor Corp. 5,600 255,076
T&D Holdings, Inc. 33,400 429,779
Taiheiyo Cement Corp. 11,200 295,114
Taisei Corp. 32,500 1,253,893
Taisho Pharmaceutical Holdings Co., Ltd. 1,900 122,780
Netherlands 6.6%ABN AMRO Bank NV(a) 17,168 208,419
Aegon NV 32,043 152,245
Akzo Nobel NV 1,189 132,747
ArcelorMittal SA(a) 425,022 12,232,743
Common Stocks (continued)Issuer Shares Value ($)
ASML Holding NV 20,800 12,762,241
Coca-Cola European Partners PLC 1,652 85,488
EXOR NV 55,000 4,638,859
Heineken Holding NV 127,820 11,357,854
Heineken NV 4,592 471,405
ING Groep NV 129,952 1,587,245
Koninklijke Ahold Delhaize NV 119,186 3,324,437
Koninklijke DSM NV 6,396 1,081,297
Koninklijke Philips NV(a) 302,265 17,236,779
Koninklijke Vopak NV 1,700 84,588
NN Group NV 11,422 557,182
NXP Semiconductors NV 44,700 8,999,898
Randstad NV 11,486 806,259
Stellantis NV 278,944 4,932,934
Stellantis NV 3,688 65,609
Total 80,718,229
New Zealand 0.1%Auckland International Airport Ltd.(a) 46,989 257,998
Chorus Ltd. 3,399 16,814
EBOS Group Ltd. 8,489 175,110
Fletcher Building Ltd. 95,281 472,091
Fonterra Co-operative Group Ltd. 23,154 79,722
Ryman Healthcare Ltd. 5,454 58,378
Total 1,060,113
Norway 0.9%DNB ASA 46,901 1,000,067
Equinor ASA 14,689 286,725
Mowi ASA 342,400 8,504,087
Norsk Hydro ASA 104,582 671,726
SpareBank 1 SR-Bank ASA 10,694 131,437
Common Stocks (continued)Issuer Shares Value ($)
Singapore 1.2%BOC Aviation Ltd. 20,900 203,399
CapitaLand Ltd. 180,000 504,345
City Developments Ltd. 44,900 267,048
DBS Group Holdings Ltd. 520,000 11,149,523
Frasers Property Ltd. 61,600 55,011
Jardine Cycle & Carriage Ltd. 3,300 55,360
Keppel Corp., Ltd. 120,200 476,216
Olam International Ltd. 74,200 94,951
Oversea-Chinese Banking Corp., Ltd. 19,993 174,919
Singapore Airlines Ltd.(a) 168,450 695,634
United Overseas Bank Ltd. 2,600 50,133
UOL Group Ltd. 29,089 171,066
Total 13,897,605
South Korea 1.4%Samsung Electronics Co., Ltd. 239,800 17,348,241
Spain 0.8%Banco Bilbao Vizcaya Argentaria SA, ADR 111,126 580,078
Banco Santander SA(a) 1,109,177 3,783,188
CaixaBank SA 469,591 1,457,980
EDP Renovaveis SA 20,186 430,942
Repsol SA 22,582 280,287
Siemens Gamesa Renewable Energy SA 68,000 2,637,340
Total 9,169,815
Sweden 2.9%Annehem Fastigheter AB, Class B(a) 5,417 16,685
Billerudkorsnas AB 16,377 304,614
Boliden AB 32,178 1,193,911
Dometic Group AB(a),(d) 16,082 233,760
Essity AB, Class B 175,300 5,540,384
Copyright © 2021 www.secdatabase.com. All Rights Reserved.Please Consider the Environment Before Printing This Document

118 Variable Portfolio – Partners International Value Fund | Quarterly Report 2021
PORTFOLIO OF INVESTMENTS (continued)
Variable Portfolio – Partners International Value Fund, March 31, 2021 (Unaudited)
Storebrand ASA(a) 31,934 320,904
Yara International ASA 5,089 265,109
Total 11,180,055
Portugal 0.0%Banco Espirito Santo SA, RegisteredShares(a),(b),(c) 533,756 1
Galp Energia SGPS SA 20,215 234,337
Total 234,338
Getinge AB, Series CPO 15,622 433,867
Holmen AB, Class B 4,381 192,316
ICA Gruppen AB 3,412 166,852
Intrum Justitia AB 1,086 34,874
Investor AB, Class B 115,400 9,207,742
Lundin Energy AB 58,400 1,836,804
Peab AB, Class B(a) 12,118 146,568
Saab AB, Class B(a) 5,752 157,581
Common Stocks (continued)Issuer Shares Value ($)
Securitas AB 28,179 479,261
Skandinaviska Enskilda Banken AB, Class A 80,302 979,563
Skanska AB, Class B 45,999 1,153,638
SKF AB, Class B 21,206 603,406
SSAB AB, Class A(a) 11,044 58,398
SSAB AB, Class B(a) 27,246 131,861
Svenska Cellulosa AB SCA, Class A(a) 11,223 200,188
Svenska Cellulosa AB, Class B(a) 30,406 538,189
Svenska Handelsbanken AB, Class A 34,854 378,905
Svenska Handelsbanken AB, Class B 2,028 24,814
Swedbank AB, Class A 23,181 408,725
Swedish Orphan Biovitrum AB(a) 5,121 81,895
Tele2 AB, Class B 47,889 646,020
Telia Co. AB 202,285 877,062
Trelleborg AB, Class B(a) 12,680 322,495
Volvo AB 7,808 199,673
Volvo AB, B Shares 349,815 8,859,074
Total 35,409,125
Switzerland 9.8%ABB Ltd. 495,318 15,068,304
Adecco Group AG, Registered Shares 13,786 929,892
Alcon, Inc.(a) 172,414 12,099,219
Baloise Holding AG, Registered Shares 2,373 403,533
Banque Cantonale Vaudoise, RegisteredShares 918 89,572
Common Stocks (continued)Issuer Shares Value ($)
Swiss Re AG 6,366 626,052
Swisscom AG 2,912 1,562,337
UBS AG 1,211,887 18,749,697
UBS Group AG, Registered Shares 16,453 255,515
Vifor Pharma AG 2,956 402,289
Zurich Insurance Group AG 8,682 3,695,507
Total 119,532,551
United Kingdom 14.5%3i Group PLC 1,284 20,406
Anglo American PLC 50,096 1,962,151
Antofagasta PLC 22,986 535,415
Ashtead Group PLC 116,000 6,924,693
Aviva PLC 2,890,486 16,292,772
Barclays Bank PLC 418,555 1,071,885
Barclays Bank PLC, ADR 17,956 183,690
Barratt Developments PLC(a) 382,600 3,935,428
BHP Group PLC, ADR 67,600 3,911,336
BP PLC, ADR 175,061 4,262,735
British American Tobacco PLC 75,522 2,870,625
British American Tobacco, ADR 2,358 91,349
British Land Co. PLC (The) 1,166,500 8,115,566
BT Group PLC(a) 278,812 594,793
Bunzl PLC 207,700 6,647,961
Carnival PLC(a) 8,618 190,135
DCC PLC 112,494 9,757,700
Glencore PLC(a) 1,706,238 6,699,384
Copyright © 2021 www.secdatabase.com. All Rights Reserved.Please Consider the Environment Before Printing This Document
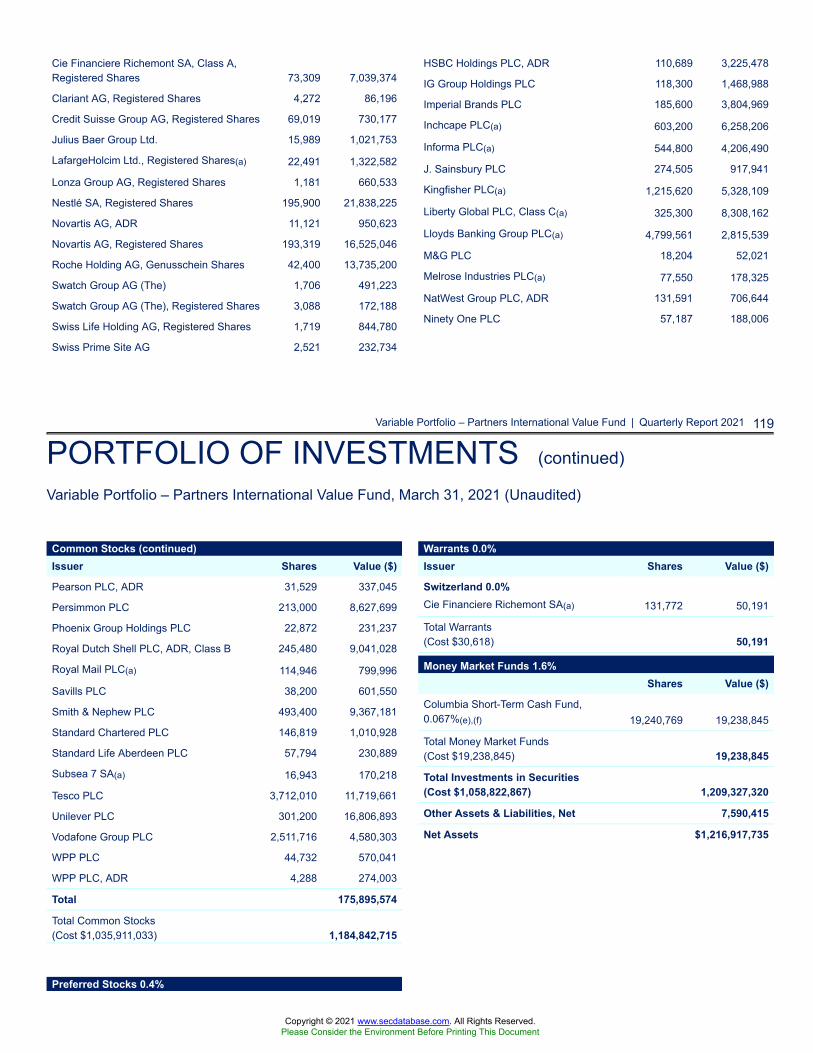
Variable Portfolio – Partners International Value Fund | Quarterly Report 2021 119
PORTFOLIO OF INVESTMENTS (continued)
Variable Portfolio – Partners International Value Fund, March 31, 2021 (Unaudited)
Cie Financiere Richemont SA, Class A,Registered Shares 73,309 7,039,374
Clariant AG, Registered Shares 4,272 86,196
Credit Suisse Group AG, Registered Shares 69,019 730,177
Julius Baer Group Ltd. 15,989 1,021,753
LafargeHolcim Ltd., Registered Shares(a) 22,491 1,322,582
Lonza Group AG, Registered Shares 1,181 660,533
Nestlé SA, Registered Shares 195,900 21,838,225
Novartis AG, ADR 11,121 950,623
Novartis AG, Registered Shares 193,319 16,525,046
Roche Holding AG, Genusschein Shares 42,400 13,735,200
Swatch Group AG (The) 1,706 491,223
Swatch Group AG (The), Registered Shares 3,088 172,188
Swiss Life Holding AG, Registered Shares 1,719 844,780
Swiss Prime Site AG 2,521 232,734
HSBC Holdings PLC, ADR 110,689 3,225,478
IG Group Holdings PLC 118,300 1,468,988
Imperial Brands PLC 185,600 3,804,969
Inchcape PLC(a) 603,200 6,258,206
Informa PLC(a) 544,800 4,206,490
J. Sainsbury PLC 274,505 917,941
Kingfisher PLC(a) 1,215,620 5,328,109
Liberty Global PLC, Class C(a) 325,300 8,308,162
Lloyds Banking Group PLC(a) 4,799,561 2,815,539
M&G PLC 18,204 52,021
Melrose Industries PLC(a) 77,550 178,325
NatWest Group PLC, ADR 131,591 706,644
Ninety One PLC 57,187 188,006
Common Stocks (continued)Issuer Shares Value ($)
Pearson PLC, ADR 31,529 337,045
Persimmon PLC 213,000 8,627,699
Phoenix Group Holdings PLC 22,872 231,237
Royal Dutch Shell PLC, ADR, Class B 245,480 9,041,028
Royal Mail PLC(a) 114,946 799,996
Savills PLC 38,200 601,550
Smith & Nephew PLC 493,400 9,367,181
Standard Chartered PLC 146,819 1,010,928
Standard Life Aberdeen PLC 57,794 230,889
Subsea 7 SA(a) 16,943 170,218
Tesco PLC 3,712,010 11,719,661
Unilever PLC 301,200 16,806,893
Vodafone Group PLC 2,511,716 4,580,303
WPP PLC 44,732 570,041
WPP PLC, ADR 4,288 274,003
Total 175,895,574
Total Common Stocks(Cost $1,035,911,033) 1,184,842,715
Preferred Stocks 0.4%
Warrants 0.0%Issuer Shares Value ($)
Switzerland 0.0%Cie Financiere Richemont SA(a) 131,772 50,191
Total Warrants(Cost $30,618) 50,191
Money Market Funds 1.6%Shares Value ($)
Columbia Short-Term Cash Fund,0.067%(e),(f) 19,240,769 19,238,845
Total Money Market Funds(Cost $19,238,845) 19,238,845
Total Investments in Securities(Cost $1,058,822,867) 1,209,327,320
Other Assets & Liabilities, Net 7,590,415
Net Assets $1,216,917,735
Copyright © 2021 www.secdatabase.com. All Rights Reserved.Please Consider the Environment Before Printing This Document
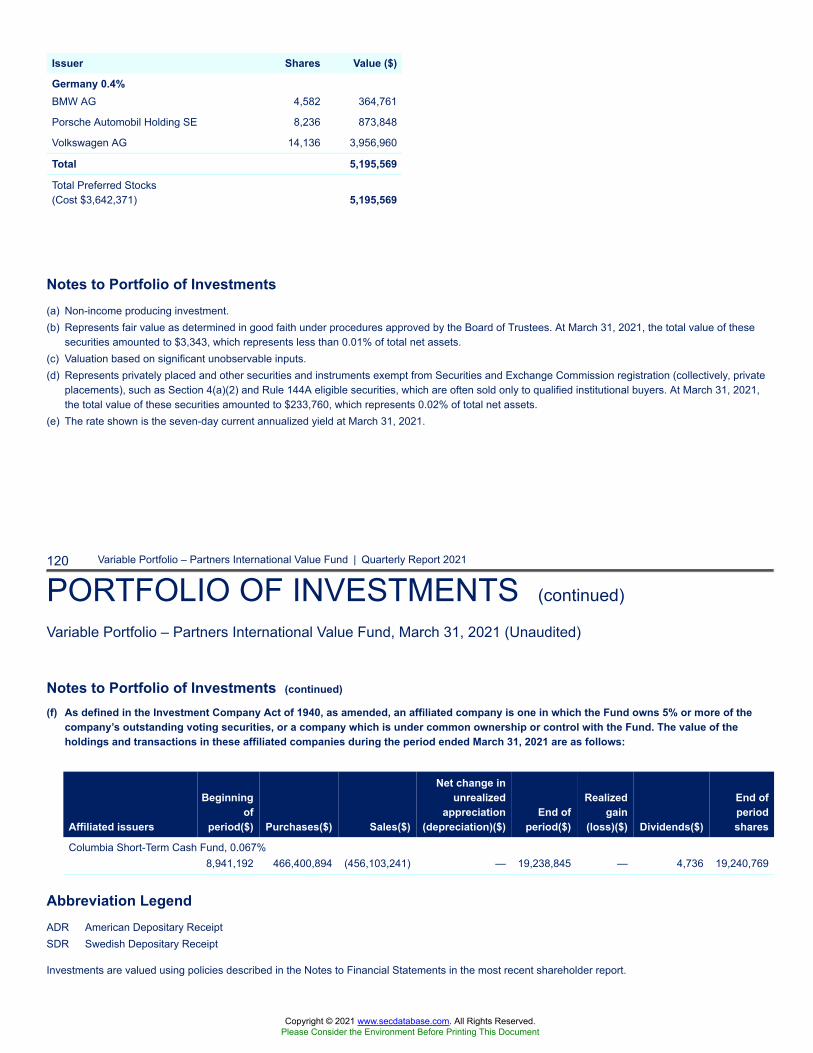
Notes to Portfolio of Investments(a) Non-income producing investment.(b) Represents fair value as determined in good faith under procedures approved by the Board of Trustees. At March 31, 2021, the total value of these
securities amounted to $3,343, which represents less than 0.01% of total net assets.(c) Valuation based on significant unobservable inputs.(d) Represents privately placed and other securities and instruments exempt from Securities and Exchange Commission registration (collectively, private
placements), such as Section 4(a)(2) and Rule 144A eligible securities, which are often sold only to qualified institutional buyers. At March 31, 2021,the total value of these securities amounted to $233,760, which represents 0.02% of total net assets.
(e) The rate shown is the seven-day current annualized yield at March 31, 2021.
120 Variable Portfolio – Partners International Value Fund | Quarterly Report 2021
PORTFOLIO OF INVESTMENTS (continued)
Variable Portfolio – Partners International Value Fund, March 31, 2021 (Unaudited)
Notes to Portfolio of Investments (continued)
(f) As defined in the Investment Company Act of 1940, as amended, an affiliated company is one in which the Fund owns 5% or more of thecompany’s outstanding voting securities, or a company which is under common ownership or control with the Fund. The value of theholdings and transactions in these affiliated companies during the period ended March 31, 2021 are as follows:
Affiliated issuers
Beginningof
period($) Purchases($) Sales($)
Net change inunrealized
appreciation(depreciation)($)
End ofperiod($)
Realizedgain
(loss)($) Dividends($)
End ofperiodshares
Columbia Short-Term Cash Fund, 0.067%8,941,192 466,400,894 (456,103,241) — 19,238,845 — 4,736 19,240,769
Abbreviation LegendADR American Depositary ReceiptSDR Swedish Depositary Receipt
Investments are valued using policies described in the Notes to Financial Statements in the most recent shareholder report.
Issuer Shares Value ($)
Germany 0.4%BMW AG 4,582 364,761
Porsche Automobil Holding SE 8,236 873,848
Volkswagen AG 14,136 3,956,960
Total 5,195,569
Total Preferred Stocks(Cost $3,642,371) 5,195,569
Copyright © 2021 www.secdatabase.com. All Rights Reserved.Please Consider the Environment Before Printing This Document
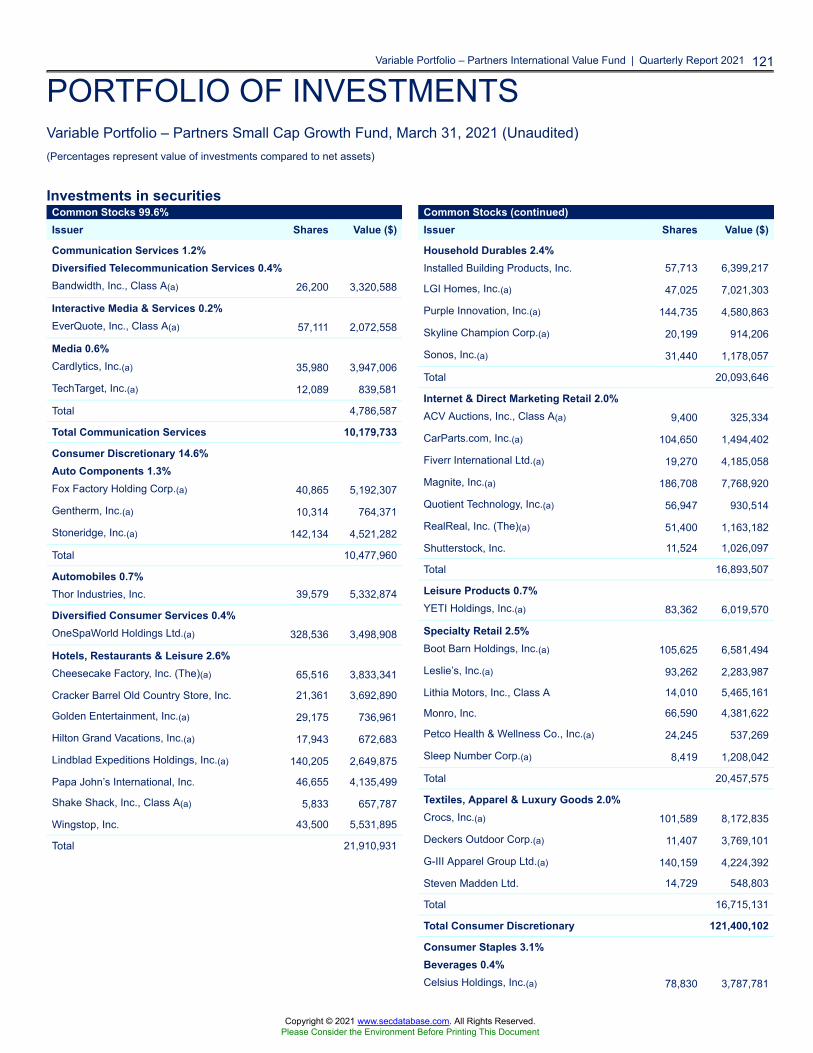
Variable Portfolio – Partners International Value Fund | Quarterly Report 2021 121
PORTFOLIO OF INVESTMENTSVariable Portfolio – Partners Small Cap Growth Fund, March 31, 2021 (Unaudited)(Percentages represent value of investments compared to net assets)
Investments in securitiesCommon Stocks 99.6%Issuer Shares Value ($)
Communication Services 1.2%Diversified Telecommunication Services 0.4%Bandwidth, Inc., Class A(a) 26,200 3,320,588
Interactive Media & Services 0.2%EverQuote, Inc., Class A(a) 57,111 2,072,558
Media 0.6%Cardlytics, Inc.(a) 35,980 3,947,006
TechTarget, Inc.(a) 12,089 839,581
Total 4,786,587
Total Communication Services 10,179,733
Consumer Discretionary 14.6%Auto Components 1.3%Fox Factory Holding Corp.(a) 40,865 5,192,307
Gentherm, Inc.(a) 10,314 764,371
Stoneridge, Inc.(a) 142,134 4,521,282
Total 10,477,960
Automobiles 0.7%Thor Industries, Inc. 39,579 5,332,874
Diversified Consumer Services 0.4%OneSpaWorld Holdings Ltd.(a) 328,536 3,498,908
Hotels, Restaurants & Leisure 2.6%Cheesecake Factory, Inc. (The)(a) 65,516 3,833,341
Cracker Barrel Old Country Store, Inc. 21,361 3,692,890
Golden Entertainment, Inc.(a) 29,175 736,961
Hilton Grand Vacations, Inc.(a) 17,943 672,683
Lindblad Expeditions Holdings, Inc.(a) 140,205 2,649,875
Papa John’s International, Inc. 46,655 4,135,499
Shake Shack, Inc., Class A(a) 5,833 657,787
Wingstop, Inc. 43,500 5,531,895
Total 21,910,931
Common Stocks (continued)Issuer Shares Value ($)
Household Durables 2.4%Installed Building Products, Inc. 57,713 6,399,217
LGI Homes, Inc.(a) 47,025 7,021,303
Purple Innovation, Inc.(a) 144,735 4,580,863
Skyline Champion Corp.(a) 20,199 914,206
Sonos, Inc.(a) 31,440 1,178,057
Total 20,093,646
Internet & Direct Marketing Retail 2.0%ACV Auctions, Inc., Class A(a) 9,400 325,334
CarParts.com, Inc.(a) 104,650 1,494,402
Fiverr International Ltd.(a) 19,270 4,185,058
Magnite, Inc.(a) 186,708 7,768,920
Quotient Technology, Inc.(a) 56,947 930,514
RealReal, Inc. (The)(a) 51,400 1,163,182
Shutterstock, Inc. 11,524 1,026,097
Total 16,893,507
Leisure Products 0.7%YETI Holdings, Inc.(a) 83,362 6,019,570
Specialty Retail 2.5%Boot Barn Holdings, Inc.(a) 105,625 6,581,494
Leslie’s, Inc.(a) 93,262 2,283,987
Lithia Motors, Inc., Class A 14,010 5,465,161
Monro, Inc. 66,590 4,381,622
Petco Health & Wellness Co., Inc.(a) 24,245 537,269
Sleep Number Corp.(a) 8,419 1,208,042
Total 20,457,575
Textiles, Apparel & Luxury Goods 2.0%Crocs, Inc.(a) 101,589 8,172,835
Deckers Outdoor Corp.(a) 11,407 3,769,101
G-III Apparel Group Ltd.(a) 140,159 4,224,392
Steven Madden Ltd. 14,729 548,803
Total 16,715,131
Total Consumer Discretionary 121,400,102
Consumer Staples 3.1%Beverages 0.4%Celsius Holdings, Inc.(a) 78,830 3,787,781
Copyright © 2021 www.secdatabase.com. All Rights Reserved.Please Consider the Environment Before Printing This Document
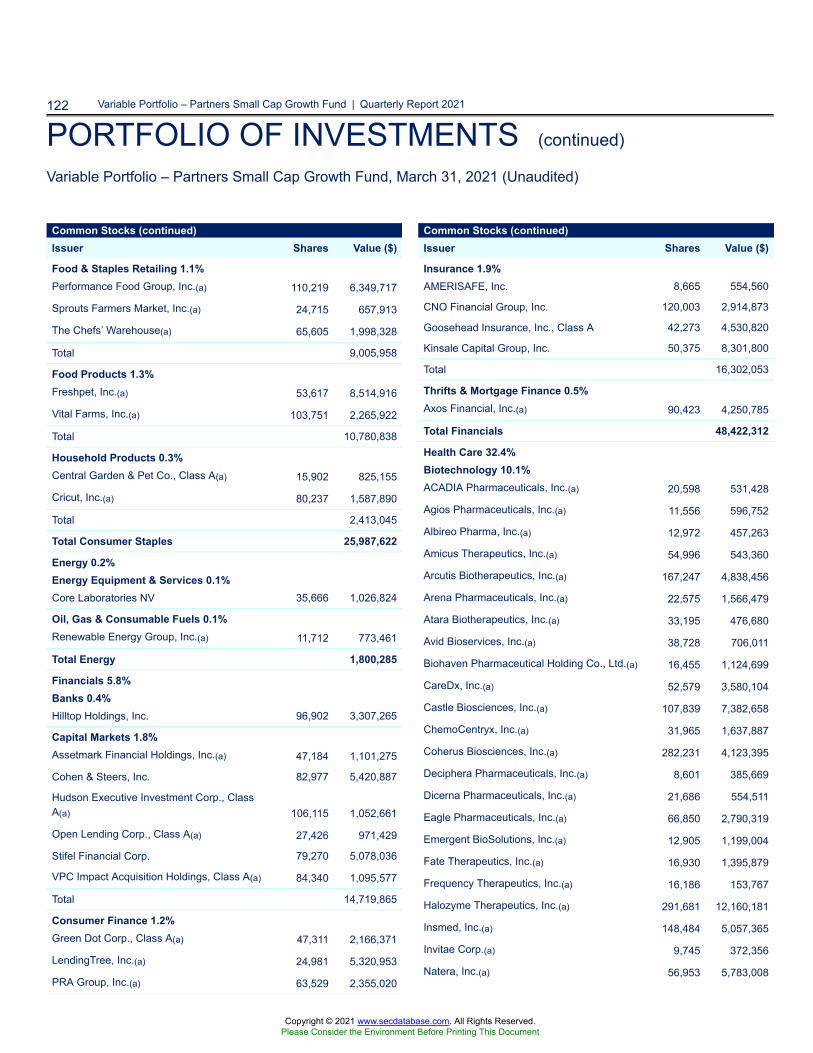
122 Variable Portfolio – Partners Small Cap Growth Fund | Quarterly Report 2021
PORTFOLIO OF INVESTMENTS (continued)
Variable Portfolio – Partners Small Cap Growth Fund, March 31, 2021 (Unaudited)
Common Stocks (continued)Issuer Shares Value ($)
Food & Staples Retailing 1.1%Performance Food Group, Inc.(a) 110,219 6,349,717
Sprouts Farmers Market, Inc.(a) 24,715 657,913
The Chefs’ Warehouse(a) 65,605 1,998,328
Total 9,005,958
Food Products 1.3%Freshpet, Inc.(a) 53,617 8,514,916
Vital Farms, Inc.(a) 103,751 2,265,922
Total 10,780,838
Household Products 0.3%Central Garden & Pet Co., Class A(a) 15,902 825,155
Cricut, Inc.(a) 80,237 1,587,890
Total 2,413,045
Total Consumer Staples 25,987,622
Energy 0.2%Energy Equipment & Services 0.1%Core Laboratories NV 35,666 1,026,824
Oil, Gas & Consumable Fuels 0.1%Renewable Energy Group, Inc.(a) 11,712 773,461
Total Energy 1,800,285
Financials 5.8%Banks 0.4%Hilltop Holdings, Inc. 96,902 3,307,265
Capital Markets 1.8%Assetmark Financial Holdings, Inc.(a) 47,184 1,101,275
Cohen & Steers, Inc. 82,977 5,420,887
Hudson Executive Investment Corp., ClassA(a) 106,115 1,052,661
Open Lending Corp., Class A(a) 27,426 971,429
Stifel Financial Corp. 79,270 5,078,036
VPC Impact Acquisition Holdings, Class A(a) 84,340 1,095,577
Total 14,719,865
Consumer Finance 1.2%Green Dot Corp., Class A(a) 47,311 2,166,371
LendingTree, Inc.(a) 24,981 5,320,953
PRA Group, Inc.(a) 63,529 2,355,020
Common Stocks (continued)Issuer Shares Value ($)
Insurance 1.9%AMERISAFE, Inc. 8,665 554,560
CNO Financial Group, Inc. 120,003 2,914,873
Goosehead Insurance, Inc., Class A 42,273 4,530,820
Kinsale Capital Group, Inc. 50,375 8,301,800
Total 16,302,053
Thrifts & Mortgage Finance 0.5%Axos Financial, Inc.(a) 90,423 4,250,785
Total Financials 48,422,312
Health Care 32.4%Biotechnology 10.1%ACADIA Pharmaceuticals, Inc.(a) 20,598 531,428
Agios Pharmaceuticals, Inc.(a) 11,556 596,752
Albireo Pharma, Inc.(a) 12,972 457,263
Amicus Therapeutics, Inc.(a) 54,996 543,360
Arcutis Biotherapeutics, Inc.(a) 167,247 4,838,456
Arena Pharmaceuticals, Inc.(a) 22,575 1,566,479
Atara Biotherapeutics, Inc.(a) 33,195 476,680
Avid Bioservices, Inc.(a) 38,728 706,011
Biohaven Pharmaceutical Holding Co., Ltd.(a) 16,455 1,124,699
CareDx, Inc.(a) 52,579 3,580,104
Castle Biosciences, Inc.(a) 107,839 7,382,658
ChemoCentryx, Inc.(a) 31,965 1,637,887
Coherus Biosciences, Inc.(a) 282,231 4,123,395
Deciphera Pharmaceuticals, Inc.(a) 8,601 385,669
Dicerna Pharmaceuticals, Inc.(a) 21,686 554,511
Eagle Pharmaceuticals, Inc.(a) 66,850 2,790,319
Emergent BioSolutions, Inc.(a) 12,905 1,199,004
Fate Therapeutics, Inc.(a) 16,930 1,395,879
Frequency Therapeutics, Inc.(a) 16,186 153,767
Halozyme Therapeutics, Inc.(a) 291,681 12,160,181
Insmed, Inc.(a) 148,484 5,057,365
Invitae Corp.(a) 9,745 372,356
Natera, Inc.(a) 56,953 5,783,008
Copyright © 2021 www.secdatabase.com. All Rights Reserved.Please Consider the Environment Before Printing This Document
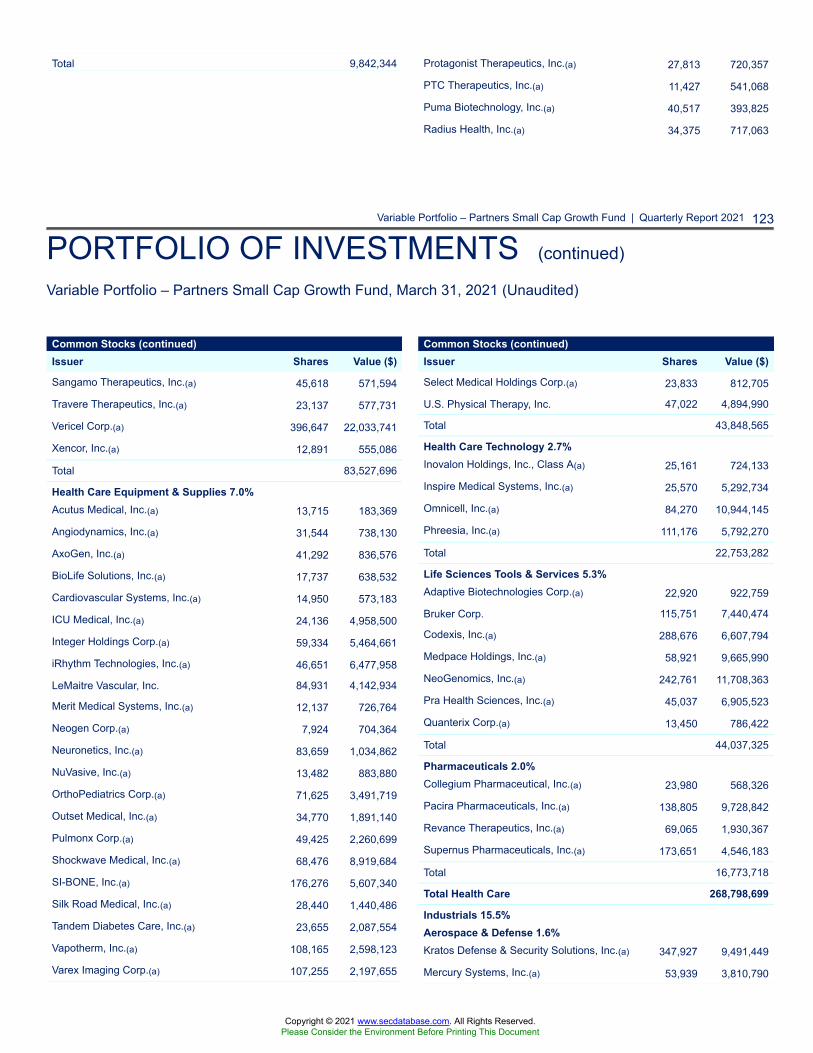
Variable Portfolio – Partners Small Cap Growth Fund | Quarterly Report 2021 123
PORTFOLIO OF INVESTMENTS (continued)
Variable Portfolio – Partners Small Cap Growth Fund, March 31, 2021 (Unaudited)
Total 9,842,344 Protagonist Therapeutics, Inc.(a) 27,813 720,357
PTC Therapeutics, Inc.(a) 11,427 541,068
Puma Biotechnology, Inc.(a) 40,517 393,825
Radius Health, Inc.(a) 34,375 717,063
Common Stocks (continued)Issuer Shares Value ($)
Sangamo Therapeutics, Inc.(a) 45,618 571,594
Travere Therapeutics, Inc.(a) 23,137 577,731
Vericel Corp.(a) 396,647 22,033,741
Xencor, Inc.(a) 12,891 555,086
Total 83,527,696
Health Care Equipment & Supplies 7.0%Acutus Medical, Inc.(a) 13,715 183,369
Angiodynamics, Inc.(a) 31,544 738,130
AxoGen, Inc.(a) 41,292 836,576
BioLife Solutions, Inc.(a) 17,737 638,532
Cardiovascular Systems, Inc.(a) 14,950 573,183
ICU Medical, Inc.(a) 24,136 4,958,500
Integer Holdings Corp.(a) 59,334 5,464,661
iRhythm Technologies, Inc.(a) 46,651 6,477,958
LeMaitre Vascular, Inc. 84,931 4,142,934
Merit Medical Systems, Inc.(a) 12,137 726,764
Neogen Corp.(a) 7,924 704,364
Neuronetics, Inc.(a) 83,659 1,034,862
NuVasive, Inc.(a) 13,482 883,880
OrthoPediatrics Corp.(a) 71,625 3,491,719
Outset Medical, Inc.(a) 34,770 1,891,140
Pulmonx Corp.(a) 49,425 2,260,699
Shockwave Medical, Inc.(a) 68,476 8,919,684
SI-BONE, Inc.(a) 176,276 5,607,340
Silk Road Medical, Inc.(a) 28,440 1,440,486
Tandem Diabetes Care, Inc.(a) 23,655 2,087,554
Vapotherm, Inc.(a) 108,165 2,598,123
Varex Imaging Corp.(a) 107,255 2,197,655
Common Stocks (continued)Issuer Shares Value ($)
Select Medical Holdings Corp.(a) 23,833 812,705
U.S. Physical Therapy, Inc. 47,022 4,894,990
Total 43,848,565
Health Care Technology 2.7%Inovalon Holdings, Inc., Class A(a) 25,161 724,133
Inspire Medical Systems, Inc.(a) 25,570 5,292,734
Omnicell, Inc.(a) 84,270 10,944,145
Phreesia, Inc.(a) 111,176 5,792,270
Total 22,753,282
Life Sciences Tools & Services 5.3%Adaptive Biotechnologies Corp.(a) 22,920 922,759
Bruker Corp. 115,751 7,440,474
Codexis, Inc.(a) 288,676 6,607,794
Medpace Holdings, Inc.(a) 58,921 9,665,990
NeoGenomics, Inc.(a) 242,761 11,708,363
Pra Health Sciences, Inc.(a) 45,037 6,905,523
Quanterix Corp.(a) 13,450 786,422
Total 44,037,325
Pharmaceuticals 2.0%Collegium Pharmaceutical, Inc.(a) 23,980 568,326
Pacira Pharmaceuticals, Inc.(a) 138,805 9,728,842
Revance Therapeutics, Inc.(a) 69,065 1,930,367
Supernus Pharmaceuticals, Inc.(a) 173,651 4,546,183
Total 16,773,718
Total Health Care 268,798,699
Industrials 15.5%Aerospace & Defense 1.6%Kratos Defense & Security Solutions, Inc.(a) 347,927 9,491,449
Mercury Systems, Inc.(a) 53,939 3,810,790
Copyright © 2021 www.secdatabase.com. All Rights Reserved.Please Consider the Environment Before Printing This Document
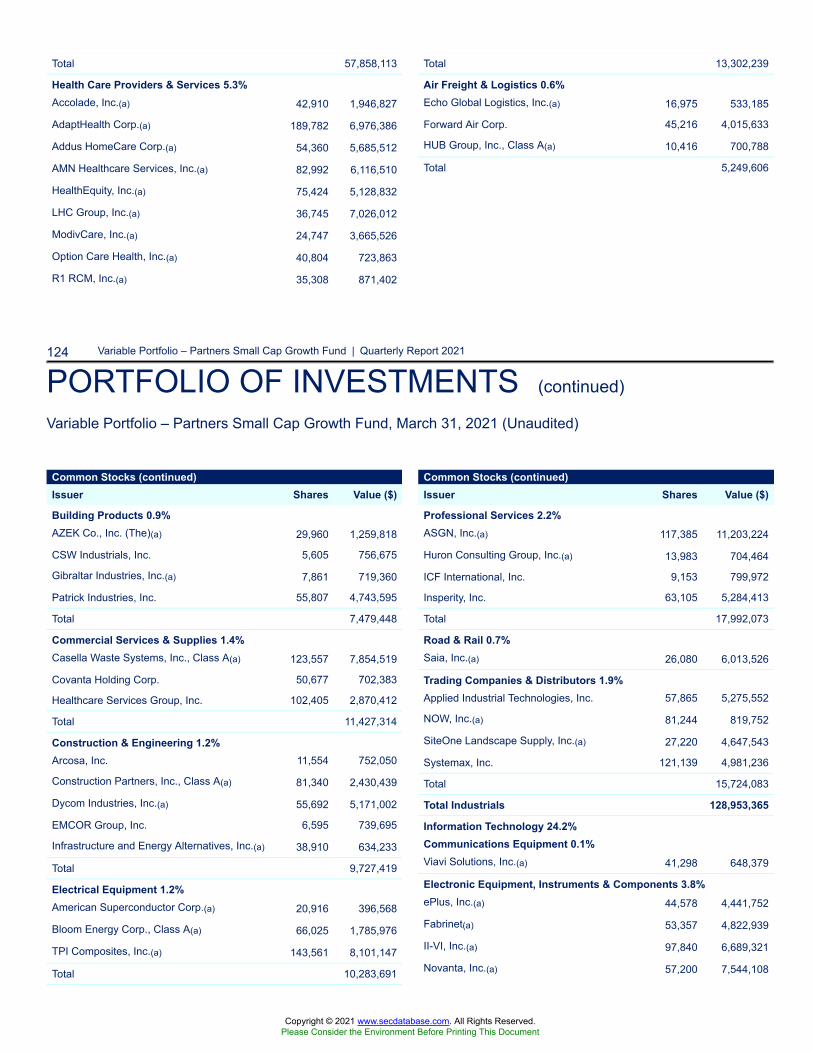
124 Variable Portfolio – Partners Small Cap Growth Fund | Quarterly Report 2021
PORTFOLIO OF INVESTMENTS (continued)
Variable Portfolio – Partners Small Cap Growth Fund, March 31, 2021 (Unaudited)
Total 57,858,113
Health Care Providers & Services 5.3%Accolade, Inc.(a) 42,910 1,946,827
AdaptHealth Corp.(a) 189,782 6,976,386
Addus HomeCare Corp.(a) 54,360 5,685,512
AMN Healthcare Services, Inc.(a) 82,992 6,116,510
HealthEquity, Inc.(a) 75,424 5,128,832
LHC Group, Inc.(a) 36,745 7,026,012
ModivCare, Inc.(a) 24,747 3,665,526
Option Care Health, Inc.(a) 40,804 723,863
R1 RCM, Inc.(a) 35,308 871,402
Total 13,302,239
Air Freight & Logistics 0.6%Echo Global Logistics, Inc.(a) 16,975 533,185
Forward Air Corp. 45,216 4,015,633
HUB Group, Inc., Class A(a) 10,416 700,788
Total 5,249,606
Common Stocks (continued)Issuer Shares Value ($)
Building Products 0.9%AZEK Co., Inc. (The)(a) 29,960 1,259,818
CSW Industrials, Inc. 5,605 756,675
Gibraltar Industries, Inc.(a) 7,861 719,360
Patrick Industries, Inc. 55,807 4,743,595
Total 7,479,448
Commercial Services & Supplies 1.4%Casella Waste Systems, Inc., Class A(a) 123,557 7,854,519
Covanta Holding Corp. 50,677 702,383
Healthcare Services Group, Inc. 102,405 2,870,412
Total 11,427,314
Construction & Engineering 1.2%Arcosa, Inc. 11,554 752,050
Construction Partners, Inc., Class A(a) 81,340 2,430,439
Dycom Industries, Inc.(a) 55,692 5,171,002
EMCOR Group, Inc. 6,595 739,695
Infrastructure and Energy Alternatives, Inc.(a) 38,910 634,233
Total 9,727,419
Electrical Equipment 1.2%American Superconductor Corp.(a) 20,916 396,568
Bloom Energy Corp., Class A(a) 66,025 1,785,976
TPI Composites, Inc.(a) 143,561 8,101,147
Total 10,283,691
Common Stocks (continued)Issuer Shares Value ($)
Professional Services 2.2%ASGN, Inc.(a) 117,385 11,203,224
Huron Consulting Group, Inc.(a) 13,983 704,464
ICF International, Inc. 9,153 799,972
Insperity, Inc. 63,105 5,284,413
Total 17,992,073
Road & Rail 0.7%Saia, Inc.(a) 26,080 6,013,526
Trading Companies & Distributors 1.9%Applied Industrial Technologies, Inc. 57,865 5,275,552
NOW, Inc.(a) 81,244 819,752
SiteOne Landscape Supply, Inc.(a) 27,220 4,647,543
Systemax, Inc. 121,139 4,981,236
Total 15,724,083
Total Industrials 128,953,365
Information Technology 24.2%Communications Equipment 0.1%Viavi Solutions, Inc.(a) 41,298 648,379
Electronic Equipment, Instruments & Components 3.8%ePlus, Inc.(a) 44,578 4,441,752
Fabrinet(a) 53,357 4,822,939
II-VI, Inc.(a) 97,840 6,689,321
Novanta, Inc.(a) 57,200 7,544,108
Copyright © 2021 www.secdatabase.com. All Rights Reserved.Please Consider the Environment Before Printing This Document
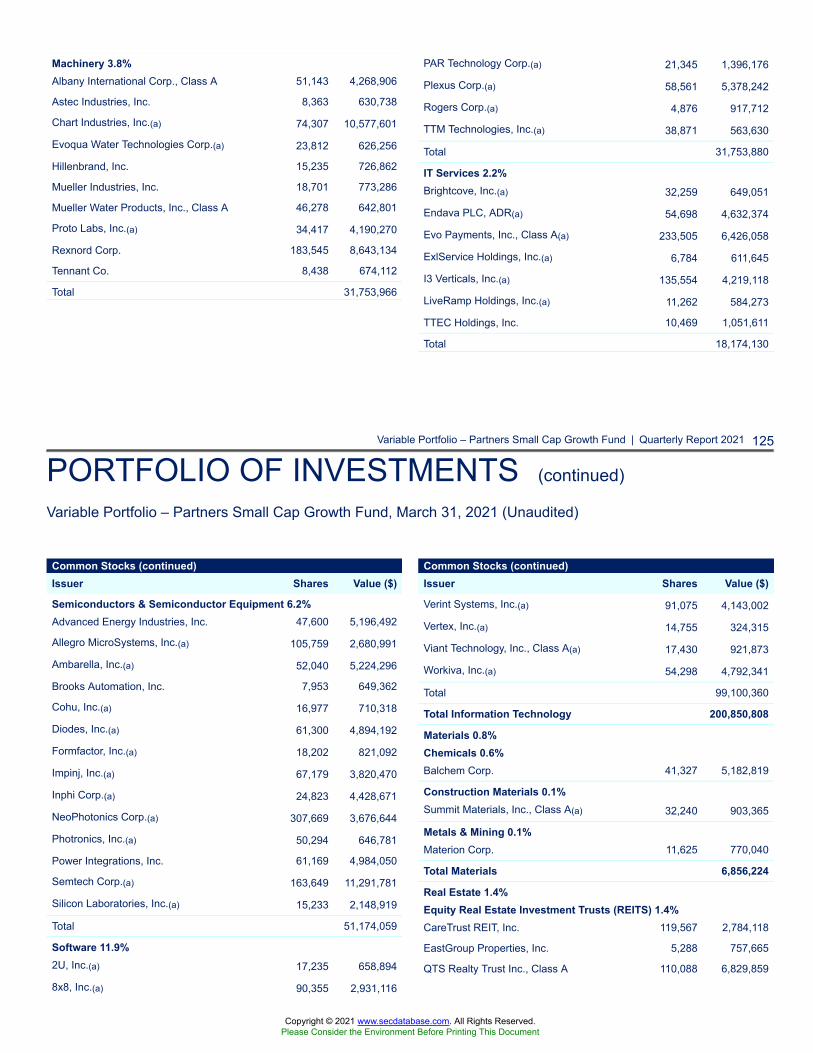
Variable Portfolio – Partners Small Cap Growth Fund | Quarterly Report 2021 125
PORTFOLIO OF INVESTMENTS (continued)
Variable Portfolio – Partners Small Cap Growth Fund, March 31, 2021 (Unaudited)
Machinery 3.8%Albany International Corp., Class A 51,143 4,268,906
Astec Industries, Inc. 8,363 630,738
Chart Industries, Inc.(a) 74,307 10,577,601
Evoqua Water Technologies Corp.(a) 23,812 626,256
Hillenbrand, Inc. 15,235 726,862
Mueller Industries, Inc. 18,701 773,286
Mueller Water Products, Inc., Class A 46,278 642,801
Proto Labs, Inc.(a) 34,417 4,190,270
Rexnord Corp. 183,545 8,643,134
Tennant Co. 8,438 674,112
Total 31,753,966
PAR Technology Corp.(a) 21,345 1,396,176
Plexus Corp.(a) 58,561 5,378,242
Rogers Corp.(a) 4,876 917,712
TTM Technologies, Inc.(a) 38,871 563,630
Total 31,753,880
IT Services 2.2%Brightcove, Inc.(a) 32,259 649,051
Endava PLC, ADR(a) 54,698 4,632,374
Evo Payments, Inc., Class A(a) 233,505 6,426,058
ExlService Holdings, Inc.(a) 6,784 611,645
I3 Verticals, Inc.(a) 135,554 4,219,118
LiveRamp Holdings, Inc.(a) 11,262 584,273
TTEC Holdings, Inc. 10,469 1,051,611
Total 18,174,130
Common Stocks (continued)Issuer Shares Value ($)
Semiconductors & Semiconductor Equipment 6.2%Advanced Energy Industries, Inc. 47,600 5,196,492
Allegro MicroSystems, Inc.(a) 105,759 2,680,991
Ambarella, Inc.(a) 52,040 5,224,296
Brooks Automation, Inc. 7,953 649,362
Cohu, Inc.(a) 16,977 710,318
Diodes, Inc.(a) 61,300 4,894,192
Formfactor, Inc.(a) 18,202 821,092
Impinj, Inc.(a) 67,179 3,820,470
Inphi Corp.(a) 24,823 4,428,671
NeoPhotonics Corp.(a) 307,669 3,676,644
Photronics, Inc.(a) 50,294 646,781
Power Integrations, Inc. 61,169 4,984,050
Semtech Corp.(a) 163,649 11,291,781
Silicon Laboratories, Inc.(a) 15,233 2,148,919
Total 51,174,059
Software 11.9%2U, Inc.(a) 17,235 658,894
8x8, Inc.(a) 90,355 2,931,116
Common Stocks (continued)Issuer Shares Value ($)
Verint Systems, Inc.(a) 91,075 4,143,002
Vertex, Inc.(a) 14,755 324,315
Viant Technology, Inc., Class A(a) 17,430 921,873
Workiva, Inc.(a) 54,298 4,792,341
Total 99,100,360
Total Information Technology 200,850,808
Materials 0.8%Chemicals 0.6%Balchem Corp. 41,327 5,182,819
Construction Materials 0.1%Summit Materials, Inc., Class A(a) 32,240 903,365
Metals & Mining 0.1%Materion Corp. 11,625 770,040
Total Materials 6,856,224
Real Estate 1.4%Equity Real Estate Investment Trusts (REITS) 1.4%CareTrust REIT, Inc. 119,567 2,784,118
EastGroup Properties, Inc. 5,288 757,665
QTS Realty Trust Inc., Class A 110,088 6,829,859
Copyright © 2021 www.secdatabase.com. All Rights Reserved.Please Consider the Environment Before Printing This Document
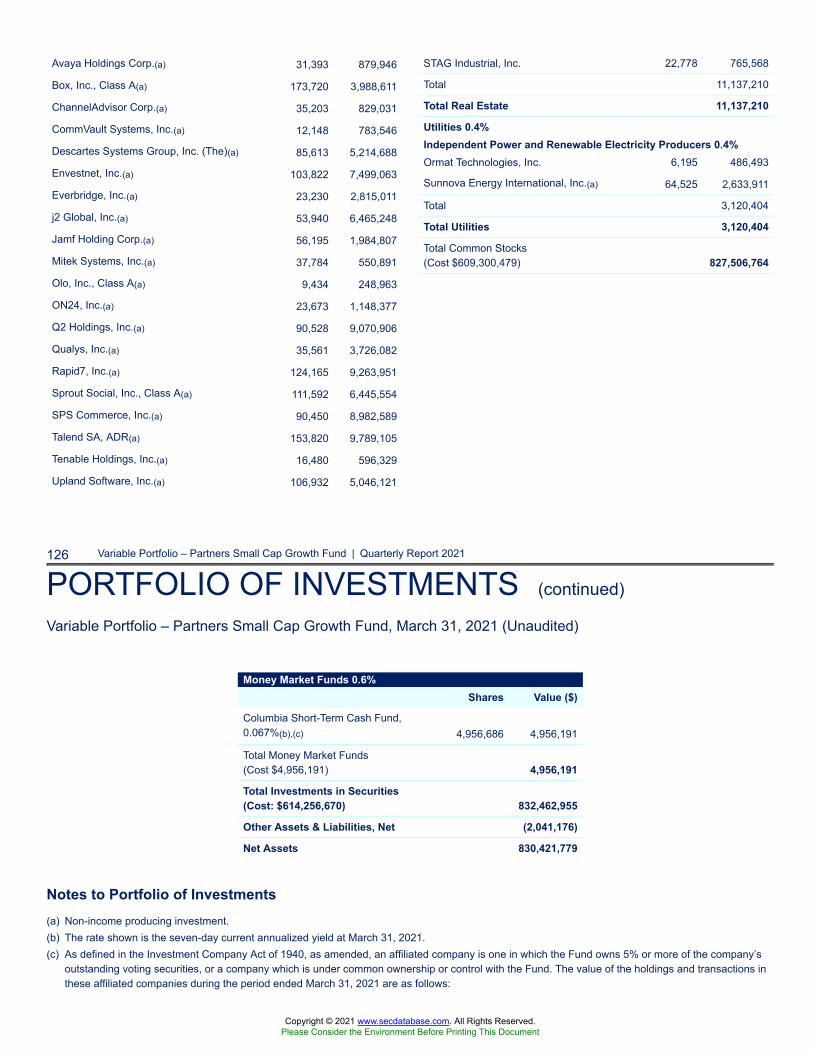
126 Variable Portfolio – Partners Small Cap Growth Fund | Quarterly Report 2021
PORTFOLIO OF INVESTMENTS (continued)
Variable Portfolio – Partners Small Cap Growth Fund, March 31, 2021 (Unaudited)
Money Market Funds 0.6%Shares Value ($)
Columbia Short-Term Cash Fund,0.067%(b),(c) 4,956,686 4,956,191
Total Money Market Funds(Cost $4,956,191) 4,956,191
Total Investments in Securities(Cost: $614,256,670) 832,462,955
Other Assets & Liabilities, Net (2,041,176)
Net Assets 830,421,779
Notes to Portfolio of Investments(a) Non-income producing investment.(b) The rate shown is the seven-day current annualized yield at March 31, 2021.(c) As defined in the Investment Company Act of 1940, as amended, an affiliated company is one in which the Fund owns 5% or more of the company’s
outstanding voting securities, or a company which is under common ownership or control with the Fund. The value of the holdings and transactions inthese affiliated companies during the period ended March 31, 2021 are as follows:
Avaya Holdings Corp.(a) 31,393 879,946
Box, Inc., Class A(a) 173,720 3,988,611
ChannelAdvisor Corp.(a) 35,203 829,031
CommVault Systems, Inc.(a) 12,148 783,546
Descartes Systems Group, Inc. (The)(a) 85,613 5,214,688
Envestnet, Inc.(a) 103,822 7,499,063
Everbridge, Inc.(a) 23,230 2,815,011
j2 Global, Inc.(a) 53,940 6,465,248
Jamf Holding Corp.(a) 56,195 1,984,807
Mitek Systems, Inc.(a) 37,784 550,891
Olo, Inc., Class A(a) 9,434 248,963
ON24, Inc.(a) 23,673 1,148,377
Q2 Holdings, Inc.(a) 90,528 9,070,906
Qualys, Inc.(a) 35,561 3,726,082
Rapid7, Inc.(a) 124,165 9,263,951
Sprout Social, Inc., Class A(a) 111,592 6,445,554
SPS Commerce, Inc.(a) 90,450 8,982,589
Talend SA, ADR(a) 153,820 9,789,105
Tenable Holdings, Inc.(a) 16,480 596,329
Upland Software, Inc.(a) 106,932 5,046,121
STAG Industrial, Inc. 22,778 765,568
Total 11,137,210
Total Real Estate 11,137,210
Utilities 0.4%Independent Power and Renewable Electricity Producers 0.4%Ormat Technologies, Inc. 6,195 486,493
Sunnova Energy International, Inc.(a) 64,525 2,633,911
Total 3,120,404
Total Utilities 3,120,404
Total Common Stocks(Cost $609,300,479) 827,506,764
Copyright © 2021 www.secdatabase.com. All Rights Reserved.Please Consider the Environment Before Printing This Document
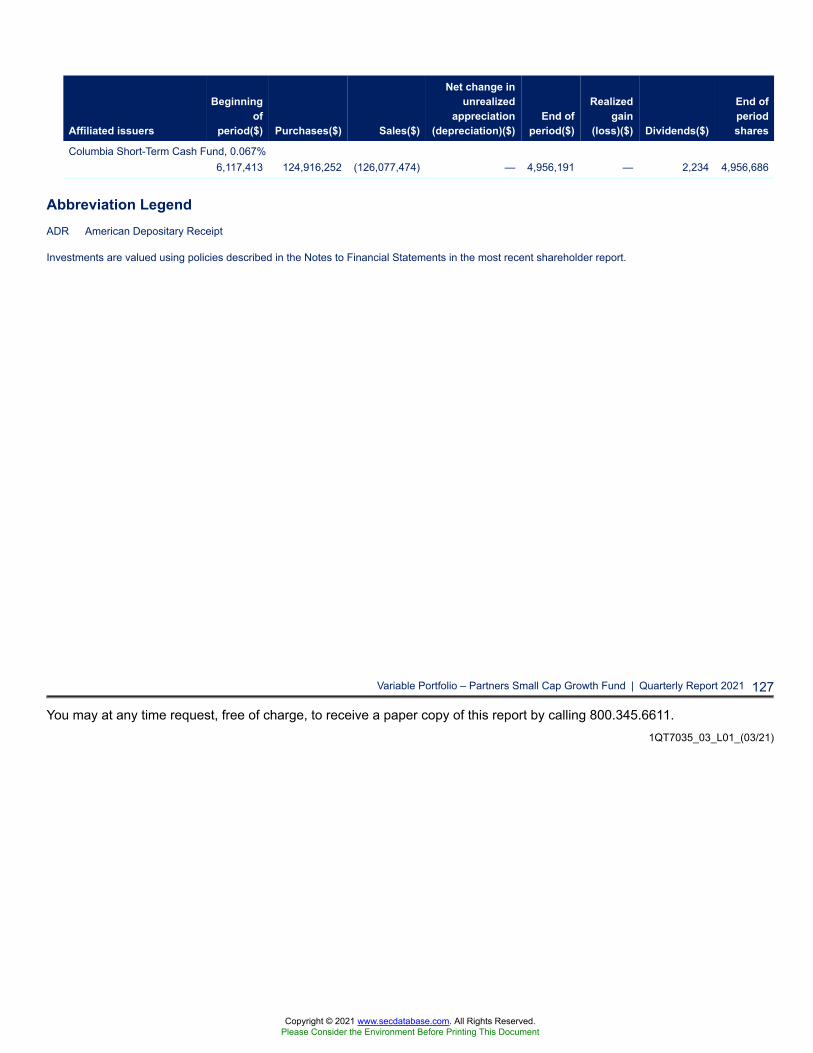
Affiliated issuers
Beginningof
period($) Purchases($) Sales($)
Net change inunrealized
appreciation(depreciation)($)
End ofperiod($)
Realizedgain
(loss)($) Dividends($)
End ofperiodshares
Columbia Short-Term Cash Fund, 0.067%6,117,413 124,916,252 (126,077,474) — 4,956,191 — 2,234 4,956,686
Abbreviation LegendADR American Depositary Receipt
Investments are valued using policies described in the Notes to Financial Statements in the most recent shareholder report.
Variable Portfolio – Partners Small Cap Growth Fund | Quarterly Report 2021 127
You may at any time request, free of charge, to receive a paper copy of this report by calling 800.345.6611.1QT7035_03_L01_(03/21)
Copyright © 2021 www.secdatabase.com. All Rights Reserved.Please Consider the Environment Before Printing This Document