form nport-p - SECDatabase
81
Business Address 71 SOUTH WACKER DRIVE C/O GOLDMAN SACHS & CO CHICAGO IL 60606 3126554400 Mailing Address 200 WEST STREET NEW YORK NY 10282 SECURITIES AND EXCHANGE COMMISSION FORM NPORT-P Filing Date: 2021-02-25 | Period of Report: 2020-12-31 SEC Accession No. 0001752724-21-040578 (HTML Version on secdatabase.com) FILER GOLDMAN SACHS TRUST CIK:822977| IRS No.: 000000000 | State of Incorp.:DE | Fiscal Year End: 1031 Type: NPORT-P | Act: 40 | File No.: 811-05349 | Film No.: 21679126 Copyright © 2021 www.secdatabase.com . All Rights Reserved. Please Consider the Environment Before Printing This Document
-
Upload
khangminh22 -
Category
Documents
-
view
2 -
download
0
Transcript of form nport-p - SECDatabase

Business Address71 SOUTH WACKER DRIVEC/O GOLDMAN SACHS & COCHICAGO IL 606063126554400
Mailing Address200 WEST STREETNEW YORK NY 10282
SECURITIES AND EXCHANGE COMMISSION
FORM NPORT-P
Filing Date: 2021-02-25 | Period of Report: 2020-12-31SEC Accession No. 0001752724-21-040578
(HTML Version on secdatabase.com)
FILERGOLDMAN SACHS TRUSTCIK:822977| IRS No.: 000000000 | State of Incorp.:DE | Fiscal Year End: 1031Type: NPORT-P | Act: 40 | File No.: 811-05349 | Film No.: 21679126
Copyright © 2021 www.secdatabase.com. All Rights Reserved.Please Consider the Environment Before Printing This Document

GOLDMAN SACHS EMERGING MARKETS DEBT FUND
Schedule of InvestmentsDecember 31, 2020 (Unaudited)
GOLDMAN SACHS EMERGING MARKETS DEBT FUND
Schedule of Investments (continued)December 31, 2020 (Unaudited)
PrincipalAmount
InterestRate
MaturityDate Value
Sovereign Debt Obligations �� 63.2%Angola �� 1.0%Republic of Angola (NR/Caa1)(a)$ 9,610,000 8.250 % 05/09/28 $ 9,222,597Republic of Angola (CCC+/Caa1)
2,670,000 9.125 (a) 11/26/49 2,464,7442,010,000 9.125 11/26/49 1,855,481
13,542,822Argentina(b) �� 1.7%Republic of Argentina (CCC+/NR)EUR 120,088 0.500 07/09/29 56,482$ 1,479,348 1.000 07/09/29 643,516
19,634,677 0.125 (c) 07/09/30 7,981,496EUR 3,559,900 0.125 07/09/30 1,609,112$ 33,640,015 0.125 (c) 07/09/35 12,312,246
1,434,455 0.125 (c) 07/09/41 540,79023,143,642
Armenia(a) �� 0.2%Republic of Armenia (NR/Ba3)
2,100,000 3.950 09/26/29 2,101,969Azerbaijan �� 0.9%Republic of Azerbaijan (NR/Ba2u)
3,534,000 4.750 03/18/24 3,854,2698,050,000 3.500 09/01/32 8,497,781
12,352,050Bahrain �� 1.9%Kingdom of Bahrain (B+/NR)
560,000 7.000 10/12/28 646,800990,000 6.000 09/19/44 1,023,103
Kingdom of Bahrain (B+/B2u)1,380,000 7.375 05/14/30 1,636,5948,530,000 7.375 (a) 05/14/30 10,116,0474,410,000 5.625 (a) 09/30/31 4,663,5751,140,000 5.625 09/30/31 1,205,5506,010,000 5.450 (a) 09/16/32 6,310,500
25,602,169
PrincipalAmount
InterestRate
MaturityDate Value
Sovereign Debt Obligations �� (continued)Belarus �� 0.6%Republic of Belarus (B/B3u)$ 450,000 7.625 % 06/29/27 $ 494,437
1,340,000 6.200 02/28/30 1,357,169Republic of Belarus Ministry of Finance (B/NR)(a)
1,400,000 5.875 02/24/26 1,435,0005,390,000 6.378 02/24/31 5,470,850
8,757,456Belize(a)(d) �� 0.1%Republic of Belize (CCC+/Caa3)
2,537,842 4.938 02/20/34 1,156,304Bermuda(a)(b) �� 0.3%Bermuda Government Bond (A+/A2)
1,900,000 2.375 08/20/30 1,993,1001,890,000 3.375 08/20/50 2,035,884
4,028,984Bolivia �� 0.0%Republic of Bolivian (B+/B2)
200,000 4.500 03/20/28 187,687Brazil �� 0.7%Republic of Brazil (BB-/NR)
5,930,000 3.875 06/12/30 6,256,1503,210,000 4.750 (b) 01/14/50 3,424,669
9,680,819Chile(b) �� 0.0%Republic of Chile (A+/A1)
390,000 3.500 01/25/50 447,159Colombia(b) �� 1.6%Republic of Colombia (BBB-/Baa2)
2,460,000 3.000 01/30/30 2,584,5374,600,000 3.125 04/15/31 4,882,9002,180,000 5.000 06/15/45 2,664,369640,000 5.200 05/15/49 809,00010,370,000 4.125 05/15/51 11,521,070
22,461,876
PrincipalAmount
InterestRate
MaturityDate Value
Sovereign Debt Obligations �� (continued)Costa Rica(a) �� 0.1%Republic of Costa Rica (B/B2)$ 1,080,000 6.125 % 02/19/31 $ 1,005,750Croatia �� 0.9%Croatia Government International Bond (BBB-/Ba1)EUR 2,720,000 1.125 06/19/29 3,497,340
6,160,000 1.500 06/17/31 8,212,05411,709,394
Dominican Republic �� 3.0%Dominican Republic (NR/NR)DOP 8,900,000 18.500(a) 02/04/28 228,421
152,600,000 10.750 08/11/28 2,988,963Dominican Republic (BB-/Ba3)$ 450,000 6.875 01/29/26 541,969
1,500,000 8.625 04/20/27 1,906,4063,130,000 4.875 (a) 09/23/32 3,449,847
PrincipalAmount
InterestRate
MaturityDate Value
Sovereign Debt Obligations �� (continued)Egypt �� 3.7%Republic of Egypt (B/B2u)(a)$ 6,510,000 8.875 % 05/29/50 $ 7,630,940Republic of Egypt (NR/B2)
2,050,000 7.500 01/31/27 2,364,547Republic of Egypt (B/NR)EUR 120,000 4.750 04/11/25 152,737
1,770,000 6.375 (a) 04/11/31 2,321,1162,369,000 6.375 04/11/31 3,106,624
Republic of Egypt (B/B2)8,360,000 4.750 (a) 04/16/26 10,595,9822,260,000 5.625 (a) 04/16/30 2,880,8577,200,000 5.625 04/16/30 9,177,952
Republic of Egypt (B/B2u)$ 8,180,000 7.625 (a) 05/29/32 9,251,069
2,850,000 8.700 (a) 03/01/49 3,294,422
Copyright © 2021 www.secdatabase.com. All Rights Reserved.Please Consider the Environment Before Printing This Document
GOLDMAN SACHS EMERGING MARKETS DEBT FUND
Schedule of Investments (continued)December 31, 2020 (Unaudited)
GOLDMAN SACHS EMERGING MARKETS DEBT FUND
Schedule of Investments (continued)December 31, 2020 (Unaudited)
GOLDMAN SACHS EMERGING MARKETS DEBT FUND
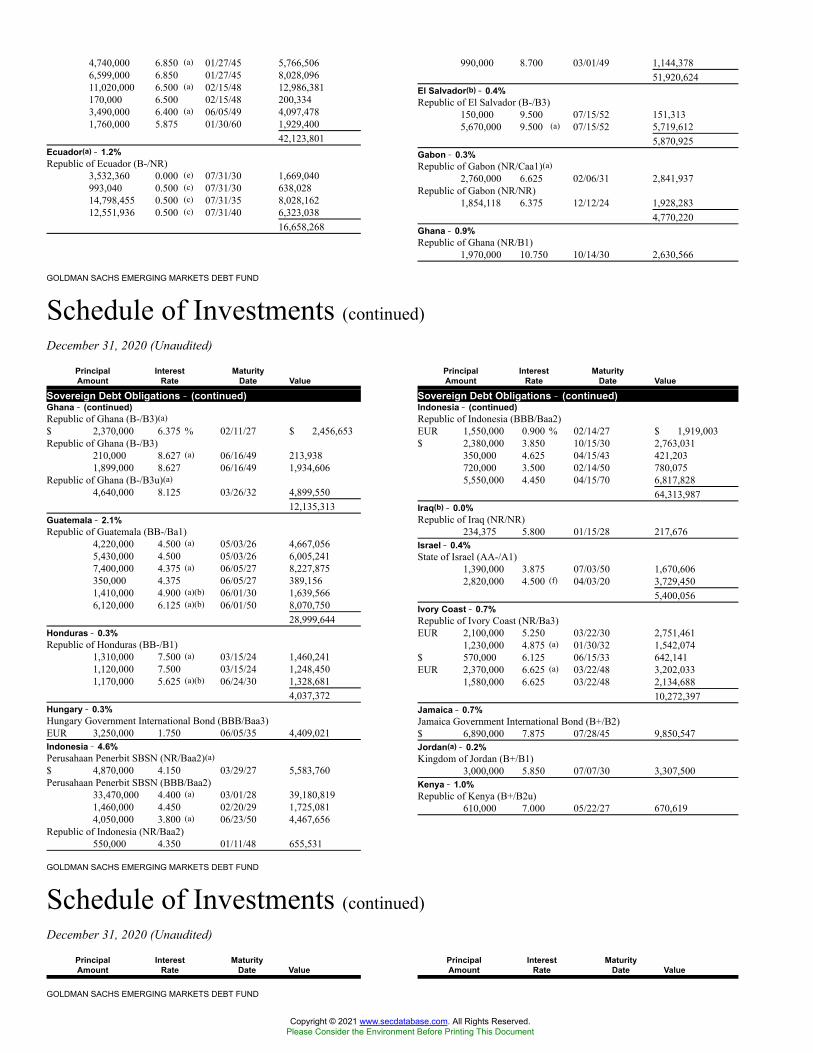
4,740,000 6.850 (a) 01/27/45 5,766,5066,599,000 6.850 01/27/45 8,028,09611,020,000 6.500 (a) 02/15/48 12,986,381170,000 6.500 02/15/48 200,3343,490,000 6.400 (a) 06/05/49 4,097,4781,760,000 5.875 01/30/60 1,929,400
42,123,801Ecuador(a) �� 1.2%Republic of Ecuador (B-/NR)
3,532,360 0.000 (e) 07/31/30 1,669,040993,040 0.500 (c) 07/31/30 638,02814,798,455 0.500 (c) 07/31/35 8,028,16212,551,936 0.500 (c) 07/31/40 6,323,038
16,658,268
990,000 8.700 03/01/49 1,144,37851,920,624
El Salvador(b) �� 0.4%Republic of El Salvador (B-/B3)
150,000 9.500 07/15/52 151,3135,670,000 9.500 (a) 07/15/52 5,719,612
5,870,925Gabon �� 0.3%Republic of Gabon (NR/Caa1)(a)
2,760,000 6.625 02/06/31 2,841,937Republic of Gabon (NR/NR)
1,854,118 6.375 12/12/24 1,928,2834,770,220
Ghana �� 0.9%Republic of Ghana (NR/B1)
1,970,000 10.750 10/14/30 2,630,566
PrincipalAmount
InterestRate
MaturityDate Value
Sovereign Debt Obligations �� (continued)Ghana �� (continued)Republic of Ghana (B-/B3)(a)$ 2,370,000 6.375 % 02/11/27 $ 2,456,653Republic of Ghana (B-/B3)
210,000 8.627 (a) 06/16/49 213,9381,899,000 8.627 06/16/49 1,934,606
Republic of Ghana (B-/B3u)(a)4,640,000 8.125 03/26/32 4,899,550
12,135,313Guatemala �� 2.1%Republic of Guatemala (BB-/Ba1)
4,220,000 4.500 (a) 05/03/26 4,667,0565,430,000 4.500 05/03/26 6,005,2417,400,000 4.375 (a) 06/05/27 8,227,875350,000 4.375 06/05/27 389,1561,410,000 4.900 (a)(b) 06/01/30 1,639,5666,120,000 6.125 (a)(b) 06/01/50 8,070,750
28,999,644Honduras �� 0.3%Republic of Honduras (BB-/B1)
1,310,000 7.500 (a) 03/15/24 1,460,2411,120,000 7.500 03/15/24 1,248,4501,170,000 5.625 (a)(b) 06/24/30 1,328,681
4,037,372Hungary �� 0.3%Hungary Government International Bond (BBB/Baa3)EUR 3,250,000 1.750 06/05/35 4,409,021Indonesia �� 4.6%Perusahaan Penerbit SBSN (NR/Baa2)(a)$ 4,870,000 4.150 03/29/27 5,583,760Perusahaan Penerbit SBSN (BBB/Baa2)
33,470,000 4.400 (a) 03/01/28 39,180,8191,460,000 4.450 02/20/29 1,725,0814,050,000 3.800 (a) 06/23/50 4,467,656
Republic of Indonesia (NR/Baa2)550,000 4.350 01/11/48 655,531
PrincipalAmount
InterestRate
MaturityDate Value
Sovereign Debt Obligations �� (continued)Indonesia �� (continued)Republic of Indonesia (BBB/Baa2)EUR 1,550,000 0.900 % 02/14/27 $ 1,919,003$ 2,380,000 3.850 10/15/30 2,763,031
350,000 4.625 04/15/43 421,203720,000 3.500 02/14/50 780,0755,550,000 4.450 04/15/70 6,817,828
64,313,987Iraq(b) �� 0.0%Republic of Iraq (NR/NR)
234,375 5.800 01/15/28 217,676Israel �� 0.4%State of Israel (AA-/A1)
1,390,000 3.875 07/03/50 1,670,6062,820,000 4.500 (f) 04/03/20 3,729,450
5,400,056Ivory Coast �� 0.7%Republic of Ivory Coast (NR/Ba3)EUR 2,100,000 5.250 03/22/30 2,751,461
1,230,000 4.875 (a) 01/30/32 1,542,074$ 570,000 6.125 06/15/33 642,141EUR 2,370,000 6.625 (a) 03/22/48 3,202,033
1,580,000 6.625 03/22/48 2,134,68810,272,397
Jamaica �� 0.7%Jamaica Government International Bond (B+/B2)$ 6,890,000 7.875 07/28/45 9,850,547Jordan(a) �� 0.2%Kingdom of Jordan (B+/B1)
3,000,000 5.850 07/07/30 3,307,500Kenya �� 1.0%Republic of Kenya (B+/B2u)
610,000 7.000 05/22/27 670,619
PrincipalAmount
InterestRate
MaturityDate Value
PrincipalAmount
InterestRate
MaturityDate Value
Copyright © 2021 www.secdatabase.com. All Rights Reserved.Please Consider the Environment Before Printing This Document

Schedule of Investments (continued)December 31, 2020 (Unaudited)
Sovereign Debt Obligations �� (continued)Kenya �� (continued)Republic of Kenya (B+/B2u) � (continued)$ 3,900,000 7.000 %(a) 05/22/27 $ 4,287,562
750,000 7.250 (a) 02/28/28 841,406550,000 7.250 02/28/28 617,0316,380,000 8.000 (a) 05/22/32 7,434,694200,000 8.000 05/22/32 233,063
14,084,375Lebanon(g) �� 0.3%Republic of Lebanon (NR/NR)
3,663,000 6.750 11/29/27 439,560Republic of Lebanon (D/NR)
3,990,000 6.200 02/26/25 478,8002,020,000 6.650 04/22/24 242,400130,000 6.600 11/27/26 15,600710,000 6.850 03/23/27 85,200750,000 6.650 11/03/28 90,0007,704,000 6.850 05/25/29 924,4809,584,000 6.650 02/26/30 1,150,0801,520,000 7.050 11/02/35 182,400
3,608,520Macedonia �� 1.3%Republic of North Macedonia (BB-/NR)EUR 600,000 5.625 07/26/23 819,345
10,480,000 2.750 (a) 01/18/25 13,547,0612,710,000 2.750 01/18/25 3,503,105
17,869,511Mexico �� 2.8%Mexico Government International Bond (BBB/Baa1)(b)
850,000 1.350 09/18/27 1,070,853820,000 4.500 04/22/29 961,450
United Mexican States (BBB/Baa1)(b)3,300,000 4.750 04/27/32 3,966,188
Sovereign Debt Obligations �� (continued)Mexico �� (continued)United Mexican States (BBB/Baa1)$ 6,970,000 2.659 %(b) 05/24/31 $ 7,168,645
1,560,000 4.750 03/08/44 1,856,010320,000 4.600 01/23/46 374,2001,220,000 4.350 01/15/47 1,390,800383,000 4.500 (b) 01/31/50 447,8715,690,000 5.000 (b) 04/27/51 7,094,00713,439,000 3.771 (b) 05/24/61 13,973,200
38,303,224Mongolia �� 0.5%Republic of Mongolia (B/B3)
781,000 5.125 12/05/22 810,5321,940,000 5.125 (a) 04/07/26 2,080,650
Republic of Mongolia (B/B3u)3,490,000 5.625 05/01/23 3,677,587
6,568,769Morocco(a) �� 1.4%Kingdom of Morocco (BBB-/NR)
7,490,000 3.000 12/15/32 7,583,625Kingdom of Morocco (BBB-/Ba1u)EUR 2,560,000 1.500 11/27/31 3,043,375Morocco Government International Bond (BBB-/NR)$ 3,300,000 2.375 12/15/27 3,312,375
5,060,000 4.000 12/15/50 5,205,47519,144,850
Mozambique(c) �� 0.1%Republic of Mozambique (NR/Caa2u)
2,060,000 5.000 09/15/31 1,868,806Nigeria �� 1.8%Republic of Nigeria (B-/B2)
3,140,000 6.500 11/28/27 3,382,3691,190,000 7.143 02/23/30 1,281,1098,390,000 7.875 02/16/32 9,236,8659,820,000 7.696 (a) 02/23/38 10,436,819
24,337,162
PrincipalAmount
InterestRate
MaturityDate Value
Sovereign Debt Obligations �� (continued)Oman �� 1.2%Oman Government International Bond (NR/Ba3)$ 2,680,000 6.750 %(a) 10/28/27 $ 2,897,750
680,000 5.625 01/17/28 692,8864,660,000 7.375 (a) 10/28/32 5,126,0004,250,000 6.750 (a) 01/17/48 4,198,203800,000 6.750 01/17/48 790,250
Oman Government International Bond (B+/Ba3)1,430,000 4.750 06/15/26 1,426,8721,280,000 6.500 03/08/47 1,253,600
16,385,561Panama �� 1.1%Panama Notas del Tesoro (BBB/Baa1)
2,740,000 3.750 04/17/26 2,984,887Republic of Panama (BBB/Baa1)(b)
6,500,000 4.500 04/01/56 8,385,0003,680,000 3.870 07/23/60 4,333,200
15,703,087Papua New Guinea(a) �� 0.1%Papua New Guinea Government International Bond (B-/B2)
1,450,000 8.375 10/04/28 1,478,547Paraguay �� 3.1%Republic of Paraguay (BB/NR)(a)
4,590,000 5.600 03/13/48 5,892,412Republic of Paraguay (BB/Ba1)
12,098,000 4.625 01/25/23 13,031,8143,930,000 5.000 (a) 04/15/26 4,594,416
PrincipalAmount
InterestRate
MaturityDate Value
Sovereign Debt Obligations �� (continued)Philippines �� 0.3%Republic of Philippines (BBB+/Baa2)$ 1,320,000 1.648 % 06/10/31 $ 1,329,900
2,470,000 2.650 12/10/45 2,488,5253,818,425
Qatar �� 1.6%Republic of Qatar (AA-/Aa3)
10,470,000 5.103 (a) 04/23/48 14,710,3502,950,000 4.817 (a) 03/14/49 4,017,531240,000 4.817 03/14/49 326,8502,770,000 4.400 (a) 04/16/50 3,601,000
22,655,731Romania �� 3.1%Republic of Romania (BBB-/Baa3)EUR 3,330,000 2.375 (a) 04/19/27 4,440,580
7,360,000 2.875 05/26/28 10,092,7841,330,000 2.500 02/08/30 1,779,1503,250,000 3.624 (a) 05/26/30 4,729,695
$ 2,070,000 3.000 (a) 02/14/31 2,215,547EUR 2,320,000 2.124 (a) 07/16/31 2,998,968
1,730,000 2.124 07/16/31 2,236,2992,270,000 2.000 (a) 01/28/32 2,904,00340,000 2.625 (a) 12/02/40 51,981420,000 4.625 (a) 04/03/49 692,676900,000 3.375 (a) 01/28/50 1,261,6591,880,000 3.375 01/28/50 2,635,466
$ 5,860,000 4.000 (a) 02/14/51 6,372,750
Copyright © 2021 www.secdatabase.com. All Rights Reserved.Please Consider the Environment Before Printing This Document

GOLDMAN SACHS EMERGING MARKETS DEBT FUND
Schedule of Investments (continued)December 31, 2020 (Unaudited)
685,000 5.000 04/15/26 800,8082,770,000 4.700 (a) 03/27/27 3,223,587400,000 4.950 (b) 04/28/31 483,0002,760,000 4.950 (a)(b) 04/28/31 3,332,7005,650,000 6.100 08/11/44 7,558,6413,050,000 5.400 (a)(b) 03/30/50 3,849,672
42,767,050Peru(b) �� 0.7%Republic of Peru (BBB+/NR)
4,910,000 2.780 12/01/60 4,941,9155,260,000 3.230 07/28/21 5,257,370
10,199,285
42,411,558
PrincipalAmount
InterestRate
MaturityDate Value
Sovereign Debt Obligations �� (continued)Russia �� 1.4%Russian Federation Bond (NR/NR)$ 4,000,000 4.750 % 05/27/26 $ 4,622,000
3,200,000 4.375 (a) 03/21/29 3,734,4004,200,000 5.100 (a) 03/28/35 5,301,1884,600,000 5.100 03/28/35 5,806,062
19,463,650Saudi Arabia �� 1.6%Saudi Government International Bond (NR/A1)
1,770,000 2.750 (a) 02/03/32 1,867,350920,000 4.500 10/26/46 1,113,7753,600,000 4.625 10/04/47 4,444,8751,380,000 5.000 04/17/49 1,807,8001,770,000 3.750 (a) 01/21/55 1,933,172410,000 3.750 01/21/55 447,7978,270,000 4.500 (a) 04/22/60 10,378,850
21,993,619Senegal(a) �� 0.4%Republic of Senegal (B+/Ba3)EUR 4,580,000 4.750 03/13/28 5,969,334Serbia �� 0.7%Republic of Serbia (NR/Ba3)
440,000 3.125 05/15/27 603,3732,740,000 3.125 (a) 05/15/27 3,757,368
Republic of Serbia (BB+/Ba3)(a)4,400,000 1.500 06/26/29 5,549,956
9,910,697South Africa �� 1.6%Republic of South Africa (NR/Ba2)$ 3,660,000 4.850 09/27/27 3,952,800
3,350,000 5.650 09/27/47 3,329,062Republic of South Africa (BB-/Ba2)
240,000 4.875 04/14/26 261,7502,670,000 4.300 10/12/28 2,776,8005,670,000 4.850 09/30/29 6,006,6561,180,000 6.250 03/08/41 1,273,2944,120,000 5.750 09/30/49 4,112,275
21,712,637
PrincipalAmount
InterestRate
MaturityDate Value
Sovereign Debt Obligations �� (continued)Sri Lanka �� 1.0%Republic of Sri Lanka (CCC+/Caa1)$ 200,000 5.750 %(a) 04/18/23 $ 126,938
4,380,000 6.850 (a) 03/14/24 2,651,269910,000 6.350 (a) 06/28/24 549,1283,960,000 6.125 06/03/25 2,341,3506,010,000 6.850 (a) 11/03/25 3,551,5342,490,000 6.850 11/03/25 1,471,434230,000 6.750 04/18/28 130,5251,690,000 6.750 (a) 04/18/28 959,0754,240,000 7.550 (a) 03/28/30 2,406,200
14,187,453Tajikistan �� 0.0%Republic of Tajikistan (B-/B3)
710,000 7.125 09/14/27 605,941Trinidad and Tobago(a)(b) �� 0.1%Republic of Trinidad & Tobago (BBB-/Ba1)
1,560,000 4.500 06/26/30 1,675,050Tunisia(a) �� 0.1%Banque Centrale de Tunisie International Bond (NR/B2)
Copyright © 2021 www.secdatabase.com. All Rights Reserved.Please Consider the Environment Before Printing This Document

GOLDMAN SACHS EMERGING MARKETS DEBT FUND
Schedule of Investments(continued)December 31, 2020 (Unaudited)
EUR 850,000 6.750 10/31/23 981,615760,000 6.375 07/15/26 847,795
1,829,410Turkey �� 3.0%Republic of Turkey (NR/B2)$ 5,380,000 4.250 03/13/25 5,388,406EUR 5,290,000 3.250 06/14/25 6,527,154
6,280,000 5.200 02/16/26 8,304,900$ 1,200,000 4.875 10/09/26 1,212,750
PrincipalAmount
InterestRate
MaturityDate Value
Sovereign Debt Obligations �� (continued)Turkey �� (continued)Republic of Turkey (NR/B2) � (continued)$ 4,780,000 6.000 % 03/25/27 $ 5,066,800
3,450,000 5.250 03/13/30 3,461,8597,640,000 5.750 05/11/47 7,258,000999,000 7.375 02/05/25 1,113,8853,640,000 6.000 01/14/41 3,588,813
41,922,567Ukraine �� 2.6%Ukraine Government Bond (B/NR)
600,000 8.994 02/01/24 678,000EUR 2,210,000 4.375 (a) 01/27/30 2,575,822$ 3,453,000 7.253 (a) 03/15/33 3,763,770
3,518,000 0.000 (h) 05/31/40 3,615,844Ukraine Government Bond (B/B3u)
1,050,000 7.750 09/01/21 1,088,8507,470,000 7.750 09/01/23 8,217,0009,860,000 7.750 09/01/24 10,935,3562,630,000 7.750 09/01/25 2,939,8471,330,000 7.750 09/01/26 1,501,238
35,315,727United Arab Emirates(a) �� 0.5%Finance Department Government of Sharjah (BBB-/Baa2)
6,310,000 4.000 07/28/50 6,396,762Uruguay(b) �� 0.0%Republic of Uruguay (BBB/Baa2)
350,000 4.375 01/23/31 429,297Uzbekistan(a) �� 0.2%Republic of Uzbekistan (BB-/NR)
1,460,000 5.375 02/20/29 1,700,9001,160,000 3.700 11/25/30 1,220,900
2,921,800Venezuela(g) �� 0.3%Petroleos de Venezuela SA (NR/NR)
138,210,000 6.000 10/28/22 3,662,565
PrincipalAmount
InterestRate
MaturityDate Value
Sovereign Debt Obligations �� (continued)Vietnam(b)(i) �� 0.3%Debt and Asset Trading Corp. (NR/NR)$ 4,680,000 1.000 % 10/10/25 $ 4,024,800Zambia �� 0.2%Republic of Zambia (D/NR)
5,834,000 5.375 09/20/22 3,008,156TOTAL SOVEREIGN DEBT OBLIGATIONS(Cost $870,027,829) $ 876,699,358
Corporate Obligations �� 25.7%Argentina(a) �� 0.0%Telecom Argentina SA (CCC+/NR)$ 256,000 8.500 % 08/06/25 $ 239,120Azerbaijan �� 0.1%State Oil Co. of the Azerbaijan Republic (BB-/Ba2)
400,000 4.750 03/13/23 425,500State Oil Co. of the Azerbaijan Republic (BB-/NR)
1,040,000 6.950 03/18/30 1,330,0171,755,517
Bahrain(a) �� 0.2%CBB International Sukuk Programme Co. SPC (B+/B2u)
2,670,000 3.950 09/16/27 2,760,112
Copyright © 2021 www.secdatabase.com. All Rights Reserved.Please Consider the Environment Before Printing This Document

GOLDMAN SACHS EMERGING MARKETS DEBT FUND
Schedule of Investments(continued)December 31, 2020 (Unaudited)
Brazil �� 1.7%Banco do Brasil SA (CCC+/NR)(b)(h) (10 Year CMT + 4.398%)
5,210,000 6.250 10/29/49 5,335,366Banco do Brasil SA (CCC+/B2)(b)(h) (10 Year CMT + 6.362%)
5,670,000 9.000 06/29/49 6,323,822BRF SA (NR/Ba2)(b)
2,020,000 4.875 01/24/30 2,192,3311,290,000 5.750 (a) 09/21/50 1,431,497200,000 5.750 09/21/50 221,937
Embraer Overseas Ltd. (BB+/Ba2)13,000 5.696 09/16/23 13,784
Itau Unibanco Holding SA (BB-/B2)(a)(b)(h) (5 Year CMT + 3.222%)3,360,000 4.625 12/31/99 3,298,050
Samarco Mineracao SA (NR/WR)(g)3,185,000 4.125 11/01/22 2,229,5002,080,000 5.750 10/24/23 1,473,550800,000 5.375 09/26/24 568,000
23,087,837
PrincipalAmount
InterestRate
MaturityDate Value
Corporate Obligations �� (continued)British Virgin Islands �� 1.0%Contemporary Ruiding Development Ltd. (BBB+/Baa1)(b)$ 290,000 2.625 % 09/17/30 $ 293,081Easy Tactic Ltd. (NR/NR)(b)
740,000 8.625 02/27/24 652,819Fortune Star BVI Ltd. (BB/NR)(b)
610,000 5.250 03/23/22 616,672260,000 6.750 07/02/23 273,569
FPC Resources Ltd. (NR/NR)(b)380,000 4.375 09/11/27 398,169
Huarong Finance 2017 Co. Ltd.3,770,000 4.750 04/27/27 4,200,015
(5 Year CMT + 6.983%)3,530,000 4.000 (b)(h) 12/31/99 3,597,291
Huarong Finance 2019 Co. Ltd.(b)1,690,000 3.875 11/13/29 1,796,681
Huarong Finance 2019 Co. Ltd. (NR/Baa1)(b)280,000 3.625 09/30/30 293,688
Sino-Ocean Land Treasure IV Ltd. (NR/Baa3)(b)320,000 4.750 01/14/30 333,200
Studio City Finance Ltd. (BB-/B1)(a)(b)430,000 6.000 07/15/25 453,650350,000 6.500 01/15/28 374,829
Sunny Express Enterprises Corp. (NR/A3)(b)(h) (3 Year CMT + 4.762%)870,000 3.350 12/31/99 882,506
14,166,170Burundi �� 0.3%Eastern & Southern African Trade & Development Bank (NR/Baa3)
3,660,000 5.375 03/14/22 3,777,523Chile �� 0.7%Corp Nacional del Cobre de Chile (A/A3)(a)(b)
2,290,000 3.750 01/15/31 2,602,012Embotelladora Andina SA (BBB/NR)(a)
506,000 5.000 10/01/23 558,972Empresa de los Ferrocarriles del Estado (A+/NR)(a)(b)
600,000 3.068 08/18/50 580,125
PrincipalAmount
InterestRate
MaturityDate Value
Corporate Obligations �� (continued)Chile �� (continued)Empresa de Transporte de Pasajeros Metro SA (A+/NR)(a)(b)$ 830,000 3.650 % 05/07/30 $ 931,675GNL Quintero SA (BBB/Baa2)
1,060,000 4.634 07/31/29 1,175,606Inversiones CMPC SA (BBB-/NR)(a)(b)
660,000 4.375 05/15/23 701,993Sociedad Quimica y Minera de Chile SA (BBB+/Baa1)(a)(b)
3,291,000 4.375 01/28/25 3,624,21410,174,597
China �� 0.4%Fantasia Holdings Group Co. Ltd. (NR/NR)(b)
200,000 9.250 07/28/23 201,438Fantasia Holdings Group Co. Ltd. (NR/NR)(b)
450,000 9.875 10/19/23 457,312iQIYI, Inc. (NR/NR)(j)
710,000 2.000 04/01/25 627,725Kaisa Group Holdings Ltd. (NR/NR)(b)
200,000 8.500 06/30/22 204,625Kaisa Group Holdings Ltd. (NR/B2)(b)
200,000 10.875 07/23/23 208,563260,000 11.950 11/12/23 275,681
Copyright © 2021 www.secdatabase.com. All Rights Reserved.Please Consider the Environment Before Printing This Document

GOLDMAN SACHS EMERGING MARKETS DEBT FUND
Schedule of Investments(continued)December 31, 2020 (Unaudited)
GOLDMAN SACHS EMERGING MARKETS DEBT FUND
240,000 11.250 04/16/25 245,250Meituan (BBB-/Baa3)(a)(b)
540,000 3.050 10/28/30 562,612Sunac China Holdings Ltd. (B+/B1)(b)
880,000 8.350 04/19/23 926,475Yuzhou Group Holdings Co. Ltd. (NR/B1)(b)
970,000 7.700 02/20/25 1,039,416Zhenro Properties Group Ltd. (NR/B2)(b)(h) (-1x3 Year CMT + 13.414%)
590,000 10.250 12/31/99 608,2535,357,350
Colombia �� 0.9%Banco de Bogota SA (NR/Ba2)
6,870,000 6.250 (a) 05/12/26 7,952,0251,980,000 6.250 05/12/26 2,291,850
Grupo Aval Ltd. (NR/Ba2)590,000 4.750 09/26/22 617,8411,530,000 4.375 (a)(b) 02/04/30 1,627,059
12,488,775
PrincipalAmount
InterestRate
MaturityDate Value
Corporate Obligations �� (continued)Cyprus �� 0.1%MHP SE (B/NR)$ 1,910,000 7.750 % 05/10/24 $ 2,090,256Dominican Republic(a)(b) �� 0.2%Aeropuertos Dominicanos Siglo XXI SA (B+/B1)
3,220,000 6.750 03/30/29 3,347,794Hong Kong �� 0.2%CNAC HK Finbridge Co. Ltd. (NR/Baa2)
2,630,000 3.000 09/22/30 2,487,216India �� 0.1%Adani Electricity Mumbai Ltd. (BBB-/Baa3)
200,000 3.949 02/12/30 211,625Greenko Investment Co. (B+/NR)(a)(b)
1,190,000 4.875 08/16/23 1,213,4281,425,053
Indonesia �� 0.2%Indonesia Asahan Aluminium Persero PT (NR/Baa2)(a)(b)
1,060,000 5.800 05/15/50 1,319,037Perusahaan Gas Persero Tbk PT (NR/Baa2)
1,730,000 5.125 05/16/24 1,910,5693,229,606
Ireland �� 0.6%Credit Bank of Moscow Via CBOM Finance PLC (NR/NR)(b)(h)(5 Year
USD Swap + 5.416%)310,000 7.500 10/05/27 310,000
Credit Bank of Moscow Via CBOM Finance PLC (BB-/NR)(a)430,000 4.700 01/29/25 439,137
Credit Bank of Moscow Via CBOM Finance PLC (BB-/Ba3)(a)3,010,000 5.550 02/14/23 3,152,975
Phosagro OAO Via Phosagro Bond Funding DAC (BBB-/Baa3)(a)(b)3,610,000 3.949 04/24/23 3,772,450
7,674,562Israel(a)(b) �� 0.3%Leviathan Bond Ltd. (BB-/Ba3)
3,350,000 5.750 06/30/23 3,566,008
PrincipalAmount
InterestRate
MaturityDate Value
Corporate Obligations �� (continued)Ivory Coast(a)(i) �� 0.2%Brazil Minas SPE via State of Minas Gerais (BB-/NR)$ 2,800,000 5.333 % 02/15/28 $ 3,044,125Japan(b)(h) �� 0.1%SoftBank Group Corp. (B+/B2u) (5 Year USD ICE Swap + 4.226%)
1,310,000 6.000 12/31/99 1,278,888Kazakhstan �� 1.0%KazMunayGas National Co. JSC (NR/Baa3)(a)(b)
2,100,000 3.500 04/14/33 2,283,750KazMunayGas National Co. JSC (BB/Baa3)
6,002,000 4.750 04/19/27 6,966,071Tengizchevroil Finance Co International Ltd. (BBB/Baa2)(a)(b)
1,500,000 3.250 08/15/30 1,588,125Tengizchevroil Finance Co. International Ltd. (BBB/Baa2)(a)(b)
2,920,000 2.625 08/15/25 3,030,96013,868,906
Luxembourg �� 0.6%Gazprom PJSC Via Gaz Capital SA (BBB-/Baa2)
410,000 8.625 (j) 04/28/34 641,1373,970,000 7.288 08/16/37 5,822,253
MHP Lux SA (B/NR)380,000 6.950 04/03/26 416,694
Copyright © 2021 www.secdatabase.com. All Rights Reserved.Please Consider the Environment Before Printing This Document
Schedule of Investments(continued)December 31, 2020 (Unaudited)
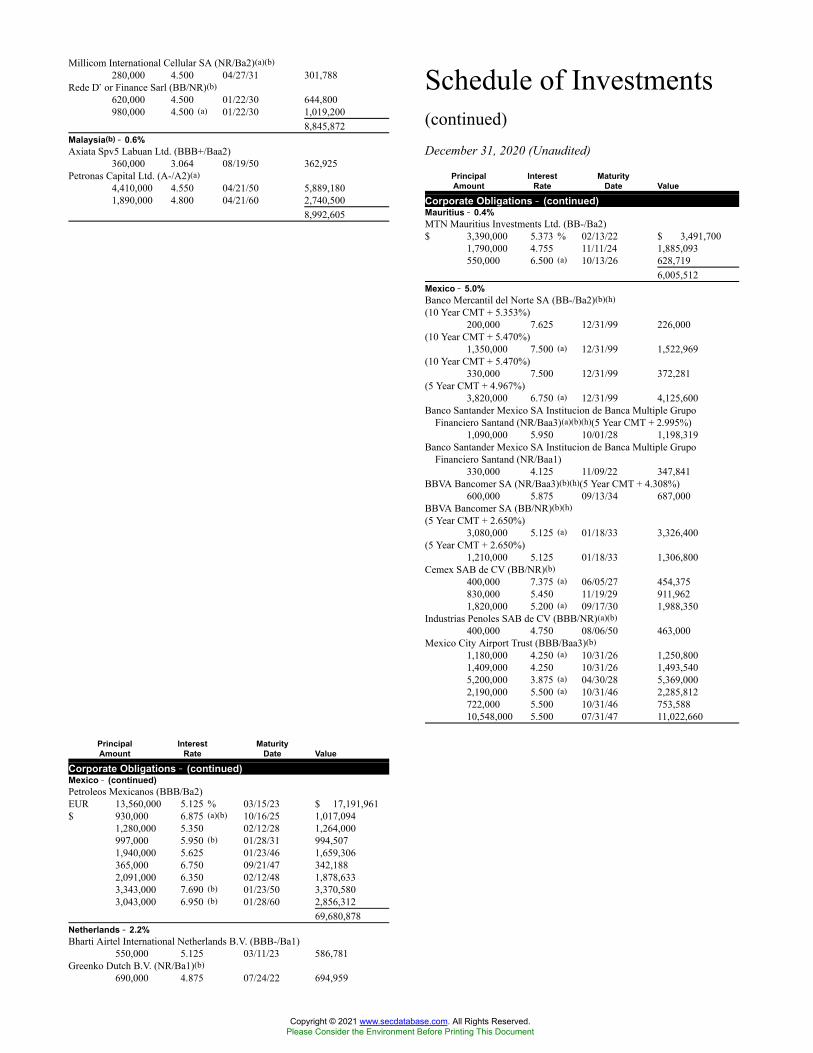
Millicom International Cellular SA (NR/Ba2)(a)(b)280,000 4.500 04/27/31 301,788
Rede D�or Finance Sarl (BB/NR)(b)620,000 4.500 01/22/30 644,800980,000 4.500 (a) 01/22/30 1,019,200
8,845,872Malaysia(b) �� 0.6%Axiata Spv5 Labuan Ltd. (BBB+/Baa2)
360,000 3.064 08/19/50 362,925Petronas Capital Ltd. (A-/A2)(a)
4,410,000 4.550 04/21/50 5,889,1801,890,000 4.800 04/21/60 2,740,500
8,992,605
PrincipalAmount
InterestRate
MaturityDate Value
Corporate Obligations �� (continued)Mauritius �� 0.4%MTN Mauritius Investments Ltd. (BB-/Ba2)$ 3,390,000 5.373 % 02/13/22 $ 3,491,700
1,790,000 4.755 11/11/24 1,885,093550,000 6.500 (a) 10/13/26 628,719
6,005,512Mexico �� 5.0%Banco Mercantil del Norte SA (BB-/Ba2)(b)(h)(10 Year CMT + 5.353%)
200,000 7.625 12/31/99 226,000(10 Year CMT + 5.470%)
1,350,000 7.500 (a) 12/31/99 1,522,969(10 Year CMT + 5.470%)
330,000 7.500 12/31/99 372,281(5 Year CMT + 4.967%)
3,820,000 6.750 (a) 12/31/99 4,125,600Banco Santander Mexico SA Institucion de Banca Multiple Grupo
Financiero Santand (NR/Baa3)(a)(b)(h)(5 Year CMT + 2.995%)1,090,000 5.950 10/01/28 1,198,319
Banco Santander Mexico SA Institucion de Banca Multiple GrupoFinanciero Santand (NR/Baa1)
330,000 4.125 11/09/22 347,841BBVA Bancomer SA (NR/Baa3)(b)(h)(5 Year CMT + 4.308%)
600,000 5.875 09/13/34 687,000BBVA Bancomer SA (BB/NR)(b)(h)(5 Year CMT + 2.650%)
3,080,000 5.125 (a) 01/18/33 3,326,400(5 Year CMT + 2.650%)
1,210,000 5.125 01/18/33 1,306,800Cemex SAB de CV (BB/NR)(b)
400,000 7.375 (a) 06/05/27 454,375830,000 5.450 11/19/29 911,9621,820,000 5.200 (a) 09/17/30 1,988,350
Industrias Penoles SAB de CV (BBB/NR)(a)(b)400,000 4.750 08/06/50 463,000
Mexico City Airport Trust (BBB/Baa3)(b)1,180,000 4.250 (a) 10/31/26 1,250,8001,409,000 4.250 10/31/26 1,493,5405,200,000 3.875 (a) 04/30/28 5,369,0002,190,000 5.500 (a) 10/31/46 2,285,812722,000 5.500 10/31/46 753,58810,548,000 5.500 07/31/47 11,022,660
PrincipalAmount
InterestRate
MaturityDate Value
Corporate Obligations �� (continued)Mexico �� (continued)Petroleos Mexicanos (BBB/Ba2)EUR 13,560,000 5.125 % 03/15/23 $ 17,191,961$ 930,000 6.875 (a)(b) 10/16/25 1,017,094
1,280,000 5.350 02/12/28 1,264,000997,000 5.950 (b) 01/28/31 994,5071,940,000 5.625 01/23/46 1,659,306365,000 6.750 09/21/47 342,1882,091,000 6.350 02/12/48 1,878,6333,343,000 7.690 (b) 01/23/50 3,370,5803,043,000 6.950 (b) 01/28/60 2,856,312
69,680,878Netherlands �� 2.2%Bharti Airtel International Netherlands B.V. (BBB-/Ba1)
550,000 5.125 03/11/23 586,781Greenko Dutch B.V. (NR/Ba1)(b)
690,000 4.875 07/24/22 694,959
Copyright © 2021 www.secdatabase.com. All Rights Reserved.Please Consider the Environment Before Printing This Document

GOLDMAN SACHS EMERGING MARKETS DEBT FUND
Schedule of Investments(continued)December 31, 2020 (Unaudited)
GOLDMAN SACHS EMERGING MARKETS DEBT FUND
IHS Netherlands Holdco B.V. (B-/B2)(a)(b)490,000 7.125 03/18/25 514,041400,000 8.000 09/18/27 431,000
Lukoil International Finance B.V. (BBB/NR)1,800,000 4.750 11/02/26 2,048,625
Lukoil Securities B.V. (BBB/NR)(a)1,740,000 3.875 05/06/30 1,881,497
Metinvest B.V. (B/NR)(b)301,000 7.750 (a) 04/23/23 320,565200,000 7.750 04/23/23 213,000
MV24 Capital B.V. (BB/NR)(a)1,457,333 6.748 06/01/34 1,598,512
NE Property B.V. (BBB/NR)(b)EUR 980,000 1.750 11/23/24 1,225,277
2,440,000 3.375 07/14/27 3,234,197Petrobras Global Finance B.V. (BB-/Ba2)$ 2,510,000 5.999 01/27/28 2,936,700
1,820,000 6.850 (k) 06/05/15 2,260,904
PrincipalAmount
InterestRate
MaturityDate Value
Corporate Obligations �� (continued)Netherlands �� (continued)PPF Telecom Group B.V. (BB+/Ba1)(b)EUR 1,648,000 2.125 % 01/31/25 $ 2,052,679Prosus NV (BBB-/Baa3)(b)$ 460,000 5.500 07/21/25 527,706
480,000 3.680 01/21/30 521,1003,220,000 3.680 (a) 01/21/30 3,495,7131,500,000 4.027 (a) 08/03/50 1,556,250
Royal Capital B.V. (NR/NR)(b)(h) (-1x5 Year CMT + 7.396%)460,000 5.000 12/31/49 477,825
Syngenta Finance NV (BBB-/Ba2)(a)(b)4,140,000 5.676 04/24/48 4,292,186
30,869,517Pakistan �� 0.5%The Third Pakistan International Sukuk Co. Ltd. (NR/B3)
2,130,000 5.500 10/13/21 2,153,297The Third Pakistan International Sukuk Co. Ltd. (B-/B3)
5,200,000 5.625 12/05/22 5,307,2507,460,547
Panama �� 0.6%Aeropuerto Internacional de Tocumen SA (BB+/NR)(b)
2,240,000 5.625 05/18/36 2,604,000Autoridad del Canal de Panama (A-/A1)(a)
380,000 4.950 07/29/35 479,631Banco Latinoamericano de Comercio Exterior SA (BBB/Baa2)(a)(b)
2,830,000 2.375 09/14/25 2,902,929Banco Nacional de Panama (BBB/Baa1)(a)(b)
2,190,000 2.500 08/11/30 2,190,0008,176,560
Peru �� 0.7%ABY Transmision Sur SA (BBB/NR)(a)
5,000,556 6.875 04/30/43 6,681,993Corp. Lindley SA (BBB/NR)
815,000 6.750 (a) 11/23/21 842,2511,780,000 6.750 11/23/21 1,839,519120,000 4.625 (a) 04/12/23 124,725
9,488,488
PrincipalAmount
InterestRate
MaturityDate Value
Corporate Obligations �� (continued)Philippines �� 0.2%International Container Terminal Services, Inc. (NR/NR)$ 340,000 4.750 % 06/17/30 $ 370,175SMC Global Power Holdings Corp. (NR/NR)(b)(h)(-1x 5 year CMT + 9.199%)
1,750,000 7.000 12/31/99 1,791,563(5 Year CMT + 6.608%)
210,000 6.500 12/31/99 211,5092,373,247
Singapore(b) �� 0.1%Eterna Capital Pte Ltd. (CCC+p/Caa2)(d)
402,741 8.000 12/11/22 193,316Innovate Capital Pte Ltd. (NR/NR)(d)
648,539 6.000 12/11/24 199,218Trafigura Group Pte Ltd. (NR/NR)(h)(5 Year USD Swap + 6.647%)
470,000 6.875 12/31/99 462,216854,750
South Africa �� 0.1%Eskom Holdings SOC Ltd. (CCC+/Caa2)
520,000 6.750 08/06/23 527,963
Copyright © 2021 www.secdatabase.com. All Rights Reserved.Please Consider the Environment Before Printing This Document

Schedule of Investments(continued)December 31, 2020 (Unaudited)
800,000 7.125 02/11/25 817,2501,345,213
Thailand(a)(b) �� 0.3%PTT Treasury Center Co. Ltd. (BBB+/Baa1)
2,850,000 3.700 07/16/70 2,996,953PTTEP Treasury Center Co. Ltd. (NR/Baa1)
1,040,000 2.993 01/15/30 1,103,3754,100,328
Turkey �� 1.2%Akbank T.A.S. (NR/Caa2)(b)(h) (5 Year USD Swap + 4.029%)
564,000 6.797 04/27/28 547,080TC Ziraat Bankasi A/S (NR/B2)
500,000 5.125 05/03/22 501,250770,000 5.125 (a) 09/29/23 769,037
Turkiye Vakiflar Bankasi TAO (NR/B2)1,090,000 8.125 (a) 03/28/24 1,163,916250,000 8.125 03/28/24 266,9531,080,000 5.250 (a) 02/05/25 1,063,125
PrincipalAmount
InterestRate
MaturityDate Value
Corporate Obligations �� (continued)Turkey �� ( continued)Yapi ve Kredi Bankasi A/S (NR/B2)$ 1,820,000 6.100 % 03/16/23 $ 1,861,519
200,000 5.850 06/21/24 204,0004,610,000 8.250 (a) 10/15/24 5,047,950
Yapi ve Kredi Bankasi A/S (NR/Caa3u)(b)(h) (5 Year USD Swap +11.245%)
4,330,000 13.875 12/31/99 4,827,95016,252,780
United Arab Emirates �� 2.9%Abu Dhabi Crude Oil Pipeline LLC (AA/NR)(a)
12,180,000 4.600 11/02/47 15,160,294DP World Crescent Ltd. (NR/Baa3)
840,000 4.848 09/26/28 976,5001,390,000 3.875 07/18/29 1,525,5251,500,000 3.750 (b) 01/30/30 1,631,250
DP World PLC (NR/Baa3)1,070,000 5.625 09/25/48 1,362,913290,000 6.850 (a) 07/02/37 397,209
DP World Salaam (NR/Ba2)(b)(h) (5 Year CMT + 5.750%)6,350,000 6.000 12/31/99 6,887,766
Galaxy Pipeline Assets Bidco Ltd. (NR/Aa2)(a)1,010,000 2.625 03/31/36 1,045,3501,840,000 3.250 09/30/40 1,941,200
NBK Tier 1 Financing 2 Ltd. (NR/Baa3)(a)(b)(h) (6 Year USD Swap +2.832%)
2,480,000 4.500 12/31/99 2,525,725Sharjah Sukuk Program Ltd. (BBB-/Baa2)
1,370,000 4.226 03/14/28 1,527,9784,900,000 3.234 10/23/29 5,117,437
40,099,147United Kingdom �� 1.1%Gazprom PJSC via Gaz Finance PLC (BB/NR)(a)(b)(h) (5 Year CMT +
4.264%)6,010,000 4.599 10/15/99 6,242,887
Gazprom PJSC Via Gaz Finance PLC (BBB-/Baa2)(a)6,160,000 3.250 02/25/30 6,354,425
Vedanta Resources Finance II PLC (B-/NR)(a)(b)500,000 13.875 01/21/24 525,313
PrincipalAmount
InterestRate
MaturityDate Value
Corporate Obligations �� (continued)United Kingdom �� (continued)Vedanta Resources Finance II PLC (B-/Caa1)(b)$ 460,000 9.250 % 04/23/26 $ 340,400Vedanta Resources Ltd. (B-/Caa1)
600,000 7.125 05/31/23 487,1251,280,000 6.125 (b) 08/09/24 911,600
14,861,750United States �� 0.7%Brazil Loan Trust 1 (BB-/NR)(a)(i)
4,742,599 5.477 07/24/23 4,907,108Sasol Financing USA LLC (BB/Ba2)(b)
4,800,000 5.875 03/27/24 5,106,00010,013,108
Venezuela(g) �� 0.2%Petroleos de Venezuela SA (CCC-/NR)
2,180,000 5.500 04/12/37 69,760Petroleos de Venezuela SA (D/NR)
41,690,000 6.000 05/16/24 1,334,0803,387,934 6.000 11/15/26 110,10819,170,000 5.375 04/12/27 613,440
Copyright © 2021 www.secdatabase.com. All Rights Reserved.Please Consider the Environment Before Printing This Document

GOLDMAN SACHS EMERGING MARKETS DEBT FUND
Schedule of Investments(continued)December 31, 2020 (Unaudited)
2,127,388TOTAL CORPORATE OBLIGATIONS(Cost $347,678,534) $ 357,367,105
Structured Notes(a)(e) �� 0.9%United Kingdom �� 0.3%HSBC Bank PLC (NR/NR)EGP 88,025,000 0.000 % 12/23/21 $ 4,975,231United States �� 0.6%Republic of Indonesia (Issuer JPMorgan Chase Bank NA) (NR/NR)
59,625,000 0.000 07/08/21 3,552,74878,475,000 0.000 09/02/21 4,599,119
8,151,867TOTAL STRUCTURED NOTES(Cost $13,104,572) $ 13,127,098
SharesDividend
Rate Value
Investment Company(l) �� 3.3%Goldman Sachs Financial Square Government Fund - Institutional Shares45,527,646 0.026% $ 45,527,646(Cost $45,527,646)TOTAL INVESTMENTS �� 93.1%(Cost $1,276,338,581) $1,292,721,207OTHER ASSETS IN EXCESS OF
LIABILITIES �� 6.9% 95,175,187NET ASSETS �� 100.0% $1,387,896,394
The percentage shown for each investment category reflects thevalue of investments in that category as a percentage of net assets.(a) Exempt from registration under Rule 144A of the Securities Act of 1933.
(b) Security with �Call� features with resetting interest rates. Maturity dates disclosedare the final maturity dates.
(c) Coupon changes periodically based upon a predetermined schedule. Interest ratedisclosed is that which is in effect on December 31, 2020.
(d) Pay-in-kind securities.
(e) Issued with a zero coupon. Income is recognized through the accretion of discount.
(f) Actual maturity date is April 03, 2120.
(g) Security is currently in default and/or non-income producing.
(h) Variable rate security. Except for floating rate notes (for which final maturity isdisclosed), maturity date disclosed is the next interest reset date. Interest ratedisclosed is that which is in effect on December 31, 2020.
(i) Guaranteed by a foreign government until maturity. Total market value of thesesecurities amounts to $11,976,033, which represents approximately 0.9% of theFund�s net assets as of December 31, 2020.
(j) Security with �Put� features and resetting interest rates. Maturity dates disclosedare the puttable dates. Interest rate disclosed is that which is in effect on December31, 2020.
(k) Actual maturity date is June 05, 2115.
(l) Represents an affiliated fund.
Security ratings disclosed, if any, are obtained from by S&P�s/Moody�s Investor Service and are unaudited. A brief description ofthe ratings is available in the Fund�s Statement of AdditionalInformation.
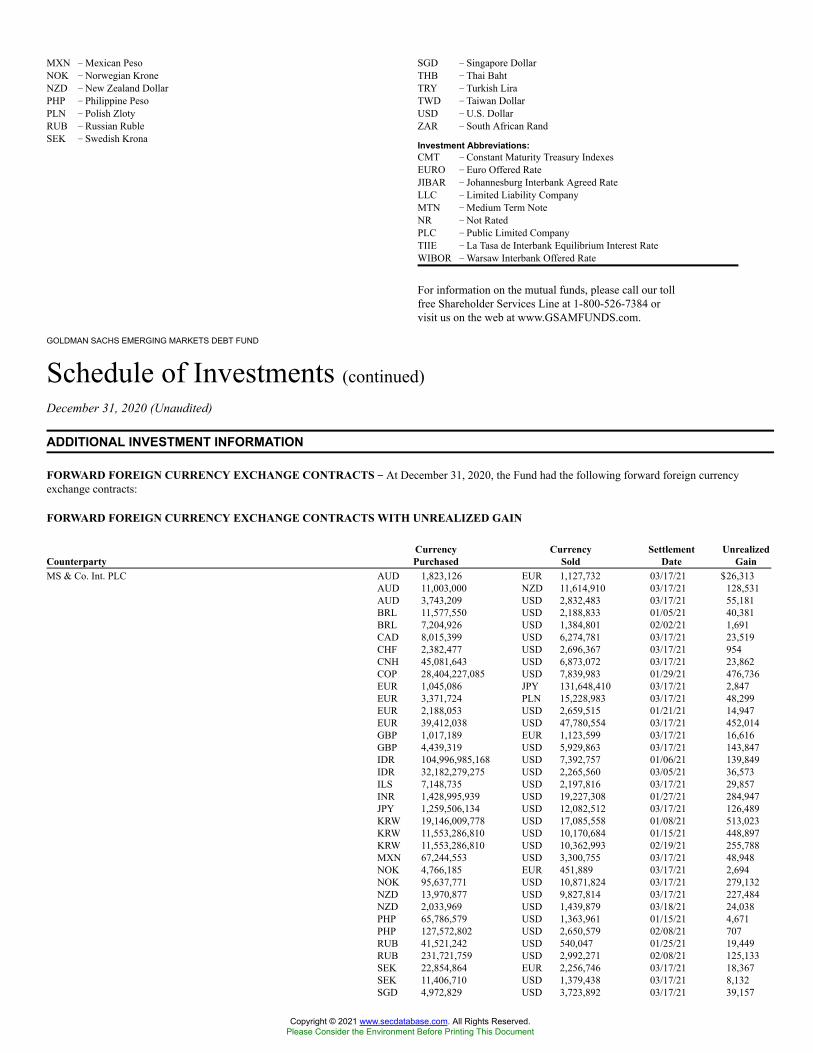
Currency Abbreviations:AUD �Australian DollarBRL � Brazilian RealCAD � Canadian DollarCHF � Swiss FrancCNH � Chinese Yuan Renminbi OffshoreCNY � Chinese Yuan RenminbiCOP � Colombian PesoCZK � Czech KorunaDOP �Dominican PesoEGP � Egyptian PoundEUR � EuroGBP � British PoundHUF �Hungarian ForintIDR � Indonesian RupiahILS � Israeli ShekelINR � Indian RupeeJPY � Japanese YenKRW � South Korean Won
Copyright © 2021 www.secdatabase.com. All Rights Reserved.Please Consider the Environment Before Printing This Document
GOLDMAN SACHS EMERGING MARKETS DEBT FUND
Schedule of Investments (continued)December 31, 2020 (Unaudited)
ADDITIONAL INVESTMENT INFORMATION
FORWARD FOREIGN CURRENCY EXCHANGE CONTRACTS �� At December 31, 2020, the Fund had the following forward foreign currencyexchange contracts:
FORWARD FOREIGN CURRENCY EXCHANGE CONTRACTS WITH UNREALIZED GAIN
CounterpartyCurrencyPurchased
CurrencySold
SettlementDate
UnrealizedGain
MS & Co. Int. PLC AUD 1,823,126 EUR 1,127,732 03/17/21 $26,313AUD 11,003,000 NZD 11,614,910 03/17/21 128,531AUD 3,743,209 USD 2,832,483 03/17/21 55,181BRL 11,577,550 USD 2,188,833 01/05/21 40,381BRL 7,204,926 USD 1,384,801 02/02/21 1,691CAD 8,015,399 USD 6,274,781 03/17/21 23,519CHF 2,382,477 USD 2,696,367 03/17/21 954CNH 45,081,643 USD 6,873,072 03/17/21 23,862COP 28,404,227,085 USD 7,839,983 01/29/21 476,736EUR 1,045,086 JPY 131,648,410 03/17/21 2,847EUR 3,371,724 PLN 15,228,983 03/17/21 48,299EUR 2,188,053 USD 2,659,515 01/21/21 14,947EUR 39,412,038 USD 47,780,554 03/17/21 452,014GBP 1,017,189 EUR 1,123,599 03/17/21 16,616GBP 4,439,319 USD 5,929,863 03/17/21 143,847IDR 104,996,985,168 USD 7,392,757 01/06/21 139,849IDR 32,182,279,275 USD 2,265,560 03/05/21 36,573ILS 7,148,735 USD 2,197,816 03/17/21 29,857INR 1,428,995,939 USD 19,227,308 01/27/21 284,947JPY 1,259,506,134 USD 12,082,512 03/17/21 126,489KRW 19,146,009,778 USD 17,085,558 01/08/21 513,023KRW 11,553,286,810 USD 10,170,684 01/15/21 448,897KRW 11,553,286,810 USD 10,362,993 02/19/21 255,788MXN 67,244,553 USD 3,300,755 03/17/21 48,948NOK 4,766,185 EUR 451,889 03/17/21 2,694NOK 95,637,771 USD 10,871,824 03/17/21 279,132NZD 13,970,877 USD 9,827,814 03/17/21 227,484NZD 2,033,969 USD 1,439,879 03/18/21 24,038PHP 65,786,579 USD 1,363,961 01/15/21 4,671PHP 127,572,802 USD 2,650,579 02/08/21 707RUB 41,521,242 USD 540,047 01/25/21 19,449RUB 231,721,759 USD 2,992,271 02/08/21 125,133SEK 22,854,864 EUR 2,256,746 03/17/21 18,367SEK 11,406,710 USD 1,379,438 03/17/21 8,132SGD 4,972,829 USD 3,723,892 03/17/21 39,157
MXN �Mexican PesoNOK �Norwegian KroneNZD �New Zealand DollarPHP � Philippine PesoPLN � Polish ZlotyRUB � Russian RubleSEK � Swedish Krona
SGD � Singapore DollarTHB � Thai BahtTRY � Turkish LiraTWD � Taiwan DollarUSD �U.S. DollarZAR � South African Rand
Investment Abbreviations:CMT � Constant Maturity Treasury IndexesEURO � Euro Offered RateJIBAR � Johannesburg Interbank Agreed RateLLC � Limited Liability CompanyMTN �Medium Term NoteNR �Not RatedPLC � Public Limited CompanyTIIE � La Tasa de Interbank Equilibrium Interest RateWIBOR �Warsaw Interbank Offered Rate
For information on the mutual funds, please call our tollfree Shareholder Services Line at 1-800-526-7384 orvisit us on the web at www.GSAMFUNDS.com.
Copyright © 2021 www.secdatabase.com. All Rights Reserved.Please Consider the Environment Before Printing This Document

THB 305,451,633 USD 10,138,072 03/17/21 58,519TRY 11,127,359 USD 1,322,437 01/11/21 169,450TRY 21,677,306 USD 2,670,345 01/19/21 227,319TRY 8,793,345 USD 1,104,717 01/25/21 68,082TRY 38,781,146 USD 4,775,818 03/17/21 285,449TWD 76,638,934 USD 2,708,800 01/04/21 19,896TWD 186,881,301 USD 6,648,138 02/05/21 40,447TWD 38,136,910 USD 1,349,406 02/17/21 18,433TWD 38,605,031 USD 1,388,171 03/05/21 987USD 1,387,755 CNH 9,070,642 03/17/21 59USD 1,319,696 JPY 136,046,091 03/17/21 935USD 2,979,365 KRW 3,232,412,345 01/08/21 8,204USD 245,183 KRW 266,531,040 02/19/21 211USD 9,874,201 MXN 197,851,345 03/04/21 3,376USD 1,094,099 MXN 21,849,101 03/17/21 5,713USD 14,804,640 PLN 53,689,621 03/10/21 427,998USD 2,198,587 THB 65,524,163 03/17/21 11,259USD 6,226,370 TWD 173,548,811 02/05/21 14,963USD 546,230 ZAR 8,065,845 03/17/21 2,743ZAR 96,614,196 USD 6,234,548 03/03/21 287,505ZAR 37,059,585 USD 2,468,944 03/17/21 28,178
TOTAL $5,768,799GOLDMAN SACHS EMERGING MARKETS DEBT FUND
Schedule of Investments (continued)December 31, 2020 (Unaudited)
ADDITIONAL INVESTMENT INFORMATION (continued)
FORWARD FOREIGN CURRENCY EXCHANGE CONTRACTS WITH UNREALIZED LOSS
CounterpartyCurrencyPurchased
CurrencySold
SettlementDate
UnrealizedLoss
MS & Co. Int. PLC EUR 1,129,313 GBP 1,014,283 03/17/21 $(5,646 )EUR 5,637,086 NOK 60,278,365 03/17/21 (129,519 )EUR 1,131,713 NZD 1,948,731 03/17/21 (17,571 )HUF 512,919,245 EUR 1,439,338 03/17/21 (33,796 )MXN 288,192,958 USD 14,399,573 03/17/21 (43,600 )PLN 5,135,372 EUR 1,145,964 03/17/21 (27,282 )PLN 64,629,243 USD 17,559,970 03/17/21 (253,514 )SEK 25,296,918 EUR 2,523,000 03/17/21 (10,411 )TWD 151,546,086 USD 5,436,091 02/05/21 (12,173 )TWD 38,517,753 USD 1,382,547 02/17/21 (1,048 )USD 2,786,783 AUD 3,677,946 03/17/21 (50,534 )USD 2,206,709 BRL 11,577,550 01/05/21 (22,505 )USD 5,198,344 CAD 6,667,786 03/17/21 (41,036 )USD 4,071,791 CNH 26,658,600 03/17/21 (6,645 )USD 7,176,959 COP 24,921,134,349 01/29/21 (119,915 )USD 11,567 CZK 252,126 03/17/21 (177 )USD 213,112,683 EUR 180,414,278 01/21/21 (7,408,002 )USD 7,539,964 GBP 5,584,730 03/17/21 (100,854 )USD 7,423,206 IDR 104,996,985,168 01/06/21 (109,398 )USD 5,197,746 ILS 16,893,455 03/17/21 (66,557 )USD 16,792,338 INR 1,245,045,647 01/27/21 (208,162 )USD 4,074,237 JPY 422,053,277 03/17/21 (16,930 )USD 19,010,808 KRW 21,354,591,537 01/08/21 (617,852 )USD 10,363,644 KRW 11,553,286,810 01/15/21 (255,937 )USD 1,937,871 MXN 39,399,294 03/17/21 (24,756 )USD 3,269,654 NOK 28,450,423 03/17/21 (47,543 )USD 1,375,918 NZD 1,933,409 03/17/21 (15,619 )USD 1,380,117 RUB 104,686,878 01/25/21 (30,532 )USD 2,740,378 RUB 207,814,546 02/08/21 (55,396 )USD 6,671,656 SEK 56,494,250 03/17/21 (200,589 )USD 4,399,511 SGD 5,850,092 03/17/21 (27,383 )USD 4,212,887 THB 127,028,763 03/17/21 (27,588 )USD 1,631,864 TRY 13,598,753 01/11/21 (191,373 )USD 2,738,052 TRY 21,939,622 01/19/21 (194,677 )USD 1,383,963 TRY 11,178,989 01/25/21 (107,018 )USD 2,720,325 TWD 76,638,934 01/04/21 (8,371 )USD 1,346,499 TWD 38,023,777 02/05/21 (14,393 )USD 8,154,971 ZAR 124,242,608 03/17/21 (216,653 )ZAR 8,176,607 USD 551,621 03/17/21 (671 )
Copyright © 2021 www.secdatabase.com. All Rights Reserved.Please Consider the Environment Before Printing This Document

TOTAL $(10,721,626 )
FUTURES CONTRACTS � At December 31, 2020, the Fund had the following futures contracts:
DescriptionNumber ofContracts
ExpirationDate
NotionalAmount
UnrealizedAppreciation/(Depreciation)
Long position contracts:Ultra 10 Year U.S. Treasury Notes 45 03/22/21 $7,036,172 $ 7,6512 Year U.S. Treasury Notes 218 03/31/21 48,172,891 42,1515 Year U.S. Treasury Notes 1,065 03/31/21 134,364,727 263,04610 Year U.S. Treasury Notes 1,269 03/22/21 175,221,141 296,77420 Year U.S. Treasury Bonds 367 03/22/21 63,559,812 (355,661 )Total $ 253,961Short position contracts:Ultra Long U.S. Treasury Bonds (33) 03/22/21 $(7,047,563 ) (15,656 )TOTAL FUTURES CONTRACTS $ 238,305GOLDMAN SACHS EMERGING MARKETS DEBT FUND
Schedule of Investments (continued)December 31, 2020 (Unaudited)
ADDITIONAL INVESTMENT INFORMATION (continued)
SWAP CONTRACTS � At December 31, 2020, the Fund had the following swap contracts:
CENTRALLY CLEARED INTEREST RATE SWAP CONTRACTS
Payments Madeby the Fund
PaymentsReceivedby Fund
TerminationDate
NotionalAmount (000s)
MarketValue
UpfrontPremium
(Received)Paid
UnrealizedAppreciation/(Depreciation)
2.500%(a) (a) 03/17/23 CNY 157,200 (b) $(291 ) $99,951 $ (100,242 )6M EURO(f) (0.250)%(c) 03/17/23 EUR 40,120 (b) 266,658 287,373 (20,715 )6M WIBOR(f) 0.345(c) 06/16/23 PLN 45,495 (b) 24,979 (49,883 ) 74,8626M WIBOR(f) 0.750(c) 12/16/25 48,880 98,854 (10,252 ) 109,1063M JIBAR(a) 4.000(a) 06/16/23 ZAR 258,850 (b) 81,699 (3,338 ) 85,0371M BID Average(d) 4.230(d) 01/02/23 BRL 76,795 107,300 (46,935 ) 154,235Mexico Interbank TIIE 28 Days(e) 4.400(e) 03/15/23 MXN 1,616,210(b) 167,554 21,857 145,697Mexico Interbank TIIE 28 Days(e) 4.900(e) 03/11/26 383,270 (b) 132,635 9,072 123,5631M BID Avg(d) 4.930(d) 01/02/24 BRL 34,105 82,989 (7,052 ) 90,0413M JIBAR(a) 5.250(a) 03/17/26 ZAR 537,155 (b) 572,130 (33,575 ) 605,705(0.250)(c) 6M EURO(f) 03/17/24 EUR 15,550 (b) (147,066 ) (159,137 ) 12,071(0.250)(c) 6M EURO(f) 03/17/26 50,920 (b) (644,471 ) (687,651 ) 43,180(0.250)(c) 6M EURO(f) 03/17/28 25,400 (b) (295,116 ) (304,476 ) 9,3600.000(c) 6M EURO(f) 03/17/31 32,000 (b) (1,019,685) (1,009,877) (9,808 )0.000(c) 6M EURO(f) 03/17/51 2,730 (b) (27,944 ) (7,850 ) (20,094 )0.250(c) 6M EURO(f) 03/17/41 3,260 (b) (200,515 ) (192,275 ) (8,240 )0.250(d) 6M WIBOR(a) 12/16/21 PLN 243,090 (67,601 ) (11,598 ) (56,003 )TOTAL $(867,891 ) $(2,105,646) $ 1,237,755
(a) Payments made quarterly.(b) Represents forward starting interest rate swaps whose effective dates of commencement of accruals and cash flows occur subsequent to December 31, 2020.(c) Payments made annually.(d) Payments made at maturity.(e) Payments made monthly.(f) Payments made semi-annually.
OVER THE COUNTER CREDIT DEFAULT SWAP CONTRACTS
ReferenceObligation/Index
Financing RatePaid by
the Fund(a)
CreditSpread at
December 31,2020(b) Counterparty
TerminationDate
NotionalAmount(000s) Value
UpfrontPremiums(Received)
Paid
UnrealizedAppreciation/(Depreciation)
Protection Purchased:People�s Republic of China,7.500%, 10/28/27(a) (1.000)% 0.057% Barclays Bank PLC 06/20/21 $7,030 $(33,801 ) $ 3,562 $ (37,363 )
Copyright © 2021 www.secdatabase.com. All Rights Reserved.Please Consider the Environment Before Printing This Document
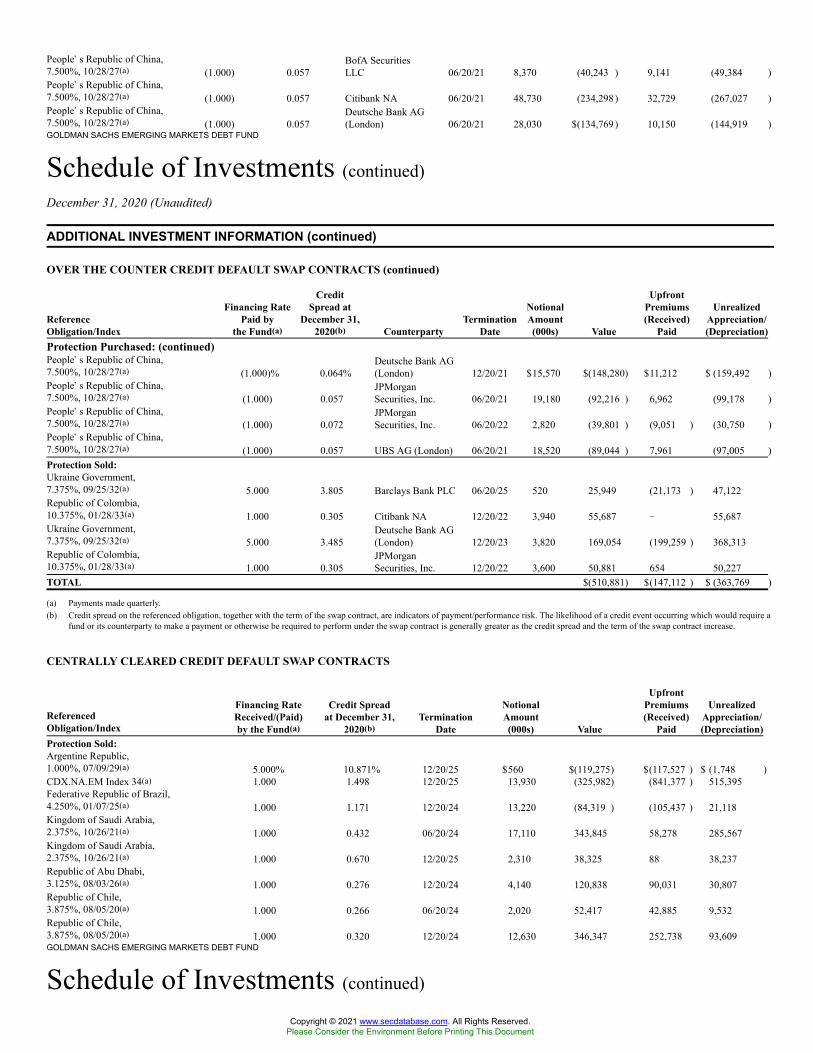
People�s Republic of China,7.500%, 10/28/27(a) (1.000) 0.057
BofA SecuritiesLLC 06/20/21 8,370 (40,243 ) 9,141 (49,384 )
People�s Republic of China,7.500%, 10/28/27(a) (1.000) 0.057 Citibank NA 06/20/21 48,730 (234,298 ) 32,729 (267,027 )People�s Republic of China,7.500%, 10/28/27(a) (1.000) 0.057
Deutsche Bank AG(London) 06/20/21 28,030 $(134,769 ) 10,150 (144,919 )
GOLDMAN SACHS EMERGING MARKETS DEBT FUND
Schedule of Investments (continued)December 31, 2020 (Unaudited)
ADDITIONAL INVESTMENT INFORMATION (continued)
OVER THE COUNTER CREDIT DEFAULT SWAP CONTRACTS (continued)
ReferenceObligation/Index
Financing RatePaid by
the Fund(a)
CreditSpread at
December 31,2020(b) Counterparty
TerminationDate
NotionalAmount(000s) Value
UpfrontPremiums(Received)
Paid
UnrealizedAppreciation/(Depreciation)
Protection Purchased: (continued)People�s Republic of China,7.500%, 10/28/27(a) (1.000)% 0.064%
Deutsche Bank AG(London) 12/20/21 $15,570 $(148,280) $11,212 $ (159,492 )
People�s Republic of China,7.500%, 10/28/27(a) (1.000) 0.057
JPMorganSecurities, Inc. 06/20/21 19,180 (92,216 ) 6,962 (99,178 )
People�s Republic of China,7.500%, 10/28/27(a) (1.000) 0.072
JPMorganSecurities, Inc. 06/20/22 2,820 (39,801 ) (9,051 ) (30,750 )
People�s Republic of China,7.500%, 10/28/27(a) (1.000) 0.057 UBS AG (London) 06/20/21 18,520 (89,044 ) 7,961 (97,005 )Protection Sold:Ukraine Government,7.375%, 09/25/32(a) 5.000 3.805 Barclays Bank PLC 06/20/25 520 25,949 (21,173 ) 47,122Republic of Colombia,10.375%, 01/28/33(a) 1.000 0.305 Citibank NA 12/20/22 3,940 55,687 � 55,687Ukraine Government,7.375%, 09/25/32(a) 5.000 3.485
Deutsche Bank AG(London) 12/20/23 3,820 169,054 (199,259 ) 368,313
Republic of Colombia,10.375%, 01/28/33(a) 1.000 0.305
JPMorganSecurities, Inc. 12/20/22 3,600 50,881 654 50,227
TOTAL $(510,881) $(147,112 ) $ (363,769 )
(a) Payments made quarterly.(b) Credit spread on the referenced obligation, together with the term of the swap contract, are indicators of payment/performance risk. The likelihood of a credit event occurring which would require a
fund or its counterparty to make a payment or otherwise be required to perform under the swap contract is generally greater as the credit spread and the term of the swap contract increase.
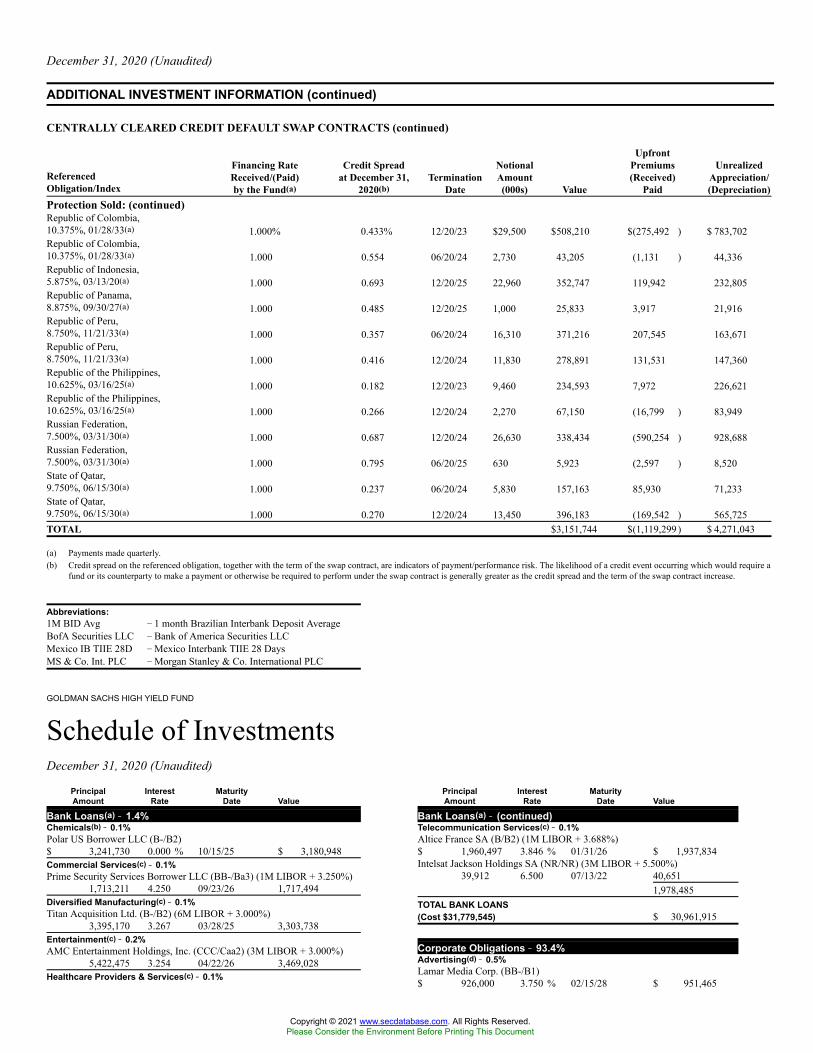
CENTRALLY CLEARED CREDIT DEFAULT SWAP CONTRACTS
ReferencedObligation/Index
Financing RateReceived/(Paid)by the Fund(a)
Credit Spreadat December 31,
2020(b)Termination
Date
NotionalAmount(000s) Value
UpfrontPremiums(Received)
Paid
UnrealizedAppreciation/(Depreciation)
Protection Sold:Argentine Republic,1.000%, 07/09/29(a) 5.000% 10.871% 12/20/25 $560 $(119,275) $(117,527 ) $ (1,748 )CDX.NA.EM Index 34(a) 1.000 1.498 12/20/25 13,930 (325,982) (841,377 ) 515,395Federative Republic of Brazil,4.250%, 01/07/25(a) 1.000 1.171 12/20/24 13,220 (84,319 ) (105,437 ) 21,118Kingdom of Saudi Arabia,2.375%, 10/26/21(a) 1.000 0.432 06/20/24 17,110 343,845 58,278 285,567Kingdom of Saudi Arabia,2.375%, 10/26/21(a) 1.000 0.670 12/20/25 2,310 38,325 88 38,237Republic of Abu Dhabi,3.125%, 08/03/26(a) 1.000 0.276 12/20/24 4,140 120,838 90,031 30,807Republic of Chile,3.875%, 08/05/20(a) 1.000 0.266 06/20/24 2,020 52,417 42,885 9,532Republic of Chile,3.875%, 08/05/20(a) 1.000 0.320 12/20/24 12,630 346,347 252,738 93,609GOLDMAN SACHS EMERGING MARKETS DEBT FUND
Schedule of Investments (continued)
Copyright © 2021 www.secdatabase.com. All Rights Reserved.Please Consider the Environment Before Printing This Document
December 31, 2020 (Unaudited)
ADDITIONAL INVESTMENT INFORMATION (continued)
CENTRALLY CLEARED CREDIT DEFAULT SWAP CONTRACTS (continued)
ReferencedObligation/Index
Financing RateReceived/(Paid)by the Fund(a)
Credit Spreadat December 31,
2020(b)Termination
Date
NotionalAmount(000s) Value
UpfrontPremiums(Received)
Paid
UnrealizedAppreciation/(Depreciation)
Protection Sold: (continued)Republic of Colombia,10.375%, 01/28/33(a) 1.000% 0.433% 12/20/23 $29,500 $508,210 $(275,492 ) $ 783,702Republic of Colombia,10.375%, 01/28/33(a) 1.000 0.554 06/20/24 2,730 43,205 (1,131 ) 44,336Republic of Indonesia,5.875%, 03/13/20(a) 1.000 0.693 12/20/25 22,960 352,747 119,942 232,805Republic of Panama,8.875%, 09/30/27(a) 1.000 0.485 12/20/25 1,000 25,833 3,917 21,916Republic of Peru,8.750%, 11/21/33(a) 1.000 0.357 06/20/24 16,310 371,216 207,545 163,671Republic of Peru,8.750%, 11/21/33(a) 1.000 0.416 12/20/24 11,830 278,891 131,531 147,360Republic of the Philippines,10.625%, 03/16/25(a) 1.000 0.182 12/20/23 9,460 234,593 7,972 226,621Republic of the Philippines,10.625%, 03/16/25(a) 1.000 0.266 12/20/24 2,270 67,150 (16,799 ) 83,949Russian Federation,7.500%, 03/31/30(a) 1.000 0.687 12/20/24 26,630 338,434 (590,254 ) 928,688Russian Federation,7.500%, 03/31/30(a) 1.000 0.795 06/20/25 630 5,923 (2,597 ) 8,520State of Qatar,9.750%, 06/15/30(a) 1.000 0.237 06/20/24 5,830 157,163 85,930 71,233State of Qatar,9.750%, 06/15/30(a) 1.000 0.270 12/20/24 13,450 396,183 (169,542 ) 565,725TOTAL $3,151,744 $(1,119,299 ) $ 4,271,043
(a) Payments made quarterly.(b) Credit spread on the referenced obligation, together with the term of the swap contract, are indicators of payment/performance risk. The likelihood of a credit event occurring which would require a
fund or its counterparty to make a payment or otherwise be required to perform under the swap contract is generally greater as the credit spread and the term of the swap contract increase.
GOLDMAN SACHS HIGH YIELD FUND
Schedule of InvestmentsDecember 31, 2020 (Unaudited)
Abbreviations:1M BID Avg � 1 month Brazilian Interbank Deposit AverageBofA Securities LLC � Bank of America Securities LLCMexico IB TIIE 28D �Mexico Interbank TIIE 28 DaysMS & Co. Int. PLC �Morgan Stanley & Co. International PLC
PrincipalAmount
InterestRate
MaturityDate Value
Bank Loans(a) �� 1.4%Chemicals(b) �� 0.1%Polar US Borrower LLC (B-/B2)$ 3,241,730 0.000 % 10/15/25 $ 3,180,948Commercial Services(c) �� 0.1%Prime Security Services Borrower LLC (BB-/Ba3) (1M LIBOR + 3.250%)
1,713,211 4.250 09/23/26 1,717,494Diversified Manufacturing(c) �� 0.1%Titan Acquisition Ltd. (B-/B2) (6M LIBOR + 3.000%)
3,395,170 3.267 03/28/25 3,303,738Entertainment(c) �� 0.2%AMC Entertainment Holdings, Inc. (CCC/Caa2) (3M LIBOR + 3.000%)
5,422,475 3.254 04/22/26 3,469,028Healthcare Providers & Services(c) �� 0.1%
PrincipalAmount
InterestRate
MaturityDate Value
Bank Loans(a) �� (continued)Telecommunication Services(c) �� 0.1%Altice France SA (B/B2) (1M LIBOR + 3.688%)$ 1,960,497 3.846 % 01/31/26 $ 1,937,834Intelsat Jackson Holdings SA (NR/NR) (3M LIBOR + 5.500%)
39,912 6.500 07/13/22 40,6511,978,485
TOTAL BANK LOANS(Cost $31,779,545) $ 30,961,915
Corporate Obligations �� 93.4%Advertising(d) �� 0.5%Lamar Media Corp. (BB-/B1)$ 926,000 3.750 % 02/15/28 $ 951,465
Copyright © 2021 www.secdatabase.com. All Rights Reserved.Please Consider the Environment Before Printing This Document

GOLDMAN SACHS HIGH YIELD FUND
Schedule of Investments (continued)December 31, 2020 (Unaudited)
RegionalCare Hospital Partners Holdings, Inc. (B/B1) (1M LIBOR +3.750%)
1,653,293 3.897 11/16/25 1,646,894Packaging(c) �� 0.1%Charter NEX US, Inc. (NR/NR) (1M LIBOR + 4.250%)
1,920,963 5.000 12/01/27 1,928,646Services Cyclical - Business Services(c) �� 0.1%Travelport Finance (Luxembourg) S.a.r.l. (B-/B3) (3M LIBOR + 1.500%)
2,091,909 8.000 02/28/25 2,059,547Travelport Finance (Luxembourg) S.a.r.l. (CCC-/Caa3) (3M LIBOR +
5.000%)1,754,078 5.220 05/29/26 1,183,635
3,243,182Technology - Software/Services �� 0.5%Banff Merger Sub, Inc. (B-/B2)(c) (1M LIBOR + 4.250%)
1,835,949 4.397 10/02/25 1,826,237Mitchell International, Inc. (B-/B2)(c)(1M LIBOR + 3.250%)
2,076,351 3.397 11/29/24 2,036,132(1M LIBOR + 4.250%)
1,795,500 4.750 11/29/24 1,794,602The Dun & Bradstreet Corp. (NR/NR)(b)
975,000 0.000 02/06/26 974,591The Dun & Bradstreet Corp. (B+/B1)(c) (1M LIBOR + 3.750%)
1,935,375 3.898 02/06/26 1,934,562TriTech Software Systems (CCC+/Caa1)(c) (3M LIBOR + 3.750%)
2,071,334 4.004 08/29/25 1,927,37610,493,500
National CineMedia LLC (CCC+/B3)(e)2,025,000 5.875 04/15/28 1,701,000
Outfront Media Capital LLC/Outfront Media Capital Corp. (B+/B2)(e)1,100,000 6.250 06/15/25 1,163,2501,160,000 5.000 08/15/27 1,191,9002,900,000 4.625 03/15/30 2,954,375
Terrier Media Buyer, Inc. (CCC+/Caa1)(e)1,925,000 8.875 12/15/27 2,122,312
10,084,302Aerospace & Defense(d) �� 1.7%Howmet Aerospace, Inc. (BB+/Ba3)
1,289,000 6.875 05/01/25 1,514,575Moog, Inc. (BB/Ba3)(e)
3,080,000 4.250 12/15/27 3,214,750Spirit AeroSystems, Inc. (B/B1)(e)
2,823,000 7.500 04/15/25 3,034,725The Boeing Co. (BBB-/Baa2)
2,150,000 2.750 02/01/26 2,265,9282,150,000 3.625 02/01/31 2,354,400
TransDigm UK Holdings PLC (B-/B3)220,000 6.875 05/15/26 232,650
TransDigm, Inc. (B+/Ba3)(e)1,323,000 8.000 12/15/25 1,463,569
TransDigm, Inc. (B-/B3)6,885,000 6.500 05/15/25 7,082,9443,580,000 6.375 06/15/26 3,714,2501,230,000 7.500 03/15/27 1,316,100
PrincipalAmount
InterestRate
MaturityDate Value
Corporate Obligations �� (continued)Aerospace & Defense(d) �� (continued)TransDigm, Inc. (B-/B3) � (continued)$ 9,215,000 5.500 % 11/15/27 $ 9,675,750Triumph Group, Inc. (B-/B2)(e)
892,000 8.875 06/01/24 981,200Triumph Group, Inc. (CCC-/Ca)
225,000 7.750 08/15/25 205,59437,056,435
Airlines �� 0.9%American Airlines Group, Inc. (CCC/Caa1)(e)
3,725,000 5.000 06/01/22 3,347,844Delta Air Lines, Inc. (B+/Baa3)(d)
3,600,000 2.900 10/28/24 3,537,0003,825,000 7.375 01/15/26 4,384,406
Delta Air Lines, Inc. (BB+/Baa2)(e)3,192,000 7.000 05/01/25 3,690,750
Mileage Plus Holdings LLC/Mileage Plus Intellectual Property Assets Ltd.(NR/Baa3)(d)(e)
2,507,000 6.500 06/20/27 2,701,292United Airlines Holdings, Inc. (B/Ba3)
1,900,000 4.250 10/01/22 1,909,50019,570,792
Apparel(d) �� 0.1%PVH Corp. (BBB-/Baa3)
1,669,000 4.625 07/10/25 1,878,243Automotive �� 4.8%Adient Global Holdings Ltd. (B/B3)(d)(e)
2,951,000 4.875 08/15/26 3,017,397Adient US LLC (B+/Ba3)(d)(e)
2,477,000 7.000 05/15/26 2,684,449Allison Transmission, Inc. (NR/Ba3)(d)(e)
1,752,000 3.750 01/30/31 1,787,040American Axle & Manufacturing, Inc. (B-/B2)(d)
7,810,000 6.250 04/01/25 8,102,875230,000 6.250 03/15/26 238,050230,000 6.500 04/01/27 241,2131,775,000 6.875 07/01/28 1,912,563
PrincipalAmount
InterestRate
MaturityDate Value
Corporate Obligations �� (continued)Automotive �� (continued)Clarios Global LP/Clarios US Finance Co. (B/B1)(d)EUR 836,000 4.375 % 05/15/26 $ 1,057,525Clarios Global LP/Clarios US Finance Co. (CCC+/Caa1)(d)(e)$ 8,200,000 8.500 05/15/27 8,897,000Dana Financing Luxembourg S.a.r.l. (BB-/B2)(d)(e)
2,440,000 5.750 04/15/25 2,528,450Dana, Inc. (BB-/B2)(d)
4,350,000 5.375 11/15/27 4,611,000Dealer Tire LLC/DT Issuer LLC (CCC/Caa1)(d)(e)
4,623,000 8.000 02/01/28 4,894,601Ford Motor Co. (BB+/Ba2)
4,823,000 9.000 (d) 04/22/25 5,925,0847,526,000 4.750 01/15/43 7,638,890
Ford Motor Credit Co. LLC (BB+/Ba2)3,027,000 3.336 03/18/21 3,031,4862,332,000 3.813 10/12/21 2,361,1152,650,000 3.350 11/01/22 2,689,739958,000 3.087 01/09/23 967,6344,200,000 4.140 (d) 02/15/23 4,321,3596,166,000 4.375 08/06/23 6,398,4521,837,000 3.810 (d) 01/09/24 1,882,6291,350,000 4.687 (d) 06/09/25 1,437,8114,881,000 5.125 (d) 06/16/25 5,294,7673,020,000 3.375 (d) 11/13/25 3,091,3994,730,000 4.125 (d) 08/17/27 4,956,174
IHO Verwaltungs GmbH (BB-/Ba2)(d)(e)(f)(PIK 5.500%, Cash 4.750%)
2,695,000 4.750 09/15/26 2,792,694(PIK 6.750%, Cash 6.000%)
900,000 6.000 05/15/27 951,750(PIK 7.125%, Cash 6.375%)
2,985,000 6.375 05/15/29 3,276,037Meritor, Inc. (BB-/B1)(d)(e)
730,000 6.250 06/01/25 786,575Navistar International Corp. (CCC+/B3)(d)(e)
2,175,000 6.625 11/01/25 2,267,438
Copyright © 2021 www.secdatabase.com. All Rights Reserved.Please Consider the Environment Before Printing This Document
GOLDMAN SACHS HIGH YIELD FUND
Schedule of Investments (continued)December 31, 2020 (Unaudited)
GOLDMAN SACHS HIGH YIELD FUND
Schedule of Investments (continued)December 31, 2020 (Unaudited)
GOLDMAN SACHS HIGH YIELD FUND
BorgWarner, Inc. (BBB/Baa1)(e)1,128,000 5.000 10/01/25 1,326,020
Tesla, Inc. (BB/B3)(d)(e)2,570,000 5.300 08/15/25 2,679,225
PrincipalAmount
InterestRate
MaturityDate Value
Corporate Obligations �� (continued)Automotive �� (continued)The Goodyear Tire & Rubber Co. (B+/B2)(d)$ 1,955,000 9.500 % 05/31/25 $ 2,201,819
106,250,260Banks �� 2.4%Barclays PLC (B+/Ba2)(c)(d) (5 Year CMT + 5.672%)
6,325,000 8.000 12/31/99 7,052,375Citigroup, Inc. (BB+/Ba1)(c)(d)(3M USD LIBOR + 3.423%)
6,125,000 6.300 12/29/49 6,637,969(3M USD LIBOR + 3.950%)
2,050,000 5.950 12/29/49 2,224,250(5 Year CMT + 3.597%)
955,000 4.000 12/31/99 981,263Credit Suisse Group AG (BB/NR)(c)(d) (5 Year USD Swap + 3.455%)
1,129,000 6.250 12/29/49 1,233,432Credit Suisse Group AG (BB-/Ba1u)(c)(d)(e)(5 Year CMT + 3.554%)
2,230,000 4.500 12/31/99 2,241,150(5 Year CMT + 4.889%)
1,075,000 5.250 12/31/99 1,142,188Deutsche Bank AG (B+/B1)(c)(d) (5 Year CMT + 4.524%)
1,800,000 6.000 12/31/99 1,804,500Deutsche Bank AG (BB+/Ba2)(c)(d) (5 Year USD ICE Swap + 2.553%)
5,150,000 4.875 12/01/32 5,381,750Freedom Mortgage Corp. (B-/B2)(d)(e)
4,825,000 7.625 05/01/26 5,066,250HSBC Holdings PLC (NR/Baa3)(c)(d) (5 Year CMT + 3.649%)
2,110,000 4.600 12/31/99 2,148,592Intesa Sanpaolo SpA (BB+/Ba1)(e)
2,350,000 5.017 06/26/24 2,561,5003,120,000 5.710 01/15/26 3,564,600
Natwest Group PLC (BB-/Ba2)(c)(d) (3M USD LIBOR + 2.320%)2,300,000 2.574 12/31/99 2,231,000
The Bank of New York Mellon Corp. (BBB/Baa1)(c)(d) (5 Year CMT +4.358%)
1,220,000 4.700 12/31/99 1,342,939UBS Group AG (BB/Ba1u)(c)(d)(e) (5 Year USD Swap + 4.344%)
4,000,000 7.000 12/31/99 4,400,000UniCredit SpA (BB+/Baa3)(c)(d)(e) (5 Year CMT + 4.750%)
3,415,000 5.459 06/30/35 3,735,59053,749,348
Building Materials(d) �� 2.2%American Woodmark Corp. (BB/Ba2)(e)
3,170,000 4.875 03/15/26 3,233,400
PrincipalAmount
InterestRate
MaturityDate Value
Corporate Obligations �� (continued)Building Materials(d) �� (continued)Builders FirstSource, Inc. (B+/B3)(e)$ 611,000 5.000 % 03/01/30 $ 661,408Builders FirstSource, Inc. (BB+/B1)(e)
7,034,000 6.750 06/01/27 7,614,305Cornerstone Building Brands, Inc. (B-/Caa1)(e)
6,465,000 8.000 04/15/26 6,772,087336,000 6.125 01/15/29 357,840
CP Atlas Buyer, Inc. (CCC+/Caa2)(e)1,500,000 7.000 12/01/28 1,560,000
Forterra Finance LLC/FRTA Finance Corp. (B/B2)(e)1,096,000 6.500 07/15/25 1,174,090
Griffon Corp. (B+/B2)986,000 5.750 03/01/28 1,042,695
JELD-WEN, Inc. (BB-/B2)(e)3,730,000 4.625 12/15/25 3,813,9254,220,000 4.875 12/15/27 4,494,300
Masonite International Corp. (BB+/Ba3)(e)2,675,000 5.375 02/01/28 2,855,563
SRM Escrow Issuer LLC (B+/B1)(e)2,782,000 6.000 11/01/28 2,903,712
Standard Industries, Inc. (BBB-/Ba2)(e)3,020,000 4.375 07/15/30 3,231,6424,209,000 5.000 02/15/27 4,408,927
Summit Materials LLC/Summit Materials Finance Corp. (BB/B2)(e)2,580,000 6.500 03/15/27 2,741,2501,455,000 5.250 01/15/29 1,527,750
48,392,894Chemicals �� 3.9%Ashland Services B.V. (BB+/Ba1)(d)(e)EUR 825,000 2.000 01/30/28 1,003,149Axalta Coating Systems LLC (BB-/B1)(d)(e)$ 4,465,000 3.375 02/15/29 4,470,581Axalta Coating Systems LLC/Axalta Coating Systems Dutch Holding B B.V.
(BB-/B1)(d)(e)860,000 4.750 06/15/27 910,525
Cornerstone Chemical Co. (B-/B3)(d)(e)4,060,000 6.750 08/15/24 3,577,875
HB Fuller Co. (BB-/B2)(d)350,000 4.000 02/15/27 360,500430,000 4.250 10/15/28 441,825
PrincipalAmount
InterestRate
MaturityDate Value
Corporate Obligations �� (continued)Chemicals �� (continued)Hexion, Inc. (CCC+/B3)(d)(e)$ 1,698,000 7.875 % 07/15/27 $ 1,818,983Illuminate Buyer LLC/Illuminate Holdings IV, Inc. (B-/Caa1)(d)(e)
1,087,000 9.000 07/01/28 1,195,700
PrincipalAmount
InterestRate
MaturityDate Value
Corporate Obligations �� (continued)Chemicals �� (continued)Valvoline, Inc. (BB-/Ba3)(d)$ 4,630,000 4.375 % 08/15/25 $ 4,783,716
1,680,000 3.625 (e) 06/15/31 1,726,200WR Grace & Co-Conn (BB-/Ba3)(e)
Copyright © 2021 www.secdatabase.com. All Rights Reserved.Please Consider the Environment Before Printing This Document

Schedule of Investments (continued)December 31, 2020 (Unaudited)
Ingevity Corp. (NR/Ba3)(d)(e)4,330,000 4.500 02/01/26 4,394,950565,000 3.875 11/01/28 566,413
Kraton Polymers LLC/Kraton Polymers Capital Corp. (BB-/B2)(d)(e)1,275,000 4.250 12/15/25 1,300,500
Methanex Corp. (BB/Ba1)(d)4,425,000 5.125 10/15/27 4,812,1872,625,000 5.250 12/15/29 2,848,125
Minerals Technologies, Inc. (BB-/Ba3)(d)(e)3,507,000 5.000 07/01/28 3,664,815
Nouryon Holding B.V. (B-/Caa1)(d)(e)5,365,000 8.000 10/01/26 5,720,431
OCI NV (BB/Ba3)(d)(e)1,500,000 5.250 11/01/24 1,558,1253,025,000 4.625 10/15/25 3,146,000
Olin Corp. (BB-/Ba3)(d)1,650,000 5.000 02/01/30 1,757,250
PQ Corp. (B/B3)(d)(e)5,475,000 5.750 12/15/25 5,611,875
Rayonier AM Products, Inc. (B-/B1)(d)(e)458,000 7.625 01/15/26 477,465
SPCM SA (BB+/Ba2)(d)(e)3,180,000 4.875 09/15/25 3,279,375
The Chemours Co. (B/B1)(d)6,290,000 7.000 05/15/25 6,518,012270,000 5.375 (g) 05/15/27 286,2003,685,000 5.750 (e) 11/15/28 3,758,700
Tronox Finance PLC (B/B3)(d)(e)3,155,000 5.750 10/01/25 3,273,313
Tronox, Inc. (B/B3)(d)(e)230,000 6.500 04/15/26 238,338
Tronox, Inc. (B+/Ba3)(d)(e)2,100,000 6.500 05/01/25 2,244,375
8,815,000 5.625 10/01/24 9,542,2371,018,000 4.875 (d) 06/15/27 1,073,990
86,361,730Commercial Services �� 3.2%Algeco Global Finance PLC (B-/B2)(d)(e)
2,375,000 8.000 02/15/23 2,419,531Allied Universal Holdco LLC/Allied Universal Finance Corp. (B-/B3)(d)(e)
1,624,000 6.625 07/15/26 1,725,500Allied Universal Holdco LLC/Allied Universal Finance Corp.
(CCC/Caa2)(d)(e)6,685,000 9.750 07/15/27 7,286,650
APX Group, Inc. (B-/B3)(d)(e)3,125,000 6.750 02/15/27 3,359,375
Gartner, Inc. (BB/Ba3)(d)(e)1,545,000 3.750 10/01/30 1,628,044
Graham Holdings Co. (BB/Ba1)(d)(e)3,350,000 5.750 06/01/26 3,525,875
Herc Holdings, Inc. (B+/B3)(d)(e)947,000 5.500 07/15/27 1,006,188
IHS Markit Ltd. (NR/Ba1)(d)3,725,000 4.250 05/01/29 4,483,969
Jaguar Holding Co. II/PPD Development LP (B+/B2)(d)(e)1,150,000 4.625 06/15/25 1,206,0621,350,000 5.000 06/15/28 1,447,875
MPH Acquisition Holdings LLC (B-/B3)(d)(e)7,460,000 5.750 11/01/28 7,310,800
Nielsen Finance LLC/Nielsen Finance Co. (BB-/B2)(d)(e)1,218,000 5.000 04/15/22 1,221,045
Prime Security Services Borrower LLC/Prime Finance, Inc. (B-/B3)(d)(e)7,512,000 6.250 01/15/28 8,056,620
Prime Security Services Borrower LLC/Prime Finance, Inc. (BB-/Ba3)(e)1,900,000 5.250 04/15/24 2,023,5006,975,000 3.375 (d) 08/31/27 6,887,812
Refinitiv US Holdings, Inc. (B-/Caa2)(d)(e)5,814,000 8.250 11/15/26 6,337,260
PrincipalAmount
InterestRate
MaturityDate Value
Corporate Obligations �� (continued)Commercial Services �� (continued)Service Corp. International (BB/Ba3)(d)$ 520,000 3.375 % 08/15/30 $ 538,200Shift4 Payments LLC/Shift4 Payments Finance Sub, Inc. (B/Ba3)(d)(e)
1,885,000 4.625 11/01/26 1,950,975Team Health Holdings, Inc. (CCC/Ca)(d)(e)(g)
1,605,000 6.375 02/01/25 1,380,300The ADT Security Corp. (BB-/Ba3)(e)
585,000 4.875 07/15/32 633,263The Nielsen Co. Luxembourg S.a.r.l. (BB-/B2)(d)(e)
1,325,000 5.000 02/01/25 1,361,437United Rentals North America, Inc. (BB-/Ba3)(d)
1,041,000 4.875 01/15/28 1,108,6651,370,000 3.875 02/15/31 1,438,500
Verscend Escrow Corp. (CCC+/Caa2)(d)(e)2,145,000 9.750 08/15/26 2,327,325
70,664,771Computers(d)(e) �� 1.3%Austin BidCo, Inc. (CCC+/NR)
548,000 7.125 12/15/28 572,660Banff Merger Sub, Inc. (CCC+/Caa2)
8,510,000 9.750 09/01/26 9,148,250Booz Allen Hamilton, Inc. (BB-/Ba2)
1,035,000 3.875 09/01/28 1,064,756Dell International LLC/EMC Corp. (BB/Ba2)
1,196,000 5.875 06/15/21 1,197,4956,980,000 7.125 06/15/24 7,241,750
MTS Systems Corp. (B/B3)600,000 5.750 08/15/27 651,000
Presidio Holdings, Inc. (CCC+/Caa1)
PrincipalAmount
InterestRate
MaturityDate Value
Corporate Obligations �� (continued)Distribution & Wholesale(d)(e) �� (continued)Avient Corp. (BB-/Ba3)$ 2,193,000 5.750 % 05/15/25 $ 2,330,063Core & Main Holdings LP (CCC+/Caa2)(f) (PIK 9.375%, Cash 8.625%)
5,000,000 8.625 09/15/24 5,093,750Core & Main LP (CCC+/Caa2)
2,725,000 6.125 08/15/25 2,799,937H&E Equipment Services, Inc. (BB-/B2)
915,000 3.875 12/15/28 919,575IAA, Inc. (B/B2)
1,450,000 5.500 06/15/27 1,535,188Performance Food Group, Inc. (B/B2)
946,000 5.500 06/01/24 951,913Resideo Funding, Inc. (BB/B3)
4,454,000 6.125 11/01/26 4,700,386Wolverine Escrow LLC (CCC+/Caa3)
230,000 8.500 11/15/24 216,20021,694,424
Diversified Financial Services �� 4.3%AerCap Holdings NV (BB+/Ba2)(c)(d) (5 Year CMT + 4.535%)
3,265,000 5.875 10/10/79 3,240,512Curo Group Holdings Corp. (B-/B3)(d)(e)
2,835,000 8.250 09/01/25 2,707,425Global Aircraft Leasing Co. Ltd. (NR/B1)(d)(e)(f) (PIK 7.250%, Cash 6.500%)
9,641,391 6.500 09/15/24 8,532,631Icahn Enterprises LP/Icahn Enterprises Finance Corp. (BB/Ba3)(d)
7,800,000 4.750 09/15/24 8,131,500LD Holdings Group LLC (B-/B2)(d)(e)
2,870,000 6.500 11/01/25 2,991,975Lincoln Financing S.a.r.l. (BB+/B1)(d)(e)
Copyright © 2021 www.secdatabase.com. All Rights Reserved.Please Consider the Environment Before Printing This Document

GOLDMAN SACHS HIGH YIELD FUND
Schedule of Investments (continued)December 31, 2020 (Unaudited)
GOLDMAN SACHS HIGH YIELD FUND
Schedule of Investments (continued)December 31, 2020 (Unaudited)
1,335,000 8.250 02/01/28 1,473,506Science Applications International Corp. (BB-/B1)
4,551,000 4.875 04/01/28 4,795,617Seagate HDD (BB+/Ba1)
3,432,000 3.375 07/15/31 3,445,21329,590,247
Distribution & Wholesale(d)(e) �� 1.0%American Builders & Contractors Supply Co., Inc. (B+/B3)
3,030,000 5.875 05/15/26 3,147,412
EUR 3,125,000 3.625 04/01/24 3,855,222LPL Holdings, Inc. (BB/B1)(d)(e)$ 820,000 5.750 09/15/25 846,650Nationstar Mortgage Holdings, Inc. (B/B2)(d)(e)
2,800,000 6.000 01/15/27 2,975,0003,043,000 5.500 08/15/28 3,183,587554,000 5.125 12/15/30 578,930
Navient Corp. (B+/Ba3)1,090,000 7.250 01/25/22 1,140,4133,185,000 5.500 01/25/23 3,344,250
PrincipalAmount
InterestRate
MaturityDate Value
Corporate Obligations �� (continued)Diversified Financial Services �� (continued)Navient Corp. (B+/Ba3) � (continued)$ 6,482,000 5.875 % 10/25/24 $ 6,887,125
3,035,000 6.750 06/15/26 3,300,5625,550,000 5.000 (d) 03/15/27 5,591,625
OneMain Finance Corp. (BB-/Ba3)5,190,000 7.125 03/15/26 6,085,2753,790,000 5.625 03/15/23 4,074,2505,703,000 8.875 (d) 06/01/25 6,451,5193,115,000 6.625 (d) 01/15/28 3,691,2751,275,000 4.000 (d) 09/15/30 1,318,031
PennyMac Financial Services, Inc. (B+/B2)(d)(e)1,733,000 5.375 10/15/25 1,828,315
Quicken Loans, Inc. (BB/Ba1)(d)(e)4,525,000 5.250 01/15/28 4,834,682
The Charles Schwab Corp. (BBB/Baa2)(c)(d)(10 Year CMT + 3.079%)
2,235,000 4.000 12/31/99 2,346,236(5 Year CMT + 4.971%)
1,700,000 5.375 12/31/99 1,892,576United Shore Financial Services LLC (NR/Ba3)(d)(e)
4,300,000 5.500 11/15/25 4,504,25094,333,816
Electrical �� 2.9%Calpine Corp. (B+/B2)(d)(e)
2,980,000 5.125 03/15/28 3,136,450Calpine Corp. (BB+/Ba2)(d)(e)
4,017,000 5.250 06/01/26 4,157,5957,535,000 4.500 02/15/28 7,836,4004,730,000 3.750 03/01/31 4,670,875
FirstEnergy Corp. (BB/Ba1)1,475,000 2.650 (d) 03/01/30 1,474,198590,000 7.375 11/15/31 837,4782,690,000 4.850 (d) 07/15/47 3,340,784
FirstEnergy Transmission LLC (BB/Baa2)(d)(e)1,475,000 5.450 07/15/44 1,860,426
NRG Energy, Inc. (BB+/Ba2)(d)2,990,000 5.750 01/15/28 3,251,6251,599,000 3.375 (e) 02/15/29 1,636,976
PrincipalAmount
InterestRate
MaturityDate Value
Corporate Obligations �� (continued)Electrical �� (continued)NRG Energy, Inc. (BB+/Ba2)(d) � (continued)$ 905,000 5.250 %(e) 06/15/29 $ 990,975
4,262,000 3.625 (e) 02/15/31 4,384,532Pattern Energy Operations LP/Pattern Energy Operations, Inc.
(BB-/Ba3)(d)(e)1,705,000 4.500 08/15/28 1,798,775
PG&E Corp. (BB-/B1)(d)275,000 5.000 07/01/28 292,8752,190,000 5.250 07/01/30 2,409,000
Pike Corp. (CCC+/B3)(d)(e)2,905,000 5.500 09/01/28 3,057,513
Talen Energy Supply LLC (BB-/Ba3)(d)(e)3,850,000 7.250 05/15/27 4,081,0001,675,000 6.625 01/15/28 1,754,563
Talen Energy Supply LLC (CCC+/B3)(d)4,380,000 6.500 06/01/25 3,536,8502,050,000 10.500(e) 01/15/26 1,824,500
Vistra Operations Co. LLC (BB+/Ba2)(d)(e)1,249,000 5.625 02/15/27 1,330,1856,875,000 5.000 07/31/27 7,304,687
64,968,262Electrical Components & Equipment(d)(e) �� 0.4%Energizer Holdings, Inc. (B+/B2)
1,645,000 4.375 03/31/29 1,702,575Wesco Distribution, Inc. (BB-/B2)
5,824,000 7.125 06/15/25 6,384,5608,087,135
Electronics(e) �� 0.3%Sensata Technologies B.V. (BB+/Ba3)
1,040,000 5.000 10/01/25 1,151,800Sensata Technologies, Inc. (BB+/Ba3)(d)
3,475,000 4.375 02/15/30 3,748,6561,557,000 3.750 02/15/31 1,607,603
TTM Technologies, Inc. (BB-/Ba3)(d)975,000 5.625 10/01/25 998,156
7,506,215
PrincipalAmount
InterestRate
MaturityDate Value
Corporate Obligations �� (continued)Energy-Alternate Sources(d)(e) �� 0.0%Enviva Partners LP/Enviva Partners Finance Corp. (B+/B1)$ 690,000 6.500 % 01/15/26 $ 732,263Engineering & Construction(d)(e) �� 0.1%
PrincipalAmount
InterestRate
MaturityDate Value
Corporate Obligations �� (continued)Entertainment(d)(e) �� (continued)Penn National Gaming, Inc. (B/B3)$ 2,175,000 5.625 % 01/15/27 $ 2,272,875Pinewood Finance Co. Ltd. (BB/NR)
Copyright © 2021 www.secdatabase.com. All Rights Reserved.Please Consider the Environment Before Printing This Document
GOLDMAN SACHS HIGH YIELD FUND
Schedule of Investments (continued)December 31, 2020 (Unaudited)
KBR, Inc. (B+/B1)1,707,000 4.750 09/30/28 1,779,547
MasTec, Inc. (BB/Ba2)449,000 4.500 08/15/28 470,889
2,250,436Entertainment(d)(e) �� 2.5%Allen Media LLC/Allen Media Co-Issuer, Inc. (B-/Caa1)
3,500,000 10.500 02/15/28 3,644,375AMC Entertainment Holdings, Inc. (CCC/Caa2)
1,263,000 10.500 04/15/25 896,730Banijay Group SAS (CCC+/Caa1)EUR 1,275,000 6.500 03/01/26 1,561,171Caesars Entertainment, Inc. (B/B1)$ 1,893,000 6.250 07/01/25 2,016,045Caesars Entertainment, Inc. (CCC+/Caa1)
3,499,000 8.125 07/01/27 3,870,769Caesars Resort Collection LLC/CRC Finco, Inc. (B+/B1)
1,471,000 5.750 07/01/25 1,553,744Caesars Resort Collection LLC/CRC Finco, Inc. (CCC+/Caa1)
5,310,000 5.250 10/15/25 5,363,100Cedar Fair LP/Canada�s Wonderland Co/Magnum Management Corp./
Millennium Op (B/Ba2)1,844,000 5.500 05/01/25 1,926,980
Cinemark USA, Inc. (BB-/Ba3)990,000 8.750 05/01/25 1,069,200
International Game Technology PLC (BB/Ba3)2,556,000 5.250 01/15/29 2,754,090
Lions Gate Capital Holdings LLC (CCC+/B3)235,000 6.375 02/01/24 240,8756,775,000 5.875 11/01/24 6,876,625
Live Nation Entertainment, Inc. (B+/B1)1,005,000 3.750 01/15/28 1,015,050
Live Nation Entertainment, Inc. (B-/B3)1,700,000 5.625 03/15/26 1,742,500
Motion Bondco DAC (CCC-/Caa2)(g)2,235,000 6.625 11/15/27 2,318,812
GBP 1,200,000 3.250 09/30/25 1,671,392Scientific Games International, Inc. (B-/Caa2)$ 2,964,000 8.250 03/15/26 3,193,710
1,280,000 7.000 05/15/28 1,372,800SeaWorld Parks & Entertainment, Inc. (CCC/Caa2)
2,975,000 9.500 08/01/25 3,220,437Six Flags Theme Parks, Inc. (B/Ba2)
1,711,000 7.000 07/01/25 1,852,158Vail Resorts, Inc. Co. (BB/B1)
463,000 6.250 05/15/25 494,253WMG Acquisition Corp. (BB/Ba3)
1,230,000 3.875 07/15/30 1,303,8002,996,000 3.000 02/15/31 2,936,080
WMG Acquisition Corp. (BB-/B2)1,225,000 5.500 04/15/26 1,269,406
56,436,977Environmental(d) �� 0.6%Covanta Holding Corp. (B/B1)
395,000 5.000 09/01/30 421,663GFL Environmental, Inc. (B-/B3)(e)
4,113,000 8.500 05/01/27 4,575,712GFL Environmental, Inc. (BB-/Ba3)(e)
700,000 4.250 06/01/25 728,0002,420,000 3.750 08/01/25 2,471,4253,547,000 3.500 09/01/28 3,617,940
Waste Pro USA, Inc. (B/Caa1)(e)909,000 5.500 02/15/26 927,180
12,741,920
PrincipalAmount
InterestRate
MaturityDate Value
Corporate Obligations �� (continued)Food & Drug Retailing �� 4.7%Albertsons Cos, Inc./Safeway, Inc./New Albertsons LP/Albertsons LLC
(BB-/B1)(d)$ 3,839,000 3.500 %(e) 03/15/29 $ 3,867,792
3,944,000 5.750 03/15/25 4,062,320510,000 7.500 (e) 03/15/26 568,0135,385,000 4.625 (e) 01/15/27 5,694,6374,025,000 5.875 (e) 02/15/28 4,372,1562,630,000 4.875 (e) 02/15/30 2,886,425
B&G Foods, Inc. (B/B2)(d)3,415,000 5.250 04/01/25 3,517,450235,000 5.250 09/15/27 249,394
Chobani LLC/Chobani Finance Corp., Inc. (CCC/Caa2)(d)(e)3,157,000 7.500 04/15/25 3,291,172
FAGE International SA/FAGE USA Dairy Industry, Inc. (B+/B2)(d)(e)1,505,000 5.625 08/15/26 1,544,506
H-Food Holdings LLC/Hearthside Finance Co., Inc. (CCC/Caa2)(d)(e)5,299,000 8.500 06/01/26 5,537,455
JBS USA LUX SA/JBS USA Finance, Inc. (BB+/Ba2)(d)(e)2,275,000 5.750 06/15/25 2,348,938
JBS USA LUX SA/JBS USA Food Co./JBS USA Finance, Inc. (BB+/Ba2)(d)(e)
950,000 6.500 04/15/29 1,106,7503,200,000 5.500 01/15/30 3,684,000
Kraft Heinz Foods Co. (BB+/Baa3)(d)16,075,000 3.000 06/01/26 16,777,0921,752,000 4.625 01/30/29 2,001,471770,000 4.250 (e) 03/01/31 857,1766,745,000 4.875 (e) 10/01/49 7,847,531
Lamb Weston Holdings, Inc. (BB+/Ba2)(d)(e)705,000 4.875 05/15/28 784,313
New Albertsons LP (B/WR)3,100,000 7.450 08/01/29 3,627,000
Post Holdings, Inc. (B+/B2)(d)(e)1,535,000 5.000 08/15/26 1,584,8884,945,000 5.750 03/01/27 5,241,700
Copyright © 2021 www.secdatabase.com. All Rights Reserved.Please Consider the Environment Before Printing This Document

GOLDMAN SACHS HIGH YIELD FUND
Schedule of Investments (continued)December 31, 2020 (Unaudited)
6,180,000 5.625 01/15/28 6,589,4254,080,000 4.625 04/15/30 4,284,000
SEG Holding LLC/SEG Finance Corp. (B+/B2)(d)(e)370,000 5.625 10/15/28 390,350
PrincipalAmount
InterestRate
MaturityDate Value
Corporate Obligations �� (continued)Food & Drug Retailing �� (continued)Sigma Holdco B.V. (B-/Caa1)(d)(e)$ 2,350,000 7.875 % 05/15/26 $ 2,411,687TreeHouse Foods, Inc. (BB-/B2)(d)
849,000 4.000 09/01/28 874,470United Natural Foods, Inc. (CCC+/B3)(d)(e)
3,427,000 6.750 10/15/28 3,572,647US Foods, Inc. (B+/Caa1)(d)(e)
2,655,000 5.875 06/15/24 2,684,869US Foods, Inc. (BB-/B3)(d)(e)
1,980,000 6.250 04/15/25 2,116,125104,375,752
Food Service(d)(e) �� 0.0%Aramark Services, Inc. (B+/B1)
582,000 6.375 05/01/25 624,195Forest Products&Paper(d) �� 0.3%Mercer International, Inc. (B+/Ba3)
4,950,000 7.375 01/15/25 5,135,6252,305,000 5.500 01/15/26 2,339,575
7,475,200Gaming �� 1.8%Boyd Gaming Corp. (B-/Caa1)(d)
695,000 8.625 (e) 06/01/25 773,1881,585,000 6.000 08/15/26 1,650,3812,200,000 4.750 12/01/27 2,285,250
Hilton Domestic Operating Co., Inc. (BB/Ba2)(d)1,235,000 5.375 (e) 05/01/25 1,315,2751,599,000 5.750 (e) 05/01/28 1,746,9071,970,000 4.875 01/15/30 2,162,075
Marriott International, Inc. (BBB-/Baa3)(d)998,000 4.625 06/15/30 1,170,375
MGM China Holdings Ltd. (BB-/Ba3)(d)(e)910,000 5.250 06/18/25 944,978
MGM Resorts International (BB-/Ba3)2,569,000 7.750 03/15/22 2,735,9855,630,000 6.000 03/15/23 5,995,9505,648,000 5.500 (d) 04/15/27 6,290,4601,483,000 4.750 (d) 10/15/28 1,579,395
PrincipalAmount
InterestRate
MaturityDate Value
Corporate Obligations �� (continued)Gaming �� (continued)Sands China Ltd. (BBB-/Baa2)(d)(e)$ 630,000 4.375 % 06/18/30 $ 693,000Station Casinos LLC (B-/Caa1)(d)(e)
3,912,000 4.500 02/15/28 3,931,560Wyndham Destinations, Inc. (BB-/Ba3)(d)(e)
3,370,000 4.625 03/01/30 3,555,350Wynn Las Vegas LLC/Wynn Las Vegas Capital Corp. (BB-/B1)(d)(e)
2,350,000 5.500 03/01/25 2,452,812Wynn Macau Ltd. (BB-/B1)(d)(e)
1,510,000 5.625 08/26/28 1,582,56340,865,504
Gas(d) �� 0.4%AmeriGas Partners LP/AmeriGas Finance Corp. (NR/Ba3)
550,000 5.875 08/20/26 621,5007,580,000 5.750 05/20/27 8,622,250
9,243,750Hand/Machine Tools(d)(e) �� 0.0%Colfax Corp. (BB/Ba2)
360,000 6.000 02/15/24 373,050Healthcare Providers & Services �� 4.2%Acadia Healthcare Co, Inc. (B-/B3)(d)
PrincipalAmount
InterestRate
MaturityDate Value
Corporate Obligations �� (continued)Healthcare Providers & Services �� (continued)Encompass Health Corp. (B+/B1)(d)$ 3,950,000 4.500 % 02/01/28 $ 4,127,750Global Medical Response, Inc. (B/B2)(d)(e)
3,490,000 6.500 10/01/25 3,655,775HCA, Inc. (BB-/Ba2)
735,000 5.875 05/01/23 804,8256,120,000 5.375 02/01/25 6,862,050590,000 5.875 (d) 02/01/29 710,2136,795,000 3.500 (d) 09/01/30 7,160,231
Hill-Rom Holdings, Inc. (BB/Ba3)(d)(e)1,005,000 5.000 02/15/25 1,030,125
Hologic, Inc. (BB-/Ba2)(d)(e)760,000 3.250 02/15/29 774,250
Lifepoint Health, Inc. (CCC+/Caa1)(d)(e)2,205,000 5.375 01/15/29 2,213,489
MEDNAX, Inc. (B+/B1)(d)(e)1,365,000 6.250 01/15/27 1,463,963
Molina Healthcare, Inc. (BB-/Ba3)(d)(e)1,860,000 3.875 11/15/30 1,971,600
RegionalCare Hospital Partners Holdings, Inc./LifePoint Health, Inc. (CCC+/Caa1)(d)(e)
5,635,000 9.750 12/01/26 6,156,237
Copyright © 2021 www.secdatabase.com. All Rights Reserved.Please Consider the Environment Before Printing This Document

GOLDMAN SACHS HIGH YIELD FUND
Schedule of Investments (continued)December 31, 2020 (Unaudited)
GOLDMAN SACHS HIGH YIELD FUND
Schedule of Investments (continued)
1,400,000 5.500 (e) 07/01/28 1,498,000415,000 5.625 02/15/23 416,5561,070,000 6.500 03/01/24 1,095,413
Centene Corp. (BBB-/Ba1)(d)1,755,000 4.625 12/15/29 1,947,1557,100,000 3.375 02/15/30 7,483,045
CHS/Community Health Systems, Inc. (B-/Caa2)(d)(e)225,000 8.625 01/15/24 234,2813,940,000 8.000 03/15/26 4,255,2004,120,000 5.625 03/15/27 4,444,450
CHS/Community Health Systems, Inc. (CCC-/Ca)(d)(e)2,200,000 8.125 06/30/24 2,282,500
DaVita, Inc. (B+/Ba3)(d)(e)2,800,000 4.625 06/01/30 2,968,0003,610,000 3.750 02/15/31 3,646,100
Select Medical Corp. (B-/B3)(d)(e)1,300,000 6.250 08/15/26 1,397,500
Syneos Health, Inc. (BB-/B2)(d)(e)1,808,000 3.625 01/15/29 1,812,520
Tenet Healthcare Corp. (NR/B1)(d)(e)3,000,000 4.625 09/01/24 3,060,000
Tenet Healthcare Corp. (BB-/B1)(d)2,475,000 4.625 07/15/24 2,536,8752,700,000 7.500 (e) 04/01/25 2,956,5004,200,000 4.625 (e) 06/15/28 4,420,500
Tenet Healthcare Corp. (CCC+/B1)(d)(e)600,000 6.250 02/01/27 634,500
Tenet Healthcare Corp. (CCC+/Caa1)(d)5,940,000 7.000 08/01/25 6,155,325
West Street Merger Sub, Inc. (CCC/Caa2)(d)(e)2,425,000 6.375 09/01/25 2,479,562
92,654,490
PrincipalAmount
InterestRate
MaturityDate Value
Corporate Obligations �� (continued)Home Builders �� 0.9%Brookfield Residential Properties, Inc./Brookfield Residential US Corp.
(B+/B1)(d)(e)$ 5,400,000 6.375 % 05/15/25 $ 5,494,500
1,057,000 4.875 02/15/30 1,092,674Installed Building Products, Inc. (B+/B3)(d)(e)
1,250,000 5.750 02/01/28 1,329,687Mattamy Group Corp. (BB/B1)(d)(e)
2,800,000 5.250 12/15/27 2,964,5001,518,000 4.625 03/01/30 1,601,490
Taylor Morrison Communities, Inc. (BB/Ba3)(d)(e)605,000 5.875 06/15/27 684,4061,201,000 5.125 08/01/30 1,345,120
TRI Pointe Group, Inc. (BB-/Ba3)(d)1,910,000 5.250 06/01/27 2,072,3501,472,000 5.700 06/15/28 1,661,520
TRI Pointe Group, Inc./TRI Pointe Homes, Inc. (BB-/Ba3)695,000 5.875 06/15/24 757,550
Williams Scotsman International, Inc. (B+/B3)(d)(e)845,000 4.625 08/15/28 874,575
19,878,372Household Products(d) �� 0.7%Central Garden & Pet Co. (BB/B1)
2,365,000 4.125 10/15/30 2,471,425Kronos Acquisition Holdings, Inc. (CCC/Caa1)(e)
6,985,000 9.000 08/15/23 7,150,894Kronos Acquisition Holdings, Inc./KIK Custom Products, Inc. (CCC/
Caa2)(e)2,458,000 7.000 12/31/27 2,571,683
Prestige Brands, Inc. (B+/B3)(e)1,550,000 5.125 01/15/28 1,654,625
Spectrum Brands, Inc. (B/B2)2,550,000 5.750 07/15/25 2,629,687
16,478,314Housewares(d) �� 0.3%CD&R Smokey Buyer, Inc. (B/B2)(e)
950,000 6.750 07/15/25 1,015,313
PrincipalAmount
InterestRate
MaturityDate Value
Corporate Obligations �� (continued)Housewares(d) �� (continued)Newell Brands, Inc. (BB+/Ba1)$ 1,043,000 4.875 % 06/01/25 $ 1,144,693
4,565,000 4.700 04/01/26 5,032,9127,192,918
Insurance(d)(e) �� 1.2%Acrisure LLC/Acrisure Finance, Inc. (B/B2)
3,280,000 8.125 02/15/24 3,472,700Acrisure LLC/Acrisure Finance, Inc. (CCC+/Caa2)
4,075,000 7.000 11/15/25 4,248,187Alliant Holdings Intermediate LLC/Alliant Holdings Co-Issuer (CCC+/Caa2)
8,651,000 6.750 10/15/27 9,202,501AssuredPartners, Inc. (CCC+/Caa2)
695,000 5.625 01/15/29 725,406GTCR AP Finance, Inc. (CCC+/Caa2)
3,550,000 8.000 05/15/27 3,856,188HUB International Ltd. (CCC+/Caa2)
2,580,000 7.000 05/01/26 2,683,200USI, Inc. (CCC+/Caa2)
2,510,000 6.875 05/01/25 2,575,88826,764,070
Internet �� 2.0%Adevinta ASA (NR/Ba3)(d)(e)EUR 475,000 2.625 11/15/25 593,044Adevinta ASA (BB-/Ba3)(d)(e)
375,000 3.000 11/15/27 473,594ANGI Group LLC (BB-/Ba3)(d)(e)$ 3,715,000 3.875 08/15/28 3,742,863Arches Buyer, Inc. (CCC+/Caa1)(d)(e)
718,000 6.125 12/01/28 741,335Cablevision Lightpath LLC (B+/B1)(d)(e)
200,000 3.875 09/15/27 201,250Cars.com, Inc. (B/B3)(d)(e)
3,342,000 6.375 11/01/28 3,542,520Expedia Group, Inc. (BBB-/Baa3)(d)(e)
2,170,000 6.250 05/01/25 2,516,614797,000 4.625 08/01/27 888,846
Getty Images, Inc. (CCC+/Caa2)(d)(e)3,145,000 9.750 03/01/27 3,333,700
Go Daddy Operating Co. LLC/GD Finance Co., Inc. (BB-/B1)(d)(e)2,620,000 5.250 12/01/27 2,754,275
Copyright © 2021 www.secdatabase.com. All Rights Reserved.Please Consider the Environment Before Printing This Document
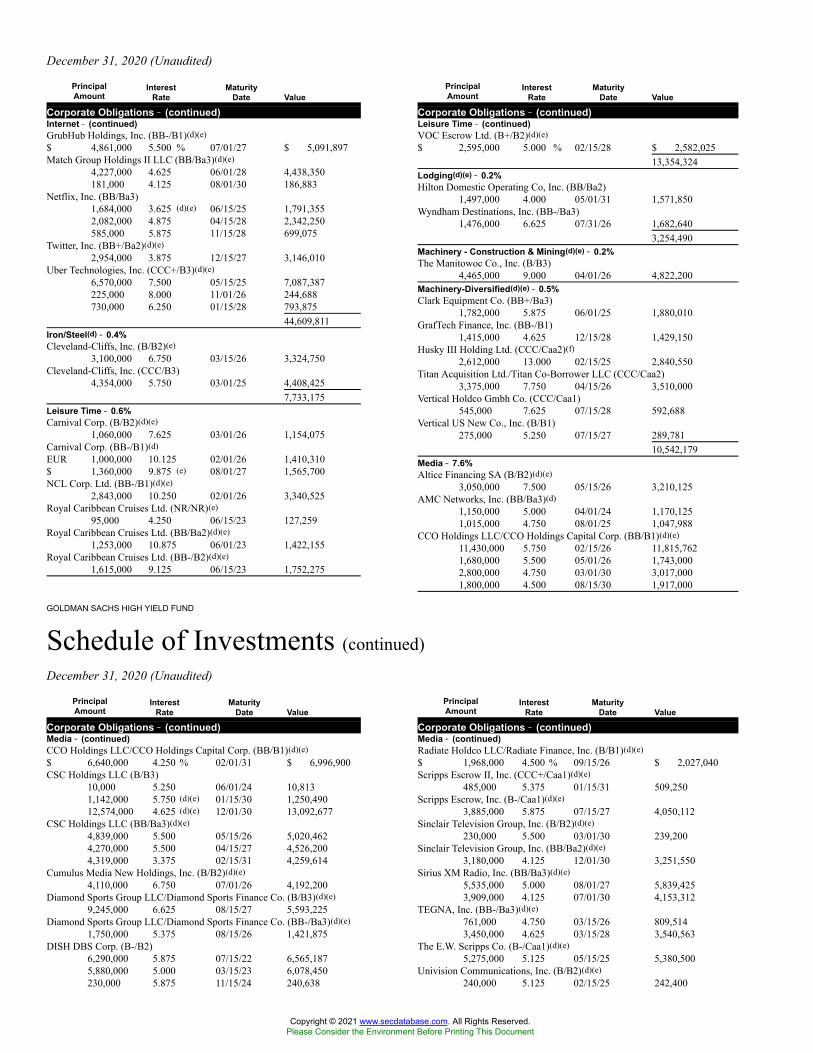
December 31, 2020 (Unaudited)
GOLDMAN SACHS HIGH YIELD FUND
Schedule of Investments (continued)December 31, 2020 (Unaudited)
PrincipalAmount
InterestRate
MaturityDate Value
Corporate Obligations �� (continued)Internet �� (continued)GrubHub Holdings, Inc. (BB-/B1)(d)(e)$ 4,861,000 5.500 % 07/01/27 $ 5,091,897Match Group Holdings II LLC (BB/Ba3)(d)(e)
4,227,000 4.625 06/01/28 4,438,350181,000 4.125 08/01/30 186,883
Netflix, Inc. (BB/Ba3)1,684,000 3.625 (d)(e) 06/15/25 1,791,3552,082,000 4.875 04/15/28 2,342,250585,000 5.875 11/15/28 699,075
Twitter, Inc. (BB+/Ba2)(d)(e)2,954,000 3.875 12/15/27 3,146,010
Uber Technologies, Inc. (CCC+/B3)(d)(e)6,570,000 7.500 05/15/25 7,087,387225,000 8.000 11/01/26 244,688730,000 6.250 01/15/28 793,875
44,609,811Iron/Steel(d) �� 0.4%Cleveland-Cliffs, Inc. (B/B2)(e)
3,100,000 6.750 03/15/26 3,324,750Cleveland-Cliffs, Inc. (CCC/B3)
4,354,000 5.750 03/01/25 4,408,4257,733,175
Leisure Time �� 0.6%Carnival Corp. (B/B2)(d)(e)
1,060,000 7.625 03/01/26 1,154,075Carnival Corp. (BB-/B1)(d)EUR 1,000,000 10.125 02/01/26 1,410,310$ 1,360,000 9.875 (e) 08/01/27 1,565,700NCL Corp. Ltd. (BB-/B1)(d)(e)
2,843,000 10.250 02/01/26 3,340,525Royal Caribbean Cruises Ltd. (NR/NR)(e)
95,000 4.250 06/15/23 127,259Royal Caribbean Cruises Ltd. (BB/Ba2)(d)(e)
1,253,000 10.875 06/01/23 1,422,155Royal Caribbean Cruises Ltd. (BB-/B2)(d)(e)
1,615,000 9.125 06/15/23 1,752,275
PrincipalAmount
InterestRate
MaturityDate Value
Corporate Obligations �� (continued)Leisure Time �� (continued)VOC Escrow Ltd. (B+/B2)(d)(e)$ 2,595,000 5.000 % 02/15/28 $ 2,582,025
13,354,324Lodging(d)(e) �� 0.2%Hilton Domestic Operating Co, Inc. (BB/Ba2)
1,497,000 4.000 05/01/31 1,571,850Wyndham Destinations, Inc. (BB-/Ba3)
1,476,000 6.625 07/31/26 1,682,6403,254,490
Machinery - Construction & Mining(d)(e) �� 0.2%The Manitowoc Co., Inc. (B/B3)
4,465,000 9.000 04/01/26 4,822,200Machinery-Diversified(d)(e) �� 0.5%Clark Equipment Co. (BB+/Ba3)
1,782,000 5.875 06/01/25 1,880,010GrafTech Finance, Inc. (BB-/B1)
1,415,000 4.625 12/15/28 1,429,150Husky III Holding Ltd. (CCC/Caa2)(f)
2,612,000 13.000 02/15/25 2,840,550Titan Acquisition Ltd./Titan Co-Borrower LLC (CCC/Caa2)
3,375,000 7.750 04/15/26 3,510,000Vertical Holdco Gmbh Co. (CCC/Caa1)
545,000 7.625 07/15/28 592,688Vertical US New Co., Inc. (B/B1)
275,000 5.250 07/15/27 289,78110,542,179
Media �� 7.6%Altice Financing SA (B/B2)(d)(e)
3,050,000 7.500 05/15/26 3,210,125AMC Networks, Inc. (BB/Ba3)(d)
1,150,000 5.000 04/01/24 1,170,1251,015,000 4.750 08/01/25 1,047,988
CCO Holdings LLC/CCO Holdings Capital Corp. (BB/B1)(d)(e)11,430,000 5.750 02/15/26 11,815,7621,680,000 5.500 05/01/26 1,743,0002,800,000 4.750 03/01/30 3,017,0001,800,000 4.500 08/15/30 1,917,000
PrincipalAmount
InterestRate
MaturityDate Value
Corporate Obligations �� (continued)Media �� (continued)CCO Holdings LLC/CCO Holdings Capital Corp. (BB/B1)(d)(e)$ 6,640,000 4.250 % 02/01/31 $ 6,996,900CSC Holdings LLC (B/B3)
10,000 5.250 06/01/24 10,8131,142,000 5.750 (d)(e) 01/15/30 1,250,49012,574,000 4.625 (d)(e) 12/01/30 13,092,677
CSC Holdings LLC (BB/Ba3)(d)(e)4,839,000 5.500 05/15/26 5,020,4624,270,000 5.500 04/15/27 4,526,2004,319,000 3.375 02/15/31 4,259,614
Cumulus Media New Holdings, Inc. (B/B2)(d)(e)4,110,000 6.750 07/01/26 4,192,200
Diamond Sports Group LLC/Diamond Sports Finance Co. (B/B3)(d)(e)9,245,000 6.625 08/15/27 5,593,225
Diamond Sports Group LLC/Diamond Sports Finance Co. (BB-/Ba3)(d)(e)1,750,000 5.375 08/15/26 1,421,875
DISH DBS Corp. (B-/B2)6,290,000 5.875 07/15/22 6,565,1875,880,000 5.000 03/15/23 6,078,450230,000 5.875 11/15/24 240,638
PrincipalAmount
InterestRate
MaturityDate Value
Corporate Obligations �� (continued)Media �� (continued)Radiate Holdco LLC/Radiate Finance, Inc. (B/B1)(d)(e)$ 1,968,000 4.500 % 09/15/26 $ 2,027,040Scripps Escrow II, Inc. (CCC+/Caa1)(d)(e)
485,000 5.375 01/15/31 509,250Scripps Escrow, Inc. (B-/Caa1)(d)(e)
3,885,000 5.875 07/15/27 4,050,112Sinclair Television Group, Inc. (B/B2)(d)(e)
230,000 5.500 03/01/30 239,200Sinclair Television Group, Inc. (BB/Ba2)(d)(e)
3,180,000 4.125 12/01/30 3,251,550Sirius XM Radio, Inc. (BB/Ba3)(d)(e)
5,535,000 5.000 08/01/27 5,839,4253,909,000 4.125 07/01/30 4,153,312
TEGNA, Inc. (BB-/Ba3)(d)(e)761,000 4.750 03/15/26 809,5143,450,000 4.625 03/15/28 3,540,563
The E.W. Scripps Co. (B-/Caa1)(d)(e)5,275,000 5.125 05/15/25 5,380,500
Univision Communications, Inc. (B/B2)(d)(e)240,000 5.125 02/15/25 242,400
Copyright © 2021 www.secdatabase.com. All Rights Reserved.Please Consider the Environment Before Printing This Document
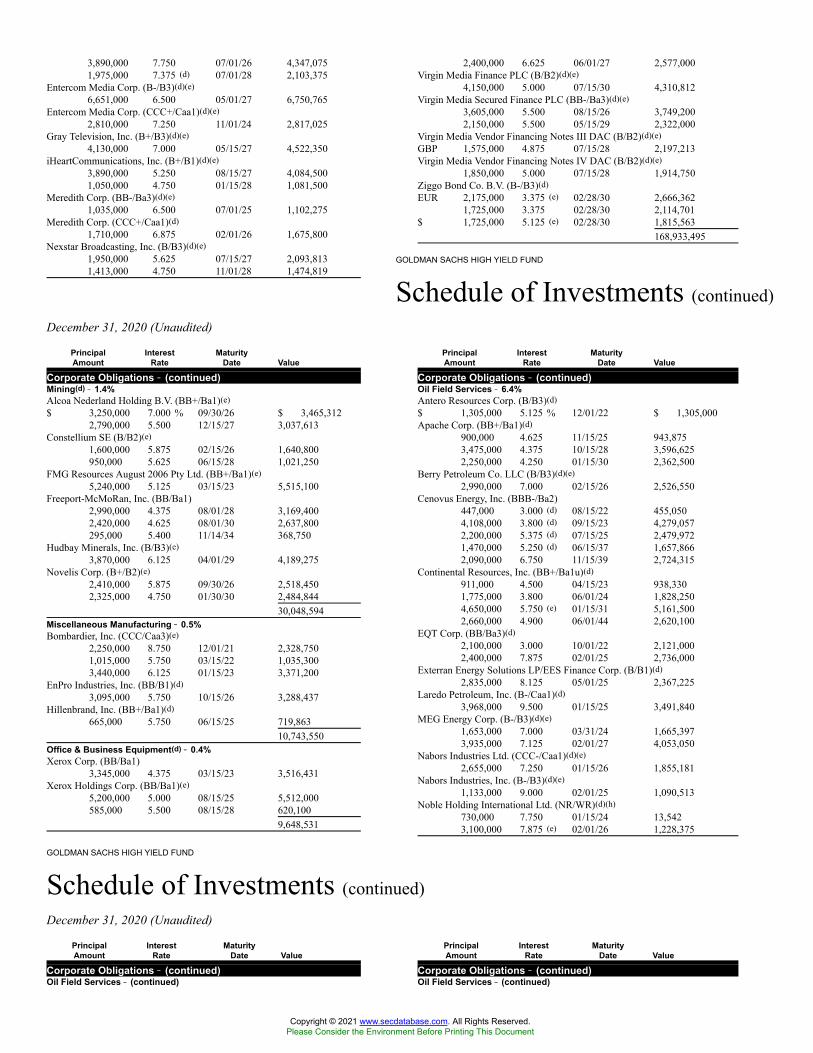
GOLDMAN SACHS HIGH YIELD FUND
Schedule of Investments (continued)December 31, 2020 (Unaudited)
GOLDMAN SACHS HIGH YIELD FUND
Schedule of Investments (continued)December 31, 2020 (Unaudited)
3,890,000 7.750 07/01/26 4,347,0751,975,000 7.375 (d) 07/01/28 2,103,375
Entercom Media Corp. (B-/B3)(d)(e)6,651,000 6.500 05/01/27 6,750,765
Entercom Media Corp. (CCC+/Caa1)(d)(e)2,810,000 7.250 11/01/24 2,817,025
Gray Television, Inc. (B+/B3)(d)(e)4,130,000 7.000 05/15/27 4,522,350
iHeartCommunications, Inc. (B+/B1)(d)(e)3,890,000 5.250 08/15/27 4,084,5001,050,000 4.750 01/15/28 1,081,500
Meredith Corp. (BB-/Ba3)(d)(e)1,035,000 6.500 07/01/25 1,102,275
Meredith Corp. (CCC+/Caa1)(d)1,710,000 6.875 02/01/26 1,675,800
Nexstar Broadcasting, Inc. (B/B3)(d)(e)1,950,000 5.625 07/15/27 2,093,8131,413,000 4.750 11/01/28 1,474,819
2,400,000 6.625 06/01/27 2,577,000Virgin Media Finance PLC (B/B2)(d)(e)
4,150,000 5.000 07/15/30 4,310,812Virgin Media Secured Finance PLC (BB-/Ba3)(d)(e)
3,605,000 5.500 08/15/26 3,749,2002,150,000 5.500 05/15/29 2,322,000
Virgin Media Vendor Financing Notes III DAC (B/B2)(d)(e)GBP 1,575,000 4.875 07/15/28 2,197,213Virgin Media Vendor Financing Notes IV DAC (B/B2)(d)(e)
1,850,000 5.000 07/15/28 1,914,750Ziggo Bond Co. B.V. (B-/B3)(d)EUR 2,175,000 3.375 (e) 02/28/30 2,666,362
1,725,000 3.375 02/28/30 2,114,701$ 1,725,000 5.125 (e) 02/28/30 1,815,563
168,933,495
PrincipalAmount
InterestRate
MaturityDate Value
Corporate Obligations �� (continued)Mining(d) �� 1.4%Alcoa Nederland Holding B.V. (BB+/Ba1)(e)$ 3,250,000 7.000 % 09/30/26 $ 3,465,312
2,790,000 5.500 12/15/27 3,037,613Constellium SE (B/B2)(e)
1,600,000 5.875 02/15/26 1,640,800950,000 5.625 06/15/28 1,021,250
FMG Resources August 2006 Pty Ltd. (BB+/Ba1)(e)5,240,000 5.125 03/15/23 5,515,100
Freeport-McMoRan, Inc. (BB/Ba1)2,990,000 4.375 08/01/28 3,169,4002,420,000 4.625 08/01/30 2,637,800295,000 5.400 11/14/34 368,750
Hudbay Minerals, Inc. (B/B3)(e)3,870,000 6.125 04/01/29 4,189,275
Novelis Corp. (B+/B2)(e)2,410,000 5.875 09/30/26 2,518,4502,325,000 4.750 01/30/30 2,484,844
30,048,594Miscellaneous Manufacturing �� 0.5%Bombardier, Inc. (CCC/Caa3)(e)
2,250,000 8.750 12/01/21 2,328,7501,015,000 5.750 03/15/22 1,035,3003,440,000 6.125 01/15/23 3,371,200
EnPro Industries, Inc. (BB/B1)(d)3,095,000 5.750 10/15/26 3,288,437
Hillenbrand, Inc. (BB+/Ba1)(d)665,000 5.750 06/15/25 719,863
10,743,550Office & Business Equipment(d) �� 0.4%Xerox Corp. (BB/Ba1)
3,345,000 4.375 03/15/23 3,516,431Xerox Holdings Corp. (BB/Ba1)(e)
5,200,000 5.000 08/15/25 5,512,000585,000 5.500 08/15/28 620,100
9,648,531
PrincipalAmount
InterestRate
MaturityDate Value
Corporate Obligations �� (continued)Oil Field Services �� 6.4%Antero Resources Corp. (B/B3)(d)$ 1,305,000 5.125 % 12/01/22 $ 1,305,000Apache Corp. (BB+/Ba1)(d)
900,000 4.625 11/15/25 943,8753,475,000 4.375 10/15/28 3,596,6252,250,000 4.250 01/15/30 2,362,500
Berry Petroleum Co. LLC (B/B3)(d)(e)2,990,000 7.000 02/15/26 2,526,550
Cenovus Energy, Inc. (BBB-/Ba2)447,000 3.000 (d) 08/15/22 455,0504,108,000 3.800 (d) 09/15/23 4,279,0572,200,000 5.375 (d) 07/15/25 2,479,9721,470,000 5.250 (d) 06/15/37 1,657,8662,090,000 6.750 11/15/39 2,724,315
Continental Resources, Inc. (BB+/Ba1u)(d)911,000 4.500 04/15/23 938,3301,775,000 3.800 06/01/24 1,828,2504,650,000 5.750 (e) 01/15/31 5,161,5002,660,000 4.900 06/01/44 2,620,100
EQT Corp. (BB/Ba3)(d)2,100,000 3.000 10/01/22 2,121,0002,400,000 7.875 02/01/25 2,736,000
Exterran Energy Solutions LP/EES Finance Corp. (B/B1)(d)2,835,000 8.125 05/01/25 2,367,225
Laredo Petroleum, Inc. (B-/Caa1)(d)3,968,000 9.500 01/15/25 3,491,840
MEG Energy Corp. (B-/B3)(d)(e)1,653,000 7.000 03/31/24 1,665,3973,935,000 7.125 02/01/27 4,053,050
Nabors Industries Ltd. (CCC-/Caa1)(d)(e)2,655,000 7.250 01/15/26 1,855,181
Nabors Industries, Inc. (B-/B3)(d)(e)1,133,000 9.000 02/01/25 1,090,513
Noble Holding International Ltd. (NR/WR)(d)(h)730,000 7.750 01/15/24 13,5423,100,000 7.875 (e) 02/01/26 1,228,375
PrincipalAmount
InterestRate
MaturityDate Value
Corporate Obligations �� (continued)Oil Field Services �� (continued)
PrincipalAmount
InterestRate
MaturityDate Value
Corporate Obligations �� (continued)Oil Field Services �� (continued)
Copyright © 2021 www.secdatabase.com. All Rights Reserved.Please Consider the Environment Before Printing This Document
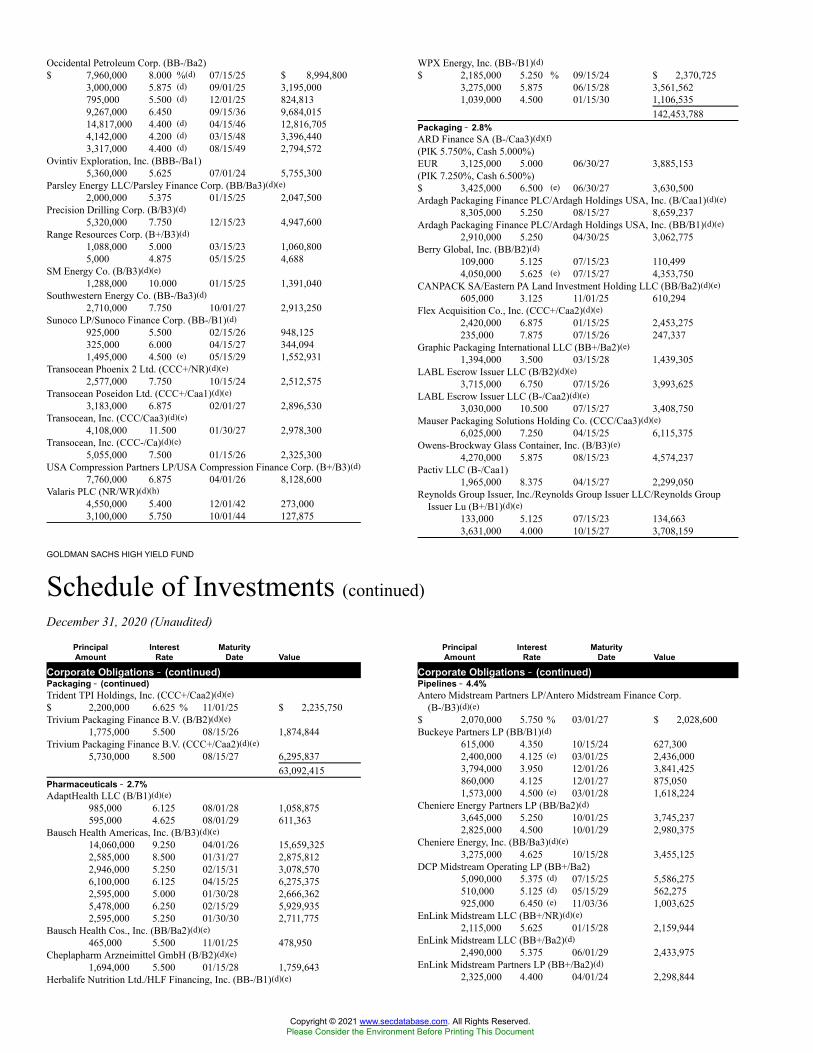
GOLDMAN SACHS HIGH YIELD FUND
Schedule of Investments (continued)December 31, 2020 (Unaudited)
Occidental Petroleum Corp. (BB-/Ba2)$ 7,960,000 8.000 %(d) 07/15/25 $ 8,994,800
3,000,000 5.875 (d) 09/01/25 3,195,000795,000 5.500 (d) 12/01/25 824,8139,267,000 6.450 09/15/36 9,684,01514,817,000 4.400 (d) 04/15/46 12,816,7054,142,000 4.200 (d) 03/15/48 3,396,4403,317,000 4.400 (d) 08/15/49 2,794,572
Ovintiv Exploration, Inc. (BBB-/Ba1)5,360,000 5.625 07/01/24 5,755,300
Parsley Energy LLC/Parsley Finance Corp. (BB/Ba3)(d)(e)2,000,000 5.375 01/15/25 2,047,500
Precision Drilling Corp. (B/B3)(d)5,320,000 7.750 12/15/23 4,947,600
Range Resources Corp. (B+/B3)(d)1,088,000 5.000 03/15/23 1,060,8005,000 4.875 05/15/25 4,688
SM Energy Co. (B/B3)(d)(e)1,288,000 10.000 01/15/25 1,391,040
Southwestern Energy Co. (BB-/Ba3)(d)2,710,000 7.750 10/01/27 2,913,250
Sunoco LP/Sunoco Finance Corp. (BB-/B1)(d)925,000 5.500 02/15/26 948,125325,000 6.000 04/15/27 344,0941,495,000 4.500 (e) 05/15/29 1,552,931
Transocean Phoenix 2 Ltd. (CCC+/NR)(d)(e)2,577,000 7.750 10/15/24 2,512,575
Transocean Poseidon Ltd. (CCC+/Caa1)(d)(e)3,183,000 6.875 02/01/27 2,896,530
Transocean, Inc. (CCC/Caa3)(d)(e)4,108,000 11.500 01/30/27 2,978,300
Transocean, Inc. (CCC-/Ca)(d)(e)5,055,000 7.500 01/15/26 2,325,300
USA Compression Partners LP/USA Compression Finance Corp. (B+/B3)(d)7,760,000 6.875 04/01/26 8,128,600
Valaris PLC (NR/WR)(d)(h)4,550,000 5.400 12/01/42 273,0003,100,000 5.750 10/01/44 127,875
WPX Energy, Inc. (BB-/B1)(d)$ 2,185,000 5.250 % 09/15/24 $ 2,370,725
3,275,000 5.875 06/15/28 3,561,5621,039,000 4.500 01/15/30 1,106,535
142,453,788Packaging �� 2.8%ARD Finance SA (B-/Caa3)(d)(f)(PIK 5.750%, Cash 5.000%)EUR 3,125,000 5.000 06/30/27 3,885,153(PIK 7.250%, Cash 6.500%)$ 3,425,000 6.500 (e) 06/30/27 3,630,500Ardagh Packaging Finance PLC/Ardagh Holdings USA, Inc. (B/Caa1)(d)(e)
8,305,000 5.250 08/15/27 8,659,237Ardagh Packaging Finance PLC/Ardagh Holdings USA, Inc. (BB/B1)(d)(e)
2,910,000 5.250 04/30/25 3,062,775Berry Global, Inc. (BB/B2)(d)
109,000 5.125 07/15/23 110,4994,050,000 5.625 (e) 07/15/27 4,353,750
CANPACK SA/Eastern PA Land Investment Holding LLC (BB/Ba2)(d)(e)605,000 3.125 11/01/25 610,294
Flex Acquisition Co., Inc. (CCC+/Caa2)(d)(e)2,420,000 6.875 01/15/25 2,453,275235,000 7.875 07/15/26 247,337
Graphic Packaging International LLC (BB+/Ba2)(e)1,394,000 3.500 03/15/28 1,439,305
LABL Escrow Issuer LLC (B/B2)(d)(e)3,715,000 6.750 07/15/26 3,993,625
LABL Escrow Issuer LLC (B-/Caa2)(d)(e)3,030,000 10.500 07/15/27 3,408,750
Mauser Packaging Solutions Holding Co. (CCC/Caa3)(d)(e)6,025,000 7.250 04/15/25 6,115,375
Owens-Brockway Glass Container, Inc. (B/B3)(e)4,270,000 5.875 08/15/23 4,574,237
Pactiv LLC (B-/Caa1)1,965,000 8.375 04/15/27 2,299,050
Reynolds Group Issuer, Inc./Reynolds Group Issuer LLC/Reynolds GroupIssuer Lu (B+/B1)(d)(e)
133,000 5.125 07/15/23 134,6633,631,000 4.000 10/15/27 3,708,159
PrincipalAmount
InterestRate
MaturityDate Value
Corporate Obligations �� (continued)Packaging �� (continued)Trident TPI Holdings, Inc. (CCC+/Caa2)(d)(e)$ 2,200,000 6.625 % 11/01/25 $ 2,235,750Trivium Packaging Finance B.V. (B/B2)(d)(e)
1,775,000 5.500 08/15/26 1,874,844Trivium Packaging Finance B.V. (CCC+/Caa2)(d)(e)
5,730,000 8.500 08/15/27 6,295,83763,092,415
Pharmaceuticals �� 2.7%AdaptHealth LLC (B/B1)(d)(e)
985,000 6.125 08/01/28 1,058,875595,000 4.625 08/01/29 611,363
Bausch Health Americas, Inc. (B/B3)(d)(e)14,060,000 9.250 04/01/26 15,659,3252,585,000 8.500 01/31/27 2,875,8122,946,000 5.250 02/15/31 3,078,5706,100,000 6.125 04/15/25 6,275,3752,595,000 5.000 01/30/28 2,666,3625,478,000 6.250 02/15/29 5,929,9352,595,000 5.250 01/30/30 2,711,775
Bausch Health Cos., Inc. (BB/Ba2)(d)(e)465,000 5.500 11/01/25 478,950
Cheplapharm Arzneimittel GmbH (B/B2)(d)(e)1,694,000 5.500 01/15/28 1,759,643
Herbalife Nutrition Ltd./HLF Financing, Inc. (BB-/B1)(d)(e)
PrincipalAmount
InterestRate
MaturityDate Value
Corporate Obligations �� (continued)Pipelines �� 4.4%Antero Midstream Partners LP/Antero Midstream Finance Corp.
(B-/B3)(d)(e)$ 2,070,000 5.750 % 03/01/27 $ 2,028,600Buckeye Partners LP (BB/B1)(d)
615,000 4.350 10/15/24 627,3002,400,000 4.125 (e) 03/01/25 2,436,0003,794,000 3.950 12/01/26 3,841,425860,000 4.125 12/01/27 875,0501,573,000 4.500 (e) 03/01/28 1,618,224
Cheniere Energy Partners LP (BB/Ba2)(d)3,645,000 5.250 10/01/25 3,745,2372,825,000 4.500 10/01/29 2,980,375
Cheniere Energy, Inc. (BB/Ba3)(d)(e)3,275,000 4.625 10/15/28 3,455,125
DCP Midstream Operating LP (BB+/Ba2)5,090,000 5.375 (d) 07/15/25 5,586,275510,000 5.125 (d) 05/15/29 562,275925,000 6.450 (e) 11/03/36 1,003,625
EnLink Midstream LLC (BB+/NR)(d)(e)2,115,000 5.625 01/15/28 2,159,944
EnLink Midstream LLC (BB+/Ba2)(d)2,490,000 5.375 06/01/29 2,433,975
EnLink Midstream Partners LP (BB+/Ba2)(d)2,325,000 4.400 04/01/24 2,298,844
Copyright © 2021 www.secdatabase.com. All Rights Reserved.Please Consider the Environment Before Printing This Document

GOLDMAN SACHS HIGH YIELD FUND
Schedule of Investments (continued)December 31, 2020 (Unaudited)
GOLDMAN SACHS HIGH YIELD FUND
Schedule of Investments (continued)December 31, 2020 (Unaudited)
GOLDMAN SACHS HIGH YIELD FUND
1,408,000 7.875 09/01/25 1,534,720HLF Financing S.a.r.l. LLC/Herbalife International, Inc. (BB-/B1)(d)(e)
5,425,000 7.250 08/15/26 5,736,937Par Pharmaceutical, Inc. (B+/B2)(d)(e)
6,675,000 7.500 04/01/27 7,209,000Teva Pharmaceutical Finance Co. B.V. (BB-/Ba2)
855,000 3.650 11/10/21 863,550Vizient, Inc. (B/B2)(d)(e)
990,000 6.250 05/15/27 1,056,82559,507,017
3,235,000 5.450 06/01/47 2,588,000EQM Midstream Partners LP (BB-/Ba3)(d)
2,800,000 6.500 (e) 07/01/27 3,150,0002,970,000 5.500 07/15/28 3,237,300
Genesis Energy LP/Genesis Energy Finance Corp. (B+/B1)(d)3,584,000 5.625 06/15/24 3,476,480
Global Partners LP/GLP Finance Corp. (B+/B2)(d)2,970,000 7.000 08/01/27 3,177,9001,780,000 6.875 (e) 01/15/29 1,931,300
NuStar Logistics LP (BB-/Ba3)(d)2,790,000 5.750 10/01/25 2,971,3503,420,000 5.625 04/28/27 3,642,300
PrincipalAmount
InterestRate
MaturityDate Value
Corporate Obligations �� (continued)Pipelines �� (continued)Plains All American Pipeline LP/PAA Finance Corp. (BBB-/Ba1)(d)$ 1,308,000 3.800 % 09/15/30 $ 1,400,829Summit Midstream Holdings LLC/Summit Midstream Finance Corp. (D/
Caa2)(d)5,321,000 5.750 04/15/25 3,418,742
Tallgrass Energy Partners LP/Tallgrass Energy Finance Corp.(BB-/B1)(d)(e)
5,955,000 4.750 10/01/23 6,097,9201,935,000 5.500 09/15/24 1,968,8622,563,000 7.500 10/01/25 2,748,8171,310,000 5.500 01/15/28 1,337,838
Tallgrass Energy Partners LP/Tallgrass Energy Finance Corp.(BB-/B1)(d)(e)
3,140,000 6.000 12/31/30 3,234,200Targa Resources Partners LP/Targa Resources Partners Finance Corp. (BB/
Ba3)(d)1,865,000 5.875 04/15/26 1,962,9134,525,000 5.375 02/01/27 4,739,9371,810,000 6.500 07/15/27 1,963,8501,980,000 5.000 01/15/28 2,079,000
Western Midstream Operating LP (BB/Ba2)(d)1,500,000 5.375 06/01/21 1,507,5002,230,000 5.050 02/01/30 2,475,3001,725,000 5.300 03/01/48 1,703,438675,000 6.250 02/01/50 739,125
97,205,175Pipelines(d) �� 0.1%EQM Midstream Partners LP (BB-/Ba3)
2,030,000 4.000 08/01/24 2,080,750Real Estate(d)(e) �� 0.3%Realogy Group LLC/Realogy Co-Issuer Corp. (B-/Caa1)
3,510,000 4.875 06/01/23 3,580,2001,919,000 9.375 04/01/27 2,125,292
Realogy Group LLC/Realogy Co.-Issuer Corp. (B-/B3)773,000 7.625 06/15/25 836,773
The Howard Hughes Corp. (BB-/Ba3)603,000 5.375 08/01/28 645,210
7,187,475
PrincipalAmount
InterestRate
MaturityDate Value
Corporate Obligations �� (continued)Real Estate Investment Trust(d) �� 2.0%ESH Hospitality, Inc. (BB-/Ba3)(e)$ 4,125,000 4.625 % 10/01/27 $ 4,222,969Iron Mountain, Inc. (BB-/Ba3)(e)
4,200,000 5.000 07/15/28 4,462,5002,085,000 4.500 02/15/31 2,168,400
MGM Growth Properties Operating Partnership LP/MGP Finance Co-Issuer,Inc. (BB-/B1)(e)
3,120,000 4.625 06/15/25 3,318,9003,337,000 3.875 02/15/29 3,395,398
MPT Operating Partnership LP/MPT Finance Corp. (BBB-/Ba1)1,685,000 4.625 08/01/29 1,808,2584,680,000 3.500 03/15/31 4,832,802
Service Properties Trust (BB/Ba1)1,531,000 7.500 09/15/25 1,779,895
Service Properties Trust (BB-/Ba2)2,900,000 4.350 10/01/24 2,871,136
Starwood Property Trust, Inc. (B+/Ba3)7,835,000 4.750 03/15/25 7,972,112
Uniti Group LP/Uniti Fiber Holdings, Inc./CSL Capital LLC (B/B2)(e)2,715,000 6.000 04/15/23 2,769,300
Uniti Group LP/Uniti Fiber Holdings, Inc./CSL Capital LLC (CCC/Caa2)1,270,000 8.250 10/15/23 1,273,175275,000 7.125 (e) 12/15/24 277,406
VICI Properties LP/VICI Note Co., Inc. (BB/Ba3)(e)2,154,000 3.500 02/15/25 2,197,080
43,349,331Retailing �� 4.5%1011778 BC ULC/New Red Finance, Inc. (B+/B2)(d)(e)
1,635,000 4.375 01/15/28 1,686,0941011778 BC ULC/New Red Finance, Inc. (B+/B2)(d)(e)
7,857,000 4.000 10/15/30 7,915,927Asbury Automotive Group, Inc. (BB/B1)(d)
295,000 4.500 03/01/28 307,538190,000 4.750 03/01/30 202,350
Beacon Roofing Supply, Inc. (B-/Caa1)(d)(e)10,615,000 4.875 11/01/25 10,880,375
PrincipalAmount
InterestRate
MaturityDate Value
Corporate Obligations �� (continued)Retailing �� (continued)
PrincipalAmount
InterestRate
MaturityDate Value
Corporate Obligations �� (continued)Retailing �� (continued)
Copyright © 2021 www.secdatabase.com. All Rights Reserved.Please Consider the Environment Before Printing This Document

Schedule of Investments (continued)December 31, 2020 (Unaudited)
Burlington Stores, Inc. (NR/NR)(e)$ 1,141,000 2.250 % 04/15/25 $ 1,585,534Carvana Co. (CCC+/Caa2)(d)(e)
4,210,000 5.625 10/01/25 4,309,987eG Global Finance PLC (B-/B3)(d)(e)
2,560,000 6.750 02/07/25 2,636,8002,210,000 8.500 10/30/25 2,353,650
Group 1 Automotive, Inc. (BB+/Ba2)(d)(e)1,382,000 4.000 08/15/28 1,413,095
IRB Holding Corp. (B/B2)(d)(e)1,171,000 7.000 06/15/25 1,273,463
IRB Holding Corp. (CCC+/Caa1)(d)(e)8,870,000 6.750 02/15/26 9,158,275
Ken Garff Automotive LLC (B/B1)(d)(e)720,000 4.875 09/15/28 748,800
KFC Holding Co./Pizza Hut Holdings LLC/Taco Bell of America LLC (BB/Ba3)(d)(e)
4,187,000 5.250 06/01/26 4,344,012Kirk Beauty One GmbH (CCC-/Caa3)(d)EUR 2,250,000 8.750 07/15/23 1,723,086L Brands, Inc. (B+/B2)$ 5,785,000 5.250 02/01/28 6,030,862L Brands, Inc. (BB/Ba2)(d)(e)
880,000 6.875 07/01/25 954,800LBM Acquisition LLC (CCC+/NR)(d)(e)
1,195,000 6.250 01/15/29 1,242,800Lithia Motors, Inc. (BB/Ba2)(d)(e)
875,000 4.375 01/15/31 936,250Macy�s Retail Holdings, Inc. (B/B1)(d)
2,550,000 2.875 02/15/23 2,441,625Macy�s, Inc. (BB-/Ba1)(d)(e)
2,900,000 8.375 06/15/25 3,219,000Nordstrom, Inc. (BB+/Baa3)(d)
2,370,000 5.000 01/15/44 2,215,950Penske Automotive Group, Inc. (B+/Ba3)(d)
3,175,000 3.500 09/01/25 3,190,875PetSmart, Inc. (CCC+/Caa1)(d)(e)
6,095,000 7.125 03/15/23 6,079,762QVC, Inc. (BB+/Ba2)
1,465,000 5.950 03/15/43 1,545,575
Specialty Building Products Holdings LLC/SBP Finance Corp.(B-/B3)(d)(e)
$ 1,418,000 6.375 % 09/30/26 $ 1,492,445Staples, Inc. (B/B1)(d)(e)
4,855,000 7.500 04/15/26 5,037,062Staples, Inc. (CCC+/B3)(d)(e)
3,095,000 10.750 04/15/27 3,071,787Stonegate Pub Co Financing 2019 PLC (NR/B3)(d)(e)GBP 1,750,000 8.250 07/31/25 2,410,692Suburban Propane Partners LP/Suburban Energy Finance Corp.
(BB-/B1)(d)$ 1,895,000 5.500 06/01/24 1,928,163
2,175,000 5.875 03/01/27 2,267,438Walgreens Boots Alliance, Inc. (BBB/Baa2)(d)
1,740,000 4.100 04/15/50 1,843,356Yum! Brands, Inc. (B+/B1)(d)
187,000 7.750 (e) 04/01/25 207,1032,400,000 4.750 (e) 01/15/30 2,631,000495,000 3.625 03/15/31 499,950
99,785,481Semiconductors(d)(e) �� 0.4%Amkor Technology, Inc. (BB/B1)
3,489,000 6.625 09/15/27 3,785,565Microchip Technology, Inc. (NR/Ba2)
280,000 4.250 09/01/25 296,100ON Semiconductor Corp. (BB/Ba2)
2,170,000 3.875 09/01/28 2,254,088Qorvo, Inc. (BB+/Ba1)
3,320,000 3.375 04/01/31 3,419,6009,755,353
Software(d) �� 1.6%Black Knight InfoServ LLC (B+/Ba3)(e)
1,555,000 3.625 09/01/28 1,586,100BY Crown Parent LLC/BY Bond Finance, Inc. (B-/B1)(e)
355,000 4.250 01/31/26 363,875Camelot Finance SA (B/B2)(e)
3,450,000 4.500 11/01/26 3,596,625Castle US Holding Corp. (CCC/Caa2)(e)
2,020,000 9.500 02/15/28 2,020,000
PrincipalAmount
InterestRate
MaturityDate Value
Corporate Obligations �� (continued)Software(d) �� (continued)Change Healthcare Holdings LLC/Change Healthcare Finance, Inc. (B-/
Caa1)(e)$ 950,000 5.750 % 03/01/25 $ 966,625J2 Global, Inc. (BB/Ba3)(e)
3,565,000 4.625 10/15/30 3,744,712Nuance Communications, Inc. (BB-/Ba3)
3,640,000 5.625 12/15/26 3,844,750Open Text Corp. (BB/Ba2)(e)
4,730,000 3.875 02/15/28 4,848,250PTC, Inc. (BB/Ba3)(e)
1,077,000 3.625 02/15/25 1,109,310Solera LLC/Solera Finance, Inc. (CCC+/Caa1)(e)
6,500,000 10.500 03/01/24 6,727,500SS&C Technologies, Inc. (B+/B2)(e)
5,090,000 5.500 09/30/27 5,439,937The Dun & Bradstreet Corp. (B-/Caa1)(e)
1,968,000 10.250 02/15/27 2,218,92036,466,604
Storage/Warehousing(d)(e) �� 0.1%Modulaire Global Finance 2 PLC (CCC/Caa1)
2,390,000 10.000 08/15/23 2,428,838Telecommunication Services �� 6.3%Altice France Holding SA (CCC+/WR)(d)(e)
4,755,000 10.500 05/15/27 5,343,431
PrincipalAmount
InterestRate
MaturityDate Value
Corporate Obligations �� (continued)Telecommunication Services �� (continued)Digicel Group 0.5 Ltd. (NR/Ca)(d)(e)(f) (PIK 3.000%, Cash 5.000%)$ 2,594,498 8.000 % 04/01/25 $ 1,364,544Frontier Communications Corp. (B+/B3)(d)(e)
401,000 5.875 10/15/27 433,5811,211,000 5.000 05/01/28 1,262,468
Intelsat Jackson Holdings SA (NR/WR)(e)(h)210,000 9.500 09/30/22 233,6256,885,000 8.500 (d) 10/15/24 4,888,35015,490,000 9.750 (d) 07/15/25 11,075,350
Intelsat Luxembourg SA (NR/WR)(d)(h)13,875,000 8.125 06/01/23 641,719
Intelsat SA (NR/NR)(h)4,650,000 4.500 06/15/25 1,534,500
Level 3 Financing, Inc. (BB/Ba3)(d)5,285,000 5.250 03/15/26 5,450,1566,921,000 4.625 (e) 09/15/27 7,206,4915,950,000 4.250 (e) 07/01/28 6,098,7502,075,000 3.625 (e) 01/15/29 2,069,813
LogMeIn, Inc. (B-/B1)(d)(e)3,175,000 5.500 09/01/27 3,309,938
Nokia of America Corp. (NR/WR)5,200,000 6.450 03/15/29 5,668,000
Nokia Oyj (BB+/Ba2)295,000 6.625 05/15/39 377,600
Sprint Capital Corp. (BB/B1)
Copyright © 2021 www.secdatabase.com. All Rights Reserved.Please Consider the Environment Before Printing This Document
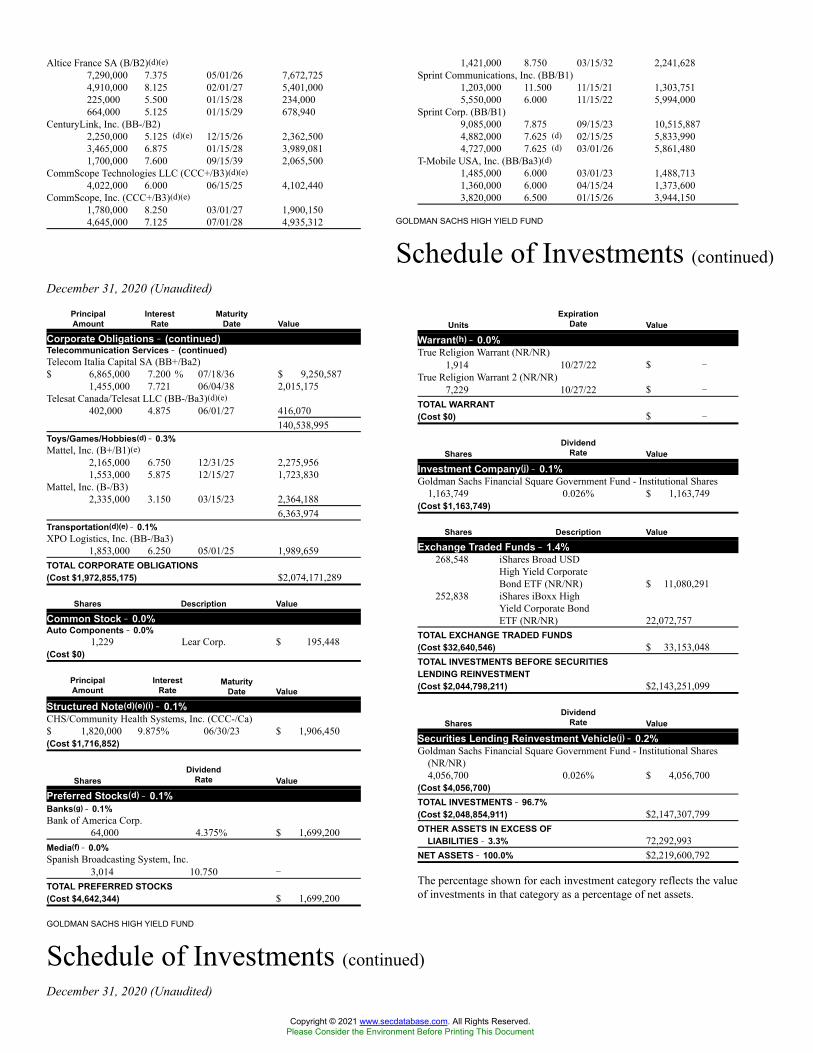
GOLDMAN SACHS HIGH YIELD FUND
Schedule of Investments (continued)December 31, 2020 (Unaudited)
GOLDMAN SACHS HIGH YIELD FUND
Schedule of Investments (continued)December 31, 2020 (Unaudited)
Altice France SA (B/B2)(d)(e)7,290,000 7.375 05/01/26 7,672,7254,910,000 8.125 02/01/27 5,401,000225,000 5.500 01/15/28 234,000664,000 5.125 01/15/29 678,940
CenturyLink, Inc. (BB-/B2)2,250,000 5.125 (d)(e) 12/15/26 2,362,5003,465,000 6.875 01/15/28 3,989,0811,700,000 7.600 09/15/39 2,065,500
CommScope Technologies LLC (CCC+/B3)(d)(e)4,022,000 6.000 06/15/25 4,102,440
CommScope, Inc. (CCC+/B3)(d)(e)1,780,000 8.250 03/01/27 1,900,1504,645,000 7.125 07/01/28 4,935,312
1,421,000 8.750 03/15/32 2,241,628Sprint Communications, Inc. (BB/B1)
1,203,000 11.500 11/15/21 1,303,7515,550,000 6.000 11/15/22 5,994,000
Sprint Corp. (BB/B1)9,085,000 7.875 09/15/23 10,515,8874,882,000 7.625 (d) 02/15/25 5,833,9904,727,000 7.625 (d) 03/01/26 5,861,480
T-Mobile USA, Inc. (BB/Ba3)(d)1,485,000 6.000 03/01/23 1,488,7131,360,000 6.000 04/15/24 1,373,6003,820,000 6.500 01/15/26 3,944,150
PrincipalAmount
InterestRate
MaturityDate Value
Corporate Obligations �� (continued)Telecommunication Services �� (continued)Telecom Italia Capital SA (BB+/Ba2)$ 6,865,000 7.200 % 07/18/36 $ 9,250,587
1,455,000 7.721 06/04/38 2,015,175Telesat Canada/Telesat LLC (BB-/Ba3)(d)(e)
402,000 4.875 06/01/27 416,070140,538,995
Toys/Games/Hobbies(d) �� 0.3%Mattel, Inc. (B+/B1)(e)
2,165,000 6.750 12/31/25 2,275,9561,553,000 5.875 12/15/27 1,723,830
Mattel, Inc. (B-/B3)2,335,000 3.150 03/15/23 2,364,188
6,363,974Transportation(d)(e) �� 0.1%XPO Logistics, Inc. (BB-/Ba3)
1,853,000 6.250 05/01/25 1,989,659TOTAL CORPORATE OBLIGATIONS(Cost $1,972,855,175) $2,074,171,289
Shares Description Value
Common Stock �� 0.0%Auto Components �� 0.0%
1,229 Lear Corp. $ 195,448(Cost $0)
PrincipalAmount
InterestRate
MaturityDate Value
Structured Note(d)(e)(i) �� 0.1%CHS/Community Health Systems, Inc. (CCC-/Ca)$ 1,820,000 9.875% 06/30/23 $ 1,906,450(Cost $1,716,852)
SharesDividend
Rate Value
Preferred Stocks(d) �� 0.1%Banks(g) �� 0.1%Bank of America Corp.
64,000 4.375% $ 1,699,200Media(f) �� 0.0%Spanish Broadcasting System, Inc.
3,014 10.750 �
TOTAL PREFERRED STOCKS(Cost $4,642,344) $ 1,699,200
UnitsExpiration
Date Value
Warrant(h) �� 0.0%True Religion Warrant (NR/NR)
1,914 10/27/22 $ �True Religion Warrant 2 (NR/NR)
7,229 10/27/22 $ �
TOTAL WARRANT(Cost $0) $ �
SharesDividend
Rate Value
Investment Company(j) �� 0.1%Goldman Sachs Financial Square Government Fund - Institutional Shares
1,163,749 0.026% $ 1,163,749(Cost $1,163,749)
Shares Description Value
Exchange Traded Funds �� 1.4%268,548 iShares Broad USD
High Yield CorporateBond ETF (NR/NR) $ 11,080,291
252,838 iShares iBoxx HighYield Corporate BondETF (NR/NR) 22,072,757
TOTAL EXCHANGE TRADED FUNDS(Cost $32,640,546) $ 33,153,048TOTAL INVESTMENTS BEFORE SECURITIESLENDING REINVESTMENT(Cost $2,044,798,211) $2,143,251,099
SharesDividend
Rate Value
Securities Lending Reinvestment Vehicle(j) �� 0.2%Goldman Sachs Financial Square Government Fund - Institutional Shares
(NR/NR)4,056,700 0.026% $ 4,056,700
(Cost $4,056,700)TOTAL INVESTMENTS �� 96.7%(Cost $2,048,854,911) $2,147,307,799OTHER ASSETS IN EXCESS OF
LIABILITIES �� 3.3% 72,292,993NET ASSETS �� 100.0% $2,219,600,792
The percentage shown for each investment category reflects the valueof investments in that category as a percentage of net assets.
Copyright © 2021 www.secdatabase.com. All Rights Reserved.Please Consider the Environment Before Printing This Document

GOLDMAN SACHS HIGH YIELD FUND
Schedule of Investments (continued)December 31, 2020 (Unaudited)
ADDITIONAL INVESTMENT INFORMATION
FORWARD FOREIGN CURRENCY EXCHANGE CONTRACTS � At December 31, 2020, the Fund had the following forward foreign currencyexchange contracts:
FORWARD FOREIGN CURRENCY EXCHANGE CONTRACTS WITH UNREALIZED LOSS
CounterpartyCurrencyPurchased
CurrencySold
SettlementDate
UnrealizedLoss
Deutsche Bank AG USD 1,374,401 EUR 1,155,463 01/21/21 $(37,923 )JPMorgan Securities, Inc. USD 17,990,821 EUR 15,231,588 01/21/21 (626,776 )UBS AG (London) USD 5,784,066 GBP 4,490,358 01/13/21 (357,254 )TOTAL $(1,021,953)
FUTURES CONTRACTS � At December 31, 2020, the Fund had the following futures contracts:
DescriptionNumber ofContracts
ExpirationDate
NotionalAmount
UnrealizedAppreciation/(Depreciation)
Long position contracts:2 Year U.S. Treasury Notes 38 03/31/21 $8,397,109 $ 5,37410 Year U.S. Treasury Notes 1,434 03/22/21 198,004,031 269,73620 Year U.S. Treasury Bonds 513 03/22/21 88,845,188 (726,972 )Total $ (451,862 )
(a) Bank Loans often require prepayments from excess cash flows or permit theborrower to repay at its election. The degree to which borrowers repay, whether as acontractual requirement or at their election, cannot be predicted with accuracy. As aresult, the actual remaining maturity may be substantially less than the statedmaturities shown. As bank loan positions may involve multiple underlying tranchesfor which the aggregate position is presented, the stated interest rate represents theweighted average interest rate of all contracts on December 31, 2020. Bank Loanstypically have rates of interest which are predetermined either daily, monthly,quarterly or semi-annually by reference to a base lending rate, plus a premium.These base lending rates are primarily the London-Interbank Offered Rate(�LIBOR�), and secondarily the prime rate offered by one or more major UnitedStates banks (the �Prime Rate�) and the certificate of deposit (�CD�) rate or otherbase lending rates used by commercial lenders.
(b) This position represents an unsettled loan commitment at period end. Certain detailsassociated with this purchase are not known prior to the settlement date, includingcoupon rate.
(c) Variable rate security. Except for floating rate notes (for which final maturity isdisclosed), maturity date disclosed is the next interest reset date. Interest ratedisclosed is that which is in effect on December 31, 2020.
(d) Security with �Call� features with resetting interest rates. Maturity dates disclosedare the final maturity dates.
(e) Exempt from registration under Rule 144A of the Securities Act of 1933.
(f) Pay-in-kind securities.
(g) All or a portion of security is on loan.
(h) Security is currently in default and/or non-income producing.
(i) Coupon changes periodically based upon a predetermined schedule. Interest ratedisclosed is that which is in effect on December 31, 2020.
(j) Represents an affiliated issuer.
Currency Abbreviations:EUR � EuroGBP � British PoundUSD �U.S. Dollar
Investment Abbreviations:CMT � Constant Maturity Treasury IndexesCP � Commercial PaperETF � Exchange Traded FundLIBOR � London Interbank Offered RateLLC � Limited Liability CompanyLP � Limited PartnershipPLC � Public Limited CompanyWR �Withdrawn Rating
For information on the mutual funds, please call our toll freeShareholder Services Line at 1-800-526-7384 or visit us on the webat www.GSAMFUNDS.com.
Copyright © 2021 www.secdatabase.com. All Rights Reserved.Please Consider the Environment Before Printing This Document

Short position contracts:Ultra Long U.S. Treasury Bonds (56) 03/22/21 (11,959,500 ) (20,693 )Ultra 10 Year U.S. Treasury Notes (79) 03/22/21 (12,352,391 ) (8,037 )5 Year German Euro-Bobl (85) 03/08/21 (14,037,126 ) 2,9725 Year U.S. Treasury Notes (167) 03/31/21 (21,069,398 ) (1,948 )Total $ (27,706 )TOTAL FUTURES CONTRACTS $ (479,568 )
SWAP CONTRACTS � At December 31, 2020, the Fund had the following swap contracts:
CENTRALLY CLEARED CREDIT DEFAULT SWAP CONTRACTS
ReferencedObligation/Index
Financing RateReceived/(Paid)by the Fund(a)
Credit Spreadat December 31,
2020(b)Termination
Date
NotionalAmount(000s) Value
UpfrontPremiums
(Received) Paid
UnrealizedAppreciation/(Depreciation)
Protection Sold:CDX.NA.HY Index 34 5.000% 2.758% 06/20/25 $77,073 $7,247,820 $ 2,879,388 $ 4,368,432Nabors Industries, Inc., 5.750%, 01/02/25 1.000 13.818 12/20/22 2,030 (448,077 ) (814,738 ) 366,661CDX.NA.HY Index 35 5.000 2.938 12/20/25 81,245 7,679,755 3,568,035 4,111,720TOTAL $14,479,498 $ 5,632,685 $ 8,846,813
(a) Payments made quarterly.(b) Credit spread on the referenced obligation, together with the term of the swap contract, are indicators of payment/performance risk. The likelihood of a credit event occurring which would require a
fund or its counterparty to make a payment or otherwise be required to perform under the swap contract is generally greater as the credit spread and the term of the swap contract increase.GOLDMAN SACHS HIGH YIELD FUND
Schedule of Investments (continued)December 31, 2020 (Unaudited)
ADDITIONAL INVESTMENT INFORMATION (continued)
OVER THE COUNTER TOTAL RETURN SWAP CONTRACTS ON COMMODITY INDICES
ReferenceObligation/Index
Financing RatePaid
by the Fund(a) CounterpartyTermination
Date(b)
NotionalAmount(000s) Value
UpfrontPremiums
(Received) Paid
UnrealizedAppreciation/(Depreciation)
IBOXHY Index0.235%
JPMorganSecurities, Inc. 06/20/21 $69 $312,021 $ � $ 312,021
(a) Payments made quarterly.(b) The Fund pays/receives annual coupon payments in accordance with the swap contract. On the termination date of the swap contract, the Fund will either receive from or pay to the counterparty an
amount equal to the net of the accrued financing fees and the value of the reference security subtracted from the original notional cost (notional multiplied by the price change of the referencesecurity, converted to U.S. Dollars).
GOLDMAN SACHS HIGH YIELD FLOATING RATE FUND
Schedule of InvestmentsDecember 31, 2020 (Unaudited)
Abbreviations:CDX.NA.IG Index 34 � CDX North America Investment Grade Index 34CDX.NA.IG Index 35 � CDX North America Investment Grade Index 35IBOXHY Index �Markit iBoxx USD Liquid High Yield Index
PrincipalAmount
InterestRate
MaturityDate Value
Bank Loans(a) �� 88.6%Aerospace & Defense(b) �� 0.5%Dynasty Acquisition Co., Inc. (B-/Caa1)(3M LIBOR + 3.500%)$ 2,255,831 3.754 % 04/06/26 $ 2,143,039(3M LIBOR + 3.500%)
1,212,812 3.754 04/06/26 1,152,172TransDigm, Inc. (B+/Ba3) (1M LIBOR + 2.250%)
4,007,529 2.397 08/22/24 3,924,4537,219,664
PrincipalAmount
InterestRate
MaturityDate Value
Bank Loans(a) �� (continued)Automotive - Parts �� (continued)Belron Finance US LLC (BB/Ba3)(c)$ 1,296,725 0.000 % 10/30/26 $ 1,293,484CS Intermediate Holdco 2 LLC (B-/B1)(b) (1M LIBOR + 2.000%)
2,939,834 3.000 11/02/23 2,735,104Dana, Inc. (BBB-/Baa3)(b) (1M LIBOR + 2.250%)
1,100,000 2.397 02/27/26 1,093,125Garrett LX III S.a r.l. (D/WR)(b) (3M LIBOR + 2.500%)
4,761,107 5.750 09/27/25 4,659,933
Copyright © 2021 www.secdatabase.com. All Rights Reserved.Please Consider the Environment Before Printing This Document
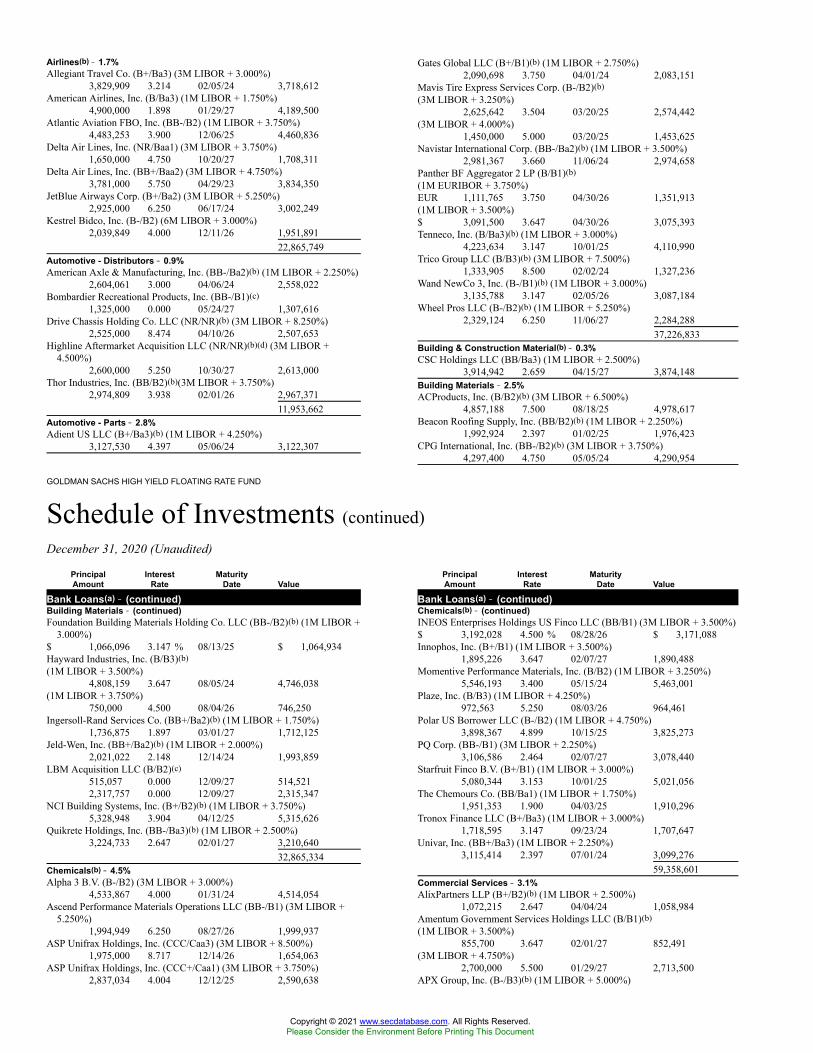
GOLDMAN SACHS HIGH YIELD FLOATING RATE FUND
Schedule of Investments (continued)December 31, 2020 (Unaudited)
Airlines(b) �� 1.7%Allegiant Travel Co. (B+/Ba3) (3M LIBOR + 3.000%)
3,829,909 3.214 02/05/24 3,718,612American Airlines, Inc. (B/Ba3) (1M LIBOR + 1.750%)
4,900,000 1.898 01/29/27 4,189,500Atlantic Aviation FBO, Inc. (BB-/B2) (1M LIBOR + 3.750%)
4,483,253 3.900 12/06/25 4,460,836Delta Air Lines, Inc. (NR/Baa1) (3M LIBOR + 3.750%)
1,650,000 4.750 10/20/27 1,708,311Delta Air Lines, Inc. (BB+/Baa2) (3M LIBOR + 4.750%)
3,781,000 5.750 04/29/23 3,834,350JetBlue Airways Corp. (B+/Ba2) (3M LIBOR + 5.250%)
2,925,000 6.250 06/17/24 3,002,249Kestrel Bidco, Inc. (B-/B2) (6M LIBOR + 3.000%)
2,039,849 4.000 12/11/26 1,951,89122,865,749
Automotive - Distributors �� 0.9%American Axle & Manufacturing, Inc. (BB-/Ba2)(b) (1M LIBOR + 2.250%)
2,604,061 3.000 04/06/24 2,558,022Bombardier Recreational Products, Inc. (BB-/B1)(c)
1,325,000 0.000 05/24/27 1,307,616Drive Chassis Holding Co. LLC (NR/NR)(b) (3M LIBOR + 8.250%)
2,525,000 8.474 04/10/26 2,507,653Highline Aftermarket Acquisition LLC (NR/NR)(b)(d) (3M LIBOR +
4.500%)2,600,000 5.250 10/30/27 2,613,000
Thor Industries, Inc. (BB/B2)(b)(3M LIBOR + 3.750%)2,974,809 3.938 02/01/26 2,967,371
11,953,662Automotive - Parts �� 2.8%Adient US LLC (B+/Ba3)(b) (1M LIBOR + 4.250%)
3,127,530 4.397 05/06/24 3,122,307
Gates Global LLC (B+/B1)(b) (1M LIBOR + 2.750%)2,090,698 3.750 04/01/24 2,083,151
Mavis Tire Express Services Corp. (B-/B2)(b)(3M LIBOR + 3.250%)
2,625,642 3.504 03/20/25 2,574,442(3M LIBOR + 4.000%)
1,450,000 5.000 03/20/25 1,453,625Navistar International Corp. (BB-/Ba2)(b) (1M LIBOR + 3.500%)
2,981,367 3.660 11/06/24 2,974,658Panther BF Aggregator 2 LP (B/B1)(b)(1M EURIBOR + 3.750%)EUR 1,111,765 3.750 04/30/26 1,351,913(1M LIBOR + 3.500%)$ 3,091,500 3.647 04/30/26 3,075,393Tenneco, Inc. (B/Ba3)(b) (1M LIBOR + 3.000%)
4,223,634 3.147 10/01/25 4,110,990Trico Group LLC (B/B3)(b) (3M LIBOR + 7.500%)
1,333,905 8.500 02/02/24 1,327,236Wand NewCo 3, Inc. (B-/B1)(b) (1M LIBOR + 3.000%)
3,135,788 3.147 02/05/26 3,087,184Wheel Pros LLC (B-/B2)(b) (1M LIBOR + 5.250%)
2,329,124 6.250 11/06/27 2,284,28837,226,833
Building & Construction Material(b) �� 0.3%CSC Holdings LLC (BB/Ba3) (1M LIBOR + 2.500%)
3,914,942 2.659 04/15/27 3,874,148Building Materials �� 2.5%ACProducts, Inc. (B/B2)(b) (3M LIBOR + 6.500%)
4,857,188 7.500 08/18/25 4,978,617Beacon Roofing Supply, Inc. (BB/B2)(b) (1M LIBOR + 2.250%)
1,992,924 2.397 01/02/25 1,976,423CPG International, Inc. (BB-/B2)(b) (3M LIBOR + 3.750%)
4,297,400 4.750 05/05/24 4,290,954
PrincipalAmount
InterestRate
MaturityDate Value
Bank Loans(a) �� (continued)Building Materials �� (continued)Foundation Building Materials Holding Co. LLC (BB-/B2)(b) (1M LIBOR +
3.000%)$ 1,066,096 3.147 % 08/13/25 $ 1,064,934Hayward Industries, Inc. (B/B3)(b)(1M LIBOR + 3.500%)
4,808,159 3.647 08/05/24 4,746,038(1M LIBOR + 3.750%)
750,000 4.500 08/04/26 746,250Ingersoll-Rand Services Co. (BB+/Ba2)(b) (1M LIBOR + 1.750%)
1,736,875 1.897 03/01/27 1,712,125Jeld-Wen, Inc. (BB+/Ba2)(b) (1M LIBOR + 2.000%)
2,021,022 2.148 12/14/24 1,993,859LBM Acquisition LLC (B/B2)(c)
515,057 0.000 12/09/27 514,5212,317,757 0.000 12/09/27 2,315,347
NCI Building Systems, Inc. (B+/B2)(b) (1M LIBOR + 3.750%)5,328,948 3.904 04/12/25 5,315,626
Quikrete Holdings, Inc. (BB-/Ba3)(b) (1M LIBOR + 2.500%)3,224,733 2.647 02/01/27 3,210,640
32,865,334Chemicals(b) �� 4.5%Alpha 3 B.V. (B-/B2) (3M LIBOR + 3.000%)
4,533,867 4.000 01/31/24 4,514,054Ascend Performance Materials Operations LLC (BB-/B1) (3M LIBOR +
5.250%)1,994,949 6.250 08/27/26 1,999,937
ASP Unifrax Holdings, Inc. (CCC/Caa3) (3M LIBOR + 8.500%)1,975,000 8.717 12/14/26 1,654,063
ASP Unifrax Holdings, Inc. (CCC+/Caa1) (3M LIBOR + 3.750%)2,837,034 4.004 12/12/25 2,590,638
PrincipalAmount
InterestRate
MaturityDate Value
Bank Loans(a) �� (continued)Chemicals(b) �� (continued)INEOS Enterprises Holdings US Finco LLC (BB/B1) (3M LIBOR + 3.500%)$ 3,192,028 4.500 % 08/28/26 $ 3,171,088Innophos, Inc. (B+/B1) (1M LIBOR + 3.500%)
1,895,226 3.647 02/07/27 1,890,488Momentive Performance Materials, Inc. (B/B2) (1M LIBOR + 3.250%)
5,546,193 3.400 05/15/24 5,463,001Plaze, Inc. (B/B3) (1M LIBOR + 4.250%)
972,563 5.250 08/03/26 964,461Polar US Borrower LLC (B-/B2) (1M LIBOR + 4.750%)
3,898,367 4.899 10/15/25 3,825,273PQ Corp. (BB-/B1) (3M LIBOR + 2.250%)
3,106,586 2.464 02/07/27 3,078,440Starfruit Finco B.V. (B+/B1) (1M LIBOR + 3.000%)
5,080,344 3.153 10/01/25 5,021,056The Chemours Co. (BB/Ba1) (1M LIBOR + 1.750%)
1,951,353 1.900 04/03/25 1,910,296Tronox Finance LLC (B+/Ba3) (1M LIBOR + 3.000%)
1,718,595 3.147 09/23/24 1,707,647Univar, Inc. (BB+/Ba3) (1M LIBOR + 2.250%)
3,115,414 2.397 07/01/24 3,099,27659,358,601
Commercial Services �� 3.1%AlixPartners LLP (B+/B2)(b) (1M LIBOR + 2.500%)
1,072,215 2.647 04/04/24 1,058,984Amentum Government Services Holdings LLC (B/B1)(b)(1M LIBOR + 3.500%)
855,700 3.647 02/01/27 852,491(3M LIBOR + 4.750%)
2,700,000 5.500 01/29/27 2,713,500APX Group, Inc. (B-/B3)(b) (1M LIBOR + 5.000%)
Copyright © 2021 www.secdatabase.com. All Rights Reserved.Please Consider the Environment Before Printing This Document

GOLDMAN SACHS HIGH YIELD FLOATING RATE FUND
Schedule of Investments (continued)December 31, 2020 (Unaudited)
GOLDMAN SACHS HIGH YIELD FLOATING RATE FUND
Schedule of Investments (continued)December 31, 2020 (Unaudited)
Consolidated Energy Finance SA (B+/B1) (1M LIBOR + 2.500%)3,909,898 2.645 05/07/25 3,729,066
Cyanco Intermediate Corp. (B/B2) (1M LIBOR + 3.500%)3,869,416 3.647 03/16/25 3,838,770
Diamond (BC) B.V. (B-/B1) (3M LIBOR + 5.000%)997,500 6.000 09/06/24 995,006
Element Solutions, Inc. (BB/Ba2) (1M LIBOR + 2.000%)3,169,127 2.147 01/31/26 3,133,475
Emerald Performance Materials LLC (B/B2) (1M LIBOR + 4.000%)3,193,676 5.000 08/12/25 3,207,664
Hexion, Inc. (B+/Ba3) (6M LIBOR + 3.500%)3,600,911 3.730 07/01/26 3,564,902
1,984,998 5.147 12/31/25 1,971,877AQ Carver Buyer, Inc. (B/B2)(b) (6M LIBOR + 5.000%)
2,172,500 6.000 09/23/25 2,139,913Avis Budget Car Rental LLC (BB-/Ba2)(b) (1M LIBOR + 2.250%)
2,008,909 2.400 08/06/27 1,935,464Da Vinci Purchaser Corp. (B/B2)(b) (3M LIBOR + 4.000%)
3,980,000 5.000 01/08/27 3,986,647Fly Funding II S.a.r.l. (BB+/Ba3)(b) (3M LIBOR + 6.000%)
1,475,000 6.237 10/08/25 1,452,875GlobalLogic Holdings, Inc. (B/B2)(b) (1M LIBOR + 3.750%)
2,094,750 4.500 09/14/27 2,084,276
PrincipalAmount
InterestRate
MaturityDate Value
Bank Loans(a) �� (continued)Commercial Services �� (continued)IRB Holding Corp. (B/B2)$ 1,300,000 0.000 %(c) 12/15/27 $ 1,300,403(6M LIBOR + 2.750%)
5,652,988 3.750 (b) 02/05/25 5,598,380Northstar Group Services, Inc. (NR/NR)(b)(d) (3M LIBOR + 5.500%)
2,700,000 6.500 11/09/26 2,666,250Packers Holdings LLC (B-/B2)(b) (1M LIBOR + 4.000%)
1,250,000 4.750 12/04/24 1,249,225Prime Security Services Borrower LLC (BB-/Ba3)(b) (1M LIBOR +
3.250%)3,118,399 4.250 09/23/26 3,126,195
Rockwood Service Corporation (B/B2)(b) (1M LIBOR + 4.250%)1,488,750 4.397 01/23/27 1,483,167
STG-Fairway Holdings LLC (B-/B2)(b) (1M LIBOR + 3.250%)2,315,871 3.397 01/31/27 2,275,344
Trans Union LLC (BBB-/Ba2)(b) (1M LIBOR + 1.750%)2,436,745 1.898 11/16/26 2,425,074
TruGreen LP (NR/NR)(c)(d)1,225,000 0.000 11/02/28 1,225,000
TruGreen LP (B/B1)(c)1,275,000 0.000 11/02/27 1,279,781
40,824,846Computers(b) �� 0.2%Redstone Buyer LLC (B/B1) (2M LIBOR + 5.000%)
2,600,000 6.000 09/01/27 2,607,306Construction Machinery(b) �� 0.5%Brookfield WEC Holdings Inc. (B/B2) (1M LIBOR + 3.000%)
4,917,918 3.750 08/01/25 4,900,361Welbilt, Inc. (CCC+/B3) (1M LIBOR + 2.500%)
2,147,500 2.645 10/23/25 2,029,3886,929,749
Consumer Cyclical Services �� 0.3%Fleet U.S. Bidco, Inc. (B+/B2)(b) (1M LIBOR + 3.250%)
2,577,475 3.397 10/07/26 2,551,700KAR Auction Services, Inc. (B/Ba3)(c)
1,975,000 0.000 09/19/26 1,940,4374,492,137
Consumer Cyclical Services - Business(b) �� 1.8%Advantage Sales & Marketing, Inc. (B/B2) (3M LIBOR + 5.250%)
2,500,000 6.000 10/28/27 2,488,550
PrincipalAmount
InterestRate
MaturityDate Value
Bank Loans(a) �� (continued)Consumer Cyclical Services - Business(b) �� (continued)Allied Universal Holding Co. LLC (B-/B3) (1M LIBOR + 4.250%)$ 4,379,695 4.397 % 07/10/26 $ 4,356,877Colorado Buyer, Inc. (CC/Caa2) (3M LIBOR + 7.250%)
2,875,000 8.250 05/01/25 2,240,948GT Polaris, Inc. (NR/NR) (3M LIBOR + 4.000%)
1,275,000 5.000 09/24/27 1,278,506Guidehouse LLP (B-/B1) (1M LIBOR + 4.500%)
3,677,847 4.647 05/01/25 3,671,706Sabre GLBL, Inc. (B/Ba3) (1M LIBOR + 2.000%)
3,361,741 2.147 02/22/24 3,275,310Stats Intermediate Holdings LLC (B-/B2) (3M LIBOR + 5.250%)
1,308,454 5.471 07/10/26 1,289,913Tempo Acquisition LLC (B/B1) (1M LIBOR + 3.250%)
2,468,519 3.750 11/02/26 2,448,474The House of HR (NR/NR) (6M EURIBOR + 4.250%)EUR 2,475,000 4.250 07/27/26 3,001,542
24,051,826Consumer Products(b) �� 0.2%Coty, Inc. (B/B3) (1M LIBOR + 2.250%)$ 3,406,781 2.402 04/07/25 3,202,375Consumer Products - Household & Leisure(b) �� 0.7%Diamond (BC) B.V. (B-/B1) (3M LIBOR + 3.000%)
3,057,775 3.214 09/06/24 3,009,371Harbor Freight Tools USA, Inc. (BB-/Ba3) (1M LIBOR + 3.250%)
3,999,149 4.000 10/19/27 3,992,471Prestige Brands, Inc. (BB/Ba3) (1M LIBOR + 2.000%)
1,998,892 2.147 01/26/24 1,999,7319,001,573
Consumer Products - Non Durable �� 0.7%Alphabet Holding Co., Inc. (B-/B3)(b) (1M LIBOR + 3.500%)
2,782,147 3.647 09/26/24 2,753,547Alphabet Holding Co., Inc. (CCC/Caa2)(b) (1M LIBOR + 7.750%)
2,575,000 7.897 09/26/25 2,558,262HLF Financing S.a r.l. (BB+/Ba1)(b) (1M LIBOR + 2.750%)
1,915,559 2.897 08/18/25 1,910,368Kronos Acquisition Holdings, Inc. (B-/B2)(c)
1,925,000 0.000 12/17/26 1,922,5949,144,771
PrincipalAmount
InterestRate
MaturityDate Value
Bank Loans(a) �� (continued)
PrincipalAmount
InterestRate
MaturityDate Value
Bank Loans(a) �� (continued)
Copyright © 2021 www.secdatabase.com. All Rights Reserved.Please Consider the Environment Before Printing This Document

GOLDMAN SACHS HIGH YIELD FLOATING RATE FUND
Schedule of Investments (continued)December 31, 2020 (Unaudited)
Distribution & Wholesale(c) �� 0.1%American Builders & Contractors Supply Co., Inc. (BB+/B1)$ 1,271,780 0.000 % 01/15/27 $ 1,258,605Distributor(b) �� 0.2%UGI Energy Services LLC (NR/Ba3) (1M LIBOR + 3.750%)
2,615,460 3.897 08/13/26 2,615,460Diversified Financial Services �� 3.4%Advisor Group, Inc. (B-/B2)(b) (1M LIBOR + 5.000%)
1,965,075 5.147 07/31/26 1,943,794Blackstone CQP Holding Co. LP (B+/B1)(b) (3M LIBOR + 3.500%)
4,331,089 3.736 09/30/24 4,314,847Citadel Securities LP (BBB-/Ba1)(b) (1M LIBOR + 2.750%)
4,357,550 2.897 02/27/26 4,355,719DLG Acquisitions Ltd. (NR/NR)(b) (6M EURIBOR + 3.500%)EUR 1,825,000 3.500 05/15/26 2,204,429Edelman Financial Center LLC (B/B2)(b) (1M LIBOR + 3.000%)$ 3,609,487 3.147 07/21/25 3,549,714FinCo I LLC (BB/Baa3)(b) (1M LIBOR + 2.500%)
1,390,589 2.647 06/27/25 1,387,988First Eagle Holdings, Inc. (BB/Ba2)(b) (3M LIBOR + 2.500%)
2,620,407 2.754 02/01/27 2,591,294Fiserv Investment Solutions, Inc. (B/B2)(b) (3M LIBOR + 4.750%)
2,544,744 4.970 02/18/27 2,561,718Franklin Square Holdings LP (BB/Ba1)(b) (1M LIBOR + 2.250%)
1,279,931 2.438 08/01/25 1,268,732Jefferies Finance LLC (BB-/Ba3)(b) (1M LIBOR + 3.000%)
3,956,127 3.188 06/03/26 3,922,500KREF Holdings X LLC (BB-/Ba2)(c)
1,275,000 0.000 08/05/27 1,284,563MHI Holdings LLC (B/B2)(b) (1M LIBOR + 5.000%)
3,060,393 5.147 09/21/26 3,045,091Milano Acquisition Corp. (B+/B2)(b) (3M LIBOR + 4.000%)
3,250,000 4.750 10/01/27 3,244,573Nielsen Finance LLC (BBB-/Ba1)(b) (1M EURIBOR + 3.750%)EUR 622,745 3.750 06/04/25 762,047Radar Bidco SARL (NR/NR)(b)(d) (3M EURIBOR + 8.000%)
1,149,826 8.000 12/16/24 1,415,220Syncapay, Inc (B/B2)(c)$ 4,650,000 0.000 12/10/27 4,464,000
Diversified Financial Services �� (continued)VFH Parent LLC (B+/Ba3)(b) (3M LIBOR + 3.000%)$ 1,721,820 3.153 % 03/01/26 $ 1,717,154Victory Capital Holdings, Inc. (BB-/Ba3)(b) (3M LIBOR + 2.500%)
1,161,757 2.734 07/01/26 1,156,43645,189,819
Diversified Manufacturing(b) �� 2.0%AI Aqua Merger Sub, Inc. (B/B2)(1M LIBOR + 3.250%)
966,302 4.250 12/13/23 959,054(1M LIBOR + 3.250%)
1,605,652 4.250 12/13/23 1,591,603(1M LIBOR + 5.250%)
500,000 6.250 (d) 12/13/23 500,000AI Plex Acquico GmbH (B-/B3) (6M LIBOR + 5.000%)
2,693,866 5.316 07/31/26 2,601,817Apex Tool Group LLC (CCC+/B3) (1M LIBOR + 5.250%)
3,874,367 6.500 08/01/24 3,822,218Atkore International, Inc. (BB-/Ba3) (3M LIBOR + 2.750%)
3,732,485 3.750 12/22/23 3,740,249Dynacast International LLC (CCC/Caa1) (3M LIBOR + 3.250%)
4,070,343 3.490 01/28/22 3,846,474Gardner Denver, Inc. (BB+/Ba2) (1M LIBOR + 1.750%)
1,495,665 1.897 03/01/27 1,474,351Robertshaw US Holding Corp. (CCC-/Caa3) (1M LIBOR + 8.000%)
4,650,000 9.000 02/28/26 3,627,000Titan Acquisition Ltd. (B-/B2) (6M LIBOR + 3.000%)
4,148,835 3.267 03/28/25 4,037,10726,199,873
Electrical Utilities �� 0.5%Energizer Holdings, Inc. (NR/NR)
925,000 0.000 (c) 12/16/27 923,270(3M LIBOR + 2.250%)
750,000 2.750 (b) 12/16/27 748,597Pacific Gas & Electric Co. (BB-/B1)(b) (1M LIBOR + 4.500%)
2,587,000 5.500 06/23/25 2,613,517Resideo Funding, Inc. (BBB-/Ba2)(b) (3M LIBOR + 2.250%)
2,613,810 2.510 10/24/25 2,568,0696,853,453
Entertainment(b) �� 3.0%Allen Media LLC (BB-/Ba3) (3M LIBOR + 5.500%)
4,579,680 5.754 02/10/27 4,554,858
PrincipalAmount
InterestRate
MaturityDate Value
Bank Loans(a) �� (continued)Entertainment(b) �� (continued)Alterra Mountain Co. (B/B2)(1M LIBOR + 2.750%)$ 3,482,859 2.897 % 07/31/24 $ 3,429,154(1M LIBOR + 4.500%)
369,576 5.500 08/01/26 370,962AMC Entertainment Holdings, Inc. (CCC/Caa2) (3M LIBOR + 2.000%)
5,631,904 5.250 04/22/26 3,603,010Amer Sports Oyj (NR/NR) (6M EURIBOR + 4.500%)EUR 3,225,000 4.500 03/30/26 3,748,267Banijay Entertainment S.A.S (B/B1) (1M LIBOR + 3.750%)$ 3,640,875 3.903 03/01/25 3,586,262CityCenter Holdings LLC (B+/B2) (1M LIBOR + 2.250%)
3,538,895 2.397 04/18/24 3,483,618Crown Finance US, Inc. (B-/B3) (3M LIBOR + 7.000%)
447,586 7.000 05/23/24 531,136Crown Finance US, Inc. (CCC/Caa2)(6M LIBOR + 2.250%)
3,096,308 2.769 02/28/25 2,089,512(6M LIBOR + 2.750%)
1,091,723 3.019 09/30/26 728,725PCI Gaming Authority (BB+/Ba3) (1M LIBOR + 2.500%)
PrincipalAmount
InterestRate
MaturityDate Value
Bank Loans(a) �� (continued)Food & Beverages �� (continued)Chobani LLC (B-/B1)(b) (1M LIBOR + 3.500%)$ 3,192,000 4.500 % 10/20/27 $ 3,180,828Froneri International Ltd. (B+/B1)(b)(1M EURIBOR + 2.625%)EUR 1,100,000 2.625 01/31/27 1,324,115(1M LIBOR + 2.250%)$ 5,174,000 2.397 01/31/27 5,117,086Shearer�s Foods, Inc. (B-/B2)(b) (3M LIBOR + 4.000%)
1,271,813 4.750 09/23/27 1,271,418Sigma Bidco B.V. (NR/NR)(b) (6M LIBOR + 3.000%)
4,474,905 3.369 07/02/25 4,431,544Sunshine Investments B.V. (NR/NR)(c)EUR 1,200,000 0.000 03/28/25 1,467,475Sunshine Investments B.V. (B+/B1)(b)(3M EURIBOR + 3.250%)
525,000 3.250 03/28/25 635,818(3M LIBOR + 3.250%)$ 3,169,746 3.471 03/28/25 3,142,011
24,290,911Food & Drug Retailing(b) �� 0.2%B&G Foods, Inc. (BB/Ba2) (1M LIBOR + 2.500%)
Copyright © 2021 www.secdatabase.com. All Rights Reserved.Please Consider the Environment Before Printing This Document

GOLDMAN SACHS HIGH YIELD FLOATING RATE FUND
Schedule of Investments (continued)December 31, 2020 (Unaudited)
4,918,308 2.647 05/29/26 4,858,501Playtika Holding Corp. (BB-/B1) (3M LIBOR + 6.000%)
3,117,340 7.000 12/10/24 3,132,584UFC Holdings LLC (B/B2) (6M LIBOR + 3.250%)
2,551,228 4.250 04/29/26 2,540,462Vue International Bidco PLC (CCC+/Caa1) (6M EURIBOR + 4.750%)EUR 3,136,096 4.750 07/03/26 3,245,573
39,902,624Environmental(b) �� 1.0%Core & Main LP (B/B2) (3M LIBOR + 2.750%)$ 4,040,700 3.750 08/01/24 4,017,143EnergySolutions LLC (B-/B3) (3M LIBOR + 3.750%)
4,477,482 4.750 05/09/25 4,397,246GFL Environmental, Inc. (BB-/WR) (3M LIBOR + 3.000%)
2,378,165 3.500 05/30/25 2,380,139Innovative Water Care Global Corp. (CCC+/Caa1) (3M LIBOR + 5.000%)
2,225,462 6.000 02/27/26 1,991,78812,786,316
Food & Beverages �� 1.8%BellRing Brands LLC (B+/B2)(b) (1M LIBOR + 5.000%)
1,173,461 6.000 10/21/24 1,176,982CHG PPC Parent LLC (B/B2)(b) (1M LIBOR + 2.750%)
2,587,281 2.897 03/31/25 2,543,634
1,350,000 2.647 10/10/26 1,346,139US Foods, Inc. (BB-/B3) (1M LIBOR + 1.750%)
1,919,974 1.897 06/27/23 1,889,2163,235,355
Gaming(b) �� 1.2%Caesars Resort Collection LLC (B+/B1) (1M LIBOR + 2.750%)
6,936,292 2.897 12/23/24 6,796,733Mohegan Tribal Gaming Authority (CCC+/Caa1) (3M LIBOR + 5.375%)
1,351,697 6.375 10/13/23 1,288,722Scientific Games International, Inc. (B+/B1) (1M LIBOR + 2.750%)
6,709,437 2.897 08/14/24 6,543,378The Stars Group Holdings B.V. (BBB-/Ba1) (3M LIBOR + 3.500%)
1,228,178 3.751 07/10/25 1,231,93615,860,769
Health Care - Pharmaceuticals(b) �� 1.8%Amedes Holding AG (B/B2) (3M EURIBOR + 3.000%)EUR 3,010,720 3.000 06/08/26 3,682,644Bausch Health Cos., Inc. (BB/Ba2)(1M LIBOR + 2.750%)$ 2,172,111 2.898 11/27/25 2,149,608(1M LIBOR + 3.000%)
5,013,722 3.148 06/02/25 4,991,812
PrincipalAmount
InterestRate
MaturityDate Value
Bank Loans(a) �� (continued)Health Care - Pharmaceuticals(b) �� (continued)Endo Finance Co. (Luxembourg) S.a.r.l. (B+/B2) (3M LIBOR + 4.250%)$ 5,055,860 5.000 % 04/29/24 $ 4,967,383Grifols Worldwide Operations USA, Inc. (BB+/Ba2) (1 Week LIBOR +
2.000%)4,899,399 2.102 11/15/27 4,853,491
Sunshine Luxembourg VII S.a r.l. (B-/B2) (3M LIBOR + 4.000%)3,185,042 5.000 10/01/26 3,191,029
23,835,967Health Care - Services �� 6.0%Air Medical Group Holdings, Inc. (B/B2)(b) (3M LIBOR + 4.250%)
3,018,878 5.250 03/14/25 2,985,459Air Methods Corp. (B/B3)(b) (3M LIBOR + 3.500%)
2,051,375 4.500 04/22/24 1,970,345American Renal Holdings, Inc. (B-/B3)(b) (1M LIBOR + 5.000%)
3,062,227 5.147 06/21/24 3,052,397Athenahealth, Inc. (B/B2)(b) (1M LIBOR + 4.500%)
4,431,566 4.648 02/11/26 4,419,380Change Healthcare Holdings LLC (B+/B1)(b) (3M LIBOR + 2.500%)
2,649,872 3.500 03/01/24 2,635,298Envision Healthcare Corp. (CCC/Caa1)(b) (1M LIBOR + 3.750%)
6,730,210 3.897 10/10/25 5,593,680ExamWorks Group, Inc. (B/B1)(b) (3M LIBOR + 3.250%)
2,579,846 4.250 07/27/23 2,574,480Gentiva Health Services, Inc. (B/B1)(b) (1M LIBOR + 3.250%)
3,801,266 3.438 07/02/25 3,775,151Global Medical Response, Inc. (B/B2)(b) (3M LIBOR + 4.750%)
1,500,000 5.750 10/02/25 1,487,505Help At Home, Inc. (B-/B1)(b) (3M LIBOR + 5.000%)
1,864,655 6.000 10/29/27 1,848,339Jaguar Holding Company II (BB-/Ba2)(b) (1M LIBOR + 2.500%)
4,498,401 3.500 08/18/22 4,494,488MPH Acquisition Holdings LLC (B+/Ba3)(b) (3M LIBOR + 2.750%)
5,165,057 3.750 06/07/23 5,136,029Pluto Acquisition I, Inc. (B-/B2)(c)
1,250,000 0.000 06/22/26 1,250,000RegionalCare Hospital Partners Holdings, Inc. (B/B1)(b) (1M LIBOR +
3.750%)5,599,810 3.897 11/16/25 5,578,138
Rodenstock GmbH (NR/NR)(b)(d) (6M EURIBOR + 5.250%)EUR 2,725,000 5.250 06/15/26 3,287,384
PrincipalAmount
InterestRate
MaturityDate Value
Bank Loans(a) �� (continued)Health Care - Services �� (continued)Sedgwick Claims Management Services, Inc. (B/B2)(b) (1M LIBOR +
3.250%)$ 6,111,141 3.397 % 12/31/25 $ 6,006,763Sotera Health Holdings LLC (B+/B1)(b) (3M LIBOR + 4.500%)
4,400,670 5.500 12/11/26 4,413,521Team Health Holdings, Inc. (B-/Caa1)(b) (1M LIBOR + 2.750%)
7,075,001 3.750 02/06/24 6,282,884U.S. Renal Care, Inc. (B-/B2)(b) (1M LIBOR + 5.000%)
4,834,110 5.147 06/26/26 4,803,896Verscend Holding Corp. (B+/B3)(b) (1M LIBOR + 4.500%)
4,558,426 4.647 08/27/25 4,549,309Vizient, Inc. (BB-/Ba2)(b) (1M LIBOR + 2.000%)
1,977,437 2.147 05/06/26 1,958,493WP CityMD Bidco LLC (B-/B2)(b) (3M LIBOR + 4.500%)
1,435,500 5.500 08/13/26 1,432,51479,535,453
Healthcare Providers & Services(b) �� 0.2%Conservice Midco LLC (B/B2) (3M LIBOR + 4.250%)
2,498,738 4.503 05/13/27 2,498,738Home Construction �� 0.3%CP Atlas Buyer, Inc. (B/B2)(b)(3M LIBOR + 4.500%)
825,000 5.250 11/23/27 826,031(3M LIBOR + 4.500%)
275,000 5.250 11/23/27 275,344Gyp Holdings III Corp. (BB-/B1)(b) (1M LIBOR + 2.750%)
1,926,566 2.897 06/01/25 1,916,124MI Windows and Doors LLC (NR/NR)(c)
1,500,000 0.000 12/18/27 1,501,8754,519,374
Hotels, Restaurants & Leisure(b) �� 0.1%Carnival Corp. (BB-/Ba2) (1M LIBOR + 7.500%)
1,246,867 8.500 06/30/25 1,281,156Insurance �� 1.6%Acrisure LLC (B/B2)(b) (1M LIBOR + 3.500%)
3,473,750 3.647 02/15/27 3,400,662Alliant Holdings Intermediate LLC (B/B2)(b) (1M LIBOR + 3.250%)
3,965,661 3.397 05/09/25 3,894,795AssuredPartners, Inc. (B/B1)(b) (1M LIBOR + 3.500%)
1,841,213 3.647 02/12/27 1,811,864
Copyright © 2021 www.secdatabase.com. All Rights Reserved.Please Consider the Environment Before Printing This Document

GOLDMAN SACHS HIGH YIELD FLOATING RATE FUND
Schedule of Investments (continued)December 31, 2020 (Unaudited)
GOLDMAN SACHS HIGH YIELD FLOATING RATE FUND
Schedule of Investments (continued)December 31, 2020 (Unaudited)
PrincipalAmount
InterestRate
MaturityDate Value
Bank Loans(a) �� (continued)Insurance �� (continued)HUB International Ltd. (B/B2)(b) (3M LIBOR + 2.750%)$ 5,153,053 2.965 % 04/25/25 $ 5,054,836OneDigital Borrower LLC (B/B3)(c)
1,624,219 0.000 11/16/27 1,624,219300,781 0.000 11/16/27 300,781
Sedgwick Claims Management Services, Inc. (B/B2)(b) (1M LIBOR +4.250%)
547,250 5.250 09/03/26 550,670USI, Inc. (B/B2)(b) (3M LIBOR + 3.000%)
5,008,480 3.254 05/16/24 4,932,30221,570,129
Lodging(c) �� 0.1%Four Seasons Hotels Ltd. (BB+/Ba3)
1,944,935 0.000 11/30/23 1,929,298Machinery �� 0.6%Shape Technologies Group, Inc. (CCC+/Caa2)(b) (1M LIBOR + 3.000%)
2,869,363 3.147 04/21/25 2,499,932Star US Bidco LLC (B-/B3)(b)(1M LIBOR + 4.250%)
1,991,247 5.250 03/17/27 1,948,933Vertical Midco GmbH (NR/NR)(c) (6M LIBOR + 4.250%)
3,192,000 0.000 07/30/27 3,202,8217,651,686
Media �� 0.4%Adevinta ASA (NR/NR)(c)
950,000 0.000 10/13/27 948,518EUR 1,250,000 0.000 10/13/27 1,528,116Gray Television, Inc. (BB/Ba2)(c)$ 1,300,000 0.000 01/02/26 1,289,704Meredith Corp. (BB-/Ba3)(b) (1M LIBOR + 2.500%)
1,893,413 2.647 01/31/25 1,871,0525,637,390
Media - Broadcasting & Radio �� 1.8%Cumulus Media New Holdings, Inc. (B/B2)(b) (3M LIBOR + 3.750%)
3,278,353 4.750 03/31/26 3,215,507Diamond Sports Group LLC (BB-/Ba3)(b) (1M LIBOR + 3.250%)
2,742,025 3.400 08/24/26 2,415,834Digital Room Holdings, Inc. (B-/B2)(b) (6M LIBOR + 5.000%)
2,992,175 5.269 05/21/26 2,805,164
PrincipalAmount
InterestRate
MaturityDate Value
Bank Loans(a) �� (continued)Media - Broadcasting & Radio �� (continued)Metro-Goldwyn-Mayer, Inc. (BB-/Ba3)(b) (1M LIBOR + 2.500%)$ 2,210,427 2.650 % 07/03/25 $ 2,210,427Metro-Goldwyn-Mayer, Inc. (CCC+/B3)(b) (1M LIBOR + 4.500%)
1,050,000 5.500 07/03/26 1,044,750Nexstar Broadcasting, Inc. (BB/Ba3)(b)(1M LIBOR + 2.250%)
2,057,015 2.395 01/17/24 2,036,116(3M LIBOR + 2.750%)
2,221,570 2.905 09/18/26 2,204,087Renaissance Holding Corp. (B-/B2)(b) (1M LIBOR + 3.250%)
1,916,649 3.397 05/30/25 1,880,405Renaissance Holding Corp. (CCC/Caa2)(b) (1M LIBOR + 7.000%)
2,000,000 7.147 05/29/26 1,972,500The E.W. Scripps Co. (BB-/Ba3)
1,350,000 0.000 (c) 12/15/27 1,350,000(1M LIBOR + 2.000%)
1,546,351 2.147 (b) 10/02/24 1,534,274WMG Acquisition Corp. (BB/Ba3)(b) (1M LIBOR + 2.125%)
1,136,053 2.272 11/01/23 1,133,03223,802,096
Media - Cable �� 3.0%Altice Financing SA (B/B2)(b)(1M LIBOR + 2.750%)
1,964,377 2.909 07/15/25 1,919,117(1M LIBOR + 2.750%)
4,028,673 2.897 01/31/26 3,934,000Altice France SA (B/B2)(b) (1M LIBOR + 3.688%)
4,435,335 3.846 01/31/26 4,384,062Charter Communications Operating LLC (BBB-/Ba1)(c)
1,296,717 0.000 02/01/27 1,288,133Cogeco Communications, Inc. (BB/B1)(b) (1M LIBOR + 2.000%)
3,254,527 2.147 01/03/25 3,209,777CSC Holdings LLC (BB/Ba3)(b) (1M LIBOR + 2.250%)
3,912,453 2.409 07/17/25 3,848,172iHeartCommunications, Inc. (B+/B1)(b) (1M LIBOR + 4.000%)
1,726,188 4.750 05/01/26 1,724,755ION Media Networks, Inc. (BB-/B1)(b) (1M LIBOR + 3.000%)
2,525,725 3.188 12/18/24 2,521,507Numericable Group SA (B/B2)(b) (1M LIBOR + 2.750%)
4,700,984 2.897 07/31/25 4,594,835Univision Communications, Inc. (B/B2)(b) (1M LIBOR + 3.750%)
1,923,142 4.750 03/15/26 1,922,334Virgin Media Bristol LLC (BB-/Ba3)(b) (1M LIBOR + 2.500%)
4,858,080 2.659 01/31/28 4,808,625
PrincipalAmount
InterestRate
MaturityDate Value
Bank Loans(a) �� (continued)Media - Cable �� (continued)Windstream Services LLC (B/B3)(c)$ 1,325,000 0.000 % 09/21/27 $ 1,293,531Ziggo Financing Partnership B.V. (B+/B1)(b) (1M LIBOR + 2.500%)
4,500,000 2.659 04/30/28 4,467,64539,916,493
Media - Non Cable(b) �� 3.7%Ascend Learning LLC (B-/B1) (1M LIBOR + 3.000%)
2,462,778 4.000 07/12/24 2,447,386
PrincipalAmount
InterestRate
MaturityDate Value
Bank Loans(a) �� (continued)Media - Non Cable(b) �� (continued)Terrier Media Buyer, Inc. (B+/B1)(1M LIBOR + 4.250%)$ 4,752,000 4.397 % 12/17/26 $ 4,750,527(1M LIBOR + 4.250%)
995,000 4.397 12/17/26 992,51248,642,453
Metals & Mining(b) �� 0.9%Anvil International LLC (B-/B3) (1M LIBOR + 5.000%)
Copyright © 2021 www.secdatabase.com. All Rights Reserved.Please Consider the Environment Before Printing This Document

GOLDMAN SACHS HIGH YIELD FLOATING RATE FUND
Schedule of Investments (continued)December 31, 2020 (Unaudited)
Cambium Learning Group, Inc. (NR/Caa2) (3M LIBOR + 8.500%)1,075,000 9.500 12/18/26 1,045,437
Cambium Learning Group, Inc. (B-/B2) (3M LIBOR + 4.500%)2,652,328 4.754 12/18/25 2,633,099
Clear Channel Outdoor Holdings, Inc. (B/B1) (3M LIBOR + 3.500%)4,162,673 3.714 08/21/26 3,999,122
Entercom Media Corp. (BB-/Ba3) (1M LIBOR + 2.500%)2,790,329 2.648 11/18/24 2,720,571
Getty Images, Inc. (B-/B2) (1M LIBOR + 4.500%)4,428,458 4.647 02/19/26 4,350,960
Hubbard Radio LLC (B/B2) (3M LIBOR + 4.250%)3,790,378 5.250 03/28/25 3,657,714
iHeartCommunications, Inc. (B+/B1) (1M LIBOR + 3.000%)925,672 3.147 05/01/26 909,473
Lions Gate Capital Holdings LLC (B+/Ba2) (1M LIBOR + 2.250%)3,224,921 2.398 03/24/25 3,172,516
McGraw-Hill Global Education Holdings LLC (B/Caa1) (3M LIBOR +4.000%)
4,673,373 5.000 05/04/22 4,545,369Meredith Corp. (BB-/Ba3) (3M LIBOR + 4.250%)
4,104,375 5.250 01/31/25 4,122,845NEP/NCP Holdco, Inc. (B/Caa1) (1M LIBOR + 3.250%)
2,819,601 3.397 10/20/25 2,666,102NEP/NCP Holdco, Inc. (CCC/Caa3) (1M LIBOR + 7.000%)
3,200,000 7.147 10/19/26 2,713,600Nielsen Finance LLC (NR/NR) (1M LIBOR + 3.750%)
2,546,375 4.750 06/04/25 2,558,572Prometric Holdings, Inc. (B-/B2) (1M LIBOR + 3.000%)
1,396,447 4.000 01/29/25 1,356,648
3,950,000 5.150 05/28/26 3,721,887Crosby US Acquisition Corp. (B-/B2) (1M LIBOR + 4.750%)
3,335,569 4.894 06/26/26 3,252,180Oxbow Carbon LLC (BB-/B1) (1M LIBOR + 4.250%)
3,480,938 5.000 10/13/25 3,472,235U.S. Silica Co. (CCC+/Caa1) (1M LIBOR + 4.000%)
1,538,478 5.000 05/01/25 1,344,24511,790,547
Oil & Gas Services(b) �� 0.0%EG Group Ltd. (B-/B3) (3M LIBOR + 4.000%)
548,590 4.254 02/07/25 541,392Packaging �� 3.6%Berlin Packaging LLC (B-/B3)(b) (1M LIBOR + 3.000%)
4,959,314 3.160 11/07/25 4,871,931Berry Global, Inc. (BBB-/Ba2)(c)
3,250,000 0.000 07/01/26 3,230,922BWAY Holding Co. (B-/B3)(b) (3M LIBOR + 3.250%)
5,705,949 3.480 04/03/24 5,499,108Canister International Group, Inc. (B/B2)(b) (1M LIBOR + 4.750%)
2,387,486 4.897 12/21/26 2,375,549Charter NEX US, Inc. (NR/NR)(b) (1M LIBOR + 4.250%)
4,735,717 5.000 12/01/27 4,754,660Consolidated Container Co. LLC (B+/B2)(b) (1M LIBOR + 2.750%)
3,959,717 3.750 05/22/24 3,945,699Flex Acquisition Co., Inc. (B/B2)(b)(3M LIBOR + 3.000%)
1,114,243 4.000 12/29/23 1,106,934(3M LIBOR + 3.000%)
3,242,609 3.225 06/29/25 3,199,644LABL, Inc. (B/B2)(b)(1M EURIBOR + 5.000%)EUR 3,050,000 5.000 07/01/26 3,726,033(1M LIBOR + 4.500%)$ 1,105,049 4.647 07/01/26 1,104,010Pregis TopCo Corp. (B-/B2)(b) (1M LIBOR + 4.250%)
1,500,000 5.000 08/01/26 1,488,750
PrincipalAmount
InterestRate
MaturityDate Value
Bank Loans(a) �� (continued)Packaging �� (continued)Pro Mach Group, Inc. (B-/B2)(b) (1M LIBOR + 2.750%)$ 4,722,760 2.897 % 03/07/25 $ 4,632,508Reynolds Consumer Products, Inc (BB+/Ba1)(b) (1M LIBOR + 1.750%)
2,735,076 1.897 02/04/27 2,714,563Reynolds Group Holdings, Inc. (B+/B1)(b) (1M LIBOR + 3.250%)
2,475,000 3.397 02/05/26 2,453,344Trident TPI Holdings, Inc. (B-/B2)(b) (3M LIBOR + 3.000%)
2,520,348 4.000 10/17/24 2,483,09747,586,752
Paper �� 0.4%Altium Packaging LLC (B+/B2)(b) (1M LIBOR + 3.000%)
738,787 3.147 06/14/26 733,247Clearwater Paper Corp. (BB+/Ba1)(c)
1,206,643 0.000 07/26/26 1,209,659Pregis TopCo Corp. (B-/B2)(b) (1M LIBOR + 3.750%)
3,636,699 3.897 07/31/26 3,618,5165,561,422
Pipelines(b) �� 2.2%BCP Raptor LLC (B-/B3)(1M LIBOR + 4.250%)
1,527,108 5.250 06/24/24 1,394,448(1M LIBOR + 4.750%)
3,229,911 4.897 11/03/25 2,894,000Buckeye Partners LP (BBB-/Ba1) (1M LIBOR + 2.750%)
3,932,844 2.897 11/01/26 3,924,860Centurion Pipeline Co. LLC (BB/B1)(1M LIBOR + 3.250%)
PrincipalAmount
InterestRate
MaturityDate Value
Bank Loans(a) �� (continued)Real Estate Investment Trust(b) �� 0.8%Brookfield Property REIT, Inc. (BB+/B1) (1M LIBOR + 2.500%)$ 4,835,935 2.647 % 08/27/25 $ 4,555,160Forest City Enterprises LP (B+/B2) (1M LIBOR + 3.500%)
2,828,354 3.647 12/08/25 2,699,325Realogy Group LLC (BB/Ba3) (1M LIBOR + 2.250%)
3,011,196 3.000 02/08/25 2,953,11010,207,595
Restaurants(b) �� 0.4%1011778 B.C. Unlimited Liability Co. (BB+/Ba2) (1M LIBOR + 1.750%)
4,837,162 1.897 11/19/26 4,763,105Retailers(b) �� 1.8%Bass Pro Group LLC (B+/B1) (1M LIBOR + 5.000%)
4,984,898 5.750 09/25/24 4,993,821Dealer Tire LLC (B-/B1) (1M LIBOR + 4.250%)
3,339,910 4.397 12/12/25 3,309,283EG America LLC (B-/B3) (3M LIBOR + 4.000%)
3,980,870 4.254 02/07/25 3,928,641Neiman Marcus Group Ltd. LLC (CCC+/Caa2) (3M LIBOR + 12.000%)
827,336 13.000 09/25/25 877,663OEConnection LLC (B-/B2) (1M LIBOR + 4.000%)
3,208,483 4.147 09/25/26 3,168,377Shutterfly, Inc. (B-/B2) (3M LIBOR + 6.000%)
2,122,565 7.000 09/25/26 2,107,409Staples, Inc. (B/B1) (3M LIBOR + 5.000%)
5,363,729 5.214 04/16/26 5,185,11723,570,311
Retailing(c) �� 0.1%
Copyright © 2021 www.secdatabase.com. All Rights Reserved.Please Consider the Environment Before Printing This Document

GOLDMAN SACHS HIGH YIELD FLOATING RATE FUND
Schedule of Investments (continued)December 31, 2020 (Unaudited)
GOLDMAN SACHS HIGH YIELD FLOATING RATE FUND
Schedule of Investments (continued)December 31, 2020 (Unaudited)
1,247,212 3.397 09/29/25 1,237,471(1M LIBOR + 4.250%)
1,560,000 4.147 (d) 09/28/25 1,552,200Illuminate Buyer LLC (B+/B1) (1M LIBOR + 4.000%)
2,593,500 4.147 06/30/27 2,592,411Lower Cadence Holdings LLC (B-/B2) (1M LIBOR + 4.000%)
2,216,250 4.147 05/22/26 2,159,470NorthRiver Midstream Finance LP (BB/Ba3) (3M LIBOR + 3.250%)
3,714,500 3.475 10/01/25 3,648,976Prairie ECI Acquiror LP (B-/B3) (1M LIBOR + 4.750%)
3,079,942 4.897 03/11/26 3,002,943Traverse Midstream Partners LLC (B/B3) (1M LIBOR + 5.500%)
2,717,508 6.500 09/27/24 2,659,761Waterbridge Midstream Operating LLC (B-/B3) (6M LIBOR + 5.750%)
4,141,049 6.750 06/22/26 3,543,20628,609,746
PetSmart, Inc. (B/B1)1,300,000 0.000 03/11/22 1,296,334
Semiconductors(b)(d) �� 0.0%Allegro Microsystems, Inc. (BB/B1) (1M LIBOR + 4.000%)
150,000 4.147 09/30/27 149,625Services Cyclical - Business Services �� 0.7%Asurion LLC (B+/Ba3)(c)
2,668,159 0.000 11/03/24 2,644,145EVO Payments International LLC (B/B2)(b) (1M LIBOR + 3.250%)
2,507,227 3.400 12/22/23 2,504,093
PrincipalAmount
InterestRate
MaturityDate Value
Bank Loans(a) �� (continued)Services Cyclical - Business Services �� (continued)Travelport Finance (Luxembourg) S.a.r.l. (B-/B3)(b) (3M LIBOR + 1.500%)$ 2,774,727 8.000 % 02/28/25 $ 2,731,802Travelport Finance (Luxembourg) S.a.r.l. (CCC-/Caa3)(b) (3M LIBOR +
5.000%)2,320,928 5.220 05/29/26 1,566,139
9,446,179Services Cyclical - Consumer Services(b) �� 1.6%Asurion LLC (B/B3) (1M LIBOR + 6.500%)
1,769,818 6.647 08/04/25 1,780,880Asurion LLC (B+/Ba3) (1M LIBOR + 3.000%)
2,488,481 3.147 11/03/23 2,462,551KUEHG Corp. (CCC+/B3) (3M LIBOR + 3.750%)
3,685,206 4.750 02/21/25 3,484,363Red Ventures LLC (B+/B1) (1M LIBOR + 3.500%)
2,825,000 4.250 11/08/24 2,803,812USIC Holdings, Inc. (B-/B2) (1M LIBOR + 3.000%)
2,750,467 4.000 12/08/23 2,747,029USS Ultimate Holdings, Inc. (B-/B1) (1M LIBOR + 3.750%)
2,485,861 4.750 08/25/24 2,480,417USS Ultimate Holdings, Inc. (CCC/Caa1) (1M LIBOR + 7.750%)
2,225,000 8.750 08/25/25 2,213,875Weight Watchers International, Inc. (BB/Ba2) (1M LIBOR + 4.750%)
3,303,390 5.500 11/29/24 3,298,56721,271,494
Technology - Hardware �� 0.8%CommScope, Inc. (B/Ba3)(b) (1M LIBOR + 3.250%)
3,224,634 3.397 04/06/26 3,196,418Dell International LLC (BBB-/Baa3)(c)
2,548,924 0.000 09/19/25 2,549,230ON Semiconductor Corp. (BB+/Baa3)(b) (1M LIBOR + 2.000%)
2,641,563 2.147 09/19/26 2,645,974Tech Data Corp. (BBB-/Ba2)(b) (1M LIBOR + 5.500%)
1,300,000 5.645 06/30/25 1,296,750Xperi Corp. (BB-/Ba3)(b) (1M LIBOR + 4.000%)
915,357 4.147 06/01/25 916,30910,604,681
Technology - Software �� 2.4%Avast Software B.V. (BB+/Ba2)(b) (3M LIBOR + 2.250%)
490,252 3.250 09/29/23 487,497
PrincipalAmount
InterestRate
MaturityDate Value
Bank Loans(a) �� (continued)Technology - Software �� (continued)Camelot U.S. Acquisition 1 Co. (B/B2)(b) (1M LIBOR + 3.000%)$ 2,530,827 3.147 % 10/30/26 $ 2,517,110Castle US Holding Corp. (B-/B2)(b) (3M LIBOR + 3.750%)
3,796,624 4.004 01/29/27 3,717,123Cornerstone OnDemand, Inc. (B/B1)(b) (1M LIBOR + 4.250%)
2,061,321 4.394 04/22/27 2,068,309Dynatrace LLC (BB-/B1)(b) (1M LIBOR + 2.250%)
2,389,134 2.397 08/22/25 2,363,762Flexera Software LLC (B-/B1)(c)
1,275,000 0.000 01/26/28 1,273,406Go Daddy Operating Co. LLC (BB/Ba1)(b) (1M LIBOR + 2.500%)
1,265,882 2.647 08/10/27 1,269,578Informatica LLC (B-/B1)(b) (1M LIBOR + 3.250%)
2,411,775 3.397 02/25/27 2,389,177Ivanti Software, Inc. (B-/B2)(c)
1,925,000 0.000 12/01/27 1,918,378The Ultimate Software Group, Inc. (B/B1)(b) (3M LIBOR + 4.000%)
1,521,188 4.750 05/04/26 1,527,926The Ultimate Software Group, Inc. (CCC/Caa1)(b) (3M LIBOR + 6.750%)
50,000 7.500 05/03/27 51,313Tibco Software, Inc. (B/B2)(b) (1M LIBOR + 3.750%)
4,226,404 3.900 06/30/26 4,137,903Uber Technologies (B/B1)(b) (1M LIBOR + 4.000%)
1,338,172 5.000 04/04/25 1,341,798VS Buyer LLC (B-/B1)(b) (1M LIBOR + 3.250%)
2,431,625 3.397 02/28/27 2,416,427Weld North Education LLC (B-/WR)(c)
1,775,000 0.000 02/15/25 1,766,125Zelis Healthcare Corp. (B/B2)(b) (1M LIBOR + 4.750%)
2,679,699 4.897 09/30/26 2,683,79931,929,631
Technology - Software/Services �� 11.7%Ahead Data Blue LLC (B/B1)(b) (3M LIBOR + 5.000%)
1,975,000 6.000 10/13/27 1,938,581Almonde, Inc. (CCC-/Caa2)(b) (6M LIBOR + 7.250%)
1,625,000 8.250 06/13/25 1,625,585AppLovin Corp. (B+/B1)(b)(1M LIBOR + 3.500%)
2,742,732 3.647 08/15/25 2,732,447(1M LIBOR + 4.000%)
863,475 4.147 08/15/25 860,781
PrincipalAmount
InterestRate
MaturityDate Value
Bank Loans(a) �� (continued)Technology - Software/Services �� (continued)
PrincipalAmount
InterestRate
MaturityDate Value
Bank Loans(a) �� (continued)Technology - Software/Services �� (continued)
Copyright © 2021 www.secdatabase.com. All Rights Reserved.Please Consider the Environment Before Printing This Document

GOLDMAN SACHS HIGH YIELD FLOATING RATE FUND
Schedule of Investments (continued)December 31, 2020 (Unaudited)
Aston Finance Co. S.a.r.l. (B-/B2)(b) (3M LIBOR + 4.250%)$ 620,188 4.391 % 10/09/26 $ 611,078Banff Merger Sub, Inc. (B-/B2)(b) (1M LIBOR + 4.250%)
3,764,569 4.397 10/02/25 3,744,654Bracket Intermediate Holding Corp. (B-/B2)(b) (3M LIBOR + 4.250%)
3,007,676 4.484 09/05/25 2,966,320BY Crown Parent LLC (B-/B1)(c)
1,945,113 0.000 02/02/26 1,940,250Camelot U.S. Acquisition 1 Co. (B/B2)(b) (1M LIBOR + 3.000%)
675,000 4.000 10/30/26 674,366Cardtronics USA, Inc. (BB+/Ba2)(b) (1M LIBOR + 4.000%)
2,566,427 5.000 06/29/27 2,562,141Ceridian HCM Holding, Inc. (B+/B2)(b) (1 Week LIBOR + 2.500%)
3,882,436 2.600 04/30/25 3,827,422Cloudera, Inc. (NR/NR)(b) (3M LIBOR + 2.500%)
1,400,000 3.250 12/17/27 1,396,500ConvergeOne Holdings, Inc. (B-/B2)(b) (1M LIBOR + 5.000%)
2,379,669 5.148 01/04/26 2,233,914DCert Buyer, Inc. (B-/B2)(b) (1M LIBOR + 4.000%)
3,200,813 4.147 10/16/26 3,193,387Electronics for Imaging, Inc. (CCC+/B3)(b) (1M LIBOR + 5.000%)
1,856,250 5.147 07/23/26 1,578,388Emerald TopCo, Inc. (B/B2)(b) (3M LIBOR + 3.500%)
3,476,347 3.714 07/24/26 3,428,548Epicor Software Corp. (B-/B2)(b) (1M LIBOR + 4.250%)
2,443,875 5.250 07/30/27 2,455,581Epicor Software Corp. (CCC/Caa2)(b) (1M LIBOR + 7.750%)
200,000 8.750 07/31/28 208,126Eta Australia Holdings III Pty Ltd. (B-/B3)(b) (1M LIBOR + 4.000%)
5,072,750 4.147 05/06/26 4,945,931Finastra USA, Inc. (CCC+/B2)(b)(6M LIBOR + 3.500%)
2,373,784 4.500 06/13/24 2,322,605Genuine Financial Holdings LLC (B-/B3)(b) (1M LIBOR + 3.750%)
4,116,963 3.897 07/11/25 3,981,433Genuine Financial Holdings LLC (CCC/Caa3)(b) (1M LIBOR + 7.250%)
4,300,000 7.397 07/10/26 3,341,100Hudson River Trading LLC (BB-/Ba2)(b) (1M LIBOR + 3.000%)
3,382,915 3.147 02/18/27 3,378,686Huskies Parent, Inc. (B-/B2)(b)(2M LIBOR + 4.000%)
2,871,000 4.179 07/31/26 2,856,645
Hyland Software, Inc. (B-/B1)(b) (1M LIBOR + 3.500%)$ 2,532,565 4.250 % 07/01/24 $ 2,535,376Hyland Software, Inc. (CCC/Caa1)(b) (1M LIBOR + 7.000%)
1,716,000 7.750 07/07/25 1,726,004Ion Trading Technologies S.a.r.l. (B/B3)(b) (3M LIBOR + 4.000%)
4,268,590 5.000 11/21/24 4,253,351MA FinanceCo. LLC (BB-/B1)(b) (1M LIBOR + 2.750%)
411,089 2.897 06/21/24 404,923Marcel LUX IV S.a.r.l. (B/B2)(b) (1M LIBOR + 3.250%)
4,518,458 3.395 03/15/26 4,411,145McAfee LLC (BB-/B1)(b) (1M LIBOR + 3.750%)
1,733,393 3.898 09/30/24 1,732,093MH Sub I LLC (B/B2)(b) (1M LIBOR + 3.500%)
3,580,806 3.647 09/13/24 3,528,455Mitchell International, Inc. (NR/NR)(b) (1M LIBOR + 7.250%)
1,100,000 7.397 12/01/25 1,061,500Mitchell International, Inc. (B-/B2)(b)(1M LIBOR + 3.250%)
2,899,089 3.397 11/29/24 2,842,933(1M LIBOR + 4.250%)
1,745,625 4.750 11/29/24 1,744,752Omnitracs, Inc. (B-/B2)(b)(1M LIBOR + 2.750%)
4,152,423 2.898 03/21/25 4,058,122(1M LIBOR + 4.250%)
1,100,000 4.403 03/23/25 1,102,750Omnitracs, Inc. (CCC/Caa2)(b) (1M LIBOR + 8.000%)
1,600,000 8.148 09/29/28 1,576,000Park Place Technologies LLC (B-/B2)(b) (1M LIBOR + 5.000%)
1,600,000 6.000 11/10/27 1,533,328Pitney Bowes, Inc. (BBB-/Ba1)(b) (1M LIBOR + 5.500%)
2,021,250 5.650 01/07/25 2,001,462Presidio, Inc. (B/B1)(b) (3M LIBOR + 3.500%)
1,990,000 3.720 01/22/27 1,981,921Project Boost Purchaser LLC (B-/B2)(b) (1M LIBOR + 3.500%)
3,763,472 3.647 06/01/26 3,721,133QBS Parent, Inc. (B/B3)(b) (3M LIBOR + 4.250%)
4,203,527 4.504 09/22/25 3,854,634Quest Software US Holdings, Inc. (B+/B2)(b) (3M LIBOR + 4.250%)
2,529,825 4.464 05/16/25 2,482,390Refinitiv US Holdings, Inc. (B/B2)(b) (1M LIBOR + 3.250%)
5,702,941 3.397 10/01/25 5,691,079Rocket Software, Inc. (B-/B2)(b) (1M LIBOR + 4.250%)
1,947,312 4.397 11/28/25 1,928,112
PrincipalAmount
InterestRate
MaturityDate Value
Bank Loans(a) �� (continued)Technology - Software/Services �� (continued)Seattle SpinCo, Inc. (BB-/B1)(b) (1M LIBOR + 2.750%)$ 2,776,186 2.897 % 06/21/24 $ 2,734,543Severin Acquisition LLC (B-/B2)(b) (1M LIBOR + 3.250%)
5,034,523 3.404 08/01/25 4,965,299Sirius Computer Solutions, Inc. (B/Ba3)(b) (1M LIBOR + 3.500%)
2,712,223 3.647 07/01/26 2,696,248Syncsort, Inc. (B-/B2)(b) (3M LIBOR + 6.000%)
4,399,328 7.000 08/16/24 4,391,101The Dun & Bradstreet Corp. (B+/B1)
550,000 0.000 (c) 02/06/26 549,769(1M LIBOR + 3.750%)
4,488,265 3.898 (b) 02/06/26 4,486,380The Ultimate Software Group, Inc. (B/B1)(b) (1M LIBOR + 3.750%)
4,888,125 3.897 05/04/26 4,880,500TriTech Software Systems (CCC+/Caa1)(b) (3M LIBOR + 3.750%)
7,352,085 4.004 08/29/25 6,841,115TTM Technologies, Inc. (BB+/Ba1)(b) (3M LIBOR + 2.500%)
1,456,321 2.655 09/28/24 1,449,040Ultra Clean Holdings, Inc. (B+/B1)(b) (1M LIBOR + 4.500%)
PrincipalAmount
InterestRate
MaturityDate Value
Bank Loans(a) �� (continued)Telecommunication Services �� (continued)Imperva, Inc. (B-/B2)(b) (3M LIBOR + 4.000%)$ 5,630,380 5.000 % 01/12/26 $ 5,623,342Intelsat Jackson Holdings Ltd. (NR/WR)(b) (1M LIBOR + 8.625%)
3,375,000 8.625 01/02/24 3,426,840Intelsat Jackson Holdings SA (NR/NR)(b) (3M LIBOR + 5.500%)
481,082 6.500 07/13/22 489,982LogMeIn, Inc. (B-/B1)(b) (1M LIBOR + 4.750%)
2,425,000 4.903 08/31/27 2,414,403MH Sub I LLC (B/B2)(b) (1M LIBOR + 3.750%)
1,644,119 4.750 09/13/24 1,637,543MLN US Holding Co. LLC (B-/B3)(b) (1M LIBOR + 4.500%)
3,322,520 4.652 11/30/25 2,996,514Project Alpha Intermediate Holding, Inc. (B/B3)(b) (3M LIBOR + 3.500%)
5,092,943 4.500 04/26/24 5,039,875PUG LLC (B-/B3)(b) (1M LIBOR + 3.500%)
2,019,899 3.647 02/12/27 1,922,277Rackspace Hosting, Inc. (B+/B1)(b) (3M LIBOR + 3.000%)
1,736,504 4.000 11/03/23 1,732,597Web.com Group, Inc. (B+/B2)(b) (1M LIBOR + 3.750%)
Copyright © 2021 www.secdatabase.com. All Rights Reserved.Please Consider the Environment Before Printing This Document

GOLDMAN SACHS HIGH YIELD FLOATING RATE FUND
Schedule of Investments (continued)December 31, 2020 (Unaudited)
GOLDMAN SACHS HIGH YIELD FLOATING RATE FUND
2,761,026 4.647 08/27/25 2,733,416Upland Software, Inc. (B/B2)(b) (1M LIBOR + 3.750%)
4,369,687 3.897 08/06/26 4,333,288Virtusa Corp. (NR/NR)(c)
3,230,000 0.000 12/01/27 3,205,775156,242,406
Telecommunication Services �� 4.2%Buzz Merger Sub Ltd. (B/B1)(b)(1M LIBOR + 2.750%)
2,605,313 2.897 01/29/27 2,589,029(1M LIBOR + 3.250%)
997,500 3.750 01/29/27 996,253CCI Buyer, Inc. (B-/B1)(c)
1,275,000 0.000 12/17/27 1,272,871CenturyLink, Inc. (BBB-/Ba3)(b) (1M LIBOR + 2.250%)
5,113,085 2.397 03/15/27 5,054,285CNT Holdings I Corp. (NR/NR)(b) (3M LIBOR + 6.750%)
525,000 7.500 10/16/28 532,875CNT Holdings I Corp. (B/B2)(b)(6M LIBOR + 3.750%)
3,350,000 4.500 11/08/27 3,344,238Connect Finco S.a.r.l. (B+/B1)(b) (1M LIBOR + 4.500%)
4,328,250 5.500 12/11/26 4,338,292Hoya Midco LLC ( B-/B3)(b)(6M LIBOR + 3.500%)
5,134,570 4.500 06/30/24 4,823,313
5,425,000 3.898 10/10/25 5,341,346Zayo Group Holdings, Inc. (B/B1)(b) (1M LIBOR + 3.000%)
2,915,382 3.147 03/09/27 2,893,51756,469,392
Textiles(b) �� 0.4%Kontoor Brands, Inc. (B+/Ba2) (1M LIBOR + 4.250%)
1,709,667 4.397 05/15/26 1,701,118Renfro Corp. (NR/NR)(d) (1M LIBOR + 9.000%)
1,425,211 10.000 02/12/21 1,325,446Renfro Corp. (CC/Caa3)(d)(2M LIBOR + 5.500%)
6,189,104 6.750 03/31/21 2,175,8425,202,406
Transportation(c) �� 0.2%Genesee & Wyoming, Inc. (BB+/Ba2)
2,568,530 0.000 12/30/26 2,560,902Transportation Services(b) �� 0.2%XPO Logistics, Inc. (BBB-/Baa3) (1M LIBOR + 2.500%)
3,200,000 2.658 02/24/25 3,196,448
PrincipalAmount
InterestRate
MaturityDate Value
Bank Loans(a) �� (continued)Utilities - Electric(b) �� 0.9%Calpine Corp. (BB+/Ba2)(1M LIBOR + 2.000%)$ 1,234,375 2.147 % 08/12/26 $ 1,216,415(1M LIBOR + 2.500%)
2,360,328 2.650 12/16/27 2,342,626LMBE-MC Holdco II LLC (BB-/Ba3)(3M LIBOR + 4.000%)
5,039,243 4.240 12/03/25 4,969,953Lonestar II Generation Holdings LLC (B+/Ba3)(1M LIBOR + 5.000%)
3,318,545 5.147 04/20/26 3,241,389(1M LIBOR + 5.000%)
404,463 5.147 04/20/26 395,05912,165,442
Wireless Telecommunications �� 0.9%Digicel International Finance Ltd. (NR/Caa1)(b)(6M LIBOR + 3.250%)
3,731,178 3.510 05/28/24 3,403,133Radiate Holdco LLC (B/B1)(b)(1M LIBOR + 3.500%)
1,925,000 4.250 09/25/26 1,925,905Telesat Canada (BB-/Ba3)(b)(1M LIBOR + 2.750%)
1,604,677 2.900 12/07/26 1,587,138UPC Broadband Holding B.V. (BB-/B1)(c)
2,225,000 0.000 01/31/29 2,226,1122,225,000 0.000 01/31/29 2,226,112
11,368,400Wirelines Telecommunications(b) �� 0.7%GTT Communications, Inc. (CCC/WR)(3M LIBOR + 2.750%)
2,803,123 3.000 05/31/25 2,182,007Level 3 Financing, Inc. (BBB-/Ba1)(1M LIBOR + 1.750%)
3,823,623 1.897 03/01/27 3,755,906Zacapa LLC (B-/B2)(6M LIBOR + 4.500%)
3,677,496 4.769 07/02/25 3,662,5669,600,479
TOTAL BANK LOANS(Cost $1,195,919,791) $1,178,766,681
Corporate Obligations(e) �� 4.8%Aerospace & Defense(f) �� 0.1%TransDigm, Inc. (B+/Ba3)$ 319,000 8.000 % 12/15/25 $ 352,894Triumph Group, Inc. (B-/B2)
544,000 8.875 06/01/24 598,400951,294
PrincipalAmount
InterestRate
MaturityDate Value
Corporate Obligations(e) �� (continued)Airlines(f) �� 0.1%Mileage Plus Holdings LLC/Mileage Plus Intellectual Property Assets Ltd.
(NR/Baa3)$ 1,585,000 6.500 % 06/20/27 $ 1,707,838Automotive �� 0.6%Dana, Inc. (BB-/B2)
945,000 5.625 06/15/28 1,017,056Ford Motor Co. (BB+/Ba2)
2,019,000 9.000 04/22/25 2,480,354Ford Motor Credit Co. LLC (BB+/Ba2)
2,650,000 4.140 02/15/23 2,726,572650,000 4.687 06/09/25 692,279
The Goodyear Tire & Rubber Co. (B+/B2)710,000 5.125 11/15/23 710,887
7,627,148Capital Goods(f) �� 0.1%Vertical US New Co., Inc. (B/B1)
700,000 5.250 07/15/27 737,625Chemicals(f) �� 0.2%Illuminate Buyer LLC/Illuminate Holdings IV, Inc. (B-/Caa1)
553,000 9.000 07/01/28 608,300Rayonier AM Products, Inc. (B-/B1)
253,000 7.625 01/15/26 263,753The Chemours Co. (B/B1)
1,445,000 5.750 11/15/28 1,473,9002,345,953
Commercial Services(f) �� 0.0%Shift4 Payments LLC/Shift4 Payments Finance Sub, Inc. (B/Ba3)
505,000 4.625 11/01/26 522,675Diversified Financial Services(f) �� 0.3%LD Holdings Group LLC (B-/B2)
1,050,000 6.500 11/01/25 1,094,625PennyMac Financial Services, Inc. (B+/B2)
1,215,000 5.375 10/15/25 1,281,825United Shore Financial Services LLC (NR/Ba3)
1,550,000 5.500 11/15/25 1,623,6254,000,075
Copyright © 2021 www.secdatabase.com. All Rights Reserved.Please Consider the Environment Before Printing This Document

Schedule of Investments (continued)December 31, 2020 (Unaudited)
GOLDMAN SACHS HIGH YIELD FLOATING RATE FUND
Schedule of Investments (continued)December 31, 2020 (Unaudited)
PrincipalAmount
InterestRate
MaturityDate Value
Corporate Obligations(e) �� (continued)Electrical �� 0.2%PG&E Corp. (BB-/B1)$ 2,215,000 5.000 % 07/01/28 $ 2,358,975Entertainment(f) �� 0.1%Caesars Entertainment, Inc. (B/B1)
1,785,000 6.250 07/01/25 1,901,025Food & Drug Retailing(f) �� 0.2%US Foods, Inc. (B+/Caa1)
1,300,000 5.875 06/15/24 1,314,625US Foods, Inc. (BB-/B3)
1,019,000 6.250 04/15/25 1,089,0562,403,681
Food Service(f) �� 0.0%Aramark Services, Inc. (B+/B1)
400,000 6.375 05/01/25 429,000Gaming �� 0.2%MGM Resorts International (BB-/Ba3)
2,281,000 4.750 10/15/28 2,429,265Healthcare Providers & Services(f) �� 0.1%DaVita, Inc. (B+/Ba3)
1,420,000 3.750 02/15/31 1,434,200Insurance(f) �� 0.2%Alliant Holdings Intermediate LLC/Alliant Holdings Co-Issuer (B/B2)
2,500,000 4.250 10/15/27 2,543,750Internet(f) �� 0.6%ANGI Group LLC (BB-/Ba3)
1,055,000 3.875 08/15/28 1,062,913Cablevision Lightpath LLC (B+/B1)
2,469,000 3.875 09/15/27 2,484,431Uber Technologies, Inc. (CCC+/B3)
1,780,000 7.500 05/15/25 1,920,1752,175,000 6.250 01/15/28 2,365,312
7,832,831Leisure Time(f) �� 0.0%Sabre GLBL, Inc. (B/Ba3)
416,000 9.250 04/15/25 495,040
PrincipalAmount
InterestRate
MaturityDate Value
Corporate Obligations(e) �� (continued)Machinery-Diversified(f) �� 0.1%Clark Equipment Co. (BB+/Ba3)$ 899,000 5.875 % 06/01/25 $ 948,445GrafTech Finance, Inc. (BB-/B1)
1,040,000 4.625 12/15/28 1,050,4001,998,845
Media �� 0.8%Diamond Sports Group LLC/Diamond Sports Finance Co. (BB-/Ba3)(f)
4,850,000 5.375 08/15/26 3,940,625iHeartCommunications, Inc. (B+/B1)
1,393,436 6.375 05/01/26 1,487,493iHeartCommunications, Inc. (CCC+/Caa1)
1 8.375 05/01/27 1Nexstar Broadcasting, Inc. (B/B3)(f)
1,894,000 4.750 11/01/28 1,976,862Radiate Holdco LLC/Radiate Finance, Inc. (B/B1)(f)
797,000 4.500 09/15/26 820,910Scripps Escrow II, Inc. (CCC+/Caa1)(f)
450,000 5.375 01/15/31 472,500Townsquare Media, Inc. (B/B2)(f)
957,000 6.875 02/01/26 1,000,065Univision Communications, Inc. (B/B2)(f)
1,500,000 6.625 06/01/27 1,610,62511,309,081
Oil Field Services �� 0.3%CNX Resources Corp. (NR/B3)(f)
525,000 6.000 01/15/29 535,500Exterran Energy Solutions LP/EES Finance Corp. (B/B1)
3,700,000 8.125 05/01/25 3,089,500Noble Holding International Ltd. (NR/WR)(g)
1,008,000 7.750 01/15/24 18,6983,643,698
Pharmaceuticals(f) �� 0.2%Herbalife Nutrition Ltd./HLF Financing, Inc. (BB-/B1)
2,017,000 7.875 09/01/25 2,198,530Real Estate Investment Trust �� 0.1%Realogy Group LLC/Realogy Co.-Issuer Corp. (B/B3)(f)
717,000 7.625 06/15/25 776,153
PrincipalAmount
InterestRate
MaturityDate Value
Corporate Obligations(e) �� (continued)Real Estate Investment Trust �� (continued)Service Properties Trust (BB/Ba1)$ 455,000 7.500% 09/15/25 $ 528,969
1,305,122Retailing(f) �� 0.3%PetSmart, Inc. (CCC+/Caa1)
1,875,000 8.875 06/01/25 1,921,875Specialty Building Products Holdings LLC/SBP Finance Corp. (B-/B3)
855,000 6.375 09/30/26 899,888Staples, Inc. (B/B1)
1,375,000 7.500 04/15/26 1,426,5624,248,325
TOTAL CORPORATE OBLIGATIONS(Cost $62,664,247) $ 64,423,976
Asset-Backed Securities(b)(f) �� 0.8%
UnitsExpiration
Date Value
Warrant(g) �� 0.0%Aspect Software, Inc. Class B (NR/NR)(d)162,749 //0 $ 40,687True Religion Warrant (NR/NR)2,145 10/27/22 �True Religion Warrant 2 (NR/NR)8,103 10/27/22 �
TOTAL WARRANT(Cost $��) $ 40,687
Shares Description Value
Exchange Traded Funds �� 2.8%186,021 Eaton Vance Senior
Floating-RateTrust (NR/NR)(h) $ 2,368,047
Copyright © 2021 www.secdatabase.com. All Rights Reserved.Please Consider the Environment Before Printing This Document
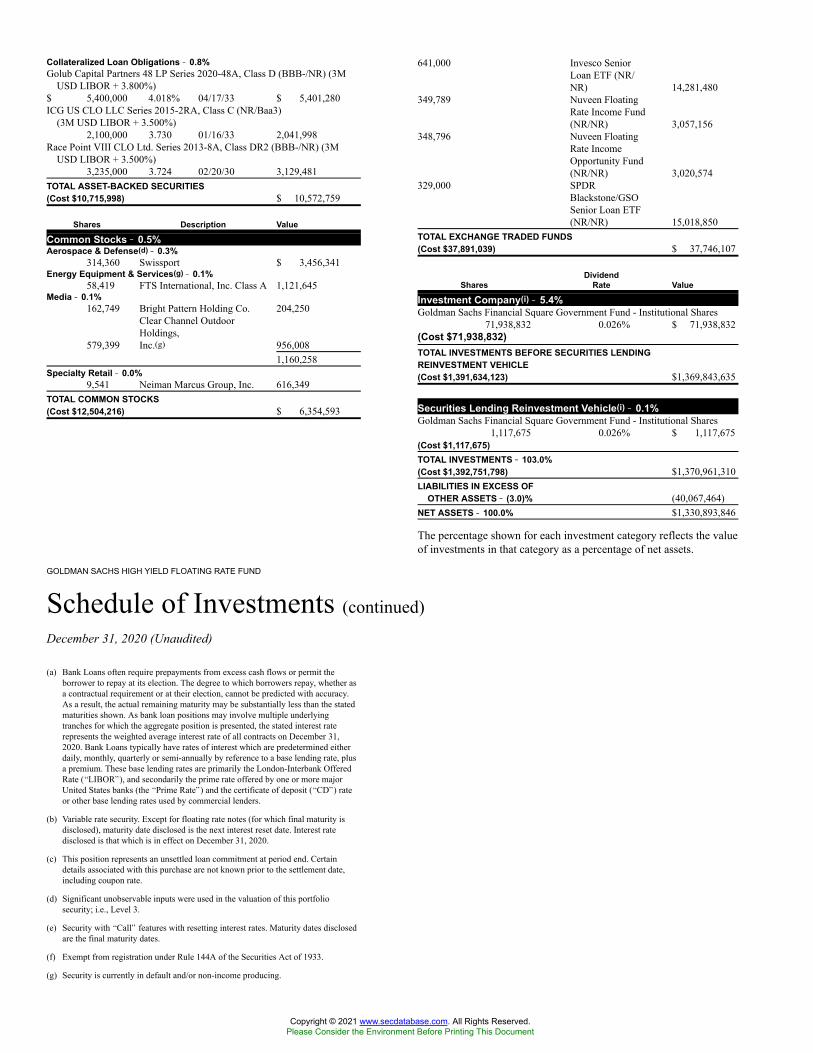
GOLDMAN SACHS HIGH YIELD FLOATING RATE FUND
Schedule of Investments (continued)December 31, 2020 (Unaudited)
Collateralized Loan Obligations �� 0.8%Golub Capital Partners 48 LP Series 2020-48A, Class D (BBB-/NR) (3M
USD LIBOR + 3.800%)$ 5,400,000 4.018% 04/17/33 $ 5,401,280ICG US CLO LLC Series 2015-2RA, Class C (NR/Baa3)
(3M USD LIBOR + 3.500%)2,100,000 3.730 01/16/33 2,041,998
Race Point VIII CLO Ltd. Series 2013-8A, Class DR2 (BBB-/NR) (3MUSD LIBOR + 3.500%)
3,235,000 3.724 02/20/30 3,129,481TOTAL ASSET-BACKED SECURITIES(Cost $10,715,998) $ 10,572,759
Shares Description Value
Common Stocks �� 0.5%Aerospace & Defense(d) �� 0.3%
314,360 Swissport $ 3,456,341Energy Equipment & Services(g) �� 0.1%
58,419 FTS International, Inc. Class A 1,121,645Media �� 0.1%
162,749 Bright Pattern Holding Co. 204,250
579,399
Clear Channel OutdoorHoldings,Inc.(g) 956,008
1,160,258Specialty Retail �� 0.0%
9,541 Neiman Marcus Group, Inc. 616,349TOTAL COMMON STOCKS(Cost $12,504,216) $ 6,354,593
641,000 Invesco SeniorLoan ETF (NR/NR) 14,281,480
349,789 Nuveen FloatingRate Income Fund(NR/NR) 3,057,156
348,796 Nuveen FloatingRate IncomeOpportunity Fund(NR/NR) 3,020,574
329,000 SPDRBlackstone/GSOSenior Loan ETF(NR/NR) 15,018,850
TOTAL EXCHANGE TRADED FUNDS(Cost $37,891,039) $ 37,746,107
SharesDividend
Rate Value
Investment Company(i) �� 5.4%Goldman Sachs Financial Square Government Fund - Institutional Shares
71,938,832(Cost $71,938,832)
0.026% $ 71,938,832
TOTAL INVESTMENTS BEFORE SECURITIES LENDINGREINVESTMENT VEHICLE(Cost $1,391,634,123) $1,369,843,635
Securities Lending Reinvestment Vehicle(i) �� 0.1%Goldman Sachs Financial Square Government Fund - Institutional Shares
1,117,675 0.026% $ 1,117,675(Cost $1,117,675)TOTAL INVESTMENTS �� 103.0%(Cost $1,392,751,798) $1,370,961,310LIABILITIES IN EXCESS OF
OTHER ASSETS �� (3.0)% (40,067,464)NET ASSETS �� 100.0% $1,330,893,846
The percentage shown for each investment category reflects the valueof investments in that category as a percentage of net assets.
(a) Bank Loans often require prepayments from excess cash flows or permit theborrower to repay at its election. The degree to which borrowers repay, whether asa contractual requirement or at their election, cannot be predicted with accuracy.As a result, the actual remaining maturity may be substantially less than the statedmaturities shown. As bank loan positions may involve multiple underlyingtranches for which the aggregate position is presented, the stated interest raterepresents the weighted average interest rate of all contracts on December 31,2020. Bank Loans typically have rates of interest which are predetermined eitherdaily, monthly, quarterly or semi-annually by reference to a base lending rate, plusa premium. These base lending rates are primarily the London-Interbank OfferedRate (�LIBOR�), and secondarily the prime rate offered by one or more majorUnited States banks (the �Prime Rate�) and the certificate of deposit (�CD�) rateor other base lending rates used by commercial lenders.
(b) Variable rate security. Except for floating rate notes (for which final maturity isdisclosed), maturity date disclosed is the next interest reset date. Interest ratedisclosed is that which is in effect on December 31, 2020.
(c) This position represents an unsettled loan commitment at period end. Certaindetails associated with this purchase are not known prior to the settlement date,including coupon rate.
(d) Significant unobservable inputs were used in the valuation of this portfoliosecurity; i.e., Level 3.
(e) Security with �Call� features with resetting interest rates. Maturity dates disclosedare the final maturity dates.
(f) Exempt from registration under Rule 144A of the Securities Act of 1933.
(g) Security is currently in default and/or non-income producing.
Copyright © 2021 www.secdatabase.com. All Rights Reserved.Please Consider the Environment Before Printing This Document

GOLDMAN SACHS HIGH YIELD FLOATING RATE FUND
Schedule of Investments (continued)December 31, 2020 (Unaudited)
ADDITIONAL INVESTMENT INFORMATION
UNFUNDED LOAN COMMITMENTS � At December 31, 2020, the Fund hadunfunded loan commitments which could be extended at the option of theborrowers, pursuant to the following loan agreements:
BorrowerPrincipalAmount
CurrentValue
UnrealizedGain (Loss)
Help At Home, Inc. (B-/B1), due 10/29/27 $235,345 $233,286 $ 1,392Intelsat Jackson Holdings SA (NR/NR), due 07/13/22 160,361 163,327 2,966OEConnection LLC (B-/B2), due 09/25/26(a) 11,607 11,462 (97 )TOTAL $408,075 $ 4,261
(a) Significant unobservable inputs were used in the valuation of this portfolio security; i.e., Level 3.
FORWARD FOREIGN CURRENCY EXCHANGE CONTRACTS � At December 31, 2020, the Fund had the following forward foreign currencyexchange contracts:
FORWARD FOREIGN CURRENCY EXCHANGE CONTRACTS WITH UNREALIZED GAIN
CounterpartyCurrencyPurchased
CurrencySold
SettlementDate
UnrealizedGain
MS & Co. Int. PLC USD 4,578,238 EUR 3,722,339 01/21/21 $ 28,417
FORWARD FOREIGN CURRENCY EXCHANGE CONTRACTS WITH UNREALIZED LOSS
CounterpartyCurrencyPurchased
CurrencySold
SettlementDate
UnrealizedGain
MS & Co. Int. PLC USD 32,318,395 EUR 27,296,216 01/21/21 $(1,045,818 )
FUTURES CONTRACTS �� At December 31, 2020, the Fund had the following futures contracts:
DescriptionNumber ofContracts
ExpirationDate
NotionalAmount
UnrealizedAppreciation/(Depreciation)
Long position contracts:Ultra Long U.S. Treasury Bonds 3 03/22/21 $640,688 $ (7,389 )Short position contracts:Ultra 10 Year U.S. Treasury Notes (22) 03/22/21 (3,439,906 ) 9,9932 Year U.S. Treasury Notes (80) 03/31/21 (17,678,125) (16,268 )5 Year U.S. Treasury Notes (129) 03/31/21 (16,275,164) (36,625 )10 Year U.S. Treasury Notes (93) 03/22/21 (12,841,266) (9,921 )20 Year U.S. Treasury Bonds (2) 03/22/21 (346,375 ) 3,004Total $ (49,817 )TOTAL FUTURES CONTRACTS $ (57,206 )
SWAP CONTRACTS � At December 31, 2020, the Fund had the following swap contracts:
CENTRALLY CLEARED CREDIT DEFAULT SWAP CONTRACT
ReferencedObligation/Index
Financing RateReceived/(Paid)by the Fund(a)
CreditSpread at
December 31,2020(b)
TerminationDate
NotionalAmount(000s) Value
UpfrontPremiums(Received)
Paid
UnrealizedAppreciation/(Depreciation)
Protection Sold:CDX.NA.HY Index 35 5.000% 2.938% 12/20/25 $11,700 $1,105,952 $524,898 $ 581,054
(a) Payments made quarterly.(b) Credit spread on the referenced obligation, together with the term of the swap contract, are indicators of payment/performance risk. The likelihood of a credit event occurring which would require a
fund or its counterparty to make a payment or otherwise be required to perform under the swap contract is generally greater as the credit spread and the term of the swap contract increase.
(h) All or a portion of security is on loan.
(i) Represents an affiliated fund.
Currency Abbreviations:EUR � EuroUSD � U.S. Dollar
Investment Abbreviations:CLO � Collateralized Loan ObligationETF � Exchange Traded FundLIBOR � London Interbank Offered RateLLC � Limited Liability CompanyLP � Limited PartnershipPLC � Public Limited CompanyREIT � Real Estate Investment Trust
Copyright © 2021 www.secdatabase.com. All Rights Reserved.Please Consider the Environment Before Printing This Document

GOLDMAN SACHS HIGH YIELD FLOATING RATE FUND
Schedule of Investments (continued)December 31, 2020 (Unaudited)
ADDITIONAL INVESTMENT INFORMATION (continued)
GOLDMAN SACHS INVESTMENT GRADE CREDIT FUND
Schedule of InvestmentsDecember 31, 2020 (Unaudited)
GOLDMAN SACHS INVESTMENT GRADE CREDIT FUND
Schedule of Investments (continued)December 31, 2020 (Unaudited)
Abbreviations:CDX.NA.HY Index 35 � CDX North America High Yield Index 35MS & Co. Int. PLC �Morgan Stanley & Co. International PLC
PrincipalAmount
InterestRate
MaturityDate Value
Corporate Obligations �� 91.3%Aerospace & Defense �� 2.3%Lockheed Martin Corp.$ 850,000 4.070 % 12/15/42 $ 1,101,047
125,000 4.700 (a) 05/15/46 174,946Northrop Grumman Corp.
1,175,000 4.750 06/01/43 1,571,022380,000 4.030 (a) 10/15/47 474,221
Raytheon Technologies Corp.1,725,000 4.125 (a) 11/16/28 2,056,027370,000 5.700 04/15/40 541,558550,000 4.050 (a) 05/04/47 683,920500,000 4.625 (a) 11/16/48 679,350
The Boeing Co.(a)1,000,000 1.875 06/15/23 1,019,4001,950,000 3.450 11/01/28 2,096,2111,350,000 3.250 02/01/35 1,378,188500,000 3.550 03/01/38 510,430450,000 3.375 06/15/46 440,001575,000 3.625 03/01/48 580,164150,000 3.850 11/01/48 155,1021,450,000 5.805 05/01/50 1,994,359
15,455,946Agriculture(a) �� 1.4%Altria Group, Inc.
2,225,000 3.800 02/14/24 2,429,6111,100,000 4.400 02/14/26 1,276,561
BAT Capital Corp.620,000 3.222 08/15/24 671,231675,000 2.789 09/06/24 721,825200,000 3.557 08/15/27 222,8881,875,000 2.259 03/25/28 1,938,056700,000 4.390 08/15/37 782,460175,000 5.282 04/02/50 215,652
PrincipalAmount
InterestRate
MaturityDate Value
Corporate Obligations �� (continued)Agriculture(a) �� (continued)Cargill, Inc.(b)$ 600,000 3.875 % 05/23/49 $ 743,406
9,001,690Automotive �� 1.1%Ford Motor Credit Co. LLC
1,475,000 5.875 08/02/21 1,506,332General Motors Co.
2,425,000 5.400 10/02/23 2,723,687625,000 6.600 (a) 04/01/36 849,000125,000 5.950 (a) 04/01/49 168,444
General Motors Financial Co., Inc.(a)1,425,000 5.650 01/17/29 1,764,264
7,011,727Automotive �� 0.0%General Motors Co.
75,000 5.200 04/01/45 90,67490,674
Banks �� 20.6%ABN AMRO Bank NV(a)(c) (-1X 5 year EUR Swap + 4.674%)EUR 600,000 4.375 09/22/49 779,022AIB Group PLC(b)$ 1,975,000 4.750 10/12/23 2,171,275Banco Santander SA
1,000,000 2.746 05/28/25 1,068,9001,000,000 4.250 04/11/27 1,159,0901,000,000 3.306 06/27/29 1,124,2801,600,000 2.749 12/03/30 1,649,856
Bank of America Corp.4,850,000 4.200 08/26/24 5,429,6724,100,000 3.950 04/21/25 4,618,445
(3M USD LIBOR + 0.990%)275,000 2.496 (a)(c) 02/13/31 291,695
(3M USD LIBOR + 1.040%)5,363,000 3.419 (a)(c) 12/20/28 6,055,417
(3M USD LIBOR + 1.070%)2,300,000 3.970 (a)(c) 03/05/29 2,678,672
(3M USD LIBOR + 1.210%)400,000 3.974 (a)(c) 02/07/30 471,172
(3M USD LIBOR + 1.310%)1,125,000 4.271 (a)(c) 07/23/29 1,338,109
(SOFR + 1.010%)100,000 1.197 (a)(c) 10/24/26 101,698
Copyright © 2021 www.secdatabase.com. All Rights Reserved.Please Consider the Environment Before Printing This Document
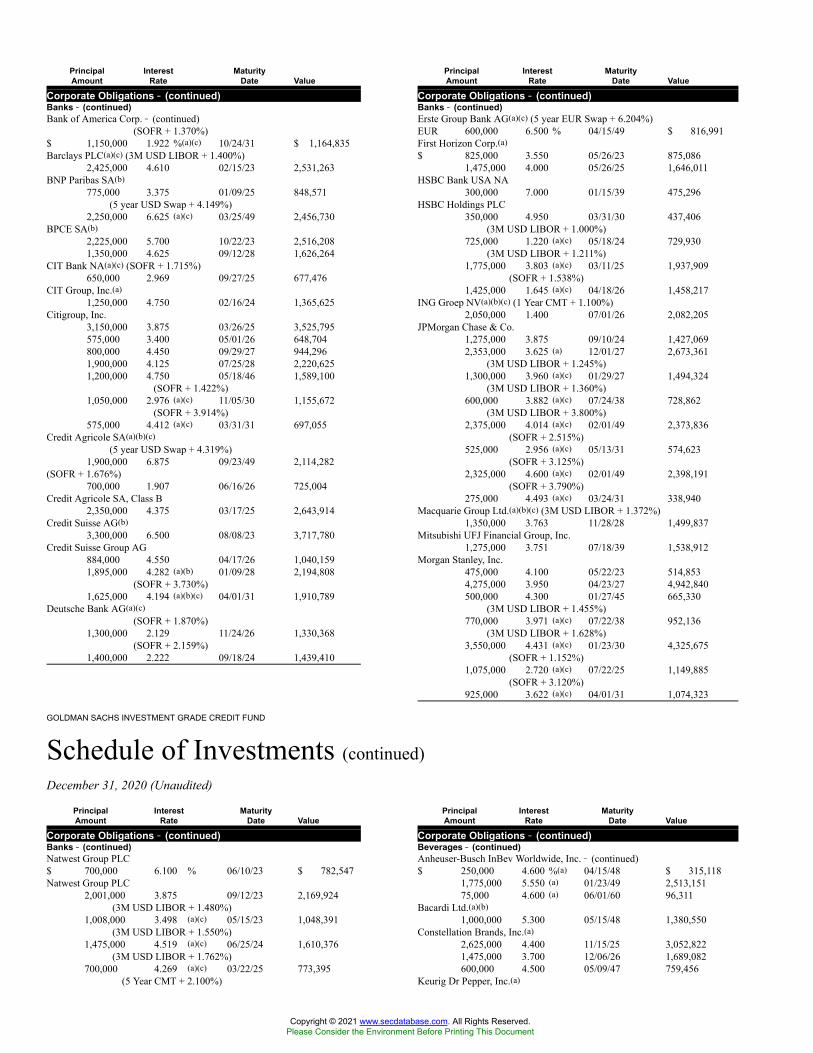
GOLDMAN SACHS INVESTMENT GRADE CREDIT FUND
Schedule of Investments (continued)December 31, 2020 (Unaudited)
PrincipalAmount
InterestRate
MaturityDate Value
Corporate Obligations �� (continued)Banks �� (continued)Bank of America Corp. � (continued)
(SOFR + 1.370%)$ 1,150,000 1.922 %(a)(c) 10/24/31 $ 1,164,835Barclays PLC(a)(c) (3M USD LIBOR + 1.400%)
2,425,000 4.610 02/15/23 2,531,263BNP Paribas SA(b)
775,000 3.375 01/09/25 848,571(5 year USD Swap + 4.149%)
2,250,000 6.625 (a)(c) 03/25/49 2,456,730BPCE SA(b)
2,225,000 5.700 10/22/23 2,516,2081,350,000 4.625 09/12/28 1,626,264
CIT Bank NA(a)(c) (SOFR + 1.715%)650,000 2.969 09/27/25 677,476
CIT Group, Inc.(a)1,250,000 4.750 02/16/24 1,365,625
Citigroup, Inc.3,150,000 3.875 03/26/25 3,525,795575,000 3.400 05/01/26 648,704800,000 4.450 09/29/27 944,2961,900,000 4.125 07/25/28 2,220,6251,200,000 4.750 05/18/46 1,589,100
(SOFR + 1.422%)1,050,000 2.976 (a)(c) 11/05/30 1,155,672
(SOFR + 3.914%)575,000 4.412 (a)(c) 03/31/31 697,055
Credit Agricole SA(a)(b)(c)(5 year USD Swap + 4.319%)
1,900,000 6.875 09/23/49 2,114,282(SOFR + 1.676%)
700,000 1.907 06/16/26 725,004Credit Agricole SA, Class B
2,350,000 4.375 03/17/25 2,643,914Credit Suisse AG(b)
3,300,000 6.500 08/08/23 3,717,780Credit Suisse Group AG
884,000 4.550 04/17/26 1,040,1591,895,000 4.282 (a)(b) 01/09/28 2,194,808
(SOFR + 3.730%)1,625,000 4.194 (a)(b)(c) 04/01/31 1,910,789
Deutsche Bank AG(a)(c)(SOFR + 1.870%)
1,300,000 2.129 11/24/26 1,330,368(SOFR + 2.159%)
1,400,000 2.222 09/18/24 1,439,410
PrincipalAmount
InterestRate
MaturityDate Value
Corporate Obligations �� (continued)Banks �� (continued)Erste Group Bank AG(a)(c) (5 year EUR Swap + 6.204%)EUR 600,000 6.500 % 04/15/49 $ 816,991First Horizon Corp.(a)$ 825,000 3.550 05/26/23 875,086
1,475,000 4.000 05/26/25 1,646,011HSBC Bank USA NA
300,000 7.000 01/15/39 475,296HSBC Holdings PLC
350,000 4.950 03/31/30 437,406(3M USD LIBOR + 1.000%)
725,000 1.220 (a)(c) 05/18/24 729,930(3M USD LIBOR + 1.211%)
1,775,000 3.803 (a)(c) 03/11/25 1,937,909(SOFR + 1.538%)
1,425,000 1.645 (a)(c) 04/18/26 1,458,217ING Groep NV(a)(b)(c) (1 Year CMT + 1.100%)
2,050,000 1.400 07/01/26 2,082,205JPMorgan Chase & Co.
1,275,000 3.875 09/10/24 1,427,0692,353,000 3.625 (a) 12/01/27 2,673,361
(3M USD LIBOR + 1.245%)1,300,000 3.960 (a)(c) 01/29/27 1,494,324
(3M USD LIBOR + 1.360%)600,000 3.882 (a)(c) 07/24/38 728,862
(3M USD LIBOR + 3.800%)2,375,000 4.014 (a)(c) 02/01/49 2,373,836
(SOFR + 2.515%)525,000 2.956 (a)(c) 05/13/31 574,623
(SOFR + 3.125%)2,325,000 4.600 (a)(c) 02/01/49 2,398,191
(SOFR + 3.790%)275,000 4.493 (a)(c) 03/24/31 338,940
Macquarie Group Ltd.(a)(b)(c) (3M USD LIBOR + 1.372%)1,350,000 3.763 11/28/28 1,499,837
Mitsubishi UFJ Financial Group, Inc.1,275,000 3.751 07/18/39 1,538,912
Morgan Stanley, Inc.475,000 4.100 05/22/23 514,8534,275,000 3.950 04/23/27 4,942,840500,000 4.300 01/27/45 665,330
(3M USD LIBOR + 1.455%)770,000 3.971 (a)(c) 07/22/38 952,136
(3M USD LIBOR + 1.628%)3,550,000 4.431 (a)(c) 01/23/30 4,325,675
(SOFR + 1.152%)1,075,000 2.720 (a)(c) 07/22/25 1,149,885
(SOFR + 3.120%)925,000 3.622 (a)(c) 04/01/31 1,074,323
PrincipalAmount
InterestRate
MaturityDate Value
Corporate Obligations �� (continued)Banks �� (continued)Natwest Group PLC$ 700,000 6.100 % 06/10/23 $ 782,547Natwest Group PLC
2,001,000 3.875 09/12/23 2,169,924(3M USD LIBOR + 1.480%)
1,008,000 3.498 (a)(c) 05/15/23 1,048,391(3M USD LIBOR + 1.550%)
1,475,000 4.519 (a)(c) 06/25/24 1,610,376(3M USD LIBOR + 1.762%)
700,000 4.269 (a)(c) 03/22/25 773,395(5 Year CMT + 2.100%)
PrincipalAmount
InterestRate
MaturityDate Value
Corporate Obligations �� (continued)Beverages �� (continued)Anheuser-Busch InBev Worldwide, Inc. � (continued)$ 250,000 4.600 %(a) 04/15/48 $ 315,118
1,775,000 5.550 (a) 01/23/49 2,513,15175,000 4.600 (a) 06/01/60 96,311
Bacardi Ltd.(a)(b)1,000,000 5.300 05/15/48 1,380,550
Constellation Brands, Inc.(a)2,625,000 4.400 11/15/25 3,052,8221,475,000 3.700 12/06/26 1,689,082600,000 4.500 05/09/47 759,456
Keurig Dr Pepper, Inc.(a)
Copyright © 2021 www.secdatabase.com. All Rights Reserved.Please Consider the Environment Before Printing This Document
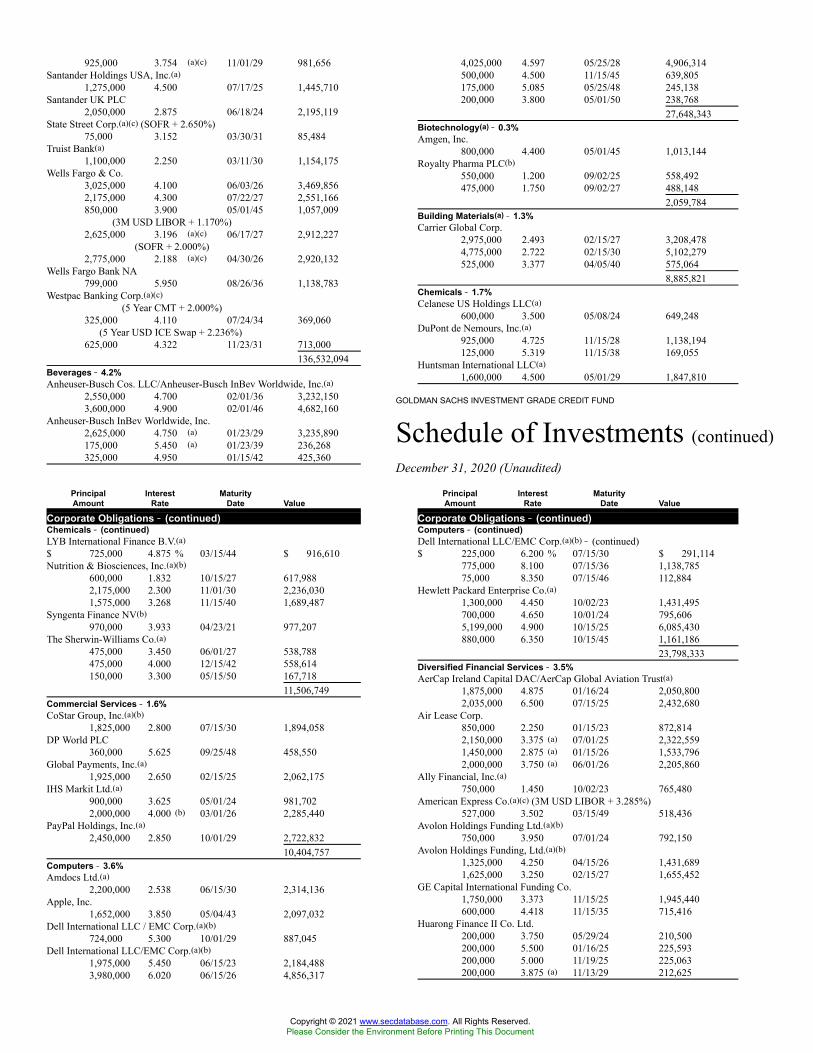
GOLDMAN SACHS INVESTMENT GRADE CREDIT FUND
Schedule of Investments (continued)December 31, 2020 (Unaudited)
925,000 3.754 (a)(c) 11/01/29 981,656Santander Holdings USA, Inc.(a)
1,275,000 4.500 07/17/25 1,445,710Santander UK PLC
2,050,000 2.875 06/18/24 2,195,119State Street Corp.(a)(c) (SOFR + 2.650%)
75,000 3.152 03/30/31 85,484Truist Bank(a)
1,100,000 2.250 03/11/30 1,154,175Wells Fargo & Co.
3,025,000 4.100 06/03/26 3,469,8562,175,000 4.300 07/22/27 2,551,166850,000 3.900 05/01/45 1,057,009
(3M USD LIBOR + 1.170%)2,625,000 3.196 (a)(c) 06/17/27 2,912,227
(SOFR + 2.000%)2,775,000 2.188 (a)(c) 04/30/26 2,920,132
Wells Fargo Bank NA799,000 5.950 08/26/36 1,138,783
Westpac Banking Corp.(a)(c)(5 Year CMT + 2.000%)
325,000 4.110 07/24/34 369,060(5 Year USD ICE Swap + 2.236%)
625,000 4.322 11/23/31 713,000136,532,094
Beverages �� 4.2%Anheuser-Busch Cos. LLC/Anheuser-Busch InBev Worldwide, Inc.(a)
2,550,000 4.700 02/01/36 3,232,1503,600,000 4.900 02/01/46 4,682,160
Anheuser-Busch InBev Worldwide, Inc.2,625,000 4.750 (a) 01/23/29 3,235,890175,000 5.450 (a) 01/23/39 236,268325,000 4.950 01/15/42 425,360
4,025,000 4.597 05/25/28 4,906,314500,000 4.500 11/15/45 639,805175,000 5.085 05/25/48 245,138200,000 3.800 05/01/50 238,768
27,648,343Biotechnology(a) �� 0.3%Amgen, Inc.
800,000 4.400 05/01/45 1,013,144Royalty Pharma PLC(b)
550,000 1.200 09/02/25 558,492475,000 1.750 09/02/27 488,148
2,059,784Building Materials(a) �� 1.3%Carrier Global Corp.
2,975,000 2.493 02/15/27 3,208,4784,775,000 2.722 02/15/30 5,102,279525,000 3.377 04/05/40 575,064
8,885,821Chemicals �� 1.7%Celanese US Holdings LLC(a)
600,000 3.500 05/08/24 649,248DuPont de Nemours, Inc.(a)
925,000 4.725 11/15/28 1,138,194125,000 5.319 11/15/38 169,055
Huntsman International LLC(a)1,600,000 4.500 05/01/29 1,847,810
PrincipalAmount
InterestRate
MaturityDate Value
Corporate Obligations �� (continued)Chemicals �� (continued)LYB International Finance B.V.(a)$ 725,000 4.875 % 03/15/44 $ 916,610Nutrition & Biosciences, Inc.(a)(b)
600,000 1.832 10/15/27 617,9882,175,000 2.300 11/01/30 2,236,0301,575,000 3.268 11/15/40 1,689,487
Syngenta Finance NV(b)970,000 3.933 04/23/21 977,207
The Sherwin-Williams Co.(a)475,000 3.450 06/01/27 538,788475,000 4.000 12/15/42 558,614150,000 3.300 05/15/50 167,718
11,506,749Commercial Services �� 1.6%CoStar Group, Inc.(a)(b)
1,825,000 2.800 07/15/30 1,894,058DP World PLC
360,000 5.625 09/25/48 458,550Global Payments, Inc.(a)
1,925,000 2.650 02/15/25 2,062,175IHS Markit Ltd.(a)
900,000 3.625 05/01/24 981,7022,000,000 4.000 (b) 03/01/26 2,285,440
PayPal Holdings, Inc.(a)2,450,000 2.850 10/01/29 2,722,832
10,404,757Computers �� 3.6%Amdocs Ltd.(a)
2,200,000 2.538 06/15/30 2,314,136Apple, Inc.
1,652,000 3.850 05/04/43 2,097,032Dell International LLC / EMC Corp.(a)(b)
724,000 5.300 10/01/29 887,045Dell International LLC/EMC Corp.(a)(b)
1,975,000 5.450 06/15/23 2,184,4883,980,000 6.020 06/15/26 4,856,317
PrincipalAmount
InterestRate
MaturityDate Value
Corporate Obligations �� (continued)Computers �� (continued)Dell International LLC/EMC Corp.(a)(b) � (continued)$ 225,000 6.200 % 07/15/30 $ 291,114
775,000 8.100 07/15/36 1,138,78575,000 8.350 07/15/46 112,884
Hewlett Packard Enterprise Co.(a)1,300,000 4.450 10/02/23 1,431,495700,000 4.650 10/01/24 795,6065,199,000 4.900 10/15/25 6,085,430880,000 6.350 10/15/45 1,161,186
23,798,333Diversified Financial Services �� 3.5%AerCap Ireland Capital DAC/AerCap Global Aviation Trust(a)
1,875,000 4.875 01/16/24 2,050,8002,035,000 6.500 07/15/25 2,432,680
Air Lease Corp.850,000 2.250 01/15/23 872,8142,150,000 3.375 (a) 07/01/25 2,322,5591,450,000 2.875 (a) 01/15/26 1,533,7962,000,000 3.750 (a) 06/01/26 2,205,860
Ally Financial, Inc.(a)750,000 1.450 10/02/23 765,480
American Express Co.(a)(c) (3M USD LIBOR + 3.285%)527,000 3.502 03/15/49 518,436
Avolon Holdings Funding Ltd.(a)(b)750,000 3.950 07/01/24 792,150
Avolon Holdings Funding, Ltd.(a)(b)1,325,000 4.250 04/15/26 1,431,6891,625,000 3.250 02/15/27 1,655,452
GE Capital International Funding Co.1,750,000 3.373 11/15/25 1,945,440600,000 4.418 11/15/35 715,416
Huarong Finance II Co. Ltd.200,000 3.750 05/29/24 210,500200,000 5.500 01/16/25 225,593200,000 5.000 11/19/25 225,063200,000 3.875 (a) 11/13/29 212,625
Copyright © 2021 www.secdatabase.com. All Rights Reserved.Please Consider the Environment Before Printing This Document
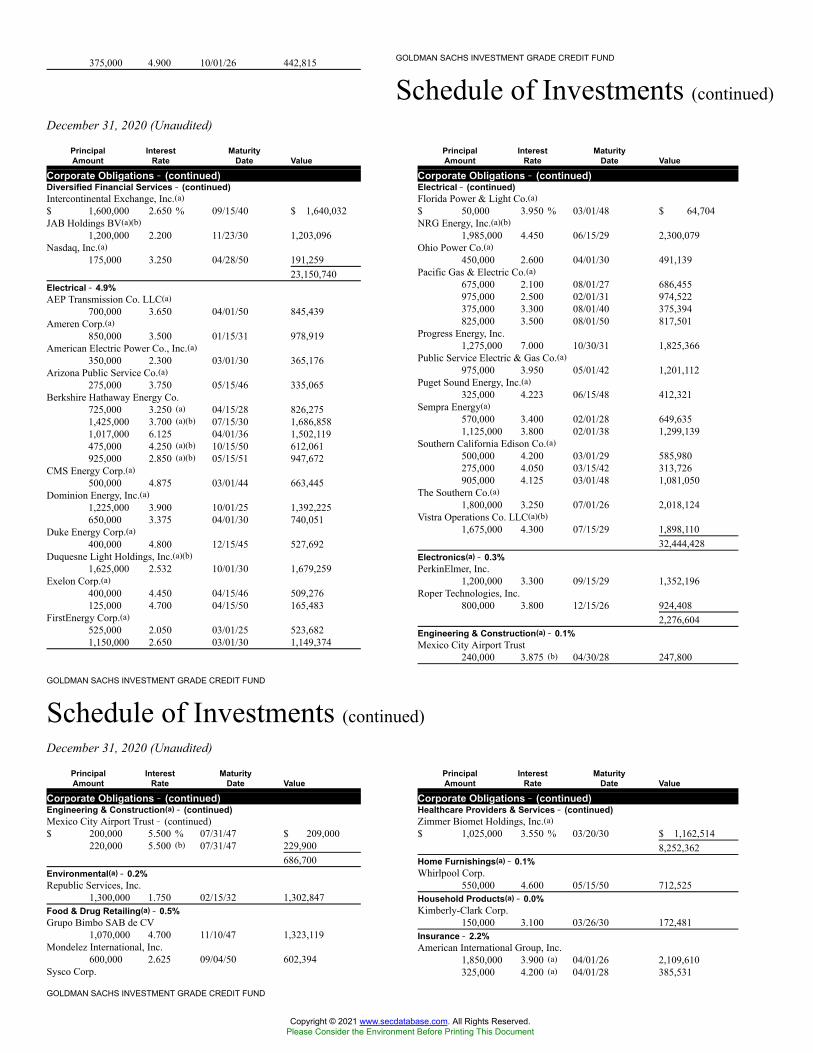
GOLDMAN SACHS INVESTMENT GRADE CREDIT FUND
Schedule of Investments (continued)December 31, 2020 (Unaudited)
GOLDMAN SACHS INVESTMENT GRADE CREDIT FUND
Schedule of Investments (continued)December 31, 2020 (Unaudited)
GOLDMAN SACHS INVESTMENT GRADE CREDIT FUND
375,000 4.900 10/01/26 442,815
PrincipalAmount
InterestRate
MaturityDate Value
Corporate Obligations �� (continued)Diversified Financial Services �� (continued)Intercontinental Exchange, Inc.(a)$ 1,600,000 2.650 % 09/15/40 $ 1,640,032JAB Holdings BV(a)(b)
1,200,000 2.200 11/23/30 1,203,096Nasdaq, Inc.(a)
175,000 3.250 04/28/50 191,25923,150,740
Electrical �� 4.9%AEP Transmission Co. LLC(a)
700,000 3.650 04/01/50 845,439Ameren Corp.(a)
850,000 3.500 01/15/31 978,919American Electric Power Co., Inc.(a)
350,000 2.300 03/01/30 365,176Arizona Public Service Co.(a)
275,000 3.750 05/15/46 335,065Berkshire Hathaway Energy Co.
725,000 3.250 (a) 04/15/28 826,2751,425,000 3.700 (a)(b) 07/15/30 1,686,8581,017,000 6.125 04/01/36 1,502,119475,000 4.250 (a)(b) 10/15/50 612,061925,000 2.850 (a)(b) 05/15/51 947,672
CMS Energy Corp.(a)500,000 4.875 03/01/44 663,445
Dominion Energy, Inc.(a)1,225,000 3.900 10/01/25 1,392,225650,000 3.375 04/01/30 740,051
Duke Energy Corp.(a)400,000 4.800 12/15/45 527,692
Duquesne Light Holdings, Inc.(a)(b)1,625,000 2.532 10/01/30 1,679,259
Exelon Corp.(a)400,000 4.450 04/15/46 509,276125,000 4.700 04/15/50 165,483
FirstEnergy Corp.(a)525,000 2.050 03/01/25 523,6821,150,000 2.650 03/01/30 1,149,374
PrincipalAmount
InterestRate
MaturityDate Value
Corporate Obligations �� (continued)Electrical �� (continued)Florida Power & Light Co.(a)$ 50,000 3.950 % 03/01/48 $ 64,704NRG Energy, Inc.(a)(b)
1,985,000 4.450 06/15/29 2,300,079Ohio Power Co.(a)
450,000 2.600 04/01/30 491,139Pacific Gas & Electric Co.(a)
675,000 2.100 08/01/27 686,455975,000 2.500 02/01/31 974,522375,000 3.300 08/01/40 375,394825,000 3.500 08/01/50 817,501
Progress Energy, Inc.1,275,000 7.000 10/30/31 1,825,366
Public Service Electric & Gas Co.(a)975,000 3.950 05/01/42 1,201,112
Puget Sound Energy, Inc.(a)325,000 4.223 06/15/48 412,321
Sempra Energy(a)570,000 3.400 02/01/28 649,6351,125,000 3.800 02/01/38 1,299,139
Southern California Edison Co.(a)500,000 4.200 03/01/29 585,980275,000 4.050 03/15/42 313,726905,000 4.125 03/01/48 1,081,050
The Southern Co.(a)1,800,000 3.250 07/01/26 2,018,124
Vistra Operations Co. LLC(a)(b)1,675,000 4.300 07/15/29 1,898,110
32,444,428Electronics(a) �� 0.3%PerkinElmer, Inc.
1,200,000 3.300 09/15/29 1,352,196Roper Technologies, Inc.
800,000 3.800 12/15/26 924,4082,276,604
Engineering & Construction(a) �� 0.1%Mexico City Airport Trust
240,000 3.875 (b) 04/30/28 247,800
PrincipalAmount
InterestRate
MaturityDate Value
Corporate Obligations �� (continued)Engineering & Construction(a) �� (continued)Mexico City Airport Trust � (continued)$ 200,000 5.500 % 07/31/47 $ 209,000
220,000 5.500 (b) 07/31/47 229,900686,700
Environmental(a) �� 0.2%Republic Services, Inc.
1,300,000 1.750 02/15/32 1,302,847Food & Drug Retailing(a) �� 0.5%Grupo Bimbo SAB de CV
1,070,000 4.700 11/10/47 1,323,119Mondelez International, Inc.
600,000 2.625 09/04/50 602,394Sysco Corp.
PrincipalAmount
InterestRate
MaturityDate Value
Corporate Obligations �� (continued)Healthcare Providers & Services �� (continued)Zimmer Biomet Holdings, Inc.(a)$ 1,025,000 3.550 % 03/20/30 $ 1,162,514
8,252,362Home Furnishings(a) �� 0.1%Whirlpool Corp.
550,000 4.600 05/15/50 712,525Household Products(a) �� 0.0%Kimberly-Clark Corp.
150,000 3.100 03/26/30 172,481Insurance �� 2.2%American International Group, Inc.
1,850,000 3.900 (a) 04/01/26 2,109,610325,000 4.200 (a) 04/01/28 385,531
Copyright © 2021 www.secdatabase.com. All Rights Reserved.Please Consider the Environment Before Printing This Document
Schedule of Investments (continued)December 31, 2020 (Unaudited)
GOLDMAN SACHS INVESTMENT GRADE CREDIT FUND
150,000 6.600 04/01/40 218,894600,000 6.600 04/01/50 919,788
3,064,195Gas(a) �� 0.2%NiSource, Inc.
225,000 3.600 05/01/30 260,435Piedmont Natural Gas Co., Inc.
325,000 3.350 06/01/50 364,088The East Ohio Gas Co.(b)
400,000 2.000 06/15/30 413,2561,037,779
Healthcare Providers & Services �� 1.2%Centene Corp.(a)
1,250,000 4.250 12/15/27 1,330,425CommonSpirit Health
150,000 4.350 11/01/42 175,512DENTSPLY SIRONA, Inc.(a)
450,000 3.250 06/01/30 500,913DH Europe Finance II S.a.r.l.(a)
1,775,000 2.600 11/15/29 1,940,412Stryker Corp.(a)
2,025,000 1.950 06/15/30 2,081,437Thermo Fisher Scientific, Inc.(a)
850,000 4.497 03/25/30 1,061,149
1,025,000 3.400 (a) 06/30/30 1,172,610700,000 6.250 05/01/36 1,003,674598,000 4.500 (a) 07/16/44 764,256375,000 4.800 (a) 07/10/45 497,280
Arch Capital Finance LLC(a)400,000 4.011 12/15/26 464,060323,000 5.031 12/15/46 439,729
Arch Capital Group Ltd.845,000 7.350 05/01/34 1,285,989
Great-West Lifeco Finance 2018 LP(a)(b)425,000 4.047 05/17/28 498,041
Marsh & McLennan Cos., Inc.(a)1,500,000 4.375 03/15/29 1,826,085
MetLife, Inc.475,000 4.721 12/15/44 649,824
Principal Financial Group, Inc.150,000 6.050 10/15/36 213,771
Teachers Insurance & Annuity Association of America(b)990,000 4.900 09/15/44 1,334,936
The Hartford Financial Services Group, Inc.200,000 6.625 04/15/42 290,792
Willis North America, Inc.(a)400,000 2.950 09/15/29 436,968
PrincipalAmount
InterestRate
MaturityDate Value
Corporate Obligations �� (continued)Insurance �� (continued)XLIT Ltd.$ 998,000 4.450 % 03/31/25 $ 1,139,476
14,512,632Internet(a) �� 1.3%Alphabet, Inc.
700,000 1.900 08/15/40 682,605Amazon.com, Inc.
900,000 4.950 12/05/44 1,318,608Booking Holdings, Inc.
375,000 4.100 04/13/25 425,730Expedia Group, Inc.
3,125,000 3.600 (b) 12/15/23 3,334,531775,000 4.625 (b) 08/01/27 864,3111,825,000 3.250 02/15/30 1,891,558
Prosus NV200,000 3.680 (b) 01/21/30 217,125200,000 3.680 01/21/30 217,125
8,951,593Iron/Steel(a) �� 0.2%Steel Dynamics, Inc.
1,250,000 1.650 10/15/27 1,285,575Machinery-Diversified(a) �� 0.5%Otis Worldwide Corp.
2,625,000 2.565 02/15/30 2,816,940325,000 3.112 02/15/40 354,289
3,171,229Media �� 2.5%Charter Communications Operating LLC/Charter Communications
Operating Capital(a)3,150,000 4.908 07/23/25 3,662,2532,050,000 3.750 02/15/28 2,298,193300,000 6.484 10/23/45 425,613375,000 5.750 04/01/48 489,034
Comcast Corp.638,000 3.300 (a) 02/01/27 719,651175,000 3.400 (a) 04/01/30 201,798150,000 3.250 (a) 11/01/39 169,442
PrincipalAmount
InterestRate
MaturityDate Value
Corporate Obligations �� (continued)Media �� (continued)Comcast Corp. � (continued)$ 250,000 6.400 % 03/01/40 $ 392,640
475,000 3.750 (a) 04/01/40 572,23775,000 4.750 03/01/44 102,575525,000 3.400 (a) 07/15/46 602,243950,000 4.700 (a) 10/15/48 1,321,241263,000 3.999 (a) 11/01/49 332,619
Discovery Communications LLC(a)150,000 5.200 09/20/47 194,68875,000 5.300 05/15/49 99,301
Fox Corp.(a)225,000 5.476 01/25/39 308,927
The Walt Disney Co.650,000 3.800 03/22/30 773,7011,100,000 4.625 (a) 03/23/40 1,466,44350,000 4.950 (a) 10/15/45 69,3001,000,000 4.700 (a) 03/23/50 1,417,040
Time Warner Cable LLC(a)500,000 5.875 11/15/40 663,585
ViacomCBS, Inc.(a)450,000 5.850 09/01/43 623,192
16,905,716Mining �� 0.8%Glencore Finance Canada Ltd.(b)
825,000 4.250 10/25/22 877,948Glencore Funding LLC(b)
781,000 4.625 04/29/24 874,673Newcrest Finance Pty Ltd.(a)(b)
375,000 3.250 05/13/30 415,688Newmont Corp.(a)
1,600,000 2.250 10/01/30 1,686,288Teck Resources, Ltd.(a)
1,225,000 3.900 07/15/30 1,362,9845,217,581
Miscellaneous Manufacturing �� 0.9%General Electric Co.
600,000 3.450 (a) 05/15/24 654,174325,000 3.450 (a) 05/01/27 366,567
Copyright © 2021 www.secdatabase.com. All Rights Reserved.Please Consider the Environment Before Printing This Document

Schedule of Investments (continued)December 31, 2020 (Unaudited)
GOLDMAN SACHS INVESTMENT GRADE CREDIT FUND
Schedule of Investments (continued)December 31, 2020 (Unaudited)
PrincipalAmount
InterestRate
MaturityDate Value
Corporate Obligations �� (continued)Miscellaneous Manufacturing �� (continued)General Electric Co. � (continued)$ 500,000 3.625 %(a) 05/01/30 $ 569,705
600,000 6.750 03/15/32 840,594625,000 6.150 08/07/37 856,3121,069,000 5.875 01/14/38 1,448,891575,000 4.350 (a) 05/01/50 694,836
Parker-Hannifin Corp.(a)270,000 4.000 06/14/49 336,706
5,767,785Oil Field Services �� 3.6%BP Capital Markets America, Inc.(a)
450,000 3.410 02/11/26 504,122950,000 3.119 05/04/26 1,051,260175,000 4.234 11/06/28 208,831
Continental Resources, Inc.(a)216,000 4.500 04/15/23 222,480
Devon Energy Corp.(a)2,492,000 5.850 12/15/25 2,928,000
Diamondback Energy, Inc.(a)1,525,000 4.750 05/31/25 1,715,045
Gazprom PJSC Via Gaz Capital SA200,000 5.150 (b) 02/11/26 227,62570,000 8.625 (d) 04/28/34 109,463110,000 7.288 08/16/37 161,322
Gazprom PJSC Via Gaz Finance PLC(b)450,000 3.250 02/25/30 464,203
KazMunayGas National Co. JSC280,000 6.375 10/24/48 403,288
Lukoil International Finance B.V.1,030,000 4.563 04/24/23 1,102,744
Marathon Petroleum Corp.(a)1,250,000 3.625 09/15/24 1,359,6621,895,000 3.800 04/01/28 2,112,698
Occidental Petroleum Corp.(a)1,100,000 2.900 08/15/24 1,057,375
Ovintiv Exploration, Inc.1,750,000 5.625 07/01/24 1,879,062
PrincipalAmount
InterestRate
MaturityDate Value
Corporate Obligations �� (continued)Oil Field Services �� (continued)Ovintiv, Inc.(a)$ 2,025,000 3.900 % 11/15/21 $ 2,048,166Pertamina Persero PT(a)
370,000 4.175 01/21/50 397,519Phillips 66(a)
200,000 3.850 04/09/25 225,320875,000 1.300 02/15/26 889,648
Shell International Finance B.V.225,000 6.375 12/15/38 350,737
Suncor Energy, Inc.400,000 2.800 05/15/23 420,940900,000 3.600 (a) 12/01/24 993,321850,000 3.100 (a) 05/15/25 931,064
Valero Energy Corp.1,175,000 2.700 04/15/23 1,226,817650,000 2.850 (a) 04/15/25 693,479
23,684,191Packaging(a) �� 0.1%Berry Global, Inc.(b)
450,000 1.570 01/15/26 454,014Packaging Corp. of America
375,000 4.050 12/15/49 465,731919,745
Pharmaceuticals(a) �� 6.2%AbbVie, Inc.
5,950,000 3.200 11/21/29 6,698,6883,300,000 4.050 11/21/39 3,987,12675,000 4.875 11/14/48 101,9363,350,000 4.250 11/21/49 4,208,236
Bayer US Finance II LLC(b)2,375,000 3.375 07/15/24 2,565,000
Becton Dickinson & Co.3,839,000 3.700 06/06/27 4,395,540500,000 4.685 12/15/44 645,370175,000 4.669 06/06/47 228,9021,175,000 3.794 05/20/50 1,395,136
PrincipalAmount
InterestRate
MaturityDate Value
Corporate Obligations �� (continued)Pharmaceuticals(a) �� (continued)Bristol-Myers Squibb Co.$ 375,000 4.550 % 02/20/48 $ 519,184
675,000 4.250 10/26/49 908,766Cigna Corp.
4,050,000 4.125 11/15/25 4,662,6431,425,000 2.400 03/15/30 1,514,604650,000 4.900 12/15/48 891,254
CVS Health Corp.3,300,000 3.875 07/20/25 3,736,194325,000 4.780 03/25/38 410,381720,000 5.125 07/20/45 964,8141,125,000 4.250 04/01/50 1,405,193
Takeda Pharmaceutical Co. Ltd.1,545,000 2.050 03/31/30 1,579,114
Zoetis, Inc.75,000 4.450 08/20/48 $100,202
PrincipalAmount
InterestRate
MaturityDate Value
Corporate Obligations �� (continued)Pipelines �� (continued)MPLX LP(a)$ 600,000 2.650 % 08/15/30 $ 629,718
400,000 4.500 04/15/38 458,124400,000 4.700 04/15/48 473,288520,000 5.500 02/15/49 682,448
Plains All American Pipeline LP/PAA Finance Corp.(a)400,000 3.650 06/01/22 412,1162,175,000 3.850 10/15/23 2,322,4431,769,000 4.650 10/15/25 1,977,600
Sabine Pass Liquefaction LLC(a)1,875,000 6.250 03/15/22 1,973,1564,050,000 5.625 03/01/25 4,725,945975,000 5.000 03/15/27 1,150,324
Sunoco Logistics Partners Operations LP(a)550,000 5.950 12/01/25 645,860100,000 5.400 10/01/47 111,740
The Williams Cos., Inc.
Copyright © 2021 www.secdatabase.com. All Rights Reserved.Please Consider the Environment Before Printing This Document

GOLDMAN SACHS INVESTMENT GRADE CREDIT FUND
Schedule of Investments (continued)December 31, 2020 (Unaudited)
GOLDMAN SACHS INVESTMENT GRADE CREDIT FUND
Schedule of Investments (continued)
40,918,283Pipelines �� 4.9%Abu Dhabi Crude Oil Pipeline LLC(b)
490,000 4.600 11/02/47 609,897Energy Transfer Operating LP(a)
650,000 4.650 06/01/21 654,1601,540,000 5.200 02/01/22 1,596,1331,575,000 2.900 05/15/25 1,665,8141,500,000 4.200 04/15/27 1,649,760456,000 5.150 03/15/45 492,111550,000 5.300 04/15/47 603,823450,000 6.250 04/15/49 546,611
Enterprise Products Operating LLC(a)575,000 4.800 02/01/49 725,961
(3M USD LIBOR + 2.778%)4,420,000 3.003 (c) 06/01/67 3,807,300
EQM Midstream Partners LP(a)1,139,000 4.750 07/15/23 1,190,255
Galaxy Pipeline Assets Bidco Ltd.(b)200,000 2.625 03/31/36 207,000
Kinder Morgan Energy Partners LP650,000 6.550 09/15/40 859,950
150,000 6.300 04/15/40 199,761Western Midstream Operating LP(a)
725,000 4.100 02/01/25 743,1251,000,000 5.450 04/01/44 1,010,000
32,124,423Real Estate Investment Trust �� 4.4%Agree LP(a)
375,000 2.900 10/01/30 396,964Alexandria Real Estate Equities, Inc.(a)
500,000 3.800 04/15/26 575,6801,125,000 3.375 08/15/31 1,288,980475,000 4.000 02/01/50 595,859
American Campus Communities Operating Partnership LP(a)1,100,000 3.875 01/30/31 1,232,660
American Tower Corp.1,550,000 5.000 02/15/24 1,755,1421,400,000 3.375 (a) 05/15/24 1,523,9421,300,000 4.000 (a) 06/01/25 1,467,297525,000 3.800 (a) 08/15/29 609,525
PrincipalAmount
InterestRate
MaturityDate Value
Corporate Obligations �� (continued)Real Estate Investment Trust �� (continued)American Tower Corp. � (continued)$ 1,400,000 2.100 %(a) 06/15/30 $ 1,437,044Camden Property Trust(a)
700,000 3.150 07/01/29 788,270Crown Castle International Corp.(a)
625,000 3.650 09/01/27 707,862275,000 4.300 02/15/29 325,716225,000 3.300 07/01/30 252,317975,000 4.000 11/15/49 1,138,030575,000 4.150 07/01/50 695,112
Duke Realty LP(a)925,000 1.750 07/01/30 936,063
Essex Portfolio LP(a)1,200,000 3.000 01/15/30 1,326,348
Healthcare Realty Trust, Inc.(a)450,000 2.050 03/15/31 450,405
Kimco Realty Corp.(a)550,000 3.800 04/01/27 622,501
Mid-America Apartments LP(a)1,075,000 1.700 02/15/31 1,074,409
MPT Operating Partnership LP/MPT Finance Corp.(a)950,000 4.625 08/01/29 1,019,492
National Retail Properties, Inc.(a)700,000 3.600 12/15/26 766,640
Spirit Realty LP(a)1,675,000 4.000 07/15/29 1,876,218
UDR, Inc.(a)875,000 2.100 08/01/32 889,936
VEREIT Operating Partnership LP(a)1,350,000 3.400 01/15/28 1,489,914975,000 3.100 12/15/29 1,051,157550,000 2.850 12/15/32 574,475
WP Carey, Inc.(a)700,000 3.850 07/15/29 794,4441,250,000 2.400 02/01/31 1,299,325
28,961,727Retailing �� 2.1%AutoNation, Inc.(a)
1,675,000 4.750 06/01/30 2,015,896
PrincipalAmount
InterestRate
MaturityDate Value
Corporate Obligations �� (continued)Retailing �� (continued)Dollar Tree, Inc.(a)$ 1,925,000 4.000 % 05/15/25 $ 2,172,863Lowe�s Cos, Inc.(a)
1,600,000 3.000 10/15/50 1,713,360Lowe�s Cos., Inc.(a)
875,000 1.700 10/15/30 883,977McDonald�s Corp.(a)
150,000 4.450 09/01/48 195,249525,000 4.200 04/01/50 672,215
Starbucks Corp.(a)1,125,000 3.500 11/15/50 1,290,724
The Home Depot, Inc.400,000 5.875 12/16/36 605,572500,000 4.875 (a) 02/15/44 706,920200,000 4.400 (a) 03/15/45 266,718400,000 4.250 (a) 04/01/46 531,244
Tractor Supply Co(a)1,300,000 1.750 11/01/30 1,306,149
Walgreens Boots Alliance, Inc.(a)1,200,000 4.100 04/15/50 1,271,280
13,632,167Savings & Loans(a)(b)(c) �� 0.2%Nationwide Building Society (3M USD LIBOR + 1.855%)
1,250,000 3.960 07/18/30 1,456,025Semiconductors �� 2.9%Broadcom Corp./Broadcom Cayman Finance Ltd.(a)
600,000 3.125 01/15/25 648,5108,675,000 3.875 01/15/27 9,747,92464,000 3.500 01/15/28 70,421
Broadcom, Inc.(a)1,875,000 4.700 04/15/25 2,149,7252,075,000 4.250 04/15/26 2,377,722
KLA Corp.(a)550,000 3.300 03/01/50 620,109
Microchip Technology, Inc.(b)1,350,000 2.670 09/01/23 1,413,463
NXP B.V./NXP Funding LLC/NXP USA, Inc.(a)(b)550,000 3.875 06/18/26 629,030
Copyright © 2021 www.secdatabase.com. All Rights Reserved.Please Consider the Environment Before Printing This Document

December 31, 2020 (Unaudited)
GOLDMAN SACHS INVESTMENT GRADE CREDIT FUND
Schedule of Investments (continued)December 31, 2020 (Unaudited)
PrincipalAmount
InterestRate
MaturityDate Value
Corporate Obligations �� (continued)Semiconductors �� (continued)NXP B.V./NXP Funding LLC/NXP USA, Inc.(a)(b) � (continued)$ 1,125,000 3.400 % 05/01/30 $ 1,275,502
18,932,406Software(a) �� 1.5%Citrix Systems, Inc.
1,925,000 3.300 03/01/30 2,126,624Fiserv, Inc.
2,100,000 3.200 07/01/26 2,350,9711,025,000 4.400 07/01/49 1,364,183
Oracle Corp.750,000 3.600 04/01/40 879,300950,000 4.000 11/15/47 1,166,439425,000 3.600 04/01/50 495,656
ServiceNow, Inc.1,300,000 1.400 09/01/30 1,267,760
9,650,933Telecommunication Services �� 7.2%AT&T, Inc.
4,925,000 2.300 (a) 06/01/27 5,248,868250,000 1.650 (a) 02/01/28 255,3983,100,000 2.750 (a) 06/01/31 3,310,490486,000 2.550 (a)(b) 12/01/33 499,637550,000 6.150 09/15/34 740,448175,000 4.900 (a) 08/15/37 218,7381,450,000 4.850 (a) 03/01/39 1,795,607300,000 6.000 (a) 08/15/40 416,121925,000 3.500 (a) 06/01/41 992,895125,000 4.300 (a) 12/15/42 145,799275,000 4.850 (a) 07/15/45 341,946250,000 4.750 (a) 05/15/46 309,2501,050,000 5.150 (a) 11/15/46 1,354,458575,000 3.650 (a) 06/01/51 600,990525,000 3.850 (a) 06/01/60 552,311
British Telecommunications PLC(a)(b)935,000 4.250 11/08/49 1,127,797
PrincipalAmount
InterestRate
MaturityDate Value
Corporate Obligations �� (continued)Telecommunication Services �� (continued)Deutsche Telekom International Finance B.V.(a)(b)$ 575,000 4.375 % 06/21/28 $ 681,340T-Mobile USA, Inc.(a)(b)
1,975,000 3.500 04/15/25 2,182,780775,000 1.500 02/15/26 793,8944,800,000 3.750 04/15/27 5,458,0901,950,000 2.050 02/15/28 2,027,9024,525,000 3.875 04/15/30 5,237,3931,400,000 3.000 02/15/41 1,448,314
Verizon Communications, Inc.2,931,000 4.329 09/21/28 3,523,971750,000 3.875 (a) 02/08/29 881,9102,551,000 4.016 (a) 12/03/29 3,026,353475,000 3.150 (a) 03/22/30 532,371375,000 5.250 03/16/37 511,4631,100,000 2.650 (a) 11/20/40 1,111,759295,000 4.125 08/15/46 361,753400,000 4.862 08/21/46 536,82483,000 5.012 04/15/49 114,923881,000 2.987 (a)(b) 10/30/56 885,564
Vodafone Group PLC525,000 4.375 05/30/28 629,590
47,856,947Transportation �� 0.7%Burlington Northern Santa Fe LLC
425,000 6.150 05/01/37 646,680825,000 5.750 (a) 05/01/40 1,216,033
FedEx Corp.(a)850,000 4.050 02/15/48 1,021,156700,000 5.250 05/15/50 989,338
Union Pacific Corp.(a)450,000 3.950 09/10/28 536,009
PrincipalAmount
InterestRate
MaturityDate Value
Corporate Obligations �� (continued)Transportation �� (continued)Union Pacific Corp.(a) � (continued)$ 275,000 3.550 % 08/15/39 $ 316,954
4,726,170TOTAL CORPORATE OBLIGATIONS(Cost $551,820,802) $604,171,707
Foreign Debt Obligations �� 3.8%Sovereign �� 3.8%Abu Dhabi Government International Bond$ 1,680,000 4.125 % 10/11/47 $ 2,104,725Perusahaan Penerbit SBSN
1,580,000 4.550 03/29/26 1,826,381Republic of Chile(a)
200,000 3.500 01/25/50 229,313Republic of Colombia(a)
1,221,000 4.000 02/26/24 1,318,680350,000 4.500 03/15/29 404,250690,000 3.000 01/30/30 724,931200,000 5.200 05/15/49 252,812490,000 4.125 05/15/51 544,390
Republic of Indonesia
PrincipalAmount
InterestRate
MaturityDate Value
Foreign Debt Obligations �� (continued)Sovereign �� (continued)Republic of Philippines � (continued)$ 210,000 2.650 % 12/10/45 $ 211,575Republic of Qatar(b)
1,800,000 5.103 04/23/48 2,529,000Republic of Romania(b)EUR 90,000 2.124 07/16/31 116,339
70,000 2.000 01/28/32 89,55180,000 4.625 04/03/49 131,938
State of Israel(g)200,000 4.500 04/03/20 264,500
United Mexican StatesEUR 1,770,000 1.625 04/08/26 2,246,111
130,000 1.350 (a) 09/18/27 163,777$ 740,000 3.750 01/11/28 833,656
2,540,000 3.250 (a) 04/16/30 2,752,725960,000 2.659 (a) 05/24/31 987,360709,000 3.771 (a) 05/24/61 737,183
TOTAL FOREIGN DEBT OBLIGATIONS(Cost $21,714,240) $ 24,896,472
Municipal Debt Obligations �� 0.7%California(a) �� 0.1%
Copyright © 2021 www.secdatabase.com. All Rights Reserved.Please Consider the Environment Before Printing This Document
GOLDMAN SACHS INVESTMENT GRADE CREDIT FUND
Schedule of Investments (continued)December 31, 2020 (Unaudited)
200,000 3.700 (b) 01/08/22 206,063387,000 5.875 01/15/24 445,050350,000 4.350 (b) 01/08/27 407,6411,610,000 4.350 01/08/27 1,875,147470,000 6.750 01/15/44 720,862
Republic of Panama(a)380,000 2.252 09/29/32 391,020200,000 3.870 07/23/60 235,500
Republic of Peru(a)610,000 2.783 01/23/31 668,865290,000 2.780 12/01/60 291,885220,000 3.230 (e) 07/28/21 219,890
Republic of PhilippinesEUR 340,000 0.000 (f) 02/03/23 414,063
450,000 0.700 02/03/29 551,289
California State GO Bonds Build America Taxable Series 2009$ 455,000 7.300 % 10/01/39 $ 751,036Illinois �� 0.5%Illinois State GO Bonds Build America Series 2010(a)
1,625,000 6.630 02/01/35 1,861,681Illinois State GO Bonds Taxable-Pension Series 2003
1,360,000 5.100 06/01/33 1,463,6463,325,327
New Jersey(a) �� 0.1%New Jersey State Turnpike Authority RB Build America Bonds Taxable
Series 2009 F350,000 7.414 01/01/40 586,950
TOTAL MUNICIPAL DEBT OBLIGATIONS(Cost $3,797,150) $ 4,663,313
PrincipalAmount
InterestRate
MaturityDate Value
U.S. Treasury Obligation �� 0.1%United States Treasury Bonds$ 700,000 3.375 % 11/15/48 $ 982,625(Cost $856,709)TOTAL INVESTMENTS �� 95.9%(Cost $578,188,901) $634,714,117OTHER ASSETS IN EXCESS OF
LIABILITIES �� 4.1% 26,937,354NET ASSETS �� 100.0% $661,651,471
The percentage shown for each investment category reflects thevalue of investments in that category as a percentage of net assets.(a) Security with �Call� features with resetting interest rates. Maturity dates disclosed
are the final maturity dates.
(b) Exempt from registration under Rule 144A of the Securities Act of 1933.
(c) Variable rate security. Except for floating rate notes (for which final maturity isdisclosed), maturity date disclosed is the next interest reset date. Interest ratedisclosed is that which is in effect on December 31, 2020.
(d) Security with �Put� features and resetting interest rates. Maturity dates disclosedare the puttable dates. Interest rate disclosed is that which is in effect on December31, 2020.
(e) Actual maturity date is July 28, 2121.
(f) Issued with a zero coupon. Income is recognized through the accretion of discount.
(g) Actual maturity date is April 3, 2120.
Currency Abbreviations:AUD �Australian DollarCAD � Canadian DollarEUR � EuroJPY � Japanese YenNOK �Norwegian KroneNZD �New Zealand DollarSEK � Swedish KronaUSD �U.S. Dollar
Investment Abbreviations:BP � British Pound Offered RateCDOR � Canadian Dollar Offered RateCMT � Constant Maturity Treasury IndexesEURO � Euro Offered RateGO �General ObligationLIBOR � London Interbank Offered RateLLC � Limited Liability CompanyLP � Limited PartnershipPLC � Public Limited CompanyRB � Revenue BondSOFR � Secured Overnight Funding Rate
Copyright © 2021 www.secdatabase.com. All Rights Reserved.Please Consider the Environment Before Printing This Document

GOLDMAN SACHS INVESTMENT GRADE CREDIT FUND
Schedule of Investments (continued)December 31, 2020 (Unaudited)
ADDITIONAL INVESTMENT INFORMATION
FORWARD FOREIGN CURRENCY EXCHANGE CONTRACTS � At December 31, 2020, the Fund had the following forward foreign currencyexchange contracts:
FORWARD FOREIGN CURRENCY EXCHANGE CONTRACTS WITH UNREALIZED GAIN
CounterpartyCurrencyPurchased
CurrencySold
SettlementDate
UnrealizedGain
Barclays Bank PLC EUR 7,338,628 USD 8,906,379 03/17/21 $ 74,655MS & Co. Int. PLC JPY 538,792,671 USD 5,165,688 03/17/21 57,089TOTAL $ 131,744
FORWARD FOREIGN CURRENCY EXCHANGE CONTRACTS WITH UNREALIZED LOSS
CounterpartyCurrencyPurchased
CurrencySold
SettlementDate
UnrealizedLoss
Barclays Bank PLC USD 3,738,756 AUD 5,001,372 03/17/21 $(119,506 )USD 4,334,464 NOK 38,187,908 03/17/21 (118,083 )
Deutsche Bank AG USD 3,733,244 NZD 5,308,785 03/17/21 (87,662 )JPMorgan Securities, Inc. USD 4,366,412 EUR 3,661,557 01/21/21 (109,116 )MS & Co. Int. PLC USD 4,552,130 CAD 5,816,253 03/17/21 (18,135 )State Street Bank (London) USD 725,607 EUR 612,000 01/21/21 (22,442 )UBS AG (London) USD 4,826,325 SEK 40,886,162 03/17/21 (147,273 )TOTAL $(622,217 )
FUTURES CONTRACTS � At December 31, 2020, the Fund had the following futures contracts:
DescriptionNumber ofContracts
ExpirationDate
NotionalAmount
UnrealizedAppreciation/(Depreciation)
Long position contracts:Ultra Long U.S. Treasury Bonds 202 03/22/21 $43,139,625 $ (184,722 )2 Year U.S. Treasury Notes 205 03/31/21 45,300,195 41,67110 Year U.S. Treasury Notes 140 03/22/21 19,330,938 11,09620 Year U.S. Treasury Bonds 164 03/22/21 28,402,750 (183,323 )Total $ (315,278 )Short position contracts:Ultra 10 Year U.S. Treasury Notes (175) 03/22/21 (27,362,891) 72,5095 Year U.S. Treasury Notes (285) 03/31/21 (35,956,758) (46,061 )Total $ 26,448TOTAL FUTURES CONTRACTS $ (288,830 )
SWAP CONTRACTS � At December 31, 2020, the Fund had the following swap contracts:
CENTRALLY CLEARED INTEREST RATE SWAP CONTRACTS
Payments Madeby the Fund
PaymentsReceived by
FundTermination
Date
NotionalAmount(000s)
MarketValue
UpfrontPremium
(Received) Paid
UnrealizedAppreciation/(Depreciation)
0.000%(c) 3M LIBOR© 07/25/24 $ 17,380 (b) $(5,835 ) $ 5,837 $ (11,672 )6M CDOR(a) 0.960%(a) 11/09/24 CAD 31,430 (b) 44,129 27,667 16,4620.000%(c) 3M LIBOR© 11/10/24 $ 10,290 (b) (8,910 ) 10 (8,920 )3M LIBOR© 0.500(a) 03/17/26 690 (b) 1,369 470 8991.430(a) 6M CDOR(a) 11/09/30 CAD 6,300 (b) (26,260) (19,313 ) (6,947 )3M LIBOR© 1.245(a) 11/24/30 $ 5,240 (b) (44,405) (5,890 ) (38,515 )0.000(d) 6M EURO(a) 03/17/31 EUR 430(b) (13,702) (13,570 ) (132 )1.543(a) 3M LIBOR(c) 11/25/35 $ 5,720 (b) 57,477 1,630 55,847TOTAL $3,863 $ (3,159 ) $ 7,022
(a) Payments made semi-annually.
Copyright © 2021 www.secdatabase.com. All Rights Reserved.Please Consider the Environment Before Printing This Document

(b) Represents forward starting interest rate swaps whose effective dates of commencement of accruals and cash flows occur subsequent to September 30, 2020.(c) Payments made quarterly.(d) Payments made annually.GOLDMAN SACHS INVESTMENT GRADE CREDIT FUND
Schedule of Investments (continued)December 31, 2020 (Unaudited)
ADDITIONAL INVESTMENT INFORMATION (continued)
CENTRALLY CLEARED CREDIT DEFAULT SWAP CONTRACTS
ReferencedObligation/Index
Financing RateReceived/(Paid) by
the Fund(a)
Credit Spreadat December31, 2020(b)
TerminationDate
NotionalAmount(000s) Value
UpfrontPremiums
(Received) Paid
UnrealizedAppreciation/(Depreciation)
Protection Sold:AT&T, Inc., 2.450%, 06/30/20 1.000% 0.550% 06/20/24 $2,325 $36,978 $ 3,754 $ 33,224CDX.NA.IG Index 28 1.000 0.437 06/20/22 28,500 246,754 289,084 (42,330 )CDX.NA.IG Index 34 1.000 0.418 06/20/23 17,200 252,330 181,510 70,820CDX.NA.IG Index 34 1.000 0.629 06/20/25 134,800 2,240,313 1,206,947 1,033,366General Electric Co. 2.700%, 10/09/22 1.000 0.687 06/20/24 1,175 13,101 (13,921 ) 27,022General Electric Co. 2.700%, 10/09/22 1.000 0.770 12/20/24 550 5,156 (6,950 ) 12,106Prudential Financial, Inc., 3.500%, 05/15/24 1.000 0.359 06/20/24 1,150 26,029 11,910 14,119Republic of Colombia, 10.375%, 01/28/33 1.000 0.554 06/20/24 1,830 28,962 (7,116 ) 36,078Republic of Indonesia, 5.875%, 03/13/20 1.000 0.449 06/20/24 70 1,362 (110 ) 1,472Republic of Peru, 8.750%, 11/21/33 1.000 0.357 06/20/24 550 12,518 6,179 6,339The Boeing Co., 8.750%, 08/15/21 1.000 1.073 06/20/24 1,750 (3,778 ) 26,333 (30,111 )United Mexican States, 4.150%, 03/28/27 1.000 0.497 06/20/24 640 11,406 (6,573 ) 17,979TOTAL $2,871,131 $ 1,691,047 $ 1,180,084
(a) Payments made quarterly.(b) Credit spread on the referenced obligation, together with the term of the swap contract, are indicators of payment/performance risk. The likelihood of a credit event occurring which would require a
fund or its counterparty to make a payment or otherwise be required to perform under the swap contract is generally greater as the credit spread and the term of the swap contract increase.
GOLDMAN SACHS LOCAL EMERGING MARKETS DEBT FUND
Schedule of InvestmentsDecember 31, 2020 (Unaudited)
Abbreviations:CDX.NA.IG Index 28 � CDX North America Investment Grade Index 28MS & Co. Int. PLC �Morgan Stanley & Co. International PLC
PrincipalAmount
InterestRate
MaturityDate Value
Sovereign Debt Obligations �� 76.6%Argentina(a) �� 0.1%Republic of Argentina (CCC+/NR)$ 12,578 1.000 % 07/09/29 $ 5,471
65,075 0.125 (b) 07/09/30 26,453188,322 0.125 (b) 07/09/35 68,926
100,850Brazil �� 4.9%Brazil Letras do Tesouro Nacional (NR/NR)(c)BRL 13,552,000 0.000 04/01/21 2,595,914Brazil Notas do Tesouro Nacional (BB-/Ba2)
8,473,000 10.000 01/01/25 1,885,7954,481,709
Chile �� 3.2%Bonos de la Tesoreria de la Republica en pesos (NR/NR)(d)CLP 55,000,000 4.700 09/01/30 90,625Bonos de la Tesoreria de la Republica en Pesos (NR/NR)
790,000,000 5.000 03/01/35 1,336,728Bonos de la Tesoreria de la Republica en Pesos (NR/A1)
935,000,000 4.500 03/01/26 1,506,9582,934,311
China �� 8.6%Agricultural Development Bank of China (NR/NR)
PrincipalAmount
InterestRate
MaturityDate Value
Sovereign Debt Obligations �� (continued)Colombia �� (continued)Republic of Colombia (BBB/Baa2)COP 3,598,400,000 7.500 % 08/26/26 $ 1,214,142
3,130,500,000 6.000 04/28/28 978,2414,847,100
Czech Republic �� 3.8%Czech Republic Government Bond (NR/NR)CZK 33,200,000 1.000 06/26/26 1,552,002
27,080,000 0.250 02/10/27 1,205,402Czech Republic Government Bond (NR/Aa3)
11,320,000 4.200 12/04/36 735,8123,493,216
Dominican Republic �� 0.2%Dominican Republic (NR/NR)DOP 2,800,000 10.500 04/07/23 51,163Dominican Republic (BB-/Ba3)$ 150,000 5.875 01/30/60 164,438
215,601Egypt(d) �� 0.3%Republic of Egypt (B/B2u)
200,000 8.875 05/29/50 234,437Hungary �� 3.2%
Copyright © 2021 www.secdatabase.com. All Rights Reserved.Please Consider the Environment Before Printing This Document
GOLDMAN SACHS LOCAL EMERGING MARKETS DEBT FUND
Schedule of Investments (continued)December 31, 2020 (Unaudited)
GOLDMAN SACHS LOCAL EMERGING MARKETS DEBT FUND
Schedule of Investments (continued)December 31, 2020 (Unaudited)
CNY 21,890,000 2.960 04/17/30 3,161,219China Development Bank (NR/NR)
17,780,000 3.090 06/18/30 2,592,109China Government Bond (NR/NR)
13,900,000 2.850 06/04/27 2,084,3397,837,667
Colombia �� 5.3%Republic of Colombia (NR/NR)COP 1,279,041,090 3.300 03/17/27 417,929
2,538,700,000 5.750 11/03/27 785,291704,100,000 7.000 06/30/32 226,7532,058,100,000 7.250 10/18/34 672,331
Republic of Colombia (NR/Baa2)(a)1,851,000,000 4.375 03/21/23 552,413
Hungary Government Bond (NR/NR)HUF 179,680,000 2.750 12/22/26 650,634Hungary Government Bond (NR/Baa3)
124,250,000 3.000 08/21/30 453,329Hungary Government Bond (BBB/NR)
194,960,000 5.500 06/24/25 781,499292,160,000 3.000 10/27/27 1,077,046
2,962,508Indonesia �� 1.5%Indonesia Treasury Bond (NR/NR)IDR 12,184,000,000 7.500 06/15/35 954,585Indonesia Treasury Bond (NR/Baa2)
6,000,000,000 7.000 05/15/27 455,0181,409,603
PrincipalAmount
InterestRate
MaturityDate Value
Sovereign Debt Obligations �� (continued)Mexico �� 5.5%United Mexican States (NR/Baa1)MXN 9,697,500 8.000 % 09/05/24 $ 544,280
4,741,100 5.750 03/05/26 249,2711,907,500 8.000 11/07/47 112,901
United Mexican States (BBB/Baa1)(a)$ 200,000 2.659 05/24/31 205,700
200,000 3.771 05/24/61 207,950United Mexican States (BBB+/Baa1)MXN 17,779,300 8.500 05/31/29 1,088,060
5,456,000 7.750 05/29/31 321,9028,836,600 10.000 11/20/36 621,96426,082,800 8.500 11/18/38 1,624,072
4,976,100Morocco(d) �� 0.2%Kingdom of Morocco (BBB-/NR)$ 200,000 3.000 12/15/32 202,500Peru �� 4.2%Republic of Peru (NR/A3)PEN 963,000 6.714 02/12/55 328,956Republic of Peru (A-/A3)
2,018,000 8.200 08/12/26 756,2291,269,000 6.350 08/12/28 444,6481,326,000 6.950 08/12/31 475,2122,660,000 6.150 08/12/32 894,0791,665,000 5.400 08/12/34 507,037246,000 6.900 08/12/37 83,6921,050,000 5.350 08/12/40 300,743
3,790,596Philippines �� 0.3%Republic of Philippines (BBB+/Baa2)PHP 10,000,000 6.250 01/14/36 266,442
PrincipalAmount
InterestRate
MaturityDate Value
Sovereign Debt Obligations �� (continued)Poland �� 6.3%Republic of Poland Government Bond (NR/NR)PLN 9,170,000 0.750 % 04/25/25 $ 2,490,434Republic of Poland Government Bond (A/A2)
5,120,000 2.500 07/25/27 1,520,9525,610,000 2.750 04/25/28 1,696,155
5,707,541Romania �� 2.0%Republic of Romania (NR/NR)RON 2,110,000 3.650 07/28/25 552,165
700,000 4.150 01/26/28 189,7182,600,000 3.650 09/24/31 673,241
Republic of Romania (BBB-/Baa3)(d)EUR 100,000 3.624 05/26/30 145,529
150,000 2.000 01/28/32 191,894$ 50,000 4.000 02/14/51 54,375
1,806,922Russia �� 6.0%Russian Federation Bond (NR/NR)RUB 43,640,000 6.000 10/06/27 600,150
33,630,000 7.650 04/10/30 511,66560,150,000 5.900 03/12/31 808,39345,560,000 7.700 03/23/33 692,52223,220,000 7.250 05/10/34 340,700161,060,000 7.700 03/16/39 2,480,537
5,433,967Serbia(d) �� 0.1%Republic of Serbia (NR/Ba3)EUR 100,000 3.125 05/15/27 137,130South Africa �� 9.2%Republic of South Africa (BB/Ba2)ZAR 33,490,000 10.500 12/21/26 2,701,330
6,930,000 7.000 02/28/31 404,19348,325,000 8.875 02/28/35 2,896,702
PrincipalAmount
InterestRate
MaturityDate Value
Sovereign Debt Obligations �� (continued)South Africa �� (continued)Republic of South Africa (BB/Ba2) � (continued)$ 12,200,000 8.500 % 01/31/37 $ 689,105
25,784,300 8.750 01/31/44 1,435,549
PrincipalAmount
InterestRate
MaturityDate Value
Corporate Obligations �� (continued)British Virgin Islands �� 0.3%Huarong Finance II Co. Ltd. (BBB+/Baa1)$ 260,000 5.500 % 01/16/25 $ 293,271China(f) �� 0.0%
Copyright © 2021 www.secdatabase.com. All Rights Reserved.Please Consider the Environment Before Printing This Document

GOLDMAN SACHS LOCAL EMERGING MARKETS DEBT FUND
Schedule of Investments (continued)December 31, 2020 (Unaudited)
4,620,000 8.750 02/28/48 257,5328,384,411
Thailand �� 8.5%Thailand Government Bond (NR/NR)THB 16,360,000 3.300 06/17/38 674,399
1,220,000 3.600 06/17/67 54,319Thailand Government Bond (NR/Baa1)
52,996,099 1.250 03/12/28 1,766,55779,990,000 3.775 06/25/32 3,330,830
Thailand Government Bond (A-/Baa1)49,960,000 3.850 12/12/25 1,931,531
7,757,636Turkey �� 2.8%Republic of Turkey (NR/NR)TRY 13,490,000 12.200 01/18/23 1,755,896
4,460,000 10.600 02/11/26 558,6252,080,000 11.000 02/24/27 260,665
2,575,186Ukraine(d) �� 0.1%Ukraine Government Bond (B/NR)EUR 100,000 4.375 01/27/30 116,553Uruguay �� 0.3%Republic of Uruguay (BBB/NR)UYU 4,338,062 3.875 07/02/40 119,431Republic of Uruguay (BBB/Baa2)
4,511,236 4.375 12/15/28 122,131241,562
TOTAL SOVEREIGN DEBT OBLIGATIONS(Cost $66,921,959) $ 69,913,548
Corporate Obligations �� 5.4%Brazil(a)(e) �� 0.2%Banco do Brasil SA (CCC+/NR) (10 Year CMT + 4.398%)$ 200,000 6.250 % 04/15/49 $ 204,812
iQIYI, Inc. (NR/NR)10,000 2.000 04/01/25 8,841
Colombia �� 0.2%Banco de Bogota SA (NR/Ba2)
200,000 6.250 05/12/26 231,500Israel(a)(d) �� 0.1%Leviathan Bond Ltd. (BB-/Ba3)
50,000 5.750 06/30/23 53,224Mexico(a) �� 0.3%Mexico City Airport Trust (BBB/Baa3)
270,000 3.875 04/30/28 278,775Petroleos Mexicanos (BBB/Ba2)(d)
10,000 6.875 10/16/25 10,936289,711
Peru(a) �� 1.2%Banco de Credito del Peru (BBB+/NR)PEN 3,640,000 4.650 09/17/24 1,077,797South Africa �� 0.4%Eastern & Southern African Trade & Development Bank (NR/Baa3)$ 390,000 4.875 05/23/24 411,497Turkey �� 0.2%Yapi ve Kredi Bankasi AS (NR/B2)
200,000 8.250 10/15/24 219,000United Kingdom(d) �� 1.0%Gazprom PJSC via Gaz Finance PLC (BB/NR)(a)(e)(5 Year CMT + 4.264%)
200,000 4.599 10/26/49 207,750HSBC Bank PLC (NR/NR)(c)EGP 11,800,000 0.000 12/23/21 666,944
874,694United States(d) �� 1.2%JPMorgan Chase Bank NA (NR/NR)IDR 7,753,000,000 6.500 02/15/31 573,612
PrincipalAmount
InterestRate
MaturityDate Value
Corporate Obligations �� (continued)United States(d) �� (continued)JPMorgan Chase Bank NA (NR/NR) � (continued)$ 6,269,000,000 7.500 %(e) 06/17/35 $ 491,160
1,064,772Venezuela(g) �� 0.3%Petroleos de Venezuela SA (NR/NR)
9,280,000 6.000 10/28/22 245,920TOTAL CORPORATE OBLIGATIONS(Cost $7,703,780) $ 4,975,039
Structured Notes �� 8.8%United Kingdom(d) �� 4.2%Republic of Indonesia (Issuer Standard Chartered Bank) (NR/NR)IDR 33,591,000,000 8.750 % 05/19/31 $ 2,821,166
12,570,000,000 7.500 08/19/32 968,4723,789,638
United States �� 4.6%Republic of Columbia (Issuer Citibank NA) (NR/NR)COP 4,226,000,000 11.000 07/25/24 1,502,404Republic of Indonesia (Issuer JPMorgan Chase Bank NA) (NR/NR)(d)EGP 6,900,000 0.000 (c) 07/08/21 411,136
10,375,000 0.000 (c) 09/02/21 608,039IDR 15,558,000,000 7.000 05/17/27 1,179,861
6,568,000,000 7.500 08/19/32 506,0404,207,480
TOTAL STRUCTURED NOTES(Cost $8,618,128) $ 7,997,118
U.S. Treasury Obligations �� 0.1%United States Treasury Notes
Security ratings disclosed, if any, are obtained from by Standard &Poor�s /Moody�s Investor Service and are unaudited. A briefdescription of the ratings is available in the Fund�s Statement ofAdditional Information.
Currency Abbreviations:AUD �Australian DollarBRL � Brazilian RealCAD � Canadian DollarCHF � Swiss FrancCLP � Chilean PesoCNH � Chinese Yuan Renminbi OffshoreCNY � Chinese Yuan RenminbiCOP � Colombian PesoCZK � Czech KorunaDOP �Dominican PesoEGP � Egyptian PoundEUR � EuroGBP � British PoundHUF �Hungarian ForintIDR � Indonesian RupiahILS � Israeli ShekelINR � Indian RupeeJPY � Japanese YenKRW � South Korean WonMXN �Mexican PesoMYR �Malaysian RinggitNOK �Norwegian KroneNZD �New Zealand DollarPEN � Peruvian Nuevo SolPHP � Philippine PesoPLN � Polish Zloty
Copyright © 2021 www.secdatabase.com. All Rights Reserved.Please Consider the Environment Before Printing This Document

GOLDMAN SACHS LOCAL EMERGING MARKETS DEBT FUND
Schedule of Investments (continued)December 31, 2020 (Unaudited)
ADDITIONAL INVESTMENT INFORMATION
FORWARD FOREIGN CURRENCY EXCHANGE CONTRACTS �� At December 31, 2020, the Fund had the following forward foreign currencyexchange contracts:
FORWARD FOREIGN CURRENCY EXCHANGE CONTRACTS WITH UNREALIZED GAIN
CounterpartyCurrencyPurchased
CurrencySold
SettlementDate
UnrealizedGain
MS & Co. Int. PLC AUD 257,211 EUR 159,103 03/17/21 $3,712AUD 1,516,000 NZD 1,600,309 03/17/21 17,709AUD 520,169 USD 393,619 03/17/21 7,660BRL 35,000,126 USD 6,636,250 01/05/21 102,894CAD 1,106,984 USD 866,597 03/17/21 3,244CHF 335,389 USD 379,577 03/17/21 135CNH 47,382,132 USD 7,211,561 03/17/21 37,318COP 5,179,708,119 USD 1,449,991 01/29/21 66,619EUR 144,919 JPY 18,255,246 03/17/21 395EUR 470,178 PLN 2,123,632 03/17/21 6,737EUR 2,037,000 USD 2,472,713 03/17/21 20,174GBP 141,850 EUR 156,689 03/17/21 2,317GBP 601,927 USD 804,081 03/17/21 19,454IDR 34,805,077,981 USD 2,408,831 01/06/21 88,126IDR 11,279,759,870 USD 794,070 03/05/21 12,819ILS 1,003,860 USD 308,628 03/17/21 4,192INR 189,067,703 USD 2,544,024 01/27/21 37,604JPY 128,396,750 USD 1,232,160 03/17/21 12,451KRW 2,540,497,918 USD 2,267,553 01/08/21 67,616KRW 1,527,005,081 USD 1,344,266 01/15/21 59,331KRW 1,527,005,081 USD 1,369,683 02/19/21 33,808MXN 13,065,490 USD 642,060 03/17/21 8,781MYR 11,720,886 USD 2,807,869 01/13/21 120,523MYR 10,447,105 USD 2,515,920 01/26/21 94,225MYR 1,224,141 USD 301,327 03/17/21 4,436NOK 664,313 EUR 62,985 03/17/21 376NOK 12,307,448 USD 1,397,936 03/17/21 37,060
$ 28,000 2.875 % 10/15/21 $ 28,60072,000 1.750 09/30/22 74,029
TOTAL U.S. TREASURY OBLIGATIONS(Cost $100,370) $ 102,629
SharesDividend
Rate Value
Investment Company(h) �� 3.1%Goldman Sachs Financial Square Government Fund - Institutional Shares
2,800,830 0.026% $ 2,800,830(Cost $2,800,830)TOTAL INVESTMENTS �� 94.0%(Cost $86,145,067) $85,789,164OTHER ASSETS IN EXCESS OF
LIABILITIES �� 6.0% 5,443,166NET ASSETS �� 100.0% $91,232,330
The percentage shown for each investment category reflects thevalue of investments in that category as a percentage of net assets.(a) Security with �Call� features with resetting interest rates. Maturity dates disclosed
are the final maturity dates.
(b) Coupon changes periodically based upon a predetermined schedule. Interest ratedisclosed is that which is in effect on December 31, 2020.
(c) Issued with a zero coupon. Income is recognized through the accretion of discount.
(d) Exempt from registration under Rule 144A of the Securities Act of 1933.
(e) Variable rate security. Except for floating rate notes (for which final maturity isdisclosed), maturity date disclosed is the next interest reset date. Interest ratedisclosed is that which is in effect on December 31, 2020.
(f) Security with �Put� features and resetting interest rates. Maturity dates disclosedare the puttable dates. Interest rate disclosed is that which is in effect on December31, 2020.
(g) Security is currently in default and/or non-income producing.
(h) Represents an affiliated issuer.
RON �New Romanian LeuRUB � Russian RubleSEK � Swedish KronaSGD � Singapore DollarTHB � Thai BahtTRY � Turkish LiraTWD � Taiwan DollarUSD �U.S. DollarUYU �Uruguayan PesoZAR � South African Rand
Investment Abbreviations:BUBOR � Budapest Interbank Offered RateCLICP � Sinacofi Chile Interbank RateCMT � Constant Maturity Treasury IndexesEURO � Euro Offered RateJIBAR � Johannesburg Interbank Agreed RateKLIBOR �Kuala Lumpur Interbank Offered RateLIBOR � London Interbank Offered RateLLC � Limited Liability CompanyNR �Not RatedPLC � Public Limited CompanyTIIE � La Tasa de Interbank Equilibrium Interest RateWIBOR �Warsaw Interbank Offered Rate
For information on the mutual funds, please call our toll freeShareholder Services Line at 1-800-526-7384 or visit us on the webat www.GSAMFUNDS.com.
Copyright © 2021 www.secdatabase.com. All Rights Reserved.Please Consider the Environment Before Printing This Document
NZD 1,933,650 USD 1,360,226 03/17/21 31,485PEN 9,094,606 USD 2,497,675 07/12/21 12,868PHP 9,115,589 USD 188,995 01/15/21 647PHP 17,563,857 USD 364,854 02/08/21 168RON 5,766,032 USD 1,431,829 03/17/21 9,513RUB 157,899,570 USD 2,056,076 02/08/21 68,180SEK 3,204,142 EUR 316,386 03/17/21 2,575SEK 1,612,987 USD 195,062 03/17/21 1,150SGD 939,670 USD 703,724 03/17/21 7,345THB 52,092,833 USD 1,728,868 03/17/21 10,097TRY 1,468,117 USD 173,188 01/11/21 23,648TRY 2,826,164 USD 348,165 01/19/21 29,616TRY 1,167,796 USD 146,831 01/25/21 8,922TRY 620,189 USD 76,754 03/17/21 4,185TRY 5,852,333 USD 689,321 08/04/21 31,503TWD 20,584,156 USD 729,549 01/04/21 3,341TWD 24,682,444 USD 878,015 02/05/21 5,383TWD 5,192,498 USD 183,783 02/17/21 2,454TWD 5,396,192 USD 194,024 03/05/21 152USD 3,251,559 BRL 16,719,913 01/05/21 32,202USD 184,586 JPY 19,028,797 03/17/21 131USD 388,529 KRW 421,520,211 01/08/21 1,077USD 34,294 KRW 37,279,761 02/19/21 29USD 152,015 MXN 3,035,522 03/17/21 804USD 5,541,628 PEN 19,674,353 07/12/21 110,574USD 309,223 THB 9,215,745 03/17/21 1,583USD 180,402 TWD 5,065,520 01/04/21 46USD 767,439 TWD 21,406,024 02/05/21 1,304USD 77,325 ZAR 1,141,807 03/17/21 387ZAR 6,970,764 USD 465,670 03/17/21 4,028
TOTAL $1,275,113GOLDMAN SACHS LOCAL EMERGING MARKETS DEBT FUND
Schedule of Investments (continued)December 31, 2020 (Unaudited)
ADDITIONAL INVESTMENT INFORMATION (continued)
FORWARD FOREIGN CURRENCY EXCHANGE CONTRACTS WITH UNREALIZED LOSS
CounterpartyCurrencyPurchased
CurrencySold
SettlementDate
UnrealizedLoss
MS & Co. Int. PLC BRL 16,719,913 USD 3,249,758 02/02/21 $(32,233 )CNH 2,396,400 USD 367,000 03/17/21 (380 )COP 1,575,531,711 USD 461,897 01/29/21 (584 )EUR 157,764 GBP 141,695 03/17/21 (789 )EUR 796,153 NOK 8,514,320 03/17/21 (18,399 )EUR 157,821 NZD 271,756 03/17/21 (2,450 )HUF 71,845,074 EUR 201,609 03/17/21 (4,734 )HUF 124,105,335 USD 419,021 03/17/21 (996 )MXN 89,524,316 USD 4,473,235 03/17/21 (13,692 )PEN 1,996,290 USD 559,202 07/12/21 (8,132 )PLN 726,445 EUR 162,107 03/17/21 (3,859 )PLN 6,874,725 USD 1,867,885 03/17/21 (26,967 )SEK 3,519,310 EUR 351,000 03/17/21 (1,448 )TWD 20,423,672 USD 732,485 02/05/21 (1,510 )TWD 5,351,236 USD 192,076 02/17/21 (146 )USD 540,730 AUD 716,322 03/17/21 (11,869 )USD 3,514,784 BRL 18,280,213 01/05/21 (5,003 )USD 727,022 CAD 932,532 03/17/21 (5,739 )USD 379,439 CLP 277,944,903 03/15/21 (11,790 )USD 6,242,073 CNH 41,281,428 02/24/21 (83,555 )USD 376,003 CNH 2,463,207 03/17/21 (837 )USD 3,566,570 COP 12,732,601,394 01/29/21 (161,517 )USD 3,042,662 EUR 2,510,499 03/17/21 (29,694 )USD 1,054,649 GBP 781,157 03/17/21 (14,099 )USD 2,454,022 IDR 34,805,077,980 01/06/21 (42,934 )USD 698,591 ILS 2,270,526 03/17/21 (8,945 )USD 2,232,870 INR 165,538,904 01/27/21 (27,483 )USD 565,817 JPY 58,612,707 03/17/21 (2,344 )USD 2,501,406 KRW 2,809,949,480 01/08/21 (81,438 )USD 1,369,769 KRW 1,527,005,081 01/15/21 (33,827 )
Copyright © 2021 www.secdatabase.com. All Rights Reserved.Please Consider the Environment Before Printing This Document

USD 273,526 MXN 5,561,206 03/17/21 (3,498 )USD 452,722 NOK 3,938,524 03/17/21 (6,494 )USD 188,567 NZD 265,056 03/17/21 (2,203 )USD 550,159 RUB 41,959,466 01/25/21 (15,242 )USD 381,788 RUB 28,946,186 02/08/21 (7,631 )USD 882,605 SEK 7,473,726 03/17/21 (26,536 )USD 620,073 SGD 824,524 03/17/21 (3,863 )USD 583,304 THB 17,588,202 03/17/21 (3,825 )USD 218,589 TRY 1,818,267 01/11/21 (25,193 )USD 658,219 TRY 5,304,905 01/19/21 (50,902 )USD 247,563 TRY 1,999,698 01/25/21 (19,143 )USD 44,507 TRY 360,482 03/17/21 (2,539 )USD 622,274 TRY 5,342,155 08/04/21 (35,713 )USD 551,314 TWD 15,518,636 01/04/21 (1,220 )USD 355,874 TWD 10,001,597 02/05/21 (2,089 )USD 2,105,036 ZAR 32,165,374 03/17/21 (62,307 )ZAR 6,216,757 USD 420,362 03/17/21 (1,469 )
TOTAL $(907,260 )GOLDMAN SACHS LOCAL EMERGING MARKETS DEBT FUND
Schedule of Investments (continued)December 31, 2020 (Unaudited)
ADDITIONAL INVESTMENT INFORMATION (continued)
FUTURES CONTRACTS � At December 31, 2020, the Fund had the following futures contracts:
DescriptionNumber ofContracts
ExpirationDate
NotionalAmount
UnrealizedAppreciation/(Depreciation)
Long position contracts:5 Year U.S. Treasury Notes 1 03/31/21 $126,164 $ 100Ultra Long U.S. Treasury Bonds 7 03/22/21 1,494,938 (7,722 )Ultra 10 Year U.S. Treasury Notes 50 03/22/21 7,817,969 (21,793 )Total $ (29,415 )Short position contracts:10 Year U.S. Treasury Notes (26) 03/22/21 (3,590,031) (1,058 )20 Year U.S. Treasury Bonds (41) 03/22/21 (7,100,688) 62,2062 Year U.S. Treasury Notes (9) 03/31/21 (1,988,789) (1,371 )Total $ 59,777TOTAL FUTURES CONTRACTS $ 30,362
SWAP CONTRACTS �� At December 31, 2020, the Fund had the following swap contracts:
OVER THE COUNTER INTEREST RATE SWAP CONTRACTS
Payments Made bythe Fund
PaymentsReceived by
the Fund CounterpartyTermination
Date
NotionalAmount(000s) Value
UpfrontPayments
(Received) Paid
UnrealizedAppreciation/(Depreciation)
3M TELBOR(a) 1.020%(b) BofA Securities LLC 03/18/30 ILS 1,925 $25,011 $ 245 $ 24,7663M KLIBOR(a) 3.650(a) Citibank NA 02/27/24 MYR 3,020 38,988 � 38,9883M KLIBOR(a) 3.693(a) MS & Co. Int. PLC 03/01/24 5,490 72,547 � 72,5473M KLIBOR(a) 3.605(a) MS & Co. Int. PLC 03/06/24 25,010 313,269 � 313,2693M KLIBOR(a) 3.330(a) MS & Co. Int. PLC 05/31/24 2,610 28,800 � 28,8003M KLIBOR(a) 3.250(a) MS & Co. Int. PLC 12/18/24 2,000 22,677 429 22,248TOTAL $501,292 $ 674 $ 500,618
(a) Payments made quarterly.(b) Payments made annually.
CENTRALLY CLEARED INTEREST RATE SWAP CONTRACTS
Payments Made bythe Fund
PaymentsReceived/(Paid)
by FundTermination
Date
NotionalAmount(000s)
MarketValue
UpfrontPremium
(Received) Paid
UnrealizedAppreciation/(Depreciation)
0.505%(a) 6M CLICP(a) 12/16/21 CLP 7,500,000 $(482 ) $ � $ (482 )0.250(b) 6M WIBOR(c) 12/16/21 PLN 30,110 (8,373 ) (1,437 ) (6,936 )
Copyright © 2021 www.secdatabase.com. All Rights Reserved.Please Consider the Environment Before Printing This Document

1M BID Average(d) 4.120%(d) 01/03/22 BRL 16,325 76,912 (30,531 ) 107,4431M BID Average(d) 4.230(d) 01/02/23 15,865 22,167 (1,698 ) 23,865Mexico Interbank TIIE 28 Days(d) 4.400(d) 03/15/23 MXN 239,990 (e) 24,880 3,593 21,2872.500(c) 3M LIBOR(c) 03/17/23 CNY 13,580 (e) (25 ) 7,900 (7,925 )6M EURO(f) (0.250)(a) 03/17/23 EUR 6,060 (e) 40,278 43,407 (3,129 )6M BUBOR(f) 0.800(a) 03/17/23 HUF 147,900 (e) 196 181 153M LIBOR(c) 2.500(c) 03/17/23 COP 5,679,870(e) 8,643 1,138 7,5056M WIBOR(f) 0.345(a) 06/16/23 PLN 3,189 (e) 1,751 (141 ) 1,8923M JIBAR(c) 4.000(c) 06/16/23 ZAR 29,120 (e) 9,191 (378 ) 9,5691M BID Average(d) 4.930(d) 01/02/24 BRL 23,550 57,305 (51,045 ) 108,350GOLDMAN SACHS LOCAL EMERGING MARKETS DEBT FUND
Schedule of Investments (continued)December 31, 2020 (Unaudited)
ADDITIONAL INVESTMENT INFORMATION (continued)
CENTRALLY CLEARED INTEREST RATE SWAP CONTRACTS (continued)
Payments Made bythe Fund
PaymentsReceived/(Paid)
by FundTermination
Date
NotionalAmount(000s)
MarketValue
UpfrontPremium
(Received) Paid
UnrealizedAppreciation/(Depreciation)
6M LIBOR(a) 0.750%(a) 12/16/25 THB 73,680 $14,316 $ (1,040 ) $ 15,3566M WIBOR(f) 0.750(a) 12/16/25 PLN 6,030 12,195 (3,802 ) 15,997Mexico Interbank TIIE 28(d) Days 4.900(d) 03/11/26 MXN 73,370 (e) 25,390 2,842 22,5486M CLICP(a) 1.700(a) 03/17/26 CLP 1,115,710(e) 7,475 1,763 5,7123M JIBAR(c) 5.250(c) 03/17/26 ZAR 33,325 (e) 35,495 2,897 32,598(0.250)%(f) 6M EURO(a) 03/17/26 EUR 2,510 (e) (31,768 ) (33,896 ) 2,128Mexico Interbank TIIE 28 Days(d) 5.200(d) 03/08/28 MXN 19,480 (e) 8,514 11 8,503(0.250)(f) 6M EURO(a) 03/17/28 EUR 70 (e) (813 ) (839 ) 260.750(a) 3M LIBOR(c) 03/17/31 $ 1,110 (e) 21,944 23,149 (1,205 )0.000(f) 6M EURO(a) 03/17/31 EUR 210 (e) (6,692 ) (6,627 ) (65 )TOTAL $318,499 $ (44,553 ) $ 363,052
(a) Payments made semi-annually.(b) Payments made on termination date.(c) Payments made quarterly.(d) Payments made monthly.(e) Represents forward starting interest rate swaps whose effective dates of commencement of accruals and cash flows occur subsequent to December 31, 2020.(f) Payments made annually.
OVER THE COUNTER CREDIT DEFAULT SWAP CONTRACTS
ReferenceObligation/Index
Financing RatePaid by
the Fund(a)
CreditSpread at
December 31,2020(b) Counterparty
TerminationDate
NotionalAmount(000s) Value
UpfrontPremiums(Received)
Paid
UnrealizedAppreciation/(Depreciation)
Protection Purchased:People�s Republic of China, 7.500%, 10/28/27 (1.000)% 0.057% BofA Securities LLC 06/20/21 $ 70 $(336 ) $76 $ (412 )People�s Republic of China, 7.500%, 10/28/27 (1.000) 0.057 Citibank NA 06/20/21 2,190 (10,530 ) 2,169 (12,699 )People�s Republic of China, 7.500%, 10/28/27 (1.000) 0.057 JPMorgan Securities, Inc. 06/20/21 250 (1,202 ) 238 (1,440 )People�s Republic of China, 7.500%, 10/28/27 (1.000) 0.057 UBS AG (London) 06/20/21 280 (1,346 ) 115 (1,461 )TOTAL $(13,414 ) $2,598 $ (16,012 )Protection Sold:People�s Republic of China, 7.500%, 10/28/27 1.000% 0.133% MS & Co. Int. PLC 12/20/23 $ 6,780 $178,280 $98,822 $ 79,458TOTAL $164,866 $101,420 $ 63,446
(a) Payments made quarterly.(b) Credit spread on the referenced obligation, together with the term of the swap contract, are indicators of payment/performance risk. The likelihood of a credit event occurring which would require a
fund or its counterparty to make a payment or otherwise be required to perform under the swap contract is generally greater as the credit spread and the term of the swap contract increase.GOLDMAN SACHS LOCAL EMERGING MARKETS DEBT FUND
Schedule of Investments (continued)December 31, 2020 (Unaudited)
ADDITIONAL INVESTMENT INFORMATION (continued)
Copyright © 2021 www.secdatabase.com. All Rights Reserved.Please Consider the Environment Before Printing This Document

CENTRALLY CLEARED CREDIT DEFAULT SWAP CONTRACTS
ReferencedObligation/Index
Financing RateReceived/(Paid) by
the Fund(a)
CreditSpread at
December 31,2020(b)
TerminationDate
NotionalAmount(000s) Value
UpfrontPremiums(Received)
Paid
UnrealizedAppreciation/(Depreciation)
Protection Sold:Republic of Colombia,10.375%, 01/28/33 1.000% 0.554% 06/20/24 $ 650 $10,287 $ 2,776 $ 7,511State of Qatar, 9.750%, 06/15/30 1.000 0.270 12/20/24 950 27,983 21,402 6,581Republic of Peru, 8.750%,11/21/33 1.000 0.416 12/20/24 1,000 23,575 16,700 6,875People�s Republic of China,7.500%, 10/28/27 1.000 0.072 06/20/22 1,210 17,078 12,836 4,242Russian Federation, 7.500%,03/31/30 1.000 0.795 06/20/25 200 1,880 (822 ) 2,702TOTAL $80,803 $ 52,892 $ 27,911
(a) Payments made quarterly.(b) Credit spread on the referenced obligation, together with the term of the swap contract, are indicators of payment/performance risk. The likelihood of a credit event occurring which would require a
fund or its counterparty to make a payment or otherwise be required to perform under the swap contract is generally greater as the credit spread and the term of the swap contract increase.
NON-DELIVERABLE BOND FORWARD CONTRACTS �� 0.0%
Counterparty
NotionalAmount(000s) Reference Obligation
SettlementDate
UnrealizedAppreciation/Depreciation)*
Deutsche Bank AG COP 3,693,500 Colombia Domestic Bond, 0.650%, 01/06/21 01/06/21 $ 8,992COP 642,500 Colombia Domestic Bond, 0.750%, 01/06/21 01/06/21 3,831
TOTAL $ 12,823
GOLDMAN SACHS U.S. MORTGAGES FUND
Schedule of InvestmentsDecember 31, 2020 (Unaudited)
Abbreviations:1M BID Avg � 1 month Brazilian Interbank Deposit AverageMS & Co. Int. PLC �Morgan Stanley & Co. International PLCMexico IB TIIE 28D �Mexico Interbank TIIE 28 Days
PrincipalAmount
InterestRate
MaturityDate Value
Mortgage-Backed Obligations �� 119.4%Collateralized Mortgage Obligations �� 6.4%Interest Only(a) �� 2.6%FHLMC REMIC Series 3852, Class SW(b)(-1x 1M USD LIBOR + 6.000%)$ 272,089 5.841 % 05/15/41 $ 40,901FHLMC REMIC Series 4286, Class SN(b)(-1x1M USD LIBOR + 6.000%)
2,331,501 5.841 12/15/43 388,163FHLMC REMIC Series 4314, Class SE(b)(-1x 1M USD LIBOR + 6.050%)
220,983 5.891 03/15/44 35,688FHLMC REMIC Series 4320, Class SD(b)(-1x 1M USD LIBOR + 6.100%)
127,066 5.941 07/15/39 25,090FHLMC REMIC Series 4456, Class IO
129,251 4.500 10/15/44 18,369FHLMC REMIC Series 4468, Class SY(b)(-1x1M USD LIBOR + 6.100%)
224,559 5.941 05/15/45 47,959FHLMC REMIC Series 4583, Class ST(b)(-1x 1M USD LIBOR + 6.000%)
948,805 5.841 05/15/46 164,227FHLMC REMIC Series 4936, Class ES(b)(-1x 1M USD LIBOR + 6.000%)
315,092 5.852 12/25/49 41,649FHLMC REMIC Series 4936, Class PS(b)(-1x 1M USD LIBOR + 6.000%)
267,666 5.852 12/25/49 35,222FHLMC REMIC Series 4998, Class GI
870,353 4.000 08/25/50 121,093FHLMC REMIC Series 5009, Class DI
1,462,079 2.000 09/25/50 117,163FHLMC REMIC Series 5012, Class DI
PrincipalAmount
InterestRate
MaturityDate Value
Mortgage-Backed Obligations �� (continued)Interest Only(a) �� (continued)FNMA REMIC Series 2012-88, Class SB(b)(-1x 1M USD LIBOR + 6.670%)$ 258,440 6.522 % 07/25/42 $ 43,925FNMA REMIC Series 2015-34, Class LS(b)(-1x 1M USD LIBOR + 6.100%)
1,615,418 5.952 06/25/45 326,407FNMA REMIC Series 2017-104, Class SB(b)(-1x1M USD LIBOR + 6.150%)
713,198 6.002 01/25/48 121,094FNMA REMIC Series 2017-69, Class SG(b)(-1x1M USD LIBOR + 6.150%)
964,379 6.002 09/25/47 178,089FNMA REMIC Series 2017-86, Class SB(b)(-1x 1M USD LIBOR + 6.150%)
839,790 6.002 11/25/47 151,539FNMA REMIC Series 2018-8, Class SA(b)(-1x 1M USD LIBOR + 6.150%)
650,351 6.002 02/25/48 97,621FNMA REMIC Series 2019-81, Class SD(b)(-1x1M USD LIBOR + 6.000%)
416,748 5.852 01/25/50 62,675FNMA REMIC Series 2020-45, Class AI
903,300 4.000 07/25/50 115,122FNMA REMIC Series 2020-60, Class KI
2,183,305 2.000 09/25/50 179,636FNMA REMIC Series 2020-60, Class NI
307,611 4.000 09/25/50 42,982GNMA REMIC Series 2010-101, Class S(b)(-1x 1M USD LIBOR + 6.000%)
601,953 5.848 08/20/40 118,385GNMA REMIC Series 2010-20, Class SE(b)(-1x 1M USD LIBOR + 6.250%)
261,863 6.098 02/20/40 52,723
Copyright © 2021 www.secdatabase.com. All Rights Reserved.Please Consider the Environment Before Printing This Document

GOLDMAN SACHS U.S. MORTGAGES FUND
Schedule of Investments (continued)December 31, 2020 (Unaudited)
GOLDMAN SACHS U.S. MORTGAGES FUND
Schedule of Investments (continued)December 31, 2020 (Unaudited)
331,226 4.000 09/25/50 46,185FHLMC STRIPS Series 304, Class C45
158,716 3.000 12/15/27 8,894FNMA REMIC Series 2007-36, Class SN(b)(-1x1M USD LIBOR +
6.770%)302,056 6.622 04/25/37 67,088
FNMA REMIC Series 2008-17, Class SI(b)(-1x1M USD LIBOR + 6.300%)389,441 6.152 03/25/38 79,257
FNMA REMIC Series 2011-124, Class SC(b)(-1x 1M USD LIBOR +6.550%)
198,137 6.402 12/25/41 36,061
GNMA REMIC Series 2010-85, Class SN(b)(-1x1M USD LIBOR + 5.940%)27,771 5.788 07/20/40 6,003
GNMA REMIC Series 2013-124, Class CS(b)(-1x 1M USD LIBOR +6.050%)
1,112,036 5.898 08/20/43 225,891GNMA REMIC Series 2013-134, Class DS(b)(-1x 1M USD LIBOR +
6.100%)59,105 5.948 09/20/43 11,767
GNMA REMIC Series 2014-11, Class KI118,276 4.500 12/20/42 9,034
PrincipalAmount
InterestRate
MaturityDate Value
Mortgage-Backed Obligations �� (continued)Interest Only(a) �� (continued)GNMA REMIC Series 2014-117, Class SJ(b)(-1x 1M USD LIBOR +
5.600%)$ 2,643,010 5.448 % 08/20/44 $ 440,954GNMA REMIC Series 2014-132, Class SL(b) (-1x 1M USD LIBOR +
6.100%)404,210 5.948 10/20/43 58,669
GNMA REMIC Series 2014-133, Class BS(b) (-1x 1M USD LIBOR +5.600%)
207,712 5.448 09/20/44 36,443GNMA REMIC Series 2014-158, Class SA(b) (-1x 1M USD LIBOR +
5.600%)1,244,508 5.447 10/16/44 220,301
GNMA REMIC Series 2015-110, Class MS(b) (-1x 1M USD LIBOR +5.710%)
802,879 5.558 08/20/45 140,040GNMA REMIC Series 2015-111, Class IM
681,307 4.000 08/20/45 74,205GNMA REMIC Series 2015-111, Class SM(b) (-1x1M USD LIBOR +
6.200%)250,089 6.048 08/20/45 45,211
GNMA REMIC Series 2015-112, Class SB(b) (-1x 1M USD LIBOR +5.740%)
237,890 5.588 08/20/45 40,471GNMA REMIC Series 2015-119, Class SN(b) (-1x1M USD LIBOR +
6.250%)512,724 6.098 08/20/45 93,366
GNMA REMIC Series 2015-129, Class IC482,375 4.500 09/16/45 75,173
GNMA REMIC Series 2015-168, Class SD(b) (-1x 1M USD LIBOR +6.200%)
137,989 6.048 11/20/45 27,837GNMA REMIC Series 2015-57, Class AS(b) (-1x 1M USD LIBOR +
5.600%)1,487,814 5.448 04/20/45 249,816
GNMA REMIC Series 2015-72, Class JI36,910 3.500 05/20/45 2,506
GNMA REMIC Series 2015-83, Class PI77,155 3.500 06/20/45 5,799
GNMA REMIC Series 2015-90, Class PI48,159 3.500 04/20/45 2,215
GNMA REMIC Series 2016-1, Class ST(b) (-1x 1M USD LIBOR +6.200%)
246,353 6.048 01/20/46 41,713GNMA REMIC Series 2016-138, Class DI
155,311 4.000 10/20/46 19,467
PrincipalAmount
InterestRate
MaturityDate Value
Mortgage-Backed Obligations �� (continued)Interest Only(a) �� (continued)GNMA REMIC Series 2016-27, Class IA$ 498,904 4.000 % 06/20/45 $ 45,215GNMA REMIC Series 2016-4, Class SM(b) (-1x 1M USD LIBOR + 5.650%)
406,930 5.498 01/20/46 73,916GNMA REMIC Series 2017-112, Class SJ(b) (-1x1M USD LIBOR + 5.660%)
773,961 5.508 07/20/47 119,077GNMA REMIC Series 2018-105, Class SC(b) (-1x 1M USD LIBOR +
6.200%)450,867 6.048 08/20/48 69,122
GNMA REMIC Series 2018-124, Class SN(b) (-1x 1M USD LIBOR +6.200%)
1,297,426 6.048 09/20/48 227,329GNMA REMIC Series 2018-139, Class SQ(b) (-1x 1M USD LIBOR +
6.150%)791,890 5.998 10/20/48 117,809
GNMA REMIC Series 2018-67, Class PS (-1x1M USD LIBOR + 6.200%)1,242,496 6.048 05/20/48 197,139
GNMA REMIC Series 2018-72, Class IB1,800,401 4.000 04/20/46 234,885
GNMA REMIC Series 2019-1, Class SN(b) (-1x 1M USD LIBOR + 6.050%)672,947 5.898 01/20/49 99,316
GNMA REMIC Series 2019-110, Class SD(b) (-1x 1M USD LIBOR +6.100%)
1,145,687 5.948 09/20/49 176,412GNMA REMIC Series 2019-110, Class SE(b) (-1x 1M USD LIBOR +
6.100%)1,213,768 5.948 09/20/49 173,933
GNMA REMIC Series 2019-128, Class IO1,026,653 4.000 10/20/49 121,524
GNMA REMIC Series 2019-129, Class AI1,561,728 3.500 10/20/49 174,019
GNMA REMIC Series 2019-151, Class IA4,101,743 3.500 12/20/49 443,158
GNMA REMIC Series 2019-151, Class NI4,029,788 3.500 10/20/49 359,702
GNMA REMIC Series 2019-20, Class SF(b) (-1x 1M USD LIBOR + 3.790%)1,184,068 3.638 02/20/49 100,539
GNMA REMIC Series 2019-4, Class SJ (-1x 1M USD LIBOR + 6.050%)1,189,599 5.898 01/20/49 187,730
Copyright © 2021 www.secdatabase.com. All Rights Reserved.Please Consider the Environment Before Printing This Document
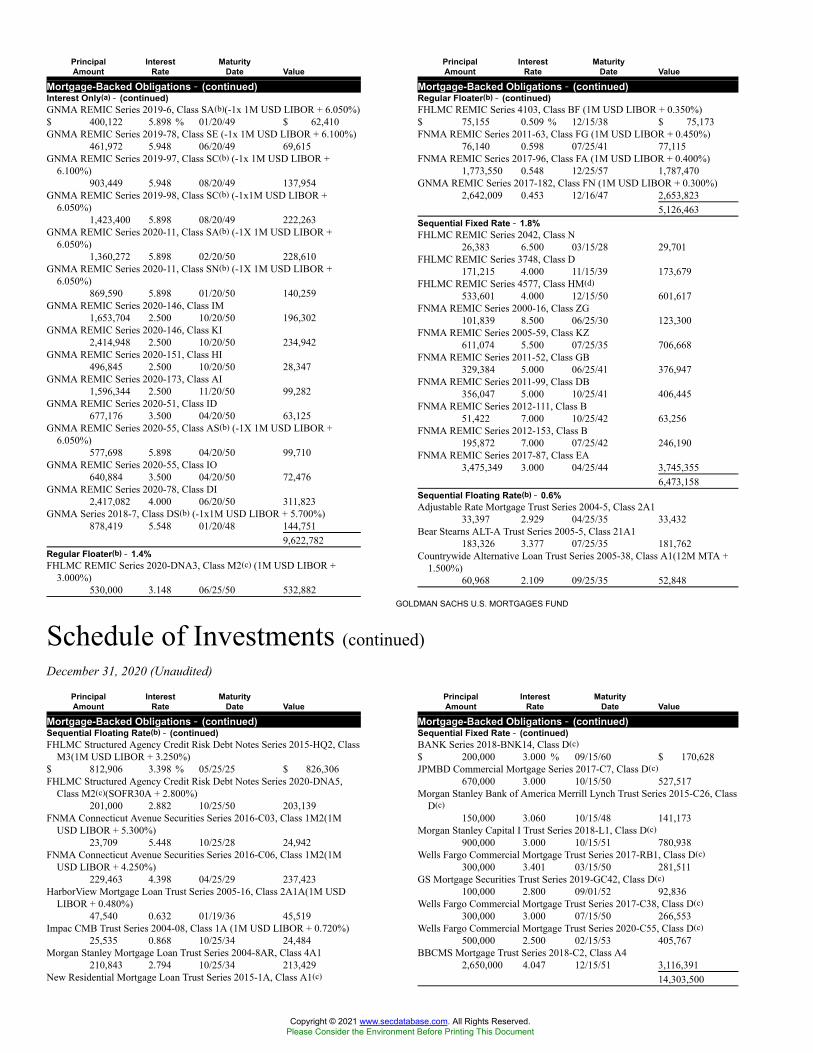
GOLDMAN SACHS U.S. MORTGAGES FUND
Schedule of Investments (continued)December 31, 2020 (Unaudited)
PrincipalAmount
InterestRate
MaturityDate Value
Mortgage-Backed Obligations �� (continued)Interest Only(a) �� (continued)GNMA REMIC Series 2019-6, Class SA(b)(-1x 1M USD LIBOR + 6.050%)$ 400,122 5.898 % 01/20/49 $ 62,410GNMA REMIC Series 2019-78, Class SE (-1x 1M USD LIBOR + 6.100%)
461,972 5.948 06/20/49 69,615GNMA REMIC Series 2019-97, Class SC(b) (-1x 1M USD LIBOR +
6.100%)903,449 5.948 08/20/49 137,954
GNMA REMIC Series 2019-98, Class SC(b) (-1x1M USD LIBOR +6.050%)
1,423,400 5.898 08/20/49 222,263GNMA REMIC Series 2020-11, Class SA(b) (-1X 1M USD LIBOR +
6.050%)1,360,272 5.898 02/20/50 228,610
GNMA REMIC Series 2020-11, Class SN(b) (-1X 1M USD LIBOR +6.050%)
869,590 5.898 01/20/50 140,259GNMA REMIC Series 2020-146, Class IM
1,653,704 2.500 10/20/50 196,302GNMA REMIC Series 2020-146, Class KI
2,414,948 2.500 10/20/50 234,942GNMA REMIC Series 2020-151, Class HI
496,845 2.500 10/20/50 28,347GNMA REMIC Series 2020-173, Class AI
1,596,344 2.500 11/20/50 99,282GNMA REMIC Series 2020-51, Class ID
677,176 3.500 04/20/50 63,125GNMA REMIC Series 2020-55, Class AS(b) (-1X 1M USD LIBOR +
6.050%)577,698 5.898 04/20/50 99,710
GNMA REMIC Series 2020-55, Class IO640,884 3.500 04/20/50 72,476
GNMA REMIC Series 2020-78, Class DI2,417,082 4.000 06/20/50 311,823
GNMA Series 2018-7, Class DS(b) (-1x1M USD LIBOR + 5.700%)878,419 5.548 01/20/48 144,751
9,622,782Regular Floater(b) �� 1.4%FHLMC REMIC Series 2020-DNA3, Class M2(c) (1M USD LIBOR +
3.000%)530,000 3.148 06/25/50 532,882
PrincipalAmount
InterestRate
MaturityDate Value
Mortgage-Backed Obligations �� (continued)Regular Floater(b) �� (continued)FHLMC REMIC Series 4103, Class BF (1M USD LIBOR + 0.350%)$ 75,155 0.509 % 12/15/38 $ 75,173FNMA REMIC Series 2011-63, Class FG (1M USD LIBOR + 0.450%)
76,140 0.598 07/25/41 77,115FNMA REMIC Series 2017-96, Class FA (1M USD LIBOR + 0.400%)
1,773,550 0.548 12/25/57 1,787,470GNMA REMIC Series 2017-182, Class FN (1M USD LIBOR + 0.300%)
2,642,009 0.453 12/16/47 2,653,8235,126,463
Sequential Fixed Rate �� 1.8%FHLMC REMIC Series 2042, Class N
26,383 6.500 03/15/28 29,701FHLMC REMIC Series 3748, Class D
171,215 4.000 11/15/39 173,679FHLMC REMIC Series 4577, Class HM(d)
533,601 4.000 12/15/50 601,617FNMA REMIC Series 2000-16, Class ZG
101,839 8.500 06/25/30 123,300FNMA REMIC Series 2005-59, Class KZ
611,074 5.500 07/25/35 706,668FNMA REMIC Series 2011-52, Class GB
329,384 5.000 06/25/41 376,947FNMA REMIC Series 2011-99, Class DB
356,047 5.000 10/25/41 406,445FNMA REMIC Series 2012-111, Class B
51,422 7.000 10/25/42 63,256FNMA REMIC Series 2012-153, Class B
195,872 7.000 07/25/42 246,190FNMA REMIC Series 2017-87, Class EA
3,475,349 3.000 04/25/44 3,745,3556,473,158
Sequential Floating Rate(b) �� 0.6%Adjustable Rate Mortgage Trust Series 2004-5, Class 2A1
33,397 2.929 04/25/35 33,432Bear Stearns ALT-A Trust Series 2005-5, Class 21A1
183,326 3.377 07/25/35 181,762Countrywide Alternative Loan Trust Series 2005-38, Class A1(12M MTA +
1.500%)60,968 2.109 09/25/35 52,848
PrincipalAmount
InterestRate
MaturityDate Value
Mortgage-Backed Obligations �� (continued)Sequential Floating Rate(b) �� (continued)FHLMC Structured Agency Credit Risk Debt Notes Series 2015-HQ2, Class
M3(1M USD LIBOR + 3.250%)$ 812,906 3.398 % 05/25/25 $ 826,306FHLMC Structured Agency Credit Risk Debt Notes Series 2020-DNA5,
Class M2(c)(SOFR30A + 2.800%)201,000 2.882 10/25/50 203,139
FNMA Connecticut Avenue Securities Series 2016-C03, Class 1M2(1MUSD LIBOR + 5.300%)
23,709 5.448 10/25/28 24,942FNMA Connecticut Avenue Securities Series 2016-C06, Class 1M2(1M
USD LIBOR + 4.250%)229,463 4.398 04/25/29 237,423
HarborView Mortgage Loan Trust Series 2005-16, Class 2A1A(1M USDLIBOR + 0.480%)
47,540 0.632 01/19/36 45,519Impac CMB Trust Series 2004-08, Class 1A (1M USD LIBOR + 0.720%)
25,535 0.868 10/25/34 24,484Morgan Stanley Mortgage Loan Trust Series 2004-8AR, Class 4A1
210,843 2.794 10/25/34 213,429New Residential Mortgage Loan Trust Series 2015-1A, Class A1(c)
PrincipalAmount
InterestRate
MaturityDate Value
Mortgage-Backed Obligations �� (continued)Sequential Fixed Rate �� (continued)BANK Series 2018-BNK14, Class D(c)$ 200,000 3.000 % 09/15/60 $ 170,628JPMBD Commercial Mortgage Series 2017-C7, Class D(c)
670,000 3.000 10/15/50 527,517Morgan Stanley Bank of America Merrill Lynch Trust Series 2015-C26, Class
D(c)150,000 3.060 10/15/48 141,173
Morgan Stanley Capital I Trust Series 2018-L1, Class D(c)900,000 3.000 10/15/51 780,938
Wells Fargo Commercial Mortgage Trust Series 2017-RB1, Class D(c)300,000 3.401 03/15/50 281,511
GS Mortgage Securities Trust Series 2019-GC42, Class D(c)100,000 2.800 09/01/52 92,836
Wells Fargo Commercial Mortgage Trust Series 2017-C38, Class D(c)300,000 3.000 07/15/50 266,553
Wells Fargo Commercial Mortgage Trust Series 2020-C55, Class D(c)500,000 2.500 02/15/53 405,767
BBCMS Mortgage Trust Series 2018-C2, Class A42,650,000 4.047 12/15/51 3,116,391
14,303,500
Copyright © 2021 www.secdatabase.com. All Rights Reserved.Please Consider the Environment Before Printing This Document

GOLDMAN SACHS U.S. MORTGAGES FUND
Schedule of Investments (continued)December 31, 2020 (Unaudited)
164,856 3.750 05/28/52 175,365Wells Fargo Mortgage Backed Securities Trust Series 2019-3,
Class A1(c)175,936 3.500 07/25/49 180,612
2,199,261TOTAL COLLATERALIZED MORTGAGEOBLIGATIONS(Cost $23,409,423) $ 23,421,664Commercial Mortgage-Backed Securities �� 4.4%Sequential Fixed Rate �� 3.9%Morgan Stanley Capital I Trust Series 2018-L1, Class A3$ 3,800,000 4.139 % 10/15/51 $ 4,487,675Cantor Commercial Real Estate Lending Series 2019-CF3, Class A4
1,900,000 3.006 01/15/53 2,116,097Bank Series 2018-BK15, Class D(c)
800,000 3.000 11/15/61 632,023BANK Series 2019-BNK19, Class D(c)
100,000 3.000 08/15/61 93,710Citigroup Commercial Mortgage Trust Series 2017-P8, Class D(c)
1,000,000 3.000 09/15/50 810,671Citigroup Commercial Mortgage Trust Series 2017-P7, Class D(c)
125,000 3.250 04/14/50 105,267Benchmark Mortgage Trust Series 2019-B13, Class D(c)
300,000 2.500 08/15/57 274,743
Sequential Floating Rate(b) �� 0.5%Bancorp Commercial Mortgage Trust Series 2018-CRE4, Class A(c)(1M USD
LIBOR + 0.900%)33,727 1.059 09/15/35 33,589
BANK 2018-BNK15 Series 2018-BN15, Class A4900,000 4.407 11/15/61 1,084,281
Benchmark Mortgage Trust Series 2018-B6, Class D(c)220,000 3.118 10/10/51 208,451
Citigroup Commercial Mortgage Trust Series 2016-GC36, Class C400,000 4.755 02/10/49 389,582
Morgan Stanley Bank of America Merrill Lynch Trust Series 2015-C23, ClassD(c)
150,000 4.145 07/15/50 147,3001,863,203
TOTAL COMMERCIAL MORTGAGE-BACKEDSECURITIES(Cost $14,648,463) $ 16,166,703Federal Agencies �� 108.6%Adjustable Rate FHLMC(b) �� 0.0%(1 Year CMT + 2.107%)$ 6,354 2.253 % 10/01/34 $ 6,704(1 Year CMT + 2.200%)
10,032 2.422 09/01/33 10,561
PrincipalAmount
InterestRate
MaturityDate Value
Mortgage-Backed Obligations �� (continued)Adjustable Rate FHLMC(b) �� (continued)(1 Year CMT + 2.250%)$ 19,211 3.761 % 04/01/33 $ 20,130
9,611 2.375 11/01/34 10,1098,394 3.643 02/01/35 8,81730,424 3.154 06/01/35 32,009
88,330Adjustable Rate FNMA(b) �� 0.1%(1 Year CMT + 2.196%)
9,768 3.464 02/01/35 10,287(1 Year CMT + 2.200%)
2,612 2.880 07/01/33 2,741(1 Year CMT + 2.273%)
65,764 2.677 06/01/33 69,048(1 Year CMT + 2.309%)
837 3.089 04/01/34 877(12M USD LIBOR + 1.621%)
19,037 3.621 03/01/35 19,921(12M USD LIBOR + 1.646%)
20,660 2.344 12/01/33 21,582(12M USD LIBOR + 1.670%)
10,304 2.175 11/01/34 10,810(12M USD LIBOR + 1.810%)
11,984 3.807 04/01/35 12,619(12M USD LIBOR + 1.980%)
29,561 3.892 05/01/35 31,195(6M USD LIBOR + 1.412%)
3,833 2.080 06/01/33 3,949(COF + 1.250%)
411 1.903 07/01/22 4126,150 1.773 07/01/27 6,1947,168 1.773 11/01/27 7,2194,209 1.773 01/01/31 4,2535,888 1.773 06/01/32 5,9545,985 1.903 08/01/32 6,0528,377 1.903 05/01/33 8,47566,730 1.779 08/01/33 67,3972,645 1.773 11/01/35 2,67513,651 1.773 12/01/37 13,7507,303 1.773 01/01/38 7,3586,641 1.773 11/01/40 6,710
PrincipalAmount
InterestRate
MaturityDate Value
Mortgage-Backed Obligations �� (continued)Adjustable Rate GNMA(b) �� (continued)$ 5,855 2.250 % 09/20/24 $ 5,936
7,474 3.125 11/20/24 7,6028,704 3.125 12/20/24 8,9014,980 3.000 01/20/25 5,0753,105 3.000 02/20/25 3,16612,041 2.875 05/20/25 12,30410,390 2.250 07/20/25 10,5994,401 3.000 02/20/26 4,485229 2.250 07/20/26 23311,516 3.000 01/20/27 11,7784,922 3.000 02/20/27 5,02638,060 2.875 04/20/27 38,9253,972 2.875 05/20/27 4,0635,695 2.875 06/20/27 5,8262,062 3.125 11/20/27 2,1046,018 3.125 12/20/27 6,14312,965 3.000 01/20/28 13,2604,229 3.000 02/20/28 4,3244,868 3.000 03/20/28 4,98020,933 2.250 07/20/29 21,40411,911 2.250 08/20/29 12,1742,737 2.250 09/20/29 2,80011,732 3.125 10/20/29 12,00817,150 3.125 11/20/29 17,5563,126 3.125 12/20/29 3,1994,616 3.000 01/20/30 4,7351,962 3.000 02/20/30 2,01412,661 3.000 03/20/30 12,99113,246 2.875 04/20/30 13,61036,539 2.875 05/20/30 37,6893,883 2.875 06/20/30 3,98830,271 2.250 07/20/30 31,2866,247 2.250 09/20/30 6,45810,163 3.125 10/20/30 10,417
443,207FHLMC �� 11.5%
49,755 5.000 10/01/33 56,8102,444 5.000 07/01/35 2,7971,585 4.500 08/01/35 1,7754,245 4.500 09/01/35 4,754
Copyright © 2021 www.secdatabase.com. All Rights Reserved.Please Consider the Environment Before Printing This Document

GOLDMAN SACHS U.S. MORTGAGES FUND
Schedule of Investments (continued)December 31, 2020 (Unaudited)
319,478Adjustable Rate GNMA(b) �� 0.1%(1 Year CMT + 1.500%)
5,139 2.875 06/20/23 5,2082,579 2.250 07/20/23 2,6192,505 2.250 08/20/23 2,5455,716 2.250 09/20/23 5,7802,062 3.000 03/20/24 2,09219,046 2.875 04/20/24 19,3802,665 2.875 05/20/24 2,72222,357 2.875 06/20/24 22,73013,739 2.250 07/20/24 13,94618,850 2.250 08/20/24 19,126
1,535 4.500 10/01/35 1,72060,637 5.000 12/01/35 69,7271,923 5.000 02/01/37 2,21322,531 4.500 01/01/38 25,234976 4.500 06/01/38 1,09437,365 4.500 09/01/38 42,238105 4.500 01/01/39 11820,212 4.500 02/01/39 22,6267,232 4.500 03/01/39 8,0951,753 4.500 04/01/39 1,96254,906 4.500 05/01/39 61,454136,778 5.000 05/01/39 156,461166,759 4.500 06/01/39 186,6462,728 4.500 07/01/39 3,053275,561 5.000 07/01/39 317,8634,028 4.500 08/01/39 4,5089,319 4.500 09/01/39 10,4312,127 4.500 10/01/39 2,3811,351 4.500 11/01/39 1,5125,519 4.500 12/01/39 6,1775,923 4.500 01/01/40 6,629
PrincipalAmount
InterestRate
MaturityDate Value
Mortgage-Backed Obligations �� (continued)FHLMC �� (continued)$ 4,130 4.500 % 04/01/40 $ 4,618
6,279 4.500 05/01/40 7,02015,052 4.000 06/01/40 16,6009,080 4.500 06/01/40 10,1525,478 4.500 07/01/40 6,1241,681 4.500 08/01/40 1,8798,154 5.000 08/01/40 9,25811,843 5.000 10/01/40 13,655120,937 4.000 02/01/41 133,41933,999 4.500 02/01/41 38,0076,192 4.500 03/01/41 6,92213,267 4.500 04/01/41 14,83113,809 4.500 05/01/41 15,43729,041 4.500 06/01/41 32,4641,619 5.000 06/01/41 1,86567,931 4.500 08/01/41 75,93576,582 4.500 09/01/41 85,62352,152 4.000 10/01/41 58,5337,909 4.000 11/01/41 8,7714,602 4.500 12/01/41 5,145512,263 4.000 03/01/42 565,47162,029 4.500 03/01/42 69,34126,799 3.000 05/01/42 28,599301,258 3.500 06/01/42 331,873644,933 4.500 06/01/42 722,65695,887 3.000 08/01/42 103,97385,559 3.500 08/01/42 93,36738,643 3.000 10/01/42 41,848226,010 3.500 10/01/42 246,634538,230 3.000 11/01/42 588,830147,657 3.500 11/01/42 161,131947,121 3.000 12/01/42 1,036,1651,632,615 3.000 01/01/43 1,785,167151,053 3.000 02/01/43 162,0931,871,600 3.500 08/01/43 2,029,147858,191 4.000 08/01/43 948,207478,968 4.000 01/01/44 528,876549,278 3.500 02/01/44 597,746465,676 3.500 06/01/44 513,26413,009 4.000 11/01/44 14,65461,918 3.500 02/01/45 68,47799,813 3.500 03/01/45 110,387
PrincipalAmount
InterestRate
MaturityDate Value
Mortgage-Backed Obligations �� (continued)FNMA �� (continued)$ 93,363 3.500 % 08/01/42 $ 101,852
73,500 3.500 09/01/42 80,1829,672 3.500 10/01/42 10,55217,824 3.500 11/01/42 19,4459,651 3.500 01/01/43 10,529206,966 3.500 02/01/43 225,78424,166 3.500 05/01/43 26,363908,890 3.500 07/01/43 990,961458,404 3.500 01/01/44 500,08320,382 3.500 12/01/44 22,146393,963 4.000 03/01/45 430,968183,171 4.000 04/01/45 200,3771,987,520 4.500 06/01/51 2,249,3903,749,465 4.000 05/01/56 4,205,9454,266,024 4.000 07/01/56 4,786,7252,372,332 3.500 08/01/56 2,628,8043,980,495 3.500 10/01/56 4,436,9483,037,138 4.000 02/01/57 3,406,895
24,446,418GNMA �� 46.9%
3,314 6.000 04/15/26 3,517175 6.500 01/15/32 191878 6.500 02/15/32 984246,278 5.500 04/15/33 279,4784,485 5.000 11/15/33 5,050697 6.500 08/15/34 810567 6.500 02/15/36 6671,497 6.500 03/15/36 1,7692,208 6.500 04/15/36 2,5549,168 6.500 05/15/36 10,8454,915 6.500 06/15/36 5,84724,098 6.500 07/15/36 28,40127,766 6.500 08/15/36 32,52849,343 6.500 09/15/36 58,53720,848 6.500 10/15/36 24,58130,482 6.500 11/15/36 36,15413,044 6.500 12/15/36 15,3397,529 6.500 01/15/37 8,8821,608 6.500 03/15/37 1,9173,438 6.500 04/15/37 4,0561,363 6.500 05/15/37 1,5841,940 6.500 08/15/37 2,292
Copyright © 2021 www.secdatabase.com. All Rights Reserved.Please Consider the Environment Before Printing This Document

GOLDMAN SACHS U.S. MORTGAGES FUND
Schedule of Investments (continued)December 31, 2020 (Unaudited)
14,794 3.500 08/01/45 15,99117,055 3.500 09/01/45 18,43538,998 3.500 11/01/45 42,1282,934,086 3.500 03/01/46 3,211,429474,280 3.500 05/01/46 515,733599,871 3.500 06/01/46 646,902232,591 3.500 07/01/46 250,97234,590 3.500 10/01/46 37,28155,298 3.500 12/01/46 59,59811,027,524 3.000 05/01/47 11,891,968374,647 3.500 12/01/47 409,7723,886,984 3.000 01/01/48 4,224,2842,303,469 4.000 06/01/48 2,490,5752,065,895 4.000 07/01/48 2,233,7043,341,710 3.500 12/01/48 3,538,133
41,879,347FNMA �� 6.7%
2,352 7.000 08/01/31 2,720100,574 3.500 07/01/42 109,749
7,259 6.500 09/15/37 8,5349,577 6.500 10/15/37 11,4072,810 6.500 11/15/37 3,2812,229 6.500 05/15/38 2,6441,737 6.500 02/15/39 2,048243,149 5.000 01/20/40 278,410212,103 4.500 05/15/40 237,473101,338 5.000 07/15/40 107,226151,946 3.500 09/15/42 165,401222,345 3.500 02/15/45 238,51558,766 4.000 05/20/45 64,45545,408 4.000 07/20/45 49,80482,937 4.000 10/20/45 90,811255,333 4.000 01/20/46 279,572984,384 4.500 03/20/46 1,087,7432,471,576 3.000 06/20/46 2,625,4081,632,757 3.500 09/20/46 1,764,434694,069 3.500 10/20/46 750,043710,457 3.500 12/20/46 767,754
PrincipalAmount
InterestRate
MaturityDate Value
Mortgage-Backed Obligations �� (continued)GNMA �� (continued)$ 718,455 3.500 % 01/20/47 $ 776,396
786,919 3.500 02/20/47 850,3834,330,148 4.500 02/20/47 4,734,84515,347 3.500 03/20/47 16,442478,272 4.500 03/20/47 524,6032,410,547 3.500 04/20/47 2,590,87826,507 3.500 05/20/47 28,3992,758,752 4.500 05/20/47 3,011,3454,065,566 4.000 06/20/47 4,379,097472,903 4.500 06/20/47 516,202145,424 4.500 07/20/47 158,73938,145 3.500 08/20/47 40,8681,384,903 4.500 08/20/47 1,511,7059,253 3.500 09/20/47 9,91315,245 3.500 10/20/47 16,3331,002,944 3.500 11/20/47 1,074,53114,223 3.500 12/20/47 15,2382,754,763 3.500 01/20/48 2,951,388768,361 4.500 09/20/48 830,3081,095,010 5.000 09/20/48 1,200,4245,313,153 5.000 11/20/48 5,814,6742,358,699 4.500 12/20/48 2,548,8651,920,746 5.000 12/20/48 2,102,04978,981 3.500 01/20/49 84,6183,428,257 4.500 01/20/49 3,700,1002,268,225 5.000 01/20/49 2,480,0252,673,483 4.000 02/20/49 2,862,3231,707,385 4.500 03/20/49 1,842,2392,645,738 5.000 03/20/49 2,889,8953,238,560 4.000 04/20/49 3,464,2772,046,023 4.000 05/20/49 2,187,985398,278 5.000 06/20/49 434,7845,714,486 3.000 07/20/49 5,985,0463,771,299 4.500 10/20/49 4,061,533755,459 4.500 12/20/49 809,8996,900,845 3.000 08/20/50 7,241,48053,000,000 2.000 TBA - 30yr(e) 55,423,75315,000,000 2.500 TBA - 30yr(e) 15,880,4557,000,000 2.500 TBA - 30yr(e) 7,396,3876,000,000 3.000 TBA - 30yr(e) 6,273,5671,000,000 3.500 TBA - 30yr(e) 1,059,7042,000,000 5.000 TBA - 30yr(e) 2,181,562
171,024,203UMBS �� 25.3%
PrincipalAmount
InterestRate
MaturityDate Value
Mortgage-Backed Obligations �� (continued)UMBS �� (continued)$ 10,164 5.000 % 07/01/25 $ 11,240
3,853,679 5.000 09/01/31 4,253,4982,202 5.000 01/01/33 2,514198,624 4.500 07/01/36 222,01716,743 4.500 12/01/36 18,714160,241 4.500 02/01/39 179,3254,151 4.500 03/01/39 4,6614,533 4.500 05/01/39 5,0902,900 4.500 07/01/39 3,2543,183 4.000 08/01/39 3,5109,437 4.500 09/01/39 10,56111,261 4.500 10/01/39 12,60328,736 4.500 02/01/40 32,4684,645 4.500 03/01/40 5,19868,838 4.500 04/01/40 76,93824,457 4.500 06/01/40 27,6344,718 4.500 09/01/40 5,3315,578 4.500 12/01/40 6,23460,484 4.500 01/01/41 67,60218,614 4.500 04/01/41 20,80735,161 4.500 06/01/41 39,30224,534 4.500 07/01/41 27,423102,039 4.500 08/01/41 114,050126,651 4.500 09/01/41 141,567106,161 3.500 10/01/41 116,84190,337 4.500 10/01/41 100,97633,213 3.500 11/01/41 36,59685,791 4.500 11/01/41 95,89551,734 4.500 12/01/41 57,826110,912 3.500 01/01/42 122,21060,563 4.500 01/01/42 67,69715,379 3.500 02/01/42 16,730442,467 4.000 03/01/42 488,2936,602 4.500 03/01/42 7,504
Copyright © 2021 www.secdatabase.com. All Rights Reserved.Please Consider the Environment Before Printing This Document

GOLDMAN SACHS U.S. MORTGAGES FUND
Schedule of Investments (continued)December 31, 2020 (Unaudited)
GOLDMAN SACHS U.S. MORTGAGES FUND
468 7.000 09/01/21 4704,954 7.000 06/01/22 5,0872,914 7.000 07/01/22 2,998341 4.500 04/01/23 35136,833 5.000 07/01/23 40,6835,293 5.000 12/01/23 5,837
PrincipalAmount
InterestRate
MaturityDate Value
Mortgage-Backed Obligations �� (continued)UMBS �� (continued)$ 89,219 4.000 % 04/01/42 $ 98,459
17,370 4.500 04/01/42 19,5238,864 3.500 05/01/42 9,65941,884 3.500 06/01/42 46,20382,338 3.000 09/01/42 88,40627,894 3.500 09/01/42 30,797182,977 3.500 10/01/42 202,014443,587 3.000 12/01/42 477,11279,770 3.500 12/01/42 87,99594,134 3.000 01/01/43 103,15535,286 3.000 02/01/43 38,703269,598 3.500 02/01/43 296,738940,750 3.000 03/01/43 1,031,8391,021,819 3.500 03/01/43 1,117,7861,025,303 3.000 04/01/43 1,124,5791,050,094 3.500 04/01/43 1,138,178410,738 2.500 05/01/43 437,7651,236,227 3.000 05/01/43 1,355,926180,897 3.500 05/01/43 196,90346,252 3.000 06/01/43 50,730763,092 3.500 06/01/43 834,827369,062 3.000 07/01/43 405,1432,563,100 3.500 07/01/43 2,789,0321,269,771 3.500 08/01/43 1,377,11740,471 3.500 09/01/43 44,68285,553 3.500 01/01/44 94,45431,916 3.500 08/01/44 34,29467,955 3.500 09/01/44 73,995110,929 3.500 10/01/44 123,33843,811 5.000 12/01/44 49,49335,391 3.500 01/01/45 39,161370,967 4.000 02/01/45 412,160136,904 3.500 03/01/45 150,77971,024 3.500 04/01/45 76,838790,034 3.500 05/01/45 877,9141,860,739 4.500 06/01/45 2,076,725104,963 3.500 07/01/45 113,49017,113 3.500 11/01/45 18,482430,869 4.000 11/01/45 469,568
PrincipalAmount
InterestRate
MaturityDate Value
Mortgage-Backed Obligations �� (continued)UMBS �� (continued)$ 327,266 3.500 % 01/01/46 $ 353,851
675,985 3.500 03/01/46 749,786257,845 4.000 03/01/46 280,57397,321 3.500 04/01/46 108,025597,402 3.500 05/01/46 650,973163,522 4.000 06/01/46 177,687435,930 4.500 06/01/46 476,883444,298 3.000 07/01/46 469,659479,445 4.000 07/01/46 520,975251,803 3.000 08/01/46 266,176639,984 4.000 08/01/46 695,422962,978 3.000 09/01/46 1,017,945330,272 3.000 10/01/46 349,124283,394 4.000 10/01/46 307,9431,220,700 3.000 11/01/46 1,298,335528,037 3.000 12/01/46 558,1782,157,172 3.000 01/01/47 2,280,30796,794 3.000 02/01/47 102,3191,776,128 4.000 02/01/47 1,930,7321,241,967 4.500 02/01/47 1,386,129
Copyright © 2021 www.secdatabase.com. All Rights Reserved.Please Consider the Environment Before Printing This Document

Schedule of Investments(continued)December 31, 2020 (Unaudited)
324,251 3.000 04/01/47 343,2121,020,136 3.500 06/01/47 1,081,0101,652,379 3.000 09/01/47 1,746,699323,731 4.500 11/01/47 357,2802,873,829 4.000 02/01/48 3,137,4892,130,416 3.500 03/01/48 2,257,543633,475 4.500 05/01/48 708,0311,082,685 3.500 06/01/48 1,147,1492,801,519 4.500 06/01/48 3,036,6912,528,400 3.500 11/01/48 2,678,9422,942,448 5.000 11/01/48 3,354,1893,363,648 4.000 01/01/49 3,671,196644,438 4.500 TBA - 30yr 697,4299,449,311 4.500 03/01/49 10,230,7191,424,698 3.500 07/01/49 1,556,668945,722 3.500 08/01/49 1,034,3693,000,000 3.000 09/01/49 3,237,978
PrincipalAmount
InterestRate
MaturityDate Value
Mortgage-Backed Obligations �� (continued)UMBS �� (continued)$ 229,053 4.500 % 12/01/49 $ 248,066
7,566,889 4.500 01/01/50 8,197,360669,445 4.500 02/01/50 724,177381,478 4.500 03/01/50 416,5632,949,335 3.000 TBA -30yr 3,115,579994,317 3.000 08/01/50 1,050,443
92,481,301UMBS, 30 Year, Single Family(e) �� 18.0%
46,000,000 2.000 TBA -30yr 47,818,22414,000,000 3.000 TBA -30yr 14,667,7233,000,000 4.500 TBA - 30yr 3,251,250
65,737,197TOTAL FEDERAL AGENCIES $396,419,481TOTAL MORTGAGE-BACKED OBLIGATIONS(Cost $423,855,715) $436,007,848
Asset-Backed Securities(b) �� 7.7%Collateralized Loan Obligations(c) �� 5.0%Arbor Realty Commercial Real Estate Notes Ltd. Series 2018-FL1, Class A
(1M USD LIBOR + 1.150%)$ 1,300,000 1.309 % 06/15/28 $ 1,286,252Battalion CLO Ltd. Series 2018-12A, Class A1 (3M USD LIBOR +
1.070%)800,000 1.292 05/17/31 796,980
Crown City CLO I Series 2020-1A, Class A2 (3M USD LIBOR + 2.550%)1,000,000 2.857 07/20/30 1,002,692
Crown City CLO I Series 2020-1A, Class B (3M USD LIBOR + 3.030%)600,000 3.337 07/20/30 600,080
Crown City CLO I Series 2020-1A, Class C (3M USD LIBOR + 4.620%)2,500,000 4.927 07/20/30 2,510,293
Cutwater Ltd. Series 2014-1A, Class A1AR (3M USD LIBOR + 1.250%)418,587 1.487 07/15/26 417,972
Elmwood CLO IV Ltd. Series 2020-1A, Class A (3M USD LIBOR +1.240%)
1,500,000 1.477 04/15/33 1,501,742Halseypoint CLO 2 Ltd. Series 2020-2A, Class A1 (3M USD LIBOR +
1.860%)1,850,000 2.078 07/20/31 1,855,744
PrincipalAmount
InterestRate
MaturityDate Value
Asset-Backed Securities (b)�� (continued)Collateralized Loan Obligations(c) �� (continued)Madison Park Funding XII Ltd. Series 2014-12A, Class AR (3M USD
LIBOR + 1.260%)$ 130,023 1.478 % 07/20/26 $ 130,043Magnetite XVI Ltd. Series 2015-16A, Class AR (3M USD LIBOR + 0.800%)
1,479,941 1.018 01/18/28 1,474,391Nassau Ltd. Series 2019-IA, Class ANA (3M USD LIBOR + 1.510%)
1,000,000 1.747 04/15/31 1,000,592Pikes Peak CLO 6 Series 2020-6A, Class C (3M USD LIBOR + 4.040%)
800,000 4.260 08/18/30 806,995Sound Point CLO XVIII Ltd. Series 2017-4A, Class A2A (3M USD LIBOR +
1.400%)850,000 1.618 01/21/31 838,231
Sound Point CLO XVIII Ltd. Series 2017-4A, Class B (3M USD LIBOR +1.800%)
550,000 2.018 01/21/31 524,602Thacher Park CLO Ltd. Series 2014-1A, Class AR (3M USD LIBOR +
1.160%)407,497 1.378 10/20/26 407,552
Copyright © 2021 www.secdatabase.com. All Rights Reserved.Please Consider the Environment Before Printing This Document

GOLDMAN SACHS U.S. MORTGAGES FUND
Schedule of Investments(continued)December 31, 2020 (Unaudited)
York CLO 1 Ltd. Series 2014-1A, Class ARR (3M USD LIBOR + 1.120%)2,100,000 1.336 10/22/29 2,094,292
Zais CLO Ltd. Series 2020-15A, Class A1 (3M USD LIBOR + 2.555%)925,000 2.777 07/28/30 931,050
18,179,503Student Loan �� 2.7%Brazos Education Loan Authority, Inc. Series 2012-1, Class A1 (1M USD
LIBOR + 0.700%)262,611 0.848 12/26/35 259,909
ECMC Group Student Loan Trust Series 2017-1A, Class A(c) (1M USDLIBOR + 1.200%)
1,498,487 1.348 12/27/66 1,504,975Goal Capital Funding Trust Series 2010-1, Class A(c) (3M USD LIBOR +
0.700%)1,025,544 0.907 08/25/48 1,013,456
Higher Education Funding I Series 2014-1, Class A(c) (3M USD LIBOR +1.050%)
1,078,821 1.257 05/25/34 1,080,903Illinois Student Assistance Commission Series 2010-1, Class A3 (3M USD
LIBOR + 0.900%)728,377 1.115 07/25/45 723,745
PHEAA Student Loan Trust Series 2011-1A, Class A1(c) (3M USD LIBOR +1.100%)
1,382,669 1.351 06/25/38 1,379,585
PrincipalAmount
InterestRate
MaturityDate Value
Asset-Backed Securities (b)�� (continued)Student Loan �� (continued)PHEAA Student Loan Trust Series 2014-3A, Class A(c) (1M USD LIBOR +
0.590%)$ 3,170,856 0.738 % 08/25/40 $ 3,159,342PHEAA Student Loan Trust Series 2016-1A, Class A(c) (1M USD LIBOR +
1.150%)731,342 1.298 09/25/65 738,719
9,860,634TOTAL ASSET-BACKED SECURITIES(Cost $27,961,287) $ 28,040,137
U.S. Treasury Obligations �� 12.1%United States Cash Management Bill(f)$ 20,000,000 0.000 % 03/30/21 $ 19,996,600United States Treasury Bills(f)
15,620,000 0.000 01/21/21 15,619,628United States Treasury Bonds
880,000 1.625 11/15/50 875,462United States Treasury Notes
3,790,000 0.250 12/31/25 3,792,3693,780,000 0.625 12/31/27 3,774,094
TOTAL U.S. TREASURY OBLIGATIONS(Cost $44,043,546) $ 44,058,153
SharesDividend
Rate Value
Investment Company(g) �� 2.1%Goldman Sachs Financial Square Government Fund - Institutional Shares
7,654,918 0.026 % $ 7,654,918(Cost $7,654,918)TOTAL INVESTMENTS �� 141.3%(Cost $503,515,466) $ 515,761,056LIABILITIES IN EXCESS OF
OTHER ASSETS �� (41.3)% (150,753,743)NET ASSETS �� 100.0% $ 365,007,313
The percentage shown for each investment category reflects thevalue of investments in that category as a percentage of net assets.(a) Security with a notional or nominal principal amount. The actual effective yield of
this security is different than the stated interest rate.
(b) Variable rate security. Except for floating rate notes (for which final maturity isdisclosed), maturity date disclosed is the next interest reset date. Interest ratedisclosed is that which is in effect on December 31, 2020.
(c) Exempt from registration under Rule 144A of the Securities Act of 1933.
(d) Coupon changes periodically based upon a predetermined schedule. Interest ratedisclosed is that which is in effect on December 31, 2020.
(e) TBA (To Be Announced) Securities are purchased on a forward commitment basiswith an approximate principal amount and no defined maturity date. The actualprincipal and maturity date will be determined upon settlement when the specificmortgage pools are assigned. Total market value of TBA securities (excludingforward sales contracts, if any) amounts to $153,952,625 which representsapproximately 42.2% of the Fund�s net assets as of December 31, 2020.
(f) Issued with a zero coupon. Income is recognized through the accretion of discount.
(g) Represents an affiliated issuer.
Currency Abbreviations:CAD � Canadian Dollar
Copyright © 2021 www.secdatabase.com. All Rights Reserved.Please Consider the Environment Before Printing This Document

GOLDMAN SACHS U.S. MORTGAGES FUND
Schedule of Investments(continued)December 31, 2020 (Unaudited)
ADDITIONAL INVESTMENT INFORMATION
FORWARD SALES CONTRACTS � At December 31, 2020, the Fundhad the following forward sales contracts:
DescriptionInterest
RateMaturityDate(a)
SettlementDate
PrincipalAmount Value
UMBS, 30 Year, Single Family 3.500 % TBA-30yr 01/14/20 $(1,000,000) $(1,057,188)UMBS, 30 Year, Single Family 4.000 TBA-30yr 01/14/20 (3,000,000) (3,203,672)UMBS, 30 Year, Single Family 5.000 TBA-30yr 01/14/20 (1,000,000) (1,106,562)TOTAL (Proceeds Receivable: $5,361,484) $(5,367,422)
(a) TBA (To Be Announced) Securities are purchased on a forward commitment basis with an approximate principal amount and no defined maturity date. The actual principal and maturity date willbe determined upon settlement when the specific mortgage pools are assigned.
FUTURES CONTRACTS � At December 31, 2020, the Fund had the following futures contracts:
DescriptionNumber ofContracts
ExpirationDate
NotionalAmount
UnrealizedAppreciation/(Depreciation)
Long position contracts:Ultra 10 Year U.S. Treasury Notes 3 03/22/21 $469,078 $ 1,40120 Year U.S. Treasury Bonds 7 03/22/21 1,212,313 643Total $ 2,044Short position contracts:Ultra Long U.S. Treasury Bonds (17) 03/22/21 (3,630,562 ) 17,6482 Year U.S. Treasury Notes (142) 03/31/21 (31,378,672) (27,864 )5 Year U.S. Treasury Notes (112) 03/31/21 (14,130,375) (13,771 )10 Year U.S. Treasury Notes (46) 03/22/21 (6,351,594 ) (5,282 )Total $ (29,269 )TOTAL FUTURES CONTRACTS $ (27,225 )
SWAP CONTRACTS � At December 31, 2020, the Fund had the following swap contracts:
CENTRALLY CLEARED INTEREST RATE SWAP CONTRACTS
Payments Madeby the Fund
PaymentsReceivedby Fund
TerminationDate
NotionalAmount(000s)(a)
MarketValue
UpfrontPremium
(Received)Paid
UnrealizedAppreciation/(Depreciation)
0.000%(b) 3M LIBOR(b) 07/25/24 $ 16,200 $(5,438 ) $ 5,438 $ (10,876 )6M CDOR(c) 0.960%(c) 11/09/24 CAD14,760 20,724 15,168 5,5560.000(b) 3M LIBOR(b) 11/10/24 $ 9,600 (8,313 ) 9 (8,322 )3M LIBOR(b) 0.500(c) 03/17/26 140 278 96 1821.430(c) 6M CDOR(c) 11/09/30 CAD2,960 (12,338) (11,285 ) (1,053 )3M LIBOR(b) 1.245(c) 11/24/30 $ 2,520 (21,355) (3,237 ) (18,118 )1.543(c) 3M LIBOR(b) 11/25/35 2,780 27,934 1,336 26,598TOTAL $1,492 $ 7,525 $ (6,033 )
(a) Represents forward starting interest rate swaps whose effective dates of commencement of accruals and cash flows occur subsequent to December 31, 2020.(b) Payments made quarterly.(c) Payments made semi-annually.GOLDMAN SACHS U.S. MORTGAGES FUND
Schedule of Investments (continued)December 31, 2020 (Unaudited)
USD �U.S. Dollar
Investment Abbreviations:CDOR � Canadian Dollar Offered RateCLO � Collateralized Loan ObligationCMT � Constant Maturity Treasury IndexesCOF � Cost of Funds IndexFHLMC � Federal Home Loan Mortgage Corp.FNMA � Federal National Mortgage AssociationGNMA �Government National Mortgage AssociationLIBOR � London Interbank Offered RateMTA �Monthly Treasury AveragePI � Private InvestmentPLC � Public Limited CompanyREMIC � Real Estate Mortgage Investment ConduitSTRIPS � Separate Trading of Registered Interest and Principal of
Securities
Copyright © 2021 www.secdatabase.com. All Rights Reserved.Please Consider the Environment Before Printing This Document

ADDITIONAL INVESTMENT INFORMATION (continued)
OVER THE COUNTER CREDIT DEFAULT SWAP CONTRACTS
ReferenceObligation/Index
FinancingRate Paid bythe Fund(a)
CreditSpread at
December 31,2020(b) Counterparty
TerminationDate
NotionalAmount(000s) Value
UpfrontPremiums(Received)
Paid
UnrealizedAppreciation/(Depreciation)
Protection Sold:Markit CMBX Series 11 3.000% 4.368% Citibank NA 11/18/54 $ 1,500 $(117,768 ) $(218,565 ) $ 100,797Markit CMBX Series 8 3.000 7.961 Citibank NA 10/17/57 2,200 (352,046 ) (509,388 ) 157,342Markit CMBX Series 10
3.000 5.517JPMorganSecurities, Inc. 11/17/59 2,450 (302,549 ) (7,255 ) (295,294 )
Markit CMBX Series 112.000 2.643
JPMorganSecurities, Inc. 11/18/54 2,500 (97,667 ) (390,354 ) 292,687
Markit CMBX Series 113.000 4.368
JPMorganSecurities, Inc. 11/18/54 2,400 (188,531 ) (32,363 ) (156,168 )
Markit CMBX Series 93.000 2.643
JPMorganSecurities, Inc. 09/17/58 1,200 (143,124 ) (5,469 ) (137,655 )
Markit CMBX Series 103.000 5.517
MS & Co. Int.PLC 11/17/59 400 (49,463 ) (64,015 ) 14,552
TOTAL $(1,251,148) $(1,227,409) $ (23,739 )
(a) Payments made monthly.(b) Credit spread on the referenced obligation, together with the term of the swap contract, are indicators of payment/performance risk. The likelihood of a credit event occurring which would require a
fund or its counterparty to make a payment or otherwise be required to perform under the swap contract is generally greater as the credit spread and the term of the swap contract increase.
PURCHASED AND WRITTEN OPTIONS CONTRACTS � At December 31, 2020, the Fund had the following purchased and written options:
OVER-THE-COUNTER INTEREST RATE SWAPTIONS
Description CounterpartyExercise
RateExpiration
DateNumber ofContracts
NotionalAmount
MarketValue
PremiumsPaid
(Received)by Portfolio
UnrealizedAppreciation/(Depreciation)
Purchased option contractsCalls6M IRS JPMorgan Securities, Inc. $ 1.100 03/17/2021 5,000,000 $5,000,000 $10,169 $ 60,000 $ (49,831 )Puts6M IRS JPMorgan Securities, Inc. 0.555 06/17/2021 5,290,000 5,290,000 22,803 23,627 (824 )Total purchased option contracts 10,290,000 $10,290,000 $32,972 $ 83,627 $ (50,655 )GOLDMAN SACHS U.S. MORTGAGES FUND
Schedule of Investments (continued)December 31, 2020 (Unaudited)
ADDITIONAL INVESTMENT INFORMATION (continued)
OVER-THE-COUNTER INTEREST RATE SWAPTIONS (continued)
Description CounterpartyExercise
RateExpiration
DateNumber ofContracts
NotionalAmount
MarketValue
PremiumsPaid
(Received)by Portfolio
UnrealizedAppreciation/(Depreciation)
Written option contractsCalls6M IRS JPMorgan Securities, Inc. $ 0.900 03/17/2021 (5,000,000 ) $(5,000,000 ) $(4,248 ) $ (40,000 ) $ 35,7526M IRS JPMorgan Securities, Inc. 0.700 03/17/2021 (5,000,000 ) (5,000,000 ) (1,656 ) (22,825 ) 21,1693M IRS Deutsche Bank AG (London) 0.280 01/06/2021 (5,100,000 ) (5,100,000 ) (1 ) (5,610 ) 5,6093M IRS Deutsche Bank AG (London) 0.310 01/20/2021 (5,090,000 ) (5,090,000 ) (768 ) (5,854 ) 5,086
(20,190,000) $(20,190,000 ) $(6,673 ) $ (74,289 ) $ 67,616Puts6M IRS JPMorgan Securities, Inc. 0.763 06/17/2021 (5,290,000 ) (5,290,000 ) (9,410 ) (9,270 ) (140 )6M IRS JPMorgan Securities, Inc. 0.659 06/17/2021 (5,290,000 ) (5,290,000 ) (14,490) (14,357 ) (133 )3M IRS Deutsche Bank AG (London) 0.480 01/06/2021 (5,100,000 ) (5,100,000 ) (431 ) (12,877 ) 12,4463M IRS Deutsche Bank AG (London) 0.510 01/20/2021 (5,090,000 ) (5,090,000 ) (2,304 ) (14,252 ) 11,948
(20,770,000) $(20,770,000 ) $(26,635) $ (50,756 ) $ 24,121Total written option contracts (40,960,000) $(40,960,000) $(33,308) $ (125,045 ) $ 91,737
Copyright © 2021 www.secdatabase.com. All Rights Reserved.Please Consider the Environment Before Printing This Document

TOTAL (30,670,000) $(30,670,000) $(336 ) $ (41,418 ) $ 41,082
GOLDMAN SACHS U.S. MORTGAGES FUND
Schedule of Investments (continued)December 31, 2020 (Unaudited)
NOTES TO THE SCHEDULE OF INVESTMENTS
1. INVESTMENTS AND FAIR VALUE MEASUREMENTS
U.S. GAAP defines the fair value of a financial instrument as the amount that would be received to sell an asset or paid to transfer a liability in an orderlytransaction between market participants at the measurement date (i.e., the exit price); the Funds� policy is to use the market approach. GAAP establishes afair value hierarchy that prioritizes the inputs to valuation techniques used to measure fair value. The hierarchy gives the highest priority to unadjusted quotedprices in active markets for identical assets or liabilities (Level 1 measurements) and the lowest priority to unobservable inputs (Level 3 measurements). Thelevel in the fair value hierarchy within the fair value measurement in its entirely falls shall be determined based on the lowest level input that is significant tothe fair value measurement in its entirety. The levels used for classifying investments are not necessarily an indication of the risk associated with investing inthese investments. The three levels of the fair value hierarchy are described below:
Level 1 � Unadjusted quoted prices in active markets that are accessible at the measurement date for identical, unrestricted assets or liabilities;Level 2 � Quoted prices in markets that are not active or financial instruments for which significant inputs are observable (including, but not limited to,quoted prices for similar investments, interest rates, foreign exchange rates, volatility and credit spreads), either directly or indirectly;Level 3 � Prices or valuations that require significant unobservable inputs (including GSAM�s assumptions in determining fair value measurement).
The Board of Trustees (�Trustees�) has approved Valuation Procedures that govern the valuation of the portfolio investments held by the Funds, includinginvestments for which market quotations are not readily available. The Trustees have delegated to GSAM day-to-day responsibility for implementing andmaintaining internal controls and procedures related to the valuation of the Funds� investments. To assess the continuing appropriateness of pricing sourcesand methodologies, GSAM regularly performs price verification procedures and issues challenges as necessary to third party pricing vendors or brokers, andany differences are reviewed in accordance with the Valuation Procedures.
A. Level 1 and Level 2 Fair Value Investments � The valuation techniques and significant inputs used in determining the fair values for investmentsclassified as Level 1 and Level 2 are as follows:
Equity Securities � Equity securities traded on a United States (�U.S.�) securities exchange or the NASDAQ system, or those located on certain foreignexchanges, including but not limited to the Americas, are valued daily at their last sale price or official closing price on the principal exchange or system onwhich they are traded. If there is no sale or official closing price or such price is believed by GSAM to not represent fair value, equity securities will bevalued at the valid closing bid price for long positions and at the valid closing ask price for short positions (i.e. where there is sufficient volume, duringnormal exchange trading hours). If no valid bid/ask price is available, the equity security will be valued pursuant to the Valuation Procedures approved by theTrustees and consistent with applicable regulatory guidance. To the extent these investments are actively traded, they are classified as Level 1 of the fair valuehierarchy, otherwise they are generally classified as Level 2. Certain equity securities containing unique attributes may be classified as Level 2.
Unlisted equity securities for which market quotations are available are valued at the last sale price on the valuation date, or if no sale occurs, at the lastbid price for long positions or the last ask price for short positions, and are generally classified as Level 2. Securities traded on certain foreign securitiesexchanges are valued daily at fair value determined by an independent fair value service (if available) under Valuation Procedures approved by the Trusteesand consistent with applicable regulatory guidance. The independent fair value service takes into account multiple factors including, but not limited to,movements in the securities markets, certain depositary receipts, futures contracts and foreign currency exchange rates that have occurred subsequent to theclose of the foreign securities exchange. These investments are generally classified as Level 2 of the fair value hierarchy.GOLDMAN SACHS U.S. MORTGAGES FUND
Schedule of Investments (continued)December 31, 2020 (Unaudited)
NOTES TO THE SCHEDULE OF INVESTMENTS (continued)
Private Investments � Private investments may include, but are not limited to, investments in private equity or debt instruments. The investment managerestimates the fair value of private investments based upon various factors, including, but not limited to, transactions in similar instruments, completed orpending third-party transactions in underlying investments or comparable entities, subsequent rounds of financing, recapitalizations, and other transactionsacross the capital structure, offerings in equity or debt capital markets, and changes in current and projected financial ratios or cash flows.
Abbreviations:MS & Co. Int. PLC-Morgan Stanley & Co. International PLC
Copyright © 2021 www.secdatabase.com. All Rights Reserved.Please Consider the Environment Before Printing This Document
Underlying Funds (including Money Market Funds) � Underlying Funds (�Underlying Funds�) include other investment companies and exchange-tradedfunds (�ETFs�). Investments in the Underlying Funds (except ETFs) are valued at the NAV per share on the day of valuation. ETFs are valued daily at thelast sale price or official closing price on the principal exchange or system on which the investment is traded. Because the Funds invest in Underlying Fundsthat fluctuate in value, the Funds� shares will correspondingly fluctuate in value. To the extent these investments are actively traded, they are classified asLevel 1 of the fair value hierarchy, otherwise they are generally classified as Level 2. For information regarding an Underlying Fund�s accounting policiesand investment holdings, please see the Underlying Fund�s shareholder report.
Debt Securities � Debt securities for which market quotations are readily available are valued daily on the basis of quotations supplied by dealers or anindependent pricing service approved by the Trustees. The pricing services may use valuation models or matrix pricing, which consider: (i) yield or price withrespect to bonds that are considered comparable in characteristics such as rating, interest rate and maturity date or (ii) quotations from securities dealers todetermine current value. With the exception of treasury securities of G7 countries, which are generally classified as Level 1, these investments are generallyclassified as Level 2 of the fair value hierarchy.
i. Bank Loans � Bank loans (�Loans�) are interests in amounts owed by corporate, governmental, or other borrowers to lenders or lending syndicates.Loans are arranged through private negotiations between the borrower and one or more financial institutions (�Lenders�). A Fund�s investments inLoans are in the form of either participations in Loans (�Participations�) or assignments of all or a portion of Loans from third parties(�Assignments�). With respect to Participations, a Fund has the right to receive payments of principal, interest and any fees to which it is entitled fromthe Lender selling the Participations and only upon receipt by the Lender of the payments from the borrower. A Fund generally has no right to enforcecompliance by the borrower with the terms of the loan agreement with respect to Participations. Conversely, assignments result in a Fund having adirect contractual relationship with the borrower, and the Fund may be permitted to enforce compliance by the borrower with the terms of the loanagreement.
ii. Commercial Paper � Commercial paper normally represents short-term unsecured promissory notes issued in bearer form by banks or bank holdingcompanies, corporations, finance companies and other issuers. Commercial paper consists of direct U.S. dollar-denominated obligations of domestic orforeign issuers. Asset-backed commercial paper is issued by a special purpose entity that is organized to issue the commercial paper and to purchasetrade receivables or other financial assets.
iii. Mortgage-Backed and Asset-Backed Securities � Mortgage-backed securities represent direct or indirect participations in, or are collateralized byand payable from, mortgage loans secured by residential and/or commercial real estate property. Asset-backed securities include securities whoseprincipal and interest payments are collateralized by pools of other assets or receivables. The value of certain mortgage-backed and asset-backedsecurities (including adjustable rate mortgage loans) may be particularly sensitive to changes in prevailing interest rates. The value of these securitiesmay also fluctuate in response to the market�s perception of the creditworthiness of the issuers.
Asset-backed securities may present credit risks that are not presented by mortgage-backed securities because they generally do not have thebenefit of a security interest in collateral that is comparable to mortgage assets. Some asset-backed securities may only have a subordinated claim oncollateral.
Stripped mortgage-backed securities are usually structured with two different classes: one that receives substantially all interest payments(interest-only, or �IO� and/or high coupon rate with relatively low principal amount, or �IOette�), and the other that receives substantially all principalpayments (principal-only, or �PO�) from a pool of mortgage loans. Little to no principal will be received at the maturity of an IO; as a result, periodicadjustments are recorded to reduce the cost of the security until maturity. These adjustments are included in interest income.
iv. Mortgage Dollar Rolls � Mortgage dollar rolls are transactions whereby a Fund sells mortgage-backed-securities and simultaneously contracts withthe same counterparty to repurchase similar securities on a specified future date. During the settlement period, a Fund will not be entitled to accrueinterest and receive principal payments on the securities sold. The Funds account for mortgage dollar roll transactions as purchases and sales andrealize gains and losses on these transactions
v. Structured Notes � The values of structured notes are based on the price movements of a reference security or index. Upon termination, a Fund willreceive a payment from the issuer based on the value of the referenced instrument (notional amount multiplied by price of the referenced instrument)and record a realized gain or loss. Structured notes that are exchange traded are generally classified as Level 1 of the fair value hierarchy.
GOLDMAN SACHS U.S. MORTGAGES FUND
Schedule of Investments (continued)December 31, 2020 (Unaudited)
NOTES TO THE SCHEDULE OF INVESTMENTS (continued)
vi. Treasury Inflation Protected Securities � TIPS are treasury securities in which the principal amount is adjusted daily to keep pace with inflation,as measured by the U.S. Consumer Pricing Index for Urban Consumers. The repayment of the original bond principal upon maturity is guaranteed bythe full faith and credit of the U.S. Government.
vii. When-Issued Securities and Forward Commitments � When-issued securities, including TBA (�To Be Announced�) securities, are securitiesthat are authorized but not yet issued in the market and purchased in order to secure what is considered to be an advantageous price or yield to a Fund.A forward commitment involves entering into a contract to purchase or sell securities, typically on an extended settlement basis, for a fixed price at afuture date. The purchase of securities on a when-issued or forward commitment basis involves a risk of loss if the value of the security to be purchaseddeclines before the settlement date. Conversely, the sale of securities on a forward commitment basis involves the risk that the value of the securitiessold may increase before the settlement date. Although a Fund will generally purchase securities on a when-issued or forward commitment basis with
Copyright © 2021 www.secdatabase.com. All Rights Reserved.Please Consider the Environment Before Printing This Document

the intention of acquiring the securities for its portfolio, the Fund may dispose of when-issued securities or forward commitments prior to settlement,which may result in a realized gain or loss. For financial reporting purposes, cash collateral that has been pledged to cover obligations of a Fund andcash collateral received, if any, is reported separately on the Statements of Assets and Liabilities as receivables/payables for collateral on otherinvestments. Non-cash collateral pledged by a Fund, if any, is noted in the Schedules of Investments.
Derivative Contracts � A derivative is an instrument whose value is derived from underlying assets, indices, reference rates or a combination of thesefactors. A Fund enters into derivative transactions to hedge against changes in interest rates, securities prices, and/or currency exchange rates, to increase totalreturn, or to gain access to certain markets or attain exposure to other underliers. For financial reporting purposes, cash collateral that has been pledged tocover obligations of a Fund and cash collateral received, if any, is reported separately on the Statements of Assets and Liabilities as receivables/payables forcollateral on certain derivatives contract. Non-cash collateral pledged by a Fund, if any, is noted in the Schedules of Investments.
Exchange-traded derivatives, including futures and options contracts, are generally valued at the last sale or settlement price on the exchange wherethey are principally traded. Exchange-traded options without settlement prices are generally valued at the midpoint of the bid and ask prices on the exchangewhere they are principally traded (or, in the absence of two-way trading, at the last bid price for long positions and the last ask price for short positions).Exchange-traded derivatives typically fall within Level 1 of the fair value hierarchy. Over-the-counter (�OTC�) and centrally cleared derivatives are valuedusing market transactions and other market evidence, including market-based inputs to models, calibration to market-clearing transactions, broker or dealerquotations, or other alternative pricing sources. Where models are used, the selection of a particular model to value OTC and centrally cleared derivativesdepends upon the contractual terms of, and specific risks inherent in, the instrument, as well as the availability of pricing information in the market. Valuationmodels require a variety of inputs, including contractual terms, market prices, yield curves, credit curves, measures of volatility, voluntary and involuntaryprepayment rates, loss severity rates and correlations of such inputs. For OTC and centrally cleared derivatives that trade in liquid markets, model inputs cangenerally be verified and model selection does not involve significant management judgment. OTC and centrally cleared derivatives are classified withinLevel 2 of the fair value hierarchy when significant inputs are corroborated by market evidence.
i. Forward Contracts � A forward contract is a contract between two parties to buy or sell an asset at a specified price on a future date. A forwardcontract settlement can occur on a cash or delivery basis. Forward contracts are marked-to-market daily using independent vendor prices, and thechange in value, if any, is recorded as an unrealized gain or loss. Cash and certain investments may be used to collateralize forward contracts.
A forward foreign currency exchange contract is a forward contract in which a Fund agrees to receive or deliver a fixed quantity of one currencyfor another, at a pre-determined price at a future date.All forward foreign currency exchange contracts are marked to market daily by using the outrightforward rates or interpolating based upon maturity dates, where available. Non-deliverable forward foreign currency exchange contracts are settled withthe counterparty in cash without the delivery of foreign currency.
ii. Futures Contracts � Futures contracts are contracts to buy or sell a standardized quantity of a specified commodity or security. Upon entering into afutures contract, a Fund deposits cash or securities in an account on behalf of the broker in an amount sufficient to meet the initial margin requirement.Subsequent payments are made or received by a Fund equal to the daily change in the contract value and are recorded as variation margin receivable orpayable with a corresponding offset to unrealized gains or losses.
GOLDMAN SACHS U.S. MORTGAGES FUND
Schedule of Investments (continued)December 31, 2020 (Unaudited)
NOTES TO THE SCHEDULE OF INVESTMENTS (continued)
iii. Options � When a Fund writes call or put options, an amount equal to the premium received is recorded as a liability and is subsequently marked-to-market to reflect the current value of the option written. Swaptions are options on interest rate and or credit default, swap contracts.
Upon the purchase of a call option or a put option by a Fund, the premium paid is recorded as an investment and subsequently marked-to-marketto reflect the current value of the option. Certain options may be purchased with premiums to be determined on a future date. The premiums for theseoptions are based upon implied volatility parameters at specified terms.
iv. Swap Contracts � Bilateral swap contracts are agreements in which a Fund and a counterparty agree to exchange periodic payments on a specifiednotional amount or make a net payment upon termination. Bilateral swap transactions are privately negotiated in the OTC market and payments aresettled through direct payments between a Fund and the counterparty. By contrast, certain swap transactions are subject to mandatory central clearing.These swaps are executed through a derivatives clearing member (�DCM�), acting in an agency capacity, and submitted to a central counterparty(�CCP�) (�centrally cleared swaps�), in which case all payments are settled with the CCP through the DCM. Swaps are marked-to-market daily usingpricing vendor quotations, counterparty or clearinghouse prices or model prices, and the change in value, if any, is recorded as an unrealized gain orloss. Upon entering into a swap contract, a Fund is required to satisfy an initial margin requirement by delivering cash or securities to the counterparty(or in some cases, segregated in a triparty account on behalf of the counterparty), which can be adjusted by any mark-to-market gains or losses pursuantto bilateral or centrally cleared arrangements. For centrally cleared swaps the daily change in valuation, if any, is recorded as a receivable or payablefor variation margin.
An interest rate swap is an agreement that obligates two parties to exchange a series of cash flows at specified intervals, based upon or calculatedby reference to changes in interest rates on a specified notional principal amount. The payment flows are usually netted against each other, with thedifference being paid by one party to the other.
A credit default swap is an agreement that involves one party (the buyer of protection) making a stream of payments to another party (the sellerof protection) in exchange for the right to receive protection on a reference security or obligation, including a group of assets or exposure to theperformance of an index. A Fund�s investment in credit default swaps may involve greater risks than if the Fund had invested in the referencedobligation directly. Credit events are contract specific but may include bankruptcy, failure to pay, restructuring and obligation acceleration. If a Fund
Copyright © 2021 www.secdatabase.com. All Rights Reserved.Please Consider the Environment Before Printing This Document

buys protection through a credit default swap and no credit event occurs, its payments are limited to the periodic payments previously made to thecounterparty. Upon the occurrence of a specified credit event, a Fund, as a buyer of credit protection, is entitled to receive an amount equal to thenotional amount of the swap and deliver to the seller the defaulted reference obligation in a physically settled trade. A Fund may also receive a netsettlement amount in the form of cash or securities equal to the notional amount of the swap reduced by the recovery value of the reference obligationin a cash settled trade.
As a seller of protection, a Fund generally receives a payment stream throughout the term of the swap, provided that there is no credit event. Inaddition, if a Fund sells protection through a credit default swap, a Fund could suffer a loss because the value of the referenced obligation and thepremium payments received may be less than the notional amount of the swap paid to the buyer of protection. Upon the occurrence of a specified creditevent, a Fund, as a seller of credit protection, may be required to take possession of the defaulted reference obligation and pay the buyer an amountequal to the notional amount of the swap in a physically settled trade. A Fund may also pay a net settlement amount in the form of cash or securitiesequal to the notional amount of the swap reduced by the recovery value of the reference obligation in a cash settled trade. Recovery values are at timesestablished through the credit event auction process in which market participants are ensured that a transparent price has been set for the defaultedsecurity or obligation. In addition, a Fund is entitled to a return of any assets, which have been pledged as collateral to the counterparty uponsettlement.
The maximum potential amount of future payments (undiscounted) that a Fund as seller of protection could be required to make under a creditdefault swap would be an amount equal to the notional amount of the agreement. These potential amounts would be partially offset by any recoveryvalues of the respective referenced obligations or net amounts received from a settlement of a credit default swap for the same reference security orobligation where a Fund bought credit protection.
A total return swap is an agreement that gives a Fund the right to receive or pay the appreciation or depreciation, as applicable, in the value of aspecified security, an index, a basket of securities or indices or other instrument in return for a fee paid to the counterparty, which will typically be anagreed upon interest rate. If the underlying asset declines in value over the term of the swap, a Fund may also be required to pay the dollar value of thatdecline to the counterparty.
Secured Borrowings � Secured borrowings are valued at their contractual amounts, which approximate fair value, and are generally classified as Level 2 ofthe fair value hierarchy.
i. Reverse Repurchase Agreements � Reverse repurchase agreements involve the sale of securities held by a Fund subject to the Fund�s agreement torepurchase the securities at a mutually agreed upon date and price (including interest), under the terms of a Master Repurchase Agreement (� MRA�).The gross value of reverse repurchase agreements is included in the Statements of Assets and Liabilities for financial reporting purposes.
GOLDMAN SACHS U.S. MORTGAGES FUND
Schedule of Investments (continued)December 31, 2020 (Unaudited)
NOTES TO THE SCHEDULE OF INVESTMENTS (continued)
When a Fund enters into a reverse repurchase agreement, it is required to deliver securities as collateral to the counterparty that exceed the valueof the reverse repurchase agreement. During the term of a reverse repurchase agreement, the value of the underlying securities pledged as collateral onbehalf of a Fund, including accrued interest, is required to exceed the value of the reverse repurchase agreement, including accrued interest. If the valueof those securities pledged as collateral, including accrued interest, becomes less than the value of the reverse repurchase agreement, including accruedinterest, a Fund will be obligated to deliver additional collateral to the buyer. If the buyer defaults on its commitment to sell back the securities, a Fundcould suffer a loss to the extent that the amount borrowed is less than the replacement cost of similar securities and the Fund�s costs associated withdelay and enforcement of the reverse repurchase agreement. In addition, in the event of default or insolvency of the buyer, a court could determine thatthe Fund�s interest in the amount borrowed is not enforceable, resulting in additional losses to a Fund.
B. Level 3 Fair Value Investments � To the extent that significant inputs to valuation models and other alternative pricing sources are unobservable, or ifquotations are not readily available, or if GSAM believes that such quotations do not accurately reflect fair value, the fair value of the Funds� investmentsmay be determined under Valuation Procedures approved by the Trustees. GSAM, consistent with its procedures and applicable regulatory guidance, maymake an adjustment to the most recent valuation prices of either domestic or foreign securities in light of significant events to reflect what it believes to be thefair value of the securities at the time of determining a Fund�s NAV.
To the extent investments are valued using single source broker quotations obtained directly from the broker or passed through from third party pricingvendors, such investments are classified as Level 3 investments. GSAM did not develop the unobservable inputs for the valuation of Level 3 Assets andLiabilities.
C. Fair Value Hierarchy � The following is a summary of the Funds� investments and derivatives classified in the fair value hierarchy as of December 31,2020:
EMERGING MARKETS DEBT
Investment Type Level 1 Level 2 Level 3AssetsFixed Income
Sovereign Debt Obligations $� $876,699,358 $�Corporate Obligations � 357,367,105 �Structured Notes � 13,127,098 �
Copyright © 2021 www.secdatabase.com. All Rights Reserved.Please Consider the Environment Before Printing This Document

Investment Company 45,527,646 � �
Total $45,527,646 $1,247,193,561 $�
Derivative TypeAssets(a)
Forward Foreign Currency Exchange Contracts $� $5,768,799 $�Futures Contracts 609,622 � �Interest Rate Swap Contracts � 1,452,857 �
Credit Default Swap Contracts � 4,794,140 �
Total $609,622 $12,015,796 $�Liabilities(a)
Forward Foreign Currency Exchange Contracts $� $(10,721,626 ) $�Futures Contracts (371,317 ) � �Interest Rate Swap Contracts � (215,102 ) �
Credit Default Swap Contracts � (886,866 ) �
Total $(371,317 ) $(11,823,594 ) $�
(a) Amount shown represents unrealized gain (loss) at period end.GOLDMAN SACHS U.S. MORTGAGES FUND
Schedule of Investments (continued)December 31, 2020 (Unaudited)
NOTES TO THE SCHEDULE OF INVESTMENTS (continued)
HIGH YIELD
Investment Type Level 1 Level 2 Level 3AssetsFixed Income
Bank Loans $� $30,961,915 $�Corporate Obligations � 2,074,171,289 �Structured Note � 1,906,450 �
Common Stock and/or Other Equity InvestmentsNorth America 195,448 1,699,200 �
Investment Company 1,163,749 � �
Exchange Traded Funds 33,153,048 � �
Total $34,512,245 $2,108,738,854 $�
Derivative TypeAssets(a)
Futures Contracts $278,082 $� $�Credit Default Swap Contracts � 8,846,813 �
Total Return Swap Contracts � 312,021 �
Total $278,082 $9,158,834 $�Liabilities(a)
Forward Foreign Currency Exchange Contracts $� $(1,021,953 ) $�Futures Contracts (757,650 ) � �
Total $(757,650 ) $(1,021,953 ) $�
(a) Amount shown represents unrealized gain (loss) at period end.
HIGH YIELD FLOATING RATE
Investment Type Level 1 Level 2 Level 3AssetsFixed Income
Bank Loans $� $1,161,856,714 $16,909,967Corporate Obligations � 64,423,976 �Asset-Backed Securities � 10,572,759 �Unfunded Loan Commitments � 396,613 11,462
Common Stock and/or Other Equity Investments(a)Europe � � 3,456,341North America 2,077,653 820,599 �
Warrants � � 40,687Exchange Traded Funds 37,746,107 � �Investment Company 71,938,832 � �
Securities Lending Reinvestment Vehicle 1,117,675 � �
Total $112,880,267 $1,238,070,661 $20,418,457
Copyright © 2021 www.secdatabase.com. All Rights Reserved.Please Consider the Environment Before Printing This Document

Derivative TypeAssets(b)
Forward Foreign Currency Exchange Contracts $� $28,417 $�Futures Contracts 12,997 � �
Credit Default Swap Contracts � 581,054 �
Total $12,997 $609,471 $�Liabilities(b)
Forward Foreign Currency Exchange Contracts $� $(1,045,818 ) $�Futures Contracts (70,203 ) � �
Total $(70,203 ) $(1,045,818 ) $�
(a) Amounts are disclosed by continent to highlight the impact of time zone differences between local market close and the calculation of net asset value. Security valuations are based on the principalexchange or system on which they are traded, which may differ from country of domicile. The Funds utilize fair value model prices provided by an independent fair value service for internationalequities, resulting in a Level 2 classification.
(b) Amount shown represents unrealized gain (loss) at period end.
The following is a reconciliation of Level 3 investments for the nine months ended December 31, 2020:
Bank Loans Common Stocks WarrantBeginning Balance as of April 1, 2020 $96,748,223 $ � $40,687Realized gain (loss) (184,371 ) � �Net change in unrealized gain (loss) relating to instruments still held at reporting date 3,027,356 (713,730 ) �Purchases 7,684,907 4,170,071 �Sales (7,542,099 ) � �Amortization 136,341 � �Transfers into Level 3 2,956,781 � �
Transfers out of Level 3 (85,905,709) � �
Ending Balance as of December 31, 2020 $16,921,429 $ 3,456,341 $40,687
INVESTMENT GRADE CREDIT
Investment Type Level 1 Level 2 Level 3AssetsFixed Income
Corporate Obligations $� $604,171,707 $�Foreign Debt Obligations � 24,896,472 �Municipal Debt Obligations � 4,663,313 �
U.S. Treasury Obligations 982,625 � �
Total $982,625 $633,731,492 $�
Derivative TypeAssets(a)
Forward Foreign Currency Exchange Contracts $� $131,744 $�Futures Contracts 125,276 � �Interest Rate Swap Contracts � 73,208 �
Credit Default Swap Contracts � 1,252,525 �
Total $125,276 $1,457,477 $�Liabilities(a)
Forward Foreign Currency Exchange Contracts $� $(622,217 ) $�Futures Contracts (414,106 ) � �Interest Rate Swap Contracts � (66,186 ) �
Credit Default Swap Contracts � (72,441 ) �
Total $(414,106 ) $(760,844 ) $�
(a) Amount shown represents unrealized gain (loss) at period end.
GOLDMAN SACHS U.S. MORTGAGES FUND
Schedule of Investments (continued)December 31, 2020 (Unaudited)
NOTES TO THE SCHEDULE OF INVESTMENTS (continued)
LOCAL EMERGING MARKETS DEBT
Investment Type Level 1 Level 2 Level 3AssetsFixed Income
Copyright © 2021 www.secdatabase.com. All Rights Reserved.Please Consider the Environment Before Printing This Document
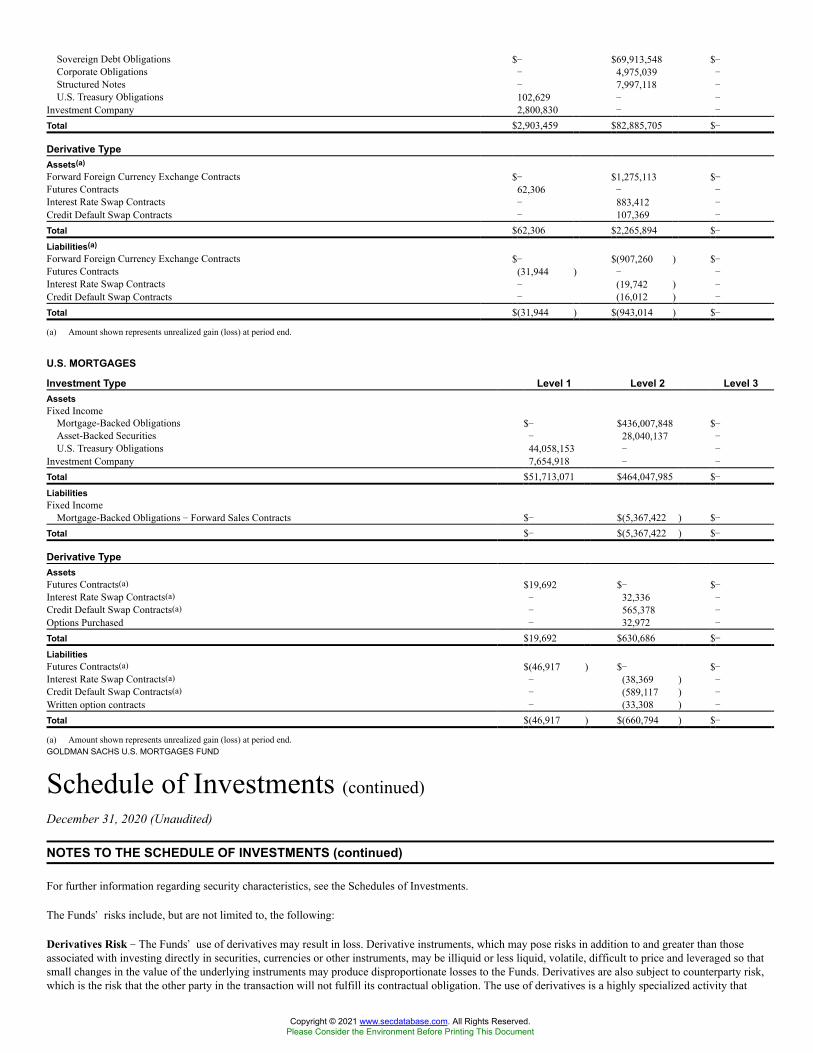
Sovereign Debt Obligations $� $69,913,548 $�Corporate Obligations � 4,975,039 �Structured Notes � 7,997,118 �U.S. Treasury Obligations 102,629 � �
Investment Company 2,800,830 � �
Total $2,903,459 $82,885,705 $�
Derivative TypeAssets(a)
Forward Foreign Currency Exchange Contracts $� $1,275,113 $�Futures Contracts 62,306 � �Interest Rate Swap Contracts � 883,412 �
Credit Default Swap Contracts � 107,369 �
Total $62,306 $2,265,894 $�Liabilities(a)
Forward Foreign Currency Exchange Contracts $� $(907,260 ) $�Futures Contracts (31,944 ) � �Interest Rate Swap Contracts � (19,742 ) �
Credit Default Swap Contracts � (16,012 ) �
Total $(31,944 ) $(943,014 ) $�
(a) Amount shown represents unrealized gain (loss) at period end.
U.S. MORTGAGES
Investment Type Level 1 Level 2 Level 3AssetsFixed Income
Mortgage-Backed Obligations $� $436,007,848 $�Asset-Backed Securities � 28,040,137 �U.S. Treasury Obligations 44,058,153 � �
Investment Company 7,654,918 � �
Total $51,713,071 $464,047,985 $�LiabilitiesFixed Income
Mortgage-Backed Obligations � Forward Sales Contracts $� $(5,367,422 ) $�Total $� $(5,367,422 ) $�
Derivative TypeAssetsFutures Contracts(a) $19,692 $� $�Interest Rate Swap Contracts(a) � 32,336 �Credit Default Swap Contracts(a) � 565,378 �
Options Purchased � 32,972 �
Total $19,692 $630,686 $�LiabilitiesFutures Contracts(a) $(46,917 ) $� $�Interest Rate Swap Contracts(a) � (38,369 ) �Credit Default Swap Contracts(a) � (589,117 ) �
Written option contracts � (33,308 ) �
Total $(46,917 ) $(660,794 ) $�
(a) Amount shown represents unrealized gain (loss) at period end.GOLDMAN SACHS U.S. MORTGAGES FUND
Schedule of Investments (continued)December 31, 2020 (Unaudited)
NOTES TO THE SCHEDULE OF INVESTMENTS (continued)
For further information regarding security characteristics, see the Schedules of Investments.
The Funds� risks include, but are not limited to, the following:
Derivatives Risk � The Funds� use of derivatives may result in loss. Derivative instruments, which may pose risks in addition to and greater than thoseassociated with investing directly in securities, currencies or other instruments, may be illiquid or less liquid, volatile, difficult to price and leveraged so thatsmall changes in the value of the underlying instruments may produce disproportionate losses to the Funds. Derivatives are also subject to counterparty risk,which is the risk that the other party in the transaction will not fulfill its contractual obligation. The use of derivatives is a highly specialized activity that
Copyright © 2021 www.secdatabase.com. All Rights Reserved.Please Consider the Environment Before Printing This Document

involves investment techniques and risks different from those associated with investments in more traditional securities and instruments. Losses fromderivatives can also result from a lack of correlation between changes in the value of derivative instruments and the portfolio assets (if any) being hedged.
Floating and Variable Rate Obligations Risk � Floating rate and variable rate obligations are debt instruments issued by companies or other entities withinterest rates that reset periodically (typically, daily, monthly, quarterly, or semiannually) in response to changes in the market rate of interest on which theinterest rate is based. For floating and variable rate obligations, there may be a lag between an actual change in the underlying interest rate benchmark and thereset time for an interest payment of such an obligation, which could harm or benefit a Fund, depending on the interest rate environment or othercircumstances. In a rising interest rate environment, for example, a floating or variable rate obligation that does not reset immediately would prevent a Fundfrom taking full advantage of rising interest rates in a timely manner. However, in a declining interest rate environment, a Fund may benefit from a lag due toan obligation�s interest rate payment not being immediately impacted by a decline in interest rates.
In 2017, the United Kingdom�s Financial Conduct Authority (�FCA�) warned that LIBOR may cease to be available or appropriate for use by 2021. Theunavailability or replacement of LIBOR may affect the value, liquidity or return on certain Fund investments and may result in costs incurred in connectionwith closing out positions and entering into new trades. Any pricing adjustments to a Fund�s investments resulting from a substitute reference rate may alsoadversely affect the Fund�s performance and/or NAV.
Foreign Custody Risk � If a Fund invests in foreign securities, the Fund may hold such securities and cash with foreign banks, agents, and securitiesdepositories appointed by the Fund�s custodian (each a �Foreign Custodian�). Some foreign custodians may be recently organized or new to the foreigncustody business. In some countries, Foreign Custodians may be subject to little or no regulatory oversight over, or independent evaluation of, theiroperations. Further, the laws of certain countries may place limitations on a Fund�s ability to recover its assets if a Foreign Custodian enters bankruptcy.
Investments in emerging markets may be subject to even greater custody risks than investments in more developed markets. Custody services in emergingmarket countries are very often undeveloped and may be considerably less well regulated than in more developed countries, and thus may not afford the samelevel of investor protection as would apply in developed countries.GOLDMAN SACHS U.S. MORTGAGES FUND
Schedule of Investments (continued)December 31, 2020 (Unaudited)
NOTES TO THE SCHEDULE OF INVESTMENTS (continued)
Foreign and Emerging Countries Risk � Investing in foreign markets may involve special risks and considerations not typically associated with investing inthe U.S. Foreign securities may be subject to risk of loss because of more or less foreign government regulation, less public information and less economic,political and social stability in the countries in which the Underlying Fund invests. The imposition of exchange controls (including repatriation restrictions),confiscation of assets and property, trade restrictions (including tariffs) and other government restrictions by the U.S. or other governments, or from problemsin share registration, settlement or custody, may also result in losses. Foreign risk also involves the risk of negative foreign currency rate fluctuations, whichmay cause the value of securities denominated in such foreign currency (or other instruments through which the Fund has exposure to foreign currencies) todecline in value. Currency exchange rates may fluctuate significantly over short periods of time. To the extent that the Underlying Funds also invest insecurities of issuers located in emerging markets, these risks may be more pronounced.
Geographic Risk � If a Fund focuses its investments in securities of issuers located in a particular country or geographic region, the Fund may be subjected,to a greater extent than if its investments were less focused, to the risks of volatile economic cycles and/or conditions and developments that may beparticular to that country or region, such as: adverse securities markets; adverse exchange rates; adverse social, political, regulatory, economic, business,environmental or other developments; or natural disasters.
Interest Rate Risk � When interest rates increase, fixed income securities or instruments held by the Funds will generally decline in value. Long-term fixedincome securities or instruments will normally have more price volatility because of this risk than short-term fixed income securities or instruments. The risksassociated with changing interest rates may have unpredictable effects on the markets and the Funds� investments. Fluctuations in interest rates may alsoaffect the liquidity of fixed income securities and instruments held by the Funds.
Investments in Other Investment Companies Risk � As a shareholder of another investment company, including an exchange-traded fund (�ETF�), a Fundwill indirectly bear its proportionate share of any net management fees and other expenses paid by such other investment companies, in addition to the feesand expenses regularly borne by the Fund. ETFs are subject to risks that do not apply to conventional mutual funds, including but not limited to thefollowing: (i) the market price of the ETF�s shares may trade at a premium or a discount to their NAV; and (ii) an active trading market for an ETF�s sharesmay not develop or be maintained.
Large Shareholder Transactions Risk � A Fund may experience adverse effects when certain large shareholders, such as other funds, institutional investors(including those trading by use of non-discretionary mathematical formulas), financial intermediaries (who may make investment decisions on behalf ofunderlying clients and/or include a Fund in their investment model), individuals, accounts and Goldman Sachs affiliates, purchase or redeem large amounts ofshares of a Fund. Such large shareholder redemptions, which may occur rapidly or unexpectedly, may cause a Fund to sell portfolio securities at times when itwould not otherwise do so, which may negatively impact a Fund�s NAV and liquidity. These transactions may also accelerate the realization of taxableincome to shareholders if such sales of investments resulted in gains, and may also increase transaction costs. In addition, a large redemption could result in aFund�s current expenses being allocated over a smaller asset base, leading to an increase in the Fund�s expense ratio. Similarly, large Fund share purchasesmay adversely affect a Fund�s performance to the extent that the Fund is delayed in investing new cash or otherwise maintains a larger cash position than itordinarily would.
Copyright © 2021 www.secdatabase.com. All Rights Reserved.Please Consider the Environment Before Printing This Document

GOLDMAN SACHS U.S. MORTGAGES FUND
Schedule of Investments (continued)December 31, 2020 (Unaudited)
NOTES TO THE SCHEDULE OF INVESTMENTS (continued)
Leverage Risk � Leverage creates exposure to potential gains and losses in excess of the initial amount invested. Borrowing and the use of derivatives mayresult in leverage and may make a Fund more volatile. When a Fund uses leverage, the sum of that Fund�s investment exposure may significantly exceed theamount of assets invested in the Fund, although these exposures may vary over time. Relatively small market movements may result in large changes in thevalue of a leveraged investment. A Fund will identify liquid assets on its books or otherwise cover transactions that may give rise to such risk, to the extentrequired by applicable law. The use of leverage may cause a Fund to liquidate portfolio positions to satisfy its obligations or to meet segregation requirementswhen it may not be advantageous to do so. The use of leverage by a Fund can substantially increase the adverse impact to which the Fund�s investmentportfolio may be subject.
Liquidity Risk � A Fund may make investments that are illiquid or that may become less liquid in response to market developments or adverse investorperceptions. Illiquid investments may be more difficult to value. Liquidity risk may also refer to the risk that a Fund will not be able to pay redemptionproceeds within the allowable time period or without significant dilution to remaining investors� interests because of unusual market conditions, an unusuallyhigh volume of redemption requests, or other reasons. To meet redemption requests, a Fund may be forced to sell investments at an unfavorable time and/orunder unfavorable conditions. If a Fund is forced to sell securities at an unfavorable time and/or under unfavorable conditions, such sales may adverselyaffect Fund�s NAV and dilute remaining investors� interests. Liquidity risk may be the result of, among other things, the reduced number and capacity oftraditional market participants to make a market in fixed income securities or the lack of an active market. The potential for liquidity risk may be magnifiedby a rising interest rate environment or other circumstances where investor redemptions from fixed income mutual funds may be higher than normal,potentially causing increased supply in the market due to selling activity. These risks may be more pronounced in connection with the Funds� investments insecurities of issuers located in emerging market countries. Redemptions by large shareholders may have a negative impact on a Fund�s liquidity.
Loan-Related Investments Risk � In addition to risks generally associated with debt investments, loan-related investments (e.g., interest rate risk and defaultrisk), loan participations and assignments are subject to other risks. Although a loan obligation may be fully collateralized at the time of acquisition, thecollateral may decline in value, be relatively illiquid, or lose all or substantially all of its value subsequent to investment. Many loan investments are subjectto legal or contractual restrictions on resale and certain loan investments may be or become illiquid or less liquid and more difficult to value, particularly inthe event of a downgrade of the loan or the borrower. There is less readily available, reliable information about most loan investments than is the case formany other types of securities. Substantial increases in interest rates may cause an increase in loan obligation defaults. With respect to loan participations, theFund may not always have direct recourse against a borrower if the borrower fails to pay scheduled principal and/or interest; may be subject to greater delays,expenses and risks than if the Fund had purchased a direct obligation of the borrower; and may be regarded as the creditor of the agent lender (rather than theborrower), subjecting the Fund to the creditworthiness of that lender as well. Investors in loans, such as the Fund, may not be entitled to rely on the anti-fraudprotections of the federal securities laws, although they may be entitled to certain contractual remedies. The market for loan obligations may be subject toirregular trading activity, wide bid/ask spreads and extended trade settlement periods. Because transactions in many loans are subject to extended tradesettlement periods, the Fund may not receive the proceeds from the sale of a loan for a period after the sale. As a result, sale proceeds related to the sale ofloans may not be available to make additional investments or to meet the Fund�s redemption obligations for a period after the sale of the loans, and, as aresult, the Fund may have to sell other investments or engage in borrowing transactions, such as borrowing from its credit facility, if necessary to raise cash tomeet its obligations.
Senior Loans hold the most senior position in the capital structure of a business entity, and are typically secured with specific collateral, but are neverthelessusually rated below investment grade. Because Second Lien Loans are subordinated or unsecured and thus lower in priority of payment to Senior Loans, theyare subject to the additional risk that the cash flow of the borrower and property securing the loan or debt, if any, may be insufficient to meet scheduledpayments after giving effect to the senior secured obligations of the borrower. Second Lien Loans generally have greater price volatility than Senior Loansand may be less liquid.
Market and Credit Risks � In the normal course of business, a Fund trades financial instruments and enters into financial transactions where risk ofpotential loss exists due to changes in the market (market risk). The value of the securities in which [a/the] Fund invests may go up or down in response to theprospects of individual companies, particular sectors or governments and/or general economic conditions throughout the world due to increasinglyinterconnected global economies and financial markets. Events such as war, acts of terrorism, social unrest, natural disasters, the spread of infectious illnessor other public health threats could also significantly impact a Fund and its investments. Additionally, a Fund may also be exposed to credit risk in the eventthat an issuer or guarantor fails to perform or that an institution or entity with which the Fund has unsettled or open transactions defaults.
Non-Diversification Risk � Each of the Emerging Markets Debt Fund and Local Emerging Markets Debt Fund is non-diversified, meaning that they arepermitted to invest a larger percentage of their assets in fewer issuers than diversified mutual funds. Thus, a Fund may be more susceptible to adversedevelopments affecting any single issuer held in its portfolio, and may be more susceptible to greater losses because of these developments.
Sector Risk � To the extent a Fund focuses its investments in securities of issuers in one or more sectors (such as the financial services ortelecommunications sectors), the Fund may be subjected, to a greater extent than if its investments were diversified across different sectors, to the risks ofvolatile economic cycles and/or conditions and developments that may be particular to that sector, such as: adverse economic, business, political,environmental or other developments.
Copyright © 2021 www.secdatabase.com. All Rights Reserved.Please Consider the Environment Before Printing This Document