Brinker Capital Destinations Trust Form NPORT-P Filed 2020-01-27
Upload
khangminh22Category
view
0download
0
Business Address6300 BEE CAVE ROADBUILDING ONEAUSTIN TX 78746(512) 306-7400
Mailing Address6300 BEE CAVE ROADBUILDING ONEAUSTIN TX 78746
SECURITIES AND EXCHANGE COMMISSION
FORM NPORT-EX
Filing Date: 2019-09-27 | Period of Report: 2019-07-31SEC Accession No. 0001752724-19-129436
(HTML Version on secdatabase.com)
FILERDFA INVESTMENT TRUST COCIK:896162| IRS No.: 000000000 | State of Incorp.:DE | Fiscal Year End: 1031Type: NPORT-EX | Act: 40 | File No.: 811-07436 | Film No.: 191123118
Copyright © 2021 www.secdatabase.com. All Rights Reserved.Please Consider the Environment Before Printing This Document

THE DFA INVESTMENT TRUST COMPANYFORM N-Q REPORT
July 31, 2019(UNAUDITED)
Table of Contents
DEFINITIONS OF ABBREVIATIONS AND FOOTNOTESSCHEDULES OF INVESTMENTS
The U.S. Large Cap Value SeriesThe DFA International Value SeriesThe Japanese Small Company SeriesThe Asia Pacific Small Company SeriesThe United Kingdom Small Company SeriesThe Continental Small Company SeriesThe Canadian Small Company SeriesThe Emerging Markets SeriesThe Emerging Markets Small Cap SeriesThe Tax-Managed U.S. Marketwide Value Series
NOTES TO FINANCIAL STATEMENTSOrganizationSecurity ValuationFinancial InstrumentsFederal Tax CostRecently Issued Accounting StandardsOtherSubsequent Event Evaluations
Table of Contents
THE DFA INVESTMENT TRUST COMPANY
DEFINITIONS OF ABBREVIATIONS AND FOOTNOTES
Schedules of Investments
Investment AbbreviationsP.L.C. Public Limited CompanyADR American Depositary ReceiptSA Special AssessmentST Special TaxCP Certificate ParticipationGDR Global Depositary Receipt
Investment Footnotes† See Security Valuation Note within the Notes to Schedules of Investments.# Total or Partial Securities on Loan.
Copyright © 2021 www.secdatabase.com. All Rights Reserved.Please Consider the Environment Before Printing This Document

Altice USA, Inc., Class AAT&T, Inc.CenturyLink, Inc.Charter Communications, Inc., Class AComcast Corp., Class ADiscovery, Inc., Class ADiscovery, Inc., Class CDISH Network Corp., Class AFox Corp., Class AFox Corp., Class BGCI Liberty, Inc., Class AInterpublic Group of Cos., Inc. (The)Liberty Broadband Corp., Class ALiberty Broadband Corp., Class CLiberty Media Corp.-Liberty Formula One, Class ALiberty Media Corp.-Liberty Formula One, Class CLiberty Media Corp.-Liberty SiriusXM, Class ALiberty Media Corp.-Liberty SiriusXM, Class CMadison Square Garden Co. (The), Class ANews Corp., Class ANews Corp., Class BSprint Corp.T-Mobile US, Inc.Viacom, Inc., Class AViacom, Inc., Class BWalt Disney Co. (The)
TOTAL COMMUNICATION SERVICES
Advance Auto Parts, Inc.AramarkAutoliv, Inc.BorgWarner, Inc.Caesars Entertainment Corp.
* Non-Income Producing Securities.@ Security purchased with cash proceeds from Securities on Loan.§ Affiliated Fund.^^ See Federal Tax Cost Note within the Notes to Schedules of Investments.» Securities have generally been fair valued. See Security Valuation Note within the Notes to
Schedules of Investments.
Table of Contents
THE U.S. LARGE CAP VALUE SERIES
SCHEDULE OF INVESTMENTS
July 31, 2019
(Unaudited)
Shares Value†
COMMON STOCKS — (97.0%)COMMUNICATION SERVICES — (10.0%)#* 584,995 $ 15,098,721
35,707,606 1,215,843,984# 7,391,428 89,362,365#* 940,732 362,539,298
21,970,229 948,454,786#* 1,025,284 31,076,358* 1,476,314 41,691,107#* 438,597 14,850,894
68,001 2,537,797* 35,419 1,317,587#* 59,566 3,557,877
407,368 9,336,875* 27,366 2,687,068* 179,960 17,907,820#* 39,281 1,472,252#* 78,562 3,093,772* 157,126 6,541,155* 314,252 13,154,589* 12,058 3,497,302
527,829 6,946,23064,856 872,962
#* 2,014,058 14,763,045* 1,093,947 87,220,394# 4,879 170,570
1,836,044 55,723,935723,205 103,425,547
3,053,144,290
CONSUMER DISCRETIONARY — (6.8%)260,621 39,259,947948,310 34,319,339
# 418,017 30,159,9271,108,515 41,901,867
* 154,842 1,833,329
Copyright © 2021 www.secdatabase.com. All Rights Reserved.Please Consider the Environment Before Printing This Document

Capri Holdings, Ltd.CarMax, Inc.Carnival Corp.Dollar Tree, Inc.DR Horton, Inc.Foot Locker, Inc.Ford Motor Co.Gap, Inc. (The)Garmin, Ltd.General Motors Co.Gentex Corp.Goodyear Tire & Rubber Co. (The)Harley-Davidson, Inc.Hyatt Hotels Corp., Class AKohl's Corp.Lear Corp.Lennar Corp., Class ALennar Corp., Class BLKQ Corp.Macy's, Inc.
MGM Resorts InternationalMohawk Industries, Inc.Newell Brands, Inc.Norwegian Cruise Line Holdings, Ltd.PulteGroup, Inc.PVH Corp.Qurate Retail, Inc.Ralph Lauren Corp.Royal Caribbean Cruises, Ltd.Skechers U.S.A., Inc., Class ATapestry, Inc.Target Corp.Toll Brothers, Inc.Veoneer, Inc.Whirlpool Corp.
TOTAL CONSUMER DISCRETIONARY
Archer-Daniels-Midland Co.Bunge, Ltd.Conagra Brands, Inc.Constellation Brands, Inc., Class ACoty, Inc., Class AIngredion, Inc.JM Smucker Co. (The)Kraft Heinz Co. (The)Kroger Co. (The)Molson Coors Brewing Co., Class B
* 46,834 1,666,822#* 262,735 23,057,624
1,353,266 63,914,753* 753,443 76,662,825
3,053,585 140,251,159# 428,567 17,596,961
16,051,999 152,975,551# 942,706 18,382,767
537,036 42,205,6596,055,833 244,292,3031,387,044 38,032,747
84,020 1,153,595# 509,141 18,217,065# 139,548 10,794,038
1,636,864 88,161,495355,345 45,050,639954,715 45,415,793
# 37,985 1,443,430* 1,632,589 43,965,622# 2,356,380 53,560,517Table of Contents
The U.S. Large Cap Value SeriesCONTINUED
Shares Value†
CONSUMER DISCRETIONARY — (Continued)2,471,336 $ 74,189,507
* 582,542 72,637,162# 686,895 9,747,040* 1,521,501 75,223,009
2,391,049 75,341,954453,566 40,331,089
* 2,762,021 39,054,977326,288 34,008,998
1,212,750 141,091,335* 31,900 1,210,286
359,565 11,121,3451,473,116 127,277,222
# 212,428 7,641,035#* 320,697 5,820,651# 493,880 71,849,662
2,060,821,046
CONSUMER STAPLES — (4.7%)1,090,428 44,794,782
586,005 34,240,272318,122 9,184,182
# 213,898 42,099,404# 420,041 4,582,647
246,558 19,056,468896,822 99,717,638974,551 31,195,378
2,545,010 53,852,4121,007,046 54,370,414
Copyright © 2021 www.secdatabase.com. All Rights Reserved.Please Consider the Environment Before Printing This Document

Mondelez International, Inc., Class APilgrim's Pride Corp.Post Holdings, Inc.Seaboard Corp.Tyson Foods, Inc., Class AUS Foods Holding Corp.Walgreens Boots Alliance, Inc.Walmart, Inc.
TOTAL CONSUMER STAPLES
Anadarko Petroleum Corp.Apache Corp.Baker Hughes a GE Co.Chevron Corp.Cimarex Energy Co.Concho Resources, Inc.ConocoPhillipsDevon Energy Corp.Diamondback Energy, Inc.Exxon Mobil Corp.Helmerich & Payne, Inc.Hess Corp.HollyFrontier Corp.Kinder Morgan, Inc.Marathon Oil Corp.Marathon Petroleum Corp.Murphy Oil Corp.National Oilwell Varco, Inc.Noble Energy, Inc.
Occidental Petroleum Corp.Parsley Energy, Inc., Class APhillips 66Pioneer Natural Resources Co.Schlumberger, Ltd.Targa Resources Corp.TechnipFMC P.L.C.Transocean, Ltd.Valero Energy Corp.WPX Energy, Inc.
TOTAL ENERGY
Aflac, Inc.Alleghany Corp.Allstate Corp. (The)Ally Financial, Inc.American Financial Group, Inc.
3,530,822 188,863,669* 6,211 168,070* 411,384 44,108,592
13 53,0611,750,467 139,162,127
* 1,061,406 37,541,9303,401,321 185,337,9813,918,069 432,476,456
1,420,805,483
ENERGY — (13.2%)1,045,026 76,976,615
# 2,420,600 59,111,052# 820,593 20,834,856
8,424,414 1,037,129,608# 164,116 8,315,758
769,257 75,141,0245,133,675 303,297,5191,783,080 48,143,160
521,040 53,891,16713,342,676 992,161,387
# 360,314 17,900,399# 942,191 61,091,664
1,384,206 68,891,9337,033,591 145,032,6466,031,073 84,857,1973,109,699 175,355,927
# 401,288 9,646,963# 1,225,519 29,191,863# 2,942,820 64,977,466Table of Contents
The U.S. Large Cap Value SeriesCONTINUED
Shares Value†
ENERGY — (Continued)3,079,335 $ 158,154,646
* 301,021 4,993,9381,185,191 121,553,189
356,619 49,227,6871,546,495 61,813,405
# 943,828 36,724,3471,440,051 39,659,005
#* 586,439 3,565,5492,446,479 208,562,335
#* 21,015 219,397
4,016,421,702
FINANCIALS — (22.4%)2,301,528 121,152,434
* 33,873 23,227,732958,107 102,900,692
2,985,389 98,249,152352,608 36,100,007
Copyright © 2021 www.secdatabase.com. All Rights Reserved.Please Consider the Environment Before Printing This Document

American International Group, Inc.Arch Capital Group, Ltd.Assurant, Inc.Athene Holding, Ltd., Class AAxis Capital Holdings, Ltd.Bank of America Corp.Bank of New York Mellon Corp. (The)BB&T Corp.Berkshire Hathaway, Inc., Class BBOK Financial Corp.Capital One Financial Corp.Chubb, Ltd.CIT Group, Inc.Citigroup, Inc.Citizens Financial Group, Inc.CNA Financial Corp.Comerica, Inc.East West Bancorp, Inc.Everest Re Group, Ltd.Fifth Third BancorpGoldman Sachs Group, Inc. (The)Hartford Financial Services Group, Inc. (The)Huntington Bancshares, Inc.Invesco, Ltd.Jefferies Financial Group, Inc.JPMorgan Chase & Co.KeyCorpLincoln National Corp.Loews Corp.M&T Bank Corp.Markel Corp.MetLife, Inc.Morgan StanleyNew York Community Bancorp, Inc.Old Republic International Corp.PacWest BancorpPeople's United Financial, Inc.PNC Financial Services Group, Inc. (The)Principal Financial Group, Inc.Prosperity Bancshares, Inc.Prudential Financial, Inc.
Regions Financial Corp.Reinsurance Group of America, Inc.RenaissanceRe Holdings, Ltd.Santander Consumer USA Holdings, Inc.State Street Corp.SunTrust Banks, Inc.
1,399,338 78,348,935* 522,976 20,233,941
226,026 25,622,307* 102,152 4,173,931
110,882 7,059,85716,545,018 507,601,152
3,657,167 171,594,276# 2,089,291 107,661,165* 2,964,684 609,035,034
6,114 511,6202,121,634 196,081,414
590,560 90,261,190473,057 23,913,031
7,149,102 508,730,098912,076 33,983,952
# 188,355 9,020,32132,500 2,379,00069,413 3,332,518
128,591 31,715,6844,857,785 144,227,6371,393,141 306,672,1282,305,055 132,840,320
# 6,621,934 94,362,559# 920,299 17,660,538
303,442 6,472,4188,390,883 973,342,4284,150,437 76,243,528
796,355 52,033,8361,174,023 62,857,191
137,746 22,624,781* 240 267,343
1,663,754 82,222,7234,980,221 221,918,648
# 922,610 10,637,693816,263 18,618,959
# 230,494 8,903,983# 396,896 6,517,032
1,313,525 187,702,7221,705,517 98,988,207
# 53,792 3,732,627751,138 76,097,791
Table of Contents
The U.S. Large Cap Value SeriesCONTINUED
Shares Value†
FINANCIALS — (Continued)6,240,662 $ 99,413,746
239,920 37,408,326112,797 20,433,177811,033 21,824,898412,299 23,950,449
1,285,995 85,647,267
Copyright © 2021 www.secdatabase.com. All Rights Reserved.Please Consider the Environment Before Printing This Document

Synchrony FinancialSynovus Financial Corp.Travelers Cos., Inc. (The)Unum GroupVoya Financial, Inc.Wells Fargo & Co.WR Berkley Corp.Zions Bancorp NA
TOTAL FINANCIALS
Abbott LaboratoriesAlexion Pharmaceuticals, Inc.Allergan P.L.C.Anthem, Inc.Becton Dickinson and Co.Bio-Rad Laboratories, Inc., Class ACardinal Health, Inc.Centene Corp.Cigna Corp.CVS Health Corp.Danaher Corp.DaVita, Inc.DENTSPLY SIRONA, Inc.Elanco Animal Health, Inc.Henry Schein, Inc.Humana, Inc.IQVIA Holdings, Inc.Jazz Pharmaceuticals P.L.C.Laboratory Corp. of America HoldingsMcKesson Corp.Medtronic P.L.C.Mylan NVPerkinElmer, Inc.Perrigo Co. P.L.C.Pfizer, Inc.Quest Diagnostics, Inc.STERIS P.L.C.Syneos Health, Inc.Thermo Fisher Scientific, Inc.United Therapeutics Corp.Universal Health Services, Inc., Class BWellCare Health Plans, Inc.Zimmer Biomet Holdings, Inc.
TOTAL HEALTH CARE
Acuity Brands, Inc.AECOMAGCO Corp.Alaska Air Group, Inc.AMERCO
949,129 34,054,749261,271 9,972,714
1,165,331 170,860,831831,133 26,554,699184,436 10,359,770
15,912,090 770,304,277451,690 31,342,769
# 922,609 41,581,988
6,801,544,195
HEALTH CARE — (14.4%)2,681,107 233,524,420
* 800 90,632496,938 79,758,549
1,376,563 405,549,22571,096 17,973,069
* 21,944 6,910,1661,267,590 57,966,891
* 1,547,126 80,589,793* 1,485,867 252,478,521
5,447,574 304,355,9591,886,239 265,016,579
* 1,134,770 67,915,985220,294 11,995,008
* 73,065 2,408,222#* 186,248 12,392,942
529,635 157,169,186* 525,816 83,694,133* 214,373 29,879,309* 759,892 127,297,108
681,683 94,719,8534,359,974 444,455,750
* 3,245,750 67,836,175# 110,802 9,542,268# 386,545 20,877,295
24,583,746 954,832,695959,708 97,966,993209,661 31,210,136
#* 13,705 700,1881,073,774 298,165,564
* 144,987 11,488,770538,930 81,302,980
* 37,753 10,844,549322,650 43,599,695
4,364,508,608
INDUSTRIALS — (10.3%)24,065 3,230,004
#* 520,350 18,706,582438,069 33,731,313621,071 39,351,059
84,734 32,792,058Table of Contents
The U.S. Large Cap Value SeriesCONTINUED
Copyright © 2021 www.secdatabase.com. All Rights Reserved.Please Consider the Environment Before Printing This Document

Arconic, Inc.Arcosa, Inc.Carlisle Cos., Inc.Cummins, Inc.Delta Air Lines, Inc.Dover Corp.Eaton Corp. P.L.C.FedEx Corp.Fluor Corp.Fortune Brands Home & Security, Inc.Gardner Denver Holdings, Inc.General Electric Co.Genesee & Wyoming, Inc., Class AHubbell, Inc.Ingersoll-Rand P.L.C.Jacobs Engineering Group, Inc.JetBlue Airways Corp.Johnson Controls International P.L.C.Kansas City SouthernL3Harris Technologies, Inc.ManpowerGroup, Inc.Nielsen Holdings P.L.C.Norfolk Southern Corp.nVent Electric P.L.C.Oshkosh Corp.Owens CorningPACCAR, Inc.Pentair P.L.C.Quanta Services, Inc.Republic Services, Inc.Sensata Technologies Holding P.L.C.Snap-on, Inc.Southwest Airlines Co.Stanley Black & Decker, Inc.Textron, Inc.United Airlines Holdings, Inc.United Rentals, Inc.United Technologies Corp.Wabtec Corp.XPO Logistics, Inc.
TOTAL INDUSTRIALS
Akamai Technologies, Inc.Amdocs, Ltd.Analog Devices, Inc.Arrow Electronics, Inc.Avnet, Inc.Broadcom, Inc.Ciena Corp.Cisco Systems, Inc.Cognizant Technology Solutions Corp., Class A
Shares Value†
INDUSTRIALS — (Continued)2,007,289 $ 50,262,517
81,906 3,071,475360,870 52,041,063400,577 65,694,628
2,950,569 180,102,732630,974 61,109,832
1,816,899 149,330,9291,023,792 174,587,250
227,563 7,398,073489,366 26,885,768
* 81,351 2,682,1429,165,737 95,781,952
* 58,287 6,400,49527,996 3,636,120
830,409 102,688,377415,660 34,296,107
#* 2,227,456 42,833,9792,804,749 119,033,548
681,598 84,340,937511,599 106,207,952395,462 36,125,454
1,405,882 32,560,2271,385,379 264,773,634
811,261 20,111,160362,340 30,280,754810,816 47,027,328769,837 53,996,367
1,025,620 39,804,312653,713 24,461,940
1,904,674 168,849,350#* 638,184 30,269,067# 315,643 48,170,278
1,390,636 71,659,4731,036,769 153,016,7371,940,539 95,668,573
* 1,792,883 164,783,877#* 63,053 7,979,357
2,093,399 279,678,106# 304,785 23,675,699#* 847,283 57,174,657
3,146,263,242
INFORMATION TECHNOLOGY — (10.0%)* 37,876 3,338,012
706,765 45,225,892609,183 71,554,635
* 652,120 47,350,433491,284 22,314,119305,471 88,583,535
* 75,200 3,400,5442,513,566 139,251,556
102,928 6,704,730
Copyright © 2021 www.secdatabase.com. All Rights Reserved.Please Consider the Environment Before Printing This Document

Corning, Inc.Cypress Semiconductor Corp.Dell Technologies, Class CDolby Laboratories, Inc., Class ADXC Technology Co.Fidelity National Information Services, Inc.Flex, Ltd.
Hewlett Packard Enterprise Co.HP, Inc.Intel Corp.IPG Photonics Corp.Jabil, Inc.Juniper Networks, Inc.Lam Research Corp.Leidos Holdings, Inc.Marvell Technology Group, Ltd.Micron Technology, Inc.Nuance Communications, Inc.ON Semiconductor Corp.Qorvo, Inc.Skyworks Solutions, Inc.SS&C Technologies Holdings, Inc.SYNNEX Corp.TE Connectivity, Ltd.Western Digital Corp.Xerox Corp.
TOTAL INFORMATION TECHNOLOGY
Air Products & Chemicals, Inc.Albemarle Corp.Alcoa Corp.Ashland Global Holdings, Inc.Ball Corp.CF Industries Holdings, Inc.Corteva, Inc.Dow, Inc.DuPont de Nemours, Inc.Eastman Chemical Co.Freeport-McMoRan, Inc.Huntsman Corp.International Flavors & Fragrances, Inc.International Paper Co.Linde P.L.C.LyondellBasell Industries NV, Class AMartin Marietta Materials, Inc.Mosaic Co. (The)Newmont Goldcorp Corp.
3,685,701 113,335,30693,842 2,155,551
* 343,797 19,850,83916,857 1,147,962
1,347,255 75,136,4111,545,803 205,978,307
* 1,392,460 15,525,929Table of Contents
The U.S. Large Cap Value SeriesCONTINUED
Shares Value†
INFORMATION TECHNOLOGY — (Continued)7,887,270 $ 113,340,0709,619,949 202,403,727
22,465,295 1,135,620,662#* 1,434 187,868
219,735 6,785,4171,769,573 47,813,862
71,254 14,864,297739,121 60,681,834
# 1,044,578 27,430,618* 5,266,057 236,393,299#* 5,268 87,660#* 1,982,115 42,635,294* 497,807 36,484,275
258,206 22,019,808125,493 6,017,389
39,666 3,908,688991,804 91,642,690
1,422,853 76,677,5481,739,519 55,838,560
3,041,687,327
MATERIALS — (4.6%)389,905 89,003,614
# 584,580 42,650,957#* 90,453 2,034,288
317,279 25,217,335481,524 34,419,336
1,284,847 63,677,017* 1,044,893 30,824,344* 1,154,596 55,928,630
1,044,893 75,399,4791,058,943 79,791,3556,741,535 74,561,377
528,188 10,854,263# 34,815 5,013,012
2,075,616 91,140,299405,425 77,549,694518,051 43,355,688
# 262,481 65,029,6681,232,432 31,044,9622,371,000 86,588,920
Copyright © 2021 www.secdatabase.com. All Rights Reserved.Please Consider the Environment Before Printing This Document

Nucor Corp.Packaging Corp. of AmericaReliance Steel & Aluminum Co.Royal Gold, Inc.Sonoco Products Co.Steel Dynamics, Inc.Valvoline, Inc.Vulcan Materials Co.Westlake Chemical Corp.WestRock Co.
TOTAL MATERIALS
CBRE Group, Inc., Class AHoward Hughes Corp. (The)Jones Lang LaSalle, Inc.
TOTAL REAL ESTATE
MDU Resources Group, Inc.NRG Energy, Inc.Vistra Energy Corp.
TOTAL UTILITIES
TOTAL COMMON STOCKS
State Street Institutional U.S. Government Money Market Fund 2.260%
DFA Short Term Investment Fund
(Cost $22,649,847,299)^^
S&P 500® Emini Index
Total Futures Contracts
2,517,086 136,879,137102,646 10,364,167456,094 45,586,595
# 121,993 13,962,099172,782 10,372,103
1,698,064 53,505,9971,033,732 20,871,049
517,644 71,616,047# 371,564 25,106,579
1,056,585 38,089,889
1,410,437,900
REAL ESTATE — (0.3%)* 741,284 39,295,465#* 4,513 609,255
309,764 45,129,517
85,034,237
Table of Contents
The U.S. Large Cap Value SeriesCONTINUED
Shares Value†
UTILITIES — (0.3%)248,941 $ 6,656,682
1,445,428 49,346,9121,043,212 22,387,330
78,390,924
29,479,058,954
TEMPORARY CASH INVESTMENTS — (0.8%)250,558,709 250,558,709
SECURITIES LENDING COLLATERAL — (2.2%)@§ 57,740,398 668,114,140
TOTAL INVESTMENTS — (100.0%)$30,397,731,803
As of July 31, 2019, The U.S. Large Cap Value Series had entered into the following outstanding futures contracts:
Description
Numberof
ContractsExpiration
DateNotional
ValueMarketValue
UnrealizedAppreciation
(Depreciation)
Long Position Contracts:1,395 09/20/19 $203,559,940 $208,015,425 $4,455,485
$203,559,940 $208,015,425 $4,455,485
Summary of the Series' investments as of July 31, 2019, based on their valuation inputs, is as follows (see Security Valuation Note):
Investments in Securities (Market Value)
Level 1 Level 2 Level 3 Total
Common Stocks
Copyright © 2021 www.secdatabase.com. All Rights Reserved.Please Consider the Environment Before Printing This Document

Communication ServicesConsumer DiscretionaryConsumer StaplesEnergyFinancialsHealth CareIndustrialsInformation TechnologyMaterialsReal EstateUtilities
Temporary Cash InvestmentsSecurities Lending CollateralFutures Contracts**
TOTAL
AMP, Ltd.Aurizon Holdings, Ltd.Australia & New Zealand Banking Group, Ltd.Bank of Queensland, Ltd.Bendigo & Adelaide Bank, Ltd.BlueScope Steel, Ltd.Boral, Ltd.Challenger, Ltd.Crown Resorts, Ltd.Downer EDI, Ltd.Fortescue Metals Group, Ltd.Harvey Norman Holdings, Ltd.Incitec Pivot, Ltd.LendLease GroupNational Australia Bank, Ltd.Newcrest Mining, Ltd.Oil Search, Ltd.Origin Energy, Ltd.QBE Insurance Group, Ltd.Qube Holdings, Ltd.Santos, Ltd.South32, Ltd.Star Entertainment Grp, Ltd. (The)Suncorp Group, Ltd.Tabcorp Holdings, Ltd.
$ 3,053,144,290 — — $ 3,053,144,2902,060,821,046 — — 2,060,821,0461,420,805,483 — — 1,420,805,4834,016,421,702 — — 4,016,421,7026,801,544,195 — — 6,801,544,1954,364,508,608 — — 4,364,508,6083,146,263,242 — — 3,146,263,2423,041,687,327 — — 3,041,687,3271,410,437,900 — — 1,410,437,900
85,034,237 — — 85,034,23778,390,924 — — 78,390,924
250,558,709 — — 250,558,709— $668,114,140 — 668,114,140
4,455,485 — — 4,455,485
$29,734,073,148 $668,114,140 — $30,402,187,288** Valued at the unrealized appreciation/(depreciation) on the investment.
Table of Contents
THE DFA INTERNATIONAL VALUE SERIES
SCHEDULE OF INVESTMENTS
July 31, 2019
(Unaudited)Shares Value»
COMMON STOCKS — (96.8%)AUSTRALIA — (7.1%)
7,180,545 $ 8,734,3821,818,522 7,138,989
10,445,267 198,508,9381,684,752 10,731,3052,076,879 16,257,7483,397,511 29,986,9054,088,291 14,327,869
39,058 188,15889,944 727,232
2,503,006 12,297,25811,010,907 61,993,705
# 2,695,782 8,073,1096,892,552 16,364,5471,329,871 13,181,2296,235,045 121,432,3631,180,943 28,502,2941,058,391 5,125,1154,869,242 26,348,2243,591,778 30,610,573
11,942 25,7106,433,210 31,697,506
# 25,273,728 53,776,4523,958,059 11,171,4023,499,139 32,250,7894,801,883 14,730,683
Copyright © 2021 www.secdatabase.com. All Rights Reserved.Please Consider the Environment Before Printing This Document

Westpac Banking Corp.Whitehaven Coal, Ltd.Woodside Petroleum, Ltd.WorleyParsons, Ltd.
TOTAL AUSTRALIA
Raiffeisen Bank International AGVoestalpine AG
TOTAL AUSTRIA
AgeasKBC Group NVSolvay SAUCB SA
TOTAL BELGIUM
AltaGas, Ltd.ARC Resources, Ltd.Bank of MontrealBank of Nova Scotia (The)Bank of Nova Scotia (The)Barrick Gold Corp.Barrick Gold Corp.Bausch Health Cos., Inc.Cameco Corp.Cameco Corp.
Canadian Imperial Bank of CommerceCanadian Imperial Bank of CommerceCanadian Natural Resources, Ltd.Canadian Natural Resources, Ltd.Cenovus Energy, Inc.Crescent Point Energy Corp.Empire Co., Ltd., Class AEncana Corp.Encana Corp.Fairfax Financial Holdings, Ltd.First Quantum Minerals, Ltd.Genworth MI Canada, Inc.Great-West Lifeco, Inc.Husky Energy, Inc.IA Financial Crop., Inc.Imperial Oil, Ltd.Imperial Oil, Ltd.Kinross Gold Corp.Linamar Corp.Lundin Mining Corp.
# 247,597 4,857,830# 4,495,686 11,267,043
3,123,201 73,648,127648,053 7,101,078
851,056,563
AUSTRIA — (0.1%)352,752 8,272,600
5,336 140,867
8,413,467
BELGIUM — (0.9%)469,049 25,181,573565,642 36,369,532314,975 32,251,850
# 252,673 19,702,550
113,505,505
CANADA — (8.3%)# 455,083 6,968,652
320,576 1,639,557# 1,357,448 101,550,685
220,313 11,761,8231,156,202 61,718,0631,930,949 31,382,676
605,141 9,839,593* 128,109 3,070,773
468,671 4,303,904# 571,821 5,255,035Table of Contents
The DFA International Value SeriesCONTINUED
Shares Value»
CANADA — (Continued)215,587 $ 16,960,447
# 230,446 18,129,187496,828 12,584,452
# 2,862,125 72,354,520# 2,110,053 19,581,292# 94,471 312,700
210,280 5,565,2982,565,885 11,723,205
846,145 3,866,883100,734 46,669,048
# 1,844,735 16,996,496# 153,865 5,678,712
472,224 10,369,034# 1,715,497 13,310,115* 573,199 23,000,924
187,707 5,139,969499,213 13,673,444
* 6,772,750 27,403,00451,274 1,736,587
3,310,964 16,030,505
Copyright © 2021 www.secdatabase.com. All Rights Reserved.Please Consider the Environment Before Printing This Document

Magna International, Inc.Manulife Financial Corp.Manulife Financial Corp.Nutrien, Ltd.Onex Corp.Seven Generations Energy, Ltd., Class ASNC-Lavalin Group, Inc.Stars Group, Inc. (The)Sun Life Financial, Inc.Sun Life Financial, Inc.Suncor Energy, Inc.Suncor Energy, Inc.Teck Resources, Ltd., Class BTeck Resources, Ltd., Class BTMX Group, Ltd.Tourmaline Oil Corp.Turquoise Hill Resources, Ltd.Turquoise Hill Resources, Ltd.West Fraser Timber Co., Ltd.Wheaton Precious Metals Corp.
TOTAL CANADA
AP Moller - Maersk A.S., Class AAP Moller - Maersk A.S., Class BCarlsberg A.S., Class BDanske Bank A.S.Demant A.S.DSV A.S.H Lundbeck A.S.ISS A.S.Rockwool International A.S., Class BTryg A.S.Vestas Wind Systems A.S.
TOTAL DENMARK
Fortum Oyj
Nokia OyjNordea Bank AbpStora Enso Oyj, Class RUPM-Kymmene Oyj
TOTAL FINLAND
Amundi SAArkema SAAXA SABNP Paribas SA
1,166,029 58,791,1821,802,195 32,635,597
# 1,596,153 28,858,446603,968 33,103,475
6,220 375,754* 422,186 2,344,767# 22,072 349,192#* 275,049 4,277,012
420,981 17,492,497334,277 13,835,725
3,145,721 90,262,4901,502,973 43,135,3251,355,792 27,736,3121,867,648 38,268,108
135,224 10,042,9281,225,804 16,160,774
* 21,000 11,934#* 127,382 73,920
33,886 1,324,579# 111,867 2,921,966
1,000,578,566
DENMARK — (1.6%)7,614 8,150,6427,899 8,869,377
288,439 39,397,822950,671 14,110,398
#* 10,766 317,190281,831 26,899,022222,244 8,567,431553,648 15,526,799
21,183 5,170,163158,072 4,824,541774,838 63,584,380
195,417,765
FINLAND — (0.9%)1,125,438 25,817,132
Table of Contents
The DFA International Value SeriesCONTINUED
Shares Value»
FINLAND — (Continued)# 881,374 $ 4,750,301
4,139,333 26,554,9181,157,812 13,333,8371,258,242 33,915,912
104,372,100
FRANCE — (9.8%)15,838 1,089,726
237,138 21,343,7372,698,893 67,980,3791,990,380 93,149,822
Copyright © 2021 www.secdatabase.com. All Rights Reserved.Please Consider the Environment Before Printing This Document

Bollore SABouygues SACarrefour SACasino Guichard Perrachon SACie de Saint-GobainCie Generale des Etablissements Michelin SCACNP AssurancesCredit Agricole SAElectricite de France SAEngie SAIliad SANatixis SAOrange SAPeugeot SAPublicis Groupe SARenault SASanofiSCOR SESES SASociete Generale SATotal SAValeo SA
TOTAL FRANCE
1&1 Drillisch AGBASF SEBayer AGBayerische Motoren Werke AGCommerzbank AGContinental AGDaimler AGDeutsche Bank AGDeutsche Bank AGDeutsche Lufthansa AGDeutsche Telekom AGEvonik Industries AGFraport AG Frankfurt Airport Services WorldwideHapag-Lloyd AGHeidelbergCement AGInnogy SEMETRO AGMuenchener Rueckversicherungs-Gesellschaft AG in MuenchenRWE AGTalanx AGTelefonica Deutschland Holding AGUniper SE
Volkswagen AG
1,707,770 7,343,9941,023,747 36,649,238
# 2,495,917 47,962,442# 71,021 2,627,682
2,069,157 79,266,496637,668 70,492,509584,638 12,083,403
1,053,519 12,541,0531,705,570 21,113,5782,838,450 43,682,298
# 12,285 1,270,0753,147,635 12,623,0085,978,647 88,618,3973,133,702 73,964,740
74,338 3,668,2691,007,824 56,214,069
40,305 3,358,690331,761 13,633,530240,518 3,972,263
# 1,417,282 34,715,848# 6,874,996 356,332,284
652,868 20,344,956
1,186,042,486
GERMANY — (5.8%)# 13,439 403,604
28,252 1,875,4881,731,111 112,122,2881,225,665 90,195,5073,217,449 21,832,456
136,997 18,782,9003,530,733 182,455,483
# 1,938,873 14,987,6111,679,248 13,114,9271,604,407 25,426,690
2,598 42,558444,408 12,646,362186,460 15,571,838
# 25,653 1,077,410801,446 57,878,373213,467 8,969,182
# 335,254 5,156,816147,523 35,155,858713,698 19,283,301
* 207,392 8,702,7173,588,412 9,034,191
842,588 25,959,510Table of Contents
The DFA International Value SeriesCONTINUED
Shares Value»
GERMANY — (Continued)125,075 $ 21,324,598
Copyright © 2021 www.secdatabase.com. All Rights Reserved.Please Consider the Environment Before Printing This Document

TOTAL GERMANY
Bank of East Asia, Ltd. (The)BOC Aviation, Ltd.Cathay Pacific Airways, Ltd.CK Asset Holdings, Ltd.CK Hutchison Holdings, Ltd.Guoco Group, Ltd.Hang Lung Group, Ltd.Hang Lung Properties, Ltd.Henderson Land Development Co., Ltd.Kerry Properties, Ltd.Melco International Development, Ltd.MTR Corp., Ltd.New World Development Co., Ltd.NWS Holdings, Ltd.Shangri-La Asia, Ltd.Sino Land Co., Ltd.SJM Holdings, Ltd.Sun Hung Kai Properties, Ltd.Swire Pacific, Ltd., Class ASwire Pacific, Ltd., Class BWH Group, Ltd.Wharf Holdings, Ltd. (The)Wheelock & Co., Ltd.Xinyi Glass Holdings, Ltd.Yue Yuen Industrial Holdings, Ltd.
TOTAL HONG KONG
AIB Group P.L.C.Bank of Ireland Group P.L.C.CRH P.L.C.CRH P.L.C., Sponsored ADRFlutter Entertainment P.L.C.
TOTAL IRELAND
Bank Hapoalim BMBank Leumi Le-Israel BMFirst International Bank Of Israel, Ltd.Israel Discount Bank, Ltd., Class AMizrahi Tefahot Bank, Ltd.
TOTAL ISRAEL
Assicurazioni Generali SpAEni SpAFiat Chrysler Automobiles NVFiat Chrysler Automobiles NVIntesa Sanpaolo SpAMediobanca Banca di Credito Finanziario SpATelecom Italia SpATelecom Italia SpA, Sponsored ADR
701,999,668
HONG KONG — (3.1%)# 127,125 367,395
647,400 5,577,5925,830,000 8,222,3582,590,500 19,478,3127,657,984 71,563,695
9,000 141,789# 3,168,000 8,137,372
5,009,000 11,778,7902,256,485 11,670,8733,101,000 11,644,275
257,000 625,3302,070,933 13,590,449
22,685,168 31,940,484# 3,732,400 6,929,964
3,398,000 4,134,2448,949,867 14,493,2115,295,000 5,748,1334,291,920 69,165,7622,580,500 29,412,7343,447,500 6,138,8358,773,000 8,539,3734,714,990 11,464,4112,816,000 17,720,5971,106,000 1,114,8883,080,500 8,631,355
378,232,221
IRELAND — (0.3%)909,055 3,113,634
2,070,103 9,134,704293,793 9,777,545198,709 6,628,932
93,007 7,346,354
36,001,169
ISRAEL — (0.4%)2,736,994 20,698,6482,017,506 14,676,373
* 86,561 2,231,2232,847,378 12,289,361
* 70,853 1,700,080
51,595,685
ITALY — (2.2%)836,611 15,603,057
3,757,497 58,696,9822,776,827 37,199,575
# 1,744,870 23,014,83520,933,480 45,402,753
367,951 3,685,411* 63,812,045 35,876,836#* 1,847,002 10,269,331Table of Contents
Copyright © 2021 www.secdatabase.com. All Rights Reserved.Please Consider the Environment Before Printing This Document

UniCredit SpA
TOTAL ITALY
AGC, Inc.Aisin Seiki Co., Ltd.Alfresa Holdings Corp.Alps Alpine Co., Ltd.Amada Holdings Co., Ltd.Aozora Bank, Ltd.Asahi Kasei Corp.Bank of Kyoto, Ltd. (The)Brother Industries, Ltd.Canon Marketing Japan, Inc.Chiba Bank, Ltd. (The)Chugoku Bank, Ltd. (The)Citizen Watch Co., Ltd.Coca-Cola Bottlers Japan Holdings, Inc.Concordia Financial Group, Ltd.Cosmo Energy Holdings Co., Ltd.Credit Saison Co., Ltd.Dai Nippon Printing Co., Ltd.Daicel Corp.Daido Steel Co., Ltd.Dai-ichi Life Holdings, Inc.Daio Paper Corp.Daiwa Securities Group, Inc.DeNA Co., Ltd.Denka Co., Ltd.Denso Corp.Dentsu, Inc.DIC Corp.Dowa Holdings Co., Ltd.Ebara Corp.Fuji Media Holdings, Inc.FUJIFILM Holdings Corp.Fukuoka Financial Group, Inc.Fukuyama Transporting Co., Ltd.Furukawa Electric Co., Ltd.Fuyo General Lease Co., Ltd.Glory, Ltd.Gunma Bank, Ltd. (The)Hachijuni Bank, Ltd. (The)Hankyu Hanshin Holdings, Inc.Haseko Corp.Heiwa Corp.Hino Motors, Ltd.Hitachi Capital Corp.Hitachi Chemical Co., Ltd.Hitachi Metals, Ltd.
The DFA International Value SeriesCONTINUED
Shares Value»
ITALY — (Continued)3,293,998 $ 38,785,227
268,534,007
JAPAN — (21.5%)895,500 27,429,115423,200 13,753,207
26,900 648,55836,500 664,458
907,100 9,973,211237,400 5,440,618173,500 1,764,996113,679 4,411,867100,900 1,786,480153,000 2,930,618
1,064,000 5,262,408256,900 2,246,037
1,284,600 6,392,758# 407,057 10,019,676
2,530,100 8,909,333131,600 2,712,651393,600 4,785,058474,300 9,948,228
1,087,400 9,201,644112,900 4,286,475
1,805,447 26,541,956# 39,000 465,801
4,606,000 19,858,934163,100 3,110,720234,800 6,757,173831,700 35,301,871180,700 5,973,225361,500 9,753,133189,000 5,968,929278,900 7,495,173
52,200 679,16365,700 3,114,076
386,600 7,079,58250,893 1,916,267
392,700 10,532,4205,300 314,559
185,800 4,906,284661,596 2,279,266622,531 2,345,906676,200 23,740,244290,600 3,147,978173,900 3,568,171
50,400 404,323199,000 4,075,371366,500 10,022,050
1,026,900 10,796,153
Copyright © 2021 www.secdatabase.com. All Rights Reserved.Please Consider the Environment Before Printing This Document

Hitachi Transport System, Ltd.Hitachi, Ltd.Honda Motor Co., Ltd., Sponsored ADRHonda Motor Co., Ltd.Ibiden Co., Ltd.Idemitsu Kosan Co., Ltd.IHI Corp.Iida Group Holdings Co., Ltd.Inpex Corp.
Isetan Mitsukoshi Holdings, Ltd.Isuzu Motors, Ltd.ITOCHU Corp.Itoham Yonekyu Holdings, Inc.Iyo Bank, Ltd. (The)J Front Retailing Co., Ltd.Japan Post Holdings Co., Ltd.JFE Holdings, Inc.JGC Corp.JSR Corp.JTEKT Corp.JXTG Holdings, Inc.Kamigumi Co., Ltd.Kandenko Co., Ltd.Kaneka Corp.Kawasaki Heavy Industries, Ltd.Kinden Corp.Kobe Steel, Ltd.Kokuyo Co., Ltd.Konica Minolta, Inc.K's Holdings Corp.Kuraray Co., Ltd.Kurita Water Industries, Ltd.Kyocera Corp.Kyushu Financial Group, Inc.Lintec Corp.LIXIL Group Corp.Mabuchi Motor Co., Ltd.Maeda Corp.Maeda Road Construction Co., Ltd.Marubeni Corp.Maruichi Steel Tube, Ltd.Mazda Motor Corp.Mebuki Financial Group, Inc.Medipal Holdings Corp.Mitsubishi Chemical Holdings Corp.Mitsubishi Corp.Mitsubishi Gas Chemical Co., Inc.
4,900 152,4121,942,300 68,863,858
# 26,040 647,8754,590,300 114,209,034
507,300 9,044,365556,596 15,338,336236,700 5,640,218655,750 10,756,000
2,842,483 24,929,581Table of Contents
The DFA International Value SeriesCONTINUED
Shares Value»
JAPAN — (Continued)647,400 $ 5,146,762128,400 1,420,801
1,410,700 26,860,746196,800 1,289,235492,300 2,392,629
1,025,800 12,042,6531,147,210 11,245,5491,980,900 26,189,455
257,700 3,355,095706,100 11,661,167980,500 11,625,386
9,040,403 42,542,568342,200 7,866,870402,500 3,509,374250,708 9,308,179677,300 14,736,575222,800 3,370,415
1,581,200 10,145,424160,600 2,166,195
2,140,500 17,738,658403,300 3,677,319
1,529,300 18,086,7097,500 189,341
103,400 6,301,947668,749 2,538,022
9,400 197,7841,075,500 18,602,980
81,200 2,803,337377,800 2,830,506
10,100 214,3272,768,100 17,944,401
15,500 408,0702,970,600 28,739,6921,258,420 3,105,115
181,950 3,864,9253,045,600 21,622,2511,950,600 52,378,058
727,100 9,675,861
Copyright © 2021 www.secdatabase.com. All Rights Reserved.Please Consider the Environment Before Printing This Document

Mitsubishi Heavy Industries, Ltd.Mitsubishi Logistics Corp.Mitsubishi Materials Corp.Mitsubishi Motors Corp.Mitsubishi Tanabe Pharma Corp.Mitsubishi UFJ Financial Group, Inc., Sponsored ADRMitsubishi UFJ Financial Group, Inc.Mitsubishi UFJ Lease & Finance Co., Ltd.Mitsui & Co., Ltd., Sponsored ADRMitsui & Co., Ltd.Mitsui Chemicals, Inc.Mitsui Fudosan Co., Ltd.Mitsui OSK Lines, Ltd.Mizuho Financial Group, Inc.Mizuho Financial Group, Inc., ADRMS&AD Insurance Group Holdings, Inc.Nagase & Co., Ltd.NEC Corp.NGK Insulators, Ltd.NGK Spark Plug Co., Ltd.NH Foods, Ltd.
NHK Spring Co., Ltd.Nikon Corp.Nippo Corp.Nippon Electric Glass Co., Ltd.Nippon Express Co., Ltd.Nippon Kayaku Co., Ltd.Nippon Paper Industries Co., Ltd.Nippon Shokubai Co., Ltd.Nippon Steel Corp.Nippon Yusen K.K.Nipro Corp.Nissan Motor Co., Ltd.NOK Corp.Nomura Holdings, Inc.Nomura Real Estate Holdings, Inc.NSK, Ltd.NTN Corp.Obayashi Corp.Oji Holdings Corp.Orient Corp.ORIX Corp.Rengo Co., Ltd.Resona Holdings, Inc.Ricoh Co., Ltd.Rohm Co., Ltd.Sankyo Co., Ltd.
603,600 24,899,20289,600 2,382,911
518,200 14,253,4001,574,200 6,927,256
252,700 2,852,955# 4,407,514 21,905,345
11,934,650 58,945,2471,638,400 8,682,230
11,723 3,828,4971,157,000 18,809,189
823,660 18,834,894145,700 3,289,059546,400 13,401,017
28,808,800 40,888,92064,489 183,149
666,953 21,861,770251,300 3,661,262925,610 37,838,264
20,600 306,379165,200 3,154,418423,867 15,720,310
Table of Contents
The DFA International Value SeriesCONTINUED
Shares Value»
JAPAN — (Continued)883,400 $ 6,927,371
# 825,300 11,142,951285,900 5,446,781232,300 5,195,003316,124 17,816,901162,000 1,904,798475,600 8,385,385115,900 7,522,479
2,142,693 33,569,865771,300 12,850,244136,100 1,508,801
6,443,700 41,883,552423,620 6,219,224
4,362,402 14,021,700521,500 10,560,364
1,136,400 9,608,669887,200 2,461,996
2,342,282 22,183,8103,422,700 17,699,653
38,400 44,9383,324,900 47,452,737
899,500 6,830,4452,696,600 10,993,1052,004,400 18,359,005
248,800 17,339,41026,400 908,870
Copyright © 2021 www.secdatabase.com. All Rights Reserved.Please Consider the Environment Before Printing This Document

Sawai Pharmaceutical Co., Ltd.Sega Sammy Holdings, Inc.Seino Holdings Co., Ltd.Sekisui House, Ltd.Shimamura Co., Ltd.Shimizu Corp.Shinsei Bank, Ltd.Shizuoka Bank, Ltd. (The)Showa Denko K.K.Sojitz Corp.Sompo Holdings, Inc.Sumitomo Bakelite Co., Ltd.Sumitomo Chemical Co., Ltd.Sumitomo Corp.Sumitomo Electric Industries, Ltd.Sumitomo Forestry Co., Ltd.Sumitomo Heavy Industries, Ltd.Sumitomo Metal Mining Co., Ltd.Sumitomo Mitsui Financial Group, Inc.Sumitomo Mitsui Trust Holdings, Inc.Sumitomo Osaka Cement Co., Ltd.Sumitomo Rubber Industries, Ltd.T&D Holdings, Inc.Taiheiyo Cement Corp.Taisho Pharmaceutical Holdings Co., Ltd.Taiyo Yuden Co., Ltd.Takashimaya Co., Ltd.Takeda Pharmaceutical Co, Ltd., Sponsored ADRTakeda Pharmaceutical Co., Ltd.TDK Corp.Teijin, Ltd.THK Co., Ltd.Toda Corp.
Toho Holdings Co., Ltd.Tokai Rika Co., Ltd.Tokio Marine Holdings, Inc.Tokyo Broadcasting System Holdings, Inc.Tokyo Tatemono Co., Ltd.Tokyu Fudosan Holdings Corp.Toppan Printing Co., Ltd.Toray Industries, Inc.Tosoh Corp.Toyo Seikan Group Holdings, Ltd.Toyoda Gosei Co., Ltd.Toyota Industries Corp.Toyota Motor Corp., Sponsored ADRToyota Motor Corp.
7,500 413,79252,200 669,153
481,500 5,997,391# 2,614,100 43,951,845
73,300 5,182,964746,000 6,003,309
# 313,400 4,733,897851,000 5,884,000193,500 5,191,080
3,995,200 12,482,153309,710 12,826,007
3,400 115,6587,962,000 36,308,4471,701,500 25,247,9833,161,100 39,112,058
598,600 7,492,696524,600 16,912,364961,164 27,300,898
2,857,600 99,929,627391,543 13,382,309
16,700 637,787770,500 8,410,372
1,897,000 21,303,006528,721 14,849,309
2,800 213,501# 216,000 4,272,492# 463,917 5,321,513* 411,114 7,235,600
739,571 25,452,99389,800 6,894,604
855,090 14,793,636197,800 4,984,994717,800 3,931,916
Table of Contents
The DFA International Value SeriesCONTINUED
Shares Value»
JAPAN — (Continued)194,600 $ 4,327,258155,700 2,550,418
11,719 622,05656,000 949,268
870,300 10,154,7162,556,700 14,790,717
656,900 10,677,1661,598,700 10,998,2151,241,700 17,403,502
503,949 8,797,184310,400 5,708,495235,200 12,210,268212,618 27,438,353
3,658,590 236,393,139
Copyright © 2021 www.secdatabase.com. All Rights Reserved.Please Consider the Environment Before Printing This Document

Toyota Tsusho Corp.TS Tech Co., Ltd.TV Asahi Holdings Corp.Ube Industries, Ltd.Universal Entertainment Corp.Wacoal Holdings Corp.Yamada Denki Co., Ltd.Yamaguchi Financial Group, Inc.Yamaha Motor Co., Ltd.Yamato Kogyo Co., Ltd.Yamazaki Baking Co., Ltd.Yokohama Rubber Co., Ltd. (The)Zeon Corp.
TOTAL JAPAN
ABN AMRO Bank NVAegon NVAegon NVAkzo Nobel NVArcelorMittalArcelorMittalASR Nederland NVCoca-Cola European Partners P.L.C.ING Groep NV, Sponsored ADRING Groep NVKoninklijke Ahold Delhaize NVKoninklijke DSM NVKoninklijke Philips NVKoninklijke Philips NVKoninklijke Vopak NVNN Group NVRandstad NV
TOTAL NETHERLANDS
Air New Zealand, Ltd.Auckland International Airport, Ltd.EBOS Group, Ltd.Fletcher Building, Ltd.Fonterra Co-operative Group, Ltd.Ryman Healthcare, Ltd.SKYCITY Entertainment Group, Ltd.
TOTAL NEW ZEALAND
Austevoll Seafood ASADNB ASAEquinor ASANorsk Hydro ASA
524,100 15,170,560145,000 3,991,734
31,700 520,011504,100 10,495,590
# 32,900 1,033,32069,200 1,678,700
# 1,863,600 8,220,271399,348 2,788,079
# 263,200 4,615,19051,100 1,321,91921,100 320,410
563,500 10,367,719404,300 4,675,654
2,587,215,181
NETHERLANDS — (3.6%)1,461,221 29,249,961
# 4,539,272 22,369,189503,770 2,478,548
29,483 2,781,8181,780,735 28,249,112
726,121 11,414,624253,829 9,538,010
24,638 1,358,028# 921,132 10,224,565
6,111,967 67,816,8175,195,538 118,005,818
# 640,817 79,389,56981,630 3,829,317
# 13,834 647,293156,800 7,731,036
# 836,995 31,446,787209,874 10,534,386
437,064,878
NEW ZEALAND — (0.2%)2,720,019 4,842,2421,946,257 11,856,673
96,709 1,581,6211,687,154 5,483,637
#* 284,937 704,59718,786 158,399
266,175 698,270
25,325,439
Table of Contents
The DFA International Value SeriesCONTINUED
Shares Value»
NORWAY — (0.8%)90,175 $ 917,436
2,146,171 38,396,284106,659 1,912,427
5,166,320 17,572,150
Copyright © 2021 www.secdatabase.com. All Rights Reserved.Please Consider the Environment Before Printing This Document

Norsk Hydro ASA, Sponsored ADRSpareBank 1 SR-Bank ASAStorebrand ASASubsea 7 SAYara International ASA
TOTAL NORWAY
EDP Renovaveis SA
CapitaLand, Ltd.City Developments, Ltd.Frasers Property, Ltd.Golden Agri-Resources, Ltd.Hongkong Land Holdings, Ltd.Hutchison Port Holdings TrustKeppel Corp., Ltd.Olam International, Ltd.Sembcorp Industries, Ltd.Singapore Airlines, Ltd.Singapore Press Holdings, Ltd.United Industrial Corp., Ltd.UOL Group, Ltd.Wilmar International, Ltd.Yangzijiang Shipbuilding Holdings Ltd.
TOTAL SINGAPORE
Banco Bilbao Vizcaya Argentaria SABanco de Sabadell SABanco Santander SABanco Santander SA, Sponsored ADRBankia SARepsol SA
TOTAL SPAIN
BillerudKorsnas ABBoliden ABDometic Group ABGetinge AB, Class BHolmen AB, Class AHolmen AB, Class BHusqvarna AB, Class BICA Gruppen ABIntrum ABMillicom International Cellular SAPandox ABSkandinaviska Enskilda Banken AB, Class ASkandinaviska Enskilda Banken AB, Class CSKF AB, Class BSSAB AB, Class ASSAB AB, Class B
46,000 158,700369,350 3,973,940
1,436,496 9,707,290# 927,092 9,936,613
262,501 12,297,999
94,872,839
PORTUGAL — (0.1%)541,158 5,571,471
SINGAPORE — (1.1%)8,246,300 21,603,7761,714,600 12,031,953
492,700 648,76112,637,100 2,699,167
1,260,100 7,684,71215,881,900 3,472,355
# 6,501,200 30,040,313# 464,700 654,973
4,282,400 7,245,7243,017,400 21,125,432
999,500 1,598,1261,539,670 3,332,2781,203,774 6,397,6215,258,600 15,200,660
896,000 923,922
134,659,773
SPAIN — (2.3%)# 526,771 2,682,165
18,523,466 16,178,06952,022,978 222,048,260
# 71,002 301,0491,716,143 3,402,4062,185,613 34,665,582
279,277,531
SWEDEN — (2.0%)# 504,958 5,829,728
1,195,043 27,100,343124,909 1,139,530559,676 8,211,936
# 5,562 126,335462,589 9,767,255132,968 1,177,411167,988 7,454,804
# 190,801 5,001,971133,262 6,846,290
92,987 1,695,3254,478,462 42,106,715
# 28,685 271,9981,067,972 17,517,720
546,342 1,547,6851,359,160 3,445,461
Table of Contents
The DFA International Value Series
Copyright © 2021 www.secdatabase.com. All Rights Reserved.Please Consider the Environment Before Printing This Document

Svenska Cellulosa AB SCA, Class ASvenska Cellulosa AB SCA, Class BSvenska Handelsbanken AB, Class ASvenska Handelsbanken AB, Class BSwedbank AB, Class ATele2 AB, Class BTelefonaktiebolaget LM Ericsson, Class BTelia Co. ABTrelleborg AB, Class BVolvo AB, Class B
TOTAL SWEDEN
ABB, Ltd.Adecco Group AGAlcon, Inc.Alcon, Inc.Baloise Holding AGBanque Cantonale VaudoiseChocoladefabriken Lindt & Spruengli AGCie Financiere Richemont SAClariant AGCredit Suisse Group AGCredit Suisse Group AG, Sponsored ADRDufry AGFlughafen Zurich AGHelvetia Holding AGJulius Baer Group, Ltd.LafargeHolcim, Ltd.LafargeHolcim, Ltd.Lonza Group AGNovartis AG, Sponsored ADRNovartis AGSwatch Group AG (The)Swatch Group AG (The)Swiss Life Holding AGSwiss Prime Site AGSwiss Re AGSwisscom AGUBS Group AGUBS Group AGVifor Pharma AGZurich Insurance Group AG
TOTAL SWITZERLAND
3i Group P.L.C.Anglo American P.L.C.Antofagasta P.L.C.Aviva P.L.C.Barclays P.L.C., Sponsored ADR
CONTINUED
Shares Value»
SWEDEN — (Continued)# 63,918 $ 612,919
1,727,990 14,342,1892,560,946 23,043,189
37,204 352,4511,115,007 15,183,859
140,411 2,006,385136,922 1,197,968
7,857,507 34,955,294636,361 8,762,736350,017 5,199,541
244,897,038
SWITZERLAND — (9.6%)2,982,977 56,310,112
683,506 37,291,443* 69,515 4,084,030* 529,166 30,643,761
183,510 33,144,9323,001 2,231,884
6 496,3411,165,784 99,899,8071,326,060 24,231,1941,363,427 16,485,244
# 1,052,790 12,707,17559,979 5,260,25444,330 8,095,38215,210 1,936,572
# 716,015 30,597,187804,630 39,493,247375,078 18,369,857146,116 50,052,562333,391 30,531,948
2,512,666 230,408,514# 144,166 41,876,178
195,503 10,661,039104,266 50,385,400120,516 10,610,766330,331 31,988,197
# 66,689 32,320,2846,275,625 70,047,484
* 1,233,581 13,779,100# 32,760 4,848,689
445,436 154,936,708
1,153,725,291
UNITED KINGDOM — (15.1%)830,059 11,185,061
4,517,719 110,703,974246,621 2,782,581
16,319,347 80,121,724# 6,570,671 49,148,619
Copyright © 2021 www.secdatabase.com. All Rights Reserved.Please Consider the Environment Before Printing This Document

Barclays P.L.C.Barratt Developments P.L.C.BP P.L.C., Sponsored ADRBritish American Tobacco P.L.C., Sponsored ADRBritish American Tobacco P.L.C.Carnival P.L.C.Carnival P.L.C., ADR
Glencore P.L.C.GVC Holdings P.L.C.HSBC Holdings P.L.C.HSBC Holdings P.L.C., Sponsored ADRInvestec P.L.C.J Sainsbury P.L.C.John Wood Group P.L.C.Kingfisher P.L.C.Lloyds Banking Group P.L.C.Lloyds Banking Group P.L.C., ADRMelrose Industries P.L.C.Micro Focus International P.L.C., Sponsored ADRMicro Focus International P.L.C.Pearson P.L.C.Pearson P.L.C., Sponsored ADRPhoenix Group Holdings P.L.C.Royal Bank of Scotland Group P.L.C.Royal Bank of Scotland Group P.L.C., Sponsored ADRRoyal Dutch Shell P.L.C., Class ARoyal Dutch Shell P.L.C., Sponsored ADR, Class ARoyal Dutch Shell P.L.C., Sponsored ADR, Class BRoyal Mail P.L.C.Standard Chartered P.L.C.Standard Life Aberdeen P.L.C.Vodafone Group P.L.C.Vodafone Group P.L.C., Sponsored ADRWm Morrison Supermarkets P.L.C.WPP P.L.C., Sponsored ADRWPP P.L.C.
TOTAL UNITED KINGDOM
TOTAL COMMON STOCKS
Bayerische Motoren Werke AGPorsche Automobil Holding SEVolkswagen AG
TOTAL GERMANY
TOTAL INVESTMENT SECURITIES
191,609 358,6593,934,603 30,718,3263,666,922 145,723,480
852,128 30,344,2783,130,216 111,537,519
42,492 1,918,05420,467 938,412
Table of Contents
The DFA International Value SeriesCONTINUED
Shares Value»
UNITED KINGDOM — (Continued)26,606,474 $ 85,322,133
# 69,102 495,04013,949,143 111,711,533
2,687,511 107,930,4411,244,333 7,079,9018,162,535 19,477,703
688,658 4,437,5117,975,671 21,533,403
181,694,609 117,535,256# 1,479,223 3,801,603
5,861,802 13,229,564# 187,071 3,902,311
241,441 5,085,734# 748,020 7,921,056# 1,119,256 11,796,958
234,553 1,972,9145,175,515 13,635,127
# 1,051,278 5,655,876136,125 4,287,321
3,293,873 207,151,649# 3,253,475 206,498,058
1,158,503 2,958,6114,078,355 33,563,6311,614,944 5,857,468
58,351,986 106,199,5634,011,201 72,682,9679,487,736 22,403,733
# 140,610 8,279,1172,296,513 27,051,597
1,814,938,466
11,673,297,109
PREFERRED STOCKS — (1.2%)GERMANY — (1.2%)
157,620 9,358,117322,304 21,125,775701,336 116,542,862
147,026,754
11,820,323,863
Copyright © 2021 www.secdatabase.com. All Rights Reserved.Please Consider the Environment Before Printing This Document

DFA Short Term Investment Fund
(Cost $12,265,390,313)^^
MSCI EAFA Index Future
S&P 500® Emini Index
Total Futures Contracts
AustraliaAustriaBelgiumCanadaDenmarkFinlandFranceGermanyHong KongIrelandIsraelItalyJapanNetherlandsNew ZealandNorwayPortugalSingaporeSpainSwedenSwitzerlandUnited Kingdom
Value†
SECURITIES LENDING COLLATERAL — (2.0%)@§ 21,150,575 244,733,303
TOTAL INVESTMENTS — (100.0%)$12,065,057,166
As of July 31, 2019, The DFA International Value Series had entered into the following outstanding futures contracts:
Description
Numberof
ContractsExpiration
DateNotional
ValueMarketValue
UnrealizedAppreciation
(Depreciation)
Long Position Contracts:44 09/20/19 $ 4,135,649 $ 4,147,660 $ 12,011
Table of Contents
The DFA International Value SeriesCONTINUED
Description
Numberof
ContractsExpiration
DateNotional
ValueMarketValue
UnrealizedAppreciation
(Depreciation)
676 09/20/19 $ 98,838,337 $100,801,740 $1,963,403
$102,973,986 $104,949,400 $1,975,414
Summary of the Series' investments as of July 31, 2019, based on their valuation inputs, is as follows (see Security Valuation Note):
Investments in Securities (Market Value)
Level 1 Level 2 Level 3 Total
Common Stocks— $ 851,056,563 — $ 851,056,563— 8,413,467 — 8,413,467— 113,505,505 — 113,505,505
$1,000,578,566 — — 1,000,578,566— 195,417,765 — 195,417,765— 104,372,100 — 104,372,100— 1,186,042,486 — 1,186,042,486
13,114,927 688,884,741 — 701,999,668— 378,232,221 — 378,232,221
6,628,932 29,372,237 — 36,001,169— 51,595,685 — 51,595,685
33,284,166 235,249,841 — 268,534,00761,238,819 2,525,976,362 — 2,587,215,18124,765,030 412,299,848 — 437,064,878
— 25,325,439 — 25,325,439158,700 94,714,139 — 94,872,839
— 5,571,471 — 5,571,471— 134,659,773 — 134,659,773
301,049 278,976,482 — 279,277,531— 244,897,038 — 244,897,038
61,102,253 1,092,623,038 — 1,153,725,291853,853,769 961,084,697 — 1,814,938,466
Copyright © 2021 www.secdatabase.com. All Rights Reserved.Please Consider the Environment Before Printing This Document

GermanySecurities Lending CollateralFutures Contracts**
TOTAL
Adways, Inc.Aeria, Inc.Akatsuki, Inc.AlphaPolis Co., Ltd.Amuse, Inc.AOI TYO Holdings, Inc.Asahi Broadcasting Group Holdings Corp.Asahi Net, Inc.Ateam, Inc.Atrae, Inc.Avex, Inc.Bengo4.com, Inc.Broccoli Co., Ltd.CareerIndex, Inc.Carta Holdings, Inc.Ceres, Inc.COLOPL, Inc.COOKPAD, Inc.Cyberstep, Inc.Dip Corp.eBook Initiative Japan Co., Ltd.Extreme Co., Ltd.F@N Communications, Inc.Faith, Inc.Freebit Co., Ltd.Full Speed, Inc.Gakken Holdings Co., Ltd.Gree, Inc.Gumi, Inc.Gurunavi, Inc.Imagica Group, Inc.Intage Holdings, Inc.Internet Initiative Japan, Inc.ITmedia, Inc.
Preferred Stocks— 147,026,754 — 147,026,754
— 244,733,303 — 244,733,3031,975,414 — — 1,975,414
$2,057,001,625 $10,010,030,955 — $12,067,032,580** Valued at the unrealized appreciation/(depreciation) on the investment.
Table of Contents
THE JAPANESE SMALL COMPANY SERIES
SCHEDULE OF INVESTMENTS
July 31, 2019
(Unaudited)
Shares Value»
COMMON STOCKS — (97.0%)COMMUNICATION SERVICES — (2.7%)
14,000 $ 43,78515,800 121,04630,200 2,027,199
#* 13,800 368,5021,898 42,341
166,231 1,086,74972,200 473,112
102,300 641,348# 94,800 966,246* 37,200 835,146
286,800 3,687,463* 33,300 1,471,456
3,700 44,438#* 25,100 169,594
88,500 989,192# 24,900 367,988
27,700 170,000* 228,500 641,609#* 29,500 288,254# 243,500 4,998,381* 11,700 195,062
17,300 316,027368,300 1,858,183
60,910 420,181# 69,000 693,598
41,900 208,93038,900 1,750,019
973,000 4,567,528* 6,900 35,700
219,500 1,353,918118,100 588,366260,600 2,202,180194,900 3,642,602
20,400 100,051
Copyright © 2021 www.secdatabase.com. All Rights Reserved.Please Consider the Environment Before Printing This Document

Itokuro, Inc.Kadokawa DwangoKamakura Shinsho, Ltd.KLab, Inc.LIFULL Co., Ltd.Macromill, Inc.MarkLines Co., Ltd.Marvelous, Inc.Members Co., Ltd.Mixi, Inc.Mobile Factory, Inc.MTI, Ltd.Mynet, Inc.Okinawa Cellular Telephone Co.PR Times, Inc.Proto Corp.Shobunsha Publications, Inc.SKY Perfect JSAT Holdings, Inc.SoldOut, Inc.Synchro Food Co., Ltd.
Toei Animation Co., Ltd.Toei Co., Ltd.Tohokushinsha Film Corp.Tow Co., Ltd.TV Asahi Holdings Corp.Tv Tokyo Holdings Corp.Usen-Next Holdings Co., Ltd.ValueCommerce Co., Ltd.V-Cube, Inc.Vector, Inc.Vision, Inc.Wowow, Inc.Zappallas, Inc.Zenrin Co., Ltd.ZIGExN Co., Ltd.
TOTAL COMMUNICATION SERVICES
Adastria Co., Ltd.Adventure, Inc.Aeon Fantasy Co., Ltd.AGORA Hospitality Group Co., Ltd.Ahresty Corp.Aigan Co., Ltd.Ainavo Holdings Co., Ltd.Aisan Industry Co., Ltd.Akebono Brake Industry Co., Ltd.Alleanza Holdings Co., Ltd.
#* 55,100 860,635#* 291,416 3,703,304# 56,100 775,609#* 141,900 1,161,362
462,800 2,139,916257,400 2,988,568
69,800 1,190,353241,800 1,716,639
# 45,500 818,251180,400 3,408,460
#* 22,300 320,241192,600 1,391,142
* 17,800 103,90286,400 2,887,405
#* 600 17,024183,600 1,910,317
#* 252,700 894,8811,132,900 4,470,160
# 6,300 109,140#* 47,900 255,922Table of Contents
The Japanese Small Company SeriesCONTINUED
Shares Value»
COMMUNICATION SERVICES — (Continued)54,100 $ 2,263,04926,000 3,564,09990,500 488,159
135,400 969,1342,500 41,010
103,500 2,190,843* 97,100 727,719
107,000 1,852,549* 112,200 606,772#* 206,200 1,775,372* 42,800 2,044,371
44,100 1,062,849* 55,900 173,544
287,150 5,279,235445,600 3,192,692
94,720,822
CONSUMER DISCRETIONARY — (17.9%)150,440 2,944,025
#* 8,800 270,253# 60,932 1,754,633* 341,200 106,291
158,000 830,33886,100 211,796
5,600 52,012273,500 1,829,887
#* 396,600 556,670# 99,000 745,405
Copyright © 2021 www.secdatabase.com. All Rights Reserved.Please Consider the Environment Before Printing This Document

Alpen Co., Ltd.Alpha Corp.Amiyaki Tei Co., Ltd.Anrakutei Co., Ltd.AOKI Holdings, Inc.Aoyama Trading Co., Ltd.Arata Corp.Arcland Sakamoto Co., Ltd.Arcland Service Holdings Co., Ltd.Asahi Co., Ltd.Asante, Inc.Ashimori Industry Co., Ltd.ASKUL Corp.Asti Corp.Atom Corp.Atsugi Co., Ltd.Aucfan Co., Ltd.Aucnet, Inc.Autobacs Seven Co., Ltd.Baroque Japan, Ltd.Beaglee, Inc.Beauty Garage, Inc.Belluna Co., Ltd.Bic Camera, Inc.Bookoff Group Holdings, Ltd.BRONCO BILLY Co., Ltd.Can Do Co., Ltd.Central Automotive Products, Ltd.Central Sports Co., Ltd.Chikaranomoto Holdings Co., Ltd.CHIMNEY Co., Ltd.
Chiyoda Co., Ltd.Chofu Seisakusho Co., Ltd.Choushimaru Co., Ltd.Chuo Spring Co., Ltd.Cleanup Corp.Coco's Japan Co., Ltd.Colowide Co., Ltd.Corona Corp.Create Restaurants Holdings, Inc.Cross Plus, Inc.Daido Metal Co., Ltd.Daidoh, Ltd.Daikoku Denki Co., Ltd.Daikyonishikawa Corp.Dainichi Co., Ltd.DCM Holdings Co., Ltd.
132,500 1,890,88052,600 610,55332,000 1,017,215
* 1,300 59,603287,400 2,818,271343,700 6,400,587102,100 3,304,791228,600 2,767,596106,900 1,871,371111,900 1,298,10849,700 908,27530,899 435,382
# 32,900 820,115# 20,800 338,875# 738,900 6,766,574
125,900 1,046,650* 3,100 25,187
21,500 244,276555,300 9,036,508
96,500 966,375* 35,400 277,524# 17,400 295,120
383,700 2,477,936143,400 1,413,694
# 68,800 788,49975,800 1,572,30170,100 1,047,93985,400 1,559,04652,100 1,481,927
# 35,400 320,99937,900 835,488
Table of Contents
The Japanese Small Company SeriesCONTINUED
Shares Value»
CONSUMER DISCRETIONARY — (Continued)123,100 $1,819,895142,400 2,886,992
6,300 68,04820,000 522,727
149,800 708,97657,700 781,969
315,500 6,149,064105,500 975,668
# 346,200 5,166,9359,800 55,358
312,200 1,875,95896,600 260,47962,000 759,951
274,100 2,256,07466,800 390,182
# 813,400 7,675,646
Copyright © 2021 www.secdatabase.com. All Rights Reserved.Please Consider the Environment Before Printing This Document

DD Holdings Co., Ltd.Descente, Ltd.Doshisha Co., Ltd.Doutor Nichires Holdings Co., Ltd.Dynic Corp.Eagle Industry Co., Ltd.EAT&Co, Ltd.EDION Corp.Enigmo, Inc.ES-Con Japan, Ltd.ESCRIT, Inc.ESTELLE Holdings Co., Ltd.Evolable Asia Corp.Exedy Corp.FCC Co., Ltd.Felissimo Corp.Fields Corp.Fine Sinter Co., Ltd.First Juken Co., Ltd.First-corp, Inc.FJ Next Co., Ltd.Foster Electric Co., Ltd.France Bed Holdings Co., Ltd.F-Tech, Inc.Fuji Co., Ltd.Fuji Corp.Fuji Corp., Ltd.Fuji Kyuko Co., Ltd.Fujibo Holdings, Inc.Fujikura Composites, Inc.Fujio Food System Co., Ltd.Fujishoji Co., Ltd.Fujita Kanko, Inc.Fujitsu General, Ltd.FuKoKu Co., Ltd.Funai Electric Co., Ltd.Furukawa Battery Co., Ltd. (The)Furyu Corp.Futaba Industrial Co., Ltd.Gakkyusha Co., Ltd.Genki Sushi Co., Ltd.Geo Holdings Corp.Gfoot Co., Ltd.
GLOBERIDE, Inc.Gokurakuyu Holdings Co., Ltd.Golf Digest Online, Inc.Greens Co., Ltd.
29,600 820,732182,100 2,826,162176,500 2,750,465211,686 3,897,09142,200 289,980
202,100 2,016,045# 33,000 496,688
552,600 5,239,730* 183,400 1,961,959# 194,100 1,219,224
47,100 327,37112,600 73,79152,000 1,229,491
225,100 4,588,811286,300 5,563,394
21,200 196,788119,200 522,819
# 10,300 206,03750,100 577,813
# 45,300 254,090# 116,100 1,132,270
151,200 2,645,133153,900 1,406,862104,800 713,361148,400 2,510,476
40,200 752,089200,800 1,348,747
# 72,300 2,776,47377,700 1,881,982
145,600 568,624# 58,100 1,378,822
55,100 492,11358,300 1,460,034
512,500 8,190,30367,200 451,702
* 133,100 946,070101,100 602,779
97,600 968,264441,000 3,059,476
# 50,900 613,110# 38,000 1,070,102
245,000 3,224,506# 98,100 585,887Table of Contents
The Japanese Small Company SeriesCONTINUED
Shares Value»
CONSUMER DISCRETIONARY — (Continued)63,399 $1,888,856
# 82,500 436,883# 71,200 377,058
31,100 423,411
Copyright © 2021 www.secdatabase.com. All Rights Reserved.Please Consider the Environment Before Printing This Document

GSI Creos Corp.G-Tekt Corp.Gunze, Ltd.H2O Retailing Corp.Hagihara Industries, Inc.Hakuyosha Co., Ltd.Hamee Corp.Handsman Co., Ltd.Happinet Corp.Harada Industry Co., Ltd.Hard Off Corp. Co., Ltd.Haruyama Holdings, Inc.Heian Ceremony Service Co., Ltd.Hiday Hidaka Corp.HI-LEX Corp.Himaraya Co., Ltd.Hinokiya Group Co., Ltd.Hiramatsu, Inc.HIS Co., Ltd.H-One Co., Ltd.Honeys Holdings Co., Ltd.Hoosiers HoldingsHotland Co., Ltd.House Do Co., Ltd.HUB Co., Ltd.I K K, Inc.IBJ, Inc.Ichibanya Co., Ltd.Ichikoh Industries, Ltd.IDOM, Inc.IJTT Co., Ltd.Imasen Electric IndustrialIstyle, Inc.Janome Sewing Machine Co., Ltd.Japan Best Rescue System Co., Ltd.Japan Wool Textile Co., Ltd. (The)JFLA Holdings, Inc.JINS Holdings, Inc.Joban Kosan Co., Ltd.Jolly - Pasta Co., Ltd.Joshin Denki Co., Ltd.Joyful Honda Co., Ltd.JP-Holdings, Inc.JVCKenwood Corp.Kappa Create Co., Ltd.Kasai Kogyo Co., Ltd.Kawai Musical Instruments Manufacturing Co., Ltd.Keihin Corp.Keiyo Co., Ltd.KFC Holdings Japan, Ltd.King Co., Ltd.Kintetsu Department Store Co., Ltd.Ki-Star Real Estate Co., Ltd.KNT-CT Holdings Co., Ltd.
31,592 364,724147,400 2,148,847121,100 5,381,260289,200 3,268,587
99,300 1,235,195# 13,600 352,325# 36,100 238,346# 40,600 439,297
123,800 1,485,932# 65,600 510,763
69,200 467,73957,900 430,559
8,300 67,582# 180,165 3,482,042
122,100 1,985,702# 35,900 267,404
49,000 929,859# 266,500 879,073
71,000 1,731,615144,500 939,867123,740 1,498,903
# 368,500 2,098,299* 66,900 893,273
28,700 435,41933,900 379,619
# 66,200 429,724# 65,500 530,938# 117,158 5,518,458
153,100 979,455# 245,200 923,652
170,180 813,373128,100 1,038,349
#* 307,900 2,322,132104,900 448,927
# 114,400 1,499,690375,600 3,106,243
# 106,300 407,183107,700 5,669,500
# 44,899 681,151* 23,200 400,407
133,200 2,541,3689,000 101,605
356,800 935,980747,400 1,671,469
71,300 910,843204,200 1,675,454
37,400 1,047,953340,100 4,720,464282,600 1,225,098
69,400 1,362,96051,600 314,10661,400 1,752,70850,600 761,916
* 78,700 949,665
Copyright © 2021 www.secdatabase.com. All Rights Reserved.Please Consider the Environment Before Printing This Document

Kohnan Shoji Co., Ltd.
Kojima Co., Ltd.Komatsu Matere Co., Ltd.KOMEDA Holdings Co., Ltd.Komehyo Co., Ltd.Komeri Co., Ltd.Konaka Co., Ltd.Koshidaka Holdings Co., Ltd.Kourakuen Holdings Corp.KU Holdings Co., Ltd.Kura Sushi, Inc.Kurabo Industries, Ltd.Kushikatsu Tanaka Holdings Co.KYB Corp.Kyoritsu Maintenance Co., Ltd.Kyoto Kimono Yuzen Co., Ltd.Laox Co., Ltd.LEC, Inc.LIKE Kidsnext Co., Ltd.Litalico, Inc.LIXIL VIVA Corp.Look Holdings, Inc.Mamiya-Op Co., Ltd.Mars Group Holdings Corp.Maruzen CHI Holdings Co., Ltd.Matsuya Co., Ltd.Matsuyafoods Holdings Co., Ltd.Media Do Holdings Co., Ltd.Meiko Network Japan Co., Ltd.Meiwa Estate Co., Ltd.Mikuni Corp.Misawa Homes Co., Ltd.Mitsuba Corp.Mizuno Corp.Monogatari Corp. (The)Morito Co., Ltd.MRK Holdings, Inc.MrMax Holdings, Ltd.Murakami Corp.Musashi Seimitsu Industry Co., Ltd.Nafco Co., Ltd.Nagase Brothers, Inc.Nagawa Co., Ltd.Naigai Co., Ltd.Nakayamafuku Co., Ltd.New Art Holdings Co., Ltd.Nextage Co., Ltd.
171,100 3,729,576Table of Contents
The Japanese Small Company SeriesCONTINUED
Shares Value»
CONSUMER DISCRETIONARY — (Continued)#* 251,600 $1,096,258
231,000 1,643,182384,600 7,122,191
53,500 577,312245,500 5,043,359160,206 615,866
# 258,600 3,658,20382,400 2,283,232
127,700 1,018,16483,700 3,431,149
126,500 2,438,25716,800 302,255
* 153,900 4,367,54194,762 4,079,652
# 29,100 89,992#* 153,800 445,962
184,500 2,165,198#* 43,600 427,028* 41,100 717,627
176,800 2,148,65136,700 398,62632,700 279,19796,500 1,803,338
# 117,200 407,566165,400 1,221,338
73,300 2,415,84437,400 1,191,056
# 163,100 1,404,77389,900 466,258
174,900 588,881135,400 1,321,872219,790 1,307,769147,900 3,394,812
40,800 3,467,958115,800 861,90215,300 26,089
176,100 722,59230,200 656,366
380,200 4,974,84650,300 651,814
200 11,28649,700 2,293,847
* 21,500 87,85272,300 350,630
112,700 46,668211,200 2,386,524
Copyright © 2021 www.secdatabase.com. All Rights Reserved.Please Consider the Environment Before Printing This Document

NHK Spring Co., Ltd.Nichirin Co., Ltd.Nihon Eslead Corp.Nihon House Holdings Co., Ltd.Nihon Plast Co., Ltd.Nihon Tokushu Toryo Co., Ltd.Nikki Co., Ltd.Nippon Felt Co., Ltd.Nippon Piston Ring Co., Ltd.Nippon Seiki Co., Ltd.Nippon View Hotel Co., Ltd.Nishikawa Rubber Co., Ltd.Nishimatsuya Chain Co., Ltd.
Nissan Shatai Co., Ltd.Nissan Tokyo Sales Holdings Co., Ltd.Nissin Kogyo Co., Ltd.Nittan Valve Co., Ltd.Nojima Corp.Ohashi Technica, Inc.Ohsho Food Service Corp.Oisix ra daichi, Inc.Onward Holdings Co., Ltd.Ootoya Holdings Co., Ltd.Open Door, Inc.Otsuka Kagu, Ltd.Ozu Corp.Pacific Industrial Co., Ltd.PAL GROUP Holdings Co., Ltd.PAPYLESS Co., Ltd.Parco Co., Ltd.Paris Miki Holdings, Inc.PC Depot Corp.People Co., Ltd.Pepper Food Service Co., Ltd.PIA Corp.Piolax, Inc.Plenus Co., Ltd.Press Kogyo Co., Ltd.Pressance Corp.Raccoon Holdings, Inc.Regal Corp.Renaissance, Inc.Renown, Inc.Resol Holdings Co., Ltd.Resorttrust, Inc.Rhythm Watch Co., Ltd.Riberesute Corp.
296,600 2,325,85369,660 1,006,40759,800 937,668
312,800 1,266,569122,500 779,929
87,400 1,047,0352,100 39,001
84,000 352,12646,000 585,790
357,100 6,254,42541,400 555,96731,700 526,786
# 372,800 3,005,602Table of Contents
The Japanese Small Company SeriesCONTINUED
Shares Value»
CONSUMER DISCRETIONARY — (Continued)530,700 $4,438,509174,100 448,002316,900 4,354,679
93,500 254,171228,900 3,685,512
73,600 993,521108,000 6,639,860
#* 63,300 837,953825,300 4,232,585
# 39,600 798,154* 69,400 1,744,758#* 70,200 132,778# 23,700 377,534
372,500 5,243,02682,400 2,569,291
# 34,600 677,007# 153,800 1,683,461
180,100 555,856223,881 935,474
19,600 188,127# 70,600 1,092,152# 35,500 1,500,028
225,200 4,037,974151,700 2,492,392636,000 2,874,205
# 281,800 3,922,36387,200 504,226
1,500 35,96393,100 1,378,891
#* 345,000 392,166# 16,799 622,924
412,000 5,968,39253,800 626,35660,400 456,180
Copyright © 2021 www.secdatabase.com. All Rights Reserved.Please Consider the Environment Before Printing This Document

Ride On Express Holdings Co., Ltd.Right On Co., Ltd.Riken Corp.Ringer Hut Co., Ltd.Riso Kyoiku Co., Ltd.Round One Corp.Royal Holdings Co., Ltd.Royal Hotel, Ltd. (The)Sac's Bar Holdings, Inc.Saizeriya Co., Ltd.Sakai Ovex Co., Ltd.San Holdings, Inc.Sanden Holdings Corp.Sanei Architecture Planning Co., Ltd.Sangetsu Corp.Sankyo Seiko Co., Ltd.Sanoh Industrial Co., Ltd.Sanyei Corp.Sanyo Electric Railway Co., Ltd.Sanyo Housing Nagoya Co., Ltd.Sanyo Shokai, Ltd.Scroll Corp.Seiko Holdings Corp.Seiren Co., Ltd.Senshukai Co., Ltd.
Seria Co., Ltd.SFP Holdings Co., Ltd.Shidax Corp.Shikibo, Ltd.Shimachu Co., Ltd.Shimojima Co., Ltd.Shoei Co., Ltd.Showa Corp.Snow Peak, Inc.SNT Corp.Soft99 Corp.Sotoh Co., Ltd.Space Value Holdings Co., Ltd.SPK Corp.SRS Holdings Co., Ltd.St Marc Holdings Co., Ltd.Starts Corp., Inc.Step Co., Ltd.Studio Alice Co., Ltd.Studio Atao Co., Ltd.Suminoe Textile Co., Ltd.Sumitomo Riko Co., Ltd.
# 52,500 675,347# 106,825 700,640
69,100 2,689,605# 176,100 4,129,239
697,600 3,259,149525,500 7,987,276
# 224,700 5,577,368* 2,100 33,514
138,350 1,195,387# 228,500 5,340,538
32,199 543,74931,100 655,854
* 97,400 463,038# 80,900 1,127,226
349,650 6,337,086249,700 1,156,220193,000 900,788
4,300 124,158127,298 2,491,617
# 79,600 712,221100,699 1,419,595206,200 642,641
# 217,781 4,230,379380,600 5,239,422
* 230,700 677,223Table of Contents
The Japanese Small Company SeriesCONTINUED
Shares Value»
CONSUMER DISCRETIONARY — (Continued)45,200 $1,056,76567,100 1,333,238
#* 143,400 305,57065,500 597,481
290,000 6,399,56446,100 464,70392,700 3,870,554
399,000 5,367,19261,500 764,874
233,800 722,92383,400 731,91047,400 425,379
239,300 1,109,94622,700 545,660
122,200 1,142,223125,700 2,669,255267,400 6,321,017
64,000 895,64064,700 1,197,463
* 1,000 7,655# 39,100 1,051,785
293,300 2,276,048
Copyright © 2021 www.secdatabase.com. All Rights Reserved.Please Consider the Environment Before Printing This Document

Suncall Corp.Sushiro Global Holdings, Ltd.Syuppin Co., Ltd.T RAD Co., Ltd.Tachikawa Corp.Tachi-S Co., Ltd.Taiho Kogyo Co., Ltd.Takashimaya Co., Ltd.Take And Give Needs Co., Ltd.Takihyo Co., Ltd.Tama Home Co., Ltd.Tamron Co., Ltd.Tbk Co., Ltd.Tear Corp.Temairazu, Inc.Tenpos Holdings Co., Ltd.T-Gaia Corp.Tigers Polymer Corp.TKP Corp.Toa Corp.Toabo Corp.Tokai Rika Co., Ltd.Token Corp.Tokyo Base Co., Ltd.Tokyo Dome Corp.Tokyo Individualized Educational Institute, Inc.Tokyo Radiator Manufacturing Co., Ltd.Tokyotokeiba Co., Ltd.Tokyu Recreation Co., Ltd.Tomy Co., Ltd.Topre Corp.Toridoll Holdings Corp.Torikizoku Co., Ltd.Tosho Co., Ltd.Toyo Tire CorpTPR Co., Ltd.Treasure Factory Co., Ltd.
TS Tech Co., Ltd.TSI Holdings Co., Ltd.Tsukada Global Holdings, Inc.Tsukamoto Corp. Co., Ltd.Tsutsumi Jewelry Co., Ltd.Umenohana Co., Ltd.Unipres Corp.United Arrows, Ltd.Unitika, Ltd.VIA Holdings, Inc.
132,600 612,90555,600 3,410,042
# 124,400 844,48849,000 833,75873,900 909,192
226,340 2,900,390120,900 859,281268,900 3,084,506
# 65,910 613,823# 36,100 616,599
129,600 1,793,503134,200 3,002,816163,200 597,548
60,900 359,6458,500 239,103
33,300 664,625160,300 3,242,135
87,800 453,726#* 9,900 462,262
187,600 2,055,33052,099 219,911
218,300 3,575,82751,050 2,930,542
#* 103,600 704,735667,400 6,141,735
98,900 830,808# 24,300 203,446
89,900 2,565,856# 20,700 941,716
685,193 8,751,245263,500 3,952,782
# 160,500 3,628,292# 42,500 828,538# 124,000 3,081,885# 208,900 2,728,942
171,400 2,968,3163,600 41,025
Table of Contents
The Japanese Small Company SeriesCONTINUED
Shares Value»
CONSUMER DISCRETIONARY — (Continued)65,400 $ 1,800,410
507,795 2,740,060109,700 554,676
19,000 183,64157,100 1,087,069
* 22,200 520,549314,000 5,112,131177,600 5,089,716
* 460,900 1,752,513* 155,400 909,095
Copyright © 2021 www.secdatabase.com. All Rights Reserved.Please Consider the Environment Before Printing This Document

Village Vanguard Co., Ltd.Visionary Holdings Co., Ltd.VT Holdings Co., Ltd.Wacoal Holdings Corp.Waseda Academy Co., Ltd.WATAMI Co., Ltd.Watts Co., Ltd.Weds Co., Ltd.Xebio Holdings Co., Ltd.Yachiyo Industry Co., Ltd.Yagi & Co., Ltd.Yamato International, Inc.Yasunaga Corp.Yellow Hat, Ltd.Yomiuri Land Co., Ltd.Yondoshi Holdings, Inc.Yorozu Corp.Yossix Co., Ltd.Yume No Machi Souzou Iinkai Co., Ltd.Yutaka Giken Co., Ltd.Zojirushi Corp.
TOTAL CONSUMER DISCRETIONARY
Aeon Hokkaido Corp.AFC-HD AMS Life Science Co., Ltd.Albis Co., Ltd.Arcs Co., Ltd.Artnature, Inc.Axial Retailing, Inc.Belc Co., Ltd.Bourbon Corp.Bull-Dog Sauce Co., Ltd.Cawachi, Ltd.C'BON COSMETICS Co., Ltd.Chubu Shiryo Co., Ltd.Chuo Gyorui Co., Ltd.cocokara fine, Inc.Como Co., Ltd.Cota Co., Ltd.Create SD Holdings Co., Ltd.Daikokutenbussan Co., Ltd.Delica Foods Holdings Co., Ltd.DyDo Group Holdings, Inc.Earth Corp.Ebara Foods Industry, Inc.Eco's Co., Ltd.Ensuiko Sugar Refining Co., Ltd.Feed One Co., Ltd.
38,600 352,797#* 501,100 195,949
611,700 2,404,235242,400 5,880,301
27,000 181,387177,900 2,492,213
59,800 385,88114,500 80,694
# 202,000 2,236,61554,900 318,76518,600 283,479
# 119,800 463,816# 54,500 712,030
261,800 3,346,55731,800 1,406,759
# 132,420 3,171,793150,500 1,976,304
# 22,600 531,275# 123,400 1,850,122
8,700 137,877# 285,400 3,438,167
636,302,039
CONSUMER STAPLES — (7.1%)256,300 1,740,842
51,100 310,18538,700 902,798
332,000 6,905,833130,100 782,804121,300 4,202,170
82,600 3,823,673# 50,700 787,649# 3,000 31,049
46,700 867,78210,800 238,752
175,100 2,014,7349,800 242,299
149,160 7,861,072# 2,600 54,688# 84,221 915,395
189,800 4,251,87545,600 1,369,39731,100 416,76773,000 2,867,97115,300 656,21727,900 543,07054,000 735,19086,200 169,291
968,940 1,582,927Table of Contents
The Japanese Small Company SeriesCONTINUED
Shares Value»
Copyright © 2021 www.secdatabase.com. All Rights Reserved.Please Consider the Environment Before Printing This Document

First Baking Co., Ltd.Fujicco Co., Ltd.Fujiya Co., Ltd.G-7 Holdings, Inc.Genky DrugStores Co., Ltd.HABA Laboratories, Inc.Hagoromo Foods Corp.Halows Co., Ltd.Hayashikane Sangyo Co., Ltd.Heiwado Co., Ltd.Hokkaido Coca-Cola Bottling Co., Ltd.Hokuto Corp.Ichimasa Kamaboko Co., Ltd.Imuraya Group Co., Ltd.Inageya Co., Ltd.Itochu-Shokuhin Co., Ltd.Itoham Yonekyu Holdings, Inc.Iwatsuka Confectionery Co., Ltd.Japan Meat Co., Ltd.J-Oil Mills, Inc.Kadoya Sesame Mills, Inc.Kakiyasu Honten Co., Ltd.Kameda Seika Co., Ltd.Kaneko Seeds Co., Ltd.Kanemi Co., Ltd.Kansai Super Market, Ltd.Kato Sangyo Co., Ltd.Kenko Mayonnaise Co., Ltd.Key Coffee, Inc.Kirindo Holdings Co., Ltd.Kitanotatsujin Corp.Kotobuki Spirits Co., Ltd.Kyokuyo Co., Ltd.Lacto Japan Co., Ltd.Life Corp.Mandom Corp.Marudai Food Co., Ltd.Maruha Nichiro Corp.Maxvalu Nishinihon Co., Ltd.Maxvalu Tokai Co., Ltd.Medical System Network Co., Ltd.Megmilk Snow Brand Co., Ltd.Meito Sangyo Co., Ltd.Milbon Co., Ltd.Ministop Co., Ltd.Mitsubishi Shokuhin Co., Ltd.Mitsui Sugar Co., Ltd.Miyoshi Oil & Fat Co., Ltd.Morinaga Milk Industry Co., Ltd.Morozoff, Ltd.Nagatanien Holdings Co., Ltd.Nakamuraya Co., Ltd.Natori Co., Ltd.
CONSUMER STAPLES — (Continued)* 12,000 $ 107,468
152,300 2,746,56075,700 1,343,79444,800 1,215,962
# 56,700 1,101,973# 16,100 1,305,716
19,500 472,01359,300 1,227,99029,400 181,011
# 235,500 4,323,46818,699 630,876
189,700 3,233,630# 41,800 397,780
60,500 1,152,351170,500 2,310,764
36,700 1,502,99473,500 481,498
6,500 236,951# 76,100 1,260,742
75,900 2,721,38214,900 554,39065,000 1,276,89493,700 4,376,45543,600 511,466
# 5,400 156,82389,900 895,609
188,000 5,547,88793,700 2,141,048
138,900 2,712,89449,400 801,981
378,400 2,444,435159,100 9,385,106
70,399 1,971,653# 32,700 1,002,523
151,600 3,126,044132,000 3,105,883157,300 2,939,924131,507 3,841,789
22,500 347,27749,300 883,933
169,200 826,257206,300 4,408,408
# 66,200 839,175168,752 8,234,188
# 116,300 1,588,345119,600 3,007,220126,370 2,695,855
49,300 493,835250,300 9,713,080
# 20,400 920,23383,000 1,579,76027,700 1,084,37068,500 997,665
Copyright © 2021 www.secdatabase.com. All Rights Reserved.Please Consider the Environment Before Printing This Document

Nichimo Co., Ltd.Nihon Chouzai Co., Ltd.Niitaka Co., Ltd.Nippon Beet Sugar Manufacturing Co., Ltd.Nippon Flour Mills Co., Ltd.Nishimoto Co., Ltd.
Nisshin Oillio Group, Ltd. (The)Nissin Sugar Co., Ltd.Nitto Fuji Flour Milling Co., Ltd.Noevir Holdings Co., Ltd.Oenon Holdings, Inc.OIE Sangyo Co., Ltd.Okuwa Co., Ltd.Olympic Group Corp.OUG Holdings, Inc.Pickles Corp.Plant Co., Ltd.Prima Meat Packers, Ltd.Qol Holdings Co., Ltd.Retail Partners Co., Ltd.Riken Vitamin Co., Ltd.Rock Field Co., Ltd.Rokko Butter Co., Ltd.S Foods, Inc.S&B Foods, Inc.Sagami Rubber Industries Co., Ltd.San-A Co., Ltd.Sapporo Holdings, Ltd.Sato Foods Co., Ltd.Satudora Holdings Co., Ltd.Shinobu Foods Products Co., Ltd.Shoei Foods Corp.Showa Sangyo Co., Ltd.Sogo Medical Holdings Co., Ltd.ST Corp.Starzen Co., Ltd.Toho Co., Ltd.Tohto Suisan Co., Ltd.Torigoe Co., Ltd. (The)Toyo Sugar Refining Co., Ltd.Transaction Co., Ltd.United Super Markets Holdings, Inc.Valor Holdings Co., Ltd.Warabeya Nichiyo Holdings Co., Ltd.Watahan & Co., Ltd.Yaizu Suisankagaku Industry Co., Ltd.Yakuodo Co., Ltd.
17,000 272,13652,760 1,600,215
2,860 38,34571,600 1,317,894
425,300 6,707,3298,300 298,285
Table of Contents
The Japanese Small Company SeriesCONTINUED
Shares Value»
CONSUMER STAPLES — (Continued)201,900 $ 5,883,244117,300 2,125,469
8,100 482,27124,900 1,299,725
444,900 1,568,29422,000 259,412
180,900 1,787,469# 62,300 375,274
19,800 491,78128,800 614,33129,100 203,926
228,000 4,268,366165,300 2,484,482111,200 1,245,95280,200 2,517,761
149,800 1,935,78292,800 1,532,575
135,462 4,158,604# 42,798 1,609,859# 63,300 980,044
141,200 5,668,844294,100 6,633,546
800 27,1881,300 22,5671,600 10,163
# 83,600 2,391,457145,400 4,100,974131,900 1,993,278
9,300 143,70554,400 2,093,902
# 55,000 992,01818,099 432,310
# 105,400 784,88115,700 147,423
# 92,400 906,510441,700 3,917,425283,500 5,852,363101,560 1,596,078
# 47,300 993,05062,100 616,542
# 81,300 1,785,585
Copyright © 2021 www.secdatabase.com. All Rights Reserved.Please Consider the Environment Before Printing This Document

Yamami Co.YA-MAN, Ltd.Yamatane Corp.Yamaya Corp.Yamazawa Co., Ltd.Yaoko Co., Ltd.Yokohama Reito Co., Ltd.Yomeishu Seizo Co., Ltd.Yuasa Funashoku Co., Ltd.Yutaka Foods Corp.
TOTAL CONSUMER STAPLES
BP Castrol K.K.Cosmo Energy Holdings Co., Ltd.Fuji Kosan Co., Ltd.Fuji Oil Co., Ltd.Itochu Enex Co., Ltd.
Iwatani Corp.Japan Oil Transportation Co., Ltd.Japan Petroleum Exploration Co., Ltd.Mitsuuroko Group Holdings Co., Ltd.Modec, Inc.Nippon Coke & Engineering Co., Ltd.Raiznext Corp.Sala Corp.San-Ai Oil Co., Ltd.Sinanen Holdings Co., Ltd.Toa Oil Co., Ltd.Toyo Kanetsu K.K.
TOTAL ENERGY
77 Bank, Ltd. (The)Advance Create Co., Ltd.Aichi Bank, Ltd. (The)Aiful Corp.Aizawa Securities Co., Ltd.Akatsuki Corp.Akita Bank, Ltd. (The)Anicom Holdings, Inc.Aomori Bank, Ltd. (The)Asax Co., Ltd.Awa Bank, Ltd. (The)Bank of Iwate, Ltd. (The)Bank of Kochi, Ltd. (The)Bank of Nagoya, Ltd. (The)Bank of Okinawa, Ltd. (The)
1,200 29,240# 183,900 1,481,592
67,600 863,74128,500 594,42211,000 168,8644,900 224,368
359,400 3,372,47951,100 917,185
# 14,300 474,8363,900 58,389
251,995,508
ENERGY — (1.2%)52,100 638,642
154,600 3,186,746# 33,100 269,767
294,200 687,133377,700 3,056,379
Table of Contents
The Japanese Small Company SeriesCONTINUED
Shares Value»
ENERGY — (Continued)293,300 $ 9,681,830
16,600 441,196288,200 6,274,675211,600 1,637,710128,800 3,418,454762,100 655,689
# 328,800 3,498,510356,800 1,905,729403,700 3,883,804
57,200 932,768# 51,700 890,950# 63,200 1,126,245
42,186,227
FINANCIALS — (8.1%)471,152 6,716,993
41,800 713,72472,200 2,475,470
* 2,481,200 5,057,320# 271,900 1,727,824# 112,400 348,172
116,540 2,137,362# 141,000 4,911,583
142,900 3,501,542# 9,300 50,094
255,400 5,797,769119,900 2,949,776
# 54,300 375,84396,830 3,004,528
166,360 5,112,812
Copyright © 2021 www.secdatabase.com. All Rights Reserved.Please Consider the Environment Before Printing This Document

Bank of Saga, Ltd. (The)Bank of the Ryukyus, Ltd.Bank of Toyama, Ltd. (The)Chiba Kogyo Bank, Ltd. (The)Chugoku Bank, Ltd. (The)Chukyo Bank, Ltd. (The)Daishi Hokuetsu Financial Group, Inc.Daito Bank, Ltd. (The)DSB Co., Ltd.eGuarantee, Inc.Ehime Bank, Ltd. (The)Entrust, Inc.FIDEA Holdings Co., Ltd.Financial Products Group Co., Ltd.First Bank of Toyama, Ltd. (The)First Brothers Co., Ltd.Fukui Bank, Ltd. (The)Fukushima Bank, Ltd. (The)Fuyo General Lease Co., Ltd.GCA Corp.GMO Financial Holdings, Inc.Gunma Bank, Ltd. (The)Hirose Tusyo, Inc.Hiroshima Bank, Ltd. (The)Hokkoku Bank, Ltd. (The)Hokuhoku Financial Group, Inc.Hyakugo Bank, Ltd. (The)Hyakujushi Bank, Ltd. (The)IBJ Leasing Co., Ltd.
Ichiyoshi Securities Co., Ltd.IwaiCosmo Holdings, Inc.Iyo Bank, Ltd. (The)J Trust Co., Ltd.Jaccs Co., Ltd.Jafco Co., Ltd.Japan Asia Investment Co., Ltd.Japan Investment Adviser Co., Ltd.Japan Securities Finance Co., Ltd.Jimoto Holdings, Inc.Juroku Bank, Ltd. (The)Kansai Mirai Financial Group, Inc.Keiyo Bank, Ltd. (The)Kita-Nippon Bank, Ltd. (The)Kiyo Bank, Ltd. (The)Kosei Securities Co., Ltd. (The)Kyokuto Securities Co., Ltd.Kyushu Financial Group, Inc.
113,500 1,583,947237,880 2,466,096
# 14,500 345,785408,600 1,147,951373,300 3,263,704
81,500 1,648,101293,700 7,806,794
64,900 326,46361,300 293,261
219,900 2,357,584245,200 2,448,390
21,000 141,1971,258,300 1,387,117
497,600 4,383,892# 294,300 825,807# 43,700 433,625
173,300 2,208,105204,100 461,205150,600 8,938,223145,500 946,448
# 274,500 1,491,365734,100 2,529,049
20,800 357,7591,270,500 6,072,073
175,200 4,866,728923,400 9,251,757
1,680,509 4,927,799168,100 3,345,657217,200 5,451,008
Table of Contents
The Japanese Small Company SeriesCONTINUED
Shares Value»
FINANCIALS — (Continued)303,300 $2,002,401148,600 1,515,637425,200 2,066,516
# 505,700 2,209,079181,100 3,601,841241,100 8,937,830
* 127,300 303,451# 75,600 1,276,248
828,500 4,200,0751,028,500 923,667
234,500 4,781,13123,453 157,511
786,200 4,785,02753,706 889,939
475,090 6,187,470# 33,999 195,415
190,900 1,602,898717,527 2,723,144
Copyright © 2021 www.secdatabase.com. All Rights Reserved.Please Consider the Environment Before Printing This Document

Kyushu Leasing Service Co., Ltd.M&A Capital Partners Co., Ltd.Marusan Securities Co., Ltd.Mercuria Investment Co., Ltd.Michinoku Bank, Ltd. (The)Mito Securities Co., Ltd.Miyazaki Bank, Ltd. (The)Monex Group, Inc.Money Partners Group Co., Ltd.Morningstar Japan KKMusashino Bank, Ltd. (The)Nagano Bank, Ltd. (The)Nanto Bank, Ltd. (The)NEC Capital Solutions, Ltd.Newton Financial Consulting, Inc.Nishi-Nippon Financial Holdings, Inc.North Pacific Bank, Ltd.OAK Capital Corp.Ogaki Kyoritsu Bank, Ltd. (The)Oita Bank, Ltd. (The)Okasan Securities Group, Inc.Orient Corp.Ricoh Leasing Co., Ltd.San ju San Financial Group, Inc.San-In Godo Bank, Ltd. (The)Sawada Holdings Co., Ltd.Senshu Ikeda Holdings, Inc.Shiga Bank, Ltd. (The)Shikoku Bank, Ltd. (The)Shimane Bank, Ltd. (The)Shimizu Bank, Ltd. (The)Sparx Group Co., Ltd.Strike Co., Ltd.Taiko Bank, Ltd. (The)Tochigi Bank, Ltd. (The)Toho Bank, Ltd. (The)Tohoku Bank, Ltd. (The)Tokai Tokyo Financial Holdings, Inc.Tokyo Kiraboshi Financial Group, Inc.Tomato Bank, Ltd.TOMONY Holdings, Inc.
Tottori Bank, Ltd. (The)Towa Bank, Ltd. (The)Toyo Securities Co., Ltd.Traders Holdings Co., Ltd.Tsukuba Bank, Ltd.Yamagata Bank, Ltd. (The)
34,000 190,745* 38,400 2,565,438# 404,100 2,032,531# 81,600 547,388# 325,398 5,054,257
424,800 777,658125,900 3,030,357
# 1,353,000 4,017,221# 149,100 384,414
3,300 10,619243,000 4,693,790
58,399 916,377198,700 4,266,731
72,000 1,306,5114,200 87,074
878,000 6,202,1812,218,700 4,946,606
# 354,100 456,539287,300 6,179,570
94,099 2,666,3441,129,300 4,036,743
512,000 599,178110,300 3,387,638126,510 1,879,318
1,033,700 6,244,117150,600 1,237,899
1,953,300 3,583,281# 338,200 7,458,628
408,400 3,522,35229,800 189,97750,900 867,547
# 693,300 1,437,13742,800 1,035,93641,800 707,809
813,600 1,329,8191,414,800 3,395,422
70,400 670,6381,635,800 4,963,295
234,538 3,136,39054,500 520,649
974,950 3,169,434Table of Contents
The Japanese Small Company SeriesCONTINUED
Shares Value»
FINANCIALS — (Continued)67,800 $ 894,573
176,200 1,167,488513,300 579,961
* 68,600 48,810307,600 476,784203,500 2,972,230
Copyright © 2021 www.secdatabase.com. All Rights Reserved.Please Consider the Environment Before Printing This Document

Yamaguchi Financial Group, Inc.Yamanashi Chuo Bank, Ltd. (The)
TOTAL FINANCIALS
Advantage Risk Management Co., Ltd.As One Corp.ASKA Pharmaceutical Co., Ltd.Biofermin Pharmaceutical Co., Ltd.BML, Inc.Carenet, Inc.Charm Care Corp. KKCMIC Holdings Co., Ltd.Create Medic Co., Ltd.Daiken Medical Co., Ltd.Daito Pharmaceutical Co., Ltd.Dvx, Inc.Eiken Chemical Co., Ltd.Elan Corp.EM Systems Co., Ltd.EPS Holdings, Inc.FALCO HOLDINGS Co., Ltd.FINDEX, Inc.Fuji Pharma Co., Ltd.Fukuda Denshi Co., Ltd.Fuso Pharmaceutical Industries, Ltd.Hogy Medical Co., Ltd.I'rom Group Co., Ltd.Iwaki & Co., Ltd.Japan Animal Referral Medical Center Co., Ltd.Japan Lifeline Co., Ltd.Japan Medical Dynamic Marketing, Inc.JCR Pharmaceuticals Co., Ltd.Jeol, Ltd.JMS Co., Ltd.Kanamic Network Co., Ltd.Kawasumi Laboratories, Inc.Kissei Pharmaceutical Co., Ltd.KYORIN Holdings, Inc.Linical Co., Ltd.Mani, Inc.Medical Data Vision Co., Ltd.Medius Holdings Co., Ltd.MedPeer, Inc.Menicon Co., Ltd.Miraca Holdings, Inc.Mizuho Medy Co., Ltd.Mochida Pharmaceutical Co., Ltd.N Field Co., Ltd.Nagaileben Co., Ltd.Nakanishi, Inc.NichiiGakkan Co., Ltd.Nichi-iko Pharmaceutical Co., Ltd.
435,700 3,041,874248,700 2,589,697
290,423,957
HEALTH CARE — (4.7%)38,800 263,94642,468 3,515,931
181,500 2,170,52328,700 575,046
202,200 5,549,662# 25,600 147,360# 36,700 639,835
86,100 1,470,11944,100 373,078
118,800 675,07986,580 2,413,369
# 45,800 333,666239,400 4,022,830105,700 1,685,670
# 139,300 2,146,201256,900 3,955,397
67,300 992,011119,200 1,029,093120,400 1,613,394
56,900 3,737,25048,000 845,970
155,200 4,314,067# 31,800 500,931
196,300 874,320* 13,900 280,818# 462,300 8,136,622
114,000 1,427,37020,300 1,428,376
266,300 5,984,01496,557 708,45741,200 833,43994,480 663,093
209,800 5,182,113274,000 4,608,922
84,500 816,60451,300 3,686,629
* 152,500 1,527,244# 75,300 467,016#* 40,000 578,379
197,600 7,266,823472,500 10,683,216
# 26,200 599,46452,398 2,200,88564,600 406,116
5,400 112,651199,300 3,638,161289,200 4,576,261366,450 4,198,963
Table of Contents
Copyright © 2021 www.secdatabase.com. All Rights Reserved.Please Consider the Environment Before Printing This Document

Nikkiso Co., Ltd.Nippon Chemiphar Co., Ltd.Nipro Corp.Nissui Pharmaceutical Co., Ltd.Paramount Bed Holdings Co., Ltd.Pharma Foods International Co., Ltd.Rion Co., Ltd.Seed Co., Ltd.Seikagaku Corp.Shin Nippon Biomedical Laboratories, Ltd.Ship Healthcare Holdings, Inc.Shofu, Inc.Software Service, Inc.Solasto Corp.St-Care Holding Corp.Techno Medica Co., Ltd.Toho Holdings Co., Ltd.Tokai Corp.Torii Pharmaceutical Co., Ltd.Towa Pharmaceutical Co., Ltd.Tsukui Corp.Uchiyama Holdings Co., Ltd.UNIMAT Retirement Community Co., Ltd.Value HR Co., Ltd.Vital KSK Holdings, Inc.Wakamoto Pharmaceutical Co., Ltd.WIN-Partners Co., Ltd.
TOTAL HEALTH CARE
A&A Material Corp.Abist Co., Ltd.Advan Co., Ltd.Advanex, Inc.Aeon Delight Co., Ltd.Aichi Corp.Aida Engineering, Ltd.Airtech Japan, Ltd.AIT Corp.Ajis Co., Ltd.Alconix Corp.Alinco, Inc.Alps Logistics Co., Ltd.Altech Co., Ltd.Altech Corp.Anest Iwata Corp.Arrk Corp.Asahi Diamond Industrial Co., Ltd.Asahi Kogyosha Co., Ltd.Asanuma Corp.
The Japanese Small Company SeriesCONTINUED
Shares Value»
HEALTH CARE — (Continued)420,800 $ 5,385,616
17,100 446,544199,700 2,213,870
94,200 1,046,528149,800 5,729,173
#* 39,600 176,79765,300 1,438,992
# 94,700 922,984257,300 2,822,368127,300 854,945
48,400 2,174,91569,200 882,82924,900 2,378,494
350,700 3,826,93293,200 436,31727,800 558,426
170,200 3,784,683160,800 3,163,552114,500 2,739,098216,000 5,420,428422,300 1,941,784
26,400 125,96427,300 431,45423,200 733,872
329,400 3,192,925* 112,300 264,150
125,700 1,387,328
168,337,352
INDUSTRIALS — (29.0%)26,000 243,74522,400 555,083
197,900 2,010,920# 22,099 342,804
98,700 2,940,896266,400 1,668,357353,300 2,796,656
22,000 119,65478,700 729,93731,200 984,839
# 169,400 2,018,32099,200 883,396
111,600 767,03310,900 21,665
# 138,270 2,133,087248,900 2,098,680
#* 606,500 560,592374,300 2,311,658
30,100 745,373# 51,700 1,649,217
Copyright © 2021 www.secdatabase.com. All Rights Reserved.Please Consider the Environment Before Printing This Document

Asukanet Co., Ltd.Asunaro Aoki Construction Co., Ltd.Bando Chemical Industries, Ltd.BayCurrent Consulting, Inc.Bell System24 Holdings, Inc.Br Holdings Corp.Bunka Shutter Co., Ltd.Canare Electric Co., Ltd.Career Design Center Co., Ltd.
Central Glass Co., Ltd.Central Security Patrols Co., Ltd.Chilled & Frozen Logistics Holdings Co., Ltd., Class HChiyoda Integre Co., Ltd.Chodai Co., Ltd.Chori Co., Ltd.Chudenko Corp.Chugai Ro Co., Ltd.Chuo Warehouse Co., Ltd.CKD Corp.CMC Corp.Comany, Inc.Cosel Co., Ltd.Creek & River Co., Ltd.CTI Engineering Co., Ltd.CTS Co., Ltd.Dai-Dan Co., Ltd.Daido Kogyo Co., Ltd.Daihatsu Diesel Manufacturing Co., Ltd.Daihen Corp.Daiho Corp.Dai-Ichi Cutter Kogyo K.K.Daiichi Jitsugyo Co., Ltd.Daiichi Kensetsu Corp.Daiki Axis Co., Ltd.Daikokuya Holdings Co., Ltd.Daiohs Corp.Daiseki Co., Ltd.Daiseki Eco. Solution Co., Ltd.Daisue Construction Co., Ltd.Daiwa Industries, Ltd.Denyo Co., Ltd.DMG Mori Co., Ltd.DMW Corp.Duskin Co., Ltd.Ebara Jitsugyo Co., Ltd.Eidai Co., Ltd.Endo Lighting Corp.
# 66,800 936,002135,400 1,022,809261,100 2,253,185100,800 4,603,028266,700 3,797,715194,000 617,761
# 430,700 3,524,83123,500 401,35533,900 493,400
Table of Contents
The Japanese Small Company SeriesCONTINUED
Shares Value»
INDUSTRIALS — (Continued)238,300 $ 5,417,064
# 57,500 2,583,695# 109,900 1,337,290
78,300 1,495,1193,900 29,150
82,100 1,278,572236,200 5,165,936
44,000 648,408# 21,000 207,470
398,200 4,368,45014,600 330,741
4,700 60,040# 175,000 1,735,314# 72,100 878,729
83,400 1,213,047197,400 1,213,706114,900 2,331,54148,400 393,308
# 124,100 735,549160,000 4,429,994132,300 3,287,132
25,300 408,65266,200 1,815,159
# 31,000 503,463# 51,700 402,962* 138,700 50,483
20,200 268,824302,863 7,197,007
46,559 291,33659,100 517,234
240,700 2,384,550124,600 1,796,975
# 692,400 10,029,6654,800 94,049
346,300 9,165,79943,300 800,562
214,300 680,33029,600 206,862
Copyright © 2021 www.secdatabase.com. All Rights Reserved.Please Consider the Environment Before Printing This Document

en-japan, Inc.Enshu, Ltd.EPCO Co., Ltd.ERI Holdings Co., Ltd.Escrow Agent Japan, Inc.F&M Co., Ltd.FDK Corp.Freund Corp.Fudo Tetra Corp.Fuji Corp.Fuji Die Co., Ltd.Fuji Furukawa Engineering & Construction Co., Ltd.Fujikura, Ltd.Fujimak Corp.Fujisash Co., Ltd.Fujitec Co., Ltd.Fukuda Corp.Fukushima Industries Corp.Fukuvi Chemical Industry Co., Ltd.Fukuyama Transporting Co., Ltd.FULLCAST Holdings Co., Ltd.
Funai Soken Holdings, Inc.Furukawa Co., Ltd.Furukawa Electric Co., Ltd.Furusato Industries, Ltd.Futaba Corp.G Three Holdings Corp.Gakujo Co., Ltd.Gecoss Corp.Giken, Ltd.Glory, Ltd.Grace Technology, Inc.GS Yuasa Corp.Hamakyorex Co., Ltd.Hanwa Co., Ltd.Hashimoto Sogyo Holdings Co., Ltd.Hazama Ando Corp.Helios Techno Holdings Co., Ltd.Hibiya Engineering, Ltd.Hirakawa Hewtech Corp.Hirano Tecseed Co., Ltd.Hirata Corp.Hisaka Works, Ltd.Hitachi Zosen Corp.Hito Communications Holdings, Inc.Hoden Seimitsu Kako Kenkyusho Co., Ltd.Hokuetsu Industries Co., Ltd.
81,200 3,331,045# 36,099 388,221
28,000 321,3141,500 10,901
# 171,400 374,51041,700 480,173
* 47,198 357,129# 83,900 619,665
126,080 1,511,657# 484,400 6,458,992
61,100 349,5321,200 20,994
1,953,600 7,146,385# 12,600 92,969
677,400 533,363527,900 6,580,871
75,000 3,150,93497,600 3,030,22010,600 56,40957,557 2,167,185
140,900 2,881,026Table of Contents
The Japanese Small Company SeriesCONTINUED
Shares Value»
INDUSTRIALS — (Continued)308,470 $ 7,038,818238,200 3,108,431
38,900 1,043,31866,800 892,455
# 268,000 3,568,5762,520 9,568
27,600 310,615100,700 862,957
90,100 2,639,990339,255 8,958,457
# 54,300 1,432,726324,899 6,076,623132,900 4,748,628285,000 7,765,448
4,070 58,5671,528,900 10,539,287
# 138,300 814,410144,700 2,609,119
81,000 940,648# 70,400 1,072,975
57,400 3,510,704163,300 1,281,564
1,274,979 4,572,23350,900 863,55230,300 238,591
162,700 1,769,196
Copyright © 2021 www.secdatabase.com. All Rights Reserved.Please Consider the Environment Before Printing This Document

Hokuriku Electrical Construction Co., Ltd.Hosokawa Micron Corp.Howa Machinery, Ltd.HyAS&Co, Inc.Ichikawa Co., Ltd.Ichiken Co., Ltd.Ichinen Holdings Co., Ltd.Idec Corp.Ihara Science Corp.Iino Kaiun Kaisha, Ltd.Inaba Denki Sangyo Co., Ltd.Inaba Seisakusho Co., Ltd.Inabata & Co., Ltd.Insource Co., Ltd.Interworks, Inc.Inui Global Logistics Co., Ltd.IR Japan Holdings, Ltd.Iseki & Co., Ltd.Ishii Iron Works Co., Ltd.Ishikawa Seisakusho, Ltd.Isolite Insulating Products Co., Ltd.Itoki Corp.Iwaki Co., Ltd.Iwasaki Electric Co., Ltd.JAC Recruitment Co., Ltd.Jalux, Inc.Jamco Corp.Japan Asia Group, Ltd.Japan Elevator Service Holdings Co., Ltd.Japan Foundation Engineering Co., Ltd.Japan Pulp & Paper Co., Ltd.Japan Steel Works, Ltd. (The)Japan Transcity Corp.
JK Holdings Co., Ltd.JMC Corp.Juki Corp.Kamei Corp.Kanaden Corp.Kanagawa Chuo Kotsu Co., Ltd.Kanamoto Co., Ltd.Kandenko Co., Ltd.Kanematsu Corp.Katakura Industries Co., Ltd.Kato Works Co., Ltd.KAWADA TECHNOLOGIES, Inc.Kawagishi Bridge Works Co., Ltd.Kawanishi Warehouse Co., Ltd.
81,500 672,78355,000 2,225,39962,700 484,02030,100 89,156
1,000 14,01335,400 556,932
157,800 1,609,952230,200 4,134,294
51,800 602,511650,500 2,177,822201,800 9,293,580
68,100 869,635337,600 4,393,004
# 45,100 1,321,6828,400 55,453
# 146,080 1,176,983# 61,000 1,590,214
147,000 1,923,675# 11,000 203,399#* 3,600 46,878# 48,000 199,861
252,700 1,042,36541,000 448,88435,800 434,693
104,400 2,413,58044,600 1,030,73773,100 1,332,104
# 189,000 586,718138,100 3,487,505134,500 415,241
84,400 2,840,044421,200 7,333,810271,200 1,238,989
Table of Contents
The Japanese Small Company SeriesCONTINUED
Shares Value»
INDUSTRIALS — (Continued)111,140 $ 560,946
* 6,800 109,384235,300 2,124,701172,600 1,757,760135,500 1,736,266
42,800 1,447,939243,500 6,259,064335,700 2,926,948644,825 7,398,024182,800 2,085,737
61,100 1,090,66747,300 3,243,52511,700 261,6211,700 16,558
Copyright © 2021 www.secdatabase.com. All Rights Reserved.Please Consider the Environment Before Printing This Document

Kawasaki Kinkai Kisen Kaisha, Ltd.Kawasaki Kisen Kaisha, Ltd.Kawata Manufacturing Co., Ltd.Keihin Co., Ltd.KFC, Ltd.Kimura Chemical Plants Co., Ltd.Kimura Unity Co., Ltd.King Jim Co., Ltd.Kinki Sharyo Co., Ltd. (The)Kintetsu World Express, Inc.Kitagawa Corp.Kitano Construction Corp.Kito Corp.Kitz Corp.Kobayashi Metals, Ltd.Kobe Electric Railway Co., Ltd.Kobelco Eco-Solutions Co., Ltd.Koike Sanso Kogyo Co., Ltd.Kokusai Co., Ltd.Kokuyo Co., Ltd.KOMAIHALTEC, Inc.Komatsu Wall Industry Co., Ltd.Komori Corp.Kondotec, Inc.Konoike Transport Co., Ltd.Kosaido Co., Ltd.Kozo Keikaku Engineering, Inc.KRS Corp.Kumagai Gumi Co., Ltd.Kuroda Precision Industries, Ltd.Kyodo Printing Co., Ltd.Kyokuto Boeki Kaisha, Ltd.Kyokuto Kaihatsu Kogyo Co., Ltd.Kyoritsu Printing Co., Ltd.Like Co., Ltd.Link And Motivation, Inc.Lonseal Corp.Maeda Corp.Maeda Kosen Co., Ltd.Maeda Road Construction Co., Ltd.Maezawa Industries, Inc.Maezawa Kasei Industries Co., Ltd.Maezawa Kyuso Industries Co., Ltd.Makino Milling Machine Co., Ltd.Marufuji Sheet Piling Co., Ltd.
Maruka Corp.Marumae Co., Ltd.
9,599 252,136#* 632,300 8,077,755
28,600 270,11124,900 282,917
8,700 135,640107,500 353,599
23,500 224,954# 105,700 801,267* 26,999 418,367
293,300 3,933,00257,700 1,115,70726,172 628,823
160,700 2,379,497623,900 4,239,080
7,900 21,542* 36,599 1,337,388# 21,399 346,309# 14,500 317,055# 51,600 343,588
274,725 3,705,52924,900 370,64153,500 941,970
396,800 4,007,022129,900 1,102,166202,500 3,133,106
* 212,900 1,396,713# 20,700 418,577
46,500 840,215299,100 7,995,974
9,900 75,76852,500 1,365,083
# 45,000 734,080237,800 2,934,276199,200 333,848
# 63,200 1,081,614# 210,200 1,078,600
13,900 214,850425,400 3,187,128135,500 2,266,125245,700 5,213,864
25,300 79,76895,100 993,43674,400 1,321,608
177,900 7,416,31311,800 240,491
Table of Contents
The Japanese Small Company SeriesCONTINUED
Shares Value»
INDUSTRIALS — (Continued)43,700 $ 769,604
# 26,300 215,678
Copyright © 2021 www.secdatabase.com. All Rights Reserved.Please Consider the Environment Before Printing This Document

Maruwa Unyu Kikan Co., Ltd.Maruyama Manufacturing Co., Inc.Maruzen Co., Ltd.Maruzen Showa Unyu Co., Ltd.Matching Service Japan Co., Ltd.Matsuda Sangyo Co., Ltd.Matsui Construction Co., Ltd.Max Co., Ltd.Meidensha Corp.Meiji Electric Industries Co., Ltd.Meiji Shipping Co., Ltd.Meisei Industrial Co., Ltd.Meitec Corp.Meiwa Corp.Mesco, Inc.METAWATER Co., Ltd.Mie Kotsu Group Holdings, Inc.Mirait Holdings Corp.Mitani Corp.Mitani Sangyo Co., Ltd.Mitsubishi Kakoki Kaisha, Ltd.Mitsubishi Logisnext Co., Ltd.Mitsubishi Pencil Co., Ltd.Mitsuboshi Belting, Ltd.Mitsui E&S Holdings Co., Ltd.Mitsui Matsushima Holdings Co., Ltd.Mitsui-Soko Holdings Co., Ltd.Mitsumura Printing Co., Ltd.Miyaji Engineering Group, Inc.Mori-Gumi Co., Ltd.Morita Holdings Corp.Musashi Co., Ltd.NAC Co., Ltd.Nachi-Fujikoshi Corp.Nadex Co., Ltd.Nagase & Co., Ltd.Naigai Trans Line, Ltd.Nakabayashi Co., Ltd.Nakakita Seisakusho Co., Ltd.Nakamoto Packs Co., Ltd.Nakanishi Manufacturing Co., Ltd.Nakano Corp.Nakano Refrigerators Co., Ltd.Namura Shipbuilding Co., Ltd.Narasaki Sangyo Co., Ltd.Nexyz Group Corp.Nice Holdings, Inc.Nichias Corp.Nichiban Co., Ltd.Nichiden Corp.Nichiha Corp.Nichireki Co., Ltd.Nihon Dengi Co., Ltd.Nihon Flush Co., Ltd.
# 74,700 3,192,56227,900 293,455
# 67,300 1,299,57980,000 2,376,50152,000 821,554
100,082 1,411,427146,300 910,389206,800 3,261,730277,110 4,271,75654,800 690,244
111,000 319,995297,400 2,054,367216,400 11,152,606170,200 591,018
# 29,800 261,79682,500 2,760,891
391,400 2,034,702# 586,235 8,655,427
73,800 3,651,243145,000 373,906
44,100 646,180217,400 2,222,814
83,600 1,293,106167,300 3,067,235
* 639,200 5,601,46665,700 781,346
173,600 2,459,837# 9,300 165,253
41,517 669,79069,500 206,137
224,500 3,685,495# 5,000 97,845
76,500 692,073111,500 4,691,63240,600 325,038
269,700 3,929,33743,400 522,325
113,400 570,603# 3,700 95,988
38,500 527,4905,700 63,154
108,100 422,941200 11,631
420,428 1,108,58425,400 410,164
# 58,000 1,070,411#* 50,900 284,242
480,100 8,598,93481,800 1,418,914
100,300 1,759,942213,280 5,563,062192,500 1,928,601
# 30,200 784,89765,800 1,764,179
Copyright © 2021 www.secdatabase.com. All Rights Reserved.Please Consider the Environment Before Printing This Document

Nikkato Corp.Nikko Co., Ltd.Nikkon Holdings Co., Ltd.
Nippi, Inc.Nippon Air Conditioning Services Co., Ltd.Nippon Aqua Co., Ltd.Nippon Carbon Co., Ltd.Nippon Concept Corp.Nippon Densetsu Kogyo Co., Ltd.Nippon Dry-Chemical Co., Ltd.Nippon Filcon Co., Ltd.Nippon Hume Corp.Nippon Kanzai Co., Ltd.Nippon Koei Co., Ltd.Nippon Parking Development Co., Ltd., Class CNippon Rietec Co., Ltd.Nippon Road Co., Ltd. (The)Nippon Seisen Co., Ltd.Nippon Sharyo, Ltd.Nippon Sheet Glass Co., Ltd.Nippon Steel Trading Corp.Nippon Thompson Co., Ltd.Nippon Tungsten Co., Ltd.Nishimatsu Construction Co., Ltd.Nishi-Nippon Railroad Co., Ltd.Nishio Rent All Co., Ltd.Nissei ASB Machine Co., Ltd.Nissei Corp.Nissei Plastic Industrial Co., Ltd.Nisshinbo Holdings, Inc.Nissin Corp.Nissin Electric Co., Ltd.Nitta Corp.Nitto Boseki Co., Ltd.Nitto Kogyo Corp.Nitto Kohki Co., Ltd.Nitto Seiko Co., Ltd.Nittoc Construction Co., Ltd.NJS Co., Ltd.nms Holdings Co.Noda Corp.Nomura Co., Ltd.Noritake Co., Ltd.Noritsu Koki Co., Ltd.Noritz Corp.NS Tool Co., Ltd.NS United Kaiun Kaisha, Ltd.
53,000 325,94636,100 966,374
385,300 9,003,565Table of Contents
The Japanese Small Company SeriesCONTINUED
Shares Value»
INDUSTRIALS — (Continued)11,900 $ 367,080
205,900 1,366,4175,300 28,172
# 74,000 2,839,37441,800 465,360
272,400 5,219,0084,300 44,814
13,100 58,235165,600 1,059,436
77,200 1,300,38585,900 1,884,460
1,511,300 2,352,0049,300 115,423
51,100 2,842,79924,300 592,562
* 54,899 1,255,878772,500 4,830,916117,460 4,714,142402,900 1,845,146
6,699 126,258398,600 7,531,399185,600 3,915,228138,000 3,857,872
# 63,900 1,596,415# 38,900 442,596
169,000 1,629,202972,780 7,574,410109,100 1,743,611384,200 4,414,047160,700 4,431,042200,000 4,494,959195,500 3,722,136
80,100 1,604,247198,900 1,040,311170,600 934,495
42,800 676,138# 44,200 173,708
145,800 1,010,117637,600 8,633,920
74,500 2,902,255# 154,700 2,700,573
220,100 2,693,934# 61,700 1,144,540
67,800 1,503,063
Copyright © 2021 www.secdatabase.com. All Rights Reserved.Please Consider the Environment Before Printing This Document

NTN Corp.Obara Group, Inc.Ochi Holdings Co., Ltd.Odawara Engineering Co., Ltd.Odelic Co., Ltd.Ohba Co., Ltd.Ohmoto Gumi Co., Ltd.Oiles Corp.Okabe Co., Ltd.Okada Aiyon Corp.Okamoto Machine Tool Works, Ltd.Okamura Corp.OKK Corp.OKUMA Corp.Okumura Corp.
Onoken Co., Ltd.Organo Corp.Oriental Consultants Holdings Co., Ltd.Origin Co., Ltd.OSG Corp.OSJB Holdings Corp.Outsourcing, Inc.Oyo Corp.Paraca, Inc.Parker Corp.Pasco Corp.Pasona Group, Inc.Pegasus Sewing Machine Manufacturing Co., Ltd.Penta-Ocean Construction Co., Ltd.Phil Co., Inc.Pilot Corp.Prestige International, Inc.Pronexus, Inc.PS Mitsubishi Construction Co., Ltd.Punch Industry Co., Ltd.Quick Co., Ltd.Raito Kogyo Co., Ltd.Rasa Corp.Relia, Inc.Rheon Automatic Machinery Co., Ltd.Rix Corp.Rozetta Corp.Ryobi, Ltd.S LINE Co., Ltd.Sakai Heavy Industries, Ltd.Sakai Moving Service Co., Ltd.Sanix, Inc.
3,034,100 8,419,68290,600 3,135,953
8,900 95,0396,500 125,215
27,800 1,022,844# 87,200 489,533
4,100 185,171177,470 2,518,154291,100 2,238,948
40,400 468,15321,699 546,245
475,200 4,632,486# 28,700 210,007
105,400 5,479,821247,480 7,051,170
Table of Contents
The Japanese Small Company SeriesCONTINUED
Shares Value»
INDUSTRIALS — (Continued)128,700 $1,617,975
53,300 1,887,2766,100 108,399
27,600 363,488243,700 4,837,124
1,031,600 2,330,019791,800 9,425,311165,400 1,673,587
# 37,900 725,43534,000 154,171
#* 7,800 62,255134,000 2,040,073150,600 756,101
1,618,700 7,838,699#* 8,900 278,495
8,800 332,366400,100 6,126,103124,000 1,232,866243,400 1,403,280107,900 550,339
77,900 1,160,811313,200 4,121,879
# 63,200 477,261252,900 2,987,522152,100 2,552,306
17,300 248,964* 22,800 694,658
178,440 3,307,48923,800 211,31324,500 660,51586,600 5,158,051
* 146,200 308,608
Copyright © 2021 www.secdatabase.com. All Rights Reserved.Please Consider the Environment Before Printing This Document
Sanki Engineering Co., Ltd.Sanko Gosei, Ltd.Sanko Metal Industrial Co., Ltd.Sankyo Tateyama, Inc.Sanoyas Holdings Corp.Sansei Technologies, Inc.Sansha Electric Manufacturing Co., Ltd.Sanyo Denki Co., Ltd.Sanyo Engineering & Construction, Inc.Sanyo Industries, Ltd.Sanyo Trading Co., Ltd.Sata Construction Co., Ltd.Sato Holdings Corp.Sato Shoji Corp.Sawafuji Electric Co., Ltd.SBS Holdings, Inc.SEC Carbon, Ltd.Secom Joshinetsu Co., Ltd.Seibu Electric & Machinery Co., Ltd.Seika Corp.Seikitokyu Kogyo Co., Ltd.Sekisui Jushi Corp.Senko Group Holdings Co., Ltd.Senshu Electric Co., Ltd.Shibusawa Warehouse Co., Ltd. (The)Shibuya Corp.Shima Seiki Manufacturing, Ltd.
Shin Nippon Air Technologies Co., Ltd.Shin-Keisei Electric Railway Co., Ltd.Shinki Bus Co., Ltd.Shinmaywa Industries, Ltd.Shinnihon Corp.Shinsho Corp.Shinwa Co., Ltd.Shoko Co., Ltd.Showa Aircraft Industry Co., Ltd.SIGMAXYZ, Inc.Sinfonia Technology Co., Ltd.Sinko Industries, Ltd.Sintokogio, Ltd.SMS Co., Ltd.Soda Nikka Co., Ltd.Sodick Co., Ltd.Space Co., Ltd.S-Pool, Inc.Star Micronics Co., Ltd.Subaru Enterprise Co., Ltd.
337,700 3,803,827139,300 472,894
17,700 396,179210,300 2,359,586
# 159,500 291,074# 88,000 945,134
66,700 462,56344,100 1,906,90178,500 495,675
9,900 165,20380,000 1,792,26891,299 333,978
214,300 5,176,04093,000 753,684
1,900 31,905149,200 2,200,265
# 10,900 978,179# 33,600 1,087,573# 10,300 81,443
67,000 837,913208,430 1,278,521223,200 4,251,563900,100 7,051,940
54,200 1,345,17362,200 1,038,17399,400 2,748,591
# 211,500 6,181,389Table of Contents
The Japanese Small Company SeriesCONTINUED
Shares Value»
INDUSTRIALS — (Continued)116,680 $ 1,906,032
# 42,999 807,9791,900 66,455
707,200 8,839,656208,700 1,640,584
36,300 759,60669,000 1,436,754
* 44,400 266,195# 48,937 591,328# 133,700 1,696,016
173,200 1,985,175151,700 2,168,089328,700 2,767,018455,300 10,109,524126,500 656,504209,900 1,879,642100,062 1,064,772
# 54,500 1,304,557263,600 3,458,814
# 8,100 458,257
Copyright © 2021 www.secdatabase.com. All Rights Reserved.Please Consider the Environment Before Printing This Document

Sugimoto & Co., Ltd.Sumiseki Holdings, Inc.Sumitomo Densetsu Co., Ltd.Sumitomo Mitsui Construction Co., Ltd.Sumitomo Precision Products Co., Ltd.Sumitomo Warehouse Co., Ltd. (The)Suzumo Machinery Co., Ltd.SWCC Showa Holdings Co., Ltd.Tacmina Corp.Tadano, Ltd.Taihei Dengyo Kaisha, Ltd.Taiheiyo Kouhatsu, Inc.Taikisha, Ltd.Taisei Oncho Co., Ltd.Takadakiko Co., Ltd.Takagi Seiko Corp.Takamatsu Construction Group Co., Ltd.Takamatsu Machinery Co., Ltd.Takamiya Co., Ltd.Takano Co., Ltd.Takaoka Toko Co., Ltd.Takara Printing Co., Ltd.Takara Standard Co., Ltd.Takasago Thermal Engineering Co., Ltd.Takashima & Co., Ltd.Takeei Corp.Takeuchi Manufacturing Co., Ltd.Takigami Steel Construction Co., Ltd. (The)Takisawa Machine Tool Co., Ltd.Takuma Co., Ltd.Tanabe Engineering Corp.Tanseisha Co., Ltd.Tatsuta Electric Wire and Cable Co., Ltd.TECHNO ASSOCIE Co., Ltd.Techno Ryowa, Ltd.Techno Smart Corp.Teikoku Electric Manufacturing Co., Ltd.Teikoku Sen-I Co., Ltd.Tekken Corp.
Tenox Corp.Teraoka Seisakusho Co., Ltd.Terasaki Electric Co., Ltd.Toa Corp.TOA ROAD Corp.Toba, Inc.Tobishima Corp.Tocalo Co., Ltd.
70,500 1,250,015# 476,200 579,719
129,500 2,295,6751,393,140 7,405,200
21,184 534,124473,900 6,102,465
2,200 28,34698,700 785,221
# 14,700 238,783825,100 7,418,759121,700 2,514,425
44,200 306,739184,900 5,514,764
14,000 242,5137,500 172,3722,300 54,206
107,800 2,264,630# 41,800 325,596
128,600 934,63660,100 436,38059,620 653,84222,155 333,369
267,900 4,199,481350,100 5,404,936
26,600 409,602162,900 1,463,884289,400 4,475,918
# 5,300 236,03045,100 585,822
303,000 3,595,450# 39,500 273,530
268,249 3,181,396317,600 1,401,635
# 56,800 666,83271,390 521,41949,500 306,460
131,300 1,428,347118,600 2,169,25497,800 2,598,607
Table of Contents
The Japanese Small Company SeriesCONTINUED
Shares Value»
INDUSTRIALS — (Continued)22,500 $ 172,45376,000 331,00224,400 229,601
117,000 1,519,63227,300 843,881
# 9,800 263,350151,070 1,747,219474,700 3,548,952
Copyright © 2021 www.secdatabase.com. All Rights Reserved.Please Consider the Environment Before Printing This Document

Toda Corp.Toenec Corp.Togami Electric Manufacturing Co., Ltd.TOKAI Holdings Corp.Tokai Lease Co., Ltd.Tokyo Energy & Systems, Inc.Tokyo Keiki, Inc.Tokyo Sangyo Co., Ltd.Tokyu Construction Co., Ltd.Toli Corp.Tomoe Corp.Tomoe Engineering Co., Ltd.Tonami Holdings Co., Ltd.Toppan Forms Co., Ltd.Torishima Pump Manufacturing Co., Ltd.Toshiba Machine Co., Ltd.Toshiba Plant Systems & Services Corp.Tosho Printing Co., Ltd.Totech Corp.Totetsu Kogyo Co., Ltd.Totoku Electric Co., Ltd.Toyo Construction Co., Ltd.Toyo Denki Seizo K.K.Toyo Engineering Corp.Toyo Logistics Co., Ltd.Toyo Machinery & Metal Co., Ltd.Toyo Tanso Co., Ltd.Toyo Wharf & Warehouse Co., Ltd.Trancom Co., Ltd.Trinity Industrial Corp.Trusco Nakayama Corp.Trust Tech, Inc.Tsubaki Nakashima Co., Ltd.Tsubakimoto Chain Co.Tsubakimoto Kogyo Co., Ltd.Tsudakoma Corp.Tsugami Corp.Tsukishima Kikai Co., Ltd.Tsurumi Manufacturing Co., Ltd.Uchida Yoko Co., Ltd.Ueki Corp.Union Tool Co.Ushio, Inc.UT Group Co., Ltd.Utoc Corp.Waida Manufacturing Co., Ltd.Wakachiku Construction Co., Ltd.Wakita & Co., Ltd.WDB Holdings Co., Ltd.Weathernews, Inc.Will Group, Inc.
392,200 2,148,36658,600 1,715,635
# 17,800 266,981743,300 6,341,318
19,300 304,650184,200 1,585,203
# 67,522 596,601146,700 667,093661,700 4,525,954289,200 675,371159,000 584,514
# 58,900 1,294,01040,900 2,126,808
366,900 3,196,115143,800 1,328,315157,000 3,453,550172,350 2,883,928
* 175,399 2,293,29557,000 1,244,215
193,200 5,283,59517,700 307,389
595,000 2,341,93141,250 577,286
* 221,078 1,138,111# 85,100 248,304
109,300 582,04583,800 1,609,181
# 41,300 522,03756,800 3,272,998
# 36,000 236,726154,100 3,166,646154,200 2,193,376333,200 5,744,988208,840 6,841,611
28,800 882,568# 31,998 406,518# 336,300 2,705,085
210,100 2,484,795141,900 2,392,615
54,000 1,679,80334,800 728,72852,300 1,560,404
799,700 10,202,877# 204,000 4,476,258
102,200 454,7724,300 51,475
99,200 1,327,119294,800 2,953,836
65,900 1,666,82640,200 1,152,214
101,200 815,162Table of Contents
The Japanese Small Company SeriesCONTINUED
Copyright © 2021 www.secdatabase.com. All Rights Reserved.Please Consider the Environment Before Printing This Document

World Holdings Co., Ltd.Yahagi Construction Co., Ltd.YAMABIKO Corp.YAMADA Consulting Group Co., Ltd.Yamashina Corp.Yamato Corp.Yamaura Corp.Yamazen Corp.Yasuda Logistics Corp.Yokogawa Bridge Holdings Corp.Yondenko Corp.Yuasa Trading Co., Ltd.Yuken Kogyo Co., Ltd.Yumeshin Holdings Co., Ltd.Yurtec Corp.Zaoh Co., Ltd.Zenitaka Corp. (The)Zuiko Corp.
TOTAL INDUSTRIALS
A&D Co., Ltd.Access Co., Ltd.Ad-sol Nissin Corp.Adtec Plasma Technology Co., Ltd.AGS Corp.Ai Holdings Corp.Aichi Tokei Denki Co., Ltd.Aiphone Co., Ltd.Allied Telesis Holdings K.K.Alpha Systems, Inc.Amano Corp.AOI Electronics Co., Ltd.Argo Graphics, Inc.Arisawa Manufacturing Co., Ltd.ArtSpark Holdings, Inc.Asahi Intelligence Service Co., Ltd.Aval Data Corp.Avant Corp.Axell Corp.Azia Co., Ltd.Billing System Corp.BrainPad, Inc.Broadleaf Co., Ltd.Business Brain Showa-Ota, Inc.CAC Holdings Corp.Canon Electronics, Inc.Capital Asset Planning, Inc.CDS Co., Ltd.Change, Inc.Chino Corp.Citizen Watch Co., Ltd.
Shares Value»
INDUSTRIALS — (Continued)45,300 $ 614,095
200,200 1,290,074256,528 2,175,267
78,800 1,425,537224,200 149,779117,000 605,50047,100 359,606
465,300 4,420,643122,200 997,764239,000 3,715,198
27,360 681,570128,600 3,624,544
24,000 376,670# 362,700 2,655,416
277,500 1,841,39423,400 287,310
# 19,600 805,67529,000 887,924
1,034,256,112
INFORMATION TECHNOLOGY — (13.6%)141,000 1,016,669
# 208,000 1,569,20843,000 758,977
# 30,700 212,48711,600 71,121
301,400 4,705,71918,900 728,41974,900 1,145,115
* 64,500 51,90460,520 1,511,506
281,900 8,480,27731,400 618,045
122,200 2,767,872223,500 1,851,270
48,100 386,2101,300 13,300
# 26,000 415,33757,900 1,031,349
#* 44,900 270,28214,300 162,257
# 20,000 220,421#* 7,200 414,371
722,700 3,797,45213,300 292,67394,200 1,202,348
147,700 2,417,41313,200 160,72217,600 216,357
* 10,000 206,92047,400 613,604
1,117,200 5,559,699
Copyright © 2021 www.secdatabase.com. All Rights Reserved.Please Consider the Environment Before Printing This Document

CMK Corp.Computer Engineering & Consulting, Ltd.Computer Institute of Japan, Ltd.Comture Corp.CONEXIO Corp.Core Corp.Cresco, Ltd.
CRI Middleware Co., Ltd.Cube System, Inc.Cyber Com Co., Ltd.Cybernet Systems Co., Ltd.Cybozu, Inc.Dai-ichi Seiko Co., Ltd.Daiko Denshi Tsushin, Ltd.Daishinku Corp.Daitron Co., Ltd.Daiwabo Holdings Co., Ltd.Denki Kogyo Co., Ltd.Densan System Co., Ltd.Dexerials Corp.Digital Arts, Inc.Digital Hearts Holdings Co., Ltd.Digital Information Technologies Corp.DKK-Toa Corp.Double Standard, Inc.DTS Corp.Ebase Co., Ltd.E-Guardian, Inc.Eizo Corp.Elecom Co., Ltd.Elematec Corp.Enomoto Co., Ltd.Enplas Corp.ESPEC Corp.Excel Co., Ltd.Fenwal Controls of Japan, Ltd.Ferrotec Holdings Corp.FFRI, Inc.Fixstars Corp.Focus Systems Corp.Forval Corp.Fronteo, Inc.FTGroup Co., Ltd.Fuji Soft, Inc.Fujitsu Frontech, Ltd.Fukui Computer Holdings, Inc.Furuno Electric Co., Ltd.
# 392,800 2,241,844# 173,300 3,856,260
105,000 952,80382,500 3,159,633
128,600 1,735,263# 44,500 585,248
41,500 1,461,939Table of Contents
The Japanese Small Company SeriesCONTINUED
Shares Value»
INFORMATION TECHNOLOGY — (Continued)* 8,500 $ 193,294# 60,600 482,270# 14,800 268,114# 49,900 310,072
141,600 1,671,748# 72,300 881,127# 37,200 195,191
64,099 701,46854,400 669,177
137,900 6,682,68975,300 2,112,54850,300 1,481,200
# 469,900 3,099,73388,000 8,909,043
# 109,300 1,090,286# 54,900 884,814# 26,800 201,991
11,400 489,512332,400 7,265,909
27,500 299,340# 74,000 1,316,409
132,900 4,874,123141,200 5,112,699122,942 1,154,453
# 30,200 248,00665,800 2,101,574
166,000 3,411,64356,000 778,47821,600 297,594
264,900 2,272,052* 20,500 685,839
115,700 1,911,12022,500 175,91252,300 448,466
# 118,100 412,93467,000 948,09942,500 1,909,67088,800 780,41552,500 1,099,965
194,900 1,670,252
Copyright © 2021 www.secdatabase.com. All Rights Reserved.Please Consider the Environment Before Printing This Document

Furuya Metal Co., Ltd.Future Corp.Future Innovation Group, Inc.Geomatec Co., Ltd.GL Sciences, Inc.Glosel Co., Ltd.GMO Cloud K.K.GMO internet, Inc.GMO Pepabo, Inc.Gunosy, Inc.Hagiwara Electric Holdings Co., Ltd.Hakuto Co., Ltd.Hibino Corp.Hioki EE Corp.Hochiki Corp.Hokuriku Electric Industry Co., Ltd.Honda Tsushin Kogyo Co., Ltd.Hosiden Corp.Ibiden Co., Ltd.
Icom, Inc.ID Holdings Corp.Ikegami Tsushinki Co., Ltd.Ines Corp.I-Net Corp.Infocom Corp.Infomart Corp.Information Services International-Dentsu, Ltd.Innotech Corp.Intelligent Wave, Inc.Inter Action Corp.I-O Data Device, Inc.Iriso Electronics Co., Ltd.ISB Corp.ITbook Holdings Co., Ltd.Itfor, Inc.Iwatsu Electric Co., Ltd.Japan Aviation Electronics Industry, Ltd.Japan Cash Machine Co., Ltd.Japan Display, Inc.Japan Electronic Materials Corp.Japan Material Co., Ltd.Jastec Co., Ltd.JBCC Holdings, Inc.JFE Systems, Inc.JIG-SAW, Inc.Justsystems Corp.Kaga Electronics Co., Ltd.
6,700 223,410150,800 2,682,091
11,900 36,776# 29,900 206,217
46,700 640,371105,100 419,486
17,300 495,465192,900 3,135,856
7,300 256,158#* 44,800 668,428
51,100 1,338,492100,600 1,132,777
26,900 625,01170,900 2,411,057
120,000 1,494,820# 48,200 465,296# 113,800 519,114
423,800 4,704,78032,578 580,815
Table of Contents
The Japanese Small Company SeriesCONTINUED
Shares Value»
INFORMATION TECHNOLOGY — (Continued)# 79,000 $1,642,695
52,100 565,506# 40,799 395,908
166,100 1,769,54780,390 1,078,564
188,000 4,659,775503,400 6,790,108
90,100 3,128,423116,200 963,757
# 33,500 286,605# 27,600 479,616
56,200 482,819154,500 7,047,729
15,300 241,070* 101,500 324,968
164,700 1,409,92768,500 493,883
382,900 5,332,760154,800 1,539,265
#* 3,483,900 2,380,872# 51,800 251,293
481,200 6,264,80083,900 836,750
117,800 1,733,8211,600 45,368
* 26,700 1,226,235119,300 4,025,413133,600 2,032,465
Copyright © 2021 www.secdatabase.com. All Rights Reserved.Please Consider the Environment Before Printing This Document

Kanematsu Electronics, Ltd.KEL Corp.Koa Corp.KSK Co., Ltd.Kyoden Co., Ltd.Kyosan Electric Manufacturing Co., Ltd.Kyowa Electronic Instruments Co., Ltd.LAC Co., Ltd.Lasertec Corp.Lecip Holdings Corp.Macnica Fuji Electronics Holdings, Inc.Mamezou Holdings Co., Ltd.Marubun Corp.Maruwa Co., Ltd.Maxell Holdings, Ltd.MCJ Co., Ltd.Megachips Corp.Meiko Electronics Co., Ltd.Melco Holdings, Inc.Metaps, Inc.Micronics Japan Co., Ltd.Mimaki Engineering Co., Ltd.Mimasu Semiconductor Industry Co., Ltd.Miraial Co., Ltd.Miroku Jyoho Service Co., Ltd.Mitachi Co., Ltd.Mitsubishi Research Institute, Inc.Mitsui High-Tec, Inc.Mutoh Holdings Co., Ltd.Nagano Keiki Co., Ltd.Nakayo, Inc.
NEC Networks & System Integration Corp.Neos Corp.NF Corp.Nichicon Corp.Nihon Dempa Kogyo Co., Ltd.Nihon Denkei Co., Ltd.Nippon Chemi-Con Corp.Nippon Computer Dynamics Co., Ltd.Nippon Information Development Co., Ltd.Nippon Kodoshi Corp.Nippon Signal Co., Ltd.Nippon Systemware Co., Ltd.Nissha Co., Ltd.Nohmi Bosai, Ltd.NSD Co., Ltd.NuFlare Technology, Inc.
89,400 2,452,02427,900 202,710
172,100 2,071,7083,000 52,363
# 110,000 333,195319,900 1,100,286142,900 549,312
# 100,100 1,556,171160,100 7,615,980
5,100 37,760389,750 5,407,498124,900 1,689,659112,200 601,763
# 70,000 4,305,369# 396,400 5,067,652
537,300 3,929,056# 112,800 1,683,474# 179,500 3,027,872
13,400 349,407#* 12,800 128,963
223,800 2,135,570# 136,300 739,100
119,981 1,993,04348,000 618,494
# 140,300 4,384,99217,900 115,58356,200 2,059,138
184,400 2,167,85214,600 222,58696,400 685,56977,100 1,179,749
Table of Contents
The Japanese Small Company SeriesCONTINUED
Shares Value»
INFORMATION TECHNOLOGY — (Continued)176,700 $4,569,264
8,600 58,597# 22,500 464,358
397,800 3,273,687#* 121,600 536,669
31,800 412,15083,600 1,279,520
# 38,600 303,429# 12,600 159,024# 56,200 761,414
372,300 4,132,19556,800 1,449,903
253,600 2,939,178167,400 3,409,983293,480 9,039,689
35,300 2,493,310
Copyright © 2021 www.secdatabase.com. All Rights Reserved.Please Consider the Environment Before Printing This Document

Ohara, Inc.Ohizumi Manufacturing Co., Ltd.Okaya Electric Industries Co., Ltd.Oki Electric Industry Co., Ltd.ONO Sokki Co., Ltd.Optex Group Co., Ltd.Oro Co., Ltd.Osaki Electric Co., Ltd.Oval Corp.Paltek Corp.PCI Holdings, Inc.Poletowin Pitcrew Holdings, Inc.Pro-Ship, Inc.Rakus Co., Ltd.RECOMM Co., Ltd.Remixpoint, Inc.Restar Holdings Corp.Riken Keiki Co., Ltd.Riso Kagaku Corp.Roland DG Corp.Rorze Corp.RS Technologies Co., Ltd.Ryoden Corp.Ryosan Co., Ltd.Ryoyo Electro Corp.Saison Information Systems Co., Ltd.Sakura Internet, Inc.Samco, Inc.Sanken Electric Co., Ltd.Sanshin Electronics Co., Ltd.Satori Electric Co., Ltd.Saxa Holdings, Inc.Scala, Inc.SCREEN Holdings Co., Ltd.Seikoh Giken Co., Ltd.SEMITEC Corp.Shibaura Electronics Co., Ltd.Shibaura Mechatronics Corp.SHIFT, Inc.Shindengen Electric Manufacturing Co., Ltd.Shinko Electric Industries Co., Ltd.Shinko Shoji Co., Ltd.Shizuki Electric Co., Inc.
Showa Shinku Co., Ltd.Sigma Koki Co., Ltd.Siix Corp.SK-Electronics Co., Ltd.
# 35,900 475,261# 27,100 174,570# 77,800 275,872
694,400 9,236,118# 37,400 177,757
271,520 3,429,257# 15,800 354,983
324,800 1,951,28735,600 80,02938,500 188,58415,400 314,476
221,100 2,361,149# 40,600 465,525
130,300 3,328,188# 404,200 524,886#* 150,200 343,937
161,100 2,421,771113,500 2,008,881177,600 2,802,428104,400 2,189,301
# 74,600 1,814,32726,000 805,653
110,600 1,653,677187,200 4,571,409
# 168,200 2,790,392# 24,800 470,833# 151,000 879,869
14,700 121,006193,200 4,038,435150,100 2,514,513
88,480 716,36932,600 616,848
120,700 1,036,085# 96,400 5,223,518# 18,000 492,896
5,500 172,019# 58,000 1,557,896
31,800 901,957* 41,800 1,937,732
53,700 1,743,155566,300 4,553,980157,100 2,765,119127,100 679,291
Table of Contents
The Japanese Small Company SeriesCONTINUED
Shares Value»
INFORMATION TECHNOLOGY — (Continued)# 25,400 $ 299,656
31,600 343,287# 242,700 3,065,154
64,100 1,378,541
Copyright © 2021 www.secdatabase.com. All Rights Reserved.Please Consider the Environment Before Printing This Document
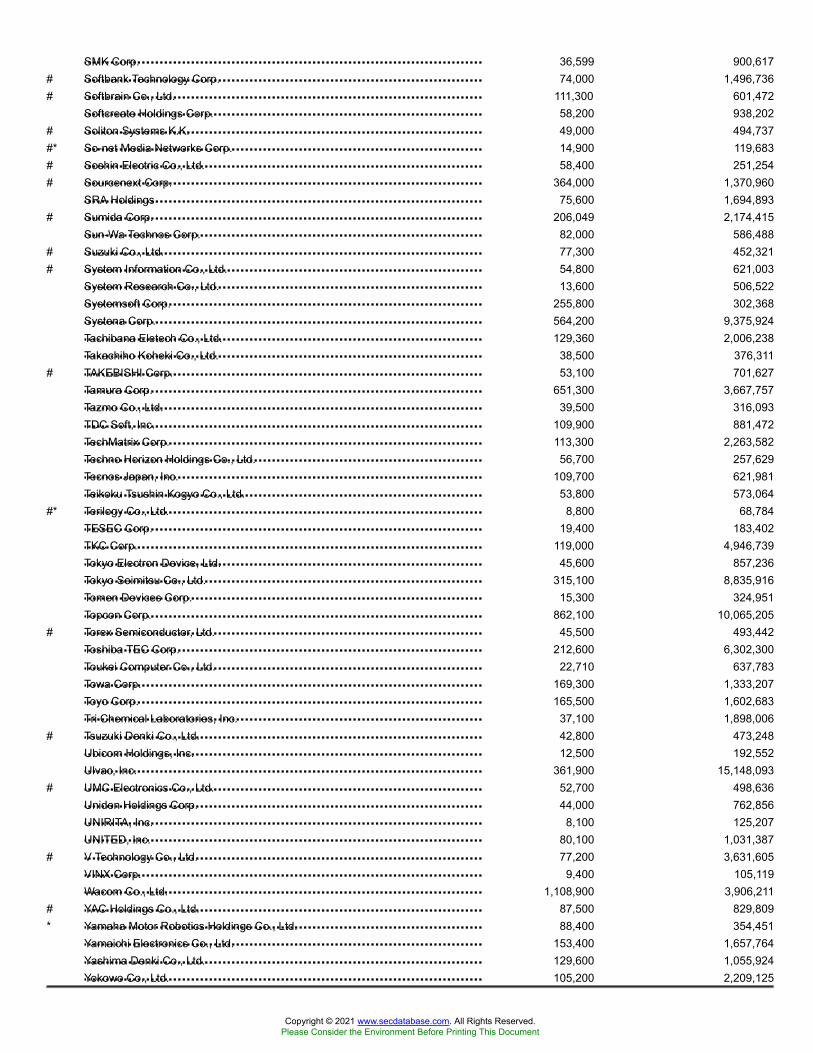
SMK Corp.Softbank Technology Corp.Softbrain Co., Ltd.Softcreate Holdings Corp.Soliton Systems K.K.So-net Media Networks Corp.Soshin Electric Co., Ltd.Sourcenext Corp.SRA HoldingsSumida Corp.Sun-Wa Technos Corp.Suzuki Co., Ltd.System Information Co., Ltd.System Research Co., Ltd.Systemsoft Corp.Systena Corp.Tachibana Eletech Co., Ltd.Takachiho Koheki Co., Ltd.TAKEBISHI Corp.Tamura Corp.Tazmo Co., Ltd.TDC Soft, Inc.TechMatrix Corp.Techno Horizon Holdings Co., Ltd.Tecnos Japan, Inc.Teikoku Tsushin Kogyo Co., Ltd.Terilogy Co., Ltd.TESEC Corp.TKC Corp.Tokyo Electron Device, Ltd.Tokyo Seimitsu Co., Ltd.Tomen Devices Corp.Topcon Corp.Torex Semiconductor, Ltd.Toshiba TEC Corp.Toukei Computer Co., Ltd.Towa Corp.Toyo Corp.Tri Chemical Laboratories, Inc.Tsuzuki Denki Co., Ltd.Ubicom Holdings, Inc.Ulvac, Inc.UMC Electronics Co., Ltd.Uniden Holdings Corp.UNIRITA, Inc.UNITED, Inc.V Technology Co., Ltd.VINX Corp.Wacom Co., Ltd.YAC Holdings Co., Ltd.Yamaha Motor Robotics Holdings Co., Ltd.Yamaichi Electronics Co., Ltd.Yashima Denki Co., Ltd.Yokowo Co., Ltd.
36,599 900,617# 74,000 1,496,736# 111,300 601,472
58,200 938,202# 49,000 494,737#* 14,900 119,683# 58,400 251,254# 364,000 1,370,960
75,600 1,694,893# 206,049 2,174,415
82,000 586,488# 77,300 452,321# 54,800 621,003
13,600 506,522255,800 302,368564,200 9,375,924129,360 2,006,238
38,500 376,311# 53,100 701,627
651,300 3,667,75739,500 316,093
109,900 881,472113,300 2,263,58256,700 257,629
109,700 621,98153,800 573,064
#* 8,800 68,78419,400 183,402
119,000 4,946,73945,600 857,236
315,100 8,835,91615,300 324,951
862,100 10,065,205# 45,500 493,442
212,600 6,302,30022,710 637,783
169,300 1,333,207165,500 1,602,683
37,100 1,898,006# 42,800 473,248
12,500 192,552361,900 15,148,093
# 52,700 498,63644,000 762,856
8,100 125,20780,100 1,031,387
# 77,200 3,631,6059,400 105,119
1,108,900 3,906,211# 87,500 829,809* 88,400 354,451
153,400 1,657,764129,600 1,055,924105,200 2,209,125
Copyright © 2021 www.secdatabase.com. All Rights Reserved.Please Consider the Environment Before Printing This Document

Zuken, Inc.
TOTAL INFORMATION TECHNOLOGY
Achilles Corp.ADEKA Corp.Aichi Steel Corp.Arakawa Chemical Industries, Ltd.Araya Industrial Co., Ltd.Asahi Holdings, Inc.Asahi Printing Co., Ltd.Asahi Yukizai Corp.Asahipen Corp.Asia Pile Holdings Corp.C Uyemura & Co., Ltd.Carlit Holdings Co., Ltd.Chuetsu Pulp & Paper Co., Ltd.Chugai Mining Co., Ltd.Chugoku Marine Paints, Ltd.CI Takiron Corp.CK-San-Etsu Co., Ltd.Dai Nippon Toryo Co., Ltd.Daido Steel Co., Ltd.Daiichi Kigenso Kagaku-Kogyo Co., Ltd.Daiken Corp.Daiki Aluminium Industry Co., Ltd.Dainichiseika Color & Chemicals Manufacturing Co., Ltd.Daio Paper Corp.DKS Co., Ltd.Dowa Holdings Co., Ltd.Dynapac Co., Ltd.Fuji Seal International, Inc.Fujikura Kasei Co., Ltd.Fujimi, Inc.Fujimori Kogyo Co., Ltd.Fuso Chemical Co., Ltd.Geostr Corp.Godo Steel, Ltd.Gun-Ei Chemical Industry Co., Ltd.Hakudo Co., Ltd.Harima Chemicals Group, Inc.Hodogaya Chemical Co., Ltd.Hokkan Holdings, Ltd.Hokko Chemical Industry Co., Ltd.Hokuetsu Corp.Honshu Chemical Industry Co., Ltd.Ise Chemicals Corp.Ishihara Chemical Co., Ltd.
Table of Contents
The Japanese Small Company SeriesCONTINUED
Shares Value»
INFORMATION TECHNOLOGY — (Continued)113,200 $ 1,939,553
484,846,573
MATERIALS — (9.6%)109,000 2,037,173665,700 9,736,620
81,700 2,548,506132,600 1,793,512
26,500 363,259299,850 6,226,294
25,700 254,26698,600 1,238,847
2,100 32,622220,000 1,086,075
35,500 1,942,201139,400 787,521
49,900 721,082* 652,700 119,819# 478,100 3,578,204
324,200 2,082,358# 21,200 555,242
145,500 1,312,17380,900 3,071,531
130,800 1,053,07393,900 1,861,391
# 202,100 1,415,89693,400 2,577,999
# 290,600 3,470,81868,800 2,032,67392,500 2,921,301
8,500 116,38851,400 1,505,883
184,200 1,004,59411,500 237,634
120,900 3,248,624142,200 2,968,977111,400 328,78567,700 1,271,26931,600 718,25847,200 605,138
106,100 1,118,90044,900 1,159,83756,100 878,327
135,500 600,4041,042,799 5,174,815
28,200 305,47814,800 449,334
# 35,500 552,048
Copyright © 2021 www.secdatabase.com. All Rights Reserved.Please Consider the Environment Before Printing This Document

Ishihara Sangyo Kaisha, Ltd.Ishizuka Glass Co., Ltd.JCU Corp.JSP Corp.Kanto Denka Kogyo Co., Ltd.Katakura & Co-op Agri Corp.KeePer Technical Laboratory Co., Ltd.KH Neochem Co., Ltd.Kimoto Co., Ltd.Koatsu Gas Kogyo Co., Ltd.Kohsoku Corp.
Konishi Co., Ltd.Konoshima Chemical Co., Ltd.Krosaki Harima Corp.Kumiai Chemical Industry Co., Ltd.Kunimine Industries Co., Ltd.Kureha Corp.Kurimoto, Ltd.Kuriyama Holdings Corp.Kyoei Steel, Ltd.Kyowa Leather Cloth Co., Ltd.Lintec Corp.MEC Co., Ltd.Mitani Sekisan Co., Ltd.Mitsubishi Paper Mills, Ltd.Mitsubishi Steel Manufacturing Co., Ltd.Mitsui Mining & Smelting Co., Ltd.Molitec Steel Co., Ltd.MORESCO Corp.Mory Industries, Inc.Nakayama Steel Works, Ltd.Neturen Co., Ltd.New Japan Chemical Co., Ltd.Nicca Chemical Co., Ltd.Nichia Steel Works, Ltd.Nihon Kagaku Sangyo Co., Ltd.Nihon Nohyaku Co., Ltd.Nihon Parkerizing Co., Ltd.Nihon Yamamura Glass Co., Ltd.Nippon Carbide Industries Co., Inc.Nippon Chemical Industrial Co., Ltd.Nippon Concrete Industries Co., Ltd.Nippon Denko Co., Ltd.Nippon Fine Chemical Co., Ltd.Nippon Kinzoku Co., Ltd.Nippon Koshuha Steel Co., Ltd.Nippon Light Metal Holdings Co., Ltd.
222,050 2,359,07516,100 294,948
181,800 3,410,052102,700 1,784,641335,900 2,295,173
21,500 215,260# 51,000 582,392
230,400 5,708,355247,400 435,334225,193 1,724,195
72,200 827,676Table of Contents
The Japanese Small Company SeriesCONTINUED
Shares Value»
MATERIALS — (Continued)260,700 $ 3,712,229
39,000 303,71041,200 2,259,481
# 697,587 5,730,424# 38,600 313,945
141,650 9,383,58167,900 919,76892,800 749,660
158,900 2,691,42291,900 662,965
199,100 4,189,226131,000 1,291,690
73,600 2,016,969405,600 2,108,398
53,500 597,970484,900 11,140,480
83,100 279,92047,800 637,49639,300 709,656
220,200 970,019261,200 2,014,206
* 200,600 386,05249,300 385,754
138,600 423,914# 90,200 851,736
243,500 1,027,686505,500 5,632,599110,400 1,407,96149,300 599,39042,600 825,524
306,600 788,246# 970,214 1,666,466
81,500 892,76427,000 214,10826,799 109,384
4,755,800 8,693,999
Copyright © 2021 www.secdatabase.com. All Rights Reserved.Please Consider the Environment Before Printing This Document
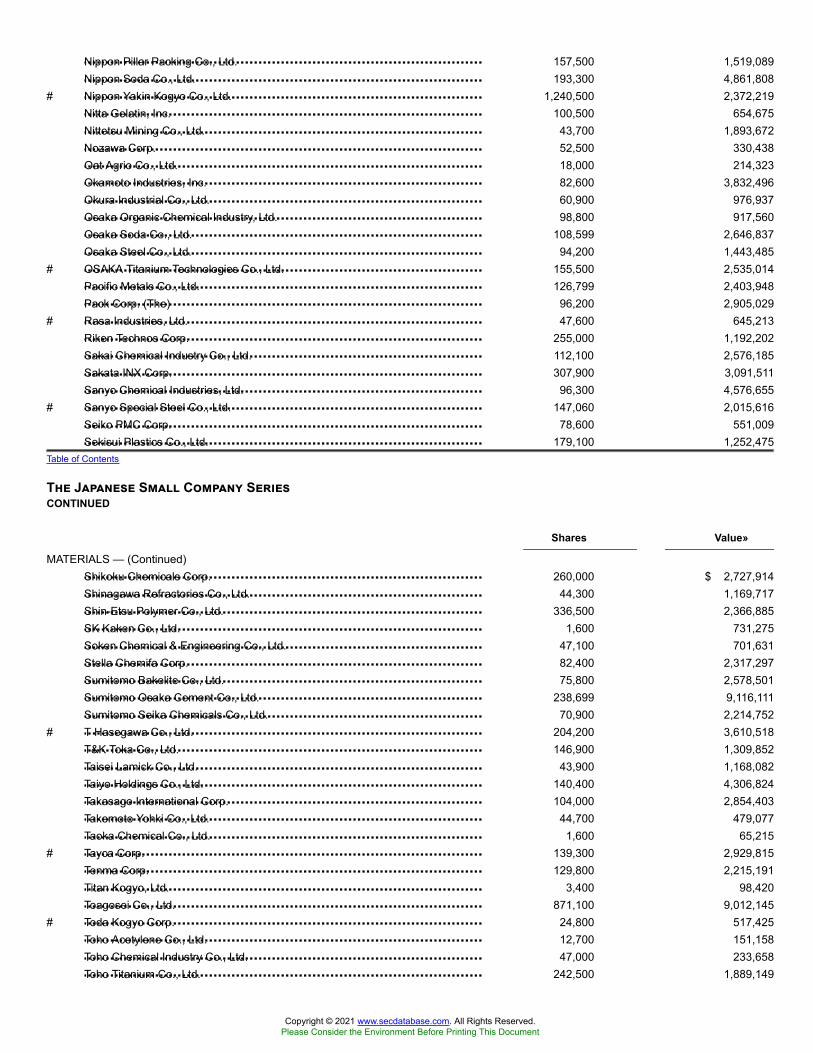
Nippon Pillar Packing Co., Ltd.Nippon Soda Co., Ltd.Nippon Yakin Kogyo Co., Ltd.Nitta Gelatin, Inc.Nittetsu Mining Co., Ltd.Nozawa Corp.Oat Agrio Co., Ltd.Okamoto Industries, Inc.Okura Industrial Co., Ltd.Osaka Organic Chemical Industry, Ltd.Osaka Soda Co., Ltd.Osaka Steel Co., Ltd.OSAKA Titanium Technologies Co., Ltd.Pacific Metals Co., Ltd.Pack Corp. (The)Rasa Industries, Ltd.Riken Technos Corp.Sakai Chemical Industry Co., Ltd.Sakata INX Corp.Sanyo Chemical Industries, Ltd.Sanyo Special Steel Co., Ltd.Seiko PMC Corp.Sekisui Plastics Co., Ltd.
Shikoku Chemicals Corp.Shinagawa Refractories Co., Ltd.Shin-Etsu Polymer Co., Ltd.SK Kaken Co., Ltd.Soken Chemical & Engineering Co., Ltd.Stella Chemifa Corp.Sumitomo Bakelite Co., Ltd.Sumitomo Osaka Cement Co., Ltd.Sumitomo Seika Chemicals Co., Ltd.T Hasegawa Co., Ltd.T&K Toka Co., Ltd.Taisei Lamick Co., Ltd.Taiyo Holdings Co., Ltd.Takasago International Corp.Takemoto Yohki Co., Ltd.Taoka Chemical Co., Ltd.Tayca Corp.Tenma Corp.Titan Kogyo, Ltd.Toagosei Co., Ltd.Toda Kogyo Corp.Toho Acetylene Co., Ltd.Toho Chemical Industry Co., Ltd.Toho Titanium Co., Ltd.
157,500 1,519,089193,300 4,861,808
# 1,240,500 2,372,219100,500 654,675
43,700 1,893,67252,500 330,43818,000 214,32382,600 3,832,49660,900 976,93798,800 917,560
108,599 2,646,83794,200 1,443,485
# 155,500 2,535,014126,799 2,403,948
96,200 2,905,029# 47,600 645,213
255,000 1,192,202112,100 2,576,185307,900 3,091,511
96,300 4,576,655# 147,060 2,015,616
78,600 551,009179,100 1,252,475
Table of Contents
The Japanese Small Company SeriesCONTINUED
Shares Value»
MATERIALS — (Continued)260,000 $ 2,727,914
44,300 1,169,717336,500 2,366,885
1,600 731,27547,100 701,63182,400 2,317,29775,800 2,578,501
238,699 9,116,11170,900 2,214,752
# 204,200 3,610,518146,900 1,309,852
43,900 1,168,082140,400 4,306,824104,000 2,854,403
44,700 479,0771,600 65,215
# 139,300 2,929,815129,800 2,215,191
3,400 98,420871,100 9,012,145
# 24,800 517,42512,700 151,15847,000 233,658
242,500 1,889,149
Copyright © 2021 www.secdatabase.com. All Rights Reserved.Please Consider the Environment Before Printing This Document

Toho Zinc Co., Ltd.Tohoku Steel Co., Ltd.Tokushu Tokai Paper Co., Ltd.Tokuyama Corp.Tokyo Ohka Kogyo Co., Ltd.Tokyo Printing Ink Manufacturing Co., Ltd.Tokyo Rope Manufacturing Co., Ltd.Tokyo Steel Manufacturing Co., Ltd.Tokyo Tekko Co., Ltd.Tomoegawa Co., Ltd.Tomoku Co., Ltd.Topy Industries, Ltd.Toyo Gosei Co., Ltd.Toyo Ink SC Holdings Co., Ltd.Toyobo Co., Ltd.TYK Corp.UACJ Corp.Ultrafabrics Holdings Co., Ltd.Valqua, Ltd.Vertex Corp.Wavelock Holdings Co., Ltd.Wood One Co., Ltd.Yamato Kogyo Co., Ltd.Yodogawa Steel Works, Ltd.Yoshicon Co., Ltd.Yotai Refractories Co., Ltd.Yushiro Chemical Industry Co., Ltd.
TOTAL MATERIALS
AD Works Co., Ltd.Airport Facilities Co., Ltd.Anabuki Kosan, Inc.Aoyama Zaisan Networks Co., Ltd.Apaman Co., Ltd.
Arealink Co., Ltd.B-Lot Co., Ltd.Cosmos Initia Co., Ltd.CRE, Inc.Daibiru Corp.Dear Life Co., Ltd.Goldcrest Co., Ltd.Good Com Asset Co., Ltd.Grandy House Corp.Heiwa Real Estate Co., Ltd.Ichigo, Inc.Intellex Co., Ltd.Japan Asset Marketing Co., Ltd.
93,799 2,006,59116,300 216,48671,058 2,442,328
414,298 9,536,349242,500 8,200,936
10,200 241,252100,300 839,970842,500 6,399,709
74,900 953,34433,600 296,27581,500 1,317,135
114,200 2,434,176# 32,800 526,911
275,600 6,021,542715,200 8,924,881
# 183,700 515,954208,041 3,401,522
# 2,400 46,864126,199 2,514,737
# 45,998 563,48830,900 196,74248,500 440,403
171,600 4,439,164154,200 2,935,131
3,100 31,078# 118,000 617,276
73,800 911,287
340,435,990
REAL ESTATE — (1.9%)# 1,948,800 606,812
148,670 701,9305,500 143,625
# 52,600 713,34477,800 697,612
Table of Contents
The Japanese Small Company SeriesCONTINUED
Shares Value»
REAL ESTATE — (Continued)29,600 $ 348,38814,900 270,989
# 99,600 456,383# 70,600 736,136
358,100 3,312,079145,300 623,050139,170 2,508,808
8,800 123,990117,800 532,519236,600 4,968,770970,800 3,507,847
30,000 207,846* 1,648,500 1,374,890
Copyright © 2021 www.secdatabase.com. All Rights Reserved.Please Consider the Environment Before Printing This Document
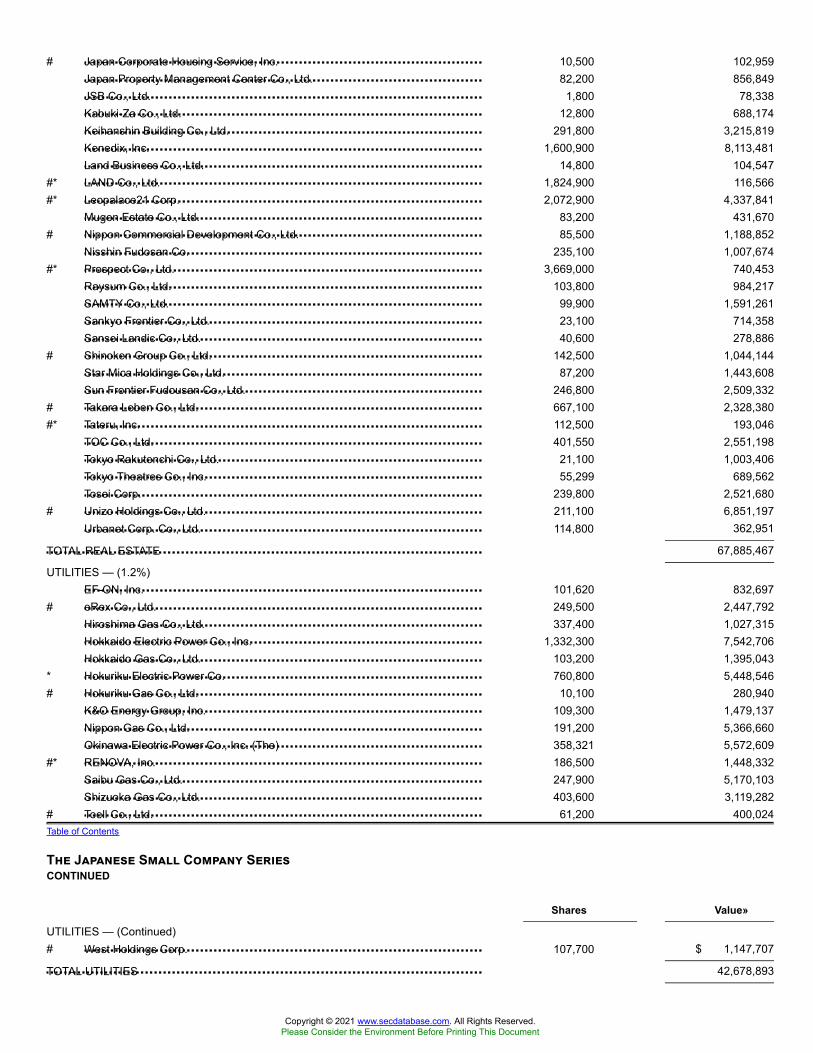
Japan Corporate Housing Service, Inc.Japan Property Management Center Co., Ltd.JSB Co., Ltd.Kabuki-Za Co., Ltd.Keihanshin Building Co., Ltd.Kenedix, Inc.Land Business Co., Ltd.LAND Co., Ltd.Leopalace21 Corp.Mugen Estate Co., Ltd.Nippon Commercial Development Co., Ltd.Nisshin Fudosan Co.Prospect Co., Ltd.Raysum Co., Ltd.SAMTY Co., Ltd.Sankyo Frontier Co., Ltd.Sansei Landic Co., Ltd.Shinoken Group Co., Ltd.Star Mica Holdings Co., Ltd.Sun Frontier Fudousan Co., Ltd.Takara Leben Co., Ltd.Tateru, Inc.TOC Co., Ltd.Tokyo Rakutenchi Co., Ltd.Tokyo Theatres Co., Inc.Tosei Corp.Unizo Holdings Co., Ltd.Urbanet Corp. Co., Ltd.
TOTAL REAL ESTATE
EF-ON, Inc.eRex Co., Ltd.Hiroshima Gas Co., Ltd.Hokkaido Electric Power Co., Inc.Hokkaido Gas Co., Ltd.Hokuriku Electric Power Co.Hokuriku Gas Co., Ltd.K&O Energy Group, Inc.Nippon Gas Co., Ltd.Okinawa Electric Power Co., Inc. (The)RENOVA, Inc.Saibu Gas Co., Ltd.Shizuoka Gas Co., Ltd.Toell Co., Ltd.
West Holdings Corp.
TOTAL UTILITIES
# 10,500 102,95982,200 856,849
1,800 78,33812,800 688,174
291,800 3,215,8191,600,900 8,113,481
14,800 104,547#* 1,824,900 116,566#* 2,072,900 4,337,841
83,200 431,670# 85,500 1,188,852
235,100 1,007,674#* 3,669,000 740,453
103,800 984,21799,900 1,591,26123,100 714,35840,600 278,886
# 142,500 1,044,14487,200 1,443,608
246,800 2,509,332# 667,100 2,328,380#* 112,500 193,046
401,550 2,551,19821,100 1,003,40655,299 689,562
239,800 2,521,680# 211,100 6,851,197
114,800 362,951
67,885,467
UTILITIES — (1.2%)101,620 832,697
# 249,500 2,447,792337,400 1,027,315
1,332,300 7,542,706103,200 1,395,043
* 760,800 5,448,546# 10,100 280,940
109,300 1,479,137191,200 5,366,660358,321 5,572,609
#* 186,500 1,448,332247,900 5,170,103403,600 3,119,282
# 61,200 400,024Table of Contents
The Japanese Small Company SeriesCONTINUED
Shares Value»
UTILITIES — (Continued)# 107,700 $ 1,147,707
42,678,893
Copyright © 2021 www.secdatabase.com. All Rights Reserved.Please Consider the Environment Before Printing This Document

TOTAL COMMON STOCKS
AD Works Co., Ltd. Rights 08/23/2019
TOTAL INVESTMENT SECURITIES
DFA Short Term Investment Fund
(Cost $3,361,872,180)^^
Communication ServicesConsumer DiscretionaryConsumer StaplesEnergyFinancialsHealth CareIndustrialsInformation TechnologyMaterialsReal EstateUtilities
Real EstateSecurities Lending Collateral
TOTAL
3P Learning, Ltd.88 Energy, Ltd.A2B Australia, Ltd.Accent Group, Ltd.Adairs, Ltd.Adelaide Brighton, Ltd.Ainsworth Game Technology, Ltd.
3,454,068,940
RIGHTS/WARRANTS — (0.0%)REAL ESTATE — (0.0%)#* 1,948,800 17,913
3,454,086,853
Value†
SECURITIES LENDING COLLATERAL — (3.0%)@§ 9,349,014 108,177,436
TOTAL INVESTMENTS — (100.0%)$3,562,264,289
Summary of the Series' investments as of July 31, 2019, based on their valuation inputs, is as follows (see Security Valuation Note):
Investments in Securities (Market Value)
Level 1 Level 2 Level 3 Total
Common Stocks— $ 94,720,822 — $ 94,720,822
$2,565,856 633,736,183 — 636,302,039— 251,995,508 — 251,995,508— 42,186,227 — 42,186,227— 290,423,957 — 290,423,957— 168,337,352 — 168,337,352— 1,034,256,112 — 1,034,256,112— 484,846,573 — 484,846,573— 340,435,990 — 340,435,990— 67,885,467 — 67,885,467— 42,678,893 — 42,678,893
Rights/Warrants— 17,913 — 17,913
— 108,177,436 — 108,177,436
$2,565,856 $3,559,698,433 — $3,562,264,289
Table of Contents
THE ASIA PACIFIC SMALL COMPANY SERIES
SCHEDULE OF INVESTMENTS
July 31, 2019
(Unaudited)Shares Value»
COMMON STOCKS — (95.0%)AUSTRALIA — (52.4%)* 93,233 $ 62,488* 604,262 6,490
212,947 261,1202,000,348 2,064,818
# 554,548 542,2122,667,604 6,434,215
# 392,180 188,664
Copyright © 2021 www.secdatabase.com. All Rights Reserved.Please Consider the Environment Before Printing This Document

Alkane Resources, Ltd.Alliance Aviation Services, Ltd.ALS, Ltd.Altium, Ltd.Altura Mining, Ltd.AMA Group, Ltd.Amaysim Australia, Ltd.Ansell, Ltd.AP Eagers, Ltd.APN Property Group, Ltd.Apollo Tourism & Leisure, Ltd.Appen, Ltd.ARB Corp., Ltd.Ardent Leisure Group, Ltd.ARQ Group, Ltd.Asaleo Care, Ltd.AUB Group, Ltd.Aurelia Metals, Ltd.Ausdrill, Ltd.Austal, Ltd.Australian Agricultural Co., Ltd.Australian Finance Group, Ltd.Australian Pharmaceutical Industries, Ltd.Australian Vintage, Ltd.Auswide Bank, Ltd.Automotive Holdings Group, Ltd.Aveo GroupAVJennings, Ltd.AVZ Minerals, Ltd.Axsesstoday, Ltd.Baby Bunting Group, Ltd.Bank of Queensland, Ltd.Bapcor, Ltd.Base Resources, Ltd.Beach Energy, Ltd.Bega Cheese, Ltd.Bell Financial Group, Ltd.Bellamy's Australia, Ltd.Berkeley Energia, Ltd.Bingo Industries, Ltd.Blackmores, Ltd.Bravura Solutions, Ltd.Breville Group, Ltd.Brickworks, Ltd.Bubs Australia, Ltd.Buru Energy, Ltd.BWX, Ltd.Byron Energy, Ltd.
#* 1,385,657 363,56958,836 114,709
2,222,296 10,894,673642,776 15,984,379
#* 1,015,510 76,9761,692,138 1,682,139
#* 1,875,508 972,027896,729 17,059,260314,888 2,411,138
26,661 9,465# 131,394 38,020
715,559 14,799,241# 583,893 7,366,995
4,016,599 3,227,194# 982,475 466,389* 657,269 433,381# 427,921 3,477,324* 3,199,548 1,104,250
3,868,695 5,183,956# 1,715,047 4,737,435#* 3,379,915 2,291,022
694,985 917,9803,189,340 3,137,4564,317,004 1,430,622
102,961 388,215# 1,525,769 3,236,367
3,145,497 4,398,3947,058,528 2,865,099
* 254,799 9,661* 20,251 8,439# 318,497 519,786
1,134,493 7,226,3401,740,383 7,422,175
* 393,323 72,3962,241,986 3,231,808
# 1,470,334 4,432,845122,493 82,659
#* 670,621 4,587,917* 27,600 5,834# 979,741 1,604,822# 96,425 5,888,341
1,366,036 4,565,834834,341 10,931,845491,321 5,604,109
#* 114,559 105,115* 678,801 118,248# 357,302 538,724#* 41,456 6,771Table of Contents
The Asia Pacific Small Company SeriesCONTINUED
Shares Value»
Copyright © 2021 www.secdatabase.com. All Rights Reserved.Please Consider the Environment Before Printing This Document

Cann Group, Ltd.Capitol Health, Ltd.Cardno, Ltd.Carnarvon Petroleum, Ltd.carsales.com, Ltd.Cash Converters International, Ltd.Catapult Group International, Ltd.Cedar Woods Properties, Ltd.Centuria Capital GroupChampion Iron, Ltd.Citadel Group, Ltd. (The)City Chic Collective, Ltd.Class, Ltd.Clean Seas Seafood, Ltd.Clean TeQ Holdings, Ltd.Cleanaway Waste Management, Ltd.Clinuvel Pharmaceuticals, Ltd.Clover Corp., Ltd.Codan, Ltd.Collection House, Ltd.Collins Foods, Ltd.Cooper Energy, Ltd.Corporate Travel Management, Ltd.Costa Group Holdings, Ltd.Credit Corp. Group, Ltd.CSG, Ltd.CSR, Ltd.CuDeco, Ltd.Dacian Gold, Ltd.Data#3, Ltd.Decmil Group, Ltd.Dicker Data, Ltd.Domain Holdings Australia, Ltd.Domino's Pizza Enterprises, Ltd.Downer EDI, Ltd.DuluxGroup, Ltd.DWS, Ltd.Eclipx Group, Ltd.Elders, Ltd.Electro Optic Systems Holdings, Ltd.Emeco Holdings, Ltd.EML Payments, Ltd.Energy World Corp., Ltd.EQT Holdings, Ltd.ERM Power, Ltd.Estia Health, Ltd.Euroz, Ltd.EVENT Hospitality and Entertainment, Ltd.FAR, Ltd.FBR, Ltd.Finbar Group, Ltd.Fleetwood Corp., Ltd.FlexiGroup, Ltd.
AUSTRALIA — (Continued)* 35,345 $ 52,380
3,495,372 535,375#* 1,127,842 706,797#* 5,781,642 1,607,487
1,744,892 17,535,410* 3,582,331 318,936* 384,667 334,105
409,425 1,793,768130,290 173,143
* 41,342 89,911# 83,353 258,309
146,651 181,556# 386,717 390,061# 87,730 53,875#* 86,928 24,794
10,062,156 16,568,77339,169 868,959
340,617 537,510659,052 1,816,521
# 2,180,326 1,827,154820,761 4,857,798
#* 11,144,508 4,442,686# 548,400 8,583,658# 2,112,283 5,707,501# 553,754 9,467,871* 1,608,459 198,550# 3,957,955 10,821,694* 387,893 11,698#* 275,576 155,908
821,486 1,422,120828,599 514,010193,123 884,227
# 1,683,207 3,461,957# 205,372 5,406,045
710,927 3,492,7812,924,888 18,651,492
514,109 423,364# 2,757,791 2,727,694# 1,177,990 5,917,007* 456,109 1,269,787* 410,800 639,086#* 436,776 965,550* 87,518 5,805# 93,813 1,926,857
1,112,209 1,375,5381,508,440 2,778,653
101,762 78,190546,035 4,638,770
#* 8,256,005 348,785#* 490,881 27,128# 203,868 122,463* 338,355 401,859
1,974,721 2,458,159
Copyright © 2021 www.secdatabase.com. All Rights Reserved.Please Consider the Environment Before Printing This Document

Freedom Foods Group, Ltd.G8 Education, Ltd.Galaxy Resources, Ltd.GBST Holdings, Ltd.Genworth Mortgage Insurance Australia, Ltd.Gold Road Resources, Ltd.
GR Engineering Services, Ltd.GrainCorp, Ltd., Class AGrange Resources, Ltd.GUD Holdings, Ltd.GWA Group, Ltd.Hansen Technologies, Ltd.Healius, Ltd.Helloworld Travel, Ltd.Highfield Resources, Ltd.Horizon Oil, Ltd.HT&E, Ltd.HUB24, Ltd.IDP Education, Ltd.Iluka Resources, Ltd.Image Resources NLImdex, Ltd.IMF Bentham, Ltd.Immutep, Ltd.ImpediMed, Ltd.Independence Group NLInfigen EnergyInfomedia, Ltd.Inghams Group, Ltd.Integral Diagnostics, Ltd.Integrated Research, Ltd.InvoCare, Ltd.ioneer, Ltd.IOOF Holdings, Ltd.IPH, Ltd.IRESS, Ltd.iSelect, Ltd.iSentia Group, Ltd.IVE Group, Ltd.Japara Healthcare, Ltd.JB Hi-Fi, Ltd.Jumbo Interactive, Ltd.Jupiter Mines, Ltd.K&S Corp., Ltd.Karoon Energy, Ltd.Kingsgate Consolidated, Ltd.Kogan.com, Ltd.
112,045 363,7473,059,923 6,048,809
#* 2,700,784 2,338,132178,479 474,049
# 1,921,522 4,444,545#* 3,764,891 3,530,495Table of Contents
The Asia Pacific Small Company SeriesCONTINUED
Shares Value»
AUSTRALIA — (Continued)55,230 $ 37,147
1,833,496 10,742,466449,866 76,368951,434 6,163,455
# 1,988,370 4,861,6861,234,241 3,238,1963,214,850 6,444,661
# 37,164 121,332#* 160,730 95,148* 714,889 57,883# 1,761,318 2,101,751# 61,300 518,250
475,130 6,210,045847,721 5,531,263
* 243,336 42,2142,201,682 2,007,499
#* 2,056,204 4,802,178#* 1,409,121 19,859#* 417,437 40,866
3,606,613 13,060,703# 5,498,123 1,777,865
2,770,034 3,873,298# 1,849,486 5,124,432
38,035 85,821# 555,701 1,044,027# 984,745 10,519,100* 290,821 36,442# 2,296,344 9,124,187
1,023,580 5,811,8441,095,248 10,473,809
#* 96,851 42,350* 1,014,066 179,541
543,356 805,409# 1,727,720 1,234,938# 861,985 17,682,014# 208,843 2,752,244# 2,071,082 571,858# 197,087 242,848#* 1,803,598 2,041,339* 1,797,365 416,502# 229,522 770,361
Copyright © 2021 www.secdatabase.com. All Rights Reserved.Please Consider the Environment Before Printing This Document

Lifestyle Communities, Ltd.Link Administration Holdings, Ltd.Lovisa Holdings, Ltd.Lynas Corp., Ltd.MACA, Ltd.Macmahon Holdings, Ltd.MaxiTRANS Industries, Ltd.Mayne Pharma Group, Ltd.McMillan Shakespeare, Ltd.McPherson's, Ltd.Medusa Mining, Ltd.Mesoblast, Ltd.Metals X, Ltd.Metcash, Ltd.Michael Hill International, Ltd.Michael Hill International, Ltd.Midway, Ltd.Millennium Minerals, Ltd.
Mincor Resources NLMineral Resources, Ltd.MMA Offshore, Ltd.MNF Group, Ltd.Moelis Australia, Ltd.Monadelphous Group, Ltd.Monash IVF Group, Ltd.Money3 Corp., Ltd.Mortgage Choice, Ltd.Motorcycle Holdings, Ltd.Mount Gibson Iron, Ltd.Myanmar Metals, Ltd.Myer Holdings, Ltd.MyState, Ltd.Navigator Global Investments, Ltd.Neometals, Ltd.Netwealth Group, Ltd.New Hope Corp., Ltd.NEXTDC, Ltd.nib holdings, Ltd.Nick Scali, Ltd.Nine Entertainment Co. Holdings, Ltd.NRW Holdings, Ltd.Nufarm, Ltd.OFX Group, Ltd.OM Holdings, Ltd.OneMarket, Ltd.Onevue Holdings, Ltd.oOh!media, Ltd.
# 96,718 447,003271,150 939,099
# 104,858 794,434#* 4,538,007 8,052,723
780,506 501,257* 4,718,877 579,686
823,085 161,713* 9,984,203 3,591,492
490,350 4,642,880470,863 599,365
* 155,314 79,797#* 585,984 586,206#* 3,061,840 445,868# 7,553,452 14,516,671# 1,490,263 508,200
94,305 32,8943,757 9,076
* 1,328,072 90,087Table of Contents
The Asia Pacific Small Company SeriesCONTINUED
Shares Value»
AUSTRALIA — (Continued)* 181,609 $ 57,159
1,210,928 13,160,542#* 4,729,196 711,652# 194,514 472,029
19,541 50,818726,646 9,358,380
# 901,686 937,959764,767 1,118,243
# 793,228 624,83219,615 17,935
4,535,796 2,694,609#* 1,076,259 42,548#* 3,413,945 1,255,760# 488,761 1,545,349
964,292 2,273,529# 626,513 81,225
32,728 185,0241,735,687 2,965,198
#* 1,551,034 7,244,0603,390,280 18,477,752
# 368,417 1,582,207# 11,957,501 16,416,281
2,502,117 4,148,236# 1,894,118 6,291,199
1,759,273 1,638,072342,290 184,603
#* 136,653 63,183* 857,257 274,922
1,219,177 3,709,122
Copyright © 2021 www.secdatabase.com. All Rights Reserved.Please Consider the Environment Before Printing This Document
Orocobre, Ltd.Orora, Ltd.Ovato, Ltd.OZ Minerals, Ltd.Pacific Current Group, Ltd.Pacific Energy, Ltd.Pacific Smiles Group, Ltd.Pact Group Holdings, Ltd.Paladin Energy, Ltd.Panoramic Resources, Ltd.Pantoro, Ltd.Paragon Care, Ltd.Peet, Ltd.Pendal Group, Ltd.Perpetual, Ltd.Perseus Mining, Ltd.Pioneer Credit, Ltd.Platinum Asset Management, Ltd.Praemium, Ltd.Premier Investments, Ltd.Prime Media Group, Ltd.Pro Medicus, Ltd.Propel Funeral Partners, Ltd.PWR Holdings, Ltd.QMS Media, Ltd.Qube Holdings, Ltd.Ramelius Resources, Ltd.Reckon, Ltd.Red 5, Ltd.Red River Resources, Ltd.
Redbubble, Ltd.Reece, Ltd.Regis Healthcare, Ltd.Regis Resources, Ltd.Reject Shop, Ltd. (The)Reliance Worldwide Corp., Ltd.Resolute Mining, Ltd.Rhipe, Ltd.Ridley Corp., Ltd.RPMGlobal Holdings, Ltd.Ruralco Holdings, Ltd.RXP Services, Ltd.Salmat, Ltd.Sandfire Resources NLSaracen Mineral Holdings, Ltd.SeaLink Travel Group, Ltd.Select Harvests, Ltd.
* 23,186 44,4306,055,609 13,992,8392,421,092 101,2222,477,965 17,186,242
# 207,641 790,20533,400 22,236
256,946 231,2641,813,106 3,472,374
#* 576,526 62,752* 3,159,152 725,481* 632,837 81,173
834,834 284,591850,167 687,793
# 1,938,181 10,306,713# 353,370 9,506,669#* 6,569,858 3,055,529# 166,590 270,804# 2,196,902 7,204,663#* 1,152,591 414,611
829,371 8,922,919* 62,765 9,697# 256,588 5,357,107
4,902 10,645153,231 449,274497,270 322,473
1,950,645 4,199,516#* 3,194,151 2,180,875
446,073 214,969* 682,020 108,827#* 614,980 74,960Table of Contents
The Asia Pacific Small Company SeriesCONTINUED
Shares Value»
AUSTRALIA — (Continued)* 79,435 $ 75,372# 290,526 2,089,684
1,336,461 2,547,6413,442,546 12,997,352
# 107,368 154,199# 3,009,448 7,541,172
6,407,325 7,777,427210,569 398,924
1,847,357 1,399,773* 52,065 20,593# 241,336 700,824
364,327 119,799645,788 227,394
1,293,091 5,899,858* 5,547,363 15,687,093
182,139 465,857651,572 3,312,886
Copyright © 2021 www.secdatabase.com. All Rights Reserved.Please Consider the Environment Before Printing This Document

Senex Energy, Ltd.Servcorp, Ltd.Service Stream, Ltd.Seven Group Holdings, Ltd.Seven West Media, Ltd.SG Fleet Group, Ltd.Sheffield Resources, Ltd.Sigma Healthcare, Ltd.Silver Lake Resources, Ltd.Sims Metal Management, Ltd.SmartGroup Corp., Ltd.Southern Cross Media Group, Ltd.Spark Infrastructure GroupSpeedCast International, Ltd.SRG Global, Ltd.St Barbara, Ltd.Stanmore Coal, Ltd.Star Entertainment Grp, Ltd. (The)Steadfast Group, Ltd.Strike Energy, Ltd.Sundance Energy Australia, Ltd.Sunland Group, Ltd.Super Retail Group, Ltd.Superloop, Ltd.Syrah Resources, Ltd.Tassal Group, Ltd.Technology One, Ltd.Thorn Group, Ltd.Tiger Resources, Ltd.Tribune Resources, Ltd.Troy Resources, Ltd.Villa World, Ltd.Village Roadshow, Ltd.Virgin Australia Holdings, Ltd.Virtus Health, Ltd.Vita Group, Ltd.Vocus Group, Ltd.Wagners Holding Co., Ltd.Webjet, Ltd.Webster, Ltd.West African Resources, Ltd.Western Areas, Ltd.
Westgold Resources, Ltd.WPP AUNZ, Ltd.Xenith IP Group, Ltd.
TOTAL AUSTRALIA
* 12,495,492 2,661,678# 343,996 949,779
2,308,460 4,702,547131,931 1,617,487
* 5,378,078 1,590,791362,774 728,300
#* 142,244 62,7653,411,098 1,387,788
#* 2,847,954 2,512,305# 1,382,214 10,232,453
546,028 3,489,4563,928,938 3,585,8479,579,326 15,523,738
# 1,977,399 2,532,019268,763 94,910
5,006,626 12,547,32645,430 42,051
218,258 616,0215,738,685 14,884,161
* 2,191,814 187,359#* 2,937,895 368,176
1,211,896 1,421,801# 1,087,081 6,673,247#* 466,251 310,659#* 2,327,569 1,359,441
1,469,560 5,172,2291,891,632 9,871,214
#* 744,756 132,326* 9,447,997 3,541
3,093 14,702* 372,547 24,290# 907,350 1,452,613* 968,676 1,752,658#* 11,131,924 1,257,505
579,205 2,022,157421,403 353,007
* 4,033,290 8,876,6398,503 10,370
925,822 8,561,59478,767 73,911
* 110,509 26,9702,166,063 3,214,949
Table of Contents
The Asia Pacific Small Company SeriesCONTINUED
Shares Value»
AUSTRALIA — (Continued)* 1,796,983 $ 2,366,042
1,744,557 772,1559,607 16,259
905,360,658
CANADA — (0.0%)
Copyright © 2021 www.secdatabase.com. All Rights Reserved.Please Consider the Environment Before Printing This Document

Great Panther Mining, Ltd.
APT Satellite Holdings, Ltd.China Flavors & Fragrances Co., Ltd.China Medical & HealthCare Group, Ltd.KWG Group Holdings, Ltd.
TOTAL CHINA
Aeon Credit Service Asia Co., Ltd.Aeon Stores Hong Kong Co., Ltd.Agritrade Resources, Ltd.Alco Holdings, Ltd.Allied Group, Ltd.Allied Properties HK, Ltd.Alltronics Holdings, Ltd.APAC Resources, Ltd.Applied Development Holdings, Ltd.Arts Optical International Hldgs, Ltd.Asia Financial Holdings, Ltd.Asia Satellite Telecommunications Holdings, Ltd.Asia Standard Hotel Group, Ltd.Asia Standard International Group, Ltd.Asiasec Properties, Ltd.ASM Pacific Technology, Ltd.Associated International Hotels, Ltd.Auto Italia HoldingsAutomated Systems Holdings, Ltd.BeijingWest Industries International, Ltd.Best Food Holding Co., Ltd.Bison Finance Group, Ltd.BOCOM International Holdings Co., Ltd.BOE Varitronix, Ltd.Bonjour Holdings, Ltd.Bright Smart Securities & Commodities Group, Ltd.Brightoil Petroleum Holdings, Ltd.Brockman Mining, Ltd.Build King Holdings, Ltd.Burwill Holdings, Ltd.Cafe de Coral Holdings, Ltd.Camsing International Holding, Ltd.Century City International Holdings, Ltd.CGN Mining Co., Ltd.Champion Technology Holdings, Ltd.Chen Hsong HoldingsCheuk Nang Holdings, Ltd.Chevalier International Holdings, Ltd.China Baoli Technologies Holdings, Ltd.China Best Group Holding, Ltd.China Cloud Copper Co., Ltd.China Display Optoelectronics Technology Holdings, Ltd.
* 292,836 237,411
CHINA — (0.1%)1,864,500 726,6041,407,028 296,452
* 25,766,800 548,996100,000 92,975
1,665,027
HONG KONG — (25.4%)842,000 724,206248,000 119,450
# 25,785,000 3,691,167856,000 52,445661,200 3,657,945
12,875,857 2,854,3822,459,600 156,810
# 3,766,513 481,438#* 14,125,000 585,922
730,000 161,5372,404,908 1,310,741
934,500 1,147,81430,391,654 1,392,14613,222,917 2,591,363
# 1,673,000 351,526473,400 5,530,483952,000 2,752,460
* 1,900,000 16,031* 404,400 54,028
456,800 37,203* 996,000 141,038* 788,000 112,651
353,000 57,392# 3,647,293 1,186,837* 14,578,600 278,692# 6,758,000 1,204,204* 9,102,000 1,308,068* 21,910,814 450,361
440,000 59,739* 37,300,960 448,160
3,476,000 11,558,380# 3,238,000 479,817
7,111,460 592,0665,195,000 217,638
* 595,743 13,6581,212,000 406,051
693,120 374,192820,989 1,173,526
* 1,147,500 14,512* 4,250,000 97,757
1,565,200 41,988* 6,752,000 462,298Table of Contents
The Asia Pacific Small Company SeriesCONTINUED
Copyright © 2021 www.secdatabase.com. All Rights Reserved.Please Consider the Environment Before Printing This Document

China Energy Development Holdings, Ltd.China Ludao Technology Co., Ltd.China Motor Bus Co., Ltd.China New Higher Education Group, Ltd.China Shandong Hi-Speed Financial Group, Ltd.China Solar Energy Holdings, Ltd.China Star Entertainment, Ltd.China Strategic Holdings, Ltd.China Tonghai International Financial, Ltd.Chinese Estates Holdings, Ltd.Chinlink International Holdings, Ltd.Chinney Investments, Ltd.Chong Hing Bank, Ltd.Chow Sang Sang Holdings International, Ltd.Chuang's China Investments, Ltd.Chuang's Consortium International, Ltd.CITIC Telecom International Holdings, Ltd.CK Life Sciences Intl Holdings, Inc.CMIC Ocean En-Tech Holding Co., Ltd.CNQC International Holdings, Ltd.CNT Group, Ltd.Common Splendor International Health Industry Group, Ltd.Continental Holdings, Ltd.Convenience Retail Asia, Ltd.Convoy Global Holdings, Ltd.Cosmopolitan International Holdings, Ltd.Cowell e Holdings, Inc.CP Lotus Corp.Crocodile GarmentsCross-Harbour Holdings, Ltd. (The)CSI Properties, Ltd.CST Group, Ltd.CW Group Holdings, Ltd.Dah Sing Banking Group, Ltd.Dah Sing Financial Holdings, Ltd.Dickson Concepts International, Ltd.Digital Domain Holdings, Ltd.Dingyi Group Investment, Ltd.Dynamic Holdings, Ltd.Eagle Nice International Holdings, Ltd.EcoGreen International Group, Ltd.eForce Holdings, Ltd.Emperor Capital Group, Ltd.Emperor Entertainment Hotel, Ltd.Emperor International Holdings, Ltd.Emperor Watch & Jewellery, Ltd.Energy International Investments Holdings, Ltd.ENM Holdings, Ltd.EPI Holdings, Ltd.Esprit Holdings, Ltd.Eternity Investment, Ltd.Fairwood Holdings, Ltd.
Shares Value»
HONG KONG — (Continued)* 59,926,000 $1,654,647* 580,000 77,824
65,400 1,046,098# 1,535,000 592,055#* 12,624,000 515,857* 1,669,500 7,198# 11,710,000 1,293,493#* 80,821,250 592,984* 1,300,000 63,810
3,251,000 2,946,112* 944,800 114,492
1,180,000 395,144211,000 364,917
2,579,000 3,515,6398,571,407 534,4867,519,043 1,607,180
14,540,125 6,000,620# 23,922,000 1,198,161* 1,134,000 41,705
4,920,000 878,4888,303,264 404,538
#* 15,722,000 1,162,116450,000 4,991
# 192,000 98,840#* 38,622,000 154,426#* 4,714,000 884,360# 5,499,000 948,922* 11,880,000 156,366
2,196,000 195,9031,581,645 2,281,921
47,776,383 2,127,156* 140,296,000 445,236* 1,361,500 7,531
4,081,116 7,096,6221,766,144 7,919,0391,534,500 929,785
#* 34,030,000 458,896#* 6,285,000 264,087
70,000 71,4362,252,000 698,9491,994,640 380,694
* 8,784,000 194,49432,721,000 1,141,965
5,165,000 1,032,624# 10,274,753 2,575,602
35,970,000 883,633* 1,960,000 42,019* 16,812,000 1,622,243* 1,005,000 22,374#* 18,240,650 3,018,742* 820,000 17,292
953,600 3,144,026
Copyright © 2021 www.secdatabase.com. All Rights Reserved.Please Consider the Environment Before Printing This Document

Far East Consortium International, Ltd.Far East Holdings International, Ltd.FIH Mobile, Ltd.First Pacific Co., Ltd.First Shanghai Investments, Ltd.Fountain SET Holdings, Ltd.Four Seas Mercantile Holdings, Ltd.
Freeman Fintech Corp, Ltd.Future Bright Holdings, Ltd.Genting Hong Kong, Ltd.Get Nice Financial Group, Ltd.Get Nice Holdings, Ltd.Giordano International, Ltd.Global Brands Group Holding, Ltd.Glorious Sun Enterprises, Ltd.Glory Sun Land Group, Ltd.Gold Peak Industries Holdings, Ltd.Golden Resources Development International, Ltd.Gold-Finance Holdings, Ltd.Good Resources Holdings, Ltd.Goodbaby International Holdings, Ltd.GR Properties, Ltd.Great Eagle Holdings, Ltd.Great Harvest Maeta Group Holdings, Ltd.Greater Bay Area Investments Group Holdings, Ltd.Greenheart Group, Ltd.Greentech Technology International, Ltd.G-Resources Group, Ltd.Guangnan Holdings, Ltd.Guotai Junan International Holdings, Ltd.Haitong International Securities Group, Ltd.Hang Lung Group, Ltd.Hanison Construction Holdings, Ltd.Hao Tian Development Group, Ltd.Harbour Centre Development, Ltd.HKBN, Ltd.HKBridge Financial Holdings, Ltd.HKR International, Ltd.Hoifu Energy Group, Ltd.Hon Kwok Land Investment Co., Ltd.Hong Kong Education International Investments, Ltd.Hong Kong Ferry Holdings Co., Ltd.Hong Kong Finance Investment Holding Group, Ltd.Hong Kong Shanghai Alliance Holdings, Ltd.Hong Kong Television Network, Ltd.Hongkong & Shanghai Hotels, Ltd. (The)Hongkong Chinese, Ltd.
10,979,130 5,209,967* 1,911,000 75,542#* 35,087,000 4,922,995
15,556,000 6,485,706* 7,496,000 416,706
6,836,000 1,030,383610,000 249,473
Table of Contents
The Asia Pacific Small Company SeriesCONTINUED
Shares Value»
HONG KONG — (Continued)* 17,658,000 $ 462,320
2,088,000 104,579483,000 58,956
2,438,600 281,91156,702,000 1,914,48213,514,000 4,643,529
# 7,256,599 572,7014,328,000 485,282
* 3,081,000 326,3653,029,642 316,4753,770,500 269,227
#* 9,580,000 88,113* 9,720,000 136,281#* 7,261,000 1,490,147* 2,888,000 428,333
817,349 3,313,048#* 932,500 189,125* 18,640,000 23,812* 779,400 29,860* 6,240,000 47,100* 245,577,600 1,746,429
2,363,600 274,097# 36,748,797 5,805,429# 23,025,400 6,745,122
895,000 2,298,9102,551,649 432,473
* 19,412,400 619,146935,500 1,611,105
5,738,000 10,359,028* 103,000 8,962
7,133,369 3,622,3011,766,000 198,525
388,800 193,846* 96,000 11,195
918,300 970,168* 7,208,000 808,971
1,248,002 91,487* 2,871,751 1,655,539
3,679,845 4,795,9335,038,000 646,502
Copyright © 2021 www.secdatabase.com. All Rights Reserved.Please Consider the Environment Before Printing This Document

Honma Golf, Ltd.Hop Hing Group Holdings, Ltd.Hsin Chong Group Holdings, Ltd.Hung Hing Printing Group, Ltd.Hutchison Telecommunications Hong Kong Holdings, Ltd.I-CABLE Communications, Ltd.IGG, Inc.Imagi International Holdings, Ltd.International Housewares Retail Co., Ltd.IPE Group, Ltd.IRC, Ltd.IT, Ltd.ITC Properties Group, Ltd.Jacobson Pharma Corp., Ltd.Johnson Electric Holdings, Ltd.Kader Holdings Co., Ltd.Kam Hing International Holdings, Ltd.Karrie International Holdings, Ltd.Keck Seng Investments
Kerry Logistics Network, Ltd.Kin Yat Holdings, Ltd.Kingmaker Footwear Holdings, Ltd.Kiu Hung International Holdings, Ltd.Kowloon Development Co., Ltd.Kwan On Holdings, Ltd.Kwoon Chung Bus Holdings, Ltd.Lai Sun Development Co., Ltd.Lai Sun Garment International, Ltd.Lam Soon Hong Kong, Ltd.Landing International Development, Ltd.Landsea Green Group Co., Ltd.Langham Hospitality Investments and Langham Hospitality Investments, Ltd.Lerthai Group, Ltd.Leyou Technologies Holdings, Ltd.Li & Fung, Ltd.Lifestyle International Holdings, Ltd.Lippo China Resources, Ltd.Lippo, Ltd.Liu Chong Hing Investment, Ltd.L'Occitane International SALuk Fook Holdings International, Ltd.Luks Group Vietnam Holdings Co., Ltd.Lung Kee Bermuda HoldingsMacau Legend Development, Ltd.Magnificent Hotel Investment, Ltd.Magnus Concordia Group, Ltd.Man Wah Holdings, Ltd.
1,126,500 1,002,83513,596,000 223,366
#* 10,243,403 343,4903,040,000 441,066
14,724,000 3,187,570#* 4,080,000 49,846
12,055,000 11,453,373#* 2,590,300 657,201
1,833,000 502,1473,345,000 339,047
* 32,796,266 710,2305,248,532 1,916,504
# 6,476,100 1,307,322# 2,856,000 541,258# 2,798,992 5,030,734
788,000 90,3811,830,000 128,7192,352,000 341,880
912,600 582,693Table of Contents
The Asia Pacific Small Company SeriesCONTINUED
Shares Value»
HONG KONG — (Continued)3,603,000 $ 6,177,557
242,000 25,3082,436,955 386,353
* 7,240,000 21,9573,042,000 3,822,361
* 2,340,000 145,24944,000 23,852
# 2,049,008 2,889,677677,602 794,080308,310 563,255
* 4,612,000 649,0003,016,000 353,4011,650,000 595,178
#* 40,000 36,756#* 1,345,000 383,455# 16,780,000 2,338,735
3,513,000 4,800,27020,922,000 467,999
1,161,700 436,8841,421,200 2,155,0752,265,000 4,704,623
# 3,963,000 11,954,533514,913 116,404
1,577,875 534,253#* 19,906,000 2,841,471
13,170,000 298,278* 8,740,000 204,500# 17,293,600 8,337,428
Copyright © 2021 www.secdatabase.com. All Rights Reserved.Please Consider the Environment Before Printing This Document

Mason Group Holdings, Ltd.Master Glory Group, Ltd.Matrix Holdings, Ltd.Maxnerva Technology Services, Ltd.Mei Ah Entertainment Group, Ltd.Melbourne Enterprises, Ltd.Melco International Development, Ltd.Microport Scientific Corp.Midland Holdings, Ltd.Million Hope Industries Holdings, Ltd.Ming Fai International Holdings, Ltd.Miramar Hotel & InvestmentModern Dental Group, Ltd.Mongolian Mining Corp.NagaCorp., Ltd.Nameson Holdings, Ltd.Nanyang Holdings, Ltd.National Electronics HldgsNational United Resources Holdings, Ltd.Neo-Neon Holdings, Ltd.New Century Group Hong Kong, Ltd.NEW Concepts Holdings, Ltd.New Times Energy Corp., Ltd.NewOcean Energy Holdings, Ltd.Nimble Holdings Co., Ltd.NOVA Group Holdings, Ltd.OCI International Holdings, Ltd.OP Financial, Ltd.Orange Sky Golden Harvest Entertainment Holdings, Ltd.Oriental Watch Holdings
Oshidori International Holdings, Ltd.Pacific Andes International Holdings, Ltd.Pacific Basin Shipping, Ltd.Pacific Textiles Holdings, Ltd.Pak Fah Yeow International, Ltd.Paliburg Holdings, Ltd.Paradise Entertainment, Ltd.PC Partner Group, Ltd.PCCW, Ltd.Pegasus International Holdings, Ltd.Perfect Shape Medical, Ltd.Pico Far East Holdings, Ltd.Playmates Holdings, Ltd.Playmates Toys, Ltd.Plover Bay Technologies, Ltd.Pokfulam Development Co., Ltd.Polytec Asset Holdings, Ltd.
# 102,773,399 1,557,142972,981 32,316
1,067,414 444,646* 982,000 61,243* 1,080,000 27,239
39,500 1,129,980790,000 1,922,220
72,000 60,3633,801,897 647,053
484,615 41,8732,148,000 266,0271,113,000 2,343,4962,568,000 414,489
#* 23,426,500 295,2562,004,000 3,012,2807,900,000 487,914
133,500 936,8742,668,600 416,040
* 18,280,000 62,115* 2,625,500 201,239* 13,351,464 209,391* 1,012,000 188,282* 10,056,600 95,599#* 10,548,000 2,230,402* 1,002,000 102,422# 870,000 194,130* 48,000 7,640# 8,140,000 2,035,208* 10,874,706 311,376
3,570,800 1,054,217Table of Contents
The Asia Pacific Small Company SeriesCONTINUED
Shares Value»
HONG KONG — (Continued)# 17,318,400 $2,134,686* 19,435,067 68,026# 34,024,000 6,984,983
8,706,000 6,866,8405,000 1,850
3,180,830 1,219,209# 3,688,000 564,878
2,406,000 568,3263,003,000 1,712,621
* 120,000 14,3393,948,000 1,876,780
# 5,924,000 1,830,0777,082,000 1,064,616
* 6,288,000 591,6372,192,000 362,040
# 234,000 498,42813,613,026 1,751,677
Copyright © 2021 www.secdatabase.com. All Rights Reserved.Please Consider the Environment Before Printing This Document

PT International Development Co., Ltd.Public Financial Holdings, Ltd.PYI Corp., Ltd.Rare Earth Magnesium Technology Group Holdings, Ltd.Realord Group Holdings, Ltd.Regal Hotels International Holdings, Ltd.Regent Pacific Group, Ltd.Regina Miracle International Holdings, Ltd.Sa Sa International Holdings, Ltd.Safety Godown Co., Ltd.Samsonite International SASAS Dragon Holdings, Ltd.SEA Holdings, Ltd.Shangri-La Asia, Ltd.Shenwan Hongyuan HK, Ltd.Shun Ho Property Investments, Ltd.Shun Tak Holdings, Ltd.Shunten International Holdings, Ltd.Silver Base Group Holdings, Ltd.Sincere Watch Hong Kong, Ltd.Sing Tao News Corp., Ltd.Singamas Container Holdings, Ltd.SIS International HoldingsSITC International Holdings Co., Ltd.Sitoy Group Holdings, Ltd.SmarTone Telecommunications Holdings, Ltd.SOCAM Development, Ltd.Solartech International Holdings, Ltd.Solomon Systech International, Ltd.Soundwill Holdings, Ltd.South China Holdings Co., Ltd.South Shore Holdings, Ltd.Stella International Holdings, Ltd.Success Universe Group, Ltd.Summit Ascent Holdings, Ltd.Sun Hing Vision Group Holdings, Ltd.Sun Hung Kai & Co., Ltd.SUNeVision Holdings, Ltd.Synergy Group Holdings International, Ltd.TAI Cheung Holdings, Ltd.Tai Sang Land Development, Ltd.Tai United Holdings, Ltd.
Talent Property Group, Ltd.Tan Chong International, Ltd.Tao Heung Holdings, Ltd.Television Broadcasts, Ltd.Termbray Industries International Holdings, Ltd.
* 5,669,150 328,9843,124,000 1,298,674
* 30,759,973 415,2838,440,000 310,691
* 2,256,000 1,279,3893,075,800 1,865,025
* 10,370,000 297,917# 2,346,000 1,761,164# 14,519,522 4,067,909
400,000 769,1602,259,300 4,423,9122,182,000 645,766
# 1,683,523 1,983,680444,000 540,201
4,506,250 799,9001,254,757 446,970
13,453,419 4,967,337#* 4,476,000 307,963* 6,728,515 253,309* 4,450,000 92,937
1,974,000 220,32912,932,000 1,709,469
34,000 14,8665,006,000 5,517,819
# 2,487,000 387,4574,244,481 3,900,672
* 1,448,170 381,349* 8,140,000 75,551* 11,998,000 311,845
654,500 906,892* 17,774,503 471,758* 156,750 4,305
2,499,500 4,029,810* 6,716,000 212,113#* 8,864,000 1,419,933
358,000 128,4275,413,429 2,484,3552,019,000 1,489,547
* 652,000 64,4842,207,000 2,139,030
798,910 537,978# 670,000 18,033Table of Contents
The Asia Pacific Small Company SeriesCONTINUED
Shares Value»
HONG KONG — (Continued)* 14,355,000 $ 76,831# 1,176,000 357,000# 1,784,000 330,533
2,967,600 4,767,821* 1,642,900 67,802
Copyright © 2021 www.secdatabase.com. All Rights Reserved.Please Consider the Environment Before Printing This Document

Tern Properties Co., Ltd.Texwinca Holdings, Ltd.Theme International Holdings, Ltd.Tian Teck Land, Ltd.TK Group Holdings, Ltd.TOM Group, Ltd.Town Health International Medical Group, Ltd.Tradelink Electronic Commerce, Ltd.Transport International Holdings, Ltd.Trinity, Ltd.Tsui Wah Holdings, Ltd.Union Medical Healthcare, Ltd.United Laboratories International Holdings, Ltd. (The)Universal Technologies Holdings, Ltd.Up Energy Development Group, Ltd.Value Convergence Holdings, Ltd.Value Partners Group, Ltd.Vanke Property Overseas, Ltd.Vantage International Holdings, Ltd.Vedan International Holdings, Ltd.Victory City International Holdings, Ltd.Vitasoy International Holdings, Ltd.VPower Group International Holdings, Ltd.VSTECS Holdings, Ltd.VTech Holdings, Ltd.Wai Kee Holdings, Ltd.Wan Kei Group Holdings, Ltd.Wang On Group, Ltd.We Solutions, Ltd.Win Hanverky Holdings, Ltd.Winfull Group Holdings, Ltd.Wing On Co. International, Ltd.Wing Tai Properties, Ltd.Wonderful Sky Financial Group Holdings, Ltd.Wong's International Holdings, Ltd.Xinyi Glass Holdings, Ltd.Yangtzekiang Garment, Ltd.YGM Trading, Ltd.YT Realty Group, Ltd.YTO Express Holdings, Ltd.Yue Yuen Industrial Holdings, Ltd.Yunfeng Financial Group, Ltd.Zhaobangji Properties Holdings, Ltd.
TOTAL HONG KONG
Abano Healthcare Group, Ltd.Air New Zealand, Ltd.Arvida Group, Ltd.Briscoe Group, Ltd.CBL Corp., Ltd.Chorus, Ltd.Colonial Motor Co., Ltd. (The)Comvita, Ltd.
7,200 4,4157,392,000 2,185,920
* 5,990,000 112,0311,024,000 1,118,3481,322,000 577,271
#* 1,146,000 239,215# 5,764,157 381,054
6,090,000 969,9691,482,264 4,257,719
* 8,046,000 301,486# 4,630,000 353,697
1,884,097 1,651,075# 7,578,000 4,150,501* 6,170,000 161,479* 3,929,000 12,146* 8,372,000 691,127
9,132,000 5,443,99349,000 30,477
3,160,000 277,5883,576,000 353,8755,630,349 351,494
205,000 965,062# 1,330,000 441,278# 7,319,600 4,003,228
1,359,100 11,919,7417,126,738 4,706,150
* 1,005,000 86,76536,500,000 483,546
#* 8,436,000 408,7913,310,000 384,3899,512,000 115,628
759,000 2,351,4062,165,331 1,462,472
* 1,386,000 189,99991,641 36,176
3,896,000 3,927,309334,500 153,060447,000 423,376
# 3,450,008 1,013,996144,000 42,940224,000 627,633
#* 280,000 146,655#* 96,000 99,682
438,946,827
NEW ZEALAND — (6.4%)58,106 156,14698,269 174,941
# 604,161 542,7415,431 12,229
* 47,180 18,4143,080,794 11,156,461
144,588 858,558# 31,904 63,258
Copyright © 2021 www.secdatabase.com. All Rights Reserved.Please Consider the Environment Before Printing This Document

EBOS Group, Ltd.Freightways, Ltd.Genesis Energy, Ltd.Gentrack Group, Ltd.Hallenstein Glasson Holdings, Ltd.Heartland Group Holdings, Ltd.Infratil, Ltd.Investore Property, Ltd.Kathmandu Holdings, Ltd.Mainfreight, Ltd.Metlifecare, Ltd.Metro Performance Glass, Ltd.Millennium & Copthorne Hotels New Zealand, Ltd.NEW Zealand King Salmon Investments, Ltd.New Zealand Refining Co., Ltd. (The)NZME, Ltd.NZME, Ltd.NZX, Ltd.Oceania Healthcare, Ltd.Pacific Edge, Ltd.PGG Wrightson, Ltd.Port of Tauranga, Ltd.Pushpay Holdings, Ltd.Restaurant Brands New Zealand, Ltd.Rubicon, Ltd.Sanford, Ltd.Scales Corp., Ltd.Scott Technology, Ltd.Serko, Ltd.Skellerup Holdings, Ltd.SKY Network Television, Ltd.SKYCITY Entertainment Group, Ltd.Steel & Tube Holdings, Ltd.Summerset Group Holdings, Ltd.Synlait Milk, Ltd.Tourism Holdings, Ltd.TOWER, Ltd.Trustpower, Ltd.Turners Automotive Group, Ltd.Vector, Ltd.Vista Group International, Ltd.Warehouse Group, Ltd. (The)Z Energy, Ltd.
TOTAL NEW ZEALAND
Abterra, Ltd.Accordia Golf Trust
Table of Contents
The Asia Pacific Small Company SeriesCONTINUED
Shares Value»
NEW ZEALAND — (Continued)370,661 $ 6,061,950
1,007,754 5,669,1052,166,025 4,870,616
# 71,302 247,927318,169 1,119,807
1,677,956 1,801,1734,778,499 14,567,344
287,293 356,593866,272 1,207,538428,464 11,809,539989,560 2,841,552
76,447 18,719# 395,725 712,629
51,906 63,240850,370 1,202,753
16,366 6,147# 945,851 334,695# 1,250,020 975,313
601,672 409,751* 442,720 60,549# 1,130,027 408,499
578,196 2,337,510* 756,788 1,656,894* 164,934 1,063,420* 994,681 120,500
399,789 1,757,101# 376,481 1,124,105
46,619 70,199* 42,804 116,288# 786,109 1,198,933
666,636 554,8304,786,590 12,556,907
# 516,064 318,0851,328,026 4,914,317
* 361,550 2,375,613651,201 1,749,058
#* 2,065,565 1,011,321249,956 1,243,955
32,205 48,088737,878 1,858,098
# 257,353 1,045,637328,270 489,204985,554 4,191,648
109,529,898
SINGAPORE — (10.7%)* 230,320 1,224
4,831,800 1,863,170
Copyright © 2021 www.secdatabase.com. All Rights Reserved.Please Consider the Environment Before Printing This Document

AEM Holdings, Ltd.Amara Holdings, Ltd.Ascendas India TrustAvarga, Ltd.Baker Technology, Ltd.Banyan Tree Holdings, Ltd.Best World International, Ltd.Bonvests Holdings, Ltd.Boustead Singapore, Ltd.BreadTalk Group, Ltd.Bukit Sembawang Estates, Ltd.
Bund Center Investment, Ltd.Centurion Corp., Ltd.China Aviation Oil Singapore Corp., Ltd.China Sunsine Chemical Holdings, Ltd.Chip Eng Seng Corp., Ltd.Chuan Hup Holdings, Ltd.CITIC Envirotech, Ltd.Civmec, Ltd.COSCO Shipping International Singapore Co., Ltd.Creative Technology, Ltd.CSE Global, Ltd.Del Monte Pacific, Ltd.Delfi, Ltd.Delong Holdings, Ltd.Duty Free International, Ltd.Dyna-Mac Holdings, Ltd.Elec & Eltek International Co., Ltd.Ezion Holdings, Ltd.Ezra Holdings, Ltd.Far East Orchard, Ltd.First Resources, Ltd.First Sponsor Group, Ltd.Food Empire Holdings, Ltd.Fragrance Group, Ltd.Frasers Property, Ltd.Frencken Group, Ltd.Fu Yu Corp., Ltd.Gallant Venture, Ltd.Geo Energy Resources, Ltd.GK Goh Holdings, Ltd.GL, Ltd.Golden Agri-Resources, Ltd.Golden Energy & Resources, Ltd.GP Industries, Ltd.GuocoLand, Ltd.Halcyon Agri Corp., Ltd.
2,590,900 2,191,399974,800 344,592
# 4,483,600 4,595,6923,076,900 421,894
289,580 88,015# 1,214,100 426,375# 2,911,550 2,881,674# 950,000 884,865
1,955,536 1,094,268# 2,101,100 1,070,365# 1,192,003 4,773,005Table of Contents
The Asia Pacific Small Company SeriesCONTINUED
Shares Value»
SINGAPORE — (Continued)# 659,825 $ 273,280# 1,404,600 424,040# 2,781,599 2,553,964# 1,969,400 1,605,572# 4,170,900 2,129,642
3,937,600 772,020# 3,131,700 736,849
162,700 37,725#* 8,909,700 2,020,604#* 444,950 1,189,208# 4,237,900 1,417,616
2,449,764 267,385788,500 747,502148,300 754,912720,700 94,345
#* 2,007,300 167,381163,500 233,481
#* 44,905,878 1,055,571#* 12,568,855 95,449
1,226,403 1,065,659# 5,593,200 6,335,751
484,728 461,8581,426,600 538,681
# 6,077,000 574,86715,500 20,410
# 2,079,200 1,071,2312,977,200 484,143
* 5,118,600 438,637# 3,932,300 439,375
1,484,065 914,704# 3,551,000 2,038,684
29,343,400 6,267,478# 603,700 91,808
2,540,709 1,135,9821,754,614 2,536,308
#* 1,760,948 606,796
Copyright © 2021 www.secdatabase.com. All Rights Reserved.Please Consider the Environment Before Printing This Document

Hanwell Holdings, Ltd.Haw Par Corp., Ltd.Health Management International, Ltd.Hiap Hoe, Ltd.Hi-P International, Ltd.Ho Bee Land, Ltd.Hong Fok Corp., Ltd.Hong Leong Asia, Ltd.Hong Leong Finance, Ltd.Hotel Grand Central, Ltd.Hour Glass, Ltd. (The)Hutchison Port Holdings TrustHwa Hong Corp., Ltd.Hyflux, Ltd.iFAST Corp., Ltd.Indofood Agri Resources, Ltd.Japfa, Ltd.Keppel Infrastructure TrustKoh Brothers Group, Ltd.KSH Holdings, Ltd.Lian Beng Group, Ltd.Low Keng Huat Singapore, Ltd.Lum Chang Holdings, Ltd.
Mandarin Oriental International, Ltd.Metro Holdings, Ltd.Mewah International, Inc.Midas Holdings, Ltd.mm2 Asia, Ltd.Nera Telecommunications, Ltd.NetLink NBN TrustNew Toyo International Holdings, Ltd.NSL, Ltd.OUE, Ltd.Oxley Holdings, Ltd.Pacc Offshore Services Holdings, Ltd.Pan-United Corp., Ltd.Penguin International, Ltd.Perennial Real Estate Holdings, Ltd.Q&M Dental Group Singapore, Ltd.QAF, Ltd.Raffles Education Corp., Ltd.Raffles Medical Group, Ltd.RHT Health TrustRiverstone Holdings, Ltd.Roxy-Pacific Holdings, Ltd.SBS Transit, Ltd.Sembcorp Industries, Ltd.
# 1,888,219 281,118308,200 3,125,111
# 1,950,830 1,021,885# 498,000 291,841
1,561,200 1,557,8851,648,900 2,824,7303,575,094 2,230,048
* 1,932,800 805,645# 834,000 1,678,652
1,660,083 1,581,486# 1,879,432 1,156,033# 15,895,300 3,475,285# 2,123,500 466,057#* 3,707,700 78,603# 941,900 765,599# 3,609,300 771,546# 4,208,400 1,553,834
17,527,346 6,492,5551,432,000 223,734
# 1,278,300 420,112# 2,842,100 1,030,627# 912,900 321,444
1,094,030 274,509Table of Contents
The Asia Pacific Small Company SeriesCONTINUED
Shares Value»
SINGAPORE — (Continued)1,379,600 $2,186,0242,979,192 2,251,765
89,000 17,280#* 9,643,353 252,646* 3,143,200 524,563
1,143,400 233,646# 4,608,500 2,899,706
948,900 134,426409,900 306,456
# 2,266,600 2,467,079# 7,303,479 1,744,937* 1,132,900 124,348# 2,435,750 585,509# 518,132 194,401
167,100 75,333# 2,356,900 822,001
1,593,080 847,459#* 5,429,723 313,210# 7,785,395 5,818,196# 3,131,500 43,589# 1,406,800 920,926# 505,740 143,008# 898,200 2,727,647
1,652,200 2,795,485
Copyright © 2021 www.secdatabase.com. All Rights Reserved.Please Consider the Environment Before Printing This Document

Sembcorp Marine, Ltd.Sheng Siong Group, Ltd.SHS Holdings, Ltd.SIA Engineering Co., Ltd.SIIC Environment Holdings, Ltd.Sinarmas Land, Ltd.Sing Holdings, Ltd.Sing Investments & Finance, Ltd.Singapore Post, Ltd.Singapore Press Holdings, Ltd.Singapore Reinsurance Corp., Ltd.Singapore Shipping Corp., Ltd.Sino Grandness Food Industry Group, Ltd.Stamford Land Corp., Ltd.StarHub, Ltd.Straco Corp., Ltd.Sunningdale Tech, Ltd.SunVic Chemical Holdings, Ltd.Swiber Holdings, Ltd.Thomson Medical Group, Ltd.Tuan Sing Holdings, Ltd.UMS Holdings, Ltd.United Engineers, Ltd.United Industrial Corp., Ltd.United Overseas Insurance, Ltd.UOB-Kay Hian Holdings, Ltd.Valuetronics Holdings, Ltd.Venture Corp., Ltd.Vibrant Group, Ltd.Vicom, Ltd.Wee Hur Holdings, Ltd.Wing Tai Holdings, Ltd.Yeo Hiap Seng, Ltd.Yongnam Holdings, Ltd.
Zhongmin Baihui Retail Group, Ltd.
TOTAL SINGAPORE
TOTAL COMMON STOCKS
Ezion Holdings, Ltd. Warrants 04/16/23First Sponsor Group, Ltd. Rights 05/30/24
TOTAL SINGAPORE
TOTAL INVESTMENT SECURITIES
#* 1,925,500 1,874,6155,540,700 4,671,881
* 2,175,300 275,8061,302,100 2,505,286
# 5,137,920 879,264# 6,963,400 1,227,177# 1,668,000 484,694# 350,675 373,793# 12,231,500 8,564,979# 1,186,700 1,897,445
1,514,530 318,9821,640,700 346,921
#* 4,412,635 147,5233,297,700 1,139,6976,606,300 7,238,396
130,000 71,253# 1,215,160 1,214,024* 526,945 6,327#* 2,895,250 42,983# 4,294,500 195,736# 5,233,556 1,307,056# 3,740,975 1,724,655# 3,318,328 6,297,960
87,769 189,957# 181,850 946,395
2,182,410 1,917,073# 3,589,550 1,698,528
543,600 6,066,272* 1,386,603 150,759
124,100 648,7502,769,000 451,8994,092,967 6,275,554
223,731 148,711#* 2,817,300 362,112Table of Contents
The Asia Pacific Small Company SeriesCONTINUED
Shares Value»
SINGAPORE — (Continued)26,900 $ 13,997
184,769,895
1,640,509,716
RIGHTS/WARRANTS — (0.0%)SINGAPORE — (0.0%)#* 5,659,201 0* 48,473 353
353
1,640,510,069
Value†
Copyright © 2021 www.secdatabase.com. All Rights Reserved.Please Consider the Environment Before Printing This Document

DFA Short Term Investment Fund
(Cost $1,783,711,300)^^
AustraliaCanadaChinaHong KongNew ZealandSingapore
SingaporeSecurities Lending Collateral
TOTAL
4imprint Group P.L.C.Ascential P.L.C.Auto Trader Group P.L.C.Bloomsbury Publishing P.L.C.Centaur Media P.L.C.Cineworld Group P.L.C.Daily Mail & General Trust P.L.C., Class AEntertainment One, Ltd.Euromoney Institutional Investor P.L.C.Frontier Developments PLCFuture P.L.C.Gamma Communications P.L.C.Huntsworth P.L.C.Inmarsat P.L.C.ITE Group P.L.C.KCOM Group P.L.C.Kin & Carta P.L.C.Reach P.L.C.Rightmove P.L.C.
SECURITIES LENDING COLLATERAL — (5.0%)@§ 7,488,599 86,650,581
TOTAL INVESTMENTS — (100.0%)$1,727,160,650
Summary of the Series' investments as of July 31, 2019, based on their valuation inputs, is as follows (see Security Valuation Note):
Investments in Securities (Market Value)
Level 1 Level 2 Level 3 Total
Common Stocks— $ 905,360,658 — $ 905,360,658
$237,411 — — 237,411— 1,665,027 — 1,665,027
264,325 438,682,502 — 438,946,827— 109,529,898 — 109,529,898
13,997 184,755,898 — 184,769,895Rights/Warrants
— 353 — 353— 86,650,581 — 86,650,581
$515,733 $1,726,644,917 — $1,727,160,650
Table of Contents
THE UNITED KINGDOM SMALL COMPANY SERIES
SCHEDULE OF INVESTMENTS
July 31, 2019
(Unaudited)
Shares Value»
COMMON STOCKS — (99.1%)COMMUNICATION SERVICES — (5.7%)
133,034 $ 4,515,364424,498 2,052,023
3,493,845 22,935,626148,618 416,134537,905 294,197
3,783,444 11,744,6691,014,493 9,744,3052,554,739 13,643,449
658,764 11,104,144* 7,940 94,171
58,536 805,77518,586 245,602
1,116,562 1,357,4162,400,987 16,691,8474,637,058 4,112,8463,365,144 4,916,5581,021,659 1,289,6261,819,647 1,877,3031,510,646 9,661,814
Copyright © 2021 www.secdatabase.com. All Rights Reserved.Please Consider the Environment Before Printing This Document

STV Group P.L.C.TalkTalk Telecom Group P.L.C.Tarsus Group P.L.C.
TOTAL COMMUNICATION SERVICES
888 Holdings P.L.C.AA P.L.C.ASOS P.L.C.B&M European Value Retail SABCA Marketplace P.L.C.Bellway P.L.C.Boohoo Group P.L.C.Bovis Homes Group P.L.C.Card Factory P.L.C.Carpetright P.L.C.Coats Group PLCConnect Group P.L.C.Countryside Properties P.L.C.Crest Nicholson Holdings P.L.C.DFS Furniture P.L.C.Dignity P.L.C.Dixons Carphone P.L.C.Domino's Pizza Group P.L.C.Dunelm Group P.L.C.EI Group P.L.C.Findel P.L.C.Fuller Smith & Turner P.L.C., Class AGames Workshop Group P.L.C.GoCo Group P.L.C.Greene King P.L.C.Greggs P.L.C.GVC Holdings P.L.C.Gym Group P.L.C. (The)Halfords Group P.L.C.
Headlam Group P.L.C.Henry Boot P.L.C.Hollywood Bowl Group P.L.C.Hostelworld Group P.L.C.Inchcape P.L.C.J D Wetherspoon P.L.C.JD Sports Fashion P.L.C.JPJ Group P.L.C.Lookers P.L.C.Marston's P.L.C.McCarthy & Stone P.L.C.Merlin Entertainments P.L.C.Millennium & Copthorne Hotels P.L.C.
4,868 21,837# 3,919,347 5,008,779
244,568 1,257,895
123,791,380
CONSUMER DISCRETIONARY — (22.3%)1,648,130 3,048,4903,904,659 2,367,304
* 58,746 1,844,7645,683,092 25,509,0902,529,197 7,427,599
864,989 31,179,016* 4,441,452 12,869,808
1,275,625 16,294,7872,082,297 4,183,338
* 406,341 74,817178,890 173,698811,940 372,425
2,572,073 9,171,4541,470,044 6,537,1421,114,467 3,193,483
333,917 2,192,7366,029,318 8,738,0063,605,668 10,835,504
757,667 8,491,489* 3,907,228 13,393,712* 246,067 696,892
140,561 1,829,028224,457 12,318,662
1,913,273 1,991,2142,728,082 20,714,427
734,900 19,917,3481,668,716 11,954,510
736,666 2,290,2941,399,265 3,248,826
Table of Contents
The United Kingdom Small Company SeriesCONTINUED
Shares Value»
CONSUMER DISCRETIONARY — (Continued)480,270 $ 2,587,867493,078 1,469,905185,855 485,785226,453 469,099
2,915,715 22,089,002522,819 9,748,330
2,029,276 16,003,673* 401,143 3,353,474
1,995,121 1,014,6814,588,585 5,955,2482,414,814 4,086,8954,495,638 24,592,6461,670,579 13,828,174
Copyright © 2021 www.secdatabase.com. All Rights Reserved.Please Consider the Environment Before Printing This Document

Mitchells & Butlers P.L.C.MJ Gleeson P.L.C.Moneysupermarket.com Group P.L.C.Mothercare P.L.C.Motorpoint group P.L.C.N Brown Group P.L.C.On the Beach Group P.L.C.Pendragon P.L.C.Pets at Home Group P.L.C.Photo-Me International P.L.C.Playtech P.L.C.Rank Group P.L.C.Redrow P.L.C.Restaurant Group P.L.C. (The)Revolution Bars Group P.L.C.Sportech P.L.C.Sports Direct International P.L.C.SSP Group P.L.C.Superdry P.L.C.Ted Baker P.L.C.Telford Homes P.L.C.Thomas Cook Group P.L.C.Topps Tiles P.L.C.Vertu Motors P.L.C.Vitec Group P.L.C. (The)WH Smith P.L.C.William Hill P.L.C.
TOTAL CONSUMER DISCRETIONARY
A.G. Barr P.L.C.Anglo-Eastern Plantations P.L.C.Britvic P.L.C.Carr's Group P.L.C.Cranswick P.L.C.Devro P.L.C.Fevertree Drinks P.L.C.Greencore Group P.L.C.Hilton Food Group P.L.C.Majestic Wine P.L.C.McBride P.L.C.McColl's Retail Group P.L.C.Nichols P.L.C.Premier Foods P.L.C.PZ Cussons P.L.C.REA Holdings P.L.C.
Stock Spirits Group P.L.C.Tate & Lyle P.L.C.
* 1,634,891 6,028,516205,820 2,099,769
3,912,801 17,515,604* 1,543,280 310,442# 48,046 125,305
1,135,948 1,655,063# 770,184 4,422,754
7,772,229 1,204,9822,617,820 6,616,0541,513,993 1,833,3711,752,372 9,406,955
881,366 1,627,4041,760,115 11,977,4603,173,445 5,867,682
17,764 13,801* 408,363 167,415* 1,414,236 3,895,097
2,978,266 25,475,186306,154 1,603,499196,229 2,178,742174,739 738,897
#* 8,571,929 576,361925,429 775,303262,507 115,736197,528 2,718,430739,393 19,016,962
5,495,723 10,161,789
486,673,221
CONSUMER STAPLES — (5.2%)736,792 6,159,424107,628 597,101
1,841,682 20,461,568349,511 638,117346,453 11,213,287
1,052,919 2,629,790622,316 17,641,806
3,527,432 9,179,347235,125 2,662,270
# 149,568 463,1341,141,195 896,744
60,390 49,907131 2,854
* 4,896,591 2,007,1051,729,638 4,600,165
* 50,639 68,730Table of Contents
The United Kingdom Small Company SeriesCONTINUED
Shares Value»
CONSUMER STAPLES — (Continued)1,075,332 $ 2,992,2583,470,820 31,787,726
Copyright © 2021 www.secdatabase.com. All Rights Reserved.Please Consider the Environment Before Printing This Document
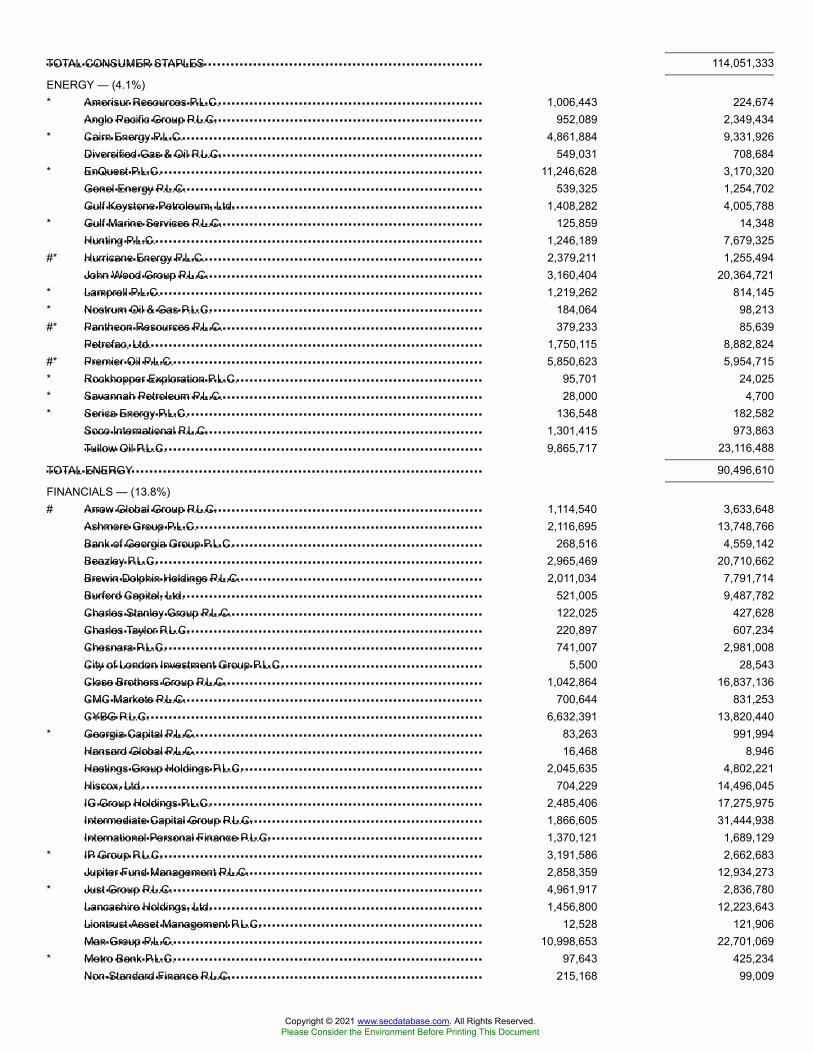
TOTAL CONSUMER STAPLES
Amerisur Resources P.L.C.Anglo Pacific Group P.L.C.Cairn Energy P.L.C.Diversified Gas & Oil P.L.C.EnQuest P.L.C.Genel Energy P.L.C.Gulf Keystone Petroleum, Ltd.Gulf Marine Services P.L.C.Hunting P.L.C.Hurricane Energy P.L.C.John Wood Group P.L.C.Lamprell P.L.C.Nostrum Oil & Gas P.L.C.Pantheon Resources P.L.C.Petrofac, Ltd.Premier Oil P.L.C.Rockhopper Exploration P.L.C.Savannah Petroleum P.L.C.Serica Energy P.L.C.Soco International P.L.C.Tullow Oil P.L.C.
TOTAL ENERGY
Arrow Global Group P.L.C.Ashmore Group P.L.C.Bank of Georgia Group P.L.C.Beazley P.L.C.Brewin Dolphin Holdings P.L.C.Burford Capital, Ltd.Charles Stanley Group P.L.C.Charles Taylor P.L.C.Chesnara P.L.C.City of London Investment Group P.L.C.Close Brothers Group P.L.C.CMC Markets P.L.C.CYBG P.L.C.Georgia Capital P.L.C.Hansard Global P.L.C.Hastings Group Holdings P.L.C.Hiscox, Ltd.IG Group Holdings P.L.C.Intermediate Capital Group P.L.C.International Personal Finance P.L.C.IP Group P.L.C.Jupiter Fund Management P.L.C.Just Group P.L.C.Lancashire Holdings, Ltd.Liontrust Asset Management P.L.C.Man Group P.L.C.Metro Bank P.L.C.Non-Standard Finance P.L.C.
114,051,333
ENERGY — (4.1%)* 1,006,443 224,674
952,089 2,349,434* 4,861,884 9,331,926
549,031 708,684* 11,246,628 3,170,320
539,325 1,254,7021,408,282 4,005,788
* 125,859 14,3481,246,189 7,679,325
#* 2,379,211 1,255,4943,160,404 20,364,721
* 1,219,262 814,145* 184,064 98,213#* 379,233 85,639
1,750,115 8,882,824#* 5,850,623 5,954,715* 95,701 24,025* 28,000 4,700* 136,548 182,582
1,301,415 973,8639,865,717 23,116,488
90,496,610
FINANCIALS — (13.8%)# 1,114,540 3,633,648
2,116,695 13,748,766268,516 4,559,142
2,965,469 20,710,6622,011,034 7,791,714
521,005 9,487,782122,025 427,628220,897 607,234741,007 2,981,008
5,500 28,5431,042,864 16,837,136
700,644 831,2536,632,391 13,820,440
* 83,263 991,99416,468 8,946
2,045,635 4,802,221704,229 14,496,045
2,485,406 17,275,9751,866,605 31,444,9381,370,121 1,689,129
* 3,191,586 2,662,6832,858,359 12,934,273
* 4,961,917 2,836,7801,456,800 12,223,643
12,528 121,90610,998,653 22,701,069
* 97,643 425,234215,168 99,009
Copyright © 2021 www.secdatabase.com. All Rights Reserved.Please Consider the Environment Before Printing This Document

Numis Corp. P.L.C.
OneSavings Bank P.L.C.Paragon Banking Group P.L.C.Phoenix Group Holdings P.L.C.Plus500, Ltd.Polar Capital Holdings P.L.C.Provident Financial P.L.C.Quilter P.L.C.Rathbone Brothers P.L.C.River & Mercantile Group P.L.C.S&U P.L.C.Saga P.L.C.TP ICAP P.L.C.Waterloo Investment Holdings, Ltd..
TOTAL FINANCIALS
Advanced Medical Solutions Group PLCAlliance Pharma P.L.C.BTG P.L.C.CareTech Holdings P.L.C.Circassia Pharmaceuticals P.L.C.Consort Medical P.L.C.ConvaTec Group P.L.C.CVS Group P.L.C.EMIS Group P.L.C.Genus P.L.C.Hikma Pharmaceuticals P.L.C.Horizon Discovery Group P.L.C.Indivior P.L.C.Integrated Diagnostics Holdings P.L.C.Mediclinic International P.L.C.Oxford Biomedica PLCSpire Healthcare Group P.L.C.UDG Healthcare P.L.C.Vectura Group P.L.C.
TOTAL HEALTH CARE
Aggreko P.L.C.Air Partner P.L.C.Avon Rubber P.L.C.Babcock International Group P.L.C.Balfour Beatty P.L.C.BBA Aviation P.L.C.Biffa P.L.C.Bodycote P.L.C.Braemar Shipping Services P.L.C.
193,765 560,688Table of Contents
The United Kingdom Small Company SeriesCONTINUED
Shares Value»
FINANCIALS — (Continued)1,426,567 $ 6,288,1131,986,747 10,088,9971,803,021 15,165,890
28,537 207,5026,512 45,252
1,085,414 5,717,4379,433,407 16,521,027
320,484 8,587,20310,512 35,37820,717 579,640
6,657,190 3,601,1283,563,660 13,571,365
4,000 40
301,148,461
HEALTH CARE — (3.7%)36,091 127,787
1,133,628 984,087* 2,027,017 20,598,387
232,974 1,055,788#* 516,889 124,528
293,388 2,669,1027,734,601 14,614,042
238,704 2,688,277220,750 3,266,423108,791 3,492,330150,269 3,352,403
* 8,433 15,500* 4,141,064 2,738,170
330,094 1,671,791# 1,757,752 7,329,417#* 45,378 380,597
1,508,515 2,072,0951,023,880 9,913,258
* 4,100,188 3,977,567
81,071,549
INDUSTRIALS — (27.8%)1,631,424 16,459,288
253,425 220,370196,015 3,196,614
3,027,476 17,446,5764,454,820 11,113,4007,255,414 28,181,642
919,591 2,450,4631,394,162 12,439,352
144,282 347,509
Copyright © 2021 www.secdatabase.com. All Rights Reserved.Please Consider the Environment Before Printing This Document

Capita P.L.C.Chemring Group P.L.C.Clarkson P.L.C.Clipper Logistics P.L.C.Cobham P.L.C.Costain Group P.L.C.Dart Group P.L.C.De La Rue P.L.C.Dialight P.L.C.Diploma P.L.C.easyJet P.L.C.
Firstgroup P.L.C.G4S P.L.C.Galliford Try P.L.C.Go-Ahead Group P.L.C. (The)Goodwin P.L.C.Grafton Group P.L.C.Hays P.L.C.HomeServe P.L.C.Howden Joinery Group P.L.C.IMI P.L.C.IWG P.L.C.James Fisher & Sons P.L.C.James Halstead P.L.C.John Laing Group P.L.C.John Menzies P.L.C.Johnson Service Group P.L.C.Keller Group P.L.C.Kier Group P.L.C.Luceco P.L.C.Mears Group P.L.C.Meggitt P.L.C.Mitie Group P.L.C.Morgan Advanced Materials P.L.C.Morgan Sindall Group P.L.C.National Express Group P.L.C.Norcros P.L.C.Northgate P.L.C.Pagegroup P.L.C.PayPoint P.L.C.Polypipe Group P.L.C.Porvair P.L.C.QinetiQ Group P.L.C.Redde P.L.C.Renewi P.L.C.Renold P.L.C.Ricardo P.L.C.
* 3,583,107 5,053,4131,750,142 3,901,328
188,879 5,884,712# 194,719 633,078* 16,545,169 33,129,353
719,416 1,372,512360,607 3,307,285726,960 2,063,714
#* 105,397 463,130771,284 14,216,888
39,472 462,569Table of Contents
The United Kingdom Small Company SeriesCONTINUED
Shares Value»
INDUSTRIALS — (Continued)* 8,133,769 $11,321,356
9,741,041 22,608,463764,429 5,475,654331,229 8,562,680
383 15,9381,613,523 14,199,537
10,128,695 18,916,0631,833,638 25,370,6724,476,142 30,069,0391,858,419 23,530,5734,308,277 19,732,933
305,629 8,098,7211,873 11,614
2,170,683 10,143,268537,443 2,707,708
14,226 29,949486,001 3,879,467
# 929,137 693,35190,365 106,878
763,170 2,544,2582,843,522 20,519,8232,341,363 4,676,9631,827,870 5,631,638
224,660 3,065,6452,924,082 14,894,818
116,690 296,1942,144,364 8,617,8112,346,683 12,767,792
412,524 4,724,2891,496,824 7,436,447
15,572 111,0013,934,302 13,816,278
249,307 345,6334,241,278 1,500,574
#* 193,435 58,596305,149 2,606,495
Copyright © 2021 www.secdatabase.com. All Rights Reserved.Please Consider the Environment Before Printing This Document

Robert Walters P.L.C.Rotork P.L.C.Royal Mail P.L.C.RPS Group P.L.C.Senior P.L.C.Serco Group P.L.C.Severfield P.L.C.SIG P.L.C.Speedy Hire P.L.C.Spirax-Sarco Engineering P.L.C.Staffline Group P.L.C.Stagecoach Group P.L.C.SThree P.L.C.Stobart Group, Ltd.T Clarke P.L.C.Travis Perkins P.L.C.Trifast P.L.C.Tyman P.L.C.Ultra Electronics Holdings P.L.C.Vesuvius P.L.C.Volex P.L.C.Volution Group P.L.C.Vp P.L.C.
Weir Group P.L.C (The)Wilmington P.L.C.Wincanton P.L.C.Wizz Air Holdings P.L.C.XP Power, Ltd.
TOTAL INDUSTRIALS
AVEVA Group P.L.C.Computacenter P.L.C.DiscoverIE Group P.L.C.Electrocomponents P.L.C.Equiniti Group P.L.C.FDM Group Holdings P.L.C.iomart Group P.L.C.IQE P.L.C.Kainos Group P.L.C.NCC Group P.L.C.Oxford Instruments P.L.C.Renishaw P.L.C.RM P.L.C.SDL P.L.C.Smart Metering Systems P.L.C.Softcat P.L.C.Sophos Group P.L.C.
392,594 2,542,8235,776,947 21,570,6012,901,275 7,409,3421,430,346 2,179,3073,232,361 7,870,642
* 758,599 1,359,3601,090,941 886,9714,544,685 7,265,1042,938,428 1,858,177
57,805 6,303,2333,354 4,708
3,009,333 4,784,138665,796 2,284,247
1,752,370 2,442,988147,457 210,890
1,715,478 28,399,982522,598 1,231,314819,563 2,170,236646,972 15,340,057
1,658,142 10,104,547#* 307,047 344,365
338,389 744,997159,998 1,519,262
Table of Contents
The United Kingdom Small Company SeriesCONTINUED
Shares Value»
INDUSTRIALS — (Continued)34,315 $ 620,375
334,384 796,590725,062 2,074,058
* 38,273 1,638,14696,359 2,382,524
607,770,299
INFORMATION TECHNOLOGY — (6.1%)271,132 13,098,462533,866 9,902,605450,154 2,430,180
3,231,445 23,809,8462,320,681 5,931,504
304,597 3,049,350116,388 480,093
#* 333,707 270,323261,845 1,784,526
1,582,738 3,559,665347,435 5,460,094256,980 11,963,421336,909 971,872467,878 2,696,436
# 389,147 2,384,070763,113 8,859,176193,012 1,018,939
Copyright © 2021 www.secdatabase.com. All Rights Reserved.Please Consider the Environment Before Printing This Document

Spectris P.L.C.Spirent Communications P.L.C.Strix Group P.L.C.Telit Communications P.L.C.TT Electronics P.L.C.Xaar P.L.C.
TOTAL INFORMATION TECHNOLOGY
Acacia Mining P.L.C.Carclo P.L.C.Castings P.L.C.Centamin P.L.C.Central Asia Metals P.L.C.Elementis P.L.C.Essentra P.L.C.Ferrexpo P.L.C.Forterra P.L.C.Gem Diamonds, Ltd.Highland Gold Mining, Ltd.Hill & Smith Holdings P.L.C.Hochschild Mining P.L.C.Ibstock P.L.C.KAZ Minerals P.L.C.Low & Bonar P.L.C.Marshalls P.L.C.Petra Diamonds, Ltd.Petropavlovsk P.L.C.Rhi Magnesita NVScapa Group P.L.C.Sirius Minerals P.L.C.Synthomer P.L.C.Victrex P.L.C.
Zotefoams P.L.C.
TOTAL MATERIALS
Capital & Counties Properties P.L.C.CLS Holdings P.L.C.Countrywide P.L.C.Daejan Holdings P.L.C.Foxtons Group P.L.C.Grainger P.L.C.Harworth Group P.L.C.Helical P.L.C.LSL Property Services P.L.C.Purplebricks Group P.L.C.Raven Property Group, Ltd.
800,305 24,651,7963,952,162 7,601,859
# 181,909 383,682* 82,391 163,385
973,422 2,599,657165,171 178,013
133,248,954
MATERIALS — (5.5%)* 777,386 2,114,561* 113,594 14,771
159,566 799,5708,553,267 13,346,409
408,089 1,013,9094,004,056 7,340,2351,319,583 6,841,8702,362,974 7,311,5001,212,464 4,130,839
* 679,902 567,3471,365,137 3,610,839
520,366 7,146,2171,451,720 3,640,7292,765,172 7,760,3151,775,954 12,293,3342,377,348 216,5141,451,367 11,200,972
* 5,639,982 765,426* 838,033 101,194
72,918 3,948,627180,225 430,594
* 1,683,489 305,6712,329,892 8,574,774
625,988 15,479,418Table of Contents
The United Kingdom Small Company SeriesCONTINUED
Shares Value»
MATERIALS — (Continued)92,020 $ 640,890
119,596,525
REAL ESTATE — (2.9%)4,766,212 11,460,109
526,949 1,463,109* 1,699,141 102,535# 46,566 3,140,129* 1,145,927 784,349
4,344,203 12,002,35330,680 49,191
671,471 2,923,414404,839 999,875
* 65,365 92,024* 952,767 454,660
Copyright © 2021 www.secdatabase.com. All Rights Reserved.Please Consider the Environment Before Printing This Document

Savills P.L.C.St. Modwen Properties P.L.C.U & I Group P.L.C.Urban & Civic P.L.C.Watkin Jones P.L.C.
TOTAL REAL ESTATE
Drax Group P.L.C.Pennon Group P.L.C.Telecom Plus P.L.C.
TOTAL UTILITIES
TOTAL COMMON STOCKS
DFA Short Term Investment Fund
(Cost $2,235,294,761)^^
Communication ServicesConsumer DiscretionaryConsumer StaplesEnergyFinancialsHealth CareIndustrialsInformation TechnologyMaterialsReal Estate
UtilitiesSecurities Lending Collateral
TOTAL
1,037,868 11,979,1992,832,022 14,391,855
851,229 1,478,738# 488,075 1,816,737
374,055 969,337
64,107,614
UTILITIES — (2.0%)2,913,829 10,676,7832,915,542 25,411,983
407,312 6,587,866
42,676,632
2,164,632,578
Value†
SECURITIES LENDING COLLATERAL — (0.9%)@§ 1,628,739 18,846,138
TOTAL INVESTMENTS — (100.0%)$2,183,478,716
Summary of the Series' investments as of July 31, 2019, based on their valuation inputs, is as follows (see Security Valuation Note):
Investments in Securities (Market Value)
Level 1 Level 2 Level 3 Total
Common Stocks— $ 123,791,380 — $ 123,791,380— 486,673,221 — 486,673,221— 114,051,333 — 114,051,333— 90,496,610 — 90,496,610— 301,148,461 — 301,148,461— 81,071,549 — 81,071,549— 607,770,299 — 607,770,299— 133,248,954 — 133,248,954— 119,596,525 — 119,596,525— 64,107,614 — 64,107,614
Table of Contents
The United Kingdom Small Company SeriesCONTINUED
Investments in Securities (Market Value)
Level 1 Level 2 Level 3 Total
— $ 42,676,632 — $ 42,676,632— 18,846,138 — 18,846,138
— $2,183,478,716 — $2,183,478,716
Table of Contents
THE CONTINENTAL SMALL COMPANY SERIES
Copyright © 2021 www.secdatabase.com. All Rights Reserved.Please Consider the Environment Before Printing This Document

Agrana Beteiligungs AGANDRITZ AGAtrium European Real Estate, Ltd.Austria Technologie & Systemtechnik AGCA Immobilien Anlagen AGDO & CO AGEVN AGFACC AGFlughafen Wien AGIMMOFINANZ AGJosef Manner & Co. AGKapsch TrafficCom AGLenzing AGMayr Melnhof Karton AGOberbank AGOesterreichische Post AGPalfinger AGPOLYTEC Holding AGPorr AGRosenbauer International AGS IMMO AGSchoeller-Bleckmann Oilfield Equipment AGSemperit AG HoldingStrabag SETelekom Austria AGUBM Development AGUNIQA Insurance Group AGVienna Insurance Group AG Wiener Versicherung GruppeVoestalpine AGWienerberger AGZumtobel Group AG
TOTAL AUSTRIA
Ackermans & van Haaren NVAGFA-Gevaert NVArgenx SEAtenorBanque Nationale de BelgiqueBarco NVBekaert SABiocartis NVbpost SACelyad SACie d'Entreprises CFECo.Br.Ha Societe Commerciale de Brasserie SADeceuninck NV
SCHEDULE OF INVESTMENTS
July 31, 2019
(Unaudited)Shares Value»
COMMON STOCKS — (92.2%)AUSTRIA — (3.0%)
83,446 $ 1,596,042510,397 18,179,314968,162 3,964,388182,880 2,938,993496,800 17,499,047
52,537 4,631,253230,431 3,656,629
# 174,996 2,075,03631,155 1,375,448
# 669,588 17,841,291870 87,701
36,036 1,273,530# 92,686 9,454,236
56,819 7,179,360# 38,990 4,118,136# 242,864 8,111,874
98,045 2,533,882# 105,679 1,026,954# 75,463 1,646,033# 20,385 963,072
363,879 8,036,95276,257 6,065,783
#* 69,672 972,627111,162 3,567,154
1,098,493 8,113,39119,127 848,680
958,393 8,587,267268,962 6,893,176
# 272,630 7,197,259617,965 14,125,522
#* 182,287 1,524,257
176,084,287
BELGIUM — (4.4%)174,099 25,359,722
* 1,452,124 5,848,471* 195,734 27,498,141
18,030 1,445,06087 224,130
74,142 15,483,484# 253,902 7,149,743#* 231,370 2,750,819# 600,057 5,579,458#* 42,190 517,206
48,396 4,253,033111 475,987
# 435,935 973,012
Copyright © 2021 www.secdatabase.com. All Rights Reserved.Please Consider the Environment Before Printing This Document

D'ieteren SAEconocom Group SAElia System Operator SAEuronav NVEVS Broadcast Equipment SAExmar NVFagronGalapagos NV
Galapagos NVGimv NVImmobel SAIon Beam ApplicationsJensen-Group NVKinepolis Group NVLotus Bakeries NVMDxHealthMelexis NVNyrstar NVOntex Group NVOrange Belgium SAOxurion NVPicanolRecticel SAResiluxRoularta Media Group NVSioen Industries NVSipef NVTelenet Group Holding NVTER Beke SATessenderlo Group SAVan de Velde NVViohalco SA
TOTAL BELGIUM
Agat Ejendomme A.S.ALK-Abello A.S.Alm Brand A.S.Ambu A.S., Class BBang & Olufsen A.S.BankNordik P/FBavarian Nordic A.S.Brodrene Hartmann A.S.Columbus A.S.D/S Norden A.S.DFDS A.S.Djurslands Bank A.S.Drilling Co. of 1972 A.S. (The)
202,237 9,471,506# 727,792 2,403,695# 221,440 16,859,548# 1,282,924 10,797,835
67,811 1,611,746#* 148,882 981,084
282,720 4,694,517* 41,834 7,312,390Table of Contents
The Continental Small Company SeriesCONTINUED
Shares Value»
BELGIUM — (Continued)* 220,186 $ 38,204,534
91,777 5,386,99317,740 1,208,506
* 126,538 2,422,09920,645 787,03298,670 5,821,577
# 1,729 4,506,375#* 239,516 323,753
111,148 7,607,792#* 84,985 55,232
504,176 8,306,287176,101 4,017,592
* 128,049 776,722# 28,690 2,064,029
270,323 2,178,544# 5,788 914,136
19,318 267,01453,303 1,469,897
# 36,491 1,653,787104,541 5,134,517
3,565 456,023* 214,654 6,719,717
38,465 1,101,921* 583,796 2,687,864
255,762,530
DENMARK — (4.6%)* 307,965 177,888* 43,768 9,899,503
563,835 5,040,784# 730,304 10,694,362* 256,627 1,652,523
10,800 178,267#* 185,816 5,095,417
16,148 766,949430,058 749,930217,180 3,249,732306,367 11,284,012
8,970 323,884* 18,294 1,241,089
Copyright © 2021 www.secdatabase.com. All Rights Reserved.Please Consider the Environment Before Printing This Document

FLSmidth & Co. A.S.Fluegger Group A.S.GronlandsBANKEN A.S.H+H International A.S., Class BHarboes Bryggeri A.S., Class BISS A.S.Jeudan A.S.Jyske Bank A.S.Lan & Spar BankMatas A.S.Nilfisk Holding A.S.NKT A.S.NNIT A.S.Pandora A.S.Parken Sport & Entertainment A.S.Per Aarsleff Holding A.S.Ringkjoebing Landbobank A.S.Roblon A.S., Class BRockwool International A.S., Class A
Rockwool International A.S., Class BRoyal Unibrew A.S.RTX A.S.Scandinavian Tobacco Group A.S., Class ASchouw & Co., A.S.SimCorp A.S.Solar A.S., Class BSpar Nord Bank A.S.Sydbank A.S.Tivoli A.S.Topdanmark A.S.TORM P.L.C.United International EnterprisesVeloxis Pharmaceuticals A.S.Vestjysk Bank A.S.Zealand Pharma A.S.
TOTAL DENMARK
Adapteo OyjAfarak Group OyjAhlstrom-Munksjo OyjAktia Bank OyjAlandsbanken Abp, Class BAlma Media OyjApetit OyjAsiakastieto Group OyjAspo OyjAtria Oyj
296,273 12,134,5524,198 187,7241,125 94,293
* 112,329 1,607,58917,239 197,887
612,951 17,189,924# 7,494 1,131,428* 500,030 15,935,799
4,981 336,601153,936 1,587,371
* 198,988 5,037,156* 206,194 3,027,590# 71,616 1,113,437
305,458 11,708,89736,911 645,957
140,513 4,629,960197,894 13,524,201
# 973 25,982993 218,110
Table of Contents
The Continental Small Company SeriesCONTINUED
Shares Value»
DENMARK — (Continued)42,036 $ 10,259,783
364,385 27,154,853# 57,507 1,363,161
299,618 3,162,11990,380 6,727,141
285,503 25,733,07637,386 1,714,583
596,914 5,268,986505,787 8,799,141
9,878 1,006,405475,380 24,366,069
* 138,120 1,138,04410,336 1,952,553
#* 120,013 56,666#* 1,761,030 1,074,601#* 185,786 4,161,141
264,627,120
FINLAND — (5.4%)* 277,432 3,244,902#* 316,672 299,582# 178,111 2,932,950
300,079 2,841,33421,354 350,518
129,772 920,50519,668 187,084
1,406 44,11695,329 947,35185,658 722,039
Copyright © 2021 www.secdatabase.com. All Rights Reserved.Please Consider the Environment Before Printing This Document
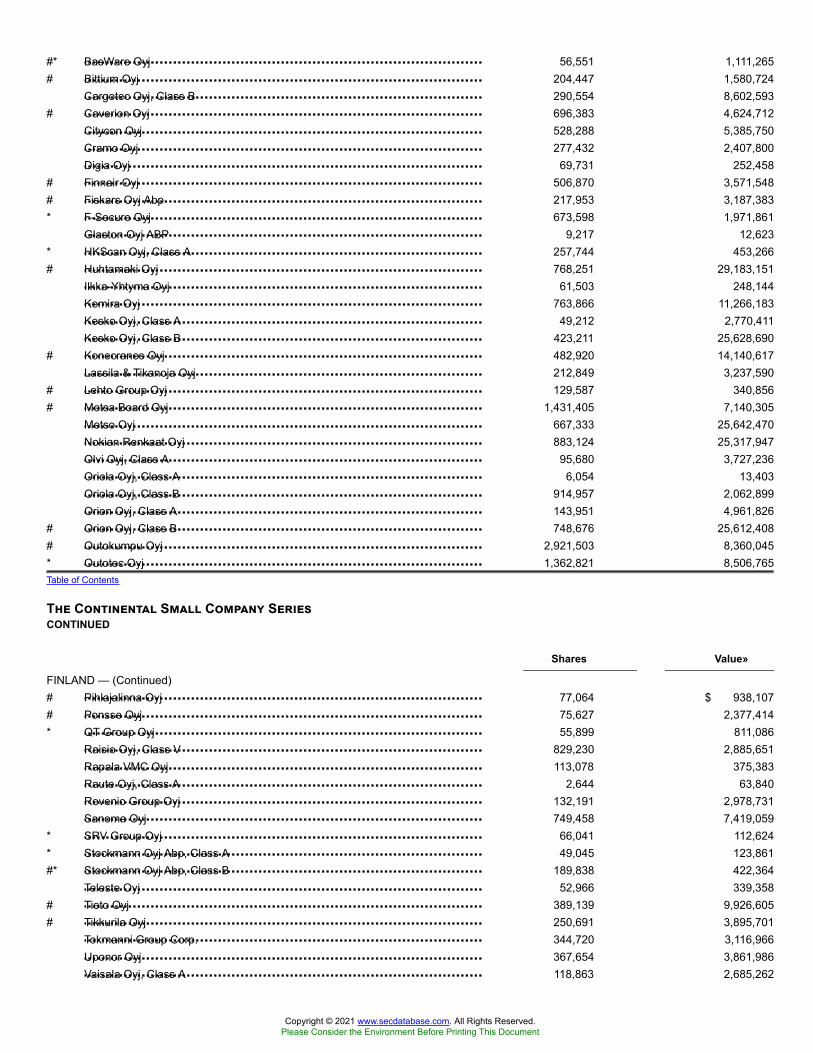
BasWare OyjBittium OyjCargotec Oyj, Class BCaverion OyjCitycon OyjCramo OyjDigia OyjFinnair OyjFiskars Oyj AbpF-Secure OyjGlaston Oyj ABPHKScan Oyj, Class AHuhtamaki OyjIlkka-Yhtyma OyjKemira OyjKesko Oyj, Class AKesko Oyj, Class BKonecranes OyjLassila & Tikanoja OyjLehto Group OyjMetsa Board OyjMetso OyjNokian Renkaat OyjOlvi Oyj, Class AOriola Oyj, Class AOriola Oyj, Class BOrion Oyj, Class AOrion Oyj, Class BOutokumpu OyjOutotec Oyj
Pihlajalinna OyjPonsse OyjQT Group OyjRaisio Oyj, Class VRapala VMC OyjRaute Oyj, Class ARevenio Group OyjSanoma OyjSRV Group OyjStockmann Oyj Abp, Class AStockmann Oyj Abp, Class BTeleste OyjTieto OyjTikkurila OyjTokmanni Group Corp.Uponor OyjVaisala Oyj, Class A
#* 56,551 1,111,265# 204,447 1,580,724
290,554 8,602,593# 696,383 4,624,712
528,288 5,385,750277,432 2,407,800
69,731 252,458# 506,870 3,571,548# 217,953 3,187,383* 673,598 1,971,861
9,217 12,623* 257,744 453,266# 768,251 29,183,151
61,503 248,144763,866 11,266,183
49,212 2,770,411423,211 25,628,690
# 482,920 14,140,617212,849 3,237,590
# 129,587 340,856# 1,431,405 7,140,305
667,333 25,642,470883,124 25,317,947
95,680 3,727,2366,054 13,403
914,957 2,062,899143,951 4,961,826
# 748,676 25,612,408# 2,921,503 8,360,045* 1,362,821 8,506,765Table of Contents
The Continental Small Company SeriesCONTINUED
Shares Value»
FINLAND — (Continued)# 77,064 $ 938,107# 75,627 2,377,414* 55,899 811,086
829,230 2,885,651113,078 375,383
2,644 63,840132,191 2,978,731749,458 7,419,059
* 66,041 112,624* 49,045 123,861#* 189,838 422,364
52,966 339,358# 389,139 9,926,605# 250,691 3,895,701
344,720 3,116,966367,654 3,861,986118,863 2,685,262
Copyright © 2021 www.secdatabase.com. All Rights Reserved.Please Consider the Environment Before Printing This Document

Valmet OyjViking Line AbpYIT Oyj
TOTAL FINLAND
ABC arbitrageActia GroupAdociaAir France-KLMAkka TechnologiesAKWELAlbioma SAAltamirAlten SAAltran Technologies SAAmplitude Surgical SASAPRIL SAAssystem SAAubayAxway Software SABaikowski SASBastide le Confort MedicalBeneteau SABigben InteractiveBoiron SABonduelle SCABourbon Corp.Burelle SACasino Guichard Perrachon SACatering International ServicesCegedim SACGG SAChargeurs SACie des AlpesCie Plastic Omnium SACoface SADerichebourg SADevoteam SAEdenredElectricite de Strasbourg SAElior Group SA
Elis SAErametErytech Pharma SAEsso SA FrancaiseEtablissements Maurel et PromEuronext NV
# 956,184 18,566,7497,869 159,315
# 1,430,763 7,917,306
312,790,678
FRANCE — (11.3%)82,694 577,50051,304 259,321
#* 6,607 129,746* 1,450,296 15,118,558
80,089 5,656,17958,127 1,142,388
188,895 5,014,636136,094 2,433,756191,025 23,631,595
# 1,693,540 26,716,195#* 19,526 31,102
75,626 1,814,25762,252 2,644,59341,397 1,456,10238,973 541,888
* 6,569 120,804# 19,001 772,434# 241,400 2,515,346
93,677 1,256,308# 40,254 1,788,423
93,600 2,769,219#* 163,857 636,673
1,054 988,699# 271,603 10,048,947
14,124 186,530* 31,774 979,985* 4,389,424 9,628,781# 133,346 2,463,638
67,699 1,860,909379,375 10,008,594
* 676,344 8,375,717644,921 2,384,765
37,273 4,459,026457,196 22,942,816
# 21,353 2,467,244# 858,106 11,222,145Table of Contents
The Continental Small Company SeriesCONTINUED
Shares Value»
FRANCE — (Continued)1,112,804 $20,591,498
65,268 3,121,476#* 3,609 23,003
17,215 475,114250,401 807,516373,020 28,795,790
Copyright © 2021 www.secdatabase.com. All Rights Reserved.Please Consider the Environment Before Printing This Document

Europcar Mobility GroupEutelsat Communications SAExel Industries, Class AFleury Michon SAFnac Darty S.A.Gaumont SAGaztransport Et Technigaz SAGEAGetlink SEGevelot SAGL EventsGroupe CritGroupe GorgeGroupe OpenGroupe SFPIGuerbetHaulotte Group SAHERIGE SADCSHEXAOMID Logistics GroupIliad SAImerys SAIngenico Group SAInnate Pharma SAIPSOSJacquet Metal Service SAJCDecaux SAKaufman & Broad SAKorian SALagardere SCALanson-BCCLatecoere SACALaurent-PerrierLe BelierLectraLinedata ServicesLISILNA Sante SAMaisons du Monde SAManitou BF SAManutan InternationalMersen SAMETabolic EXplorer SAMetropole Television SAMGI Digital Graphic TechnologyMr Bricolage SANeopost SANexans SANexity SANicoxNRJ GroupOeneo SAOL Groupe SA
# 662,189 4,146,6971,279,751 24,464,549
10,459 532,2656,124 240,403
* 127,014 8,909,35111,360 1,443,989
126,899 11,512,9132,433 269,984
68,459 988,4963,466 751,052
64,765 1,762,06323,123 1,554,28823,816 379,184
# 30,206 524,95829,940 73,64938,731 2,237,40175,426 585,661
# 4,147 119,438#* 15,908 584,567* 14,585 2,730,262
9,285 959,923# 208,694 8,724,355
424,498 40,220,385* 11,013 75,878
245,937 6,725,78784,944 1,513,148
1,424 40,998124,014 5,092,277380,676 15,025,587778,374 17,587,658
* 8,795 274,488* 458,502 1,927,466
13,775 1,357,83110,566 320,468
165,142 3,384,316# 14,505 460,434
114,054 3,306,38737,021 2,042,829
283,561 5,679,23566,476 1,569,99215,102 1,217,139
125,596 4,495,023#* 156,395 260,670
285,999 4,961,395* 1,691 93,345
29,965 113,861# 287,438 5,775,373
221,611 7,492,869298,976 14,354,867
#* 145,865 751,05181,965 605,569
138,546 1,589,473* 10,735 38,629Table of Contents
Copyright © 2021 www.secdatabase.com. All Rights Reserved.Please Consider the Environment Before Printing This Document

Onxeo SAOnxeo SAPierre & Vacances SAPlastivaloirePSB Industries SARallye SARecylex SARexel SARobertet SARothschild & Co.Rubis SCASamse SASavencia SASeche Environnement SASociete BIC SASociete des Bains de Mer et du Cercle des Etrangers a MonacoSociete Marseillaise du Tunnel Prado-Carenage SASociete pour l'Informatique IndustrielleSOITECSolocal GroupSomfy SASopra Steria GroupSPIE SASRP Groupe SAStef SASword GroupSynergie SATarkett SATechnicolor SATelevision Francaise 1TFF GroupThermador GroupeTotal GabonTouax SATransgene SATrigano SAUnion Financiere de France BQE SAVallourec SAValneva SEVetoquinol SAVicat SAVIEL & Cie SAVilmorin & Cie SAVirbac SAVranken-Pommery Monopole SAXPO Logistics Europe SADIR
TOTAL FRANCE
1&1 Drillisch AG
The Continental Small Company SeriesCONTINUED
Shares Value»
FRANCE — (Continued)#* 246,319 $ 200,174#* 48,958 39,241#* 29,600 556,895# 52,074 349,035
8,805 246,865# 156,235 732,591#* 102,008 434,758
2,320,855 25,914,5932,926 2,081,514
98,860 3,095,753610,442 34,398,363
8,068 1,408,12333,888 2,499,65516,034 619,310
# 180,119 12,552,280#* 59,706 3,896,168
5,211 103,713# 41,811 1,300,423* 128,068 13,290,148#* 4,233,535 3,505,886# 102,875 9,298,073
104,887 13,497,941# 852,935 15,809,638#* 55,158 71,513
27,648 2,452,52337,529 1,291,053
# 69,728 2,218,206# 221,856 3,711,117#* 2,040,996 1,727,746# 615,411 6,165,788# 12,398 502,148# 37,127 2,344,639
3,171 468,023#* 9,530 51,407* 4,014 10,336
55,119 5,530,053# 18,317 370,204#* 2,261,226 7,856,190* 53,370 180,932
19,343 1,279,126121,901 5,469,276162,802 890,433
35,320 1,935,592* 21,012 3,900,419
22,338 541,84233 11,117
655,519,915
GERMANY — (15.8%)55,974 1,681,026
Copyright © 2021 www.secdatabase.com. All Rights Reserved.Please Consider the Environment Before Printing This Document

7C Solarparken AGAareal Bank AGAdler Modemaerkte AGADLER Real Estate AGADO Properties SAADVA Optical Networking SEAIXTRON SEAll for One Group AGAllgeier SE
Amadeus Fire AGAtoss Software AGAurubis AGAxel Springer SEBasler AGBauer AGBayWa AGBayWa AGBechtle AGBertrandt AGbet-at-home.com AGBijou Brigitte AGBilfinger SEBorussia Dortmund GmbH & Co. KGaACANCOM SECECONOMY AGCENIT AGCENTROTEC Sustainable AGCewe Stiftung & Co. KGAAcomdirect bank AGCompuGroup Medical SECorestate Capital Holding SACropEnergies AGCTS Eventim AG & Co. KGaAData Modul AG Produktion Und Vertrieb Von Elektronischen SystemenDEAG Deutsche Entertainment AGDelticom AGDeutsche Beteiligungs AGDeutsche EuroShop AGDeutsche Pfandbriefbank AGDeutz AGDialog Semiconductor P.L.C.DIC Asset AGDMG Mori AGDr Hoenle AGDraegerwerk AG & Co. KGaADuerr AGEckert & Ziegler Strahlen- und Medizintechnik AG
12,773 43,161455,580 12,961,343
#* 47,849 160,889# 245,889 3,380,866# 220,260 9,436,343* 364,431 2,821,119#* 549,541 6,133,473
4,222 195,368# 46,014 1,194,203Table of Contents
The Continental Small Company SeriesCONTINUED
Shares Value»
GERMANY — (Continued)41,125 $ 5,586,624
2,385 343,047# 300,477 13,050,171# 11,260 777,197# 31,956 1,389,224
82,351 1,901,739# 106,449 2,770,791
124 4,146225,300 24,956,643
42,139 2,822,53121,796 1,372,15422,217 978,689
240,674 7,066,085602,892 6,006,946259,318 14,497,470
* 1,156,067 7,408,20753,174 669,78242,180 560,45643,060 3,977,560
217,781 2,247,573182,337 14,067,997
# 77,099 2,802,200155,852 1,039,562442,453 22,063,429
# 11,455 862,538* 54,104 248,818* 28,981 110,061
96,185 3,359,944394,656 10,677,689
1,033,260 11,730,2271,027,597 7,093,735
* 621,432 27,816,894435,337 4,907,941
15,692 732,286# 35,751 2,241,425
18,322 783,570410,542 12,210,041
32,518 4,292,587
Copyright © 2021 www.secdatabase.com. All Rights Reserved.Please Consider the Environment Before Printing This Document

EDAG Engineering Group AGElmos Semiconductor AGElringKlinger AGEnergiekontor AGEvotec SEFerratum OyjFielmann AGFirst Sensor AGFORTEC Elektronik AGFrancotyp-Postalia Holding AG, Class AFreenet AGFRIWO AGFuchs Petrolub SEGEA Group AGGerresheimer AGGesco AGGFT Technologies SEGrand City Properties SAGRENKE AGH&R GmbH & Co. KGaAHamburger Hafen und Logistik AG
Hapag-Lloyd AGHawesko Holding AGHeidelberger Druckmaschinen AGHella GmbH & Co KGaAHighlight Communications AGHolidayCheck Group AGHornbach Baumarkt AGHornbach Holding AG & Co. KGaAHugo Boss AGHypoport AGIndus Holding AGIsra Vision AGIVU Traffic Technologies AGJenoptik AGK+S AGKloeckner & Co. SEKoenig & Bauer AGKrones AGKSB SE & Co. KGaAKWS Saat SE & Co., KGaALanxess AGLeifheit AGLeoni AGLPKF Laser & Electronics AGManz AGMasterFlex SE
52,516 632,30592,807 2,021,409
#* 204,148 1,158,7152,066 39,517
* 667,317 18,805,363# 64,645 760,852
153,639 10,690,846# 44,242 1,439,464# 372 8,799# 55,619 213,229
981,903 19,158,533513 13,853
70,345 2,470,556770,940 19,134,762262,222 20,396,130
56,186 1,437,621123,639 956,302806,380 18,166,698
64,487 5,535,077* 70,149 494,831
182,979 4,612,733Table of Contents
The Continental Small Company SeriesCONTINUED
Shares Value»
GERMANY — (Continued)# 64,363 $ 2,703,205
52 2,040#* 1,982,859 2,160,408
244,384 11,522,28898,406 462,122
222,207 627,06437,380 689,96425,787 1,386,918
488,688 30,714,341* 310 81,849
133,474 5,297,117# 119,837 5,190,589
50,314 491,878391,123 10,960,542
# 1,567,865 25,303,458# 575,851 2,826,001# 95,477 3,832,866
114,135 6,486,6743,466 1,139,785
80,955 5,631,973620,363 36,925,571
# 60,321 1,303,249#* 245,460 3,291,589* 79,814 619,367#* 30,876 759,062# 21,291 138,976
Copyright © 2021 www.secdatabase.com. All Rights Reserved.Please Consider the Environment Before Printing This Document

Mediclin AGMedigene AGMETRO AGMLP SENemetschek SENexus AGNordex SENorma Group SEOHB SEOSRAM Licht AGParagon GmbH & Co. KGaAPatrizia AGPetro Welt Technologies AGPfeiffer Vacuum Technology AGPNE AGProgress-Werk Oberkirch AGProSiebenSat.1 Media SEPSI Software AGQSC AGR Stahl AGRheinmetall AGRHOEN-KLINIKUM AGRIB Software SERocket Internet SES&T AGSAF-Holland SASalzgitter AGSchaltbau Holding AGSchloss Wachenheim AGScout24 AGSecunet Security Networks AGSenvion SASGL Carbon SE
Shop Apotheke Europe NVSiltronic AGSixt Leasing SESixt SESLM Solutions Group AGSMA Solar Technology AGSMT Scharf AGSofting AGSoftware AGStabilus SASTRATEC SEStroeer SE & Co. KGaASuedzucker AGSUESS MicroTec SE
# 88,966 498,511#* 104,479 756,499# 359,027 5,522,488
415,171 2,064,123378,735 21,056,590
87,089 3,065,813* 508,398 5,951,616
237,761 8,524,844# 38,414 1,409,026# 602,174 22,665,870# 14,660 282,033
358,404 6,923,517* 12,774 52,980
56,577 7,890,914493,007 1,566,563
# 8,558 244,9781,109,960 14,337,491
# 50,278 951,406724,521 1,098,112
* 14,952 442,460339,164 38,485,934233,180 6,181,314292,708 6,299,828
#* 497,217 13,989,660# 322,003 7,515,878
362,112 3,731,244310,376 6,700,038
#* 32,728 1,019,996# 8,017 144,318
271,406 15,010,7056,248 844,648
#* 31,747 11,012* 293,218 1,971,615Table of Contents
The Continental Small Company SeriesCONTINUED
Shares Value»
GERMANY — (Continued)#* 24,816 $ 972,930
153,046 11,716,76064,806 774,536
# 96,696 9,930,233#* 9,386 135,923* 87,177 2,090,580* 22,763 320,902
26,963 216,733395,714 11,107,579170,155 7,754,466
# 24,452 1,594,527216,062 17,020,063584,233 9,072,976
#* 137,494 1,359,140
Copyright © 2021 www.secdatabase.com. All Rights Reserved.Please Consider the Environment Before Printing This Document

Surteco Group SESyzygy AGTAG Immobilien AGTakkt AGTechnotrans SETele Columbus AGTLG Immobilien AGTraffic Systems SEVERBIO Vereinigte BioEnergie AGVossloh AGWacker Chemie AGWacker Neuson SEWashtec AGWuestenrot & Wuerttembergische AGXING SEZeal Network SE
TOTAL GERMANY
Bank of Ireland Group P.L.C.C&C Group P.L.C.C&C Group P.L.C.Cairn Homes P.L.CDatalex P.L.C.FBD Holdings P.L.C.FBD Holdings P.L.C.Flutter Entertainment P.L.C.Glanbia P.L.C.Glanbia P.L.C.IFG Group P.L.C.Irish Continental Group P.L.C.Irish Continental Group P.L.C.Permanent TSB Group Holdings P.L.C.
TOTAL IRELAND
Adgar Investment and Development, Ltd.ADO Group, Ltd.Afcon Holdings, Ltd.AFI Properties, Ltd.Africa Israel Residences, Ltd.Airport City, Ltd.Albaad Massuot Yitzhak, Ltd.Allot, Ltd.
Alony Hetz Properties & Investments, Ltd.Alrov Properties and Lodgings, Ltd.Amot Investments, Ltd.Arad, Ltd.
46,502 1,207,2222,030 20,365
1,024,715 24,123,097203,963 2,784,947
# 47,270 1,009,990#* 296,432 657,597
722,981 21,220,68835,766 712,917
151,277 1,203,63568,437 2,682,456
# 89,853 6,638,786220,998 4,428,006
76,707 4,058,488115,343 2,294,90420,306 7,777,18964,157 1,271,963
915,503,883
IRELAND — (0.5%)390,533 1,723,298
1,127,341 5,130,107399,607 1,809,118
* 631,932 750,327107,125 108,626125,459 1,276,160
5,704 59,8771,546 122,114
285,853 3,721,069700,613 9,119,030
* 313,153 722,418543,391 2,489,434234,200 1,127,891
* 147,302 185,603
28,345,072
ISRAEL — (3.1%)6,982 13,429
* 99,315 1,524,8881,840 93,259
* 98,160 3,007,6062,237 50,081
#* 462,195 8,476,079* 2,660 17,578* 189,732 1,369,140Table of Contents
The Continental Small Company SeriesCONTINUED
Shares Value»
ISRAEL — (Continued)534,357 $7,269,145
# 49,177 1,849,083698,200 4,922,783
15,796 224,163
Copyright © 2021 www.secdatabase.com. All Rights Reserved.Please Consider the Environment Before Printing This Document

Arko Holdings, Ltd.Ashtrom Group, Ltd.Ashtrom Properties, Ltd.AudioCodes, Ltd.Avgol Industries 1953, Ltd.Azorim-Investment Development & Construction Co., Ltd.Bayside Land Corp.Bet Shemesh Engines Holdings 1997, Ltd.Big Shopping Centers, Ltd.BioLine RX, Ltd.Blue Square Real Estate, Ltd.Bonus Biogroup, Ltd.Brack Capital Properties NVBrainsway, Ltd.Camtek, Ltd.Carasso Motors, Ltd.Castro Model, Ltd.Cellcom Israel, Ltd.Ceragon Networks, Ltd.Clal Biotechnology Industries, Ltd.Clal Insurance Enterprises Holdings, Ltd.Cohen Development & Industrial Buildings, Ltd.Compugen, Ltd.Danel Adir Yeoshua, Ltd.Delek Automotive Systems, Ltd.Delek Group, Ltd.Delta-Galil Industries, Ltd.Direct Insurance Financial Investments, Ltd.Dor Alon Energy in Israel 1988, Ltd.El Al Israel AirlinesElectra Consumer Products 1970, Ltd.Electra, Ltd.Elron Electronic Industries, Ltd.Energix-Renewable Energies, Ltd.Enlight Renewable Energy, Ltd.Equital, Ltd.Evogene, Ltd.First International Bank Of Israel, Ltd.FMS Enterprises Migun, Ltd.Foresight Autonomous Holdings, Ltd.Formula Systems 1985, Ltd.Fox Wizel, Ltd.Gilat Satellite Networks, Ltd.Hadera Paper, Ltd.Hamlet Israel-Canada, Ltd.Harel Insurance Investments & Financial Services, Ltd.Hilan, Ltd.IDI Insurance Co., Ltd.Industrial Buildings Corp., Ltd.Inrom Construction Industries, Ltd.Intec Pharma, Ltd.Intercure, Ltd.Israel Canada T.R, Ltd.Israel Land Development - Urban Renewal, Ltd.
#* 1,440,389 618,511# 75,229 639,540
200,707 1,092,695178,789 3,453,490
* 468,925 470,840* 434,861 727,902
6,361 3,420,234# 16,900 542,932* 32,218 2,520,220#* 96,617 23,737
35,391 1,588,812* 613,036 76,530* 17,815 1,740,754# 54,222 280,368* 116,162 1,126,108
94,524 382,042* 145 2,289* 379,471 1,086,300#* 266,244 809,382* 182,384 89,436* 214,552 3,468,610
3,184 81,196#* 197,189 644,926
22,019 1,548,448# 222,032 944,246
1,151 175,531# 71,758 2,089,962# 111,207 1,266,214
9,069 148,434* 979,163 248,863
44,280 617,60412,544 3,557,736
* 37,137 53,209#* 799,844 1,588,431#* 2,163,770 1,894,255* 110,847 3,621,175* 79,189 114,375* 40,007 1,031,227
19,186 545,826#* 172,589 60,860
62,881 3,559,214# 57,530 1,723,438
225,761 1,896,478# 24,531 1,396,452# 32,722 666,306
761,702 5,947,525# 98,707 3,430,081
44,710 1,605,847* 1,009,017 2,168,219# 359,992 1,416,646
24,773 11,841#* 52,127 95,667
2,330 3,25229,765 299,393
Copyright © 2021 www.secdatabase.com. All Rights Reserved.Please Consider the Environment Before Printing This Document

Isras Investment Co., Ltd.
Issta Lines, Ltd.Kamada, Ltd.Kenon Holdings, Ltd.Kerur Holdings, Ltd.Klil Industries, Ltd.Maabarot Products, Ltd.Magic Software Enterprises, Ltd.Matrix IT, Ltd.Maytronics, Ltd.Mediterranean Towers, Ltd.Mega Or Holdings, Ltd.Meitav Dash Investments, Ltd.Melisron, Ltd.Menora Mivtachim Holdings, Ltd.Migdal Insurance & Financial Holding, Ltd.Minrav Holdings, Ltd.Mivtach Shamir Holdings, Ltd.Municipal Bank, Ltd.Naphtha Israel Petroleum Corp., Ltd.Nawi Brothers, Ltd.Neto ME Holdings, Ltd.Nova Measuring Instruments, Ltd.NR Spuntech Industries, Ltd.Oil Refineries, Ltd.One Software Technologies, Ltd.OPC Energy, Ltd.Partner Communications Co., Ltd.Paz Oil Co., Ltd.Perion Network, Ltd.Phoenix Holdings, Ltd. (The)Plasson Industries, Ltd.Pluristem Therapeutics, Inc.Rami Levy Chain Stores Hashikma Marketing 2006, Ltd.Redhill Biopharma, Ltd.Scope Metals Group, Ltd.Shapir Engineering and Industry, Ltd.Shikun & Binui, Ltd.Shufersal, Ltd.Summit Real Estate Holdings, Ltd.Suny Cellular Communication, Ltd.Tadiran Holdings, Ltd.Tower Semiconductor, Ltd.Union Bank of IsraelYH Dimri Construction & Development, Ltd.
TOTAL ISRAEL
5,159 862,794Table of Contents
The Continental Small Company SeriesCONTINUED
Shares Value»
ISRAEL — (Continued)11,573 $ 206,681
* 204,692 1,168,861103,975 2,186,686
30,969 828,3965,406 511,919
25,295 304,164# 133,292 1,214,864
238,821 3,751,334# 283,393 2,008,752# 326,956 760,221# 81,523 1,603,103
91,774 344,35266,739 3,505,606
183,483 2,932,3572,412,990 2,940,296
263 36,68923,078 466,203
1,031 213,966244,337 1,607,455
* 102,674 668,9198,982 803,108
* 182,733 5,349,594# 76,176 171,559* 9,073,048 4,868,318
552 34,15133,545 265,426
* 816,972 3,333,722# 56,718 8,032,728* 5,485 24,543
571,475 3,562,90720,285 818,897
* 1,813 9,680# 50,072 2,642,435#* 613,939 410,679# 47,147 1,146,315# 593,025 2,253,802# 1,337,236 4,598,251# 785,728 5,779,390
198,692 1,966,732* 473,129 255,680# 14,981 553,249* 262,838 5,155,611#* 199,952 950,131
1,529 33,559
178,574,928
ITALY — (9.6%)
Copyright © 2021 www.secdatabase.com. All Rights Reserved.Please Consider the Environment Before Printing This Document

A.S. Roma SpAA2A SpAACEA SpAAeffe SpAAmplifon SpAAnima Holding SpAAquafil SpAArnoldo Mondadori Editore SpAAscopiave SpAAutogrill SpAAutostrade Meridionali SpAAvio SpA
Azimut Holding SpAB&C Speakers SpABanca Carige SpABanca Farmafactoring SpABanca Finnat Euramerica SpABanca Generali SpABanca IFIS SpABanca Mediolanum SpABanca Monte dei Paschi di Siena SpABanca Popolare di Sondrio SCPABanca Profilo SpABanca Sistema SpABanco BPM SpABanco di Desio e della Brianza SpABasicNet SpABEBiesse SpABPER BancaBrunello Cucinelli SpABuzzi Unicem SpACairo Communication SpACarraro SpACembre SpACementir Holding SpACerved Group SpACIR-Compagnie Industriali Riunite SpACredito Emiliano SpACredito Valtellinese SpAd'Amico International Shipping SADanieli & C Officine Meccaniche SpADatalogic SpADe' Longhi SpADeA Capital SpADiaSorin SpAdoValue SpA
#* 856,401 485,07910,193,924 17,818,789
407,737 7,666,863* 310,503 595,554
665,253 16,396,7051,876,634 6,898,726
# 83,289 726,840* 1,200,844 1,956,099
574,531 2,611,067976,190 10,317,919
3,917 135,73883,312 1,117,661
Table of Contents
The Continental Small Company SeriesCONTINUED
Shares Value»
ITALY — (Continued)# 925,979 $17,354,997
18,289 240,780#* 148,414,098 180,724
745,039 4,026,747# 616,149 198,714
431,373 12,559,396158,534 2,239,763210,639 1,507,151
#* 213,039 308,1653,145,191 6,536,101
# 1,814,636 310,362# 331,868 457,911#* 12,626,497 23,539,781# 238,796 521,391# 169,891 851,786# 564,587 624,182# 88,272 1,099,042# 3,576,937 13,308,620
251,092 7,952,409620,584 12,612,077546,490 1,565,664
# 162,374 345,63710,902 256,958
357,880 2,513,4311,380,566 10,878,5872,650,178 2,928,752
577,631 2,892,847* 46,943,662 2,776,890#* 2,577,810 275,133
99,329 1,731,442126,734 2,228,397416,772 8,379,671778,374 1,116,775114,890 13,324,10475,176 939,770
Copyright © 2021 www.secdatabase.com. All Rights Reserved.Please Consider the Environment Before Printing This Document

El.En. SpAElica SpAEmak SpAEnav SpAERG SpAEsprinet SpAEurotech SpAExpert System SpAExprivia SpAFalck Renewables SpAFiera Milano SpAFila SpAFincantieri SpAFNM SpAFreni Brembo SpAGEDI Gruppo Editoriale SpAGefran SpAGeox SpAGima TT SpAGruppo MutuiOnline SpAGuala Closures SpAHera SpAIllimity Bank SpAIMA Industria Macchine Automatiche SpA
IMMSI SpAIntek Group SpAInterpump Group SpAIren SpAItalgas SpAItalmobiliare SpAIVS Group SAJuventus Football Club SpALa Doria SpAMaire Tecnimont SpAMARR SpAMassimo Zanetti Beverage Group SpAMediaset SpAOpenjobmetis SpA agenzia per il lavoroOVS SpAPiaggio & C SpAPirelli & C SpAPrima Industrie SpAPrysmian SpARAI Way SpAReno de Medici SpAReply SpARetelit SpA
# 30,013 586,002#* 140,268 334,296
388,913 422,1031,325,433 7,290,157
420,457 8,130,646235,490 791,033
#* 276,627 1,496,268* 45,395 147,807* 109,673 117,117
988,254 4,565,714182,588 793,907141,852 2,079,370
* 3,883,790 4,011,6491,231,913 693,093
# 1,149,779 11,760,599#* 927,122 292,253# 37,987 278,146
604,392 848,853# 59,692 533,941
169,566 2,890,485* 23,379 166,079# 6,455,969 24,038,243
23,835 218,734# 129,592 10,174,719Table of Contents
The Continental Small Company SeriesCONTINUED
Shares Value»
ITALY — (Continued)* 1,338,219 $ 917,712* 1,988,417 684,873
569,177 15,999,1585,087,546 13,311,6413,818,401 24,127,596
58,711 1,310,28056,191 627,774
#* 3,178,690 5,464,123# 80,464 714,186# 1,175,046 2,827,960
234,377 5,052,26865,668 415,497
#* 3,820,606 11,190,171# 63,025 481,590#* 1,248,714 2,197,120
1,557,750 4,678,713# 297,522 1,752,457# 32,468 543,362# 507,230 10,442,150
549,510 3,261,287# 1,282,618 974,891
150,466 10,066,896# 812,002 1,348,807
Copyright © 2021 www.secdatabase.com. All Rights Reserved.Please Consider the Environment Before Printing This Document

Rizzoli Corriere Della Sera Mediagroup SpASabaf SpASAES Getters SpASafilo Group SpASaipem SpASalini Impregilo SpASalvatore Ferragamo SpASaras SpAServizi Italia SpASesa SpASocieta Cattolica di Assicurazioni SCSocieta Iniziative Autostradali e Servizi SpASogefi SpASOL SpATamburi Investment Partners SpATechnogym SpATinexta S.p.A.Tiscali SpATod's SpATREVI - Finanziaria Industriale SpATXT e-solutions SpAUnieuro SpAUnione di Banche Italiane SpAUnipol Gruppo SpAUnipolSai Assicurazioni SpAZignago Vetro SpA
TOTAL ITALY
Aalberts NVAccell Group NVAFC Ajax NVAltice Europe NVAltice Europe NV, Class BAMG Advanced Metallurgical Group NVAmsterdam Commodities NV
APERAM SAArcadis NVArgenx SEASM International NVASR Nederland NVBasic-Fit NVBE Semiconductor Industries NVBeter Bed Holding NVBinckBank NVBoskalis WestminsterBrunel International NVCorbion NV
# 1,132,439 1,214,26849,948 809,37626,758 631,904
#* 233,748 226,728* 5,057,693 24,997,957#* 1,282,257 2,451,544
377,547 7,917,9944,486,402 7,384,837
62,874 222,41955,676 2,193,243
1,205,206 10,227,333# 454,965 8,629,777#* 332,859 443,539# 171,736 2,050,530
805,238 5,073,243667,996 7,175,496
* 139,927 1,911,575#* 9,160,788 137,370# 73,658 3,667,649#* 509,518 139,412# 38,226 354,126
67,560 927,382# 7,724,232 19,831,020
3,241,237 16,626,493348,889 909,562200,088 2,262,094
554,779,794
NETHERLANDS — (6.5%)728,381 29,307,134154,132 3,678,255
#* 13,955 269,474#* 4,683,910 17,437,459* 159,363 594,492# 184,488 5,281,703
119,553 2,522,178Table of Contents
The Continental Small Company SeriesCONTINUED
Shares Value»
NETHERLANDS — (Continued)390,560 $ 9,651,647
# 526,001 10,731,235* 12,041 1,694,166
331,781 27,062,822237,743 8,933,554
* 181,080 5,702,589589,568 17,448,686
#* 22,883 54,906* 388,322 2,722,198
653,419 14,755,168158,072 2,253,712418,361 13,674,823
Copyright © 2021 www.secdatabase.com. All Rights Reserved.Please Consider the Environment Before Printing This Document

Flow TradersForFarmers NVFugro NVGrandVision NVHeijmans NVHunter Douglas NVIMCD NVIntertrust NVKAS Bank NVKendrion NVKoninklijke BAM Groep NVKoninklijke Vopak NVLucas Bols NVNederland ApparatenfabriekOCI NVOrdina NVPostNL NVSBM Offshore NVSIF Holding NVSignify NVSligro Food Group NVTakeaway.com NVTKH Group NVTomTom NVVan Lanschot Kempen NVWessanen
TOTAL NETHERLANDS
ABG Sundal Collier Holding ASAAF Gruppen ASAAkastor ASAAker Solutions ASAAmerican Shipping Co. ASAArcher, Ltd.Arendals Fossekompani A.S.Atea ASAAustevoll Seafood ASAAvance Gas Holding, Ltd.Axactor SEB2Holding ASABonheur ASABorregaard ASABW LPG, Ltd.BW Offshore, Ltd.Data Respons ASADNO ASA
DOF ASA
226,049 5,988,836213,722 1,680,272
#* 597,586 4,877,636173,216 5,191,941
* 163,686 1,511,94724,041 1,627,093
357,303 31,478,380# 464,189 8,867,068
99,500 1,377,801# 107,439 2,066,768
1,955,582 6,541,980232,211 11,449,180
* 20,321 299,89833,193 1,776,601
* 327,478 8,541,287673,792 1,378,621
# 3,252,691 5,567,9141,376,758 27,242,050
# 35,317 493,167712,323 19,338,686
# 166,919 5,343,920#* 233,901 20,923,739
272,075 16,141,986545,686 6,443,627
77,449 1,581,436484,021 6,067,378
377,575,413
NORWAY — (2.3%)2,436,095 979,756
68,590 1,306,160* 1,077,318 1,371,304* 1,116,886 3,572,545
201,797 791,298#* 745,010 391,351
90 26,325# 530,643 6,750,924
94,578 962,232* 414,113 1,226,998#* 856,868 1,800,607# 1,157,660 1,288,214
140,320 2,836,398724,224 7,584,886
* 735,889 3,366,770* 837,993 4,704,651
23,566 88,0504,227,991 7,071,642
Table of Contents
The Continental Small Company SeriesCONTINUED
Shares Value»
NORWAY — (Continued)#* 847,189 $ 347,361
Copyright © 2021 www.secdatabase.com. All Rights Reserved.Please Consider the Environment Before Printing This Document
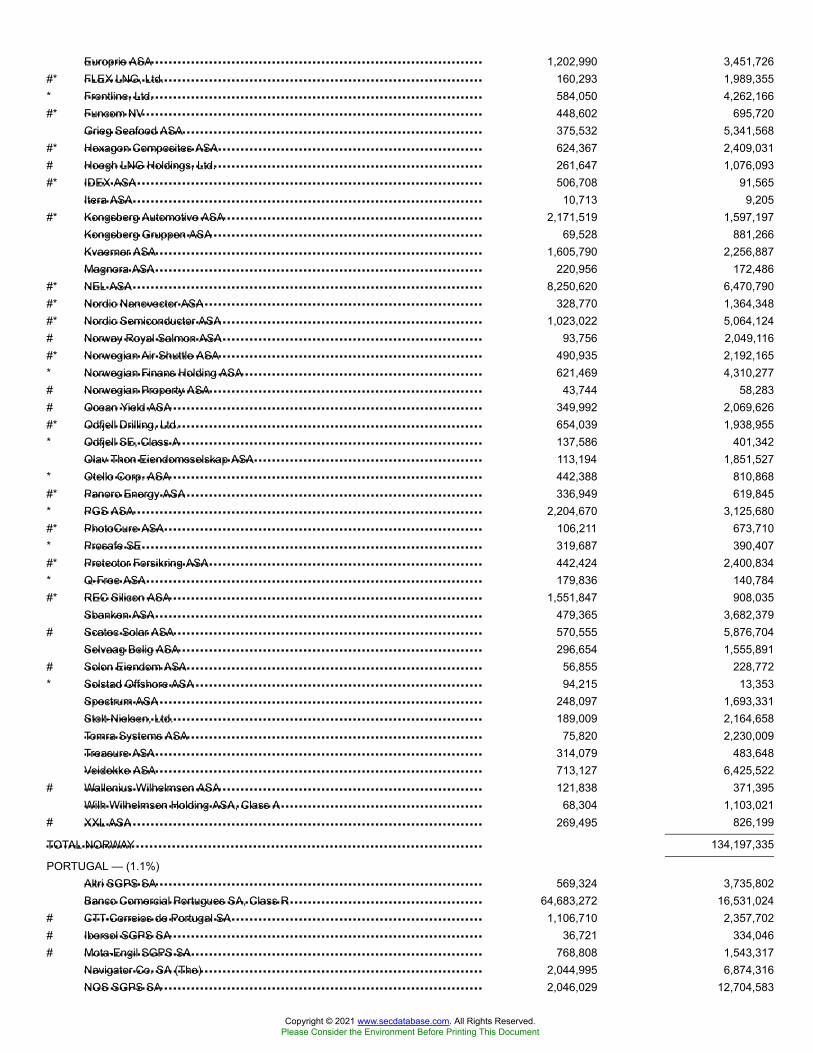
Europris ASAFLEX LNG, Ltd.Frontline, Ltd.Funcom NVGrieg Seafood ASAHexagon Composites ASAHoegh LNG Holdings, Ltd.IDEX ASAItera ASAKongsberg Automotive ASAKongsberg Gruppen ASAKvaerner ASAMagnora ASANEL ASANordic Nanovector ASANordic Semiconductor ASANorway Royal Salmon ASANorwegian Air Shuttle ASANorwegian Finans Holding ASANorwegian Property ASAOcean Yield ASAOdfjell Drilling, Ltd.Odfjell SE, Class AOlav Thon Eiendomsselskap ASAOtello Corp. ASAPanoro Energy ASAPGS ASAPhotoCure ASAProsafe SEProtector Forsikring ASAQ-Free ASAREC Silicon ASASbanken ASAScatec Solar ASASelvaag Bolig ASASolon Eiendom ASASolstad Offshore ASASpectrum ASAStolt-Nielsen, Ltd.Tomra Systems ASATreasure ASAVeidekke ASAWallenius Wilhelmsen ASAWilh Wilhelmsen Holding ASA, Class AXXL ASA
TOTAL NORWAY
Altri SGPS SABanco Comercial Portugues SA, Class RCTT-Correios de Portugal SAIbersol SGPS SAMota-Engil SGPS SANavigator Co. SA (The)NOS SGPS SA
1,202,990 3,451,726#* 160,293 1,989,355* 584,050 4,262,166#* 448,602 695,720
375,532 5,341,568#* 624,367 2,409,031# 261,647 1,076,093#* 506,708 91,565
10,713 9,205#* 2,171,519 1,597,197
69,528 881,2661,605,790 2,256,887
220,956 172,486#* 8,250,620 6,470,790#* 328,770 1,364,348#* 1,023,022 5,064,124# 93,756 2,049,116#* 490,935 2,192,165* 621,469 4,310,277# 43,744 58,283# 349,992 2,069,626#* 654,039 1,938,955* 137,586 401,342
113,194 1,851,527* 442,388 810,868#* 336,949 619,845* 2,204,670 3,125,680#* 106,211 673,710* 319,687 390,407#* 442,424 2,400,834* 179,836 140,784#* 1,551,847 908,035
479,365 3,682,379# 570,555 5,876,704
296,654 1,555,891# 56,855 228,772* 94,215 13,353
248,097 1,693,331189,009 2,164,658
75,820 2,230,009314,079 483,648713,127 6,425,522
# 121,838 371,39568,304 1,103,021
# 269,495 826,199
134,197,335
PORTUGAL — (1.1%)569,324 3,735,802
64,683,272 16,531,024# 1,106,710 2,357,702# 36,721 334,046# 768,808 1,543,317
2,044,995 6,874,3162,046,029 12,704,583
Copyright © 2021 www.secdatabase.com. All Rights Reserved.Please Consider the Environment Before Printing This Document

Novabase SGPS SAREN - Redes Energeticas Nacionais SGPS SASemapa-Sociedade de Investimento e Gestao
Sonae Capital SGPS SASonae SGPS SA
TOTAL PORTUGAL
Acciona SAAcerinox SAAdveo Group International SAAlantra Partners SAAlmirall SAAmper SAApplus Services SAAtresmedia Corp. de Medios de Comunicacion SAAzkoyen SABanco de Sabadell SABankinter SABolsas y Mercados Espanoles SHMSF SACellnex Telecom SACia de Distribucion Integral Logista Holdings SACIE Automotive SAConstrucciones y Auxiliar de Ferrocarriles SADeoleo SADuro Felguera SAEbro Foods SAeDreams ODIGEO SAElecnor SAEnagas SAEnce Energia y Celulosa SAErcros SAEuskaltel SAFaes Farma SAFluidra SAFomento de Construcciones y Contratas SAGlobal Dominion Access SAGrupo Catalana Occidente SAGrupo Empresarial San Jose SAGrupo Ezentis SAIberpapel Gestion SAIndra Sistemas SALaboratorios Farmaceuticos Rovi SALiberbank SAMasmovil Ibercom SAMediaset Espana Comunicacion SAMelia Hotels International SAMiquel y Costas & Miquel SA
# 72,649 214,1033,152,817 8,522,234
174,523 2,305,462Table of Contents
The Continental Small Company SeriesCONTINUED
Shares Value»
PORTUGAL — (Continued)789,547 $ 618,206
6,828,206 6,367,813
62,108,608
SPAIN — (5.4%)# 190,411 20,274,771
1,257,724 10,508,003#* 84,445 17,004
65,000 1,082,487478,628 8,675,617
#* 6,171,198 1,687,617915,222 12,865,018
# 609,294 2,374,04967,253 528,313
4,856,217 4,241,334113,170 734,104501,422 11,832,944981,389 36,702,311363,381 7,571,484504,560 12,757,934129,944 5,871,463
#* 2,541,069 174,142#* 326,411 82,642
533,238 10,714,978#* 408,701 1,849,052
200,108 2,507,50057,744 1,259,636
# 1,139,858 4,120,595# 793,840 1,527,418
530,684 4,635,4422,013,792 9,969,472
* 357,448 4,471,366330,043 4,201,901
* 710,368 3,415,113247,676 8,842,038
#* 153,495 1,391,460#* 1,683,706 977,540
47,580 1,490,832* 859,495 7,361,167
72,954 1,677,01813,599,029 5,064,420
* 357,426 8,095,6281,072,499 6,296,111
793,796 6,993,210# 145,855 2,520,432
Copyright © 2021 www.secdatabase.com. All Rights Reserved.Please Consider the Environment Before Printing This Document

Obrascon Huarte Lain SAParques Reunidos Servicios Centrales SAU, Class CPharma Mar SAPrim SAPromotora de Informaciones SA, Class AProsegur Cia de Seguridad SAQuabit Inmobiliaria SARealia Business SARenta 4 Banco SASacyr S.A.Solaria Energia y Medio Ambiente SATalgo SATecnicas Reunidas SATubacex SA
Tubos Reunidos SAUnicaja Banco SAVidrala SAViscofan SAVocento SAZardoya Otis SA
TOTAL SPAIN
AcadeMedia ABAddLife AB, Class BAddNode Group ABAddTech AB, Class BAF POYRY ABAlimak Group ABArise ABArjo AB, Class BAtrium Ljungberg AB, Class BAttendo ABAvanza Bank Holding ABBE Group ABBeijer Alma ABBeijer Electronics Group ABBeijer Ref ABBergman & Beving ABBesqab ABBetsson ABBilia AB, Class ABillerudKorsnas ABBioGaia AB, Class BBiotage ABBjorn Borg ABBonava ABBonava AB, Class B
#* 926,681 1,156,02845,336 692,994
#* 1,334,762 2,306,75839,523 486,560
* 2,378,213 3,502,7161,802,082 8,410,564
#* 822,731 860,367* 1,782,137 1,849,541
442 3,3573,190,457 8,186,190
#* 395,783 2,339,989* 644,045 3,462,467* 202,691 4,887,332# 799,622 2,551,112Table of Contents
The Continental Small Company SeriesCONTINUED
Shares Value»
SPAIN — (Continued)#* 785,848 $ 183,359
1,933,461 1,522,697110,672 10,025,643
# 281,337 13,770,757352,577 477,788
1,139,409 7,810,760
311,850,545
SWEDEN — (7.6%)* 311,664 1,628,630
100,397 2,704,85177,247 1,235,662
383,287 10,049,235691,852 16,304,295
# 255,129 3,545,641* 36,861 97,133
683,624 2,751,566248,215 4,587,323668,745 3,039,650813,250 7,257,116
27,710 124,041284,395 3,497,390
91,696 417,509449,196 9,956,998193,579 1,905,753
21,962 278,210985,787 5,203,834664,671 5,868,040
# 304,503 3,515,480122,939 5,111,852460,673 4,967,658
99,769 258,98612,198 148,448
448,766 5,372,574
Copyright © 2021 www.secdatabase.com. All Rights Reserved.Please Consider the Environment Before Printing This Document

Bravida Holding ABBufab ABBulten ABBure Equity ABByggmax Group ABCatena ABCavotec SAClas Ohlson AB, Class BCloetta AB, Class BCLX Communications ABCollector ABConcentric ABCoor Service Management Holding ABCorem Property Group AB, Class BDios Fastigheter ABDometic Group ABDoro ABDuni ABDustin Group ABEastnine ABElanders AB, Class BEltel ABEnea ABeWork Group ABFagerhult AB
Fenix Outdoor International AGFingerprint Cards AB, Class BGranges ABGunnebo ABHaldex ABHeba Fastighets AB, Class BHembla ABHemfosa Fastigheter ABHexpol ABHIQ International ABHMS Networks ABHoist Finance ABHolmen AB, Class BHumana ABIndutrade ABInwido ABJM ABKappAhl ABKindred Group P.L.C.Klovern AB, Class BKNOW IT ABKungsleden AB
939,847 7,806,291216,910 2,241,989
# 119,933 804,739451,708 8,416,103
#* 375,639 1,289,653151,646 4,736,012
#* 79,682 114,849148,783 1,339,213
1,704,263 5,076,652#* 19,218 276,034* 144,838 786,253
372,059 4,584,374238,696 2,013,148163,626 336,978859,999 7,376,869
1,096,450 10,002,781* 155,569 580,490
218,979 2,596,677# 452,450 3,905,933
126,421 1,433,687# 54,920 473,297#* 201,453 464,091* 91,642 1,558,708
32,666 251,117# 295,890 1,829,665Table of Contents
The Continental Small Company SeriesCONTINUED
Shares Value»
SWEDEN — (Continued)19,372 $ 2,066,692
#* 634,700 1,142,526548,678 5,463,298193,747 500,862241,657 1,204,717
# 133,938 1,173,081* 152,541 2,853,018
1,375,665 12,382,930# 158,720 1,207,709
143,428 755,668130,365 2,263,193
#* 445,011 2,677,6069,065 191,401
76,769 432,88437,858 1,072,602
385,875 2,370,192# 535,651 13,817,780# 488,702 990,985# 1,200,537 7,366,942# 4,192,728 6,896,096
205,187 4,032,0331,454,460 12,649,182
Copyright © 2021 www.secdatabase.com. All Rights Reserved.Please Consider the Environment Before Printing This Document

Lagercrantz Group AB, Class BLindab International ABLoomis AB, Class BMedivir AB, Class BMekonomen ABModern Times Group MTG AB, Class BMomentum Group AB, Class BMQ Holding ABMycronic ABNederman Holding ABNet Insight AB, Class BNetEnt ABNew Wave Group AB, Class BNobia ABNobina ABNolato AB, Class BNordic Entertainment Group AB, Class BNordic Waterproofing Holding A.S.NP3 Fastigheter ABNyfosa ABOEM International AB, Class BOpus Group ABPeab ABPlatzer Fastigheter Holding AB, Class BPricer AB, Class BProact IT Group ABQliro Group ABRatos AB, Class BRaySearch Laboratories ABRecipharm AB, Class BResurs Holding ABRottneros ABSagax AB, Class BSAS ABScandi Standard ABScandic Hotels Group ABSectra AB, Class B
Semcon ABSensys Gatso Group ABSkiStar ABSweco AB, Class BSystemair ABThule Group ABTroax Group ABVBG Group AB, Class BVitrolife ABWallenstam AB, Class B
467,176 5,834,125605,276 6,892,067438,261 15,074,562
#* 169,635 408,847#* 282,646 2,091,629* 110,530 1,023,395
180,501 2,034,190* 75,366 18,859
476,989 7,329,81829,566 366,268
#* 1,129,868 210,6981,474,929 4,375,904
440,390 2,940,786871,514 5,651,979738,622 4,304,728176,156 10,023,902
28,658 685,11857,361 492,790
141,534 1,234,736* 1,248,769 7,683,155# 46,319 1,151,573
1,440,504 912,5991,247,377 10,554,294
249,458 2,202,485884,404 1,165,392
62,004 1,090,604* 857,613 994,273
1,479,999 3,752,570#* 165,675 2,370,661# 339,783 4,219,735
612,798 3,547,133704,234 752,273312,484 3,052,541
* 2,103,222 2,868,252401,353 2,562,994478,299 4,010,714111,485 3,743,130
Table of Contents
The Continental Small Company SeriesCONTINUED
Shares Value»
SWEDEN — (Continued)115,027 $ 634,568
* 2,274,070 376,391330,885 3,836,328180,253 5,026,859
84,050 1,062,956724,255 15,819,986204,686 1,943,480
26,108 433,976425,065 8,179,953256,735 2,682,266
Copyright © 2021 www.secdatabase.com. All Rights Reserved.Please Consider the Environment Before Printing This Document

Wihlborgs Fastigheter AB
TOTAL SWEDEN
Allreal Holding AGALSO Holding AGams AGAPG SGA SAArbonia AGAryzta AGAscom Holding AGAutoneum Holding AGBachem Holding AG, Class BBanque Cantonale de GeneveBanque Cantonale du Jura SABanque Cantonale VaudoiseBelimo Holding AGBell Food Group AGBellevue Group AGBerner Kantonalbank AGBFW Liegenschaften AGBKW AGBobst Group SABossard Holding AG, Class ABucher Industries AGBurckhardt Compression Holding AGBurkhalter Holding AGCalida Holding AGCarlo Gavazzi Holding AGCembra Money Bank AGCham Group AGCicor Technologies, Ltd.Cie Financiere Tradition SAClariant AGColtene Holding AGConzzeta AGDaetwyler Holding AGDKSH Holding AGdormakaba Holding AGDottikon Es Holding AGDufry AGEFG International AGEmmi AGEnergiedienst Holding AGEvolva Holding SAFeintool International Holding AGFlughafen Zurich AGForbo Holding AGGAM Holding AG
1,075,165 15,631,478
436,891,895
SWITZERLAND — (11.6%)103,683 18,110,038
42,929 6,615,277#* 295,070 15,404,262
8,652 2,315,185328,378 3,809,106
* 6,132,124 5,100,567237,470 3,083,373
# 20,419 2,243,5893,642 485,1399,270 1,854,9724,071 238,9013,260 2,424,5063,005 17,698,626
12,884 3,443,96455,759 1,187,288
# 28,273 6,420,6522,894 126,297
143,722 9,303,495# 64,387 3,219,507
42,891 5,914,17954,491 16,282,053
2,760 667,75129,107 2,145,89730,217 839,800
# 2,556 706,521214,769 20,698,690
2,552 1,099,82514,897 751,12610,356 1,068,964
320,318 5,853,19525,919 2,191,170
9,287 7,298,12749,826 7,680,207
183,816 9,282,322# 24,489 17,945,562* 143 76,357
158,814 13,928,241627,844 4,068,369
16,371 13,621,02777,299 2,404,810
#* 3,349,123 600,525# 14,850 930,808
86,882 15,866,0718,638 13,473,607
#* 1,294,052 5,665,770Table of Contents
The Continental Small Company SeriesCONTINUED
Shares Value»
Copyright © 2021 www.secdatabase.com. All Rights Reserved.Please Consider the Environment Before Printing This Document

Georg Fischer AGGurit Holding AGHelvetia Holding AGHiag Immobilien Holding AGHOCHDORF Holding AGHuber & Suhner AGHypothekarbank Lenzburg AGImplenia AGInficon Holding AGInterroll Holding AGIntershop Holding AGInvestis Holding SAJungfraubahn Holding AGKardex AGKomax Holding AGKudelski SALastminute.com NVLEM Holding SALiechtensteinische Landesbank AGLuzerner Kantonalbank AGMCH Group AGMeier Tobler Group AGMetall Zug AGMeyer Burger Technology AGMikron Holding AGMobilezone Holding AGMobimo Holding AGNewron Pharmaceuticals SpAOC Oerlikon Corp. AGOrascom Development Holding AGOrell Fuessli Holding AGOrior AGPanalpina Welttransport Holding AGPhoenix Mecano AGPlazza AG, Class APSP Swiss Property AGRieter Holding AGRomande Energie Holding SASchaffner Holding AGSchmolz + Bickenbach AGSchweiter Technologies AGSFS Group AGSiegfried Holding AGSt Galler Kantonalbank AGSulzer AGSunrise Communications Group AGSwiss Prime Site AGSwissquote Group Holding SATamedia AGTecan Group AGThurgauer KantonalbankTornos Holding AGu-blox Holding AG
SWITZERLAND — (Continued)31,450 $27,108,924
3,022 3,308,232209,024 26,613,421
18,218 2,340,148#* 7,010 531,006
93,238 7,424,5946 27,179
# 105,240 2,818,93514,476 9,030,147
4,844 9,851,74210,094 5,071,220
1,504 102,19612,553 1,882,52948,000 6,907,319
# 30,538 5,725,345# 235,411 1,595,553* 22,924 692,741
3,811 5,267,05660,520 3,689,723
# 19,248 8,506,776* 4,326 96,432#* 22,913 367,864
1,041 2,258,631#* 677,774 276,293
8,692 68,567256,704 2,369,292
50,969 13,604,996#* 34,584 210,323
1,632,781 17,476,025* 94,819 1,424,373# 5,028 458,033
36,191 2,940,798* 72,893 16,402,849
4,259 1,876,3717,210 1,822,096
325,433 39,019,553# 18,593 2,444,450
2,625 3,289,036# 3,363 690,705* 3,372,134 1,109,883
6,581 6,502,796122,248 9,383,443
30,745 11,445,791# 15,421 6,600,746
134,486 13,551,584266,460 19,707,666
10,169 895,32468,671 2,780,40915,945 1,752,137
1,256 319,1103,152 342,992
# 26,632 208,606# 48,136 3,928,498
Copyright © 2021 www.secdatabase.com. All Rights Reserved.Please Consider the Environment Before Printing This Document

Valiant Holding AGValora Holding AGVAT Group AGVaudoise Assurances Holding SAVetropack Holding AGVon Roll Holding AG
Vontobel Holding AGVP Bank AGVZ Holding AGWalliser KantonalbankWarteck Invest AGYpsomed Holding AGZehnder Group AGZug Estates Holding AG, Class BZuger Kantonalbank AG
TOTAL SWITZERLAND
Rhi Magnesita NV
Pluristem Therapeutics, Inc.
TOTAL COMMON STOCKS
Biotest AGDraegerwerk AG & Co. KGaAFuchs Petrolub SEJungheinrich AGSixt SESTO SE & Co. KGaAVilleroy & Boch AG
TOTAL GERMANY
Intercell AG Rights 05/16/13
Anoto Group AB Warrants 04/30/21
TOTAL RIGHTS/WARRANTS
TOTAL INVESTMENT SECURITIES
DFA Short Term Investment Fund
(Cost $5,379,084,131)^^
106,613 10,928,950# 27,786 7,656,070
199,273 24,917,0016,489 3,290,2681,292 2,641,571
* 378,198 395,408Table of Contents
The Continental Small Company SeriesCONTINUED
Shares Value»
SWITZERLAND — (Continued)183,690 $ 9,667,342
22,768 3,565,17717,371 4,783,452
# 18,991 2,257,43222 42,376
# 21,974 2,799,03873,360 2,764,512
1,128 2,079,173689 4,262,373
670,316,319
UNITED KINGDOM — (0.0%)35,579 1,972,619
UNITED STATES — (0.0%)17,233 9,202
5,336,910,143
PREFERRED STOCKS — (0.5%)GERMANY — (0.5%)
100,615 2,442,31258,871 3,194,561
# 126,127 4,833,036369,052 8,206,914117,444 7,789,67813,302 1,362,22450,436 746,171
28,574,896
RIGHTS/WARRANTS — (0.0%)AUSTRIA — (0.0%)* 254,689 0
SWEDEN — (0.0%)#* 24,130 1,124
1,124
5,365,486,163
Value†
SECURITIES LENDING COLLATERAL — (7.3%)@§ 36,330,316 420,378,090
TOTAL INVESTMENTS — (100.0%)$5,785,864,253
Copyright © 2021 www.secdatabase.com. All Rights Reserved.Please Consider the Environment Before Printing This Document

AustriaBelgium
DenmarkFinlandFranceGermanyIrelandIsraelItalyNetherlandsNorwayPortugalSpainSwedenSwitzerlandUnited KingdomUnited States
Germany
SwedenSecurities Lending Collateral
TOTAL
Aimia, Inc.Cineplex, Inc.Cogeco Communications, Inc.
Summary of the Series' investments as of July 31, 2019, based on their valuation inputs, is as follows (see Security Valuation Note):
Investments in Securities (Market Value)
Level 1 Level 2 Level 3 Total
Common Stocks— $ 176,084,287 — $ 176,084,287
$ 7,312,390 248,450,140 — 255,762,530
Table of Contents
The Continental Small Company SeriesCONTINUED
Investments in Securities (Market Value)
Level 1 Level 2 Level 3 Total
— $ 264,627,120 — $ 264,627,120$ 5,652,702 307,137,976 — 312,790,678
— 655,519,915 — 655,519,915— 915,503,883 — 915,503,883— 28,345,072 — 28,345,072
819,062 177,755,866 — 178,574,928— 554,779,794 — 554,779,794
1,694,166 375,881,247 — 377,575,413— 134,197,335 — 134,197,335— 62,108,608 — 62,108,608— 311,850,545 — 311,850,545— 436,891,895 — 436,891,895
16,402,849 653,913,470 — 670,316,319— 1,972,619 — 1,972,619— 9,202 — 9,202
Preferred Stocks— 28,574,896 — 28,574,896
Rights/Warrants— 1,124 — 1,124
— 420,378,090 — 420,378,090
$31,881,169 $5,753,983,084 — $5,785,864,253
Table of Contents
THE CANADIAN SMALL COMPANY SERIES
SCHEDULE OF INVESTMENTS
July 31, 2019
(Unaudited)
Shares Value»
COMMON STOCKS — (86.3%)COMMUNICATION SERVICES — (1.9%)#* 1,049,417 $ 2,973,799# 401,438 7,208,729
95,472 7,539,814
Copyright © 2021 www.secdatabase.com. All Rights Reserved.Please Consider the Environment Before Printing This Document

Cogeco, Inc.Corus Entertainment, Inc., Class BDHX Media, Ltd.Glacier Media, Inc.Mediagrif Interactive Technologies, Inc.TeraGo, Inc.Yellow Pages, Ltd.
TOTAL COMMUNICATION SERVICES
Aritzia, Inc.AutoCanada, Inc.BMTC Group, Inc.BRP, Inc.Dorel Industries, Inc., Class BGamehost, Inc.Great Canadian Gaming Corp.Hudson's Bay Co.Indigo Books & Music, Inc.Intertain Group, Ltd. (The)Leon's Furniture, Ltd.Linamar Corp.Martinrea International, Inc.MTY Food Group, Inc.Park Lawn Corp.Pizza Pizza Royalty Corp.Points International, Ltd.Pollard Banknote, Ltd.Real Matters, Inc.Recipe Unlimited Corp.Reitmans Canada, Ltd., Class ARoots Corp.Sleep Country Canada Holdings, Inc.Spin Master Corp.Uni-Select, Inc.Zenith Capital Corp.
TOTAL CONSUMER DISCRETIONARY
Alcanna, Inc.Andrew Peller, Ltd., Class AClearwater Seafoods, Inc.Corby Spirit and Wine, Ltd.Cott Corp.Cott Corp.High Liner Foods, Inc.Jamieson Wellness, Inc.KP Tissue, Inc.Lassonde Industries, Inc., Class AMaple Leaf Foods, Inc.
37,500 2,670,859925,728 3,556,176
#* 782,135 1,114,119* 171,625 96,879
30,070 145,588* 2,400 18,730#* 105,820 639,827
25,964,520
CONSUMER DISCRETIONARY — (5.0%)* 459,853 6,372,717# 178,738 1,224,270# 20,581 168,727# 38,173 1,344,645
212,497 1,502,19575,373 522,551
* 418,284 13,887,865# 662,726 4,931,027* 12,232 74,840* 70,628 584,910
162,775 1,899,329322,683 10,928,876647,360 5,302,289
# 134,904 6,693,09652,900 1,105,858
161,012 1,176,054* 47,459 566,358
25,700 471,238* 56,000 364,904
106,377 2,165,745269,312 561,152
#* 5,800 15,205# 245,348 3,455,841* 19,000 539,854
305,382 2,776,621111,820 6,863
68,643,030
CONSUMER STAPLES — (4.2%)# 215,711 1,032,955
172,200 1,837,078# 104,195 418,422
83,467 1,111,16596,682 1,236,563
909,370 11,637,566# 120,134 972,141
187,895 2,935,592# 33,800 208,977
17,200 2,410,971340,005 7,973,295
Table of Contents
The Canadian Small Company SeriesCONTINUED
Copyright © 2021 www.secdatabase.com. All Rights Reserved.Please Consider the Environment Before Printing This Document

Mav Beauty Brands, Inc.North West Co., Inc. (The)Premium Brands Holdings Corp.Rogers Sugar, Inc.SunOpta, Inc.
TOTAL CONSUMER STAPLES
Advantage Oil & Gas, Ltd.Africa Oil Corp.AKITA Drilling, Ltd., Class AARC Resources, Ltd.Athabasca Oil Corp.Baytex Energy Corp.Birchcliff Energy, Ltd.Bonavista Energy Corp.Bonterra Energy Corp.Calfrac Well Services, Ltd.Canacol Energy, Ltd.Cardinal Energy, Ltd.CES Energy Solutions Corp.Computer Modelling Group, Ltd.Crescent Point Energy Corp.Crew Energy, Inc.Delphi Energy Corp.Denison Mines Corp.Enerflex, Ltd.Energy Fuels, Inc.Enerplus Corp.Ensign Energy Services, Inc.Epsilon Energy, Ltd.Essential Energy Services TrustFission Uranium Corp.Freehold Royalties, Ltd.Frontera Energy Corp.GASFRAC Energy Services, Inc.Gear Energy, Ltd.Gibson Energy, Inc.Gran Tierra Energy, Inc.High Arctic Energy Services, Inc.International Petroleum Corp.Kelt Exploration, Ltd.Kinder Morgan Canada, Ltd.MEG Energy Corp.North American Construction Group, Ltd.NuVista Energy, Ltd.Obsidian Energy, Ltd.Painted Pony Energy, Ltd.Paramount Resources, Ltd., Class AParex Resources, Inc.Pason Systems, Inc.Pengrowth Energy Corp.
Shares Value»
CONSUMER STAPLES — (Continued)* 7,000 $ 36,490# 350,436 8,021,421# 186,219 13,552,307# 669,336 2,860,324#* 286,840 817,183
57,062,450
ENERGY — (14.0%)#* 1,225,742 1,755,306#* 1,333,299 1,202,171# 71,362 134,095# 1,631,414 8,343,722#* 3,664,410 1,971,307#* 3,175,275 4,835,810
1,785,429 3,557,871# 1,749,900 715,977# 179,118 690,795#* 797,615 1,075,735* 921,342 3,511,402# 763,603 1,440,651# 1,549,897 2,231,250
480,583 2,388,7141,949,926 6,471,189
#* 1,141,376 639,959#* 1,106,839 117,410#* 3,394,735 1,646,182
661,336 8,323,072#* 347,960 632,750# 1,624,918 10,772,869
996,560 3,133,599* 150,301 568,140#* 1,034,741 254,804#* 1,962,000 550,038# 712,794 4,401,630
198,580 2,013,184* 91,560 9* 901,000 334,513
855,146 14,818,297#* 2,888,144 4,683,004# 136,900 330,892* 142,316 610,327* 974,740 3,087,144# 38,600 330,197#* 1,549,736 6,516,923
214,334 2,687,701* 1,091,726 2,249,958#* 538,649 587,706#* 782,649 551,495#* 409,113 2,461,251* 1,044,698 17,857,544
486,401 6,537,925#* 3,196,369 1,053,508
Copyright © 2021 www.secdatabase.com. All Rights Reserved.Please Consider the Environment Before Printing This Document

Peyto Exploration & Development Corp.PHX Energy Services Corp.Pine Cliff Energy, Ltd.Pinnacle Renewable Energy, Inc.PrairieSky Royalty, Ltd.Precision Drilling Corp.Pulse Seismic, Inc.
Questerre Energy Corp., Class ASecure Energy Services, Inc.Seven Generations Energy, Ltd., Class AShawCor, Ltd.STEP Energy Services, Ltd.Storm Resources, Ltd.Strad, Inc.Surge Energy, Inc.Tamarack Valley Energy, Ltd.Tervita Corp.Tidewater Midstream and Infrastructure, Ltd.TORC Oil & Gas, Ltd.Total Energy Services, Inc.Tourmaline Oil Corp.TransGlobe Energy Corp.Trican Well Service, Ltd.Vermilion Energy, Inc.Whitecap Resources, Inc.Yangarra Resources, Ltd.
TOTAL ENERGY
AGF Management, Ltd., Class BAlaris Royalty Corp.Canaccord Genuity Group, Inc.Canadian Western BankChesswood Group, Ltd.Clairvest Group, Inc.Echelon Financial Holdings, Inc.ECN Capital Corp.E-L Financial Corp., Ltd.Element Fleet Management Corp.Equitable Group, Inc.Fiera Capital Corp.Firm Capital Mortgage Investment Corp.First National Financial Corp.Genworth MI Canada, Inc.GMP Capital, Inc.goeasy, Ltd.GoldMoney, Inc.Guardian Capital Group, Ltd., Class A
# 1,155,732 3,502,749* 285,274 549,019#* 496,700 50,807
11,400 87,759# 88,278 1,182,569* 2,116,935 3,641,038* 308,039 542,651Table of Contents
The Canadian Small Company SeriesCONTINUED
Shares Value»
ENERGY — (Continued)#* 797,460 $ 126,888# 1,108,215 5,894,582* 534,418 2,968,089
495,943 6,493,329#* 24,196 32,083#* 5,600 7,425* 17,174 22,772# 2,014,064 1,922,807* 1,457,940 2,386,082#* 70,398 356,309
1,159,300 1,124,3401,100,490 3,427,045
287,079 1,513,92038,700 510,214
498,445 774,217#* 2,310,767 1,698,321# 214,585 3,845,231
2,833,976 9,104,454* 479,471 701,151
190,543,877
FINANCIALS — (8.9%)496,637 1,926,635
# 353,745 5,440,994982,516 4,109,326
# 643,831 15,039,635# 77,342 577,809
1,900 74,54315,650 73,815
2,446,608 8,768,3406,978 3,965,374
2,883,697 21,936,898# 77,602 5,421,203
331,137 2,812,582# 165,218 1,732,548
94,437 2,343,394# 297,480 10,979,126
376,387 775,703# 62,639 2,691,987* 125,000 211,680
87,214 1,678,463
Copyright © 2021 www.secdatabase.com. All Rights Reserved.Please Consider the Environment Before Printing This Document
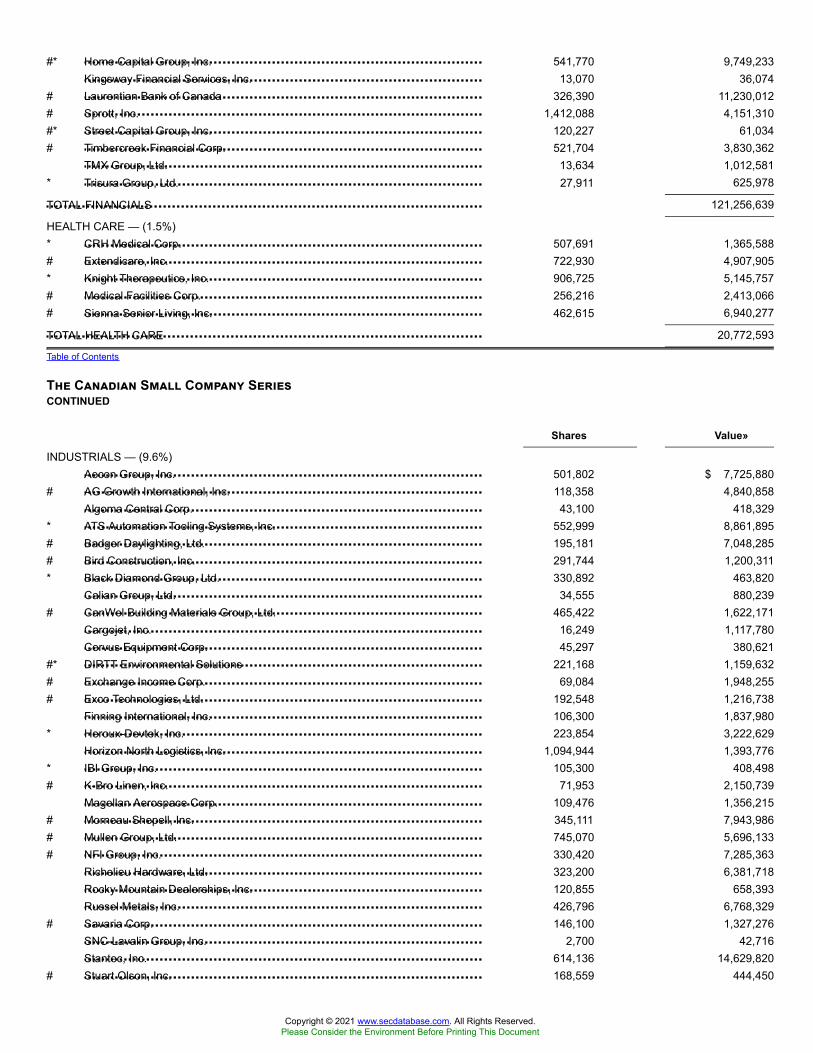
Home Capital Group, Inc.Kingsway Financial Services, Inc.Laurentian Bank of CanadaSprott, Inc.Street Capital Group, Inc.Timbercreek Financial Corp.TMX Group, Ltd.Trisura Group, Ltd.
TOTAL FINANCIALS
CRH Medical Corp.Extendicare, Inc.Knight Therapeutics, Inc.Medical Facilities Corp.Sienna Senior Living, Inc.
TOTAL HEALTH CARE
Aecon Group, Inc.AG Growth International, Inc.Algoma Central Corp.ATS Automation Tooling Systems, Inc.Badger Daylighting, Ltd.Bird Construction, Inc.Black Diamond Group, Ltd.Calian Group, Ltd.CanWel Building Materials Group, Ltd.Cargojet, Inc.Cervus Equipment Corp.DIRTT Environmental SolutionsExchange Income Corp.Exco Technologies, Ltd.Finning International, Inc.Heroux-Devtek, Inc.Horizon North Logistics, Inc.IBI Group, Inc.K-Bro Linen, Inc.Magellan Aerospace Corp.Morneau Shepell, Inc.Mullen Group, Ltd.NFI Group, Inc.Richelieu Hardware, Ltd.Rocky Mountain Dealerships, Inc.Russel Metals, Inc.Savaria Corp.SNC-Lavalin Group, Inc.Stantec, Inc.Stuart Olson, Inc.
#* 541,770 9,749,23313,070 36,074
# 326,390 11,230,012# 1,412,088 4,151,310#* 120,227 61,034# 521,704 3,830,362
13,634 1,012,581* 27,911 625,978
121,256,639
HEALTH CARE — (1.5%)* 507,691 1,365,588# 722,930 4,907,905* 906,725 5,145,757# 256,216 2,413,066# 462,615 6,940,277
20,772,593
Table of Contents
The Canadian Small Company SeriesCONTINUED
Shares Value»
INDUSTRIALS — (9.6%)501,802 $ 7,725,880
# 118,358 4,840,85843,100 418,329
* 552,999 8,861,895# 195,181 7,048,285# 291,744 1,200,311* 330,892 463,820
34,555 880,239# 465,422 1,622,171
16,249 1,117,78045,297 380,621
#* 221,168 1,159,632# 69,084 1,948,255# 192,548 1,216,738
106,300 1,837,980* 223,854 3,222,629
1,094,944 1,393,776* 105,300 408,498# 71,953 2,150,739
109,476 1,356,215# 345,111 7,943,986# 745,070 5,696,133# 330,420 7,285,363
323,200 6,381,718120,855 658,393426,796 6,768,329
# 146,100 1,327,2762,700 42,716
614,136 14,629,820# 168,559 444,450
Copyright © 2021 www.secdatabase.com. All Rights Reserved.Please Consider the Environment Before Printing This Document
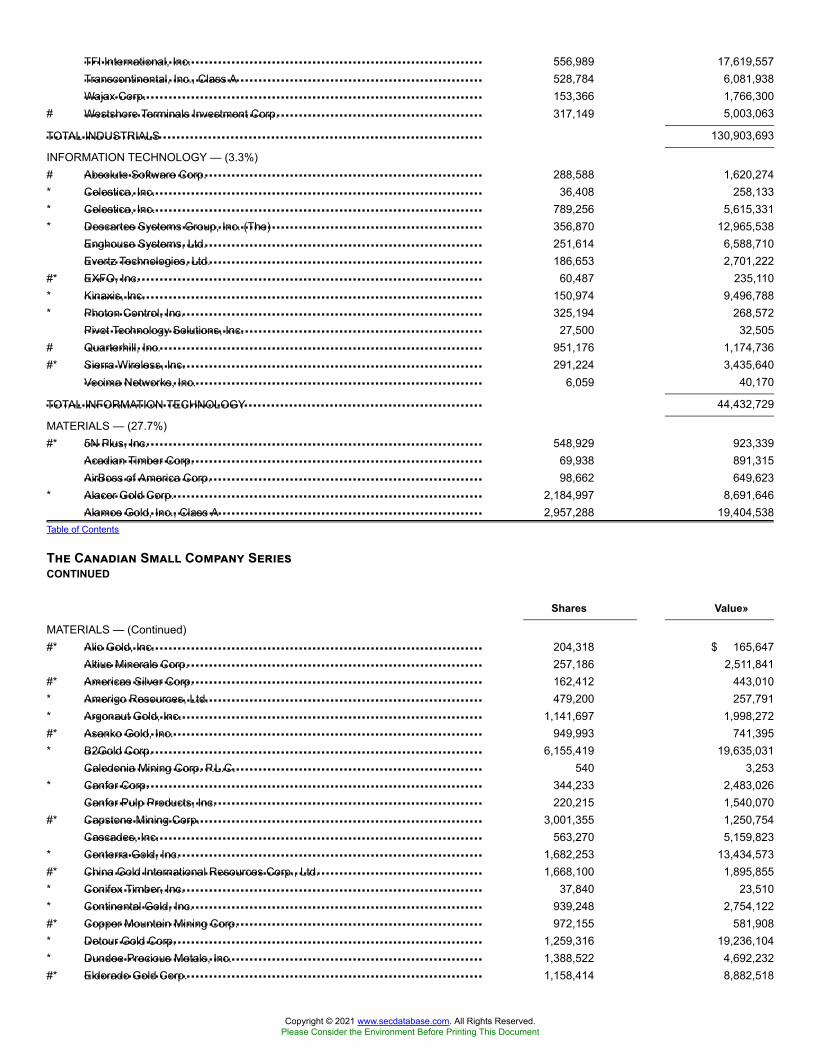
TFI International, Inc.Transcontinental, Inc., Class AWajax Corp.Westshore Terminals Investment Corp.
TOTAL INDUSTRIALS
Absolute Software Corp.Celestica, Inc.Celestica, Inc.Descartes Systems Group, Inc. (The)Enghouse Systems, Ltd.Evertz Technologies, Ltd.EXFO, Inc.Kinaxis, Inc.Photon Control, Inc.Pivot Technology Solutions, Inc.Quarterhill, Inc.Sierra Wireless, Inc.Vecima Networks, Inc.
TOTAL INFORMATION TECHNOLOGY
5N Plus, Inc.Acadian Timber Corp.AirBoss of America Corp.Alacer Gold Corp.Alamos Gold, Inc., Class A
Alio Gold, Inc.Altius Minerals Corp.Americas Silver Corp.Amerigo Resources, Ltd.Argonaut Gold, Inc.Asanko Gold, Inc.B2Gold Corp.Caledonia Mining Corp. P.L.C.Canfor Corp.Canfor Pulp Products, Inc.Capstone Mining Corp.Cascades, Inc.Centerra Gold, Inc.China Gold International Resources Corp., Ltd.Conifex Timber, Inc.Continental Gold, Inc.Copper Mountain Mining Corp.Detour Gold Corp.Dundee Precious Metals, Inc.Eldorado Gold Corp.
556,989 17,619,557528,784 6,081,938153,366 1,766,300
# 317,149 5,003,063
130,903,693
INFORMATION TECHNOLOGY — (3.3%)# 288,588 1,620,274* 36,408 258,133* 789,256 5,615,331* 356,870 12,965,538
251,614 6,588,710186,653 2,701,222
#* 60,487 235,110* 150,974 9,496,788* 325,194 268,572
27,500 32,505# 951,176 1,174,736#* 291,224 3,435,640
6,059 40,170
44,432,729
MATERIALS — (27.7%)#* 548,929 923,339
69,938 891,31598,662 649,623
* 2,184,997 8,691,6462,957,288 19,404,538
Table of Contents
The Canadian Small Company SeriesCONTINUED
Shares Value»
MATERIALS — (Continued)#* 204,318 $ 165,647
257,186 2,511,841#* 162,412 443,010* 479,200 257,791* 1,141,697 1,998,272#* 949,993 741,395* 6,155,419 19,635,031
540 3,253* 344,233 2,483,026
220,215 1,540,070#* 3,001,355 1,250,754
563,270 5,159,823* 1,682,253 13,434,573#* 1,668,100 1,895,855* 37,840 23,510* 939,248 2,754,122#* 972,155 581,908* 1,259,316 19,236,104* 1,388,522 4,692,232#* 1,158,414 8,882,518
Copyright © 2021 www.secdatabase.com. All Rights Reserved.Please Consider the Environment Before Printing This Document

Endeavour Mining Corp.Endeavour Silver Corp.ERO Copper Corp.First Majestic Silver Corp.First Mining Gold Corp.Fortuna Silver Mines, Inc.Gold Standard Ventures Corp.Golden Star Resources, Ltd.Great Panther Mining, Ltd.Guyana Goldfields, Inc.Hudbay Minerals, Inc.IAMGOLD Corp.Imperial Metals Corp.Interfor Corp.International Tower Hill Mines, Ltd.Intertape Polymer Group, Inc.IPL Plastics, Inc.Ivanhoe Mines, Ltd., Class AJervois Mining, Ltd.Labrador Iron Ore Royalty Corp.Largo Resources, Ltd.Leagold Mining Corp.Lucara Diamond Corp.Lundin Gold, Inc.Major Drilling Group International, Inc.Mandalay Resources Corp.Marathon Gold Corp.Methanex Corp.Mountain Province Diamonds, Inc.Nemaska Lithium, Inc.New Gold, Inc.Norbord, Inc.Northern Dynasty Minerals, Ltd.OceanaGold Corp.Orbite Technologies, Inc.Osisko Gold Royalties, Ltd.Osisko Mining, Inc.Pan American Silver Corp.PolyMet Mining Corp.
Premier Gold Mines, Ltd.Pretium Resources, Inc.Pretium Resources, Inc.Roxgold, Inc.Sabina Gold & Silver Corp.Sandstorm Gold, Ltd.Seabridge Gold, Inc.SEMAFO, Inc.
#* 502,056 9,380,733#* 746,544 1,719,574* 31,400 593,122#* 977,531 9,221,294* 749,400 153,310* 1,152,121 4,338,567* 10,700 10,945#* 463,313 1,649,925#* 719,621 583,418#* 979,918 831,572
1,922,188 9,335,676* 3,346,046 12,169,284#* 346,592 656,524* 483,839 4,388,205* 13,001 7,881
416,437 5,736,342* 7,900 48,485* 3,744,528 11,745,981* 166,485 22,706
387,856 9,245,302#* 522,593 736,493* 268,242 420,716# 2,181,549 2,446,350#* 151,909 900,082* 605,112 2,021,931* 464 460#* 147,500 139,699
52,761 2,076,780# 102,431 90,029#* 275,000 59,384* 4,348,961 5,799,493
250,961 5,816,714#* 76,877 60,579
4,416,629 11,980,248* 73,500 2,205
959,872 11,323,848#* 486,477 1,256,923
1,525,893 23,238,708#* 642,081 257,844Table of Contents
The Canadian Small Company SeriesCONTINUED
Shares Value»
MATERIALS — (Continued)#* 1,039,349 $ 1,748,261#* 293,903 3,185,908* 794,788 8,617,530* 1,208,860 989,217* 1,690,021 1,869,549#* 1,264,677 7,780,859#* 68,095 933,868* 2,376,290 9,524,605
Copyright © 2021 www.secdatabase.com. All Rights Reserved.Please Consider the Environment Before Printing This Document

SSR Mining, Inc.Stelco Holdings, Inc.Stella-Jones, Inc.Stornoway Diamond Corp.Supremex, Inc.Tanzanian Gold Corp.Taseko Mines, Ltd.Teranga Gold Corp.TMAC Resources, Inc.Torex Gold Resources, Inc.Trevali Mining Corp.Turquoise Hill Resources, Ltd.Wesdome Gold Mines Ltd.West Fraser Timber Co., Ltd.Western Forest Products, Inc.Winpak, Ltd.Yamana Gold, Inc.
TOTAL MATERIALS
Altus Group, Ltd.Bridgemarq Real Estate ServicesColliers International Group, Inc.DREAM Unlimited Corp., Class AFirstService Corp.FirstService Corp.Genesis Land Development Corp.Information Services Corp.Invesque, Inc.Mainstreet Equity Corp.Melcor Developments, Ltd.Morguard Corp.Tricon Capital Group, Inc.
TOTAL REAL ESTATE
Boralex, Inc., Class ACapital Power Corp.Innergex Renewable Energy, Inc.Just Energy Group, Inc.Maxim Power Corp.Northland Power, Inc.Polaris Infrastructure, Inc.Superior Plus Corp.TransAlta Corp.TransAlta Renewables, Inc.
Valener, Inc.
TOTAL UTILITIES
* 859,605 13,280,305# 15,300 176,209# 328,602 10,250,450* 918,109 17,391
91 172#* 207,891 189,020* 1,417,826 655,307* 655,298 2,547,112#* 93,713 423,903* 632,604 8,148,407#* 3,825,789 724,691* 1,827,680 1,038,612* 948,829 4,831,134
63,000 2,462,623# 3,049,303 3,280,808
205,835 7,089,9076,883,874 20,341,801
378,826,177
REAL ESTATE — (4.1%)228,753 5,808,087
# 41,769 447,819224,919 16,339,774455,185 2,886,724
1,234 129,410154,969 16,262,469
76,842 147,59414,174 173,873
# 203,166 1,499,365* 30,149 1,393,460
54,040 544,57622,568 3,146,490
1,029,132 7,789,838
56,569,479
UTILITIES — (6.1%)485,312 7,339,618724,420 16,258,009740,781 8,436,079
# 654,141 2,274,971* 92,234 132,781# 513,208 9,767,984
98,922 1,032,093# 1,170,310 11,687,139
2,047,057 12,547,879# 779,039 8,080,803Table of Contents
The Canadian Small Company SeriesCONTINUED
Shares Value»
UTILITIES — (Continued)289,365 $ 5,678,553
83,235,909
Copyright © 2021 www.secdatabase.com. All Rights Reserved.Please Consider the Environment Before Printing This Document

TOTAL COMMON STOCKS
Tervita Corp. Warrants 07/19/20
Pan American Silver Corp. Rights 02/22/29
TOTAL RIGHTS/WARRANTS
TOTAL INVESTMENT SECURITIES
DFA Short Term Investment Fund
(Cost $1,553,537,825)^^
Communication ServicesConsumer DiscretionaryConsumer StaplesEnergyFinancialsHealth CareIndustrialsInformation TechnologyMaterialsReal EstateUtilities
EnergyMaterials
Securities Lending Collateral
TOTAL
Titan Cement International SA
1,178,211,096
RIGHTS/WARRANTS — (0.0%)ENERGY — (0.0%)#* 9,964 76
MATERIALS — (0.0%)* 1,876,416 426,083
426,159
1,178,637,255
Value†
SECURITIES LENDING COLLATERAL — (13.7%)@§ 16,167,347 187,072,367
TOTAL INVESTMENTS — (100.0%)$1,365,709,622
Summary of the Series' investments as of July 31, 2019, based on their valuation inputs, is as follows (see Security Valuation Note):
Investments in Securities (Market Value)
Level 1 Level 2 Level 3 Total
Common Stocks$ 25,964,520 — — $ 25,964,520
68,636,167 $ 6,863 — 68,643,03057,062,450 — — 57,062,450
189,975,728 568,149 — 190,543,877121,256,639 — — 121,256,639
20,772,593 — — 20,772,593130,903,693 — — 130,903,693
44,432,729 — — 44,432,729378,823,972 2,205 — 378,826,177
56,569,479 — — 56,569,47983,235,909 — — 83,235,909
Rights/Warrants— 76 — 76— 426,083 — 426,083
— 187,072,367 — 187,072,367
$1,177,633,879 $188,075,743 — $1,365,709,622
Table of Contents
THE EMERGING MARKETS SERIES
SCHEDULE OF INVESTMENTS
July 31, 2019
(Unaudited)Shares Value»
COMMON STOCKS — (94.4%)BELGIUM — (0.0%)* 61,385 $ 1,291,111
BRAZIL — (6.8%)
Copyright © 2021 www.secdatabase.com. All Rights Reserved.Please Consider the Environment Before Printing This Document

Ambev SA, ADRAmbev SAAtacadao S.A.B3 SA - Brasil Bolsa BalcaoBanco Bradesco SA, ADRBanco Bradesco SABanco BTG Pactual SABanco do Brasil SABanco Santander Brasil SABB Seguridade Participacoes SABraskem SA, Sponsored ADRBRF SACCR SACentrais Eletricas Brasileiras SACentrais Eletricas Brasileiras SA, ADRCia de Saneamento Basico do Estado de Sao PauloCia de Saneamento Basico do Estado de Sao Paulo, ADRCia Energetica de Minas GeraisCia Siderurgica Nacional SA, Sponsored ADRCia Siderurgica Nacional SACielo SACosan SAEmbraer SA, Sponsored ADREnergisa SAEngie Brasil Energia SAEquatorial Energia SAGerdau SA, Sponsored ADRGerdau SAHapvida Participacoes e Investimentos S.A.Hypera SAIRB Brasil Resseguros S/AItau Unibanco Holding SAJBS SAKlabin SAKroton Educacional SALocaliza Rent a Car SALojas Americanas SALojas Renner SAM Dias Branco SAMagazine Luiza SANatura Cosmeticos SAPetrobras Distribuidora S.A.Petroleo Brasileiro SA, Sponsored ADRPetroleo Brasileiro SA, Sponsored ADRPetroleo Brasileiro SAPorto Seguro SARaia Drogasil SARumo SASuzano SASuzano SA, Sponsored ADRTelefonica Brasil SA, ADRTIM Participacoes SA
5,984,451 31,538,057855,320 4,511,534459,081 2,816,064
1,724,517 19,064,6491,268,081 11,463,4511,230,994 10,034,777
187,056 2,929,099716,865 9,245,508359,257 4,033,740636,043 5,408,203
* 144,940 2,569,931* 802,740 7,027,538
2,491,049 9,758,325270,077 2,787,567
42,419 430,129457,600 6,402,935
34,381 478,240193,500 862,963380,551 1,624,953890,490 3,857,036
1,808,236 3,430,406324,677 4,328,630
# 329,053 6,646,87144,400 574,727
271,376 3,432,421333,000 8,245,706
# 631,681 2,248,784176,416 546,858229,609 2,514,878385,349 3,047,371215,574 5,366,261551,339 4,319,582
3,172,448 20,698,823929,979 3,908,673
2,692,854 8,862,459557,879 6,431,977166,884 611,765
1,401,732 17,431,8926,131 62,863
114,700 7,926,077339,200 5,436,835550,056 3,833,896
1,299,604 17,830,567556,265 8,371,788
2,884,877 21,763,100331,829 4,530,059402,200 8,748,312
* 1,776,456 10,203,444725,080 5,827,087
#* 45,406 723,77966,193 902,872
1,073,613 3,437,722Table of Contents
The Emerging Markets Series
Copyright © 2021 www.secdatabase.com. All Rights Reserved.Please Consider the Environment Before Printing This Document

Ultrapar Participacoes SAUltrapar Participacoes SA, Sponsored ADRVale SA, Sponsored ADRVale SAWEG SA
TOTAL BRAZIL
AES Gener SAAguas Andinas SA, Class ABanco de Chile, ADRBanco de Credito e Inversiones SABanco Santander Chile, ADRCencosud SACia Cervecerias Unidas SACia Cervecerias Unidas SA, Sponsored ADRColbun SAEmbotelladora Andina SA, ADR, Class BEmpresa Nacional de Telecomunicaciones SAEmpresas CMPC SAEmpresas COPEC SAEnel Americas SA, ADREnel Chile SA, ADRItau CorpBancaItau CorpBancaLatam Airlines Group SA, Sponsored ADRLatam Airlines Group SASACI FalabellaSociedad Quimica y Minera de Chile SA, Sponsored ADR
TOTAL CHILE
58.com, Inc., ADRAAC Technologies Holdings, Inc.Agile Group Holdings, Ltd.Agricultural Bank of China, Ltd., Class HAir China, Ltd., Class HAlibaba Group Holding, Ltd., Sponsored ADRAlibaba Health Information Technology, Ltd.Alibaba Pictures Group, Ltd.Aluminum Corp. of China, Ltd., ADRAluminum Corp. of China, Ltd., Class HAngang Steel Co., Ltd., Class HAnhui Conch Cement Co., Ltd., Class HANTA Sports Products, Ltd.BAIC Motor Corp., Ltd., Class HBaidu, Inc., Sponsored ADRBank of China, Ltd., Class HBank of Communications Co., Ltd., Class HBBMG Corp., Class HBeijing Capital International Airport Co., Ltd., Class H
CONTINUED
Shares Value»
BRAZIL — (Continued)622,968 $ 3,246,776
# 519,216 2,705,1151,665,739 21,637,9433,260,013 42,548,830
363,333 2,267,767
411,497,615
CHILE — (1.2%)2,468,815 618,9094,770,656 2,670,223
# 128,472 3,692,29472,108 4,542,591
227,071 6,582,7882,652,360 5,236,792
109,017 1,528,373# 122,813 3,433,852
11,908,297 2,236,14122,761 480,257
* 226,524 2,075,3531,691,695 3,967,229
319,791 2,934,3831,131,713 9,336,633
808,893 3,720,908231,853,767 1,798,146
30,902 367,116# 517,962 4,982,794
35,910 342,260783,273 4,839,723
# 153,936 4,539,573
69,926,338
CHINA — (16.7%)* 13,298 749,741
922,500 4,957,0923,456,000 4,441,873
12,316,000 4,985,2132,406,000 2,336,542
* 495,925 85,849,577* 1,208,000 1,085,236* 1,380,000 278,861#* 81,508 656,139* 3,718,000 1,214,120
3,060,200 1,160,756# 1,609,000 9,290,747
960,000 7,166,3363,597,500 2,272,831
* 142,937 15,966,06332,226,181 13,086,654
3,273,515 2,381,6403,531,500 1,027,5001,172,000 923,429
Copyright © 2021 www.secdatabase.com. All Rights Reserved.Please Consider the Environment Before Printing This Document

Beijing Enterprises Holdings, Ltd.Beijing Enterprises Water Group, Ltd.Brilliance China Automotive Holdings, Ltd.BYD Co., Ltd., Class HCGN Power Co., Ltd., Class HChina Cinda Asset Management Co., Ltd., Class HChina CITIC Bank Corp., Ltd., Class H
China Coal Energy Co., Ltd., Class HChina Common Rich Renewable Energy Investments, Ltd.China Communications Construction Co., Ltd., Class HChina Communications Services Corp., Ltd., Class HChina Conch Venture Holdings, Ltd.China Construction Bank Corp., Class HChina Eastern Airlines Corp., Ltd., ADRChina Eastern Airlines Corp., Ltd., Class HChina Everbright Bank Co., Ltd., Class HChina Everbright International, Ltd.China Evergrande GroupChina Galaxy Securities Co., Ltd., Class HChina Gas Holdings, Ltd.China Hongqiao Group, Ltd.China Huarong Asset Management Co., Ltd., Class HChina International Capital Corp., Ltd., Class HChina International Marine Containers Group Co., Ltd., Class HChina Jinmao Holdings Group, Ltd.China Life Insurance Co., Ltd., ADRChina Longyuan Power Group Corp., Ltd., Class HChina Mengniu Dairy Co., Ltd.China Merchants Bank Co., Ltd., Class HChina Merchants Port Holdings Co., Ltd.China Merchants Securities Co., Ltd., Class HChina Minsheng Banking Corp., Ltd., Class HChina Mobile, Ltd., Sponsored ADRChina Molybdenum Co., Ltd., Class HChina National Building Material Co., Ltd., Class HChina Oilfield Services, Ltd., Class HChina Overseas Land & Investment, Ltd.China Pacific Insurance Group Co., Ltd., Class HChina Petroleum & Chemical Corp., ADRChina Petroleum & Chemical Corp., Class HChina Railway Construction Corp., Ltd., Class HChina Railway Group, Ltd., Class HChina Railway Signal & Communication Corp., Ltd., Class HChina Reinsurance Group Corp., Class HChina Resources Beer Holdings Co., Ltd.China Resources Cement Holdings, Ltd.China Resources Gas Group, Ltd.
545,472 2,663,1105,806,000 3,055,965
# 2,582,000 2,813,892# 662,386 4,139,005
4,916,000 1,418,9609,500,000 2,072,4187,325,928 4,058,875
Table of Contents
The Emerging Markets SeriesCONTINUED
Shares Value»
CHINA — (Continued)2,256,777 $ 874,4045,416,000 1,297,2414,383,000 3,694,2192,176,000 1,514,9521,450,500 4,991,275
48,066,590 36,902,172* 2,200 60,434* 2,220,000 1,219,739
2,002,000 900,3332,975,703 2,620,433
# 3,151,000 8,318,8172,505,000 1,337,0151,752,800 7,262,6992,630,000 1,925,246
13,176,000 2,221,3471,015,600 1,921,347
415,920 393,9355,776,000 3,721,509
539,265 6,870,2362,767,000 1,691,9941,227,000 4,950,9962,139,054 10,596,6571,470,638 2,433,855
281,400 324,8275,119,600 3,526,428
902,501 38,446,543# 4,872,966 1,385,913
7,488,000 6,564,9121,656,000 1,868,1015,578,000 19,015,7151,752,600 7,475,677
123,421 7,919,90610,440,800 6,703,101
2,318,500 2,678,8353,567,000 2,497,4801,662,000 1,109,5725,460,000 959,614
849,611 3,980,8174,378,000 4,001,0471,108,000 5,608,243
Copyright © 2021 www.secdatabase.com. All Rights Reserved.Please Consider the Environment Before Printing This Document

China Resources Land, Ltd.China Resources Pharmaceutical Group, Ltd.China Resources Power Holdings Co., Ltd.China Shenhua Energy Co., Ltd., Class HChina Southern Airlines Co., Ltd., Sponsored ADRChina Southern Airlines Co., Ltd., Class HChina State Construction International Holdings, Ltd.China Taiping Insurance Holdings Co., Ltd.China Telecom Corp., Ltd., ADRChina Telecom Corp., Ltd., Class HChina Unicom Hong Kong, Ltd.China Unicom Hong Kong, Ltd., ADRChina Vanke Co., Ltd., Class HChongqing Rural Commercial Bank Co., Ltd., Class HCIFI Holdings Group Co., Ltd.CITIC Securities Co., Ltd., Class HCITIC, Ltd.CNOOC, Ltd.CNOOC, Ltd., Sponsored ADR
COSCO SHIPPING Development Co., Ltd., Class HCOSCO SHIPPING Holdings Co., Ltd., Class HCountry Garden Holdings Co., Ltd.Country Garden Services Holdings Co., Ltd.CRRC Corp., Ltd., Class HCSC Financial Co., Ltd., Class HCSPC Pharmaceutical Group, Ltd.Ctrip.com International, Ltd., ADRDali Foods Group Co., Ltd.Dalian Port PDA Co., Ltd., Class HDatang International Power Generation Co., Ltd., Class HDongfeng Motor Group Co., Ltd., Class HENN Energy Holdings, Ltd.Everbright Securities Co., Ltd., Class HFosun International, Ltd.Future Land Development Holdings, Ltd.Fuyao Glass Industry Group Co., Ltd., Class HGeely Automobile Holdings, Ltd.GF Securities Co., Ltd.Great Wall Motor Co., Ltd., Class HGuangdong Investment, Ltd.Guangshen Railway Co., Ltd., Sponsored ADRGuangzhou Automobile Group Co., Ltd., Class HGuangzhou Baiyunshan Pharmaceutical Holdings Co., Ltd.Guangzhou R&F Properties Co., Ltd., Class HGuotai Junan Securities Co., Ltd., Class HHaier Electronics Group Co., Ltd.Haitian International Holdings, Ltd.
3,844,666 16,429,8201,569,000 1,706,4061,790,517 2,571,2122,188,000 4,322,513
# 11,404 369,2623,138,000 2,011,4701,914,250 1,966,3781,634,506 4,523,166
55,096 2,464,9953,440,000 1,534,3434,736,000 4,614,069
508,463 4,982,9371,335,700 5,016,9973,392,000 1,773,045
657,191 418,946# 1,548,000 2,955,591
2,851,000 3,774,9181,832,000 3,020,535
104,426 17,264,751Table of Contents
The Emerging Markets SeriesCONTINUED
Shares Value»
CHINA — (Continued)921,000 $ 113,384
* 2,761,000 1,026,8197,976,686 10,747,028
908,492 2,187,5522,686,000 2,114,289
# 374,500 269,9595,148,000 8,933,713
* 208,150 8,113,6871,145,500 713,906
# 155,000 19,9702,836,000 637,2303,018,000 2,691,793
538,500 5,539,225# 129,400 99,378
1,692,222 2,212,171# 1,726,000 1,450,086# 716,400 2,169,351
5,029,000 7,669,873* 1,142,800 1,281,702# 3,594,500 2,434,961
1,340,000 2,816,339# 25,401 426,737# 2,175,162 2,211,584
168,000 690,2872,051,600 3,711,943
312,800 505,6491,372,000 3,224,589
22,000 44,444
Copyright © 2021 www.secdatabase.com. All Rights Reserved.Please Consider the Environment Before Printing This Document

Haitong Securities Co., Ltd., Class HHengan International Group Co., Ltd.Huadian Power International Corp., Ltd., Class HHuaneng Power International, Inc., Sponsored ADRHuaneng Power International, Inc., Class HHuatai Securities Co., Ltd.Huazhu Group, Ltd., ADRHuishang Bank Corp., Ltd., Class HIndustrial & Commercial Bank of China, Ltd., Class HJD.com, Inc., ADRJiangsu Expressway Co., Ltd., Class HJiangxi Copper Co., Ltd., Class HKunlun Energy Co., Ltd.Lee & Man Paper Manufacturing, Ltd.Legend Holdings Corp.Legend Holdings Corp., Class HLenovo Group, Ltd.Li Ning Co., Ltd.Logan Property Holdings Co., Ltd.Longfor Group Holdings, Ltd.Maanshan Iron & Steel Co., Ltd., Class HMetallurgical Corp. of China, Ltd., Class HMinth Group, Ltd.Momo, Inc., Sponsored ADRNetEase, Inc., ADRNew China Life Insurance Co., Ltd., Class HNew Oriental Education & Technology Group, Inc., Sponsored ADRNine Dragons Paper Holdings, Ltd.Orient Securities Co., Ltd., Class HPeople's Insurance Co. Group of China, Ltd. (The), Class HPetroChina Co., Ltd., ADR
PetroChina Co., Ltd., Class HPICC Property & Casualty Co., Ltd., Class HPing An Insurance Group Co. of China, Ltd., Class HPostal Savings Bank of China Co., Ltd., Class HRed Star Macalline Group Corp., Ltd., Class HSemiconductor Manufacturing International Corp.Shanghai Electric Group Co., Ltd., Class HShanghai Fosun Pharmaceutical Group Co., Ltd., Class HShanghai Pharmaceuticals Holding Co., Ltd., Class HShenzhen International Holdings, Ltd.Shenzhou International Group Holdings, Ltd.Shimao Property Holdings, Ltd.Sino Biopharmaceutical, Ltd.Sinopec Engineering Group Co., Ltd., Class HSinopec Oilfield Service Corp.Sinopec Shanghai Petrochemical Co., Ltd., Sponsored ADR
2,657,600 2,630,165853,000 6,451,777
1,738,000 727,44933,132 773,632
1,082,000 626,9251,105,800 1,791,482
# 52,649 1,724,781800,800 311,092
37,297,185 25,046,781* 221,362 6,620,937
1,192,000 1,606,0451,322,000 1,636,1105,458,000 4,760,071
740,000 451,696* 25,976 0
337,700 795,28610,679,278 8,593,121
1,047,500 2,582,5112,282,000 3,450,5241,986,000 7,344,6061,124,000 426,0622,643,000 645,165
# 68,000 191,630133,815 4,545,696
51,056 11,784,746465,300 2,307,992
* 28,372 2,959,4833,293,000 2,665,425
778,800 474,6863,240,000 1,359,185
118,623 6,295,323Table of Contents
The Emerging Markets SeriesCONTINUED
Shares Value»
CHINA — (Continued)3,056,000 $ 1,620,9136,075,198 7,213,4773,690,000 43,489,635
958,000 557,124350,809 305,836
#* 3,574,600 4,210,4412,292,000 796,073
511,500 1,514,213723,000 1,390,287210,009 387,913574,000 7,902,447
2,297,871 6,346,2617,435,000 9,068,955
661,000 517,833* 1,082,000 126,402
7,417 259,612
Copyright © 2021 www.secdatabase.com. All Rights Reserved.Please Consider the Environment Before Printing This Document

Sinopec Shanghai Petrochemical Co., Ltd., Class HSinopharm Group Co., Ltd., Class HSinotruk Hong Kong, Ltd.Sun Art Retail Group, Ltd.Sunac China Holdings, Ltd.Sunny Optical Technology Group Co., Ltd.Tencent Holdings, Ltd.Tingyi Cayman Islands Holding Corp.TravelSky Technology, Ltd., Class HTsingtao Brewery Co., Ltd., Class HUnited Energy Group, Ltd.Vipshop Holdings, Ltd., ADRWant Want China Holdings, Ltd.Weibo Corp., Sponsored ADRWeichai Power Co., Ltd., Class HXinjiang Goldwind Science & Technology Co., Ltd., Class HYanzhou Coal Mining Co., Ltd., Class HYihai International Holding, Ltd.Yum China Holdings, Inc.YY, Inc., ADRZhejiang Expressway Co., Ltd., Class HZhongsheng Group Holdings, Ltd.Zhuzhou CRRC Times Electric Co., Ltd., Class HZijin Mining Group Co., Ltd., Class HZoomlion Heavy Industry Science and Technology Co., Ltd., Class HZTE Corp., Class HZTO Express Cayman, Inc., ADR
TOTAL CHINA
Banco de Bogota SABancolombia SA, Sponsored ADRBancolombia SACementos Argos SAEcopetrol SA, Sponsored ADREcopetrol SAGrupo Argos SAGrupo Aval Acciones y Valores SAGrupo de Inversiones Suramericana SAGrupo Energia Bogota SA ESPGrupo Nutresa SA
Interconexion Electrica SA ESP
TOTAL COLOMBIA
CEZ A.S.Komercni banka A.S.Moneta Money Bank A.S.
5,113,000 1,783,8381,370,000 5,064,334
# 1,021,000 1,497,1573,156,500 3,196,4042,940,000 13,261,377
581,700 6,726,4163,697,300 172,268,1653,242,000 4,838,410
# 963,000 1,884,941320,000 1,871,599
* 3,164,000 570,313* 153,282 1,164,943
6,644,000 5,167,368#* 48,168 1,886,741
3,524,800 5,413,162788,159 880,787
3,460,000 3,045,350340,000 1,804,106
38,932 1,771,406* 16,883 1,083,720
904,000 875,0221,061,500 2,950,315
476,700 2,278,5357,745,000 3,099,637
724,400 505,738#* 319,685 954,785# 46,324 910,267
1,001,661,806
COLOMBIA — (0.4%)51,765 1,128,094
111,500 5,561,620248,044 2,971,148306,742 718,957
# 130,475 2,339,4173,327,922 2,982,109
289,800 1,485,68781,855 614,731
276,874 2,911,416* 904,734 579,086
171,224 1,310,954Table of Contents
The Emerging Markets SeriesCONTINUED
Shares Value»
COLOMBIA — (Continued)507,224 $ 2,751,838
25,355,057
CZECH REPUBLIC — (0.1%)222,501 4,988,713
57,958 2,235,69844,477 152,852
Copyright © 2021 www.secdatabase.com. All Rights Reserved.Please Consider the Environment Before Printing This Document

O2 Czech Republic A.S.Philip Morris CR A.S.
TOTAL CZECH REPUBLIC
Commercial International Bank Egypt S.A.E., GDRCommercial International Bank Egypt S.A.E., GDREgyptian Financial Group-Hermes Holding Co., GDREgyptian Financial Group-Hermes Holding Co., GDR
TOTAL EGYPT
Alpha Bank AEEurobank Ergasias SAFF GroupHellenic Petroleum SAHellenic Telecommunications Organization SAJUMBO SAMotor Oil Hellas Corinth Refineries SAMytilineos SANational Bank of Greece SAOPAP SAPiraeus Bank SATerna Energy SA
TOTAL GREECE
MOL Hungarian Oil & Gas P.L.C.OTP Bank P.L.C.Richter Gedeon Nyrt
TOTAL HUNGARY
3M India, Ltd.5Paisa Capital, Ltd.5Paisa Capital, Ltd.ABB India, Ltd.ACC, Ltd.Adani Gas, Ltd.Adani Green Energy, Ltd.Adani Ports & Special Economic Zone, Ltd.Adani Power, Ltd.Adani Transmissions, Ltd.Aditya Birla Capital, Ltd.Aditya Birla Fashion and Retail, Ltd.AIA Engineering, Ltd.Ambuja Cements, Ltd.Apollo Hospitals Enterprise, Ltd.Apollo Tyres, Ltd.
70,083 664,698140 82,454
8,124,415
EGYPT — (0.1%)# 1,751,028 7,510,392
110,141 473,60634,725 68,40817,482 33,903
8,086,309
GREECE — (0.3%)* 316,811 614,941* 1,129,901 1,097,276* 12,618 31,040
109,986 1,146,859340,319 4,679,452168,373 3,299,901
96,253 2,386,30924,686 300,036
* 543,761 1,585,782294,440 3,313,988
* 11,341 38,68078,450 628,603
19,122,867
HUNGARY — (0.4%)1,279,647 12,986,740
262,272 10,922,566151,458 2,661,132
26,570,438
INDIA — (13.1%)* 1,698 519,428* 4,048 10,001* 4,049 5,262
42,536 844,93689,253 2,017,538
274,364 593,646* 208,791 140,713
1,059,392 5,792,218* 1,288,677 1,130,816* 323,333 967,544* 952,698 1,134,045* 385,907 1,053,561* 17,408 432,230
819,644 2,383,98598,257 1,926,76579,582 181,651
Table of Contents
The Emerging Markets SeriesCONTINUED
Shares Value»
INDIA — (Continued)
Copyright © 2021 www.secdatabase.com. All Rights Reserved.Please Consider the Environment Before Printing This Document

Ashok Leyland, Ltd.Asian Paints, Ltd.Astral Polytechnik, Ltd.Aurobindo Pharma, Ltd.Avenue Supermarts, Ltd.Axis Bank, Ltd.Bajaj Auto, Ltd.Bajaj Finance, Ltd.Bajaj Finserv, Ltd.Bajaj Holdings & Investment, Ltd.Balkrishna Industries, Ltd.Bank of BarodaBata India, Ltd.Bayer CropScience, Ltd.Berger Paints India, Ltd.Bharat Electronics, Ltd.Bharat Forge, Ltd.Bharat Heavy Electricals, Ltd.Bharat Petroleum Corp., Ltd.Bharti Airtel, Ltd.Bharti Infratel, Ltd.Biocon, Ltd.Bosch, Ltd.Britannia Industries, Ltd.Cadila Healthcare, Ltd.Canara BankCastrol India, Ltd.Cholamandalam Investment and Finance Co., Ltd.Cipla, Ltd.City Union Bank, Ltd.Coal India, Ltd.Colgate-Palmolive India, Ltd.Container Corp. Of India, Ltd.Coromandel International, Ltd.Crompton Greaves Consumer Electricals, Ltd.Cummins India, Ltd.Dabur India, Ltd.Dewan Housing Finance Corp., Ltd.Divi's Laboratories, Ltd.DLF, Ltd.Dr Reddy's Laboratories, Ltd., ADRDr Reddy's Laboratories, Ltd.Edelweiss Financial Services, Ltd.Eicher Motors, Ltd.Emami, Ltd.Endurance Technologies, Ltd.Exide Industries, Ltd.Federal Bank, Ltd.Future Retail, Ltd.GAIL India, Ltd.GAIL India, Ltd., GDRGeneral Insurance Corp. of IndiaGillette India, Ltd.GlaxoSmithKline Consumer Healthcare, Ltd.
3,332,094 $ 3,359,483448,324 9,881,786
8,850 159,078652,018 5,374,289
* 16,071 345,5261,624,999 15,875,598
152,968 5,553,647249,497 11,734,173
46,272 4,753,29965,332 3,219,589
140,951 1,438,494* 932,221 1,436,980
31,465 596,4133,410 150,947
372,075 1,777,9931,847,465 2,746,182
405,941 2,492,7571,489,332 1,268,190
829,380 4,139,5202,578,179 12,549,636
472,935 1,674,116298,370 979,081
6,941 1,435,57163,182 2,400,141
481,453 1,594,838* 283,414 962,828
521,631 918,039563,835 2,108,804555,658 4,170,655112,069 315,710745,896 2,204,503118,327 2,040,960312,698 2,325,335
5,122 27,4789,816 32,691
97,690 1,008,275743,476 4,595,769360,475 256,131118,342 2,801,744786,711 2,016,272148,465 5,464,997
71,015 2,636,789879,818 1,869,082
20,610 4,840,112182,619 842,879
16,026 214,708403,542 1,069,148
2,661,927 3,557,651* 179,554 1,078,573
2,255,765 4,211,334102,368 1,086,227
7,098 19,7791,999 207,615
13,803 1,474,610
Copyright © 2021 www.secdatabase.com. All Rights Reserved.Please Consider the Environment Before Printing This Document

GlaxoSmithKline Pharmaceuticals, Ltd.Glenmark Pharmaceuticals, Ltd.Godrej Consumer Products, Ltd.Godrej Industries, Ltd.Godrej Properties, Ltd.
Graphite India, Ltd.Grasim Industries, Ltd.GRUH Finance, Ltd.Havells India, Ltd.HCL Technologies, Ltd.HDFC Bank, Ltd.HDFC Life Insurance Co., Ltd.HEG, Ltd.Hero MotoCorp, Ltd.Hindalco Industries, Ltd.Hindustan Petroleum Corp., Ltd.Hindustan Unilever, Ltd.Honeywell Automation India, Ltd.Housing Development Finance Corp., Ltd.ICICI Bank, Ltd., Sponsored ADRICICI Lombard General Insurance Co., Ltd.ICICI Prudential Life Insurance Co., Ltd.IDFC First Bank, Ltd.IIFL Finance, Ltd.IIFL Securities, Ltd.IIFL Wealth Management, Ltd.Indiabulls Housing Finance, Ltd.Indiabulls Ventures, Ltd.Indian BankIndian Hotels Co., Ltd. (The)Indian Oil Corp., Ltd.Indraprastha Gas, Ltd.IndusInd Bank, Ltd.Info Edge India, Ltd.Infosys, Ltd., Sponsored ADRInfosys, Ltd.InterGlobe Aviation, Ltd.ITC, Ltd.Jindal Steel & Power, Ltd.JSW Steel, Ltd.Jubilant Foodworks, Ltd.Kansai Nerolac Paints, Ltd.Kotak Mahindra Bank, Ltd.L&T Finance Holdings, Ltd.Larsen & Toubro Infotech, Ltd.Larsen & Toubro, Ltd.LIC Housing Finance, Ltd.
27,076 473,412209,511 1,292,654506,589 4,408,869102,233 699,473
* 20,013 274,906Table of Contents
The Emerging Markets SeriesCONTINUED
Shares Value»
INDIA — (Continued)47,786 $ 212,251
389,869 4,424,278249,522 884,947234,115 2,187,666862,054 12,920,571
1,383,984 45,103,82777,686 555,805
9,287 133,19091,372 3,103,075
2,322,605 6,398,637726,814 2,783,905992,915 24,809,508
319 106,3831,235,052 37,994,8241,010,599 12,339,408
48,718 854,619237,801 1,383,294
* 2,686,862 1,631,335120,008 204,594
* 120,008 359,160* 17,144 23,710
888,168 6,886,427103,518 357,760
* 103,786 281,706182,164 376,324
1,482,131 2,977,789274,014 1,206,526173,449 3,534,861
32,656 1,064,747# 1,695,776 19,196,184
3,610,458 41,276,106133,462 3,022,244
4,651,620 18,252,170* 906,886 1,760,896
2,677,650 9,179,210128,080 2,222,909135,798 836,512538,866 11,842,907
1,403,145 2,006,08177,400 1,697,568
417,782 8,401,815915,481 6,851,763
Copyright © 2021 www.secdatabase.com. All Rights Reserved.Please Consider the Environment Before Printing This Document

Lupin, Ltd.Mahindra & Mahindra Financial Services, Ltd.Mahindra & Mahindra, Ltd.Mangalore Refinery & Petrochemicals, Ltd.Marico, Ltd.Maruti Suzuki India, Ltd.Mindtree, Ltd.Motherson Sumi Systems, Ltd.Mphasis, Ltd.MRF, Ltd.Muthoot Finance, Ltd.Nestle India, Ltd.NHPC, Ltd.NTPC, Ltd.Oberoi Realty, Ltd.Odisha Cement, Ltd.Oil & Natural Gas Corp., Ltd.
Oil India, Ltd.Oracle Financial Services Software, Ltd.Page Industries, Ltd.Petronet LNG, Ltd.Pfizer, Ltd.PI Industries, Ltd.Pidilite Industries, Ltd.Piramal Enterprises, Ltd.PNB Housing Finance, Ltd.Power Finance Corp., Ltd.Power Grid Corp. of India, Ltd.Procter & Gamble Hygiene & Health Care, Ltd.Punjab National BankRajesh Exports, Ltd.Ramco Cements, Ltd. (The)RBL Bank, Ltd.REC, Ltd.Reliance Industries, Ltd.Reliance Industries, Ltd.Sanofi India, Ltd.SBI Life Insurance Co., Ltd.Shree Cement, Ltd.Shriram Transport Finance Co., Ltd.Siemens, Ltd.SRF, Ltd.State Bank of IndiaSteel Authority of India, Ltd.Sun Pharmaceutical Industries, Ltd.Sun TV Network, Ltd.Sundaram Finance Holdings, Ltd.
520,813 5,791,843539,797 2,373,417
1,020,852 8,110,08456,507 49,778
738,680 3,931,148138,331 10,959,364
30,554 315,2311,437,389 2,216,911
172,487 2,335,1082,969 2,301,100
360,148 3,179,12037,106 6,263,634
3,026,547 970,6121,784,906 3,273,877
* 85,041 675,097* 78,770 1,061,718
1,184,335 2,375,227Table of Contents
The Emerging Markets SeriesCONTINUED
Shares Value»
INDIA — (Continued)356,798 $ 822,363
36,943 1,818,5196,472 1,698,867
1,989,103 6,798,7772,325 100,9133,550 56,617
195,176 3,507,475119,497 3,139,00526,993 276,869
* 1,462,437 2,312,0581,910,627 5,874,001
11,021 1,741,910* 1,362,458 1,363,852
161,667 1,614,034106,172 1,122,806362,712 2,110,854
2,124,950 4,314,9593,374 113,056
3,145,620 52,980,123529 46,735
35,169 406,35410,928 3,192,237
342,689 4,795,38182,309 1,364,04710,220 399,783
* 1,485,493 7,145,615* 1,037,967 641,076
773,736 4,777,446164,006 1,123,021
27,690 29,798
Copyright © 2021 www.secdatabase.com. All Rights Reserved.Please Consider the Environment Before Printing This Document

Sundaram Finance, Ltd.Supreme Industries, Ltd.Tata Chemicals, Ltd.Tata Communications, Ltd.Tata Consultancy Services, Ltd.Tata Global Beverages, Ltd.Tata Motors, Ltd., Sponsored ADRTata Motors, Ltd.Tata Power Co., Ltd. (The)Tata Steel, Ltd.Tech Mahindra, Ltd.Titan Co., Ltd.Torrent Pharmaceuticals, Ltd.TVS Motor Co., Ltd.UltraTech Cement, Ltd.United Breweries, Ltd.United Spirits, Ltd.UPL, Ltd.Varun Beverages, Ltd.Varun Beverages, Ltd.Vedanta, Ltd.Vodafone Idea, Ltd.Voltas, Ltd.Whirlpool of India, Ltd.Wipro, Ltd.Yes Bank, Ltd.Zee Entertainment Enterprises, Ltd.
TOTAL INDIA
Ace Hardware Indonesia Tbk PTAdaro Energy Tbk PTAstra Agro Lestari Tbk PTAstra International Tbk PTBank Central Asia Tbk PTBank Danamon Indonesia Tbk PTBank Mandiri Persero Tbk PTBank Negara Indonesia Persero Tbk PTBank Pan Indonesia Tbk PTBank Permata Tbk PTBank Rakyat Indonesia Persero Tbk PTBank Tabungan Negara Persero Tbk PTBarito Pacific Tbk PTBayan Resources Tbk PTBukit Asam Tbk PTBumi Serpong Damai Tbk PTCharoen Pokphand Indonesia Tbk PTGudang Garam Tbk PTIndah Kiat Pulp & Paper Corp. Tbk PT
47,405 1,047,5153,625 55,910
103,755 870,794109,030 740,913
1,381,009 44,109,188335,765 1,219,134
#* 41,094 399,023* 4,224,425 8,273,063
1,856,520 1,626,696841,300 5,267,514939,022 8,637,517364,783 5,572,081106,907 2,584,621131,305 702,883
79,522 4,988,02697,945 2,008,265
* 364,742 3,133,1041,634,904 14,072,406
2,849 26,5661,425 13,231
4,103,469 9,098,338* 16,898,183 1,692,469
145,520 1,222,94714,784 333,730
1,807,033 6,968,4833,630,287 4,705,2511,179,299 6,165,399
786,634,057
Table of Contents
The Emerging Markets SeriesCONTINUED
Shares Value»
INDONESIA — (2.8%)9,398,700 $ 1,228,018
56,601,000 5,090,0401,255,245 891,179
22,239,310 11,022,4628,457,600 18,567,6184,749,479 1,717,541
15,448,034 8,690,97013,179,322 7,900,916
* 3,308,400 338,598* 7,825,200 526,566
63,168,800 20,016,7999,133,700 1,587,146
12,319,700 3,397,23879,500 95,607
8,520,100 1,655,841* 14,811,100 1,486,701
11,695,400 4,475,321812,100 4,362,522
6,816,100 3,597,058
Copyright © 2021 www.secdatabase.com. All Rights Reserved.Please Consider the Environment Before Printing This Document

Indo Tambangraya Megah Tbk PTIndocement Tunggal Prakarsa Tbk PTIndofood CBP Sukses Makmur Tbk PTIndofood Sukses Makmur Tbk PTJapfa Comfeed Indonesia Tbk PTJasa Marga Persero Tbk PTKalbe Farma Tbk PTMatahari Department Store Tbk PTMayora Indah Tbk PTMedia Nusantara Citra Tbk PTMitra Keluarga Karyasehat Tbk PTPabrik Kertas Tjiwi Kimia Tbk PTPakuwon Jati Tbk PTPerusahaan Gas Negara Tbk PTSarana Menara Nusantara Tbk PTSemen Baturaja Persero Tbk PTSemen Indonesia Persero Tbk PTSinar Mas Agro Resources & Technology Tbk PTSmartfren Telecom Tbk PTSurya Citra Media Tbk PTTelekomunikasi Indonesia Persero Tbk PTTelekomunikasi Indonesia Persero Tbk PT, Sponsored ADRTotalindo Eka Persada Tbk PTTower Bersama Infrastructure Tbk PTUnilever Indonesia Tbk PTUnited Tractors Tbk PTVale Indonesia Tbk PTWaskita Karya Persero Tbk PTXL Axiata Tbk PT
TOTAL INDONESIA
AFFIN Bank BhdAirAsia Group BhdAlliance Bank Malaysia BhdAMMB Holdings BhdAstro Malaysia Holdings BhdAxiata Group BhdBatu Kawan BhdBIMB Holdings Bhd
Boustead Holdings BhdBritish American Tobacco Malaysia BhdBursa Malaysia BhdCarlsberg Brewery Malaysia Bhd, Class BCIMB Group Holdings BhdDialog Group BhdDiGi.Com BhdFGV Holdings Bhd
623,300 744,6991,611,700 2,560,4443,456,800 2,629,126
14,335,900 7,197,735759,300 86,306
3,871,113 1,644,05227,775,800 2,902,322
162,500 42,87414,317,225 2,539,049
3,313,700 323,4132,981,900 430,984
617,200 524,46846,392,900 2,423,76014,270,600 2,073,28321,923,500 1,154,524
1,298,200 91,5864,499,500 4,090,2171,035,900 298,841
* 20,439,500 251,5198,971,800 986,549
37,216,900 11,357,913# 196,768 5,928,620* 722,000 31,630
2,119,900 634,5862,015,700 6,245,9584,354,996 7,713,835
* 4,292,200 918,63013,797,379 1,997,804
* 12,562,600 2,878,685
167,351,553
MALAYSIA — (2.9%)467,090 228,218
6,063,200 2,869,7741,892,200 1,683,1533,674,859 3,759,0032,812,500 984,7403,932,895 4,775,619
105,400 417,2231,193,855 1,208,804
Table of Contents
The Emerging Markets SeriesCONTINUED
Shares Value»
MALAYSIA — (Continued)264,800 $ 73,027251,600 1,374,088406,600 663,989
54,600 318,3634,938,173 6,059,3631,629,918 1,359,6745,082,520 6,143,155
* 1,076,600 293,790
Copyright © 2021 www.secdatabase.com. All Rights Reserved.Please Consider the Environment Before Printing This Document

Fraser & Neave Holdings BhdGamuda BhdGenting BhdGenting Malaysia BhdGenting Plantations BhdHAP Seng Consolidated BhdHartalega Holdings BhdHeineken Malaysia BhdHong Leong Bank BhdHong Leong Financial Group BhdIHH Healthcare BhdIJM Corp. BhdInari Amertron BhdIOI Corp. BhdIOI Properties Group BhdKuala Lumpur Kepong BhdLotte Chemical Titan Holding BhdMalayan Banking BhdMalaysia Airports Holdings BhdMalaysia Building Society BhdMaxis BhdMISC BhdMMC Corp. BhdNestle Malaysia BhdPetronas Chemicals Group BhdPetronas Dagangan BhdPetronas Gas BhdPPB Group BhdPress Metal Aluminium Holdings BhdPublic Bank BhdQL Resources BhdRHB Bank BhdSerba Dinamik Holdings BhdSime Darby BhdSime Darby Plantation BhdSime Darby Property BhdSP Setia Bhd GroupSunway BhdTelekom Malaysia BhdTenaga Nasional BhdTop Glove Corp. BhdUMW Holdings BhdUnited Plantations BhdWestports Holdings BhdYTL Corp. BhdYTL Power International Bhd
TOTAL MALAYSIA
Alfa S.A.B. de C.V., Class AAmerica Movil S.A.B. de C.V.
151,200 1,263,1613,132,000 2,806,6444,686,800 7,783,2604,360,000 4,072,952
# 415,400 976,451973,700 2,332,043
2,213,600 2,650,23764,600 355,778
446,566 1,939,366638,383 2,778,755
1,421,700 1,968,4245,975,162 3,362,6051,336,000 528,362
# 2,452,205 2,483,4782,847,529 866,507
# 648,700 3,708,3269,800 6,705
4,863,338 10,173,2582,790,541 5,652,485
# 4,165,860 876,277# 2,881,400 3,959,681
2,133,598 3,722,222847,600 225,210
44,500 1,601,4943,389,400 6,142,721
307,800 1,747,570835,700 3,252,553947,980 4,295,986
1,919,800 2,111,2753,656,014 19,367,372
964,490 1,604,3281,697,005 2,259,096
85,200 82,5224,756,961 2,515,747
# 3,100,461 3,456,0893,068,061 724,3611,667,711 789,367
# 3,620,874 1,452,7381,604,564 1,586,9073,718,850 12,414,354
# 2,541,300 2,788,603936,466 1,146,697
44,800 280,1771,666,900 1,612,574
13,545,299 3,370,5232,843,597 536,618
171,843,842
MEXICO — (3.4%)11,293,476 9,782,62148,207,854 33,784,175
Table of Contents
The Emerging Markets SeriesCONTINUED
Copyright © 2021 www.secdatabase.com. All Rights Reserved.Please Consider the Environment Before Printing This Document

America Movil S.A.B. de C.V., Sponsored ADR, Class LArca Continental S.A.B. de C.V.Banco Santander Mexico SA Institucion de Banca Multiple Grupo FinancieroSantand, ADRBanco Santander Mexico SA Institucion de Banca Multiple Grupo FinancieroSantand, Class BBecle S.A.B. de C.V.Cemex S.A.B. de C.V.Coca-Cola Femsa S.A.B. de C.V., Sponsored ADRCoca-Cola Femsa S.A.B. de C.V.El Puerto de Liverpool S.A.B. de C.V.Fomento Economico Mexicano S.A.B. de C.V.Gruma S.A.B. de C.V., Class BGrupo Aeroportuario del Pacifico S.A.B. de C.V., ADRGrupo Aeroportuario del Pacifico S.A.B. de C.V., Class BGrupo Aeroportuario del Sureste S.A.B. de C.V., ADRGrupo Bimbo S.A.B. de C.V.Grupo Carso S.A.B. de C.V.Grupo Elektra S.A.B. de C.V.Grupo Financiero Banorte S.A.B. de C.V.Grupo Financiero Inbursa S.A.B. de C.V.Grupo Lala S.A.B. de C.V.Grupo Mexico S.A.B. de C.V., Series BGrupo Televisa S.A.B., Sponsored ADRGrupo Televisa S.A.B.Impulsora del Desarrollo y el Empleo en America Latina S.A.B. de C.V.Industrias Penoles S.A.B. de C.V.Infraestructura Energetica Nova S.A.B. de C.V.Kimberly-Clark de Mexico S.A.B. de C.V., Class AMegacable Holdings S.A.B. de C.V.Mexichem S.A.B. de C.V.Organizacion Soriana S.A.B. de C.V., Class BPromotora y Operadora de Infraestructura S.A.B. de C.V.Wal-Mart de Mexico S.A.B. de C.V.
TOTAL MEXICO
Cementos Pacasmayo SAA, ADRCia de Minas Buenaventura SAA, ADRCredicorp, Ltd.Grana y Montero SAA, Sponsored ADR
TOTAL PERU
Aboitiz Equity Ventures, Inc.Aboitiz Power Corp.Alliance Global Group, Inc.Ayala Corp.Ayala Land, Inc.Bank of the Philippine IslandsBDO Unibank, Inc.Bloomberry Resorts Corp.DMCI Holdings, Inc.
Shares Value»
MEXICO — (Continued)109,448 $ 1,531,178697,902 3,708,427
122,692 871,113
2,874,373 4,087,231# 789,596 1,172,213# 24,758,419 8,811,032
25,753 1,579,689390,519 2,402,567297,404 1,446,224
# 1,232,252 11,179,406573,607 5,254,541
13,641 1,365,328533,221 5,350,644
32,374 4,925,057# 2,617,893 5,002,530
793,269 2,537,05395,655 6,416,715
2,969,480 14,855,341# 3,950,124 4,837,749
604,703 654,7566,360,255 15,598,825
202,737 1,928,029# 3,716,830 7,040,424#* 2,300,948 2,989,687# 374,851 3,448,502
489,358 1,886,0602,758,212 5,722,602
250,780 1,063,774# 3,426,482 6,261,582#* 1,059,965 1,116,175# 324,845 2,924,050# 7,198,435 21,241,745
202,777,045
PERU — (0.3%)15,158 136,577
# 125,122 1,906,85970,995 15,476,200
108,988 318,245
17,837,881
PHILIPPINES — (1.5%)2,290,670 2,375,1111,962,800 1,362,4399,328,900 2,847,622
253,862 4,765,1129,812,818 9,568,2521,214,942 2,141,4061,553,962 4,468,3241,686,400 379,401
12,875,600 2,561,760
Copyright © 2021 www.secdatabase.com. All Rights Reserved.Please Consider the Environment Before Printing This Document
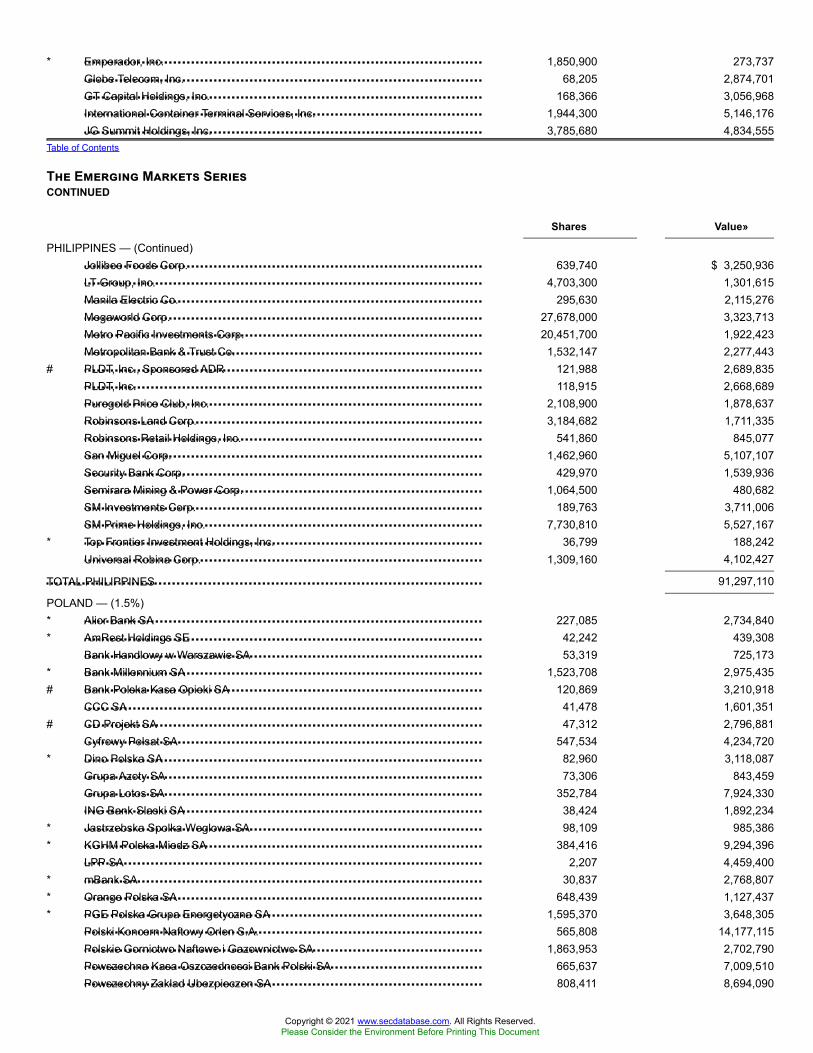
Emperador, Inc.Globe Telecom, Inc.GT Capital Holdings, Inc.International Container Terminal Services, Inc.JG Summit Holdings, Inc.
Jollibee Foods Corp.LT Group, Inc.Manila Electric Co.Megaworld Corp.Metro Pacific Investments Corp.Metropolitan Bank & Trust Co.PLDT, Inc., Sponsored ADRPLDT, Inc.Puregold Price Club, Inc.Robinsons Land Corp.Robinsons Retail Holdings, Inc.San Miguel Corp.Security Bank Corp.Semirara Mining & Power Corp.SM Investments Corp.SM Prime Holdings, Inc.Top Frontier Investment Holdings, Inc.Universal Robina Corp.
TOTAL PHILIPPINES
Alior Bank SAAmRest Holdings SEBank Handlowy w Warszawie SABank Millennium SABank Polska Kasa Opieki SACCC SACD Projekt SACyfrowy Polsat SADino Polska SAGrupa Azoty SAGrupa Lotos SAING Bank Slaski SAJastrzebska Spolka Weglowa SAKGHM Polska Miedz SALPP SAmBank SAOrange Polska SAPGE Polska Grupa Energetyczna SAPolski Koncern Naftowy Orlen S.A.Polskie Gornictwo Naftowe i Gazownictwo SAPowszechna Kasa Oszczednosci Bank Polski SAPowszechny Zaklad Ubezpieczen SA
* 1,850,900 273,73768,205 2,874,701
168,366 3,056,9681,944,300 5,146,1763,785,680 4,834,555
Table of Contents
The Emerging Markets SeriesCONTINUED
Shares Value»
PHILIPPINES — (Continued)639,740 $ 3,250,936
4,703,300 1,301,615295,630 2,115,276
27,678,000 3,323,71320,451,700 1,922,423
1,532,147 2,277,443# 121,988 2,689,835
118,915 2,668,6892,108,900 1,878,6373,184,682 1,711,335
541,860 845,0771,462,960 5,107,107
429,970 1,539,9361,064,500 480,682
189,763 3,711,0067,730,810 5,527,167
* 36,799 188,2421,309,160 4,102,427
91,297,110
POLAND — (1.5%)* 227,085 2,734,840* 42,242 439,308
53,319 725,173* 1,523,708 2,975,435# 120,869 3,210,918
41,478 1,601,351# 47,312 2,796,881
547,534 4,234,720* 82,960 3,118,087
73,306 843,459352,784 7,924,330
38,424 1,892,234* 98,109 985,386* 384,416 9,294,396
2,207 4,459,400* 30,837 2,768,807* 648,439 1,127,437* 1,595,370 3,648,305
565,808 14,177,1151,863,953 2,702,790
665,637 7,009,510808,411 8,694,090
Copyright © 2021 www.secdatabase.com. All Rights Reserved.Please Consider the Environment Before Printing This Document

Santander Bank Polska SA
TOTAL POLAND
Gazprom PJSC, Sponsored ADRGazprom PJSC, Sponsored ADRLukoil PJSC, Sponsored ADRMagnitogorsk Iron & Steel Works PJSC, GDRMail.Ru Group, Ltd., GDRMMC Norilsk Nickel PJSC, ADRMMC Norilsk Nickel PJSC, ADRNovatek PJSC, GDRNovolipetsk Steel PJSC, GDRPhosAgro PJSC, GDRPhosAgro PJSC, GDR
Rosneft Oil Co. PJSC, GDRRosneft Oil Co. PJSC, GDRRostelecom PJSC, Sponsored ADRRostelecom PJSC, Sponsored ADRRusHydro PJSC, ADRRusHydro PJSC, ADRSberbank of Russia PJSC, Sponsored ADRSeverstal PJSC, GDRSeverstal PJSC, GDRTatneft PJSC, Sponsored ADRTatneft PJSC, Sponsored ADRVEON, Ltd.VTB Bank PJSC, GDRVTB Bank PJSC, GDRX5 Retail Group NV, GDR
TOTAL RUSSIA
Absa Group, Ltd.Anglo American Platinum, Ltd.AngloGold Ashanti, Ltd.AngloGold Ashanti, Ltd.Aspen Pharmacare Holdings, Ltd.Assore, Ltd.AVI, Ltd.Bid Corp., Ltd.Bidvest Group, Ltd. (The)Capitec Bank Holdings, Ltd.Clicks Group, Ltd.Discovery, Ltd.Distell Group Holdings, Ltd.Exxaro Resources, Ltd.FirstRand, Ltd.
33,813 2,845,614
90,209,586
RUSSIA — (1.9%)2,221,918 16,240,892
42,939 313,884240,181 19,711,179199,210 1,721,071
* 52,592 1,342,14836,191 825,517
406,377 9,362,43030,449 6,353,212
111,869 2,627,71083,207 1,035,387
2,148 26,786Table of Contents
The Emerging Markets SeriesCONTINUED
Shares Value»
RUSSIA — (Continued)71,061 $ 470,850
700,727 4,622,08617,296 133,17978,867 615,21812,131 10,208
1,183,182 1,014,6901,512,183 22,446,941
191,829 3,076,4263,447 55,462
137,960 9,573,89126,646 1,870,549
361,489 1,131,4611,358,280 1,800,7981,913,221 2,550,324
79,886 2,671,388
111,603,687
SOUTH AFRICA — (7.1%)# 2,048,444 22,697,985
87,998 5,223,91430,125 517,689
1,637,102 27,928,960574,874 3,608,240
44,296 1,080,159346,393 2,095,705
# 668,539 13,983,932983,621 12,595,916
75,595 6,209,928444,655 6,315,175761,043 6,982,790
13,110 121,809631,839 7,326,733
# 4,821,116 20,628,663
Copyright © 2021 www.secdatabase.com. All Rights Reserved.Please Consider the Environment Before Printing This Document
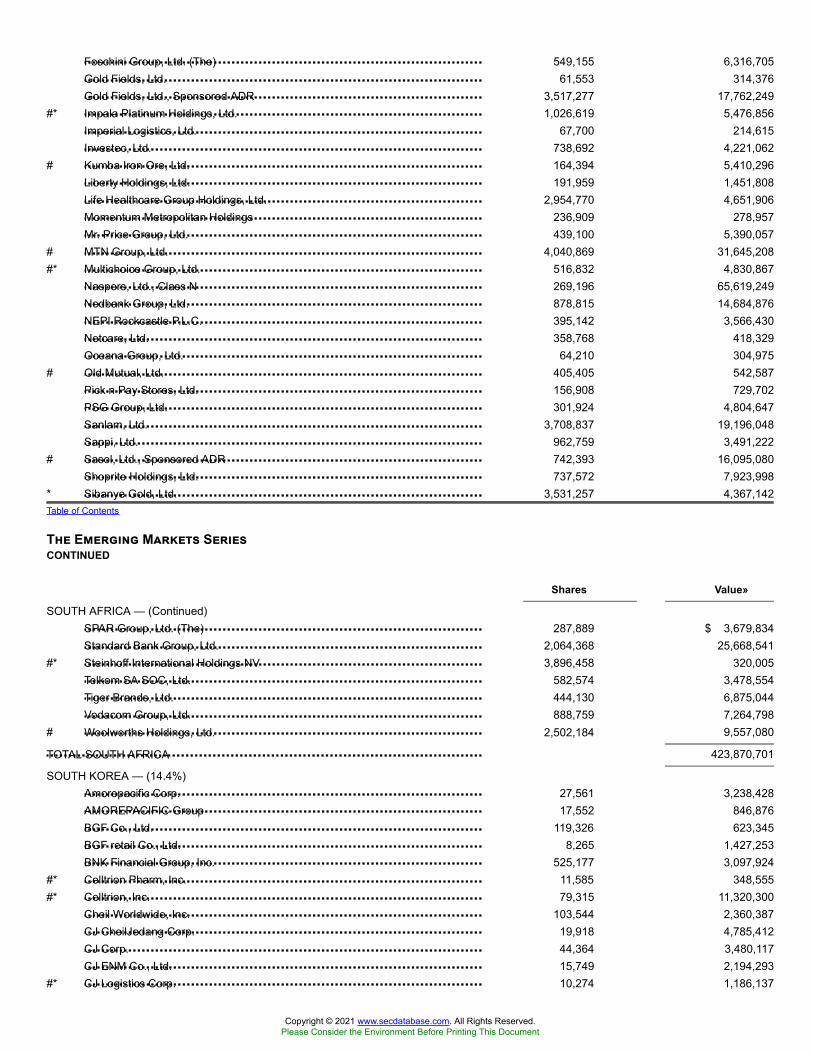
Foschini Group, Ltd. (The)Gold Fields, Ltd.Gold Fields, Ltd., Sponsored ADRImpala Platinum Holdings, Ltd.Imperial Logistics, Ltd.Investec, Ltd.Kumba Iron Ore, Ltd.Liberty Holdings, Ltd.Life Healthcare Group Holdings, Ltd.Momentum Metropolitan HoldingsMr. Price Group, Ltd.MTN Group, Ltd.Multichoice Group, Ltd.Naspers, Ltd., Class NNedbank Group, Ltd.NEPI Rockcastle P.L.C.Netcare, Ltd.Oceana Group, Ltd.Old Mutual, Ltd.Pick n Pay Stores, Ltd.PSG Group, Ltd.Sanlam, Ltd.Sappi, Ltd.Sasol, Ltd., Sponsored ADRShoprite Holdings, Ltd.Sibanye Gold, Ltd.
SPAR Group, Ltd. (The)Standard Bank Group, Ltd.Steinhoff International Holdings NVTelkom SA SOC, Ltd.Tiger Brands, Ltd.Vodacom Group, Ltd.Woolworths Holdings, Ltd.
TOTAL SOUTH AFRICA
Amorepacific Corp.AMOREPACIFIC GroupBGF Co., Ltd.BGF retail Co., Ltd.BNK Financial Group, Inc.Celltrion Pharm, Inc.Celltrion, Inc.Cheil Worldwide, Inc.CJ CheilJedang Corp.CJ Corp.CJ ENM Co., Ltd.CJ Logistics Corp.
549,155 6,316,70561,553 314,376
3,517,277 17,762,249#* 1,026,619 5,476,856
67,700 214,615738,692 4,221,062
# 164,394 5,410,296191,959 1,451,808
2,954,770 4,651,906236,909 278,957439,100 5,390,057
# 4,040,869 31,645,208#* 516,832 4,830,867
269,196 65,619,249878,815 14,684,876395,142 3,566,430358,768 418,329
64,210 304,975# 405,405 542,587
156,908 729,702301,924 4,804,647
3,708,837 19,196,048962,759 3,491,222
# 742,393 16,095,080737,572 7,923,998
* 3,531,257 4,367,142Table of Contents
The Emerging Markets SeriesCONTINUED
Shares Value»
SOUTH AFRICA — (Continued)287,889 $ 3,679,834
2,064,368 25,668,541#* 3,896,458 320,005
582,574 3,478,554444,130 6,875,044888,759 7,264,798
# 2,502,184 9,557,080
423,870,701
SOUTH KOREA — (14.4%)27,561 3,238,42817,552 846,876
119,326 623,3458,265 1,427,253
525,177 3,097,924#* 11,585 348,555#* 79,315 11,320,300
103,544 2,360,38719,918 4,785,41244,364 3,480,11715,749 2,194,293
#* 10,274 1,186,137
Copyright © 2021 www.secdatabase.com. All Rights Reserved.Please Consider the Environment Before Printing This Document

Com2uSCorpCosmax, Inc.Cuckoo Holdings Co., Ltd.Daelim Industrial Co., Ltd.Daewoo Engineering & Construction Co., Ltd.Daewoo Shipbuilding & Marine Engineering Co., Ltd.Daewoong Pharmaceutical Co., Ltd.DB Insurance Co., Ltd.DGB Financial Group, Inc.Dongsuh Cos., Inc.Doosan Bobcat, Inc.Doosan Corp.Doosan Heavy Industries & Construction Co., Ltd.Doosan Infracore Co., Ltd.Douzone Bizon Co., Ltd.E-MART, Inc.Fila Korea, Ltd.Grand Korea Leisure Co., Ltd.Green Cross Corp.Green Cross Holdings Corp.GS Engineering & Construction Corp.GS Holdings Corp.GS Home Shopping, Inc.GS Retail Co., Ltd.Hana Financial Group, Inc.Hanall Biopharma Co., Ltd.Hanjin Kal Corp.Hankook Tire & Technology Co., Ltd.Hanmi Pharm Co., Ltd.Hanmi Science Co., Ltd.Hanon SystemsHanssem Co., Ltd.Hanwha Aerospace Co., Ltd.Hanwha Chemical Corp.Hanwha Corp.Hanwha Life Insurance Co., Ltd.HDC Holdings Co., Ltd.
Hite Jinro Co., Ltd.HLB, Inc.Hotel Shilla Co., Ltd.Hugel, Inc.Hyosung Advanced Materials Corp.Hyosung Chemical Corp.Hyosung Corp.Hyosung TNC Co., Ltd.Hyundai Department Store Co., Ltd.Hyundai Elevator Co., Ltd.
11,105 823,4496,758 580,414
768 77,14658,487 5,196,115
* 353,220 1,217,536* 71,856 1,768,438
3,379 449,075171,260 8,105,059341,331 2,167,368
31,182 468,97070,216 2,121,30516,851 1,487,640
#* 378,754 1,933,914#* 492,270 2,561,681
28,707 1,542,69542,516 4,358,24575,486 4,271,38241,934 655,285
4,294 387,55623,565 388,428
165,660 4,718,236190,987 8,091,482
4,597 649,31053,143 1,671,641
580,821 17,000,688#* 21,051 466,442# 50,693 1,102,732
169,903 4,428,4586,448 1,570,221
# 10,613 419,117266,528 2,621,227
# 16,476 841,251* 61,456 1,665,074
268,962 4,208,828114,258 2,287,188
# 1,038,851 2,296,04959,752 626,759
Table of Contents
The Emerging Markets SeriesCONTINUED
Shares Value»
SOUTH KOREA — (Continued)# 48,621 $ 871,205* 16,181 367,417# 55,107 3,631,620* 2,135 672,530* 7,969 783,378
5,674 776,58124,735 1,699,717
7,698 931,46128,328 1,767,03616,325 1,096,133
Copyright © 2021 www.secdatabase.com. All Rights Reserved.Please Consider the Environment Before Printing This Document

Hyundai Engineering & Construction Co., Ltd.Hyundai Glovis Co., Ltd.Hyundai Greenfood Co., Ltd.Hyundai Heavy Industries Holdings Co., Ltd.Hyundai Home Shopping Network Corp.Hyundai Marine & Fire Insurance Co., Ltd.Hyundai Merchant Marine Co., Ltd.Hyundai Mipo Dockyard Co., Ltd.Hyundai Mobis Co., Ltd.Hyundai Motor Co.Hyundai Rotem Co., Ltd.Hyundai Steel Co.Hyundai Wia Corp.Iljin Materials Co., Ltd.Industrial Bank of KoreaInnocean Worldwide, Inc.Kakao Corp.Kangwon Land, Inc.KB Financial Group, Inc.KB Financial Group, Inc., ADRKCC Corp.KEPCO Plant Service & Engineering Co., Ltd.Kia Motors Corp.KIWOOM Securities Co., Ltd.KMW Co., Ltd.Koh Young Technology, Inc.Kolmar Korea Co., Ltd.Kolon Industries, Inc.Korea Aerospace Industries, Ltd.Korea Electric Power Corp., Sponsored ADRKorea Electric Power Corp.Korea Gas Corp.Korea Investment Holdings Co., Ltd.Korea Petrochemical Ind Co., Ltd.Korea Shipbuilding & Offshore Engineering Co., Ltd.Korea Zinc Co., Ltd.Korean Air Lines Co., Ltd.Korean Reinsurance Co.KT Corp., Sponsored ADRKT&G Corp.Kumho Petrochemical Co., Ltd.Kumho Tire Co., Inc.LG Chem, Ltd.LG Corp.LG Display Co., Ltd., ADRLG Display Co., Ltd.LG Electronics, Inc.LG Household & Health Care, Ltd.LG Innotek Co., Ltd.
115,296 4,159,05127,895 3,614,62351,951 542,74017,989 4,931,945
5,020 395,491208,568 4,918,164
* 188,580 524,61440,720 1,463,63256,335 11,399,488
128,680 13,688,658#* 32,868 457,200
167,530 5,459,87418,822 684,844
* 21,152 663,571481,487 5,333,217
4,197 236,422# 28,969 3,085,972
104,801 2,718,924413,344 15,104,324
63,998 2,314,80811,809 2,421,08130,975 831,980
252,530 9,301,928# 25,281 1,546,620* 3,098 142,150
2,393 167,11115,861 735,61840,014 1,339,94837,044 1,149,792
#* 130,759 1,533,803* 150,306 3,538,561
41,078 1,478,70487,714 5,472,224
946 95,514* 60,096 5,456,052
8,213 3,059,966185,901 3,992,308
59,695 402,41882,100 968,78098,283 7,980,90036,680 2,515,365
#* 149,636 505,56141,518 11,742,436
147,582 8,803,713#* 808,137 4,873,066#* 525,059 6,379,620
226,351 12,394,79113,212 13,989,19840,182 3,794,307
Table of Contents
The Emerging Markets SeriesCONTINUED
Shares Value»
Copyright © 2021 www.secdatabase.com. All Rights Reserved.Please Consider the Environment Before Printing This Document

LG Uplus Corp.Lotte Chemical Corp.Lotte Chilsung Beverage Co., Ltd.Lotte Confectionery Co., Ltd.Lotte Corp.LOTTE Fine Chemical Co., Ltd.LOTTE Himart Co., Ltd.Lotte Shopping Co., Ltd.LS Corp.LS Industrial Systems Co., Ltd.Macquarie Korea Infrastructure FundMando Corp.Medy-Tox, Inc.Meritz Financial Group, Inc.Meritz Fire & Marine Insurance Co., Ltd.Meritz Securities Co., Ltd.Mirae Asset Daewoo Co., Ltd.NAVER Corp.NCSoft Corp.Netmarble Corp.Nexen Tire Corp.NH Investment & Securities Co., Ltd.NHN Corp.NongShim Co., Ltd.OCI Co., Ltd.Orange Life Insurance, Ltd.Orion Corp.Orion Holdings Corp.Ottogi Corp.Pan Ocean Co., Ltd.Paradise Co., Ltd.Pearl Abyss Corp.POSCO, Sponsored ADRPOSCOPOSCO Chemtech Co., Ltd.Posco International Corp.S-1 Corp.Samsung Biologics Co., Ltd.Samsung C&T Corp.Samsung Card Co., Ltd.Samsung Electro-Mechanics Co., Ltd.Samsung Electronics Co., Ltd., GDRSamsung Electronics Co., Ltd.Samsung Engineering Co., Ltd.Samsung Fire & Marine Insurance Co., Ltd.Samsung Heavy Industries Co., Ltd.Samsung Life Insurance Co., Ltd.Samsung SDI Co., Ltd.Samsung SDS Co., Ltd.Samsung Securities Co., Ltd.Seoul Semiconductor Co., Ltd.SFA Engineering Corp.Shinhan Financial Group Co., Ltd.
SOUTH KOREA — (Continued)427,869 $ 4,685,559
42,891 8,382,2183,309 404,493
237 29,50722,342 639,12334,820 1,423,460
# 14,100 436,40121,751 2,487,49741,095 1,525,89033,789 1,309,585
501,890 4,941,865# 96,447 2,743,255
7,354 2,578,820132,014 1,549,771174,445 2,931,412
# 775,459 3,296,586# 770,173 4,862,411
127,452 14,786,59016,404 6,665,699
#* 13,796 1,051,86138,894 281,971
316,524 3,470,024#* 18,836 988,529
5,761 1,141,41846,230 2,918,873
7,362 175,8678,589 584,048
67,257 884,5051,212 659,967
* 431,074 1,741,88249,111 672,409
#* 10,242 1,479,076104,186 4,879,030
70,065 13,206,022# 25,913 1,056,159
99,219 1,561,97125,840 2,281,925
* 6,740 1,584,43051,407 3,962,50955,760 1,708,578
# 47,511 3,642,30852,511 50,321,298
4,912,950 186,076,534* 229,832 3,170,805
63,656 14,131,245* 718,775 4,257,884
113,052 7,257,394# 35,445 7,381,502
29,343 5,132,400135,268 4,155,553
43,467 586,62828,906 914,373
305,033 11,172,935
Copyright © 2021 www.secdatabase.com. All Rights Reserved.Please Consider the Environment Before Printing This Document

Shinhan Financial Group Co., Ltd., ADRShinsegae International, Inc.Shinsegae, Inc.SK Discovery Co., Ltd.SK Holdings Co., Ltd.SK Hynix, Inc.
SK Innovation Co., Ltd.SK Materials Co., Ltd.SK Networks Co., Ltd.SK Telecom Co., Ltd., Sponsored ADRSK Telecom Co., Ltd.SKC Co., Ltd.S-Oil Corp.Ssangyong Cement Industrial Co., Ltd.Taekwang Industrial Co., Ltd.Tongyang Life Insurance Co., Ltd.Woongjin Coway Co., Ltd.Woori Financial Group, Inc., Sponsored ADRWoori Financial Group, Inc.Young Poong Corp.Youngone Corp.Yuhan Corp.Yungjin Pharmaceutical Co., Ltd.
TOTAL SOUTH KOREA
Accton Technology Corp.Acer, Inc.Advantech Co., Ltd.Airtac International GroupASE Technology Holding Co., Ltd., ADRASE Technology Holding Co., Ltd.Asia Cement Corp.Asia Pacific Telecom Co., Ltd.Asustek Computer, Inc.AU Optronics Corp., Sponsored ADRAU Optronics Corp.Brighton-Best International Taiwan, Inc.Catcher Technology Co., Ltd.Cathay Financial Holding Co., Ltd.Chailease Holding Co., Ltd.Chang Hwa Commercial Bank, Ltd.Cheng Shin Rubber Industry Co., Ltd.Chicony Electronics Co., Ltd.China Airlines, Ltd.China Development Financial Holding Corp.China Life Insurance Co., Ltd.China Motor Corp.
67,490 2,451,2372,305 328,028
14,738 3,134,75935,747 729,55638,964 7,244,894
821,484 52,586,585Table of Contents
The Emerging Markets SeriesCONTINUED
Shares Value»
SOUTH KOREA — (Continued)91,931 $ 13,209,486
# 9,016 1,351,529327,565 1,373,585
# 24,883 570,07018,352 3,841,647
# 45,410 1,612,36539,787 3,143,253
246,810 1,170,628539 565,010
44,805 146,28680,403 5,679,277
#* 3,749 124,692807,880 8,924,763
516 295,82447,262 1,339,853
9,855 1,794,923* 41,594 157,021
862,990,912
TAIWAN — (14.9%)685,000 2,915,956
5,364,811 3,240,209373,663 3,142,915218,518 2,231,297133,966 586,772
# 7,079,782 15,774,5623,763,758 5,033,988
* 1,105,000 250,8281,099,180 7,787,693
169,591 434,153# 22,720,873 5,998,730# 175,000 195,697# 1,524,429 11,171,233
6,655,450 8,689,6692,525,473 10,594,4249,221,974 6,444,989
# 3,477,965 4,496,8501,172,497 2,981,4229,779,536 2,996,172
22,365,121 6,641,2325,303,933 4,370,963
825,000 676,651
Copyright © 2021 www.secdatabase.com. All Rights Reserved.Please Consider the Environment Before Printing This Document

China Petrochemical Development Corp.China Steel Corp.Chipbond Technology Corp.Chroma ATE, Inc.Chunghwa Telecom Co., Ltd., Sponsored ADRChunghwa Telecom Co., Ltd.Compal Electronics, Inc.CTBC Financial Holding Co., Ltd.CTCI Corp.Delta Electronics, Inc.E Ink Holdings, Inc.E.Sun Financial Holding Co., Ltd.Eclat Textile Co., Ltd.Eternal Materials Co., Ltd.Eva Airways Corp.Evergreen Marine Corp. Taiwan, Ltd.Far Eastern International Bank
Far Eastern New Century Corp.Far EasTone Telecommunications Co., Ltd.Feng Hsin Steel Co., Ltd.Feng TAY Enterprise Co., Ltd.First Financial Holding Co., Ltd.Formosa Chemicals & Fibre Corp.Formosa Petrochemical Corp.Formosa Plastics Corp.Formosa Sumco Technology Corp.Formosa Taffeta Co., Ltd.Foxconn Technology Co., Ltd.Fubon Financial Holding Co., Ltd.General Interface Solution Holding, Ltd.Giant Manufacturing Co., Ltd.Globalwafers Co., Ltd.Gourmet Master Co., Ltd.Highwealth Construction Corp.Hiwin Technologies Corp.Hon Hai Precision Industry Co., Ltd.Hotai Motor Co., Ltd.Hua Nan Financial Holdings Co., Ltd.Innolux Corp.International CSRC Investment Holdings Co.Inventec Corp.Kenda Rubber Industrial Co., Ltd.King's Town Bank Co., Ltd.Largan Precision Co., Ltd.Lien Hwa Industrial Corp.Lite-On Technology Corp.Macronix International
3,324,300 1,104,26217,053,932 13,120,178
1,246,000 2,498,131# 730,000 3,400,156# 254,851 8,728,647
1,536,000 5,313,7138,616,541 5,264,419
20,702,175 13,456,9311,199,000 1,750,3481,961,486 9,468,3731,268,000 1,389,359
16,099,057 13,409,276# 258,402 3,381,529
1,479,591 1,243,3198,054,441 3,770,4435,141,782 2,365,852
402,000 161,128Table of Contents
The Emerging Markets SeriesCONTINUED
Shares Value»
TAIWAN — (Continued)7,623,085 $ 7,212,0822,601,000 5,970,322
7,000 12,836550,466 3,660,632
14,687,988 11,028,2412,951,518 8,978,0791,340,000 4,542,2793,312,153 10,654,571
143,000 507,4201,665,000 1,883,9421,689,627 3,471,5178,817,233 12,189,457
608,000 2,234,877489,506 3,736,394
# 293,000 3,108,8362,840 16,816
1,580,190 2,470,596# 452,627 4,014,141
9,612,322 24,095,880# 390,000 5,613,058
12,116,935 8,527,075# 29,692,241 6,865,026
534,000 650,1445,188,550 3,858,731
132,377 123,2571,629,000 1,664,111
# 133,860 18,094,98683,600 104,750
4,435,410 6,278,715# 5,204,074 5,207,246
Copyright © 2021 www.secdatabase.com. All Rights Reserved.Please Consider the Environment Before Printing This Document

Makalot Industrial Co., Ltd.MediaTek, Inc.Mega Financial Holding Co., Ltd.Merida Industry Co., Ltd.Micro-Star International Co., Ltd.Nan Ya Plastics Corp.Nanya Technology Corp.Nien Made Enterprise Co., Ltd.Novatek Microelectronics Corp.Parade Technologies, Ltd.Pegatron Corp.Phison Electronics Corp.Pou Chen Corp.Powertech Technology, Inc.Poya International Co., Ltd.President Chain Store Corp.Qisda Corp.Quanta Computer, Inc.Radiant Opto-Electronics Corp.Realtek Semiconductor Corp.Ruentex Development Co., Ltd.Ruentex Industries, Ltd.Shin Kong Financial Holding Co., Ltd.Silergy Corp.Simplo Technology Co., Ltd.Sino-American Silicon Products, Inc.SinoPac Financial Holdings Co., Ltd.Standard Foods Corp.Synnex Technology International Corp.
TA Chen Stainless PipeTaichung Commercial Bank Co., Ltd.Taishin Financial Holding Co., Ltd.Taiwan Business BankTaiwan Cement Corp.Taiwan Cooperative Financial Holding Co., Ltd.Taiwan FamilyMart Co., Ltd.Taiwan Fertilizer Co., Ltd.Taiwan Glass Industry Corp.Taiwan High Speed Rail Corp.Taiwan Mobile Co., Ltd.Taiwan Secom Co., Ltd.Taiwan Semiconductor Manufacturing Co., Ltd., Sponsored ADRTaiwan Semiconductor Manufacturing Co., Ltd.Tatung Co., Ltd.TCI Co., Ltd.Teco Electric and Machinery Co., Ltd.Tripod Technology Corp.
229,950 1,342,5941,092,995 10,932,380
12,347,369 12,696,715184,287 1,148,052
1,900,000 5,317,1244,153,599 9,484,5092,714,010 6,350,376
272,000 2,088,440# 883,000 4,663,180
82,000 1,350,035# 4,155,345 6,744,671
295,000 2,888,2245,983,487 7,363,3402,453,819 6,699,797
55,275 762,156795,831 7,653,521
3,366,000 2,087,233# 3,869,000 7,110,711
865,000 3,399,265426,950 2,835,513
1,044,230 1,384,922876,109 1,863,429
19,205,329 5,551,31285,000 1,714,590
338,000 2,626,5631,508,000 4,102,446
17,621,623 6,989,519# 624,418 1,203,529
2,164,343 2,657,035Table of Contents
The Emerging Markets SeriesCONTINUED
Shares Value»
TAIWAN — (Continued)# 1,806,000 $ 2,668,448
1,871,442 759,54216,620,662 7,778,081
8,176,631 3,508,0498,576,292 12,265,888
13,573,806 9,133,22185,000 617,402
1,322,000 2,033,6352,181,374 844,9862,031,000 2,707,0392,215,300 7,798,335
432,670 1,206,6121,784,041 76,053,668
22,557,808 185,494,005#* 3,114,000 2,002,874# 99,000 1,309,545
3,222,000 2,565,703893,870 2,971,445
Copyright © 2021 www.secdatabase.com. All Rights Reserved.Please Consider the Environment Before Printing This Document

Unimicron Technology Corp.Uni-President Enterprises Corp.United Microelectronics Corp.Vanguard International Semiconductor Corp.Voltronic Power Technology Corp.Walsin Lihwa Corp.Walsin Technology Corp.Wan Hai Lines, Ltd.Win Semiconductors Corp.Winbond Electronics Corp.Wintek Corp.Wistron Corp.WPG Holdings, Ltd.Yageo Corp.Yuanta Financial Holding Co., Ltd.Yulon Motor Co., Ltd.Zhen Ding Technology Holding, Ltd.
TOTAL TAIWAN
Advanced Info Service PCLAEON Thana Sinsap Thailand PCLAirports of Thailand PCLB Grimm Power PCLBangkok Bank PCLBangkok Bank PCLBangkok Dusit Medical Services PCL, Class FBangkok Expressway & Metro PCLBanpu PCLBanpu Power PCLBerli Jucker PCLBTS Group Holdings PCLBumrungrad Hospital PCLCarabao Group PCL, Class FCentral Pattana PCLCentral Plaza Hotel PCLCH Karnchang PCLCharoen Pokphand Foods PCLCP ALL PCLDelta Electronics Thailand PCLElectricity Generating PCL
Energy Absolute PCLGlobal Power Synergy PCL, Class FHome Product Center PCLIndorama Ventures PCLIntouch Holdings PCLIRPC PCLJasmine International PCL
2,809,000 3,391,2935,022,033 12,999,361
33,504,000 14,875,6571,133,000 2,287,195
75,350 1,624,368# 6,242,000 2,993,002# 759,000 4,223,219
1,467,800 976,018578,034 4,885,232
7,437,407 4,534,185604,760 6,673
6,755,699 5,018,8763,260,039 4,306,199
# 499,682 4,195,83616,914,806 9,476,813
826,000 634,1401,297,700 4,720,945
897,137,157
THAILAND — (3.6%)1,483,600 10,274,973
4,400 33,9074,615,300 10,804,799
922,400 1,064,711207,800 1,226,327
3,800 22,4265,181,900 4,212,242
14,823,799 5,060,9625,804,850 2,699,052
910,600 654,3411,395,200 2,347,6386,576,800 2,651,677
594,200 3,294,134416,000 1,058,430
1,713,700 4,081,5651,157,700 1,279,850
70,400 61,8057,313,600 6,599,0055,689,600 16,048,539
74,200 127,869177,000 1,893,448
Table of Contents
The Emerging Markets SeriesCONTINUED
Shares Value»
THAILAND — (Continued)2,027,900 $ 3,445,221
530,900 1,152,2546,546,913 3,661,4182,975,200 3,966,288
871,186 1,805,82423,713,100 3,700,955
5,215,000 1,068,265
Copyright © 2021 www.secdatabase.com. All Rights Reserved.Please Consider the Environment Before Printing This Document

Kasikornbank PCLKasikornbank PCLKiatnakin Bank PCLKrung Thai Bank PCLKrungthai Card PCLLand & Houses PCLLand & Houses PCLMinor International PCLMK Restaurants Group PCLMuangthai Capital PCLPruksa Holding PCLPTT Exploration & Production PCLPTT Global Chemical PCLPTT PCLRatch Group PCLRobinson PCLSiam Cement PCL (The)Siam Cement PCL (The)Siam City Cement PCLSiam Commercial Bank PCL (The)Siam Global House PCLSrisawad Corp. PCLSupalai PCLThai Oil PCLThai Union Group PCL, Class FThanachart Capital PCLTisco Financial Group PCLTMB Bank PCLTOA Paint Thailand PCLTotal Access Communication PCLTotal Access Communication PCLTPI Polene Power PCLTrue Corp. PCLTTW PCLVGI Global Media PCLWHA Corp. PCL
TOTAL THAILAND
Akbank Turk A.S.Anadolu Efes Biracilik Ve Malt Sanayii A.S.Arcelik A.S.Aselsan Elektronik Sanayi Ve Ticaret A.S.BIM Birlesik Magazalar A.S.Coca-Cola Icecek A.S.Enka Insaat ve Sanayi A.S.Eregli Demir ve Celik Fabrikalari TASFord Otomotiv Sanayi A.S.KOC Holding A.S.Koza Altin Isletmeleri A.S.Petkim Petrokimya Holding A.S.Soda Sanayii A.S.
990,400 5,571,101179,400 1,006,227753,600 1,788,743
6,252,287 3,984,5501,904,000 2,956,1373,013,400 1,107,1832,877,040 1,057,0822,330,270 3,049,695
605,500 1,545,4971,772,300 3,486,397
928,800 664,3991,864,655 8,215,2744,344,272 8,545,877
16,434,000 25,248,139749,300 1,644,538942,400 1,945,778193,800 2,734,814223,000 3,146,870111,567 863,370
1,119,366 5,004,4812,854,944 1,540,9551,381,172 2,458,760
18,800 13,4482,883,600 6,469,4654,164,340 2,559,1291,743,200 3,344,133
724,600 2,379,60026,863,500 1,650,854
670,500 872,0531,066,300 2,028,2411,459,300 2,775,7782,998,600 584,998
26,292,131 5,514,0381,094,800 480,5663,110,500 975,982
14,117,300 2,148,235
213,660,312
TURKEY — (0.9%)#* 2,990,413 4,000,287# 331,656 1,272,616#* 325,341 1,015,483
141,812 479,887723,446 6,072,595204,766 1,217,815976,278 1,065,573
2,461,933 3,270,131126,138 1,378,647540,881 1,811,059
* 67,645 688,137* 2,262,679 1,585,630# 477,309 522,459Table of Contents
The Emerging Markets Series
Copyright © 2021 www.secdatabase.com. All Rights Reserved.Please Consider the Environment Before Printing This Document

TAV Havalimanlari Holding A.S.Tekfen Holding A.S.Tofas Turk Otomobil Fabrikasi A.S.Tupras Turkiye Petrol Rafinerileri A.S.Turk Hava Yollari AOTurk Telekomunikasyon A.S.Turkcell Iletisim Hizmetleri A.S.Turkcell Iletisim Hizmetleri A.S., ADRTurkiye Garanti Bankasi A.S.Turkiye Halk Bankasi A.S.Turkiye Is Bankasi, Class CTurkiye Sise ve Cam Fabrikalari A.S.Turkiye Vakiflar Bankasi TAO, Class DYapi ve Kredi Bankasi A.S.
TOTAL TURKEY
Mondi P.L.C.
TOTAL COMMON STOCKS
Banco Bradesco SACentrais Eletricas Brasileiras SA, Class BCia Brasileira de DistribuicaoCia Energetica de Minas GeraisGerdau SAItau Unibanco Holding SALojas Americanas SAPetroleo Brasileiro SATelefonica Brasil SA
TOTAL BRAZIL
Embotelladora Andina SA, Class B
Banco Davivienda SABancolombia SAGrupo Argos SAGrupo Aval Acciones y Valores SAGrupo de Inversiones Suramericana SA
TOTAL COLOMBIA
CJ Corp.
TOTAL PREFERRED STOCKS
TOTAL INVESTMENT SECURITIES
CONTINUED
Shares Value»
TURKEY — (Continued)540,265 $ 2,428,098423,774 1,789,556285,875 1,006,977
# 188,145 4,717,925#* 1,606,643 3,581,849* 802,767 773,071
1,664,980 3,879,994# 73,838 409,801#* 2,660,861 4,680,010# 1,332,954 1,432,446#* 1,565,886 1,743,464
1,624,463 1,433,6551,962,311 1,778,974
#* 2,425,128 1,180,514
55,216,653
UNITED KINGDOM — (0.1%)295,967 6,423,738
5,670,490,190
PREFERRED STOCKS — (1.9%)BRAZIL — (1.8%)
2,296,111 20,756,961208,452 2,162,983300,540 7,367,122
1,249,530 4,629,6471,407,421 5,070,8244,269,308 38,952,744
681,959 3,243,2972,860,161 19,545,639
314,262 4,306,707
106,035,924
CHILE — (0.0%)412,391 1,449,781
COLOMBIA — (0.1%)172,705 2,165,570
30,330 381,42155,405 232,365
3,971,981 1,531,443135,078 1,309,226
5,620,025
SOUTH KOREA — (0.0%)#* 6,654 206,223
113,311,953
5,783,802,143
Value†
SECURITIES LENDING COLLATERAL — (3.7%)
Copyright © 2021 www.secdatabase.com. All Rights Reserved.Please Consider the Environment Before Printing This Document

DFA Short Term Investment Fund
(Cost $4,298,840,959)^^
MSCI Emerging Markets Index®
S&P 500® Emini Index
Total Futures Contracts
BelgiumBrazilChileChinaColombiaCzech RepublicEgyptGreeceHungaryIndiaIndonesiaMalaysiaMexicoPeruPhilippinesPolandRussiaSouth AfricaSouth KoreaTaiwanThailandTurkeyUnited Kingdom
BrazilChileColombiaSouth Korea
Securities Lending CollateralFutures Contracts**
@§ 19,062,978 220,577,720
TOTAL INVESTMENTS — (100.0%)$6,004,379,863
Table of Contents
The Emerging Markets SeriesCONTINUED
As of July 31, 2019, The Emerging Markets Series had entered into the following outstanding futures contracts:
Description
Numberof
ContractsExpiration
DateNotional
ValueMarketValue
UnrealizedAppreciation
(Depreciation)
Long Position Contracts:650 09/20/19 $34,293,694 $33,332,000 $ (961,694)
62 09/20/19 9,351,685 9,245,130 (106,555)
$43,645,379 $42,577,130 $(1,068,249)
Summary of the Series' investments as of July 31, 2019, based on their valuation inputs, is as follows (see Security Valuation Note):
Investments in Securities (Market Value)
Level 1 Level 2 Level 3 Total
Common Stocks$ 1,291,111 — — $ 1,291,111
411,497,615 — — 411,497,61569,926,338 — — 69,926,338
231,922,295 $ 769,739,511 — 1,001,661,80625,355,057 — — 25,355,057
— 8,124,415 — 8,124,415542,014 7,544,295 — 8,086,309
— 19,122,867 — 19,122,867— 26,570,438 — 26,570,438
37,399,612 749,234,445 — 786,634,0575,928,620 161,422,933 — 167,351,553
— 171,843,842 — 171,843,842202,777,045 — — 202,777,045
17,837,881 — — 17,837,8812,689,835 88,607,275 — 91,297,110
— 90,209,586 — 90,209,58611,401,756 100,201,931 — 111,603,68761,786,289 362,084,412 — 423,870,70117,715,486 845,275,426 — 862,990,91285,803,240 811,333,917 — 897,137,157
213,660,312 — — 213,660,312409,801 54,806,852 — 55,216,653
— 6,423,738 — 6,423,738Preferred Stocks
106,035,924 — — 106,035,9241,449,781 — — 1,449,7815,620,025 — — 5,620,025
— 206,223 — 206,223— 220,577,720 — 220,577,720
(1,068,249) — — (1,068,249)
Copyright © 2021 www.secdatabase.com. All Rights Reserved.Please Consider the Environment Before Printing This Document

TOTAL
AES Tiete Energia SAAES Tiete Energia SAAliansce Shopping Centers SAAlliar Medicos A Frente SAAlupar Investimento SAAnima Holding SAArezzo Industria e Comercio SAAzul SA, ADRBR Malls Participacoes SABR Properties SABrasilAgro - Co. Brasileira de Propriedades AgricolasBRF SACamil Alimentos S.A.Cia de Locacao das AmericasCia de Saneamento de Minas Gerais-COPASACia de Saneamento do ParanaCia de Saneamento do ParanaCia Energetica de Minas GeraisCia HeringCia Paranaense de Energia, Sponsored ADRCia Paranaense de EnergiaCia Siderurgica Nacional SAConstrutora Tenda SACosan Logistica SACosan SACSU Cardsystem SACVC Brasil Operadora e Agencia de Viagens SACyrela Brazil Realty SA Empreendimentos e ParticipacoesCyrela Commercial Properties SA Empreendimentos e ParticipacoesDimed SA Distribuidora da MedicamentosDirecional Engenharia SADuratex SAEcoRodovias Infraestrutura e Logistica SAEDP - Energias do Brasil SAEmbraer SAEmbraer SA, Sponsored ADREnauta Participacoes SAEnergisa SAEneva SA
$1,509,981,788 $4,493,329,826 — $6,003,311,614** Valued at the unrealized appreciation/(depreciation) on the investment.
Table of Contents
THE EMERGING MARKETS SMALL CAP SERIES
SCHEDULE OF INVESTMENTS
July 31, 2019
(Unaudited)Shares Value»
COMMON STOCKS — (94.2%)BRAZIL — (9.5%)
2,350,408 $ 7,877,080878 672
1,143,577 8,447,191317,000 1,228,512
1,503,552 10,444,316388,000 2,187,892508,786 6,717,866
#* 548,856 22,338,4058,434,620 33,174,013
* 1,259,053 3,312,299290,842 1,271,936
* 320,146 2,802,698751,735 1,455,664658,554 8,628,061669,392 11,822,034909,407 20,397,825
9,900 56,162896,439 3,997,902
1,452,401 12,178,346# 127,664 1,648,142
213,600 2,699,9794,538,551 19,658,1151,273,200 8,453,860
* 1,205,962 5,902,857120,100 1,601,186276,835 466,427
1,224,087 16,316,4562,713,904 17,351,463
37,800 138,6671,100 111,258
1,461,177 4,820,3703,182,390 10,481,9112,185,807 6,746,9723,222,514 16,288,4161,183,795 5,989,776
# 613,394 12,390,559880,424 3,056,747603,584 7,812,976
* 730,700 4,955,131
Copyright © 2021 www.secdatabase.com. All Rights Reserved.Please Consider the Environment Before Printing This Document

Equatorial Energia SAEven Construtora e Incorporadora SAEz Tec Empreendimentos e Participacoes SAFleury SAFras-Le SAGafisa SAGafisa SA, ADRGol Linhas Aereas Inteligentes SA, ADRGrendene SAGuararapes Confeccoes SAHelbor Empreendimentos SAHypera SAIndustrias Romi SAInstituto Hermes Pardini SAInternational Meal Co. Alimentacao SA, Class AIochpe-Maxion SA
JHSF Participacoes SAJSL SAKepler Weber SAKroton Educacional SALight SALocaliza Rent a Car SALOG Commercial Properties e Participacoes SALog-in Logistica Intermodal SAM Dias Branco SAMahle-Metal Leve SAMarcopolo SAMarisa Lojas SAMills Estruturas e Servicos de Engenharia SAMovida Participacoes SAMRV Engenharia e Participacoes SANatura Cosmeticos SAOdontoprev SAOmega Geracao SAOuro Fino Saude Animal Participacoes SAParanapanema SAPetro Rio SAPorto Seguro SAPortobello SAProfarma Distribuidora de Produtos Farmaceuticos SAQualicorp Consultoria e Corretora de Seguros SARestoque Comercio e Confeccoes de Roupas SASantos Brasil Participacoes SASao Carlos Empreendimentos e Participacoes SASao Martinho SASer Educacional SASLC Agricola SA
1,651,958 40,905,585* 1,957,504 5,026,672
899,063 7,738,8681,957,331 11,965,499
242,460 301,777* 303,161 512,371# 70,312 235,545
372,923 8,010,3862,687,823 5,352,616
751,424 3,837,503* 2,487,248 1,446,851
112,000 885,705183,900 707,391415,758 2,138,517
1,571,295 3,899,0561,111,600 6,358,491
Table of Contents
The Emerging Markets Small Cap SeriesCONTINUED
Shares Value»
BRAZIL — (Continued)1,274,247 $ 1,275,466
637,228 2,838,544168,446 911,449
1,183,300 3,894,3621,972,115 9,999,194
434,334 5,007,58566,991 413,036
* 6,900 28,3863,214 32,954
459,414 2,964,971625,900 574,017
* 765,320 1,696,544* 1,316,920 2,398,259
1,066,588 4,172,6153,320,154 17,643,225
76,018 1,218,4472,786,869 12,779,281
* 174,649 1,258,4927,600 80,036
* 190,603 1,148,205* 953,244 4,396,110
429,542 5,864,016874,451 934,862
* 166,002 192,6942,491,663 14,507,252
137,481 742,0963,044,590 4,212,254
84,509 748,2431,650,044 8,738,032
589,517 4,068,7771,083,127 5,119,974
Copyright © 2021 www.secdatabase.com. All Rights Reserved.Please Consider the Environment Before Printing This Document

Smiles Fidelidade SASonae Sierra Brasil SASprings Global Participacoes SASul America SAT4F Entretenimento SATechnos SATecnisa SATegma Gestao Logistica SATerra Santa Agro SATOTVS SATransmissora Alianca de Energia Eletrica SATrisul SATupy SAUnipar Carbocloro SAUsinas Siderurgicas de Minas Gerais SAValid Solucoes e Servicos de Seguranca em Meios de Pagamento eIdentificacao S.AVia Varejo SAVulcabras Azaleia SAWiz Solucoes e Corretagem de Seguros SAYDUQS Part
TOTAL BRAZIL
AES Gener SABanvida SABesalco SACAP SA
Cementos BIO BIO SACia Pesquera Camanchaca SACia Sud Americana de Vapores SAClinica Las Condes SACristalerias de Chile SAEmbotelladora Andina SA, ADR, Class BEmpresa Nacional de Telecomunicaciones SAEmpresas Hites SAEmpresas La Polar SAEmpresas Lipigas SAEmpresas Tricot SAEngie Energia Chile SAEnjoy SAForus SAGrupo Security SAHortifrut SAInstituto de Diagnostico SAInversiones Aguas Metropolitanas SAInversiones La Construccion SAMasisa SA
490,700 5,069,844281,046 2,613,576
* 148,300 524,5982,887,314 31,790,836
311,200 463,985* 272,800 185,853* 4,110,581 1,335,601
356,802 2,957,183* 400 1,640
677,487 8,609,8313,552,851 25,899,175
309,200 660,312729,608 3,672,559
5,573 49,11076,900 201,703
757,250 3,018,007* 5,702,519 11,535,485* 797,709 1,484,071
729,344 2,274,2132,829,490 25,430,452
652,190,387
CHILE — (1.6%)8,053,467 2,018,929
48,106 25,7953,002,361 2,580,099
757,901 7,772,518Table of Contents
The Emerging Markets Small Cap SeriesCONTINUED
Shares Value»
CHILE — (Continued)352,724 $ 465,946
1,358,085 124,829* 159,259,592 5,361,324
4,398 237,231130,323 1,001,726
19,933 420,586* 681,486 6,243,595
1,238,776 853,400* 21,273,948 830,694
4,717 33,83670,631 77,452
6,125,605 10,789,188* 2,562,139 151,032
808,176 1,779,3278,487,244 3,172,401
72,075 184,5862,928 8,859
3,788,594 5,532,090356,965 5,602,811
* 19,941,198 1,199,562
Copyright © 2021 www.secdatabase.com. All Rights Reserved.Please Consider the Environment Before Printing This Document

Multiexport Foods SAParque Arauco SAPAZ Corp. SARipley Corp. SASalfacorp SASigdo Koppers SASMU SASociedad Matriz SAAM SASocovesa SASONDA SAVina Concha y Toro SA
TOTAL CHILE
21Vianet Group, Inc., ADR361 Degrees International, Ltd.3SBio, Inc.500.com, Ltd., ADR, Class A51job, Inc., ADRA8 New Media Group, Ltd.AAG Energy Holdings, Ltd.Agile Group Holdings, Ltd.Ajisen China Holdings, Ltd.AKM Industrial Co., Ltd.Alibaba Pictures Group, Ltd.AMVIG Holdings, Ltd.Angang Steel Co., Ltd., Class HAnhui Expressway Co., Ltd., Class HAnton Oilfield Services GroupAowei Holdings, Ltd.Art Group Holdings, Ltd.Asia Cement China Holdings Corp.Asia Television Holdings, Ltd.Asian Citrus Holdings, Ltd.Ausnutria Dairy Corp., Ltd.AVIC International Holding HK, Ltd.AVIC International Holdings, Ltd., Class HAviChina Industry & Technology Co., Ltd., Class HBAIC Motor Corp., Ltd., Class H
BAIOO Family Interactive, Ltd.Bank of Chongqing Co., Ltd., Class HBank of Tianjin Co., Ltd., Class HBank of Zhengzhou Co., Ltd., Class HBaoye Group Co., Ltd., Class HBaozun, Inc., Sponsored ADRBBI Life Sciences Corp.BBMG Corp., Class HBeijing Capital International Airport Co., Ltd., Class H
5,216,772 2,686,0995,873,859 16,002,5871,324,324 1,770,1178,670,756 6,398,2413,307,957 3,627,3981,138,112 1,988,4205,050,091 1,294,704
39,293,153 3,572,0293,154,986 1,547,2103,799,040 5,018,5114,465,061 8,974,328
109,347,460
CHINA — (16.1%)* 524,163 3,857,840
5,364,000 963,514# 7,065,500 11,932,028#* 49,009 547,431* 146,514 11,362,161* 4,572,000 114,006
84,601 15,014512,000 658,055
4,063,000 1,743,4232,590,000 358,078
* 56,110,000 11,338,3322,508,000 590,713
# 2,620,999 994,1642,922,000 1,775,274
11,304,000 1,297,779* 1,795,000 414,882* 320,000 13,954
3,009,000 4,137,969#* 5,268,000 33,490* 2,314,000 33,255# 2,098,000 3,786,113# 36,125,722 852,362# 1,918,000 1,184,735
13,648,000 7,325,631# 2,729,500 1,724,446Table of Contents
The Emerging Markets Small Cap SeriesCONTINUED
Shares Value»
CHINA — (Continued)5,590,000 $ 342,6692,533,500 1,479,280
22,500 10,901# 162,000 57,495* 1,742,000 1,092,702#* 224,628 11,143,795
1,299,000 317,638527,000 153,332
5,398,000 4,253,129
Copyright © 2021 www.secdatabase.com. All Rights Reserved.Please Consider the Environment Before Printing This Document

Beijing Capital Land, Ltd., Class HBeijing Enterprises Clean Energy Group, Ltd.Beijing Enterprises Environment Group, Ltd.Beijing Enterprises Medical & Health Group, Ltd.Beijing Enterprises Water Group, Ltd.Beijing Gas Blue Sky Holdings, Ltd.Beijing Jingneng Clean Energy Co., Ltd., Class HBeijing North Star Co., Ltd.Beijing Properties Holdings, Ltd.Beijing Urban Construction Design & Development Group Co., Ltd., Class HBest Pacific International Holdings, Ltd.BII Railway Transportation Technology Holdings Co., Ltd.Billion Industrial Holdings, Ltd.Bitauto Holdings, Ltd., ADRBoer Power Holdings, Ltd.Bosideng International Holdings, Ltd.Boyaa Interactive International, Ltd.Brilliance China Automotive Holdings, Ltd.Brilliant Circle Holdings International, Ltd.BYD Electronic International Co., Ltd.C C Land Holdings, Ltd.C.banner International Holdings, Ltd.Cabbeen Fashion, Ltd.Canvest Environmental Protection Group Co., Ltd.Capital Environment Holdings, Ltd.CAR, Inc.Carnival Group International Holdings, Ltd.Carrianna Group Holdings Co., Ltd.CECEP COSTIN New Materials Group, Ltd.Central China Real Estate, Ltd.Central China Securities Co., Ltd., Class HCentury Sunshine Group Holdings, Ltd.CGN Meiya Power Holdings Co., Ltd.Changshouhua Food Co., Ltd.Changyou.com, Ltd., ADRChaowei Power Holdings, Ltd.Cheetah Mobile, Inc., ADRChiho Environmental Group, Ltd.China Aerospace International Holdings, Ltd.China Agri-Industries Holdings, Ltd.China Aircraft Leasing Group Holdings, Ltd.China All Access Holdings, Ltd.China Animal Healthcare, Ltd.China Animation Characters Co., Ltd.China Aoyuan Group, Ltd.China Beidahuang Industry Group Holdings, Ltd.China BlueChemical, Ltd., Class HChina Chengtong Development Group, Ltd.China Common Rich Renewable Energy Investments, Ltd.
# 6,810,500 2,499,947* 59,768,570 805,257#* 622,000 58,675#* 27,660,000 861,320
3,068,000 1,614,829#* 15,784,000 430,682
8,788,000 1,521,352# 5,554,000 2,082,049#* 10,632,000 290,272
1,963,000 574,630# 2,102,000 704,666
2,636,000 214,121# 44,000 28,564#* 180,052 2,054,393* 252,000 11,718# 1,316,000 454,000# 2,981,000 506,786
3,072,000 3,347,900* 250,000 24,669
4,106,500 6,413,17714,998,015 3,441,450
#* 4,677,000 202,9201,511,000 343,392
# 4,608,000 2,404,755#* 21,762,000 574,099* 5,708,000 4,072,514* 21,490,000 79,268
2,031,257 217,204* 4,494,000 64,584# 6,441,626 3,013,877# 4,614,000 974,658* 12,390,000 330,502* 9,014,000 1,155,658
1,758,000 651,360104,951 828,063
# 4,359,000 1,634,958* 210,157 685,112#* 2,108,000 246,577# 16,298,500 972,896
13,896,800 4,230,1611,837,500 1,980,9106,278,000 219,582
* 3,671,000 175,856# 5,196,000 1,421,419# 8,810,000 11,784,257#* 4,032,000 101,863
11,894,000 3,260,966#* 2,628,000 76,163
17,084,000 4,091,963Table of Contents
The Emerging Markets Small Cap SeriesCONTINUED
Shares Value»
Copyright © 2021 www.secdatabase.com. All Rights Reserved.Please Consider the Environment Before Printing This Document

China Communications Services Corp., Ltd., Class HChina Conch Venture Holdings, Ltd.China Datang Corp. Renewable Power Co., Ltd., Class HChina Daye Non-Ferrous Metals Mining, Ltd.China Dili GroupChina Distance Education Holdings, Ltd., ADRChina Dongxiang Group Co., Ltd.China Dynamics Holdings, Ltd.China Electronics Huada Technology Co., Ltd.China Electronics Optics Valley Union Holding Co., Ltd.China Energine International Holdings, Ltd.China Energy Engineering Corp., Ltd., Class HChina Everbright Greentech Ltd.China Everbright, Ltd.China Fiber Optic Network System Group, Ltd.China Financial Services Holdings, Ltd.China Flavors & Fragrances Co., Ltd.China Foods, Ltd.China Glass Holdings, Ltd.China Grand Pharmaceutical and Healthcare Holdings, Ltd., Class AChina Greenfresh Group Co., Ltd.China Greenland Broad Greenstate Group Co., Ltd.China Hanking Holdings, Ltd.China Harmony New Energy Auto Holding, Ltd.China High Precision Automation Group, Ltd.China High Speed Transmission Equipment Group Co., Ltd.China Huiyuan Juice Group, Ltd.China Index Holdings, Ltd., ADRChina International Marine Containers Group Co., Ltd., Class HChina ITS Holdings Co., Ltd.China Jinmao Holdings Group, Ltd.China Lesso Group Holdings, Ltd.China Lilang, Ltd.China Logistics Property Holdings Co., Ltd.China Longevity Group Co., Ltd.China Longyuan Power Group Corp., Ltd., Class HChina LotSynergy Holdings Ltd.China Machinery Engineering Corp., Class HChina Maple Leaf Educational Systems, Ltd.China Medical & HealthCare Group, Ltd.China Medical System Holdings, Ltd.China Meidong Auto Holdings, Ltd.China Merchants Land, Ltd.China Metal Resources Utilization, Ltd.China Minsheng Financial Holding Corp., Ltd.China Modern Dairy Holdings, Ltd.China New Town Development Co., Ltd.China NT Pharma Group Co., Ltd.China Nuclear Energy Technology Corp., Ltd.China Oceanwide Holdings, Ltd.China Oil & Gas Group, Ltd.China Oriental Group Co., Ltd.China Outfitters Holdings, Ltd.
CHINA — (Continued)8,878,000 $6,180,9481,155,500 3,976,159
14,791,000 1,428,515* 7,434,000 47,573#* 12,945,699 3,807,272* 32,075 162,620
24,043,985 2,966,497#* 10,040,000 125,518# 5,724,000 516,876# 14,756,000 1,087,544* 5,728,000 114,832
582,000 60,803885,000 557,988
6,016,000 7,947,0239,639,999 129,3037,270,000 431,145
20,000 4,2146,380,000 2,727,024
* 4,470,000 266,184# 5,072,000 2,712,634* 2,446,000 215,227#* 5,628,000 353,046
4,130,000 611,161# 5,640,500 1,716,027* 1,289,000 37,667# 2,578,000 1,653,967* 4,929,500 238,536* 117,658 338,853
1,863,320 1,764,826* 856,412 21,176
1,708,300 1,100,6677,407,000 6,843,6423,299,000 2,918,570
* 2,215,000 874,713#* 1,076,350 35,337
1,147,000 701,380* 2,320,000 79,572
6,270,000 2,679,465# 9,432,000 3,382,418* 20,000 426
7,667,500 7,314,025# 2,402,000 1,767,232
11,036,000 1,570,450* 300,000 139,508#* 4,620,000 80,297#* 4,216,000 665,918# 11,720,648 267,695* 4,238,000 425,062* 2,560,000 117,355#* 4,994,000 245,159
32,458,000 1,483,0057,686,000 3,411,945
* 24,000 510
Copyright © 2021 www.secdatabase.com. All Rights Reserved.Please Consider the Environment Before Printing This Document
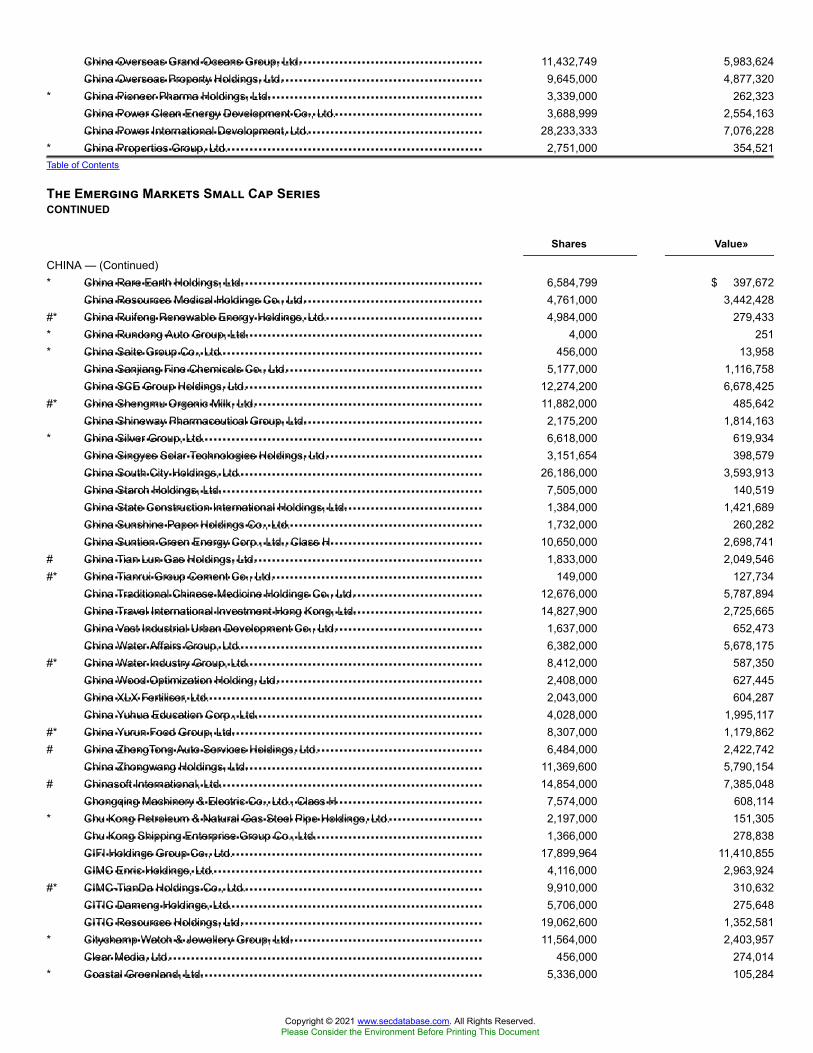
China Overseas Grand Oceans Group, Ltd.China Overseas Property Holdings, Ltd.China Pioneer Pharma Holdings, Ltd.China Power Clean Energy Development Co., Ltd.China Power International Development, Ltd.China Properties Group, Ltd.
China Rare Earth Holdings, Ltd.China Resources Medical Holdings Co., Ltd.China Ruifeng Renewable Energy Holdings, Ltd.China Rundong Auto Group, Ltd.China Saite Group Co., Ltd.China Sanjiang Fine Chemicals Co., Ltd.China SCE Group Holdings, Ltd.China Shengmu Organic Milk, Ltd.China Shineway Pharmaceutical Group, Ltd.China Silver Group, Ltd.China Singyes Solar Technologies Holdings, Ltd.China South City Holdings, Ltd.China Starch Holdings, Ltd.China State Construction International Holdings, Ltd.China Sunshine Paper Holdings Co., Ltd.China Suntien Green Energy Corp., Ltd., Class HChina Tian Lun Gas Holdings, Ltd.China Tianrui Group Cement Co., Ltd.China Traditional Chinese Medicine Holdings Co., Ltd.China Travel International Investment Hong Kong, Ltd.China Vast Industrial Urban Development Co., Ltd.China Water Affairs Group, Ltd.China Water Industry Group, Ltd.China Wood Optimization Holding, Ltd.China XLX Fertiliser, Ltd.China Yuhua Education Corp., Ltd.China Yurun Food Group, Ltd.China ZhengTong Auto Services Holdings, Ltd.China Zhongwang Holdings, Ltd.Chinasoft International, Ltd.Chongqing Machinery & Electric Co., Ltd., Class HChu Kong Petroleum & Natural Gas Steel Pipe Holdings, Ltd.Chu Kong Shipping Enterprise Group Co., Ltd.CIFI Holdings Group Co., Ltd.CIMC Enric Holdings, Ltd.CIMC-TianDa Holdings Co., Ltd.CITIC Dameng Holdings, Ltd.CITIC Resources Holdings, Ltd.Citychamp Watch & Jewellery Group, Ltd.Clear Media, Ltd.Coastal Greenland, Ltd.
11,432,749 5,983,6249,645,000 4,877,320
* 3,339,000 262,3233,688,999 2,554,163
28,233,333 7,076,228* 2,751,000 354,521Table of Contents
The Emerging Markets Small Cap SeriesCONTINUED
Shares Value»
CHINA — (Continued)* 6,584,799 $ 397,672
4,761,000 3,442,428#* 4,984,000 279,433* 4,000 251* 456,000 13,958
5,177,000 1,116,75812,274,200 6,678,425
#* 11,882,000 485,6422,175,200 1,814,163
* 6,618,000 619,9343,151,654 398,579
26,186,000 3,593,9137,505,000 140,5191,384,000 1,421,6891,732,000 260,282
10,650,000 2,698,741# 1,833,000 2,049,546#* 149,000 127,734
12,676,000 5,787,89414,827,900 2,725,665
1,637,000 652,4736,382,000 5,678,175
#* 8,412,000 587,3502,408,000 627,4452,043,000 604,2874,028,000 1,995,117
#* 8,307,000 1,179,862# 6,484,000 2,422,742
11,369,600 5,790,154# 14,854,000 7,385,048
7,574,000 608,114* 2,197,000 151,305
1,366,000 278,83817,899,964 11,410,855
4,116,000 2,963,924#* 9,910,000 310,632
5,706,000 275,64819,062,600 1,352,581
* 11,564,000 2,403,957456,000 274,014
* 5,336,000 105,284
Copyright © 2021 www.secdatabase.com. All Rights Reserved.Please Consider the Environment Before Printing This Document

COFCO Meat Holdings, Ltd.Cogobuy GroupColour Life Services Group Co., Ltd.Comba Telecom Systems Holdings, Ltd.Concord New Energy Group, Ltd.Consun Pharmaceutical Group, Ltd.Coolpad Group, Ltd.COSCO SHIPPING Development Co., Ltd., Class HCOSCO SHIPPING Energy Transportation Co., Ltd., Class HCOSCO SHIPPING International Hong Kong Co., Ltd.COSCO SHIPPING Ports, Ltd.Coslight Technology International Group Co., Ltd.Cosmo Lady China Holdings Co., Ltd.Country Garden Services Holdings Co., Ltd.CP Pokphand Co., Ltd.CPMC Holdings, Ltd.CRCC High-Tech Equipment Corp., Ltd.CSMall Group, Ltd.
CSSC Offshore and Marine Engineering Group Co., Ltd., Class HCT Environmental Group, Ltd.CWT International, Ltd.Cybernaut International Holdings Co., Ltd.Da Ming International Holdings, Ltd.DaChan Food Asia, Ltd.Dah Chong Hong Holdings, Ltd.Dalian Port PDA Co., Ltd., Class HDaphne International Holdings, Ltd.Dawnrays Pharmaceutical Holdings, Ltd.DBA Telecommunication Asia Holdings, Ltd.Differ Group Holding Co., Ltd.Digital China Holdings, Ltd.Dongfang Electric Corp., Ltd.Dongjiang Environmental Co., Ltd., Class HDongyue Group, Ltd.Dynagreen Environmental Protection Group Co., Ltd., Class HDynasty Fine Wines Group, Ltd.E-Commodities Holdings, Ltd.EEKA Fashion Holdings, Ltd.Embry Holdings, Ltd.Essex Bio-technology, Ltd.EVA Precision Industrial Holdings, Ltd.EverChina International Holdings Co., Ltd.Evergreen International Holdings, Ltd.Fang Holdings, Ltd., ADRFanhua, Inc., ADRFantasia Holdings Group Co., Ltd.Far East Horizon, Ltd.
#* 2,330,000 879,580* 4,446,000 1,160,230
2,279,000 1,560,309#* 10,631,338 2,657,372
39,644,964 1,940,920# 2,677,000 1,618,829* 18,661,174 810,511# 15,984,000 1,967,793# 8,836,000 5,032,260# 3,737,000 1,166,123
10,918,780 9,515,452* 868,000 183,801# 4,552,000 869,917
4,514,000 10,869,22942,204,594 3,548,525
# 2,640,000 1,006,237# 3,588,000 701,238* 388,131 26,550Table of Contents
The Emerging Markets Small Cap SeriesCONTINUED
Shares Value»
CHINA — (Continued)#* 1,142,000 $ 1,054,698# 18,320,000 795,693#* 24,080,000 406,042* 3,760,000 90,871#* 880,000 222,093* 679,955 38,242
6,606,856 2,099,0985,140,400 662,283
* 5,744,000 118,5976,892,886 1,310,100
#* 876,000 42,591#* 11,822,000 692,466* 6,330,500 3,525,920
2,087,000 1,254,046# 1,254,575 1,129,631
7,396,000 3,981,920# 2,963,000 1,382,646#* 1,508,000 111,730
8,448,000 434,789# 1,008,000 1,238,584
470,000 113,928# 880,000 692,691
5,080,435 433,988* 12,045,000 330,408* 412,000 22,979#* 117,656 243,549
37,163 1,258,71113,068,000 2,138,49012,166,000 11,315,657
Copyright © 2021 www.secdatabase.com. All Rights Reserved.Please Consider the Environment Before Printing This Document

Feiyu Technology International Co., Ltd.First Tractor Co., Ltd.Flat Glass Group Co., Ltd., Class HForgame Holdings, Ltd.Fu Shou Yuan International Group, Ltd.Fufeng Group, Ltd.Fuguiniao Co., Ltd., Class HFullshare Holdings, Ltd.Future Land Development Holdings, Ltd.GCL New Energy Holdings, Ltd.GCL-Poly Energy Holdings, Ltd.Gemdale Properties & Investment Corp., Ltd.Genertec Universal Medical Group Co., Ltd.Glorious Property Holdings, Ltd.Golden Eagle Retail Group, Ltd.Golden Meditech Holdings, Ltd.Golden Throat Holdings Group Co., Ltd.Golden Wheel Tiandi Holdings Co., Ltd.Goldlion Holdings, Ltd.Goldpac Group, Ltd.GOME Retail Holdings, Ltd.Good Friend International Holdings, Inc.Grand Baoxin Auto Group, Ltd.Greater China Financial Holdings, Ltd.Greatview Aseptic Packaging Co., Ltd.Greenland Hong Kong Holdings, Ltd.Greentown China Holdings, Ltd.Greentown Service Group Co., Ltd.Ground International Development, Ltd.Guangdong Land Holdings, Ltd.
Guangdong Yueyun Transportation Co., Ltd., Class HGuangshen Railway Co., Ltd., Class HGuodian Technology & Environment Group Corp., Ltd., Class HGuolian Securities Co., Ltd., Class HGuorui Properties, Ltd.Haichang Ocean Park Holdings, Ltd.Hailiang Education Group, Inc., ADRHaitian International Holdings, Ltd.Harbin Bank Co., Ltd., Class HHarbin Electric Co., Ltd., Class HHarmonicare Medical Holdings, Ltd.HC Group, Inc.HC Group, Inc.Health and Happiness H&H International Holdings, Ltd.Henderson Investment, Ltd.Hengdeli Holdings, Ltd.HengTen Networks Group, Ltd.
* 1,512,000 42,454* 2,603,176 613,709
299,000 145,668* 23,400 14,158# 5,578,000 4,766,453# 9,456,600 4,640,090#* 1,930,000 179,362#* 9,537,500 339,722# 7,070,000 5,939,809#* 18,764,000 714,665#* 80,265,000 4,571,695
24,900,000 2,967,7645,957,500 4,509,768
#* 21,037,501 921,5583,117,000 3,599,256
* 356,000 41,237991,500 259,346546,000 45,233
1,872,962 711,5862,314,000 570,888
#* 75,249,000 8,014,288248,667 28,483
#* 4,297,492 926,675* 1,780,000 45,499
7,010,000 3,832,7017,142,000 2,605,1555,573,648 4,185,0764,450,000 3,748,706
#* 370,000 8,537* 4,744,800 835,266Table of Contents
The Emerging Markets Small Cap SeriesCONTINUED
Shares Value»
CHINA — (Continued)902,000 $ 321,304
3,742,000 1,216,869* 594,000 19,169
1,591,500 483,687# 4,210,000 750,054* 5,944,000 921,446#* 30,293 1,917,547# 4,159,000 8,401,970* 1,594,000 325,037#* 5,127,413 1,685,849#* 2,403,000 626,217
40,000 10,271#* 3,540,500 906,390# 1,338,500 7,798,556
2,087,000 177,850# 14,001,399 750,379#* 63,004,000 1,192,119
Copyright © 2021 www.secdatabase.com. All Rights Reserved.Please Consider the Environment Before Printing This Document

Hi Sun Technology China, Ltd.Hilong Holding, Ltd.Hisense Home Appliances Group Co., Ltd., Class HHKC Holdings, Ltd.Honghua Group, Ltd.Honworld Group, Ltd.Hopefluent Group Holdings, Ltd.Hopson Development Holdings, Ltd.HOSA International, Ltd.Hua Han Health Industry Holdings, Ltd.Hua Hong Semiconductor, Ltd.Huadian Fuxin Energy Corp., Ltd., Class HHuadian Power International Corp., Ltd., Class HHuaneng Renewables Corp., Ltd., Class HHuaxi Holdings Co., Ltd.Huazhong In-Vehicle Holdings Co., Ltd.Hydoo International Holding, Ltd.IMAX China Holding, Inc.Inner Mongolia Yitai Coal Co., Ltd., Class HInspur International, Ltd.Jiangnan Group, Ltd.Jiayuan International Group, Ltd.Jilin Jiutai Rural Commercial Bank Corp., Ltd., Class HJinchuan Group International Resources Co., Ltd.Jingrui Holdings, Ltd.JinkoSolar Holding Co., Ltd., ADRJinmao Hotel and Jinmao China Hotel Investments and Management, Ltd.JNBY Design, Ltd.Joy City Property, Ltd.Ju Teng International Holdings, Ltd.Jumei International Holding, Ltd., ADRJutal Offshore Oil Services, Ltd.K Wah International Holdings, Ltd.Kai Yuan Holdings, Ltd.Kaisa Group Holdings, Ltd.Kangda International Environmental Co., Ltd.Kasen International Holdings, Ltd.Kinetic Mines and Energy, Ltd.Kingboard Holdings, Ltd.Kingboard Laminates Holdings, Ltd.Kingdee International Software Group Co., Ltd.Kingsoft Corp., Ltd.
Kong Sun Holdings, Ltd.KuangChi Science, Ltd.KWG Group Holdings, Ltd.Labixiaoxin Snacks Group, Ltd.Lai Fung Holdings, Ltd.
* 12,714,000 2,228,4126,002,000 563,1622,503,000 2,745,5891,441,577 930,005
* 19,266,000 1,514,3231,123,000 540,8091,553,670 427,4584,376,000 4,529,609
* 3,700,000 25,712* 25,871,698 262,744
2,768,000 5,704,35816,644,000 3,088,423
3,034,000 1,269,89629,328,000 7,971,211
444,000 124,4043,430,000 599,809
#* 2,110,000 117,250# 834,100 1,915,249
250,100 184,715994,000 473,839
#* 11,016,000 462,8183,575,816 1,547,064
# 110,249 45,993# 12,519,000 1,016,465# 1,536,000 502,829* 184,362 3,611,652
19,500 10,8521,084,500 1,984,454
18,952,000 2,284,9515,814,000 1,375,680
* 166,982 379,049# 1,158,000 123,081
6,677,948 3,474,570* 13,400,000 73,916
17,106,000 7,094,676* 4,400,000 553,689# 4,675,000 3,915,497
468,000 26,2784,077,921 10,028,7445,917,000 4,879,341
# 14,416,200 13,732,492* 4,827,000 10,400,140Table of Contents
The Emerging Markets Small Cap SeriesCONTINUED
Shares Value»
CHINA — (Continued)* 1,325,000 $ 19,607#* 8,317,000 474,539# 9,839,950 9,148,712* 944,000 48,649
627,532 627,514
Copyright © 2021 www.secdatabase.com. All Rights Reserved.Please Consider the Environment Before Printing This Document

Launch Tech Co., Ltd., Class HLe Saunda Holdings, Ltd.Lee & Man Chemical Co., Ltd.Lee & Man Paper Manufacturing, Ltd.Lee's Pharmaceutical Holdings, Ltd.Legend Holdings Corp., Class HLeoch International Technology, Ltd.Lexinfintech Holdings, Ltd., ADRLi Ning Co., Ltd.Lianhua Supermarket Holdings Co., Ltd., Class HLifestyle China Group, Ltd.Lifetech Scientific Corp.Link Motion, Inc., Sponsored ADRLivzon Pharmaceutical Group, Inc., Class HLK Technology Holdings, Ltd.LongiTech Smart Energy Holding, Ltd.Lonking Holdings, Ltd.Luye Pharma Group, Ltd.LVGEM China Real Estate Investment Co., Ltd.Maanshan Iron & Steel Co., Ltd., Class HMaoye International Holdings, Ltd.Min Xin Holdings, Ltd.Mingfa Group International Co., Ltd.Mingyuan Medicare Development Co., Ltd.Minmetals Land, Ltd.Minth Group, Ltd.MMG, Ltd.MOBI Development Co., Ltd.Modern Land China Co., Ltd.Munsun Capital Group, Ltd.Nan Hai Corp., Ltd.Nature Home Holding Co., Ltd.NetDragon Websoft Holdings, Ltd.New Century Healthcare Holding Co., Ltd.New Provenance Everlasting Holdings, Ltd.New World Department Store China, Ltd.Nexteer Automotive Group, Ltd.Nine Dragons Paper Holdings, Ltd.Noah Holdings, Ltd., ADRNorth Mining Shares Co., Ltd.NVC Lighting Holdings, Ltd.O-Net Technologies Group, Ltd.Ourgame International Holdings, Ltd.Overseas Chinese Town Asia Holdings, Ltd.Ozner Water International Holding, Ltd.Pacific Online, Ltd.Panda Green Energy Group, Ltd.Parkson Retail Group, Ltd.PAX Global Technology, Ltd.Peking University Resources Holdings Co., Ltd.Phoenix Media Investment Holdings, Ltd.Phoenix New Media, Ltd., ADRPoly Culture Group Corp., Ltd., Class HPoly Property Group Co., Ltd.
67,800 45,304187,799 14,378
1,070,785 553,9428,606,000 5,253,1021,699,000 1,073,614
75,800 178,5102,659,000 214,872
* 147,035 1,558,57112,617,000 31,106,002
* 2,343,600 550,497* 1,979,500 630,644#* 15,388,000 2,886,494* 690,535 79,701
1,021,103 2,476,980322,500 27,114
#* 995,000 74,79212,039,000 3,122,955
7,266,500 5,611,038# 600,000 213,097# 12,790,000 4,848,159
8,262,000 578,365922,000 458,192
* 7,108,000 51,121* 6,950,000 38,265# 11,070,000 1,713,830# 3,357,000 9,460,318* 14,598,999 4,531,196
962,000 139,0425,670,800 817,572
* 2,228,905 19,989# 24,100,000 430,076* 1,187,000 175,742
485,000 1,212,487# 110,500 42,344* 1,230,000 3,893* 3,569,462 628,506
5,545,000 5,762,8905,046,000 4,084,340
#* 189,282 6,121,380#* 72,110,000 164,455# 8,596,000 781,378
3,069,000 1,674,949* 1,942,000 178,179
1,374,183 501,568# 2,579,000 400,386# 2,819,365 649,987#* 19,320,000 736,357
8,026,500 642,5095,840,000 2,341,654
176,000 4,795# 8,174,000 711,966* 149,801 426,933
614,100 586,32615,348,000 5,661,947
Copyright © 2021 www.secdatabase.com. All Rights Reserved.Please Consider the Environment Before Printing This Document

Pou Sheng International Holdings, Ltd.Powerlong Real Estate Holdings, Ltd.Prosperity International Holdings HK, Ltd.PW Medtech Group, Ltd.Q Technology Group Co., Ltd.Qingdao Port International Co., Ltd., Class HQingling Motors Co., Ltd., Class HQinhuangdao Port Co., Ltd., Class HQinqin Foodstuffs Group Cayman Co., Ltd.Qunxing Paper Holdings Co., Ltd.Real Gold Mining, Ltd.Redco Properties Group Ltd.Regal International Airport Group Co., Ltd., Class HRenren, Inc., ADRREXLot Holdings, Ltd.Road King Infrastructure, Ltd.Ronshine China Holdings, Ltd.Royale Furniture Holdings, Ltd.Sany Heavy Equipment International Holdings Co., Ltd.Seaspan Corp.Secoo Holding, Ltd., ADRSemiconductor Manufacturing International Corp.Shandong Chenming Paper Holdings, Ltd., Class HShandong Weigao Group Medical Polymer Co., Ltd., Class HShandong Xinhua Pharmaceutical Co., Ltd.Shanghai Fudan Microelectronics Group Co., Ltd., Class HShanghai Fudan-Zhangjiang Bio-Pharmaceutical Co., Ltd.Shanghai Haohai Biological Technology Co., Ltd., Class HShanghai Industrial Holdings, Ltd.Shanghai Industrial Urban Development Group, Ltd.Shanghai Jin Jiang International Hotels Group Co., Ltd., Class HShanghai La Chapelle Fashion Co., Ltd., Class HShanghai Prime Machinery Co., Ltd.Shanghai Zendai Property, Ltd.Shengjing Bank Co., Ltd.Shenguan Holdings Group, Ltd.Shenzhen Expressway Co., Ltd., Class HShenzhen International Holdings, Ltd.Shenzhen Investment, Ltd.Shougang Concord International Enterprises Co., Ltd.Shougang Fushan Resources Group, Ltd.Shui On Land, Ltd.Shunfeng International Clean Energy, Ltd.Sichuan Expressway Co., Ltd., Class HSihuan Pharmaceutical Holdings Group, Ltd.Silver Grant International Holdings Group, Ltd.SINA Corp.Sino Oil And Gas Holdings, Ltd.
Table of Contents
The Emerging Markets Small Cap SeriesCONTINUED
Shares Value»
CHINA — (Continued)14,901,806 $ 4,146,110
9,541,000 5,788,1841,626,800 39,900
#* 4,965,000 643,465#* 2,248,000 2,178,364
3,037,000 2,164,5424,464,000 1,148,880
# 3,885,500 740,880#* 65,000 20,026
669,913 32,348* 300,500 10,096# 6,742,000 2,682,031
783,000 539,278#* 37,726 32,444* 98,652,252 264,647
1,905,000 3,916,6182,005,000 2,610,140
#* 130,000 19,3296,752,000 2,654,730
# 466,904 4,739,076* 18,031 144,068#* 4,621,000 5,442,973# 2,825,750 1,234,034
11,908,000 11,352,6311,350,400 647,543
#* 434,000 422,5001,688,000 1,284,863
207,000 1,214,9533,511,000 7,193,621
# 13,400,000 2,158,2908,100,000 1,436,686
# 175,800 72,9905,246,000 574,974
* 21,220,000 275,92862,500 44,689
7,048,000 283,1714,844,400 5,750,2557,852,816 14,505,125
22,548,643 8,085,06650,652,000 1,968,48617,550,000 3,634,38826,060,143 5,562,702
#* 9,642,000 375,2095,248,000 1,581,203
25,422,000 5,207,987* 6,502,000 1,230,127* 16,828 658,311* 7,481,777 122,428
Copyright © 2021 www.secdatabase.com. All Rights Reserved.Please Consider the Environment Before Printing This Document

Sinofert Holdings, Ltd.Sino-I Technology, Ltd.Sinolink Worldwide Holdings, Ltd.SinoMedia Holding, Ltd.Sino-Ocean Group Holding, Ltd.Sinopec Engineering Group Co., Ltd., Class HSinopec Kantons Holdings, Ltd.Sinosoft Technology Group, Ltd.Sinotrans, Ltd., Class HSinotruk Hong Kong, Ltd.Skyfame Realty Holdings, Ltd.
Skyworth Group, Ltd.SMI Holdings Group, Ltd.SOHO China, Ltd.Sohu.com, Ltd., ADRSouthern Energy Holdings Group, Ltd.Sparkle Roll Group, Ltd.Springland International Holdings, Ltd.SPT Energy Group, Inc.SRE Group, Ltd.SSY Group, Ltd.Starrise Media Holdings, Ltd.Suchuang Gas Corp., Ltd.Sun King Power Electronics GroupSunshine 100 China Holdings, Ltd.Symphony Holdings, Ltd.Tang Palace China Holdings, Ltd.Tarena International, Inc., ADRTaung Gold International, Ltd.TCL Electronics Holdings, Ltd.Tech Pro Technology Development, Ltd.Technovator International, Ltd.Ten Pao Group Holdings, Ltd.Tenfu Cayman Holdings Co., Ltd.Tenwow International Holdings, Ltd.Tesson Holdings, Ltd.Texhong Textile Group, Ltd.Tian An China Investment Co., Ltd.Tian Ge Interactive Holdings, Ltd.Tian Shan Development Holding, Ltd.Tiangong International Co., Ltd.Tianjin Capital Environmental Protection Group Co., Ltd., Class HTianjin Development Holdings, Ltd.Tianjin Port Development Holdings, Ltd.Tianneng Power International, Ltd.Tianyun International Holdings, Ltd.Tibet Water Resources, Ltd.
# 16,315,327 1,825,066* 3,950,000 34,583#* 16,046,800 1,138,235# 1,072,000 195,037
13,704,500 5,514,0057,677,500 6,014,6146,844,000 2,753,468
# 5,316,599 1,424,01414,490,000 4,994,177
# 4,350,500 6,379,41218,146,000 2,724,838
Table of Contents
The Emerging Markets Small Cap SeriesCONTINUED
Shares Value»
CHINA — (Continued)# 12,031,628 $ 3,266,863#* 6,450,413 309,001
14,454,000 4,621,255#* 115,019 1,402,082#* 274,000 340,568* 7,624,000 260,647
5,104,000 1,008,704* 4,010,000 391,057* 33,284,346 377,422
12,031,152 10,667,791#* 2,410,000 410,275
608,000 146,741# 3,622,000 482,967#* 877,000 164,054
8,480,000 995,123440,000 68,942
#* 238,494 379,205* 52,950,000 255,789
4,770,347 2,160,107* 43,862,000 71,720* 3,050,000 366,397
1,296,000 130,191# 244,000 160,222#* 4,336,000 39,493* 54,000 3,336
2,063,500 2,072,2961,718,000 842,693
* 2,904,000 680,434# 1,742,000 601,618
2,562,000 794,2952,358,000 819,2573,654,000 1,120,974
14,130,800 1,453,659# 5,050,048 4,038,401
1,794,000 278,580* 12,716,000 3,168,338
Copyright © 2021 www.secdatabase.com. All Rights Reserved.Please Consider the Environment Before Printing This Document

Time Watch Investments, Ltd.Tomson Group, Ltd.Tong Ren Tang Technologies Co., Ltd., Class HTongda Group Holdings, Ltd.Tonly Electronics Holdings, Ltd.Top Spring International Holdings, Ltd.Tou Rong Chang Fu Group, Ltd.Towngas China Co., Ltd.TPV Technology, Ltd.Trigiant Group, Ltd.Truly International Holdings, Ltd.Tsaker Chemical Group, Ltd.Tuniu Corp., Sponsored ADRUni-President China Holdings, Ltd.United Energy Group, Ltd.V1 Group, Ltd.Vinda International Holdings, Ltd.Vipshop Holdings, Ltd., ADRWanguo International Mining Group, Ltd.Wasion Holdings, Ltd.Weiqiao Textile Co., Class HWest China Cement, Ltd.Wisdom Education International Holdings Co., Ltd.
Wisdom Sports GroupWison Engineering Services Co., Ltd.Xiabuxiabu Catering Management China Holdings Co., Ltd.Xiamen International Port Co., Ltd.Xinchen China Power Holdings, Ltd.Xingda International Holdings, Ltd.Xingfa Aluminium Holdings, Ltd.Xinhua Winshare Publishing and Media Co., Ltd., Class HXinjiang Xinxin Mining Industry Co., Ltd., Class HXinming China Holdings, Ltd.Xinyi Solar Holdings, Ltd.Xinyuan Real Estate Co., Ltd., ADRXtep International Holdings, Ltd.Xunlei, Ltd., ADRYadea Group Holdings, Ltd.Yanchang Petroleum International, Ltd.Yangtze Optical Fibre and Cable Joint Stock, Ltd. Co., Class HYashili International Holdings, Ltd.YiChang HEC ChangJiang Pharmaceutical Co., Ltd., Class HYida China Holdings, Ltd.Yihai International Holding, Ltd.Yip's Chemical Holdings, Ltd.Yirendai, Ltd., ADRYouyuan International Holdings, Ltd.
1,562,000 185,0573,091,054 882,9933,956,000 4,726,924
# 24,440,000 1,794,386574,176 424,353
# 1,539,500 337,059* 15,232,000 172,203
7,105,609 5,410,2835,135,964 1,608,8453,830,000 718,334
* 8,011,573 1,123,4031,314,500 526,682
* 118,517 366,2188,077,000 9,553,124
#* 40,144,900 7,236,144#* 10,687,579 251,672
865,000 1,691,077* 1,811,472 13,767,187
486,000 110,1353,962,000 1,444,7152,249,500 660,915
15,520,000 2,615,173# 2,600,000 1,163,834Table of Contents
The Emerging Markets Small Cap SeriesCONTINUED
Shares Value»
CHINA — (Continued)# 3,060,000 $ 114,950
1,334,000 179,871# 2,082,500 2,894,568
7,162,000 894,007* 1,110,000 52,545
6,564,713 1,763,023503,000 488,296
2,673,103 1,864,656* 3,005,598 206,214* 328,000 45,124# 18,154,405 9,966,633# 128,474 538,306
6,907,500 4,974,261* 129,262 288,254# 6,976,000 1,423,590* 29,680,000 335,987# 904,000 1,642,380# 5,308,000 699,423# 580,800 2,925,125* 1,148,000 326,595
1,432,000 7,598,4681,850,000 559,002
#* 85,486 956,588#* 2,698,070 753,999
Copyright © 2021 www.secdatabase.com. All Rights Reserved.Please Consider the Environment Before Printing This Document

YuanShengTai Dairy Farm, Ltd.Yuexiu Property Co., Ltd.Yuexiu Transport Infrastructure, Ltd.Yunnan Water Investment Co., Ltd., Class HYuzhou Properties Co., Ltd.YY, Inc., ADRZhaojin Mining Industry Co., Ltd., Class HZhejiang Expressway Co., Ltd., Class HZhengzhou Coal Mining Machinery Group Co., Ltd.Zhong An Group Ltd.Zhongsheng Group Holdings, Ltd.Zhongyu Gas Holdings, Ltd.Zhou Hei Ya International Holdings Co., Ltd.Zhuguang Holdings Group Co., Ltd.Zhuhai Holdings Investment Group, Ltd.Zoomlion Heavy Industry Science and Technology Co., Ltd., Class H
TOTAL CHINA
Almacenes Exito SABolsa de Valores de ColombiaCelsia SA ESPCementos Argos SACEMEX Latam Holdings SAConstructora Conconcreto SACorp. Financiera Colombiana SAEmpresa de Telecomunicaciones de BogotaGrupo Nutresa SAInterconexion Electrica SA ESPMineros SAPromigas SA ESP
TOTAL COLOMBIA
Aegean Airlines SAAthens Water Supply & Sewage Co. SAAUTOHELLAS SABank of GreeceEllaktor SAFourlis Holdings SAGEK Terna Holding Real Estate Construction SAHellenic Exchanges - Athens Stock Exchange SAHolding Co. ADMIE IPTO SAIntracom Holdings SAIntralot SA-Integrated Lottery Systems & ServicesLAMDA Development SAMarfin Investment Group Holdings SAMytilineos SAPiraeus Bank SA
* 5,941,000 192,83048,622,284 10,991,463
# 4,508,018 3,580,5151,531,000 409,124
11,699,364 5,496,465#* 250,678 16,091,021
7,571,500 8,800,2664,660,000 4,510,6201,804,000 869,538
#* 21,268,800 730,1983,115,500 8,659,168
# 1,834,306 1,907,873# 3,214,500 1,741,822#* 7,324,000 942,247
1,800,000 187,2255,407,200 3,775,026
1,096,798,290
COLOMBIA — (0.3%)1,672,516 8,869,978
63,819 234,5852,134,258 2,894,7431,235,372 2,895,524
* 1,118,385 1,431,672* 323,906 49,757* 298,769 2,460,498* 3,105,048 229,027
172,300 1,319,192109,442 593,755115,553 109,18110,240 22,159
21,110,071
Table of Contents
The Emerging Markets Small Cap SeriesCONTINUED
Shares Value»
GREECE — (0.4%)199,732 $ 1,806,288124,127 1,134,690
14,241 92,768140,045 2,277,740
* 733,119 1,759,676267,223 1,705,328
* 469,772 3,327,354423,013 2,320,512282,657 705,811
* 368,162 480,210* 728,559 463,636* 113,811 1,181,293* 5,032,612 873,298
276,956 3,366,149* 481,588 1,642,530
Copyright © 2021 www.secdatabase.com. All Rights Reserved.Please Consider the Environment Before Printing This Document

Piraeus Port Authority SASarantis SATerna Energy SAThessaloniki Port Authority SA
TOTAL GREECE
China City Infrastructure Group, Ltd.China State Construction Development Holdings, Ltd.Leyou Technologies Holdings, Ltd.Lisi Group Holdings, Ltd.New Universe Environmental Group, Ltd.Rivera Holdings, Ltd.Tongfang Kontafarma Holdings, Ltd.Yorkey Optical International Cayman, Ltd.
TOTAL HONG KONG
CIG Pannonia Life Insurance P.L.C., Class AMagyar Telekom Telecommunications P.L.C.Opus Global NyrtRichter Gedeon Nyrt
TOTAL HUNGARY
3M India, Ltd.5Paisa Capital, Ltd.5Paisa Capital, Ltd.Aarti Drugs, Ltd.Aarti Industries, Ltd.Abbott India, Ltd.Accelya Kale Solutions, Ltd.Adani Enterprises, Ltd.Adani Gas, Ltd.Adani Green Energy, Ltd.Adani Power, Ltd.Adani Transmissions, Ltd.Aditya Birla Capital, Ltd.Aditya Birla Fashion and Retail, Ltd.Advanced Enzyme Technologies, Ltd.Aegis Logistics, Ltd.Agro Tech Foods, Ltd.Ahluwalia Contracts India, Ltd.
AIA Engineering, Ltd.Ajanta Pharma, Ltd.Akzo Nobel India, Ltd.Alembic Pharmaceuticals, Ltd.Alembic, Ltd.Alkyl Amines Chemicals
44,610 1,222,951185,882 1,779,737177,048 1,418,647
344 11,405
27,570,023
HONG KONG — (0.0%)* 1,220,000 45,350
116,000 13,036* 4,130,000 1,177,449#* 662,000 67,670
300,000 11,5641,382,000 88,058
* 186,000 4,883396,000 51,074
1,459,084
HUNGARY — (0.2%)205,071 253,464
2,342,099 3,388,516#* 163,458 234,709
365,791 6,426,983
10,303,672
INDIA — (10.0%)* 5,883 1,799,645* 12,730 31,446* 20,139 26,174
20,845 138,955197,062 4,779,797
15,291 1,852,492* 3,300 37,409
681,891 1,264,927303,642 656,995
* 321,380 216,591* 2,678,174 2,350,102* 515,362 1,542,173* 189,181 225,192* 716,807 1,956,949
161,345 347,153690,260 1,870,072
73,996 550,93224,323 103,681
Table of Contents
The Emerging Markets Small Cap SeriesCONTINUED
Shares Value»
INDIA — (Continued)* 236,152 $5,863,516
194,402 2,496,90475,281 1,906,085
450,452 3,407,195646,465 401,577
22,811 234,903
Copyright © 2021 www.secdatabase.com. All Rights Reserved.Please Consider the Environment Before Printing This Document

Allahabad BankAllcargo Logistics, Ltd.Amara Raja Batteries, Ltd.Amtek Auto, Ltd.Anant Raj, Ltd.Andhra BankAndhra Sugars, Ltd. (The)Anveshan Heavy Engineering, Ltd.Apar Industries, Ltd.Apcotex Industries, Ltd.APL Apollo Tubes, Ltd.Apollo Hospitals Enterprise, Ltd.Apollo Tyres, Ltd.Aptech, Ltd.Arti Surfactants, Ltd.Arvind Fashions, Ltd.Arvind, Ltd.Asahi India Glass, Ltd.Ashiana Housing, Ltd.Ashoka Buildcon, Ltd.Astra Microwave Products, Ltd.Astral Polytechnik, Ltd.AstraZeneca Pharma India, Ltd.Atul, Ltd.Automotive Axles, Ltd.Avanti Feeds, Ltd.Bajaj Corp., Ltd.Bajaj Electricals, Ltd.Bajaj Hindusthan Sugar, Ltd.Bajaj Holdings & Investment, Ltd.Balaji Amines, Ltd.Balaji Telefilms, Ltd.Balkrishna Industries, Ltd.Ballarpur Industries, Ltd.Balmer Lawrie & Co., Ltd.Balrampur Chini Mills, Ltd.Banco Products India, Ltd.Bank of BarodaBank of MaharashtraBannari Amman Sugars, Ltd.BASF India, Ltd.Bata India, Ltd.Bayer CropScience, Ltd.BEML, Ltd.Berger Paints India, Ltd.BF Utilities, Ltd.Bhansali Engineering Polymers, Ltd.Bharat Forge, Ltd.Bharat Rasayan, Ltd.Bharti Airtel, Ltd.Birla Corp., Ltd.Bliss Gvs Pharma, Ltd.BLS International Services, Ltd.
* 2,757,858 1,466,797446,499 627,623266,056 2,626,124
* 217,501 8,696672,753 267,357
* 2,013,437 545,74926,020 100,920
* 41,601 277,57898,378 708,360
3,763 10,55141,693 848,556
296,223 5,808,7672,096,065 4,784,401
88,473 160,78119,706 60,879
* 224,643 1,944,9791,123,214 892,495
452,109 1,284,195240,932 376,235
* 502,607 878,98345,929 52,808
129,728 2,331,849* 19,541 547,029
71,191 3,755,26438,935 455,272
210,094 937,792* 458,771 1,728,354
185,644 979,682* 2,833,384 246,033
108,946 5,368,90664,754 220,192
203,812 161,134466,279 4,758,672
* 967,333 10,547308,856 772,804
1,105,938 2,272,171152,996 219,634
* 976,400 1,505,080* 1,028,030 191,011
14,297 284,75084,973 1,256,092
124,458 2,359,0797,238 320,396
91,484 1,115,995508,953 2,432,075
* 30,209 77,556345,140 276,901
26,402 162,1262,566 150,387
915 4,452156,222 1,316,651354,023 747,185
20,214 24,016Table of Contents
Copyright © 2021 www.secdatabase.com. All Rights Reserved.Please Consider the Environment Before Printing This Document

Blue Dart Express, Ltd.Blue Star, Ltd.Bodal Chemicals, Ltd.Bombay Dyeing & Manufacturing Co., Ltd.Borosil Glass Works, Ltd.Brigade Enterprises, Ltd.BSE, Ltd.Can Fin Homes, Ltd.Canara BankCapacit'e Infraprojects, Ltd.Caplin Point Laboratories, Ltd.Carborundum Universal, Ltd.Care Ratings, Ltd.Castrol India, Ltd.CCL Products India, Ltd.Ceat, Ltd.Central Depository Services India, Ltd.Century Plyboards India, Ltd.Century Textiles & Industries, Ltd.Cera Sanitaryware, Ltd.CESC, Ltd.CG Power and Industrial Solutions, Ltd.Chambal Fertilizers & Chemicals, Ltd.Chennai Petroleum Corp., Ltd.Chennai Super Kings Cricket, Ltd.Cholamandalam Investment and Finance Co., Ltd.City Union Bank, Ltd.Claro India, Ltd.Coffee Day Enterprises, Ltd.Coromandel International, Ltd.Corp. BankCox & Kings Financial Service, Ltd.Cox & Kings, Ltd.CRISIL, Ltd.Crompton Greaves Consumer Electricals, Ltd.Cummins India, Ltd.Cyient, Ltd.DB Corp., Ltd.DCB Bank, Ltd.DCM Shriram, Ltd.Deepak Fertilisers & Petrochemicals Corp., Ltd.Deepak Nitrite, Ltd.Delta Corp., Ltd.Dewan Housing Finance Corp., Ltd.DFM Foods, Ltd.Dhampur Sugar Mills, Ltd.Dhanuka Agritech, Ltd.Digicontent, Ltd.Dilip Buildcon, Ltd.
The Emerging Markets Small Cap SeriesCONTINUED
Shares Value»
INDIA — (Continued)34,277 $ 1,190,174
203,234 2,029,128310,384 353,355607,393 623,929
57,864 111,465302,306 1,143,875
45,992 339,345240,769 1,349,788
* 621,330 2,110,81415,657 53,247
129,574 803,371393,186 1,870,492161,996 1,780,342374,128 658,443443,978 1,579,620139,736 1,648,794152,861 427,210456,848 837,160
87,679 1,130,95432,942 1,232,411
604,391 6,499,017* 2,641,173 692,197
1,065,698 2,313,905344,525 981,841
1,658,632 10,17327,814 104,027
1,414,629 3,985,164* 34,850 36,402* 236,430 419,995
566,009 3,036,427* 1,571,373 517,900* 263,757 7,670
791,270 132,179117,175 2,213,589
3,162,419 10,532,12312,141 125,309
394,638 2,598,073166,994 389,907
1,574,983 4,439,483295,410 1,713,475187,415 236,736291,386 1,174,627661,802 1,466,937857,976 609,625
40,642 152,156142,644 331,517
50,591 266,980* 182,037 21,966
168,716 1,012,224
Copyright © 2021 www.secdatabase.com. All Rights Reserved.Please Consider the Environment Before Printing This Document

Dish TV India, Ltd.Dishman Carbogen Amcis, Ltd.Dixon Technologies India, Ltd.Dr Lal PathLabs, Ltd.Dynamatic Technologies, Ltd.eClerx Services, Ltd.Edelweiss Financial Services, Ltd.EID Parry India, Ltd.EIH, Ltd.Electrosteel Castings, Ltd.
Elgi Equipments, Ltd.Emami, Ltd.Endurance Technologies, Ltd.Engineers India, Ltd.Entertainment Network India, Ltd.Eris Lifesciences, Ltd.Eros International Media, Ltd.Escorts, Ltd.Essel Propack, Ltd.Eveready Industries India, Ltd.Excel Crop Care, Ltd.Excel Industries, Ltd.Exide Industries, Ltd.FDC, Ltd.Federal Bank, Ltd.Federal-Mogul Goetze India, Ltd.FIEM Industries, Ltd.Finolex Cables, Ltd.Finolex Industries, Ltd.Firstsource Solutions, Ltd.Fortis Healthcare, Ltd.Future Enterprises, Ltd.Future Lifestyle Fashions, Ltd.Future Retail, Ltd.Gabriel India, Ltd.Galaxy Surfactants, Ltd.Garware Technical Fibres, Ltd.Gateway Distriparks, Ltd.Gati, Ltd.Gayatri Projects, Ltd.GE Power India, Ltd.GE T&D India, Ltd.Geojit Financial Services, Ltd.GFL, Ltd.GHCL, Ltd.GIC Housing Finance, Ltd.Gillette India, Ltd.
3,416,870 1,339,397* 638,924 1,920,434
4,153 128,300127,716 2,012,330
8,945 162,176135,492 1,171,928
1,071,741 2,276,802504,770 1,055,355
1,034,213 2,490,283761,096 139,640
Table of Contents
The Emerging Markets Small Cap SeriesCONTINUED
Shares Value»
INDIA — (Continued)360,052 $ 1,328,406
59,452 274,40113,729 183,934
1,179,297 1,702,43167,400 390,186
* 12,326 72,254* 73,514 12,746
513,152 3,484,246782,764 1,512,334
* 150,841 162,1564,882 193,7893,403 40,390
960,986 2,546,045* 417,298 935,936
9,528,690 12,735,044* 82,059 622,071
13,594 71,228703,474 3,820,666296,857 2,283,103
1,545,250 1,099,834* 2,321,065 4,056,265* 834,553 289,992
120,814 787,913* 192,546 1,156,616
415,189 541,7991,308 23,873
55,228 896,149612,145 959,090124,440 97,694
* 297,572 612,29839,477 441,135
186,710 417,230280,174 100,781
* 224,424 2,956,362228,000 685,613
98,590 350,10614,426 1,498,279
Copyright © 2021 www.secdatabase.com. All Rights Reserved.Please Consider the Environment Before Printing This Document

GlaxoSmithKline Pharmaceuticals, Ltd.Glenmark Pharmaceuticals, Ltd.GM Breweries, Ltd.GMR Infrastructure, Ltd.GOCL Corp., Ltd.Godfrey Phillips India, Ltd.Godrej Agrovet, Ltd.Godrej Industries, Ltd.Godrej Properties, Ltd.Granules India, Ltd.Graphite India, Ltd.Great Eastern Shipping Co., Ltd. (The)Greaves Cotton, Ltd.Greenpanel Industries, Ltd.Greenply Industries, Ltd.Grindwell Norton, Ltd.GRUH Finance, Ltd.GTL Infrastructure, Ltd.Gujarat Alkalies & Chemicals, Ltd.Gujarat Ambuja Exports, Ltd.Gujarat Gas, Ltd.Gujarat Industries Power Co., Ltd.
Gujarat Mineral Development Corp., Ltd.Gujarat Narmada Valley Fertilizers & Chemicals, Ltd.Gujarat Pipavav Port, Ltd.Gujarat State Fertilizers & Chemicals, Ltd.Gujarat State Petronet, Ltd.Gulf Oil Lubricants India, Ltd.GVK Power & Infrastructure, Ltd.Hatsun Agro Products, Ltd.Hatsun Agro Products, Ltd.HBL Power Systems, Ltd.HealthCare Global Enterprises, Ltd.HEG, Ltd.HeidelbergCement India, Ltd.Heritage Foods, Ltd.Hester Biosciences, Ltd.Hexaware Technologies, Ltd.Hikal, Ltd.HIL, Ltd.Himachal Futuristic Communications, Ltd.Himadri Speciality Chemical, Ltd.Himatsingka Seide, Ltd.Hinduja Global Solutions, Ltd.Hinduja Ventures, Ltd.Hindustan Oil Exploration Co., Ltd.Honda SIEL Power Products, Ltd.
15,014 262,513520,956 3,214,226
32,948 187,673* 11,542,849 2,513,019
46,789 169,41491,690 924,20317,766 112,346
420,827 2,879,274* 214,042 2,940,164
674,954 888,75052,686 234,015
470,650 1,608,632620,829 1,202,438223,561 37,214223,561 397,601101,866 805,104
1,261,788 4,475,017* 938,311 8,750
173,142 1,044,232257,558 496,885
1,484,059 3,695,856310,190 313,525
Table of Contents
The Emerging Markets Small Cap SeriesCONTINUED
Shares Value»
INDIA — (Continued)747,422 $ 773,145250,999 764,879
1,223,530 1,386,015969,096 1,133,941
1,224,601 3,785,88998,949 1,105,131
* 5,950,892 413,49059,532 595,170
3,375 26,597627,675 178,129
* 92,974 156,83511,644 166,993
560,512 1,564,44077,941 400,34510,018 224,857
756,344 3,964,126329,825 707,350
15,712 264,1083,600,628 1,020,978
756,535 884,621253,987 491,302
46,310 397,64936,485 154,528
* 256,846 427,10116,776 212,577
Copyright © 2021 www.secdatabase.com. All Rights Reserved.Please Consider the Environment Before Printing This Document

Honeywell Automation India, Ltd.Hotel Leela Venture, Ltd.Housing Development & Infrastructure, Ltd.HSIL, Ltd.HT Media, Ltd.Huhtamaki PPL, Ltd.I G Petrochemicals, Ltd.ICRA, Ltd.IDFC First Bank, Ltd.IDFC, Ltd.IFB Industries, Ltd.IFCI, Ltd.Igarashi Motors India, Ltd.IIFL Finance, Ltd.IIFL Securities, Ltd.IIFL Wealth Management, Ltd.IL&FS Transportation Networks, Ltd.India Cements, Ltd. (The)India Glycols, Ltd.India Nippon Electricals, Ltd.Indiabulls Integrated Services, Ltd.Indiabulls Real Estate, Ltd.Indiabulls Ventures, Ltd.Indiabulls Ventures, Ltd.Indian BankIndian Hotels Co., Ltd. (The)Indian Hume Pipe Co., Ltd.Indian Overseas BankIndo Count Industries, Ltd.Indoco Remedies, Ltd.IndusInd Bank, Ltd.INEOS Styrolution India, Ltd.Infibeam Avenues, Ltd.Ingersoll-Rand India, Ltd.
Inox Leisure, Ltd.Inox Wind, Ltd.Insecticides India, Ltd.Intellect Design Arena, Ltd.International Paper APPM, Ltd.Ipca Laboratories, Ltd.IRB Infrastructure Developers, Ltd.ITD Cementation India, Ltd.ITI, Ltd.J Kumar Infraprojects, Ltd.Jagran Prakashan, Ltd.Jai Corp., Ltd.Jain Irrigation Systems, Ltd.
12,154 4,053,234* 487,744 52,582* 2,848,295 492,103
230,605 734,370685,577 238,903141,795 458,763
70,737 197,7673,234 151,055
* 9,693,262 5,885,289* 5,560,941 2,896,122* 63,811 559,980* 5,996,452 629,656
1,191 3,3941,410,829 2,405,231
* 1,410,829 4,222,334* 201,547 278,741* 546,574 20,258
1,409,890 1,791,69467,908 205,80014,955 66,764
* 41,160 65,359* 1,754,817 2,219,315
876,407 3,028,881152,225 255,275
* 720,775 1,956,3963,616,936 7,472,067
61,177 250,653* 2,984,119 484,967
435,926 215,409245,481 594,802234,655 4,782,238
30,905 176,845835,920 503,552
78,519 673,746Table of Contents
The Emerging Markets Small Cap SeriesCONTINUED
Shares Value»
INDIA — (Continued)* 417,544 $1,785,882* 288,165 229,632
32,706 319,340* 325,426 1,057,412* 51,872 325,333
376,669 5,210,1841,131,314 1,530,606
370,866 418,561* 41,760 46,301
166,672 303,146750,194 910,037351,131 383,101
2,117,960 627,692
Copyright © 2021 www.secdatabase.com. All Rights Reserved.Please Consider the Environment Before Printing This Document

Jaiprakash Associates, Ltd.Jaiprakash Power Ventures, Ltd.Jammu & Kashmir Bank, Ltd. (The)Jamna Auto Industries, Ltd.Jayant Agro-Organics, Ltd.Jaypee Infratech, Ltd.JB Chemicals & Pharmaceuticals, Ltd.JBM Auto, Ltd.Jindal Poly Films, Ltd.Jindal Saw, Ltd.Jindal Stainless Hisar, Ltd.Jindal Stainless, Ltd.Jindal Steel & Power, Ltd.JK Cement, Ltd.JK Lakshmi Cement, Ltd.JK Paper, Ltd.JK Tyre & Industries, Ltd.JM Financial, Ltd.JMC Projects India, Ltd.Johnson Controls-Hitachi Air Conditioning India, Ltd.JSW Energy, Ltd.JSW Holdings, Ltd.JTEKT India, Ltd.Jubilant Foodworks, Ltd.Jubilant Life Sciences, Ltd.Just Dial, Ltd.Jyothy Labs Ltd.Kajaria Ceramics, Ltd.Kalpataru Power Transmission, Ltd.Kalyani Steels, Ltd.Kansai Nerolac Paints, Ltd.Karnataka Bank, Ltd. (The)Karur Vysya Bank, Ltd. (The)Kaveri Seed Co., Ltd.KCP, Ltd. (The)KEC International, Ltd.KEI Industries, Ltd.Kesoram Industries, Ltd.Kewal Kiran Clothing, Ltd.Kiri Industries, Ltd.Kirloskar Brothers, Ltd.Kirloskar Oil Engines, Ltd.Kitex Garments, Ltd.KNR Constructions, Ltd.Kolte-Patil Developers, Ltd.KPIT Engineering, Ltd.
KPIT Technologies, Ltd.
* 7,025,568 222,976* 14,119,051 367,656* 2,013,045 1,041,417
934,382 556,1736,584 12,037
* 2,580,451 52,117199,949 1,085,856
9,244 22,114115,861 391,949986,494 963,200
* 334,099 324,510* 475,544 203,350* 2,327,292 4,518,890
158,530 2,211,385288,501 1,391,216516,633 824,948455,463 471,210
1,826,773 1,747,275273,093 466,998
63,119 1,511,455* 2,868,635 2,827,025* 665 22,325
94,377 96,724485,505 8,426,245503,831 3,186,266
* 323,490 3,249,416834,911 1,851,629527,284 3,610,512385,719 2,690,497109,183 270,405246,162 1,516,350
1,408,214 1,711,9362,769,853 2,527,022
208,478 1,347,191269,517 285,472600,830 2,675,486259,199 1,651,835
* 78,725 68,8042,328 33,824
* 74,470 523,453136,214 354,284257,475 634,673
6,808 8,125257,784 1,002,381135,264 415,652
* 1,131,802 1,338,904Table of Contents
The Emerging Markets Small Cap SeriesCONTINUED
Shares Value»
INDIA — (Continued)* 1,131,802 $1,230,740
Copyright © 2021 www.secdatabase.com. All Rights Reserved.Please Consider the Environment Before Printing This Document

KPR Mill, Ltd.KRBL, Ltd.KSB, Ltd.LA Opala RG, Ltd.Lakshmi Machine Works, Ltd.Lakshmi Vilas Bank, Ltd. (The)Laurus Labs, Ltd.LG Balakrishnan & Bros, Ltd.Linde India, Ltd.LT Foods, Ltd.Lumax Auto Technologies, Ltd.Lumax Industries, Ltd.LUX Industries, Ltd.Magma Fincorp, Ltd.Mahanagar Gas, Ltd.Maharashtra Scooters, Ltd.Maharashtra Seamless, Ltd.Mahindra & Mahindra Financial Services, Ltd.Mahindra CIE Automotive, Ltd.Mahindra Holidays & Resorts India, Ltd.Mahindra Lifespace Developers, Ltd.Mahindra Logistics, Ltd.Maithan Alloys, Ltd.Majesco, Ltd.Man Infraconstruction, Ltd.Manappuram Finance, Ltd.Mangalore Refinery & Petrochemicals, Ltd.Manpasand Beverages Ltd.Marksans Pharma, Ltd.MAS Financial Services, Ltd.Mastek, Ltd.Max Financial Services, Ltd.Max India, Ltd.Mayur Uniquoters, Ltd.McLeod Russel India, Ltd.Meghmani Organics, Ltd.Minda Corp., Ltd.Minda Industries, Ltd.Mindtree, Ltd.MM Forgings, Ltd.MOIL, Ltd.Monte Carlo Fashions, Ltd.Morepen Laboratories, Ltd.Motilal Oswal Financial Services, Ltd.Mphasis, Ltd.MPS, Ltd.Multi Commodity Exchange of India, Ltd.Munjal Showa, Ltd.Music Broadcast, Ltd.Muthoot Capital Services, Ltd.Muthoot Finance, Ltd.Nagarjuna Fertilizers & Chemicals, Ltd.Narayana Hrudayalaya, Ltd.Natco Pharma, Ltd.
106,334 885,264413,915 1,329,721
40,851 367,019111,012 288,77222,392 1,305,116
* 722,986 503,937102,340 500,101
50,669 165,69999,527 715,238
694,369 189,6214,975 5,4337,257 105,095
36,373 574,623387,886 459,312183,365 2,150,066
6,170 360,573205,955 1,240,323193,561 851,062
* 340,666 888,244307,406 1,023,689151,214 824,232
9,183 53,56217,038 113,67392,732 631,318
474,414 163,7703,631,856 5,996,760
830,249 731,38123,406 8,508
1,386,544 324,7727,968 67,995
54,899 297,531* 644,488 3,887,598* 960,513 834,311
95,841 345,32691,184 13,662
537,316 387,094381,569 464,979250,639 1,053,791109,625 1,131,020
9,652 47,787434,850 853,659
17,675 62,139* 1,397,628 326,694
180,212 1,361,008518,214 7,015,518
36,417 254,72077,195 911,43739,839 73,097
* 24,775 16,829* 34,866 260,839
674,387 5,952,990* 535,484 32,158* 176,134 568,266
581,260 4,339,177
Copyright © 2021 www.secdatabase.com. All Rights Reserved.Please Consider the Environment Before Printing This Document

National Aluminium Co., Ltd.National Fertilizers, Ltd.Nava Bharat Ventures, Ltd.Navin Fluorine International, Ltd.
Navneet Education, Ltd.NBCC India, Ltd.NCC, Ltd.NESCO, Ltd.Network18 Media & Investments, Ltd.Neuland Laboratories, Ltd.NIIT Technologies, Ltd.NIIT, Ltd.Nilkamal, Ltd.NLC India, Ltd.NOCIL, Ltd.NRB Bearings, Ltd.Nucleus Software Exports, Ltd.Oberoi Realty, Ltd.Odisha Cement, Ltd.Oil India, Ltd.Omaxe, Ltd.Orient Cement, Ltd.Orient Electric, Ltd.Orient Paper & Industries, Ltd.Orient Refractories, Ltd.Oriental Bank of CommerceOriental Carbon & Chemicals, Ltd.Page Industries, Ltd.Paisalo Digital, Ltd.Panama Petrochem, Ltd.Parag Milk Foods, Ltd.PC Jeweller, Ltd.Persistent Systems, Ltd.Pfizer, Ltd.Phillips Carbon Black, Ltd.Phoenix Mills, Ltd.(The)PI Industries, Ltd.PNB Housing Finance, Ltd.PNC Infratech, Ltd.Poly Medicure, Ltd.Polyplex Corp., Ltd.Power Mech Projects, Ltd.Prabhat Dairy, Ltd.Praj Industries, Ltd.Prakash Industries, Ltd.Prestige Estates Projects, Ltd.Prime Focus, Ltd.
3,401,457 2,239,46549,204 23,792
493,710 637,805101,219 914,016
Table of Contents
The Emerging Markets Small Cap SeriesCONTINUED
Shares Value»
INDIA — (Continued)669,884 $1,000,920
1,986,749 1,219,9873,085,488 3,277,001
174,514 1,397,705* 627,668 196,308
14,795 106,278306,008 5,337,985437,214 573,555
34,638 471,868273,047 230,135353,792 452,766282,048 417,408
30,339 128,591* 574,781 4,562,889* 318,094 4,287,495
329,716 759,943318,490 921,022417,073 580,344307,079 684,014307,079 104,317173,321 449,363
* 2,130,750 2,089,79213,160 196,851
3,643 956,2699,580 57,169
126,555 133,593250,465 837,749
1,075,573 535,313256,346 1,947,781
91,985 3,992,450520,492 901,165350,890 3,262,085444,832 7,094,327
63,410 650,40154,727 144,73957,204 144,05049,131 325,30515,464 212,244
* 159,023 154,580684,555 1,048,931
* 358,348 251,455781,418 2,874,602
* 140,332 87,099
Copyright © 2021 www.secdatabase.com. All Rights Reserved.Please Consider the Environment Before Printing This Document
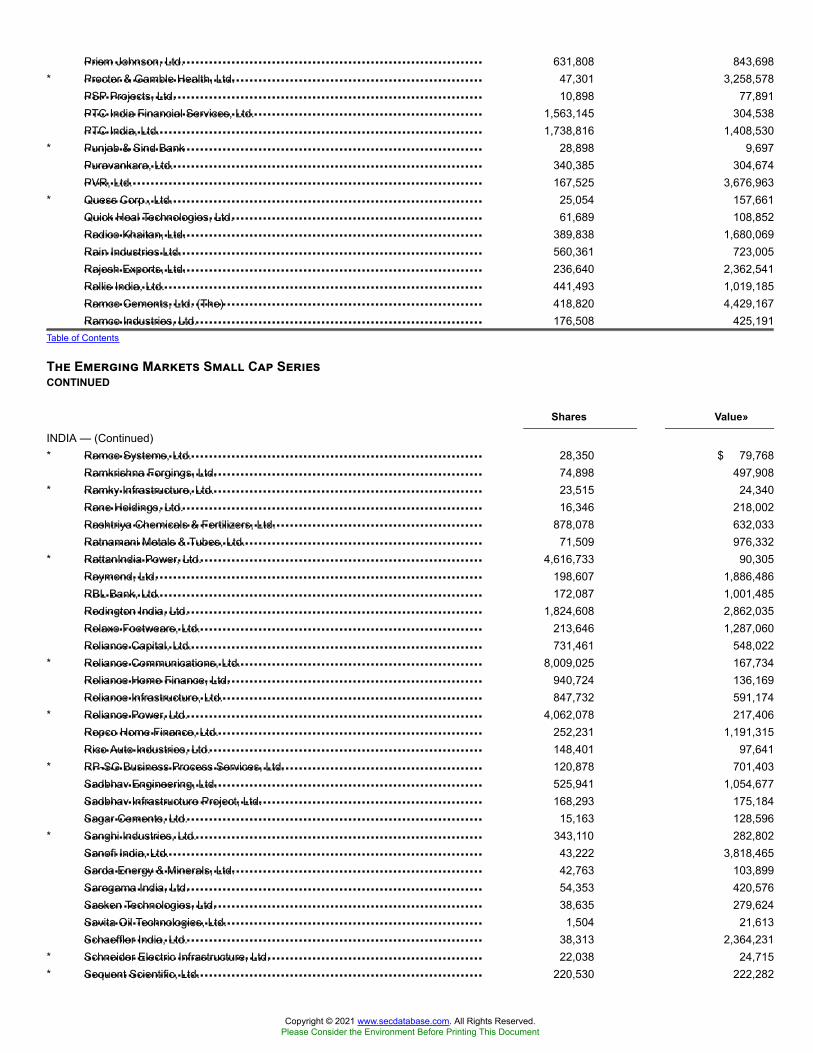
Prism Johnson, Ltd.Procter & Gamble Health, Ltd.PSP Projects, Ltd.PTC India Financial Services, Ltd.PTC India, Ltd.Punjab & Sind BankPuravankara, Ltd.PVR, Ltd.Quess Corp., Ltd.Quick Heal Technologies, Ltd.Radico Khaitan, Ltd.Rain Industries Ltd.Rajesh Exports, Ltd.Rallis India, Ltd.Ramco Cements, Ltd. (The)Ramco Industries, Ltd.
Ramco Systems, Ltd.Ramkrishna Forgings, Ltd.Ramky Infrastructure, Ltd.Rane Holdings, Ltd.Rashtriya Chemicals & Fertilizers, Ltd.Ratnamani Metals & Tubes, Ltd.RattanIndia Power, Ltd.Raymond, Ltd.RBL Bank, Ltd.Redington India, Ltd.Relaxo Footwears, Ltd.Reliance Capital, Ltd.Reliance Communications, Ltd.Reliance Home Finance, Ltd.Reliance Infrastructure, Ltd.Reliance Power, Ltd.Repco Home Finance, Ltd.Rico Auto Industries, Ltd.RP-SG Business Process Services, Ltd.Sadbhav Engineering, Ltd.Sadbhav Infrastructure Project, Ltd.Sagar Cements, Ltd.Sanghi Industries, Ltd.Sanofi India, Ltd.Sarda Energy & Minerals, Ltd.Saregama India, Ltd.Sasken Technologies, Ltd.Savita Oil Technologies, Ltd.Schaeffler India, Ltd.Schneider Electric Infrastructure, Ltd.Sequent Scientific, Ltd.
631,808 843,698* 47,301 3,258,578
10,898 77,8911,563,145 304,5381,738,816 1,408,530
* 28,898 9,697340,385 304,674167,525 3,676,963
* 25,054 157,66161,689 108,852
389,838 1,680,069560,361 723,005236,640 2,362,541441,493 1,019,185418,820 4,429,167176,508 425,191
Table of Contents
The Emerging Markets Small Cap SeriesCONTINUED
Shares Value»
INDIA — (Continued)* 28,350 $ 79,768
74,898 497,908* 23,515 24,340
16,346 218,002878,078 632,033
71,509 976,332* 4,616,733 90,305
198,607 1,886,486172,087 1,001,485
1,824,608 2,862,035213,646 1,287,060731,461 548,022
* 8,009,025 167,734940,724 136,169847,732 591,174
* 4,062,078 217,406252,231 1,191,315148,401 97,641
* 120,878 701,403525,941 1,054,677168,293 175,184
15,163 128,596* 343,110 282,802
43,222 3,818,46542,763 103,89954,353 420,57638,635 279,624
1,504 21,61338,313 2,364,231
* 22,038 24,715* 220,530 222,282
Copyright © 2021 www.secdatabase.com. All Rights Reserved.Please Consider the Environment Before Printing This Document

SH Kelkar & Co., Ltd.Shankara Building Products, Ltd.Shanthi Gears, Ltd.Sharda Cropchem, Ltd.Sharda Motor Industries, Ltd.Sheela Foam, Ltd.Shemaroo Entertainment, Ltd.Shilpa Medicare, Ltd.Shipping Corp. of India, Ltd.Shoppers Stop, Ltd.Shriram City Union Finance, Ltd.Shriram EPC, Ltd.Sical Logistics, Ltd.Simplex Infrastructures, Ltd.Sintex Industries, Ltd.Sintex Plastics Technology, Ltd.SITI Networks, Ltd.Siyaram Silk Mills, Ltd.SJVN, Ltd.SKF India, Ltd.Skipper, Ltd.SML ISUZU, Ltd.Sobha, Ltd.Solar Industries India, Ltd.Solara Active Pharma Sciences, Ltd.Somany Ceramics, Ltd.Sonata Software, Ltd.South Indian Bank, Ltd. (The)
Spencer's Retail Ltd.Srei Infrastructure Finance, Ltd.SRF, Ltd.Srikalahasthi Pipes, Ltd.Star Cement, Ltd.Steel Authority of India, Ltd.Sterlite Technologies, Ltd.Strides Pharma Science, Ltd.Subros, Ltd.Sudarshan Chemical IndustriesSun TV Network, Ltd.Sundaram Finance Holdings, Ltd.Sundaram Finance, Ltd.Sundaram-Clayton, Ltd.Sundram Fasteners, Ltd.Sunteck Realty, Ltd.Suprajit Engineering, Ltd.Supreme Industries, Ltd.Supreme Petrochem, Ltd.
130,662 220,83123,325 94,353
5,154 7,36697,276 369,385
1,720 24,033* 1,683 30,310
16,694 80,255* 123,440 637,038* 842,726 351,315
72,814 396,40159,815 1,177,952
* 106,141 11,963* 54,452 45,626
113,011 128,0011,094,584 37,919
* 2,286,671 168,678* 1,024,334 32,529
30,118 110,514733,114 262,143125,990 3,359,744
11,372 8,83039,250 325,883
380,090 3,023,508148,671 2,446,359
* 9,208 45,13850,658 258,572
292,269 1,370,5354,729,662 838,532
Table of Contents
The Emerging Markets Small Cap SeriesCONTINUED
Shares Value»
INDIA — (Continued)* 362,635 $ 363,282
1,205,273 207,735128,616 5,031,163120,091 292,126198,387 291,203
* 3,201,267 1,977,189798,069 1,721,975360,666 2,053,449120,150 342,805129,298 616,983232,272 1,590,468
54,598 58,75456,012 1,237,705
6,812 209,301458,819 2,924,655295,827 1,653,357222,187 615,925300,632 4,636,754165,945 440,856
Copyright © 2021 www.secdatabase.com. All Rights Reserved.Please Consider the Environment Before Printing This Document

Surya Roshni, Ltd.Sutlej Textiles and Industries, Ltd.Suven Life Sciences, Ltd.Suzlon Energy, Ltd.Swan Energy, Ltd.Swaraj Engines, Ltd.Symphony, Ltd.Syndicate BankSyngene International, Ltd.TAKE Solutions, Ltd.Tamil Nadu Newsprint & Papers, Ltd.Tasty Bite Eatables, Ltd.Tata Chemicals, Ltd.Tata Communications, Ltd.Tata Elxsi, Ltd.Tata Global Beverages, Ltd.Tata Metaliks, Ltd.Tata Power Co., Ltd. (The)Tata Sponge Iron, Ltd.Tata Teleservices Maharashtra, Ltd.TCI Express, Ltd.Techno Electric & Engineering Co., Ltd.Tejas Networks, Ltd.Texmaco Rail & Engineering, Ltd.Thermax, Ltd.Thirumalai Chemicals, Ltd.Thomas Cook India, Ltd.Thyrocare Technologies, Ltd.TI Financial Holdings, Ltd.Tide Water Oil Co India, Ltd.Time Technoplast, Ltd.Timken India, Ltd.Tinplate Co. of India, Ltd. (The)Titagarh Wagons, Ltd.Torrent Power, Ltd.Tourism Finance Corp. of India, Ltd.Transport Corp. of India, Ltd.Trent, Ltd.Trident, Ltd.Triveni Engineering & Industries, Ltd.
Triveni Turbine, Ltd.TTK Prestige, Ltd.Tube Investments of India, Ltd.TV Today Network, Ltd.TV18 Broadcast, Ltd.TVS Srichakra, Ltd.UCO Bank
101,312 274,428144 57
451,724 1,506,844* 10,013,342 608,629
76,621 116,68427,150 407,64264,529 1,121,278
* 3,985,122 1,834,326412,072 1,799,429353,354 486,850151,619 341,563
574 70,125241,764 2,029,074209,985 1,426,953123,460 1,140,196
2,377,227 8,631,50977,916 592,481
331,886 290,801117,210 778,307
* 1,361,820 59,297125,394 1,032,304
* 248,038 913,42452,773 69,628
418,713 289,622219,431 3,484,761307,194 279,939247,903 672,595
66,123 429,725* 526,505 3,498,365
6,961 452,717751,341 865,267161,067 1,632,852172,253 274,325260,726 133,157
1,202,606 5,304,54995,791 83,350
253,698 973,131449,150 2,587,886639,903 491,164449,332 356,380
Table of Contents
The Emerging Markets Small Cap SeriesCONTINUED
Shares Value»
INDIA — (Continued)426,083 $ 632,826
35,144 2,765,218547,189 2,754,753162,914 637,569
* 3,725,921 1,168,00914,677 337,863
* 2,001,055 481,007
Copyright © 2021 www.secdatabase.com. All Rights Reserved.Please Consider the Environment Before Printing This Document

Uflex, Ltd.UFO Moviez India, Ltd.Unichem Laboratories, Ltd.Union Bank of IndiaUniply Industries, Ltd.Unitech, Ltd.Usha Martin, Ltd.V2 Retail, Ltd.VA Tech Wabag, Ltd.Vaibhav Global, Ltd.Vardhman Textiles, Ltd.Varun Beverages, Ltd.Varun Beverages, Ltd.Venky's India, Ltd.Vesuvius India, Ltd.V-Guard Industries, Ltd.Vinati Organics, Ltd.Vindhya Telelinks, Ltd.VIP Industries, Ltd.Visaka Industries, Ltd.V-Mart Retail, Ltd.Voltas, Ltd.VRL Logistics, Ltd.VST Industries, Ltd.VST Tillers Tractors, Ltd.WABCO India, Ltd.Welspun Corp., Ltd.Welspun Enterprises, Ltd.Welspun India, Ltd.West Coast Paper Mills, Ltd.Wheels India, Ltd.Whirlpool of India, Ltd.Wockhardt, Ltd.Wonderla Holidays, Ltd.Zee Learn, Ltd.Zee Media Corp., Ltd.Zensar Technologies, Ltd.Zuari Agro Chemicals, Ltd.Zydus Wellness, Ltd.
TOTAL INDIA
Ace Hardware Indonesia Tbk PTAdhi Karya Persero Tbk PTAgung Podomoro Land Tbk PTAKR Corporindo Tbk PTAlam Sutera Realty Tbk PTAlfa Energi Investama Tbk PTAneka Tambang Tbk PTArwana Citramulia Tbk PTAsahimas Flat Glass Tbk PTAstra Agro Lestari Tbk PT
232,965 740,67838,046 88,165
245,041 596,204* 2,932,388 2,859,899
12,215 8,872* 8,022,089 115,951* 23,860 9,969* 88,780 176,135
208,469 875,11656,829 745,507
134,356 1,778,78217,997 167,816
8,999 83,58125,598 455,961
9,930 144,057982,956 3,327,925
76,368 2,010,95815,392 207,298
329,928 1,818,57825,952 100,83540,820 1,104,648
188,244 1,581,998199,211 684,72831,480 1,530,43313,719 200,11628,241 2,490,264
595,524 975,438395,274 583,866
2,261,213 1,660,370152,997 488,386
3,448 33,46675,047 1,694,092
* 169,050 760,60480,157 290,843
911,672 270,128* 838,464 142,997
540,560 1,651,917* 16,783 27,447
84,095 1,834,406
684,492,738
INDONESIA — (3.1%)50,182,000 6,556,69114,130,888 1,484,770
* 48,147,100 691,35814,955,300 4,245,969
* 102,813,800 2,426,120* 685,700 123,755
60,411,191 3,979,72728,231,700 1,137,024
978,600 369,0592,958,100 2,100,145
Table of Contents
The Emerging Markets Small Cap Series
Copyright © 2021 www.secdatabase.com. All Rights Reserved.Please Consider the Environment Before Printing This Document
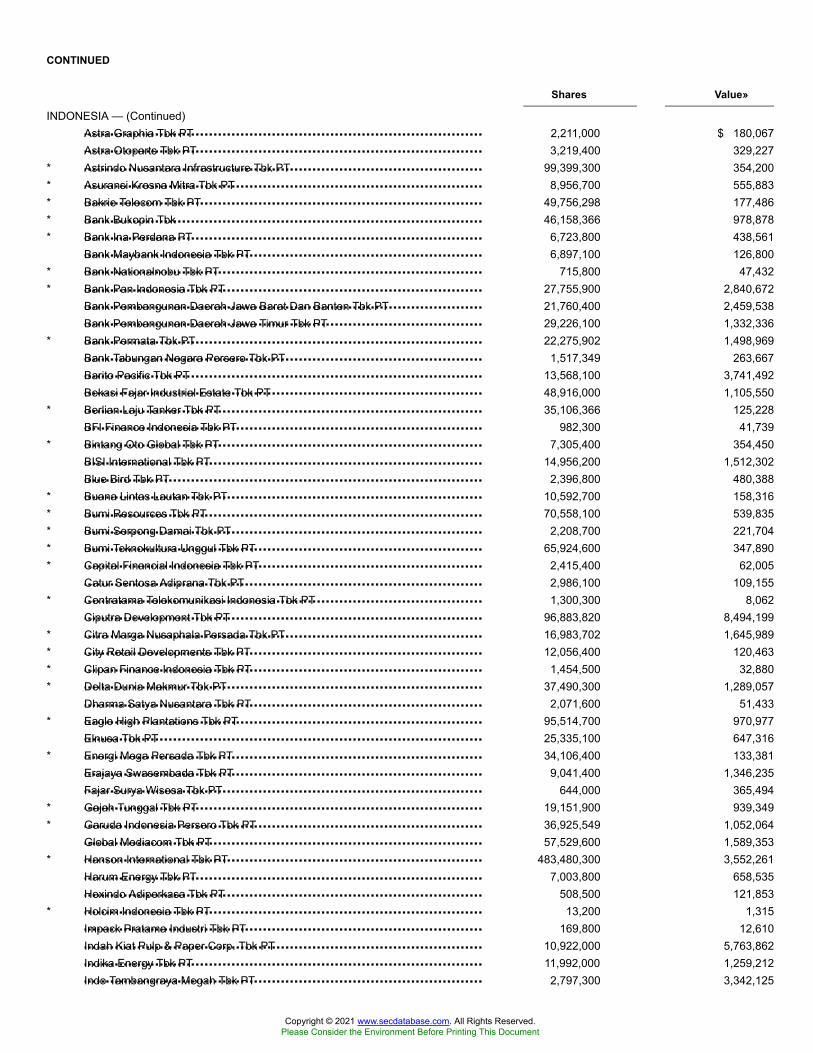
Astra Graphia Tbk PTAstra Otoparts Tbk PTAstrindo Nusantara Infrastructure Tbk PTAsuransi Kresna Mitra Tbk PTBakrie Telecom Tbk PTBank Bukopin TbkBank Ina Perdana PTBank Maybank Indonesia Tbk PTBank Nationalnobu Tbk PTBank Pan Indonesia Tbk PTBank Pembangunan Daerah Jawa Barat Dan Banten Tbk PTBank Pembangunan Daerah Jawa Timur Tbk PTBank Permata Tbk PTBank Tabungan Negara Persero Tbk PTBarito Pacific Tbk PTBekasi Fajar Industrial Estate Tbk PTBerlian Laju Tanker Tbk PTBFI Finance Indonesia Tbk PTBintang Oto Global Tbk PTBISI International Tbk PTBlue Bird Tbk PTBuana Lintas Lautan Tbk PTBumi Resources Tbk PTBumi Serpong Damai Tbk PTBumi Teknokultura Unggul Tbk PTCapital Financial Indonesia Tbk PTCatur Sentosa Adiprana Tbk PTCentratama Telekomunikasi Indonesia Tbk PTCiputra Development Tbk PTCitra Marga Nusaphala Persada Tbk PTCity Retail Developments Tbk PTClipan Finance Indonesia Tbk PTDelta Dunia Makmur Tbk PTDharma Satya Nusantara Tbk PTEagle High Plantations Tbk PTElnusa Tbk PTEnergi Mega Persada Tbk PTErajaya Swasembada Tbk PTFajar Surya Wisesa Tbk PTGajah Tunggal Tbk PTGaruda Indonesia Persero Tbk PTGlobal Mediacom Tbk PTHanson International Tbk PTHarum Energy Tbk PTHexindo Adiperkasa Tbk PTHolcim Indonesia Tbk PTImpack Pratama Industri Tbk PTIndah Kiat Pulp & Paper Corp. Tbk PTIndika Energy Tbk PTIndo Tambangraya Megah Tbk PT
CONTINUED
Shares Value»
INDONESIA — (Continued)2,211,000 $ 180,0673,219,400 329,227
* 99,399,300 354,200* 8,956,700 555,883* 49,756,298 177,486* 46,158,366 978,878* 6,723,800 438,561
6,897,100 126,800* 715,800 47,432* 27,755,900 2,840,672
21,760,400 2,459,53829,226,100 1,332,336
* 22,275,902 1,498,9691,517,349 263,667
13,568,100 3,741,49248,916,000 1,105,550
* 35,106,366 125,228982,300 41,739
* 7,305,400 354,45014,956,200 1,512,302
2,396,800 480,388* 10,592,700 158,316* 70,558,100 539,835* 2,208,700 221,704* 65,924,600 347,890* 2,415,400 62,005
2,986,100 109,155* 1,300,300 8,062
96,883,820 8,494,199* 16,983,702 1,645,989* 12,056,400 120,463* 1,454,500 32,880* 37,490,300 1,289,057
2,071,600 51,433* 95,514,700 970,977
25,335,100 647,316* 34,106,400 133,381
9,041,400 1,346,235644,000 365,494
* 19,151,900 939,349* 36,925,549 1,052,064
57,529,600 1,589,353* 483,480,300 3,552,261
7,003,800 658,535508,500 121,853
* 13,200 1,315169,800 12,610
10,922,000 5,763,86211,992,000 1,259,2122,797,300 3,342,125
Copyright © 2021 www.secdatabase.com. All Rights Reserved.Please Consider the Environment Before Printing This Document

Indofarma Persero Tbk PTIndomobil Multi Jasa Tbk PTIndomobil Sukses Internasional Tbk PTIndo-Rama Synthetics Tbk PTIndosat Tbk PTIndustri dan Perdagangan Bintraco Dharma Tbk PTIndustri Jamu Dan Farmasi Sido Muncul Tbk PTInti Agri Resources Tbk PTIntikeramik Alamasri Industri Tbk PT
Intiland Development Tbk PTJapfa Comfeed Indonesia Tbk PTJaya Real Property Tbk PTKapuas Prima Coal Tbk PTKawasan Industri Jababeka Tbk PTKMI Wire & Cable Tbk PTKrakatau Steel Persero Tbk PTKresna Graha Investama Tbk PTLink Net Tbk PTLippo Cikarang Tbk PTLippo Karawaci Tbk PTM Cash Integrasi PTMalindo Feedmill Tbk PTMatahari Department Store Tbk PTMedco Energi Internasional Tbk PTMedia Nusantara Citra Tbk PTMega Manunggal Property Tbk PTMetrodata Electronics Tbk PTMetropolitan Kentjana Tbk PTMinna Padi Investama Sekuritas Tbk PTMitra Adiperkasa Tbk PTMitra Keluarga Karyasehat Tbk PTMNC Investama Tbk PTMNC Land Tbk PTMNC Sky Vision Tbk PTModernland Realty Tbk PTMultipolar Tbk PTNippon Indosari Corpindo Tbk PTPabrik Kertas Tjiwi Kimia Tbk PTPacific Strategic Financial Tbk PTPakuwon Jati Tbk PTPan Brothers Tbk PTPanin Financial Tbk PTPanin Sekuritas Tbk PTPaninvest Tbk PTPelat Timah Nusantara Tbk PTPelayaran Tamarin Samudra Tbk PTPerusahaan Perkebunan London Sumatra Indonesia Tbk PT
* 161,900 25,3485,577,700 204,2951,854,400 315,007
130,400 41,512* 6,888,700 1,671,756
31,691,000 559,74425,354,500 1,826,827
* 92,782,800 344,454* 50,434,007 503,343Table of Contents
The Emerging Markets Small Cap SeriesCONTINUED
Shares Value»
INDONESIA — (Continued)66,115,732 $2,085,32033,765,800 3,837,98415,213,300 601,91132,212,300 1,252,772
* 155,903,557 3,422,48515,344,100 655,626
* 35,812,702 881,305* 108,722,100 4,456,103
6,553,000 2,111,240* 19,040,965 2,250,649
367,879,440 7,330,911* 2,257,200 582,602
11,010,900 869,20013,555,500 3,576,459
* 56,340,633 3,391,38737,728,900 3,682,292
* 1,096,800 28,4734,179,400 385,595
7,900 8,647* 143,400 7,800
65,943,600 4,437,1526,656,800 962,130
* 193,556,400 1,074,757* 11,480,500 109,664* 1,494,300 105,604
87,414,700 1,640,521* 29,105,600 221,493
19,389,489 1,782,2452,999,800 2,549,093
* 18,107,400 852,62910,328,900 539,62530,784,400 1,572,674
* 160,310,100 3,992,40030,500 3,769
* 9,360,600 909,131* 52,300 4,964* 49,814,000 1,732,110
26,734,100 2,015,577
Copyright © 2021 www.secdatabase.com. All Rights Reserved.Please Consider the Environment Before Printing This Document
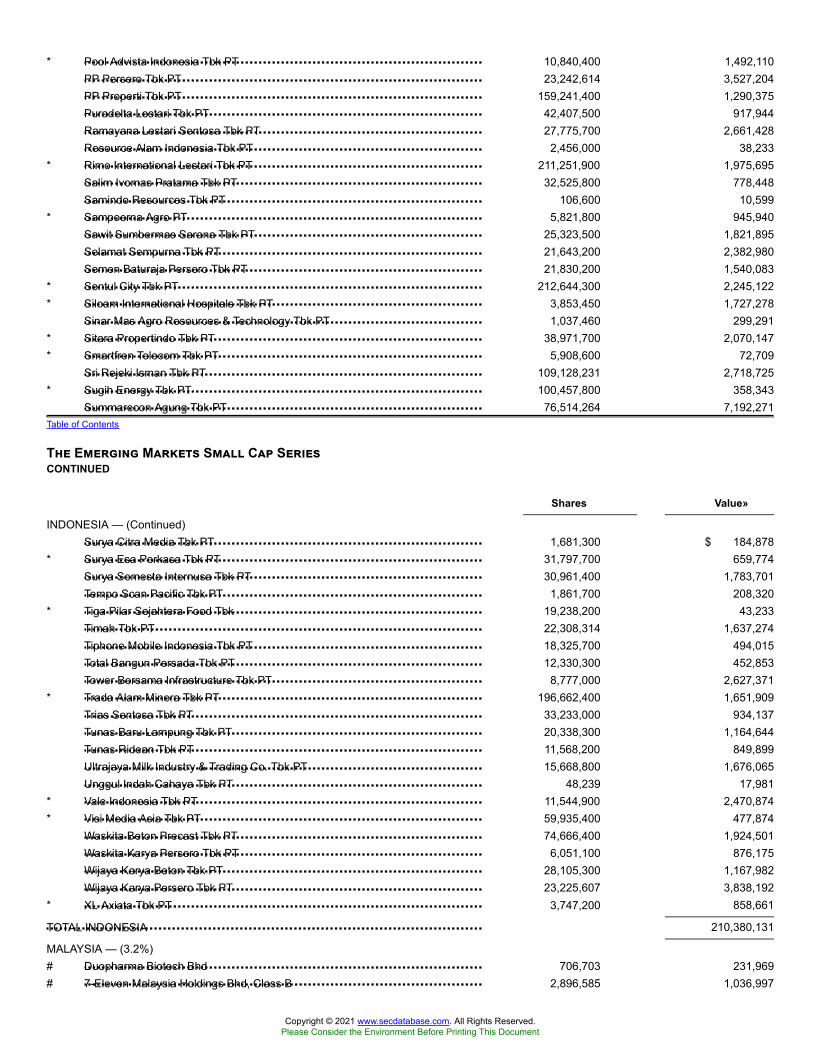
Pool Advista Indonesia Tbk PTPP Persero Tbk PTPP Properti Tbk PTPuradelta Lestari Tbk PTRamayana Lestari Sentosa Tbk PTResource Alam Indonesia Tbk PTRimo International Lestari Tbk PTSalim Ivomas Pratama Tbk PTSamindo Resources Tbk PTSampoerna Agro PTSawit Sumbermas Sarana Tbk PTSelamat Sempurna Tbk PTSemen Baturaja Persero Tbk PTSentul City Tbk PTSiloam International Hospitals Tbk PTSinar Mas Agro Resources & Technology Tbk PTSitara Propertindo Tbk PTSmartfren Telecom Tbk PTSri Rejeki Isman Tbk PTSugih Energy Tbk PTSummarecon Agung Tbk PT
Surya Citra Media Tbk PTSurya Esa Perkasa Tbk PTSurya Semesta Internusa Tbk PTTempo Scan Pacific Tbk PTTiga Pilar Sejahtera Food TbkTimah Tbk PTTiphone Mobile Indonesia Tbk PTTotal Bangun Persada Tbk PTTower Bersama Infrastructure Tbk PTTrada Alam Minera Tbk PTTrias Sentosa Tbk PTTunas Baru Lampung Tbk PTTunas Ridean Tbk PTUltrajaya Milk Industry & Trading Co. Tbk PTUnggul Indah Cahaya Tbk PTVale Indonesia Tbk PTVisi Media Asia Tbk PTWaskita Beton Precast Tbk PTWaskita Karya Persero Tbk PTWijaya Karya Beton Tbk PTWijaya Karya Persero Tbk PTXL Axiata Tbk PT
TOTAL INDONESIA
Duopharma Biotech Bhd7-Eleven Malaysia Holdings Bhd, Class B
* 10,840,400 1,492,11023,242,614 3,527,204
159,241,400 1,290,37542,407,500 917,94427,775,700 2,661,428
2,456,000 38,233* 211,251,900 1,975,695
32,525,800 778,448106,600 10,599
* 5,821,800 945,94025,323,500 1,821,89521,643,200 2,382,98021,830,200 1,540,083
* 212,644,300 2,245,122* 3,853,450 1,727,278
1,037,460 299,291* 38,971,700 2,070,147* 5,908,600 72,709
109,128,231 2,718,725* 100,457,800 358,343
76,514,264 7,192,271Table of Contents
The Emerging Markets Small Cap SeriesCONTINUED
Shares Value»
INDONESIA — (Continued)1,681,300 $ 184,878
* 31,797,700 659,77430,961,400 1,783,701
1,861,700 208,320* 19,238,200 43,233
22,308,314 1,637,27418,325,700 494,01512,330,300 452,853
8,777,000 2,627,371* 196,662,400 1,651,909
33,233,000 934,13720,338,300 1,164,64411,568,200 849,89915,668,800 1,676,065
48,239 17,981* 11,544,900 2,470,874* 59,935,400 477,874
74,666,400 1,924,5016,051,100 876,175
28,105,300 1,167,98223,225,607 3,838,192
* 3,747,200 858,661
210,380,131
MALAYSIA — (3.2%)# 706,703 231,969# 2,896,585 1,036,997
Copyright © 2021 www.secdatabase.com. All Rights Reserved.Please Consider the Environment Before Printing This Document

Aeon Co. M BhdAEON Credit Service M BhdAFFIN Bank BhdAirAsia X BhdAjinomoto Malaysia BhdAlliance Bank Malaysia BhdAllianz Malaysia BhdAmway Malaysia Holdings BhdAnn Joo Resources BhdAPM Automotive Holdings BhdATA IMS BhdBenalec Holdings BhdBerjaya Assets BhdBerjaya Corp. BhdBerjaya Food BhdBerjaya Land BhdBerjaya Sports Toto BhdBermaz Auto BhdBIMB Holdings BhdBintulu Port Holdings BhdBorneo Oil BhdBoustead Holdings BhdBoustead Plantations BhdBumi Armada BhdBursa Malaysia BhdCAB Cakaran Corp. BhdCahya Mata Sarawak BhdCan-One BhdCarlsberg Brewery Malaysia Bhd, Class BCB Industrial Product Holding BhdChin Teck Plantations BHDCJ Century Logistics Holdings Bhd, Class B
Coastal Contracts BhdComfort Glove BhdCSC Steel Holdings BhdCypark Resources BhdD&O Green Technologies BhdDagang NeXchange BhdDatasonic Group BhdDayang Enterprise Holdings BhdDRB-Hicom BhdDutch Lady Milk Industries BhdEastern & Oriental BhdEco World Development Group BhdEco World International BhdEconpile Holdings BhdEkovest BHD
# 3,548,000 1,482,045# 664,000 2,659,877# 1,781,764 870,563#* 19,274,700 1,047,210
62,800 264,9103,286,000 2,922,969
151,800 510,974210,200 305,933
# 1,131,950 409,398256,900 156,216
* 230,000 81,947* 920,100 36,636#* 3,662,800 256,299* 22,916,027 1,442,407
393,300 154,072* 4,424,500 176,647
4,207,967 2,677,226#* 4,752,200 2,931,704
1,330,708 1,347,37025,900 26,679
#* 6,671,999 71,6292,775,328 765,3843,392,899 574,314
#* 17,512,700 966,5494,791,200 7,824,167
# 2,240,500 267,7894,007,300 2,754,572
375,700 297,3531,096,700 6,394,668
# 2,699,940 639,42933,000 51,906
1,140,500 123,920Table of Contents
The Emerging Markets Small Cap SeriesCONTINUED
Shares Value»
MALAYSIA — (Continued)* 1,706,966 $ 406,083# 772,600 149,373
875,500 220,866# 1,738,950 603,810# 4,297,400 584,778
8,606,100 567,821# 4,433,800 724,306* 2,575,796 887,607
6,096,000 3,895,283139,300 2,146,043
#* 6,188,607 1,195,279#* 7,226,800 1,371,784#* 872,100 134,903
91,550 17,792# 8,038,650 1,612,031
Copyright © 2021 www.secdatabase.com. All Rights Reserved.Please Consider the Environment Before Printing This Document

Engtex Group BhdEvergreen Fibreboard BhdFAR East Holdings BHDFGV Holdings BhdFrontken Corp. BhdGabungan AQRS BhdGadang Holdings BhdGas Malaysia BhdGeorge Kent Malaysia BhdGlobetronics Technology BhdGlomac BhdGuan Chong BhdGuocoLand Malaysia BhdHai-O Enterprise BhdHAP Seng Consolidated BhdHap Seng Plantations Holdings BhdHeineken Malaysia BhdHengyuan Refining Co. BhdHeveaBoard BhdHiap Teck Venture BhdHibiscus Petroleum BhdHock Seng LEE BhdHong Leong Industries BhdHSS Engineers BhdHup Seng Industries BhdI-BhdIGB BhdIJM Plantations BhdInari Amertron BhdInch Kenneth Kajang Rubber P.L.C.Insas BhdIris Corp. BhdIskandar Waterfront City BhdJAKS Resources BhdJaya Tiasa Holdings BhdJCY International BhdJHM Consolidation BhdKarex BhdKeck Seng Malaysia BhdKenanga Investment Bank BhdKerjaya Prospek Group BhdKim Loong Resources BhdKimlun Corp. BhdKNM Group Bhd
Kossan Rubber IndustriesKPJ Healthcare BhdKretam Holdings Bhd
448,700 74,8514,150,750 300,179
258,300 166,826* 10,147,800 2,769,200
3,149,700 1,178,3102,362,810 797,3833,218,800 640,382
# 1,194,900 816,218# 2,115,900 590,657
3,874,772 1,656,6682,743,160 258,665
# 449,800 391,725# 1,578,400 274,674
1,347,620 740,1351,315,040 3,149,5631,241,100 467,013
905,900 4,989,158#* 742,700 897,998# 2,743,500 400,993
6,301,000 340,915#* 6,121,500 1,540,420
1,166,808 390,370614,100 1,645,068
#* 858,100 219,2151,433,633 322,6931,556,200 131,487
623,877 412,8591,456,300 507,531
# 14,318,345 5,662,622871,000 123,677
3,987,881 788,649* 12,157,700 454,942#* 3,508,100 823,595#* 2,787,100 523,255# 3,127,127 367,364* 3,776,100 168,565
1,456,900 440,780774,649 102,559858,750 973,210
1,704,860 234,6592,135,480 737,4201,032,880 292,544
# 760,653 255,959#* 13,951,980 1,357,719Table of Contents
The Emerging Markets Small Cap SeriesCONTINUED
Shares Value»
MALAYSIA — (Continued)5,541,400 $5,461,689
# 18,367,700 4,153,793#* 4,653,800 427,173
Copyright © 2021 www.secdatabase.com. All Rights Reserved.Please Consider the Environment Before Printing This Document

KSL Holdings BhdKumpulan Fima BHDKumpulan Perangsang Selangor BhdLand & General BhdLandmarks BhdLBS Bina Group BhdLii Hen Industries BhdLingkaran Trans Kota Holdings BhdLion Industries Corp. BhdLPI Capital BhdMagni-Tech Industries BhdMagnum BhdMah Sing Group BhdMalakoff Corp. BhdMalayan Flour Mills BhdMalayan United Industries BhdMalaysia Building Society BhdMalaysia Marine and Heavy Engineering Holdings BhdMalaysian Bulk Carriers BhdMalaysian Pacific Industries BhdMalaysian Resources Corp. BhdMalton BhdMatrix Concepts Holdings BhdMBM Resources BHDMedia Chinese International, Ltd.Media Prima BhdMega First Corp. BhdMitrajaya Holdings BhdMKH BhdMMC Corp. BhdMNRB Holdings BhdMPHB Capital BhdMuda Holdings BhdMudajaya Group BhdMuhibbah Engineering M BhdMulpha International BhdMy EG Services BhdNaim Holdings BhdNTPM Holdings BhdOCK Group BhdOriental Holdings BHDOSK Holdings BhdPadini Holdings BhdPanasonic Manufacturing Malaysia BhdPantech Group Holdings BhdParamount Corp. BhdParkson Holdings BhdPentamaster Corp. BhdPESTECH International BhdPetron Malaysia Refining & Marketing BhdPIE Industrial BhdPos Malaysia BhdQL Resources BhdRanhill Holdings Bhd
#* 4,342,918 877,863826,650 350,288
1,389,246 309,54915,164,960 585,243
* 1,645,300 238,9324,719,980 605,050
807,700 576,7291,258,500 1,401,992
#* 1,661,400 201,738# 349,724 1,324,304
460,400 539,885# 4,919,300 3,188,035
10,245,187 2,291,4047,392,700 1,608,416
# 3,141,675 507,905* 2,568,600 142,399# 8,109,083 1,705,723* 1,302,000 284,819#* 2,579,600 368,477
720,213 1,586,212# 11,062,898 2,428,859
1,964,100 254,3072,912,658 1,339,2711,450,696 1,156,4854,708,500 199,076
* 6,273,103 726,8671,223,400 1,123,0021,218,278 97,099
# 2,267,334 663,436# 3,639,900 967,134#* 2,685,320 727,148#* 1,429,100 403,541
520,200 207,960* 2,490,823 179,806
2,493,150 1,616,896* 1,254,030 640,286
12,365,600 4,607,630#* 1,211,050 258,203
640,000 63,593* 1,947,200 250,812
602,300 956,759# 8,092,155 1,827,984
2,799,200 2,385,662147,384 1,429,384
2,356,663 284,8571,077,755 394,060
* 70,514 4,334#* 1,680,210 1,416,213#* 1,009,100 350,692
506,800 733,094# 1,132,800 343,195# 2,880,900 1,204,572
3,055,059 5,081,772# 1,748,360 540,540
Copyright © 2021 www.secdatabase.com. All Rights Reserved.Please Consider the Environment Before Printing This Document

RGB International BhdRimbunan Sawit Bhd
Salcon BhdSam Engineering & Equipment M BhdSapura Energy BhdSarawak Oil Palms BhdScientex BhdSEG International BHDSelangor Dredging BhdSerba Dinamik Holdings BhdShangri-La Hotels Malaysia BhdSHL Consolidated BhdSKP Resources BhdStar Media Group BhdSumatec Resources BhdSunway BhdSunway Construction Group BhdSupermax Corp. BhdSuria Capital Holdings BhdSyarikat Takaful Malaysia Keluarga BhdTa Ann Holdings BhdTA Enterprise BhdTA Global BhdTaliworks Corp. BhdTambun Indah Land BhdTan Chong Motor Holdings BhdTDM BhdTH Plantations BhdThong Guan Industries BhdTIME dotCom BhdTiong NAM Logistics HoldingsTMC Life Sciences BhdTropicana Corp. BhdTSH Resources BhdTune Protect Group BhdUchi Technologies BhdUEM Edgenta BhdUEM Sunrise BhdUMW Holdings BhdUnited Malacca BhdUnited Plantations BhdUOA Development BhdVelesto Energy BhdViTrox Corp. BhdVivocom International Holdings BhdVizione Holdings BhdVS Industry Bhd
2,549,714 125,854#* 3,667,900 159,201Table of Contents
The Emerging Markets Small Cap SeriesCONTINUED
Shares Value»
MALAYSIA — (Continued)3,994,464 $ 230,774
175,200 355,68228,208,300 2,033,971
1,033,504 571,851# 1,595,624 3,257,311# 145,885 22,238
339,800 55,8571,926,000 1,865,454
426,800 543,552125,500 73,718
5,288,300 1,582,7501,660,900 251,040
* 10,584,300 90,0761,471,892 590,5412,590,236 1,358,791
# 6,538,900 2,614,199839,760 284,128
1,990,200 2,936,029# 1,652,289 899,625
9,123,900 1,413,4018,309,740 502,541
# 3,520,716 769,3101,067,900 206,524
# 1,488,100 525,3801,961,120 89,988
* 743,120 88,255195,900 120,123
2,037,188 4,440,239* 1,282,116 176,353# 1,464,600 251,755
4,261,355 886,8994,063,900 895,144
# 3,985,000 667,692# 1,751,900 1,150,953
2,335,600 1,701,68112,463,500 2,407,160
# 1,042,800 1,276,902# 466,350 576,252
432,400 2,704,2095,331,300 2,684,965
#* 24,155,808 1,831,592807,900 1,365,170
* 11,667,833 42,563#* 938,828 219,793
7,533,337 2,179,262
Copyright © 2021 www.secdatabase.com. All Rights Reserved.Please Consider the Environment Before Printing This Document

Wah Seong Corp. BhdWCE Holdings BhdWCT Holdings BhdWellcall Holdings BhdWTK Holdings BhdYinson Holdings BhdYNH Property BhdYTL Land & Development BhdYTL Power International BhdZhulian Corp. Bhd
TOTAL MALAYSIA
ALEATICA S.A.B. de C.V.
Alpek S.A.B. de C.V.Alsea S.A.B. de C.V.Axtel S.A.B. de C.V.Banco del Bajio SABecle S.A.B. de C.V.Bio Pappel S.A.B. de C.V.Bolsa Mexicana de Valores S.A.B. de C.V.CMR S.A.B. de C.V.Consorcio ARA S.A.B. de C.V.Controladora Vuela Cia de Aviacion S.A.B. de C.V., ADRControladora Vuela Cia de Aviacion S.A.B. de C.V., Class ACorp Interamericana de Entretenimiento S.A.B. de C.V., Class BCorp. Actinver S.A.B. de C.V.Corp. Inmobiliaria Vesta S.A.B. de C.V.Corp. Moctezuma S.A.B. de C.V.Corporativo Fragua S.A.B. de C.V.Corporativo GBM S.A.B. de C.V.Corpovael S.A. de C.V.Credito Real S.A.B. de C.V. SOFOM ERCydsa S.A.B. de C.V.Elementia S.A.B. de C.V.Empresas ICA S.A.B. de C.V.Financiera Independencia S.A.B. de C.V. SOFOM ENRGenomma Lab Internacional S.A.B. de C.V., Class BGentera S.A.B. de C.V.Gruma S.A.B. de C.V., Class BGrupo Aeromexico S.A.B. de C.V.Grupo Aeroportuario del Centro Norte S.A.B. de C.V.Grupo Aeroportuario del Pacifico S.A.B. de C.V., Class BGrupo Aeroportuario del Sureste S.A.B. de C.V., ADRGrupo Aeroportuario del Sureste S.A.B. de C.V., Class BGrupo Cementos de Chihuahua S.A.B. de C.V.Grupo Comercial Chedraui S.A. de C.V.Grupo Famsa S.A.B. de C.V., Class A
* 2,025,569 342,870* 758,500 102,913
7,347,354 2,025,457# 2,990,700 839,550
2,082,300 261,4473,928,200 6,603,736
# 3,307,116 2,238,016* 328,100 26,595
165,700 31,269123,633 48,844
220,857,754
MEXICO — (2.9%)# 228,600 196,705Table of Contents
The Emerging Markets Small Cap SeriesCONTINUED
Shares Value»
MEXICO — (Continued)3,838,925 $ 4,148,673
#* 5,303,117 10,839,376#* 8,276,274 1,071,041# 4,125,890 7,752,830# 149,360 221,736* 347,496 469,644
4,045,245 6,723,165* 1,323 276# 9,098,066 1,899,016* 288,296 2,822,418* 2,046,089 2,002,981* 960,372 664,010
198,770 128,615# 6,116,168 9,213,947
875,200 2,628,7403 37
22,477 12,43373,341 53,388
# 1,879,321 2,150,59710,875 13,591
#* 642,287 206,122#* 3,768,186 27,790* 6,374 610* 7,232,006 6,611,689
8,288,277 6,807,513# 175,756 1,610,017#* 2,242,023 1,754,894# 3,445,190 21,170,469
200,911 2,016,056573 87,171
28,457 430,632# 1,420,710 7,588,487
3,084,315 4,628,786#* 2,173,528 636,279
Copyright © 2021 www.secdatabase.com. All Rights Reserved.Please Consider the Environment Before Printing This Document

Grupo GICSA SAB de CVGrupo Herdez S.A.B. de C.V., Series *Grupo Hotelero Santa Fe S.A.B. de C.V.Grupo Industrial Saltillo S.A.B. de C.V.Grupo KUO S.A.B. de C.V., Series BGrupo Lala S.A.B. de C.V.Grupo Pochteca S.A.B. de C.V.Grupo Posadas S.A.B. de C.V.Grupo Rotoplas S.A.B. de C.V.Grupo Sanborns S.A.B. de C.V.Grupo Simec S.A.B. de C.V., Series BGrupo Sports World S.A.B. de C.V.Grupo Traxion S.A.B. de C.V.Hoteles City Express S.A.B. de C.V.Industrias Bachoco S.A.B. de C.V., Sponsored ADRIndustrias Bachoco S.A.B. de C.V., Series BIndustrias CH S.A.B. de C.V.La Comer S.A.B. de C.V.Megacable Holdings S.A.B. de C.V.Minera Frisco S.A.B. de C.V., Class A1Nemak S.A.B. de C.V.Organizacion Cultiba S.A.B. de C.V.Organizacion Soriana S.A.B. de C.V., Class BPromotora y Operadora de Infraestructura S.A.B. de C.V.Promotora y Operadora de Infraestructura S.A.B. de C.V., Class L
Qualitas Controladora S.A.B. de C.V.Regional S.A.B. de C.V.Telesites S.A.B. de C.V.TV Azteca S.A.B. de C.V.Unifin Financiera S.A.B. de C.V. SOFOM ENRVitro S.A.B. de C.V., Series A
TOTAL MEXICO
8990 Holdings, Inc.A Soriano Corp.ACR Mining Corp.AgriNurture, Inc.Alsons Consolidated Resources, Inc.Apex Mining Co., Inc.Atlas Consolidated Mining & Development Corp.Belle Corp.Bloomberry Resorts Corp.Cebu Air, Inc.Cebu Holdings, Inc.CEMEX Holdings Philippines, Inc.Century Pacific Food, Inc.Century Properties Group, Inc.
#* 2,528,781 610,959# 1,987,643 4,169,500* 585,676 168,700
1,098,605 1,089,218758,658 1,860,249
# 1,449,519 1,569,501* 561,552 204,973#* 198,900 404,780# 902,602 649,972
905,924 969,092#* 1,190,255 3,447,089* 583,706 563,489* 317,143 233,177#* 2,729,384 2,716,032
29,505 1,585,3041,390,019 6,295,206
#* 1,935,098 6,356,502#* 4,473,101 5,368,538
2,841,643 12,053,860#* 2,242,920 310,155
5,681,527 2,594,135# 1,205,623 879,505#* 323,319 340,465# 1,067,217 9,606,415
23,763 145,067Table of Contents
The Emerging Markets Small Cap SeriesCONTINUED
Shares Value»
MEXICO — (Continued)1,852,570 $ 5,772,198
# 2,170,957 10,380,264#* 10,614,827 6,325,553# 12,114,652 986,177# 660,150 1,390,660
946,504 2,122,550
197,759,019
PHILIPPINES — (1.5%)3,073,500 953,8773,282,911 458,100
48,205 3,179* 1,969,700 554,227
7,226,000 187,509* 10,607,000 266,538* 6,148,000 329,956
31,568,400 1,400,35720,131,100 4,529,027
1,614,670 2,960,3773,294,900 392,391
* 10,620,600 609,3206,562,000 1,943,249
23,171,151 272,452
Copyright © 2021 www.secdatabase.com. All Rights Reserved.Please Consider the Environment Before Printing This Document

Chelsea Logistics and Infrastructure Holdings Corp.China Banking Corp.China Lotsynergy Holdings Ltd.Cirtek Holdings Philippines Corp.COL Financial Group, Inc.Cosco Capital, Inc.D&L Industries, Inc.DMCI Holdings, Inc.DoubleDragon Properties Corp.Eagle Cement Corp.East West Banking Corp.EEI Corp.Emperador, Inc.Empire East Land Holdings, Inc.Filinvest Development Corp.Filinvest Land, Inc.First Gen Corp.First Philippine Holdings Corp.Global Ferronickel Holdings, Inc.Global-Estate Resorts, Inc.Holcim Philippines, Inc.Integrated Micro-Electronics, Inc.Leisure & Resorts World Corp.Lepanto Consolidated Mining Co.Lopez Holdings Corp.MacroAsia Corp.Manila Water Co., Inc.Max's Group, Inc.Megawide Construction Corp.Metro Retail Stores Group, Inc.Nickel Asia Corp.Pepsi-Cola Products Philippines, Inc.Petron Corp.Philex Mining Corp.Philippine National BankPhilippine National Construction Corp.
Philippine Savings BankPhilippine Seven Corp.Philippine Stock Exchange, Inc. (The)Phinma Energy Corp.Phoenix Petroleum Philippines, Inc.Pilipinas Shell Petroleum Corp.Premium Leisure Corp.Puregold Price Club, Inc.PXP Energy Corp.RFM Corp.Rizal Commercial Banking Corp.
364,500 53,1312,739,328 1,445,9624,110,000 321,626
922,600 288,52792,200 33,744
17,361,800 2,336,32420,247,900 4,088,540
171,400 34,102* 4,396,890 2,089,441
515,100 146,817* 5,203,000 1,267,283
3,290,500 702,812* 7,259,700 1,073,667* 15,465,000 140,719
3,592,622 985,68394,629,577 3,526,70810,210,900 5,326,976
2,145,560 3,648,319* 13,305,294 376,080* 2,410,000 64,748
1,859,900 514,6383,915,614 729,363
* 2,134,640 150,270* 30,065,454 70,902
18,736,000 1,668,7473,808,560 1,449,8749,543,700 4,401,2802,604,800 715,7755,925,808 2,211,5525,654,900 299,918
16,192,600 802,22510,393,900 361,24515,485,800 1,685,253
5,473,700 367,190* 2,850,126 2,781,010* 173,000 3,124Table of Contents
The Emerging Markets Small Cap SeriesCONTINUED
Shares Value»
PHILIPPINES — (Continued)564,877 $ 661,910
6,350 18,646121,592 449,624
* 12,199,000 562,2942,243,580 528,1891,522,990 1,148,482
42,219,000 596,0834,681,700 4,170,523
* 5,474,100 1,090,5628,840,668 877,2013,896,052 2,349,891
Copyright © 2021 www.secdatabase.com. All Rights Reserved.Please Consider the Environment Before Printing This Document

Robinsons Land Corp.Robinsons Retail Holdings, Inc.San Miguel Food and Beverage, Inc.Security Bank Corp.Semirara Mining & Power Corp.Shakey's Pizza Asia Ventures, Inc.SSI Group, Inc.Starmalls, Inc.STI Education Systems Holdings, Inc.Top Frontier Investment Holdings, Inc.Travellers International Hotel Group, Inc.Union Bank Of PhilippinesVista Land & Lifescapes, Inc.Wilcon Depot, Inc.
TOTAL PHILIPPINES
AB SAAgora SAAlior Bank SAAlumetal SAAmica SAApator SAAsseco Poland SABank Handlowy w Warszawie SABank Ochrony Srodowiska SABioton SABoryszew SABudimex SACCC SACiech SACognor SAComArch SADom Development SAEcho Investment SAEnea SAEnerga SAEurocash SAFabryki Mebli Forte SAFamur SAFirma Oponiarska Debica SAGetin Holding SAGetin Noble Bank SAGlobe Trade Centre SAGrupa Azoty SAGrupa Azoty Zaklady Chemiczne Police SAGrupa Kety SAInter Cars SA
15,193,851 8,164,6352,272,860 3,544,7171,157,440 2,306,136
174,090 623,5033,898,700 1,760,484
274,900 74,6708,093,000 508,704
589,600 69,42419,394,000 270,243
* 2,580 13,1988,892,700 956,6931,467,341 1,736,781
40,523,000 6,083,0737,032,300 2,165,672
101,755,472
POLAND — (1.2%)* 2,202 10,823
272,784 862,290* 278,775 3,357,356
7,000 67,96522,493 682,38969,995 424,140
636,651 8,997,2032,330 31,690
* 39,255 78,303* 493,659 728,474* 848,419 977,191# 90,910 3,022,616
56,300 2,173,587248,318 2,531,114
* 53,176 22,47011,396 516,3398,295 166,716
# 141,860 170,243* 1,445,996 3,068,636* 1,192,335 2,247,082# 694,622 3,348,833* 120,485 820,622
1,106,166 1,306,51329,483 621,753
#* 751,114 217,496#* 2,585,838 300,078
471,596 1,159,90474,745 860,01776,751 279,34574,861 6,547,66940,888 2,081,396
Table of Contents
The Emerging Markets Small Cap SeriesCONTINUED
Shares Value»
POLAND — (Continued)
Copyright © 2021 www.secdatabase.com. All Rights Reserved.Please Consider the Environment Before Printing This Document

Jastrzebska Spolka Weglowa SAKernel Holding SAKRUK SALC Corp. SALentex SALubelski Wegiel Bogdanka SANetia SANeuca SANEWAG SAOrange Polska SAPfleiderer Group SAPKP Cargo SAPolnord SARafako SAStalexport Autostrady SAStalprodukt SATauron Polska Energia SATrakcja SAVRG SAWarsaw Stock ExchangeWawel SAZespol Elektrocieplowni Wroclawskich Kogeneracja SAZespol Elektrowni Patnow Adamow Konin SA
TOTAL POLAND
Etalon Group P.L.C., GDRGlobaltrans Investment P.L.C., GDRMagnitogorsk Iron & Steel Works PJSC, GDRMail.Ru Group, Ltd., GDRMechel PJSC, Sponsored ADRPhosAgro PJSC, GDRRos Agro P.L.C., GDRRostelecom PJSC, Sponsored ADRRusHydro PJSC, ADRTMK PJSC, GDRVEON, Ltd.
TOTAL RUSSIA
Pacc Offshore Services Holdings, Ltd.
Adcock Ingram Holdings, Ltd.Adcorp Holdings, Ltd.Advtech, Ltd.AECI, Ltd.African Oxygen, Ltd.African Phoenix Investments, Ltd.African Rainbow Minerals, Ltd.Afrimat, Ltd.Alexander Forbes Group Holdings, Ltd.Allied Electronics Corp., Ltd., Class AAlviva Holdings, Ltd.ArcelorMittal South Africa, Ltd.Ascendis Health, Ltd.
#* 177,684 $ 1,784,620393,572 4,911,799132,292 6,311,914
1,533,137 1,094,688116,123 219,856
# 74,454 706,101* 1,046,440 1,263,219
6,154 490,669* 522 2,435* 4,151,458 7,218,115# 26,161 188,969# 159,033 1,382,594* 257,729 369,185#* 524,953 241,432
633,273 566,0159,458 512,547
#* 6,946,481 2,826,08479,546 49,162
1,458,170 1,632,198170,024 1,703,069
2,022 333,008672 5,931
91,906 190,386
81,684,249
RUSSIA — (0.1%)250,803 554,275224,184 1,968,336
5,140 44,924* 40,783 1,040,782* 51,323 107,778
44,812 558,80624,853 287,79843,902 338,045
137,998 116,125131,503 474,068415,086 1,299,219
6,790,156
SINGAPORE — (0.0%)* 538,856 59,145
SOUTH AFRICA — (7.0%)607,733 2,416,685
* 903,638 1,477,4064,028,440 3,558,9931,186,561 7,723,3621,006,967 1,496,561
#* 5,869,014 281,2361,230,107 15,152,952
268,204 652,1865,966,832 2,336,208
857,016 1,657,4811,347,307 1,518,799
* 1,929,062 322,892#* 1,529,922 532,732
Copyright © 2021 www.secdatabase.com. All Rights Reserved.Please Consider the Environment Before Printing This Document

Assore, Ltd.Astral Foods, Ltd.
Aveng, Ltd.AVI, Ltd.Barloworld, Ltd.Blue Label Telecoms, Ltd.Brait SECashbuild, Ltd.Caxton and CTP Publishers and Printers, Ltd.City Lodge Hotels, Ltd.Clicks Group, Ltd.Clover Industries, Ltd.Coronation Fund Managers, Ltd.Curro Holdings, Ltd.DataTec, Ltd.Dis-Chem Pharmacies, Ltd.Distell Group Holdings, Ltd.DRDGOLD, Ltd.enX Group, Ltd.EOH Holdings, Ltd.Famous Brands, Ltd.Foschini Group, Ltd. (The)Gold Fields, Ltd.Gold Fields, Ltd., Sponsored ADRGrand Parade Investments, Ltd.Grindrod Shipping Holdings, Ltd.Grindrod, Ltd.Harmony Gold Mining Co., Ltd.Harmony Gold Mining Co., Ltd., Sponsored ADRHudaco Industries, Ltd.Hulamin, Ltd.Impala Platinum Holdings, Ltd.Imperial Logistics, Ltd.Invicta Holdings, Ltd.Italtile, Ltd.JSE, Ltd.KAP Industrial Holdings, Ltd.Lewis Group, Ltd.Liberty Holdings, Ltd.Life Healthcare Group Holdings, Ltd.Long4Life, Ltd.Massmart Holdings, Ltd.Merafe Resources, Ltd.Metair Investments, Ltd.MiX Telematics, Ltd.MiX Telematics, Ltd., Sponsored ADRMomentum Metropolitan Holdings
114,579 2,794,011418,370 4,800,835
Table of Contents
The Emerging Markets Small Cap SeriesCONTINUED
Shares Value»
SOUTH AFRICA — (Continued)* 49,342,489 $ 102,904
3,472,270 21,007,5082,389,068 20,027,369
#* 4,108,900 1,048,598#* 2,007,780 1,655,315
202,014 3,733,564323,754 169,037316,950 2,537,663
1,541,817 21,897,524# 1,360,664 2,188,613
2,019,773 5,896,9381,016,595 1,577,9663,529,201 8,272,579
# 1,668,172 2,633,633362,716 3,370,117
* 1,729,522 564,508* 408,074 341,394#* 1,103,441 1,365,488# 696,100 4,425,734# 1,261,155 14,506,550
1,398,586 7,143,1482,024,601 10,224,235
* 3,013,383 607,276#* 123,682 718,928# 5,036,349 2,113,809* 2,428,144 6,015,425#* 2,323,915 5,670,353
278,331 2,269,1951,369,904 243,998
#* 5,947,577 31,729,418850,373 2,695,761
# 370,489 612,416640,451 585,540
# 963,148 8,606,46013,007,430 4,683,504
950,293 2,153,822# 1,295,429 9,797,480
8,269,032 13,018,529* 3,324,904 1,049,717# 947,929 3,379,495
11,617,602 980,9571,506,648 2,491,463
37,895 23,59827,358 409,276
8,391,793 9,881,211
Copyright © 2021 www.secdatabase.com. All Rights Reserved.Please Consider the Environment Before Printing This Document

Motus Holdings Ltd.Mpact, Ltd.Murray & Roberts Holdings, Ltd.Nampak, Ltd.Net 1 UEPS Technologies, Inc.Netcare, Ltd.Northam Platinum, Ltd.Oceana Group, Ltd.Omnia Holdings, Ltd.Peregrine Holdings, Ltd.Pick n Pay Stores, Ltd.Pioneer Foods Group, Ltd.PPC, Ltd.PSG Konsult, Ltd.
Raubex Group, Ltd.RCL Foods, Ltd.Reunert, Ltd.Rhodes Food Group Pty, Ltd.Royal Bafokeng Platinum, Ltd.Santam, Ltd.Sappi, Ltd.Sibanye Gold, Ltd.SPAR Group, Ltd. (The)Spur Corp., Ltd.Stadio Holdings, Ltd.Sun International, Ltd.Super Group, Ltd.Telkom SA SOC, Ltd.Tiger Brands, Ltd.Tongaat Hulett, Ltd.Transaction Capital, Ltd.Trencor, Ltd.Truworths International, Ltd.Tsogo Sun Gaming, Ltd.Wilson Bayly Holmes-Ovcon, Ltd.
TOTAL SOUTH AFRICA
3S Korea Co., Ltd.ABco Electronics Co., Ltd.Able C&C Co., Ltd.ABOV Semiconductor Co., Ltd.Ace Technologies Corp.Actoz Soft Co., Ltd.ADTechnology Co., Ltd.Advanced Cosmeceutical Technology Co., Ltd.Advanced Digital Chips, Inc.Advanced Nano Products Co., Ltd.
# 228,887 1,179,303# 1,678,378 2,651,708
3,959,853 3,181,334* 6,091,752 4,226,226* 776 3,151
3,254,874 3,795,233* 3,302,942 14,503,352# 419,669 1,993,279# 669,020 1,572,220# 2,040,460 2,620,657
3,803,930 17,690,200902,282 6,473,054
#* 15,053,969 5,110,663337,091 221,512
Table of Contents
The Emerging Markets Small Cap SeriesCONTINUED
Shares Value»
SOUTH AFRICA — (Continued)1,443,850 $ 1,925,312
716,485 519,9331,703,323 7,730,620
# 695,531 824,622#* 871,533 2,057,480
370,038 7,617,690892,481 3,236,375
* 9,471,405 11,713,3851,926,541 24,625,294
620,797 939,258#* 754,869 157,558* 1,300,826 4,193,546#* 3,691,892 7,610,169
2,845,745 16,991,96924,786 383,682
1,012,167 932,1641,967,372 3,154,543
* 1,407,311 2,420,028# 4,172,160 18,065,160
3,699,806 3,624,037504,590 4,058,213
479,153,285
SOUTH KOREA — (14.2%)#* 312,236 799,805# 76,717 319,770#* 71,247 599,473# 100,505 495,951#* 190,914 1,580,747#* 45,880 482,668# 56,104 680,208#* 97,584 277,138#* 169,506 223,472# 63,367 928,148
Copyright © 2021 www.secdatabase.com. All Rights Reserved.Please Consider the Environment Before Printing This Document

Advanced Process Systems Corp.Aekyung Petrochemical Co., Ltd.AfreecaTV Co., Ltd.Agabang&CompanyAhn-Gook Pharmaceutical Co., Ltd.Ahnlab, Inc.AIBIT Co., Ltd.AJ Networks Co., Ltd.AJ Rent A Car Co., Ltd.Ajin Industrial Co., Ltd.AJINEXTEK Co., Ltd.AK Holdings, Inc.Alticast Corp.ALUKO Co., Ltd.Aminologics Co., Ltd.Amotech Co., Ltd.Anam Electronics Co., Ltd.Ananti, Inc.Anapass, Inc.Aprogen Healthcare & Games, Inc.Aprogen KIC, Inc.Aprogen pharmaceuticals, Inc.APS Holdings Corp.Arion Technology, Inc.Asia Cement Co., Ltd.
ASIA Holdings Co., Ltd.Asia Paper Manufacturing Co., Ltd.Asiana Airlines, Inc.Atec Co., Ltd.A-Tech Solution Co., Ltd.Atinum Investment Co., Ltd.AUK Corp.Aurora World Corp.Austem Co., Ltd.Autech Corp.Avaco Co., Ltd.Avatec Co., Ltd.Baiksan Co., Ltd.Barun Electronics Co., Ltd.Barunson Entertainment & Arts Corp.Bcworld Pharm Co., Ltd.BG T&A Co.BGF Co., Ltd.BH Co., Ltd.Binex Co., Ltd.Binggrae Co., Ltd.Biolog Device Co., Ltd.
# 95,837 1,889,923# 119,874 764,625# 66,705 3,250,144#* 236,156 571,111# 58,793 465,410
48,995 2,244,584#* 255,720 155,108# 99,527 392,196* 96,956 842,338#* 102,112 277,758
31,359 186,14242,819 1,479,739
* 73,734 131,866# 348,822 678,983#* 464,945 662,404* 67,963 1,072,642#* 631,352 1,260,314#* 270,016 2,613,682# 69,107 1,718,318#* 348,018 165,824#* 115,172 215,261#* 901,560 653,228#* 269,479 1,729,820#* 129,146 77,660# 15,152 1,034,832Table of Contents
The Emerging Markets Small Cap SeriesCONTINUED
Shares Value»
SOUTH KOREA — (Continued)9,785 $ 886,154
40,601 1,120,397* 814,156 3,959,445# 15,058 113,904#* 36,321 234,763# 278,681 423,337# 214,954 362,836# 45,949 479,354# 172,157 336,055# 110,722 957,677# 99,159 474,266
5,446 36,183# 85,242 506,725#* 545,499 72,274#* 180,998 228,945# 43,184 531,251# 46,993 97,959
166,931 872,024#* 190,780 2,922,977* 224,974 1,602,500
53,949 2,967,522#* 126,061 192,417
Copyright © 2021 www.secdatabase.com. All Rights Reserved.Please Consider the Environment Before Printing This Document

BioSmart Co., Ltd.Biotoxtech Co., Ltd.Biovill Co., Ltd.BIT Computer Co., Ltd.Bixolon Co., Ltd.Bluecom Co., Ltd.Boditech Med, Inc.Bohae Brewery Co., Ltd.BoKwang Industry Co., Ltd.Bolak Co., Ltd.Bookook Securities Co., Ltd.Boryung Medience Co., Ltd.Boryung Pharmaceutical Co., Ltd.Bosung Power Technology Co., Ltd.Brain Contents Co., Ltd.Bubang Co., Ltd.Bukwang Pharmaceutical Co., Ltd.Busan City Gas Co., Ltd.BYC Co., Ltd.BYON Co., Ltd.Byucksan Corp.CammSys Corp.Capro Corp.Caregen Co., Ltd.Castec Korea Co., Ltd.Cell Biotech Co., Ltd.Changhae Ethanol Co., Ltd.Charm Engineering Co., Ltd.Chemtronics Co., Ltd.Chemtros Co., Ltd.Cheryong Electric Co., Ltd.Cheryong Industrial Co. Ltd/newChinHung International, Inc.Chinyang Holdings Corp.Choa Pharmaceutical Co.Chokwang Leather Co., Ltd.Chokwang Paint, Ltd.
Chong Kun Dang Pharmaceutical Corp.Chongkundang Holdings Corp.Choong Ang Vaccine LaboratoryChorokbaem Media Co., Ltd.Chosun Refractories Co., Ltd.Chungdahm Learning, Inc.CJ CGV Co., Ltd.CJ Freshway Corp.CJ Hello Co., Ltd.CJ Seafood Corp.
* 141,602 574,843#* 93,297 522,567#* 187,949 194,804#* 115,979 425,102# 91,886 417,281#* 96,226 279,582# 123,359 958,742#* 576,129 543,829# 108,320 307,861# 325,449 531,494
14,493 245,901#* 53,361 326,953# 246,940 2,426,555#* 420,174 660,834#* 844,733 545,542#* 189,863 526,169# 234,390 3,033,802# 7,115 219,283# 1,007 190,639#* 424,660 415,105# 357,349 613,544#* 340,736 626,800
305,670 900,88927,611 1,339,0097,540 18,989
# 45,843 683,59050,474 558,038
#* 307,521 292,315#* 71,610 561,584#* 103,775 416,430# 92,994 460,537# 59,347 277,727#* 234,602 414,739
167,246 348,501#* 203,262 635,993#* 607 18,373# 44,694 217,793Table of Contents
The Emerging Markets Small Cap SeriesCONTINUED
Shares Value»
SOUTH KOREA — (Continued)59,737 $4,383,445
# 25,229 2,206,056# 67,796 995,060#* 344,008 426,624# 7,263 509,181# 44,088 640,149
112,076 3,203,772# 46,771 1,175,070
212,558 1,070,846#* 186,914 373,290
Copyright © 2021 www.secdatabase.com. All Rights Reserved.Please Consider the Environment Before Printing This Document

CKD Bio Corp.Clean & Science Co., Ltd.CLIO Cosmetics Co., Ltd.CMG Pharmaceutical Co., Ltd.Codes Combine Co., Ltd.CODI-M Co., Ltd.Com2uSCorpCommax Co., Ltd.Coreana Cosmetics Co., Ltd.Cosmax BTI, Inc.COSMAX NBT Inc.Cosmax, Inc.Cosmecca Korea Co., Ltd.CosmoAM&T Co., Ltd.Cosmochemical Co., Ltd.COSON Co., Ltd.COWELL FASHION Co., Ltd.Creative & Innovative SystemCrown Confectionery Co., Ltd.CROWNHAITAI Holdings Co., Ltd.CrucialTec Co., Ltd.CS Wind Corp.CTC BIO, Inc.CTGen Co., Ltd.Cuckoo Holdings Co., Ltd.Cuckoo Homesys Co., Ltd.Curexo, Inc.Curo Co., Ltd.CUROCOM Co., Ltd.Curoholdings Co., Ltd.Cymechs, Inc.D.I Corp.DA Technology Co., Ltd.Dae Dong Industrial Co., Ltd.Dae Han Flour Mills Co., Ltd.Dae Hwa Pharmaceutical Co., Ltd.Dae Hyun Co., Ltd.Dae Won Chemical Co., Ltd.Dae Won Kang Up Co., Ltd.Dae Young Packaging Co., Ltd.Daea TI Co., Ltd.Daebongls Co., Ltd.Daechang Co., Ltd.Daechang Forging Co., Ltd.Daeduck Electronics Co.Daegu Department StoreDaehan New Pharm Co., Ltd.Daehan Steel Co., Ltd.Dae-Il Corp.
# 30,880 750,029# 33,856 557,596#* 33,489 528,663#* 743,101 1,647,498#* 76,049 197,941#* 997,941 454,720
38,737 2,872,394# 70,961 216,726#* 215,426 581,739# 36,404 535,971
98,646 673,899# 63,464 5,450,637# 46,298 633,667#* 104,108 1,006,385#* 87,632 660,033#* 134,276 701,075# 220,371 1,208,527#* 281,148 567,532# 39,940 293,948# 55,967 548,651#* 523,029 411,391# 46,867 1,305,871#* 158,918 778,143#* 190,033 314,816# 10,065 1,011,517# 36,691 1,376,112* 4,005 20,302#* 696,561 434,557#* 334,192 278,591#* 423,171 199,618
44,360 277,115# 212,639 588,241#* 303,365 673,402# 106,425 461,681
7,679 1,207,447107,045 1,179,147
# 223,934 471,137#* 266,508 311,713# 163,574 546,376#* 599,323 560,714
573,971 2,322,090# 61,042 339,413# 314,932 318,791# 8,880 299,127
482,225 4,149,21931,479 151,845
#* 88,866 768,459# 106,579 595,648# 109,136 290,410Table of Contents
The Emerging Markets Small Cap SeriesCONTINUED
Shares Value»
Copyright © 2021 www.secdatabase.com. All Rights Reserved.Please Consider the Environment Before Printing This Document

Daejoo Electronic Materials Co., Ltd.Daekyo Co., Ltd.Daelim B&Co Co., Ltd.Daelim C&S Co., Ltd.Daemyung Corp. Co., Ltd.Daeryuk Can Co., Ltd.Daesang Corp.Daesang Holdings Co., Ltd.Daesung Energy Co., Ltd.Daesung Holdings Co., Ltd.Daesung Industrial Co., Ltd.Daesung Private Equity, Inc.Daewon Cable Co., Ltd.Daewon Media Co., Ltd.Daewon Pharmaceutical Co., Ltd.Daewon San Up Co., Ltd.Daewoo Electronic Components Co., Ltd.Daewoong Co., Ltd.Dahaam E-Tec Co., Ltd.Daihan Pharmaceutical Co., Ltd.Daishin Securities Co., Ltd.Daiyang Metal Co., Ltd.Danal Co., Ltd.Danawa Co., Ltd.Daou Data Corp.Daou Technology, Inc.Dasan Networks, Inc.Dawonsys Co., Ltd.DAYLI BlockChian Co., Ltd.Dayou Automotive Seat Technology Co., Ltd.Dayou Plus Co., Ltd.DB Financial Investment Co., Ltd.DB HiTek Co., Ltd.DB, Inc.DCM Corp.Dentium Co., Ltd.Deutsch Motors, Inc.Development Advance Solution Co., Ltd.DHP Korea Co., Ltd.DI Dong Il Corp.Digital Chosun Co., Ltd.Digital Daesung Co., Ltd.Digital Optics Co., Ltd.Digital Power Communications Co., Ltd.DIO Corp.Diostech Co., Ltd.Display Tech Co., Ltd.DMS Co., Ltd.DNF Co., Ltd.Dohwa Engineering Co., Ltd.Dong A Eltek Co., Ltd.Dong Ah Tire & Rubber Co., Ltd.Dong-A Socio Holdings Co., Ltd.
SOUTH KOREA — (Continued)#* 81,087 $1,275,692
228,026 1,179,113# 95,813 316,879* 7,531 55,803#* 502,743 742,875# 102,149 403,707
207,553 4,170,255# 134,689 784,261# 65,638 298,196# 26,734 175,497#* 83,195 287,102* 59,602 74,599#* 428,874 403,680# 69,938 392,933# 117,501 1,453,254# 104,480 529,254#* 278,267 509,383
211,442 2,758,254* 2,100 56,622
37,280 1,049,176287,137 2,868,171
* 2,014 12,682#* 400,227 974,763# 56,288 1,041,744# 153,929 1,101,250# 257,258 4,411,039#* 162,841 991,596
167,481 1,918,521#* 47,181 32,789#* 461,278 351,295#* 443,110 302,707
269,937 1,039,611293,840 3,262,144
* 904,150 607,105# 42,882 421,219
40,266 2,312,885#* 165,401 1,238,433# 68,749 340,243# 94,291 569,368
7,217 437,484208,832 434,753
# 73,064 492,363#* 63,634 34,118# 286,332 1,147,922* 97,850 3,352,466#* 550,695 265,906# 52,616 166,286
154,330 646,497# 71,182 426,784# 60,443 452,803# 73,971 515,592# 44,790 461,202
20,129 1,484,383
Copyright © 2021 www.secdatabase.com. All Rights Reserved.Please Consider the Environment Before Printing This Document
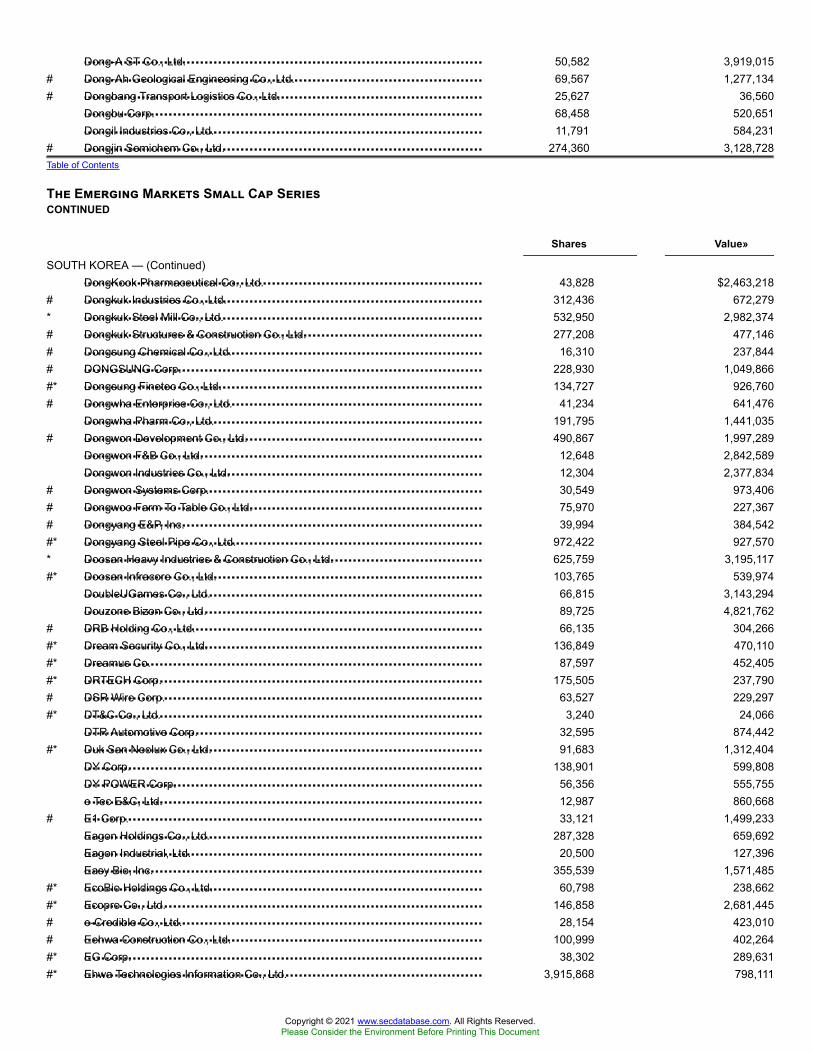
Dong-A ST Co., Ltd.Dong-Ah Geological Engineering Co., Ltd.Dongbang Transport Logistics Co., Ltd.Dongbu Corp.Dongil Industries Co., Ltd.Dongjin Semichem Co., Ltd.
DongKook Pharmaceutical Co., Ltd.Dongkuk Industries Co., Ltd.Dongkuk Steel Mill Co., Ltd.Dongkuk Structures & Construction Co., Ltd.Dongsung Chemical Co., Ltd.DONGSUNG Corp.Dongsung Finetec Co., Ltd.Dongwha Enterprise Co., Ltd.Dongwha Pharm Co., Ltd.Dongwon Development Co., Ltd.Dongwon F&B Co., Ltd.Dongwon Industries Co., Ltd.Dongwon Systems Corp.Dongwoo Farm To Table Co., Ltd.Dongyang E&P, Inc.Dongyang Steel Pipe Co., Ltd.Doosan Heavy Industries & Construction Co., Ltd.Doosan Infracore Co., Ltd.DoubleUGames Co., Ltd.Douzone Bizon Co., Ltd.DRB Holding Co., Ltd.Dream Security Co., Ltd.Dreamus Co.DRTECH Corp.DSR Wire Corp.DT&C Co., Ltd.DTR Automotive Corp.Duk San Neolux Co., Ltd.DY Corp.DY POWER Corp.e Tec E&C, Ltd.E1 Corp.Eagon Holdings Co., Ltd.Eagon Industrial, Ltd.Easy Bio, Inc.EcoBio Holdings Co., Ltd.Ecopro Co., Ltd.e-Credible Co., Ltd.Eehwa Construction Co., Ltd.EG Corp.Ehwa Technologies Information Co., Ltd.
50,582 3,919,015# 69,567 1,277,134# 25,627 36,560
68,458 520,65111,791 584,231
# 274,360 3,128,728Table of Contents
The Emerging Markets Small Cap SeriesCONTINUED
Shares Value»
SOUTH KOREA — (Continued)43,828 $2,463,218
# 312,436 672,279* 532,950 2,982,374# 277,208 477,146# 16,310 237,844# 228,930 1,049,866#* 134,727 926,760# 41,234 641,476
191,795 1,441,035# 490,867 1,997,289
12,648 2,842,58912,304 2,377,834
# 30,549 973,406# 75,970 227,367# 39,994 384,542#* 972,422 927,570* 625,759 3,195,117#* 103,765 539,974
66,815 3,143,29489,725 4,821,762
# 66,135 304,266#* 136,849 470,110#* 87,597 452,405#* 175,505 237,790# 63,527 229,297#* 3,240 24,066
32,595 874,442#* 91,683 1,312,404
138,901 599,80856,356 555,75512,987 860,668
# 33,121 1,499,233287,328 659,692
20,500 127,396355,539 1,571,485
#* 60,798 238,662#* 146,858 2,681,445# 28,154 423,010# 100,999 402,264#* 38,302 289,631#* 3,915,868 798,111
Copyright © 2021 www.secdatabase.com. All Rights Reserved.Please Consider the Environment Before Printing This Document

Elcomtec Co., Ltd.Elentec Co., Ltd.e-LITECOM Co., Ltd.ELK Corp.EMKOREA Co., Ltd.EM-Tech Co., Ltd.EMW Co., Ltd.Enerzent Co., Ltd.Enex Co., Ltd.ENF Technology Co., Ltd.Eo Technics Co., Ltd.Estechpharma Co., Ltd.ESTsoft Corp.ESV, Inc.E-TRON Co., Ltd.Eugene Corp.Eugene Investment & Securities Co., Ltd.Eugene Technology Co., Ltd.
Eusu Holdings Co., Ltd.EVERDIGM Corp.E-WorldEXA E&C, Inc.Exem Co., Ltd.Ezwelfare Co., Ltd.F&F Co., Ltd.FarmscoFarmStory Co., Ltd.Feelingk Co., Ltd.Feelux Co., Ltd.Fine DNC Co., Ltd.Fine Semitech Corp.Fine Technix Co., Ltd.Firstec Co., Ltd.FN Republic Co., Ltd.FNC Entertainment Co., Ltd.Foosung Co., Ltd.Fourth-Link, Inc.Fursys, Inc.Futurestream Networks Co., Ltd.Gabia, Inc.Galaxia Communications Co., Ltd.Gamevil, Inc.Gaon Cable Co., Ltd.Genic Co., Ltd.Genie Music Corp.Geumhwa PSC Co., Ltd.Gigalane Co., Ltd.
# 261,529 322,468#* 112,258 566,504# 36,695 147,347#* 192,381 95,979* 236,062 1,039,939# 101,917 1,008,333#* 204,411 180,119#* 224,980 179,286# 312,464 292,307# 84,532 1,377,715
69,018 4,122,975# 86,130 465,972#* 31,344 202,002#* 46,918 9,152#* 1,491,477 508,944
401,637 1,704,870588,034 1,166,628
# 119,738 1,115,660Table of Contents
The Emerging Markets Small Cap SeriesCONTINUED
Shares Value»
SOUTH KOREA — (Continued)* 119,655 $ 678,235# 87,678 355,944#* 84,101 201,924#* 69,546 121,953#* 152,435 360,325# 45,722 314,211# 56,694 3,305,936# 155,877 671,697#* 433,269 340,319#* 315,573 310,360#* 283,759 1,194,237# 103,000 149,235# 39,942 239,120#* 216,885 236,461#* 209,199 348,835#* 328,447 325,513* 3,147 17,923#* 443,577 3,297,599#* 52,309 48,414# 16,042 411,374#* 16,175 17,101# 61,787 435,157# 102,339 275,589* 45,010 1,362,614# 23,823 345,773#* 42,514 204,087#* 275,927 804,145# 6,842 182,403#* 267,290 345,485
Copyright © 2021 www.secdatabase.com. All Rights Reserved.Please Consider the Environment Before Printing This Document

Globon Co., Ltd.GMB Korea Corp.GMP Co., Ltd.GnCenergy Co., Ltd.GNCO Co., Ltd.GOLFZON Co., Ltd.Golfzon Newdin Holdings Co., Ltd.Good People Co., Ltd.Grand Korea Leisure Co., Ltd.Green Cross Cell Corp.Green Cross Corp.Green Cross Holdings Corp.GS Global Corp.GS Home Shopping, Inc.G-SMATT GLOBAL Co., Ltd.Gwangju Shinsegae Co., Ltd.GY Commerce Co., Ltd.Haatz, Inc.Hae In Corp.HAESUNG DS Co., Ltd.Haesung Industrial Co., Ltd.Haimarrow Food Service Co., Ltd.Haitai Confectionery & Foods Co., Ltd.Halla Corp.Halla Holdings Corp.Han Chang Corp.Han Kuk Carbon Co., Ltd.Hana Micron, Inc.Hana Tour Service, Inc.Hancom MDS, Inc.
Hancom, Inc.Handok, Inc.Handsome Co., Ltd.Hanil Cement Co., Ltd.Hanil Holdings Co., Ltd.Hanil Hyundai Cement Co., Ltd.Hanil Vacuum Co., Ltd.Hanjin Heavy Industries & Construction Co., Ltd.Hanjin Heavy Industries & Construction Holdings Co., Ltd.Hanjin Kal Corp.Hanjin Transportation Co., Ltd.Hankook AtlasBX Co., Ltd.Hankook Corp., Inc.Hankook Cosmetics Co., Ltd.Hankook Cosmetics Manufacturing Co., Ltd.Hankook Shell Oil Co., Ltd.Hankook Technology, Inc.
* 29,365 82,482# 72,543 318,979* 59,009 486,226
26,859 106,051#* 669,569 613,089# 25,135 1,502,478# 196,366 757,408#* 190,533 725,876
57,512 898,71748,667 1,534,650
712 64,26262,225 1,025,671
392,336 804,74827,767 3,921,989
#* 535,408 235,0253,808 556,248
#* 149,142 53,182# 24,715 112,021# 49,750 187,262
78,229 850,822# 24,140 203,268# 166,776 345,082
64,176 464,547#* 161,986 428,420
83,403 3,014,762#* 97,030 225,726# 235,377 1,434,759# 153,881 500,866# 88,250 3,209,235# 48,897 480,308Table of Contents
The Emerging Markets Small Cap SeriesCONTINUED
Shares Value»
SOUTH KOREA — (Continued)145,599 $1,350,842
# 57,637 1,145,574136,149 4,266,489
# 15,772 1,400,606# 12,939 538,314# 20,842 512,340#* 342,149 286,815#* 135,637 564,271#* 83,704 214,888
55,708 1,211,833# 78,949 2,065,366# 1,212 56,295* 9,559 16,612* 75,730 512,525# 15,453 310,049
5,573 1,504,244#* 79,500 72,450
Copyright © 2021 www.secdatabase.com. All Rights Reserved.Please Consider the Environment Before Printing This Document

Hankuk Paper Manufacturing Co., Ltd.Hankuk Steel Wire Co., Ltd.Hanla IMS Co., Ltd.Hanmi Semiconductor Co., Ltd.HanmiGlobal Co., Ltd.Hans Biomed Corp.Hansae Co., Ltd.Hansae MK Co., Ltd.Hansae Yes24 Holdings Co., Ltd.Hanshin ConstructionHanshin Machinery Co.Hansol Chemical Co., Ltd.Hansol Holdings Co., Ltd.Hansol HomeDeco Co., Ltd.Hansol Paper Co., Ltd.Hansol Technics Co., Ltd.Hanwha Galleria Timeworld Co., Ltd.Hanwha General Insurance Co., Ltd.Hanwha Investment & Securities Co., Ltd.Hanyang Eng Co., Ltd.Hanyang Securities Co., Ltd.Harim Co., Ltd.Harim Holdings Co., Ltd.HB Technology Co., Ltd.HDC Holdings Co., Ltd.HDC Hyundai Engineering Plastics Co., Ltd.HDC I-Controls Co., Ltd.Heung-A Shipping Co., Ltd.Heungkuk Fire & Marine Insurance Co., Ltd.High Tech Pharm Co., Ltd.Hisem Co., Ltd.Hite Jinro Co., Ltd.Hitejinro Holdings Co., Ltd.HizeAero Co., Ltd.HJ Magnolia Yongpyong Hotel & Resort Corp.HLB Life Science Co., Ltd.HLB POWER Co., Ltd.Home Center Holdings Co., Ltd.Homecast Co., Ltd.HS Industries Co., Ltd.HS R&A Co., Ltd.HSD Engine Co., Ltd.
Huayi Brothers Korea Co., Ltd.Huchems Fine Chemical Corp.Humax Co., Ltd.Humedix Co., Ltd.Huneed Technologies
24,759 378,870#* 58,735 119,208# 41,360 244,322# 200,357 1,100,290# 61,991 455,815# 63,593 1,226,919
162,631 2,583,35542,409 177,665
# 98,521 630,279# 63,914 844,698# 232,826 317,787
75,358 5,153,249* 374,793 1,345,348# 617,459 620,006
147,650 1,757,690#* 221,290 1,299,806# 14,252 218,910
469,248 1,379,822* 1,048,893 1,895,439# 86,681 833,735
41,592 247,036#* 393,831 894,631
177,913 1,532,492# 465,974 1,119,164
220,087 2,308,572140,395 643,124
# 43,044 338,916#* 729,772 312,089#* 326,723 1,077,042# 28,011 289,211* 71,606 314,531
171,410 3,071,373# 67,271 605,670
9,927 42,884162,717 897,056
* 38,917 218,998#* 266,189 180,702#* 524,561 475,584#* 247,449 1,020,315
348,186 2,488,765# 262,709 416,875#* 177,715 466,546Table of Contents
The Emerging Markets Small Cap SeriesCONTINUED
Shares Value»
SOUTH KOREA — (Continued)#* 77,945 $ 165,437
192,778 3,693,135* 128,191 562,469# 48,722 872,255* 85,643 505,586
Copyright © 2021 www.secdatabase.com. All Rights Reserved.Please Consider the Environment Before Printing This Document

Huons Co., Ltd.Huons Global Co., Ltd.Husteel Co., Ltd.Huvis Corp.Huvitz Co., Ltd.Hwa Shin Co., Ltd.Hwacheon Machine Tool Co., Ltd.Hwail Pharm Co., Ltd.Hwajin Co., Ltd.Hwangkum Steel & Technology Co., Ltd.HWASEUNG ENTERPRISE CO LTDHwaSung Industrial Co., Ltd.Hy-Lok Corp.Hyosung ONB Co., Ltd.HyosungITX Co., Ltd.Hyulim ROBOT Co., Ltd.Hyundai Bioscience Co LtdHyundai BNG Steel Co., Ltd.Hyundai Construction Equipment Co., Ltd.Hyundai Corp Holdings, Inc.Hyundai Corp.Hyundai Electric & Energy System Co., Ltd.Hyundai Greenfood Co., Ltd.Hyundai Home Shopping Network Corp.Hyundai Hy Communications & Networks Co., Ltd.Hyundai Livart Furniture Co., Ltd.Hyundai Merchant Marine Co., Ltd.Hyundai Motor Securities Co., Ltd.Hyundai Pharmaceutical Co., Ltd.Hyundai Telecommunication Co., Ltd.Hyundai Wia Corp.HyVision System, Inc.I&C Technology Co., Ltd.i3system, Inc.iA, Inc.ICD Co., Ltd.i-Components Co., Ltd.IDIS Holdings Co., Ltd.IHQ, Inc.Il Dong Pharmaceutical Co., Ltd.IlDong Holdings Co., Ltd.Iljin Diamond Co., Ltd.Iljin Display Co., Ltd.Iljin Electric Co., Ltd.Iljin Holdings Co., Ltd.Ilshin Spinning Co., Ltd.Ilshin Stone Co., Ltd.ilShinbiobase Co., Ltd.Ilsung Pharmaceuticals Co., Ltd.Ilyang Pharmaceutical Co., Ltd.IM Co., Ltd.iMarketKorea, Inc.In the F Co., Ltd.InBody Co., Ltd.
49,924 2,063,45851,418 1,376,486
# 20,207 181,406# 124,216 717,380# 92,612 720,137
153,608 314,5166,481 233,796
# 76,780 378,413#* 195,001 189,133
76,268 491,306# 30,488 332,408
80,662 884,301# 79,256 1,215,575#* 15,415 89,772# 27,938 223,449#* 547,191 415,526#* 290,847 3,150,651# 85,455 602,331# 88,920 2,323,509# 54,532 538,925
65,699 1,075,855* 31,492 363,374
314,062 3,281,05642,667 3,361,435
332,548 1,004,016# 115,728 1,512,736* 1,336,905 3,719,157
150,588 1,298,741# 192,135 725,899
26,501 204,206111,526 4,057,904
# 91,380 635,279#* 56,987 232,279# 36,390 634,731#* 1,198,542 592,359# 107,499 1,038,673* 35,217 206,140
1,320 12,808# 535,723 813,731
75,754 1,097,250# 34,859 376,931# 41,385 1,071,203# 147,030 488,424#* 143,914 337,179# 198,059 476,002# 11,884 898,529#* 420,824 1,003,467# 281,686 370,413# 4,137 305,576* 92,098 1,817,171#* 267,965 248,162
160,012 1,583,295#* 76,193 199,811
77,587 1,602,428
Copyright © 2021 www.secdatabase.com. All Rights Reserved.Please Consider the Environment Before Printing This Document

INCON Co., Ltd.Incross Co., Ltd.Infinitt Healthcare Co., Ltd.InfoBank Corp.Infraware, Inc.INITECH Co., Ltd.InkTec Co., Ltd.Innocean Worldwide, Inc.InnoWireless, Inc.Innox Advanced Materials Co., Ltd.Inscobee, Inc.Insun ENT Co., Ltd.Insung Information Co., Ltd.Intelligent Digital Integrated Security Co., Ltd.Interflex Co., Ltd.Intergis Co., Ltd.Interojo Co., Ltd.Interpark Corp.Interpark Holdings Corp.INTOPS Co., Ltd.INVENIA Co., Ltd.Inzi Controls Co., Ltd.INZI Display Co., Ltd.Iones Co., Ltd.IS Dongseo Co., Ltd.ISC Co., Ltd.i-SENS, Inc.ISU Chemical Co., Ltd.IsuPetasys Co., Ltd.It's Hanbul Co., Ltd.J.ESTINA Co., Ltd.Jahwa Electronics Co., Ltd.JASTECH, Ltd.Jayjun Cosmetic Co., Ltd.JB Financial Group Co., Ltd.JC Hyun System, Inc.Jcontentree Corp.Jeil Pharma Holdings, Inc.Jeil Pharmaceutical Co., Ltd.Jeju Semiconductor Corp.Jejuair Co., Ltd.Jeongsan Aikang Co., Ltd.Jinro Distillers Co., Ltd.Jinsung T.E.C.JLS Co., Ltd.JNK Heaters Co., Ltd.JoyCity Corp.JS Corp.
Table of Contents
The Emerging Markets Small Cap SeriesCONTINUED
Shares Value»
SOUTH KOREA — (Continued)#* 102,257 $ 161,319#* 30,079 499,428#* 127,161 582,510
4,325 22,394#* 177,642 190,004# 67,933 289,846#* 10,746 36,900
52,996 2,985,324#* 39,934 901,074* 47,394 2,106,800#* 591,826 1,214,227#* 232,192 1,392,940#* 84,518 183,143# 44,742 728,050#* 80,840 662,829* 11,220 21,289# 68,303 1,294,494# 95,524 442,346
360,436 665,080108,101 1,354,280
# 107,804 272,498# 69,983 323,189
32,254 62,330#* 75,333 318,094
127,411 3,574,850# 75,550 543,351# 91,020 1,900,215
92,426 707,981# 234,729 962,193# 72,336 1,167,164# 96,373 443,009# 92,216 754,592# 66,749 569,344#* 177,338 736,026
1,536,575 7,138,671# 96,331 338,657* 369,237 1,441,869# 16,398 239,938
5,220 137,526#* 154,448 421,998
63,504 1,444,987#* 202,408 336,936# 16,024 400,572# 98,542 606,695# 62,953 392,702#* 52,520 250,337* 6,537 40,287# 40,769 457,912
Copyright © 2021 www.secdatabase.com. All Rights Reserved.Please Consider the Environment Before Printing This Document

J-Technology Co., Ltd.Jusung Engineering Co., Ltd.JVM Co., Ltd.JW Holdings Corp.JW Life Science Corp.JW Pharmaceutical Corp.JYP Entertainment Corp.Kanglim Co., Ltd.Kangnam Jevisco Co., Ltd.KAON Media Co., Ltd.KB Metal Co., Ltd.
KBI Dongkook Industrial Co., Ltd.KC Co., Ltd.KC Cottrell Co., Ltd.KC Green Holdings Co., Ltd.KC Tech Co., Ltd.KCC Engineering & Construction Co., Ltd.KCI, Ltd.KCTCKD Corp.KEC Corp.KEPCO Engineering & Construction Co., Inc.Keyang Electric Machinery Co., Ltd.KEYEAST Co., Ltd.KG Chemical Corp.KG Eco Technology Service Co., Ltd.Kginicis Co., Ltd.KGMobilians Co., Ltd.KH Vatec Co., Ltd.KINX, Inc.KISCO Corp.KISCO Holdings Co., Ltd.Kishin Corp.KISWIRE, Ltd.Kiwi Media Group Co., Ltd.KleanNara Co., Ltd.KL-Net Corp.KM Corp.KMH Co., Ltd.KMH Hitech Co., Ltd.Kocom Co., Ltd.Kodaco Co., Ltd.Koentec Co., Ltd.Koh Young Technology, Inc.Kolmar BNH Co., Ltd.Kolmar Korea Holdings Co., Ltd.Kolon Corp.
#* 253,982 59,371311,520 1,630,343
# 27,890 776,711287,332 1,443,184
# 65,062 1,229,744105,208 2,498,271200,095 3,415,678
#* 240,269 586,749# 30,467 630,281# 111,714 943,218* 4,711 6,842Table of Contents
The Emerging Markets Small Cap SeriesCONTINUED
Shares Value»
SOUTH KOREA — (Continued)* 147,284 $ 99,559
62,852 676,685# 77,372 383,552# 118,684 383,150# 74,585 940,649
62,491 329,58733,797 271,94313,113 31,082
* 147,361 9,248#* 714,549 641,658
109,258 1,732,115# 192,918 510,216#* 466,462 1,071,045# 72,789 721,943# 261,445 735,357
136,223 1,417,021# 134,426 666,668#* 109,990 835,750# 19,529 612,675
190,216 846,813# 56,887 607,089# 49,420 160,106
56,680 1,138,655#* 1,683,238 240,494* 96,399 183,649# 122,853 255,005
32,246 180,311123,798 603,530
#* 121,868 116,552# 59,560 329,565#* 278,877 388,049# 161,790 1,604,242# 87,881 6,137,019
104,192 2,448,036# 84,156 1,671,431# 54,920 756,608
Copyright © 2021 www.secdatabase.com. All Rights Reserved.Please Consider the Environment Before Printing This Document

Kolon Fashion Material, Inc.Kolon Global Corp.Kolon Industries, Inc.Kolon Life Science, Inc.Kolon Plastic, Inc.Komelon Corp.KoMiCo, Ltd.KONA I Co., Ltd.Kook Soon Dang Brewery Co., Ltd.Kopla Co., Ltd.Korea Alcohol Industrial Co., Ltd.Korea Asset In Trust Co., Ltd.Korea Autoglass Corp.Korea Cast Iron Pipe Industries Co., Ltd.Korea Circuit Co., Ltd.Korea District Heating Corp.Korea Electric Terminal Co., Ltd.Korea Electronic Certification Authority, Inc.Korea Electronic Power Industrial Development Co., Ltd.Korea Export Packaging Industrial Co., Ltd.Korea Flange Co., Ltd.Korea Fuel-Tech Corp.Korea Industrial Co., Ltd.
Korea Information & Communications Co., Ltd.Korea Information Certificate Authority, Inc.Korea Line Corp.Korea Materials & Analysis Corp.Korea Petrochemical Ind Co., Ltd.Korea Real Estate Investment & Trust Co., Ltd.Korea United Pharm, Inc.Korean Reinsurance Co.Kortek Corp.KPM Tech Co., Ltd.KPX Chemical Co., Ltd.KSIGN Co., Ltd.KSS LINE, Ltd.KT Hitel Co., Ltd.KT Skylife Co., Ltd.KT Submarine Co., Ltd.KTB Investment & Securities Co., Ltd.KTCS Corp.Ktis Corp.Kuk Young G&MKukbo Design Co., Ltd.Kukdo Chemical Co., Ltd.Kukdong Oil & Chemicals Co., Ltd.Kuk-il Paper Manufacturing Co., Ltd.
#* 98,755 132,844# 44,535 314,203
43,156 1,445,164#* 60,941 1,078,395# 112,909 531,075# 37,331 233,476# 36,775 811,958#* 94,356 1,322,184# 102,707 328,850# 112,709 330,605# 109,537 731,988# 313,877 997,357# 70,686 1,092,930# 75,278 777,884#* 93,570 388,455* 26,322 1,201,635
50,169 2,816,881# 139,013 411,665# 71,059 201,303
5,621 88,839#* 97,231 130,958# 46,115 90,308# 88,039 215,515Table of Contents
The Emerging Markets Small Cap SeriesCONTINUED
Shares Value»
SOUTH KOREA — (Continued)* 113,713 $ 848,815# 143,355 417,550* 115,938 2,470,203#* 41,315 401,164
30,118 3,040,8901,092,399 2,016,434
# 85,387 1,459,013581,400 3,919,354
88,235 956,585#* 113,288 122,535# 17,515 835,729#* 353,784 398,275# 117,050 653,335* 110,032 528,548
191,759 1,618,222# 124,984 331,421#* 401,713 885,711
270,563 456,569212,059 390,157
#* 186,943 209,763# 30,951 388,207# 28,905 1,183,501# 89,179 254,549#* 596,800 2,732,513
Copyright © 2021 www.secdatabase.com. All Rights Reserved.Please Consider the Environment Before Printing This Document

Kum Yang Co., Ltd.Kumho Industrial Co., Ltd.Kumho Tire Co., Inc.Kumkang Kind Co., Ltd.Kwang Dong Pharmaceutical Co., Ltd.Kwang Myung Electric Co., Ltd.Kyeryong Construction Industrial Co., Ltd.Kyobo Securities Co., Ltd.Kyongbo Pharmaceutical Co., Ltd.Kyung Dong Navien Co., Ltd.Kyung Nam Pharm Co., Ltd.Kyung Nong Corp.Kyungbang Co., Ltd.KyungDong City Gas Co., Ltd.KyungDong Invest Co., Ltd.Kyungdong Pharm Co., Ltd.Kyung-In Synthetic Corp.L&F Co., Ltd.L&K Biomed Co., Ltd.LabGenomics Co., Ltd.LB Semicon, Inc.LEADCORP, Inc. (The)Leaders Cosmetics Co., Ltd.Lee Ku Industrial Co., Ltd.LEED Corp.LEENO Industrial, Inc.Leenos Corp.LF Corp.LG Hausys, Ltd.LG International Corp.LIG Nex1 Co., Ltd.Lion Chemtech Co., Ltd.LIS Co., Ltd.Liveplex Co., Ltd.LMS Co., Ltd.
Lock & Lock Co., Ltd.LONGTU KOREA, Inc.LOT Vacuum Co., Ltd.Lotte Chilsung Beverage Co., Ltd.Lotte Confectionery Co., Ltd.LOTTE Fine Chemical Co., Ltd.Lotte Food Co., Ltd.LOTTE Himart Co., Ltd.Lotte Non-Life Insurance Co., Ltd.Lotte Tour Development Co., Ltd.LS Cable & System Asia, Ltd.LS Industrial Systems Co., Ltd.
# 95,714 177,698# 209,790 2,309,786#* 646,850 2,185,450# 106,055 356,476# 313,305 1,789,385#* 324,006 589,291# 33,110 711,134
171,171 1,407,69190,650 655,091
# 48,128 1,510,611#* 62,169 169,466# 35,483 388,686# 90,006 758,275
22,772 565,125# 8,652 257,236
129,644 920,808# 256,198 1,797,311# 116,425 2,777,537#* 26,992 119,948#* 49,913 214,018#* 280,854 2,336,665# 150,534 827,312#* 103,385 605,535#* 223,689 325,216#* 2,533 6,795
79,506 3,707,397#* 229,858 274,550
173,767 3,580,162# 59,634 3,006,615
297,119 4,608,851106,997 2,652,123
# 72,991 479,405#* 61,215 655,354#* 686,550 455,478# 51,354 600,412Table of Contents
The Emerging Markets Small Cap SeriesCONTINUED
Shares Value»
SOUTH KOREA — (Continued)167,217 $2,180,107
#* 102,159 804,938# 76,658 454,915
9,579 1,170,9391,746 217,750
123,078 5,031,4943,701 1,526,951
# 62,911 1,947,121#* 573,001 988,087#* 125,590 1,179,872# 81,589 521,227
4,527 175,456
Copyright © 2021 www.secdatabase.com. All Rights Reserved.Please Consider the Environment Before Printing This Document

Lumens Co., Ltd.Lutronic Corp.LVMC HoldingsMacrogen, Inc.Maeil Holdings Co., Ltd.Magicmicro Co., Ltd.MAKUS, Inc.Maniker Co., Ltd.Mcnex Co., Ltd.ME2ON Co., Ltd.Mediana Co., Ltd.Medipost Co., Ltd.Meerecompany, Inc.MegaStudy Co., Ltd.MegaStudyEdu Co., Ltd.Melfas, Inc.META BIOMED Co., Ltd.Metalabs Co., Ltd.Mgame Corp.Mi Chang Oil Industrial Co., Ltd.MiCo, Ltd.Microfriend, Inc.Minwise Co., Ltd.Mirae Asset Life Insurance Co., Ltd.Mirae Corp.Miwon Chemicals Co., Ltd.Miwon Commercial Co., Ltd.Miwon Specialty Chemical Co., Ltd.MK Electron Co., Ltd.MNTech Co., Ltd.Mobase Co., Ltd.Mobile Appliance, Inc.Moda-InnoChips Co., Ltd.Modetour Network, Inc.Monalisa Co., Ltd.MonAmi Co., Ltd.Moorim P&P Co., Ltd.Moorim Paper Co., Ltd.Motonic Corp.MP Group, Inc.MP Hankang Co., Ltd.MS Autotech Co., Ltd.Muhak Co., Ltd.Multicampus Corp.MyungMoon Pharm Co., Ltd.Nam Hwa Construction Co., Ltd.Namhae Chemical Corp.
#* 362,528 554,618#* 166,662 1,025,619#* 254,936 617,864* 78,892 1,683,871
70,833 707,310#* 415,153 491,948# 21,923 75,466* 373,806 270,870# 96,753 1,697,441#* 190,228 890,462#* 35,251 274,832* 3,664 88,661# 27,462 905,283# 64,566 560,318
65,798 1,725,022#* 166,086 323,177# 157,118 318,903#* 146,421 181,831#* 132,226 378,288
6,392 418,434# 222,497 949,853#* 41,780 173,408# 70,028 1,075,428
713,519 2,396,261#* 5,388,167 737,479# 3,853 128,045
4,834 185,499# 13,243 826,930# 133,585 910,924#* 145,586 395,917# 112,618 512,415#* 87,251 401,114* 26,364 85,946
134,187 1,761,647# 104,413 266,482# 104,161 504,521# 209,422 762,020
166,723 378,693# 85,938 690,128#* 151,072 31,484* 156,859 111,504# 143,953 462,761
122,263 1,082,224# 19,542 738,295#* 158,796 581,087# 37,268 241,875# 250,899 1,912,057Table of Contents
The Emerging Markets Small Cap SeriesCONTINUED
Shares Value»
SOUTH KOREA — (Continued)
Copyright © 2021 www.secdatabase.com. All Rights Reserved.Please Consider the Environment Before Printing This Document

NamKwang Engineering & Construction Co., Ltd.Namsun Aluminum Co., Ltd.Namuga Co., Ltd.Namyang Dairy Products Co., Ltd.Nano Chem Tech, Inc.NanoenTek, Inc.Nasmedia Co., Ltd.Nature & Environment Co., Ltd.NeoPharm Co., Ltd.NeowizNEOWIZ HOLDINGS Corp.NEPES Corp.Neuros Co., Ltd.New Power Plasma Co., Ltd.Nexen Corp.Nexen Tire Corp.Next Entertainment World Co., Ltd.Next Science Co LtdNextEye Co., Ltd.Nexturn Co., Ltd.NHN BUGS Corp.NHN Corp.NHN KCP Corp.NI Steel Co., Ltd.NICE Holdings Co., Ltd.Nice Information & Telecommunication, Inc.NICE Information Service Co., Ltd.NICE Total Cash Management Co., Ltd.NK Co., Ltd.Nong Shim Holdings Co., Ltd.Nong Woo Bio Co., Ltd.Noroo Holdings Co., Ltd.NOROO Paint & Coatings Co., Ltd.NPCNS Shopping Co., Ltd.nTels Co., Ltd.Nuri Telecom Co., Ltd.NUVOTEC Co., Ltd.Oceanbridge Co., Ltd.Omnisystem Co., Ltd.Openbase, Inc.Opto Device Technology Co., Ltd.OptoElectronics Solutions Co., Ltd.OPTRON-TEC, Inc.Orbitech Co., Ltd.Orientbio, Inc.Orion Holdings Corp.OSANGJAIEL Co., Ltd.Oscotec, Inc.Osstem Implant Co., Ltd.Osung Advanced Materials Co., Ltd.Paik Kwang Industrial Co., Ltd.Pang Rim Co., Ltd.Pan-Pacific Co., Ltd.
#* 24,008 $ 222,063#* 572,197 1,540,693* 9,117 300,751
3,096 1,401,756#* 123,768 503,841#* 97,625 352,098# 31,278 807,760#* 245,711 231,734# 37,087 1,354,627#* 124,624 1,339,481#* 42,417 473,144# 130,637 3,307,592#* 132,787 549,312#* 34,503 418,725
247,720 1,238,097270,530 1,961,272
#* 127,809 420,874#* 63,886 168,812# 197,968 331,746# 53,705 434,628* 55,774 295,044* 88,879 4,664,443# 117,757 1,845,926
6,100 12,140# 142,334 2,603,614
47,343 1,244,096265,548 3,484,566
# 169,036 1,162,671#* 510,585 482,791# 14,750 988,312# 64,184 598,355# 14,784 141,545# 80,483 477,721
66,771 188,804138,388 1,207,297
#* 24,999 267,438# 57,184 245,520#* 153,125 163,052# 19,278 153,816#* 287,741 421,473# 183,847 418,099
76,275 308,029# 38,837 2,159,227# 154,117 764,368#* 159,009 515,478#* 1,249,881 476,374
126,204 1,659,726#* 95,462 531,069* 50,887 799,357* 97,161 5,626,787#* 278,129 362,202# 153,313 346,702
101,740 171,886# 249,450 612,075
Copyright © 2021 www.secdatabase.com. All Rights Reserved.Please Consider the Environment Before Printing This Document

PaperCorea, Inc.Paradise Co., Ltd.Partron Co., Ltd.Paru Co., Ltd.Paxnet Co., Ltd.
People & Technology, Inc.Pharma Research Products Co., Ltd.Pharmicell Co., Ltd.Phoenix Materials Co., Ltd.PNE Solution Co., Ltd.Pobis TNC Co., Ltd.POLUS BioPharm, Inc.Poongsan Corp.Poongsan Holdings Corp.POSCO Coated & Color Steel Co., Ltd.Posco ICT Co., Ltd.Posco M-Tech Co., Ltd.Power Logics Co., Ltd.Protec Co., Ltd.PS TEC Co., Ltd.PSK Holdings, Inc.PSK, Inc.Pulmuone Co., Ltd.Pungkuk Alcohol Industry Co., Ltd.Pyeong Hwa Automotive Co., Ltd.RaonSecure Co., Ltd.Rayence Co., Ltd.Redrover Co., Ltd.Reyon Pharmaceutical Co., Ltd.RFHIC Corp.RFTech Co., Ltd.Robostar Co., Ltd.Rorze Systems Corp.Rsupport Co., Ltd.S Net Systems, Inc.S&S Tech Corp.S&T Corp.S&T Dynamics Co., Ltd.S&T Holdings Co., Ltd.S&T Motiv Co., Ltd.S.Y. Co., Ltd.Sajo Industries Co., Ltd.Sajodongaone Co., Ltd.Sam Chun Dang Pharm Co., Ltd.SAM KANG M&T Co., Ltd.Sam Young Electronics Co., Ltd.Sam Yung Trading Co., Ltd.
#* 237,569 143,79187,525 1,198,359
351,329 4,246,447#* 257,213 497,075#* 60,006 577,070Table of Contents
The Emerging Markets Small Cap SeriesCONTINUED
Shares Value»
SOUTH KOREA — (Continued)#* 123,130 $ 478,319
41,067 1,219,480* 29,731 206,442#* 304,133 162,090# 79,979 708,982#* 250,451 278,882#* 42,209 49,807# 176,889 3,510,734# 34,674 1,098,030
20,770 288,146423,426 1,795,791
# 196,627 812,975#* 204,736 1,743,116# 46,463 728,877# 102,079 357,815# 33,953 224,966#* 90,057 1,282,615# 101,534 923,739# 39,040 672,269# 89,058 709,742#* 235,194 559,329
21,966 223,258* 335,561 173,013# 59,538 711,525# 35,138 869,762#* 166,961 1,130,091# 49,956 797,126* 12,806 44,892# 59,819 182,041# 100,072 720,762# 126,918 854,479#* 13,299 191,585
190,917 1,066,61465,647 841,290
# 85,853 3,617,916#* 125,687 504,362# 24,428 927,066#* 256,108 249,732
119,648 3,357,403#* 103,756 356,570
95,284 832,300# 91,416 1,271,795
Copyright © 2021 www.secdatabase.com. All Rights Reserved.Please Consider the Environment Before Printing This Document

Sam-A Pharm Co., Ltd.Sambo Corrugated Board Co., Ltd.Sambo Motors Co., Ltd.Sambon Electronics Co., Ltd.Samchully Co., Ltd.Samchuly Bicycle Co., Ltd.Samho Development Co., Ltd.Samho International Co., Ltd.SAMHWA Paints Industrial Co., Ltd.Samick Musical Instruments Co., Ltd.Samick THK Co., Ltd.Samil Pharmaceutical Co., Ltd.Samji Electronics Co., Ltd.Samjin LND Co., Ltd.Samjin Pharmaceutical Co., Ltd.Samkee Automotive Co., Ltd.Samkwang Glass Co., Ltd.
Sammok S-Form Co., Ltd.SAMPYO Cement Co., Ltd.Samsung Climate Control Co., Ltd.Samsung Pharmaceutical Co., Ltd.Samsung Publishing Co., Ltd.SAMT Co., Ltd.Samwha Capacitor Co., Ltd.Samwha Electric Co., Ltd.Samyang Corp.Samyang Foods Co., Ltd.Samyang Holdings Corp.Samyang Tongsang Co., Ltd.Samyoung M-Tek Co., Ltd.Sang-A Frontec Co., Ltd.Sangbo Corp.Sangsangin Co., Ltd.Sangsangin Industry Co., Ltd.Sangsin BrakeSangsin Energy Display Precision Co., Ltd.SaraminHR Co., Ltd.Satrec Initiative Co., Ltd.SAVEZONE I&C Corp.SBI Investment Korea Co., Ltd.SBS Media Holdings Co., Ltd.SBWS-Connect Co., Ltd.SD Biotechnologies Co., Ltd.SDN Co., Ltd.Seah Besteel Corp.SeAH Holdings Corp.
# 4,439 58,6227,239 55,524
# 76,305 346,955#* 284,390 671,055
23,679 1,786,402#* 65,563 349,825# 159,828 615,830# 42,355 739,661# 83,835 430,584# 487,714 685,114# 77,099 787,617# 34,462 627,456# 84,389 775,080# 98,862 168,476
82,855 1,889,945# 179,493 406,186# 25,070 786,804Table of Contents
The Emerging Markets Small Cap SeriesCONTINUED
Shares Value»
SOUTH KOREA — (Continued)# 31,502 $ 270,484#* 231,777 642,523
3,552 29,233#* 296,288 524,075# 33,817 388,800# 388,498 699,752# 63,837 2,338,343# 34,786 518,661
32,725 1,481,074# 28,556 1,521,358
36,680 2,152,760# 14,630 726,162# 10,739 28,226# 60,793 797,892#* 184,995 206,170#* 328,527 5,214,136#* 240,030 59,914
47,715 144,53874,772 669,574
# 46,142 897,148# 43,202 663,165# 118,777 370,994#* 753,154 436,563* 396,565 731,684#* 910,924 867,216#* 412,236 513,895#* 91,170 466,051#* 374,984 383,508
117,713 1,604,0105,096 370,532
Copyright © 2021 www.secdatabase.com. All Rights Reserved.Please Consider the Environment Before Printing This Document

SeAH Steel Corp.SeAH Steel Holdings Corp.Sebang Co., Ltd.Sebang Global Battery Co., Ltd.Sebo Manufacturing Engineer Corp.Secuve Co., Ltd.Seegene, Inc.Sejin Heavy Industries Co., Ltd.Sejong Industrial Co., Ltd.Sejong Telecom, Inc.Sejoong Co., Ltd.Sekonix Co., Ltd.Selvas AI, Inc.Sempio Foods Co.Semyung Electric Machinery Co., Ltd.S-Energy Co., Ltd.Seobu T&DSeohan Co., Ltd.Seohee Construction Co., Ltd.Seojin System Co., Ltd.Seondo Electric Co., Ltd.Seoul Auction Co., Ltd.Seoul Electronics & TelecomSeoul Food Industrial Co., Ltd.Seoul Pharma Co., Ltd.Seoul Semiconductor Co., Ltd.Seouleaguer Co., Ltd.Seoulin Bioscience Co., Ltd.Seowon Co., Ltd.
SEOWONINTECH Co., Ltd.Seoyon Co., Ltd.Seoyon E-Hwa Co., Ltd.Sewha P&C, Inc.Sewon Cellontech Co., Ltd.Sewon Precision Industry Co., Ltd.SEWOONMEDICAL Co., Ltd.SFA Engineering Corp.SFA Semicon Co., Ltd.SFC Co., Ltd.SG Corp.SG&G Corp.SGA Co., Ltd.SGA Solutions Co., Ltd.SH Energy & Chemical Co., Ltd.Shin Poong Pharmaceutical Co., Ltd.Shindaeyang Paper Co., Ltd.Shinil Industrial Co., Ltd.
13,823 750,21115,520 678,85885,670 865,88858,200 1,988,003
# 50,252 378,606# 175,005 215,525* 159,453 2,979,772
45,765 178,126# 78,586 315,610* 2,581,865 936,852#* 80,478 199,155#* 84,992 450,485#* 179,027 428,993# 14,221 338,284# 76,449 292,954# 89,497 297,595* 262,250 1,866,395# 696,802 795,006
1,253,684 1,253,292# 7,450 158,516# 91,667 245,197# 95,239 516,410#* 269,734 243,545#* 2,476,815 383,922#* 56,814 279,509
304,747 4,112,849#* 113,345 189,689# 28,534 201,214# 158,377 149,317Table of Contents
The Emerging Markets Small Cap SeriesCONTINUED
Shares Value»
SOUTH KOREA — (Continued)# 91,951 $ 399,594# 112,588 323,774# 96,108 401,722# 111,502 261,704#* 408,508 985,660
25,563 174,799# 179,369 522,784
136,503 4,317,952#* 658,251 1,405,246#* 290,874 334,674#* 861,294 710,661#* 178,205 302,882#* 319,722 227,218* 160,395 175,544# 739,431 658,167#* 290,377 1,503,278
12,266 711,000# 651,705 940,778
Copyright © 2021 www.secdatabase.com. All Rights Reserved.Please Consider the Environment Before Printing This Document

Shinsegae Engineering & Construction Co., Ltd.Shinsegae Food Co., Ltd.Shinsegae Information & Communication Co., Ltd.Shinsegae International, Inc.Shinsung E&G Co., Ltd.Shinsung Tongsang Co., Ltd.Shinwha Intertek Corp.Shinwon Construction Co., Ltd.Shinwon Corp.Shinyoung Securities Co., Ltd.SHOWBOX Corp.Signetics Corp.SIGONG TECH Co., Ltd.Silicon Works Co., Ltd.Silla Co., Ltd.SIMMTECH Co., Ltd.Simmtech Holding Co., Ltd.SIMPAC, Inc.Sindoh Co., Ltd.Sinil Pharm Co., Ltd.SinSin Pharmaceutical Co., Ltd.SK Bioland Co., Ltd.SK Chemicals Co., Ltd.SK D&D Co., Ltd.SK Discovery Co., Ltd.SK Gas, Ltd.SK Networks Co., Ltd.SK Securities Co., Ltd.SKC Co., Ltd.SKC Solmics Co., Ltd.SKCKOLONPI, Inc.SL Corp.SM Culture & Contents Co., Ltd.SM Entertainment Co.S-MAC Co., Ltd.SMARK Co., Ltd.SMCore, Inc.SMEC Co., Ltd.SNTEK Co., Ltd.SNU Precision Co., Ltd.Solborn, Inc.
Solco Biomedical Co., Ltd.Solid, Inc.Songwon Industrial Co., Ltd.Sonokong Co., Ltd.Soosan Heavy Industries Co., Ltd.Soulbrain Co., Ltd.
# 21,969 524,584# 17,198 1,078,829# 8,477 921,339# 16,759 2,385,000#* 907,709 804,527#* 467,967 545,307#* 245,476 1,123,711#* 96,617 263,589#* 442,259 750,479# 33,458 1,659,164# 255,126 821,112#* 450,335 371,610# 93,198 414,826
89,032 2,843,528# 55,354 581,469
123,693 555,889126,986 184,664
# 114,590 255,70940,874 1,488,104
1,227 8,246# 60,923 310,460# 88,938 1,001,864# 23,095 865,317# 61,345 1,313,302
62,178 1,268,97435,778 2,338,565
1,121,588 4,703,178# 3,872,100 2,106,996
134,318 4,769,206#* 235,187 784,827# 123,138 2,974,592
116,221 2,162,023* 324,599 369,609#* 153,231 4,549,270#* 1,016,327 737,206* 45,350 28,691# 109,478 835,358# 216,193 501,610* 1,749 11,239* 165,332 370,711#* 137,765 455,628Table of Contents
The Emerging Markets Small Cap SeriesCONTINUED
Shares Value»
SOUTH KOREA — (Continued)#* 1,496,270 $ 300,520#* 229,788 1,053,738# 158,926 2,513,847#* 138,753 236,484#* 206,213 245,199# 97,130 5,313,117
Copyright © 2021 www.secdatabase.com. All Rights Reserved.Please Consider the Environment Before Printing This Document

SPC Samlip Co., Ltd.SPG Co., Ltd.Spigen Korea Co., Ltd.Ssangyong Motor Co.ST Pharm Co., Ltd.Suheung Co., Ltd.Sun Kwang Co., Ltd.Sunchang Corp.SundayToz Corp.Sung Bo Chemicals Co., Ltd.Sung Kwang Bend Co., Ltd.Sungchang Enterprise Holdings, Ltd.Sungdo Engineering & Construction Co., Ltd.Sungshin Cement Co., Ltd.Sungwoo Hitech Co., Ltd.Sunjin Co., Ltd.Sunny Electronics Corp.Supex BNP Co., Ltd.Suprema HQ, Inc.Suprema, Inc.SurplusGlobal, Inc.Synergy Innovation Co., Ltd.Synopex, Inc.Systems Technology, Inc.Tae Kyung Industrial Co., Ltd.Taekwang Industrial Co., Ltd.Taewoong Co., Ltd.Taeyoung Engineering & Construction Co., Ltd.Taihan Electric Wire Co., Ltd.Taihan Fiberoptics Co., Ltd.Taihan Textile Co., Ltd.Tailim Packaging Co., Ltd.TBH Global Co., Ltd.TechWing, Inc.Tego Science, Inc.Telcon RF Pharmaceutical, Inc.Telechips, Inc.TES Co., Ltd.Tesna Co., Ltd.Theragen Etex Co., Ltd.Thinkware Systems Corp.TK Chemical Corp.TK Corp.TOBESOFT Co., Ltd.Tokai Carbon Korea Co., Ltd.Tong Yang Moolsan Co., Ltd.Tongyang Life Insurance Co., Ltd.Tongyang Networks Corp.Tongyang pile, Inc.Tongyang, Inc.Tonymoly Co., Ltd.Top Engineering Co., Ltd.Toptec Co., Ltd.
19,070 1,515,297# 130,253 930,465
23,443 1,147,956* 342,624 959,885
65,312 774,101# 55,860 1,497,463
24,809 345,117# 55,687 227,357#* 43,325 615,069
89,031 375,655# 166,665 1,288,657#* 514,267 779,148# 96,060 399,994# 145,390 929,175
454,984 1,452,575# 116,336 999,295#* 208,190 539,681#* 290,949 165,921#* 36,612 203,059#* 36,649 888,331
14,061 28,389* 105,399 142,102#* 552,009 1,155,576# 93,403 1,085,637#* 55,377 263,786
2,517 2,638,459* 87,859 678,835# 339,073 3,776,290* 1,276,968 659,978#* 455,943 1,442,118
1,976 33,304# 119,701 620,890#* 131,435 311,053# 113,770 1,008,639* 917 18,845#* 37,614 144,829# 59,054 555,670# 112,570 1,524,669# 40,112 1,420,213#* 205,088 1,299,950#* 59,508 342,819#* 444,689 990,717# 139,918 1,095,287#* 120,531 325,734# 38,778 1,830,689# 438,988 519,619
337,737 1,102,693#* 133,420 195,124* 3,387 15,939# 1,419,008 1,934,027# 48,437 371,878# 82,138 604,739
162,584 1,325,068Table of Contents
Copyright © 2021 www.secdatabase.com. All Rights Reserved.Please Consider the Environment Before Printing This Document

Tovis Co., Ltd.TS Corp.T'way Holdings, Inc.UBCare Co., Ltd.Ubiquoss Holdings, Inc.Ubiquoss, Inc.Ugint Co., Ltd.UIL Co., Ltd.Uju Electronics Co., Ltd.Uni-Chem Co., Ltd.Unick Corp.Unid Co., Ltd.Union Semiconductor Equipment & Materials Co., Ltd.Uniquest Corp.Unison Co., Ltd.Unitekno Co., Ltd.UniTest, Inc.Value Added Technology Co., Ltd.Very Good Tour Co., Ltd.Viatron Technologies, Inc.VICTEK Co., Ltd.Vieworks Co., Ltd.Visang Education, Inc.Vitzro Tech Co., Ltd.Vitzrocell Co., Ltd.VitzroSys Co., Ltd.W Holding Co., Ltd.Webzen, Inc.Welcron Co., Ltd.Wemade Co., Ltd.Whanin Pharmaceutical Co., Ltd.WillBes & Co. (The)Winix, Inc.Wins Co., Ltd.WiSoL Co., Ltd.WIZIT Co., Ltd.Won Ik Corp.WONIK CUBE Corp.Wonik Holdings Co., Ltd.WONIK IPS Co., Ltd.Wonik Materials Co., Ltd.Wonik QnC Corp.Woojin, Inc.Woongjin Co., Ltd.Woongjin Energy Co., Ltd.Woongjin Thinkbig Co., Ltd.Woori Investment Bank Co., Ltd.Woori Technology Investment Co., Ltd.Woori Technology, Inc.
The Emerging Markets Small Cap SeriesCONTINUED
Shares Value»
SOUTH KOREA — (Continued)127,615 $ 746,750
29,662 493,535#* 280,509 378,286# 239,565 1,111,216# 80,974 2,289,665# 26,219 748,455#* 630,240 559,353# 100,293 417,917# 57,321 395,775#* 349,887 554,931#* 67,234 353,149# 46,458 1,858,468# 202,255 686,675# 110,923 565,087#* 554,510 465,308#* 17,561 170,559# 124,888 1,186,991
78,683 1,653,572# 51,748 273,404
86,093 718,425# 129,990 285,642# 65,044 1,492,730# 54,760 361,586# 11,550 50,995#* 106,295 929,158#* 289,611 89,042#* 971,568 305,274* 127,638 1,638,680#* 189,702 469,550# 75,166 1,684,266# 117,357 1,619,902#* 395,146 339,992# 69,947 1,154,794# 56,653 607,784# 150,568 2,164,913#* 601,253 470,823* 8,055 25,112#* 186,576 331,811* 285,104 888,294
251,504 5,216,783# 62,069 1,215,721#* 125,673 1,139,324* 2,070 8,280#* 445,869 542,212#* 130,463 75,592#* 410,177 824,913#* 2,998,895 1,798,171
439,468 1,082,401#* 758,362 596,637
Copyright © 2021 www.secdatabase.com. All Rights Reserved.Please Consider the Environment Before Printing This Document

Wooridul Pharmaceutical, Ltd.Wooriro Co., Ltd.Woorison F&G Co., Ltd.Woory Industrial Co., Ltd.Wooshin Systems Co., Ltd.Woosu AMS Co., Ltd.WooSung Feed Co., Ltd.Woowon Development Co., Ltd.Worldex Industry & Trading Co., Ltd.Y G-1 Co., Ltd.
YeaRimDang Publishing Co., Ltd.Yeong Hwa Metal Co., Ltd.YES24 Co., Ltd.Yest Co., Ltd.YG Entertainment, Inc.YG PLUSYIK Corp.YJM Games Co., Ltd.YMC Co., Ltd.Yonwoo Co., Ltd.Yoosung Enterprise Co., Ltd.YooSung T&S Co., Ltd.Youlchon Chemical Co., Ltd.Young Heung Iron & Steel Co., Ltd.Young In Frontier Co., Ltd.Young Poong Corp.Young Poong Precision Corp.Youngone Corp.Youngone Holdings Co., Ltd.YoungWoo DSP Co., Ltd.YTN Co., Ltd.Yuanta Securities Korea Co., Ltd.YuHwa Securities Co., Ltd.Yujin Robot Co., Ltd.Yungjin Pharmaceutical Co., Ltd.Yuyang DNU Co., Ltd.Yuyu Pharma, Inc.Zeus Co., Ltd.Zungwon En-Sys, Inc.
TOTAL SOUTH KOREA
ABC Taiwan Electronics Corp.Ability Enterprise Co., Ltd.Ability Opto-Electronics Technology Co., Ltd.AcBel Polytech, Inc.Ace Pillar Co., Ltd.ACES Electronic Co., Ltd.
#* 98,530 506,929* 16,683 35,671# 148,048 247,460
47,038 830,897# 87,771 432,513#* 139,479 433,798#* 171,724 407,956#* 30,318 87,011# 49,210 265,315# 160,017 1,139,341Table of Contents
The Emerging Markets Small Cap SeriesCONTINUED
Shares Value»
SOUTH KOREA — (Continued)#* 110,224 $ 376,757#* 195,869 228,146
58,265 314,027#* 54,484 510,263# 93,654 1,967,977#* 174,306 160,652#* 162,264 313,565#* 291,334 424,629# 114,353 436,708#* 33,958 598,769# 146,134 350,651# 106,473 239,171# 85,563 1,134,506# 241,560 243,821#* 81,993 770,912
324 185,750# 88,201 607,731
25,621 726,34238,622 1,715,377
#* 197,393 261,90473,837 121,356
* 874,579 2,023,968# 19,251 202,377#* 137,792 332,719* 494,889 1,868,248#* 142,996 812,177
1,676 14,248# 56,787 578,734#* 86,136 102,515
966,893,060
TAIWAN — (17.7%)# 494,910 358,255# 1,872,293 1,034,240# 477,232 802,208
3,273,599 2,373,509448,000 298,544
# 738,000 526,845
Copyright © 2021 www.secdatabase.com. All Rights Reserved.Please Consider the Environment Before Printing This Document

Acon Holding, Inc.Acter Group Corp., Ltd.Action Electronics Co., Ltd.Actron Technology Corp.A-DATA Technology Co., Ltd.Addcn Technology Co., Ltd.Adlink Technology, Inc.Advanced Ceramic X Corp.Advanced International Multitech Co., Ltd.Advanced Lithium Electrochemistry Cayman Co., Ltd.Advanced Lithium Electrochemistry Cayman Co., Ltd.Advanced Optoelectronic Technology, Inc.Advanced Power Electronics Corp.Advanced Wireless Semiconductor Co.Advancetek Enterprise Co., Ltd.AEON Motor Co., Ltd.Aerospace Industrial Development Corp.AGV Products Corp.AimCore Technology Co., Ltd.Airmate Cayman International Co., Ltd.Alchip Technologies, Ltd.
Alcor Micro Corp.Alexander Marine Co., Ltd.ALI Corp.All Ring Tech Co., Ltd.Allied Circuit Co., Ltd.Allis Electric Co., Ltd.Alltek Technology Corp.Alltop Technology Co., Ltd.Alpha Networks, Inc.Altek Corp.Amazing Microelectronic Corp.Ambassador Hotel (The)AMICCOM Electronics Corp.Ampire Co., Ltd.AMPOC Far-East Co., Ltd.AmTRAN Technology Co., Ltd.Anderson Industrial Corp.Anpec Electronics Corp.AP Memory Technology Corp.Apacer Technology, Inc.APAQ Technology Co., Ltd.APCB, Inc.Apex Biotechnology Corp.Apex International Co., Ltd.Apex Medical Corp.Apex Science & Engineering
* 1,294,000 364,285328,302 1,724,838
1,395,000 298,731# 507,150 1,584,563
1,685,879 2,843,388117,299 983,166
# 858,031 1,343,964# 318,000 2,427,337
908,000 1,198,188* 720,000 381,373
84,797 12,544642,000 321,774
# 113,000 101,530# 1,124,000 2,533,140# 1,403,519 742,882
9,000 12,3231,817,000 1,861,709
* 3,439,434 816,790111,551 51,384
* 7,000 6,766# 423,000 1,356,870Table of Contents
The Emerging Markets Small Cap SeriesCONTINUED
Shares Value»
TAIWAN — (Continued)278,000 $ 135,841
17,000 26,603* 2,225,000 802,144
476,000 566,082# 194,000 447,855
1,196,000 695,562# 1,093,873 700,618# 423,000 777,789# 2,560,386 1,870,732# 2,076,945 1,662,925# 450,054 1,280,535
1,701,000 1,211,513* 311,000 237,757
712,000 598,347685,444 633,709
* 7,236,951 2,622,1941,002,416 296,688
503,007 1,013,244# 242,375 310,580
672,325 707,662# 401,120 407,223# 998,000 854,758
755,483 724,250#* 1,285,470 2,113,470
464,500 388,4301,046,132 288,726
Copyright © 2021 www.secdatabase.com. All Rights Reserved.Please Consider the Environment Before Printing This Document

Arcadyan Technology Corp.Ardentec Corp.Argosy Research, Inc.Asia Electronic Material Co., Ltd.Asia Optical Co., Inc.Asia Pacific Telecom Co., Ltd.Asia Plastic Recycling Holding, Ltd.Asia Polymer Corp.Asia Tech Image, Inc.Asia Vital Components Co., Ltd.ASMedia Technology, Inc.ASPEED Technology, Inc.ASROCK, Inc.ATE Energy International Co., Ltd.Aten International Co., Ltd.Audix Corp.AURAS Technology Co., Ltd.Aurona Industries, Inc.Aurora Corp.Avalue Technology, Inc.Avermedia TechnologiesAVY Precision Technology, Inc.Awea Mechantronic Co., Ltd.Axiomtek Co., Ltd.Azurewave Technologies, Inc.Bank of Kaohsiung Co., Ltd.Baolong International Co., Ltd.Basso Industry Corp.BenQ Materials Corp.BES Engineering Corp.Bin Chuan Enterprise Co., Ltd.Bionet Corp.Bionime Corp.
Biostar Microtech International Corp.Bioteque Corp.Bizlink Holding, Inc.Boardtek Electronics Corp.Bon Fame Co., Ltd.Bright Led Electronics Corp.Brighton-Best International Taiwan, Inc.C Sun Manufacturing, Ltd.Calin Technology Co., Ltd.Cameo Communications, Inc.Capital Futures Corp.Capital Securities Corp.Career Technology MFG. Co., Ltd.Carnival Industrial Corp.
993,718 3,412,2113,433,274 3,291,542
408,000 765,844470,000 304,906
# 1,699,000 4,497,982* 2,273,000 515,956
1,699,182 340,291# 2,907,232 1,400,715
382,000 539,237# 2,619,058 3,376,206# 170,424 2,887,534# 157,599 3,447,920# 271,000 515,320
9,000 9,576# 665,479 1,816,169
592,600 703,283# 474,148 2,411,297
490,000 300,882# 511,349 1,580,332
320,000 626,0931,411,446 506,771
601,691 725,313# 273,210 272,050
420,000 728,332#* 457,000 307,947# 3,516,548 1,102,614
436,000 179,729# 980,900 1,801,257# 1,500,000 1,152,812# 11,253,750 2,769,426
565,070 421,454#* 132,000 197,250
202,000 329,923Table of Contents
The Emerging Markets Small Cap SeriesCONTINUED
Shares Value»
TAIWAN — (Continued)# 1,252,975 $ 463,015# 425,308 1,774,935
842,492 6,385,133#* 893,000 861,573
135,000 246,469809,520 301,966
# 833,318 931,871# 1,104,221 1,029,263* 122,000 127,432#* 1,675,818 462,083# 747,642 1,049,046
15,006,501 4,566,192# 2,999,843 3,099,383* 1,419,000 286,811
Copyright © 2021 www.secdatabase.com. All Rights Reserved.Please Consider the Environment Before Printing This Document

Casetek Holdings, Ltd.Cathay Chemical WorksCathay Real Estate Development Co., Ltd.Cayman Engley Industrial Co., Ltd.CCP Contact Probes Co., Ltd.Celxpert Energy Corp.Center Laboratories, Inc.Central Reinsurance Co., Ltd.Chain Chon Industrial Co., Ltd.ChainQui Construction Development Co., Ltd.Champion Building Materials Co., Ltd.Chang Wah Electromaterials, Inc.Chang Wah Technology Co., Ltd.Channel Well Technology Co., Ltd.Chant Sincere Co., Ltd.Charoen Pokphand EnterpriseChaun-Choung Technology Corp.CHC Healthcare GroupCHC Resources Corp.Chen Full International Co., Ltd.Chenbro Micom Co., Ltd.Cheng Loong Corp.Cheng Mei Materials Technology Corp.Cheng Uei Precision Industry Co., Ltd.Chenming Mold Industry Corp.Chia Chang Co., Ltd.Chia Hsin Cement Corp.Chian Hsing Forging Industrial Co., Ltd.Chicony Power Technology Co., Ltd.Chieftek Precision Co., Ltd.Chien Kuo Construction Co., Ltd.Chilisin Electronics Corp.Chime Ball Technology Co., Ltd.China Bills Finance Corp.China Chemical & Pharmaceutical Co., Ltd.China Ecotek Corp.China Electric Manufacturing Corp.China Fineblanking Technology Co., Ltd.China General Plastics Corp.China Glaze Co., Ltd.China Man-Made Fiber Corp.China Metal ProductsChina Motor Corp.China Petrochemical Development Corp.China Steel Chemical Corp.
China Steel Structure Co., Ltd.China Wire & Cable Co., Ltd.
1,315,571 2,155,75730,000 17,337
4,358,700 3,050,121# 237,099 784,804# 137,000 160,748
629,000 595,7461,531,023 3,908,457
# 965,380 552,8551,197,000 340,523
# 523,714 496,772* 2,387,851 531,382# 255,905 1,299,292# 80,817 715,139
1,263,000 1,026,762411,000 342,165
1,314,985 3,114,482# 165,000 1,294,811
722,000 1,131,977# 495,282 806,695# 700,000 947,739# 494,000 1,010,409# 6,317,383 3,802,226#* 4,790,900 1,636,240
2,917,331 3,162,308732,437 334,491842,000 1,062,196
# 2,646,121 1,411,444240,000 347,581
1,136,454 2,045,128# 384,750 1,180,118
1,660,312 532,890# 1,136,380 3,040,224
203,840 246,5065,842,000 2,767,5191,914,000 1,135,349
214,000 224,8502,593,900 780,629
# 413,432 443,3752,934,829 2,004,570
# 507,002 197,50211,587,605 3,483,288
# 1,987,603 2,071,7891,329,000 1,090,023
# 22,284,150 7,402,324# 1,171,554 4,767,655Table of Contents
The Emerging Markets Small Cap SeriesCONTINUED
Shares Value»
TAIWAN — (Continued)# 621,000 $ 483,439# 716,160 477,893
Copyright © 2021 www.secdatabase.com. All Rights Reserved.Please Consider the Environment Before Printing This Document

Chinese Maritime Transport, Ltd.Ching Feng Home Fashions Co., Ltd.Chin-Poon Industrial Co., Ltd.Chipbond Technology Corp.ChipMOS Techinologies, Inc.ChipMOS Technologies, Inc., ADRChlitina Holding, Ltd.Chong Hong Construction Co., Ltd.Chun YU Works & Co., Ltd.Chun Yuan SteelChung Hsin Electric & Machinery Manufacturing Corp.Chung Hung Steel Corp.Chung Hwa Food Industrial Co., Ltd.Chung Hwa Pulp Corp.Chunghwa Chemical Synthesis & Biotech Co., Ltd.Chunghwa Precision Test Tech Co., Ltd.Chyang Sheng Dyeing & Finishing Co., Ltd.Cleanaway Co., Ltd.Clevo Co.CMC Magnetics Corp.C-Media Electronics, Inc.CoAsia Electronics Corp.Coland Holdings, Ltd.Collins Co., Ltd.Compeq Manufacturing Co., Ltd.Compucase EnterpriseConcord Securities Co., Ltd.Concraft Holding Co., Ltd.Continental Holdings Corp.Contrel Technology Co., Ltd.Coremax Corp.Coretronic Corp.Co-Tech Development Corp.Cowealth Medical Holding Co., Ltd.Coxon Precise Industrial Co., Ltd.Creative Sensor, Inc.CSBC Corp. TaiwanCTCI Corp.C-Tech United Corp.Cub Elecparts, Inc.CviLux Corp.CX Technology Co., Ltd.Cyberlink Corp.CyberPower Systems, Inc.CyberTAN Technology, Inc.Cypress Technology Co., Ltd.DA CIN Construction Co., Ltd.Dadi Early-Childhood Education Group, Ltd.Dafeng TV, Ltd.Da-Li Development Co., Ltd.Danen Technology Corp.Darfon Electronics Corp.Darwin Precisions Corp.Davicom Semiconductor, Inc.
# 723,594 843,276#* 615,409 527,970
2,773,207 2,986,1992,770,000 5,553,629
# 2,190,076 2,000,1155,134 93,430
366,000 2,871,4781,313,666 3,770,963
# 1,442,000 1,005,8972,655,529 865,9572,953,375 1,994,178
# 6,950,979 2,339,83096,850 242,992
3,908,405 1,277,583139,000 146,491
9,000 124,740# 1,195,000 545,608
623,000 3,179,7343,756,200 3,830,581
#* 13,545,566 2,960,517# 464,000 260,849
803,397 241,204# 321,000 296,658
562,431 195,5807,608,000 6,523,794
548,000 461,0234,106,723 969,631
# 315,520 1,488,3723,226,320 1,799,090
# 976,000 551,838# 502,275 1,231,255
3,141,200 4,033,6801,202,533 1,279,591
139,700 225,621# 819,000 493,189
740,000 518,154#* 1,757,676 1,471,562
2,105,000 3,072,962376,971 238,980
# 416,887 3,766,776# 552,040 436,950
313,755 216,574# 504,697 1,386,306# 315,000 925,891
2,412,779 1,232,168255,700 647,876
# 1,226,711 772,966169,886 1,601,868482,870 551,534
# 1,148,032 1,101,033* 2,556,000 130,399# 1,568,550 2,075,892# 3,395,635 1,956,104
611,888 349,171
Copyright © 2021 www.secdatabase.com. All Rights Reserved.Please Consider the Environment Before Printing This Document

Daxin Materials Corp.De Licacy Industrial Co., Ltd.Delpha Construction Co., Ltd.
Depo Auto Parts Ind Co., Ltd.Dimerco Data System Corp.Dimerco Express Corp.D-Link Corp.Donpon Precision, Inc.Draytek Corp.Dyaco International, Inc.DYNACOLOR, Inc.Dynamic Electronics Co., Ltd.Dynapack International Technology Corp.E Ink Holdings, Inc.Eastern Media International Corp.ECOVE Environment Corp.Edimax Technology Co., Ltd.Edison Opto Corp.Edom Technology Co., Ltd.eGalax_eMPIA Technology, Inc.Egis Technology, Inc.Elan Microelectronics Corp.E-Lead Electronic Co., Ltd.Electric Power Technology, Ltd.E-LIFE MALL Corp.Elite Advanced Laser Corp.Elite Material Co., Ltd.Elite Semiconductor Memory Technology, Inc.Elitegroup Computer Systems Co., Ltd.eMemory Technology, Inc.Emerging Display Technologies Corp.ENG Electric Co., Ltd.Ennoconn Corp.EnTie Commercial Bank Co., Ltd.Epileds Technologies, Inc.Episil Holdings, Inc.Episil-Precision, Inc.Epistar Corp.Eslite Spectrum Corp. (The)Eson Precision Ind. Co., Ltd.Eternal Materials Co., Ltd.E-Ton Solar Tech Co., Ltd.Etron Technology, Inc.Eurocharm Holdings Co., Ltd.Everest Textile Co., Ltd.Evergreen International Storage & Transport Corp.Everlight Chemical Industrial Corp.
# 384,200 1,198,457# 1,999,407 1,495,957#* 809,931 418,626Table of Contents
The Emerging Markets Small Cap SeriesCONTINUED
Shares Value»
TAIWAN — (Continued)800,000 $1,847,492290,000 355,863828,000 568,818
#* 4,653,668 1,960,970104,000 77,406332,000 309,154
36,224 50,529# 297,000 351,610* 2,012,321 642,916
1,114,000 1,708,9042,368,000 2,594,639
# 3,584,511 1,176,375# 217,000 1,425,036* 1,405,108 496,712
829,000 381,6781,255,968 551,488
# 372,131 565,841# 444,000 3,139,924# 2,155,400 5,493,775* 507,942 351,151#* 141,000 73,676# 512,000 1,060,979# 1,009,226 1,807,819# 2,094,350 7,968,957
2,053,200 2,158,3432,649,254 921,503
523,000 6,287,550# 748,000 425,532* 744,514 77,501# 313,378 2,186,799# 2,229,603 1,165,091
584,000 291,154867,000 673,548
# 183,000 289,579# 7,963,000 6,277,775
72,000 292,288525,000 663,527
5,269,985 4,428,435* 547,530 44,581* 3,017,000 1,079,787# 224,000 959,030#* 2,936,957 1,072,859
4,029,000 1,848,0283,499,606 1,928,928
Copyright © 2021 www.secdatabase.com. All Rights Reserved.Please Consider the Environment Before Printing This Document

Everlight Electronics Co., Ltd.Everspring Industry Co., Ltd.Excellence Opto, Inc.Excelsior Medical Co., Ltd.EZconn Corp.Far Eastern Department Stores, Ltd.Far Eastern International BankFaraday Technology Corp.Farglory F T Z Investment Holding Co., Ltd.Farglory Land Development Co., Ltd.Federal Corp.Feedback Technology Corp.Feng Hsin Steel Co., Ltd.Firich Enterprises Co., Ltd.First Copper Technology Co., Ltd.
First Hi-Tec Enterprise Co., Ltd.First HotelFirst Insurance Co., Ltd. (The)First Steamship Co., Ltd.FIT Holding Co., Ltd.FLEXium Interconnect, Inc.Flytech Technology Co., Ltd.FocalTech Systems Co., Ltd.Forest Water Environment Engineering Co., Ltd.Formosa Advanced Technologies Co., Ltd.Formosa International Hotels Corp.Formosa Laboratories, Inc.Formosa Oilseed Processing Co., Ltd.Formosa Optical Technology Co., Ltd.Formosan Rubber Group, Inc.Formosan Union ChemicalFortune Electric Co., Ltd.Founding Construction & Development Co., Ltd.Foxsemicon Integrated Technology, Inc.Froch Enterprise Co., Ltd.FSP Technology, Inc.Fulgent Sun International Holding Co., Ltd.Fullerton Technology Co., Ltd.Fulltech Fiber Glass Corp.Fwusow Industry Co., Ltd.G Shank Enterprise Co., Ltd.G Tech Optoelectronics Corp.Gallant Precision Machining Co., Ltd.Gamania Digital Entertainment Co., Ltd.GCS Holdings, Inc.GEM Services, Inc.Gemtek Technology Corp.
3,233,000 3,107,381* 1,017,000 383,156
72,000 49,914670,217 1,079,271352,800 415,447
9,121,000 6,903,47817,542,108 7,031,151
860,305 1,717,293# 485,000 314,083
2,419,000 2,957,959#* 3,345,238 1,298,314# 254,200 598,141
3,367,100 6,174,19713,000 17,608
* 1,136,000 375,314Table of Contents
The Emerging Markets Small Cap SeriesCONTINUED
Shares Value»
TAIWAN — (Continued)542,205 $ 763,370
1,084,350 550,2421,424,179 687,694
#* 3,772,424 1,514,561#* 485,456 377,869# 2,576,087 7,840,139
826,309 2,016,501# 2,166,048 1,606,760
342,133 566,618# 1,222,000 1,301,012
407,329 2,204,575# 670,832 820,079
617,567 1,124,714# 160,000 340,205
2,586,952 1,597,746# 2,529,193 1,103,717
996,078 813,5741,138,623 581,264
# 476,027 1,794,5051,262,189 513,6681,062,427 657,989
# 716,033 2,067,694668,600 425,823
2,523,083 1,224,459# 867,138 504,398
952,281 751,425* 749,354 268,409# 1,157,000 724,222
533,000 1,154,451# 520,000 1,000,591# 493,570 1,005,335* 2,674,219 2,305,103
Copyright © 2021 www.secdatabase.com. All Rights Reserved.Please Consider the Environment Before Printing This Document

General Interface Solution Holding, Ltd.General Plastic Industrial Co., Ltd.Generalplus Technology, Inc.Genesys Logic, Inc.Genius Electronic Optical Co., Ltd.Genmont Biotech, Inc.Genovate Biotechnology Co., Ltd.GeoVision, Inc.Getac Technology Corp.Giantplus Technology Co., Ltd.Gigabyte Technology Co., Ltd.Gigasolar Materials Corp.Gigastorage Corp.Ginko International Co., Ltd.Global Brands Manufacture, Ltd.Global Lighting Technologies, Inc.Global Mixed Mode Technology, Inc.Global PMX Co., Ltd.Global Unichip Corp.Globe Union Industrial Corp.Gloria Material Technology Corp.GlycoNex, Inc.Gold Circuit Electronics, Ltd.Golden Friends Corp.Goldsun Building Materials Co., Ltd.Good Way Technology Co., Ltd.Good Will Instrument Co., Ltd.
Gourmet Master Co., Ltd.Grand Fortune Securities Co., Ltd.Grand Ocean Retail Group, Ltd.Grand Pacific PetrochemicalGrand Plastic Technology Corp.GrandTech CG Systems, Inc.Grape King Bio, Ltd.Great China Metal IndustryGreat Taipei Gas Co., Ltd.Great Wall Enterprise Co., Ltd.Greatek Electronics, Inc.Green Energy Technology, Inc.Green River Holding Co., Ltd.Green Seal Holding, Ltd.GTM Holdings Corp.Gudeng Precision Industrial Co., Ltd.Hannstar Board Corp.HannStar Display Corp.HannsTouch Solution, Inc.Hanpin Electron Co., Ltd.
# 914,000 3,359,667# 410,357 421,796# 398,000 435,108
607,000 623,847# 258,427 3,468,989# 299,000 261,594
268,800 232,486* 510,096 505,978
2,870,360 4,171,8272,186,900 842,239
# 4,095,800 6,120,832#* 187,880 828,365#* 2,617,561 772,431
359,000 2,323,379# 2,134,359 1,159,939
605,000 1,201,503606,000 1,936,323
# 278,000 1,046,349# 638,000 5,184,098
1,644,914 854,1443,868,547 2,400,761
* 258,000 180,007#* 3,019,227 1,290,827
250,600 473,4329,349,722 2,494,889
175,000 177,003# 369,869 316,416Table of Contents
The Emerging Markets Small Cap SeriesCONTINUED
Shares Value»
TAIWAN — (Continued)# 52,000 $ 307,894
1,616,000 434,567610,000 662,408
* 6,864,000 4,481,388133,000 575,805414,750 553,794790,000 4,894,167
1,134,000 887,1691,912,000 1,787,7244,288,868 5,608,6742,242,000 3,194,045
* 1,570,850 16,16515,950 47,012
335,700 421,671# 801,150 588,531
28,000 60,098# 2,191,934 2,617,560# 21,676,505 4,600,561#* 4,039,805 1,886,470
413,000 501,075
Copyright © 2021 www.secdatabase.com. All Rights Reserved.Please Consider the Environment Before Printing This Document

Harvatek Corp.Hey Song Corp.Hi-Clearance, Inc.Highlight Tech Corp.HIM International Music, Inc.Hiroca Holdings, Ltd.Hitron Technology, Inc.Ho Tung Chemical Corp.Hocheng Corp.Hold-Key Electric Wire & Cable Co., Ltd.Holiday Entertainment Co., Ltd.Holtek Semiconductor, Inc.Holy Stone Enterprise Co., Ltd.Hong Pu Real Estate Development Co., Ltd.Hong TAI Electric IndustrialHong YI Fiber Industry Co.Horizon Securities Co., Ltd.Hota Industrial Manufacturing Co., Ltd.Hotron Precision Electronic Industrial Co., Ltd.Hsin Kuang Steel Co., Ltd.Hsin Yung Chien Co., Ltd.Hsing TA Cement Co.Hu Lane Associate, Inc.HUA ENG Wire & Cable Co., Ltd.Huaku Development Co., Ltd.Huang Hsiang Construction Corp.Hung Ching Development & Construction Co., Ltd.Hung Sheng Construction, Ltd.Huxen Corp.Hwa Fong Rubber Industrial Co., Ltd.Hwacom Systems, Inc.Ibase Technology, Inc.IBF Financial Holdings Co., Ltd.Ichia Technologies, Inc.I-Chiun Precision Industry Co., Ltd.Ideal Bike Corp.IEI Integration Corp.Infortrend Technology, Inc.Info-Tek Corp.
Innodisk Corp.Inpaq Technology Co., Ltd.Intai Technology Corp.Integrated Service Technology, Inc.IntelliEPI, Inc.International CSRC Investment Holdings Co.International Games System Co., Ltd.Iron Force Industrial Co., Ltd.
# 1,000,949 482,573# 2,037,750 2,075,453
184,964 605,999564,000 448,383203,710 858,469
# 579,448 1,265,015# 1,636,557 1,069,299
6,872,684 1,545,8042,223,700 550,692
205,908 54,426572,800 1,229,253
1,359,000 3,036,3131,024,910 3,066,4451,717,185 1,135,077
# 1,589,000 497,789# 1,228,652 753,099#* 2,827,000 569,594# 1,670,932 5,837,123
398,439 616,102# 1,975,443 1,944,901
248,100 710,047488,162 278,782
# 595,866 1,484,2572,885,565 914,4721,821,816 4,772,246
# 883,800 895,783# 1,254,000 913,524
4,300,080 2,773,344292,244 450,695
* 1,907,890 693,942# 442,000 263,078
919,206 1,361,42616,174,982 5,761,572
* 2,178,000 1,128,094* 1,337,313 358,719* 1,239,734 198,825
1,366,388 1,444,9761,371,163 568,919
478,000 241,121Table of Contents
The Emerging Markets Small Cap SeriesCONTINUED
Shares Value»
TAIWAN — (Continued)# 462,864 $ 1,871,510# 461,000 448,290# 250,000 1,129,406
432,178 657,699225,000 444,251
# 5,210,941 6,344,311475,000 4,696,533389,393 1,355,639
Copyright © 2021 www.secdatabase.com. All Rights Reserved.Please Consider the Environment Before Printing This Document

I-Sheng Electric Wire & Cable Co., Ltd.ITE Technology, Inc.ITEQ Corp.Jarllytec Co., Ltd.Jentech Precision Industrial Co., Ltd.Jess-Link Products Co., Ltd.Jih Lin Technology Co., Ltd.Jih Sun Financial Holdings Co., Ltd.Jinan Acetate Chemical Co., Ltd.Jinli Group Holdings, Ltd.JMC Electronics Co., Ltd.Johnson Health Tech Co., Ltd.Jourdeness Group, Ltd.K Laser Technology, Inc.Kaimei Electronic Corp.Kaori Heat Treatment Co., Ltd.Kaulin Manufacturing Co., Ltd.KEE TAI Properties Co., Ltd.Kenda Rubber Industrial Co., Ltd.Kenmec Mechanical Engineering Co., Ltd.Kerry TJ Logistics Co., Ltd.Key Ware Electronics Co., Ltd.Kindom Construction Corp.King Chou Marine Technology Co., Ltd.King Slide Works Co., Ltd.King Yuan Electronics Co., Ltd.Kingcan Holdings, Ltd.Kingpak Technology, Inc.Kingpak Technology, Inc.King's Town Bank Co., Ltd.King's Town Construction Co., Ltd.Kinik Co.Kinko Optical Co., Ltd.Kinpo ElectronicsKinsus Interconnect Technology Corp.KMC Kuei Meng International, Inc.KNH Enterprise Co., Ltd.KS Terminals, Inc.Kung Long Batteries Industrial Co., Ltd.Kung Sing Engineering Corp.Kuo Toong International Co., Ltd.Kuoyang Construction Co., Ltd.Kwong Fong Industries Corp.Kwong Lung Enterprise Co., Ltd.KYE Systems Corp.L&K Engineering Co., Ltd.La Kaffa International Co., Ltd.LAN FA TextileLand Mark Optoelectronics Corp.Lanner Electronics, Inc.Laser Tek Taiwan Co., Ltd.
# 791,000 1,050,151# 1,132,095 1,204,387# 1,451,614 6,323,557
392,000 862,802# 499,868 2,029,371
778,925 758,210# 324,000 693,603
11,810,332 4,070,82249,000 218,255
1,001,653 470,425# 208,000 686,093
494,257 1,269,763# 176,000 570,053# 1,036,000 690,286
278,795 464,775601,197 853,522
# 896,330 454,3452,783,473 1,079,1801,265,000 1,177,847
# 1,413,000 636,2781,612,000 1,875,992
266,244 69,889# 2,452,000 1,979,743
482,920 552,94167,000 706,200
9,933,979 10,311,679* 254,844 137,236# 217,117 1,033,669
22,657 31,3314,532,701 4,630,399
# 838,074 751,369# 834,000 1,571,569* 1,023,000 983,725
9,720,157 3,240,197# 2,248,000 2,854,112
456,253 1,522,397# 333,020 113,945# 964,482 1,253,376
460,000 2,456,759# 2,033,000 462,606* 1,730,511 1,089,046
3,902,383 1,508,110788,764 392,901534,000 779,348
# 1,826,672 480,3251,281,048 1,153,909
157,701 894,292* 1,708,933 413,685# 505,300 3,972,765# 753,626 1,890,310
528,504 454,704Table of Contents
The Emerging Markets Small Cap SeriesCONTINUED
Copyright © 2021 www.secdatabase.com. All Rights Reserved.Please Consider the Environment Before Printing This Document

Laster Tech Corp., Ltd.Leader Electronics, Inc.Lealea Enterprise Co., Ltd.Ledlink Optics, Inc.LEE CHI Enterprises Co., Ltd.Lelon Electronics Corp.Lemtech Holdings Co., Ltd.Leofoo Development Co., Ltd.LES Enphants Co., Ltd.Lextar Electronics Corp.Li Cheng Enterprise Co., Ltd.Li Peng Enterprise Co., Ltd.Lian HWA Food Corp.Lida Holdings, Ltd.Lien Hwa Industrial Corp.Lifestyle Global Enterprise, Inc.Lingsen Precision Industries, Ltd.Lion Travel Service Co., Ltd.Lite-On Semiconductor Corp.Long Bon International Co., Ltd.Longchen Paper & Packaging Co., Ltd.Longwell Co.Lotes Co., Ltd.Lu Hai Holding Corp.Lucky Cement Corp.Lumax International Corp., Ltd.Lung Yen Life Service Corp.LuxNet Corp.Macauto Industrial Co., Ltd.Machvision, Inc.Macroblock, Inc.Macronix InternationalMakalot Industrial Co., Ltd.Marketech International Corp.Materials Analysis Technology, Inc.Mayer Steel Pipe Corp.Maywufa Co., Ltd.Mechema Chemicals International Corp.Meiloon Industrial Co.Mercuries & Associates Holding, Ltd.Mercuries Life Insurance Co., Ltd.Merry Electronics Co., Ltd.Microbio Co., Ltd.Microelectronics Technology, Inc.Mildef Crete, Inc.MIN AIK Technology Co., Ltd.Mirle Automation Corp.Mitac Holdings Corp.Mobiletron Electronics Co., Ltd.momo.com, Inc.Mosel Vitelic, Inc.Motech Industries, Inc.
Shares Value»
TAIWAN — (Continued)# 341,589 $ 403,275* 749,000 185,071
5,727,892 1,677,333325,300 259,233
# 1,386,000 428,480587,300 785,787
# 145,000 652,421* 1,810,116 406,939# 986,754 237,307# 2,301,500 1,121,938# 634,506 1,200,361
5,029,897 1,165,637576,625 859,461
# 310,000 495,9704,981,587 6,241,863
110,000 277,8622,752,506 786,049
284,000 758,6421,698,539 1,719,091
# 2,889,093 1,469,959# 4,317,685 2,059,041# 788,000 1,445,114# 544,923 3,984,785
306,690 410,051* 1,645,000 360,612
641,592 1,802,7031,281,000 2,561,461
#* 630,153 424,411# 390,000 1,071,711# 247,000 2,917,144# 301,010 1,154,085# 10,467,486 10,473,866# 1,309,010 7,642,828# 168,000 280,258
291,041 699,375944,567 462,279
69,322 29,116236,000 557,988937,730 665,093
3,100,696 1,763,493#* 9,151,820 3,177,831# 1,372,216 6,601,335* 2,852,607 1,237,805
367,655 295,816365,000 510,440
* 1,087,452 510,5201,248,098 1,740,3455,325,403 5,516,741
496,800 609,297235,000 1,970,466
#* 278,486 178,801#* 3,683,731 1,284,445
Copyright © 2021 www.secdatabase.com. All Rights Reserved.Please Consider the Environment Before Printing This Document

MPI Corp.Nak Sealing Technologies Corp.Namchow Holdings Co., Ltd.Nan Kang Rubber Tire Co., Ltd.Nan Liu Enterprise Co., Ltd.Nan Ren Lake Leisure Amusement Co., Ltd.Nan Ya Printed Circuit Board Corp.
Nang Kuang Pharmaceutical Co., Ltd.Nantex Industry Co., Ltd.National Aerospace Fasteners Corp.National Petroleum Co., Ltd.Netronix, Inc.New Asia Construction & Development Corp.New Best Wire Industrial Co., Ltd.New Era Electronics Co., Ltd.Nexcom International Co., Ltd.Nichidenbo Corp.Nien Hsing Textile Co., Ltd.Niko Semiconductor Co., Ltd.Nishoku Technology, Inc.Nova Technology Corp.Nuvoton Technology Corp.O-Bank Co., Ltd.Ocean Plastics Co., Ltd.On-Bright Electronics, Inc.OptoTech Corp.Orient Europharma Co., Ltd.Orient Semiconductor Electronics, Ltd.Oriental Union Chemical Corp.O-TA Precision Industry Co., Ltd.Pacific Construction Co.Pacific Hospital Supply Co., Ltd.Paiho Shih Holdings Corp.Pan Jit International, Inc.Pan-International Industrial Corp.Panion & BF Biotech, Inc.Parade Technologies, Ltd.Paragon Technologies Co., Ltd.Parpro Corp.PCL Technologies, Inc.P-Duke Technology Co., Ltd.Pharmally International Holding Co., Ltd.Phihong Technology Co., Ltd.Phoenix Tours International, Inc.Pili International Multimedia Co., Ltd.Pixart Imaging, Inc.Planet Technology Corp.
474,000 1,010,468# 412,954 933,122
1,279,000 2,182,389# 4,014,952 4,816,466# 309,000 1,487,667
765,000 241,154# 2,173,000 2,933,249Table of Contents
The Emerging Markets Small Cap SeriesCONTINUED
Shares Value»
TAIWAN — (Continued)436,000 $ 422,608
2,084,606 2,318,37541,000 122,709
# 217,824 289,190510,000 815,669
* 338,835 64,582195,600 163,100
# 312,000 204,055733,094 712,923
# 1,230,417 1,941,998984,345 814,231357,000 405,659
# 253,400 363,446# 76,000 369,612
592,000 935,917* 1,328,000 335,215* 1,107,200 989,054# 240,052 1,280,460
3,230,358 2,293,276305,000 592,699
* 3,462,599 1,710,018# 4,857,267 3,682,267# 111,227 170,691
1,868,921 711,312429,000 1,120,981
# 1,033,365 1,600,665# 2,420,541 1,977,288
3,108,747 2,505,1965,000 14,637
# 358,401 5,900,659* 480,246 334,391
233,000 256,468292,705 790,285345,950 922,405
# 344,452 2,567,274#* 2,328,401 648,625
291,322 342,263* 38,500 52,135# 1,016,150 3,523,408
196,000 420,191
Copyright © 2021 www.secdatabase.com. All Rights Reserved.Please Consider the Environment Before Printing This Document

Plastron Precision Co., Ltd.Plotech Co., Ltd.Polytronics Technology Corp.Posiflex Technology, Inc.Power Wind Health Industry, Inc.Poya International Co., Ltd.President Securities Corp.Primax Electronics, Ltd.Prince Housing & Development Corp.Princeton Technology Corp.Pro Hawk Corp.Promate Electronic Co., Ltd.Promise Technology, Inc.Prosperity Dielectrics Co., Ltd.P-Two Industries, Inc.Qisda Corp.QST International Corp.Qualipoly Chemical Corp.Quang Viet Enterprise Co., Ltd.
Quanta Storage, Inc.Quintain Steel Co., Ltd.Radiant Opto-Electronics Corp.Radium Life Tech Co., Ltd.Rafael Microelectronics, Inc.Rechi Precision Co., Ltd.Rexon Industrial Corp., Ltd.Rich Development Co., Ltd.RichWave Technology Corp.Right WAY Industrial Co., Ltd.Ritek Corp.Roo Hsing Co., Ltd.Rotam Global Agrosciences, Ltd.Ruentex Engineering & Construction Co.Ruentex Industries, Ltd.Run Long Construction Co., Ltd.Sagittarius Life Science Corp.Samebest Co., Ltd.Sampo Corp.San Fang Chemical Industry Co., Ltd.San Far Property, Ltd.San Shing Fastech Corp.Sanitar Co., Ltd.Sanyang Motor Co., Ltd.SCI Pharmtech, Inc.Scientech Corp.SDI Corp.Sea Sonic Electronics Co., Ltd.
562,491 235,547# 684,000 403,626
408,027 851,309# 306,457 1,136,910# 180,525 1,330,206
363,098 5,006,5576,489,524 2,643,6822,856,000 4,863,326
# 8,816,644 3,139,127* 1,016,000 282,003
122,000 569,6221,227,000 1,292,929
* 1,094,286 274,582# 770,559 1,528,999# 221,000 190,894
3,180,900 1,972,454# 407,000 859,064
662,048 581,956# 119,000 622,632Table of Contents
The Emerging Markets Small Cap SeriesCONTINUED
Shares Value»
TAIWAN — (Continued)1,493,000 $2,211,2211,680,823 382,5442,327,000 9,144,612
* 5,207,100 2,302,313# 165,000 1,102,250# 2,521,181 2,005,522
81,000 229,5134,431,036 1,343,057
# 339,900 1,341,117* 96,000 48,664* 8,749,924 2,424,590#* 5,115,000 1,998,991#* 497,268 277,113# 215,000 379,288
315,000 669,985# 243,000 489,826# 156,889 286,160# 160,400 659,101
2,651,861 1,573,6031,333,647 995,140
192,300 136,736# 782,875 1,331,758
311,000 392,430# 4,243,628 2,852,236# 422,395 1,296,361
330,000 708,642937,000 1,901,927
45,000 49,565
Copyright © 2021 www.secdatabase.com. All Rights Reserved.Please Consider the Environment Before Printing This Document

Senao International Co., Ltd.Senao Networks, Inc.Sercomm Corp.Sesoda Corp.Shan-Loong Transportation Co., Ltd.Sharehope Medicine Co., Ltd.Sheng Yu Steel Co., Ltd.ShenMao Technology, Inc.Shieh Yih Machinery Industry Co., Ltd.Shih Her Technologies, Inc.Shih Wei Navigation Co., Ltd.Shihlin Electric & Engineering Corp.Shin Hai Gas Corp.Shin Zu Shing Co., Ltd.Shinih Enterprise Co., Ltd.Shining Building Business Co., Ltd.Shinkong Insurance Co., Ltd.Shinkong Synthetic Fibers Corp.Shinkong Textile Co., Ltd.Shiny Chemical Industrial Co., Ltd.Shuttle, Inc.Sigurd Microelectronics Corp.Silicon Integrated Systems Corp.Silitech Technology Corp.Simplo Technology Co., Ltd.Sinbon Electronics Co., Ltd.Sincere Navigation Corp.Single Well Industrial Corp.Sinher Technology, Inc.Sinmag Equipment Corp.Sinon Corp.
Sinphar Pharmaceutical Co., Ltd.Sinyi Realty Co.Sirtec International Co., Ltd.Sitronix Technology Corp.Siward Crystal Technology Co., Ltd.Softstar Entertainment, Inc.Soft-World International Corp.Solar Applied Materials Technology Co.Solomon Technology Corp.Solteam, Inc.Song Shang Electronics Co., Ltd.Sonix Technology Co., Ltd.Southeast Cement Co., Ltd.Speed Tech Corp.Spirox Corp.Sporton International, Inc.
# 802,541 839,939# 200,000 639,361# 1,654,000 3,914,186
1,393,047 1,165,788558,000 536,107
# 744,107 690,636867,980 572,860604,891 416,124166,000 62,039
# 360,000 486,695* 1,334,081 397,552# 1,745,000 2,494,277
1,245 1,594# 1,239,144 4,975,010
71,000 40,558* 2,954,272 913,363# 1,482,131 1,807,807
9,973,395 4,228,940# 979,542 1,303,386
493,031 1,289,445* 2,436,152 982,541
2,925,974 2,720,382#* 3,569,887 951,315* 994,774 460,875
960,800 7,466,2771,625,813 6,903,9182,493,786 1,334,959
296,916 211,480332,000 469,129305,056 1,006,119
# 3,065,510 1,844,739Table of Contents
The Emerging Markets Small Cap SeriesCONTINUED
Shares Value»
TAIWAN — (Continued)1,128,938 $ 727,9081,679,660 1,683,919
749,600 850,116# 879,879 3,811,694# 1,230,000 835,633#* 73,000 218,514
797,000 1,845,674#* 1,726,207 1,300,715
869,000 558,443484,034 421,622649,840 314,784
# 1,117,000 1,114,160# 1,053,700 562,998#* 435,000 920,030
667,824 559,954512,192 3,409,016
Copyright © 2021 www.secdatabase.com. All Rights Reserved.Please Consider the Environment Before Printing This Document

St Shine Optical Co., Ltd.Standard Chemical & Pharmaceutical Co., Ltd.Stark Technology, Inc.Sun Race Sturmey-Archer, Inc.Sun Yad Construction Co., Ltd.Sunjuice Holdings Co., Ltd.Sunko INK Co., Ltd.Sunny Friend Environmental Technology Co., Ltd.Sunonwealth Electric Machine Industry Co., Ltd.Sunplus Technology Co., Ltd.Sunrex Technology Corp.Sunspring Metal Corp.Sunty Development Co., Ltd.Supreme Electronics Co., Ltd.Swancor Holding Co., Ltd.Sweeten Real Estate Development Co., Ltd.Symtek Automation Asia Co., Ltd.Syncmold Enterprise Corp.Synmosa Biopharma Corp.Sysage Technology Co., Ltd.SysgrationSystex Corp.T3EX Global Holdings Corp.TA Chen Stainless PipeTa Liang Technology Co., Ltd.Ta Ya Electric Wire & CableTa Yih Industrial Co., Ltd.Tah Hsin Industrial Corp.TAI Roun Products Co., Ltd.TA-I Technology Co., Ltd.Tai Tung Communication Co., Ltd.Taichung Commercial Bank Co., Ltd.TaiDoc Technology Corp.Taiflex Scientific Co., Ltd.Taimide Tech, Inc.Tainan Enterprises Co., Ltd.Tainan Spinning Co., Ltd.Tainergy Tech Co., Ltd.Tainet Communication System Corp.Tai-Saw Technology Co., Ltd.TaiSol Electronics Co., Ltd.Taisun Enterprise Co., Ltd.Taita Chemical Co., Ltd.
Taiwan Chinsan Electronic Industrial Co., Ltd.Taiwan Cogeneration Corp.Taiwan Fire & Marine Insurance Co., Ltd.Taiwan FU Hsing Industrial Co., Ltd.
# 251,000 4,186,527# 880,571 948,741# 764,688 1,270,415# 253,000 245,446# 135,000 66,708
39,600 268,173#* 865,000 257,695
522,000 4,435,184# 1,471,487 1,650,519
4,002,000 1,774,970896,612 1,144,400765,000 773,959
* 42,000 16,1642,838,508 2,558,435
# 429,206 1,041,862# 581,874 520,187
305,172 532,210856,750 2,148,443
# 731,601 592,601852,041 908,363
* 945,256 205,5161,365,388 3,222,238
730,117 560,538838,251 1,238,554384,000 428,010
# 4,300,306 1,537,210213,000 418,591439,600 439,993201,000 69,718
# 983,718 1,250,951* 604,197 317,997
17,659,234 7,167,165# 387,470 1,608,172# 1,462,340 2,258,613# 672,262 1,030,675# 835,370 687,049
9,507,044 3,735,799* 1,582,000 221,245
66,000 124,813# 235,120 155,596# 63,000 126,064# 2,229,648 1,478,332
1,459,570 492,282Table of Contents
The Emerging Markets Small Cap SeriesCONTINUED
Shares Value»
TAIWAN — (Continued)# 670,935 $ 758,268# 2,747,566 2,336,473
1,356,338 878,3451,173,000 1,618,369
Copyright © 2021 www.secdatabase.com. All Rights Reserved.Please Consider the Environment Before Printing This Document

Taiwan Glass Industry Corp.Taiwan Hon Chuan Enterprise Co., Ltd.Taiwan Hopax Chemicals Manufacturing Co., Ltd.Taiwan Land Development Corp.Taiwan Line Tek ElectronicTaiwan Mask Corp.Taiwan Navigation Co., Ltd.Taiwan Optical Platform Co., Ltd.Taiwan Paiho, Ltd.Taiwan PCB Techvest Co., Ltd.Taiwan Prosperity Chemical Corp.Taiwan Pulp & Paper Corp.Taiwan Sakura Corp.Taiwan Sanyo Electric Co., Ltd.Taiwan Secom Co., Ltd.Taiwan Semiconductor Co., Ltd.Taiwan Shin Kong Security Co., Ltd.Taiwan Styrene MonomerTaiwan Surface Mounting Technology Corp.Taiwan Taxi Co., Ltd.Taiwan TEA Corp.Taiwan Union Technology Corp.Taiyen Biotech Co., Ltd.Tatung Co., Ltd.Tayih Lun An Co., Ltd.TCI Co., Ltd.Te Chang Construction Co., Ltd.Teapo Electronic Corp.Tehmag Foods Corp.Ten Ren Tea Co., Ltd.Test Research, Inc.Test-Rite International Co., Ltd.Tex-Ray Industrial Co., Ltd.Thinking Electronic Industrial Co., Ltd.Thye Ming Industrial Co., Ltd.Ton Yi Industrial Corp.Tong Hsing Electronic Industries, Ltd.Tong Yang Industry Co., Ltd.Tong-Tai Machine & Tool Co., Ltd.TOPBI International Holdings, Ltd.Topco Scientific Co., Ltd.Topco Technologies Corp.Topkey Corp.Topoint Technology Co., Ltd.Toung Loong Textile ManufacturingTPK Holding Co., Ltd.Trade-Van Information Services Co.Transart Graphics Co., Ltd.Transcend Information, Inc.TrueLight Corp.Tsang Yow Industrial Co., Ltd.Tsann Kuen Enterprise Co., Ltd.TSC Auto ID Technology Co., Ltd.TSEC Corp.
235,000 91,0312,196,468 3,868,015
# 1,321,120 793,383* 6,576,991 1,935,201# 552,306 556,166#* 121,000 93,583
1,335,777 960,7649,453 33,375
# 1,955,287 5,739,853# 2,035,238 2,641,986#* 457,000 254,067# 2,174,980 1,314,573# 1,517,803 2,280,293
417,400 372,43119,000 52,986
# 1,622,000 2,574,2471,728,710 2,072,6763,646,209 2,858,2311,995,388 4,878,786
58,800 133,727# 5,442,897 2,834,809# 1,668,000 6,821,139# 766,883 835,552#* 3,204,015 2,060,770
315,890 228,695# 200,826 2,656,472
334,206 307,988480,000 637,070154,800 1,088,923164,980 204,751
1,214,820 1,835,9142,127,495 1,394,151
* 803,000 235,124647,204 1,635,090
1,153,669 1,199,4445,537,644 2,214,5451,128,963 4,644,2673,163,741 4,621,5751,557,892 900,711
# 392,464 1,098,1991,349,087 3,579,336
283,720 632,923103,000 565,961
1,034,898 632,949# 694,000 1,145,495#* 2,846,000 5,033,411# 245,000 274,052
18,000 35,7531,069,000 2,331,336
* 37,100 33,411554,000 407,964357,686 220,404195,470 1,599,447
* 1,988,195 556,614
Copyright © 2021 www.secdatabase.com. All Rights Reserved.Please Consider the Environment Before Printing This Document

TSRC Corp.
Ttet Union Corp.TTFB Co., Ltd.TTY Biopharm Co., Ltd.Tul Corp.Tung Ho Steel Enterprise Corp.Tung Thih Electronic Co., Ltd.TURVO International Co., Ltd.TXC Corp.TYC Brother Industrial Co., Ltd.Tycoons Group EnterpriseTyntek Corp.UDE Corp.Ultra Chip, Inc.U-Ming Marine Transport Corp.Unimicron Technology Corp.Union Bank Of TaiwanUnion Insurance Co., Ltd.Unitech Computer Co., Ltd.Unitech Printed Circuit Board Corp.United Integrated Services Co., Ltd.United Orthopedic Corp.United Radiant TechnologyUnited Renewable Energy Co., Ltd.Unity Opto Technology Co., Ltd.Univacco Technology, Inc.Universal Cement Corp.Universal Microelectronics Co., Ltd.Universal Microwave Technology, Inc.Unizyx Holding Corp.UPC Technology Corp.Userjoy Technology Co., Ltd.USI Corp.Usun Technology Co., Ltd.Utechzone Co., Ltd.Ve Wong Corp.VHQ Media Holdings, Ltd.Victory New Materials, Ltd. Co.Visual Photonics Epitaxy Co., Ltd.Vivotek, Inc.Wafer Works Corp.Waffer Technology Corp.Wah Hong Industrial Corp.Wah Lee Industrial Corp.Walsin Technology Corp.Walton Advanced Engineering, Inc.Wan Hai Lines, Ltd.
4,975,200 4,316,180Table of Contents
The Emerging Markets Small Cap SeriesCONTINUED
Shares Value»
TAIWAN — (Continued)303,000 $ 1,182,804
69,000 684,2341,761,979 4,573,907
# 101,200 247,025# 6,531,000 4,515,745# 466,600 1,045,555
452,922 1,076,1782,416,053 2,969,0521,516,980 1,367,440
#* 2,822,767 605,647# 2,295,039 1,232,302
473,000 409,608485,000 514,922
3,635,000 4,078,4344,426,000 5,343,489
# 8,151,693 3,140,203# 425,660 275,024
684,804 454,8274,549,937 3,445,0661,418,951 7,179,055
# 673,935 1,012,047# 735,000 430,253* 15,352,403 4,402,335* 2,760,500 785,827
32,000 25,2412,965,433 1,799,968
* 29,000 16,921# 350,526 1,164,186#* 2,509,430 2,015,709
6,912,611 2,494,104240,487 484,833
7,043,156 2,697,127354,200 336,181433,000 981,770
# 660,696 564,979# 176,000 818,932
877,120 515,6521,251,772 3,995,696
180,200 646,400# 2,761,548 3,164,861
780,000 329,802144,021 129,104
1,277,000 2,231,061# 1,910,793 10,632,012# 2,347,197 781,102
39,000 25,933
Copyright © 2021 www.secdatabase.com. All Rights Reserved.Please Consider the Environment Before Printing This Document

WAN HWA Enterprise Co.Ways Technical Corp., Ltd.Wei Chuan Foods Corp.Weikeng Industrial Co., Ltd.Well Shin Technology Co., Ltd.Weltrend SemiconductorWha Yu Industrial Co., Ltd.Wholetech System Hitech, Ltd.Winmate, Inc.Winstek Semiconductor Co., Ltd.Wintek Corp.Wisdom Marine Lines Co., Ltd.Wisechip Semiconductor, Inc.
Wistron NeWeb Corp.Wowprime Corp.WT Microelectronics Co., Ltd.WUS Printed Circuit Co., Ltd.XAC Automation Corp.XPEC Entertainment, Inc.Xxentria Technology Materials Corp.Yang Ming Marine Transport Corp.YC Co., Ltd.YC INOX Co., Ltd.YCC Parts Manufacturing Co., Ltd.Yea Shin International Development Co., Ltd.Yeong Guan Energy Technology Group Co., Ltd.YFC-Boneagle Electric Co., Ltd.YFY, Inc.Yi Jinn Industrial Co., Ltd.Yieh Phui Enterprise Co., Ltd.Ying Han Technology Co., Ltd.Yonyu Plastics Co., Ltd.Young Fast Optoelectronics Co., Ltd.Youngtek Electronics Corp.Yuanta Futures Co., Ltd.Yulon Finance Corp.Yulon Motor Co., Ltd.Yung Chi Paint & Varnish Manufacturing Co., Ltd.Yungshin Construction & Development Co., Ltd.YungShin Global Holding Corp.Yusin Holding Corp.YUSIN HOLDING Corp. DUMMY RGHTZeng Hsing Industrial Co., Ltd.Zenitron Corp.Zero One Technology Co., Ltd.Zig Sheng Industrial Co., Ltd.Zinwell Corp.
781,238 337,455#* 189,000 195,516
1,398,000 1,341,740# 2,156,515 1,396,052
680,000 1,113,755# 182,000 155,161#* 301,000 160,790# 207,000 212,577# 230,000 386,765
469,000 403,6475,447,000 60,1012,707,953 2,828,284
137,302 167,371Table of Contents
The Emerging Markets Small Cap SeriesCONTINUED
Shares Value»
TAIWAN — (Continued)# 2,196,155 $ 5,497,034
500,000 1,269,853# 3,725,450 4,834,923
1,587,700 1,585,558539,000 496,427192,135 15,324
1,017,207 2,295,663* 8,849,981 2,472,283# 3,328,674 1,316,152
2,603,388 2,196,855# 204,000 237,075
873,076 478,214#* 779,929 1,414,603
714,000 673,42310,957,212 4,073,501
1,545,284 694,6999,410,833 2,734,155
73,000 72,690# 487,600 528,031# 905,872 522,890# 903,666 1,330,928
302,000 483,494906,928 3,409,347
# 4,782,000 3,671,258452,869 1,078,385652,000 700,466
1,463,015 1,935,4376,000 13,096
721 278416,107 1,811,782
1,414,000 984,993764,000 742,253
# 3,502,732 989,643# 2,304,586 1,671,191
Copyright © 2021 www.secdatabase.com. All Rights Reserved.Please Consider the Environment Before Printing This Document

Zippy Technology Corp.ZongTai Real Estate Development Co., Ltd.
TOTAL TAIWAN
AAPICO Hitech PCLAAPICO Hitech PCLAdvanced Information Technology PCLAEON Thana Sinsap Thailand PCLAEON Thana Sinsap Thailand PCLAfter You PCLAikchol Hospital PCLAJ Plast PCLAllianz Ayudhya General Insurance PCLAlucon PCLAMA Marine PCLAmarin Printing & Publishing PCLAmata Corp. PCLAmata VN PCLAnanda Development PCLAP Thailand PCLAreeya Property PCLAsia Aviation PCLAsia Green Energy PCLAsia Plus Group Holdings PCL
Asia Precision PCLAsia Sermkij Leasing PCLAsian Insulators PCLAsian Phytoceuticals PCLAsian Seafoods Coldstorage PCLBangchak Corp. PCLBangkok Airways PCLBangkok Aviation Fuel Services PCLBangkok Chain Hospital PCLBangkok Insurance PCLBangkok Land PCLBangkok Life Assurance PCLBangkok Ranch PCLBCPG PCLBeauty Community PCLBEC World PCLBetter World Green PCLBig Camera Corp. PCLBJC Heavy Industries PCLBrooker Group PCL (The)Buriram Sugar PCLCal-Comp Electronics Thailand PCLCentral Plaza Hotel PCL
# 926,948 1,043,570# 1,199,849 900,259
1,210,761,043
THAILAND — (4.2%)32,300 19,639
966,439 587,625675,300 531,369527,600 4,065,719
74,500 574,1023,089,700 1,717,895
67,300 33,9181,497,588 438,247
195,200 264,9852,200 12,053
132,000 35,838415,000 67,199
4,805,810 3,765,892401,400 63,430
15,370,900 1,789,23212,078,616 3,004,435
* 9,600 1,95114,544,000 1,815,931
679,900 21,8868,853,800 800,311
Table of Contents
The Emerging Markets Small Cap SeriesCONTINUED
Shares Value»
THAILAND — (Continued)* 80,900 $ 11,732
1,094,900 886,45812,731,600 567,137
139,443 16,5041,389,200 311,6723,227,300 3,174,3076,459,700 2,247,4001,938,746 2,285,142
16,998,537 8,511,704185,181 1,980,964
103,230,370 5,773,24867,300 56,895
4,294,500 458,0063,414,400 2,187,081
16,468,700 2,002,697* 10,277,148 3,324,910
13,163,300 368,08412,840,300 517,704
3,479,500 300,9421,909,700 32,2891,978,400 385,967
17,055,044 970,4541,651,700 1,825,973
Copyright © 2021 www.secdatabase.com. All Rights Reserved.Please Consider the Environment Before Printing This Document

CH Karnchang PCLCharoong Thai Wire & Cable PCL, Class FChow Steel Industries PCLChristiani & Nielsen ThaiChularat Hospital PCL, Class FCIMB Thai Bank PCLCK Power PCLCOL PCLCom7 PCLCommunication & System Solution PCLCountry Group Development PCLCountry Group Holdings PCLDemco PCLDhipaya Insurance PCLDiamond Building Products PCLDo Day Dream PCLDusit Thani PCLDynasty Ceramic PCLEast Coast Furnitech P.L.C.Eastern Polymer Group PCL, Class FEastern Printing PCLEastern Star Real Estate PCLEastern Water Resources Development and Management PCL, Class FErawan Group PCL (The)Esso Thailand PCLEverland PCLFN Factory Outlet PCLForth Corp. PCLForth Smart Service PCLFortune Parts Industry PCLGFPT PCLGlobal Green Chemicals PCLGMM Grammy PCLGolden Land Property Development PCLGrand Canal Land PCLGrande Asset Hotels & Property PCL
Group Lease PCLGunkul Engineering PCLHaad Thip PCLHana Microelectronics PCLICC International PCLIchitan Group PCLInterhides PCLInterlink Communication PCLInterlink Telecom PCLInternet Thailand PCLItalian-Thai Development PCL
3,719,600 3,265,459968,400 242,454
* 416,800 30,899* 866,900 59,193
54,742,500 4,236,292* 8,093,200 189,469
9,820,690 2,139,445412,500 321,899
3,504,900 2,877,539601,200 33,232
* 24,407,500 833,291* 8,799,300 248,915
260,300 27,2532,378,500 1,925,6921,741,800 342,640
537,700 437,083114,500 37,230
23,143,480 1,670,575412,400 32,450
8,609,200 1,959,4991,639,108 191,8641,887,300 29,4554,687,400 2,057,548
14,749,270 2,685,60911,606,100 3,773,728
* 6,117,000 89,5031,324,400 84,4032,395,600 440,0962,728,900 696,5332,852,900 248,6035,658,700 3,330,271
* 1,730,200 658,213* 154,160 57,644
9,715,830 2,653,649* 121,600 10,992
1,507,800 40,201Table of Contents
The Emerging Markets Small Cap SeriesCONTINUED
Shares Value»
THAILAND — (Continued)* 749,000 $ 161,953
9,914,680 999,366241,700 168,966
4,533,496 4,127,390204,600 269,429
4,445,400 1,127,4301,178,200 197,2921,638,900 274,438
592,800 68,233228,100 24,178
16,994,327 1,237,759
Copyright © 2021 www.secdatabase.com. All Rights Reserved.Please Consider the Environment Before Printing This Document
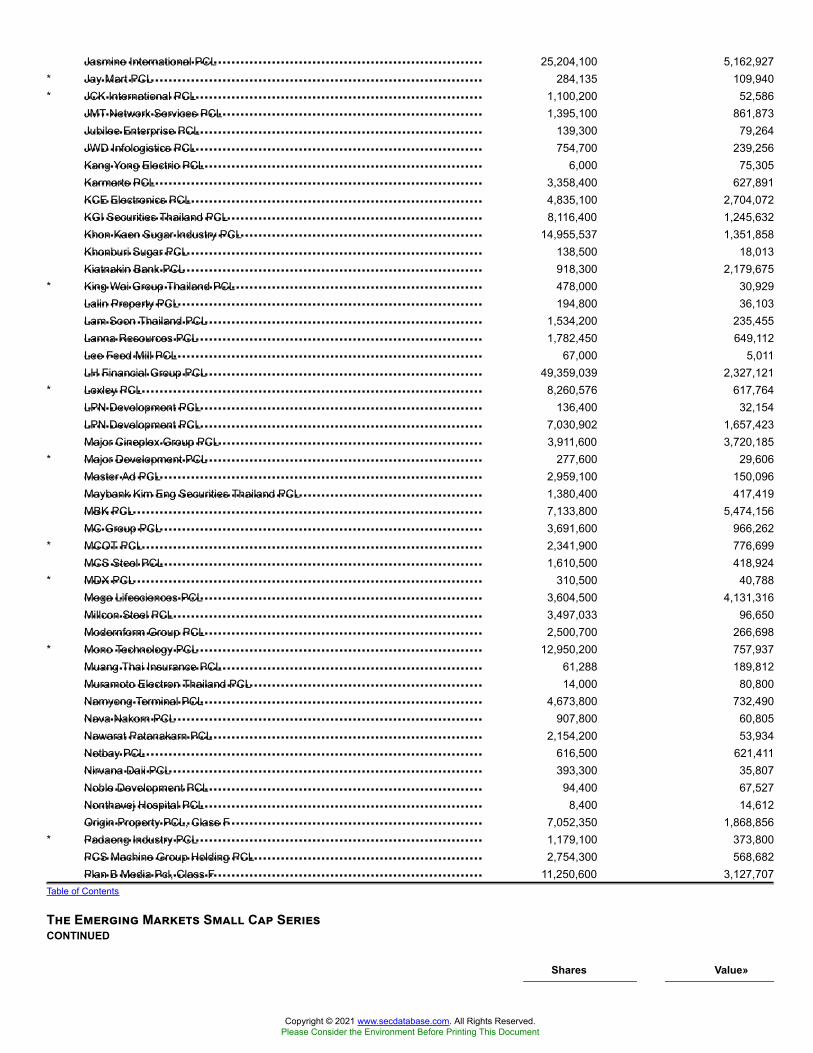
Jasmine International PCLJay Mart PCLJCK International PCLJMT Network Services PCLJubilee Enterprise PCLJWD Infologistics PCLKang Yong Electric PCLKarmarts PCLKCE Electronics PCLKGI Securities Thailand PCLKhon Kaen Sugar Industry PCLKhonburi Sugar PCLKiatnakin Bank PCLKing Wai Group Thailand PCLLalin Property PCLLam Soon Thailand PCLLanna Resources PCLLee Feed Mill PCLLH Financial Group PCLLoxley PCLLPN Development PCLLPN Development PCLMajor Cineplex Group PCLMajor Development PCLMaster Ad PCLMaybank Kim Eng Securities Thailand PCLMBK PCLMC Group PCLMCOT PCLMCS Steel PCLMDX PCLMega Lifesciences PCLMillcon Steel PCLModernform Group PCLMono Technology PCLMuang Thai Insurance PCLMuramoto Electron Thailand PCLNamyong Terminal PCLNava Nakorn PCLNawarat Patanakarn PCLNetbay PCLNirvana Daii PCLNoble Development PCLNonthavej Hospital PCLOrigin Property PCL, Class FPadaeng Industry PCLPCS Machine Group Holding PCLPlan B Media Pcl, Class F
25,204,100 5,162,927* 284,135 109,940* 1,100,200 52,586
1,395,100 861,873139,300 79,264754,700 239,256
6,000 75,3053,358,400 627,8914,835,100 2,704,0728,116,400 1,245,632
14,955,537 1,351,858138,500 18,013918,300 2,179,675
* 478,000 30,929194,800 36,103
1,534,200 235,4551,782,450 649,112
67,000 5,01149,359,039 2,327,121
* 8,260,576 617,764136,400 32,154
7,030,902 1,657,4233,911,600 3,720,185
* 277,600 29,6062,959,100 150,0961,380,400 417,4197,133,800 5,474,1563,691,600 966,262
* 2,341,900 776,6991,610,500 418,924
* 310,500 40,7883,604,500 4,131,3163,497,033 96,6502,500,700 266,698
* 12,950,200 757,93761,288 189,81214,000 80,800
4,673,800 732,490907,800 60,805
2,154,200 53,934616,500 621,411393,300 35,807
94,400 67,5278,400 14,612
7,052,350 1,868,856* 1,179,100 373,800
2,754,300 568,68211,250,600 3,127,707
Table of Contents
The Emerging Markets Small Cap SeriesCONTINUED
Shares Value»
Copyright © 2021 www.secdatabase.com. All Rights Reserved.Please Consider the Environment Before Printing This Document

Platinum Group PCL (The)Polyplex Thailand PCLPower Solution Technologies PCLPP Prime PCLPrecious Shipping PCLPremier Marketing PCLPrima Marine PCLPrincipal Capital PCLProperty Perfect PCLPruksa Holding PCLPTG Energy PCLPylon PCLQTC Energy PCLQuality Houses PCLRaimon Land PCLRajthanee Hospital PCLRatchthani Leasing PCLRegional Container Lines PCLRojana Industrial Park PCLRS PCLS 11 Group PCLSabina PCLSaha Pathana Inter-Holding PCLSahakol Equipment PCLSahamitr Pressure Container PCLSaha-Union PCLSahaviriya Steel Industries PCLSamart Corp. PCLSamart Digital Public Co., Ltd.Samart Telcoms PCLSansiri PCLSappe PCLSC Asset Corp. PCLScan Inter PCLSCG Ceramics PCLSCI Electric PCLSEAFCO PCLSena Development PCLSermsang Power Corp. Co., Ltd.Siam Future Development PCLSiam Wellness Group PclSiamgas & Petrochemicals PCLSingha Estate PCLSino-Thai Engineering & Construction PCLSNC Former PCLSomboon Advance Technology PCLSouthern Concrete Pile PCLSPCG PCLSri Trang Agro-Industry PCLSriracha Construction PCLSrisawad Corp. PCLSrithai Superware PCLSrivichai Vejvivat PCL
THAILAND — (Continued)2,929,500 $ 604,8553,798,150 1,914,2039,617,600 228,283
* 216,900 18,760* 5,976,900 1,661,600
3,019,800 918,0663,199,100 904,964
* 1,648,100 227,21348,538,700 1,231,025
5,246,200 3,752,7697,839,300 5,735,1411,816,300 366,154
* 369,700 67,31751,373,826 5,078,08313,342,000 472,859
360,200 319,15012,364,137 2,954,850
* 3,754,500 542,0258,359,254 1,739,5294,422,100 2,300,5561,137,300 297,684
420,100 392,713699,100 1,505,946
* 2,083,800 200,554295,400 74,919859,300 1,236,353
87,225,900 26,6603,812,200 1,251,934
* 5,492,200 57,1452,160,100 856,876
68,528,510 3,320,0291,563,100 1,158,793
18,267,615 1,698,7604,052,200 437,435
* 4,998,929 328,332151,400 9,944
3,160,302 837,4722,263,933 265,003
250,700 67,65811,696,347 2,433,9662,361,800 998,3227,385,800 2,341,458
25,167,354 2,913,2104,404,500 3,651,918
384,400 176,2332,135,637 1,319,366
115,700 28,9673,350,500 2,069,8917,355,208 2,845,943
* 840,700 322,5582,994,230 5,330,323
10,347,100 343,165306,300 56,768
Copyright © 2021 www.secdatabase.com. All Rights Reserved.Please Consider the Environment Before Printing This Document

Star Petroleum Refining PCLStars Microelectronics Thailand PCLSTP & I PCLSub Sri Thai PCLSupalai PCLSuper Energy Corp. PCL
Susco PCLSVI PCLSymphony Communication PCLSynnex Thailand PCLSyntec Construction PCLTAC Consumer PCLTaokaenoi Food & Marketing PCL, Class FTapaco PCLTata Steel Thailand PCLTCM Corp. PCLThai Agro Energy PCLThai Airways International PCLThai Airways International PCLThai Central Chemical PCLThai Nakarin Hospital PCLThai President Foods PCLThai Rayon PCLThai Reinsurance PCLThai Rubber Latex Group PCLThai Rung Union Car PCLThai Solar Energy PCL, Class FThai Stanley Electric PCLThai Stanley Electric PCL, Class FThai Steel Cable PCLThai Vegetable Oil PCLThai Wacoal PCLThai Wah PCLThaicom PCLThaifoods Group PCLThaire Life Assurance PCLThitikorn PCLThoresen Thai Agencies PCLTipco Asphalt PCLTIPCO Foods PCLTKS Technologies PCLTMT Steel PCLTPBI Public Co.TPC Power Holdings Co., Ltd.TPI Polene PCLTPI Polene Power PCLTRC Construction PCL
6,777,500 2,170,651* 189,700 11,411
6,740,764 1,972,58677,800 11,738
7,288,791 5,213,897* 99,227,900 2,290,743Table of Contents
The Emerging Markets Small Cap SeriesCONTINUED
Shares Value»
THAILAND — (Continued)2,356,200 $ 245,158
12,690,300 1,658,755210,405 29,555
3,031,440 975,8175,373,800 447,307
903,300 142,7424,290,280 1,576,334
152,600 30,515* 26,758,900 600,346
704,200 59,532612,000 78,801
* 6,229,800 2,086,391* 141,400 47,356
344,400 259,798329,200 388,018
1,730 10,29540,200 48,690
12,859,300 338,678218,900 10,249156,000 23,941
6,128,895 554,0025,800 40,735
206,600 1,451,0033,400 1,393
4,521,375 4,226,61578,000 120,468
2,788,800 652,881* 4,350,500 827,522
10,706,700 1,503,9162,634,300 449,6851,681,800 546,8389,558,454 1,926,9204,341,900 2,781,1881,980,382 721,193
486,050 124,0612,400,400 421,465
* 6,700 1,0811,562,700 619,897
57,351,300 3,543,08197,400 19,002
* 46,202,724 210,320
Copyright © 2021 www.secdatabase.com. All Rights Reserved.Please Consider the Environment Before Printing This Document

Triton Holding PCLTTCL PCLTTCL PCLTTW PCLU City PCL, Class FUAC Global PCLUnion Auction PCLUnique Engineering & Construction PCLUnited Paper PCLUnited Power of Asia PCLUnivanich Palm Oil PCLUniventures PCLVanachai Group PCLVGI Global Media PCLVibhavadi Medical Center PCLVinythai PCLWHA Corp. PCLWHA Utilities and Power PCL
Workpoint Entertainment PCL
TOTAL THAILAND
Adana Cimento Sanayii TAS, Class AAfyon Cimento Sanayi TASAkcansa Cimento A.S.Aksa Akrilik Kimya Sanayii A.S.Aksa Enerji Uretim A.S.Aksigorta A.S.Alarko Holding A.S.Albaraka Turk Katilim Bankasi A.S.Alkim Alkali Kimya A.S.Anadolu Anonim Turk Sigorta SirketiAnadolu Cam Sanayii A.S.Anadolu Hayat Emeklilik A.S.AvivaSA Emeklilik ve Hayat A.S., Class AAygaz A.S.Bagfas Bandirma Gubre Fabrikalari A.S.Baticim Bati Anadolu Cimento Sanayii A.S.Bera Holding A.S.Besiktas Futbol Yatirimlari Sanayi ve Ticaret A.S.Bizim Toptan Satis Magazalari A.S.Bolu Cimento Sanayii A.S.Borusan Mannesmann Boru Sanayi ve Ticaret A.S.Borusan Yatirim ve Pazarlama A.S.Boyner Perakende Ve Tekstil Yatirimlari A.S.Brisa Bridgestone Sabanci Sanayi ve Ticaret A.S.Celebi Hava Servisi A.S.Cimsa Cimento Sanayi VE Ticaret A.S.
4,559,700 53,373* 1,373,940 482,476* 1,068,171 375,102
11,746,700 5,156,249* 6,942,114 417,588
353,200 35,372518,700 123,119
6,208,070 2,200,2263,153,900 1,158,806
* 2,389,900 21,7582,378,600 406,0367,797,800 1,698,7575,125,659 829,9726,726,300 2,110,512
21,060,200 1,520,1972,644,634 2,235,7503,602,800 548,2396,358,500 1,271,493
Table of Contents
The Emerging Markets Small Cap SeriesCONTINUED
Shares Value»
THAILAND — (Continued)1,964,840 $ 1,820,775
283,598,595
TURKEY — (1.0%)573,750 709,824
#* 409,554 296,688# 365,692 434,117# 688,943 1,166,178#* 1,065,259 459,287
991,138 821,1241,194,310 708,530
#* 3,367,493 726,242# 128,328 624,420# 2,052,847 1,489,302
1,939,357 991,460884,139 796,919
97,076 152,557# 673,766 1,232,823#* 270,435 338,488#* 770,153 357,753#* 3,062,039 992,231#* 1,001,974 265,279#* 291,163 392,087
57,394 25,603# 444,418 653,219
28,364 190,025* 50,786 76,462#* 406,440 432,651# 35,541 577,101#* 498,987 602,850
Copyright © 2021 www.secdatabase.com. All Rights Reserved.Please Consider the Environment Before Printing This Document

Dogan Sirketler Grubu Holding A.S.Dogus Otomotiv Servis ve Ticaret A.S.Eczacibasi Yatirim Holding Ortakligi A.S.EGE Endustri VE Ticaret A.S.EIS Eczacibasi Ilac ve Sinai ve Finansal Yatirimlar Sanayi ve Ticaret A.S.ENERJISA ENERJI ASErbosan Erciyas Boru Sanayii ve Ticaret A.S.Fenerbahce Futbol A.S.Galatasaray Sportif Sinai ve Ticari Yatirimlar A.S.Global Yatirim Holding A.S.Goltas Goller Bolgesi Cimento Sanayi ve Ticaret A.S.Goodyear Lastikleri TASGozde Girisim Sermayesi Yatirim Ortakligi A.S.GSD Holding ASGubre Fabrikalari TASHektas Ticaret TASIhlas Gayrimenkul Proje Gelistirme Ve Ticaret A.S.Ihlas Holding A.S.Indeks Bilgisayar Sistemleri Muhendislik Sanayi ve Ticaret A.S.Ipek Dogal Enerji Kaynaklari Arastirma Ve Uretim A.S.Is Finansal Kiralama A.S.Is Yatirim Menkul Degerler A.S., Class AIsiklar Enerji ve Yapi Holding A.S.Izmir Demir Celik Sanayi A.S.Kardemir Karabuk Demir Celik Sanayi ve Ticaret A.S., Class AKardemir Karabuk Demir Celik Sanayi ve Ticaret A.S., Class BKardemir Karabuk Demir Celik Sanayi ve Ticaret A.S., Class DKarsan Otomotiv Sanayii Ve Ticaret A.S.Kartonsan Karton Sanayi ve Ticaret A.S.
Kerevitas Gida Sanayi ve Ticaret A.S.Konya Cimento Sanayii A.S.Kordsa Teknik Tekstil A.S.Koza Altin Isletmeleri A.S.Koza Anadolu Metal Madencilik Isletmeleri A.S.Logo Yazilim Sanayi Ve Ticaret A.S.Mardin Cimento Sanayii ve Ticaret A.S.Mavi Giyim Sanayi Ve Ticaret AS, Class BMetro Ticari ve Mali Yatirimlar Holding A.S.Migros Ticaret A.S.MLP SAGLIK HIZMETLERI ASNET Holding A.S.Netas Telekomunikasyon A.S.Nuh Cimento Sanayi A.S.Otokar Otomotiv Ve Savunma Sanayi A.S.Parsan Makina Parcalari Sanayii A.S.Pegasus Hava Tasimaciligi A.S.Polisan Holding A.S.
# 8,546,269 1,986,411#* 432,015 387,226
134,867 148,86313,257 1,267,624
# 1,231,041 534,343# 1,464,920 1,588,069# 144,106 394,435#* 190,973 257,277#* 413,527 108,642#* 1,299,765 800,088
107,555 213,150# 613,895 286,539#* 1,384,852 684,019* 2,632,862 399,558#* 625,472 392,131#* 363,374 868,862#* 1,141,706 206,035#* 6,521,746 557,533
170,909 257,545#* 796,450 737,670#* 558,147 256,138
1,135,191 650,214#* 739,540 45,113* 933,580 265,728
1,761,667 653,270# 851,302 316,540
5,462,665 2,135,403#* 942,397 187,129# 8,129 468,297Table of Contents
The Emerging Markets Small Cap SeriesCONTINUED
Shares Value»
TURKEY — (Continued)#* 459,795 $ 176,900#* 9,203 303,216
487,374 1,084,119* 244,985 2,492,174#* 911,041 1,162,602* 113,926 896,984
159,912 80,445* 13,914 103,264#* 1,698,921 331,796#* 352,575 1,070,938#* 9,950 21,345#* 1,658,567 472,807#* 356,406 466,690
435,429 490,088# 81,988 1,836,269#* 126,184 360,880#* 326,074 2,772,601# 698,330 286,474
Copyright © 2021 www.secdatabase.com. All Rights Reserved.Please Consider the Environment Before Printing This Document

Sarkuysan Elektrolitik Bakir Sanayi ve Ticaret A.S.Sasa Polyester Sanayi A.S.Sekerbank Turk ASSelcuk Ecza Deposu Ticaret ve Sanayi A.S.Soda Sanayii A.S.Tat Gida Sanayi A.S.Tekfen Holding A.S.Trakya Cam Sanayii A.S.Tumosan Motor ve Traktor Sanayi A.S.Turcas Petrol A.S.Turk Traktor ve Ziraat Makineleri A.S.Turkiye Sinai Kalkinma Bankasi A.S.Ulker Biskuvi Sanayi A.S.Vestel Elektronik Sanayi ve Ticaret A.S.Yatas Yatak ve Yorgan Sanayi ve Ticaret A.S.Zorlu Enerji Elektrik Uretim A.S.
TOTAL TURKEY
TOTAL COMMON STOCKS
AES Tiete Energia SAAlpargatas SAAZUL SABanco ABC Brasil S.A.Banco do Estado do Rio Grande do Sul SA, Class BBanco Pan SACentrais Eletricas Santa CatarinaCia de Saneamento do ParanaCia de Transmissao de Energia Eletrica PaulistaCia Energetica de Minas GeraisCia Energetica de Sao Paulo, Class BCia Energetica do Ceara, Class ACia Ferro Ligas da Bahia - FERBASACia Paranaense de EnergiaEucatex SA Industria e ComercioGol Linhas Aereas Inteligentes SAGrazziotin SAMarcopolo SARandon SA Implementos e Participacoes
Schulz SAUnipar Carbocloro SAUsinas Siderurgicas de Minas Gerais SA, Class A
TOTAL BRAZIL
Coca-Cola Embonor SA, Class B
# 1,508,806 976,021# 566,919 624,730#* 2,648,150 458,610
1,345,460 1,117,099# 2,553,246 2,794,762#* 567,533 506,652
972,029 4,104,7823,354,040 1,661,595
* 252,555 188,094#* 822,759 209,915#* 92,627 618,129* 7,746,253 1,151,274* 1,144,106 3,798,399#* 788,499 1,328,912#* 931,138 902,401#* 3,011,709 656,285
68,074,324
6,431,037,958
PREFERRED STOCKS — (2.0%)BRAZIL — (2.0%)
7,992 5,1311,462,211 7,950,235
* 478,582 6,493,371967,846 4,547,140
1,888,992 11,636,8261,878,440 4,651,370
80,500 980,2132,871,501 11,978,5392,108,269 13,368,8234,006,953 14,846,2051,984,488 15,074,694
135,739 2,112,725506,034 2,990,047960,299 12,367,497157,378 204,127
* 207,748 2,230,25512,400 79,280
5,506,518 5,497,3561,982,457 5,147,890
Table of Contents
The Emerging Markets Small Cap SeriesCONTINUED
Shares Value»
BRAZIL — (Continued)51,100 $ 117,294
548,344 4,843,5473,685,171 8,449,237
135,571,802
CHILE — (0.0%)666,620 1,354,801
Copyright © 2021 www.secdatabase.com. All Rights Reserved.Please Consider the Environment Before Printing This Document

Avianca Holdings SABanco Davivienda SA
TOTAL COLOMBIA
TOTAL PREFERRED STOCKS
Hortifrut SA Rights 08/07/19
Medco Energi Internasional Tbk PT Warrants 12/11/20
Paramount Corp. Bhd Warrants 7/28/2024
Dae-Il Corp. Rights 08/08/2019G Smatt Global Co., Ltd. Rights 09/03/19Iljin Diamond Co., Ltd. Rights 08/02/19Nature & Environment Co., Ltd. Rights 08/06/19Sangbo Corp. Rights 07/23/19Sonokong Co., Ltd. Rights 09/03/19
TOTAL SOUTH KOREA
PLASTRON PRECISION Co., Ltd. Rights 08/15/19
TOTAL RIGHTS/WARRANTS
TOTAL INVESTMENT SECURITIES
DFA Short Term Investment Fund
(Cost $6,785,533,952)^^
MSCI Emerging Markets Index®
S&P 500® Emini Index
Total Futures Contracts
COLOMBIA — (0.0%)2,978,325 1,452,430
34,759 435,847
1,888,277
138,814,880
RIGHTS/WARRANTS — (0.0%)CHILE — (0.0%)* 8,366 0
INDONESIA — (0.0%)* 11,600,866 177,113
MALAYSIA — (0.0%)* 307,930 0
SOUTH KOREA — (0.0%)* 54,572 51,431* 299,815 5,829* 8,590 42,840* 138,970 6,460* 88,193 11,554* 31,830 7,129
125,243
TAIWAN — (0.0%)* 64,969 4,701
307,057
6,570,159,895
Value†
SECURITIES LENDING COLLATERAL — (3.8%)@§ 22,535,986 260,763,898
TOTAL INVESTMENTS — (100.0%)$6,830,923,793
As of July 31, 2019, The Emerging Markets Small Cap Series had entered into the following outstanding futures contracts:
Description
Numberof
ContractsExpiration
DateNotional
ValueMarketValue
UnrealizedAppreciation
(Depreciation)
Long Position Contracts:650 09/20/19 $33,824,862 $33,332,000 $(492,862)
92 09/20/19 13,684,727 13,718,580 33,853
$47,509,589 $47,050,580 $(459,009)Table of Contents
The Emerging Markets Small Cap SeriesCONTINUED
Summary of the Series' investments as of July 31, 2019, based on their valuation inputs, is as follows (see Security Valuation Note):
Investments in Securities (Market Value)
Level 1 Level 2 Level 3 Total
Common Stocks
Copyright © 2021 www.secdatabase.com. All Rights Reserved.Please Consider the Environment Before Printing This Document

BrazilChileChinaColombiaGreeceHong KongHungaryIndiaIndonesiaMalaysiaMexicoPhilippinesPolandRussiaSingaporeSouth AfricaSouth KoreaTaiwanThailandTurkey
BrazilChileColombia
IndonesiaSouth KoreaTaiwan
Securities Lending CollateralFutures Contracts**
TOTAL
Activision Blizzard, Inc.AT&T, Inc.ATN International, Inc.Beasley Broadcast Group, Inc., Class ACars.com, Inc.CBS Corp., Class ACharter Communications, Inc., Class ACinemark Holdings, Inc.
$ 652,190,387 — — $ 652,190,387109,347,460 — — 109,347,460
86,792,932 $1,010,005,358 — 1,096,798,29021,110,071 — — 21,110,071
— 27,570,023 — 27,570,023— 1,459,084 — 1,459,084— 10,303,672 — 10,303,672
58,368 684,434,370 — 684,492,7381,595,194 208,784,937 — 210,380,131
— 220,857,754 — 220,857,754197,731,229 27,790 — 197,759,019
— 101,755,472 — 101,755,472— 81,684,249 — 81,684,249
6,790,156 — — 6,790,156— 59,145 — 59,145
19,927,901 459,225,384 — 479,153,2851,282,615 965,610,445 — 966,893,060
93,430 1,210,667,613 — 1,210,761,043283,571,935 26,660 — 283,598,595
— 68,074,324 — 68,074,324Preferred Stocks
135,571,802 — — 135,571,8021,354,801 — — 1,354,8011,888,277 — — 1,888,277
Rights/Warrants— 177,113 — 177,113— 125,243 — 125,243— 4,701 — 4,701
— 260,763,898 — 260,763,898(459,009) — — (459,009)
$1,518,847,549 $5,311,617,235 — $6,830,464,784** Valued at the unrealized appreciation/(depreciation) on the investment.
Table of Contents
THE TAX-MANAGED U.S. MARKETWIDE VALUE SERIES
SCHEDULE OF INVESTMENTS
July 31, 2019
(Unaudited)
Shares Value†
COMMON STOCKS — (97.9%)COMMUNICATION SERVICES — (12.6%)
496,359 $ 24,192,5387,170,552 244,157,296
684 38,4899,471 30,781
#* 43,079 818,50114,300 736,164
* 339,394 130,795,66039,447 1,574,724
Copyright © 2021 www.secdatabase.com. All Rights Reserved.Please Consider the Environment Before Printing This Document

Comcast Corp., Class AConsolidated Communications Holdings, Inc.Discovery, Inc., Class BDiscovery, Inc., Class CEntravision Communications Corp., Class AEW Scripps Co. (The), Class AFox Corp., Class AFox Corp., Class BGannett Co., Inc.GCI Liberty, Inc., Class AGCI Liberty, Inc., Class BGray Television, Inc.Hemisphere Media Group, Inc.IAC/InterActiveCorpInterpublic Group of Cos., Inc. (The)Iridium Communications, Inc.John Wiley & Sons, Inc., Class ALiberty Broadband Corp.Liberty Broadband Corp., Class ALiberty Broadband Corp., Class CLiberty Latin America, Ltd., Class ALiberty Latin America, Ltd., Class CLiberty Media Corp.-Liberty Braves, Class ALiberty Media Corp.-Liberty Braves, Class BLiberty Media Corp.-Liberty Braves, Class CLiberty Media Corp.-Liberty Formula One, Class ALiberty Media Corp.-Liberty Formula One, Class CLiberty Media Corp.-Liberty SiriusXM, Class ALiberty Media Corp.-Liberty SiriusXM, Class BLiberty Media Corp.-Liberty SiriusXM, Class CLiberty TripAdvisor Holdings, Inc., Class ALiberty TripAdvisor Holdings, Inc., Class BLions Gate Entertainment Corp., Class ALions Gate Entertainment Corp., Class BMadison Square Garden Co. (The), Class AMarcus Corp. (The)Meet Group, Inc. (The)Meredith Corp.MSG Networks, Inc., Class ANew Media Investment Group, Inc.News Corp., Class ANews Corp., Class BNexstar Media Group, Inc., Class AORBCOMM, Inc.Saga Communications, Inc., Class ASalem Media Group, Inc.
Scholastic Corp.
7,135,970 308,059,825# 10,700 50,397* 3,609 133,317* 3,762 106,239
56,828 185,25981,265 1,245,792
211,170 7,880,864* 143,308 5,331,058# 71,219 729,995* 123,145 7,355,451* 1,686 100,907* 54,374 965,139* 18,877 232,376* 81,587 19,503,372
79,202 1,815,310* 41,000 1,043,040
28,891 1,314,829* 1,905 187,833* 24,095 2,365,888* 67,601 6,726,976* 4,700 77,033* 2,660 43,624* 7,613 220,016* 762 26,480* 16,901 486,242* 17,043 638,772#* 82,356 3,243,179* 96,383 4,012,424* 7,314 305,725* 208,010 8,707,299* 76,802 887,063* 3,422 41,064# 19,000 245,290# 14,469 176,377* 12,352 3,582,574
20,599 720,759* 83,800 288,272# 44,176 2,423,495* 29,558 561,306# 44,459 478,823
402,247 5,293,57199,903 1,344,69451,781 5,269,752
#* 82,899 485,7888,693 271,396
10,922 22,718Table of Contents
The Tax-Managed U.S. Marketwide Value SeriesCONTINUED
Shares Value†
COMMUNICATION SERVICES — (Continued)31,200 $ 1,066,104
Copyright © 2021 www.secdatabase.com. All Rights Reserved.Please Consider the Environment Before Printing This Document
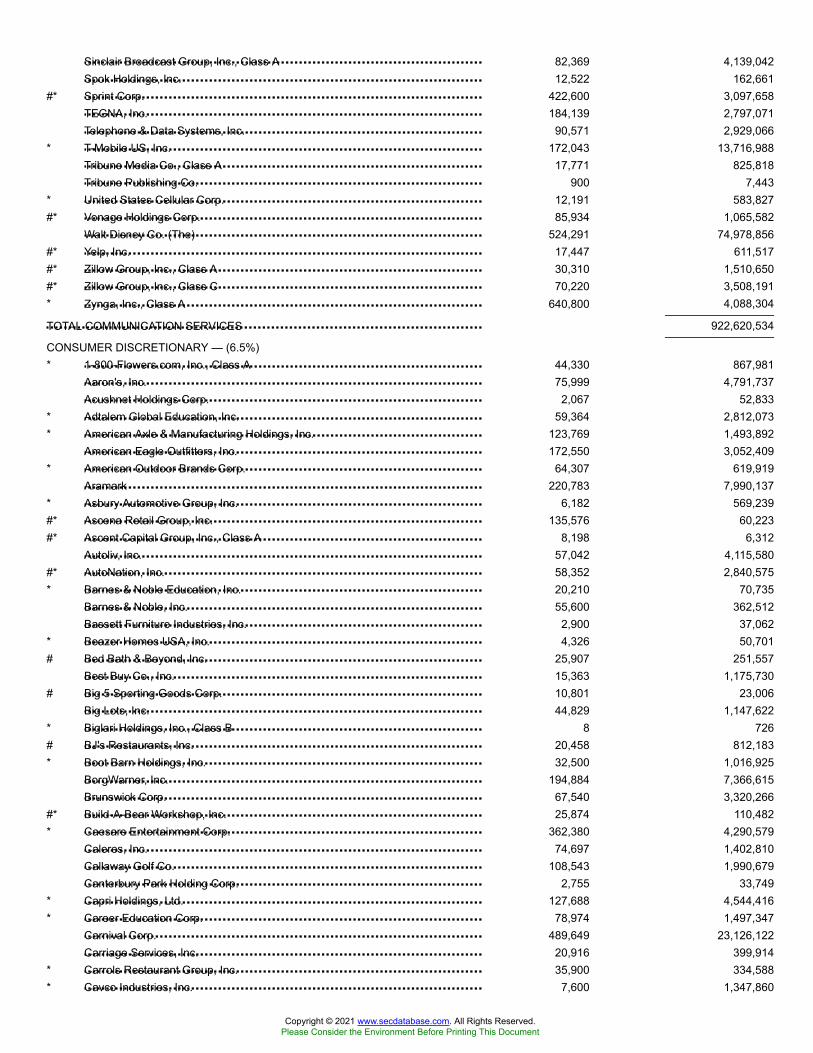
Sinclair Broadcast Group, Inc., Class ASpok Holdings, Inc.Sprint Corp.TEGNA, Inc.Telephone & Data Systems, Inc.T-Mobile US, Inc.Tribune Media Co., Class ATribune Publishing Co.United States Cellular Corp.Vonage Holdings Corp.Walt Disney Co. (The)Yelp, Inc.Zillow Group, Inc., Class AZillow Group, Inc., Class CZynga, Inc., Class A
TOTAL COMMUNICATION SERVICES
1-800-Flowers.com, Inc., Class AAaron's, Inc.Acushnet Holdings Corp.Adtalem Global Education, Inc.American Axle & Manufacturing Holdings, Inc.American Eagle Outfitters, Inc.American Outdoor Brands Corp.AramarkAsbury Automotive Group, Inc.Ascena Retail Group, Inc.Ascent Capital Group, Inc., Class AAutoliv, Inc.AutoNation, Inc.Barnes & Noble Education, Inc.Barnes & Noble, Inc.Bassett Furniture Industries, Inc.Beazer Homes USA, Inc.Bed Bath & Beyond, Inc.Best Buy Co., Inc.Big 5 Sporting Goods Corp.Big Lots, Inc.Biglari Holdings, Inc., Class BBJ's Restaurants, Inc.Boot Barn Holdings, Inc.BorgWarner, Inc.Brunswick Corp.Build-A-Bear Workshop, Inc.Caesars Entertainment Corp.Caleres, Inc.Callaway Golf Co.Canterbury Park Holding Corp.Capri Holdings, Ltd.Career Education Corp.Carnival Corp.Carriage Services, Inc.Carrols Restaurant Group, Inc.Cavco Industries, Inc.
82,369 4,139,04212,522 162,661
#* 422,600 3,097,658184,139 2,797,071
90,571 2,929,066* 172,043 13,716,988
17,771 825,818900 7,443
* 12,191 583,827#* 85,934 1,065,582
524,291 74,978,856#* 17,447 611,517#* 30,310 1,510,650#* 70,220 3,508,191* 640,800 4,088,304
922,620,534
CONSUMER DISCRETIONARY — (6.5%)* 44,330 867,981
75,999 4,791,7372,067 52,833
* 59,364 2,812,073* 123,769 1,493,892
172,550 3,052,409* 64,307 619,919
220,783 7,990,137* 6,182 569,239#* 135,576 60,223#* 8,198 6,312
57,042 4,115,580#* 58,352 2,840,575* 20,210 70,735
55,600 362,5122,900 37,062
* 4,326 50,701# 25,907 251,557
15,363 1,175,730# 10,801 23,006
44,829 1,147,622* 8 726# 20,458 812,183* 32,500 1,016,925
194,884 7,366,61567,540 3,320,266
#* 25,874 110,482* 362,380 4,290,579
74,697 1,402,810108,543 1,990,679
2,755 33,749* 127,688 4,544,416* 78,974 1,497,347
489,649 23,126,12220,916 399,914
* 35,900 334,588* 7,600 1,347,860
Copyright © 2021 www.secdatabase.com. All Rights Reserved.Please Consider the Environment Before Printing This Document

Century Communities, Inc.Chuy's Holdings, Inc.Citi Trends, Inc.
Conn's, Inc.Cooper Tire & Rubber Co.Cooper-Standard Holdings, Inc.Core-Mark Holding Co., Inc.Culp, Inc.Dana, Inc.Deckers Outdoor Corp.Delta Apparel, Inc.Designer Brands, Inc., Class ADick's Sporting Goods, Inc.Dillard's, Inc., Class ADorman Products, Inc.DR Horton, Inc.Educational Development Corp.El Pollo Loco Holdings, Inc.Escalade, Inc.Ethan Allen Interiors, Inc.Expedia Group, Inc.Extended Stay America, Inc.Fiesta Restaurant Group, Inc.Flanigan's Enterprises, Inc.Flexsteel Industries, Inc.Foot Locker, Inc.Ford Motor Co.Fossil Group, Inc.GameStop Corp., Class AGap, Inc. (The)General Motors Co.Genesco, Inc.Gentex Corp.Gentherm, Inc.G-III Apparel Group, Ltd.Goodyear Tire & Rubber Co. (The)Graham Holdings Co., Class BGreen Brick Partners, Inc.Group 1 Automotive, Inc.Guess?, Inc.Habit Restaurants, Inc. (The), Class AHamilton Beach Brands Holding Co., Class AHarley-Davidson, Inc.Haverty Furniture Cos., Inc.Helen of Troy, Ltd.Hibbett Sports, Inc.Hooker Furniture Corp.
#* 14,709 405,527* 16,443 388,877
5,815 89,260Table of Contents
The Tax-Managed U.S. Marketwide Value SeriesCONTINUED
Shares Value†
CONSUMER DISCRETIONARY — (Continued)#* 25,450 $ 529,360
55,558 1,495,621* 18,702 925,375
96,236 3,602,11310,036 180,347
112,665 1,882,632* 22,626 3,535,991* 7,532 143,409# 75,552 1,388,646# 83,076 3,087,935# 120,300 8,755,434* 9,311 669,275
208,125 9,559,181# 3,358 22,331#* 4,415 43,444
277 3,19416,717 344,03630,370 4,031,30890,395 1,511,404
* 20,300 193,865865 19,488
2,068 37,98997,386 3,998,669
2,868,969 27,341,275#* 600 6,624# 104,752 421,103# 149,047 2,906,416
1,095,598 44,196,423* 6,456 254,237
221,133 6,063,467* 37,081 1,516,984* 31,225 894,909
267,257 3,669,4395,780 4,292,979
* 2,594 24,41057,936 4,864,307
# 70,100 1,181,185#* 23,800 238,000
10,413 170,877# 137,875 4,933,167# 33,479 606,305* 61,653 9,141,907#* 20,800 382,720
14,814 308,872
Copyright © 2021 www.secdatabase.com. All Rights Reserved.Please Consider the Environment Before Printing This Document

Houghton Mifflin Harcourt Co.Hyatt Hotels Corp., Class AInternational Game Technology P.L.C.International Speedway Corp., Class AJ Alexander's Holdings, Inc.Johnson Outdoors, Inc., Class AKB HomeKohl's Corp.Lakeland Industries, Inc.Lands' End, Inc.Laureate Education, Inc., Class ALa-Z-Boy, Inc.LCI IndustriesLear Corp.Lennar Corp., Class A
Lennar Corp., Class BLibbey, Inc.Lifetime Brands, Inc.Lithia Motors, Inc., Class ALKQ Corp.M/I Homes, Inc.Macy's, Inc.MarineMax, Inc.Marriott Vacations Worldwide Corp.Media General, Inc. Contingent Value RightsMeritage Homes Corp.MGM Resorts InternationalModine Manufacturing Co.Mohawk Industries, Inc.Monarch Casino & Resort, Inc.Monro, Inc.Motorcar Parts of America, Inc.Movado Group, Inc.Murphy USA, Inc.Newell Brands, Inc.Office Depot, Inc.Overstock.com, Inc.Oxford Industries, Inc.Penske Automotive Group, Inc.Potbelly Corp.PulteGroup, Inc.PVH Corp.Qurate Retail Group, Inc. QVC Group, Class BQurate Retail, Inc.Ralph Lauren Corp.RCI Hospitality Holdings, Inc.Red Robin Gourmet Burgers, Inc.
* 6,300 36,855# 16,230 1,255,390# 7,100 94,785
24,844 1,119,968* 2,666 28,713
15,588 1,059,82830,800 809,116
144,069 7,759,556#* 9,887 106,088#* 13,703 149,363* 17,544 287,546
56,332 1,858,3939,411 862,330
51,273 6,500,391224,100 10,660,437
Table of Contents
The Tax-Managed U.S. Marketwide Value SeriesCONTINUED
Shares Value†
CONSUMER DISCRETIONARY — (Continued)12,506 $ 475,228
#* 25,700 43,43316,431 145,086
# 34,933 4,606,964* 208,413 5,612,562* 37,930 1,341,584
275,055 6,252,000* 29,164 450,292# 26,009 2,658,900» 25,196 988* 28,156 1,768,478
227,871 6,840,687* 14,650 200,998* 98,740 12,311,891* 1,103 51,918# 3,100 261,051#* 17,638 315,367
21,998 579,207* 34,678 3,064,148# 169,803 2,409,505
599,426 1,222,829#* 251 5,653# 11,400 834,366# 43,845 2,015,555* 25,202 104,840
275,833 8,691,49856,771 5,048,077
* 28,189 399,438* 620,725 8,777,051
36,864 3,842,33512,026 203,841
#* 31,175 1,029,398
Copyright © 2021 www.secdatabase.com. All Rights Reserved.Please Consider the Environment Before Printing This Document

Regis Corp.Rocky Brands, Inc.Royal Caribbean Cruises, Ltd.RTW RetailWinds, Inc.ServiceMaster Global Holdings, Inc.Shiloh Industries, Inc.Shoe Carnival, Inc.Skechers U.S.A., Inc., Class ASonic Automotive, Inc., Class ASpeedway Motorsports, Inc.Sportsman's Warehouse Holdings, Inc.Standard Motor Products, Inc.Steven Madden, Ltd.Stoneridge, Inc.Strategic Education, Inc.Strattec Security Corp.Superior Group of Cos, Inc.Superior Industries International, Inc.Tandy Leather Factory, Inc.Tapestry, Inc.Target Corp.Taylor Morrison Home Corp.Tenneco, Inc., Class AThor Industries, Inc.Tile Shop Holdings, Inc.Tilly's, Inc., Class AToll Brothers, Inc.
TopBuild Corp.Tower International, Inc.Unifi, Inc.Universal Electronics, Inc.Urban Outfitters, Inc.Veoneer, Inc.Vista Outdoor, Inc.Whirlpool Corp.William Lyon Homes, Class AWinnebago Industries, Inc.Wolverine World Wide, Inc.Wyndham Hotels & Resorts, Inc.ZAGG, Inc.Zovio, Inc.
TOTAL CONSUMER DISCRETIONARY
Alico, Inc.Andersons, Inc. (The)Archer-Daniels-Midland Co.Bunge, Ltd.
* 38,593 706,2528,729 275,138
322,500 37,519,650#* 8,600 18,748* 53,587 2,852,436* 15,461 77,923# 32,650 828,657* 146,140 5,544,552# 17,700 487,989
14,935 295,713#* 21,200 95,188
37,342 1,718,105# 35,225 1,215,615* 29,561 962,802
15,678 2,790,5275,224 108,607
17,956 305,61123,275 59,584
* 9,974 58,049236,819 7,324,812277,933 24,013,411
* 16,370 368,652# 5,044 45,598
38,190 2,276,124# 34,900 90,391
18,598 152,318179,799 6,467,370
Table of Contents
The Tax-Managed U.S. Marketwide Value SeriesCONTINUED
Shares Value†
CONSUMER DISCRETIONARY — (Continued)* 33,200 $ 2,693,516
13,300 409,640* 41,401 774,613* 15,506 663,967* 51,870 1,235,025#* 9,404 170,683* 23,950 172,440# 50,924 7,408,424#* 23,600 463,504# 2,635 106,191
51,777 1,405,74647,600 2,691,780
#* 30,497 202,195* 10,994 41,887
473,500,773
CONSUMER STAPLES — (5.9%)960 30,624
30,460 817,851813,476 33,417,594114,694 6,701,570
Copyright © 2021 www.secdatabase.com. All Rights Reserved.Please Consider the Environment Before Printing This Document

Cal-Maine Foods, Inc.Casey's General Stores, Inc.Central Garden & Pet Co.Central Garden & Pet Co., Class AConstellation Brands, Inc., Class AConstellation Brands, Inc., Class BCoty, Inc., Class ACraft Brew Alliance, Inc.Darling Ingredients, Inc.Edgewell Personal Care Co.Flowers Foods, Inc.Fresh Del Monte Produce, Inc.Hain Celestial Group, Inc. (The)Hostess Brands, Inc.Ingles Markets, Inc., Class AIngredion, Inc.JM Smucker Co. (The)John B. Sanfilippo & Son, Inc.Landec Corp.Limoneira Co.Molson Coors Brewing Co., Class AMolson Coors Brewing Co., Class BMondelez International, Inc., Class ANatural Grocers by Vitamin Cottage, Inc.Nature's Sunshine Products, Inc.Nu Skin Enterprises, Inc., Class AOil-Dri Corp. of AmericaPerformance Food Group Co.Pilgrim's Pride Corp.Post Holdings, Inc.PriceSmart, Inc.Pyxus International, Inc.Sanderson Farms, Inc.Seaboard Corp.Seneca Foods Corp., Class ASeneca Foods Corp., Class BSimply Good Foods Co. (The)SpartanNash Co.
Spectrum Brands Holdings, Inc.TreeHouse Foods, Inc.Tyson Foods, Inc., Class AUniversal Corp.US Foods Holding Corp.Village Super Market, Inc., Class AWalgreens Boots Alliance, Inc.Walmart, Inc.Weis Markets, Inc.
# 4,230 168,22726,905 4,356,189
#* 25,184 765,090* 48,121 1,325,734
5,370 1,056,9239,385 1,871,838
# 71,758 782,880* 9,754 153,235* 173,938 3,536,160* 10,174 309,595# 84,458 2,001,655
39,437 1,196,124#* 87,292 1,900,347* 4,500 63,540# 11,437 360,037
62,117 4,801,023108,204 12,031,203
10,428 906,297* 37,056 413,915
6,194 122,5791,908 118,582
186,550 10,071,8342,081,099 111,317,985
* 1,000 9,170* 1,029 9,292
19,563 782,1295,047 178,815
* 50,855 2,229,992* 7,900 213,774* 72,415 7,764,336
4,262 259,982#* 3,508 50,059# 22,700 2,974,154
1,812 7,395,932* 6,301 198,986* 300 9,420* 8,033 218,739
33,983 401,679Table of Contents
The Tax-Managed U.S. Marketwide Value SeriesCONTINUED
Shares Value†
CONSUMER STAPLES — (Continued)# 3,206 $ 160,653* 40,400 2,397,336
405,030 32,199,88522,290 1,326,255
* 208,373 7,370,1531,900 47,557
659,669 35,945,3641,173,687 129,551,571
# 11,602 422,893
Copyright © 2021 www.secdatabase.com. All Rights Reserved.Please Consider the Environment Before Printing This Document

TOTAL CONSUMER STAPLES
Adams Resources & Energy, Inc.Anadarko Petroleum Corp.Antero Resources Corp.Apache Corp.Apergy Corp.Arch Coal, Inc., Class AArchrock, Inc.Bonanza Creek Energy, Inc.Callon Petroleum Co.Carrizo Oil & Gas, Inc.Centennial Resource Development, Inc., Class AChevron Corp.Cimarex Energy Co.CNX Resources Corp.Concho Resources, Inc.ConocoPhillipsCONSOL Energy, Inc.Contura Energy, Inc.Dawson Geophysical Co.Delek US Holdings, Inc.Denbury Resources, Inc.DMC Global, Inc.Dorian LPG, Ltd.Earthstone Energy, Inc., Class AEnLink Midstream LLCEra Group, Inc.Evolution Petroleum Corp.Exterran Corp.Exxon Mobil Corp.GasLog, Ltd.Green Plains, Inc.Gulf Island Fabrication, Inc.Gulfport Energy Corp.Hallador Energy Co.Helix Energy Solutions Group, Inc.Helmerich & Payne, Inc.Hess Corp.HollyFrontier Corp.International Seaways, Inc.Keane Group, Inc.Kinder Morgan, Inc.Kosmos Energy, Ltd.Laredo Petroleum, Inc.Marathon Oil Corp.Marathon Petroleum Corp.Matador Resources Co.Matrix Service Co.
432,716,757
ENERGY — (9.8%)6,004 195,911
137,668 10,140,625#* 26,000 119,860
15,708 383,589* 13,433 436,976# 17,190 1,532,660
69,200 759,816* 6,200 135,160#* 250,011 1,230,054#* 1,000 9,530#* 56,834 338,162
1,222,366 150,485,47879,704 4,038,602
* 175,641 1,443,76915,381 1,502,416
1,439,649 85,054,463* 3,800 81,662* 200 7,166* 21,211 50,482
82,793 3,566,722#* 193,800 218,994
372 19,433* 13,595 124,394* 8,400 36,792# 195,680 1,878,528* 24,458 252,407
17,727 108,135* 35,500 484,575
2,036,573 151,439,56819,438 276,79721,234 214,251
* 13,009 93,144#* 68,661 259,539
14,700 78,792* 137,210 1,201,960
95,808 4,759,742146,488 9,498,282145,960 7,264,429
* 12 204* 1,400 8,806
574,540 11,847,015# 26,900 161,669* 36,900 122,508
467,019 6,570,9571,004,662 56,652,890
#* 63,704 1,123,102* 29,245 537,231Table of Contents
The Tax-Managed U.S. Marketwide Value SeriesCONTINUED
Copyright © 2021 www.secdatabase.com. All Rights Reserved.Please Consider the Environment Before Printing This Document
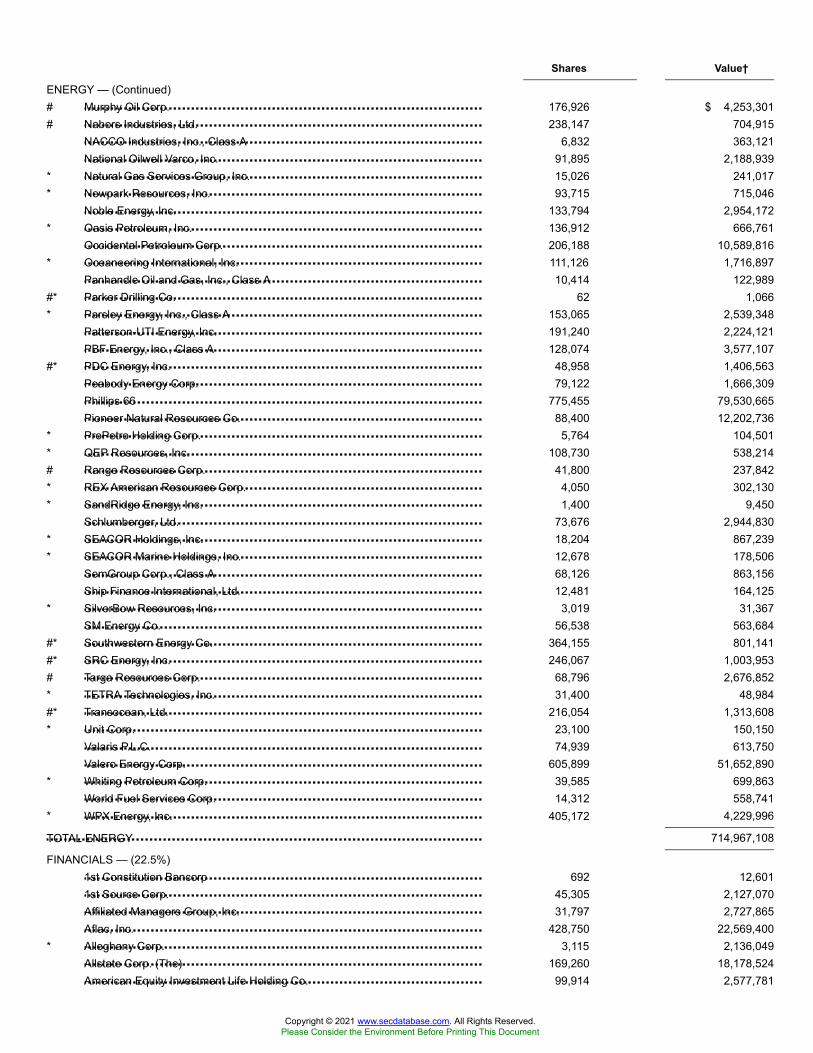
Murphy Oil Corp.Nabors Industries, Ltd.NACCO Industries, Inc., Class ANational Oilwell Varco, Inc.Natural Gas Services Group, Inc.Newpark Resources, Inc.Noble Energy, Inc.Oasis Petroleum, Inc.Occidental Petroleum Corp.Oceaneering International, Inc.Panhandle Oil and Gas, Inc., Class AParker Drilling Co.Parsley Energy, Inc., Class APatterson-UTI Energy, Inc.PBF Energy, Inc., Class APDC Energy, Inc.Peabody Energy Corp.Phillips 66Pioneer Natural Resources Co.ProPetro Holding Corp.QEP Resources, Inc.Range Resources Corp.REX American Resources Corp.SandRidge Energy, Inc.Schlumberger, Ltd.SEACOR Holdings, Inc.SEACOR Marine Holdings, Inc.SemGroup Corp., Class AShip Finance International, Ltd.SilverBow Resources, Inc.SM Energy Co.Southwestern Energy Co.SRC Energy, Inc.Targa Resources Corp.TETRA Technologies, Inc.Transocean, Ltd.Unit Corp.Valaris P.L.C.Valero Energy Corp.Whiting Petroleum Corp.World Fuel Services Corp.WPX Energy, Inc.
TOTAL ENERGY
1st Constitution Bancorp1st Source Corp.Affiliated Managers Group, Inc.Aflac, Inc.Alleghany Corp.Allstate Corp. (The)American Equity Investment Life Holding Co.
Shares Value†
ENERGY — (Continued)# 176,926 $ 4,253,301# 238,147 704,915
6,832 363,12191,895 2,188,939
* 15,026 241,017* 93,715 715,046
133,794 2,954,172* 136,912 666,761
206,188 10,589,816* 111,126 1,716,897
10,414 122,989#* 62 1,066* 153,065 2,539,348
191,240 2,224,121128,074 3,577,107
#* 48,958 1,406,56379,122 1,666,309
775,455 79,530,66588,400 12,202,736
* 5,764 104,501* 108,730 538,214# 41,800 237,842* 4,050 302,130* 1,400 9,450
73,676 2,944,830* 18,204 867,239* 12,678 178,506
68,126 863,15612,481 164,125
* 3,019 31,36756,538 563,684
#* 364,155 801,141#* 246,067 1,003,953# 68,796 2,676,852* 31,400 48,984#* 216,054 1,313,608* 23,100 150,150
74,939 613,750605,899 51,652,890
* 39,585 699,86314,312 558,741
* 405,172 4,229,996
714,967,108
FINANCIALS — (22.5%)692 12,601
45,305 2,127,07031,797 2,727,865
428,750 22,569,400* 3,115 2,136,049
169,260 18,178,52499,914 2,577,781
Copyright © 2021 www.secdatabase.com. All Rights Reserved.Please Consider the Environment Before Printing This Document

American Financial Group, Inc.American International Group, Inc.American National Insurance Co.Ameris BancorpAmeriServ Financial, Inc.Arch Capital Group, Ltd.Argo Group International Holdings, Ltd.
Associated Banc-CorpAssurant, Inc.Assured Guaranty, Ltd.Asta Funding, Inc.Athene Holding, Ltd., Class AAtlantic Union Bankshares Corp.Atlanticus Holdings Corp.Axis Capital Holdings, Ltd.Banc of California, Inc.Bancorp, Inc. (The)BancorpSouth BankBank of America Corp.Bank of New York Mellon Corp. (The)Bank OZKBankFinancial Corp.BankUnited, Inc.Banner Corp.Bar Harbor BanksharesBB&T Corp.BCB Bancorp, Inc.Berkshire Hathaway, Inc., Class BBerkshire Hills Bancorp, Inc.Blucora, Inc.BOK Financial Corp.Boston Private Financial Holdings, Inc.Brighthouse Financial, Inc.Brookline Bancorp, Inc.Cadence BanCorpCannae Holdings, Inc.Capital City Bank Group, Inc.Capital One Financial Corp.Capitol Federal Financial, Inc.Carolina Financial Corp.Cathay General BancorpCenterState Banks Corp.Century Bancorp, Inc., Class AChemung Financial Corp.Chubb, Ltd.Cincinnati Financial Corp.CIT Group, Inc.
156,083 15,979,778421,331 23,590,323
23,302 2,820,0085,770 229,473
30,968 126,969* 9,282 359,121
59,381 4,064,036Table of Contents
The Tax-Managed U.S. Marketwide Value SeriesCONTINUED
Shares Value†
FINANCIALS — (Continued)98,375 $ 2,131,78665,820 7,461,355
122,989 5,373,389* 885 6,487* 90,662 3,704,449
68,246 2,595,395* 12,567 59,316
62,010 3,948,1774,100 64,083
* 3,659 35,41946,327 1,384,714
5,929,137 181,905,923552,910 25,942,537
52,132 1,594,19716,687 223,77342,709 1,469,61740,520 2,401,215
2,733 69,391195,478 10,072,981
1,059 13,587* 137,627 28,272,715
33,464 1,097,619* 57,127 1,710,382
23,100 1,933,00812,500 144,250
* 54,858 2,148,78890,600 1,343,59852,543 900,587
* 15,438 446,93014,283 368,787
372,872 34,460,830146,829 2,005,684
1,153 40,493# 85,940 3,198,687
22,895 556,806295 24,706300 13,092
147,355 22,521,73812,284 1,318,44270,603 3,568,982
Copyright © 2021 www.secdatabase.com. All Rights Reserved.Please Consider the Environment Before Printing This Document

Citigroup, Inc.Citizens Community Bancorp, Inc.CME Group, Inc.CNA Financial Corp.CNO Financial Group, Inc.Codorus Valley Bancorp, Inc.Columbia Banking System, Inc.Community Bankers Trust Corp.Community Financial Corp. (The)Community Trust Bancorp, Inc.Community West BancsharesConnectOne Bancorp, Inc.Consumer Portfolio Services, Inc.Cowen, Inc., Class ACustomers Bancorp, Inc.Donegal Group, Inc., Class AE*TRADE Financial Corp.Eagle Bancorp Montana, Inc.East West Bancorp, Inc.
EMC Insurance Group, Inc.Employers Holdings, Inc.Equity Bancshares, Inc., Class AESSA Bancorp, Inc.Evans Bancorp, Inc.Everest Re Group, Ltd.FBL Financial Group, Inc., Class AFederal Agricultural Mortgage Corp., Class AFederal Agricultural Mortgage Corp., Class CFedNat Holding Co.Fifth Third BancorpFinancial Institutions, Inc.First American Financial Corp.First BancorpFirst BanCorpFirst Busey Corp.First Business Financial Services, Inc.First Citizens BancShares, Inc., Class AFirst Commonwealth Financial Corp.First Defiance Financial Corp.First Financial BancorpFirst Financial Northwest, Inc.First Hawaiian, Inc.First Horizon National Corp.First Internet BancorpFirst Interstate BancSystem, Inc., Class AFirst Merchants Corp.First Midwest Bancorp, Inc.
1,870,326 133,092,39810,355 112,86977,028 14,975,78451,474 2,465,090
301,264 5,094,374158 3,697
69,936 2,637,2875,917 47,099
408 13,27218,195 769,467
400 3,86038,800 886,968
* 26,500 96,725#* 3,989 70,047* 2,290 47,220
12,386 183,93286,881 4,238,924
1,000 17,77076,046 3,650,968
Table of Contents
The Tax-Managed U.S. Marketwide Value SeriesCONTINUED
Shares Value†
FINANCIALS — (Continued)23,450 $ 842,79336,900 1,619,910
* 2,393 63,3918,217 126,1311,681 62,298
34,913 8,610,94224,660 1,546,182
177 12,1449,500 734,065
13,665 170,676202,049 5,998,835
296 9,11481,153 4,692,26616,138 596,138
224,525 2,415,8893,120 84,334
964 22,9728,627 4,028,982
31,647 435,77921,760 624,947
112,065 2,856,53725,371 374,98346,692 1,249,478
239,535 3,928,3745,329 112,3352,348 93,990
37,532 1,479,13698,318 2,126,618
Copyright © 2021 www.secdatabase.com. All Rights Reserved.Please Consider the Environment Before Printing This Document

First United Corp.Flagstar Bancorp, Inc.FNB Corp.Franklin Financial Network, Inc.Fulton Financial Corp.Genworth Financial, Inc., Class AGlobal Indemnity, Ltd.Goldman Sachs Group, Inc. (The)Great Southern Bancorp, Inc.Great Western Bancorp, Inc.Guaranty Federal Bancshares, Inc.Hallmark Financial Services, Inc.Hancock Whitney Corp.Hanmi Financial Corp.Hanover Insurance Group, Inc. (The)Hartford Financial Services Group, Inc. (The)Heartland Financial USA, Inc.Hilltop Holdings, Inc.HMN Financial, Inc.Home Bancorp, Inc.Home BancShares, Inc.HomeStreet, Inc.Hope Bancorp, Inc.HopFed Bancorp, Inc.Horace Mann Educators Corp.Huntington Bancshares, Inc.IBERIABANK Corp.Independent Bank Corp.Independent Bank Group, Inc.International Bancshares Corp.Invesco, Ltd.
Investors Bancorp, Inc.Investors Title Co.Janus Henderson Group P.L.C.Jefferies Financial Group, Inc.JPMorgan Chase & Co.Kemper Corp.KeyCorpLakeland Bancorp, Inc.Landmark Bancorp, Inc.Legg Mason, Inc.Lincoln National Corp.Loews Corp.Mackinac Financial Corp.Marlin Business Services Corp.MBIA, Inc.MBT Financial Corp.
1,266 26,9538,432 290,735
155,117 1,869,160# 5,337 157,441
111,080 1,888,360* 34,964 139,506
8,282 234,298205,139 45,157,248
1,616 96,89518,793 635,579
1,684 39,742* 16,734 259,377
43,617 1,810,9783,221 69,219
88,829 11,522,010245,844 14,167,990
465 22,36226,171 593,558
* 3,456 73,267719 26,862
# 49,545 974,550* 2,200 63,844
92,224 1,360,304#*» 6,781 136,549
58,206 2,528,46986,935 1,238,82430,509 2,397,092
339 26,36140,199 2,283,70520,718 779,618
198,147 3,802,441Table of Contents
The Tax-Managed U.S. Marketwide Value SeriesCONTINUED
Shares Value†
FINANCIALS — (Continued)111,911 $ 1,271,309
1,069 175,42371,388 1,432,757
138,460 2,953,3522,307,658 267,688,328
59,119 5,203,654526,210 9,666,478
55,240 904,8312,509 59,589
43,400 1,634,444134,595 8,794,437243,798 13,052,945
6,893 106,15213,787 319,996
#* 82,267 767,5519,396 101,289
Copyright © 2021 www.secdatabase.com. All Rights Reserved.Please Consider the Environment Before Printing This Document

Mercantile Bank Corp.Meridian Bancorp, Inc.Meridian Corp.MetLife, Inc.MGIC Investment Corp.Middlefield Banc Corp.MidWestOne Financial Group, Inc.Morgan StanleyMutualFirst Financial, Inc.MVB Financial Corp.National Western Life Group, Inc., Class ANavient Corp.Nelnet, Inc., Class ANew York Community Bancorp, Inc.NewStar Financial, Inc.Northfield Bancorp, Inc.Northrim BanCorp, Inc.Northwest Bancshares, Inc.OceanFirst Financial Corp.OFG BancorpOld National BancorpOld Republic International Corp.OneMain Holdings, Inc.Oppenheimer Holdings, Inc., Class AOritani Financial Corp.Pacific Mercantile BancorpPacific Premier Bancorp, Inc.PacWest BancorpPeoples Bancorp of North Carolina, Inc.Peoples Bancorp, Inc.People's United Financial, Inc.Pinnacle Financial Partners, Inc.PNC Financial Services Group, Inc. (The)Popular, Inc.PRA Group, Inc.Premier Financial Bancorp, Inc.Principal Financial Group, Inc.ProAssurance Corp.Prosperity Bancshares, Inc.Protective Insurance Corp., Class AProtective Insurance Corp., Class BProvident Financial Holdings, Inc.Provident Financial Services, Inc.
Prudential Bancorp, Inc.Prudential Financial, Inc.Radian Group, Inc.Regions Financial Corp.
4,422 148,5791,000 18,340
* 511 8,713949,912 46,944,651
* 340,167 4,371,146226 9,863346 10,750
1,036,923 46,205,2892,300 74,957
716 12,466900 242,100
53,529 757,43516,900 1,057,264
# 232,135 2,676,517» 41,166 4,005
2,300 35,9955,734 223,454
89,407 1,533,3305,000 122,000
34,148 772,769104,940 1,847,993231,167 5,272,919
43,655 1,809,5003,097 90,247
46,800 847,080* 4,866 37,566
3,466 109,630# 87,381 3,375,528
275 7,45815,923 516,064
266,475 4,375,519# 27,914 1,695,496
217,040 31,015,01687,336 5,027,060
#* 44,671 1,390,6089,004 140,642
218,754 12,696,4823,184 124,463
# 26,194 1,817,602300 4,905
5,098 84,372544 11,299
71,759 1,735,133Table of Contents
The Tax-Managed U.S. Marketwide Value SeriesCONTINUED
Shares Value†
FINANCIALS — (Continued)1,222 $ 22,326
497,625 50,414,389166,814 3,803,359
1,302,555 20,749,701
Copyright © 2021 www.secdatabase.com. All Rights Reserved.Please Consider the Environment Before Printing This Document

Reinsurance Group of America, Inc.RenaissanceRe Holdings, Ltd.Renasant Corp.Riverview Bancorp, Inc.Safety Insurance Group, Inc.Salisbury Bancorp, Inc.Sandy Spring Bancorp, Inc.Santander Consumer USA Holdings, Inc.SB Financial Group, Inc.Select Bancorp, Inc.Selective Insurance Group, Inc.Severn Bancorp, Inc.Signature BankSimmons First National Corp., Class ASLM Corp.South State Corp.Southern National Bancorp of Virginia, Inc.State Auto Financial Corp.State Street Corp.Sterling BancorpStewart Information Services Corp.Stifel Financial Corp.SunTrust Banks, Inc.Synchrony FinancialSynovus Financial Corp.TCF Financial Corp.TCF Financial Corp.Territorial Bancorp, Inc.Texas Capital Bancshares, Inc.Timberland Bancorp, Inc.Tiptree, Inc.Towne BankTravelers Cos., Inc. (The)TriCo BancsharesTrustmark Corp.Two River BancorpUMB Financial Corp.Umpqua Holdings Corp.United Bankshares, Inc.United Community Banks, Inc.United Financial Bancorp, Inc.United Fire Group, Inc.Unity Bancorp, Inc.Univest Financial Corp.Unum GroupValley National BancorpVoya Financial, Inc.Washington Federal, Inc.Waterstone Financial, Inc.Webster Financial Corp.Wells Fargo & Co.WesBanco, Inc.Western New England Bancorp, Inc.White Mountains Insurance Group, Ltd.
153,566 23,944,01128,067 5,084,33744,538 1,598,469
1,682 14,29726,197 2,584,596
300 11,55010,325 376,24348,660 1,309,441
1,128 18,680* 2,728 30,963
45,200 3,399,0401,399 11,780
26,089 3,325,30442,645 1,098,10963,919 582,30214,479 1,159,334
193 3,07315,100 522,15837,988 2,206,723
124,400 2,718,14012,271 464,21270,500 4,216,605
255,532 17,018,431544,549 19,538,418
95,809 3,657,03013,100 280,07824,611 1,034,646
823 23,661* 22,592 1,421,715
3,971 109,75837,071 253,19510,057 283,004
168,250 24,668,815854 32,239
# 68,702 2,441,669700 9,947
6,961 475,15880,686 1,408,778
# 31,427 1,181,3417,372 211,5769,993 143,300
24,429 1,276,9043,592 74,3902,256 61,950
517,445 16,532,368# 158,654 1,770,579
75,644 4,248,92397,887 3,580,706
1,426 24,09922,479 1,146,429
3,014,787 145,945,83934,796 1,272,83813,698 127,939
1,572 1,691,472
Copyright © 2021 www.secdatabase.com. All Rights Reserved.Please Consider the Environment Before Printing This Document

Wintrust Financial Corp.
WSFS Financial Corp.Zions Bancorp NA
TOTAL FINANCIALS
Abbott LaboratoriesAcadia Healthcare Co., Inc.Acorda Therapeutics, Inc.Addus HomeCare Corp.Allergan P.L.C.Allscripts Healthcare Solutions, Inc.AMN Healthcare Services, Inc.AngioDynamics, Inc.Anika Therapeutics, Inc.Anthem, Inc.Arena Pharmaceuticals, Inc.Avanos Medical, Inc.Becton Dickinson and Co.Bio-Rad Laboratories, Inc., Class ABluebird Bio, Inc.Brookdale Senior Living, Inc.Cambrex Corp.Catalent, Inc.Centene Corp.Cigna Corp.Concert Pharmaceuticals, Inc.CONMED Corp.Cooper Cos., Inc. (The)Covetrus, Inc.Cross Country Healthcare, Inc.CryoLife, Inc.Cumberland Pharmaceuticals, Inc.CVS Health Corp.Danaher Corp.DaVita, Inc.DENTSPLY SIRONA, Inc.Digirad Corp.Diplomat Pharmacy, Inc.Emergent BioSolutions, Inc.Enzo Biochem, Inc.FONAR Corp.Globus Medical, Inc., Class AHarvard Bioscience, Inc.HMS Holdings Corp.Horizon Therapeutics P.L.C.Humana, Inc.Integer Holdings Corp.
47,328 3,385,845Table of Contents
The Tax-Managed U.S. Marketwide Value SeriesCONTINUED
Shares Value†
FINANCIALS — (Continued)9,624 $ 407,769
113,084 5,096,696
1,645,934,587
HEALTH CARE — (13.2%)915,297 79,722,369
#* 68,394 2,184,504#* 6,700 46,431* 2,044 164,726
26,101 4,189,211* 33,823 348,377* 3,400 181,492* 14,354 292,535#* 14,671 808,225
504,640 148,671,990* 2,796 175,253#* 23,671 963,883
31,580 7,983,424* 6,342 1,997,096#* 7,100 931,733* 127,554 993,646* 3,325 145,635* 59,241 3,346,524* 40,272 2,097,768* 256,808 43,636,815#* 5,383 54,153
43,239 3,776,92713,956 4,708,754
#* 7,558 178,898* 33,795 320,715* 17,502 504,408#* 23,319 136,416
1,510,745 84,405,323405,225 56,934,113
* 73,290 4,386,40773,992 4,028,864
2,671 14,290#* 34,200 180,234* 32,483 1,433,800#* 6,287 24,582* 1,460 35,828* 13,207 601,975* 16,180 40,126* 6,400 223,360* 42,600 1,060,314
198,071 58,777,569* 41,672 3,647,550
Copyright © 2021 www.secdatabase.com. All Rights Reserved.Please Consider the Environment Before Printing This Document

Integra LifeSciences Holdings Corp.IntriCon Corp.Jazz Pharmaceuticals P.L.C.Kewaunee Scientific Corp.Laboratory Corp. of America HoldingsLHC Group, Inc.Ligand Pharmaceuticals, Inc.LivaNova P.L.C.Luminex Corp.Magellan Health, Inc.Mallinckrodt P.L.C.MEDNAX, Inc.
Medpace Holdings, Inc.Medtronic P.L.C.Meridian Bioscience, Inc.Merit Medical Systems, Inc.Molina Healthcare, Inc.Mylan NVMyriad Genetics, Inc.National HealthCare Corp.Natus Medical, Inc.Nektar TherapeuticsNuVasive, Inc.Nuvectra Corp.Omnicell, Inc.OraSure Technologies, Inc.Patterson Cos., Inc.PerkinElmer, Inc.Perrigo Co. P.L.C.Pfizer, Inc.Premier, Inc., Class APrestige Consumer Healthcare, Inc.Providence Service Corp. (The)Quest Diagnostics, Inc.RTI Surgical Holdings, Inc.Select Medical Holdings Corp.STERIS P.L.C.Supernus Pharmaceuticals, Inc.Surmodics, Inc.Syneos Health, Inc.Taro Pharmaceutical Industries, Ltd.Teleflex, Inc.Thermo Fisher Scientific, Inc.Triple-S Management Corp., Class BUnited Therapeutics Corp.UnitedHealth Group, Inc.Varex Imaging Corp.
#* 15,398 976,079#* 9,335 167,843* 46,944 6,543,055
1,631 29,766* 9,871 1,653,590* 30,318 3,837,652#* 5,369 491,317#* 6,183 476,400
19,129 415,673* 18,699 1,315,288#* 33,959 231,261* 81,102 1,992,676Table of Contents
The Tax-Managed U.S. Marketwide Value SeriesCONTINUED
Shares Value†
HEALTH CARE — (Continued)#* 800 $ 63,008
814,175 82,996,99919,800 236,610
* 37,630 1,484,880* 18,941 2,514,986* 28,680 599,412* 80,916 2,357,892
6,880 602,688* 16,198 503,272#* 55,300 1,573,838* 4,355 290,043* 10,668 22,616* 35,405 2,662,810* 69,400 579,490# 12,992 257,242# 76,500 6,588,180# 59,570 3,217,376
3,696,959 143,589,888#* 24,342 943,253#* 111,489 3,857,519* 200 11,148
3,282 335,027* 65,316 278,246* 124,004 2,075,827
200 29,772* 523 17,453* 5,593 233,228#* 36,967 1,888,644
3,478 280,91823,829 8,095,664
435,609 120,959,907* 21,741 521,352* 30,939 2,451,606
89,716 22,340,181* 5,400 171,666
Copyright © 2021 www.secdatabase.com. All Rights Reserved.Please Consider the Environment Before Printing This Document

WellCare Health Plans, Inc.
TOTAL HEALTH CARE
AAR Corp.ABM Industries, Inc.Acme United Corp.Acuity Brands, Inc.Advanced Disposal Services, Inc.AECOMAegion Corp.Aerovironment, Inc.AGCO Corp.Air Lease Corp.Air Transport Services Group, Inc.Alamo Group, Inc.Alaska Air Group, Inc.Albany International Corp., Class AAllegiant Travel Co.Allied Motion Technologies, Inc.Altra Industrial Motion Corp.AMERCOAmeresco, Inc., Class AAmerican Woodmark Corp.
Apogee Enterprises, Inc.Applied Industrial Technologies, Inc.ARC Document Solutions, Inc.ArcBest Corp.Arconic, Inc.Arcosa, Inc.Argan, Inc.Armstrong Flooring, Inc.ASGN, Inc.Astec Industries, Inc.Atlas Air Worldwide Holdings, Inc.AZZ, Inc.Barnes Group, Inc.Beacon Roofing Supply, Inc.BMC Stock Holdings, Inc.Brady Corp., Class ABriggs & Stratton Corp.Builders FirstSource, Inc.CAI International, Inc.Carlisle Cos., Inc.Casella Waste Systems, Inc., Class ACBIZ, Inc.CECO Environmental Corp.Chart Industries, Inc.
* 18,375 5,278,219
962,397,703
INDUSTRIALS — (12.5%)35,596 1,490,04976,400 3,215,676
1,030 21,42439,826 5,345,446
* 9,007 291,557* 114,331 4,110,199* 38,330 722,521#* 35,065 1,923,315
73,273 5,642,02174,037 3,094,006
* 36,179 843,33222,751 2,227,095
112,092 7,102,14920,551 1,767,18010,873 1,629,319
1,458 57,79515,484 444,85529,431 11,389,797
* 981 13,979#* 16,604 1,408,849Table of Contents
The Tax-Managed U.S. Marketwide Value SeriesCONTINUED
Shares Value†
INDUSTRIALS — (Continued)36,374 $ 1,475,32911,718 712,923
* 20,800 39,31212,135 363,201
257,834 6,456,16361,271 2,297,66216,121 663,379
* 22,983 192,138* 53,951 3,401,611
22,925 749,418#* 29,094 1,328,141
18,300 852,41451,900 2,700,876
#* 32,399 1,173,816* 3,700 78,255
55,500 2,871,01548,233 459,660
* 28,442 488,634* 17,082 389,470
46,423 6,694,661* 5,201 226,764* 39,049 912,575* 3,773 34,825* 19,320 1,459,240
Copyright © 2021 www.secdatabase.com. All Rights Reserved.Please Consider the Environment Before Printing This Document

Chicago Rivet & Machine Co.CIRCOR International, Inc.Clean Harbors, Inc.Colfax Corp.Columbus McKinnon Corp.Comfort Systems USA, Inc.Commercial Vehicle Group, Inc.CompX International, Inc.Copa Holdings SA, Class ACovenant Transportation Group, Inc., Class ACRA International, Inc.Crane Co.CSW Industrials, Inc.CSX Corp.Cubic Corp.Cummins, Inc.Curtiss-Wright Corp.Delta Air Lines, Inc.Deluxe Corp.Douglas Dynamics, Inc.Ducommun, Inc.DXP Enterprises, Inc.Dycom Industries, Inc.Eastern Co. (The)Eaton Corp. P.L.C.Echo Global Logistics, Inc.EMCOR Group, Inc.Encore Wire Corp.EnerSysEnnis, Inc.EnPro Industries, Inc.ESCO Technologies, Inc.Espey Manufacturing & Electronics Corp.Federal Signal Corp.FedEx Corp.
Flowserve Corp.Fluor Corp.Fortune Brands Home & Security, Inc.Forward Air Corp.Franklin Covey Co.Franklin Electric Co., Inc.FTI Consulting, Inc.Gardner Denver Holdings, Inc.GATX Corp.Gencor Industries, Inc.General Electric Co.Genesee & Wyoming, Inc., Class A
700 18,137* 9,719 369,322* 40,519 3,152,783#* 16,746 463,529
17,542 674,31444,560 1,871,520
* 31,533 256,048500 8,225
33,488 3,385,637* 7,080 119,298
7,613 330,55623,381 1,956,990
300 21,1831,055,544 74,310,298
# 31,381 2,077,42216,500 2,706,00046,353 5,882,659
433,135 26,438,56027,627 1,232,71730,234 1,242,617
* 12,645 532,987* 15,502 526,293* 8,097 446,631
10,193 257,475265,270 21,802,541
* 31,380 660,86363,171 5,331,00124,066 1,321,70544,939 3,060,795
# 30,835 626,8768,338 592,332
29,848 2,494,0991,671 42,794
71,923 2,240,401127,314 21,710,856
Table of Contents
The Tax-Managed U.S. Marketwide Value SeriesCONTINUED
Shares Value†
INDUSTRIALS — (Continued)52,147 $ 2,608,914
153,901 5,003,322125,352 6,886,839
5,247 330,561* 3,046 111,179
22,458 1,052,382* 43,936 4,589,115* 65,747 2,167,679# 65,445 5,030,103* 13,149 167,781
778,179 8,131,971* 33,263 3,652,610
Copyright © 2021 www.secdatabase.com. All Rights Reserved.Please Consider the Environment Before Printing This Document
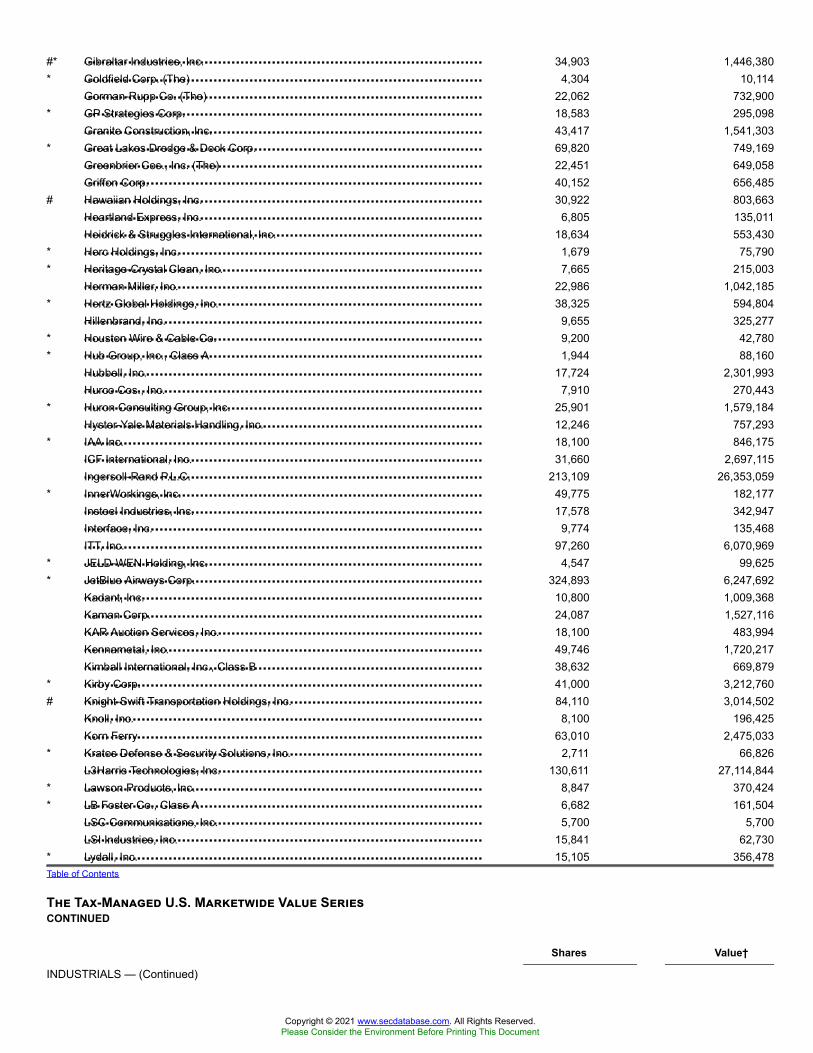
Gibraltar Industries, Inc.Goldfield Corp. (The)Gorman-Rupp Co. (The)GP Strategies Corp.Granite Construction, Inc.Great Lakes Dredge & Dock Corp.Greenbrier Cos., Inc. (The)Griffon Corp.Hawaiian Holdings, Inc.Heartland Express, Inc.Heidrick & Struggles International, Inc.Herc Holdings, Inc.Heritage-Crystal Clean, Inc.Herman Miller, Inc.Hertz Global Holdings, Inc.Hillenbrand, Inc.Houston Wire & Cable Co.Hub Group, Inc., Class AHubbell, Inc.Hurco Cos., Inc.Huron Consulting Group, Inc.Hyster-Yale Materials Handling, Inc.IAA Inc.ICF International, Inc.Ingersoll-Rand P.L.C.InnerWorkings, Inc.Insteel Industries, Inc.Interface, Inc.ITT, Inc.JELD-WEN Holding, Inc.JetBlue Airways Corp.Kadant, Inc.Kaman Corp.KAR Auction Services, Inc.Kennametal, Inc.Kimball International, Inc., Class BKirby Corp.Knight-Swift Transportation Holdings, Inc.Knoll, Inc.Korn FerryKratos Defense & Security Solutions, Inc.L3Harris Technologies, Inc.Lawson Products, Inc.LB Foster Co., Class ALSC Communications, Inc.LSI Industries, Inc.Lydall, Inc.
#* 34,903 1,446,380* 4,304 10,114
22,062 732,900* 18,583 295,098
43,417 1,541,303* 69,820 749,169
22,451 649,05840,152 656,485
# 30,922 803,6636,805 135,011
18,634 553,430* 1,679 75,790* 7,665 215,003
22,986 1,042,185* 38,325 594,804
9,655 325,277* 9,200 42,780* 1,944 88,160
17,724 2,301,9937,910 270,443
* 25,901 1,579,18412,246 757,293
* 18,100 846,17531,660 2,697,115
213,109 26,353,059* 49,775 182,177
17,578 342,9479,774 135,468
97,260 6,070,969* 4,547 99,625* 324,893 6,247,692
10,800 1,009,36824,087 1,527,11618,100 483,99449,746 1,720,21738,632 669,879
* 41,000 3,212,760# 84,110 3,014,502
8,100 196,42563,010 2,475,033
* 2,711 66,826130,611 27,114,844
* 8,847 370,424* 6,682 161,504
5,700 5,70015,841 62,730
* 15,105 356,478Table of Contents
The Tax-Managed U.S. Marketwide Value SeriesCONTINUED
Shares Value†
INDUSTRIALS — (Continued)
Copyright © 2021 www.secdatabase.com. All Rights Reserved.Please Consider the Environment Before Printing This Document

Macquarie Infrastructure Corp.ManpowerGroup, Inc.Marten Transport, Ltd.Masonite International Corp.MasTec, Inc.Matson, Inc.Matthews International Corp., Class AMcGrath RentCorpMercury Systems, Inc.Milacron Holdings Corp.Miller Industries, Inc.Mistras Group, Inc.Mobile Mini, Inc.Moog, Inc., Class AMRC Global, Inc.MSC Industrial Direct Co., Inc., Class AMueller Industries, Inc.Mueller Water Products, Inc., Class AMYR Group, Inc.National Presto Industries, Inc.Navigant Consulting, Inc.Nielsen Holdings P.L.C.NL Industries, Inc.NN, Inc.Norfolk Southern Corp.Northwest Pipe Co.NOW, Inc.nVent Electric P.L.C.Oshkosh Corp.Owens CorningPACCAR, Inc.PAM Transportation Services, Inc.Park Aerospace Corp.Park-Ohio Holdings Corp.Patrick Industries, Inc.Pentair P.L.C.Perma-Pipe International Holdings, Inc.PGT Innovations, Inc.Powell Industries, Inc.Preformed Line Products Co.Primoris Services Corp.Quad/Graphics, Inc.Quanex Building Products Corp.Quanta Services, Inc.Radiant Logistics, Inc.Raytheon Co.RBC Bearings, Inc.RCM Technologies, Inc.Regal Beloit Corp.Republic Services, Inc.Resideo Technologies, Inc.Resources Connection, Inc.Rexnord Corp.Rush Enterprises, Inc., Class A
# 15,762 $ 653,17755,619 5,080,79679,636 1,598,295
* 25,806 1,375,460#* 63,539 3,260,821
62,316 2,549,34831,887 1,088,94117,552 1,195,467
* 2,055 167,524* 37,800 636,552
20,099 627,491* 14,828 224,792
54,461 1,849,49635,839 2,919,445
* 97,164 1,519,64526,313 1,869,53949,200 1,485,34870,207 714,005
* 19,582 707,302# 5,471 503,168
12,297 299,555261,585 6,058,309
* 100 509# 18,396 151,031
545,229 104,204,166* 5,286 123,481* 6,649 81,450
136,734 3,389,63676,335 6,379,316
149,300 8,659,40084,661 5,938,123
* 6,449 376,6865,230 95,1342,542 77,785
* 2,700 123,849112,916 4,382,270
* 8,900 78,765* 42,780 689,614
5,719 211,546400 23,108
34,000 712,640# 6,491 73,413
30,731 572,211168,307 6,298,048
* 42,044 230,8226,649 1,212,046
* 1,191 193,764* 15,245 50,309
22,480 1,789,858429,755 38,097,781
* 27,514 518,91431,255 550,088
* 66,378 1,944,21233,503 1,261,723
Copyright © 2021 www.secdatabase.com. All Rights Reserved.Please Consider the Environment Before Printing This Document
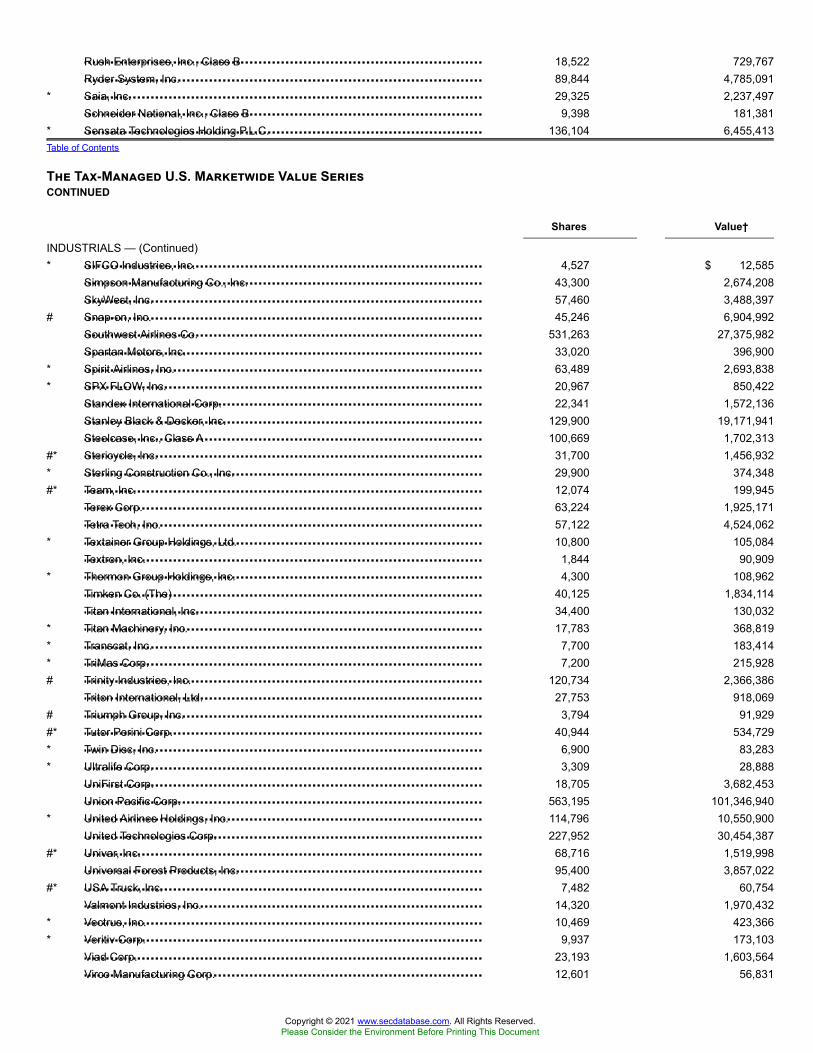
Rush Enterprises, Inc., Class BRyder System, Inc.Saia, Inc.Schneider National, Inc., Class BSensata Technologies Holding P.L.C.
SIFCO Industries, Inc.Simpson Manufacturing Co., Inc.SkyWest, Inc.Snap-on, Inc.Southwest Airlines Co.Spartan Motors, Inc.Spirit Airlines, Inc.SPX FLOW, Inc.Standex International Corp.Stanley Black & Decker, Inc.Steelcase, Inc., Class AStericycle, Inc.Sterling Construction Co., Inc.Team, Inc.Terex Corp.Tetra Tech, Inc.Textainer Group Holdings, Ltd.Textron, Inc.Thermon Group Holdings, Inc.Timken Co. (The)Titan International, Inc.Titan Machinery, Inc.Transcat, Inc.TriMas Corp.Trinity Industries, Inc.Triton International, Ltd.Triumph Group, Inc.Tutor Perini Corp.Twin Disc, Inc.Ultralife Corp.UniFirst Corp.Union Pacific Corp.United Airlines Holdings, Inc.United Technologies Corp.Univar, Inc.Universal Forest Products, Inc.USA Truck, Inc.Valmont Industries, Inc.Vectrus, Inc.Veritiv Corp.Viad Corp.Virco Manufacturing Corp.
18,522 729,76789,844 4,785,091
* 29,325 2,237,4979,398 181,381
* 136,104 6,455,413Table of Contents
The Tax-Managed U.S. Marketwide Value SeriesCONTINUED
Shares Value†
INDUSTRIALS — (Continued)* 4,527 $ 12,585
43,300 2,674,20857,460 3,488,397
# 45,246 6,904,992531,263 27,375,982
33,020 396,900* 63,489 2,693,838* 20,967 850,422
22,341 1,572,136129,900 19,171,941100,669 1,702,313
#* 31,700 1,456,932* 29,900 374,348#* 12,074 199,945
63,224 1,925,17157,122 4,524,062
* 10,800 105,0841,844 90,909
* 4,300 108,96240,125 1,834,11434,400 130,032
* 17,783 368,819* 7,700 183,414* 7,200 215,928# 120,734 2,366,386
27,753 918,069# 3,794 91,929#* 40,944 534,729* 6,900 83,283* 3,309 28,888
18,705 3,682,453563,195 101,346,940
* 114,796 10,550,900227,952 30,454,387
#* 68,716 1,519,99895,400 3,857,022
#* 7,482 60,75414,320 1,970,432
* 10,469 423,366* 9,937 173,103
23,193 1,603,56412,601 56,831
Copyright © 2021 www.secdatabase.com. All Rights Reserved.Please Consider the Environment Before Printing This Document

VSE Corp.Wabash National Corp.Watts Water Technologies, Inc., Class AWerner Enterprises, Inc.Wesco Aircraft Holdings, Inc.WESCO International, Inc.Willdan Group, Inc.Willis Lease Finance Corp.Woodward, Inc.XPO Logistics, Inc.
TOTAL INDUSTRIALS
ACI Worldwide, Inc.Advanced Energy Industries, Inc.Agilysys, Inc.Alithya Group, Inc., Class A
Alliance Data Systems Corp.Alpha & Omega Semiconductor, Ltd.Amdocs, Ltd.Amkor Technology, Inc.Analog Devices, Inc.Anixter International, Inc.Arrow Electronics, Inc.AstroNova, Inc.Avaya Holdings Corp.Avnet, Inc.AVX Corp.Aware, Inc.Axcelis Technologies, Inc.AXT, Inc.Bel Fuse, Inc., Class ABel Fuse, Inc., Class BBelden, Inc.Benchmark Electronics, Inc.Brooks Automation, Inc.Cabot Microelectronics Corp.CACI International, Inc., Class ACalAmp Corp.Calix, Inc.Carbonite, Inc.Cardtronics P.L.C., Class ACCUR Holdings, Inc.Ciena Corp.Cirrus Logic, Inc.Cisco Systems, Inc.Cognizant Technology Solutions Corp., Class ACoherent, Inc.
6,244 187,07023,800 376,75426,909 2,497,962
# 51,539 1,708,518* 16,656 175,388* 50,840 2,579,622#* 7,100 248,358* 6,713 417,884
14,712 1,648,332#* 103,005 6,950,777
911,088,972
INFORMATION TECHNOLOGY — (12.2%)* 49,250 1,652,830* 15,342 895,973* 14,791 362,823* 11,334 33,775Table of Contents
The Tax-Managed U.S. Marketwide Value SeriesCONTINUED
Shares Value†
INFORMATION TECHNOLOGY — (Continued)33,374 $ 5,237,048
* 20,661 209,70999,072 6,339,617
* 1,400 12,922133,165 15,641,561
* 17,801 1,145,672* 175,521 12,744,580
6,285 151,971* 4,570 55,023
139,400 6,331,54872,760 1,108,135
* 14,326 40,543* 31,733 509,315#* 24,921 106,413
3,574 52,35911,381 187,67312,684 576,61562,063 1,679,42550,847 1,972,86413,809 1,679,865
* 27,304 5,874,456* 34,000 379,440* 8,963 56,288* 18,200 326,326* 13,293 378,585* 11,740 43,438* 133,800 6,050,436* 66,501 3,261,874
4,221,011 233,844,00918,876 1,229,583
#* 16,954 2,354,063
Copyright © 2021 www.secdatabase.com. All Rights Reserved.Please Consider the Environment Before Printing This Document

Cohu, Inc.CommScope Holding Co., Inc.Comtech Telecommunications Corp.Conduent, Inc.CoreLogic, Inc.Corning, Inc.Cray, Inc.Cree, Inc.CSP, Inc.CTS Corp.CyberOptics Corp.Cypress Semiconductor Corp.Daktronics, Inc.Dell Technologies, Class CDigi International, Inc.Diodes, Inc.Dolby Laboratories, Inc., Class ADSP Group, Inc.DXC Technology Co.EchoStar Corp., Class AEMCORE Corp.ePlus, Inc.FabrinetFARO Technologies, Inc.Fidelity National Information Services, Inc.Finisar Corp.First Solar, Inc.Flex, Ltd.
FLIR Systems, Inc.FormFactor, Inc.Frequency Electronics, Inc.GSI Technology, Inc.Harmonic, Inc.Hewlett Packard Enterprise Co.Ichor Holdings, Ltd.II-VI, Inc.Insight Enterprises, Inc.Intel Corp.InterDigital, Inc.IPG Photonics Corp.Itron, Inc.Jabil, Inc.Juniper Networks, Inc.KBR, Inc.KEMET Corp.Key Tronic Corp.Kimball Electronics, Inc.
35,808 542,849* 149,929 2,140,986
15,569 463,333* 14,381 130,867* 96,545 4,399,556
785,955 24,168,116* 7,670 265,689* 77,800 4,837,604
2,414 32,97566,936 2,109,823
* 3,281 44,129271,878 6,245,038
44,000 278,960* 24,705 1,426,467* 25,438 334,001* 46,270 1,971,102
26,154 1,781,087* 46,713 753,014
228,936 12,767,761* 29,950 1,363,324* 744 2,217* 17,490 1,327,491* 41,355 2,219,936* 20,000 1,067,800
198,899 26,503,292* 66,449 1,563,545* 32,183 2,075,482* 467,295 5,210,339Table of Contents
The Tax-Managed U.S. Marketwide Value SeriesCONTINUED
Shares Value†
INFORMATION TECHNOLOGY — (Continued)78,882 $ 3,917,280
* 83,395 1,399,368* 7,390 86,167* 2,491 20,476* 102,517 765,802
894,616 12,855,632* 14,000 352,940#* 68,240 2,709,128* 42,100 2,316,342
4,943,498 249,893,82431,683 2,041,336
#* 23,074 3,022,925* 25,301 1,568,662
156,633 4,836,827212,100 5,730,942
69,686 1,838,31758,223 1,171,447
* 17,623 86,881* 23,443 372,744
Copyright © 2021 www.secdatabase.com. All Rights Reserved.Please Consider the Environment Before Printing This Document

Knowles Corp.Kulicke & Soffa Industries, Inc.KVH Industries, Inc.Lattice Semiconductor Corp.Limelight Networks, Inc.Littelfuse, Inc.LiveRamp Holdings, Inc.LogMeIn, Inc.Lumentum Holdings, Inc.ManTech International Corp., Class AMarvell Technology Group, Ltd.Methode Electronics, Inc.Micron Technology, Inc.MicroStrategy, Inc., Class AMKS Instruments, Inc.Monotype Imaging Holdings, Inc.MTS Systems Corp.Nanometrics, Inc.NETGEAR, Inc.Netscout Systems, Inc.Nuance Communications, Inc.ON Semiconductor Corp.Optical Cable Corp.OSI Systems, Inc.PAR Technology Corp.PC Connection, Inc.PCM, Inc.Perceptron, Inc.Perficient, Inc.Perspecta, Inc.Photronics, Inc.Plantronics, Inc.Plexus Corp.Qorvo, Inc.Rambus, Inc.Richardson Electronics, Ltd.Rogers Corp.Rudolph Technologies, Inc.Sanmina Corp.ScanSource, Inc.
Science Applications International Corp.Silicon Laboratories, Inc.SS&C Technologies Holdings, Inc.Sykes Enterprises, Inc.Synaptics, Inc.SYNNEX Corp.TE Connectivity, Ltd.
* 97,815 1,990,53574,988 1,696,978
* 13,696 138,330* 35,397 684,578* 63,304 171,554# 9,138 1,543,956* 48,169 2,538,025
24,899 1,891,577#* 51,495 2,916,162
30,048 2,066,701# 166,418 4,370,137
72,016 2,156,879* 878,203 39,422,533* 200 27,346
62,405 5,312,5382,400 47,928
20,400 1,175,448* 23,600 740,568* 34,428 1,165,388* 21,784 567,255* 195,900 3,259,776* 379,816 8,169,842* 10,474 39,382* 19,200 2,161,152#* 10,048 261,147
35,467 1,160,126* 10,471 364,705* 1,300 5,447* 28,300 967,011
114,468 2,670,538* 79,712 767,627# 2,093 80,371* 35,152 2,098,926* 95,832 7,023,527* 9,315 116,065
15,464 87,681* 9,843 1,561,690* 26,797 721,375* 39,846 1,265,110* 21,541 731,317Table of Contents
The Tax-Managed U.S. Marketwide Value SeriesCONTINUED
Shares Value†
INFORMATION TECHNOLOGY — (Continued)# 47,819 $ 4,082,308* 4,106 460,734
51,586 2,473,549* 21,292 602,351#* 38,700 1,245,366
55,899 5,508,287197,255 18,226,362
Copyright © 2021 www.secdatabase.com. All Rights Reserved.Please Consider the Environment Before Printing This Document

Tech Data Corp.TESSCO Technologies, Inc.TiVo Corp.TTM Technologies, Inc.Ultra Clean Holdings, Inc.Veeco Instruments, Inc.Verint Systems, Inc.ViaSat, Inc.Viavi Solutions, Inc.Virtusa Corp.Vishay Intertechnology, Inc.Vishay Precision Group, Inc.Western Digital Corp.Xerox Corp.Xperi Corp.
TOTAL INFORMATION TECHNOLOGY
AdvanSix, Inc.Albemarle Corp.Alcoa Corp.Allegheny Technologies, Inc.Amcor, PLCAshland Global Holdings, Inc.Boise Cascade Co.Cabot Corp.Carpenter Technology Corp.Century Aluminum Co.Clearwater Paper Corp.Commercial Metals Co.Compass Minerals International, Inc.Core Molding Technologies, Inc.Corteva, Inc.Domtar Corp.Dow, Inc.DuPont de Nemours, Inc.Eagle Materials, Inc.Element Solutions, Inc.Freeport-McMoRan, Inc.Friedman Industries, Inc.FutureFuel Corp.Gold Resource Corp.Graphic Packaging Holding Co.Greif, Inc., Class AGreif, Inc., Class BHawkins, Inc.Haynes International, Inc.HB Fuller Co.Hecla Mining Co.Huntsman Corp.Innophos Holdings, Inc.Innospec, Inc.
* 81,325 8,241,4758,689 127,902
19,000 144,020#* 72,684 760,275#* 24,282 354,274* 15,978 190,298* 44,826 2,594,081#* 38,556 3,145,784* 16,203 237,698* 30,064 1,343,259
151,731 2,579,427* 16,480 671,395
215,907 11,635,228219,074 7,032,275
54,435 1,162,187
890,496,346
MATERIALS — (2.4%)* 19,500 499,980# 92,334 6,736,689#* 210,309 4,729,849#* 66,897 1,456,348* 213,649 2,264,679
112,560 8,946,26943,464 1,173,52852,535 2,349,36552,999 2,385,485
#* 15,822 113,760* 14,095 276,685# 75,297 1,318,450# 3,757 209,828* 11,847 78,783* 3,686 108,737
46,407 1,969,977* 92,236 4,467,912
3,686 265,982# 27,740 2,296,317* 90,367 905,477
302,737 3,348,2713,048 18,8376,104 71,112
53,300 191,347228,542 3,396,134
21,053 736,013400 17,200
10,809 472,02910,047 298,99957,208 2,735,115
# 252,648 467,399219,652 4,513,849
22,786 619,09616,733 1,562,528
Table of Contents
The Tax-Managed U.S. Marketwide Value Series
Copyright © 2021 www.secdatabase.com. All Rights Reserved.Please Consider the Environment Before Printing This Document

International Paper Co.Kaiser Aluminum Corp.Kraton Corp.Kronos Worldwide, Inc.Linde P.L.C.Louisiana-Pacific Corp.LSB Industries, Inc.LyondellBasell Industries NV, Class AMartin Marietta Materials, Inc.Materion Corp.Mercer International, Inc.Minerals Technologies, Inc.Mosaic Co. (The)Neenah, Inc.Newmont Goldcorp Corp.Northern Technologies International Corp.Nucor Corp.Olin Corp.Olympic Steel, Inc.Owens-Illinois, Inc.Packaging Corp. of AmericaPH Glatfelter Co.PolyOne Corp.PQ Group Holdings, Inc.Rayonier Advanced Materials, Inc.Reliance Steel & Aluminum Co.Royal Gold, Inc.Ryerson Holding Corp.Schnitzer Steel Industries, Inc., Class ASchweitzer-Mauduit International, Inc.Sensient Technologies Corp.Silgan Holdings, Inc.Sonoco Products Co.Steel Dynamics, Inc.Stepan Co.Summit Materials, Inc., Class ASunCoke Energy, Inc.Synalloy Corp.TimkenSteel Corp.Trecora ResourcesTredegar Corp.Trinseo SATronox Holdings P.L.C., Class AUFP Technologies, Inc.United States Lime & Minerals, Inc.United States Steel Corp.Universal Stainless & Alloy Products, Inc.US Concrete, Inc.Valvoline, Inc.Verso Corp., Class A
CONTINUED
Shares Value†
MATERIALS — (Continued)12,784 $ 561,34527,181 2,616,715
* 18,082 554,575# 2,217 29,730
45,569 8,716,438173,457 4,534,166
* 1,758 8,77266,107 5,532,495
# 23,633 5,855,07619,190 1,192,27521,725 283,07734,280 1,825,41042,427 1,068,736
7,684 504,91648,146 1,758,292
6,070 68,591105,332 5,727,954186,712 3,747,310
9,986 125,62452,313 887,75227,871 2,814,13543,300 706,656
1,985 65,048* 2,829 44,104# 4,094 19,037
93,801 9,375,410# 44,609 5,105,500* 10,600 86,496
400 10,65230,600 1,053,55838,101 2,597,345
5,100 153,306# 74,973 4,500,629
215,469 6,789,42822,152 2,196,371
#* 26,298 484,935* 45,766 347,364
949 16,114#* 36,857 257,630* 10,776 102,264
26,545 442,50533,919 1,316,396
* 57,713 638,306* 339 14,767
2,500 202,200# 168,857 2,537,921* 6,269 101,432#* 10,500 494,445
204,538 4,129,622* 2,361 38,201
Copyright © 2021 www.secdatabase.com. All Rights Reserved.Please Consider the Environment Before Printing This Document

Vulcan Materials Co.Westlake Chemical Corp.WestRock Co.Worthington Industries, Inc.
TOTAL MATERIALS
Alexander & Baldwin, Inc.Griffin Industrial Realty, Inc.
Howard Hughes Corp. (The)Jones Lang LaSalle, Inc.Kennedy-Wilson Holdings, Inc.Newmark Group, Inc., Class ARafael Holdings, Inc., Class BRE/MAX Holdings, Inc., Class ASt Joe Co. (The)Stratus Properties, Inc.
TOTAL REAL ESTATE
MDU Resources Group, Inc.New Jersey Resources Corp.NRG Energy, Inc.Ormat Technologies, Inc.
TOTAL UTILITIES
TOTAL COMMON STOCKS
Parker Drilling Co. Warrants 09/16/2024
TOTAL INVESTMENT SECURITIES
State Street Institutional U.S. Government Money Market Fund 2.260%
DFA Short Term Investment Fund
(Cost $4,076,716,025)^^
Communication Services
58,246 8,058,334# 158,152 10,686,331
162,029 5,841,14547,320 1,903,210
179,732,075
REAL ESTATE — (0.2%)55,273 1,299,468
1,500 58,290Table of Contents
The Tax-Managed U.S. Marketwide Value SeriesCONTINUED
Shares Value†
REAL ESTATE — (Continued)#* 29,339 $ 3,960,765
40,139 5,847,851# 96,704 2,081,070
37,683 371,555* 550 11,385
3,800 110,504#* 40,700 783,068* 3,069 86,607
14,610,563
UTILITIES — (0.1%)134,867 3,606,343
71,617 3,571,54055,469 1,893,71221,734 1,424,664
10,496,259
7,158,561,677
RIGHTS/WARRANTS — (0.0%)ENERGY — (0.0%)#*» 710 0
7,158,561,677
TEMPORARY CASH INVESTMENTS — (0.3%)19,157,593 19,157,593
SECURITIES LENDING COLLATERAL — (1.8%)@§ 11,703,680 135,423,277
TOTAL INVESTMENTS — (100.0%)$7,313,142,547
Summary of the Series' investments as of July 31, 2019, based on their valuation inputs, is as follows (see Security Valuation Note):
Investments in Securities (Market Value)
Level 1 Level 2 Level 3 Total
Common Stocks$ 922,620,534 — — $ 922,620,534
Copyright © 2021 www.secdatabase.com. All Rights Reserved.Please Consider the Environment Before Printing This Document

Consumer DiscretionaryConsumer StaplesEnergyFinancialsHealth CareIndustrialsInformation TechnologyMaterialsReal EstateUtilities
Temporary Cash InvestmentsSecurities Lending Collateral
TOTAL
473,499,785 $ 988 — 473,500,773432,716,757 — — 432,716,757714,967,108 — — 714,967,108
1,645,794,033 140,554 — 1,645,934,587962,397,703 — — 962,397,703911,088,972 — — 911,088,972890,496,346 — — 890,496,346179,732,075 — — 179,732,075
14,610,563 — — 14,610,56310,496,259 — — 10,496,259
19,157,593 — — 19,157,593— 135,423,277 — 135,423,277
$7,177,577,728 $135,564,819 — $7,313,142,547
Table of Contents
ORGANIZATION
The DFA Investment Trust Company (the "Trust") is an open-end management investment company registered under theInvestment Company Act of 1940. The Trust’s advisor is Dimensional Fund Advisors LP (the "Advisor"). At July 31, 2019,the Trust consisted of eleven operational portfolios, of which ten are included in this document and are "Master Funds" in amaster-feeder structure (collectively, the "Series").
SECURITY VALUATION
The Series use a fair value hierarchy, which prioritizes the inputs-to-valuation techniques used to measure fair value intothree broad levels described below:
• Level 1 - inputs are quoted prices in active markets for identical securities (including equity securities, open-endinvestment companies and futures contracts)
• Level 2 - other significant observable inputs (including quoted prices for similar securities, interest rates, prepaymentspeeds, credit risk, etc.)
• Level 3 - significant unobservable inputs (including the Series' own assumptions in determining the fair value ofinvestments)
Securities held by the Domestic Equity Portfolios (The U.S. Large Cap Value Series and The Tax-Managed U.S. MarketwideValue Series) and the International Equity Portfolios (The DFA International Value Series , The Japanese Small CompanySeries, The Asia Pacific Small Company Series, The United Kingdom Small Company Series, The Continental SmallCompany Series, The Canadian Small Company Series, The Emerging Markets Series and The Emerging Markets SmallCap Series), including over-the-counter securities, are valued at the last quoted sale price of the day. International equitysecurities are subject to a fair value factor, as described later in this note. Securities held by the Domestic Equity Portfoliosand the International Equity Portfolios that are listed on Nasdaq are valued at the Nasdaq Official Closing Price ("NOCP"). Ifthere is no last reported sale price or NOCP for the day, the Domestic Equity Portfolios and the International Equity Portfoliosvalue the securities within the range of the most recent quoted bid and ask prices. Price information on listed securitiesis taken from the exchange where the security is primarily traded. Generally, securities issued by open-end managementinvestment companies are valued using their respective net asset values or public offering prices, as appropriate, forpurchase orders placed at the close of the New York Stock Exchange (NYSE). These securities are generally categorized asLevel 1 in the hierarchy.
Securities for which no market quotations are readily available (including restricted securities), or for which market quotationshave become unreliable, are valued in good faith at fair value in accordance with procedures adopted by the Board ofTrustees of the Trust. Fair value pricing may also be used if events that have a significant effect on the value of an investment(as determined in the discretion of the Advisor) occur before the net asset value of the Series is calculated. When fair valuepricing is used, the prices of securities used by the Series may differ from the quoted or published prices for the samesecurities on their primary markets or exchanges. These securities are generally categorized as Level 2 in the hierarchy.
Copyright © 2021 www.secdatabase.com. All Rights Reserved.Please Consider the Environment Before Printing This Document

The International Equity Portfolios will also apply a fair value price in the circumstances described below. Generally, tradingin foreign securities markets is completed each day at various times prior to the close of the NYSE. For example, tradingin the Japanese securities markets is completed each day at the close of the Tokyo Stock Exchange (normally, 2:00 a.m.ET), which is fourteen hours before the close of the NYSE (normally, 4:00 p.m. ET) and the time that the net asset valuesof the International Equity Portfolios are computed. Due to the time differences between the closings of the relevant foreignsecurities exchanges and the time the International Equity Portfolios price their shares at the close of the NYSE, theInternational Equity Portfolios will fair value their foreign investments when it is determined that the market quotations for theforeign investments are either unreliable or not readily available. The fair value prices will attempt to reflect the impact ofthe U.S. financial markets’ perceptions and trading activities on the International Equity Portfolios’ foreign investments sincethe last closing prices of the foreign investments were calculated on their primary foreign securities markets or exchanges.For these purposes, the Board of Trustees of the International Equity Portfolios has determined that movements in relevantindices or other appropriate market indicators, after the close of the Tokyo Stock Exchange or the London Stock Exchange,demonstrate that market quotations may be unreliable. Fair valuation of portfolio securities may occur on a daily basis. Thefair value pricing by the International Equity Portfolios uses data furnished by an independent pricing service (and that datadraws upon, among other information, the market values of foreign investments). When an International Equity Portfolio
Table of Contents
uses fair value pricing, the values assigned to the International Equity Portfolio’s foreign investments may not be the quotedor published prices of the investments on their primary markets or exchanges. These securities are generally categorized asLevel 2 in the hierarchy.
Futures contracts held by the Series are valued using the settlement price established each day on the exchange on whichthey are traded. These valuations are generally categorized as Level 1 in the hierarchy.
Over-the-counter derivative contracts, which include forward currency contracts, do not require material subjectivity aspricing inputs are observed from quoted markets and are categorized as Level 2 in the hierarchy.
A summary of the inputs used to value the Series' investments by each major security type, industry and/or country isdisclosed previously in this note. A valuation hierarchy table has been included at the end of the Schedule of Investments.The methodology or inputs used for valuing securities are not necessarily an indication of the risk associated with investingin those securities.
FINANCIAL INSTRUMENTS
In accordance with the Series' investment objectives and policies, the Series may invest in certain financial instruments thathave off-balance sheet risk in excess of the amounts recognized in the financial statements and concentrations of credit andmarket risk. These instruments and their significant corresponding risks are described below:
1. FOREIGN MARKET RISKS: Investments in foreign markets may involve certain considerations and risks not typicallyassociated with investments in the United States of America, including the possibility of future political and economicdevelopments and the level of foreign governmental supervision and regulation of foreign securities markets. These marketsare generally smaller, less liquid and more volatile than the major securities markets in the United States of America.Consequently, acquisition and disposition of international securities held by the Series may be inhibited.
Derivative Financial Instruments
Summarized below are the specific types of derivative instruments used by the Series:
2. FUTURES CONTRACTS: The Series may purchase or sell futures contracts and options on futures contracts for equitysecurities and indices to adjust market exposure based on actual or expected cash inflows to or outflows from the Series.The Series, however, do not intend to sell futures contracts to establish short positions in individual securities. Upon enteringinto a futures contract, a Series deposits cash or pledges U.S. Government securities to a broker in an amount equal to theminimum "initial margin" requirements of the exchange on which the contract is traded to a broker. Subsequent paymentsare received from or paid to the broker each day, based on the daily fluctuation in the market value of the contract. Thesereceipts or payments are known as "variation margin" and are recorded daily by the Series as unrealized gains or losses untilthe contracts are closed. When the contracts are closed, the Series record a realized gain or loss, which is presented in theStatements of Operations as a net realized gain or loss on futures, equal to the difference between the value of the contractat the time it was opened and the value at the time it was closed.
Copyright © 2021 www.secdatabase.com. All Rights Reserved.Please Consider the Environment Before Printing This Document
The U.S. Large Cap Value SeriesThe DFA International Value SeriesThe Japanese Small Company Series
The Asia Pacific Small Company SeriesThe United Kingdom Small Company SeriesThe Continental Small Company SeriesThe Canadian Small Company SeriesThe Emerging Markets SeriesThe Emerging Markets Small Cap SeriesThe Tax-Managed U.S. Marketwide Value Series
Risks may arise upon entrance into futures contracts from potential imperfect price correlations between the futures contractsand the underlying securities or indices, from the possibility of an illiquid secondary market for these instruments and fromthe possibility that the Series could lose more than the initial margin requirements. Entering into stock index futures subjectsthe Series to equity price risk from those futures contracts. Counterparty credit risk related to exchange-traded futures isminimal because the exchange’s clearinghouse, as counterparty to all exchange-traded futures, guarantees the futuresagainst default.
FEDERAL TAX COST
At July 31, 2019, the total cost of securities for federal income tax purposes was:
FederalTax Cost
$22,649,84712,265,243
3,361,872
Table of Contents
FederalTax Cost
$ 1,783,7112,235,2955,379,0841,553,5384,298,8416,785,5344,076,716
RECENTLY ISSUED ACCOUNTING STANDARDS
In March 2017, the Financial Accounting Standards Board (FASB) issued Accounting Standards Update (ASU) 2017-08which changes the amortization period for a callable debt security from the maturity date to the earliest call date. TheASU is effective for annual periods beginning after December 15, 2018, and interim periods within those annual periods.Management has evaluated the requirements of this update and does not expect any material impact to the Trust's financialstatements.
In August 2018, the FASB issued ASU No. 2018-13, “Fair Value Measurements” (“ASU 2018-13”). This update makescertain removals from, changes to and additions to existing disclosure requirements for fair value measurement. ASU2018-13 does not change fair value measurements already required or permitted by existing standards. ASU 2018-13 iseffective for financial statements issued for fiscal years beginning after December 15, 2019, and interim periods within thosefiscal years. The Series' early adoption of certain of the ASU 2018-13 disclosure requirements are reflected within thesefinancial statements prepared as of April 30, 2019. Management does not believe that adoption of the remaining disclosurerequirements within ASU 2018-13 will materially impact the Series' financial statements.
In August 2018, the SEC adopted amendments to certain financial statement disclosure requirements to conform them toGAAP for investment companies. These amendments made certain removals from, changes to and additions to existingdisclosure requirements under Regulation S-X. These amendments became effective for filings made with the SEC afterNovember 5, 2018. The Series' adoption of these amendments, effective with the financial statements prepared as of October31, 2018, required modified disclosures reflected herein, but had no effect on the Series' net assets or results of operations.
OTHER
Copyright © 2021 www.secdatabase.com. All Rights Reserved.Please Consider the Environment Before Printing This Document

The Series and the Trust are subject to claims and suits that arise from time to time in the ordinary course of business.Although management currently believes that resolving claims against us, individually or in aggregate, will not have a materialadverse impact on our financial position, our results of operations, or our cash flows, these matters are subject to inherentuncertainties and management’s view of these matters may change in the future.
The U.S. Large Cap Value Series and The Tax-Managed U.S. Marketwide Value Series have been named as defendantsin a multi-district litigation pending in the United States District Court for the Southern District of New York (the "Court"),captioned IN RE TRIBUNE COMPANY FRAUDULENT CONVEYANCE LITIGATION, No. 11-MD-2296-RJS (the "TribuneMDL"). The Tribune MDL arises from the 2007 leveraged buyout of The Tribune Company ("Tribune") (the "LBO") andTribune’s subsequent bankruptcy and reorganization. In connection with the LBO, thousands of Tribune shareholders,including The U.S. Large Cap Value Series and The Tax-Managed U.S. Marketwide Value Series, sold Tribune shares backto Tribune for $34 per share. The Tribune MDL includes a series of lawsuits brought by individual creditors of Tribune (the"Individual Creditor Actions") and a lawsuit brought by a court-appointed trustee (the "Trustee") on behalf of the committeeof unsecured creditors of Tribune (the "Committee Action," and with the Individual Creditor Actions, collectively referred toas the "Lawsuits"). The Lawsuits seek to unwind the LBO stock repurchases as fraudulent transfers and recover the stockrepurchase proceeds paid to the Tribune shareholders who participated in the LBO.
On September 23, 2013, the Court entered an order dismissing the Individual Creditor Actions in their entirety on the groundsthat the individual creditor plaintiffs lacked standing to pursue their claims. The parties appealed the Court’s dismissal orderto the United States Court of Appeals for the Second Circuit (the “Second Circuit”), and, on March 29, 2016, the SecondCircuit affirmed the dismissal, albeit on the grounds that the individual creditor plaintiffs’ claims
Table of Contents
were preempted by the Bankruptcy Code’s safe harbor for securities transactions. The individual creditor plaintiffs filed apetition for certiorari with the Supreme Court of the United States (the Supreme Court ), seeking review of the SecondCircuit’s ruling. Thereafter, the individual creditor plaintiffs moved the Second Circuit to review its prior ruling in light of theSupreme Court’s decision in MERIT MANAGEMENT GROUP, LP v. FTI CONSULTING, INC., 138 S.Ct. 883 (2018) (“MeritMgmt.”), which addressed the scope of the Bankruptcy Code’s safe harbor for securities transactions. The Second Circuitagreed to review the matter and withdrew its mandate with respect to the affirmance of the dismissal order. Consequently,the Supreme Court dismissed the individual creditor plaintiffs’ petition for certiorari. The Second Circuit’s review is pending.
On January 6, 2017, the Court granted the shareholder defendants’ motion to dismiss the claims against them in theCommittee Action. The Trustee has advised that he intends to appeal the dismissal order to the Second Circuit. The Trusteealso moved for leave from the District Court to file an amended complaint to assert new constructive fraudulent transferclaims against the shareholder defendants in light of the Merit Mgmt. decision. The District Court denied the motion, rulingthat the proposed amendment would unduly prejudice the shareholder defendants and would be futile because the Trustee’sproposed constructive fraudulent transfer claims would be barred by the Bankruptcy Code’s safe harbor for securitiestransactions, notwithstanding the Merit Mgmt. decision.
Litigation counsel to The U.S. Large Cap Value Series and The Tax-Managed U.S. Marketwide Value Series in the Lawsuitshas advised management that it does not believe that it is possible to predict with any reasonable certainty the probableoutcome of the Lawsuits or quantify the ultimate exposure to The U.S. Large Cap Value Series and The Tax-Managed U.S.Marketwide Value Series arising from the Lawsuits. Until The U.S. Large Cap Value Series and The Tax-Managed U.S.Marketwide Value Series can do so, no reduction of the respective net asset values of The U.S. Large Cap Value Series andThe Tax-Managed U.S. Marketwide Value Series will be made relating to the Lawsuits. However, even if the plaintiffs in theLawsuits were to obtain the full recovery the plaintiffs seek, the amount would be less than 1% of the respective net assetvalues of The U.S. Large Cap Value Series and The Tax-Managed U.S. Marketwide Value Series at this time.
The U.S. Large Cap Value Series and The Tax-Managed U.S. Marketwide Value Series also cannot quantify the cost of theLawsuits that could potentially be deducted from their respective net asset values. Therefore, at this time, those investorsbuying or redeeming shares of The U.S. Large Cap Value Series and The Tax-Managed U.S. Marketwide Value Series willpay or receive, as the case may be, a price based on the respective net asset values of The U.S. Large Cap Value Seriesand The Tax-Managed U.S. Marketwide Value Series, with no adjustment relating to the Lawsuits. The attorneys' fees andcosts relating to the Lawsuits will be borne by The U.S. Large Cap Value Series and The Tax-Managed U.S. MarketwideValue Series as incurred and in a manner similar to any other expenses incurred by The U.S. Large Cap Value Series andThe Tax-Managed U.S. Marketwide Value Series.
Copyright © 2021 www.secdatabase.com. All Rights Reserved.Please Consider the Environment Before Printing This Document

SUBSEQUENT EVENT EVALUATIONS
Management has evaluated the impact of all subsequent events on the Series through the date on which the financialstatements were issued and has determined that there are no subsequent events requiring recognition or disclosure in theSchedules of Investments.
Copyright © 2021 www.secdatabase.com. All Rights Reserved.Please Consider the Environment Before Printing This Document
Copyright © 2022 FDOKUMEN