DFA INVESTMENT DIMENSIONS GROUP INC Form NPORT ...
655
Business Address 6300 BEE CAVE ROAD BUILDING ONE AUSTIN TX 78746 (512) 306-7400 Mailing Address 6300 BEE CAVE ROAD BUILDING ONE AUSTIN TX 78746 SECURITIES AND EXCHANGE COMMISSION FORM NPORT-EX Filing Date: 2019-09-30 | Period of Report: 2019-07-31 SEC Accession No. 0001752724-19-129422 (HTML Version on secdatabase.com) FILER DFA INVESTMENT DIMENSIONS GROUP INC CIK:355437| IRS No.: 363129984 | State of Incorp.:MD | Fiscal Year End: 1031 Type: NPORT-EX | Act: 40 | File No.: 811-03258 | Film No.: 191125159 Copyright © 2021 www.secdatabase.com . All Rights Reserved. Please Consider the Environment Before Printing This Document
-
Upload
khangminh22 -
Category
Documents
-
view
0 -
download
0
Transcript of DFA INVESTMENT DIMENSIONS GROUP INC Form NPORT ...

Business Address6300 BEE CAVE ROADBUILDING ONEAUSTIN TX 78746(512) 306-7400
Mailing Address6300 BEE CAVE ROADBUILDING ONEAUSTIN TX 78746
SECURITIES AND EXCHANGE COMMISSION
FORM NPORT-EX
Filing Date: 2019-09-30 | Period of Report: 2019-07-31SEC Accession No. 0001752724-19-129422
(HTML Version on secdatabase.com)
FILERDFA INVESTMENT DIMENSIONS GROUP INCCIK:355437| IRS No.: 363129984 | State of Incorp.:MD | Fiscal Year End: 1031Type: NPORT-EX | Act: 40 | File No.: 811-03258 | Film No.: 191125159
Copyright © 2021 www.secdatabase.com. All Rights Reserved.Please Consider the Environment Before Printing This Document

A.H. Belo Corp., Class AAMC Entertainment Holdings, Inc., Class AAMC Networks, Inc., Class AATN International, Inc.Bandwidth, Inc., Class ABeasley Broadcast Group, Inc., Class ABoingo Wireless, Inc.Boston Omaha Corp., Class ACable One, Inc.Care.com, Inc.Cars.com, Inc.CbdMD, Inc.Central European Media Enterprises, Ltd., Class ACincinnati Bell, Inc.Clear Channel Outdoor Holdings, Inc.Cogent Communications Holdings, Inc.comScore, Inc.Consolidated Communications Holdings, Inc.Cumulus Media, Inc., Class ADaily Journal Corp.DHI Group, Inc.Emerald Expositions Events, Inc.Entercom Communications Corp., Class AEntravision Communications Corp., Class AEW Scripps Co. (The), Class AFluent, Inc.Gaia, Inc.Gannett Co., Inc.GCI Liberty, Inc., Class AGlu Mobile, Inc.Gray Television, Inc.Gray Television, Inc., Class AHemisphere Media Group, Inc.IDT Corp., Class BIMAX Corp.Intelsat SAIridium Communications, Inc.John Wiley & Sons, Inc., Class ALee Enterprises, Inc.Liberty Latin America, Ltd., Class ALiberty Latin America, Ltd., Class CLiberty Media Corp.-Liberty Braves, Class ALiberty Media Corp.-Liberty Braves, Class CLiberty TripAdvisor Holdings, Inc., Class ALions Gate Entertainment Corp., Class A
TAX-MANAGED U.S. SMALL CAP PORTFOLIO
SCHEDULE OF INVESTMENTS
July 31, 2019
(Unaudited)
Shares Value†
COMMON STOCKS — (88.6%)COMMUNICATION SERVICES — (3.3%)
57,261 $ 211,293# 64,618 764,431#* 41,099 2,193,865
28,186 1,586,026#* 9,811 730,920
5,471 17,781#* 139,117 2,089,537#* 991 20,960
422 513,490* 39,514 433,073#* 99,457 1,889,683
6,215 27,035* 23,816 111,935#* 65,618 250,661#* 37,408 113,346# 88,424 5,571,596#* 10,041 33,135# 112,578 530,242* 1,100 16,621#* 249 61,777* 34,373 126,493
8,246 87,902# 65,665 372,977
90,237 294,173152,076 2,331,325
#* 9,268 48,194#* 9,771 56,476# 116,482 1,193,941* 61,671 3,683,609#* 162,168 1,209,773* 138,234 2,453,654* 912 15,349* 20,085 247,246* 73,066 742,351* 56,442 1,238,902#* 79,952 1,810,113* 112,323 2,857,497
57,643 2,623,333* 55,258 119,910* 51,030 836,382* 56,214 921,910* 8,885 256,777* 20,880 600,718* 224,666 2,594,892# 16,488 212,860

Lions Gate Entertainment Corp., Class BLoral Space & Communications, Inc.Marchex, Inc., Class BMarcus Corp. (The)Meet Group, Inc. (The)Meredith Corp.MSG Networks, Inc., Class ANational CineMedia, Inc.New Media Investment Group, Inc.
New York Times Co. (The), Class ANexstar Media Group, Inc., Class AORBCOMM, Inc.Pareteum Corp.pdvWireless, Inc.QuinStreet, Inc.Reading International, Inc., Class AReading International, Inc., Class BRosetta Stone, Inc.Saga Communications, Inc., Class ASalem Media Group, Inc.Scholastic Corp.Shenandoah Telecommunications Co.Sinclair Broadcast Group, Inc., Class ASocial Reality, Inc.Spok Holdings, Inc.TechTarget, Inc.TEGNA, Inc.Telephone & Data Systems, Inc.Townsquare Media, Inc., Class ATravelzooTribune Media Co., Class ATribune Publishing Co.TrueCar Inc.United States Cellular Corp.Urban One, Inc.Vonage Holdings Corp.Yelp, Inc.Zedge, Inc., Class BZynga, Inc., Class A
TOTAL COMMUNICATION SERVICES
1-800-Flowers.com, Inc., Class AAaron's, Inc.Abercrombie & Fitch Co., Class AAcushnet Holdings Corp.Adient P.L.C.Adtalem Global Education, Inc.AMCON Distributing Co.American Axle & Manufacturing Holdings, Inc.
5,268 64,217* 941 34,619* 108,684 472,775
46,006 1,609,750#* 260,953 897,678# 68,533 3,759,720* 106,469 2,021,846
342,706 2,440,067# 93,625 1,008,341
Tax-Managed U.S. Small Cap PortfolioCONTINUED
Shares Value†
COMMUNICATION SERVICES — (Continued)# 213,321 $ 7,611,293
73,168 7,446,307* 217,876 1,276,753#* 18,830 65,905* 11,908 529,787#* 147,745 2,406,766* 35,897 468,456* 2,340 58,055* 41,894 961,886
17,282 539,54416,375 34,06054,523 1,863,051
103,180 4,061,16591,559 4,600,840
#* 4,334 17,11949,865 647,746
* 70,340 1,619,22764,530 980,211
201,647 6,521,26413,238 71,353
#* 27,729 348,8317,446 346,016
43,426 359,133* 27,374 139,060* 34,381 1,646,506#* 39,200 84,280#* 386,922 4,797,833#* 31,553 1,105,933* 17,051 27,452* 1,611,163 10,279,220
117,328,229
CONSUMER DISCRETIONARY — (11.9%)* 119,349 2,336,853
116,009 7,314,367# 106,845 2,022,576
6,773 173,118# 76,716 1,822,005* 83,075 3,935,263
300 29,301* 168,922 2,038,889

American Eagle Outfitters, Inc.American Outdoor Brands Corp.American Public Education, Inc.America's Car-Mart, Inc.Ark Restaurants Corp.Asbury Automotive Group, Inc.At Home Group, Inc.AutoNation, Inc.Barnes & Noble Education, Inc.Barnes & Noble, Inc.Bassett Furniture Industries, Inc.BBX Capital Corp.Beazer Homes USA, Inc.Bed Bath & Beyond, Inc.Big Lots, Inc.Biglari Holdings, Inc., Class ABiglari Holdings, Inc., Class BBJ's Restaurants, Inc.
Blink Charging Co.Bloomin' Brands, Inc.Boot Barn Holdings, Inc.Bowl America, Inc., Class ABrinker International, Inc.Brunswick Corp.Buckle, Inc. (The)Build-A-Bear Workshop, Inc.Caleres, Inc.Callaway Golf Co.Canterbury Park Holding Corp.Career Education Corp.Carriage Services, Inc.Carrols Restaurant Group, Inc.Carter's, Inc.Cato Corp. (The), Class ACavco Industries, Inc.Century Casinos, Inc.Century Communities, Inc.Cheesecake Factory, Inc. (The)Chico's FAS, Inc.Children's Place, Inc. (The)Choice Hotels International, Inc.Churchill Downs, Inc.Chuy's Holdings, Inc.Citi Trends, Inc.Collectors Universe, Inc.Conn's, Inc.Container Store Group, Inc. (The)Cooper Tire & Rubber Co.Cooper-Standard Holdings, Inc.
296,064 5,237,372* 61,126 589,255* 40,099 1,324,069* 24,910 2,245,886
3,723 71,742#* 46,541 4,285,495#* 44,398 265,944* 21,551 1,049,103* 97,828 342,398
272,928 1,779,49127,060 345,82730,794 132,722
* 1,224 14,345# 19,087 185,335# 96,419 2,468,326* 59 26,963* 2,034 184,687
56,230 2,232,331
Tax-Managed U.S. Small Cap PortfolioCONTINUED
Shares Value†
CONSUMER DISCRETIONARY — (Continued)#* 6,223 $ 18,918
188,225 3,205,472#* 103,158 3,227,814
1,400 21,812# 90,837 3,619,854
13,800 678,408# 6,297 128,144#* 38,633 164,963
81,772 1,535,678217,556 3,989,977
6,569 80,470* 202,478 3,838,983
46,628 891,527* 121,505 1,132,427# 19,906 1,851,656# 58,165 835,831* 20,327 3,604,993* 4,960 48,955#* 133,501 3,680,623# 93,330 4,020,656# 162,816 519,383# 42,020 4,104,093# 65,468 5,617,809# 64,854 7,759,781* 70,894 1,676,643
17,803 273,27626,791 635,215
#* 71,920 1,495,936#* 13,502 82,497
129,134 3,476,287* 31,804 1,573,662

Core-Mark Holding Co., Inc.Cracker Barrel Old Country Store, Inc.Crocs, Inc.CSS Industries, Inc.Culp, Inc.Dana, Inc.Dave & Buster's Entertainment, Inc.Deckers Outdoor Corp.Del Frisco's Restaurant Group, Inc.Del Taco Restaurants, Inc.Delphi Technologies P.L.C.Delta Apparel, Inc.Denny's Corp.Designer Brands, Inc., Class ADestination XL Group, Inc.Dick's Sporting Goods, Inc.Dillard's, Inc., Class ADine Brands Global, Inc.Dorman Products, Inc.Drive Shack, Inc.Educational Development Corp.El Pollo Loco Holdings, Inc.Eldorado Resorts, Inc.Escalade, Inc.Ethan Allen Interiors, Inc.Everi Holdings, Inc.Expedia Group, Inc.Express, Inc.
Extended Stay America, Inc.Famous Dave's of America, Inc.Fiesta Restaurant Group, Inc.Flanigan's Enterprises, Inc.Flexsteel Industries, Inc.Floor & Decor Holdings, Inc., Class AFossil Group, Inc.Fox Factory Holding Corp.frontdoor, Inc.Funko, Inc., Class AGameStop Corp., Class AGarrett Motion, Inc.Genesco, Inc.Gentherm, Inc.G-III Apparel Group, Ltd.Goodyear Tire & Rubber Co. (The)GoPro, Inc., Class AGraham Holdings Co., Class BGreen Brick Partners, Inc.Group 1 Automotive, Inc.Groupon, Inc.
115,588 4,326,459# 23,721 4,120,575#* 238,173 5,442,253
8,412 43,15435,956 646,12976,069 1,271,113
# 70,105 2,849,768* 34,618 5,410,101#* 61,834 492,199* 66,999 812,028
75,071 1,406,831* 6,563 124,960* 135,166 3,053,400
136,838 2,515,082* 40,970 72,107# 100,933 3,751,680# 23,978 1,745,119# 18,007 1,478,195#* 58,084 4,175,078#* 147,010 767,392
5,452 36,256#* 77,505 762,649#* 42,636 1,923,736
20,056 231,24685,738 1,764,488
* 16,971 203,82224,627 3,269,020
#* 89,741 221,660
Tax-Managed U.S. Small Cap PortfolioCONTINUED
Shares Value†
CONSUMER DISCRETIONARY — (Continued)98,756 $1,651,200
* 18,078 82,616* 47,521 453,826
1,877 42,28913,447 247,021
#* 26,062 1,020,327#* 87,690 968,098* 63,260 5,065,861* 5,000 228,200#* 3,600 90,036# 124,430 500,209#* 21,634 306,554* 74,450 2,931,841* 64,874 2,653,995* 85,410 2,447,851
7,467 102,522#* 22,507 119,062
8,014 5,952,238* 18,791 176,823# 35,286 2,962,613* 653,942 2,059,917

Guess?, Inc.Habit Restaurants, Inc. (The), Class AHamilton Beach Brands Holding Co., Class AHaverty Furniture Cos., Inc.Haverty Furniture Cos., Inc., Class AHelen of Troy, Ltd.Hibbett Sports, Inc.Hilton Grand Vacations, Inc.Hooker Furniture Corp.Horizon Global Corp.Houghton Mifflin Harcourt Co.Installed Building Products, Inc.International Game Technology P.L.C.International Speedway Corp., Class AiRobot Corp.J Alexander's Holdings, Inc.Jack in the Box, Inc.Johnson Outdoors, Inc., Class AK12, Inc.KB HomeLakeland Industries, Inc.Lands' End, Inc.Laureate Education, Inc., Class ALa-Z-Boy, Inc.LCI IndustriesLeaf Group, Ltd.LGI Homes, Inc.Libbey, Inc.Liberty Tax, Inc.Lifetime Brands, Inc.Lindblad Expeditions Holdings, Inc.Liquidity Services, Inc.Lithia Motors, Inc., Class ALumber Liquidators Holdings, Inc.M/I Homes, Inc.Malibu Boats, Inc., Class AMarine Products Corp.MarineMax, Inc.
Marriott Vacations Worldwide Corp.MasterCraft Boat Holdings, Inc.Mattel, Inc.MDC Holdings, Inc.Media General, Inc. Contingent Value RightsMeritage Homes Corp.Michaels Cos., Inc. (The)Modine Manufacturing Co.Monarch Casino & Resort, Inc.Monro, Inc.Motorcar Parts of America, Inc.
# 138,291 2,330,203#* 60,690 606,900
31,475 516,505# 48,416 876,814
457 8,276* 49,830 7,388,792#* 50,865 935,916* 11,555 377,849
27,991 583,612#* 16,767 96,243* 123,920 724,932* 53,555 2,853,410# 1,000 13,350
27,375 1,234,065#* 48,029 3,510,920* 13,968 150,435# 53,012 3,807,852
22,037 1,498,296* 85,255 2,544,862
93,504 2,456,350* 19,414 208,312#* 21,143 230,459* 57,384 940,524
116,492 3,843,071# 44,007 4,032,361* 63,405 386,770#* 2,259 158,785#* 30,970 52,339
4,084 48,60022,827 201,562
* 76,229 1,435,392* 56,410 367,793# 51,735 6,822,812#* 43,357 380,241* 42,762 1,512,492* 58,307 1,756,790# 40,616 652,293* 81,558 1,259,256
Tax-Managed U.S. Small Cap PortfolioCONTINUED
Shares Value†
CONSUMER DISCRETIONARY — (Continued)# 52,110 $5,327,205* 51,858 860,843#* 51,289 748,819
89,497 3,234,422» 64,715 2,537* 43,894 2,756,982#* 149,860 1,029,538* 83,141 1,140,695#* 36,281 1,707,747# 45,850 3,861,028#* 53,870 963,196

Movado Group, Inc.Murphy USA, Inc.Nathan's Famous, Inc.National Vision Holdings, Inc.Nautilus, Inc.New Home Co., Inc. (The)Noodles & Co.Office Depot, Inc.Overstock.com, Inc.Oxford Industries, Inc.Papa John's International, Inc.Party City Holdco, Inc.Penn National Gaming, Inc.Penske Automotive Group, Inc.PetMed Express, Inc.Planet Fitness, Inc., Class APlaya Hotels & Resorts NVPlayAGS, Inc.Potbelly Corp.Quotient Technology Inc.RCI Hospitality Holdings, Inc.Red Lion Hotels Corp.Red Robin Gourmet Burgers, Inc.Regis Corp.RHRocky Brands, Inc.Rubicon Project, Inc. (The)RumbleON, Inc., Class BRuth's Hospitality Group, Inc.Sally Beauty Holdings, Inc.Scientific Games Corp., Class ASeaWorld Entertainment, Inc.Select Interior Concepts, Inc., Class AShake Shack, Inc., Class AShiloh Industries, Inc.Shoe Carnival, Inc.Shutterfly, Inc.Shutterstock, Inc.Signet Jewelers, Ltd.Skechers U.S.A., Inc., Class ASkyline Champion Corp.Sleep Number Corp.Sonic Automotive, Inc., Class ASonos, Inc.Sotheby'sSpeedway Motorsports, Inc.Sportsman's Warehouse Holdings, Inc.Stamps.com, Inc.
Standard Motor Products, Inc.
41,516 1,093,116* 58,705 5,187,174
15,237 1,075,885#* 29,700 938,223* 43,562 84,075* 28,539 118,722#* 46,743 346,366
761,096 1,552,636#* 50,852 1,145,187# 32,402 2,371,502# 52,571 2,335,204#* 78,393 500,147#* 63,991 1,249,104# 69,913 3,213,901# 65,339 1,134,938* 76,446 6,013,242#* 9,189 67,355* 16,337 306,482* 32,339 134,530#* 24,637 259,181
15,408 261,166* 44,924 305,034#* 31,274 1,032,667* 83,833 1,534,144#* 18,208 2,538,195
20,684 651,960* 120,325 915,673#* 4,112 19,203
103,292 2,300,313#* 190,910 2,623,103#* 52,730 1,078,328#* 51,744 1,581,814* 3,122 35,747#* 40,071 2,991,701* 58,593 295,309# 48,652 1,234,788* 56,504 2,864,188
43,678 1,675,92557,963 1,051,449
* 70,830 2,687,290* 38,512 1,097,592#* 89,608 4,406,025# 53,942 1,487,181#* 14,600 158,410#* 86,805 5,183,127
53,969 1,068,586#* 71,056 319,041#* 23,569 1,125,420
Tax-Managed U.S. Small Cap PortfolioCONTINUED
Shares Value†
CONSUMER DISCRETIONARY — (Continued)57,284 $ 2,635,637

Steven Madden, Ltd.Stitch Fix, Inc., Class AStoneridge, Inc.Strategic Education, Inc.Strattec Security Corp.Superior Group of Cos, Inc.Superior Industries International, Inc.Tailored Brands, Inc.Tandy Leather Factory, Inc.Taylor Morrison Home Corp.Tempur Sealy International, Inc.Tenneco, Inc., Class ATexas Roadhouse, Inc.Thor Industries, Inc.Tile Shop Holdings, Inc.Tilly's, Inc., Class ATopBuild Corp.Tower International, Inc.Town Sports International Holdings, Inc.TravelCenters of America LLCTRI Pointe Group, Inc.Tupperware Brands Corp.Twin River Worldwide Holding, Inc.Unifi, Inc.Universal Electronics, Inc.Urban Outfitters, Inc.Veoneer, Inc.Vera Bradley, Inc.Vince Holding Corp.Vista Outdoor, Inc.Visteon Corp.Vitamin Shoppe, Inc.VOXX International Corp.Vuzix Corp.Weight Watchers International, Inc.Wendy's Co. (The)Weyco Group, Inc.William Lyon Homes, Class AWilliams-Sonoma, Inc.Wingstop, Inc.Winmark Corp.Winnebago Industries, Inc.Wolverine World Wide, Inc.ZAGG, Inc.Zumiez, Inc.
TOTAL CONSUMER DISCRETIONARY
Alico, Inc.Andersons, Inc. (The)Avon Products, Inc.B&G Foods, Inc.BJ's Wholesale Club Holdings, Inc.Boston Beer Co., Inc. (The), Class ABridgford Foods Corp.
165,451 5,709,714#* 10,395 271,102* 93,017 3,029,564
49,832 8,869,5987,730 160,707
24,071 409,68832,548 83,323
# 113,489 552,691* 23,665 137,730* 150,772 3,395,385* 25,595 2,053,231# 76,520 691,741
88,757 4,902,0496,872 409,571
# 56,028 145,11338,857 318,239
* 64,007 5,192,88830,375 935,550
#* 52,311 80,036* 41,760 144,072* 228,472 3,127,782
36,492 558,693# 1,978 52,199* 37,068 693,542* 34,139 1,461,832#* 129,940 3,093,871#* 10,658 193,443* 48,570 570,697#* 1,906 26,760* 70,234 505,685#* 59,589 3,925,723#* 40,688 179,841* 55,708 261,271#* 5,900 11,623* 50,509 1,093,520# 362,549 6,594,766
14,890 409,773#* 63,629 1,249,674# 17,045 1,136,561# 28,782 2,751,271
10,214 1,726,268# 77,870 3,138,161# 114,766 3,115,897#* 61,437 407,327* 49,163 1,217,768
416,945,377
CONSUMER STAPLES — (3.5%)10,504 335,07851,926 1,394,213
#* 617,317 2,623,597# 65,549 1,198,236#* 7,079 166,781#* 10,813 4,242,156* 6,838 243,911

Calavo Growers, Inc.Cal-Maine Foods, Inc.Casey's General Stores, Inc.
Central Garden & Pet Co.Central Garden & Pet Co., Class AChefs' Warehouse, Inc. (The)Coca-Cola Consolidated, Inc.Coffee Holding Co., Inc.Craft Brew Alliance, Inc.Darling Ingredients, Inc.Edgewell Personal Care Co.elf Beauty Inc.Energizer Holdings, Inc.Farmer Brothers Co.Flowers Foods, Inc.Fresh Del Monte Produce, Inc.Hain Celestial Group, Inc. (The)Hostess Brands, Inc.Ingles Markets, Inc., Class AInter Parfums, Inc.J&J Snack Foods Corp.John B. Sanfilippo & Son, Inc.Lancaster Colony Corp.Landec Corp.Lifevantage Corp.Lifeway Foods, Inc.Limoneira Co.Mannatech, Inc.Medifast, Inc.MGP Ingredients, Inc.National Beverage Corp.Natural Alternatives International, Inc.Natural Grocers by Vitamin Cottage, Inc.Natural Health Trends Corp.Nature's Sunshine Products, Inc.Nu Skin Enterprises, Inc., Class AOil-Dri Corp. of AmericaPerformance Food Group Co.PriceSmart, Inc.Primo Water Corp.Pyxus International, Inc.Revlon, Inc., Class ARiceBran TechnologiesRocky Mountain Chocolate Factory, Inc.Sanderson Farms, Inc.Seaboard Corp.Seneca Foods Corp., Class ASeneca Foods Corp., Class BSimply Good Foods Co. (The)
# 33,621 2,973,441# 74,426 2,959,922
9,982 1,616,186
Tax-Managed U.S. Small Cap PortfolioCONTINUED
Shares Value†
CONSUMER STAPLES — (Continued)#* 27,336 $ 830,468* 76,906 2,118,760* 74,343 2,711,289# 12,876 3,779,492* 7,765 31,371* 69,668 1,094,484* 292,864 5,953,925* 98,854 3,008,127#* 18,347 304,377# 91,522 3,851,246#* 48,843 793,210# 60,749 1,439,751
91,186 2,765,671* 1,676 36,487#* 118,036 1,666,668# 46,616 1,467,472
63,168 4,376,279# 26,004 4,832,583
31,178 2,709,680# 38,638 6,020,573* 76,604 855,667#* 40,287 467,329* 4,180 14,254
29,520 584,2011,440 23,083
34,884 3,894,799# 44,536 2,226,355# 81,150 3,532,460* 22,059 222,575* 34,380 315,265# 1,244 9,342* 216 1,950
32,345 1,293,15313,193 467,428
* 77,695 3,406,92647,398 2,891,278
#* 63,112 932,164#* 12,036 171,754#* 15,397 306,708#* 5,300 14,946
9,263 83,367# 46,425 6,082,603
99 404,082* 22,487 710,139* 1,443 45,310* 14,968 407,579

SpartanNash Co.Spectrum Brands Holdings, Inc.Sprouts Farmers Market, Inc.Tootsie Roll Industries, Inc.TreeHouse Foods, Inc.Turning Point Brands, Inc.United Natural Foods, Inc.United-Guardian, Inc.Universal Corp.USANA Health Sciences, Inc.Vector Group, Ltd.Village Super Market, Inc., Class AWD-40 Co.
Weis Markets, Inc.Youngevity International, Inc.
TOTAL CONSUMER STAPLES
Adams Resources & Energy, Inc.Antero Resources Corp.Apergy Corp.Arch Coal, Inc., Class AArchrock, Inc.Ardmore Shipping Corp.Basic Energy Services, Inc.Berry Petroleum Corp.Bonanza Creek Energy, Inc.C&J Energy Services, Inc.Cactus, Inc., Class ACalifornia Resources Corp.Callon Petroleum Co.Carrizo Oil & Gas, Inc.Centennial Resource Development, Inc., Class AChaparral Energy, Inc., Class AClean Energy Fuels Corp.CNX Resources Corp.CONSOL Energy, Inc.Contura Energy, Inc.Core Laboratories NVCVR Energy, Inc.Dawson Geophysical Co.Delek US Holdings, Inc.DHT Holdings, Inc.Diamond Offshore Drilling, Inc.DMC Global, Inc.Dorian LPG, Ltd.Dril-Quip, Inc.Earthstone Energy, Inc., Class AEnLink Midstream LLCEQT Corp.
66,657 787,88628,883 1,447,327
#* 158,125 2,677,056# 39,385 1,471,424#* 88,175 5,232,305# 34,251 1,271,740#* 86,106 849,005
14,172 277,48835,059 2,086,011
#* 53,904 3,668,167# 172,936 1,997,411# 19,588 490,288# 20,997 3,812,215
Tax-Managed U.S. Small Cap PortfolioCONTINUED
Shares Value†
CONSUMER STAPLES — (Continued)# 36,255 $ 1,321,495#* 3,900 18,291
124,318,260
ENERGY — (3.6%)8,197 267,468
#* 2,100 9,681* 30,194 982,211# 36,717 3,273,688
136,596 1,499,824* 43,373 318,358#* 28,887 51,419# 9,161 89,778#* 33,427 728,709* 19,870 217,378* 15,874 466,219#* 68,988 1,056,206#* 332,739 1,637,076#* 182,116 1,735,565#* 60,464 359,761#* 4,592 16,302* 292,014 779,677#* 237,825 1,954,921* 38,723 832,157* 2,362 84,630# 3,174 159,240# 29,913 1,587,483* 38,489 91,604# 156,490 6,741,589
274,510 1,550,981#* 93,669 846,768# 39,931 2,085,995* 68,277 624,735#* 83,890 4,414,292* 37,026 162,174# 89,120 855,552# 17,657 266,797

Era Group, Inc.Evolution Petroleum Corp.Exterran Corp.Extraction Oil & Gas, Inc.Forum Energy Technologies, Inc.Frank's International NVFTS International, Inc.GasLog, Ltd.Geospace Technologies Corp.Goodrich Petroleum Corp.Green Plains, Inc.Gulf Island Fabrication, Inc.Gulfport Energy Corp.Hallador Energy Co.Helix Energy Solutions Group, Inc.International Seaways, Inc.ION Geophysical Corp.Jagged Peak Energy, Inc.Keane Group, Inc.KLX Energy Services Holdings, Inc.Kosmos Energy, Ltd.Laredo Petroleum, Inc.
Lonestar Resources US, Inc., Class AMammoth Energy Services, Inc.Matador Resources Co.Matrix Service Co.McDermott International, Inc.Midstates Petroleum Co., Inc.Mitcham Industries, Inc.Montage Resources Corp.Murphy Oil Corp.Nabors Industries, Ltd.NACCO Industries, Inc., Class ANatural Gas Services Group, Inc.NCS Multistage Holdings, Inc.Newpark Resources, Inc.Nine Energy Service, Inc.Northern Oil and Gas, Inc.Oasis Petroleum, Inc.Oceaneering International, Inc.Oil States International, Inc.Pacific Drilling SAPanhandle Oil and Gas, Inc., Class APar Pacific Holdings, Inc.Patterson-UTI Energy, Inc.PBF Energy, Inc., Class APDC Energy, Inc.Peabody Energy Corp.Penn Virginia Corp.
* 34,924 360,41653,129 324,087
* 44,200 603,330#* 144,508 536,125* 189,390 496,202* 60,083 342,473* 23,232 92,231
102,386 1,457,977* 25,198 393,341* 7,444 85,680
50,355 508,082* 65,466 468,737#* 67,159 253,861
44,558 238,831* 277,075 2,427,177* 54,065 919,646#* 25,157 243,017#* 56,879 417,492* 110,288 693,711* 41,740 656,153# 429,461 2,581,061* 291,581 968,049
Tax-Managed U.S. Small Cap PortfolioCONTINUED
Shares Value†
ENERGY — (Continued)* 27,670 $ 68,622# 11,994 77,721#* 142,461 2,511,587* 86,647 1,591,705#* 392,110 2,517,346* 26,491 120,534* 12,886 53,606* 3,336 11,142# 13,292 319,540# 550,131 1,628,388
15,945 847,477* 27,174 435,871#* 9,951 31,943* 409,450 3,124,103* 5,763 74,170#* 305,408 494,761* 509,920 2,483,310* 199,785 3,086,678* 60,247 898,885* 1,708 16,055
39,775 469,743* 41,869 965,499
307,682 3,578,342218,320 6,097,678
#* 80,646 2,316,960120,184 2,531,075
#* 22,186 759,649

ProPetro Holding Corp.QEP Resources, Inc.Range Resources Corp.Renewable Energy Group, Inc.REX American Resources Corp.RigNet, Inc.Ring Energy, Inc.RPC, Inc.SAExploration Holdings, Inc.SandRidge Energy, Inc.Scorpio Tankers, Inc.SEACOR Holdings, Inc.SEACOR Marine Holdings, Inc.Select Energy Services, Inc., Class ASemGroup Corp., Class AShip Finance International, Ltd.SilverBow Resources, Inc.SM Energy Co.Smart Sand, Inc.Solaris Oilfield Infrastructure, Inc., Class ASouthwestern Energy Co.SRC Energy, Inc.Superior Energy Services, Inc.Talos Energy, Inc.TETRA Technologies, Inc.Tidewater, Inc.Transocean, Ltd.Unit Corp.US Silica Holdings, Inc.Valaris P.L.C.W&T Offshore, Inc.Whiting Petroleum Corp.
World Fuel Services Corp.WPX Energy, Inc.
TOTAL ENERGY
1st Constitution Bancorp1st Source Corp.ACNB Corp.Affiliated Managers Group, Inc.Allegiance Bancshares, Inc.A-Mark Precious Metals, Inc.Ambac Financial Group, Inc.American Equity Investment Life Holding Co.American National Bankshares, Inc.American National Insurance Co.American River BanksharesAmeris BancorpAMERISAFE, Inc.
* 88,760 1,609,219* 199,531 987,678# 263,195 1,497,580#* 118,975 1,616,870#* 18,425 1,374,505* 22,067 192,645* 86,821 212,711# 102,842 635,564* 4,035 13,114#* 36,344 245,322
73,794 1,934,141* 29,976 1,428,057* 19,687 277,193* 40,396 410,827
87,308 1,106,192# 107,589 1,414,795* 4,514 46,900
136,568 1,361,583#* 6,902 16,220# 63,651 910,846#* 658,425 1,448,535#* 430,998 1,758,472* 292,383 265,250* 35,768 736,105* 219,570 342,529* 11,321 260,270#* 620,203 3,770,834* 67,487 438,665# 89,492 1,240,359
215,676 1,766,386* 283,415 1,272,533#* 123,243 2,178,936
Tax-Managed U.S. Small Cap PortfolioCONTINUED
Shares Value†
ENERGY — (Continued)89,961 $ 3,512,077
* 40,726 425,179
124,636,399
FINANCIALS — (18.7%)# 170 3,096
56,132 2,635,3971,396 52,071
680 58,337* 13,944 467,961* 5,785 73,354* 28,864 525,902
129,659 3,345,20211,885 439,62610,537 1,275,188
2,368 31,139132,497 5,269,406
46,160 3,003,170

AmeriServ Financial, Inc.Argo Group International Holdings, Ltd.Arrow Financial Corp.Artisan Partners Asset Management, Inc., Class AAshford, Inc.Associated Banc-CorpAssociated Capital Group, Inc., Class AAtlantic American Corp.Atlantic Capital Bancshares, Inc.Atlantic Union Bankshares Corp.Atlanticus Holdings Corp.Auburn National Bancorporation, Inc.Axos Financial, Inc.Banc of California, Inc.BancFirst Corp.Bancorp, Inc. (The)BancorpSouth BankBank of Commerce HoldingsBank of Hawaii Corp.Bank of Marin BancorpBank of NT Butterfield & Son, Ltd. (The)Bank OZKBankFinancial Corp.BankUnited, Inc.Bankwell Financial Group, Inc.Banner Corp.Bar Harbor BanksharesBaycom Corp.BCB Bancorp, Inc.Berkshire Bancorp, Inc.Berkshire Hills Bancorp, Inc.BGC Partners, Inc., Class ABlucora, Inc.Blue Capital Reinsurance Holdings, Ltd.Boston Private Financial Holdings, Inc.Bridge Bancorp, Inc.Bridgewater Bancshares, Inc.Brighthouse Financial, Inc.BrightSphere Investment Group P.L.C.Brookline Bancorp, Inc.Bryn Mawr Bank Corp.
Byline Bancorp, Inc.C&F Financial Corp.Cadence BanCorpCalifornia First National BancorpCambridge BancorpCamden National Corp.Cannae Holdings, Inc.Capital City Bank Group, Inc.
87,157 357,34460,193 4,119,60940,712 1,354,08194,214 2,787,792
#* 2,291 78,604276,878 5,999,946
# 212 7,9224,900 11,515
* 33,922 623,826110,132 4,188,320
* 19,846 93,673300 11,604
#* 104,916 3,075,08894,251 1,473,14344,276 2,583,062
* 154,066 1,491,359# 196,194 5,864,239
8,387 90,328# 68,402 5,831,270
19,870 868,71620,543 645,666
674 20,61133,214 445,400
101,041 3,476,8212,181 61,286
67,708 4,012,37618,966 481,547
* 3,516 80,51611,993 153,870
* 150 1,96593,115 3,054,17285,450 470,830
* 92,763 2,777,3241,285 10,344
203,462 2,347,95128,325 827,373
* 1,400 16,688* 689 26,988* 90,066 963,706
147,121 2,181,80441,204 1,527,844
Tax-Managed U.S. Small Cap PortfolioCONTINUED
Shares Value†
FINANCIALS — (Continued)* 2,192 $ 41,889
3,311 179,787113,552 1,946,281
3,097 53,609# 221 17,282
31,684 1,416,592* 27,105 784,690
18,768 484,590

Capitol Federal Financial, Inc.Capstar Financial Holdings, Inc.Carolina Financial Corp.Cathay General BancorpCBTX, Inc.CenterState Banks Corp.Central Pacific Financial Corp.Central Valley Community BancorpCentury Bancorp, Inc., Class AChemung Financial Corp.Citizens & Northern Corp.Citizens Community Bancorp, Inc.Citizens Holding Co.Citizens, Inc.City Holding Co.Civista Bancshares, Inc.CNB Financial Corp.CNO Financial Group, Inc.Codorus Valley Bancorp, Inc.Cohen & Steers, Inc.Colony Bankcorp, Inc.Columbia Banking System, Inc.Columbia Financial, Inc.Community Bank System, Inc.Community Bankers Trust Corp.Community Financial Corp. (The)Community Trust Bancorp, Inc.Community West BancsharesConnectOne Bancorp, Inc.Consumer Portfolio Services, Inc.County Bancorp, Inc.Cowen, Inc., Class ACrawford & Co., Class ACrawford & Co., Class BCuro Group Holdings Corp.Customers Bancorp, Inc.CVB Financial Corp.Diamond Hill Investment Group, Inc.Dime Community Bancshares, Inc.Donegal Group, Inc., Class ADonegal Group, Inc., Class BDonnelley Financial Solutions, Inc.Eagle Bancorp, Inc.Eaton Vance Corp.eHealth, Inc.Elevate Credit, Inc.EMC Insurance Group, Inc.Employers Holdings, Inc.Encore Capital Group, Inc.Enova International, Inc.Enstar Group, Ltd.
341,231 4,661,2159,782 158,468
21,955 771,060206,467 7,684,702
1,668 50,274118,060 2,871,21936,153 1,065,429
6,161 127,7184,437 371,599
763 33,29712,978 332,496
# 20,282 221,074592 12,556
#* 100,100 745,745# 36,845 2,853,645
7,234 160,37819,642 554,297
336,171 5,684,6523,272 76,565
# 58,981 3,088,8351,629 27,286
145,269 5,478,094* 3,402 52,017
93,818 6,191,0504,335 34,5071,099 35,750
43,311 1,831,6221,200 11,580
61,689 1,410,211#* 48,217 175,992# 952 17,003#* 46,810 821,984# 70,697 730,300
50,444 472,660#* 4,882 60,634* 137,533 2,835,930
230,262 5,068,0677,918 1,116,042
93,580 1,888,44445,810 680,279
870 11,971* 124,573 1,697,930
64,275 2,590,925# 11,709 521,051#* 50,417 5,230,764* 23,452 97,560
45,244 1,626,06963,359 2,781,460
#* 57,829 2,080,687* 90,539 2,440,026* 17,850 3,162,127
Tax-Managed U.S. Small Cap PortfolioCONTINUED

Entegra Financial Corp.Enterprise Bancorp, Inc.Enterprise Financial Services Corp.Equity Bancshares, Inc., Class AESSA Bancorp, Inc.Essent Group, Ltd.Evans Bancorp, Inc.Evercore, Inc., Class AEZCORP, Inc., Class AFarmers National Banc Corp.FB Financial Corp.FBL Financial Group, Inc., Class AFederal Agricultural Mortgage Corp., Class AFederal Agricultural Mortgage Corp., Class CFederated Investors, Inc., Class BFedNat Holding Co.Financial Institutions, Inc.First Acceptance Corp.First BancorpFirst BanCorpFirst Bancorp, Inc.First Bancshares, Inc. (The)First BankFirst Busey Corp.First Business Financial Services, Inc.First Choice BancorpFirst Citizens BancShares, Inc., Class AFirst Commonwealth Financial Corp.First Community Bancshares, Inc.First Community Corp.First Defiance Financial Corp.First Financial BancorpFirst Financial Bankshares, Inc.First Financial Corp.First Financial Northwest, Inc.First Foundation, Inc.First Hawaiian, Inc.First Horizon National Corp.First Internet BancorpFirst Interstate BancSystem, Inc., Class AFirst Merchants Corp.First Mid Bancshares, Inc.First Midwest Bancorp, Inc.First Northwest BancorpFirst of Long Island Corp. (The)First United Corp.FirstCash, Inc.Flagstar Bancorp, Inc.Flushing Financial Corp.FNB Corp.Franklin Financial Network, Inc.FS Bancorp, Inc.
Shares Value†
FINANCIALS — (Continued)* 1,415 $ 42,181
5,676 173,40246,305 1,929,992
* 18,373 486,70114,300 219,505
* 42,753 1,973,4782,846 105,473
53,675 4,635,910#* 100,394 988,881
25,532 373,0237,505 285,265
40,672 2,550,1341,115 76,500
23,600 1,823,572# 167,751 5,829,347
32,651 407,81136,632 1,127,899
* 96,214 86,59355,196 2,038,940
291,191 3,133,21515,097 395,692
5,799 192,5856,366 72,445
84,921 2,295,4157,367 175,556
# 4,152 92,1741,503 701,931
178,386 2,456,37541,219 1,363,112
400 7,64454,410 1,562,655
173,297 4,417,341# 125,116 4,097,549
25,478 1,106,00027,065 400,02161,880 930,67560,429 1,617,080
8,945 146,69812,265 258,54676,271 3,053,12897,703 3,850,475
6,664 227,109192,486 4,163,472
7,344 118,01843,021 951,625
1,912 40,70683,455 8,398,91186,800 2,992,86477,544 1,578,796
173,089 2,085,722# 23,178 683,751
3,416 168,409

Fulton Financial Corp.GAIN Capital Holdings, Inc.GAMCO Investors, Inc., Class AGenworth Financial, Inc., Class AGerman American Bancorp, Inc.Glacier Bancorp, Inc.Global Indemnity, Ltd.
Goosehead Insurance, Inc., Class AGreat Southern Bancorp, Inc.Great Western Bancorp, Inc.Green Dot Corp., Class AGreenhill & Co., Inc.Greenlight Capital Re, Ltd., Class AGuaranty Bancshares, Inc.Guaranty Federal Bancshares, Inc.Hallmark Financial Services, Inc.Hamilton Lane, Inc., Class AHancock Whitney Corp.Hanmi Financial Corp.Hanover Insurance Group, Inc. (The)HarborOne Bancorp, Inc.Hawthorn Bancshares, Inc.HCI Group, Inc.Heartland Financial USA, Inc.Hennessy Advisors, Inc.Heritage Commerce Corp.Heritage Financial Corp.Heritage Insurance Holdings, Inc.Hilltop Holdings, Inc.Hingham Institution for SavingsHMN Financial, Inc.Home Bancorp, Inc.Home BancShares, Inc.HomeStreet, Inc.HomeTrust Bancshares, Inc.Hope Bancorp, Inc.HopFed Bancorp, Inc.Horace Mann Educators Corp.Horizon Bancorp, Inc.Houlihan Lokey, Inc.Howard Bancorp, Inc.IBERIABANK Corp.Independence Holding Co.Independent Bank Corp.Independent Bank Corp.Independent Bank Group, Inc.Interactive Brokers Group, Inc., Class AInternational Bancshares Corp.INTL. FCStone, Inc.
354,355 6,024,035# 67,039 285,586
13,077 265,463* 6,100 24,339
52,618 1,660,098134,100 5,620,131
24,008 679,186
Tax-Managed U.S. Small Cap PortfolioCONTINUED
Shares Value†
FINANCIALS — (Continued)# 1,300 $ 58,513
34,088 2,043,91679,580 2,691,396
* 84,511 4,283,863# 107,072 1,777,395#* 140,116 1,169,969
3,073 94,7102,022 47,719
* 33,293 516,042# 8,660 508,342
88,958 3,693,53685,261 1,832,25950,699 6,576,167
#* 14,319 274,2092,198 53,697
33,285 1,334,396# 46,294 2,226,278# 2,761 27,610
131,114 1,621,88054,712 1,560,38627,177 365,259
197,180 4,472,0421,923 370,735
* 2,746 58,2152,487 92,914
# 240,974 4,739,959* 52,779 1,531,647
11,678 305,146260,431 3,841,357
#*» 5,577 112,30477,779 3,378,72067,359 1,173,394
# 17,046 784,116* 6,442 95,921
23,864 1,874,9942,009 76,141
46,556 3,620,19521,971 477,65045,778 2,600,648
# 114,563 5,872,499113,925 4,286,998
* 34,579 1,410,132

Investar Holding Corp.Investors Bancorp, Inc.Investors Title Co.James River Group Holdings, Ltd.Kearny Financial Corp.Kemper Corp.Kentucky First Federal BancorpKingstone Cos., Inc.Kinsale Capital Group, Inc.Ladenburg Thalmann Financial Services, Inc.Lake Shore Bancorp, Inc.Lakeland Bancorp, Inc.Lakeland Financial Corp.Landmark Bancorp, Inc.Lazard, Ltd., Class ALCNB Corp.LegacyTexas Financial Group, Inc.
Legg Mason, Inc.LendingClub Corp.LendingTree, Inc.Limestone Bancorp, Inc.Live Oak Bancshares, Inc.Luther Burbank Corp.Macatawa Bank Corp.Mackinac Financial Corp.Magyar Bancorp, Inc.Malvern Bancorp, Inc.Marlin Business Services Corp.MBIA, Inc.MBT Financial Corp.Mercantile Bank Corp.Merchants BancorpMercury General Corp.Meridian Bancorp, Inc.Meta Financial Group, Inc.Metropolitan Bank Holding Corp.MGIC Investment Corp.Mid Penn Bancorp, Inc.Middlefield Banc Corp.Midland States Bancorp, Inc.MidSouth Bancorp, Inc.MidWestOne Financial Group, Inc.Moelis & Co., Class AMr Cooper Group, Inc.MutualFirst Financial, Inc.National Bank Holdings Corp., Class ANational Bankshares, Inc.National General Holdings Corp.National Security Group, Inc. (The)
678 16,34725,119 285,3522,479 406,804
33,682 1,611,010175,852 2,347,624
86,600 7,622,5323,402 25,855
20,452 173,43310,630 955,212
230,662 712,746338 5,019
89,736 1,469,87660,442 2,779,728
3,138 74,5287,366 285,1382,648 47,690
98,078 4,191,854
Tax-Managed U.S. Small Cap PortfolioCONTINUED
Shares Value†
FINANCIALS — (Continued)30 $ 1,130
#* 129,485 1,913,788#* 16,526 5,330,296* 857 12,992# 29,302 570,510
2,130 23,77160,005 616,851
7,750 119,350* 809 9,546* 1,300 27,612
37,093 860,929#* 159,089 1,484,300
29,000 312,62027,018 907,805
2,630 47,05177,822 4,413,286
101,526 1,861,98765,821 2,031,894
* 833 34,961* 216,764 2,785,417
2,400 62,520307 13,397
17,122 464,34927,342 334,393
9,347 290,41161,697 2,248,239
#* 38,654 294,1579,275 302,272
58,487 2,121,9081,806 66,172
67,093 1,659,2101,000 11,190

National Western Life Group, Inc., Class ANavient Corp.NBT Bancorp, Inc.Nelnet, Inc., Class ANewStar Financial, Inc.Nicholas Financial, Inc.Nicolet Bankshares, Inc.NMI Holdings, Inc., Class ANortheast BankNorthfield Bancorp, Inc.Northrim BanCorp, Inc.Northwest Bancshares, Inc.Norwood Financial Corp.OceanFirst Financial Corp.OFG BancorpOhio Valley Banc Corp.Old Line Bancshares, Inc.Old National BancorpOld Second Bancorp, Inc.On Deck Capital, Inc.OneMain Holdings, Inc.Oppenheimer Holdings, Inc., Class AOpus BankOrigin Bancorp, Inc.Oritani Financial Corp.Orrstown Financial Services, Inc.Pacific Mercantile Bancorp
Pacific Premier Bancorp, Inc.Park National Corp.Parke Bancorp, Inc.PCSB Financial Corp.Peapack Gladstone Financial Corp.Penns Woods Bancorp, Inc.Pennymac Financial Services, Inc.Peoples Bancorp of North Carolina, Inc.Peoples Bancorp, Inc.Peoples Financial Services Corp.People's Utah BancorpPinnacle Financial Partners, Inc.Piper Jaffray Cos.PJT Partners, Inc., Class APopular, Inc.PRA Group, Inc.Preferred BankPremier Financial Bancorp, Inc.Primerica, Inc.ProAssurance Corp.Prosperity Bancshares, Inc.Protective Insurance Corp., Class A
2,443 657,167208,021 2,943,497
# 82,955 3,210,35859,149 3,700,361
» 112,900 10,985* 9,480 79,442* 4,348 285,707* 102,175 2,542,114* 7,526 165,196
98,988 1,549,16211,583 451,390
259,647 4,452,946949 32,854
79,941 1,950,56081,453 1,843,281
# 1,400 50,48423,389 660,505
243,405 4,286,36246,116 605,964
* 92,370 330,68545,669 1,892,98010,748 313,19744,699 1,001,705
# 1,286 44,766104,517 1,891,758
4,279 97,861* 35,354 272,933
Tax-Managed U.S. Small Cap PortfolioCONTINUED
Shares Value†
FINANCIALS — (Continued)83,417 $2,638,480
# 16,584 1,568,6813,933 94,2743,775 73,386
40,441 1,149,7385,789 262,589
50,895 1,221,9891,084 29,398
36,359 1,178,39560 2,903
23,623 715,777# 66,239 4,023,357
17,595 1,360,094# 31,874 1,343,808
93,185 5,363,729#* 105,239 3,276,090
30,623 1,659,46019,676 307,33956,551 6,938,242
105,362 4,118,601# 3,383 234,746
550 8,993

Protective Insurance Corp., Class BProvident Bancorp, Inc.Provident Financial Holdings, Inc.Provident Financial Services, Inc.Prudential Bancorp, Inc.Pzena Investment Management, Inc., Class AQCR Holdings, Inc.Radian Group, Inc.RBB BancorpRegional Management Corp.Renasant Corp.Republic Bancorp, Inc., Class ARepublic First Bancorp, Inc.Riverview Bancorp, Inc.RLI Corp.S&T Bancorp, Inc.Safeguard Scientifics, Inc.Safety Insurance Group, Inc.Salisbury Bancorp, Inc.Sandy Spring Bancorp, Inc.SB One BancorpSeacoast Banking Corp. of FloridaSecurity National Financial Corp., Class ASelect Bancorp, Inc.Selective Insurance Group, Inc.ServisFirst Bancshares, Inc.Shore Bancshares, Inc.Siebert Financial Corp.Sierra BancorpSilvercrest Asset Management Group, Inc., Class ASimmons First National Corp., Class ASmartFinancial, Inc.South State Corp.Southern First Bancshares, Inc.Southern Missouri Bancorp, Inc.Southern National Bancorp of Virginia, Inc.Southside Bancshares, Inc.
Southwest Georgia Financial Corp.Spirit of Texas Bancshares, Inc.State Auto Financial Corp.Sterling BancorpSterling Bancorp, Inc.Stewart Information Services Corp.Stifel Financial Corp.Stock Yards Bancorp, Inc.Summit Financial Group, Inc.Summit State BankSynovus Financial Corp.TCF Financial Corp.
16,176 267,713#* 257 7,106
6,061 125,887105,610 2,553,650
1,711 31,26038,493 313,33322,834 873,629
324,032 7,387,9306,113 122,871
* 23,372 563,96696,580 3,466,25639,187 1,871,963
* 57,875 251,75642,903 364,676
# 70,858 6,386,43262,285 2,371,190
* 55,071 643,22938,135 3,762,399
551 21,21462,290 2,269,848
6,356 145,616* 59,709 1,614,531* 3,663 18,718* 2,536 28,784
96,545 7,260,184# 74,169 2,526,196
8,781 144,008#* 7,500 88,650
29,330 764,6334,500 64,485
157,071 4,044,578* 4,927 106,867
53,881 4,314,252* 13,314 542,945
6,269 218,47515,776 251,154
# 62,849 2,175,832
Tax-Managed U.S. Small Cap PortfolioCONTINUED
Shares Value†
FINANCIALS — (Continued)1,439 $ 29,500
* 480 10,29175,429 2,608,335
290,961 6,357,4987,731 75,918
48,701 1,842,35991,446 5,469,38547,361 1,811,558
5,280 140,5011,000 12,250
56,358 2,151,185354,252 7,573,908

TCF Financial Corp.Territorial Bancorp, Inc.Texas Capital Bancshares, Inc.TFS Financial Corp.TheStreet, Inc.Third Point Reinsurance, Ltd.Timberland Bancorp, Inc.Tiptree, Inc.Tompkins Financial Corp.Towne BankTriCo BancsharesTriState Capital Holdings, Inc.Triumph Bancorp, Inc.TrustCo Bank Corp. NYTrustmark Corp.UMB Financial Corp.Umpqua Holdings Corp.Unico American Corp.United Bancshares, Inc.United Bankshares, Inc.United Community Banks, Inc.United Community Financial Corp.United Financial Bancorp, Inc.United Fire Group, Inc.United Insurance Holdings Corp.United Security BancsharesUnity Bancorp, Inc.Universal Insurance Holdings, Inc.Univest Financial Corp.Valley National BancorpValue Line, Inc.Veritex Holdings, Inc.Victory Capital Holdings, Inc., Class AVirtu Financial, Inc., Class AVirtus Investment Partners, Inc.Waddell & Reed Financial, Inc., Class AWalker & Dunlop, Inc.Washington Federal, Inc.Washington Trust Bancorp, Inc.Waterstone Financial, Inc.Webster Financial Corp.WesBanco, Inc.West Bancorporation, Inc.Westamerica BancorporationWestern Alliance BancorpWestern New England Bancorp, Inc.Westwood Holdings Group, Inc.
White Mountains Insurance Group, Ltd.Wintrust Financial Corp.
94,699 3,981,14621,514 618,528
* 35,342 2,224,072# 6,500 116,740
487 3,039* 43,830 441,806
17,788 491,66068,482 467,73226,932 2,207,616
106,632 3,000,62444,408 1,676,402
#* 66,724 1,401,204* 26,121 815,236
208,268 1,686,971156,234 5,552,556
83,669 5,711,24678,738 1,374,765
* 4,300 25,886110 2,408
# 162,418 6,105,293160,340 4,601,758119,905 1,220,633143,947 2,064,200
39,695 2,074,85867,740 767,494
7,256 77,7849,777 202,482
101,962 2,529,67758,252 1,599,600
# 519,073 5,792,8553,230 84,303
73,713 1,886,316* 9,260 165,476# 4,300 93,224# 22,448 2,405,528# 155,869 2,727,707
62,422 3,641,699193,136 7,064,915
37,710 1,894,17383,761 1,415,56135,000 1,785,00091,971 3,364,29941,449 877,890
# 37,378 2,395,930* 15,340 758,410
49,422 461,60122,863 715,612
Tax-Managed U.S. Small Cap PortfolioCONTINUED
Shares Value†
FINANCIALS — (Continued)# 1,975 $ 2,125,100
62,888 4,499,008

WisdomTree Investments, Inc.World Acceptance Corp.WSFS Financial Corp.WVS Financial Corp.
TOTAL FINANCIALS
Abeona Therapeutics, Inc.Acadia Healthcare Co., Inc.Acceleron Pharma Inc.Accuray, Inc.Acer Therapeutics, Inc.Achillion Pharmaceuticals, Inc.Aclaris Therapeutics, Inc.Acorda Therapeutics, Inc.Adamas Pharmaceuticals, Inc.Addus HomeCare Corp.Advaxis, Inc.Adverum Biotechnologies, Inc.Aeglea BioTherapeutics, Inc.Agios Pharmaceuticals, Inc.Aimmune Therapeutics Inc.Akebia Therapeutics, Inc.Akorn, Inc.Albireo Pharma, Inc.Alder Biopharmaceuticals, Inc.Aldeyra Therapeutics, Inc.Alkermes P.L.C.Allena Pharmaceuticals, Inc.Allscripts Healthcare Solutions, Inc.Altimmune, Inc.AMAG Pharmaceuticals, Inc.Amedisys, Inc.Amicus Therapeutics, Inc.AMN Healthcare Services, Inc.Amneal Pharmaceuticals, Inc.Amphastar Pharmaceuticals, Inc.AnaptysBio, Inc.AngioDynamics, Inc.ANI Pharmaceuticals, Inc.Anika Therapeutics, Inc.Apollo Endosurgery, Inc.Apollo Medical Holdings, Inc.Applied Genetic Technologies Corp.Aptinyx, Inc.Apyx Medical Corp.Aquinox Pharmaceuticals, Inc.Aravive, Inc.ARCA biopharma, Inc.Arcus Biosciences, Inc.Ardelyx, Inc.Arena Pharmaceuticals, Inc.Assembly Biosciences, Inc.Assertio Therapeutics, Inc.Atara Biotherapeutics, Inc.
# 151,199 937,434* 25,209 3,194,737
91,102 3,859,992700 12,047
655,079,235
HEALTH CARE — (8.7%)#* 13,944 36,115#* 119,368 3,812,614* 3,840 167,654#* 165,928 686,942#* 2,202 6,584* 318,885 1,406,283#* 56,760 72,653#* 58,559 405,814#* 15,245 95,434* 43,369 3,495,108* 5,990 3,360#* 81,005 1,086,277* 37,624 337,111#* 1,397 67,210#* 666 12,821#* 57,609 241,382#* 164,590 612,275* 13,168 340,920#* 14,491 146,649#* 12,323 67,530* 11,233 260,156* 5,776 23,624* 306,659 3,158,588#* 5,313 12,751#* 26,767 221,095* 68,500 9,445,465#* 59,459 737,292* 86,819 4,634,398#* 1,900 6,954* 88,418 1,781,623#* 7,930 425,920* 65,485 1,334,584#* 41,251 3,489,422#* 50,046 2,757,034* 3,322 9,069* 364 5,569* 44,373 171,280#* 2,443 9,088
26,699 193,301* 8,321 22,217* 8,700 56,985* 3,100 21,235#* 2,200 17,402* 136,122 328,054* 16,742 1,049,389* 30,584 382,300* 106,157 364,119#* 23,307 332,591

Atossa Genetics, Inc.AtriCure Inc.
Atrion Corp.aTyr Pharma, Inc.Audentes Therapeutics, Inc.Avanos Medical, Inc.Avrobio, Inc.AxoGen, Inc.Bio-Path Holdings, Inc.BioScrip, Inc.BioSpecifics Technologies Corp.BioTelemetry, Inc.Brookdale Senior Living, Inc.Calithera Biosciences, Inc.Calyxt, Inc.Cambrex Corp.Cantel Medical Corp.Capital Senior Living Corp.Capricor Therapeutics, Inc.Cardiovascular Systems, Inc.CASI Pharmaceuticals, Inc.Castlight Health, Inc., Class BCatabasis Pharmaceuticals, Inc.Catalyst Biosciences, Inc.Catalyst Pharmaceuticals, Inc.Celldex Therapeutics, Inc.Cellular Biomedicine Group, Inc.Champions Oncology, Inc.Chembio Diagnostics, Inc.Chemed Corp.ChemoCentryx, Inc.Chiasma, Inc.Chimerix, Inc.Clovis Oncology, Inc.Collegium Pharmaceutical, Inc.Community Health Systems, Inc.Computer Programs & Systems, Inc.Concert Pharmaceuticals, Inc.Conformis, Inc.CONMED Corp.Corcept Therapeutics, Inc.CorVel Corp.Corvus Pharmaceuticals, Inc.Covetrus, Inc.Cross Country Healthcare, Inc.CryoLife, Inc.Cumberland Pharmaceuticals, Inc.Cutera, Inc.Cymabay Therapeutics, Inc.
* 2,349 4,886* 3,500 112,280
Tax-Managed U.S. Small Cap PortfolioCONTINUED
Shares Value†
HEALTH CARE — (Continued)# 3,399 $2,615,530#* 1,042 3,657* 22,843 889,050* 98,489 4,010,472#* 5,860 124,349#* 4,193 75,390#* 2,000 27,320* 74,800 211,684* 20,577 1,195,524* 102,457 4,810,356* 428,304 3,336,488* 69,581 295,023#* 819 7,609#* 72,842 3,190,480# 83,217 7,679,265#* 69,564 371,472* 3,300 14,520* 1,244 57,013#* 3,000 9,360* 103,584 166,770#* 13,309 94,228* 42,381 347,100#* 39,874 198,971#* 10,678 23,278#* 367 5,061#* 16,185 104,717#* 1,700 10,285
2,679 1,086,040#* 75,691 604,014#* 1,266 6,950* 134,403 483,851#* 7,879 83,123#* 42,363 464,722#* 169,421 347,313# 16,356 422,148* 75,646 760,999#* 5,700 15,732
47,238 4,126,239#* 131,043 1,475,544* 44,234 3,768,737#* 37,603 147,028#* 14,612 345,866* 87,198 827,509* 114,699 3,305,625* 43,217 252,819* 50,628 1,294,052#* 87,066 538,068

Cytokinetics, Inc.CytomX Therapeutics, Inc.Deciphera Pharmaceuticals, Inc.Denali Therapeutics, Inc.Dermira, Inc.Dicerna Pharmaceuticals, Inc.Digirad Corp.Eagle Pharmaceuticals, Inc.Eiger BioPharmaceuticals, Inc.Elanco Animal Health, Inc.Electromed, Inc.Emergent BioSolutions, Inc.
Enanta Pharmaceuticals, Inc.Endo International P.L.C.Endologix, Inc.Enochian Biosciences, Inc.Ensign Group, Inc. (The)Enzo Biochem, Inc.Epizyme, Inc.Evelo Biosciences, Inc.Evolent Health, Inc., Class AEyenovia, Inc.FibroGen, Inc.Five Prime Therapeutics, Inc.Flexion Therapeutics, Inc.Fluidigm Corp.FONAR Corp.G1 Therapeutics, Inc.Genomic Health, Inc.Global Blood Therapeutics, Inc.Globus Medical, Inc., Class AGlycoMimetics, Inc.Haemonetics Corp.Hanger, Inc.Harrow Health, Inc.Harvard Bioscience, Inc.HealthEquity, Inc.HealthStream, Inc.Heron Therapeutics, Inc.Heska Corp.HMS Holdings Corp.Horizon Therapeutics P.L.C.Icad, Inc.ICU Medical, Inc.Idera Pharmaceuticals, Inc.InfuSystem Holdings, Inc.Innoviva, Inc.Inogen, Inc.Inovalon Holdings, Inc., Class A
#* 24,940 304,019#* 29,074 299,753#* 8,744 193,242#* 2,113 45,113#* 91,904 809,674* 2,838 38,682
4,050 21,668#* 14,350 787,241#* 3,008 33,299#* 15,654 515,956* 9,750 51,968* 71,414 3,152,214
Tax-Managed U.S. Small Cap PortfolioCONTINUED
Shares Value†
HEALTH CARE — (Continued)* 52,726 $3,955,505#* 147,501 467,578* 14,143 97,587#* 2,300 11,247
77,518 4,671,235* 111,211 434,835#* 44,028 583,811#* 300 1,833#* 131,232 895,002#* 3,267 10,422#* 4,260 201,328* 77,306 395,034#* 3,800 38,152#* 11,760 138,180* 10,130 248,590#* 19,256 477,741* 29,324 2,139,772#* 24,086 1,319,913* 49,092 2,237,613#* 67,947 627,151* 9,947 1,214,330#* 10,231 176,485# 4,000 31,000* 103,195 255,924#* 23,878 1,957,518* 81,548 2,302,916#* 1,231 21,469#* 12,551 1,005,837* 80,062 2,794,164* 209,169 5,206,216#* 2,400 15,288* 20,567 5,233,067#* 16,952 45,770* 3,700 16,428#* 138,347 1,643,562#* 23,520 1,446,480#* 7,741 116,115

Inovio Pharmaceuticals, Inc.Insmed, Inc.Inspire Medical Systems, Inc.Integer Holdings Corp.Integra LifeSciences Holdings Corp.Intellia Therapeutics, Inc.Intra-Cellular Therapies, Inc.IntriCon Corp.Invacare Corp.Invitae Corp.Iovance Biotherapeutics, Inc.IRIDEX Corp.Joint Corp. (The)Jounce Therapeutics, Inc.Kadmon Holdings, Inc.Kala Pharmaceuticals, Inc.KalVista Pharmaceuticals, Inc.Karyopharm Therapeutics, Inc.Kewaunee Scientific Corp.Kindred Biosciences, Inc.Kodiak Sciences, Inc.Krystal Biotech, Inc.
Kura Oncology, Inc.Lannett Co., Inc.Lantheus Holdings, Inc.LeMaitre Vascular, Inc.LHC Group, Inc.Ligand Pharmaceuticals, Inc.LivaNova P.L.C.Luminex Corp.MacroGenics, Inc.Madrigal Pharmaceuticals, Inc.Magellan Health, Inc.Mallinckrodt P.L.C.Marinus Pharmaceuticals, Inc.Marker Therapeutics, Inc.Medidata Solutions, Inc.MEDNAX, Inc.Medpace Holdings, Inc.MEI Pharma, Inc.Melinta Therapeutics, Inc.Menlo Therapeutics, Inc.Meridian Bioscience, Inc.Merit Medical Systems, Inc.Merrimack Pharmaceuticals, Inc.Mersana Therapeutics, Inc.Mesa Laboratories, Inc.Micron Solutions, Inc.Millendo Therapeutics, Inc.
#* 71,893 198,425#* 21,563 473,308* 17,771 1,201,853* 61,421 5,376,180#* 85,708 5,433,030#* 61,058 1,105,150#* 80,207 669,728#* 32,669 587,389# 56,764 303,687#* 4,963 133,455#* 52,535 1,291,836#* 4,751 16,343#* 4,842 89,480* 40,118 192,165#* 11,851 31,050#* 41,225 242,403#* 7,477 124,043#* 84,335 742,991
2,424 44,238* 91,208 622,039* 1,900 23,389#* 2,037 97,796
Tax-Managed U.S. Small Cap PortfolioCONTINUED
Shares Value†
HEALTH CARE — (Continued)#* 22,493 $ 430,066#* 4,756 33,625* 78,028 1,764,993# 69,838 2,310,939* 68,923 8,724,273#* 21,940 2,007,729#* 34,061 2,624,400
71,209 1,547,372* 71,234 1,025,057#* 5,737 500,783* 45,979 3,234,163#* 159,224 1,084,315#* 17,998 19,798#* 7,600 35,036* 11,851 1,082,826* 36,795 904,053#* 32,063 2,525,282#* 24,871 42,281* 12,463 49,478* 1,754 6,648
82,227 982,613* 73,976 2,919,093#* 22,439 137,775* 3,964 13,874# 11,119 2,798,430* 5,700 13,794
650 6,377

Minerva Neurosciences, Inc.Miragen Therapeutics, Inc.Mirati Therapeutics, Inc.Misonix, Inc.Molecular Templates, Inc.Momenta Pharmaceuticals, Inc.MyoKardia Inc.Myriad Genetics, Inc.Nabriva Therapeutics P.L.C.National HealthCare Corp.National Research Corp.Natus Medical, Inc.Neogen Corp.NeoGenomics, Inc.Neurotrope, Inc.NextGen Healthcare, Inc.NuVasive, Inc.Nuvectra Corp.ObsEva SAOcular Therapeutix, Inc.Omnicell, Inc.OncoSec Medical, Inc.Oncternal Therapeutics, Inc.OPKO Health, Inc.OraSure Technologies, Inc.Orthofix Medical, Inc.OrthoPediatrics Corp.Otonomy, Inc.Owens & Minor, Inc.Oxford Immunotec Global P.L.C.Pacira BioSciences, Inc.Patterson Cos., Inc.
PDL BioPharma, Inc.PDS Biotechnology Corp.PetIQ, Inc.Pfenex, Inc.Phibro Animal Health Corp., Class APieris Pharmaceuticals, Inc.PolarityTE, Inc.Precipio, Inc.Premier, Inc., Class APrestige Consumer Healthcare, Inc.Pro-Dex, Inc.Progenics Pharmaceuticals, Inc.Protagonist Therapeutics, Inc.Prothena Corp. P.L.C.Providence Service Corp. (The)Psychemedics Corp.PTC Therapeutics, Inc.
#* 57,297 380,452#* 27,200 54,400#* 4,051 428,596#* 1,809 42,928#* 19,318 126,919* 59,407 671,299#* 3,750 204,113* 112,170 3,268,634#* 42,060 99,893
24,420 2,139,19242,285 2,850,855
* 81,179 2,522,232* 51,156 3,652,538#* 64,478 1,571,329#* 6,001 31,745* 122,295 2,000,746#* 67,327 4,483,978* 24,127 51,149* 10,377 93,289#* 9,395 43,687* 93,919 7,063,648* 4,100 9,143#* 2,045 9,284#* 160,995 339,699* 215,440 1,798,924* 44,025 2,353,136#* 2,208 77,964* 58,100 165,004# 76,573 207,513#* 5,489 70,808* 28,356 1,244,545# 114,050 2,258,190
Tax-Managed U.S. Small Cap PortfolioCONTINUED
Shares Value†
HEALTH CARE — (Continued)#* 229,299 $ 660,381# 1,525 9,913#* 18,381 629,365* 43,549 256,068
28,984 902,272* 23,833 131,082#* 5,800 27,608* 2,800 8,176* 9,700 375,875#* 110,081 3,808,803* 4,614 65,611#* 55,382 297,955* 41,356 455,743* 64,858 607,071* 41,699 2,324,302
4,247 38,265#* 31,950 1,539,031

Pulse Biosciences, Inc.Quidel Corp.Quorum Health Corp.Ra Pharmaceuticals, Inc.RadNet, Inc.Recro Pharma, Inc.REGENXBIO, Inc.Repligen Corp.Retrophin, Inc.Revance Therapeutics, Inc.Rexahn Pharmaceuticals, Inc.Rhythm Pharmaceuticals, Inc.Rigel Pharmaceuticals, Inc.Rocket Pharmaceuticals, Inc.RTI Surgical Holdings, Inc.Salarius Pharmaceuticals, Inc.Sangamo Therapeutics, Inc.Savara, Inc.SeaSpine Holdings Corp.Select Medical Holdings Corp.SIGA Technologies, Inc.Simulations Plus, Inc.Solid Biosciences, Inc.Spark Therapeutics, Inc.Spectrum Pharmaceuticals, Inc.Spero Therapeutics, Inc.Spring Bank Pharmaceuticals, Inc.Supernus Pharmaceuticals, Inc.Surface Oncology, Inc.Surgery Partners, Inc.Surmodics, Inc.Syndax Pharmaceuticals, Inc.Syneos Health, Inc.Synlogic, Inc.Syros Pharmaceuticals, Inc.Tabula Rasa HealthCare, Inc.Taro Pharmaceutical Industries, Ltd.Teladoc Health, Inc.Tenet Healthcare Corp.Tetraphase Pharmaceuticals, Inc.Tivity Health, Inc.Tocagen, Inc.
Triple-S Management Corp., Class BTrovagene, Inc.Ultragenyx Pharmaceutical Inc.United Therapeutics Corp.US Physical Therapy, Inc.Utah Medical Products, Inc.Vanda Pharmaceuticals, Inc.
#* 2,000 26,120* 56,818 3,353,967#* 25,997 43,155* 20,609 701,530* 104,073 1,532,995* 1,704 16,358#* 18,648 828,158#* 70,302 6,635,806#* 74,701 1,478,333#* 36,773 462,604* 1,446 7,404#* 4,069 78,328#* 220,917 503,691#* 4,100 49,938* 176,570 752,188
900 6,723#* 70,036 841,132* 9,047 22,979* 40,844 519,127* 241,318 4,039,663#* 9,693 54,281
42,954 1,667,474#* 4,211 24,129* 11,602 1,160,432#* 94,746 718,175#* 4,900 50,911* 1,200 5,688* 83,186 2,775,917#* 2,500 5,525#* 47,207 360,189* 41,143 1,715,663#* 81,650 783,840#* 36,008 1,839,649#* 57,356 321,767#* 31,089 232,546#* 453 27,302
900 72,693#* 5,491 374,706#* 179,639 4,234,091#* 71,885 24,714#* 88,869 1,550,764* 7,103 37,788
Tax-Managed U.S. Small Cap PortfolioCONTINUED
Shares Value†
HEALTH CARE — (Continued)* 38,624 $ 926,203#* 7,600 13,300#* 15,176 914,506* 4,823 382,175# 29,093 3,755,324# 12,463 1,134,008#* 28,550 355,447

Varex Imaging Corp.Vericel Corp.Verrica Pharmaceuticals, Inc.Vocera Communications, Inc.WaVe Life Sciences Ltd.Wright Medical Group NVXencor, Inc.Zogenix, Inc.Zynerba Pharmaceuticals, Inc.Zynex, Inc.
TOTAL HEALTH CARE
AAON, Inc.AAR Corp.ABM Industries, Inc.Acacia Research Corp.ACCO Brands Corp.Acme United Corp.Actuant Corp., Class AAdvanced Disposal Services, Inc.Advanced Drainage Systems, Inc.Aegion Corp.Aerojet Rocketdyne Holdings, Inc.Aerovironment, Inc.AGCO Corp.Air Lease Corp.Air Transport Services Group, Inc.Alamo Group, Inc.Albany International Corp., Class AAllegiant Travel Co.Allied Motion Technologies, Inc.Altra Industrial Motion Corp.Ameresco, Inc., Class AAmerican Woodmark Corp.AMREP Corp.Apogee Enterprises, Inc.Applied Industrial Technologies, Inc.Aqua Metals, Inc.ARC Document Solutions, Inc.ArcBest Corp.Arcosa, Inc.Argan, Inc.Armstrong Flooring, Inc.Armstrong World Industries, Inc.ASGN, Inc.Astec Industries, Inc.Astronics Corp.Astronics Corp., Class BAtkore International Group, Inc.Atlas Air Worldwide Holdings, Inc.Avis Budget Group, Inc.
* 47,647 1,514,698#* 15,695 300,088* 1,000 12,240#* 5,957 152,916#* 921 19,719#* 59,735 1,723,952#* 9,173 403,795#* 36,081 1,738,022#* 2,800 29,652# 2,102 17,489
304,999,066
INDUSTRIALS — (17.8%)# 102,100 5,186,680
58,300 2,440,438# 106,105 4,465,959* 66,699 186,090
158,432 1,549,46510,426 216,861
104,488 2,392,775* 2,293 74,224
59,115 1,946,657* 68,967 1,300,028#* 117,038 4,999,863#* 65,240 3,578,414
9,666 744,28274,564 3,116,030
* 135,939 3,168,73827,770 2,718,40551,795 4,453,85224,018 3,599,09731,330 1,241,92165,132 1,871,242
* 40,773 581,015#* 32,860 2,788,171* 2,776 16,934
71,211 2,888,31861,312 3,730,222
#* 16,400 31,324* 110,195 208,269
65,791 1,969,1256,546 245,475
50,230 2,066,965* 65,743 549,611
65,441 6,394,240* 101,799 6,418,427
63,788 2,085,230* 48,819 1,798,492#* 8,090 301,595* 47,046 1,283,885* 41,558 1,897,123* 141,110 5,134,993
Tax-Managed U.S. Small Cap PortfolioCONTINUED

Axon Enterprise, Inc.AZZ, Inc.Barnes Group, Inc.Barrett Business Services, Inc.Beacon Roofing Supply, Inc.BG Staffing, Inc.Blue Bird Corp.BMC Stock Holdings, Inc.Brady Corp., Class ABriggs & Stratton Corp.Brink's Co. (The)Builders FirstSource, Inc.BWX Technologies, Inc.CAI International, Inc.Casella Waste Systems, Inc., Class ACBIZ, Inc.CECO Environmental Corp.Chart Industries, Inc.Chicago Rivet & Machine Co.Cimpress NVCIRCOR International, Inc.Civeo Corp.Clean Harbors, Inc.Colfax Corp.Columbus McKinnon Corp.Comfort Systems USA, Inc.Commercial Vehicle Group, Inc.CompX International, Inc.Construction Partners, Inc., Class AContinental Building Products, Inc.Continental Materials Corp.Copa Holdings SA, Class ACornerstone Building Brands, Inc.Costamare, Inc.Covanta Holding Corp.Covenant Transportation Group, Inc., Class ACPI Aerostructures, Inc.CRA International, Inc.CSW Industrials, Inc.Cubic Corp.Curtiss-Wright Corp.Daseke, Inc.Deluxe Corp.Douglas Dynamics, Inc.Ducommun, Inc.DXP Enterprises, Inc.Dycom Industries, Inc.Eagle Bulk Shipping, Inc.Eastern Co. (The)Echo Global Logistics, Inc.Ecology and Environment, Inc., Class AEMCOR Group, Inc.
Shares Value†
INDUSTRIALS — (Continued)#* 117,616 $8,258,996
48,691 2,268,02788,315 4,595,91323,420 2,049,250
#* 96,255 3,487,31916,066 267,017
* 32,429 671,929* 79,274 1,676,645
53,643 2,774,95251,171 487,660
# 60,744 5,476,679* 199,520 3,427,754# 58,682 3,163,547* 54,658 1,246,202* 143,196 6,243,346* 126,222 2,949,808* 88,143 813,560* 67,386 5,089,665
841 21,790#* 40,170 3,874,397* 33,745 1,282,310* 50,318 83,025* 74,961 5,832,715#* 77,660 2,149,629
45,359 1,743,60081,966 3,442,572
* 137,009 1,112,5132,107 34,660
#* 8,576 134,043* 70,902 1,742,771* 135 2,057
27,455 2,775,701* 93,981 546,969
76,367 460,49384,997 1,463,648
* 35,593 599,742* 13,295 104,366
20,118 873,52425,145 1,775,48848,407 3,204,54326,134 3,316,666
#* 10,862 40,18977,461 3,456,31074,591 3,065,690
* 21,433 903,401* 49,081 1,666,300* 72,056 3,974,609#* 42,001 194,465
7,733 195,336* 97,805 2,059,773
920 9,56888,383 7,458,641

Encore Wire Corp.Energous Corp.Energy Recovery, Inc.EnerSysEnnis, Inc.EnPro Industries, Inc.ESCO Technologies, Inc.
Espey Manufacturing & Electronics Corp.EVI Industries, Inc.Evoqua Water Technologies Corp.ExOne Co. (The)Exponent, Inc.Federal Signal Corp.Fluor Corp.Forrester Research, Inc.Forward Air Corp.Franklin Covey Co.Franklin Electric Co., Inc.FreightCar America, Inc.FTI Consulting, Inc.Gates Industrial Corp. P.L.C.GATX Corp.Genco Shipping & Trading, Ltd.Gencor Industries, Inc.Generac Holdings, Inc.Gibraltar Industries, Inc.GMS, Inc.Goldfield Corp. (The)Gorman-Rupp Co. (The)GP Strategies Corp.GrafTech International, Ltd.Graham Corp.Granite Construction, Inc.Great Lakes Dredge & Dock Corp.Greenbrier Cos., Inc. (The)Griffon Corp.H&E Equipment Services, Inc.Harsco Corp.Hawaiian Holdings, Inc.HC2 Holdings, Inc.Healthcare Services Group, Inc.Heartland Express, Inc.Heidrick & Struggles International, Inc.Helios Technologies, Inc.Herc Holdings, Inc.Heritage-Crystal Clean, Inc.Herman Miller, Inc.Hertz Global Holdings, Inc.Hill International, Inc.
41,411 2,274,292#* 4,513 18,458#* 7,134 78,331
68,976 4,697,95563,660 1,294,20841,842 2,972,45641,752 3,488,797
Tax-Managed U.S. Small Cap PortfolioCONTINUED
Shares Value†
INDUSTRIALS — (Continued)6,393 $ 163,725
# 837 29,395#* 14,776 210,115#* 1,980 15,761
82,404 5,669,395148,867 4,637,207
12,026 390,96545,122 2,135,62453,916 3,396,708
* 43,560 1,589,94075,981 3,560,470
* 21,105 115,444* 76,280 7,967,446#* 3,358 36,871# 64,012 4,919,962#* 47,901 460,808* 35,043 447,149* 75,685 5,472,026* 65,935 2,732,346* 43,380 976,484* 21,775 51,171
67,573 2,244,775* 39,071 620,447# 10,300 117,935
33,735 730,363# 81,628 2,897,794* 135,012 1,448,679
56,814 1,642,49391,355 1,493,65497,220 2,975,904
* 102,320 2,400,427# 116,041 3,015,906#* 14,820 32,159# 84,963 2,031,465
152,321 3,022,04961,616 1,829,99546,648 2,190,590
* 37,666 1,700,243* 40,956 1,148,816
84,012 3,809,104* 37,792 586,532* 64,518 203,232

Hillenbrand, Inc.HNI Corp.Houston Wire & Cable Co.Hub Group, Inc., Class AHurco Cos., Inc.Huron Consulting Group, Inc.Hyster-Yale Materials Handling, Inc.ICF International, Inc.IES Holdings, Inc.InnerWorkings, Inc.Innovative Solutions & Support, Inc.Insperity, Inc.Insteel Industries, Inc.Interface, Inc.ITT, Inc.JELD-WEN Holding, Inc.John Bean Technologies Corp.
Kadant, Inc.Kaman Corp.Kelly Services, Inc., Class AKennametal, Inc.Kforce, Inc.Kimball International, Inc., Class BKirby Corp.Knoll, Inc.Korn FerryKratos Defense & Security Solutions, Inc.Landstar System, Inc.Lawson Products, Inc.LB Foster Co., Class ALimbach Holdings, Inc.Lindsay Corp.LS Starrett Co. (The), Class ALSC Communications, Inc.LSI Industries, Inc.Lydall, Inc.Macquarie Infrastructure Corp.Manitex International, Inc.Manitowoc Co., Inc. (The)ManpowerGroup, Inc.Marten Transport, Ltd.Masonite International Corp.MasTec, Inc.Matson, Inc.Matthews International Corp., Class AMaxar Technologies, Inc.McGrath RentCorpMercury Systems, Inc.Meritor, Inc.
80,423 2,709,45164,401 2,205,090
* 11,452 53,252* 59,349 2,691,477
17,511 598,701* 42,784 2,608,541
18,824 1,164,07646,923 3,997,370
* 34,805 630,319* 157,999 578,276* 19,757 108,861
57,030 6,065,14165,862 1,284,968
122,955 1,704,15610,458 652,788
* 53,645 1,175,36262,171 7,377,211
Tax-Managed U.S. Small Cap PortfolioCONTINUED
Shares Value†
INDUSTRIALS — (Continued)23,091 $2,158,08550,949 3,230,16758,105 1,617,062
129,752 4,486,82482,920 2,826,743
126,118 2,186,886* 79,565 6,234,713
91,845 2,227,241114,090 4,481,455
* 192,292 4,739,998# 44,453 4,946,285* 21,468 898,865* 24,669 596,250* 14,820 131,602# 17,072 1,557,308* 1,920 11,232# 749,877 749,877
99,038 392,190* 52,593 1,241,195# 50,797 2,105,028* 25,113 163,235* 118,039 2,118,800
7,801 712,621131,915 2,647,534
* 18,631 993,032#* 126,820 6,508,402
77,909 3,187,25762,993 2,151,211
#* 8,917 65,62935,076 2,389,026
* 64,744 5,277,931* 186,477 4,611,576

Mesa Air Group, Inc.Milacron Holdings Corp.Miller Industries, Inc.Mistras Group, Inc.Mobile Mini, Inc.Moog, Inc., Class AMRC Global, Inc.MSA Safety, Inc.MSC Industrial Direct Co., Inc., Class AMueller Industries, Inc.Mueller Water Products, Inc., Class AMYR Group, Inc.National Presto Industries, Inc.Navigant Consulting, Inc.Navistar International Corp.NL Industries, Inc.NN, Inc.Northwest Pipe Co.NOW, Inc.NV5 Global, Inc.nVent Electric P.L.C.Omega Flex, Inc.Orion Energy Systems, Inc.Orion Group Holdings, Inc.Oshkosh Corp.PAM Transportation Services, Inc.Park Aerospace Corp.
Park-Ohio Holdings Corp.Patrick Industries, Inc.Patriot Transportation Holding, Inc.Perma-Pipe International Holdings, Inc.PGT Innovations, Inc.PICO Holdings, Inc.Pitney Bowes, Inc.Powell Industries, Inc.Preformed Line Products Co.Primoris Services Corp.Quad/Graphics, Inc.Quanex Building Products Corp.Radiant Logistics, Inc.Raven Industries, Inc.RBC Bearings, Inc.RCM Technologies, Inc.Red Violet, Inc.Regal Beloit Corp.Resideo Technologies, Inc.Resources Connection, Inc.REV Group, Inc.Rexnord Corp.
* 4,869 49,859* 35,188 592,566
28,647 894,359* 64,290 974,636
76,887 2,611,08340,439 3,294,161
* 199,112 3,114,112# 44,387 4,676,170
4,036 286,758104,433 3,152,832317,702 3,231,029
* 49,036 1,771,180# 10,986 1,010,382
83,387 2,031,307* 86,978 2,717,193* 1,951 9,931# 96,603 793,111* 30,319 708,252* 203,094 2,487,902#* 33,219 2,639,914
33,600 832,944# 22,050 1,677,123* 3,292 10,600* 46,941 191,050
313 26,157* 12,000 700,920
71,585 1,302,131
Tax-Managed U.S. Small Cap PortfolioCONTINUED
Shares Value†
INDUSTRIALS — (Continued)39,251 $1,201,081
* 52,368 2,402,120* 5,218 89,228* 7,792 68,959* 153,051 2,467,182* 25,462 256,912# 156,070 632,084
30,913 1,143,4727,527 434,835
92,739 1,943,809# 46,210 522,635
65,094 1,212,050* 102,896 564,899
73,896 2,677,991* 30,823 5,014,594* 22,513 74,293#* 1,609 25,470
84,944 6,763,241* 23,046 434,648
115,931 2,040,386# 30,102 438,586* 86,966 2,547,234

Roadrunner Transportation Systems, Inc.RR Donnelley & Sons Co.Rush Enterprises, Inc., Class ARush Enterprises, Inc., Class BRyder System, Inc.Saia, Inc.Scorpio Bulkers, Inc.Servotronics, Inc.SIFCO Industries, Inc.Simpson Manufacturing Co., Inc.SiteOne Landscape Supply, Inc.SkyWest, Inc.SP Plus Corp.Spartan Motors, Inc.Spirit Airlines, Inc.SPX Corp.SPX FLOW, Inc.Standex International Corp.Steelcase, Inc., Class AStericycle, Inc.Sterling Construction Co., Inc.Sunrun, Inc.Systemax, Inc.Team, Inc.Tennant Co.Terex Corp.Tetra Tech, Inc.Textainer Group Holdings, Ltd.Thermon Group Holdings, Inc.Timken Co. (The)Titan International, Inc.Titan Machinery, Inc.TPI Composites, Inc.Transcat, Inc.Trex Co., Inc.TriMas Corp.TriNet Group, Inc.
Trinity Industries, Inc.Triton International, Ltd.Triumph Group, Inc.TrueBlue, Inc.Tutor Perini Corp.Twin Disc, Inc.Ultralife Corp.UniFirst Corp.Univar, Inc.Universal Forest Products, Inc.Universal Logistics Holdings, Inc.US Ecology, Inc.
#* 1,100 10,659# 86,243 174,211
46,147 1,737,89618,930 745,842
1,354 72,114* 68,445 5,222,354# 120,318 723,111
2,783 28,860* 6,261 17,406
87,482 5,402,888#* 200 14,774
90,303 5,482,295* 47,738 1,648,393
107,673 1,294,229* 161,347 6,845,953* 51,556 1,799,304* 75,304 3,054,330
32,398 2,279,847175,756 2,972,034
#* 1,600 73,536* 139,392 1,745,188#* 89,603 1,706,937
67,300 1,460,410#* 93,431 1,547,217# 30,565 2,326,302
149,828 4,562,263107,483 8,512,654
* 54,356 528,884* 75,414 1,910,991
121,901 5,572,09574,593 281,962
* 64,459 1,336,880#* 46,646 1,192,738* 8,529 203,161#* 62,964 5,147,307* 81,389 2,440,856* 64,978 4,778,482
Tax-Managed U.S. Small Cap PortfolioCONTINUED
Shares Value†
INDUSTRIALS — (Continued)# 42,539 $ 833,764
119,482 3,952,465# 45,048 1,091,513* 80,832 1,598,049#* 85,635 1,118,393* 22,135 267,169* 49,397 431,236
26,680 5,252,492#* 11,783 260,640
116,525 4,711,10634,938 687,92942,546 2,707,202

USA Truck, Inc.Valmont Industries, Inc.Vectrus, Inc.Veritiv Corp.Viad Corp.Vicor Corp.Virco Manufacturing Corp.VSE Corp.Wabash National Corp.Watsco, Inc., Class BWatts Water Technologies, Inc., Class AWelbilt, Inc.Werner Enterprises, Inc.Wesco Aircraft Holdings, Inc.WESCO International, Inc.Willdan Group, Inc.Willis Lease Finance Corp.WillScot Corp.YRC Worldwide, Inc.
TOTAL INDUSTRIALS
2U, Inc.3D Systems Corp.A10 Networks Inc.Acacia Communications, Inc.ACI Worldwide, Inc.ACM Research, Inc., Class AActua Corp.Adesto Technologies Corp.ADTRAN, Inc.Advanced Energy Industries, Inc.Agilysys, Inc.Airgain, Inc.Alarm.com Holdings, Inc.Alithya Group, Inc., Class AAlpha & Omega Semiconductor, Ltd.Altair Engineering, Inc., Class AAmbarella, Inc.American Software, Inc., Class AAmkor Technology, Inc.Amtech Systems, Inc.Anixter International, Inc.Appfolio, Inc., Class AAquantia Corp.Arlo Technologies, Inc.AstroNova, Inc.
Asure Software, Inc.Avaya Holdings Corp.Aviat Networks, Inc.
#* 27,483 223,16226,941 3,707,082
* 34,042 1,376,658* 20,267 353,051
43,595 3,014,158#* 25,089 741,631
6,861 30,94316,296 488,228
# 102,957 1,629,8091,248 206,538
47,698 4,427,805#* 186,776 3,066,862# 120,784 4,003,990* 187,400 1,973,322* 44,976 2,282,082#* 37,291 1,304,439* 11,622 723,470#* 12,935 205,925#* 90,575 295,275
625,950,701
INFORMATION TECHNOLOGY — (12.9%)#* 13,948 178,534#* 38,901 350,887#* 10,321 78,233* 14,284 959,456* 173,522 5,823,398#* 1,167 20,341* 15,285 27,589#* 26,332 224,349
123,527 1,372,385* 83,074 4,851,522* 77,604 1,903,626* 13,455 174,646#* 15,289 763,074* 14,711 43,839* 46,648 473,477#* 4,169 173,472#* 31,789 1,587,861
83,811 1,116,363* 409,728 3,781,789#* 2,380 13,994* 59,816 3,849,758#* 8,197 791,420* 7,034 92,356#* 135,605 583,102
11,891 287,524
Tax-Managed U.S. Small Cap PortfolioCONTINUED
Shares Value†
INFORMATION TECHNOLOGY — (Continued)#* 14,509 $ 131,306* 34,725 418,089* 4,294 55,049

Avid Technology, Inc.Avnet, Inc.AVX Corp.Aware, Inc.Axcelis Technologies, Inc.AXT, Inc.Badger Meter, Inc.Bel Fuse, Inc., Class ABel Fuse, Inc., Class BBelden, Inc.Benchmark Electronics, Inc.BK Technologies Corp.Blackbaud, Inc.Blackline Inc.Bottomline Technologies De, Inc.Brightcove, Inc.Brooks Automation, Inc.Cabot Microelectronics Corp.CACI International, Inc., Class ACalAmp Corp.Calix, Inc.Carbonite, Inc.Cardtronics P.L.C., Class ACasa Systems, Inc.Cass Information Systems, Inc.CCUR Holdings, Inc.CEVA, Inc.ChannelAdvisor Corp.Ciena Corp.Cirrus Logic, Inc.Cision, Ltd.Clearfield, Inc.Cloudera, Inc.Coda Octopus Group, Inc.Coherent, Inc.Cohu, Inc.Communications Systems, Inc.CommVault Systems, Inc.Computer Task Group, Inc.Comtech Telecommunications Corp.Conduent, Inc.Control4 Corp.CoreLogic, Inc.Cornerstone OnDemand Inc.Cray, Inc.Cree, Inc.CSG Systems International, Inc.CSP, Inc.CTS Corp.CyberOptics Corp.Daktronics, Inc.DASAN Zhone Solutions, Inc.Data I/O Corp.Diebold Nixdorf, Inc.Digi International, Inc.
#* 378,090 3,875,423606 27,525
103,114 1,570,426* 34,012 96,254* 105,863 1,699,101#* 98,159 419,139# 63,572 3,400,466
2,583 37,84125,231 416,05976,462 3,475,96366,556 1,801,005
* 29,676 115,736# 52,217 4,751,747#* 7,700 343,420* 51,832 2,181,609* 15,611 194,825
104,431 4,051,923# 44,906 5,462,815* 47,362 10,189,934* 111,027 1,239,061* 177,317 1,113,551#* 84,682 1,518,348#* 91,495 2,605,778#* 21,753 143,352
39,547 2,013,338* 10,672 39,486* 54,819 1,522,872* 15,651 142,894* 1,404 63,489* 125,945 6,177,602* 48,449 503,385* 33,636 445,677#* 54,340 324,953#* 4,194 49,657#* 17,867 2,480,833
92,190 1,397,60011,195 41,198
* 27,143 1,233,378* 21,319 93,804
61,465 1,829,198* 343,008 3,121,373* 71,799 1,716,714* 91,247 4,158,126* 440 26,048* 100,026 3,464,901* 145,997 9,078,093
71,089 3,642,6002,788 38,084
72,034 2,270,512* 25,529 343,365
165,170 1,047,178* 1,847 18,599* 2,221 9,772#* 19,060 265,125* 52,484 689,115

Diodes, Inc.
DSP Group, Inc.Ebix, Inc.EchoStar Corp., Class AeGain Corp.EMCORE Corp.Endurance International Group Holdings, Inc.Enphase Energy Inc.Entegris, Inc.Envestnet, Inc.ePlus, Inc.Euronet Worldwide, Inc.EVERTEC, Inc.Evo Payments, Inc., Class AExela Technologies, Inc.ExlService Holdings, Inc.Extreme Networks, Inc.FabrinetFair Isaac Corp.FARO Technologies, Inc.Finisar Corp.Finjan Holdings, Inc.Fitbit, Inc., Class AFlex, Ltd.FormFactor, Inc.Frequency Electronics, Inc.GlobalSCAPE, Inc.Globant SAGreenSky, Inc., Class AGSE Systems, Inc.GSI Technology, Inc.GTT Communications, Inc.Hackett Group, Inc. (The)Harmonic, Inc.I3 Verticals, Inc., Class AIchor Holdings, Ltd.ID Systems, Inc.IEC Electronics Corp.II-VI, Inc.Image Sensing Systems, Inc.Immersion Corp.Infinera Corp.Information Services Group, Inc.Inphi Corp.Insight Enterprises, Inc.InterDigital, Inc.Internap Corp.inTEST Corp.Intevac, Inc.
* 86,720 3,694,272
Tax-Managed U.S. Small Cap PortfolioCONTINUED
Shares Value†
INFORMATION TECHNOLOGY — (Continued)* 79,696 $ 1,284,700# 54,888 2,526,495* 10,510 478,415* 47,814 370,080* 40,708 121,310#* 80,295 380,598#* 41,377 1,164,763
113,644 4,944,650#* 16,157 1,153,771* 39,060 2,964,654* 49,036 7,645,203
79,709 2,552,282#* 3,400 105,808#* 4,700 12,455* 55,403 3,811,172#* 78,118 635,881* 77,707 4,171,312* 45,659 15,862,850* 44,491 2,375,375* 210,580 4,954,947* 74,242 159,620#* 224,373 942,367* 11,646 129,853* 149,544 2,509,348* 19,976 232,920
23,755 331,382#* 10,041 1,064,346#* 3,673 41,982* 17,551 37,910* 50,322 413,647#* 67,950 822,195
104,884 1,722,195* 292,203 2,182,756* 10,381 296,585* 58,491 1,474,558#* 16,326 100,078* 18,594 111,564#* 100,451 3,987,905#* 700 3,500#* 77,190 620,608#* 134,455 518,996* 44,727 121,657#* 24,400 1,469,124* 60,629 3,335,808
63,560 4,095,171#* 32,771 97,658* 16,182 73,304* 59,247 304,530

Iteris, Inc.Itron, Inc.j2 Global, Inc.Jabil, Inc.KBR, Inc.KEMET Corp.Key Tronic Corp.Kimball Electronics, Inc.Knowles Corp.Kulicke & Soffa Industries, Inc.KVH Industries, Inc.
Lantronix, Inc.Lattice Semiconductor Corp.Limelight Networks, Inc.Littelfuse, Inc.LivePerson, Inc.LiveRamp Holdings, Inc.Lumentum Holdings, Inc.Luna Innovations, Inc.MACOM Technology Solutions Holdings, Inc.MagnaChip Semiconductor Corp.Manhattan Associates, Inc.ManTech International Corp., Class AMAXIMUS, Inc.MaxLinear, Inc.Methode Electronics, Inc.MicroStrategy, Inc., Class AMitek Systems, Inc.MKS Instruments, Inc.Monotype Imaging Holdings, Inc.MTS Systems Corp.Nanometrics, Inc.Napco Security Technologies, Inc.NCR Corp.NeoPhotonics Corp.NETGEAR, Inc.Netscout Systems, Inc.NetSol Technologies, Inc.Network-1 Technologies, Inc.NIC, Inc.Novanta, Inc.NVE Corp.OneSpan, Inc.Optical Cable Corp.OSI Systems, Inc.PAR Technology Corp.Paylocity Holding Corp.Paysign, Inc.PC Connection, Inc.
#* 25,716 139,124* 58,009 3,596,558# 42,640 3,798,798
25,053 773,637218,756 5,770,783163,654 3,292,718
* 24,700 121,771* 54,202 861,812* 209,233 4,257,892
117,342 2,655,449* 44,636 450,824
Tax-Managed U.S. Small Cap PortfolioCONTINUED
Shares Value†
INFORMATION TECHNOLOGY — (Continued)* 17,133 $ 58,938* 271,513 5,251,061* 358,815 972,389
22,098 3,733,678#* 7,174 238,105* 143,216 7,546,051#* 25,923 1,468,019* 31,457 162,004#* 56,293 1,104,469#* 13,480 148,954* 114,370 9,720,306
45,781 3,148,8178,797 646,667
#* 120,565 2,650,01997,835 2,930,158
* 17,235 2,356,542#* 30,941 310,648
52,886 4,502,18579,791 1,593,42628,891 1,664,699
* 78,829 2,473,654* 52,414 1,517,385#* 10,413 352,064* 160,356 736,034* 61,161 2,070,300* 168,152 4,378,678* 13,690 82,140
8,465 20,739105,377 1,911,539
#* 68,099 5,726,44511,100 746,142
* 61,153 894,057* 5,961 22,413#* 35,547 4,001,170#* 30,836 801,428* 2,488 254,000# 10,269 144,896
63,474 2,076,235

PCM, Inc.PC-Tel, Inc.PDF Solutions, Inc.Pegasystems, Inc.Perceptron, Inc.Perficient, Inc.Perspecta, Inc.PFSweb, Inc.Photronics, Inc.Pivotal Software, Inc., Class APixelworks, Inc.Plantronics, Inc.Plexus Corp.Power Integrations, Inc.Presidio, Inc.PRGX Global, Inc.Progress Software Corp.Pure Storage, Inc., Class AQAD, Inc., Class AQAD, Inc., Class BQualys, Inc.
Rambus, Inc.RF Industries, Ltd.Ribbon Communications, Inc.Richardson Electronics, Ltd.Rogers Corp.Rudolph Technologies, Inc.SailPoint Technologies Holding, Inc.Sanmina Corp.Sapiens International Corp. NVScanSource, Inc.Science Applications International Corp.Semtech Corp.ShotSpotter, Inc.Silicon Laboratories, Inc.SMART Global Holdings, Inc.SMTC Corp.SolarEdge Technologies, Inc.SPS Commerce, Inc.StarTek, Inc.Steel Connect, Inc.Stratasys, Ltd.Super Micro Computer, Inc.Sykes Enterprises, Inc.Synaptics, Inc.Synchronoss Technologies, Inc.SYNNEX Corp.Tech Data Corp.Telaria, Inc.
* 29,837 1,039,2238,084 37,348
#* 62,744 837,63250,361 3,807,292
* 16,326 68,406* 90,312 3,085,961
65,492 1,527,928#* 5,455 20,074* 187,995 1,810,392#* 17,609 166,933* 65,681 200,984# 71,179 2,733,274* 67,101 4,006,601# 53,191 4,844,104
6,830 95,620* 44,148 247,670
87,734 3,798,005* 42,446 642,632
24,355 1,050,6754,173 137,751
#* 12,606 1,091,175
Tax-Managed U.S. Small Cap PortfolioCONTINUED
Shares Value†
INFORMATION TECHNOLOGY — (Continued)* 206,418 $ 2,571,968
3,591 29,518* 133,311 655,890
19,377 109,868* 28,758 4,562,744* 101,040 2,719,997#* 56,954 1,204,008* 148,533 4,715,923
10,092 162,380* 44,998 1,527,682
82,169 7,014,768* 80,651 4,264,018#* 3,604 135,474* 58,169 6,527,144#* 57,753 1,758,001#* 19,072 75,048#* 23,692 1,545,429* 14,272 1,596,038* 54,384 364,917* 5,603 9,973#* 697 19,439* 51,799 948,440* 83,905 2,373,672#* 63,054 2,029,078* 59,362 480,239
73,232 7,216,281* 67,381 6,828,391* 73,170 592,677

Telenav, Inc.Teradata Corp.TESSCO Technologies, Inc.TiVo Corp.TransAct Technologies, Inc.TTEC Holdings, Inc.TTM Technologies, Inc.Ultra Clean Holdings, Inc.Unisys Corp.Upland Software, Inc.Veeco Instruments, Inc.Verint Systems, Inc.Veritone, Inc.Verra Mobility Corp.Versum Materials, Inc.ViaSat, Inc.Viavi Solutions, Inc.Virtusa Corp.Vishay Intertechnology, Inc.Vishay Precision Group, Inc.Wayside Technology Group, Inc.Xperi Corp.Zix Corp.
TOTAL INFORMATION TECHNOLOGY
Advanced Emissions Solutions, Inc.AdvanSix, Inc.AK Steel Holding Corp.Alcoa Corp.Allegheny Technologies, Inc.
American Vanguard Corp.Ampco-Pittsburgh Corp.Balchem Corp.Boise Cascade Co.Cabot Corp.Carpenter Technology Corp.Century Aluminum Co.Chase Corp.Chemours Co. (The)Clearwater Paper Corp.Cleveland-Cliffs, Inc.Coeur Mining, Inc.Commercial Metals Co.Compass Minerals International, Inc.Core Molding Technologies, Inc.Domtar Corp.Eagle Materials, Inc.Element Solutions, Inc.Ferro Corp.
* 76,210 718,660* 8,213 300,760
17,012 250,41799,652 755,36225,072 299,86176,661 3,596,934
#* 182,139 1,905,174#* 125,845 1,836,079#* 82,907 1,027,218#* 30,710 1,350,933* 137,219 1,634,278* 54,764 3,169,193#* 3,826 26,552* 10,041 139,068
66,303 3,446,430#* 29,600 2,415,064* 108,328 1,589,172* 75,389 3,368,381
235,440 4,002,480* 32,220 1,312,643
11,631 131,198213,294 4,553,827
#* 190,285 1,733,496
454,507,954
MATERIALS — (4.4%)# 4,865 61,931* 70,930 1,818,645#* 384,896 1,085,407* 12,133 272,871#* 193,983 4,223,010
Tax-Managed U.S. Small Cap PortfolioCONTINUED
Shares Value†
MATERIALS — (Continued)52,378 $ 747,958
#* 2,649 9,58944,195 4,536,17576,010 2,052,27072,120 3,225,20693,523 4,209,470
#* 143,260 1,030,03920,838 2,158,400
2,670 50,917#* 24,248 475,988# 397,434 4,236,646* 353,633 1,626,712
207,556 3,634,306# 60,435 3,375,295* 24,525 163,091
123,391 5,237,948# 5,833 482,856* 379,481 3,802,400* 148,023 2,180,379

Flexible Solutions International, Inc.Flotek Industries, Inc.Friedman Industries, Inc.FutureFuel Corp.GCP Applied Technologies, Inc.Gold Resource Corp.Graphic Packaging Holding Co.Greif, Inc., Class AGreif, Inc., Class BHawkins, Inc.Haynes International, Inc.HB Fuller Co.Huntsman Corp.Ingevity Corp.Innophos Holdings, Inc.Innospec, Inc.Intrepid Potash, Inc.Kaiser Aluminum Corp.Koppers Holdings, Inc.Kraton Corp.Kronos Worldwide, Inc.Livent Corp.Louisiana-Pacific Corp.LSB Industries, Inc.Materion Corp.Mercer International, Inc.Minerals Technologies, Inc.Myers Industries, Inc.Neenah, Inc.Nexa Resources SANorthern Technologies International Corp.Olin Corp.Olympic Steel, Inc.OMNOVA Solutions, Inc.Owens-Illinois, Inc.PH Glatfelter Co.PolyOne Corp.PQ Group Holdings, Inc.Quaker Chemical Corp.Ramaco Resources, Inc.
Rayonier Advanced Materials, Inc.Resolute Forest Products, Inc.Ryerson Holding Corp.Schnitzer Steel Industries, Inc., Class ASchweitzer-Mauduit International, Inc.Scotts Miracle-Gro Co. (The)Sensient Technologies Corp.Silgan Holdings, Inc.Stepan Co.
3,406 10,865#* 96,967 297,689
7,760 47,95767,918 791,245
* 101,106 2,227,36568,573 246,17745,863 681,52449,097 1,716,431
4,065 174,79523,702 1,035,06641,190 1,225,81494,929 4,538,55612,481 256,485
* 56,174 5,535,38699,422 2,701,29646,254 4,319,199
* 189,279 707,90333,977 3,270,966
* 45,150 1,232,595* 61,782 1,894,854# 92,361 1,238,561#* 14,708 94,720
206,881 5,407,869#* 68,295 340,792
41,809 2,597,59397,420 1,269,38361,810 3,291,383
112,271 1,815,422# 39,603 2,602,313
730 6,01517,386 196,46275,790 1,521,10516,478 207,293
* 111,422 1,108,64919,186 325,58671,213 1,162,196
131,230 4,300,407* 11,216 174,857
33,824 6,338,279#* 3,731 18,170
Tax-Managed U.S. Small Cap PortfolioCONTINUED
Shares Value†
MATERIALS — (Continued)# 61,816 $ 287,444
143,281 874,014#* 100,888 823,246
73,482 1,956,82662,703 2,158,864
# 7,247 812,969# 73,966 5,042,262
12,131 364,65840,082 3,974,130

Summit Materials, Inc., Class ASunCoke Energy, Inc.Synalloy Corp.Tecnoglass, Inc.TimkenSteel Corp.Trecora ResourcesTredegar Corp.Trinseo SATronox Holdings P.L.C., Class AUFP Technologies, Inc.United States Lime & Minerals, Inc.United States Steel Corp.Universal Stainless & Alloy Products, Inc.US Concrete, Inc.Valvoline, Inc.Venator Materials P.L.CVerso Corp., Class AWarrior Met Coal, Inc.Worthington Industries, Inc.WR Grace & Co.
TOTAL MATERIALS
Alexander & Baldwin, Inc.Altisource Asset Management Corp.Altisource Portfolio Solutions SACKX Lands, Inc.Consolidated-Tomoka Land Co.Five Point Holdings LLC, Class AForestar Group, Inc.FRP Holdings, Inc.Griffin Industrial Realty, Inc.Jones Lang LaSalle, Inc.Kennedy-Wilson Holdings, Inc.Marcus & Millichap, Inc.Maui Land & Pineapple Co., Inc.Newmark Group, Inc., Class ARafael Holdings, Inc., Class BRE/MAX Holdings, Inc., Class ARealogy Holdings Corp.RMR Group, Inc. (The), Class ASt Joe Co. (The)Stratus Properties, Inc.Tejon Ranch Co.Trinity Place Holdings, Inc.
TOTAL REAL ESTATE
ALLETE, Inc.
American States Water Co.
#* 131,530 2,425,413* 93,849 712,314
17,201 292,0731,400 9,968
#* 144,845 1,012,467* 37,922 359,880
62,523 1,042,25857,920 2,247,875
* 9,455 104,572* 7,723 336,414
14,662 1,185,863# 114,854 1,726,256* 13,142 212,638#* 58,748 2,766,443
42,550 859,085* 23,600 90,388* 49,812 805,958
18,621 460,68498,879 3,976,913
# 13,684 927,912
155,476,519
REAL ESTATE — (0.4%)12,561 295,309
* 674 6,376#* 1,973 41,433* 702 7,002
15,038 943,183#* 2,200 17,182#* 6,906 142,678* 17,953 890,110
4,903 190,53110,478 1,526,54062,760 1,350,595
* 58,120 1,929,584* 36,053 408,480
37,717 371,890* 39,800 823,860
34,542 1,004,481# 29,413 153,242
17,537 863,522#* 45,829 881,750* 15,750 444,465* 40,494 750,354#* 51,069 214,490
13,257,057
UTILITIES — (3.4%)68,437 5,950,597
Tax-Managed U.S. Small Cap PortfolioCONTINUED
Shares Value†
UTILITIES — (Continued)# 64,605 $ 5,004,949

AquaVenture Holdings, Ltd.Artesian Resources Corp., Class AAtlantica Yield P.L.C.Avista Corp.Black Hills Corp.California Water Service GroupChesapeake Utilities Corp.Clearway Energy, Inc., Class AClearway Energy, Inc., Class CConnecticut Water Service, Inc.Consolidated Water Co., Ltd.El Paso Electric Co.Genie Energy, Ltd., Class BHawaiian Electric Industries, Inc.IDACORP, Inc.MGE Energy, Inc.Middlesex Water Co.National Fuel Gas Co.New Jersey Resources Corp.Northwest Natural Holding Co.NorthWestern Corp.ONE Gas, Inc.Ormat Technologies, Inc.Otter Tail Corp.Pattern Energy Group, Inc., Class APNM Resources, Inc.Portland General Electric Co.RGC Resources, Inc.SJW GroupSouth Jersey Industries, Inc.Southwest Gas Holdings, Inc.Spark Energy, Inc., Class ASpire, Inc.TerraForm Power, Inc., Class AUnitil Corp.York Water Co. (The)
TOTAL UTILITIES
TOTAL COMMON STOCKS
GCI Liberty, Inc.
Social Reality, Inc. Rights 12/31/19, Class A
TOTAL INVESTMENT SECURITIES
State Street Institutional U.S. Government Money Market Fund 2.260%
* 6,851 118,04328,411 1,022,22858,326 1,352,580
106,134 4,885,34875,388 5,966,96084,987 4,537,45633,157 3,098,85342,245 725,347
# 88,428 1,593,47335,278 2,465,93226,724 374,93868,846 4,561,736
# 49,647 547,110# 33,010 1,478,848
38,631 3,942,68049,729 3,687,405
# 41,145 2,576,911# 8,135 388,365
145,601 7,261,12251,118 3,650,84871,197 4,978,09456,950 5,192,70158,876 3,859,32268,600 3,661,868
# 72,030 1,651,648135,652 6,737,835
64,504 3,538,04422,515 647,98240,978 2,659,062
# 98,964 3,369,72461,986 5,511,175
# 2,045 22,37273,831 6,084,41333,045 509,22352,373 3,067,48734,366 1,236,145
117,918,824
3,110,417,621
PREFERRED STOCKS — (0.0%)COMMUNICATION SERVICES — (0.0%)
11,847 313,235
RIGHTS/WARRANTS — (0.0%)CONSUMER DISCRETIONARY — (0.0%)* 10,334 310
3,110,731,166
TEMPORARY CASH INVESTMENTS — (0.2%)8,030,530 8,030,530
Tax-Managed U.S. Small Cap PortfolioCONTINUED

DFA Short Term Investment Fund
(Cost $2,226,407,839)^^
Communication ServicesConsumer DiscretionaryConsumer StaplesEnergyFinancialsHealth CareIndustrialsInformation TechnologyMaterialsReal EstateUtilities
Communication Services
Consumer DiscretionaryTemporary Cash InvestmentsSecurities Lending Collateral
TOTAL
A.H. Belo Corp., Class AActivision Blizzard, Inc.Alaska Communications Systems Group, Inc.Alphabet, Inc., Class AAlphabet, Inc., Class CAltice USA, Inc., Class AAMC Entertainment Holdings, Inc., Class AAMC Networks, Inc., Class AANGI Homeservices, Inc., Class AAT&T, Inc.ATN International, Inc.AutoWeb, Inc.
Shares Value†
SECURITIES LENDING COLLATERAL — (11.2%)@§ 33,900,260 $ 392,259,907
TOTAL INVESTMENTS — (100.0%)$3,511,021,603
Summary of the Portfolio's investments as of July 31, 2019, based on their valuation inputs, is as follows (see Security Valuation Note):
Investments in Securities (Market Value)
Level 1 Level 2 Level 3 Total
Common Stocks$ 117,328,229 — — $ 117,328,229
416,942,840 $ 2,537 — 416,945,377124,318,260 — — 124,318,260124,636,399 — — 124,636,399654,955,946 123,289 — 655,079,235304,999,066 — — 304,999,066625,950,701 — — 625,950,701454,480,365 27,589 — 454,507,954155,476,519 — — 155,476,519
13,257,057 — — 13,257,057117,918,824 — — 117,918,824
Preferred Stocks313,235 — — 313,235
Rights/Warrants— 310 — 310
8,030,530 — — 8,030,530— 392,259,907 — 392,259,907
$3,118,607,971 $392,413,632 — $3,511,021,603
T.A. U.S. CORE EQUITY 2 PORTFOLIO
SCHEDULE OF INVESTMENTS
July 31, 2019
(Unaudited)
Shares Value†
COMMON STOCKS — (93.7%)COMMUNICATION SERVICES — (6.9%)
17,110 $ 63,136161,228 7,858,253
* 33,007 61,063* 34,928 42,549,290* 36,723 44,680,140* 295,062 7,615,550# 62,169 735,459#* 49,426 2,638,360#* 24,480 339,048
2,668,735 90,870,42723,710 1,334,162
#* 3,801 12,999

Ballantyne Strong, Inc.Bandwidth, Inc., Class ABeasley Broadcast Group, Inc., Class ABoingo Wireless, Inc.Boston Omaha Corp., Class ACable One, Inc.Care.com, Inc.Cargurus, Inc.Cars.com, Inc.CBS Corp., Class ACBS Corp., Class BCenturyLink, Inc.Charter Communications, Inc., Class ACincinnati Bell, Inc.Cinemark Holdings, Inc.Clear Channel Outdoor Holdings, Inc.Cogent Communications Holdings, Inc.Comcast Corp., Class AcomScore, Inc.Consolidated Communications Holdings, Inc.Cumulus Media, Inc., Class ADaily Journal Corp.DHI Group, Inc.Discovery, Inc., Class ADiscovery, Inc., Class BDiscovery, Inc., Class CDISH Network Corp., Class AElectronic Arts, Inc.Emerald Expositions Events, Inc.Emmis Communications Corp., Class AEntercom Communications Corp., Class AEntravision Communications Corp., Class AEW Scripps Co. (The), Class AFacebook, Inc., Class AFluent, Inc.Fox Corp., Class AFox Corp., Class BFrontier Communications Corp.Gaia, Inc.Gannett Co., Inc.GCI Liberty, Inc., Class AGlu Mobile, Inc.
Gray Television, Inc.Gray Television, Inc., Class AHemisphere Media Group, Inc.IAC/InterActiveCorpIDT Corp., Class BIMAX Corp.Intelsat SA
* 7,721 21,850#* 1,738 129,481
4,143 13,465#* 43,754 657,185#* 673 14,234
4,983 6,063,314* 25,294 277,222#* 3,300 122,991#* 90,914 1,727,366# 3,886 200,051
163,213 8,407,102552,953 6,685,202
* 72,184 27,818,270#* 36,332 138,788# 147,265 5,878,819#* 27,964 84,731
34,353 2,164,5831,750,323 75,561,444
#* 50,998 168,293# 103,760 488,710* 9,277 140,175#* 200 49,620* 38,113 140,256#* 93,472 2,833,136* 1,077 39,784* 128,860 3,639,006* 101,360 3,432,050* 53,397 4,939,222
37,285 397,458* 2,473 13,008# 161,924 919,728
75,162 245,02864,132 983,144
* 293,369 56,981,061#* 18,382 95,586
79,362 2,961,790* 38,239 1,422,491#* 23,115 30,512#* 6,465 37,368# 137,242 1,406,731* 89,851 5,366,800#* 89,155 665,096
T.A. U.S. Core Equity 2 PortfolioCONTINUED
Shares Value†
COMMUNICATION SERVICES — (Continued)* 108,987 $ 1,934,519* 2,300 38,709* 12,264 150,970* 33,330 7,967,536* 32,465 329,844* 63,916 1,402,956#* 88,813 2,010,726

Interpublic Group of Cos., Inc. (The)Iridium Communications, Inc.John Wiley & Sons, Inc., Class AJohn Wiley & Sons, Inc., Class BLiberty Broadband Corp.Liberty Broadband Corp., Class ALiberty Broadband Corp., Class CLiberty Latin America, Ltd., Class CLiberty Media Corp.-Liberty Braves, Class ALiberty Media Corp.-Liberty Braves, Class BLiberty Media Corp.-Liberty Braves, Class CLiberty Media Corp.-Liberty Formula One, Class ALiberty Media Corp.-Liberty Formula One, Class BLiberty Media Corp.-Liberty Formula One, Class CLiberty Media Corp.-Liberty SiriusXM, Class ALiberty Media Corp.-Liberty SiriusXM, Class BLiberty Media Corp.-Liberty SiriusXM, Class CLiberty TripAdvisor Holdings, Inc., Class ALiberty TripAdvisor Holdings, Inc., Class BLions Gate Entertainment Corp., Class ALions Gate Entertainment Corp., Class BLive Nation Entertainment, Inc.Loral Space & Communications, Inc.Madison Square Garden Co. (The), Class AMarchex, Inc., Class BMarcus Corp. (The)Match Group, Inc.McClatchy Co. (The), Class AMeet Group, Inc. (The)Meredith Corp.MSG Networks, Inc., Class ANational CineMedia, Inc.Netflix, Inc.New Media Investment Group, Inc.New York Times Co. (The), Class ANews Corp., Class ANews Corp., Class BNexstar Media Group, Inc., Class AOmnicom Group, Inc.ORBCOMM, Inc.pdvWireless, Inc.QuinStreet, Inc.Reading International, Inc., Class ARosetta Stone, Inc.Saga Communications, Inc., Class ASalem Media Group, Inc.Scholastic Corp.Shenandoah Telecommunications Co.Sinclair Broadcast Group, Inc., Class ASirius XM Holdings, Inc.Snap, Inc., Class ASpok Holdings, Inc.
284,993 6,532,040* 61,985 1,576,898
54,959 2,501,1842,517 116,663
* 145 14,297* 15,303 1,502,602* 58,807 5,851,885* 55,956 917,678* 6,772 195,711* 58 2,016* 19,641 565,072* 17,871 669,805#* 145 5,543* 102,223 4,025,542* 47,725 1,986,792* 581 24,286* 96,612 4,044,178* 92,314 1,066,227* 110 1,320# 60,468 780,642# 88,384 1,077,401#* 221,538 15,964,028* 7,070 260,105* 17,278 5,011,311* 23,549 102,438
25,536 893,505# 27,045 2,036,218#* 5,251 11,605#* 111,428 383,312# 56,690 3,110,013* 62,023 1,177,817
64,745 460,984* 22,400 7,234,976
74,291 800,114# 142,941 5,100,135
245,024 3,224,516105,257 1,416,759
66,043 6,721,196# 86,478 6,937,265* 74,773 438,170* 13,427 597,367#* 42,903 698,890* 17,935 234,052* 22,951 526,955
1,505 46,98610,305 21,43440,592 1,387,02981,706 3,215,948
105,206 5,286,601# 253,303 1,585,677#* 76,081 1,278,161
19,425 252,331
T.A. U.S. Core Equity 2 PortfolioCONTINUED
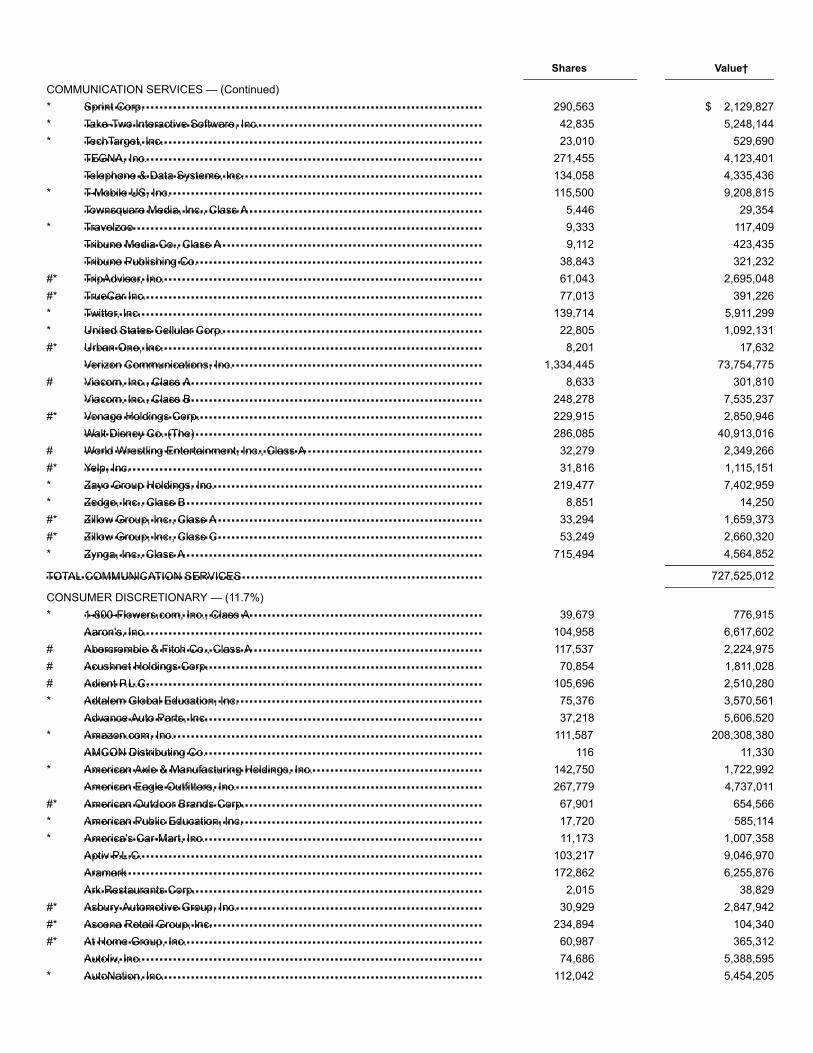
Sprint Corp.Take-Two Interactive Software, Inc.TechTarget, Inc.TEGNA, Inc.Telephone & Data Systems, Inc.T-Mobile US, Inc.Townsquare Media, Inc., Class ATravelzooTribune Media Co., Class ATribune Publishing Co.TripAdvisor, Inc.TrueCar Inc.Twitter, Inc.United States Cellular Corp.Urban One, Inc.Verizon Communications, Inc.Viacom, Inc., Class AViacom, Inc., Class BVonage Holdings Corp.Walt Disney Co. (The)World Wrestling Entertainment, Inc., Class AYelp, Inc.Zayo Group Holdings, Inc.Zedge, Inc., Class BZillow Group, Inc., Class AZillow Group, Inc., Class CZynga, Inc., Class A
TOTAL COMMUNICATION SERVICES
1-800-Flowers.com, Inc., Class AAaron's, Inc.Abercrombie & Fitch Co., Class AAcushnet Holdings Corp.Adient P.L.C.Adtalem Global Education, Inc.Advance Auto Parts, Inc.Amazon.com, Inc.AMCON Distributing Co.American Axle & Manufacturing Holdings, Inc.American Eagle Outfitters, Inc.American Outdoor Brands Corp.American Public Education, Inc.America's Car-Mart, Inc.Aptiv P.L.C.AramarkArk Restaurants Corp.Asbury Automotive Group, Inc.Ascena Retail Group, Inc.At Home Group, Inc.Autoliv, Inc.AutoNation, Inc.
Shares Value†
COMMUNICATION SERVICES — (Continued)* 290,563 $ 2,129,827* 42,835 5,248,144* 23,010 529,690
271,455 4,123,401134,058 4,335,436
* 115,500 9,208,8155,446 29,354
* 9,333 117,4099,112 423,435
38,843 321,232#* 61,043 2,695,048#* 77,013 391,226* 139,714 5,911,299* 22,805 1,092,131#* 8,201 17,632
1,334,445 73,754,775# 8,633 301,810
248,278 7,535,237#* 229,915 2,850,946
286,085 40,913,016# 32,279 2,349,266#* 31,816 1,115,151* 219,477 7,402,959* 8,851 14,250#* 33,294 1,659,373#* 53,249 2,660,320* 715,494 4,564,852
727,525,012
CONSUMER DISCRETIONARY — (11.7%)* 39,679 776,915
104,958 6,617,602# 117,537 2,224,975# 70,854 1,811,028# 105,696 2,510,280* 75,376 3,570,561
37,218 5,606,520* 111,587 208,308,380
116 11,330* 142,750 1,722,992
267,779 4,737,011#* 67,901 654,566* 17,720 585,114* 11,173 1,007,358
103,217 9,046,970172,862 6,255,876
2,015 38,829#* 30,929 2,847,942#* 234,894 104,340#* 60,987 365,312
74,686 5,388,595* 112,042 5,454,205

AutoZone, Inc.Barnes & Noble Education, Inc.Barnes & Noble, Inc.Bassett Furniture Industries, Inc.BBX Capital Corp.Beazer Homes USA, Inc.Bed Bath & Beyond, Inc.
Best Buy Co., Inc.Big 5 Sporting Goods Corp.Big Lots, Inc.Biglari Holdings, Inc., Class ABiglari Holdings, Inc., Class BBJ's Restaurants, Inc.Bloomin' Brands, Inc.Booking Holdings, Inc.Boot Barn Holdings, Inc.BorgWarner, Inc.Bowl America, Inc., Class ABoyd Gaming Corp.Bright Horizons Family Solutions, Inc.Brinker International, Inc.Brunswick Corp.Buckle, Inc. (The)Build-A-Bear Workshop, Inc.Burlington Stores, Inc.Caesars Entertainment Corp.Caleres, Inc.Callaway Golf Co.Canterbury Park Holding Corp.Capri Holdings, Ltd.Career Education Corp.CarMax, Inc.Carnival Corp.Carriage Services, Inc.Carrols Restaurant Group, Inc.Carter's, Inc.Carvana Co.Cato Corp. (The), Class ACavco Industries, Inc.Century Casinos, Inc.Century Communities, Inc.Cheesecake Factory, Inc. (The)Chegg, Inc.Chico's FAS, Inc.Children's Place, Inc. (The)Chipotle Mexican Grill, Inc.Choice Hotels International, Inc.Churchill Downs, Inc.Chuy's Holdings, Inc.
* 3,820 4,290,013* 47,536 166,376
84,250 549,3106,115 78,150
34,809 150,027* 39,267 460,209# 153,967 1,495,020
T.A. U.S. Core Equity 2 PortfolioCONTINUED
Shares Value†
CONSUMER DISCRETIONARY — (Continued)256,123 $19,601,093
# 20,304 43,248# 80,730 2,066,688* 117 53,469* 1,670 151,636
29,898 1,186,951125,013 2,128,971
* 9,117 17,200,223#* 35,287 1,104,130
143,683 5,431,2171,280 19,942
# 22,632 599,522* 33,989 5,168,707# 30,830 1,228,575
94,399 4,640,655# 14,000 284,900* 18,084 77,219* 29,056 5,251,872* 333,447 3,948,012
56,018 1,052,018111,594 2,046,634
200 2,450* 131,641 4,685,103* 95,931 1,818,852#* 121,212 10,637,565
102,163 4,825,15820,519 392,323
#* 55,542 517,651# 37,541 3,492,064#* 3,633 230,913
21,972 315,738* 8,667 1,537,092* 3,288 32,453#* 35,383 975,509# 67,561 2,910,528#* 16,629 746,975
89,320 284,931# 31,056 3,033,240* 7,581 6,030,913# 27,973 2,400,363# 11,091 1,327,038* 19,205 454,198

Citi Trends, Inc.Clarus Corp.Collectors Universe, Inc.Columbia Sportswear Co.Conn's, Inc.Container Store Group, Inc. (The)Cooper Tire & Rubber Co.Cooper-Standard Holdings, Inc.Core-Mark Holding Co., Inc.Cracker Barrel Old Country Store, Inc.Crocs, Inc.Culp, Inc.Dana, Inc.Darden Restaurants, Inc.Dave & Buster's Entertainment, Inc.DavidsTea, Inc.Deckers Outdoor Corp.
Del Frisco's Restaurant Group, Inc.Del Taco Restaurants, Inc.Delphi Technologies P.L.C.Delta Apparel, Inc.Denny's Corp.Designer Brands, Inc., Class ADestination XL Group, Inc.Dick's Sporting Goods, Inc.Dillard's, Inc., Class ADine Brands Global, Inc.Dixie Group, Inc. (The)Dollar General Corp.Dollar Tree, Inc.Domino's Pizza, Inc.Dorman Products, Inc.DR Horton, Inc.Drive Shack, Inc.Duluth Holdings, Inc., Class BDunkin' Brands Group, Inc.eBay, Inc.Educational Development Corp.El Pollo Loco Holdings, Inc.Eldorado Resorts, Inc.Emerson Radio Corp.Escalade, Inc.Ethan Allen Interiors, Inc.Etsy, Inc.Everi Holdings, Inc.Expedia Group, Inc.Express, Inc.Extended Stay America, Inc.Famous Dave's of America, Inc.
15,913 244,265# 29,499 423,901
5,144 121,96453,468 5,666,539
#* 36,326 755,581#* 47,455 289,950
75,654 2,036,606* 25,840 1,278,563
44,534 1,666,908# 28,919 5,023,519* 61,394 1,402,853
17,140 308,006225,562 3,769,141
70,951 8,624,804# 56,988 2,316,562#* 1,300 2,080* 32,868 5,136,611
T.A. U.S. Core Equity 2 PortfolioCONTINUED
Shares Value†
CONSUMER DISCRETIONARY — (Continued)#* 30,596 $ 243,544* 42,325 512,979
40,206 753,460* 6,871 130,824* 65,165 1,472,077# 95,031 1,746,670#* 51,876 91,302# 93,701 3,482,866# 39,857 2,900,792# 22,222 1,824,204* 7,544 3,986
156,481 20,971,584* 130,642 13,292,823
19,800 4,841,694* 43,239 3,108,019
193,224 8,874,778#* 40,469 211,248#* 5,670 68,891
49,286 3,950,766263,301 10,845,368
2,000 13,300#* 41,379 407,169#* 24,198 1,091,814* 11,467 11,926
11,525 132,88335,248 725,404
* 7,092 475,306* 19,215 230,772
57,129 7,583,335#* 47,975 118,498
239,986 4,012,566* 5,581 25,505

Fiesta Restaurant Group, Inc.Five Below, Inc.Flexsteel Industries, Inc.Floor & Decor Holdings, Inc., Class AFoot Locker, Inc.Ford Motor Co.Fossil Group, Inc.Fox Factory Holding Corp.frontdoor, Inc.Full House Resorts, Inc.GameStop Corp., Class AGap, Inc. (The)Garmin, Ltd.Garrett Motion, Inc.General Motors Co.Genesco, Inc.Gentex Corp.Gentherm, Inc.Genuine Parts Co.G-III Apparel Group, Ltd.Goodyear Tire & Rubber Co. (The)Graham Holdings Co., Class BGrand Canyon Education, Inc.Green Brick Partners, Inc.Group 1 Automotive, Inc.Groupon, Inc.GrubHub, Inc.
Guess?, Inc.H&R Block, Inc.Habit Restaurants, Inc. (The), Class AHamilton Beach Brands Holding Co., Class AHanesbrands, Inc.Harley-Davidson, Inc.Hasbro, Inc.Haverty Furniture Cos., Inc.Haverty Furniture Cos., Inc., Class AHelen of Troy, Ltd.Hibbett Sports, Inc.Hilton Grand Vacations, Inc.Hilton Worldwide Holdings, Inc.Home Depot, Inc. (The)Hooker Furniture Corp.Horizon Global Corp.Houghton Mifflin Harcourt Co.Hyatt Hotels Corp., Class AInstalled Building Products, Inc.International Game Technology P.L.C.International Speedway Corp., Class AiRobot Corp.
* 25,982 248,128* 37,623 4,419,198
6,129 112,590#* 60,171 2,355,695
98,355 4,038,4561,452,452 13,841,868
#* 60,589 668,903* 47,662 3,816,773* 50,212 2,291,676* 6,121 11,630# 123,961 498,323# 254,525 4,963,237
60,621 4,764,204#* 13,399 189,864
614,834 24,802,404* 23,930 942,363
313,552 8,597,596* 46,558 1,904,688
83,779 8,136,616* 62,427 1,789,158
221,456 3,040,5914,575 3,397,990
#* 55,679 6,056,205* 5,961 56,093# 26,764 2,247,105* 450,419 1,418,820#* 46,987 3,177,731
T.A. U.S. Core Equity 2 PortfolioCONTINUED
Shares Value†
CONSUMER DISCRETIONARY — (Continued)# 96,759 $ 1,630,389# 103,181 2,857,082#* 14,676 146,760
14,688 241,030# 261,790 4,212,201# 160,063 5,727,054# 26,167 3,170,394
21,314 385,997717 12,985
* 27,618 4,095,197#* 21,288 391,699* 77,254 2,526,206
85,985 8,301,852198,912 42,505,505
13,297 277,242#* 26,445 151,794* 136,797 800,262
28,550 2,208,342#* 27,223 1,450,441# 48,760 650,946
25,651 1,156,347#* 26,784 1,957,910

J Alexander's Holdings, Inc.J. Jill, Inc.Jack in the Box, Inc.JC Penney Co., Inc.Johnson Outdoors, Inc., Class AK12, Inc.KB HomeKirkland's, Inc.Kohl's Corp.Kontoor Brands, Inc.L Brands, Inc.Lakeland Industries, Inc.Lands' End, Inc.Las Vegas Sands Corp.Laureate Education, Inc., Class ALa-Z-Boy, Inc.LCI IndustriesLeaf Group, Ltd.Lear Corp.Leggett & Platt, Inc.Lennar Corp., Class ALennar Corp., Class BLGI Homes, Inc.Libbey, Inc.Liberty Tax, Inc.Lifetime Brands, Inc.Lindblad Expeditions Holdings, Inc.Liquidity Services, Inc.Lithia Motors, Inc., Class ALKQ Corp.Lowe's Cos., Inc.Luby's, Inc.Lululemon Athletica, Inc.Lumber Liquidators Holdings, Inc.M/I Homes, Inc.Macy's, Inc.Malibu Boats, Inc., Class A
Marine Products Corp.MarineMax, Inc.Marriott International, Inc., Class AMarriott Vacations Worldwide Corp.MasterCraft Boat Holdings, Inc.Mattel, Inc.McDonald's Corp.MDC Holdings, Inc.Media General, Inc. Contingent Value RightsMeritage Homes Corp.MGM Resorts InternationalMichaels Cos., Inc. (The)
* 10,076 108,519# 32,904 70,415
24,776 1,779,660#* 32,180 25,599
11,117 755,845* 47,453 1,416,472
49,212 1,292,799#* 20,234 34,600# 153,238 8,253,399* 7,637 223,993
83,624 2,170,043* 3,363 36,085#* 35,605 388,095
88,181 5,329,660* 6,180 101,290
62,286 2,054,815# 41,088 3,764,893* 27,296 166,506
56,080 7,109,822# 93,176 3,724,245
155,534 7,398,75215,889 603,782
#* 25,862 1,817,840#* 10,263 17,344# 5,864 69,782
16,644 146,967* 4,692 88,350* 28,323 184,666# 33,589 4,429,717* 162,940 4,387,974
216,161 21,918,725* 17,827 20,679* 30,579 5,843,341#* 26,295 230,607* 25,779 911,803
263,458 5,988,400* 29,863 899,772
T.A. U.S. Core Equity 2 PortfolioCONTINUED
Shares Value†
CONSUMER DISCRETIONARY — (Continued)# 10,739 $ 172,468* 32,733 505,398
59,573 8,284,22147,606 4,866,761
* 25,660 425,956#* 60,232 879,387
102,238 21,543,59175,526 2,729,510
» 38,671 1,516* 41,802 2,625,584
191,385 5,745,378#* 89,672 616,047

Modine Manufacturing Co.Mohawk Industries, Inc.Monarch Casino & Resort, Inc.Monro, Inc.Motorcar Parts of America, Inc.Movado Group, Inc.Murphy USA, Inc.Nathan's Famous, Inc.National Vision Holdings, Inc.Nautilus, Inc.New Home Co., Inc. (The)Newell Brands, Inc.NIKE, Inc., Class BNobility Homes, Inc.Nordstrom, Inc.Norwegian Cruise Line Holdings, Ltd.NVR, Inc.Office Depot, Inc.Ollie's Bargain Outlet Holdings, Inc.O'Reilly Automotive, Inc.Overstock.com, Inc.Oxford Industries, Inc.Papa John's International, Inc.Party City Holdco, Inc.Penn National Gaming, Inc.Penske Automotive Group, Inc.PetMed Express, Inc.Pier 1 Imports, Inc.Planet Fitness, Inc., Class APlaya Hotels & Resorts NVPlayAGS, Inc.Polaris Industries, Inc.Pool Corp.Potbelly Corp.PulteGroup, Inc.PVH Corp.Quotient Technology Inc.Qurate Retail Group, Inc. QVC Group, Class BQurate Retail, Inc.Ralph Lauren Corp.RCI Hospitality Holdings, Inc.Red Lion Hotels Corp.Red Robin Gourmet Burgers, Inc.Red Rock Resorts, Inc., Class ARegis Corp.Rent-A-Center, Inc.RH
Rocky Brands, Inc.Ross Stores, Inc.
* 61,497 843,739* 36,066 4,497,070* 1,439 67,734# 42,036 3,539,852#* 21,461 383,723
19,419 511,302* 51,055 4,511,220
4,377 309,060#* 7,781 245,802* 40,483 78,132* 11,494 47,815# 134,358 1,906,540
202,511 17,422,0211,152 26,496
# 107,537 3,560,550* 88,068 4,354,082* 2,379 7,955,709
684,524 1,396,429#* 34,873 2,953,394* 32,384 12,330,532#* 30,852 694,787# 20,786 1,521,327
28,426 1,262,683#* 117,896 752,176#* 54,592 1,065,636# 100,789 4,633,270# 22,786 395,793#* 4,391 16,905* 61,837 4,864,098* 31,899 233,820* 9,406 176,457# 48,416 4,583,543
26,696 5,055,422* 22,742 94,607
250,711 7,899,90451,995 4,623,395
#* 79,568 837,055* 600 8,502* 297,097 4,200,952
20,878 2,176,11412,873 218,197
* 20,113 136,567#* 16,572 547,207# 57,785 1,204,239* 73,148 1,338,608* 38,161 1,031,492#* 17,231 2,402,001
T.A. U.S. Core Equity 2 PortfolioCONTINUED
Shares Value†
CONSUMER DISCRETIONARY — (Continued)6,987 $ 220,230
80,478 8,533,082

Royal Caribbean Cruises, Ltd.RTW RetailWinds, Inc.Rubicon Project, Inc. (The)Ruth's Hospitality Group, Inc.Sally Beauty Holdings, Inc.Scientific Games Corp., Class ASeaWorld Entertainment, Inc.Select Interior Concepts, Inc., Class AService Corp. InternationalServiceMaster Global Holdings, Inc.Shake Shack, Inc., Class AShiloh Industries, Inc.Shoe Carnival, Inc.Shutterfly, Inc.Shutterstock, Inc.Signet Jewelers, Ltd.Six Flags Entertainment Corp.Skechers U.S.A., Inc., Class ASkyline Champion Corp.Sleep Number Corp.Sonic Automotive, Inc., Class ASonos, Inc.Sotheby'sSpeedway Motorsports, Inc.Sportsman's Warehouse Holdings, Inc.Stamps.com, Inc.Standard Motor Products, Inc.Starbucks Corp.Steven Madden, Ltd.Stoneridge, Inc.Strategic Education, Inc.Strattec Security Corp.Superior Group of Cos, Inc.Superior Industries International, Inc.Sypris Solutions, Inc.Tailored Brands, Inc.Tandy Leather Factory, Inc.Tapestry, Inc.Target Corp.Taylor Morrison Home Corp.Tempur Sealy International, Inc.Tenneco, Inc., Class ATesla, Inc.Texas Roadhouse, Inc.Thor Industries, Inc.Tiffany & Co.Tile Shop Holdings, Inc.Tilly's, Inc., Class ATJX Cos., Inc. (The)Toll Brothers, Inc.TopBuild Corp.Tower International, Inc.Town Sports International Holdings, Inc.Tractor Supply Co.TravelCenters of America LLC
94,154 10,953,876#* 82,882 180,683* 54,426 414,182
74,826 1,666,375#* 94,629 1,300,202#* 41,282 844,217#* 110,217 3,369,334* 10,751 123,099
149,993 6,920,677* 100,425 5,345,623#* 17,980 1,342,387* 21,461 108,163# 17,356 440,495* 40,520 2,053,959
32,533 1,248,29164,367 1,167,61742,394 2,239,675
* 140,565 5,333,036* 65,856 1,876,896#* 54,004 2,655,377
38,777 1,069,082#* 6,400 69,440#* 52,645 3,143,433
42,472 840,946#* 70,016 314,372#* 12,900 615,975
28,748 1,322,695201,063 19,038,655113,386 3,912,951
* 49,402 1,609,02332,090 5,711,699
3,827 79,56313,632 232,01730,693 78,574
* 8,523 8,779# 35,252 171,677* 9,590 55,814
136,431 4,219,811210,806 18,213,638
* 115,839 2,608,694#* 48,541 3,893,959# 64,491 582,999#* 7,091 1,713,257
63,815 3,524,50271,988 4,290,485
# 61,664 5,791,483# 60,127 155,729
20,768 170,090236,699 12,914,297148,262 5,332,984
* 42,567 3,453,46130,396 936,197
#* 14,917 22,82366,001 7,181,569
* 26,570 91,667

TRI Pointe Group, Inc.Tuesday Morning Corp.
Tupperware Brands Corp.Ulta Salon Cosmetics & Fragrance, Inc.Under Armour, Inc., Class AUnder Armour, Inc., Class CUnifi, Inc.Unique Fabricating, Inc.Universal Electronics, Inc.Universal Technical Institute, Inc.Urban Outfitters, Inc.US Auto Parts Network, Inc.Vail Resorts, Inc.Veoneer, Inc.Vera Bradley, Inc.VF Corp.Vince Holding Corp.Vista Outdoor, Inc.Visteon Corp.Vitamin Shoppe, Inc.VOXX International Corp.Wayfair, Inc., Class AWeight Watchers International, Inc.Wendy's Co. (The)Weyco Group, Inc.Whirlpool Corp.William Lyon Homes, Class AWilliams-Sonoma, Inc.Wingstop, Inc.Winmark Corp.Winnebago Industries, Inc.Wolverine World Wide, Inc.Wyndham Destinations, Inc.Wyndham Hotels & Resorts, Inc.Wynn Resorts, Ltd.Yum! Brands, Inc.ZAGG, Inc.Zovio, Inc.Zumiez, Inc.
TOTAL CONSUMER DISCRETIONARY
Alico, Inc.Altria Group, Inc.Andersons, Inc. (The)Archer-Daniels-Midland Co.Avon Products, Inc.B&G Foods, Inc.BJ's Wholesale Club Holdings, Inc.Boston Beer Co., Inc. (The), Class A
* 148,256 2,029,625#* 29,673 48,664
T.A. U.S. Core Equity 2 PortfolioCONTINUED
Shares Value†
CONSUMER DISCRETIONARY — (Continued)37,101 $ 568,016
* 25,508 8,908,669#* 81,537 1,881,059#* 104,748 2,130,574* 19,408 363,124
1,260 3,238* 15,759 674,800* 9,310 34,261#* 152,293 3,626,096#* 10,392 12,263
29,350 7,235,362#* 32,952 598,079* 41,097 482,890
53,460 4,671,869#* 1,616 22,689* 60,738 437,314#* 43,035 2,835,146#* 21,712 95,967* 14,866 69,722#* 15,225 1,996,911#* 28,271 612,067
298,595 5,431,4438,909 245,176
# 45,565 6,628,796* 36,943 725,561# 116,460 7,765,553# 20,623 1,971,353
2,732 461,735# 37,749 1,521,285
91,834 2,493,29348,100 2,263,58677,521 4,383,813
# 24,440 3,178,91133,855 3,809,365
#* 31,708 210,224* 40,068 152,659* 30,352 751,819
1,236,762,116
CONSUMER STAPLES — (5.3%)7,482 238,676
414,701 19,519,97636,535 980,965
214,400 8,807,552* 310,840 1,321,070# 90,474 1,653,865#* 58,005 1,366,598#* 12,135 4,760,803

Bridgford Foods Corp.Brown-Forman Corp., Class ABrown-Forman Corp., Class BBunge, Ltd.Calavo Growers, Inc.Cal-Maine Foods, Inc.Campbell Soup Co.Casey's General Stores, Inc.Central Garden & Pet Co.Central Garden & Pet Co., Class AChefs' Warehouse, Inc. (The)
Church & Dwight Co., Inc.Clorox Co. (The)Coca-Cola Co. (The)Coca-Cola Consolidated, Inc.Colgate-Palmolive Co.Conagra Brands, Inc.Constellation Brands, Inc., Class AConstellation Brands, Inc., Class BCostco Wholesale Corp.Coty, Inc., Class ACraft Brew Alliance, Inc.Crimson Wine Group, Ltd.Darling Ingredients, Inc.Dean Foods Co.Edgewell Personal Care Co.elf Beauty Inc.Energizer Holdings, Inc.Estee Lauder Cos., Inc. (The), Class AFarmer Brothers Co.Flowers Foods, Inc.Fresh Del Monte Produce, Inc.General Mills, Inc.Hain Celestial Group, Inc. (The)Herbalife Nutrition, Ltd.Hershey Co. (The)Hormel Foods Corp.Hostess Brands, Inc.Ingles Markets, Inc., Class AIngredion, Inc.Inter Parfums, Inc.J&J Snack Foods Corp.JM Smucker Co. (The)John B. Sanfilippo & Son, Inc.Kellogg Co.Keurig Dr Pepper, Inc.Kimberly-Clark Corp.Kraft Heinz Co. (The)Kroger Co. (The)
* 2,509 89,49613,986 746,293
108,606 5,952,69599,617 5,820,621
# 17,713 1,566,538# 49,074 1,951,673# 124,514 5,147,409# 48,268 7,815,072#* 15,617 474,444* 53,524 1,474,586* 28,528 1,040,416
T.A. U.S. Core Equity 2 PortfolioCONTINUED
Shares Value†
CONSUMER STAPLES — (Continued)73,376 $ 5,535,485
# 47,674 7,751,792760,646 40,032,799
# 9,711 2,850,47076,902 5,516,949
192,660 5,562,09454,607 10,747,750
# 1,902 379,35476,477 21,079,356
# 215,846 2,354,880#* 20,621 323,956* 9,858 72,949* 160,581 3,264,612# 87,239 126,497* 60,720 1,847,710#* 39,201 650,345# 51,714 2,176,125
37,185 6,849,105#* 19,168 311,288# 238,838 5,660,461
55,815 1,692,869200,916 10,670,649
#* 76,799 1,671,914#* 69,394 2,846,542
48,382 7,341,485# 181,818 7,452,720* 120,666 1,703,804
16,579 521,90760,426 4,670,32631,500 2,182,32019,581 3,638,93356,032 6,230,19810,470 909,948
136,709 7,959,198# 62,606 1,761,733
36,348 4,930,606107,634 3,445,364522,038 11,046,324

Lamb Weston Holdings, Inc.Lancaster Colony Corp.Landec Corp.Lifeway Foods, Inc.Limoneira Co.Mannatech, Inc.McCormick & Co., Inc.McCormick & Co., Inc. Non-VotingMedifast, Inc.MGP Ingredients, Inc.Molson Coors Brewing Co., Class AMolson Coors Brewing Co., Class BMondelez International, Inc., Class AMonster Beverage Corp.National Beverage Corp.Natural Alternatives International, Inc.Natural Grocers by Vitamin Cottage, Inc.Natural Health Trends Corp.Nature's Sunshine Products, Inc.New Age Beverages Corp.Nu Skin Enterprises, Inc., Class A
Oil-Dri Corp. of AmericaPepsiCo, Inc.Performance Food Group Co.Philip Morris International, Inc.Pilgrim's Pride Corp.Post Holdings, Inc.PriceSmart, Inc.Primo Water Corp.Procter & Gamble Co. (The)Pyxus International, Inc.Revlon, Inc., Class ARite Aid Corp.Rocky Mountain Chocolate Factory, Inc.S&W Seed Co.Sanderson Farms, Inc.Seaboard Corp.Seneca Foods Corp., Class ASeneca Foods Corp., Class BSimply Good Foods Co. (The)SpartanNash Co.Spectrum Brands Holdings, Inc.Sprouts Farmers Market, Inc.Sysco Corp.Tootsie Roll Industries, Inc.TreeHouse Foods, Inc.Turning Point Brands, Inc.Tyson Foods, Inc., Class AUnited Natural Foods, Inc.
40,621 2,726,48220,755 3,234,044
#* 30,527 340,987* 2,867 9,776
15,163 300,076600 9,618
# 1,509 237,984# 54,096 8,576,380
25,005 2,791,808# 23,869 1,193,211
266 16,53292,518 4,995,047
314,907 16,844,375* 81,819 5,274,871# 25,483 1,109,275* 5,470 55,192* 26,728 245,096# 6,437 48,342* 13,753 124,190#* 13,090 48,957
65,401 2,614,732
T.A. U.S. Core Equity 2 PortfolioCONTINUED
Shares Value†
CONSUMER STAPLES — (Continued)5,619 $ 199,081
303,798 38,828,422* 111,730 4,899,360
124,624 10,419,813* 104,657 2,832,018* 95,819 10,273,713
30,424 1,855,864#* 48,126 710,821
458,732 54,148,725#* 8,313 118,627#* 27,411 546,027#* 13,790 96,116
4,490 40,410* 5,318 15,741
29,686 3,889,460346 1,412,247
* 8,682 274,178* 283 8,886* 73,375 1,998,001
43,974 519,773# 63,666 3,190,303#* 148,236 2,509,635
74,993 5,142,270# 31,456 1,175,196* 71,619 4,249,871# 7,399 274,725
142,930 11,362,935#* 53,580 528,299

United-Guardian, Inc.Universal Corp.US Foods Holding Corp.USANA Health Sciences, Inc.Vector Group, Ltd.Village Super Market, Inc., Class AWalgreens Boots Alliance, Inc.Walmart, Inc.WD-40 Co.Weis Markets, Inc.Youngevity International, Inc.
TOTAL CONSUMER STAPLES
Abraxas Petroleum Corp.Adams Resources & Energy, Inc.Anadarko Petroleum Corp.Antero Midstream Corp.Antero Resources Corp.Apache Corp.Apergy Corp.Arch Coal, Inc., Class AArchrock, Inc.Ardmore Shipping Corp.Aspen Aerogels, Inc.Baker Hughes a GE Co.Basic Energy Services, Inc.Berry Petroleum Corp.Bonanza Creek Energy, Inc.C&J Energy Services, Inc.Cabot Oil & Gas Corp.
Cactus, Inc., Class ACalifornia Resources Corp.Callon Petroleum Co.CARBO Ceramics, Inc.Carrizo Oil & Gas, Inc.Centennial Resource Development, Inc., Class AChaparral Energy, Inc., Class ACheniere Energy, Inc.Chesapeake Energy Corp.Chevron Corp.Cimarex Energy Co.Clean Energy Fuels Corp.CNX Resources Corp.Comstock Resources, Inc.Concho Resources, Inc.ConocoPhillipsCONSOL Energy, Inc.Contango Oil & Gas Co.Continental Resources, Inc.
1,431 28,01930,752 1,829,744
* 177,055 6,262,435* 33,692 2,292,741# 96,931 1,119,553# 9,492 237,585
285,393 15,551,065364,614 40,246,093
# 13,211 2,398,589# 31,962 1,165,015#* 1,700 7,973
557,955,869
ENERGY — (4.7%)* 164,391 143,086
3,585 116,979112,085 8,256,181
# 128,681 1,173,571#* 211,952 977,099# 224,068 5,471,741* 44,003 1,431,418# 31,173 2,779,385
156,374 1,716,986* 25,542 187,478* 12,907 85,186# 93,363 2,370,487#* 12,174 21,670# 19,073 186,915* 24,838 541,468* 78,066 854,042
177,048 3,392,240
T.A. U.S. Core Equity 2 PortfolioCONTINUED
Shares Value†
ENERGY — (Continued)* 21,880 $ 642,616#* 14,239 217,999#* 290,934 1,431,395#* 3,649 4,671#* 111,785 1,065,311#* 184,201 1,095,996#* 3,601 12,784* 54,529 3,552,564#* 767,312 1,388,835
543,129 66,864,61184,699 4,291,698
* 211,434 564,529* 239,064 1,965,106#* 2,107 14,391
85,353 8,337,281413,560 24,433,125
* 33,244 714,414#* 22,037 29,309* 90,091 3,348,682
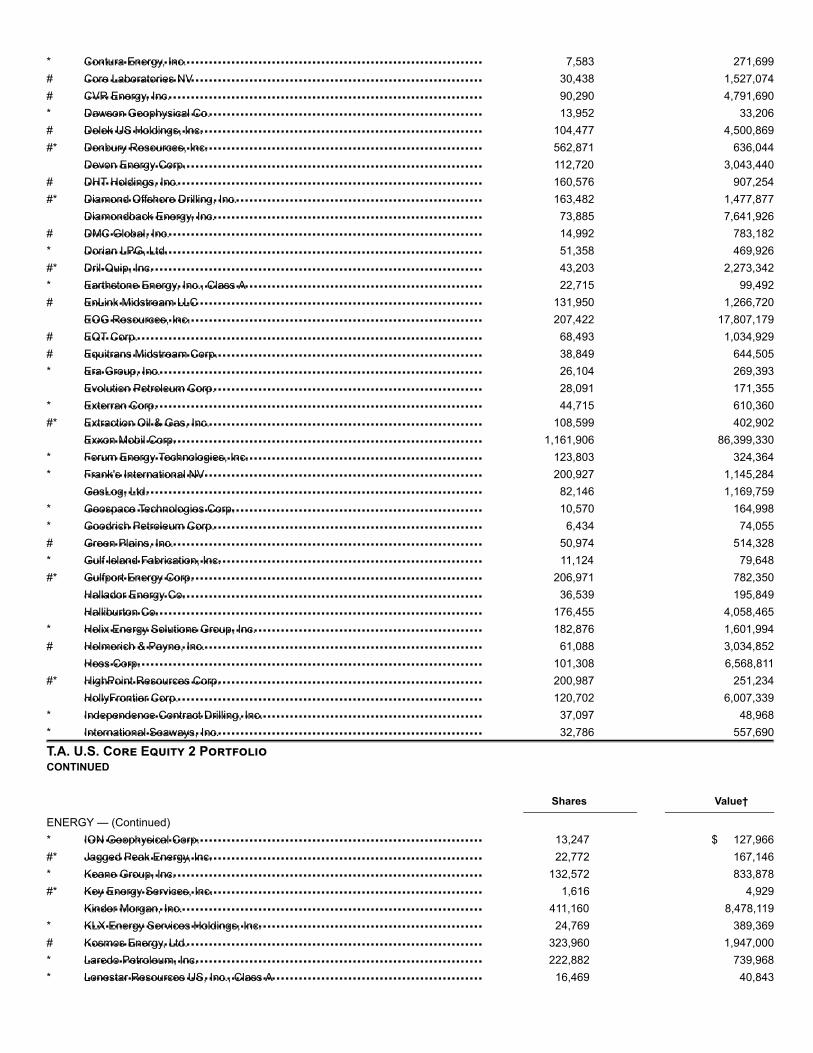
Contura Energy, Inc.Core Laboratories NVCVR Energy, Inc.Dawson Geophysical Co.Delek US Holdings, Inc.Denbury Resources, Inc.Devon Energy Corp.DHT Holdings, Inc.Diamond Offshore Drilling, Inc.Diamondback Energy, Inc.DMC Global, Inc.Dorian LPG, Ltd.Dril-Quip, Inc.Earthstone Energy, Inc., Class AEnLink Midstream LLCEOG Resources, Inc.EQT Corp.Equitrans Midstream Corp.Era Group, Inc.Evolution Petroleum Corp.Exterran Corp.Extraction Oil & Gas, Inc.Exxon Mobil Corp.Forum Energy Technologies, Inc.Frank's International NVGasLog, Ltd.Geospace Technologies Corp.Goodrich Petroleum Corp.Green Plains, Inc.Gulf Island Fabrication, Inc.Gulfport Energy Corp.Hallador Energy Co.Halliburton Co.Helix Energy Solutions Group, Inc.Helmerich & Payne, Inc.Hess Corp.HighPoint Resources Corp.HollyFrontier Corp.Independence Contract Drilling, Inc.International Seaways, Inc.
ION Geophysical Corp.Jagged Peak Energy, Inc.Keane Group, Inc.Key Energy Services, Inc.Kinder Morgan, Inc.KLX Energy Services Holdings, Inc.Kosmos Energy, Ltd.Laredo Petroleum, Inc.Lonestar Resources US, Inc., Class A
* 7,583 271,699# 30,438 1,527,074# 90,290 4,791,690* 13,952 33,206# 104,477 4,500,869#* 562,871 636,044
112,720 3,043,440# 160,576 907,254#* 163,482 1,477,877
73,885 7,641,926# 14,992 783,182* 51,358 469,926#* 43,203 2,273,342* 22,715 99,492# 131,950 1,266,720
207,422 17,807,179# 68,493 1,034,929# 38,849 644,505* 26,104 269,393
28,091 171,355* 44,715 610,360#* 108,599 402,902
1,161,906 86,399,330* 123,803 324,364* 200,927 1,145,284
82,146 1,169,759* 10,570 164,998* 6,434 74,055# 50,974 514,328* 11,124 79,648#* 206,971 782,350
36,539 195,849176,455 4,058,465
* 182,876 1,601,994# 61,088 3,034,852
101,308 6,568,811#* 200,987 251,234
120,702 6,007,339* 37,097 48,968* 32,786 557,690
T.A. U.S. Core Equity 2 PortfolioCONTINUED
Shares Value†
ENERGY — (Continued)* 13,247 $ 127,966#* 22,772 167,146* 132,572 833,878#* 1,616 4,929
411,160 8,478,119* 24,769 389,369# 323,960 1,947,000* 222,882 739,968* 16,469 40,843

Mammoth Energy Services, Inc.Marathon Oil Corp.Marathon Petroleum Corp.Matador Resources Co.Matrix Service Co.McDermott International, Inc.Midstates Petroleum Co., Inc.Mitcham Industries, Inc.Montage Resources Corp.Murphy Oil Corp.Nabors Industries, Ltd.NACCO Industries, Inc., Class ANational Oilwell Varco, Inc.Natural Gas Services Group, Inc.Navios Maritime Acquisition Corp.NCS Multistage Holdings, Inc.Newpark Resources, Inc.Nine Energy Service, Inc.Noble Corp. P.L.C.Noble Energy, Inc.Northern Oil and Gas, Inc.Oasis Petroleum, Inc.Occidental Petroleum Corp.Oceaneering International, Inc.Oil States International, Inc.ONEOK, Inc.Overseas Shipholding Group, Inc., Class APacific Ethanol, Inc.Panhandle Oil and Gas, Inc., Class APar Pacific Holdings, Inc.Parker Drilling Co.Parsley Energy, Inc., Class APatterson-UTI Energy, Inc.PBF Energy, Inc., Class APDC Energy, Inc.Peabody Energy Corp.Penn Virginia Corp.Phillips 66Pioneer Energy Services Corp.Pioneer Natural Resources Co.PrimeEnergy Resources Corp.Profire Energy, Inc.ProPetro Holding Corp.QEP Resources, Inc.Quintana Energy Services, Inc.Range Resources Corp.Renewable Energy Group, Inc.REX American Resources Corp.RigNet, Inc.Ring Energy, Inc.
# 27,146 175,906456,190 6,418,593316,782 17,863,337
#* 145,384 2,563,120* 30,862 566,935#* 204,588 1,313,455* 20,454 93,066* 13,388 55,694#* 5,474 18,283# 203,607 4,894,712# 403,615 1,194,700
7,344 390,334168,466 4,012,860
* 15,772 252,9833,300 21,087
#* 675 2,167* 122,312 933,241* 2,270 29,215* 308,431 687,801
158,663 3,503,279#* 258,494 418,760* 365,050 1,777,793
270,559 13,895,910* 119,067 1,839,585* 66,759 996,044
142,270 9,970,282* 48,171 93,933#* 27,323 14,790
13,067 154,321#* 51,571 1,189,227* 105 1,806* 136,977 2,272,448
215,477 2,505,997145,292 4,058,006
* 60,767 1,745,836120,189 2,531,180
#* 14,681 502,677102,695 10,532,399
#* 89,700 18,74756,724 7,830,181
* 692 83,621#* 3,250 4,745* 99,774 1,808,903* 101,867 504,242#* 9,586 19,460# 188,830 1,074,443#* 59,963 814,897#* 6,572 490,271* 11,561 100,928* 61,689 151,138
T.A. U.S. Core Equity 2 PortfolioCONTINUED
Shares Value†

RPC, Inc.SandRidge Energy, Inc.Schlumberger, Ltd.Scorpio Tankers, Inc.SEACOR Holdings, Inc.SEACOR Marine Holdings, Inc.Select Energy Services, Inc., Class ASemGroup Corp., Class AShip Finance International, Ltd.SilverBow Resources, Inc.SM Energy Co.Smart Sand, Inc.Solaris Oilfield Infrastructure, Inc., Class ASouthwestern Energy Co.SRC Energy, Inc.Superior Energy Services, Inc.Talos Energy, Inc.Targa Resources Corp.TechnipFMC P.L.C.TETRA Technologies, Inc.Tidewater, Inc.Transocean, Ltd.Ultra Petroleum Corp.Unit Corp.US Silica Holdings, Inc.VAALCO Energy, Inc.Valaris P.L.C.Valero Energy Corp.W&T Offshore, Inc.Whiting Petroleum Corp.Williams Cos., Inc. (The)World Fuel Services Corp.WPX Energy, Inc.
TOTAL ENERGY
1st Constitution Bancorp1st Source Corp.ACNB Corp.Affiliated Managers Group, Inc.Aflac, Inc.Alleghany Corp.Allegiance Bancshares, Inc.Allstate Corp. (The)Ally Financial, Inc.A-Mark Precious Metals, Inc.Ambac Financial Group, Inc.American Equity Investment Life Holding Co.American Express Co.American Financial Group, Inc.American International Group, Inc.American National Bankshares, Inc.American National Insurance Co.American River Bankshares
ENERGY — (Continued)# 135,339 $ 836,395* 30,054 202,864
218,247 8,723,33359,438 1,557,870
* 22,509 1,072,329* 26,305 370,374#* 87,669 891,594
91,663 1,161,370# 130,559 1,716,851* 5,746 59,701
142,832 1,424,035#* 7,531 17,698# 21,997 314,777#* 556,895 1,225,169#* 301,696 1,230,920* 132,464 120,171* 54,624 1,124,162# 77,533 3,016,809
98,002 2,698,975* 150,968 235,510* 31,856 732,369#* 305,851 1,859,574#* 77,969 12,475* 66,176 430,144# 92,529 1,282,452* 15,230 26,652
245,974 2,014,527171,420 14,613,555
#* 124,708 559,939#* 116,337 2,056,838
138,787 3,419,71285,228 3,327,301
* 310,747 3,244,199
500,028,131
FINANCIALS — (16.1%)# 6,663 121,333
31,267 1,467,9866,116 228,127
20,715 1,777,140193,812 10,202,264
* 7,207 4,942,056* 8,013 268,916
108,567 11,660,096333,135 10,963,473
* 7,393 93,743* 25,869 471,333
113,034 2,916,277272,571 33,899,655
68,232 6,985,592227,977 12,764,432
8,832 326,69617,036 2,061,697
2,071 27,234

Ameriprise Financial, Inc.Ameris BancorpAMERISAFE, Inc.AmeriServ Financial, Inc.Ames National Corp.
Aon P.L.C.Arch Capital Group, Ltd.Ares Management Corp., Class AArgo Group International Holdings, Ltd.Arrow Financial Corp.Arthur J Gallagher & Co.Artisan Partners Asset Management, Inc., Class AAshford, Inc.Associated Banc-CorpAssociated Capital Group, Inc., Class AAssurant, Inc.Assured Guaranty, Ltd.Asta Funding, Inc.Athene Holding, Ltd., Class AAtlantic Capital Bancshares, Inc.Atlantic Union Bankshares Corp.Atlanticus Holdings Corp.Auburn National Bancorporation, Inc.Axis Capital Holdings, Ltd.Axos Financial, Inc.Banc of California, Inc.BancFirst Corp.Bancorp of New Jersey, Inc.Bancorp, Inc. (The)BancorpSouth BankBank of America Corp.Bank of Commerce HoldingsBank of Hawaii Corp.Bank of Marin BancorpBank of New York Mellon Corp. (The)Bank of NT Butterfield & Son, Ltd. (The)Bank of Princeton (The)Bank of South Carolina Corp.Bank OZKBankFinancial Corp.BankUnited, Inc.Bankwell Financial Group, Inc.Banner Corp.Bar Harbor BanksharesBaycom Corp.BB&T Corp.BCB Bancorp, Inc.Berkshire Hathaway, Inc., Class BBerkshire Hills Bancorp, Inc.
87,443 12,723,83188,697 3,527,48026,204 1,704,832
3,367 13,8058,700 237,597
T.A. U.S. Core Equity 2 PortfolioCONTINUED
Shares Value†
FINANCIALS — (Continued)45,061 $ 8,527,794
* 172,299 6,666,248# 30,257 885,017
41,601 2,847,17215,830 526,50656,579 5,116,43950,788 1,502,817
#* 600 20,586148,534 3,218,732
# 1,887 70,51758,469 6,628,046
132,787 5,801,464* 736 5,395* 55,011 2,247,749* 28,199 518,580
93,864 3,569,648* 11,295 53,312
2,087 80,72575,408 4,801,227
#* 74,972 2,197,42956,944 890,03532,722 1,909,001
#* 3,414 47,113* 88,920 860,746# 116,483 3,481,677
1,864,905 57,215,28514,664 157,931
# 43,487 3,707,26711,296 493,861
248,087 11,640,24270,010 2,200,414
# 4,109 113,285800 15,336
89,116 2,725,16723,262 311,943
101,580 3,495,3684,335 121,814
42,080 2,493,66111,010 279,544
* 3,098 70,944192,345 9,911,538
12,179 156,257* 371,183 76,252,124
61,129 2,005,031

BGC Partners, Inc., Class ABlackRock, Inc.Blucora, Inc.Blue Capital Reinsurance Holdings, Ltd.BOK Financial Corp.Boston Private Financial Holdings, Inc.Bridge Bancorp, Inc.Bridgewater Bancshares, Inc.Brighthouse Financial, Inc.BrightSphere Investment Group P.L.C.Brookline Bancorp, Inc.Brown & Brown, Inc.Bryn Mawr Bank Corp.Byline Bancorp, Inc.C&F Financial Corp.
Cadence BanCorpCambridge BancorpCamden National Corp.Cannae Holdings, Inc.Capital City Bank Group, Inc.Capital One Financial Corp.Capitol Federal Financial, Inc.Capstar Financial Holdings, Inc.Carolina Financial Corp.Cathay General BancorpCboe Global Markets, Inc.CBTX, Inc.CenterState Banks Corp.Central Pacific Financial Corp.Central Valley Community BancorpCentury Bancorp, Inc., Class ACharles Schwab Corp. (The)Chemung Financial Corp.Chubb, Ltd.Cincinnati Financial Corp.CIT Group, Inc.Citigroup, Inc.Citizens & Northern Corp.Citizens Community Bancorp, Inc.Citizens Financial Group, Inc.Citizens Holding Co.Citizens, Inc.City Holding Co.Civista Bancshares, Inc.CME Group, Inc.CNA Financial Corp.CNB Financial Corp.CNO Financial Group, Inc.Codorus Valley Bancorp, Inc.
# 296,735 1,635,01019,041 8,905,095
* 52,563 1,573,7364,531 36,475
46,270 3,871,874117,108 1,351,42621,363 624,013
* 9,638 114,885* 42,882 1,679,688* 103,112 1,103,298
104,170 1,544,841221,171 7,946,674
25,731 954,105* 620 11,848
2,604 141,397
T.A. U.S. Core Equity 2 PortfolioCONTINUED
Shares Value†
FINANCIALS — (Continued)142,678 $ 2,445,501
# 1,660 129,81218,719 836,926
* 90,690 2,625,47615,460 399,177
132,272 12,224,578186,164 2,543,000
15,450 250,29026,126 917,54584,165 3,132,62136,246 3,962,050
6,633 199,919123,887 3,012,932
41,241 1,215,3727,529 156,0764,519 378,466
280,855 12,138,5533,869 168,843
95,408 14,582,15973,427 7,880,92074,984 3,790,441
511,208 36,377,5618,808 225,6612,181 23,773
164,685 6,136,1631,501 31,836
#* 28,479 212,16918,549 1,436,62013,460 298,40866,232 12,876,82557,913 2,773,45415,464 436,394
150,916 2,551,9906,342 148,403

Cohen & Steers, Inc.Colony Bankcorp, Inc.Columbia Banking System, Inc.Comerica, Inc.Commerce Bancshares, Inc.Commercial National Financial Corp.Community Bank System, Inc.Community Bankers Trust Corp.Community Financial Corp. (The)Community First Bancshares, Inc.Community Trust Bancorp, Inc.Community West BancsharesConnectOne Bancorp, Inc.Consumer Portfolio Services, Inc.County Bancorp, Inc.Cowen, Inc., Class ACrawford & Co., Class ACrawford & Co., Class BCredit Acceptance Corp.Cullen/Frost Bankers, Inc.Customers Bancorp, Inc.CVB Financial Corp.Diamond Hill Investment Group, Inc.Dime Community Bancshares, Inc.Discover Financial Services
DNB Financial Corp.Donegal Group, Inc., Class ADonegal Group, Inc., Class BDonnelley Financial Solutions, Inc.E*TRADE Financial Corp.Eagle Bancorp Montana, Inc.Eagle Bancorp, Inc.East West Bancorp, Inc.Eaton Vance Corp.eHealth, Inc.Elevate Credit, Inc.EMC Insurance Group, Inc.Emclaire Financial Corp.Employers Holdings, Inc.Encore Capital Group, Inc.Enova International, Inc.Enstar Group, Ltd.Entegra Financial Corp.Enterprise Bancorp, Inc.Enterprise Financial Services Corp.Equity Bancshares, Inc., Class AErie Indemnity Co., Class AEsquire Financial Holdings, Inc.ESSA Bancorp, Inc.
# 56,047 2,935,1815,329 89,261
93,096 3,510,65081,765 5,985,198
# 106,419 6,473,468923 20,528
64,346 4,246,19319,082 151,893
4,091 133,080* 927 9,316
22,705 960,1944,200 40,530
40,336 922,081* 34,102 124,472# 4,577 81,745#* 22,872 401,632
32,830 339,13420,524 192,310
#* 21,904 10,470,769# 55,663 5,284,645* 39,125 806,758
136,289 2,999,7214,190 590,581
54,333 1,096,440156,725 14,064,501
T.A. U.S. Core Equity 2 PortfolioCONTINUED
Shares Value†
FINANCIALS — (Continued)3,405 $ 155,915
27,456 407,7221,947 26,791
* 47,259 644,140163,776 7,990,631
4,900 87,07340,386 1,627,960
129,732 6,228,433# 93,873 4,177,348#* 21,317 2,211,639* 9,277 38,592
16,920 608,105# 300 9,621
41,844 1,836,952#* 35,766 1,286,861* 52,265 1,408,542* 12,513 2,216,678* 4,888 145,711
5,786 176,76228,030 1,168,290
* 16,693 442,198# 30,211 6,730,104* 3,467 88,929
7,776 119,362

Essent Group, Ltd.Evans Bancorp, Inc.Evercore, Inc., Class AEverest Re Group, Ltd.EZCORP, Inc., Class AFactSet Research Systems, Inc.Farmers & Merchants Bancorp, Inc.Farmers National Banc Corp.Fauquier Bankshares, Inc.FB Financial Corp.FBL Financial Group, Inc., Class AFederal Agricultural Mortgage Corp., Class AFederal Agricultural Mortgage Corp., Class CFederated Investors, Inc., Class BFedNat Holding Co.Fidelity D&D Bancorp, Inc.Fidelity National Financial, Inc.Fifth Third BancorpFinancial Institutions, Inc.First Acceptance Corp.First American Financial Corp.First BancorpFirst BanCorpFirst Bancorp, Inc.First Bancshares, Inc. (The)First BankFirst Busey Corp.First Business Financial Services, Inc.First Capital, Inc.First Choice BancorpFirst Citizens BancShares, Inc., Class AFirst Commonwealth Financial Corp.First Community Bancshares, Inc.First Community Corp.First Defiance Financial Corp.
First Financial BancorpFirst Financial Bankshares, Inc.First Financial Corp.First Financial Northwest, Inc.First Foundation, Inc.First Guaranty Bancshares, Inc.First Hawaiian, Inc.First Horizon National Corp.First Internet BancorpFirst Interstate BancSystem, Inc., Class AFirst Merchants Corp.First Mid Bancshares, Inc.First Midwest Bancorp, Inc.First Northwest Bancorp
* 62,643 2,891,6014,016 148,833
45,505 3,930,26723,301 5,746,959
#* 77,547 763,838# 23,188 6,430,032# 1,880 53,843
12,694 185,459700 14,392
34,729 1,320,04926,534 1,663,682
635 43,56711,172 863,260
141,394 4,913,44113,480 168,365
# 1,602 105,684140,300 6,016,064428,052 12,708,864
23,604 726,767* 16,289 14,660
118,781 6,867,91738,199 1,411,071
278,337 2,994,9069,663 253,2673,053 101,390
10,839 123,34864,334 1,738,948
6,819 162,497# 2,028 115,089# 5,940 131,868
9,362 4,372,241125,496 1,728,080
19,210 635,2755,860 111,985
21,912 629,313
T.A. U.S. Core Equity 2 PortfolioCONTINUED
Shares Value†
FINANCIALS — (Continued)122,920 $ 3,133,231
# 99,822 3,269,1717,979 346,368
13,447 198,74751,805 779,147
565 12,3457,631 204,206
325,711 5,341,6608,289 174,732
42,696 1,709,12163,034 2,484,17010,273 350,104
140,824 3,046,0237,811 125,523

First of Long Island Corp. (The)First Republic BankFirst Savings Financial Group, Inc.First United Corp.First Western Financial, Inc.FirstCash, Inc.Flagstar Bancorp, Inc.Flushing Financial Corp.FNB Corp.Franklin Financial Network, Inc.Franklin Resources, Inc.FS Bancorp, Inc.Fulton Financial Corp.GAIN Capital Holdings, Inc.GAMCO Investors, Inc., Class AGenworth Financial, Inc., Class AGerman American Bancorp, Inc.Glacier Bancorp, Inc.Global Indemnity, Ltd.Goldman Sachs Group, Inc. (The)Great Elm Capital Group, Inc.Great Southern Bancorp, Inc.Great Western Bancorp, Inc.Green Dot Corp., Class AGreene County Bancorp, Inc.Greenhill & Co., Inc.Greenlight Capital Re, Ltd., Class AGuaranty Bancshares, Inc.Guaranty Federal Bancshares, Inc.Hallmark Financial Services, Inc.Hamilton Lane, Inc., Class AHancock Whitney Corp.Hanmi Financial Corp.Hanover Insurance Group, Inc. (The)HarborOne Bancorp, Inc.Harleysville Financial Corp.Hartford Financial Services Group, Inc. (The)Hawthorn Bancshares, Inc.HCI Group, Inc.Heartland Financial USA, Inc.Hennessy Advisors, Inc.Heritage Commerce Corp.Heritage Financial Corp.Heritage Insurance Holdings, Inc.Hilltop Holdings, Inc.
Hingham Institution for SavingsHMN Financial, Inc.Home Bancorp, Inc.Home BancShares, Inc.
25,402 561,89247,024 4,672,305
1,058 64,0625,001 106,471
* 1,300 18,27862,082 6,247,93268,789 2,371,84540,449 823,542
259,622 3,128,44517,772 524,274
# 131,346 4,285,8204,384 216,131
221,409 3,763,953# 36,233 154,353
11,830 240,149* 268,656 1,071,937
26,319 830,36487,779 3,678,81813,212 373,76784,365 18,571,267
#* 8,182 33,79218,454 1,106,50275,851 2,565,281
#* 62,298 3,157,886# 358 9,935# 18,254 303,016#* 39,376 328,790
5,653 174,2251,800 42,480
* 19,071 295,60119,882 1,167,07398,404 4,085,73441,663 895,33841,123 5,334,064
#* 9,482 181,5801,326 30,830
195,278 11,253,8713,439 84,015
# 13,757 551,51842,316 2,034,976
# 5,706 57,06053,720 664,51643,518 1,241,13332,470 436,397
118,386 2,684,994
T.A. U.S. Core Equity 2 PortfolioCONTINUED
Shares Value†
FINANCIALS — (Continued)2,003 $ 386,158
* 3,012 63,8547,397 276,352
# 150,350 2,957,385

HomeStreet, Inc.HomeTrust Bancshares, Inc.Hope Bancorp, Inc.HopFed Bancorp, Inc.Horace Mann Educators Corp.Horizon Bancorp, Inc.Houlihan Lokey, Inc.Howard Bancorp, Inc.Huntington Bancshares, Inc.IBERIABANK Corp.IF Bancorp, Inc.Impac Mortgage Holdings, Inc.Independence Holding Co.Independent Bank Corp.Independent Bank Corp.Independent Bank Group, Inc.Interactive Brokers Group, Inc., Class AIntercontinental Exchange, Inc.International Bancshares Corp.INTL. FCStone, Inc.Invesco, Ltd.Investar Holding Corp.Investors Bancorp, Inc.Investors Title Co.James River Group Holdings, Ltd.Janus Henderson Group P.L.C.Jefferies Financial Group, Inc.JPMorgan Chase & Co.Kearny Financial Corp.Kemper Corp.Kentucky First Federal BancorpKeyCorpKingstone Cos., Inc.Kinsale Capital Group, Inc.Ladenburg Thalmann Financial Services, Inc.Lake Shore Bancorp, Inc.Lakeland Bancorp, Inc.Lakeland Financial Corp.Landmark Bancorp, Inc.Lazard, Ltd., Class ALCNB Corp.LegacyTexas Financial Group, Inc.Legg Mason, Inc.LendingClub Corp.LendingTree, Inc.Level One Bancorp, Inc.Limestone Bancorp, Inc.Lincoln National Corp.Live Oak Bancshares, Inc.Loews Corp.LPL Financial Holdings, Inc.M&T Bank Corp.Macatawa Bank Corp.Mackinac Financial Corp.Maiden Holdings, Ltd.
* 42,098 1,221,6846,636 173,399
# 185,003 2,728,794#*» 2,767 55,719
47,681 2,071,26346,909 817,15535,399 1,628,354
#* 14,985 223,127# 626,897 8,933,282
36,502 2,867,962723 15,328
#* 1,461 6,3857,983 302,556
36,378 2,828,75328,585 621,43850,154 2,849,249
# 105,687 5,417,516129,584 11,385,250
84,765 3,189,707* 21,939 894,672# 217,830 4,180,158
7,734 186,467272,898 3,100,121
1,811 297,18536,329 1,737,616
112,215 2,252,155170,544 3,637,704947,073 109,860,468127,177 1,697,813
72,044 6,341,3131,549 11,772
474,334 8,713,5165,834 49,4723,370 302,828
91,438 282,5431,022 15,177
59,053 967,28827,255 1,253,457
2,463 58,496115,809 4,482,96614,976 269,71858,891 2,517,00185,041 3,202,644
#* 101,094 1,494,169#* 7,499 2,418,727# 4,448 104,795* 1,427 21,633
105,037 6,863,118# 42,874 834,757
141,970 7,601,074144,676 12,133,976
44,186 7,257,55031,316 321,928
7,534 116,02499,949 49,475

Malvern Bancorp, Inc.Markel Corp.MarketAxess Holdings, Inc.Marlin Business Services Corp.Marsh & McLennan Cos., Inc.MBIA, Inc.MBT Financial Corp.Mercantile Bank Corp.Merchants BancorpMercury General Corp.Meridian Bancorp, Inc.Meridian Corp.Meta Financial Group, Inc.MetLife, Inc.Metropolitan Bank Holding Corp.MGIC Investment Corp.Mid Penn Bancorp, Inc.Middlefield Banc Corp.Midland States Bancorp, Inc.MidSouth Bancorp, Inc.MidWestOne Financial Group, Inc.MMA Capital Holdings, Inc.Moelis & Co., Class AMoody's Corp.Morgan StanleyMorningstar, Inc.Mr Cooper Group, Inc.MSB Financial Corp.MSCI, Inc.MutualFirst Financial, Inc.MVB Financial Corp.Nasdaq, Inc.National Bank Holdings Corp., Class ANational Bankshares, Inc.National General Holdings Corp.National Western Life Group, Inc., Class ANavient Corp.NBT Bancorp, Inc.Nelnet, Inc., Class ANew York Community Bancorp, Inc.NewStar Financial, Inc.NI Holdings, Inc.Nicholas Financial, Inc.Nicolet Bankshares, Inc.NMI Holdings, Inc., Class ANortheast BankNortheast Community Bancorp, Inc.Northern Trust Corp.Northfield Bancorp, Inc.
T.A. U.S. Core Equity 2 PortfolioCONTINUED
Shares Value†
FINANCIALS — (Continued)* 5,035 $ 106,943* 6,509 7,250,570
18,326 6,176,59517,363 402,99597,170 9,600,396
#* 166,900 1,557,17718,808 202,75015,965 536,424
1,147 20,52070,022 3,970,94866,931 1,227,515
* 1,400 23,87043,776 1,351,365
212,186 10,486,232* 3,222 135,227* 111,894 1,437,838
2,232 58,1442,077 90,640
14,162 384,073# 14,050 171,832
10,788 335,183* 4,788 153,599
33,259 1,211,95830,244 6,482,499
358,555 15,977,21139,025 5,931,019
#* 19,504 148,4251,903 30,924
67,973 15,446,1859,030 294,2887,799 135,781
85,845 8,272,88337,669 1,366,631
1,672 61,262101,362 2,506,682
4,022 1,081,918379,605 5,371,411
58,704 2,271,84537,333 2,335,552
# 282,910 3,261,952» 42,768 4,161* 8,302 139,557* 1,248 10,458* 2,491 163,684* 81,693 2,032,522* 6,219 136,507
5,046 58,029101,409 9,938,082
66,163 1,035,451

Northrim BanCorp, Inc.Northwest Bancshares, Inc.Norwood Financial Corp.Oak Valley BancorpOceanFirst Financial Corp.Oconee Federal Financial Corp.Ocwen Financial Corp.OFG BancorpOhio Valley Banc Corp.Old Line Bancshares, Inc.
Old National BancorpOld Point Financial Corp.Old Republic International Corp.Old Second Bancorp, Inc.On Deck Capital, Inc.OneMain Holdings, Inc.Oppenheimer Holdings, Inc., Class AOpus BankOrigin Bancorp, Inc.Oritani Financial Corp.Orrstown Financial Services, Inc.Pacific Mercantile BancorpPacific Premier Bancorp, Inc.PacWest BancorpPark National Corp.Parke Bancorp, Inc.PB Bancorp, Inc.PCB BancorpPCSB Financial Corp.Peapack Gladstone Financial Corp.Penns Woods Bancorp, Inc.Pennymac Financial Services, Inc.Peoples Bancorp of North Carolina, Inc.Peoples Bancorp, Inc.Peoples Financial Services Corp.People's United Financial, Inc.People's Utah BancorpPinnacle Financial Partners, Inc.Piper Jaffray Cos.PJT Partners, Inc., Class APlumas BancorpPNC Financial Services Group, Inc. (The)Ponce de Leon Federal BankPopular, Inc.PRA Group, Inc.Preferred BankPremier Financial Bancorp, Inc.Primerica, Inc.Principal Financial Group, Inc.
6,426 250,421# 139,017 2,384,142
3,138 108,638# 4,855 90,983
58,841 1,435,720400 9,400
* 26,744 50,81460,052 1,358,977
4,777 172,25916,288 459,973
T.A. U.S. Core Equity 2 PortfolioCONTINUED
Shares Value†
FINANCIALS — (Continued)# 194,483 $ 3,424,846
2,663 60,184236,951 5,404,852
9,603 126,183* 84,683 303,165
55,271 2,290,98310,148 295,71340,132 899,358
# 2,244 78,114# 74,180 1,342,658
8,572 196,042* 17,616 135,996
74,620 2,360,231# 105,429 4,072,722# 15,428 1,459,335
8,219 197,0092,175 24,447
# 709 11,76912,628 245,48823,355 663,983
3,624 164,38568,342 1,640,891
3,288 89,17122,037 714,219
1,494 72,280# 232,515 3,817,896
9,305 281,942# 51,552 3,131,268
19,045 1,472,17919,725 831,606
3,091 75,884117,131 16,738,020
#* 13,679 196,70494,942 5,464,862
#* 57,333 1,784,77615,476 838,64411,166 174,41358,393 7,164,237
159,624 9,264,577

ProAssurance Corp.Progressive Corp. (The)Prosperity Bancshares, Inc.Protective Insurance Corp., Class AProtective Insurance Corp., Class BProvident Bancorp, Inc.Provident Financial Holdings, Inc.Provident Financial Services, Inc.Prudential Bancorp, Inc.Prudential Financial, Inc.Pzena Investment Management, Inc., Class AQCR Holdings, Inc.Radian Group, Inc.Randolph Bancorp, Inc.Raymond James Financial, Inc.RBB BancorpRegional Management Corp.Regions Financial Corp.Reinsurance Group of America, Inc.RenaissanceRe Holdings, Ltd.
Renasant Corp.Republic Bancorp, Inc., Class ARepublic First Bancorp, Inc.Riverview Bancorp, Inc.RLI Corp.S&P Global, Inc.S&T Bancorp, Inc.Safeguard Scientifics, Inc.Safety Insurance Group, Inc.Salisbury Bancorp, Inc.Sandy Spring Bancorp, Inc.Santander Consumer USA Holdings, Inc.SB Financial Group, Inc.SB One BancorpSeacoast Banking Corp. of FloridaSecurity National Financial Corp., Class ASEI Investments Co.Select Bancorp, Inc.Selective Insurance Group, Inc.ServisFirst Bancshares, Inc.Severn Bancorp, Inc.Shore Bancshares, Inc.Sierra BancorpSignature BankSilvercrest Asset Management Group, Inc., Class ASimmons First National Corp., Class ASLM Corp.SmartFinancial, Inc.Sound Financial Bancorp, Inc.
64,135 2,507,037156,554 12,677,743
# 61,371 4,258,534298 4,872
9,068 150,075* 4,533 125,337
6,656 138,24582,071 1,984,477
6,497 118,70092,516 9,372,796
8,763 71,33115,736 602,05980,134 1,827,055
* 1,654 24,82770,406 5,679,652
6,689 134,449* 17,091 412,406
554,575 8,834,38036,993 5,767,94940,944 7,417,006
T.A. U.S. Core Equity 2 PortfolioCONTINUED
Shares Value†
FINANCIALS — (Continued)63,262 $ 2,270,47316,710 798,237
* 49,443 215,07717,979 152,822
# 35,939 3,239,18251,188 12,538,50144,399 1,690,270
* 28,786 336,22021,435 2,114,777
1,410 54,28542,918 1,563,932
244,328 6,574,8663,331 55,161
11,401 261,197* 35,223 952,430* 3,558 18,181
117,956 7,028,998* 16,697 189,511
78,380 5,894,176# 49,786 1,695,711
4,355 36,6699,404 154,226
16,572 432,03231,123 3,966,938
3,719 53,293116,809 3,007,832522,602 4,760,904
* 6,862 148,837771 26,985

South State Corp.Southern First Bancshares, Inc.Southern Missouri Bancorp, Inc.Southern National Bancorp of Virginia, Inc.Southside Bancshares, Inc.Spirit of Texas Bancshares, Inc.Standard AVB Financial Corp.State Auto Financial Corp.State Street Corp.Sterling BancorpSterling Bancorp, Inc.Stewardship Financial Corp.Stewart Information Services Corp.Stifel Financial Corp.Stock Yards Bancorp, Inc.Summit Financial Group, Inc.Summit State BankSunTrust Banks, Inc.SVB Financial GroupSynchrony FinancialSynovus Financial Corp.T Rowe Price Group, Inc.TCF Financial Corp.TCF Financial Corp.TD Ameritrade Holding Corp.Territorial Bancorp, Inc.Teton Advisors, Inc., Class ATexas Capital Bancshares, Inc.TFS Financial Corp.TheStreet, Inc.
Third Point Reinsurance, Ltd.Timberland Bancorp, Inc.Tiptree, Inc.Tompkins Financial Corp.Torchmark Corp.Towne BankTravelers Cos., Inc. (The)TriCo BancsharesTriState Capital Holdings, Inc.Triumph Bancorp, Inc.TrustCo Bank Corp. NYTrustmark Corp.Two River BancorpU.S. Bancorp.UMB Financial Corp.Umpqua Holdings Corp.Union Bankshares, Inc.United Bancshares, Inc.United Bankshares, Inc.
40,232 3,221,376* 6,964 283,992
4,181 145,70819,302 307,288
# 44,541 1,542,009#* 5,936 127,268
2,079 57,27652,143 1,803,10597,787 5,680,447
215,171 4,701,4865,735 56,3183,021 46,554
34,612 1,309,37253,898 3,223,63925,424 972,468
6,233 165,8602,851 34,925
135,540 9,026,964* 33,790 7,838,266
522,364 18,742,420180,452 6,887,853150,312 17,043,878201,689 4,312,111
64,073 2,693,629121,680 6,217,848
11,411 328,066# 29 1,639* 60,964 3,836,465# 135,866 2,440,153
1,783 11,126
T.A. U.S. Core Equity 2 PortfolioCONTINUED
Shares Value†
FINANCIALS — (Continued)* 109,600 $ 1,104,768
8,097 223,80147,142 321,98017,476 1,432,50860,777 5,550,15688,500 2,490,390
100,425 14,724,31335,071 1,323,930
* 35,514 745,794* 32,221 1,005,617
123,977 1,004,21495,584 3,397,055
5,292 75,199420,235 24,016,430
44,533 3,039,823183,754 3,208,345
619 20,545606 13,265
# 88,705 3,334,421

United Community Banks, Inc.United Community Financial Corp.United Financial Bancorp, Inc.United Fire Group, Inc.United Insurance Holdings Corp.United Security BancsharesUnity Bancorp, Inc.Universal Insurance Holdings, Inc.Univest Financial Corp.Unum GroupValley National BancorpValue Line, Inc.Veritex Holdings, Inc.Victory Capital Holdings, Inc., Class AVirtu Financial, Inc., Class AVirtus Investment Partners, Inc.Voya Financial, Inc.Waddell & Reed Financial, Inc., Class AWalker & Dunlop, Inc.Washington Federal, Inc.Washington Trust Bancorp, Inc.Waterstone Financial, Inc.Webster Financial Corp.Wellesley BankWells Fargo & Co.WesBanco, Inc.West Bancorporation, Inc.Westamerica BancorporationWestern Alliance BancorpWestern New England Bancorp, Inc.Westwood Holdings Group, Inc.White Mountains Insurance Group, Ltd.Willis Towers Watson P.L.C.Wintrust Financial Corp.WisdomTree Investments, Inc.World Acceptance Corp.WR Berkley Corp.WSFS Financial Corp.WVS Financial Corp.
Zions Bancorp NA
TOTAL FINANCIALS
Abbott LaboratoriesAbbVie, Inc.ABIOMED, Inc.Acadia Healthcare Co., Inc.Accuray, Inc.Acer Therapeutics, Inc.Achillion Pharmaceuticals, Inc.
96,002 2,755,25758,731 597,88264,377 923,16630,167 1,576,82949,560 561,51511,687 125,2859,514 197,035
# 55,727 1,382,58736,576 1,004,377
130,691 4,175,577# 223,443 2,493,624
1,300 33,930# 44,050 1,127,240* 8,570 153,146# 76,147 1,650,867# 9,673 1,036,559
89,684 5,037,550# 105,608 1,848,140
48,984 2,857,727114,583 4,191,44618,309 919,66136,010 608,56993,484 4,767,684
# 542 16,9381,245,689 60,303,804
65,694 2,403,08719,598 415,086
# 27,388 1,755,571* 101,538 5,020,039
30,474 284,6278,986 281,2624,013 4,317,988
46,472 9,072,26449,595 3,548,026
# 133,653 828,649* 12,817 1,624,298
103,610 7,189,49867,389 2,855,272
757 13,028
T.A. U.S. Core Equity 2 PortfolioCONTINUED
Shares Value†
FINANCIALS — (Continued)# 135,981 $ 6,128,664
1,706,980,071
HEALTH CARE — (10.9%)229,239 19,966,717196,114 13,065,115
* 10,100 2,813,456#* 103,370 3,301,638#* 33,775 139,828#* 819 2,449* 174,484 769,474

Aclaris Therapeutics, Inc.Acorda Therapeutics, Inc.Addus HomeCare Corp.Aduro Biotech, Inc.Adverum Biotechnologies, Inc.Aeglea BioTherapeutics, Inc.Agilent Technologies, Inc.Agios Pharmaceuticals, Inc.Akebia Therapeutics, Inc.Akorn, Inc.Albireo Pharma, Inc.Alder Biopharmaceuticals, Inc.Aldeyra Therapeutics, Inc.Alexion Pharmaceuticals, Inc.Align Technology, Inc.Alkermes P.L.C.Allena Pharmaceuticals, Inc.Allergan P.L.C.Allscripts Healthcare Solutions, Inc.Alnylam Pharmaceuticals, Inc.Alpine Immune Sciences, Inc.AMAG Pharmaceuticals, Inc.Amedisys, Inc.American Renal Associates Holdings, Inc.AmerisourceBergen Corp.Amgen, Inc.Amicus Therapeutics, Inc.AMN Healthcare Services, Inc.Amphastar Pharmaceuticals, Inc.AnaptysBio, Inc.AngioDynamics, Inc.ANI Pharmaceuticals, Inc.Anika Therapeutics, Inc.Anthem, Inc.Apollo Endosurgery, Inc.Applied Genetic Technologies Corp.Aptevo Therapeutics, Inc.Apyx Medical Corp.Ardelyx, Inc.Arena Pharmaceuticals, Inc.Assembly Biosciences, Inc.Assertio Therapeutics, Inc.Atara Biotherapeutics, Inc.Atrion Corp.Audentes Therapeutics, Inc.Avanos Medical, Inc.Baxter International, Inc.Becton Dickinson and Co.
Bellicum Pharmaceuticals, Inc.
* 26,968 34,519#* 64,250 445,252* 11,870 956,603* 40,320 53,222#* 58,537 784,981* 17,876 160,169
111,385 7,731,233#* 9,632 463,396#* 34,861 146,068#* 10,095 37,553#* 9,695 251,004#* 30,348 307,122#* 14,742 80,786* 20,652 2,339,665* 36,980 7,731,778* 27,027 625,945* 5,792 23,689
60,237 9,668,038* 208,406 2,146,582#* 19,376 1,503,384* 1,694 7,183#* 7,668 63,338* 26,906 3,710,068#* 18,250 140,525
85,165 7,422,130141,669 26,432,602
#* 55,262 685,249* 91,877 4,904,394* 44,669 900,080#* 16,948 910,277* 50,849 1,036,303#* 16,144 1,365,621#* 16,824 926,834
83,421 24,576,661* 3,804 10,385* 9,627 37,160#* 20,118 17,905
18,279 132,340* 52,822 127,301#* 36,626 2,295,718* 11,593 144,912#* 58,005 198,957#* 35,344 504,359
1,573 1,210,423* 41,785 1,626,272* 60,076 2,446,295
101,472 8,520,60443,543 11,007,670
T.A. U.S. Core Equity 2 PortfolioCONTINUED
Shares Value†
HEALTH CARE — (Continued)#* 16,467 $ 23,712

Biogen, Inc.BioMarin Pharmaceutical, Inc.Bio-Rad Laboratories, Inc., Class ABioScrip, Inc.BioSpecifics Technologies Corp.Bio-Techne Corp.BioTelemetry, Inc.Bluebird Bio, Inc.Boston Scientific Corp.Bristol-Myers Squibb Co.Brookdale Senior Living, Inc.Bruker Corp.Calithera Biosciences, Inc.Cambrex Corp.Cantel Medical Corp.Capital Senior Living Corp.Cardinal Health, Inc.Cardiovascular Systems, Inc.Castlight Health, Inc., Class BCatalent, Inc.Catalyst Biosciences, Inc.Celgene Corp.Cellular Biomedicine Group, Inc.Centene Corp.Cerner Corp.Charles River Laboratories International, Inc.Chembio Diagnostics, Inc.Chemed Corp.ChemoCentryx, Inc.Chiasma, Inc.Chimerix, Inc.Cidara Therapeutics, Inc.Cigna Corp.Clearside Biomedical, Inc.Cocrystal Pharma, Inc.Collegium Pharmaceutical, Inc.Community Health Systems, Inc.Computer Programs & Systems, Inc.Concert Pharmaceuticals, Inc.CONMED Corp.Cooper Cos., Inc. (The)Corcept Therapeutics, Inc.CorVel Corp.Corvus Pharmaceuticals, Inc.Covetrus, Inc.Cross Country Healthcare, Inc.CryoLife, Inc.Cumberland Pharmaceuticals, Inc.Cutera, Inc.CVS Health Corp.Cymabay Therapeutics, Inc.CytomX Therapeutics, Inc.Danaher Corp.DaVita, Inc.Deciphera Pharmaceuticals, Inc.
* 35,325 8,400,991* 24,458 1,940,009* 18,090 5,696,541#* 8,203 23,214* 7,011 407,339
19,795 4,159,919* 40,786 1,914,903#* 13,460 1,766,356* 234,551 9,959,035# 193,364 8,587,295* 224,592 1,749,572
94,750 4,533,787* 30,755 130,401#* 44,319 1,941,172# 27,844 2,569,444* 30,415 162,416
114,710 5,245,688* 4,460 204,402* 85,300 137,333* 140,973 7,963,565#* 4,256 34,857* 97,802 8,984,092#* 1,300 17,927* 192,082 10,005,551
170,353 12,205,792* 60,390 8,124,871* 2,903 17,563
14,479 5,869,642* 19,906 158,850#* 4,306 23,640* 43,891 158,008#* 3,901 5,539* 131,831 22,400,724#* 6,000 6,780#* 10,001 21,202#* 4,465 48,981#* 140,707 288,449
12,920 333,465#* 27,172 273,350
28,648 2,502,40319,448 6,561,755
#* 107,494 1,210,382* 19,547 1,665,404#* 12,238 47,851#* 24,314 575,512* 39,133 371,372* 34,272 987,719#* 12,297 71,937* 8,996 229,938
437,696 24,454,076* 50,683 313,221#* 25,356 261,420
128,498 18,053,969* 116,580 6,977,313#* 32,746 723,687

Denali Therapeutics, Inc.DENTSPLY SIRONA, Inc.Dermira, Inc.
DexCom, Inc.Digirad Corp.Diplomat Pharmacy, Inc.Dyadic International, Inc.Eagle Pharmaceuticals, Inc.Edwards Lifesciences Corp.Eiger BioPharmaceuticals, Inc.Elanco Animal Health, Inc.Eli Lilly & Co.Emergent BioSolutions, Inc.Enanta Pharmaceuticals, Inc.Encompass Health Corp.Endo International P.L.C.Endologix, Inc.Enochian Biosciences, Inc.Ensign Group, Inc. (The)Enzo Biochem, Inc.Evelo Biosciences, Inc.Evolent Health, Inc., Class AExact Sciences Corp.Exelixis, Inc.Five Prime Therapeutics, Inc.Flexion Therapeutics, Inc.FONAR Corp.Fulgent Genetics, Inc.G1 Therapeutics, Inc.Genomic Health, Inc.Gilead Sciences, Inc.Global Blood Therapeutics, Inc.Globus Medical, Inc., Class AGlycoMimetics, Inc.Guardant Health, Inc.Haemonetics Corp.Halozyme Therapeutics, Inc.Hanger, Inc.Harvard Bioscience, Inc.HCA Healthcare, Inc.HealthEquity, Inc.HealthStream, Inc.Henry Schein, Inc.Heron Therapeutics, Inc.Heska Corp.Hill-Rom Holdings, Inc.HMS Holdings Corp.Hologic, Inc.Horizon Therapeutics P.L.C.
#* 15,033 320,955101,162 5,508,271
#* 24,309 214,162
T.A. U.S. Core Equity 2 PortfolioCONTINUED
Shares Value†
HEALTH CARE — (Continued)* 8,806 $ 1,381,397
862 4,612#* 90,391 476,361#* 2,750 15,923#* 6,909 379,028* 35,600 7,577,460#* 3,700 40,959* 61,311 2,020,811
150,141 16,357,862#* 50,168 2,214,416* 11,470 860,479
128,110 8,178,542#* 170,953 541,921* 5,099 35,183#* 13,353 65,296
64,263 3,872,488* 64,190 250,983#* 2,447 14,951#* 94,253 642,805#* 11,578 1,332,744* 191,428 4,071,674* 41,340 211,247#* 9,342 93,794* 4,738 116,271* 2,085 13,886#* 8,631 214,135* 6,104 445,409
355,008 23,260,124#* 40,259 2,206,193* 69,048 3,147,208#* 33,333 307,664#* 700 65,793* 39,988 4,881,735* 9,810 166,672#* 14,155 244,174* 31,221 77,428
23,046 3,076,871#* 26,457 2,168,945* 31,090 877,982#* 60,787 4,044,767#* 8,228 143,496#* 3,504 280,811
85,379 9,104,817* 71,942 2,510,776* 197,703 10,132,279* 184,545 4,593,325

Humana, Inc.ICU Medical, Inc.IDEXX Laboratories, Inc.Illumina, Inc.Incyte Corp.Infinity Pharmaceuticals, Inc.InfuSystem Holdings, Inc.Innoviva, Inc.Inogen, Inc.Inovalon Holdings, Inc., Class AInovio Pharmaceuticals, Inc.Insmed, Inc.Inspire Medical Systems, Inc.
Insulet Corp.Integer Holdings Corp.Integra LifeSciences Holdings Corp.Intellia Therapeutics, Inc.Intra-Cellular Therapies, Inc.IntriCon Corp.Intuitive Surgical, Inc.Invacare Corp.Ionis Pharmaceuticals, Inc.Iovance Biotherapeutics, Inc.IQVIA Holdings, Inc.IRIDEX Corp.IVERIC bio, Inc.Jazz Pharmaceuticals P.L.C.Johnson & JohnsonJounce Therapeutics, Inc.Kadmon Holdings, Inc.Kala Pharmaceuticals, Inc.KalVista Pharmaceuticals, Inc.Karyopharm Therapeutics, Inc.Kewaunee Scientific Corp.Kindred Biosciences, Inc.Kodiak Sciences, Inc.Kura Oncology, Inc.Laboratory Corp. of America HoldingsLannett Co., Inc.Lantheus Holdings, Inc.LeMaitre Vascular, Inc.LHC Group, Inc.Ligand Pharmaceuticals, Inc.Lipocine, Inc.LivaNova P.L.C.Luminex Corp.MacroGenics, Inc.Madrigal Pharmaceuticals, Inc.Magellan Health, Inc.
61,779 18,332,918* 12,586 3,202,382* 26,214 7,393,659* 8,628 2,583,051* 25,048 2,127,076#* 17,364 25,525* 3,809 16,912#* 76,744 911,719#* 10,076 619,674#* 21,381 320,715#* 36,606 101,033#* 40,738 894,199* 10,853 733,988
T.A. U.S. Core Equity 2 PortfolioCONTINUED
Shares Value†
HEALTH CARE — (Continued)#* 6,319 $ 776,858* 26,683 2,335,563#* 56,322 3,570,252#* 40,445 732,054#* 48,796 407,447#* 4,649 83,589* 9,063 4,708,319# 40,299 215,600#* 13,892 914,927#* 44,215 1,087,247* 69,787 11,107,997#* 3,478 11,964
19,992 23,790* 34,366 4,789,933
750,976 97,792,095* 20,531 98,343#* 16,175 42,379#* 17,388 102,241#* 4,537 75,269#* 39,061 344,127
1,276 23,287* 33,036 225,306#* 2,330 28,682* 32,207 615,798* 50,564 8,470,481#* 22,129 156,452* 52,402 1,185,333# 18,926 626,261#* 38,941 4,929,152#* 11,658 1,066,824#* 5,003 9,456#* 33,811 2,605,138
40,939 889,604* 41,093 591,328#* 7,027 613,387* 29,704 2,089,379

Mallinckrodt P.L.C.Marinus Pharmaceuticals, Inc.Masimo Corp.McKesson Corp.Medidata Solutions, Inc.MEDNAX, Inc.Medpace Holdings, Inc.Medtronic P.L.C.MEI Pharma, Inc.Melinta Therapeutics, Inc.Menlo Therapeutics, Inc.Merck & Co., Inc.Meridian Bioscience, Inc.Merit Medical Systems, Inc.Merrimack Pharmaceuticals, Inc.Mersana Therapeutics, Inc.Mesa Laboratories, Inc.Mettler-Toledo International, Inc.Millendo Therapeutics, Inc.Minerva Neurosciences, Inc.Mirati Therapeutics, Inc.Molecular Templates, Inc.Molina Healthcare, Inc.
Momenta Pharmaceuticals, Inc.Mylan NVMyoKardia Inc.Myriad Genetics, Inc.Nabriva Therapeutics P.L.C.National HealthCare Corp.National Research Corp.Natus Medical, Inc.Nektar TherapeuticsNeogen Corp.NeoGenomics, Inc.Neurocrine Biosciences, Inc.NextGen Healthcare, Inc.Novocure, Ltd.NuVasive, Inc.Nuvectra Corp.ObsEva SAOmnicell, Inc.OPKO Health, Inc.OraSure Technologies, Inc.Orthofix Medical, Inc.Otonomy, Inc.Ovid therapeutics, Inc.Owens & Minor, Inc.Oxford Immunotec Global P.L.C.Pacira BioSciences, Inc.
#* 104,096 708,894#* 27,955 30,751* 48,812 7,704,974
72,185 10,030,106* 10,267 938,096* 68,590 1,685,256#* 34,236 2,696,427
226,678 23,107,555* 12,900 21,930* 2,768 10,989* 7,134 27,038
600,469 49,832,92267,232 803,422
* 40,323 1,591,146* 6,647 40,813* 6,913 24,196# 3,467 872,575* 9,121 6,902,317# 9,307 91,302* 42,207 280,254#* 7,652 809,582#* 19,933 130,960* 66,038 8,768,526
T.A. U.S. Core Equity 2 PortfolioCONTINUED
Shares Value†
HEALTH CARE — (Continued)* 89,402 $ 1,010,243* 249,180 5,207,862#* 2,441 132,864* 70,310 2,048,833#* 29,403 69,832
16,190 1,418,24410,330 696,449
* 31,308 972,740#* 25,277 719,383* 27,994 1,998,772#* 29,968 730,320#* 9,115 878,595* 62,291 1,019,081* 7,368 613,165#* 65,453 4,359,170* 9,196 19,496#* 4,923 44,258* 32,637 2,454,629#* 104,349 220,176* 52,558 438,859* 18,760 1,002,722#* 20,058 56,965#* 10,234 20,877# 48,656 131,858#* 15,050 194,145* 13,839 607,394

Patterson Cos., Inc.PDL BioPharma, Inc.Penumbra, Inc.PerkinElmer, Inc.Perrigo Co. P.L.C.PetIQ, Inc.Pfenex, Inc.Pfizer, Inc.Phibro Animal Health Corp., Class APieris Pharmaceuticals, Inc.PRA Health Sciences, Inc.Premier, Inc., Class APrestige Consumer Healthcare, Inc.Progenics Pharmaceuticals, Inc.Protagonist Therapeutics, Inc.Prothena Corp. P.L.C.Providence Service Corp. (The)Psychemedics Corp.PTC Therapeutics, Inc.Pulse Biosciences, Inc.Quest Diagnostics, Inc.Quidel Corp.Quorum Health Corp.Ra Pharmaceuticals, Inc.RadNet, Inc.Regeneron Pharmaceuticals, Inc.REGENXBIO, Inc.Repligen Corp.ResMed, Inc.Retrophin, Inc.Rhythm Pharmaceuticals, Inc.Rigel Pharmaceuticals, Inc.Rocket Pharmaceuticals, Inc.
RTI Surgical Holdings, Inc.Sage Therapeutics, Inc.Sangamo Therapeutics, Inc.Sarepta Therapeutics, Inc.Savara, Inc.SeaSpine Holdings Corp.Seattle Genetics, Inc.Select Medical Holdings Corp.Sesen Bio, Inc.Simulations Plus, Inc.Spark Therapeutics, Inc.Spectrum Pharmaceuticals, Inc.Spero Therapeutics, Inc.Spring Bank Pharmaceuticals, Inc.STAAR Surgical Co.STERIS P.L.C.
# 106,925 2,117,115#* 183,404 528,204#* 2,958 495,761# 60,588 5,217,839
45,085 2,435,041#* 20,575 704,488* 17,614 103,570
1,578,695 61,316,51421,512 669,669
* 18,423 101,326* 51,907 5,186,028#* 65,577 2,541,109#* 67,883 2,348,752#* 42,113 226,568* 16,855 185,742#* 41,695 390,265* 14,660 817,148
478 4,307#* 20,137 969,999#* 2,315 30,234
83,636 8,537,563* 31,504 1,859,681#* 30,755 51,053* 12,555 427,372#* 39,944 588,375* 10,883 3,316,703#* 33,495 1,487,513#* 35,241 3,326,398
46,588 5,995,876#* 38,496 761,836#* 14,178 272,926#* 122,448 279,181#* 1,075 13,094
T.A. U.S. Core Equity 2 PortfolioCONTINUED
Shares Value†
HEALTH CARE — (Continued)* 61,505 $ 262,011#* 7,788 1,248,728#* 104,823 1,258,924#* 11,676 1,737,973* 4,259 10,818* 16,348 207,783#* 16,801 1,272,004* 191,155 3,199,935#* 24,931 30,665
6,759 262,384#* 19,799 1,980,296#* 70,532 534,633* 6,986 72,585* 2,715 12,869#* 6,053 177,413
30,398 4,525,046

Stryker Corp.Supernus Pharmaceuticals, Inc.Surgery Partners, Inc.Surmodics, Inc.Syndax Pharmaceuticals, Inc.Syneos Health, Inc.Synlogic, Inc.Syros Pharmaceuticals, Inc.Taro Pharmaceutical Industries, Ltd.Teladoc Health, Inc.Teleflex, Inc.Tenet Healthcare Corp.Tetraphase Pharmaceuticals, Inc.Thermo Fisher Scientific, Inc.Tivity Health, Inc.Tocagen, Inc.Triple-S Management Corp., Class BUltragenyx Pharmaceutical Inc.United Therapeutics Corp.UnitedHealth Group, Inc.Universal Health Services, Inc., Class BUS Physical Therapy, Inc.Utah Medical Products, Inc.Vanda Pharmaceuticals, Inc.Varex Imaging Corp.Varian Medical Systems, Inc.VBI Vaccines, Inc.Veeva Systems, Inc., Class AVerastem, Inc.Vertex Pharmaceuticals, Inc.ViewRay, Inc.Viking Therapeutics, Inc.Vocera Communications, Inc.Waters Corp.WellCare Health Plans, Inc.West Pharmaceutical Services, Inc.Wright Medical Group NVXencor, Inc.Zafgen, Inc.Zimmer Biomet Holdings, Inc.Zoetis, Inc.Zogenix, Inc.
Zynerba Pharmaceuticals, Inc.
TOTAL HEALTH CARE
3M Co.AAON, Inc.AAR Corp.ABM Industries, Inc.
34,060 7,145,107#* 58,613 1,955,916#* 14,404 109,903* 12,709 529,965#* 11,973 114,941#* 67,961 3,472,127#* 43,410 243,530#* 21,519 160,962
22,175 1,791,075#* 8,979 612,727
23,195 7,880,269#* 122,828 2,895,056#* 44,297 15,229
75,511 20,967,894#* 56,626 988,124* 11,260 59,903* 26,289 630,416#* 5,873 353,907* 63,752 5,051,708
228,707 56,950,33055,046 8,304,24015,992 2,064,247
# 3,908 355,589#* 50,448 628,078* 46,958 1,492,795* 21,286 2,498,338#* 3,707 2,713* 25,160 4,174,044#* 46,019 69,029* 13,281 2,212,880#* 7,940 71,142#* 29,392 226,024#* 2,944 75,572#* 11,900 2,505,664* 46,674 13,407,106
46,887 6,436,178#* 40,124 1,157,979#* 50,513 2,223,582#* 12,728 11,582
62,343 8,424,410102,206 11,742,447
#* 39,849 1,919,526
T.A. U.S. Core Equity 2 PortfolioCONTINUED
Shares Value†
HEALTH CARE — (Continued)#* 3,973 $ 42,074
1,154,041,974
INDUSTRIALS — (13.5%)106,457 18,600,167
# 74,999 3,809,94959,943 2,509,21482,460 3,470,741

Acacia Research Corp.ACCO Brands Corp.Acme United Corp.Actuant Corp., Class AAcuity Brands, Inc.ADT, Inc.Advanced Disposal Services, Inc.Advanced Drainage Systems, Inc.AECOMAegion Corp.Aerojet Rocketdyne Holdings, Inc.Aerovironment, Inc.AGCO Corp.Air Lease Corp.Air T, Inc.Air Transport Services Group, Inc.Alamo Group, Inc.Alaska Air Group, Inc.Albany International Corp., Class AAllegiant Travel Co.Allegion P.L.C.Allied Motion Technologies, Inc.Allison Transmission Holdings, Inc.Altra Industrial Motion Corp.AMERCOAmeresco, Inc., Class AAmerican Airlines Group, Inc.American Woodmark Corp.AMETEK, Inc.AMREP Corp.AO Smith Corp.Apogee Enterprises, Inc.Applied Industrial Technologies, Inc.ARC Document Solutions, Inc.ArcBest Corp.Arconic, Inc.Arcosa, Inc.Argan, Inc.Armstrong Flooring, Inc.Armstrong World Industries, Inc.Arotech Corp.ASGN, Inc.Astec Industries, Inc.Astronics Corp.Astronics Corp., Class BAtkore International Group, Inc.Atlas Air Worldwide Holdings, Inc.Avis Budget Group, Inc.Axon Enterprise, Inc.AZZ, Inc.Barnes Group, Inc.
* 23,858 66,564129,368 1,265,219
1,355 28,18466,466 1,522,07130,155 4,047,404
# 24,156 153,391* 64,747 2,095,860
62,511 2,058,487* 142,703 5,130,173* 31,723 597,979#* 108,189 4,621,834* 26,314 1,443,323
88,531 6,816,887133,286 5,570,022
* 720 12,650* 118,409 2,760,114
11,204 1,096,760102,671 6,505,235
35,332 3,038,19920,484 3,069,52754,111 5,602,65312,549 497,442
143,034 6,572,41252,234 1,500,68315,147 5,861,889
* 23,292 331,911# 69,911 2,132,985* 22,313 1,893,258
88,506 7,931,023* 2,552 15,567# 96,389 4,380,880
34,742 1,409,13649,526 3,013,162
* 42,825 80,93918,043 540,027
204,691 5,125,46360,480 2,268,000
# 30,716 1,263,963* 34,801 290,936
50,555 4,939,729* 10,528 22,793* 61,338 3,867,361
28,253 923,591* 25,320 932,789#* 15,064 561,586* 57,711 1,574,933* 32,530 1,484,994* 115,605 4,206,866#* 31,200 2,190,864
31,874 1,484,69169,815 3,633,173
T.A. U.S. Core Equity 2 PortfolioCONTINUED

Barrett Business Services, Inc.Beacon Roofing Supply, Inc.BG Staffing, Inc.Blue Bird Corp.BMC Stock Holdings, Inc.Boeing Co. (The)Brady Corp., Class ABriggs & Stratton Corp.Brink's Co. (The)Builders FirstSource, Inc.BWX Technologies, Inc.CAI International, Inc.Carlisle Cos., Inc.Casella Waste Systems, Inc., Class ACaterpillar, Inc.CBIZ, Inc.CECO Environmental Corp.CH Robinson Worldwide, Inc.Chart Industries, Inc.Cimpress NVCintas Corp.CIRCOR International, Inc.Civeo Corp.Clean Harbors, Inc.Colfax Corp.Columbus McKinnon Corp.Comfort Systems USA, Inc.Commercial Vehicle Group, Inc.CompX International, Inc.Construction Partners, Inc., Class AContinental Building Products, Inc.Copa Holdings SA, Class ACopart, Inc.Cornerstone Building Brands, Inc.Costamare, Inc.CoStar Group, Inc.Covanta Holding Corp.Covenant Transportation Group, Inc., Class ACPI Aerostructures, Inc.CRA International, Inc.Crane Co.CSW Industrials, Inc.CSX Corp.Cubic Corp.Cummins, Inc.Curtiss-Wright Corp.Daseke, Inc.Deere & Co.Delta Air Lines, Inc.Deluxe Corp.Donaldson Co., Inc.Douglas Dynamics, Inc.
Shares Value†
INDUSTRIALS — (Continued)11,192 $ 979,300
#* 80,716 2,924,3417,751 128,822
* 9,860 204,299* 81,129 1,715,878
78,395 26,746,80649,275 2,548,996
# 48,257 459,88963,012 5,681,162
* 136,993 2,353,540# 88,203 4,755,024* 23,439 534,409
46,196 6,661,925* 42,430 1,849,948
169,510 22,319,382* 74,325 1,736,975* 35,553 328,154# 59,118 4,949,950* 43,585 3,291,975#* 38,848 3,746,890
43,381 11,298,148* 23,971 910,898* 136,572 225,344* 71,334 5,550,499#* 97,120 2,688,282
23,037 885,54245,334 1,904,028
* 56,952 462,450294 4,836
#* 12,400 193,812* 54,709 1,344,747
29,180 2,950,098* 150,908 11,699,897* 96,858 563,714
86,413 521,070* 7,497 4,613,654# 220,850 3,803,037* 19,763 333,007* 7,107 55,790
9,617 417,57062,637 5,242,71717,375 1,226,849
311,864 21,955,22632,407 2,145,34375,556 12,391,18447,705 6,054,242
#* 6,067 22,44864,412 10,669,848
338,350 20,652,88463,252 2,822,304
# 88,075 4,399,34635,005 1,438,706

Dover Corp.Ducommun, Inc.DXP Enterprises, Inc.Dycom Industries, Inc.Eagle Bulk Shipping, Inc.Eastern Co. (The)Eaton Corp. P.L.C.
Echo Global Logistics, Inc.Ecology and Environment, Inc., Class AEMCOR Group, Inc.Emerson Electric Co.Encore Wire Corp.EnerSysEnnis, Inc.EnPro Industries, Inc.Equifax, Inc.ESCO Technologies, Inc.Espey Manufacturing & Electronics Corp.Evoqua Water Technologies Corp.ExOne Co. (The)Expeditors International of Washington, Inc.Exponent, Inc.Fastenal Co.Federal Signal Corp.FedEx Corp.Flowserve Corp.Fluor Corp.Forrester Research, Inc.Fortive Corp.Fortune Brands Home & Security, Inc.Forward Air Corp.Franklin Covey Co.Franklin Electric Co., Inc.FreightCar America, Inc.FTI Consulting, Inc.Gardner Denver Holdings, Inc.GATX Corp.Genco Shipping & Trading, Ltd.Gencor Industries, Inc.Generac Holdings, Inc.General Dynamics Corp.General Electric Co.Genesee & Wyoming, Inc., Class AGibraltar Industries, Inc.GMS, Inc.Goldfield Corp. (The)Gorman-Rupp Co. (The)GP Strategies Corp.Graco, Inc.
80,644 7,810,371* 13,169 555,073* 19,774 671,327* 45,595 2,515,020#* 37,344 172,903
4,389 110,866120,015 9,864,033
T.A. U.S. Core Equity 2 PortfolioCONTINUED
Shares Value†
INDUSTRIALS — (Continued)* 38,202 $ 804,534
903 9,39163,337 5,345,009
108,572 7,044,15126,699 1,466,30949,887 3,397,80434,457 700,51126,684 1,895,63142,708 5,940,25625,975 2,170,471
1,611 41,258#* 9,576 136,171#* 9,959 79,274
55,543 4,240,70850,000 3,440,000
# 182,444 5,619,27571,942 2,240,99397,812 16,679,88065,653 3,284,62074,745 2,429,96020,341 962,74066,741 5,075,65389,236 4,902,62636,968 2,328,984
* 13,311 485,85247,939 2,246,422
#* 12,603 68,938* 55,532 5,800,317* 97,311 3,208,344# 35,809 2,752,280* 38,018 365,733* 11,809 150,683* 82,517 5,965,979
64,163 11,930,468747,658 7,813,026
* 58,444 6,417,736* 36,956 1,531,457* 47,349 1,065,826* 31,656 74,392
35,293 1,172,433* 20,022 317,949
111,411 5,356,641

GrafTech International, Ltd.Graham Corp.Granite Construction, Inc.Great Lakes Dredge & Dock Corp.Greenbrier Cos., Inc. (The)Griffon Corp.H&E Equipment Services, Inc.Harsco Corp.Hawaiian Holdings, Inc.HC2 Holdings, Inc.HD Supply Holdings, Inc.Healthcare Services Group, Inc.Heartland Express, Inc.HEICO Corp.HEICO Corp., Class AHeidrick & Struggles International, Inc.Helios Technologies, Inc.
Herc Holdings, Inc.Heritage-Crystal Clean, Inc.Herman Miller, Inc.Hertz Global Holdings, Inc.Hexcel Corp.Hill International, Inc.Hillenbrand, Inc.HNI Corp.Honeywell International, Inc.Houston Wire & Cable Co.Hub Group, Inc., Class AHubbell, Inc.Hudson Global, Inc.Hudson Technologies, Inc.Huntington Ingalls Industries, Inc.Hurco Cos., Inc.Huron Consulting Group, Inc.Huttig Building Products, Inc.Hyster-Yale Materials Handling, Inc.IAA Inc.ICF International, Inc.IDEX Corp.IES Holdings, Inc.Illinois Tool Works, Inc.Ingersoll-Rand P.L.C.InnerWorkings, Inc.Innovative Solutions & Support, Inc.Insperity, Inc.Insteel Industries, Inc.Interface, Inc.ITT, Inc.Jacobs Engineering Group, Inc.
# 54,064 619,0337,838 169,693
53,468 1,898,114* 75,977 815,233
40,805 1,179,67356,022 915,96054,015 1,653,399
* 108,658 2,549,117# 87,798 2,281,870#* 15,682 34,030* 144,444 5,851,426# 24,507 585,962
115,676 2,295,012# 39,723 5,432,120
62,847 6,623,44525,795 766,11230,834 1,447,965
T.A. U.S. Core Equity 2 PortfolioCONTINUED
Shares Value†
INDUSTRIALS — (Continued)* 42,771 $ 1,930,683* 20,432 573,118
85,547 3,878,701* 158,660 2,462,403
107,617 8,798,766* 40,744 128,344
103,461 3,485,60159,435 2,035,054
133,998 23,109,295* 12,789 59,469* 38,908 1,764,478
43,677 5,672,769* 1,869 19,905#* 37,672 23,097
41,775 9,537,2328,108 277,213
* 28,531 1,739,535* 5,571 14,429
15,181 938,793* 149,684 6,997,727
21,044 1,792,73833,656 5,661,612
* 14,183 256,85461,692 9,514,757
115,700 14,307,462* 85,242 311,986* 12,137 66,875
50,491 5,369,71826,337 513,83577,195 1,069,92391,601 5,717,73473,738 6,084,122

JB Hunt Transport Services, Inc.JELD-WEN Holding, Inc.JetBlue Airways Corp.John Bean Technologies Corp.Johnson Controls International P.L.C.Kadant, Inc.Kaman Corp.Kansas City SouthernKAR Auction Services, Inc.Kelly Services, Inc., Class AKennametal, Inc.Kforce, Inc.Kimball International, Inc., Class BKirby Corp.Knight-Swift Transportation Holdings, Inc.Knoll, Inc.Korn FerryKratos Defense & Security Solutions, Inc.L3Harris Technologies, Inc.Landstar System, Inc.Lawson Products, Inc.LB Foster Co., Class ALennox International, Inc.Limbach Holdings, Inc.Lincoln Electric Holdings, Inc.Lindsay Corp.Lockheed Martin Corp.
LS Starrett Co. (The), Class ALSC Communications, Inc.LSI Industries, Inc.Lydall, Inc.Macquarie Infrastructure Corp.Manitex International, Inc.Manitowoc Co., Inc. (The)ManpowerGroup, Inc.Marten Transport, Ltd.Masco Corp.Masonite International Corp.MasTec, Inc.Matson, Inc.Matthews International Corp., Class AMcGrath RentCorpMercury Systems, Inc.Meritor, Inc.Mesa Air Group, Inc.Middleby Corp. (The)Milacron Holdings Corp.Miller Industries, Inc.Mistras Group, Inc.
38,999 3,992,328* 121,055 2,652,315* 275,495 5,297,769# 22,217 2,636,269
200,739 8,519,36313,178 1,231,61634,460 2,184,76450,400 6,236,496
# 149,684 4,002,55041,582 1,157,227
103,754 3,587,81346,792 1,595,13964,808 1,123,771
* 55,355 4,337,618# 164,321 5,889,265
74,618 1,809,48664,344 2,527,432
* 97,656 2,407,220123,286 25,594,174
# 27,561 3,066,712* 6,294 263,530* 10,130 244,842# 18,053 4,630,233* 2,344 20,815
59,616 5,038,744# 10,424 950,877
50,581 18,318,921
T.A. U.S. Core Equity 2 PortfolioCONTINUED
Shares Value†
INDUSTRIALS — (Continued)* 2,592 $ 15,163# 34,525 34,525
23,361 92,510* 20,104 474,454
53,850 2,231,544* 12,574 81,731* 39,244 704,430
45,721 4,176,61357,873 1,161,51174,631 3,042,706
* 38,747 2,065,215#* 84,560 4,339,619
63,024 2,578,31239,060 1,333,89933,064 2,251,989
* 40,352 3,289,495* 91,107 2,253,076* 3,909 40,028#* 42,464 5,706,312* 88,603 1,492,075
10,037 313,355* 28,670 434,637

Mobile Mini, Inc.Moog, Inc., Class AMRC Global, Inc.MSA Safety, Inc.MSC Industrial Direct Co., Inc., Class AMueller Industries, Inc.Mueller Water Products, Inc., Class AMYR Group, Inc.National Presto Industries, Inc.Navigant Consulting, Inc.Navistar International Corp.Nielsen Holdings P.L.C.NL Industries, Inc.NN, Inc.Nordson Corp.Norfolk Southern Corp.Northrop Grumman Corp.Northwest Pipe Co.NOW, Inc.NV5 Global, Inc.nVent Electric P.L.C.Old Dominion Freight Line, Inc.Omega Flex, Inc.Orion Group Holdings, Inc.Oshkosh Corp.Owens CorningPACCAR, Inc.PAM Transportation Services, Inc.Pangaea Logistics Solutions, Ltd.Park Aerospace Corp.Parker-Hannifin Corp.Park-Ohio Holdings Corp.Patrick Industries, Inc.Patriot Transportation Holding, Inc.Pentair P.L.C.Performant Financial Corp.Perma-Pipe International Holdings, Inc.
PGT Innovations, Inc.PICO Holdings, Inc.Pitney Bowes, Inc.Powell Industries, Inc.Preformed Line Products Co.Primoris Services Corp.Proto Labs, Inc.Quad/Graphics, Inc.Quanex Building Products Corp.Quanta Services, Inc.Radiant Logistics, Inc.Raven Industries, Inc.
52,321 1,776,82138,692 3,151,850
* 103,528 1,619,178# 37,215 3,920,600
53,995 3,836,34577,069 2,326,713
222,744 2,265,306* 25,013 903,470# 6,747 620,522
61,700 1,503,012* 51,681 1,614,514
134,084 3,105,385* 39,645 201,793# 39,356 323,113
45,994 6,515,51096,853 18,510,54540,050 13,840,078
* 11,077 258,759* 140,079 1,715,968* 11,608 922,488
70,577 1,749,604# 71,869 12,000,686# 3,089 234,949* 23,843 97,041
78,392 6,551,21995,607 5,545,206
162,634 11,407,149* 5,543 323,767
14,834 52,51219,413 353,12267,788 11,868,32314,894 455,756
* 38,092 1,747,280* 1,695 28,985
132,057 5,125,132* 53,477 65,242* 2,769 24,506
T.A. U.S. Core Equity 2 PortfolioCONTINUED
Shares Value†
INDUSTRIALS — (Continued)* 98,942 $ 1,594,945* 11,695 118,003# 75,768 306,860
18,073 668,5204,777 275,967
62,925 1,318,908* 16,397 1,706,928# 60,556 684,888
42,959 799,897134,118 5,018,696
* 48,514 266,34230,265 1,096,804

Raytheon Co.RBC Bearings, Inc.RCM Technologies, Inc.Red Violet, Inc.Regal Beloit Corp.Republic Services, Inc.Resideo Technologies, Inc.Resources Connection, Inc.REV Group, Inc.Rexnord Corp.Robert Half International, Inc.Rockwell Automation, Inc.Rollins, Inc.Roper Technologies, Inc.Rush Enterprises, Inc., Class ARush Enterprises, Inc., Class BRyder System, Inc.Saia, Inc.Schneider National, Inc., Class BScorpio Bulkers, Inc.Sensata Technologies Holding P.L.C.SIFCO Industries, Inc.Simpson Manufacturing Co., Inc.SiteOne Landscape Supply, Inc.SkyWest, Inc.Snap-on, Inc.Southwest Airlines Co.SP Plus Corp.Spartan Motors, Inc.Spirit AeroSystems Holdings, Inc., Class ASpirit Airlines, Inc.SPX Corp.SPX FLOW, Inc.Standex International Corp.Stanley Black & Decker, Inc.Steelcase, Inc., Class AStericycle, Inc.Sterling Construction Co., Inc.Sunrun, Inc.Systemax, Inc.Team, Inc.Teledyne Technologies, Inc.Tennant Co.Terex Corp.Tetra Tech, Inc.Textainer Group Holdings, Ltd.Textron, Inc.
Thermon Group Holdings, Inc.Timken Co. (The)
53,816 9,810,119* 21,455 3,490,514* 6,052 19,972#* 746 11,809
42,050 3,348,021147,636 13,087,931
* 22,333 421,20048,687 856,891
# 62,213 906,443* 127,123 3,723,433
70,875 4,281,55943,604 7,010,651
# 85,825 2,877,71224,323 8,845,05936,658 1,380,540
1,308 51,53586,863 4,626,323
* 33,038 2,520,79912,934 249,62670,964 426,494
#* 138,570 6,572,375* 1,400 3,892
48,044 2,967,197#* 29,597 2,186,330
65,586 3,981,726# 35,034 5,346,539
285,281 14,700,530* 26,783 924,817
32,820 394,49677,839 5,981,149
* 88,323 3,747,545* 49,028 1,711,077* 52,139 2,114,758
12,499 879,55565,913 9,728,100
110,818 1,873,932#* 33,348 1,532,674* 28,096 351,762#* 131,754 2,509,914
26,758 580,649#* 32,574 539,425* 36,198 10,543,753# 21,274 1,619,164
88,348 2,690,19757,145 4,525,884
* 58,438 568,602146,297 7,212,442
T.A. U.S. Core Equity 2 PortfolioCONTINUED
Shares Value†
INDUSTRIALS — (Continued)* 36,693 $ 929,801
69,507 3,177,165

Titan International, Inc.Titan Machinery, Inc.Toro Co. (The)TPI Composites, Inc.Transcat, Inc.TransDigm Group, Inc.TransUnionTrex Co., Inc.TriMas Corp.TriNet Group, Inc.Trinity Industries, Inc.Triton International, Ltd.Triumph Group, Inc.TrueBlue, Inc.Tutor Perini Corp.Twin Disc, Inc.Ultralife Corp.UniFirst Corp.Union Pacific Corp.United Airlines Holdings, Inc.United Parcel Service, Inc., Class BUnited Rentals, Inc.United Technologies Corp.Univar, Inc.Universal Forest Products, Inc.Universal Logistics Holdings, Inc.US Ecology, Inc.USA Truck, Inc.Valmont Industries, Inc.Vectrus, Inc.Verisk Analytics, Inc.Veritiv Corp.Viad Corp.Vicor Corp.Virco Manufacturing Corp.Volt Information Sciences, Inc.VSE Corp.Wabash National Corp.WABCO Holdings, Inc.Wabtec Corp.WageWorks, Inc.Waste Management, Inc.Watsco, Inc.Watsco, Inc., Class BWatts Water Technologies, Inc., Class AWelbilt, Inc.Werner Enterprises, Inc.Wesco Aircraft Holdings, Inc.WESCO International, Inc.Willdan Group, Inc.Willis Lease Finance Corp.WillScot Corp.Woodward, Inc.WW Grainger, Inc.XPO Logistics, Inc.
71,467 270,145* 28,047 581,695# 80,842 5,886,914#* 38,014 972,018* 4,552 108,429* 7,991 3,879,151
43,924 3,636,468#* 58,144 4,753,272* 57,658 1,729,163* 55,574 4,086,912# 181,440 3,556,224
103,917 3,437,574# 64,705 1,567,802* 49,115 971,004#* 60,130 785,298* 11,080 133,736* 10,343 90,294
15,110 2,974,706237,535 42,744,423
* 208,186 19,134,375134,825 16,107,543
* 60,012 7,594,519241,232 32,228,595
#* 75,429 1,668,48974,546 3,013,89525,915 510,26628,025 1,783,231
#* 7,165 58,18022,891 3,149,802
* 12,323 498,34251,501 7,813,732
* 17,364 302,48128,309 1,957,284
#* 14,805 437,6362,861 12,903
* 6,239 28,63712,191 365,24280,993 1,282,119
* 43,139 5,712,035# 49,775 3,866,522* 26,167 1,338,965
99,177 11,603,709# 25,998 4,227,795
1,750 289,61628,582 2,653,267
#* 109,890 1,804,394# 93,733 3,107,249* 123,282 1,298,159* 60,409 3,065,153#* 10,968 383,661* 4,690 291,953#* 85,017 1,353,471
62,104 6,958,13224,242 7,055,149
#* 137,833 9,300,971
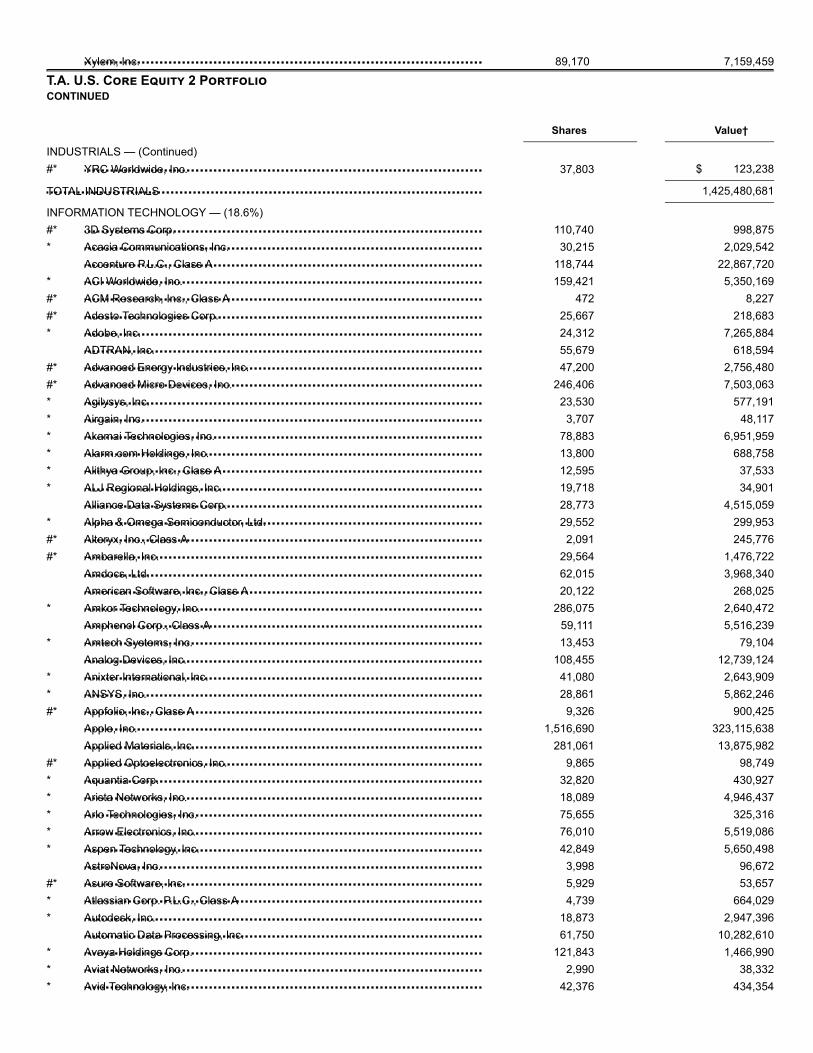
Xylem, Inc.
YRC Worldwide, Inc.
TOTAL INDUSTRIALS
3D Systems Corp.Acacia Communications, Inc.Accenture P.L.C., Class AACI Worldwide, Inc.ACM Research, Inc., Class AAdesto Technologies Corp.Adobe, Inc.ADTRAN, Inc.Advanced Energy Industries, Inc.Advanced Micro Devices, Inc.Agilysys, Inc.Airgain, Inc.Akamai Technologies, Inc.Alarm.com Holdings, Inc.Alithya Group, Inc., Class AALJ Regional Holdings, Inc.Alliance Data Systems Corp.Alpha & Omega Semiconductor, Ltd.Alteryx, Inc., Class AAmbarella, Inc.Amdocs, Ltd.American Software, Inc., Class AAmkor Technology, Inc.Amphenol Corp., Class AAmtech Systems, Inc.Analog Devices, Inc.Anixter International, Inc.ANSYS, Inc.Appfolio, Inc., Class AApple, Inc.Applied Materials, Inc.Applied Optoelectronics, Inc.Aquantia Corp.Arista Networks, Inc.Arlo Technologies, Inc.Arrow Electronics, Inc.Aspen Technology, Inc.AstroNova, Inc.Asure Software, Inc.Atlassian Corp. P.L.C., Class AAutodesk, Inc.Automatic Data Processing, Inc.Avaya Holdings Corp.Aviat Networks, Inc.Avid Technology, Inc.
89,170 7,159,459
T.A. U.S. Core Equity 2 PortfolioCONTINUED
Shares Value†
INDUSTRIALS — (Continued)#* 37,803 $ 123,238
1,425,480,681
INFORMATION TECHNOLOGY — (18.6%)#* 110,740 998,875* 30,215 2,029,542
118,744 22,867,720* 159,421 5,350,169#* 472 8,227#* 25,667 218,683* 24,312 7,265,884
55,679 618,594#* 47,200 2,756,480#* 246,406 7,503,063* 23,530 577,191* 3,707 48,117* 78,883 6,951,959* 13,800 688,758* 12,595 37,533* 19,718 34,901
28,773 4,515,059* 29,552 299,953#* 2,091 245,776#* 29,564 1,476,722
62,015 3,968,34020,122 268,025
* 286,075 2,640,47259,111 5,516,239
* 13,453 79,104108,455 12,739,124
* 41,080 2,643,909* 28,861 5,862,246#* 9,326 900,425
1,516,690 323,115,638281,061 13,875,982
#* 9,865 98,749* 32,820 430,927* 18,089 4,946,437* 75,655 325,316* 76,010 5,519,086* 42,849 5,650,498
3,998 96,672#* 5,929 53,657* 4,739 664,029* 18,873 2,947,396
61,750 10,282,610* 121,843 1,466,990* 2,990 38,332* 42,376 434,354

Avnet, Inc.AVX Corp.Aware, Inc.Axcelis Technologies, Inc.AXT, Inc.Badger Meter, Inc.Bel Fuse, Inc., Class ABel Fuse, Inc., Class BBelden, Inc.Benchmark Electronics, Inc.
BK Technologies Corp.Black Knight, Inc.Blackbaud, Inc.Booz Allen Hamilton Holding Corp.Bottomline Technologies De, Inc.Brightcove, Inc.Broadcom, Inc.Broadridge Financial Solutions, Inc.Brooks Automation, Inc.BSQUARE Corp.Cabot Microelectronics Corp.CACI International, Inc., Class ACadence Design Systems, Inc.CalAmp Corp.Calix, Inc.Carbonite, Inc.Cardtronics P.L.C., Class ACass Information Systems, Inc.CCUR Holdings, Inc.CDK Global, Inc.CDW Corp.CEVA, Inc.ChannelAdvisor Corp.Ciena Corp.Cirrus Logic, Inc.Cisco Systems, Inc.Cision, Ltd.Citrix Systems, Inc.Clearfield, Inc.Cloudera, Inc.Cognex Corp.Cognizant Technology Solutions Corp., Class ACoherent, Inc.Cohu, Inc.CommScope Holding Co., Inc.Communications Systems, Inc.CommVault Systems, Inc.Computer Task Group, Inc.Comtech Telecommunications Corp.
110,063 4,999,061117,260 1,785,870
* 6,547 18,528* 36,882 591,956#* 52,486 224,115
39,109 2,091,9401,600 23,440
10,720 176,77353,148 2,416,10852,100 1,409,826
T.A. U.S. Core Equity 2 PortfolioCONTINUED
Shares Value†
INFORMATION TECHNOLOGY — (Continued)* 766 $ 2,987* 85,344 5,403,982
28,689 2,610,69997,819 6,725,056
* 17,340 729,841* 10,100 126,048
65,997 19,138,47058,348 7,417,19874,905 2,906,314
* 9,139 11,51526,019 3,165,211
* 24,183 5,202,972* 96,715 7,148,206#* 27,267 304,300* 58,681 368,517#* 31,324 561,639* 55,506 1,580,811
14,638 745,221* 5,474 20,254
52,612 2,728,98475,620 8,935,259
* 18,133 503,735* 18,912 172,667* 148,389 6,710,151* 81,044 3,975,208
1,130,572 62,633,689* 59,202 615,109
37,090 3,495,362* 7,734 102,475#* 29,103 174,036
98,102 4,317,469165,341 10,770,313
#* 21,708 3,014,15648,266 731,713
* 132,566 1,893,0426,432 23,670
* 5,133 233,244* 11,157 49,091
14,182 422,056

Conduent, Inc.Control4 Corp.CoreLogic, Inc.Cornerstone OnDemand Inc.Corning, Inc.Coupa Software, Inc.Cray, Inc.Cree, Inc.CSG Systems International, Inc.CTS Corp.CyberOptics Corp.Cypress Semiconductor Corp.Daktronics, Inc.DASAN Zhone Solutions, Inc.Data I/O Corp.Dell Technologies, Class CDiebold Nixdorf, Inc.Digi International, Inc.Diodes, Inc.Dolby Laboratories, Inc., Class A
Domo, Inc., Class BDSP Group, Inc.DXC Technology Co.Ebix, Inc.EchoStar Corp., Class AeGain Corp.EMCORE Corp.Endurance International Group Holdings, Inc.Enphase Energy Inc.Entegris, Inc.Envestnet, Inc.EPAM Systems, Inc.ePlus, Inc.Euronet Worldwide, Inc.EVERTEC, Inc.Evolving Systems, Inc.ExlService Holdings, Inc.Extreme Networks, Inc.F5 Networks, Inc.FabrinetFair Isaac Corp.FARO Technologies, Inc.Fidelity National Information Services, Inc.Finisar Corp.Finjan Holdings, Inc.First Solar, Inc.Fiserv, Inc.Fitbit, Inc., Class AFleetCor Technologies, Inc.
* 202,024 1,838,418* 22,196 530,706* 99,910 4,552,899* 4,775 282,680
290,852 8,943,699#* 3,302 448,114* 48,643 1,684,994#* 111,609 6,939,848
39,407 2,019,21535,166 1,108,432
* 4,601 61,883282,554 6,490,265
45,909 291,063* 13,003 130,940* 5,845 25,718* 36,711 2,119,693#* 18,981 264,026* 26,824 352,199* 61,941 2,638,687
49,331 3,359,441
T.A. U.S. Core Equity 2 PortfolioCONTINUED
Shares Value†
INFORMATION TECHNOLOGY — (Continued)#* 6,093 $ 169,020* 20,898 336,876
144,247 8,044,655# 31,867 1,466,838* 45,300 2,062,056* 3,704 28,669* 21,229 63,262#* 106,491 504,767#* 6,012 169,238
136,196 5,925,888#* 16,689 1,191,761* 24,174 4,684,679* 17,759 1,347,908* 45,560 7,103,260
68,184 2,183,252* 1,300 1,050* 34,686 2,386,050* 17,695 144,037* 21,667 3,178,982* 50,625 2,717,550* 28,227 9,806,624* 19,942 1,064,703
174,128 23,202,603* 144,554 3,401,356* 14,482 31,136#* 78,838 5,084,263#* 201,488 21,242,822#* 204,259 857,888* 40,945 11,635,341

Flex, Ltd.FLIR Systems, Inc.FormFactor, Inc.Fortinet, Inc.Frequency Electronics, Inc.Gartner, Inc.Genpact, Ltd.Global Payments, Inc.GlobalSCAPE, Inc.Globant SAGoDaddy, Inc., Class AGSE Systems, Inc.GSI Technology, Inc.GTT Communications, Inc.Guidewire Software, Inc.Hackett Group, Inc. (The)Harmonic, Inc.Hewlett Packard Enterprise Co.HP, Inc.HubSpot, Inc.Ichor Holdings, Ltd.ID Systems, Inc.IEC Electronics Corp.II-VI, Inc.Immersion Corp.Infinera Corp.Information Services Group, Inc.Inphi Corp.Inseego Corp.Insight Enterprises, Inc.
Intel Corp.InterDigital, Inc.Internap Corp.International Business Machines Corp.inTEST Corp.Intevac, Inc.Intuit, Inc.IPG Photonics Corp.Iteris, Inc.Itron, Inc.j2 Global, Inc.Jabil, Inc.Jack Henry & Associates, Inc.Juniper Networks, Inc.KBR, Inc.KEMET Corp.Key Tronic Corp.Keysight Technologies, Inc.Kimball Electronics, Inc.
* 336,356 3,750,369116,230 5,771,982
* 97,119 1,629,657* 36,878 2,961,672* 4,145 48,331* 18,874 2,629,714
169,717 6,734,371102,877 17,275,106
3,392 47,318#* 16,454 1,744,124* 36,408 2,671,619* 8,763 18,928* 14,940 122,807#* 60,847 736,249#* 21,831 2,228,508
41,660 684,057* 87,598 654,357
616,923 8,865,184243,212 5,117,180
#* 3,949 705,765* 30,018 756,754#* 4,988 30,576* 4,588 27,528#* 63,935 2,538,219#* 31,194 250,800#* 200,143 772,552* 22,709 61,768#* 23,275 1,401,388#* 10,653 55,396* 40,341 2,219,562
T.A. U.S. Core Equity 2 PortfolioCONTINUED
Shares Value†
INFORMATION TECHNOLOGY — (Continued)1,852,635 $ 93,650,699
55,966 3,605,889#* 11,119 33,135
206,494 30,610,671* 2,800 12,684* 12,535 64,430
34,921 9,683,942#* 38,485 5,041,920* 6,961 37,659* 43,548 2,699,976# 55,871 4,977,547
243,345 7,514,49443,188 6,033,364
162,883 4,401,099179,400 4,732,572
# 69,897 1,406,328* 5,745 28,323* 115,835 10,369,549* 17,079 271,556

KLA Corp.Knowles Corp.Kopin Corp.Kulicke & Soffa Industries, Inc.KVH Industries, Inc.Lam Research Corp.Lattice Semiconductor Corp.Leidos Holdings, Inc.Limelight Networks, Inc.Littelfuse, Inc.LiveRamp Holdings, Inc.LogMeIn, Inc.LRAD Corp.Lumentum Holdings, Inc.Luna Innovations, Inc.MACOM Technology Solutions Holdings, Inc.MagnaChip Semiconductor Corp.Manhattan Associates, Inc.ManTech International Corp., Class AMarvell Technology Group, Ltd.Mastercard, Inc., Class AMaxim Integrated Products, Inc.MAXIMUS, Inc.MaxLinear, Inc.Methode Electronics, Inc.Microchip Technology, Inc.Micron Technology, Inc.Microsoft Corp.MicroStrategy, Inc., Class AMimecast, Ltd.Mitek Systems, Inc.MKS Instruments, Inc.MoneyGram International, Inc.MongoDB, Inc.Monolithic Power Systems, Inc.Monotype Imaging Holdings, Inc.Motorola Solutions, Inc.MTS Systems Corp.Nanometrics, Inc.Napco Security Technologies, Inc.
National Instruments Corp.NCR Corp.NeoPhotonics Corp.NetApp, Inc.NETGEAR, Inc.Netscout Systems, Inc.NetSol Technologies, Inc.Network-1 Technologies, Inc.New Relic, Inc.
59,798 8,151,663* 116,407 2,368,882#* 39,747 46,107
86,453 1,956,431* 13,737 138,744
83,915 17,505,508* 105,555 2,041,434
84,551 6,941,637* 97,014 262,908# 20,488 3,461,652* 88,608 4,668,756
36,893 2,802,761* 3,057 12,717#* 35,153 1,990,714* 9,046 46,587#* 70,432 1,381,876#* 16,223 179,264* 73,490 6,245,915
33,094 2,276,205# 328,968 8,638,700
178,420 48,578,41386,501 5,119,99475,629 5,559,488
#* 66,481 1,461,25242,516 1,273,354
# 73,983 6,985,475* 631,762 28,359,796
1,530,138 208,511,905* 8,582 1,173,417* 4,759 226,528#* 23,421 235,147
54,977 4,680,192#* 37,429 91,701#* 1,967 281,714# 24,423 3,618,512
37,930 757,46235,174 5,837,47721,076 1,214,399
* 27,210 853,850* 7,089 205,227
T.A. U.S. Core Equity 2 PortfolioCONTINUED
Shares Value†
INFORMATION TECHNOLOGY — (Continued)70,927 $ 2,961,912
#* 95,736 3,236,834* 30,452 139,775
122,597 7,170,699* 38,204 1,293,205* 96,181 2,504,553* 3,510 21,060
8,087 19,813* 4,156 387,215

NIC, Inc.Novanta, Inc.Nuance Communications, Inc.Nutanix, Inc., Class ANVE Corp.NVIDIA Corp.Okta, Inc.ON Semiconductor Corp.OneSpan, Inc.Oracle Corp.OSI Systems, Inc.Palo Alto Networks, Inc.PAR Technology Corp.Paychex, Inc.Paycom Software, Inc.Paylocity Holding Corp.PayPal Holdings, Inc.PC Connection, Inc.PCM, Inc.PC-Tel, Inc.PDF Solutions, Inc.Pegasystems, Inc.Perceptron, Inc.Perficient, Inc.Perspecta, Inc.PFSweb, Inc.Photronics, Inc.Pivotal Software, Inc., Class APixelworks, Inc.Plantronics, Inc.Plexus Corp.Power Integrations, Inc.Presidio, Inc.PRGX Global, Inc.Progress Software Corp.Proofpoint, Inc.PTC, Inc.Pure Storage, Inc., Class AQAD, Inc., Class AQAD, Inc., Class BQorvo, Inc.QUALCOMM, Inc.Qualys, Inc.Rambus, Inc.RealNetworks, Inc.RealPage, Inc.Ribbon Communications, Inc.Richardson Electronics, Ltd.RingCentral, Inc., Class ARogers Corp.
54,808 994,217* 30,942 2,601,913* 227,311 3,782,455#* 12,958 294,147
3,642 244,815138,723 23,405,345
* 7,869 1,029,501* 440,330 9,471,498* 33,564 490,706
495,426 27,892,484#* 21,769 2,450,319* 5,065 1,147,425#* 9,783 254,260
89,834 7,460,714#* 39,371 9,478,568* 22,325 2,279,159* 116,229 12,831,682
33,214 1,086,430* 11,350 395,320
14,847 68,593#* 36,748 490,586
24,892 1,881,835* 8,358 35,020* 47,526 1,623,963
78,852 1,839,617* 15,487 56,992* 80,157 771,912#* 18,361 174,062* 15,908 48,678
36,351 1,395,878* 42,331 2,527,584
25,037 2,280,12073,719 1,032,066
* 19,607 109,99558,751 2,543,331
* 2,844 358,913* 21,547 1,460,456#* 35,646 539,680
9,085 391,9271,920 63,379
* 79,280 5,810,431407,518 29,814,017
#* 18,758 1,623,692* 128,200 1,597,372* 65,004 100,106#* 26,839 1,676,901* 118,289 581,982
8,608 48,807* 6,933 984,347* 18,677 2,963,293
T.A. U.S. Core Equity 2 PortfolioCONTINUED
Shares Value†

Rudolph Technologies, Inc.Sabre Corp.salesforce.com, Inc.Sanmina Corp.Sapiens International Corp. NVScanSource, Inc.Science Applications International Corp.Seachange International, Inc.Seagate Technology P.L.C.Semtech Corp.ServiceNow, Inc.ServiceSource International, Inc.Silicon Laboratories, Inc.Skyworks Solutions, Inc.SMART Global Holdings, Inc.SMTC Corp.SolarEdge Technologies, Inc.Splunk, Inc.SPS Commerce, Inc.Square, Inc., Class ASS&C Technologies Holdings, Inc.StarTek, Inc.Steel Connect, Inc.Stratasys, Ltd.Super Micro Computer, Inc.Sykes Enterprises, Inc.Symantec Corp.Synacor, Inc.Synaptics, Inc.Synchronoss Technologies, Inc.SYNNEX Corp.Synopsys, Inc.Tableau Software, Inc., Class ATE Connectivity, Ltd.Tech Data Corp.Telaria, Inc.Telenav, Inc.Teradata Corp.Teradyne, Inc.TESSCO Technologies, Inc.Texas Instruments, Inc.TiVo Corp.Total System Services, Inc.Trade Desk, Inc. (The), Class ATransAct Technologies, Inc.Trimble, Inc.TTEC Holdings, Inc.TTM Technologies, Inc.Twilio, Inc., Class ATyler Technologies, Inc.Ubiquiti Networks, Inc.Ultra Clean Holdings, Inc.Unisys Corp.
INFORMATION TECHNOLOGY — (Continued)* 42,313 $ 1,139,066
196,123 4,610,852* 27,620 4,267,290* 84,596 2,685,923
16,847 271,068* 31,397 1,065,928
59,397 5,070,722* 29,323 58,939
111,640 5,170,048* 54,038 2,856,989* 7,840 2,174,738* 30,324 27,295* 29,127 3,268,341
104,842 8,940,926#* 26,976 821,149#* 12,467 49,058#* 56,486 3,684,582* 7,924 1,072,196* 9,989 1,117,070* 9,357 752,396
83,532 4,005,359* 29,265 196,368* 53,705 95,595#* 64,399 1,796,088* 50,253 920,132* 52,599 1,488,026
156,816 3,380,953* 3,670 5,358#* 37,483 1,206,203* 39,236 317,419
56,884 5,605,349* 44,219 5,870,514* 11,676 1,979,432
140,789 13,008,904* 44,291 4,488,450* 26,569 215,209* 35,217 332,096#* 145,987 5,346,044
171,647 9,565,8876,626 97,535
187,873 23,486,004101,944 772,736115,925 15,733,341
#* 7,478 1,969,0326,652 79,558
* 75,411 3,186,86953,568 2,513,411
#* 128,870 1,347,980#* 3,895 541,833* 10,588 2,470,710# 40,771 5,248,451#* 39,504 576,363#* 20,516 254,193

Universal Display Corp.Upland Software, Inc.USA Technologies, Inc.Veeco Instruments, Inc.Verint Systems, Inc.VeriSign, Inc.
Versum Materials, Inc.ViaSat, Inc.Viavi Solutions, Inc.Virtusa Corp.Visa, Inc., Class AVishay Intertechnology, Inc.Vishay Precision Group, Inc.VMware, Inc., Class AWayside Technology Group, Inc.Western Digital Corp.Western Union Co. (The)WEX, Inc.Workday, Inc., Class AXerox Corp.Xilinx, Inc.Xperi Corp.Zebra Technologies Corp., Class AZendesk, Inc.Zix Corp.
TOTAL INFORMATION TECHNOLOGY
Advanced Emissions Solutions, Inc.AdvanSix, Inc.AgroFresh Solutions, Inc.Air Products & Chemicals, Inc.AK Steel Holding Corp.Albemarle Corp.Alcoa Corp.Allegheny Technologies, Inc.Amcor, PLCAmerican Vanguard Corp.Ampco-Pittsburgh Corp.AptarGroup, Inc.Ashland Global Holdings, Inc.Avery Dennison Corp.Axalta Coating Systems, Ltd.Balchem Corp.Ball Corp.Berry Global Group, Inc.Boise Cascade Co.Cabot Corp.Carpenter Technology Corp.Celanese Corp.
14,522 3,065,304* 4,874 214,407#* 8,489 55,858* 59,239 705,536* 52,741 3,052,122* 14,200 2,997,478
T.A. U.S. Core Equity 2 PortfolioCONTINUED
Shares Value†
INFORMATION TECHNOLOGY — (Continued)74,455 $ 3,870,171
#* 39,920 3,257,073* 203,831 2,990,201* 34,357 1,535,071# 350,018 62,303,204
154,327 2,623,559* 10,529 428,951
6,687 1,166,8153,335 37,619
145,325 7,831,564# 181,401 3,809,421* 32,456 7,077,680* 3,900 779,922
173,641 5,573,87695,771 10,938,00659,761 1,275,897
* 53,438 11,269,540#* 6,772 565,868#* 42,901 390,828
1,971,660,454
MATERIALS — (3.9%)# 1,692 21,539* 36,394 933,142* 19,213 28,627
38,463 8,779,949#* 254,872 718,739# 63,888 4,661,268* 87,091 1,958,677#* 98,654 2,147,698* 554,262 5,875,177
40,452 577,655#* 3,640 13,177
73,152 8,852,85539,372 3,129,28773,397 8,431,113
* 211,617 6,270,21230,850 3,166,444
185,037 13,226,445* 109,212 4,920,001
49,459 1,335,39358,563 2,618,93759,378 2,672,60486,305 9,680,832

Century Aluminum Co.CF Industries Holdings, Inc.Chase Corp.Chemours Co. (The)Clearwater Paper Corp.Cleveland-Cliffs, Inc.Coeur Mining, Inc.Commercial Metals Co.Compass Minerals International, Inc.Contango ORE, Inc.Core Molding Technologies, Inc.Corteva, Inc.Crown Holdings, Inc.Domtar Corp.Dow, Inc.
DuPont de Nemours, Inc.Eagle Materials, Inc.Eastman Chemical Co.Ecolab, Inc.Element Solutions, Inc.Ferro Corp.Ferroglobe P.L.C.Flotek Industries, Inc.FMC Corp.Freeport-McMoRan, Inc.Friedman Industries, Inc.FutureFuel Corp.GCP Applied Technologies, Inc.Gold Resource Corp.Graphic Packaging Holding Co.Greif, Inc., Class AGreif, Inc., Class BHawkins, Inc.Haynes International, Inc.HB Fuller Co.Hecla Mining Co.Huntsman Corp.Ingevity Corp.Innophos Holdings, Inc.Innospec, Inc.International Flavors & Fragrances, Inc.International Paper Co.Intrepid Potash, Inc.Kaiser Aluminum Corp.Koppers Holdings, Inc.Kraton Corp.Kronos Worldwide, Inc.Linde P.L.C.Livent Corp.
#* 106,878 768,453115,649 5,731,56410,926 1,131,715
108,352 2,066,273* 20,022 393,032# 289,795 3,089,215* 233,931 1,076,083# 145,236 2,543,082# 42,409 2,368,543* 780 11,895* 6,699 44,548* 137,345 4,051,677#* 96,831 6,198,152
80,327 3,409,881* 137,345 6,652,992
T.A. U.S. Core Equity 2 PortfolioCONTINUED
Shares Value†
MATERIALS — (Continued)137,345 $ 9,910,815
41,526 3,437,52286,161 6,492,23128,663 5,782,187
* 302,466 3,030,709* 109,934 1,619,328
128,681 194,308#* 43,297 132,922
55,416 4,789,051785,168 8,683,958
5,121 31,64843,253 503,897
#* 83,417 1,837,67770,007 251,325
456,613 6,785,26937,608 1,314,77612,847 552,42112,128 529,63015,440 459,494
# 62,098 2,968,905# 575,847 1,065,317
345,609 7,102,265* 34,911 3,440,130
23,873 648,62925,734 2,403,041
# 19,260 2,773,247222,109 9,752,806
* 153,694 574,81612,565 1,209,633
* 24,108 658,148* 40,048 1,228,272# 83,977 1,126,132
50,058 9,575,094#* 51,830 333,785

Louisiana-Pacific Corp.LSB Industries, Inc.LyondellBasell Industries NV, Class AMartin Marietta Materials, Inc.Materion Corp.Mercer International, Inc.Minerals Technologies, Inc.Mosaic Co. (The)Myers Industries, Inc.Neenah, Inc.NewMarket Corp.Newmont Goldcorp Corp.Nexa Resources SANorthern Technologies International Corp.Nucor Corp.Olin Corp.Olympic Steel, Inc.OMNOVA Solutions, Inc.Owens-Illinois, Inc.Packaging Corp. of AmericaPH Glatfelter Co.PolyOne Corp.PPG Industries, Inc.PQ Group Holdings, Inc.Quaker Chemical Corp.
Ramaco Resources, Inc.Rayonier Advanced Materials, Inc.Reliance Steel & Aluminum Co.Resolute Forest Products, Inc.Royal Gold, Inc.RPM International, Inc.Ryerson Holding Corp.Schnitzer Steel Industries, Inc., Class ASchweitzer-Mauduit International, Inc.Scotts Miracle-Gro Co. (The)Sealed Air Corp.Sensient Technologies Corp.Sherwin-Williams Co. (The)Silgan Holdings, Inc.Sonoco Products Co.Southern Copper Corp.Steel Dynamics, Inc.Stepan Co.Summit Materials, Inc., Class ASunCoke Energy, Inc.Synalloy Corp.TimkenSteel Corp.Trecora ResourcesTredegar Corp.
150,572 3,935,952* 29,408 146,746
115,041 9,627,781# 26,524 6,571,321
26,150 1,624,69983,349 1,086,03743,020 2,290,815
153,756 3,873,11469,668 1,126,53222,884 1,503,708
# 7,928 3,342,524244,073 8,913,546
3,500 28,8405,456 61,653
118,240 6,429,891234,289 4,702,180
16,080 202,286* 63,080 627,646
206,316 3,501,18363,610 6,422,70248,803 796,46593,130 3,051,870
103,673 12,170,173* 3,040 47,394
15,831 2,966,571
T.A. U.S. Core Equity 2 PortfolioCONTINUED
Shares Value†
MATERIALS — (Continued)* 6,117 $ 29,790# 61,501 285,980
71,129 7,109,34464,156 391,352
# 47,315 5,415,202# 100,884 6,842,962* 34,253 279,504
31,040 826,59539,405 1,356,714
# 50,580 5,674,064# 80,023 3,344,161# 53,745 3,663,797
13,434 6,892,179128,720 3,869,323
# 111,793 6,710,93422,465 804,022
195,556 6,161,97028,889 2,864,344
#* 136,643 2,519,697* 114,410 868,372
5,922 100,556#* 67,070 468,819* 20,945 198,768
34,968 582,917

Trinseo SATronox Holdings P.L.C., Class AUFP Technologies, Inc.United States Lime & Minerals, Inc.United States Steel Corp.Universal Stainless & Alloy Products, Inc.US Concrete, Inc.Valvoline, Inc.Venator Materials P.L.CVerso Corp., Class AVulcan Materials Co.Warrior Met Coal, Inc.Westlake Chemical Corp.WestRock Co.Worthington Industries, Inc.WR Grace & Co.
TOTAL MATERIALS
Alexander & Baldwin, Inc.Altisource Asset Management Corp.Altisource Portfolio Solutions SACBRE Group, Inc., Class ACKX Lands, Inc.Consolidated-Tomoka Land Co.Five Point Holdings LLC, Class AForestar Group, Inc.FRP Holdings, Inc.Griffin Industrial Realty, Inc.Howard Hughes Corp. (The)Jones Lang LaSalle, Inc.Kennedy-Wilson Holdings, Inc.Marcus & Millichap, Inc.Newmark Group, Inc., Class ARafael Holdings, Inc., Class B
RE/MAX Holdings, Inc., Class ARealogy Holdings Corp.RMR Group, Inc. (The), Class ASt Joe Co. (The)Stratus Properties, Inc.Tejon Ranch Co.Trinity Place Holdings, Inc.
TOTAL REAL ESTATE
AES Corp.ALLETE, Inc.Alliant Energy Corp.Ameren Corp.American Electric Power Co., Inc.
49,458 1,919,465* 79,396 878,120* 4,382 190,880
5,417 438,127# 137,736 2,070,172* 9,341 151,137#* 21,479 1,011,446
121,136 2,445,736* 47,422 181,626* 39,389 637,314
44,838 6,203,33763,386 1,568,170
# 79,109 5,345,395125,734 4,532,711
77,854 3,131,288# 38,403 2,604,107
416,378,290
REAL ESTATE — (0.3%)39,161 920,675
* 743 7,029* 8,399 176,379* 182,441 9,671,197* 39 389
5,564 348,974#* 3,182 24,851#* 2,633 54,398* 10,189 505,171
3,069 119,261#* 32,393 4,373,055
47,662 6,943,877174,667 3,758,834
* 49,855 1,655,186167,531 1,651,856
* 16,232 336,002
T.A. U.S. Core Equity 2 PortfolioCONTINUED
Shares Value†
REAL ESTATE — (Continued)21,136 $ 614,635
# 153,794 801,267# 12,637 622,246#* 69,648 1,340,027* 7,316 206,458* 31,003 574,486* 16,037 67,355
34,773,608
UTILITIES — (1.8%)259,356 4,354,587
28,503 2,478,33639,365 1,950,14238,281 2,897,48937,600 3,301,656

American States Water Co.American Water Works Co., Inc.Aqua America, Inc.AquaVenture Holdings, Ltd.Artesian Resources Corp., Class AAtlantica Yield P.L.C.Atmos Energy Corp.Avangrid, Inc.Avista Corp.Black Hills Corp.California Water Service GroupCenterPoint Energy, Inc.Chesapeake Utilities Corp.Clearway Energy, Inc., Class AClearway Energy, Inc., Class CCMS Energy Corp.Connecticut Water Service, Inc.Consolidated Edison, Inc.Consolidated Water Co., Ltd.Dominion Energy, Inc.DTE Energy Co.Duke Energy Corp.Edison InternationalEl Paso Electric Co.Entergy Corp.Evergy, Inc.Eversource EnergyExelon Corp.FirstEnergy Corp.Genie Energy, Ltd., Class BHawaiian Electric Industries, Inc.IDACORP, Inc.MDU Resources Group, Inc.MGE Energy, Inc.Middlesex Water Co.National Fuel Gas Co.New Jersey Resources Corp.NextEra Energy, Inc.NiSource, Inc.Northwest Natural Holding Co.NorthWestern Corp.NRG Energy, Inc.OGE Energy Corp.ONE Gas, Inc.
Ormat Technologies, Inc.Otter Tail Corp.Pattern Energy Group, Inc., Class APG&E Corp.Pinnacle West Capital Corp.
# 26,118 2,023,36127,581 3,165,747
# 75,684 3,174,944* 2,642 45,522
6,355 228,65392,208 2,138,30335,933 3,918,134
# 24,409 1,233,87539,964 1,839,543
# 45,735 3,619,925# 43,574 2,326,416
67,859 1,968,59014,778 1,381,15222,752 390,65247,356 853,35543,378 2,525,46710,735 750,37650,098 4,256,326
8,030 112,66163,687 4,731,30726,133 3,321,76650,672 4,394,27646,580 3,472,07335,161 2,329,76832,823 3,466,76585,366 5,163,78945,056 3,417,94870,755 3,188,220
# 72,534 3,189,320# 15,076 166,137# 46,687 2,091,578
27,260 2,782,156130,696 3,494,811
30,533 2,264,02214,184 888,344
# 37,254 1,778,50662,225 3,103,16136,470 7,555,490
# 106,538 3,163,11325,919 1,851,13541,554 2,905,456
368,666 12,586,25777,354 3,322,35429,343 2,675,495
T.A. U.S. Core Equity 2 PortfolioCONTINUED
Shares Value†
UTILITIES — (Continued)# 52,901 $ 3,467,661
36,029 1,923,228# 89,943 2,062,393#* 33,562 608,479
20,547 1,874,297

PNM Resources, Inc.Portland General Electric Co.PPL Corp.Public Service Enterprise Group, Inc.Pure Cycle Corp.RGC Resources, Inc.Sempra EnergySJW GroupSouth Jersey Industries, Inc.Southern Co. (The)Southwest Gas Holdings, Inc.Spark Energy, Inc., Class ASpire, Inc.TerraForm Power, Inc., Class AUGI Corp.Unitil Corp.Vistra Energy Corp.WEC Energy Group, Inc.Xcel Energy, Inc.York Water Co. (The)
TOTAL UTILITIES
TOTAL COMMON STOCKS
GCI Liberty, Inc.
Air T Funding
TOTAL PREFERRED STOCKS
Parker Drilling Co. Warrants 09/16/2024
Air T Funding, Warrants 07/06/2020
TOTAL RIGHTS/WARRANTS
TOTAL INVESTMENT SECURITIES
State Street Institutional U.S. Government Money Market Fund 2.260%
DFA Short Term Investment Fund
(Cost $6,376,753,678)^^
68,383 3,396,58453,704 2,945,66496,485 2,858,85150,049 2,860,300
* 13,614 147,9844,261 122,632
# 18,649 2,525,63425,140 1,631,335
# 72,979 2,484,93577,191 4,338,13425,612 2,277,163
# 6,094 66,66823,955 1,974,13219,409 299,09389,981 4,597,12912,837 751,863
298,203 6,399,436# 49,804 4,256,250
56,192 3,349,6059,812 352,938
195,810,847
9,927,397,053
PREFERRED STOCKS — (0.0%)COMMUNICATION SERVICES — (0.0%)
9,450 249,858
INDUSTRIALS — (0.0%)380 908
250,766
RIGHTS/WARRANTS — (0.0%)ENERGY — (0.0%)*» 1,207 0
INDUSTRIALS — (0.0%)» 1,996 120
120
9,927,647,939
TEMPORARY CASH INVESTMENTS — (0.3%)26,848,813 26,848,813
SECURITIES LENDING COLLATERAL — (6.0%)@§ 54,916,909 635,443,550
TOTAL INVESTMENTS — (100.0%)$10,589,940,302
T.A. U.S. Core Equity 2 PortfolioCONTINUED
Summary of the Portfolio's investments as of July 31, 2019, based on their valuation inputs, is as follows (see Security Valuation Note):
Investments in Securities (Market Value)
Level 1 Level 2 Level 3 Total

Communication ServicesConsumer DiscretionaryConsumer StaplesEnergyFinancialsHealth CareIndustrialsInformation TechnologyMaterialsReal EstateUtilities
Communication ServicesIndustrials
IndustrialsTemporary Cash InvestmentsSecurities Lending Collateral
TOTAL
AMP, Ltd.Aurizon Holdings, Ltd.Australia & New Zealand Banking Group, Ltd.Bank of Queensland, Ltd.Bendigo & Adelaide Bank, Ltd.BlueScope Steel, Ltd.Boral, Ltd.Challenger, Ltd.Crown Resorts, Ltd.Downer EDI, Ltd.Fortescue Metals Group, Ltd.Harvey Norman Holdings, Ltd.Incitec Pivot, Ltd.National Australia Bank, Ltd.Newcrest Mining, Ltd.Oil Search, Ltd.Origin Energy, Ltd.QBE Insurance Group, Ltd.Qube Holdings, Ltd.Rio Tinto, Ltd.Santos, Ltd.South32, Ltd.Star Entertainment Grp, Ltd. (The)Suncorp Group, Ltd.
Common Stocks$ 727,525,012 — — $ 727,525,012
1,236,760,600 $ 1,516 — 1,236,762,116557,955,869 — — 557,955,869500,028,131 — — 500,028,131
1,706,920,191 59,880 — 1,706,980,0711,154,041,974 — — 1,154,041,9741,425,480,681 — — 1,425,480,6811,971,660,454 — — 1,971,660,454
416,378,290 — — 416,378,29034,773,608 — — 34,773,608
195,810,847 — — 195,810,847Preferred Stocks
249,858 — — 249,858908 — — 908
Rights/Warrants— 120 — 120
26,848,813 — — 26,848,813— 635,443,550 — 635,443,550
$9,954,435,236 $635,505,066 — $10,589,940,302
TAX-MANAGED DFA INTERNATIONAL VALUE PORTFOLIO
SCHEDULE OF INVESTMENTS
July 31, 2019
(Unaudited)Shares Value»
COMMON STOCKS — (98.8%)AUSTRALIA — (6.8%)
2,142,183 $ 2,605,742173,465 680,973
3,007,023 57,147,505424,892 2,706,420489,636 3,832,856989,921 8,737,181
1,307,721 4,583,05370,533 339,78631,033 250,914
680,607 3,343,8193,084,104 17,364,149
940,640 2,816,9521,486,197 3,528,5831,883,661 36,685,767
472,999 11,415,925270,507 1,309,893
1,324,719 7,168,260988,846 8,427,342137,805 296,678
846 56,6212,296,013 11,312,8428,045,380 17,118,645
807,852 2,280,1171,263,194 11,642,579

Tabcorp Holdings, Ltd.Westpac Banking Corp.Westpac Banking Corp., Sponsored ADRWhitehaven Coal, Ltd.Woodside Petroleum, Ltd.WorleyParsons, Ltd.
TOTAL AUSTRALIA
Erste Group Bank AGRaiffeisen Bank International AGVerbund AGVoestalpine AG
TOTAL AUSTRIA
AgeasKBC Group NVProximus SADPSolvay SAUCB SA
TOTAL BELGIUM
Agnico Eagle Mines, Ltd.AltaGas, Ltd.Bank of MontrealBank of Nova Scotia (The)Bank of Nova Scotia (The)Barrick Gold Corp.
Barrick Gold Corp.Bausch Health Cos., Inc.Cameco Corp.Canadian Imperial Bank of CommerceCanadian Imperial Bank of CommerceCanadian Natural Resources, Ltd.Cenovus Energy, Inc.Cenovus Energy, Inc.Empire Co., Ltd., Class AEncana Corp.Encana Corp.Fairfax Financial Holdings, Ltd.First Quantum Minerals, Ltd.Genworth MI Canada, Inc.Great-West Lifeco, Inc.Husky Energy, Inc.IA Financial Crop., Inc.Imperial Oil, Ltd.Kinross Gold Corp.Linamar Corp.Lundin Mining Corp.
1,518,842 4,659,33599,928 1,960,57810,974 215,420
1,130,734 2,833,8341,003,276 23,658,227
215,076 2,356,708
251,336,704
AUSTRIA — (0.1%)27,558 989,131
116,827 2,739,7813,594 200,5687,895 208,423
4,137,903
BELGIUM — (1.1%)207,329 11,130,757179,942 11,569,873
15,452 440,56586,655 8,873,035
114,937 8,962,382
40,976,612
CANADA — (8.5%)134,603 7,030,315111,722 1,710,791423,189 31,658,769
91,692 4,895,150371,330 19,821,595676,018 10,986,957
Tax-Managed DFA International Value PortfolioCONTINUED
Shares Value»
CANADA — (Continued)38,527 $ 626,449
* 925 22,172244,907 2,250,695
65,541 5,156,17782,451 6,486,420
1,036,236 26,196,046102,100 949,210429,409 3,984,916
43,743 1,157,7081,048,258 4,789,359
146,858 671,14128,217 13,072,651
476,469 4,389,95242,300 1,561,171
138,257 3,035,830558,772 4,335,375
* 155,214 6,228,318217,898 5,968,226
* 1,947,880 7,881,25414,953 506,440
789,101 3,820,545

Magna International, Inc.Manulife Financial Corp.Manulife Financial Corp.Metro, Inc.Nutrien, Ltd.Onex Corp.Seven Generations Energy, Ltd., Class ASNC-Lavalin Group, Inc.Stars Group, Inc. (The)Sun Life Financial, Inc.Suncor Energy, Inc.Suncor Energy, Inc.Teck Resources, Ltd., Class ATeck Resources, Ltd., Class BTeck Resources, Ltd., Class BTMX Group, Ltd.Tourmaline Oil Corp.Turquoise Hill Resources, Ltd.West Fraser Timber Co., Ltd.Wheaton Precious Metals Corp.
TOTAL CANADA
AP Moller - Maersk A.S., Class AAP Moller - Maersk A.S., Class BCarlsberg A.S., Class BDanske Bank A.S.Demant A.S.DSV A.S.H Lundbeck A.S.ISS A.S.Rockwool International A.S., Class BTryg A.S.Vestas Wind Systems A.S.
TOTAL DENMARK
Fortum OyjNokia OyjNordea Bank AbpStora Enso Oyj, Class RUPM-Kymmene Oyj
TOTAL FINLAND
Amundi SAArkema SAAtos SEAXA SABNP Paribas SABollore SABouygues SA
364,946 18,400,577422,548 7,651,839521,873 9,435,464
16,689 652,740233,353 12,790,089
4,013 242,428* 24,653 136,920
11,061 174,991* 82,859 1,288,457
264,241 10,936,935798,401 22,909,115613,987 17,621,427
600 12,388222,229 4,546,282592,686 12,144,136
48,600 3,609,465291,891 3,848,237
* 112,298 63,81513,366 522,467
192,935 5,039,462
311,220,866
DENMARK — (1.8%)1,275 1,364,8632,675 3,003,619
83,957 11,467,669258,347 3,834,533
* 41,507 1,222,888161,387 15,403,389
79,052 3,047,428163,361 4,581,383
6,187 1,510,06962,921 1,920,422
222,153 18,230,211
65,586,474
Tax-Managed DFA International Value PortfolioCONTINUED
Shares Value»
FINLAND — (0.9%)318,452 $ 7,305,171374,337 2,017,547874,513 5,610,233435,368 5,013,876446,721 12,041,364
31,988,191
FRANCE — (9.7%)26,289 1,808,80284,597 7,614,200
6,800 546,794608,078 15,316,418555,589 26,001,576809,515 3,481,191299,451 10,720,081

Carrefour SACie de Saint-GobainCie Generale des Etablissements Michelin SCACNP AssurancesCredit Agricole SAElectricite de France SAEngie SAFaurecia SEIliad SANatixis SAOrange SAPeugeot SAPublicis Groupe SARenault SASanofiSCOR SESES SASociete Generale SATotal SAValeo SAVivendi SAWorldline SA
TOTAL FRANCE
1&1 Drillisch AGAllianz SEBayer AGBayerische Motoren Werke AGCommerzbank AGContinental AGDaimler AGDeutsche Bank AGDeutsche Bank AGDeutsche Lufthansa AGDeutsche Telekom AGEvonik Industries AGFraport AG Frankfurt Airport Services WorldwideHannover Rueck SEHapag-Lloyd AGHeidelbergCement AGInnogy SEMuenchener Rueckversicherungs-Gesellschaft AG in Muenchen
RWE AGTalanx AGTelefonica Deutschland Holding AGUniper SEVolkswagen AG
TOTAL GERMANY
722,566 13,885,089623,319 23,878,475209,836 23,196,814215,286 4,449,570320,484 3,815,030525,218 6,501,774925,280 14,239,588
25,359 1,200,0536,667 689,263
622,192 2,495,1861,734,362 25,707,552
931,406 21,983,96724,585 1,213,167
214,912 11,987,28955,362 4,613,418
104,207 4,282,327138,329 2,284,566442,588 10,841,045
2,033,537 105,398,590218,084 6,796,028
73,806 2,049,964* 2,646 189,080
357,186,897
GERMANY — (6.1%)4,261 127,967
22,261 5,164,751532,064 34,461,241357,806 26,330,599731,577 4,964,219
39,365 5,397,1171,022,416 52,834,753
411,744 3,182,807719,334 5,617,998504,513 7,995,537394,344 6,459,779
20,362 579,43436,156 3,019,497
3,788 590,68711,033 463,379
239,843 17,320,84665,046 2,733,01969,429 16,545,461
Tax-Managed DFA International Value PortfolioCONTINUED
Shares Value»
GERMANY — (Continued)297,402 $ 8,035,461
* 70,139 2,943,2181,203,216 3,029,218
274,523 8,457,85037,078 6,321,595
222,576,433

Bank of East Asia, Ltd. (The)BOC Aviation, Ltd.Cathay Pacific Airways, Ltd.CK Asset Holdings, Ltd.CK Hutchison Holdings, Ltd.Hang Lung Group, Ltd.Hang Lung Properties, Ltd.Henderson Land Development Co., Ltd.Kerry Properties, Ltd.Melco International Development, Ltd.MTR Corp., Ltd.New World Development Co., Ltd.NWS Holdings, Ltd.Shangri-La Asia, Ltd.Sino Land Co., Ltd.SJM Holdings, Ltd.Sun Hung Kai Properties, Ltd.Swire Pacific, Ltd., Class ASwire Pacific, Ltd., Class BTsim Sha Tsui Properties, Ltd.WH Group, Ltd.Wharf Holdings, Ltd. (The)Wheelock & Co., Ltd.Xinyi Glass Holdings, Ltd.Yue Yuen Industrial Holdings, Ltd.
TOTAL HONG KONG
AIB Group P.L.C.Bank of Ireland Group P.L.C.CRH P.L.C.CRH P.L.C., Sponsored ADRFlutter Entertainment P.L.C.
TOTAL IRELAND
Bank Hapoalim BMBank Leumi Le-Israel BMFirst International Bank Of Israel, Ltd.Israel Discount Bank, Ltd., Class AMizrahi Tefahot Bank, Ltd.
TOTAL ISRAEL
Assicurazioni Generali SpAEni SpAFiat Chrysler Automobiles NVFiat Chrysler Automobiles NVIntesa Sanpaolo SpA
Mediobanca Banca di Credito Finanziario SpA
HONG KONG — (3.2%)128,381 371,025321,000 2,765,534
# 896,000 1,263,676938,500 7,056,706
2,105,348 19,674,432707,000 1,816,011
1,430,000 3,362,681596,730 3,086,375891,500 3,347,588284,000 691,026665,711 4,368,713
6,899,799 9,714,8461,634,172 3,034,175
822,000 1,000,1032,545,552 4,122,2092,311,000 2,508,7701,360,934 21,931,918
727,500 8,292,1001,162,500 2,070,021
259,125 876,7323,530,000 3,435,9951,313,000 3,192,5351,044,000 6,569,710
664,000 669,336806,000 2,258,358
117,480,575
IRELAND — (0.3%)297,883 1,020,289446,047 1,968,266
34,724 1,155,628122,045 4,071,421
37,842 2,989,066
11,204,670
ISRAEL — (0.5%)1,062,548 8,035,570
638,044 4,641,459* 48,295 1,244,867
854,958 3,690,022* 30,578 733,703
18,345,621
ITALY — (2.4%)410,030 7,647,188
1,117,458 17,456,1451,151,944 15,431,940
285,302 3,763,1338,996,662 19,512,915
Tax-Managed DFA International Value PortfolioCONTINUED
Shares Value»
ITALY — (Continued)271,342 $ 2,717,771

Telecom Italia SpATelecom Italia SpA, Sponsored ADRUniCredit SpA
TOTAL ITALY
AGC, Inc.Aisin Seiki Co., Ltd.Alfresa Holdings Corp.Amada Holdings Co., Ltd.Aozora Bank, Ltd.Asahi Kasei Corp.Bank of Kyoto, Ltd. (The)Brother Industries, Ltd.Canon Marketing Japan, Inc.Chiba Bank, Ltd. (The)Chugoku Bank, Ltd. (The)Citizen Watch Co., Ltd.Coca-Cola Bottlers Japan Holdings, Inc.Concordia Financial Group, Ltd.Cosmo Energy Holdings Co., Ltd.Credit Saison Co., Ltd.Dai Nippon Printing Co., Ltd.Daicel Corp.Daido Steel Co., Ltd.Dai-ichi Life Holdings, Inc.Daio Paper Corp.Daiwa Securities Group, Inc.Denka Co., Ltd.Denso Corp.Dentsu, Inc.DIC Corp.Dowa Holdings Co., Ltd.Ebara Corp.FUJIFILM Holdings Corp.Fukuoka Financial Group, Inc.Fukuyama Transporting Co., Ltd.Furukawa Electric Co., Ltd.Fuyo General Lease Co., Ltd.Glory, Ltd.GS Yuasa Corp.Gunma Bank, Ltd. (The)Hachijuni Bank, Ltd. (The)Hankyu Hanshin Holdings, Inc.Haseko Corp.Heiwa Corp.Hino Motors, Ltd.Hitachi Capital Corp.Hitachi Chemical Co., Ltd.Hitachi Metals, Ltd.Hitachi, Ltd.Honda Motor Co., Ltd.Ibiden Co., Ltd.Idemitsu Kosan Co., Ltd.IHI Corp.
* 17,626,803 9,910,260* 36,047 200,421
1,121,346 13,203,306
89,843,079
JAPAN — (22.2%)267,500 8,193,510124,500 4,046,017
67,500 1,627,422286,000 3,144,458
94,200 2,158,830486,400 4,948,092
29,600 1,148,77261,900 1,095,96856,300 1,078,391
356,600 1,763,69873,800 645,222
388,400 1,932,856144,375 3,553,779631,800 2,224,780
69,000 1,422,286118,700 1,443,055142,700 2,993,068333,800 2,824,636
30,000 1,139,010582,800 8,567,768
56,900 679,5921,223,800 5,276,457
84,000 2,417,387323,633 13,736,744
83,900 2,773,40197,700 2,635,90958,600 1,850,68488,400 2,375,666
151,400 7,176,11997,183 1,779,65624,700 930,02585,300 2,287,791
2,000 118,70242,500 1,122,26613,600 254,362
155,000 533,991217,000 817,729194,300 6,821,546110,200 1,193,76255,400 1,136,72653,400 428,39056,700 1,161,174
133,100 3,639,658288,700 3,035,202678,700 24,063,173
1,399,700 34,825,259144,200 2,570,860184,100 5,073,317
81,900 1,951,558

Iida Group Holdings Co., Ltd.Inpex Corp.Isetan Mitsukoshi Holdings, Ltd.
Isuzu Motors, Ltd.ITOCHU Corp.Itoham Yonekyu Holdings, Inc.Iyo Bank, Ltd. (The)J Front Retailing Co., Ltd.Japan Post Holdings Co., Ltd.JFE Holdings, Inc.JGC Corp.JSR Corp.JTEKT Corp.JXTG Holdings, Inc.Kajima Corp.Kamigumi Co., Ltd.Kandenko Co., Ltd.Kaneka Corp.Kawasaki Heavy Industries, Ltd.Kobe Steel, Ltd.Kokuyo Co., Ltd.Konica Minolta, Inc.K's Holdings Corp.Kuraray Co., Ltd.Kurita Water Industries, Ltd.Kyushu Financial Group, Inc.Lintec Corp.LIXIL Group Corp.Mabuchi Motor Co., Ltd.Maeda Corp.Maeda Road Construction Co., Ltd.Marubeni Corp.Mazda Motor Corp.Mebuki Financial Group, Inc.Medipal Holdings Corp.Mitsubishi Chemical Holdings Corp.Mitsubishi Corp.Mitsubishi Gas Chemical Co., Inc.Mitsubishi Heavy Industries, Ltd.Mitsubishi Logistics Corp.Mitsubishi Materials Corp.Mitsubishi Motors Corp.Mitsubishi Tanabe Pharma Corp.Mitsubishi UFJ Financial Group, Inc., Sponsored ADRMitsubishi UFJ Financial Group, Inc.Mitsubishi UFJ Lease & Finance Co., Ltd.Mitsui Chemicals, Inc.Mitsui Fudosan Co., Ltd.Mitsui OSK Lines, Ltd.
183,300 3,006,595243,300 2,133,827141,500 1,124,910
Tax-Managed DFA International Value PortfolioCONTINUED
Shares Value»
JAPAN — (Continued)95,700 $ 1,058,962
568,900 10,832,266127,500 835,251
48,818 237,261310,300 3,642,850396,700 3,888,660461,492 6,101,380
94,700 1,232,936245,500 4,054,407284,300 3,370,829
2,670,686 12,567,78513,800 177,48093,000 2,137,986
115,700 1,008,78168,600 2,546,947
189,400 4,120,932394,200 2,529,298
71,500 964,402624,500 5,175,329193,800 1,767,083491,400 5,811,684
11,100 280,224149,510 567,417
9,900 208,304337,340 5,834,988
31,900 1,101,311160,400 1,201,729
54,200 1,150,148924,500 5,993,136796,500 7,705,906382,218 943,111128,800 2,735,930
1,140,100 8,094,145629,900 16,914,251223,100 2,968,897192,000 7,920,223
23,400 622,323153,400 4,219,359528,700 2,326,541101,200 1,142,537
1,558,354 7,745,0193,959,034 19,553,673
545,800 2,892,310248,000 5,671,094156,800 3,539,632140,700 3,450,811

Mizuho Financial Group, Inc.MS&AD Insurance Group Holdings, Inc.Nagase & Co., Ltd.NEC Corp.NGK Insulators, Ltd.NGK Spark Plug Co., Ltd.NH Foods, Ltd.NHK Spring Co., Ltd.Nikkon Holdings Co., Ltd.Nikon Corp.Nippo Corp.Nippon Electric Glass Co., Ltd.Nippon Express Co., Ltd.
Nippon Kayaku Co., Ltd.Nippon Paper Industries Co., Ltd.Nippon Shokubai Co., Ltd.Nippon Steel Corp.Nippon Yusen K.K.Nipro Corp.Nissan Motor Co., Ltd.NOK Corp.Nomura Holdings, Inc.Nomura Real Estate Holdings, Inc.NSK, Ltd.NTN Corp.Obayashi Corp.Oji Holdings Corp.Orient Corp.Rengo Co., Ltd.Resona Holdings, Inc.Ricoh Co., Ltd.Rohm Co., Ltd.Sankyo Co., Ltd.Sawai Pharmaceutical Co., Ltd.Seino Holdings Co., Ltd.Sekisui House, Ltd.Shimamura Co., Ltd.Shimizu Corp.Shinsei Bank, Ltd.Shizuoka Bank, Ltd. (The)Showa Denko K.K.Sojitz Corp.Sompo Holdings, Inc.Sumitomo Bakelite Co., Ltd.Sumitomo Chemical Co., Ltd.Sumitomo Corp.Sumitomo Electric Industries, Ltd.Sumitomo Forestry Co., Ltd.Sumitomo Heavy Industries, Ltd.
7,074,900 10,041,550234,163 7,675,530
85,000 1,238,390274,300 11,213,183
92,500 1,375,73167,100 1,281,244
124,000 4,598,892255,800 2,005,911
21,700 507,079316,600 4,274,638
66,000 1,257,38967,700 1,513,99887,500 4,931,545
Tax-Managed DFA International Value PortfolioCONTINUED
Shares Value»
JAPAN — (Continued)95,400 $ 1,121,714
120,800 2,129,84533,800 2,193,786
648,000 10,152,305173,000 2,882,267
64,800 718,3711,904,600 12,379,753
120,100 1,763,205973,400 3,128,717164,100 3,323,022435,300 3,680,617247,600 687,094829,000 7,851,479
1,147,000 5,931,429110,500 129,315223,900 1,700,207
1,091,400 4,449,260487,300 4,463,352
84,900 5,916,8659,900 340,8264,600 253,793
122,500 1,525,816801,100 13,469,195
14,900 1,053,563469,800 3,780,636
93,900 1,418,357269,400 1,862,690122,800 3,294,391
1,065,100 3,327,679205,960 8,529,413
3,100 105,4532,387,000 10,885,238
571,900 8,486,231933,500 11,550,127169,700 2,124,140156,100 5,032,444

Sumitomo Metal Mining Co., Ltd.Sumitomo Mitsui Financial Group, Inc.Sumitomo Mitsui Trust Holdings, Inc.Sumitomo Osaka Cement Co., Ltd.Sumitomo Rubber Industries, Ltd.T&D Holdings, Inc.Taiheiyo Cement Corp.Taiyo Yuden Co., Ltd.Takashimaya Co., Ltd.Takeda Pharmaceutical Co, Ltd., Sponsored ADRTakeda Pharmaceutical Co., Ltd.TDK Corp.Teijin, Ltd.THK Co., Ltd.Toda Corp.Toho Holdings Co., Ltd.Tokai Rika Co., Ltd.Tokio Marine Holdings, Inc.Tokyo Tatemono Co., Ltd.Tokyu Fudosan Holdings Corp.Toray Industries, Inc.Tosoh Corp.Toyo Seikan Group Holdings, Ltd.
Toyoda Gosei Co., Ltd.Toyota Motor Corp., Sponsored ADRToyota Motor Corp.Toyota Tsusho Corp.TS Tech Co., Ltd.Ube Industries, Ltd.Universal Entertainment Corp.Wacoal Holdings Corp.Yamada Denki Co., Ltd.Yamaguchi Financial Group, Inc.Yamaha Motor Co., Ltd.Yamazaki Baking Co., Ltd.Yokohama Rubber Co., Ltd. (The)Zeon Corp.
TOTAL JAPAN
ABN AMRO Bank NVAegon NVAegon NVAkzo Nobel NVArcelorMittalArcelorMittalASR Nederland NVCoca-Cola European Partners P.L.C.ING Groep NVKoninklijke Ahold Delhaize NV
305,800 8,685,942789,027 27,592,096147,000 5,024,215
21,800 832,560232,900 2,542,214708,100 7,951,850149,700 4,204,374
78,100 1,544,82247,800 548,306
* 81,697 1,437,874545,294 18,766,778
50,400 3,869,577243,400 4,210,985
56,300 1,418,884178,100 975,584
54,300 1,207,45248,200 789,532
165,300 8,774,289240,500 2,806,169806,400 4,665,089430,900 2,964,365352,900 4,946,200171,100 2,986,807
Tax-Managed DFA International Value PortfolioCONTINUED
Shares Value»
JAPAN — (Continued)81,000 $ 1,489,652
1,343 173,3141,319,788 85,275,701
253,000 7,323,31947,600 1,310,390
131,600 2,739,97211,000 345,48719,400 470,618
554,300 2,444,997107,000 747,029137,800 2,416,312
5,500 83,519153,300 2,820,535175,900 2,034,251
815,708,319
NETHERLANDS — (3.6%)347,443 6,954,933873,469 4,304,389
25,347 124,70754,664 5,157,786
393,472 6,241,938209,998 3,301,161
89,164 3,350,4739,297 512,444
1,741,138 19,319,2201,350,935 30,683,669

Koninklijke DSM NVKoninklijke Philips NVKoninklijke Philips NVKoninklijke Vopak NVNN Group NVRandstad NV
TOTAL NETHERLANDS
Air New Zealand, Ltd.Auckland International Airport, Ltd.EBOS Group, Ltd.Fletcher Building, Ltd.Fonterra Co-operative Group, Ltd.Ryman Healthcare, Ltd.SKYCITY Entertainment Group, Ltd.
TOTAL NEW ZEALAND
Austevoll Seafood ASADNB ASAEquinor ASAEquinor ASA, Sponsored ADRNorsk Hydro ASASpareBank 1 SR-Bank ASAStorebrand ASASubsea 7 SAYara International ASA
TOTAL NORWAY
EDP Renovaveis SA
CapitaLand, Ltd.City Developments, Ltd.Frasers Property, Ltd.Golden Agri-Resources, Ltd.Hongkong Land Holdings, Ltd.Hutchison Port Holdings TrustKeppel Corp., Ltd.Olam International, Ltd.Sembcorp Industries, Ltd.Singapore Airlines, Ltd.United Industrial Corp., Ltd.UOL Group, Ltd.Wilmar International, Ltd.
TOTAL SINGAPORE
Banco Bilbao Vizcaya Argentaria SABanco de Sabadell SABanco Santander SA
204,802 25,372,520246,957 11,584,915
44,750 2,093,85246,211 2,278,437
204,322 7,676,59479,860 4,008,481
132,965,519
NEW ZEALAND — (0.2%)749,639 1,334,525650,774 3,964,537
64,811 1,059,947528,289 1,717,060
* 91,695 226,74514,760 124,45384,477 221,613
8,648,880
NORWAY — (0.8%)74,515 758,112
615,267 11,007,495131,020 2,349,226
55,613 990,4681,608,426 5,470,723
105,315 1,133,113285,931 1,932,212221,208 2,370,917
71,837 3,365,516
29,377,782
Tax-Managed DFA International Value PortfolioCONTINUED
Shares Value»
PORTUGAL — (0.0%)189,207 $ 1,947,973
SINGAPORE — (1.1%)2,368,000 6,203,721
495,800 3,479,203282,800 372,376
5,138,500 1,097,536422,500 2,576,614211,500 46,242
2,145,500 9,913,784485,800 684,712
1,325,900 2,243,393959,700 6,719,055339,701 735,208272,807 1,449,870
1,694,400 4,897,881
40,419,595
SPAIN — (2.2%)663,107 3,376,348
3,831,641 3,346,48814,815,104 63,234,904

Banco Santander SA, Sponsored ADRBankia SAIberdrola S.A.Iberdrola SARepsol SA
TOTAL SPAIN
BillerudKorsnas ABBoliden ABDometic Group ABGetinge AB, Class BHolmen AB, Class BHusqvarna AB, Class BICA Gruppen ABIntrum ABMillicom International Cellular SASkandinaviska Enskilda Banken AB, Class ASKF AB, Class BSSAB AB, Class ASSAB AB, Class BSvenska Cellulosa AB SCA, Class ASvenska Cellulosa AB SCA, Class BSvenska Handelsbanken AB, Class ASvenska Handelsbanken AB, Class BSwedbank AB, Class ATele2 AB, Class BTelefonaktiebolaget LM Ericsson, Class BTelia Co. ABTrelleborg AB, Class BVolvo AB, Class AVolvo AB, Class B
TOTAL SWEDEN
ABB, Ltd.
Adecco Group AGAlcon, Inc.Alcon, Inc.Baloise Holding AGBanque Cantonale VaudoiseChocoladefabriken Lindt & Spruengli AGCie Financiere Richemont SAClariant AGCredit Suisse Group AGCredit Suisse Group AG, Sponsored ADRDufry AGFlughafen Zurich AGHelvetia Holding AGJulius Baer Group, Ltd.
2,080 8,819653,281 1,295,188
1,220 11,57028 269
502,289 7,966,706
79,240,292
SWEDEN — (2.1%)204,631 2,362,460351,237 7,965,105
66,946 610,74098,420 1,444,083
122,156 2,579,24257,075 505,39097,902 4,344,59776,577 2,007,51571,420 3,669,178
1,249,139 11,744,465425,012 6,971,382153,185 433,945444,761 1,127,466
4,705 45,117433,333 3,596,632769,767 6,926,303
16,634 157,582420,300 5,723,530
14,846 212,14018,890 165,274
2,250,392 10,011,205266,674 3,672,120
6,315 94,17051,177 760,240
77,129,881
SWITZERLAND — (9.9%)825,333 15,579,937
Tax-Managed DFA International Value PortfolioCONTINUED
Shares Value»
SWITZERLAND — (Continued)181,472 $ 9,900,941
* 58,864 3,458,260* 132,199 7,655,592
51,160 9,240,3391,276 948,978
4 330,894400,427 34,313,887468,021 8,552,183575,806 6,962,091
68,468 826,41125,487 2,235,25123,031 4,205,83712,755 1,623,996
222,002 9,486,724

LafargeHolcim, Ltd.LafargeHolcim, Ltd.Lonza Group AGNovartis AG, Sponsored ADRNovartis AGSwatch Group AG (The)Swatch Group AG (The)Swiss Life Holding AGSwiss Re AGSwisscom AGUBS Group AGUBS Group AGVifor Pharma AGZurich Insurance Group AG
TOTAL SWITZERLAND
Anglo American P.L.C.Antofagasta P.L.C.Aviva P.L.C.Barclays P.L.C., Sponsored ADRBarclays P.L.C.Barratt Developments P.L.C.BP P.L.C., Sponsored ADRBritish American Tobacco P.L.C., Sponsored ADRBritish American Tobacco P.L.C.Carnival P.L.C.Glencore P.L.C.GVC Holdings P.L.C.HSBC Holdings P.L.C.HSBC Holdings P.L.C., Sponsored ADRInvestec P.L.C.J Sainsbury P.L.C.John Wood Group P.L.C.Kingfisher P.L.C.Lloyds Banking Group P.L.C.Lloyds Banking Group P.L.C., ADRMelrose Industries P.L.C.Micro Focus International P.L.C., Sponsored ADRMicro Focus International P.L.C.Pearson P.L.C.Pearson P.L.C., Sponsored ADRPhoenix Group Holdings P.L.C.Royal Bank of Scotland Group P.L.C.Royal Bank of Scotland Group P.L.C., Sponsored ADR
Royal Dutch Shell P.L.C., Class ARoyal Dutch Shell P.L.C., Sponsored ADR, Class ARoyal Dutch Shell P.L.C., Sponsored ADR, Class BStandard Chartered P.L.C.Standard Life Aberdeen P.L.C.
234,263 11,498,212116,138 5,687,98645,757 15,674,225
294,324 26,954,192660,996 60,612,555
35,418 10,287,93562,309 3,397,79330,439 14,709,313
155,792 15,086,39922,419 10,865,187
1,854,646 20,701,251* 345,673 3,861,167
16,099 2,382,755134,082 46,637,954
363,678,245
UNITED KINGDOM — (15.3%)1,360,585 33,340,313
243,456 2,746,8714,995,385 24,525,4211,808,466 13,527,326
55,867 104,5731,410,355 11,010,9571,511,511 60,067,442
90,672 3,228,8301,156,042 41,192,703
41,574 1,876,6169,178,897 29,435,056
44,435 318,3281,086,831 8,703,8721,250,152 50,206,104
641,798 3,651,6482,540,246 6,061,616
121,059 780,0692,281,868 6,160,784
60,864,404 39,372,183386,353 992,927
2,172,994 4,904,254107,514 2,242,735
36,011 758,545296,730 3,142,182
50,671 534,072237,094 1,994,287528,459 1,392,249816,430 4,392,393
Tax-Managed DFA International Value PortfolioCONTINUED
Shares Value»
UNITED KINGDOM — (Continued)159,771 $ 5,032,062
1,024,535 64,432,990946,894 60,099,362
1,090,923 8,977,967423,531 1,536,166

Tesco P.L.C.Vodafone Group P.L.C.Vodafone Group P.L.C., Sponsored ADRWm Morrison Supermarkets P.L.C.WPP P.L.C., Sponsored ADRWPP P.L.C.
TOTAL UNITED KINGDOM
TOTAL COMMON STOCKS
Bayerische Motoren Werke AGPorsche Automobil Holding SEVolkswagen AG
TOTAL GERMANY
TOTAL INVESTMENT SECURITIES
DFA Short Term Investment Fund
(Cost $3,638,906,137)^^
S&P 500® Emini Index
Total Futures Contracts
AustraliaAustriaBelgiumCanadaDenmarkFinlandFranceGermany
146,824 397,70320,021,312 36,438,428
490,086 8,880,3523,262,779 7,704,518
34,072 2,006,159760,260 8,955,424
561,125,487
3,632,125,998
PREFERRED STOCKS — (1.2%)GERMANY — (1.2%)
59,288 3,520,01194,085 6,166,906
211,617 35,164,958
44,851,875
3,676,977,873
Value†
SECURITIES LENDING COLLATERAL — (0.0%)@§ 267 3,089
TOTAL INVESTMENTS — (100.0%)$3,676,980,962
As of July 31, 2019, Tax-Managed DFA International Value Portfolio had entered into the following outstanding futures contracts:
Description
Numberof
ContractsExpiration
DateNotional
ValueMarketValue
UnrealizedAppreciation
(Depreciation)
Long Position Contracts:180 09/20/19 $26,448,810 $26,840,700 $391,890
$26,448,810 $26,840,700 $391,890
Summary of the Portfolio's investments as of July 31, 2019, based on their valuation inputs, is as follows (see Security Valuation Note):
Investments in Securities (Market Value)
Level 1 Level 2 Level 3 Total
Common Stocks$ 215,420 $ 251,121,284 — $ 251,336,704
— 4,137,903 — 4,137,903— 40,976,612 — 40,976,612
311,220,866 — — 311,220,866— 65,586,474 — 65,586,474— 31,988,191 — 31,988,191— 357,186,897 — 357,186,897
5,617,998 216,958,435 — 222,576,433
Tax-Managed DFA International Value PortfolioCONTINUED
Investments in Securities (Market Value)
Level 1 Level 2 Level 3 Total

Hong KongIrelandIsraelItalyJapanNetherlandsNew ZealandNorwayPortugalSingaporeSpainSwedenSwitzerlandUnited Kingdom
GermanySecurities Lending CollateralFutures Contracts**
TOTAL
A2B Australia, Ltd.Accent Group, Ltd.Adairs, Ltd.Adelaide Brighton, Ltd.Afterpay Touch Group, Ltd.AGL Energy, Ltd.Ainsworth Game Technology, Ltd.Alliance Aviation Services, Ltd.ALS, Ltd.Altium, Ltd.Alumina, Ltd.AMA Group, Ltd.Amaysim Australia, Ltd.AMP, Ltd.Ansell, Ltd.AP Eagers, Ltd.APA GroupApollo Tourism & Leisure, Ltd.Appen, Ltd.ARB Corp., Ltd.Aristocrat Leisure, Ltd.ARQ Group, Ltd.Asaleo Care, Ltd.ASX, Ltd.
— $ 117,480,575 — $ 117,480,575$ 4,071,421 7,133,249 — 11,204,670
— 18,345,621 — 18,345,6213,963,554 85,879,525 — 89,843,0799,356,207 806,352,112 — 815,708,3195,519,720 127,445,799 — 132,965,519
— 8,648,880 — 8,648,880990,468 28,387,314 — 29,377,782
— 1,947,973 — 1,947,973— 40,419,595 — 40,419,595
8,819 79,231,473 — 79,240,292— 77,129,881 — 77,129,881
35,100,030 328,578,215 — 363,678,245270,610,692 290,514,795 — 561,125,487
Preferred Stocks— 44,851,875 — 44,851,875
— 3,089 — 3,089391,890 — — 391,890
$647,067,085 $3,030,305,767 — $3,677,372,852** Valued at the unrealized appreciation/(depreciation) on the investment.
T.A. WORLD EX U.S. CORE EQUITY PORTFOLIO
SCHEDULE OF INVESTMENTS
July 31, 2019
(Unaudited)Shares Value»
COMMON STOCKS — (98.7%)AUSTRALIA — (4.7%)
111,103 $ 136,23782,285 84,93732,505 31,782
219,263 528,859* 6,039 108,438
44,453 637,06727,880 13,41220,257 39,494
177,516 870,26235,665 886,90734,413 54,557
146,259 145,395* 50,925 26,393
1,108,884 1,348,84133,195 631,49817,839 136,59696,929 730,06545,025 13,02837,214 769,66322,424 282,92482,577 1,718,35015,983 7,587
* 268,124 176,7924,967 300,458

Atlas Arteria, Ltd.AUB Group, Ltd.Aurelia Metals, Ltd.Aurizon Holdings, Ltd.Ausdrill, Ltd.AusNet ServicesAustal, Ltd.Australia & New Zealand Banking Group, Ltd.Australian Agricultural Co., Ltd.Australian Pharmaceutical Industries, Ltd.Auswide Bank, Ltd.Automotive Holdings Group, Ltd.AVJennings, Ltd.Baby Bunting Group, Ltd.Bank of Queensland, Ltd.Bapcor, Ltd.Beach Energy, Ltd.Bega Cheese, Ltd.Bell Financial Group, Ltd.Bellamy's Australia, Ltd.Bendigo & Adelaide Bank, Ltd.BHP Group, Ltd.BHP Group, Ltd., Sponsored ADRBingo Industries, Ltd.Blackmores, Ltd.BlueScope Steel, Ltd.Boral, Ltd.Brambles, Ltd.Bravura Solutions, Ltd.Breville Group, Ltd.Brickworks, Ltd.
Buru Energy, Ltd.BWX, Ltd.Caltex Australia, Ltd.Capitol Health, Ltd.Cardno, Ltd.carsales.com, Ltd.Cash Converters International, Ltd.Cedar Woods Properties, Ltd.Challenger, Ltd.Champion Iron, Ltd.CIMIC Group, Ltd.City Chic Collective, Ltd.Class, Ltd.Clean Seas Seafood, Ltd.Cleanaway Waste Management, Ltd.Clinuvel Pharmaceuticals, Ltd.Coca-Cola Amatil, Ltd.Cochlear, Ltd.
165,976 925,0809,029 73,370
* 95,370 32,915497,433 1,952,777282,080 377,980325,950 394,906121,559 335,780287,481 5,463,484
* 172,205 116,726201,372 198,096
1,410 5,316127,775 271,028
8,932 3,6269,308 15,191
180,095 1,147,145133,407 568,938
1,032,334 1,488,10369,575 209,75938,273 25,827
* 25,370 173,564153,585 1,202,259414,517 11,411,925
44,166 2,426,03813,432 22,002
4,915 300,142300,018 2,648,002349,572 1,225,114100,191 896,200
9,525 31,83633,086 433,50533,610 383,363
T.A. World ex U.S. Core Equity PortfolioCONTINUED
Shares Value»
AUSTRALIA — (Continued)* 110,733 $ 19,290
20,231 30,503116,783 2,147,995106,977 16,385
* 99,590 62,41183,734 841,490
* 96,321 8,57513,306 58,296
133,400 642,642* 10,947 23,808
6,127 152,93917,261 21,36924,575 24,78722,579 13,866
698,428 1,150,0612,372 52,623
106,906 773,74910,902 1,638,022

Codan, Ltd.Coles Group, Ltd.Collection House, Ltd.Collins Foods, Ltd.Commonwealth Bank of AustraliaComputershare, Ltd.Cooper Energy, Ltd.Corporate Travel Management, Ltd.Costa Group Holdings, Ltd.Credit Corp. Group, Ltd.Crown Resorts, Ltd.CSG, Ltd.CSL, Ltd.CSR, Ltd.Data#3, Ltd.Decmil Group, Ltd.Dicker Data, Ltd.Domain Holdings Australia, Ltd.Domino's Pizza Enterprises, Ltd.Downer EDI, Ltd.DuluxGroup, Ltd.DWS, Ltd.Eclipx Group, Ltd.Elders, Ltd.Ellex Medical Lasers, Ltd.Emeco Holdings, Ltd.EML Payments, Ltd.Energy World Corp., Ltd.EQT Holdings, Ltd.ERM Power, Ltd.Estia Health, Ltd.EVENT Hospitality and Entertainment, Ltd.Evolution Mining, Ltd.Fleetwood Corp., Ltd.FlexiGroup, Ltd.Flight Centre Travel Group, Ltd.Fortescue Metals Group, Ltd.Freedom Foods Group, Ltd.G8 Education, Ltd.GBST Holdings, Ltd.Genworth Mortgage Insurance Australia, Ltd.
GrainCorp, Ltd., Class AGUD Holdings, Ltd.GWA Group, Ltd.Hansen Technologies, Ltd.Harvey Norman Holdings, Ltd.Healius, Ltd.Helloworld Travel, Ltd.Horizon Oil, Ltd.
56,171 154,822* 127,592 1,238,813
49,356 41,36168,040 402,70577,976 4,376,13664,128 690,804
* 527,596 210,32323,584 369,138
137,043 370,29727,518 470,49260,066 485,657
* 89,104 10,99929,256 4,565,175
299,296 818,32431,676 54,83667,773 42,04213,335 61,055
110,298 226,85722,875 602,143
277,473 1,363,224147,386 939,854
30,792 25,35799,955 98,86478,305 393,324
* 26,958 11,496* 21,702 33,762* 30,202 66,765* 511,901 33,954
3,382 69,46446,362 57,339
108,310 199,51551,003 433,289
635,228 2,155,949* 18,528 22,005
136,729 170,20220,167 634,234
678,361 3,819,31410,414 33,808
196,123 387,6936,127 16,274
145,517 336,586
T.A. World ex U.S. Core Equity PortfolioCONTINUED
Shares Value»
AUSTRALIA — (Continued)98,244 $ 575,61232,532 210,745
135,577 331,49597,418 255,589
308,343 923,401938,758 1,881,885
9,009 29,412* 251,263 20,344

HT&E, Ltd.Huon Aquaculture Group, Ltd.IDP Education, Ltd.Iluka Resources, Ltd.Imdex, Ltd.IMF Bentham, Ltd.Incitec Pivot, Ltd.Independence Group NLInfomedia, Ltd.Inghams Group, Ltd.Insurance Australia Group, Ltd.Integral Diagnostics, Ltd.Integrated Research, Ltd.InvoCare, Ltd.IOOF Holdings, Ltd.IPH, Ltd.IRESS, Ltd.iSelect, Ltd.iSentia Group, Ltd.IVE Group, Ltd.James Hardie Industries P.L.C.James Hardie Industries P.L.C., Sponsored ADRJapara Healthcare, Ltd.JB Hi-Fi, Ltd.Jumbo Interactive, Ltd.Lifestyle Communities, Ltd.Link Administration Holdings, Ltd.Lovisa Holdings, Ltd.Lynas Corp., Ltd.MACA, Ltd.Macmahon Holdings, Ltd.Macquarie Group, Ltd.Magellan Financial Group, Ltd.Mayne Pharma Group, Ltd.McMillan Shakespeare, Ltd.McPherson's, Ltd.Medibank Pvt, Ltd.Medusa Mining, Ltd.Mesoblast, Ltd.Metals X, Ltd.Metcash, Ltd.Michael Hill International, Ltd.Midway, Ltd.Millennium Minerals, Ltd.Mineral Resources, Ltd.MMA Offshore, Ltd.MNF Group, Ltd.Monadelphous Group, Ltd.Monash IVF Group, Ltd.Money3 Corp., Ltd.Mortgage Choice, Ltd.
127,805 152,5086,619 21,138
37,995 496,602230,361 1,503,074175,102 159,658
* 75,412 176,122482,742 1,146,144181,347 656,716100,715 140,828112,440 311,541284,080 1,673,159
16,555 37,35439,117 73,49145,628 487,401
139,314 553,54491,500 519,53346,307 442,832
* 138,718 60,657* 80,415 14,237
19,021 28,19533,952 459,197
6,180 84,66688,070 62,95178,479 1,609,850
8,083 106,5222,536 11,721
244,778 847,7621,398 10,592
* 350,922 622,713146,139 93,853
* 196,207 24,10370,545 6,174,04526,882 1,128,940
* 689,464 248,01244,740 423,62151,205 65,179
440,322 1,085,473* 96,557 49,609* 133,807 133,858* 240,563 35,031
603,924 1,160,65712,057 4,206
5,301 12,806* 74,492 5,053
107,020 1,163,109* 266,586 40,116
7,840 19,02542,928 552,864
110,701 115,15484,184 123,09433,757 26,591
T.A. World ex U.S. Core Equity PortfolioCONTINUED

Motorcycle Holdings, Ltd.Myer Holdings, Ltd.MyState, Ltd.National Australia Bank, Ltd.Navigator Global Investments, Ltd.Netwealth Group, Ltd.New Hope Corp., Ltd.Newcrest Mining, Ltd.NEXTDC, Ltd.nib holdings, Ltd.Nick Scali, Ltd.Nine Entertainment Co. Holdings, Ltd.Northern Star Resources, Ltd.NRW Holdings, Ltd.Nufarm, Ltd.OFX Group, Ltd.Oil Search, Ltd.Onevue Holdings, Ltd.oOh!media, Ltd.Orica, Ltd.Origin Energy, Ltd.Orora, Ltd.OZ Minerals, Ltd.Pacific Current Group, Ltd.Pact Group Holdings, Ltd.Paragon Care, Ltd.Peet, Ltd.Pendal Group, Ltd.Perpetual, Ltd.Perseus Mining, Ltd.Pioneer Credit, Ltd.Platinum Asset Management, Ltd.Praemium, Ltd.Premier Investments, Ltd.Prime Media Group, Ltd.Pro Medicus, Ltd.PWR Holdings, Ltd.Qantas Airways, Ltd.QBE Insurance Group, Ltd.QMS Media, Ltd.Qube Holdings, Ltd.Ramelius Resources, Ltd.Ramsay Health Care, Ltd.REA Group, Ltd.Reckon, Ltd.Red 5, Ltd.Red River Resources, Ltd.Reece, Ltd.Regis Healthcare, Ltd.Regis Resources, Ltd.Reject Shop, Ltd. (The)Reliance Worldwide Corp., Ltd.
Shares Value»
AUSTRALIA — (Continued)5,984 $ 5,472
* 2,332,650 858,0257,947 25,127
304,809 5,936,39333,262 78,422
5,049 28,544116,689 199,34847,297 1,141,522
* 38,535 179,977169,127 921,778
16,806 72,175776,389 1,065,893233,623 2,055,745222,248 368,463121,400 403,223
88,684 82,574174,998 847,404
* 37,857 12,141101,079 307,514
14,034 209,081305,705 1,654,217630,727 1,457,436202,735 1,406,094
17,876 68,02992,135 176,45327,748 9,45996,329 77,931
132,622 705,24728,588 769,099
* 425,935 198,09511,600 18,85793,400 306,302
* 68,361 24,59128,712 308,903
* 211,487 32,67412,662 264,36013,795 40,447
334,671 1,302,869219,104 1,867,292
25,217 16,353359,338 773,614
* 285,385 194,85315,894 789,723
6,645 445,70723,466 11,309
* 100,556 16,045* 89,190 10,871
3,313 23,83046,584 88,801
239,478 904,15113,159 18,89980,327 201,286

Resolute Mining, Ltd.Ridley Corp., Ltd.Rio Tinto, Ltd.Ruralco Holdings, Ltd.Salmat, Ltd.Sandfire Resources NLSantos, Ltd.
Saracen Mineral Holdings, Ltd.SeaLink Travel Group, Ltd.Seek, Ltd.Select Harvests, Ltd.Senex Energy, Ltd.Servcorp, Ltd.Service Stream, Ltd.Seven Group Holdings, Ltd.Seven West Media, Ltd.SG Fleet Group, Ltd.Sigma Healthcare, Ltd.Silver Chef, Ltd.Silver Lake Resources, Ltd.Sims Metal Management, Ltd.SmartGroup Corp., Ltd.Sonic Healthcare, Ltd.South32, Ltd., ADRSouth32, Ltd.Southern Cross Media Group, Ltd.Spark Infrastructure GroupSpeedCast International, Ltd.St Barbara, Ltd.Star Entertainment Grp, Ltd. (The)Steadfast Group, Ltd.Suncorp Group, Ltd.Sundance Energy Australia, Ltd.Sunland Group, Ltd.Super Retail Group, Ltd.Sydney AirportTabcorp Holdings, Ltd.Tassal Group, Ltd.Technology One, Ltd.Telstra Corp., Ltd.Telstra Corp., Ltd., ADRTerracom, Ltd.Thorn Group, Ltd.Tiger Resources, Ltd.TPG Telecom, Ltd.Transurban GroupTreasury Wine Estates, Ltd.Troy Resources, Ltd.Villa World, Ltd.
351,280 426,396103,427 78,368
61,465 4,113,6908,131 23,612
11,000 3,873124,735 569,116429,083 2,114,164
T.A. World ex U.S. Core Equity PortfolioCONTINUED
Shares Value»
AUSTRALIA — (Continued)* 354,155 $1,001,496
12,809 32,76256,971 811,07029,205 148,491
* 611,190 130,19017,667 48,779
131,772 268,43237,537 460,207
* 687,208 203,27030,558 61,348
1,667,728 678,507* 27,492 13,545* 345,568 304,841
75,930 562,10633,792 215,95232,483 621,68947,819 507,360
397,945 846,732256,095 233,732493,948 800,465148,941 190,716375,864 941,969280,947 792,957220,367 571,556200,305 1,846,167
* 300,591 37,67021,844 25,62792,040 565,00585,466 487,828
336,080 1,030,99090,872 319,83196,867 505,487
352,315 955,240600 8,142
* 36,980 13,748* 57,038 10,134* 202,588 76
200,194 952,67286,191 913,49436,455 438,333
* 169,473 11,04998,748 158,090

Village Roadshow, Ltd.Virgin Australia Holdings, Ltd.Virtus Health, Ltd.Vita Group, Ltd.Vocus Group, Ltd.Webjet, Ltd.Wesfarmers, Ltd.Western Areas, Ltd.Westgold Resources, Ltd.Westpac Banking Corp.Whitehaven Coal, Ltd.WiseTech Global, Ltd.Woodside Petroleum, Ltd.Woolworths Group, Ltd.WorleyParsons, Ltd.WPP AUNZ, Ltd.
Xero, Ltd.
TOTAL AUSTRALIA
Agrana Beteiligungs AGANDRITZ AGAtrium European Real Estate, Ltd.Austria Technologie & Systemtechnik AGCA Immobilien Anlagen AGDO & CO AGErste Group Bank AGEVN AGFACC AGFlughafen Wien AGKapsch TrafficCom AGLenzing AGMayr Melnhof Karton AGOesterreichische Post AGOMV AGPalfinger AGPOLYTEC Holding AGPorr AGRaiffeisen Bank International AGRosenbauer International AGS IMMO AGSchoeller-Bleckmann Oilfield Equipment AGSemperit AG HoldingStrabag SETelekom Austria AGUBM Development AGUNIQA Insurance Group AGVerbund AGVienna Insurance Group AG Wiener Versicherung GruppeVoestalpine AG
* 44,163 79,906* 1,109,508 125,334
43,258 151,02585,452 71,583
* 271,395 597,29834,256 316,78493,077 2,492,594
107,064 158,908* 88,402 116,397
234,329 4,597,513460,295 1,153,587
20,963 450,744106,387 2,508,709
67,669 1,649,793146,889 1,609,545143,627 63,570
T.A. World ex U.S. Core Equity PortfolioCONTINUED
Shares Value»
AUSTRALIA — (Continued)* 2,010 $ 88,484
179,267,557
AUSTRIA — (0.4%)7,730 147,849
28,651 1,020,49144,004 180,18619,045 306,06520,128 708,979
2,338 206,10050,403 1,809,10017,207 273,052
6,488 76,9321,500 66,2231,571 55,5204,086 416,7842,813 355,436
11,733 391,89346,691 2,336,278
4,858 125,5505,223 50,7552,474 53,964
67,108 1,573,790731 34,535
18,580 410,3742,857 227,257
* 2,415 33,7147,103 227,933
58,773 434,0931,284 56,972
71,452 640,2154,184 233,494
19,589 502,04353,314 1,407,456

Warimpex Finanz- und Beteiligungs AGWienerberger AGZumtobel Group AG
TOTAL AUSTRIA
Ackermans & van Haaren NVAgeasAGFA-Gevaert NVAnheuser-Busch InBev SAAnheuser-Busch InBev SA/NV, Sponsored ADRArgenx SE, ADRArgenx SEAtenorBanque Nationale de BelgiqueBarco NVBekaert SABiocartis NVbpost SACelyad SACie d'Entreprises CFEColruyt SADeceuninck NVD'ieteren SA
Econocom Group SAElia System Operator SAEuronav NVEuronav NVEVS Broadcast Equipment SAExmar NVFagronGalapagos NVGalapagos NVGimv NVImmobel SAJensen-Group NVKBC Group NVKinepolis Group NVLotus Bakeries NVMDxHealthMelexis NVNyrstar NVOntex Group NVOrange Belgium SAPicanolProximus SADPRecticel SAResiluxRoularta Media Group NVSioen Industries NV
10,740 15,92918,923 432,544
* 8,937 74,730
14,886,236
BELGIUM — (0.8%)9,454 1,377,095
54,378 2,919,351* 136,729 550,680
77,177 7,759,1128,449 853,180
* 297 41,717* 949 133,322
1,050 84,15547 121,082
3,143 656,37021,848 615,228
* 2,296 27,29833,766 313,963
* 572 7,0125,218 458,557
22,901 1,193,28427,471 61,31616,107 754,350
T.A. World ex U.S. Core Equity PortfolioCONTINUED
Shares Value»
BELGIUM — (Continued)64,162 $ 211,909
7,840 596,90636,257 305,160
* 38,214 321,7626,891 163,787
* 13,346 87,94613,453 223,385
* 570 99,633* 1,322 229,381
1,201 70,494329 22,412589 22,454
26,646 1,713,2797,850 463,154
87 226,752#* 5,908 7,986
7,558 517,325#* 39,159 25,450
33,190 546,80419,795 451,606
532 38,27335,664 1,016,84622,621 182,304
571 90,1821,508 20,8444,604 126,961

Sipef NVSolvay SATelenet Group Holding NVTER Beke SATessenderlo Group SATitan Cement International SAUCB SAUmicore SAVan de Velde NVViohalco SA
TOTAL BELGIUM
AES Tiete Energia SAAES Tiete Energia SAAliansce Shopping Centers SAAlliar Medicos A Frente SAAlupar Investimento SAAmbev SA, ADRAmbev SAAnima Holding SAArezzo Industria e Comercio SAAtacadao S.A.Azul SA, ADRB3 SA - Brasil Bolsa BalcaoBanco Bradesco SA, ADRBanco Bradesco SABanco do Brasil SABanco Santander Brasil SABB Seguridade Participacoes SABR Malls Participacoes SABR Properties SABrasil Brokers Participacoes SA
BrasilAgro - Co. Brasileira de Propriedades AgricolasBraskem SA, Sponsored ADRBRF SABRF SA, ADRCamil Alimentos S.A.CCR SACentrais Eletricas Brasileiras SACia de Locacao das AmericasCia de Saneamento Basico do Estado de Sao PauloCia de Saneamento Basico do Estado de Sao Paulo, ADRCia de Saneamento de Minas Gerais-COPASACia de Saneamento do ParanaCia de Saneamento do ParanaCia Energetica de Minas GeraisCia HeringCia Paranaense de EnergiaCia Siderurgica Nacional SA, Sponsored ADR
2,093 94,85612,790 1,309,63115,377 755,239
294 37,607* 16,074 503,195* 10,553 221,961
25,619 1,997,67911,381 356,2662,567 73,538
* 20,959 96,498
31,156,537
BRAZIL — (1.9%)77,904 261,085
21 1632,467 239,82217,249 66,84743,448 301,808
327,200 1,724,34424,800 130,812
8,900 50,18619,450 256,81252,942 324,753
* 10,235 416,56559,738 660,408
186,348 1,684,58579,491 647,99286,884 1,120,55527,828 312,45381,950 696,812
271,189 1,066,607* 32,617 85,808* 13,900 23,201
T.A. World ex U.S. Core Equity PortfolioCONTINUED
Shares Value»
BRAZIL — (Continued)14,800 $ 64,725
* 23,556 417,671* 110,184 964,599* 5,502 47,812
33,561 64,988293,850 1,151,115
37,516 387,21757,738 756,45633,000 461,75025,800 358,87823,981 423,52537,634 844,123
9,200 52,19136,039 160,72412,358 103,622
7,100 89,747222,689 950,882

Cia Siderurgica Nacional SACielo SAConstrutora Tenda SACosan Logistica SACosan SACSU Cardsystem SACVC Brasil Operadora e Agencia de Viagens SACyrela Brazil Realty SA Empreendimentos e ParticipacoesCyrela Commercial Properties SA Empreendimentos e ParticipacoesDimed SA Distribuidora da MedicamentosDirecional Engenharia SADuratex SAEcoRodovias Infraestrutura e Logistica SAEDP - Energias do Brasil SAEmbraer SA, Sponsored ADREnergisa SAEneva SAEngie Brasil Energia SAEquatorial Energia SAEven Construtora e Incorporadora SAEz Tec Empreendimentos e Participacoes SAFleury SAFras-Le SAGafisa SAGerdau SA, Sponsored ADRGerdau SAGol Linhas Aereas Inteligentes SA, ADRGrendene SAGuararapes Confeccoes SAHapvida Participacoes e Investimentos S.A.Helbor Empreendimentos SAHypera SAIndustrias Romi SAInstituto Hermes Pardini SAInternational Meal Co. Alimentacao SA, Class AIochpe-Maxion SAIRB Brasil Resseguros S/AItau Unibanco Holding SAJBS SAJHSF Participacoes SAJSL SAKepler Weber SA
Klabin SAKroton Educacional SALight SALocaliza Rent a Car SALOG Commercial Properties e Participacoes SALog-in Logistica Intermodal SALojas Americanas SA
226,966 983,07291,444 173,47942,944 285,142
* 89,123 436,23454,391 725,14718,186 30,64144,590 594,362
155,121 991,773300 1,101200 20,229
68,736 226,758194,385 640,250
79,920 246,69189,952 454,66975,026 1,515,52568,145 882,090
* 34,261 232,33624,375 308,30063,732 1,578,124
* 101,800 261,41236,434 313,61375,200 459,71015,300 19,043
* 22,143 37,424134,698 479,525
53,900 167,0809,991 214,607
36,500 72,68749,064 250,56911,745 128,642
* 117,105 68,12164,806 512,49123,600 90,78024,400 125,50587,900 218,11879,610 455,37928,601 711,96233,703 264,053
486,160 3,171,98085,900 85,98245,700 203,57216,400 88,739
T.A. World ex U.S. Core Equity PortfolioCONTINUED
Shares Value»
BRAZIL — (Continued)148,078 $ 622,367458,884 1,510,234
50,235 254,706157,827 1,819,641
9,390 57,892* 5,100 20,981
9,394 34,437

Lojas Renner SAM Dias Branco SAMagazine Luiza SAMahle-Metal Leve SAMarcopolo SAMarisa Lojas SAMills Estruturas e Servicos de Engenharia SAMovida Participacoes SAMRV Engenharia e Participacoes SANatura Cosmeticos SAOdontoprev SAOmega Geracao SAOuro Fino Saude Animal Participacoes SAParanapanema SAPetrobras Distribuidora S.A.Petroleo Brasileiro SA, Sponsored ADRPetroleo Brasileiro SA, Sponsored ADRPetroleo Brasileiro SAPorto Seguro SAPortobello SAProfarma Distribuidora de Produtos Farmaceuticos SAQualicorp Consultoria e Corretora de Seguros SARaia Drogasil SARestoque Comercio e Confeccoes de Roupas SARumo SASantos Brasil Participacoes SASao Martinho SASer Educacional SASLC Agricola SASmiles Fidelidade SASonae Sierra Brasil SASprings Global Participacoes SASul America SASuzano SASuzano SA, Sponsored ADRT4F Entretenimento SATechnos SATecnisa SATegma Gestao Logistica SATelefonica Brasil SA, ADRTerra Santa Agro SATIM Participacoes SA, ADRTIM Participacoes SATOTVS SATransmissora Alianca de Energia Eletrica SATrisul SATupy SAUltrapar Participacoes SA, Sponsored ADRUnipar Carbocloro SAUsinas Siderurgicas de Minas Gerais SAVale SA
184,476 2,294,1371,795 18,4057,210 498,230
30,238 195,15054,800 50,257
* 34,360 76,169* 95,157 173,292
51,698 202,249130,137 691,545
65,747 1,053,820128,363 588,613
* 17,400 125,3825,300 55,814
* 8,840 53,253123,000 857,311
72,469 994,27519,287 290,269
610,847 4,608,14371,042 969,85058,513 62,555
* 5,496 6,380160,703 935,664
54,950 1,195,2264,719 25,472
* 128,682 739,11489,250 123,479
130,829 692,82322,907 158,10172,000 340,34622,347 230,886
8,937 83,109* 18,800 66,503
148,894 1,639,398124,726 1,002,357
* 5,281 84,18213,900 20,724
* 30,800 20,983* 125,860 40,894
19,812 164,20212,260 167,226
* 2,300 9,4326,220 99,271
78,821 252,38619,434 246,973
104,081 758,71843,500 92,89640,600 204,364
146,684 764,2247,000 61,685
23,560 61,796552,353 7,209,164
T.A. World ex U.S. Core Equity PortfolioCONTINUED

Valid Solucoes e Servicos de Seguranca em Meios de Pagamento eIdentificacao S.AVia Varejo SAVulcabras Azaleia SAWEG SAWiz Solucoes e Corretagem de Seguros SAYDUQS Part
TOTAL BRAZIL
5N Plus, Inc.Absolute Software Corp.Acadian Timber Corp.Advantage Oil & Gas, Ltd.Aecon Group, Inc.AG Growth International, Inc.AGF Management, Ltd., Class BAgnico Eagle Mines, Ltd.Agnico Eagle Mines, Ltd.Aimia, Inc.Air CanadaAirBoss of America Corp.Alacer Gold Corp.Alamos Gold, Inc., Class AAlamos Gold, Inc., Class AAlaris Royalty Corp.Alcanna, Inc.Alexco Resource Corp.Algoma Central Corp.Algonquin Power & Utilities Corp.Algonquin Power & Utilities Corp.Alimentation Couche-Tard, Inc., Class BAlio Gold, Inc.AltaGas, Ltd.Altus Group, Ltd.Americas Silver Corp.Amerigo Resources, Ltd.Andrew Peller, Ltd., Class AARC Resources, Ltd.Argonaut Gold, Inc.Aritzia, Inc.Asanko Gold, Inc.Atco, Ltd., Class IAthabasca Oil Corp.ATS Automation Tooling Systems, Inc.Aurora Cannabis, Inc.AutoCanada, Inc.B2Gold Corp.Badger Daylighting, Ltd.Bank of MontrealBank of MontrealBank of Nova Scotia (The)Bank of Nova Scotia (The)
Shares Value»
BRAZIL — (Continued)
62,733 $ 250,021* 208,004 420,766* 41,656 77,498
18,700 116,71729,400 91,674
152,308 1,368,890
74,100,934
CANADA — (6.8%)* 24,500 41,211
14,380 80,7364,453 56,751
* 413,761 592,52031,265 481,36411,375 465,239
124,528 483,0915,826 304,392
600 31,338* 54,830 155,375* 45,730 1,573,420
10,693 70,406* 187,402 745,462
192,365 1,262,22542,742 279,96023,548 362,195
9,891 47,364* 33,113 55,824
3,600 34,94262,523 778,814
1,500 18,67538,870 2,382,621
* 19,045 15,44072,197 1,105,547
6,811 172,933* 11,652 31,783* 21,300 11,459
11,100 118,418224,697 1,149,193
* 96,041 168,097* 32,068 444,403* 70,680 55,160
12,000 399,970* 182,955 98,423* 7,150 114,580#* 70,242 438,547
14,210 97,332* 596,946 1,904,184
13,390 483,53364,884 4,857,20568,197 5,101,81868,381 3,650,64871,552 3,819,446

Barrick Gold Corp.Barrick Gold Corp.Bausch Health Cos., Inc.Bausch Health Cos., Inc.Baytex Energy Corp.Baytex Energy Corp.
BCE, Inc.Birchcliff Energy, Ltd.Bird Construction, Inc.Black Diamond Group, Ltd.BlackBerry, Ltd.BlackBerry, Ltd.BNK Petroleum, Inc.Bombardier, Inc., Class ABombardier, Inc., Class BBonavista Energy Corp.Bonterra Energy Corp.Boralex, Inc., Class ABrookfield Asset Management, Inc., Class ABRP, Inc.CAE, Inc.CAE, Inc.Calfrac Well Services, Ltd.Calian Group, Ltd.Cameco Corp.Cameco Corp.Canaccord Genuity Group, Inc.Canacol Energy, Ltd.Canada Goose Holdings, Inc.Canada Goose Holdings, Inc.Canadian Imperial Bank of CommerceCanadian Imperial Bank of CommerceCanadian National Railway Co.Canadian National Railway Co.Canadian Natural Resources, Ltd.Canadian Natural Resources, Ltd.Canadian Pacific Railway, Ltd.Canadian Pacific Railway, Ltd.Canadian Tire Corp., Ltd., Class ACanadian Utilities, Ltd., Class ACanadian Utilities, Ltd., Class BCanadian Western BankCanfor Corp.Canfor Pulp Products, Inc.Canopy Growth Corp.Canopy Growth Corp.CanWel Building Materials Group, Ltd.Capital Power Corp.Capstone Mining Corp.
218,135 3,546,87554,067 897,408
* 68,677 1,646,188* 34,276 823,528* 217,096 330,628* 22,889 34,791
T.A. World ex U.S. Core Equity PortfolioCONTINUED
Shares Value»
CANADA — (Continued)18,344 $ 828,936
130,221 259,4957,616 31,334
* 36,016 50,485* 102,153 745,365* 34,433 251,361* 52,000 9,062* 23,990 41,262* 283,900 488,296
361,811 148,03613,150 50,71535,436 535,91612,656 620,142
9,248 325,76126,952 726,793
5,994 161,598* 55,031 74,220
4,200 106,989102,984 945,724
25,555 234,85067,015 280,288
* 36,305 138,365* 500 23,416* 11,062 517,591
38,986 3,067,0687,445 585,698
13,000 1,230,45946,957 4,442,60228,391 719,133
241,723 6,110,7579,072 2,165,9931,755 418,725
12,043 1,314,98518,114 493,270
600 16,32156,966 1,330,703
* 47,104 339,77121,106 147,604
#* 3,200 104,913* 474 15,471
25,200 87,83130,345 681,027
* 298,688 124,472

Cardinal Energy, Ltd.Cascades, Inc.CCL Industries, Inc., Class BCelestica, Inc.Celestica, Inc.Cenovus Energy, Inc.Cenovus Energy, Inc.Centerra Gold, Inc.Cervus Equipment Corp.CES Energy Solutions Corp.CGI, Inc.Chesswood Group, Ltd.China Gold International Resources Corp., Ltd.CI Financial Corp.Cineplex, Inc.Clearwater Seafoods, Inc.
Cogeco Communications, Inc.Cogeco, Inc.Colliers International Group, Inc.Colliers International Group, Inc.Computer Modelling Group, Ltd.Conifex Timber, Inc.Constellation Software, Inc.Copper Mountain Mining Corp.Corby Spirit and Wine, Ltd.Corus Entertainment, Inc., Class BCott Corp.Cott Corp.Crescent Point Energy Corp.Crescent Point Energy Corp.Crew Energy, Inc.CRH Medical Corp.Cronos Group, Inc.Delphi Energy Corp.Denison Mines Corp.Descartes Systems Group, Inc. (The)Detour Gold Corp.DHX Media, Ltd.DIRTT Environmental SolutionsDollarama, Inc.Dorel Industries, Inc., Class BDREAM Unlimited Corp., Class ADundee Precious Metals, Inc.Echelon Financial Holdings, Inc.ECN Capital Corp.E-L Financial Corp., Ltd.Eldorado Gold Corp.Eldorado Gold Corp.Element Fleet Management Corp.
46,873 88,43348,759 446,65628,675 1,433,967
* 50,960 361,306* 5,600 39,842
28,200 262,172165,194 1,533,000
* 116,854 933,2053,004 25,242
119,725 172,358* 27,460 2,113,492
5,700 42,584* 207,724 236,086
79,936 1,239,19642,263 758,92811,500 46,181
T.A. World ex U.S. Core Equity PortfolioCONTINUED
Shares Value»
CANADA — (Continued)12,627 $ 997,20643,394 3,090,647
2,800 203,4139,358 679,016
35,217 175,044* 3,100 1,926
2,791 2,655,426* 136,204 81,528
5,700 75,882293,525 1,127,574
30,576 391,06744,999 575,87053,200 176,554
117,243 388,074* 193,575 108,536* 46,658 125,501* 2,757 38,074* 362,471 38,450* 188,385 91,352* 3,518 127,813* 93,470 1,427,758#* 43,523 61,997* 10,600 55,578
39,342 1,457,66318,150 128,30729,600 187,719
* 67,427 227,8562,200 10,377
122,569 439,272184 104,561
* 87,838 673,524* 4,518 34,790
194,983 1,483,277

Emera, Inc.Empire Co., Ltd., Class AEnbridge, Inc.Enbridge, Inc.Encana Corp.Encana Corp.Endeavour Mining Corp.Endeavour Silver Corp.Enerflex, Ltd.Energy Fuels, Inc.Enerplus Corp.Enerplus Corp.Enghouse Systems, Ltd.Ensign Energy Services, Inc.Epsilon Energy, Ltd.Equitable Group, Inc.Essential Energy Services TrustEvertz Technologies, Ltd.Exchange Income Corp.Exco Technologies, Ltd.EXFO, Inc.Extendicare, Inc.Fairfax Financial Holdings, Ltd.Fiera Capital Corp.Finning International, Inc.First Capital Realty, Inc.
First Majestic Silver Corp.First National Financial Corp.First Quantum Minerals, Ltd.FirstService Corp.FirstService Corp.Fortis, Inc.Fortis, Inc.Fortuna Silver Mines, Inc.Franco-Nevada Corp.Frontera Energy Corp.Gamehost, Inc.GDI Integrated Facility Services, Inc.Gear Energy, Ltd.Genesis Land Development Corp.Genworth MI Canada, Inc.George Weston, Ltd.Gibson Energy, Inc.Gildan Activewear, Inc.Glacier Media, Inc.GMP Capital, Inc.goeasy, Ltd.Golden Star Resources, Ltd.GoldMoney, Inc.
5,459 226,66653,584 1,418,16155,946 1,868,54723,256 776,518
253,379 1,157,657116,859 534,046
* 29,721 555,334* 16,340 37,637
44,095 554,946* 31,800 57,827# 82,000 543,643
85,064 563,12417,344 454,166
118,520 372,676* 8,880 33,566
7,300 509,971* 38,149 9,394
8,165 118,1638,657 244,138
50,840 321,265* 2,877 11,183
41,022 278,4956,000 2,779,739
16,900 143,54475,564 1,306,53932,200 533,088
T.A. World ex U.S. Core Equity PortfolioCONTINUED
Shares Value»
CANADA — (Continued)#* 47,170 $ 444,966
4,700 116,62897,178 895,348
7,370 772,8922,400 251,856
19,888 783,8875,383 212,198
* 97,753 368,1113,701 321,3581,619 16,4137,898 54,756
* 300 6,521* 122,642 45,533
12,700 24,39325,974 958,62519,810 1,566,72849,052 849,99221,696 854,492
* 1,400 79032,869 67,740
8,267 355,284* 19,013 67,708* 16,200 27,434
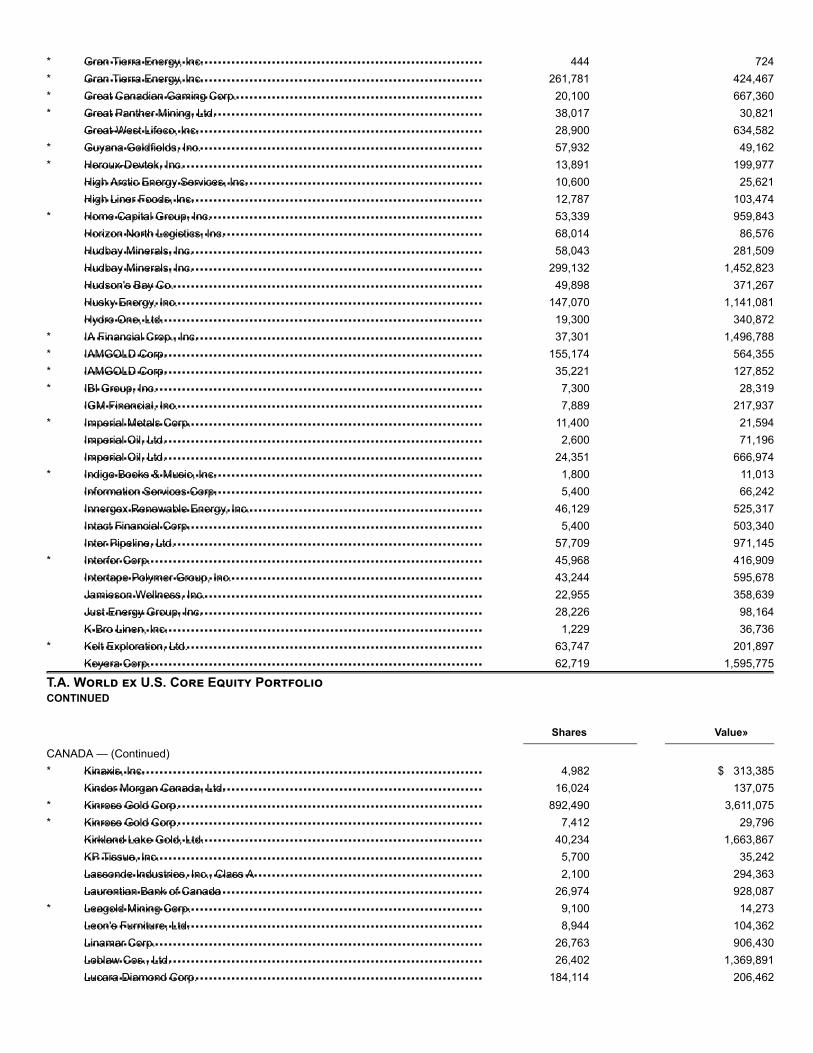
Gran Tierra Energy, Inc.Gran Tierra Energy, Inc.Great Canadian Gaming Corp.Great Panther Mining, Ltd.Great-West Lifeco, Inc.Guyana Goldfields, Inc.Heroux-Devtek, Inc.High Arctic Energy Services, Inc.High Liner Foods, Inc.Home Capital Group, Inc.Horizon North Logistics, Inc.Hudbay Minerals, Inc.Hudbay Minerals, Inc.Hudson's Bay Co.Husky Energy, Inc.Hydro One, Ltd.IA Financial Crop., Inc.IAMGOLD Corp.IAMGOLD Corp.IBI Group, Inc.IGM Financial, Inc.Imperial Metals Corp.Imperial Oil, Ltd.Imperial Oil, Ltd.Indigo Books & Music, Inc.Information Services Corp.Innergex Renewable Energy, Inc.Intact Financial Corp.Inter Pipeline, Ltd.Interfor Corp.Intertape Polymer Group, Inc.Jamieson Wellness, Inc.Just Energy Group, Inc.K-Bro Linen, Inc.Kelt Exploration, Ltd.Keyera Corp.
Kinaxis, Inc.Kinder Morgan Canada, Ltd.Kinross Gold Corp.Kinross Gold Corp.Kirkland Lake Gold, Ltd.KP Tissue, Inc.Lassonde Industries, Inc., Class ALaurentian Bank of CanadaLeagold Mining Corp.Leon's Furniture, Ltd.Linamar Corp.Loblaw Cos., Ltd.Lucara Diamond Corp.
* 444 724* 261,781 424,467* 20,100 667,360* 38,017 30,821
28,900 634,582* 57,932 49,162* 13,891 199,977
10,600 25,62112,787 103,474
* 53,339 959,84368,014 86,57658,043 281,509
299,132 1,452,82349,898 371,267
147,070 1,141,08119,300 340,872
* 37,301 1,496,788* 155,174 564,355* 35,221 127,852* 7,300 28,319
7,889 217,937* 11,400 21,594
2,600 71,19624,351 666,974
* 1,800 11,0135,400 66,242
46,129 525,3175,400 503,340
57,709 971,145* 45,968 416,909
43,244 595,67822,955 358,63928,226 98,164
1,229 36,736* 63,747 201,897
62,719 1,595,775
T.A. World ex U.S. Core Equity PortfolioCONTINUED
Shares Value»
CANADA — (Continued)* 4,982 $ 313,385
16,024 137,075* 892,490 3,611,075* 7,412 29,796
40,234 1,663,8675,700 35,2422,100 294,363
26,974 928,087* 9,100 14,273
8,944 104,36226,763 906,43026,402 1,369,891
184,114 206,462

Lundin Mining Corp.Magellan Aerospace Corp.Magna International, Inc.Magna International, Inc.Mainstreet Equity Corp.Major Drilling Group International, Inc.Mandalay Resources Corp.Manulife Financial Corp.Manulife Financial Corp.Maple Leaf Foods, Inc.Martinrea International, Inc.Mav Beauty Brands, Inc.Medical Facilities Corp.MEG Energy Corp.Methanex Corp.Methanex Corp.Metro, Inc.Morguard Corp.Morneau Shepell, Inc.Mountain Province Diamonds, Inc.MTY Food Group, Inc.Mullen Group, Ltd.National Bank of CanadaNew Gold, Inc.NFI Group, Inc.Norbord, Inc.Norbord, Inc.North American Construction Group, Ltd.North American Construction Group, Ltd.North West Co., Inc. (The)Northland Power, Inc.Nutrien, Ltd.NuVista Energy, Ltd.Obsidian Energy, Ltd.Obsidian Energy, Ltd.OceanaGold Corp.Onex Corp.Open Text Corp.Open Text Corp.Osisko Gold Royalties, Ltd.Painted Pony Energy, Ltd.Pan American Silver Corp.Pan American Silver Corp.Paramount Resources, Ltd., Class AParex Resources, Inc.Park Lawn Corp.
Parkland Fuel Corp.Pason Systems, Inc.Pembina Pipeline Corp.
450,411 2,180,7299,800 121,405
80,312 4,050,28529,284 1,476,499
* 3,543 163,754* 60,497 202,146* 18,509 18,371
51,141 926,102141,354 2,555,680
26,873 630,18655,453 454,195
* 2,500 13,03231,821 299,693
* 129,677 545,31518,500 728,197
5,399 212,23528,767 1,125,147
700 97,59619,996 460,281
6,000 5,2746,344 314,773
49,819 380,871103,172 4,993,656
* 873,319 1,164,60237,760 832,562
9,562 221,6357,657 177,336
19,300 242,0181,018 12,725
22,094 505,72843,075 819,85537,568 2,059,093
* 75,369 155,329* 21,375 23,322* 3,722 4,057
380,881 1,033,15212,665 765,10118,400 784,76716,829 717,42045,173 532,915
#* 137,252 96,71539,788 605,958
108,615 1,649,855* 31,088 187,026* 106,941 1,827,996
6,881 143,845
T.A. World ex U.S. Core Equity PortfolioCONTINUED
Shares Value»
CANADA — (Continued)41,414 $1,353,37628,330 380,796
1,010 36,638

Pembina Pipeline Corp.Pengrowth Energy Corp.Peyto Exploration & Development Corp.Photon Control, Inc.PHX Energy Services Corp.Pizza Pizza Royalty Corp.Polaris Infrastructure, Inc.Pollard Banknote, Ltd.Precision Drilling Corp.Precision Drilling Corp.Premier Gold Mines, Ltd.Premium Brands Holdings Corp.Pretium Resources, Inc.Pretium Resources, Inc.Pulse Seismic, Inc.Quarterhill, Inc.Quebecor, Inc., Class BQuesterre Energy Corp., Class ARecipe Unlimited Corp.Reitmans Canada, Ltd., Class ARestaurant Brands International, Inc.Restaurant Brands International, Inc.Richelieu Hardware, Ltd.Ritchie Bros Auctioneers, Inc.Ritchie Bros Auctioneers, Inc.Rocky Mountain Dealerships, Inc.Rogers Communications, Inc., Class BRogers Communications, Inc., Class BRogers Sugar, Inc.Roxgold, Inc.Royal Bank of CanadaRoyal Bank of CanadaRussel Metals, Inc.Sandstorm Gold, Ltd.Saputo, Inc.Secure Energy Services, Inc.SEMAFO, Inc.Seven Generations Energy, Ltd., Class AShaw Communications, Inc., Class BShaw Communications, Inc., Class BShawCor, Ltd.Shopify, Inc., Class ASienna Senior Living, Inc.Sierra Wireless, Inc.Sierra Wireless, Inc.Sleep Country Canada Holdings, Inc.SNC-Lavalin Group, Inc.Spin Master Corp.Sprott, Inc.SSR Mining, Inc.SSR Mining, Inc.Stantec, Inc.Stantec, Inc.Stars Group, Inc. (The)Stars Group, Inc. (The)
21,847 792,828#* 216,240 71,272
97,254 294,754* 8,300 6,855* 18,919 36,410
10,074 73,5825,200 54,2542,600 47,674
* 107,261 184,484* 24,082 41,180* 95,451 160,556
14,391 1,047,322* 7,794 84,487* 44,718 484,857* 22,820 40,200
76,668 94,68849,926 1,131,071
* 32,700 5,20314,874 302,82219,404 40,431
9,100 670,192796 58,665
29,641 585,2747,600 274,3904,495 162,2258,291 45,1684,600 238,783
19,209 996,75556,990 243,540
* 28,000 22,91355,774 4,404,27891,876 7,249,93542,512 674,175
* 79,325 488,04317,716 535,05178,065 415,227
* 168,337 674,725* 163,953 910,574
10,587 207,52162,788 1,229,38935,032 458,670
* 900 286,09215,909 238,671
* 7,200 84,940* 11,505 135,529
19,915 280,51216,374 259,046
* 5,400 153,43243,899 129,056
* 49,463 764,162* 8,887 136,860
16,542 394,0608,147 193,980
* 5,297 82,437* 48,072 747,520

Stella-Jones, Inc.
STEP Energy Services, Ltd.Storm Resources, Ltd.Strad, Inc.Stuart Olson, Inc.Sun Life Financial, Inc.Suncor Energy, Inc.Suncor Energy, Inc.SunOpta, Inc.SunOpta, Inc.Superior Plus Corp.Supremex, Inc.Surge Energy, Inc.Tamarack Valley Energy, Ltd.Taseko Mines, Ltd.TC Energy Corp.TC Energy Corp.Teck Resources, Ltd., Class ATeck Resources, Ltd., Class BTeck Resources, Ltd., Class BTELUS Corp.TeraGo, Inc.Teranga Gold Corp.Tervita Corp.TFI International, Inc.Thomson Reuters Corp.Tidewater Midstream and Infrastructure, Ltd.Timbercreek Financial Corp.TMX Group, Ltd.TORC Oil & Gas, Ltd.Torex Gold Resources, Inc.Toromont Industries, Ltd.Toronto-Dominion Bank (The)Toronto-Dominion Bank (The)Total Energy Services, Inc.Tourmaline Oil Corp.TransAlta Corp.TransAlta Corp.TransAlta Renewables, Inc.Transcontinental, Inc., Class ATransGlobe Energy Corp.TransGlobe Energy Corp.Trican Well Service, Ltd.Trisura Group, Ltd.Turquoise Hill Resources, Ltd.Uni-Select, Inc.Valener, Inc.Vermilion Energy, Inc.Vermilion Energy, Inc.
12,388 386,433
T.A. World ex U.S. Core Equity PortfolioCONTINUED
Shares Value»
CANADA — (Continued)* 12,691 $ 16,828* 4,600 6,099* 100 133
15,040 39,65749,784 2,060,560
111,613 3,202,593185,607 5,326,921
* 7,675 21,874* 4,800 13,675
94,458 943,2927,129 13,504
157,442 150,308* 113,214 185,287* 158,513 73,263
5,380 263,41510,742 525,928
600 12,38878,125 1,598,254
162,372 3,327,00224,664 886,544
* 1,900 14,828* 41,335 160,666* 5,715 28,928
57,363 1,814,59711,681 784,516
109,000 105,71317,361 127,46513,592 1,009,462
106,408 331,365* 37,174 478,829
17,959 900,80889,278 5,218,819
9,606 561,37518,599 98,085
100,951 1,330,913133,581 818,814
33,238 203,41739,506 409,78751,756 595,28444,981 69,867
1,119 1,734* 148,510 109,149* 2,121 47,566* 217,037 123,335
22,152 201,41213,234 259,70613,653 244,66240,364 724,130

VersaBankWajax Corp.Waste Connections, Inc.Wesdome Gold Mines Ltd.West Fraser Timber Co., Ltd.Western Forest Products, Inc.Westshore Terminals Investment Corp.Wheaton Precious Metals Corp.Whitecap Resources, Inc.Winpak, Ltd.WSP Global, Inc.
Yamana Gold, Inc.Yamana Gold, Inc.Yangarra Resources, Ltd.Yellow Pages, Ltd.
TOTAL CANADA
AES Gener SAAguas Andinas SA, Class ABanco de Chile, ADRBanco de Credito e Inversiones SABanco Santander Chile, ADRBanco Santander ChileBesalco SACAP SACencosud SACia Cervecerias Unidas SACia Cervecerias Unidas SA, Sponsored ADRCia Sud Americana de Vapores SAColbun SACristalerias de Chile SAEmbotelladora Andina SA, ADR, Class BEmpresa Nacional de Telecomunicaciones SAEmpresas CMPC SAEmpresas COPEC SAEmpresas Hites SAEmpresas La Polar SAEnel Americas SA, ADREnel Americas SAEnel Chile SA, ADREnel Chile SAEngie Energia Chile SAForus SAGrupo Security SAHortifrut SAInversiones Aguas Metropolitanas SAInversiones La Construccion SAItau CorpBancaItau CorpBanca
4,000 21,36715,240 175,51711,349 1,029,409
* 124,514 633,98628,536 1,115,451
244,498 263,06027,839 439,16354,756 1,430,227
187,079 601,0109,400 323,7796,203 349,865
T.A. World ex U.S. Core Equity PortfolioCONTINUED
Shares Value»
CANADA — (Continued)398,609 $ 1,177,887
8,700 25,665* 54,109 79,126#* 9,936 60,077
260,693,311
CHILE — (0.3%)535,720 134,300422,238 236,334
4,851 139,42410,154 639,674
8,227 238,4891,227,899 88,916
159,422 137,00033,285 341,348
213,682 421,89212,277 172,11911,298 315,892
* 11,350,219 382,094714,528 134,174
2,000 15,3734,903 103,453
* 76,642 702,174154,949 363,374
15,233 139,77740,531 27,922
* 718,081 28,03979,243 653,755
3,644,157 601,27360,103 276,474
844,942 76,583137,375 241,962
24,881 54,780355,879 133,022
2,991 7,660232,596 339,636
17,905 281,03128,721,008 222,746
9,675 114,939

Latam Airlines Group SA, Sponsored ADRLatam Airlines Group SAMasisa SAMolibdenos y Metales SAMultiexport Foods SAParque Arauco SAPAZ Corp. SARipley Corp. SASACI FalabellaSalfacorp SASigdo Koppers SASociedad Matriz SAAM SASociedad Quimica y Minera de Chile SA, Sponsored ADRSocovesa SASONDA SAVina Concha y Toro SA
TOTAL CHILE
21Vianet Group, Inc., ADR3SBio, Inc.500.com, Ltd., ADR, Class A51job, Inc., ADR58.com, Inc., ADRAAC Technologies Holdings, Inc.Agile Group Holdings, Ltd.Agricultural Bank of China, Ltd., Class HAir China, Ltd., Class HAKM Industrial Co., Ltd.Alibaba Group Holding, Ltd., Sponsored ADRAlibaba Health Information Technology, Ltd.Alibaba Pictures Group, Ltd.Aluminum Corp. of China, Ltd., Class HAMVIG Holdings, Ltd.Angang Steel Co., Ltd., Class HAnhui Conch Cement Co., Ltd., Class HAnhui Expressway Co., Ltd., Class HANTA Sports Products, Ltd.Anton Oilfield Services GroupAowei Holdings, Ltd.APT Satellite Holdings, Ltd.Asia Cement China Holdings Corp.Asia Television Holdings, Ltd.Ausnutria Dairy Corp., Ltd.AVIC International Holding HK, Ltd.AVIC International Holdings, Ltd., Class HAviChina Industry & Technology Co., Ltd., Class HBAIC Motor Corp., Ltd., Class HBaidu, Inc., Sponsored ADRBank of China, Ltd., Class HBank of Chongqing Co., Ltd., Class H
69,715 670,6584,845 46,178
* 1,118,583 67,2881,797 21,572
175,108 90,163177,763 484,294
30,769 41,127379,101 279,743
25,508 157,610188,280 206,462
85,947 150,1601,380,854 125,530
5,679 167,474126,028 61,804246,425 325,526103,004 207,028
10,868,246
T.A. World ex U.S. Core Equity PortfolioCONTINUED
Shares Value»
CHINA — (8.0%)* 18,641 $ 137,198
538,500 909,404* 4,144 46,288* 5,450 422,648* 4,919 277,333
307,500 1,652,3641,244,749 1,599,8313,711,000 1,502,121
540,000 524,41150,000 6,913
* 45,038 7,796,528* 130,000 116,789* 3,130,000 632,489* 1,460,000 476,766
130,000 30,619# 1,115,400 423,079
359,500 2,075,838140,000 85,058254,000 1,896,093
# 1,118,000 128,354* 59,000 13,637
186,250 72,583254,000 349,300
#* 572,000 3,636239,000 431,307
1,307,948 30,860136,000 84,006
1,032,000 553,9311,408,500 889,863
* 16,904 1,888,17710,095,800 4,099,780
# 341,500 199,398

Bank of Communications Co., Ltd., Class HBank of Zhengzhou Co., Ltd., Class HBaoye Group Co., Ltd., Class HBaozun, Inc., Sponsored ADRBBMG Corp., Class HBeijing Capital International Airport Co., Ltd., Class HBeijing Capital Land, Ltd., Class HBeijing Enterprises Clean Energy Group, Ltd.Beijing Enterprises Holdings, Ltd.Beijing Enterprises Medical & Health Group, Ltd.Beijing Enterprises Water Group, Ltd.Beijing Gas Blue Sky Holdings, Ltd.Beijing Jingneng Clean Energy Co., Ltd., Class HBeijing North Star Co., Ltd.Beijing Properties Holdings, Ltd.Beijing Urban Construction Design & Development Group Co., Ltd., Class HBest Pacific International Holdings, Ltd.Bitauto Holdings, Ltd., ADRBrilliance China Automotive Holdings, Ltd.BYD Co., Ltd., Class HBYD Electronic International Co., Ltd.C.banner International Holdings, Ltd.Cabbeen Fashion, Ltd.Canvest Environmental Protection Group Co., Ltd.Capital Environment Holdings, Ltd.CAR, Inc.
Carrianna Group Holdings Co., Ltd.Central China Real Estate, Ltd.Central China Securities Co., Ltd., Class HCentury Sunshine Group Holdings, Ltd.CGN Meiya Power Holdings Co., Ltd.CGN Power Co., Ltd., Class HChaowei Power Holdings, Ltd.Cheetah Mobile, Inc., ADRChigo Holding, Ltd.Chiho Environmental Group, Ltd.China Aerospace International Holdings, Ltd.China Agri-Industries Holdings, Ltd.China All Access Holdings, Ltd.China Animal Healthcare, Ltd.China Animation Characters Co., Ltd.China Aoyuan Group, Ltd.China Chengtong Development Group, Ltd.China Cinda Asset Management Co., Ltd., Class HChina CITIC Bank Corp., Ltd., Class HChina Coal Energy Co., Ltd., Class HChina Common Rich Renewable Energy Investments, Ltd.China Communications Construction Co., Ltd., Class HChina Communications Services Corp., Ltd., Class H
1,112,695 809,539# 76,000 26,973* 87,040 54,597* 4,280 212,331
981,000 285,4251,044,000 822,576
# 490,000 179,865#* 10,500,000 141,466
167,500 817,770#* 1,896,000 59,041
1,875,000 986,899#* 1,400,000 38,200
350,000 60,591398,000 149,200
* 616,000 16,818123,000 36,006
# 186,000 62,354* 14,796 168,822
1,148,000 1,251,103# 189,500 1,184,115
531,000 829,270* 270,000 11,714
155,000 35,225218,000 113,767
* 2,440,000 64,369* 557,000 397,405
T.A. World ex U.S. Core Equity PortfolioCONTINUED
Shares Value»
CHINA — (Continued)238,000 $ 25,450370,696 173,439308,000 65,062
* 1,055,000 28,142* 752,000 96,412
718,000 207,244348,000 130,527
* 11,548 37,646* 1,272,000 9,247#* 144,000 16,844# 848,000 50,619
1,196,700 364,273270,000 9,444
* 47,000 2,251129,000 35,289541,000 723,642
* 498,000 14,4332,786,000 607,7641,658,000 918,602
715,000 277,032710,000 170,059
1,205,000 1,015,636680,000 473,422

China Conch Venture Holdings, Ltd.China Construction Bank Corp., Class HChina Datang Corp. Renewable Power Co., Ltd., Class HChina Daye Non-Ferrous Metals Mining, Ltd.China Dili GroupChina Distance Education Holdings, Ltd., ADRChina Dynamics Holdings, Ltd.China Eastern Airlines Corp., Ltd., ADRChina Eastern Airlines Corp., Ltd., Class HChina Electronics Huada Technology Co., Ltd.China Electronics Optics Valley Union Holding Co., Ltd.China Energy Engineering Corp., Ltd., Class HChina Everbright Bank Co., Ltd., Class HChina Everbright Greentech Ltd.China Everbright International, Ltd.China Everbright Water, Ltd.China Evergrande GroupChina Fiber Optic Network System Group, Ltd.China Financial Services Holdings, Ltd.China Flavors & Fragrances Co., Ltd.China Foods, Ltd.China Galaxy Securities Co., Ltd., Class HChina Gas Holdings, Ltd.China Glass Holdings, Ltd.China Grand Pharmaceutical and Healthcare Holdings, Ltd., Class AChina Greenland Broad Greenstate Group Co., Ltd.China Hanking Holdings, Ltd.China Harmony New Energy Auto Holding, Ltd.China High Precision Automation Group, Ltd.China High Speed Transmission Equipment Group Co., Ltd.China Hongqiao Group, Ltd.China Huiyuan Juice Group, Ltd.China Index Holdings, Ltd., ADRChina International Capital Corp., Ltd., Class HChina International Marine Containers Group Co., Ltd., Class HChina Jinmao Holdings Group, Ltd.
China Lesso Group Holdings, Ltd.China Life Insurance Co., Ltd., ADRChina Life Insurance Co., Ltd., Class HChina Lilang, Ltd.China Logistics Property Holdings Co., Ltd.China Longyuan Power Group Corp., Ltd., Class HChina LotSynergy Holdings Ltd.China Maple Leaf Educational Systems, Ltd.China Medical System Holdings, Ltd.China Meidong Auto Holdings, Ltd.China Mengniu Dairy Co., Ltd.China Merchants Bank Co., Ltd., Class HChina Merchants Land, Ltd.
425,000 1,462,45615,486,200 11,889,223
954,000 92,137* 3,026,163 19,365#* 715,600 210,455* 5,206 26,394#* 1,050,000 13,127* 2,373 65,186* 674,000 370,317
256,000 23,117664,000 48,938780,000 81,488483,000 217,213183,000 115,381532,074 468,550
# 129,348 32,307# 1,570,000 4,144,888
521,599 6,996354,000 20,994146,000 30,761538,000 229,959915,500 488,637444,200 1,840,536
* 262,000 15,602456,000 243,880
* 356,000 22,332268,000 39,659
# 499,500 151,964* 127,000 3,711# 195,000 125,106
529,500 387,611* 368,500 17,832* 2,931 8,442
199,600 377,610277,320 262,661
1,882,000 1,212,583
T.A. World ex U.S. Core Equity PortfolioCONTINUED
Shares Value»
CHINA — (Continued)744,000 $ 687,413
3,332 42,450101,000 257,264323,000 285,753
* 310,000 122,420742,000 453,726
* 198,000 6,791430,000 154,203832,000 793,644
# 290,000 213,36388,000 355,084
501,201 2,482,899794,000 112,988

China Merchants Securities Co., Ltd., Class HChina Metal Resources Utilization, Ltd.China Minsheng Banking Corp., Ltd., Class HChina Mobile, Ltd.China Mobile, Ltd., Sponsored ADRChina Modern Dairy Holdings, Ltd.China Molybdenum Co., Ltd., Class HChina National Building Material Co., Ltd., Class HChina NT Pharma Group Co., Ltd.China Nuclear Energy Technology Corp., Ltd.China Oceanwide Holdings, Ltd.China Oil & Gas Group, Ltd.China Oilfield Services, Ltd., Class HChina Oriental Group Co., Ltd.China Overseas Grand Oceans Group, Ltd.China Overseas Land & Investment, Ltd.China Overseas Property Holdings, Ltd.China Pacific Insurance Group Co., Ltd., Class HChina Petroleum & Chemical Corp., ADRChina Petroleum & Chemical Corp., Class HChina Pioneer Pharma Holdings, Ltd.China Power Clean Energy Development Co., Ltd.China Power International Development, Ltd.China Properties Group, Ltd.China Railway Construction Corp., Ltd., Class HChina Railway Group, Ltd., Class HChina Railway Signal & Communication Corp., Ltd., Class HChina Reinsurance Group Corp., Class HChina Resources Beer Holdings Co., Ltd.China Resources Cement Holdings, Ltd.China Resources Gas Group, Ltd.China Resources Land, Ltd.China Resources Medical Holdings Co., Ltd.China Resources Pharmaceutical Group, Ltd.China Resources Power Holdings Co., Ltd.China Ruifeng Renewable Energy Holdings, Ltd.China Rundong Auto Group, Ltd.China Sanjiang Fine Chemicals Co., Ltd.China SCE Group Holdings, Ltd.China Shanshui Cement Group, Ltd.China Shengmu Organic Milk, Ltd.China Shenhua Energy Co., Ltd., Class HChina Silver Group, Ltd.China Singyes Solar Technologies Holdings, Ltd.China South City Holdings, Ltd.China Southern Airlines Co., Ltd., Sponsored ADR
China Southern Airlines Co., Ltd., Class HChina State Construction International Holdings, Ltd.China Sunshine Paper Holdings Co., Ltd.
13,200 15,237#* 164,000 76,264
1,159,620 798,757770,500 6,552,620
73,952 3,150,355* 1,092,000 172,482# 663,000 188,563
2,747,400 2,408,713* 276,000 27,682* 134,000 6,143#* 964,000 47,324
2,404,000 109,839644,000 726,484956,000 424,385841,375 440,355
1,624,827 5,539,1261,049,275 530,601
151,000 644,08712,059 773,794
4,419,400 2,837,300* 250,000 19,641
133,000 92,0861,383,333 346,710
* 173,000 22,294831,500 960,730808,000 565,732738,000 492,698
1,489,000 261,697120,962 566,762
1,328,610 1,214,214466,000 2,358,701734,444 3,138,578475,000 343,447550,000 598,166316,678 454,755
* 300,000 16,820* 62,000 3,887
473,000 102,0331,251,600 680,999
* 77,000 30,509#* 1,157,000 47,289
714,616 1,411,763#* 546,000 51,146
153,600 19,4252,548,000 349,702
3,231 104,620
T.A. World ex U.S. Core Equity PortfolioCONTINUED
Shares Value»
CHINA — (Continued)844,000 $ 541,007781,300 802,576201,000 30,206

China Suntien Green Energy Corp., Ltd., Class HChina Taiping Insurance Holdings Co., Ltd.China Telecom Corp., Ltd., ADRChina Telecom Corp., Ltd., Class HChina Tian Lun Gas Holdings, Ltd.China Tianrui Group Cement Co., Ltd.China Traditional Chinese Medicine Holdings Co., Ltd.China Travel International Investment Hong Kong, Ltd.China Unicom Hong Kong, Ltd.China Unicom Hong Kong, Ltd., ADRChina Vanke Co., Ltd., Class HChina Vast Industrial Urban Development Co., Ltd.China Water Affairs Group, Ltd.China Water Industry Group, Ltd.China Wood Optimization Holding, Ltd.China XLX Fertiliser, Ltd.China Yuhua Education Corp., Ltd.China Yurun Food Group, Ltd.China ZhengTong Auto Services Holdings, Ltd.China Zhongwang Holdings, Ltd.Chinasoft International, Ltd.Chongqing Machinery & Electric Co., Ltd., Class HChongqing Rural Commercial Bank Co., Ltd., Class HChu Kong Shipping Enterprise Group Co., Ltd.CIFI Holdings Group Co., Ltd.CIMC Enric Holdings, Ltd.CITIC Dameng Holdings, Ltd.CITIC Resources Holdings, Ltd.CITIC Securities Co., Ltd., Class HCITIC, Ltd.Citychamp Watch & Jewellery Group, Ltd.Clear Media, Ltd.CNOOC, Ltd.CNOOC, Ltd., Sponsored ADRCoastal Greenland, Ltd.COFCO Meat Holdings, Ltd.Cogobuy GroupColour Life Services Group Co., Ltd.Comba Telecom Systems Holdings, Ltd.Concord New Energy Group, Ltd.Consun Pharmaceutical Group, Ltd.Coolpad Group, Ltd.COSCO SHIPPING Development Co., Ltd., Class HCOSCO SHIPPING Energy Transportation Co., Ltd., Class HCOSCO SHIPPING Holdings Co., Ltd., Class HCoslight Technology International Group Co., Ltd.Cosmo Lady China Holdings Co., Ltd.Country Garden Holdings Co., Ltd.Country Garden Services Holdings Co., Ltd.CP Pokphand Co., Ltd.CPMC Holdings, Ltd.CRCC High-Tech Equipment Corp., Ltd.CRRC Corp., Ltd., Class HCSPC Pharmaceutical Group, Ltd.CSSC Offshore and Marine Engineering Group Co., Ltd., Class H
587,000 148,748669,106 1,851,616
3,368 150,684618,000 275,647
# 106,000 118,523#* 53,000 45,436
784,000 357,9761,228,000 225,7311,930,000 1,880,311
88,795 870,191387,200 1,454,354218,000 86,890310,000 275,812
* 156,000 10,89288,000 22,930
228,000 67,439# 370,000 183,265* 478,000 67,891# 666,000 248,850
878,400 447,340# 816,000 405,695
633,925 50,8981,506,000 787,207
180,000 36,7432,509,085 1,599,490
100,000 72,010361,000 17,439
1,250,000 88,693185,500 354,174833,000 1,102,949
* 1,004,000 208,71480,000 48,073
1,241,000 2,046,11620,875 3,451,264
* 561,000 11,069* 416,000 157,041* 246,000 64,196
221,000 151,307#* 607,429 151,831
2,600,000 127,290296,000 178,996
* 1,451,600 63,0471,310,000 161,274
663,752 378,019* 562,000 209,009* 130,000 27,528# 295,000 56,376
2,179,786 2,936,836315,550 759,811
4,042,000 339,848# 247,000 94,144
284,000 55,505717,000 564,388
1,924,000 3,338,863* 66,000 60,955

CT Environmental Group, Ltd.
Ctrip.com International, Ltd., ADRDa Ming International Holdings, Ltd.Dah Chong Hong Holdings, Ltd.Dali Foods Group Co., Ltd.Dalian Port PDA Co., Ltd., Class HDaphne International Holdings, Ltd.Datang International Power Generation Co., Ltd., Class HDawnrays Pharmaceutical Holdings, Ltd.DBA Telecommunication Asia Holdings, Ltd.Differ Group Holding Co., Ltd.Dongfeng Motor Group Co., Ltd., Class HDongjiang Environmental Co., Ltd., Class HDongyue Group, Ltd.Dynagreen Environmental Protection Group Co., Ltd., Class HDynasty Fine Wines Group, Ltd.E-Commodities Holdings, Ltd.EEKA Fashion Holdings, Ltd.ENN Energy Holdings, Ltd.Essex Bio-technology, Ltd.EVA Precision Industrial Holdings, Ltd.Everbright Securities Co., Ltd., Class HFang Holdings, Ltd., ADRFantasia Holdings Group Co., Ltd.Far East Horizon, Ltd.Flat Glass Group Co., Ltd., Class HFosun International, Ltd.Fu Shou Yuan International Group, Ltd.Fufeng Group, Ltd.Fuguiniao Co., Ltd., Class HFullshare Holdings, Ltd.Future Land Development Holdings, Ltd.Fuyao Glass Industry Group Co., Ltd., Class HGCL New Energy Holdings, Ltd.GCL-Poly Energy Holdings, Ltd.Geely Automobile Holdings, Ltd.Gemdale Properties & Investment Corp., Ltd.Genertec Universal Medical Group Co., Ltd.GF Securities Co., Ltd.Glorious Property Holdings, Ltd.Glory Sun Financial Group, Ltd.Golden Eagle Retail Group, Ltd.Golden Meditech Holdings, Ltd.Golden Throat Holdings Group Co., Ltd.Goldlion Holdings, Ltd.GOME Retail Holdings, Ltd.Grand Baoxin Auto Group, Ltd.Great Wall Motor Co., Ltd., Class HGreater China Financial Holdings, Ltd.
# 1,368,000 59,416
T.A. World ex U.S. Core Equity PortfolioCONTINUED
Shares Value»
CHINA — (Continued)* 58,874 $2,294,909* 42,000 10,600
464,024 147,427855,500 533,170664,200 85,575
* 350,000 7,227506,000 113,695450,000 85,529
* 72,000 3,501#* 772,000 45,219
890,000 793,802# 96,800 87,160
960,000 516,853# 104,000 48,530* 114,000 8,446
828,000 42,61476,000 93,385
129,300 1,330,031# 140,000 110,201
396,000 33,828# 69,000 52,992* 2,931 6,068# 810,000 132,551
1,241,000 1,154,26044,000 21,436
412,892 539,757284,000 242,681903,600 443,371
#* 53,000 4,925#* 3,450,000 122,888# 1,404,000 1,179,560# 268,000 811,538* 4,602,000 175,277#* 8,179,000 465,856
2,045,000 3,118,8882,698,000 321,567
# 555,000 420,129* 231,600 259,750* 1,768,000 77,448# 1,476,000 56,501
273,000 315,238* 172,000 19,923
46,000 12,032162,000 61,548
#* 6,059,060 645,312#* 439,881 94,852
1,721,000 1,165,828* 528,000 13,496

Greatview Aseptic Packaging Co., Ltd.Greenland Hong Kong Holdings, Ltd.Greentown China Holdings, Ltd.Greentown Service Group Co., Ltd.Guangdong Investment, Ltd.Guangdong Yueyun Transportation Co., Ltd., Class HGuangshen Railway Co., Ltd., Sponsored ADRGuangshen Railway Co., Ltd., Class HGuangzhou Automobile Group Co., Ltd., Class HGuangzhou Baiyunshan Pharmaceutical Holdings Co., Ltd.Guangzhou R&F Properties Co., Ltd., Class H
Guolian Securities Co., Ltd., Class HGuorui Properties, Ltd.Haichang Ocean Park Holdings, Ltd.Haier Electronics Group Co., Ltd.Hailiang Education Group, Inc., ADRHaitian International Holdings, Ltd.Haitong Securities Co., Ltd., Class HHarbin Bank Co., Ltd., Class HHarbin Electric Co., Ltd., Class HHarmonicare Medical Holdings, Ltd.HC Group, Inc.Health and Happiness H&H International Holdings, Ltd.Hengan International Group Co., Ltd.Hengdeli Holdings, Ltd.HengTen Networks Group, Ltd.Hilong Holding, Ltd.Hisense Home Appliances Group Co., Ltd., Class HHKC Holdings, Ltd.Honghua Group, Ltd.Honworld Group, Ltd.Hopson Development Holdings, Ltd.HOSA International, Ltd.Hua Han Health Industry Holdings, Ltd.Hua Hong Semiconductor, Ltd.Huadian Fuxin Energy Corp., Ltd., Class HHuadian Power International Corp., Ltd., Class HHuaneng Power International, Inc., Sponsored ADRHuaneng Power International, Inc., Class HHuaneng Renewables Corp., Ltd., Class HHuatai Securities Co., Ltd.Huaxi Holdings Co., Ltd.Huazhong In-Vehicle Holdings Co., Ltd.Huazhu Group, Ltd., ADRHuishang Bank Corp., Ltd., Class HHydoo International Holding, Ltd.IMAX China Holding, Inc.Industrial & Commercial Bank of China, Ltd., Class HInner Mongolia Yitai Coal Co., Ltd., Class H
543,000 296,884589,000 214,847
# 499,500 375,059562,000 473,432194,000 407,739
91,000 32,4156,099 102,463
442,000 143,735424,000 431,100
16,000 65,742766,000 1,385,917
T.A. World ex U.S. Core Equity PortfolioCONTINUED
Shares Value»
CHINA — (Continued)124,000 $ 37,686
# 554,000 98,701* 344,000 53,327
376,000 883,707* 1,838 116,345
412,000 832,318530,400 524,925
* 231,000 47,104#* 354,236 116,470* 74,000 19,284* 211,500 54,145# 124,500 725,379
305,000 2,306,9071,021,400 54,740
#* 6,592,000 124,729544,000 51,043146,000 160,150
91,739 59,184* 1,656,000 130,163
59,000 28,413360,000 372,637
* 178,000 1,237* 1,573,842 15,983# 175,000 360,644
686,000 127,293388,000 162,399
3,000 70,050468,000 271,165
3,032,000 824,083170,000 275,413
60,000 16,811344,000 60,156
30,524 999,966186,200 72,334
#* 146,000 8,113# 113,000 259,469
8,824,460 5,926,03221,900 16,175

JD.com, Inc., ADRJiangnan Group, Ltd.Jiangsu Expressway Co., Ltd., Class HJiangxi Copper Co., Ltd., Class HJiayuan International Group, Ltd.Jinchuan Group International Resources Co., Ltd.Jingrui Holdings, Ltd.JinkoSolar Holding Co., Ltd., ADRJinmao Hotel and Jinmao China Hotel Investments and Management, Ltd.JNBY Design, Ltd.Joy City Property, Ltd.Ju Teng International Holdings, Ltd.Jutal Offshore Oil Services, Ltd.K Wah International Holdings, Ltd.Kai Yuan Holdings, Ltd.Kaisa Group Holdings, Ltd.Kangda International Environmental Co., Ltd.Kasen International Holdings, Ltd.Kinetic Mines and Energy, Ltd.Kingboard Holdings, Ltd.Kingboard Laminates Holdings, Ltd.
Kingdee International Software Group Co., Ltd.Kingsoft Corp., Ltd.KuangChi Science, Ltd.Kunlun Energy Co., Ltd.KWG Group Holdings, Ltd.Labixiaoxin Snacks Group, Ltd.Lai Fung Holdings, Ltd.Launch Tech Co., Ltd., Class HLee & Man Chemical Co., Ltd.Lee & Man Paper Manufacturing, Ltd.Lee's Pharmaceutical Holdings, Ltd.Legend Holdings Corp.Legend Holdings Corp., Class HLenovo Group, Ltd.Leoch International Technology, Ltd.Lexinfintech Holdings, Ltd., ADRLi Ning Co., Ltd.Lianhua Supermarket Holdings Co., Ltd., Class HLifestyle China Group, Ltd.Lifetech Scientific Corp.Livzon Pharmaceutical Group, Inc., Class HLogan Property Holdings Co., Ltd.Longfor Group Holdings, Ltd.Lonking Holdings, Ltd.Luye Pharma Group, Ltd.LVGEM China Real Estate Investment Co., Ltd.Maanshan Iron & Steel Co., Ltd., Class HMaoye International Holdings, Ltd.
* 20,371 609,297* 762,000 32,014
198,000 266,776372,000 460,388
# 498,787 215,798# 737,000 59,840# 257,000 84,132* 11,280 220,975
83,500 46,469173,000 316,561
2,024,000 244,024460,000 108,843
# 124,000 13,180583,931 303,822
* 1,980,000 10,9221,407,000 583,550
* 285,000 35,864# 194,000 162,483
812,000 45,594443,000 1,089,460735,000 606,104
T.A. World ex U.S. Core Equity PortfolioCONTINUED
Shares Value»
CHINA — (Continued)# 237,600 $ 226,331* 270,000 581,736#* 664,000 37,886
2,228,000 1,943,100# 718,400 667,934* 200,000 10,307
27,560 27,55916,800 11,22666,300 34,299
846,600 516,765122,000 77,093
* 4,884 063,500 149,543
3,976,000 3,199,303195,000 15,758
* 10,746 113,908293,500 723,596
* 67,400 15,832#* 327,000 104,178#* 708,000 132,807# 61,856 150,050
740,000 1,118,925575,500 2,128,309
1,256,000 325,810# 677,500 523,151
162,000 57,536# 960,000 363,896
445,000 31,151

Metallurgical Corp. of China, Ltd., Class HMingfa Group International Co., Ltd.Minmetals Land, Ltd.Minth Group, Ltd.MMG, Ltd.MOBI Development Co., Ltd.Modern Land China Co., Ltd.Momo, Inc., Sponsored ADRMunsun Capital Group, Ltd.Nan Hai Corp., Ltd.Nanfang Communication Holdings, Ltd.Nature Home Holding Co., Ltd.NetDragon Websoft Holdings, Ltd.NetEase, Inc., ADRNew China Life Insurance Co., Ltd., Class HNew Oriental Education & Technology Group, Inc., Sponsored ADRNew Provenance Everlasting Holdings, Ltd.New World Department Store China, Ltd.Nexteer Automotive Group, Ltd.Nine Dragons Paper Holdings, Ltd.Noah Holdings, Ltd., ADRNorth Mining Shares Co., Ltd.NVC Lighting Holdings, Ltd.O-Net Technologies Group, Ltd.Orient Securities Co., Ltd., Class HOverseas Chinese Town Asia Holdings, Ltd.Ozner Water International Holding, Ltd.Pacific Online, Ltd.Panda Green Energy Group, Ltd.Parkson Retail Group, Ltd.PAX Global Technology, Ltd.
Peking University Resources Holdings Co., Ltd.People's Insurance Co. Group of China, Ltd. (The), Class HPetroChina Co., Ltd., ADRPetroChina Co., Ltd., Class HPICC Property & Casualty Co., Ltd., Class HPing An Insurance Group Co. of China, Ltd., Class HPoly Culture Group Corp., Ltd., Class HPoly Property Group Co., Ltd.Postal Savings Bank of China Co., Ltd., Class HPou Sheng International Holdings, Ltd.Powerlong Real Estate Holdings, Ltd.PW Medtech Group, Ltd.Q Technology Group Co., Ltd.Qingdao Port International Co., Ltd., Class HQinhuangdao Port Co., Ltd., Class HQinqin Foodstuffs Group Cayman Co., Ltd.Qunxing Paper Holdings Co., Ltd.Real Gold Mining, Ltd.
878,000 214,323* 589,000 4,236
764,000 118,281# 344,000 969,422* 1,680,000 521,434
124,000 17,922# 444,400 64,070
63,205 2,147,074* 1,295,700 11,620# 8,450,000 150,794# 64,000 37,616* 228,000 33,757
18,500 46,25010,443 2,410,45388,000 436,500
* 3,673 383,131* 750,000 2,374* 223,000 39,266
698,000 725,4281,293,000 1,046,582
* 6,747 218,198* 6,050,000 13,798
545,000 49,54186,000 46,936
222,000 135,311146,000 53,289
# 175,000 27,169210,000 48,414
#* 1,408,000 53,664605,000 48,429417,000 167,204
T.A. World ex U.S. Core Equity PortfolioCONTINUED
Shares Value»
CHINA — (Continued)350,000 $ 9,536289,000 121,236
9,000 477,6303,212,000 1,703,6561,391,753 1,652,519
833,000 9,817,57940,500 38,668
1,141,000 420,920622,000 361,723
1,044,000 290,471728,000 441,652
* 280,000 36,288#* 239,000 231,597# 363,000 258,719
206,000 39,280* 8,400 2,588
147,174 7,107* 19,000 638

Red Star Macalline Group Corp., Ltd., Class HRedco Properties Group Ltd.Regal International Airport Group Co., Ltd., Class HREXLot Holdings, Ltd.Road King Infrastructure, Ltd.Ronshine China Holdings, Ltd.Sany Heavy Equipment International Holdings Co., Ltd.Seaspan Corp.Semiconductor Manufacturing International Corp.Semiconductor Manufacturing International Corp., ADRShandong Chenming Paper Holdings, Ltd., Class HShandong Weigao Group Medical Polymer Co., Ltd., Class HShandong Xinhua Pharmaceutical Co., Ltd.Shanghai Electric Group Co., Ltd., Class HShanghai Fosun Pharmaceutical Group Co., Ltd., Class HShanghai Fudan Microelectronics Group Co., Ltd., Class HShanghai Fudan-Zhangjiang Bio-Pharmaceutical Co., Ltd.Shanghai Haohai Biological Technology Co., Ltd., Class HShanghai Industrial Holdings, Ltd.Shanghai Industrial Urban Development Group, Ltd.Shanghai Jin Jiang International Hotels Group Co., Ltd., Class HShanghai La Chapelle Fashion Co., Ltd., Class HShanghai Pharmaceuticals Holding Co., Ltd., Class HShanghai Prime Machinery Co., Ltd.Shanghai Zendai Property, Ltd.Shengjing Bank Co., Ltd.Shenguan Holdings Group, Ltd.Shenzhen Expressway Co., Ltd., Class HShenzhen International Holdings, Ltd.Shenzhen Investment, Ltd.Shenzhou International Group Holdings, Ltd.Shimao Property Holdings, Ltd.Shougang Fushan Resources Group, Ltd.Shui On Land, Ltd.Shunfeng International Clean Energy, Ltd.Sichuan Expressway Co., Ltd., Class HSihuan Pharmaceutical Holdings Group, Ltd.SIM Technology Group, Ltd.SINA Corp.Sino Biopharmaceutical, Ltd.Sinofert Holdings, Ltd.
Sino-Ocean Group Holding, Ltd.Sinopec Engineering Group Co., Ltd., Class HSinopec Kantons Holdings, Ltd.Sinopec Oilfield Service Corp.Sinopec Shanghai Petrochemical Co., Ltd., Sponsored ADRSinopec Shanghai Petrochemical Co., Ltd., Class HSinopharm Group Co., Ltd., Class HSinosoft Technology Group, Ltd.
152,672 133,100# 606,000 241,073
50,000 34,437* 5,031,399 13,497
96,000 197,373198,000 257,759421,000 165,527
42,872 435,151* 1,143,100 1,346,432* 10,590 61,740
243,250 106,230644,000 613,965109,200 52,364700,000 243,129158,500 469,214
#* 74,000 72,039111,000 84,490
# 12,800 75,128271,000 555,247894,000 143,993684,000 121,320
# 33,800 14,033236,100 454,007420,000 46,033
* 2,745,000 35,694144,500 103,321446,000 17,919210,000 249,268614,016 1,134,164
1,885,568 676,091102,000 1,404,268809,500 2,235,677
1,270,000 263,0012,069,656 441,781
#* 974,000 37,902266,000 80,145
2,104,000 431,028400,000 15,000
* 19,422 759,7892,344,497 2,859,736
# 1,194,000 133,563
T.A. World ex U.S. Core Equity PortfolioCONTINUED
Shares Value»
CHINA — (Continued)1,721,832 $ 692,779
706,000 553,086514,000 206,792
* 538,000 62,851602 21,070
1,142,000 398,424356,800 1,318,945416,000 111,423

Sinotrans, Ltd., Class HSinotruk Hong Kong, Ltd.Skyfame Realty Holdings, Ltd.Skyworth Group, Ltd.SMI Holdings Group, Ltd.SOHO China, Ltd.Sohu.com, Ltd., ADRSouthern Energy Holdings Group, Ltd.Sparkle Roll Group, Ltd.Springland International Holdings, Ltd.SPT Energy Group, Inc.SRE Group, Ltd.SSY Group, Ltd.Strong Petrochemical Holdings, Ltd.Suchuang Gas Corp., Ltd.Sun Art Retail Group, Ltd.Sun King Power Electronics GroupSunac China Holdings, Ltd.Sunny Optical Technology Group Co., Ltd.Sunshine 100 China Holdings, Ltd.Superb Summit International Group, Ltd.Symphony Holdings, Ltd.TAL Education Group, ADRTang Palace China Holdings, Ltd.Tarena International, Inc., ADRTCL Electronics Holdings, Ltd.Tech Pro Technology Development, Ltd.Technovator International, Ltd.Ten Pao Group Holdings, Ltd.Tencent Holdings, Ltd.Tenwow International Holdings, Ltd.Texhong Textile Group, Ltd.Tian An China Investment Co., Ltd.Tian Ge Interactive Holdings, Ltd.Tian Shan Development Holding, Ltd.Tiangong International Co., Ltd.Tianjin Capital Environmental Protection Group Co., Ltd., Class HTianjin Port Development Holdings, Ltd.Tianneng Power International, Ltd.Tianyun International Holdings, Ltd.Tibet Water Resources, Ltd.Tingyi Cayman Islands Holding Corp.Tomson Group, Ltd.Tong Ren Tang Technologies Co., Ltd., Class HTongda Group Holdings, Ltd.Tonly Electronics Holdings, Ltd.Top Spring International Holdings, Ltd.Tou Rong Chang Fu Group, Ltd.Towngas China Co., Ltd.TPV Technology, Ltd.TravelSky Technology, Ltd., Class H
830,000 286,071# 434,500 637,135
1,856,000 278,701996,196 270,490
#* 466,400 22,3421,213,500 387,982
* 5,447 66,399#* 82,000 101,922* 944,000 32,273
378,000 74,704* 416,000 40,569* 2,440,285 27,671
1,141,042 1,011,740* 132,000 5,726
98,000 23,6521,174,000 1,188,842
144,000 19,201500,000 2,255,336170,700 1,973,868
#* 217,000 40,593* 55,000 1,924# 450,000 52,807* 34,138 1,099,244
88,000 13,788* 8,228 13,083
379,000 171,619* 2,780,000 4,546* 204,000 24,507
196,000 19,689475,000 22,131,658
* 286,000 2,605214,000 214,912141,000 69,162
#* 191,000 44,753# 66,000 22,794
476,000 147,57494,000 32,659
1,134,000 116,656# 522,000 417,431
70,000 10,870* 583,000 145,261
826,000 1,232,735340,503 97,268237,000 283,185
# 2,240,000 164,46131,200 23,059
# 107,600 23,558* 856,000 9,677
299,250 227,852292,000 91,469173,471 339,546
T.A. World ex U.S. Core Equity PortfolioCONTINUED

Trigiant Group, Ltd.Truly International Holdings, Ltd.Tsaker Chemical Group, Ltd.Tsingtao Brewery Co., Ltd., Class HTuniu Corp., Sponsored ADRUni-President China Holdings, Ltd.United Energy Group, Ltd.Vinda International Holdings, Ltd.Vipshop Holdings, Ltd., ADRWanguo International Mining Group, Ltd.Want Want China Holdings, Ltd.Wasion Holdings, Ltd.Weibo Corp., Sponsored ADRWeichai Power Co., Ltd., Class HWest China Cement, Ltd.Wisdom Education International Holdings Co., Ltd.Wison Engineering Services Co., Ltd.Xiabuxiabu Catering Management China Holdings Co., Ltd.Xiamen International Port Co., Ltd.Xingda International Holdings, Ltd.Xingfa Aluminium Holdings, Ltd.Xinghua Port Holdings, Ltd.Xinjiang Goldwind Science & Technology Co., Ltd., Class HXinyi Solar Holdings, Ltd.Xinyuan Real Estate Co., Ltd., ADRXtep International Holdings, Ltd.Yadea Group Holdings, Ltd.Yanchang Petroleum International, Ltd.Yangtze Optical Fibre and Cable Joint Stock, Ltd. Co., Class HYanzhou Coal Mining Co., Ltd., Class HYashili International Holdings, Ltd.Yeebo International Holdings, Ltd.YiChang HEC ChangJiang Pharmaceutical Co., Ltd., Class HYida China Holdings, Ltd.Yihai International Holding, Ltd.Yip's Chemical Holdings, Ltd.Yirendai, Ltd., ADRYouyuan International Holdings, Ltd.YuanShengTai Dairy Farm, Ltd.Yuexiu Property Co., Ltd.Yuexiu Transport Infrastructure, Ltd.Yum China Holdings, Inc.Yunnan Water Investment Co., Ltd., Class HYuzhou Properties Co., Ltd.YY, Inc., ADRZhaojin Mining Industry Co., Ltd., Class HZhejiang Expressway Co., Ltd., Class HZhong An Group Ltd.Zhongsheng Group Holdings, Ltd.Zhongyu Gas Holdings, Ltd.Zhou Hei Ya International Holdings Co., Ltd.Zhuguang Holdings Group Co., Ltd.
Shares Value»
CHINA — (Continued)360,000 $ 67,520
#* 608,000 85,25517,500 7,01274,000 432,807
* 11,956 36,944752,400 889,906
* 5,022,000 905,219134,000 261,970
* 140,389 1,066,95638,000 8,611
2,098,000 1,631,719250,000 91,161
* 5,779 226,3631,186,880 1,822,7341,698,000 286,119
# 302,000 135,18488,000 11,866
# 307,500 427,409500,000 62,413472,332 126,850
48,000 46,59753,750 6,785
354,953 396,6692,083,412 1,143,778
23,488 98,415316,000 227,559
# 606,000 123,666* 1,360,000 15,396# 92,500 168,053
1,322,000 1,163,570# 482,000 63,512
106,000 17,37861,600 310,241
* 110,000 31,294213,000 1,130,219
96,000 29,008* 8,553 95,708#* 259,510 72,522* 393,000 12,756
3,891,720 879,755172,639 137,119
35,683 1,623,576140,000 37,412
1,096,027 514,923* 15,328 983,904
105,000 122,040416,000 402,665
* 1,486,000 51,017354,500 985,291213,666 222,235
# 357,000 193,445* 234,000 30,105

Zhuhai Holdings Investment Group, Ltd.Zhuzhou CRRC Times Electric Co., Ltd., Class HZijin Mining Group Co., Ltd., Class HZoomlion Heavy Industry Science and Technology Co., Ltd., Class HZTE Corp., Class HZTO Express Cayman, Inc., ADR
TOTAL CHINA
Almacenes Exito SABanco de Bogota SABancolombia SA, Sponsored ADRBancolombia SACelsia SA ESPCementos Argos SACEMEX Latam Holdings SACorp. Financiera Colombiana SAEcopetrol SA, Sponsored ADREcopetrol SAEmpresa de Telecomunicaciones de BogotaGrupo Argos SAGrupo Aval Acciones y Valores SAGrupo de Inversiones Suramericana SAGrupo Energia Bogota SA ESPGrupo Nutresa SAInterconexion Electrica SA ESP
TOTAL COLOMBIA
CEZ A.S.Komercni banka A.S.Moneta Money Bank A.S.O2 Czech Republic A.S.Philip Morris CR A.S.
TOTAL CZECH REPUBLIC
Agat Ejendomme A.S.ALK-Abello A.S.Alm Brand A.S.Ambu A.S., Class BAP Moller - Maersk A.S., Class AAP Moller - Maersk A.S., Class BBang & Olufsen A.S.BankNordik P/FBavarian Nordic A.S.Brodrene Hartmann A.S.Carlsberg A.S., Class BChr Hansen Holding A.S.Coloplast A.S., Class BColumbus A.S.D/S Norden A.S.
304,000 31,62082,400 393,856
3,117,000 1,247,459762,000 531,989
* 20,204 60,34221,805 428,468
306,735,679
T.A. World ex U.S. Core Equity PortfolioCONTINUED
Shares Value»
COLOMBIA — (0.1%)90,627 $ 480,629
4,740 103,2975,279 263,317
17,822 213,47789,300 121,12070,695 165,698
* 37,434 47,920* 17,502 144,136
10,314 184,930356,765 319,693
* 40,000 2,95064,982 333,136
5,281 39,66030,393 319,592
* 47,042 30,11022,661 173,50172,437 392,992
3,336,158
CZECH REPUBLIC — (0.1%)27,736 621,871
4,943 190,673301,322 1,035,544
6,416 60,852100 58,896
1,967,836
DENMARK — (1.3%)* 52,779 30,486* 3,265 738,482
39,702 354,943# 45,670 668,778
369 395,007640 718,623
* 14,114 90,886590 9,739
* 13,068 358,3491,220 57,944
14,616 1,996,39622,719 1,983,751
6,991 816,51835,018 61,06414,643 219,108

Danske Bank A.S.Demant A.S.DFDS A.S.Drilling Co. of 1972 A.S. (The)DSV A.S.FLSmidth & Co. A.S.Genmab A.S.GN Store Nord A.S.H Lundbeck A.S.H+H International A.S., Class BISS A.S.Jeudan A.S.Jyske Bank A.S.Matas A.S.Nilfisk Holding A.S.
NKT A.S.NNIT A.S.Novo Nordisk A.S., Sponsored ADRNovo Nordisk A.S., Class BNovozymes A.S., Class BOrsted A.S.Pandora A.S.Parken Sport & Entertainment A.S.Per Aarsleff Holding A.S.Ringkjoebing Landbobank A.S.Rockwool International A.S., Class ARockwool International A.S., Class BRoyal Unibrew A.S.RTX A.S.Scandinavian Tobacco Group A.S., Class ASchouw & Co., A.S.SimCorp A.S.Solar A.S., Class BSpar Nord Bank A.S.Sydbank A.S.Tivoli A.S.Topdanmark A.S.TORM P.L.C.Tryg A.S.Vestas Wind Systems A.S.Vestjysk Bank A.S.Zealand Pharma A.S.
TOTAL DENMARK
Commercial International Bank Egypt S.A.E., GDRCommercial International Bank Egypt S.A.E., GDR
TOTAL EGYPT
48,182 715,145* 32,505 957,669
15,439 568,644* 2,018 136,904
25,163 2,401,65219,629 803,952
* 6,648 1,231,24952,868 2,507,81223,106 890,728
* 8,326 119,15780,000 2,243,563
595 89,832* 31,317 998,063
17,726 182,789* 14,008 354,597
T.A. World ex U.S. Core Equity PortfolioCONTINUED
Shares Value»
DENMARK — (Continued)* 11,345 $ 166,581
4,966 77,20820,820 997,694
132,667 6,370,57936,674 1,695,995
6,739 614,29469,812 2,676,052
2,697 47,1999,252 304,857
14,285 976,243311 68,310
3,041 742,22128,321 2,110,550
3,391 80,38122,954 242,253
6,657 495,49212,571 1,133,055
2,756 126,39543,506 384,02935,677 620,670
80 8,15128,136 1,442,138
* 6,957 57,32238,777 1,183,51944,257 3,631,796
* 32,285 19,701* 9,863 220,906
49,195,421
EGYPT — (0.0%)37,735 161,85130,828 132,560
294,411
FINLAND — (1.2%)

Adapteo OyjAhlstrom-Munksjo OyjAktia Bank OyjAlma Media OyjAsiakastieto Group OyjAspo OyjAtria OyjBasWare OyjBittium OyjCargotec Oyj, Class BCaverion OyjCitycon OyjCramo OyjElisa OyjFinnair OyjFiskars Oyj AbpFortum OyjF-Secure OyjHKScan Oyj, Class AHuhtamaki OyjKemira OyjKesko Oyj, Class AKesko Oyj, Class B
Kone Oyj, Class BKonecranes OyjLassila & Tikanoja OyjMetsa Board OyjMetso OyjNeste OyjNokia OyjNokia OyjNokian Renkaat OyjNordea Bank AbpOlvi Oyj, Class AOriola Oyj, Class BOrion Oyj, Class AOrion Oyj, Class BOutokumpu OyjOutotec OyjPonsse OyjRaisio Oyj, Class VRapala VMC OyjRevenio Group OyjSampo Oyj, Class ASanoma OyjSRV Group OyjStockmann Oyj Abp, Class BStora Enso Oyj, Sponsored ADRStora Enso Oyj, Class R
* 20,921 244,69612,664 208,54819,350 183,21810,852 76,976
518 16,2536,086 60,4816,165 51,967
* 1,070 21,02613,056 100,94517,540 519,317
6,562 43,57915,792 160,99320,921 181,57140,076 1,882,45032,899 231,81513,847 202,50185,180 1,953,998
* 26,205 76,711* 20,409 35,891
57,915 2,199,98757,596 849,478
6,764 380,78224,752 1,498,925
T.A. World ex U.S. Core Equity PortfolioCONTINUED
Shares Value»
FINLAND — (Continued)22,183 $ 1,263,84228,082 822,28316,264 247,38794,015 468,97760,875 2,339,140
152,754 5,055,591129,856 699,879150,663 815,009
63,102 1,809,047291,852 1,872,308
6,636 258,50772,809 164,158
9,151 315,42536,756 1,257,433
# 158,239 452,810* 35,571 222,035
3,963 124,58160,202 209,498
1,596 5,2988,066 181,756
51,062 2,120,27647,701 472,203
* 3,551 6,056* 14,423 32,089
1,800 20,622239,479 2,757,938

Teleste OyjTieto OyjTikkurila OyjTokmanni Group Corp.UPM-Kymmene OyjUponor OyjVaisala Oyj, Class AValmet OyjWartsila Oyj AbpYIT Oyj
TOTAL FINLAND
ABC arbitrageAccor SAActia GroupAeroports de ParisAir France-KLMAir Liquide SAAirbus SEAkka TechnologiesAKWELAlbioma SAAlstom SAAlten SAAltran Technologies SAAmplitude Surgical SASAmundi SAAPRIL SAArkema SAAssystem SAAtos SEAubay
AXA SA, Sponsored ADRAXA SAAxway Software SABaikowski SASBastide le Confort MedicalBeneteau SABigben InteractiveBioMerieuxBNP Paribas SABoiron SABollore SABonduelle SCABourbon Corp.Bouygues SABureau Veritas SABurelle SACapgemini SE
1,219 7,81030,620 781,09015,509 241,00824,997 226,023
210,965 5,686,56124,735 259,826
5,625 127,07666,924 1,299,500
119,220 1,497,84372,875 403,262
45,706,255
FRANCE — (5.9%)3,527 24,631
26,776 1,194,6195,948 30,0653,235 556,128
* 125,616 1,309,47927,829 3,841,41250,205 7,097,022
7,898 557,7857,357 144,590
15,115 401,26135,331 1,521,66216,790 2,077,08194,678 1,493,579
* 2,916 4,64511,477 789,6703,950 94,760
44,513 4,006,4173,590 152,511
22,770 1,830,9572,443 85,930
T.A. World ex U.S. Core Equity PortfolioCONTINUED
Shares Value»
FRANCE — (Continued)5,414 $ 135,621
171,463 4,318,8521,805 25,097
* 356 6,5472,315 94,110
18,792 195,8098,107 108,723
14,309 1,210,868112,120 5,247,218
3,504 155,677166,884 717,657
8,947 264,703#* 20,509 79,689
87,992 3,150,03648,091 1,198,294
26 24,38928,204 3,580,901

Carrefour SACasino Guichard Perrachon SACatering International ServicesCegedim SACGG SAChargeurs SACie de Saint-GobainCie des AlpesCie Generale des Etablissements Michelin SCACie Plastic Omnium SACNP AssurancesCoface SACredit Agricole SADanone SA, Sponsored ADRDanone SADassault Aviation SADassault Systemes SEDassault Systemes SE, Sponsored ADRDerichebourg SADevoteam SAEdenredEiffage SAElectricite de France SAElior Group SAElis SAEngie SAErametEssilorLuxottica SAEsso SA FrancaiseEtablissements Maurel et PromEurofins Scientific SEEuronext NVEuropcar Mobility GroupEutelsat Communications SAExel Industries, Class AFaurecia SEFleury Michon SAFnac Darty S.A.Fnac Darty SA (BLRZL56)Gaztransport Et Technigaz SAGetlink SEGL Events
Groupe CritGroupe GorgeGroupe OpenGuerbetHaulotte Group SAHermes InternationalHEXAOM
116,303 2,234,920# 22,347 826,809
977 12,903* 1,319 40,681* 104,203 228,583
10,865 200,737112,894 4,324,810
6,122 168,28150,834 5,619,56434,079 899,06532,914 680,273
* 57,384 710,633114,991 1,368,849
600 10,33249,891 4,327,193
74 101,7104,673 710,8401,228 187,454
59,500 220,0172,730 326,594
55,353 2,777,70145,566 4,502,484
143,748 1,779,48448,509 634,39130,453 563,507
166,950 2,569,2756,101 291,784
11,460 1,551,2981,602 44,213
14,004 45,1613,764 1,610,093
21,464 1,656,94360,208 377,029
110,664 2,115,525538 27,379
44,559 2,108,646371 14,564
* 10,006 701,867* 3,486 247,804
8,235 747,121105,642 1,525,391
7,370 200,516
T.A. World ex U.S. Core Equity PortfolioCONTINUED
Shares Value»
FRANCE — (Continued)2,025 $ 136,1171,866 29,7091,810 31,4563,868 223,4453,630 28,1862,632 1,848,780
* 1,444 53,062

ID Logistics GroupIliad SAImerys SAIngenico Group SAInterparfums SAIpsen SAIPSOSJacquet Metal Service SAJCDecaux SAKaufman & Broad SAKering SAKorian SALagardere SCALatecoere SACALaurent-PerrierLe BelierLectraLegrand SALinedata ServicesLISILNA Sante SAL'Oreal SALVMH Moet Hennessy Louis Vuitton SEMaisons du Monde SAManitou BF SAManutan InternationalMersen SAMETabolic EXplorer SAMetropole Television SAMGI Digital Graphic TechnologyNatixis SANeopost SANexans SANexity SANicoxNRJ GroupOeneo SAOL Groupe SAOnxeo SAOrange SA, Sponsored ADROrange SAOrpeaPernod Ricard SAPeugeot SAPierre & Vacances SAPlastivaloirePSB Industries SAPublicis Groupe SA, ADRPublicis Groupe SARallye SARecylex SARemy Cointreau SA
* 971 181,76813,235 1,368,29014,893 622,59532,079 3,039,425
2,424 114,6975,548 634,762
17,638 482,3577,553 134,545
23,861 686,97713,978 573,966
6,217 3,211,15028,488 1,124,44473,302 1,656,287
* 35,844 150,682664 65,452
1,492 45,2539,871 202,290
32,156 2,265,1151,886 59,868
11,986 347,4702,102 115,9899,247 2,474,167
24,347 10,056,75414,787 296,158
3,963 93,596734 59,156
7,318 261,908* 7,442 12,404
17,775 308,354* 340 18,768
177,646 712,41617,196 345,51227,605 933,35024,700 1,185,932
* 4,348 22,3868,607 63,590
11,220 128,722* 2,387 8,589* 18,755 15,241
26,020 383,014418,276 6,199,889
12,466 1,557,4733,559 624,546
246,391 5,815,565* 2,468 46,433
6,808 45,632356 9,981
1,600 19,79255,957 2,761,243
# 13,551 63,541* 4,505 19,200
1,691 250,213
T.A. World ex U.S. Core Equity PortfolioCONTINUED

Renault SARexel SARobertet SARothschild & Co.Rubis SCASafran SASanofi, ADRSanofiSartorius Stedim BiotechSavencia SASchneider Electric SESchneider Electric SESCOR SESEB SASeche Environnement SASES SASociete BIC SASociete Generale SASociete Marseillaise du Tunnel Prado-Carenage SASociete pour l'Informatique IndustrielleSodexo SASOITECSolocal GroupSomfy SASopra Steria GroupSPIE SAStef SASTMicroelectronics NVSTMicroelectronics NVSuezSword GroupSynergie SATarkett SATechnicolor SATeleperformanceTelevision Francaise 1Thales SAThermador GroupeTotal GabonTotal SATOTAL SA, Sponsored ADRTouax SATrigano SAUbisoft Entertainment SAUnion Financiere de France BQE SAValeo SAVallourec SAValneva SEVeolia Environnement SA, ADRVeolia Environnement SAVetoquinol SAVicat SA
Shares Value»
FRANCE — (Continued)39,257 $ 2,189,664
138,509 1,546,587133 94,614
4,151 129,98724,023 1,353,69420,793 2,985,06114,072 586,80241,111 3,425,8566,240 994,4342,171 160,138
42,659 3,680,4511,443 123,073
51,950 2,134,8569,458 1,512,827
824 31,827158,557 2,618,640
12,846 895,22383,931 2,055,862
1,473 29,3171,100 34,213
15,238 1,749,358* 5,991 621,709* 184,554 152,833
3,079 278,2877,385 950,442
49,105 910,1892,220 196,926
184,506 3,381,4268,672 158,264
50,665 742,656998 34,333
6,848 217,85119,701 329,550
* 109,923 93,05219,032 3,986,95746,092 461,79513,781 1,552,760
2,169 136,976219 32,323
288,924 14,974,9835,654 292,547
* 25 1353,741 375,332
* 39,703 3,265,7581,915 38,704
43,488 1,355,192#* 147,735 513,277* 7,258 24,606
13,366 337,09139,060 985,712
532 35,1809,130 409,632

VIEL & Cie SAVilmorin & Cie SAVinci SAVirbac SAVivendi SAVranken-Pommery Monopole SA
Worldline SA
TOTAL FRANCE
1&1 Drillisch AG7C Solarparken AGAareal Bank AGAdidas AGAdler Modemaerkte AGADO Properties SAADVA Optical Networking SEAIXTRON SEAll for One Group AGAllgeier SEAllianz SE, Sponsored ADRAllianz SEAmadeus Fire AGAtoss Software AGAurubis AGAxel Springer SEBASF SEBasler AGBauer AGBayer AGBayerische Motoren Werke AGBayWa AGBechtle AGBeiersdorf AGBertrandt AGbet-at-home.com AGBijou Brigitte AGBilfinger SEBorussia Dortmund GmbH & Co. KGaABrenntag AGCANCOM SECarl Zeiss Meditec AGCECONOMY AGCENIT AGCENTROTEC Sustainable AGCewe Stiftung & Co. KGAAcomdirect bank AGCommerzbank AGCompuGroup Medical SEContinental AG
13,569 74,2153,102 169,995
59,854 6,156,805* 1,348 250,227
30,617 850,391954 23,141
T.A. World ex U.S. Core Equity PortfolioCONTINUED
Shares Value»
FRANCE — (Continued)* 16,432 $ 1,174,209
225,126,426
GERMANY — (5.0%)18,382 552,053
3,330 11,25232,085 912,82516,545 5,273,604
* 2,793 9,3918,788 376,494
* 27,653 214,066* 14,215 158,655
326 15,0851,637 42,485
35,377 820,57021,470 4,981,232
2,244 304,836515 74,075
21,241 922,52919,671 1,357,748
153,754 10,206,8431,425 61,9495,636 130,153
74,717 4,839,34473,155 5,383,406
6,697 174,31815,434 1,709,635
4,961 574,9203,201 214,4081,125 70,8241,389 61,187
17,202 505,04362,002 617,76047,648 2,327,20123,673 1,323,466
4,631 507,415* 98,205 629,309
4,236 53,3573,714 49,3494,034 372,6314,284 44,212
314,134 2,131,6008,544 659,202
19,180 2,629,664

Corestate Capital Holding SACovestro AGCropEnergies AGCTS Eventim AG & Co. KGaADaimler AGData Modul AG Produktion Und Vertrieb Von Elektronischen SystemenDelticom AGDeutsche Bank AGDeutsche Bank AGDeutsche Boerse AGDeutsche Lufthansa AGDeutsche Pfandbriefbank AGDeutsche Post AGDeutsche Telekom AG, Sponsored ADRDeutsche Telekom AG
Deutsche Wohnen SEDeutz AGDialog Semiconductor P.L.C.DIC Asset AGDMG Mori AGDr Hoenle AGDraegerwerk AG & Co. KGaADuerr AGE.ON SEEckert & Ziegler Strahlen- und Medizintechnik AGEDAG Engineering Group AGElmos Semiconductor AGElringKlinger AGEnergiekontor AGEvonik Industries AGEvotec SEFielmann AGFirst Sensor AGFrancotyp-Postalia Holding AG, Class AFraport AG Frankfurt Airport Services WorldwideFreenet AGFresenius Medical Care AG & Co. KGaAFresenius SE & Co. KGaAFuchs Petrolub SEGEA Group AGGerresheimer AGGesco AGGFT Technologies SEGrammer AGGrand City Properties SAGRENKE AGH&R GmbH & Co. KGaAHamburger Hafen und Logistik AGHannover Rueck SE
5,611 203,93545,792 2,065,26812,477 83,22420,387 1,016,621
200,918 10,382,714208 15,662
* 285 1,0823,370 26,050
321,111 2,507,87719,604 2,721,475
114,800 1,819,35466,660 756,767
114,278 3,717,066104,159 1,703,000519,957 8,517,455
T.A. World ex U.S. Core Equity PortfolioCONTINUED
Shares Value»
GERMANY — (Continued)38,655 $1,409,66487,265 602,410
* 33,381 1,494,21917,469 196,944
7,777 362,9231,671 104,7641,428 61,071
32,270 959,751507,298 5,052,088
1,137 150,0915,318 64,0307,196 156,735
* 14,246 80,8583,966 75,858
49,194 1,399,896* 36,322 1,023,574
6,941 482,9841,547 50,3336,658 25,525
13,684 1,142,79273,647 1,436,97356,515 3,914,27446,031 2,300,047
9,594 336,94762,845 1,559,81519,577 1,522,737
3,607 92,29211,646 90,077
363 12,27928,574 643,735
1,784 153,125* 7,950 56,080
19,327 487,21610,482 1,634,525

Hapag-Lloyd AGHeidelbergCement AGHeidelberger Druckmaschinen AGHella GmbH & Co KGaAHenkel AG & Co. KGaAHighlight Communications AGHochtief AGHolidayCheck Group AGHornbach Baumarkt AGHornbach Holding AG & Co. KGaAHugo Boss AGIndus Holding AGInfineon Technologies AGInfineon Technologies AG, ADRInnogy SEIsra Vision AGIVU Traffic Technologies AGJenoptik AGK+S AGKION Group AGKloeckner & Co. SEKoenig & Bauer AGKrones AGKSB SE & Co. KGaAKWS Saat SE & Co., KGaA
Lanxess AGLEG Immobilien AGLeifheit AGLeoni AGLPKF Laser & Electronics AGManz AGMedigene AGMerck KGaAMETRO AGMLP SEMTU Aero Engines AGMuenchener Rueckversicherungs-Gesellschaft AG in MuenchenNemetschek SENexus AGNordex SENorma Group SEOHB SEOSRAM Licht AGParagon GmbH & Co. KGaAPatrizia AGPetro Welt Technologies AGPfeiffer Vacuum Technology AGPNE AGProgress-Werk Oberkirch AG
12,549 527,05022,763 1,643,885
* 199,929 217,83123,981 1,130,663
3,035 285,1422,399 11,2665,911 669,825
17,746 50,0793,936 72,6511,724 92,723
23,845 1,498,67310,309 409,128
125,498 2,324,49536,257 682,357
7,562 317,7304,635 200,7593,202 31,303
14,267 399,808105,450 1,701,836
33,749 1,798,88538,611 189,4847,720 309,9154,409 250,578
38 12,4963,610 251,145
T.A. World ex U.S. Core Equity PortfolioCONTINUED
Shares Value»
GERMANY — (Continued)47,341 $2,817,85617,625 2,032,535
4,363 94,264* 20,855 279,663* 3,068 23,808* 1,394 34,270* 1,703 12,331
5,059 515,987100,184 1,541,012
29,188 145,11518,748 4,671,94215,491 3,691,62420,442 1,136,517
1,365 48,052* 29,160 341,365
24,056 862,5203,082 113,048
32,255 1,214,084720 13,852
15,994 308,970* 617 2,559
4,499 627,48535,221 111,917
1,010 28,912

ProSiebenSat.1 Media SEPSI Software AGPuma SEPuma SEQIAGEN NVQSC AGR Stahl AGRational AGRheinmetall AGRHOEN-KLINIKUM AGRIB Software SERTL Group SARWE AGS&T AGSAF-Holland SASalzgitter AGSAP SE, Sponsored ADRSAP SESchaltbau Holding AGSchloss Wachenheim AGScout24 AGSecunet Security Networks AGShop Apotheke Europe NVSiemens AGSiltronic AGSixt Leasing SESixt SESMA Solar Technology AGSMT Scharf AGSoftware AGStabilus SASTRATEC SEStroeer SE & Co. KGaASuedzucker AGSUESS MicroTec SE
Surteco Group SESymrise AGTAG Immobilien AGTakkt AGTalanx AGTechnotrans SETele Columbus AGTelefonica Deutschland Holding AGThyssenkrupp AGTLG Immobilien AGTraffic Systems SETUI AGUniper SEUnited Internet AG
57,703 745,3571,178 22,291
12,760 888,9451,980 138,635
* 21,558 818,28169,244 104,949
* 845 25,005800 544,553
26,789 3,039,8266,612 175,2767,397 159,202
15,932 782,26386,337 2,332,72716,765 391,31226,601 274,10017,700 382,087
9,200 1,131,87617,271 2,111,138
* 2,053 63,984321 5,779
7,410 409,826423 57,184
* 1,009 39,55922,483 2,446,89914,161 1,084,125
6,611 79,0128,157 837,686
* 4,385 105,156* 1,160 16,353
15,798 443,4456,680 304,427
617 40,2359,941 783,092
39,365 611,328* 7,109 70,273
T.A. World ex U.S. Core Equity PortfolioCONTINUED
Shares Value»
GERMANY — (Continued)3,313 $ 86,008
17,987 1,657,37243,943 1,034,47413,736 187,554
* 16,922 710,0922,947 62,967
* 1,021 2,265288,578 726,524
31,780 406,70529,266 859,006
1,003 19,99363,010 624,26350,512 1,556,23766,481 1,971,952

VERBIO Vereinigte BioEnergie AGVolkswagen AGVonovia SEVossloh AGWacker Chemie AGWacker Neuson SEWashtec AGWirecard AGWuestenrot & Wuerttembergische AGXING SEZalando SEZeal Network SE
TOTAL GERMANY
Aegean Airlines SAAlpha Bank AEAthens Water Supply & Sewage Co. SABank of GreeceEllaktor SAFF GroupFourlis Holdings SAGEK Terna Holding Real Estate Construction SAHellenic Exchanges - Athens Stock Exchange SAHellenic Petroleum SAHellenic Telecommunications Organization SAHolding Co. ADMIE IPTO SAIntralot SA-Integrated Lottery Systems & ServicesJUMBO SAMarfin Investment Group Holdings SAMotor Oil Hellas Corinth Refineries SAMytilineos SANational Bank of Greece SAOPAP SAPiraeus Bank SAPiraeus Port Authority SAPublic Power Corp. SASarantis SATerna Energy SA
TOTAL GREECE
Agritrade Resources, Ltd.AIA Group, Ltd.
Allied Properties HK, Ltd.Alltronics Holdings, Ltd.Applied Development Holdings, Ltd.Asia Financial Holdings, Ltd.Asia Satellite Telecommunications Holdings, Ltd.ASM Pacific Technology, Ltd.
11,970 95,2398,069 1,375,720
31,355 1,530,8903,269 128,1328,826 652,109
14,206 284,6374,642 245,6039,575 1,589,550
11,676 232,3101,082 414,406
* 3,989 182,4835,123 101,567
189,931,917
GREECE — (0.1%)4,941 44,684
* 2,364 4,5896,973 63,7432,794 45,443
* 27,611 66,273* 3,954 9,727
8,683 55,412* 10,261 72,678
18,545 101,73216,443 171,45624,316 334,35013,423 33,518
* 32,611 20,75319,703 386,154
* 175,597 30,47113,959 346,07223,447 284,977
* 245 71418,832 211,958
* 28 982,736 75,005
* 13,423 41,7991,644 15,7409,557 76,577
2,493,923
HONG KONG — (2.2%)# 1,445,000 206,854
829,400 8,505,282
T.A. World ex U.S. Core Equity PortfolioCONTINUED
Shares Value»
HONG KONG — (Continued)668,000 $ 148,085126,000 8,033
* 310,000 12,85972,000 39,24239,000 47,902
168,600 1,969,665

Associated International Hotels, Ltd.Bank of East Asia, Ltd. (The)BeijingWest Industries International, Ltd.Bison Finance Group, Ltd.BOC Aviation, Ltd.BOC Hong Kong Holdings, Ltd.BOE Varitronix, Ltd.Bonjour Holdings, Ltd.Bright Smart Securities & Commodities Group, Ltd.Brightoil Petroleum Holdings, Ltd.Brockman Mining, Ltd.Build King Holdings, Ltd.Burwill Holdings, Ltd.Cafe de Coral Holdings, Ltd.Camsing International Holding, Ltd.Cathay Pacific Airways, Ltd.Century City International Holdings, Ltd.CGN Mining Co., Ltd.Cheuk Nang Holdings, Ltd.Chevalier International Holdings, Ltd.China Baoli Technologies Holdings, Ltd.China Display Optoelectronics Technology Holdings, Ltd.China Energy Development Holdings, Ltd.China New Higher Education Group, Ltd.Chinlink International Holdings, Ltd.Chong Hing Bank, Ltd.Chow Sang Sang Holdings International, Ltd.Chow Tai Fook Jewellery Group, Ltd.Chuang's Consortium International, Ltd.CITIC Telecom International Holdings, Ltd.CK Asset Holdings, Ltd.CK Hutchison Holdings, Ltd.CK Infrastructure Holdings, Ltd.CK Life Sciences Intl Holdings, Inc.CLP Holdings, Ltd.CNQC International Holdings, Ltd.Common Splendor International Health Industry Group, Ltd.Convenience Retail Asia, Ltd.Cosmopolitan International Holdings, Ltd.Cowell e Holdings, Inc.CP Lotus Corp.Crocodile GarmentsCSI Properties, Ltd.CW Group Holdings, Ltd.Dah Sing Banking Group, Ltd.Dah Sing Financial Holdings, Ltd.Eagle Nice International Holdings, Ltd.Emperor Capital Group, Ltd.Emperor International Holdings, Ltd.Energy International Investments Holdings, Ltd.Esprit Holdings, Ltd.Fairwood Holdings, Ltd.Far East Consortium International, Ltd.
# 38,000 109,867247,480 715,225166,000 13,520
* 84,000 12,008103,600 892,553499,500 1,903,293183,000 59,549
* 737,000 14,089362,000 64,505
* 1,089,000 156,503* 896,780 18,433
300,000 40,731* 1,710,000 20,545
176,000 585,23434,000 5,038
250,000 352,588596,000 49,620135,000 5,656
22,259 12,01734,349 49,099
* 177,500 2,245* 360,000 24,649* 3,908,000 107,906
275,000 106,068* 130,000 15,754
29,000 50,154136,000 185,392235,800 224,840532,000 113,714910,000 375,551240,760 1,810,306266,260 2,488,194
90,500 701,6501,286,000 64,411
66,500 723,031457,500 81,689
#* 668,000 49,37640,000 20,592
#* 170,000 31,893882,000 152,200
* 80,000 1,053177,000 15,790
2,750,000 122,439* 210,000 1,162
233,196 405,50384,300 377,984
118,000 36,62312,000 419
723,333 181,320* 400,000 8,575#* 1,222,382 202,298
21,000 69,237760,692 360,974
T.A. World ex U.S. Core Equity PortfolioCONTINUED

FIH Mobile, Ltd.First Pacific Co., Ltd.First Shanghai Investments, Ltd.Fountain SET Holdings, Ltd.Galaxy Entertainment Group, Ltd.Get Nice Financial Group, Ltd.Get Nice Holdings, Ltd.Giordano International, Ltd.Global Brands Group Holding, Ltd.Glory Sun Land Group, Ltd.Gold Peak Industries Holdings, Ltd.Gold-Finance Holdings, Ltd.Goodbaby International Holdings, Ltd.Great Eagle Holdings, Ltd.Great Harvest Maeta Group Holdings, Ltd.Guotai Junan International Holdings, Ltd.Haitong International Securities Group, Ltd.Hang Lung Group, Ltd.Hang Lung Properties, Ltd.Hang Seng Bank, Ltd.Hanison Construction Holdings, Ltd.Harbour Centre Development, Ltd.Henderson Land Development Co., Ltd.HK Electric Investments & HK Electric Investments, Ltd.HKBN, Ltd.HKR International, Ltd.HKT Trust & HKT, Ltd.Hoifu Energy Group, Ltd.Hon Kwok Land Investment Co., Ltd.Hong Kong & China Gas Co., Ltd.Hong Kong Exchanges & Clearing, Ltd.Hong Kong Finance Investment Holding Group, Ltd.Hong Kong Television Network, Ltd.Hongkong & Shanghai Hotels, Ltd. (The)Honma Golf, Ltd.Hsin Chong Group Holdings, Ltd.Huan Yue Interactive Holdings, Ltd.Hysan Development Co., Ltd.I-CABLE Communications, Ltd.IGG, Inc.International Housewares Retail Co., Ltd.IPE Group, Ltd.IRC, Ltd.IT, Ltd.ITC Properties Group, Ltd.Jacobson Pharma Corp., Ltd.Johnson Electric Holdings, Ltd.Karrie International Holdings, Ltd.Kerry Logistics Network, Ltd.Kerry Properties, Ltd.Kingmaker Footwear Holdings, Ltd.Kingston Financial Group, Ltd.
Shares Value»
HONG KONG — (Continued)#* 2,673,000 $ 375,044
1,328,400 553,845* 1,168,000 64,930
1,024,000 154,346223,000 1,518,027
80,525 9,3098,205,000 277,033
894,000 307,186# 241,599 19,067* 227,000 24,046
262,000 27,368* 62,000 570#* 373,000 76,549
10,000 40,534#* 127,500 25,859# 1,580,000 249,602# 1,310,724 383,967
256,000 657,565359,000 844,198103,500 2,459,966215,208 36,475
21,000 36,166159,486 824,885259,000 262,556237,000 427,865404,560 205,434
1,112,000 1,776,348160,000 17,986
20,000 9,972481,223 1,062,589104,509 3,520,099
* 112,000 12,570#* 96,000 55,343# 233,307 304,068# 12,500 11,128* 876,000 29,375* 89,000 6,590
107,000 509,751#* 752,776 9,197
324,000 307,830153,000 41,914140,000 14,190
* 2,236,000 48,422312,000 113,927
# 186,285 37,605# 140,000 26,532
202,125 363,287232,000 33,723231,250 396,492240,500 903,079186,000 29,488
1,205,000 223,451

Kowloon Development Co., Ltd.Kwan On Holdings, Ltd.Lai Sun Development Co., Ltd.Landing International Development, Ltd.Leyou Technologies Holdings, Ltd.Li & Fung, Ltd.Lifestyle International Holdings, Ltd.
Lisi Group Holdings, Ltd.Liu Chong Hing Investment, Ltd.L'Occitane International SALuk Fook Holdings International, Ltd.Lung Kee Bermuda HoldingsMacau Legend Development, Ltd.Magnificent Hotel Investment, Ltd.Man Wah Holdings, Ltd.Master Glory Group, Ltd.Maxnerva Technology Services, Ltd.Melco International Development, Ltd.Melco Resorts & Entertainment, Ltd., ADRMGM China Holdings, Ltd.Microport Scientific Corp.Midland Holdings, Ltd.Ming Fai International Holdings, Ltd.Miramar Hotel & InvestmentModern Dental Group, Ltd.Mongolian Mining Corp.MTR Corp., Ltd.NagaCorp., Ltd.Nameson Holdings, Ltd.National Electronics HldgsNeo-Neon Holdings, Ltd.NEW Concepts Holdings, Ltd.New World Development Co., Ltd.NewOcean Energy Holdings, Ltd.NOVA Group Holdings, Ltd.NWS Holdings, Ltd.Orange Sky Golden Harvest Entertainment Holdings, Ltd.Pacific Andes International Holdings, Ltd.Pacific Basin Shipping, Ltd.Pacific Textiles Holdings, Ltd.Paliburg Holdings, Ltd.Paradise Entertainment, Ltd.PC Partner Group, Ltd.PCCW, Ltd.Perfect Shape Medical, Ltd.Pico Far East Holdings, Ltd.Polytec Asset Holdings, Ltd.Power Assets Holdings, Ltd.Prada SpA
162,000 203,558* 70,000 4,345# 131,380 185,283* 451,200 63,493#* 1,140,000 325,010# 3,382,000 471,371
202,000 276,019
T.A. World ex U.S. Core Equity PortfolioCONTINUED
Shares Value»
HONG KONG — (Continued)#* 478,000 $ 48,862
88,000 133,441255,000 529,660
# 192,000 579,17568,000 23,024
* 1,025,000 146,313500,000 11,324
# 962,000 463,790211,687 7,031
* 154,000 9,604433,000 1,053,571
11,953 268,584191,200 312,445
# 92,000 77,130148,100 25,205107,000 13,252
54,000 113,70141,000 6,618
* 1,658,500 20,90367,585 443,525
996,000 1,497,121764,000 47,186
30,800 4,802* 560,500 42,961* 40,000 7,442
1,687,408 2,375,853* 466,000 98,537# 370,000 82,561
303,508 563,525* 515,000 14,746* 1,128,607 3,950# 2,523,000 517,961
549,000 433,023222,000 85,092
# 132,000 20,21872,000 17,007
2,293,511 1,307,997180,000 85,567396,000 122,335
2,130,200 274,10780,000 571,781
# 128,000 392,928

Public Financial Holdings, Ltd.PYI Corp., Ltd.Quali-Smart Holdings, Ltd.Rare Earth Magnesium Technology Group Holdings, Ltd.Realord Group Holdings, Ltd.Regal Hotels International Holdings, Ltd.Regina Miracle International Holdings, Ltd.Sa Sa International Holdings, Ltd.Samsonite International SASands China, Ltd.SAS Dragon Holdings, Ltd.Shangri-La Asia, Ltd.Shenwan Hongyuan HK, Ltd.Singamas Container Holdings, Ltd.Sino Land Co., Ltd.SITC International Holdings Co., Ltd.Sitoy Group Holdings, Ltd.
SJM Holdings, Ltd.SmarTone Telecommunications Holdings, Ltd.Soundwill Holdings, Ltd.South China Holdings Co., Ltd.South Shore Holdings, Ltd.Stella International Holdings, Ltd.Summit Ascent Holdings, Ltd.Sun Hung Kai & Co., Ltd.Sun Hung Kai Properties, Ltd.SUNeVision Holdings, Ltd.Swire Pacific, Ltd., Class ASwire Pacific, Ltd., Class BSwire Properties, Ltd.Tai Sang Land Development, Ltd.Talent Property Group, Ltd.Tao Heung Holdings, Ltd.Techtronic Industries Co., Ltd.Television Broadcasts, Ltd.Texwinca Holdings, Ltd.TK Group Holdings, Ltd.TOM Group, Ltd.Town Health International Medical Group, Ltd.Tradelink Electronic Commerce, Ltd.Transport International Holdings, Ltd.Trinity, Ltd.Tsui Wah Holdings, Ltd.Union Medical Healthcare, Ltd.United Laboratories International Holdings, Ltd. (The)Up Energy Development Group, Ltd.Value Convergence Holdings, Ltd.Value Partners Group, Ltd.Vantage International Holdings, Ltd.
174,000 72,333* 3,002,000 40,529* 148,000 9,341
680,000 25,032* 72,000 40,832
192,000 116,420# 104,000 78,074# 715,596 200,487
646,200 1,265,317205,200 984,932216,000 63,925405,166 492,953302,500 53,697806,000 106,544605,994 981,333694,000 764,955203,000 31,626
T.A. World ex U.S. Core Equity PortfolioCONTINUED
Shares Value»
HONG KONG — (Continued)695,301 $ 754,803216,586 199,042
40,500 56,118* 1,160,000 30,788* 144,650 3,973
173,500 279,725* 268,000 42,931
386,529 177,388148,088 2,386,489
# 226,000 166,735107,000 1,219,594197,500 351,681
81,200 293,20520,710 13,946
* 1,845,000 9,875144,000 26,680312,500 2,323,952123,700 198,740298,000 88,123138,000 60,260
#* 162,000 33,816# 320,000 21,154
268,000 42,685115,976 333,134
* 416,000 15,588280,000 21,390
35,000 30,671332,500 182,112
* 524,000 1,620* 140,000 11,557# 512,954 305,795
164,000 14,406

Vedan International Holdings, Ltd.Victory City International Holdings, Ltd.Vitasoy International Holdings, Ltd.VPower Group International Holdings, Ltd.VSTECS Holdings, Ltd.VTech Holdings, Ltd.Wai Kee Holdings, Ltd.WH Group, Ltd.Wharf Holdings, Ltd. (The)Wharf Real Estate Investment Co., Ltd.Wheelock & Co., Ltd.Win Hanverky Holdings, Ltd.Wing On Co. International, Ltd.Wing Tai Properties, Ltd.Wynn Macau, Ltd.Xinyi Glass Holdings, Ltd.YGM Trading, Ltd.Yue Yuen Industrial Holdings, Ltd.
TOTAL HONG KONG
Magyar Telekom Telecommunications P.L.C.MOL Hungarian Oil & Gas P.L.C.OTP Bank P.L.C.Richter Gedeon Nyrt
TOTAL HUNGARY
3M India, Ltd.5Paisa Capital, Ltd.5Paisa Capital, Ltd.Aarti Drugs, Ltd.Aarti Industries, Ltd.ABB India, Ltd.Abbott India, Ltd.ACC, Ltd.Adani Enterprises, Ltd.Adani Gas, Ltd.Adani Green Energy, Ltd.Adani Ports & Special Economic Zone, Ltd.Adani Power, Ltd.Adani Transmissions, Ltd.Aditya Birla Capital, Ltd.Aditya Birla Fashion and Retail, Ltd.Advanced Enzyme Technologies, Ltd.Aegis Logistics, Ltd.Agro Tech Foods, Ltd.AIA Engineering, Ltd.Ajanta Pharma, Ltd.Akzo Nobel India, Ltd.Alembic Pharmaceuticals, Ltd.
152,000 15,042507,569 31,687216,000 1,016,846
# 37,000 12,276# 349,600 191,203
57,300 502,53926,000 17,169
2,370,500 2,307,373272,000 661,363
84,000 529,898138,000 868,410316,000 36,697
32,000 99,137102,000 68,891159,200 357,218968,000 975,779
20,000 18,943367,000 1,028,310
83,006,359
HUNGARY — (0.1%)155,376 224,796160,932 1,633,249
22,504 937,20031,722 557,359
3,352,604
T.A. World ex U.S. Core Equity PortfolioCONTINUED
Shares Value»
INDIA — (2.8%)* 176 $ 53,839* 2,700 6,669* 2,700 3,509
4,524 30,1579,729 235,9801,905 37,841
554 67,11711,833 267,48172,180 133,89672,180 156,177
* 54,928 37,018116,227 635,472
* 452,504 397,073* 90,238 270,029* 108,166 128,756* 73,294 200,099
7,364 15,84536,650 99,293
923 6,872* 8,732 216,810
14,401 184,9663,110 78,744
27,389 207,169

Alembic, Ltd.Allahabad BankAllcargo Logistics, Ltd.Amara Raja Batteries, Ltd.Ambuja Cements, Ltd.Amtek Auto, Ltd.Anant Raj, Ltd.Andhra BankAnveshan Heavy Engineering, Ltd.Apar Industries, Ltd.APL Apollo Tubes, Ltd.Apollo Hospitals Enterprise, Ltd.Apollo Tyres, Ltd.Arti Surfactants, Ltd.Arvind Fashions, Ltd.Arvind, Ltd.Asahi India Glass, Ltd.Ashiana Housing, Ltd.Ashok Leyland, Ltd.Ashoka Buildcon, Ltd.Asian Paints, Ltd.Astral Polytechnik, Ltd.AstraZeneca Pharma India, Ltd.Atul, Ltd.Aurobindo Pharma, Ltd.Automotive Axles, Ltd.Avanti Feeds, Ltd.Avenue Supermarts, Ltd.Axis Bank, Ltd.Bajaj Auto, Ltd.Bajaj Corp., Ltd.Bajaj Electricals, Ltd.Bajaj Finance, Ltd.Bajaj Finserv, Ltd.Bajaj Hindusthan Sugar, Ltd.Bajaj Holdings & Investment, Ltd.
Balaji Amines, Ltd.Balaji Telefilms, Ltd.Balkrishna Industries, Ltd.Balmer Lawrie & Co., Ltd.Balrampur Chini Mills, Ltd.Banco Products India, Ltd.Bank of BarodaBank of MaharashtraBASF India, Ltd.Bata India, Ltd.Bayer CropScience, Ltd.BEML, Ltd.Berger Paints India, Ltd.
29,520 18,338* 149,428 79,475
29,538 41,52017,627 173,98999,704 289,995
* 48,317 1,93249,377 19,623
* 181,195 49,114* 2,260 15,080
3,922 28,2402,717 55,298
12,140 238,059126,505 288,756
973 3,006* 12,204 105,663
61,020 48,4865,732 16,2819,305 14,531
520,217 524,493* 33,587 58,739
31,962 704,4945,589 100,462
* 535 14,9773,454 182,196
141,654 1,167,5903,306 38,658
19,071 85,127* 7,353 158,089
55,413 541,36310,614 385,351
* 14,240 53,64712,964 68,41420,970 986,247
2,353 241,712* 152,226 13,218
10,153 500,344
T.A. World ex U.S. Core Equity PortfolioCONTINUED
Shares Value»
INDIA — (Continued)3,847 $ 13,0816,503 5,141
28,906 295,00418,406 46,05566,636 136,905
7,652 10,985* 157,774 243,202* 113,699 21,126
2,175 32,15113,096 248,232
177 7,8355,064 61,775
74,368 355,374

Bhansali Engineering Polymers, Ltd.Bharat Electronics, Ltd.Bharat Forge, Ltd.Bharat Heavy Electricals, Ltd.Bharat Petroleum Corp., Ltd.Bharti Airtel, Ltd.Bharti Infratel, Ltd.Biocon, Ltd.Birla Corp., Ltd.Bliss Gvs Pharma, Ltd.Blue Dart Express, Ltd.Blue Star, Ltd.Bodal Chemicals, Ltd.Bombay Dyeing & Manufacturing Co., Ltd.Borosil Glass Works, Ltd.Bosch, Ltd.Brigade Enterprises, Ltd.Britannia Industries, Ltd.Cadila Healthcare, Ltd.Can Fin Homes, Ltd.Canara BankCapacit'e Infraprojects, Ltd.Caplin Point Laboratories, Ltd.Carborundum Universal, Ltd.Care Ratings, Ltd.Castrol India, Ltd.CCL Products India, Ltd.Ceat, Ltd.Central Depository Services India, Ltd.Century Plyboards India, Ltd.Century Textiles & Industries, Ltd.Cera Sanitaryware, Ltd.CESC, Ltd.CG Power and Industrial Solutions, Ltd.Chambal Fertilizers & Chemicals, Ltd.Chennai Petroleum Corp., Ltd.Chennai Super Kings Cricket, Ltd.Cholamandalam Investment and Finance Co., Ltd.Cipla, Ltd.City Union Bank, Ltd.Claro India, Ltd.Coal India, Ltd.Cochin Shipyard, Ltd.Coffee Day Enterprises, Ltd.Colgate-Palmolive India, Ltd.Container Corp. Of India, Ltd.
Coromandel International, Ltd.Corp. BankCox & Kings Financial Service, Ltd.
9,545 7,658236,407 351,409
79,600 488,799209,203 178,140
65,079 324,816414,991 2,020,025
56,897 201,40730,180 99,034
9,430 79,47717,529 36,996
1,361 47,2577,440 74,282
23,330 26,56018,839 19,352
6,650 12,810419 86,660
18,763 70,9968,390 318,717
41,130 136,24521,581 120,986
* 64,224 218,1854,256 14,4747,571 46,941
19,475 92,64810,581 116,28641,833 73,62431,949 113,671
9,652 113,8875,627 15,726
29,747 54,51014,491 186,916
2,798 104,67816,500 177,425
* 155,965 40,87561,351 133,20911,326 32,27765,357 40182,225 307,53055,878 419,40973,189 206,181
* 2,278 2,37920,943 61,897
6,292 32,685* 11,470 20,375
15,789 272,33641,058 305,323
T.A. World ex U.S. Core Equity PortfolioCONTINUED
Shares Value»
INDIA — (Continued)47,407 $254,321
* 136,111 44,860* 12,673 369

Cox & Kings, Ltd.CRISIL, Ltd.Crompton Greaves Consumer Electricals, Ltd.Cummins India, Ltd.Cyient, Ltd.Dabur India, Ltd.DB Corp., Ltd.DCB Bank, Ltd.DCM Shriram, Ltd.Deepak Fertilisers & Petrochemicals Corp., Ltd.Deepak Nitrite, Ltd.Delta Corp., Ltd.Dewan Housing Finance Corp., Ltd.Dhampur Sugar Mills, Ltd.Dhanuka Agritech, Ltd.Dilip Buildcon, Ltd.Dish TV India, Ltd.Dishman Carbogen Amcis, Ltd.Divi's Laboratories, Ltd.Dixon Technologies India, Ltd.DLF, Ltd.Dr Lal PathLabs, Ltd.Dr Reddy's Laboratories, Ltd., ADRDr Reddy's Laboratories, Ltd.Dredging Corp. of India, Ltd.Dynamatic Technologies, Ltd.eClerx Services, Ltd.Eicher Motors, Ltd.EID Parry India, Ltd.EIH, Ltd.Electrosteel Castings, Ltd.Elgi Equipments, Ltd.Emami, Ltd.Endurance Technologies, Ltd.Engineers India, Ltd.Eris Lifesciences, Ltd.Escorts, Ltd.Essel Propack, Ltd.Eveready Industries India, Ltd.Excel Industries, Ltd.Exide Industries, Ltd.FDC, Ltd.Federal Bank, Ltd.Federal-Mogul Goetze India, Ltd.Finolex Cables, Ltd.Finolex Industries, Ltd.Firstsource Solutions, Ltd.Fortis Healthcare, Ltd.Future Enterprises, Ltd.Future Lifestyle Fashions, Ltd.Future Retail, Ltd.Gabriel India, Ltd.GAIL India, Ltd.Garware Technical Fibres, Ltd.Gateway Distriparks, Ltd.
38,019 6,3515,279 99,727
113,428 377,7616,720 69,3589,584 63,096
59,064 365,10213,065 30,50585,478 240,94119,899 115,42113,545 17,110
8,967 36,14830,239 67,02771,561 50,84712,251 28,472
4,995 26,36014,499 86,988
195,798 76,752* 31,108 93,502
18,309 433,4651,078 33,303
147,887 379,0224,296 67,689
12,143 446,9843,990 148,1491,860 8,7971,070 19,4008,860 76,6342,071 486,360
27,218 56,90628,044 67,52729,267 5,370
6,798 25,08110,097 46,603
2,826 37,86151,875 74,887
* 3,487 20,44023,174 157,34944,938 86,822
* 14,260 15,3301,374 16,308
88,368 234,123* 14,340 32,162
451,790 603,815* 1,631 12,364
18,226 98,98816,888 129,88478,398 55,800
* 117,479 205,305* 81,448 28,302
3,745 24,424* 41,879 251,565
24,904 32,498277,798 518,626
2,671 43,34128,152 44,108

Gati, Ltd.
Gayatri Projects, Ltd.GE T&D India, Ltd.General Insurance Corp. of IndiaGeojit Financial Services, Ltd.GFL, Ltd.GHCL, Ltd.GIC Housing Finance, Ltd.Gillette India, Ltd.GlaxoSmithKline Consumer Healthcare, Ltd.GlaxoSmithKline Pharmaceuticals, Ltd.Glenmark Pharmaceuticals, Ltd.GM Breweries, Ltd.GMR Infrastructure, Ltd.Godfrey Phillips India, Ltd.Godrej Agrovet, Ltd.Godrej Consumer Products, Ltd.Godrej Industries, Ltd.Godrej Properties, Ltd.Granules India, Ltd.Graphite India, Ltd.Grasim Industries, Ltd.Great Eastern Shipping Co., Ltd. (The)Greaves Cotton, Ltd.Greenpanel Industries, Ltd.Greenply Industries, Ltd.Grindwell Norton, Ltd.GRUH Finance, Ltd.Gujarat Alkalies & Chemicals, Ltd.Gujarat Ambuja Exports, Ltd.Gujarat Gas, Ltd.Gujarat Industries Power Co., Ltd.Gujarat Mineral Development Corp., Ltd.Gujarat Narmada Valley Fertilizers & Chemicals, Ltd.Gujarat Pipavav Port, Ltd.Gujarat State Fertilizers & Chemicals, Ltd.Gujarat State Petronet, Ltd.Gulf Oil Lubricants India, Ltd.GVK Power & Infrastructure, Ltd.Hatsun Agro Products, Ltd.Hatsun Agro Products, Ltd.Havells India, Ltd.HCL Technologies, Ltd.HDFC Bank, Ltd.HDFC Bank, Ltd., ADRHealthCare Global Enterprises, Ltd.HEG, Ltd.HeidelbergCement India, Ltd.Heritage Foods, Ltd.
16,078 12,622
T.A. World ex U.S. Core Equity PortfolioCONTINUED
Shares Value»
INDIA — (Continued)* 23,512 $ 48,379
5,381 12,0253,271 9,115
10,881 3,914* 13,383 176,296
19,423 58,4068,499 30,1811,021 106,041
913 97,5381,028 17,974
42,344 261,2571,739 9,907
* 389,759 84,8553,450 34,7754,522 28,595
28,693 249,7177,436 50,877
* 3,806 52,28170,007 92,182
6,521 28,96449,807 565,21624,793 84,74040,207 77,87423,606 3,92923,606 41,98310,398 82,18144,010 156,084
9,984 60,21417,723 34,19245,979 114,50513,913 14,06340,207 41,59120,095 61,23694,018 106,50440,083 46,90178,663 243,189
3,366 37,594* 130,003 9,033
4,549 45,479206 1,623
29,435 275,05391,476 1,371,05951,927 1,692,293
2,000 229,960* 498 840
1,450 20,79532,536 90,811
4,050 20,803

Hero MotoCorp, Ltd.Hexaware Technologies, Ltd.Hikal, Ltd.HIL, Ltd.Himachal Futuristic Communications, Ltd.Himadri Speciality Chemical, Ltd.Himatsingka Seide, Ltd.Hindalco Industries, Ltd.Hinduja Global Solutions, Ltd.Hindustan Petroleum Corp., Ltd.Hindustan Unilever, Ltd.
Honeywell Automation India, Ltd.Hotel Leela Venture, Ltd.Housing Development & Infrastructure, Ltd.Housing Development Finance Corp., Ltd.HSIL, Ltd.I G Petrochemicals, Ltd.ICICI Bank, Ltd., Sponsored ADRICICI Bank, Ltd.ICICI Lombard General Insurance Co., Ltd.ICICI Prudential Life Insurance Co., Ltd.IDFC First Bank, Ltd.IDFC, Ltd.IFB Industries, Ltd.IFCI, Ltd.IIFL Finance, Ltd.IIFL Securities, Ltd.IIFL Wealth Management, Ltd.India Cements, Ltd. (The)India Glycols, Ltd.Indiabulls Housing Finance, Ltd.Indiabulls Real Estate, Ltd.Indiabulls Ventures, Ltd.Indiabulls Ventures, Ltd.Indian BankIndian Hotels Co., Ltd. (The)Indian Hume Pipe Co., Ltd.Indian Oil Corp., Ltd.Indian Overseas BankIndo Count Industries, Ltd.Indoco Remedies, Ltd.Indraprastha Gas, Ltd.IndusInd Bank, Ltd.Infibeam Avenues, Ltd.Info Edge India, Ltd.Infosys, Ltd., Sponsored ADRInfosys, Ltd.Ingersoll-Rand India, Ltd.Inox Leisure, Ltd.
7,364 250,08847,982 251,48221,706 46,550
758 12,741221,560 62,825
39,781 46,51624,860 48,088
220,088 606,3291,337 11,480
95,937 367,46630,646 765,737
T.A. World ex U.S. Core Equity PortfolioCONTINUED
Shares Value»
INDIA — (Continued)588 $ 196,092
* 37,363 4,028* 146,987 25,395
37,478 1,152,96413,542 43,125
2,442 6,82797,108 1,185,68950,380 310,915
2,868 50,31115,424 89,722
* 688,563 418,063* 322,800 168,113* 2,668 23,413* 304,825 32,008
67,491 115,061* 67,491 201,987* 9,642 13,334
82,812 105,2382,704 8,195
120,380 933,369* 76,526 96,782
19,321 66,7741,946 3,263
* 41,656 113,06780,106 165,487
7,493 30,700104,412 209,777
* 226,331 36,78224,075 11,896
4,041 9,79151,880 228,43612,866 262,21444,412 26,753
1,065 34,72422,480 254,474
521,326 5,959,9944,075 34,966
* 24,804 106,089

Inox Wind, Ltd.Intellect Design Arena, Ltd.InterGlobe Aviation, Ltd.International Paper APPM, Ltd.Ipca Laboratories, Ltd.IRB Infrastructure Developers, Ltd.ITC, Ltd.ITD Cementation India, Ltd.J Kumar Infraprojects, Ltd.Jagran Prakashan, Ltd.Jai Corp., Ltd.Jain Irrigation Systems, Ltd.Jaiprakash Associates, Ltd.Jaiprakash Power Ventures, Ltd.Jammu & Kashmir Bank, Ltd. (The)Jamna Auto Industries, Ltd.JB Chemicals & Pharmaceuticals, Ltd.Jindal Poly Films, Ltd.Jindal Saw, Ltd.Jindal Stainless Hisar, Ltd.Jindal Stainless, Ltd.
Jindal Steel & Power, Ltd.JK Cement, Ltd.JK Lakshmi Cement, Ltd.JK Paper, Ltd.JK Tyre & Industries, Ltd.JM Financial, Ltd.JMC Projects India, Ltd.Johnson Controls-Hitachi Air Conditioning India, Ltd.JSW Energy, Ltd.JSW Steel, Ltd.JTEKT India, Ltd.Jubilant Foodworks, Ltd.Jubilant Life Sciences, Ltd.Just Dial, Ltd.Jyothy Labs Ltd.Kajaria Ceramics, Ltd.Kalpataru Power Transmission, Ltd.Kalyani Steels, Ltd.Kansai Nerolac Paints, Ltd.Karnataka Bank, Ltd. (The)Karur Vysya Bank, Ltd. (The)Kaveri Seed Co., Ltd.KCP, Ltd. (The)KEC International, Ltd.KEI Industries, Ltd.Kiri Industries, Ltd.Kirloskar Brothers, Ltd.KNR Constructions, Ltd.
* 8,782 6,998* 15,315 49,763
10,550 238,905* 2,357 14,783
9,259 128,07348,779 65,995
316,199 1,240,71325,447 28,72013,503 24,55933,725 40,911
9,299 10,146157,411 46,651
* 548,665 17,413* 482,655 12,568* 112,876 58,395
34,285 20,40711,812 64,1473,631 12,283
62,028 60,563* 23,161 22,496* 30,116 12,878
T.A. World ex U.S. Core Equity PortfolioCONTINUED
Shares Value»
INDIA — (Continued)* 152,924 $ 296,932
10,057 140,28813,770 66,40231,079 49,62629,960 30,996
125,477 120,01618,948 32,402
1,603 38,386* 171,454 168,967
397,413 1,362,3659,992 10,240
18,565 322,20750,358 318,468
* 16,908 169,83917,934 39,77331,187 213,54924,528 171,090
8,223 20,36510,517 64,78474,461 90,521
166,660 152,0499,051 58,488
19,778 20,94938,887 173,16324,931 158,881
* 4,301 30,23211,621 30,22515,249 59,295

Kolte-Patil Developers, Ltd.Kotak Mahindra Bank, Ltd.KPIT Engineering, Ltd.KPIT Technologies, Ltd.KPR Mill, Ltd.KRBL, Ltd.KSB, Ltd.L&T Finance Holdings, Ltd.Lakshmi Machine Works, Ltd.Lakshmi Vilas Bank, Ltd. (The)Larsen & Toubro Infotech, Ltd.Larsen & Toubro, Ltd.Laurus Labs, Ltd.LG Balakrishnan & Bros, Ltd.LIC Housing Finance, Ltd.Linde India, Ltd.LT Foods, Ltd.Lupin, Ltd.LUX Industries, Ltd.Magma Fincorp, Ltd.Mahanagar Gas, Ltd.Maharashtra Seamless, Ltd.Mahindra & Mahindra Financial Services, Ltd.Mahindra & Mahindra, Ltd., GDRMahindra & Mahindra, Ltd.Mahindra CIE Automotive, Ltd.Mahindra Holidays & Resorts India, Ltd.Mahindra Lifespace Developers, Ltd.Majesco, Ltd.Man Infraconstruction, Ltd.Manappuram Finance, Ltd.
Mangalore Refinery & Petrochemicals, Ltd.Marico, Ltd.Marksans Pharma, Ltd.Maruti Suzuki India, Ltd.MAS Financial Services, Ltd.Mastek, Ltd.Max Financial Services, Ltd.Max India, Ltd.Mayur Uniquoters, Ltd.McLeod Russel India, Ltd.Meghmani Organics, Ltd.Minda Corp., Ltd.Minda Industries, Ltd.Mindtree, Ltd.MM Forgings, Ltd.MOIL, Ltd.Morepen Laboratories, Ltd.Motherson Sumi Systems, Ltd.
11,211 34,45021,270 467,461
* 55,541 65,704* 62,453 67,912
7,928 66,00328,061 90,147
1,172 10,530241,351 345,060
669 38,993* 57,782 40,275
6,257 137,23120,437 410,989
8,990 43,9312,724 8,908
161,907 1,211,7665,728 41,164
41,893 11,44058,881 654,802
681 10,75822,155 26,23511,558 135,5259,763 58,796
78,936 347,0719,424 74,335
137,617 1,093,288* 19,916 51,928
17,870 59,50710,029 54,666
3,324 22,63022,903 7,906
260,995 430,943
T.A. World ex U.S. Core Equity PortfolioCONTINUED
Shares Value»
INDIA — (Continued)63,805 $ 56,20793,949 499,98395,755 22,429
7,947 629,6061,391 11,8701,872 10,146
* 31,154 187,923* 26,905 23,370
5,050 18,19624,846 3,72340,612 29,25830,991 37,76634,659 145,721
7,888 81,3821,316 6,516
29,918 58,732* 39,894 9,325
126,669 195,363
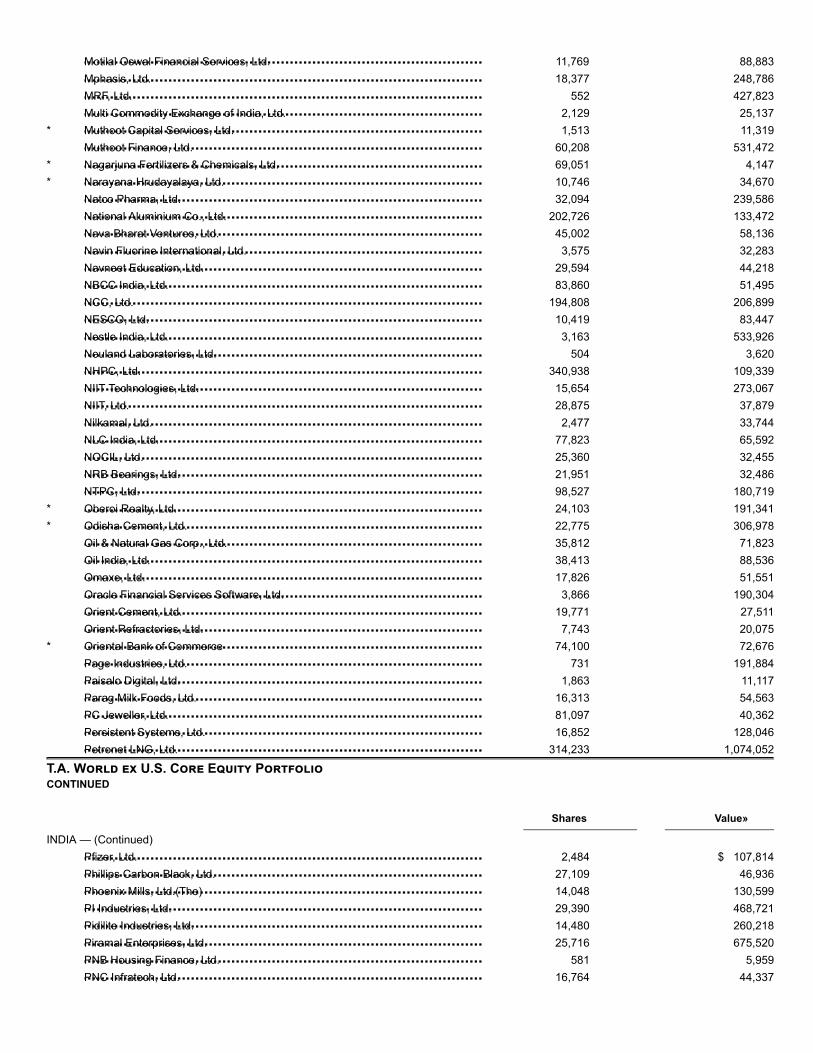
Motilal Oswal Financial Services, Ltd.Mphasis, Ltd.MRF, Ltd.Multi Commodity Exchange of India, Ltd.Muthoot Capital Services, Ltd.Muthoot Finance, Ltd.Nagarjuna Fertilizers & Chemicals, Ltd.Narayana Hrudayalaya, Ltd.Natco Pharma, Ltd.National Aluminium Co., Ltd.Nava Bharat Ventures, Ltd.Navin Fluorine International, Ltd.Navneet Education, Ltd.NBCC India, Ltd.NCC, Ltd.NESCO, Ltd.Nestle India, Ltd.Neuland Laboratories, Ltd.NHPC, Ltd.NIIT Technologies, Ltd.NIIT, Ltd.Nilkamal, Ltd.NLC India, Ltd.NOCIL, Ltd.NRB Bearings, Ltd.NTPC, Ltd.Oberoi Realty, Ltd.Odisha Cement, Ltd.Oil & Natural Gas Corp., Ltd.Oil India, Ltd.Omaxe, Ltd.Oracle Financial Services Software, Ltd.Orient Cement, Ltd.Orient Refractories, Ltd.Oriental Bank of CommercePage Industries, Ltd.Paisalo Digital, Ltd.Parag Milk Foods, Ltd.PC Jeweller, Ltd.Persistent Systems, Ltd.Petronet LNG, Ltd.
Pfizer, Ltd.Phillips Carbon Black, Ltd.Phoenix Mills, Ltd.(The)PI Industries, Ltd.Pidilite Industries, Ltd.Piramal Enterprises, Ltd.PNB Housing Finance, Ltd.PNC Infratech, Ltd.
11,769 88,88318,377 248,786
552 427,8232,129 25,137
* 1,513 11,31960,208 531,472
* 69,051 4,147* 10,746 34,670
32,094 239,586202,726 133,472
45,002 58,1363,575 32,283
29,594 44,21883,860 51,495
194,808 206,89910,419 83,447
3,163 533,926504 3,620
340,938 109,33915,654 273,06728,875 37,879
2,477 33,74477,823 65,59225,360 32,45521,951 32,48698,527 180,719
* 24,103 191,341* 22,775 306,978
35,812 71,82338,413 88,53617,826 51,551
3,866 190,30419,771 27,511
7,743 20,075* 74,100 72,676
731 191,8841,863 11,117
16,313 54,56381,097 40,36216,852 128,046
314,233 1,074,052
T.A. World ex U.S. Core Equity PortfolioCONTINUED
Shares Value»
INDIA — (Continued)2,484 $ 107,814
27,109 46,93614,048 130,59929,390 468,72114,480 260,21825,716 675,520
581 5,95916,764 44,337

Polyplex Corp., Ltd.Power Finance Corp., Ltd.Power Grid Corp. of India, Ltd.Power Mech Projects, Ltd.Praj Industries, Ltd.Prakash Industries, Ltd.Prestige Estates Projects, Ltd.Prime Focus, Ltd.Prism Johnson, Ltd.Procter & Gamble Health, Ltd.Procter & Gamble Hygiene & Health Care, Ltd.PSP Projects, Ltd.PTC India Financial Services, Ltd.PTC India, Ltd.Punjab & Sind BankPunjab National BankPuravankara, Ltd.PVR, Ltd.Quess Corp., Ltd.Radico Khaitan, Ltd.Rain Industries Ltd.Rajesh Exports, Ltd.Rallis India, Ltd.Ramco Cements, Ltd. (The)Ramkrishna Forgings, Ltd.Rashtriya Chemicals & Fertilizers, Ltd.RattanIndia Power, Ltd.Raymond, Ltd.RBL Bank, Ltd.REC, Ltd.Redington India, Ltd.Relaxo Footwears, Ltd.Reliance Communications, Ltd.Reliance Home Finance, Ltd.Reliance Industries, Ltd.Reliance Industries, Ltd.Reliance Infrastructure, Ltd.Reliance Power, Ltd.Repco Home Finance, Ltd.Rico Auto Industries, Ltd.RP-SG Business Process Services, Ltd.Sadbhav Engineering, Ltd.Sanofi India, Ltd.SBI Life Insurance Co., Ltd.Schaeffler India, Ltd.Security & Intelligence Services India, Ltd.Sequent Scientific, Ltd.SH Kelkar & Co., Ltd.Shankara Building Products, Ltd.Sharda Cropchem, Ltd.Sharda Motor Industries, Ltd.
5,376 35,595* 228,582 361,380
75,063 230,772840 11,529
38,085 58,357* 18,220 12,785
54,482 200,423* 5,458 3,388
9,143 12,209* 2,147 147,907
1,532 242,1383,321 23,736
51,751 10,08275,922 61,501
* 15,909 5,339* 209,721 209,936
6,796 6,08310,800 237,046
* 6,338 39,88410,457 45,06651,180 66,03526,295 262,52121,200 48,94025,138 265,843
5,499 36,55650,739 36,522
* 305,973 5,98514,947 141,97524,230 141,010
452,865 919,595115,863 181,74013,704 82,557
* 403,088 8,44232,475 4,70148,733 1,632,952
255,551 4,304,11931,989 22,308
* 225,835 12,08720,245 95,61918,607 12,243
* 3,300 19,14850,476 101,220
2,471 218,3023,963 45,7901,115 68,8051,801 21,865
* 31,610 31,8612,220 3,7521,458 5,8989,288 35,269
272 3,801
T.A. World ex U.S. Core Equity PortfolioCONTINUED

Shilpa Medicare, Ltd.Shipping Corp. of India, Ltd.Shoppers Stop, Ltd.Shree Cement, Ltd.Shriram City Union Finance, Ltd.Shriram Transport Finance Co., Ltd.Siemens, Ltd.Simplex Infrastructures, Ltd.Sintex Plastics Technology, Ltd.Siyaram Silk Mills, Ltd.SKF India, Ltd.SML ISUZU, Ltd.Sobha, Ltd.Solar Industries India, Ltd.Solara Active Pharma Sciences, Ltd.Somany Ceramics, Ltd.Sonata Software, Ltd.South Indian Bank, Ltd. (The)Spencer's Retail Ltd.Srei Infrastructure Finance, Ltd.SRF, Ltd.Srikalahasthi Pipes, Ltd.Star Cement, Ltd.State Bank of IndiaState Bank of India, GDRState Bank of India, GDRSteel Authority of India, Ltd.Sterlite Technologies, Ltd.Strides Pharma Science, Ltd.Subros, Ltd.Sudarshan Chemical IndustriesSun Pharmaceutical Industries, Ltd.Sun TV Network, Ltd.Sundaram-Clayton, Ltd.Sundram Fasteners, Ltd.Sunteck Realty, Ltd.Suprajit Engineering, Ltd.Supreme Industries, Ltd.Supreme Petrochem, Ltd.Surya Roshni, Ltd.Sutlej Textiles and Industries, Ltd.Suven Life Sciences, Ltd.Suzlon Energy, Ltd.Swaraj Engines, Ltd.Symphony, Ltd.Syndicate BankSyngene International, Ltd.TAKE Solutions, Ltd.Tamil Nadu Newsprint & Papers, Ltd.Tata Chemicals, Ltd.Tata Communications, Ltd.Tata Consultancy Services, Ltd.
Shares Value»
INDIA — (Continued)* 6,077 $ 31,362* 48,621 20,269
3,960 21,5581,212 354,0443,178 62,585
49,268 689,4261,769 29,3163,825 4,332
* 132,335 9,7625,283 19,3853,394 90,5072,162 17,951
22,239 176,9054,377 72,023
* 2,772 13,5897,496 38,262
22,141 103,826413,283 73,272
* 9,900 9,91885,602 14,754
8,369 327,3762,107 5,1258,363 12,276
* 153,210 736,983* 226 10,926* 490 23,716* 208,678 128,885
45,756 98,72723,701 134,94110,510 29,987
7,007 33,436106,907 660,097
39,645 271,467625 19,203
24,211 154,32820,427 114,16518,045 50,02321,778 335,89017,029 45,24010,195 27,616
8,019 3,18225,013 83,437
* 648,648 39,4261,454 21,8314,435 77,064
* 341,829 157,34214,924 65,17021,777 30,004
9,810 22,10043,095 361,68712,550 85,28367,309 2,149,824

Tata Elxsi, Ltd.Tata Global Beverages, Ltd.Tata Metaliks, Ltd.Tata Motors, Ltd.Tata Power Co., Ltd. (The)Tata Sponge Iron, Ltd.Tata Steel, Ltd.
TCI Express, Ltd.Tech Mahindra, Ltd.Techno Electric & Engineering Co., Ltd.Tejas Networks, Ltd.Texmaco Rail & Engineering, Ltd.Thermax, Ltd.Thirumalai Chemicals, Ltd.Thomas Cook India, Ltd.Thyrocare Technologies, Ltd.TI Financial Holdings, Ltd.Tide Water Oil Co India, Ltd.Time Technoplast, Ltd.Timken India, Ltd.Tinplate Co. of India, Ltd. (The)Titagarh Wagons, Ltd.Titan Co., Ltd.Torrent Pharmaceuticals, Ltd.Torrent Power, Ltd.Transport Corp. of India, Ltd.Trent, Ltd.Trident, Ltd.Triveni Engineering & Industries, Ltd.Triveni Turbine, Ltd.TTK Prestige, Ltd.Tube Investments of India, Ltd.TV Today Network, Ltd.TV18 Broadcast, Ltd.TVS Srichakra, Ltd.UCO BankUflex, Ltd.UFO Moviez India, Ltd.UltraTech Cement, Ltd.Unichem Laboratories, Ltd.Union Bank of IndiaUniply Industries, Ltd.Unitech, Ltd.United Breweries, Ltd.United Spirits, Ltd.UPL, Ltd.VA Tech Wabag, Ltd.Vaibhav Global, Ltd.Vakrangee, Ltd.
9,456 87,329152,631 554,190
5,278 40,134* 553,499 1,083,966
260,328 228,1015,359 35,583
147,600 924,147
T.A. World ex U.S. Core Equity PortfolioCONTINUED
Shares Value»
INDIA — (Continued)3,908 $ 32,172
170,682 1,570,004* 13,851 51,008
11,379 15,01324,867 17,200
3,658 58,09218,070 16,46722,854 62,006
5,937 38,584* 26,134 173,647
261 16,97445,379 52,260
5,879 59,60013,266 21,12715,510 7,92146,986 717,71411,562 279,52736,474 160,88211,637 44,6376,550 37,739
50,451 38,72436,941 29,29934,210 50,809
426 33,51934,439 173,379
9,445 36,963* 190,935 59,855
1,157 26,634* 227,991 54,804
15,054 47,8625,376 12,4585,926 371,709
12,637 30,747* 155,791 151,940
11,130 8,084* 482,996 6,981
8,333 170,860* 50,174 430,991
245,772 2,115,47911,864 49,8032,986 39,172
74,772 36,813

Vardhman Textiles, Ltd.Vedanta, Ltd.Vedanta, Ltd., ADRVenky's India, Ltd.Vesuvius India, Ltd.V-Guard Industries, Ltd.Vinati Organics, Ltd.Vindhya Telelinks, Ltd.VIP Industries, Ltd.V-Mart Retail, Ltd.Vodafone Idea, Ltd.Voltas, Ltd.VRL Logistics, Ltd.VST Industries, Ltd.WABCO India, Ltd.Welspun Corp., Ltd.Welspun Enterprises, Ltd.
Welspun India, Ltd.West Coast Paper Mills, Ltd.Whirlpool of India, Ltd.Wipro, Ltd.Wockhardt, Ltd.Yes Bank, Ltd.Zee Entertainment Enterprises, Ltd.Zee Learn, Ltd.Zee Media Corp., Ltd.Zensar Technologies, Ltd.
TOTAL INDIA
Ace Hardware Indonesia Tbk PTAdaro Energy Tbk PTAdhi Karya Persero Tbk PTAgung Podomoro Land Tbk PTAKR Corporindo Tbk PTAlam Sutera Realty Tbk PTAneka Tambang Tbk PTArwana Citramulia Tbk PTAsahimas Flat Glass Tbk PTAstra Agro Lestari Tbk PTAstra International Tbk PTAstrindo Nusantara Infrastructure Tbk PTAsuransi Kresna Mitra Tbk PTBank Bukopin TbkBank Central Asia Tbk PTBank Danamon Indonesia Tbk PTBank Mandiri Persero Tbk PTBank Negara Indonesia Persero Tbk PTBank Pan Indonesia Tbk PTBank Pembangunan Daerah Jawa Barat Dan Banten Tbk PT
7,337 97,137373,778 828,753
28,241 246,5472,499 44,5131,061 15,392
24,622 83,3615,750 151,4121,145 15,421
10,856 59,839800 21,649
* 2,518,391 252,23410,368 87,13211,268 38,7301,064 51,727
876 77,24536,901 60,442
7,231 10,681
T.A. World ex U.S. Core Equity PortfolioCONTINUED
Shares Value»
INDIA — (Continued)156,632 $ 115,012
12,018 38,3634,838 109,212
166,080 640,456* 13,260 59,661
494,114 640,426100,015 522,880
23,196 6,873* 27,305 4,657
22,305 68,163
105,697,540
INDONESIA — (0.6%)1,935,200 252,8509,821,400 883,2231,072,687 112,710
* 2,441,400 35,057512,700 145,561
* 6,082,600 143,5323,929,720 258,879
232,600 9,36886,500 32,622
197,889 140,4941,243,900 616,514
* 3,406,400 12,138* 245,400 15,230* 2,664,000 56,495
388,600 853,123627,263 226,835
1,187,218 667,9221,466,520 879,169
* 1,316,000 134,6861,163,400 131,497

Bank Pembangunan Daerah Jawa Timur Tbk PTBank Permata Tbk PTBank Rakyat Indonesia Persero Tbk PTBank Tabungan Negara Persero Tbk PTBarito Pacific Tbk PTBayan Resources Tbk PTBekasi Fajar Industrial Estate Tbk PTBerlian Laju Tanker Tbk PTBISI International Tbk PTBuana Lintas Lautan Tbk PTBukit Asam Tbk PTBumi Serpong Damai Tbk PTBumi Teknokultura Unggul Tbk PTCharoen Pokphand Indonesia Tbk PTCiputra Development Tbk PTCitra Marga Nusaphala Persada Tbk PTCity Retail Developments Tbk PTDelta Dunia Makmur Tbk PTEagle High Plantations Tbk PTElnusa Tbk PTErajaya Swasembada Tbk PTGajah Tunggal Tbk PTGaruda Indonesia Persero Tbk PTGlobal Mediacom Tbk PTGudang Garam Tbk PTHanson International Tbk PT
Indah Kiat Pulp & Paper Corp. Tbk PTIndika Energy Tbk PTIndo Tambangraya Megah Tbk PTIndocement Tunggal Prakarsa Tbk PTIndofood CBP Sukses Makmur Tbk PTIndofood Sukses Makmur Tbk PTIndomobil Sukses Internasional Tbk PTIndo-Rama Synthetics Tbk PTIndosat Tbk PTIndustri dan Perdagangan Bintraco Dharma Tbk PTIndustri Jamu Dan Farmasi Sido Muncul Tbk PTInti Agri Resources Tbk PTIntikeramik Alamasri Industri Tbk PTIntiland Development Tbk PTJapfa Comfeed Indonesia Tbk PTJasa Marga Persero Tbk PTJaya Real Property Tbk PTKalbe Farma Tbk PTKapuas Prima Coal Tbk PTKawasan Industri Jababeka Tbk PTKMI Wire & Cable Tbk PTKrakatau Steel Persero Tbk PTKresna Graha Investama Tbk PT
1,666,800 75,985* 1,447,325 97,392
6,638,000 2,103,4361,103,441 191,7432,790,800 769,581
16,000 19,2422,056,600 46,481
* 514,666 1,836468,500 47,373
* 2,625,600 39,2421,560,500 303,276
* 2,092,800 210,070* 2,300,800 12,142
1,011,100 386,9045,847,371 512,663
* 517,167 50,122* 911,900 9,111* 4,476,500 153,919* 4,587,600 46,636
1,814,900 46,371626,100 93,224
* 1,049,800 51,490* 1,784,500 50,843
3,675,000 101,52861,000 327,686
* 17,616,800 129,435
T.A. World ex U.S. Core Equity PortfolioCONTINUED
Shares Value»
INDONESIA — (Continued)980,300 $517,333
1,022,000 107,314183,800 219,598
66,000 104,852279,300 212,426
1,536,200 771,292127,200 21,607
40,300 12,829* 272,050 66,021
696,000 12,2931,286,700 92,709
* 473,600 1,758* 1,513,300 15,103
3,125,700 98,5862,168,300 246,459
255,626 108,564293,000 11,592
2,130,000 222,5661,024,000 39,825
* 5,953,389 130,692964,700 41,220
* 2,016,837 49,632* 3,143,100 128,824

Link Net Tbk PTLippo Cikarang Tbk PTLippo Karawaci Tbk PTMalindo Feedmill Tbk PTMatahari Department Store Tbk PTMayora Indah Tbk PTMedco Energi Internasional Tbk PTMedia Nusantara Citra Tbk PTMetrodata Electronics Tbk PTMitra Adiperkasa Tbk PTMitra Keluarga Karyasehat Tbk PTMNC Investama Tbk PTModernland Realty Tbk PTMultistrada Arah Sarana Tbk PTNippon Indosari Corpindo Tbk PTPabrik Kertas Tjiwi Kimia Tbk PTPacific Strategic Financial Tbk PTPakuwon Jati Tbk PTPan Brothers Tbk PTPanin Financial Tbk PTPaninvest Tbk PTPelayaran Tamarin Samudra Tbk PTPerusahaan Gas Negara Tbk PTPerusahaan Perkebunan London Sumatra Indonesia Tbk PTPool Advista Indonesia Tbk PTPP Persero Tbk PTPP Properti Tbk PTPuradelta Lestari Tbk PTRamayana Lestari Sentosa Tbk PTRimo International Lestari Tbk PTSalim Ivomas Pratama Tbk PTSawit Sumbermas Sarana Tbk PTSelamat Sempurna Tbk PTSemen Baturaja Persero Tbk PTSemen Indonesia Persero Tbk PTSentul City Tbk PT
Siloam International Hospitals Tbk PTSitara Propertindo Tbk PTSri Rejeki Isman Tbk PTSummarecon Agung Tbk PTSurya Citra Media Tbk PTSurya Esa Perkasa Tbk PTSurya Semesta Internusa Tbk PTTelekomunikasi Indonesia Persero Tbk PTTelekomunikasi Indonesia Persero Tbk PT, Sponsored ADRTempo Scan Pacific Tbk PTTiga Pilar Sejahtera Food TbkTimah Tbk PTTiphone Mobile Indonesia Tbk PT
292,600 94,270* 848,155 100,252
18,632,395 371,297473,600 37,386901,900 237,956
2,753,725 488,352* 3,664,667 220,592
2,591,200 252,898295,300 27,245
4,108,300 276,435420,900 60,834
* 9,936,200 55,1733,322,300 62,350
* 167,600 7,406323,700 29,754155,000 131,712
* 553,200 26,0494,335,300 226,4941,291,500 65,978
* 8,949,500 222,880* 148,100 14,384* 537,000 18,672
1,640,000 238,2651,560,700 117,667
* 91,300 12,5671,508,154 228,8712,876,700 23,3112,214,800 47,9411,111,824 106,533
* 3,021,600 28,2591,950,400 46,6791,815,600 130,623
576,100 63,430772,600 54,506433,400 393,977
* 10,397,200 109,775
T.A. World ex U.S. Core Equity PortfolioCONTINUED
Shares Value»
INDONESIA — (Continued)* 132,431 $ 59,361* 358,500 19,043
4,830,100 120,3333,716,100 349,3101,153,600 126,851
* 1,124,200 23,3261,861,600 107,248
206,200 62,92812,307 370,810
206,900 23,152* 839,100 1,886
1,442,756 105,888784,500 21,148

Totalindo Eka Persada Tbk PTTower Bersama Infrastructure Tbk PTTrada Alam Minera Tbk PTTunas Baru Lampung Tbk PTTunas Ridean Tbk PTUnilever Indonesia Tbk PTUnited Tractors Tbk PTVale Indonesia Tbk PTVisi Media Asia Tbk PTWaskita Beton Precast Tbk PTWaskita Karya Persero Tbk PTWijaya Karya Beton Tbk PTWijaya Karya Persero Tbk PTXL Axiata Tbk PT
TOTAL INDONESIA
AIB Group P.L.C.Bank of Ireland Group P.L.C.C&C Group P.L.C.Cairn Homes P.L.CCRH P.L.C.CRH P.L.C., Sponsored ADRDatalex P.L.C.FBD Holdings P.L.C.Flutter Entertainment P.L.C.Flutter Entertainment P.L.C.Glanbia P.L.C.IFG Group P.L.C.Irish Continental Group P.L.C.Kenmare Resources P.L.C.Kerry Group P.L.C., Class AKingspan Group P.L.C.Permanent TSB Group Holdings P.L.C.Smurfit Kappa Group P.L.C.
TOTAL IRELAND
Afcon Holdings, Ltd.AFI Properties, Ltd.Airport City, Ltd.Albaad Massuot Yitzhak, Ltd.Allot, Ltd.Alrov Properties and Lodgings, Ltd.Amot Investments, Ltd.
Arad, Ltd.Arko Holdings, Ltd.Ashtrom Group, Ltd.Ashtrom Properties, Ltd.AudioCodes, Ltd.
* 288,000 12,617496,600 148,656
* 5,604,000 47,0721,270,400 72,748
537,500 39,48964,200 198,934
593,024 1,050,400* 716,600 153,369* 4,205,000 33,527
5,424,200 139,8073,338,063 483,3381,962,100 81,5401,429,459 236,228
* 1,923,600 440,788
23,879,301
IRELAND — (0.5%)151,416 518,620287,392 1,268,169
81,512 370,930* 2,651 3,148
1,971 65,596148,893 4,967,070
10,868 11,1067,366 77,324
24,674 1,948,9672,126 168,628
100,289 1,305,504* 10,052 23,189
52,604 240,994* 385 1,003
14,315 1,665,62750,750 2,482,198
* 11,387 14,34896,110 3,023,783
18,156,204
ISRAEL — (0.6%)628 31,830
* 4,516 138,370* 23,129 424,165* 638 4,215* 5,226 37,712
2,753 103,52342,477 299,492
T.A. World ex U.S. Core Equity PortfolioCONTINUED
Shares Value»
ISRAEL — (Continued)2,321 $ 32,938
* 70,066 30,0874,898 41,6395,949 32,3883,346 64,639

Avgol Industries 1953, Ltd.Azorim-Investment Development & Construction Co., Ltd.Azrieli Group, Ltd.Bank Hapoalim BMBank Leumi Le-Israel BMBayside Land Corp.Bet Shemesh Engines Holdings 1997, Ltd.Bezeq The Israeli Telecommunication Corp., Ltd.Big Shopping Centers, Ltd.Blue Square Real Estate, Ltd.Brack Capital Properties NVCamtek, Ltd.Carasso Motors, Ltd.Cellcom Israel, Ltd.Cellcom Israel, Ltd.Ceragon Networks, Ltd.Clal Biotechnology Industries, Ltd.Clal Insurance Enterprises Holdings, Ltd.Danel Adir Yeoshua, Ltd.Delek Automotive Systems, Ltd.Delek Group, Ltd.Delta-Galil Industries, Ltd.Direct Insurance Financial Investments, Ltd.Dor Alon Energy in Israel 1988, Ltd.El Al Israel AirlinesElbit Systems, Ltd.Elbit Systems, Ltd.Electra Consumer Products 1970, Ltd.Electra Real Estate, Ltd.Electra, Ltd.Energix-Renewable Energies, Ltd.Equital, Ltd.First International Bank Of Israel, Ltd.FMS Enterprises Migun, Ltd.Formula Systems 1985, Ltd.Fox Wizel, Ltd.Gilat Satellite Networks, Ltd.Hadera Paper, Ltd.Hamlet Israel-Canada, Ltd.Harel Insurance Investments & Financial Services, Ltd.Hilan, Ltd.IDI Insurance Co., Ltd.IES Holdings, Ltd.Industrial Buildings Corp., Ltd.Inrom Construction Industries, Ltd.Israel Canada T.R, Ltd.Israel Chemicals, Ltd.Israel Discount Bank, Ltd., Class AIsrael Land Development - Urban Renewal, Ltd.Isras Investment Co., Ltd.Kamada, Ltd.Kenon Holdings, Ltd.Kerur Holdings, Ltd.Klil Industries, Ltd.
* 26,233 26,340* 30,502 51,057
6,148 431,194254,790 1,926,862474,614 3,452,586
381 204,8591,171 37,620
265,698 180,765* 1,423 111,313
1,707 76,609* 710 69,340* 37 359
7,791 31,489* 27,071 77,495* 11,977 34,374* 16,269 49,458* 41,016 20,113* 11,416 184,560
1,587 111,60314,896 63,349
1,225 186,8167,386 215,1187,542 85,8741,389 22,734
* 342,944 87,1622,679 428,6031,800 287,2805,785 80,687
* 2,484 12,8471,001 283,904
* 20,253 40,221* 10,987 358,919* 19,943 514,067
917 26,0885,389 305,0306,475 193,973
11,636 97,7473,184 181,2531,748 35,594
62,595 488,7555,686 197,5892,159 77,545
436 29,132* 66,848 143,646
21,650 85,19736,509 50,96164,027 344,592
382,322 1,650,1121,092 10,984
110 18,396* 6,921 39,521
5,006 105,2812,125 56,842
429 40,624

Malam - Team, Ltd.Matrix IT, Ltd.Maytronics, Ltd.Mediterranean Towers, Ltd.Mega Or Holdings, Ltd.Meitav Dash Investments, Ltd.Melisron, Ltd.Menora Mivtachim Holdings, Ltd.Migdal Insurance & Financial Holding, Ltd.Mizrahi Tefahot Bank, Ltd.Municipal Bank, Ltd.Naphtha Israel Petroleum Corp., Ltd.Neto ME Holdings, Ltd.Nice, Ltd., Sponsored ADRNova Measuring Instruments, Ltd.Oil Refineries, Ltd.One Software Technologies, Ltd.OPC Energy, Ltd.Partner Communications Co., Ltd.Partner Communications Co., Ltd., ADRPaz Oil Co., Ltd.Phoenix Holdings, Ltd. (The)Plasson Industries, Ltd.Rami Levy Chain Stores Hashikma Marketing 2006, Ltd.Scope Metals Group, Ltd.Shapir Engineering and Industry, Ltd.Shikun & Binui, Ltd.Shufersal, Ltd.Strauss Group, Ltd.Summit Real Estate Holdings, Ltd.Suny Cellular Communication, Ltd.Tadiran Holdings, Ltd.Teva Pharmaceutical Industries, Ltd., Sponsored ADRTower Semiconductor, Ltd.Tower Semiconductor, Ltd.Union Bank of IsraelYH Dimri Construction & Development, Ltd.
TOTAL ISRAEL
A.S. Roma SpAA2A SpAACEA SpAAeffe SpAAmplifon SpAAnima Holding SpAArnoldo Mondadori Editore SpAAscopiave SpAAssicurazioni Generali SpAAtlantia SpA
T.A. World ex U.S. Core Equity PortfolioCONTINUED
Shares Value»
ISRAEL — (Continued)176 $ 21,923
14,912 234,23413,459 95,40019,682 45,764
3,829 75,2957,442 27,9241,879 98,679
13,207 211,069181,872 221,616
* 44,429 1,066,05075 15,565
24,518 161,300679 60,711
* 7,239 1,105,540* 8,248 241,464* 977,915 524,719
1,100 68,0549,401 74,386
* 81,126 331,041* 1,600 6,528
3,315 469,48950,044 312,003
1,457 58,8182,148 113,3564,129 100,391
30,549 116,102115,380 396,74831,507 231,749
9,128 275,4217,164 70,912
* 38,947 21,0471,130 41,731
* 16,208 128,529* 15,804 310,865* 4,323 84,787* 4,714 22,400
1,092 23,967
22,631,014
ITALY — (2.0%)* 66,579 37,711
757,223 1,323,61230,673 576,758
* 11,360 21,78944,383 1,093,92295,584 351,378
* 71,829 117,00531,833 144,67184,093 1,568,36127,082 696,438

Autogrill SpAAutostrade Meridionali SpAAzimut Holding SpABanca Carige SpABanca Farmafactoring SpABanca Finnat Euramerica SpABanca Generali SpABanca IFIS SpABanca Mediolanum SpA
Banca Monte dei Paschi di Siena SpABanca Popolare di Sondrio SCPABanca Profilo SpABanca Sistema SpABanco BPM SpABanco di Desio e della Brianza SpABasicNet SpABEBiesse SpABPER BancaBrunello Cucinelli SpABuzzi Unicem SpACairo Communication SpACarraro SpACementir Holding SpACerved Group SpACIR-Compagnie Industriali Riunite SpACNH Industrial NVCredito Emiliano SpACredito Valtellinese SpAd'Amico International Shipping SADanieli & C Officine Meccaniche SpADatalogic SpADavide Campari-Milano SpADe' Longhi SpADiaSorin SpAdoValue SpAEl.En. SpAElica SpAEmak SpAEnel SpAEni SpAEni SpA, Sponsored ADRERG SpAEsprinet SpAEurotech SpAFalck Renewables SpAFerrari NVFerrari NVFiat Chrysler Automobiles NV
44,910 474,680305 10,569
48,194 903,267* 289,369 352
20,907 112,99736,232 11,68517,997 523,98112,169 171,92347,697 341,279
T.A. World ex U.S. Core Equity PortfolioCONTINUED
Shares Value»
ITALY — (Continued)* 3,026 $ 4,377
206,084 428,26861,003 10,43322,699 31,320
* 860,585 1,604,40212,951 28,27715,391 77,16657,250 63,293
5,154 64,171232,366 864,559
10,752 340,53026,107 530,57045,366 129,971
8,063 17,16327,672 194,34460,383 475,806
158,960 175,669187,473 1,898,258
44,490 222,811* 3,220,315 190,493* 132,518 14,144
6,446 112,3634,298 75,573
124,346 1,156,46516,180 325,317
7,840 909,2263,407 42,5911,776 34,676
* 4,280 10,20029,309 31,810
936,477 6,406,087387,838 6,058,533
26,710 836,29026,974 521,61424,551 82,469
* 11,463 62,00379,144 365,64417,952 2,890,800
559 90,044249,186 3,338,203

Fiat Chrysler Automobiles NVFiera Milano SpAFila SpAFincantieri SpAFinecoBank Banca Fineco SpAFNM SpAFreni Brembo SpAGEDI Gruppo Editoriale SpAGefran SpAGeox SpAGruppo MutuiOnline SpAHera SpAIMA Industria Macchine Automatiche SpAIMMSI SpAInfrastrutture Wireless Italiane SpAInterpump Group SpAIntesa Sanpaolo SpAIren SpAItalgas SpA
Juventus Football Club SpALa Doria SpALeonardo SpALU-VE SpAMaire Tecnimont SpAMARR SpAMassimo Zanetti Beverage Group SpAMediaset SpAMediobanca Banca di Credito Finanziario SpAMoncler SpAOVS SpAPiaggio & C SpAPirelli & C SpAPoste Italiane SpAPrima Industrie SpAPrysmian SpARAI Way SpARecordati SpAReno de Medici SpAReply SpARetelit SpARizzoli Corriere Della Sera Mediagroup SpASabaf SpASAES Getters SpASafilo Group SpASaipem SpASalini Impregilo SpASalvatore Ferragamo SpASaras SpAServizi Italia SpA
79,083 1,043,1057,744 33,6726,803 99,723
* 66,621 68,814142,208 1,414,682
64,413 36,24058,777 601,205
* 33,656 10,6091,949 14,271
25,019 35,13912,607 214,904
377,579 1,405,8836,722 527,768
* 154,940 106,25334,072 344,67724,168 679,345
1,498,786 3,250,726225,767 590,723168,503 1,064,730
T.A. World ex U.S. Core Equity PortfolioCONTINUED
Shares Value»
ITALY — (Continued)* 149,340 $ 256,713
4,431 39,329110,299 1,342,928
1,368 17,305# 57,102 137,426
10,967 236,4067,385 46,727
#* 308,562 903,747187,570 1,878,708
44,480 1,826,359* 110,569 194,547
120,217 361,07357,201 336,924
113,376 1,209,9742,367 39,613
28,368 584,00123,449 139,16721,288 953,379
121,336 92,2254,940 330,510
36,467 60,57534,455 36,945
2,072 33,575713 16,838
* 17,360 16,839* 190,530 941,705* 30,099 57,546
16,854 353,466368,419 606,436
5,016 17,744

Sesa SpASnam SpASocieta Cattolica di Assicurazioni SCSocieta Iniziative Autostradali e Servizi SpASogefi SpASOL SpATechnogym SpATelecom Italia SpATelecom Italia SpA, Sponsored ADRTenaris SA, ADRTerna Rete Elettrica Nazionale SpATinexta S.p.A.Tiscali SpATod's SpATREVI - Finanziaria Industriale SpATXT e-solutions SpAUniCredit SpAUnieuro SpAUnione di Banche Italiane SpAUnipol Gruppo SpAUnipolSai Assicurazioni SpAZignago Vetro SpA
TOTAL ITALY
77 Bank, Ltd. (The)A&A Material Corp.A&D Co., Ltd.ABC-Mart, Inc.
Abist Co., Ltd.Achilles Corp.Acom Co., Ltd.AD Works Co., Ltd.Adastria Co., Ltd.ADEKA Corp.Ad-sol Nissin Corp.Adtec Plasma Technology Co., Ltd.Advan Co., Ltd.Advance Create Co., Ltd.Advanex, Inc.Advantage Risk Management Co., Ltd.Advantest Corp.Adventure, Inc.Aeon Co., Ltd.Aeon Delight Co., Ltd.Aeon Fantasy Co., Ltd.AEON Financial Service Co., Ltd.Aeon Hokkaido Corp.Aeon Mall Co., Ltd.Aeria, Inc.
1,443 56,844194,620 955,539
83,860 711,63319,190 363,996
* 33,393 44,49710,344 123,50837,737 405,364
* 3,764,104 2,116,280* 48,868 271,706
1,800 44,964183,955 1,120,262
* 7,970 108,880* 763,357 11,447# 5,252 261,513* 34,212 9,361
926 8,578162,667 1,915,324
4,908 67,371447,736 1,149,507224,129 1,149,709324,387 845,686
9,750 110,231
75,661,710
JAPAN — (16.7%)28,100 400,608
1,800 16,87510,900 78,594
3,400 214,887
T.A. World ex U.S. Core Equity PortfolioCONTINUED
Shares Value»
JAPAN — (Continued)2,200 $ 54,5176,300 117,745
45,100 159,31481,800 25,47117,480 342,07439,600 579,195
800 14,1211,400 9,6907,000 71,1291,300 22,197
400 6,2052,100 14,286
28,700 1,105,204* 600 18,426
196,905 3,407,28910,000 297,963
5,400 155,50132,800 529,14112,000 81,50616,280 249,926
8,800 67,418

AFC-HD AMS Life Science Co., Ltd.AGC, Inc.Ahresty Corp.Ai Holdings Corp.Aica Kogyo Co., Ltd.Aichi Bank, Ltd. (The)Aichi Corp.Aichi Steel Corp.Aichi Tokei Denki Co., Ltd.Aida Engineering, Ltd.Aiful Corp.Ain Holdings, Inc.Air Water, Inc.Airport Facilities Co., Ltd.Aisan Industry Co., Ltd.Aisin Seiki Co., Ltd.AIT Corp.Ajinomoto Co., Inc.Ajis Co., Ltd.Akatsuki Corp.Akatsuki, Inc.Akebono Brake Industry Co., Ltd.Akita Bank, Ltd. (The)Albis Co., Ltd.Alconix Corp.Alfresa Holdings Corp.Alinco, Inc.Alleanza Holdings Co., Ltd.Alpen Co., Ltd.Alpha Corp.Alps Alpine Co., Ltd.Alps Logistics Co., Ltd.Altech Corp.Amada Holdings Co., Ltd.Amano Corp.Amiyaki Tei Co., Ltd.Amuse, Inc.ANA Holdings, Inc.
Anabuki Kosan, Inc.Anest Iwata Corp.Anicom Holdings, Inc.AOI TYO Holdings, Inc.AOKI Holdings, Inc.Aomori Bank, Ltd. (The)Aoyama Trading Co., Ltd.Aoyama Zaisan Networks Co., Ltd.Aozora Bank, Ltd.Apaman Co., Ltd.Arakawa Chemical Industries, Ltd.
1,800 10,92673,300 2,245,175
9,700 50,97613,300 207,65113,100 377,373
3,600 123,43116,800 105,212
5,000 155,9671,400 53,957
23,700 187,605* 138,400 282,095
15,100 825,98373,000 1,193,035
9,700 45,79819,700 131,80541,862 1,360,437
3,000 27,82543,500 779,453
1,600 50,5054,000 12,3901,900 127,539
#* 57,200 80,28610,000 183,402
2,600 60,65312,700 151,314
7,800 188,0587,800 69,4614,900 36,8948,500 121,3022,600 30,179
50,500 919,3184,400 30,2415,610 86,545
60,700 667,37315,300 460,263
2,700 85,8271,700 37,9245,100 171,179
T.A. World ex U.S. Core Equity PortfolioCONTINUED
Shares Value»
JAPAN — (Continued)600 $ 15,668
11,600 97,8093,300 114,952
10,554 68,99819,000 186,316
9,000 220,53120,500 381,763
2,900 39,32939,100 896,075
3,400 30,4878,300 112,264

Arata Corp.Arcland Sakamoto Co., Ltd.Arcland Service Holdings Co., Ltd.Arcs Co., Ltd.Arealink Co., Ltd.Ariake Japan Co., Ltd.Arrk Corp.Artnature, Inc.ArtSpark Holdings, Inc.As One Corp.Asahi Broadcasting Group Holdings Corp.Asahi Co., Ltd.Asahi Diamond Industrial Co., Ltd.Asahi Group Holdings, Ltd.Asahi Holdings, Inc.Asahi Intecc Co., Ltd.Asahi Kasei Corp.Asahi Kogyosha Co., Ltd.Asahi Net, Inc.Asahi Yukizai Corp.Asante, Inc.Asanuma Corp.Asax Co., Ltd.Ashimori Industry Co., Ltd.Asia Pile Holdings Corp.Asics Corp.ASKA Pharmaceutical Co., Ltd.ASKUL Corp.Astellas Pharma, Inc.Asti Corp.Asukanet Co., Ltd.Asunaro Aoki Construction Co., Ltd.Ateam, Inc.Atom Corp.Autobacs Seven Co., Ltd.Avant Corp.Avex, Inc.Awa Bank, Ltd. (The)Axial Retailing, Inc.Azbil Corp.Bandai Namco Holdings, Inc.Bando Chemical Industries, Ltd.Bank of Iwate, Ltd. (The)Bank of Kochi, Ltd. (The)Bank of Kyoto, Ltd. (The)Bank of Nagoya, Ltd. (The)Bank of Okinawa, Ltd. (The)Bank of Saga, Ltd. (The)
Bank of the Ryukyus, Ltd.
4,800 155,36713,400 162,230
5,000 87,52917,900 372,333
2,200 25,8944,300 265,690
* 11,700 10,81411,000 66,1862,900 23,2852,400 198,6963,800 24,9015,800 67,284
26,700 164,89833,300 1,442,38719,700 409,06528,200 736,903
342,000 3,479,1271,900 47,0504,300 26,9586,100 76,6432,700 49,3433,600 114,839
300 1,6163,300 46,499
11,800 58,25328,100 301,09117,000 203,300
2,400 59,826154,400 2,188,140
800 13,034# 3,100 43,437
6,600 49,8563,800 38,731
34,300 314,10720,100 327,091
600 10,68819,000 244,28817,500 397,263
9,600 332,57122,800 544,28220,900 1,123,56815,300 132,033
6,500 159,9132,800 19,380
17,000 659,7685,900 183,071
10,080 309,79312,101 168,875
T.A. World ex U.S. Core Equity PortfolioCONTINUED
Shares Value»
JAPAN — (Continued)20,200 $ 209,413

Baroque Japan, Ltd.BayCurrent Consulting, Inc.Belc Co., Ltd.Bell System24 Holdings, Inc.Belluna Co., Ltd.Benefit One, Inc.Benesse Holdings, Inc.Bengo4.com, Inc.Bic Camera, Inc.Biofermin Pharmaceutical Co., Ltd.BML, Inc.Bookoff Group Holdings, Ltd.BP Castrol K.K.Br Holdings Corp.Bridgestone Corp.Broadleaf Co., Ltd.BRONCO BILLY Co., Ltd.Brother Industries, Ltd.Bunka Shutter Co., Ltd.Business Brain Showa-Ota, Inc.C Uyemura & Co., Ltd.Calbee, Inc.Can Do Co., Ltd.Canon Electronics, Inc.Canon Marketing Japan, Inc.Canon, Inc.Capcom Co., Ltd.Career Design Center Co., Ltd.Carlit Holdings Co., Ltd.Carta Holdings, Inc.Casio Computer Co., Ltd.Cawachi, Ltd.CDS Co., Ltd.Central Glass Co., Ltd.Central Japan Railway Co.Central Security Patrols Co., Ltd.Central Sports Co., Ltd.Change, Inc.Charm Care Corp. KKChiba Bank, Ltd. (The)Chiba Kogyo Bank, Ltd. (The)Chilled & Frozen Logistics Holdings Co., Ltd., Class HCHIMNEY Co., Ltd.Chino Corp.Chiyoda Co., Ltd.Chori Co., Ltd.Chubu Electric Power Co., Inc.Chubu Shiryo Co., Ltd.Chuetsu Pulp & Paper Co., Ltd.Chugai Pharmaceutical Co., Ltd.Chugai Ro Co., Ltd.Chugoku Bank, Ltd. (The)Chugoku Electric Power Co., Inc. (The)Chugoku Marine Paints, Ltd.Chukyo Bank, Ltd. (The)
8,400 84,12011,300 516,0146,000 277,749
16,300 232,10624,300 156,92918,400 314,324
6,800 159,153* 2,400 106,051
33,600 331,2421,100 22,0409,100 249,7623,500 40,1133,500 42,9036,300 20,061
91,400 3,431,20131,200 163,941
2,000 41,48674,000 1,310,20425,000 204,599
700 15,404800 43,768
7,900 222,8705,100 76,2419,800 160,397
16,100 308,38546,100 1,250,28927,600 576,308
1,300 18,9218,000 45,1954,000 44,709
47,600 543,0357,600 141,2241,300 15,981
20,300 461,4626,800 1,366,8861,900 85,3743,500 99,554
* 1,300 26,900700 12,204
99,100 490,13621,600 60,685
6,000 73,0091,100 24,2492,200 28,4806,000 88,7034,400 68,523
35,600 502,54210,400 119,66416,100 232,654
1,500 107,3202,700 39,789
48,600 424,90239,000 486,69121,600 161,659
5,800 117,288

CI Takiron Corp.Citizen Watch Co., Ltd.CKD Corp.
CK-San-Etsu Co., Ltd.Cleanup Corp.CMIC Holdings Co., Ltd.CMK Corp.Coca-Cola Bottlers Japan Holdings, Inc.cocokara fine, Inc.Coco's Japan Co., Ltd.Colowide Co., Ltd.Computer Engineering & Consulting, Ltd.COMSYS Holdings Corp.Comture Corp.Concordia Financial Group, Ltd.CONEXIO Corp.COOKPAD, Inc.Core Corp.Cosel Co., Ltd.Cosmo Energy Holdings Co., Ltd.Cosmos Initia Co., Ltd.Cosmos Pharmaceutical Corp.CRE, Inc.Create Medic Co., Ltd.Create Restaurants Holdings, Inc.Create SD Holdings Co., Ltd.Credit Saison Co., Ltd.Creek & River Co., Ltd.Cresco, Ltd.CTI Engineering Co., Ltd.CTS Co., Ltd.Cube System, Inc.CyberAgent, Inc.Cybernet Systems Co., Ltd.Cybozu, Inc.Dai Nippon Printing Co., Ltd.Dai Nippon Toryo Co., Ltd.Daibiru Corp.Daicel Corp.Dai-Dan Co., Ltd.Daido Kogyo Co., Ltd.Daido Metal Co., Ltd.Daido Steel Co., Ltd.Daifuku Co., Ltd.Daihatsu Diesel Manufacturing Co., Ltd.Daihen Corp.Daiho Corp.Dai-Ichi Cutter Kogyo K.K.Daiichi Jitsugyo Co., Ltd.
19,000 122,038145,200 722,582
27,800 304,980
T.A. World ex U.S. Core Equity PortfolioCONTINUED
Shares Value»
JAPAN — (Continued)800 $ 20,953
9,900 46,8557,700 131,474
26,100 148,96222,513 554,168
5,900 310,9431,100 14,908
23,500 458,01312,800 284,82521,000 529,842
4,100 157,024189,424 667,026
12,800 172,717* 9,700 27,237
1,100 14,4678,500 84,287
35,400 729,6952,200 10,0813,000 552,4215,100 53,1772,900 24,533
15,700 234,31813,600 304,66549,800 605,427
2,500 30,4692,000 70,4555,800 84,3619,600 59,0251,400 11,142
16,200 650,0192,100 13,0495,400 63,753
36,600 767,66811,300 101,90816,500 152,609
125,800 1,064,5276,400 129,8683,211 26,090
20,900 125,58514,800 561,91222,700 1,241,537
6,400 37,9338,800 243,6508,800 218,6451,000 16,1524,000 109,677

Daiichi Kigenso Kagaku-Kogyo Co., Ltd.Dai-ichi Life Holdings, Inc.Daiichi Sankyo Co., Ltd.Dai-ichi Seiko Co., Ltd.Daiichikosho Co., Ltd.Daiken Corp.Daiken Medical Co., Ltd.Daiki Aluminium Industry Co., Ltd.Daiki Axis Co., Ltd.Daikin Industries, Ltd.Daikoku Denki Co., Ltd.Daikokutenbussan Co., Ltd.Daikyonishikawa Corp.
Dainichiseika Color & Chemicals Manufacturing Co., Ltd.Daio Paper Corp.Daiohs Corp.Daiseki Co., Ltd.Daiseki Eco. Solution Co., Ltd.Daishi Hokuetsu Financial Group, Inc.Daishinku Corp.Daisue Construction Co., Ltd.Daito Pharmaceutical Co., Ltd.Daito Trust Construction Co., Ltd.Daitron Co., Ltd.Daiwa House Industry Co., Ltd.Daiwa Securities Group, Inc.Daiwabo Holdings Co., Ltd.DCM Holdings Co., Ltd.DD Holdings Co., Ltd.Dear Life Co., Ltd.Delica Foods Holdings Co., Ltd.Denka Co., Ltd.Denso Corp.Dentsu, Inc.Denyo Co., Ltd.Descente, Ltd.Dexerials Corp.DIC Corp.Digital Arts, Inc.Digital Hearts Holdings Co., Ltd.Digital Information Technologies Corp.Dip Corp.Disco Corp.DKK-Toa Corp.DKS Co., Ltd.DMG Mori Co., Ltd.Doshisha Co., Ltd.Doutor Nichires Holdings Co., Ltd.Dowa Holdings Co., Ltd.
11,600 93,392106,200 1,561,251
6,200 376,7563,500 42,655
13,300 549,3686,500 128,8504,400 25,003
14,600 102,2861,200 9,353
11,700 1,452,1665,500 67,4154,100 123,126
28,300 232,933
T.A. World ex U.S. Core Equity PortfolioCONTINUED
Shares Value»
JAPAN — (Continued)6,200 $ 171,131
35,900 428,7762,300 30,609
11,600 275,6543,240 20,274
16,850 447,8872,900 31,7363,600 31,5076,880 191,776
12,300 1,586,1243,600 44,284
107,900 3,067,786279,300 1,204,212
11,100 537,91050,100 472,768
2,800 77,63711,100 47,5971,300 17,421
42,500 1,223,08325,900 1,099,33719,900 657,815
6,700 96,6275,800 90,015
37,800 249,35140,900 1,103,466
4,400 445,4525,100 50,8732,000 32,234
12,300 252,4853,300 605,6391,800 13,5675,000 147,723
42,900 621,42211,900 185,44212,500 230,12227,900 881,128

DTS Corp.Dvx, Inc.DyDo Group Holdings, Inc.Dynic Corp.Eagle Industry Co., Ltd.Earth Corp.East Japan Railway Co.Ebara Corp.Ebara Foods Industry, Inc.Ebara Jitsugyo Co., Ltd.Ebase Co., Ltd.Eco's Co., Ltd.EDION Corp.EF-ON, Inc.eGuarantee, Inc.E-Guardian, Inc.Ehime Bank, Ltd. (The)Eidai Co., Ltd.Eiken Chemical Co., Ltd.Eisai Co., Ltd.Eizo Corp.Elan Corp.Elecom Co., Ltd.
Electric Power Development Co., Ltd.Elematec Corp.EM Systems Co., Ltd.Endo Lighting Corp.Enigmo, Inc.en-japan, Inc.Enomoto Co., Ltd.Enplas Corp.Enshu, Ltd.EPS Holdings, Inc.eRex Co., Ltd.ES-Con Japan, Ltd.ESCRIT, Inc.Escrow Agent Japan, Inc.ESPEC Corp.Evolable Asia Corp.Excel Co., Ltd.Exedy Corp.Ezaki Glico Co., Ltd.F@N Communications, Inc.FALCO HOLDINGS Co., Ltd.FamilyMart UNY Holdings Co., Ltd.FANUC Corp.Fast Retailing Co., Ltd.FCC Co., Ltd.FDK Corp.
18,800 410,9482,900 21,1274,700 184,6502,100 14,430
14,900 148,6352,100 90,069
14,400 1,320,12035,400 951,341
2,400 46,7162,200 40,6751,100 11,9744,300 58,543
39,200 371,69310,080 82,598
8,000 85,7692,900 51,589
15,400 153,77316,800 53,33412,400 208,367
3,500 189,1674,600 168,7063,400 54,2227,400 267,946
T.A. World ex U.S. Core Equity PortfolioCONTINUED
Shares Value»
JAPAN — (Continued)8,500 $ 190,2829,104 85,4898,900 137,123
10,900 76,176* 6,200 66,326
12,600 516,8862,700 22,1732,300 73,4591,800 19,358
15,900 244,80710,600 103,99423,400 146,985
4,700 32,668* 6,800 14,858
4,400 90,4291,500 35,4663,500 48,655
15,500 315,97810,300 447,19920,800 104,942
4,600 67,80511,980 255,7703,200 568,7245,900 3,538,964
24,400 474,142* 3,100 23,456

Feed One Co., Ltd.Ferrotec Holdings Corp.FFRI, Inc.FIDEA Holdings Co., Ltd.Fields Corp.Financial Products Group Co., Ltd.FINDEX, Inc.First Bank of Toyama, Ltd. (The)First Brothers Co., Ltd.First Juken Co., Ltd.Fixstars Corp.FJ Next Co., Ltd.Focus Systems Corp.Forval Corp.Foster Electric Co., Ltd.FP Corp.France Bed Holdings Co., Ltd.Freebit Co., Ltd.Freund Corp.Fronteo, Inc.F-Tech, Inc.FTGroup Co., Ltd.Fudo Tetra Corp.Fuji Co., Ltd.Fuji Corp.Fuji Corp.Fuji Corp., Ltd.Fuji Die Co., Ltd.Fuji Electric Co., Ltd.Fuji Furukawa Engineering & Construction Co., Ltd.Fuji Kyuko Co., Ltd.Fuji Oil Co., Ltd.Fuji Oil Holdings, Inc.
Fuji Pharma Co., Ltd.Fuji Seal International, Inc.Fuji Soft, Inc.Fujibo Holdings, Inc.Fujicco Co., Ltd.FUJIFILM Holdings Corp.Fujikura Composites, Inc.Fujikura Kasei Co., Ltd.Fujikura, Ltd.Fujimak Corp.Fujimi, Inc.Fujimori Kogyo Co., Ltd.Fujio Food System Co., Ltd.Fujisash Co., Ltd.Fujita Kanko, Inc.Fujitec Co., Ltd.
44,980 73,48222,300 191,267
* 1,000 33,45676,000 83,780
7,100 31,14124,600 216,728
4,200 36,2603,600 10,1022,700 26,7923,300 38,0606,000 99,1076,300 61,4411,500 11,7273,700 31,727
16,500 288,6559,700 598,004
11,700 106,9545,200 52,2712,400 17,7263,800 13,2876,600 44,9254,600 65,093
10,550 126,4918,900 150,561
24,100 321,3503,400 63,610
11,200 75,2293,700 21,166
31,400 959,266200 3,499
7,200 276,49531,900 74,50614,000 430,980
T.A. World ex U.S. Core Equity PortfolioCONTINUED
Shares Value»
JAPAN — (Continued)6,200 $ 83,082
20,000 585,9471,400 62,9074,500 108,9955,200 93,776
15,800 748,89510,700 41,78810,700 58,356
162,500 594,4351,400 10,3307,200 148,7808,000 214,9631,700 40,344
55,900 44,0145,000 125,217
17,600 219,404

Fujitsu Frontech, Ltd.Fujitsu General, Ltd.Fujitsu, Ltd.Fujiya Co., Ltd.FuKoKu Co., Ltd.Fukuda Corp.Fukuda Denshi Co., Ltd.Fukui Bank, Ltd. (The)Fukui Computer Holdings, Inc.Fukuoka Financial Group, Inc.Fukushima Bank, Ltd. (The)Fukushima Industries Corp.Fukuyama Transporting Co., Ltd.Full Speed, Inc.FULLCAST Holdings Co., Ltd.Funai Soken Holdings, Inc.Furukawa Battery Co., Ltd. (The)Furukawa Co., Ltd.Furukawa Electric Co., Ltd.Furuno Electric Co., Ltd.Furusato Industries, Ltd.Furyu Corp.Fuso Chemical Co., Ltd.Fuso Pharmaceutical Industries, Ltd.Futaba Industrial Co., Ltd.Future Corp.Fuyo General Lease Co., Ltd.G-7 Holdings, Inc.Gakken Holdings Co., Ltd.Gakkyusha Co., Ltd.GCA Corp.Gecoss Corp.Genki Sushi Co., Ltd.Genky DrugStores Co., Ltd.Geo Holdings Corp.Geostr Corp.Gfoot Co., Ltd.Giken, Ltd.GL Sciences, Inc.Global, Ltd. (The)GLOBERIDE, Inc.Glory, Ltd.Glosel Co., Ltd.
GMO Cloud K.K.GMO Financial Holdings, Inc.GMO internet, Inc.GMO Payment Gateway, Inc.Godo Steel, Ltd.Gokurakuyu Holdings Co., Ltd.
5,600 49,21525,200 402,72340,750 3,180,064
2,400 42,6046,500 43,6912,400 100,8301,500 98,5228,800 112,1252,300 48,189
56,880 1,041,61012,000 27,116
6,400 198,7038,800 331,3451,400 6,9816,800 139,042
10,660 243,2457,400 44,120
13,100 170,95141,500 1,113,052
9,500 81,4134,400 58,7847,700 76,390
11,800 246,3713,000 52,873
36,800 255,30315,100 268,56511,600 688,4694,000 108,5681,500 67,4811,500 18,0686,600 42,9327,400 63,4151,800 50,6896,000 116,611
20,300 267,1736,900 20,3656,100 36,4316,500 190,4542,400 32,9103,300 13,9546,200 184,717
24,400 644,3138,500 33,926
T.A. World ex U.S. Core Equity PortfolioCONTINUED
Shares Value»
JAPAN — (Continued)1,300 $ 37,231
12,300 66,82625,000 406,410
7,600 549,0935,700 107,0346,900 36,539

Goldcrest Co., Ltd.Goldwin, Inc.Golf Digest Online, Inc.Grandy House Corp.Greens Co., Ltd.GS Yuasa Corp.GSI Creos Corp.G-Tekt Corp.GungHo Online Entertainment, Inc.Gunma Bank, Ltd. (The)Gunosy, Inc.Gunze, Ltd.Gurunavi, Inc.H2O Retailing Corp.HABA Laboratories, Inc.Hachijuni Bank, Ltd. (The)Hagihara Industries, Inc.Hagiwara Electric Holdings Co., Ltd.Hakudo Co., Ltd.Hakuhodo DY Holdings, Inc.Hakuto Co., Ltd.Halows Co., Ltd.Hamakyorex Co., Ltd.Hamamatsu Photonics KKHandsman Co., Ltd.Hankyu Hanshin Holdings, Inc.Hanwa Co., Ltd.Happinet Corp.Harada Industry Co., Ltd.Hard Off Corp. Co., Ltd.Harima Chemicals Group, Inc.Harmonic Drive Systems, Inc.Haruyama Holdings, Inc.Haseko Corp.Havix Corp.Hayashikane Sangyo Co., Ltd.Hazama Ando Corp.Heiwa Corp.Heiwa Real Estate Co., Ltd.Heiwado Co., Ltd.Helios Techno Holdings Co., Ltd.Hibino Corp.Hiday Hidaka Corp.Hikari Tsushin, Inc.Hino Motors, Ltd.Hinokiya Group Co., Ltd.Hioki EE Corp.Hirakawa Hewtech Corp.Hiramatsu, Inc.Hirano Tecseed Co., Ltd.Hirata Corp.Hirose Electric Co., Ltd.Hiroshima Bank, Ltd. (The)
8,910 160,6202,600 357,5826,700 35,4827,600 34,3562,500 34,036
38,600 721,9402,900 33,480
11,000 160,3626,650 175,460
102,500 353,123* 3,100 46,253
7,100 315,49921,300 131,38339,625 447,848
1,500 121,651105,600 397,936
3,600 44,7803,200 83,8195,000 64,104
37,500 588,1346,600 74,3173,100 64,1959,000 321,577
10,100 374,5551,000 10,820
37,800 1,327,09418,100 493,174
8,600 103,2234,200 32,7013,900 26,3616,500 68,5473,100 116,7544,000 29,745
132,600 1,436,4141,800 10,4043,600 22,165
103,720 714,98122,000 451,40813,700 287,71014,600 268,03712,400 73,020
2,100 48,7937,881 152,3164,000 881,907
68,200 547,1204,500 85,3952,200 74,8144,300 49,936
11,000 36,2841,400 21,3384,800 293,578
735 77,008113,200 541,014
T.A. World ex U.S. Core Equity PortfolioCONTINUED

Hiroshima Gas Co., Ltd.HIS Co., Ltd.Hisamitsu Pharmaceutical Co., Inc.Hitachi Capital Corp.Hitachi Chemical Co., Ltd.Hitachi Construction Machinery Co., Ltd.Hitachi High-Technologies Corp.Hitachi Metals, Ltd.Hitachi Transport System, Ltd.Hitachi Zosen Corp.Hitachi, Ltd.Hito Communications Holdings, Inc.Hochiki Corp.Hodogaya Chemical Co., Ltd.Hogy Medical Co., Ltd.Hokkaido Electric Power Co., Inc.Hokkaido Gas Co., Ltd.Hokkan Holdings, Ltd.Hokko Chemical Industry Co., Ltd.Hokkoku Bank, Ltd. (The)Hokuetsu Corp.Hokuetsu Industries Co., Ltd.Hokuhoku Financial Group, Inc.Hokuriku Electric Industry Co., Ltd.Hokuriku Electric Power Co.Hokuriku Electrical Construction Co., Ltd.Hokuto Corp.Honda Motor Co., Ltd., Sponsored ADRHonda Motor Co., Ltd.Honda Tsushin Kogyo Co., Ltd.H-One Co., Ltd.Honeys Holdings Co., Ltd.Honshu Chemical Industry Co., Ltd.Hoosiers HoldingsHoriba, Ltd.Hoshizaki Corp.Hosiden Corp.Hosokawa Micron Corp.Hotland Co., Ltd.House Foods Group, Inc.Howa Machinery, Ltd.Hoya Corp.HUB Co., Ltd.Hulic Co., Ltd.Hyakugo Bank, Ltd. (The)Hyakujushi Bank, Ltd. (The)I K K, Inc.Ibiden Co., Ltd.IBJ Leasing Co., Ltd.IBJ, Inc.Ichibanya Co., Ltd.Ichigo, Inc.
Shares Value»
JAPAN — (Continued)14,400 $ 43,84516,500 402,417
1,800 72,34035,100 718,82210,700 292,59530,800 722,307
7,600 382,94248,410 508,95120,000 622,09072,500 259,99479,100 2,804,475
3,400 57,6838,900 110,8662,800 72,3287,000 194,578
60,000 339,6854,400 59,4794,700 73,5859,200 40,765
10,800 300,00466,900 331,98613,700 148,97355,900 560,075
4,100 39,579* 54,400 389,591
3,900 32,1958,300 141,482
37,467 932,179249,900 6,217,641
8,200 37,40510,200 66,344
9,100 110,2312,600 28,165
16,300 92,81516,600 888,349
4,100 289,66127,400 304,179
4,500 182,078* 2,900 38,722
12,300 452,4196,400 49,406
38,800 2,975,257900 10,078
16,100 138,305102,000 299,097
10,300 204,9995,400 35,053
37,400 666,78316,100 404,057
5,600 45,3933,500 164,859
129,300 467,207

Ichiken Co., Ltd.Ichikoh Industries, Ltd.Ichinen Holdings Co., Ltd.Ichiyoshi Securities Co., Ltd.ID Holdings Corp.Idec Corp.Idemitsu Kosan Co., Ltd.
IDOM, Inc.Ihara Science Corp.IHI Corp.Iida Group Holdings Co., Ltd.Iino Kaiun Kaisha, Ltd.IJTT Co., Ltd.Ikegami Tsushinki Co., Ltd.Imagica Group, Inc.Imasen Electric IndustrialImuraya Group Co., Ltd.Inaba Denki Sangyo Co., Ltd.Inaba Seisakusho Co., Ltd.Inabata & Co., Ltd.Inageya Co., Ltd.Ines Corp.I-Net Corp.Infocom Corp.Infomart Corp.Information Services International-Dentsu, Ltd.Innotech Corp.Intage Holdings, Inc.Intelligent Wave, Inc.Internet Initiative Japan, Inc.Inui Global Logistics Co., Ltd.I-O Data Device, Inc.IR Japan Holdings, Ltd.Iriso Electronics Co., Ltd.I'rom Group Co., Ltd.ISB Corp.Iseki & Co., Ltd.Isetan Mitsukoshi Holdings, Ltd.Ishihara Sangyo Kaisha, Ltd.Ishizuka Glass Co., Ltd.Istyle, Inc.Isuzu Motors, Ltd.ITbook Holdings Co., Ltd.Itfor, Inc.Ito En, Ltd.ITOCHU Corp.Itochu Enex Co., Ltd.Itochu Techno-Solutions Corp.Itochu-Shokuhin Co., Ltd.
3,500 55,06424,000 153,54013,300 135,69323,900 157,789
3,200 34,7348,500 152,656
77,541 2,136,828
T.A. World ex U.S. Core Equity PortfolioCONTINUED
Shares Value»
JAPAN — (Continued)46,100 $ 173,656
3,600 41,87347,700 1,136,62226,616 436,57542,200 141,28210,900 52,096
3,300 32,0233,700 18,4338,200 66,4671,500 28,5715,300 244,0834,100 52,357
22,000 286,2742,600 35,2378,100 86,2937,230 97,002
13,800 342,04734,000 458,609
5,400 187,4979,600 79,622
18,500 156,3331,900 16,255
17,300 323,3304,700 37,8684,000 34,3643,200 83,421
11,400 520,027800 12,602900 14,181
9,500 124,319110,100 875,28316,100 171,048
1,100 20,152* 11,200 84,469
141,700 1,567,971* 2,500 8,004
5,100 43,6599,800 427,935
59,800 1,138,63526,300 212,82217,700 453,740
2,100 86,002

Itoham Yonekyu Holdings, Inc.Itoki Corp.IwaiCosmo Holdings, Inc.Iwaki & Co., Ltd.Iwaki Co., Ltd.Iwasaki Electric Co., Ltd.Iwatani Corp.Iyo Bank, Ltd. (The)Izumi Co., Ltd.J Front Retailing Co., Ltd.J Trust Co., Ltd.JAC Recruitment Co., Ltd.Jaccs Co., Ltd.Jalux, Inc.Jamco Corp.Janome Sewing Machine Co., Ltd.Japan Airlines Co., Ltd.
Japan Airport Terminal Co., Ltd.Japan Asia Group, Ltd.Japan Asset Marketing Co., Ltd.Japan Aviation Electronics Industry, Ltd.Japan Best Rescue System Co., Ltd.Japan Cash Machine Co., Ltd.Japan Display, Inc.Japan Electronic Materials Corp.Japan Exchange Group, Inc.Japan Investment Adviser Co., Ltd.Japan Lifeline Co., Ltd.Japan Material Co., Ltd.Japan Meat Co., Ltd.Japan Medical Dynamic Marketing, Inc.Japan Oil Transportation Co., Ltd.Japan Post Holdings Co., Ltd.Japan Property Management Center Co., Ltd.Japan Pulp & Paper Co., Ltd.Japan Securities Finance Co., Ltd.Japan Steel Works, Ltd. (The)Japan Tobacco, Inc.Japan Transcity Corp.Japan Wool Textile Co., Ltd. (The)JBCC Holdings, Inc.JCU Corp.Jeol, Ltd.JFE Holdings, Inc.JFLA Holdings, Inc.JGC Corp.JIG-SAW, Inc.Jimoto Holdings, Inc.JINS Holdings, Inc.
56,568 370,57615,800 65,17410,200 104,03415,000 66,810
1,300 14,2333,700 44,926
22,900 755,92971,543 347,70612,400 465,12574,100 869,91731,400 137,166
5,000 115,59311,800 234,6863,000 69,3325,300 96,5828,100 34,664
19,900 623,174
T.A. World ex U.S. Core Equity PortfolioCONTINUED
Shares Value»
JAPAN — (Continued)7,200 $ 297,7009,300 28,870
* 40,100 33,44431,000 431,746
1,400 18,3538,200 81,537
#* 974,700 666,1033,000 14,554
78,700 1,153,3873,700 62,462
22,600 397,76722,600 294,232
5,600 92,77510,700 133,972
1,600 42,525155,100 1,520,371
3,900 40,6534,600 154,789
49,600 251,44743,600 759,150
114,900 2,531,67616,800 76,75224,300 200,963
3,900 57,40215,700 294,48714,500 325,829
102,032 1,348,9645,500 21,068
62,200 809,806* 900 41,334
49,800 44,7244,900 257,944

JK Holdings Co., Ltd.JMS Co., Ltd.Joban Kosan Co., Ltd.J-Oil Mills, Inc.Joshin Denki Co., Ltd.JP-Holdings, Inc.JSB Co., Ltd.JSP Corp.JSR Corp.JTEKT Corp.Juki Corp.Juroku Bank, Ltd. (The)Justsystems Corp.JVCKenwood Corp.JXTG Holdings, Inc.Kadoya Sesame Mills, Inc.Kaga Electronics Co., Ltd.Kajima Corp.Kakaku.com, Inc.Kaken Pharmaceutical Co., Ltd.Kakiyasu Honten Co., Ltd.Kameda Seika Co., Ltd.Kamei Corp.Kamigumi Co., Ltd.Kanaden Corp.Kanagawa Chuo Kotsu Co., Ltd.Kanamic Network Co., Ltd.
Kanamoto Co., Ltd.Kandenko Co., Ltd.Kaneka Corp.Kaneko Seeds Co., Ltd.Kanematsu Corp.Kanematsu Electronics, Ltd.Kansai Electric Power Co., Inc. (The)Kansai Mirai Financial Group, Inc.Kansai Paint Co., Ltd.Kansai Super Market, Ltd.Kanto Denka Kogyo Co., Ltd.Kao Corp.Kappa Create Co., Ltd.Kasai Kogyo Co., Ltd.Katakura & Co-op Agri Corp.Kato Sangyo Co., Ltd.Kato Works Co., Ltd.KAWADA TECHNOLOGIES, Inc.Kawagishi Bridge Works Co., Ltd.Kawai Musical Instruments Manufacturing Co., Ltd.Kawasaki Heavy Industries, Ltd.Kawasaki Kisen Kaisha, Ltd.
5,200 26,2459,200 67,5022,900 43,9954,900 175,6898,000 152,635
16,300 42,759200 8,704
6,200 107,73948,200 796,01879,300 940,22819,400 175,17713,600 277,285
8,400 283,43282,500 184,501
722,168 3,398,397600 22,324
8,400 127,790139,000 1,787,662
19,300 400,88315,400 746,044
2,300 45,1824,000 186,828
10,900 111,00628,000 643,695
9,000 115,3242,500 84,5761,700 34,389
T.A. World ex U.S. Core Equity PortfolioCONTINUED
Shares Value»
JAPAN — (Continued)17,600 $ 452,40039,600 345,27017,800 660,870
2,000 23,46242,800 491,041
6,200 170,05137,800 466,81437,123 249,31917,000 335,695
5,200 51,80431,300 213,87048,600 3,546,864
1,700 21,71715,000 123,074
1,800 18,0225,700 168,2074,700 83,8971,900 130,290
800 17,8893,000 84,060
41,600 905,125* 36,700 468,850

Kawata Manufacturing Co., Ltd.KDDI Corp.KeePer Technical Laboratory Co., Ltd.Keihan Holdings Co., Ltd.Keihanshin Building Co., Ltd.Keihin Co., Ltd.Keihin Corp.Keikyu Corp.Keio Corp.Keisei Electric Railway Co., Ltd.Keiyo Bank, Ltd. (The)Keiyo Co., Ltd.KEL Corp.Kenedix, Inc.Kenko Mayonnaise Co., Ltd.Kewpie Corp.Key Coffee, Inc.Keyence Corp.KFC Holdings Japan, Ltd.KFC, Ltd.KH Neochem Co., Ltd.Kikkoman Corp.Kimura Unity Co., Ltd.King Jim Co., Ltd.Kinki Sharyo Co., Ltd. (The)Kintetsu Department Store Co., Ltd.Kintetsu Group Holdings Co., Ltd.Kintetsu World Express, Inc.Kirin Holdings Co., Ltd.Kirindo Holdings Co., Ltd.Ki-Star Real Estate Co., Ltd.Kitagawa Corp.Kita-Nippon Bank, Ltd. (The)Kitano Construction Corp.Kitanotatsujin Corp.Kito Corp.Kitz Corp.
Kiyo Bank, Ltd. (The)KLab, Inc.KNT-CT Holdings Co., Ltd.Koa Corp.Koatsu Gas Kogyo Co., Ltd.Kobayashi Pharmaceutical Co., Ltd.Kobe Bussan Co., Ltd.Kobe Electric Railway Co., Ltd.Kobe Steel, Ltd.Kobelco Eco-Solutions Co., Ltd.Koei Tecmo Holdings Co., Ltd.Kohnan Shoji Co., Ltd.
1,100 10,389191,100 4,986,084
1,800 20,55531,200 1,264,56012,700 139,962
2,900 32,95026,000 360,87117,400 292,417
7,000 433,1458,800 323,466
44,300 269,62216,200 70,229
1,500 10,89883,800 424,705
6,200 141,67028,700 649,449
4,400 85,9384,004 2,297,6906,000 117,835
600 9,3549,300 230,4153,900 177,3062,800 26,8031,800 13,645
* 2,500 38,7391,700 48,528
15,800 749,12822,600 303,05483,740 1,816,175
4,400 71,4325,200 78,3004,400 85,0803,700 61,3111,800 43,248
22,800 147,28613,800 204,33832,800 222,859
T.A. World ex U.S. Core Equity PortfolioCONTINUED
Shares Value»
JAPAN — (Continued)29,200 $ 380,295
* 15,600 127,676* 1,500 18,100
8,900 107,13710,700 81,925
5,200 370,99510,000 558,608
* 2,600 95,008190,700 1,223,585
1,200 19,4202,500 47,898
13,500 294,268

Kohsoku Corp.Koito Manufacturing Co., Ltd.Kojima Co., Ltd.Kokusai Co., Ltd.Kokuyo Co., Ltd.KOMAIHALTEC, Inc.Komatsu Matere Co., Ltd.Komatsu Wall Industry Co., Ltd.Komatsu, Ltd.KOMEDA Holdings Co., Ltd.Komehyo Co., Ltd.Komeri Co., Ltd.Konaka Co., Ltd.Konami Holdings Corp.Kondotec, Inc.Konica Minolta, Inc.Konishi Co., Ltd.Konoike Transport Co., Ltd.Konoshima Chemical Co., Ltd.Kosaido Co., Ltd.Kose Corp.Kosei Securities Co., Ltd. (The)Koshidaka Holdings Co., Ltd.Kotobuki Spirits Co., Ltd.Kourakuen Holdings Corp.Krosaki Harima Corp.KRS Corp.K's Holdings Corp.KU Holdings Co., Ltd.Kubota Corp., Sponsored ADRKubota Corp.Kumagai Gumi Co., Ltd.Kumiai Chemical Industry Co., Ltd.Kura Sushi, Inc.Kurabo Industries, Ltd.Kuraray Co., Ltd.Kureha Corp.Kurimoto, Ltd.Kurita Water Industries, Ltd.Kuriyama Holdings Corp.Kushikatsu Tanaka Holdings Co.Kusuri no Aoki Holdings Co., Ltd.KYB Corp.Kyoden Co., Ltd.Kyodo Printing Co., Ltd.Kyoei Steel, Ltd.Kyokuto Boeki Kaisha, Ltd.
Kyokuto Kaihatsu Kogyo Co., Ltd.Kyokuto Securities Co., Ltd.
4,100 47,00119,000 949,873
* 9,200 40,0863,100 20,642
27,800 374,9701,200 17,862
11,200 79,6693,200 56,342
102,700 2,296,41318,300 338,887
3,600 38,84715,100 310,20324,000 92,26114,600 619,476
5,800 49,211156,900 1,300,255
12,400 176,56912,500 193,402
4,600 35,822* 5,600 36,738
5,500 937,5442,500 14,369
16,100 227,7547,700 454,2133,500 96,9822,900 159,0413,200 57,821
71,020 647,5664,600 36,676
371 28,65241,700 643,24417,700 473,18228,170 231,406
4,200 172,1727,600 146,488
110,700 1,309,2268,900 589,5794,300 58,247
22,500 568,0228,400 67,8571,200 21,5904,400 290,919
* 9,800 278,11511,300 34,2283,600 93,6069,400 159,2162,700 44,045
T.A. World ex U.S. Core Equity PortfolioCONTINUED
Shares Value»
JAPAN — (Continued)13,500 $166,58011,900 99,919

Kyokuyo Co., Ltd.KYORIN Holdings, Inc.Kyoritsu Maintenance Co., Ltd.Kyoritsu Printing Co., Ltd.Kyosan Electric Manufacturing Co., Ltd.Kyowa Electronic Instruments Co., Ltd.Kyowa Exeo Corp.Kyowa Kirin Co., Ltd.Kyowa Leather Cloth Co., Ltd.Kyudenko Corp.Kyushu Electric Power Co., Inc.Kyushu Financial Group, Inc.Kyushu Railway Co.LAC Co., Ltd.Lacto Japan Co., Ltd.Land Business Co., Ltd.LAND Co., Ltd.Lasertec Corp.Lawson, Inc.LEC, Inc.Leopalace21 Corp.Life Corp.LIFULL Co., Ltd.Like Co., Ltd.LINE Corp.Linical Co., Ltd.Link And Motivation, Inc.Lintec Corp.Lion Corp.Litalico, Inc.LIXIL Group Corp.LIXIL VIVA Corp.Lonseal Corp.Look Holdings, Inc.M&A Capital Partners Co., Ltd.M3, Inc.Mabuchi Motor Co., Ltd.Macnica Fuji Electronics Holdings, Inc.Macromill, Inc.Maeda Corp.Maeda Kosen Co., Ltd.Maeda Road Construction Co., Ltd.Maezawa Industries, Inc.Makino Milling Machine Co., Ltd.Makita Corp.Mamezou Holdings Co., Ltd.Mandom Corp.Mani, Inc.MarkLines Co., Ltd.Marubeni Corp.Marubun Corp.Marudai Food Co., Ltd.Marufuji Sheet Piling Co., Ltd.Maruha Nichiro Corp.Marui Group Co., Ltd.
4,000 112,02718,600 312,86813,920 599,27813,500 22,62520,600 70,853
4,600 17,68331,274 751,119
3,600 59,3325,300 38,234
15,800 489,20331,100 309,01999,050 375,91310,900 310,564
4,700 73,0673,200 98,1061,800 12,715
* 40,400 2,58115,000 713,552
8,200 409,76712,400 145,520
* 152,700 319,54710,600 218,57615,600 72,132
2,500 42,785* 1,000 31,795
3,300 31,89111,500 59,01018,000 378,73536,000 706,703
* 1,300 22,69957,200 989,391
9,800 119,099400 6,183
3,000 32,585* 2,600 173,702
44,900 904,5339,800 338,334
25,350 351,71322,300 258,91662,000 464,50912,000 200,69022,000 466,850
5,000 15,76411,300 471,07511,200 369,2869,500 128,5176,000 141,1765,600 402,439
800 13,643146,100 947,103
8,900 47,73310,600 198,113
300 6,11425,800 753,71120,300 438,579

Maruka Corp.Marusan Securities Co., Ltd.
Maruwa Co., Ltd.Maruwa Unyu Kikan Co., Ltd.Maruyama Manufacturing Co., Inc.Maruzen CHI Holdings Co., Ltd.Maruzen Showa Unyu Co., Ltd.Marvelous, Inc.Matching Service Japan Co., Ltd.Matsuda Sangyo Co., Ltd.Matsui Securities Co., Ltd.Matsumotokiyoshi Holdings Co., Ltd.Matsuya Co., Ltd.Matsuyafoods Holdings Co., Ltd.Max Co., Ltd.Maxell Holdings, Ltd.Maxvalu Tokai Co., Ltd.Mazda Motor Corp.McDonald's Holdings Co. Japan, Ltd.MCJ Co., Ltd.Mebuki Financial Group, Inc.MEC Co., Ltd.Media Do Holdings Co., Ltd.Medical Data Vision Co., Ltd.Medical System Network Co., Ltd.Medipal Holdings Corp.Medius Holdings Co., Ltd.Megachips Corp.Megmilk Snow Brand Co., Ltd.Meidensha Corp.Meiji Electric Industries Co., Ltd.MEIJI Holdings Co., Ltd.Meiji Shipping Co., Ltd.Meiko Electronics Co., Ltd.Meiko Network Japan Co., Ltd.Meisei Industrial Co., Ltd.Meitec Corp.Meiwa Corp.Meiwa Estate Co., Ltd.Members Co., Ltd.Menicon Co., Ltd.Mercuria Investment Co., Ltd.Mesco, Inc.Metaps, Inc.METAWATER Co., Ltd.Michinoku Bank, Ltd. (The)Micronics Japan Co., Ltd.Mie Kotsu Group Holdings, Inc.Mikuni Corp.
2,500 44,02819,000 95,566
T.A. World ex U.S. Core Equity PortfolioCONTINUED
Shares Value»
JAPAN — (Continued)6,000 $ 369,0325,200 222,2401,400 14,7256,600 22,9524,900 145,561
14,400 102,2321,600 25,2795,700 80,385
19,700 163,54121,100 702,353
5,100 37,6594,400 145,017
10,700 168,76524,600 314,491
3,300 59,168134,900 1,305,118
1,300 58,37340,300 294,697
297,880 735,0106,900 68,0362,100 66,877
* 4,200 42,06216,100 78,62122,800 484,310
4,900 30,3909,800 146,259
22,000 470,11620,400 314,474
1,200 15,11514,274 991,257
7,600 21,91015,900 268,207
4,900 42,20316,800 116,05010,600 546,29210,000 34,725
4,600 23,857600 10,790
14,300 525,8883,900 26,1621,800 15,813
* 1,100 11,0834,700 157,2877,500 116,4949,500 90,652
30,000 155,95611,600 39,057

Milbon Co., Ltd.Mimaki Engineering Co., Ltd.Mimasu Semiconductor Industry Co., Ltd.Minebea Mitsumi, Inc.Ministop Co., Ltd.Miraca Holdings, Inc.Mirait Holdings Corp.Miroku Jyoho Service Co., Ltd.Misawa Homes Co., Ltd.MISUMI Group, Inc.Mitachi Co., Ltd.Mitani Corp.
Mitani Sangyo Co., Ltd.Mitani Sekisan Co., Ltd.Mito Securities Co., Ltd.Mitsuba Corp.Mitsubishi Chemical Holdings Corp.Mitsubishi Corp.Mitsubishi Electric Corp.Mitsubishi Estate Co., Ltd.Mitsubishi Gas Chemical Co., Inc.Mitsubishi Heavy Industries, Ltd.Mitsubishi Kakoki Kaisha, Ltd.Mitsubishi Logisnext Co., Ltd.Mitsubishi Logistics Corp.Mitsubishi Materials Corp.Mitsubishi Motors Corp.Mitsubishi Paper Mills, Ltd.Mitsubishi Pencil Co., Ltd.Mitsubishi Research Institute, Inc.Mitsubishi Shokuhin Co., Ltd.Mitsubishi Steel Manufacturing Co., Ltd.Mitsubishi Tanabe Pharma Corp.Mitsubishi UFJ Financial Group, Inc., Sponsored ADRMitsubishi UFJ Financial Group, Inc.Mitsubishi UFJ Lease & Finance Co., Ltd.Mitsuboshi Belting, Ltd.Mitsui Chemicals, Inc.Mitsui E&S Holdings Co., Ltd.Mitsui Fudosan Co., Ltd.Mitsui High-Tec, Inc.Mitsui Matsushima Holdings Co., Ltd.Mitsui Mining & Smelting Co., Ltd.Mitsui OSK Lines, Ltd.Mitsui Sugar Co., Ltd.Mitsui-Soko Holdings Co., Ltd.Miura Co., Ltd.Mixi, Inc.Miyaji Engineering Group, Inc.
6,992 341,1728,800 47,719
11,000 182,725115,375 1,969,160
5,900 80,57828,200 637,60123,190 342,387
6,800 212,53014,500 141,55919,500 437,610
1,300 8,3943,700 183,057
T.A. World ex U.S. Core Equity PortfolioCONTINUED
Shares Value»
JAPAN — (Continued)9,100 $ 23,4661,200 32,885
29,500 54,00435,400 210,633
434,200 3,082,605117,500 3,155,143167,800 2,191,590
52,600 968,20552,200 694,65011,350 468,2013,500 51,284
17,600 179,95218,500 492,00744,800 1,232,251
121,200 533,34014,500 75,374
4,900 75,7923,900 142,8947,000 176,0085,200 58,120
46,700 527,238372,645 1,852,046776,200 3,833,653184,600 978,235
9,000 165,00449,600 1,134,219
* 37,200 325,99336,800 830,730
8,800 103,4554,400 52,328
36,800 845,47338,782 951,168
7,900 168,53113,100 185,621
3,200 88,45425,800 487,463
3,100 50,011

Miyazaki Bank, Ltd. (The)Miyoshi Oil & Fat Co., Ltd.Mizuho Financial Group, Inc.Mizuno Corp.Mobile Factory, Inc.Mochida Pharmaceutical Co., Ltd.Modec, Inc.Monex Group, Inc.Monogatari Corp. (The)MonotaRO Co., Ltd.MORESCO Corp.Morinaga & Co., Ltd.Morinaga Milk Industry Co., Ltd.Morita Holdings Corp.Morito Co., Ltd.Morozoff, Ltd.Mory Industries, Inc.MRK Holdings, Inc.MrMax Holdings, Ltd.MS&AD Insurance Group Holdings, Inc.MTI, Ltd.Mugen Estate Co., Ltd.
Murata Manufacturing Co., Ltd.Musashi Seimitsu Industry Co., Ltd.Musashino Bank, Ltd. (The)Mynet, Inc.N Field Co., Ltd.Nabtesco Corp.NAC Co., Ltd.Nachi-Fujikoshi Corp.Nadex Co., Ltd.Nagaileben Co., Ltd.Nagano Bank, Ltd. (The)Nagano Keiki Co., Ltd.Nagase & Co., Ltd.Nagatanien Holdings Co., Ltd.Nagawa Co., Ltd.Nagoya Railroad Co., Ltd.Naigai Trans Line, Ltd.Nakabayashi Co., Ltd.Nakamuraya Co., Ltd.Nakanishi, Inc.Nakano Corp.Nakayama Steel Works, Ltd.Nakayamafuku Co., Ltd.Nankai Electric Railway Co., Ltd.Nanto Bank, Ltd. (The)Narasaki Sangyo Co., Ltd.Natori Co., Ltd.
7,400 178,1153,300 33,056
2,388,955 3,390,6938,500 195,104
* 2,000 28,7215,700 239,4186,600 175,169
79,000 234,5612,400 203,998
24,800 541,3975,600 74,6869,800 459,490
21,700 842,08511,100 182,2237,000 52,101
900 40,5992,300 41,5328,300 14,153
10,700 43,90546,813 1,534,46318,200 131,458
8,500 44,101
T.A. World ex U.S. Core Equity PortfolioCONTINUED
Shares Value»
JAPAN — (Continued)57,339 $2,625,62034,100 446,19213,800 266,561
* 2,900 16,9283,400 21,375
22,900 616,9148,800 79,611
10,700 450,2281,800 14,4112,000 41,7233,600 56,4903,700 26,313
36,900 537,6074,100 78,0361,800 83,077
24,400 671,7231,700 20,4609,900 49,815
892 34,90712,600 230,009
8,000 31,3009,500 41,8492,200 10,669
17,300 414,48915,900 341,424
1,200 19,3782,300 33,498

NEC Capital Solutions, Ltd.NEC Corp.NEC Networks & System Integration Corp.NET One Systems Co., Ltd.Neturen Co., Ltd.New Japan Chemical Co., Ltd.Nexon Co., Ltd.Nextage Co., Ltd.Nexyz Group Corp.NF Corp.NGK Insulators, Ltd.NGK Spark Plug Co., Ltd.NH Foods, Ltd.NHK Spring Co., Ltd.Nicca Chemical Co., Ltd.Nice Holdings, Inc.Nichias Corp.Nichiban Co., Ltd.Nichicon Corp.Nichiden Corp.Nichiha Corp.NichiiGakkan Co., Ltd.Nichi-iko Pharmaceutical Co., Ltd.Nichimo Co., Ltd.Nichirei Corp.Nichirin Co., Ltd.Nidec Corp.Nidec Corp., Sponsored ADRNifco, Inc.Nihon Chouzai Co., Ltd.Nihon Dempa Kogyo Co., Ltd.Nihon Denkei Co., Ltd.
Nihon Eslead Corp.Nihon Flush Co., Ltd.Nihon House Holdings Co., Ltd.Nihon Kohden Corp.Nihon M&A Center, Inc.Nihon Nohyaku Co., Ltd.Nihon Parkerizing Co., Ltd.Nihon Plast Co., Ltd.Nihon Tokushu Toryo Co., Ltd.Nihon Unisys, Ltd.Nihon Yamamura Glass Co., Ltd.Nikkato Corp.Nikkiso Co., Ltd.Nikkon Holdings Co., Ltd.Nikon Corp.Nintendo Co., Ltd.Nippi, Inc.
5,500 99,80353,500 2,187,041
6,400 165,49730,700 809,72114,800 114,128
* 8,500 16,358* 26,100 413,123
10,700 120,9081,800 33,2201,100 22,702
55,900 831,38842,600 813,42719,100 708,378
127,600 1,000,6031,000 7,825
* 2,400 13,40238,800 694,936
2,500 43,36525,200 207,383
5,700 100,01716,100 419,94227,000 427,24426,000 297,921
700 11,20648,500 1,122,087
5,330 77,0057,018 938,4728,634 289,239
28,400 700,4455,060 153,470
* 29,100 128,4302,400 31,106
T.A. World ex U.S. Core Equity PortfolioCONTINUED
Shares Value»
JAPAN — (Continued)3,600 $ 56,4482,300 61,666
21,800 88,27114,100 385,83324,400 654,78718,500 78,07922,200 247,366
7,300 46,4775,200 62,295
38,200 1,253,7173,300 42,0863,000 18,450
25,800 330,20223,900 558,48741,900 565,721
1,700 625,4181,200 37,016

Nippo Corp.Nippon Air Conditioning Services Co., Ltd.Nippon Aqua Co., Ltd.Nippon Carbide Industries Co., Inc.Nippon Carbon Co., Ltd.Nippon Chemical Industrial Co., Ltd.Nippon Chemi-Con Corp.Nippon Chemiphar Co., Ltd.Nippon Coke & Engineering Co., Ltd.Nippon Commercial Development Co., Ltd.Nippon Concept Corp.Nippon Concrete Industries Co., Ltd.Nippon Denko Co., Ltd.Nippon Densetsu Kogyo Co., Ltd.Nippon Electric Glass Co., Ltd.Nippon Express Co., Ltd.Nippon Filcon Co., Ltd.Nippon Flour Mills Co., Ltd.Nippon Gas Co., Ltd.Nippon Kayaku Co., Ltd.Nippon Kinzoku Co., Ltd.Nippon Kodoshi Corp.Nippon Koei Co., Ltd.Nippon Koshuha Steel Co., Ltd.Nippon Light Metal Holdings Co., Ltd.Nippon Paint Holdings Co., Ltd.Nippon Paper Industries Co., Ltd.Nippon Parking Development Co., Ltd., Class CNippon Pillar Packing Co., Ltd.Nippon Piston Ring Co., Ltd.Nippon Road Co., Ltd. (The)Nippon Seisen Co., Ltd.Nippon Sharyo, Ltd.Nippon Sheet Glass Co., Ltd.Nippon Shokubai Co., Ltd.Nippon Signal Co., Ltd.Nippon Soda Co., Ltd.Nippon Steel Corp.Nippon Steel Trading Corp.Nippon Suisan Kaisha, Ltd.Nippon Systemware Co., Ltd.Nippon Telegraph & Telephone Corp.
Nippon Thompson Co., Ltd.Nippon Tungsten Co., Ltd.Nippon View Hotel Co., Ltd.Nippon Yakin Kogyo Co., Ltd.Nippon Yusen K.K.Nipro Corp.Nishimatsu Construction Co., Ltd.
23,000 438,1817,000 46,4544,000 21,2623,200 38,9065,900 226,3832,300 44,5718,000 122,4421,700 44,393
81,900 70,4645,300 73,6952,900 32,286
25,800 66,33052,200 89,66014,900 285,47426,100 583,68320,900 1,177,935
7,300 32,45222,600 356,42121,300 597,85549,200 578,494
2,600 20,6183,900 52,8385,600 122,8524,600 18,776
359,000 656,2826,300 274,114
44,100 777,53573,000 113,60810,000 96,450
3,700 47,1182,900 161,3331,200 29,262
* 4,700 107,51868,800 430,249
8,100 525,73023,300 258,60912,200 306,85094,378 1,478,639
7,752 311,119177,500 1,118,580
3,100 79,13230,600 1,381,010
T.A. World ex U.S. Core Equity PortfolioCONTINUED
Shares Value»
JAPAN — (Continued)27,900 $ 127,773
800 15,0782,800 37,602
66,500 127,16842,900 714,73580,100 887,98727,800 525,271

Nishimatsuya Chain Co., Ltd.Nishi-Nippon Financial Holdings, Inc.Nishi-Nippon Railroad Co., Ltd.Nishio Rent All Co., Ltd.Nissan Chemical Corp.Nissan Motor Co., Ltd.Nissan Shatai Co., Ltd.Nissan Tokyo Sales Holdings Co., Ltd.Nissei ASB Machine Co., Ltd.Nissei Plastic Industrial Co., Ltd.Nissha Co., Ltd.Nisshin Fudosan Co.Nisshin Oillio Group, Ltd. (The)Nisshin Seifun Group, Inc.Nisshinbo Holdings, Inc.Nissin Corp.Nissin Electric Co., Ltd.Nissin Foods Holdings Co., Ltd.Nissin Kogyo Co., Ltd.Nitori Holdings Co., Ltd.Nitta Corp.Nitta Gelatin, Inc.Nittan Valve Co., Ltd.Nittetsu Mining Co., Ltd.Nitto Boseki Co., Ltd.Nitto Denko Corp.Nitto Fuji Flour Milling Co., Ltd.Nitto Kogyo Corp.Nitto Kohki Co., Ltd.Nitto Seiko Co., Ltd.Nittoc Construction Co., Ltd.Noda Corp.Noevir Holdings Co., Ltd.NOF Corp.Nohmi Bosai, Ltd.Nojima Corp.NOK Corp.Nomura Co., Ltd.Nomura Holdings, Inc.Nomura Holdings, Inc., Sponsored ADRNomura Real Estate Holdings, Inc.Nomura Research Institute, Ltd.Noritake Co., Ltd.Noritsu Koki Co., Ltd.Noritz Corp.North Pacific Bank, Ltd.Nozawa Corp.NS Solutions Corp.NS Tool Co., Ltd.NS United Kaiun Kaisha, Ltd.NSD Co., Ltd.NSK, Ltd.
17,000 137,05865,600 463,39817,900 377,60012,300 343,85420,700 905,238
515,200 3,348,76023,800 199,05112,100 31,136
4,400 109,9255,800 55,913
14,100 163,41613,400 57,43413,700 399,210
3,930 74,27081,055 631,123
7,000 111,87212,000 137,867
100 6,20720,400 280,326
3,700 499,0038,800 242,6466,300 41,0399,600 26,0972,500 108,334
11,600 260,70839,800 1,960,144
700 41,6788,600 163,7364,700 94,132
12,500 65,37912,900 70,662
6,400 44,3405,300 276,648
18,400 658,6158,400 171,110
18,900 304,30840,700 597,52224,200 327,699
225,400 724,484102,675 346,015
39,600 801,89915,079 266,985
4,200 163,6177,300 127,435
14,100 172,578140,700 313,692
3,700 23,28811,300 380,6691,600 29,6805,700 126,3647,930 244,258
99,700 842,999
T.A. World ex U.S. Core Equity PortfolioCONTINUED

NTN Corp.NTT Data Corp.NTT DOCOMO, Inc.NuFlare Technology, Inc.Oat Agrio Co., Ltd.Obara Group, Inc.Obayashi Corp.OBIC Business Consultants Co., Ltd.Obic Co., Ltd.Odakyu Electric Railway Co., Ltd.Odelic Co., Ltd.Oenon Holdings, Inc.Ogaki Kyoritsu Bank, Ltd. (The)Ohara, Inc.Ohba Co., Ltd.Ohsho Food Service Corp.Oiles Corp.Oita Bank, Ltd. (The)Oji Holdings Corp.Okabe Co., Ltd.Okada Aiyon Corp.Okamoto Industries, Inc.Okamoto Machine Tool Works, Ltd.Okamura Corp.Okasan Securities Group, Inc.Oki Electric Industry Co., Ltd.Okinawa Cellular Telephone Co.Okinawa Electric Power Co., Inc. (The)OKK Corp.OKUMA Corp.Okumura Corp.Okura Industrial Co., Ltd.Okuwa Co., Ltd.Olympic Group Corp.Olympus Corp.Omron Corp.Ono Pharmaceutical Co., Ltd.ONO Sokki Co., Ltd.Onoken Co., Ltd.Onward Holdings Co., Ltd.Ootoya Holdings Co., Ltd.Open Door, Inc.Open House Co., Ltd.Optex Group Co., Ltd.Oracle Corp.Organo Corp.Orient Corp.Oriental Land Co., Ltd.Origin Co., Ltd.Osaka Gas Co., Ltd.Osaka Organic Chemical Industry, Ltd.Osaka Soda Co., Ltd.
Shares Value»
JAPAN — (Continued)253,500 $ 703,467
73,200 961,138154,600 3,706,903
1,900 134,2011,400 16,6706,600 228,447
158,800 1,503,999700 30,129
4,200 447,51127,100 605,037
1,800 66,22733,000 116,32716,900 363,504
3,000 39,7154,400 24,7014,800 295,1059,084 128,895
14,300 405,198271,000 1,401,410
18,500 142,2901,200 13,9063,600 167,0342,400 60,417
19,900 193,99569,800 249,50455,700 740,858
5,100 170,43712,843 199,734
4,700 34,3918,600 447,120
15,800 450,1724,100 65,771
11,500 113,6314,500 27,106
118,200 1,288,72023,100 1,099,015
5,000 90,7162,500 11,8827,900 99,316
51,500 264,1201,100 22,171
* 2,600 65,36612,800 557,657
8,600 108,6175,500 456,6653,300 116,848
216,900 253,8314,800 633,3382,800 36,876
20,600 378,4347,300 67,7957,400 180,357

OSAKA Titanium Technologies Co., Ltd.Osaki Electric Co., Ltd.OSG Corp.OSJB Holdings Corp.Otsuka Corp.Otsuka Holdings Co., Ltd.Outsourcing, Inc.
Ozu Corp.Pacific Industrial Co., Ltd.Pacific Metals Co., Ltd.Pack Corp. (The)PAL GROUP Holdings Co., Ltd.PALTAC Corp.Paltek Corp.Pan Pacific International Holdings Corp.Panasonic Corp.PAPYLESS Co., Ltd.Paraca, Inc.Paramount Bed Holdings Co., Ltd.Parco Co., Ltd.Park24 Co., Ltd.Parker Corp.Pasco Corp.Pasona Group, Inc.PC Depot Corp.PCI Holdings, Inc.Pegasus Sewing Machine Manufacturing Co., Ltd.Penta-Ocean Construction Co., Ltd.Pepper Food Service Co., Ltd.PeptiDream, Inc.Persol Holdings Co., Ltd.PIA Corp.Pickles Corp.Pigeon Corp.Pilot Corp.Piolax, Inc.Plant Co., Ltd.Plenus Co., Ltd.Pola Orbis Holdings, Inc.Poletowin Pitcrew Holdings, Inc.Press Kogyo Co., Ltd.Pressance Corp.Prestige International, Inc.Prima Meat Packers, Ltd.Pronexus, Inc.Pro-Ship, Inc.Proto Corp.PS Mitsubishi Construction Co., Ltd.Punch Industry Co., Ltd.
11,600 189,10722,400 134,57237,700 748,29552,900 119,482
7,200 283,91014,300 525,88246,600 554,710
T.A. World ex U.S. Core Equity PortfolioCONTINUED
Shares Value»
JAPAN — (Continued)800 $ 12,744
19,700 277,2826,900 130,8153,600 108,7126,400 199,557
10,050 490,5903,000 14,6956,400 409,441
400,744 3,379,1381,100 21,5232,400 45,9386,200 237,122
10,300 112,74225,900 559,785
4,000 18,138* 2,400 19,156
11,300 172,03614,720 61,507
500 10,2108,500 42,675
186,200 901,6903,600 55,690
* 15,400 856,65923,000 556,300
1,300 54,9311,900 40,529
19,100 696,4799,400 355,027
11,200 200,8232,400 16,8196,700 110,0799,600 241,265
19,800 211,44646,100 208,33524,000 334,05514,600 223,54721,800 408,116
1,200 11,9311,000 11,466
12,200 126,93819,300 111,27111,100 56,615

Qol Holdings Co., Ltd.Quick Co., Ltd.Raccoon Holdings, Inc.Raito Kogyo Co., Ltd.Raiznext Corp.Rakus Co., Ltd.Rakuten, Inc.Rasa Corp.Rasa Industries, Ltd.Raysum Co., Ltd.Recruit Holdings Co., Ltd.Relia, Inc.Relo Group, Inc.Renaissance, Inc.Renesas Electronics Corp.Rengo Co., Ltd.RENOVA, Inc.
Renown, Inc.Resol Holdings Co., Ltd.Resona Holdings, Inc.Resorttrust, Inc.Restar Holdings Corp.Retail Partners Co., Ltd.Rheon Automatic Machinery Co., Ltd.Riberesute Corp.Ricoh Co., Ltd.Ricoh Leasing Co., Ltd.Ride On Express Holdings Co., Ltd.Right On Co., Ltd.Riken Corp.Riken Keiki Co., Ltd.Riken Technos Corp.Riken Vitamin Co., Ltd.Ringer Hut Co., Ltd.Rinnai Corp.Rion Co., Ltd.Riso Kagaku Corp.Riso Kyoiku Co., Ltd.Rock Field Co., Ltd.Rohm Co., Ltd.Rohto Pharmaceutical Co., Ltd.Rokko Butter Co., Ltd.Roland DG Corp.Rorze Corp.Round One Corp.Royal Holdings Co., Ltd.RS Technologies Co., Ltd.RVH, Inc.Ryobi, Ltd.
15,600 234,4703,200 47,6843,200 18,504
21,500 282,95116,400 174,500
5,200 132,82194,800 966,885
5,600 42,2894,600 62,3528,500 80,596
116,400 3,941,59212,300 145,30126,000 688,995
3,300 48,876* 126,900 745,825
81,000 615,082* 5,000 38,829
T.A. World ex U.S. Core Equity PortfolioCONTINUED
Shares Value»
JAPAN — (Continued)* 28,700 $ 32,624
500 18,540286,369 1,167,427
42,500 615,67111,300 169,8702,000 22,4096,100 102,3613,100 23,413
123,281 1,129,1747,700 236,4905,800 74,6107,700 50,5024,200 163,4784,200 74,337
17,100 79,9482,400 75,3446,500 152,4148,300 559,3433,100 68,3147,360 116,137
31,500 147,1665,600 72,366
13,300 926,90613,600 391,744
7,500 123,8618,000 167,7624,500 109,443
44,800 680,93214,600 362,392
3,200 99,157* 14,000 23,797
13,700 253,937

Ryoden Corp.Ryohin Keikaku Co., Ltd.Ryosan Co., Ltd.S Foods, Inc.S LINE Co., Ltd.Sac's Bar Holdings, Inc.Sagami Rubber Industries Co., Ltd.Saibu Gas Co., Ltd.Saizeriya Co., Ltd.Sakai Chemical Industry Co., Ltd.Sakai Heavy Industries, Ltd.Sakai Moving Service Co., Ltd.Sakai Ovex Co., Ltd.Sakata INX Corp.Sakura Internet, Inc.Sala Corp.SAMTY Co., Ltd.San Holdings, Inc.San ju San Financial Group, Inc.San-A Co., Ltd.San-Ai Oil Co., Ltd.Sanden Holdings Corp.Sanei Architecture Planning Co., Ltd.Sangetsu Corp.San-In Godo Bank, Ltd. (The)Sanix, Inc.Sanken Electric Co., Ltd.
Sanki Engineering Co., Ltd.Sanko Gosei, Ltd.Sanko Metal Industrial Co., Ltd.Sankyo Co., Ltd.Sankyo Frontier Co., Ltd.Sankyo Tateyama, Inc.Sankyu, Inc.Sanoh Industrial Co., Ltd.Sanoyas Holdings Corp.Sansei Technologies, Inc.Sansha Electric Manufacturing Co., Ltd.Sanshin Electronics Co., Ltd.Santen Pharmaceutical Co., Ltd.Sanwa Holdings Corp.Sanyo Chemical Industries, Ltd.Sanyo Denki Co., Ltd.Sanyo Electric Railway Co., Ltd.Sanyo Housing Nagoya Co., Ltd.Sanyo Special Steel Co., Ltd.Sanyo Trading Co., Ltd.Sapporo Holdings, Ltd.Sato Holdings Corp.
8,000 119,6153,900 692,2618,700 212,4534,500 138,1471,300 11,5429,350 80,7872,000 30,965
10,200 212,72713,800 322,536
6,400 147,0791,600 43,1365,700 339,5022,600 43,907
18,900 189,7689,500 55,356
26,200 139,9399,500 151,3211,600 33,7428,890 132,0626,600 264,974
27,500 264,564* 12,700 60,376
6,800 94,74811,800 213,86469,800 421,630
* 10,700 22,58618,100 378,342
T.A. World ex U.S. Core Equity PortfolioCONTINUED
Shares Value»
JAPAN — (Continued)20,500 $ 230,910
4,800 16,2951,200 26,8609,400 323,6131,000 30,925
12,500 140,25118,800 1,009,34512,800 59,74116,500 30,111
1,000 10,7406,400 44,384
12,500 209,40321,600 348,07466,200 738,034
6,400 304,1605,700 246,4705,500 107,6524,800 42,9488,800 120,6135,900 132,180
39,500 890,93914,500 350,222

Sato Shoji Corp.Satori Electric Co., Ltd.Sawada Holdings Co., Ltd.Sawai Pharmaceutical Co., Ltd.Saxa Holdings, Inc.SBI Holdings, Inc.SBS Holdings, Inc.Scala, Inc.SCREEN Holdings Co., Ltd.Scroll Corp.SCSK Corp.SEC Carbon, Ltd.Secom Co., Ltd.Seed Co., Ltd.Seibu Holdings, Inc.Seika Corp.Seikagaku Corp.Seikitokyu Kogyo Co., Ltd.Seiko Epson Corp.Seiko Holdings Corp.Seiko PMC Corp.Seino Holdings Co., Ltd.Seiren Co., Ltd.Sekisui Chemical Co., Ltd.Sekisui House, Ltd.Sekisui Plastics Co., Ltd.Senko Group Holdings Co., Ltd.Senshu Electric Co., Ltd.Senshu Ikeda Holdings, Inc.Senshukai Co., Ltd.Seria Co., Ltd.Seven & I Holdings Co., Ltd.Seven Bank, Ltd.SFP Holdings Co., Ltd.Sharp Corp.Shibaura Electronics Co., Ltd.Shibaura Mechatronics Corp.
Shibusawa Warehouse Co., Ltd. (The)Shibuya Corp.Shidax Corp.SHIFT, Inc.Shiga Bank, Ltd. (The)Shikibo, Ltd.Shikoku Bank, Ltd. (The)Shikoku Chemicals Corp.Shikoku Electric Power Co., Inc.Shima Seiki Manufacturing, Ltd.Shimachu Co., Ltd.Shimadzu Corp.
3,400 27,5547,500 60,7237,000 57,538
19,000 1,048,2742,300 43,520
68,830 1,564,91614,000 206,459
9,000 77,25622,100 1,197,50814,700 45,814
6,100 289,607600 53,845
9,000 705,33911,400 111,10954,500 856,877
4,300 53,77713,900 152,47220,100 123,29580,000 1,177,25015,600 303,028
2,100 14,72237,400 465,84119,300 265,68895,300 1,408,633
102,800 1,728,41511,000 76,92564,400 504,549
3,000 74,456122,640 224,980
* 13,800 40,5108,000 187,038
115,800 3,952,015210,600 569,764
5,100 101,33427,500 344,921
4,300 115,4991,700 48,218
T.A. World ex U.S. Core Equity PortfolioCONTINUED
Shares Value»
JAPAN — (Continued)3,000 $ 50,0736,800 188,032
* 4,300 9,163* 2,600 120,529
20,500 452,1052,900 26,453
16,500 142,30912,200 128,00241,200 387,53410,700 312,72319,200 423,69521,300 511,428

Shimamura Co., Ltd.Shimane Bank, Ltd. (The)Shimano, Inc.Shimizu Bank, Ltd. (The)Shimizu Corp.Shimojima Co., Ltd.Shin Nippon Air Technologies Co., Ltd.Shin Nippon Biomedical Laboratories, Ltd.Shinagawa Refractories Co., Ltd.Shindengen Electric Manufacturing Co., Ltd.Shin-Etsu Chemical Co., Ltd.Shin-Etsu Polymer Co., Ltd.Shin-Keisei Electric Railway Co., Ltd.Shinko Electric Industries Co., Ltd.Shinko Shoji Co., Ltd.Shinmaywa Industries, Ltd.Shinnihon Corp.Shinoken Group Co., Ltd.Shinsei Bank, Ltd.Shinsho Corp.Shionogi & Co., Ltd.Ship Healthcare Holdings, Inc.Shiseido Co., Ltd.Shizuki Electric Co., Inc.Shizuoka Bank, Ltd. (The)Shizuoka Gas Co., Ltd.SHO-BOND Holdings Co., Ltd.Shoei Co., Ltd.Shoei Foods Corp.Shofu, Inc.Shoko Co., Ltd.Showa Aircraft Industry Co., Ltd.Showa Corp.Showa Denko K.K.Showa Sangyo Co., Ltd.Showa Shinku Co., Ltd.Siix Corp.Sinanen Holdings Co., Ltd.Sinfonia Technology Co., Ltd.Sinko Industries, Ltd.SK-Electronics Co., Ltd.SKY Perfect JSAT Holdings, Inc.Skylark Holdings Co., Ltd.SMC Corp.SMK Corp.SMS Co., Ltd.Snow Peak, Inc.
Soda Nikka Co., Ltd.Sodick Co., Ltd.
6,900 487,8921,200 7,6502,900 409,420
23,600 402,242122,800 988,212
700 7,0565,400 88,2128,700 58,4292,700 71,2923,700 120,106
31,400 3,197,01821,700 152,634
2,600 48,85638,100 306,38610,100 177,77030,600 382,48517,200 135,20920,000 146,54641,700 629,877
2,400 50,22210,000 553,65024,200 1,087,45740,800 3,002,250
4,900 26,18872,800 503,35529,100 224,904
2,800 96,1204,100 171,1904,400 125,8664,700 59,961
* 4,400 26,3802,000 24,167
32,700 439,86860,300 1,617,685
8,600 242,561800 9,438
15,800 199,5443,600 58,706
14,500 166,1958,600 122,9115,300 113,982
72,000 284,09558,400 1,019,083
1,100 398,5982,800 68,902
24,800 550,6611,000 12,437
T.A. World ex U.S. Core Equity PortfolioCONTINUED
Shares Value»
JAPAN — (Continued)9,000 $ 46,708
27,900 249,843

SoftBank Group Corp.Softbank Technology Corp.Softbrain Co., Ltd.Softcreate Holdings Corp.Software Service, Inc.Sogo Medical Holdings Co., Ltd.Sohgo Security Services Co., Ltd.Sojitz Corp.Soken Chemical & Engineering Co., Ltd.Solasto Corp.Sompo Holdings, Inc.Sony Corp.Sony Corp., Sponsored ADRSony Financial Holdings, Inc.Sotetsu Holdings, Inc.Sourcenext Corp.Space Co., Ltd.Space Value Holdings Co., Ltd.Sparx Group Co., Ltd.SPK Corp.Square Enix Holdings Co., Ltd.SRA HoldingsSt Marc Holdings Co., Ltd.Stanley Electric Co., Ltd.Star Mica Holdings Co., Ltd.Star Micronics Co., Ltd.Starts Corp., Inc.Starzen Co., Ltd.St-Care Holding Corp.Stella Chemifa Corp.Step Co., Ltd.Strike Co., Ltd.Studio Alice Co., Ltd.Subaru Corp.Subaru Enterprise Co., Ltd.Sugi Holdings Co., Ltd.Sugimoto & Co., Ltd.SUMCO Corp.Sumida Corp.Suminoe Textile Co., Ltd.Sumitomo Bakelite Co., Ltd.Sumitomo Chemical Co., Ltd.Sumitomo Corp.Sumitomo Dainippon Pharma Co., Ltd.Sumitomo Densetsu Co., Ltd.Sumitomo Electric Industries, Ltd.Sumitomo Forestry Co., Ltd.Sumitomo Heavy Industries, Ltd.Sumitomo Metal Mining Co., Ltd.Sumitomo Mitsui Construction Co., Ltd.Sumitomo Mitsui Financial Group, Inc.Sumitomo Mitsui Trust Holdings, Inc.Sumitomo Osaka Cement Co., Ltd.Sumitomo Precision Products Co., Ltd.Sumitomo Realty & Development Co., Ltd.
181,692 9,276,8585,200 105,176
13,800 74,5764,200 67,705
800 76,41712,400 187,389
8,100 392,659321,900 1,005,708
2,700 40,22116,200 176,77938,575 1,597,50588,100 5,010,59251,518 2,929,31322,600 547,52913,100 345,96822,200 83,613
4,620 49,16217,900 83,02665,200 135,153
1,200 28,8458,900 303,5765,600 125,5489,100 193,240
33,900 840,6085,800 96,020
24,100 316,22721,200 501,143
3,600 138,5674,900 22,9394,900 137,8001,700 23,7902,200 53,2496,500 120,302
88,600 2,064,932600 33,945
5,300 255,1223,500 62,057
131,100 1,718,18316,700 176,233
2,900 78,01013,200 449,027
419,355 1,912,350105,300 1,562,511
18,900 347,0928,200 145,363
169,700 2,099,68682,800 1,036,41035,200 1,134,79836,000 1,022,544
126,320 671,451131,583 4,601,428
33,344 1,139,64217,600 672,158
1,200 30,25616,000 582,191

Sumitomo Riko Co., Ltd.Sumitomo Rubber Industries, Ltd.
Sumitomo Seika Chemicals Co., Ltd.Sun Frontier Fudousan Co., Ltd.Suncall Corp.Sundrug Co., Ltd.Suntory Beverage & Food, Ltd.Sun-Wa Technos Corp.Suruga Bank, Ltd.Suzuken Co., Ltd.Suzuki Co., Ltd.Suzuki Motor Corp.SWCC Showa Holdings Co., Ltd.Sysmex Corp.System Research Co., Ltd.Systemsoft Corp.Systena Corp.Syuppin Co., Ltd.T Hasegawa Co., Ltd.T RAD Co., Ltd.T&D Holdings, Inc.T&K Toka Co., Ltd.Tachibana Eletech Co., Ltd.Tachikawa Corp.Tachi-S Co., Ltd.Tadano, Ltd.Taihei Dengyo Kaisha, Ltd.Taiheiyo Cement Corp.Taiheiyo Kouhatsu, Inc.Taiho Kogyo Co., Ltd.Taikisha, Ltd.Taiko Bank, Ltd. (The)Taisei Corp.Taisei Lamick Co., Ltd.Taiyo Holdings Co., Ltd.Taiyo Nippon Sanso Corp.Taiyo Yuden Co., Ltd.Takachiho Koheki Co., Ltd.Takamatsu Construction Group Co., Ltd.Takamatsu Machinery Co., Ltd.Takamiya Co., Ltd.Takaoka Toko Co., Ltd.Takara Bio, Inc.Takara Holdings, Inc.Takara Leben Co., Ltd.Takara Standard Co., Ltd.Takasago International Corp.Takasago Thermal Engineering Co., Ltd.Takashima & Co., Ltd.
21,900 169,94796,134 1,049,344
T.A. World ex U.S. Core Equity PortfolioCONTINUED
Shares Value»
JAPAN — (Continued)5,700 $ 178,055
23,300 236,9028,000 36,978
16,400 453,44612,300 488,045
5,200 37,192* 39,200 148,718
8,960 493,7594,800 28,087
33,700 1,317,95557,500 457,44917,200 1,248,773
1,200 44,6939,400 11,111
28,200 468,6309,000 61,096
12,400 219,2483,900 66,360
121,000 1,358,8119,200 82,0337,920 122,8314,200 51,673
13,500 172,99342,900 385,729
7,000 144,62643,222 1,213,918
2,700 18,7376,900 49,0415,600 167,024
700 11,85325,300 872,868
2,200 58,5375,300 162,580
68,700 1,408,63865,600 1,297,572
1,800 17,5944,300 90,333
600 4,67411,200 81,3995,380 59,0021,100 21,606
10,000 103,21158,700 204,88117,100 268,052
6,800 186,63412,000 185,259
1,600 24,638

Takashimaya Co., Ltd.Take And Give Needs Co., Ltd.TAKEBISHI Corp.Takeda Pharmaceutical Co, Ltd., Sponsored ADRTakeda Pharmaceutical Co., Ltd.Takeei Corp.Takemoto Yohki Co., Ltd.Takeuchi Manufacturing Co., Ltd.Takihyo Co., Ltd.Takisawa Machine Tool Co., Ltd.Takuma Co., Ltd.Tama Home Co., Ltd.
Tamron Co., Ltd.Tamura Corp.Tanseisha Co., Ltd.Tateru, Inc.Tatsuta Electric Wire and Cable Co., Ltd.Tayca Corp.Tazmo Co., Ltd.Tbk Co., Ltd.TDC Soft, Inc.TDK Corp., Sponsored ADRTDK Corp.Tear Corp.TechMatrix Corp.Techno Smart Corp.TechnoPro Holdings, Inc.Tecnos Japan, Inc.Teijin, Ltd.Teikoku Electric Manufacturing Co., Ltd.Tekken Corp.Tenpos Holdings Co., Ltd.Terasaki Electric Co., Ltd.Terumo Corp.T-Gaia Corp.THK Co., Ltd.Tigers Polymer Corp.TIS, Inc.Toa Corp.Toa Corp.Toa Oil Co., Ltd.TOA ROAD Corp.Tobishima Corp.Tobu Railway Co., Ltd.TOC Co., Ltd.Tocalo Co., Ltd.Tochigi Bank, Ltd. (The)Toda Corp.Toda Kogyo Corp.
46,700 535,6884,820 44,8893,900 51,532
* 19,633 345,53439,708 1,366,58613,100 117,722
3,400 36,44018,800 290,765
2,500 42,7012,300 29,876
25,900 307,33410,000 138,388
T.A. World ex U.S. Core Equity PortfolioCONTINUED
Shares Value»
JAPAN — (Continued)7,000 $ 156,630
28,000 157,68010,300 122,157
* 7,800 13,38517,800 78,555
6,500 136,7113,000 24,0079,700 35,5166,600 52,9367,012 565,202
27,500 2,111,3775,100 30,1185,700 113,8781,600 9,906
14,100 796,2245,500 31,184
129,300 2,236,9787,300 79,4136,100 162,081
800 15,967800 7,528
52,000 1,513,4786,700 135,510
34,200 861,9156,200 32,040
19,700 1,022,5459,200 100,7946,800 88,3202,500 43,0832,400 74,187
10,210 118,08514,700 417,94221,100 134,05643,900 328,205
141,300 230,95363,000 345,097
2,100 43,814

Toei Animation Co., Ltd.Toei Co., Ltd.Toell Co., Ltd.Toenec Corp.Togami Electric Manufacturing Co., Ltd.Toho Bank, Ltd. (The)Toho Co., Ltd.Toho Co., Ltd.Toho Gas Co., Ltd.Toho Holdings Co., Ltd.Toho Titanium Co., Ltd.Toho Zinc Co., Ltd.Tohoku Bank, Ltd. (The)Tohoku Electric Power Co., Inc.Tohto Suisan Co., Ltd.Tokai Carbon Co., Ltd.Tokai Corp.TOKAI Holdings Corp.Tokai Lease Co., Ltd.Tokai Rika Co., Ltd.Tokai Tokyo Financial Holdings, Inc.Token Corp.
Tokio Marine Holdings, Inc.Tokushu Tokai Paper Co., Ltd.Tokuyama Corp.Tokyo Base Co., Ltd.Tokyo Century Corp.Tokyo Dome Corp.Tokyo Electric Power Co. Holdings, Inc.Tokyo Electron Device, Ltd.Tokyo Electron, Ltd.Tokyo Energy & Systems, Inc.Tokyo Gas Co., Ltd.Tokyo Individualized Educational Institute, Inc.Tokyo Keiki, Inc.Tokyo Kiraboshi Financial Group, Inc.Tokyo Ohka Kogyo Co., Ltd.Tokyo Rakutenchi Co., Ltd.Tokyo Rope Manufacturing Co., Ltd.Tokyo Sangyo Co., Ltd.Tokyo Seimitsu Co., Ltd.Tokyo Steel Manufacturing Co., Ltd.Tokyo Tatemono Co., Ltd.Tokyo Tekko Co., Ltd.Tokyo Theatres Co., Inc.Tokyotokeiba Co., Ltd.Tokyu Construction Co., Ltd.Tokyu Corp.Tokyu Fudosan Holdings Corp.
4,900 204,9711,700 233,0372,100 13,7263,900 114,180
800 11,99992,800 222,714
3,500 135,8953,800 68,539
10,800 410,66922,000 489,20720,600 160,480
7,800 166,8612,900 27,626
35,600 356,2071,300 31,052
71,200 697,6907,200 141,652
59,200 505,053200 3,157
32,400 530,72384,300 255,781
3,900 223,881
T.A. World ex U.S. Core Equity PortfolioCONTINUED
Shares Value»
JAPAN — (Continued)46,000 $2,441,726
3,900 134,04745,600 1,049,625
* 6,600 44,89616,700 690,29539,700 365,338
* 129,188 621,4413,600 67,677
15,200 2,574,45912,200 104,99220,700 516,707
2,600 21,8415,500 48,596
13,213 176,68715,400 520,802
1,000 47,5556,700 56,1109,500 43,200
16,500 462,68732,200 244,59468,900 803,930
4,500 57,2773,800 47,3855,600 159,831
55,100 376,87824,500 429,016
273,925 1,584,678

Toli Corp.Tomato Bank, Ltd.Tomen Devices Corp.Tomoe Corp.Tomoe Engineering Co., Ltd.Tomoegawa Co., Ltd.Tomoku Co., Ltd.TOMONY Holdings, Inc.Tomy Co., Ltd.Tonami Holdings Co., Ltd.Topcon Corp.Toppan Forms Co., Ltd.Topre Corp.Topy Industries, Ltd.Toray Industries, Inc.Torex Semiconductor, Ltd.Toridoll Holdings Corp.Torii Pharmaceutical Co., Ltd.Torikizoku Co., Ltd.Torishima Pump Manufacturing Co., Ltd.Tosei Corp.Toshiba Corp.Toshiba Machine Co., Ltd.Toshiba Plant Systems & Services Corp.Toshiba TEC Corp.Tosho Co., Ltd.Tosoh Corp.Totech Corp.Totetsu Kogyo Co., Ltd.TOTO, Ltd.Totoku Electric Co., Ltd.Tottori Bank, Ltd. (The)
Toukei Computer Co., Ltd.Tow Co., Ltd.Towa Bank, Ltd. (The)Towa Corp.Towa Pharmaceutical Co., Ltd.Toyo Construction Co., Ltd.Toyo Denki Seizo K.K.Toyo Engineering Corp.Toyo Ink SC Holdings Co., Ltd.Toyo Kanetsu K.K.Toyo Logistics Co., Ltd.Toyo Machinery & Metal Co., Ltd.Toyo Securities Co., Ltd.Toyo Seikan Group Holdings, Ltd.Toyo Suisan Kaisha, Ltd.Toyo Tanso Co., Ltd.Toyo Tire Corp
21,200 49,5083,500 33,4361,600 33,982
15,300 56,2463,600 79,0911,400 12,3455,000 80,806
92,400 300,38055,100 703,734
2,700 140,40162,000 723,86321,800 189,90318,800 282,020
9,700 206,756199,600 1,373,143
3,600 39,04213,500 305,183
6,900 165,0642,000 38,9908,300 76,669
21,800 229,24413,500 430,74010,500 230,970
5,800 97,05117,400 515,804
5,400 134,211123,000 1,723,952
2,900 63,3029,400 257,069
12,500 500,5141,700 29,5234,000 52,777
T.A. World ex U.S. Core Equity PortfolioCONTINUED
Shares Value»
JAPAN — (Continued)600 $ 16,850
8,100 57,97624,000 159,02211,200 88,19815,000 376,41948,000 188,929
2,600 36,386* 13,700 70,528
17,800 388,9094,300 76,6276,800 19,8417,600 40,472
26,300 29,71535,800 624,94313,200 530,813
4,900 94,09366,600 870,022

Toyo Wharf & Warehouse Co., Ltd.Toyobo Co., Ltd.Toyoda Gosei Co., Ltd.Toyota Boshoku Corp.Toyota Motor Corp., Sponsored ADRToyota Motor Corp.Toyota Tsusho Corp.TPR Co., Ltd.Trancom Co., Ltd.Transaction Co., Ltd.Trend Micro, Inc.Tri Chemical Laboratories, Inc.Trusco Nakayama Corp.Trust Tech, Inc.TS Tech Co., Ltd.Tsubaki Nakashima Co., Ltd.Tsubakimoto Chain Co.Tsubakimoto Kogyo Co., Ltd.Tsudakoma Corp.Tsugami Corp.Tsukada Global Holdings, Inc.Tsukishima Kikai Co., Ltd.Tsukuba Bank, Ltd.Tsukui Corp.Tsumura & Co.Tsuruha Holdings, Inc.Tsurumi Manufacturing Co., Ltd.Tv Tokyo Holdings Corp.UACJ Corp.Ube Industries, Ltd.Uchida Yoko Co., Ltd.Uchiyama Holdings Co., Ltd.Ulvac, Inc.UMC Electronics Co., Ltd.Umenohana Co., Ltd.Unicharm Corp.Uniden Holdings Corp.UNIMAT Retirement Community Co., Ltd.Union Tool Co.Unipres Corp.United Arrows, Ltd.United Super Markets Holdings, Inc.
UNITED, Inc.Unitika, Ltd.Universal Entertainment Corp.Unizo Holdings Co., Ltd.Urbanet Corp. Co., Ltd.USS Co., Ltd.UT Group Co., Ltd.
2,200 27,80846,200 576,52341,200 757,70037,500 526,43142,528 5,488,238
270,373 17,469,66025,100 726,54314,100 244,185
4,800 276,5914,200 41,205
20,700 902,5602,000 102,318
14,600 300,0205,200 73,966
23,300 641,43023,900 412,08013,300 435,709
1,500 45,9671,800 22,868
27,000 217,17910,100 51,069
9,600 113,53788,500 137,17636,700 168,75114,700 405,076
5,200 529,3167,700 129,8327,000 148,173
20,791 339,93565,120 1,355,828
3,400 105,7651,500 7,157
30,200 1,264,0853,100 29,332
* 500 11,72420,000 565,822
3,300 57,2142,100 33,1892,100 62,655
24,400 397,2488,200 234,998
26,300 233,254
T.A. World ex U.S. Core Equity PortfolioCONTINUED
Shares Value»
JAPAN — (Continued)3,700 $ 47,642
* 39,400 149,8136,600 207,292
10,200 331,03810,100 31,93212,400 245,557
9,400 206,259

Utoc Corp.V Technology Co., Ltd.Valor Holdings Co., Ltd.Valqua, Ltd.Value HR Co., Ltd.ValueCommerce Co., Ltd.V-Cube, Inc.Vector, Inc.Vertex Corp.VIA Holdings, Inc.Village Vanguard Co., Ltd.Vision, Inc.Visionary Holdings Co., Ltd.Vital KSK Holdings, Inc.VT Holdings Co., Ltd.Wacoal Holdings Corp.Wacom Co., Ltd.Wakachiku Construction Co., Ltd.Wakita & Co., Ltd.Warabeya Nichiyo Holdings Co., Ltd.Watahan & Co., Ltd.WATAMI Co., Ltd.Watts Co., Ltd.WDB Holdings Co., Ltd.Weathernews, Inc.Welcia Holdings Co., Ltd.West Holdings Corp.West Japan Railway Co.Will Group, Inc.WIN-Partners Co., Ltd.Wood One Co., Ltd.Workman Co., Ltd.World Holdings Co., Ltd.Wowow, Inc.Xebio Holdings Co., Ltd.YAC Holdings Co., Ltd.Yachiyo Industry Co., Ltd.Yahagi Construction Co., Ltd.Yahoo Japan Corp.Yakult Honsha Co., Ltd.Yakuodo Co., Ltd.YAMABIKO Corp.YAMADA Consulting Group Co., Ltd.Yamada Denki Co., Ltd.Yamagata Bank, Ltd. (The)Yamaguchi Financial Group, Inc.Yamaha Corp.Yamaha Motor Co., Ltd.Yamaha Motor Robotics Holdings Co., Ltd.Yamaichi Electronics Co., Ltd.YA-MAN, Ltd.Yamanashi Chuo Bank, Ltd. (The)
7,600 33,8193,400 159,941
21,200 437,6379,400 187,312
500 15,8169,900 171,404
* 2,300 12,438* 9,500 81,795
3,020 36,996* 5,300 31,005
2,800 25,591* 2,700 128,967* 58,900 23,032
20,700 200,64857,900 227,57116,100 390,56520,600 72,566
5,800 77,59418,200 182,360
6,700 105,2954,200 88,1788,800 123,2803,600 23,2302,900 73,3501,400 40,1278,600 399,602
10,600 112,9597,700 630,3005,000 40,2756,000 66,2213,700 33,598
800 36,4384,300 58,2923,400 81,943
12,800 141,7264,800 45,5213,600 20,903
13,000 83,771170,300 498,796
2,400 135,3123,900 85,655
14,900 126,3475,200 94,071
108,240 477,44312,800 186,95153,000 370,024
6,300 296,99791,700 1,607,952
* 8,400 33,68113,900 150,21510,400 83,78814,400 149,946
T.A. World ex U.S. Core Equity PortfolioCONTINUED

Yamatane Corp.Yamato Corp.Yamato Holdings Co., Ltd.Yamaura Corp.Yamaya Corp.Yamazaki Baking Co., Ltd.Yamazen Corp.Yaoko Co., Ltd.Yashima Denki Co., Ltd.Yaskawa Electric Corp.Yasunaga Corp.Yellow Hat, Ltd.Yokogawa Bridge Holdings Corp.Yokogawa Electric Corp.Yokohama Reito Co., Ltd.Yokohama Rubber Co., Ltd. (The)Yokowo Co., Ltd.Yomiuri Land Co., Ltd.Yondenko Corp.Yondoshi Holdings, Inc.Yorozu Corp.Yossix Co., Ltd.Yotai Refractories Co., Ltd.Yuasa Funashoku Co., Ltd.Yuasa Trading Co., Ltd.Yuken Kogyo Co., Ltd.Yume No Machi Souzou Iinkai Co., Ltd.Yumeshin Holdings Co., Ltd.Yurtec Corp.Yushiro Chemical Industry Co., Ltd.Zaoh Co., Ltd.Zenrin Co., Ltd.Zensho Holdings Co., Ltd.Zeon Corp.ZIGExN Co., Ltd.Zojirushi Corp.ZOZO, Inc.Zuiko Corp.
TOTAL JAPAN
Duopharma Biotech Bhd7-Eleven Malaysia Holdings Bhd, Class BAeon Co. M BhdAEON Credit Service M BhdAFFIN Bank BhdAirAsia Group BhdAirAsia X BhdAlliance Bank Malaysia BhdAMMB Holdings BhdAnn Joo Resources BhdAPM Automotive Holdings Bhd
Shares Value»
JAPAN — (Continued)4,600 $ 58,7757,100 36,744
43,000 844,1941,900 14,5062,500 52,142
59,200 898,97021,500 204,264
9,700 444,1571,700 13,851
34,300 1,135,0514,700 61,404
14,400 184,07313,600 211,40928,100 502,90024,400 228,96162,800 1,155,444
9,400 197,3932,200 97,3231,500 37,3674,200 100,6019,700 127,3761,000 23,5088,000 41,849
400 13,2826,100 171,9261,600 25,1118,400 125,940
16,300 119,33617,800 118,115
4,700 58,0361,400 17,189
12,450 228,89240,500 870,01185,100 984,16620,100 144,01512,000 144,56233,200 626,030
1,200 36,742
637,264,927
MALAYSIA — (0.7%)# 53,527 17,570# 114,356 40,940
243,200 101,58849,150 196,887
128,790 62,9261,062,600 502,939
#* 849,300 46,143376,100 334,549484,500 495,594
# 120,200 43,47334,700 21,100

Astro Malaysia Holdings BhdAxiata Group BhdBatu Kawan BhdBerjaya Assets BhdBerjaya Corp. BhdBerjaya Land BhdBerjaya Sports Toto Bhd
Bermaz Auto BhdBIMB Holdings BhdBorneo Oil BhdBoustead Holdings BhdBoustead Plantations BhdBritish American Tobacco Malaysia BhdBumi Armada BhdBursa Malaysia BhdCAB Cakaran Corp. BhdCahya Mata Sarawak BhdCan-One BhdCarlsberg Brewery Malaysia Bhd, Class BCB Industrial Product Holding BhdCIMB Group Holdings BhdCoastal Contracts BhdComfort Glove BhdCypark Resources BhdD&O Green Technologies BhdDagang NeXchange BhdDatasonic Group BhdDayang Enterprise Holdings BhdDialog Group BhdDiGi.Com BhdDRB-Hicom BhdDutch Lady Milk Industries BhdEastern & Oriental BhdEco World Development Group BhdEconpile Holdings BhdEvergreen Fibreboard BhdFGV Holdings BhdFraser & Neave Holdings BhdFrontken Corp. BhdGabungan AQRS BhdGadang Holdings BhdGamuda BhdGas Malaysia BhdGenting Malaysia BhdGenting Plantations BhdGeorge Kent Malaysia BhdGlobetronics Technology BhdGlomac BhdGuan Chong Bhd
151,100 52,905452,576 549,553
32,700 129,442* 277,000 19,383* 1,321,110 83,155* 315,100 12,580# 316,659 201,467
T.A. World ex U.S. Core Equity PortfolioCONTINUED
Shares Value»
MALAYSIA — (Continued)* 273,800 $168,911
148,500 150,359* 412,350 4,427
220,899 60,92070,980 12,01523,400 127,797
#* 999,100 55,142212,000 346,202
89,900 10,745177,600 122,080
18,400 14,56350,200 292,708
102,800 24,346514,949 631,866
* 42,800 10,18279,200 15,31289,100 30,938
248,900 33,870# 387,100 25,540
154,100 25,174* 281,339 96,948
390,658 325,886172,900 208,981359,300 229,589
4,500 69,327* 315,069 60,853* 481,100 91,322
315,000 61,217210,750 15,241
* 937,500 255,83115,000 125,314
322,300 120,573170,034 57,382196,250 39,044431,500 386,675
80,000 54,647479,800 448,212
# 46,700 109,774# 195,300 54,518
126,633 54,14295,260 8,98254,500 47,463

Hai-O Enterprise BhdHAP Seng Consolidated BhdHap Seng Plantations Holdings BhdHartalega Holdings BhdHeineken Malaysia BhdHengyuan Refining Co. BhdHeveaBoard BhdHiap Teck Venture BhdHibiscus Petroleum BhdHock Seng LEE BhdHong Leong Bank BhdHong Leong Financial Group BhdHong Leong Industries BhdHSS Engineers BhdIHH Healthcare BhdIJM Corp. BhdIJM Plantations Bhd
Inari Amertron BhdInsas BhdIOI Corp. BhdIOI Properties Group BhdIris Corp. BhdIskandar Waterfront City BhdJAKS Resources BhdJaya Tiasa Holdings BhdJHM Consolidation BhdKerjaya Prospek Group BhdKNM Group BhdKossan Rubber IndustriesKPJ Healthcare BhdKretam Holdings BhdKSL Holdings BhdKuala Lumpur Kepong BhdKumpulan Perangsang Selangor BhdLandmarks BhdLBS Bina Group BhdLii Hen Industries BhdLingkaran Trans Kota Holdings BhdLion Industries Corp. BhdLPI Capital BhdMagni-Tech Industries BhdMagnum BhdMah Sing Group BhdMalakoff Corp. BhdMalayan Banking BhdMalayan Flour Mills BhdMalaysia Airports Holdings BhdMalaysia Building Society BhdMalaysian Pacific Industries Bhd
81,100 44,541229,580 549,851
72,400 27,243128,000 153,248
39,900 219,745#* 58,600 70,853
142,700 20,857425,300 23,011
#* 486,400 122,39855,900 18,70230,132 130,85943,353 188,70736,400 97,509
* 64,200 16,401# 94,400 130,702
740,320 416,62572,500 25,267
T.A. World ex U.S. Core Equity PortfolioCONTINUED
Shares Value»
MALAYSIA — (Continued)# 685,988 $271,295
225,200 44,536179,426 181,714412,924 125,653
* 271,500 10,160#* 91,000 21,364* 137,900 25,890
170,800 20,06541,000 12,404
149,680 51,687* 1,116,730 108,673
204,000 201,066# 522,800 118,229* 113,800 10,446* 222,492 44,974
27,100 154,91846,630 10,390
* 74,700 10,848295,680 37,903
52,800 37,70148,400 53,918
* 75,600 9,18038,184 144,59264,000 75,049
251,900 163,248576,440 128,925339,500 73,864199,083 416,447109,800 17,751284,992 577,276601,627 126,551
44,675 98,393

Malaysian Resources Corp. BhdMalton BhdMatrix Concepts Holdings BhdMaxis BhdMedia Prima BhdMega First Corp. BhdMISC BhdMitrajaya Holdings BhdMKH BhdMMC Corp. BhdMNRB Holdings BhdMPHB Capital BhdMuda Holdings BhdMudajaya Group BhdMuhibbah Engineering M BhdMulpha International BhdMy EG Services BhdNestle Malaysia BhdOCK Group BhdPadini Holdings BhdPanasonic Manufacturing Malaysia BhdPantech Group Holdings BhdParamount Corp. BhdPentamaster Corp. BhdPESTECH International BhdPetron Malaysia Refining & Marketing BhdPetronas Chemicals Group Bhd
Petronas Dagangan BhdPetronas Gas BhdPIE Industrial BhdPos Malaysia BhdPress Metal Aluminium Holdings BhdPublic Bank BhdQL Resources BhdRanhill Holdings BhdRGB International BhdRHB Bank BhdSalcon BhdSapura Energy BhdSarawak Oil Palms BhdScientex BhdSerba Dinamik Holdings BhdShangri-La Hotels Malaysia BhdSime Darby BhdSime Darby Plantation BhdSime Darby Property BhdSKP Resources BhdSP Setia Bhd GroupStar Media Group Bhd
906,300 198,978169,500 21,946142,275 65,420131,200 180,298
* 306,800 35,54984,100 77,198
164,580 287,122163,800 13,055124,324 36,378
# 227,500 60,448* 112,680 30,512* 114,100 32,219# 76,200 30,462* 119,967 8,660
98,000 63,556#* 51,880 26,489
569,600 212,2423,300 118,763
* 106,000 13,653269,400 229,600
4,500 43,643193,198 23,352107,240 39,210
#* 67,350 56,768* 141,100 49,036
36,200 52,364268,400 486,430
T.A. World ex U.S. Core Equity PortfolioCONTINUED
Shares Value»
MALAYSIA — (Continued)17,100 $ 97,08730,300 117,92822,300 6,756
# 93,200 38,969343,839 378,132348,940 1,848,475172,705 287,277141,000 43,593757,485 37,389215,943 287,469248,008 14,328
2,342,843 168,93277,957 43,135
124,600 254,359192,700 186,642
15,100 19,231265,822 140,582
# 183,822 204,907332,922 78,602386,500 115,677150,024 71,010
50,500 7,633

Sumatec Resources BhdSunway BhdSunway Construction Group BhdSupermax Corp. BhdSuria Capital Holdings BhdSyarikat Takaful Malaysia Keluarga BhdTa Ann Holdings BhdTA Enterprise BhdTA Global BhdTaliworks Corp. BhdTambun Indah Land BhdTan Chong Motor Holdings BhdTDM BhdTelekom Malaysia BhdTenaga Nasional BhdThong Guan Industries BhdTIME dotCom BhdTMC Life Sciences BhdTop Glove Corp. BhdTropicana Corp. BhdTSH Resources BhdTune Protect Group BhdUchi Technologies BhdUEM Edgenta BhdUEM Sunrise BhdUMW Holdings BhdUnited Plantations BhdUOA Development BhdVelesto Energy BhdViTrox Corp. BhdVizione Holdings BhdVS Industry BhdWah Seong Corp. BhdWCT Holdings BhdWestports Holdings BhdWTK Holdings BhdYinson Holdings Bhd
YNH Property BhdYTL Corp. BhdYTL Power International Bhd
TOTAL MALAYSIA
Alfa S.A.B. de C.V., Class AAlpek S.A.B. de C.V.Alsea S.A.B. de C.V.America Movil S.A.B. de C.V.America Movil S.A.B. de C.V., Sponsored ADR, Class LArca Continental S.A.B. de C.V.Axtel S.A.B. de C.V.
* 598,000 5,089416,821 167,234
# 111,780 58,638452,100 180,746
19,320 6,537107,200 158,146
80,257 43,698333,600 51,679444,500 26,882150,500 32,886
80,300 15,529100,000 35,305302,940 13,901193,648 191,517126,150 421,117
23,200 14,22647,300 103,09572,700 12,497
419,200 459,994204,663 42,596164,100 36,146178,800 29,958
52,600 34,55778,600 57,267
806,058 155,67975,400 92,32711,300 70,670
259,900 130,892* 1,276,083 96,758
18,400 31,092* 104,700 24,512
656,075 189,791* 104,398 17,672
481,481 132,731152,600 147,627
72,500 9,103240,900 404,979
T.A. World ex U.S. Core Equity PortfolioCONTINUED
Shares Value»
MALAYSIA — (Continued)134,015 $ 90,692
1,701,762 423,455349,503 65,955
24,863,480
MEXICO — (0.7%)1,725,090 1,494,305
236,508 255,591* 243,821 498,360
1,806,998 1,266,34825,067 350,687
114,633 609,123* 593,377 76,790

Banco del Bajio SABanco Santander Mexico SA Institucion de Banca Multiple Grupo FinancieroSantand, ADRBanco Santander Mexico SA Institucion de Banca Multiple Grupo FinancieroSantand, Class BBecle S.A.B. de C.V.Bolsa Mexicana de Valores S.A.B. de C.V.Cemex S.A.B. de C.V.Coca-Cola Femsa S.A.B. de C.V., Sponsored ADRCoca-Cola Femsa S.A.B. de C.V.Consorcio ARA S.A.B. de C.V.Controladora Vuela Cia de Aviacion S.A.B. de C.V., ADRControladora Vuela Cia de Aviacion S.A.B. de C.V., Class ACorp. Inmobiliaria Vesta S.A.B. de C.V.Corp. Moctezuma S.A.B. de C.V.Credito Real S.A.B. de C.V. SOFOM EREl Puerto de Liverpool S.A.B. de C.V.Empresas ICA S.A.B. de C.V.Financiera Independencia S.A.B. de C.V. SOFOM ENRFomento Economico Mexicano S.A.B. de C.V.Fomento Economico Mexicano S.A.B. de C.V., Sponsored ADRGenomma Lab Internacional S.A.B. de C.V., Class BGentera S.A.B. de C.V.Gruma S.A.B. de C.V., Class BGrupo Aeromexico S.A.B. de C.V.Grupo Aeroportuario del Centro Norte S.A.B. de C.V.Grupo Aeroportuario del Pacifico S.A.B. de C.V., ADRGrupo Aeroportuario del Pacifico S.A.B. de C.V., Class BGrupo Aeroportuario del Sureste S.A.B. de C.V., ADRGrupo Bimbo S.A.B. de C.V.Grupo Carso S.A.B. de C.V.Grupo Cementos de Chihuahua S.A.B. de C.V.Grupo Comercial Chedraui S.A. de C.V.Grupo Elektra S.A.B. de C.V.Grupo Famsa S.A.B. de C.V., Class AGrupo Financiero Banorte S.A.B. de C.V.Grupo Financiero Inbursa S.A.B. de C.V.Grupo GICSA SAB de CVGrupo Herdez S.A.B. de C.V., Series *Grupo Industrial Saltillo S.A.B. de C.V.Grupo Lala S.A.B. de C.V.Grupo Lamosa S.A.B. de C.V.Grupo Mexico S.A.B. de C.V., Series BGrupo Pochteca S.A.B. de C.V.Grupo Sanborns S.A.B. de C.V.Grupo Simec S.A.B. de C.V., Sponsored ADR
Grupo Simec S.A.B. de C.V., Series BGrupo Televisa S.A.B., Sponsored ADRGrupo Televisa S.A.B.Grupo Traxion S.A.B. de C.V.
48,437 91,016
6,817 48,401
331,102 470,81288,536 131,438
223,741 371,8562,319,321 825,401
4,452 273,08613,300 81,825
305,857 63,841* 15,370 150,472* 25,993 25,445
201,577 303,67473,800 221,66585,587 97,94130,360 147,635
* 117,564 867* 32,800 3,141
23,152 210,043527 47,799
* 450,602 411,952471,339 387,131
75,569 692,252* 104,243 81,594
179,878 1,105,3399,537 954,558
33,125 332,3952,878 437,830
222,900 425,94076,516 244,71547,506 253,745
184,226 276,47713,973 937,335
* 110,408 32,321246,697 1,234,146427,783 523,909
* 109,089 26,356128,128 268,775
7,200 7,13893,077 100,78135,276 53,658
777,552 1,906,983* 3,616 1,320
53,862 57,618* 1,049 9,239
T.A. World ex U.S. Core Equity PortfolioCONTINUED
Shares Value»
MEXICO — (Continued)* 35,729 $ 103,475
23,672 225,121364,917 691,226
* 33,240 24,439

Hoteles City Express S.A.B. de C.V.Impulsora del Desarrollo y el Empleo en America Latina S.A.B. de C.V.Industrias Bachoco S.A.B. de C.V., Sponsored ADRIndustrias Bachoco S.A.B. de C.V., Series BIndustrias CH S.A.B. de C.V.Industrias Penoles S.A.B. de C.V.Infraestructura Energetica Nova S.A.B. de C.V.Kimberly-Clark de Mexico S.A.B. de C.V., Class ALa Comer S.A.B. de C.V.Megacable Holdings S.A.B. de C.V.Mexichem S.A.B. de C.V.Minera Frisco S.A.B. de C.V., Class A1Nemak S.A.B. de C.V.Organizacion Cultiba S.A.B. de C.V.Organizacion Soriana S.A.B. de C.V., Class BPromotora y Operadora de Infraestructura S.A.B. de C.V.Promotora y Operadora de Infraestructura S.A.B. de C.V., Class LQualitas Controladora S.A.B. de C.V.Regional S.A.B. de C.V.Telesites S.A.B. de C.V.TV Azteca S.A.B. de C.V.Unifin Financiera S.A.B. de C.V. SOFOM ENRVitro S.A.B. de C.V., Series AWal-Mart de Mexico S.A.B. de C.V.
TOTAL MEXICO
Aalberts NVABN AMRO Bank NVAccell Group NVAegon NVAegon NVAFC Ajax NVAkzo Nobel NVAltice Europe NVAltice Europe NV, Class BAMG Advanced Metallurgical Group NVAmsterdam Commodities NVAPERAM SAArcadis NVArcelorMittalArcelorMittalASM International NVASML Holding NVASR Nederland NVBasic-Fit NVBE Semiconductor Industries NVBeter Bed Holding NVBinckBank NVBoskalis WestminsterBrunel International NVCoca-Cola European Partners P.L.C.Corbion NVForFarmers NVFugro NV
* 167,851 167,030* 133,290 173,187
266 14,29277,686 351,829
* 83,707 274,96552,736 485,15345,203 174,219
286,012 593,404* 254,723 305,714
176,278 747,747480,909 878,817
* 88,464 12,233320,074 146,143
12,061 8,799* 151,399 159,428
57,834 520,5852,632 16,068
57,781 180,033124,507 595,321
* 437,806 260,896471,517 38,383
43,871 92,41816,205 36,340
241,333 712,146
26,870,480
NETHERLANDS — (2.2%)56,572 2,276,23174,475 1,490,80210,504 250,671
316,225 1,558,333116,141 571,414
* 546 10,54357,385 5,414,514
* 17,214 64,085* 5,112 19,070# 20,713 592,992
8,922 188,22523,132 571,64635,390 722,011
6,911 109,63472,449 1,138,89721,236 1,732,18524,438 5,444,91957,924 2,176,582
* 9,579 301,66350,536 1,495,649
#* 7,640 18,331* 27,641 193,768
42,580 961,5196,552 93,415
36,858 2,031,58532,429 1,059,99613,965 109,792
* 36,135 294,942

GrandVision NVHeijmans NVHeineken NVHunter Douglas NVIMCD NVING Groep NV, Sponsored ADRING Groep NVIntertrust NVKAS Bank NVKendrion NVKoninklijke Ahold Delhaize NV, Sponsored ADRKoninklijke Ahold Delhaize NVKoninklijke BAM Groep NVKoninklijke DSM NVKoninklijke KPN NVKoninklijke Philips NVKoninklijke Vopak NVNederland ApparatenfabriekNN Group NVOCI NVOrdina NVPostNL NVRandstad NVSBM Offshore NVSignify NVSligro Food Group NVTKH Group NVTomTom NVUnilever NVUnilever NVVan Lanschot Kempen NVWessanenWolters Kluwer NV
TOTAL NETHERLANDS
a2 Milk Co., Ltd.Air New Zealand, Ltd.Auckland International Airport, Ltd.Chorus, Ltd.Chorus, Ltd., ADRComvita, Ltd.Contact Energy, Ltd.EBOS Group, Ltd.Fisher & Paykel Healthcare Corp., Ltd.Fletcher Building, Ltd.Fletcher Building, Ltd.Fonterra Co-operative Group, Ltd.Freightways, Ltd.Genesis Energy, Ltd.
T.A. World ex U.S. Core Equity PortfolioCONTINUED
Shares Value»
NETHERLANDS — (Continued)24,330 $ 729,263
* 11,972 110,58433,999 3,647,697
1,878 127,10312,404 1,092,792
157,227 1,745,220202,247 2,244,081
26,987 515,5135,395 74,7068,308 159,818
787 17,812233,772 5,309,644144,722 484,136
47,743 5,914,7871,131,446 3,226,256
37,098 1,735,81534,574 1,704,674
2,302 123,21156,876 2,136,891
* 33,717 879,40748,363 98,954
185,583 317,67966,959 3,360,93092,151 1,823,40147,475 1,288,88712,137 388,56726,570 1,576,37628,622 337,98094,159 5,436,74115,787 915,072
5,395 110,16140,223 504,21070,283 5,094,486
84,126,268
NEW ZEALAND — (0.4%)* 129,455 1,521,110
375,730 668,88391,516 557,519
191,067 691,9102,187 39,0054,222 8,371
53,899 274,99026,308 430,25298,156 1,058,003
104,784 340,57212,299 39,681
* 16,111 39,84056,517 317,936
115,929 260,683

Gentrack Group, Ltd.Hallenstein Glasson Holdings, Ltd.Heartland Group Holdings, Ltd.Infratil, Ltd.Kathmandu Holdings, Ltd.Mainfreight, Ltd.Mercury NZ, Ltd.Meridian Energy, Ltd.Metlifecare, Ltd.
Metro Performance Glass, Ltd.NEW Zealand King Salmon Investments, Ltd.New Zealand Refining Co., Ltd. (The)NZME, Ltd.NZX, Ltd.PGG Wrightson, Ltd.Port of Tauranga, Ltd.Pushpay Holdings, Ltd.Restaurant Brands New Zealand, Ltd.Ryman Healthcare, Ltd.Sanford, Ltd.Scales Corp., Ltd.Skellerup Holdings, Ltd.SKY Network Television, Ltd.SKYCITY Entertainment Group, Ltd.Spark New Zealand, Ltd.Steel & Tube Holdings, Ltd.Summerset Group Holdings, Ltd.Synlait Milk, Ltd.Tourism Holdings, Ltd.TOWER, Ltd.Trustpower, Ltd.Vector, Ltd.Vista Group International, Ltd.Warehouse Group, Ltd. (The)Z Energy, Ltd.
TOTAL NEW ZEALAND
ABG Sundal Collier Holding ASAAdevinta ASA, Class AAdevinta ASA, Class BAF Gruppen ASAAkastor ASAAker ASA, Class AAker BP ASAAker Solutions ASAAmerican Shipping Co. ASAArcher, Ltd.Atea ASAAustevoll Seafood ASA
5,110 17,7689,906 34,864
143,543 154,084165,212 503,652
41,157 57,37131,997 881,91728,664 85,73067,998 209,29459,988 172,257
T.A. World ex U.S. Core Equity PortfolioCONTINUED
Shares Value»
NEW ZEALAND — (Continued)43,009 $ 10,531
4,992 6,08270,771 100,09883,243 29,45665,795 51,336
8,757 3,16637,400 151,199
* 5,451 11,934* 9,039 58,279
41,494 349,86816,333 71,78545,399 135,55353,927 82,247
415,308 345,654295,923 776,310421,958 1,099,938
99,869 61,556114,665 424,314
* 13,992 91,93660,177 161,629
* 87,000 42,59613,045 64,92154,504 137,25016,696 67,83743,907 65,432
141,377 601,289
13,367,888
NORWAY — (0.6%)241,840 97,264
* 3,700 41,630* 3,700 41,039
3,951 75,239* 70,814 90,138
5,131 270,03338,985 1,103,233
* 59,470 190,22521,848 85,672
* 52,769 27,71937,610 478,48048,750 495,980

Avance Gas Holding, Ltd.Axactor SEBakkafrost P/FBonheur ASABorregaard ASABW LPG, Ltd.BW Offshore, Ltd.Data Respons ASADNB ASADNO ASADOF ASAEntra ASAEquinor ASAEquinor ASA, Sponsored ADREuropris ASAFLEX LNG, Ltd.Frontline, Ltd.Gjensidige Forsikring ASA
Golar LNG, Ltd.Grieg Seafood ASAHexagon Composites ASAHoegh LNG Holdings, Ltd.Kongsberg Automotive ASAKongsberg Gruppen ASAKvaerner ASALeroy Seafood Group ASAMowi ASANEL ASANordic Semiconductor ASANorsk Hydro ASANorway Royal Salmon ASANorwegian Air Shuttle ASANorwegian Finans Holding ASAOcean Yield ASAOdfjell Drilling, Ltd.Odfjell SE, Class AOrkla ASAOtello Corp. ASAPanoro Energy ASAPGS ASAPhotoCure ASAProsafe SEProtector Forsikring ASAQ-Free ASAREC Silicon ASASalmar ASASbanken ASAScatec Solar ASASchibsted ASA, Class A
* 18,822 55,769* 45,745 96,128
9,791 564,0859,038 182,692
47,678 499,337* 38,229 174,902* 57,352 321,985
2,947 11,01192,230 1,650,050
495,483 828,734* 53,590 21,973
20,937 303,691156,357 2,803,526
36,145 643,74289,594 257,071
* 4,719 58,569* 33,235 242,536
16,480 320,100
T.A. World ex U.S. Core Equity PortfolioCONTINUED
Shares Value»
NORWAY — (Continued)3,007 $ 50,939
33,933 482,663* 19,451 75,049
14,629 60,166* 187,622 138,000
9,843 124,76065,381 91,89142,657 268,16241,266 991,732
#* 176,376 138,328* 9,590 47,472
251,367 854,9722,496 54,552
* 38,859 173,516* 44,813 310,806
30,197 178,565* 34,752 103,025* 2,716 7,923
26,533 225,681* 44,957 82,403* 11,211 20,624* 148,540 210,593* 3,477 22,055* 16,760 20,468* 15,508 84,155* 7,742 6,061* 366,931 214,703
8,154 376,6233,765 28,922
44,885 462,3143,700 99,506

Schibsted ASA, Class BSelvaag Bolig ASASolon Eiendom ASASolstad Offshore ASASpareBank 1 SR-Bank ASASpectrum ASAStolt-Nielsen, Ltd.Storebrand ASASubsea 7 SATelenor ASATGS NOPEC Geophysical Co. ASATomra Systems ASAVeidekke ASAWallenius Wilhelmsen ASAWilh Wilhelmsen Holding ASA, Class AXXL ASAYara International ASA
TOTAL NORWAY
Cementos Pacasmayo SAA, ADRCredicorp, Ltd.Grana y Montero SAA, Sponsored ADR
TOTAL PERU
Aboitiz Equity Ventures, Inc.
Aboitiz Power Corp.Alliance Global Group, Inc.Apex Mining Co., Inc.Atlas Consolidated Mining & Development Corp.Ayala Corp.Ayala Land, Inc.Bank of the Philippine IslandsBDO Unibank, Inc.Belle Corp.Bloomberry Resorts Corp.Cebu Air, Inc.CEMEX Holdings Philippines, Inc.Century Pacific Food, Inc.Century Properties Group, Inc.Chelsea Logistics and Infrastructure Holdings Corp.China Banking Corp.Cosco Capital, Inc.D&L Industries, Inc.DMCI Holdings, Inc.DoubleDragon Properties Corp.Eagle Cement Corp.East West Banking Corp.EEI Corp.
3,700 95,38518,108 94,973
9,046 36,399* 50,744 7,192
56,107 603,67117,894 122,13211,950 136,859
144,041 973,37447,072 504,52051,150 1,036,45040,842 987,20030,975 911,03338,821 349,79122,907 69,827
5,341 86,25027,187 83,348
7,517 352,166
24,489,752
PERU — (0.0%)2,701 24,3323,175 692,118
10,766 31,437
747,887
PHILIPPINES — (0.3%)102,430 106,206
T.A. World ex U.S. Core Equity PortfolioCONTINUED
Shares Value»
PHILIPPINES — (Continued)201,000 $139,520929,700 283,788
* 1,214,000 30,506* 113,900 6,113
33,985 637,915513,300 500,507110,125 194,102115,446 331,959
1,510,800 67,0182,171,800 488,604
108,820 199,513* 387,000 22,203
310,200 91,862730,005 8,584204,500 29,809121,067 63,906
1,123,900 151,240707,400 142,841
1,700,550 338,345* 159,060 75,587
145,700 41,528* 301,150 73,350
181,100 38,681

Emperador, Inc.Filinvest Land, Inc.First Gen Corp.First Philippine Holdings Corp.Global Ferronickel Holdings, Inc.Global-Estate Resorts, Inc.Globe Telecom, Inc.GT Capital Holdings, Inc.Holcim Philippines, Inc.Integrated Micro-Electronics, Inc.International Container Terminal Services, Inc.JG Summit Holdings, Inc.Jollibee Foods Corp.Leisure & Resorts World Corp.Lopez Holdings Corp.LT Group, Inc.MacroAsia Corp.Manila Electric Co.Manila Water Co., Inc.Max's Group, Inc.Megawide Construction Corp.Megaworld Corp.Metro Pacific Investments Corp.Metro Retail Stores Group, Inc.Metropolitan Bank & Trust Co.Nickel Asia Corp.Pepsi-Cola Products Philippines, Inc.Petron Corp.Philex Mining Corp.Philippine National BankPhilippine Stock Exchange, Inc. (The)Phinma Energy Corp.Phoenix Petroleum Philippines, Inc.Pilipinas Shell Petroleum Corp.PLDT, Inc., Sponsored ADRPLDT, Inc.
Premium Leisure Corp.Puregold Price Club, Inc.PXP Energy Corp.RFM Corp.Rizal Commercial Banking Corp.Robinsons Land Corp.Robinsons Retail Holdings, Inc.San Miguel Corp.San Miguel Food and Beverage, Inc.Security Bank Corp.Semirara Mining & Power Corp.SM Investments Corp.SM Prime Holdings, Inc.
* 390,600 57,7674,810,000 179,262
364,800 190,314105,830 179,954
* 222,352 6,285* 436,000 11,714
7,340 309,36612,900 234,221
278,700 77,117248,579 46,303171,360 453,556326,630 417,127
56,820 288,740* 141,000 9,926
806,300 71,814504,600 139,646
46,100 17,55018,880 135,089
342,200 157,813167,800 46,110314,600 117,411
3,026,500 363,4372,131,800 200,385
155,000 8,221103,252 153,478
1,291,660 63,992343,700 11,945
1,103,700 120,111516,300 34,635
* 182,073 177,658312 1,154
* 357,000 16,455130,700 30,770144,130 108,688
5,222 115,1457,325 164,388
T.A. World ex U.S. Core Equity PortfolioCONTINUED
Shares Value»
PHILIPPINES — (Continued)1,877,000 $ 26,501
265,800 236,778* 44,700 8,905
196,000 19,448125,767 75,856
1,018,978 547,563117,470 183,204148,420 518,125
61,160 121,85881,624 292,336
545,140 246,1621,355 26,498
377,326 269,770

SSI Group, Inc.Starmalls, Inc.STI Education Systems Holdings, Inc.Top Frontier Investment Holdings, Inc.Travellers International Hotel Group, Inc.Union Bank Of PhilippinesUniversal Robina Corp.Vista Land & Lifescapes, Inc.Wilcon Depot, Inc.
TOTAL PHILIPPINES
Agora SAAlior Bank SAAmica SAAmRest Holdings SEAsseco Poland SABank Handlowy w Warszawie SABank Millennium SABank Ochrony Srodowiska SABank Polska Kasa Opieki SABioton SABoryszew SABudimex SACCC SACD Projekt SACiech SAComArch SACyfrowy Polsat SADino Polska SADom Development SAEnea SAEnerga SAEurocash SAFabryki Mebli Forte SAFamur SAGetin Noble Bank SAGlobe Trade Centre SAGrupa Azoty SAGrupa Kety SAGrupa Lotos SAING Bank Slaski SAInter Cars SAJastrzebska Spolka Weglowa SAKernel Holding SAKGHM Polska Miedz SA
LC Corp. SALPP SALubelski Wegiel Bogdanka SAmBank SA
485,000 30,48658,000 6,829
634,000 8,834* 3,465 17,725
112,000 12,04977,815 92,10492,460 289,736
2,668,100 400,519161,800 49,828
12,262,348
POLAND — (0.3%)8,317 26,291
* 32,971 397,078814 24,695
* 14,882 154,77030,072 424,980
5,128 69,744* 109,410 213,651* 4,661 9,297
3,814 101,320* 9,806 14,470* 54,851 63,176
3,875 128,8384,109 158,6374,334 256,207
19,145 195,146886 40,144
91,821 710,159* 10,431 392,054
1,479 29,726* 112,213 238,134* 40,209 75,778
25,664 123,728* 1,025 6,981
94,887 112,073* 122,278 14,190
21,396 52,62414,635 168,390
2,908 254,34660,449 1,357,822
2,828 139,2681,915 97,483
* 27,276 273,95423,532 293,681
* 38,203 923,671
T.A. World ex U.S. Core Equity PortfolioCONTINUED
Shares Value»
POLAND — (Continued)100,816 $ 71,984
221 446,5466,074 57,604
* 2,316 207,950

Netia SANeuca SAOrange Polska SAPfleiderer Group SAPGE Polska Grupa Energetyczna SAPKP Cargo SAPolnord SAPolski Koncern Naftowy Orlen S.A.Polskie Gornictwo Naftowe i Gazownictwo SAPowszechna Kasa Oszczednosci Bank Polski SAPowszechny Zaklad Ubezpieczen SARafako SASantander Bank Polska SAStalprodukt SATauron Polska Energia SAVRG SAWarsaw Stock ExchangeWawel SA
TOTAL POLAND
Altri SGPS SABanco Comercial Portugues SA, Class RCTT-Correios de Portugal SAEDP - Energias de Portugal SAEDP Renovaveis SAGalp Energia SGPS SAJeronimo Martins SGPS SAMota-Engil SGPS SANavigator Co. SA (The)NOS SGPS SAREN - Redes Energeticas Nacionais SGPS SASemapa-Sociedade de Investimento e GestaoSonae Capital SGPS SASonae SGPS SA
TOTAL PORTUGAL
Etalon Group P.L.C., GDREtalon Group P.L.C., GDRGazprom PJSC, Sponsored ADRGazprom PJSC, Sponsored ADRGlobaltrans Investment P.L.C., GDRGlobaltrans Investment P.L.C., GDRLukoil PJSC, Sponsored ADRMagnitogorsk Iron & Steel Works PJSC, GDRMail.Ru Group, Ltd., GDRMail.Ru Group, Ltd., GDRMechel PJSC, Sponsored ADRMMC Norilsk Nickel PJSC, ADRMMC Norilsk Nickel PJSC, ADRNovatek PJSC, GDRNovatek PJSC, GDRNovolipetsk Steel PJSC, GDR
* 53,536 64,626914 72,875
* 161,071 280,0531,100 7,946
* 169,440 387,47710,504 91,319
* 9,078 13,00454,564 1,367,178
101,680 147,43914,502 152,71426,699 287,136
* 19,463 8,9511,004 84,496
407 22,056* 486,893 198,086
23,900 26,75214,142 141,655
43 7,082
11,687,435
PORTUGAL — (0.2%)42,109 276,312
3,291,327 841,16045,285 96,474
150,256 550,03055,261 568,93781,676 1,271,54033,557 541,47867,336 135,171
109,729 368,859177,258 1,100,665
96,743 261,50214,032 185,36450,652 39,660
430,226 401,218
6,638,370
RUSSIA — (0.3%)36,272 80,15725,285 55,880
245,653 1,795,57721,000 153,51012,202 106,70211,492 100,90017,851 1,464,99638,822 335,402
* 1,419 36,393* 7,458 190,328* 16,260 34,146
18,273 416,8079,287 213,961
838 174,849588 123,362
16,393 385,058
T.A. World ex U.S. Core Equity PortfolioCONTINUED

PhosAgro PJSC, GDRPhosAgro PJSC, GDRRos Agro P.L.C., GDRRos Agro P.L.C., GDRRosneft Oil Co. PJSC, GDRRosneft Oil Co. PJSC, GDRRostelecom PJSC, Sponsored ADRRostelecom PJSC, Sponsored ADRRusHydro PJSC, ADRSberbank of Russia PJSC, Sponsored ADRSeverstal PJSC, GDRSeverstal PJSC, GDRTatneft PJSC, Sponsored ADRTatneft PJSC, Sponsored ADRTMK PJSC, GDRTMK PJSC, GDRVEON, Ltd.VTB Bank PJSC, GDRVTB Bank PJSC, GDRX5 Retail Group NV, GDRX5 Retail Group NV, GDR
TOTAL RUSSIA
Accordia Golf TrustAEM Holdings, Ltd.Amara Holdings, Ltd.Aspial Corp., Ltd.Avarga, Ltd.Banyan Tree Holdings, Ltd.Best World International, Ltd.Bonvests Holdings, Ltd.Boustead Projects, Ltd.Boustead Singapore, Ltd.BreadTalk Group, Ltd.Bukit Sembawang Estates, Ltd.Bund Center Investment, Ltd.CapitaLand, Ltd.Centurion Corp., Ltd.China Aviation Oil Singapore Corp., Ltd.China Sunsine Chemical Holdings, Ltd.Chip Eng Seng Corp., Ltd.CITIC Envirotech, Ltd.City Developments, Ltd.Civmec, Ltd.ComfortDelGro Corp., Ltd.COSCO Shipping International Singapore Co., Ltd.CSE Global, Ltd.Dairy Farm International Holdings, Ltd.DBS Group Holdings, Ltd.Del Monte Pacific, Ltd.Delfi, Ltd.
Shares Value»
RUSSIA — (Continued)8,962 $ 111,5196,440 80,3073,044 35,2695,574 64,547
191,873 1,271,35056,263 371,118
8,483 65,3197,748 60,440
218,605 187,474126,637 1,879,808
15,052 241,3944,738 76,2348,623 598,403
10,785 757,10766,893 241,149
3,193 11,398130,039 407,022
80,161 106,277324,250 432,225
12,244 409,9446,638 221,975
13,298,307
SINGAPORE — (0.8%)283,200 109,204
49,200 41,61425,000 8,83858,100 7,93164,000 8,775
203,300 71,396114,600 113,42422,000 20,49215,189 10,956
179,533 100,46254,000 27,50942,600 170,57864,750 26,817
431,400 1,130,188128,700 38,854132,800 121,932115,000 93,755201,000 102,630523,900 123,267
72,200 506,65316,000 3,710
434,000 850,634* 119,200 27,033
83,500 27,93131,900 238,869
137,452 2,620,773179,159 19,555
7,000 6,636

Duty Free International, Ltd.Dyna-Mac Holdings, Ltd.Elec & Eltek International Co., Ltd.Ezion Holdings, Ltd.Ezra Holdings, Ltd.Far East Orchard, Ltd.First Resources, Ltd.
Food Empire Holdings, Ltd.Fragrance Group, Ltd.Frasers Property, Ltd.Frencken Group, Ltd.Gallant Venture, Ltd.Genting Singapore, Ltd.Geo Energy Resources, Ltd.GL, Ltd.Golden Agri-Resources, Ltd.Golden Energy & Resources, Ltd.Great Eastern Holdings, Ltd.GuocoLand, Ltd.Halcyon Agri Corp., Ltd.Health Management International, Ltd.Hiap Hoe, Ltd.Hi-P International, Ltd.Ho Bee Land, Ltd.Hong Fok Corp., Ltd.Hong Leong Asia, Ltd.Hong Leong Finance, Ltd.Hongkong Land Holdings, Ltd.Hotel Grand Central, Ltd.Hutchison Port Holdings TrustHyflux, Ltd.iFAST Corp., Ltd.Indofood Agri Resources, Ltd.Japfa, Ltd.Jardine Cycle & Carriage, Ltd.Keppel Corp., Ltd.Keppel Infrastructure TrustKoh Brothers Group, Ltd.KSH Holdings, Ltd.Lian Beng Group, Ltd.Low Keng Huat Singapore, Ltd.Mandarin Oriental International, Ltd.Midas Holdings, Ltd.mm2 Asia, Ltd.Nera Telecommunications, Ltd.Oceanus Group, Ltd.Olam International, Ltd.OUE, Ltd.Oversea-Chinese Banking Corp., Ltd.
91,400 11,965* 150,000 12,508
5,000 7,140* 1,747,154 41,069#* 767,465 5,828
45,776 39,776218,400 247,395
T.A. World ex U.S. Core Equity PortfolioCONTINUED
Shares Value»
SINGAPORE — (Continued)131,300 $ 49,579206,000 19,487110,100 144,974147,500 75,994
* 282,900 24,243528,100 351,430267,800 29,923168,800 96,911
2,988,200 638,252117,900 17,930
5,600 103,362120,266 173,845
* 115,356 39,75070,800 37,08639,000 22,855
139,000 138,70593,800 160,689
141,220 88,089* 145,600 60,690
15,700 31,601108,000 658,637
41,908 39,9242,379,800 520,310
* 291,500 6,18057,100 46,412
175,000 37,409260,400 96,145
13,355 326,769213,800 987,913836,215 309,754
48,000 7,49966,000 21,691
154,500 56,02666,000 23,23921,800 34,543
* 550,500 14,423* 135,400 22,597
53,000 10,830* 2,196,800 6,395
164,100 231,291151,300 164,682381,840 3,179,078

Oxley Holdings, Ltd.Pan-United Corp., Ltd.Penguin International, Ltd.Perennial Real Estate Holdings, Ltd.Q&M Dental Group Singapore, Ltd.QAF, Ltd.Raffles Education Corp., Ltd.Raffles Medical Group, Ltd.RHT Health TrustRiverstone Holdings, Ltd.SATS, Ltd.SBS Transit, Ltd.Sembcorp Industries, Ltd.Sembcorp Marine, Ltd.Sheng Siong Group, Ltd.SIA Engineering Co., Ltd.SIIC Environment Holdings, Ltd.
Sinarmas Land, Ltd.Sing Holdings, Ltd.Singapore Airlines, Ltd.Singapore Exchange, Ltd.Singapore Post, Ltd.Singapore Technologies Engineering, Ltd.Singapore Telecommunications, Ltd.Singapore Telecommunications, Ltd.Stamford Land Corp., Ltd.StarHub, Ltd.Sunningdale Tech, Ltd.Swiber Holdings, Ltd.Tai Sin Electric, Ltd.Thomson Medical Group, Ltd.Tuan Sing Holdings, Ltd.UMS Holdings, Ltd.United Engineers, Ltd.United Industrial Corp., Ltd.United Overseas Bank, Ltd.UOB-Kay Hian Holdings, Ltd.UOL Group, Ltd.Valuetronics Holdings, Ltd.Venture Corp., Ltd.Vicom, Ltd.Wee Hur Holdings, Ltd.Wilmar International, Ltd.Wing Tai Holdings, Ltd.Yeo Hiap Seng, Ltd.Yongnam Holdings, Ltd.
TOTAL SINGAPORE
Absa Group, Ltd.
421,903 100,80053,750 12,92041,666 15,63318,900 8,52194,100 32,81992,707 49,317
* 143,481 8,27753,614 40,067
271,700 3,78282,600 54,072
142,070 494,99618,200 55,270
660,100 1,116,874* 87,400 85,090
210,900 177,82918,800 36,172
409,000 69,993
T.A. World ex U.S. Core Equity PortfolioCONTINUED
Shares Value»
SINGAPORE — (Continued)520,200 $ 91,676
16,000 4,649217,700 1,524,162122,300 701,693758,900 531,412169,400 519,591582,300 1,404,633
40,000 96,252150,000 51,841209,100 229,107
88,300 88,217* 105,749 1,570
53,197 12,388380,900 17,361233,079 58,210195,000 89,898219,200 416,027103,613 224,248113,892 2,169,95579,540 69,870
142,255 756,034371,680 175,874103,600 1,156,118
4,600 24,047112,500 18,360176,800 511,063211,800 324,743
7,067 4,698* 124,875 16,050
29,755,418
SOUTH AFRICA — (1.8%)216,901 2,403,393

Adcock Ingram Holdings, Ltd.Adcorp Holdings, Ltd.Advtech, Ltd.AECI, Ltd.African Oxygen, Ltd.African Rainbow Minerals, Ltd.Afrimat, Ltd.Alexander Forbes Group Holdings, Ltd.Allied Electronics Corp., Ltd., Class AAlviva Holdings, Ltd.Anglo American Platinum, Ltd.AngloGold Ashanti, Ltd.AngloGold Ashanti, Ltd.ArcelorMittal South Africa, Ltd.Ascendis Health, Ltd.Aspen Pharmacare Holdings, Ltd.Assore, Ltd.Astral Foods, Ltd.Aveng, Ltd.AVI, Ltd.Balwin Properties, Ltd.Barloworld, Ltd.Bid Corp., Ltd.Bidvest Group, Ltd. (The)Blue Label Telecoms, Ltd.Capitec Bank Holdings, Ltd.
Cashbuild, Ltd.Caxton and CTP Publishers and Printers, Ltd.City Lodge Hotels, Ltd.Clicks Group, Ltd.Clover Industries, Ltd.Coronation Fund Managers, Ltd.Curro Holdings, Ltd.DataTec, Ltd.Discovery, Ltd.Distell Group Holdings, Ltd.DRDGOLD, Ltd.enX Group, Ltd.EOH Holdings, Ltd.Exxaro Resources, Ltd.Famous Brands, Ltd.FirstRand, Ltd.Foschini Group, Ltd. (The)Gold Fields, Ltd.Gold Fields, Ltd., Sponsored ADRGrindrod Shipping Holdings, Ltd.Grindrod, Ltd.Harmony Gold Mining Co., Ltd.Harmony Gold Mining Co., Ltd., Sponsored ADR
37,617 149,586* 30,200 49,376
277,790 245,41868,185 443,81857,335 85,21256,227 692,62714,318 34,817
384,692 150,61946,162 89,27857,884 65,25212,433 738,073
104,054 1,788,136171,502 2,925,824
* 140,868 23,579* 67,523 23,512
45,907 288,13913,290 324,07727,568 316,345
* 2,478,114 5,168146,804 888,176
30,346 6,125113,993 955,59462,747 1,312,489
163,390 2,092,317* 196,376 50,115
14,213 1,167,560
T.A. World ex U.S. Core Equity PortfolioCONTINUED
Shares Value»
SOUTH AFRICA — (Continued)13,762 $ 254,345
6,415 3,34918,314 146,63169,704 989,96555,986 90,05381,420 237,71428,501 44,239
144,442 338,57888,894 815,62814,489 134,622
* 26,808 8,750* 11,577 9,685* 59,009 73,023
84,244 976,88427,746 176,406
570,026 2,439,036109,400 1,258,383
90,296 461,178503,365 2,541,993
* 5,985 34,792239,421 100,488
* 14,209 35,201* 199,683 487,227

Hudaco Industries, Ltd.Hulamin, Ltd.Impala Platinum Holdings, Ltd.Imperial Logistics, Ltd.Investec, Ltd.Invicta Holdings, Ltd.Italtile, Ltd.JSE, Ltd.KAP Industrial Holdings, Ltd.Kumba Iron Ore, Ltd.Lewis Group, Ltd.Liberty Holdings, Ltd.Life Healthcare Group Holdings, Ltd.Long4Life, Ltd.Massmart Holdings, Ltd.Merafe Resources, Ltd.Metair Investments, Ltd.MiX Telematics, Ltd., Sponsored ADRMomentum Metropolitan HoldingsMotus Holdings Ltd.Mpact, Ltd.Mr. Price Group, Ltd.MTN Group, Ltd.Multichoice Group, Ltd.Murray & Roberts Holdings, Ltd.Nampak, Ltd.Naspers, Ltd., Class NNedbank Group, Ltd.NEPI Rockcastle P.L.C.Netcare, Ltd.Northam Platinum, Ltd.Novus Holdings, Ltd.Oceana Group, Ltd.Old Mutual, Ltd.Old Mutual, Ltd.Omnia Holdings, Ltd.
Peregrine Holdings, Ltd.Pick n Pay Stores, Ltd.Pioneer Foods Group, Ltd.PPC, Ltd.PSG Group, Ltd.Raubex Group, Ltd.RCL Foods, Ltd.Reunert, Ltd.Rhodes Food Group Pty, Ltd.Royal Bafokeng Platinum, Ltd.Sanlam, Ltd.Santam, Ltd.Sappi, Ltd.
19,536 159,27457,757 10,287
* 298,643 1,593,21586,598 274,52448,449 276,849
6,662 11,01251,483 47,06946,852 418,658
822,506 296,15523,130 761,22158,479 132,54293,030 703,597
988,382 1,556,081* 13,949 4,404
66,875 238,418762,601 64,392
98,252 162,4747,590 113,546
572,855 674,5284,714 24,288
81,828 129,28267,867 833,084
509,485 3,989,924* 38,133 356,432
181,217 145,589* 283,257 196,513
6,440 1,569,81578,607 1,313,51256,413 509,166
650,443 758,427* 122,047 535,913
13,400 3,36338,491 182,819
258,830 346,4131,048,747 1,378,642
26,191 61,550
T.A. World ex U.S. Core Equity PortfolioCONTINUED
Shares Value»
SOUTH AFRICA — (Continued)133,208 $ 171,085137,682 640,291
54,309 389,618* 620,481 210,647
29,840 474,85782,409 109,88937,465 27,187
110,443 501,25133,536 39,760
* 28,659 67,656357,151 1,848,528
21,037 433,073339,247 1,230,200

Sasol, Ltd.Sasol, Ltd., Sponsored ADRShoprite Holdings, Ltd.Sibanye Gold, Ltd.Sibanye Gold, Ltd., Sponsored ADRSPAR Group, Ltd. (The)Spur Corp., Ltd.Standard Bank Group, Ltd.Steinhoff International Holdings NVSun International, Ltd.Super Group, Ltd.Telkom SA SOC, Ltd.Tiger Brands, Ltd.Tongaat Hulett, Ltd.Transaction Capital, Ltd.Trencor, Ltd.Truworths International, Ltd.Tsogo Sun Gaming, Ltd.Vodacom Group, Ltd.Wilson Bayly Holmes-Ovcon, Ltd.Woolworths Holdings, Ltd.
TOTAL SOUTH AFRICA
ABco Electronics Co., Ltd.Able C&C Co., Ltd.ABOV Semiconductor Co., Ltd.Actoz Soft Co., Ltd.Advanced Nano Products Co., Ltd.Advanced Process Systems Corp.Aekyung Petrochemical Co., Ltd.AfreecaTV Co., Ltd.Agabang&CompanyAhn-Gook Pharmaceutical Co., Ltd.Ahnlab, Inc.AJ Networks Co., Ltd.AJ Rent A Car Co., Ltd.Ajin Industrial Co., Ltd.AK Holdings, Inc.ALUKO Co., Ltd.Amorepacific Corp.AMOREPACIFIC GroupAmotech Co., Ltd.Aprogen pharmaceuticals, Inc.APS Holdings Corp.Asia Cement Co., Ltd.
ASIA Holdings Co., Ltd.Asia Paper Manufacturing Co., Ltd.Asiana Airlines, Inc.Aurora World Corp.
6,235 134,82383,230 1,804,42650,371 541,154
* 822,803 1,017,569* 49,830 243,171
95,379 1,219,14723,750 35,933
263,436 3,275,587* 314,204 25,805* 73,525 237,026* 233,589 481,502
188,008 1,122,59741,929 649,05357,378 52,843
185,160 296,891* 88,428 152,062
251,587 1,089,354341,104 334,118114,626 936,96429,309 235,720
403,134 1,539,768
70,375,328
SOUTH KOREA — (3.5%)3,072 12,805
* 1,922 16,1723,017 14,888
* 1,966 20,683930 13,622
3,034 59,8314,580 29,2142,494 121,518
* 9,906 23,9562,769 21,920
579 26,5256,725 26,501
* 7,772 67,522#* 13,993 38,063
2,876 99,38914,837 28,880
1,320 155,1004,260 205,543
#* 4,799 75,741* 12,443 9,016* 6,201 39,805
960 65,571
T.A. World ex U.S. Core Equity PortfolioCONTINUED
Shares Value»
SOUTH KOREA — (Continued)567 $ 51,312
2,188 60,379* 77,860 378,653
4,405 45,954
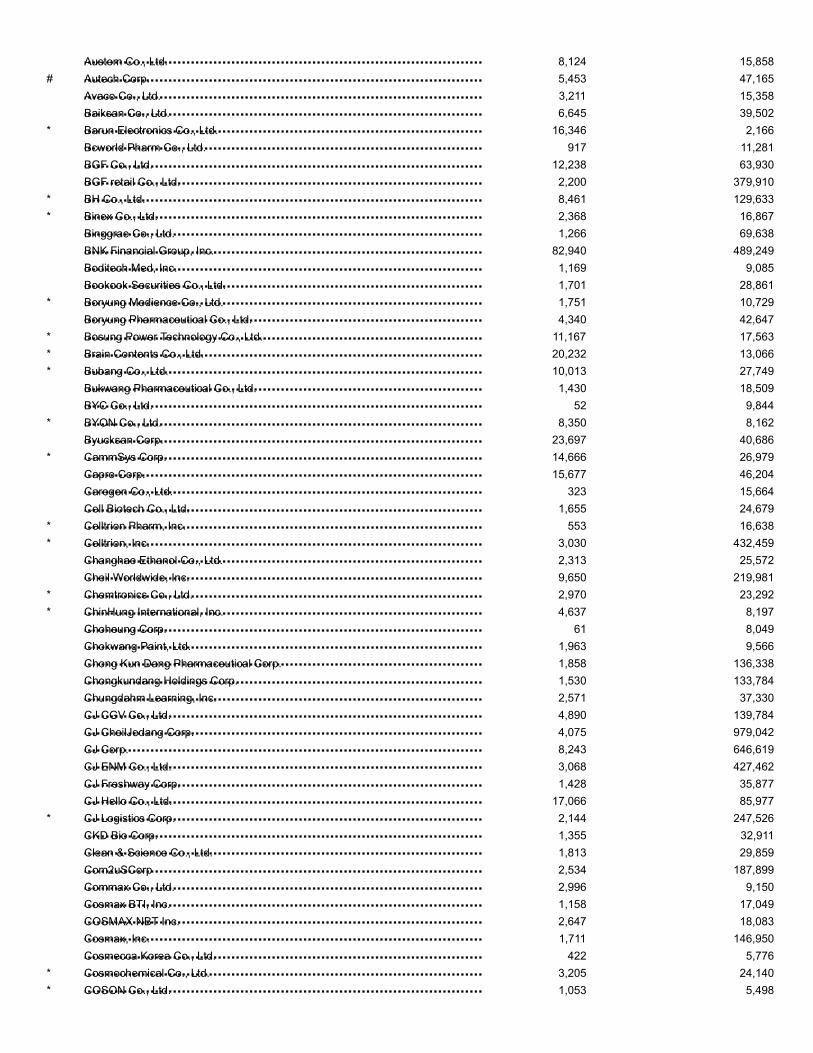
Austem Co., Ltd.Autech Corp.Avaco Co., Ltd.Baiksan Co., Ltd.Barun Electronics Co., Ltd.Bcworld Pharm Co., Ltd.BGF Co., Ltd.BGF retail Co., Ltd.BH Co., Ltd.Binex Co., Ltd.Binggrae Co., Ltd.BNK Financial Group, Inc.Boditech Med, Inc.Bookook Securities Co., Ltd.Boryung Medience Co., Ltd.Boryung Pharmaceutical Co., Ltd.Bosung Power Technology Co., Ltd.Brain Contents Co., Ltd.Bubang Co., Ltd.Bukwang Pharmaceutical Co., Ltd.BYC Co., Ltd.BYON Co., Ltd.Byucksan Corp.CammSys Corp.Capro Corp.Caregen Co., Ltd.Cell Biotech Co., Ltd.Celltrion Pharm, Inc.Celltrion, Inc.Changhae Ethanol Co., Ltd.Cheil Worldwide, Inc.Chemtronics Co., Ltd.ChinHung International, Inc.Choheung Corp.Chokwang Paint, Ltd.Chong Kun Dang Pharmaceutical Corp.Chongkundang Holdings Corp.Chungdahm Learning, Inc.CJ CGV Co., Ltd.CJ CheilJedang Corp.CJ Corp.CJ ENM Co., Ltd.CJ Freshway Corp.CJ Hello Co., Ltd.CJ Logistics Corp.CKD Bio Corp.Clean & Science Co., Ltd.Com2uSCorpCommax Co., Ltd.Cosmax BTI, Inc.COSMAX NBT Inc.Cosmax, Inc.Cosmecca Korea Co., Ltd.Cosmochemical Co., Ltd.COSON Co., Ltd.
8,124 15,858# 5,453 47,165
3,211 15,3586,645 39,502
* 16,346 2,166917 11,281
12,238 63,9302,200 379,910
* 8,461 129,633* 2,368 16,867
1,266 69,63882,940 489,249
1,169 9,0851,701 28,861
* 1,751 10,7294,340 42,647
* 11,167 17,563* 20,232 13,066* 10,013 27,749
1,430 18,50952 9,844
* 8,350 8,16223,697 40,686
* 14,666 26,97915,677 46,204
323 15,6641,655 24,679
* 553 16,638* 3,030 432,459
2,313 25,5729,650 219,981
* 2,970 23,292* 4,637 8,197
61 8,0491,963 9,5661,858 136,3381,530 133,7842,571 37,3304,890 139,7844,075 979,0428,243 646,6193,068 427,4621,428 35,877
17,066 85,977* 2,144 247,526
1,355 32,9111,813 29,8592,534 187,8992,996 9,1501,158 17,0492,647 18,0831,711 146,950
422 5,776* 3,205 24,140* 1,053 5,498

COWELL FASHION Co., Ltd.Crown Confectionery Co., Ltd.CROWNHAITAI Holdings Co., Ltd.CrucialTec Co., Ltd.CS Wind Corp.CTC BIO, Inc.Cuckoo Holdings Co., Ltd.Cuckoo Homesys Co., Ltd.Cymechs, Inc.D.I Corp.Dae Dong Industrial Co., Ltd.Dae Hwa Pharmaceutical Co., Ltd.Dae Hyun Co., Ltd.Dae Won Chemical Co., Ltd.Dae Won Kang Up Co., Ltd.Dae Young Packaging Co., Ltd.Daechang Co., Ltd.Daehan New Pharm Co., Ltd.Daehan Steel Co., Ltd.Dae-Il Corp.Daelim B&Co Co., Ltd.Daelim C&S Co., Ltd.Daelim Industrial Co., Ltd.Daemyung Corp. Co., Ltd.Daeryuk Can Co., Ltd.Daesang Corp.Daesang Holdings Co., Ltd.Daesung Industrial Co., Ltd.Daewon Cable Co., Ltd.Daewon Media Co., Ltd.Daewon Pharmaceutical Co., Ltd.Daewoo Engineering & Construction Co., Ltd.Daewoo Shipbuilding & Marine Engineering Co., Ltd.Daewoong Co., Ltd.Daewoong Pharmaceutical Co., Ltd.Daihan Pharmaceutical Co., Ltd.Daishin Securities Co., Ltd.Danal Co., Ltd.Danawa Co., Ltd.Dasan Networks, Inc.Dawonsys Co., Ltd.Dayou Plus Co., Ltd.DB Financial Investment Co., Ltd.DB HiTek Co., Ltd.DB Insurance Co., Ltd.Dentium Co., Ltd.Deutsch Motors, Inc.Development Advance Solution Co., Ltd.DGB Financial Group, Inc.
T.A. World ex U.S. Core Equity PortfolioCONTINUED
Shares Value»
SOUTH KOREA — (Continued)10,296 $ 56,464
3,461 25,4726,390 62,641
* 12,543 9,866538 14,990
* 2,495 12,217129 12,964
1,215 45,5693,749 23,4207,893 21,8358,847 38,3792,230 24,564
11,980 25,205* 6,000 7,018
13,591 45,397* 26,795 25,069
10,260 10,386* 2,481 21,454
5,480 30,627# 7,510 19,984
2,393 7,914* 1,152 8,536
9,207 817,970* 7,420 10,964
5,718 22,5988,484 170,4657,797 45,400
* 9,975 34,423* 7,277 6,850
2,936 16,4952,565 31,724
* 49,132 169,356* 17,168 422,519
6,975 90,989173 22,932
2,757 77,59116,973 169,541
* 12,134 29,5531,579 29,223
* 1,978 12,0451,073 12,291
* 35,302 24,11620,826 80,20726,181 290,65530,976 1,465,972
1,498 86,045* 10,784 80,745
2,470 12,22451,060 324,217

DHP Korea Co., Ltd.DI Dong Il Corp.Digital Daesung Co., Ltd.DIO Corp.Diostech Co., Ltd.DMS Co., Ltd.DNF Co., Ltd.Dohwa Engineering Co., Ltd.Dong A Eltek Co., Ltd.Dong Ah Tire & Rubber Co., Ltd.
Dong-A Socio Holdings Co., Ltd.Dong-A ST Co., Ltd.Dong-Ah Geological Engineering Co., Ltd.Dongbang Transport Logistics Co., Ltd.Dongjin Semichem Co., Ltd.DongKook Pharmaceutical Co., Ltd.Dongkuk Industries Co., Ltd.Dongkuk Steel Mill Co., Ltd.Dongkuk Structures & Construction Co., Ltd.Dongsuh Cos., Inc.Dongsung Chemical Co., Ltd.DONGSUNG Corp.Dongwha Enterprise Co., Ltd.Dongwha Pharm Co., Ltd.Dongwon F&B Co., Ltd.Dongwon Industries Co., Ltd.Dongwon Systems Corp.Dongyang Steel Pipe Co., Ltd.Doosan Bobcat, Inc.Doosan Corp.Doosan Heavy Industries & Construction Co., Ltd.Doosan Infracore Co., Ltd.DoubleUGames Co., Ltd.Douzone Bizon Co., Ltd.DRB Holding Co., Ltd.Dreamus Co.DSR Wire Corp.DTR Automotive Corp.Duk San Neolux Co., Ltd.DY Corp.DY POWER Corp.e Tec E&C, Ltd.E1 Corp.Eagon Holdings Co., Ltd.Eagon Industrial, Ltd.Easy Bio, Inc.Ecopro Co., Ltd.Ehwa Technologies Information Co., Ltd.Elentec Co., Ltd.
2,180 13,164762 46,191
3,145 21,194* 2,543 87,126* 2,630 1,270
7,933 33,2323,673 22,0222,620 19,6274,939 34,4262,232 22,987
T.A. World ex U.S. Core Equity PortfolioCONTINUED
Shares Value»
SOUTH KOREA — (Continued)701 $ 51,695528 40,909
# 5,490 100,78710,932 15,596
# 14,691 167,5321,504 84,528
16,033 34,499* 28,589 159,983
5,855 10,0782,175 32,7111,451 21,1608,113 37,2062,674 41,5996,113 45,930
458 102,934960 185,527803 25,587
* 6,370 6,0764,980 150,4512,819 248,867
* 76,474 390,478#* 88,899 462,614
1,921 90,3736,519 350,3274,715 21,692
* 2,777 14,3424,487 16,1961,624 43,568
* 1,045 14,9598,589 37,0913,503 34,5451,035 68,5911,247 56,446
21,635 49,6722,793 17,357
19,995 88,378* 5,558 101,482* 183,188 37,336* 8,635 43,576

E-MART, Inc.EM-Tech Co., Ltd.Enerzent Co., Ltd.ENF Technology Co., Ltd.Eo Technics Co., Ltd.Estechpharma Co., Ltd.Eugene Investment & Securities Co., Ltd.Eugene Technology Co., Ltd.Eusu Holdings Co., Ltd.EVERDIGM Corp.F&F Co., Ltd.FarmscoFarmStory Co., Ltd.Feelux Co., Ltd.Fila Korea, Ltd.Fine Semitech Corp.Fine Technix Co., Ltd.Foosung Co., Ltd.Gabia, Inc.Gamevil, Inc.
Gaon Cable Co., Ltd.Gigalane Co., Ltd.GMB Korea Corp.GNCO Co., Ltd.GOLFZON Co., Ltd.Golfzon Newdin Holdings Co., Ltd.Grand Korea Leisure Co., Ltd.Green Cross Cell Corp.Green Cross Corp.Green Cross Holdings Corp.GS Engineering & Construction Corp.GS Global Corp.GS Holdings Corp.GS Retail Co., Ltd.G-SMATT GLOBAL Co., Ltd.Gwangju Shinsegae Co., Ltd.GY Commerce Co., Ltd.Hae In Corp.HAESUNG DS Co., Ltd.Haitai Confectionery & Foods Co., Ltd.Halla Corp.Halla Holdings Corp.Han Chang Corp.Han Kuk Carbon Co., Ltd.Hana Financial Group, Inc.Hana Micron, Inc.Hana Tour Service, Inc.Hanall Biopharma Co., Ltd.Hancom MDS, Inc.
7,165 734,4722,896 28,652
* 11,300 9,0055,534 90,194
998 59,6181,289 6,974
30,725 60,9575,544 51,656
* 8,096 45,8895,587 22,681
# 2,079 121,2306,803 29,315
* 27,766 21,809* 2,399 10,097
19,444 1,100,2412,525 15,116
* 12,615 13,754* 15,917 118,329
4,066 28,636* 729 22,069
T.A. World ex U.S. Core Equity PortfolioCONTINUED
Shares Value»
SOUTH KOREA — (Continued)1,340 $ 19,449
* 5,905 7,6335,922 26,040
* 4,594 4,2071,146 68,485
11,193 43,1734,938 77,164
495 15,609403 36,373
2,915 48,04926,430 752,76524,411 50,07137,024 1,568,583
6,051 190,337* 9,664 4,242
211 30,822* 4,617 1,646
3,117 11,7335,280 57,4262,877 20,826
* 12,234 32,3564,259 153,950
#* 8,680 20,1937,973 48,600
70,132 2,052,7649,004 29,3072,791 101,495
* 687 15,2221,513 14,862
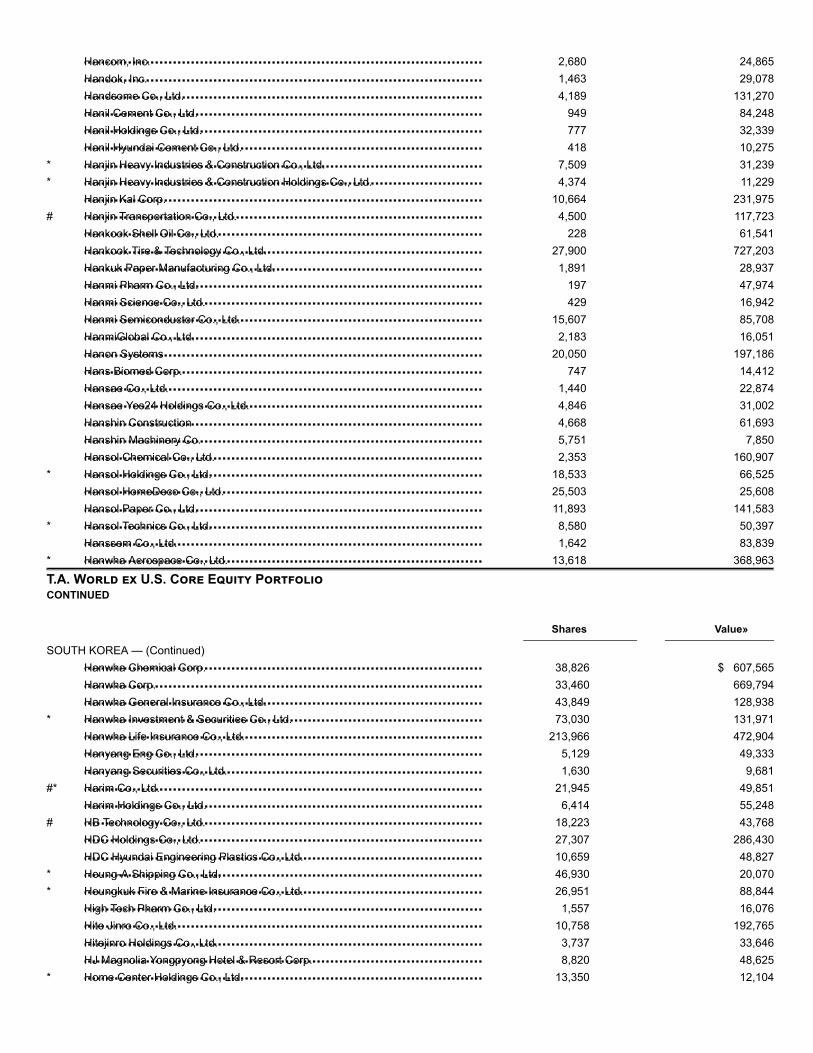
Hancom, Inc.Handok, Inc.Handsome Co., Ltd.Hanil Cement Co., Ltd.Hanil Holdings Co., Ltd.Hanil Hyundai Cement Co., Ltd.Hanjin Heavy Industries & Construction Co., Ltd.Hanjin Heavy Industries & Construction Holdings Co., Ltd.Hanjin Kal Corp.Hanjin Transportation Co., Ltd.Hankook Shell Oil Co., Ltd.Hankook Tire & Technology Co., Ltd.Hankuk Paper Manufacturing Co., Ltd.Hanmi Pharm Co., Ltd.Hanmi Science Co., Ltd.Hanmi Semiconductor Co., Ltd.HanmiGlobal Co., Ltd.Hanon SystemsHans Biomed Corp.Hansae Co., Ltd.Hansae Yes24 Holdings Co., Ltd.Hanshin ConstructionHanshin Machinery Co.Hansol Chemical Co., Ltd.Hansol Holdings Co., Ltd.Hansol HomeDeco Co., Ltd.Hansol Paper Co., Ltd.Hansol Technics Co., Ltd.Hanssem Co., Ltd.Hanwha Aerospace Co., Ltd.
Hanwha Chemical Corp.Hanwha Corp.Hanwha General Insurance Co., Ltd.Hanwha Investment & Securities Co., Ltd.Hanwha Life Insurance Co., Ltd.Hanyang Eng Co., Ltd.Hanyang Securities Co., Ltd.Harim Co., Ltd.Harim Holdings Co., Ltd.HB Technology Co., Ltd.HDC Holdings Co., Ltd.HDC Hyundai Engineering Plastics Co., Ltd.Heung-A Shipping Co., Ltd.Heungkuk Fire & Marine Insurance Co., Ltd.High Tech Pharm Co., Ltd.Hite Jinro Co., Ltd.Hitejinro Holdings Co., Ltd.HJ Magnolia Yongpyong Hotel & Resort Corp.Home Center Holdings Co., Ltd.
2,680 24,8651,463 29,0784,189 131,270
949 84,248777 32,339418 10,275
* 7,509 31,239* 4,374 11,229
10,664 231,975# 4,500 117,723
228 61,54127,900 727,203
1,891 28,937197 47,974429 16,942
15,607 85,7082,183 16,051
20,050 197,186747 14,412
1,440 22,8744,846 31,0024,668 61,6935,751 7,8502,353 160,907
* 18,533 66,52525,503 25,60811,893 141,583
* 8,580 50,3971,642 83,839
* 13,618 368,963
T.A. World ex U.S. Core Equity PortfolioCONTINUED
Shares Value»
SOUTH KOREA — (Continued)38,826 $ 607,56533,460 669,79443,849 128,938
* 73,030 131,971213,966 472,904
5,129 49,3331,630 9,681
#* 21,945 49,8516,414 55,248
# 18,223 43,76827,307 286,43010,659 48,827
* 46,930 20,070* 26,951 88,844
1,557 16,07610,758 192,765
3,737 33,6468,820 48,625
* 13,350 12,104

Homecast Co., Ltd.Hotel Shilla Co., Ltd.HS Industries Co., Ltd.HS R&A Co., Ltd.Huchems Fine Chemical Corp.Hugel, Inc.Humax Co., Ltd.Humedix Co., Ltd.Huneed TechnologiesHuons Co., Ltd.Huons Global Co., Ltd.Huvis Corp.Huvitz Co., Ltd.Hwa Shin Co., Ltd.Hwail Pharm Co., Ltd.Hwangkum Steel & Technology Co., Ltd.Hy-Lok Corp.Hyosung Advanced Materials Corp.Hyosung Chemical Corp.Hyosung Corp.Hyosung TNC Co., Ltd.Hyundai BNG Steel Co., Ltd.Hyundai Construction Equipment Co., Ltd.Hyundai Corp.Hyundai Department Store Co., Ltd.Hyundai Electric & Energy System Co., Ltd.Hyundai Elevator Co., Ltd.Hyundai Engineering & Construction Co., Ltd.Hyundai Glovis Co., Ltd.Hyundai Greenfood Co., Ltd.Hyundai Heavy Industries Holdings Co., Ltd.Hyundai Livart Furniture Co., Ltd.Hyundai Marine & Fire Insurance Co., Ltd.Hyundai Merchant Marine Co., Ltd.Hyundai Motor Co.Hyundai Motor Securities Co., Ltd.Hyundai Pharmaceutical Co., Ltd.Hyundai Rotem Co., Ltd.Hyundai Steel Co.Hyundai Telecommunication Co., Ltd.
Hyundai Wia Corp.HyVision System, Inc.ICD Co., Ltd.IHQ, Inc.Il Dong Pharmaceutical Co., Ltd.IlDong Holdings Co., Ltd.Iljin Diamond Co., Ltd.Iljin Display Co., Ltd.Iljin Electric Co., Ltd.
* 5,594 23,0669,154 603,260
# 24,285 173,58423,290 36,95712,983 248,721
* 81 25,515* 8,415 36,923
667 11,941* 4,349 25,674
1,459 60,3211,724 46,1526,198 35,7954,275 33,2428,784 17,9852,876 14,1745,202 33,5102,898 44,448
* 1,295 127,330922 126,247
6,436 442,2741,251 151,4114,605 32,4584,756 124,2712,255 36,9214,534 282,821
* 5,808 67,0163,637 244,204
11,716 422,6295,345 692,603
27,727 289,6682,720 745,7285,239 68,481
39,512 931,718* 9,288 25,838
14,724 1,566,3029,464 81,6225,505 20,798
* 1,976 27,48715,609 508,714
3,577 27,563
T.A. World ex U.S. Core Equity PortfolioCONTINUED
Shares Value»
SOUTH KOREA — (Continued)9,534 $ 346,8976,124 42,5746,946 67,113
28,719 43,6223,128 45,301
625 6,758# 809 20,940
6,416 21,314* 5,010 11,738

Iljin Holdings Co., Ltd.Iljin Materials Co., Ltd.Ilyang Pharmaceutical Co., Ltd.IM Co., Ltd.iMarketKorea, Inc.InBody Co., Ltd.Industrial Bank of KoreaINITECH Co., Ltd.Innocean Worldwide, Inc.Innox Advanced Materials Co., Ltd.Inscobee, Inc.Insun ENT Co., Ltd.Interflex Co., Ltd.Interojo Co., Ltd.Interpark Corp.Interpark Holdings Corp.Inzi Controls Co., Ltd.INZI Display Co., Ltd.Iones Co., Ltd.IS Dongseo Co., Ltd.ISC Co., Ltd.i-SENS, Inc.ISU Chemical Co., Ltd.IsuPetasys Co., Ltd.It's Hanbul Co., Ltd.J.ESTINA Co., Ltd.Jahwa Electronics Co., Ltd.JASTECH, Ltd.Jayjun Cosmetic Co., Ltd.JB Financial Group Co., Ltd.JC Hyun System, Inc.Jcontentree Corp.Jeju Semiconductor Corp.Jejuair Co., Ltd.Jinsung T.E.C.JLS Co., Ltd.JS Corp.Jusung Engineering Co., Ltd.JVM Co., Ltd.JW Holdings Corp.JW Life Science Corp.JW Pharmaceutical Corp.JYP Entertainment Corp.Kakao Corp.Kanglim Co., Ltd.Kangnam Jevisco Co., Ltd.Kangwon Land, Inc.KAON Media Co., Ltd.KB Financial Group, Inc.KB Financial Group, Inc., ADR
12,465 29,958* 1,588 49,818* 972 19,178* 18,750 17,364
4,349 43,0333,074 63,488
53,684 594,6343,292 14,0461,400 78,864
* 1,281 56,947* 8,916 18,293* 6,974 41,838* 4,407 36,134
1,996 37,8291,465 6,784
19,400 35,797# 5,879 27,150
6,794 13,129* 3,321 14,023
10,228 286,9733,461 24,8911,006 21,0024,844 37,1053,544 14,527
391 6,3093,368 15,4823,600 29,4584,304 36,712
* 4,560 18,92674,744 347,251
3,025 10,635* 12,863 50,230* 2,916 7,967
2,469 56,1806,911 42,5491,806 11,2661,371 15,399
12,280 64,268239 6,656
4,459 22,3962,069 39,106
919 21,8236,019 102,7461,059 112,812
* 5,478 13,378545 11,275
8,480 220,0025,150 43,482
36,689 1,340,68212,984 469,631
T.A. World ex U.S. Core Equity PortfolioCONTINUED
Shares Value»

KC Co., Ltd.KC Green Holdings Co., Ltd.KC Tech Co., Ltd.KCC Engineering & Construction Co., Ltd.KCTCKEC Corp.KEPCO Engineering & Construction Co., Inc.KEPCO Plant Service & Engineering Co., Ltd.Keyang Electric Machinery Co., Ltd.KEYEAST Co., Ltd.KG Chemical Corp.KG Eco Technology Service Co., Ltd.Kginicis Co., Ltd.KGMobilians Co., Ltd.KH Vatec Co., Ltd.Kia Motors Corp.KISWIRE, Ltd.Kiwi Media Group Co., Ltd.KIWOOM Securities Co., Ltd.KleanNara Co., Ltd.KMH Co., Ltd.Kodaco Co., Ltd.Koentec Co., Ltd.Koh Young Technology, Inc.Kolmar BNH Co., Ltd.Kolmar Korea Co., Ltd.Kolmar Korea Holdings Co., Ltd.Kolon Corp.Kolon Global Corp.Kolon Industries, Inc.Kolon Life Science, Inc.Kolon Plastic, Inc.KoMiCo, Ltd.KONA I Co., Ltd.Korea Aerospace Industries, Ltd.Korea Asset In Trust Co., Ltd.Korea Autoglass Corp.Korea Cast Iron Pipe Industries Co., Ltd.Korea Circuit Co., Ltd.Korea District Heating Corp.Korea Electric Power Corp., Sponsored ADRKorea Electric Terminal Co., Ltd.Korea Export Packaging Industrial Co., Ltd.Korea Gas Corp.Korea Information & Communications Co., Ltd.Korea Information Certificate Authority, Inc.Korea Investment Holdings Co., Ltd.Korea Line Corp.Korea Petrochemical Ind Co., Ltd.Korea Real Estate Investment & Trust Co., Ltd.Korea Shipbuilding & Offshore Engineering Co., Ltd.Korea United Pharm, Inc.Korea Zinc Co., Ltd.
SOUTH KOREA — (Continued)3,540 $ 38,1135,380 17,3684,198 52,9443,969 20,9335,280 12,515
* 44,982 40,393860 13,634
2,501 67,1767,846 20,751
* 20,377 46,7885,320 52,7655,045 14,1907,157 74,4495,711 28,323
* 4,940 37,53644,302 1,631,862
3,301 66,314* 40,032 5,720# 3,976 243,240* 7,238 13,789
5,485 26,740* 17,987 25,028
6,483 64,283# 3,269 228,285
2,817 66,187907 42,066
2,211 43,9133,004 41,3852,357 16,6296,395 214,149
* 976 17,2713,939 18,527
709 15,654* 1,490 20,879
5,693 176,70325,389 80,675
5,301 81,963# 2,160 22,320* 4,621 19,184* 1,101 50,262* 14,609 171,364
2,571 144,3561,272 20,1043,822 137,582
* 4,831 36,0614,361 12,702
13,153 820,578* 8,577 182,744
2,039 205,86983,855 154,786
* 6,275 569,7013,679 62,863
699 260,431

Korean Air Lines Co., Ltd.Korean Reinsurance Co.Kortek Corp.KPX Chemical Co., Ltd.KSS LINE, Ltd.KT Corp., Sponsored ADR
KT Hitel Co., Ltd.KT Skylife Co., Ltd.KT&G Corp.KTB Investment & Securities Co., Ltd.KTCS Corp.Ktis Corp.Kukbo Design Co., Ltd.Kukdo Chemical Co., Ltd.Kukdong Oil & Chemicals Co., Ltd.Kumho Industrial Co., Ltd.Kumho Petrochemical Co., Ltd.Kumho Tire Co., Inc.Kumkang Kind Co., Ltd.Kwang Dong Pharmaceutical Co., Ltd.Kwang Myung Electric Co., Ltd.Kyeryong Construction Industrial Co., Ltd.Kyobo Securities Co., Ltd.Kyongbo Pharmaceutical Co., Ltd.Kyung Dong Navien Co., Ltd.Kyungbang Co., Ltd.KyungDong City Gas Co., Ltd.KyungDong Invest Co., Ltd.Kyungdong Pharm Co., Ltd.Kyung-In Synthetic Corp.L&F Co., Ltd.LB Semicon, Inc.LEADCORP, Inc. (The)Leaders Cosmetics Co., Ltd.LEENO Industrial, Inc.Leenos Corp.LF Corp.LG Chem, Ltd.LG Corp.LG Display Co., Ltd., ADRLG Display Co., Ltd.LG Electronics, Inc.LG Hausys, Ltd.LG Household & Health Care, Ltd.LG Innotek Co., Ltd.LG International Corp.LG Uplus Corp.LIG Nex1 Co., Ltd.Lion Chemtech Co., Ltd.
39,843 855,64752,000 350,545
5,148 55,8111,049 50,0538,759 48,890
14,332 169,118
T.A. World ex U.S. Core Equity PortfolioCONTINUED
Shares Value»
SOUTH KOREA — (Continued)* 5,172 $ 24,844
14,519 122,5239,033 733,509
* 28,526 62,89517,023 28,72613,062 24,032
1,171 14,6871,090 44,6305,000 14,2723,629 39,9558,110 556,151
* 29,214 98,7037,285 24,4879,744 55,651
* 4,580 8,3304,548 97,682
10,286 84,5915,796 41,8851,147 36,0016,447 54,314
958 23,776388 11,536
4,078 28,964# 6,920 48,546# 4,210 100,437#* 12,595 104,789
10,359 56,931* 848 4,967
3,102 144,648* 10,030 11,980
9,236 190,2926,621 1,872,601
15,362 916,390* 144,957 874,091* 27,349 332,298
35,088 1,921,3903,750 189,067
737 780,3547,043 665,057
11,639 180,54293,210 1,020,735
1,412 34,9991,359 8,926

Lock & Lock Co., Ltd.LOT Vacuum Co., Ltd.Lotte Chemical Corp.Lotte Chilsung Beverage Co., Ltd.Lotte Corp.LOTTE Fine Chemical Co., Ltd.Lotte Food Co., Ltd.LOTTE Himart Co., Ltd.Lotte Non-Life Insurance Co., Ltd.Lotte Shopping Co., Ltd.Lotte Tour Development Co., Ltd.LS Cable & System Asia, Ltd.LS Corp.LS Industrial Systems Co., Ltd.Lumens Co., Ltd.Lutronic Corp.
LVMC HoldingsMacquarie Korea Infrastructure FundMacrogen, Inc.Maeil Holdings Co., Ltd.Magicmicro Co., Ltd.Mando Corp.Maniker Co., Ltd.Mcnex Co., Ltd.ME2ON Co., Ltd.Medy-Tox, Inc.Meerecompany, Inc.MegaStudyEdu Co., Ltd.Melfas, Inc.Meritz Financial Group, Inc.Meritz Fire & Marine Insurance Co., Ltd.Meritz Securities Co., Ltd.Mgame Corp.MiCo, Ltd.Minwise Co., Ltd.Mirae Asset Daewoo Co., Ltd.Mirae Asset Life Insurance Co., Ltd.Mirae Corp.Miwon Commercial Co., Ltd.Miwon Specialty Chemical Co., Ltd.Mobase Co., Ltd.Modetour Network, Inc.MonAmi Co., Ltd.Moorim P&P Co., Ltd.Moorim Paper Co., Ltd.Multicampus Corp.Namhae Chemical Corp.Namsun Aluminum Co., Ltd.NanoenTek, Inc.
1,936 25,2412,575 15,2815,135 1,003,5371,080 132,0193,759 107,5317,009 286,532
197 81,2783,486 107,893
* 41,598 71,7323,744 428,200
* 1,689 15,8682,950 18,8465,047 187,3996,112 236,887
* 22,437 34,326* 3,980 24,492
T.A. World ex U.S. Core Equity PortfolioCONTINUED
Shares Value»
SOUTH KOREA — (Continued)* 13,279 $ 32,183# 60,833 598,993* 1,148 24,503
4,128 41,221#* 7,947 9,417
16,984 483,079* 24,024 17,408
6,556 115,019* 8,057 37,715
1,026 359,7861,117 36,8223,356 87,984
#* 5,717 11,12416,897 198,36130,872 518,780
128,077 544,474* 4,913 14,056# 18,529 79,101
723 11,103125,224 790,589
45,023 151,204* 121,127 16,579
279 10,7061,128 70,4473,844 17,4903,431 45,0439,145 44,295
12,956 47,14313,596 30,882
752 28,4114,401 33,539
#* 33,053 88,998* 2,610 9,413

Nasmedia Co., Ltd.NAVER Corp.NCSoft Corp.NeoPharm Co., Ltd.NeowizNEPES Corp.Netmarble Corp.Neuros Co., Ltd.New Power Plasma Co., Ltd.Nexen Corp.Nexen Tire Corp.Next Entertainment World Co., Ltd.NH Investment & Securities Co., Ltd.NHN KCP Corp.NICE Holdings Co., Ltd.Nice Information & Telecommunication, Inc.NICE Information Service Co., Ltd.NICE Total Cash Management Co., Ltd.NK Co., Ltd.Nong Shim Holdings Co., Ltd.Nong Woo Bio Co., Ltd.NongShim Co., Ltd.Noroo Holdings Co., Ltd.NOROO Paint & Coatings Co., Ltd.NS Shopping Co., Ltd.OCI Co., Ltd.
OPTRON-TEC, Inc.Orange Life Insurance, Ltd.Orion Corp.Orion Holdings Corp.Osstem Implant Co., Ltd.Osung Advanced Materials Co., Ltd.Ottogi Corp.Paik Kwang Industrial Co., Ltd.Pan Ocean Co., Ltd.Pan-Pacific Co., Ltd.Paradise Co., Ltd.Partron Co., Ltd.Paru Co., Ltd.Pearl Abyss Corp.People & Technology, Inc.Pharma Research Products Co., Ltd.PNE Solution Co., Ltd.Poongsan Corp.POSCO, Sponsored ADRPOSCOPOSCO Chemtech Co., Ltd.POSCO Coated & Color Steel Co., Ltd.Posco ICT Co., Ltd.
1,322 34,1416,277 728,238
890 361,6481,311 47,885
* 3,850 41,380# 9,458 239,467* 492 37,512* 2,376 9,829* 1,574 19,102
11,315 56,55221,618 156,725
* 4,451 14,65745,555 499,411
3,333 52,2475,517 100,9192,812 73,895
12,936 169,7485,591 38,456
* 11,386 10,766919 61,577
4,265 39,760792 156,918
1,230 11,7765,516 32,7416,820 59,4986,671 421,194
T.A. World ex U.S. Core Equity PortfolioCONTINUED
Shares Value»
SOUTH KOREA — (Continued)# 11,325 $ 56,168
2,240 53,510628 42,688
9,992 131,402* 3,554 205,819* 7,724 10,059
75 40,84013,521 30,576
* 40,670 164,33912,857 31,547
3,530 48,33118,711 226,156
* 7,856 15,181* 1,507 217,630* 2,698 10,481
588 17,4612,025 17,9519,581 190,155
33,942 1,589,5041,578 297,425
# 6,847 279,069778 10,793
7,848 33,284

Posco International Corp.Posco M-Tech Co., Ltd.Power Logics Co., Ltd.Protec Co., Ltd.PSK Holdings, Inc.PSK, Inc.Pulmuone Co., Ltd.Pungkuk Alcohol Industry Co., Ltd.Pyeong Hwa Automotive Co., Ltd.Rayence Co., Ltd.Redrover Co., Ltd.Reyon Pharmaceutical Co., Ltd.RFHIC Corp.RFTech Co., Ltd.S&S Tech Corp.S&T Corp.S&T Motiv Co., Ltd.S-1 Corp.Sajo Industries Co., Ltd.Sajodongaone Co., Ltd.Sam Chun Dang Pharm Co., Ltd.SAM KANG M&T Co., Ltd.Sam Yung Trading Co., Ltd.Sambo Motors Co., Ltd.Samchully Co., Ltd.Samchuly Bicycle Co., Ltd.SAMHWA Paints Industrial Co., Ltd.Samick Musical Instruments Co., Ltd.Samick THK Co., Ltd.Samji Electronics Co., Ltd.Samjin LND Co., Ltd.Samjin Pharmaceutical Co., Ltd.Samkee Automotive Co., Ltd.Samkwang Glass Co., Ltd.Sammok S-Form Co., Ltd.SAMPYO Cement Co., Ltd.
Samsung Card Co., Ltd.Samsung Electro-Mechanics Co., Ltd.Samsung Electronics Co., Ltd., GDRSamsung Electronics Co., Ltd.Samsung Engineering Co., Ltd.Samsung Fire & Marine Insurance Co., Ltd.Samsung Heavy Industries Co., Ltd.Samsung Life Insurance Co., Ltd.Samsung Pharmaceutical Co., Ltd.Samsung SDS Co., Ltd.Samsung Securities Co., Ltd.SAMT Co., Ltd.Samwha Capacitor Co., Ltd.
14,598 229,8116,657 27,524
#* 17,904 152,4342,555 40,0811,573 10,424
* 4,173 59,4308,790 79,9701,529 26,3296,035 48,0961,665 16,923
* 12,814 6,6071,719 20,543
910 22,525* 6,617 44,788
4,200 28,277* 674 9,710
3,768 158,7871,719 151,8051,222 46,376
* 16,592 16,1793,365 94,424
* 2,334 8,0213,897 54,2166,699 30,460
928 70,011* 1,364 7,278
4,408 22,64034,284 48,160
2,953 30,1675,213 47,8796,353 10,8262,222 50,684
10,140 22,9461,638 51,4076,146 52,771
* 10,906 30,233
T.A. World ex U.S. Core Equity PortfolioCONTINUED
Shares Value»
SOUTH KOREA — (Continued)10,356 $ 317,32510,373 795,219
9,769 9,361,982475,156 17,996,393
* 23,844 328,9567,788 1,728,889
* 109,921 651,1518,350 536,030
* 13,158 23,2741,104 193,101
20,002 614,47928,477 51,292
3,281 120,183

Samwha Electric Co., Ltd.Samyang Corp.Samyang Foods Co., Ltd.Samyang Holdings Corp.Sang-A Frontec Co., Ltd.Sangsangin Co., Ltd.Sangsangin Industry Co., Ltd.Sangsin BrakeSangsin Energy Display Precision Co., Ltd.SaraminHR Co., Ltd.SAVEZONE I&C Corp.S-Connect Co., Ltd.SD Biotechnologies Co., Ltd.SDN Co., Ltd.Seah Besteel Corp.SeAH Holdings Corp.SeAH Steel Corp.SeAH Steel Holdings Corp.Sebang Co., Ltd.Sebo Manufacturing Engineer Corp.Seegene, Inc.Sejin Heavy Industries Co., Ltd.Sejong Industrial Co., Ltd.Sekonix Co., Ltd.Sempio Foods Co.S-Energy Co., Ltd.Seobu T&DSeohan Co., Ltd.Seondo Electric Co., Ltd.Seoul Auction Co., Ltd.Seoul Semiconductor Co., Ltd.SEOWONINTECH Co., Ltd.Seoyon Co., Ltd.Seoyon E-Hwa Co., Ltd.Sewon Cellontech Co., Ltd.SFA Engineering Corp.SFA Semicon Co., Ltd.SG Corp.SG&G Corp.SH Energy & Chemical Co., Ltd.Shin Poong Pharmaceutical Co., Ltd.Shindaeyang Paper Co., Ltd.Shinhan Financial Group Co., Ltd.Shinhan Financial Group Co., Ltd., ADRShinil Industrial Co., Ltd.Shinsegae Engineering & Construction Co., Ltd.
Shinsegae Food Co., Ltd.Shinsegae International, Inc.Shinsegae, Inc.
1,000 14,9101,987 89,928
882 46,9901,661 97,464
# 2,592 34,019* 20,943 332,400* 3,523 879
6,269 18,9901,581 14,1581,961 38,128
10,599 33,105* 28,101 35,031* 2,671 13,654#* 14,510 14,840
7,234 98,574341 24,794578 31,351862 37,705
5,476 55,3471,807 13,614
* 1,339 25,0235,545 21,582
# 4,410 17,711* 4,832 25,611
12 2852,942 9,783
* 7,003 49,83945,007 51,350
4,419 11,8202,802 15,193
19,446 262,4423,718 16,1575,173 14,8772,891 12,084
* 8,094 19,52912,841 406,195
* 43,839 93,588#* 33,602 27,725* 1,946 3,307
33,182 29,535* 3,365 17,421
1,347 78,07923,087 845,64518,630 676,642
# 17,933 25,8871,204 28,750
T.A. World ex U.S. Core Equity PortfolioCONTINUED
Shares Value»
SOUTH KOREA — (Continued)965 $ 60,534138 19,639
2,932 623,634

Shinsung E&G Co., Ltd.Shinsung Tongsang Co., Ltd.Shinwha Intertek Corp.Shinwon Corp.SHOWBOX Corp.Signetics Corp.SIGONG TECH Co., Ltd.Silicon Works Co., Ltd.SIMMTECH Co., Ltd.SIMPAC, Inc.SK Bioland Co., Ltd.SK Chemicals Co., Ltd.SK D&D Co., Ltd.SK Discovery Co., Ltd.SK Gas, Ltd.SK Holdings Co., Ltd.SK Hynix, Inc.SK Innovation Co., Ltd.SK Materials Co., Ltd.SK Networks Co., Ltd.SK Securities Co., Ltd.SK Telecom Co., Ltd., Sponsored ADRSK Telecom Co., Ltd.SKC Co., Ltd.SKC Solmics Co., Ltd.SKCKOLONPI, Inc.SL Corp.SM Entertainment Co.S-MAC Co., Ltd.SMEC Co., Ltd.SNU Precision Co., Ltd.S-Oil Corp.Solco Biomedical Co., Ltd.Solid, Inc.Songwon Industrial Co., Ltd.Soulbrain Co., Ltd.SPC Samlip Co., Ltd.SPG Co., Ltd.Ssangyong Cement Industrial Co., Ltd.Ssangyong Motor Co.ST Pharm Co., Ltd.Suheung Co., Ltd.Sun Kwang Co., Ltd.Sunchang Corp.Sung Kwang Bend Co., Ltd.Sungchang Enterprise Holdings, Ltd.Sungdo Engineering & Construction Co., Ltd.Sungshin Cement Co., Ltd.Sungwoo Hitech Co., Ltd.Sunjin Co., Ltd.Suprema HQ, Inc.Suprema, Inc.SurplusGlobal, Inc.Synopex, Inc.Systems Technology, Inc.
* 62,593 55,478#* 24,154 28,146* 9,715 44,472* 18,733 31,788
14,133 45,486#* 32,920 27,165
2,538 11,2971,799 57,4578,945 40,2009,227 20,5903,311 37,298
928 34,770694 14,857
6,508 132,8222,190 143,1453,834 712,884
78,942 5,053,40410,608 1,524,254
1,887 282,86859,521 249,591
156,646 85,2391,900 43,529
786 164,5349,852 349,813
#* 12,624 42,127# 4,450 107,497
7,768 144,506* 683 20,278* 38,704 28,074
8,184 18,988* 5,939 13,317
4,121 325,567* 51,623 10,368#* 21,726 99,629
5,192 82,126# 6,255 342,155
610 48,4703,002 21,445
# 48,615 230,583* 14,162 39,676
1,339 15,8701,649 44,2051,342 18,6692,805 11,4529,457 73,122
* 29,253 44,3205,870 24,4435,696 36,403
27,956 89,2524,399 37,786
* 703 3,899* 651 15,789
3,060 6,178* 20,512 42,940# 3,598 41,820

Tae Kyung Industrial Co., Ltd.
Taewoong Co., Ltd.Taeyoung Engineering & Construction Co., Ltd.Taihan Electric Wire Co., Ltd.Taihan Textile Co., Ltd.Tailim Packaging Co., Ltd.TBH Global Co., Ltd.TechWing, Inc.Telechips, Inc.TES Co., Ltd.Tesna Co., Ltd.Theragen Etex Co., Ltd.Thinkware Systems Corp.TK Chemical Corp.TK Corp.Tokai Carbon Korea Co., Ltd.Tong Yang Moolsan Co., Ltd.Tongyang Life Insurance Co., Ltd.Top Engineering Co., Ltd.Toptec Co., Ltd.Tovis Co., Ltd.TS Corp.T'way Holdings, Inc.Ubiquoss, Inc.Ugint Co., Ltd.UIL Co., Ltd.Unick Corp.Unid Co., Ltd.Union Semiconductor Equipment & Materials Co., Ltd.Uniquest Corp.Unison Co., Ltd.UniTest, Inc.Value Added Technology Co., Ltd.Very Good Tour Co., Ltd.Viatron Technologies, Inc.Vieworks Co., Ltd.Visang Education, Inc.W Holding Co., Ltd.Webzen, Inc.Welcron Co., Ltd.Wemade Co., Ltd.Whanin Pharmaceutical Co., Ltd.WillBes & Co. (The)Winix, Inc.Wins Co., Ltd.WiSoL Co., Ltd.WONIK CUBE Corp.Wonik Holdings Co., Ltd.WONIK IPS Co., Ltd.
* 1,986 9,460
T.A. World ex U.S. Core Equity PortfolioCONTINUED
Shares Value»
SOUTH KOREA — (Continued)* 4,708 $ 36,376# 25,371 282,559* 16,521 8,539
1,266 21,3388,922 46,278
* 5,201 12,3095,406 47,9271,183 11,1319,566 129,5642,758 97,650
* 2,137 13,545* 2,319 13,360* 11,104 24,738
8,803 68,9101,830 86,393
16,528 19,56420,755 67,764
5,140 37,8436,539 53,2938,847 51,7692,334 38,835
* 16,901 22,792321 9,163
* 33,350 29,5995,306 22,110
* 3,277 17,2133,047 121,890
16,169 54,8953,824 19,481
* 16,347 13,7174,539 43,1412,976 62,5422,730 14,4245,732 47,8321,861 42,7092,959 19,539
* 24,735 7,772* 3,631 46,617* 4,034 9,985
618 13,8482,903 40,071
* 29,785 25,6281,488 24,566
945 10,138# 14,909 214,366* 8,997 16,000* 17,153 53,443
13,884 287,992

Wonik Materials Co., Ltd.Wonik QnC Corp.Woongjin Co., Ltd.Woongjin Coway Co., Ltd.Woongjin Energy Co., Ltd.Woongjin Thinkbig Co., Ltd.Woori Financial Group, Inc., Sponsored ADRWoori Financial Group, Inc.Woori Investment Bank Co., Ltd.Wooridul Pharmaceutical, Ltd.Woorison F&G Co., Ltd.
Woory Industrial Co., Ltd.Wooshin Systems Co., Ltd.Y G-1 Co., Ltd.Yeong Hwa Metal Co., Ltd.YJM Games Co., Ltd.YMC Co., Ltd.Yonwoo Co., Ltd.YooSung T&S Co., Ltd.Youlchon Chemical Co., Ltd.Young Poong Corp.Youngone Corp.Youngone Holdings Co., Ltd.YoungWoo DSP Co., Ltd.Yuanta Securities Korea Co., Ltd.Yuhan Corp.Yungjin Pharmaceutical Co., Ltd.Zeus Co., Ltd.
TOTAL SOUTH KOREA
Acciona SAAcerinox SAACS Actividades de Construccion y Servicios SAAena SME SAAlantra Partners SAAlmirall SAAmadeus IT Group SAAmper SAApplus Services SAAtresmedia Corp. de Medios de Comunicacion SAAzkoyen SABanco Bilbao Vizcaya Argentaria SABanco Bilbao Vizcaya Argentaria SA, Sponsored ADRBanco de Sabadell SABanco Santander SABanco Santander SA, Sponsored ADRBankia SABankinter SABolsas y Mercados Espanoles SHMSF SA
4,076 79,835* 6,042 54,775* 30,214 36,743
8,615 608,522* 2,621 1,519* 20,115 40,454* 2,923 97,208
88,365 976,180* 55,554 33,311* 2,161 11,118
12,563 20,999
T.A. World ex U.S. Core Equity PortfolioCONTINUED
Shares Value»
SOUTH KOREA — (Continued)1,316 $ 23,2461,763 8,6888,699 61,938
* 16,137 18,796* 7,970 11,617# 6,786 25,915* 670 11,814
7,220 16,2183,645 48,330
115 65,9308,136 230,6512,822 125,338
* 5,383 7,142#* 52,438 121,353
781 142,246* 2,603 9,827
2,458 25,050
134,225,182
SPAIN — (1.6%)15,118 1,609,74992,870 775,90756,107 2,267,082
7,298 1,322,997614 10,225
15,964 289,36838,582 3,015,064
* 310,784 84,98977,383 1,087,75131,367 122,218
4,453 34,981273,322 1,391,677
38,831 198,4281,618,770 1,413,8051,507,399 6,433,991
233,754 991,117360,701 715,122216,386 1,403,639
43,757 1,032,611

CaixaBank SACellnex Telecom SACia de Distribucion Integral Logista Holdings SACIE Automotive SAConstrucciones y Auxiliar de Ferrocarriles SADeoleo SADuro Felguera SAEbro Foods SAeDreams ODIGEO SAElecnor SAEnagas SAEnce Energia y Celulosa SAEndesa SAErcros SAEuskaltel SAFaes Farma SAFerrovial SAFluidra SAFomento de Construcciones y Contratas SAGlobal Dominion Access SA
Grifols SAGrupo Catalana Occidente SAGrupo Empresarial San Jose SAGrupo Ezentis SAIberdrola S.A.Iberdrola SAIberpapel Gestion SAIndra Sistemas SAIndustria de Diseno Textil SALaboratorios Farmaceuticos Rovi SALiberbank SAMapfre SAMasmovil Ibercom SAMediaset Espana Comunicacion SAMelia Hotels International SAMiquel y Costas & Miquel SANaturgy Energy Group SAObrascon Huarte Lain SAPharma Mar SAPromotora de Informaciones SA, Class AProsegur Cia de Seguridad SAQuabit Inmobiliaria SARealia Business SARed Electrica Corp. SARepsol SA, Sponsored ADRRepsol SASacyr S.A.Siemens Gamesa Renewable Energy SASolaria Energia y Medio Ambiente SA
363,632 901,24371,968 2,691,48314,308 298,12524,889 629,325
7,787 351,852* 218,644 14,984* 11,953 3,026
12,980 260,822* 18,832 85,200
8,321 104,268100,650 2,195,594
81,778 295,62732,657 806,90266,827 128,58137,378 326,491
162,400 803,97920,491 533,043
* 15,954 199,57115,321 195,057
* 50,319 241,912
T.A. World ex U.S. Core Equity PortfolioCONTINUED
Shares Value»
SPAIN — (Continued)29,198 $ 946,26712,173 434,576
* 3,318 30,078* 46,082 26,754
725,312 6,881,32319,228 182,420
352 11,013* 66,457 569,175
63,563 1,901,952824 18,942
1,076,318 400,832249,439 686,665
* 10,617 240,473105,629 620,096
65,079 573,33511,594 200,34966,262 1,678,474
* 51,945 64,801* 14,094 24,357* 111,527 164,261
118,571 553,387* 39,123 40,913* 69,999 72,646
52,668 992,99452,463 828,912
192,206 3,048,534238,392 611,674
8,910 124,674* 34,794 205,713

Talgo SATecnicas Reunidas SATelefonica SA, Sponsored ADRTelefonica SATubacex SATubos Reunidos SAVidrala SAViscofan SAVocento SAZardoya Otis SA
TOTAL SPAIN
AAK ABAcadeMedia ABAddLife AB, Class BAddNode Group ABAddTech AB, Class BAF POYRY ABAlfa Laval ABAlimak Group ABArjo AB, Class BAssa Abloy AB, Class BAtlas Copco AB, Class AAtlas Copco AB, Class BAtrium Ljungberg AB, Class BAttendo ABAvanza Bank Holding ABAxfood ABBE Group AB
Beijer Alma ABBeijer Electronics Group ABBeijer Ref ABBergman & Beving ABBesqab ABBetsson ABBilia AB, Class ABillerudKorsnas ABBioGaia AB, Class BBiotage ABBjorn Borg ABBoliden ABBonava ABBonava AB, Class BBravida Holding ABBufab ABBulten ABByggmax Group ABCastellum ABCatena AB
* 41,808 224,765* 3,605 86,925
47,435 360,980375,794 2,864,910
24,810 79,154* 30,261 7,061
6,909 625,91119,692 963,875
6,696 9,07448,655 333,533
62,959,584
SWEDEN — (1.9%)70,745 1,447,288
* 14,029 73,3103,547 95,5758,186 130,945
15,502 406,44029,713 700,22122,725 424,506
8,628 119,90743,543 175,25919,435 445,78347,532 1,451,82327,621 753,51915,011 277,42229,264 133,01435,135 313,53117,613 370,830
1,844 8,254
T.A. World ex U.S. Core Equity PortfolioCONTINUED
Shares Value»
SWEDEN — (Continued)22,051 $ 271,176
9,700 44,16617,619 390,54712,025 118,384
1,033 13,08670,099 370,04361,438 542,40583,624 965,437
6,804 282,91317,611 189,90811,488 29,821
105,287 2,387,6243,052 37,143
32,578 390,0209,487 78,798
15,696 162,2346,216 41,709
* 31,325 107,54618,860 382,869
6,264 195,629

Clas Ohlson AB, Class BCloetta AB, Class BCollector ABConcentric ABCoor Service Management Holding ABCorem Property Group AB, Class BDios Fastigheter ABDometic Group ABDoro ABDuni ABDustin Group ABEastnine ABElanders AB, Class BElectrolux ABElekta AB, Class BEltel ABEnea ABEpiroc AB, Class AEpiroc AB, Class BEssity AB, Class AEssity AB, Class BeWork Group ABFabege ABFagerhult ABFastighets AB Balder, Class BFastPartner ABFenix Outdoor International AGFingerprint Cards AB, Class BGetinge AB, Class BGranges ABGunnebo ABHaldex ABHembla ABHemfosa Fastigheter ABHennes & Mauritz AB, Class BHexagon AB, Class BHexpol ABHIQ International ABHolmen AB, Class B
Hufvudstaden AB, Class AHusqvarna AB, Class AHusqvarna AB, Class BICA Gruppen ABIndutrade ABInternational Petroleum Corp.Intrum ABInwido ABITAB Shop Concept AB, Class BJM AB
16,146 145,33293,501 278,520
* 5,084 27,59920,211 249,0334,969 41,908
21,057 43,36633,367 286,214
143,816 1,312,016* 9,675 36,101
10,582 125,48329,000 250,353
8,283 93,9342,164 18,649
44,147 1,020,11134,531 491,299
* 18,432 42,462* 6,373 108,396
40,318 441,79638,078 395,769
3,204 95,89079,422 2,359,079
3,724 28,62824,212 373,64411,474 70,951
* 11,128 381,05610,334 91,915
789 84,174* 115,486 207,887
70,940 1,040,87944,502 443,11541,274 106,69920,108 100,243
* 4,192 78,40443,448 391,09371,334 1,243,71513,577 657,83763,206 480,93827,168 143,13841,834 883,297
T.A. World ex U.S. Core Equity PortfolioCONTINUED
Shares Value»
SWEDEN — (Continued)21,576 $ 380,01516,594 146,989
213,953 1,894,52014,790 656,33622,986 651,245
* 33,561 143,92828,236 740,22552,454 322,193
* 3,537 10,30331,451 811,317

KappAhl ABKindred Group P.L.C.Klovern AB, Class BKNOW IT ABKungsleden ABLagercrantz Group AB, Class BLifco AB, Class BLindab International ABLoomis AB, Class BLundin Petroleum ABMedivir AB, Class BMekonomen ABMillicom International Cellular SAModern Times Group MTG AB, Class BMomentum Group AB, Class BMQ Holding ABMycronic ABNederman Holding ABNet Insight AB, Class BNetEnt ABNew Wave Group AB, Class BNibe Industrier AB, Class BNobia ABNobina ABNolato AB, Class BNordic Waterproofing Holding A.S.NP3 Fastigheter ABOEM International AB, Class BOpus Group ABPeab ABPlatzer Fastigheter Holding AB, Class BPricer AB, Class BProact IT Group ABQliro Group ABRatos AB, Class BRaySearch Laboratories ABRecipharm AB, Class BResurs Holding ABRottneros ABSaab AB, Class BSagax AB, Class BSandvik ABSAS ABScandi Standard ABScandic Hotels Group ABSectra AB, Class BSecuritas AB, Class BSemcon ABSensys Gatso Group AB
36,944 74,91567,551 414,518
174,308 286,69817,201 338,00960,690 527,81020,489 255,868
4,216 215,40234,213 389,57245,762 1,574,04420,983 659,991
* 2,956 7,124* 19,554 144,703
17,949 922,124* 1,542 14,277
10,464 117,926* 234,879 58,773
28,090 431,6551,650 20,440
* 64,475 12,02366,792 198,16224,373 162,75536,780 519,38469,989 453,89666,772 389,15115,102 859,357
1,273 10,9369,523 83,0782,886 71,751
125,364 79,422107,724 911,473
3,198 28,23558,280 76,796
5,753 101,191* 43,215 50,101
97,977 248,423* 7,166 102,539
21,390 265,6414,750 27,495
45,215 48,29917,220 542,08822,524 220,029
147,721 2,266,867* 172,240 234,891
31,872 203,53133,280 279,065
3,390 113,82069,799 1,080,926
5,895 32,521* 132,179 21,878
T.A. World ex U.S. Core Equity PortfolioCONTINUED
Shares Value»
SWEDEN — (Continued)

Sintercast ABSkandinaviska Enskilda Banken AB, Class ASkandinaviska Enskilda Banken AB, Class CSkanska AB, Class BSKF AB, Class ASKF AB, Class BSkiStar ABSSAB AB, Class ASSAB AB, Class ASSAB AB, Class B, Share, Class BSSAB AB, Class BSvenska Cellulosa AB SCA, Class ASvenska Cellulosa AB SCA, Class BSvenska Handelsbanken AB, Class ASvenska Handelsbanken AB, Class BSweco AB, Class BSwedbank AB, Class ASwedish Match ABSwedish Orphan Biovitrum ABSystemair ABTele2 AB, Class BTelefonaktiebolaget LM Ericsson, Sponsored ADRTelefonaktiebolaget LM Ericsson, Class ATelefonaktiebolaget LM Ericsson, Class BTelia Co. ABThule Group ABTrelleborg AB, Class BTroax Group ABVitrolife ABVolvo AB, Class AVolvo AB, Class BWallenstam AB, Class BWihlborgs Fastigheter AB
TOTAL SWEDEN
ABB, Ltd.Adecco Group AGAlcon, Inc.Alcon, Inc.Allreal Holding AGALSO Holding AGams AGAPG SGA SAArbonia AGAryzta AGAscom Holding AGAutoneum Holding AGBachem Holding AG, Class BBaloise Holding AGBanque Cantonale de GeneveBanque Cantonale VaudoiseBarry Callebaut AGBelimo Holding AGBell Food Group AG
958 $ 14,231197,610 1,857,939
1,755 16,64135,473 662,317
3,420 56,07899,292 1,628,66625,958 300,96113,020 36,82867,343 190,77073,712 187,511
183,600 465,4255,089 48,799
107,952 895,994166,114 1,494,681
5,211 49,36626,657 743,40699,959 1,361,21423,762 906,616
* 8,103 156,4082,857 36,132
92,642 1,323,79225,726 224,073
4,242 38,332123,302 1,078,803355,210 1,580,205
31,892 696,62139,300 541,16413,140 124,76318,528 356,55342,804 638,298
269,328 4,000,89740,951 427,84043,629 634,308
73,682,284
SWITZERLAND — (5.0%)148,297 2,799,425
62,773 3,424,836* 39,457 2,318,099* 6,206 359,387
10,097 1,763,6172,933 451,970
* 9,578 500,024506 135,400
25,022 290,249* 350,444 291,492
19,142 248,5451,715 188,440
484 64,47215,017 2,712,318
445 89,0471,100 818,085
538 1,049,618154 907,018
1,013 270,780

Bellevue Group AGBerner Kantonalbank AGBKW AGBobst Group SA
Bossard Holding AG, Class ABucher Industries AGBurckhardt Compression Holding AGBurkhalter Holding AGCalida Holding AGCarlo Gavazzi Holding AGCembra Money Bank AGCham Group AGChocoladefabriken Lindt & Spruengli AGCicor Technologies, Ltd.Cie Financiere Richemont SACie Financiere Tradition SAClariant AGColtene Holding AGConzzeta AGCredit Suisse Group AGCredit Suisse Group AG, Sponsored ADRDaetwyler Holding AGDKSH Holding AGdormakaba Holding AGDottikon Es Holding AGDufry AGEFG International AGEmmi AGEMS-Chemie Holding AGEnergiedienst Holding AGEvolva Holding SAFeintool International Holding AGFlughafen Zurich AGForbo Holding AGGAM Holding AGGeberit AGGeorg Fischer AGGivaudan SAGurit Holding AGHelvetia Holding AGHOCHDORF Holding AGHuber & Suhner AGHypothekarbank Lenzburg AGImplenia AGInficon Holding AGInterroll Holding AGIntershop Holding AGJulius Baer Group, Ltd.Jungfraubahn Holding AG
4,979 106,0191,586 360,1725,962 385,9365,176 258,813
T.A. World ex U.S. Core Equity PortfolioCONTINUED
Shares Value»
SWITZERLAND — (Continued)4,372 $ 602,8494,147 1,239,1341,121 271,2131,683 124,0782,049 56,946
107 29,57711,813 1,138,496
39 16,80810 827,235
869 43,81651,708 4,431,026
841 86,809135,347 2,473,206
1,624 137,292538 422,784
165,579 2,002,02140,310 486,546
2,987 460,41815,966 806,249
1,029 754,052* 16 8,543
12,643 1,108,81174,656 483,764
875 728,019937 585,605
1,334 41,501* 73,727 13,220
1,240 77,7249,780 1,785,988
716 1,116,821* 79,101 346,329
4,504 2,079,2352,775 2,391,964
993 2,640,973232 253,974
16,015 2,039,067* 415 31,436
7,280 579,7109 40,769
7,232 193,715842 525,241256 520,654423 212,515
61,489 2,627,585100 14,997

Kardex AGKomax Holding AGKudelski SAKuehne + Nagel International AGLafargeHolcim, Ltd.LafargeHolcim, Ltd.Lastminute.com NVLEM Holding SALiechtensteinische Landesbank AGLogitech International SALogitech International SALonza Group AGLuzerner Kantonalbank AGMeier Tobler Group AG
Metall Zug AGMikron Holding AGMobilezone Holding AGMobimo Holding AGNestle SANewron Pharmaceuticals SpANovartis AG, Sponsored ADRNovartis AGOC Oerlikon Corp. AGOrascom Development Holding AGOrell Fuessli Holding AGOrior AGPanalpina Welttransport Holding AGPartners Group Holding AGPhoenix Mecano AGPlazza AG, Class APSP Swiss Property AGRieter Holding AGRoche Holding AGRoche Holding AGRomande Energie Holding SASchaffner Holding AGSchindler Holding AGSchmolz + Bickenbach AGSchweiter Technologies AGSFS Group AGSGS SASiegfried Holding AGSika AGSonova Holding AGSt Galler Kantonalbank AGStraumann Holding AGSulzer AGSunrise Communications Group AGSwatch Group AG (The)
4,601 662,0951,888 353,967
18,111 122,7516,094 897,300
48,585 2,384,67323,757 1,163,525
* 2,606 78,751165 228,041
4,520 275,57116,891 694,63618,686 770,61113,260 4,542,261
1,408 622,275* 996 15,991
T.A. World ex U.S. Core Equity PortfolioCONTINUED
Shares Value»
SWITZERLAND — (Continued)82 $ 177,913
2,431 19,17712,320 113,709
3,772 1,006,848291,193 30,891,843
* 3,526 21,443118,999 10,897,92831,034 2,845,781
102,197 1,093,838* 6,054 90,943
152 13,8472,210 179,580
* 4,672 1,051,3232,807 2,232,379
223 98,246244 61,663
13,899 1,666,4961,570 206,4102,558 686,038
61,822 16,547,59059 73,925
216 44,3632,478 557,465
* 261,907 86,202518 511,858
8,928 685,290650 1,605,153
1,822 678,29733,600 4,850,971
9,168 2,108,241953 407,918
1,581 1,289,7858,150 821,241
27,143 2,007,5254,575 1,328,909

Swatch Group AG (The)Swiss Life Holding AGSwiss Prime Site AGSwiss Re AGSwisscom AGSwissquote Group Holding SATamedia AGTecan Group AGTemenos AGThurgauer KantonalbankTornos Holding AGu-blox Holding AGUBS Group AGValiant Holding AGValora Holding AGVAT Group AGVaudoise Assurances Holding SAVetropack Holding AGVifor Pharma AGVon Roll Holding AGVontobel Holding AGVP Bank AGVZ Holding AGWarteck Invest AG
Ypsomed Holding AGZehnder Group AGZug Estates Holding AG, Class BZuger Kantonalbank AGZurich Insurance Group AG
TOTAL SWITZERLAND
Ability Opto-Electronics Technology Co., Ltd.Abnova Corp.AcBel Polytech, Inc.Accton Technology Corp.Acer, Inc.ACES Electronic Co., Ltd.Acon Holding, Inc.Acter Group Corp., Ltd.Actron Technology Corp.A-DATA Technology Co., Ltd.Addcn Technology Co., Ltd.Adlink Technology, Inc.Advanced Ceramic X Corp.Advanced International Multitech Co., Ltd.Advanced Lithium Electrochemistry Cayman Co., Ltd.Advanced Lithium Electrochemistry Cayman Co., Ltd.Advanced Optoelectronic Technology, Inc.Advanced Power Electronics Corp.
8,093 441,3227,043 3,403,452
18,885 1,662,72030,702 2,973,083
9,184 4,450,9513,549 143,6951,154 126,809
522 132,62417,328 3,050,467
112 12,1883,658 28,6534,230 345,221
* 389,088 4,346,1136,995 717,0611,827 503,406
17,376 2,172,687523 265,189107 218,768
9,692 1,434,478* 14,867 15,543
12,679 667,2781,567 245,372
676 186,150# 13 25,040
T.A. World ex U.S. Core Equity PortfolioCONTINUED
Shares Value»
SWITZERLAND — (Continued)1,220 $ 155,4035,117 192,830
60 110,59431 191,776
18,766 6,527,407
191,171,343
TAIWAN — (4.1%)35,000 58,83411,000 9,909
116,540 84,497173,929 740,393937,521 566,239
43,000 30,697* 73,000 20,551
25,300 132,92235,000 109,35671,503 120,596
3,000 25,14529,933 46,88511,000 83,96464,000 84,454
* 20,000 10,5942,355 348
31,000 15,53734,000 30,549

Advanced Wireless Semiconductor Co.Advancetek Enterprise Co., Ltd.Advantech Co., Ltd.Aerospace Industrial Development Corp.AGV Products Corp.Airtac International GroupAlchip Technologies, Ltd.All Ring Tech Co., Ltd.Allied Circuit Co., Ltd.Allis Electric Co., Ltd.Alltek Technology Corp.Alltop Technology Co., Ltd.Alpha Networks, Inc.Amazing Microelectronic Corp.Ambassador Hotel (The)Ampire Co., Ltd.AMPOC Far-East Co., Ltd.AmTRAN Technology Co., Ltd.Anpec Electronics Corp.AP Memory Technology Corp.Apacer Technology, Inc.APAQ Technology Co., Ltd.APCB, Inc.Apex Biotechnology Corp.Apex International Co., Ltd.Apex Medical Corp.Apex Science & EngineeringArcadyan Technology Corp.Ardentec Corp.Argosy Research, Inc.ASE Technology Holding Co., Ltd., ADRASE Technology Holding Co., Ltd.Asia Cement Corp.
Asia Electronic Material Co., Ltd.Asia Optical Co., Inc.Asia Pacific Telecom Co., Ltd.Asia Tech Image, Inc.Asia Vital Components Co., Ltd.ASMedia Technology, Inc.ASPEED Technology, Inc.ASROCK, Inc.Asustek Computer, Inc.Aten International Co., Ltd.AU Optronics Corp., Sponsored ADRAU Optronics Corp.Audix Corp.AURAS Technology Co., Ltd.Aurora Corp.Avalue Technology, Inc.
71,000 160,01267,532 35,74534,586 290,906
304,000 311,480* 218,413 51,868
33,773 344,85825,000 80,19328,000 33,299
5,000 11,54365,000 37,80232,002 20,49728,000 51,485
154,200 112,66535,254 100,308
110,000 78,34640,000 33,61524,000 22,189
* 224,000 81,16340,781 82,148
8,397 10,76040,501 42,63026,319 26,71962,000 53,10131,226 29,935
#* 57,252 94,12920,000 16,72575,920 20,95346,674 160,268
293,120 281,01926,000 48,80480,709 353,504
279,796 623,417417,029 557,771
T.A. World ex U.S. Core Equity PortfolioCONTINUED
Shares Value»
TAIWAN — (Continued)17,000 $ 11,02974,000 195,910
* 1,075,000 244,01813,000 18,351
# 128,053 165,0727,364 124,7706,000 131,2676,000 11,409
100,502 712,05736,000 98,24819,526 50,020
# 3,746,980 989,27247,200 56,01622,000 111,88218,100 55,93816,000 31,305

AVY Precision Technology, Inc.Axiomtek Co., Ltd.Bank of Kaohsiung Co., Ltd.BenQ Materials Corp.BES Engineering Corp.Bin Chuan Enterprise Co., Ltd.Bionime Corp.Bioteque Corp.Bizlink Holding, Inc.Boardtek Electronics Corp.Bright Led Electronics Corp.Brighton-Best International Taiwan, Inc.C Sun Manufacturing, Ltd.Capital Futures Corp.Capital Securities Corp.Career Technology MFG. Co., Ltd.Casetek Holdings, Ltd.Caswell, Inc.Catcher Technology Co., Ltd.Cathay Financial Holding Co., Ltd.Cathay Real Estate Development Co., Ltd.Cayman Engley Industrial Co., Ltd.Center Laboratories, Inc.Central Reinsurance Co., Ltd.Chailease Holding Co., Ltd.Chain Chon Industrial Co., Ltd.Champion Building Materials Co., Ltd.Chang Hwa Commercial Bank, Ltd.Chang Wah Electromaterials, Inc.Channel Well Technology Co., Ltd.Charoen Pokphand EnterpriseChaun-Choung Technology Corp.CHC Healthcare GroupCHC Resources Corp.Chen Full International Co., Ltd.Chenbro Micom Co., Ltd.Cheng Fwa Industrial Co., Ltd.Cheng Loong Corp.Cheng Mei Materials Technology Corp.Cheng Shin Rubber Industry Co., Ltd.Cheng Uei Precision Industry Co., Ltd.Chenming Mold Industry Corp.Chian Hsing Forging Industrial Co., Ltd.
Chicony Electronics Co., Ltd.Chicony Power Technology Co., Ltd.Chieftek Precision Co., Ltd.Chilisin Electronics Corp.China Airlines, Ltd.China Bills Finance Corp.
49,962 60,22718,000 31,214
275,393 86,34969,000 53,029
690,000 169,80251,000 38,038
7,000 11,43339,000 162,75860,038 455,020
* 47,000 45,34647,000 17,532
# 141,423 158,14979,000 73,63729,900 41,954
1,047,600 318,76596,780 99,99182,753 135,603
7,000 17,183191,360 1,402,313888,692 1,160,318
# 327,300 229,03715,327 50,733
105,063 268,20967,788 38,821
325,686 1,366,26127,000 7,681
* 74,526 16,585965,048 674,446
21,913 111,25885,000 69,10193,920 222,44510,000 78,47350,000 78,39237,900 61,73048,000 64,98833,000 67,49736,000 14,359
387,360 233,139#* 293,100 100,103
568,341 734,839183,051 198,422
38,000 17,35421,000 30,413
T.A. World ex U.S. Core Equity PortfolioCONTINUED
Shares Value»
TAIWAN — (Continued)159,400 $ 405,323
68,807 123,82327,000 82,81577,024 206,067
2,166,019 663,607421,000 199,439

China Chemical & Pharmaceutical Co., Ltd.China Development Financial Holding Corp.China Ecotek Corp.China Electric Manufacturing Corp.China General Plastics Corp.China Life Insurance Co., Ltd.China Metal ProductsChina Steel Chemical Corp.China Steel Corp.China Steel Structure Co., Ltd.China Wire & Cable Co., Ltd.Chinese Maritime Transport, Ltd.Ching Feng Home Fashions Co., Ltd.Chin-Poon Industrial Co., Ltd.Chipbond Technology Corp.ChipMOS Techinologies, Inc.ChipMOS Technologies, Inc., ADRChlitina Holding, Ltd.Chong Hong Construction Co., Ltd.Chroma ATE, Inc.Chun YU Works & Co., Ltd.Chun Yuan SteelChung Hsin Electric & Machinery Manufacturing Corp.Chung Hung Steel Corp.Chung Hwa Pulp Corp.Chunghwa Precision Test Tech Co., Ltd.Chunghwa Telecom Co., Ltd., Sponsored ADRChunghwa Telecom Co., Ltd.Cleanaway Co., Ltd.Clevo Co.CMC Magnetics Corp.CoAsia Electronics Corp.Coland Holdings, Ltd.Compal Electronics, Inc.Compeq Manufacturing Co., Ltd.Compucase EnterpriseConcord Securities Co., Ltd.Concraft Holding Co., Ltd.Continental Holdings Corp.Contrel Technology Co., Ltd.Coremax Corp.Coretronic Corp.Co-Tech Development Corp.Cowealth Medical Holding Co., Ltd.Coxon Precise Industrial Co., Ltd.CSBC Corp. TaiwanCTBC Financial Holding Co., Ltd.CTCI Corp.Cub Elecparts, Inc.CviLux Corp.CX Technology Co., Ltd.CyberPower Systems, Inc.CyberTAN Technology, Inc.
122,000 72,3682,412,412 716,356
11,000 11,558168,000 50,559
# 201,323 137,509722,708 595,583104,290 108,708
41,000 166,8501,025,881 789,246
24,000 18,68434,160 22,79531,570 36,792
* 54,000 46,328189,126 203,652349,000 699,717
39,096 35,7054,591 83,558
19,000 149,066116,941 335,68665,560 305,36218,000 12,556
160,570 52,361170,000 114,787
# 621,212 209,112191,629 62,640
2,000 27,7203,702 126,793
82,727 286,190# 45,000 229,676
223,401 227,825#* 893,101 195,196
65,094 19,54311,000 10,166
1,343,747 820,984702,000 601,959
31,000 26,080227,727 53,768
11,515 54,319215,200 120,002
77,000 43,536# 16,772 41,114
208,000 267,097101,253 107,741
14,000 22,61140,000 24,087
* 83,286 69,7291,901,655 1,236,123
222,444 324,73316,450 148,63426,600 21,05416,689 11,52020,000 58,787
152,424 77,841
T.A. World ex U.S. Core Equity PortfolioCONTINUED

Cypress Technology Co., Ltd.DA CIN Construction Co., Ltd.Dadi Early-Childhood Education Group, Ltd.Da-Li Development Co., Ltd.Danen Technology Corp.Darfon Electronics Corp.Darwin Precisions Corp.Daxin Materials Corp.De Licacy Industrial Co., Ltd.Delpha Construction Co., Ltd.Delta Electronics, Inc.Depo Auto Parts Ind Co., Ltd.Dimerco Express Corp.D-Link Corp.Donpon Precision, Inc.Dynamic Electronics Co., Ltd.Dynapack International Technology Corp.E Ink Holdings, Inc.E.Sun Financial Holding Co., Ltd.Eastern Media International Corp.Eclat Textile Co., Ltd.ECOVE Environment Corp.Edimax Technology Co., Ltd.Edison Opto Corp.Edom Technology Co., Ltd.eGalax_eMPIA Technology, Inc.Egis Technology, Inc.Elan Microelectronics Corp.E-Lead Electronic Co., Ltd.E-LIFE MALL Corp.Elite Advanced Laser Corp.Elite Material Co., Ltd.Elite Semiconductor Memory Technology, Inc.Elitegroup Computer Systems Co., Ltd.eMemory Technology, Inc.Ennoconn Corp.EnTie Commercial Bank Co., Ltd.Epileds Technologies, Inc.Epistar Corp.Eson Precision Ind. Co., Ltd.Eternal Materials Co., Ltd.E-Ton Solar Tech Co., Ltd.Etron Technology, Inc.Eurocharm Holdings Co., Ltd.Eva Airways Corp.Everest Textile Co., Ltd.Evergreen International Storage & Transport Corp.Evergreen Marine Corp. Taiwan, Ltd.Everlight Chemical Industrial Corp.Everlight Electronics Co., Ltd.Everspring Industry Co., Ltd.Excelsior Medical Co., Ltd.
Shares Value»
TAIWAN — (Continued)17,000 $ 43,07495,000 59,861
7,495 70,67136,603 35,105
* 121,000 6,173104,000 137,638178,000 102,539
31,100 97,01261,742 46,195
* 53,320 27,56082,699 399,20058,000 133,94327,000 18,548
* 313,976 132,30417,000 12,653
* 134,183 42,87071,000 108,916
171,000 187,3661,753,607 1,460,620
170,064 55,81236,143 472,97814,000 91,938
* 52,313 18,49340,000 18,41654,162 23,78223,861 36,28239,000 275,80482,600 210,534
* 42,000 29,03525,000 51,80693,723 167,885
160,162 609,413# 114,000 119,838
157,087 54,64019,000 228,42018,310 127,770
206,000 107,64629,000 14,458
# 466,743 367,96535,000 44,235
311,993 262,172* 60,667 4,940* 112,000 40,085
17,000 72,7841,618,832 757,807
* 154,995 56,619262,000 120,175768,836 353,759199,155 109,771210,225 202,057
* 35,000 13,18646,172 74,353

EZconn Corp.Far Eastern Department Stores, Ltd.Far Eastern International BankFar Eastern New Century Corp.Far EasTone Telecommunications Co., Ltd.Faraday Technology Corp.Farglory Land Development Co., Ltd.
Federal Corp.Feedback Technology Corp.Feng Hsin Steel Co., Ltd.Feng TAY Enterprise Co., Ltd.First Copper Technology Co., Ltd.First Financial Holding Co., Ltd.First Hi-Tec Enterprise Co., Ltd.First Insurance Co., Ltd. (The)First Steamship Co., Ltd.FLEXium Interconnect, Inc.Flytech Technology Co., Ltd.FocalTech Systems Co., Ltd.Forest Water Environment Engineering Co., Ltd.Formosa Advanced Technologies Co., Ltd.Formosa Chemicals & Fibre Corp.Formosa International Hotels Corp.Formosa Laboratories, Inc.Formosa Petrochemical Corp.Formosa Plastics Corp.Formosa Sumco Technology Corp.Formosan Union ChemicalFortune Electric Co., Ltd.Founding Construction & Development Co., Ltd.Foxsemicon Integrated Technology, Inc.Froch Enterprise Co., Ltd.Fubon Financial Holding Co., Ltd.Fulgent Sun International Holding Co., Ltd.Fulltech Fiber Glass Corp.Fwusow Industry Co., Ltd.Gallant Precision Machining Co., Ltd.Gamania Digital Entertainment Co., Ltd.GCS Holdings, Inc.GEM Services, Inc.Gemtek Technology Corp.General Interface Solution Holding, Ltd.General Plastic Industrial Co., Ltd.Generalplus Technology, Inc.Genesys Logic, Inc.Genius Electronic Optical Co., Ltd.Genmont Biotech, Inc.Getac Technology Corp.Giant Manufacturing Co., Ltd.
12,600 14,837496,249 375,600
1,147,576 459,966571,625 540,806191,000 438,420
62,637 125,032196,575 240,372
T.A. World ex U.S. Core Equity PortfolioCONTINUED
Shares Value»
TAIWAN — (Continued)* 203,567 $ 79,006
6,300 14,824240,000 440,084
52,748 350,780* 61,000 20,153
1,583,859 1,189,21521,000 29,56635,000 16,900
* 227,113 91,182# 158,515 482,429
61,312 149,624# 140,000 103,851
11,349 18,79569,000 73,461
206,821 629,11914,246 77,10338,403 46,947
104,000 352,535114,000 366,716
8,000 28,387142,426 62,153
22,000 17,96947,208 24,10039,845 150,20689,000 36,220
942,019 1,302,30230,808 88,965
163,965 79,57370,321 40,90465,000 40,68746,000 99,63424,000 46,18124,200 49,292
* 153,348 132,182127,000 466,825
19,114 19,64739,000 42,63643,000 44,19346,000 617,48023,000 20,123
182,000 264,522102,760 784,366

Giantplus Technology Co., Ltd.Gigabyte Technology Co., Ltd.Gigasolar Materials Corp.Gigastorage Corp.Ginko International Co., Ltd.Global Brands Manufacture, Ltd.Global Lighting Technologies, Inc.Global Mixed Mode Technology, Inc.Global PMX Co., Ltd.Global Unichip Corp.Globalwafers Co., Ltd.Globe Union Industrial Corp.Gloria Material Technology Corp.Gold Circuit Electronics, Ltd.Goldsun Building Materials Co., Ltd.Good Will Instrument Co., Ltd.Gourmet Master Co., Ltd.
Grand Ocean Retail Group, Ltd.Grand Pacific PetrochemicalGrand Plastic Technology Corp.GrandTech CG Systems, Inc.Grape King Bio, Ltd.Great China Metal IndustryGreat Taipei Gas Co., Ltd.Great Wall Enterprise Co., Ltd.Greatek Electronics, Inc.Green Seal Holding, Ltd.GTM Holdings Corp.HannsTouch Solution, Inc.Harvatek Corp.Hey Song Corp.Highwealth Construction Corp.HIM International Music, Inc.Hiroca Holdings, Ltd.Hitron Technology, Inc.Hiwin Technologies Corp.Ho Tung Chemical Corp.Hocheng Corp.Holiday Entertainment Co., Ltd.Holtek Semiconductor, Inc.Holy Stone Enterprise Co., Ltd.Hon Hai Precision Industry Co., Ltd.Hon Hai Precision Industry Co., Ltd., GDRHon Hai Precision Industry Co., Ltd., GDRHong Pu Real Estate Development Co., Ltd.Hong YI Fiber Industry Co.Horizon Securities Co., Ltd.Hota Industrial Manufacturing Co., Ltd.Hotai Motor Co., Ltd.
169,000 65,087261,000 390,043
* 3,600 15,872* 155,450 45,873
18,000 116,493122,000 66,302
29,000 57,59317,000 54,31915,000 56,45832,000 260,017
# 33,000 350,142129,075 67,024194,636 120,788
* 219,000 93,630# 560,624 149,597
25,000 21,38727,026 160,022
T.A. World ex U.S. Core Equity PortfolioCONTINUED
Shares Value»
TAIWAN — (Continued)40,000 $ 43,437
* 393,000 256,5838,000 34,635
26,250 35,05037,000 229,22057,000 44,59341,000 38,335
382,446 500,135193,000 274,956
29,700 37,30644,350 32,580
#* 269,465 125,83258,239 28,078
129,500 131,896257,478 402,561
19,800 83,44121,795 47,58187,559 57,21069,247 614,120
418,118 94,04366,000 16,34521,000 45,06799,000 221,18877,000 230,378
996,177 2,497,18725,924 132,19929,237 148,524
111,695 73,83264,000 39,229
* 142,000 28,611# 64,047 223,738# 38,000 546,913

Hotron Precision Electronic Industrial Co., Ltd.Hsin Kuang Steel Co., Ltd.Hsin Yung Chien Co., Ltd.Hu Lane Associate, Inc.Hua Nan Financial Holdings Co., Ltd.Huaku Development Co., Ltd.Huang Hsiang Construction Corp.Hung Ching Development & Construction Co., Ltd.Hung Sheng Construction, Ltd.Hwa Fong Rubber Industrial Co., Ltd.Ibase Technology, Inc.IBF Financial Holdings Co., Ltd.Ichia Technologies, Inc.I-Chiun Precision Industry Co., Ltd.Innodisk Corp.Innolux Corp.Inpaq Technology Co., Ltd.Intai Technology Corp.Integrated Service Technology, Inc.IntelliEPI, Inc.International CSRC Investment Holdings Co.International Games System Co., Ltd.Inventec Corp.Iron Force Industrial Co., Ltd.I-Sheng Electric Wire & Cable Co., Ltd.ITE Technology, Inc.ITEQ Corp.
Jarllytec Co., Ltd.Jentech Precision Industrial Co., Ltd.Jess-Link Products Co., Ltd.Jih Lin Technology Co., Ltd.Jih Sun Financial Holdings Co., Ltd.Jourdeness Group, Ltd.K Laser Technology, Inc.Kaimei Electronic Corp.Kaori Heat Treatment Co., Ltd.Kaulin Manufacturing Co., Ltd.KEE TAI Properties Co., Ltd.Kenda Rubber Industrial Co., Ltd.Kenmec Mechanical Engineering Co., Ltd.Kerry TJ Logistics Co., Ltd.Key Ware Electronics Co., Ltd.Kindom Construction Corp.King Chou Marine Technology Co., Ltd.King Slide Works Co., Ltd.King Yuan Electronics Co., Ltd.Kingcan Holdings, Ltd.Kingpak Technology, Inc.Kingpak Technology, Inc.
29,715 45,948# 87,000 85,655
15,800 45,21933,431 83,274
1,042,897 733,92087,540 229,31172,000 72,97660,000 43,709
397,200 256,175* 97,304 35,392
47,353 70,1341,193,220 425,028
* 139,000 71,995* 61,000 16,363
38,061 153,8933,573,685 826,258
27,000 26,25612,000 54,21134,596 52,649
5,000 9,872289,635 352,630
36,000 355,948823,945 612,769
18,000 62,66640,000 53,10548,000 51,065
153,835 670,138
T.A. World ex U.S. Core Equity PortfolioCONTINUED
Shares Value»
TAIWAN — (Continued)26,000 $ 57,227
9,000 36,53845,000 43,80325,000 53,519
795,425 274,17018,000 58,30177,000 51,30518,538 30,90430,147 42,80034,000 17,234
186,790 72,420162,825 151,607
68,000 30,62161,000 70,99049,793 13,071
118,000 95,27339,220 44,907
9,000 94,863805,545 836,173
* 17,712 9,53810,000 47,609
1,044 1,443

King's Town Bank Co., Ltd.King's Town Construction Co., Ltd.Kinik Co.Kinko Optical Co., Ltd.Kinpo ElectronicsKinsus Interconnect Technology Corp.KMC Kuei Meng International, Inc.KS Terminals, Inc.Kung Long Batteries Industrial Co., Ltd.Kung Sing Engineering Corp.Kuo Toong International Co., Ltd.Kuoyang Construction Co., Ltd.Kwong Fong Industries Corp.Kwong Lung Enterprise Co., Ltd.L&K Engineering Co., Ltd.La Kaffa International Co., Ltd.LAN FA TextileLand Mark Optoelectronics Corp.Lanner Electronics, Inc.Largan Precision Co., Ltd.Laser Tek Taiwan Co., Ltd.Laster Tech Corp., Ltd.Leader Electronics, Inc.Lealea Enterprise Co., Ltd.Ledlink Optics, Inc.LEE CHI Enterprises Co., Ltd.Lelon Electronics Corp.Lemtech Holdings Co., Ltd.Leofoo Development Co., Ltd.LES Enphants Co., Ltd.Lextar Electronics Corp.Li Cheng Enterprise Co., Ltd.Li Peng Enterprise Co., Ltd.Lian HWA Food Corp.Lien Hwa Industrial Corp.Lifestyle Global Enterprise, Inc.Lingsen Precision Industries, Ltd.
Lion Travel Service Co., Ltd.Lite-On Semiconductor Corp.Lite-On Technology Corp.Long Da Construction & Development Corp.Longchen Paper & Packaging Co., Ltd.Longwell Co.Lotes Co., Ltd.Lu Hai Holding Corp.Lumax International Corp., Ltd.Lung Yen Life Service Corp.LuxNet Corp.Macauto Industrial Co., Ltd.
403,000 411,68650,000 44,82759,000 111,178
* 37,000 35,579644,000 214,676118,000 149,81526,581 88,69447,162 61,28931,000 165,564
121,000 27,533* 59,103 37,195
169,420 65,47448,915 24,36619,000 27,73074,000 66,656
5,000 28,354* 88,922 21,526# 20,000 157,244# 45,179 113,322
5,000 675,89220,000 17,20718,493 21,833
* 40,000 9,884308,933 90,467
18,900 15,06296,000 29,67840,750 54,522
# 22,000 98,988* 72,917 16,393
81,000 19,480147,500 71,903
55,501 104,997246,366 57,093
48,240 71,902212,055 265,702
6,000 15,156179,000 51,118
T.A. World ex U.S. Core Equity PortfolioCONTINUED
Shares Value»
TAIWAN — (Continued)4,000 $ 10,685
113,448 114,821791,164 1,119,963
41,000 21,863244,293 116,500
41,000 75,19033,653 246,090
6,599 8,82340,034 112,48548,000 95,980
* 26,066 17,55634,000 93,431

Machvision, Inc.Macroblock, Inc.Macronix InternationalMakalot Industrial Co., Ltd.Marketech International Corp.Materials Analysis Technology, Inc.Mayer Steel Pipe Corp.MediaTek, Inc.Mega Financial Holding Co., Ltd.Meiloon Industrial Co.Mercuries & Associates Holding, Ltd.Mercuries Life Insurance Co., Ltd.Merida Industry Co., Ltd.Merry Electronics Co., Ltd.Microbio Co., Ltd.Micro-Star International Co., Ltd.Mildef Crete, Inc.MIN AIK Technology Co., Ltd.Mirle Automation Corp.MJ International Co., Ltd.Mobiletron Electronics Co., Ltd.momo.com, Inc.Motech Industries, Inc.MPI Corp.Nak Sealing Technologies Corp.Namchow Holdings Co., Ltd.Nan Kang Rubber Tire Co., Ltd.Nan Liu Enterprise Co., Ltd.Nan Ren Lake Leisure Amusement Co., Ltd.Nan Ya Plastics Corp.Nan Ya Printed Circuit Board Corp.Nang Kuang Pharmaceutical Co., Ltd.Nantex Industry Co., Ltd.Nanya Technology Corp.National Aerospace Fasteners Corp.National Petroleum Co., Ltd.Nexcom International Co., Ltd.Nichidenbo Corp.Nien Hsing Textile Co., Ltd.Nien Made Enterprise Co., Ltd.Niko Semiconductor Co., Ltd.Nova Technology Corp.Novatek Microelectronics Corp.Nuvoton Technology Corp.O-Bank Co., Ltd.Ocean Plastics Co., Ltd.On-Bright Electronics, Inc.
OptoTech Corp.Orient Europharma Co., Ltd.
9,000 106,2938,000 30,672
# 1,017,974 1,018,594103,561 604,655
15,000 25,02320,355 48,91329,700 14,53559,048 590,611
1,458,365 1,499,62729,050 20,604
201,742 114,739* 508,756 176,658
13,000 80,986# 83,050 399,530* 141,881 61,565
113,394 317,33220,000 27,969
* 64,000 30,04687,805 122,436
8,000 21,24432,600 39,98212,000 100,620
* 155,752 54,30831,000 66,08535,000 79,08784,000 143,331
118,183 141,77613,000 62,58850,000 15,762
321,187 733,412# 100,000 134,986
16,000 15,509137,392 152,799
# 313,110 732,63010,000 29,92967,000 88,95120,000 19,45090,424 142,71862,654 51,82643,000 330,15815,000 17,045
7,000 34,043113,000 596,76049,000 77,466
* 304,000 76,736* 50,000 44,665
17,160 91,533
T.A. World ex U.S. Core Equity PortfolioCONTINUED
Shares Value»
TAIWAN — (Continued)181,183 $ 128,624
9,000 17,489

Orient Semiconductor Electronics, Ltd.Oriental Union Chemical Corp.O-TA Precision Industry Co., Ltd.Pacific Hospital Supply Co., Ltd.Paiho Shih Holdings Corp.Pan Jit International, Inc.Pan-International Industrial Corp.Parade Technologies, Ltd.Paragon Technologies Co., Ltd.PCL Technologies, Inc.P-Duke Technology Co., Ltd.Pegatron Corp.Pharmally International Holding Co., Ltd.Phihong Technology Co., Ltd.Phison Electronics Corp.Phoenix Tours International, Inc.Pixart Imaging, Inc.Planet Technology Corp.Plotech Co., Ltd.Polytronics Technology Corp.Posiflex Technology, Inc.Pou Chen Corp.Power Wind Health Industry, Inc.Powertech Technology, Inc.Poya International Co., Ltd.President Chain Store Corp.President Securities Corp.Primax Electronics, Ltd.Prince Housing & Development Corp.Pro Hawk Corp.Promate Electronic Co., Ltd.Promise Technology, Inc.Prosperity Dielectrics Co., Ltd.Qisda Corp.QST International Corp.Qualipoly Chemical Corp.Quang Viet Enterprise Co., Ltd.Quanta Computer, Inc.Quintain Steel Co., Ltd.Radiant Opto-Electronics Corp.Radium Life Tech Co., Ltd.Rafael Microelectronics, Inc.Realtek Semiconductor Corp.Rechi Precision Co., Ltd.Rexon Industrial Corp., Ltd.Rich Development Co., Ltd.RichWave Technology Corp.Right WAY Industrial Co., Ltd.Ritek Corp.Rodex Fasteners Corp.Roo Hsing Co., Ltd.Rotam Global Agrosciences, Ltd.Ruentex Development Co., Ltd.Ruentex Engineering & Construction Co.Ruentex Industries, Ltd.
* 120,605 59,561# 330,992 250,923
27,642 42,42014,000 36,58246,573 72,141
158,940 129,835# 197,000 158,753
42,000 691,481* 20,423 14,220
15,643 42,23524,970 66,577
# 695,261 1,128,5009,756 72,714
* 148,272 41,30432,000 313,299
7,717 9,0667,000 24,272
15,000 32,15747,000 27,73510,000 20,86429,698 110,175
1,401,528 1,724,7356,856 50,519
453,900 1,239,30818,436 254,20490,768 872,918
455,361 185,504210,000 357,597569,000 202,590
3,000 14,00759,000 62,170
* 34,874 8,751# 46,000 91,277
715,875 443,90927,000 56,98943,547 38,27911,000 57,554
371,007 681,86264,842 14,75885,782 337,107
* 411,030 181,7378,000 53,442
96,098 638,220183,185 145,718
17,000 48,169264,814 80,266
16,500 65,103* 15,000 7,604* 419,606 116,272
11,000 14,476* 295,000 115,289* 21,319 11,880
237,061 314,40513,000 22,934
172,901 367,749

Run Long Construction Co., Ltd.Samebest Co., Ltd.
Sampo Corp.San Fang Chemical Industry Co., Ltd.San Far Property, Ltd.San Shing Fastech Corp.Sanitar Co., Ltd.Sanyang Motor Co., Ltd.SCI Pharmtech, Inc.Scientech Corp.SDI Corp.Senao International Co., Ltd.Senao Networks, Inc.Sercomm Corp.Sesoda Corp.Shan-Loong Transportation Co., Ltd.Sharehope Medicine Co., Ltd.Sheng Yu Steel Co., Ltd.ShenMao Technology, Inc.Shih Her Technologies, Inc.Shih Wei Navigation Co., Ltd.Shin Kong Financial Holding Co., Ltd.Shin Zu Shing Co., Ltd.Shinih Enterprise Co., Ltd.Shining Building Business Co., Ltd.Shinkong Insurance Co., Ltd.Shinkong Synthetic Fibers Corp.Shinkong Textile Co., Ltd.Shiny Chemical Industrial Co., Ltd.Sigurd Microelectronics Corp.Silergy Corp.Simplo Technology Co., Ltd.Sinbon Electronics Co., Ltd.Sincere Navigation Corp.Single Well Industrial Corp.Sinher Technology, Inc.Sinmag Equipment Corp.Sino-American Silicon Products, Inc.Sinon Corp.SinoPac Financial Holdings Co., Ltd.Sinphar Pharmaceutical Co., Ltd.Sinyi Realty Co.Sirtec International Co., Ltd.Sitronix Technology Corp.Siward Crystal Technology Co., Ltd.Solar Applied Materials Technology Co.Solteam, Inc.Sonix Technology Co., Ltd.Southeast Cement Co., Ltd.
87,000 175,3705,000 20,546
T.A. World ex U.S. Core Equity PortfolioCONTINUED
Shares Value»
TAIWAN — (Continued)166,200 $ 98,622
60,648 45,25448,100 34,20249,565 84,31616,000 20,189
200,900 135,02919,450 59,69318,000 38,653
# 59,000 119,75839,000 40,81713,000 41,558
# 61,000 144,356100,191 83,846
48,000 46,11721,814 20,24661,000 40,26044,922 30,90321,000 28,391
* 91,814 27,3602,232,053 645,176
53,549 214,99324,000 13,710
* 227,168 70,23396,000 117,095
601,799 255,17659,000 78,50628,000 73,230
243,000 225,9265,000 100,858
63,600 494,229120,616 512,189158,125 84,647
15,000 10,68433,000 46,63022,196 73,206
263,000 715,480203,000 122,160
1,909,308 757,31634,977 22,552
128,077 128,40260,800 68,95364,000 277,25270,000 47,556
* 124,519 93,82619,190 16,71644,000 43,88833,000 17,632
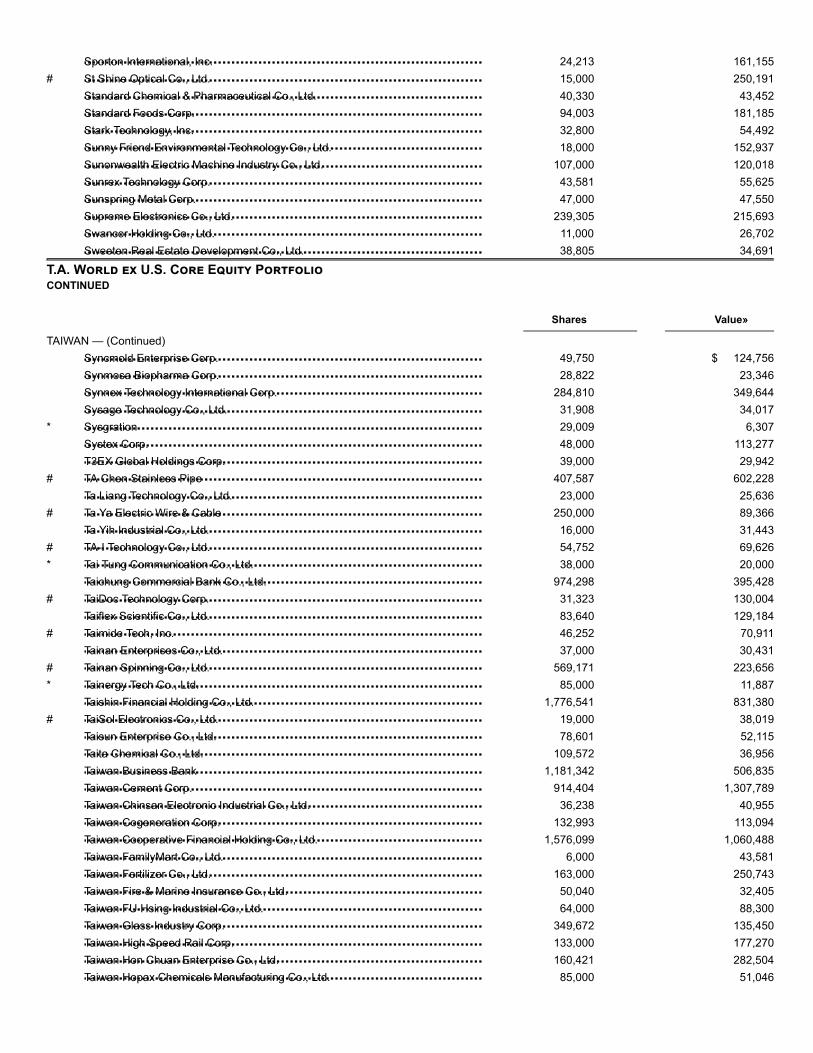
Sporton International, Inc.St Shine Optical Co., Ltd.Standard Chemical & Pharmaceutical Co., Ltd.Standard Foods Corp.Stark Technology, Inc.Sunny Friend Environmental Technology Co., Ltd.Sunonwealth Electric Machine Industry Co., Ltd.Sunrex Technology Corp.Sunspring Metal Corp.Supreme Electronics Co., Ltd.Swancor Holding Co., Ltd.Sweeten Real Estate Development Co., Ltd.
Syncmold Enterprise Corp.Synmosa Biopharma Corp.Synnex Technology International Corp.Sysage Technology Co., Ltd.SysgrationSystex Corp.T3EX Global Holdings Corp.TA Chen Stainless PipeTa Liang Technology Co., Ltd.Ta Ya Electric Wire & CableTa Yih Industrial Co., Ltd.TA-I Technology Co., Ltd.Tai Tung Communication Co., Ltd.Taichung Commercial Bank Co., Ltd.TaiDoc Technology Corp.Taiflex Scientific Co., Ltd.Taimide Tech, Inc.Tainan Enterprises Co., Ltd.Tainan Spinning Co., Ltd.Tainergy Tech Co., Ltd.Taishin Financial Holding Co., Ltd.TaiSol Electronics Co., Ltd.Taisun Enterprise Co., Ltd.Taita Chemical Co., Ltd.Taiwan Business BankTaiwan Cement Corp.Taiwan Chinsan Electronic Industrial Co., Ltd.Taiwan Cogeneration Corp.Taiwan Cooperative Financial Holding Co., Ltd.Taiwan FamilyMart Co., Ltd.Taiwan Fertilizer Co., Ltd.Taiwan Fire & Marine Insurance Co., Ltd.Taiwan FU Hsing Industrial Co., Ltd.Taiwan Glass Industry Corp.Taiwan High Speed Rail Corp.Taiwan Hon Chuan Enterprise Co., Ltd.Taiwan Hopax Chemicals Manufacturing Co., Ltd.
24,213 161,155# 15,000 250,191
40,330 43,45294,003 181,18532,800 54,49218,000 152,937
107,000 120,01843,581 55,62547,000 47,550
239,305 215,69311,000 26,70238,805 34,691
T.A. World ex U.S. Core Equity PortfolioCONTINUED
Shares Value»
TAIWAN — (Continued)49,750 $ 124,75628,822 23,346
284,810 349,64431,908 34,017
* 29,009 6,30748,000 113,27739,000 29,942
# 407,587 602,22823,000 25,636
# 250,000 89,36616,000 31,443
# 54,752 69,626* 38,000 20,000
974,298 395,428# 31,323 130,004
83,640 129,184# 46,252 70,911
37,000 30,431# 569,171 223,656* 85,000 11,887
1,776,541 831,380# 19,000 38,019
78,601 52,115109,572 36,956
1,181,342 506,835914,404 1,307,789
36,238 40,955132,993 113,094
1,576,099 1,060,4886,000 43,581
163,000 250,74350,040 32,40564,000 88,300
349,672 135,450133,000 177,270160,421 282,504
85,000 51,046

Taiwan Land Development Corp.Taiwan Line Tek ElectronicTaiwan Mobile Co., Ltd.Taiwan Navigation Co., Ltd.Taiwan Paiho, Ltd.Taiwan PCB Techvest Co., Ltd.Taiwan Prosperity Chemical Corp.Taiwan Pulp & Paper Corp.Taiwan Sakura Corp.Taiwan Sanyo Electric Co., Ltd.Taiwan Secom Co., Ltd.Taiwan Semiconductor Co., Ltd.Taiwan Semiconductor Manufacturing Co., Ltd., Sponsored ADRTaiwan Semiconductor Manufacturing Co., Ltd.Taiwan Shin Kong Security Co., Ltd.Taiwan Steel Union Co., Ltd.Taiwan Styrene MonomerTaiwan Surface Mounting Technology Corp.Taiwan TEA Corp.Taiwan Union Technology Corp.Taiyen Biotech Co., Ltd.Tatung Co., Ltd.
TCI Co., Ltd.Te Chang Construction Co., Ltd.Teco Electric and Machinery Co., Ltd.Tehmag Foods Corp.Tera Autotech Corp.Test Research, Inc.Test-Rite International Co., Ltd.Tex-Ray Industrial Co., Ltd.Thinking Electronic Industrial Co., Ltd.Thye Ming Industrial Co., Ltd.Ton Yi Industrial Corp.Tong Hsing Electronic Industries, Ltd.Tong Yang Industry Co., Ltd.Tong-Tai Machine & Tool Co., Ltd.TOPBI International Holdings, Ltd.Topco Scientific Co., Ltd.Topco Technologies Corp.Topkey Corp.Topoint Technology Co., Ltd.Toung Loong Textile ManufacturingTPK Holding Co., Ltd.Transcend Information, Inc.Tripod Technology Corp.Tsang Yow Industrial Co., Ltd.Tsann Kuen Enterprise Co., Ltd.TSC Auto ID Technology Co., Ltd.TSEC Corp.
* 371,640 109,35111,337 11,41697,800 344,27773,000 52,506
131,892 387,176140,800 182,775
* 79,000 43,92078,280 47,31357,512 86,40412,750 11,37644,330 123,626
108,000 171,405318,398 13,573,307507,465 4,172,911
94,630 113,45910,000 30,960
280,833 220,142125,867 307,749352,704 183,698101,000 413,031
48,000 52,298* 698,000 448,942
T.A. World ex U.S. Core Equity PortfolioCONTINUED
Shares Value»
TAIWAN — (Continued)21,948 $ 290,32223,562 21,714
545,000 433,98810,500 73,86116,000 13,82799,532 150,419
119,389 78,236* 59,000 17,276
44,000 111,16165,850 68,463
388,200 155,24449,000 201,574
219,041 319,97376,160 44,03232,713 91,53853,945 143,12410,000 22,30832,000 175,83367,044 41,00440,000 66,023
#* 223,000 394,39664,483 140,628
193,970 644,80431,000 22,82829,913 18,43214,630 119,711
* 90,461 25,325

TSRC Corp.Ttet Union Corp.TTFB Co., Ltd.TTY Biopharm Co., Ltd.Tung Ho Steel Enterprise Corp.Tung Thih Electronic Co., Ltd.TURVO International Co., Ltd.TWi Pharmaceuticals, Inc.TXC Corp.TYC Brother Industrial Co., Ltd.Tycoons Group EnterpriseTyntek Corp.UDE Corp.Ultra Chip, Inc.U-Ming Marine Transport Corp.Unimicron Technology Corp.Union Bank Of TaiwanUni-President Enterprises Corp.Unitech Printed Circuit Board Corp.United Integrated Services Co., Ltd.United Microelectronics Corp.United Orthopedic Corp.United Radiant TechnologyUnited Renewable Energy Co., Ltd.Unity Opto Technology Co., Ltd.Universal Cement Corp.Universal Microelectronics Co., Ltd.Universal Microwave Technology, Inc.Unizyx Holding Corp.UPC Technology Corp.Userjoy Technology Co., Ltd.USI Corp.
Usun Technology Co., Ltd.Utechzone Co., Ltd.Vanguard International Semiconductor Corp.VHQ Media Holdings, Ltd.Visual Photonics Epitaxy Co., Ltd.Vivotek, Inc.Voltronic Power Technology Corp.Wafer Works Corp.Waffer Technology Corp.Wah Hong Industrial Corp.Wah Lee Industrial Corp.Walsin Lihwa Corp.Walsin Technology Corp.Walton Advanced Engineering, Inc.Wan Hai Lines, Ltd.Wei Chuan Foods Corp.Weikeng Industrial Co., Ltd.
240,717 208,83115,000 58,555
6,000 59,49963,267 164,234
402,254 278,13125,492 57,12229,135 69,228
* 16,000 36,481118,411 145,514111,000 100,058
* 152,401 32,699103,167 55,395
36,000 31,17538,000 40,344
191,000 214,300666,356 804,489561,606 216,342395,948 1,024,897364,321 275,852
82,000 414,8724,748,453 2,108,296
24,924 37,42828,000 16,391
* 859,613 246,496* 115,929 33,001
186,340 113,105* 22,000 12,837
21,916 72,789* 133,000 106,833
353,654 127,60010,452 21,072
465,861 178,398
T.A. World ex U.S. Core Equity PortfolioCONTINUED
Shares Value»
TAIWAN — (Continued)15,400 $ 14,61722,000 49,882
261,000 526,88310,000 46,53089,475 285,60721,700 77,84113,100 282,405
120,593 138,20516,000 6,76524,423 21,89379,000 138,022
1,212,000 581,147# 113,000 628,753
166,385 55,370297,557 197,861113,000 108,453119,907 77,624

Well Shin Technology Co., Ltd.Weltrend SemiconductorWin Semiconductors Corp.Winbond Electronics Corp.Winstek Semiconductor Co., Ltd.Wintek Corp.Wisdom Marine Lines Co., Ltd.Wisechip Semiconductor, Inc.Wistron Corp.Wistron NeWeb Corp.Wonderful Hi-Tech Co., Ltd.Wowprime Corp.WPG Holdings, Ltd.WT Microelectronics Co., Ltd.XAC Automation Corp.XPEC Entertainment, Inc.Xxentria Technology Materials Corp.Yageo Corp.Yang Ming Marine Transport Corp.YC Co., Ltd.YC INOX Co., Ltd.Yea Shin International Development Co., Ltd.Yeong Guan Energy Technology Group Co., Ltd.YFC-Boneagle Electric Co., Ltd.YFY, Inc.Yi Jinn Industrial Co., Ltd.Yieh Phui Enterprise Co., Ltd.Yonyu Plastics Co., Ltd.Youngtek Electronics Corp.Yuanta Financial Holding Co., Ltd.Yuanta Futures Co., Ltd.Yuen Chang Stainless Steel Co., Ltd.Yulon Finance Corp.Yulon Motor Co., Ltd.Yung Chi Paint & Varnish Manufacturing Co., Ltd.Yungshin Construction & Development Co., Ltd.YungShin Global Holding Corp.Zeng Hsing Industrial Co., Ltd.Zenitron Corp.Zero One Technology Co., Ltd.Zhen Ding Technology Holding, Ltd.Zig Sheng Industrial Co., Ltd.
Zinwell Corp.Zippy Technology Corp.ZongTai Real Estate Development Co., Ltd.
TOTAL TAIWAN
Advanced Info Service PCLAdvanced Information Technology PCL
44,000 72,06617,000 14,493
121,868 1,029,9632,075,117 1,265,087
31,000 26,680312,087 3,443170,052 177,608
7,000 8,5331,094,506 813,119
114,113 285,62938,000 22,12245,000 114,287
385,756 509,547220,836 286,603
13,000 11,9735,612 448
48,306 109,018# 129,261 1,085,406* 563,428 157,396
185,019 73,156112,200 94,67984,533 46,302
* 47,432 86,03045,000 42,443
# 615,000 228,635114,700 51,565470,380 136,661
36,400 39,41851,120 75,290
2,189,991 1,226,98029,000 46,42849,000 33,51772,600 272,920
468,223 359,46632,000 76,19924,000 25,78469,950 92,53831,423 136,82087,000 60,60433,000 32,061
320,650 1,166,503200,543 56,660
T.A. World ex U.S. Core Equity PortfolioCONTINUED
Shares Value»
TAIWAN — (Continued)136,000 $ 98,622
50,000 56,29183,477 62,634
156,364,619
THAILAND — (0.8%)75,600 523,58327,600 21,717

AEON Thana Sinsap Thailand PCLAirports of Thailand PCLAJ Plast PCLAllianz Ayudhya General Insurance PCLAmata Corp. PCLAnanda Development PCLAP Thailand PCLAsia Aviation PCLAsia Plus Group Holdings PCLAsia Sermkij Leasing PCLAsian Insulators PCLB Grimm Power PCLBangchak Corp. PCLBangkok Aviation Fuel Services PCLBangkok Bank PCLBangkok Chain Hospital PCLBangkok Dusit Medical Services PCL, Class FBangkok Expressway & Metro PCLBangkok Land PCLBangkok Life Assurance PCLBangkok Ranch PCLBanpu PCLBanpu PCLBanpu Power PCLBCPG PCLBeauty Community PCLBEC World PCLBerli Jucker PCLBetter World Green PCLBig Camera Corp. PCLBJC Heavy Industries PCLBTS Group Holdings PCLBumrungrad Hospital PCLBuriram Sugar PCLCal-Comp Electronics Thailand PCLCarabao Group PCL, Class FCentral Pattana PCLCentral Plaza Hotel PCLCH Karnchang PCLCharoen Pokphand Foods PCLChularat Hospital PCL, Class FCK Power PCLCOL PCLCom7 PCLCountry Group Development PCLCP ALL PCLDhipaya Insurance PCLDiamond Building Products PCLDynasty Ceramic PCLEastern Polymer Group PCL, Class FEastern Printing PCL
45,300 349,085211,000 493,96842,900 12,554
3,900 5,29455,400 43,412
520,700 60,611542,404 134,918627,800 78,386518,200 46,841
53,000 42,910416,640 18,559
54,600 63,024238,100 234,190105,350 124,173
26,400 155,799361,975 181,252443,400 360,429
1,166,202 398,1514,276,400 239,161
78,400 66,279202,500 21,596465,300 216,348204,750 95,202
63,900 45,917168,500 107,932624,000 75,882
* 729,900 236,141200,900 338,045408,300 11,417977,700 39,420114,800 9,929174,100 70,195
91,500 507,259123,700 24,133604,518 34,398
35,800 91,086136,400 324,868200,200 221,323
53,300 46,792772,700 697,201
1,240,700 96,013411,300 89,60214,000 10,925
114,200 93,759* 645,200 22,028
334,500 943,517144,400 116,910
8,300 1,6331,335,900 96,430
155,800 35,461214,032 25,053
T.A. World ex U.S. Core Equity PortfolioCONTINUED
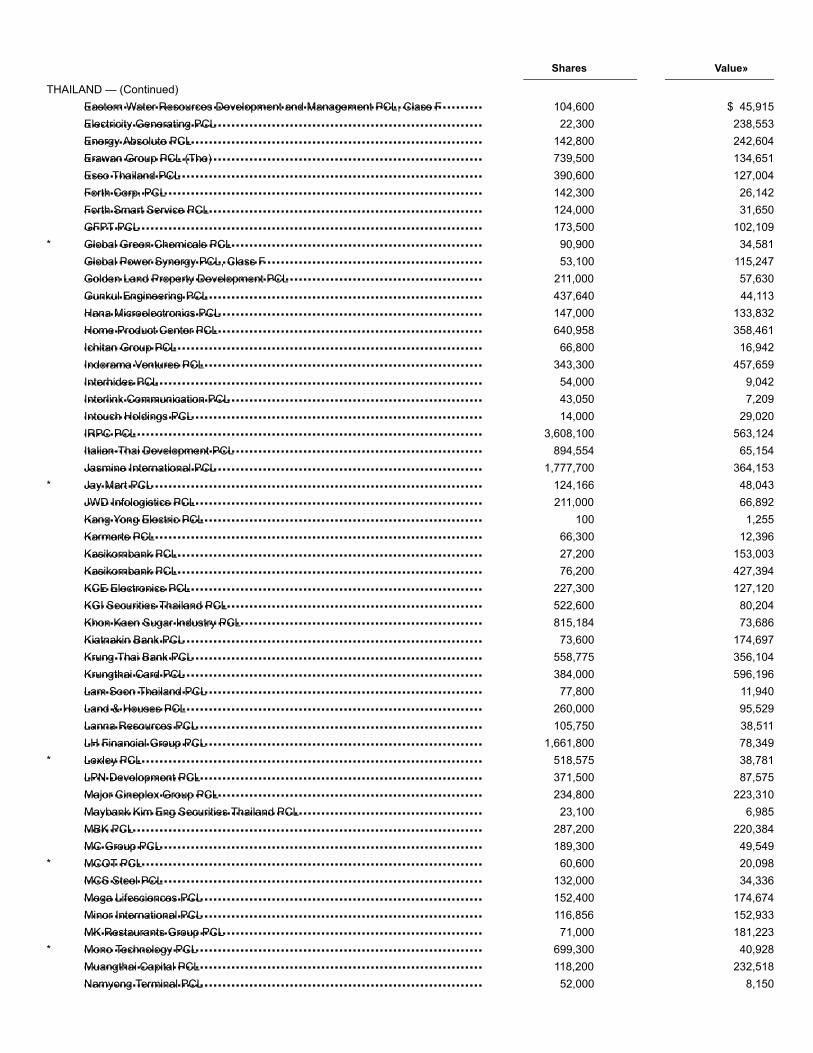
Eastern Water Resources Development and Management PCL, Class FElectricity Generating PCLEnergy Absolute PCLErawan Group PCL (The)Esso Thailand PCLForth Corp. PCLForth Smart Service PCLGFPT PCLGlobal Green Chemicals PCLGlobal Power Synergy PCL, Class FGolden Land Property Development PCLGunkul Engineering PCLHana Microelectronics PCLHome Product Center PCLIchitan Group PCLIndorama Ventures PCLInterhides PCLInterlink Communication PCLIntouch Holdings PCLIRPC PCLItalian-Thai Development PCLJasmine International PCLJay Mart PCLJWD Infologistics PCLKang Yong Electric PCLKarmarts PCLKasikornbank PCLKasikornbank PCLKCE Electronics PCLKGI Securities Thailand PCLKhon Kaen Sugar Industry PCLKiatnakin Bank PCLKrung Thai Bank PCLKrungthai Card PCLLam Soon Thailand PCLLand & Houses PCLLanna Resources PCLLH Financial Group PCLLoxley PCLLPN Development PCLMajor Cineplex Group PCLMaybank Kim Eng Securities Thailand PCLMBK PCLMC Group PCLMCOT PCLMCS Steel PCLMega Lifesciences PCLMinor International PCLMK Restaurants Group PCLMono Technology PCLMuangthai Capital PCLNamyong Terminal PCL
Shares Value»
THAILAND — (Continued)104,600 $ 45,915
22,300 238,553142,800 242,604739,500 134,651390,600 127,004142,300 26,142124,000 31,650173,500 102,109
* 90,900 34,58153,100 115,247
211,000 57,630437,640 44,113147,000 133,832640,958 358,461
66,800 16,942343,300 457,659
54,000 9,04243,050 7,20914,000 29,020
3,608,100 563,124894,554 65,154
1,777,700 364,153* 124,166 48,043
211,000 66,892100 1,255
66,300 12,39627,200 153,00376,200 427,394
227,300 127,120522,600 80,204815,184 73,686
73,600 174,697558,775 356,104384,000 596,196
77,800 11,940260,000 95,529105,750 38,511
1,661,800 78,349* 518,575 38,781
371,500 87,575234,800 223,310
23,100 6,985287,200 220,384189,300 49,549
* 60,600 20,098132,000 34,336152,400 174,674116,856 152,93371,000 181,223
* 699,300 40,928118,200 232,51852,000 8,150

Netbay PCLOrigin Property PCL, Class FPCS Machine Group Holding PCLPlan B Media Pcl, Class FPlatinum Group PCL (The)Polyplex Thailand PCLPrecious Shipping PCL
Premier Marketing PCLPrima Marine PCLPrincipal Capital PCLProperty Perfect PCLPruksa Holding PCLPTG Energy PCLPTT Exploration & Production PCLPTT Global Chemical PCLPTT PCLPTT PCLPylon PCLQuality Houses PCLRaimon Land PCLRajthanee Hospital PCLRatch Group PCLRatch Group PCLRatchthani Leasing PCLRegional Container Lines PCLRobinson PCLRojana Industrial Park PCLRS PCLS 11 Group PCLSamart Corp. PCLSamart Telcoms PCLSansiri PCLSappe PCLSC Asset Corp. PCLScan Inter PCLSEAFCO PCLSiam Cement PCL (The)Siam City Cement PCLSiam Commercial Bank PCL (The)Siam Future Development PCLSiam Global House PCLSiam Wellness Group PclSiamgas & Petrochemicals PCLSingha Estate PCLSNC Former PCLSomboon Advance Technology PCLSPCG PCLSri Trang Agro-Industry PCLSri Trang Agro-Industry PCL
12,000 12,096411,500 109,04741,000 8,465
230,500 64,08028,600 5,905
146,200 73,682* 165,000 45,871
T.A. World ex U.S. Core Equity PortfolioCONTINUED
Shares Value»
THAILAND — (Continued)112,400 $ 34,171176,800 50,013
* 136,700 18,8461,518,700 38,517
307,700 220,107449,700 328,995233,985 1,030,888347,545 683,677189,000 290,367
1,631,640 2,506,74776,800 15,482
2,019,109 199,580859,600 30,465
43,200 38,27712,000 26,33747,699 104,688
768,500 183,660* 173,100 24,990
47,200 97,454383,190 79,740136,700 71,117
82,600 21,620115,700 37,996110,000 43,635
2,954,733 143,14997,100 71,984
641,562 59,66191,000 9,823
154,000 40,81011,400 160,87115,435 119,445
141,600 633,068480,912 100,076206,279 111,339
37,400 15,809488,800 154,960522,564 60,489
8,800 4,03495,050 58,721
257,400 159,018126,360 48,892210,920 81,611

Sriracha Construction PCLSrisawad Corp. PCLSrithai Superware PCLStar Petroleum Refining PCLSupalai PCLSuper Energy Corp. PCLSVI PCLSynnex Thailand PCLSyntec Construction PCLTaokaenoi Food & Marketing PCL, Class FTata Steel Thailand PCLThai Airways International PCLThai Airways International PCLThai Oil PCLThai Reinsurance PCLThai Solar Energy PCL, Class FThai Stanley Electric PCL, Class F
Thai Union Group PCL, Class FThai Vegetable Oil PCLThai Wah PCLThaicom PCLThaicom PCLThaifoods Group PCLThaire Life Assurance PCLThanachart Capital PCLThitikorn PCLThoresen Thai Agencies PCLTipco Asphalt PCLTIPCO Foods PCLTisco Financial Group PCLTMB Bank PCLTMT Steel PCLTotal Access Communication PCLTotal Access Communication PCLTPI Polene PCLTPI Polene Power PCLTrue Corp. PCLTrue Corp. PCLTTCL PCLTTCL PCLTTW PCLU City PCL, Class FUnique Engineering & Construction PCLUnited Paper PCLUnivanich Palm Oil PCLUniventures PCLVanachai Group PCLVGI Global Media PCLVibhavadi Medical Center PCL
* 26,800 10,283211,310 376,174372,000 12,338970,500 310,825392,475 280,749
* 5,854,300 135,150234,000 30,586
87,780 28,256228,200 18,995221,700 81,457
* 1,030,600 23,122* 358,500 120,063* 60,600 20,295
426,800 957,542426,400 11,230141,330 12,775
9,600 67,423
T.A. World ex U.S. Core Equity PortfolioCONTINUED
Shares Value»
THAILAND — (Continued)173,140 $ 106,400190,400 177,987109,900 25,729
* 80,600 15,331* 109,200 20,771
383,800 53,910112,800 19,255215,300 413,029
40,900 13,299334,851 67,504162,000 103,769
85,900 31,282111,900 367,482
3,753,600 230,672187,600 32,939235,300 447,571
46,900 89,2102,028,000 125,287
254,500 49,6502,587,642 542,685
999,565 209,631* 45,600 16,013* 19,363 6,800
346,900 152,273* 547,900 32,958
219,345 77,739133,000 48,867
44,900 7,665288,800 62,915244,900 39,655203,700 63,915
1,436,000 103,655

Vinythai PCLWHA Corp. PCLWHA Utilities and Power PCLWorkpoint Entertainment PCL
TOTAL THAILAND
Adana Cimento Sanayii TAS, Class AAkbank Turk A.S.Akcansa Cimento A.S.Aksa Akrilik Kimya Sanayii A.S.Aksa Enerji Uretim A.S.Aksigorta A.S.Alarko Holding A.S.Albaraka Turk Katilim Bankasi A.S.Alkim Alkali Kimya A.S.Anadolu Anonim Turk Sigorta SirketiAnadolu Cam Sanayii A.S.Anadolu Efes Biracilik Ve Malt Sanayii A.S.Anadolu Hayat Emeklilik A.S.Arcelik A.S.Aselsan Elektronik Sanayi Ve Ticaret A.S.Aygaz A.S.Bera Holding A.S.Besiktas Futbol Yatirimlari Sanayi ve Ticaret A.S.BIM Birlesik Magazalar A.S.Borusan Mannesmann Boru Sanayi ve Ticaret A.S.
Boyner Perakende Ve Tekstil Yatirimlari A.S.Bursa Cimento Fabrikasi A.S.Cemtas Celik Makina Sanayi Ve Ticaret A.S.Cimsa Cimento Sanayi VE Ticaret A.S.Coca-Cola Icecek A.S.Dogus Otomotiv Servis ve Ticaret A.S.EGE Endustri VE Ticaret A.S.ENERJISA ENERJI ASEnka Insaat ve Sanayi A.S.Erbosan Erciyas Boru Sanayii ve Ticaret A.S.Eregli Demir ve Celik Fabrikalari TASFenerbahce Futbol A.S.Ford Otomotiv Sanayi A.S.Global Yatirim Holding A.S.Goodyear Lastikleri TASGSD Holding ASGubre Fabrikalari TASHektas Ticaret TASIhlas Holding A.S.Kardemir Karabuk Demir Celik Sanayi ve Ticaret A.S., Class AKardemir Karabuk Demir Celik Sanayi ve Ticaret A.S., Class DKarsan Otomotiv Sanayii Ve Ticaret A.S.KOC Holding A.S.
79,400 67,124437,100 66,514315,800 63,150
44,200 40,959
30,439,402
TURKEY — (0.2%)20,624 25,515
* 341,724 457,12535,588 42,24743,895 74,301
* 47,841 20,62780,848 66,980
110,684 65,664* 229,211 49,432
8,700 42,33354,184 39,309
212,261 108,51543,991 168,80018,435 16,616
* 46,518 145,1967,370 24,940
17,557 32,125* 154,605 50,099* 44,015 11,653
61,060 512,53720,919 30,747
T.A. World ex U.S. Core Equity PortfolioCONTINUED
Shares Value»
TURKEY — (Continued)* 17,656 $ 26,583* 21,402 17,050
30,838 30,593* 25,331 30,604
36,806 218,898* 28,345 25,406
615 58,80662,099 67,31942,234 46,097
8,272 22,641317,734 422,039
* 11,698 15,7599,472 103,526
* 55,198 33,97857,623 26,896
* 90,000 13,658* 15,038 9,428* 18,329 43,826* 420,638 35,960
91,735 34,018134,706 52,658
* 93,429 18,55251,091 171,069

Konya Cimento Sanayii A.S.Kordsa Teknik Tekstil A.S.Koza Altin Isletmeleri A.S.Logo Yazilim Sanayi Ve Ticaret A.S.Migros Ticaret A.S.Netas Telekomunikasyon A.S.Nuh Cimento Sanayi A.S.Pegasus Hava Tasimaciligi A.S.Petkim Petrokimya Holding A.S.Polisan Holding A.S.Sarkuysan Elektrolitik Bakir Sanayi ve Ticaret A.S.Sasa Polyester Sanayi A.S.Sekerbank Turk ASSelcuk Ecza Deposu Ticaret ve Sanayi A.S.Soda Sanayii A.S.Tat Gida Sanayi A.S.TAV Havalimanlari Holding A.S.Tekfen Holding A.S.Tofas Turk Otomobil Fabrikasi A.S.Trakya Cam Sanayii A.S.Tupras Turkiye Petrol Rafinerileri A.S.Turk Hava Yollari AOTurk Telekomunikasyon A.S.Turk Traktor ve Ziraat Makineleri A.S.Turkcell Iletisim Hizmetleri A.S.Turkcell Iletisim Hizmetleri A.S., ADRTurkiye Garanti Bankasi A.S.Turkiye Halk Bankasi A.S.Turkiye Is Bankasi, Class CTurkiye Sinai Kalkinma Bankasi A.S.Turkiye Sise ve Cam Fabrikalari A.S.Turkiye Vakiflar Bankasi TAO, Class DUlker Biskuvi Sanayi A.S.Vestel Elektronik Sanayi ve Ticaret A.S.Yapi ve Kredi Bankasi A.S.Yatas Yatak ve Yorgan Sanayi ve Ticaret A.S.
Zorlu Enerji Elektrik Uretim A.S.
TOTAL TURKEY
4imprint Group P.L.C.888 Holdings P.L.C.A.G. Barr P.L.C.AA P.L.C.Acacia Mining P.L.C.Admiral Group P.L.C.Aggreko P.L.C.Air Partner P.L.C.Anglo American P.L.C.Anglo-Eastern Plantations P.L.C.
* 12 39534,473 76,682
* 8,332 84,759* 12,045 94,835* 21,932 66,618* 19,492 25,524
18,387 20,695* 26,634 226,468* 213,567 149,663
17,402 7,139111,485 72,11811,571 12,751
* 197,155 34,14472,493 60,18999,082 108,454
* 26,900 24,01465,370 293,791
108,194 456,89331,476 110,872
209,372 103,72313,008 326,189
* 226,248 504,397* 66,604 64,140* 4,531 30,237
196,131 457,0559,157 50,821
* 136,402 239,908144,619 155,413
* 243,241 270,826* 707,163 105,101
12,313 10,867218,335 197,936
* 139,080 461,742* 37,710 63,555* 286,653 139,538* 87,870 85,158
T.A. World ex U.S. Core Equity PortfolioCONTINUED
Shares Value»
TURKEY — (Continued)* 158,755 $ 34,595
8,737,330
UNITED KINGDOM — (11.2%)2,065 70,089
120,773 223,39073,131 611,360
206,663 125,295* 118,075 321,175
33,621 884,169167,992 1,694,859
15,229 13,243444,183 10,884,436
542 3,007

Antofagasta P.L.C.Arrow Global Group P.L.C.Ashmore Group P.L.C.Ashtead Group P.L.C.ASOS P.L.C.Associated British Foods P.L.C.AstraZeneca P.L.C., Sponsored ADRAstraZeneca P.L.C.Auto Trader Group P.L.C.AVEVA Group P.L.C.Aviva P.L.C.Avon Rubber P.L.C.B&M European Value Retail SABabcock International Group P.L.C.BAE Systems P.L.C.Balfour Beatty P.L.C.Bank of Georgia Group P.L.C.Barclays P.L.C., Sponsored ADRBarclays P.L.C.Barratt Developments P.L.C.BBA Aviation P.L.C.Beazley P.L.C.Begbies Traynor Group P.L.C.Bellway P.L.C.Berkeley Group Holdings P.L.C.BHP Group P.L.C., ADRBHP Group P.L.C.Bloomsbury Publishing P.L.C.Bodycote P.L.C.Boohoo Group P.L.C.Bovis Homes Group P.L.C.BP P.L.C., Sponsored ADRBP P.L.C.Braemar Shipping Services P.L.C.Brewin Dolphin Holdings P.L.C.British American Tobacco P.L.C., Sponsored ADRBritish American Tobacco P.L.C.Britvic P.L.C.BT Group P.L.C., Sponsored ADRBT Group P.L.C.BTG P.L.C.Bunzl P.L.C.Burberry Group P.L.C.Burford Capital, Ltd.Cairn Energy P.L.C.
Capita P.L.C.Capital & Counties Properties P.L.C.Carclo P.L.C.Card Factory P.L.C.
84,007 947,83688,475 288,448
156,032 1,013,489118,226 3,250,879
* 7,912 248,45664,868 1,906,572
213,118 9,251,4521,641 141,772
368,944 2,421,9633,463 167,298
745,696 3,661,0806,677 108,889
580,889 2,607,375172,093 991,728298,043 1,980,117247,888 618,404
22,423 380,721257,075 1,922,921709,856 1,328,728330,042 2,576,712494,256 1,919,802183,753 1,283,320
12,000 11,70687,934 3,169,63162,800 2,953,66175,383 3,598,784
133,997 3,194,96121,145 59,206
123,910 1,105,582* 235,609 682,714
72,362 924,350513,940 20,423,979
1,325 8,7673,998 9,629
236,584 916,64033,528 1,193,932
149,195 5,316,195108,262 1,202,819
35,000 417,200857,607 2,008,817
* 35,545 361,20637,449 976,09560,755 1,675,24555,480 1,010,321
* 130,985 251,413
T.A. World ex U.S. Core Equity PortfolioCONTINUED
Shares Value»
UNITED KINGDOM — (Continued)* 198,897 $ 280,514
275,370 662,113* 13,633 1,773
150,506 302,367

CareTech Holdings P.L.C.Carnival P.L.C.Carnival P.L.C., ADRCarpetright P.L.C.Carr's Group P.L.C.Castings P.L.C.Centamin P.L.C.Centrica P.L.C.Charles Stanley Group P.L.C.Chemring Group P.L.C.Chesnara P.L.C.Cineworld Group P.L.C.Circassia Pharmaceuticals P.L.C.City of London Investment Group P.L.C.Clarkson P.L.C.Clipper Logistics P.L.C.Close Brothers Group P.L.C.CLS Holdings P.L.C.CMC Markets P.L.C.Cobham P.L.C.Coca-Cola HBC AGCompass Group P.L.C.Computacenter P.L.C.Connect Group P.L.C.Consort Medical P.L.C.ConvaTec Group P.L.C.Costain Group P.L.C.Countryside Properties P.L.C.Countrywide P.L.C.Cranswick P.L.C.Crest Nicholson Holdings P.L.C.Croda International P.L.C.CYBG P.L.C.Daily Mail & General Trust P.L.C., Class ADart Group P.L.C.DCC P.L.C.De La Rue P.L.C.Devro P.L.C.DFS Furniture P.L.C.Diageo P.L.C., Sponsored ADRDiageo P.L.C.Dialight P.L.C.Dignity P.L.C.Diploma P.L.C.Direct Line Insurance Group P.L.C.DiscoverIE Group P.L.C.Dixons Carphone P.L.C.Domino's Pizza Group P.L.C.Drax Group P.L.C.DS Smith P.L.C.Dunelm Group P.L.C.easyJet P.L.C.EI Group P.L.C.Electrocomponents P.L.C.Elementis P.L.C.
7,081 32,08812,420 560,628
730 33,471* 35,172 6,476
9,590 17,5091,976 9,902
579,273 903,8901,448,225 1,333,216
382 1,339100,630 224,319
26,225 105,501446,619 1,386,407
* 20,894 5,0344,266 22,1393,841 119,6705,686 18,487
88,703 1,432,11846,017 127,76975,060 89,037
* 588,621 1,178,63048,919 1,683,265
121,028 3,062,06947,733 885,38655,168 25,30511,442 104,094
360,189 680,55465,361 124,69767,627 241,143
* 92,209 5,56426,191 847,697
138,429 615,58027,000 1,533,686
185,359 386,24732,806 315,108
939 8,61212,545 1,057,90339,052 110,862
111,395 278,22212,850 36,82120,387 3,402,18319,831 826,956
* 7,092 31,16313,885 91,18261,364 1,131,108
607,251 2,375,38513,621 73,534
336,067 487,046188,182 565,512221,659 812,198422,371 1,821,738
39,290 440,33942,738 500,844
* 254,877 873,701270,323 1,991,787131,108 240,347

EMIS Group P.L.C.EnQuest P.L.C.Entertainment One, Ltd.Equiniti Group P.L.C.Essentra P.L.C.Euromoney Institutional Investor P.L.C.Evraz P.L.C.Experian P.L.C.FDM Group Holdings P.L.C.Ferguson P.L.C.Ferrexpo P.L.C.Fevertree Drinks P.L.C.Findel P.L.C.Firstgroup P.L.C.Flowtech Fluidpower P.L.C.Forterra P.L.C.Foxtons Group P.L.C.Fresnillo P.L.C.Future P.L.C.G4S P.L.C.Galliford Try P.L.C.Games Workshop Group P.L.C.Gem Diamonds, Ltd.Genel Energy P.L.C.Genus P.L.C.Georgia Capital P.L.C.GlaxoSmithKline P.L.C., Sponsored ADRGlaxoSmithKline P.L.C.Glencore P.L.C.Go-Ahead Group P.L.C. (The)GoCo Group P.L.C.Grafton Group P.L.C.Grainger P.L.C.Greencore Group P.L.C.Greene King P.L.C.Greggs P.L.C.Gulf Keystone Petroleum, Ltd.Gulf Marine Services P.L.C.GVC Holdings P.L.C.Gym Group P.L.C. (The)Halfords Group P.L.C.Halma P.L.C.Hargreaves Lansdown P.L.C.Hastings Group Holdings P.L.C.Hays P.L.C.Headlam Group P.L.C.Helical P.L.C.Henry Boot P.L.C.Highland Gold Mining, Ltd.
T.A. World ex U.S. Core Equity PortfolioCONTINUED
Shares Value»
UNITED KINGDOM — (Continued)5,988 $ 88,604
* 703,615 198,343185,088 988,453
25,799 65,94181,506 422,59819,789 333,561
107,225 839,87061,660 1,870,096
3,926 39,30434,587 2,573,678
266,878 825,7727,797 221,034
* 17,046 48,277* 734,155 1,021,867
6,694 11,3535,070 17,273
* 80,868 55,35119,968 144,121
2,237 30,793517,780 1,201,741
70,799 507,1368,770 481,316
* 196,540 164,00445,011 104,715
9,211 295,685* 10,657 126,967
198,016 8,174,10026,079 539,338
1,880,751 6,031,22731,861 823,64690,463 94,14862,797 552,63424,338 67,24241,890 109,010
204,084 1,549,61476,734 2,079,65474,454 211,781
* 11,440 1,304163,379 1,170,427
15,488 48,152148,253 344,215139,141 3,360,181
30,925 785,649110,882 260,301
1,083,617 2,023,73217,127 92,286
122,417 532,9722,952 8,800
15,722 41,585

Hikma Pharmaceuticals P.L.C.Hill & Smith Holdings P.L.C.Hilton Food Group P.L.C.Hiscox, Ltd.Hochschild Mining P.L.C.Hollywood Bowl Group P.L.C.HomeServe P.L.C.Hostelworld Group P.L.C.Howden Joinery Group P.L.C.HSBC Holdings P.L.C.
HSBC Holdings P.L.C., Sponsored ADRHunting P.L.C.Huntsworth P.L.C.Ibstock P.L.C.IMI P.L.C.Imperial Brands P.L.C.Inchcape P.L.C.Indivior P.L.C.Informa P.L.C.Inmarsat P.L.C.InterContinental Hotels Group P.L.C., ADRInterContinental Hotels Group P.L.C.International Consolidated Airlines Group SAIntertek Group P.L.C.Investec P.L.C.ITE Group P.L.C.ITV P.L.C.IWG P.L.C.J D Wetherspoon P.L.C.J Sainsbury P.L.C.James Fisher & Sons P.L.C.JD Sports Fashion P.L.C.John Laing Group P.L.C.John Menzies P.L.C.John Wood Group P.L.C.Johnson Matthey P.L.C.Joules Group P.L.C.JPJ Group P.L.C.Jupiter Fund Management P.L.C.Just Eat P.L.C.Just Group P.L.C.Kainos Group P.L.C.KAZ Minerals P.L.C.KCOM Group P.L.C.Keller Group P.L.C.Kier Group P.L.C.Kin & Carta P.L.C.Kingfisher P.L.C.Lamprell P.L.C.
39,672 885,05644,600 612,494
5,319 60,226109,377 2,251,444177,206 444,410
11,862 31,005162,939 2,254,460
2,814 5,829421,527 2,831,660530,401 4,247,710
T.A. World ex U.S. Core Equity PortfolioCONTINUED
Shares Value»
UNITED KINGDOM — (Continued)300,322 $12,060,931
62,132 382,87350,950 61,940
143,385 402,403217,991 2,760,112
90,005 2,284,331239,911 1,817,528
* 212,291 140,372185,224 1,961,107195,765 1,360,973
10,590 742,8959,638 669,629
197,808 1,017,86536,030 2,494,151
216,890 1,234,044239,883 212,765898,247 1,206,480408,857 1,872,662
65,453 1,220,417337,113 804,43026,218 694,739
193,896 1,529,1412,011 9,397
55,353 278,876402,304 2,592,330
27,274 1,063,4606,431 20,273
* 7,755 64,830266,659 1,206,650
* 21,760 200,192* 232,274 132,793
3,675 25,046112,829 781,015291,447 425,811
41,282 329,53146,982 35,05985,113 107,437
691,440 1,866,809* 192,715 128,683

Lancashire Holdings, Ltd.Legal & General Group P.L.C.Liberty Global P.L.C., Class ALiberty Global P.L.C., Class CLloyds Banking Group P.L.C.Lloyds Banking Group P.L.C., ADRLondon Stock Exchange Group P.L.C.Lookers P.L.C.Low & Bonar P.L.C.LSL Property Services P.L.C.Man Group P.L.C.Marks & Spencer Group P.L.C.Marshalls P.L.C.Marston's P.L.C.McBride P.L.C.McCarthy & Stone P.L.C.Mears Group P.L.C.Mediclinic International P.L.C.Mediclinic International P.L.C.Meggitt P.L.C.
Melrose Industries P.L.C.Merlin Entertainments P.L.C.Micro Focus International P.L.C., Sponsored ADRMicro Focus International P.L.C.Millennium & Copthorne Hotels P.L.C.Mitchells & Butlers P.L.C.Mitie Group P.L.C.MJ Gleeson P.L.C.Mondi P.L.C.Mondi P.L.C.Moneysupermarket.com Group P.L.C.Morgan Advanced Materials P.L.C.Morgan Sindall Group P.L.C.Mortgage Advice Bureau Holdings, Ltd.Mothercare P.L.C.Motorpoint group P.L.C.N Brown Group P.L.C.National Express Group P.L.C.National Grid P.L.C.National Grid P.L.C., Sponsored ADRNCC Group P.L.C.Next Fifteen Communications Group P.L.C.Next P.L.C.NMC Health P.L.C.Norcros P.L.C.Northgate P.L.C.Nostrum Oil & Gas P.L.C.Ocado Group P.L.C.On the Beach Group P.L.C.
67,272 564,4621,054,437 3,343,933
* 12,282 327,561* 30,121 784,342
7,881,167 5,098,197108,571 279,027
40,337 3,239,537158,309 80,513630,175 57,392
7,393 18,2591,004,184 2,072,622
819,240 2,059,103133,933 1,033,632696,785 904,315104,034 81,749111,794 189,20344,682 148,96134,624 144,211
100,395 418,624317,110 2,288,374
T.A. World ex U.S. Core Equity PortfolioCONTINUED
Shares Value»
UNITED KINGDOM — (Continued)902,503 $2,036,870294,739 1,612,321
10,253 213,87855,309 1,165,02760,888 503,999
* 106,629 393,185194,308 388,138
650 6,63188,836 1,935,36235,242 764,901
210,992 944,503146,302 450,754
14,137 192,909223 1,623
* 117,858 23,7088,534 22,257
140,411 204,577317,218 1,615,859
35,218 360,95818,116 931,88334,461 77,505
2,878 21,01816,526 1,216,471
7,628 227,7969,498 24,109
89,612 360,134* 7,162 3,822* 65,723 992,054
64,177 368,534

OneSavings Bank P.L.C.Oxford Instruments P.L.C.Pagegroup P.L.C.Paragon Banking Group P.L.C.Parkmead Group P.L.C. (The)PayPoint P.L.C.Pearson P.L.C.Pearson P.L.C., Sponsored ADRPendragon P.L.C.Pennon Group P.L.C.Persimmon P.L.C.Petra Diamonds, Ltd.Petrofac, Ltd.Petropavlovsk P.L.C.Pets at Home Group P.L.C.Phoenix Group Holdings P.L.C.Photo-Me International P.L.C.Playtech P.L.C.Polar Capital Holdings P.L.C.Polypipe Group P.L.C.Porvair P.L.C.Premier Foods P.L.C.Premier Oil P.L.C.Provident Financial P.L.C.Prudential P.L.C., ADRPrudential P.L.C.PZ Cussons P.L.C.QinetiQ Group P.L.C.Rank Group P.L.C.Raven Property Group, Ltd.
Reach P.L.C.Reckitt Benckiser Group P.L.C.Redrow P.L.C.RELX P.L.C., Sponsored ADRRELX P.L.C.RELX P.L.C.Renewi P.L.C.Renishaw P.L.C.Renold P.L.C.Rentokil Initial P.L.C.Restaurant Group P.L.C. (The)Rhi Magnesita NVRicardo P.L.C.Rightmove P.L.C.Rio Tinto P.L.C.Rio Tinto P.L.C., Sponsored ADRRM P.L.C.Robert Walters P.L.C.Rolls-Royce Holdings P.L.C.
98,752 435,28528,887 453,972
247,343 1,345,73952,507 266,638
* 14,461 9,81324,795 283,95649,730 526,60965,631 691,751
652,031 101,089155,995 1,359,659
91,051 2,221,515* 468,727 63,613
103,891 527,306* 1,374,805 166,010
223,971 566,045182,190 1,532,469155,153 187,883153,089 821,801
536 3,725120,181 597,077
3,245 23,131* 1,313,109 538,241* 667,128 678,997
29,602 155,92928,699 1,191,00926,666 548,632
142,856 379,941318,072 1,116,989
79,561 146,906* 25,035 11,947
T.A. World ex U.S. Core Equity PortfolioCONTINUED
Shares Value»
UNITED KINGDOM — (Continued)683,924 $ 705,594
18,757 1,449,978125,857 856,449
56,878 1,349,72019,573 464,23860,337 1,433,156
659,822 233,44725,814 1,201,742
* 4,231 1,282393,216 2,077,519333,768 617,135
6,143 340,58815,024 128,331
286,549 1,832,71542,958 2,425,901
118,367 6,756,38810,751 31,01420,483 132,668
279,216 2,918,460

Rotork P.L.C.Royal Bank of Scotland Group P.L.C.Royal Bank of Scotland Group P.L.C., Sponsored ADRRoyal Dutch Shell P.L.C., Class ARoyal Dutch Shell P.L.C., Sponsored ADR, Class ARoyal Dutch Shell P.L.C., Sponsored ADR, Class BRoyal Dutch Shell P.L.C., Class BRoyal Mail P.L.C.RPS Group P.L.C.RSA Insurance Group P.L.C.Saga P.L.C.Sage Group P.L.C. (The)Savills P.L.C.Schroders P.L.C.Schroders P.L.C.SDL P.L.C.Senior P.L.C.Severfield P.L.C.Severn Trent P.L.C.SIG P.L.C.Smith & Nephew P.L.C., Sponsored ADRSmith & Nephew P.L.C.Smiths Group P.L.C.Soco International P.L.C.Softcat P.L.C.Sophos Group P.L.C.Spectris P.L.C.Speedy Hire P.L.C.Spirax-Sarco Engineering P.L.C.Spire Healthcare Group P.L.C.Spirent Communications P.L.C.Sports Direct International P.L.C.SSE P.L.C.SSP Group P.L.C.St James's Place P.L.C.St. Modwen Properties P.L.C.Stagecoach Group P.L.C.Standard Chartered P.L.C.Standard Life Aberdeen P.L.C.SThree P.L.C.
Stobart Group, Ltd.Stock Spirits Group P.L.C.Superdry P.L.C.Synthomer P.L.C.T Clarke P.L.C.TalkTalk Telecom Group P.L.C.Tate & Lyle P.L.C.Taylor Wimpey P.L.C.Ted Baker P.L.C.
564,217 2,106,736282,326 743,801
97,736 525,820177,300 5,584,134181,989 11,445,272143,548 9,110,992
35,290 1,114,635233,049 595,166
95,848 146,036288,613 1,962,967229,992 124,411217,428 1,896,058104,974 1,211,623
22,672 817,8648,330 251,043
15,559 89,668216,927 528,207
55,690 45,27847,186 1,153,928
185,699 296,8574,855 220,634
61,606 1,394,68641,463 824,607
188,253 140,87265,717 762,92618,782 99,15333,908 1,044,468
129,755 82,05320,262 2,209,422
186,340 255,956153,840 295,906
* 156,692 431,562200,146 2,668,282153,221 1,310,602133,730 1,595,776111,333 565,775299,334 475,871458,248 3,771,243458,217 1,661,970
31,206 107,063
T.A. World ex U.S. Core Equity PortfolioCONTINUED
Shares Value»
UNITED KINGDOM — (Continued)48,278 $ 67,30516,573 46,11733,500 175,458
219,970 809,56215,864 22,688
238,145 304,340180,182 1,650,208
1,678,869 3,289,46716,026 177,938

Telecom Plus P.L.C.Telit Communications P.L.C.Tesco P.L.C.Thomas Cook Group P.L.C.Topps Tiles P.L.C.TP ICAP P.L.C.Travis Perkins P.L.C.Trifast P.L.C.TT Electronics P.L.C.TUI AGTullow Oil P.L.C.U & I Group P.L.C.UDG Healthcare P.L.C.Ultra Electronics Holdings P.L.C.Unilever P.L.C., Sponsored ADRUnilever P.L.C.United Utilities Group P.L.C.Urban & Civic P.L.C.Vectura Group P.L.C.Vesuvius P.L.C.Victrex P.L.C.Vitec Group P.L.C. (The)Vodafone Group P.L.C.Volex P.L.C.Volution Group P.L.C.Weir Group P.L.C (The)WH Smith P.L.C.Whitbread P.L.C.William Hill P.L.C.Wilmington P.L.C.Wincanton P.L.C.Wm Morrison Supermarkets P.L.C.WPP P.L.C., Sponsored ADRWPP P.L.C.Xaar P.L.C.
TOTAL UNITED KINGDOM
TOTAL COMMON STOCKS
Alpargatas SABanco ABC Brasil S.A.Banco Bradesco SABanco do Estado do Rio Grande do Sul SA, Class BBanco Pan SABraskem SA, Class ACentrais Eletricas Brasileiras SA, Class BCentrais Eletricas Santa CatarinaCia Brasileira de Distribuicao
34,655 560,510* 6,860 13,604
1,084,096 2,936,499* 631,386 42,453
70,051 58,687437,881 1,667,567121,743 2,015,473
13,102 30,87046,202 123,38947,881 475,431
921,471 2,159,11271,679 124,51929,228 282,98750,507 1,197,54877,830 4,679,14012,127 729,586
124,790 1,192,6803,852 14,338
* 452,200 438,67678,061 475,69655,606 1,375,024
9,290 127,8513,346,848 6,091,204
* 1,437 1,612322 709
39,469 713,55343,220 1,111,60531,532 1,732,160
483,389 893,8043,357 7,997
28,616 81,857737,154 1,740,668
18,997 1,118,543121,750 1,434,145
19,001 20,478
427,235,384
3,768,708,595
PREFERRED STOCKS — (0.9%)BRAZIL — (0.5%)
33,843 184,00946,421 218,09545,524 411,539
114,194 703,47476,997 190,659
* 14,800 132,00924,904 258,414
4,700 57,23044,056 1,079,943
T.A. World ex U.S. Core Equity PortfolioCONTINUED
Shares Value»
BRAZIL — (Continued)
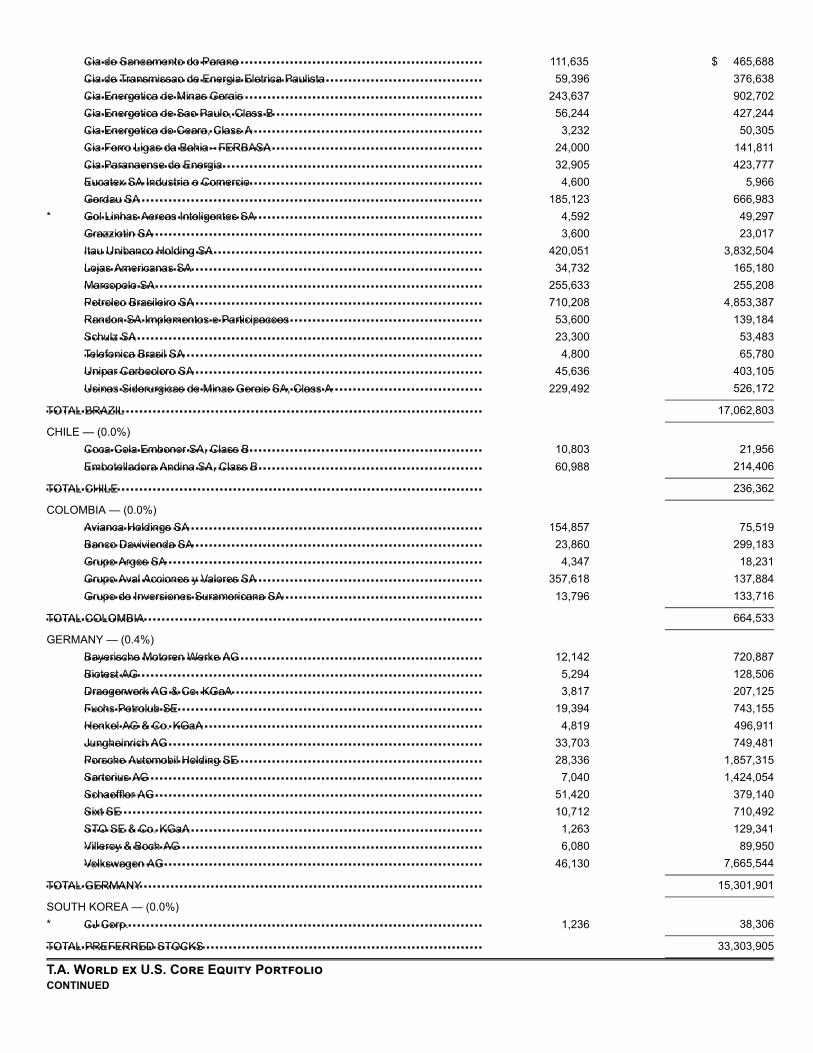
Cia de Saneamento do ParanaCia de Transmissao de Energia Eletrica PaulistaCia Energetica de Minas GeraisCia Energetica de Sao Paulo, Class BCia Energetica do Ceara, Class ACia Ferro Ligas da Bahia - FERBASACia Paranaense de EnergiaEucatex SA Industria e ComercioGerdau SAGol Linhas Aereas Inteligentes SAGrazziotin SAItau Unibanco Holding SALojas Americanas SAMarcopolo SAPetroleo Brasileiro SARandon SA Implementos e ParticipacoesSchulz SATelefonica Brasil SAUnipar Carbocloro SAUsinas Siderurgicas de Minas Gerais SA, Class A
TOTAL BRAZIL
Coca-Cola Embonor SA, Class BEmbotelladora Andina SA, Class B
TOTAL CHILE
Avianca Holdings SABanco Davivienda SAGrupo Argos SAGrupo Aval Acciones y Valores SAGrupo de Inversiones Suramericana SA
TOTAL COLOMBIA
Bayerische Motoren Werke AGBiotest AGDraegerwerk AG & Co. KGaAFuchs Petrolub SEHenkel AG & Co. KGaAJungheinrich AGPorsche Automobil Holding SESartorius AGSchaeffler AGSixt SESTO SE & Co. KGaAVilleroy & Boch AGVolkswagen AG
TOTAL GERMANY
CJ Corp.
TOTAL PREFERRED STOCKS
111,635 $ 465,68859,396 376,638
243,637 902,70256,244 427,244
3,232 50,30524,000 141,81132,905 423,777
4,600 5,966185,123 666,983
* 4,592 49,2973,600 23,017
420,051 3,832,50434,732 165,180
255,633 255,208710,208 4,853,387
53,600 139,18423,300 53,483
4,800 65,78045,636 403,105
229,492 526,172
17,062,803
CHILE — (0.0%)10,803 21,95660,988 214,406
236,362
COLOMBIA — (0.0%)154,857 75,519
23,860 299,1834,347 18,231
357,618 137,88413,796 133,716
664,533
GERMANY — (0.4%)12,142 720,887
5,294 128,5063,817 207,125
19,394 743,1554,819 496,911
33,703 749,48128,336 1,857,315
7,040 1,424,05451,420 379,14010,712 710,492
1,263 129,3416,080 89,950
46,130 7,665,544
15,301,901
SOUTH KOREA — (0.0%)* 1,236 38,306
33,303,905
T.A. World ex U.S. Core Equity PortfolioCONTINUED

Intercell AG Rights 05/16/13
Pan American Silver Corp. Rights 02/22/29Pan American Silver Corp. Rights 02/22/29Tervita Corp. Warrants 07/19/20
TOTAL CANADA
Hortifrut SA Rights 08/07/19
Medco Energi Internasional Tbk PT Warrants 12/11/20
AD Works Co., Ltd. Rights 08/23/2019
Paramount Corp. Bhd Warrants 7/28/2024
Tourism Holdings, Ltd Rights 07/16/19
Ezion Holdings, Ltd. Warrants 04/16/23
Dae-Il Corp. Rights 08/08/2019G Smatt Global Co., Ltd. Rights 09/03/19Iljin Diamond Co., Ltd. Rights 08/02/19
TOTAL SOUTH KOREA
TOTAL RIGHTS/WARRANTS
TOTAL INVESTMENT SECURITIES
DFA Short Term Investment Fund
(Cost $3,414,542,779)^^
AustraliaAustriaBelgiumBrazilCanadaChileChina
Shares Value»
RIGHTS/WARRANTS — (0.0%)AUSTRIA — (0.0%)* 4,255 $ 0
CANADA — (0.0%)* 153,369 34,826* 80,828 18,354* 1,194 9
53,189
CHILE — (0.0%)* 347 0
INDONESIA — (0.0%)* 916,167 13,987
JAPAN — (0.0%)* 81,800 752
MALAYSIA — (0.0%)* 30,640 0
NEW ZEALAND — (0.0%)* 6,686 0
SINGAPORE — (0.0%)#* 85,767 0
SOUTH KOREA — (0.0%)* 3,755 3,539* 5,412 105* 168 838
4,482
72,410
3,802,084,910
Value†
SECURITIES LENDING COLLATERAL — (0.4%)@§ 1,278,516 14,793,711
TOTAL INVESTMENTS — (100.0%)$3,816,878,621
Summary of the Portfolio's investments as of July 31, 2019, based on their valuation inputs, is as follows (see Security Valuation Note):
Investments in Securities (Market Value)
Level 1 Level 2 Level 3 Total
Common Stocks$ 3,026,206 $ 176,241,351 — $ 179,267,557
— 14,886,236 — 14,886,2361,538,253 29,618,284 — 31,156,537
74,100,934 — — 74,100,934259,762,337 930,974 — 260,693,311
10,868,246 — — 10,868,24636,889,121 269,846,558 — 306,735,679
T.A. World ex U.S. Core Equity PortfolioCONTINUED

ColombiaCzech RepublicDenmarkEgyptFinlandFranceGermanyGreeceHong KongHungaryIndiaIndonesiaIrelandIsraelItalyJapanMalaysiaMexicoNetherlandsNew ZealandNorwayPeruPhilippinesPolandPortugalRussiaSingaporeSouth AfricaSouth KoreaSpainSwedenSwitzerlandTaiwanThailandTurkeyUnited Kingdom
BrazilChileColombiaGermanySouth Korea
CanadaIndonesiaJapanSouth Korea
Securities Lending Collateral
TOTAL
Investments in Securities (Market Value)
Level 1 Level 2 Level 3 Total
$ 3,336,158 — — $ 3,336,158— $ 1,967,836 — 1,967,836
997,694 48,197,727 — 49,195,421132,560 161,851 — 294,411446,889 45,259,366 — 45,706,255
2,110,917 223,015,509 — 225,126,4266,984,315 182,947,602 — 189,931,917
— 2,493,923 — 2,493,923286,570 82,719,789 — 83,006,359
— 3,352,604 — 3,352,6042,389,749 103,307,791 — 105,697,540
372,646 23,506,655 — 23,879,3014,967,070 13,189,134 — 18,156,2041,922,574 20,708,440 — 22,631,0142,286,109 73,375,601 — 75,661,710
12,936,249 624,328,678 — 637,264,927— 24,863,480 — 24,863,480
26,869,613 867 — 26,870,48016,090,818 68,035,450 — 84,126,268
39,005 13,328,883 — 13,367,888694,681 23,795,071 — 24,489,752747,887 — — 747,887115,145 12,147,203 — 12,262,348
— 11,687,435 — 11,687,435— 6,638,370 — 6,638,370
4,692,168 8,606,139 — 13,298,3076,395 29,749,023 — 29,755,418
8,450,305 61,925,023 — 70,375,3284,150,517 130,074,665 — 134,225,1822,379,437 60,580,147 — 62,959,584
368,001 73,314,283 — 73,682,28419,870,620 171,300,723 — 191,171,34314,335,706 142,028,913 — 156,364,61930,439,402 — — 30,439,402
50,821 8,686,509 — 8,737,330100,847,808 326,387,576 — 427,235,384
Preferred Stocks17,062,803 — — 17,062,803
236,362 — — 236,362664,533 — — 664,533
— 15,301,901 — 15,301,901— 38,306 — 38,306
Rights/Warrants— 53,189 — 53,189— 13,987 — 13,987— 752 — 752— 4,482 — 4,482
— 14,793,711 — 14,793,711
$673,466,624 $3,143,411,997 — $3,816,878,621
VA U.S. TARGETED VALUE PORTFOLIO

A.H. Belo Corp., Class AAMC Entertainment Holdings, Inc., Class AATN International, Inc.Ballantyne Strong, Inc.Beasley Broadcast Group, Inc., Class ACars.com, Inc.Cincinnati Bell, Inc.Cinemark Holdings, Inc.comScore, Inc.Consolidated Communications Holdings, Inc.Cumulus Media, Inc., Class ADHI Group, Inc.Emerald Expositions Events, Inc.Entercom Communications Corp., Class AEntravision Communications Corp., Class AEW Scripps Co. (The), Class AFluent, Inc.Frontier Communications Corp.Gaia, Inc.Gannett Co., Inc.GCI Liberty, Inc., Class AGray Television, Inc.Harte-Hanks, Inc.Hemisphere Media Group, Inc.IMAX Corp.Iridium Communications, Inc.John Wiley & Sons, Inc., Class ALiberty Latin America, Ltd., Class ALiberty Latin America, Ltd., Class CLiberty TripAdvisor Holdings, Inc., Class ALions Gate Entertainment Corp., Class ALions Gate Entertainment Corp., Class BMarchex, Inc., Class BMarcus Corp. (The)Meet Group, Inc. (The)Meredith Corp.New Media Investment Group, Inc.News Corp., Class ANews Corp., Class BNexstar Media Group, Inc., Class AORBCOMM, Inc.Reading International, Inc., Class ASaga Communications, Inc., Class ASalem Media Group, Inc.Scholastic Corp.Sinclair Broadcast Group, Inc., Class A
SCHEDULE OF INVESTMENTS
July 31, 2019
(Unaudited)
Shares Value†
COMMON STOCKS — (93.9%)COMMUNICATION SERVICES — (3.3%)
6,766 $ 24,967# 13,141 155,458
4,526 254,678* 3,604 10,199
1,850 6,013#* 16,027 304,513* 420 1,604# 13,215 527,543#* 8,391 27,690# 15,209 71,634* 1,778 26,866* 19,403 71,403
6,782 72,296# 31,033 176,267
24,076 78,48818,731 287,146
#* 2,902 15,090#* 15,962 21,070#* 1,095 6,329# 27,965 286,641* 72 4,301* 21,343 378,838* 1,068 3,097* 3,920 48,255* 9,426 206,901* 20,074 510,683
6,227 283,391* 10,147 166,309* 22,322 366,081* 19,612 226,519# 16,492 212,912
21,802 265,766* 9,439 41,060
4,677 163,648* 25,341 87,173# 9,874 541,688
14,664 157,93178,638 1,034,87635,726 480,87211,268 1,146,744
* 15,988 93,690* 5,626 73,419
1,966 61,3794,900 10,1928,907 304,3528,719 438,130

Spok Holdings, Inc.TEGNA, Inc.Telephone & Data Systems, Inc.Townsquare Media, Inc., Class ATribune Media Co., Class ATribune Publishing Co.United States Cellular Corp.
Yelp, Inc.
TOTAL COMMUNICATION SERVICES
1-800-Flowers.com, Inc., Class AAaron's, Inc.Abercrombie & Fitch Co., Class AAcushnet Holdings Corp.Adient P.L.C.Adtalem Global Education, Inc.American Axle & Manufacturing Holdings, Inc.American Eagle Outfitters, Inc.American Outdoor Brands Corp.American Public Education, Inc.America's Car-Mart, Inc.AramarkArk Restaurants Corp.Ascena Retail Group, Inc.At Home Group, Inc.AutoNation, Inc.Barnes & Noble Education, Inc.Barnes & Noble, Inc.Bassett Furniture Industries, Inc.BBX Capital Corp.Bed Bath & Beyond, Inc.Big 5 Sporting Goods Corp.Big Lots, Inc.Biglari Holdings, Inc., Class ABiglari Holdings, Inc., Class BBJ's Restaurants, Inc.Boot Barn Holdings, Inc.BorgWarner, Inc.Bowl America, Inc., Class ABoyd Gaming Corp.Brunswick Corp.Build-A-Bear Workshop, Inc.Caleres, Inc.Callaway Golf Co.Capri Holdings, Ltd.Career Education Corp.Carriage Services, Inc.Carrols Restaurant Group, Inc.Cato Corp. (The), Class A
6,453 83,82524,974 379,35523,909 773,217
1,365 7,3578,028 373,0616,793 56,178
* 7,480 358,217
VA U.S. Targeted Value PortfolioCONTINUED
Shares Value†
COMMUNICATION SERVICES — (Continued)#* 2,459 $ 86,188
11,851,500
CONSUMER DISCRETIONARY — (13.3%)* 10,868 212,795
13,658 861,137# 26,345 498,711
18,485 472,477# 19,448 461,890* 20,176 955,737* 30,446 367,483
37,041 655,255* 13,278 128,000* 8,083 266,901* 2,763 249,112
35,811 1,296,000411 7,920
#* 52,471 23,308#* 6,423 38,474* 25,761 1,254,045* 17,003 59,510
22,503 146,7202,400 30,672
13,325 57,431# 29,592 287,338# 7,076 15,072
3,692 94,515* 30 13,710* 525 47,670
261 10,362* 6,193 193,779
33,781 1,276,922120 1,870
# 1,076 28,5036,882 338,319
* 7,383 31,52510,825 203,29323,049 422,719
* 23,426 833,731* 7,743 146,807
4,980 95,218* 7,410 69,061
6,385 91,752

Cavco Industries, Inc.Century Casinos, Inc.Century Communities, Inc.Chico's FAS, Inc.Chuy's Holdings, Inc.Citi Trends, Inc.Clarus Corp.Conn's, Inc.Container Store Group, Inc. (The)Cooper Tire & Rubber Co.Cooper-Standard Holdings, Inc.Core-Mark Holding Co., Inc.Crown Crafts, Inc.CSS Industries, Inc.Culp, Inc.Dana, Inc.
Deckers Outdoor Corp.Del Frisco's Restaurant Group, Inc.Del Taco Restaurants, Inc.Delta Apparel, Inc.Designer Brands, Inc., Class ADestination Maternity Corp.Destination XL Group, Inc.Dick's Sporting Goods, Inc.Dillard's, Inc., Class ADine Brands Global, Inc.Dixie Group, Inc. (The)Dover Motorsports, Inc.El Pollo Loco Holdings, Inc.Eldorado Resorts, Inc.Escalade, Inc.Ethan Allen Interiors, Inc.Expedia Group, Inc.Express, Inc.Fiesta Restaurant Group, Inc.Flexsteel Industries, Inc.Foot Locker, Inc.Fossil Group, Inc.Francesca's Holdings Corp.GameStop Corp., Class AGap, Inc. (The)Genesco, Inc.Gentex Corp.Gentherm, Inc.G-III Apparel Group, Ltd.Goodyear Tire & Rubber Co. (The)Graham Holdings Co., Class BGreen Brick Partners, Inc.Group 1 Automotive, Inc.
* 1,774 314,619* 6,224 61,431#* 7,525 207,464
32,262 102,916* 3,600 85,140
3,808 58,4532,603 37,405
#* 7,013 145,870#* 5,454 33,324
12,773 343,849* 3,664 181,295
6,854 256,5451,600 7,3602,121 10,8812,793 50,190
11,315 189,074
VA U.S. Targeted Value PortfolioCONTINUED
Shares Value†
CONSUMER DISCRETIONARY — (Continued)* 3,492 $ 545,730* 8,976 71,449* 13,090 158,651* 2,240 42,650
17,248 317,018#* 3,659 3,040* 363 639# 16,299 605,834# 7,236 526,636# 792 65,015* 3,300 1,744
3,360 6,720#* 7,560 74,390#* 2,261 102,016
794 9,1557,093 145,9744,067 539,747
#* 26,099 64,465* 5,726 54,683
1,834 33,69117,232 707,546
#* 8,842 97,616#* 682 2,135# 23,664 95,129# 42,242 823,719* 6,230 245,337
26,006 713,084* 6,280 256,915* 11,226 321,737
56,026 769,2371,254 931,383
* 7,770 73,1164,736 397,635

Guess?, Inc.Habit Restaurants, Inc. (The), Class AHarley-Davidson, Inc.Haverty Furniture Cos., Inc.Helen of Troy, Ltd.Hibbett Sports, Inc.Hooker Furniture Corp.Horizon Global Corp.Houghton Mifflin Harcourt Co.Hudson, Ltd., Class AInternational Game Technology P.L.C.J Alexander's Holdings, Inc.J. Jill, Inc.JAKKS Pacific, Inc.JC Penney Co., Inc.Johnson Outdoors, Inc., Class AK12, Inc.KB HomeKirkland's, Inc.Kohl's Corp.Lakeland Industries, Inc.Lands' End, Inc.Laureate Education, Inc., Class ALa-Z-Boy, Inc.LCI IndustriesLear Corp.
LGI Homes, Inc.Libbey, Inc.Liberty Tax, Inc.Lifetime Brands, Inc.Lincoln Educational Services Corp.Liquidity Services, Inc.Lithia Motors, Inc., Class ALuby's, Inc.M/I Homes, Inc.Macy's, Inc.MarineMax, Inc.Marriott Vacations Worldwide Corp.MDC Holdings, Inc.Media General, Inc. Contingent Value RightsMeritage Homes Corp.Modine Manufacturing Co.Monarch Casino & Resort, Inc.Motorcar Parts of America, Inc.Movado Group, Inc.Murphy USA, Inc.National Vision Holdings, Inc.Nautilus, Inc.New Home Co., Inc. (The)
# 21,305 358,989* 4,612 46,120# 1,023 36,603
3,937 71,299* 236 34,994#* 6,411 117,962
2,723 56,775#* 2,583 14,826* 24,377 142,605* 798 10,198# 38,236 510,451* 3,615 38,934# 3,554 7,606#* 539 468#* 54,959 43,720
2,148 146,043* 11,866 354,200
22,037 578,912#* 5,543 9,479
19,525 1,051,616* 3,668 39,358#* 2,371 25,844* 4,188 68,641
11,360 374,7661,082 99,144
10,083 1,278,323
VA U.S. Targeted Value PortfolioCONTINUED
Shares Value†
CONSUMER DISCRETIONARY — (Continued)#* 601 $ 42,244* 7,719 13,045
1,820 21,6583,891 34,358
* 5,134 9,498* 8,718 56,841
5,099 672,456* 7,944 9,215* 5,985 211,689
58,121 1,321,090* 6,458 99,712
9,074 927,63515,709 567,723
» 11,816 463* 9,811 616,229* 11,385 156,202* 777 36,573#* 5,453 97,500
3,197 84,177* 553 48,863#* 401 12,668* 13,516 26,086* 4,689 19,506

Newell Brands, Inc.Office Depot, Inc.Oxford Industries, Inc.Party City Holdco, Inc.Penske Automotive Group, Inc.Pier 1 Imports, Inc.Playa Hotels & Resorts NVPotbelly Corp.PulteGroup, Inc.PVH Corp.Qurate Retail, Inc.RCI Hospitality Holdings, Inc.Red Lion Hotels Corp.Red Robin Gourmet Burgers, Inc.Regis Corp.Rocky Brands, Inc.RTW RetailWinds, Inc.Rubicon Project, Inc. (The)Sequential Brands Group, Inc.Shiloh Industries, Inc.Shoe Carnival, Inc.Shutterfly, Inc.Signet Jewelers, Ltd.Skyline Champion Corp.Sonic Automotive, Inc., Class ASpeedway Motorsports, Inc.Stamps.com, Inc.Standard Motor Products, Inc.Stoneridge, Inc.Strattec Security Corp.Superior Group of Cos, Inc.Superior Industries International, Inc.Tandy Leather Factory, Inc.Tapestry, Inc.Taylor Morrison Home Corp.Tenneco, Inc., Class A
Thor Industries, Inc.Tile Shop Holdings, Inc.Tilly's, Inc., Class AToll Brothers, Inc.TopBuild Corp.Tower International, Inc.Trans World Entertainment Corp.TravelCenters of America LLCTRI Pointe Group, Inc.Tuesday Morning Corp.Unifi, Inc.Universal Electronics, Inc.Universal Technical Institute, Inc.
# 59,141 839,211122,111 249,106
1,847 135,182#* 18,951 120,907# 18,533 851,962* 1,308 5,036* 10,195 74,729* 5,499 22,876
31,965 1,007,21710,759 956,690
* 49,969 706,5622,700 45,765
* 7,678 52,134* 3,969 131,056* 12,269 224,523
1,900 59,888* 5,571 12,145* 13,046 99,280#* 4,756 2,022* 9,263 46,686# 4,498 114,159* 584 29,603
12,968 235,240* 2,052 58,482
6,081 167,65311,672 231,106
* 1,504 71,8165,448 250,662
* 6,084 198,1561,214 25,2393,172 53,9876,190 15,846
* 2,694 15,67919,119 591,351
* 23,684 533,36410,481 94,748
VA U.S. Targeted Value PortfolioCONTINUED
Shares Value†
CONSUMER DISCRETIONARY — (Continued)4,376 $ 260,810
# 7,107 18,4073,737 30,606
43,252 1,555,774* 10,058 816,006
5,476 168,661* 8,600 2,537* 7,536 25,999* 44,693 611,847#* 11,651 19,108* 5,360 100,286* 2,709 115,999* 1,400 5,152

Urban Outfitters, Inc.Vera Bradley, Inc.Vista Outdoor, Inc.Vitamin Shoppe, Inc.VOXX International Corp.Weyco Group, Inc.William Lyon Homes, Class AWinnebago Industries, Inc.Wolverine World Wide, Inc.ZAGG, Inc.Zovio, Inc.Zumiez, Inc.
TOTAL CONSUMER DISCRETIONARY
Alico, Inc.Andersons, Inc. (The)B&G Foods, Inc.Bunge, Ltd.Cal-Maine Foods, Inc.Casey's General Stores, Inc.Central Garden & Pet Co.Central Garden & Pet Co., Class AChefs' Warehouse, Inc. (The)Coty, Inc., Class ACraft Brew Alliance, Inc.Darling Ingredients, Inc.Dean Foods Co.Edgewell Personal Care Co.elf Beauty Inc.Farmer Brothers Co.Fresh Del Monte Produce, Inc.Hain Celestial Group, Inc. (The)Hostess Brands, Inc.Ingles Markets, Inc., Class AIngredion, Inc.John B. Sanfilippo & Son, Inc.Landec Corp.Limoneira Co.Mannatech, Inc.Natural Alternatives International, Inc.Natural Grocers by Vitamin Cottage, Inc.Nature's Sunshine Products, Inc.Nu Skin Enterprises, Inc., Class AOcean Bio-Chem, Inc.Oil-Dri Corp. of America
Performance Food Group Co.Pilgrim's Pride Corp.Post Holdings, Inc.PriceSmart, Inc.
* 16,222 386,246* 11,647 136,852* 14,619 105,257#* 11,892 52,563* 9,507 44,588
2,729 75,102* 9,419 184,989# 7,482 301,525
8,628 234,250#* 7,970 52,841* 7,465 28,442* 9,329 231,079
47,633,697
CONSUMER STAPLES — (4.0%)1,067 34,0377,081 190,125
# 4,873 89,07822,863 1,335,885
# 4,626 183,976759 122,890
#* 2,954 89,742* 9,405 259,108#* 6,388 232,970# 118,903 1,297,232* 6,674 104,848* 40,132 815,884# 25,483 36,950* 10,636 323,653* 3,708 61,516#* 3,928 63,791
10,493 318,253* 5,003 108,915* 22,933 323,814# 3,020 95,070
9,528 736,4191,878 163,217
* 6,851 76,5262,183 43,202
682 10,932* 1,808 18,243* 7,594 69,637* 2,068 18,674
557 22,269# 2,771 9,782
882 31,249
VA U.S. Targeted Value PortfolioCONTINUED
Shares Value†
CONSUMER STAPLES — (Continued)* 4,092 $ 179,434* 13,695 370,587* 13,515 1,449,078
3,419 208,559

Pyxus International, Inc.Rite Aid Corp.Sanderson Farms, Inc.Seaboard Corp.Seneca Foods Corp., Class ASimply Good Foods Co. (The)SpartanNash Co.Spectrum Brands Holdings, Inc.TreeHouse Foods, Inc.United Natural Foods, Inc.Universal Corp.US Foods Holding Corp.Village Super Market, Inc., Class AWeis Markets, Inc.
TOTAL CONSUMER STAPLES
Adams Resources & Energy, Inc.Alta Mesa Resources, Inc., Class AAntero Resources Corp.Apergy Corp.Arch Coal, Inc., Class AArchrock, Inc.Ardmore Shipping Corp.Aspen Aerogels, Inc.Barnwell Industries, Inc.Basic Energy Services, Inc.Berry Petroleum Corp.Bonanza Creek Energy, Inc.C&J Energy Services, Inc.Callon Petroleum Co.CARBO Ceramics, Inc.Carrizo Oil & Gas, Inc.Centennial Resource Development, Inc., Class AChaparral Energy, Inc., Class AChesapeake Energy Corp.Cimarex Energy Co.Clean Energy Fuels Corp.CNX Resources Corp.CONSOL Energy, Inc.Contango Oil & Gas Co.Contura Energy, Inc.Dawson Geophysical Co.Delek US Holdings, Inc.Denbury Resources, Inc.DHT Holdings, Inc.Diamond Offshore Drilling, Inc.Dorian LPG, Ltd.Dril-Quip, Inc.Earthstone Energy, Inc., Class AEnLink Midstream LLCEra Group, Inc.Exterran Corp.Extraction Oil & Gas, Inc.Forum Energy Technologies, Inc.
#* 4,943 70,537#* 1,011 7,047# 6,047 792,278
152 620,409* 2,614 82,550* 499 13,588
7,655 90,4825,652 283,222
* 10,143 601,886#* 14,367 141,659
6,117 363,961* 40,057 1,416,816# 3,265 81,723# 5,710 208,129
14,269,832
ENERGY — (7.1%)489 15,956
#* 3,496 524#* 90,357 416,546* 8,322 270,715# 6,279 559,836
24,849 272,842* 7,341 53,883* 2,398 15,827* 480 485* 6,569 11,693
2,632 25,794#* 4,995 108,891* 9,930 108,634#* 54,857 269,896#* 827 1,059#* 6,600 62,898#* 41,829 248,883#* 5,399 19,166#* 55,432 100,332
14,329 726,050* 45,020 120,203* 59,883 492,238* 7,672 164,871#* 10,315 13,719#* 432 15,479* 8,749 20,823
17,936 772,683#* 65,691 74,231
30,170 170,460#* 27,754 250,896* 14,226 130,168#* 10,838 570,296* 3,585 15,702# 511 4,906* 6,933 71,549* 10,215 139,435#* 26,381 97,873* 25,537 66,907

Frank's International NVGasLog, Ltd.Geospace Technologies Corp.Green Plains, Inc.Gulf Island Fabrication, Inc.Gulfport Energy Corp.Hallador Energy Co.Helix Energy Solutions Group, Inc.Helmerich & Payne, Inc.HighPoint Resources Corp.HollyFrontier Corp.Hornbeck Offshore Services, Inc.Independence Contract Drilling, Inc.International Seaways, Inc.Jagged Peak Energy, Inc.Keane Group, Inc.KLX Energy Services Holdings, Inc.Kosmos Energy, Ltd.Laredo Petroleum, Inc.Lonestar Resources US, Inc., Class AMammoth Energy Services, Inc.Matador Resources Co.Matrix Service Co.McDermott International, Inc.Midstates Petroleum Co., Inc.Mitcham Industries, Inc.Montage Resources Corp.Murphy Oil Corp.Nabors Industries, Ltd.NACCO Industries, Inc., Class ANational Oilwell Varco, Inc.Natural Gas Services Group, Inc.Newpark Resources, Inc.Nine Energy Service, Inc.Noble Corp. P.L.C.Northern Oil and Gas, Inc.Oasis Petroleum, Inc.Oceaneering International, Inc.Oil States International, Inc.Overseas Shipholding Group, Inc., Class APacific Ethanol, Inc.Panhandle Oil and Gas, Inc., Class APar Pacific Holdings, Inc.Parsley Energy, Inc., Class APatterson-UTI Energy, Inc.PBF Energy, Inc., Class APDC Energy, Inc.Peabody Energy Corp.Penn Virginia Corp.
VA U.S. Targeted Value PortfolioCONTINUED
Shares Value†
ENERGY — (Continued)* 25,812 $ 147,128
10,916 155,444* 4,922 76,832
11,208 113,089* 6,655 47,650* 44,379 167,753
9,690 51,938* 46,931 411,116
16,185 804,071* 36,033 45,041
28,032 1,395,153#* 5,318 5,531* 5,149 6,797* 7,073 120,312#* 11,450 84,043* 23,368 146,985* 6,884 108,216# 41,768 251,026* 43,966 145,967* 1,924 4,772# 2,793 18,099#* 19,613 345,777* 8,891 163,328#* 34,492 221,439* 2,548 11,593* 3,927 16,336* 1,671 5,581# 44,623 1,072,737# 86,958 257,396
143 7,60036,895 878,839
* 4,280 68,651* 32,430 247,441* 3,454 44,453* 68,450 152,643#* 10,305 16,694* 93,607 455,866* 24,579 379,746* 16,831 251,119* 17,360 33,852#* 15,208 8,232
2,090 24,683* 8,812 203,205* 55,456 920,015
44,704 519,90730,503 851,949
* 15,231 437,58721,777 458,624
#* 2,427 83,100

Pioneer Energy Services Corp.ProPetro Holding Corp.QEP Resources, Inc.Range Resources Corp.Renewable Energy Group, Inc.REX American Resources Corp.Ring Energy, Inc.Roan Resources, Inc.RPC, Inc.SandRidge Energy, Inc.
Scorpio Tankers, Inc.SEACOR Holdings, Inc.SEACOR Marine Holdings, Inc.Select Energy Services, Inc., Class ASemGroup Corp., Class AShip Finance International, Ltd.SilverBow Resources, Inc.SM Energy Co.Smart Sand, Inc.Southwestern Energy Co.SRC Energy, Inc.Superior Energy Services, Inc.Talos Energy, Inc.Teekay Corp.Teekay Tankers, Ltd., Class ATETRA Technologies, Inc.Tidewater, Inc.Transocean, Ltd.Unit Corp.US Silica Holdings, Inc.Valaris P.L.C.Whiting Petroleum Corp.World Fuel Services Corp.WPX Energy, Inc.
TOTAL ENERGY
1st Constitution Bancorp1st Source Corp.ACNB Corp.Allegiance Bancshares, Inc.Ambac Financial Group, Inc.American Equity Investment Life Holding Co.American National Bankshares, Inc.American National Insurance Co.American River BanksharesAmeris BancorpAmeriServ Financial, Inc.Argo Group International Holdings, Ltd.Arrow Financial Corp.
#* 34,135 7,134* 5,876 106,532* 52,643 260,583# 53,800 306,122#* 15,040 204,394#* 1,614 120,404* 12,656 31,007#* 9,756 11,707# 13,975 86,365* 6,733 45,448
VA U.S. Targeted Value PortfolioCONTINUED
Shares Value†
ENERGY — (Continued)11,204 $ 293,657
* 4,510 214,856* 5,315 74,835* 11,752 119,518
28,690 363,502# 19,531 256,833* 1,342 13,943
38,923 388,062#* 3,473 8,162#* 117,442 258,372#* 60,387 246,379* 42,805 38,833* 6,042 124,344# 400 1,824* 40,309 49,580* 36,854 57,492* 5,082 116,835#* 48,042 292,095* 16,577 107,750# 17,601 243,950
48,985 401,187#* 17,677 312,529
15,054 587,708* 83,226 868,879
25,548,526
FINANCIALS — (25.6%)713 12,984
6,479 304,189539 20,105
* 3,668 123,098* 11,213 204,301
24,785 639,4532,249 83,1904,189 506,953
776 10,20415,703 624,508
6,300 25,8306,978 477,5743,728 123,993

Associated Banc-CorpAssurant, Inc.Assured Guaranty, Ltd.Asta Funding, Inc.Athene Holding, Ltd., Class AAtlantic Capital Bancshares, Inc.Atlantic Union Bankshares Corp.Auburn National Bancorporation, Inc.Axis Capital Holdings, Ltd.Axos Financial, Inc.Banc of California, Inc.BancFirst Corp.Bancorp, Inc. (The)BancorpSouth BankBank of Commerce HoldingsBank of Marin BancorpBank OZKBankFinancial Corp.BankUnited, Inc.
Banner Corp.Bar Harbor BanksharesBaycom Corp.BCB Bancorp, Inc.Berkshire Hills Bancorp, Inc.Blucora, Inc.Boston Private Financial Holdings, Inc.Bridge Bancorp, Inc.Bridgewater Bancshares, Inc.Brighthouse Financial, Inc.Brookline Bancorp, Inc.Bryn Mawr Bank Corp.Byline Bancorp, Inc.C&F Financial Corp.Cadence BanCorpCalifornia First National BancorpCamden National Corp.Cannae Holdings, Inc.Capital City Bank Group, Inc.Capitol Federal Financial, Inc.Carolina Financial Corp.CBTX, Inc.CenterState Banks Corp.Central Pacific Financial Corp.Central Valley Community BancorpCentury Bancorp, Inc., Class AChemung Financial Corp.CIT Group, Inc.Citizens & Northern Corp.Citizens Community Bancorp, Inc.
50,499 1,094,3137,479 847,819
30,658 1,339,448* 202 1,481* 18,486 755,338* 3,371 61,993
19,389 737,36444 1,702
9,975 635,108* 6,317 185,151
10,277 160,6295,813 339,130
* 24,087 233,1628,660 258,8472,233 24,0492,890 126,351
19,880 607,9304,311 57,811
14,972 515,187
VA U.S. Targeted Value PortfolioCONTINUED
Shares Value†
FINANCIALS — (Continued)9,724 $ 576,2442,147 54,512
* 877 20,0831,806 23,171
12,308 403,702* 14,134 423,172
19,176 221,2914,218 123,208
* 887 10,573* 1,098 43,009
18,889 280,1245,025 186,327
* 4,138 79,077703 38,173
24,499 419,9131,000 17,3104,436 198,334
* 16,608 480,8026,330 163,441
33,839 462,2413,673 128,996
524 15,79316,039 390,068
6,301 185,6902,514 52,115
503 42,126665 29,021
23,242 1,174,8831,038 26,5942,054 22,389

Citizens Holding Co.City Holding Co.Civista Bancshares, Inc.CNB Financial Corp.CNO Financial Group, Inc.Codorus Valley Bancorp, Inc.Columbia Banking System, Inc.Community Bankers Trust Corp.Community Trust Bancorp, Inc.ConnectOne Bancorp, Inc.Consumer Portfolio Services, Inc.Cowen, Inc., Class ACustomers Bancorp, Inc.CVB Financial Corp.Dime Community Bancshares, Inc.DNB Financial Corp.Donegal Group, Inc., Class ADonegal Group, Inc., Class BEagle Bancorp, Inc.eHealth, Inc.EMC Insurance Group, Inc.Employers Holdings, Inc.Encore Capital Group, Inc.Enstar Group, Ltd.Entegra Financial Corp.Enterprise Bancorp, Inc.Enterprise Financial Services Corp.Equity Bancshares, Inc., Class AESSA Bancorp, Inc.
EZCORP, Inc., Class AFarmers National Banc Corp.FB Financial Corp.FBL Financial Group, Inc., Class AFederal Agricultural Mortgage Corp., Class CFedNat Holding Co.Financial Institutions, Inc.First American Financial Corp.First BancorpFirst BanCorpFirst Bancorp, Inc.First Bancshares, Inc. (The)First BankFirst Busey Corp.First Business Financial Services, Inc.First Commonwealth Financial Corp.First Community Bancshares, Inc.First Defiance Financial Corp.First Financial BancorpFirst Financial Corp.
171 3,6271,880 145,6062,083 46,1803,635 102,580
28,026 473,9201,027 24,032
13,049 492,0782,739 21,8024,289 181,382
10,282 235,047* 5,621 20,517#* 9,884 173,563* 7,728 159,351
6,451 141,98614,998 302,660
372 17,0347,034 104,455
592 8,1467,739 311,959
* 472 48,9705,769 207,3389,698 425,742
#* 6,158 221,565* 2,946 521,884* 866 25,815
673 20,5604,051 168,846
* 3,328 88,1591,308 20,078
VA U.S. Targeted Value PortfolioCONTINUED
Shares Value†
FINANCIALS — (Continued)#* 18,858 $185,751
6,114 89,3261,261 47,9314,819 302,1512,141 165,4356,659 83,1716,494 199,9507,866 454,8125,387 198,996
54,205 583,2461,809 47,414
592 19,660# 1,860 21,167
7,552 204,131600 14,298
23,663 325,8396,410 211,9796,504 186,795
22,939 584,7151,400 60,774

First Financial Northwest, Inc.First Foundation, Inc.First Hawaiian, Inc.First Horizon National Corp.First Internet BancorpFirst Interstate BancSystem, Inc., Class AFirst Merchants Corp.First Mid Bancshares, Inc.First Midwest Bancorp, Inc.First Northwest BancorpFirst of Long Island Corp. (The)Flagstar Bancorp, Inc.Flushing Financial Corp.FNB Corp.Franklin Financial Network, Inc.FS Bancorp, Inc.Fulton Financial Corp.GAIN Capital Holdings, Inc.Genworth Financial, Inc., Class AGerman American Bancorp, Inc.Global Indemnity, Ltd.Great Southern Bancorp, Inc.Great Western Bancorp, Inc.Greenlight Capital Re, Ltd., Class AGuaranty Federal Bancshares, Inc.Hallmark Financial Services, Inc.Hancock Whitney Corp.Hanmi Financial Corp.HarborOne Bancorp, Inc.HCI Group, Inc.Heartland Financial USA, Inc.Heritage Commerce Corp.Heritage Financial Corp.Heritage Insurance Holdings, Inc.Hilltop Holdings, Inc.HMN Financial, Inc.Home Bancorp, Inc.Home BancShares, Inc.HomeStreet, Inc.
HomeTrust Bancshares, Inc.Hope Bancorp, Inc.HopFed Bancorp, Inc.Horace Mann Educators Corp.Horizon Bancorp, Inc.IBERIABANK Corp.Independence Holding Co.Independent Bank Corp.Independent Bank Corp.Independent Bank Group, Inc.
2,949 43,5869,159 137,7517,521 201,262
51,289 841,1401,836 38,7038,864 354,8269,959 392,4841,985 67,649
27,460 593,9601,905 30,6134,425 97,881
14,114 486,65112,098 246,31570,804 853,188
3,698 109,091645 31,798
37,399 635,783# 17,960 76,510* 77,912 310,869
3,358 105,9454,049 114,5464,783 286,789
13,088 442,636#* 15,335 128,047
100 2,360* 5,065 78,507
19,579 812,9207,512 161,433
* 1,414 27,078# 2,337 93,690
5,959 286,56811,096 137,2588,641 246,4418,054 108,246
21,057 477,573* 750 15,900
1,226 45,8036,564 129,114
* 6,669 193,534
VA U.S. Targeted Value PortfolioCONTINUED
Shares Value†
FINANCIALS — (Continued)4,946 $ 129,239
36,109 532,608#*» 683 13,754
9,287 403,42710,329 179,93111,789 926,2625,587 211,7476,267 487,3223,881 84,3738,407 477,602

International Bancshares Corp.INTL. FCStone, Inc.Invesco, Ltd.Investors Bancorp, Inc.Investors Title Co.James River Group Holdings, Ltd.Janus Henderson Group P.L.C.Jefferies Financial Group, Inc.Kearny Financial Corp.Kentucky First Federal BancorpKingstone Cos., Inc.Lakeland Bancorp, Inc.Landmark Bancorp, Inc.LCNB Corp.LegacyTexas Financial Group, Inc.Legg Mason, Inc.LendingClub Corp.Live Oak Bancshares, Inc.Luther Burbank Corp.Macatawa Bank Corp.Mackinac Financial Corp.Maiden Holdings, Ltd.Malvern Bancorp, Inc.Marlin Business Services Corp.MBIA, Inc.MBT Financial Corp.Mercantile Bank Corp.Mercury General Corp.Meridian Bancorp, Inc.Meta Financial Group, Inc.Metropolitan Bank Holding Corp.MGIC Investment Corp.Midland States Bancorp, Inc.MidSouth Bancorp, Inc.MidWestOne Financial Group, Inc.Mr Cooper Group, Inc.MutualFirst Financial, Inc.National Bank Holdings Corp., Class ANational General Holdings Corp.National Western Life Group, Inc., Class ANavient Corp.NBT Bancorp, Inc.Nelnet, Inc., Class ANew York Community Bancorp, Inc.NewStar Financial, Inc.Nicholas Financial, Inc.Nicolet Bankshares, Inc.NMI Holdings, Inc., Class ANortheast Bank
19,438 731,452* 4,967 202,554
61,750 1,184,98275,714 860,111
125 20,5124,243 202,943
46,500 933,2556,657 141,994
27,645 369,061120 912
2,182 18,50311,119 182,129
215 5,106950 17,109
12,139 518,82122,003 828,633
* 6,560 96,957# 4,981 96,980
2,020 22,5438,982 92,3351,448 22,299
33,780 16,721* 496 10,535
3,590 83,324#* 26,055 243,093
6,681 72,0214,279 143,7742,039 115,632
11,551 211,8456,039 186,424
* 417 17,501* 1,576 20,252
4,141 112,3043,991 48,8102,011 62,482
#* 13,007 98,983414 13,492
7,326 265,78722,532 557,216
759 204,17170,362 995,622
8,450 327,0158,117 507,800
# 113,503 1,308,690» 13,529 1,316* 1,554 13,023* 1,492 98,039* 14,020 348,818* 1,666 36,569
VA U.S. Targeted Value PortfolioCONTINUED
Shares Value†
FINANCIALS — (Continued)

Northfield Bancorp, Inc.Northrim BanCorp, Inc.Northwest Bancshares, Inc.Norwood Financial Corp.OceanFirst Financial Corp.Ocwen Financial Corp.OFG BancorpOhio Valley Banc Corp.Old Line Bancshares, Inc.Old National BancorpOld Republic International Corp.Old Second Bancorp, Inc.On Deck Capital, Inc.OneMain Holdings, Inc.Oppenheimer Holdings, Inc., Class AOpus BankOritani Financial Corp.Orrstown Financial Services, Inc.Pacific Premier Bancorp, Inc.PacWest BancorpPark National Corp.Parke Bancorp, Inc.Patriot National Bancorp, Inc.PCSB Financial Corp.Peapack Gladstone Financial Corp.Penns Woods Bancorp, Inc.Pennymac Financial Services, Inc.Peoples Bancorp, Inc.People's United Financial, Inc.People's Utah BancorpPinnacle Financial Partners, Inc.Piper Jaffray Cos.Popular, Inc.PRA Group, Inc.Preferred BankPremier Financial Bancorp, Inc.ProAssurance Corp.Prosperity Bancshares, Inc.Protective Insurance Corp., Class BProvident Financial Holdings, Inc.Provident Financial Services, Inc.Prudential Bancorp, Inc.QCR Holdings, Inc.Radian Group, Inc.RBB BancorpRegional Management Corp.Reinsurance Group of America, Inc.RenaissanceRe Holdings, Ltd.Renasant Corp.Republic Bancorp, Inc., Class ARiverview Bancorp, Inc.S&T Bancorp, Inc.Safety Insurance Group, Inc.Sandy Spring Bancorp, Inc.Santander Consumer USA Holdings, Inc.
21,066 $ 329,6831,773 69,094
27,125 465,19466 2,285
10,485 255,834* 15,331 29,129
15,064 340,898197 7,104
3,043 85,93439,933 703,22053,215 1,213,83411,322 148,771
* 25,970 92,97324,662 1,022,240
6,326 184,3408,382 187,841
19,067 345,113899 20,560
10,556 333,886# 30,208 1,166,935
1,187 112,278704 16,875
60 8671,024 19,9075,152 146,471
733 33,249570 13,686
7,498 243,01088,575 1,454,401
3,926 118,95817,600 1,069,024
1,196 92,45124,047 1,384,145
#* 9,719 302,5521,314 71,2062,767 43,2218,420 329,138
# 15,628 1,084,4274,384 72,5553,183 66,111
15,607 377,3771,535 28,0442,473 94,617
24,852 566,626600 12,060
* 5,039 121,5911,679 261,7903,581 648,698
11,794 423,2873,411 162,9436,235 52,9978,236 313,5453,256 321,2377,624 277,819
62,057 1,669,954
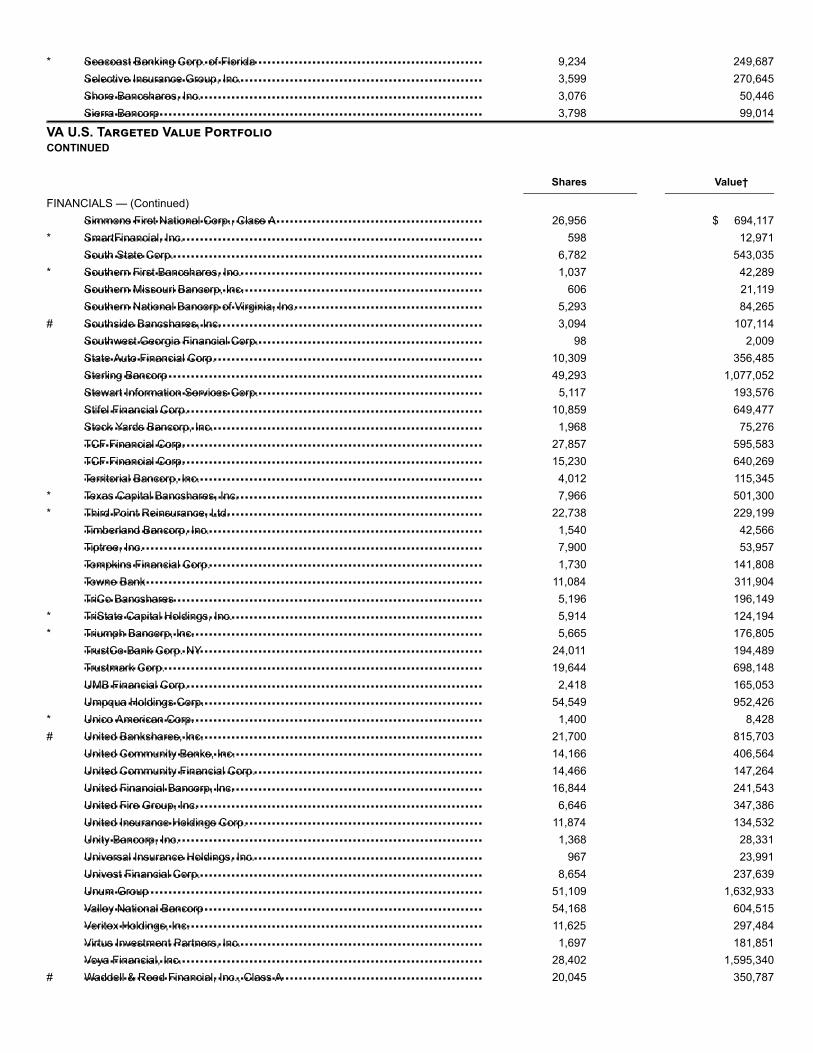
Seacoast Banking Corp. of FloridaSelective Insurance Group, Inc.Shore Bancshares, Inc.Sierra Bancorp
Simmons First National Corp., Class ASmartFinancial, Inc.South State Corp.Southern First Bancshares, Inc.Southern Missouri Bancorp, Inc.Southern National Bancorp of Virginia, Inc.Southside Bancshares, Inc.Southwest Georgia Financial Corp.State Auto Financial Corp.Sterling BancorpStewart Information Services Corp.Stifel Financial Corp.Stock Yards Bancorp, Inc.TCF Financial Corp.TCF Financial Corp.Territorial Bancorp, Inc.Texas Capital Bancshares, Inc.Third Point Reinsurance, Ltd.Timberland Bancorp, Inc.Tiptree, Inc.Tompkins Financial Corp.Towne BankTriCo BancsharesTriState Capital Holdings, Inc.Triumph Bancorp, Inc.TrustCo Bank Corp. NYTrustmark Corp.UMB Financial Corp.Umpqua Holdings Corp.Unico American Corp.United Bankshares, Inc.United Community Banks, Inc.United Community Financial Corp.United Financial Bancorp, Inc.United Fire Group, Inc.United Insurance Holdings Corp.Unity Bancorp, Inc.Universal Insurance Holdings, Inc.Univest Financial Corp.Unum GroupValley National BancorpVeritex Holdings, Inc.Virtus Investment Partners, Inc.Voya Financial, Inc.Waddell & Reed Financial, Inc., Class A
* 9,234 249,6873,599 270,6453,076 50,4463,798 99,014
VA U.S. Targeted Value PortfolioCONTINUED
Shares Value†
FINANCIALS — (Continued)26,956 $ 694,117
* 598 12,9716,782 543,035
* 1,037 42,289606 21,119
5,293 84,265# 3,094 107,114
98 2,00910,309 356,48549,293 1,077,052
5,117 193,57610,859 649,477
1,968 75,27627,857 595,58315,230 640,269
4,012 115,345* 7,966 501,300* 22,738 229,199
1,540 42,5667,900 53,9571,730 141,808
11,084 311,9045,196 196,149
* 5,914 124,194* 5,665 176,805
24,011 194,48919,644 698,148
2,418 165,05354,549 952,426
* 1,400 8,428# 21,700 815,703
14,166 406,56414,466 147,26416,844 241,543
6,646 347,38611,874 134,5321,368 28,331
967 23,9918,654 237,639
51,109 1,632,93354,168 604,51511,625 297,4841,697 181,851
28,402 1,595,340# 20,045 350,787

Walker & Dunlop, Inc.Washington Federal, Inc.Washington Trust Bancorp, Inc.Waterstone Financial, Inc.WesBanco, Inc.West Bancorporation, Inc.Western New England Bancorp, Inc.Westwood Holdings Group, Inc.White Mountains Insurance Group, Ltd.Wintrust Financial Corp.World Acceptance Corp.WSFS Financial Corp.Zions Bancorp NA
TOTAL FINANCIALS
Acadia Healthcare Co., Inc.Achillion Pharmaceuticals, Inc.Aclaris Therapeutics, Inc.Acorda Therapeutics, Inc.Addus HomeCare Corp.Adverum Biotechnologies, Inc.Akebia Therapeutics, Inc.Akorn, Inc.Allscripts Healthcare Solutions, Inc.AMAG Pharmaceuticals, Inc.American Shared Hospital ServicesAmphastar Pharmaceuticals, Inc.AngioDynamics, Inc.Anika Therapeutics, Inc.Applied Genetic Technologies Corp.Aravive, Inc.Ardelyx, Inc.Arena Pharmaceuticals, Inc.Assertio Therapeutics, Inc.Avanos Medical, Inc.Brookdale Senior Living, Inc.Calithera Biosciences, Inc.Cambrex Corp.Catalyst Biosciences, Inc.Chimerix, Inc.Community Health Systems, Inc.Computer Programs & Systems, Inc.Concert Pharmaceuticals, Inc.CONMED Corp.Covetrus, Inc.Cross Country Healthcare, Inc.Cumberland Pharmaceuticals, Inc.DaVita, Inc.Digirad Corp.Diplomat Pharmacy, Inc.
5,048 294,50013,458 492,294
2,415 121,3059,518 160,854
15,128 553,3822,647 56,063
12,440 116,1901,679 52,553
430 462,6804,264 305,047
* 2,688 340,65011,610 491,916
# 13,109 590,823
91,467,468
VA U.S. Targeted Value PortfolioCONTINUED
Shares Value†
HEALTH CARE — (4.6%)#* 27,703 $884,834* 70,786 312,166* 4,946 6,331#* 23,888 165,544* 4,045 325,987#* 14,557 195,209#* 3,935 16,488#* 15,029 55,908* 50,295 518,039#* 10,082 83,277* 400 1,208* 2,959 59,624* 12,603 256,849#* 3,714 204,604* 4,817 18,594* 1,603 10,500* 24,119 58,127* 5,310 332,831* 14,644 50,229* 11,094 451,748* 47,258 368,140* 3,973 16,846* 2,529 110,770* 1,500 12,285* 20,509 73,832#* 17,477 35,828
864 22,300* 4,952 49,817
6,019 525,760#* 3,151 74,584* 9,073 86,103#* 3,402 19,902* 16,250 972,563
700 3,745#* 7,552 39,799

Emergent BioSolutions, Inc.Endo International P.L.C.Ensign Group, Inc. (The)Evolent Health, Inc., Class AFive Prime Therapeutics, Inc.Five Star Senior Living, Inc.FONAR Corp.Harvard Bioscience, Inc.HealthStream, Inc.Idera Pharmaceuticals, Inc.Infinity Pharmaceuticals, Inc.Integer Holdings Corp.IntriCon Corp.Invacare Corp.Jazz Pharmaceuticals P.L.C.Kewaunee Scientific Corp.LHC Group, Inc.Ligand Pharmaceuticals, Inc.Luminex Corp.Magellan Health, Inc.Mallinckrodt P.L.C.MEDNAX, Inc.Medpace Holdings, Inc.Melinta Therapeutics, Inc.
Meridian Bioscience, Inc.Merrimack Pharmaceuticals, Inc.Micron Solutions, Inc.Myriad Genetics, Inc.National HealthCare Corp.Natus Medical, Inc.NextGen Healthcare, Inc.OPKO Health, Inc.OraSure Technologies, Inc.Orthofix Medical, Inc.Otonomy, Inc.Owens & Minor, Inc.Patterson Cos., Inc.PDL BioPharma, Inc.Perrigo Co. P.L.C.Premier, Inc., Class APrestige Consumer Healthcare, Inc.Prothena Corp. P.L.C.Providence Service Corp. (The)Quorum Health Corp.Ra Pharmaceuticals, Inc.RTI Surgical Holdings, Inc.Select Medical Holdings Corp.Surgery Partners, Inc.Taro Pharmaceutical Industries, Ltd.
* 5,578 246,213#* 6,169 19,556
4,457 268,579#* 31,750 216,535* 11,846 60,533#* 3,016 1,404* 1,830 44,908* 11,180 27,726* 6,405 180,877#* 4,100 11,070#* 7,948 11,684* 8,618 754,334#* 1,631 29,325# 14,077 75,312* 7,022 978,726
637 11,625* 7,900 999,982#* 138 12,628
8,320 180,794* 6,061 426,331#* 20,849 141,982* 21,373 525,135#* 800 63,008* 396 1,572
VA U.S. Targeted Value PortfolioCONTINUED
Shares Value†
HEALTH CARE — (Continued)3,741 $ 44,705
#* 5,810 35,673* 291 704* 8,174 238,190
2,869 251,324* 2,541 78,949* 4,358 71,297#* 6,138 12,951* 7,048 58,851* 1,741 93,056* 13,318 37,823# 13,325 36,111# 18,324 362,815* 40,768 117,412
24,324 1,313,739* 5,224 202,430#* 9,944 344,062* 7,716 72,222* 3,206 178,702#* 2,047 3,398* 1,700 57,868* 24,063 102,508* 33,657 563,418#* 8,900 67,907
761 61,466

Tivity Health, Inc.Triple-S Management Corp., Class BVanda Pharmaceuticals, Inc.Varex Imaging Corp.Zafgen, Inc.
TOTAL HEALTH CARE
AAR Corp.ABM Industries, Inc.Acacia Research Corp.ACCO Brands Corp.Acme United Corp.Actuant Corp., Class AADT, Inc.Advanced Disposal Services, Inc.AECOMAegion Corp.AGCO Corp.Air Lease Corp.Air Transport Services Group, Inc.Aircastle, Ltd.Alamo Group, Inc.Alaska Air Group, Inc.Allegiant Travel Co.Alpha Pro Tech, Ltd.Altra Industrial Motion Corp.AMERCOAmeresco, Inc., Class AAmerican Woodmark Corp.AMREP Corp.Apogee Enterprises, Inc.Applied Industrial Technologies, Inc.ARC Document Solutions, Inc.
ArcBest Corp.Arcosa, Inc.Argan, Inc.Armstrong Flooring, Inc.Arotech Corp.ASGN, Inc.Astec Industries, Inc.Astronics Corp.Astronics Corp., Class BAtlas Air Worldwide Holdings, Inc.AZZ, Inc.Barnes Group, Inc.Beacon Roofing Supply, Inc.BMC Stock Holdings, Inc.Brady Corp., Class ABriggs & Stratton Corp.
#* 2,441 42,595* 4,423 106,065* 385 4,793* 2,818 89,584* 8,953 8,147
16,368,975
INDUSTRIALS — (19.5%)6,561 274,643
16,912 711,826* 22,344 62,340
28,133 275,141100 2,080
14,397 329,691# 3,599 22,854* 18,735 606,452* 66,299 2,383,449* 8,070 152,119
14,837 1,142,44948,094 2,009,848
* 5,481 127,76218,118 376,6734,765 466,446
16,589 1,051,079765 114,635
* 3,388 11,9604,434 127,389
# 3,538 1,369,206* 8,615 122,764* 1,007 85,444* 600 3,660
10,351 419,8373,872 235,572
* 22,733 42,965
VA U.S. Targeted Value PortfolioCONTINUED
Shares Value†
INDUSTRIALS — (Continued)8,910 $266,676
15,469 580,0875,177 213,034
* 11,968 100,052* 12,206 26,426* 3,875 244,319
7,688 251,321* 2,898 106,762* 385 14,353* 6,497 296,588
12,039 560,7778,772 456,495
* 13,809 500,300* 16,283 344,385
8,420 435,5679,071 86,447

Broadwind Energy, Inc.Builders FirstSource, Inc.CAI International, Inc.Carlisle Cos., Inc.CBIZ, Inc.CECO Environmental Corp.Celadon Group, Inc.Chart Industries, Inc.CIRCOR International, Inc.Civeo Corp.Clean Harbors, Inc.Colfax Corp.Columbus McKinnon Corp.Commercial Vehicle Group, Inc.CompX International, Inc.Continental Building Products, Inc.Copa Holdings SA, Class ACornerstone Building Brands, Inc.Costamare, Inc.Covenant Transportation Group, Inc., Class ACPI Aerostructures, Inc.CRA International, Inc.CSW Industrials, Inc.Cubic Corp.Deluxe Corp.Ducommun, Inc.DXP Enterprises, Inc.Dycom Industries, Inc.Eagle Bulk Shipping, Inc.Eastern Co. (The)Echo Global Logistics, Inc.Ecology and Environment, Inc., Class AEMCOR Group, Inc.Encore Wire Corp.EnerSysEnnis, Inc.EnPro Industries, Inc.ESCO Technologies, Inc.Federal Signal Corp.Fluor Corp.Fortune Brands Home & Security, Inc.Forward Air Corp.Franklin Electric Co., Inc.
FreightCar America, Inc.FTI Consulting, Inc.Gates Industrial Corp. P.L.C.GATX Corp.Genco Shipping & Trading, Ltd.Gencor Industries, Inc.
* 2,514 4,953* 3,054 52,468* 5,295 120,726
1,365 196,847* 17,838 416,874* 9,481 87,510#* 8,097 10,445* 10,385 784,379* 4,246 161,348* 26,178 43,194* 7,655 595,636#* 27,116 750,571
5,038 193,661* 4,537 36,840
200 3,290* 1,160 28,513
3,026 305,929* 4,840 28,169
14,859 89,600* 3,274 55,167* 3,207 25,175
3,010 130,6942,996 211,5487,062 467,5046,035 269,282
* 3,539 149,169* 3,786 128,535* 2,600 143,416#* 4,235 19,608
910 22,987* 6,865 144,577
210 2,1844,501 379,8395,068 278,3352,917 198,6776,015 122,2853,232 229,6016,211 518,991
17,196 535,6557,273 236,4454,563 250,6912,463 155,1697,794 365,227
VA U.S. Targeted Value PortfolioCONTINUED
Shares Value†
INDUSTRIALS — (Continued)* 4,774 $ 26,114* 9,003 940,363#* 978 10,738
9,182 705,728* 5,361 51,573* 1,822 23,249

Genesee & Wyoming, Inc., Class AGibraltar Industries, Inc.GMS, Inc.Goldfield Corp. (The)Gorman-Rupp Co. (The)GP Strategies Corp.Graham Corp.Granite Construction, Inc.Great Lakes Dredge & Dock Corp.Greenbrier Cos., Inc. (The)Griffon Corp.Hawaiian Holdings, Inc.Heartland Express, Inc.Heidrick & Struggles International, Inc.Helios Technologies, Inc.Herc Holdings, Inc.Heritage-Crystal Clean, Inc.Herman Miller, Inc.Hertz Global Holdings, Inc.Hill International, Inc.HNI Corp.Houston Wire & Cable Co.Hub Group, Inc., Class AHudson Global, Inc.Hudson Technologies, Inc.Hurco Cos., Inc.Huron Consulting Group, Inc.Hyster-Yale Materials Handling, Inc.ICF International, Inc.IES Holdings, Inc.InnerWorkings, Inc.Insteel Industries, Inc.Interface, Inc.ITT, Inc.JELD-WEN Holding, Inc.JetBlue Airways Corp.Kadant, Inc.Kaman Corp.Kelly Services, Inc., Class AKennametal, Inc.Kimball International, Inc., Class BKirby Corp.Knight-Swift Transportation Holdings, Inc.Knoll, Inc.Korn FerryLawson Products, Inc.LB Foster Co., Class ALimbach Holdings, Inc.LS Starrett Co. (The), Class ALSC Communications, Inc.LSI Industries, Inc.Lydall, Inc.Macquarie Infrastructure Corp.
* 14,979 1,644,844* 7,673 317,969* 10,108 227,531* 14,200 33,370
9,371 311,305* 4,357 69,189
3,184 68,93410,076 357,698
* 18,178 195,05010,425 301,38710,863 177,610
# 8,269 214,9114,857 96,3636,255 185,7731,147 53,863
* 1,714 77,370* 3,996 112,088
3,076 139,466* 22,810 354,011* 8,440 26,586
3,677 125,900* 4,069 18,921* 8,402 381,031* 170 1,810* 8,444 5,177
1,730 59,149* 6,466 394,232
2,873 177,6664,421 376,625
* 1,262 22,855* 18,477 67,626
4,744 92,555775 10,741
10,307 643,363* 10,710 234,656* 80,051 1,539,381
1,102 102,9936,925 439,0459,154 254,756
11,537 398,949655 11,358
* 8,886 696,307# 28,668 1,027,461
3,746 90,84013,957 548,231
* 1,607 67,285* 3,630 87,737* 1,631 14,483* 489 2,861
6,962 6,9627,336 29,051
* 2,294 54,138# 10,809 447,925
VA U.S. Targeted Value PortfolioCONTINUED

Manitowoc Co., Inc. (The)ManpowerGroup, Inc.Marten Transport, Ltd.Masonite International Corp.MasTec, Inc.Matson, Inc.Matthews International Corp., Class AMcGrath RentCorpMercury Systems, Inc.Milacron Holdings Corp.Miller Industries, Inc.Mistras Group, Inc.Mobile Mini, Inc.Moog, Inc., Class AMRC Global, Inc.MSC Industrial Direct Co., Inc., Class AMueller Industries, Inc.Mueller Water Products, Inc., Class AMYR Group, Inc.National Presto Industries, Inc.Navigant Consulting, Inc.Nielsen Holdings P.L.C.NL Industries, Inc.NN, Inc.Northwest Pipe Co.NOW, Inc.NV5 Global, Inc.Orion Group Holdings, Inc.Oshkosh Corp.Owens CorningPAM Transportation Services, Inc.Park Aerospace Corp.Park-Ohio Holdings Corp.Patrick Industries, Inc.Patriot Transportation Holding, Inc.Perma-Pipe International Holdings, Inc.PGT Innovations, Inc.PICO Holdings, Inc.Powell Industries, Inc.Preformed Line Products Co.Primoris Services Corp.Quad/Graphics, Inc.Quanex Building Products Corp.Quanta Services, Inc.Radiant Logistics, Inc.RCM Technologies, Inc.Regal Beloit Corp.Resideo Technologies, Inc.Resources Connection, Inc.REV Group, Inc.Rexnord Corp.Rush Enterprises, Inc., Class A
Shares Value†
INDUSTRIALS — (Continued)* 9,081 $ 163,004
9,925 906,64914,216 285,315
* 5,954 317,348#* 11,508 590,591
10,742 439,4555,065 172,9705,993 408,183
* 8,235 671,317* 12,467 209,944
3,056 95,408* 5,968 90,475
10,925 371,0136,241 508,392
* 12,329 192,8263,196 227,0765,280 159,403
11,500 116,955* 3,861 139,459# 1,049 96,477
12,572 306,25443,259 1,001,878
* 5,599 28,4999,772 80,228
* 4,013 93,744* 28,487 348,966* 1,675 133,112* 8,609 35,039
9,918 828,84718,544 1,075,552
* 1,458 85,1622,063 37,5262,900 88,740
* 715 32,797* 178 3,044* 1,500 13,275* 2,555 41,187* 8,513 85,896
4,041 149,4771,747 100,924
12,426 260,449# 6,182 69,918
10,042 186,98238,352 1,435,132
* 12,254 67,274* 4,177 13,784
10,781 858,383* 9,020 170,117
10,756 189,306# 4,380 63,817* 13,548 396,821
6,105 229,914

Rush Enterprises, Inc., Class BRyder System, Inc.Saia, Inc.Schneider National, Inc., Class BScorpio Bulkers, Inc.Sensata Technologies Holding P.L.C.SIFCO Industries, Inc.
Simpson Manufacturing Co., Inc.SkyWest, Inc.Snap-on, Inc.SP Plus Corp.Spartan Motors, Inc.Spirit Airlines, Inc.SPX FLOW, Inc.Standex International Corp.Steelcase, Inc., Class ASterling Construction Co., Inc.Sunrun, Inc.Team, Inc.Terex Corp.Textainer Group Holdings, Ltd.Thermon Group Holdings, Inc.Timken Co. (The)Titan International, Inc.Titan Machinery, Inc.TriMas Corp.Trinity Industries, Inc.Triton International, Ltd.Triumph Group, Inc.TrueBlue, Inc.Tutor Perini Corp.Twin Disc, Inc.Ultralife Corp.UniFirst Corp.Univar, Inc.Universal Forest Products, Inc.USA Truck, Inc.Valmont Industries, Inc.Vectrus, Inc.Veritiv Corp.Viad Corp.Virco Manufacturing Corp.VSE Corp.Wabash National Corp.WageWorks, Inc.Watts Water Technologies, Inc., Class AWerner Enterprises, Inc.Wesco Aircraft Holdings, Inc.WESCO International, Inc.
1,650 65,01011,573 616,378
* 6,347 484,27612,155 234,59115,122 90,883
* 5,202 246,731* 659 1,832
VA U.S. Targeted Value PortfolioCONTINUED
Shares Value†
INDUSTRIALS — (Continued)1,506 $ 93,011
13,399 813,453200 30,522
* 5,677 196,0278,315 99,946
* 16,509 700,477* 8,347 338,554
2,335 164,31421,131 357,325
* 6,799 85,123#* 6,806 129,654#* 8,866 146,821
16,734 509,550* 7,888 76,750* 8,245 208,928
11,449 523,33416,208 61,266
* 7,999 165,899* 6,595 197,784
42,457 832,15718,560 613,965
# 4,485 108,672* 9,839 194,517#* 12,998 169,754* 2,022 24,406* 969 8,459
1,599 314,795* 8,639 191,095
14,860 600,790* 3,957 32,131
3,507 482,563* 2,279 92,163* 3,347 58,305
5,089 351,8534,400 19,8441,686 50,513
14,256 225,672* 542 27,734
3,431 318,50017,945 594,877
* 23,343 245,802* 12,736 646,225
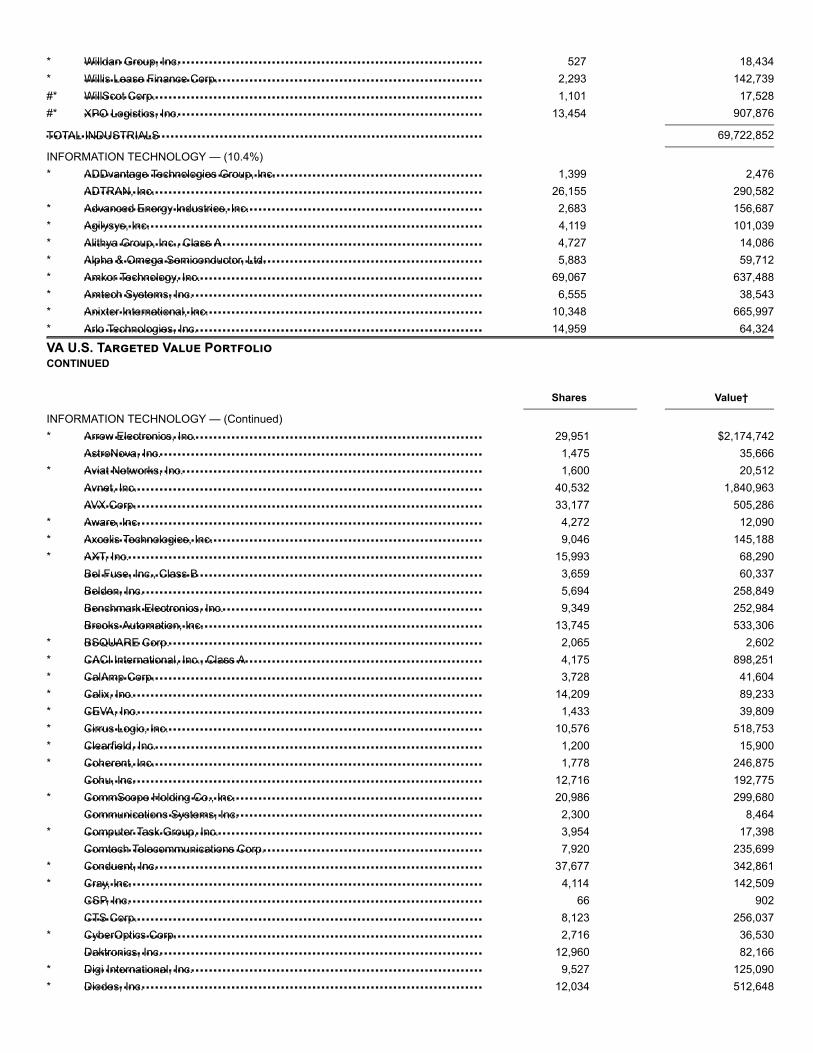
Willdan Group, Inc.Willis Lease Finance Corp.WillScot Corp.XPO Logistics, Inc.
TOTAL INDUSTRIALS
ADDvantage Technologies Group, Inc.ADTRAN, Inc.Advanced Energy Industries, Inc.Agilysys, Inc.Alithya Group, Inc., Class AAlpha & Omega Semiconductor, Ltd.Amkor Technology, Inc.Amtech Systems, Inc.Anixter International, Inc.Arlo Technologies, Inc.
Arrow Electronics, Inc.AstroNova, Inc.Aviat Networks, Inc.Avnet, Inc.AVX Corp.Aware, Inc.Axcelis Technologies, Inc.AXT, Inc.Bel Fuse, Inc., Class BBelden, Inc.Benchmark Electronics, Inc.Brooks Automation, Inc.BSQUARE Corp.CACI International, Inc., Class ACalAmp Corp.Calix, Inc.CEVA, Inc.Cirrus Logic, Inc.Clearfield, Inc.Coherent, Inc.Cohu, Inc.CommScope Holding Co., Inc.Communications Systems, Inc.Computer Task Group, Inc.Comtech Telecommunications Corp.Conduent, Inc.Cray, Inc.CSP, Inc.CTS Corp.CyberOptics Corp.Daktronics, Inc.Digi International, Inc.Diodes, Inc.
* 527 18,434* 2,293 142,739#* 1,101 17,528#* 13,454 907,876
69,722,852
INFORMATION TECHNOLOGY — (10.4%)* 1,399 2,476
26,155 290,582* 2,683 156,687* 4,119 101,039* 4,727 14,086* 5,883 59,712* 69,067 637,488* 6,555 38,543* 10,348 665,997* 14,959 64,324
VA U.S. Targeted Value PortfolioCONTINUED
Shares Value†
INFORMATION TECHNOLOGY — (Continued)* 29,951 $2,174,742
1,475 35,666* 1,600 20,512
40,532 1,840,96333,177 505,286
* 4,272 12,090* 9,046 145,188* 15,993 68,290
3,659 60,3375,694 258,8499,349 252,984
13,745 533,306* 2,065 2,602* 4,175 898,251* 3,728 41,604* 14,209 89,233* 1,433 39,809* 10,576 518,753* 1,200 15,900* 1,778 246,875
12,716 192,775* 20,986 299,680
2,300 8,464* 3,954 17,398
7,920 235,699* 37,677 342,861* 4,114 142,509
66 9028,123 256,037
* 2,716 36,53012,960 82,166
* 9,527 125,090* 12,034 512,648

DSP Group, Inc.EchoStar Corp., Class AEMCORE Corp.ePlus, Inc.Evolving Systems, Inc.FabrinetFARO Technologies, Inc.Finisar Corp.First Solar, Inc.Fitbit, Inc., Class AFlex, Ltd.FormFactor, Inc.Frequency Electronics, Inc.GSI Technology, Inc.Harmonic, Inc.Ichor Holdings, Ltd.II-VI, Inc.Immersion Corp.Infinera Corp.Insight Enterprises, Inc.InterDigital, Inc.inTEST Corp.Intevac, Inc.Jabil, Inc.KBR, Inc.KEMET Corp.
Key Tronic Corp.Kimball Electronics, Inc.Knowles Corp.Kulicke & Soffa Industries, Inc.KVH Industries, Inc.Limelight Networks, Inc.LiveRamp Holdings, Inc.LogMeIn, Inc.MACOM Technology Solutions Holdings, Inc.ManTech International Corp., Class AMethode Electronics, Inc.MKS Instruments, Inc.Monotype Imaging Holdings, Inc.MTS Systems Corp.Nanometrics, Inc.Napco Security Technologies, Inc.NeoPhotonics Corp.NETGEAR, Inc.Netscout Systems, Inc.Network-1 Technologies, Inc.ON Semiconductor Corp.OneSpan, Inc.Optical Cable Corp.
* 3,572 57,581* 12,908 587,572* 6,506 19,388* 3,140 238,326* 2,454 1,982* 8,009 429,923* 4,010 214,094* 28,108 661,381* 10,874 701,264#* 21,605 90,741* 114,348 1,274,980* 14,214 238,511* 2,659 31,004* 4,816 39,588#* 31,893 238,241* 1,261 31,790#* 15,571 618,169#* 1,200 9,648* 21,463 82,847* 8,734 480,545
3,854 248,313* 4,410 19,977* 7,564 38,879
41,431 1,279,38928,657 755,972
7,124 143,335
VA U.S. Targeted Value PortfolioCONTINUED
Shares Value†
INFORMATION TECHNOLOGY — (Continued)* 2,718 $ 13,400* 9,720 154,548* 24,185 492,165
12,487 282,581* 3,206 32,381* 13,585 36,815* 4,873 256,758
5,909 448,907#* 4,928 96,687
6,874 472,7945,826 174,4897,657 651,8403,365 67,1992,568 147,968
* 5,858 183,824* 938 27,155* 13,287 60,987* 7,554 255,703* 19,624 511,009
3,000 7,350* 64,265 1,382,340* 4,435 64,840* 1,600 6,016

OSI Systems, Inc.PC Connection, Inc.PCM, Inc.PC-Tel, Inc.PDF Solutions, Inc.Perficient, Inc.Perspecta, Inc.Photronics, Inc.Plantronics, Inc.Plexus Corp.PRGX Global, Inc.Rambus, Inc.RealNetworks, Inc.RF Industries, Ltd.Ribbon Communications, Inc.Richardson Electronics, Ltd.Rogers Corp.Rudolph Technologies, Inc.Sanmina Corp.ScanSource, Inc.Seachange International, Inc.SMART Global Holdings, Inc.SMTC Corp.Steel Connect, Inc.Stratasys, Ltd.Super Micro Computer, Inc.Sykes Enterprises, Inc.Synaptics, Inc.Synchronoss Technologies, Inc.SYNNEX Corp.Tech Data Corp.Telaria, Inc.TESSCO Technologies, Inc.TiVo Corp.TTM Technologies, Inc.Ultra Clean Holdings, Inc.
Veeco Instruments, Inc.Verint Systems, Inc.Vishay Intertechnology, Inc.Vishay Precision Group, Inc.Xerox Corp.Xperi Corp.
TOTAL INFORMATION TECHNOLOGY
AdvanSix, Inc.AgroFresh Solutions, Inc.Alcoa Corp.Allegheny Technologies, Inc.American Vanguard Corp.
#* 3,974 447,3136,934 226,811
* 4,296 149,6304,282 19,783
* 9,595 128,093* 9,552 326,392
3,714 86,648* 18,041 173,735
1,511 58,022* 8,395 501,265* 2,300 12,903* 23,438 292,037* 5,224 8,045
681 5,598* 20,057 98,680
3,224 18,280* 3,710 588,629* 8,606 231,674* 20,163 640,175* 6,350 215,582* 13,521 27,177#* 1,331 40,516* 2,059 8,102* 11,199 19,934#* 9,275 258,680* 12,744 233,343* 10,441 295,376#* 5,828 187,545* 8,428 68,183
10,748 1,059,108* 9,711 984,113* 780 6,318
3,407 50,151# 35,879 271,963* 26,524 277,441#* 11,190 163,262
VA U.S. Targeted Value PortfolioCONTINUED
Shares Value†
INFORMATION TECHNOLOGY — (Continued)* 14,697 $ 175,041* 4,493 260,010
34,468 585,956* 2,563 104,417
38,196 1,226,0926,929 147,934
37,086,086
MATERIALS — (5.7%)* 6,420 164,609* 10,796 16,086* 39,500 888,355#* 13,307 289,693
9,936 141,886

Ampco-Pittsburgh Corp.Ashland Global Holdings, Inc.Boise Cascade Co.Cabot Corp.Carpenter Technology Corp.Century Aluminum Co.Clearwater Paper Corp.Coeur Mining, Inc.Commercial Metals Co.Core Molding Technologies, Inc.Domtar Corp.Element Solutions, Inc.Ferroglobe P.L.C.Flotek Industries, Inc.Friedman Industries, Inc.FutureFuel Corp.Gold Resource Corp.Graphic Packaging Holding Co.Greif, Inc., Class AGreif, Inc., Class BHawkins, Inc.Haynes International, Inc.HB Fuller Co.Hecla Mining Co.Huntsman Corp.Innophos Holdings, Inc.Innospec, Inc.Intrepid Potash, Inc.Kraton Corp.Kronos Worldwide, Inc.Livent Corp.Louisiana-Pacific Corp.LSB Industries, Inc.Materion Corp.Mercer International, Inc.Minerals Technologies, Inc.Mosaic Co. (The)Neenah, Inc.Nexa Resources SAOlin Corp.Olympic Steel, Inc.PH Glatfelter Co.PQ Group Holdings, Inc.Rayonier Advanced Materials, Inc.Reliance Steel & Aluminum Co.
Resolute Forest Products, Inc.Schnitzer Steel Industries, Inc., Class ASchweitzer-Mauduit International, Inc.Sonoco Products Co.
#* 4,848 17,5501,614 128,2819,960 268,9206,975 311,922
13,131 591,026#* 26,808 192,750* 4,361 85,606* 35,260 162,196
24,409 427,402* 2,490 16,559
13,667 580,164* 60,806 609,276
17,682 26,700#* 15,915 48,859
1,905 11,77314,713 171,406
7,937 28,49439,577 588,114
6,268 219,1291,431 61,5332,704 118,0843,948 117,492
11,474 548,572# 130,656 241,714
52,125 1,071,1694,390 119,2766,121 571,579
* 31,876 119,216* 7,897 242,201# 2,402 32,211#* 4,775 30,751
28,028 732,652* 3,651 18,219
6,626 411,67316,859 219,673
7,929 422,21925,744 648,491
613 40,2801,752 14,436
30,411 610,3493,793 47,716
10,635 173,563* 8,236 128,399# 8,785 40,850
19,032 1,902,248
VA U.S. Targeted Value PortfolioCONTINUED
Shares Value†
MATERIALS — (Continued)21,514 $ 131,235
8,293 220,8437,750 266,8336,116 367,144

Steel Dynamics, Inc.Stepan Co.Summit Materials, Inc., Class ASunCoke Energy, Inc.Synalloy Corp.TimkenSteel Corp.Trecora ResourcesTredegar Corp.Trinseo SATronox Holdings P.L.C., Class AUFP Technologies, Inc.United States Lime & Minerals, Inc.United States Steel Corp.Universal Stainless & Alloy Products, Inc.US Concrete, Inc.Venator Materials P.L.CVerso Corp., Class AWestlake Chemical Corp.Worthington Industries, Inc.
TOTAL MATERIALS
Consolidated-Tomoka Land Co.Forestar Group, Inc.FRP Holdings, Inc.Jones Lang LaSalle, Inc.Marcus & Millichap, Inc.Rafael Holdings, Inc., Class BRE/MAX Holdings, Inc., Class ARealogy Holdings Corp.St Joe Co. (The)Stratus Properties, Inc.Tejon Ranch Co.
TOTAL REAL ESTATE
AquaVenture Holdings, Ltd.Genie Energy, Ltd., Class BOrmat Technologies, Inc.TerraForm Power, Inc., Class A
TOTAL UTILITIES
TOTAL COMMON STOCKS
State Street Institutional U.S. Government Money Market Fund 2.260%
DFA Short Term Investment Fund
(Cost $349,114,880)^^
35,639 1,122,9855,683 563,469
#* 25,617 472,378* 19,275 146,297
842 14,297* 17,420 121,766* 3,192 30,292
6,533 108,9053,996 155,085
* 16,399 181,373* 1,242 54,102
941 76,108# 33,986 510,810* 2,690 43,524#* 1,782 83,914* 12,212 46,772* 7,342 118,794
5,818 393,12213,566 545,625
20,446,995
REAL ESTATE — (0.2%)1,381 86,616
#* 1,413 29,193* 1,216 60,289
325 47,349* 739 24,535* 5,162 106,854
3,415 99,308# 27,392 142,712#* 4,421 85,060* 650 18,343* 9,061 167,901
868,160
UTILITIES — (0.2%)* 3,604 62,097# 2,650 29,203
7,946 520,86013,932 214,692
826,852
336,090,943
TEMPORARY CASH INVESTMENTS — (0.2%)745,251 745,251
SECURITIES LENDING COLLATERAL — (5.9%)@§ 1,825,234 21,119,784
TOTAL INVESTMENTS — (100.0%)$357,955,978
VA U.S. Targeted Value PortfolioCONTINUED

Communication ServicesConsumer DiscretionaryConsumer StaplesEnergyFinancialsHealth CareIndustrialsInformation TechnologyMaterialsReal EstateUtilities
Temporary Cash InvestmentsSecurities Lending Collateral
TOTAL
Activision Blizzard, Inc.Altice USA, Inc., Class AAT&T, Inc.CenturyLink, Inc.Charter Communications, Inc., Class AComcast Corp., Class ADiscovery, Inc., Class ADiscovery, Inc., Class CDISH Network Corp., Class AFox Corp., Class AFox Corp., Class BInterpublic Group of Cos., Inc. (The)Liberty Broadband Corp., Class ALiberty Broadband Corp., Class CLiberty Media Corp.-Liberty Formula One, Class ALiberty Media Corp.-Liberty Formula One, Class CLiberty Media Corp.-Liberty SiriusXM, Class ALiberty Media Corp.-Liberty SiriusXM, Class CMadison Square Garden Co. (The), Class ANews Corp., Class ANews Corp., Class BSprint Corp.T-Mobile US, Inc.Viacom, Inc., Class B
Summary of the Portfolio's investments as of July 31, 2019, based on their valuation inputs, is as follows (see Security Valuation Note):
Investments in Securities (Market Value)
Level 1 Level 2 Level 3 Total
Common Stocks$ 11,851,500 — — $ 11,851,500
47,633,234 $ 463 — 47,633,69714,269,832 — — 14,269,83225,548,526 — — 25,548,52691,452,398 15,070 — 91,467,46816,368,975 — — 16,368,97569,722,852 — — 69,722,85237,086,086 — — 37,086,08620,446,995 — — 20,446,995
868,160 — — 868,160826,852 — — 826,852
745,251 — — 745,251— 21,119,784 — 21,119,784
$336,820,661 $21,135,317 — $357,955,978
VA U.S. LARGE VALUE PORTFOLIO
SCHEDULE OF INVESTMENTS
July 31, 2019
(Unaudited)
Shares Value†
COMMON STOCKS — (99.4%)COMMUNICATION SERVICES — (11.1%)
30,610 $ 1,491,931* 16,543 426,975
577,430 19,661,491121,947 1,474,339
* 13,352 5,145,594395,937 17,092,600
#* 20,493 621,143* 34,138 964,057* 23,343 790,394
28,516 1,064,217* 18,564 690,581
7,936 181,893* 600 58,914* 3,821 380,228#* 535 20,052* 1,727 68,009* 2,140 89,088* 6,909 289,211* 622 180,405
10,744 141,3916,265 84,327
#* 33,154 243,019* 21,324 1,700,163
42,346 1,285,201

Walt Disney Co. (The)
TOTAL COMMUNICATION SERVICES
Advance Auto Parts, Inc.AramarkAutoliv, Inc.BorgWarner, Inc.Capri Holdings, Ltd.CarMax, Inc.Carnival Corp.Dollar Tree, Inc.DR Horton, Inc.Foot Locker, Inc.Ford Motor Co.Gap, Inc. (The)Garmin, Ltd.General Motors Co.Gentex Corp.Harley-Davidson, Inc.Hyatt Hotels Corp., Class AKohl's Corp.Lear Corp.Lennar Corp., Class ALennar Corp., Class BLKQ Corp.Macy's, Inc.MGM Resorts InternationalMohawk Industries, Inc.Newell Brands, Inc.
Norwegian Cruise Line Holdings, Ltd.PulteGroup, Inc.PVH Corp.Qurate Retail, Inc.Ralph Lauren Corp.Royal Caribbean Cruises, Ltd.Tapestry, Inc.Target Corp.Toll Brothers, Inc.Veoneer, Inc.Whirlpool Corp.
TOTAL CONSUMER DISCRETIONARY
Archer-Daniels-Midland Co.Bunge, Ltd.Conagra Brands, Inc.Constellation Brands, Inc., Class ACoty, Inc., Class AIngredion, Inc.
44,856 6,414,857
60,560,080
CONSUMER DISCRETIONARY — (6.4%)4,728 712,226
22,279 806,277# 6,304 454,834
20,653 780,683* 1,300 46,267* 4,971 436,255
24,422 1,153,451* 11,500 1,170,125
50,604 2,324,2427,709 316,531
286,100 2,726,533# 18,576 362,232
12,206 959,26997,773 3,944,16327,109 743,329
# 6,273 224,4482,188 169,242
24,910 1,341,6536,060 768,287
19,467 926,045607 23,066
* 29,426 792,44240,996 931,83932,476 974,929
* 9,865 1,230,06710,577 150,088
VA U.S. Large Value PortfolioCONTINUED
Shares Value†
CONSUMER DISCRETIONARY — (Continued)* 26,812 $ 1,325,585
39,397 1,241,3998,175 726,921
* 46,141 652,4345,787 603,179
17,135 1,993,4868,069 249,574
24,624 2,127,5133,807 136,938
#* 2,824 51,2567,935 1,154,384
34,731,192
CONSUMER STAPLES — (4.5%)20,188 829,32312,642 738,672
4,245 122,5535,354 1,053,774
11,310 123,3924,331 334,743

JM Smucker Co. (The)Kraft Heinz Co. (The)Kroger Co. (The)Molson Coors Brewing Co., Class BMondelez International, Inc., Class APost Holdings, Inc.Seaboard Corp.Tyson Foods, Inc., Class AUS Foods Holding Corp.Walgreens Boots Alliance, Inc.Walmart, Inc.
TOTAL CONSUMER STAPLES
Anadarko Petroleum Corp.Apache Corp.Baker Hughes a GE Co.Chevron Corp.Cimarex Energy Co.Concho Resources, Inc.ConocoPhillipsDevon Energy Corp.Diamondback Energy, Inc.Exxon Mobil Corp.Helmerich & Payne, Inc.Hess Corp.HollyFrontier Corp.Kinder Morgan, Inc.Marathon Oil Corp.Marathon Petroleum Corp.Murphy Oil Corp.National Oilwell Varco, Inc.Noble Energy, Inc.Occidental Petroleum Corp.Parsley Energy, Inc., Class APhillips 66Pioneer Natural Resources Co.Schlumberger, Ltd.
Targa Resources Corp.TechnipFMC P.L.C.Transocean, Ltd.Valero Energy Corp.WPX Energy, Inc.
TOTAL ENERGY
Aflac, Inc.Alleghany Corp.Allstate Corp. (The)Ally Financial, Inc.
13,623 1,514,74113,469 431,14346,267 979,01018,047 974,35863,318 3,386,880
* 6,880 737,67412 48,980
23,525 1,870,237* 20,298 717,940
53,539 2,917,34071,578 7,900,780
24,681,540
ENERGY — (13.3%)16,618 1,224,08236,776 898,07014,996 380,749
167,173 20,580,6682,323 117,706
12,560 1,226,86191,117 5,383,19241,038 1,108,026
8,510 880,189234,526 17,439,353
6,825 339,06626,336 1,707,62623,175 1,153,420
125,563 2,589,10995,803 1,347,94855,729 3,142,558
# 14,637 351,87419,350 460,91752,942 1,168,95953,803 2,763,322
* 3,962 65,73019,207 1,969,870
6,438 888,70229,353 1,173,239
VA U.S. Large Value PortfolioCONTINUED
Shares Value†
ENERGY — (Continued)16,690 $ 649,40822,952 632,098
#* 8,100 49,24832,870 2,802,168
* 1,746 18,228
72,512,386
FINANCIALS — (23.9%)36,222 1,906,726
* 521 357,26512,679 1,361,72551,633 1,699,242

American Financial Group, Inc.American International Group, Inc.Arch Capital Group, Ltd.Assurant, Inc.Athene Holding, Ltd., Class AAxis Capital Holdings, Ltd.Bank of America Corp.Bank of New York Mellon Corp. (The)BB&T Corp.Berkshire Hathaway, Inc., Class BCapital One Financial Corp.Chubb, Ltd.CIT Group, Inc.Citigroup, Inc.Citizens Financial Group, Inc.CNA Financial Corp.Comerica, Inc.East West Bancorp, Inc.Everest Re Group, Ltd.Fifth Third BancorpFranklin Resources, Inc.Goldman Sachs Group, Inc. (The)Hartford Financial Services Group, Inc. (The)Huntington Bancshares, Inc.Invesco, Ltd.Jefferies Financial Group, Inc.JPMorgan Chase & Co.KeyCorpLincoln National Corp.Loews Corp.M&T Bank Corp.MetLife, Inc.Morgan StanleyNew York Community Bancorp, Inc.Old Republic International Corp.PacWest BancorpPeople's United Financial, Inc.PNC Financial Services Group, Inc. (The)Principal Financial Group, Inc.Prosperity Bancshares, Inc.Prudential Financial, Inc.Regions Financial Corp.Reinsurance Group of America, Inc.RenaissanceRe Holdings, Ltd.Santander Consumer USA Holdings, Inc.Signature BankState Street Corp.
SunTrust Banks, Inc.Synchrony Financial
5,612 574,55723,508 1,316,213
* 10,751 415,9563,963 449,246
* 6,508 265,9171,673 106,520
414,877 12,728,42662,976 2,954,83436,312 1,871,157
* 54,589 11,214,21834,138 3,155,034
9,800 1,497,8328,140 411,477
128,445 9,140,14614,080 524,621
3,404 163,01817,468 1,278,65810,598 508,810
2,530 623,99973,951 2,195,605
# 367 11,97524,966 5,495,76651,701 2,979,529
132,757 1,891,78712,680 243,329
6,961 148,478165,431 19,189,996
74,613 1,370,64111,260 735,72817,112 916,1772,208 362,664
25,180 1,244,39689,250 3,976,98016,685 192,37813,666 311,721
1,151 44,4638,409 138,076
21,999 3,143,65729,370 1,704,635
# 567 39,34413,537 1,371,43497,923 1,559,913
4,352 678,5642,150 389,473
14,288 384,490444 56,592
8,498 493,649
VA U.S. Large Value PortfolioCONTINUED
Shares Value†
FINANCIALS — (Continued)20,607 $ 1,372,42619,684 706,262

Synovus Financial Corp.Travelers Cos., Inc. (The)Unum GroupVoya Financial, Inc.Wells Fargo & Co.WR Berkley Corp.Zions Bancorp NA
TOTAL FINANCIALS
Abbott LaboratoriesAllergan P.L.C.Anthem, Inc.Becton Dickinson and Co.Bio-Rad Laboratories, Inc., Class ACardinal Health, Inc.Centene Corp.Cigna Corp.CVS Health Corp.Danaher Corp.DaVita, Inc.DENTSPLY SIRONA, Inc.Elanco Animal Health, Inc.Henry Schein, Inc.Humana, Inc.IQVIA Holdings, Inc.Jazz Pharmaceuticals P.L.C.Laboratory Corp. of America HoldingsMcKesson Corp.Medtronic P.L.C.Mylan NVPerkinElmer, Inc.Perrigo Co. P.L.C.Pfizer, Inc.Quest Diagnostics, Inc.STERIS P.L.C.Syneos Health, Inc.Thermo Fisher Scientific, Inc.United Therapeutics Corp.Universal Health Services, Inc., Class BWellCare Health Plans, Inc.Zimmer Biomet Holdings, Inc.
TOTAL HEALTH CARE
Acuity Brands, Inc.AECOMAGCO Corp.Alaska Air Group, Inc.AMERCOArconic, Inc.Arcosa, Inc.Carlisle Cos., Inc.Cummins, Inc.Delta Air Lines, Inc.Dover Corp.
4,904 187,18619,149 2,807,62613,893 443,881
6,430 361,173363,301 17,587,401
8,544 592,86815,492 698,224
130,554,084
HEALTH CARE — (13.4%)36,990 3,221,829
7,075 1,135,53721,026 6,194,470
1,497 378,442* 754 237,435
21,056 962,891* 26,102 1,359,653* 25,823 4,387,844
90,272 5,043,49732,152 4,517,356
* 19,353 1,158,2775,350 291,307
* 1,300 42,848* 3,668 244,069
9,731 2,887,674* 9,413 1,498,267* 5,173 721,013* 14,026 2,349,635
12,043 1,673,37574,900 7,635,306
* 52,664 1,100,678200 17,224
8,650 467,186406,902 15,804,074
17,259 1,761,7993,874 576,684
* 1,106 56,50616,736 4,647,252
* 2,598 205,8669,906 1,494,419
* 1,162 333,7846,119 826,860
73,233,057
INDUSTRIALS — (10.3%)331 44,427
* 9,375 337,0318,813 678,601
11,735 743,5301,629 630,423
53,719 1,345,1241,576 59,1006,401 923,088
10,007 1,641,14845,864 2,799,53910,040 972,374
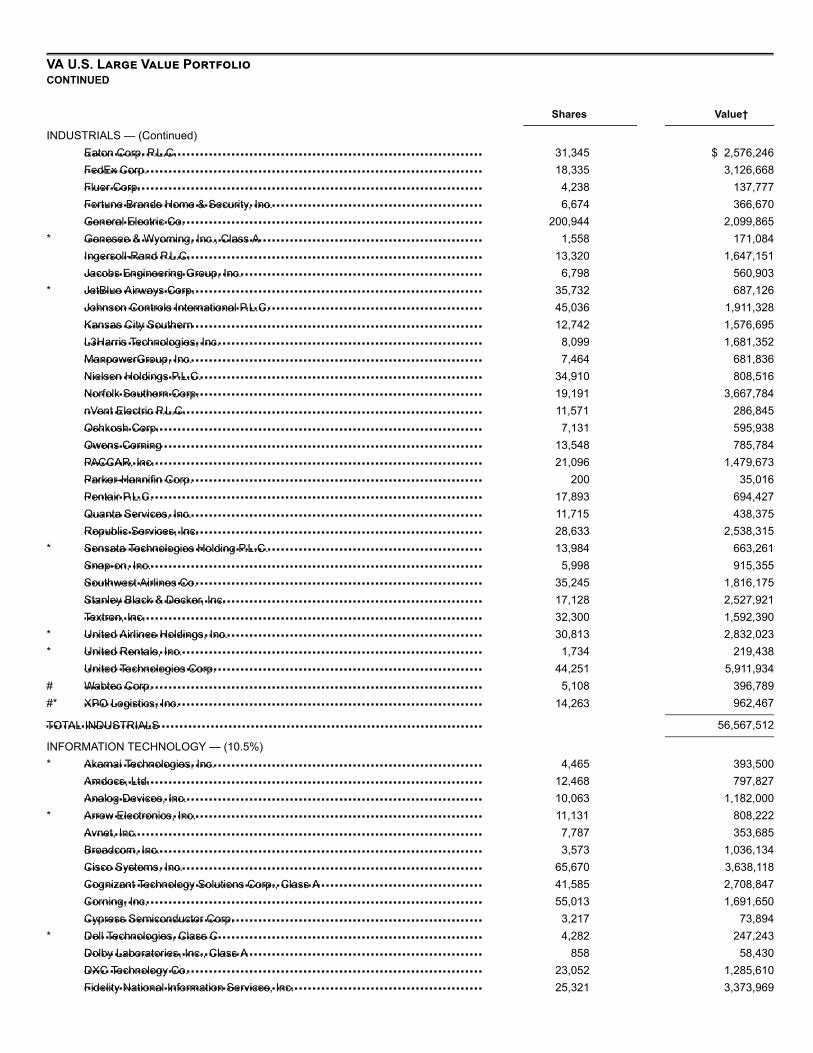
Eaton Corp. P.L.C.FedEx Corp.Fluor Corp.Fortune Brands Home & Security, Inc.General Electric Co.Genesee & Wyoming, Inc., Class AIngersoll-Rand P.L.C.Jacobs Engineering Group, Inc.JetBlue Airways Corp.Johnson Controls International P.L.C.Kansas City SouthernL3Harris Technologies, Inc.ManpowerGroup, Inc.Nielsen Holdings P.L.C.Norfolk Southern Corp.nVent Electric P.L.C.Oshkosh Corp.Owens CorningPACCAR, Inc.Parker-Hannifin Corp.Pentair P.L.C.Quanta Services, Inc.Republic Services, Inc.Sensata Technologies Holding P.L.C.Snap-on, Inc.Southwest Airlines Co.Stanley Black & Decker, Inc.Textron, Inc.United Airlines Holdings, Inc.United Rentals, Inc.United Technologies Corp.Wabtec Corp.XPO Logistics, Inc.
TOTAL INDUSTRIALS
Akamai Technologies, Inc.Amdocs, Ltd.Analog Devices, Inc.Arrow Electronics, Inc.Avnet, Inc.Broadcom, Inc.Cisco Systems, Inc.Cognizant Technology Solutions Corp., Class ACorning, Inc.Cypress Semiconductor Corp.Dell Technologies, Class CDolby Laboratories, Inc., Class ADXC Technology Co.Fidelity National Information Services, Inc.
VA U.S. Large Value PortfolioCONTINUED
Shares Value†
INDUSTRIALS — (Continued)31,345 $ 2,576,24618,335 3,126,668
4,238 137,7776,674 366,670
200,944 2,099,865* 1,558 171,084
13,320 1,647,1516,798 560,903
* 35,732 687,12645,036 1,911,32812,742 1,576,695
8,099 1,681,3527,464 681,836
34,910 808,51619,191 3,667,78411,571 286,8457,131 595,938
13,548 785,78421,096 1,479,673
200 35,01617,893 694,42711,715 438,37528,633 2,538,315
* 13,984 663,2615,998 915,355
35,245 1,816,17517,128 2,527,92132,300 1,592,390
* 30,813 2,832,023* 1,734 219,438
44,251 5,911,934# 5,108 396,789#* 14,263 962,467
56,567,512
INFORMATION TECHNOLOGY — (10.5%)* 4,465 393,500
12,468 797,82710,063 1,182,000
* 11,131 808,2227,787 353,6853,573 1,036,134
65,670 3,638,11841,585 2,708,84755,013 1,691,650
3,217 73,894* 4,282 247,243
858 58,43023,052 1,285,61025,321 3,373,969

Flex, Ltd.Hewlett Packard Enterprise Co.HP, Inc.Intel Corp.IPG Photonics Corp.Jabil, Inc.Juniper Networks, Inc.Lam Research Corp.Leidos Holdings, Inc.
Marvell Technology Group, Ltd.Micron Technology, Inc.ON Semiconductor Corp.Qorvo, Inc.Skyworks Solutions, Inc.SS&C Technologies Holdings, Inc.SYNNEX Corp.Synopsys, Inc.TE Connectivity, Ltd.Western Digital Corp.Xerox Corp.
TOTAL INFORMATION TECHNOLOGY
Air Products & Chemicals, Inc.Albemarle Corp.Ashland Global Holdings, Inc.Ball Corp.CF Industries Holdings, Inc.Corteva, Inc.Dow, Inc.DuPont de Nemours, Inc.Eastman Chemical Co.FMC Corp.Freeport-McMoRan, Inc.Huntsman Corp.International Flavors & Fragrances, Inc.International Paper Co.Linde P.L.C.LyondellBasell Industries NV, Class AMartin Marietta Materials, Inc.Mosaic Co. (The)Newmont Goldcorp Corp.Nucor Corp.Packaging Corp. of AmericaReliance Steel & Aluminum Co.Royal Gold, Inc.Sonoco Products Co.Steel Dynamics, Inc.Valvoline, Inc.Vulcan Materials Co.
* 27,933 311,453170,324 2,447,556106,724 2,245,473392,945 19,863,370
* 1,230 161,1421,501 46,351
31,998 864,5861,304 272,027
16,325 1,340,282
VA U.S. Large Value PortfolioCONTINUED
Shares Value†
INFORMATION TECHNOLOGY — (Continued)17,533 $ 460,417
* 86,728 3,893,220* 37,134 798,752* 8,700 637,623
4,627 394,59118,616 892,637
979 96,471* 651 86,427
23,110 2,135,36438,721 2,086,67528,577 917,322
57,600,868
MATERIALS — (5.3%)6,186 1,412,078
# 9,079 662,4045,633 447,711
10,479 749,03923,026 1,141,169
* 17,233 508,374* 53,775 2,604,861
17,233 1,243,53318,227 1,373,404
3,749 323,989115,618 1,278,735
9,737 200,095# 1,536 221,169
33,058 1,451,57713,100 2,505,76816,339 1,367,411
4,539 1,124,53721,306 536,69842,550 1,553,92642,059 2,287,16810,295 1,039,486
8,693 868,8652,190 250,6462,845 170,785
28,855 909,22116,013 323,302
9,441 1,306,162

Westlake Chemical Corp.WestRock Co.
TOTAL MATERIALS
CBRE Group, Inc., Class AHoward Hughes Corp. (The)Jones Lang LaSalle, Inc.
TOTAL REAL ESTATE
MDU Resources Group, Inc.NRG Energy, Inc.
Vistra Energy Corp.
TOTAL UTILITIES
TOTAL COMMON STOCKS
DFA Short Term Investment Fund
(Cost $450,641,736)^^
Communication ServicesConsumer DiscretionaryConsumer StaplesEnergyFinancialsHealth CareIndustrialsInformation TechnologyMaterialsReal EstateUtilities
Securities Lending Collateral
TOTAL
5,517 372,78426,354 950,062
29,184,959
REAL ESTATE — (0.3%)* 16,234 860,564* 807 108,945
5,582 813,242
1,782,751
UTILITIES — (0.4%)6,027 161,162
17,305 590,793
VA U.S. Large Value PortfolioCONTINUED
Shares Value†
UTILITIES — (Continued)55,822 $ 1,197,940
1,949,895
543,358,324
SECURITIES LENDING COLLATERAL — (0.6%)@§ 284,349 3,290,206
TOTAL INVESTMENTS — (100.0%)$546,648,530
Summary of the Portfolio's investments as of July 31, 2019, based on their valuation inputs, is as follows (see Security Valuation Note):
Investments in Securities (Market Value)
Level 1 Level 2 Level 3 Total
Common Stocks$ 60,560,080 — — $ 60,560,080
34,731,192 — — 34,731,19224,681,540 — — 24,681,54072,512,386 — — 72,512,386
130,554,084 — — 130,554,08473,233,057 — — 73,233,05756,567,512 — — 56,567,51257,600,868 — — 57,600,86829,184,959 — — 29,184,959
1,782,751 — — 1,782,7511,949,895 — — 1,949,895
— $3,290,206 — 3,290,206
$543,358,324 $3,290,206 — $546,648,530
VA INTERNATIONAL VALUE PORTFOLIO
SCHEDULE OF INVESTMENTS
July 31, 2019
(Unaudited)

AMP, Ltd.Aurizon Holdings, Ltd.Australia & New Zealand Banking Group, Ltd.Bank of Queensland, Ltd.Bendigo & Adelaide Bank, Ltd.BlueScope Steel, Ltd.Boral, Ltd.Challenger, Ltd.Crown Resorts, Ltd.Downer EDI, Ltd.Fortescue Metals Group, Ltd.Harvey Norman Holdings, Ltd.Incitec Pivot, Ltd.LendLease GroupNational Australia Bank, Ltd.Newcrest Mining, Ltd.Oil Search, Ltd.Origin Energy, Ltd.QBE Insurance Group, Ltd.Qube Holdings, Ltd.Santos, Ltd.South32, Ltd.Star Entertainment Grp, Ltd. (The)Suncorp Group, Ltd.Tabcorp Holdings, Ltd.Westpac Banking Corp.Whitehaven Coal, Ltd.Woodside Petroleum, Ltd.WorleyParsons, Ltd.
TOTAL AUSTRALIA
Raiffeisen Bank International AGVoestalpine AG
TOTAL AUSTRIA
AgeasKBC Group NVSolvay SAUCB SA
TOTAL BELGIUM
AltaGas, Ltd.Bank of MontrealBank of Nova Scotia (The)Bank of Nova Scotia (The)Barrick Gold Corp.Barrick Gold Corp.Cameco Corp.Canadian Imperial Bank of Commerce
Shares Value»
COMMON STOCKS — (97.7%)AUSTRALIA — (6.8%)
170,099 $ 206,90879,484 312,031
242,031 4,599,72141,357 263,43045,980 359,93071,685 632,702
108,300 379,5497,788 37,5188,789 71,063
34,395 168,983241,074 1,357,297
# 57,544 172,328153,141 363,593
39,494 391,451166,658 3,245,795
29,042 700,93455,910 270,73792,720 501,72262,715 534,48259,269 127,599
179,159 882,746562,620 1,197,121
68,502 193,34381,567 751,78591,547 280,83812,982 254,706
105,012 263,18080,603 1,900,69714,874 162,983
20,585,172
AUSTRIA — (0.1%)8,733 204,8034,517 119,246
324,049
BELGIUM — (1.0%)12,339 662,42614,235 915,279
6,973 714,0009,161 714,343
3,006,048
CANADA — (8.5%)# 9,391 143,804
22,673 1,696,16746,450 2,479,820
9,982 532,83914,212 230,98037,208 605,00221,467 197,282
7,164 563,599

Canadian Imperial Bank of CommerceCanadian Natural Resources, Ltd.
Cenovus Energy, Inc.Element Fleet Management Corp.Empire Co., Ltd., Class AEncana Corp.Encana Corp.Fairfax Financial Holdings, Ltd.First Quantum Minerals, Ltd.Genworth MI Canada, Inc.Great-West Lifeco, Inc.Husky Energy, Inc.IA Financial Crop., Inc.Imperial Oil, Ltd.Imperial Oil, Ltd.Kinross Gold Corp.Linamar Corp.Lundin Mining Corp.Magna International, Inc.Manulife Financial Corp.Manulife Financial Corp.Nutrien, Ltd.Nutrien, Ltd.Onex Corp.Stars Group, Inc. (The)Sun Life Financial, Inc.Suncor Energy, Inc.Suncor Energy, Inc.Teck Resources, Ltd., Class BTeck Resources, Ltd., Class BTMX Group, Ltd.Tourmaline Oil Corp.West Fraser Timber Co., Ltd.Wheaton Precious Metals Corp.
TOTAL CANADA
AP Moller - Maersk A.S., Class AAP Moller - Maersk A.S., Class BCarlsberg A.S., Class BDanske Bank A.S.Demant A.S.DSV A.S.H Lundbeck A.S.ISS A.S.Rockwool International A.S., Class ARockwool International A.S., Class BTryg A.S.Vestas Wind Systems A.S.
8,249 648,94986,549 2,187,959
VA International Value PortfolioCONTINUED
Shares Value»
CANADA — (Continued)# 42,100 $ 390,688
12,245 93,1503,167 83,818
44,395 202,83547,818 218,528
2,494 1,155,44530,796 283,739
# 2,700 99,64911,680 256,46844,388 344,397
* 11,174 448,3822,100 57,504
19,463 533,092* 136,784 553,437
849 28,75563,520 307,54133,879 1,708,179
5,708 103,36586,295 1,560,214
3,400 186,41017,524 960,523
2,695 162,807#* 5,583 86,816
18,713 774,53145,346 1,301,14575,053 2,154,02114,790 302,569
# 55,838 1,144,1213,800 282,221
19,704 259,7744,400 171,9931,613 42,164
25,544,682
DENMARK — (1.6%)139 148,797167 187,516
7,124 973,06620,535 304,792
#* 6,848 201,7576,473 617,8087,719 297,565
12,670 355,32430 6,589
680 165,9683,496 106,702
16,721 1,372,151

TOTAL DENMARK
Fortum OyjNokia OyjNordea Bank AbpStora Enso Oyj, Class RUPM-Kymmene Oyj
TOTAL FINLAND
Amundi SAArkema SAAtos SEAXA SABNP Paribas SABollore SABouygues SACarrefour SACie de Saint-GobainCie Generale des Etablissements Michelin SCACNP AssurancesCredit Agricole SAElectricite de France SAEngie SAFaurecia SEIliad SANatixis SAOrange SAPeugeot SAPublicis Groupe SARenault SASanofiSCOR SESES SASociete Generale SATotal SAValeo SAWorldline SA
TOTAL FRANCE
1&1 Drillisch AGAllianz SEBASF SEBayer AGBayerische Motoren Werke AGCommerzbank AGContinental AGDaimler AGDeutsche Bank AGDeutsche Bank AG
4,738,035
FINLAND — (0.9%)27,784 637,355
# 20,691 111,517100,535 644,959
28,397 327,03139,810 1,073,079
2,793,941
VA International Value PortfolioCONTINUED
Shares Value»
FRANCE — (9.9%)1,413 $ 97,2216,604 594,397
566 45,51358,603 1,476,10751,999 2,433,55460,142 258,63126,110 934,71557,381 1,102,65454,149 2,074,37219,053 2,106,25914,800 305,88926,596 316,59853,134 657,75681,674 1,256,921
515 24,371# 562 58,102
69,834 280,056133,175 1,973,984
69,936 1,650,6992,849 140,586
22,289 1,243,2281,809 150,7476,163 253,265
13,379 220,96036,966 905,470
167,429 8,677,875# 22,309 695,203* 220 15,721
29,950,854
GERMANY — (5.8%)2,142 64,329
776 180,0392,983 198,024
45,248 2,930,66729,120 2,142,91375,025 509,093
3,826 524,56292,360 4,772,83047,302 365,64747,848 373,693

Deutsche Lufthansa AGEvonik Industries AGFraport AG Frankfurt Airport Services WorldwideHapag-Lloyd AGHeidelbergCement AGInnogy SEMETRO AGMuenchener Rueckversicherungs-Gesellschaft AG in MuenchenRWE AGTalanx AGTelefonica Deutschland Holding AGUniper SEVolkswagen AG
TOTAL GERMANY
Bank of East Asia, Ltd. (The)
BOC Aviation, Ltd.Cathay Pacific Airways, Ltd.CK Asset Holdings, Ltd.CK Hutchison Holdings, Ltd.Guoco Group, Ltd.Hang Lung Group, Ltd.Hang Lung Properties, Ltd.Henderson Land Development Co., Ltd.Kerry Properties, Ltd.Melco International Development, Ltd.MTR Corp., Ltd.New World Development Co., Ltd.NWS Holdings, Ltd.PCCW, Ltd.Shangri-La Asia, Ltd.Sino Land Co., Ltd.SJM Holdings, Ltd.Sun Hung Kai Properties, Ltd.Swire Pacific, Ltd., Class ASwire Pacific, Ltd., Class BWH Group, Ltd.Wharf Holdings, Ltd. (The)Wheelock & Co., Ltd.Xinyi Glass Holdings, Ltd.Yue Yuen Industrial Holdings, Ltd.
TOTAL HONG KONG
AIB Group P.L.C.Bank of Ireland Group P.L.C.CRH P.L.C., Sponsored ADRFlutter Entertainment P.L.C.
TOTAL IRELAND
36,444 577,56611,238 319,7963,040 253,8801,750 73,499
21,343 1,541,3374,599 193,2357,044 108,3492,310 550,491
17,269 466,588* 4,970 208,554
92,553 233,01116,317 502,715
3,115 531,090
17,621,908
HONG KONG — (3.1%)33,341 96,357
VA International Value PortfolioCONTINUED
Shares Value»
HONG KONG — (Continued)18,500 $ 159,38488,000 124,11171,500 537,618
164,012 1,532,6897,000 110,280
77,000 197,783120,000 282,183
68,255 353,02557,000 214,03522,000 53,53056,660 371,830
549,842 774,172118,889 220,74253,000 30,22652,000 63,267
226,492 366,776155,000 168,265
95,362 1,536,79151,500 587,00192,500 164,711
564,000 548,981107,635 261,712
53,000 333,52086,000 86,69160,500 169,517
9,345,197
IRELAND — (0.4%)35,416 121,30557,304 252,91517,802 593,875
3,388 267,608
1,235,703

Bank Hapoalim BMBank Leumi Le-Israel BMFirst International Bank Of Israel, Ltd.Israel Discount Bank, Ltd., Class A
TOTAL ISRAEL
Eni SpAFiat Chrysler Automobiles NVIntesa Sanpaolo SpAMediobanca Banca di Credito Finanziario SpATelecom Italia SpATelecom Italia SpA, Sponsored ADRUniCredit SpA
TOTAL ITALY
AEON Financial Service Co., Ltd.AGC, Inc.Aisin Seiki Co., Ltd.Alps Alpine Co., Ltd.Amada Holdings Co., Ltd.
Aozora Bank, Ltd.Asahi Kasei Corp.Bank of Kyoto, Ltd. (The)Brother Industries, Ltd.Canon Marketing Japan, Inc.Chiba Bank, Ltd. (The)Chugoku Bank, Ltd. (The)Citizen Watch Co., Ltd.Coca-Cola Bottlers Japan Holdings, Inc.Concordia Financial Group, Ltd.Cosmo Energy Holdings Co., Ltd.Credit Saison Co., Ltd.Dai Nippon Printing Co., Ltd.Daicel Corp.Daido Steel Co., Ltd.Dai-ichi Life Holdings, Inc.Daiwa Securities Group, Inc.DeNA Co., Ltd.Denka Co., Ltd.Denso Corp.Dentsu, Inc.DIC Corp.Dowa Holdings Co., Ltd.Ebara Corp.Fuji Media Holdings, Inc.FUJIFILM Holdings Corp.Fukuoka Financial Group, Inc.
ISRAEL — (0.4%)67,998 514,23848,338 351,635
* 4,732 121,97478,197 337,500
1,325,347
ITALY — (2.3%)115,611 1,805,994103,842 1,391,112709,285 1,538,373
18,386 184,155* 1,601,899 900,630* 18,000 100,080# 88,315 1,039,864
6,960,208
JAPAN — (22.0%)3,100 50,010
21,000 643,22912,300 399,727
3,000 54,61324,400 268,269
VA International Value PortfolioCONTINUED
Shares Value»
JAPAN — (Continued)6,400 $ 146,6727,900 80,3662,500 97,025
16,000 283,2876,700 128,334
30,300 149,8604,700 41,091
31,000 154,270# 9,400 231,380
57,500 202,4774,700 96,8809,900 120,3569,300 195,063
28,800 243,7072,600 98,714
46,300 680,658121,000 521,696
2,800 53,4035,400 155,403
26,100 1,107,82611,600 383,4508,000 215,8374,900 154,7509,400 252,6161,800 23,4194,100 194,3349,200 168,474

Fukuyama Transporting Co., Ltd.Furukawa Electric Co., Ltd.Fuyo General Lease Co., Ltd.Glory, Ltd.GS Yuasa Corp.Gunma Bank, Ltd. (The)Hachijuni Bank, Ltd. (The)Hankyu Hanshin Holdings, Inc.Haseko Corp.Heiwa Corp.Hino Motors, Ltd.Hitachi Capital Corp.Hitachi Chemical Co., Ltd.Hitachi Metals, Ltd.Hitachi, Ltd.Honda Motor Co., Ltd.Ibiden Co., Ltd.Idemitsu Kosan Co., Ltd.IHI Corp.Iida Group Holdings Co., Ltd.Inpex Corp.Isetan Mitsukoshi Holdings, Ltd.Isuzu Motors, Ltd.ITOCHU Corp.Itoham Yonekyu Holdings, Inc.Iyo Bank, Ltd. (The)J Front Retailing Co., Ltd.Japan Post Holdings Co., Ltd.JFE Holdings, Inc.JGC Corp.JSR Corp.JTEKT Corp.
JXTG Holdings, Inc.Kajima Corp.Kamigumi Co., Ltd.Kandenko Co., Ltd.Kaneka Corp.Kawasaki Heavy Industries, Ltd.Kinden Corp.Kobe Steel, Ltd.Kokuyo Co., Ltd.Konica Minolta, Inc.K's Holdings Corp.Kuraray Co., Ltd.Kyocera Corp.Kyushu Financial Group, Inc.Lintec Corp.LIXIL Group Corp.Mabuchi Motor Co., Ltd.
3,000 112,9598,100 217,246
200 11,8702,300 60,734
400 7,48112,000 41,34115,000 56,52517,800 624,928
9,000 97,4945,200 106,6967,900 63,3766,000 122,8768,600 235,170
26,700 280,70645,000 1,595,466
108,400 2,697,04812,200 217,50714,700 405,094
8,900 212,07414,400 236,19770,000 613,92513,100 104,14413,600 150,49040,300 767,341
9,300 60,92412,500 60,75124,500 287,62427,800 272,51047,800 631,963
6,800 88,53222,400 369,93425,600 303,529
VA International Value PortfolioCONTINUED
Shares Value»
JAPAN — (Continued)211,827 $ 996,82124,300 312,519
6,400 147,1308,900 77,5997,200 267,318
15,400 335,0717,000 105,893
31,600 202,7555,300 71,487
47,400 392,81113,800 125,82935,100 415,120
3,000 182,8425,550 21,0631,100 23,145
27,000 467,0202,700 93,214

Maeda Corp.Maeda Road Construction Co., Ltd.Marubeni Corp.Mazda Motor Corp.Mebuki Financial Group, Inc.Medipal Holdings Corp.Mitsubishi Chemical Holdings Corp.Mitsubishi Corp.Mitsubishi Gas Chemical Co., Inc.Mitsubishi Heavy Industries, Ltd.Mitsubishi Logistics Corp.Mitsubishi Materials Corp.Mitsubishi Motors Corp.Mitsubishi Tanabe Pharma Corp.Mitsubishi UFJ Financial Group, Inc.Mitsubishi UFJ Lease & Finance Co., Ltd.Mitsui & Co., Ltd.Mitsui Chemicals, Inc.Mitsui Fudosan Co., Ltd.Mitsui OSK Lines, Ltd.Mizuho Financial Group, Inc.MS&AD Insurance Group Holdings, Inc.Nagase & Co., Ltd.NEC Corp.NGK Insulators, Ltd.NGK Spark Plug Co., Ltd.NH Foods, Ltd.NHK Spring Co., Ltd.Nikkon Holdings Co., Ltd.Nikon Corp.Nippo Corp.Nippon Electric Glass Co., Ltd.Nippon Express Co., Ltd.Nippon Kayaku Co., Ltd.Nippon Paper Industries Co., Ltd.Nippon Shokubai Co., Ltd.Nippon Steel Corp.Nippon Yusen K.K.Nipro Corp.Nissan Motor Co., Ltd.NOK Corp.Nomura Holdings, Inc.
Nomura Real Estate Holdings, Inc.NSK, Ltd.NTN Corp.Obayashi Corp.Oji Holdings Corp.ORIX Corp.Rengo Co., Ltd.
15,800 118,3756,100 129,445
65,800 426,55356,800 549,52428,540 70,422
3,400 72,22280,300 570,09049,000 1,315,76216,700 222,23513,500 556,891
2,599 69,12011,500 316,31446,300 203,743
7,000 79,029386,000 1,906,454
46,200 244,82436,100 586,87319,900 455,060
3,000 67,72310,600 259,976
736,200 1,044,90416,650 545,763
7,600 110,72715,700 641,80519,900 295,968
7,700 147,0289,700 359,752
19,400 152,1291,000 23,368
21,900 295,6875,000 95,2575,900 131,9447,600 428,3406,000 70,5488,000 141,0493,200 207,696
52,518 822,80714,500 241,577
7,700 85,362134,500 874,240
9,000 132,130113,200 363,849
VA International Value PortfolioCONTINUED
Shares Value»
JAPAN — (Continued)12,900 $ 261,22535,700 301,85614,400 39,96070,100 663,91993,000 480,92772,600 1,036,14220,300 154,150

Resona Holdings, Inc.Ricoh Co., Ltd.Rohm Co., Ltd.Sankyo Co., Ltd.Sega Sammy Holdings, Inc.Seino Holdings Co., Ltd.Sekisui House, Ltd.Shimamura Co., Ltd.Shimizu Corp.Shinsei Bank, Ltd.Shizuoka Bank, Ltd. (The)Showa Denko K.K.Sojitz Corp.Sompo Holdings, Inc.Sumitomo Bakelite Co., Ltd.Sumitomo Chemical Co., Ltd.Sumitomo Corp.Sumitomo Electric Industries, Ltd.Sumitomo Forestry Co., Ltd.Sumitomo Heavy Industries, Ltd.Sumitomo Metal Mining Co., Ltd.Sumitomo Mitsui Financial Group, Inc.Sumitomo Mitsui Trust Holdings, Inc.Sumitomo Osaka Cement Co., Ltd.Sumitomo Rubber Industries, Ltd.T&D Holdings, Inc.Taiheiyo Cement Corp.Taisho Pharmaceutical Holdings Co., Ltd.Takashimaya Co., Ltd.Takeda Pharmaceutical Co., Ltd.TDK Corp.Teijin, Ltd.THK Co., Ltd.Toda Corp.Toho Holdings Co., Ltd.Tokai Rika Co., Ltd.Tokio Marine Holdings, Inc.Tokyo Tatemono Co., Ltd.Tokyu Fudosan Holdings Corp.Toppan Printing Co., Ltd.Toray Industries, Inc.Tosoh Corp.Toyo Seikan Group Holdings, Ltd.Toyoda Gosei Co., Ltd.Toyota Industries Corp.Toyota Motor Corp.Toyota Tsusho Corp.TS Tech Co., Ltd.Ube Industries, Ltd.Universal Entertainment Corp.Wacoal Holdings Corp.Yamada Denki Co., Ltd.
74,000 301,67250,000 457,968
6,700 466,9381,800 61,9683,400 43,5857,900 98,400
# 65,900 1,108,0011,900 134,347
58,900 473,9885,500 83,077
13,000 89,88510,600 284,36989,970 281,09213,397 554,809
1,400 47,624160,700 732,827
48,500 719,67571,600 885,90211,400 142,69412,100 390,08724,700 701,57965,900 2,304,50811,503 393,1531,600 61,105
17,500 191,02154,700 614,27212,600 353,875
700 53,375# 10,999 126,168
54,267 1,867,6473,600 276,398
18,500 320,0631,400 35,283
12,000 65,7334,600 102,2891,100 18,0181,400 74,313
17,400 203,02470,500 407,84810,000 162,53946,700 321,27126,000 364,41311,800 205,9876,400 117,7015,900 306,295
100,670 6,504,60913,300 384,981
4,700 129,38710,600 220,697
1,600 50,2531,800 43,666
# 40,900 180,408
VA International Value PortfolioCONTINUED

Yamaguchi Financial Group, Inc.Yamaha Motor Co., Ltd.Yamato Kogyo Co., Ltd.Yamazaki Baking Co., Ltd.Yokohama Rubber Co., Ltd. (The)Zeon Corp.
TOTAL JAPAN
ABN AMRO Bank NVAegon NVArcelorMittalArcelorMittalASR Nederland NVCoca-Cola European Partners P.L.C.ING Groep NV, Sponsored ADRING Groep NVKoninklijke Ahold Delhaize NVKoninklijke DSM NVKoninklijke Philips NVKoninklijke Vopak NVNN Group NVRandstad NV
TOTAL NETHERLANDS
Air New Zealand, Ltd.Auckland International Airport, Ltd.EBOS Group, Ltd.Fletcher Building, Ltd.Fonterra Co-operative Group, Ltd.Ryman Healthcare, Ltd.SKYCITY Entertainment Group, Ltd.
TOTAL NEW ZEALAND
Austevoll Seafood ASADNB ASAEquinor ASANorsk Hydro ASASpareBank 1 SR-Bank ASAStorebrand ASASubsea 7 SAYara International ASA
TOTAL NORWAY
EDP Renovaveis SA
CapitaLand, Ltd.City Developments, Ltd.Frasers Property, Ltd.Golden Agri-Resources, Ltd.Hongkong Land Holdings, Ltd.
Shares Value»
JAPAN — (Continued)6,000 $ 41,889
19,300 338,4241,600 41,3911,400 21,259
11,900 218,94613,700 158,438
66,661,166
NETHERLANDS — (3.3%)29,120 582,909
# 127,305 627,34921,499 341,04933,843 532,007
7,324 275,2111,208 66,584
18,092 200,821114,815 1,273,958109,832 2,494,616
16,205 2,007,606# 2,641 123,572
5,834 287,646# 15,074 566,346
10,142 509,066
9,888,740
NEW ZEALAND — (0.3%)75,203 133,87851,128 311,47410,846 177,380
# 58,153 189,011* 4,334 10,717
6,929 58,4249,716 25,488
906,372
NORWAY — (0.9%)6,393 65,042
64,001 1,145,0162,751 49,326
156,575 532,55710,821 116,42627,367 184,93623,150 248,123
6,217 291,262
2,632,688
PORTUGAL — (0.0%)7,795 80,253
SINGAPORE — (1.1%)225,500 590,768
40,600 284,90523,600 31,075
297,300 63,50142,200 257,356

Hutchison Port Holdings TrustKeppel Corp., Ltd.
Olam International, Ltd.Sembcorp Industries, Ltd.Singapore Airlines, Ltd.United Industrial Corp., Ltd.UOL Group, Ltd.Wilmar International, Ltd.Yangzijiang Shipbuilding Holdings Ltd.
TOTAL SINGAPORE
Banco Bilbao Vizcaya Argentaria SABanco de Sabadell SABanco Santander SABankia SARepsol SA
TOTAL SPAIN
BillerudKorsnas ABBoliden ABDometic Group ABGetinge AB, Class BHolmen AB, Class BHusqvarna AB, Class BICA Gruppen ABIntrum ABMillicom International Cellular SAPandox ABPeab ABSkandinaviska Enskilda Banken AB, Class ASKF AB, Class BSSAB AB, Class ASSAB AB, Class BSvenska Cellulosa AB SCA, Class ASvenska Cellulosa AB SCA, Class BSvenska Handelsbanken AB, Class ASwedbank AB, Class ATelefonaktiebolaget LM Ericsson, Class BTelia Co. ABTrelleborg AB, Class BVolvo AB, Class AVolvo AB, Class B
TOTAL SWEDEN
ABB, Ltd.Adecco Group AGAlcon, Inc.Alcon, Inc.
275,100 60,147182,400 842,822
VA International Value PortfolioCONTINUED
Shares Value»
SINGAPORE — (Continued)53,900 $ 75,96997,300 164,62967,000 469,08113,400 29,00123,399 124,357
128,600 371,73595,500 98,476
3,463,822
SPAIN — (2.5%)# 30,254 154,045
402,337 351,3941,390,771 5,936,191
48,854 96,85759,145 938,089
7,476,576
SWEDEN — (2.1%)15,047 173,71727,615 626,233
5,980 54,55516,901 247,983
9,624 203,20410,631 94,136
4,635 205,687# 7,206 188,910
5,562 285,7463,484 63,5203,561 30,130
102,385 962,62935,749 586,383
9,099 25,77636,937 93,635
318 3,04940,820 338,80365,991 593,78225,207 343,262
4,381 38,331175,120 779,047
21,385 294,4733,448 51,4178,056 119,673
6,404,081
SWITZERLAND — (9.4%)55,875 1,054,76118,991 1,036,131
* 10,147 596,113* 4,147 240,163

Baloise Holding AGBanque Cantonale VaudoiseChocoladefabriken Lindt & Spruengli AGCie Financiere Richemont SAClariant AGCredit Suisse Group AGDufry AGFlughafen Zurich AGHelvetia Holding AG
Julius Baer Group, Ltd.LafargeHolcim, Ltd.LafargeHolcim, Ltd.Lonza Group AGNovartis AG, Sponsored ADRNovartis AGSwatch Group AG (The)Swatch Group AG (The)Swiss Life Holding AGSwiss Prime Site AGSwiss Re AGSwisscom AGUBS Group AGUBS Group AGVifor Pharma AGZurich Insurance Group AG
TOTAL SWITZERLAND
3i Group P.L.C.Anglo American P.L.C.Antofagasta P.L.C.Aviva P.L.C.Barclays P.L.C., Sponsored ADRBarratt Developments P.L.C.BP P.L.C., Sponsored ADRBritish American Tobacco P.L.C., Sponsored ADRBritish American Tobacco P.L.C.Carnival P.L.C.Glencore P.L.C.GVC Holdings P.L.C.HSBC Holdings P.L.C., Sponsored ADRInvestec P.L.C.J Sainsbury P.L.C.John Wood Group P.L.C.Kingfisher P.L.C.Lloyds Banking Group P.L.C.Lloyds Banking Group P.L.C., ADRMelrose Industries P.L.C.Micro Focus International P.L.C., Sponsored ADRPearson P.L.C.
3,212 580,14058 43,135
1 82,72331,128 2,667,45924,689 451,14450,891 615,325
1,856 162,7742,343 427,8701,140 145,147
VA International Value PortfolioCONTINUED
Shares Value»
SWITZERLAND — (Continued)17,349 $ 741,36817,735 870,478
8,340 408,4615,143 1,761,753
45,615 4,177,42220,736 1,901,467
3,070 891,7495,580 304,2852,132 1,030,2662,133 187,7998,472 820,4011,939 939,721
128,899 1,438,749* 61,485 686,787
1,694 250,72311,124 3,869,278
28,383,592
UNITED KINGDOM — (15.3%)72,467 976,49494,836 2,323,899
5,469 61,706419,769 2,060,907172,039 1,286,852106,704 833,062
89,429 3,553,90411,391 405,63496,390 3,434,620
3,640 164,307666,265 2,136,590
10,609 76,002# 134,469 5,400,275
57,703 328,314209,983 501,068
13,861 89,316171,023 461,743
2,989,405 1,933,797492,605 1,265,995162,151 365,960
12,054 251,44812,532 132,706

Pearson P.L.C., Sponsored ADRPhoenix Group Holdings P.L.C.Royal Bank of Scotland Group P.L.C., Sponsored ADRRoyal Dutch Shell P.L.C., Sponsored ADR, Class ARoyal Dutch Shell P.L.C., Sponsored ADR, Class BStandard Chartered P.L.C.Standard Life Aberdeen P.L.C.Tesco P.L.C.Vodafone Group P.L.C.Vodafone Group P.L.C., Sponsored ADRWm Morrison Supermarkets P.L.C.WPP P.L.C.
TOTAL UNITED KINGDOM
TOTAL COMMON STOCKS
Bayerische Motoren Werke AGPorsche Automobil Holding SEVolkswagen AG
TOTAL GERMANY
TOTAL INVESTMENT SECURITIES
DFA Short Term Investment Fund
(Cost $322,878,129)^^
AustraliaAustriaBelgiumCanadaDenmarkFinlandFranceGermanyHong KongIrelandIsraelItalyJapanNetherlands
18,039 190,13127,006 227,15891,424 491,86185,104 5,352,191
# 80,339 5,099,11699,248 816,781
175,855 637,8336,559 17,766
1,569,855 2,857,10730,486 552,403
265,568 627,095120,592 1,420,504
46,334,545
295,662,979
VA International Value PortfolioCONTINUED
Shares Value»
PREFERRED STOCKS — (1.3%)GERMANY — (1.3%)
5,480 $ 325,3557,818 512,440
18,370 3,052,592
3,890,387
299,553,366
Value†
SECURITIES LENDING COLLATERAL — (1.0%)@§ 249,496 2,886,915
TOTAL INVESTMENTS — (100.0%)$302,440,281
Summary of the Portfolio's investments as of July 31, 2019, based on their valuation inputs, is as follows (see Security Valuation Note):
Investments in Securities (Market Value)
Level 1 Level 2 Level 3 Total
Common Stocks— $ 20,585,172 — $ 20,585,172— 324,049 — 324,049— 3,006,048 — 3,006,048
$25,544,682 — — 25,544,682— 4,738,035 — 4,738,035— 2,793,941 — 2,793,941— 29,950,854 — 29,950,854
373,693 17,248,215 — 17,621,908— 9,345,197 — 9,345,197
593,875 641,828 — 1,235,703— 1,325,347 — 1,325,347
100,080 6,860,128 — 6,960,208— 66,661,166 — 66,661,166
856,400 9,032,340 — 9,888,740

New ZealandNorwayPortugalSingaporeSpainSwedenSwitzerlandUnited Kingdom
GermanySecurities Lending Collateral
TOTAL
3P Learning, Ltd.A2B Australia, Ltd.Accent Group, Ltd.Adairs, Ltd.Adelaide Brighton, Ltd.Ainsworth Game Technology, Ltd.Alkane Resources, Ltd.Alliance Aviation Services, Ltd.ALS, Ltd.Altium, Ltd.AMA Group, Ltd.Amaysim Australia, Ltd.Ansell, Ltd.AP Eagers, Ltd.Appen, Ltd.ARB Corp., Ltd.Ardent Leisure Group, Ltd.ARQ Group, Ltd.Asaleo Care, Ltd.AUB Group, Ltd.Aurelia Metals, Ltd.Ausdrill, Ltd.Austal, Ltd.Australian Agricultural Co., Ltd.Australian Finance Group, Ltd.Australian Pharmaceutical Industries, Ltd.Auswide Bank, Ltd.Automotive Holdings Group, Ltd.Aveo GroupAVJennings, Ltd.Bank of Queensland, Ltd.Bapcor, Ltd.
— 906,372 — 906,372— 2,632,688 — 2,632,688— 80,253 — 80,253— 3,463,822 — 3,463,822— 7,476,576 — 7,476,576— 6,404,081 — 6,404,081
5,460,322 22,923,270 — 28,383,59223,849,810 22,484,735 — 46,334,545
Preferred Stocks— 3,890,387 — 3,890,387
— 2,886,915 — 2,886,915
$56,778,862 $245,661,419 — $302,440,281
VA INTERNATIONAL SMALL PORTFOLIO
SCHEDULE OF INVESTMENTS
July 31, 2019
(Unaudited)Shares Value»
COMMON STOCKS — (94.6%)AUSTRALIA — (6.6%)#* 16,910 $ 11,334
9,538 11,69635,134 36,266
9,893 9,67341,040 98,988
# 21,326 10,259#* 19,700 5,169
12,786 24,92831,147 152,69610,936 271,95351,262 50,959
#* 36,044 18,68113,247 252,00910,209 78,17211,841 244,896
# 6,754 85,21545,015 36,168
# 19,035 9,036* 38,434 25,342
8,931 72,574* 107,681 37,164
90,272 120,96253,523 147,845
* 47,194 31,99019,471 25,71952,628 51,772
3,989 15,04129,309 62,16851,638 72,206
# 30,044 12,19544,910 286,06227,701 118,136

Beach Energy, Ltd.Bega Cheese, Ltd.Bellamy's Australia, Ltd.Bingo Industries, Ltd.Blackmores, Ltd.Blue Sky Alternative Investments, Ltd.Bravura Solutions, Ltd.Breville Group, Ltd.Brickworks, Ltd.BWX, Ltd.Byron Energy, Ltd.Capitol Health, Ltd.Cardno, Ltd.Carnarvon Petroleum, Ltd.carsales.com, Ltd.Cash Converters International, Ltd.Cedar Woods Properties, Ltd.Centuria Capital GroupChampion Iron, Ltd.Citadel Group, Ltd. (The)City Chic Collective, Ltd.Class, Ltd.Cleanaway Waste Management, Ltd.
ClearView Wealth, Ltd.Clinuvel Pharmaceuticals, Ltd.Clover Corp., Ltd.Codan, Ltd.Collection House, Ltd.Collins Foods, Ltd.Cooper Energy, Ltd.Corporate Travel Management, Ltd.Costa Group Holdings, Ltd.Credit Corp. Group, Ltd.CSG, Ltd.CSR, Ltd.CuDeco, Ltd.Dacian Gold, Ltd.Data#3, Ltd.Decmil Group, Ltd.Dicker Data, Ltd.Domain Holdings Australia, Ltd.Domino's Pizza Enterprises, Ltd.Downer EDI, Ltd.DuluxGroup, Ltd.Eclipx Group, Ltd.Elders, Ltd.Electro Optic Systems Holdings, Ltd.Emeco Holdings, Ltd.EML Payments, Ltd.
125,149 180,401# 25,152 75,830#* 12,639 86,467# 43,277 70,888# 1,296 79,142#* 3,762 476
27,141 90,71610,783 141,283
8,872 101,196# 5,230 7,886#* 58,539 9,561
65,386 10,015* 35,915 22,507#* 13,971 3,884
23,675 237,924* 15,875 1,413
6,587 28,85924,757 32,900
* 15,408 33,5094,052 12,557
12,807 15,855# 7,230 7,293
179,792 296,053
VA International Small PortfolioCONTINUED
Shares Value»
AUSTRALIA — (Continued)24,888 $ 11,409
3,456 76,67115,168 23,93617,350 47,821
# 19,602 16,42715,075 89,224
#* 248,890 99,218# 7,737 121,109
30,456 82,2946,882 117,666
* 19,429 2,39858,905 161,056
* 4,262 129* 3,985 2,255
9,441 16,34417,170 10,651
# 5,119 23,438# 21,446 44,109# 5,100 134,248
18,941 93,05738,776 247,26822,128 21,88716,221 81,477
* 6,122 17,043* 34,080 53,019* 11,075 24,483

Energy World Corp., Ltd.EQT Holdings, Ltd.ERM Power, Ltd.Estia Health, Ltd.EVENT Hospitality and Entertainment, Ltd.FAR, Ltd.Fleetwood Corp., Ltd.FlexiGroup, Ltd.Freedom Foods Group, Ltd.G8 Education, Ltd.Galaxy Resources, Ltd.Gascoyne Resources, Ltd.GBST Holdings, Ltd.Genworth Mortgage Insurance Australia, Ltd.Gold Road Resources, Ltd.GrainCorp, Ltd., Class AGUD Holdings, Ltd.GWA Group, Ltd.Hansen Technologies, Ltd.Harvey Norman Holdings, Ltd.Healius, Ltd.Helloworld Travel, Ltd.Highfield Resources, Ltd.HT&E, Ltd.HUB24, Ltd.IDP Education, Ltd.Iluka Resources, Ltd.Imdex, Ltd.IMF Bentham, Ltd.Independence Group NLInfigen EnergyInfomedia, Ltd.Inghams Group, Ltd.
Integral Diagnostics, Ltd.Integrated Research, Ltd.InvoCare, Ltd.IOOF Holdings, Ltd.IPH, Ltd.IRESS, Ltd.iSelect, Ltd.iSentia Group, Ltd.IVE Group, Ltd.Japara Healthcare, Ltd.JB Hi-Fi, Ltd.Jumbo Interactive, Ltd.Jupiter Mines, Ltd.Karoon Energy, Ltd.Kingsgate Consolidated, Ltd.Kogan.com, Ltd.
#* 50,545 3,3531,961 40,278
19,540 24,16628,335 52,195
8,362 71,038* 588,845 24,876* 9,756 11,587
35,882 44,6668,186 26,575
46,983 92,875#* 39,774 34,433* 29,553 788
4,021 10,680# 33,243 76,892#* 121,246 113,697
27,185 159,27711,742 76,06532,056 78,37820,391 53,499
# 13,065 39,12658,537 117,346
5,594 18,263#* 21,161 12,527# 38,557 46,009
4,268 36,08311,245 146,97415,458 100,86148,773 44,471
* 24,631 57,52557,733 209,070
160,735 51,97529,538 41,303
# 20,841 57,745
VA International Small PortfolioCONTINUED
Shares Value»
AUSTRALIA — (Continued)15,730 $ 35,49311,699 21,980
# 13,461 143,791# 36,197 143,823
17,786 100,98816,175 154,681
#* 28,342 12,393#* 23,190 4,106
8,273 12,263# 25,811 18,449# 13,033 267,348
3,461 45,61139,890 11,014
* 22,730 25,726* 11,507 2,667# 3,868 12,982

Lifestyle Communities, Ltd.Link Administration Holdings, Ltd.Lovisa Holdings, Ltd.Lynas Corp., Ltd.MACA, Ltd.Macmahon Holdings, Ltd.Mayne Pharma Group, Ltd.McMillan Shakespeare, Ltd.Medusa Mining, Ltd.Mesoblast, Ltd.Metals X, Ltd.Metcash, Ltd.Michael Hill International, Ltd.Mineral Resources, Ltd.MMA Offshore, Ltd.MNF Group, Ltd.Moelis Australia, Ltd.Monadelphous Group, Ltd.Monash IVF Group, Ltd.Money3 Corp., Ltd.Mortgage Choice, Ltd.Mount Gibson Iron, Ltd.Myer Holdings, Ltd.MyState, Ltd.Navigator Global Investments, Ltd.Netwealth Group, Ltd.New Energy Solar, Ltd.New Hope Corp., Ltd.NEXTDC, Ltd.nib holdings, Ltd.Nick Scali, Ltd.Nine Entertainment Co. Holdings, Ltd.NRW Holdings, Ltd.Nufarm, Ltd.OFX Group, Ltd.OM Holdings, Ltd.Onevue Holdings, Ltd.oOh!media, Ltd.Orora, Ltd.OZ Minerals, Ltd.Pacific Current Group, Ltd.Pact Group Holdings, Ltd.Panoramic Resources, Ltd.
Paragon Care, Ltd.Peet, Ltd.Pendal Group, Ltd.Perpetual, Ltd.Perseus Mining, Ltd.Pilbara Minerals, Ltd.
# 11,551 53,38516,468 57,035
4,906 37,169* 72,247 128,203
34,411 22,099* 161,782 19,874* 168,566 60,636
8,031 76,042* 7,354 3,778#* 30,610 30,622#* 97,453 14,191# 110,615 212,586
19,759 6,89217,998 195,605
* 36,820 5,541# 4,922 11,944
2,314 6,0189,312 119,928
17,197 17,8899,812 14,347
10,500 8,271105,077 62,424
#* 91,183 33,54010,521 33,26515,251 35,958
4,880 27,58813,104 11,63128,446 48,596
#* 36,933 172,49550,683 276,233
# 5,776 24,806# 172,584 236,939
58,423 96,859# 26,921 89,416
28,697 26,72027,595 14,882
* 23,091 7,40528,932 88,020
109,911 253,97437,798 262,153
4,475 17,03017,637 33,778
* 58,920 13,531
VA International Small PortfolioCONTINUED
Shares Value»
AUSTRALIA — (Continued)# 36,572 $ 12,467
32,470 26,26928,867 153,507
# 4,479 120,498* 113,003 52,556* 31,495 10,011

Platinum Asset Management, Ltd.Praemium, Ltd.Premier Investments, Ltd.Prime Media Group, Ltd.Pro Medicus, Ltd.PSC Insurance Group, Ltd.PWR Holdings, Ltd.QMS Media, Ltd.Qube Holdings, Ltd.Ramelius Resources, Ltd.Reckon, Ltd.Regis Healthcare, Ltd.Regis Resources, Ltd.Reject Shop, Ltd. (The)Reliance Worldwide Corp., Ltd.Resolute Mining, Ltd.Rhipe, Ltd.Ridley Corp., Ltd.Salmat, Ltd.Sandfire Resources NLSaracen Mineral Holdings, Ltd.SeaLink Travel Group, Ltd.Select Harvests, Ltd.Senex Energy, Ltd.Servcorp, Ltd.Service Stream, Ltd.Seven Group Holdings, Ltd.Seven West Media, Ltd.SG Fleet Group, Ltd.Sheffield Resources, Ltd.Sigma Healthcare, Ltd.Silver Chef, Ltd.Silver Lake Resources, Ltd.Sims Metal Management, Ltd.SmartGroup Corp., Ltd.Southern Cross Media Group, Ltd.Spark Infrastructure GroupSpeedCast International, Ltd.St Barbara, Ltd.Star Entertainment Grp, Ltd. (The)Steadfast Group, Ltd.Sundance Energy Australia, Ltd.Sunland Group, Ltd.Super Retail Group, Ltd.Superloop, Ltd.Syrah Resources, Ltd.Tassal Group, Ltd.Technology One, Ltd.Thorn Group, Ltd.Tiger Resources, Ltd.Troy Resources, Ltd.Villa World, Ltd.Village Roadshow, Ltd.
# 29,052 95,275#* 25,426 9,146
10,542 113,418* 30,543 4,719
3,696 77,1664,598 8,9863,365 9,866
14,186 9,19965,816 141,694
* 40,850 27,8911,448 698
16,349 31,16548,880 184,547
1,897 2,724# 80,984 202,932
115,197 139,83013,642 25,84533,330 25,255
3,642 1,28219,825 90,454
* 92,036 260,2648,701 22,255
14,912 75,819* 191,723 40,839
6,297 17,38641,543 84,627
2,641 32,379* 118,278 34,986
9,631 19,335#* 30,759 13,572
161,490 65,701* 1,766 870* 71,080 62,703
18,932 140,1539,040 57,771
88,200 80,498156,329 253,338
# 29,981 38,39074,428 186,52733,472 94,47386,728 224,942
#* 95,846 12,01114,139 16,588
# 12,641 77,599#* 23,474 15,641#* 42,059 24,565
28,507 100,33322,548 117,664
* 15,487 2,752* 149,819 56#* 3,735 244
12,158 19,464* 13,032 23,579
VA International Small PortfolioCONTINUED

Virgin Australia Holdings, Ltd.Virtus Health, Ltd.Vita Group, Ltd.Vocus Group, Ltd.Webjet, Ltd.Western Areas, Ltd.Westgold Resources, Ltd.Whitehaven Coal, Ltd.WPP AUNZ, Ltd.
TOTAL AUSTRALIA
Agrana Beteiligungs AGANDRITZ AGAtrium European Real Estate, Ltd.Austria Technologie & Systemtechnik AGCA Immobilien Anlagen AGDO & CO AGEVN AGFACC AGFlughafen Wien AGIMMOFINANZ AGKapsch TrafficCom AGLenzing AGMayr Melnhof Karton AGOberbank AGOesterreichische Post AGPalfinger AGPOLYTEC Holding AGPorr AGRosenbauer International AGS IMMO AGSchoeller-Bleckmann Oilfield Equipment AGSemperit AG HoldingStrabag SETelekom Austria AGUBM Development AGUNIQA Insurance Group AGVienna Insurance Group AG Wiener Versicherung GruppeWienerberger AGZumtobel Group AG
TOTAL AUSTRIA
Ackermans & van Haaren NVAGFA-Gevaert NVArgenx SEAtenorBanque Nationale de BelgiqueBarco NVBekaert SABiocartis NVbpost SA
Shares Value»
AUSTRALIA — (Continued)* 130,547 $ 14,747
12,419 43,35819,409 16,259
* 69,381 152,69711,482 106,18034,456 51,141
* 23,434 30,85513,500 33,83438,883 17,210
15,870,740
AUSTRIA — (1.2%)2,144 41,0086,106 217,483
20,363 83,3822,825 45,3998,156 287,283
994 87,6234,196 66,585
# 2,374 28,150307 13,554
10,231 272,623757 26,753
1,530 156,064896 113,214414 43,727
3,336 111,4252,245 58,020
# 1,603 15,577# 1,717 37,452
346 16,3477,081 156,3971,398 111,202
* 1,085 15,1471,862 59,751
18,718 138,250812 36,029
18,513 165,8785,713 146,417
10,988 251,165* 5,328 44,552
2,846,457
BELGIUM — (1.8%)2,774 404,068
* 20,629 83,084* 2,771 389,290
427 34,22320 51,524
1,349 281,7194,826 135,898
#* 3,596 42,754# 7,319 68,054

Celyad SACie d'Entreprises CFEDeceuninck NVD'ieteren SAEconocom Group SA
Elia System Operator SAEuronav NVEVS Broadcast Equipment SAExmar NVFagronGalapagos NVGalapagos NVGalapagos NV (B083BK7)Gimv NVImmobel SAIon Beam ApplicationsJensen-Group NVKinepolis Group NVLotus Bakeries NVMDxHealthMelexis NVNyrstar NVOntex Group NVOrange Belgium SAOxurion NVPicanolRecticel SAResiluxRoularta Media Group NVSioen Industries NVSipef NVTelenet Group Holding NVTessenderlo Group SAVan de Velde NVViohalco SA
TOTAL BELGIUM
5N Plus, Inc.Absolute Software Corp.Acadian Timber Corp.Advantage Oil & Gas, Ltd.Aecon Group, Inc.Africa Oil Corp.AG Growth International, Inc.AGF Management, Ltd., Class BAimia, Inc.AirBoss of America Corp.AKITA Drilling, Ltd., Class AAlacer Gold Corp.
#* 590 7,233891 78,301
10,393 23,1973,587 167,992
# 14,168 46,793
VA International Small PortfolioCONTINUED
Shares Value»
BELGIUM — (Continued)# 3,600 $ 274,089
19,147 161,1521,783 42,379
#* 4,511 29,7264,796 79,637
* 1,072 187,381* 2,063 357,952* 974 170,302
1,642 96,380# 426 29,020* 2,603 49,825
507 19,3281,598 94,283
33 86,009#* 6,303 8,520
1,773 121,357#* 9,456 6,146# 9,351 154,057
4,217 96,207* 5,542 33,617
234 16,8354,845 39,046
88 13,898455 6,289775 21,372638 28,914
2,598 127,600* 3,602 112,760
716 20,512* 9,200 42,358
4,341,081
CANADA — (8.9%)* 10,900 18,335
7,500 42,109# 500 6,372* 16,781 24,031
8,691 133,809#* 54,929 49,527
1,567 64,09110,933 42,413
#* 21,900 62,0592,200 14,4861,431 2,689
* 39,601 157,528

Alamos Gold, Inc., Class AAlaris Royalty Corp.Alcanna, Inc.Alexco Resource Corp.Algoma Central Corp.Alio Gold, Inc.Altius Minerals Corp.Altus Group, Ltd.Amerigo Resources, Ltd.Andrew Peller, Ltd., Class AARC Resources, Ltd.Argonaut Gold, Inc.Aritzia, Inc.Asanko Gold, Inc.
Athabasca Oil Corp.ATS Automation Tooling Systems, Inc.AutoCanada, Inc.B2Gold Corp.Badger Daylighting, Ltd.Baytex Energy Corp.Birchcliff Energy, Ltd.Bird Construction, Inc.Black Diamond Group, Ltd.BMTC Group, Inc.Bonavista Energy Corp.Bonterra Energy Corp.Boralex, Inc., Class ABridgemarq Real Estate ServicesCalfrac Well Services, Ltd.Calian Group, Ltd.Canaccord Genuity Group, Inc.Canacol Energy, Ltd.Canadian Western BankCanfor Corp.Canfor Pulp Products, Inc.CanWel Building Materials Group, Ltd.Capital Power Corp.Capstone Mining Corp.Cardinal Energy, Ltd.Cascades, Inc.Celestica, Inc.Centerra Gold, Inc.Cervus Equipment Corp.CES Energy Solutions Corp.China Gold International Resources Corp., Ltd.Cineplex, Inc.Clearwater Seafoods, Inc.Cogeco Communications, Inc.Cogeco, Inc.
44,808 294,010# 5,125 78,828
5,866 28,090* 7,261 12,241
1,600 15,530#* 5,135 4,163
5,800 56,6463,800 96,483
* 14,600 7,8545,900 62,943
38,215 195,447* 25,712 45,003* 4,908 68,016* 12,801 9,990
VA International Small PortfolioCONTINUED
Shares Value»
CANADA — (Continued)#* 58,945 $ 31,710* 9,114 146,053# 2,934 20,096* 92,114 293,832
4,309 155,605#* 66,739 101,641
38,913 77,543# 3,138 12,911* 2,510 3,518
850 6,968# 44,120 18,052# 3,561 13,734
11,076 167,508700 7,505
* 10,144 13,681600 15,284
15,050 62,946* 18,050 68,792
10,718 250,368* 6,700 48,329
3,143 21,981# 4,700 16,381
12,231 274,498#* 44,912 18,716# 13,363 25,212
11,329 103,779* 24,395 173,563* 28,068 224,156
1,000 8,403# 31,177 44,883* 43,400 49,326# 6,952 124,839# 1,700 6,827
1,895 149,656900 64,101

Colliers International Group, Inc.Computer Modelling Group, Ltd.Continental Gold, Inc.Copper Mountain Mining Corp.Corby Spirit and Wine, Ltd.Corridor Resources, Inc.Corus Entertainment, Inc., Class BCott Corp.Crescent Point Energy Corp.Crew Energy, Inc.CRH Medical Corp.Delphi Energy Corp.Denison Mines Corp.Descartes Systems Group, Inc. (The)Detour Gold Corp.DHX Media, Ltd.DIRTT Environmental SolutionsDorel Industries, Inc., Class BDREAM Unlimited Corp., Class ADundee Precious Metals, Inc.Echelon Financial Holdings, Inc.ECN Capital Corp.E-L Financial Corp., Ltd.Eldorado Gold Corp.
Element Fleet Management Corp.Endeavour Mining Corp.Endeavour Silver Corp.Enerflex, Ltd.Energy Fuels, Inc.Enerplus Corp.Enghouse Systems, Ltd.Ensign Energy Services, Inc.Equitable Group, Inc.ERO Copper Corp.Essential Energy Services TrustEvertz Technologies, Ltd.Exchange Income Corp.Exco Technologies, Ltd.Extendicare, Inc.Fiera Capital Corp.Finning International, Inc.Firm Capital Mortgage Investment Corp.First Majestic Silver Corp.First Mining Gold Corp.First National Financial Corp.FirstService Corp.Fission Uranium Corp.Fortuna Silver Mines, Inc.Freehold Royalties, Ltd.
3,734 271,26512,340 61,335
* 16,500 48,382#* 12,235 7,324
900 11,981* 2,900 1,450
18,496 71,05218,495 236,688
8,700 28,873* 22,528 12,631* 12,400 33,354#* 16,088 1,707#* 76,968 37,323* 6,875 249,777* 21,900 334,523#* 9,928 14,142* 3,400 17,827
3,700 26,15610,650 67,541
* 18,655 63,041100 472
41,322 148,093104 59,100
* 26,734 204,990
VA International Small PortfolioCONTINUED
Shares Value»
CANADA — (Continued)# 41,890 $318,666* 6,031 112,692#* 20,500 47,219
10,336 130,081#* 5,331 9,693# 23,265 154,242
3,990 104,48123,650 74,365
# 1,543 107,793* 1,689 31,904* 11,693 2,879
3,302 47,786# 943 26,594
4,600 29,068# 16,710 113,443
5,700 48,4141,900 32,8522,800 29,362
#* 18,399 173,562* 27,500 5,626
2,280 56,5773,073 322,481
#* 56,500 15,840* 20,248 76,248# 11,649 71,935

Frontera Energy Corp.Gamehost, Inc.GDI Integrated Facility Services, Inc.Gear Energy, Ltd.Genworth MI Canada, Inc.Gibson Energy, Inc.Glacier Media, Inc.GMP Capital, Inc.goeasy, Ltd.Golden Star Resources, Ltd.Gran Tierra Energy, Inc.Great Canadian Gaming Corp.Great Panther Mining, Ltd.Guardian Capital Group, Ltd., Class AGuyana Goldfields, Inc.Heroux-Devtek, Inc.High Liner Foods, Inc.Home Capital Group, Inc.Horizon North Logistics, Inc.Hudbay Minerals, Inc.Hudson's Bay Co.IAMGOLD Corp.IBI Group, Inc.Imperial Metals Corp.Indigo Books & Music, Inc.Information Services Corp.Innergex Renewable Energy, Inc.Interfor Corp.International Tower Hill Mines, Ltd.Intertain Group, Ltd. (The)Intertape Polymer Group, Inc.Invesque, Inc.IPL Plastics, Inc.Ivanhoe Mines, Ltd., Class A
Jamieson Wellness, Inc.Just Energy Group, Inc.K-Bro Linen, Inc.Kelt Exploration, Ltd.Kinaxis, Inc.Kinder Morgan Canada, Ltd.Kingsway Financial Services, Inc.Knight Therapeutics, Inc.Labrador Iron Ore Royalty Corp.Largo Resources, Ltd.Lassonde Industries, Inc., Class ALaurentian Bank of CanadaLeagold Mining Corp.Leon's Furniture, Ltd.Linamar Corp.
1,620 16,4232,000 13,866
* 1,200 26,086* 25,800 9,579# 5,170 190,810
13,601 235,683* 1,800 1,016
2,541 5,237# 1,136 48,821* 9,815 34,953#* 52,923 85,812* 9,600 318,739#* 13,485 10,933
2,850 54,849* 20,243 17,178* 6,300 90,696
2,300 18,612#* 10,597 190,695
22,417 28,53532,692 158,77813,927 103,624
* 56,196 204,380* 2,900 11,250#* 5,000 9,471* 850 5,201
900 11,04011,210 127,660
* 7,200 65,301* 1,260 764* 2,200 18,219
8,944 123,2024,300 31,734
* 3,348 20,548* 69,262 217,264
VA International Small PortfolioCONTINUED
Shares Value»
CANADA — (Continued)3,313 $ 51,761
# 16,955 58,9661,500 44,836
* 15,188 48,103* 2,617 164,618# 3,000 25,663
600 1,656* 14,616 82,947
7,000 166,859* 17,532 24,708
300 42,052# 7,200 247,728* 7,000 10,979
4,500 52,5085,605 189,834

Lucara Diamond Corp.Lundin Gold, Inc.Magellan Aerospace Corp.Mainstreet Equity Corp.Major Drilling Group International, Inc.Maple Leaf Foods, Inc.Martinrea International, Inc.Maxim Power Corp.Medical Facilities Corp.MEG Energy Corp.Melcor Developments, Ltd.Morguard Corp.Morneau Shepell, Inc.Mountain Province Diamonds, Inc.MTY Food Group, Inc.Mullen Group, Ltd.New Gold, Inc.NFI Group, Inc.Norbord, Inc.North American Construction Group, Ltd.North West Co., Inc. (The)Northland Power, Inc.NuVista Energy, Ltd.Obsidian Energy, Ltd.OceanaGold Corp.Osisko Gold Royalties, Ltd.Osisko Mining, Inc.Painted Pony Energy, Ltd.Pan American Silver Corp.Paramount Resources, Ltd., Class AParex Resources, Inc.Park Lawn Corp.Pason Systems, Inc.Pengrowth Energy Corp.Peyto Exploration & Development Corp.Photon Control, Inc.PHX Energy Services Corp.Pinnacle Renewable Energy, Inc.Pizza Pizza Royalty Corp.Points International, Ltd.Polaris Infrastructure, Inc.Pollard Banknote, Ltd.PolyMet Mining Corp.PrairieSky Royalty, Ltd.
Precision Drilling Corp.Premier Gold Mines, Ltd.Premium Brands Holdings Corp.Pretium Resources, Inc.Pulse Seismic, Inc.
# 52,607 58,993* 4,591 27,202
2,400 29,732* 300 13,866* 10,973 36,665
6,696 157,02511,210 91,817
* 1,300 1,872# 5,100 48,032* 25,593 107,623
500 5,039600 83,654
5,601 128,927# 15,600 13,711
2,800 138,918# 12,588 96,236* 80,270 107,043
4,553 100,3883,903 90,4673,900 48,9055,281 120,8819,731 185,212
* 29,960 61,745#* 7,182 7,837
74,728 202,70212,240 144,394
#* 12,400 32,038#* 15,407 10,857
24,798 377,663#* 8,344 50,200* 17,840 304,948
2,354 49,2108,052 108,230
#* 63,899 21,061# 19,559 59,279* 8,868 7,324* 3,600 6,928
2,300 17,7066,500 47,477
* 761 9,0812,100 21,910
700 12,835#* 10,894 4,375# 15,800 211,656
VA International Small PortfolioCONTINUED
Shares Value»
CANADA — (Continued)* 38,590 $ 66,373* 31,724 53,362
3,030 220,512* 14,200 153,964* 3,900 6,870

Quarterhill, Inc.Questerre Energy Corp., Class AReal Matters, Inc.Recipe Unlimited Corp.Reitmans Canada, Ltd., Class ARichelieu Hardware, Ltd.Rocky Mountain Dealerships, Inc.Rogers Sugar, Inc.Roxgold, Inc.Russel Metals, Inc.Sabina Gold & Silver Corp.Sandstorm Gold, Ltd.Savaria Corp.Seabridge Gold, Inc.Secure Energy Services, Inc.SEMAFO, Inc.Seven Generations Energy, Ltd., Class AShawCor, Ltd.Sienna Senior Living, Inc.Sierra Metals, Inc.Sierra Wireless, Inc.Sleep Country Canada Holdings, Inc.Sprott, Inc.SSR Mining, Inc.Stantec, Inc.Stelco Holdings, Inc.Stella-Jones, Inc.STEP Energy Services, Ltd.Storm Resources, Ltd.Stornoway Diamond Corp.Stuart Olson, Inc.SunOpta, Inc.Superior Plus Corp.Surge Energy, Inc.Tamarack Valley Energy, Ltd.Taseko Mines, Ltd.TeraGo, Inc.Teranga Gold Corp.Tervita Corp.TFI International, Inc.Tidewater Midstream and Infrastructure, Ltd.Timbercreek Financial Corp.TMAC Resources, Inc.TMX Group, Ltd.TORC Oil & Gas, Ltd.Torex Gold Resources, Inc.Total Energy Services, Inc.TransAlta Corp.TransAlta Renewables, Inc.Transcontinental, Inc., Class ATransGlobe Energy Corp.Trevali Mining Corp.Trican Well Service, Ltd.Tricon Capital Group, Inc.
# 10,900 13,462#* 14,450 2,299* 3,600 23,458
1,100 22,3954,500 9,3765,569 109,9621,300 7,082
12,650 54,058* 35,140 28,755
8,500 134,797* 36,019 39,845* 23,400 143,967# 3,300 29,980#* 2,000 27,428
20,082 106,816* 48,100 192,794* 8,932 49,607
7,942 103,984# 8,177 122,674* 5,800 8,745#* 5,200 61,346
3,801 53,539# 25,983 76,386* 18,306 282,815
10,445 248,8193,500 40,3095,365 167,356
#* 2,700 3,580#* 15,193 20,145* 70,900 1,343# 5,845 15,412#* 9,384 26,734# 18,414 183,889# 40,298 38,472* 25,980 42,519* 35,100 16,223* 400 3,122* 11,800 45,866* 742 3,756
9,351 295,80635,300 34,235
# 9,052 66,460#* 1,187 5,369
463 34,386# 20,774 64,693* 10,710 137,953
6,761 35,65333,263 203,89316,383 169,93713,225 152,11116,572 25,741
#* 49,000 9,282#* 49,274 36,214
15,547 117,680

Trisura Group, Ltd.Uni-Select, Inc.Valener, Inc.Vermilion Energy, Inc.Wajax Corp.Wesdome Gold Mines Ltd.West Fraser Timber Co., Ltd.Western Forest Products, Inc.WestJet Airlines, Ltd.Westshore Terminals Investment Corp.Whitecap Resources, Inc.Winpak, Ltd.Yamana Gold, Inc.Yangarra Resources, Ltd.Yellow Pages, Ltd.Zenith Capital Corp.
TOTAL CANADA
APT Satellite Holdings, Ltd.
Agat Ejendomme A.S.ALK-Abello A.S.Alm Brand A.S.Ambu A.S., Class BBang & Olufsen A.S.Bavarian Nordic A.S.Brodrene Hartmann A.S.Columbus A.S.D/S Norden A.S.DFDS A.S.Drilling Co. of 1972 A.S. (The)FLSmidth & Co. A.S.H+H International A.S., Class BISS A.S.Jeudan A.S.Jyske Bank A.S.Matas A.S.Nilfisk Holding A.S.NKT A.S.NNIT A.S.Pandora A.S.Parken Sport & Entertainment A.S.Per Aarsleff Holding A.S.Ringkjoebing Landbobank A.S.Rockwool International A.S., Class ARockwool International A.S., Class BRoyal Unibrew A.S.RTX A.S.Scandinavian Tobacco Group A.S., Class A
VA International Small PortfolioCONTINUED
Shares Value»
CANADA — (Continued)* 1,000 $ 22,428
6,255 56,8725,800 113,820
# 7,634 136,7973,913 45,066
* 20,679 105,291337 13,173
# 51,630 55,5501,600 37,290
# 3,842 60,60845,699 146,813
4,500 155,001129,415 382,420
* 6,942 10,152#* 2,040 12,335
1,300 80
21,557,066
CHINA — (0.0%)43,500 16,952
DENMARK — (1.7%)* 5,947 3,435* 728 164,660
9,028 80,712# 9,671 141,619* 4,667 30,053* 3,307 90,684
204 9,6896,761 11,7904,596 68,7713,765 138,671
* 636 43,1474,390 179,803
* 2,539 36,33710,181 285,521
228 34,423* 7,680 244,759
5,259 54,230* 3,104 78,574* 3,029 44,475
995 15,4705,127 196,529
400 7,0002,371 78,1252,916 199,281
159 34,924664 162,063
5,343 398,173# 1,421 33,684
4,790 50,553

Schouw & Co., A.S.SimCorp A.S.Solar A.S., Class BSpar Nord Bank A.S.Sydbank A.S.Tivoli A.S.Topdanmark A.S.TORM P.L.C.
United International EnterprisesVestjysk Bank A.S.Zealand Pharma A.S.
TOTAL DENMARK
Adapteo OyjAhlstrom-Munksjo OyjAktia Bank OyjAlma Media OyjAsiakastieto Group OyjAspo OyjAtria OyjBasWare OyjBittium OyjCargotec Oyj, Class BCaverion OyjCitycon OyjCramo OyjFinnair OyjFiskars Oyj AbpF-Secure OyjHKScan Oyj, Class AHuhtamaki OyjKemira OyjKesko Oyj, Class AKesko Oyj, Class BKonecranes OyjLassila & Tikanoja OyjLehto Group OyjMetsa Board OyjMetso OyjNokian Renkaat OyjOlvi Oyj, Class AOriola Oyj, Class AOriola Oyj, Class BOrion Oyj, Class AOrion Oyj, Class BOutokumpu OyjOutotec OyjPihlajalinna OyjPonsse Oyj
1,410 104,9494,587 413,437
610 27,9769,494 83,804
# 7,973 138,706244 24,860
5,098 261,303* 3,422 28,196
VA International Small PortfolioCONTINUED
Shares Value»
DENMARK — (Continued)# 176 $ 33,248* 113,137 69,038* 3,739 83,744
4,186,416
FINLAND — (2.1%)* 5,028 58,809# 2,420 39,850
5,359 50,7424,469 31,7001,519 47,6612,685 26,683
781 6,583#* 944 18,550# 5,377 41,573
4,700 139,155# 12,245 81,320# 8,329 84,912
5,028 43,6376,960 49,0424,565 66,759
* 12,707 37,198* 1,550 2,726
12,148 461,46013,763 202,989
990 55,7327,336 444,2518,185 239,6693,659 55,656
# 783 2,060# 21,016 104,835
12,166 467,48213,371 383,328
1,579 61,5105,827 12,901
16,336 36,8322,441 84,138
11,176 382,334# 32,709 93,599* 19,917 124,322
563 6,8531,180 37,095

QT Group OyjRaisio Oyj, Class VRapala VMC OyjRevenio Group OyjSanoma OyjSRV Group OyjStockmann Oyj Abp, Class AStockmann Oyj Abp, Class BTieto OyjTikkurila OyjTokmanni Group Corp.Uponor OyjVaisala Oyj, Class AValmet OyjYIT Oyj
TOTAL FINLAND
ABC arbitrageAdociaAir France-KLMAkka TechnologiesAKWELAlbioma SAAltamirAlten SAAltran Technologies SAAmplitude Surgical SASAPRIL SAAssystem SAAubayAxway Software SABastide le Confort MedicalBeneteau SABigben InteractiveBoiron SABonduelle SCABourbon Corp.Burelle SACasino Guichard Perrachon SACegedim SACGG SAChargeurs SACie des AlpesCie Plastic Omnium SACoface SADerichebourg SADevoteam SAElectricite de Strasbourg SAElior Group SAElis SA
* 1,063 15,42417,176 59,771
1,900 6,3072,269 51,129
10,553 104,467* 2,217 3,781* 1,299 3,281* 2,495 5,551
5,452 139,0764,795 74,5145,903 53,3757,321 76,9031,838 41,523
14,662 284,700# 17,951 99,332
5,103,080
VA International Small PortfolioCONTINUED
Shares Value»
FRANCE — (4.4%)3,292 $ 22,990
* 959 18,833* 26,184 272,954
1,377 97,249768 15,094
3,404 90,3671,905 34,0673,127 386,839
28,524 449,976* 1,840 2,931
1,417 33,9941,354 57,521
936 32,923836 11,624
# 266 10,8133,904 40,6792,306 30,926
776 34,4761,660 49,112
#* 2,220 8,62628 26,265
# 4,112 152,138* 532 16,408* 82,253 180,434# 2,518 46,521
1,635 44,9436,434 169,740
* 13,486 167,00816,273 60,174
623 74,530132 15,252
# 14,729 192,62314,638 270,864

ErametErytech Pharma SAEsso SA FrancaiseEtablissements Maurel et PromEuronext NVEuropcar Mobility GroupEutelsat Communications SAExel Industries, Class AFnac Darty S.A.Fnac Darty SA (BLRZL56)Gaumont SAGaztransport Et Technigaz SAGL EventsGroupe CritGroupe GorgeGroupe OpenGuerbetHaulotte Group SAHERIGE SADCSHEXAOMID Logistics GroupImerys SAIngenico Group SAIPSOSJacquet Metal Service SAJCDecaux SA
Kaufman & Broad SAKorian SALagardere SCALatecoere SACALaurent-PerrierLe BelierLectraLinedata ServicesLISILNA Sante SAMaisons du Monde SAManitou BF SAManutan InternationalMersen SAMetropole Television SAMGI Digital Graphic TechnologyNeopost SANexans SANexity SANicoxNRJ GroupOeneo SAOnxeo SA
1,279 61,169#* 1,201 7,655
197 5,4378,900 28,7025,979 461,557
# 14,904 93,33021,073 402,845
184 9,364* 1,710 119,947* 648 46,073
129 16,3972,233 202,5891,343 36,539
446 29,979778 12,387581 10,097934 53,955
1,014 7,873186 5,357
* 440 16,169* 360 67,391
2,590 108,2747,159 678,3024,374 119,6181,426 25,4021,972 56,775
VA International Small PortfolioCONTINUED
Shares Value»
FRANCE — (Continued)2,328 $ 95,5936,500 256,5609,584 216,554
* 9,654 40,584396 39,035216 6,551
3,315 67,936535 16,983
3,138 90,970809 44,641
4,270 85,5211,600 37,788
508 40,9422,045 73,1901,844 31,989
* 409 22,5775,381 108,1184,464 150,9324,436 212,988
#* 2,438 12,5532,200 16,2542,102 24,115
#* 4,614 3,750

Pierre & Vacances SAPlastivaloireRallye SARecylex SARexel SARobertet SARothschild & Co.Rubis SCASamse SASavencia SASeche Environnement SASociete BIC SASociete des Bains de Mer et du Cercle des Etrangers a MonacoSociete pour l'Informatique IndustrielleSOITECSolocal GroupSomfy SASopra Steria GroupSPIE SASRP Groupe SAStef SASword GroupSynergie SATarkett SATechnicolor SATelevision Francaise 1Thermador GroupeTotal GabonTrigano SAVallourec SAVetoquinol SAVicat SAVIEL & Cie SAVilmorin & Cie SAVirbac SA
Voltalia SA
TOTAL FRANCE
Aareal Bank AGADLER Real Estate AGADO Properties SAADVA Optical Networking SEAIXTRON SEAll for One Group AGAllgeier SEAmadeus Fire AGAtoss Software AGAurubis AGBasler AG
* 633 11,909# 1,105 7,406# 3,323 15,582#* 1,750 7,458
37,300 416,49188 62,602
3,219 100,801# 9,853 555,216
132 23,038669 49,347288 11,124
# 3,082 214,781* 561 36,609
1,084 33,715* 2,111 219,077#* 71,908 59,548
786 71,0401,595 205,261
14,600 270,619#* 992 1,286
521 46,215702 24,150
1,041 33,117# 4,268 71,393* 21,143 17,898
4,737 47,460# 782 49,385
95 14,021957 96,015
#* 33,070 114,895354 23,410
2,211 99,2004,347 23,776
883 48,390* 383 71,096
VA International Small PortfolioCONTINUED
Shares Value»
FRANCE — (Continued)* 941 $ 11,056
10,662,588
GERMANY — (6.2%)6,977 198,4976,426 88,3553,335 142,878
* 6,520 50,472* 8,383 93,563
139 6,432979 25,408661 89,794206 29,630
5,011 217,635633 27,518

Bauer AGBayWa AGBechtle AGBertrandt AGbet-at-home.com AGBijou Brigitte AGBilfinger SEBorussia Dortmund GmbH & Co. KGaACANCOM SECECONOMY AGCENIT AGCENTROTEC Sustainable AGCewe Stiftung & Co. KGAAcomdirect bank AGCompuGroup Medical SECorestate Capital Holding SACropEnergies AGCTS Eventim AG & Co. KGaADelticom AGDeutsche Beteiligungs AGDeutsche EuroShop AGDeutsche Pfandbriefbank AGDeutz AGDialog Semiconductor P.L.C.DIC Asset AGDMG Mori AGDr Hoenle AGDraegerwerk AG & Co. KGaADuerr AGEckert & Ziegler Strahlen- und Medizintechnik AGEDAG Engineering Group AGElmos Semiconductor AGElringKlinger AGEnergiekontor AGEvotec SEFerratum OyjFielmann AGFirst Sensor AGFreenet AGFuchs Petrolub SEGEA Group AGGerresheimer AGGesco AGGFT Technologies SE
Grand City Properties SAGRENKE AGH&R GmbH & Co. KGaAHamburger Hafen und Logistik AGHapag-Lloyd AG
2,210 51,0361,352 35,1923,227 357,457
738 49,432393 24,741711 31,321
4,751 139,4879,378 93,4383,477 194,386
* 16,100 103,1711,323 16,6651,909 25,365
818 75,5614,102 42,3342,769 213,639
# 1,975 71,7823,994 26,6415,995 298,948
* 212 8052,003 69,9694,705 127,297
19,103 216,86917,619 121,628
* 9,400 420,7687,097 80,0112,097 97,859
579 36,301307 13,129
4,886 145,316672 88,708
1,225 14,7491,962 42,734
* 4,625 26,251790 15,110
* 11,113 313,171851 10,016
2,791 194,210880 28,632
15,482 302,079781 27,429
17,565 435,9643,776 293,7051,167 29,8601,914 14,804
VA International Small PortfolioCONTINUED
Shares Value»
GERMANY — (Continued)12,674 $285,529
1,394 119,650* 1,853 13,072
3,521 88,761613 25,746

Heidelberger Druckmaschinen AGHella GmbH & Co KGaAHolidayCheck Group AGHornbach Baumarkt AGHornbach Holding AG & Co. KGaAHugo Boss AGHypoport AGIndus Holding AGIsra Vision AGIVU Traffic Technologies AGJenoptik AGK+S AGKloeckner & Co. SEKoenig & Bauer AGKrones AGKSB SE & Co. KGaAKWS Saat SE & Co., KGaALanxess AGLeifheit AGLeoni AGLPKF Laser & Electronics AGManz AGMedigene AGMETRO AGMLP SENemetschek SENexus AGNordex SENorma Group SEOHB SEOSRAM Licht AGParagon GmbH & Co. KGaAPatrizia AGPfeiffer Vacuum Technology AGPNE AGProSiebenSat.1 Media SEPSI Software AGQSC AGRheinmetall AGRHOEN-KLINIKUM AGRIB Software SERocket Internet SES&T AGSAF-Holland SASalzgitter AGSchaltbau Holding AGScout24 AGSecunet Security Networks AGSenvion SASGL Carbon SEShop Apotheke Europe NVSiltronic AGSixt Leasing SESixt SE
* 28,620 31,1834,140 195,1943,303 9,3211,015 18,7351,203 64,7026,984 438,949
* 198 52,2782,037 80,8411,883 81,5601,595 15,5936,077 170,297
26,378 425,7098,520 41,8121,558 62,5451,902 108,097
31 10,1941,165 81,0489,534 567,4881,697 36,664
* 4,291 57,542* 1,227 9,522* 726 17,848* 1,273 9,217
6,713 103,2587,438 36,9802,988 166,1241,759 61,922
* 10,174 119,1033,611 129,4711,058 38,807
10,845 408,207263 5,060
7,419 143,3181,032 143,935
11,501 36,54516,189 209,115
1,437 27,1928,683 13,1604,965 563,3933,484 92,3575,661 121,839
* 9,151 257,4725,640 131,6437,645 78,7754,476 96,623
* 369 11,5008,481 469,060
157 21,224* 1,441 500* 6,333 42,583* 1,251 49,046
1,830 140,1001,354 16,1821,172 120,359

SMA Solar Technology AGSoftware AGStabilus SASTRATEC SEStroeer SE & Co. KGaASuedzucker AGSUESS MicroTec SESurteco Group SETAG Immobilien AGTakkt AGTechnotrans SETele Columbus AGTLG Immobilien AGTraffic Systems SEVERBIO Vereinigte BioEnergie AGVossloh AGWacker Chemie AGWacker Neuson SEWashtec AGWuestenrot & Wuerttembergische AGXING SEZeal Network SE
TOTAL GERMANY
Aeon Credit Service Asia Co., Ltd.Agritrade Resources, Ltd.Allied Group, Ltd.Allied Properties HK, Ltd.APAC Resources, Ltd.Applied Development Holdings, Ltd.Asia Financial Holdings, Ltd.Asia Satellite Telecommunications Holdings, Ltd.Asia Standard International Group, Ltd.Asiasec Properties, Ltd.ASM Pacific Technology, Ltd.Associated International Hotels, Ltd.BOE Varitronix, Ltd.Bonjour Holdings, Ltd.Bright Smart Securities & Commodities Group, Ltd.Brightoil Petroleum Holdings, Ltd.Brockman Mining, Ltd.Burwill Holdings, Ltd.Cafe de Coral Holdings, Ltd.Camsing International Holding, Ltd.Century City International Holdings, Ltd.Chen Hsong HoldingsChevalier International Holdings, Ltd.China Baoli Technologies Holdings, Ltd.China Energy Development Holdings, Ltd.
VA International Small PortfolioCONTINUED
Shares Value»
GERMANY — (Continued)* 2,378 $ 57,027
4,278 120,0822,641 120,358
656 42,7783,363 264,9178,190 127,188
* 2,434 24,0601,107 28,738
14,999 353,0965,172 70,6191,129 24,123
* 3,055 6,77710,954 321,518
408 8,1335,292 42,1061,143 44,8011,917 141,6383,888 77,9021,419 75,0783,125 62,176
266 101,8781,170 23,196
15,100,291
HONG KONG — (2.6%)12,000 10,321
# 320,000 45,80913,600 75,239
219,416 48,6419,853 1,259
#* 255,000 10,57854,874 29,90811,500 14,12598,940 19,390
# 30,000 6,3046,900 80,609
28,000 80,95582,009 26,686
* 61,600 1,17886,000 15,324
* 248,000 35,641* 256,330 5,269* 302,000 3,628
42,000 139,65840,000 5,927
183,340 15,26430,000 10,051
4,000 5,718* 145,000 1,834* 186,000 5,136

China Motor Bus Co., Ltd.China Shandong Hi-Speed Financial Group, Ltd.China Star Entertainment, Ltd.China Strategic Holdings, Ltd.China Tonghai International Financial, Ltd.China Touyun Tech Group, Ltd.Chinese Estates Holdings, Ltd.Chong Hing Bank, Ltd.Chow Sang Sang Holdings International, Ltd.
Chuang's Consortium International, Ltd.CITIC Telecom International Holdings, Ltd.CK Life Sciences Intl Holdings, Inc.CNQC International Holdings, Ltd.Convenience Retail Asia, Ltd.Convoy Global Holdings, Ltd.Cosmopolitan International Holdings, Ltd.Cowell e Holdings, Inc.CP Lotus Corp.Cross-Harbour Holdings, Ltd. (The)CSI Properties, Ltd.CST Group, Ltd.Dah Sing Banking Group, Ltd.Dah Sing Financial Holdings, Ltd.Dickson Concepts International, Ltd.Dingyi Group Investment, Ltd.eForce Holdings, Ltd.Emperor Capital Group, Ltd.Emperor Entertainment Hotel, Ltd.Emperor International Holdings, Ltd.Emperor Watch & Jewellery, Ltd.ENM Holdings, Ltd.Esprit Holdings, Ltd.Fairwood Holdings, Ltd.Far East Consortium International, Ltd.FIH Mobile, Ltd.First Pacific Co., Ltd.Fountain SET Holdings, Ltd.Freeman Fintech Corp, Ltd.Future World Financial Holdings, Ltd.Genting Hong Kong, Ltd.Get Nice Holdings, Ltd.Giordano International, Ltd.Global Brands Group Holding, Ltd.Glorious Sun Enterprises, Ltd.Gold-Finance Holdings, Ltd.Goodbaby International Holdings, Ltd.GR Properties, Ltd.Great Eagle Holdings, Ltd.G-Resources Group, Ltd.
2,400 38,389#* 642,000 26,234# 310,000 34,243#* 1,321,250 9,694* 130,000 6,381* 430,000 4,064
47,000 42,59221,000 36,31936,000 49,074
VA International Small PortfolioCONTINUED
Shares Value»
HONG KONG — (Continued)100,000 $ 21,375154,000 63,555352,000 17,630
30,000 5,35750,000 25,739
#* 516,000 2,063* 140,000 26,264
47,000 8,110* 290,000 3,817
43,826 63,230859,543 38,270
* 2,064,000 6,55044,528 77,42917,806 79,83914,500 8,786
#* 155,000 6,513* 696,000 15,411
270,000 9,42340,000 7,997
140,333 35,178210,000 5,159
* 144,000 13,895#* 257,250 42,574
10,500 34,619161,876 76,816
#* 401,000 56,264288,000 120,075
28,000 4,220* 62,000 1,623* 8,383 72
30,000 3,662651,000 21,980126,000 43,295
# 63,400 5,00472,000 8,073
* 88,000 809* 129,000 26,474* 80,000 11,865
22,225 90,087* 2,577,000 18,326

Guotai Junan International Holdings, Ltd.Haitong International Securities Group, Ltd.Hang Lung Group, Ltd.Hanison Construction Holdings, Ltd.Hao Tian Development Group, Ltd.Harbour Centre Development, Ltd.HKBN, Ltd.HKBridge Financial Holdings, Ltd.HKR International, Ltd.Hong Kong Ferry Holdings Co., Ltd.Hong Kong Finance Investment Holding Group, Ltd.Hong Kong Television Network, Ltd.Hongkong & Shanghai Hotels, Ltd. (The)Hongkong Chinese, Ltd.Hung Hing Printing Group, Ltd.Hutchison Telecommunications Hong Kong Holdings, Ltd.IGG, Inc.Imagi International Holdings, Ltd.International Housewares Retail Co., Ltd.
IRC, Ltd.IT, Ltd.ITC Properties Group, Ltd.Johnson Electric Holdings, Ltd.Kerry Logistics Network, Ltd.Kingston Financial Group, Ltd.Kowloon Development Co., Ltd.Lai Sun Development Co., Ltd.Lai Sun Garment International, Ltd.Landing International Development, Ltd.Landsea Green Group Co., Ltd.Langham Hospitality Investments and Langham Hospitality Investments, Ltd.Lerthai Group, Ltd.Leyou Technologies Holdings, Ltd.Li & Fung, Ltd.Lifestyle International Holdings, Ltd.Lippo China Resources, Ltd.Liu Chong Hing Investment, Ltd.L'Occitane International SALuk Fook Holdings International, Ltd.Lung Kee Bermuda HoldingsMacau Legend Development, Ltd.Magnificent Hotel Investment, Ltd.Man Wah Holdings, Ltd.Mason Group Holdings, Ltd.Melco International Development, Ltd.Microport Scientific Corp.Midland Holdings, Ltd.Ming Fai International Holdings, Ltd.Miramar Hotel & Investment
# 322,400 50,931# 249,191 72,999
12,000 30,82327,198 4,610
* 202,400 6,45513,500 23,25076,000 137,206
* 82,000 7,134100,386 50,976
23,000 24,299* 102,000 11,448#* 56,239 32,421
69,000 89,928# 90,000 11,549
29,818 4,326162,000 35,071107,000 101,660
* 22,800 5,78541,000 11,232
VA International Small PortfolioCONTINUED
Shares Value»
HONG KONG — (Continued)#* 258,000 $ 5,587
54,000 19,71830,000 6,05632,875 59,08761,000 104,58836,000 6,67641,000 51,518
# 30,608 43,1669,000 10,547
* 133,200 18,744180,000 21,092
91,000 32,825#* 24,000 22,054#* 110,000 31,361
748,000 104,25455,000 75,154
586,000 13,10818,000 27,29532,250 66,98638,000 114,62826,000 8,803
* 293,000 41,824336,000 7,610
# 151,600 73,0882,829,598 42,872
58,000 141,12520,000 16,76743,417 7,38944,000 5,44921,000 44,217

Modern Dental Group, Ltd.Mongolian Mining Corp.Nameson Holdings, Ltd.New Times Energy Corp., Ltd.NewOcean Energy Holdings, Ltd.Nimble Holdings Co., Ltd.NOVA Group Holdings, Ltd.OP Financial, Ltd.Orange Sky Golden Harvest Entertainment Holdings, Ltd.Oriental Watch HoldingsOshidori International Holdings, Ltd.Pacific Andes International Holdings, Ltd.Pacific Basin Shipping, Ltd.Pacific Textiles Holdings, Ltd.Paliburg Holdings, Ltd.Paradise Entertainment, Ltd.PC Partner Group, Ltd.PCCW, Ltd.Perfect Shape Medical, Ltd.Pico Far East Holdings, Ltd.Playmates Toys, Ltd.Polytec Asset Holdings, Ltd.Public Financial Holdings, Ltd.PYI Corp., Ltd.Regal Hotels International Holdings, Ltd.Regina Miracle International Holdings, Ltd.Sa Sa International Holdings, Ltd.Samsonite International SA
SEA Holdings, Ltd.Shangri-La Asia, Ltd.Shenwan Hongyuan HK, Ltd.Shun Ho Property Investments, Ltd.Shun Tak Holdings, Ltd.Sing Tao News Corp., Ltd.Singamas Container Holdings, Ltd.SITC International Holdings Co., Ltd.SmarTone Telecommunications Holdings, Ltd.SOCAM Development, Ltd.Solomon Systech International, Ltd.Soundwill Holdings, Ltd.South Shore Holdings, Ltd.Stella International Holdings, Ltd.Summit Ascent Holdings, Ltd.Sun Hung Kai & Co., Ltd.SUNeVision Holdings, Ltd.TAI Cheung Holdings, Ltd.Tao Heung Holdings, Ltd.Television Broadcasts, Ltd.Texwinca Holdings, Ltd.
43,000 6,940* 171,249 2,158
74,000 4,570* 52,200 496* 110,000 23,260* 28,000 2,862# 130,000 29,008
116,000 29,003* 115,000 3,293
56,000 16,533# 700,200 86,307* 126,000 441# 547,000 112,297
78,000 61,52226,000 9,966
# 40,000 6,12730,000 7,086
135,000 76,99160,000 28,52296,000 29,657
* 60,000 5,64599,100 12,75224,000 9,977
* 169,839 2,29329,000 17,584
# 43,000 32,280# 128,015 35,866
83,700 163,892
VA International Small PortfolioCONTINUED
Shares Value»
HONG KONG — (Continued)# 50,046 $ 58,969
20,000 24,33325,000 4,438
5,544 1,975190,000 70,153
14,000 1,563256,000 33,840135,000 148,803
43,000 39,517* 6,566 1,729* 58,000 1,507
4,000 5,542* 54,450 1,495
55,000 88,674* 92,000 14,738
50,464 23,159# 55,000 40,577
37,000 35,86017,000 3,15043,600 70,049
# 112,000 33,120
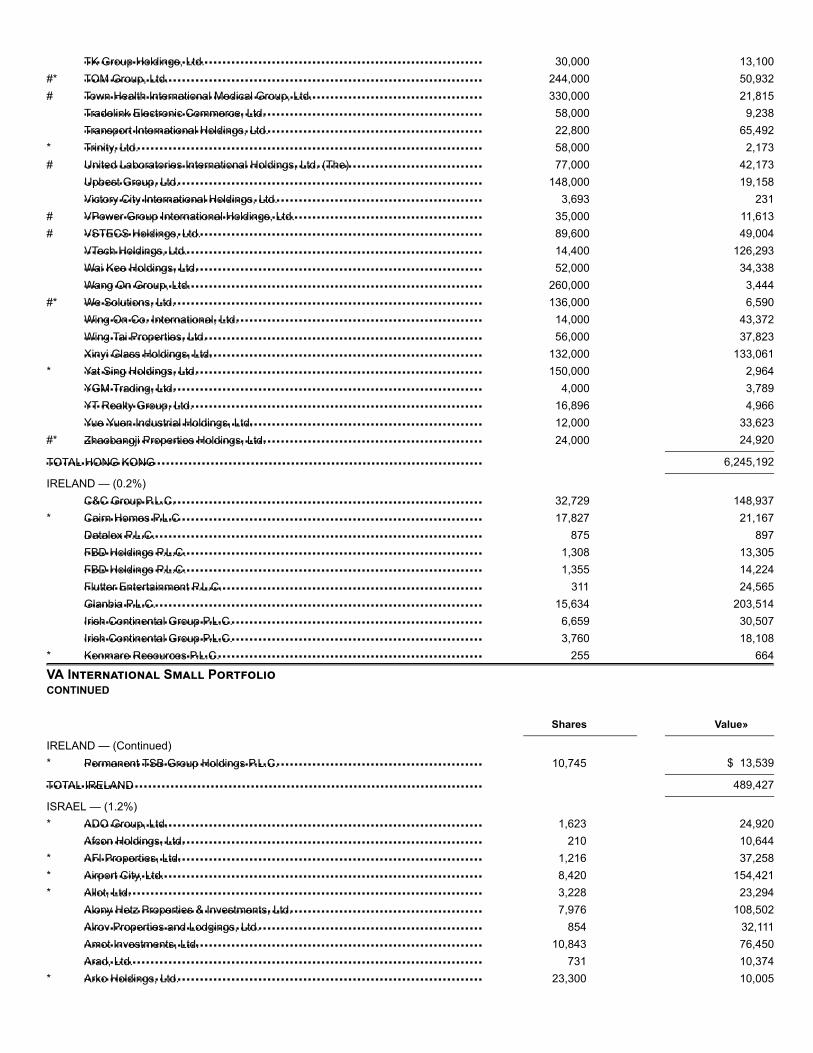
TK Group Holdings, Ltd.TOM Group, Ltd.Town Health International Medical Group, Ltd.Tradelink Electronic Commerce, Ltd.Transport International Holdings, Ltd.Trinity, Ltd.United Laboratories International Holdings, Ltd. (The)Upbest Group, Ltd.Victory City International Holdings, Ltd.VPower Group International Holdings, Ltd.VSTECS Holdings, Ltd.VTech Holdings, Ltd.Wai Kee Holdings, Ltd.Wang On Group, Ltd.We Solutions, Ltd.Wing On Co. International, Ltd.Wing Tai Properties, Ltd.Xinyi Glass Holdings, Ltd.Yat Sing Holdings, Ltd.YGM Trading, Ltd.YT Realty Group, Ltd.Yue Yuen Industrial Holdings, Ltd.Zhaobangji Properties Holdings, Ltd.
TOTAL HONG KONG
C&C Group P.L.C.Cairn Homes P.L.CDatalex P.L.C.FBD Holdings P.L.C.FBD Holdings P.L.C.Flutter Entertainment P.L.C.Glanbia P.L.C.Irish Continental Group P.L.C.Irish Continental Group P.L.C.Kenmare Resources P.L.C.
Permanent TSB Group Holdings P.L.C.
TOTAL IRELAND
ADO Group, Ltd.Afcon Holdings, Ltd.AFI Properties, Ltd.Airport City, Ltd.Allot, Ltd.Alony Hetz Properties & Investments, Ltd.Alrov Properties and Lodgings, Ltd.Amot Investments, Ltd.Arad, Ltd.Arko Holdings, Ltd.
30,000 13,100#* 244,000 50,932# 330,000 21,815
58,000 9,23822,800 65,492
* 58,000 2,173# 77,000 42,173
148,000 19,1583,693 231
# 35,000 11,613# 89,600 49,004
14,400 126,29352,000 34,338
260,000 3,444#* 136,000 6,590
14,000 43,37256,000 37,823
132,000 133,061* 150,000 2,964
4,000 3,78916,896 4,96612,000 33,623
#* 24,000 24,920
6,245,192
IRELAND — (0.2%)32,729 148,937
* 17,827 21,167875 897
1,308 13,3051,355 14,224
311 24,56515,634 203,514
6,659 30,5073,760 18,108
* 255 664
VA International Small PortfolioCONTINUED
Shares Value»
IRELAND — (Continued)* 10,745 $ 13,539
489,427
ISRAEL — (1.2%)* 1,623 24,920
210 10,644* 1,216 37,258* 8,420 154,421* 3,228 23,294
7,976 108,502854 32,111
10,843 76,450731 10,374
* 23,300 10,005

Ashtrom Group, Ltd.Ashtrom Properties, Ltd.AudioCodes, Ltd.Azorim-Investment Development & Construction Co., Ltd.Bayside Land Corp.Bet Shemesh Engines Holdings 1997, Ltd.Big Shopping Centers, Ltd.Blue Square Real Estate, Ltd.Brack Capital Properties NVCamtek, Ltd.Carasso Motors, Ltd.Cellcom Israel, Ltd.Clal Biotechnology Industries, Ltd.Clal Insurance Enterprises Holdings, Ltd.Compugen, Ltd.Danel Adir Yeoshua, Ltd.Delek Automotive Systems, Ltd.Delta-Galil Industries, Ltd.Direct Insurance Financial Investments, Ltd.El Al Israel AirlinesElectra Consumer Products 1970, Ltd.Electra, Ltd.Energix-Renewable Energies, Ltd.Enlight Renewable Energy, Ltd.Equital, Ltd.First International Bank Of Israel, Ltd.FMS Enterprises Migun, Ltd.Formula Systems 1985, Ltd.Fox Wizel, Ltd.Gilat Satellite Networks, Ltd.Hadera Paper, Ltd.Hamlet Israel-Canada, Ltd.Harel Insurance Investments & Financial Services, Ltd.Hilan, Ltd.IDI Insurance Co., Ltd.IES Holdings, Ltd.Industrial Buildings Corp., Ltd.Inrom Construction Industries, Ltd.Intercure, Ltd.Israel Canada T.R, Ltd.Isras Investment Co., Ltd.Kamada, Ltd.Kenon Holdings, Ltd.Kerur Holdings, Ltd.Magic Software Enterprises, Ltd.
Matrix IT, Ltd.Maytronics, Ltd.Mediterranean Towers, Ltd.Mega Or Holdings, Ltd.
1,136 9,6572,835 15,4342,455 47,421
* 2,807 4,699103 55,382515 16,545
* 632 49,438808 36,273
* 328 32,076* 1,575 15,268
2,404 9,716* 7,200 20,611* 4,323 2,120* 3,002 48,533* 6,673 21,825
447 31,4344,148 17,6401,324 38,5621,815 20,666
* 28,107 7,144515 7,183177 50,201
* 10,863 21,573* 62,108 54,372* 2,435 79,536* 2,702 69,648
266 7,5671,241 70,2441,280 38,3454,321 36,298
335 19,070463 9,428
12,315 96,1581,842 64,010
657 23,597230 15,368
* 20,310 43,6438,372 32,946
#* 4,205 7,7178,057 11,246
192 32,110* 3,545 20,243
1,743 36,657357 9,549
2,800 25,520
VA International Small PortfolioCONTINUED
Shares Value»
ISRAEL — (Continued)3,427 $ 53,8305,889 41,742
10,111 23,5102,038 40,076

Menora Mivtachim Holdings, Ltd.Migdal Insurance & Financial Holding, Ltd.Municipal Bank, Ltd.Naphtha Israel Petroleum Corp., Ltd.Nawi Brothers, Ltd.Neto ME Holdings, Ltd.Nova Measuring Instruments, Ltd.One Software Technologies, Ltd.OPC Energy, Ltd.Partner Communications Co., Ltd.Paz Oil Co., Ltd.Phoenix Holdings, Ltd. (The)Plasson Industries, Ltd.Rami Levy Chain Stores Hashikma Marketing 2006, Ltd.Redhill Biopharma, Ltd.Scope Metals Group, Ltd.Shapir Engineering and Industry, Ltd.Shikun & Binui, Ltd.Summit Real Estate Holdings, Ltd.YH Dimri Construction & Development, Ltd.
TOTAL ISRAEL
A2A SpAACEA SpAAeffe SpAAmplifon SpAAnima Holding SpAAquafil SpAArnoldo Mondadori Editore SpAAscopiave SpAAutogrill SpAAvio SpAAzimut Holding SpABanca Carige SpABanca Farmafactoring SpABanca Generali SpABanca IFIS SpABanca Mediolanum SpABanca Popolare di Sondrio SCPABanca Profilo SpABanca Sistema SpABanco BPM SpABanco di Desio e della Brianza SpABasicNet SpABF SpABiesse SpABPER BancaBrunello Cucinelli SpABuzzi Unicem SpACairo Communication SpACarraro SpACementir Holding SpACerved Group SpACIR-Compagnie Industriali Riunite SpA
3,053 48,79244,849 54,650
56 11,6224,099 26,967
* 1,867 12,16395 8,494
* 2,529 74,038535 33,099
2,662 21,063* 10,429 42,556
1,048 148,42410,796 67,308
283 11,425700 36,941
* 26,767 17,905872 21,201
9,594 36,46222,660 77,919
4,648 46,008721 15,825
2,842,672
ITALY — (3.8%)171,654 300,048
7,126 133,993* 3,833 7,352
9,264 228,33326,423 97,134
1,320 11,519* 28,311 46,117
10,073 45,77916,142 170,614
1,784 23,93313,811 258,850
#* 13,880 1713,300 71,883
6,768 197,0502,374 33,5402,042 14,611
59,679 124,02012,870 2,201
3,568 4,923#* 205,939 383,935
5,000 10,917# 1,940 9,727#* 7,534 21,225
1,304 16,236# 55,703 207,253
3,394 107,49210,037 203,98112,430 35,612
# 2,536 5,3986,965 48,916
22,191 174,86163,037 69,663

Credito Emiliano SpACredito Valtellinese SpADanieli & C Officine Meccaniche SpADatalogic SpADe' Longhi SpADeA Capital SpADiaSorin SpAdoValue SpAEl.En. SpAEmak SpAEnav SpAERG SpAEsprinet SpAEurotech SpAFalck Renewables SpAFiera Milano SpAFincantieri SpAFNM SpAFreni Brembo SpAGEDI Gruppo Editoriale SpAGeox SpAGruppo MutuiOnline SpAHera SpAIllimity Bank SpAIMA Industria Macchine Automatiche SpAIMMSI SpAInfrastrutture Wireless Italiane SpAIntek Group SpAInterpump Group SpAIren SpAItalgas SpAItalmobiliare SpAIVS Group SAJuventus Football Club SpALa Doria SpALeonardo SpALU-VE SpAMaire Tecnimont SpAMARR SpAMassimo Zanetti Beverage Group SpAMediaset SpAOpenjobmetis SpA agenzia per il lavoroOVS SpAPiaggio & C SpAPirelli & C SpAPrima Industrie SpARAI Way SpAReno de Medici SpAReply SpA
VA International Small PortfolioCONTINUED
Shares Value»
ITALY — (Continued)11,213 $ 56,156
* 912,608 53,9841,716 29,9122,311 40,6357,541 151,620
11,197 16,0651,896 219,8842,360 29,502
# 1,340 26,1636,798 7,378
25,524 140,3876,580 127,2422,060 6,920
* 5,018 27,14224,106 111,369
4,851 21,093#* 58,307 60,227
21,790 12,259# 18,041 184,534* 7,849 2,474
8,460 11,8823,477 59,270
102,323 380,9894,727 43,380
# 1,976 155,143* 26,564 18,217
6,727 68,051* 17,854 6,149
7,810 219,53469,654 182,25159,473 375,796
1,450 32,3601,842 20,579
#* 44,278 76,113# 1,865 16,553
5,879 71,579796 10,069
# 20,289 48,8294,048 87,2591,475 9,333
#* 41,897 122,712845 6,457
#* 16,480 28,99730,934 92,910
7,798 45,932# 444 7,430
10,541 62,560# 26,327 20,011
1,920 128,457

Retelit SpARizzoli Corriere Della Sera Mediagroup SpASabaf SpASAES Getters SpASafilo Group SpASaipem SpASalini Impregilo SpASalvatore Ferragamo SpASaras SpASesa SpA
Societa Cattolica di Assicurazioni SCSocieta Iniziative Autostradali e Servizi SpASogefi SpASOL SpATamburi Investment Partners SpATechnogym SpATinexta S.p.A.Tiscali SpATod's SpATREVI - Finanziaria Industriale SpAUnieuro SpAUnione di Banche Italiane SpAUnipol Gruppo SpAUnipolSai Assicurazioni SpAZignago Vetro SpA
TOTAL ITALY
77 Bank, Ltd. (The)A&D Co., Ltd.Abist Co., Ltd.Access Co., Ltd.Achilles Corp.Adastria Co., Ltd.ADEKA Corp.Ad-sol Nissin Corp.Advan Co., Ltd.Advance Create Co., Ltd.Adventure, Inc.Aeon Delight Co., Ltd.Aeon Fantasy Co., Ltd.Aeon Hokkaido Corp.Aeria, Inc.Ahresty Corp.Ai Holdings Corp.Aichi Bank, Ltd. (The)Aichi Corp.Aichi Steel Corp.Aichi Tokei Denki Co., Ltd.Aida Engineering, Ltd.
# 23,036 38,26522,611 24,2451,277 20,693
489 11,548* 2,996 2,906* 71,737 354,566#* 21,276 40,678
5,030 105,49073,078 120,290
768 30,254
VA International Small PortfolioCONTINUED
Shares Value»
ITALY — (Continued)23,798 $ 201,949
5,483 104,002#* 3,015 4,018
3,646 43,53315,032 94,70611,973 128,612
* 3,403 46,489#* 110,959 1,664# 1,112 55,370* 6,018 1,647
837 11,489# 127,388 327,053
71,733 367,967# 46,134 120,272
4,262 48,184
9,106,771
JAPAN — (22.2%)7,300 104,0733,000 21,631
500 12,3904,800 36,2122,500 46,7243,140 61,4487,700 112,6211,200 21,1814,100 41,661
700 11,952* 300 9,213
2,200 65,552# 800 23,037
1,400 9,509# 2,100 16,088
2,700 14,1893,200 49,9611,600 54,8585,600 35,0711,500 46,790
300 11,5625,500 43,537

Aiful Corp.Ain Holdings, Inc.Aiphone Co., Ltd.Airport Facilities Co., Ltd.Aisan Industry Co., Ltd.AIT Corp.Aizawa Securities Co., Ltd.Ajis Co., Ltd.Akatsuki, Inc.Akebono Brake Industry Co., Ltd.Akita Bank, Ltd. (The)Albis Co., Ltd.Alconix Corp.Alinco, Inc.Alleanza Holdings Co., Ltd.Alpen Co., Ltd.Alpha Corp.Alpha Systems, Inc.Alps Logistics Co., Ltd.
Altech Corp.Amano Corp.Amiyaki Tei Co., Ltd.Anest Iwata Corp.Anicom Holdings, Inc.AOI Electronics Co., Ltd.AOI TYO Holdings, Inc.AOKI Holdings, Inc.Aomori Bank, Ltd. (The)Aoyama Trading Co., Ltd.Aoyama Zaisan Networks Co., Ltd.Apaman Co., Ltd.Arakawa Chemical Industries, Ltd.Arata Corp.Arcland Sakamoto Co., Ltd.Arcland Service Holdings Co., Ltd.Arcs Co., Ltd.Arealink Co., Ltd.Argo Graphics, Inc.Arisawa Manufacturing Co., Ltd.Artnature, Inc.As One Corp.Asahi Co., Ltd.Asahi Diamond Industrial Co., Ltd.Asahi Holdings, Inc.Asahi Kogyosha Co., Ltd.Asahi Printing Co., Ltd.Asahi Yukizai Corp.Asante, Inc.Asanuma Corp.
#* 38,800 79,0841,700 92,9911,100 16,8173,500 16,5254,170 27,9001,800 16,695
# 5,200 33,044800 25,252500 33,563
#* 14,000 19,6512,400 44,016
800 18,663# 2,600 30,978
2,200 19,591# 700 5,271
2,000 28,542500 5,804
1,300 32,4682,000 13,746
VA International Small PortfolioCONTINUED
Shares Value»
JAPAN — (Continued)2,310 $ 35,6365,200 156,429
300 9,5363,000 25,295
300 10,450500 9,841
2,900 18,9595,300 51,972
# 2,600 63,7094,900 91,251
# 1,600 21,699# 1,800 16,140
1,800 24,3461,300 42,0792,700 32,6882,000 35,0124,200 87,363
# 1,000 11,7702,200 49,8315,100 42,2441,000 6,0171,090 90,2412,700 31,3229,000 55,5843,700 76,829
600 14,8581,100 10,8832,300 28,8981,200 21,930
800 25,520

Ashimori Industry Co., Ltd.Asia Pile Holdings Corp.ASKA Pharmaceutical Co., Ltd.ASKUL Corp.Asukanet Co., Ltd.Asunaro Aoki Construction Co., Ltd.Ateam, Inc.Atom Corp.Atrae, Inc.Atsugi Co., Ltd.Autobacs Seven Co., Ltd.Avex, Inc.Awa Bank, Ltd. (The)Axial Retailing, Inc.Bando Chemical Industries, Ltd.Bank of Iwate, Ltd. (The)Bank of Nagoya, Ltd. (The)Bank of Okinawa, Ltd. (The)Bank of Saga, Ltd. (The)Bank of the Ryukyus, Ltd.Baroque Japan, Ltd.BayCurrent Consulting, Inc.Belc Co., Ltd.Bell System24 Holdings, Inc.Belluna Co., Ltd.Bengo4.com, Inc.Bic Camera, Inc.Billing System Corp.Biofermin Pharmaceutical Co., Ltd.
BML, Inc.Bookoff Group Holdings, Ltd.Bourbon Corp.BP Castrol K.K.Br Holdings Corp.BrainPad, Inc.Broadleaf Co., Ltd.BRONCO BILLY Co., Ltd.Bunka Shutter Co., Ltd.C Uyemura & Co., Ltd.CAC Holdings Corp.Can Do Co., Ltd.Canon Electronics, Inc.Career Design Center Co., Ltd.CareerIndex, Inc.Carlit Holdings Co., Ltd.Carta Holdings, Inc.Cawachi, Ltd.Central Automotive Products, Ltd.Central Glass Co., Ltd.
300 4,2274,100 20,2403,300 39,464
# 1,100 27,420# 600 8,407
1,800 13,5971,400 14,269
# 9,000 82,419* 300 6,735
4,000 33,2537,200 117,1674,300 55,2863,800 86,2631,800 62,3575,100 44,0112,000 49,2041,400 43,4412,460 75,6041,600 22,3293,600 37,321
# 1,700 17,0241,600 73,0641,000 46,2912,400 34,1756,900 44,560
#* 400 17,6755,900 58,165
# 800 8,817400 8,015
VA International Small PortfolioCONTINUED
Shares Value»
JAPAN — (Continued)2,000 $ 54,893
# 1,000 11,4611,100 17,0891,300 15,935
# 1,200 3,821#* 500 28,776
8,900 46,7651,100 22,8176,984 57,157
800 43,7681,700 21,6981,000 14,9492,600 42,554
500 7,277#* 800 5,405
2,600 14,6882,400 26,8261,800 33,4481,600 29,2093,400 77,289

Central Security Patrols Co., Ltd.Central Sports Co., Ltd.Chiba Kogyo Bank, Ltd. (The)Chilled & Frozen Logistics Holdings Co., Ltd., Class HCHIMNEY Co., Ltd.Chiyoda Co., Ltd.Chiyoda Integre Co., Ltd.Chofu Seisakusho Co., Ltd.Chori Co., Ltd.Chubu Shiryo Co., Ltd.Chudenko Corp.Chuetsu Pulp & Paper Co., Ltd.Chugai Ro Co., Ltd.Chugoku Bank, Ltd. (The)Chugoku Marine Paints, Ltd.Chukyo Bank, Ltd. (The)Chuo Spring Co., Ltd.CI Takiron Corp.Citizen Watch Co., Ltd.CKD Corp.Cleanup Corp.CMIC Holdings Co., Ltd.CMK Corp.cocokara fine, Inc.Coco's Japan Co., Ltd.COLOPL, Inc.Colowide Co., Ltd.Computer Engineering & Consulting, Ltd.Computer Institute of Japan, Ltd.Comture Corp.CONEXIO Corp.COOKPAD, Inc.Corona Corp.Cosel Co., Ltd.Cosmo Energy Holdings Co., Ltd.Cota Co., Ltd.Create Restaurants Holdings, Inc.Create SD Holdings Co., Ltd.Creek & River Co., Ltd.
Cresco, Ltd.CTI Engineering Co., Ltd.CTS Co., Ltd.Cybozu, Inc.Dai Nippon Toryo Co., Ltd.Daibiru Corp.Dai-Dan Co., Ltd.Daido Kogyo Co., Ltd.Daido Metal Co., Ltd.Daido Steel Co., Ltd.
# 1,000 44,934900 25,600
7,400 20,7901,100 13,385
400 8,8182,100 31,0461,900 36,2802,300 46,6301,400 21,8033,200 36,8203,900 85,297
800 11,560700 10,316
7,700 67,3207,800 58,3771,800 36,400
500 13,0688,000 51,385
33,800 168,2047,500 82,2792,000 9,4661,500 25,6126,400 36,5271,779 93,757
600 8,1315,000 30,6866,000 116,9392,100 46,7291,900 17,241
900 34,4692,400 32,384
* 4,500 12,6361,300 12,022
# 2,500 24,7905,600 115,432
# 1,331 14,467# 4,500 67,161
2,400 53,7641,700 20,719
VA International Small PortfolioCONTINUED
Shares Value»
JAPAN — (Continued)500 $ 17,614
1,400 20,3633,200 19,6752,000 23,6122,200 19,8405,700 52,7191,500 30,438
900 7,3145,500 33,0492,900 110,104

Daihatsu Diesel Manufacturing Co., Ltd.Daihen Corp.Daiho Corp.Daiichi Jitsugyo Co., Ltd.Daiichi Kensetsu Corp.Daiichi Kigenso Kagaku-Kogyo Co., Ltd.Dai-ichi Seiko Co., Ltd.Daiken Corp.Daiken Medical Co., Ltd.Daiki Aluminium Industry Co., Ltd.Daikoku Denki Co., Ltd.Daikokutenbussan Co., Ltd.Daikyonishikawa Corp.Dainichiseika Color & Chemicals Manufacturing Co., Ltd.Daio Paper Corp.Daiseki Co., Ltd.Daishi Hokuetsu Financial Group, Inc.Daito Bank, Ltd. (The)Daito Pharmaceutical Co., Ltd.Daitron Co., Ltd.Daiwa Industries, Ltd.Daiwabo Holdings Co., Ltd.DCM Holdings Co., Ltd.DD Holdings Co., Ltd.Dear Life Co., Ltd.Denki Kogyo Co., Ltd.Densan System Co., Ltd.Denyo Co., Ltd.Descente, Ltd.Dexerials Corp.Digital Arts, Inc.Digital Hearts Holdings Co., Ltd.Digital Information Technologies Corp.Dip Corp.DKS Co., Ltd.DMG Mori Co., Ltd.Doshisha Co., Ltd.Doutor Nichires Holdings Co., Ltd.Dowa Holdings Co., Ltd.DTS Corp.Duskin Co., Ltd.DyDo Group Holdings, Inc.Eagle Industry Co., Ltd.Earth Corp.Ebara Foods Industry, Inc.Ebara Jitsugyo Co., Ltd.Eco's Co., Ltd.EDION Corp.EF-ON, Inc.
2,400 14,2252,200 60,9122,400 59,6311,000 27,419
# 1,100 17,865# 2,500 20,128
1,400 17,0621,400 27,7522,800 15,9113,000 21,018
900 11,032# 800 24,025
4,200 34,5701,600 44,1636,400 76,4393,730 88,6374,000 106,3231,000 5,0301,450 40,418
800 9,8414,300 42,5991,600 77,5379,900 93,421
300 8,318# 5,600 24,013
1,600 44,888600 17,668
2,000 28,8443,300 51,2158,900 58,7101,000 101,239
# 1,200 11,970800 12,893
4,000 82,1091,200 35,4549,400 136,1622,900 45,1923,112 57,2912,300 72,6383,800 83,0644,100 108,5181,400 55,0023,000 29,926
500 21,445800 15,572900 16,640
# 800 10,8929,900 93,8711,080 8,850
VA International Small PortfolioCONTINUED
Shares Value»
JAPAN — (Continued)

eGuarantee, Inc.E-Guardian, Inc.Ehime Bank, Ltd. (The)Eidai Co., Ltd.Eiken Chemical Co., Ltd.Eizo Corp.Elan Corp.Elecom Co., Ltd.Elematec Corp.EM Systems Co., Ltd.Endo Lighting Corp.Enigmo, Inc.en-japan, Inc.Enplas Corp.EPS Holdings, Inc.eRex Co., Ltd.ES-Con Japan, Ltd.Escrow Agent Japan, Inc.ESPEC Corp.Evolable Asia Corp.Excel Co., Ltd.Exedy Corp.F@N Communications, Inc.FALCO HOLDINGS Co., Ltd.FCC Co., Ltd.FDK Corp.Feed One Co., Ltd.Ferrotec Holdings Corp.FFRI, Inc.FIDEA Holdings Co., Ltd.Fields Corp.Financial Products Group Co., Ltd.FINDEX, Inc.First Bank of Toyama, Ltd. (The)Fixstars Corp.FJ Next Co., Ltd.Focus Systems Corp.Foster Electric Co., Ltd.France Bed Holdings Co., Ltd.Freebit Co., Ltd.Freund Corp.Fronteo, Inc.F-Tech, Inc.FTGroup Co., Ltd.Fudo Tetra Corp.Fuji Co., Ltd.Fuji Corp.Fuji Corp.Fuji Corp., Ltd.Fuji Kosan Co., Ltd.Fuji Kyuko Co., Ltd.Fuji Oil Co., Ltd.Fuji Pharma Co., Ltd.Fuji Seal International, Inc.Fujibo Holdings, Inc.
3,200 $ 34,308# 1,100 19,568
3,800 37,9443,000 9,5243,000 50,4111,500 55,0132,200 35,0851,100 39,8301,800 16,902
# 2,000 30,8141,700 11,881
* 2,600 27,8142,700 110,7611,300 41,5204,300 66,2063,900 38,2623,600 22,613
# 3,500 7,6482,000 41,1041,000 23,6441,200 16,6823,100 63,1966,200 31,2811,400 20,6363,800 73,842
* 1,100 8,32319,600 32,020
5,400 46,316* 400 13,382
30,500 33,6223,000 13,1584,700 41,407
700 6,0434,700 13,1883,000 49,554
# 1,300 12,6781,700 13,2913,400 59,4813,800 34,737
# 2,000 20,104# 1,700 12,556# 1,100 3,846
1,600 10,891# 1,100 15,566
1,930 23,1402,600 43,9847,400 98,672
800 14,9673,000 20,151
# 600 4,8901,500 57,6038,300 19,3852,000 26,8014,400 128,9081,500 36,332

Fujicco Co., Ltd.Fujikura Composites, Inc.Fujikura Kasei Co., Ltd.Fujikura, Ltd.
Fujimi, Inc.Fujimori Kogyo Co., Ltd.Fujio Food System Co., Ltd.Fujita Kanko, Inc.Fujitec Co., Ltd.Fujitsu Frontech, Ltd.Fujitsu General, Ltd.Fujiya Co., Ltd.Fukuda Corp.Fukuda Denshi Co., Ltd.Fukui Bank, Ltd. (The)Fukui Computer Holdings, Inc.Fukushima Bank, Ltd. (The)Fukushima Industries Corp.Fukuyama Transporting Co., Ltd.FULLCAST Holdings Co., Ltd.Funai Electric Co., Ltd.Funai Soken Holdings, Inc.Furukawa Battery Co., Ltd. (The)Furukawa Co., Ltd.Furukawa Electric Co., Ltd.Furuno Electric Co., Ltd.Furusato Industries, Ltd.Furuya Metal Co., Ltd.Furyu Corp.Fuso Chemical Co., Ltd.Fuso Pharmaceutical Industries, Ltd.Futaba Corp.Futaba Industrial Co., Ltd.Future Corp.Fuyo General Lease Co., Ltd.G-7 Holdings, Inc.Gakken Holdings Co., Ltd.Gakkyusha Co., Ltd.Gakujo Co., Ltd.GCA Corp.Gecoss Corp.Genki Sushi Co., Ltd.Genky DrugStores Co., Ltd.Geo Holdings Corp.Geostr Corp.Giken, Ltd.GL Sciences, Inc.GLOBERIDE, Inc.Glory, Ltd.
2,200 39,6751,100 4,2964,200 22,906
29,700 108,644
VA International Small PortfolioCONTINUED
Shares Value»
JAPAN — (Continued)300 $ 6,199
2,200 59,115# 900 21,359
800 20,0357,300 91,0031,400 12,3046,000 95,8861,100 19,5271,000 42,012
500 32,8412,600 33,128
900 18,8574,200 9,4911,200 37,2571,800 67,7752,000 40,895
* 1,900 13,5053,060 69,8252,400 14,3093,300 43,0643,200 85,8263,500 29,9941,000 13,360
400 13,338300 2,976
2,000 41,7581,100 19,3874,200 55,9258,700 60,3571,900 33,7932,100 124,637
500 13,571300 13,496
# 1,000 12,0451,000 11,2542,900 18,8642,000 17,139
800 22,5281,000 19,4353,800 50,0131,300 3,8371,300 38,091
600 8,2271,000 29,7934,500 118,828

GMO Cloud K.K.GMO Financial Holdings, Inc.GMO internet, Inc.Godo Steel, Ltd.Goldcrest Co., Ltd.Golf Digest Online, Inc.Grace Technology, Inc.Gree, Inc.GS Yuasa Corp.G-Tekt Corp.Gun-Ei Chemical Industry Co., Ltd.Gunma Bank, Ltd. (The)Gunosy, Inc.Gunze, Ltd.
Gurunavi, Inc.H2O Retailing Corp.HABA Laboratories, Inc.Hagihara Industries, Inc.Hagiwara Electric Holdings Co., Ltd.Hakudo Co., Ltd.Hakuto Co., Ltd.Halows Co., Ltd.Hamakyorex Co., Ltd.Handsman Co., Ltd.Hanwa Co., Ltd.Happinet Corp.Harima Chemicals Group, Inc.Hazama Ando Corp.Heiwa Real Estate Co., Ltd.Heiwado Co., Ltd.Helios Techno Holdings Co., Ltd.Hibiya Engineering, Ltd.Hiday Hidaka Corp.HI-LEX Corp.Hinokiya Group Co., Ltd.Hioki EE Corp.Hirakawa Hewtech Corp.Hiramatsu, Inc.Hirano Tecseed Co., Ltd.Hirata Corp.Hiroshima Bank, Ltd. (The)Hiroshima Gas Co., Ltd.HIS Co., Ltd.Hisaka Works, Ltd.Hitachi Zosen Corp.Hito Communications Holdings, Inc.Hochiki Corp.Hodogaya Chemical Co., Ltd.Hogy Medical Co., Ltd.
700 20,0484,400 23,9053,600 58,5231,600 30,0452,590 46,690
# 1,000 5,2961,200 31,662
10,400 48,8206,700 125,3112,400 34,988
700 15,9118,000 27,561
#* 1,100 16,4121,900 84,429
VA International Small PortfolioCONTINUED
Shares Value»
JAPAN — (Continued)2,500 $ 15,420
11,700 132,235400 32,440
1,400 17,4151,000 26,194
800 10,2571,400 15,7641,100 22,7792,200 78,608
# 800 8,6564,500 122,6121,800 21,6052,500 26,364
19,410 133,8003,600 75,6033,600 66,091
# 2,400 14,1332,400 43,2752,792 53,9612,500 40,657
400 7,5911,100 37,4071,200 13,9362,300 7,587
# 1,700 25,910700 42,813
27,300 130,4746,100 18,5733,000 73,1674,200 32,961
16,500 59,1711,000 16,9661,700 21,177
800 20,6652,200 61,153

Hokkaido Coca-Cola Bottling Co., Ltd.Hokkaido Electric Power Co., Inc.Hokkaido Gas Co., Ltd.Hokkan Holdings, Ltd.Hokko Chemical Industry Co., Ltd.Hokkoku Bank, Ltd. (The)Hokuetsu Corp.Hokuetsu Industries Co., Ltd.Hokuhoku Financial Group, Inc.Hokuriku Electric Industry Co., Ltd.Hokuriku Electric Power Co.Hokuriku Electrical Construction Co., Ltd.Hokuto Corp.Honda Tsushin Kogyo Co., Ltd.H-One Co., Ltd.Honeys Holdings Co., Ltd.Hoosiers HoldingsHosiden Corp.Hosokawa Micron Corp.Hotland Co., Ltd.House Do Co., Ltd.Howa Machinery, Ltd.Hyakugo Bank, Ltd. (The)Hyakujushi Bank, Ltd. (The)
Ibiden Co., Ltd.IBJ Leasing Co., Ltd.IBJ, Inc.Ichibanya Co., Ltd.Ichigo, Inc.Ichiken Co., Ltd.Ichikoh Industries, Ltd.Ichimasa Kamaboko Co., Ltd.Ichinen Holdings Co., Ltd.Ichiyoshi Securities Co., Ltd.Icom, Inc.ID Holdings Corp.Idec Corp.IDOM, Inc.Ihara Science Corp.Iino Kaiun Kaisha, Ltd.IJTT Co., Ltd.Imagica Group, Inc.Imasen Electric IndustrialImuraya Group Co., Ltd.Inaba Denki Sangyo Co., Ltd.Inaba Seisakusho Co., Ltd.Inabata & Co., Ltd.Inageya Co., Ltd.Ines Corp.
600 20,24318,600 105,302
1,600 21,6291,200 18,7883,300 14,6222,500 69,445
14,000 69,4742,800 30,447
13,900 139,267400 3,861
* 17,400 124,6121,500 12,3832,800 47,7291,400 6,3864,000 26,0172,670 32,3435,300 30,1797,500 83,2611,000 40,462
* 1,300 17,358# 600 9,103
2,200 16,98323,900 70,083
2,900 57,718
VA International Small PortfolioCONTINUED
Shares Value»
JAPAN — (Continued)4,100 $ 73,0972,900 72,781
# 1,100 8,9171,400 65,944
28,300 102,258700 11,013
4,000 25,590# 1,100 10,468
2,000 20,4057,100 46,8751,500 31,1901,300 14,111
# 3,300 59,2678,500 32,0191,200 13,958
10,400 34,8182,100 10,037
900 4,4843,201 25,9471,600 30,4752,300 105,9231,700 21,7094,800 62,4603,100 42,0143,600 38,353

I-Net Corp.Infocom Corp.Infomart Corp.Information Services International-Dentsu, Ltd.Innotech Corp.Insource Co., Ltd.Intage Holdings, Inc.Inter Action Corp.Internet Initiative Japan, Inc.Inui Global Logistics Co., Ltd.IR Japan Holdings, Ltd.Iriso Electronics Co., Ltd.I'rom Group Co., Ltd.Iseki & Co., Ltd.Ishihara Chemical Co., Ltd.Ishihara Sangyo Kaisha, Ltd.Istyle, Inc.Itfor, Inc.Itochu Enex Co., Ltd.Itochu-Shokuhin Co., Ltd.Itoham Yonekyu Holdings, Inc.Itoki Corp.Itokuro, Inc.IwaiCosmo Holdings, Inc.Iwaki Co., Ltd.Iwasaki Electric Co., Ltd.Iwatani Corp.Iwatsu Electric Co., Ltd.Iwatsuka Confectionery Co., Ltd.Iyo Bank, Ltd. (The)J Trust Co., Ltd.JAC Recruitment Co., Ltd.Jaccs Co., Ltd.Jafco Co., Ltd.
Jalux, Inc.Jamco Corp.Janome Sewing Machine Co., Ltd.Japan Asset Marketing Co., Ltd.Japan Aviation Electronics Industry, Ltd.Japan Best Rescue System Co., Ltd.Japan Cash Machine Co., Ltd.Japan Display, Inc.Japan Elevator Service Holdings Co., Ltd.Japan Investment Adviser Co., Ltd.Japan Lifeline Co., Ltd.Japan Material Co., Ltd.Japan Meat Co., Ltd.Japan Medical Dynamic Marketing, Inc.Japan Petroleum Exploration Co., Ltd.
1,600 21,4673,200 79,3157,800 105,2101,100 38,1942,400 19,905
# 1,000 29,3063,800 32,112
# 1,600 27,8043,100 57,938
# 2,525 20,344800 20,855
1,800 82,109# 900 14,177
2,200 28,790700 10,885
4,400 46,746#* 4,200 31,676
3,600 30,8185,500 44,506
600 24,5726,800 44,5474,500 18,562
#* 600 9,3722,900 29,5781,300 14,233
400 4,8574,000 132,040
300 2,163500 18,227
16,500 80,192# 11,300 49,362
1,600 36,9903,200 63,6443,300 122,334
VA International Small PortfolioCONTINUED
Shares Value»
JAPAN — (Continued)800 $ 18,489
1,500 27,3352,299 9,839
* 22,400 18,6825,000 69,636
# 1,200 15,7312,100 20,882
* 65,700 44,8991,200 30,304
# 1,100 18,5705,100 89,7626,600 85,926
# 1,500 24,8502,570 32,1783,800 82,733

Japan Property Management Center Co., Ltd.Japan Pulp & Paper Co., Ltd.Japan Securities Finance Co., Ltd.Japan Steel Works, Ltd. (The)Japan Transcity Corp.Japan Wool Textile Co., Ltd. (The)Jastec Co., Ltd.JBCC Holdings, Inc.JCR Pharmaceuticals Co., Ltd.JCU Corp.Jeol, Ltd.JIG-SAW, Inc.Jimoto Holdings, Inc.JINS Holdings, Inc.JK Holdings Co., Ltd.JMS Co., Ltd.Joban Kosan Co., Ltd.J-Oil Mills, Inc.Jolly - Pasta Co., Ltd.Joshin Denki Co., Ltd.JP-Holdings, Inc.JSP Corp.Juki Corp.Juroku Bank, Ltd. (The)Justsystems Corp.JVCKenwood Corp.K&O Energy Group, Inc.Kadokawa DwangoKadoya Sesame Mills, Inc.Kaga Electronics Co., Ltd.Kakiyasu Honten Co., Ltd.Kamakura Shinsho, Ltd.Kameda Seika Co., Ltd.Kamei Corp.Kanaden Corp.Kanagawa Chuo Kotsu Co., Ltd.Kanamoto Co., Ltd.Kandenko Co., Ltd.Kaneko Seeds Co., Ltd.Kanematsu Corp.Kanematsu Electronics, Ltd.Kansai Mirai Financial Group, Inc.Kansai Super Market, Ltd.Kanto Denka Kogyo Co., Ltd.
Kappa Create Co., Ltd.Kasai Kogyo Co., Ltd.Katakura Industries Co., Ltd.Kato Sangyo Co., Ltd.Kato Works Co., Ltd.
900 9,3821,600 53,840
13,500 68,4386,300 109,6943,000 13,7066,000 49,620
300 2,9922,000 29,437
300 21,1092,900 54,3962,600 58,424
* 300 13,77821,100 18,949
1,100 57,9062,500 12,6182,200 16,142
400 6,0681,100 39,440
* 700 12,0813,100 59,1462,900 7,6071,300 22,5902,400 21,6714,100 83,5932,300 77,606
30,770 68,8132,300 31,125
* 7,169 91,101400 14,883
1,900 28,905600 11,787
# 2,800 38,7111,200 56,0493,600 36,6621,900 24,346
800 27,0643,400 87,3969,000 78,470
900 10,5587,405 84,9571,400 38,3996,197 41,6191,800 17,9326,400 43,731
VA International Small PortfolioCONTINUED
Shares Value»
JAPAN — (Continued)2,100 $ 26,8273,100 25,4352,700 30,8072,900 85,5791,600 28,561

KAWADA TECHNOLOGIES, Inc.Kawai Musical Instruments Manufacturing Co., Ltd.Kawasaki Kisen Kaisha, Ltd.Kawasumi Laboratories, Inc.Keihanshin Building Co., Ltd.Keihin Corp.Keiyo Bank, Ltd. (The)Keiyo Co., Ltd.Kenedix, Inc.Kenko Mayonnaise Co., Ltd.Key Coffee, Inc.KFC Holdings Japan, Ltd.KH Neochem Co., Ltd.King Jim Co., Ltd.Kintetsu Department Store Co., Ltd.Kintetsu World Express, Inc.Kirindo Holdings Co., Ltd.Kissei Pharmaceutical Co., Ltd.Ki-Star Real Estate Co., Ltd.Kitagawa Corp.Kita-Nippon Bank, Ltd. (The)Kitano Construction Corp.Kitanotatsujin Corp.Kito Corp.Kitz Corp.Kiyo Bank, Ltd. (The)KLab, Inc.KNT-CT Holdings Co., Ltd.Koa Corp.Koatsu Gas Kogyo Co., Ltd.Kobe Electric Railway Co., Ltd.Kohnan Shoji Co., Ltd.Kohsoku Corp.Koike Sanso Kogyo Co., Ltd.Kojima Co., Ltd.Kokuyo Co., Ltd.Komatsu Matere Co., Ltd.Komatsu Wall Industry Co., Ltd.KOMEDA Holdings Co., Ltd.Komehyo Co., Ltd.Komeri Co., Ltd.Komori Corp.Konaka Co., Ltd.Kondotec, Inc.Konishi Co., Ltd.Konoike Transport Co., Ltd.Koshidaka Holdings Co., Ltd.Kotobuki Spirits Co., Ltd.Kourakuen Holdings Corp.Krosaki Harima Corp.KRS Corp.KU Holdings Co., Ltd.Kumagai Gumi Co., Ltd.Kumiai Chemical Industry Co., Ltd.
600 41,1441,300 36,426
#* 10,600 135,417100 702
5,000 55,1035,100 70,786
12,500 76,0786,700 29,045
21,700 109,9772,000 45,7002,600 50,7811,400 27,4952,200 54,5073,000 22,7421,100 31,4003,600 48,274
900 14,6113,200 79,0411,100 16,5631,600 30,9381,000 16,571
700 16,8197,800 50,3872,700 39,9798,600 58,4337,200 93,771
#* 4,100 33,556* 1,300 15,687
3,500 42,1323,600 27,563
* 899 32,8512,300 50,1351,300 14,903
# 400 8,746* 2,300 10,021
6,700 90,3714,000 28,453
600 10,5643,900 72,222
800 8,6333,300 67,7937,500 75,7381,760 6,7662,900 24,6064,000 56,9582,900 44,869
# 4,400 62,2431,800 106,1801,000 27,709
800 43,8731,000 18,0692,400 19,1354,000 106,934
# 10,267 84,340

Kura Sushi, Inc.Kurabo Industries, Ltd.Kureha Corp.Kurimoto, Ltd.Kuriyama Holdings Corp.KYB Corp.Kyoden Co., Ltd.Kyodo Printing Co., Ltd.Kyoei Steel, Ltd.Kyokuto Boeki Kaisha, Ltd.Kyokuto Kaihatsu Kogyo Co., Ltd.Kyokuto Securities Co., Ltd.Kyokuyo Co., Ltd.KYORIN Holdings, Inc.Kyoritsu Maintenance Co., Ltd.Kyosan Electric Manufacturing Co., Ltd.Kyowa Electronic Instruments Co., Ltd.Kyowa Leather Cloth Co., Ltd.Kyushu Financial Group, Inc.LAC Co., Ltd.Lacto Japan Co., Ltd.Laox Co., Ltd.Lasertec Corp.LEC, Inc.Leopalace21 Corp.Life Corp.LIFULL Co., Ltd.Like Co., Ltd.Linical Co., Ltd.Link And Motivation, Inc.Lintec Corp.LIXIL VIVA Corp.M&A Capital Partners Co., Ltd.Macnica Fuji Electronics Holdings, Inc.Macromill, Inc.Maeda Corp.Maeda Kosen Co., Ltd.Maeda Road Construction Co., Ltd.Maezawa Kasei Industries Co., Ltd.Maezawa Kyuso Industries Co., Ltd.Makino Milling Machine Co., Ltd.Mamezou Holdings Co., Ltd.Mandom Corp.Mani, Inc.MarkLines Co., Ltd.Mars Group Holdings Corp.Marubun Corp.Marudai Food Co., Ltd.Maruha Nichiro Corp.
VA International Small PortfolioCONTINUED
Shares Value»
JAPAN — (Continued)1,000 $ 40,9931,800 34,6951,900 125,8651,100 14,9011,000 8,078
* 3,100 87,9751,800 5,452
900 23,4012,900 49,120
800 13,0503,800 46,8892,600 21,8311,100 30,8084,500 75,6941,500 64,5775,000 17,1975,600 21,527
900 6,49312,400 47,060
2,400 37,311# 400 12,263#* 5,100 14,788
2,300 109,4112,400 28,165
#* 26,900 56,2922,000 41,2418,200 37,916
# 1,600 27,3831,600 15,462
# 3,900 20,0123,900 82,0592,500 30,383
* 600 40,0856,399 88,7813,500 40,6377,800 58,4381,900 31,7765,900 125,2011,200 12,5351,200 21,3162,600 108,3893,000 40,5842,200 51,765
600 43,1181,500 25,5811,800 33,6371,900 10,1902,600 48,5944,152 121,309

Maruka Corp.Marusan Securities Co., Ltd.Maruwa Co., Ltd.Maruwa Unyu Kikan Co., Ltd.Maruyama Manufacturing Co., Inc.Maruzen CHI Holdings Co., Ltd.Maruzen Co., Ltd.Maruzen Showa Unyu Co., Ltd.Marvelous, Inc.Matching Service Japan Co., Ltd.
Matsuda Sangyo Co., Ltd.Matsui Construction Co., Ltd.Matsuya Co., Ltd.Matsuyafoods Holdings Co., Ltd.Max Co., Ltd.Maxell Holdings, Ltd.Maxvalu Nishinihon Co., Ltd.Maxvalu Tokai Co., Ltd.MCJ Co., Ltd.MEC Co., Ltd.Media Do Holdings Co., Ltd.Medical Data Vision Co., Ltd.Medical System Network Co., Ltd.Megachips Corp.Megmilk Snow Brand Co., Ltd.Meidensha Corp.Meiji Electric Industries Co., Ltd.Meiko Electronics Co., Ltd.Meiko Network Japan Co., Ltd.Meisei Industrial Co., Ltd.Meitec Corp.Meito Sangyo Co., Ltd.Meiwa Corp.Menicon Co., Ltd.Metaps, Inc.METAWATER Co., Ltd.Michinoku Bank, Ltd. (The)Micronics Japan Co., Ltd.Mie Kotsu Group Holdings, Inc.Mikuni Corp.Milbon Co., Ltd.Mimaki Engineering Co., Ltd.Mimasu Semiconductor Industry Co., Ltd.Ministop Co., Ltd.Miraca Holdings, Inc.Miraial Co., Ltd.Mirait Holdings Corp.Miroku Jyoho Service Co., Ltd.Misawa Homes Co., Ltd.
800 14,0899,700 48,7891,200 73,806
# 800 34,191300 3,155
# 400 1,3911,400 27,0341,200 35,6483,300 23,428
600 9,479
VA International Small PortfolioCONTINUED
Shares Value»
JAPAN — (Continued)2,725 $ 38,4303,400 21,1573,800 28,060
800 26,3674,000 63,0905,500 70,3131,300 20,065
# 700 12,5516,500 47,5322,100 20,706
900 28,662#* 1,200 12,018
2,400 11,7202,500 37,3115,100 108,9814,600 70,9111,400 17,634
# 2,400 40,484# 2,600 22,394
5,000 34,5392,300 118,5351,200 15,2122,200 7,6391,600 58,841
#* 800 8,060900 30,119
2,400 37,2782,500 23,8565,900 30,6712,700 9,0912,100 102,4691,900 10,3032,619 43,5051,800 24,5835,300 119,8331,100 14,174
# 8,300 122,545# 2,200 68,760
2,000 19,525

Mitani Corp.Mitani Sekisan Co., Ltd.Mito Securities Co., Ltd.Mitsuba Corp.Mitsubishi Kakoki Kaisha, Ltd.Mitsubishi Logisnext Co., Ltd.Mitsubishi Paper Mills, Ltd.Mitsubishi Pencil Co., Ltd.Mitsubishi Research Institute, Inc.Mitsubishi Shokuhin Co., Ltd.Mitsubishi Steel Manufacturing Co., Ltd.Mitsuboshi Belting, Ltd.Mitsui E&S Holdings Co., Ltd.Mitsui High-Tec, Inc.Mitsui Matsushima Holdings Co., Ltd.Mitsui Mining & Smelting Co., Ltd.Mitsui Sugar Co., Ltd.Mitsui-Soko Holdings Co., Ltd.Mitsuuroko Group Holdings Co., Ltd.Mixi, Inc.
Miyaji Engineering Group, Inc.Miyazaki Bank, Ltd. (The)Mizuno Corp.Mochida Pharmaceutical Co., Ltd.Modec, Inc.Monex Group, Inc.Monogatari Corp. (The)MORESCO Corp.Morinaga Milk Industry Co., Ltd.Morita Holdings Corp.Morito Co., Ltd.Morozoff, Ltd.Mory Industries, Inc.MrMax Holdings, Ltd.MTI, Ltd.Mugen Estate Co., Ltd.Murakami Corp.Musashi Seimitsu Industry Co., Ltd.Musashino Bank, Ltd. (The)N Field Co., Ltd.Nachi-Fujikoshi Corp.Nafco Co., Ltd.Nagaileben Co., Ltd.Nagano Bank, Ltd. (The)Nagano Keiki Co., Ltd.Nagase & Co., Ltd.Nagatanien Holdings Co., Ltd.Nagawa Co., Ltd.Nakabayashi Co., Ltd.
1,200 59,3701,800 49,328
10,500 19,2225,000 29,7501,000 14,6532,300 23,5166,500 33,7881,700 26,2951,100 40,3031,900 47,7742,300 25,7073,500 64,168
* 10,000 87,632# 3,300 38,796
1,000 11,8936,400 147,0391,800 38,3993,600 51,0105,400 41,7944,500 85,023
VA International Small PortfolioCONTINUED
Shares Value»
JAPAN — (Continued)900 $ 14,519
2,000 48,1392,500 57,384
200 8,4012,300 61,044
# 18,400 54,632600 50,999
1,100 14,6703,700 143,5812,600 42,6832,600 19,352
# 300 13,533900 16,252
4,600 18,8754,500 32,503
# 1,600 8,301500 10,867
5,300 69,3503,100 59,8801,000 6,2871,700 71,5321,300 16,846
800 16,689600 9,415
2,100 14,9357,600 110,7271,000 19,033
400 18,4623,300 16,605

Nakamuraya Co., Ltd.Nakanishi, Inc.Nakayama Steel Works, Ltd.Namura Shipbuilding Co., Ltd.Nanto Bank, Ltd. (The)Natori Co., Ltd.NEC Capital Solutions, Ltd.NEC Networks & System Integration Corp.Neturen Co., Ltd.Nextage Co., Ltd.Nexyz Group Corp.NHK Spring Co., Ltd.Nichia Steel Works, Ltd.Nichias Corp.Nichiban Co., Ltd.Nichicon Corp.Nichiden Corp.Nichiha Corp.NichiiGakkan Co., Ltd.Nichi-iko Pharmaceutical Co., Ltd.Nichireki Co., Ltd.Nichirin Co., Ltd.Nihon Chouzai Co., Ltd.Nihon Dempa Kogyo Co., Ltd.Nihon Dengi Co., Ltd.Nihon Eslead Corp.Nihon Flush Co., Ltd.Nihon House Holdings Co., Ltd.Nihon Kagaku Sangyo Co., Ltd.Nihon Nohyaku Co., Ltd.
Nihon Parkerizing Co., Ltd.Nihon Plast Co., Ltd.Nihon Tokushu Toryo Co., Ltd.Nihon Yamamura Glass Co., Ltd.Nikkiso Co., Ltd.Nikko Co., Ltd.Nikkon Holdings Co., Ltd.Nippon Air Conditioning Services Co., Ltd.Nippon Beet Sugar Manufacturing Co., Ltd.Nippon Carbide Industries Co., Inc.Nippon Carbon Co., Ltd.Nippon Chemical Industrial Co., Ltd.Nippon Chemi-Con Corp.Nippon Coke & Engineering Co., Ltd.Nippon Commercial Development Co., Ltd.Nippon Concrete Industries Co., Ltd.Nippon Denko Co., Ltd.Nippon Densetsu Kogyo Co., Ltd.Nippon Fine Chemical Co., Ltd.
300 11,7445,000 91,2733,500 15,4187,996 21,0843,500 75,156
700 10,195900 16,331
2,700 69,8193,800 29,3032,900 32,770
# 1,200 22,1463,400 26,6624,000 12,2346,100 109,2551,500 26,0195,900 48,5541,800 31,5842,700 70,4255,700 90,1964,250 48,6993,900 39,0731,430 20,660
700 21,231* 600 2,648
600 15,5941,000 15,6801,600 42,8985,600 22,675
# 1,900 17,9416,100 25,745
VA International Small PortfolioCONTINUED
Shares Value»
JAPAN — (Continued)8,900 $ 99,1691,700 10,8241,400 16,772
800 10,2035,000 63,993
500 13,3856,100 142,5432,700 17,9181,200 22,0881,100 13,374
# 1,100 42,2071,300 25,1922,000 30,611
12,500 10,7551,600 22,2488,400 21,596
# 15,100 25,9363,700 70,8901,900 20,813

Nippon Flour Mills Co., Ltd.Nippon Gas Co., Ltd.Nippon Hume Corp.Nippon Kanzai Co., Ltd.Nippon Kinzoku Co., Ltd.Nippon Kodoshi Corp.Nippon Koei Co., Ltd.Nippon Koshuha Steel Co., Ltd.Nippon Light Metal Holdings Co., Ltd.Nippon Paper Industries Co., Ltd.Nippon Parking Development Co., Ltd., Class CNippon Pillar Packing Co., Ltd.Nippon Piston Ring Co., Ltd.Nippon Road Co., Ltd. (The)Nippon Seiki Co., Ltd.Nippon Seisen Co., Ltd.Nippon Sharyo, Ltd.Nippon Sheet Glass Co., Ltd.Nippon Signal Co., Ltd.Nippon Soda Co., Ltd.Nippon Steel Trading Corp.Nippon Systemware Co., Ltd.Nippon Thompson Co., Ltd.Nippon Yakin Kogyo Co., Ltd.Nipro Corp.Nishikawa Rubber Co., Ltd.Nishimatsu Construction Co., Ltd.Nishimatsuya Chain Co., Ltd.Nishimoto Co., Ltd.Nishi-Nippon Financial Holdings, Inc.Nishi-Nippon Railroad Co., Ltd.Nishio Rent All Co., Ltd.Nissan Shatai Co., Ltd.Nissei ASB Machine Co., Ltd.Nissei Corp.Nissei Plastic Industrial Co., Ltd.Nissha Co., Ltd.Nisshin Fudosan Co.Nisshin Oillio Group, Ltd. (The)Nisshinbo Holdings, Inc.
Nissin Corp.Nissin Electric Co., Ltd.Nissin Kogyo Co., Ltd.Nissin Sugar Co., Ltd.Nissui Pharmaceutical Co., Ltd.Nitta Corp.Nittan Valve Co., Ltd.Nittetsu Mining Co., Ltd.Nitto Boseki Co., Ltd.
5,200 82,0083,800 106,6603,300 21,1121,700 28,635
300 2,379400 5,419
1,700 37,2941,000 4,082
55,700 101,824800 14,105
23,500 36,5732,900 27,971
700 8,9141,000 55,6325,000 87,572
500 12,193#* 1,200 27,451
9,500 59,4097,000 77,6943,200 80,4851,548 62,1281,200 30,632
11,800 54,040# 16,600 31,744
10,700 118,6201,200 19,9416,000 113,368
# 7,800 62,885700 25,157
14,900 105,2535,700 120,2412,100 58,7077,700 64,3991,000 24,983
400 4,5511,400 13,4966,100 70,6985,400 23,1453,100 90,332
20,036 156,007
VA International Small PortfolioCONTINUED
Shares Value»
JAPAN — (Continued)2,200 $ 35,1606,100 70,0825,800 79,7012,100 38,0521,400 15,5542,300 63,4192,000 5,437
800 34,6673,200 71,919

Nitto Fuji Flour Milling Co., Ltd.Nitto Kogyo Corp.Nitto Kohki Co., Ltd.Nitto Seiko Co., Ltd.Nittoc Construction Co., Ltd.Noda Corp.Noevir Holdings Co., Ltd.Nohmi Bosai, Ltd.Nojima Corp.Nomura Co., Ltd.Noritake Co., Ltd.Noritsu Koki Co., Ltd.Noritz Corp.North Pacific Bank, Ltd.NS Tool Co., Ltd.NS United Kaiun Kaisha, Ltd.NSD Co., Ltd.NTN Corp.NuFlare Technology, Inc.OAK Capital Corp.Obara Group, Inc.Odelic Co., Ltd.Oenon Holdings, Inc.Ogaki Kyoritsu Bank, Ltd. (The)Ohara, Inc.Ohashi Technica, Inc.Ohsho Food Service Corp.Oiles Corp.Oisix ra daichi, Inc.Oita Bank, Ltd. (The)Okabe Co., Ltd.Okamoto Industries, Inc.Okamoto Machine Tool Works, Ltd.Okamura Corp.Okasan Securities Group, Inc.Oki Electric Industry Co., Ltd.Okinawa Cellular Telephone Co.Okinawa Electric Power Co., Inc. (The)OKK Corp.OKUMA Corp.Okumura Corp.Okura Industrial Co., Ltd.Okuwa Co., Ltd.Onoken Co., Ltd.Onward Holdings Co., Ltd.Ootoya Holdings Co., Ltd.Open Door, Inc.OPT Holding, Inc.Optex Group Co., Ltd.Organo Corp.
200 11,9083,700 70,4451,300 26,0366,200 32,4283,500 19,172
800 5,542800 41,758
2,800 57,0373,100 49,9136,400 86,6641,100 42,8522,700 47,1333,000 36,719
32,300 72,0131,000 18,5501,500 33,2543,730 114,890
41,100 114,053700 49,442
5,200 6,7041,000 34,613
600 22,0765,000 17,6254,700 101,093
# 700 9,2671,700 22,9481,200 73,7763,673 52,117
#* 1,900 25,1521,600 45,3374,000 30,7651,200 55,678
300 7,5527,300 71,164
17,000 60,7676,500 86,4561,100 36,7615,357 83,312
500 3,6592,000 103,9813,400 96,872
800 12,8334,000 39,5242,900 36,458
12,000 61,542500 10,078
* 900 22,627800 12,424
3,300 41,679800 28,327
VA International Small PortfolioCONTINUED
Shares Value»

Orient Corp.Origin Co., Ltd.Osaka Organic Chemical Industry, Ltd.Osaka Soda Co., Ltd.Osaka Steel Co., Ltd.OSAKA Titanium Technologies Co., Ltd.Osaki Electric Co., Ltd.OSG Corp.OSJB Holdings Corp.OUG Holdings, Inc.Outsourcing, Inc.Oyo Corp.Ozu Corp.Pacific Industrial Co., Ltd.Pacific Metals Co., Ltd.Pack Corp. (The)PAL GROUP Holdings Co., Ltd.Paramount Bed Holdings Co., Ltd.Parco Co., Ltd.Paris Miki Holdings, Inc.Pasona Group, Inc.PC Depot Corp.Pegasus Sewing Machine Manufacturing Co., Ltd.Penta-Ocean Construction Co., Ltd.Pepper Food Service Co., Ltd.Phil Co., Inc.PIA Corp.Pickles Corp.Pilot Corp.Piolax, Inc.Plenus Co., Ltd.Poletowin Pitcrew Holdings, Inc.Press Kogyo Co., Ltd.Pressance Corp.Prestige International, Inc.Prima Meat Packers, Ltd.Pronexus, Inc.Prospect Co., Ltd.Proto Corp.PS Mitsubishi Construction Co., Ltd.Punch Industry Co., Ltd.Qol Holdings Co., Ltd.Quick Co., Ltd.Raito Kogyo Co., Ltd.Raiznext Corp.Rakus Co., Ltd.Rasa Industries, Ltd.Raysum Co., Ltd.RECOMM Co., Ltd.Relia, Inc.Remixpoint, Inc.Renaissance, Inc.RENOVA, Inc.
JAPAN — (Continued)49,500 $ 57,928
600 7,9022,900 26,9322,000 48,7451,500 22,9853,300 53,7986,000 36,0465,900 117,107
18,400 41,559500 12,419
8,500 101,1812,700 27,320
# 600 9,5584,800 67,5612,700 51,1891,000 30,1981,400 43,6532,000 76,4913,300 36,1211,000 3,0861,500 22,8375,160 21,5612,600 13,054
29,400 142,372900 13,923
#* 200 6,258600 25,353
1,200 25,5972,000 75,5383,900 69,9292,200 36,1453,400 36,3099,000 40,673
# 3,600 50,1084,800 73,4953,000 56,1631,300 12,925
#* 44,000 8,8802,000 20,8103,600 20,7552,600 13,2612,600 39,078
700 10,4314,700 61,8556,500 69,1621,800 45,977
# 800 10,8441,900 18,0169,700 12,5964,800 56,703
#* 1,500 3,4351,600 23,697
#* 3,400 26,404
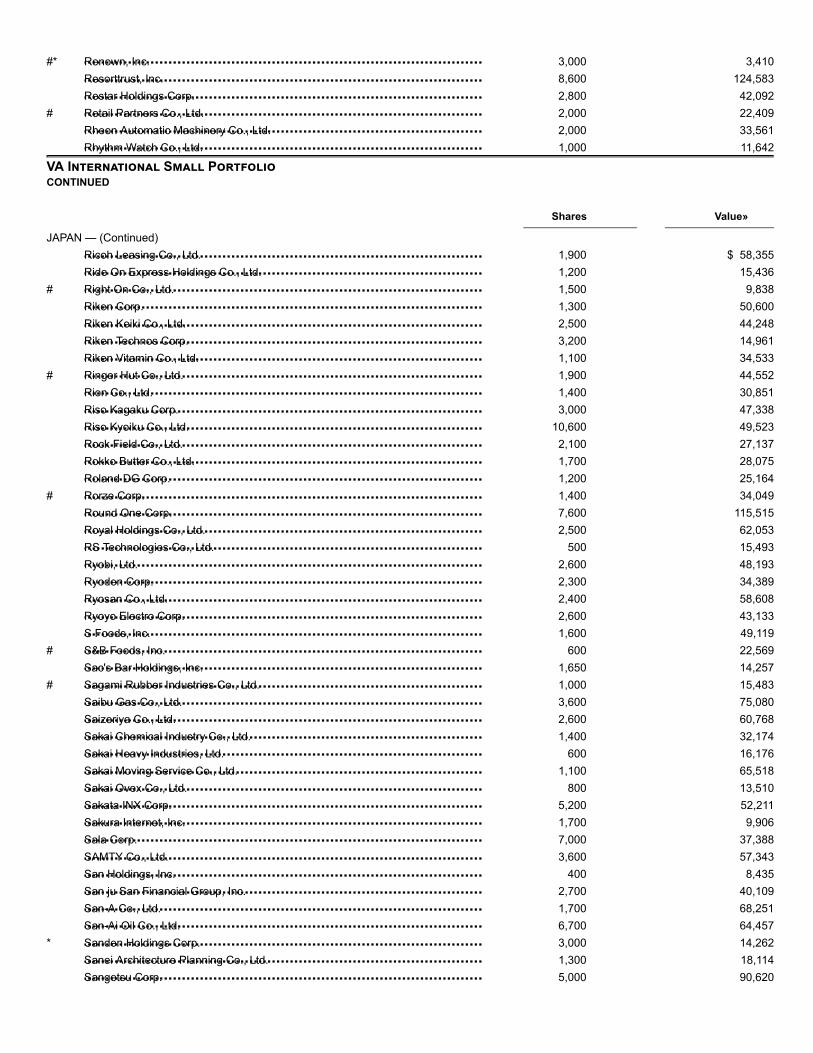
Renown, Inc.Resorttrust, Inc.Restar Holdings Corp.Retail Partners Co., Ltd.Rheon Automatic Machinery Co., Ltd.Rhythm Watch Co., Ltd.
Ricoh Leasing Co., Ltd.Ride On Express Holdings Co., Ltd.Right On Co., Ltd.Riken Corp.Riken Keiki Co., Ltd.Riken Technos Corp.Riken Vitamin Co., Ltd.Ringer Hut Co., Ltd.Rion Co., Ltd.Riso Kagaku Corp.Riso Kyoiku Co., Ltd.Rock Field Co., Ltd.Rokko Butter Co., Ltd.Roland DG Corp.Rorze Corp.Round One Corp.Royal Holdings Co., Ltd.RS Technologies Co., Ltd.Ryobi, Ltd.Ryoden Corp.Ryosan Co., Ltd.Ryoyo Electro Corp.S Foods, Inc.S&B Foods, Inc.Sac's Bar Holdings, Inc.Sagami Rubber Industries Co., Ltd.Saibu Gas Co., Ltd.Saizeriya Co., Ltd.Sakai Chemical Industry Co., Ltd.Sakai Heavy Industries, Ltd.Sakai Moving Service Co., Ltd.Sakai Ovex Co., Ltd.Sakata INX Corp.Sakura Internet, Inc.Sala Corp.SAMTY Co., Ltd.San Holdings, Inc.San ju San Financial Group, Inc.San-A Co., Ltd.San-Ai Oil Co., Ltd.Sanden Holdings Corp.Sanei Architecture Planning Co., Ltd.Sangetsu Corp.
#* 3,000 3,4108,600 124,5832,800 42,092
# 2,000 22,4092,000 33,5611,000 11,642
VA International Small PortfolioCONTINUED
Shares Value»
JAPAN — (Continued)1,900 $ 58,3551,200 15,436
# 1,500 9,8381,300 50,6002,500 44,2483,200 14,9611,100 34,533
# 1,900 44,5521,400 30,8513,000 47,338
10,600 49,5232,100 27,1371,700 28,0751,200 25,164
# 1,400 34,0497,600 115,5152,500 62,053
500 15,4932,600 48,1932,300 34,3892,400 58,6082,600 43,1331,600 49,119
# 600 22,5691,650 14,257
# 1,000 15,4833,600 75,0802,600 60,7681,400 32,174
600 16,1761,100 65,518
800 13,5105,200 52,2111,700 9,9067,000 37,3883,600 57,343
400 8,4352,700 40,1091,700 68,2516,700 64,457
* 3,000 14,2621,300 18,1145,000 90,620

San-In Godo Bank, Ltd. (The)Sanken Electric Co., Ltd.Sanki Engineering Co., Ltd.Sankyo Frontier Co., Ltd.Sankyo Seiko Co., Ltd.Sankyo Tateyama, Inc.Sanoh Industrial Co., Ltd.Sansei Technologies, Inc.Sansha Electric Manufacturing Co., Ltd.Sanshin Electronics Co., Ltd.Sanyo Chemical Industries, Ltd.Sanyo Denki Co., Ltd.Sanyo Electric Railway Co., Ltd.Sanyo Housing Nagoya Co., Ltd.Sanyo Shokai, Ltd.Sanyo Special Steel Co., Ltd.
Sanyo Trading Co., Ltd.Sapporo Holdings, Ltd.Sato Holdings Corp.Sato Shoji Corp.Satori Electric Co., Ltd.Sawada Holdings Co., Ltd.Saxa Holdings, Inc.SBS Holdings, Inc.Scala, Inc.SCREEN Holdings Co., Ltd.Scroll Corp.SEC Carbon, Ltd.Secom Joshinetsu Co., Ltd.Seed Co., Ltd.Seika Corp.Seikagaku Corp.Seikitokyu Kogyo Co., Ltd.Seiko Holdings Corp.Seiko PMC Corp.Seiren Co., Ltd.Sekisui Jushi Corp.Sekisui Plastics Co., Ltd.Senko Group Holdings Co., Ltd.Senshu Electric Co., Ltd.Senshu Ikeda Holdings, Inc.Senshukai Co., Ltd.Seria Co., Ltd.SFP Holdings Co., Ltd.Shibaura Electronics Co., Ltd.Shibaura Mechatronics Corp.Shibusawa Warehouse Co., Ltd. (The)Shibuya Corp.SHIFT, Inc.
16,400 99,0653,000 62,7095,000 56,320
600 18,5554,000 18,5222,800 31,416
# 3,000 14,002# 1,200 12,888# 800 5,548
2,000 33,5051,600 76,0401,000 43,2402,000 39,146
# 1,300 11,6322,500 35,2443,000 41,118
VA International Small PortfolioCONTINUED
Shares Value»
JAPAN — (Continued)1,300 $ 29,1246,400 144,3552,700 65,2141,300 10,535
# 2,600 21,0513,300 27,125
400 7,5691,500 22,121
# 1,600 13,734# 1,700 92,116
2,300 7,168# 200 17,948
945 30,5881,500 14,6201,000 12,5064,200 46,0715,600 34,3513,300 64,102
800 5,6085,800 79,8442,700 51,4303,500 24,476
11,100 86,964700 17,373
29,200 53,567* 3,000 8,807
2,800 65,4631,400 27,817
# 700 18,802400 11,345
1,200 20,0292,000 55,304
* 800 37,086
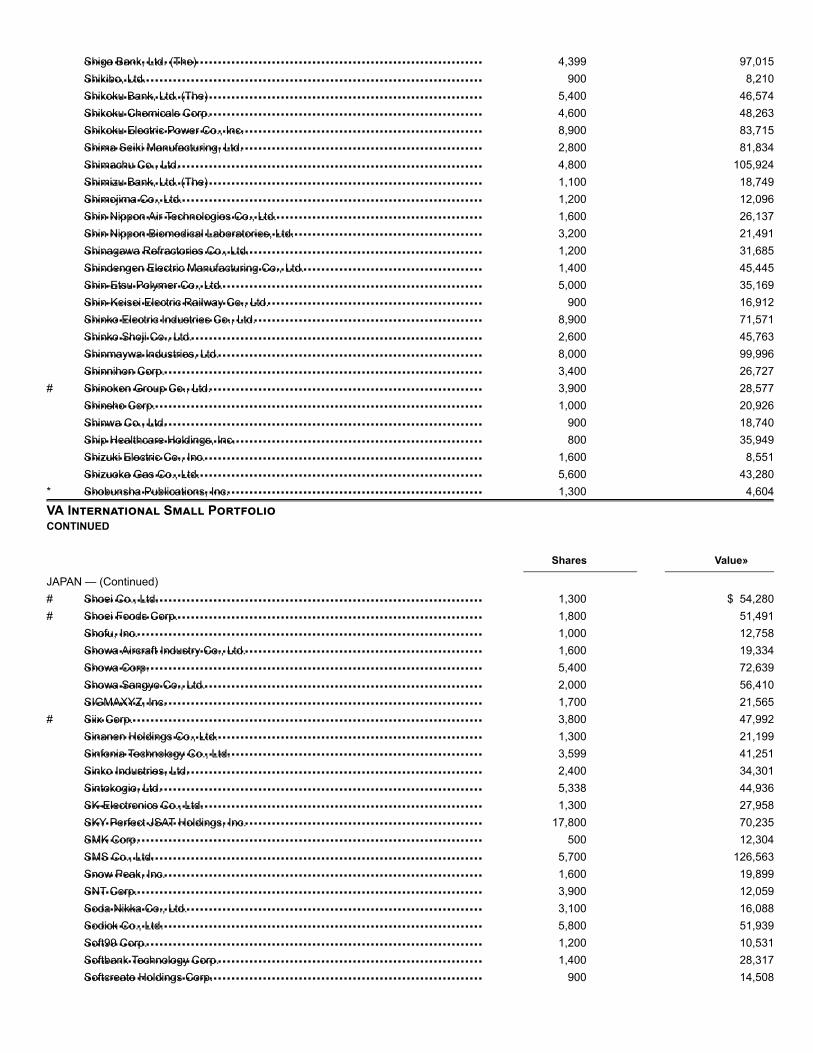
Shiga Bank, Ltd. (The)Shikibo, Ltd.Shikoku Bank, Ltd. (The)Shikoku Chemicals Corp.Shikoku Electric Power Co., Inc.Shima Seiki Manufacturing, Ltd.Shimachu Co., Ltd.Shimizu Bank, Ltd. (The)Shimojima Co., Ltd.Shin Nippon Air Technologies Co., Ltd.Shin Nippon Biomedical Laboratories, Ltd.Shinagawa Refractories Co., Ltd.Shindengen Electric Manufacturing Co., Ltd.Shin-Etsu Polymer Co., Ltd.Shin-Keisei Electric Railway Co., Ltd.Shinko Electric Industries Co., Ltd.Shinko Shoji Co., Ltd.Shinmaywa Industries, Ltd.Shinnihon Corp.Shinoken Group Co., Ltd.Shinsho Corp.Shinwa Co., Ltd.Ship Healthcare Holdings, Inc.Shizuki Electric Co., Inc.Shizuoka Gas Co., Ltd.Shobunsha Publications, Inc.
Shoei Co., Ltd.Shoei Foods Corp.Shofu, Inc.Showa Aircraft Industry Co., Ltd.Showa Corp.Showa Sangyo Co., Ltd.SIGMAXYZ, Inc.Siix Corp.Sinanen Holdings Co., Ltd.Sinfonia Technology Co., Ltd.Sinko Industries, Ltd.Sintokogio, Ltd.SK-Electronics Co., Ltd.SKY Perfect JSAT Holdings, Inc.SMK Corp.SMS Co., Ltd.Snow Peak, Inc.SNT Corp.Soda Nikka Co., Ltd.Sodick Co., Ltd.Soft99 Corp.Softbank Technology Corp.Softcreate Holdings Corp.
4,399 97,015900 8,210
5,400 46,5744,600 48,2638,900 83,7152,800 81,8344,800 105,9241,100 18,7491,200 12,0961,600 26,1373,200 21,4911,200 31,6851,400 45,4455,000 35,169
900 16,9128,900 71,5712,600 45,7638,000 99,9963,400 26,727
# 3,900 28,5771,000 20,926
900 18,740800 35,949
1,600 8,5515,600 43,280
* 1,300 4,604
VA International Small PortfolioCONTINUED
Shares Value»
JAPAN — (Continued)# 1,300 $ 54,280# 1,800 51,491
1,000 12,7581,600 19,3345,400 72,6392,000 56,4101,700 21,565
# 3,800 47,9921,300 21,1993,599 41,2512,400 34,3015,338 44,9361,300 27,958
17,800 70,235500 12,304
5,700 126,5631,600 19,8993,900 12,0593,100 16,0885,800 51,9391,200 10,5311,400 28,317
900 14,508

Software Service, Inc.Sogo Medical Holdings Co., Ltd.Soken Chemical & Engineering Co., Ltd.Solasto Corp.Soliton Systems K.K.Sourcenext Corp.Space Co., Ltd.Space Value Holdings Co., Ltd.Sparx Group Co., Ltd.SPK Corp.SRA HoldingsSRS Holdings Co., Ltd.ST Corp.St Marc Holdings Co., Ltd.Star Mica Holdings Co., Ltd.Star Micronics Co., Ltd.Starts Corp., Inc.Starzen Co., Ltd.Stella Chemifa Corp.Step Co., Ltd.Strike Co., Ltd.Studio Alice Co., Ltd.Sugimoto & Co., Ltd.Sumida Corp.Suminoe Textile Co., Ltd.Sumitomo Bakelite Co., Ltd.Sumitomo Densetsu Co., Ltd.Sumitomo Mitsui Construction Co., Ltd.Sumitomo Osaka Cement Co., Ltd.Sumitomo Precision Products Co., Ltd.Sumitomo Riko Co., Ltd.Sumitomo Seika Chemicals Co., Ltd.Sumitomo Warehouse Co., Ltd. (The)Sun Frontier Fudousan Co., Ltd.Suncall Corp.Sun-Wa Technos Corp.
Sushiro Global Holdings, Ltd.SWCC Showa Holdings Co., Ltd.Systena Corp.Syuppin Co., Ltd.T Hasegawa Co., Ltd.T RAD Co., Ltd.T&K Toka Co., Ltd.Tachibana Eletech Co., Ltd.Tachikawa Corp.Tachi-S Co., Ltd.Tadano, Ltd.Taihei Dengyo Kaisha, Ltd.Taiho Kogyo Co., Ltd.
# 400 38,2092,600 39,291
800 11,9175,000 54,561
# 1,500 15,145# 6,400 24,105
880 9,3642,500 11,596
# 11,800 24,460500 12,019
1,000 22,4192,500 23,368
700 10,8161,700 36,1001,800 29,7994,000 52,4862,700 63,8251,000 38,491
900 25,3101,500 20,992
600 14,5221,100 20,359
900 15,9582,200 23,216
# 900 24,2102,600 88,4452,200 39,000
14,392 76,5004,000 152,763
200 5,0435,000 38,8011,600 49,9806,500 83,7013,700 37,6201,500 6,9331,500 10,728
VA International Small PortfolioCONTINUED
Shares Value»
JAPAN — (Continued)1,200 $ 73,5983,700 29,4367,000 116,3271,800 12,2193,000 53,0441,100 18,7172,300 20,5082,500 38,7721,100 13,5334,300 55,1029,900 89,0142,600 53,7181,900 13,504

Taikisha, Ltd.Taiko Bank, Ltd. (The)Taisei Lamick Co., Ltd.Taiyo Holdings Co., Ltd.Takamatsu Construction Group Co., Ltd.Takamiya Co., Ltd.Takaoka Toko Co., Ltd.Takara Leben Co., Ltd.Takara Standard Co., Ltd.Takasago International Corp.Takasago Thermal Engineering Co., Ltd.Takashimaya Co., Ltd.Take And Give Needs Co., Ltd.TAKEBISHI Corp.Takeei Corp.Takeuchi Manufacturing Co., Ltd.Takihyo Co., Ltd.Takisawa Machine Tool Co., Ltd.Takuma Co., Ltd.Tama Home Co., Ltd.Tamron Co., Ltd.Tamura Corp.Tanseisha Co., Ltd.Tateru, Inc.Tatsuta Electric Wire and Cable Co., Ltd.Tayca Corp.Tazmo Co., Ltd.Tbk Co., Ltd.TDC Soft, Inc.TechMatrix Corp.Techno Smart Corp.TechnoPro Holdings, Inc.Tecnos Japan, Inc.Teikoku Electric Manufacturing Co., Ltd.Teikoku Sen-I Co., Ltd.Teikoku Tsushin Kogyo Co., Ltd.Tekken Corp.Tenma Corp.Terilogy Co., Ltd.T-Gaia Corp.TKC Corp.Toa Corp.Toa Corp.Toa Oil Co., Ltd.TOA ROAD Corp.Toagosei Co., Ltd.
Tobishima Corp.TOC Co., Ltd.Tocalo Co., Ltd.
2,300 68,599400 6,773800 21,286
1,500 46,0131,600 33,6121,700 12,3551,200 13,1609,300 32,4604,200 65,8372,100 57,6374,100 63,2973,200 36,7071,000 9,3131,400 18,4991,900 17,0743,200 49,492
200 3,4161,100 14,2885,500 65,2641,900 26,2942,000 44,751
11,000 61,9463,800 45,067
* 3,400 5,8345,200 22,9491,900 39,9621,100 8,8032,800 10,2521,600 12,8332,100 41,955
700 4,334600 33,882
1,400 7,9383,100 33,7231,200 21,949
800 8,5211,800 47,8272,000 34,132
#* 1,600 12,5062,100 42,4731,600 66,5112,600 28,4851,800 23,3791,200 20,680
300 9,27311,400 117,941
VA International Small PortfolioCONTINUED
Shares Value»
JAPAN — (Continued)3,420 $ 39,5546,100 38,7568,600 64,295

Tochigi Bank, Ltd. (The)Toda Corp.Toda Kogyo Corp.Toei Animation Co., Ltd.Toei Co., Ltd.Toenec Corp.Toho Bank, Ltd. (The)Toho Co., Ltd.Toho Holdings Co., Ltd.Toho Titanium Co., Ltd.Toho Zinc Co., Ltd.Tohoku Bank, Ltd. (The)Tohokushinsha Film Corp.Tokai Corp.TOKAI Holdings Corp.Tokai Rika Co., Ltd.Tokai Tokyo Financial Holdings, Inc.Token Corp.Tokushu Tokai Paper Co., Ltd.Tokuyama Corp.Tokyo Base Co., Ltd.Tokyo Dome Corp.Tokyo Electron Device, Ltd.Tokyo Energy & Systems, Inc.Tokyo Keiki, Inc.Tokyo Kiraboshi Financial Group, Inc.Tokyo Ohka Kogyo Co., Ltd.Tokyo Rakutenchi Co., Ltd.Tokyo Rope Manufacturing Co., Ltd.Tokyo Sangyo Co., Ltd.Tokyo Seimitsu Co., Ltd.Tokyo Steel Manufacturing Co., Ltd.Tokyo Tekko Co., Ltd.Tokyo Theatres Co., Inc.Tokyotokeiba Co., Ltd.Tokyu Construction Co., Ltd.Tokyu Recreation Co., Ltd.Toli Corp.Tomato Bank, Ltd.Tomoe Corp.Tomoe Engineering Co., Ltd.Tomoku Co., Ltd.TOMONY Holdings, Inc.Tomy Co., Ltd.Tonami Holdings Co., Ltd.Topcon Corp.Toppan Forms Co., Ltd.Topre Corp.Topy Industries, Ltd.Toridoll Holdings Corp.Torigoe Co., Ltd. (The)Torii Pharmaceutical Co., Ltd.Torikizoku Co., Ltd.Torishima Pump Manufacturing Co., Ltd.Tosei Corp.
19,000 31,0554,100 22,459
# 700 14,605700 29,282400 54,832
1,400 40,98821,500 51,599
900 16,2334,200 93,3943,900 30,3821,600 34,228
800 7,621300 1,618
1,800 35,4139,000 76,7825,900 96,644
24,000 72,820680 39,036919 31,583
5,200 119,694#* 2,400 16,326
8,300 76,3811,200 22,5594,100 35,2841,800 15,9043,924 52,4743,900 131,891
# 500 23,7771,200 10,0492,700 12,2784,000 112,167
10,500 79,759600 7,637600 7,482
1,400 39,9589,100 62,243
600 27,2966,000 14,012
900 8,5983,500 12,8671,000 21,9701,000 16,161
16,800 54,6159,217 117,719
800 41,6009,900 115,5857,500 65,3344,300 64,5051,800 38,3672,400 54,2552,500 18,6171,600 38,276
# 1,000 19,4952,000 18,4744,200 44,166

Toshiba Machine Co., Ltd.
Toshiba Plant Systems & Services Corp.Toshiba TEC Corp.Tosho Co., Ltd.Tosho Printing Co., Ltd.Totech Corp.Totetsu Kogyo Co., Ltd.Tottori Bank, Ltd. (The)Tow Co., Ltd.Towa Bank, Ltd. (The)Towa Corp.Towa Pharmaceutical Co., Ltd.Toyo Construction Co., Ltd.Toyo Corp.Toyo Denki Seizo K.K.Toyo Engineering Corp.Toyo Ink SC Holdings Co., Ltd.Toyo Kanetsu K.K.Toyo Machinery & Metal Co., Ltd.Toyo Securities Co., Ltd.Toyo Tanso Co., Ltd.Toyo Tire CorpToyobo Co., Ltd.TPR Co., Ltd.Trancom Co., Ltd.Transaction Co., Ltd.Tri Chemical Laboratories, Inc.Trusco Nakayama Corp.Trust Tech, Inc.TS Tech Co., Ltd.TSI Holdings Co., Ltd.Tsubaki Nakashima Co., Ltd.Tsubakimoto Chain Co.Tsubakimoto Kogyo Co., Ltd.Tsugami Corp.Tsukishima Kikai Co., Ltd.Tsukuba Bank, Ltd.Tsukui Corp.Tsurumi Manufacturing Co., Ltd.Tsutsumi Jewelry Co., Ltd.TV Asahi Holdings Corp.Tv Tokyo Holdings Corp.UACJ Corp.Uchida Yoko Co., Ltd.Ulvac, Inc.UMC Electronics Co., Ltd.Umenohana Co., Ltd.Uniden Holdings Corp.Union Tool Co.
3,200 70,391
VA International Small PortfolioCONTINUED
Shares Value»
JAPAN — (Continued)3,200 $ 53,5461,600 47,4301,400 34,795
* 2,500 32,687# 1,200 26,194
2,200 60,165600 7,917
1,500 10,7364,300 28,4912,500 19,6873,000 75,284
12,400 48,8073,000 29,0521,000 13,995
* 3,400 17,5033,800 83,0261,200 21,3842,600 13,846
12,000 13,5581,900 36,4855,700 74,4619,900 123,5413,300 57,150
700 40,336# 2,400 23,546
900 46,0434,100 84,2522,000 28,4482,200 60,5648,125 43,8423,900 67,2432,700 88,452
400 12,258# 5,000 40,218
3,000 35,4805,500 8,5255,200 23,9102,000 33,723
800 15,2303,300 54,1342,000 42,3354,503 73,632
800 24,8864,300 179,986
900 8,516* 600 14,069
1,000 17,338900 26,852

Unipres Corp.United Arrows, Ltd.United Super Markets Holdings, Inc.UNITED, Inc.Unitika, Ltd.Unizo Holdings Co., Ltd.Ushio, Inc.UT Group Co., Ltd.V Technology Co., Ltd.Valor Holdings Co., Ltd.Valqua, Ltd.
ValueCommerce Co., Ltd.Vector, Inc.VIA Holdings, Inc.Vision, Inc.Vital KSK Holdings, Inc.VT Holdings Co., Ltd.Wacoal Holdings Corp.Wacom Co., Ltd.Wakachiku Construction Co., Ltd.Wakita & Co., Ltd.Warabeya Nichiyo Holdings Co., Ltd.Watahan & Co., Ltd.WATAMI Co., Ltd.WDB Holdings Co., Ltd.Weathernews, Inc.West Holdings Corp.Will Group, Inc.WIN-Partners Co., Ltd.Wood One Co., Ltd.World Holdings Co., Ltd.Wowow, Inc.Xebio Holdings Co., Ltd.Yachiyo Industry Co., Ltd.Yahagi Construction Co., Ltd.Yakuodo Co., Ltd.YAMABIKO Corp.YAMADA Consulting Group Co., Ltd.Yamagata Bank, Ltd. (The)Yamaguchi Financial Group, Inc.Yamaha Motor Robotics Holdings Co., Ltd.Yamaichi Electronics Co., Ltd.YA-MAN, Ltd.Yamanashi Chuo Bank, Ltd. (The)Yamatane Corp.Yamato Corp.Yamato Kogyo Co., Ltd.Yamazen Corp.Yaoko Co., Ltd.
5,500 89,5442,200 63,0486,300 55,8751,200 15,451
* 10,400 39,545# 3,000 97,364
11,500 146,7212,300 50,468
# 1,200 56,4504,200 86,7022,400 47,824
VA International Small PortfolioCONTINUED
Shares Value»
JAPAN — (Continued)1,500 $ 25,970
* 3,300 28,413* 1,200 7,020* 800 38,213
4,800 46,52711,300 44,4144,400 106,738
16,400 57,7711,700 22,7434,500 45,0892,500 39,2891,000 20,995
# 3,300 46,230600 15,176700 20,063
# 2,200 23,4441,500 12,0823,100 34,214
600 5,4481,000 13,556
800 19,2814,700 52,0401,500 8,7094,200 27,064
# 1,000 21,9633,960 33,579
900 16,2823,600 52,5804,000 27,926
* 1,000 4,0103,100 33,501
# 2,800 22,5584,600 47,9001,000 12,7771,400 7,2453,200 82,7825,400 51,3031,200 54,947

Yashima Denki Co., Ltd.Yasuda Logistics Corp.Yasunaga Corp.Yellow Hat, Ltd.Yodogawa Steel Works, Ltd.Yokogawa Bridge Holdings Corp.Yokohama Reito Co., Ltd.Yokowo Co., Ltd.Yomeishu Seizo Co., Ltd.Yomiuri Land Co., Ltd.Yondenko Corp.Yondoshi Holdings, Inc.Yorozu Corp.Yotai Refractories Co., Ltd.Yuasa Trading Co., Ltd.Yume No Machi Souzou Iinkai Co., Ltd.Yumeshin Holdings Co., Ltd.Yurtec Corp.Yushiro Chemical Industry Co., Ltd.Zenitaka Corp. (The)Zenrin Co., Ltd.
ZIGExN Co., Ltd.Zojirushi Corp.Zuiko Corp.Zuken, Inc.
TOTAL JAPAN
Aalberts NVAccell Group NVAltice Europe NVAMG Advanced Metallurgical Group NVAmsterdam Commodities NVAPERAM SAArcadis NVArgenx SEASM International NVASR Nederland NVBasic-Fit NVBE Semiconductor Industries NVBeter Bed Holding NVBinckBank NVBoskalis WestminsterBrunel International NVCorbion NVFlow TradersForFarmers NVFugro NVGrandVision NVHeijmans NV
2,600 21,1842,000 16,330
900 11,7583,600 46,0182,400 45,6833,300 51,2986,700 62,8701,700 35,6991,000 17,949
500 22,119420 10,463
2,300 55,0913,300 43,3343,000 15,6932,000 56,369
# 1,600 23,989# 7,100 51,981
6,100 40,4771,000 12,348
400 16,4422,700 49,639
VA International Small PortfolioCONTINUED
Shares Value»
JAPAN — (Continued)5,200 $ 37,258
# 5,600 67,462700 21,433
2,000 34,268
53,715,270
NETHERLANDS — (2.6%)11,113 447,1433,013 71,903
#* 50,204 186,902# 2,744 78,558
2,318 48,9025,507 136,091
# 8,847 180,492* 703 98,912
5,440 443,7324,982 187,206
* 2,756 86,7929,082 268,788
#* 1,921 4,609* 10,730 75,219
8,885 200,6362,547 36,3145,996 195,989
# 3,614 95,7484,983 39,176
#* 9,528 77,7702,203 66,032
* 2,916 26,935

Hunter Douglas NVIMCD NVIntertrust NVKAS Bank NVKendrion NVKoninklijke BAM Groep NVKoninklijke Vopak NVLucas Bols NVNederland ApparatenfabriekOCI NVOrdina NVPostNL NVSBM Offshore NVSIF Holding NVSignify NVSligro Food Group NVTakeaway.com NVTKH Group NVTomTom NVVan Lanschot Kempen NVWessanen
TOTAL NETHERLANDS
Air New Zealand, Ltd.Arvida Group, Ltd.Briscoe Group, Ltd.Chorus, Ltd.Delegat Group, Ltd.
Freightways, Ltd.Genesis Energy, Ltd.Gentrack Group, Ltd.Hallenstein Glasson Holdings, Ltd.Heartland Group Holdings, Ltd.Infratil, Ltd.Investore Property, Ltd.Kathmandu Holdings, Ltd.Mainfreight, Ltd.Metlifecare, Ltd.New Zealand Refining Co., Ltd. (The)NZME, Ltd.NZX, Ltd.Oceania Healthcare, Ltd.PGG Wrightson, Ltd.Pushpay Holdings, Ltd.Restaurant Brands New Zealand, Ltd.Sanford, Ltd.Scales Corp., Ltd.Skellerup Holdings, Ltd.SKY Network Television, Ltd.
685 46,3615,477 482,5237,191 137,3651,902 26,3372,182 41,974
# 34,191 114,379# 8,202 404,400* 553 8,161
608 32,542* 4,871 127,046
14,344 29,349# 56,145 96,108
21,716 429,697# 540 7,541# 10,139 275,261
3,086 98,798* 3,310 296,098
4,150 246,2166,927 81,7921,388 28,3428,503 106,588
6,170,727
NEW ZEALAND — (0.7%)34,085 60,67915,354 13,793
9,711 21,86532,358 117,178
2,022 16,473
VA International Small PortfolioCONTINUED
Shares Value»
NEW ZEALAND — (Continued)10,246 $ 57,63932,503 73,088
# 4,745 16,4995,327 18,749
37,034 39,75359,825 182,37822,564 28,00719,090 26,610
4,689 129,24114,953 42,93822,065 31,208
# 14,069 4,978# 31,716 24,746
30,121 20,51310,577 3,824
* 11,016 24,118* 2,935 18,924
6,562 28,840# 8,503 25,388# 17,609 26,856
36,103 30,048

SKYCITY Entertainment Group, Ltd.Steel & Tube Holdings, Ltd.Summerset Group Holdings, Ltd.Synlait Milk, Ltd.Tourism Holdings, Ltd.TOWER, Ltd.Trustpower, Ltd.Vista Group International, Ltd.Warehouse Group, Ltd. (The)Z Energy, Ltd.
TOTAL NEW ZEALAND
ABG Sundal Collier Holding ASAAF Gruppen ASAAkastor ASAAker Solutions ASAAmerican Shipping Co. ASAArcher, Ltd.Atea ASAAustevoll Seafood ASAAvance Gas Holding, Ltd.Axactor SEB2Holding ASABonheur ASABorregaard ASABW LPG, Ltd.BW Offshore, Ltd.Data Respons ASADNO ASADOF ASAEuropris ASAFLEX LNG, Ltd.Frontline, Ltd.Funcom NVGrieg Seafood ASAHexagon Composites ASAHoegh LNG Holdings, Ltd.
Kongsberg Automotive ASAKvaerner ASAMagnora ASANEL ASANordic Nanovector ASANordic Semiconductor ASANorway Royal Salmon ASANorwegian Air Shuttle ASANorwegian Finans Holding ASANorwegian Property ASAOcean Yield ASAOdfjell Drilling, Ltd.
62,747 164,607# 31,557 19,451
14,504 53,672* 5,821 38,248
12,251 32,905* 13,924 6,817
4,827 24,02312,811 52,0525,475 8,159
29,327 124,730
1,608,997
NORWAY — (0.9%)48,103 19,346
3,415 65,032* 20,811 26,490* 16,214 51,863
5,693 22,324#* 15,426 8,103
7,139 90,8241,547 15,739
* 4,699 13,923* 19,390 40,745# 15,191 16,904
2,524 51,02212,564 131,584
* 11,386 52,092* 10,768 60,454
6,742 25,19074,076 123,898
#* 11,184 4,58621,503 61,698
* 3,636 45,128* 11,340 82,752#* 4,499 6,977
5,477 77,905* 13,175 50,834# 8,753 35,999
VA International Small PortfolioCONTINUED
Shares Value»
NORWAY — (Continued)* 47,061 $ 34,614
20,809 29,2461,337 1,044
#* 102,353 80,273#* 5,457 22,646#* 16,200 80,193
1,435 31,363* 4,848 21,648* 8,729 60,541
953 1,2705,542 32,772
* 9,723 28,825

Odfjell SE, Class AOlav Thon Eiendomsselskap ASAOtello Corp. ASAPanoro Energy ASAPGS ASAProsafe SEProtector Forsikring ASAREC Silicon ASASbanken ASAScatec Solar ASASelvaag Bolig ASASpectrum ASAStolt-Nielsen, Ltd.Treasure ASAVeidekke ASAWallenius Wilhelmsen ASAWilh Wilhelmsen Holding ASA, Class AXXL ASA
TOTAL NORWAY
Altri SGPS SABanco Comercial Portugues SA, Class RCTT-Correios de Portugal SAMota-Engil SGPS SANavigator Co. SA (The)NOS SGPS SAREN - Redes Energeticas Nacionais SGPS SASemapa-Sociedade de Investimento e GestaoSonae Capital SGPS SASonae SGPS SA
TOTAL PORTUGAL
Accordia Golf TrustAEM Holdings, Ltd.Ascendas India TrustBanyan Tree Holdings, Ltd.Best World International, Ltd.Boustead Projects, Ltd.Boustead Singapore, Ltd.Bukit Sembawang Estates, Ltd.Bund Center Investment, Ltd.China Aviation Oil Singapore Corp., Ltd.China Sunsine Chemical Holdings, Ltd.Chip Eng Seng Corp., Ltd.
Chuan Hup Holdings, Ltd.CITIC Envirotech, Ltd.COSCO Shipping International Singapore Co., Ltd.Creative Technology, Ltd.
* 1,000 2,917# 1,263 20,659* 22,618 41,457* 7,973 14,667* 33,331 47,255* 9,316 11,377#* 8,297 45,024#* 26,008 15,218
8,254 63,406# 10,093 103,958
5,226 27,4094,869 33,2322,682 30,7161,741 2,681
11,063 99,682# 7,933 24,182
1,434 23,157# 7,246 22,214
2,235,058
PORTUGAL — (0.4%)7,954 52,193
915,426 233,954# 16,912 36,029# 12,914 25,924
29,096 97,80635,021 217,46156,778 153,474
3,410 45,0469,999 7,829
105,019 97,938
967,654
SINGAPORE — (1.2%)65,600 25,29615,600 13,19580,400 82,410
7,000 2,45833,400 33,057
6,600 4,76040,300 22,55122,400 89,69427,000 11,18327,800 25,52521,900 17,85445,000 22,977
VA International Small PortfolioCONTINUED
Shares Value»
SINGAPORE — (Continued)87,000 $ 17,05893,100 21,905
* 175,500 39,801* 2,650 7,083

CSE Global, Ltd.Del Monte Pacific, Ltd.Delfi, Ltd.Ezion Holdings, Ltd.Ezra Holdings, Ltd.Far East Orchard, Ltd.First Resources, Ltd.Fragrance Group, Ltd.Fraser and Neave, Ltd.Frencken Group, Ltd.GK Goh Holdings, Ltd.GL, Ltd.Golden Agri-Resources, Ltd.GuocoLand, Ltd.Halcyon Agri Corp., Ltd.Haw Par Corp., Ltd.Health Management International, Ltd.Hi-P International, Ltd.Ho Bee Land, Ltd.Hong Fok Corp., Ltd.Hong Leong Asia, Ltd.Hong Leong Finance, Ltd.Hotel Grand Central, Ltd.Hour Glass, Ltd. (The)Hutchison Port Holdings TrustHwa Hong Corp., Ltd.Hyflux, Ltd.Indofood Agri Resources, Ltd.Japfa, Ltd.Keppel Infrastructure TrustMandarin Oriental International, Ltd.Metro Holdings, Ltd.Midas Holdings, Ltd.mm2 Asia, Ltd.NetLink NBN TrustOUE, Ltd.Oxley Holdings, Ltd.Perennial Real Estate Holdings, Ltd.Raffles Education Corp., Ltd.Raffles Medical Group, Ltd.RHT Health TrustRiverstone Holdings, Ltd.SATS, Ltd.SBS Transit, Ltd.Sembcorp Industries, Ltd.Sembcorp Marine, Ltd.Sheng Siong Group, Ltd.SIA Engineering Co., Ltd.SIIC Environment Holdings, Ltd.Sinarmas Land, Ltd.Singapore Post, Ltd.Singapore Press Holdings, Ltd.Stamford Land Corp., Ltd.StarHub, Ltd.Straits Trading Co., Ltd.
40,000 13,38072,000 7,85920,200 19,150
* 243,320 5,720#* 229,921 1,746
11,239 9,76648,700 55,16582,000 7,75724,800 30,46241,100 21,17517,813 10,97953,000 30,428
590,000 126,01828,200 40,763
* 25,666 8,84412,100 122,69325,100 13,14820,600 20,55614,000 23,98354,120 33,759
* 16,000 6,66926,300 52,93643,574 41,51127,500 16,915
459,200 100,39859,000 12,949
* 27,500 58328,000 5,98529,200 10,781
357,981 132,60522,400 35,49449,200 37,187
* 114,000 2,987* 48,000 8,011
83,700 52,66524,500 26,66776,057 18,17120,600 9,287
* 63,960 3,68965,762 49,14554,900 76430,400 19,90110,200 35,539
8,500 25,81338,400 64,972
* 77,600 75,54966,800 56,32524,700 47,52458,600 10,028
108,000 19,033129,400 90,611
# 111,400 178,12021,000 7,25845,300 49,634
7,100 11,814

Sunningdale Tech, Ltd.Swiber Holdings, Ltd.Tuan Sing Holdings, Ltd.UMS Holdings, Ltd.United Engineers, Ltd.United Industrial Corp., Ltd.UOB-Kay Hian Holdings, Ltd.Valuetronics Holdings, Ltd.Venture Corp., Ltd.Vicom, Ltd.Wing Tai Holdings, Ltd.Yeo Hiap Seng, Ltd.Yongnam Holdings, Ltd.
TOTAL SINGAPORE
Acciona SAAcerinox SAAlantra Partners SAAlmirall SAAmper SAApplus Services SAAtresmedia Corp. de Medios de Comunicacion SAAzkoyen SABolsas y Mercados Espanoles SHMSF SACellnex Telecom SACia de Distribucion Integral Logista Holdings SACIE Automotive SAConstrucciones y Auxiliar de Ferrocarriles SADuro Felguera SAEbro Foods SAeDreams ODIGEO SAElecnor SAEnagas SAEnce Energia y Celulosa SAErcros SAEuskaltel SAFaes Farma SAFluidra SAFomento de Construcciones y Contratas SAGlobal Dominion Access SAGrupo Catalana Occidente SAGrupo Empresarial San Jose SAGrupo Ezentis SAIberpapel Gestion SAIndra Sistemas SALaboratorios Farmaceuticos Rovi SALiberbank SAMasmovil Ibercom SAMediaset Espana Comunicacion SA
VA International Small PortfolioCONTINUED
Shares Value»
SINGAPORE — (Continued)15,000 $ 14,986
* 17,249 25645,795 11,43731,250 14,40734,000 64,53016,800 36,36035,091 30,82529,800 14,10124,400 272,290
2,200 11,50145,470 69,717
2,482 1,650* 26,250 3,374
2,903,112
SPAIN — (2.0%)3,199 340,626
16,658 139,1741,872 31,1765,535 100,325
* 88,071 24,08410,629 149,40910,142 39,517
2,184 17,1577,416 175,008
15,814 591,4173,876 80,7615,994 151,5602,580 116,576
* 5,142 1,3029,691 194,733
* 10,043 45,4374,118 51,6024,934 107,631
14,110 51,00810,095 19,424
9,796 85,56731,893 157,889
* 4,554 56,9676,144 78,221
* 11,493 55,2534,848 173,074
* 2,273 20,605#* 30,572 17,750
963 30,182* 10,276 88,009
1,642 37,745249,756 93,012
* 3,922 88,83215,385 90,318

Melia Hotels International SAMiquel y Costas & Miquel SAObrascon Huarte Lain SAParques Reunidos Servicios Centrales SAU, Class CPharma Mar SAPrim SAPromotora de Informaciones SA, Class AProsegur Cia de Seguridad SAQuabit Inmobiliaria SA
Realia Business SASacyr S.A.Solaria Energia y Medio Ambiente SATalgo SATecnicas Reunidas SATubacex SAUnicaja Banco SAVidrala SAViscofan SAVocento SAZardoya Otis SA
TOTAL SPAIN
AcadeMedia ABAddLife AB, Class BAddNode Group ABAddTech AB, Class BAF POYRY ABAlimak Group ABArjo AB, Class BAtrium Ljungberg AB, Class BAttendo ABAvanza Bank Holding ABBeijer Alma ABBeijer Electronics Group ABBeijer Ref ABBergman & Beving ABBetsson ABBilia AB, Class ABillerudKorsnas ABBioGaia AB, Class BBiotage ABBonava ABBonava AB, Class BBravida Holding ABBufab ABBulten ABBure Equity ABByggmax Group ABCatena AB
10,698 94,2482,523 43,598
#* 18,131 22,6181,848 28,248
* 20,076 34,696846 10,415
* 21,413 31,53824,644 115,017
* 9,552 9,989
VA International Small PortfolioCONTINUED
Shares Value»
SPAIN — (Continued)* 40,885 $ 42,431
57,025 146,315* 6,097 36,047* 8,642 46,460* 3,329 80,270
10,795 34,44015,735 12,392
2,048 185,5114,359 213,362
10,365 14,04616,103 110,388
4,813,380
SWEDEN — (3.3%)* 2,247 11,742
2,222 59,8714,034 64,5296,154 161,3498,473 199,6764,650 64,623
23,668 95,2634,164 76,956
10,224 46,47113,185 117,658
4,864 59,8163,083 14,0377,206 159,7304,110 40,462
15,720 82,98410,967 96,822
7,779 89,8082,077 86,3626,310 68,044
691 8,4099,951 119,132
20,665 171,6424,911 50,7601,365 9,1598,278 154,233
#* 8,034 27,5822,748 85,822

Clas Ohlson AB, Class BCloetta AB, Class BCollector ABConcentric ABCoor Service Management Holding ABCorem Property Group AB, Class BDios Fastigheter ABDometic Group ABDuni ABDustin Group ABEastnine ABElanders AB, Class BEltel ABEnea ABeWork Group ABFagerhult ABFastPartner ABFenix Outdoor International AG
Fingerprint Cards AB, Class BGranges ABGunnebo ABHaldex ABHeba Fastighets AB, Class BHembla ABHemfosa Fastigheter ABHIQ International ABHMS Networks ABHoist Finance ABHumana ABInternational Petroleum Corp.Inwido ABITAB Shop Concept AB, Class BJM ABKappAhl ABKindred Group P.L.C.Klovern AB, Class BKNOW IT ABKungsleden ABLagercrantz Group AB, Class BLindab International ABLoomis AB, Class BMedivir AB, Class BMekonomen ABModern Times Group MTG AB, Class BMomentum Group AB, Class BMycronic ABNederman Holding ABNetEnt ABNew Wave Group AB, Class B
4,505 40,55038,522 114,749
* 3,491 18,9515,416 66,7342,743 23,134
17,834 36,72812,748 109,34922,475 205,037
5,155 61,1297,661 66,1363,095 35,0991,738 14,978
#* 2,122 4,888* 2,398 40,787
1,140 8,7649,072 56,0984,631 41,190
523 55,796
VA International Small PortfolioCONTINUED
Shares Value»
SWEDEN — (Continued)#* 39,853 $ 71,740
10,797 107,5087,524 19,4514,760 23,7304,330 37,924
* 3,895 72,84917,268 155,436
6,152 32,4132,545 44,182
* 7,538 45,3563,640 20,525
* 9,696 41,5798,536 52,431
#* 1,515 4,4138,446 217,8758,594 17,427
23,558 144,56170,588 116,101
2,857 56,14223,412 203,610
8,330 104,02614,073 160,244
7,070 243,182#* 1,986 4,787* 5,111 37,822* 2,501 23,157
3,336 37,5967,486 115,0362,831 35,071
27,545 81,7226,935 46,310

Nobia ABNobina ABNolato AB, Class BNordic Entertainment Group AB, Class BNordic Waterproofing Holding A.S.NP3 Fastigheter ABNyfosa ABOEM International AB, Class BOpus Group ABPeab ABPlatzer Fastigheter Holding AB, Class BPricer AB, Class BProact IT Group ABQliro Group ABRatos AB, Class BRaySearch Laboratories ABRecipharm AB, Class BResurs Holding ABRottneros ABSagax AB, Class BSAS ABScandi Standard ABScandic Hotels Group ABSectra AB, Class BSintercast ABSkiStar ABSweco AB, Class BSystemair AB
Thule Group ABTroax Group ABVBG Group AB, Class BVitrolife ABWihlborgs Fastigheter AB
TOTAL SWEDEN
Allreal Holding AGALSO Holding AGams AGAPG SGA SAArbonia AGAryzta AGAscom Holding AGAutoneum Holding AGBanque Cantonale de GeneveBanque Cantonale VaudoiseBelimo Holding AGBell Food Group AGBellevue Group AGBerner Kantonalbank AG
16,346 106,00812,314 71,767
2,054 116,880608 14,535
2,253 19,3564,739 41,343
* 21,554 132,6131,480 36,795
18,472 11,70219,371 163,902
6,591 58,19216,074 21,181
775 13,632* 9,126 10,580
27,304 69,230* 2,968 42,469# 6,960 86,436
11,633 67,3378,130 8,6858,280 80,884
#* 47,741 65,1068,278 52,8629,661 81,0112,449 82,2261,032 15,3306,071 70,3883,413 95,1812,722 34,424
VA International Small PortfolioCONTINUED
Shares Value»
SWEDEN — (Continued)10,488 $ 229,091
4,497 42,6991,326 22,0416,097 117,331
16,126 234,451
7,912,913
SWITZERLAND — (4.7%)2,124 370,993
709 109,256#* 7,400 386,320
152 40,6746,387 74,088
* 77,285 64,2844,196 54,482
# 308 33,842255 51,027139 103,376
45 265,038220 58,807711 15,139559 126,946

BFW Liegenschaften AGBKW AGBobst Group SABossard Holding AG, Class ABucher Industries AGBurkhalter Holding AGCalida Holding AGCarlo Gavazzi Holding AGCembra Money Bank AGCham Group AGCicor Technologies, Ltd.Cie Financiere Tradition SAClariant AGColtene Holding AGConzzeta AGDaetwyler Holding AGDKSH Holding AGdormakaba Holding AGDottikon Es Holding AGDufry AGEFG International AGEmmi AGEnergiedienst Holding AGEvolva Holding SAFeintool International Holding AGFlughafen Zurich AGForbo Holding AGGAM Holding AGGeorg Fischer AGGurit Holding AGHelvetia Holding AGHiag Immobilien Holding AGHOCHDORF Holding AGHuber & Suhner AGHypothekarbank Lenzburg AGImplenia AGInficon Holding AG
Interroll Holding AGIntershop Holding AGInvestis Holding SAJungfraubahn Holding AGKardex AGKomax Holding AGKudelski SALastminute.com NVLEM Holding SALiechtensteinische Landesbank AGLuzerner Kantonalbank AGMCH Group AG
329 14,3582,007 129,918
# 950 47,502618 85,215725 216,632430 31,701895 24,874
62 17,1383,077 296,551
79 34,046259 13,059144 14,864
14,094 257,541358 30,265132 103,731726 111,906
1,480 74,737332 243,290
* 12 6,4081,233 108,136
# 11,761 76,210260 216,326
1,000 31,110#* 115,096 20,638
183 11,4711,549 282,873
130 202,775* 23,150 101,358
459 395,64463 68,967
3,458 440,281778 99,936
#* 130 9,8471,759 140,070
3 13,5901,837 49,205
226 140,979
VA International Small PortfolioCONTINUED
Shares Value»
SWITZERLAND — (Continued)80 $ 162,704
164 82,393526 35,742350 52,488792 113,971
# 474 88,867# 6,965 47,207* 995 30,068
50 69,1031,370 83,525
401 177,224* 129 2,876

Meier Tobler Group AGMetall Zug AGMobilezone Holding AGMobimo Holding AGNewron Pharmaceuticals SpAOC Oerlikon Corp. AGOrascom Development Holding AGOrior AGPanalpina Welttransport Holding AGPhoenix Mecano AGPlazza AG, Class APSP Swiss Property AGRieter Holding AGRomande Energie Holding SASchaffner Holding AGSchmolz + Bickenbach AGSchweiter Technologies AGSFS Group AGSiegfried Holding AGSt Galler Kantonalbank AGSulzer AGSunrise Communications Group AGSwiss Prime Site AGSwissquote Group Holding SATamedia AGThurgauer Kantonalbanku-blox Holding AGValiant Holding AGValora Holding AGVAT Group AGVaudoise Assurances Holding SAVetropack Holding AGVon Roll Holding AGVontobel Holding AGVP Bank AGVZ Holding AGWalliser KantonalbankWarteck Invest AGYpsomed Holding AGZehnder Group AGZug Estates Holding AG, Class BZuger Kantonalbank AG
TOTAL SWITZERLAND
4imprint Group P.L.C.888 Holdings P.L.C.
A.G. Barr P.L.C.AA P.L.C.Acacia Mining P.L.C.
#* 174 2,79426 56,412
4,503 41,561884 235,963
* 2,077 12,63123,783 254,555
* 1,611 24,200618 50,217
* 1,106 248,87971 31,280
231 58,3785,009 600,581
383 50,35438 47,61370 14,377
* 75,342 24,798122 120,554
1,636 125,575441 164,176312 133,547
2,117 213,3213,501 258,938
390 34,3371,186 48,020
438 48,130118 12,840
# 798 65,1271,754 179,803
456 125,6453,009 376,244
144 73,01626 53,159
* 1,435 1,5002,628 138,308
364 56,998266 73,248485 57,651
# 28 53,933468 59,614
1,401 52,79626 47,92415 92,795
11,285,384
UNITED KINGDOM — (15.9%)4,059 137,768
21,753 40,236
VA International Small PortfolioCONTINUED
Shares Value»
UNITED KINGDOM — (Continued)11,359 $ 94,95961,811 37,475
* 24,401 66,373

Aggreko P.L.C.Alliance Pharma P.L.C.Amerisur Resources P.L.C.Anglo Pacific Group P.L.C.Anglo-Eastern Plantations P.L.C.Arrow Global Group P.L.C.Ashmore Group P.L.C.ASOS P.L.C.AVEVA Group P.L.C.Avon Rubber P.L.C.B&M European Value Retail SABabcock International Group P.L.C.Balfour Beatty P.L.C.Bank of Georgia Group P.L.C.BBA Aviation P.L.C.BCA Marketplace P.L.C.Beazley P.L.C.Bellway P.L.C.Biffa P.L.C.Bloomsbury Publishing P.L.C.Bodycote P.L.C.Boohoo Group P.L.C.Bovis Homes Group P.L.C.Brewin Dolphin Holdings P.L.C.Britvic P.L.C.BTG P.L.C.Burford Capital, Ltd.Cairn Energy P.L.C.Capital & Counties Properties P.L.C.Card Factory P.L.C.CareTech Holdings P.L.C.Carr's Group P.L.C.Castings P.L.C.Centamin P.L.C.Central Asia Metals P.L.C.Charles Taylor P.L.C.Chemring Group P.L.C.Chesnara P.L.C.Cineworld Group P.L.C.Circassia Pharmaceuticals P.L.C.City of London Investment Group P.L.C.Clarkson P.L.C.Clipper Logistics P.L.C.Close Brothers Group P.L.C.CLS Holdings P.L.C.CMC Markets P.L.C.Cobham P.L.C.Computacenter P.L.C.Connect Group P.L.C.Consort Medical P.L.C.ConvaTec Group P.L.C.Costain Group P.L.C.Countryside Properties P.L.C.Countrywide P.L.C.Cranswick P.L.C.
26,874 271,12916,027 13,913
* 57,940 12,93421,303 52,569
1,293 7,17317,804 58,04537,560 243,967
* 230 7,223620 29,952
4,443 72,45680,882 363,04638,559 222,20685,249 212,670
4,639 78,766125,398 487,073
12,462 36,59852,651 367,71116,141 581,811
1,535 4,0907,374 20,647
23,492 209,606* 64,227 186,108
25,941 331,36956,636 219,43528,735 319,253
* 36,769 373,6443,837 69,874
* 71,823 137,85775,777 182,20236,595 73,519
7,585 34,3754,336 7,9164,744 23,772
133,441 208,2204,212 10,465
11,474 31,54140,809 90,96914,664 58,99262,719 194,694
* 12,752 3,0721,712 8,8854,914 153,1013,172 10,313
22,610 365,04119,418 53,91510,400 12,337
* 279,500 559,6597,732 143,420
19,192 8,8036,095 55,449
89,303 168,73210,708 20,42939,834 142,039
* 13,538 8178,712 281,972

Crest Nicholson Holdings P.L.C.
CVS Group P.L.C.CYBG P.L.C.Daejan Holdings P.L.C.Daily Mail & General Trust P.L.C., Class ADart Group P.L.C.De La Rue P.L.C.Devro P.L.C.DFS Furniture P.L.C.Dialight P.L.C.Dignity P.L.C.Diploma P.L.C.DiscoverIE Group P.L.C.Diversified Gas & Oil P.L.C.Dixons Carphone P.L.C.Domino's Pizza Group P.L.C.Drax Group P.L.C.Dunelm Group P.L.C.EI Group P.L.C.EKF Diagnostics Holdings P.L.C.Electrocomponents P.L.C.Elementis P.L.C.EMIS Group P.L.C.EnQuest P.L.C.Entertainment One, Ltd.Equiniti Group P.L.C.Essentra P.L.C.Euromoney Institutional Investor P.L.C.FDM Group Holdings P.L.C.Ferrexpo P.L.C.Fevertree Drinks P.L.C.Findel P.L.C.Firstgroup P.L.C.Forterra P.L.C.Foxtons Group P.L.C.Fuller Smith & Turner P.L.C., Class AFuture P.L.C.G4S P.L.C.Galliford Try P.L.C.Games Workshop Group P.L.C.Gamma Communications P.L.C.Gem Diamonds, Ltd.Genel Energy P.L.C.Genus P.L.C.Georgia Capital P.L.C.Global Ports Holding P.L.C.Go-Ahead Group P.L.C. (The)GoCo Group P.L.C.Gooch & Housego P.L.C.
27,257 121,209
VA International Small PortfolioCONTINUED
Shares Value»
UNITED KINGDOM — (Continued)2,091 $ 23,549
74,935 156,1491,099 74,110
15,598 149,8224,789 43,922
13,471 38,24227,112 67,71514,654 41,991
* 1,573 6,9125,679 37,292
18,909 348,5458,605 46,4568,773 11,324
90,246 130,78957,872 173,91348,358 177,192
9,198 103,086* 65,091 223,128* 28,411 11,946
71,675 528,114101,146 185,421
3,520 52,085* 139,312 39,271
36,132 192,96137,908 96,89031,057 161,02711,592 195,3917,070 70,778
32,548 100,7107,425 210,489
* 5,420 15,349* 218,529 304,170
6,878 23,433* 34,139 23,367
4,390 57,1241,569 21,597
172,346 400,00612,367 88,586
5,956 326,8781,279 16,901
* 14,716 12,28014,140 32,896
1,195 38,361* 3,318 39,531
952 4,3199,061 234,238
37,856 39,398327 5,299

Grafton Group P.L.C.Grainger P.L.C.Greencore Group P.L.C.Greene King P.L.C.Greggs P.L.C.Gulf Keystone Petroleum, Ltd.Gulf Marine Services P.L.C.GVC Holdings P.L.C.Gym Group P.L.C. (The)Halfords Group P.L.C.Hastings Group Holdings P.L.C.
Hays P.L.C.Headlam Group P.L.C.Helical P.L.C.Henry Boot P.L.C.Highland Gold Mining, Ltd.Hikma Pharmaceuticals P.L.C.Hill & Smith Holdings P.L.C.Hilton Food Group P.L.C.Hiscox, Ltd.Hochschild Mining P.L.C.Hollywood Bowl Group P.L.C.HomeServe P.L.C.Horizon Discovery Group P.L.C.Hostelworld Group P.L.C.Howden Joinery Group P.L.C.Hunting P.L.C.Huntsworth P.L.C.Hurricane Energy P.L.C.Ibstock P.L.C.IG Group Holdings P.L.C.IMI P.L.C.Inchcape P.L.C.Indivior P.L.C.Inmarsat P.L.C.Intermediate Capital Group P.L.C.International Personal Finance P.L.C.iomart Group P.L.C.IP Group P.L.C.ITE Group P.L.C.IWG P.L.C.J D Wetherspoon P.L.C.James Fisher & Sons P.L.C.James Halstead P.L.C.JD Sports Fashion P.L.C.John Laing Group P.L.C.John Menzies P.L.C.John Wood Group P.L.C.Johnson Service Group P.L.C.
28,271 248,79461,226 169,15881,784 212,82337,593 285,44512,305 333,49229,820 84,821
* 28,057 3,19916,397 117,46613,715 42,64023,225 53,92420,829 48,897
VA International Small PortfolioCONTINUED
Shares Value»
UNITED KINGDOM — (Continued)213,094 $397,968
13,204 71,14812,533 54,56513,323 39,71721,679 57,342
3,003 66,99514,461 198,594
5,673 64,23425,046 515,55928,868 72,39714,164 37,02230,314 419,435
* 8,929 16,4113,747 7,762
84,872 570,13829,847 183,92534,607 42,072
#* 61,503 32,45541,807 117,32938,741 269,28729,279 370,71950,511 382,663
* 64,365 42,56028,640 199,10731,925 537,81223,747 29,276
2,962 12,218* 51,478 42,947
137,447 121,90971,127 325,77914,749 275,006
6,723 178,1505,913 36,666
29,445 232,21516,811 78,55511,780 59,34953,018 341,634
8,968 18,880

JPJ Group P.L.C.Jupiter Fund Management P.L.C.Just Group P.L.C.Kainos Group P.L.C.KAZ Minerals P.L.C.KCOM Group P.L.C.Keller Group P.L.C.Kier Group P.L.C.Kin & Carta P.L.C.Lamprell P.L.C.Lancashire Holdings, Ltd.Liontrust Asset Management P.L.C.Lookers P.L.C.Low & Bonar P.L.C.LSL Property Services P.L.C.M&C Saatchi P.L.C.Macfarlane Group P.L.C.Majestic Wine P.L.C.Man Group P.L.C.Marshalls P.L.C.Marston's P.L.C.
McBride P.L.C.McCarthy & Stone P.L.C.McColl's Retail Group P.L.C.Mears Group P.L.C.Mediclinic International P.L.C.Meggitt P.L.C.Merlin Entertainments P.L.C.Metro Bank P.L.C.Midwich Group P.L.C.Millennium & Copthorne Hotels P.L.C.Mitchells & Butlers P.L.C.Mitie Group P.L.C.MJ Gleeson P.L.C.Moneysupermarket.com Group P.L.C.Morgan Advanced Materials P.L.C.Morgan Sindall Group P.L.C.Morses Club P.L.C.Mothercare P.L.C.Motorpoint group P.L.C.MP Evans Group P.L.C.N Brown Group P.L.C.National Express Group P.L.C.NCC Group P.L.C.Next Fifteen Communications Group P.L.C.Non-Standard Finance P.L.C.Norcros P.L.C.Northgate P.L.C.Nostrum Oil & Gas P.L.C.
* 7,493 62,64040,646 183,926
* 54,377 31,0886,118 41,695
20,078 138,98271,342 104,23212,297 98,160
# 31,248 23,31823,381 29,514
* 23,029 15,37724,613 206,521
3,244 31,56640,298 20,49581,230 7,39811,392 28,1363,423 14,1086,000 6,9553,918 12,132
176,060 363,38523,707 182,96082,294 106,804
VA International Small PortfolioCONTINUED
Shares Value»
UNITED KINGDOM — (Continued)30,429 $ 23,91130,784 52,100
626 51719,018 63,402
8,379 34,93851,514 371,74373,419 401,627
* 1,363 5,9361,611 10,551
21,788 180,350* 30,648 113,012
57,884 115,6264,098 41,808
59,239 265,18349,456 152,373
6,967 95,0704,600 7,265
* 27,456 5,5237,418 19,346
799 6,64029,795 43,41170,707 360,17031,420 70,665
1,654 12,07927,059 12,451
7,961 20,20717,729 71,250
* 1,582 844

Numis Corp. P.L.C.On the Beach Group P.L.C.OneSavings Bank P.L.C.Oxford Instruments P.L.C.Pagegroup P.L.C.Pan African Resources P.L.C.Paragon Banking Group P.L.C.Park Group P.L.C.PayPoint P.L.C.Pendragon P.L.C.Pennon Group P.L.C.Petra Diamonds, Ltd.Petrofac, Ltd.Petropavlovsk P.L.C.Pets at Home Group P.L.C.Phoenix Group Holdings P.L.C.Photo-Me International P.L.C.Playtech P.L.C.Polar Capital Holdings P.L.C.Polypipe Group P.L.C.Porvair P.L.C.Premier Asset Management Group P.L.C.Premier Foods P.L.C.Premier Oil P.L.C.Provident Financial P.L.C.PureTech Health P.L.C.PZ Cussons P.L.C.QinetiQ Group P.L.C.Quilter P.L.C.Rank Group P.L.C.Rathbone Brothers P.L.C.
Raven Property Group, Ltd.Reach P.L.C.Redde P.L.C.Redrow P.L.C.Renew Holdings P.L.C.Renewi P.L.C.Renishaw P.L.C.Renold P.L.C.Restaurant Group P.L.C. (The)Rhi Magnesita NVRhi Magnesita NVRicardo P.L.C.Rightmove P.L.C.RM P.L.C.Robert Walters P.L.C.Rockhopper Exploration P.L.C.Rotork P.L.C.Royal Mail P.L.C.
6,616 19,1448,810 50,591
20,492 90,3266,836 107,431
33,456 182,027* 263,769 35,893
33,085 168,01113,054 9,933
7,784 89,144178,766 27,715
51,927 452,598* 139,574 18,942
23,955 121,585* 432,055 52,171
63,261 159,88023,251 195,57340,883 49,50730,014 161,119
2,356 16,37224,923 123,821
3,538 25,2203,000 6,518
* 101,428 41,575* 87,623 89,182
11,031 58,106* 15,992 52,864
28,826 76,66663,787 224,004
172,293 301,74217,299 31,942
6,710 179,791
VA International Small PortfolioCONTINUED
Shares Value»
UNITED KINGDOM — (Continued)* 27,995 $ 13,359
48,158 49,6849,745 13,510
38,559 262,3924,833 23,573
163,917 57,9945,698 265,264
* 15,469 4,68665,806 121,675
# 1,651 91,5371,335 72,292
10,119 86,43428,555 182,633
8,839 25,4979,655 62,535
* 27,308 6,85597,235 363,067
6,784 17,325

RPS Group P.L.C.S&U P.L.C.Saga P.L.C.San Leon Energy P.L.C.Savannah Petroleum P.L.C.Savills P.L.C.Scapa Group P.L.C.SDL P.L.C.Senior P.L.C.Serica Energy P.L.C.Severfield P.L.C.SIG P.L.C.Sirius Minerals P.L.C.Smart Metering Systems P.L.C.Soco International P.L.C.Softcat P.L.C.Sophos Group P.L.C.Spectris P.L.C.Speedy Hire P.L.C.Spire Healthcare Group P.L.C.Spirent Communications P.L.C.Sportech P.L.C.Sports Direct International P.L.C.SSP Group P.L.C.St. Modwen Properties P.L.C.Stagecoach Group P.L.C.SThree P.L.C.Stobart Group, Ltd.Stock Spirits Group P.L.C.Strix Group P.L.C.STV Group P.L.C.Superdry P.L.C.Synthomer P.L.C.T Clarke P.L.C.TalkTalk Telecom Group P.L.C.Tarsus Group P.L.C.Tate & Lyle P.L.C.Ted Baker P.L.C.Telecom Plus P.L.C.Telit Communications P.L.C.Thomas Cook Group P.L.C.
Topps Tiles P.L.C.TP ICAP P.L.C.Travis Perkins P.L.C.Trifast P.L.C.TT Electronics P.L.C.Tullow Oil P.L.C.Tyman P.L.C.U & I Group P.L.C.
39,439 60,090354 9,905
103,064 55,751* 13,775 6,199* 69,764 11,710
16,461 189,99514,247 34,03912,706 73,22681,040 197,328
* 6,546 8,75328,520 23,188
110,955 177,372* 44,278 8,040
2,574 15,76920,801 15,56610,872 126,216
2,149 11,34516,230 499,93340,705 25,741
9,430 12,95386,637 166,644
* 13,686 5,611* 21,667 59,675
45,363 388,02433,188 168,65635,849 56,99213,227 45,38037,553 52,35324,762 68,90411,774 24,8342,950 13,2334,673 24,475
54,123 199,1913,989 5,705
65,683 83,9407,474 38,441
97,587 893,7575,303 58,8808,996 145,501
* 10,362 20,548#* 133,576 8,981
VA International Small PortfolioCONTINUED
Shares Value»
UNITED KINGDOM — (Continued)21,096 $ 17,67465,033 247,66330,403 503,32613,605 32,05518,437 49,239
184,059 431,4445,033 13,328
21,649 37,608

UDG Healthcare P.L.C.Ultra Electronics Holdings P.L.C.Urban & Civic P.L.C.Vectura Group P.L.C.Vertu Motors P.L.C.Vesuvius P.L.C.Victrex P.L.C.Vitec Group P.L.C. (The)Volex P.L.C.Volution Group P.L.C.Vp P.L.C.Watkin Jones P.L.C.Weir Group P.L.C (The)WH Smith P.L.C.William Hill P.L.C.Wilmington P.L.C.Wincanton P.L.C.Wizz Air Holdings P.L.C.Xaar P.L.C.XP Power, Ltd.
TOTAL UNITED KINGDOM
TOTAL COMMON STOCKS
Biotest AGDraegerwerk AG & Co. KGaAFuchs Petrolub SEJungheinrich AGSixt SESTO SE & Co. KGaAVilleroy & Boch AG
TOTAL GERMANY
Intercell AG Rights 05/16/13
Pan American Silver Corp. Rights 02/22/29Tervita Corp. Warrants 07/19/20
TOTAL CANADA
Tourism Holdings, Ltd Rights 07/16/19
Ezion Holdings, Ltd. Warrants 04/16/23
TOTAL RIGHTS/WARRANTS
TOTAL INVESTMENT SECURITIES
20,860 201,96811,545 273,7384,334 16,132
* 79,556 77,17637,928 16,72226,623 162,23813,540 334,817
4,188 57,636#* 1,534 1,720
11,784 25,9443,850 36,5586,122 15,865
122 2,20612,939 332,78796,812 179,009
6,879 16,38815,401 44,055
* 622 26,62310,372 11,178
1,056 26,110
38,388,352
228,369,580
PREFERRED STOCKS — (0.2%)GERMANY — (0.2%)
2,447 59,3981,057 57,3573,626 138,9445,624 125,0661,905 126,352
272 27,8551,074 15,889
550,861
RIGHTS/WARRANTS — (0.0%)AUSTRIA — (0.0%)* 2,073 0
CANADA — (0.0%)* 19,894 4,517* 156 1
4,518
NEW ZEALAND — (0.0%)1,361 0
VA International Small PortfolioCONTINUED
Shares Value»
SINGAPORE — (0.0%)* 61,932 $ 0
4,518
228,924,959

DFA Short Term Investment Fund
(Cost $247,372,416)^^
AustraliaAustriaBelgiumCanadaChinaDenmarkFinlandFranceGermanyHong KongIrelandIsraelItalyJapanNetherlandsNew ZealandNorwayPortugalSingaporeSpainSwedenSwitzerlandUnited Kingdom
Germany
CanadaSecurities Lending Collateral
TOTAL
Value†
SECURITIES LENDING COLLATERAL — (5.2%)@§ 1,083,732 12,539,868
TOTAL INVESTMENTS — (100.0%)$241,464,827
Summary of the Portfolio's investments as of July 31, 2019, based on their valuation inputs, is as follows (see Security Valuation Note):
Investments in Securities (Market Value)
Level 1 Level 2 Level 3 Total
Common Stocks— $ 15,870,740 — $ 15,870,740— 2,846,457 — 2,846,457
$ 187,381 4,153,700 — 4,341,08121,556,986 80 — 21,557,066
— 16,952 — 16,952— 4,186,416 — 4,186,416
102,446 5,000,634 — 5,103,080— 10,662,588 — 10,662,588— 15,100,291 — 15,100,291— 6,245,192 — 6,245,192— 489,427 — 489,427— 2,842,672 — 2,842,672— 9,106,771 — 9,106,771
39,958 53,675,312 — 53,715,27098,912 6,071,815 — 6,170,727
— 1,608,997 — 1,608,997— 2,235,058 — 2,235,058— 967,654 — 967,654— 2,903,112 — 2,903,112— 4,813,380 — 4,813,380
41,579 7,871,334 — 7,912,913248,879 11,036,505 — 11,285,384
— 38,388,352 — 38,388,352Preferred Stocks
— 550,861 — 550,861Rights/Warrants
— 4,518 — 4,518— 12,539,868 — 12,539,868
$22,276,141 $219,188,686 — $241,464,827
VA SHORT-TERM FIXED PORTFOLIO
SCHEDULE OF INVESTMENTS
July 31, 2019
(Unaudited)
FaceAmount Value†
(000)
AGENCY OBLIGATIONS — (5.8%)
FaceAmount Value†
(000)

VA Short-Term Fixed PortfolioCONTINUED
2.377%, 04/16/21
0.000%, 08/01/190.000%, 08/14/190.000%, 08/28/19
TOTAL AGENCYOBLIGATIONS
1.125%, 09/20/191.875%, 03/16/20
1.375%, 08/02/191.625%, 01/21/201.875%, 09/14/20
2.600%, 09/23/192.600%, 09/23/19
1.500%, 09/12/191.800%, 11/13/192.605%, 05/11/20
2.812%, 02/07/20
2.050%, 09/23/192.250%, 12/19/19
3.100%, 07/13/20
2.850%, 06/15/20
2.763%, 04/13/21
2.350%, 10/21/20
2.593%, 01/08/21
Federal Farm CreditBanks, Floating RateNote, 1M USD LIBOR +0.045%, FRN
(r) 5,000 $ 4,997,126Federal Home Loan Bank
8,000 8,000,0002,000 1,998,4833,600 3,594,330
18,589,939
BONDS — (59.1%)African DevelopmentBank
500 499,2402,950 2,943,780
Agence Francaise deDeveloppement
400 400,0001,110 1,106,6321,000 997,194
ANZ New ZealandInternational Ltd.
Ω 1,000 1,000,350900 900,315
Apple, Inc.400 399,658
2,291 2,287,949#(r) 800 800,195Apple, Inc., 3M USD
LIBOR + 0.250%, FRN(r) 500 500,518Australia & New Zealand
Banking Group, Ltd.250 249,905
Ω 2,200 2,198,616Bank of Montreal
750 756,197Bank of Montreal, 3M
USD LIBOR + 0.440%,FRN
(r) 3,710 3,722,221Bank of Montreal, 3M
USD LIBOR + 0.460%,FRN
(r) 204 204,797Bank of Nova Scotia(The)
2,900 2,905,125Bank of Nova Scotia
(The), 3M USD LIBOR+ 0.290%, FRN
(r) 1,000 1,001,307
3.099%, 12/05/19
2.658%, 01/10/20
2.778%, 08/15/19
1.750%, 10/30/191.625%, 11/25/192.500%, 02/28/202.500%, 02/28/201.750%, 03/24/20
2.403%, 07/14/20
1.750%, 09/24/191.750%, 09/24/191.875%, 01/13/202.000%, 04/17/201.875%, 07/28/20
2.994%, 09/06/19
2.599%, 10/05/20
2.581%, 02/02/21
1.991%, 03/03/202.730%, 03/03/20
2.928%, 11/15/19
1.400%, 09/20/194.450%, 01/15/20
2.300%, 09/06/19
Bank of Nova Scotia (The),3M USD LIBOR +0.620%, FRN
(r) 1,000 $1,001,967Berkshire Hathaway
Finance Corp.#(r) 1,900 1,902,643Berkshire Hathaway
Finance Corp., FloatingRate Note, 3M USDLIBOR + 0.260%, FRN
(r) 1,500 1,500,227BNG Bank NV
2,400 2,396,621300 299,373
Ω 500 500,6961,000 1,001,392
790 787,671BNG Bank NV, 3M USD
LIBOR + 0.100%, FRN(r)Ω 1,000 1,000,574Caisse d'Amortissement de
la Dette SocialeΩ 300 299,753
410 409,6631,000 998,3501,500 1,498,3921,800 1,794,207
Canadian Imperial Bank ofCommerce
(r) 1,000 1,000,797Canadian Imperial Bank of
Commerce, 3M USDLIBOR + 0.310%, FRN
(r) 890 892,415Canadian Imperial Bank of
Commerce, 3M USDLIBOR + 0.315%, FRN
(r) 3,990 3,994,329Chevron Corp.
750 749,178(r) 500 500,602Chevron Corp., Floating
Rate Note, 3M USDLIBOR + 0.410%, FRN
#(r) 900 901,032Cisco Systems, Inc.
861 859,967448 452,455
Commonwealth Bank ofAustralia
517 516,964

3.025%, 09/06/19
3.205%, 11/07/19
1.375%, 08/09/192.250%, 01/14/204.750%, 01/15/20
3.072%, 08/09/19
1.625%, 03/10/20
1.250%, 09/20/19
2.352%, 10/16/20
1.875%, 01/29/20
2.250%, 11/08/192.900%, 11/08/20
1.375%, 10/30/192.500%, 03/13/20
1.750%, 05/29/20
1.750%, 11/26/19
1.125%, 08/15/191.250%, 12/16/191.750%, 05/15/202.453%, 03/24/21
1.750%, 08/19/19
FaceAmount Value†
(000)
Commonwealth Bank ofAustralia, Floating RateNote, 3M USD LIBOR +0.550%, FRN
(r) 336 $ 336,223Commonwealth Bank of
Australia, Floating RateNote, 3M USD LIBOR +0.640%, FRN
(r) 181 181,265Cooperatieve RabobankUA# 250 249,950
300 299,911200 202,188
Cooperatieve RabobankUA, Floating Rate Note,3M USD LIBOR +0.510%, FRN
(r) 2,388 2,388,329Council Of Europe
Development Bank2,806 2,795,432
CPPIB Capital, Inc.Ω 500 499,246CPPIB Capital, Inc.,
Floating Rate Note, 3MUSD LIBOR + 0.030%,FRN
(r)Ω 2,000 2,000,012Dexia Credit Local SA
1,000 997,587Equinor ASA
1,371 1,369,559# 2,000 2,016,381Erste Abwicklungsanstalt
400 398,978400 400,598
EUROFIMA396 394,519
European Bank forReconstruction &Development
886 884,450European Investment Bank
2,000 1,999,0921,000 996,390
500 498,420(r)Ω 1,000 1,001,949Export DevelopmentCanada# 1,700 1,698,861
1.625%, 05/12/20
2.523%, 10/15/20
0.875%, 08/15/191.875%, 10/07/191.875%, 04/21/20
1.500%, 10/22/191.625%, 01/15/202.500%, 04/17/202.500%, 04/17/20
2.476%, 03/12/21
2.740%, 06/16/20
2.476%, 03/12/21
2.740%, 06/16/20
1.125%, 08/23/191.625%, 06/12/20
1.125%, 09/17/192.000%, 11/12/191.750%, 03/19/202.500%, 06/01/20
4.000%, 01/27/201.750%, 03/31/201.500%, 04/20/20
FaceAmount Value†
(000)
Inter-AmericanDevelopment Bank
641 $ 638,441Inter-American
Development Bank, 3MUSD LIBOR + 0.220%,FRN
(r) 800 801,896International Bank for
Reconstruction &Development
500 499,7241,000 999,0851,200 1,197,381
Kommunalbanken A.S.1,034 1,032,3021,200 1,196,532
#Ω 300 300,5841,300 1,302,279
Kommunalbanken A.S., 3MUSD LIBOR + 0.040%,FRN
(r)Ω 1,000 999,898Kommunalbanken A.S., 3M
USD LIBOR + 0.330%,FRN
(r)Ω 1,000 1,002,708Kommunalbanken A.S.,
Floating Rate Note, 3MUSD LIBOR + 0.040%,FRN
(r) 850 849,913Kommunalbanken A.S.,
Floating Rate Note, 3MUSD LIBOR + 0.330%,FRN
(r) 1,000 1,002,708Kommunekredit
3,900 3,897,1452,800 2,786,791
Kommuninvest I SverigeAB
800 798,798700 699,512
1,850 1,844,816500 501,275
Kreditanstalt fuerWiederaufbau
200 201,743300 299,027
2,200 2,189,327

VA Short-Term Fixed PortfolioCONTINUED
2.300%, 02/10/20
1.000%, 08/16/191.750%, 01/24/202.250%, 02/03/201.750%, 05/15/20
Ω 1,820 1,820,601FMS Wertmanagement
1,000 999,4401,000 997,8581,000 1,000,0901,200 1,196,892
1.875%, 01/22/20
1.500%, 03/23/20
LandwirtschaftlicheRentenbank
1,000 998,348Municipality Finance P.L.C.
468 465,887
2.735%, 02/07/20
2.575%, 02/17/21
2.765%, 08/29/19
2.928%, 01/10/20
1.750%, 09/05/191.750%, 09/05/191.250%, 09/09/192.555%, 02/24/201.625%, 03/04/20
2.582%, 08/09/19
2.125%, 01/14/20
1.625%, 09/30/19
1.800%, 02/14/204.400%, 04/24/20
2.000%, 09/23/19
FaceAmount Value†
(000)
Municipality FinanceP.L.C., Floating RateNote, 3M USD LIBOR +0.170%, FRN
(r) 900 $ 900,693Municipality Finance
P.L.C., Floating RateNote, 3M USD LIBOR +0.500%, FRN
(r) 2,200 2,200,330National Australia Bank,
Ltd., Floating Rate Note,3M USD LIBOR +0.240%, FRN
(r)Ω 400 400,060National Australia Bank,
Ltd., Floating Rate Note,3M USD LIBOR +0.590%, FRN
(r)Ω 500 501,162Nederlandse
Waterschapsbank NV1,300 1,299,226
Ω 1,000 999,405Ω 450 449,496(r)Ω 1,160 1,160,544
500 498,320Nederlandse
Waterschapsbank NV,Floating Rate Note, 3MUSD LIBOR + 0.020%,FRN
(r) 1,000 1,000,070Nestle Holdings, Inc.
500 499,400Nordea Bank Abp#Ω 449 448,448Novartis Capital Corp.
200 199,516958 972,954
NRW Bank800 799,504
4.000%, 10/07/194.400%, 04/14/20
2.670%, 09/30/19
2.125%, 03/02/202.150%, 03/06/202.150%, 10/26/202.350%, 10/30/20
2.507%, 10/26/20
2.656%, 04/30/21
2.900%, 03/02/20
1.375%, 09/12/194.300%, 09/22/194.375%, 03/25/202.125%, 05/11/20
2.985%, 05/11/20
2.786%, 09/12/19
FaceAmount Value†
(000)
Province of OntarioCanada
300 $ 300,8521,864 1,891,533
Roche Holdings, Inc.,Floating Rate Note, 3MUSD LIBOR + 0.340%,FRN
(r)Ω 3,800 3,802,246Royal Bank of Canada
1,950 1,948,001# 1,000 999,185
1,700 1,698,864866 867,742
Royal Bank of Canada, 3MUSD LIBOR + 0.240%,FRN
(r) 477 477,809Royal Bank of Canada, 3M
USD LIBOR + 0.390%,FRN
(r) 2,000 2,005,850Royal Bank of Canada,
Floating Rate Note, 3MUSD LIBOR + 0.380%,FRN
(r) 923 924,903Shell International FinanceBV
720 719,194400 401,040500 506,663
1,900 1,898,386Shell International Finance
BV, 3M USD LIBOR +0.450%, FRN
(r) 2,604 2,612,586Shell International Finance
BV, Floating Rate Note,3M USD LIBOR +0.350%, FRN
(r) 3,078 3,079,742

VA Short-Term Fixed PortfolioCONTINUED
2.600%, 02/08/21
1.750%, 01/24/201.375%, 02/10/20
2.420%, 09/15/20
1.900%, 12/06/19
NRW Bank, 3M USDLIBOR + 0.040%, FRN
(r) 3,200 3,198,720Oesterreichische
Kontrollbank AG2,300 2,295,4701,376 1,370,286
OesterreichischeKontrollbank AG,Floating Rate Note, 3MUSD LIBOR + 0.010%,FRN
(r) 4,000 3,995,621Province of AlbertaCanada
4,800 4,792,722
1.250%, 09/16/191.625%, 01/22/20
1.125%, 08/28/191.750%, 05/18/201.875%, 06/23/201.750%, 08/28/20
1.500%, 09/06/19
1.900%, 10/24/193.000%, 06/11/201.850%, 09/11/20
State of North Rhine-Westphalia Germany
1,500 1,497,8221,200 1,196,496
Svensk Exportkredit AB500 499,540500 498,062
1,300 1,296,345400 398,319
Svenska HandelsbankenAB
400 399,631Toronto-Dominion Bank(The)
354 353,6152,300 2,315,268
500 497,918
2.670%, 09/17/20
2.731%, 06/11/20
4.450%, 06/24/20
2.200%, 01/10/202.150%, 03/12/20
2.438%, 01/10/20
2.572%, 09/18/20
2.668%, 11/14/19
FaceAmount Value†
(000)
Toronto-Dominion Bank(The), 3M USD LIBOR+ 0.260%, FRN
(r) 3,760 $ 3,766,952Toronto-Dominion Bank
(The), 3M USD LIBOR+ 0.280%, FRN
(r) 1,800 1,803,638Total Capital SA
1,498 1,526,679Toyota Motor CreditCorp.
2,130 2,128,5051,177 1,175,878
Toyota Motor CreditCorp., 3M USD LIBOR+ 0.100%, FRN
(r) 2,700 2,700,574Toyota Motor Credit
Corp., 3M USD LIBOR+ 0.170%, FRN
(r) 1,000 1,000,774Toyota Motor Credit
Corp., Floating RateNote, 3M USD LIBOR+ 0.140%, FRN
#(r) 1,000 1,000,137Toyota Motor Credit
Corp., Floating RateNote, 3M USD LIBOR+ 0.150%, FRN
2.250%, 08/06/19
2.196%, 01/31/21
2.220%, 04/30/21
TOTAL U.S. TREASURYOBLIGATIONS
2.664%, 03/06/20
2.571%, 02/27/20
2.640%, 03/11/20
FaceAmount Value†
(000)
U.S. Treasury Bills2,000 $ 1,999,444
U.S. Treasury Notes, 3MUSTMMR + 0.115%,FRN
(r) 1,000 999,102U.S. Treasury Notes, 3M
USTMMR + 0.1390%,FRN
(r) 6,000 5,999,004
26,961,669
CERTIFICATES OF DEPOSIT — (3.3%)Bank of Montreal,
Floating Rate Note,3M USD LIBOR +0.190%, FRN
4,000 4,003,531Bank of Nova Scotia
(The), Floating RateNote, 3M USD LIBOR+ 0.050%, FRN
1,800 1,800,400Bank of Nova Scotia
(The), Floating RateNote, 3M USD LIBOR+ 0.190%, FRN
2,000 2,002,048

VA Short-Term Fixed PortfolioCONTINUED
2.672%, 08/21/20
2.843%, 01/08/21
1.750%, 10/09/192.850%, 06/23/20
2.573%, 06/23/21
2.383%, 06/23/20
1.600%, 08/19/19
TOTAL BONDS
0.000%, 09/03/190.000%, 09/05/190.000%, 09/12/19
(r) 500 499,853Toyota Motor Credit
Corp., Floating RateNote, 3M USD LIBOR+ 0.540%, FRN
(r) 969 973,174Walmart, Inc.
3,330 3,326,136908 913,621
Walmart, Inc., 3M USDLIBOR + 0.230%, FRN
(r) 1,330 1,334,298Walmart, Inc., Floating
Rate Note, 3M USDLIBOR + 0.040%, FRN
(r) 2,902 2,903,091Westpac Banking Corp.
665 664,745
189,051,222
U.S. TREASURY OBLIGATIONS — (8.4%)U.S. Treasury Bill# 8,000 7,984,783
6,000 5,988,3824,000 3,990,954
2.534%, 05/08/20
2.544%, 04/06/20
2.498%, 01/22/20
TOTAL CERTIFICATESOF DEPOSIT
TOTAL INVESTMENTSECURITIES
2.350%, 08/20/192.480%, 08/28/19BNG Bank NV 2.310%,08/16/19
Canadian Imperial Bankof Commerce, FloatingRate Note, 3M USDLIBOR + 0.170%, FRN
1,000 1,000,040Canadian Imperial Bank
of Commerce, FloatingRate Note, 3M USDLIBOR + 0.180%, FRN
1,000 1,000,135Svenska Handelsbanken
AB, Floating RateNote, 3M USD LIBOR+ 0.220%, FRN
800 800,714
10,606,868
245,209,698
COMMERCIAL PAPER — (17.1%)Banque Et Caisse d’Epargne
de l’Etat1,000 998,7291,500 1,497,357
Ω1,000 998,979
2.551%, 08/07/192.270%, 08/12/192.531%, 08/20/19Cisco Systems,Inc. 2.465%, 08/08/19
2.530%, 08/02/192.375%, 08/06/192.360%, 08/09/192.551%, 08/13/192.480%, 09/16/19
2.290%, 08/08/192.491%, 08/08/19
FaceAmount Value†
(000)
Caisse Des Depots EtConsignations
Ω 1,250 $1,249,431Ω 2,000 1,998,468Ω 1,000 998,761Ω
1,000 999,488ErsteAbwicklungsanstalt
500 499,935Ω 500 499,808Ω 1,000 999,428Ω 2,000 1,998,366Ω 1,000 997,123European InvestmentBank
1,000 999,4762,500 2,498,690
Pfizer, Inc.2.469%, 08/26/19PSP Capital, Inc.2.210%, 08/29/19QueenslandTreasury2.340%, 08/02/19Roche Holding,Inc. 2.250%, 08/05/19Sanofi-Aventis2.352%, 09/11/19
TOTALCOMMERCIALPAPER
FaceAmount Value†
(000)
Ω
400 $ 399,358Ω
1,250 1,247,769
2,000 1,999,741Ω
3,000 2,999,033Ω
2,600 2,593,248
54,731,518
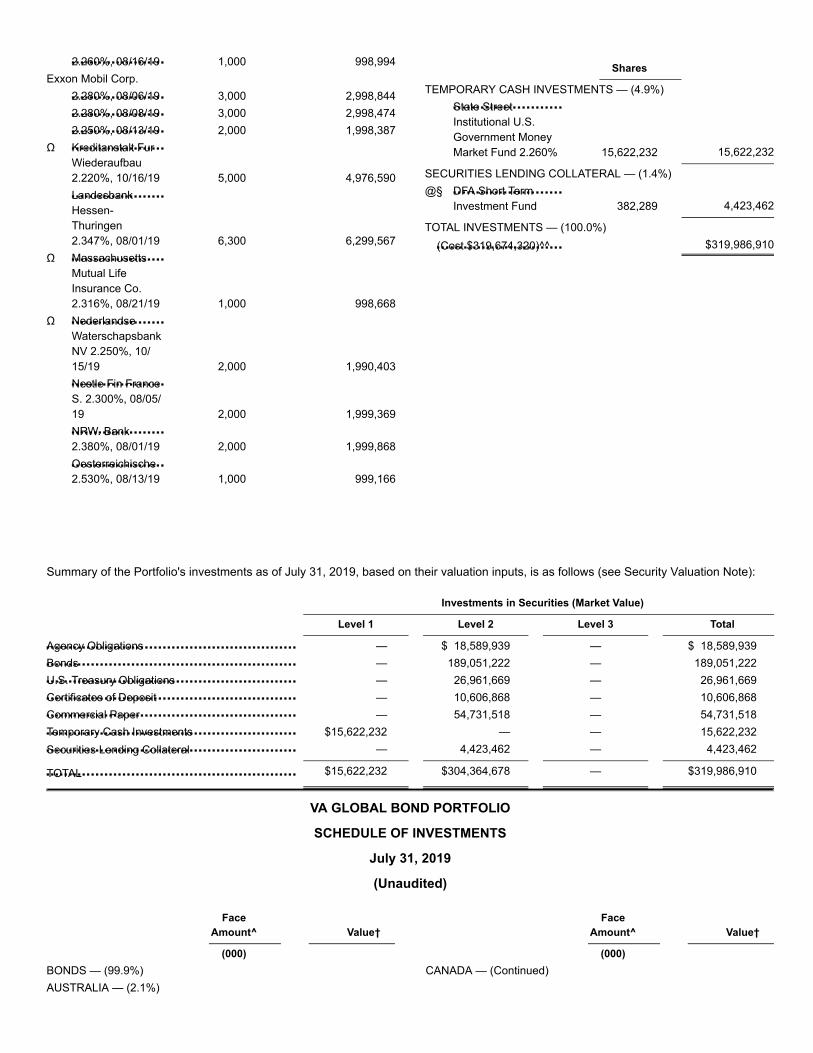
Agency ObligationsBondsU.S. Treasury ObligationsCertificates of DepositCommercial PaperTemporary Cash InvestmentsSecurities Lending Collateral
TOTAL
Summary of the Portfolio's investments as of July 31, 2019, based on their valuation inputs, is as follows (see Security Valuation Note):
Investments in Securities (Market Value)
Level 1 Level 2 Level 3 Total
— $ 18,589,939 — $ 18,589,939— 189,051,222 — 189,051,222— 26,961,669 — 26,961,669— 10,606,868 — 10,606,868— 54,731,518 — 54,731,518
$15,622,232 — — 15,622,232— 4,423,462 — 4,423,462
$15,622,232 $304,364,678 — $319,986,910
VA GLOBAL BOND PORTFOLIO
SCHEDULE OF INVESTMENTS
July 31, 2019
(Unaudited)
2.260%, 08/16/19
2.280%, 08/06/192.280%, 08/08/192.250%, 08/13/19Kreditanstalt FurWiederaufbau2.220%, 10/16/19LandesbankHessen-Thuringen2.347%, 08/01/19MassachusettsMutual LifeInsurance Co.2.316%, 08/21/19NederlandseWaterschapsbankNV 2.250%, 10/15/19Nestle Fin FranceS. 2.300%, 08/05/19NRW. Bank2.380%, 08/01/19Oesterreichische2.530%, 08/13/19
1,000 998,994Exxon Mobil Corp.
3,000 2,998,8443,000 2,998,4742,000 1,998,387
Ω
5,000 4,976,590
6,300 6,299,567Ω
1,000 998,668Ω
2,000 1,990,403
2,000 1,999,369
2,000 1,999,868
1,000 999,166
State StreetInstitutional U.S.Government MoneyMarket Fund 2.260%
DFA Short TermInvestment Fund
(Cost $319,674,320)^^
Shares
TEMPORARY CASH INVESTMENTS — (4.9%)
15,622,232 15,622,232
SECURITIES LENDING COLLATERAL — (1.4%)@§
382,289 4,423,462
TOTAL INVESTMENTS — (100.0%)$319,986,910
FaceAmount^ Value†
(000)BONDS — (99.9%)AUSTRALIA — (2.1%)
FaceAmount^ Value†
(000)CANADA — (Continued)

2.800%, 01/10/222.500%, 05/22/220.350%, 09/07/22
2.800%, 01/11/220.250%, 01/17/222.625%, 12/14/22
TOTAL AUSTRALIA
0.750%, 03/07/22
0.000%, 07/15/23
TOTAL AUSTRIA
0.040%, 12/11/19
2.250%, 06/22/23
TOTAL BELGIUM
1.880%, 03/31/210.250%, 11/17/21
0.182%, 03/14/22
2.130%, 06/15/203.270%, 01/11/212.718%, 04/20/212.700%, 03/07/220.375%, 04/06/22
1.450%, 06/15/20
1.850%, 07/14/202.599%, 10/05/201.900%, 04/26/210.750%, 03/22/23
0.750%, 12/15/21
National Australia Bank,Ltd.
2,000 $ 2,027,771587 589,984
EUR 1,650 1,857,357Westpac Banking Corp.
2,000 2,025,431EUR 600 672,292GBP 400 511,990
7,684,825
AUSTRIA — (3.4%)Oesterreichische
Kontrollbank AGGBP 1,836 2,233,786
Republic of AustriaGovernment Bond
Ω EUR 9,100 10,335,621
12,569,407
BELGIUM — (1.1%)Dexia Credit Local SA
EUR 850 942,409Kingdom of Belgium
Government BondEUR 2,550 3,149,210
4,091,619
CANADA — (21.2%)Bank of Montreal
CAD 11,000 8,312,760EUR 400 447,387
Bank of MontrealFloating Rate Note
(r) EUR 600 669,168Bank of Nova Scotia(The)
CAD 2,000 1,517,821CAD 2,500 1,927,754
(r) 5,000 5,016,5751,313 1,327,587
EUR 500 561,484Canada Housing TrustNo 1Ω CAD 2,000 1,511,487Canadian Imperial Bank
of CommerceCAD 4,000 3,027,580
(r) 500 501,357CAD 1,200 906,746EUR 1,900 2,179,604
Manitoba, Province ofCanada
GBP 500 606,304
4.000%, 12/01/19
3.250%, 12/18/21
4.750%, 02/11/201.500%, 12/15/22
4.200%, 06/02/204.000%, 06/02/213.150%, 06/02/22
4.500%, 12/01/190.875%, 05/24/223.500%, 12/01/22
2.375%, 01/22/24
1.920%, 07/17/202.860%, 03/04/212.656%, 04/30/211.968%, 03/02/22
1.693%, 04/02/202.563%, 06/24/200.625%, 03/08/211.994%, 03/23/220.625%, 07/20/23
1.125%, 03/18/22
TOTAL CANADA
4.000%, 11/15/191.500%, 11/15/23
0.000%, 09/08/220.250%, 03/29/230.125%, 08/28/23
TOTAL DENMARK
0.000%, 09/15/23
Province of AlbertaCanada
CAD 5,000 $ 3,815,654Province of British
Columbia CanadaCAD 2,500 1,959,179
Province of ManitobaCanada
CAD 3,200 2,461,803GBP 150 186,142
Province of OntarioCanada
CAD 3,000 2,318,306CAD 2,000 1,576,345CAD 4,800 3,770,208
Province of QuebecCanada
CAD 5,000 3,821,791GBP 800 974,169CAD 4,700 3,752,593
Quebec, Province ofCanada
EUR 1,000 1,242,964Royal Bank of Canada
CAD 8,500 6,439,017CAD 1,000 767,465
(r) 270 270,790CAD 4,611 3,484,732
Toronto-Dominion Bank(The)
CAD 1,000 756,471CAD 2,000 1,523,943EUR 132 148,237CAD 9,500 7,182,081EUR 1,344 1,538,418
Total Capital Canada,Ltd.
EUR 2,500 2,869,594
79,373,516
DENMARK — (4.5%)Denmark GovernmentBond
DKK 10,000 1,502,353DKK 55,000 8,946,954
KommunekreditEUR 1,072 1,205,027EUR 3,000 3,408,988EUR 1,611 1,824,741
16,888,063
FINLAND — (3.2%)Finland GovernmentBondΩ EUR 7,700 8,762,147OP Corporate BankP.L.C.

VA Global Bond PortfolioCONTINUED
0.750%, 03/03/22
TOTAL FINLAND
EUR 2,700 3,064,879
11,827,026
0.125%, 04/30/22
0.125%, 11/25/220.125%, 10/25/23
1.375%, 09/18/190.250%, 03/19/200.250%, 06/02/221.125%, 06/15/220.250%, 06/01/23
0.000%, 03/25/231.750%, 05/25/23
0.000%, 03/21/200.000%, 03/21/220.500%, 03/21/23
1.875%, 07/09/20
0.000%, 03/19/202.875%, 02/17/222.125%, 03/15/230.250%, 07/12/23
0.125%, 03/05/200.875%, 10/25/222.250%, 04/05/23
TOTAL FRANCE
1.125%, 09/07/23
1.000%, 10/12/21
FaceAmount^ Value†
(000)FRANCE — (10.7%)Agence Francaise de
DeveloppementEUR 1,700 $ 1,912,022
Caisse d'Amortissementde la Dette Sociale
EUR 1,800 2,038,590EUR 3,700 4,205,672
Dexia Credit Local SAEUR 1,000 1,109,542EUR 350 389,146EUR 2,900 3,271,607GBP 2,300 2,820,551EUR 2,400 2,719,900
French RepublicGovernment BondOAT
EUR 1,796 2,040,052EUR 1,700 2,060,166
Sanofi Floating RateNote(r) EUR 1,100 1,220,136
EUR 700 781,495EUR 6,600 7,501,709
Total Capital Canada,Ltd.
EUR 1,100 1,242,378Total Capital
International SAFloating Rate Note
(r) EUR 200 221,7941,128 1,145,648
EUR 1,600 1,923,472EUR 900 1,015,204
Unedic AsseoEUR 250 277,594EUR 1,800 2,081,272EUR 100 121,964
40,099,914
GERMANY — (9.0%)FMS Wertmanagement
GBP 800 989,720Kreditanstalt fuer
WiederaufbauNOK 5,000 557,933
0.125%, 03/10/230.125%, 07/07/23
0.000%, 12/05/220.375%, 02/16/23
TOTAL GERMANY
2.200%, 02/25/212.020%, 02/28/222.350%, 07/18/22
0.500%, 04/06/23
2.600%, 01/11/22
TOTAL JAPAN
0.500%, 01/20/230.200%, 01/17/24
1.750%, 09/12/22
0.500%, 08/14/23
TOTAL LUXEMBOURG
1.000%, 06/17/220.250%, 02/22/23
0.050%, 07/11/23
2.750%, 01/10/224.750%, 06/06/22
FaceAmount^ Value†
(000)GERMANY — (Continued)
EUR 2,500 $ 2,831,453EUR 6,250 7,086,076
State of North Rhine-Westphalia Germany
EUR 4,080 4,598,854EUR 1,350 1,542,650
33,753,160
JAPAN — (2.6%)Toyota Credit Canada,Inc.
CAD 1,000 759,191CAD 8,150 6,156,653CAD 800 608,977
Toyota FinanceAustralia, Ltd.
EUR 900 1,020,303Toyota Motor CreditCorp.
1,218 1,229,824
9,774,948
LUXEMBOURG — (1.4%)European Financial
Stability FacilityEUR 382 438,588EUR 2,195 2,506,324
Nestle FinanceInternational, Ltd.
EUR 500 589,395Novartis Finance SA
EUR 1,500 1,710,830
5,245,137
NETHERLANDS — (5.4%)Bank Nederlandse
Gemeenten NVGBP 2,000 2,447,522EUR 600 683,158
BNG Bank NVEUR 6,333 7,167,251
Cooperatieve RabobankUA
1,300 1,312,550EUR 300 379,847

VA Global Bond PortfolioCONTINUED
2.125%, 08/15/230.000%, 09/15/230.125%, 11/07/23
2.431%, 09/27/210.875%, 03/07/22
2.625%, 06/17/200.050%, 06/12/23
2.600%, 02/08/210.000%, 11/11/22
EUR 2,800 3,441,909EUR 3,964 4,491,657EUR 1,250 1,424,477
LandeskreditbankBaden-WuerttembergFoerderbank
(r) 400 400,460GBP 100 122,023
LandwirtschaftlicheRentenbank
NOK 6,000 683,541EUR 3,900 4,419,328
NRW Bank(r) 600 599,760
EUR 500 563,319
0.500%, 12/06/22
0.125%, 09/25/23
0.500%, 02/27/23
0.082%, 09/16/192.000%, 12/20/191.250%, 03/15/222.375%, 08/21/22
TOTAL NETHERLANDS
EUR 2,213 2,520,762Nederlandse
Waterschapsbank NVEUR 200 227,069
Roche Finance EuropeBV
EUR 800 910,327Shell International
Finance BV FloatingRate Note
(r) EUR 222 245,879GBP 400 488,487EUR 2,292 2,642,383
1,000 1,005,868
20,031,103
0.500%, 06/10/22
3.750%, 05/25/212.000%, 05/24/23
2.000%, 09/10/205.625%, 03/11/210.875%, 02/17/23
0.875%, 12/08/200.125%, 03/21/221.125%, 11/30/221.500%, 12/15/23
2.343%, 04/15/21
FaceAmount^ Value†
(000)NEW ZEALAND — (0.2%)ASB Finance, Ltd.
EUR 700 $ 789,825
NORWAY — (5.5%)Norway GovernmentBondΩ
NOK 7,000 825,041Ω
NOK 85,000 9,858,572Equinor ASA
EUR 500 567,435EUR 1,000 1,212,668
EUR 2,250 2,586,012KommunalbankenA.S.
GBP 500 608,895
SEK 12,000 1,249,699GBP 150 184,667
GBP 500 626,803Kommunalbanken
A.S. Floating RateNote
(r)1,000 1,000,063
Kommunalbanken AS
1.125%, 03/11/20
1.375%, 06/19/23
TOTALSUPRANATIONALORGANIZATIONOBLIGATIONS
0.250%, 06/01/220.750%, 02/22/231.000%, 11/13/23
1.250%, 08/05/22
2.570%, 12/13/211.375%, 12/15/22
FaceAmount^ Value†
(000)SUPRANATIONAL ORGANIZATION OBLIGATIONS —(Continued)International Bank for
Reconstruction &Development
CAD 1,150 $ 867,379Nordic InvestmentBank
NOK 18,000 2,015,346
44,165,632
SWEDEN — (7.2%)Kommuninvest ISverige AB
SEK 65,000 6,816,047
SEK 31,000 3,306,353SEK 10,000 1,081,430
SkandinaviskaEnskilda BankenAB
GBP 100 122,293Svensk ExportkreditAB(r)
500 500,920
GBP 4,150 5,145,016

VA Global Bond PortfolioCONTINUED
1.125%, 12/15/21
TOTAL NORWAY
0.500%, 03/01/22
0.250%, 01/24/24
0.970%, 02/01/22
0.200%, 05/25/23
0.375%, 10/27/220.125%, 05/25/23
2.608%, 11/15/21
0.125%, 10/17/23
3.500%, 01/14/211.500%, 05/12/220.050%, 12/15/232.125%, 01/15/241.500%, 01/26/24
0.100%, 07/31/23
2.430%, 10/12/21
GBP 1,500 1,839,125
20,558,980
SINGAPORE — (0.6%)Temasek Financial I,Ltd.
EUR 1,970 2,223,447
SUPRANATIONAL ORGANIZATION OBLIGATIONS — (11.8%)African DevelopmentBank
EUR 500 571,879Asian Development
Bank Floating RateNote
(r)GBP 2,000 2,433,766
Asian DevelopmentBank
EUR 5,700 6,489,356Council Of Europe
Development Bank
EUR 150 171,227
EUR 2,885 3,275,557EUROFIMA(r) 400 399,956European Financial
Stability Facility
EUR 6,000 6,826,943European InvestmentBank
SEK 9,000 980,882
NOK 53,000 5,980,692
EUR 400 454,969
EUR 2,000 2,482,139
NOK 9,000 1,012,041European StabilityMechanism
EUR 8,197 9,303,221Inter-American
Investment Corp.(r)
900 900,279
1.375%, 12/15/23
0.250%, 02/28/221.125%, 12/14/22
1.500%, 11/13/23
TOTAL SWEDEN
2.250%, 08/09/22
0.000%, 09/30/190.000%, 10/14/19
TOTAL UNITEDKINGDOM
0.375%, 02/15/220.375%, 02/15/22
1.000%, 11/10/22
0.625%, 01/17/230.750%, 03/16/231.300%, 03/15/24
2.498%, 03/03/22
0.750%, 03/09/23
4.750%, 11/06/19
GBP 500 622,932SvenskaHandelsbanken AB
EUR 934 1,047,729
EUR 2,700 3,123,204Sweden GovernmentBondΩ SEK 44,000 4,973,787
26,739,711
UNITED KINGDOM — (1.7%)Transport for London
GBP 1,333 1,690,664United KingdomTreasury Bill
GBP 3,000 3,643,823
GBP 1,000 1,214,254
6,548,741
UNITED STATES — (8.3%)3M Co.
EUR 1,500 1,685,624
EUR 500 561,875Apple, Inc.
EUR 2,550 2,944,059Berkshire Hathaway,Inc.
EUR 1,000 1,139,301
EUR 700 799,407
EUR 560 659,792Chevron Corp.
3,500 3,531,106Coca-Cola Co. (The)
EUR 1,200 1,371,580Johnson & Johnson
EUR 100 112,178

As of July 31, 2019, VA Global Bond Portfolio had entered into the following forward currency contracts and the net unrealized forwardcurrency gain (loss) is reflected in the accompanying financial statements:
Currency Purchased Currency Sold CounterpartySettlement
Date
UnrealizedForeign
ExchangeAppreciation
(Depreciation)
USD 446,979 GBP 358,944 State Street Bank and Trust 08/05/19 $ 10,405USD 31,791,827 GBP 25,147,532 Citibank, N.A. 08/05/19 1,205,611USD 1,574,841 DKK 10,447,486 State Street Bank and Trust 08/07/19 25,452USD 9,253,291 DKK 60,981,328 Barclays Capital 08/07/19 209,604USD 137,539 CAD 180,660 State Street Bank and Trust 08/08/19 635USD 1,036,275 CAD 1,350,164 Royal Bank of Scotland 08/08/19 13,129USD 1,214,134 CAD 1,597,526 State Street Bank and Trust 08/08/19 3,538USD 1,501,850 CAD 1,978,084 State Street Bank and Trust 08/08/19 2,869USD 66,651,628 CAD 87,032,963 Royal Bank of Scotland 08/08/19 698,579USD 100,606,541 EUR 89,124,293 JP Morgan 08/08/19 1,898,549USD 477,415 EUR 430,250 Bank of America Corp. 08/14/19 672USD 74,136,768 EUR 65,720,426 JP Morgan 08/14/19 1,314,609USD 19,024,372 SEK 177,722,371 State Street Bank and Trust 08/16/19 609,648USD 21,714,686 NOK 186,133,705 State Street Bank and Trust 08/22/19 686,224USD 21,378,547 EUR 19,089,894 Citibank, N.A. 10/28/19 98,080
Total Appreciation $6,777,604
EUR 1,608,195 USD 1,813,737 HSBC Bank 08/08/19 $ (32,609)EUR 121,581 USD 136,572 Citibank, N.A. 08/08/19 (1,918)GBP 1,163,731 USD 1,452,952 State Street Bank and Trust 08/05/19 (37,539)
1.125%, 10/15/21
2.250%, 01/10/211.900%, 09/15/212.500%, 05/15/22
2.200%, 12/15/210.250%, 03/06/22
4.125%, 12/07/202.150%, 08/11/222.000%, 08/16/22
1.000%, 04/06/22
2.750%, 05/17/21
FaceAmount^ Value†
(000)UNITED STATES — (Continued)Merck & Co., Inc.
EUR 1,750 $1,992,802Oracle Corp.
EUR 750 860,6293,500 3,474,7672,250 2,264,337
Pfizer, Inc.2,000 2,001,442
EUR 1,550 1,738,322Procter & Gamble Co.(The)
EUR 500 586,1911,474 1,479,896
EUR 100 118,312Shell InternationalFinance BV
EUR 1,600 1,834,149Toyota Motor Credit Corp.# 1,167 1,179,367
0.750%, 07/21/222.375%, 02/01/23
1.900%, 04/08/22
TOTAL UNITEDSTATES
TOTAL BONDS
DFA Short TermInvestment Fund
(Cost $384,082,223)^^
FaceAmount^ Value†
(000)UNITED STATES — (Continued)
EUR 100 $ 113,744EUR 43 51,864
Walmart, Inc.EUR 500 583,871
31,084,615
373,449,669
Shares
SECURITIES LENDING COLLATERAL — (0.1%)@§
27,051 313,005
TOTAL INVESTMENTS — (100.0%)$373,762,674

AustraliaAustriaBelgiumCanadaDenmarkFinlandFranceGermanyJapanLuxembourgNetherlandsNew ZealandNorwaySingaporeSupranational Organization ObligationsSwedenUnited KingdomUnited States
Securities Lending CollateralForward Currency Contracts**
TOTAL
0.250%, 01/15/252.375%, 01/15/250.375%, 07/15/250.625%, 01/15/262.000%, 01/15/26
Total (Depreciation) $ (72,066)
Total Appreciation(Depreciation) $6,705,538
VA Global Bond PortfolioCONTINUED
Summary of the Portfolio's investments as of July 31, 2019, based on their valuation inputs, is as follows (see Security Valuation Note):
Investments in Securities (Market Value)
Level 1 Level 2 Level 3 Total
Bonds— $ 7,684,825 — $ 7,684,825— 12,569,407 — 12,569,407— 4,091,619 — 4,091,619— 79,373,516 — 79,373,516— 16,888,063 — 16,888,063— 11,827,026 — 11,827,026— 40,099,914 — 40,099,914— 33,753,160 — 33,753,160— 9,774,948 — 9,774,948— 5,245,137 — 5,245,137— 20,031,103 — 20,031,103— 789,825 — 789,825— 20,558,980 — 20,558,980— 2,223,447 — 2,223,447— 44,165,632 — 44,165,632— 26,739,711 — 26,739,711— 6,548,741 — 6,548,741— 31,084,615 — 31,084,615
— 313,005 — 313,005— 6,705,538 — 6,705,538
— $380,468,212 — $380,468,212** Valued at the unrealized appreciation/(depreciation) on the investment.
VIT INFLATION-PROTECTED SECURITIES PORTFOLIO
SCHEDULE OF INVESTMENTS
July 31, 2019
(Unaudited)
FaceAmount± Value†
(000)
U.S. TREASURY OBLIGATIONS — (99.1%)Treasury Inflation Protected Security
12,090 $ 13,060,4833,015 4,558,1624,620 5,037,653
13,050 14,396,1407,440 10,665,333

0.125%, 07/15/260.375%, 01/15/272.375%, 01/15/270.375%, 07/15/270.500%, 01/15/281.750%, 01/15/283.625%, 04/15/282.500%, 01/15/293.875%, 04/15/293.375%, 04/15/32
TOTAL U.S. TREASURY OBLIGATIONS
State Street Institutional U.S. Government Money Market Fund 2.260%
(Cost $154,665,568)^^
U.S. Treasury ObligationsTemporary Cash Investments
TOTAL
Investment in U.S. Core Equity 2 Portfolio ofDFA Investment Dimensions Group Inc.Investment in DFA Selectively Hedged Global Fixed Income Portfolio ofDFA Investment Dimensions Group Inc.Investment in VA Global Bond Portfolio ofDFA Investment Dimensions Group Inc.Investment in International Core Equity Portfolio ofDFA Investment Dimensions Group Inc.Investment in U.S. Core Equity 1 Portfolio ofDFA Investment Dimensions Group Inc.Investment in VA Short-Term Fixed Portfolio ofDFA Investment Dimensions Group Inc.Investment in DFA Two-Year Global Fixed Income Portfolio ofDFA Investment Dimensions Group Inc.Investment in Emerging Markets Core Equity Portfolio ofDFA Investment Dimensions Group Inc.Investment in VA U.S. Large Value Portfolio ofDFA Investment Dimensions Group Inc.
10,900 11,576,17415,250 16,294,304
6,625 9,714,55511,400 12,061,7485,270 5,566,0097,630 10,441,9455,292 10,741,6398,550 12,264,0246,940 14,456,0312,570 5,075,598
155,909,798
Shares
TEMPORARY CASH INVESTMENTS — (0.9%)1,464,518 1,464,518
TOTAL INVESTMENTS — (100.0%)$157,374,316
Summary of the Portfolio's investments as of July 31, 2019, based on their valuation inputs, is as follows (see Security Valuation Note):
Investments in Securities (Market Value)
Level 1 Level 2 Level 3 Total
— $155,909,798 — $155,909,798$1,464,518 — — 1,464,518
$1,464,518 $155,909,798 — $157,374,316
DFA VA GLOBAL MODERATE ALLOCATION PORTFOLIO
SCHEDULE OF INVESTMENTS
July 31, 2019
(Unaudited)Shares Value†
AFFILIATED INVESTMENT COMPANIES — (100.0%)
1,861,736 $ 41,833,200
1,725,163 16,768,588
1,570,092 16,768,588
1,275,721 16,188,904
610,546 14,927,852
645,217 6,677,992
669,042 6,677,040
303,080 6,176,771
114,517 2,980,873

Investment in DFA Real Estate Securities Portfolio ofDFA Investment Dimensions Group Inc.Investment in VA International Value Portfolio ofDFA Investment Dimensions Group Inc.
TOTAL INVESTMENTS IN AFFILIATED INVESTMENT COMPANIES(Cost $111,555,860)^^
Affiliated Investment Companies
TOTAL
CBS Corp., Class ACBS Corp., Class BFacebook, Inc., Class AInterpublic Group of Cos., Inc. (The)Live Nation Entertainment, Inc.Omnicom Group, Inc.Verizon Communications, Inc.Zayo Group Holdings, Inc.
TOTAL COMMUNICATION SERVICES
Amazon.com, Inc.Aptiv P.L.C.Best Buy Co., Inc.Booking Holdings, Inc.Bright Horizons Family Solutions, Inc.Burlington Stores, Inc.Darden Restaurants, Inc.Dollar General Corp.Dunkin' Brands Group, Inc.eBay, Inc.Garrett Motion, Inc.Hanesbrands, Inc.Hasbro, Inc.Hilton Worldwide Holdings, Inc.Home Depot, Inc. (The)Kontoor Brands, Inc.Las Vegas Sands Corp.Leggett & Platt, Inc.Lowe's Cos., Inc.
60,115 2,360,103
153,746 1,791,138
$133,151,049
Summary of the Portfolio's investments as of July 31, 2019, based on their valuation inputs, is as follows (see Security Valuation Note):
Investments in Securities (Market Value)
Level 1 Level 2 Level 3 Total
$133,151,049 — — $133,151,049
$133,151,049 — — $133,151,049
U.S. LARGE CAP GROWTH PORTFOLIO
SCHEDULE OF INVESTMENTS
July 31, 2019
(Unaudited)
Shares Value†
COMMON STOCKS — (98.1%)COMMUNICATION SERVICES — (7.5%)
700 $ 36,036225,988 11,640,642
* 301,227 58,507,320169,089 3,875,520
* 26,999 1,945,548# 170,135 13,648,229
1,325,940 73,284,704* 86,196 2,907,391
165,845,390
CONSUMER DISCRETIONARY — (18.0%)* 46,338 86,502,852
72,147 6,323,685210,885 16,139,029
* 10,409 19,637,723* 1,338 203,470* 24,191 4,372,523
49,578 6,026,7026,735 902,6258,433 675,989
95,492 3,933,315* 10,845 153,674# 183,373 2,950,472
3,717 450,35246,233 4,463,796
322,959 69,013,109* 6,309 185,043
88,290 5,336,248# 46,052 1,840,698
198,581 20,136,113

Lululemon Athletica, Inc.Marriott International, Inc., Class AMcDonald's Corp.NIKE, Inc., Class BNordstrom, Inc.NVR, Inc.O'Reilly Automotive, Inc.Polaris Industries, Inc.Pool Corp.Ross Stores, Inc.Service Corp. InternationalSix Flags Entertainment Corp.Starbucks Corp.TJX Cos., Inc. (The)Tractor Supply Co.Ulta Salon Cosmetics & Fragrance, Inc.VF Corp.Wyndham Destinations, Inc.Wynn Resorts, Ltd.Yum! Brands, Inc.
TOTAL CONSUMER DISCRETIONARY
Altria Group, Inc.Brown-Forman Corp., Class ABrown-Forman Corp., Class BCampbell Soup Co.Church & Dwight Co., Inc.Clorox Co. (The)Coca-Cola Co. (The)Costco Wholesale Corp.Estee Lauder Cos., Inc. (The), Class AHerbalife Nutrition, Ltd.Hershey Co. (The)Kellogg Co.Keurig Dr Pepper, Inc.Kimberly-Clark Corp.Monster Beverage Corp.PepsiCo, Inc.Sysco Corp.
TOTAL CONSUMER STAPLES
American Express Co.Aon P.L.C.Credit Acceptance Corp.Eaton Vance Corp.Erie Indemnity Co., Class AFactSet Research Systems, Inc.Interactive Brokers Group, Inc., Class ALazard, Ltd., Class A
* 16,356 3,125,46859,484 8,271,84515,927 3,356,137
198,856 17,107,582# 73,050 2,418,685* 1,490 4,982,769* 27,325 10,404,267# 26,916 2,548,138
16,700 3,162,47967,351 7,141,22676,015 3,507,332
1,644 86,852343,683 32,543,343283,918 15,490,566
61,121 6,650,576* 32,015 11,181,239
44,167 3,859,75447,661 2,242,92746,158 6,003,77112,200 1,372,744
394,705,118
U.S. Large Cap Growth PortfolioCONTINUED
Shares Value†
CONSUMER STAPLES — (8.5%)569,130 $ 26,788,949
15,971 852,21395,023 5,208,211
# 184,859 7,642,07176,735 5,788,88849,523 8,052,440
369,603 19,452,20688,301 24,338,40520,997 3,867,437
#* 68,088 2,792,97057,200 8,679,52889,810 5,228,738
# 95,618 2,690,69167,976 9,220,944
* 6,853 441,813392,163 50,122,353
92,369 6,333,742
187,501,599
FINANCIALS — (3.3%)98,177 12,210,27325,320 4,791,810
#* 3,718 1,777,31635,202 1,566,489
# 8,653 1,927,629# 14,855 4,119,292
17,123 877,72540,060 1,550,723

LPL Financial Holdings, Inc.MarketAxess Holdings, Inc.Marsh & McLennan Cos., Inc.Moody's Corp.MSCI, Inc.S&P Global, Inc.
TOTAL FINANCIALS
AbbVie, Inc.Align Technology, Inc.AmerisourceBergen Corp.Amgen, Inc.Biogen, Inc.Bristol-Myers Squibb Co.Celgene Corp.Edwards Lifesciences Corp.Eli Lilly & Co.Encompass Health Corp.Exelixis, Inc.Gilead Sciences, Inc.IDEXX Laboratories, Inc.Johnson & JohnsonMerck & Co., Inc.Mettler-Toledo International, Inc.Molina Healthcare, Inc.Regeneron Pharmaceuticals, Inc.ResMed, Inc.Stryker Corp.Varian Medical Systems, Inc.
Waters Corp.Zoetis, Inc.
TOTAL HEALTH CARE
3M Co.Allegion P.L.C.Allison Transmission Holdings, Inc.American Airlines Group, Inc.Boeing Co. (The)BWX Technologies, Inc.Caterpillar, Inc.CH Robinson Worldwide, Inc.Cintas Corp.Copart, Inc.CSX Corp.Deere & Co.Donaldson Co., Inc.Dover Corp.Emerson Electric Co.
43,359 3,636,5197,981 2,689,916
96,020 9,486,77625,192 5,399,65340,997 9,316,15853,669 13,146,222
72,496,501
HEALTH CARE — (12.5%)397,183 26,460,331
* 3,902 815,83079,851 6,959,015
212,317 39,614,106* 11,339 2,696,641
173,329 7,697,541* 153,887 14,136,060* 17,687 3,764,678
167,231 18,219,81734,371 2,194,245
* 36,002 765,762250,702 16,425,995
* 30,716 8,663,448512,655 66,757,934398,103 33,038,568
* 11,185 8,464,249* 11,506 1,527,767* 1,958 596,720
9,887 1,272,45710,672 2,238,772
* 8,548 1,003,279
U.S. Large Cap Growth PortfolioCONTINUED
Shares Value†
HEALTH CARE — (Continued)* 3,456 $ 727,695
98,882 11,360,553
275,401,463
INDUSTRIALS — (17.3%)154,326 26,963,839
34,897 3,613,23575,770 3,481,632
# 243,965 7,443,372140,093 47,796,930
# 7,871 424,326164,921 21,715,148
# 74,267 6,218,37623,873 6,217,484
* 69,303 5,373,06229,430 2,071,87258,254 9,649,77539,208 1,958,440
2,219 214,910109,897 7,130,117

Expeditors International of Washington, Inc.Fastenal Co.General Dynamics Corp.Graco, Inc.HD Supply Holdings, Inc.HEICO Corp.HEICO Corp., Class AHoneywell International, Inc.Hubbell, Inc.Huntington Ingalls Industries, Inc.IAA Inc.Illinois Tool Works, Inc.JB Hunt Transport Services, Inc.KAR Auction Services, Inc.L3Harris Technologies, Inc.Lennox International, Inc.Lincoln Electric Holdings, Inc.Lockheed Martin Corp.Masco Corp.Nordson Corp.Northrop Grumman Corp.Old Dominion Freight Line, Inc.Raytheon Co.Robert Half International, Inc.Rockwell Automation, Inc.Rollins, Inc.Spirit AeroSystems Holdings, Inc., Class AToro Co. (The)TransUnionUnion Pacific Corp.United Parcel Service, Inc., Class BVerisk Analytics, Inc.WABCO Holdings, Inc.Waste Management, Inc.WW Grainger, Inc.
TOTAL INDUSTRIALS
Accenture P.L.C., Class AAdobe, Inc.Advanced Micro Devices, Inc.Alliance Data Systems Corp.Amphenol Corp., Class AApple, Inc.Applied Materials, Inc.Automatic Data Processing, Inc.Booz Allen Hamilton Holding Corp.Broadcom, Inc.Broadridge Financial Solutions, Inc.Cadence Design Systems, Inc.CDK Global, Inc.
49,897 3,809,636# 238,536 7,346,909
39,564 7,356,53026,482 1,273,255
* 52,387 2,122,197# 7,983 1,091,675
338 35,622119,434 20,597,588
6,680 867,59822,157 5,058,443
* 35,354 1,652,80061,099 9,423,29958,126 5,950,35935,354 945,36647,686 9,899,61415,817 4,056,74418,914 1,598,61162,391 22,596,148
101,751 4,148,38816,965 2,403,26230,714 10,613,83711,318 1,889,88037,281 6,795,95347,308 2,857,87648,305 7,766,478
# 58,104 1,948,22748,089 3,695,15931,222 2,273,58628,265 2,340,059
146,748 26,407,303172,462 20,604,035
34,309 5,205,361* 17,367 2,299,564
122,177 14,294,70928,909 8,413,386
379,911,975
U.S. Large Cap Growth PortfolioCONTINUED
Shares Value†
INFORMATION TECHNOLOGY — (28.9%)157,184 $ 30,270,495
* 2,488 743,564#* 101,801 3,099,840
20,992 3,294,06546,782 4,365,696
457,023 97,364,180267,546 13,208,746103,500 17,234,820
52,858 3,633,9873,900 1,130,961
47,631 6,054,853* 59,936 4,429,870
54,686 2,836,563

CDW Corp.Cisco Systems, Inc.Citrix Systems, Inc.F5 Networks, Inc.Fair Isaac Corp.Fiserv, Inc.FleetCor Technologies, Inc.International Business Machines Corp.Intuit, Inc.Jack Henry & Associates, Inc.KLA Corp.Lam Research Corp.Mastercard, Inc., Class AMaxim Integrated Products, Inc.Microsoft Corp.NetApp, Inc.NVIDIA Corp.Oracle Corp.Paychex, Inc.Paycom Software, Inc.QUALCOMM, Inc.Sabre Corp.Seagate Technology P.L.C.Texas Instruments, Inc.Total System Services, Inc.Ubiquiti Networks, Inc.Visa, Inc., Class AWestern Union Co. (The)Xilinx, Inc.Zebra Technologies Corp., Class A
TOTAL INFORMATION TECHNOLOGY
Avery Dennison Corp.Axalta Coating Systems, Ltd.Ball Corp.Berry Global Group, Inc.Celanese Corp.Chemours Co. (The)Crown Holdings, Inc.Ecolab, Inc.NewMarket Corp.Packaging Corp. of AmericaPPG Industries, Inc.Sealed Air Corp.Sherwin-Williams Co. (The)
Southern Copper Corp.WR Grace & Co.
TOTAL MATERIALS
96,150 11,361,084212,138 11,752,445
61,695 5,814,137* 21,073 3,091,831* 2,315 804,277#* 83,007 8,751,428* 12,120 3,444,140
333,334 49,413,43253,565 14,854,11022,260 3,109,72272,485 9,881,155
500 104,305258,540 70,392,686
92,494 5,474,720687,697 93,712,334116,979 6,842,10218,747 3,162,994
502,701 28,302,06662,724 5,209,228
#* 12,464 3,000,708284,087 20,783,805119,882 2,818,426182,925 8,471,257199,756 24,971,497
56,267 7,636,557# 12,800 1,647,744# 174,054 30,981,612# 223,401 4,691,421
19,137 2,185,637* 22,471 4,738,909
635,073,409
MATERIALS — (2.1%)45,525 5,229,457
* 67,727 2,006,75129,684 2,121,812
* 63,348 2,853,82727,982 3,138,74142,031 801,531
* 51,374 3,288,45028,738 5,797,317
# 3,727 1,571,3406,639 670,340
49,802 5,846,25772,492 3,029,44115,249 7,823,347
U.S. Large Cap Growth PortfolioCONTINUED
Shares Value†
MATERIALS — (Continued)16,394 $ 586,741
# 18,777 1,273,268
46,038,620

TOTAL COMMON STOCKS
State Street Institutional U.S. Government Money Market Fund 2.260%
DFA Short Term Investment Fund
(Cost $1,529,576,378)^^
Communication ServicesConsumer DiscretionaryConsumer StaplesFinancialsHealth CareIndustrialsInformation TechnologyMaterials
Temporary Cash InvestmentsSecurities Lending Collateral
TOTAL
AMC Networks, Inc., Class ABoingo Wireless, Inc.Cable One, Inc.Central European Media Enterprises, Ltd., Class ACinemark Holdings, Inc.Cogent Communications Holdings, Inc.GCI Liberty, Inc., Class AIDT Corp., Class BIMAX Corp.John Wiley & Sons, Inc., Class ALiberty Media Corp.-Liberty Braves, Class ALiberty Media Corp.-Liberty Braves, Class CLiberty TripAdvisor Holdings, Inc., Class AMcClatchy Co. (The), Class AMeredith Corp.
2,156,974,075
TEMPORARY CASH INVESTMENTS — (0.0%)688,270 688,270
SECURITIES LENDING COLLATERAL — (1.9%)@§ 3,635,152 42,062,348
TOTAL INVESTMENTS — (100.0%)$2,199,724,693
Summary of the Portfolio's investments as of July 31, 2019, based on their valuation inputs, is as follows (see Security Valuation Note):
Investments in Securities (Market Value)
Level 1 Level 2 Level 3 Total
Common Stocks$ 165,845,390 — — $ 165,845,390
394,705,118 — — 394,705,118187,501,599 — — 187,501,599
72,496,501 — — 72,496,501275,401,463 — — 275,401,463379,911,975 — — 379,911,975635,073,409 — — 635,073,409
46,038,620 — — 46,038,620688,270 — — 688,270
— $42,062,348 — 42,062,348
$2,157,662,345 $42,062,348 — $2,199,724,693
U.S. SMALL CAP GROWTH PORTFOLIO
SCHEDULE OF INVESTMENTS
July 31, 2019
(Unaudited)
Shares Value†
COMMON STOCKS — (88.0%)COMMUNICATION SERVICES — (3.0%)#* 34,682 $ 1,851,325* 40,010 600,950
157 191,038* 38,052 178,844# 47,833 1,909,493
7,753 488,517* 7,476 446,541* 26,129 265,471* 50,213 1,102,175
30,420 1,384,414* 7,019 202,849* 21,263 611,736* 64,087 740,205#* 2,700 5,967# 12,752 699,575

Nexstar Media Group, Inc., Class AORBCOMM, Inc.QuinStreet, Inc.Rosetta Stone, Inc.Shenandoah Telecommunications Co.Sinclair Broadcast Group, Inc., Class ATechTarget, Inc.TEGNA, Inc.TravelzooVonage Holdings Corp.Yelp, Inc.
TOTAL COMMUNICATION SERVICES
1-800-Flowers.com, Inc., Class AAmerican Eagle Outfitters, Inc.Asbury Automotive Group, Inc.BJ's Restaurants, Inc.Bloomin' Brands, Inc.Boot Barn Holdings, Inc.Brunswick Corp.Callaway Golf Co.Camping World Holdings, Inc., Class ACareer Education Corp.Carter's, Inc.Cavco Industries, Inc.Cheesecake Factory, Inc. (The)Children's Place, Inc. (The)Churchill Downs, Inc.Collectors Universe, Inc.Core-Mark Holding Co., Inc.Cracker Barrel Old Country Store, Inc.Crocs, Inc.Dave & Buster's Entertainment, Inc.Deckers Outdoor Corp.Delphi Technologies P.L.C.Denny's Corp.Dine Brands Global, Inc.Dorman Products, Inc.
Duluth Holdings, Inc., Class BEducational Development Corp.Eldorado Resorts, Inc.Extended Stay America, Inc.Floor & Decor Holdings, Inc., Class AFox Factory Holding Corp.frontdoor, Inc.Gentherm, Inc.Groupon, Inc.Habit Restaurants, Inc. (The), Class AHamilton Beach Brands Holding Co., Class A
16,455 1,674,625* 44,025 257,986#* 38,688 630,228* 16,736 384,259
46,373 1,825,2411,900 95,475
* 25,753 592,83463,566 965,568
#* 11,851 149,086* 170,655 2,116,122#* 52,354 1,835,008
21,205,532
CONSUMER DISCRETIONARY — (14.9%)* 30,208 591,473
100,147 1,771,600* 17,239 1,587,367# 19,137 759,739
84,186 1,433,688#* 21,622 676,552
33,724 1,657,87271,315 1,307,917
# 11,326 132,854* 63,218 1,198,613# 29,336 2,728,835* 8,870 1,573,094# 31,709 1,366,024# 17,021 1,662,441# 25,636 3,067,347
8,566 203,10039,361 1,473,282
# 17,604 3,057,991* 67,282 1,537,394# 34,648 1,408,441* 19,962 3,119,661
62,519 1,171,606* 885 19,992# 12,931 1,061,506#* 20,206 1,452,407
U.S. Small Cap Growth PortfolioCONTINUED
Shares Value†
CONSUMER DISCRETIONARY — (Continued)#* 16,116 $ 195,809
2,000 13,300#* 46,527 2,099,298
117,746 1,968,713#* 66,452 2,601,596#* 34,239 2,741,859* 18,500 844,340* 25,235 1,032,364* 436,458 1,374,843#* 10,654 106,540
8,800 144,408

Helen of Troy, Ltd.Hilton Grand Vacations, Inc.Installed Building Products, Inc.iRobot Corp.Jack in the Box, Inc.Johnson Outdoors, Inc., Class ALa-Z-Boy, Inc.LCI IndustriesLGI Homes, Inc.Lindblad Expeditions Holdings, Inc.Malibu Boats, Inc., Class AMarine Products Corp.MasterCraft Boat Holdings, Inc.Monro, Inc.Murphy USA, Inc.Nathan's Famous, Inc.National Vision Holdings, Inc.Noodles & Co.Oxford Industries, Inc.Papa John's International, Inc.PetMed Express, Inc.PlayAGS, Inc.Red Rock Resorts, Inc., Class ARHRuth's Hospitality Group, Inc.SeaWorld Entertainment, Inc.Shake Shack, Inc., Class AShutterfly, Inc.Shutterstock, Inc.Skyline Champion Corp.Sleep Number Corp.Sonos, Inc.Sotheby'sSportsman's Warehouse Holdings, Inc.Standard Motor Products, Inc.Steven Madden, Ltd.Stoneridge, Inc.Strategic Education, Inc.Tailored Brands, Inc.Tempur Sealy International, Inc.Texas Roadhouse, Inc.TopBuild Corp.Tupperware Brands Corp.Twin River Worldwide Holding, Inc.Visteon Corp.Wendy's Co. (The)Williams-Sonoma, Inc.Winmark Corp.
Wolverine World Wide, Inc.
* 17,004 2,521,353* 64,762 2,117,717#* 29,390 1,565,899#* 19,687 1,439,120
9,642 692,5856,563 446,218
25,257 833,228# 18,444 1,690,024#* 11,032 775,439* 35,078 660,519* 17,492 527,034
19,533 313,700* 17,343 287,894# 27,457 2,312,154* 21,585 1,907,251
430 30,362#* 48,059 1,518,184#* 3,878 28,736# 14,802 1,083,358# 21,140 939,039# 16,552 287,508* 10,210 191,540# 46,369 966,330#* 16,616 2,316,270
28,302 630,286#* 67,589 2,066,196#* 22,067 1,647,522* 11,365 576,092
29,511 1,132,337* 36,905 1,051,793#* 35,744 1,757,532#* 18,408 199,727#* 33,490 1,999,688#* 28,414 127,579
15,152 697,14453,196 1,835,794
* 24,661 803,2096,879 1,224,393
# 45,259 220,411* 38,024 3,050,285
42,904 2,369,588* 11,399 924,801
35,905 549,706# 10,515 277,491#* 21,328 1,405,089
171,167 3,113,528# 21,433 1,429,152
1,577 266,529
U.S. Small Cap Growth PortfolioCONTINUED
Shares Value†
CONSUMER DISCRETIONARY — (Continued)63,634 $ 1,727,663

TOTAL CONSUMER DISCRETIONARY
Boston Beer Co., Inc. (The), Class ACalavo Growers, Inc.Cal-Maine Foods, Inc.Casey's General Stores, Inc.Chefs' Warehouse, Inc. (The)Coca-Cola Consolidated, Inc.elf Beauty Inc.Energizer Holdings, Inc.Flowers Foods, Inc.Inter Parfums, Inc.J&J Snack Foods Corp.John B. Sanfilippo & Son, Inc.Lancaster Colony Corp.Lifevantage Corp.Medifast, Inc.MGP Ingredients, Inc.National Beverage Corp.Nu Skin Enterprises, Inc., Class APerformance Food Group Co.PriceSmart, Inc.Rocky Mountain Chocolate Factory, Inc.Sanderson Farms, Inc.Simply Good Foods Co. (The)Sprouts Farmers Market, Inc.Tootsie Roll Industries, Inc.Turning Point Brands, Inc.United-Guardian, Inc.USANA Health Sciences, Inc.Vector Group, Ltd.WD-40 Co.
TOTAL CONSUMER STAPLES
Apergy Corp.Arch Coal, Inc., Class ACactus, Inc., Class ACore Laboratories NVCVR Energy, Inc.DMC Global, Inc.Evolution Petroleum Corp.FTS International, Inc.ION Geophysical Corp.Kosmos Energy, Ltd.Liberty Oilfield Services, Inc., Class ANorthern Oil and Gas, Inc.ProPetro Holding Corp.Solaris Oilfield Infrastructure, Inc., Class A
TOTAL ENERGY
AMERISAFE, Inc.Artisan Partners Asset Management, Inc., Class ABank of Hawaii Corp.
105,678,863
CONSUMER STAPLES — (5.1%)#* 6,710 2,632,467# 16,140 1,427,422# 3,251 129,292
4,876 789,473#* 22,488 820,137
5,267 1,546,023* 23,205 384,971# 51,585 2,170,697
116,931 2,771,26527,260 1,888,573
# 10,138 1,884,0467,212 626,795
12,606 1,964,267* 1,820 21,112
10,946 1,222,121# 16,893 844,481# 16,415 714,545
40,138 1,604,717* 61,499 2,696,731
19,759 1,205,2992,500 22,500
# 11,247 1,473,582* 49,961 1,360,438* 88,641 1,500,692# 5,368 200,548# 14,622 542,915
2,424 47,462* 19,354 1,317,040# 24,904 287,641# 12,289 2,231,191
36,328,443
ENERGY — (1.7%)* 46,071 1,498,690# 16,275 1,451,079* 32,051 941,338# 25,524 1,280,539
44,532 2,363,31311,500 600,76027,422 167,274
* 14,943 59,324* 13,494 130,352# 255,803 1,537,376# 2,510 35,517#* 242,881 393,467* 68,019 1,233,184# 19,017 272,133
11,964,346
FINANCIALS — (7.2%)18,418 1,198,27539,398 1,165,787
# 27,553 2,348,893

Bank of NT Butterfield & Son, Ltd. (The)
BGC Partners, Inc., Class ABrightSphere Investment Group P.L.C.City Holding Co.Cohen & Steers, Inc.Crawford & Co., Class ACrawford & Co., Class BCuro Group Holdings Corp.Diamond Hill Investment Group, Inc.Donnelley Financial Solutions, Inc.eHealth, Inc.Enova International, Inc.Evercore, Inc., Class AFederated Investors, Inc., Class BFirst Financial Bankshares, Inc.FirstCash, Inc.Glacier Bancorp, Inc.Green Dot Corp., Class AGreenhill & Co., Inc.Hamilton Lane, Inc., Class AHealth Insurance Innovations, Inc., Class AHoulihan Lokey, Inc.Interactive Brokers Group, Inc., Class AKinsale Capital Group, Inc.Lakeland Financial Corp.Lazard, Ltd., Class ALendingTree, Inc.Moelis & Co., Class ANMI Holdings, Inc., Class APrimerica, Inc.Pzena Investment Management, Inc., Class ARLI Corp.Selective Insurance Group, Inc.ServisFirst Bancshares, Inc.Silvercrest Asset Management Group, Inc., Class AStock Yards Bancorp, Inc.Virtu Financial, Inc., Class AWestamerica BancorporationWisdomTree Investments, Inc.World Acceptance Corp.
TOTAL FINANCIALS
Accuray, Inc.Addus HomeCare Corp.Amedisys, Inc.AMN Healthcare Services, Inc.Amphastar Pharmaceuticals, Inc.ANI Pharmaceuticals, Inc.Anika Therapeutics, Inc.
37,314 1,172,779
U.S. Small Cap Growth PortfolioCONTINUED
Shares Value†
FINANCIALS — (Continued)# 105,361 $ 580,539* 99,097 1,060,338# 8,233 637,646# 42,525 2,227,034
7,878 81,38015,130 141,768
#* 11,241 139,6133,048 429,616
* 29,063 396,129* 8,585 890,694* 20,470 551,666
32,697 2,824,04078,260 2,719,535
# 72,150 2,362,91236,431 3,666,41641,479 1,738,385
* 21,628 1,096,323# 14,800 245,680
18,924 1,110,839#* 747 16,426
21,077 969,542# 8,342 427,611
17,674 1,588,18620,833 958,11037,141 1,437,728
#* 5,922 1,910,08233,856 1,233,713
* 43,908 1,092,43123,372 2,867,51114,278 116,223
# 29,710 2,677,76219,063 1,433,53838,854 1,323,367
5,400 77,38213,882 530,986
# 48,603 1,053,713# 19,089 1,223,605# 137,933 855,185* 5,091 645,182
51,224,570
HEALTH CARE — (10.7%)* 69,148 286,273* 11,095 894,146* 26,239 3,618,096* 39,555 2,111,446* 32,500 654,875* 9,723 822,469* 2,500 137,725

Arena Pharmaceuticals, Inc.Atrion Corp.BioSpecifics Technologies Corp.BioTelemetry, Inc.Cambrex Corp.Cantel Medical Corp.Capital Senior Living Corp.Champions Oncology, Inc.Chemed Corp.Collegium Pharmaceutical, Inc.
CONMED Corp.Corcept Therapeutics, Inc.CorVel Corp.CryoLife, Inc.Eagle Pharmaceuticals, Inc.Emergent BioSolutions, Inc.Enanta Pharmaceuticals, Inc.Ensign Group, Inc. (The)Globus Medical, Inc., Class AHealthStream, Inc.Heska Corp.HMS Holdings Corp.Horizon Therapeutics P.L.C.Innoviva, Inc.Inogen, Inc.Inovalon Holdings, Inc., Class AInteger Holdings Corp.Integra LifeSciences Holdings Corp.iRadimed Corp.Joint Corp. (The)Lantheus Holdings, Inc.LeMaitre Vascular, Inc.LHC Group, Inc.Ligand Pharmaceuticals, Inc.Luminex Corp.Medpace Holdings, Inc.Meridian Bioscience, Inc.Merit Medical Systems, Inc.Mesa Laboratories, Inc.National Research Corp.NeoGenomics, Inc.NextGen Healthcare, Inc.NuVasive, Inc.Omnicell, Inc.Orthofix Medical, Inc.PetIQ, Inc.Phibro Animal Health Corp., Class APremier, Inc., Class AProvidence Service Corp. (The)
* 2,910 182,3991,695 1,304,302
* 5,544 322,106* 29,420 1,381,269* 27,761 1,215,932# 25,876 2,387,837* 24,250 129,495#* 1,690 10,934
3,830 1,552,644#* 18,197 199,621
U.S. Small Cap Growth PortfolioCONTINUED
Shares Value†
HEALTH CARE — (Continued)26,539 $ 2,318,182
#* 97,131 1,093,695* 16,378 1,395,406* 27,633 796,383#* 13,585 745,273* 29,902 1,319,874* 15,737 1,180,590
44,747 2,696,454* 14,063 640,992* 25,588 722,605#* 6,218 498,310* 71,218 2,485,508* 64,636 1,608,790* 77,480 920,462* 9,930 610,695#* 7,441 111,615* 13,398 1,172,727* 20,280 1,285,549* 1,300 31,044#* 456 8,427* 33,547 758,833# 17,777 588,241* 21,528 2,725,014#* 10,555 965,888
33,704 732,388* 26,695 2,102,498
37,815 451,889* 37,617 1,484,367# 3,356 844,638
20,581 1,387,571#* 58,566 1,427,253* 53,141 869,387* 31,691 2,110,621* 35,241 2,650,476* 16,104 860,759#* 9,472 324,321
18,177 565,850* 5,633 218,279* 11,333 631,701

Psychemedics Corp.Quidel Corp.R1 RCM, Inc.RadNet, Inc.REGENXBIO, Inc.Repligen Corp.Select Medical Holdings Corp.SIGA Technologies, Inc.Simulations Plus, Inc.Supernus Pharmaceuticals, Inc.Tenet Healthcare Corp.US Physical Therapy, Inc.Utah Medical Products, Inc.Vanda Pharmaceuticals, Inc.Varex Imaging Corp.Wright Medical Group NVXencor, Inc.
TOTAL HEALTH CARE
AAON, Inc.Actuant Corp., Class AAdvanced Disposal Services, Inc.Advanced Drainage Systems, Inc.Aerojet Rocketdyne Holdings, Inc.Aerovironment, Inc.Air Transport Services Group, Inc.Alamo Group, Inc.Albany International Corp., Class AAllegiant Travel Co.Allied Motion Technologies, Inc.Applied Industrial Technologies, Inc.Armstrong World Industries, Inc.ASGN, Inc.Astronics Corp.Astronics Corp., Class BAtkore International Group, Inc.Avis Budget Group, Inc.Axon Enterprise, Inc.Barnes Group, Inc.Barrett Business Services, Inc.BG Staffing, Inc.Brady Corp., Class ABrink's Co. (The)Builders FirstSource, Inc.Casella Waste Systems, Inc., Class AChart Industries, Inc.Cimpress NVClean Harbors, Inc.Comfort Systems USA, Inc.Construction Partners, Inc., Class A
5,287 47,636* 27,128 1,601,366#* 71,316 897,155* 42,589 627,336#* 21,873 971,380* 20,897 1,972,468* 102,951 1,723,400#* 9,230 51,688
14,330 556,291#* 41,410 1,381,852#* 55,972 1,319,260
11,256 1,452,924# 3,164 287,892#* 19,180 238,791* 26,464 841,291#* 56,136 1,620,085#* 4,600 202,492
76,347,431
U.S. Small Cap Growth PortfolioCONTINUED
Shares Value†
INDUSTRIALS — (23.1%)# 47,553 $2,415,692
23,196 531,188* 8,994 291,136
48,581 1,599,772#* 63,214 2,700,502#* 20,380 1,117,843* 53,252 1,241,304
9,392 919,38325,391 2,183,37212,520 1,876,122
8,223 325,96023,028 1,401,02435,939 3,511,600
* 32,158 2,027,562* 19,751 727,627#* 4,890 182,299* 44,980 1,227,504* 58,248 2,119,645#* 19,987 1,403,487
27,246 1,417,8826,441 563,5885,921 98,407
32,340 1,672,94838,450 3,466,652
* 93,710 1,609,938* 34,144 1,488,678* 24,210 1,828,581#* 21,398 2,063,837* 34,941 2,718,759
31,989 1,343,538* 1,700 26,571

Continental Building Products, Inc.Covanta Holding Corp.CSW Industrials, Inc.Deluxe Corp.Douglas Dynamics, Inc.EMCOR Group, Inc.EnerSysESCO Technologies, Inc.Evoqua Water Technologies Corp.Exponent, Inc.Federal Signal Corp.Forrester Research, Inc.Forward Air Corp.Franklin Covey Co.Franklin Electric Co., Inc.FTI Consulting, Inc.Generac Holdings, Inc.Gorman-Rupp Co. (The)Great Lakes Dredge & Dock Corp.H&E Equipment Services, Inc.Harsco Corp.Healthcare Services Group, Inc.Heartland Express, Inc.Heidrick & Struggles International, Inc.Helios Technologies, Inc.Heritage-Crystal Clean, Inc.Herman Miller, Inc.Hillenbrand, Inc.
HNI Corp.Huron Consulting Group, Inc.Insperity, Inc.Interface, Inc.JELD-WEN Holding, Inc.John Bean Technologies Corp.Kadant, Inc.Kaman Corp.Kennametal, Inc.Kforce, Inc.Kimball International, Inc., Class BKnoll, Inc.Kratos Defense & Security Solutions, Inc.Landstar System, Inc.Lawson Products, Inc.Lindsay Corp.Masonite International Corp.MasTec, Inc.Matson, Inc.McGrath RentCorpMercury Systems, Inc.
* 31,414 772,156117,491 2,023,195
11,903 840,471120 5,354
19,783 813,0815,800 489,462
25,623 1,745,1835,714 477,462
#* 62,440 887,89743,404 2,986,19554,040 1,683,34615,783 747,00924,961 1,572,543
* 7,246 264,47933,375 1,563,953
* 11,600 1,211,620* 47,535 3,436,780
18,682 620,616* 7,600 81,548
33,873 1,036,853* 73,510 1,724,545# 48,594 1,161,883
70,475 1,398,22412,956 384,79325,573 1,200,908
* 6,890 193,26550,185 2,275,38837,893 1,276,615
U.S. Small Cap Growth PortfolioCONTINUED
Shares Value†
INDUSTRIALS — (Continued)36,722 $1,257,361
* 2,900 176,81327,684 2,944,19352,864 732,695
* 53,660 1,175,69122,394 2,657,272
9,300 869,17824,128 1,529,71548,572 1,679,62023,859 813,35331,129 539,77740,673 986,320
* 18,382 453,11630,625 3,407,644
* 3,365 140,893# 8,804 803,101* 270 14,391#* 43,331 2,223,747
35,531 1,453,57320,905 1,423,840
* 28,219 2,300,413

Meritor, Inc.Moog, Inc., Class AMSA Safety, Inc.MSC Industrial Direct Co., Inc., Class AMueller Industries, Inc.Mueller Water Products, Inc., Class ANational Presto Industries, Inc.NV5 Global, Inc.Omega Flex, Inc.PAM Transportation Services, Inc.Park Aerospace Corp.Patrick Industries, Inc.PGT Innovations, Inc.Pitney Bowes, Inc.Proto Labs, Inc.Radiant Logistics, Inc.Raven Industries, Inc.RBC Bearings, Inc.Rexnord Corp.Saia, Inc.Simpson Manufacturing Co., Inc.SiteOne Landscape Supply, Inc.SP Plus Corp.SPX Corp.Standex International Corp.Steelcase, Inc., Class ASterling Construction Co., Inc.Systemax, Inc.Tennant Co.Terex Corp.Tetra Tech, Inc.Thermon Group Holdings, Inc.Timken Co. (The)TPI Composites, Inc.Transcat, Inc.Trex Co., Inc.TriMas Corp.TriNet Group, Inc.
Univar, Inc.Universal Logistics Holdings, Inc.US Ecology, Inc.Valmont Industries, Inc.Viad Corp.Vicor Corp.WageWorks, Inc.Watts Water Technologies, Inc., Class AWelbilt, Inc.Willdan Group, Inc.WillScot Corp.
* 79,744 1,972,0694,589 373,820
# 25,272 2,662,40515,084 1,071,71841,766 1,260,916
132,517 1,347,698# 2,105 193,597* 9,433 749,641# 7,995 608,100* 315 18,399
14,818 269,539* 21,276 975,930* 45,539 734,089# 162,270 657,194* 12,831 1,335,707* 10,500 57,645
34,737 1,258,869* 15,681 2,551,142* 41,472 1,214,715* 21,405 1,633,202
29,763 1,838,163#* 30,188 2,229,988* 16,218 560,008* 37,857 1,321,209
5,552 390,69456,805 960,573
* 20,237 253,36735,656 773,73514,857 1,130,76644,901 1,367,23536,575 2,896,740
* 11,563 293,00635,990 1,645,103
#* 27,892 713,198* 7,200 171,504#* 45,088 3,685,944* 9,673 290,093* 53,003 3,897,841
U.S. Small Cap Growth PortfolioCONTINUED
Shares Value†
INDUSTRIALS — (Continued)#* 83,954 $ 1,857,062
18,905 372,23918,141 1,154,31213,422 1,846,86717,741 1,226,613
* 11,399 336,954* 27,585 1,411,524
16,721 1,552,210#* 111,174 1,825,477#* 7,915 276,867* 23,975 381,682

TOTAL INDUSTRIALS
Acacia Communications, Inc.ACI Worldwide, Inc.Advanced Energy Industries, Inc.Agilysys, Inc.Alarm.com Holdings, Inc.Ambarella, Inc.American Software, Inc., Class AAppfolio, Inc., Class ABadger Meter, Inc.Blackbaud, Inc.Brooks Automation, Inc.Cabot Microelectronics Corp.Carbonite, Inc.Cardtronics P.L.C., Class ACasa Systems, Inc.Cass Information Systems, Inc.Cision, Ltd.Clearfield, Inc.Coherent, Inc.Control4 Corp.CoreLogic, Inc.CSG Systems International, Inc.CTS Corp.Eastman Kodak Co.Ebix, Inc.Endurance International Group Holdings, Inc.Entegris, Inc.ePlus, Inc.EVERTEC, Inc.ExlService Holdings, Inc.Extreme Networks, Inc.FabrinetFARO Technologies, Inc.FormFactor, Inc.GlobalSCAPE, Inc.Globant SAGTT Communications, Inc.Hackett Group, Inc. (The)Harmonic, Inc.Ichor Holdings, Ltd.IEC Electronics Corp.II-VI, Inc.Immersion Corp.InterDigital, Inc.Internap Corp.
Itron, Inc.j2 Global, Inc.
164,167,300
INFORMATION TECHNOLOGY — (15.5%)* 791 53,131* 85,196 2,859,178* 27,497 1,605,825* 13,160 322,815#* 41,106 2,051,600#* 20,128 1,005,394
23,428 312,061#* 15,117 1,459,546
25,263 1,351,31829,316 2,667,75663,603 2,467,79623,207 2,823,132
#* 26,349 472,438* 41,434 1,180,040#* 43,928 289,486
12,019 611,887* 104,491 1,085,661* 2,337 30,965#* 11,329 1,573,032* 17,898 427,941* 49,921 2,274,900
33,846 1,734,26929,855 941,030
#* 24,798 60,011# 19,603 902,326* 124,885 591,955
66,815 2,907,121* 12,212 926,891
64,564 2,067,339* 29,891 2,056,202* 76,380 621,733* 27,187 1,459,398* 7,009 374,211* 54,698 917,832
14,606 203,754* 20,285 2,150,210#* 25,315 306,312
26,753 439,284* 78,103 583,429* 8,420 212,268* 1,200 7,200#* 31,166 1,237,290#* 22,673 182,291
20,429 1,316,240#* 16,925 50,437
U.S. Small Cap Growth PortfolioCONTINUED
Shares Value†
INFORMATION TECHNOLOGY — (Continued)* 26,446 $ 1,639,652# 30,589 2,725,174

Lattice Semiconductor Corp.Littelfuse, Inc.LiveRamp Holdings, Inc.Lumentum Holdings, Inc.Manhattan Associates, Inc.MAXIMUS, Inc.MaxLinear, Inc.MKS Instruments, Inc.Monotype Imaging Holdings, Inc.Nanometrics, Inc.Napco Security Technologies, Inc.NCR Corp.NIC, Inc.Novanta, Inc.NVE Corp.OSI Systems, Inc.PAR Technology Corp.Park City Group, Inc.Paylocity Holding Corp.Paysign, Inc.Perficient, Inc.Power Integrations, Inc.PRGX Global, Inc.Progress Software Corp.Qualys, Inc.Rogers Corp.Rudolph Technologies, Inc.Sapiens International Corp. NVScience Applications International Corp.Semtech Corp.Silicon Laboratories, Inc.SMART Global Holdings, Inc.SolarEdge Technologies, Inc.SPS Commerce, Inc.TransAct Technologies, Inc.TTEC Holdings, Inc.Tucows, Inc., Class AVerint Systems, Inc.Versum Materials, Inc.Viavi Solutions, Inc.Virtusa Corp.Vishay Precision Group, Inc.Zix Corp.
TOTAL INFORMATION TECHNOLOGY
AK Steel Holding Corp.Balchem Corp.Cabot Corp.Chase Corp.Chemours Co. (The)Cleveland-Cliffs, Inc.Compass Minerals International, Inc.Eagle Materials, Inc.Ferro Corp.
* 72,654 1,405,1288,170 1,380,403
* 24,009 1,265,034#* 37,855 2,143,729* 46,367 3,940,731
18,264 1,342,587#* 54,547 1,198,943
5,210 443,52717,740 354,268
* 20,191 633,594* 22,504 651,491#* 87,725 2,965,982
57,748 1,047,549* 30,067 2,528,334
4,037 271,367* 14,875 1,674,330#* 1,586 41,220#* 1,240 6,361* 28,430 2,902,419# 7,627 107,617* 27,817 950,507
27,849 2,536,208* 16,734 93,878
42,291 1,830,777* 13,892 1,202,492* 9,871 1,566,133* 12,004 323,148
8,334 134,09429,369 2,507,232
* 38,988 2,061,296* 26,292 2,950,225* 10,002 304,461#* 32,774 2,137,848* 1,715 191,788
5,315 63,56738,477 1,805,341
#* 852 41,688* 26,475 1,532,108
77,575 4,032,349* 130,683 1,917,120* 27,968 1,249,610* 1,800 73,332* 47,810 435,549
109,785,126
MATERIALS — (5.7%)#* 302,202 852,210
18,843 1,934,04537,395 1,672,304
8,846 916,26986,083 1,641,603
# 154,304 1,644,881# 19,617 1,095,609
19,364 1,602,952* 73,726 1,085,984

GCP Applied Technologies, Inc.Graphic Packaging Holding Co.
HB Fuller Co.Ingevity Corp.Innospec, Inc.Koppers Holdings, Inc.Louisiana-Pacific Corp.Myers Industries, Inc.Neenah, Inc.NewMarket Corp.OMNOVA Solutions, Inc.Owens-Illinois, Inc.PolyOne Corp.Quaker Chemical Corp.Ryerson Holding Corp.Scotts Miracle-Gro Co. (The)Sensient Technologies Corp.Silgan Holdings, Inc.Stepan Co.Trinseo SAUS Concrete, Inc.Worthington Industries, Inc.
TOTAL MATERIALS
Jones Lang LaSalle, Inc.Kennedy-Wilson Holdings, Inc.Marcus & Millichap, Inc.Newmark Group, Inc., Class ARE/MAX Holdings, Inc., Class ARMR Group, Inc. (The), Class A
TOTAL REAL ESTATE
Genie Energy, Ltd., Class BNew Jersey Resources Corp.Ormat Technologies, Inc.
TOTAL UTILITIES
TOTAL COMMON STOCKS
GCI Liberty, Inc.
TOTAL INVESTMENT SECURITIES
State Street Institutional U.S. Government Money Market Fund 2.260%
* 56,115 1,236,21375,225 1,117,843
U.S. Small Cap Growth PortfolioCONTINUED
Shares Value†
MATERIALS — (Continued)143 $ 6,837
* 29,906 2,946,9373,990 372,586
* 17,007 464,29134,991 914,66532,615 527,38513,844 909,689
2,019 851,231* 40,005 398,050
104,362 1,771,02361,792 2,024,924
9,092 1,703,750* 22,882 186,717# 36,128 4,052,839# 24,477 1,668,597
69,074 2,076,36417,105 1,695,96127,759 1,077,327
#* 4,484 211,15244,214 1,778,287
40,438,525
REAL ESTATE — (0.5%)976 142,193
28,775 619,238* 35,671 1,184,277
96,353 950,041598 17,390
13,876 683,254
3,596,393
UTILITIES — (0.6%)# 4,183 46,097
54,837 2,734,72118,417 1,207,234
3,988,052
624,724,581
PREFERRED STOCKS — (0.0%)COMMUNICATION SERVICES — (0.0%)
2,460 65,042
624,789,623
TEMPORARY CASH INVESTMENTS — (0.1%)265,530 265,530
SECURITIES LENDING COLLATERAL — (11.9%)

DFA Short Term Investment Fund
(Cost $587,369,822)^^
Communication ServicesConsumer DiscretionaryConsumer StaplesEnergyFinancialsHealth CareIndustrialsInformation TechnologyMaterialsReal EstateUtilities
Communication ServicesTemporary Cash InvestmentsSecurities Lending Collateral
TOTAL
Altium, Ltd.Aristocrat Leisure, Ltd.Beach Energy, Ltd.BHP Group, Ltd.BHP Group, Ltd., Sponsored ADRBrambles, Ltd.CIMIC Group, Ltd.Coca-Cola Amatil, Ltd.Cochlear, Ltd.Coles Group, Ltd.Computershare, Ltd.CSL, Ltd.Domino's Pizza Enterprises, Ltd.Evolution Mining, Ltd.IDP Education, Ltd.Iluka Resources, Ltd.
@§ 7,308,034 84,561,256
TOTAL INVESTMENTS — (100.0%)$709,616,409
U.S. Small Cap Growth PortfolioCONTINUED
Summary of the Portfolio's investments as of July 31, 2019, based on their valuation inputs, is as follows (see Security Valuation Note):
Investments in Securities (Market Value)
Level 1 Level 2 Level 3 Total
Common Stocks$ 21,205,532 — — $ 21,205,532
105,678,863 — — 105,678,86336,328,443 — — 36,328,44311,964,346 — — 11,964,34651,224,570 — — 51,224,57076,347,431 — — 76,347,431
164,167,300 — — 164,167,300109,785,126 — — 109,785,126
40,438,525 — — 40,438,5253,596,393 — — 3,596,3933,988,052 — — 3,988,052
Preferred Stocks65,042 — — 65,042
265,530 — — 265,530— $84,561,256 — 84,561,256
$625,055,153 $84,561,256 — $709,616,409
INTERNATIONAL LARGE CAP GROWTH PORTFOLIO
SCHEDULE OF INVESTMENTS
July 31, 2019
(Unaudited)Shares Value»
COMMON STOCKS — (97.3%)AUSTRALIA — (6.2%)
5,203 $ 129,36467,048 1,395,206
185,859 267,915146,880 4,043,703
711 39,05573,978 661,72711,442 285,61046,963 339,902
7,509 1,128,225* 145,987 1,417,413
42,497 457,78926,670 4,161,649
# 6,605 173,86596,290 326,80618,410 240,62231,786 207,399

James Hardie Industries P.L.C.Macquarie Group, Ltd.Magellan Financial Group, Ltd.Medibank Pvt, Ltd.Northern Star Resources, Ltd.Orora, Ltd.Qantas Airways, Ltd.Ramsay Health Care, Ltd.REA Group, Ltd.Reece, Ltd.Rio Tinto, Ltd.Telstra Corp., Ltd.TPG Telecom, Ltd.Wesfarmers, Ltd.WiseTech Global, Ltd.Woolworths Group, Ltd.
TOTAL AUSTRALIA
ANDRITZ AGOMV AG
TOTAL AUSTRIA
Anheuser-Busch InBev SAAnheuser-Busch InBev SA/NV, Sponsored ADRColruyt SAProximus SADPUmicore SA
TOTAL BELGIUM
Air CanadaAlimentation Couche-Tard, Inc., Class BB2Gold Corp.Bausch Health Cos., Inc.BCE, Inc.BCE, Inc.
CAE, Inc.CAE, Inc.Canada Goose Holdings, Inc.Canadian National Railway Co.Canadian Pacific Railway, Ltd.Canadian Tire Corp., Ltd., Class ACCL Industries, Inc., Class BCGI, Inc.CGI, Inc.CI Financial Corp.Constellation Software, Inc.Dollarama, Inc.Empire Co., Ltd., Class A
34,715 469,5171,755 153,596
15,504 651,108137,068 337,897
71,250 626,95866,670 154,056
144,597 562,91515,662 778,195
6,975 467,8424,541 32,662
19,572 1,309,902314,887 853,760
33,380 158,84752,189 1,397,623
1,872 40,25233,132 807,770
24,079,150
AUSTRIA — (0.1%)1,411 50,2578,917 446,180
496,437
BELGIUM — (1.0%)27,797 2,794,615
# 1,795 181,2596,221 324,153
14,200 404,8685,353 167,568
3,872,463
CANADA — (9.0%)* 9,313 320,430
22,470 1,377,347* 13,601 43,386#* 47,550 1,139,774
7,401 334,441# 2,084 94,009
International Large Cap Growth PortfolioCONTINUED
Shares Value»
CANADA — (Continued)2,400 $ 64,719
22,140 596,894#* 4,694 219,833
32,222 3,048,5237,120 1,698,761
# 7,800 851,68813,100 655,099
* 10,382 798,687* 3,494 268,920
31,139 482,7282,245 2,135,948
12,000 444,613# 10,400 275,248

Finning International, Inc.FirstService Corp.George Weston, Ltd.Gildan Activewear, Inc.IGM Financial, Inc.Inter Pipeline, Ltd.Keyera Corp.Kirkland Lake Gold, Ltd.Kirkland Lake Gold, Ltd.Loblaw Cos., Ltd.Methanex Corp.Metro, Inc.National Bank of CanadaNorthland Power, Inc.Open Text Corp.Parkland Fuel Corp.Quebecor, Inc., Class BRestaurant Brands International, Inc.Restaurant Brands International, Inc.Ritchie Bros Auctioneers, Inc.Rogers Communications, Inc., Class BRoyal Bank of CanadaRoyal Bank of CanadaSaputo, Inc.Shaw Communications, Inc., Class BSpin Master Corp.TC Energy Corp.TFI International, Inc.Thomson Reuters Corp.Toromont Industries, Ltd.Toronto-Dominion Bank (The)Waste Connections, Inc.Waste Connections, Inc.WSP Global, Inc.
TOTAL CANADA
Coloplast A.S., Class BNovo Nordisk A.S., Class B
TOTAL DENMARK
Elisa OyjKesko Oyj, Class AKesko Oyj, Class B
Kone Oyj, Class BNeste OyjNokia OyjSampo Oyj, Class AWartsila Oyj Abp
16,115 278,6362,300 241,3628,182 647,096
# 14,115 555,7085,000 138,127
43,563 733,09218,800 478,33311,400 471,4445,619 232,009
18,631 966,700# 8,585 337,476
2,440 95,428# 11,100 537,254
13,923 264,99928,584 1,218,536
# 9,764 319,08019,210 435,20210,176 749,437
3,973 292,8101,300 46,935
18,601 965,20624,730 1,952,84228,696 2,264,40115,374 464,31950,373 986,303
#* 3,300 93,76419,846 971,660
7,063 223,42810,296 691,582
9,004 451,63322,600 1,321,102
2,211 200,6271,440 130,6136,500 366,616
34,974,808
DENMARK — (1.7%)8,424 983,887
115,328 5,537,972
6,521,859
FINLAND — (1.0%)15,805 742,393
1,990 112,0284,598 278,444
International Large Cap Growth PortfolioCONTINUED
Shares Value»
FINLAND — (Continued)18,894 $ 1,076,45623,631 782,099
# 15,073 81,2388,357 347,012
24,360 306,052

TOTAL FINLAND
Aeroports de ParisAir Liquide SAAirbus SEAtos SEBioMerieuxBureau Veritas SADanone SADassault Systemes SEEurofins Scientific SEGetlink SEHermes InternationalIpsen SAKering SALegrand SAL'Oreal SALVMH Moet Hennessy Louis Vuitton SESafran SASartorius Stedim BiotechSEB SASodexo SASTMicroelectronics NVSTMicroelectronics NVTeleperformanceThales SAUbisoft Entertainment SAVinci SAWorldline SA
TOTAL FRANCE
Adidas AGAxel Springer SEBASF SEBeiersdorf AGBrenntag AGDeutsche Boerse AGDeutsche Post AGDeutsche Telekom AGE.ON SEFielmann AGFresenius Medical Care AG & Co. KGaAFuchs Petrolub SEHenkel AG & Co. KGaAHochtief AGHugo Boss AGInfineon Technologies AGKION Group AGMerck KGaAMTU Aero Engines AGNemetschek SE
3,725,722
FRANCE — (9.8%)2,481 426,508
17,623 2,432,61439,128 5,531,168
1,377 110,7262,137 180,839
39,375 981,11525,583 2,218,889
1,571 238,975# 1,207 516,308
13,666 197,3272,069 1,453,3155,867 671,2604,962 2,562,929
28,726 2,023,501335 89,634
14,620 6,038,92610,212 1,466,044
2,180 347,4143,662 585,745
# 15,040 1,726,62782,378 1,509,735
3,700 67,5256,241 1,307,408
10,816 1,218,682* 11,608 954,812
32,800 3,373,930* 550 39,302
38,271,258
GERMANY — (7.1%)10,029 3,196,674
4,771 329,308358 23,766
3,521 408,04112,836 626,93017,605 2,443,96962,579 2,035,477
240,938 3,946,823268,378 2,672,727
2,346 163,24516,739 1,159,357
2,255 79,1973,611 339,2572,863 324,431
719 45,190143,240 2,653,115
8,939 476,465674 68,744
4,147 1,033,4196,714 373,279
International Large Cap Growth PortfolioCONTINUED

Puma SEPuma SERational AGRTL Group SASAP SE, Sponsored ADRSAP SESymrise AGThyssenkrupp AGUnited Internet AGWirecard AG
TOTAL GERMANY
AIA Group, Ltd.ASM Pacific Technology, Ltd.Chow Tai Fook Jewellery Group, Ltd.Galaxy Entertainment Group, Ltd.Hang Seng Bank, Ltd.Hong Kong & China Gas Co., Ltd.Hong Kong Exchanges & Clearing, Ltd.MGM China Holdings, Ltd.NagaCorp., Ltd.Prada SpASamsonite International SASands China, Ltd.Techtronic Industries Co., Ltd.Vitasoy International Holdings, Ltd.Wynn Macau, Ltd.
TOTAL HONG KONG
Glanbia P.L.C.Kerry Group P.L.C., Class AKingspan Group P.L.C.Smurfit Kappa Group P.L.C.
TOTAL IRELAND
Azrieli Group, Ltd.Bank Leumi Le-Israel BMBezeq The Israeli Telecommunication Corp., Ltd.Delek Group, Ltd.Elbit Systems, Ltd.First International Bank Of Israel, Ltd.Israel Chemicals, Ltd.Mizrahi Tefahot Bank, Ltd.Nice, Ltd., Sponsored ADRStrauss Group, Ltd.Tower Semiconductor, Ltd.
TOTAL ISRAEL
A2A SpAAtlantia SpA
Shares Value»
GERMANY — (Continued)7,842 $ 546,325
450 31,508370 251,856
3,826 187,8575,177 636,926
10,453 1,277,7337,842 722,5844,854 62,1192,131 63,2108,114 1,347,009
27,526,541
HONG KONG — (3.1%)336,400 3,449,695
36,500 426,41043,800 41,764
157,000 1,068,7461,800 42,782
460,000 1,015,72678,117 2,631,157
122,400 200,017204,000 306,639
23,100 70,91117,400 34,071
151,200 725,740141,000 1,048,567110,000 517,838187,600 420,943
12,001,006
IRELAND — (0.4%)5,830 75,8923,958 460,5349,478 463,572
22,583 710,499
1,710,497
ISRAEL — (0.4%)1,707 119,7227,502 54,573
220,558 150,054440 67,101
1,308 208,757* 1,937 49,929
56,794 305,664* 4,072 97,705#* 2,506 382,716
4,186 126,305* 4,828 94,967
1,657,493
ITALY — (2.1%)93,245 162,991
3,530 90,775

CNH Industrial NVDiaSorin SpAEnel SpA
Ferrari NVFerrari NVFinecoBank Banca Fineco SpAHera SpAMoncler SpAPoste Italiane SpARecordati SpASnam SpA
TOTAL ITALY
ABC-Mart, Inc.Acom Co., Ltd.Advantest Corp.Aeon Co., Ltd.Aeon Delight Co., Ltd.Ain Holdings, Inc.Ajinomoto Co., Inc.Amano Corp.Asahi Group Holdings, Ltd.Asahi Intecc Co., Ltd.Astellas Pharma, Inc.Bandai Namco Holdings, Inc.Benefit One, Inc.Bic Camera, Inc.Calbee, Inc.Canon, Inc.Capcom Co., Ltd.Casio Computer Co., Ltd.Chugai Pharmaceutical Co., Ltd.Colowide Co., Ltd.Cosmos Pharmaceutical Corp.CyberAgent, Inc.Daifuku Co., Ltd.Daiichikosho Co., Ltd.Daikin Industries, Ltd.Daito Trust Construction Co., Ltd.Daiwa House Industry Co., Ltd.Disco Corp.DMG Mori Co., Ltd.Eisai Co., Ltd.en-japan, Inc.Fancl Corp.Fast Retailing Co., Ltd.FP Corp.Fuji Electric Co., Ltd.Fuji Kyuko Co., Ltd.
112,585 1,139,9791,290 149,605
325,900 2,229,359
International Large Cap Growth PortfolioCONTINUED
Shares Value»
ITALY — (Continued)5,441 $ 876,174
# 6,686 1,076,98131,048 308,86512,409 46,20420,041 822,88815,976 170,49911,853 530,834
134,297 659,367
8,264,521
JAPAN — (21.7%)1,200 75,843
37,500 132,46726,700 1,028,18631,700 548,544
500 14,8982,500 136,7524,100 73,4664,800 144,396
18,800 814,32020,200 527,85299,600 1,411,52012,100 650,487
7,400 126,4134,700 46,3345,200 146,700
34,500 935,6839,700 202,543
14,900 169,9843,900 279,033
200 3,8981,200 220,969
# 13,400 537,6707,951 434,8664,500 185,876
10,200 1,265,9919,300 1,199,265
18,400 523,1441,900 348,701
10,400 150,648600 32,429
3,700 151,7842,700 67,8542,600 1,559,5431,800 110,970
14,100 430,753# 3,699 142,049

Fuji Oil Holdings, Inc.Fuji Seal International, Inc.Fujitsu General, Ltd.Fujitsu, Ltd.GMO internet, Inc.GMO Payment Gateway, Inc.Goldwin, Inc.GungHo Online Entertainment, Inc.Hakuhodo DY Holdings, Inc.Hamamatsu Photonics KKHarmonic Drive Systems, Inc.Hikari Tsushin, Inc.
HIS Co., Ltd.Hitachi High-Technologies Corp.Hitachi Transport System, Ltd.Horiba, Ltd.Hoshizaki Corp.Hoya Corp.Hulic Co., Ltd.Ichigo, Inc.Idemitsu Kosan Co., Ltd.Infomart Corp.Ito En, Ltd.Itochu Techno-Solutions Corp.Izumi Co., Ltd.Japan Airport Terminal Co., Ltd.Japan Exchange Group, Inc.Japan Tobacco, Inc.Justsystems Corp.Kakaku.com, Inc.Kaken Pharmaceutical Co., Ltd.Kao Corp.KDDI Corp.Keihan Holdings Co., Ltd.Kewpie Corp.Keyence Corp.Kikkoman Corp.Kirin Holdings Co., Ltd.Kobe Bussan Co., Ltd.Koito Manufacturing Co., Ltd.Komatsu, Ltd.Konami Holdings Corp.Kose Corp.Kubota Corp.Kusuri no Aoki Holdings Co., Ltd.Kyoritsu Maintenance Co., Ltd.Kyudenko Corp.Lasertec Corp.Lawson, Inc.
3,500 107,7452,900 84,9623,200 51,139
12,300 959,8728,300 134,9284,800 346,7961,000 137,5324,140 109,234
25,400 398,3634,400 163,173
# 2,100 79,0921,429 315,061
International Large Cap Growth PortfolioCONTINUED
Shares Value»
JAPAN — (Continued)2,700 $ 65,8504,600 231,7813,000 93,3132,300 123,0841,700 120,103
19,600 1,502,96515,000 128,856
600 2,16810,004 275,68410,200 137,583
6,200 270,7343,600 92,2864,200 157,5423,100 128,176
60,700 889,58867,000 1,476,260
1,600 53,98715,300 317,799
2,400 116,26725,800 1,882,903
124,600 3,251,0006,000 243,1855,300 119,9331,800 1,032,9285,700 259,139
29,500 639,8043,000 167,582
14,200 709,90539,700 887,708
6,500 275,7943,800 647,758
600 9,2552,100 138,8481,800 77,4933,400 105,2722,100 99,8979,000 449,744

Lion Corp.M3, Inc.Mani, Inc.Matsui Securities Co., Ltd.Matsumotokiyoshi Holdings Co., Ltd.McDonald's Holdings Co. Japan, Ltd.MEIJI Holdings Co., Ltd.Minebea Mitsumi, Inc.MISUMI Group, Inc.MonotaRO Co., Ltd.Morinaga & Co., Ltd.Murata Manufacturing Co., Ltd.NET One Systems Co., Ltd.Nexon Co., Ltd.Nichirei Corp.Nidec Corp.Nifco, Inc.Nihon M&A Center, Inc.Nihon Unisys, Ltd.Nippon Suisan Kaisha, Ltd.Nissan Chemical Corp.Nitori Holdings Co., Ltd.
Nitto Denko Corp.Noevir Holdings Co., Ltd.Nomura Research Institute, Ltd.NS Solutions Corp.NTT Data Corp.NTT DOCOMO, Inc.Olympus Corp.Omron Corp.Open House Co., Ltd.Oracle Corp.Oriental Land Co., Ltd.OSG Corp.Otsuka Corp.Pan Pacific International Holdings Corp.Park24 Co., Ltd.PeptiDream, Inc.Persol Holdings Co., Ltd.Pigeon Corp.Pilot Corp.Pola Orbis Holdings, Inc.Rakuten, Inc.Recruit Holdings Co., Ltd.Relo Group, Inc.Renesas Electronics Corp.Rohto Pharmaceutical Co., Ltd.Ryohin Keikaku Co., Ltd.Sankyu, Inc.
6,000 117,78432,300 650,699
900 64,6783,500 29,0563,800 126,4901,000 44,9036,000 416,670
64,500 1,100,8529,200 206,462
14,700 320,9094,100 192,236
28,400 1,300,4692,900 76,488
* 8,700 137,70812,300 284,570
3,600 481,3779,200 226,905
16,500 442,7877,000 229,739
15,700 98,9398,300 362,9701,800 242,758
International Large Cap Growth PortfolioCONTINUED
Shares Value»
JAPAN — (Continued)500 $ 24,625600 31,319
12,630 223,6242,000 67,375
41,400 543,59468,400 1,640,05352,800 575,672
8,700 413,915# 4,900 213,478
4,400 365,3323,400 448,6144,000 79,3957,000 276,0243,900 249,503
12,700 274,489* 10,800 600,774
22,400 541,788# 14,000 510,508
3,800 143,5223,700 92,987
69,887 712,79266,200 2,241,69613,300 352,447
* 132,500 778,7386,000 172,8283,600 639,0115,400 289,918

Sanwa Holdings Corp.SCREEN Holdings Co., Ltd.SCSK Corp.Secom Co., Ltd.Seibu Holdings, Inc.Sekisui Chemical Co., Ltd.Seria Co., Ltd.Seven & I Holdings Co., Ltd.Seven Bank, Ltd.Sharp Corp.Shimadzu Corp.Shimano, Inc.Shin-Etsu Chemical Co., Ltd.Shionogi & Co., Ltd.Ship Healthcare Holdings, Inc.Shiseido Co., Ltd.Skylark Holdings Co., Ltd.SMS Co., Ltd.SoftBank Group Corp.Sohgo Security Services Co., Ltd.Sony Corp.Stanley Electric Co., Ltd.Sugi Holdings Co., Ltd.SUMCO Corp.Sumitomo Dainippon Pharma Co., Ltd.Sumitomo Realty & Development Co., Ltd.Sundrug Co., Ltd.Suntory Beverage & Food, Ltd.Sushiro Global Holdings, Ltd.Suzuki Motor Corp.Sysmex Corp.Taisei Corp.
Taiyo Nippon Sanso Corp.Taiyo Yuden Co., Ltd.TechnoPro Holdings, Inc.Terumo Corp.TIS, Inc.Toei Animation Co., Ltd.Tokai Carbon Co., Ltd.Tokyo Electron, Ltd.TOTO, Ltd.Trend Micro, Inc.Tsuruha Holdings, Inc.Unicharm Corp.USS Co., Ltd.Welcia Holdings Co., Ltd.Workman Co., Ltd.Yahoo Japan Corp.Yamato Holdings Co., Ltd.
16,700 186,181# 3,800 205,906
3,600 170,9165,300 415,366
22,000 345,89528,400 419,781
3,900 91,18128,600 976,05978,600 212,64734,233 429,371
8,900 213,6951,500 211,769
12,800 1,303,2434,600 254,6792,200 98,860
20,400 1,501,12522,800 397,861
8,000 177,633117,080 5,977,889
2,900 140,58177,900 4,430,47810,700 265,325
2,500 120,34011,700 153,3391,300 23,874
12,000 436,6438,400 232,2535,900 234,1032,300 141,063
27,400 1,071,5728,300 602,606
13,500 465,760
International Large Cap Growth PortfolioCONTINUED
Shares Value»
JAPAN — (Continued)14,300 $ 293,210
4,800 94,9443,900 220,232
20,900 608,3024,800 249,1481,000 41,831
14,900 146,0058,900 1,507,4149,399 376,347
16,600 723,7924,100 417,3459,400 265,936
14,900 295,064# 5,200 241,620
1,000 45,547127,600 373,731
19,600 384,795

Yaoko Co., Ltd.Yaskawa Electric Corp.Yokogawa Electric Corp.Zenkoku Hosho Co., Ltd.Zensho Holdings Co., Ltd.ZOZO, Inc.
TOTAL JAPAN
ASML Holding NVGrandVision NVHeineken NVKoninklijke KPN NVOCI NVUnilever NVUnilever NVWolters Kluwer NV
TOTAL NETHERLANDS
a2 Milk Co., Ltd.Fisher & Paykel Healthcare Corp., Ltd.Spark New Zealand, Ltd.
TOTAL NEW ZEALAND
Aker BP ASAAustevoll Seafood ASABakkafrost P/FEquinor ASAGjensidige Forsikring ASALeroy Seafood Group ASAMowi ASASalmar ASATelenor ASATGS NOPEC Geophysical Co. ASATomra Systems ASA
TOTAL NORWAY
Jeronimo Martins SGPS SA
Dairy Farm International Holdings, Ltd.DBS Group Holdings, Ltd.Genting Singapore, Ltd.Great Eastern Holdings, Ltd.Jardine Cycle & Carriage, Ltd.Olam International, Ltd.Oversea-Chinese Banking Corp., Ltd.SATS, Ltd.Singapore Exchange, Ltd.Singapore Technologies Engineering, Ltd.
2,100 96,15816,600 549,32514,600 261,293
7,600 296,44810,200 219,11422,900 431,810
84,608,777
NETHERLANDS — (3.0%)6,383 1,422,1966,267 187,8469,588 1,028,681
703,646 2,006,408* 5,739 149,685
71,707 4,140,3629,659 559,870
27,617 2,001,827
11,496,875
NEW ZEALAND — (0.3%)* 36,522 429,137
10,356 111,625168,096 438,184
978,946
NORWAY — (0.8%)# 10,737 303,845
5,301 53,9322,369 136,484
30,784 551,9663,451 67,031
19,860 124,84918,607 447,180
3,812 176,07242,472 860,60911,677 282,2474,203 123,618
3,127,833
International Large Cap Growth PortfolioCONTINUED
Shares Value»
PORTUGAL — (0.0%)9,942 $ 160,425
SINGAPORE — (1.1%)34,900 261,33430,800 587,258
361,200 240,3654,300 79,3679,944 243,3096,600 9,302
14,275 118,84964,300 224,03281,500 467,605
155,600 477,263

Singapore Telecommunications, Ltd.United Overseas Bank, Ltd.Venture Corp., Ltd.
TOTAL SINGAPORE
Acciona SAACS Actividades de Construccion y Servicios SAAena SME SAAmadeus IT Group SACellnex Telecom SAEnagas SAEndesa SAGrifols SAIndustria de Diseno Textil SANaturgy Energy Group SATelefonica SA
TOTAL SPAIN
AAK ABAlfa Laval ABAtlas Copco AB, Class AAtlas Copco AB, Class BAxfood ABBeijer Ref ABElectrolux ABElekta AB, Class BEpiroc AB, Class AEpiroc AB, Class BEssity AB, Class BHennes & Mauritz AB, Class BHexagon AB, Class BHexpol ABIndutrade ABLifco AB, Class BLoomis AB, Class BNibe Industrier AB, Class BSandvik ABSecuritas AB, Class BSweco AB, Class BSwedish Orphan Biovitrum ABTelefonaktiebolaget LM Ericsson, Class B
TOTAL SWEDEN
EMS-Chemie Holding AGGeberit AGGivaudan SAKuehne + Nagel International AGLogitech International SANestle SA
247,100 596,05935,323 673,00022,800 254,435
4,232,178
SPAIN — (2.8%)2,543 270,776
32,243 1,302,8224,328 784,589
23,703 1,852,31617,828 666,73715,910 347,06325,811 637,74916,493 534,51541,047 1,228,221
4,405 111,583410,076 3,126,268
10,862,639
SWEDEN — (2.4%)5,532 113,173
20,119 375,82539,724 1,213,33523,381 637,84911,827 249,0102,178 48,278
30,287 699,84625,642 364,82838,561 422,54324,352 253,10623,554 699,627
# 43,238 753,8586,775 328,2657,397 56,2846,153 174,3283,104 158,588
284 9,76921,759 307,26776,904 1,180,13836,494 565,156
4,771 133,053* 10,711 206,749
29,940 261,953
9,212,828
International Large Cap Growth PortfolioCONTINUED
Shares Value»
SWITZERLAND — (8.3%)912 $ 569,980
2,650 1,223,351814 2,164,906
6,980 1,027,7585,653 233,130
66,107 7,013,105

Partners Group Holding AGRoche Holding AGRoche Holding AGSchindler Holding AGSGS SASika AGSonova Holding AGStraumann Holding AGTemenos AG
TOTAL SWITZERLAND
Admiral Group P.L.C.Ashtead Group P.L.C.AstraZeneca P.L.C., Sponsored ADRAstraZeneca P.L.C.Auto Trader Group P.L.C.B&M European Value Retail SABAE Systems P.L.C.Berkeley Group Holdings P.L.C.BHP Group P.L.C., ADRBHP Group P.L.C.BT Group P.L.C.Bunzl P.L.C.Burberry Group P.L.C.Burford Capital, Ltd.Centrica P.L.C.Coca-Cola HBC AGCompass Group P.L.C.Croda International P.L.C.DCC P.L.C.Diageo P.L.C., Sponsored ADRDiageo P.L.C.Evraz P.L.C.Experian P.L.C.Ferguson P.L.C.Fresnillo P.L.C.G4S P.L.C.GlaxoSmithKline P.L.C., Sponsored ADRHalma P.L.C.Hargreaves Lansdown P.L.C.Hikma Pharmaceuticals P.L.C.HomeServe P.L.C.Imperial Brands P.L.C.InterContinental Hotels Group P.L.C., ADRInternational Consolidated Airlines Group SAIntertek Group P.L.C.ITV P.L.C.JD Sports Fashion P.L.C.Johnson Matthey P.L.C.London Stock Exchange Group P.L.C.Merlin Entertainments P.L.C.Mondi P.L.C.
1,507 1,198,5021,591 426,695
40,924 10,953,9252,612 587,610
704 1,738,50418,400 2,656,484
# 1,486 341,715859 700,775
8,695 1,530,691
32,367,131
UNITED KINGDOM — (15.0%)17,820 468,63366,691 1,833,81383,302 3,616,14010,719 926,055
114,154 749,37318,781 84,300
251,210 1,668,9679,077 426,917
10,624 507,19071,676 1,709,008
898,335 2,104,21618,475 481,54451,260 1,413,432
6,035 109,901689,470 634,717
13,286 457,16186,031 2,176,619
8,829 501,5362,107 177,680
11,691 1,950,994999 41,659
78,219 612,67265,315 1,980,94925,618 1,906,274
# 16,544 119,408184,889 429,118149,351 6,165,209
7,820 188,84933,811 858,9678,164 182,134
17,442 241,33287,868 2,230,093
# 6,985 490,02230,305 155,94115,324 1,060,793
435,471 584,90351,308 404,635
2,315 90,2663,933 315,8668,205 44,884
40,370 879,492
International Large Cap Growth PortfolioCONTINUED

Next P.L.C.NMC Health P.L.C.Persimmon P.L.C.RELX P.L.C.RELX P.L.C.Rentokil Initial P.L.C.Rightmove P.L.C.Rio Tinto P.L.C., Sponsored ADRRolls-Royce Holdings P.L.C.Sage Group P.L.C. (The)Smith & Nephew P.L.C.Smiths Group P.L.C.Spirax-Sarco Engineering P.L.C.SSE P.L.C.Taylor Wimpey P.L.C.Unilever P.L.C., Sponsored ADRUnilever P.L.C.Whitbread P.L.C.
TOTAL UNITED KINGDOM
TOTAL COMMON STOCKS
Fuchs Petrolub SEHenkel AG & Co. KGaASartorius AGSchaeffler AG
TOTAL GERMANY
TOTAL INVESTMENT SECURITIES
DFA Short Term Investment Fund
(Cost $332,791,120)^^
AustraliaAustriaBelgiumCanadaDenmarkFinlandFranceGermanyHong Kong
Shares Value»
UNITED KINGDOM — (Continued)17,375 $ 1,278,966
4,287 128,02322,205 541,77151,970 1,232,64071,813 1,705,740
151,940 802,761101,494 649,137
43,071 2,458,49386,276 901,78674,067 645,89342,940 972,110
7,564 150,4314,391 478,809
66,728 889,59678,057 152,94065,558 3,941,347
712 42,8358,130 446,609
58,401,549
378,550,936
PREFERRED STOCKS — (0.4%)GERMANY — (0.4%)
4,102 157,1844,682 482,7843,411 689,9783,242 23,905
1,353,851
379,904,787
Value†
SECURITIES LENDING COLLATERAL — (2.3%)@§ 784,301 9,075,143
TOTAL INVESTMENTS — (100.0%)$388,979,930
Summary of the Portfolio's investments as of July 31, 2019, based on their valuation inputs, is as follows (see Security Valuation Note):
Investments in Securities (Market Value)
Level 1 Level 2 Level 3 Total
Common Stocks$ 39,055 $ 24,040,095 — $ 24,079,150
— 496,437 — 496,437181,259 3,691,204 — 3,872,463
34,974,808 — — 34,974,808— 6,521,859 — 6,521,859— 3,725,722 — 3,725,722
67,525 38,203,733 — 38,271,258668,434 26,858,107 — 27,526,541
— 12,001,006 — 12,001,006

IrelandIsrael
ItalyJapanNetherlandsNew ZealandNorwayPortugalSingaporeSpainSwedenSwitzerlandUnited Kingdom
GermanySecurities Lending Collateral
TOTAL
3P Learning, Ltd.Adairs, Ltd.ALS, Ltd.Altium, Ltd.AMA Group, Ltd.Amaysim Australia, Ltd.Appen, Ltd.ARB Corp., Ltd.Asaleo Care, Ltd.Australian Finance Group, Ltd.Baby Bunting Group, Ltd.Bellamy's Australia, Ltd.Blackmores, Ltd.Bravura Solutions, Ltd.Breville Group, Ltd.Byron Energy, Ltd.carsales.com, Ltd.Champion Iron, Ltd.Citadel Group, Ltd. (The)City Chic Collective, Ltd.
— 1,710,497 — 1,710,497686,440 971,053 — 1,657,493
International Large Cap Growth PortfolioCONTINUED
Investments in Securities (Market Value)
Level 1 Level 2 Level 3 Total
$ 1,076,981 $ 7,187,540 — $ 8,264,521— 84,608,777 — 84,608,777
5,562,558 5,934,317 — 11,496,875— 978,946 — 978,946— 3,127,833 — 3,127,833— 160,425 — 160,425— 4,232,178 — 4,232,178— 10,862,639 — 10,862,639— 9,212,828 — 9,212,828
233,130 32,134,001 — 32,367,13119,129,395 39,272,154 — 58,401,549
Preferred Stocks— 1,353,851 — 1,353,851
— 9,075,143 — 9,075,143
$62,619,585 $326,360,345 — $388,979,930
INTERNATIONAL SMALL CAP GROWTH PORTFOLIO
SCHEDULE OF INVESTMENTS
July 31, 2019
(Unaudited)Shares Value»
COMMON STOCKS — (95.5%)AUSTRALIA — (6.7%)* 20,996 $ 14,072
14,945 14,61386,031 421,76228,568 710,42160,867 60,507
#* 51,941 26,92028,131 581,807
# 15,528 195,917* 72,248 47,638
20,789 27,459# 8,495 13,864#* 20,602 140,944# 3,334 203,596
58,889 196,83022,651 296,782
#* 59,452 9,71051,057 513,101
* 62,670 136,2957,469 23,146
24,304 30,089

Class, Ltd.Clinuvel Pharmaceuticals, Ltd.Clover Corp., Ltd.Codan, Ltd.Collins Foods, Ltd.Corporate Travel Management, Ltd.Costa Group Holdings, Ltd.Credit Corp. Group, Ltd.Data#3, Ltd.Dicker Data, Ltd.Domino's Pizza Enterprises, Ltd.DuluxGroup, Ltd.Emeco Holdings, Ltd.GUD Holdings, Ltd.HUB24, Ltd.IDP Education, Ltd.Iluka Resources, Ltd.Infomedia, Ltd.Inghams Group, Ltd.Integral Diagnostics, Ltd.Integrated Research, Ltd.InvoCare, Ltd.IPH, Ltd.IRESS, Ltd.JB Hi-Fi, Ltd.Jumbo Interactive, Ltd.Kogan.com, Ltd.Lifestyle Communities, Ltd.Lovisa Holdings, Ltd.Lycopodium, Ltd.Lynas Corp., Ltd.Macquarie Telecom Group, Ltd.McMillan Shakespeare, Ltd.MNF Group, Ltd.Monadelphous Group, Ltd.
Netwealth Group, Ltd.nib holdings, Ltd.Nick Scali, Ltd.Noni B, Ltd.NRW Holdings, Ltd.OFX Group, Ltd.Orora, Ltd.Pact Group Holdings, Ltd.Pantoro, Ltd.Perpetual, Ltd.Platinum Asset Management, Ltd.Praemium, Ltd.Pro Medicus, Ltd.PSC Insurance Group, Ltd.
# 11,009 11,1048,616 191,145
50,310 79,39223,537 64,87420,447 121,019
# 15,672 245,30167,131 181,392
# 11,956 204,41932,737 56,673
9,278 42,480# 11,539 303,743
94,966 605,581* 51,947 80,815
19,617 127,080# 1,226 10,365
29,662 387,68893,166 607,89589,983 125,822
# 57,622 159,65515,612 35,22619,978 37,534
# 28,026 299,37527,512 156,21236,860 352,491
# 25,072 514,3059,248 121,875
# 12,958 43,49215,764 72,857
9,281 70,316# 3,350 13,121#* 79,048 140,271
393 5,92816,320 154,526
# 6,344 15,39520,070 258,479
International Small Cap Growth PortfolioCONTINUED
Shares Value»
AUSTRALIA — (Continued)12,110 $ 68,462
108,113 589,239# 16,734 71,866
5,058 9,21975,058 124,43860,218 56,06975,892 175,36633,395 63,957
* 206,770 26,522# 8,982 241,642# 63,551 208,413#* 79,053 28,437
9,475 197,82113,241 25,878

PWR Holdings, Ltd.Regis Healthcare, Ltd.Regis Resources, Ltd.Saracen Mineral Holdings, Ltd.SeaLink Travel Group, Ltd.Service Stream, Ltd.SG Fleet Group, Ltd.Silver Lake Resources, Ltd.SmartGroup Corp., Ltd.St Barbara, Ltd.Stanmore Coal, Ltd.Technology One, Ltd.Terracom, Ltd.Webjet, Ltd.
TOTAL AUSTRALIA
ANDRITZ AGDO & CO AGFlughafen Wien AGKapsch TrafficCom AGLenzing AGOesterreichische Post AGPalfinger AGSchoeller-Bleckmann Oilfield Equipment AGTelekom Austria AG
TOTAL AUSTRIA
AGFA-Gevaert NVArgenx SEAtenorBarco NVbpost SAEconocom Group SAEVS Broadcast Equipment SAFagronJensen-Group NVKinepolis Group NVLotus Bakeries NVMelexis NVOrange Belgium SAPicanolResilux
Sioen Industries NVTER Beke SATessenderlo Group SAVan de Velde NV
TOTAL BELGIUM
10,213 29,94533,494 63,848
112,292 423,959* 190,858 539,717
11,321 28,95666,766 136,00919,452 39,052
* 60,403 53,28417,714 113,203
158,526 397,2896,743 6,241
59,041 308,097* 74,067 27,535
8,962 82,877
13,700,660
AUSTRIA — (0.9%)16,049 571,633
1,877 165,462529 23,355
1,400 49,4771,848 188,501
# 8,123 271,3153,871 100,0421,784 141,906
36,298 268,095
1,779,786
BELGIUM — (1.4%)* 48,528 195,448* 3,333 468,244
696 55,7832,151 449,205
20,979 195,067# 8,267 27,304
2,569 61,06010,154 168,605
796 30,3453,708 218,774
75 195,476# 4,841 331,354
4,113 93,834# 330 23,741
219 34,588
International Small Cap Growth PortfolioCONTINUED
Shares Value»
BELGIUM — (Continued)1,464 $ 40,372
123 15,734* 5,906 184,887
1,365 39,104
2,828,925
CANADA — (8.8%)

5N Plus, Inc.Aecon Group, Inc.Aeterna Zentaris, Inc.AG Growth International, Inc.AirBoss of America Corp.Almonty Industries, Inc.Altus Group, Ltd.Andrew Peller, Ltd., Class AAritzia, Inc.ATS Automation Tooling Systems, Inc.B2Gold Corp.Badger Daylighting, Ltd.BMTC Group, Inc.Boralex, Inc., Class ACalian Group, Ltd.Canacol Energy, Ltd.Cineplex, Inc.Clearwater Seafoods, Inc.Cogeco Communications, Inc.Cogeco, Inc.Colliers International Group, Inc.Computer Modelling Group, Ltd.Corby Spirit and Wine, Ltd.CRH Medical Corp.Descartes Systems Group, Inc. (The)DIRTT Environmental SolutionsEndeavour Mining Corp.Enghouse Systems, Ltd.ERO Copper Corp.Evertz Technologies, Ltd.Exchange Income Corp.Extendicare, Inc.Finning International, Inc.First National Financial Corp.FirstService Corp.Gamehost, Inc.GDI Integrated Facility Services, Inc.Gibson Energy, Inc.goeasy, Ltd.Golden Star Resources, Ltd.Great Canadian Gaming Corp.Heroux-Devtek, Inc.HLS Therapeutics, Inc.IBI Group, Inc.Information Services Corp.Innergex Renewable Energy, Inc.Intertape Polymer Group, Inc.Jamieson Wellness, Inc.Journey Energy, Inc.Just Energy Group, Inc.Kinaxis, Inc.Kinder Morgan Canada, Ltd.
* 17,900 30,1095,900 90,838
* 5,039 12,4853,900 159,5113,000 19,753
* 12,000 7,6388,149 206,9058,000 85,346
* 17,343 240,342* 14,957 239,688* 192,313 613,455
9,038 326,3761,300 10,658
17,156 259,4591,500 38,210
#* 5,700 21,724# 14,789 265,570
4,851 19,4803,006 237,3961,000 71,2238,919 647,942
25,656 127,5222,600 34,613
* 17,865 48,053* 7,542 274,010* 20,744 108,765* 20,300 379,298
9,014 236,039* 11,364 214,657
6,300 91,173# 3,800 107,165# 18,925 128,480
20,463 353,8153,437 85,2877,505 787,5763,800 26,345
* 1,900 41,30232,680 566,292
# 1,930 82,944* 18,296 65,155* 13,827 459,084* 800 11,517
2,100 28,720* 3,700 14,354
2,603 31,93128,240 321,60015,246 210,011
8,806 137,581* 5,300 9,718# 22,600 78,598* 5,450 342,824# 7,500 64,157
International Small Cap Growth PortfolioCONTINUED

Labrador Iron Ore Royalty Corp.Largo Resources, Ltd.Lassonde Industries, Inc., Class ALeon's Furniture, Ltd.Logistec Corp., Class BLucara Diamond Corp.Magellan Aerospace Corp.Maple Leaf Foods, Inc.Medical Facilities Corp.Methanex Corp.Morneau Shepell, Inc.MTY Food Group, Inc.NFI Group, Inc.Norbord, Inc.North American Construction Group, Ltd.North West Co., Inc. (The)Northland Power, Inc.Parex Resources, Inc.Pason Systems, Inc.Photon Control, Inc.Pinnacle Renewable Energy, Inc.Points International, Ltd.Pollard Banknote, Ltd.Premium Brands Holdings Corp.Pretium Resources, Inc.Pulse Seismic, Inc.Recipe Unlimited Corp.Richelieu Hardware, Ltd.Rogers Sugar, Inc.Roxgold, Inc.Russel Metals, Inc.Savaria Corp.Secure Energy Services, Inc.SEMAFO, Inc.Sienna Senior Living, Inc.Sleep Country Canada Holdings, Inc.Spin Master Corp.Stantec, Inc.Stelco Holdings, Inc.Stella-Jones, Inc.Superior Plus Corp.TeraGo, Inc.TerraVest Industries, Inc.TFI International, Inc.Vermilion Energy, Inc.Wesdome Gold Mines Ltd.Westshore Terminals Investment Corp.Winpak, Ltd.
TOTAL CANADA
Ambu A.S., Class B
Shares Value»
CANADA — (Continued)13,300 $ 317,031
#* 43,128 60,781600 84,104
5,732 66,883800 23,791
70,116 78,6272,900 35,926
16,421 385,081# 7,447 70,137
8,369 329,42114,600 336,072
4,427 219,61911,983 264,2119,236 214,0705,400 67,715
11,176 255,8173,666 69,776
* 33,745 576,82019,350 260,092
* 26,632 21,9953,200 24,634
* 3,500 41,7681,400 25,6717,050 513,072
* 37,233 403,701#* 15,400 27,129
4,300 87,54412,397 244,78421,000 89,741
* 55,900 45,74311,697 185,496
# 6,400 58,14237,090 197,281
* 55,050 220,651# 14,206 213,122# 8,349 117,600* 3,840 109,107
21,160 504,069# 5,946 68,479
12,078 376,763# 41,856 417,989* 1,900 14,828
1,100 10,53918,153 574,244
# 2,328 41,716* 33,900 172,608# 9,841 155,243
7,247 249,620
18,001,947
DENMARK — (1.7%)# 25,344 371,130

Brodrene Hartmann A.S.Nilfisk Holding A.S.NNIT A.S.Pandora A.S.Royal Unibrew A.S.
SimCorp A.S.
TOTAL DENMARK
Alma Media OyjHuhtamaki OyjLassila & Tikanoja OyjMetso OyjOlvi Oyj, Class AOrion Oyj, Class AOrion Oyj, Class BPonsse OyjRevenio Group OyjSanoma OyjTieto OyjTikkurila OyjTokmanni Group Corp.Vaisala Oyj, Class AValmet Oyj
TOTAL FINLAND
AdociaAir France-KLMAkka TechnologiesAlbioma SAAlten SAAubayBastide le Confort MedicalCegedim SACie Plastic Omnium SADevoteam SAEuronext NVGaztransport Et Technigaz SAGuerbetID Logistics GroupIngenico Group SAKaufman & Broad SALagardere SCALectraLinedata ServicesLISILNA Sante SAManitou BF SAMetropole Television SA
517 24,555* 8,178 207,017# 2,502 38,900
17,456 669,12815,601 1,162,624
International Small Cap Growth PortfolioCONTINUED
Shares Value»
DENMARK — (Continued)12,371 $1,115,028
3,588,382
FINLAND — (2.0%)7,507 53,2493,910 148,5277,233 110,019
21,742 835,4433,444 134,1626,336 218,395
26,317 900,3112,688 84,5005,694 128,306
15,690 155,31913,952 355,904
# 8,580 133,3329,317 84,2445,135 116,006
30,049 583,478
4,041,195
FRANCE — (4.3%)* 941 18,479* 44,311 461,918
2,788 196,8995,747 152,5677,031 869,8012,001 70,383
# 726 29,514* 1,355 41,791
13,034 343,8601,294 154,803
13,342 1,029,9544,650 421,8711,579 91,215
* 627 117,37213,599 1,288,480
4,553 186,95623,695 535,398
7,400 151,651871 27,648
4,013 116,336# 1,447 79,846
2,949 69,6488,527 147,923

MGI Digital Graphic TechnologyRobertet SASociete BIC SASociete pour l'Informatique IndustrielleSOITECSomfy SASopra Steria GroupStef SASynergie SATarkett SAThermador GroupeTransgene SA
Trigano SA
TOTAL FRANCE
All for One Group AGAmadeus Fire AGAtoss Software AGBasler AGBechtle AGbet-at-home.com AGBorussia Dortmund GmbH & Co. KGaACANCOM SECECONOMY AGCENIT AGCewe Stiftung & Co. KGAACompuGroup Medical SECTS Eventim AG & Co. KGaADEAG Deutsche Entertainment AGDialog Semiconductor P.L.C.Dr Hoenle AGDuerr AGEckert & Ziegler Strahlen- und Medizintechnik AGEDAG Engineering Group AGEnergiekontor AGEvotec SEFielmann AGFirst Sensor AGFuchs Petrolub SEGerresheimer AGHamburger Hafen und Logistik AGHawesko Holding AGHugo Boss AGHypoport AGIsra Vision AGNemetschek SENexus AGNorma Group SEOHB SE
* 457 25,227116 82,521
# 6,097 424,8932,187 68,021
* 4,671 484,7271,955 176,6972,500 321,726
832 73,8032,172 69,096
# 7,541 126,1431,570 99,148
* 3,815 9,824
International Small Cap Growth PortfolioCONTINUED
Shares Value»
FRANCE — (Continued)2,223 $ 223,032
8,789,171
GERMANY — (6.9%)457 21,147
1,434 194,802471 67,746
1,509 65,6017,619 843,9621,082 68,117
13,343 132,9448,499 475,146
* 38,279 245,2962,561 32,2581,579 145,8566,878 530,664
15,058 750,885* 3,168 14,569* 2,459 110,071
1,077 67,52313,850 411,917
1,076 142,0391,829 22,0221,600 30,603
* 28,193 794,4944,348 302,5521,540 50,1065,910 207,5638,095 629,6456,206 156,448
423 16,59317,355 1,090,772
* 414 109,3083,848 166,671
14,796 822,6163,982 140,1798,208 294,2951,179 43,246

Pfeiffer Vacuum Technology AGProSiebenSat.1 Media SERheinmetall AGS&T AGScout24 AGSecunet Security Networks AGSiltronic AGSixt SEStabilus SASTRATEC SEStroeer SE & Co. KGaATechnotrans SEWashtec AGXING SEZeal Network SE
TOTAL GERMANY
Agritrade Resources, Ltd.ASM Pacific Technology, Ltd.
Brightoil Petroleum Holdings, Ltd.Build King Holdings, Ltd.Cafe de Coral Holdings, Ltd.Camsing International Holding, Ltd.China Display Optoelectronics Technology Holdings, Ltd.CITIC Telecom International Holdings, Ltd.Convenience Retail Asia, Ltd.Cosmopolitan International Holdings, Ltd.Fairwood Holdings, Ltd.Giordano International, Ltd.Gold-Finance Holdings, Ltd.Great Harvest Maeta Group Holdings, Ltd.HKBN, Ltd.Honma Golf, Ltd.IGG, Inc.International Housewares Retail Co., Ltd.Karrie International Holdings, Ltd.Landsea Green Group Co., Ltd.Leyou Technologies Holdings, Ltd.Li & Fung, Ltd.Lifestyle International Holdings, Ltd.L'Occitane International SALuk Fook Holdings International, Ltd.Man Wah Holdings, Ltd.Microport Scientific Corp.Nimble Holdings Co., Ltd.NOVA Group Holdings, Ltd.Pacific Textiles Holdings, Ltd.PCCW, Ltd.Perfect Shape Medical, Ltd.
1,849 257,88438,235 493,886
5,780 655,87414,109 329,31817,252 954,160
276 37,3124,404 337,1583,091 317,4316,287 286,5171,313 85,6217,622 600,4151,325 28,3103,278 173,436
881 337,4231,933 38,323
14,130,724
HONG KONG — (2.6%)# 655,000 93,764
50,500 589,965
International Small Cap Growth PortfolioCONTINUED
Shares Value»
HONG KONG — (Continued)* 408,000 $ 58,635
80,000 10,86288,000 292,61780,000 11,855
* 144,000 9,859281,000 115,967108,000 55,597
* 280,000 52,52916,500 54,401
282,000 96,898#* 214,000 1,968#* 100,000 20,282
171,500 309,615# 19,000 16,914
211,000 200,47077,000 21,094
126,000 18,31588,000 10,311
#* 285,000 81,2531,224,000 170,597
131,500 179,68679,750 165,648
# 65,000 196,075# 326,800 157,554# 72,000 60,363* 120,000 12,266# 255,000 56,900
195,000 153,806453,000 258,347104,000 49,439

Pico Far East Holdings, Ltd.Rare Earth Magnesium Technology Group Holdings, Ltd.Realord Group Holdings, Ltd.Regina Miracle International Holdings, Ltd.Sa Sa International Holdings, Ltd.Samsonite International SASITC International Holdings Co., Ltd.SmarTone Telecommunications Holdings, Ltd.SUNeVision Holdings, Ltd.TK Group Holdings, Ltd.TOM Group, Ltd.Tradelink Electronic Commerce, Ltd.Union Medical Healthcare, Ltd.VTech Holdings, Ltd.Xinyi Glass Holdings, Ltd.YTO Express Holdings, Ltd.Zhaobangji Properties Holdings, Ltd.
TOTAL HONG KONG
Datalex P.L.C.Glanbia P.L.C.Irish Continental Group P.L.C.
TOTAL IRELAND
Arad, Ltd.Arko Holdings, Ltd.
AudioCodes, Ltd.Avgol Industries 1953, Ltd.Camtek, Ltd.Cohen Development & Industrial Buildings, Ltd.Danel Adir Yeoshua, Ltd.Delek Automotive Systems, Ltd.Direct Insurance Financial Investments, Ltd.Electra Consumer Products 1970, Ltd.Electra, Ltd.Energix-Renewable Energies, Ltd.FMS Enterprises Migun, Ltd.Formula Systems 1985, Ltd.Fox Wizel, Ltd.Hamlet Israel-Canada, Ltd.Hilan, Ltd.IDI Insurance Co., Ltd.Inrom Construction Industries, Ltd.Kamada, Ltd.Kerur Holdings, Ltd.Klil Industries, Ltd.Malam - Team, Ltd.Matrix IT, Ltd.
138,000 42,632360,000 13,252
* 70,000 39,69772,000 54,051
# 287,979 80,683102,600 200,900292,000 321,854
72,500 66,627151,000 111,402
56,000 24,453#* 96,000 20,039
178,000 28,35036,000 31,54838,900 341,165
304,000 306,44328,000 8,350
#* 80,000 83,068
5,358,366
IRELAND — (0.3%)12,439 12,68128,138 366,28431,672 145,099
524,064
ISRAEL — (1.1%)1,934 27,446
* 101,715 43,677
International Small Cap Growth PortfolioCONTINUED
Shares Value»
ISRAEL — (Continued)5,479 $ 105,832
* 10,796 10,840* 3,177 30,799
241 6,146863 60,689
7,090 30,1525,141 58,5361,294 18,048
424 120,255* 12,665 25,152
713 20,2841,512 85,5832,359 70,669
# 1,063 21,6454,016 139,5571,510 54,235
11,160 43,917* 5,134 29,317
1,337 35,764260 24,621202 25,161
8,960 140,741

Maytronics, Ltd.Naphtha Israel Petroleum Corp., Ltd.Nova Measuring Instruments, Ltd.NR Spuntech Industries, Ltd.One Software Technologies, Ltd.OPC Energy, Ltd.Partner Communications Co., Ltd.Rami Levy Chain Stores Hashikma Marketing 2006, Ltd.Scope Metals Group, Ltd.Shapir Engineering and Industry, Ltd.Shufersal, Ltd.Suny Cellular Communication, Ltd.Tadiran Holdings, Ltd.
TOTAL ISRAEL
ACEA SpAAmplifon SpAAquafil SpAArnoldo Mondadori Editore SpAAutogrill SpAAzimut Holding SpAB&C Speakers SpABanca Farmafactoring SpABanca Generali SpABasicNet SpABEBrunello Cucinelli SpACarraro SpACerved Group SpADatalogic SpADe' Longhi SpADiaSorin SpAdoValue SpAEnav SpAExpert System SpAFalck Renewables SpA
Fiera Milano SpAFinecoBank Banca Fineco SpAFreni Brembo SpAGima TT SpAGruppo MutuiOnline SpAHera SpAIMA Industria Macchine Automatiche SpAInterpump Group SpAJuventus Football Club SpAMaire Tecnimont SpAMARR SpAMediaset SpAPiaggio & C SpA
9,272 65,7228,553 56,269
* 5,860 171,5544,107 9,250
637 39,4096,358 50,308
* 24,503 99,9871,627 85,8611,256 30,538
14,984 56,94734,846 256,308
* 19,647 10,617509 18,797
2,180,633
ITALY — (3.9%)12,129 228,06726,177 645,193
2,273 19,836* 31,303 50,991
28,150 297,53429,969 561,689
1,234 16,24627,311 147,60914,077 409,851
# 7,181 36,00322,330 24,687
7,681 243,267# 9,648 20,537
41,079 323,6944,411 77,560
15,003 301,6525,237 607,3499,460 118,259
45,812 251,975* 3,358 10,934
28,439 131,388
International Small Cap Growth PortfolioCONTINUED
Shares Value»
ITALY — (Continued)7,366 $ 32,028
16,872 167,842# 33,288 340,489# 3,337 29,849
5,465 93,15824,558 91,440
4,016 315,31018,033 506,895
#* 87,086 149,700# 30,962 74,516
7,515 161,994#* 31,035 90,898
45,845 137,696

RAI Way SpAReply SpARizzoli Corriere Della Sera Mediagroup SpASalvatore Ferragamo SpASesa SpASOL SpATechnogym SpATinexta S.p.A.Unieuro SpAZignago Vetro SpA
TOTAL ITALY
A&D Co., Ltd.Abist Co., Ltd.Adastria Co., Ltd.Ad-sol Nissin Corp.Adtec Plasma Technology Co., Ltd.Advance Create Co., Ltd.Advantage Risk Management Co., Ltd.Adventure, Inc.Aeon Delight Co., Ltd.Aeon Fantasy Co., Ltd.Aeon Hokkaido Corp.Ai Holdings Corp.AIT Corp.Ajis Co., Ltd.Akatsuki, Inc.Alleanza Holdings Co., Ltd.Allied Telesis Holdings K.K.AlphaPolis Co., Ltd.Altech Corp.Amano Corp.Amiyaki Tei Co., Ltd.Anest Iwata Corp.Aoyama Zaisan Networks Co., Ltd.Apaman Co., Ltd.Arcland Service Holdings Co., Ltd.Argo Graphics, Inc.ArtSpark Holdings, Inc.As One Corp.Asahi Co., Ltd.Asahi Holdings, Inc.Asahi Net, Inc.Asante, Inc.ASKUL Corp.
Asukanet Co., Ltd.Ateam, Inc.Atom Corp.Atrae, Inc.
21,871 129,8024,704 314,720
# 15,992 17,14812,604 264,334
1,469 57,868# 5,970 71,282
20,493 220,132* 4,924 67,268
1,920 26,3556,112 69,099
7,954,144
JAPAN — (23.3%)2,600 18,747
400 9,9126,700 131,1151,300 22,946
# 1,200 8,3061,900 32,4421,800 12,245
#* 900 27,6404,000 119,185
# 2,500 71,9915,600 38,0369,200 143,6382,100 19,4771,000 31,5651,300 87,264
# 3,000 22,588#* 11,300 9,093#* 100 2,670
4,070 62,78812,900 388,065
1,200 38,1466,500 54,807
# 2,300 31,192# 3,000 26,900
3,900 68,2733,300 74,7461,500 12,0442,300 190,4173,400 39,4428,200 170,2712,500 15,6731,100 20,1033,400 84,754
International Small Cap Growth PortfolioCONTINUED
Shares Value»
JAPAN — (Continued)# 1,900 $ 26,623
2,300 23,443# 24,900 228,025* 1,200 26,940

Aucfan Co., Ltd.Aucnet, Inc.Aval Data Corp.Avant Corp.Avex, Inc.Axial Retailing, Inc.Baroque Japan, Ltd.BayCurrent Consulting, Inc.Beaglee, Inc.Belc Co., Ltd.Bell System24 Holdings, Inc.Bengo4.com, Inc.Bic Camera, Inc.Billing System Corp.B-Lot Co., Ltd.BML, Inc.Bourbon Corp.BP Castrol K.K.Br Holdings Corp.BrainPad, Inc.Broadleaf Co., Ltd.BRONCO BILLY Co., Ltd.Business Brain Showa-Ota, Inc.Can Do Co., Ltd.Career Design Center Co., Ltd.CareerIndex, Inc.Carta Holdings, Inc.Central Automotive Products, Ltd.Central Security Patrols Co., Ltd.Central Sports Co., Ltd.Ceres, Inc.Charm Care Corp. KKChikaranomoto Holdings Co., Ltd.CHIMNEY Co., Ltd.CMIC Holdings Co., Ltd.cocokara fine, Inc.Colowide Co., Ltd.Computer Engineering & Consulting, Ltd.Comture Corp.CONEXIO Corp.Core Corp.Cota Co., Ltd.CRE, Inc.Create Restaurants Holdings, Inc.Create SD Holdings Co., Ltd.Creek & River Co., Ltd.Cresco, Ltd.CRI Middleware Co., Ltd.CTS Co., Ltd.Cube System, Inc.Cybernet Systems Co., Ltd.Cybozu, Inc.Daihen Corp.Dai-Ichi Cutter Kogyo K.K.Daiken Medical Co., Ltd.
* 1,800 14,6251,700 19,315
800 12,780700 12,469
8,300 106,7153,900 135,107
# 1,700 17,0242,800 127,862
* 1,000 7,8403,000 138,8748,800 125,309
* 1,400 61,86314,000 138,018
# 1,200 13,2251,100 20,0065,500 150,9552,000 31,0712,300 28,1936,000 19,106
#* 1,000 57,55221,400 112,447
2,300 47,7081,100 24,2062,200 32,8881,000 14,555
#* 1,400 9,4594,100 45,8272,100 38,337
# 1,900 85,3741,700 48,355
# 1,300 19,2121,100 19,1781,900 17,2291,500 33,0673,100 52,9314,300 226,620
14,800 288,4516,200 137,9621,900 72,7673,900 52,6252,000 26,3033,146 34,194
# 1,600 16,683# 10,200 152,232
5,100 114,2502,400 29,2501,400 49,318
* 700 15,9186,800 41,8101,300 10,346
# 4,400 27,3415,000 59,031
900 24,9191,000 16,1523,200 18,184

Daiki Axis Co., Ltd.Daikokutenbussan Co., Ltd.Daio Paper Corp.Daiohs Corp.Daiseki Co., Ltd.Daito Pharmaceutical Co., Ltd.Daiwabo Holdings Co., Ltd.DD Holdings Co., Ltd.Dear Life Co., Ltd.Densan System Co., Ltd.Digital Arts, Inc.Digital Hearts Holdings Co., Ltd.Digital Information Technologies Corp.Dip Corp.DKS Co., Ltd.DMG Mori Co., Ltd.Double Standard, Inc.DTS Corp.Dvx, Inc.EAT&Co, Ltd.Ebase Co., Ltd.Eco's Co., Ltd.EF-ON, Inc.eGuarantee, Inc.E-Guardian, Inc.Eiken Chemical Co., Ltd.Elan Corp.Elecom Co., Ltd.EM Systems Co., Ltd.Enigmo, Inc.en-japan, Inc.EPS Holdings, Inc.ES-Con Japan, Ltd.Escrow Agent Japan, Inc.Evolable Asia Corp.Extreme Co., Ltd.F&M Co., Ltd.F@N Communications, Inc.FCC Co., Ltd.FDK Corp.FFRI, Inc.Financial Products Group Co., Ltd.FINDEX, Inc.First Brothers Co., Ltd.First-corp, Inc.Fixstars Corp.Focus Systems Corp.Forval Corp.Freebit Co., Ltd.
International Small Cap Growth PortfolioCONTINUED
Shares Value»
JAPAN — (Continued)1,100 $ 8,574
# 1,600 48,0492,700 32,2481,200 15,9706,900 163,9662,400 66,8994,100 198,688
500 13,8643,500 15,0081,000 29,4472,700 273,346
# 2,800 27,930# 2,800 45,127
8,100 166,2711,200 35,454
26,400 382,414# 600 25,764
10,200 222,9611,700 12,385
# 600 9,0312,200 23,9471,600 21,7835,119 41,9465,500 58,966
# 2,300 40,9156,900 115,9462,400 38,2744,400 159,319
# 4,000 61,628* 5,600 59,907
7,700 315,8758,300 127,7928,800 55,277
# 3,500 7,6481,100 26,008
400 7,3071,000 11,5159,900 49,9488,200 159,343
* 1,700 12,863* 600 20,073
16,000 140,9612,300 19,857
# 400 3,9691,200 6,7314,000 66,0721,300 10,1641,800 15,435
# 2,100 21,110

Fronteo, Inc.FTGroup Co., Ltd.Fuji Corp.Fuji Kyuko Co., Ltd.Fuji Pharma Co., Ltd.Fuji Seal International, Inc.Fujio Food System Co., Ltd.Fujita Kanko, Inc.Fujitsu General, Ltd.Fukuda Denshi Co., Ltd.
Fukui Computer Holdings, Inc.Fukushima Industries Corp.FULLCAST Holdings Co., Ltd.Funai Soken Holdings, Inc.Furuya Metal Co., Ltd.Furyu Corp.Fuso Chemical Co., Ltd.Future Corp.G-7 Holdings, Inc.Gakken Holdings Co., Ltd.Gakkyusha Co., Ltd.Gakujo Co., Ltd.Genki Sushi Co., Ltd.Genky DrugStores Co., Ltd.Giken, Ltd.GLOBERIDE, Inc.GMO Cloud K.K.GMO Financial Holdings, Inc.GMO internet, Inc.GMO Pepabo, Inc.Golf Digest Online, Inc.Good Com Asset Co., Ltd.Grace Technology, Inc.Greens Co., Ltd.GS Yuasa Corp.Gunosy, Inc.Gurunavi, Inc.HABA Laboratories, Inc.Hagihara Industries, Inc.Hakudo Co., Ltd.Halows Co., Ltd.Hamakyorex Co., Ltd.Hamee Corp.Handsman Co., Ltd.Harada Industry Co., Ltd.Hazama Ando Corp.Helios Techno Holdings Co., Ltd.Hibino Corp.Hiday Hidaka Corp.
# 2,700 9,440# 2,600 36,792
1,300 24,321# 5,100 195,851
3,800 50,9219,100 266,606
# 2,200 52,2102,100 52,591
14,200 226,9311,500 98,522
International Small Cap Growth PortfolioCONTINUED
Shares Value»
JAPAN — (Continued)1,800 $ 37,7133,100 96,2475,400 110,4159,130 208,333
500 16,6723,000 29,7624,500 93,9555,500 97,8221,800 48,856
500 22,494# 1,800 21,682
1,800 20,2581,700 47,8731,700 33,0403,900 114,2732,100 62,566
700 20,04810,300 55,96017,000 276,358
500 17,5452,100 11,1211,500 21,1351,200 31,662
800 10,8922,300 43,017
#* 3,200 47,7458,200 50,579
800 64,880# 2,400 29,854
1,700 21,7951,900 39,3454,300 153,643
# 1,100 7,263# 1,800 19,476
2,000 15,57231,300 215,763
# 4,900 28,8551,000 23,235
# 6,574 127,055

Hinokiya Group Co., Ltd.Hioki EE Corp.Hiramatsu, Inc.Hirata Corp.Hirose Tusyo, Inc.HIS Co., Ltd.Hito Communications Holdings, Inc.Hochiki Corp.Hokuetsu Industries Co., Ltd.Hokuto Corp.Hosokawa Micron Corp.Hotland Co., Ltd.House Do Co., Ltd.I K K, Inc.IBJ, Inc.Ichibanya Co., Ltd.Ichigo, Inc.Ichikoh Industries, Ltd.Ichimasa Kamaboko Co., Ltd.ID Holdings Corp.
Idec Corp.Ihara Science Corp.Imuraya Group Co., Ltd.I-Net Corp.Infocom Corp.Infomart Corp.Information Services International-Dentsu, Ltd.Insource Co., Ltd.Intage Holdings, Inc.Intelligent Wave, Inc.Inter Action Corp.Internet Initiative Japan, Inc.Inui Global Logistics Co., Ltd.IR Japan Holdings, Ltd.Iriso Electronics Co., Ltd.I'rom Group Co., Ltd.ISB Corp.Ishikawa Seisakusho, Ltd.Istyle, Inc.ITbook Holdings Co., Ltd.Itfor, Inc.Itokuro, Inc.Iwatani Corp.JAC Recruitment Co., Ltd.Jalux, Inc.Jamco Corp.Japan Aviation Electronics Industry, Ltd.Japan Best Rescue System Co., Ltd.Japan Elevator Service Holdings Co., Ltd.
1,400 26,5672,200 74,814
10,000 32,9861,600 97,859
400 6,8806,200 151,2111,300 22,0553,000 37,3716,100 66,3316,500 110,799
800 32,369* 2,400 32,046# 1,000 15,171
2,000 12,9835,800 47,014
# 3,364 158,45360,600 218,969
7,000 44,782# 1,900 18,081
2,100 22,794
International Small Cap Growth PortfolioCONTINUED
Shares Value»
JAPAN — (Continued)6,800 $122,1251,700 19,7742,700 51,4273,440 46,1536,000 148,716
22,500 303,4912,900 100,6931,600 46,8897,400 62,533
# 3,700 31,655# 2,500 43,443
6,200 115,8752,800 22,5601,000 26,0694,700 214,397
# 1,400 22,0541,100 17,332
#* 1,100 14,324#* 9,300 70,139* 2,300 7,364
5,600 47,939#* 1,600 24,991
7,800 257,4783,100 71,6681,300 30,0442,400 43,7353,900 54,316
# 4,500 58,9912,600 65,659

Japan Investment Adviser Co., Ltd.Japan Lifeline Co., Ltd.Japan Material Co., Ltd.Japan Meat Co., Ltd.Japan Medical Dynamic Marketing, Inc.Japan Property Management Center Co., Ltd.Japan Steel Works, Ltd. (The)JBCC Holdings, Inc.JCU Corp.Jeol, Ltd.JIG-SAW, Inc.JINS Holdings, Inc.Jolly - Pasta Co., Ltd.JP-Holdings, Inc.Justsystems Corp.Kadoya Sesame Mills, Inc.Kakiyasu Honten Co., Ltd.Kamakura Shinsho, Ltd.Kameda Seika Co., Ltd.Kanamic Network Co., Ltd.Kanematsu Electronics, Ltd.Kanto Denka Kogyo Co., Ltd.Kappa Create Co., Ltd.Kawai Musical Instruments Manufacturing Co., Ltd.KeePer Technical Laboratory Co., Ltd.Kenko Mayonnaise Co., Ltd.KFC Holdings Japan, Ltd.KH Neochem Co., Ltd.Kintetsu Department Store Co., Ltd.Kirindo Holdings Co., Ltd.
Ki-Star Real Estate Co., Ltd.Kitanotatsujin Corp.Kito Corp.Kitz Corp.KLab, Inc.KOMEDA Holdings Co., Ltd.Koshidaka Holdings Co., Ltd.Kotobuki Spirits Co., Ltd.Kourakuen Holdings Corp.Kozo Keikaku Engineering, Inc.Krosaki Harima Corp.Kumagai Gumi Co., Ltd.Kura Sushi, Inc.Kushikatsu Tanaka Holdings Co.Kyoden Co., Ltd.Kyoritsu Maintenance Co., Ltd.LAC Co., Ltd.Lacto Japan Co., Ltd.LAND Co., Ltd.
# 2,600 43,89214,500 255,20412,900 167,947
# 2,800 46,3874,300 53,8392,000 20,848
15,800 275,1053,900 57,4025,600 105,0408,200 184,262
* 600 27,5563,300 173,717
* 700 12,08112,900 33,840
7,700 259,813600 22,324
1,900 37,325# 4,000 55,302
3,000 140,121600 12,137
3,400 93,25411,100 75,8454,100 52,3771,700 47,6341,500 17,1291,600 36,5601,200 23,5677,000 173,4312,000 57,091
800 12,988
International Small Cap Growth PortfolioCONTINUED
Shares Value»
JAPAN — (Continued)1,600 $ 24,092
# 12,300 79,4574,300 63,670
18,500 125,698#* 5,700 46,651
11,500 212,962# 9,500 134,389
4,700 277,2472,800 77,586
500 10,111600 32,905
9,100 243,2742,800 114,782
300 5,397# 5,000 15,145
1,720 74,049# 2,200 34,202# 1,400 42,921#* 102,400 6,541

Lasertec Corp.LEC, Inc.Life Corp.LIFULL Co., Ltd.Like Co., Ltd.LIKE Kidsnext Co., Ltd.Linical Co., Ltd.Link And Motivation, Inc.Litalico, Inc.M&A Capital Partners Co., Ltd.Macromill, Inc.Maeda Kosen Co., Ltd.Mamezou Holdings Co., Ltd.Mani, Inc.MarkLines Co., Ltd.Maruha Nichiro Corp.Maruwa Co., Ltd.Maruwa Unyu Kikan Co., Ltd.Marvelous, Inc.Matching Service Japan Co., Ltd.Matsuyafoods Holdings Co., Ltd.MCJ Co., Ltd.MEC Co., Ltd.Media Do Holdings Co., Ltd.Medical Data Vision Co., Ltd.Medical System Network Co., Ltd.MedPeer, Inc.Megachips Corp.Megmilk Snow Brand Co., Ltd.Meiko Electronics Co., Ltd.Meiko Network Japan Co., Ltd.Meitec Corp.Melco Holdings, Inc.Members Co., Ltd.Menicon Co., Ltd.METAWATER Co., Ltd.Micronics Japan Co., Ltd.Mie Kotsu Group Holdings, Inc.Milbon Co., Ltd.Mimaki Engineering Co., Ltd.
Miraca Holdings, Inc.Miroku Jyoho Service Co., Ltd.Mitani Corp.Mitani Sekisan Co., Ltd.Mitsubishi Logisnext Co., Ltd.Mizuho Medy Co., Ltd.Mobile Factory, Inc.Monex Group, Inc.Monogatari Corp. (The)
8,400 399,5895,800 68,0664,900 101,040
12,800 59,185# 1,800 30,805#* 900 8,815
2,500 24,160# 11,400 58,497* 800 13,968* 1,700 113,574
7,600 88,2414,400 73,5864,100 55,4652,700 194,0331,700 28,9917,500 219,1022,200 135,312
# 2,200 94,0258,500 60,3452,000 31,5982,000 65,917
17,000 124,3143,900 38,455
900 28,662* 4,900 49,072
5,500 26,858#* 3,200 46,270
4,400 65,6675,100 108,981
# 5,600 94,463# 4,100 35,313
6,400 329,837400 10,430
# 1,000 17,9845,900 216,9752,800 93,7037,100 67,750
11,100 57,7045,860 285,9362,700 14,641
International Small Cap Growth PortfolioCONTINUED
Shares Value»
JAPAN — (Continued)12,600 $284,886
# 4,700 146,896400 19,790
2,300 63,0306,500 66,459
# 1,000 22,880#* 1,000 14,361# 47,000 139,549
1,300 110,499

Morinaga Milk Industry Co., Ltd.Morita Holdings Corp.Morozoff, Ltd.MTI, Ltd.Musashi Seimitsu Industry Co., Ltd.Mynet, Inc.N Field Co., Ltd.NAC Co., Ltd.Nagatanien Holdings Co., Ltd.Nagawa Co., Ltd.Naigai Trans Line, Ltd.Nakamoto Packs Co., Ltd.Nakanishi, Inc.Natori Co., Ltd.New Art Holdings Co., Ltd.Newton Financial Consulting, Inc.Nextage Co., Ltd.Nexyz Group Corp.NF Corp.Nichias Corp.Nichiban Co., Ltd.Nichiha Corp.NichiiGakkan Co., Ltd.Nihon Chouzai Co., Ltd.Nihon Flush Co., Ltd.Nikkiso Co., Ltd.Nippon Air Conditioning Services Co., Ltd.Nippon Carbon Co., Ltd.Nippon Commercial Development Co., Ltd.Nippon Computer Dynamics Co., Ltd.Nippon Concept Corp.Nippon Gas Co., Ltd.Nippon Kodoshi Corp.Nippon Parking Development Co., Ltd., Class CNippon Sharyo, Ltd.Nippon Suisan Kaisha, Ltd.Nippon Systemware Co., Ltd.Nipro Corp.Nishio Rent All Co., Ltd.Nissei ASB Machine Co., Ltd.Nissin Electric Co., Ltd.Nittoc Construction Co., Ltd.Noevir Holdings Co., Ltd.Nohmi Bosai, Ltd.Nojima Corp.Nomura Co., Ltd.NS Tool Co., Ltd.NSD Co., Ltd.NuFlare Technology, Inc.Oat Agrio Co., Ltd.
4,600 178,5067,000 114,915
# 600 27,0667,300 52,728
10,900 142,624* 800 4,670
2,600 16,3452,300 20,8072,700 51,3901,400 64,6151,400 16,849
400 5,48016,800 306,679
1,600 23,30365,800 27,247
900 18,6595,000 56,499
# 1,800 33,2201,000 20,638
13,500 241,7952,400 41,6316,300 164,325
10,500 166,1511,600 48,5282,400 64,3477,800 99,8285,100 33,845
# 3,100 118,9472,300 31,981
# 1,900 14,9361,100 12,2468,100 227,353
# 1,300 17,61352,400 81,549
#* 2,300 52,61523,100 145,573
1,600 40,84219,500 216,177
3,600 100,6402,000 49,9664,900 56,2964,800 26,2933,900 203,571
500 10,1857,100 114,317
19,600 265,409# 2,200 40,810
8,600 264,895400 28,253400 4,763
International Small Cap Growth PortfolioCONTINUED
Shares Value»

Obara Group, Inc.Oenon Holdings, Inc.Ohsho Food Service Corp.Oisix ra daichi, Inc.Okada Aiyon Corp.Okamoto Industries, Inc.Oki Electric Industry Co., Ltd.Okinawa Cellular Telephone Co.OKUMA Corp.Ootoya Holdings Co., Ltd.Open Door, Inc.Optex Group Co., Ltd.Oriental Consultants Holdings Co., Ltd.Oro Co., Ltd.Osaka Soda Co., Ltd.OSAKA Titanium Technologies Co., Ltd.OSG Corp.OSJB Holdings Corp.Outsourcing, Inc.PAL GROUP Holdings Co., Ltd.PAPYLESS Co., Ltd.Paraca, Inc.Paramount Bed Holdings Co., Ltd.Pasona Group, Inc.PCI Holdings, Inc.Penta-Ocean Construction Co., Ltd.Pepper Food Service Co., Ltd.Phil Co., Inc.PIA Corp.Pickles Corp.Pilot Corp.Poletowin Pitcrew Holdings, Inc.Prestige International, Inc.Prima Meat Packers, Ltd.Pronexus, Inc.Pro-Ship, Inc.Proto Corp.Qol Holdings Co., Ltd.Quick Co., Ltd.Raccoon Holdings, Inc.Raito Kogyo Co., Ltd.Raiznext Corp.Rakus Co., Ltd.Raysum Co., Ltd.RECOMM Co., Ltd.Relia, Inc.Remixpoint, Inc.Renaissance, Inc.RENOVA, Inc.Resol Holdings Co., Ltd.Resorttrust, Inc.Rheon Automatic Machinery Co., Ltd.Ride On Express Holdings Co., Ltd.
JAPAN — (Continued)3,000 $103,839
11,500 40,5383,200 196,737
#* 4,500 59,5701,600 18,5412,500 115,996
19,800 263,3572,800 93,5734,300 223,5601,500 30,233
* 1,900 47,7678,120 102,554
700 12,439# 1,000 22,467
700 17,0614,400 71,730
10,200 202,45731,600 71,37328,200 335,683
2,600 81,070# 1,400 27,393
1,800 34,4533,000 114,7363,300 50,241
900 18,37867,300 325,906
# 2,500 38,674#* 400 12,517
1,400 59,156800 17,065
4,300 162,4066,900 73,686
12,000 183,7376,900 129,1742,000 19,8851,200 13,7594,600 47,8625,400 81,1632,900 43,2143,500 20,238
11,400 150,0309,300 98,9543,400 86,8455,100 48,357
11,900 15,4537,600 89,779
#* 4,900 11,2203,800 56,281
#* 6,200 48,148# 500 18,541
18,500 267,9985,200 87,2581,500 19,296

Ringer Hut Co., Ltd.Rion Co., Ltd.Riso Kagaku Corp.Riso Kyoiku Co., Ltd.Rock Field Co., Ltd.Rokko Butter Co., Ltd.
Roland DG Corp.Rorze Corp.Round One Corp.Royal Holdings Co., Ltd.Rozetta Corp.RS Technologies Co., Ltd.S Foods, Inc.S&B Foods, Inc.Sagami Rubber Industries Co., Ltd.Saison Information Systems Co., Ltd.Saizeriya Co., Ltd.Sakai Moving Service Co., Ltd.Sakura Internet, Inc.San-A Co., Ltd.Sanix, Inc.Sankyo Frontier Co., Ltd.Sanyo Trading Co., Ltd.Sapporo Holdings, Ltd.Sato Foods Co., Ltd.Sato Holdings Corp.SBS Holdings, Inc.Scala, Inc.SCREEN Holdings Co., Ltd.SEC Carbon, Ltd.Seed Co., Ltd.Seiren Co., Ltd.Senko Group Holdings Co., Ltd.Seria Co., Ltd.SFP Holdings Co., Ltd.Shibaura Electronics Co., Ltd.Shibuya Corp.Shidax Corp.SHIFT, Inc.Shinwa Co., Ltd.Shoei Co., Ltd.Shoei Foods Corp.Showa Corp.Showa Sangyo Co., Ltd.SIGMAXYZ, Inc.Siix Corp.Sinfonia Technology Co., Ltd.Sinko Industries, Ltd.SK-Electronics Co., Ltd.
# 5,500 128,9651,300 28,6485,800 91,521
28,800 134,5523,300 42,6443,200 52,847
International Small Cap Growth PortfolioCONTINUED
Shares Value»
JAPAN — (Continued)3,800 $ 79,6872,100 51,074
17,800 270,5497,000 173,750
* 1,300 39,6081,000 30,9874,200 128,938
# 800 30,092# 2,000 30,965
1,200 22,7826,900 161,2682,600 154,8618,800 51,277
300 12,044* 9,100 19,209
1,100 34,0171,200 26,8848,100 182,699
600 20,3916,400 154,5814,200 61,938
# 3,700 31,761# 6,100 330,534# 400 35,896
3,000 29,23910,200 140,41517,100 133,972
7,400 173,0101,900 37,752
# 1,400 37,6043,400 94,016
* 6,500 13,851* 1,200 55,629
2,000 41,645# 3,000 125,261# 2,100 60,072
3,900 52,4613,700 104,3582,800 35,519
# 7,500 94,7203,200 36,6783,300 47,1631,400 30,109

SMS Co., Ltd.Snow Peak, Inc.Softbank Technology Corp.Softbrain Co., Ltd.Softcreate Holdings Corp.Software Service, Inc.Sogo Medical Holdings Co., Ltd.Solasto Corp.SoldOut, Inc.Soliton Systems K.K.Sourcenext Corp.Sparx Group Co., Ltd.S-Pool, Inc.SRA HoldingsSRS Holdings Co., Ltd.St Marc Holdings Co., Ltd.
Star Mica Holdings Co., Ltd.Star Micronics Co., Ltd.Starts Corp., Inc.St-Care Holding Corp.Stella Chemifa Corp.Step Co., Ltd.Strike Co., Ltd.Studio Alice Co., Ltd.Sumida Corp.Sumitomo Mitsui Construction Co., Ltd.Sumitomo Osaka Cement Co., Ltd.Sushiro Global Holdings, Ltd.Synchro Food Co., Ltd.System Information Co., Ltd.System Research Co., Ltd.Systena Corp.Syuppin Co., Ltd.Taiyo Holdings Co., Ltd.Takagi Seiko Corp.Takamiya Co., Ltd.Takara Leben Co., Ltd.Takemoto Yohki Co., Ltd.Takeuchi Manufacturing Co., Ltd.Tama Home Co., Ltd.Tamron Co., Ltd.Tanseisha Co., Ltd.Tayca Corp.Tazmo Co., Ltd.TDC Soft, Inc.Tear Corp.TechMatrix Corp.TechnoPro Holdings, Inc.Tecnos Japan, Inc.
16,400 364,1471,600 19,899
# 2,500 50,565# 5,500 29,722
2,100 33,853800 76,417
2,300 34,75810,900 118,944
800 13,859# 1,900 19,184# 13,400 50,469
25,500 52,859# 2,700 64,629
2,500 56,0485,000 46,7363,600 76,446
International Small Cap Growth PortfolioCONTINUED
Shares Value»
JAPAN — (Continued)1,700 $ 28,1448,100 106,2847,300 172,5631,100 5,1502,300 64,6822,100 29,3881,500 36,3062,200 40,7175,500 58,041
42,180 224,2071,700 64,9243,900 239,194
#* 1,800 9,617# 4,400 49,862
500 18,62216,900 280,846
4,200 28,5124,100 125,769
600 14,1413,600 26,1646,000 20,9421,400 15,0059,000 139,1962,700 37,3653,000 67,127
# 9,100 107,9253,000 63,097
# 1,100 8,8034,100 32,8851,700 10,0393,600 71,9238,900 502,5813,400 19,277

Tenpos Holdings Co., Ltd.Terilogy Co., Ltd.T-Gaia Corp.TKC Corp.Tocalo Co., Ltd.Toei Animation Co., Ltd.Toho Titanium Co., Ltd.Tokai Corp.TOKAI Holdings Corp.Token Corp.Tokuyama Corp.Tokyo Base Co., Ltd.Tokyo Individualized Educational Institute, Inc.Tokyo Seimitsu Co., Ltd.Tokyu Construction Co., Ltd.Tomy Co., Ltd.Topcon Corp.Toridoll Holdings Corp.Torikizoku Co., Ltd.Toshiba TEC Corp.Tosho Co., Ltd.Totech Corp.Totetsu Kogyo Co., Ltd.Tow Co., Ltd.Towa Pharmaceutical Co., Ltd.Toyo Gosei Co., Ltd.
Toyo Tire CorpTrancom Co., Ltd.Transaction Co., Ltd.Tri Chemical Laboratories, Inc.Trust Tech, Inc.Tsubaki Nakashima Co., Ltd.Tsugami Corp.Tsukui Corp.Tsuzuki Denki Co., Ltd.Ulvac, Inc.Umenohana Co., Ltd.United Arrows, Ltd.Unitika, Ltd.Urbanet Corp. Co., Ltd.UT Group Co., Ltd.V Technology Co., Ltd.Valor Holdings Co., Ltd.Valqua, Ltd.Value HR Co., Ltd.ValueCommerce Co., Ltd.V-Cube, Inc.Vector, Inc.Vertex Corp.
1,600 31,934#* 1,600 12,506
4,800 97,082600 24,942
14,100 105,414800 33,465
9,400 73,2294,200 82,630
21,800 185,982640 36,739
13,200 303,839#* 3,600 24,489
3,400 28,5628,500 238,354
18,800 128,59020,700 264,37924,900 290,713
5,400 122,073# 1,400 27,293
6,100 180,8284,200 104,386
# 1,400 30,5605,500 150,4135,300 37,9357,500 188,209
# 700 11,245
International Small Cap Growth PortfolioCONTINUED
Shares Value»
JAPAN — (Continued)3,200 $ 41,8031,900 109,4841,800 17,6591,600 81,8553,800 54,0529,700 167,246
11,500 92,50213,000 59,776
# 1,400 15,4809,400 393,457
* 1,000 23,4485,500 157,621
* 14,200 53,994# 4,400 13,911
6,200 136,043# 2,400 112,900
8,900 183,7254,400 87,678
500 15,8163,700 64,060
* 3,100 16,765* 7,000 60,270
1,060 12,985

VIA Holdings, Inc.VINX Corp.Vision, Inc.VT Holdings Co., Ltd.Wacom Co., Ltd.Waseda Academy Co., Ltd.Watahan & Co., Ltd.WATAMI Co., Ltd.WDB Holdings Co., Ltd.Weathernews, Inc.West Holdings Corp.Will Group, Inc.WIN-Partners Co., Ltd.World Holdings Co., Ltd.Wowow, Inc.Yakuodo Co., Ltd.YAMADA Consulting Group Co., Ltd.Yamaichi Electronics Co., Ltd.YA-MAN, Ltd.Yamazen Corp.Yaoko Co., Ltd.Yasunaga Corp.Yokogawa Bridge Holdings Corp.Yokowo Co., Ltd.Yomiuri Land Co., Ltd.Yossix Co., Ltd.Yuasa Trading Co., Ltd.Yume No Machi Souzou Iinkai Co., Ltd.Yumeshin Holdings Co., Ltd.Zenrin Co., Ltd.ZIGExN Co., Ltd.
TOTAL JAPAN
Aalberts NVAMG Advanced Metallurgical Group NV
Amsterdam Commodities NVBasic-Fit NVBE Semiconductor Industries NVCorbion NVFlow TradersGrandVision NVIMCD NVNederland ApparatenfabriekOCI NVPostNL NVTKH Group NV
TOTAL NETHERLANDS
* 3,800 22,2301,200 13,419
* 2,000 95,53119,500 76,64337,900 133,507
2,200 14,7801,000 20,9955,600 78,4511,600 40,4691,500 42,993
# 3,500 37,2982,700 21,7483,900 43,0441,900 25,7571,300 31,3312,100 46,1223,500 63,3174,400 47,5506,900 55,590
13,700 130,1594,200 192,315
# 1,900 24,8232,700 41,9713,100 65,0981,000 44,238
# 600 14,1051,099 30,975
# 3,600 53,974# 11,300 82,730
8,650 159,03015,000 107,474
47,802,146
NETHERLANDS — (2.6%)23,572 948,443
# 6,941 198,714
International Small Cap Growth PortfolioCONTINUED
Shares Value»
NETHERLANDS — (Continued)3,368 $ 71,054
* 7,611 239,686# 21,231 628,346
14,030 458,594# 9,665 256,060
11,922 357,34813,115 1,155,4311,191 63,746
* 15,955 416,138# 53,950 92,351
8,900 528,030
5,413,941
NEW ZEALAND — (0.6%)

Briscoe Group, Ltd.Chorus, Ltd.Freightways, Ltd.Hallenstein Glasson Holdings, Ltd.Mainfreight, Ltd.NZX, Ltd.Restaurant Brands New Zealand, Ltd.Skellerup Holdings, Ltd.Synlait Milk, Ltd.Z Energy, Ltd.
TOTAL NEW ZEALAND
ABG Sundal Collier Holding ASAAF Gruppen ASAAKVA GROUP ASAAtea ASAAustevoll Seafood ASABorregaard ASAData Respons ASADNO ASAEuropris ASAGrieg Seafood ASANordic Semiconductor ASANorway Royal Salmon ASANorwegian Finans Holding ASAScatec Solar ASASolon Eiendom ASASpectrum ASAVeidekke ASA
TOTAL NORWAY
Altri SGPS SACTT-Correios de Portugal SAMota-Engil SGPS SANavigator Co. SA (The)NOS SGPS SA
TOTAL PORTUGAL
AEM Holdings, Ltd.Best World International, Ltd.
Boustead Singapore, Ltd.BreadTalk Group, Ltd.Bukit Sembawang Estates, Ltd.China Sunsine Chemical Holdings, Ltd.CSE Global, Ltd.Delfi, Ltd.First Resources, Ltd.Food Empire Holdings, Ltd.
6,337 14,26872,208 261,48635,118 197,55614,701 51,741
5,139 141,64449,049 38,270
* 7,015 45,23019,601 29,894
* 13,565 89,13170,277 298,894
1,168,114
NORWAY — (1.0%)115,530 46,464
8,315 158,3431,278 11,145
20,481 260,5623,311 33,686
24,395 255,49212,959 48,419
158,699 265,43646,338 132,95711,611 165,155
* 2,889 14,3013,162 69,108
* 20,138 139,670# 18,640 191,992
3,821 15,3767,426 50,685
26,327 237,215
2,096,006
PORTUGAL — (0.4%)17,945 117,75240,087 85,400
# 18,296 36,72825,027 84,12974,988 465,629
789,638
SINGAPORE — (0.9%)45,200 38,230
# 67,600 66,906
International Small Cap Growth PortfolioCONTINUED
Shares Value»
SINGAPORE — (Continued)52,200 $ 29,21021,200 10,800
6,700 26,82827,000 22,012
100,500 33,61846,100 43,703
124,200 140,68919,800 7,476

Health Management International, Ltd.Hi-P International, Ltd.iFAST Corp., Ltd.Mandarin Oriental International, Ltd.mm2 Asia, Ltd.Q&M Dental Group Singapore, Ltd.Raffles Medical Group, Ltd.Riverstone Holdings, Ltd.Sheng Siong Group, Ltd.SIA Engineering Co., Ltd.Singapore Post, Ltd.Singapore Press Holdings, Ltd.StarHub, Ltd.UMS Holdings, Ltd.Valuetronics Holdings, Ltd.Venture Corp., Ltd.Vicom, Ltd.
TOTAL SINGAPORE
Alantra Partners SAAmper SAApplus Services SAAtresmedia Corp. de Medios de Comunicacion SABolsas y Mercados Espanoles SHMSF SACellnex Telecom SACia de Distribucion Integral Logista Holdings SACIE Automotive SAElecnor SAFomento de Construcciones y Contratas SAGrupo Empresarial San Jose SAIndra Sistemas SAMasmovil Ibercom SAMediaset Espana Comunicacion SAProsegur Cia de Seguridad SAVidrala SAViscofan SAZardoya Otis SA
TOTAL SPAIN
AddLife AB, Class BAddTech AB, Class BAvanza Bank Holding ABBeijer Alma ABBeijer Ref ABBilia AB, Class ABioGaia AB, Class BBiotage ABConcentric AB
52,961 27,74245,200 45,10438,300 31,13133,000 52,290
* 107,900 18,00773,100 25,495
191,684 143,25063,400 41,503
123,600 104,21924,100 46,369
331,400 232,05916,600 26,542
126,400 138,49449,750 22,93668,930 32,61744,600 497,711
4,900 25,616
1,930,557
SPAIN — (2.2%)1,874 31,209
#* 177,945 48,66214,878 209,13617,001 66,24316,093 379,77526,474 990,08311,747 244,76315,213 384,665
3,887 48,70714,779 188,157
* 5,264 47,719* 25,407 217,599* 11,738 265,863
26,601 156,16146,866 218,730
3,353 303,7127,149 349,926
42,030 288,120
4,439,230
SWEDEN — (2.8%)2,616 70,479
14,812 388,34927,623 246,497
9,639 118,53715,712 348,27619,888 175,581
4,621 192,14314,547 156,86711,116 136,967
International Small Cap Growth PortfolioCONTINUED
Shares Value»
SWEDEN — (Continued)

eWork Group ABFagerhult ABFenix Outdoor International AGHIQ International ABHMS Networks ABKindred Group P.L.C.KNOW IT ABLagercrantz Group AB, Class BLoomis AB, Class BMycronic ABNederman Holding ABNetEnt ABNobina ABNolato AB, Class BNordic Entertainment Group AB, Class BOEM International AB, Class BOrexo ABProact IT Group ABRaySearch Laboratories ABScandi Standard ABSectra AB, Class BSintercast ABSkiStar ABSweco AB, Class BThule Group ABTroax Group ABVitrolife AB
TOTAL SWEDEN
APG SGA SAAscom Holding AGBelimo Holding AGBossard Holding AG, Class ABucher Industries AGBurkhalter Holding AGCembra Money Bank AGCicor Technologies, Ltd.Clariant AGDaetwyler Holding AGdormakaba Holding AGEmmi AGFlughafen Zurich AGForbo Holding AGGeorg Fischer AGGurit Holding AGHuber & Suhner AGInficon Holding AGInterroll Holding AGKardex AGKomax Holding AGLastminute.com NVLEM Holding SALogitech International SAMobilezone Holding AG
2,192 $ 16,85115,965 98,721
# 1,089 116,1798,416 44,3417,219 125,325
# 59,946 367,8515,135 100,905
15,403 192,35413,706 471,43613,519 207,744
944 11,69449,671 147,36722,641 131,953
4,172 237,3561,959 46,8332,829 70,334
* 5,366 39,2932,175 38,257
* 5,136 73,4925,437 34,7205,780 194,0651,223 18,168
10,441 121,0541,138 31,736
25,372 554,20411,463 108,84015,088 290,354
5,725,123
SWITZERLAND — (4.9%)378 101,149
10,273 133,387117 689,098
1,650 227,5161,351 403,6821,198 88,3227,307 704,223
# 459 23,14315,387 281,168
1,915 295,179900 659,521437 363,593
4,078 744,709336 524,095
1,001 862,83121 22,989
1,375 109,492551 343,715191 388,456
1,838 264,493# 1,048 196,482* 1,326 40,070
118 163,0841,236 50,830
10,073 92,970

Orior AGPanalpina Welttransport Holding AGSchaffner Holding AGSFS Group AG
VAT Group AGVZ Holding AGYpsomed Holding AG
TOTAL SWITZERLAND
4imprint Group P.L.C.888 Holdings P.L.C.A.G. Barr P.L.C.Air Partner P.L.C.Ashmore Group P.L.C.ASOS P.L.C.Avon Rubber P.L.C.B&M European Value Retail SABodycote P.L.C.Boohoo Group P.L.C.Brewin Dolphin Holdings P.L.C.Britvic P.L.C.Burford Capital, Ltd.Capita P.L.C.Card Factory P.L.C.City of London Investment Group P.L.C.Clipper Logistics P.L.C.Coats Group PLCComputacenter P.L.C.Connect Group P.L.C.Cranswick P.L.C.CVS Group P.L.C.Devro P.L.C.Dignity P.L.C.Diploma P.L.C.Domino's Pizza Group P.L.C.Dunelm Group P.L.C.Electrocomponents P.L.C.EMIS Group P.L.C.Entertainment One, Ltd.Euromoney Institutional Investor P.L.C.FDM Group Holdings P.L.C.Ferrexpo P.L.C.Fevertree Drinks P.L.C.Findel P.L.C.Forterra P.L.C.Frontier Developments PLCG4S P.L.C.Games Workshop Group P.L.C.Gamma Communications P.L.C.
1,667 135,457* 3,052 686,781
127 26,0844,622 354,773
International Small Cap Growth PortfolioCONTINUED
Shares Value»
SWITZERLAND — (Continued)6,824 $ 853,270
692 190,556835 106,362
10,127,480
UNITED KINGDOM — (16.2%)6,520 221,298
57,126 105,66426,775 223,833
7,145 6,21379,233 514,649
* 6,488 203,7397,898 128,866
199,513 895,53329,416 262,463
* 173,806 503,63070,084 271,53962,876 698,56931,434 572,430
* 267,765 377,64167,542 135,692
3,921 20,349# 14,003 45,527
45,064 43,75615,630 289,91939,116 17,94212,020 389,039
9,703 109,27516,564 41,37111,300 74,20826,636 490,975
113,545 341,21823,513 263,52093,087 685,88113,225 195,68982,597 441,105
6,329 106,68218,865 188,85967,614 209,21120,796 589,538
* 9,958 28,20246,952 159,964
* 2,245 26,627339,949 789,004
7,924 434,8856,365 84,109

Go-Ahead Group P.L.C. (The)GoCo Group P.L.C.Greencore Group P.L.C.Greggs P.L.C.Hastings Group Holdings P.L.C.Hays P.L.C.Hikma Pharmaceuticals P.L.C.Hill & Smith Holdings P.L.C.Hilton Food Group P.L.C.Hollywood Bowl Group P.L.C.HomeServe P.L.C.Howden Joinery Group P.L.C.Ibstock P.L.C.
IG Group Holdings P.L.C.IMI P.L.C.Inmarsat P.L.C.Integrated Diagnostics Holdings P.L.C.iomart Group P.L.C.IWG P.L.C.J D Wetherspoon P.L.C.James Fisher & Sons P.L.C.James Halstead P.L.C.JD Sports Fashion P.L.C.John Menzies P.L.C.Johnson Service Group P.L.C.Joules Group P.L.C.Jupiter Fund Management P.L.C.Kainos Group P.L.C.KAZ Minerals P.L.C.KCOM Group P.L.C.Liontrust Asset Management P.L.C.Luceco P.L.C.Marshalls P.L.C.McBride P.L.C.Merlin Entertainments P.L.C.Midwich Group P.L.C.Mitie Group P.L.C.MJ Gleeson P.L.C.Moneysupermarket.com Group P.L.C.Morgan Advanced Materials P.L.C.Morses Club P.L.C.Mortgage Advice Bureau Holdings, Ltd.Motorpoint group P.L.C.Next Fifteen Communications Group P.L.C.Nichols P.L.C.On the Beach Group P.L.C.Oxford Biomedica PLCOxford Instruments P.L.C.Pagegroup P.L.C.
10,406 269,00811,694 12,17050,863 132,36023,340 632,56364,065 150,396
323,616 604,37620,353 454,06217,981 246,93417,237 195,17132,315 84,46470,694 978,138
144,864 973,14235,880 100,695
International Small Cap Growth PortfolioCONTINUED
Shares Value»
UNITED KINGDOM — (Continued)79,108 $549,87763,232 800,61967,643 470,259
4,075 20,63815,321 63,198
123,088 563,77217,187 320,46411,044 292,65014,355 89,01479,590 627,67819,696 99,23157,379 120,797
5,570 17,55994,616 428,14414,777 100,70841,405 286,610
117,054 171,0199,868 96,022
11,813 13,97248,408 373,59046,298 36,381
162,617 889,5695,428 35,551
90,044 179,866875 8,927
124,537 557,48857,923 178,460
6,091 9,6206,163 44,850
10,596 27,63513,722 100,211
3,743 81,54928,665 164,608
* 2,732 22,91413,510 212,31676,459 415,997

Park Group P.L.C.PayPoint P.L.C.Petrofac, Ltd.Photo-Me International P.L.C.Polar Capital Holdings P.L.C.Polypipe Group P.L.C.Premier Asset Management Group P.L.C.Redde P.L.C.Renew Holdings P.L.C.Renishaw P.L.C.Rhi Magnesita NVRicardo P.L.C.Rightmove P.L.C.River & Mercantile Group P.L.C.RM P.L.C.Robert Walters P.L.C.Rotork P.L.C.Savills P.L.C.ScS Group P.L.C.Softcat P.L.C.SSP Group P.L.C.Staffline Group P.L.C.Stagecoach Group P.L.C.
SThree P.L.C.Synthomer P.L.C.T Clarke P.L.C.TalkTalk Telecom Group P.L.C.Tarsus Group P.L.C.Tate & Lyle P.L.C.Telecom Plus P.L.C.Topps Tiles P.L.C.Ultra Electronics Holdings P.L.C.Victrex P.L.C.Vitec Group P.L.C. (The)Vp P.L.C.Watkin Jones P.L.C.WH Smith P.L.C.William Hill P.L.C.Wilmington P.L.C.XP Power, Ltd.
TOTAL UNITED KINGDOM
TOTAL COMMON STOCKS
Fuchs Petrolub SEJungheinrich AGSixt SEVilleroy & Boch AG
35,827 27,26015,890 181,97557,641 292,56162,058 75,14915,887 110,39846,563 231,33213,716 29,79957,142 79,220
# 11,521 56,1938,632 401,8532,062 111,6618,150 69,615
64,155 410,3246,028 20,287
12,391 35,74414,183 91,863
205,807 768,46532,628 376,596
5,061 13,36128,064 325,802
103,436 884,7594,590 6,444
105,708 168,051
International Small Cap Growth PortfolioCONTINUED
Shares Value»
UNITED KINGDOM — (Continued)27,763 $ 95,25165,503 241,07314,286 20,432
177,396 226,70525,064 128,913
107,417 983,78514,634 236,69024,408 20,44813,741 325,80719,177 474,208
8,661 119,1954,400 41,780
34,434 89,23325,796 663,465
122,464 226,4404,671 11,1283,182 78,677
33,245,798
195,616,030
PREFERRED STOCKS — (0.4%)GERMANY — (0.4%)
10,954 419,7447,385 164,2264,345 288,1901,484 21,955

TOTAL GERMANY
TOTAL INVESTMENT SECURITIES
DFA Short Term Investment Fund
(Cost $190,058,411)^^
AustraliaAustriaBelgiumCanadaDenmarkFinlandFranceGermanyHong KongIrelandIsraelItaly
JapanNetherlandsNew ZealandNorwayPortugalSingaporeSpainSwedenSwitzerlandUnited Kingdom
GermanySecurities Lending Collateral
TOTAL
894,115
196,510,145
Value†
SECURITIES LENDING COLLATERAL — (4.1%)@§ 730,951 8,457,836
TOTAL INVESTMENTS — (100.0%)$204,967,981
Summary of the Portfolio's investments as of July 31, 2019, based on their valuation inputs, is as follows (see Security Valuation Note):
Investments in Securities (Market Value)
Level 1 Level 2 Level 3 Total
Common Stocks— $ 13,700,660 — $ 13,700,660— 1,779,786 — 1,779,786— 2,828,925 — 2,828,925
$18,001,947 — — 18,001,947— 3,588,382 — 3,588,382— 4,041,195 — 4,041,195— 8,789,171 — 8,789,171— 14,130,724 — 14,130,724— 5,358,366 — 5,358,366— 524,064 — 524,064— 2,180,633 — 2,180,633— 7,954,144 — 7,954,144
International Small Cap Growth PortfolioCONTINUED
Investments in Securities (Market Value)
Level 1 Level 2 Level 3 Total
— $ 47,802,146 — $ 47,802,146— 5,413,941 — 5,413,941— 1,168,114 — 1,168,114— 2,096,006 — 2,096,006— 789,638 — 789,638— 1,930,557 — 1,930,557— 4,439,230 — 4,439,230— 5,725,123 — 5,725,123
$ 686,781 9,440,699 — 10,127,480— 33,245,798 — 33,245,798
Preferred Stocks— 894,115 — 894,115
— 8,457,836 — 8,457,836
$18,688,728 $186,279,253 — $204,967,981
DFA SOCIAL FIXED INCOME PORTFOLIO
SCHEDULE OF INVESTMENTS
July 31, 2019

(Unaudited)
1.875%, 03/13/204.125%, 03/13/201.875%, 11/29/212.625%, 12/10/212.250%, 03/11/223.250%, 03/08/242.875%, 06/14/245.375%, 08/15/242.875%, 09/13/242.750%, 12/13/243.125%, 09/12/255.750%, 06/12/263.000%, 09/11/263.000%, 03/10/283.250%, 06/09/283.250%, 11/16/28
6.750%, 09/15/296.750%, 03/15/316.250%, 07/15/32
2.000%, 01/05/222.375%, 01/19/232.625%, 09/06/242.125%, 04/24/261.875%, 09/24/266.250%, 05/15/297.125%, 01/15/307.250%, 05/15/306.625%, 11/15/30
3.875%, 02/15/212.875%, 09/15/246.750%, 11/01/252.875%, 02/01/277.125%, 05/01/30
TOTAL AGENCYOBLIGATIONS
0.950%, 05/15/232.875%, 10/15/27
FaceAmount^ Value†
(000)
AGENCY OBLIGATIONS — (21.5%)Federal Home LoanBank
440 $ 439,380500 506,275
1,700 1,697,9371,500 1,524,0711,500 1,513,228
250 265,473700 731,829800 934,242
2,500 2,616,8632,700 2,813,6051,000 1,059,115
200 246,0661,200 1,275,096
500 531,8843,190 3,434,767
# 3,100 3,359,968Federal Home Loan
Mortgage Corp.700 981,936
2,250 3,249,7991,550 2,217,222
Federal NationalMortgage Association
2,000 2,004,9181,500 1,525,118
# 3,600 3,728,2632,800 2,823,202
# 4,700 4,655,6302,130 2,879,990
500 723,5611,650 2,422,8703,100 4,424,092
Tennessee ValleyAuthority
1,000 1,028,2621,249 1,301,317
600 763,8952,700 2,818,4531,350 1,941,343
62,439,670
BONDS — (53.4%)3M Co.
EUR 700 811,452850 868,695
ABB Finance USA, Inc.
3.400%, 06/15/27
3.250%, 02/01/25
4.500%, 12/01/23
2.750%, 11/15/223.500%, 11/15/24
3.500%, 08/01/25
3.625%, 11/15/243.250%, 03/17/25
6.875%, 05/01/29
3.150%, 04/10/27
4.150%, 12/01/24
3.550%, 07/26/27
3.150%, 06/15/23
3.375%, 02/25/241.998%, 08/15/26
3.150%, 08/22/27
3.650%, 02/15/26
3.300%, 05/03/27
0.550%, 03/17/232.300%, 09/09/26
5.000%, 04/26/234.125%, 02/15/243.750%, 07/10/253.900%, 04/01/26
2.950%, 09/01/27
FaceAmount^ Value†
(000)
Activision Blizzard, Inc.# 100 $102,321Adobe, Inc.
160 166,208Advance Auto Parts, Inc.
200 213,259Aetna, Inc.
250 250,51650 51,460
Affiliated Managers Group,Inc.
150 153,499Aflac, Inc.
250 263,67950 51,805
Ahold Finance USA LLC40 50,059
Airbus SEΩ 200 207,157Albemarle Corp.
200 210,654Alimentation Couche-Tard,
Inc.Ω 600 613,703Allstate Corp. (The)
500 515,600Alphabet, Inc.
200 210,868200 195,540
Amazon.com, Inc.800 840,419
Ameren Corp.294 305,265
American Express CreditCorp.
700 735,133American Honda Finance
Corp.EUR 100 113,323
750 733,302American International
Group, Inc.GBP 200 275,029
350 372,193150 157,990200 211,213
American Water CapitalCorp.# 100 101,045

DFA Social Fixed Income PortfolioCONTINUED
2.875%, 05/08/22
0.000%, 09/27/20
0.500%, 07/17/23
100 101,417Abbott Ireland FinancingDAC
EUR 139 154,124ABN AMRO Bank NV
EUR 200 227,311
4.000%, 10/15/233.700%, 10/15/242.875%, 09/15/26
3.450%, 12/15/27
Ameriprise Financial, Inc.30 31,863
400 422,843500 504,317
AmerisourceBergen Corp.200 205,090
3.900%, 12/15/25
3.500%, 08/15/244.101%, 03/01/28
3.450%, 07/17/27
3.500%, 06/14/24
4.375%, 10/15/28
3.250%, 02/23/262.450%, 08/04/263.350%, 02/09/273.000%, 06/20/273.000%, 11/13/27
3.300%, 04/01/27
3.150%, 05/15/25
3.875%, 01/12/28
0.500%, 06/10/22
2.000%, 01/22/25
3.875%, 08/15/213.000%, 02/15/223.550%, 06/01/243.950%, 01/15/253.600%, 07/15/253.800%, 02/15/27
3.700%, 11/16/25
FaceAmount^ Value†
(000)
Analog Devices, Inc.533 $ 564,857
Anthem, Inc.150 155,321400 425,587
ANZ New ZealandInternational Ltd.
Ω 500 518,065Aon P.L.C.
275 286,516Apache Corp.
200 203,109Apple, Inc.
250 261,219# 695 693,968
1,300 1,368,5021,000 1,031,316
500 517,249Applied Materials, Inc.
300 313,747Arizona Public ServiceCo.
100 102,910Arrow Electronics, Inc.
400 399,402ASB Finance, Ltd.
EUR 225 253,872Asian Development Bank
150 150,436AT&T, Inc.
150 154,37850 50,730
200 207,821350 369,788300 311,573200 208,499
Australia & New ZealandBanking Group, Ltd.
250 266,341Autodesk, Inc.
3.300%, 01/11/234.000%, 04/01/24
3.419%, 12/20/28
0.250%, 11/17/211.375%, 12/29/21
3.650%, 02/04/242.800%, 05/04/26
0.375%, 04/06/22
1.500%, 04/01/224.375%, 01/12/26
4.500%, 10/15/21
3.125%, 03/15/26
4.450%, 10/01/28
3.375%, 06/01/223.200%, 03/15/27
3.600%, 06/01/26
3.850%, 05/15/25
3.119%, 05/04/263.017%, 01/16/27
3.535%, 11/04/24
FaceAmount^ Value†
(000)
Bank of America Corp.150 $ 154,007136 144,654
Bank of America Corp.,3M USD LIBOR +1.040%, FRN
(r) 120 123,468Bank of Montreal
EUR 500 559,233GBP 100 123,054
Bank of New York MellonCorp. (The)
300 316,387500 507,597
Bank of Nova Scotia(The)
EUR 500 561,484Barclays P.L.C.
EUR 200 228,581500 516,374
Bemis Co., Inc.Ω 100 103,110Berkshire Hathaway, Inc.
2,057 2,126,854Best Buy Co., Inc.
500 532,412BlackRock, Inc.
100 103,464350 365,845
Booking Holdings, Inc.635 667,519
Boston Scientific Corp.200 214,222
BP Capital MarketsAmerica, Inc.
750 771,373400 408,242
BP Capital Markets P.L.C.50 52,496
BPCE SA

DFA Social Fixed Income PortfolioCONTINUED
4.375%, 06/15/253.500%, 06/15/27
3.375%, 09/15/25
2.500%, 04/15/213.125%, 04/21/26
4.625%, 04/15/26
4.000%, 12/06/27
3.337%, 12/15/27
3.800%, 02/23/28
150 159,261845 858,821
Automatic DataProcessing, Inc.
600 636,158AutoZone, Inc.
70 70,115# 450 455,968Avnet, Inc.
250 265,118AXIS Specialty FinanceP.L.C.# 728 753,596Baker Hughes a GE Co.
LLC / Baker HughesCo-Obligor, Inc.
600 609,864Banco Santander SA
200 205,263
0.375%, 10/05/234.000%, 04/15/24
1.125%, 03/10/23
4.200%, 09/15/24
3.750%, 09/25/27
3.000%, 04/01/25
4.500%, 08/15/234.700%, 03/15/27
4.150%, 03/15/28
EUR 200 225,736500 532,822
BritishTelecommunicationsP.L.C.
EUR 200 230,836Brown & Brown, Inc.
240 253,401Bunge, Ltd. Finance Corp.
965 958,579Burlington Northern Santa
Fe LLC75 77,065
CA, Inc.100 103,590250 257,337
Campbell Soup Co.86 90,572
0.750%, 03/22/23
3.850%, 06/01/27
2.900%, 02/01/25
3.750%, 04/24/243.200%, 02/05/253.750%, 03/09/27
4.625%, 12/15/203.410%, 06/15/27
3.500%, 01/15/252.900%, 01/15/27
4.000%, 04/01/28
3.200%, 03/02/27
2.954%, 05/16/26
FaceAmount^ Value†
(000)
Canadian Imperial Bankof Commerce
EUR 800 $ 917,728Canadian Natural
Resources, Ltd.500 517,372
Canadian Pacific RailwayCo.# 50 51,059Capital One FinancialCorp.
50 52,622260 265,271700 727,419
Cardinal Health, Inc.75 77,075
# 500 488,569CBS Corp.# 250 257,624
704 686,438CenterPoint Energy
Resources Corp.200 213,000
Charles Schwab Corp.(The)
700 725,243Chevron Corp.
1,600 1,654,392
2.400%, 11/02/202.850%, 05/18/263.150%, 09/19/27
4.950%, 03/15/26
6.950%, 04/15/29
3.300%, 12/01/24
3.875%, 02/08/223.375%, 05/21/25
3.000%, 05/18/27
3.500%, 08/15/27
3.625%, 09/09/24
3.950%, 04/04/28
3.700%, 10/30/20
FaceAmount^ Value†
(000)
Commonwealth Bank ofAustralia
250 $ 250,235Ω 250 253,322Ω 100 103,504ConocoPhillips Co.
250 284,883ConocoPhillips HoldingCo.
614 825,659Consolidated Edison Co.
of New York, Inc.300 310,494
Cooperatieve RabobankUA
50 51,8641,500 1,577,045
Costco Wholesale Corp.1,200 1,243,662
Cox Communications, Inc.Ω 400 409,330Credit Suisse AG
500 525,244CRH America Finance,Inc.Ω 200 209,098CSX Corp.
70 70,957

DFA Social Fixed Income PortfolioCONTINUED
3.350%, 05/15/24
3.250%, 04/15/25
6.920%, 05/15/28
2.200%, 02/28/21
3.875%, 10/25/23
3.900%, 05/15/28
3.000%, 03/15/25
3.875%, 03/01/24
3.950%, 05/15/244.500%, 03/01/26
3.150%, 11/15/203.200%, 11/01/232.250%, 09/01/262.900%, 05/25/27
1.125%, 05/26/24
3.250%, 03/15/24
3.375%, 08/15/253.150%, 03/01/26
Chubb INA Holdings, Inc.50 52,400
Cigna Holding Co.750 762,556
Cincinnati Financial Corp.600 770,404
Cisco Systems, Inc.50 50,078
Citigroup, Inc.380 399,605
Clorox Co. (The)750 820,436
CME Group, Inc.85 88,001
CMS Energy Corp.175 182,856
CNA Financial Corp.300 316,059280 302,279
Coca-Cola Co. (The)48 48,562
600 625,280740 738,377400 415,695
Coca-Cola EuropeanPartners P.L.C.
EUR 150 175,822Colgate-Palmolive Co.
100 104,820Comcast Corp.
500 522,384200 207,015
2.750%, 12/01/223.875%, 07/20/25
0.750%, 06/02/23
5.375%, 10/16/29
1.375%, 12/07/22
3.500%, 06/15/223.250%, 04/01/233.900%, 11/15/244.900%, 03/11/26
3.250%, 04/15/234.150%, 11/01/25
4.200%, 05/15/28
2.800%, 11/15/20
3.000%, 11/15/223.500%, 10/01/24
2.850%, 10/01/26
3.750%, 04/15/24
4.750%, 04/15/27
CVS Health Corp.200 200,427505 527,461
Danske Bank A.S.EUR 300 340,670
Deere & Co.80 98,095
Dexia Credit Local SAGBP 500 618,664
DiscoveryCommunications LLC
50 51,03975 76,357
150 156,056# 200 218,889Dollar General Corp.
100 102,515500 538,677
Dollar Tree, Inc.600 624,770
Dominion Energy GasHoldings LLC
250 251,264Dow Chemical Co. (The)
30 30,363200 207,337
DTE Energy Co.750 748,912
Duke Energy Corp.275 288,843
DXC Technology Co.700 752,229
2.950%, 08/24/224.500%, 06/20/28
1.500%, 05/26/23
3.103%, 09/15/274.000%, 11/02/32
3.500%, 04/06/27
2.600%, 07/15/22
2.700%, 11/01/26
FaceAmount^ Value†
(000)
E*TRADE Financial Corp.300 $ 302,305750 803,307
Eastman Chemical Co.EUR 500 585,335
Eaton Corp.400 406,597400 443,110
Eaton Vance Corp.1,500 1,554,596
eBay, Inc.175 175,841
Ecolab, Inc.500 505,441
5.000%, 10/15/25
3.950%, 03/14/28
1.750%, 03/21/234.250%, 09/15/28
3.250%, 09/15/26
3.150%, 12/15/214.200%, 04/17/28
FaceAmount^ Value†
(000)
Fidelity NationalInformation Services,Inc.
63 $ 70,993Fifth Third Bancorp
500 541,164Fluor Corp.
EUR 200 231,297# 1,000 1,041,666GATX Corp.
400 400,894General Mills, Inc.
200 203,202# 400 435,349

DFA Social Fixed Income PortfolioCONTINUED
2.350%, 10/13/20
4.800%, 03/01/26
2.625%, 12/01/21
3.500%, 06/10/243.700%, 07/15/27
3.500%, 04/06/284.875%, 06/14/29
4.750%, 01/15/26
3.900%, 02/15/24
3.150%, 04/01/254.150%, 01/15/26
3.900%, 10/01/27
0.875%, 02/17/232.650%, 01/15/24
3.850%, 11/15/24
3.250%, 01/29/24
2.500%, 03/15/21
2.850%, 06/15/203.400%, 04/15/26
3.900%, 02/15/223.500%, 06/15/243.400%, 03/01/27
2.625%, 08/01/221.000%, 01/11/233.200%, 02/01/25
Electricite de France SAΩ 30 29,962Electronic Arts, Inc.
250 279,635Emerson Electric Co.
450 454,197Enbridge, Inc.
300 309,587# 500 523,228Enel Finance InternationalNVΩ 200 200,535Ω 200 220,264Energy Transfer
Operating L.P.200 215,620
Enterprise ProductsOperating LLC
200 211,483EOG Resources, Inc.
200 206,861100 109,228
EQT Corp.# 600 536,635Equinor ASA
EUR 200 229,868100 101,552
ERAC USA Finance LLCΩ 200 211,218European InvestmentBank
100 105,828Eversource Energy
100 100,033Exelon Corp.
150 150,418200 207,011
Express Scripts HoldingCo.
75 77,504250 258,944
56 57,028FedEx Corp.
100 100,495EUR 300 342,579
300 308,174
4.200%, 10/01/27
5.250%, 03/01/26
3.250%, 03/30/27
7.750%, 11/15/29
3.750%, 02/25/26
3.500%, 08/01/233.800%, 11/15/25
3.500%, 07/28/25
3.150%, 05/15/213.500%, 09/15/27
2.000%, 04/01/21
2.500%, 11/01/26
4.000%, 03/30/224.300%, 03/08/26
3.150%, 03/14/212.300%, 01/14/22
3.375%, 07/15/23
3.500%, 03/01/24
2.050%, 08/15/21
1.000%, 09/20/23
3.150%, 05/11/27
3.000%, 02/21/24
General Motors Co.300 304,696
General Motors FinancialCo., Inc.
250 269,366Georgia Power Co.
250 256,410Georgia-Pacific LLC
40 56,676Goldman Sachs Group,
Inc. (The)1,150 1,203,799
Halliburton Co.200 206,998500 525,274
Harley-Davidson, Inc.585 601,498
Hasbro, Inc.97 97,960
100 102,337Home Depot, Inc. (The)
100 99,750Honeywell International,Inc.
700 700,597HSBC Holdings P.L.C.
350 362,910200 213,855
Huntington Bancshares,Inc.
75 75,805300 298,922
Hyatt Hotels Corp.100 102,122
Illinois Tool Works, Inc.100 104,926
ING Bank NVΩ 350 346,706ING Groep NV
EUR 200 230,415Intel Corp.# 500 524,812Inter-American
Development Bank250 261,994
FaceAmount^ Value†
(000)
FaceAmount^ Value†
(000)

4.000%, 10/15/233.750%, 12/01/25
3.300%, 01/27/27
3.800%, 01/15/26
4.200%, 04/15/24
3.650%, 06/15/24
4.875%, 08/01/25
4.850%, 01/15/27
3.500%, 03/15/25
1.000%, 09/15/23
3.250%, 09/23/223.875%, 02/01/243.900%, 07/15/252.950%, 10/01/26
4.500%, 03/15/24
2.750%, 03/01/233.250%, 04/01/263.400%, 11/15/27
3.400%, 11/15/25
3.300%, 06/01/25
5.100%, 03/24/21
2.400%, 06/01/23
4.750%, 12/15/23
0.000%, 09/08/22
0.250%, 06/01/220.750%, 02/22/231.000%, 11/13/23
3.500%, 06/06/22
Intercontinental Exchange,Inc.
300 $318,309250 266,610
International BusinessMachines Corp.
750 776,838International Paper Co.
75 78,665Interpublic Group of Cos.,
Inc. (The)250 267,656
ITC Holdings Corp.# 200 208,457Janus Capital Group, Inc.
350 379,676Jefferies Group LLC /
Jefferies Group CapitalFinance, Inc.
400 424,568JM Smucker Co. (The)
70 72,526Johnson Controls
International P.L.C.EUR 376 431,688
JPMorgan Chase & Co.150 154,130
# 500 529,896330 351,344500 505,525
Juniper Networks, Inc.200 214,867
Kellogg Co.75 75,174
200 204,127500 512,182
Keurig Dr Pepper, Inc.250 253,728
KeyBank NA250 260,523
KeyCorp100 104,305
Kimberly-Clark Corp.50 50,374
Kohl's Corp.67 71,119
KommunekreditEUR 400 449,637
Kommuninvest I SverigeAB
SEK 4,000 419,449SEK 7,000 746,596SEK 9,000 973,287
Kraft Heinz Foods Co.200 204,700
3.600%, 09/01/27
3.800%, 09/15/27
4.750%, 03/15/26
3.350%, 03/09/25
3.750%, 01/11/27
2.625%, 05/15/233.750%, 04/01/26
3.875%, 09/15/233.375%, 09/15/252.500%, 04/15/26
6.000%, 11/15/215.750%, 04/15/24
3.900%, 01/15/26
2.900%, 02/06/25
3.625%, 09/15/245.125%, 12/15/26
5.350%, 06/01/21
2.875%, 03/01/214.000%, 04/15/28
2.750%, 01/30/223.500%, 03/10/25
2.950%, 11/21/26
3.450%, 06/15/27
2.750%, 12/09/202.625%, 01/15/222.000%, 06/01/230.625%, 01/29/243.700%, 01/30/26
3.796%, 03/15/24
3.500%, 03/15/25
Laboratory Corp. ofAmerica Holdings
750 $773,928Lear Corp.
500 496,007Legg Mason, Inc.
30 32,399Lincoln National Corp.
75 76,523Lloyds Banking GroupP.L.C.
450 456,672Loews Corp.
50 50,512200 211,201
Lowe's Cos., Inc.50 52,712
125 129,764500 494,383
LyondellBasell IndustriesNV
200 213,329300 336,652
Macquarie Bank, Ltd.Ω 250 262,847Manufacturers & Traders
Trust Co.300 305,408
Marathon Petroleum Corp.100 103,952100 110,632
Markel Corp.30 31,392
Marriott International, Inc.200 201,005100 105,597
Marsh & McLennan Cos.,Inc.
300 303,152# 250 261,130Mastercard, Inc.
300 311,152Maxim Integrated Products,
Inc.150 151,329
McDonald's Corp.30 30,180
300 302,707EUR 100 119,958EUR 200 228,461
# 150 160,040McKesson Corp.
75 78,273Medtronic, Inc.
112 118,835
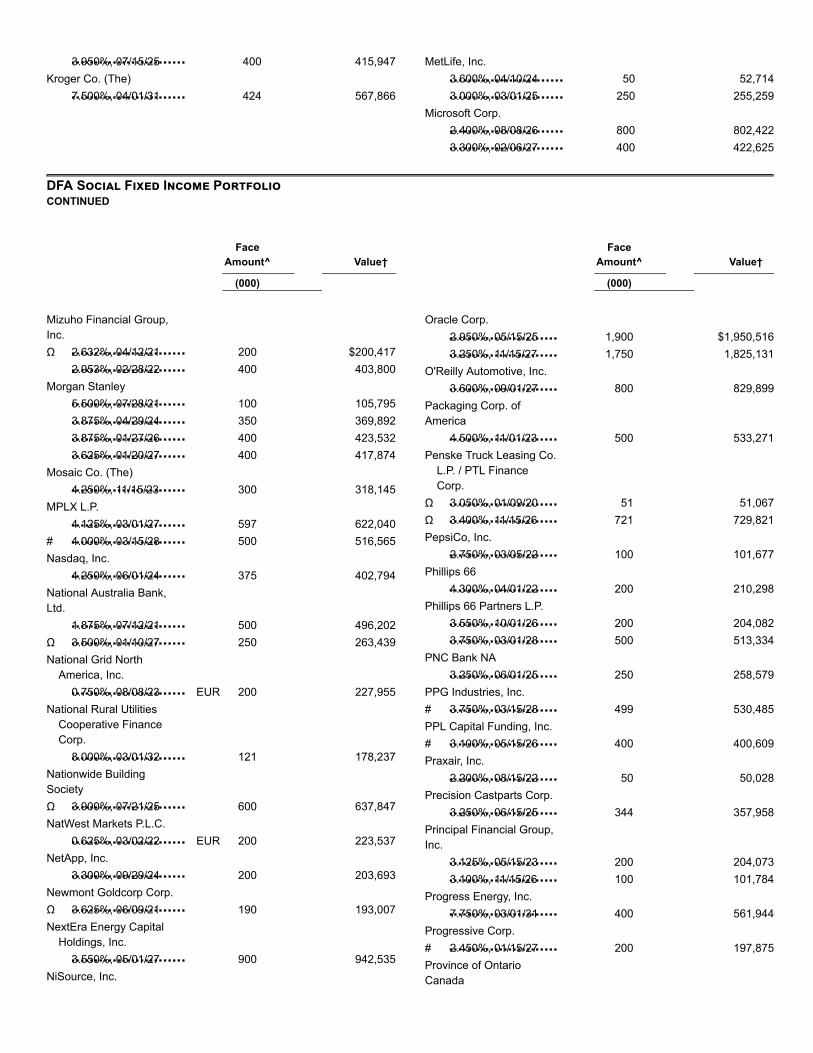
DFA Social Fixed Income PortfolioCONTINUED
3.950%, 07/15/25
7.500%, 04/01/31
400 415,947Kroger Co. (The)
424 567,8663.600%, 04/10/243.000%, 03/01/25
2.400%, 08/08/263.300%, 02/06/27
MetLife, Inc.50 52,714
250 255,259Microsoft Corp.
800 802,422400 422,625
2.632%, 04/12/212.953%, 02/28/22
5.500%, 07/28/213.875%, 04/29/243.875%, 01/27/263.625%, 01/20/27
4.250%, 11/15/23
4.125%, 03/01/274.000%, 03/15/28
4.250%, 06/01/24
1.875%, 07/12/213.500%, 01/10/27
0.750%, 08/08/23
8.000%, 03/01/32
3.900%, 07/21/25
0.625%, 03/02/22
3.300%, 09/29/24
3.625%, 06/09/21
3.550%, 05/01/27
FaceAmount^ Value†
(000)
Mizuho Financial Group,Inc.Ω 200 $200,417
400 403,800Morgan Stanley
100 105,795350 369,892400 423,532400 417,874
Mosaic Co. (The)300 318,145
MPLX L.P.597 622,040
# 500 516,565Nasdaq, Inc.
375 402,794National Australia Bank,Ltd.
500 496,202Ω 250 263,439National Grid North
America, Inc.EUR 200 227,955
National Rural UtilitiesCooperative FinanceCorp.
121 178,237Nationwide BuildingSocietyΩ 600 637,847NatWest Markets P.L.C.
EUR 200 223,537NetApp, Inc.
200 203,693Newmont Goldcorp Corp.Ω 190 193,007NextEra Energy Capital
Holdings, Inc.900 942,535
NiSource, Inc.
2.950%, 05/15/253.250%, 11/15/27
3.600%, 09/01/27
4.500%, 11/01/23
3.050%, 01/09/203.400%, 11/15/26
2.750%, 03/05/22
4.300%, 04/01/22
3.550%, 10/01/263.750%, 03/01/28
3.250%, 06/01/25
3.750%, 03/15/28
3.100%, 05/15/26
2.200%, 08/15/22
3.250%, 06/15/25
3.125%, 05/15/233.100%, 11/15/26
7.750%, 03/01/31
2.450%, 01/15/27
FaceAmount^ Value†
(000)
Oracle Corp.1,900 $1,950,5161,750 1,825,131
O'Reilly Automotive, Inc.800 829,899
Packaging Corp. ofAmerica
500 533,271Penske Truck Leasing Co.
L.P. / PTL FinanceCorp.
Ω 51 51,067Ω 721 729,821PepsiCo, Inc.
100 101,677Phillips 66
200 210,298Phillips 66 Partners L.P.
200 204,082500 513,334
PNC Bank NA250 258,579
PPG Industries, Inc.# 499 530,485PPL Capital Funding, Inc.# 400 400,609Praxair, Inc.
50 50,028Precision Castparts Corp.
344 357,958Principal Financial Group,Inc.
200 204,073100 101,784
Progress Energy, Inc.400 561,944
Progressive Corp.# 200 197,875Province of OntarioCanada

DFA Social Fixed Income PortfolioCONTINUED
3.850%, 02/15/23
4.150%, 12/15/213.850%, 01/15/28
4.000%, 03/15/27
2.900%, 06/15/26
3.950%, 05/01/28
3.625%, 03/15/24
4.125%, 11/01/24
3.000%, 02/15/27
3.650%, 11/01/24
4.000%, 07/13/27
200 207,854Noble Energy, Inc.
200 206,193# 400 408,474Nordstrom, Inc.# 200 204,083Norfolk Southern Corp.
200 203,873Nucor Corp.
300 326,640Nutrien, Ltd.
300 309,833Nuveen Finance LLCΩ 50 53,560Occidental PetroleumCorp.# 300 298,989Omnicom Group, Inc. /
Omnicom Capital, Inc.300 312,928
ONEOK, Inc.800 835,280
1.875%, 05/21/203.150%, 06/02/22
3.500%, 07/29/207.500%, 09/15/29
4.500%, 11/16/213.500%, 05/15/24
5.125%, 04/15/20
3.450%, 05/20/25
3.500%, 03/30/25
3.950%, 09/15/26
2.875%, 03/01/25
3.625%, 10/14/25
50 49,859CAD 340 267,056
Province of QuebecCanada
35 35,450500 724,876
Prudential Financial, Inc.100 104,952
# 200 211,252PSEG Power LLC
30 30,509QUALCOMM, Inc.
575 599,266Quest Diagnostics, Inc.
200 206,971Reinsurance Group of
America, Inc.400 421,139
Rockwell Automation, Inc.300 304,813
Rolls-Royce P.L.C.Ω 600 617,925
3.800%, 12/15/26
2.500%, 03/22/234.800%, 04/05/26
7.500%, 10/15/273.700%, 03/15/28
3.700%, 04/11/28
4.500%, 07/17/254.400%, 07/13/27
2.875%, 10/16/20
4.000%, 03/13/24
3.550%, 06/15/24
FaceAmount^ Value†
(000)
Roper Technologies, Inc.200 $ 210,222
Royal Bank of ScotlandGroup P.L.C.
EUR 200 235,619200 213,719
Royal Caribbean Cruises,Ltd.
200 250,505200 202,124
salesforce.com, Inc.200 216,492
Santander Holdings USA,Inc.
250 265,339200 211,584
Santander UK GroupHoldings P.L.C.
350 350,442Santander UK P.L.C.
50 52,483Sempra Energy
250 258,330
3.600%, 12/01/24
2.450%, 08/01/22
2.900%, 03/03/21
5.375%, 09/15/20
0.250%, 02/28/22
0.300%, 09/06/22
2.600%, 10/01/203.300%, 07/15/26
4.250%, 04/01/25
2.500%, 04/15/26
7.875%, 02/15/26
FaceAmount^ Value†
(000)
Suncor Energy, Inc.200 $ 208,549
SunTrust Bank400 400,450
SunTrust Banks, Inc.75 75,497
SVB Financial Group100 103,017
Svenska HandelsbankenAB
EUR 880 987,154Swedbank AB
EUR 200 223,729Sysco Corp.
30 30,0671,000 1,032,337
Tapestry, Inc.300 314,339
Target Corp.325 328,300
TCI Communications, Inc.140 181,946
TD Ameritrade HoldingCorp.

DFA Social Fixed Income PortfolioCONTINUED
2.125%, 05/11/203.250%, 05/11/252.875%, 05/10/26
3.450%, 08/01/25
6.125%, 08/17/26
5.500%, 12/01/21
4.450%, 12/03/25
3.250%, 07/01/26
4.150%, 12/01/25
3.000%, 11/15/26
3.700%, 04/01/28
4.750%, 03/15/24
4.050%, 04/12/26
2.100%, 02/04/21
3.550%, 08/18/25
3.375%, 05/15/243.375%, 11/01/25
3.784%, 03/09/26
Shell International FinanceBV
180 179,8471,222 1,278,013
850 873,800Sherwin-Williams Co. (The)
100 103,167Siemens
FinancieringsmaatschappijNV
Ω 200 242,139SNCF Reseau EPIC
GBP 778 1,047,552Solvay Finance America LLCΩ 200 211,722Southern Co. (The)
500 510,342Southern Power Co.
50 53,295Southwest Airlines Co.
250 251,621Southwest Gas Corp.
100 105,509Spectra Energy Partners L.P.
400 433,203Standard Chartered P.L.C.#Ω 200 206,318Starbucks Corp.
100 99,776State Street Corp.
200 211,308Stryker Corp.
200 208,584500 527,370
Sumitomo Mitsui FinancialGroup, Inc.
800 849,227
3.625%, 04/01/25
3.987%, 01/23/23
8.250%, 09/15/30
2.900%, 11/03/27
4.300%, 11/23/23
2.250%, 09/15/26
1.994%, 03/23/22
2.125%, 03/15/23
4.800%, 04/01/264.450%, 06/01/28
2.500%, 08/01/224.875%, 01/15/264.250%, 05/15/28
3.150%, 09/17/25
3.700%, 01/30/24
2.800%, 01/27/25
1.750%, 11/16/224.125%, 09/24/25
2.000%, 07/28/26
3.750%, 03/15/24
30 31,607Telefonica Emisiones SA
EUR 200 253,126Telefonica Europe BV# 975 1,397,460Texas Instruments, Inc.
500 515,975Thomson Reuters Corp.
400 424,033TJX Cos., Inc. (The)
1,150 1,125,924Toronto-Dominion Bank(The)
CAD 500 378,004Total Capital InternationalSA
EUR 800 961,736Total System Services,Inc.
530 584,818607 654,066
TransCanada PipeLines,Ltd.
200 199,59090 100,202
500 540,572TWDC Enterprises 18Corp.# 200 209,544U.S. Bancorp
75 79,463U.S. Bank NA
750 765,069UBS Group Funding
Switzerland AGEUR 200 234,243
Ω 400 426,713Unilever Capital Corp.
100 96,955Union Pacific Corp.
200 209,925
3.950%, 09/10/28
2.450%, 10/01/220.375%, 11/15/23
FaceAmount^ Value†
(000)
650 $ 707,130United Parcel Service,Inc.
100 100,598EUR 650 733,869
2.090%, 09/17/19
7.500%, 11/15/246.875%, 08/15/25
FaceAmount^ Value†
(000)
U.S. TREASURY OBLIGATIONS — (20.2%)U.S. Treasury Bill
1,150 $ 1,146,978U.S. Treasury Bonds
600 770,0161,000 1,285,391

7.500%, 09/15/29
3.000%, 05/15/21
3.400%, 09/15/26
3.376%, 02/15/252.625%, 08/15/264.329%, 09/21/284.016%, 12/03/29
3.875%, 04/01/24
3.150%, 12/14/25
7.875%, 02/15/30
3.450%, 06/01/26
2.550%, 04/11/23
3.000%, 09/15/22
3.700%, 09/15/24
3.500%, 05/15/24
3.550%, 06/15/25
3.000%, 02/19/253.000%, 04/22/26
4.875%, 11/19/192.850%, 05/13/263.350%, 03/08/27
8.200%, 01/15/30
3.700%, 05/01/25
4.000%, 09/15/253.750%, 06/15/27
2.900%, 10/21/19
3.550%, 04/01/25
United TechnologiesCorp.
40 55,407Unum Group
350 351,999Valero Energy Corp.
250 255,823VerizonCommunications, Inc.
24 25,045200 199,437823 911,779
Ω 151 163,846Viacom, Inc.
31 32,347Visa, Inc.
375 391,606Vodafone Group P.L.C.# 200 271,484Walgreens BootsAlliance, Inc.
450 458,905Walmart, Inc.
100 101,245Walt Disney CoΩ 180 183,933Walt Disney Co. (The)Ω 200 212,822Waste Management,Inc.
310 324,510WEC Energy Group,Inc.
500 525,376Wells Fargo & Co.# 850 866,158
450 454,200Westpac Banking Corp.
59 59,455300 305,760550 579,347
WestRock MWV LLC222 301,069
Whirlpool Corp.200 206,514
Williams Cos., Inc.(The)
500 526,506110 113,297
Wm Wrigley Jr Co.Ω 75 75,041Zimmer BiometHoldings, Inc.
300 310,018Zoetis, Inc.
6.000%, 02/15/266.750%, 08/15/266.625%, 02/15/276.125%, 11/15/275.250%, 11/15/285.250%, 02/15/296.125%, 08/15/296.250%, 05/15/305.375%, 02/15/31
1.000%, 08/31/191.250%, 08/31/191.625%, 08/31/192.750%, 02/15/242.125%, 07/31/242.125%, 05/15/252.875%, 05/31/252.000%, 08/15/252.250%, 11/15/251.625%, 02/15/261.625%, 05/15/261.500%, 08/15/262.250%, 02/15/272.250%, 11/15/272.750%, 02/15/282.875%, 05/15/282.875%, 08/15/283.125%, 11/15/282.625%, 02/15/292.375%, 05/15/29
TOTAL U.S.TREASURYOBLIGATIONS
TOTAL INVESTMENTSECURITIES
DFA Short TermInvestment Fund
(Cost $280,978,247)^^
1,000 1,251,2501,000 1,318,0081,400 1,860,195
750 989,209250 318,877
2,570 3,294,9211,045 1,435,4051,030 1,450,5702,400 3,219,656
U.S. Treasury Notes600 599,424
1,750 1,748,6741,300 1,299,408
600 623,836500 506,602
2,600 2,635,5471,300 1,371,3982,800 2,818,1562,400 2,450,0632,150 2,112,7113,100 3,042,7232,500 2,430,4691,500 1,532,8122,750 2,808,8671,700 1,803,2621,750 1,874,9612,250 2,412,9492,200 2,408,3122,900 3,053,6092,500 2,579,004
58,453,263
275,955,350
Shares
SECURITIES LENDING COLLATERAL — (4.9%)@§
1,237,224 14,315,918
TOTAL INVESTMENTS — (100.0%)$290,271,268

Agency ObligationsBondsU.S. Treasury ObligationsSecurities Lending CollateralForward Currency Contracts**
TOTAL
0.125%, 04/15/200.125%, 04/15/210.125%, 01/15/220.125%, 04/15/220.125%, 01/15/232.375%, 01/15/250.625%, 01/15/261.750%, 01/15/283.625%, 04/15/28
DFA Social Fixed Income PortfolioCONTINUED
As of July 31, 2019, DFA Social Fixed Income Portfolio had entered into the following forward currency contracts and the net unrealizedforward currency gain (loss) is reflected in the accompanying financial statements:
Currency Purchased Currency Sold CounterpartySettlement
Date
UnrealizedForeign
ExchangeAppreciation
(Depreciation)
USD 11,975,556 EUR 10,597,257 State Street Bank and Trust 08/15/19 $232,231USD 2,208,232 SEK 20,631,516 Bank of America Corp. 08/16/19 70,495USD 2,147,217 GBP 1,727,257 State Street Bank and Trust 08/19/19 44,974USD 653,655 CAD 861,161 State Street Bank and Trust 08/28/19 817
Total Appreciation $348,517
Summary of the Portfolio's investments as of July 31, 2019, based on their valuation inputs, is as follows (see Security Valuation Note):
Investments in Securities (Market Value)
Level 1 Level 2 Level 3 Total
— $ 62,439,670 — $ 62,439,670— 155,062,417 — 155,062,417— 58,453,263 — 58,453,263— 14,315,918 — 14,315,918— 348,517 — 348,517
— $290,619,785 — $290,619,785** Valued at the unrealized appreciation/(depreciation) on the investment.
DFA DIVERSIFIED FIXED INCOME PORTFOLIO
SCHEDULE OF INVESTMENTS
July 31, 2019
(Unaudited)
FaceAmount± Value†
(000)
U.S. TREASURY OBLIGATIONS — (19.5%)Treasury Inflation Protected Security
35,407 $ 38,262,76336,186 38,624,153
6,000 6,726,11917,400 18,134,61716,800 18,495,98320,873 31,556,84410,650 11,748,574
1,800 2,463,36811,900 24,154,480
3.000%, 09/12/27
TOTAL BONDS
355 360,242
155,062,417

2.500%, 01/15/293.875%, 04/15/29
TOTAL U.S. TREASURY OBLIGATIONS
Investment in DFA Intermediate Government Fixed Income Portfolio ofDFA Investment Dimensions Group Inc.Investment in DFA Two-Year Global Fixed Income Portfolio ofDFA Investment Dimensions Group Inc.
TOTAL INVESTMENTS IN AFFILIATED INVESTMENT COMPANIES
TOTAL INVESTMENT SECURITIES
State Street Institutional U.S. Government Money Market Fund 2.260%
DFA Short Term Investment Fund
(Cost $983,406,009)^^
U.S. Treasury ObligationsAffiliated Investment CompaniesTemporary Cash InvestmentsSecurities Lending Collateral
TOTAL
Altice USA, Inc., Class ACable One, Inc.CBS Corp., Class BComcast Corp., Class AInterpublic Group of Cos., Inc. (The)Live Nation Entertainment, Inc.Match Group, Inc.Omnicom Group, Inc.Sirius XM Holdings, Inc.Sprint Corp.
2,500 3,585,972800 1,666,401
195,419,274
Shares
AFFILIATED INVESTMENT COMPANIES — (78.7%)
38,587,713 492,765,096
29,482,616 294,236,506
787,001,602
982,420,876
TEMPORARY CASH INVESTMENTS — (0.6%)5,816,719 5,816,719
SECURITIES LENDING COLLATERAL — (1.2%)@§ 1,035,455 11,981,250
TOTAL INVESTMENTS — (100.0%)$1,000,218,845
Summary of the Portfolio's investments as of July 31, 2019, based on their valuation inputs, is as follows (see Security Valuation Note):
Investments in Securities (Market Value)
Level 1 Level 2 Level 3 Total
— $195,419,274 — $ 195,419,274$787,001,602 — — 787,001,602
5,816,719 — — 5,816,719— 11,981,250 — 11,981,250
$792,818,321 $207,400,524 — $1,000,218,845
U.S. HIGH RELATIVE PROFITABILITY PORTFOLIO
SCHEDULE OF INVESTMENTS
July 31, 2019
(Unaudited)
Shares Value†
COMMON STOCKS — (98.4%)COMMUNICATION SERVICES — (5.9%)* 137,941 $ 3,560,257
774 941,803123,714 6,372,508207,454 8,955,789
72,570 1,663,304* 1 72# 4,952 372,836# 75,576 6,062,707# 27,573 172,607#* 10,048 73,652

T-Mobile US, Inc.Verizon Communications, Inc.World Wrestling Entertainment, Inc., Class AZayo Group Holdings, Inc.
TOTAL COMMUNICATION SERVICES
Amazon.com, Inc.Aptiv P.L.C.AramarkAutoliv, Inc.Best Buy Co., Inc.Booking Holdings, Inc.Burlington Stores, Inc.Capri Holdings, Ltd.Darden Restaurants, Inc.Dollar General Corp.Dollar Tree, Inc.eBay, Inc.Five Below, Inc.Gap, Inc. (The)Garrett Motion, Inc.General Motors Co.H&R Block, Inc.Hanesbrands, Inc.Harley-Davidson, Inc.Hilton Worldwide Holdings, Inc.Home Depot, Inc. (The)Kohl's Corp.Kontoor Brands, Inc.Las Vegas Sands Corp.Lear Corp.Lowe's Cos., Inc.Lululemon Athletica, Inc.Macy's, Inc.Marriott International, Inc., Class ANIKE, Inc., Class BNordstrom, Inc.NVR, Inc.O'Reilly Automotive, Inc.Polaris Industries, Inc.Pool Corp.Ross Stores, Inc.Service Corp. International
ServiceMaster Global Holdings, Inc.Starbucks Corp.Target Corp.TJX Cos., Inc. (The)Tractor Supply Co.Ulta Salon Cosmetics & Fragrance, Inc.
* 38,215 3,046,882931,766 51,498,707
# 2,434 177,147* 45,431 1,532,388
84,430,659
CONSUMER DISCRETIONARY — (17.5%)* 28,607 53,402,975
93,403 8,186,77321,076 762,740
# 17,496 1,262,33696,334 7,372,441
* 7,374 13,911,862* 10,915 1,972,886* 18,890 672,295
33,578 4,081,74210,319 1,382,952
* 29,361 2,987,482119,991 4,942,429
* 2,249 264,168# 90,321 1,761,260* 5,883 83,362
170,415 6,874,541# 8,484 234,922# 70,921 1,141,119# 31,257 1,118,375
24,546 2,369,916125,512 26,820,659
39,994 2,154,077* 4,741 139,054
48,829 2,951,2259,750 1,236,105
101,152 10,256,813* 19,914 3,805,366
55,078 1,251,92331,425 4,369,961
201,874 17,367,220# 37,203 1,231,791* 1,075 3,594,951* 7,303 2,780,690# 8,976 849,758
6,161 1,166,70950,172 5,319,73739,958 1,843,662
U.S. High Relative Profitability PortfolioCONTINUED
Shares Value†
CONSUMER DISCRETIONARY — (Continued)* 7,292 $ 388,153
127,762 12,097,78495,025 8,210,160
178,033 9,713,48132,952 3,585,507
* 16,598 5,796,852

VF Corp.Williams-Sonoma, Inc.Wyndham Destinations, Inc.Wynn Resorts, Ltd.
TOTAL CONSUMER DISCRETIONARY
Altria Group, Inc.Brown-Forman Corp., Class ABrown-Forman Corp., Class BCampbell Soup Co.Church & Dwight Co., Inc.Clorox Co. (The)Coca-Cola Co. (The)Costco Wholesale Corp.Estee Lauder Cos., Inc. (The), Class AGeneral Mills, Inc.Herbalife Nutrition, Ltd.Hershey Co. (The)Ingredion, Inc.Kellogg Co.Keurig Dr Pepper, Inc.Kroger Co. (The)PepsiCo, Inc.Sysco Corp.Walmart, Inc.
TOTAL CONSUMER STAPLES
Anadarko Petroleum Corp.Apache Corp.Cabot Oil & Gas Corp.Cimarex Energy Co.ConocoPhillipsContinental Resources, Inc.Occidental Petroleum Corp.
TOTAL ENERGY
American Express Co.Ameriprise Financial, Inc.Aon P.L.C.Credit Acceptance Corp.Discover Financial ServicesErie Indemnity Co., Class AFactSet Research Systems, Inc.Interactive Brokers Group, Inc., Class ALazard, Ltd., Class ALPL Financial Holdings, Inc.MarketAxess Holdings, Inc.Marsh & McLennan Cos., Inc.Moody's Corp.
33,190 2,900,4741,800 120,0247,845 369,186
33,959 4,417,047
249,524,945
CONSUMER STAPLES — (9.3%)397,008 18,687,167
4,389 234,19727,140 1,487,543
# 69,315 2,865,48216,341 1,232,76525,879 4,207,925
536,062 28,212,94354,131 14,920,12827,526 5,070,01436,315 1,928,690
* 8,932 366,39114,045 2,131,188
5,189 401,058119,793 6,974,348
# 11,310 318,263108,512 2,296,114237,100 30,303,751
54,863 3,761,95669,502 7,671,631
133,071,554
ENERGY — (1.8%)50,636 3,729,84883,696 2,043,856
108,375 2,076,46512,792 648,171
202,922 11,988,632* 28,953 1,076,183
87,329 4,485,217
26,048,372
FINANCIALS — (3.4%)97,128 12,079,80934,037 4,952,72429,372 5,558,651
* 1,186 566,94314,023 1,258,424
# 726 161,731# 6,976 1,934,445
3,600 184,5363,825 148,066
18,737 1,571,4723,198 1,077,854
40,122 3,964,05415,986 3,426,439
U.S. High Relative Profitability PortfolioCONTINUED
Shares Value†

MSCI, Inc.S&P Global, Inc.Santander Consumer USA Holdings, Inc.T Rowe Price Group, Inc.
TOTAL FINANCIALS
AbbVie, Inc.AmerisourceBergen Corp.Amgen, Inc.Biogen, Inc.Catalent, Inc.Celgene Corp.Cigna Corp.Elanco Animal Health, Inc.Eli Lilly & Co.Encompass Health Corp.Gilead Sciences, Inc.IDEXX Laboratories, Inc.Johnson & JohnsonMerck & Co., Inc.Mettler-Toledo International, Inc.Molina Healthcare, Inc.Nektar TherapeuticsWaters Corp.Zoetis, Inc.
TOTAL HEALTH CARE
3M Co.Allegion P.L.C.Allison Transmission Holdings, Inc.American Airlines Group, Inc.Boeing Co. (The)BWX Technologies, Inc.Caterpillar, Inc.CH Robinson Worldwide, Inc.Cintas Corp.Copart, Inc.CSX Corp.Cummins, Inc.Deere & Co.Delta Air Lines, Inc.Donaldson Co., Inc.Emerson Electric Co.Expeditors International of Washington, Inc.Fastenal Co.FedEx Corp.General Dynamics Corp.Graco, Inc.HD Supply Holdings, Inc.Honeywell International, Inc.Huntington Ingalls Industries, Inc.IAA Inc.
FINANCIALS — (Continued)14,597 $ 3,317,02229,461 7,216,47221,091 567,559
8,426 955,424
48,941,625
HEALTH CARE — (10.2%)80,446 5,359,31262,312 5,430,491
108,554 20,254,005* 27,369 6,508,896* 504 28,471* 73,557 6,756,946* 5,612 953,591* 6,519 214,866
116,274 12,668,05215,589 995,202
182,157 11,934,927* 18,605 5,247,540
107,656 14,018,964478,223 39,687,727
* 5,091 3,852,614* 14,519 1,927,833#* 16,288 463,556* 15,017 3,161,980
55,604 6,388,344
145,853,317
INDUSTRIALS — (17.2%)98,182 17,154,35917,092 1,769,70622,693 1,042,74350,289 1,534,31741,230 14,066,851
# 1,500 80,865117,831 15,514,808
# 37,987 3,180,6513,432 893,830
* 47,159 3,656,237133,254 9,381,082
5,198 852,47257,267 9,486,279
108,837 6,643,41020,479 1,022,92617,117 1,110,55136,666 2,799,449
167,602 5,162,14215,941 2,718,41917,163 3,191,28831,407 1,510,049
* 29,443 1,192,73690,936 15,682,82310,810 2,467,923
* 27,656 1,292,918
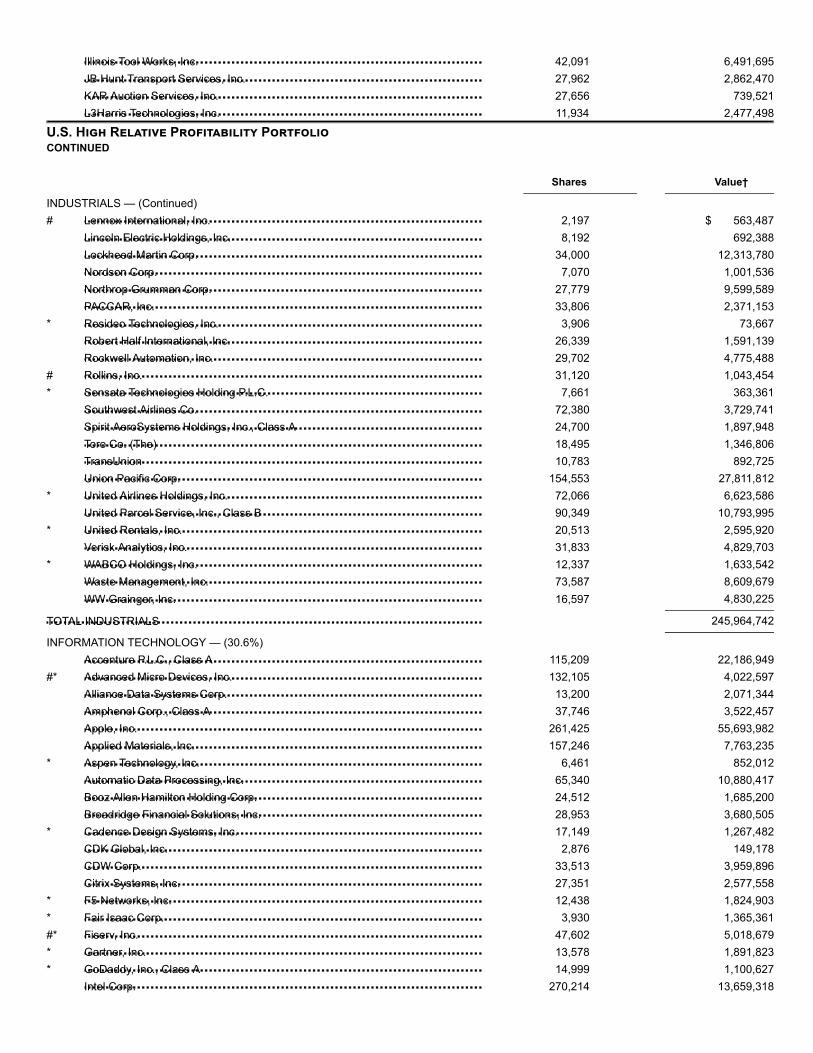
Illinois Tool Works, Inc.JB Hunt Transport Services, Inc.KAR Auction Services, Inc.L3Harris Technologies, Inc.
Lennox International, Inc.Lincoln Electric Holdings, Inc.Lockheed Martin Corp.Nordson Corp.Northrop Grumman Corp.PACCAR, Inc.Resideo Technologies, Inc.Robert Half International, Inc.Rockwell Automation, Inc.Rollins, Inc.Sensata Technologies Holding P.L.C.Southwest Airlines Co.Spirit AeroSystems Holdings, Inc., Class AToro Co. (The)TransUnionUnion Pacific Corp.United Airlines Holdings, Inc.United Parcel Service, Inc., Class BUnited Rentals, Inc.Verisk Analytics, Inc.WABCO Holdings, Inc.Waste Management, Inc.WW Grainger, Inc.
TOTAL INDUSTRIALS
Accenture P.L.C., Class AAdvanced Micro Devices, Inc.Alliance Data Systems Corp.Amphenol Corp., Class AApple, Inc.Applied Materials, Inc.Aspen Technology, Inc.Automatic Data Processing, Inc.Booz Allen Hamilton Holding Corp.Broadridge Financial Solutions, Inc.Cadence Design Systems, Inc.CDK Global, Inc.CDW Corp.Citrix Systems, Inc.F5 Networks, Inc.Fair Isaac Corp.Fiserv, Inc.Gartner, Inc.GoDaddy, Inc., Class AIntel Corp.
42,091 6,491,69527,962 2,862,47027,656 739,52111,934 2,477,498
U.S. High Relative Profitability PortfolioCONTINUED
Shares Value†
INDUSTRIALS — (Continued)# 2,197 $ 563,487
8,192 692,38834,000 12,313,780
7,070 1,001,53627,779 9,599,58933,806 2,371,153
* 3,906 73,66726,339 1,591,13929,702 4,775,488
# 31,120 1,043,454* 7,661 363,361
72,380 3,729,74124,700 1,897,94818,495 1,346,80610,783 892,725
154,553 27,811,812* 72,066 6,623,586
90,349 10,793,995* 20,513 2,595,920
31,833 4,829,703* 12,337 1,633,542
73,587 8,609,67916,597 4,830,225
245,964,742
INFORMATION TECHNOLOGY — (30.6%)115,209 22,186,949
#* 132,105 4,022,59713,200 2,071,34437,746 3,522,457
261,425 55,693,982157,246 7,763,235
* 6,461 852,01265,340 10,880,41724,512 1,685,20028,953 3,680,505
* 17,149 1,267,4822,876 149,178
33,513 3,959,89627,351 2,577,558
* 12,438 1,824,903* 3,930 1,365,361#* 47,602 5,018,679* 13,578 1,891,823* 14,999 1,100,627
270,214 13,659,318

International Business Machines Corp.Intuit, Inc.Jack Henry & Associates, Inc.KLA Corp.Lam Research Corp.Mastercard, Inc., Class AMaxim Integrated Products, Inc.Micron Technology, Inc.Microsoft Corp.NetApp, Inc.NVIDIA Corp.ON Semiconductor Corp.Oracle Corp.
Paychex, Inc.Paycom Software, Inc.QUALCOMM, Inc.Sabre Corp.Seagate Technology P.L.C.Skyworks Solutions, Inc.Texas Instruments, Inc.Total System Services, Inc.Ubiquiti Networks, Inc.Visa, Inc., Class AVMware, Inc., Class AWestern Digital Corp.Western Union Co. (The)Zebra Technologies Corp., Class A
TOTAL INFORMATION TECHNOLOGY
Avery Dennison Corp.Axalta Coating Systems, Ltd.Berry Global Group, Inc.Celanese Corp.Chemours Co. (The)Crown Holdings, Inc.Eastman Chemical Co.Freeport-McMoRan, Inc.International Paper Co.LyondellBasell Industries NV, Class ANewMarket Corp.Packaging Corp. of AmericaPPG Industries, Inc.Sealed Air Corp.Sherwin-Williams Co. (The)Southern Copper Corp.Steel Dynamics, Inc.WR Grace & Co.
TOTAL MATERIALS
180,555 26,765,47338,954 10,802,33410,351 1,446,03555,897 7,619,87924,452 5,100,932
135,986 37,024,90866,111 3,913,110
* 213,340 9,576,832386,621 52,684,844
54,833 3,207,18251,136 8,627,666
* 33,818 727,425476,114 26,805,218
U.S. High Relative Profitability PortfolioCONTINUED
Shares Value†
INFORMATION TECHNOLOGY — (Continued)38,825 $ 3,224,416
* 9,241 2,224,771161,757 11,834,142
58,513 1,375,64174,604 3,454,91115,610 1,331,221
153,071 19,135,40629,928 4,061,828
# 4,939 635,797252,382 44,923,996
889 155,12219,367 1,043,688
# 25,456 534,576* 13,047 2,751,482
436,162,358
MATERIALS — (2.5%)18,343 2,107,060
* 59,171 1,753,237* 30,253 1,362,898
33,634 3,772,72632,350 616,914
* 31,101 1,990,7756,637 500,098
129,818 1,435,78792,764 4,073,26743,157 3,611,809
319 134,49324,404 2,464,07230,385 3,566,89511,977 500,51910,473 5,373,068
2,568 91,90950,290 1,584,638
1,617 109,649
35,049,814

NRG Energy, Inc.
TOTAL COMMON STOCKS
State Street Institutional U.S. Government Money Market Fund 2.260%
DFA Short Term Investment Fund
(Cost $1,291,141,298)^^
Communication ServicesConsumer DiscretionaryConsumer StaplesEnergyFinancialsHealth CareIndustrialsInformation TechnologyMaterialsUtilities
Temporary Cash InvestmentsSecurities Lending Collateral
TOTAL
Altium, Ltd.Aristocrat Leisure, Ltd.Aurizon Holdings, Ltd.Beach Energy, Ltd.BHP Group, Ltd.BHP Group, Ltd., Sponsored ADRBlueScope Steel, Ltd.Brambles, Ltd.Caltex Australia, Ltd.CIMIC Group, Ltd.
UTILITIES — (0.0%)11,621 396,741
1,405,444,127
TEMPORARY CASH INVESTMENTS — (0.4%)5,060,429 5,060,429
SECURITIES LENDING COLLATERAL — (1.2%)@§ 1,489,661 17,236,868
TOTAL INVESTMENTS — (100.0%)$1,427,741,424
U.S. High Relative Profitability PortfolioCONTINUED
Summary of the Portfolio's investments as of July 31, 2019, based on their valuation inputs, is as follows (see Security Valuation Note):
Investments in Securities (Market Value)
Level 1 Level 2 Level 3 Total
Common Stocks$ 84,430,659 — — $ 84,430,659
249,524,945 — — 249,524,945133,071,554 — — 133,071,554
26,048,372 — — 26,048,37248,941,625 — — 48,941,625
145,853,317 — — 145,853,317245,964,742 — — 245,964,742436,162,358 — — 436,162,358
35,049,814 — — 35,049,814396,741 — — 396,741
5,060,429 — — 5,060,429— $17,236,868 — 17,236,868
$1,410,504,556 $17,236,868 — $1,427,741,424
INTERNATIONAL HIGH RELATIVE PROFITABILITY PORTFOLIO
SCHEDULE OF INVESTMENTS
July 31, 2019
(Unaudited)Shares Value»
COMMON STOCKS — (97.2%)AUSTRALIA — (6.4%)
10,318 $ 256,58564,460 1,341,35338,508 151,171
296,959 428,064247,858 6,823,693
1,500 82,39511,644 102,77298,744 883,25731,359 576,78814,448 360,644

Coca-Cola Amatil, Ltd.Cochlear, Ltd.Coles Group, Ltd.Computershare, Ltd.CSL, Ltd.Domino's Pizza Enterprises, Ltd.Evolution Mining, Ltd.Flight Centre Travel Group, Ltd.Fortescue Metals Group, Ltd.IDP Education, Ltd.Iluka Resources, Ltd.James Hardie Industries P.L.C.Macquarie Group, Ltd.Magellan Financial Group, Ltd.Medibank Pvt, Ltd.Northern Star Resources, Ltd.Qantas Airways, Ltd.Ramsay Health Care, Ltd.REA Group, Ltd.Reece, Ltd.Rio Tinto, Ltd.Seek, Ltd.Telstra Corp., Ltd.TPG Telecom, Ltd.Wesfarmers, Ltd.Woolworths Group, Ltd.
TOTAL AUSTRALIA
OMV AGRaiffeisen Bank International AGVoestalpine AG
TOTAL AUSTRIA
Anheuser-Busch InBev SAColruyt SAProximus SADPUmicore SA
TOTAL BELGIUM
Air CanadaAlimentation Couche-Tard, Inc., Class B
B2Gold Corp.Bank of MontrealBarrick Gold Corp.Barrick Gold Corp.Bausch Health Cos., Inc.Bausch Health Cos., Inc.BCE, Inc.
71,012 513,9607,077 1,063,317
* 167,141 1,622,80171,657 771,90929,951 4,673,624
# 4,701 123,74599,657 338,234
2,958 93,026123,385 694,683
17,154 224,20663,518 414,44664,692 874,953
4,672 408,88917,815 748,161
320,746 790,69792,672 815,459
135,904 529,07220,745 1,030,753
6,518 437,1899,871 71,000
31,814 2,129,22722,265 316,977
344,901 935,13824,792 117,97998,006 2,624,60471,742 1,749,094
35,119,865
AUSTRIA — (0.1%)14,517 726,387
1,685 39,5161,193 31,495
797,398
BELGIUM — (0.8%)34,322 3,450,617
7,076 368,70324,738 705,326
3,027 94,756
4,619,402
CANADA — (8.7%)* 9,300 319,983
33,933 2,079,997
International High Relative Profitability PortfolioCONTINUED
Shares Value»
CANADA — (Continued)* 88,340 $ 281,794
7,238 541,47515,999 260,023
2,592 42,146* 19,922 477,530* 27,041 649,697
10,342 466,528

CAE, Inc.CAE, Inc.Canada Goose Holdings, Inc.Canada Goose Holdings, Inc.Canadian National Railway Co.Canadian National Railway Co.Canadian Natural Resources, Ltd.Canadian Natural Resources, Ltd.Canadian Pacific Railway, Ltd.Canadian Tire Corp., Ltd., Class ACCL Industries, Inc., Class BCGI, Inc.CI Financial Corp.Cogeco Communications, Inc.Constellation Software, Inc.Dollarama, Inc.Encana Corp.Finning International, Inc.FirstService Corp.George Weston, Ltd.Gildan Activewear, Inc.Husky Energy, Inc.Inter Pipeline, Ltd.Keyera Corp.Kirkland Lake Gold, Ltd.Kirkland Lake Gold, Ltd.Linamar Corp.Loblaw Cos., Ltd.Magna International, Inc.Methanex Corp.National Bank of CanadaNorthland Power, Inc.Open Text Corp.Open Text Corp.Parkland Fuel Corp.Quebecor, Inc., Class BRestaurant Brands International, Inc.Restaurant Brands International, Inc.Rogers Communications, Inc., Class BRoyal Bank of CanadaShaw Communications, Inc., Class BShaw Communications, Inc., Class BSpin Master Corp.Suncor Energy, Inc.Suncor Energy, Inc.Teck Resources, Ltd., Class BTeck Resources, Ltd., Class BTFI International, Inc.Toromont Industries, Ltd.Vermilion Energy, Inc.Vermilion Energy, Inc.
11,219 302,53416,865 454,680
#* 2,000 93,666* 2,775 129,842
300 28,39547,311 4,476,09470,839 1,794,32332,540 822,611
7,327 1,748,1498,182 893,399
20,177 1,009,003* 24,803 1,908,095
28,873 447,5991,467 115,8552,225 2,116,9193,900 144,499
15 6914,300 247,254
2,000 209,88011,304 894,008
# 21,164 833,22732,875 255,06950,658 852,48822,037 560,69314,300 591,373
7,315 302,0361,727 58,491
27,530 1,428,43949,330 2,487,219
# 6,154 241,91442,626 2,063,15311,074 210,77414,800 631,22618,537 790,23220,354 665,15215,934 360,984
5,900 434,520# 7,575 558,277
24,595 1,276,235# 34,564 2,727,445
37,763 740,21032,364 633,687
* 1,500 42,62058,896 1,689,94763,770 1,830,19917,900 366,19254,991 1,126,766
1,400 44,28710,838 543,624
# 8,995 161,1857,737 138,802
International High Relative Profitability PortfolioCONTINUED

West Fraser Timber Co., Ltd.
TOTAL CANADA
Coloplast A.S., Class BNovo Nordisk A.S., Class B
TOTAL DENMARK
Elisa OyjKone Oyj, Class BNeste OyjStora Enso Oyj, Class RUPM-Kymmene OyjWartsila Oyj Abp
TOTAL FINLAND
Aeroports de ParisAir Liquide SAAirbus SEArkema SAAtos SEBioMerieuxBouygues SABureau Veritas SACarrefour SACie Generale des Etablissements Michelin SCADanone SAEiffage SAElectricite de France SAEurofins Scientific SEEutelsat Communications SAFaurecia SEHermes InternationalIliad SAIpsen SAKering SALegrand SALVMH Moet Hennessy Louis Vuitton SEOrange SAPeugeot SAPublicis Groupe SASartorius Stedim BiotechSEB SASodexo SASTMicroelectronics NVTeleperformanceThales SAUbisoft Entertainment SAValeo SAVinci SAWorldline SA
Shares Value»
CANADA — (Continued)6,100 $ 238,444
47,840,957
DENMARK — (1.6%)10,911 1,274,357
159,173 7,643,379
8,917,736
FINLAND — (0.9%)16,352 768,08620,771 1,183,39645,415 1,503,06838,201 439,938
9,371 252,59548,121 604,579
4,751,662
FRANCE — (9.9%)2,843 488,7399,703 1,339,366
36,981 5,227,6667,158 644,2601,182 95,046
367 31,05733,214 1,189,03233,429 832,957
1,738 33,39826,583 2,938,68029,506 2,559,14212,781 1,262,92140,393 500,033
# 1,429 611,2711,790 34,2195,934 280,8121,960 1,376,7513,563 368,3585,526 632,2455,620 2,902,793
29,739 2,094,85821,727 8,974,538
180,371 2,673,546101,643 2,399,079
28,127 1,387,9493,191 508,5323,351 536,000
11,514 1,321,834116,439 2,133,968
7,555 1,582,67413,992 1,576,534
* 9,905 814,73338,937 1,213,37237,564 3,863,973
* 473 33,800

TOTAL FRANCE
Adidas AG
Axel Springer SEBASF SEBayerische Motoren Werke AGBrenntag AGContinental AGCovestro AGDeutsche Boerse AGDeutsche Lufthansa AGDeutsche Post AGDeutsche Telekom AGE.ON SEEvonik Industries AGFielmann AGFresenius Medical Care AG & Co. KGaAFuchs Petrolub SEHella GmbH & Co KGaAHochtief AGHugo Boss AGInfineon Technologies AGInnogy SEKION Group AGMETRO AGMTU Aero Engines AGNemetschek SERational AGRTL Group SASymrise AGUnited Internet AGVolkswagen AGWirecard AG
TOTAL GERMANY
AIA Group, Ltd.ASM Pacific Technology, Ltd.BOC Aviation, Ltd.BOC Hong Kong Holdings, Ltd.Cathay Pacific Airways, Ltd.Chow Tai Fook Jewellery Group, Ltd.Galaxy Entertainment Group, Ltd.Hang Seng Bank, Ltd.HKT Trust & HKT, Ltd.Hong Kong & China Gas Co., Ltd.Hong Kong Exchanges & Clearing, Ltd.Melco International Development, Ltd.MGM China Holdings, Ltd.
54,464,136
GERMANY — (6.9%)10,827 3,451,031
International High Relative Profitability PortfolioCONTINUED
Shares Value»
GERMANY — (Continued)5,256 $ 362,784
46,056 3,057,39325,674 1,889,325
4,984 243,4269,770 1,339,511
26,972 1,216,46620,183 2,801,85432,636 517,21676,847 2,499,566
262,506 4,300,131295,513 2,942,960
19,455 553,6242,260 157,260
27,999 1,939,2333,253 114,2472,433 114,7122,903 328,963
188 11,816165,183 3,059,547
5,407 227,1848,936 476,305
26,051 400,7126,810 1,697,0314,233 235,343
366 249,1335,356 262,980
12,385 1,141,18810,600 314,416
2,791 475,85010,044 1,667,409
38,048,616
HONG KONG — (3.1%)193,000 1,979,165
36,800 429,91530,400 261,907
278,500 1,061,195# 94,000 132,573
139,200 132,730279,000 1,899,236
56,300 1,338,127550,000 878,589279,000 616,060
76,135 2,564,39939,000 94,894
116,000 189,558

NagaCorp., Ltd.PCCW, Ltd.Prada SpASamsonite International SASands China, Ltd.Techtronic Industries Co., Ltd.Vitasoy International Holdings, Ltd.WH Group, Ltd.Wynn Macau, Ltd.Xinyi Glass Holdings, Ltd.Yue Yuen Industrial Holdings, Ltd.
TOTAL HONG KONG
CRH P.L.C., Sponsored ADRGlanbia P.L.C.Kerry Group P.L.C., Class AKingspan Group P.L.C.Smurfit Kappa Group P.L.C.
TOTAL IRELAND
Bank Leumi Le-Israel BMBezeq The Israeli Telecommunication Corp., Ltd.Elbit Systems, Ltd.Elbit Systems, Ltd.Israel Chemicals, Ltd.Israel Discount Bank, Ltd., Class AMizrahi Tefahot Bank, Ltd.Nice, Ltd.Nice, Ltd., Sponsored ADROil Refineries, Ltd.Strauss Group, Ltd.Tower Semiconductor, Ltd.
TOTAL ISRAEL
A2A SpACNH Industrial NVDiaSorin SpAEnel SpAEni SpAFerrari NVFerrari NVFiat Chrysler Automobiles NVFinecoBank Banca Fineco SpAHera SpAMoncler SpARecordati SpASnam SpA
TOTAL ITALY
186,000 279,583529,000 301,691
# 60,600 186,02752,200 102,212
145,200 696,940187,500 1,394,371
78,000 367,1951,533,500 1,492,663
134,000 300,673216,000 217,736
82,000 229,759
17,147,198
International High Relative Profitability PortfolioCONTINUED
Shares Value»
IRELAND — (0.4%)2,163 $ 72,1588,470 110,2576,593 767,131
10,457 511,45520,643 649,464
2,110,465
ISRAEL — (0.3%)18,070 131,45083,741 56,972
1,780 284,776108 17,237
56,153 302,21410,484 45,249
* 4,276 102,600* 376 57,340#* 3,246 495,729* 225,592 121,046
2,965 89,464* 700 13,769
1,717,846
ITALY — (2.1%)80,563 140,823
114,794 1,162,3472,620 303,848
268,165 1,834,416# 169,760 2,651,872
1,191 191,782# 7,841 1,263,028
116,978 1,567,08855,753 554,62928,114 104,68017,143 703,895
9,295 416,275201,245 988,066
11,882,749

Acom Co., Ltd.Advantest Corp.Aeon Co., Ltd.Ain Holdings, Inc.Air Water, Inc.Aisin Seiki Co., Ltd.Alps Alpine Co., Ltd.Asahi Group Holdings, Ltd.Asahi Intecc Co., Ltd.Astellas Pharma, Inc.Bandai Namco Holdings, Inc.Benefit One, Inc.Bridgestone Corp.Brother Industries, Ltd.Calbee, Inc.Capcom Co., Ltd.Cosmo Energy Holdings Co., Ltd.Cosmos Pharmaceutical Corp.Create SD Holdings Co., Ltd.
CyberAgent, Inc.Daifuku Co., Ltd.Daiichikosho Co., Ltd.Daikin Industries, Ltd.Daio Paper Corp.Daito Trust Construction Co., Ltd.Daiwa House Industry Co., Ltd.DIC Corp.Disco Corp.DMG Mori Co., Ltd.en-japan, Inc.Fast Retailing Co., Ltd.FP Corp.Fuji Electric Co., Ltd.Fuji Kyuko Co., Ltd.Fujitsu, Ltd.Furukawa Electric Co., Ltd.Fuyo General Lease Co., Ltd.GMO internet, Inc.GMO Payment Gateway, Inc.Goldwin, Inc.GungHo Online Entertainment, Inc.Hakuhodo DY Holdings, Inc.Haseko Corp.Hikari Tsushin, Inc.Hino Motors, Ltd.HIS Co., Ltd.Hitachi Capital Corp.Hitachi Construction Machinery Co., Ltd.
JAPAN — (21.8%)57,100 201,70429,700 1,143,71350,600 875,594
2,900 158,63216,100 263,12125,300 822,20332,200 586,17929,700 1,286,45320,600 538,305
110,700 1,568,828# 23,300 1,252,591
8,100 138,37149,400 1,854,50035,900 635,626
8,300 234,15511,400 238,0406,600 136,0451,500 276,211
500 11,201
International High Relative Profitability PortfolioCONTINUED
Shares Value»
JAPAN — (Continued)12,400 $ 497,54613,900 760,236
5,800 239,57415,200 1,886,575
# 6,900 82,41110,600 1,366,90453,300 1,515,412
8,200 221,2332,400 440,4657,300 105,7431,800 73,8413,900 2,339,3152,500 154,125
17,800 543,788# 2,700 103,686
16,900 1,318,8485,800 155,559
400 23,7408,200 133,3025,100 368,4711,200 165,0384,130 108,970
35,000 548,92547,400 513,469
2,571 566,84644,600 357,794
2,000 48,7788,400 172,026
19,400 454,960

Hitachi, Ltd.Horiba, Ltd.Hoya Corp.Idemitsu Kosan Co., Ltd.IHI Corp.Infomart Corp.Isuzu Motors, Ltd.Ito En, Ltd.Iwatani Corp.Izumi Co., Ltd.Japan Airlines Co., Ltd.Japan Exchange Group, Inc.Japan Tobacco, Inc.JTEKT Corp.JXTG Holdings, Inc.Kajima Corp.Kakaku.com, Inc.Kaken Pharmaceutical Co., Ltd.Kao Corp.Kawasaki Heavy Industries, Ltd.KDDI Corp.Kirin Holdings Co., Ltd.Kobe Bussan Co., Ltd.Koito Manufacturing Co., Ltd.Komatsu, Ltd.Konami Holdings Corp.Konica Minolta, Inc.Kose Corp.Kusuri no Aoki Holdings Co., Ltd.Kyoritsu Maintenance Co., Ltd.
Kyudenko Corp.Lasertec Corp.Lawson, Inc.M3, Inc.Maruha Nichiro Corp.McDonald's Holdings Co. Japan, Ltd.MEIJI Holdings Co., Ltd.Minebea Mitsumi, Inc.Mitsubishi Chemical Holdings Corp.Mitsubishi UFJ Lease & Finance Co., Ltd.Mitsui Chemicals, Inc.MonotaRO Co., Ltd.Morinaga & Co., Ltd.Murata Manufacturing Co., Ltd.NET One Systems Co., Ltd.Nichirei Corp.Nidec Corp.Nifco, Inc.Nihon M&A Center, Inc.
3,800 134,728800 42,812
24,700 1,894,04322,338 615,57725,500 607,628
8,800 118,69988,700 981,504
6,600 288,2013,700 122,1374,700 176,2981,800 56,368
75,100 1,100,627103,600 2,282,694
32,000 379,411220,900 1,039,517
37,500 482,28316,900 351,033
2,100 101,73330,900 2,255,10510,700 232,809
146,600 3,825,01331,500 683,180
3,400 189,92716,600 829,88987,400 1,954,299
3,200 135,7767,900 65,4694,200 715,9431,900 125,6242,700 116,239
International High Relative Profitability PortfolioCONTINUED
Shares Value»
JAPAN — (Continued)1,500 $ 46,4433,800 180,7678,000 399,772
35,600 717,1804,300 125,6184,900 220,0238,300 576,393
59,100 1,008,688115,200 817,86372,300 383,13329,500 674,58612,500 272,881
4,200 196,92439,200 1,795,014
7,630 201,24311,600 268,375
600 80,23013,300 328,02517,000 456,204

Nihon Unisys, Ltd.Nippon Suisan Kaisha, Ltd.Nipro Corp.Nissan Chemical Corp.Nissan Motor Co., Ltd.Nitori Holdings Co., Ltd.Noevir Holdings Co., Ltd.Nomura Research Institute, Ltd.NSK, Ltd.NTT Data Corp.NTT DOCOMO, Inc.Olympus Corp.Open House Co., Ltd.Oracle Corp.OSG Corp.Otsuka Corp.Panasonic Corp.Park24 Co., Ltd.PeptiDream, Inc.Persol Holdings Co., Ltd.Pigeon Corp.Pilot Corp.Pola Orbis Holdings, Inc.Rakuten, Inc.Recruit Holdings Co., Ltd.Relo Group, Inc.Renesas Electronics Corp.Ryohin Keikaku Co., Ltd.Sankyu, Inc.Sanwa Holdings Corp.Sapporo Holdings, Ltd.SCREEN Holdings Co., Ltd.SCSK Corp.Seibu Holdings, Inc.Seiko Epson Corp.Sekisui Chemical Co., Ltd.Seria Co., Ltd.Seven & I Holdings Co., Ltd.Seven Bank, Ltd.Sharp Corp.
Shionogi & Co., Ltd.Shiseido Co., Ltd.Showa Denko K.K.Skylark Holdings Co., Ltd.SMS Co., Ltd.SoftBank Group Corp.Sony Corp.Stanley Electric Co., Ltd.SUMCO Corp.
10,000 328,19825,400 160,06719,600 217,28516,800 734,686
203,200 1,320,7844,000 539,4631,600 83,516
26,100 462,12055,600 470,11849,200 646,011
118,400 2,838,92289,600 976,897
4,500 196,0514,700 390,2417,500 148,865
12,000 473,184208,200 1,755,576
14,100 304,748* 11,400 634,150
22,600 546,625# 14,300 521,447
3,000 113,3068,800 221,159
91,100 929,14878,300 2,651,43213,100 347,147
* 129,700 762,2813,500 621,2607,900 424,140
24,800 276,4847,100 160,143
# 5,900 319,6976,100 289,607
31,500 495,25937,700 554,779
7,700 113,8143,300 77,153
65,800 2,245,61891,600 247,81830,800 386,312
International High Relative Profitability PortfolioCONTINUED
Shares Value»
JAPAN — (Continued)14,100 $ 780,64725,500 1,876,40621,400 574,10422,300 389,136
8,300 184,294144,100 7,357,480112,400 6,392,628
8,000 198,37438,000 498,024

Sumitomo Rubber Industries, Ltd.Sundrug Co., Ltd.Sushiro Global Holdings, Ltd.Suzuki Motor Corp.Sysmex Corp.Taiheiyo Cement Corp.Taisei Corp.Taiyo Nippon Sanso Corp.Taiyo Yuden Co., Ltd.TDK Corp.TechnoPro Holdings, Inc.Teijin, Ltd.Terumo Corp.Toei Animation Co., Ltd.Tokai Carbon Co., Ltd.Tokuyama Corp.Tokyo Century Corp.Tokyo Electron, Ltd.Topcon Corp.Tosoh Corp.Toyo Tire CorpToyoda Gosei Co., Ltd.Toyota Boshoku Corp.Trend Micro, Inc.Tsuruha Holdings, Inc.Ube Industries, Ltd.Ulvac, Inc.Unicharm Corp.USS Co., Ltd.Welcia Holdings Co., Ltd.Yahoo Japan Corp.Yamaha Motor Co., Ltd.Yaoko Co., Ltd.Yaskawa Electric Corp.Yokohama Rubber Co., Ltd. (The)Zenkoku Hosho Co., Ltd.Zensho Holdings Co., Ltd.ZOZO, Inc.
TOTAL JAPAN
ASML Holding NVASML Holding NVGrandVision NVHeineken NVKoninklijke Ahold Delhaize NVKoninklijke KPN NVOCI NVRandstad NVUnilever NV
22,403 244,53911,000 304,1401,600 98,131
34,200 1,337,50911,000 798,63418,800 528,00433,300 1,148,87411,500 235,798
# 19,700 389,66721,500 1,650,713
3,400 191,99728,000 484,41948,600 1,414,520
900 37,648# 26,900 263,594
7,300 168,0327,400 305,879
12,100 2,049,405600 7,005
46,300 648,935# 15,900 207,708
8,500 156,32211,000 154,42017,000 741,233
4,400 447,8828,700 181,1382,200 92,086
15,900 449,82824,400 483,193
6,900 320,611133,000 389,547
42,100 738,2202,000 91,579
35,600 1,178,0705,900 108,5537,200 280,845
10,100 216,96624,800 467,637
120,392,865
NETHERLANDS — (3.1%)9,811 2,186,1292,890 643,9216,983 209,307
15,683 1,682,603# 124,151 2,819,831
449,630 1,282,095* 7,748 202,084
14,352 720,382# 82,174 4,744,727
International High Relative Profitability PortfolioCONTINUED
Shares Value»
NETHERLANDS — (Continued)

Unilever NVWolters Kluwer NV
TOTAL NETHERLANDS
a2 Milk Co., Ltd.Air New Zealand, Ltd.Fisher & Paykel Healthcare Corp., Ltd.Spark New Zealand, Ltd.Z Energy, Ltd.
TOTAL NEW ZEALAND
Aker BP ASAAustevoll Seafood ASABakkafrost P/FEquinor ASAMowi ASASalmar ASATelenor ASATGS NOPEC Geophysical Co. ASA
TOTAL NORWAY
Jeronimo Martins SGPS SA
Dairy Farm International Holdings, Ltd.DBS Group Holdings, Ltd.Genting Singapore, Ltd.Great Eastern Holdings, Ltd.Jardine Cycle & Carriage, Ltd.SATS, Ltd.Sembcorp Industries, Ltd.Singapore Airlines, Ltd.Singapore Exchange, Ltd.Singapore Technologies Engineering, Ltd.Singapore Telecommunications, Ltd.Singapore Telecommunications, Ltd.United Overseas Bank, Ltd.Venture Corp., Ltd.Yangzijiang Shipbuilding Holdings Ltd.
TOTAL SINGAPORE
Acciona SAACS Actividades de Construccion y Servicios SAAena SME SAAmadeus IT Group SACellnex Telecom SAEnagas SAEndesa SAFomento de Construcciones y Contratas SAGrifols SAIndustria de Diseno Textil SANaturgy Energy Group SA
4,014 $ 232,66635,486 2,572,214
17,295,959
NEW ZEALAND — (0.3%)* 50,971 598,915
33,783 60,1412,889 31,140
273,315 712,46315,488 65,872
1,468,531
NORWAY — (0.7%)# 10,671 301,977
4,937 50,2291,233 71,036
106,645 1,912,1766,167 148,2116,132 283,229
61,693 1,250,0835,506 133,087
4,150,028
PORTUGAL — (0.1%)28,678 462,750
SINGAPORE — (1.0%)33,000 247,10638,400 732,166
698,800 465,0243,100 57,218
11,500 281,38163,600 221,59334,600 58,54273,300 513,18875,500 433,180
146,700 449,965476,900 1,150,386
19,700 47,40436,400 693,520
6,600 73,652151,900 156,634
5,580,959
SPAIN — (2.8%)3,342 355,853
41,864 1,691,5608,598 1,558,664
30,940 2,417,86515,597 583,30231,498 687,10252,280 1,291,755
8,401 106,95620,099 651,38182,939 2,481,72714,393 364,587
International High Relative Profitability Portfolio

Telefonica SA
TOTAL SPAIN
Atlas Copco AB, Class AAtlas Copco AB, Class BAxfood ABBoliden ABElectrolux ABEpiroc AB, Class AEpiroc AB, Class BEssity AB, Class BHennes & Mauritz AB, Class BIndutrade ABKindred Group P.L.C.Lifco AB, Class BLoomis AB, Class BMillicom International Cellular SASandvik ABSecuritas AB, Class BSKF AB, Class ASKF AB, Class BSweco AB, Class BSwedish Orphan Biovitrum ABTele2 AB, Class BVolvo AB, Class AVolvo AB, Class B
TOTAL SWEDEN
ABB, Ltd.Barry Callebaut AGEMS-Chemie Holding AGGeberit AGGivaudan SAKuehne + Nagel International AGLogitech International SANestle SAPartners Group Holding AGRoche Holding AGRoche Holding AGSchindler Holding AGSGS SASika AGStraumann Holding AGSwisscom AGTemenos AG
TOTAL SWITZERLAND
Admiral Group P.L.C.Anglo American P.L.C.
CONTINUED
Shares Value»
SPAIN — (Continued)439,993 $ 3,354,338
15,545,090
SWEDEN — (2.4%)44,101 1,347,02725,600 698,38510,898 229,45035,724 810,12435,472 819,65647,491 520,39628,885 300,22019,261 572,111
# 59,795 1,042,53110,614 300,719
5,975 36,6652,376 121,3939,386 322,8449,208 473,058
78,892 1,210,64532,022 495,901
1,490 24,43260,821 997,634
6,957 194,016* 9,888 190,863
2,888 41,26818,443 275,024
134,238 1,994,120
13,018,482
SWITZERLAND — (8.4%)1,826 34,470
330 643,8181,078 673,7274,869 2,247,7341,399 3,720,7669,370 1,379,669
914 37,69390,642 9,615,954
2,460 1,956,4132,231 598,339
59,293 15,870,6653,517 791,204
703 1,736,03516,888 2,438,190
1,158 944,700# 4,971 2,409,155
8,316 1,463,971
46,562,503
UNITED KINGDOM — (15.4%)28,446 748,07658,599 1,435,933

Ashtead Group P.L.C.AstraZeneca P.L.C., Sponsored ADRAstraZeneca P.L.C.Auto Trader Group P.L.C.BAE Systems P.L.C.Berkeley Group Holdings P.L.C.
BHP Group P.L.C., ADRBHP Group P.L.C.BT Group P.L.C.Bunzl P.L.C.Burberry Group P.L.C.Burford Capital, Ltd.Centrica P.L.C.Coca-Cola HBC AGCompass Group P.L.C.Croda International P.L.C.Diageo P.L.C., Sponsored ADREvraz P.L.C.Experian P.L.C.Ferguson P.L.C.Fresnillo P.L.C.G4S P.L.C.GlaxoSmithKline P.L.C., Sponsored ADRGlaxoSmithKline P.L.C.Halma P.L.C.Hargreaves Lansdown P.L.C.Hikma Pharmaceuticals P.L.C.HomeServe P.L.C.Imperial Brands P.L.C.International Consolidated Airlines Group SAIntertek Group P.L.C.ITV P.L.C.JD Sports Fashion P.L.C.Mondi P.L.C.Next P.L.C.Persimmon P.L.C.RELX P.L.C., Sponsored ADRRELX P.L.C.RELX P.L.C.Rentokil Initial P.L.C.Rightmove P.L.C.Rio Tinto P.L.C.Rio Tinto P.L.C., Sponsored ADRRolls-Royce Holdings P.L.C.Sage Group P.L.C. (The)Smith & Nephew P.L.C.Spirax-Sarco Engineering P.L.C.SSE P.L.C.St James's Place P.L.C.
79,073 2,174,283192,433 8,353,517
6,402 553,093101,768 668,064380,128 2,525,467
8,008 376,639
International High Relative Profitability PortfolioCONTINUED
Shares Value»
UNITED KINGDOM — (Continued)700 $ 33,418
171,304 4,084,4911,206,078 2,825,059
31,970 833,28764,864 1,788,54513,194 240,270
699,457 643,9118,079 277,992
115,663 2,926,32816,319 926,98042,183 7,039,49975,552 591,782
127,742 3,874,30838,703 2,880,01220,442 147,54257,218 132,800
# 151,444 6,251,60814,845 307,00812,630 305,00832,725 831,37711,799 263,20733,102 458,008
138,464 3,514,22265,315 336,09324,558 1,700,010
417,884 561,28159,145 466,44162,031 1,351,39414,675 1,080,22047,699 1,163,78880,690 1,914,774
8,501 201,62928,850 685,260
275,088 1,453,40175,350 481,925
8,041 454,08759,454 3,393,634
149,212 1,559,614146,033 1,273,465
4,818 109,07411,095 1,209,835
170,410 2,271,8514,138 49,378

TUI AGUnilever P.L.C., Sponsored ADRWhitbread P.L.C.
TOTAL UNITED KINGDOM
TOTAL COMMON STOCKS
Bayerische Motoren Werke AGFuchs Petrolub SESartorius AGSchaeffler AG
Volkswagen AG
TOTAL GERMANY
TOTAL INVESTMENT SECURITIES
DFA Short Term Investment Fund
(Cost $547,723,860)^^
AustraliaAustriaBelgiumCanadaDenmarkFinlandFranceGermanyHong KongIrelandIsraelItalyJapanNetherlandsNew ZealandNorwayPortugalSingaporeSpain
6,586 65,39678,609 4,725,97310,215 561,145
85,081,402
536,976,599
PREFERRED STOCKS — (0.7%)GERMANY — (0.7%)
4,226 250,9035,550 212,6694,030 815,1904,301 31,713
International High Relative Profitability PortfolioCONTINUED
Shares Value»
GERMANY — (Continued)16,047 $ 2,666,573
3,977,048
540,953,647
Value†
SECURITIES LENDING COLLATERAL — (2.1%)@§ 990,570 11,461,889
TOTAL INVESTMENTS — (100.0%)$552,415,536
Summary of the Portfolio's investments as of July 31, 2019, based on their valuation inputs, is as follows (see Security Valuation Note):
Investments in Securities (Market Value)
Level 1 Level 2 Level 3 Total
Common Stocks$ 82,395 $ 35,037,470 — $ 35,119,865
— 797,398 — 797,398— 4,619,402 — 4,619,402
47,840,957 — — 47,840,957— 8,917,736 — 8,917,736— 4,751,662 — 4,751,662— 54,464,136 — 54,464,136— 38,048,616 — 38,048,616— 17,147,198 — 17,147,198
72,158 2,038,307 — 2,110,465526,735 1,191,111 — 1,717,846
1,263,028 10,619,721 — 11,882,749— 120,392,865 — 120,392,865
5,388,648 11,907,311 — 17,295,959— 1,468,531 — 1,468,531— 4,150,028 — 4,150,028— 462,750 — 462,750— 5,580,959 — 5,580,959— 15,545,090 — 15,545,090

SwedenSwitzerlandUnited Kingdom
GermanySecurities Lending Collateral
TOTAL
Investment in U.S. Core Equity 1 Portfolio ofDFA Investment Dimensions Group Inc.Investment in U.S. Large Company Portfolio ofDimensional Investment Group Inc.Investment in International Core Equity Portfolio ofDFA Investment Dimensions Group Inc.Investment in VA U.S. Targeted Value Portfolio ofDFA Investment Dimensions Group Inc.Investment in Emerging Markets Core Equity Portfolio ofDFA Investment Dimensions Group Inc.Investment in VA U.S. Large Value Portfolio ofDFA Investment Dimensions Group Inc.Investment in VA International Small Portfolio ofDFA Investment Dimensions Group Inc.Investment in VA International Value Portfolio ofDFA Investment Dimensions Group Inc.Investment in DFA Real Estate Securities Portfolio ofDFA Investment Dimensions Group Inc.
TOTAL INVESTMENTS IN AFFILIATED INVESTMENT COMPANIES(Cost $60,216,316)^^
Affiliated Investment Companies
TOTAL
— 13,018,482 — 13,018,48237,693 46,524,810 — 46,562,503
31,712,423 53,368,979 — 85,081,402Preferred Stocks
— 3,977,048 — 3,977,048— 11,461,889 — 11,461,889
$86,924,037 $465,491,499 — $552,415,536
VA EQUITY ALLOCATION PORTFOLIO
SCHEDULE OF INVESTMENTS
July 31, 2019
(Unaudited)Shares Value†
AFFILIATED INVESTMENT COMPANIES — (100.0%)
700,748 $17,133,282
593,297 13,651,762
664,541 8,433,032
450,579 7,867,107
218,608 4,455,230
164,308 4,276,935
224,589 2,596,254
166,874 1,944,084
43,188 1,695,553
$62,053,239
Summary of the Portfolio’s investments as of July 31, 2019, based on their valuation inputs, is located in this report (See SecurityValuation Note).
Investments in Securities (Market Value)
Level 1 Level 2 Level 3 Total
$62,053,239 — — $62,053,239
$62,053,239 — — $62,053,239
DFA MN MUNICIPAL BOND PORTFOLIO
SCHEDULE OF INVESTMENTS
July 31, 2019
(Unaudited)
FaceAmount Value†
FaceAmount Value†

5.000%, 02/01/21
5.000%, 02/01/21
5.000%, 02/01/205.000%, 02/01/21
5.000%, 10/01/21
3.000%, 02/01/23
5.000%, 02/01/21
3.000%, 02/01/21
3.000%, 02/01/20
3.000%, 02/01/21
3.000%, 02/01/22
4.000%, 02/01/23
2.000%, 02/01/20
5.000%, 02/01/20
5.000%, 02/01/24
5.000%, 02/01/21
2.000%, 12/01/194.000%, 12/01/195.000%, 12/01/19
(000)
MUNICIPAL BONDS — (100.0%)MINNESOTA — (100.0%)Bloomington Independent
School District No. 271(GO) (SD CRED PROG)Series A
100 $ 105,837Chaska Independent
School District No. 112(GO) (SD CRED PROG)Series A
1,150 1,217,125City of Bemidji (GO) (AGM)
Series A230 234,377575 607,677
City of Brainerd (GO) (MNCRED PROG) Series A
570 617,390City of Cambridge (GO)
Series A375 397,234
City of Chaska (GO) SeriesB
385 407,472City of Circle Pines (GO)
Series B215 220,951
City of Duluth (GO) SeriesA
240 242,232City of East Grand Forks
(GO) Series A200 205,416
City of Hopkins (GO)Series D
130 135,853City of Kasson (GO)
320 350,118City of Kasson (GO) SeriesA
160 160,672City of Lakeville (GO)
Series A470 479,184
City of Lakeville (GO)Series B
710 829,649City of Marshall (GO)Series B
110 116,302City of Minneapolis (GO)
100 100,312300 302,907245 248,180
2.000%, 12/01/19
4.000%, 02/01/26
3.000%, 02/01/24
5.000%, 02/01/20
3.000%, 02/01/24
5.000%, 02/01/20
5.125%, 05/01/30(Pre-refunded @$100, 5/1/20)
3.000%, 02/01/20
5.000%, 09/01/21
5.000%, 11/01/20
3.000%, 12/01/19
3.000%, 02/01/22
3.000%, 02/01/21
5.000%, 03/01/20
5.000%, 12/01/19
3.000%, 02/01/233.000%, 02/01/26
3.000%, 02/01/23
(000)
MINNESOTA — (Continued)City of New Ulm (GO)
Series B325 $ 326,014
City of Red Wing (GO)Series A
700 809,725City of Richfield (GO)Series A
255 273,707City of Rochester (GO)
Series A1,000 1,019,540
City of Saint Cloud (GO)Series A
450 475,519City of Saint Cloud (GO)
Series B275 280,374
City of Saint Cloud (RB)Series A
¤
300 308,841City of Saint Francis (GO)
Series A285 287,651
City of Saint Paul (GO)Series A
610 658,544City of Saint Paul (GO)
Series B835 875,748
City of Saint Paul SewerRevenue (RB) Series C
250 251,603City of Savage (GO) SeriesA
325 333,726City of Shoreview (GO)
Series A290 298,027
City of State Paul (GO)Series D
500 511,395City of State Paul (GO)
Series E170 172,207
City of Waconia (GO)Series A
450 477,315820 894,694
City of West Saint Paul(GO) Series A
230 243,637

DFA MN Municipal Bond PortfolioCONTINUED
5.000%, 12/01/192.000%, 12/01/203.000%, 12/01/27
500 506,490520 526,505
5,000 5,382,050
2.000%, 02/01/202.000%, 02/01/22
5.000%, 04/01/22
3.000%, 02/01/21
5.000%, 02/01/24
5.000%, 02/01/244.000%, 02/01/27
3.000%, 02/01/20
3.000%, 02/01/24
3.000%, 02/01/23
5.000%, 01/01/23
5.000%, 02/01/20
4.000%, 02/01/25
FaceAmount Value†
(000)
MINNESOTA — (Continued)City of Woodbury (GO)
Series A135 $ 135,635145 148,222
Cloquet IndependentSchool District No. 94(GO) (SD CRED PROG)Series A
910 1,001,182Cook County (GO) SeriesA
180 184,982County of Itasca (GO)
Series A545 631,911
County of Olmsted (GO)Series A
675 787,462445 502,757
County of Rice (GO)220 222,123
County of Sherburne (GO)Series A
1,360 1,453,622County of Swift (GO)Series A
215 228,051Dakota County Community
Development Agency(RB) (CNTY GTD)Series B
1,180 1,332,904Eden Prairie Independent
School District No. 272(GO) (SD CRED PROG)Series C
1,105 1,126,702Fosston Independent
School District No. 601(GO) (SD CRED PROG)
550 627,429Hastings Independent
School District No. 200(GO) (SD CRED PROG)Series A
5.250%, 11/15/29(Pre-refunded @$100, 11/15/19)
5.000%, 02/01/23
5.000%, 02/01/20
4.000%, 02/01/21
5.000%, 02/01/21
5.000%, 03/01/21
5.000%, 03/01/26
4.000%, 02/01/234.000%, 02/01/24
5.000%, 02/01/22
FaceAmount Value†
(000)
MINNESOTA — (Continued)Housing & Redevelopment
Authority of The City ofSaint Paul Minnesota(RB) Series A1
¤
350 $ 354,088Itasca County (GO) SeriesA
865 973,705Lakeville Independent
School District No. 194(GO) (SD CRED PROG)Series A
345 351,776Luverne Independent
School District No. 2184(GO) (SD CRED PROG)Series A
510 532,216Mahtomedi Independent
School District No. 832(GO) (SD CRED PROG)Series A
175 185,215Metropolitan Council (GO)
Series B350 371,668
Metropolitan Council (GO)Series C
1,550 1,913,971Milaca Independent School
District No. 912 (GO)(SD CRED PROG)Series A
825 899,390830 924,711
Minneapolis SpecialSchool District No. 1(GO) (SD CRED PROG)Series A
750 821,745

DFA MN Municipal Bond PortfolioCONTINUED
5.000%, 02/01/21
5.000%, 12/01/205.000%, 12/01/22
5.000%, 12/01/21
5.000%, 12/15/19
740 783,194Hennepin County (GO)
Series A400 420,816
2,125 2,396,086Hennepin County (GO)
Series B2,000 2,180,260
Hennepin County SalesTax Revenue (RB)
250 253,628
5.000%, 02/01/24
6.000%, 10/01/40(Pre-refunded @$100, 10/1/21)
3.250%, 03/01/24(Pre-refunded @$100, 3/1/20)
5.000%, 08/01/19
Minneapolis SpecialSchool District No. 1(GO) (SD CRED PROG)Series B
1,200 1,402,224Minnesota Higher
Education FacilitiesAuthority (RB) Series7-K2-HA
¤
450 496,197Minnesota Public Facilities
Authority (RB) Series C¤
770 779,594Minnesota State (GO)
Series A1,310 1,310,000
5.000%, 08/01/195.000%, 08/01/205.000%, 08/01/205.000%, 10/01/205.000%, 08/01/23(Pre-refunded @$100, 8/1/20)
5.000%, 08/01/195.000%, 08/01/195.000%, 10/01/19
5.000%, 08/01/195.000%, 08/01/195.000%, 08/01/205.000%, 08/01/22
5.000%, 10/01/19
5.000%, 08/01/20
4.000%, 10/01/19
FaceAmount Value†
(000)
MINNESOTA — (Continued)500 $ 500,000
2,585 2,686,2802,000 2,078,360
505 528,068¤
250 259,593Minnesota State (GO)
Series B100 100,000750 750,000750 754,837
Minnesota State (GO)Series D
50 50,000170 170,000
1,975 2,052,3801,820 2,030,811
Minnesota State (GO)Series F
185 186,193Minnesota State (GO)
(ETM) Series D25 25,959
Minnesota State Colleges& Universities (RB)Series A
100 100,472
5.000%, 02/01/223.000%, 02/01/24
5.000%, 02/01/205.000%, 02/01/21
2.000%, 02/01/21
5.000%, 02/01/20
5.000%, 02/01/205.000%, 02/01/22
FaceAmount Value†
(000)
MINNESOTA — (Continued)North St Paul-Maplewood-
Oakdale IndependentSchool District No. 622(GO) (SD CRED PROG)Series A
255 $ 279,327255 274,286
Osseo Independent SchoolDistrict No. 279 (GO)(SD CRED PROG)Series C
780 795,124350 370,160
Pine City IndependentSchool District No. 578(GO) (SD CRED PROG)Series A
300 304,179Robbinsdale Independent
School District No. 281(GO) (SD CRED PROG)Series A
250 254,823Rochester Independent
School District No. 535(GO) (SD CRED PROG)Series B
205 209,026210 230,143

3.000%, 02/01/23
TOTAL MUNICIPALBONDS
(Cost $69,998,339)^^
Municipal Bonds
DFA MN Municipal Bond PortfolioCONTINUED
FaceAmount Value†
(000)
MINNESOTA — (Continued)White Bear Lake
Independent SchoolDistrict No. 624 (GO)(SD CRED PROG)Series A
350 $ 365,176
70,574,805
TOTAL INVESTMENTS — (100.0%)$70,574,805
Summary of the Portfolio's investments as of July 31, 2019, based on their valuation inputs, is as follows (see Security Valuation Note):
Investments in Securities (Market Value)
Level 1 Level 2 Level 3 Total
— $70,574,805 — $70,574,805
4.000%, 02/01/24
4.000%, 02/01/234.000%, 02/01/24
3.000%, 02/01/23
4.000%, 02/01/20
5.000%, 02/01/20
Moorhead IndependentSchool District No. 152(GO) (SD CRED PROG)Series A
600 672,084Morris Area Schools
Independent SchoolDistrict No. 2769 (GO)(SD CRED PROG)Series A
1,490 1,632,384300 335,763
New London-SpicerIndependent SchoolDistrict No. 345 (GO)(SD CRED PROG)Series A
150 159,159New Prague Independent
School District No. 721(GO) (SD CRED PROG)Series A
605 613,676North Branch Independent
School District No. 138(GO) (SD CRED PROG)Series A
300 305,892
5.000%, 02/01/21
3.000%, 02/01/20
5.000%, 02/01/21
5.000%, 02/01/21
4.000%, 02/01/20
2.000%, 02/01/20
Rosemount-Apple Valley-Eagan IndependentSchool District No 196(GO) (SD CRED PROG)Series A
765 809,653St Louis County
Independent SchoolDistrict No. 2142 (GO)(SD CRED PROG)Series A
600 605,844Three Rivers Park District
(GO) Series C1,060 1,121,872
Washington County (GO)Series A
310 328,095Watertown-Mayer
Independent SchoolDistrict No. 111 (GO)(SD CRED PROG)Series B
500 507,170Westonka Independent
School District No. 277(GO) (SD CRED PROG)Series A
500 502,350

TOTAL — $70,574,805 — $70,574,805
DFA CALIFORNIA MUNICIPAL REAL RETURN PORTFOLIO
SCHEDULE OF INVESTMENTS
July 31, 2019
(Unaudited)
5.000%, 08/01/25
1.750%, 08/01/22
5.000%, 08/01/23
5.000%, 10/01/33(Pre-refunded @$100, 10/1/21)5.000%, 10/01/41(Pre-refunded @$100, 10/1/21)
5.250%, 04/01/53(Pre-refunded @$100, 4/1/23)
5.000%, 08/01/27
2.000%, 08/01/22
5.000%, 08/01/24
5.000%, 08/01/24
5.000%, 07/01/36(Pre-refunded @$100, 1/1/28)
FaceAmount Value†
(000)
MUNICIPAL BONDS — (100.0%)CALIFORNIA — (100.0%)Albany Unified School
District (GO)230 $ 281,154
Alhambra Unified SchoolDistrict (GO) Series A
300 306,420Alhambra Unified School
District (GO) Series B100 115,933
Anaheim Housing & PublicImprovements Authority(RB)
¤
500 543,150¤
1,320 1,433,916Bay Area Toll Authority
(RB) Series S-4¤
250 289,105Berkeley Unified School
District (GO) Series E695 896,710
Beverly Hills UnifiedSchool District (GO)
150 154,854Burbank Unified School
District (GO)565 676,130
Cajon Valley Union SchoolDistrict (GO)
305 364,496California Infrastructure &
Economic DevelopmentBank (RB) (AMBAC)
¤
100 130,045California Municipal
Finance Authority (RB)
5.000%, 10/01/255.000%, 08/01/265.000%, 08/01/265.000%, 09/01/264.000%, 11/01/263.500%, 08/01/275.000%, 08/01/275.000%, 11/01/275.000%, 08/01/28
5.000%, 02/01/27
4.000%, 12/01/32(Pre-refunded @$100, 6/1/23)
5.000%, 12/01/24
5.000%, 05/01/205.000%, 05/01/22(Pre-refunded @$100, 5/1/20)
5.000%, 05/01/215.000%, 05/01/22
FaceAmount Value†
(000)
CALIFORNIA — (Continued)1,700 $2,088,9432,380 2,975,5952,540 3,175,6353,215 4,027,2051,735 2,061,7532,835 3,257,2454,200 5,352,774
200 256,278730 948,723
California State (GO)(AMBAC)
625 788,187California State
Department of WaterResources (RB) SeriesAQ
¤
3,500 3,914,610California State
Department of WaterResources (RB) SeriesAS
775 934,921California State
Department of WaterResources PowerSupply Revenue (RB)Series L
325 334,896¤
1,000 1,030,300California State
Department of WaterResources PowerSupply Revenue (RB)Series O
1,225 1,311,4111,675 1,859,501
California State PublicWorks Board (RB)

DFA California Municipal Real Return PortfolioCONTINUED
6.000%, 01/01/42(Pre-refunded @$100, 1/1/22)
5.000%, 12/01/225.000%, 08/01/23
¤
1,250 1,400,275California State (GO)
500 565,545585 676,465
6.125%, 11/01/29(Pre-refunded @$100, 11/1/19)
5.000%, 03/01/22(Pre-refunded @$100, 3/1/20)
5.000%, 09/01/24(Pre-refunded @$100, 9/1/22)
¤
1,000 1,012,880California State Public
Works Board (RB)Series C-1
¤
310 317,415California State Public
Works Board (RB)Series D
¤
935 1,052,427
5.000%, 09/01/29(Pre-refunded @$100, 9/1/22)
5.000%, 11/01/205.000%, 11/01/215.000%, 11/01/235.000%, 11/01/23
4.000%, 01/15/22
5.000%, 08/01/26
5.000%, 06/15/225.000%, 06/15/24
5.000%, 06/15/21
5.000%, 09/01/225.000%, 09/01/265.000%, 09/01/27
5.000%, 06/25/20
5.000%, 09/01/19
FaceAmount Value†
(000)
CALIFORNIA — (Continued)¤
1,250 $1,406,987California State University
(RB) Series A570 599,207250 272,563375 437,771
1,935 2,258,900Camrosa Water District
Financing Authority (RB)Series A
205 220,357Carlsbad Unified School
District (GO)310 391,366
City & County of SanFrancisco (GO) Series
200 223,166800 953,568
City & County of SanFrancisco (GO) SeriesR1
250 269,103City of Grover Beach (GO)
390 438,286345 436,694445 575,652
City of Los Angeles (RN)4,410 4,565,982
City of Los Angeles (GO)Series B
150 150,500
5.250%, 08/01/32(Pre-refunded @$100, 8/1/21)
4.000%, 08/01/27
5.000%, 03/01/23(Pre-refunded @$100, 3/1/20)
5.000%, 03/01/24
5.000%, 10/01/19
8.000%, 08/01/23
5.000%, 06/01/23
5.000%, 08/01/21
FaceAmount Value†
(000)
CALIFORNIA — (Continued)Cloverdale Unified School
District (GO) (AGM)Series A
¤
235 $ 255,140Conejo Valley Unified
School District (GO)Series
525 637,429Contra Costa
Transportation Authority(RB) Series
¤
225 230,382Contra Costa
Transportation Authority(RB) Series A
2,750 3,248,410Contra Costa Water District
(RB) Series U100 100,677
Culver City Unified SchoolDistrict (GO) Series C
460 587,319Desert Sands Unified
School District (GO)Series A
375 432,341Dixie School District (GO)
500 540,800

DFA California Municipal Real Return PortfolioCONTINUED
5.000%, 01/01/24
5.000%, 08/01/24
5.000%, 11/01/235.000%, 11/01/24
5.000%, 11/01/255.000%, 11/01/26
5.000%, 09/01/21
City of Pacifica COP250 293,162
City of Pittsburg WaterRevenue (RB) Series A
275 328,941City of San Francisco
Public UtilitiesCommission WaterRevenue (RB)
645 752,3801,000 1,203,540
City of San FranciscoPublic UtilitiesCommission WaterRevenue (RB) Series D
220 272,384150 190,505
City of Santa RosaWastewater Revenue(RB) Series A
330 357,829
5.500%, 08/01/34(Pre-refunded @$100, 2/1/21)
5.000%, 06/01/24
5.000%, 07/01/24
5.000%, 08/01/27
5.000%, 08/01/26
5.000%, 07/15/23
5.000%, 08/01/21
Dublin-San RamonServices District WaterRevenue (RB)
¤
1,425 1,523,368El Monte Union High
School District (GO)250 297,632
Elsinore Valley MunicipalWater District FinancingAuthority (RB) Series A
400 477,444Emery Unified School
District (GO)600 772,554
Fairfield-Suisun UnifiedSchool District (GO)
695 877,952Grossmont Healthcare
District (GO) Series1,000 1,156,780
Grossmont Union HighSchool District (GO)
200 216,320
4.000%, 08/01/24
5.000%, 08/01/225.000%, 06/01/26
5.000%, 07/01/23(Pre-refunded @$100, 7/1/21)
5.000%, 07/01/225.000%, 07/01/24
FaceAmount Value†
(000)
CALIFORNIA — (Continued)Kern High School District
(GO) Series E200 $ 229,496
Los Angeles CommunityCollege District (GO)Series C
360 403,402530 666,056
Los Angeles CountyMetropolitanTransportation Authority(RB)
¤
1,000 1,078,610Los Angeles County
MetropolitanTransportation Authority(RB) Series A
1,600 1,786,672600 717,444
2.000%, 08/01/20
4.000%, 08/01/19
5.000%, 03/15/22(Pre-refunded @$100, 3/15/20)
5.000%, 12/01/255.000%, 12/01/265.000%, 12/01/27
5.000%, 08/01/255.000%, 08/01/265.000%, 08/01/27
FaceAmount Value†
(000)
CALIFORNIA — (Continued)Los Rios Community
College District (GO)Series F
200 $ 202,280Merced Community
College District (GO)200 200,000
Mesa Water District COP¤
500 512,600Millbrae Public Financing
Authority (RB)390 483,066265 334,878385 496,665
Morongo Unified SchoolDistrict (GO) Series A
20 24,461280 350,708130 166,248

DFA California Municipal Real Return PortfolioCONTINUED
5.000%, 07/01/25
5.000%, 07/01/245.000%, 07/01/25
5.000%, 07/01/26
5.000%, 07/01/20
5.000%, 07/01/26
5.000%, 07/01/27
5.000%, 07/01/245.000%, 07/01/265.000%, 07/01/27
5.000%, 07/01/27
Los Angeles CountyMetropolitanTransportation Authority(RB) Series A-
570 698,945Los Angeles Department of
Water (RB) Series A250 298,402
1,000 1,228,150Los Angeles Department of
Water & Power PowerSystem Revenue (RB)Series
335 421,329Los Angeles Department of
Water & Power PowerSystem Revenue (RB)Series A
515 534,220Los Angeles Department of
Water & Power PowerSystem Revenue (RB)Series B
400 503,080Los Angeles Department of
Water & Power PowerSystem Revenue (RB)Series D
1,000 1,287,850Los Angeles Unified
School District (GO)Series A
1,425 1,682,8541,085 1,341,809
480 605,760Los Angeles Unified
School District (GO)Series B-1
175 220,850
3.000%, 08/01/24
5.000%, 11/01/225.000%, 11/01/235.000%, 11/01/24
5.000%, 08/01/21
5.000%, 08/01/26
5.000%, 05/01/24
4.000%, 08/01/25
5.000%, 02/01/22
4.000%, 08/01/22
4.000%, 08/01/23
5.000%, 08/01/24
Mount Diablo UnifiedSchool District (GO)Series G
130 142,646Municipal Improvement
Corp. of Los Angeles(RB) Series A
1,100 1,243,341750 876,570425 511,989
Napa Valley CommunityCollege District (GO)Series A
250 270,400New Haven Unified School
District (GO)150 187,196
Northern CaliforniaTransmission Agency(RB) Series
280 331,766Northern Humboldt Union
High School District(GO)
120 139,529Novato Sanitary District(RB)
340 374,296Oak Park Unified School
District (GO)200 218,026
Oakdale Joint UnifiedSchool District (GO)
400 446,736Oakland Unified School
District/Alameda County(GO)
750 883,860
6.625%, 08/01/38(Pre-refunded @$100, 8/1/21)
5.000%, 08/01/25
FaceAmount Value†
(000)
CALIFORNIA — (Continued)¤
800 $ 890,112Oakland Unified School
District/Alameda County(GO) Series A
200 241,646
5.000%, 05/15/25(Pre-refunded @$100, 5/15/23)5.250%, 05/15/27(Pre-refunded @$100, 5/15/23)
FaceAmount Value†
(000)
CALIFORNIA — (Continued)Regents of the University
of California MedicalCenter Pooled Revenue(RB) Series J
¤
530 $ 608,562¤
260 300,950

DFA California Municipal Real Return PortfolioCONTINUED
5.000%, 08/01/24
5.000%, 08/01/25
5.000%, 08/01/21
5.000%, 09/01/22
3.000%, 08/01/26
4.000%, 08/01/19
5.000%, 11/01/25
5.000%, 05/01/23
5.000%, 08/01/26
5.000%, 08/01/26
5.000%, 08/01/23
5.000%, 08/01/19
5.000%, 08/01/23
4.000%, 08/01/26
Oakland Unified SchoolDistrict/Alameda County(GO) Series C
510 601,025Oakland Unified School
District/Alameda County(GO) (AGM)
1,075 1,302,298Ontario Montclair School
District (GO) (AGM)Series B
160 173,056Otay Water District (RB)
740 830,657Pacific Grove Unified
School District (GO)210 235,097
Pajaro Valley UnifiedSchool District (GO)Series D
370 370,000Palm Springs Financing
Authority (RB)260 321,909
Palomar CommunityCollege District (GO)
200 229,938Pasadena Unified School
District (GO)525 661,589
Pasadena Unified SchoolDistrict (GO) Series B
1,000 1,260,170Placentia-Yorba Linda
Unified School District(GO)
205 237,839Port of Los Angeles (RB)
Series A750 750,000
Redondo Beach UnifiedSchool District (GO)(AGM) Series A
255 295,739Reed Union School District
(GO)250 299,007
5.000%, 08/01/19
5.000%, 01/01/25
5.250%, 12/01/20
5.000%, 08/15/23
5.000%, 10/01/20
5.000%, 08/01/235.000%, 08/01/26
5.000%, 05/01/24
5.000%, 06/30/20
5.250%, 07/01/27
5.000%, 07/01/26
5.000%, 07/01/24
5.000%, 06/15/24
3.000%, 02/01/22
Riverside Unified SchoolDistrict (GO) Series A
775 775,000Ross Valley Public
Financing Authority (RB)410 497,437
Sacramento CountySanitation DistrictsFinancing Authority (RB)(NATL) Series A
510 539,621Sacramento Municipal
Utility District (RB)Series E
350 406,581San Carlos CA School
District (GO)500 523,975
San Diego CommunityCollege District (GO)
500 580,0951,660 2,096,978
San Diego County WaterAuthority (RB)
940 1,117,152San Diego Unified School
District (RN) Series A2,000 2,069,960
San Diego Unified SchoolDistrict (GO) (AGM)Series F-1
475 618,174San Diego Unified School
District (GO) Series R-5200 250,934
San Diego Unified SchoolDistrict/CA Series R-4
605 721,172San Francisco Community
College District (GO)1,315 1,564,666
San Francisco CountyTransportation Authority(RB)
1,300 1,367,405
FaceAmount Value†
(000)
CALIFORNIA — (Continued)5.000%, 08/01/26
FaceAmount Value†
(000)
CALIFORNIA — (Continued)250 $ 315,235

Citibank,N.A.
As of July 31, 2019, DFA California Municipal Real Return Portfolio had entered into the following outstanding Inflation Swaps:
Counterparty
Paymentsmade
by Fund
Paymentsreceivedby Fund
PaymentFrequency
NotionalAmount
ExpirationDate
UpfrontPremiums
Paid
UpfrontPremiumsReceived
MarketValue
UnrealizedAppreciation
(Depreciation)
1.808% Fixed CPI Maturity USD 4,000,000 07/01/25 — — $ 16,669 $ 16,669
5.000%, 06/15/255.000%, 06/15/26
5.000%, 08/01/25
5.000%, 08/01/21
4.000%, 09/01/26
5.000%, 09/01/28
5.000%, 08/01/27
5.000%, 11/15/22
5.000%, 06/01/26
5.000%, 08/01/26
5.000%, 08/01/19
5.000%, 08/01/24
4.000%, 08/01/244.000%, 08/01/25
San Francisco UnifiedSchool District (GO)Series A
650 $ 796,926880 1,107,586
San Gabriel Unified SchoolDistrict (GO) Series A
230 281,752San Lorenzo Unified
School District (GO)140 151,424
San Mateo Union HighSchool District (GO)Series C
320 381,139San Matro County
Community CollegeDistrict (GO) Series B
100 132,450San Rafael City High
School District (GO)Series B
100 129,111Santa Clara County
Financing Authority (RB)Series A
2,000 2,262,940Santa Clara Valley
Transportation Authority(RB) Series A
400 503,284Santa County Clara (GO)
Series C1,100 1,389,564
Santa Paula Union HighSchool District (GO)Series A
260 260,000Santee School District(GO)
290 346,727Scotts Valley Unified
School District (GO)Series B
150 172,202250 292,898
5.000%, 08/01/19
4.000%, 08/01/25
5.000%, 08/01/26
5.000%, 08/01/25
5.000%, 08/01/26
2.000%, 08/01/20
5.000%, 05/15/225.000%, 05/15/27(Pre-refunded @$100, 5/15/23)
5.000%, 08/01/27
5.000%, 08/01/27
TOTAL MUNICIPALBONDS
(Cost $131,246,615)^^
Simi Valley UnifiedSchool District (GO)
610 610,000Southwestern
Community CollegeDistrict (GO) Series B
250 292,580Sylvan Union School
District (GO)620 781,305
Sylvan Union SchoolDistrict (GO) Series
380 466,743Tahoe-Truckee Unified
School District (GO)100 126,171
Tahoe-Truckee UnifiedSchool District (GO)Series C
1,190 1,203,566University of California
(RB) Series AF750 834,187
¤
4,240 4,885,625Washington Union
School District/Monterey County (GO)
135 173,232West Valley-Mission
Community CollegeDistrict (GO) Series B
220 284,044
135,509,913
TOTAL INVESTMENTS — (100.0%)$135,509,913

TotalAppreciationBank ofAmericaCorp.Bank ofAmericaCorp.Bank ofAmericaCorp.
Bank ofAmericaCorp.Bank ofAmericaCorp.Bank ofAmericaCorp.Bank ofAmericaCorp.Citibank,N.A.Citibank,N.A.Citibank,N.A.Citibank,N.A.Citibank,N.A.Citibank,N.A.Citibank,N.A.Citibank,N.A.Citibank,N.A.Merrill LynchCapitalServices,Inc.
Total(Depreciation)
$ 16,669 $ 16,669
2.367% Fixed CPI Maturity USD 6,000,000 07/17/25 — — (210,849) (210,849)
2.265% Fixed CPI Maturity USD 7,000,000 02/23/24 — — (158,816) (158,816)
2.065% Fixed CPI Maturity USD 9,000,000 12/12/26 — — (108,764) (108,764)
DFA California Municipal Real Return PortfolioCONTINUED
Counterparty
Paymentsmade
by Fund
Paymentsreceivedby Fund
PaymentFrequency
NotionalAmount
ExpirationDate
UpfrontPremiums
Paid
UpfrontPremiumsReceived
MarketValue
UnrealizedAppreciation
(Depreciation)
2.062% Fixed CPI Maturity USD 4,000,000 11/08/23 — — $ (25,843) $ (25,843)
2.060% Fixed CPI Maturity USD 11,000,000 11/06/21 — — (40,973) (40,973)
2.058% Fixed CPI Maturity USD 11,000,000 12/12/22 — — (89,670) (89,670)
1.885% Fixed CPI Maturity USD 8,000,000 01/22/24 — — (21,678) (21,678)
2.312% Fixed CPI Maturity USD 7,000,000 07/24/23 — — (179,195) (179,195)
2.289% Fixed CPI Maturity USD 12,000,000 07/26/23 — — (294,070) (294,070)
2.260% Fixed CPI Maturity USD 10,000,000 08/08/22 — — (202,843) (202,843)
2.225% Fixed CPI Maturity USD 6,000,000 03/26/23 — — (118,895) (118,895)
2.160% Fixed CPI Maturity USD 7,000,000 01/09/23 — — (92,904) (92,904)
2.143% Fixed CPI Maturity USD 8,000,000 01/18/22 — — (85,257) (85,257)
2.065% Fixed CPI Maturity USD 4,000,000 11/09/21 — — (17,736) (17,736)
2.054% Fixed CPI Maturity USD 10,000,000 11/06/22 — — (47,943) (47,943)
1.986% Fixed CPI Maturity USD 6,000,000 02/20/26 — — (22,369) (22,369)
2.317% Fixed CPI Maturity USD 6,000,000 05/09/25 — — (143,114) (143,114)
$(1,860,919) $(1,860,919)

TotalAppreciation(Depreciation)
Municipal BondsSwap Agreements**
TOTAL
$(1,844,250) $(1,844,250)
Summary of the Portfolio's investments as of July 31, 2019, based on their valuation inputs, is as follows (see Security Valuation Note):
Investments in Securities (Market Value)
Level 1 Level 2 Level 3 Total
— $135,509,913 — $135,509,913— (1,844,250) — (1,844,250)
— $133,665,663 — $133,665,663** Valued at the unrealized appreciation/(depreciation) on the investment.
DFA GLOBAL CORE PLUS FIXED INCOME PORTFOLIO
SCHEDULE OF INVESTMENTS
July 31, 2019
(Unaudited)
0.750%, 09/29/26
2.875%, 02/24/22
3.250%, 09/24/27
5.000%, 03/19/202.850%, 05/18/263.150%, 09/19/27
5.125%, 05/15/24
3.900%, 01/15/26
3.000%, 02/10/230.625%, 09/18/243.500%, 01/10/27
2.500%, 03/06/29
1.375%, 03/26/29
FaceAmount^ Value†
(000)BONDS — (95.2%)AUSTRALIA — (2.4%)Australia & New Zealand
Banking Group, Ltd.EUR 3,000 $ 3,481,293
BHP Billiton FinanceUSA, Ltd.
13 13,175BHP Billiton Finance,Ltd.
EUR 1,800 2,456,960Commonwealth Bank of
Australia9 9,151
Ω 266 269,535Ω 10 10,350FMG Resources August
2006 Pty, Ltd.#Ω 2,690 2,797,600Macquarie Bank, Ltd.Ω 289 303,850National Australia Bank,Ltd.
AUD 2,000 1,442,323EUR 4,000 4,576,650
Ω 351 369,868Queensland TreasuryCorp.
AUD 7,000 5,139,357Telstra Corp., Ltd.
EUR 3,000 3,634,949Westpac Banking Corp.
2.620%, 12/02/26
3.300%, 05/26/25
3.420%, 12/01/263.850%, 06/01/27
2.900%, 02/01/253.700%, 02/01/26
3.000%, 08/15/22
0.875%, 02/06/29
4.000%, 10/01/233.500%, 06/10/24
3.444%, 05/23/25
3.600%, 03/10/274.400%, 04/15/29
3.625%, 03/15/243.000%, 04/01/25
FaceAmount^ Value†
(000)CANADA — (Continued)Bank of Nova Scotia(The)
CAD 6,000 $ 4,636,975Canadian Imperial Bank
of CommerceCAD 5,300 4,242,088
Canadian NaturalResources, Ltd.
CAD 1,000 778,7393,000 3,104,233
Canadian PacificRailway Co.# 535 546,330
45 47,090Cenovus Energy, Inc.
719 719,934CPPIB Capital, Inc.
EUR 10,250 12,216,869Enbridge, Inc.
34 35,711# 15 15,479Honda Canada Finance,Inc.
CAD 5,000 3,987,309Husky Energy, Inc.
CAD 4,000 3,145,598600 630,719
Nutrien, Ltd.540 557,699
40 40,278

DFA Global Core Plus Fixed Income PortfolioCONTINUED
0.625%, 11/22/242.850%, 05/13/262.700%, 08/19/263.350%, 03/08/271.125%, 09/05/27
TOTAL AUSTRALIA
2.700%, 03/31/262.000%, 03/17/282.250%, 05/24/29
0.900%, 06/22/29
TOTAL BELGIUM
1.875%, 05/06/263.550%, 07/26/27
2.700%, 12/09/26
EUR 1,000 1,147,590104 105,997
23 23,2042,319 2,442,737
EUR 2,000 2,394,885
30,619,474
BELGIUM — (0.6%)Anheuser-Busch InBevSA
EUR 1,000 1,298,192EUR 1,000 1,261,179GBP 600 754,073
Kingdom of BelgiumGovernment Bond
Ω EUR 3,700 4,509,596
7,823,040
CANADA — (5.4%)Alimentation Couche-
Tard, Inc.EUR 700 841,563
Ω 1,620 1,656,999Bank of Montreal
CAD 5,000 3,887,294
6.500%, 01/15/26
3.700%, 05/20/26
0.875%, 05/04/270.875%, 07/05/28
3.000%, 03/15/234.000%, 03/13/24
4.930%, 07/16/25
3.600%, 12/01/24
4.300%, 11/23/233.850%, 09/29/243.350%, 05/15/26
1.994%, 03/23/22
4.500%, 11/15/22
3.800%, 10/01/204.875%, 01/15/26
Province of BritishColumbia Canada
93 115,504Province of Quebec
AUD 3,500 2,685,941Province of QuebecCanada
EUR 3,800 4,516,679EUR 6,800 8,084,616
RogersCommunications, Inc.
21 21,387CAD 2,000 1,616,593
Royal Bank of CanadaCAD 4,000 3,484,649
Suncor Energy, Inc.87 90,719
Thomson Reuters Corp.60 63,60579 81,489
2,000 2,022,575Toronto-Dominion Bank(The)
CAD 58 43,849TransAlta Corp.# 1,000 1,025,710TransCanada PipeLines,Ltd.
15 15,2183,000 3,340,068
5.000%, 07/15/22
TOTAL CANADA
1.750%, 03/16/26
1.500%, 06/26/26
0.500%, 11/15/270.500%, 11/15/29
2.900%, 11/27/26
0.750%, 07/05/28
FaceAmount^ Value†
(000)CANADA — (Continued)Videotron, Ltd.
921 $ 962,169
69,261,678
DENMARK — (2.5%)AP Moller - Maersk A.S.
EUR 4,500 5,188,314Bayer Capital Corp BV
EUR 5,700 6,694,188Denmark GovernmentBond
DKK 32,300 5,207,809Ω DKK 30,600 4,951,940Kommunekredit
AUD 7,300 5,363,732KOMMUNEKREDIT SR
EUR 4,200 4,988,557
0.875%, 01/22/29
5.250%, 12/07/281.125%, 05/25/30
1.125%, 01/23/252.125%, 09/27/28
3.750%, 04/10/24
FaceAmount^ Value†
(000)FRANCE — (Continued)SNCF Reseau
EUR 2,000 $ 2,365,970SNCF Reseau EPIC
GBP 10,498 17,216,367
EUR 1,100 1,340,318Societe Generale SA
EUR 1,200 1,377,132
EUR 2,000 2,489,954Total CapitalInternational SA
112 119,116

TOTAL DENMARK
4.375%, 06/12/27
1.000%, 03/08/27
3.250%, 03/03/231.500%, 11/17/25
3.500%, 10/23/27
4.000%, 04/15/24
2.375%, 05/20/241.375%, 05/03/27
1.000%, 10/18/27
3.625%, 10/13/256.250%, 05/30/285.875%, 07/18/31
0.875%, 02/03/278.125%, 11/20/282.000%, 01/15/29
1.500%, 05/18/263.250%, 06/08/26
0.500%, 01/13/271.125%, 04/05/280.875%, 03/21/291.375%, 03/21/30
5.375%, 03/18/271.500%, 02/02/29
32,394,540
FINLAND — (0.2%)Nokia Oyj
2,750 2,839,375
FRANCE — (6.5%)Air Liquide Finance SA
EUR 1,100 1,312,074BNP Paribas SA
22 22,709EUR 1,200 1,426,264
BPCE S.A.Ω 5,000 5,096,996BPCE SA
500 532,822Credit Agricole SA
EUR 1,000 1,236,825EUR 2,000 2,412,716
Dexia Credit Local SAEUR 11,400 13,689,079
Electricite de France SAΩ 40 42,261
GBP 1,000 1,660,426GBP 1,200 2,057,204
Orange SAEUR 500 586,408GBP 1,964 3,669,711EUR 1,200 1,527,475
Pernod Ricard SAEUR 800 960,115
#Ω 173 177,493Sanofi
EUR 2,300 2,649,370EUR 1,700 2,054,147EUR 1,000 1,185,620EUR 6,200 7,696,956
SNCF MobilitesGBP 500 789,122EUR 2,000 2,503,902
1.375%, 10/04/29
0.750%, 07/12/28
3.883%, 10/11/28
TOTAL FRANCE
2.000%, 10/08/28
1.125%, 01/10/281.500%, 02/06/29
1.000%, 11/15/27
1.125%, 12/18/28
2.950%, 08/20/203.125%, 01/13/213.700%, 05/30/24
1.125%, 05/22/261.375%, 01/30/272.250%, 04/13/29
1.625%, 05/22/29
2.050%, 02/16/263.200%, 03/15/28
EUR 1,000 1,236,900TOTAL CAPITALINTL SA
EUR 1,000 1,171,926Total Capital S.A.#
3,000 3,301,157
83,908,535
GERMANY — (4.8%)Amphenol
TechnologiesHolding GmbH
EUR 4,000 4,940,065BMW Finance NV
EUR 750 895,045
EUR 2,600 3,151,132Daimler AG
EUR 4,300 5,028,476Deutsche Bahn
Finance GMBH
EUR 6,000 7,280,034Deutsche Bank AG
2 1,995
23 22,850
113 111,455Deutsche Telekom
InternationalFinance BV
EUR 1,000 1,186,379
EUR 500 603,686
GBP 1,600 2,004,911E.ON SE
EUR 1,200 1,473,305Kreditanstalt fuer
Wiederaufbau
JPY 1,533,000 16,342,297
AUD 15,000 11,556,930Volkswagen
InternationalFinance NV

DFA Global Core Plus Fixed Income PortfolioCONTINUED
1.875%, 03/30/27
TOTAL GERMANY
4.375%, 03/15/26
1.500%, 01/17/27
EUR 5,400 6,427,051
61,025,611
IRELAND — (0.2%)Perrigo FinanceUnlimited Co.
2,500 2,534,238
ITALY — (0.4%)Eni SpA
EUR 1,000 1,214,145
1.125%, 09/19/28
1.250%, 12/01/26
TOTAL ITALY
1.800%, 09/20/31
3.677%, 02/22/27
2.125%, 03/03/20
6.700%, 03/04/20
3.784%, 03/09/26
2.020%, 02/28/22
3.300%, 01/12/22
TOTAL JAPAN
1.200%, 06/30/27
FaceAmount^ Value†
(000)ITALY — (Continued)
EUR 1,700 $ 2,006,445Italy Buoni Poliennali
Del TesoroEUR 2,100 2,344,870
5,565,460
JAPAN — (0.8%)Japan Government
Twenty Year BondJPY 880,000 9,924,045
Mitsubishi UFJFinancial Group,Inc.
35 36,987Nissan Motor
Acceptance Corp.Ω 20 19,954Nomura Holdings, Inc.
16 16,404Sumitomo Mitsui
Financial Group,Inc.
# 58 61,569Toyota Credit Canada,Inc.
CAD 58 43,814Toyota Motor CreditCorp.
30 30,736
10,133,509
LUXEMBOURG — (1.3%)DH Europe FinanceSA
EUR 1,300 1,517,431
1.375%, 01/11/28
1.125%, 03/19/26
5.750%, 09/17/29
1.375%, 05/02/28
2.250%, 11/22/243.950%, 06/15/263.125%, 11/22/28
3.150%, 09/02/261.000%, 03/01/28
5.000%, 10/01/25
1.250%, 05/12/28
3.875%, 11/13/28
2.250%, 11/10/201.625%, 01/20/270.750%, 08/15/28
8.250%, 09/15/30
FaceAmount^ Value†
(000)NETHERLANDS — (Continued)ING Groep NV
EUR 3,100 $ 3,702,806Koninklijke AholdDelhaize NV
EUR 520 608,507Koninklijke KPN NV
GBP 1,500 2,197,076Koninklijke Philips NV
EUR 2,000 2,420,461Mylan NV
EUR 1,000 1,193,789173 176,748
EUR 1,400 1,761,255Nederlandse
Waterschapsbank NVAUD 1,300 976,872EUR 7,500 9,128,752
Sensata TechnologiesBVΩ 2,886 3,037,457SHELLINTERNATIONAL FIN
EUR 5,600 6,798,579Shell International
Finance B.V.1,200 1,317,442
Shell InternationalFinance BV
54 54,052EUR 6,208 7,694,456EUR 2,000 2,330,519
Telefonica Europe BV500 716,646
Unilever NV

DFA Global Core Plus Fixed Income PortfolioCONTINUED
1.625%, 11/09/261.125%, 09/30/270.625%, 09/20/28
TOTALLUXEMBOURG
0.625%, 06/19/273.500%, 07/19/27
3.875%, 02/08/221.250%, 03/23/26
6.375%, 06/07/32
1.375%, 06/01/261.125%, 09/16/264.875%, 06/14/29
2.750%, 04/01/231.375%, 01/29/27
0.375%, 09/15/25
Novartis Finance SAEUR 3,300 4,098,670EUR 7,000 8,487,561EUR 2,300 2,676,711
16,780,373
NETHERLANDS — (5.1%)BNG Bank NV
EUR 500 589,859AUD 5,000 3,872,579
CooperatieveRabobank UA
83 86,095EUR 2,500 3,013,078
E.ON InternationalFinance BV
GBP 1,150 2,039,975Enel FinanceInternational NV
EUR 1,500 1,800,222EUR 2,000 2,356,162
Ω 2,000 2,202,637Heineken NVΩ 26 26,228
EUR 1,200 1,442,696Iberdrola InternationalBV
EUR 1,400 1,591,620
1.000%, 02/14/271.375%, 07/31/29
TOTAL NETHERLANDS
2.650%, 01/15/246.125%, 11/27/286.875%, 03/11/31
3.000%, 12/09/263.400%, 07/24/28
1.500%, 02/19/26
TOTAL NORWAY
5.462%, 02/16/21
1.715%, 01/12/28
TOTAL SPAIN
3.300%, 07/27/27
EUR 1,500 1,784,779EUR 700 862,884
65,784,231
NORWAY — (4.0%)Equinor ASA
81 82,257GBP 1,250 2,147,495GBP 17,350 33,109,997
Kommunalbanken A.S.AUD 12,500 9,341,532AUD 4,000 3,100,220
Norway GovernmentBondΩ NOK 29,000 3,317,233
51,098,734
SPAIN — (0.4%)Telefonica Emisiones SA
10 10,437Telefonica EmisionesSAU
EUR 4,300 5,266,472
5,276,909
SUPRANATIONAL ORGANIZATION OBLIGATIONS — (5.0%)African DevelopmentBank
AUD 3,000 2,285,094
2.350%, 06/21/27
0.625%, 01/30/29
0.950%, 02/14/28
1.900%, 01/26/262.150%, 01/18/27
FaceAmount^ Value†
(000)SUPRANATIONAL ORGANIZATION OBLIGATIONS —(Continued)Asian DevelopmentBank
JPY 2,720,000 $30,304,913Council Of Europe
Development Bank
EUR 2,000 2,369,557European Financial
Stability Facility
EUR 1,900 2,311,633European InvestmentBank
JPY 568,700 6,006,340
JPY 1,374,700 15,005,937
4.375%, 01/12/263.250%, 02/12/27
4.000%, 09/04/261.250%, 03/13/273.125%, 03/06/29
3.535%, 11/04/241.077%, 06/26/251.594%, 07/03/28
1.000%, 11/21/241.500%, 06/23/273.125%, 11/21/31
FaceAmount^ Value†
(000)UNITED KINGDOM — (Continued)Barclays P.L.C.
2,000 $2,065,495GBP 1,657 2,058,839
BAT International FinanceP.L.C.
GBP 1,220 1,656,483EUR 1,000 1,130,557EUR 3,200 4,129,023
BP Capital Markets P.L.C.26 27,298
EUR 1,200 1,407,201EUR 1,233 1,517,886
BritishTelecommunicationsP.L.C.
EUR 1,200 1,388,843EUR 2,500 2,942,540GBP 700 929,549

4.500%, 06/07/29
2.500%, 04/14/27
TOTALSUPRANATIONALORGANIZATIONOBLIGATIONS
0.250%, 02/28/22
2.250%, 06/01/32
4.125%, 05/15/22
TOTAL SWEDEN
1.500%, 04/10/26
1.250%, 11/02/29
1.250%, 09/01/26
TOTALSWITZERLAND
4.000%, 11/27/233.500%, 06/14/242.875%, 05/14/26
3.375%, 11/16/254.000%, 01/17/29
2.375%, 11/16/201.250%, 05/12/285.750%, 11/13/31
2.250%, 06/10/24
GBP 1,700 2,740,873Inter-American
Development Bank
AUD 5,000 3,641,034
64,665,381
SWEDEN — (1.6%)SvenskaHandelsbanken AB
EUR 110 123,394Sweden GovernmentBond
SEK 142,500 18,909,339Telefonaktiebolaget
LM Ericsson
1,323 1,363,021
20,395,754
SWITZERLAND — (0.4%)Credit Suisse AG
EUR 700 848,094Nestle Finance
International, Ltd.EUR 1,380 1,695,820
UBS Group FundingSwitzerland AG
EUR 1,800 2,131,796
4,675,710
UNITED KINGDOM — (6.2%)Aon P.L.C.
47 49,560
107 111,481
EUR 1,400 1,765,850AstraZeneca P.L.C
802 837,318
1,000 1,093,000AstraZeneca P.L.C.
34 34,012
EUR 1,200 1,423,716GBP 450 785,679
Barclays Bank P.L.C.
EUR 500 613,113
4.375%, 03/13/29
1.750%, 05/26/28
1.500%, 10/22/27
5.250%, 12/19/33
1.000%, 09/12/26
4.000%, 03/30/222.625%, 08/16/28
3.750%, 01/11/271.500%, 09/12/27
3.250%, 01/20/28
4.375%, 12/09/30
4.000%, 12/11/29
3.625%, 10/14/253.375%, 06/18/26
4.800%, 04/05/26
4.000%, 03/13/243.875%, 10/15/29
2.500%, 09/15/26
3.450%, 10/01/22
Centrica P.L.C.GBP 1,000 1,434,426
Coca-Cola EuropeanPartners P.L.C.
EUR 1,400 1,734,444Diageo Finance P.L.C.
EUR 1,000 1,218,167GLAXOSMITHKLINE
CAPITALGBP 1,388 2,398,609
GlaxoSmithKline CapitalP.L.C.
EUR 1,500 1,769,735HSBC Holdings P.L.C.
59 61,176GBP 5,164 6,533,139
Lloyds Banking GroupP.L.C.
3,500 3,551,894EUR 2,100 2,417,043
Nationwide BuildingSociety
GBP 1,500 2,023,865Network Rail
Infrastructure FinanceP.L.C.
GBP 950 1,564,845Rio Tinto Finance P.L.C.
GBP 3,500 5,263,435Rolls-Royce P.L.C.Ω 520 535,535
GBP 800 1,076,520Royal Bank of Scotland
Group P.L.C.# 3,000 3,205,779Santander UK P.L.C.
103 108,116GBP 1,478 2,126,364
Sky Ltd.EUR 2,000 2,565,894
TechnipFMC P.L.C.49 49,814

DFA Global Core Plus Fixed Income PortfolioCONTINUED
4.000%, 09/12/33
1.125%, 11/20/251.500%, 07/24/274.200%, 12/13/277.875%, 02/15/30
5.875%, 03/25/272.375%, 05/16/29
TOTAL UNITEDKINGDOM
1.500%, 11/09/262.875%, 10/15/27
2.875%, 05/08/22
1.500%, 09/27/26
2.950%, 03/15/25
2.900%, 11/06/223.600%, 05/14/254.250%, 11/14/28
3.400%, 06/15/27
3.250%, 02/01/25
4.500%, 12/01/23
5.875%, 10/15/245.125%, 03/15/27
2.750%, 11/15/223.500%, 11/15/24
3.500%, 08/01/25
3.250%, 03/17/25
FaceAmount^ Value†
(000)UNITED KINGDOM — (Continued)Transport for London
GBP 4,400 $ 6,859,253Vodafone Group P.L.C.
EUR 500 586,057EUR 1,750 2,108,934AUD 1,800 1,351,134
# 77 104,521Western Power
Distribution SouthWest P.L.C.
GBP 900 1,410,931GBP 1,300 1,654,361
79,681,434
UNITED STATES — (47.4%)3M Co.
EUR 1,100 1,344,110168 171,695
ABB Finance USA, Inc.45 45,638
Abbott Ireland FinancingDAC
EUR 5,000 6,061,602Abbott Laboratories
146 149,495AbbVie, Inc.
33 33,3051,000 1,030,3372,400 2,564,014
Activision Blizzard, Inc.1,052 1,076,413
Adobe, Inc.22 22,854
Advance Auto Parts, Inc.14 14,928
AECOM500 540,000
# 2,200 2,304,500Aetna, Inc.
97 97,20063 64,839
Affiliated ManagersGroup, Inc.
1,730 1,770,354Aflac, Inc.
129 133,658
2.125%, 06/01/29
4.125%, 02/13/225.125%, 09/30/24
1.998%, 08/15/26
4.750%, 05/05/212.200%, 06/15/274.800%, 02/14/29
3.150%, 08/22/27
2.700%, 11/15/20
2.250%, 05/05/213.300%, 05/03/27
2.300%, 09/09/26
3.300%, 03/01/214.875%, 06/01/224.125%, 02/15/243.750%, 07/10/253.900%, 04/01/261.875%, 06/21/27
3.850%, 03/01/24
4.000%, 10/15/232.875%, 09/15/26
3.400%, 05/15/24
4.100%, 06/15/213.625%, 05/22/243.125%, 05/01/252.600%, 08/19/264.000%, 09/13/29
3.900%, 12/15/253.500%, 12/05/26
FaceAmount^ Value†
(000)UNITED STATES — (Continued)
EUR 1,500 $1,834,458Ally Financial, Inc.
1,250 1,287,1252,000 2,190,000
Alphabet, Inc.86 84,082
Altria Group, Inc.2 2,079
EUR 3,000 3,604,0642,500 2,689,871
Amazon.com, Inc.2,000 2,101,047
Ameren Corp.12 12,018
American Express CreditCorp.
2 2,000131 137,575
American Honda FinanceCorp.
130 127,106American International
Group, Inc.17 17,22717 18,145
118 125,48295 100,06146 48,579
EUR 4,075 4,933,548American Water CapitalCorp.
25 26,308Ameriprise Financial, Inc.
43 45,67165 65,561
AmerisourceBergen Corp.# 433 446,020Amgen, Inc.
82 84,129# 75 78,714
37 37,81828 27,648
GBP 1,836 2,646,574Analog Devices, Inc.
35 37,09223 23,719

DFA Global Core Plus Fixed Income PortfolioCONTINUED
6.875%, 05/01/29
2.800%, 04/01/25
4.150%, 12/01/24
3.250%, 10/01/22
3.450%, 03/15/223.800%, 03/15/252.625%, 11/15/282.625%, 11/15/28
Ahold Finance USA LLC8 10,012
Alabama Power Co.30 30,084
Albemarle Corp.86 90,581
Allergan Finance LLC88 89,228
Allergan Funding SCS150 152,886
# 529 547,950EUR 3,200 4,080,698EUR 216 275,447
4.000%, 04/13/28
5.500%, 03/01/23
4.350%, 08/15/203.125%, 05/15/223.500%, 08/15/243.650%, 12/01/27
5.000%, 09/30/20
Anheuser-Busch InBevWorldwide, Inc.
2,500 2,713,552Anixter, Inc.
1,090 1,163,575Anthem, Inc.
13 13,25825 25,43758 60,058
4,424 4,583,092Aon Corp.
9 9,264
4.500%, 12/15/28
3.250%, 04/15/224.375%, 10/15/28
2.500%, 02/09/253.250%, 02/23/262.450%, 08/04/263.350%, 02/09/273.000%, 06/20/273.000%, 11/13/271.375%, 05/24/293.050%, 07/31/29
3.300%, 04/01/27
2.500%, 08/11/26
5.900%, 02/01/27
3.150%, 05/15/25
3.875%, 01/12/28
4.750%, 08/15/22
4.000%, 03/15/23
4.000%, 01/15/223.000%, 02/15/223.800%, 03/15/22
FaceAmount^ Value†
(000)UNITED STATES — (Continued)# 960 $ 1,065,595Apache Corp.
39 39,4603,000 3,046,629
Apple, Inc.53 53,381
1,000 1,044,876200 199,703
2,393 2,519,09764 66,00481 83,794
EUR 8,800 10,878,449GBP 13,660 19,376,777
Applied Materials, Inc.59 61,704
Archer-Daniels-MidlandCo.
58 57,984Arconic, Inc.
1,700 1,870,000Arizona Public ServiceCo.
71 73,066Arrow Electronics, Inc.
1,903 1,900,154Ashland LLC
900 935,055Assurant, Inc.
75 77,250AT&T, Inc.
13 13,48774 75,08059 61,050
3.337%, 12/15/27
5.000%, 03/15/225.250%, 07/01/254.875%, 03/15/26
2.400%, 08/15/26
3.300%, 01/11/234.000%, 04/01/247.000%, 07/31/283.419%, 12/20/28
3.650%, 02/04/243.000%, 02/24/252.800%, 05/04/26
2.875%, 06/23/20
2.600%, 08/15/26
5.500%, 08/15/25
3.250%, 06/15/23
3.749%, 08/01/24
FaceAmount^ Value†
(000)UNITED STATES — (Continued)Baker Hughes a GE Co.
LLC / Baker HughesCo-Obligor, Inc.
2,000 $ 2,032,879Ball Corp.
645 675,508500 544,375
# 1,500 1,590,750Baltimore Gas & ElectricCo.
8 7,828Bank of America Corp.
52 53,38972 76,581
GBP 1,500 2,602,095(r) 184 189,318Bank of New York Mellon
Corp. (The)123 129,719330 338,484
64 64,972Baxalta, Inc.
2 2,006Baxter International, Inc.
49 48,820Bayer U.S. Finance IILLCΩ 26 28,245Beam Suntory, Inc.
21 21,312Bed Bath & Beyond, Inc.# 1,907 1,775,872Bemis Co., Inc.

DFA Global Core Plus Fixed Income PortfolioCONTINUED
3.550%, 06/01/243.950%, 01/15/253.400%, 05/15/253.600%, 07/15/251.800%, 09/05/263.800%, 02/15/274.375%, 09/14/29
3.125%, 06/15/204.375%, 06/15/253.500%, 06/15/27
3.375%, 09/15/25
2.875%, 01/15/233.125%, 07/15/233.250%, 04/15/253.125%, 04/21/26
4.625%, 04/15/26
2.850%, 12/15/20
3.200%, 08/15/21
52 54,034115 121,502253 260,234998 1,036,501
EUR 800 975,214653 680,750
GBP 500 721,435Autodesk, Inc.
31 31,11935 37,161
3,036 3,085,659Automatic Data
Processing, Inc.144 152,678
AutoZone, Inc.140 141,278
15 15,28972 73,723
1,187 1,202,742Avnet, Inc.
65 68,931BAE Systems Holdings,Inc.Ω 14 14,030Baker Hughes a GE Co.LLC
2 2,028
4.500%, 10/15/21
3.400%, 01/31/223.125%, 03/15/261.125%, 03/16/272.150%, 03/15/28
4.450%, 10/01/28
2.900%, 09/15/204.050%, 09/15/25
3.200%, 03/15/27
2.800%, 04/11/263.300%, 04/06/271.000%, 04/20/27
8.750%, 08/15/212.500%, 03/01/252.600%, 10/30/25
2.375%, 09/23/243.600%, 06/01/261.800%, 03/03/27
Ω 7 7,218Berkshire Hathaway, Inc.
37 38,19413,387 13,841,612
EUR 3,748 4,436,898EUR 700 900,532
Best Buy Co., Inc.1,300 1,384,271
Biogen, Inc.172 172,780
1,000 1,070,081BlackRock, Inc.
6,306 6,591,482BMW US Capital LLCΩ 194 195,174Ω 58 59,640
EUR 1,800 2,113,874Boeing Co. (The)
11 12,34375 74,66142 41,876
Booking Holdings, Inc.EUR 1,000 1,236,303
108 113,531EUR 800 975,289
4.125%, 10/01/23
3.245%, 05/06/223.119%, 05/04/263.017%, 01/16/27
3.875%, 05/15/23
2.000%, 08/01/22
4.200%, 09/15/244.500%, 03/15/29
1.200%, 07/07/262.600%, 07/07/28
4.150%, 07/01/23
FaceAmount^ Value†
(000)UNITED STATES — (Continued)Boston Scientific Corp.
17 $ 18,020BP Capital Markets
America, Inc.33 33,84035 35,997
127 129,617Brinker International, Inc.
1,250 1,243,750Bristol-Myers Squibb Co.
79 78,288Brown & Brown, Inc.
54 57,015# 1,500 1,592,154Brown-Forman Corp.
EUR 3,000 3,541,383GBP 1,100 1,458,218
Buckeye Partners L.P.22 21,623
4.500%, 01/15/21
3.450%, 06/01/23
3.000%, 03/10/253.200%, 03/02/27
5.375%, 05/15/27
2.355%, 12/05/222.954%, 05/16/26
5.750%, 07/01/22
2.875%, 11/03/22
FaceAmount^ Value†
(000)UNITED STATES — (Continued)CenterPoint Energy
Resources Corp.18 $ 18,414
CF Industries, Inc.1,048 1,058,480
Charles Schwab Corp.(The)
99 101,1041,000 1,036,061
Chemours Co. (The)# 1,600 1,408,000Chevron Corp.
52 52,370133 137,521
Choice HotelsInternational, Inc.
988 1,060,262Chubb INA Holdings, Inc.
22 22,388

DFA Global Core Plus Fixed Income PortfolioCONTINUED
3.950%, 12/01/26
3.750%, 09/25/27
3.000%, 04/01/257.000%, 12/15/25
4.700%, 03/15/27
4.250%, 04/15/212.500%, 08/02/223.300%, 03/19/254.150%, 03/15/28
4.750%, 07/15/213.750%, 04/24/243.750%, 03/09/273.800%, 01/31/28
4.625%, 12/15/203.200%, 06/15/223.410%, 06/15/27
2.600%, 06/26/223.400%, 05/15/24
3.375%, 03/01/223.500%, 01/15/254.000%, 01/15/262.900%, 01/15/277.875%, 07/30/305.500%, 05/15/33
4.000%, 08/15/233.625%, 05/15/243.450%, 11/15/27
87 77,557Bunge, Ltd. Finance Corp.
2,200 2,185,362Burlington Northern Santa
Fe LLC50 51,37610 12,501
CA, Inc.# 205 211,016Campbell Soup Co.
12 12,31023 23,01547 47,250
3,050 3,212,138Capital One FinancialCorp.
23 23,98854 56,831
1,800 1,870,5053,000 3,104,955
Cardinal Health, Inc.7 7,194
45 45,575# 2,067 2,019,743Caterpillar, Inc.
30 30,35821 22,062
CBS Corp.27 27,574
# 28 28,854775 815,073
3,269 3,187,45413 17,705
400 467,845Celgene Corp.
96 101,18652 54,206
600 622,542
2.700%, 03/13/233.350%, 05/15/241.550%, 03/15/28
4.000%, 02/15/22
5.000%, 08/01/235.250%, 03/07/25
1.500%, 10/26/28
4.500%, 01/14/223.875%, 10/25/233.750%, 06/16/243.300%, 04/27/255.150%, 05/21/26
3.000%, 03/15/25
3.875%, 03/01/243.600%, 11/15/253.000%, 05/15/26
5.750%, 08/15/214.500%, 03/01/26
4.375%, 04/05/22
5.250%, 05/30/255.250%, 05/30/29
1.875%, 09/22/26
2.250%, 09/01/262.900%, 05/25/27
1.375%, 03/06/34
3.375%, 08/15/253.150%, 03/01/26
35 35,55160 62,881
EUR 4,900 5,939,795Cigna Holding Co.# 9 9,285CIT Group, Inc.
1,300 1,387,750# 2,140 2,345,975Citigroup Inc
EUR 1,900 2,288,597Citigroup, Inc.
17 17,83233 34,70330 31,65290 93,083
GBP 1,323 1,969,052CME Group, Inc.
33 34,165CMS Energy Corp.
20 20,89837 38,36858 58,518
CNA Financial Corp.49 52,08975 80,968
CNH Industrial CapitalLLC
406 421,014CNO Financial Group,Inc.# 2,220 2,392,050
1,000 1,082,500Coca Cola Co.
EUR 1,400 1,751,290Coca-Cola Co. (The)
147 146,678275 285,790
Colgate-Palmolive Co.EUR 2,000 2,448,127
Comcast Corp.49 51,194
102 105,578
4.250%, 01/15/33
4.000%, 02/01/29
FaceAmount^ Value†
(000)UNITED STATES — (Continued)
1,500 $1,683,067Comerica, Inc.
1,000 1,077,160Conagra Brands, Inc.
2.800%, 11/15/20
FaceAmount^ Value†
(000)UNITED STATES — (Continued)Dominion Energy Gas
Holdings LLC84 $ 84,425
Dominion Energy, Inc.

3.200%, 01/25/23
4.950%, 03/15/26
6.950%, 04/15/29
3.300%, 12/01/24
3.500%, 05/09/27
4.500%, 04/15/23
3.700%, 11/15/23
3.850%, 02/01/253.500%, 08/15/27
4.250%, 06/01/21
2.800%, 07/20/202.125%, 06/01/213.375%, 08/12/243.875%, 07/20/25
8.500%, 01/18/31
3.350%, 09/15/25
3.850%, 05/01/27
5.375%, 07/15/25
5.375%, 10/16/29
2.875%, 05/11/22
3.300%, 05/15/223.500%, 06/15/223.250%, 04/01/233.900%, 11/15/243.450%, 03/15/251.900%, 03/19/27
3.250%, 04/15/234.150%, 11/01/254.125%, 05/01/28
4.200%, 05/15/28
54 54,904ConocoPhillips Co.
173 197,139ConocoPhillips HoldingCo.
800 1,075,777Consolidated Edison Co.
of New York, Inc.15 15,525
Constellation Brands, Inc.3,000 3,099,532
Continental Resources,Inc.
800 835,298Corning, Inc.
32 33,253Cox Communications, Inc.Ω 79 82,826Ω 800 818,660CSX Corp.
9 9,254CVS Health Corp.
22 22,08015 14,902
174 177,9411,985 2,073,289
Daimler Finance NorthAmerica LLC
604 895,825Danaher Corp.
917 963,506Darden Restaurants, Inc.
4,000 4,145,040DCP MidstreamOperating LP
3,100 3,289,937Deere & Co.
5 6,131Diageo Investment Corp.
2 2,031Discovery
Communications LLC# 16 16,312
90 91,8717 7,127
63 65,54466 66,981
EUR 5,700 6,747,557Dollar General Corp.
79 80,98713 14,006
# 2,000 2,146,480Dollar Tree, Inc.
1,600 1,666,053
3.900%, 10/01/25
1.250%, 11/09/26
3.000%, 11/15/223.500%, 10/01/24
3.850%, 12/01/232.850%, 10/01/26
3.050%, 08/15/223.750%, 04/15/24
4.450%, 09/18/22
4.500%, 06/20/28
2.700%, 01/15/203.600%, 08/15/223.800%, 03/15/251.875%, 11/23/26
3.500%, 04/06/27
2.600%, 07/15/223.600%, 06/05/27
2.700%, 11/01/26
4.700%, 05/24/22
4.125%, 03/15/28
3.375%, 06/01/23
2.950%, 03/19/22
3.150%, 06/01/25
4.750%, 01/15/26
4.150%, 06/01/254.850%, 07/15/26
5.200%, 09/01/203.900%, 02/15/243.700%, 02/15/26
4.100%, 02/01/213.150%, 04/01/25
117 124,255Dover Corp.
EUR 3,100 3,625,387Dow Chemical Co. (The)
31 31,37587 90,192
DTE Energy Co.11 11,505
500 499,274Duke Energy Corp.
131 133,08467 70,373
DXC Technology Co.37 38,778
E*TRADE Financial Corp.# 3,297 3,531,339Eastman Chemical Co.
3 3,0023 3,071
51 53,135EUR 5,000 6,035,145
Eaton Vance Corp.517 535,817
eBay, Inc.31 31,149
2,215 2,276,691Ecolab, Inc.
52 52,566Edgewell Personal CareCo.
1,185 1,205,737Edison International# 795 816,550EMC Corp.
1,255 1,239,250EMD Finance LLCΩ 60 60,451Emerson Electric Co.# 62 64,000Energy Transfer
Operating L.P.2,567 2,767,482
EnLink MidstreamPartners L.P.
500 492,5003,176 3,223,640
Enterprise ProductsOperating LLC
6 6,174# 24 25,378
62 65,322EOG Resources, Inc.
20 20,56479 81,710

DFA Global Core Plus Fixed Income PortfolioCONTINUED
3.900%, 10/01/27
3.250%, 06/01/26
3.850%, 11/15/24
4.850%, 06/01/21
2.500%, 03/15/212.800%, 05/01/23
2.450%, 04/15/213.950%, 06/15/253.400%, 04/15/26
2.950%, 01/15/20
3.900%, 02/15/223.500%, 06/15/243.400%, 03/01/27
3.043%, 03/01/26
2.625%, 08/01/224.000%, 01/15/243.200%, 02/01/251.625%, 01/11/27
2.250%, 08/15/215.000%, 10/15/25
7.375%, 11/15/31
4.250%, 09/15/28
4.550%, 11/14/24
5.950%, 04/12/21
3.250%, 03/30/253.250%, 09/15/26
FaceAmount^ Value†
(000)UNITED STATES — (Continued)EQT Corp.
1,500 $1,341,588Equifax, Inc.# 900 890,861ERAC USA Finance LLCΩ 1,388 1,465,853Evergy, Inc.
29 29,947Eversource Energy
6 6,00255 55,624
Exelon Corp.15 14,97227 28,786
# 1,225 1,267,943Exelon Generation Co.LLC
10 10,013Express Scripts HoldingCo.# 56 57,869
97 100,470174 177,193
Exxon Mobil Corp.2,750 2,855,630
FedEx Corp.51 51,25299 105,22844 45,199
EUR 2,000 2,390,457Fidelity National
Information Services,Inc.
45 44,83935 39,441
FirstEnergy Corp.750 1,036,437
Fluor Corp.# 5,885 6,130,207Freeport-McMoRan, Inc.# 2,109 2,162,779Gap, Inc. (The)
315 328,100GATX Corp.
60 60,39532 32,072
General Electric Co.
3.250%, 03/30/27
4.400%, 12/01/213.700%, 04/01/243.650%, 03/01/26
4.250%, 01/29/26
5.250%, 07/27/214.000%, 03/03/243.750%, 05/22/251.625%, 07/27/262.000%, 03/22/28
4.875%, 03/15/27
4.125%, 08/15/24
4.750%, 07/15/27
3.500%, 08/01/233.800%, 11/15/25
4.875%, 05/15/26
3.500%, 07/28/25
5.125%, 04/15/22
3.500%, 09/15/27
5.375%, 02/01/25
4.900%, 10/15/25
2.500%, 11/01/262.250%, 02/22/28
FaceAmount^ Value†
(000)UNITED STATES — (Continued)Georgia Power Co.
154 $ 157,949Gilead Sciences, Inc.
17 17,736124 130,227757 799,136
Goldman Sachs GroupInc(The)
GBP 2,300 3,178,371Goldman Sachs Group,
Inc. (The)26 27,374
250 264,18687 90,924
EUR 1,175 1,407,926EUR 2,000 2,469,297
Goodyear Tire & RubberCo. (The)
# 2,739 2,597,668Graphic Packaging
International LLC# 922 945,050Graphic Packaging
International, LLCΩ 1,000 1,042,500Halliburton Co.
75 77,6242,029 2,131,564
Hanesbrands, Inc.#Ω 3,300 3,448,500Harley-Davidson, Inc.
42 43,185Hartford Financial
Services Group, Inc.(The)
79 84,533Hasbro, Inc.
3,562 3,645,247HCA Inc.
3,055 3,303,860Hewlett Packard
Enterprise Co.35 38,443
Honeywell International,Inc.
102 102,087EUR 3,905 5,079,281
Hormel Foods Corp.

DFA Global Core Plus Fixed Income PortfolioCONTINUED
0.375%, 05/17/223.375%, 03/11/240.875%, 05/17/256.750%, 03/15/32
3.150%, 12/15/213.200%, 02/10/271.500%, 04/27/27
2.250%, 09/06/245.250%, 03/01/264.350%, 01/17/27
EUR 135 150,68537 37,956
EUR 500 560,674221 276,993
General Mills, Inc.9 9,144
# 1,007 1,029,720EUR 2,000 2,347,474
General Motors FinancialCo., Inc.
GBP 950 1,159,376208 224,113
58 59,415
4.125%, 04/15/21
3.500%, 06/23/24
3.850%, 10/01/24
3.150%, 03/14/212.300%, 01/14/22
3.375%, 07/15/234.375%, 09/15/28
17 17,420HSBC USA, Inc.
147 153,749Humana, Inc.
91 95,068Huntington Bancshares,Inc.
18 18,19338 37,863
Hyatt Hotels Corp.23 23,488
3,300 3,528,276
3.500%, 03/01/24
2.700%, 12/15/22
3.750%, 12/01/25
2.250%, 02/19/213.625%, 02/12/243.300%, 01/27/271.750%, 03/07/283.500%, 05/15/29
3.650%, 06/15/243.800%, 01/15/26
4.200%, 04/15/24
3.650%, 06/15/24
4.875%, 08/01/25
4.850%, 01/15/27
3.500%, 03/15/25
3.350%, 06/12/24
FaceAmount^ Value†
(000)UNITED STATES — (Continued)Illinois Tool Works, Inc.
75 $ 78,694Intel Corp.
11 11,177Intercontinental
Exchange, Inc.1,000 1,066,440
International BusinessMachines Corp.
231 230,860112 117,386306 316,950
EUR 1,000 1,251,353800 837,611
International Paper Co.92 96,40712 12,586
Interpublic Group of Cos.,Inc. (The)
546 584,562ITC Holdings Corp.# 113 117,778Janus Capital Group, Inc.
106 114,988Jefferies Group LLC /
Jefferies Group CapitalFinance, Inc.
57 60,501JM Smucker Co. (The)
58 60,093John Deere Capital Corp.
672 700,539Johnson & Johnson
4.125%, 07/01/27
3.700%, 08/01/27
3.850%, 08/01/237.500%, 04/01/31
6.694%, 01/15/27
2.700%, 04/27/203.950%, 05/28/24
4.000%, 11/01/23
3.800%, 03/15/25
3.800%, 09/15/27
3.950%, 07/15/244.750%, 03/15/26
4.400%, 03/15/29
4.750%, 05/30/25
2.750%, 05/04/264.569%, 02/01/29
2.900%, 03/01/253.550%, 01/15/26
FaceAmount^ Value†
(000)UNITED STATES — (Continued)
GBP 1,600 $2,169,814Kroger Co
3,394 3,521,563Kroger Co. (The)# 39 40,802# 90 120,538L Brands, Inc.
950 942,875L3Harris Technologies,Inc.
6 6,009Ω 29 30,447Laboratory Corp. of
America Holdings45 47,096
Lam Research Corp.1,000 1,057,778
Lear Corp.3,600 3,571,249
Legg Mason, Inc.55 57,60423 24,839
Leggett & Platt, Inc.3,000 3,158,675
Lennar Corp.1,965 2,053,425
Liberty Mutual Group, Inc.EUR 5,200 6,519,233
Ω 78 86,046Lockheed Martin Corp.
552 568,30156 59,736
Loews Corp.

DFA Global Core Plus Fixed Income PortfolioCONTINUED
2.450%, 03/01/26
3.625%, 07/02/24
3.625%, 05/13/243.900%, 07/15/253.300%, 04/01/26
4.600%, 03/15/214.500%, 03/15/24
1.250%, 03/10/253.250%, 04/01/267.450%, 04/01/31
3.400%, 11/15/25
2.900%, 09/15/20
2.400%, 06/01/23
4.750%, 12/15/23
3.950%, 07/15/25
38 38,239Johnson Controls
International P.L.C.11 11,385
JPMorgan Chase & Co.142 149,356129 137,343
2,000 2,070,454Juniper Networks, Inc.
30 30,94249 52,642
Kellogg Co.EUR 500 585,719
661 674,64061 82,081
Keurig Dr Pepper, Inc.20 20,298
KeyCorp17 17,114
Kimberly-Clark Corp.22 22,164
Kohl's Corp.17 18,045
Kraft Heinz Foods Co.2,212 2,300,186
2.625%, 05/15/233.750%, 04/01/26
3.120%, 04/15/223.375%, 09/15/25
3.500%, 03/02/27
5.750%, 04/15/24
3.625%, 06/01/24
4.250%, 02/01/21
3.625%, 09/15/24
2.875%, 03/01/21
2.350%, 09/10/193.500%, 06/03/243.500%, 03/10/251.349%, 09/21/26
44 44,450125 132,001
Lowe's Cos., Inc.3 3,054
61 63,325LYB International Finance
II BV# 2,035 2,064,579LyondellBasell IndustriesNV
1,400 1,571,043Macy's Retail Holdings,Inc.# 750 751,392Magellan Midstream
Partners L.P.18 18,443
Marathon PetroleumCorp.
96 99,793Marriott International, Inc.
12 12,060Marsh & McLennan Cos.,Inc.
6 6,00097 100,994
# 700 731,165EUR 6,000 7,122,950
3.450%, 06/15/27
2.200%, 05/26/203.500%, 07/15/202.625%, 01/15/222.875%, 12/17/255.875%, 04/23/32
3.796%, 03/15/243.125%, 02/17/29
4.125%, 11/15/25
3.500%, 03/15/25
2.750%, 02/10/25
FaceAmount^ Value†
(000)UNITED STATES — (Continued)Maxim Integrated
Products, Inc.69 $ 69,611
McDonald's Corp.9 8,992
57 57,64422 22,199
EUR 600 778,564GBP 750 1,299,240
McKesson Corp.51 53,226
GBP 4,420 5,727,943Mead Johnson NutritionCo.
69 75,164Medtronic, Inc.
11 11,671Merck & Co., Inc.
136 139,021
4.000%, 06/01/22
4.200%, 11/29/23
4.250%, 06/01/24
2.600%, 12/01/22
8.000%, 03/01/32
3.250%, 12/15/223.300%, 09/29/24
4.375%, 11/15/264.875%, 04/15/28
FaceAmount^ Value†
(000)UNITED STATES — (Continued)Murphy Oil Corp.# 1,100 $1,100,000Mylan, Inc.
52 54,011Nasdaq, Inc.
33 35,446National Oilwell Varco,Inc.
94 93,770National Rural Utilities
Cooperative FinanceCorp.
32 47,137NetApp, Inc.
13 13,3131,800 1,833,241
Netflix, Inc.# 500 504,375
2,040 2,107,575

DFA Global Core Plus Fixed Income PortfolioCONTINUED
7.000%, 04/01/226.000%, 06/01/25
3.600%, 04/10/243.000%, 03/01/256.500%, 12/15/32
5.750%, 08/15/23
7.750%, 03/15/225.750%, 06/15/254.625%, 09/01/26
3.300%, 02/06/27
3.500%, 05/01/221.250%, 07/15/243.000%, 07/15/26
1.625%, 03/08/27
5.500%, 07/28/213.875%, 04/29/243.875%, 01/27/261.375%, 10/27/261.875%, 04/27/27
4.250%, 11/15/234.050%, 11/15/27
3.750%, 05/15/223.500%, 03/01/234.600%, 05/23/29
4.125%, 03/01/274.000%, 03/15/28
3.500%, 06/18/22
Meritage Homes Corp.272 297,160
2,188 2,379,450MetLife, Inc.
189 199,2601,500 1,531,553
# 281 385,181MGIC Investment Corp.
500 542,500MGM ResortsInternational
1,100 1,228,9202,120 2,291,614
105 107,625Microsoft Corp.
3,400 3,592,309Molson Coors BrewingCo.
33 33,810EUR 1,200 1,382,514
87 86,859Mondelez International,Inc.
EUR 2,500 2,990,905Morgan Stanley
10 10,580140 147,957
1,095 1,159,418EUR 2,550 3,026,520EUR 1,856 2,288,755
Mosaic Co. (The)46 48,782
# 4,000 4,138,194Motorola Solutions, Inc.
21 21,51037 37,706
2,300 2,443,325MPLX L.P.
2,289 2,385,0071,500 1,549,695
MUFG Americas HoldingsCorp.
64 65,491
5.875%, 11/15/28
4.000%, 06/15/22
5.625%, 07/01/245.375%, 01/01/26
3.625%, 06/09/21
4.500%, 06/01/213.550%, 05/01/27
4.500%, 09/15/27
3.850%, 02/15/23
4.150%, 12/15/213.900%, 11/15/243.850%, 01/15/28
4.750%, 05/01/204.000%, 10/15/214.000%, 03/15/27
2.900%, 06/15/26
3.250%, 08/01/23
4.750%, 02/01/225.625%, 04/28/27
4.125%, 11/01/24
2.700%, 02/15/233.400%, 04/15/263.000%, 02/15/27
5.375%, 10/01/21
1,000 1,096,250Newell Brands, Inc.
76 77,372Newfield Exploration Co.
500 551,581# 800 874,976Newmont Goldcorp Corp.Ω 46 46,728NextEra Energy Capital
Holdings, Inc.10 10,327
684 716,326NextEra Energy Operating
Partners L.P.Ω 2,200 2,210,362NiSource, Inc.
27 28,060Noble Energy, Inc.# 20 20,619
18 18,757# 1,000 1,021,186Nordstrom, Inc.
16 16,24611 11,252
# 4,148 4,232,677Norfolk Southern Corp.
526 536,187Northrop Grumman Corp.
12 12,422NuStar Logistics L.P.
500 508,7502,867 2,959,203
Nuveen Finance LLCΩ 32 34,279Occidental PetroleumCorp.
5 5,01785 86,453
# 5,376 5,357,892Ohio Power Co.
27 28,716
3.650%, 11/01/24
FaceAmount^ Value†
(000)UNITED STATES — (Continued)Omnicom Group, Inc. /
Omnicom Capital, Inc.2,038 $ 2,125,827
7.750%, 03/01/317.000%, 10/30/31
FaceAmount^ Value†
(000)UNITED STATES — (Continued)
500 $ 702,430630 856,601
Progressive Corp.

4.000%, 07/13/27
2.500%, 10/15/222.950%, 05/15/252.650%, 07/15/263.250%, 11/15/27
3.600%, 09/01/27
4.500%, 11/01/23
3.300%, 11/21/24
2.750%, 03/05/222.750%, 03/01/230.875%, 07/18/28
3.450%, 03/15/29
3.250%, 11/10/242.875%, 05/14/29
4.300%, 04/01/22
3.550%, 10/01/263.750%, 03/01/28
4.650%, 10/15/25
4.375%, 08/11/203.300%, 03/08/223.150%, 05/19/27
5.250%, 03/15/23
1.400%, 03/13/273.750%, 03/15/28
2.200%, 08/15/22
3.125%, 05/15/233.100%, 11/15/26
2.450%, 11/03/262.850%, 08/11/271.200%, 10/30/281.800%, 05/03/29
ONEOK, Inc.77 80,396
Oracle Corp.22 22,165
325 333,6412,078 2,086,627
# 5,256 5,481,651O'Reilly Automotive, Inc.
2,200 2,282,222Packaging Corp. ofAmerica
45 47,994Parker-Hannifin Corp.
71 73,613PepsiCo, Inc.
33 33,55452 53,276
EUR 1,500 1,763,319Pfizer, Inc.
6,000 6,355,316Philip MorrisInternational, Inc.
68 70,312EUR 2,650 3,569,029
Phillips 6649 51,523
Phillips 66 Partners L.P.752 767,348700 718,667
Plains All AmericanPipeline L.P. / PAAFinance Corp.
800 853,350PNC Financial Services
Group, Inc. (The)3 3,0629 9,224
1,000 1,035,195PolyOne Corp.
1,170 1,243,125PPG Industries, Inc.
EUR 1,800 2,120,320# 2,750 2,923,513Praxair, Inc.
9 9,005Principal FinancialGroup, Inc.
52 53,05953 53,946
Procter & Gamble Co.(The)
13 13,100# 150 155,016
EUR 4,660 5,672,813GBP 9,800 12,588,629
2.450%, 01/15/27
3.750%, 08/23/21
4.500%, 11/15/203.500%, 05/15/24
5.125%, 04/15/204.300%, 11/15/23
6.000%, 09/01/21
5.000%, 01/15/27
5.375%, 10/01/225.625%, 03/01/26
3.450%, 05/20/253.250%, 05/20/27
3.500%, 03/30/254.200%, 06/30/29
4.500%, 10/01/24
4.875%, 05/15/25
5.000%, 06/01/214.700%, 09/15/233.950%, 09/15/26
5.500%, 09/15/193.550%, 06/01/22
6.875%, 05/01/20
2.875%, 03/01/25
3.000%, 12/15/20
3.700%, 03/15/28
2.450%, 09/03/19
4.500%, 07/17/25
4.125%, 02/01/22
4.875%, 12/01/225.125%, 12/01/245.500%, 09/15/25
500 494,688Progressive Corp. (The)
51 52,578Prudential Financial, Inc.
4 4,115# 1,712 1,808,314PSEG Power LLC
26 26,44168 71,882
Puget Energy, Inc.92 97,992
PulteGroup, Inc.1,500 1,578,750
QEP Resources, Inc.750 695,625
# 500 428,750QUALCOMM, Inc.
1,631 1,699,8322,800 2,868,661
Quest Diagnostics, Inc.4 4,139
925 1,001,444Radian Group, Inc.
1,200 1,233,924Range Resources Corp.# 865 724,437Reinsurance Group of
America, Inc.11 11,49145 48,440
111 116,866Republic Services, Inc.
2 2,00752 53,431
Reynolds American, Inc.47 48,482
Rockwell Automation, Inc.67 68,075
Roper Technologies, Inc.15 15,093
Royal Caribbean Cruises,Ltd.
1,000 1,010,619Ryder System, Inc.# 1 1,000Santander Holdings USA,Inc.
206 218,639SCANA Corp.
11 11,200Sealed Air Corp.#Ω 1,180 1,246,092#Ω 1,500 1,597,500Ω 100 108,250Sempra Energy

DFA Global Core Plus Fixed Income PortfolioCONTINUED
1.250%, 10/25/29
4.875%, 12/01/194.400%, 01/15/21
EUR 1,000 1,215,433Progress Energy, Inc.
6 6,04527 27,621
4.050%, 12/01/233.550%, 06/15/24
49 51,48276 78,532
3.450%, 08/01/25
3.200%, 09/23/26
3.250%, 07/01/26
4.150%, 12/01/251.850%, 06/20/26
2.650%, 11/05/203.000%, 11/15/26
4.750%, 03/15/24
4.600%, 06/15/28
6.875%, 03/15/25
5.000%, 08/15/22
3.300%, 12/16/243.550%, 08/18/25
2.625%, 03/15/213.375%, 05/15/243.375%, 11/01/252.125%, 11/30/27
2.900%, 03/03/21
2.600%, 10/01/203.300%, 07/15/26
4.250%, 04/01/25
2.900%, 01/15/22
FaceAmount^ Value†
(000)UNITED STATES — (Continued)Sherwin-Williams Co.(The)
53 $ 54,678Shire Acquisitions
Investments IrelandDAC
800 813,250Southern Co. (The)
556 567,501Southern Power Co.
1,017 1,084,014EUR 1,200 1,463,181
Southwest Airlines Co.60 60,232
107 107,694Spectra Energy PartnersL.P.
22 23,826Spirit AeroSystems, Inc.
3,500 3,737,466Springleaf Finance Corp.
2,500 2,796,450StanCorp Financial
Group, Inc.37 39,150
State Street Corp.163 169,246
96 101,428Stryker Corp.
10 10,031# 6 6,258
109 114,967EUR 4,709 5,962,684
SunTrust Banks, Inc.40 40,265
Sysco Corp.35 35,07823 23,744
Tapestry, Inc.1,196 1,253,163
Target Corp.42 42,887
4.800%, 04/01/26
2.625%, 01/10/233.650%, 01/08/29
5.875%, 06/15/24
4.900%, 06/15/28
3.150%, 09/17/25
4.500%, 06/15/22
3.250%, 06/15/26
2.750%, 04/15/233.250%, 01/15/25
4.250%, 10/01/22
3.100%, 06/01/227.500%, 09/15/29
2.750%, 02/15/233.750%, 07/15/25
4.000%, 03/15/243.875%, 11/05/25
2.350%, 01/29/21
3.400%, 09/15/26
5.250%, 04/01/25
FaceAmount^ Value†
(000)UNITED STATES — (Continued)Total System Services,Inc.
69 $ 76,137Toyota Motor Credit Corp.
75 75,8492,000 2,170,422
TRI Pointe Group, Inc. /TRI Pointe Homes, Inc.
# 1,300 1,355,250Trimble, Inc.
500 536,976TWDC Enterprises 18Corp.# 75 78,579Tyson Foods, Inc.
65 68,492Under Armour, Inc.
2,750 2,659,603Union Pacific Corp.
7 7,078111 115,061
United ContinentalHoldings, Inc.
# 1,400 1,435,000United TechnologiesCorp.
2 2,0447 9,696
UnitedHealth Group, Inc.101 102,319137 146,286
Unum Group734 769,581
23 23,833US Bancorp
9 9,014Valero Energy Corp.
1,046 1,070,363VeriSign, Inc.
2,307 2,491,560Verizon Communications,Inc.

DFA Global Core Plus Fixed Income PortfolioCONTINUED
2.500%, 04/15/26
3.900%, 05/25/27
5.600%, 12/01/192.950%, 04/01/223.625%, 04/01/25
2.000%, 04/15/251.450%, 03/16/271.375%, 09/12/28
2.250%, 09/15/26
4.000%, 04/15/22
4.875%, 03/15/274.350%, 02/15/28
52 52,528TC PipeLines L.P.# 2,000 2,055,887TD Ameritrade HoldingCorp.
2 2,02121 21,34386 90,606
Thermo Fisher Scientific,Inc.
EUR 1,000 1,224,914EUR 1,000 1,209,144EUR 1,315 1,581,537
TJX Cos., Inc. (The)600 587,439
T-Mobile USA, Inc.# 800 814,000Toll Brothers FinanceCorp.
1,800 1,900,260800 807,600
3.376%, 02/15/252.625%, 08/15/261.375%, 10/27/261.375%, 11/02/284.016%, 12/03/29
4.500%, 03/01/214.250%, 09/01/233.875%, 04/01/24
3.150%, 12/14/25
3.900%, 08/21/27
5.625%, 03/27/34
3.100%, 09/15/22
3.450%, 06/01/262.125%, 11/20/26
26 27,13224 23,932
EUR 1,500 1,801,477EUR 2,000 2,396,257
Ω 183 198,569Viacom, Inc.
22 22,6167 7,376
57 59,476Visa, Inc.
1,970 2,057,240VMware, Inc.
3,000 3,041,247WAL MART, Inc.
GBP 2,500 4,573,082Walgreen Co.
80 81,297Walgreens Boots Alliance,Inc.
3,035 3,095,058EUR 2,700 3,228,635
4.875%, 09/21/295.750%, 12/19/30
3.700%, 09/15/24
4.600%, 03/01/213.500%, 05/15/243.125%, 03/01/25
2.450%, 06/15/203.550%, 06/15/25
2.600%, 07/22/203.500%, 03/08/223.000%, 02/19/253.000%, 04/22/262.000%, 04/27/262.975%, 05/19/261.375%, 10/26/261.000%, 02/02/274.150%, 01/24/292.500%, 05/02/29
4.750%, 02/15/26
FaceAmount^ Value†
(000)UNITED STATES — (Continued)Walmart, Inc.
EUR 3,415 $5,573,407GBP 3,919 6,929,029
Walt Disney Co. (The)Ω 168 178,771Waste Management, Inc.
21 21,63758 60,71540 41,475
WEC Energy Group, Inc.19 18,98752 54,639
Wells Fargo & Co.3 3,008
102 104,752190 193,612
32 32,299EUR 800 991,061CAD 3,000 2,298,621EUR 500 598,105EUR 800 932,500
1,000 1,092,693GBP 750 957,125
Western Digital Corp.# 2,695 2,664,681
3.000%, 03/15/21
3.550%, 04/01/25
3.000%, 09/12/27
TOTAL UNITEDSTATES
TOTAL BONDS
5.320%, 09/03/194.670%, 05/07/205.350%, 08/07/203.650%, 12/21/205.250%, 03/02/215.220%, 02/22/225.210%, 12/19/224.800%, 02/13/235.250%, 03/06/235.220%, 05/15/232.630%, 08/03/26
FaceAmount^ Value†
(000)UNITED STATES — (Continued)Xilinx, Inc.
11 $ 11,080Zimmer BiometHoldings, Inc.
731 755,412Zoetis, Inc.
62 62,916
610,777,832
1,225,241,818
AGENCY OBLIGATIONS — (0.7%)Federal Farm CreditBank
74 74,21319 19,37823 23,769
152 155,41821 22,06517 18,38473 80,912
7 7,68921 23,436
166 186,02567 69,034

DFA Global Core Plus Fixed Income PortfolioCONTINUED
4.000%, 07/01/22
5.253%, 04/01/20
8.200%, 01/15/30
4.700%, 06/01/223.700%, 05/01/254.750%, 02/26/29
1.250%, 11/02/261.100%, 11/09/27
7.875%, 09/01/213.700%, 01/15/234.000%, 09/15/253.750%, 06/15/27
3.100%, 06/01/25
2.900%, 10/21/19
5.125%, 10/01/21
4.200%, 06/01/32
3.900%, 03/01/23
4.070%, 03/17/223.800%, 05/15/24
Western Gas PartnersL.P.
2,200 2,239,999Western Union Co. (The)
27 27,459WestRock MWV LLC
180 244,110Whirlpool Corp.
22 23,230145 149,722
# 1,000 1,093,045Whirlpool Finance
Luxembourg SarlEUR 1,200 1,387,275EUR 500 569,364
Williams Cos., Inc. (The)498 549,983100 103,296136 143,210
16 16,480Wisconsin Electric PowerCo.
37 37,798Wm Wrigley Jr Co.Ω 2 2,001WR Grace & Co-ConnΩ 1,010 1,046,612WRKCo, Inc.
600 635,300Wyndham Destinations,Inc.
1,088 1,101,975Xerox Corp.
13 13,16350 49,934
5.770%, 01/05/27
3.000%, 03/18/202.875%, 09/11/204.625%, 09/11/203.125%, 12/11/205.250%, 12/11/205.000%, 03/12/213.625%, 06/11/213.000%, 09/10/215.000%, 12/10/212.250%, 03/11/222.500%, 03/11/225.250%, 06/10/225.750%, 06/10/222.000%, 09/09/225.250%, 12/09/224.750%, 03/10/232.500%, 12/08/232.875%, 06/14/245.375%, 08/15/244.375%, 03/13/263.250%, 11/16/28
1.500%, 06/22/201.250%, 05/06/211.875%, 09/24/267.125%, 01/15/30
TOTAL AGENCYOBLIGATIONS
22 27,249Federal Home LoanBank
65 65,38150 50,45390 92,58120 20,29425 26,08620 20,96235 36,046
110 112,516155 165,735
35 35,30940 40,57630 32,74065 71,91555 55,13050 55,343
170 187,172115 117,73555 57,50165 75,90770 80,228
5,000 5,419,304Federal National
MortgageAssociation
53 52,74358 57,317
2,000 1,981,11975 108,534
9,726,199
1.625%, 08/31/191.000%, 11/30/19
TOTAL U.S.TREASURYOBLIGATIONS
TOTAL INVESTMENTSECURITIES
FaceAmount^ Value†
(000)U.S. TREASURY OBLIGATIONS — (0.2%)U.S. Treasury Notes
2,000 $ 1,999,0891,000 996,133
2,995,222
1,237,963,239
DFA Short TermInvestment Fund
(Cost$1,267,502,096)^^
Shares Value†
SECURITIES LENDING COLLATERAL — (3.9%)@§
4,288,454 $ 49,621,696
TOTAL INVESTMENTS — (100.0%)
$1,287,584,935

As of July 31, 2019, DFA Global Core Plus Fixed Income Portfolio had entered into the following forward currency contracts and the netunrealized forward currency gain (loss) is reflected in the accompanying financial statements:
Currency Purchased Currency Sold CounterpartySettlement
Date
UnrealizedForeign
ExchangeAppreciation
(Depreciation)
USD 2,362,241 EUR 2,095,613 State Street Bank and Trust 08/01/19 $ 42,396USD 4,731,534 EUR 4,252,135 Citibank, N.A. 08/01/19 24,419USD 6,167,196 EUR 5,527,653 State Street Bank and Trust 08/01/19 48,082USD 132,404,705 EUR 116,111,132 State Street Bank and Trust 08/01/19 3,869,630USD 705,848 DKK 4,722,502 State Street Bank and Trust 08/05/19 5,605USD 1,065,338 DKK 7,050,759 State Street Bank and Trust 08/05/19 19,867USD 2,496,360 JPY 271,260,972 State Street Bank and Trust 08/05/19 2,395USD 3,982,622 GBP 3,178,815 Citibank, N.A. 08/05/19 116,321USD 8,617,230 DKK 56,803,402 State Street Bank and Trust 08/05/19 194,552USD 76,225,115 JPY 8,189,352,747 Citibank, N.A. 08/05/19 932,453USD 84,299,157 GBP 66,905,877 State Street Bank and Trust 08/05/19 2,923,473USD 28,718,349 CAD 37,587,612 State Street Bank and Trust 08/06/19 235,796USD 995,900 GBP 794,051 State Street Bank and Trust 08/09/19 29,937USD 1,422,449 GBP 1,168,775 State Street Bank and Trust 08/09/19 635USD 1,685,827 GBP 1,346,022 Citibank, N.A. 08/09/19 48,392USD 4,938,763 GBP 3,953,663 State Street Bank and Trust 08/09/19 129,133USD 5,278,515 GBP 4,338,050 State Street Bank and Trust 08/09/19 1,278USD 80,746,581 GBP 64,720,897 State Street Bank and Trust 08/09/19 2,013,629USD 277,431 SEK 2,630,381 Citibank, N.A. 08/12/19 4,965USD 578,133 SEK 5,411,272 Goldman Sachs International 08/12/19 17,611USD 1,069,947 SEK 10,317,166 Citibank, N.A. 08/12/19 1,252USD 4,733,917 EUR 4,195,969 State Street Bank and Trust 08/12/19 85,270USD 5,266,232 EUR 4,723,860 State Street Bank and Trust 08/12/19 32,743USD 17,422,011 SEK 164,593,614 Goldman Sachs International 08/12/19 372,721USD 130,033,573 EUR 115,668,289 State Street Bank and Trust 08/12/19 1,886,528USD 1,677,693 NOK 14,320,717 Citibank, N.A. 08/19/19 59,949USD 1,790,414 NOK 15,265,151 Citibank, N.A. 08/19/19 65,982USD 11,971,713 AUD 17,000,522 State Street Bank and Trust 08/26/19 335,511USD 39,920,155 AUD 57,581,551 State Street Bank and Trust 08/28/19 504,945USD 143,407,925 EUR 127,986,533 Citibank, N.A. 09/27/19 1,083,164USD 5,661,594 EUR 5,038,318 State Street Bank and Trust 10/28/19 45,127USD 141,251,967 EUR 126,154,424 State Street Bank and Trust 10/28/19 621,269
Total Appreciation $15,755,030
EUR 127,986,533 USD 142,765,138 Citibank, N.A. 08/01/19 $ (1,083,988)
Total (Depreciation) $ (1,083,988)
Total Appreciation(Depreciation) $14,671,042
DFA Global Core Plus Fixed Income PortfolioCONTINUED
Summary of the Portfolio's investments as of July 31, 2019, based on their valuation inputs, is as follows (see Security Valuation Note):

AustraliaBelgiumCanadaDenmarkFinlandFranceGermanyIrelandItalyJapanLuxembourgNetherlandsNorwaySpainSupranational Organization ObligationsSwedenSwitzerlandUnited KingdomUnited States
Agency ObligationsU.S. Treasury ObligationsSecurities Lending CollateralForward Currency Contracts**
TOTAL
AES Tiete Energia SAAliansce Shopping Centers SAAlliar Medicos A Frente SAAlupar Investimento SAAmbev SA, ADRAmbev SAArezzo Industria e Comercio SAAtacadao S.A.Azul SA, ADRB3 SA - Brasil Bolsa BalcaoBanco Bradesco SA, ADRBanco Bradesco SABanco BTG Pactual SABanco do Brasil SABanco Santander Brasil SA
Investments in Securities (Market Value)
Level 1 Level 2 Level 3 Total
Bonds— $ 30,619,474 — $ 30,619,474— 7,823,040 — 7,823,040— 69,261,678 — 69,261,678— 32,394,540 — 32,394,540— 2,839,375 — 2,839,375— 83,908,535 — 83,908,535— 61,025,611 — 61,025,611— 2,534,238 — 2,534,238— 5,565,460 — 5,565,460— 10,133,509 — 10,133,509— 16,780,373 — 16,780,373— 65,784,231 — 65,784,231— 51,098,734 — 51,098,734— 5,276,909 — 5,276,909— 64,665,381 — 64,665,381— 20,395,754 — 20,395,754— 4,675,710 — 4,675,710— 79,681,434 — 79,681,434— 610,777,832 — 610,777,832
— 9,726,199 — 9,726,199— 2,995,222 — 2,995,222— 49,621,696 — 49,621,696— 14,671,042 — 14,671,042
— $1,302,255,977 — $1,302,255,977** Valued at the unrealized appreciation/(depreciation) on the investment.
EMERGING MARKETS SUSTAINABILITY CORE 1 PORTFOLIO
SCHEDULE OF INVESTMENTS
July 31, 2019
(Unaudited)Shares Value»
COMMON STOCKS — (96.6%)BRAZIL — (9.3%)
29,853 $ 100,0482,300 16,989
11,051 42,82713,100 90,998
215,244 1,134,3365,100 26,9015,200 68,659
29,393 180,301#* 6,237 253,846
61,895 684,253180,771 1,634,168
54,008 440,26110,900 170,68241,200 531,36213,300 149,333

BB Seguridade Participacoes SABR Properties SABrasilAgro - Co. Brasileira de Propriedades AgricolasBraskem SA, Sponsored ADRBRF SACamil Alimentos S.A.CCR SACentrais Eletricas Brasileiras SACia de Locacao das AmericasCia de Saneamento Basico do Estado de Sao PauloCia de Saneamento de Minas Gerais-COPASACia de Saneamento do ParanaCia de Saneamento do ParanaCia Energetica de Minas GeraisCia HeringCia Paranaense de EnergiaCia Siderurgica Nacional SACielo SAConstrutora Tenda SACosan Logistica SACosan SACSU Cardsystem SACVC Brasil Operadora e Agencia de Viagens SACyrela Brazil Realty SA Empreendimentos e ParticipacoesDirecional Engenharia SADuratex SAEcoRodovias Infraestrutura e Logistica SAEDP - Energias do Brasil SAEmbraer SAEmbraer SA, Sponsored ADREnauta Participacoes SAEnergisa SAEquatorial Energia SAEven Construtora e Incorporadora SAEz Tec Empreendimentos e Participacoes SAFleury SAFras-Le SAGafisa SAGrendene SAGuararapes Confeccoes SA
Hapvida Participacoes e Investimentos S.A.Hypera SAIndustrias Romi SAInstituto Hermes Pardini SAInternational Meal Co. Alimentacao SA, Class AIochpe-Maxion SAIRB Brasil Resseguros S/AItau Unibanco Holding SAJHSF Participacoes SA
54,554 463,867* 5,600 14,732
3,900 17,056* 4,311 76,438* 36,370 318,399
11,342 21,963182,480 714,839
8,800 90,82810,040 131,53935,000 489,735
6,800 120,0945,400 121,1212,600 14,750
16,200 72,2488,600 72,1112,700 34,129
45,000 194,91159,150 112,214
7,960 52,853* 15,300 74,889
15,300 203,9815,800 9,772
13,000 173,28354,500 348,448
6,100 20,12453,667 176,76442,200 130,26014,900 75,313
6,294 31,84624,490 494,69820,400 70,827
6,715 86,92117,500 433,333
* 25,200 64,71112,605 108,50033,500 204,791
2,000 2,489* 6,200 10,479
23,621 47,04011,984 61,202
Emerging Markets Sustainability Core 1 PortfolioCONTINUED
Shares Value»
BRAZIL — (Continued)10,100 $ 110,62429,900 236,452
7,400 28,46512,500 64,29616,001 39,70511,700 66,92518,783 467,56318,250 142,98411,900 11,911

JSL SAKlabin SALight SALocaliza Rent a Car SALojas Americanas SALojas Renner SAM Dias Branco SAMagazine Luiza SAMahle-Metal Leve SAMarcopolo SAMarisa Lojas SAMills Estruturas e Servicos de Engenharia SAMovida Participacoes SAMRV Engenharia e Participacoes SANatura Cosmeticos SANotre Dame Intermedica Participacoes S.A.Odontoprev SAOmega Geracao SAPetro Rio SAPorto Seguro SAPortobello SAQualicorp Consultoria e Corretora de Seguros SARaia Drogasil SARumo SASantos Brasil Participacoes SASao Carlos Empreendimentos e Participacoes SASer Educacional SASLC Agricola SASmiles Fidelidade SASprings Global Participacoes SASul America SASuzano SAT4F Entretenimento SATegma Gestao Logistica SATelefonica Brasil SA, ADRTIM Participacoes SA, ADRTIM Participacoes SATOTVS SATransmissora Alianca de Energia Eletrica SAUltrapar Participacoes SA, Sponsored ADRValid Solucoes e Servicos de Seguranca em Meios de Pagamento eIdentificacao S.AVia Varejo SAVulcabras Azaleia SAWEG SAWiz Solucoes e Corretagem de Seguros SAYDUQS Part
TOTAL BRAZIL
Aguas Andinas SA, Class A
5,700 25,391148,885 625,759
14,009 71,03077,400 892,371
9,100 33,359107,409 1,335,735
1,700 17,4314,400 304,0525,200 33,560
16,000 14,674* 7,700 17,069* 20,000 36,422
15,337 60,00047,047 250,00730,123 482,82418,731 214,48449,452 226,764
* 2,003 14,433* 8,000 36,894
18,800 256,65410,300 11,01259,631 347,19123,700 515,502
* 59,500 341,75121,082 29,167
1,400 12,3965,000 34,5094,400 20,799
10,006 103,381* 4,700 16,626
48,318 532,00663,094 507,053
6,400 9,5422,200 18,234
21,716 296,206# 4,579 73,081
98,200 314,4385,600 71,167
35,500 258,78484,726 441,422
8,400 33,478* 18,900 38,232* 10,600 19,720
24,000 149,79811,800 36,79421,500 193,234
22,031,823
Emerging Markets Sustainability Core 1 PortfolioCONTINUED
Shares Value»
CHILE — (1.2%)266,705 $ 149,280

Banco de ChileBanco de Chile, ADRBanco de Credito e Inversiones SABanco Santander Chile, ADRBesalco SACAP SACencosud SACia Cervecerias Unidas SA, Sponsored ADRClinica Las Condes SAEmpresa Nacional de Telecomunicaciones SAEmpresas CMPC SAEmpresas Lipigas SAEmpresas Tricot SAEnel Americas SAEnel Americas SAEnel Chile SA, ADRForus SAGrupo Security SAHortifrut SAInversiones Aguas Metropolitanas SAItau CorpBancaItau CorpBancaMultiexport Foods SAParque Arauco SARipley Corp. SASACI FalabellaSalfacorp SASigdo Koppers SASMU SASociedad Matriz SAAM SASocovesa SASONDA SAVina Concha y Toro SA
TOTAL CHILE
21Vianet Group, Inc., ADR361 Degrees International, Ltd.3SBio, Inc.51job, Inc., ADR58.com, Inc., ADRAAC Technologies Holdings, Inc.Agile Group Holdings, Ltd.Agricultural Bank of China, Ltd., Class HAjisen China Holdings, Ltd.Alibaba Group Holding, Ltd., Sponsored ADRAlibaba Health Information Technology, Ltd.Alibaba Pictures Group, Ltd.Angang Steel Co., Ltd., Class HAnhui Expressway Co., Ltd., Class HANTA Sports Products, Ltd.Anton Oilfield Services GroupAusnutria Dairy Corp., Ltd.AVIC International Holdings, Ltd., Class HAviChina Industry & Technology Co., Ltd., Class H
150,217 21,5503,275 94,1192,739 172,5495,765 167,127
62,767 53,9393,979 40,806
204,375 403,516# 5,981 167,229
87 4,693* 9,282 85,039
67,370 157,9911,142 8,1922,361 2,589
2,017,080 332,81180,484 13,280
9,400 43,2406,499 14,308
108,387 40,5133,062 7,842
54,749 79,9446,974,394 54,090
2,300 27,32465,867 33,91530,323 82,611
121,174 89,41516,314 100,80240,481 44,39020,036 35,005
167,166 42,857324,933 29,539
15,493 7,59877,225 102,01430,688 61,680
2,771,797
CHINA — (17.0%)* 4,100 30,176
45,000 8,08354,500 92,038
* 1,338 103,762* 2,654 149,633
44,000 236,43694,000 120,815
919,000 371,98936,000 15,448
* 16,197 2,803,863* 70,000 62,886* 310,000 62,643
33,800 12,82118,000 10,93626,000 194,088
128,000 14,695# 22,000 39,702
28,000 17,295112,000 60,117

BAIC Motor Corp., Ltd., Class HBaidu, Inc., Sponsored ADRBank of China, Ltd., Class H
Bank of Chongqing Co., Ltd., Class HBank of Communications Co., Ltd., Class HBank of Tianjin Co., Ltd., Class HBaozun, Inc., Sponsored ADRBeijing Capital International Airport Co., Ltd., Class HBeijing Capital Land, Ltd., Class HBeijing Enterprises Holdings, Ltd.Beijing Enterprises Water Group, Ltd.Beijing North Star Co., Ltd.Bitauto Holdings, Ltd., ADRBosideng International Holdings, Ltd.Brilliance China Automotive Holdings, Ltd.BYD Co., Ltd., Class HBYD Electronic International Co., Ltd.C C Land Holdings, Ltd.Canvest Environmental Protection Group Co., Ltd.CAR, Inc.Central China Real Estate, Ltd.CGN Power Co., Ltd., Class HChangyou.com, Ltd., ADRChaowei Power Holdings, Ltd.Cheetah Mobile, Inc., ADRChina Agri-Industries Holdings, Ltd.China Aircraft Leasing Group Holdings, Ltd.China Animation Characters Co., Ltd.China Aoyuan Group, Ltd.China BlueChemical, Ltd., Class HChina CITIC Bank Corp., Ltd., Class HChina Communications Construction Co., Ltd., Class HChina Communications Services Corp., Ltd., Class HChina Conch Venture Holdings, Ltd.China Construction Bank Corp., Class HChina Datang Corp. Renewable Power Co., Ltd., Class HChina Dili GroupChina Distance Education Holdings, Ltd., ADRChina Dongxiang Group Co., Ltd.China Electronics Optics Valley Union Holding Co., Ltd.China Energy Engineering Corp., Ltd., Class HChina Everbright Bank Co., Ltd., Class HChina Everbright Greentech Ltd.China Everbright, Ltd.China Evergrande GroupChina Foods, Ltd.China Galaxy Securities Co., Ltd., Class HChina Gas Holdings, Ltd.China Grand Pharmaceutical and Healthcare Holdings, Ltd., Class A
118,000 74,550* 6,284 701,923
2,254,000 915,322
Emerging Markets Sustainability Core 1 PortfolioCONTINUED
Shares Value»
CHINA — (Continued)13,500 $ 7,883
182,000 132,41423,000 11,143
#* 1,509 74,86290,000 70,912
# 86,000 31,56827,500 134,261
298,000 156,85150,000 18,744
* 2,315 26,41444,000 15,179
124,000 135,137# 11,000 68,735
25,500 39,82456,000 12,85014,000 7,306
* 48,000 34,24751,000 23,862
462,000 133,352800 6,312
21,000 7,877* 4,396 14,331
51,000 15,52421,000 22,639
# 51,000 13,95281,000 108,34696,000 26,320
220,000 121,889129,000 108,728
96,000 66,83668,500 235,713
1,685,000 1,293,62576,000 7,340
* 95,400 28,057* 400 2,028
224,000 27,637140,000 10,318112,000 11,701104,000 46,771
30,000 18,91554,000 71,333
# 99,000 261,36640,000 17,09773,500 39,230
# 49,800 206,34648,000 25,672

China Harmony New Energy Auto Holding, Ltd.China High Speed Transmission Equipment Group Co., Ltd.China Huarong Asset Management Co., Ltd., Class HChina Index Holdings, Ltd., ADRChina International Capital Corp., Ltd., Class HChina International Marine Containers Group Co., Ltd., Class HChina Jinmao Holdings Group, Ltd.China Lesso Group Holdings, Ltd.China Life Insurance Co., Ltd., Class HChina Lilang, Ltd.China Logistics Property Holdings Co., Ltd.China Machinery Engineering Corp., Class HChina Maple Leaf Educational Systems, Ltd.
China Medical System Holdings, Ltd.China Mengniu Dairy Co., Ltd.China Merchants Bank Co., Ltd., Class HChina Merchants Land, Ltd.China Merchants Port Holdings Co., Ltd.China Merchants Securities Co., Ltd., Class HChina Minsheng Banking Corp., Ltd., Class HChina Modern Dairy Holdings, Ltd.China Molybdenum Co., Ltd., Class HChina Oil & Gas Group, Ltd.China Oilfield Services, Ltd., Class HChina Overseas Grand Oceans Group, Ltd.China Overseas Land & Investment, Ltd.China Overseas Property Holdings, Ltd.China Pacific Insurance Group Co., Ltd., Class HChina Petroleum & Chemical Corp., Class HChina Railway Construction Corp., Ltd., Class HChina Railway Group, Ltd., Class HChina Railway Signal & Communication Corp., Ltd., Class HChina Resources Beer Holdings Co., Ltd.China Resources Gas Group, Ltd.China Resources Land, Ltd.China Resources Medical Holdings Co., Ltd.China Resources Pharmaceutical Group, Ltd.China Sanjiang Fine Chemicals Co., Ltd.China SCE Group Holdings, Ltd.China Shengmu Organic Milk, Ltd.China Shineway Pharmaceutical Group, Ltd.China Silver Group, Ltd.China South City Holdings, Ltd.China State Construction International Holdings, Ltd.China Suntien Green Energy Corp., Ltd., Class HChina Taiping Insurance Holdings Co., Ltd.China Telecom Corp., Ltd., Class HChina Tian Lun Gas Holdings, Ltd.China Travel International Investment Hong Kong, Ltd.
# 71,500 21,75315,000 9,624
443,000 74,686* 1,309 3,769
22,800 43,13439,360 37,279
178,000 114,68659,000 54,513
101,000 257,26427,000 23,886
* 35,000 13,82257,000 24,359
# 52,000 18,648
Emerging Markets Sustainability Core 1 PortfolioCONTINUED
Shares Value»
CHINA — (Continued)111,000 $105,88334,000 137,19175,500 374,01998,000 13,94648,000 79,43813,600 15,699
203,000 139,828* 71,000 11,214
144,000 40,955260,000 11,879
80,000 90,24675,000 39,253
204,000 695,44770,000 35,39858,200 248,251
588,000 377,502128,000 147,893123,000 86,120
85,000 56,74722,000 103,08054,000 273,326
# 86,000 367,51331,500 22,77674,500 81,02477,000 16,610
142,000 77,263* 97,000 3,965
23,000 19,183* 48,000 4,496
242,000 33,213120,000 123,268114,000 28,888156,000 431,699244,000 108,831
12,000 13,41860,000 11,029

China Unicom Hong Kong, Ltd.China Vanke Co., Ltd., Class HChina Vast Industrial Urban Development Co., Ltd.China Water Affairs Group, Ltd.China Yuhua Education Corp., Ltd.China ZhengTong Auto Services Holdings, Ltd.China Zhongwang Holdings, Ltd.Chinasoft International, Ltd.Chongqing Rural Commercial Bank Co., Ltd., Class HCIFI Holdings Group Co., Ltd.CIMC Enric Holdings, Ltd.CITIC Securities Co., Ltd., Class HCitychamp Watch & Jewellery Group, Ltd.Cogobuy GroupColour Life Services Group Co., Ltd.Comba Telecom Systems Holdings, Ltd.Concord New Energy Group, Ltd.Consun Pharmaceutical Group, Ltd.COSCO SHIPPING International Hong Kong Co., Ltd.COSCO SHIPPING Ports, Ltd.Cosmo Lady China Holdings Co., Ltd.Country Garden Holdings Co., Ltd.Country Garden Services Holdings Co., Ltd.
CP Pokphand Co., Ltd.CPMC Holdings, Ltd.CRCC High-Tech Equipment Corp., Ltd.CRRC Corp., Ltd., Class HCSPC Pharmaceutical Group, Ltd.Ctrip.com International, Ltd., ADRDah Chong Hong Holdings, Ltd.Dawnrays Pharmaceutical Holdings, Ltd.Differ Group Holding Co., Ltd.Digital China Holdings, Ltd.Dongfang Electric Corp., Ltd.Dongfeng Motor Group Co., Ltd., Class HDongjiang Environmental Co., Ltd., Class HDongyue Group, Ltd.Dynagreen Environmental Protection Group Co., Ltd., Class HENN Energy Holdings, Ltd.Essex Bio-technology, Ltd.Everbright Securities Co., Ltd., Class HFang Holdings, Ltd., ADRFanhua, Inc., ADRFantasia Holdings Group Co., Ltd.Far East Horizon, Ltd.First Tractor Co., Ltd.Fu Shou Yuan International Group, Ltd.Fufeng Group, Ltd.Fullshare Holdings, Ltd.
180,000 175,36650,600 190,05825,000 9,96430,000 26,69250,000 24,76664,500 24,100
135,600 69,057164,000 81,537
67,000 35,022230,961 147,233
40,000 28,80432,500 62,052
* 100,000 20,788* 20,000 5,219
20,000 13,693* 88,000 21,996
300,000 14,68751,000 30,841
# 34,000 10,61081,695 71,19546,000 8,791
445,000 599,55160,977 146,826
Emerging Markets Sustainability Core 1 PortfolioCONTINUED
Shares Value»
CHINA — (Continued)302,000 $ 25,392
31,000 11,81667,000 13,09469,000 54,313
314,000 544,908* 6,663 259,724
59,975 19,05565,000 12,354
* 140,000 8,200* 35,000 19,494
19,000 11,417# 128,000 114,165
11,800 10,62557,000 30,68838,000 17,73231,700 326,07927,000 21,25311,400 8,755
* 1,309 2,7091,424 48,231
73,500 12,02899,000 92,080
* 64,000 15,08824,000 20,50885,000 41,707
#* 262,500 9,350

Future Land Development Holdings, Ltd.Fuyao Glass Industry Group Co., Ltd., Class HGCL New Energy Holdings, Ltd.GCL-Poly Energy Holdings, Ltd.Geely Automobile Holdings, Ltd.Gemdale Properties & Investment Corp., Ltd.Genertec Universal Medical Group Co., Ltd.GF Securities Co., Ltd.Golden Eagle Retail Group, Ltd.Goldpac Group, Ltd.GOME Retail Holdings, Ltd.Grand Baoxin Auto Group, Ltd.Great Wall Motor Co., Ltd., Class HGreatview Aseptic Packaging Co., Ltd.Greenland Hong Kong Holdings, Ltd.Greentown China Holdings, Ltd.Greentown Service Group Co., Ltd.Guangdong Investment, Ltd.Guangshen Railway Co., Ltd., Class HGuangzhou Automobile Group Co., Ltd., Class HGuangzhou Baiyunshan Pharmaceutical Holdings Co., Ltd.Guangzhou R&F Properties Co., Ltd., Class HGuorui Properties, Ltd.Guotai Junan Securities Co., Ltd., Class HHaichang Ocean Park Holdings, Ltd.Haier Electronics Group Co., Ltd.Hailiang Education Group, Inc., ADRHaitian International Holdings, Ltd.Haitong Securities Co., Ltd., Class HHarbin Electric Co., Ltd., Class HHC Group, Inc.Health and Happiness H&H International Holdings, Ltd.HengTen Networks Group, Ltd.
Hi Sun Technology China, Ltd.Hilong Holding, Ltd.Hisense Home Appliances Group Co., Ltd., Class HHKC Holdings, Ltd.Honghua Group, Ltd.Honworld Group, Ltd.Hopson Development Holdings, Ltd.Hua Hong Semiconductor, Ltd.Huaneng Renewables Corp., Ltd., Class HHuatai Securities Co., Ltd.IMAX China Holding, Inc.Industrial & Commercial Bank of China, Ltd., Class HJD.com, Inc., ADRJiangsu Expressway Co., Ltd., Class HJiangxi Copper Co., Ltd., Class HJiayuan International Group, Ltd.
108,000 90,73515,600 47,239
* 596,000 22,700#* 899,000 51,205
234,000 356,880204,000 24,314
90,000 68,129* 36,600 41,049
9,000 10,39261,000 15,049
#* 467,000 49,737* 79,500 17,143
146,500 99,24154,000 29,52482,000 29,91177,000 57,81762,000 52,22948,000 100,88466,000 21,46362,800 63,852
4,000 16,43560,400 109,281
# 73,000 13,00612,800 20,692
* 63,000 9,76652,000 122,215
* 321 20,319# 36,000 72,727
72,400 71,653#* 34,000 11,179* 73,000 18,688# 14,000 81,569#* 1,364,000 25,809
Emerging Markets Sustainability Core 1 PortfolioCONTINUED
Shares Value»
CHINA — (Continued)* 60,000 $ 10,516
83,000 7,78814,000 15,35712,000 7,742
* 432,000 33,95622,500 10,83536,000 37,264
8,000 16,487472,000 128,287
12,200 19,76513,100 30,080
1,267,000 850,849* 11,648 348,392
80,000 107,78845,000 55,69258,000 25,094

Jingrui Holdings, Ltd.JinkoSolar Holding Co., Ltd., ADRJNBY Design, Ltd.Joy City Property, Ltd.Ju Teng International Holdings, Ltd.Jumei International Holding, Ltd., ADRKaisa Group Holdings, Ltd.Kasen International Holdings, Ltd.Kingdee International Software Group Co., Ltd.Kingsoft Corp., Ltd.KuangChi Science, Ltd.Kunlun Energy Co., Ltd.KWG Group Holdings, Ltd.Lee & Man Paper Manufacturing, Ltd.Lee's Pharmaceutical Holdings, Ltd.Legend Holdings Corp.Legend Holdings Corp., Class HLenovo Group, Ltd.Lexinfintech Holdings, Ltd., ADRLi Ning Co., Ltd.Lifestyle China Group, Ltd.Lifetech Scientific Corp.Livzon Pharmaceutical Group, Inc., Class HLogan Property Holdings Co., Ltd.Longfor Group Holdings, Ltd.Lonking Holdings, Ltd.Luye Pharma Group, Ltd.LVGEM China Real Estate Investment Co., Ltd.Maanshan Iron & Steel Co., Ltd., Class HMetallurgical Corp. of China, Ltd., Class HMinmetals Land, Ltd.Minth Group, Ltd.MMG, Ltd.Momo, Inc., Sponsored ADRNan Hai Corp., Ltd.NetDragon Websoft Holdings, Ltd.NetEase, Inc., ADRNew China Life Insurance Co., Ltd., Class HNew Oriental Education & Technology Group, Inc., Sponsored ADRNexteer Automotive Group, Ltd.Nine Dragons Paper Holdings, Ltd.Noah Holdings, Ltd., ADRNVC Lighting Holdings, Ltd.
Orient Securities Co., Ltd., Class HPanda Green Energy Group, Ltd.PAX Global Technology, Ltd.People's Insurance Co. Group of China, Ltd. (The), Class HPhoenix Media Investment Holdings, Ltd.Phoenix New Media, Ltd., ADR
42,000 13,749* 1,539 30,149
16,000 29,277198,000 23,872
56,000 13,250* 4,900 11,123
137,000 56,820# 41,000 34,339
64,000 60,965* 41,000 88,338#* 44,000 2,510
212,000 184,891108,000 100,413
92,000 56,1577,000 4,423
* 515 019,500 45,923
772,000 621,193* 1,200 12,720
105,000 258,867* 31,500 10,036#* 112,000 21,009
5,980 14,506120,000 181,447
34,500 127,588146,000 37,873
# 53,500 41,31216,000 5,68338,000 14,404
150,000 36,61664,000 9,908
# 56,000 157,813* 212,000 65,800
11,692 397,177# 700,000 12,492
15,000 37,5002,787 643,295
19,500 96,724* 1,408 146,868
43,000 44,690126,000 101,987
* 1,135 36,706137,000 12,453
Emerging Markets Sustainability Core 1 PortfolioCONTINUED
Shares Value»
CHINA — (Continued)17,200 $ 10,484
#* 170,000 6,47950,000 20,048
111,000 46,565100,000 8,710
* 2,748 7,832

PICC Property & Casualty Co., Ltd., Class HPing An Insurance Group Co. of China, Ltd., Class HPoly Property Group Co., Ltd.Postal Savings Bank of China Co., Ltd., Class HPou Sheng International Holdings, Ltd.Powerlong Real Estate Holdings, Ltd.Q Technology Group Co., Ltd.Qingdao Port International Co., Ltd., Class HQingling Motors Co., Ltd., Class HRedco Properties Group Ltd.Road King Infrastructure, Ltd.Ronshine China Holdings, Ltd.Sany Heavy Equipment International Holdings Co., Ltd.Secoo Holding, Ltd., ADRShandong Xinhua Pharmaceutical Co., Ltd.Shanghai Electric Group Co., Ltd., Class HShanghai Fosun Pharmaceutical Group Co., Ltd., Class HShanghai Fudan Microelectronics Group Co., Ltd., Class HShanghai Fudan-Zhangjiang Bio-Pharmaceutical Co., Ltd.Shanghai Industrial Holdings, Ltd.Shanghai Industrial Urban Development Group, Ltd.Shanghai Jin Jiang International Hotels Group Co., Ltd., Class HShanghai Pharmaceuticals Holding Co., Ltd., Class HShanghai Prime Machinery Co., Ltd.Shengjing Bank Co., Ltd.Shenzhen Expressway Co., Ltd., Class HShenzhen International Holdings, Ltd.Shenzhen Investment, Ltd.Shenzhou International Group Holdings, Ltd.Shimao Property Holdings, Ltd.Shui On Land, Ltd.Sichuan Expressway Co., Ltd., Class HSihuan Pharmaceutical Holdings Group, Ltd.SINA Corp.Sino Biopharmaceutical, Ltd.Sinofert Holdings, Ltd.Sino-Ocean Group Holding, Ltd.Sinopec Engineering Group Co., Ltd., Class HSinopec Kantons Holdings, Ltd.Sinopec Oilfield Service Corp.Sinopec Shanghai Petrochemical Co., Ltd., Class HSinopharm Group Co., Ltd., Class HSinosoft Technology Group, Ltd.Sinotrans, Ltd., Class HSinotruk Hong Kong, Ltd.Skyfame Realty Holdings, Ltd.Skyworth Group, Ltd.SMI Holdings Group, Ltd.SOHO China, Ltd.Sohu.com, Ltd., ADRSpringland International Holdings, Ltd.SSY Group, Ltd.Sun Art Retail Group, Ltd.
225,000 267,157107,500 1,266,974118,000 43,531167,000 97,119111,000 30,883
# 76,000 46,106* 16,000 15,504
18,000 12,82942,000 10,809
# 44,000 17,50417,000 34,95146,500 60,53431,000 12,188
* 1,627 13,00022,000 10,54994,000 32,64920,000 59,207
* 14,000 13,62922,000 16,74635,000 71,711
106,000 17,07338,000 6,74038,900 74,80282,000 8,98722,000 15,73034,000 40,35855,055 101,693
134,000 48,04719,800 272,59373,000 201,611
191,500 40,87760,000 18,078
199,000 40,767* 2,000 78,240
274,000 334,216172,000 19,240144,000 57,938
78,000 61,10674,000 29,772
* 90,000 10,514204,000 71,172
77,600 286,85652,000 13,928
161,000 55,491# 34,000 49,856
222,000 33,336154,000 41,815
#* 52,000 2,49173,500 23,500
* 606 7,38768,000 13,43996,000 85,12166,000 66,834
Emerging Markets Sustainability Core 1 PortfolioCONTINUED

Sunac China Holdings, Ltd.Sunny Optical Technology Group Co., Ltd.Symphony Holdings, Ltd.TAL Education Group, ADRTCL Electronics Holdings, Ltd.Tencent Holdings, Ltd.Texhong Textile Group, Ltd.Tian An China Investment Co., Ltd.Tian Ge Interactive Holdings, Ltd.Tiangong International Co., Ltd.Tianjin Development Holdings, Ltd.Tianjin Port Development Holdings, Ltd.Tianneng Power International, Ltd.Tibet Water Resources, Ltd.Tingyi Cayman Islands Holding Corp.Tong Ren Tang Technologies Co., Ltd., Class HTongda Group Holdings, Ltd.Towngas China Co., Ltd.TPV Technology, Ltd.TravelSky Technology, Ltd., Class HTsingtao Brewery Co., Ltd., Class HTuniu Corp., Sponsored ADRUni-President China Holdings, Ltd.United Energy Group, Ltd.Vipshop Holdings, Ltd., ADRWant Want China Holdings, Ltd.Wasion Holdings, Ltd.Weibo Corp., Sponsored ADRWeichai Power Co., Ltd., Class HWisdom Education International Holdings Co., Ltd.Wison Engineering Services Co., Ltd.Xiabuxiabu Catering Management China Holdings Co., Ltd.Xiamen International Port Co., Ltd.Xingda International Holdings, Ltd.Xinhua Winshare Publishing and Media Co., Ltd., Class HXinjiang Goldwind Science & Technology Co., Ltd., Class HXinyi Solar Holdings, Ltd.Xinyuan Real Estate Co., Ltd., ADRXtep International Holdings, Ltd.Xunlei, Ltd., ADRYadea Group Holdings, Ltd.Yangtze Optical Fibre and Cable Joint Stock, Ltd. Co., Class HYashili International Holdings, Ltd.YiChang HEC ChangJiang Pharmaceutical Co., Ltd., Class HYihai International Holding, Ltd.Yirendai, Ltd., ADRYuexiu Property Co., Ltd.Yuexiu Transport Infrastructure, Ltd.Yum China Holdings, Inc.Yuzhou Properties Co., Ltd.YY, Inc., ADRZhaojin Mining Industry Co., Ltd., Class H
Shares Value»
CHINA — (Continued)97,000 $ 437,53537,500 433,627
170,000 19,949* 1,736 55,899
23,000 10,415115,400 5,376,82816,500 16,57024,000 11,772
* 26,000 6,09224,000 7,44164,000 19,634
120,000 12,34534,000 27,189
* 29,000 7,226106,000 158,196
29,000 34,651# 460,000 33,773
82,391 62,733112,000 35,08445,000 88,08114,000 81,882
* 2,276 7,03381,000 95,803
* 474,000 85,439* 29,445 223,782
228,000 177,32742,000 15,315
#* 5,704 223,426107,000 164,324
20,000 8,95328,000 3,775
# 15,000 20,84984,000 10,48546,449 12,47420,000 13,95138,556 43,087
86 472,452 10,274
67,500 48,608* 6,026 13,438# 42,000 8,571# 13,000 23,618
88,000 11,5969,000 45,327
15,000 79,593* 1,000 11,190
382,000 86,35446,000 36,536
6,655 302,803152,389 71,594
* 3,738 239,94238,000 44,167

Zhejiang Expressway Co., Ltd., Class HZhengzhou Coal Mining Machinery Group Co., Ltd.Zhongsheng Group Holdings, Ltd.Zhuguang Holdings Group Co., Ltd.Zhuzhou CRRC Times Electric Co., Ltd., Class HZoomlion Heavy Industry Science and Technology Co., Ltd., Class HZTE Corp., Class H
ZTO Express Cayman, Inc., ADR
TOTAL CHINA
Almacenes Exito SABanco de Bogota SABancolombia SA, Sponsored ADRBancolombia SAGrupo Aval Acciones y Valores SAGrupo de Inversiones Suramericana SAInterconexion Electrica SA ESP
TOTAL COLOMBIA
Komercni banka A.S.Moneta Money Bank A.S.O2 Czech Republic A.S.
TOTAL CZECH REPUBLIC
Commercial International Bank Egypt S.A.E., GDR
Aegean Airlines SAAlpha Bank AEAthens Water Supply & Sewage Co. SABank of GreeceEllaktor SAFourlis Holdings SAGEK Terna Holding Real Estate Construction SAHellenic Exchanges - Athens Stock Exchange SAHellenic Petroleum SAHellenic Telecommunications Organization SAHolding Co. ADMIE IPTO SAJUMBO SALAMDA Development SAMotor Oil Hellas Corinth Refineries SAOPAP SAPiraeus Bank SAPiraeus Port Authority SASarantis SATerna Energy SA
TOTAL GREECE
102,000 98,73022,600 10,89341,500 115,344
* 42,000 5,40325,200 120,45186,600 60,460
* 6,800 20,309
Emerging Markets Sustainability Core 1 PortfolioCONTINUED
Shares Value»
CHINA — (Continued)6,766 $ 132,952
40,300,236
COLOMBIA — (0.3%)21,854 115,900
955 20,8123,099 154,5786,380 76,4225,000 37,550
11,562 121,57854,591 296,172
823,012
CZECH REPUBLIC — (0.1%)3,552 137,017
63,271 217,4413,412 32,361
386,819
EGYPT — (0.1%)35,802 153,951
GREECE — (0.4%)2,273 20,556
* 19,223 37,3133,457 31,602
764 12,426* 12,618 30,286
3,492 22,285* 8,179 57,931
4,772 26,1785,363 55,9226,219 85,512
13,574 33,8955,852 114,692
* 3,107 32,2493,836 95,102
11,729 132,012* 13,325 45,447
716 19,6294,258 40,7686,248 50,064
943,869
HONG KONG — (0.0%)

Leyou Technologies Holdings, Ltd.
Magyar Telekom Telecommunications P.L.C.MOL Hungarian Oil & Gas P.L.C.OTP Bank P.L.C.Richter Gedeon Nyrt
TOTAL HUNGARY
3M India, Ltd.Aarti Industries, Ltd.
ABB India, Ltd.Abbott India, Ltd.ACC, Ltd.Adani Ports & Special Economic Zone, Ltd.Adani Transmissions, Ltd.Aditya Birla Capital, Ltd.Aditya Birla Fashion and Retail, Ltd.Advanced Enzyme Technologies, Ltd.Aegis Logistics, Ltd.AIA Engineering, Ltd.Ajanta Pharma, Ltd.Akzo Nobel India, Ltd.Alembic Pharmaceuticals, Ltd.Allahabad BankAllcargo Logistics, Ltd.Amara Raja Batteries, Ltd.Andhra BankApar Industries, Ltd.APL Apollo Tubes, Ltd.Apollo Hospitals Enterprise, Ltd.Apollo Tyres, Ltd.Arti Surfactants, Ltd.Ashok Leyland, Ltd.Ashoka Buildcon, Ltd.Asian Paints, Ltd.Astral Polytechnik, Ltd.Atul, Ltd.Aurobindo Pharma, Ltd.Automotive Axles, Ltd.Avanti Feeds, Ltd.Avenue Supermarts, Ltd.Axis Bank, Ltd.Axis Bank, Ltd., GDRBajaj Auto, Ltd.Bajaj Corp., Ltd.Bajaj Electricals, Ltd.Bajaj Finance, Ltd.Bajaj Finserv, Ltd.Bajaj Holdings & Investment, Ltd.
* 90,000 25,659
HUNGARY — (0.4%)48,291 69,86748,956 496,839
6,419 267,32510,852 190,671
1,024,702
INDIA — (13.1%)* 194 59,346
4,089 99,180
Emerging Markets Sustainability Core 1 PortfolioCONTINUED
Shares Value»
INDIA — (Continued)1,812 $ 35,994
126 15,265562 12,704
52,001 284,315* 11,198 33,509* 50,998 60,706* 15,991 43,657
4,178 8,9896,161 16,692
* 2,078 51,5962,822 36,2461,637 41,4484,723 35,725
* 113,755 60,5027,609 10,6961,820 17,964
* 28,151 7,6301,069 7,6971,339 27,2522,862 56,122
18,076 41,260409 1,263
170,506 171,908* 9,386 16,415
23,376 515,2452,073 37,2621,134 59,818
22,473 185,235818 9,565
1,962 8,758* 7,451 160,196
15,735 153,7251,599 78,3516,996 253,9969,179 34,5814,414 23,2946,066 285,2921,644 168,8801,548 76,286

Balkrishna Industries, Ltd.Balmer Lawrie & Co., Ltd.Balrampur Chini Mills, Ltd.Bank of BarodaBank of MaharashtraBASF India, Ltd.Bata India, Ltd.Bayer CropScience, Ltd.BEML, Ltd.Berger Paints India, Ltd.Bharat Electronics, Ltd.Bharat Heavy Electricals, Ltd.Bharat Petroleum Corp., Ltd.Bharti Airtel, Ltd.Bharti Infratel, Ltd.Biocon, Ltd.Blue Dart Express, Ltd.Blue Star, Ltd.Bombay Dyeing & Manufacturing Co., Ltd.Borosil Glass Works, Ltd.
Bosch, Ltd.Brigade Enterprises, Ltd.Britannia Industries, Ltd.BSE, Ltd.Cadila Healthcare, Ltd.Can Fin Homes, Ltd.Canara BankCapacit'e Infraprojects, Ltd.Caplin Point Laboratories, Ltd.Carborundum Universal, Ltd.Care Ratings, Ltd.CCL Products India, Ltd.Ceat, Ltd.Central Bank of IndiaCentury Plyboards India, Ltd.Cera Sanitaryware, Ltd.CG Power and Industrial Solutions, Ltd.Chambal Fertilizers & Chemicals, Ltd.Chennai Petroleum Corp., Ltd.Cholamandalam Investment and Finance Co., Ltd.Cipla, Ltd.City Union Bank, Ltd.Cochin Shipyard, Ltd.Coffee Day Enterprises, Ltd.Colgate-Palmolive India, Ltd.Container Corp. Of India, Ltd.Coromandel International, Ltd.Corp. BankCox & Kings Financial Service, Ltd.
4,347 44,3644,262 10,664
15,243 31,317* 20,661 31,847* 49,518 9,201
1,415 20,9173,147 59,651
538 23,8151,351 16,481
23,924 114,32368,519 101,85178,268 66,64644,856 223,881
111,670 543,56915,168 53,69228,754 94,354
416 14,4441,338 13,3594,398 4,5183,668 7,066
Emerging Markets Sustainability Core 1 PortfolioCONTINUED
Shares Value»
INDIA — (Continued)203 $ 41,985
3,485 13,1872,967 112,7101,785 13,170
21,727 71,9726,909 38,733
* 17,916 60,8654,149 14,1103,081 19,1023,978 18,9241,129 12,4086,689 23,799
593 6,997* 21,094 5,366
8,168 14,968505 18,893
* 53,021 13,8969,364 20,332
10,031 28,58715,045 56,27028,278 212,24919,179 54,028
3,056 15,875* 3,096 5,500
6,589 113,65019,177 142,60511,270 60,459
* 57,694 19,015* 991 29

Cox & Kings, Ltd.CRISIL, Ltd.Cummins India, Ltd.Cyient, Ltd.Dabur India, Ltd.DB Corp., Ltd.DCB Bank, Ltd.DCM Shriram, Ltd.Dewan Housing Finance Corp., Ltd.DFM Foods, Ltd.Dhanuka Agritech, Ltd.Dilip Buildcon, Ltd.Dish TV India, Ltd.Dishman Carbogen Amcis, Ltd.Divi's Laboratories, Ltd.Dixon Technologies India, Ltd.DLF, Ltd.Dr Lal PathLabs, Ltd.eClerx Services, Ltd.Edelweiss Financial Services, Ltd.Eicher Motors, Ltd.EID Parry India, Ltd.Emami, Ltd.Endurance Technologies, Ltd.Engineers India, Ltd.Eris Lifesciences, Ltd.Escorts, Ltd.Essel Propack, Ltd.Eveready Industries India, Ltd.Exide Industries, Ltd.
FDC, Ltd.Federal Bank, Ltd.Finolex Cables, Ltd.Finolex Industries, Ltd.Firstsource Solutions, Ltd.Future Enterprises, Ltd.Future Lifestyle Fashions, Ltd.Future Retail, Ltd.Gabriel India, Ltd.GAIL India, Ltd.Garware Technical Fibres, Ltd.Gateway Distriparks, Ltd.Gayatri Projects, Ltd.GE T&D India, Ltd.General Insurance Corp. of IndiaGFL, Ltd.Gillette India, Ltd.GlaxoSmithKline Consumer Healthcare, Ltd.GlaxoSmithKline Pharmaceuticals, Ltd.
2,973 4972,050 38,7274,081 42,1212,102 13,838
32,823 202,8944,160 9,713
16,407 46,2475,671 32,8948,090 5,7483,398 12,7221,466 7,7364,776 28,654
37,588 14,734* 8,585 25,804
3,963 93,824313 9,670
33,071 84,7583,200 50,4203,221 27,860
32,117 68,229732 171,905
6,206 12,97512,745 58,825
1,623 21,74415,558 22,460
* 2,036 11,9356,380 43,320
20,674 39,943* 2,362 2,539
22,697 60,134
Emerging Markets Sustainability Core 1 PortfolioCONTINUED
Shares Value»
INDIA — (Continued)* 6,240 $ 13,995
139,473 186,4056,799 36,9263,140 24,149
25,010 17,801* 17,741 6,165
2,110 13,761* 9,243 55,522
5,802 7,571108,246 202,087
665 10,7913,803 5,958
* 4,184 8,6092,445 5,4642,875 8,0113,681 48,490
857 89,008430 45,938
1,499 26,209

Glenmark Pharmaceuticals, Ltd.Godrej Consumer Products, Ltd.Godrej Industries, Ltd.Godrej Properties, Ltd.Granules India, Ltd.Graphite India, Ltd.Greaves Cotton, Ltd.Greenpanel Industries, Ltd.Greenply Industries, Ltd.Grindwell Norton, Ltd.GRUH Finance, Ltd.Gujarat Alkalies & Chemicals, Ltd.Gujarat Ambuja Exports, Ltd.Gujarat Gas, Ltd.Gujarat Narmada Valley Fertilizers & Chemicals, Ltd.Gujarat Pipavav Port, Ltd.Gujarat State Petronet, Ltd.Gulf Oil Lubricants India, Ltd.Hatsun Agro Products, Ltd.Hatsun Agro Products, Ltd.Havells India, Ltd.HCL Technologies, Ltd.HDFC Life Insurance Co., Ltd.HEG, Ltd.Hero MotoCorp, Ltd.Hexaware Technologies, Ltd.Hikal, Ltd.Himachal Futuristic Communications, Ltd.Himadri Speciality Chemical, Ltd.Himatsingka Seide, Ltd.Hinduja Global Solutions, Ltd.Hindustan Petroleum Corp., Ltd.Hindustan Unilever, Ltd.Honeywell Automation India, Ltd.Housing Development & Infrastructure, Ltd.Housing Development Finance Corp., Ltd.HSIL, Ltd.ICICI Bank, Ltd., Sponsored ADRICICI Lombard General Insurance Co., Ltd.ICICI Prudential Life Insurance Co., Ltd.
ICRA, Ltd.IDFC First Bank, Ltd.IDFC, Ltd.IFB Industries, Ltd.IFCI, Ltd.IIFL Finance, Ltd.IIFL Securities, Ltd.IIFL Wealth Management, Ltd.Indiabulls Housing Finance, Ltd.
17,332 106,93620,948 182,316
5,129 35,092* 3,360 46,154
13,717 18,0624,107 18,242
11,083 21,4668,369 1,3938,369 14,8842,727 21,553
15,651 55,5072,281 13,7573,281 6,330
13,590 33,8443,675 11,199
19,549 22,14518,741 57,938
2,672 29,8432,140 21,395
60 47316,047 149,95028,857 432,512
5,334 38,162875 12,549
5,167 175,47616,151 84,650
5,929 12,71566,885 18,966
9,211 10,7702,577 4,9851,132 9,720
93,538 358,27733,551 838,323
172 57,360* 62,791 10,848
27,743 853,4791,816 5,783
42,965 524,6032,406 42,2066,278 36,519
Emerging Markets Sustainability Core 1 PortfolioCONTINUED
Shares Value»
INDIA — (Continued)250 $ 11,677
* 125,167 75,995* 126,216 65,733* 864 7,582* 73,561 7,724
5,801 9,890* 5,801 17,361* 829 1,146
39,186 303,829

Indiabulls Integrated Services, Ltd.Indiabulls Real Estate, Ltd.Indiabulls Ventures, Ltd.Indian BankIndian Oil Corp., Ltd.Indian Overseas BankIndraprastha Gas, Ltd.IndusInd Bank, Ltd.Infibeam Avenues, Ltd.Info Edge India, Ltd.Infosys, Ltd.Ingersoll-Rand India, Ltd.Inox Leisure, Ltd.Intellect Design Arena, Ltd.InterGlobe Aviation, Ltd.Ipca Laboratories, Ltd.IRB Infrastructure Developers, Ltd.ITD Cementation India, Ltd.Jagran Prakashan, Ltd.Jain Irrigation Systems, Ltd.Jammu & Kashmir Bank, Ltd. (The)Jamna Auto Industries, Ltd.JB Chemicals & Pharmaceuticals, Ltd.Jindal Saw, Ltd.JM Financial, Ltd.JMC Projects India, Ltd.Johnson Controls-Hitachi Air Conditioning India, Ltd.JTEKT India, Ltd.Jubilant Foodworks, Ltd.Just Dial, Ltd.Kajaria Ceramics, Ltd.Kalpataru Power Transmission, Ltd.Karnataka Bank, Ltd. (The)Karur Vysya Bank, Ltd. (The)Kaveri Seed Co., Ltd.KEC International, Ltd.KEI Industries, Ltd.KNR Constructions, Ltd.Kotak Mahindra Bank, Ltd.KPIT Engineering, Ltd.KPIT Technologies, Ltd.KPR Mill, Ltd.KRBL, Ltd.Lakshmi Machine Works, Ltd.Lakshmi Vilas Bank, Ltd. (The)Laurus Labs, Ltd.LIC Housing Finance, Ltd.Lupin, Ltd.LUX Industries, Ltd.Magma Fincorp, Ltd.
* 4,301 6,830* 7,599 9,610
7,739 26,746* 11,372 30,867
69,371 139,375* 48,120 7,820
23,753 104,588811 16,528
32,279 19,4452,804 91,424
182,450 2,085,8372,626 22,533
* 5,506 23,550* 3,329 10,817
2,281 51,6533,072 42,493
12,120 16,3989,348 10,550
12,267 14,88116,352 4,846
* 23,470 12,14211,234 6,6872,554 13,870
18,284 17,85222,132 21,169
7,685 13,142685 16,403
7,355 7,5383,777 65,552
* 4,976 49,9836,740 46,1514,537 31,647
22,186 26,97133,249 30,334
1,283 8,2918,905 39,6546,045 38,5244,264 16,5807,044 154,809
* 17,211 20,360* 17,211 18,716
2,236 18,6155,074 16,300
252 14,688* 14,604 10,179
1,336 6,52934,814 260,55922,888 254,532
509 8,04110,065 11,918
Emerging Markets Sustainability Core 1 PortfolioCONTINUED
Shares Value»

Mahanagar Gas, Ltd.Maharashtra Scooters, Ltd.Mahindra & Mahindra Financial Services, Ltd.Mahindra & Mahindra, Ltd.Mahindra CIE Automotive, Ltd.Mahindra Lifespace Developers, Ltd.Mahindra Logistics, Ltd.Majesco, Ltd.Manappuram Finance, Ltd.Mangalore Refinery & Petrochemicals, Ltd.Marico, Ltd.Marksans Pharma, Ltd.Maruti Suzuki India, Ltd.MAS Financial Services, Ltd.Mastek, Ltd.Max Financial Services, Ltd.Max India, Ltd.McLeod Russel India, Ltd.Minda Corp., Ltd.Minda Industries, Ltd.Mindtree, Ltd.MOIL, Ltd.Motherson Sumi Systems, Ltd.Motilal Oswal Financial Services, Ltd.Mphasis, Ltd.MRF, Ltd.Music Broadcast, Ltd.Muthoot Capital Services, Ltd.Muthoot Finance, Ltd.Narayana Hrudayalaya, Ltd.Natco Pharma, Ltd.Navneet Education, Ltd.NBCC India, Ltd.Nestle India, Ltd.NIIT Technologies, Ltd.NIIT, Ltd.NRB Bearings, Ltd.Oberoi Realty, Ltd.Oil India, Ltd.Omaxe, Ltd.Oracle Financial Services Software, Ltd.Oriental Bank of CommercePage Industries, Ltd.PC Jeweller, Ltd.Persistent Systems, Ltd.Petronet LNG, Ltd.Pfizer, Ltd.Phillips Carbon Black, Ltd.Phoenix Mills, Ltd.(The)PI Industries, Ltd.Pidilite Industries, Ltd.Piramal Enterprises, Ltd.PNB Housing Finance, Ltd.
INDIA — (Continued)3,158 $ 37,029
241 14,08434,132 150,07450,815 403,696
* 5,090 13,2722,324 12,6681,996 11,6421,448 9,858
39,406 65,06516,296 14,35568,175 362,81828,757 6,736
4,019 318,4081,285 10,9661,601 8,677
* 12,145 73,260* 13,084 11,365
394 595,222 6,3646,758 28,4132,263 23,3488,751 17,179
74,345 114,6644,294 32,429
17,056 230,902106 82,154
* 12,716 8,638* 916 6,853
12,272 108,328* 3,609 11,644
9,374 69,9788,985 13,425
35,863 22,0221,359 229,4043,918 68,345
17,210 22,5777,569 11,202
* 6,545 51,95715,518 35,767
3,485 10,0782,775 136,599
* 34,733 34,065613 160,909
23,471 11,6824,777 36,297
130,213 445,070723 31,381
4,200 7,2723,605 33,5146,183 98,6098,672 155,8434,374 114,8985,849 59,994

PNC Infratech, Ltd.Power Finance Corp., Ltd.Power Grid Corp. of India, Ltd.Praj Industries, Ltd.Prestige Estates Projects, Ltd.Procter & Gamble Hygiene & Health Care, Ltd.
PTC India, Ltd.Punjab & Sind BankPunjab National BankPVR, Ltd.Quess Corp., Ltd.Radico Khaitan, Ltd.Rain Industries Ltd.Rajesh Exports, Ltd.Rallis India, Ltd.Rane Holdings, Ltd.Raymond, Ltd.RBL Bank, Ltd.REC, Ltd.Redington India, Ltd.Relaxo Footwears, Ltd.Reliance Capital, Ltd.Reliance Industries, Ltd.Reliance Industries, Ltd.Repco Home Finance, Ltd.Sadbhav Engineering, Ltd.Sanofi India, Ltd.SBI Life Insurance Co., Ltd.Schaeffler India, Ltd.Security & Intelligence Services India, Ltd.Sequent Scientific, Ltd.Sharda Cropchem, Ltd.Sheela Foam, Ltd.Shilpa Medicare, Ltd.Shoppers Stop, Ltd.Shriram City Union Finance, Ltd.Shriram Transport Finance Co., Ltd.Siemens, Ltd.Siyaram Silk Mills, Ltd.SKF India, Ltd.Sobha, Ltd.Somany Ceramics, Ltd.Sonata Software, Ltd.South Indian Bank, Ltd. (The)Srei Infrastructure Finance, Ltd.SRF, Ltd.Sterlite Technologies, Ltd.Strides Pharma Science, Ltd.Subros, Ltd.
5,375 14,216* 69,921 110,542
62,112 190,9565,287 8,101
13,191 48,526730 115,379
Emerging Markets Sustainability Core 1 PortfolioCONTINUED
Shares Value»
INDIA — (Continued)37,148 $ 30,092
* 24,330 8,164* 52,635 52,689
3,814 83,713* 5,090 32,031
1,834 7,9043,832 4,944
10,071 100,5467,424 17,138
693 9,2423,401 32,305
12,889 75,00975,749 153,81730,687 48,135
4,826 29,0738,730 6,541
21,905 733,99645,607 768,136
3,440 16,24813,046 26,161
601 53,0962,346 27,106
802 49,490839 10,186
* 11,712 11,8051,695 6,436
* 597 10,752* 4,071 21,009
1,322 7,1971,102 21,702
15,806 221,1804,833 80,0941,830 6,715
807 21,5204,448 35,383
991 5,0587,033 32,980
178,611 31,66619,337 3,333
2,926 114,4589,782 21,1065,475 31,1723,640 10,385

Sun Pharmaceutical Industries, Ltd.Sun TV Network, Ltd.Sundaram Finance, Ltd.Sundaram-Clayton, Ltd.Sundram Fasteners, Ltd.Sunteck Realty, Ltd.Suprajit Engineering, Ltd.Supreme Industries, Ltd.Suven Life Sciences, Ltd.Suzlon Energy, Ltd.Symphony, Ltd.Syndicate BankSyngene International, Ltd.TAKE Solutions, Ltd.Tata Chemicals, Ltd.Tata Communications, Ltd.
Tata Consultancy Services, Ltd.Tata Elxsi, Ltd.Tata Global Beverages, Ltd.Tata Motors, Ltd.TCI Express, Ltd.Tech Mahindra, Ltd.Techno Electric & Engineering Co., Ltd.Tejas Networks, Ltd.Texmaco Rail & Engineering, Ltd.Thermax, Ltd.Thomas Cook India, Ltd.Thyrocare Technologies, Ltd.TI Financial Holdings, Ltd.Time Technoplast, Ltd.Timken India, Ltd.Titan Co., Ltd.Torrent Pharmaceuticals, Ltd.Transport Corp. of India, Ltd.Trident, Ltd.Triveni Engineering & Industries, Ltd.TTK Prestige, Ltd.Tube Investments of India, Ltd.TV Today Network, Ltd.TV18 Broadcast, Ltd.TVS Motor Co., Ltd.TVS Srichakra, Ltd.UCO BankUflex, Ltd.Unichem Laboratories, Ltd.Union Bank of IndiaUnited Breweries, Ltd.United Spirits, Ltd.UPL, Ltd.
35,249 217,64515,171 103,882
3,193 70,556140 4,302
4,148 26,4416,996 39,1002,380 6,5985,593 86,2634,069 13,573
* 553,919 33,6681,436 24,952
* 66,258 30,4988,864 38,7074,839 6,6675,112 42,9043,759 25,544
Emerging Markets Sustainability Core 1 PortfolioCONTINUED
Shares Value»
INDIA — (Continued)46,583 $ 1,487,853
1,424 13,15134,248 124,352
* 306,567 600,377999 8,224
47,402 436,023* 2,244 8,264
2,818 3,71813,083 9,049
531 8,4339,735 26,4121,540 10,008
* 7,241 48,11317,732 20,421
1,152 11,67921,118 322,5794,048 97,8662,560 9,820
11,175 8,57711,082 8,789
170 13,4076,223 31,3291,757 6,876
* 77,209 24,2045,024 26,894
357 8,218* 74,869 17,997
7,791 24,7702,495 6,071
* 52,076 50,7895,401 110,742
* 30,620 263,02367,897 584,426

VA Tech Wabag, Ltd.Vaibhav Global, Ltd.Vardhman Textiles, Ltd.Varun Beverages, Ltd.Varun Beverages, Ltd.V-Guard Industries, Ltd.Vinati Organics, Ltd.Vindhya Telelinks, Ltd.VIP Industries, Ltd.Vodafone Idea, Ltd.Voltas, Ltd.VRL Logistics, Ltd.WABCO India, Ltd.Welspun Corp., Ltd.Welspun Enterprises, Ltd.Whirlpool of India, Ltd.Wipro, Ltd.Wockhardt, Ltd.Yes Bank, Ltd.Zee Entertainment Enterprises, Ltd.Zensar Technologies, Ltd.
TOTAL INDIA
Ace Hardware Indonesia Tbk PTAdhi Karya Persero Tbk PT
Agung Podomoro Land Tbk PTAlam Sutera Realty Tbk PTAsuransi Kresna Mitra Tbk PTBank Bukopin TbkBank Central Asia Tbk PTBank Danamon Indonesia Tbk PTBank Mandiri Persero Tbk PTBank Negara Indonesia Persero Tbk PTBank Pan Indonesia Tbk PTBank Pembangunan Daerah Jawa Barat Dan Banten Tbk PTBank Pembangunan Daerah Jawa Timur Tbk PTBank Permata Tbk PTBank Rakyat Indonesia Persero Tbk PTBank Tabungan Negara Persero Tbk PTBarito Pacific Tbk PTBekasi Fajar Industrial Estate Tbk PTBlue Bird Tbk PTBumi Serpong Damai Tbk PTCapital Financial Indonesia Tbk PTCiputra Development Tbk PTElnusa Tbk PTErajaya Swasembada Tbk PTGajah Tunggal Tbk PTGaruda Indonesia Persero Tbk PT
3,517 14,7641,061 13,9192,067 27,3663,249 30,296
* 1,625 15,0896,164 20,869
777 20,460373 5,024
3,363 18,537* 375,819 37,641
7,685 64,5851,754 6,029
321 28,30516,049 26,287
9,097 13,4372,453 55,373
59,361 228,916* 1,991 8,958
108,012 139,99592,590 484,062
6,946 21,227
31,085,947
INDONESIA — (2.3%)895,400 116,991262,700 27,603
Emerging Markets Sustainability Core 1 PortfolioCONTINUED
Shares Value»
INDONESIA — (Continued)* 1,072,900 $ 15,406* 1,137,000 26,830* 15,000 931* 819,000 17,368
270,100 592,97199,600 36,018
448,000 252,042409,000 245,193
* 195,400 19,998288,100 32,563276,200 12,591
* 512,900 34,5141,988,800 630,207
201,500 35,014126,500 34,883485,500 10,973
49,800 9,981* 689,800 69,240* 484,000 12,425
1,319,000 115,642509,600 13,020112,300 16,721
* 272,300 13,356* 509,400 14,514

Global Mediacom Tbk PTHanson International Tbk PTIndofood CBP Sukses Makmur Tbk PTIndofood Sukses Makmur Tbk PTIndosat Tbk PTIndustri dan Perdagangan Bintraco Dharma Tbk PTIndustri Jamu Dan Farmasi Sido Muncul Tbk PTInti Agri Resources Tbk PTJasa Marga Persero Tbk PTKalbe Farma Tbk PTKrakatau Steel Persero Tbk PTKresna Graha Investama Tbk PTLink Net Tbk PTLippo Cikarang Tbk PTLippo Karawaci Tbk PTMatahari Department Store Tbk PTMayora Indah Tbk PTMedia Nusantara Citra Tbk PTMetrodata Electronics Tbk PTMitra Adiperkasa Tbk PTMitra Keluarga Karyasehat Tbk PTModernland Realty Tbk PTMultistrada Arah Sarana Tbk PTNippon Indosari Corpindo Tbk PTPabrik Kertas Tjiwi Kimia Tbk PTPakuwon Jati Tbk PTPanin Financial Tbk PTPaninvest Tbk PTPelayaran Tamarin Samudra Tbk PTPool Advista Indonesia Tbk PTPP Persero Tbk PTPP Properti Tbk PTPuradelta Lestari Tbk PTRamayana Lestari Sentosa Tbk PTRimo International Lestari Tbk PT
Sarana Menara Nusantara Tbk PTSelamat Sempurna Tbk PTSentul City Tbk PTSiloam International Hospitals Tbk PTSitara Propertindo Tbk PTSmartfren Telecom Tbk PTSri Rejeki Isman Tbk PTSumber Alfaria Trijaya Tbk PTSummarecon Agung Tbk PTSurya Citra Media Tbk PTSurya Esa Perkasa Tbk PTSurya Semesta Internusa Tbk PTTelekomunikasi Indonesia Persero Tbk PT, Sponsored ADRTotalindo Eka Persada Tbk PT
1,260,500 34,823* 6,647,900 48,844
158,900 120,854414,200 207,961
* 174,100 42,251536,000 9,467273,800 19,728
* 550,900 2,045296,100 125,753
1,453,700 151,899* 505,200 12,432* 1,080,100 44,269
106,700 34,376* 369,600 43,687
2,886,100 57,513263,400 69,495365,700 64,854
1,265,100 123,472291,800 26,922
1,016,100 68,370218,200 31,537
1,122,000 21,057* 210,700 9,310
140,600 12,92499,400 84,466
238,600 12,465* 2,781,700 69,276* 164,000 15,928* 334,000 11,614* 64,100 8,823
343,900 52,1891,198,600 9,713
561,900 12,163245,900 23,562
* 3,949,000 36,932
Emerging Markets Sustainability Core 1 PortfolioCONTINUED
Shares Value»
INDONESIA — (Continued)2,214,300 $ 116,608
271,800 29,926* 3,623,000 38,252* 77,800 34,873* 344,900 18,321* 3,180,600 39,139
899,900 22,419377,400 25,869876,900 82,428
1,150,000 126,455* 995,400 20,654
471,700 27,175# 7,998 240,980* 365,200 15,999

Tower Bersama Infrastructure Tbk PTTrada Alam Minera Tbk PTUltrajaya Milk Industry & Trading Co. Tbk PTUnilever Indonesia Tbk PTVisi Media Asia Tbk PTWaskita Beton Precast Tbk PTWaskita Karya Persero Tbk PTWijaya Karya Beton Tbk PTWijaya Karya Persero Tbk PTXL Axiata Tbk PT
TOTAL INDONESIA
Aeon Co. M BhdAEON Credit Service M BhdAFFIN Bank BhdAjinomoto Malaysia BhdAlliance Bank Malaysia BhdAllianz Malaysia BhdAMMB Holdings BhdAstro Malaysia Holdings BhdBerjaya Corp. BhdBerjaya Land BhdBerjaya Sports Toto BhdBermaz Auto BhdBIMB Holdings BhdBoustead Holdings BhdBumi Armada BhdCarlsberg Brewery Malaysia Bhd, Class BCIMB Group Holdings BhdCypark Resources BhdD&O Green Technologies BhdDatasonic Group BhdDayang Enterprise Holdings BhdDialog Group BhdDiGi.Com BhdDRB-Hicom BhdDutch Lady Milk Industries BhdEastern & Oriental BhdEco World Development Group BhdEco World International BhdEkovest BHDFGV Holdings BhdFraser & Neave Holdings BhdFrontken Corp. Bhd
Gabungan AQRS BhdGamuda BhdGas Malaysia BhdGenting BhdGenting Malaysia Bhd
80,000 23,948* 1,606,700 13,496
226,000 24,17563,000 195,215
* 1,554,900 12,3971,422,600 36,667
521,200 75,468410,900 17,076278,000 45,941
* 471,500 108,043
5,519,493
MALAYSIA — (2.8%)65,600 27,40211,700 46,86812,300 6,010
3,400 14,34297,200 86,462
6,700 22,553138,400 141,569100,400 35,153
* 431,500 27,160* 294,800 11,770
79,400 50,516* 108,900 67,182
21,100 21,36416,900 4,661
* 48,000 2,64916,100 93,876
208,620 255,98649,000 17,01460,200 8,192
206,900 33,799* 30,500 10,510
181,800 151,65780,500 97,29984,300 53,867
1,300 20,028* 76,568 14,788* 145,500 27,619#* 141,700 21,919
89,000 17,848* 146,900 40,087
6,400 53,467103,600 38,757
Emerging Markets Sustainability Core 1 PortfolioCONTINUED
Shares Value»
MALAYSIA — (Continued)59,500 $ 20,080
180,300 161,57024,500 16,736
187,200 310,879144,300 134,800

George Kent Malaysia BhdGlobetronics Technology BhdGuan Chong BhdHai-O Enterprise BhdHAP Seng Consolidated BhdHartalega Holdings BhdHeineken Malaysia BhdHengyuan Refining Co. BhdHong Leong Bank BhdHong Leong Financial Group BhdHup Seng Industries BhdIHH Healthcare BhdIJM Corp. BhdInari Amertron BhdIOI Properties Group BhdIskandar Waterfront City BhdJAKS Resources BhdJHM Consolidation BhdKerjaya Prospek Group BhdKNM Group BhdKossan Rubber IndustriesKPJ Healthcare BhdKSL Holdings BhdLBS Bina Group BhdLii Hen Industries BhdLingkaran Trans Kota Holdings BhdLPI Capital BhdMagnum BhdMah Sing Group BhdMalayan Banking BhdMalaysia Airports Holdings BhdMalaysia Building Society BhdMalaysian Pacific Industries BhdMalaysian Resources Corp. BhdMatrix Concepts Holdings BhdMaxis BhdMBM Resources BHDMedia Prima BhdMMC Corp. BhdMuhibbah Engineering M BhdMy EG Services BhdNestle Malaysia BhdOSK Holdings BhdPadini Holdings BhdParamount Corp. BhdPetron Malaysia Refining & Marketing BhdPetronas Chemicals Group BhdPetronas Dagangan BhdPos Malaysia BhdPPB Group BhdPress Metal Aluminium Holdings BhdPublic Bank BhdRHB Bank BhdSapura Energy Bhd
16,300 4,55019,900 8,50847,200 41,10619,100 10,490
8,900 21,31695,200 113,97814,900 82,060
#* 21,800 26,35818,800 81,64515,600 67,90452,600 11,84032,900 45,552
228,600 128,648268,050 106,008172,200 52,401
#* 156,400 36,718* 51,100 9,594
67,500 20,42275,600 26,106
* 218,100 21,22461,400 60,517
114,500 25,894* 92,400 18,677
91,000 11,66523,500 16,78021,900 24,39710,900 41,275
# 50,400 32,66356,900 12,72667,592 141,39155,000 111,407
# 141,102 29,68013,500 29,733
198,000 43,47123,700 10,89754,900 75,44518,900 15,067
* 94,500 10,950126,000 33,479
16,000 10,377222,100 82,758
3,600 129,559# 99,000 22,364
50,100 42,69828,900 10,567
9,700 14,03140,600 73,58122,700 128,88259,400 24,83722,200 100,60448,700 53,557
118,900 629,86156,200 74,815
297,600 21,459

Scientex BhdSerba Dinamik Holdings BhdSime Darby Plantation BhdSime Darby Property BhdSKP Resources BhdSP Setia Bhd GroupSunway Construction Group BhdSupermax Corp. BhdSyarikat Takaful Malaysia Keluarga BhdTaliworks Corp. BhdTelekom Malaysia BhdTIME dotCom BhdTop Glove Corp. BhdUchi Technologies BhdUEM Edgenta BhdUEM Sunrise BhdUMW Holdings BhdUOA Development BhdVelesto Energy BhdViTrox Corp. BhdVizione Holdings BhdVS Industry BhdWCT Holdings BhdWestports Holdings BhdYinson Holdings BhdYNH Property Bhd
TOTAL MALAYSIA
Alfa S.A.B. de C.V., Class AAlpek S.A.B. de C.V.America Movil S.A.B. de C.V.America Movil S.A.B. de C.V., Sponsored ADR, Class LArca Continental S.A.B. de C.V.Axtel S.A.B. de C.V.Banco del Bajio SABanco Santander Mexico SA Institucion de Banca Multiple Grupo FinancieroSantand, ADRBecle S.A.B. de C.V.Bolsa Mexicana de Valores S.A.B. de C.V.Coca-Cola Femsa S.A.B. de C.V., Sponsored ADRConsorcio ARA S.A.B. de C.V.Credito Real S.A.B. de C.V. SOFOM EREl Puerto de Liverpool S.A.B. de C.V.Fomento Economico Mexicano S.A.B. de C.V.Fomento Economico Mexicano S.A.B. de C.V., Sponsored ADRGenomma Lab Internacional S.A.B. de C.V., Class BGentera S.A.B. de C.V.Gruma S.A.B. de C.V., Class BGrupo Aeromexico S.A.B. de C.V.
Emerging Markets Sustainability Core 1 PortfolioCONTINUED
Shares Value»
MALAYSIA — (Continued)50,100 $ 102,274
136,400 132,112123,200 137,331151,100 35,674
94,800 28,373124,664 59,006
31,100 16,314119,700 47,85527,800 41,01282,900 18,114
127,300 125,8996,000 13,078
173,700 190,60321,100 13,86230,000 21,858
197,400 38,12525,100 30,73564,100 32,282
* 227,100 17,22017,500 29,571
* 85,200 19,947181,675 52,555151,572 41,784
61,700 59,68915,000 25,21746,800 31,671
6,611,092
MEXICO — (2.7%)# 399,322 345,900
65,448 70,729627,527 439,772
29,452 412,03323,201 123,283
* 44,948 5,817# 62,994 118,370
20,782 147,552# 32,000 47,506
27,691 46,0222,436 149,424
213,971 44,66216,839 19,27012,274 59,68625,300 229,530
620 56,234* 122,080 111,609
73,417 60,301# 24,426 223,755#* 23,454 18,358

Grupo Aeroportuario del Centro Norte S.A.B. de C.V.Grupo Aeroportuario del Pacifico S.A.B. de C.V., Class BGrupo Aeroportuario del Sureste S.A.B. de C.V., ADRGrupo Bimbo S.A.B. de C.V.Grupo Carso S.A.B. de C.V.Grupo Comercial Chedraui S.A. de C.V.Grupo Elektra S.A.B. de C.V.Grupo Financiero Banorte S.A.B. de C.V.Grupo Financiero Inbursa S.A.B. de C.V.
Grupo GICSA SAB de CVGrupo Herdez S.A.B. de C.V., Series *Grupo Hotelero Santa Fe S.A.B. de C.V.Grupo Industrial Saltillo S.A.B. de C.V.Grupo Lala S.A.B. de C.V.Grupo Televisa S.A.B.Grupo Traxion S.A.B. de C.V.Impulsora del Desarrollo y el Empleo en America Latina S.A.B. de C.V.Industrias CH S.A.B. de C.V.Industrias Penoles S.A.B. de C.V.Infraestructura Energetica Nova S.A.B. de C.V.La Comer S.A.B. de C.V.Megacable Holdings S.A.B. de C.V.Mexichem S.A.B. de C.V.Minera Frisco S.A.B. de C.V., Class A1Organizacion Soriana S.A.B. de C.V., Class BPromotora y Operadora de Infraestructura S.A.B. de C.V.Promotora y Operadora de Infraestructura S.A.B. de C.V., Class LQualitas Controladora S.A.B. de C.V.Regional S.A.B. de C.V.Telesites S.A.B. de C.V.TV Azteca S.A.B. de C.V.Unifin Financiera S.A.B. de C.V. SOFOM ENRWal-Mart de Mexico S.A.B. de C.V.
TOTAL MEXICO
Credicorp, Ltd.Grana y Montero SAA, Sponsored ADR
TOTAL PERU
8990 Holdings, Inc.Aboitiz Equity Ventures, Inc.Alliance Global Group, Inc.Ayala Corp.BDO Unibank, Inc.China Banking Corp.Cosco Capital, Inc.D&L Industries, Inc.DoubleDragon Properties Corp.
39,234 241,09039,575 397,118
# 1,625 247,21149,400 94,398
# 9,800 31,34355,464 83,238
# 1,184 79,42550,925 254,761
114,165 139,819
Emerging Markets Sustainability Core 1 PortfolioCONTINUED
Shares Value»
MEXICO — (Continued)* 33,334 $ 8,054
12,430 26,075* 20,895 6,019
9,024 8,94733,293 36,049
# 132,090 250,205* 41,850 30,770* 11,314 14,701* 7,467 24,528
16,390 150,782# 21,164 81,569#* 58,293 69,962# 43,601 184,949
172,504 315,235* 17,000 2,351#* 14,784 15,568
15,660 140,9613,652 22,295
30,698 95,648# 7,562 36,157* 78,886 47,009
74,500 6,06513,744 28,953
169,400 499,880
6,400,948
PERU — (0.2%)1,913 417,0153,000 8,760
425,775
PHILIPPINES — (1.2%)75,400 23,40150,560 52,424
355,700 108,576920 17,269
42,980 123,58640,900 21,589
269,100 36,212432,300 87,292
* 58,000 27,562

East West Banking Corp.Emperador, Inc.Filinvest Development Corp.Filinvest Land, Inc.First Philippine Holdings Corp.Globe Telecom, Inc.Integrated Micro-Electronics, Inc.International Container Terminal Services, Inc.JG Summit Holdings, Inc.Jollibee Foods Corp.Lopez Holdings Corp.LT Group, Inc.MacroAsia Corp.Manila Electric Co.Manila Water Co., Inc.Max's Group, Inc.Megawide Construction Corp.
Megaworld Corp.Metropolitan Bank & Trust Co.Nickel Asia Corp.Petron Corp.Philippine National BankPhilippine Seven Corp.Pilipinas Shell Petroleum Corp.PLDT, Inc., Sponsored ADRPLDT, Inc.Premium Leisure Corp.Puregold Price Club, Inc.Rizal Commercial Banking Corp.Robinsons Land Corp.Robinsons Retail Holdings, Inc.San Miguel Corp.Shakey's Pizza Asia Ventures, Inc.SM Investments Corp.SSI Group, Inc.Starmalls, Inc.Travellers International Hotel Group, Inc.Universal Robina Corp.Vista Land & Lifescapes, Inc.Wilcon Depot, Inc.
TOTAL PHILIPPINES
Alior Bank SAAmica SAAmRest Holdings SEAsseco Poland SABank Ochrony Srodowiska SABank Polska Kasa Opieki SABoryszew SA
* 38,500 9,377* 166,100 24,565
39,100 10,7281,336,000 49,791
15,510 26,3732,100 88,511
60,500 11,269108,800 287,972
68,870 87,95121,930 111,441
119,000 10,599140,700 38,938
51,600 19,6448,100 57,957
100,900 46,53252,200 14,344
126,100 47,061
Emerging Markets Sustainability Core 1 PortfolioCONTINUED
Shares Value»
PHILIPPINES — (Continued)925,100 $ 111,091
51,760 76,938485,000 24,028482,100 52,465
* 49,140 47,94811,040 32,41745,200 34,085
7,465 164,6032,965 66,541
695,000 9,81399,600 88,72534,700 20,929
207,900 111,71852,070 81,20842,070 146,86441,300 11,218
5,230 102,278217,000 13,640
23,100 2,720123,000 13,233
29,150 91,345459,900 69,037109,400 33,691
2,847,499
POLAND — (1.4%)* 9,508 114,507
355 10,770* 6,642 69,075
10,804 152,683* 5,571 11,113
3,224 85,646* 7,832 9,021

Budimex SACCC SACD Projekt SACiech SAComArch SACyfrowy Polsat SADino Polska SAEcho Investment SAFamur SAGetin Noble Bank SAGlobe Trade Centre SAGrupa Lotos SAING Bank Slaski SAInter Cars SAKernel Holding SAKGHM Polska Miedz SALC Corp. SALPP SAmBank SANeuca SAPKP Cargo SAPolski Koncern Naftowy Orlen S.A.Powszechna Kasa Oszczednosci Bank Polski SAPowszechny Zaklad Ubezpieczen SASantander Bank Polska SAStalprodukt SA
VRG SAWarsaw Stock Exchange
TOTAL POLAND
Etalon Group P.L.C., GDRGlobaltrans Investment P.L.C., GDRMail.Ru Group, Ltd., GDRPhosAgro PJSC, GDRPhosAgro PJSC, GDRPolyus PJSC, GDRRos Agro P.L.C., GDRRostelecom PJSC, Sponsored ADRSberbank of Russia PJSC, Sponsored ADRTMK PJSC, GDRVTB Bank PJSC, GDRX5 Retail Group NV, GDR
TOTAL RUSSIA
Adcorp Holdings, Ltd.AECI, Ltd.Alexander Forbes Group Holdings, Ltd.Allied Electronics Corp., Ltd., Class A
1,081 35,9422,356 90,9592,538 150,0364,953 50,486
222 10,05920,861 161,342
* 4,556 171,23912,998 15,59834,682 40,963
* 40,705 4,7248,928 21,959
14,312 321,480531 26,150549 27,947
3,672 45,827* 13,929 336,775
27,380 19,550123 248,530
* 634 56,926261 20,810
1,796 15,61416,758 419,89517,111 180,18825,406 273,230
446 37,535127 6,882
Emerging Markets Sustainability Core 1 PortfolioCONTINUED
Shares Value»
POLAND — (Continued)* 10,526 $ 11,782
910 9,115
3,264,358
RUSSIA — (0.6%)7,226 15,9694,519 39,677
* 3,085 78,7292,605 32,4152,509 31,287
941 47,6541,594 18,4596,602 50,835
47,251 701,3979,084 32,748
49,518 66,0087,586 253,676
1,368,854
SOUTH AFRICA — (4.9%)* 8,686 14,201
16,132 105,004130,375 51,046
19,192 37,118

Alviva Holdings, Ltd.Anglo American Platinum, Ltd.AngloGold Ashanti, Ltd.AngloGold Ashanti, Ltd.Aspen Pharmacare Holdings, Ltd.Barloworld, Ltd.Bid Corp., Ltd.Bidvest Group, Ltd. (The)Blue Label Telecoms, Ltd.Brait SECapitec Bank Holdings, Ltd.Cashbuild, Ltd.Clicks Group, Ltd.Clover Industries, Ltd.Coronation Fund Managers, Ltd.DataTec, Ltd.Dis-Chem Pharmacies, Ltd.Discovery, Ltd.Distell Group Holdings, Ltd.EOH Holdings, Ltd.Famous Brands, Ltd.Foschini Group, Ltd. (The)Gold Fields, Ltd.Gold Fields, Ltd., Sponsored ADRGrindrod Shipping Holdings, Ltd.Harmony Gold Mining Co., Ltd.Harmony Gold Mining Co., Ltd., Sponsored ADRHudaco Industries, Ltd.Impala Platinum Holdings, Ltd.Imperial Logistics, Ltd.Investec, Ltd.Invicta Holdings, Ltd.Italtile, Ltd.KAP Industrial Holdings, Ltd.
Kumba Iron Ore, Ltd.Lewis Group, Ltd.Liberty Holdings, Ltd.Massmart Holdings, Ltd.MiX Telematics, Ltd., Sponsored ADRMomentum Metropolitan HoldingsMotus Holdings Ltd.Mpact, Ltd.Mr. Price Group, Ltd.MTN Group, Ltd.Multichoice Group, Ltd.Nampak, Ltd.Naspers, Ltd., Class NNedbank Group, Ltd.NEPI Rockcastle P.L.C.
10,377 11,6981,573 93,380
23,308 400,5412,100 35,8268,471 53,169
23,582 197,68623,311 487,60035,615 456,074
* 99,540 25,403* 20,397 16,816
1,478 121,4142,143 39,606
26,805 380,6968,398 13,508
24,579 71,76138,156 89,43946,479 73,37918,226 167,229
8,834 82,080* 15,887 19,660
3,236 20,57416,634 191,334
6,214 31,737124,834 630,412
* 466 2,710* 15,458 38,295* 14,515 35,417
4,898 39,933* 34,192 182,409
20,200 64,03617,690 101,085
5,036 8,32433,808 30,909
110,572 39,813
Emerging Markets Sustainability Core 1 PortfolioCONTINUED
Shares Value»
SOUTH AFRICA — (Continued)7,573 $ 249,2324,057 9,195
15,715 118,85412,426 44,300
2,282 34,13961,671 72,61714,132 72,813
6,530 10,31715,486 190,094
# 93,585 732,891* 45,242 422,880* 82,875 57,495
7,233 1,763,11710,694 178,69510,098 91,141

Northam Platinum, Ltd.Omnia Holdings, Ltd.Peregrine Holdings, Ltd.Pick n Pay Stores, Ltd.PSG Group, Ltd.PSG Konsult, Ltd.Raubex Group, Ltd.RCL Foods, Ltd.Reunert, Ltd.Royal Bafokeng Platinum, Ltd.Sanlam, Ltd.Santam, Ltd.Sappi, Ltd.Shoprite Holdings, Ltd.Sibanye Gold, Ltd.SPAR Group, Ltd. (The)Super Group, Ltd.Transaction Capital, Ltd.Trencor, Ltd.Truworths International, Ltd.Vodacom Group, Ltd.Wilson Bayly Holmes-Ovcon, Ltd.Woolworths Holdings, Ltd.
TOTAL SOUTH AFRICA
Able C&C Co., Ltd.Advanced Process Systems Corp.Aekyung Petrochemical Co., Ltd.AfreecaTV Co., Ltd.Agabang&CompanyAhnlab, Inc.AJ Rent A Car Co., Ltd.AK Holdings, Inc.Amorepacific Corp.AMOREPACIFIC GroupAmotech Co., Ltd.Ananti, Inc.Aprogen pharmaceuticals, Inc.BGF Co., Ltd.BGF retail Co., Ltd.BH Co., Ltd.Binex Co., Ltd.Binggrae Co., Ltd.
BNK Financial Group, Inc.Boditech Med, Inc.Boryung Pharmaceutical Co., Ltd.Bukwang Pharmaceutical Co., Ltd.Caregen Co., Ltd.Cell Biotech Co., Ltd.
* 24,451 107,36511,527 27,08911,936 15,33037,214 173,064
7,684 122,27913,836 9,09226,464 35,28912,144 8,81219,745 89,614
* 4,738 11,185133,670 691,844
3,303 67,99633,626 121,93718,470 198,430
#* 132,373 163,70729,621 378,619
* 25,425 52,40946,452 74,482
* 20,319 34,94141,547 179,89620,464 167,275
6,600 53,081# 81,774 312,335
11,605,173
SOUTH KOREA — (16.7%)* 1,620 13,631
1,113 21,9491,438 9,1721,007 49,065
* 3,403 8,230316 14,477
* 1,064 9,244798 27,577
1,521 178,7181,052 50,759
* 615 9,706* 879 8,508* 18,294 13,255
3,695 19,302887 153,173
* 2,135 32,711* 2,460 17,523
314 17,272
Emerging Markets Sustainability Core 1 PortfolioCONTINUED
Shares Value»
SOUTH KOREA — (Continued)15,758 $ 92,954
1,337 10,3911,859 18,2671,333 17,254
272 13,191476 7,098

Celltrion Pharm, Inc.Celltrion, Inc.Charm Engineering Co., Ltd.Cheil Worldwide, Inc.Chong Kun Dang Pharmaceutical Corp.Chongkundang Holdings Corp.Chosun Refractories Co., Ltd.CJ CGV Co., Ltd.CJ CheilJedang Corp.CJ Corp.CJ ENM Co., Ltd.CJ Freshway Corp.CJ Hello Co., Ltd.CJ Logistics Corp.CMG Pharmaceutical Co., Ltd.Com2uSCorpCosmax BTI, Inc.COSMAX NBT Inc.Cosmax, Inc.COWELL FASHION Co., Ltd.CS Wind Corp.Cuckoo Holdings Co., Ltd.Cuckoo Homesys Co., Ltd.Dae Han Flour Mills Co., Ltd.Dae Hwa Pharmaceutical Co., Ltd.Dae Won Kang Up Co., Ltd.Daeduck Electronics Co.Daelim Industrial Co., Ltd.Daesang Corp.Daesang Holdings Co., Ltd.Daewon Pharmaceutical Co., Ltd.Daewon San Up Co., Ltd.Daewoo Engineering & Construction Co., Ltd.Daewoo Shipbuilding & Marine Engineering Co., Ltd.Daewoong Co., Ltd.Daewoong Pharmaceutical Co., Ltd.Daihan Pharmaceutical Co., Ltd.Danawa Co., Ltd.Daou Data Corp.Daou Technology, Inc.Dawonsys Co., Ltd.DB Financial Investment Co., Ltd.DB Insurance Co., Ltd.Dentium Co., Ltd.Deutsch Motors, Inc.DGB Financial Group, Inc.DI Dong Il Corp.Digital Power Communications Co., Ltd.DIO Corp.Dong-A ST Co., Ltd.Dong-Ah Geological Engineering Co., Ltd.Dongjin Semichem Co., Ltd.DongKook Pharmaceutical Co., Ltd.
* 645 19,406* 2,679 382,363* 9,873 9,385
9,928 226,318449 32,947229 20,024164 11,497
1,407 40,2201,139 273,6512,196 172,2642,058 286,739
969 24,3456,102 30,741
* 897 103,559* 8,816 19,546
731 54,2041,055 15,5331,621 11,074
932 80,0451,843 10,107
510 14,21087 8,743
345 12,93967 10,535
1,232 13,5714,824 16,1134,109 35,3535,279 468,9981,447 29,0741,529 8,9031,366 16,8952,161 10,947
* 34,815 120,006* 2,886 71,027
1,147 14,963119 15,815368 10,357
1,099 20,3401,733 12,3981,033 17,7121,512 17,3202,722 10,4837,173 339,470
602 34,579* 2,544 19,048
6,873 43,642301 18,246
4,475 17,941* 541 18,535
208 16,1161,347 24,7293,944 44,976
394 22,144
Emerging Markets Sustainability Core 1 PortfolioCONTINUED

Dongkuk Steel Mill Co., Ltd.Dongsuh Cos., Inc.Dongwha Enterprise Co., Ltd.Dongwha Pharm Co., Ltd.Dongwon Development Co., Ltd.Dongwon F&B Co., Ltd.Dongwon Industries Co., Ltd.Doosan Bobcat, Inc.Doosan Corp.Doosan Heavy Industries & Construction Co., Ltd.Doosan Infracore Co., Ltd.DoubleUGames Co., Ltd.Douzone Bizon Co., Ltd.DTR Automotive Corp.Duk San Neolux Co., Ltd.e Tec E&C, Ltd.E1 Corp.Ecopro Co., Ltd.Ehwa Technologies Information Co., Ltd.E-MART, Inc.EM-Tech Co., Ltd.Eo Technics Co., Ltd.Eugene Corp.Eugene Technology Co., Ltd.Eusu Holdings Co., Ltd.F&F Co., Ltd.FarmscoFila Korea, Ltd.Fine Semitech Corp.Foosung Co., Ltd.Gamevil, Inc.Geumhwa PSC Co., Ltd.GOLFZON Co., Ltd.Golfzon Newdin Holdings Co., Ltd.Grand Korea Leisure Co., Ltd.Green Cross Corp.Green Cross Holdings Corp.GS Engineering & Construction Corp.GS Global Corp.GS Holdings Corp.GS Home Shopping, Inc.GS Retail Co., Ltd.Gwangju Shinsegae Co., Ltd.HAESUNG DS Co., Ltd.Haitai Confectionery & Foods Co., Ltd.Halla Holdings Corp.Han Kuk Carbon Co., Ltd.Hana Financial Group, Inc.Hana Tour Service, Inc.Hanall Biopharma Co., Ltd.Hancom, Inc.Handok, Inc.
Shares Value»
SOUTH KOREA — (Continued)* 2,213 $ 12,384
2,117 31,839702 10,921
2,026 15,2221,809 7,361
70 15,732164 31,694
5,382 162,596635 56,059
* 17,516 89,436* 25,021 130,205
722 33,9662,413 129,673
464 12,448* 835 11,953
158 10,471364 16,477
* 2,940 53,681* 54,912 11,192
2,090 214,2421,283 12,694
371 22,1634,389 18,630
# 1,647 15,346* 1,499 8,497
898 52,3641,528 6,5845,405 305,8423,078 18,427
* 2,219 16,496* 880 26,641
297 7,918260 15,542
3,070 11,8412,824 44,129
288 25,9942,029 33,445
11,161 317,8818,402 17,2348,025 339,992
524 74,0132,063 64,893
69 10,079888 9,658
2,093 15,150747 27,002
1,902 11,59425,506 746,563
520 18,910* 721 15,976
1,326 12,302789 15,682

Handsome Co., Ltd.Hanjin Heavy Industries & Construction Co., Ltd.Hanjin Kal Corp.Hanjin Transportation Co., Ltd.Hankook Shell Oil Co., Ltd.Hanmi Pharm Co., Ltd.Hanmi Science Co., Ltd.
Hanmi Semiconductor Co., Ltd.Hanon SystemsHansae Co., Ltd.Hansae Yes24 Holdings Co., Ltd.Hanshin ConstructionHansol Chemical Co., Ltd.Hansol Holdings Co., Ltd.Hansol Paper Co., Ltd.Hansol Technics Co., Ltd.Hanssem Co., Ltd.Hanwha Chemical Corp.Hanwha General Insurance Co., Ltd.Hanwha Investment & Securities Co., Ltd.Hanwha Life Insurance Co., Ltd.Hanyang Eng Co., Ltd.HDC Holdings Co., Ltd.HDC Hyundai Engineering Plastics Co., Ltd.Heungkuk Fire & Marine Insurance Co., Ltd.Hisem Co., Ltd.Hite Jinro Co., Ltd.HLB Life Science Co., Ltd.Homecast Co., Ltd.Hotel Shilla Co., Ltd.HS Industries Co., Ltd.Huchems Fine Chemical Corp.Hugel, Inc.Humax Co., Ltd.Humedix Co., Ltd.Huneed TechnologiesHuons Co., Ltd.Huons Global Co., Ltd.Huvis Corp.HwaSung Industrial Co., Ltd.Hy-Lok Corp.Hyosung Advanced Materials Corp.Hyosung Chemical Corp.Hyosung Corp.Hyosung TNC Co., Ltd.Hyundai Construction Equipment Co., Ltd.Hyundai Department Store Co., Ltd.Hyundai Electric & Energy System Co., Ltd.Hyundai Elevator Co., Ltd.
812 25,446* 1,241 5,161
1,428 31,063755 19,751111 29,961400 97,408469 18,521
Emerging Markets Sustainability Core 1 PortfolioCONTINUED
Shares Value»
SOUTH KOREA — (Continued)2,096 $ 11,5106,897 67,830
586 9,3081,422 9,097
710 9,3831,139 77,889
* 2,699 9,6882,058 24,499
* 2,682 15,753583 29,768
16,588 259,57610,427 30,661
* 11,659 21,06946,259 102,241
1,714 16,4864,181 43,8544,340 19,881
* 3,501 11,541* 1,984 8,715
2,075 37,180* 3,886 21,868* 1,271 5,241
5,378 354,4172,849 20,3643,133 60,020
* 108 34,020* 3,727 16,353
967 17,312* 2,154 12,716
320 13,226470 12,582
1,853 10,702952 10,437911 13,972
* 106 10,42175 10,332
855 58,784102 12,392
2,203 57,565799 49,840
* 865 9,9811,595 107,095

Hyundai Engineering & Construction Co., Ltd.Hyundai Greenfood Co., Ltd.Hyundai Heavy Industries Holdings Co., Ltd.Hyundai Home Shopping Network Corp.Hyundai Hy Communications & Networks Co., Ltd.Hyundai Livart Furniture Co., Ltd.Hyundai Marine & Fire Insurance Co., Ltd.Hyundai Merchant Marine Co., Ltd.Hyundai Mipo Dockyard Co., Ltd.Hyundai Mobis Co., Ltd.Hyundai Motor Co.Hyundai Motor Securities Co., Ltd.Hyundai Rotem Co., Ltd.Hyundai Steel Co.Hyundai Wia Corp.HyVision System, Inc.ICD Co., Ltd.
IDIS Holdings Co., Ltd.IHQ, Inc.Iljin Holdings Co., Ltd.Ilshin Spinning Co., Ltd.Ilyang Pharmaceutical Co., Ltd.iMarketKorea, Inc.InBody Co., Ltd.Industrial Bank of KoreaInnocean Worldwide, Inc.Inscobee, Inc.Insun ENT Co., Ltd.Interflex Co., Ltd.Interpark Holdings Corp.INTOPS Co., Ltd.IS Dongseo Co., Ltd.i-SENS, Inc.It's Hanbul Co., Ltd.Jahwa Electronics Co., Ltd.Jayjun Cosmetic Co., Ltd.JB Financial Group Co., Ltd.Jcontentree Corp.Jejuair Co., Ltd.Jusung Engineering Co., Ltd.JW Holdings Corp.JW Life Science Corp.JW Pharmaceutical Corp.JYP Entertainment Corp.Kakao Corp.Kangwon Land, Inc.KB Financial Group, Inc.KB Financial Group, Inc., ADRKC Co., Ltd.
3,879 139,9265,550 57,982
555 152,161921 72,559
6,746 20,367957 12,509
10,294 242,739* 5,519 15,353
2,258 81,1612,953 597,5455,588 594,4371,740 15,007
* 2,914 40,5342,397 78,1191,982 72,1162,448 17,0192,404 23,228
Emerging Markets Sustainability Core 1 PortfolioCONTINUED
Shares Value»
SOUTH KOREA — (Continued)952 $ 9,237
11,736 17,8263,921 9,423
139 10,510* 595 11,740
1,656 16,3861,637 33,809
12,152 134,602596 33,573
* 5,576 11,440* 2,103 12,616* 2,338 19,170
10,368 19,1312,082 26,0831,517 42,563
790 16,493364 5,873
1,170 9,574* 1,144 4,748
6,665 30,965* 4,744 18,525
696 15,8372,213 11,5823,258 16,364
508 9,602556 13,203
1,985 33,8841,453 154,7832,771 71,890
18,084 660,822434 15,698744 8,010

KCC Corp.KEC Corp.KEPCO Engineering & Construction Co., Inc.KEPCO Plant Service & Engineering Co., Ltd.Kginicis Co., Ltd.KGMobilians Co., Ltd.Kia Motors Corp.KISCO Corp.KISWIRE, Ltd.Kiwi Media Group Co., Ltd.KIWOOM Securities Co., Ltd.KMW Co., Ltd.Koentec Co., Ltd.Koh Young Technology, Inc.Kolmar BNH Co., Ltd.Kolmar Korea Co., Ltd.Kolmar Korea Holdings Co., Ltd.Kolon Corp.Kolon Industries, Inc.Kolon Life Science, Inc.KoMiCo, Ltd.Komipharm International Co., Ltd.Korea Autoglass Corp.Korea Electric Terminal Co., Ltd.Korea Gas Corp.Korea Information & Communications Co., Ltd.Korea Investment Holdings Co., Ltd.
Korea Petrochemical Ind Co., Ltd.Korea Shipbuilding & Offshore Engineering Co., Ltd.Korea United Pharm, Inc.Korea Zinc Co., Ltd.Korean Reinsurance Co.Kortek Corp.KSS LINE, Ltd.KT Skylife Co., Ltd.KTB Investment & Securities Co., Ltd.Kukdo Chemical Co., Ltd.Kumho Industrial Co., Ltd.Kumho Petrochemical Co., Ltd.Kumho Tire Co., Inc.Kwang Dong Pharmaceutical Co., Ltd.Kyeryong Construction Industrial Co., Ltd.Kyobo Securities Co., Ltd.Kyung Dong Navien Co., Ltd.Kyungdong Pharm Co., Ltd.L&F Co., Ltd.LB Semicon, Inc.LEENO Industrial, Inc.LF Corp.
333 68,272* 10,697 9,606
1,226 19,4364,180 112,2742,572 26,7542,100 10,4159,844 362,6032,079 9,2551,015 20,391
* 59,412 8,4891,418 86,749
* 419 19,2262,032 20,148
895 62,5011,270 29,8391,088 50,460
495 9,831491 6,764
3,394 113,655* 555 9,821
556 12,276* 599 9,684
749 11,581519 29,141
4,557 164,041* 1,156 8,629
3,940 245,805
Emerging Markets Sustainability Core 1 PortfolioCONTINUED
Shares Value»
SOUTH KOREA — (Continued)543 $ 54,824
* 2,149 195,1051,070 18,283
304 113,26314,571 98,227
1,790 19,4061,746 9,7461,859 15,688
* 4,113 9,068329 13,471
1,383 15,2272,706 185,566
* 5,064 17,1092,670 15,2491,100 23,6262,422 19,918
346 10,8601,406 9,9861,034 24,668
* 6,010 50,002633 29,517
2,597 53,507

LG Chem, Ltd.LG Corp.LG Electronics, Inc.LG Hausys, Ltd.LG Household & Health Care, Ltd.LG Innotek Co., Ltd.LG Uplus Corp.LIS Co., Ltd.Lock & Lock Co., Ltd.Lotte Chemical Corp.Lotte Chilsung Beverage Co., Ltd.Lotte Confectionery Co., Ltd.Lotte Corp.LOTTE Fine Chemical Co., Ltd.Lotte Food Co., Ltd.LOTTE Himart Co., Ltd.Lotte Non-Life Insurance Co., Ltd.Lotte Shopping Co., Ltd.LS Corp.LS Industrial Systems Co., Ltd.Lumens Co., Ltd.LVMC HoldingsMacquarie Korea Infrastructure FundMacrogen, Inc.Maeil Holdings Co., Ltd.Mando Corp.Mcnex Co., Ltd.ME2ON Co., Ltd.Medipost Co., Ltd.Medy-Tox, Inc.Meerecompany, Inc.MegaStudyEdu Co., Ltd.Meritz Financial Group, Inc.Meritz Fire & Marine Insurance Co., Ltd.Meritz Securities Co., Ltd.MiCo, Ltd.Minwise Co., Ltd.
Mirae Asset Daewoo Co., Ltd.Mirae Asset Life Insurance Co., Ltd.MK Electron Co., Ltd.Modetour Network, Inc.Moorim P&P Co., Ltd.Motonic Corp.Muhak Co., Ltd.Namhae Chemical Corp.Namyang Dairy Products Co., Ltd.Nasmedia Co., Ltd.NAVER Corp.NCSoft Corp.
1,866 527,7562,497 148,9549,357 512,381
615 31,007607 642,707
2,020 190,7458,756 95,886
* 1,006 10,7701,032 13,4551,481 289,433
350 42,78486 10,725
3,944 112,8232,496 102,038
29 11,9651,375 42,557
* 13,922 24,0071,119 127,9721,671 62,0461,763 68,330
* 6,480 9,913* 8,113 19,663
15,740 154,984* 591 12,614
1,193 11,9132,931 83,367
879 15,421* 3,372 15,784* 363 8,784
585 205,141197 6,494892 23,385
3,360 39,4459,141 153,607
29,949 127,3173,044 12,995
940 14,436
Emerging Markets Sustainability Core 1 PortfolioCONTINUED
Shares Value»
SOUTH KOREA — (Continued)32,940 $207,96412,176 40,892
1,168 7,965916 12,026
4,923 17,9132,192 17,6032,049 18,1372,155 16,423
50 22,638273 7,050
5,822 675,451965 392,124

NeoPharm Co., Ltd.NeowizNEPES Corp.Netmarble Corp.Nexen Tire Corp.NH Investment & Securities Co., Ltd.NHN Corp.NHN KCP Corp.Nice Information & Telecommunication, Inc.NICE Information Service Co., Ltd.NICE Total Cash Management Co., Ltd.Nong Shim Holdings Co., Ltd.NongShim Co., Ltd.NS Shopping Co., Ltd.OCI Co., Ltd.OptoElectronics Solutions Co., Ltd.OPTRON-TEC, Inc.Orange Life Insurance, Ltd.Orion Holdings Corp.Oscotec, Inc.Osstem Implant Co., Ltd.Ottogi Corp.Partron Co., Ltd.Pearl Abyss Corp.Pharmicell Co., Ltd.POSCO Chemtech Co., Ltd.Posco ICT Co., Ltd.Power Logics Co., Ltd.PSK Holdings, Inc.PSK, Inc.Pulmuone Co., Ltd.Redrover Co., Ltd.RFHIC Corp.S&T Dynamics Co., Ltd.S&T Motiv Co., Ltd.S-1 Corp.Sajo Industries Co., Ltd.Sam Chun Dang Pharm Co., Ltd.Sam Young Electronics Co., Ltd.Sam Yung Trading Co., Ltd.Samho International Co., Ltd.Samick Musical Instruments Co., Ltd.Samjin Pharmaceutical Co., Ltd.Samkwang Glass Co., Ltd.Sammok S-Form Co., Ltd.Samsung Biologics Co., Ltd.Samsung C&T Corp.
Samsung Card Co., Ltd.Samsung Electro-Mechanics Co., Ltd.
561 20,491* 1,979 21,271
2,188 55,398* 746 56,878
1,950 14,13715,997 175,374
* 1,418 74,4181,850 29,000
921 24,2023,610 47,3712,549 17,533
274 18,359164 32,493
2,380 20,7631,764 111,376
405 22,5172,610 12,9454,382 104,6792,208 29,038
* 1,020 16,023* 1,234 71,463
34 18,5142,852 34,472
* 855 123,473* 2,810 19,512# 1,263 51,477
6,222 26,388* 2,542 21,643
244 1,616* 647 9,215
1,890 17,195* 12,390 6,388
971 24,035758 4,235
1,037 43,7001,788 157,898
228 8,653604 16,949
1,482 12,945891 12,396
1,190 20,78111,471 16,114
685 15,625393 12,334
1,045 8,973* 253 59,475
2,784 214,593
Emerging Markets Sustainability Core 1 PortfolioCONTINUED
Shares Value»
SOUTH KOREA — (Continued)2,661 $ 81,5373,747 287,254

Samsung Electronics Co., Ltd., GDRSamsung Electronics Co., Ltd.Samsung Electronics Co., Ltd., GDRSamsung Engineering Co., Ltd.Samsung Fire & Marine Insurance Co., Ltd.Samsung Heavy Industries Co., Ltd.Samsung Life Insurance Co., Ltd.Samsung Pharmaceutical Co., Ltd.Samsung SDI Co., Ltd.Samsung SDS Co., Ltd.Samsung Securities Co., Ltd.Samwha Capacitor Co., Ltd.Samyang Foods Co., Ltd.Sangsangin Co., Ltd.SaraminHR Co., Ltd.SBS Media Holdings Co., Ltd.SBWSeah Besteel Corp.SeAH Steel Corp.SeAH Steel Holdings Corp.Sebang Co., Ltd.Sebang Global Battery Co., Ltd.Seegene, Inc.Sejong Telecom, Inc.Sekonix Co., Ltd.Seohan Co., Ltd.Seohee Construction Co., Ltd.Seoul Semiconductor Co., Ltd.SFA Engineering Corp.SFA Semicon Co., Ltd.Shinhan Financial Group Co., Ltd.Shinsegae Food Co., Ltd.Shinsegae International, Inc.Shinsegae, Inc.Shinsung E&G Co., Ltd.Shinwon Corp.Shinyoung Securities Co., Ltd.SHOWBOX Corp.Silicon Works Co., Ltd.Silla Co., Ltd.SIMMTECH Co., Ltd.Sindoh Co., Ltd.SK Bioland Co., Ltd.SK Chemicals Co., Ltd.SK D&D Co., Ltd.SK Discovery Co., Ltd.SK Gas, Ltd.SK Hynix, Inc.SK Innovation Co., Ltd.SK Materials Co., Ltd.SK Securities Co., Ltd.SK Telecom Co., Ltd., Sponsored ADRSKC Co., Ltd.SKC Solmics Co., Ltd.SKCKOLONPI, Inc.
2,910 2,788,757108,899 4,124,518
1,299 1,254,834* 20,624 284,532
4,218 936,370* 27,952 165,582
4,791 307,559* 7,394 13,079
1,235 257,1922,630 460,0158,002 245,829
256 9,377257 13,692
* 2,754 43,709577 11,219
* 6,667 12,301* 11,416 10,868
2,272 30,959130 7,055145 6,342981 9,915362 12,365
* 702 13,119* 33,195 12,045* 2,406 12,753
13,295 15,16917,890 17,884
2,406 32,4711,773 56,085
#* 18,338 39,14916,865 617,741
268 16,812204 29,032670 142,508
* 13,700 12,143* 11,931 20,246
258 12,7944,087 13,154
347 11,083817 8,582
2,363 10,620811 29,526797 8,978928 34,770555 11,882
1,849 37,736569 37,192
17,824 1,140,9883,463 497,595
296 44,37125,631 13,947
3,290 75,3742,118 75,203
#* 6,466 21,5771,366 32,998

SL Corp.SM Entertainment Co.
S-Oil Corp.Solid, Inc.Songwon Industrial Co., Ltd.Soulbrain Co., Ltd.SPC Samlip Co., Ltd.Spigen Korea Co., Ltd.Ssangyong Motor Co.Sung Kwang Bend Co., Ltd.Sungwoo Hitech Co., Ltd.Synopex, Inc.Taekwang Industrial Co., Ltd.Taewoong Co., Ltd.Taeyoung Engineering & Construction Co., Ltd.TechWing, Inc.TES Co., Ltd.Tesna Co., Ltd.Theragen Etex Co., Ltd.TK Corp.Tokai Carbon Korea Co., Ltd.Tongyang Life Insurance Co., Ltd.Tongyang, Inc.Toptec Co., Ltd.Tovis Co., Ltd.TS Corp.Ubiquoss, Inc.Unid Co., Ltd.Union Semiconductor Equipment & Materials Co., Ltd.Uniquest Corp.UniTest, Inc.Value Added Technology Co., Ltd.Viatron Technologies, Inc.Vieworks Co., Ltd.Webzen, Inc.Wemade Co., Ltd.Whanin Pharmaceutical Co., Ltd.WiSoL Co., Ltd.Wonik Holdings Co., Ltd.WONIK IPS Co., Ltd.Wonik Materials Co., Ltd.Wonik QnC Corp.Woongjin Co., Ltd.Woongjin Coway Co., Ltd.Woori Financial Group, Inc., Sponsored ADRWoori Financial Group, Inc.Woori Investment Bank Co., Ltd.Woory Industrial Co., Ltd.Y G-1 Co., Ltd.
1,693 31,494* 1,094 32,480
Emerging Markets Sustainability Core 1 PortfolioCONTINUED
Shares Value»
SOUTH KOREA — (Continued)2,217 $ 175,147
* 7,191 32,9762,079 32,8851,336 73,081
184 14,621385 18,853
* 4,748 13,3021,873 14,4824,058 12,956
* 5,962 12,48149 51,364
* 1,299 10,0374,706 52,4111,557 13,804
818 11,079301 10,657
* 1,688 10,6991,739 13,613
300 14,1637,227 23,596
10,249 13,9692,645 21,5571,760 10,299
733 12,196605 17,271743 29,722
7,940 26,9572,210 11,2591,273 12,0991,700 35,7272,400 20,027
627 14,389* 1,970 25,292
992 22,2281,000 13,8033,340 48,024
* 3,176 9,8952,782 57,7071,057 20,703
* 2,491 22,583* 5,880 7,151
4,764 336,506# 4,929 163,939
2,968 32,788* 33,322 19,980
676 11,941886 6,308

YG Entertainment, Inc.YMC Co., Ltd.Youlchon Chemical Co., Ltd.Young Poong Corp.Youngone Corp.Youngone Holdings Co., Ltd.Yuanta Securities Korea Co., Ltd.Yuhan Corp.
TOTAL SOUTH KOREA
Aaeon Technology, Inc.
Ability Enterprise Co., Ltd.Ability Opto-Electronics Technology Co., Ltd.AcBel Polytech, Inc.Accton Technology Corp.Acer, Inc.Acter Group Corp., Ltd.Actron Technology Corp.A-DATA Technology Co., Ltd.Advanced Ceramic X Corp.Advanced International Multitech Co., Ltd.Advanced Wireless Semiconductor Co.Advancetek Enterprise Co., Ltd.Advantech Co., Ltd.Aerospace Industrial Development Corp.AGV Products Corp.Airtac International GroupAlchip Technologies, Ltd.ALI Corp.All Ring Tech Co., Ltd.Allis Electric Co., Ltd.Alltop Technology Co., Ltd.Alpha Networks, Inc.Altek Corp.Amazing Microelectronic Corp.Ampire Co., Ltd.AMPOC Far-East Co., Ltd.AmTRAN Technology Co., Ltd.Anpec Electronics Corp.Apacer Technology, Inc.APCB, Inc.Apex Biotechnology Corp.Apex International Co., Ltd.Arcadyan Technology Corp.Argosy Research, Inc.ASE Technology Holding Co., Ltd., ADRAsia Cement Corp.Asia Optical Co., Inc.Asia Pacific Telecom Co., Ltd.
517 10,8643,691 14,0961,226 16,256
20 11,4662,581 73,170
499 22,163* 12,741 29,485
530 96,531
39,691,160
TAIWAN — (17.0%)5,000 13,365
Emerging Markets Sustainability Core 1 PortfolioCONTINUED
Shares Value»
TAIWAN — (Continued)47,000 $ 25,96210,000 16,81031,000 22,47642,000 178,789
418,000 252,4613,450 18,1267,000 21,871
27,000 45,5385,000 38,166
14,000 18,47411,000 24,7918,000 4,234
19,000 159,81136,000 36,886
* 52,000 12,34914,000 142,955
5,000 16,039* 56,000 20,189
14,000 16,64944,000 25,589
6,000 11,03255,000 40,18546,000 36,83010,595 30,14616,000 13,44622,000 20,340
* 90,000 32,6105,000 10,072
11,000 11,57816,000 13,70412,000 11,504
* 23,000 37,81513,000 44,63913,000 24,402
# 9,375 41,06531,000 41,46219,000 50,301
* 196,000 44,491

Asia Polymer Corp.Asia Vital Components Co., Ltd.ASMedia Technology, Inc.ASPEED Technology, Inc.Asustek Computer, Inc.Aten International Co., Ltd.Aurora Corp.Avalue Technology, Inc.AVY Precision Technology, Inc.Axiomtek Co., Ltd.Bank of Kaohsiung Co., Ltd.Basso Industry Corp.BenQ Materials Corp.BES Engineering Corp.Bioteque Corp.Bizlink Holding, Inc.Brighton-Best International Taiwan, Inc.C Sun Manufacturing, Ltd.Cameo Communications, Inc.Capital Futures Corp.Capital Securities Corp.
Career Technology MFG. Co., Ltd.Casetek Holdings, Ltd.Caswell, Inc.Catcher Technology Co., Ltd.Cathay Financial Holding Co., Ltd.Cathay Real Estate Development Co., Ltd.Center Laboratories, Inc.Chailease Holding Co., Ltd.Chang Hwa Commercial Bank, Ltd.Chang Wah Electromaterials, Inc.Chang Wah Technology Co., Ltd.Channel Well Technology Co., Ltd.Chaun-Choung Technology Corp.CHC Healthcare GroupChen Full International Co., Ltd.Chenbro Micom Co., Ltd.Cheng Loong Corp.Cheng Mei Materials Technology Corp.Cheng Uei Precision Industry Co., Ltd.Chia Chang Co., Ltd.Chicony Electronics Co., Ltd.Chicony Power Technology Co., Ltd.Chieftek Precision Co., Ltd.Chilisin Electronics Corp.China Bills Finance Corp.China Chemical & Pharmaceutical Co., Ltd.China Development Financial Holding Corp.China General Plastics Corp.
35,310 17,01238,000 48,985
2,000 33,8861,000 21,878
54,000 382,5907,000 19,1044,000 12,362
10,000 19,56512,000 14,465
6,000 10,40541,480 13,00610,000 18,36316,000 12,297
189,000 46,51110,000 41,73313,000 98,52519,000 21,24725,000 23,303
* 38,000 10,47815,000 21,047
111,060 33,793
Emerging Markets Sustainability Core 1 PortfolioCONTINUED
Shares Value»
TAIWAN — (Continued)36,480 $ 37,69018,000 29,496
8,000 19,638124,000 908,690339,000 442,614120,000 83,973
11,531 29,43757,185 239,893
115,440 80,6784,000 20,3092,000 17,698
26,000 21,1373,000 23,542
11,000 17,24613,000 17,60110,000 20,454
110,000 66,205* 62,000 21,175
46,000 49,86313,000 16,40078,185 198,80924,055 43,289
8,000 24,53820,979 56,12693,000 44,05717,000 10,084
547,000 162,42952,655 35,965

China Life Insurance Co., Ltd.China Man-Made Fiber Corp.China Metal ProductsChina Motor Corp.China Steel Chemical Corp.China Steel Corp.Chin-Poon Industrial Co., Ltd.Chipbond Technology Corp.ChipMOS Technologies, Inc., ADRChlitina Holding, Ltd.Chong Hong Construction Co., Ltd.Chroma ATE, Inc.Chung Hsin Electric & Machinery Manufacturing Corp.Chung Hung Steel Corp.Chung Hwa Pulp Corp.Chunghwa Telecom Co., Ltd., Sponsored ADRClevo Co.CMC Magnetics Corp.Compal Electronics, Inc.Compeq Manufacturing Co., Ltd.Concord Securities Co., Ltd.Concraft Holding Co., Ltd.Continental Holdings Corp.Contrel Technology Co., Ltd.Coretronic Corp.Co-Tech Development Corp.Coxon Precise Industrial Co., Ltd.Creative Sensor, Inc.CSBC Corp. TaiwanCTBC Financial Holding Co., Ltd.CTCI Corp.
Cub Elecparts, Inc.Cyberlink Corp.CyberPower Systems, Inc.CyberTAN Technology, Inc.Cypress Technology Co., Ltd.DA CIN Construction Co., Ltd.Dadi Early-Childhood Education Group, Ltd.Dafeng TV, Ltd.Da-Li Development Co., Ltd.Darfon Electronics Corp.Darwin Precisions Corp.De Licacy Industrial Co., Ltd.Delta Electronics, Inc.Depo Auto Parts Ind Co., Ltd.D-Link Corp.Dynamic Electronics Co., Ltd.Dynapack International Technology Corp.E & R Engineering Corp.
364,851 300,673179,550 53,974
14,000 14,59383,000 68,07519,000 77,321
289,000 222,33853,000 57,07165,000 130,320
2,254 41,0219,000 70,610
27,000 77,50547,000 218,91432,000 21,60757,000 19,18738,000 12,421
5,027 172,17566,000 67,307
* 174,000 38,029611,000 373,301124,000 106,329
46,350 10,9443,454 16,293
41,000 22,86338,000 21,48584,000 107,86625,000 26,60218,000 10,83915,000 10,503
* 22,750 19,047609,000 395,865
54,000 78,831
Emerging Markets Sustainability Core 1 PortfolioCONTINUED
Shares Value»
TAIWAN — (Continued)5,517 $ 49,8497,000 19,2282,000 5,879
35,000 17,8747,000 17,736
35,000 22,0542,000 18,858
10,000 11,42212,000 11,50921,000 27,79241,000 23,61918,000 13,46855,000 265,49313,000 30,022
* 57,000 24,019* 32,000 10,224
11,000 16,874* 11,000 10,542

E Ink Holdings, Inc.E.Sun Financial Holding Co., Ltd.Eastern Media International Corp.Eclat Textile Co., Ltd.Edom Technology Co., Ltd.eGalax_eMPIA Technology, Inc.Egis Technology, Inc.Elan Microelectronics Corp.E-LIFE MALL Corp.Elite Advanced Laser Corp.Elite Material Co., Ltd.Elite Semiconductor Memory Technology, Inc.Elitegroup Computer Systems Co., Ltd.eMemory Technology, Inc.Ennoconn Corp.EnTie Commercial Bank Co., Ltd.Epistar Corp.Eternal Materials Co., Ltd.Etron Technology, Inc.Eurocharm Holdings Co., Ltd.Everest Textile Co., Ltd.Evergreen International Storage & Transport Corp.Everlight Chemical Industrial Corp.Everlight Electronics Co., Ltd.Excellence Opto, Inc.Excelsior Medical Co., Ltd.Far Eastern Department Stores, Ltd.Far Eastern International BankFar Eastern New Century Corp.Far EasTone Telecommunications Co., Ltd.Faraday Technology Corp.Farglory Land Development Co., Ltd.Federal Corp.Feedback Technology Corp.Feng Hsin Steel Co., Ltd.First Financial Holding Co., Ltd.First Hi-Tec Enterprise Co., Ltd.First Insurance Co., Ltd. (The)First Steamship Co., Ltd.FLEXium Interconnect, Inc.Flytech Technology Co., Ltd.
FocalTech Systems Co., Ltd.Formosa Advanced Technologies Co., Ltd.Formosa Chemicals & Fibre Corp.Formosa Laboratories, Inc.Formosa Plastics Corp.Formosa Sumco Technology Corp.Foxconn Technology Co., Ltd.Foxsemicon Integrated Technology, Inc.
74,000 81,082339,214 282,539
51,000 16,73718,000 235,55425,000 10,97711,000 16,7267,000 49,503
37,100 94,5626,000 12,433
15,600 27,94426,000 98,92915,000 15,76837,000 12,870
5,000 60,1104,124 28,778
50,000 26,12878,000 61,493
143,920 120,938* 50,000 17,895
5,000 21,407* 29,000 10,594
32,000 14,67873,000 40,23637,000 35,56234,000 23,57115,000 24,15595,000 71,903
141,002 56,516201,000 190,163
53,000 121,65617,000 33,93441,000 50,135
* 34,000 13,1965,000 11,765
17,000 31,173229,960 172,662
13,000 18,30326,000 12,555
* 49,000 19,67333,000 100,43314,000 34,165
Emerging Markets Sustainability Core 1 PortfolioCONTINUED
Shares Value»
TAIWAN — (Continued)34,000 $ 25,22110,000 10,64749,000 149,051
9,000 11,00246,000 147,973
6,000 21,29088,000 180,80514,150 53,342

FSP Technology, Inc.Fubon Financial Holding Co., Ltd.Fulgent Sun International Holding Co., Ltd.Fullerton Technology Co., Ltd.Fulltech Fiber Glass Corp.G Shank Enterprise Co., Ltd.Gallant Precision Machining Co., Ltd.Gamania Digital Entertainment Co., Ltd.GCS Holdings, Inc.GEM Services, Inc.Gemtek Technology Corp.General Interface Solution Holding, Ltd.Generalplus Technology, Inc.Genesys Logic, Inc.Genius Electronic Optical Co., Ltd.Getac Technology Corp.Giant Manufacturing Co., Ltd.Giantplus Technology Co., Ltd.Gigabyte Technology Co., Ltd.Gigastorage Corp.Ginko International Co., Ltd.Global Brands Manufacture, Ltd.Global Mixed Mode Technology, Inc.Global PMX Co., Ltd.Global Unichip Corp.Globalwafers Co., Ltd.Globe Union Industrial Corp.Gloria Material Technology Corp.Gold Circuit Electronics, Ltd.Goldsun Building Materials Co., Ltd.Good Will Instrument Co., Ltd.Gourmet Master Co., Ltd.Grand Ocean Retail Group, Ltd.Grand Pacific PetrochemicalGrand Plastic Technology Corp.GrandTech CG Systems, Inc.Grape King Bio, Ltd.Great China Metal IndustryGreat Wall Enterprise Co., Ltd.Greatek Electronics, Inc.Green Seal Holding, Ltd.GTM Holdings Corp.Hannstar Board Corp.HannsTouch Solution, Inc.Harvatek Corp.Hey Song Corp.Highwealth Construction Corp.HIM International Music, Inc.Hiroca Holdings, Ltd.Hitron Technology, Inc.Hiwin Technologies Corp.
20,000 12,387346,000 478,331
10,307 29,76417,000 10,82755,000 26,69216,000 12,62530,000 18,778
6,000 12,9964,000 7,697
12,100 24,646* 48,000 41,375
27,000 99,24612,000 13,11914,000 14,389
8,000 107,38833,000 47,96329,000 221,35735,000 13,48068,000 101,620
* 31,000 9,1483,000 19,415
54,000 29,3476,000 19,1724,000 15,0555,000 40,628
15,000 159,15527,000 14,02034,000 21,100
* 35,000 14,964137,000 36,557
13,000 11,1216,208 36,758
13,000 14,117* 102,000 66,594
3,000 12,98811,550 15,42210,000 61,95117,000 13,30087,150 113,96826,000 37,041
9,000 11,30521,000 15,42736,718 43,848
* 83,000 38,75922,000 10,60712,000 12,222
104,000 162,6025,000 21,0717,000 15,282
27,080 17,69429,514 261,746
Emerging Markets Sustainability Core 1 PortfolioCONTINUED

Ho Tung Chemical Corp.Holtek Semiconductor, Inc.Holy Stone Enterprise Co., Ltd.Hon Hai Precision Industry Co., Ltd.Hon Hai Precision Industry Co., Ltd., GDRHon Hai Precision Industry Co., Ltd., GDRHong Pu Real Estate Development Co., Ltd.Hong YI Fiber Industry Co.Hota Industrial Manufacturing Co., Ltd.Hotai Motor Co., Ltd.Hotron Precision Electronic Industrial Co., Ltd.Hsin Kuang Steel Co., Ltd.Hsin Yung Chien Co., Ltd.Hu Lane Associate, Inc.HUA ENG Wire & Cable Co., Ltd.Hua Nan Financial Holdings Co., Ltd.Huaku Development Co., Ltd.Huang Hsiang Construction Corp.Hung Sheng Construction, Ltd.Ibase Technology, Inc.IBF Financial Holdings Co., Ltd.Ichia Technologies, Inc.IEI Integration Corp.Infortrend Technology, Inc.Innodisk Corp.Intai Technology Corp.Integrated Service Technology, Inc.International CSRC Investment Holdings Co.International Games System Co., Ltd.Inventec Corp.Iron Force Industrial Co., Ltd.I-Sheng Electric Wire & Cable Co., Ltd.ITE Technology, Inc.ITEQ Corp.Jarllytec Co., Ltd.Jentech Precision Industrial Co., Ltd.Jih Lin Technology Co., Ltd.Jih Sun Financial Holdings Co., Ltd.Jinli Group Holdings, Ltd.Jourdeness Group, Ltd.KEE TAI Properties Co., Ltd.Kenda Rubber Industrial Co., Ltd.Kenmec Mechanical Engineering Co., Ltd.Kerry TJ Logistics Co., Ltd.Kindom Construction Corp.King Slide Works Co., Ltd.Kingpak Technology, Inc.Kingpak Technology, Inc.King's Town Bank Co., Ltd.King's Town Construction Co., Ltd.Kinik Co.Kinpo Electronics
Shares Value»
TAIWAN — (Continued)104,000 $ 23,392
9,000 20,10824,000 71,806
424,600 1,064,3754,692 23,9277,216 36,657
33,000 21,81317,000 10,42016,000 55,89316,000 230,27913,650 21,10711,000 10,8304,000 11,4485,000 12,455
23,000 7,289241,200 169,740
37,000 96,92126,000 26,35397,800 63,07617,000 25,179
264,488 94,211* 23,000 11,913
23,700 25,06325,000 10,373
5,147 20,8115,000 22,588
13,000 19,78494,885 115,522
9,000 88,987386,000 287,069
8,000 27,85111,000 14,60414,000 14,89423,000 100,193
7,000 15,4079,000 36,5386,000 12,844
188,502 64,97323,000 10,802
4,000 12,95631,000 12,01918,000 16,76022,000 9,90721,000 24,43931,000 25,029
2,000 21,0813,000 14,283
* 313 43388,000 89,89723,000 20,620
9,000 16,959160,000 53,336

Kinsus Interconnect Technology Corp.KMC Kuei Meng International, Inc.KS Terminals, Inc.Kung Long Batteries Industrial Co., Ltd.Kuo Toong International Co., Ltd.Kuoyang Construction Co., Ltd.KYE Systems Corp.
L&K Engineering Co., Ltd.Land Mark Optoelectronics Corp.Lanner Electronics, Inc.Largan Precision Co., Ltd.Lealea Enterprise Co., Ltd.Lelon Electronics Corp.Lemtech Holdings Co., Ltd.Lextar Electronics Corp.Li Cheng Enterprise Co., Ltd.Lian HWA Food Corp.Lien Hwa Industrial Corp.Lingsen Precision Industries, Ltd.Lite-On Semiconductor Corp.Lite-On Technology Corp.Long Bon International Co., Ltd.Longchen Paper & Packaging Co., Ltd.Lotes Co., Ltd.Lumax International Corp., Ltd.Lung Yen Life Service Corp.Macauto Industrial Co., Ltd.Machvision, Inc.Macroblock, Inc.Makalot Industrial Co., Ltd.Marketech International Corp.Materials Analysis Technology, Inc.MediaTek, Inc.Mega Financial Holding Co., Ltd.Mercuries & Associates Holding, Ltd.Mercuries Life Insurance Co., Ltd.Merida Industry Co., Ltd.Merry Electronics Co., Ltd.Microbio Co., Ltd.Micro-Star International Co., Ltd.Mildef Crete, Inc.MIN AIK Technology Co., Ltd.Mirle Automation Corp.Mitac Holdings Corp.momo.com, Inc.Mosel Vitelic, Inc.Motech Industries, Inc.MPI Corp.Nak Sealing Technologies Corp.
29,000 36,8195,250 17,518
12,000 15,5947,000 37,385
* 18,000 11,32840,000 15,45818,000 4,733
Emerging Markets Sustainability Core 1 PortfolioCONTINUED
Shares Value»
TAIWAN — (Continued)21,000 $ 18,916
7,000 55,0359,000 22,5754,000 540,714
61,000 17,86318,000 24,083
3,000 13,49828,000 13,649
9,000 17,02610,000 14,90550,800 63,65237,000 10,56611,000 11,133
195,000 276,04020,000 10,17697,000 46,258
7,256 53,0608,000 22,478
10,000 19,9965,000 13,7404,000 47,2415,000 19,170
19,750 115,3138,000 13,3468,000 19,224
63,000 630,140353,000 362,987
54,200 30,826* 138,877 48,223
14,000 87,21622,193 106,764
* 70,000 30,374# 99,000 277,050
2,000 2,797* 20,000 9,389
16,000 22,310104,840 108,607
7,000 58,695* 30,000 19,261* 92,000 32,079
9,000 19,18610,000 22,596

Namchow Holdings Co., Ltd.Nan Ya Plastics Corp.Nantex Industry Co., Ltd.Nanya Technology Corp.National Petroleum Co., Ltd.Nichidenbo Corp.Nien Hsing Textile Co., Ltd.Novatek Microelectronics Corp.Nuvoton Technology Corp.O-Bank Co., Ltd.On-Bright Electronics, Inc.OptoTech Corp.Orient Semiconductor Electronics, Ltd.Oriental Union Chemical Corp.Pan Jit International, Inc.Pan-International Industrial Corp.Parade Technologies, Ltd.
PCL Technologies, Inc.Pegatron Corp.Pharmally International Holding Co., Ltd.Phison Electronics Corp.Pixart Imaging, Inc.Planet Technology Corp.Plotech Co., Ltd.Polytronics Technology Corp.Posiflex Technology, Inc.Pou Chen Corp.Power Wind Health Industry, Inc.Powertech Technology, Inc.Poya International Co., Ltd.President Chain Store Corp.President Securities Corp.Primax Electronics, Ltd.Prince Housing & Development Corp.Promate Electronic Co., Ltd.Prosperity Dielectrics Co., Ltd.Qisda Corp.QST International Corp.Quang Viet Enterprise Co., Ltd.Quanta Computer, Inc.Quanta Storage, Inc.Radiant Opto-Electronics Corp.Rafael Microelectronics, Inc.Realtek Semiconductor Corp.Rechi Precision Co., Ltd.Rich Development Co., Ltd.Ritek Corp.Roo Hsing Co., Ltd.Ruentex Development Co., Ltd.
15,000 25,595144,000 328,816
45,200 50,26973,000 170,80912,000 15,93216,000 25,25313,000 10,753
105,000 554,51215,000 23,714
* 76,000 19,1843,000 16,002
30,000 21,297* 41,000 20,248
52,000 39,42141,000 33,49256,000 45,128
4,000 65,855
Emerging Markets Sustainability Core 1 PortfolioCONTINUED
Shares Value»
TAIWAN — (Continued)7,000 $ 18,900
166,000 269,4405,000 37,266
18,000 176,2319,000 31,2076,000 12,863
38,000 22,4249,000 18,7783,000 11,130
100,000 123,0613,000 22,106
98,000 267,5752,000 27,577
41,000 394,298104,000 42,367
36,000 61,302113,000 40,23312,000 12,645
9,000 17,858207,000 128,359
6,000 12,6643,000 15,697
121,000 222,38224,000 35,54531,000 121,823
3,000 20,04130,000 199,24031,000 24,66064,000 19,399
* 35,000 9,698* 86,000 33,610
105,400 139,788
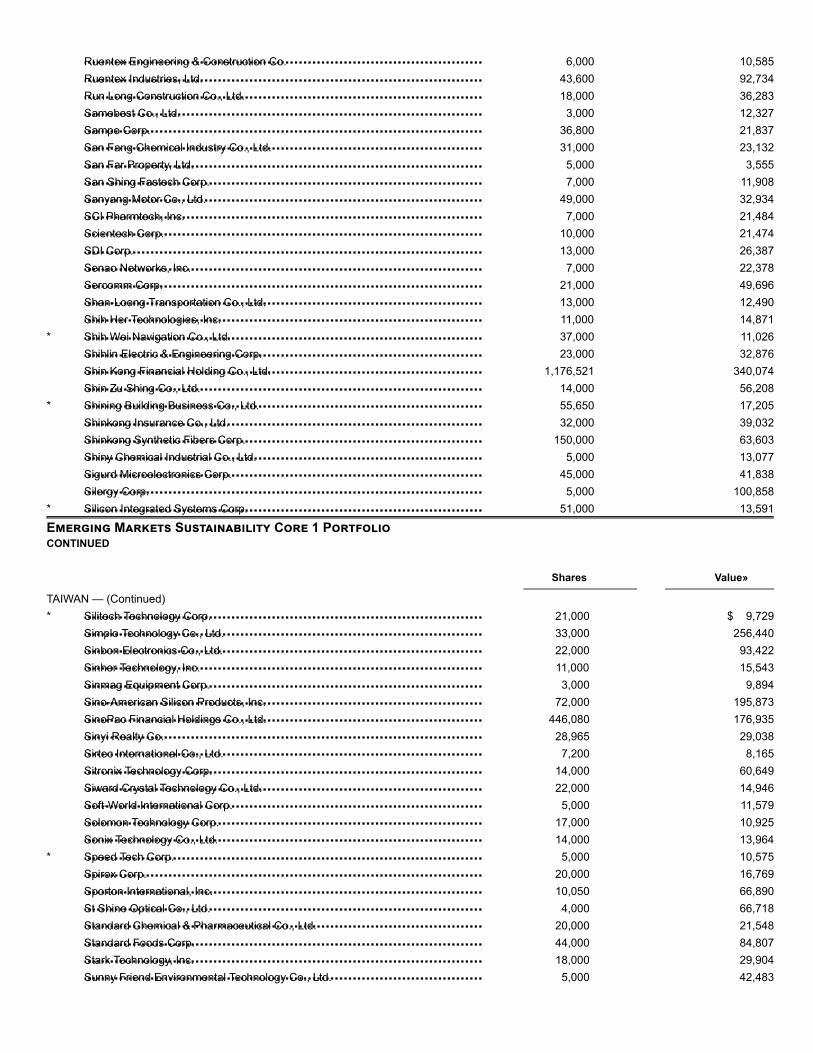
Ruentex Engineering & Construction Co.Ruentex Industries, Ltd.Run Long Construction Co., Ltd.Samebest Co., Ltd.Sampo Corp.San Fang Chemical Industry Co., Ltd.San Far Property, Ltd.San Shing Fastech Corp.Sanyang Motor Co., Ltd.SCI Pharmtech, Inc.Scientech Corp.SDI Corp.Senao Networks, Inc.Sercomm Corp.Shan-Loong Transportation Co., Ltd.Shih Her Technologies, Inc.Shih Wei Navigation Co., Ltd.Shihlin Electric & Engineering Corp.Shin Kong Financial Holding Co., Ltd.Shin Zu Shing Co., Ltd.Shining Building Business Co., Ltd.Shinkong Insurance Co., Ltd.Shinkong Synthetic Fibers Corp.Shiny Chemical Industrial Co., Ltd.Sigurd Microelectronics Corp.Silergy Corp.Silicon Integrated Systems Corp.
Silitech Technology Corp.Simplo Technology Co., Ltd.Sinbon Electronics Co., Ltd.Sinher Technology, Inc.Sinmag Equipment Corp.Sino-American Silicon Products, Inc.SinoPac Financial Holdings Co., Ltd.Sinyi Realty Co.Sirtec International Co., Ltd.Sitronix Technology Corp.Siward Crystal Technology Co., Ltd.Soft-World International Corp.Solomon Technology Corp.Sonix Technology Co., Ltd.Speed Tech Corp.Spirox Corp.Sporton International, Inc.St Shine Optical Co., Ltd.Standard Chemical & Pharmaceutical Co., Ltd.Standard Foods Corp.Stark Technology, Inc.Sunny Friend Environmental Technology Co., Ltd.
6,000 10,58543,600 92,73418,000 36,283
3,000 12,32736,800 21,83731,000 23,132
5,000 3,5557,000 11,908
49,000 32,9347,000 21,484
10,000 21,47413,000 26,387
7,000 22,37821,000 49,69613,000 12,49011,000 14,871
* 37,000 11,02623,000 32,876
1,176,521 340,07414,000 56,208
* 55,650 17,20532,000 39,032
150,000 63,6035,000 13,077
45,000 41,8385,000 100,858
* 51,000 13,591
Emerging Markets Sustainability Core 1 PortfolioCONTINUED
Shares Value»
TAIWAN — (Continued)* 21,000 $ 9,729
33,000 256,44022,000 93,42211,000 15,5433,000 9,894
72,000 195,873446,080 176,935
28,965 29,0387,200 8,165
14,000 60,64922,000 14,946
5,000 11,57917,000 10,92514,000 13,964
* 5,000 10,57520,000 16,76910,050 66,890
4,000 66,71820,000 21,54844,000 84,80718,000 29,904
5,000 42,483

Sunonwealth Electric Machine Industry Co., Ltd.Sunplus Technology Co., Ltd.Sunrex Technology Corp.Sunspring Metal Corp.Supreme Electronics Co., Ltd.Sweeten Real Estate Development Co., Ltd.Syncmold Enterprise Corp.Synnex Technology International Corp.Systex Corp.T3EX Global Holdings Corp.TA Chen Stainless PipeTa Ya Electric Wire & CableTA-I Technology Co., Ltd.Taichung Commercial Bank Co., Ltd.TaiDoc Technology Corp.Taiflex Scientific Co., Ltd.Tainan Spinning Co., Ltd.Taishin Financial Holding Co., Ltd.Taiwan Business BankTaiwan Cement Corp.Taiwan Chinsan Electronic Industrial Co., Ltd.Taiwan Cogeneration Corp.Taiwan Cooperative Financial Holding Co., Ltd.Taiwan Fertilizer Co., Ltd.Taiwan Fire & Marine Insurance Co., Ltd.Taiwan FU Hsing Industrial Co., Ltd.Taiwan Glass Industry Corp.Taiwan High Speed Rail Corp.Taiwan Hon Chuan Enterprise Co., Ltd.Taiwan Land Development Corp.Taiwan Mobile Co., Ltd.Taiwan Navigation Co., Ltd.Taiwan Optical Platform Co., Ltd.Taiwan Paiho, Ltd.Taiwan PCB Techvest Co., Ltd.Taiwan Sakura Corp.Taiwan Secom Co., Ltd.
Taiwan Semiconductor Co., Ltd.Taiwan Semiconductor Manufacturing Co., Ltd., Sponsored ADRTaiwan Semiconductor Manufacturing Co., Ltd.Taiwan Shin Kong Security Co., Ltd.Taiwan Styrene MonomerTaiwan Surface Mounting Technology Corp.Taiwan TEA Corp.Taiwan Union Technology Corp.Taiyen Biotech Co., Ltd.Tatung Co., Ltd.TCI Co., Ltd.Teco Electric and Machinery Co., Ltd.
22,000 24,67743,000 19,07118,000 22,97414,000 14,16457,000 51,37617,000 15,198
7,500 18,807174,000 213,609
10,000 23,59922,000 16,890
# 151,910 224,45449,000 17,51613,000 16,532
222,175 90,1729,000 37,354
24,000 37,068132,000 51,869261,000 122,142231,960 99,519163,800 234,268
10,000 11,30240,000 34,015
375,430 252,61032,000 49,22636,000 23,31310,000 13,797
100,000 38,73684,000 111,96034,000 59,875
* 51,000 15,00649,000 172,49115,000 10,789
3,000 10,59225,000 73,38931,000 40,24219,000 28,54534,000 94,818
Emerging Markets Sustainability Core 1 PortfolioCONTINUED
Shares Value»
TAIWAN — (Continued)22,000 $ 34,91698,219 4,187,07617,000 139,79232,000 38,36782,000 64,27925,000 61,126
104,000 54,16622,000 89,96710,000 10,895
* 174,000 111,9148,597 113,719
214,000 170,410

Test Research, Inc.Test-Rite International Co., Ltd.Thinking Electronic Industrial Co., Ltd.Ton Yi Industrial Corp.Tong Hsing Electronic Industries, Ltd.Tong Yang Industry Co., Ltd.TOPBI International Holdings, Ltd.Topco Scientific Co., Ltd.Topkey Corp.Topoint Technology Co., Ltd.Toung Loong Textile ManufacturingTPK Holding Co., Ltd.Transcend Information, Inc.Tsann Kuen Enterprise Co., Ltd.TSC Auto ID Technology Co., Ltd.TSEC Corp.TSRC Corp.Ttet Union Corp.TTY Biopharm Co., Ltd.Tung Ho Steel Enterprise Corp.Tung Thih Electronic Co., Ltd.TURVO International Co., Ltd.TWi Pharmaceuticals, Inc.TXC Corp.TYC Brother Industrial Co., Ltd.Tyntek Corp.Union Bank Of TaiwanUni-President Enterprises Corp.Unitech Printed Circuit Board Corp.United Integrated Services Co., Ltd.United Radiant TechnologyUnited Renewable Energy Co., Ltd.Unity Opto Technology Co., Ltd.Unizyx Holding Corp.UPC Technology Corp.USI Corp.Utechzone Co., Ltd.VHQ Media Holdings, Ltd.Visual Photonics Epitaxy Co., Ltd.Voltronic Power Technology Corp.Wafer Works Corp.Wah Hong Industrial Corp.Wah Lee Industrial Corp.Walsin Lihwa Corp.Walton Advanced Engineering, Inc.Wei Chuan Foods Corp.Weikeng Industrial Co., Ltd.
Well Shin Technology Co., Ltd.Wholetech System Hitech, Ltd.
20,000 30,22515,000 9,830
8,000 20,211177,000 70,784
12,000 49,36526,000 37,981
8,000 22,38616,000 42,450
6,000 32,96917,000 10,39713,000 21,457
* 36,000 63,66918,000 39,25519,000 11,708
3,300 27,002* 34,901 9,771
54,000 46,8472,000 7,807
11,000 28,55595,000 65,686
5,000 11,20410,000 23,761
* 6,000 13,68027,000 33,18022,000 19,83145,000 24,16266,950 25,791
292,000 755,83282,540 62,49721,000 106,24833,000 19,317
* 196,000 56,203* 44,000 12,525* 24,000 19,278
146,800 52,966107,320 41,097
9,000 20,4065,000 23,265
16,000 51,0736,000 129,346
34,000 38,96613,000 11,65417,000 29,701
302,000 144,80731,000 10,31616,000 15,35631,087 20,125
Emerging Markets Sustainability Core 1 PortfolioCONTINUED
Shares Value»
TAIWAN — (Continued)10,000 $ 16,37920,000 20,539

Win Semiconductors Corp.Winbond Electronics Corp.Winmate, Inc.Wisdom Marine Lines Co., Ltd.Wistron Corp.Wistron NeWeb Corp.Wowprime Corp.WPG Holdings, Ltd.WT Microelectronics Co., Ltd.WUS Printed Circuit Co., Ltd.Xxentria Technology Materials Corp.Yageo Corp.Yang Ming Marine Transport Corp.YC Co., Ltd.YC INOX Co., Ltd.Yea Shin International Development Co., Ltd.Yeong Guan Energy Technology Group Co., Ltd.YFC-Boneagle Electric Co., Ltd.YFY, Inc.Yi Jinn Industrial Co., Ltd.Yieh Phui Enterprise Co., Ltd.Youngtek Electronics Corp.Yuanta Financial Holding Co., Ltd.Yulon Finance Corp.Yulon Motor Co., Ltd.YungShin Global Holding Corp.Zeng Hsing Industrial Co., Ltd.Zenitron Corp.Zero One Technology Co., Ltd.Zhen Ding Technology Holding, Ltd.Zig Sheng Industrial Co., Ltd.Zinwell Corp.Zippy Technology Corp.
TOTAL TAIWAN
Advanced Info Service PCLAdvanced Information Technology PCLAEON Thana Sinsap Thailand PCLAfter You PCLAirports of Thailand PCLAnanda Development PCLAP Thailand PCLAsia Aviation PCLAsia Plus Group Holdings PCLAsia Sermkij Leasing PCLAsian Seafoods Coldstorage PCLBangchak Corp. PCLBangkok Aviation Fuel Services PCLBangkok Bank PCLBangkok Bank PCLBangkok Chain Hospital PCLBangkok Dusit Medical Services PCL, Class FBangkok Expressway & Metro PCLBangkok Insurance PCL
37,000 312,704231,000 140,828
7,000 11,77132,000 33,422
373,436 277,42936,340 90,960
8,000 20,318236,400 312,262
93,000 120,69638,000 37,949
8,000 18,055# 36,396 305,618* 79,000 22,069
33,164 13,11320,000 16,87720,000 10,955
* 8,000 14,51016,000 15,09151,000 18,96029,000 13,037
197,800 57,46712,000 17,674
594,000 332,79917,600 66,162
143,000 109,78512,000 15,875
4,000 17,41615,000 10,44923,000 22,34554,000 196,44849,000 13,84441,000 29,732
9,000 10,132
40,275,026
THAILAND — (3.8%)26,600 184,22417,500 13,770
7,900 60,87831,700 17,625
126,900 297,083243,100 28,298324,100 80,617249,400 31,139125,000 11,299
15,500 12,54961,400 13,77551,500 50,65418,700 22,041
3,600 21,2455,100 30,098
143,700 71,95559,300 48,203
469,600 160,3252,100 22,465

Bangkok Land PCLBangkok Life Assurance PCL
Bank of Ayudhya PCLBCPG PCLBeauty Community PCLBEC World PCLBerli Jucker PCLBetter World Green PCLBig Camera Corp. PCLBTS Group Holdings PCLBumrungrad Hospital PCLCal-Comp Electronics Thailand PCLCarabao Group PCL, Class FCentral Plaza Hotel PCLCH Karnchang PCLChularat Hospital PCL, Class FCIMB Thai Bank PCLCOL PCLCom7 PCLCountry Group Development PCLCP ALL PCLDelta Electronics Thailand PCLDemco PCLDhipaya Insurance PCLDo Day Dream PCLDynasty Ceramic PCLEastern Polymer Group PCL, Class FEastern Water Resources Development and Management PCL, Class FEnergy Absolute PCLEsso Thailand PCLForth Smart Service PCLFortune Parts Industry PCLGlobal Green Chemicals PCLGolden Land Property Development PCLGroup Lease PCLGunkul Engineering PCLHaad Thip PCLHana Microelectronics PCLHome Product Center PCLIchitan Group PCLIndorama Ventures PCLInterlink Communication PCLIntouch Holdings PCLIRPC PCLJasmine International PCLJMT Network Services PCLJubilee Enterprise PCLKarmarts PCLKasikornbank PCL
898,300 50,23821,200 17,922
Emerging Markets Sustainability Core 1 PortfolioCONTINUED
Shares Value»
THAILAND — (Continued)17,800 $ 22,717
101,900 65,272302,000 36,725
* 249,600 80,75251,800 87,161
364,600 10,195357,200 14,402298,400 120,311
23,000 127,508187,000 10,641
31,100 79,12854,600 60,36128,600 25,108
475,500 36,797* 636,000 14,889
15,600 12,17473,800 60,590
* 681,000 23,250129,500 365,278
9,500 16,371153,600 16,082
28,800 23,31727,700 22,517
230,600 16,645104,600 23,807
57,100 25,064133,100 226,125182,400 59,307
92,500 23,610117,400 10,230
* 67,200 25,56589,900 24,554
* 48,500 10,487391,200 39,432
7,300 5,10393,100 84,760
269,000 150,441127,700 32,387125,000 166,640112,600 18,855
11,700 24,2521,153,400 180,014
415,000 85,01122,400 13,83841,000 23,329
139,200 26,0258,500 47,813

Kasikornbank PCLKCE Electronics PCLKGI Securities Thailand PCLKhon Kaen Sugar Industry PCLKiatnakin Bank PCLKrung Thai Bank PCLKrungthai Card PCLLalin Property PCLLand & Houses PCLLH Financial Group PCLLoxley PCLLPN Development PCL
Major Cineplex Group PCLMC Group PCLMega Lifesciences PCLMK Restaurants Group PCLMono Technology PCLMuangthai Capital PCLNamyong Terminal PCLNetbay PCLOrigin Property PCL, Class FPlan B Media Pcl, Class FPolyplex Thailand PCLPrecious Shipping PCLPremier Marketing PCLProperty Perfect PCLPruksa Holding PCLPTG Energy PCLPTT Exploration & Production PCLPTT Global Chemical PCLPylon PCLQuality Houses PCLRaimon Land PCLRajthanee Hospital PCLRatchthani Leasing PCLRobinson PCLRS PCLSabina PCLSaha Pathana Inter-Holding PCLSamart Corp. PCLSamart Telcoms PCLSansiri PCLSappe PCLSC Asset Corp. PCLScan Inter PCLSEAFCO PCLSena Development PCLSiam Cement PCL (The)Siam Commercial Bank PCL (The)
23,600 132,36965,200 36,464
138,200 21,210113,700 10,27839,100 92,808
192,900 122,93469,000 107,12995,800 17,755
404,500 148,621793,200 37,397
* 318,400 23,81173,800 17,397
Emerging Markets Sustainability Core 1 PortfolioCONTINUED
Shares Value»
THAILAND — (Continued)65,400 $ 62,200
133,900 35,04870,000 80,23142,300 107,968
* 305,000 17,85171,700 141,04577,900 12,20924,000 24,191
152,900 40,518287,100 79,815
32,000 16,127* 78,200 21,740
75,500 22,953475,900 12,070
38,800 27,75592,400 67,599
8,500 37,449155,500 305,893
55,700 11,229416,400 41,159281,100 9,963
28,600 25,341222,625 53,204
61,100 126,15365,000 33,81624,600 22,996
9,200 19,81880,000 26,27276,700 30,426
1,355,700 65,68034,600 25,650
185,800 17,27896,400 10,40693,390 24,748
108,700 12,7247,300 103,014
62,100 277,638

Siam Future Development PCLSiam Global House PCLSiam Wellness Group PclSiamgas & Petrochemicals PCLSingha Estate PCLSino-Thai Engineering & Construction PCLSomboon Advance Technology PCLSPCG PCLSri Trang Agro-Industry PCLSrisawad Corp. PCLSrivichai Vejvivat PCLStar Petroleum Refining PCLSTP & I PCLSupalai PCLSuper Energy Corp. PCLSVI PCLSynnex Thailand PCLTAC Consumer PCLTaokaenoi Food & Marketing PCL, Class FThai Nakarin Hospital PCLThai Oil PCLThai Solar Energy PCL, Class F
Thai Stanley Electric PCLThai Stanley Electric PCL, Class FThai Union Group PCL, Class FThai Vegetable Oil PCLThaicom PCLThanachart Capital PCLThitikorn PCLTIPCO Foods PCLTisco Financial Group PCLTMB Bank PCLTotal Access Communication PCLTriton Holding PCLTrue Corp. PCLTTCL PCLTTW PCLU City PCL, Class FUnique Engineering & Construction PCLUniventures PCLVGI Global Media PCLVinythai PCLWHA Corp. PCLWHA Utilities and Power PCLWorkpoint Entertainment PCL
TOTAL THAILAND
Akbank Turk A.S.Anadolu Anonim Turk Sigorta Sirketi
153,720 31,988216,320 116,759
50,300 21,26282,600 26,186
104,200 12,061119,600 99,16442,100 26,00975,300 46,519
144,600 55,95096,420 171,647
7,100 1,316145,800 46,696239,500 70,086115,300 82,478
* 2,018,000 46,587130,800 17,097
95,270 30,667165,500 26,153110,400 40,56318,000 21,216
106,300 238,488131,200 11,859
Emerging Markets Sustainability Core 1 PortfolioCONTINUED
Shares Value»
THAILAND — (Continued)3,500 $ 24,5812,700 18,963
108,900 66,92359,300 55,434
* 129,600 24,65244,900 86,13637,600 12,22635,600 12,96434,200 112,313
1,651,100 101,466109,800 208,854649,200 7,599651,400 136,613
* 66,100 23,212114,500 50,260
* 246,000 14,79851,400 18,21772,900 15,881
183,800 57,67119,900 16,823
340,900 51,87567,800 13,55824,500 22,704
9,134,067
TURKEY — (1.0%)* 125,766 168,238# 31,009 22,496

Anadolu Efes Biracilik Ve Malt Sanayii A.S.Anadolu Hayat Emeklilik A.S.Arcelik A.S.Aselsan Elektronik Sanayi Ve Ticaret A.S.AvivaSA Emeklilik ve Hayat A.S., Class AAygaz A.S.Bera Holding A.S.BIM Birlesik Magazalar A.S.Borusan Mannesmann Boru Sanayi ve Ticaret A.S.Coca-Cola Icecek A.S.Dogan Sirketler Grubu Holding A.S.EGE Endustri VE Ticaret A.S.ENERJISA ENERJI ASEnka Insaat ve Sanayi A.S.Eregli Demir ve Celik Fabrikalari TASFord Otomotiv Sanayi A.S.Ipek Dogal Enerji Kaynaklari Arastirma Ve Uretim A.S.Kardemir Karabuk Demir Celik Sanayi ve Ticaret A.S., Class DKordsa Teknik Tekstil A.S.Koza Altin Isletmeleri A.S.Koza Anadolu Metal Madencilik Isletmeleri A.S.Logo Yazilim Sanayi Ve Ticaret A.S.Migros Ticaret A.S.Otokar Otomotiv Ve Savunma Sanayi A.S.Petkim Petrokimya Holding A.S.Sarkuysan Elektrolitik Bakir Sanayi ve Ticaret A.S.Sasa Polyester Sanayi A.S.Selcuk Ecza Deposu Ticaret ve Sanayi A.S.TAV Havalimanlari Holding A.S.Tekfen Holding A.S.Tofas Turk Otomobil Fabrikasi A.S.
Tupras Turkiye Petrol Rafinerileri A.S.Turk Traktor ve Ziraat Makineleri A.S.Turkcell Iletisim Hizmetleri A.S.Turkiye Garanti Bankasi A.S.Turkiye Halk Bankasi A.S.Turkiye Is Bankasi, Class CTurkiye Sinai Kalkinma Bankasi A.S.Turkiye Vakiflar Bankasi TAO, Class DUlker Biskuvi Sanayi A.S.Vestel Elektronik Sanayi ve Ticaret A.S.Yapi ve Kredi Bankasi A.S.Yatas Yatak ve Yorgan Sanayi ve Ticaret A.S.
TOTAL TURKEY
Mondi P.L.C.
TOTAL COMMON STOCKS
20,382 78,2096,415 5,782
* 12,145 37,9089,883 33,4447,786 12,2365,453 9,978
* 29,474 9,55131,782 266,778
5,695 8,37110,144 60,330
170,426 39,612224 21,419
22,795 24,71138,774 42,32062,003 82,357
4,487 49,041#* 27,740 25,693
78,533 30,69911,564 25,723
* 5,936 60,385* 34,104 43,521* 1,706 13,432* 7,362 22,362
893 20,000* 54,164 37,957
32,583 21,07718,111 19,95822,121 18,36621,773 97,85422,007 92,93310,018 35,288
Emerging Markets Sustainability Core 1 PortfolioCONTINUED
Shares Value»
TURKEY — (Continued)9,691 $ 243,012
* 1,192 7,95548,619 113,299
* 47,867 84,19045,323 48,706
* 72,061 80,233* 210,745 31,322
95,174 86,282* 7,845 26,045#* 17,643 29,735* 104,032 50,641* 8,253 7,998
2,347,447
UNITED KINGDOM — (0.1%)12,642 274,385
229,313,092
PREFERRED STOCKS — (1.9%)

Alpargatas SABanco ABC Brasil S.A.Banco do Estado do Rio Grande do Sul SA, Class BCentrais Eletricas Brasileiras SA, Class BCia Brasileira de DistribuicaoCia de Saneamento do ParanaCia Energetica de Minas GeraisCia Energetica de Sao Paulo, Class BCia Energetica do Ceara, Class ACia Paranaense de EnergiaGerdau SAGrazziotin SAItau Unibanco Holding SALojas Americanas SAMarcopolo SARandon SA Implementos e Participacoes
TOTAL BRAZIL
Coca-Cola Embonor SA, Class BEmbotelladora Andina SA, Class BSociedad Quimica y Minera de Chile SA, Class B
TOTAL CHILE
Banco Davivienda SAGrupo Aval Acciones y Valores SAGrupo de Inversiones Suramericana SA
TOTAL COLOMBIA
CJ Corp.
TOTAL PREFERRED STOCKS
Hortifrut SA Rights 08/07/19
TOTAL INVESTMENT SECURITIES
DFA Short Term Investment Fund
(Cost $245,270,609)^^
BRAZIL — (1.7%)11,125 60,48810,216 47,99722,800 140,45611,500 119,32920,248 496,33820,877 87,089
103,648 384,02731,300 237,763
800 12,45212,413 159,86448,500 174,741
2,000 12,787189,100 1,725,330
38,500 183,10072,161 72,04117,200 44,664
3,958,466
CHILE — (0.1%)7,515 15,273
35,945 126,3675,402 158,450
300,090
COLOMBIA — (0.1%)2,031 25,467
149,496 57,6404,770 46,233
129,340
SOUTH KOREA — (0.0%)* 128 3,967
4,391,863
Emerging Markets Sustainability Core 1 PortfolioCONTINUED
Shares Value»
RIGHTS/WARRANTS — (0.0%)CHILE — (0.0%)* 355 $ 0
233,704,955
Value†
SECURITIES LENDING COLLATERAL — (1.5%)@§ 313,468 3,627,140
TOTAL INVESTMENTS — (100.0%)$237,332,095
Summary of the Portfolio's investments as of July 31, 2019, based on their valuation inputs, is as follows (see Security Valuation Note):
Investments in Securities (Market Value)
Level 1 Level 2 Level 3 Total

BrazilChileChinaColombiaCzech RepublicEgyptGreeceHong KongHungaryIndiaIndonesiaMalaysiaMexicoPeruPhilippinesPolandRussiaSouth AfricaSouth KoreaTaiwanThailandTurkeyUnited Kingdom
BrazilChileColombiaSouth Korea
Securities Lending Collateral
TOTAL
Aliansce Shopping Centers SAAlliar Medicos A Frente SAAnima Holding SABanco BTG Pactual SABrasilAgro - Co. Brasileira de Propriedades AgricolasBRF SACamil Alimentos S.A.CCR SACia Brasileira de DistribuicaoCia de Locacao das AmericasCia Siderurgica Nacional SA, Sponsored ADRCia Siderurgica Nacional SACielo SA
Common Stocks$22,031,823 — — $ 22,031,823
2,771,797 — — 2,771,7977,201,684 $ 33,098,552 — 40,300,236
823,012 — — 823,012— 386,819 — 386,819
153,951 — — 153,951— 943,869 — 943,869— 25,659 — 25,659— 1,024,702 — 1,024,702
602,954 30,482,993 — 31,085,947240,980 5,278,513 — 5,519,493
— 6,611,092 — 6,611,0926,400,948 — — 6,400,948
425,775 — — 425,775164,603 2,682,896 — 2,847,499
— 3,264,358 — 3,264,358587,388 781,466 — 1,368,854735,794 10,869,379 — 11,605,173
1,519,060 38,172,100 — 39,691,1604,477,994 35,797,032 — 40,275,0269,134,067 — — 9,134,067
— 2,347,447 — 2,347,447— 274,385 — 274,385
Preferred Stocks3,958,466 — — 3,958,466
300,090 — — 300,090129,340 — — 129,340
— 3,967 — 3,967— 3,627,140 — 3,627,140
$61,659,726 $175,672,369 — $237,332,095
EMERGING MARKETS TARGETED VALUE PORTFOLIO
SCHEDULE OF INVESTMENTS
July 31, 2019
(Unaudited)Shares Value»
COMMON STOCKS — (97.7%)BRAZIL — (9.3%)
13,800 $101,93616,400 63,557
7,300 41,16432,029 501,540
3,500 15,307* 4,287 37,525
21,849 42,309137,800 539,812
18,959 461,84113,934 182,55774,967 320,10947,999 207,901
190,700 361,777

Construtora Tenda SACosan SACyrela Brazil Realty SA Empreendimentos e ParticipacoesDirecional Engenharia SADuratex SAEmbraer SAEmbraer SA, Sponsored ADREnauta Participacoes SAEven Construtora e Incorporadora SAEz Tec Empreendimentos e Participacoes SAGafisa SAGerdau SA, Sponsored ADRGrendene SAGuararapes Confeccoes SAHelbor Empreendimentos SAHypera SAInternational Meal Co. Alimentacao SA, Class AIochpe-Maxion SAJHSF Participacoes SAJSL SAKroton Educacional SAM Dias Branco SAMahle-Metal Leve SAMarcopolo SAMarisa Lojas SAMills Estruturas e Servicos de Engenharia SAMovida Participacoes SAMRV Engenharia e Participacoes SAPetro Rio SAPetrobras Distribuidora S.A.Porto Seguro SAPortobello SAQualicorp Consultoria e Corretora de Seguros SASantos Brasil Participacoes SASao Martinho SASer Educacional SASLC Agricola SASul America SAT4F Entretenimento SATupy SAUltrapar Participacoes SAUnipar Carbocloro SA
Usinas Siderurgicas de Minas Gerais SAValid Solucoes e Servicos de Seguranca em Meios de Pagamento eIdentificacao S.AVia Varejo SAVulcabras Azaleia SAYDUQS Part
TOTAL BRAZIL
17,600 116,86130,138 401,80352,500 335,66116,400 54,10359,179 194,91974,866 378,80811,184 225,91716,500 57,286
* 36,400 93,47114,908 128,324
* 8,699 14,702121,953 434,153
45,300 90,21219,200 98,054
* 60,300 35,07765,100 514,81629,700 73,69821,400 122,41124,900 24,924
6,700 29,845270,317 889,641
3,900 39,9886,800 43,886
13,400 12,289* 13,500 29,926* 20,400 37,151
19,105 74,74145,400 241,255
* 6,600 30,43737,863 263,90516,600 226,62019,200 20,52648,300 281,21879,142 109,49534,100 180,58113,800 95,24618,600 87,92354,300 597,871
9,600 14,31318,400 92,618
119,952 625,1641,283 11,306
Emerging Markets Targeted Value PortfolioCONTINUED
Shares Value»
BRAZIL — (Continued)4,000 $ 10,492
15,010 59,822* 42,000 84,961* 13,400 24,930
46,400 417,027
10,905,712

CAP SACia Pesquera Camanchaca SACia Sud Americana de Vapores SAEmpresa Nacional de Telecomunicaciones SAEmpresas Hites SAGrupo Security SAInversiones Aguas Metropolitanas SAItau CorpBancaMasisa SARipley Corp. SASalfacorp SASigdo Koppers SASMU SASociedad Matriz SAAM SASocovesa SA
TOTAL CHILE
21Vianet Group, Inc., ADR361 Degrees International, Ltd.Agile Group Holdings, Ltd.Aluminum Corp. of China, Ltd., Class HAngang Steel Co., Ltd., Class HAnton Oilfield Services GroupAsia Cement China Holdings Corp.AVIC International Holdings, Ltd., Class HAviChina Industry & Technology Co., Ltd., Class HBAIC Motor Corp., Ltd., Class HBank of Chongqing Co., Ltd., Class HBBMG Corp., Class HBeijing Capital International Airport Co., Ltd., Class HBeijing Capital Land, Ltd., Class HBeijing Enterprises Clean Energy Group, Ltd.Beijing Enterprises Holdings, Ltd.Beijing Enterprises Water Group, Ltd.Beijing North Star Co., Ltd.Bitauto Holdings, Ltd., ADRBrilliance China Automotive Holdings, Ltd.BYD Electronic International Co., Ltd.C C Land Holdings, Ltd.CAR, Inc.Central China Real Estate, Ltd.Central China Securities Co., Ltd., Class HCGN Meiya Power Holdings Co., Ltd.Changyou.com, Ltd., ADRChaowei Power Holdings, Ltd.Cheetah Mobile, Inc., ADRChina Aerospace International Holdings, Ltd.China Agri-Industries Holdings, Ltd.
CHILE — (0.9%)17,975 184,339
101,696 9,347* 2,815,815 94,792* 16,763 153,578
14,664 10,102193,814 72,445
31,983 46,70115,925,805 123,513
* 355,430 21,381132,151 97,516
60,512 66,35611,933 20,848
197,786 50,707630,242 57,294
18,777 9,208
1,018,127
CHINA — (16.3%)* 5,091 37,470
43,000 7,724178,000 228,777
* 450,000 146,948184,600 70,020226,000 25,946
63,500 87,32524,000 14,825
161,000 86,418192,500 121,618
69,500 40,580296,000 86,122202,000 159,157168,000 61,668
* 1,640,000 22,09658,000 283,168
622,000 327,38742,000 15,745
* 4,091 46,678304,000 331,303
78,500 122,594156,000 35,796
* 74,000 52,79789,000 41,64191,000 19,223
* 88,000 11,2822,806 22,139
63,000 23,630* 4,570 14,898
194,000 11,580237,000 72,142
Emerging Markets Targeted Value PortfolioCONTINUED
Shares Value»
CHINA — (Continued)

China Aircraft Leasing Group Holdings, Ltd.China Aoyuan Group, Ltd.China BlueChemical, Ltd., Class HChina Cinda Asset Management Co., Ltd., Class HChina Coal Energy Co., Ltd., Class HChina Communications Services Corp., Ltd., Class HChina Dili GroupChina Dongxiang Group Co., Ltd.China Eastern Airlines Corp., Ltd., Class HChina Everbright Greentech Ltd.China Everbright, Ltd.China Galaxy Securities Co., Ltd., Class HChina Harmony New Energy Auto Holding, Ltd.China Huarong Asset Management Co., Ltd., Class HChina Index Holdings, Ltd., ADRChina International Capital Corp., Ltd., Class HChina International Marine Containers Group Co., Ltd., Class HChina Jinmao Holdings Group, Ltd.China Lesso Group Holdings, Ltd.China Machinery Engineering Corp., Class HChina Medical System Holdings, Ltd.China Merchants Land, Ltd.China Merchants Port Holdings Co., Ltd.China Modern Dairy Holdings, Ltd.China National Building Material Co., Ltd., Class HChina Oceanwide Holdings, Ltd.China Oil & Gas Group, Ltd.China Oilfield Services, Ltd., Class HChina Oriental Group Co., Ltd.China Overseas Grand Oceans Group, Ltd.China Railway Signal & Communication Corp., Ltd., Class HChina Reinsurance Group Corp., Class HChina Resources Cement Holdings, Ltd.China Resources Medical Holdings Co., Ltd.China Resources Pharmaceutical Group, Ltd.China Sanjiang Fine Chemicals Co., Ltd.China SCE Group Holdings, Ltd.China Shengmu Organic Milk, Ltd.China Shineway Pharmaceutical Group, Ltd.China Silver Group, Ltd.China South City Holdings, Ltd.China State Construction International Holdings, Ltd.China Taiping Insurance Holdings Co., Ltd.China Traditional Chinese Medicine Holdings Co., Ltd.China Travel International Investment Hong Kong, Ltd.China Vast Industrial Urban Development Co., Ltd.China Water Industry Group, Ltd.China XLX Fertiliser, Ltd.China ZhengTong Auto Services Holdings, Ltd.China Zhongwang Holdings, Ltd.Chinasoft International, Ltd.Chongqing Rural Commercial Bank Co., Ltd., Class HCIFI Holdings Group Co., Ltd.CIMC Enric Holdings, Ltd.CITIC Resources Holdings, Ltd.
23,500 $ 25,334160,000 214,016224,000 61,414
1,043,000 227,530264,000 102,289264,000 183,799
#* 62,200 18,293465,000 57,371
* 166,000 91,20619,000 11,979
112,000 147,950332,500 177,468
# 77,500 23,5781,183,000 199,442
* 3,410 9,820123,600 233,831
49,680 47,054604,000 389,161110,000 101,63488,000 37,60723,000 21,940
100,000 14,230150,000 248,245
* 203,000 32,064444,000 389,266
* 112,000 5,498400,000 18,276212,000 239,153150,000 66,588246,000 128,750
85,000 56,747675,000 118,634282,000 257,719
84,500 61,097108,000 117,458
48,000 10,354208,000 113,173
#* 474,000 19,37340,000 33,361
* 154,000 14,426548,000 75,211246,000 252,699133,400 369,158260,000 118,717314,000 57,719
26,000 10,363#* 116,000 8,099
34,000 10,057141,000 52,685192,000 97,779
# 270,000 134,237293,000 153,155424,129 270,373
22,000 15,842382,000 27,105

Citychamp Watch & Jewellery Group, Ltd.Comba Telecom Systems Holdings, Ltd.Concord New Energy Group, Ltd.COSCO SHIPPING Development Co., Ltd., Class H
COSCO SHIPPING Energy Transportation Co., Ltd., Class HCOSCO SHIPPING Holdings Co., Ltd., Class HCOSCO SHIPPING International Hong Kong Co., Ltd.COSCO SHIPPING Ports, Ltd.Cosmo Lady China Holdings Co., Ltd.CP Pokphand Co., Ltd.CPMC Holdings, Ltd.Dah Chong Hong Holdings, Ltd.Dawnrays Pharmaceutical Holdings, Ltd.Digital China Holdings, Ltd.Dongfang Electric Corp., Ltd.Dongfeng Motor Group Co., Ltd., Class HDongyue Group, Ltd.Everbright Securities Co., Ltd., Class HFang Holdings, Ltd., ADRFantasia Holdings Group Co., Ltd.Far East Horizon, Ltd.Fufeng Group, Ltd.Fullshare Holdings, Ltd.GCL New Energy Holdings, Ltd.GCL-Poly Energy Holdings, Ltd.Gemdale Properties & Investment Corp., Ltd.Genertec Universal Medical Group Co., Ltd.GOME Retail Holdings, Ltd.Grand Baoxin Auto Group, Ltd.Great Wall Motor Co., Ltd., Class HGreenland Hong Kong Holdings, Ltd.Greentown China Holdings, Ltd.Guangshen Railway Co., Ltd., Class HGuangzhou R&F Properties Co., Ltd., Class HGuorui Properties, Ltd.Haichang Ocean Park Holdings, Ltd.Harbin Electric Co., Ltd., Class HHC Group, Inc.Hi Sun Technology China, Ltd.Hisense Home Appliances Group Co., Ltd., Class HHonghua Group, Ltd.Hopson Development Holdings, Ltd.Hua Hong Semiconductor, Ltd.Huaneng Renewables Corp., Ltd., Class HJiangxi Copper Co., Ltd., Class HJiayuan International Group, Ltd.Jingrui Holdings, Ltd.JinkoSolar Holding Co., Ltd., ADRJoy City Property, Ltd.
* 204,000 42,408* 280,000 69,988
730,000 35,739513,000 63,156
Emerging Markets Targeted Value PortfolioCONTINUED
Shares Value»
CHINA — (Continued)192,000 $109,347
* 100,500 37,37638,000 11,858
208,324 181,54989,000 17,008
210,000 17,657# 51,000 19,439
110,482 35,10248,000 9,123
* 88,000 49,014# 30,800 18,507# 312,000 278,277
118,000 63,53018,600 14,285
* 3,410 7,058243,000 39,765239,000 222,295
29,000 14,229#* 497,500 17,721* 964,000 36,716#* 1,699,000 96,771
458,000 54,588108,500 82,133
#* 1,157,000 123,225* 82,500 17,790
335,000 226,93362,000 22,615
113,500 85,224176,000 57,234110,800 200,469
# 118,000 21,023* 141,000 21,858#* 40,000 13,152* 68,500 17,536* 300,000 52,582
22,000 24,132* 186,000 14,620
78,000 80,738# 49,000 100,980
540,000 146,769155,000 191,828
48,000 20,76735,000 11,458
* 6,473 126,806316,000 38,099

Ju Teng International Holdings, Ltd.Jumei International Holding, Ltd., ADRKaisa Group Holdings, Ltd.Kingboard Holdings, Ltd.Kingboard Laminates Holdings, Ltd.Kingsoft Corp., Ltd.Kunlun Energy Co., Ltd.KWG Group Holdings, Ltd.Lee & Man Chemical Co., Ltd.Lee & Man Paper Manufacturing, Ltd.Legend Holdings Corp., Class HLifestyle China Group, Ltd.Livzon Pharmaceutical Group, Inc., Class HLonking Holdings, Ltd.
Maanshan Iron & Steel Co., Ltd., Class HMetallurgical Corp. of China, Ltd., Class HMinmetals Land, Ltd.NetDragon Websoft Holdings, Ltd.Nexteer Automotive Group, Ltd.Nine Dragons Paper Holdings, Ltd.NVC Lighting Holdings, Ltd.Orient Securities Co., Ltd., Class HPanda Green Energy Group, Ltd.PAX Global Technology, Ltd.Poly Property Group Co., Ltd.Pou Sheng International Holdings, Ltd.Powerlong Real Estate Holdings, Ltd.Qingdao Port International Co., Ltd., Class HQingling Motors Co., Ltd., Class HRed Star Macalline Group Corp., Ltd., Class HRonshine China Holdings, Ltd.Sany Heavy Equipment International Holdings Co., Ltd.Seaspan Corp.Semiconductor Manufacturing International Corp.Shandong Chenming Paper Holdings, Ltd., Class HShanghai Electric Group Co., Ltd., Class HShanghai Haohai Biological Technology Co., Ltd., Class HShanghai Industrial Holdings, Ltd.Shanghai Industrial Urban Development Group, Ltd.Shanghai Jin Jiang International Hotels Group Co., Ltd., Class HShanghai Pharmaceuticals Holding Co., Ltd., Class HShenzhen International Holdings, Ltd.Shenzhen Investment, Ltd.Shimao Property Holdings, Ltd.Shougang Concord International Enterprises Co., Ltd.Shougang Fushan Resources Group, Ltd.Shui On Land, Ltd.Sihuan Pharmaceutical Holdings Group, Ltd.Silver Grant International Holdings Group, Ltd.
96,000 22,715* 6,100 13,847
245,000 101,61382,000 201,661
128,000 105,553* 52,000 112,038
372,000 324,431147,000 136,673
22,000 11,38154,000 32,96226,300 61,937
#* 55,500 17,68210,530 25,544
313,000 81,193
Emerging Markets Targeted Value PortfolioCONTINUED
Shares Value»
CHINA — (Continued)220,000 $ 83,393319,000 77,869100,000 15,482
30,000 74,99918,000 18,707
184,000 148,93470,000 6,36376,000 46,323
* 420,000 16,00899,000 39,696
250,000 92,226225,000 62,601
# 151,000 91,606103,000 73,411
46,000 11,83957,800 50,39032,000 41,658
104,000 40,8907,294 74,034
* 345,500 406,95734,500 15,066
290,000 100,7254,000 23,477
60,000 122,933176,000 28,348140,000 24,832
99,500 191,33345,000 83,121
386,000 138,405133,000 367,319360,000 13,991396,000 82,007464,500 99,150364,000 74,570
* 164,000 31,027

SINA Corp.Sinofert Holdings, Ltd.Sino-Ocean Group Holding, Ltd.Sinopec Engineering Group Co., Ltd., Class HSinopec Kantons Holdings, Ltd.Sinopec Shanghai Petrochemical Co., Ltd., Class HSinopharm Group Co., Ltd., Class HSinotrans, Ltd., Class HSinotruk Hong Kong, Ltd.Skyworth Group, Ltd.SOHO China, Ltd.Sunshine 100 China Holdings, Ltd.Tarena International, Inc., ADRTCL Electronics Holdings, Ltd.Texhong Textile Group, Ltd.Tian An China Investment Co., Ltd.Tian Ge Interactive Holdings, Ltd.Tiangong International Co., Ltd.Tianjin Capital Environmental Protection Group Co., Ltd., Class HTianjin Port Development Holdings, Ltd.Tianneng Power International, Ltd.Tibet Water Resources, Ltd.Tomson Group, Ltd.Tongda Group Holdings, Ltd.
Vipshop Holdings, Ltd., ADRWasion Holdings, Ltd.Weiqiao Textile Co., Class HWest China Cement, Ltd.Xingda International Holdings, Ltd.Xinhua Winshare Publishing and Media Co., Ltd., Class HXinjiang Goldwind Science & Technology Co., Ltd., Class HXinyuan Real Estate Co., Ltd., ADRXtep International Holdings, Ltd.Xunlei, Ltd., ADRYadea Group Holdings, Ltd.Yanzhou Coal Mining Co., Ltd., Class HYirendai, Ltd., ADRYuexiu Property Co., Ltd.Yuzhou Properties Co., Ltd.YY, Inc., ADRZoomlion Heavy Industry Science and Technology Co., Ltd., Class H
TOTAL CHINA
Almacenes Exito SACEMEX Latam Holdings SACorp. Financiera Colombiana SAGrupo Argos SA
TOTAL COLOMBIA
* 4,559 178,348# 356,000 39,823
363,000 146,053140,500 110,069130,000 52,301216,000 75,359
19,200 70,975231,000 79,617
# 75,500 110,710278,000 75,483242,500 77,532
* 74,000 13,843#* 8,079 12,846
107,000 48,45231,000 31,13227,000 13,244
* 34,000 7,966108,000 33,483
28,000 9,728114,000 11,72790,000 71,971
* 72,000 17,94034,000 9,712
# 520,000 38,178
Emerging Markets Targeted Value PortfolioCONTINUED
Shares Value»
CHINA — (Continued)* 53,520 $ 406,752
60,000 21,87934,500 10,136
328,000 55,26974,534 20,01762,000 43,24990,678 101,335
# 8,920 37,375106,500 76,693
* 4,589 10,23378,000 15,917
212,000 186,594* 2,786 31,175
852,000 192,60275,000 35,236
* 6,115 392,522171,800 119,942
19,081,839
COLOMBIA — (0.4%)20,237 107,324
* 32,076 41,061* 9,082 74,795
44,244 226,821
450,001

AUTOHELLAS SABank of GreeceEllaktor SAGEK Terna Holding Real Estate Construction SAMytilineos SANational Bank of Greece SAPiraeus Bank SA
TOTAL GREECE
ACC, Ltd.Adani Enterprises, Ltd.Adani Transmissions, Ltd.Aditya Birla Capital, Ltd.Allahabad BankAllcargo Logistics, Ltd.Ambuja Cements, Ltd.Andhra BankAnveshan Heavy Engineering, Ltd.Apar Industries, Ltd.APL Apollo Tubes, Ltd.Apollo Tyres, Ltd.Arvind Fashions, Ltd.Arvind, Ltd.Ashok Leyland, Ltd.Ashoka Buildcon, Ltd.Aurobindo Pharma, Ltd.Bajaj Holdings & Investment, Ltd.Balkrishna Industries, Ltd.Balmer Lawrie & Co., Ltd.Balrampur Chini Mills, Ltd.
Bank of MaharashtraBEML, Ltd.Bharat Electronics, Ltd.Bharat Heavy Electricals, Ltd.Birla Corp., Ltd.Borosil Glass Works, Ltd.Brigade Enterprises, Ltd.BSE, Ltd.Can Fin Homes, Ltd.Canara BankCeat, Ltd.Century Textiles & Industries, Ltd.CG Power and Industrial Solutions, Ltd.Chambal Fertilizers & Chemicals, Ltd.Cipla, Ltd.City Union Bank, Ltd.Cochin Shipyard, Ltd.Coffee Day Enterprises, Ltd.
GREECE — (0.4%)1,772 11,5431,813 29,487
* 12,635 30,327* 3,754 26,589
12,380 150,468* 45,964 134,046* 33,656 114,789
497,249
INDIA — (11.7%)7,742 175,006
20,898 38,766* 36,428 109,007* 73,935 88,009* 49,802 26,488
7,469 10,4996,674 19,412
* 100,148 27,145* 876 5,844
1,269 9,137538 10,950
45,245 103,275* 4,729 40,949
23,648 18,790101,743 102,579
* 11,027 19,2855,501 45,3423,755 185,0484,857 49,5696,849 17,137
25,216 51,807
Emerging Markets Targeted Value PortfolioCONTINUED
Shares Value»
INDIA — (Continued)* 109,673 $ 20,378
1,985 24,215106,654 158,537161,813 137,786
3,651 30,7712,853 5,4962,902 10,9811,590 11,7325,185 29,068
* 30,736 104,4183,566 42,0765,197 67,035
* 82,362 21,58517,972 39,02232,481 243,79647,938 135,046
3,729 19,371* 5,178 9,198

Container Corp. Of India, Ltd.Coromandel International, Ltd.Cox & Kings, Ltd.DCB Bank, Ltd.DCM Shriram, Ltd.Dewan Housing Finance Corp., Ltd.Dilip Buildcon, Ltd.Dish TV India, Ltd.Dishman Carbogen Amcis, Ltd.DLF, Ltd.Dr Reddy's Laboratories, Ltd.eClerx Services, Ltd.Edelweiss Financial Services, Ltd.EID Parry India, Ltd.Engineers India, Ltd.Entertainment Network India, Ltd.Escorts, Ltd.Essel Propack, Ltd.Exide Industries, Ltd.FDC, Ltd.Federal Bank, Ltd.Finolex Cables, Ltd.Finolex Industries, Ltd.Firstsource Solutions, Ltd.Gateway Distriparks, Ltd.Gayatri Projects, Ltd.General Insurance Corp. of IndiaGFL, Ltd.GHCL, Ltd.Glenmark Pharmaceuticals, Ltd.Godfrey Phillips India, Ltd.Granules India, Ltd.Great Eastern Shipping Co., Ltd. (The)Greaves Cotton, Ltd.Greenpanel Industries, Ltd.Greenply Industries, Ltd.Gujarat Alkalies & Chemicals, Ltd.Gujarat Ambuja Exports, Ltd.Gujarat Mineral Development Corp., Ltd.Gujarat Narmada Valley Fertilizers & Chemicals, Ltd.Gujarat Pipavav Port, Ltd.
Hathway Cable & Datacom, Ltd.HeidelbergCement India, Ltd.Hikal, Ltd.Himachal Futuristic Communications, Ltd.Himadri Speciality Chemical, Ltd.Himatsingka Seide, Ltd.Hindalco Industries, Ltd.Housing Development & Infrastructure, Ltd.
34,646 257,6423,434 18,422
14,772 2,46829,588 83,401
7,262 42,12225,687 18,252
2,926 17,555134,081 52,559
* 9,797 29,44789,747 230,014
8,737 324,4051,856 16,053
47,807 101,56113,557 28,34438,600 55,723
1,800 10,42015,289 103,81113,100 25,31021,208 56,189
* 4,149 9,306247,236 330,430
5,643 30,6482,910 22,381
28,378 20,1986,382 9,999
* 7,061 14,5293,362 9,369
* 4,974 65,5235,981 17,985
25,269 155,9063,321 33,474
23,739 31,25811,434 39,08011,143 21,5824,737 7894,737 8,4254,036 24,3412,885 5,5668,135 8,4157,707 23,486
14,776 16,738
Emerging Markets Targeted Value PortfolioCONTINUED
Shares Value»
INDIA — (Continued)* 29,154 $ 8,437
9,938 27,7384,944 10,603
77,811 22,06415,947 18,647
3,148 6,089112,031 308,639
* 30,103 5,201

HSIL, Ltd.IDFC First Bank, Ltd.IDFC, Ltd.IFCI, Ltd.IIFL Finance, Ltd.IIFL Securities, Ltd.IIFL Wealth Management, Ltd.India Cements, Ltd. (The)Indiabulls Housing Finance, Ltd.Indiabulls Real Estate, Ltd.Indian BankIndian Hotels Co., Ltd. (The)Indian Overseas BankInfibeam Avenues, Ltd.Inox Leisure, Ltd.Intellect Design Arena, Ltd.Ipca Laboratories, Ltd.ITD Cementation India, Ltd.Jagran Prakashan, Ltd.Jain Irrigation Systems, Ltd.Jaiprakash Associates, Ltd.Jammu & Kashmir Bank, Ltd. (The)JB Chemicals & Pharmaceuticals, Ltd.Jindal Saw, Ltd.Jindal Steel & Power, Ltd.JK Cement, Ltd.JK Lakshmi Cement, Ltd.JK Paper, Ltd.JK Tyre & Industries, Ltd.JM Financial, Ltd.JSW Energy, Ltd.Jubilant Life Sciences, Ltd.Just Dial, Ltd.Kalpataru Power Transmission, Ltd.Karnataka Bank, Ltd. (The)Karur Vysya Bank, Ltd. (The)Kaveri Seed Co., Ltd.KEC International, Ltd.Kiri Industries, Ltd.KNR Constructions, Ltd.KPIT Engineering, Ltd.KPIT Technologies, Ltd.KPR Mill, Ltd.KRBL, Ltd.L&T Finance Holdings, Ltd.Lakshmi Vilas Bank, Ltd. (The)Laurus Labs, Ltd.LIC Housing Finance, Ltd.Lupin, Ltd.Magma Fincorp, Ltd.Maharashtra Scooters, Ltd.
3,064 9,757* 265,852 161,413* 157,367 81,956* 137,396 14,427
14,244 24,284* 14,244 42,629* 2,035 2,814
33,122 42,09237,711 292,393
* 37,606 47,560* 21,862 59,340
24,224 50,043* 158,036 25,683
27,370 16,487* 7,264 31,069* 7,781 25,283
8,259 114,2417,304 8,2437,667 9,301
62,855 18,628* 218,125 6,923* 37,004 19,143
2,024 10,99226,493 25,867
* 71,104 138,0621,962 27,3695,723 27,598
13,452 21,4806,770 7,004
39,853 38,119* 71,185 70,152
10,790 68,237* 6,530 65,593
5,738 40,02433,129 40,27465,165 59,452
2,772 17,91314,665 65,303
* 2,791 19,6183,460 13,454
* 25,181 29,789* 25,181 27,382
2,140 17,8169,700 31,162
91,903 131,394* 24,882 17,343
3,813 18,63350,638 378,99230,254 336,44817,169 20,331
662 38,687
Emerging Markets Targeted Value PortfolioCONTINUED
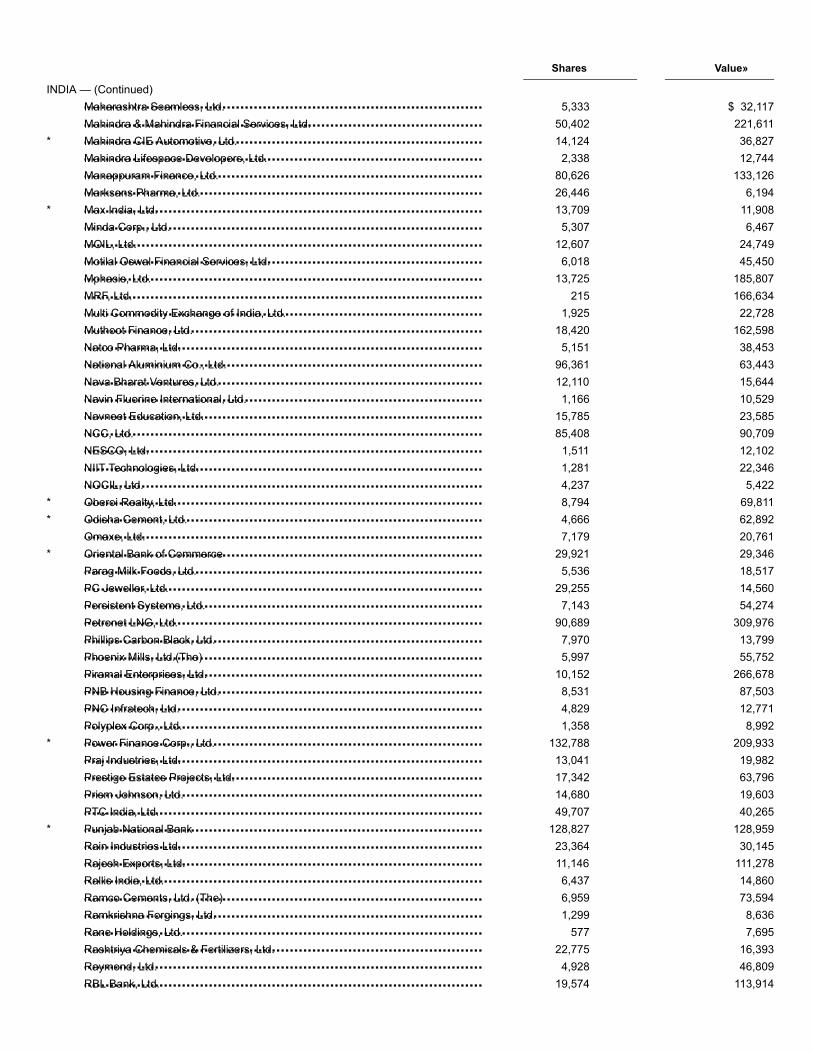
Maharashtra Seamless, Ltd.Mahindra & Mahindra Financial Services, Ltd.Mahindra CIE Automotive, Ltd.Mahindra Lifespace Developers, Ltd.Manappuram Finance, Ltd.Marksans Pharma, Ltd.Max India, Ltd.Minda Corp., Ltd.MOIL, Ltd.Motilal Oswal Financial Services, Ltd.Mphasis, Ltd.MRF, Ltd.Multi Commodity Exchange of India, Ltd.Muthoot Finance, Ltd.Natco Pharma, Ltd.National Aluminium Co., Ltd.Nava Bharat Ventures, Ltd.Navin Fluorine International, Ltd.Navneet Education, Ltd.NCC, Ltd.NESCO, Ltd.NIIT Technologies, Ltd.NOCIL, Ltd.Oberoi Realty, Ltd.Odisha Cement, Ltd.Omaxe, Ltd.Oriental Bank of CommerceParag Milk Foods, Ltd.PC Jeweller, Ltd.Persistent Systems, Ltd.Petronet LNG, Ltd.Phillips Carbon Black, Ltd.Phoenix Mills, Ltd.(The)Piramal Enterprises, Ltd.PNB Housing Finance, Ltd.PNC Infratech, Ltd.Polyplex Corp., Ltd.Power Finance Corp., Ltd.Praj Industries, Ltd.Prestige Estates Projects, Ltd.Prism Johnson, Ltd.PTC India, Ltd.Punjab National BankRain Industries Ltd.Rajesh Exports, Ltd.Rallis India, Ltd.Ramco Cements, Ltd. (The)Ramkrishna Forgings, Ltd.Rane Holdings, Ltd.Rashtriya Chemicals & Fertilizers, Ltd.Raymond, Ltd.RBL Bank, Ltd.
Shares Value»
INDIA — (Continued)5,333 $ 32,117
50,402 221,611* 14,124 36,827
2,338 12,74480,626 133,12626,446 6,194
* 13,709 11,9085,307 6,467
12,607 24,7496,018 45,450
13,725 185,807215 166,634
1,925 22,72818,420 162,598
5,151 38,45396,361 63,44312,110 15,6441,166 10,529
15,785 23,58585,408 90,709
1,511 12,1021,281 22,3464,237 5,422
* 8,794 69,811* 4,666 62,892
7,179 20,761* 29,921 29,346
5,536 18,51729,255 14,560
7,143 54,27490,689 309,976
7,970 13,7995,997 55,752
10,152 266,6788,531 87,5034,829 12,7711,358 8,992
* 132,788 209,93313,041 19,98217,342 63,79614,680 19,60349,707 40,265
* 128,827 128,95923,364 30,14511,146 111,2786,437 14,8606,959 73,5941,299 8,636
577 7,69522,775 16,393
4,928 46,80919,574 113,914

REC, Ltd.Redington India, Ltd.Reliance Capital, Ltd.Reliance Power, Ltd.Repco Home Finance, Ltd.Sharda Cropchem, Ltd.Shilpa Medicare, Ltd.
Shriram City Union Finance, Ltd.Shriram Transport Finance Co., Ltd.Sobha, Ltd.Somany Ceramics, Ltd.South Indian Bank, Ltd. (The)SRF, Ltd.Steel Authority of India, Ltd.Strides Pharma Science, Ltd.Sundaram Finance, Ltd.Sunteck Realty, Ltd.Syndicate BankTAKE Solutions, Ltd.Tata Chemicals, Ltd.Tata Global Beverages, Ltd.Tejas Networks, Ltd.Thomas Cook India, Ltd.Time Technoplast, Ltd.Timken India, Ltd.Transport Corp. of India, Ltd.TV Today Network, Ltd.TV18 Broadcast, Ltd.TVS Srichakra, Ltd.UCO BankUflex, Ltd.Union Bank of IndiaVA Tech Wabag, Ltd.Vaibhav Global, Ltd.Vardhman Textiles, Ltd.Vesuvius India, Ltd.Vindhya Telelinks, Ltd.Vodafone Idea, Ltd.Welspun Corp., Ltd.Welspun Enterprises, Ltd.Welspun India, Ltd.West Coast Paper Mills, Ltd.Wockhardt, Ltd.Yes Bank, Ltd.Zensar Technologies, Ltd.
TOTAL INDIA
Adaro Energy Tbk PTAdhi Karya Persero Tbk PT
132,979 270,02944,660 70,05327,980 20,963
* 102,272 5,4744,281 20,2201,764 6,698
* 1,958 10,105
Emerging Markets Targeted Value PortfolioCONTINUED
Shares Value»
INDIA — (Continued)1,286 $ 25,326
25,076 350,8988,336 66,3112,052 10,474
177,967 31,5522,578 100,845
* 99,143 61,2339,046 51,5034,385 96,8967,768 43,415
* 125,524 57,7789,845 13,564
11,231 94,25954,579 198,172
3,361 4,43417,303 46,94521,141 24,347
1,401 14,2035,527 21,2002,698 10,559
* 68,802 21,568316 7,274
* 110,238 26,4992,494 7,929
* 63,547 61,9764,573 19,1971,289 16,9101,259 16,668
611 8,864449 6,047
* 1,824,440 182,7309,965 16,3226,252 9,235
46,870 34,4162,110 6,735
* 6,912 31,099110,140 142,75412,992 39,703
13,619,365
INDONESIA — (3.0%)2,432,800 218,778
334,900 35,189

Alam Sutera Realty Tbk PTAneka Tambang Tbk PTAstra Agro Lestari Tbk PTAstra Otoparts Tbk PTBank Bukopin TbkBank Pan Indonesia Tbk PTBank Pembangunan Daerah Jawa Barat Dan Banten Tbk PTBank Pembangunan Daerah Jawa Timur Tbk PTBank Permata Tbk PTBank Tabungan Negara Persero Tbk PTBumi Serpong Damai Tbk PTCiputra Development Tbk PTDelta Dunia Makmur Tbk PTEagle High Plantations Tbk PTElnusa Tbk PTErajaya Swasembada Tbk PT
Garuda Indonesia Persero Tbk PTGlobal Mediacom Tbk PTIndah Kiat Pulp & Paper Corp. Tbk PTIndika Energy Tbk PTIndo Tambangraya Megah Tbk PTIndofood Sukses Makmur Tbk PTIndo-Rama Synthetics Tbk PTIntiland Development Tbk PTKrakatau Steel Persero Tbk PTLippo Karawaci Tbk PTMalindo Feedmill Tbk PTMedco Energi Internasional Tbk PTMedia Nusantara Citra Tbk PTMNC Land Tbk PTModernland Realty Tbk PTPan Brothers Tbk PTPanin Financial Tbk PTPaninvest Tbk PTPerusahaan Perkebunan London Sumatra Indonesia Tbk PTPP Persero Tbk PTPP Properti Tbk PTPuradelta Lestari Tbk PTRimo International Lestari Tbk PTSentul City Tbk PTSiloam International Hospitals Tbk PTSri Rejeki Isman Tbk PTSummarecon Agung Tbk PTSurya Semesta Internusa Tbk PTTempo Scan Pacific Tbk PTTimah Tbk PTTrada Alam Minera Tbk PTTunas Baru Lampung Tbk PTVale Indonesia Tbk PT
* 1,815,300 42,8361,807,400 119,067
121,100 85,977136,000 13,908
* 1,313,400 27,853* 434,700 44,489
265,300 29,986316,900 14,447
* 717,100 48,254960,300 166,870
* 1,370,300 137,5472,222,800 194,882
* 807,300 27,758* 2,031,300 20,650
848,700 21,684263,400 39,219
Emerging Markets Targeted Value PortfolioCONTINUED
Shares Value»
INDONESIA — (Continued)* 510,900 $ 14,556
1,139,900 31,492362,300 191,196444,100 46,632
58,000 69,297420,100 210,923
18,700 5,953545,900 17,218
* 285,400 7,0238,436,960 168,127
206,200 16,277* 1,195,600 71,968
1,081,700 105,573* 1,724,800 16,476
2,099,600 39,403402,700 20,573
* 3,192,000 79,494* 140,700 13,665
684,000 51,569551,300 83,663
4,485,600 36,348814,500 17,631
* 3,228,000 30,189* 3,986,600 42,091* 44,700 20,036
1,753,600 43,688878,600 82,588883,000 50,870
82,400 9,220620,300 45,526
* 2,672,100 22,445469,000 26,857
* 482,400 103,245

Visi Media Asia Tbk PTWaskita Beton Precast Tbk PTWaskita Karya Persero Tbk PTWijaya Karya Beton Tbk PTWijaya Karya Persero Tbk PTXL Axiata Tbk PT
TOTAL INDONESIA
Aeon Co. M BhdAFFIN Bank BhdAirAsia Group BhdAlliance Bank Malaysia BhdAllianz Malaysia BhdAMMB Holdings BhdBerjaya Corp. BhdBoustead Holdings BhdBoustead Plantations BhdBumi Armada BhdCahya Mata Sarawak BhdDayang Enterprise Holdings BhdDRB-Hicom BhdEastern & Oriental BhdEco World Development Group BhdEkovest BHDFGV Holdings Bhd
Gadang Holdings BhdGamuda BhdGenting Plantations BhdGeorge Kent Malaysia BhdHengyuan Refining Co. BhdIJM Corp. BhdIOI Properties Group BhdIskandar Waterfront City BhdJAKS Resources BhdKeck Seng Malaysia BhdKNM Group BhdLBS Bina Group BhdLotte Chemical Titan Holding BhdMagnum BhdMah Sing Group BhdMalaysia Airports Holdings BhdMalaysia Building Society BhdMalaysian Pacific Industries BhdMalaysian Resources Corp. BhdMatrix Concepts Holdings BhdMBM Resources BHDMega First Corp. BhdMKH BhdMMC Corp. Bhd
* 817,200 6,5161,916,000 49,384
994,300 143,971212,800 8,843642,300 106,145
* 542,400 124,289
3,520,354
MALAYSIA — (3.2%)96,000 40,10044,500 21,742
245,200 116,056147,400 131,115
3,700 12,455284,700 291,219
* 447,700 28,18058,300 16,07859,400 10,055
* 375,700 20,73579,000 54,304
* 61,200 21,089171,500 109,587
* 122,600 23,679* 42,200 8,010
254,400 51,016* 325,900 88,934
Emerging Markets Targeted Value PortfolioCONTINUED
Shares Value»
MALAYSIA — (Continued)106,200 $ 21,129294,300 263,728
5,300 12,45896,500 26,938
#* 22,900 27,688451,100 253,863231,700 70,507
* 81,900 19,228* 100,200 18,812
8,000 9,066* 566,400 55,118
61,400 7,87149,200 33,66186,900 56,317
151,300 33,839159,400 322,879
# 264,456 55,62810,100 22,244
182,400 40,04665,700 30,21015,700 12,51637,500 34,42339,000 11,412
174,000 46,232

Muhibbah Engineering M BhdOriental Holdings BHDOSK Holdings BhdParamount Corp. BhdPetron Malaysia Refining & Marketing BhdPos Malaysia BhdSapura Energy BhdSarawak Oil Palms BhdSime Darby BhdSime Darby Property BhdSP Setia Bhd GroupSunway BhdTa Ann Holdings BhdTA Enterprise BhdTropicana Corp. BhdUEM Sunrise BhdUMW Holdings BhdUnited Malacca BhdUOA Development BhdVizione Holdings BhdVS Industry BhdWCT Holdings BhdYinson Holdings BhdYNH Property BhdYTL Corp. Bhd
TOTAL MALAYSIA
ALEATICA S.A.B. de C.V.Alfa S.A.B. de C.V., Class AAlpek S.A.B. de C.V.Axtel S.A.B. de C.V.Banco del Bajio SABecle S.A.B. de C.V.Cemex S.A.B. de C.V.
Consorcio ARA S.A.B. de C.V.Controladora Vuela Cia de Aviacion S.A.B. de C.V., ADRCydsa S.A.B. de C.V.Elementia S.A.B. de C.V.Genomma Lab Internacional S.A.B. de C.V., Class BGentera S.A.B. de C.V.Grupo Aeromexico S.A.B. de C.V.Grupo Carso S.A.B. de C.V.Grupo Cementos de Chihuahua S.A.B. de C.V.Grupo Comercial Chedraui S.A. de C.V.Grupo Herdez S.A.B. de C.V., Series *Grupo Hotelero Santa Fe S.A.B. de C.V.Grupo Industrial Saltillo S.A.B. de C.V.Grupo KUO S.A.B. de C.V., Series BGrupo Televisa S.A.B.
39,300 25,4877,600 12,073
# 50,000 11,29553,060 19,400
7,600 10,99365,900 27,554
316,300 22,8073,700 2,047
415,300 219,634443,400 104,685235,899 111,657212,201 85,138
# 29,600 16,116176,800 27,388
57,800 12,030183,900 35,518
8,500 10,40818,300 22,61317,900 9,015
* 65,700 15,381180,500 52,215127,194 35,064
72,900 122,55332,000 21,655
505,200 125,711
3,688,604
MEXICO — (3.0%)# 25,687 22,103# 433,545 375,545
87,730 94,809* 80,525 10,421
114,740 215,604# 42,500 63,094
1,265,619 450,409
Emerging Markets Targeted Value PortfolioCONTINUED
Shares Value»
MEXICO — (Continued)98,355 $ 20,529
* 7,922 77,5568,498 10,620
* 5,664 1,818#* 145,685 133,189
103,082 84,666* 50,391 39,442
43,068 137,741# 28,788 153,766# 51,311 77,005
35,153 73,741* 28,640 8,250
19,600 19,4335,100 12,505
# 105,605 200,037

Grupo Traxion S.A.B. de C.V.Hoteles City Express S.A.B. de C.V.Industrias Bachoco S.A.B. de C.V., Series BIndustrias CH S.A.B. de C.V.Industrias Penoles S.A.B. de C.V.La Comer S.A.B. de C.V.Medica Sur S.A.B. de C.V., Series BMexichem S.A.B. de C.V.Nemak S.A.B. de C.V.Organizacion Cultiba S.A.B. de C.V.Promotora y Operadora de Infraestructura S.A.B. de C.V.TV Azteca S.A.B. de C.V.Unifin Financiera S.A.B. de C.V. SOFOM ENRVitro S.A.B. de C.V., Series A
TOTAL MEXICO
8990 Holdings, Inc.Alliance Global Group, Inc.Belle Corp.Cebu Air, Inc.China Banking Corp.Cosco Capital, Inc.DMCI Holdings, Inc.Filinvest Development Corp.Filinvest Land, Inc.First Philippine Holdings Corp.GT Capital Holdings, Inc.Integrated Micro-Electronics, Inc.International Container Terminal Services, Inc.Lopez Holdings Corp.LT Group, Inc.Megaworld Corp.Nickel Asia Corp.Petron Corp.Philex Mining Corp.Philippine National BankPilipinas Shell Petroleum Corp.RFM Corp.Rizal Commercial Banking Corp.Robinsons Land Corp.Security Bank Corp.Union Bank Of Philippines
Vista Land & Lifescapes, Inc.
TOTAL PHILIPPINES
Agora SAAlior Bank SAAmica SA
* 74,509 54,782#* 62,040 61,736
20,205 91,506* 11,503 37,786# 19,738 181,583#* 100,368 120,460
6,100 6,65391,024 166,338
115,418 52,69912,561 9,163
# 31,967 287,747385,500 31,381
27,450 57,8264,000 8,970
3,450,913
PHILIPPINES — (1.5%)109,100 33,860736,100 224,693525,000 23,289
38,560 70,69787,400 46,134
303,100 40,78767,200 13,370
121,800 33,4181,703,000 63,468
31,550 53,64810,659 193,53272,600 13,52314,660 38,802
173,300 15,435250,800 69,408
1,683,700 202,187405,000 20,065283,200 30,820146,000 9,794
* 57,773 56,37211,500 8,672
109,000 10,81568,400 41,255
288,800 155,19136,300 130,00819,090 22,595
Emerging Markets Targeted Value PortfolioCONTINUED
Shares Value»
PHILIPPINES — (Continued)634,700 $ 95,278
1,717,116
POLAND — (1.5%)3,156 9,976
* 14,847 178,806672 20,387

Asseco Poland SABank Handlowy w Warszawie SABank Millennium SACiech SAComArch SACyfrowy Polsat SADom Development SAEcho Investment SAEnea SAGrupa Azoty SAGrupa Lotos SAInter Cars SAJastrzebska Spolka Weglowa SAKernel Holding SAKRUK SALC Corp. SALubelski Wegiel Bogdanka SANetia SAPKP Cargo SAStalexport Autostrady SAStalprodukt SATauron Polska Energia SAVRG SA
TOTAL POLAND
Etalon Group P.L.C., GDRGlobaltrans Investment P.L.C., GDRMagnitogorsk Iron & Steel Works PJSC, GDRMail.Ru Group, Ltd., GDRPhosAgro PJSC, GDRRos Agro P.L.C., GDRRusHydro PJSC, ADRSeverstal PJSC, GDRTMK PJSC, GDRVEON, Ltd.VTB Bank PJSC, GDRX5 Retail Group NV, GDR
TOTAL RUSSIA
Adcock Ingram Holdings, Ltd.Adcorp Holdings, Ltd.Advtech, Ltd.AECI, Ltd.African Oxygen, Ltd.African Rainbow Minerals, Ltd.Alexander Forbes Group Holdings, Ltd.Allied Electronics Corp., Ltd., Class AAlviva Holdings, Ltd.AngloGold Ashanti, Ltd.
13,478 190,4724,450 60,523
* 97,447 190,2915,343 54,461
626 28,36320,099 155,449
185 3,71814,725 17,671
* 37,542 79,6708,937 102,829
11,487 258,024214 10,894
* 8,492 85,2927,613 95,011
470 22,42539,555 28,243
1,563 14,823* 19,625 23,690
3,662 31,83713,257 11,849
216 11,705* 181,084 73,672
10,363 11,600
1,771,681
RUSSIA — (1.0%)14,720 32,531
8,642 75,87716,840 145,489
* 4,918 125,5076,701 83,5623,013 34,891
103,992 87,5093,843 61,8343,822 13,778
57,567 180,185123,910 165,172
6,694 223,847
1,230,182
SOUTH AFRICA — (7.1%)6,350 25,251
* 7,281 11,90484,198 74,38632,383 210,78217,052 25,34329,837 367,544
176,003 68,91136,040 69,70219,705 22,21325,079 430,975
Emerging Markets Targeted Value PortfolioCONTINUED
Shares Value»

AngloGold Ashanti, Ltd.Aspen Pharmacare Holdings, Ltd.Assore, Ltd.Astral Foods, Ltd.Barloworld, Ltd.Bidvest Group, Ltd. (The)Blue Label Telecoms, Ltd.Clover Industries, Ltd.DataTec, Ltd.Distell Group Holdings, Ltd.EOH Holdings, Ltd.Exxaro Resources, Ltd.Gold Fields, Ltd.Gold Fields, Ltd., Sponsored ADRGrindrod, Ltd.Harmony Gold Mining Co., Ltd.Harmony Gold Mining Co., Ltd., Sponsored ADRHudaco Industries, Ltd.Impala Platinum Holdings, Ltd.Imperial Logistics, Ltd.Invicta Holdings, Ltd.KAP Industrial Holdings, Ltd.Lewis Group, Ltd.Liberty Holdings, Ltd.Life Healthcare Group Holdings, Ltd.Long4Life, Ltd.Merafe Resources, Ltd.Metair Investments, Ltd.Momentum Metropolitan HoldingsMotus Holdings Ltd.Mpact, Ltd.Nampak, Ltd.Oceana Group, Ltd.Omnia Holdings, Ltd.Peregrine Holdings, Ltd.Pioneer Foods Group, Ltd.PPC, Ltd.Raubex Group, Ltd.RCL Foods, Ltd.Reunert, Ltd.Rhodes Food Group Pty, Ltd.Royal Bafokeng Platinum, Ltd.Sappi, Ltd.Sibanye Gold, Ltd.Super Group, Ltd.Telkom SA SOC, Ltd.Tongaat Hulett, Ltd.Transaction Capital, Ltd.Trencor, Ltd.Tsogo Sun Gaming, Ltd.Wilson Bayly Holmes-Ovcon, Ltd.
TOTAL SOUTH AFRICA
SOUTH AFRICA — (Continued)22,300 $ 380,43810,670 66,971
5,691 138,77510,870 124,73434,950 292,98329,884 382,684
* 41,945 10,70418,040 29,01757,458 134,684
5,639 52,394* 25,195 31,178
43,210 501,05866,459 339,43391,296 461,04561,737 25,912
* 81,964 203,056* 16,913 41,268
3,955 32,245* 106,402 567,638
22,265 70,5826,213 10,270
223,916 80,6246,721 15,233
21,936 165,905149,194 234,887
* 88,335 27,889107,504 9,077
31,298 51,756163,591 192,626
12,473 64,26521,681 34,254
* 126,634 87,8545,864 27,852
# 14,165 33,28832,244 41,41223,061 165,442
#* 383,168 130,08135,771 47,699
9,673 7,01933,165 150,521
6,432 7,626* 12,976 30,634
74,610 270,556* 299,636 370,563* 62,202 128,218
61,152 365,13928,548 26,29249,054 78,655
* 27,669 47,58072,139 70,662
9,319 74,949
8,242,638
SOUTH KOREA — (15.2%)

Able C&C Co., Ltd.Aekyung Petrochemical Co., Ltd.Agabang&CompanyAJ Rent A Car Co., Ltd.AK Holdings, Inc.
ALUKO Co., Ltd.Asia Cement Co., Ltd.ASIA Holdings Co., Ltd.Asia Paper Manufacturing Co., Ltd.Asiana Airlines, Inc.Autech Corp.BGF Co., Ltd.Binggrae Co., Ltd.BNK Financial Group, Inc.Busan City Gas Co., Ltd.Byucksan Corp.Capro Corp.Chongkundang Holdings Corp.Chosun Refractories Co., Ltd.CJ CheilJedang Corp.CJ Corp.CJ Hello Co., Ltd.CJ Logistics Corp.D.I Corp.Dae Han Flour Mills Co., Ltd.Dae Won Kang Up Co., Ltd.Daeduck Electronics Co.Daekyo Co., Ltd.Daelim Industrial Co., Ltd.Daesang Corp.Daewoo Engineering & Construction Co., Ltd.Daewoo Shipbuilding & Marine Engineering Co., Ltd.Danal Co., Ltd.Daou Data Corp.Daou Technology, Inc.DB Financial Investment Co., Ltd.DB HiTek Co., Ltd.DB Insurance Co., Ltd.Deutsch Motors, Inc.DGB Financial Group, Inc.DI Dong Il Corp.DMS Co., Ltd.Dong-A ST Co., Ltd.Dong-Ah Geological Engineering Co., Ltd.Dongkuk Steel Mill Co., Ltd.DONGSUNG Corp.Dongwha Pharm Co., Ltd.Dongwon Development Co., Ltd.Dongwon Industries Co., Ltd.
* 1,801 15,1544,211 26,860
* 4,166 10,075* 2,199 19,105
985 34,040
Emerging Markets Targeted Value PortfolioCONTINUED
Shares Value»
SOUTH KOREA — (Continued)8,599 $ 16,738
269 18,37191 8,241
1,081 29,831* 17,738 86,264
1,278 11,0544,573 23,8891,362 74,918
43,405 256,038284 8,754
8,914 15,3057,250 21,368
380 33,227302 21,172
1,156 277,7362,382 186,8553,508 17,673
* 563 64,9993,646 10,086
144 22,6435,249 17,5335,983 51,4805,085 26,2944,669 414,8043,678 73,900
* 26,853 92,561* 6,460 158,986* 13,434 32,719
2,532 18,1155,867 100,5983,038 11,7007,287 80,8998,076 382,205
* 6,227 46,62428,574 181,438
179 10,8514,659 19,517
312 24,1732,381 43,711
* 9,676 54,1474,993 22,8983,593 26,9967,989 32,506
188 36,332

Doosan Bobcat, Inc.Doosan Corp.Doosan Heavy Industries & Construction Co., Ltd.Doosan Infracore Co., Ltd.DTR Automotive Corp.e Tec E&C, Ltd.Easy Bio, Inc.E-MART, Inc.EM-Tech Co., Ltd.ENF Technology Co., Ltd.Eugene Corp.Eugene Technology Co., Ltd.FarmscoFursys, Inc.Green Cross Holdings Corp.
GS Engineering & Construction Corp.GS Global Corp.GS Holdings Corp.GS Home Shopping, Inc.GS Retail Co., Ltd.Gwangju Shinsegae Co., Ltd.HAESUNG DS Co., Ltd.Halla Corp.Halla Holdings Corp.Handok, Inc.Handsome Co., Ltd.Hanjin Heavy Industries & Construction Co., Ltd.Hanjin Transportation Co., Ltd.Hankook Tire & Technology Co., Ltd.Hansae Yes24 Holdings Co., Ltd.Hanshin ConstructionHansol Holdings Co., Ltd.Hansol HomeDeco Co., Ltd.Hansol Paper Co., Ltd.Hansol Technics Co., Ltd.Hanwha Aerospace Co., Ltd.Hanwha Chemical Corp.Hanwha Corp.Hanwha General Insurance Co., Ltd.Hanwha Investment & Securities Co., Ltd.Hanwha Life Insurance Co., Ltd.Hanyang Eng Co., Ltd.Harim Co., Ltd.Harim Holdings Co., Ltd.HDC Holdings Co., Ltd.Heungkuk Fire & Marine Insurance Co., Ltd.Hite Jinro Co., Ltd.HJ Magnolia Yongpyong Hotel & Resort Corp.Huchems Fine Chemical Corp.
6,812 205,798767 67,712
* 21,717 110,887* 21,457 111,658
739 19,826342 22,665
5,999 26,5163,458 354,4742,190 21,6672,872 46,808
10,128 42,9912,599 24,2163,427 14,767
403 10,3341,809 29,818
Emerging Markets Targeted Value PortfolioCONTINUED
Shares Value»
SOUTH KOREA — (Continued)9,935 $282,963
11,688 23,9748,154 345,458
574 81,0752,384 74,990
63 9,2032,578 28,038
* 6,443 17,0401,256 45,4011,372 27,2692,491 78,060
* 3,503 14,5721,543 40,366
11,828 308,2923,050 19,5121,431 18,912
* 5,410 19,42011,444 11,4913,482 41,451
* 5,142 30,203* 6,356 172,208
17,310 270,8747,084 141,8067,541 22,174
* 19,019 34,36951,376 113,550
2,207 21,228* 11,062 25,129
4,838 41,6735,899 61,877
* 9,154 30,1764,304 77,1205,843 32,212
816 15,632

Huons Global Co., Ltd.Huvis Corp.HwaSung Industrial Co., Ltd.Hy-Lok Corp.Hyosung Corp.Hyundai BNG Steel Co., Ltd.Hyundai Construction Equipment Co., Ltd.Hyundai Corp.Hyundai Department Store Co., Ltd.Hyundai Electric & Energy System Co., Ltd.Hyundai Glovis Co., Ltd.Hyundai Greenfood Co., Ltd.Hyundai Home Shopping Network Corp.Hyundai Hy Communications & Networks Co., Ltd.Hyundai Livart Furniture Co., Ltd.Hyundai Marine & Fire Insurance Co., Ltd.Hyundai Motor Securities Co., Ltd.Hyundai Wia Corp.HyVision System, Inc.ICD Co., Ltd.IDIS Holdings Co., Ltd.IHQ, Inc.Ilshin Spinning Co., Ltd.iMarketKorea, Inc.Interflex Co., Ltd.
Interpark Holdings Corp.INTOPS Co., Ltd.IS Dongseo Co., Ltd.IsuPetasys Co., Ltd.Jahwa Electronics Co., Ltd.Kangnam Jevisco Co., Ltd.KAON Media Co., Ltd.KC Co., Ltd.KCC Corp.KG Chemical Corp.KGMobilians Co., Ltd.KISCO Corp.KISCO Holdings Co., Ltd.KISWIRE, Ltd.KIWOOM Securities Co., Ltd.KMH Co., Ltd.Kolon Corp.Kolon Industries, Inc.Korea Alcohol Industrial Co., Ltd.Korea Asset In Trust Co., Ltd.Korea Autoglass Corp.Korea Electric Terminal Co., Ltd.Korea Investment Holdings Co., Ltd.Korea Line Corp.
833 22,3001,579 9,1191,665 18,2531,868 28,650
196 13,4692,603 18,3471,632 42,6451,610 26,3652,689 167,734
* 952 10,9852,598 336,6487,090 74,070
898 70,7475,306 16,0201,826 23,869
10,237 241,3953,996 34,4632,823 102,7163,468 24,1102,922 28,2331,420 13,779
12,983 19,720160 12,097
4,471 44,240* 1,958 16,054
Emerging Markets Targeted Value PortfolioCONTINUED
Shares Value»
SOUTH KOREA — (Continued)5,276 $ 9,7352,924 36,6321,974 55,3867,799 31,9692,599 21,267
580 11,9993,271 27,6182,037 21,931
990 202,9701,807 17,9223,097 15,3592,292 10,2041,802 19,231
558 11,2102,087 127,6774,054 19,7641,235 17,0142,837 95,0031,839 12,2895,830 18,5251,897 29,3311,452 81,5277,037 439,018
* 2,164 46,107

Korea Petrochemical Ind Co., Ltd.Korea Real Estate Investment & Trust Co., Ltd.Korean Air Lines Co., Ltd.Korean Reinsurance Co.Kortek Corp.KPX Chemical Co., Ltd.KT Skylife Co., Ltd.KTB Investment & Securities Co., Ltd.Kukdo Chemical Co., Ltd.Kumho Industrial Co., Ltd.Kumho Petrochemical Co., Ltd.Kwang Dong Pharmaceutical Co., Ltd.Kyeryong Construction Industrial Co., Ltd.Kyobo Securities Co., Ltd.Kyungbang Co., Ltd.Kyungdong Pharm Co., Ltd.Kyung-In Synthetic Corp.LEADCORP, Inc. (The)LF Corp.LG Hausys, Ltd.LG Innotek Co., Ltd.LG International Corp.LIG Nex1 Co., Ltd.Lotte Chilsung Beverage Co., Ltd.Lotte Corp.LOTTE Fine Chemical Co., Ltd.Lotte Food Co., Ltd.LOTTE Himart Co., Ltd.Lotte Non-Life Insurance Co., Ltd.Lotte Shopping Co., Ltd.LS Corp.LS Industrial Systems Co., Ltd.Lumens Co., Ltd.Mando Corp.Meritz Financial Group, Inc.
Meritz Fire & Marine Insurance Co., Ltd.Meritz Securities Co., Ltd.Mirae Asset Daewoo Co., Ltd.Mirae Asset Life Insurance Co., Ltd.MK Electron Co., Ltd.Moorim P&P Co., Ltd.Muhak Co., Ltd.Namhae Chemical Corp.Namyang Dairy Products Co., Ltd.NeowizNexen Corp.Nexen Tire Corp.NH Investment & Securities Co., Ltd.NHN Corp.
740 74,71523,718 43,780
7,204 154,70914,855 100,141
2,426 26,301249 11,881
3,494 29,485* 10,955 24,154
754 30,8722,973 32,7332,943 201,8196,444 36,804
554 11,8993,914 32,1881,871 15,7632,282 16,2085,504 38,6122,739 15,0532,925 60,264
938 47,2922,363 223,1334,819 74,7511,247 30,909
550 67,2322,483 71,0302,962 121,088
74 30,5311,797 55,618
* 14,792 25,5071,417 162,0522,906 107,9022,061 79,880
* 10,766 16,4705,284 150,2936,357 74,628
Emerging Markets Targeted Value PortfolioCONTINUED
Shares Value»
SOUTH KOREA — (Continued)4,835 $ 81,248
46,870 199,25164,437 406,81714,911 50,0774,052 27,6314,758 17,3133,935 34,8312,744 20,912
48 21,733* 2,725 29,289
3,032 15,1546,381 46,261
23,021 252,377* 1,849 97,037

NICE Holdings Co., Ltd.Nice Information & Telecommunication, Inc.Nong Shim Holdings Co., Ltd.NongShim Co., Ltd.NS Shopping Co., Ltd.OCI Co., Ltd.Orange Life Insurance, Ltd.Orion Holdings Corp.Pan Ocean Co., Ltd.Poongsan Corp.Poongsan Holdings Corp.Posco International Corp.Pulmuone Co., Ltd.Reyon Pharmaceutical Co., Ltd.RFTech Co., Ltd.S&T Motiv Co., Ltd.Sajo Industries Co., Ltd.Sam Young Electronics Co., Ltd.Sam Yung Trading Co., Ltd.Samho Development Co., Ltd.Samick Musical Instruments Co., Ltd.Samji Electronics Co., Ltd.Samkwang Glass Co., Ltd.Sammok S-Form Co., Ltd.SAMPYO Cement Co., Ltd.Samsung Card Co., Ltd.Samsung Heavy Industries Co., Ltd.Samsung Securities Co., Ltd.Samyang Corp.Samyang Holdings Corp.SBWS-Connect Co., Ltd.Seah Besteel Corp.Sebang Co., Ltd.Sebang Global Battery Co., Ltd.Seohan Co., Ltd.Seohee Construction Co., Ltd.SFA Semicon Co., Ltd.Shindaeyang Paper Co., Ltd.Shinsegae Food Co., Ltd.Shinsegae Information & Communication Co., Ltd.Shinsegae, Inc.Shinsung E&G Co., Ltd.Shinyoung Securities Co., Ltd.Silla Co., Ltd.
SIMMTECH Co., Ltd.Sindoh Co., Ltd.SK Chemicals Co., Ltd.SK Discovery Co., Ltd.
2,945 53,871623 16,371164 10,989507 100,451
2,986 26,0503,004 189,6673,758 89,7734,507 59,272
* 39,992 161,5992,799 55,552
612 19,3807,967 125,4221,280 11,6451,419 16,958
* 3,243 21,9511,479 62,326
588 22,3152,074 18,1162,468 34,3354,766 18,3648,299 11,6581,682 15,449
874 27,4302,023 17,370
* 9,240 25,6154,944 151,492
* 61,706 365,53410,310 316,732
593 26,838509 29,873
* 22,720 21,630* 8,958 11,167
2,148 29,2701,020 10,3091,376 47,002
19,101 21,79327,983 27,974
* 8,599 18,357369 21,389418 26,221286 31,084
1,260 268,001* 21,811 19,332
497 24,646770 8,089
Emerging Markets Targeted Value PortfolioCONTINUED
Shares Value»
SOUTH KOREA — (Continued)4,307 $ 19,3561,082 39,3921,103 41,3272,070 42,246

SK Gas, Ltd.SK Networks Co., Ltd.SKC Co., Ltd.SL Corp.S-MAC Co., Ltd.Solid, Inc.Songwon Industrial Co., Ltd.Soulbrain Co., Ltd.SPG Co., Ltd.Ssangyong Motor Co.ST Pharm Co., Ltd.Suheung Co., Ltd.Sung Kwang Bend Co., Ltd.Sungchang Enterprise Holdings, Ltd.Sungshin Cement Co., Ltd.Sungwoo Hitech Co., Ltd.Sunjin Co., Ltd.Taekwang Industrial Co., Ltd.Taewoong Co., Ltd.Taeyoung Engineering & Construction Co., Ltd.TechWing, Inc.TES Co., Ltd.TK Chemical Corp.TK Corp.Tongyang Life Insurance Co., Ltd.Tongyang, Inc.Top Engineering Co., Ltd.Toptec Co., Ltd.Tovis Co., Ltd.Unid Co., Ltd.Whanin Pharmaceutical Co., Ltd.Wonik Holdings Co., Ltd.Wonik Materials Co., Ltd.Woongjin Co., Ltd.Y G-1 Co., Ltd.Youlchon Chemical Co., Ltd.Young Poong Corp.Youngone Corp.Youngone Holdings Co., Ltd.Yuanta Securities Korea Co., Ltd.Zeus Co., Ltd.
TOTAL SOUTH KOREA
Ability Enterprise Co., Ltd.AcBel Polytech, Inc.Acer, Inc.A-DATA Technology Co., Ltd.Advanced International Multitech Co., Ltd.AGV Products Corp.Alchip Technologies, Ltd.ALI Corp.Alpha Networks, Inc.Altek Corp.Ambassador Hotel (The)
1,140 74,51424,348 102,099
4,832 171,5692,473 46,004
* 36,548 26,511* 1,131 5,186
2,633 41,6481,537 84,0764,430 31,646
* 6,352 17,7961,650 19,5561,350 36,1902,934 22,686
* 12,418 18,8144,536 28,9898,732 27,8782,612 22,436
70 73,378* 3,151 24,346
4,719 52,5563,343 29,6382,837 38,425
* 8,032 17,8942,960 23,1715,937 19,384
19,744 26,9103,288 24,2082,680 21,8421,651 9,6611,341 53,644
625 8,627* 8,665 26,997
1,147 22,466* 15,317 18,627
3,707 26,3942,606 34,554
78 44,7183,385 95,963
926 41,128* 17,353 40,159
1,991 20,291
17,754,144
TAIWAN — (17.9%)36,000 19,88683,000 60,179
550,000 332,18651,000 86,01614,000 18,474
* 44,000 10,44911,000 35,285
* 59,000 21,27073,000 53,33759,000 47,23950,000 35,612

AmTRAN Technology Co., Ltd.Apacer Technology, Inc.APCB, Inc.Apex International Co., Ltd.Ardentec Corp.Asia Pacific Telecom Co., Ltd.Asia Polymer Corp.Asia Vital Components Co., Ltd.AU Optronics Corp.Audix Corp.Bank of Kaohsiung Co., Ltd.BES Engineering Corp.Capital Securities Corp.Casetek Holdings, Ltd.Cathay Real Estate Development Co., Ltd.Celxpert Energy Corp.Channel Well Technology Co., Ltd.CHC Healthcare GroupChen Full International Co., Ltd.Cheng Loong Corp.Cheng Mei Materials Technology Corp.Cheng Uei Precision Industry Co., Ltd.Chia Chang Co., Ltd.Chia Hsin Cement Corp.Chilisin Electronics Corp.China Airlines, Ltd.China Bills Finance Corp.China Chemical & Pharmaceutical Co., Ltd.China General Plastics Corp.China Life Insurance Co., Ltd.China Man-Made Fiber Corp.China Metal ProductsChina Motor Corp.China Petrochemical Development Corp.Chin-Poon Industrial Co., Ltd.Chipbond Technology Corp.ChipMOS Techinologies, Inc.Chong Hong Construction Co., Ltd.Chun Yuan SteelChung Hsin Electric & Machinery Manufacturing Corp.Chung Hung Steel Corp.Chung Hwa Pulp Corp.Clevo Co.CMC Magnetics Corp.Compal Electronics, Inc.Compeq Manufacturing Co., Ltd.Concord Securities Co., Ltd.Continental Holdings Corp.Coretronic Corp.
Emerging Markets Targeted Value PortfolioCONTINUED
Shares Value»
TAIWAN — (Continued)* 164,000 $ 59,423
10,000 10,52617,000 14,560
* 28,000 46,03592,000 88,202
* 232,000 52,66266,000 31,79960,000 77,345
511,000 134,9138,000 9,494
66,000 20,694361,000 88,838323,000 98,283
31,000 50,798104,000 72,777
10,000 9,47131,000 25,20213,000 20,38212,000 16,247
135,000 81,252* 78,000 26,639
76,000 82,38217,000 21,44651,000 27,20328,000 74,910
438,000 134,19196,000 45,47848,000 28,47379,040 53,987
320,370 264,016249,000 74,851
79,000 82,346109,000 89,400581,700 193,228
68,000 73,22398,000 196,48250,000 45,66331,000 88,98834,000 11,08773,000 49,291
161,000 54,19648,000 15,69074,000 75,465
* 360,000 78,682690,000 421,567189,000 162,066
57,680 13,61960,000 33,45866,000 84,752

Co-Tech Development Corp.CyberTAN Technology, Inc.DA CIN Construction Co., Ltd.Darfon Electronics Corp.Darwin Precisions Corp.Depo Auto Parts Ind Co., Ltd.D-Link Corp.Dynapack International Technology Corp.E Ink Holdings, Inc.Eastern Media International Corp.
Elite Semiconductor Memory Technology, Inc.Elitegroup Computer Systems Co., Ltd.Epistar Corp.Eternal Materials Co., Ltd.Eva Airways Corp.Everest Textile Co., Ltd.Evergreen International Storage & Transport Corp.Evergreen Marine Corp. Taiwan, Ltd.Everlight Chemical Industrial Corp.Everlight Electronics Co., Ltd.Excelsior Medical Co., Ltd.Far Eastern Department Stores, Ltd.Far Eastern International BankFarglory Land Development Co., Ltd.Federal Corp.First Insurance Co., Ltd. (The)First Steamship Co., Ltd.FLEXium Interconnect, Inc.FocalTech Systems Co., Ltd.Formosa Advanced Technologies Co., Ltd.Formosa Laboratories, Inc.Formosa Taffeta Co., Ltd.Formosan Rubber Group, Inc.Formosan Union ChemicalFoxconn Technology Co., Ltd.Fulgent Sun International Holding Co., Ltd.Fulltech Fiber Glass Corp.G Shank Enterprise Co., Ltd.GCS Holdings, Inc.Gemtek Technology Corp.General Interface Solution Holding, Ltd.Gigabyte Technology Co., Ltd.Gigastorage Corp.Global Brands Manufacture, Ltd.Globe Union Industrial Corp.Gloria Material Technology Corp.Gold Circuit Electronics, Ltd.Goldsun Building Materials Co., Ltd.Grand Pacific Petrochemical
32,000 34,05161,000 31,15260,000 37,80737,000 48,96894,000 54,150
7,000 16,166* 143,000 60,258
25,000 38,351156,000 170,931
71,000 23,301
Emerging Markets Targeted Value PortfolioCONTINUED
Shares Value»
TAIWAN — (Continued)56,000 $ 58,86825,000 8,696
178,000 140,330135,000 113,442376,799 176,387
* 42,000 15,34287,000 39,905
370,000 170,24550,000 27,559
107,000 102,84212,000 19,324
220,000 166,513407,000 163,132
72,000 88,042* 42,000 16,301
27,000 13,038* 89,000 35,732
59,000 179,56263,000 46,73312,000 12,77610,000 12,225
164,000 185,56533,000 20,38132,000 13,965
154,000 316,40919,215 55,48762,000 30,08914,000 11,047
8,000 15,394* 62,000 53,442
45,000 165,41096,000 143,464
* 51,000 15,05077,000 41,84644,000 22,84863,000 39,097
* 118,000 50,449141,000 37,625
* 157,000 102,503

Greatek Electronics, Inc.Hannstar Board Corp.HannStar Display Corp.HannsTouch Solution, Inc.Hey Song Corp.Highwealth Construction Corp.Hiroca Holdings, Ltd.Hitron Technology, Inc.Ho Tung Chemical Corp.Hong Pu Real Estate Development Co., Ltd.Hsin Kuang Steel Co., Ltd.Huaku Development Co., Ltd.Huang Hsiang Construction Corp.Hung Ching Development & Construction Co., Ltd.Hung Sheng Construction, Ltd.Ibase Technology, Inc.IBF Financial Holdings Co., Ltd.Ichia Technologies, Inc.IEI Integration Corp.Innolux Corp.
International CSRC Investment Holdings Co.Inventec Corp.ITE Technology, Inc.Jarllytec Co., Ltd.Jess-Link Products Co., Ltd.Jih Sun Financial Holdings Co., Ltd.KEE TAI Properties Co., Ltd.Kenda Rubber Industrial Co., Ltd.Kindom Construction Corp.King Yuan Electronics Co., Ltd.King's Town Bank Co., Ltd.Kinpo ElectronicsKinsus Interconnect Technology Corp.KS Terminals, Inc.Kuo Toong International Co., Ltd.Kuoyang Construction Co., Ltd.Lealea Enterprise Co., Ltd.Lextar Electronics Corp.Li Peng Enterprise Co., Ltd.Lingsen Precision Industries, Ltd.Lite-On Semiconductor Corp.Lite-On Technology Corp.Long Bon International Co., Ltd.Longchen Paper & Packaging Co., Ltd.Lung Yen Life Service Corp.Macronix InternationalMercuries & Associates Holding, Ltd.Mercuries Life Insurance Co., Ltd.Microbio Co., Ltd.
44,000 62,68470,376 84,041
504,000 106,968* 121,000 56,503
21,000 21,38935,000 54,72216,000 34,93029,000 18,948
176,000 39,58616,000 10,57643,000 42,33537,000 96,92128,000 28,38013,000 9,47097,000 62,56018,000 26,660
394,000 140,344* 27,000 13,985
31,000 32,7831,416,000 327,388
Emerging Markets Targeted Value PortfolioCONTINUED
Shares Value»
TAIWAN — (Continued)120,000 $146,100361,000 268,476
13,000 13,83010,000 22,01013,000 12,654
285,000 98,23549,000 18,99855,000 51,21171,000 57,325
207,000 214,870139,000 141,996205,000 68,336
61,000 77,44711,000 14,295
* 29,000 18,25032,000 12,367
108,000 31,62669,000 33,636
119,000 27,57739,000 11,13738,000 38,460
333,000 471,39155,000 27,984
127,000 60,56421,000 41,991
302,000 302,18452,000 29,575
* 189,113 65,667* 59,000 25,601

Mitac Holdings Corp.Motech Industries, Inc.MPI Corp.Nan Ya Printed Circuit Board Corp.Nien Hsing Textile Co., Ltd.O-Bank Co., Ltd.OptoTech Corp.Orient Semiconductor Electronics, Ltd.Oriental Union Chemical Corp.Pan Jit International, Inc.Pan-International Industrial Corp.Phihong Technology Co., Ltd.Pou Chen Corp.Powertech Technology, Inc.President Securities Corp.Prince Housing & Development Corp.Promate Electronic Co., Ltd.Qisda Corp.Quanta Storage, Inc.Radium Life Tech Co., Ltd.Rechi Precision Co., Ltd.Rich Development Co., Ltd.Ritek Corp.Roo Hsing Co., Ltd.Ruentex Development Co., Ltd.Ruentex Industries, Ltd.Sampo Corp.San Fang Chemical Industry Co., Ltd.San Far Property, Ltd.Sanyang Motor Co., Ltd.
Senao International Co., Ltd.Sesoda Corp.Shihlin Electric & Engineering Corp.Shin Kong Financial Holding Co., Ltd.Shin Zu Shing Co., Ltd.Shining Building Business Co., Ltd.Shinkong Insurance Co., Ltd.Shinkong Synthetic Fibers Corp.Sigurd Microelectronics Corp.Silicon Integrated Systems Corp.Sincere Navigation Corp.Sinher Technology, Inc.Sino-American Silicon Products, Inc.Sinon Corp.Sinphar Pharmaceutical Co., Ltd.Solar Applied Materials Technology Co.Sunplus Technology Co., Ltd.Sunspring Metal Corp.Supreme Electronics Co., Ltd.
123,000 127,419* 81,000 28,243
7,000 14,92344,000 59,39413,000 10,753
* 73,000 18,427110,000 78,091
* 82,709 40,84694,000 71,26143,000 35,12699,000 79,780
* 32,000 8,914309,000 380,259121,000 330,373103,000 41,960
34,000 12,10618,000 18,967
319,000 197,8108,000 11,848
* 166,000 73,39731,000 24,66050,000 15,155
* 85,000 23,553* 45,000 17,586
89,000 118,03760,000 127,61643,200 25,63520,000 14,92422,000 15,643
100,000 67,212
Emerging Markets Targeted Value PortfolioCONTINUED
Shares Value»
TAIWAN — (Continued)10,000 $ 10,46616,800 14,05930,000 42,882
356,000 102,90230,000 120,446
* 33,000 10,20323,000 28,054
199,000 84,38081,000 75,309
* 82,000 21,85288,000 47,108
8,000 11,30494,000 255,72356,000 33,69920,000 12,895
* 54,000 40,690144,000 63,867
12,000 12,14163,000 56,784

Sweeten Real Estate Development Co., Ltd.Syncmold Enterprise Corp.Synnex Technology International Corp.Systex Corp.Ta Ya Electric Wire & CableTaichung Commercial Bank Co., Ltd.Taiflex Scientific Co., Ltd.Tainan Enterprises Co., Ltd.Tainan Spinning Co., Ltd.Taiwan Business BankTaiwan Chinsan Electronic Industrial Co., Ltd.Taiwan Fertilizer Co., Ltd.Taiwan Fire & Marine Insurance Co., Ltd.Taiwan FU Hsing Industrial Co., Ltd.Taiwan Glass Industry Corp.Taiwan Hon Chuan Enterprise Co., Ltd.Taiwan Hopax Chemicals Manufacturing Co., Ltd.Taiwan Land Development Corp.Taiwan Navigation Co., Ltd.Taiwan PCB Techvest Co., Ltd.Taiwan Pulp & Paper Corp.Taiwan Shin Kong Security Co., Ltd.Taiwan Surface Mounting Technology Corp.Taiwan TEA Corp.Teco Electric and Machinery Co., Ltd.Test-Rite International Co., Ltd.Thye Ming Industrial Co., Ltd.Ton Yi Industrial Corp.Tong Yang Industry Co., Ltd.Tong-Tai Machine & Tool Co., Ltd.TOPBI International Holdings, Ltd.Topco Scientific Co., Ltd.TPK Holding Co., Ltd.Transcend Information, Inc.Tripod Technology Corp.TSRC Corp.Tung Ho Steel Enterprise Corp.TXC Corp.TYC Brother Industrial Co., Ltd.Tycoons Group Enterprise
Tyntek Corp.U-Ming Marine Transport Corp.Unimicron Technology Corp.Union Bank Of TaiwanUnitech Printed Circuit Board Corp.Unity Opto Technology Co., Ltd.Universal Cement Corp.Unizyx Holding Corp.UPC Technology Corp.
14,000 12,51625,000 62,692
242,000 297,08929,000 68,438
111,000 39,679361,000 146,515
39,000 60,23618,000 14,80495,000 37,330
772,000 331,21413,000 14,692
143,000 219,97716,000 10,361
9,000 12,417153,000 59,267
46,000 81,00720,000 12,011
* 124,000 36,48652,000 37,40153,000 68,80022,000 13,29730,000 35,96961,000 149,147
120,000 62,499352,000 280,300
18,000 11,79515,000 15,595
154,000 61,58684,000 122,70718,000 10,40713,000 36,37716,000 42,450
* 55,000 97,27332,000 69,78780,000 265,94073,000 63,330
127,000 87,81260,000 73,73338,000 34,254
* 88,000 18,881
Emerging Markets Targeted Value PortfolioCONTINUED
Shares Value»
TAIWAN — (Continued)60,000 $ 32,21681,000 90,881
207,000 249,910140,000 53,931135,000 102,218
* 46,000 13,09519,000 11,533
* 28,000 22,491145,000 52,317

USI Corp.Wah Lee Industrial Corp.Walsin Lihwa Corp.Walton Advanced Engineering, Inc.Wan Hai Lines, Ltd.Weikeng Industrial Co., Ltd.Well Shin Technology Co., Ltd.Weltrend SemiconductorWinbond Electronics Corp.Wisdom Marine Lines Co., Ltd.Wistron Corp.WPG Holdings, Ltd.WT Microelectronics Co., Ltd.WUS Printed Circuit Co., Ltd.Yang Ming Marine Transport Corp.YC Co., Ltd.YC INOX Co., Ltd.Yeong Guan Energy Technology Group Co., Ltd.YFY, Inc.Yieh Phui Enterprise Co., Ltd.Youngtek Electronics Corp.Yulon Motor Co., Ltd.Yung Chi Paint & Varnish Manufacturing Co., Ltd.Zenitron Corp.Zhen Ding Technology Holding, Ltd.Zig Sheng Industrial Co., Ltd.Zinwell Corp.ZongTai Real Estate Development Co., Ltd.
TOTAL TAIWAN
AAPICO Hitech PCLAdvanced Information Technology PCLAlucon PCLAmata Corp. PCLAnanda Development PCLAP Thailand PCLAsia Aviation PCLAsia Plus Group Holdings PCLAsia Sermkij Leasing PCLAsian Seafoods Coldstorage PCLBangchak Corp. PCLBangkok Airways PCLBangkok Land PCLBangkok Life Assurance PCLBanpu PCLBEC World PCLCal-Comp Electronics Thailand PCLDelta Electronics Thailand PCLDhipaya Insurance PCL
102,000 39,06014,000 24,460
448,000 214,81349,000 16,306
101,000 67,16066,000 42,726
9,000 14,74118,000 15,346
533,000 324,94156,000 58,488
490,000 364,026243,000 320,980
90,000 116,80335,000 34,953
* 204,000 56,98856,700 22,41951,000 43,036
* 23,000 41,716172,000 63,943189,000 54,911
21,000 30,929198,000 152,009
5,000 11,90627,000 18,80880,000 291,03534,000 9,60670,000 50,76127,000 20,258
20,911,254
THAILAND — (4.3%)39,100 23,77426,600 20,931
2,100 11,50591,300 71,544
401,800 46,771293,300 72,955230,800 28,817195,300 17,654
24,700 19,998132,900 29,817
95,800 94,22783,900 29,190
1,828,300 102,24990,900 76,846
379,900 176,640* 262,400 84,893
528,800 30,0898,600 14,820
56,600 45,825
Emerging Markets Targeted Value PortfolioCONTINUED
Shares Value»
THAILAND — (Continued)

Eastern Water Resources Development and Management PCL, Class FEsso Thailand PCLGFPT PCLGlobal Green Chemicals PCLGolden Land Property Development PCLGrand Canal Land PCLGroup Lease PCLHaad Thip PCLHana Microelectronics PCLICC International PCLIchitan Group PCLIRPC PCLItalian-Thai Development PCLKCE Electronics PCLKGI Securities Thailand PCLKhon Kaen Sugar Industry PCLKiatnakin Bank PCLLalin Property PCLLanna Resources PCLLH Financial Group PCLLoxley PCLLPN Development PCLMBK PCLMC Group PCLNoble Development PCLPCS Machine Group Holding PCLPolyplex Thailand PCLPrecious Shipping PCLProperty Perfect PCLPruksa Holding PCLQuality Houses PCLRegional Container Lines PCLRojana Industrial Park PCLSaha Pathanapibul PCLSaha-Union PCLSamart Telcoms PCLSansiri PCLSC Asset Corp. PCLSCG Ceramics PCLSiam City Cement PCLSiam Future Development PCLSiamgas & Petrochemicals PCLSingha Estate PCLSomboon Advance Technology PCLSPCG PCLSri Trang Agro-Industry PCLStar Petroleum Refining PCLSTP & I PCLSupalai PCLSuper Energy Corp. PCLSVI PCLSyntec Construction PCLTata Steel Thailand PCLThai Airways International PCLThai Central Chemical PCL
179,600 $ 78,836190,000 61,779
94,100 55,380* 42,800 16,282
183,800 50,201* 233,800 21,134* 152,300 32,931
19,500 13,632102,200 93,045
9,200 12,11538,500 9,764
1,479,100 230,846219,300 15,972
34,800 19,462205,600 31,554125,300 11,326
45,900 108,94820,700 3,83663,000 22,943
1,591,600 75,039* 148,300 11,091
181,500 42,786137,900 105,818
58,600 15,33834,200 24,46497,700 20,17255,700 28,072
* 146,100 40,616786,100 19,937109,100 78,043972,600 96,137
* 141,500 20,42896,100 19,998
5,500 9,65721,500 30,93430,400 12,059
1,743,700 84,478297,500 27,665
* 390,100 25,62212,989 100,516
205,140 42,689137,400 43,559555,700 64,324
35,800 22,11774,000 45,716
194,300 75,180319,200 102,231174,900 51,182151,400 108,301
* 2,236,200 51,624229,100 29,946124,600 10,372
* 1,082,200 24,280* 121,900 40,825
13,500 10,184

Thai Oil PCLThai Rayon PCLThai Stanley Electric PCLThai Union Group PCL, Class F
Thaicom PCLThaifoods Group PCLThanachart Capital PCLThitikorn PCLThoresen Thai Agencies PCLTipco Asphalt PCLTIPCO Foods PCLTisco Financial Group PCLTMB Bank PCLTPI Polene PCLTPI Polene Power PCLU City PCL, Class FUnique Engineering & Construction PCLUniventures PCLVanachai Group PCLVinythai PCL
TOTAL THAILAND
Aksa Akrilik Kimya Sanayii A.S.Aksa Enerji Uretim A.S.Albaraka Turk Katilim Bankasi A.S.Anadolu Cam Sanayii A.S.Anadolu Efes Biracilik Ve Malt Sanayii A.S.Arcelik A.S.Aygaz A.S.Bera Holding A.S.Cimsa Cimento Sanayi VE Ticaret A.S.Coca-Cola Icecek A.S.Dogan Sirketler Grubu Holding A.S.EIS Eczacibasi Ilac ve Sinai ve Finansal Yatirimlar Sanayi ve Ticaret A.S.Kardemir Karabuk Demir Celik Sanayi ve Ticaret A.S., Class DKoza Anadolu Metal Madencilik Isletmeleri A.S.Nuh Cimento Sanayi A.S.Pegasus Hava Tasimaciligi A.S.Sekerbank Turk ASSelcuk Ecza Deposu Ticaret ve Sanayi A.S.TAV Havalimanlari Holding A.S.Trakya Cam Sanayii A.S.Turkiye Halk Bankasi A.S.Turkiye Sinai Kalkinma Bankasi A.S.Turkiye Sise ve Cam Fabrikalari A.S.Turkiye Vakiflar Bankasi TAO, Class DVestel Elektronik Sanayi ve Ticaret A.S.Zorlu Enerji Elektrik Uretim A.S.
105,800 237,366300 363
4,500 31,605338,700 208,143
Emerging Markets Targeted Value PortfolioCONTINUED
Shares Value»
THAILAND — (Continued)* 118,200 $ 22,483
145,600 20,452100,300 192,414
28,100 9,137239,200 48,221111,700 71,54967,900 24,72757,900 190,145
1,861,300 114,383908,800 56,144430,300 83,947
* 274,500 16,512141,900 50,291109,300 23,811
83,600 13,53773,200 61,883
4,977,044
TURKEY — (1.0%)13,028 22,053
* 34,262 14,772* 43,951 9,479
36,374 18,59626,267 100,790
* 29,780 92,9524,735 8,664
* 69,189 22,420* 9,985 12,063
14,956 88,949237,501 55,202
22,452 9,74543,130 16,860
* 23,854 30,441# 7,715 8,683* 6,826 58,041* 54,024 9,356
15,820 13,13527,645 124,244
111,081 55,030120,153 129,121
* 402,201 59,77642,128 37,180
142,151 128,870* 15,167 25,562#* 86,061 18,754

TOTAL TURKEY
TOTAL COMMON STOCKS
Banco ABC Brasil S.A.Banco do Estado do Rio Grande do Sul SA, Class BBanco Pan SACia Brasileira de DistribuicaoCia Ferro Ligas da Bahia - FERBASAGerdau SAMarcopolo SA
Randon SA Implementos e ParticipacoesUnipar Carbocloro SAUsinas Siderurgicas de Minas Gerais SA, Class A
TOTAL BRAZIL
Avianca Holdings SA
CJ Corp.
TOTAL PREFERRED STOCKS
Paramount Corp. Bhd Warrants 7/28/2024
TOTAL INVESTMENT SECURITIES
DFA Short Term Investment Fund
(Cost $114,418,695)^^
BrazilChileChinaColombiaGreeceIndiaIndonesiaMalaysia
1,170,738
114,006,961
PREFERRED STOCKS — (1.4%)BRAZIL — (1.4%)
21,060 98,94439,700 244,56516,600 41,10511,367 278,6399,800 57,906
82,300 296,520149,694 149,445
Emerging Markets Targeted Value PortfolioCONTINUED
Shares Value»
BRAZIL — (Continued)34,900 $ 90,626
7,593 67,069104,900 240,511
1,565,330
COLOMBIA — (0.0%)68,868 33,585
SOUTH KOREA — (0.0%)* 284 8,802
1,607,717
RIGHTS/WARRANTS — (0.0%)MALAYSIA — (0.0%)* 15,160 0
115,614,678
Value†
SECURITIES LENDING COLLATERAL — (0.9%)@§ 91,098 1,054,099
TOTAL INVESTMENTS — (100.0%)$116,668,777
Summary of the Portfolio's investments as of July 31, 2019, based on their valuation inputs, is as follows (see Security Valuation Note):
Investments in Securities (Market Value)
Level 1 Level 2 Level 3 Total
Common Stocks$10,905,712 — — $ 10,905,712
1,018,127 — — 1,018,1271,422,001 $17,659,838 — 19,081,839
450,001 — — 450,001— 497,249 — 497,249— 13,619,365 — 13,619,365— 3,520,354 — 3,520,354— 3,688,604 — 3,688,604

MexicoPhilippinesPolandRussiaSouth AfricaSouth KoreaTaiwanThailandTurkey
BrazilColombiaSouth Korea
Securities Lending Collateral
TOTAL
3,450,913 — — 3,450,913— 1,717,116 — 1,717,116— 1,771,681 — 1,771,681
1,084,693 145,489 — 1,230,182953,413 7,289,225 — 8,242,638
— 17,754,144 — 17,754,144— 20,911,254 — 20,911,254
4,977,044 — — 4,977,044— 1,170,738 — 1,170,738
Preferred Stocks1,565,330 — — 1,565,330
33,585 — — 33,585— 8,802 — 8,802
— 1,054,099 — 1,054,099
$25,860,819 $90,807,958 — $116,668,777
DFA GLOBAL SUSTAINABILITY FIXED INCOME PORTFOLIO
SCHEDULE OF INVESTMENTS
July 31, 2019
(Unaudited)
0.750%, 09/29/26
1.125%, 01/18/28
1.375%, 08/30/28
2.125%, 05/02/25
TOTAL AUSTRALIA
0.250%, 09/26/24
0.750%, 10/20/26
TOTAL AUSTRIA
2.250%, 05/24/29
FaceAmount^ Value†
(000)BONDS — (91.5%)AUSTRALIA — (1.2%)Australia & New Zealand
Banking Group, Ltd.EUR 300 $ 348,129
Commonwealth Bank ofAustralia
EUR 1,000 1,188,659National Australia Bank,Ltd.
EUR 1,000 1,217,287Westpac Banking Corp.
GBP 700 891,329
3,645,404
AUSTRIA — (1.2%)Oesterreichische
Kontrollbank AGEUR 1,700 1,945,118
Republic of AustriaGovernment Bond
Ω EUR 1,600 1,923,394
3,868,512
BELGIUM — (1.6%)Anheuser-Busch InBevSA
GBP 700 879,751Kingdom of Belgium
Government Bond
2.550%, 06/18/27
3.250%, 09/05/29
2.600%, 09/08/235.850%, 03/08/33
2.750%, 04/12/27
6.400%, 09/05/31
3.350%, 05/15/26
0.625%, 07/20/23
2.700%, 01/25/23
TOTAL CANADA
FaceAmount^ Value†
(000)CANADA — (Continued)Province of British
Columbia CanadaCAD 1,000 $ 785,505
Province of ManitobaCanada
CAD 800 658,160Province of OntarioCanada
CAD 2,500 1,946,659CAD 800 850,074
Province of QuebecCanada
4,000 4,152,865Province of
SaskatchewanCanada
CAD 1,000 1,080,550Thomson Reuters Corp.
500 505,644Toronto-Dominion Bank(The)
EUR 1,700 1,945,915Toyota Credit Canada,Inc.
CAD 4,000 3,081,891
26,976,343
DENMARK — (1.7%)Danske Bank A.S.

DFA Global Sustainability Fixed Income PortfolioCONTINUED
5.500%, 03/28/281.000%, 06/22/311.250%, 04/22/33
TOTAL BELGIUM
1.875%, 05/06/26
1.900%, 08/27/21
2.620%, 12/02/26
4.850%, 03/29/29
3.300%, 05/26/25
1.500%, 03/04/33
3.444%, 05/23/25
3.300%, 03/15/28
EUR 1,700 2,829,927Ω EUR 500 616,740
EUR 600 763,379
5,089,797
CANADA — (8.6%)Alimentation Couche-
Tard, Inc.EUR 800 961,787
Bank of Montreal2,000 1,987,488
Bank of Nova Scotia(The)
CAD 1,000 772,829Brookfield Finance, Inc.
800 879,504Canadian Imperial Bank
of CommerceCAD 1,000 800,394
CPPIB Capital, Inc.EUR 1,050 1,343,284
Honda Canada Finance,Inc.
CAD 500 398,731Province of AlbertaCanada
4,500 4,825,063
4.375%, 06/12/28
0.500%, 11/15/270.500%, 11/15/29
0.750%, 05/18/27
TOTAL DENMARK
1.125%, 04/15/34
1.250%, 12/07/221.250%, 02/23/33
0.875%, 06/26/23
TOTAL FINLAND
1.375%, 07/05/32
1.625%, 02/23/26
0.875%, 01/31/24
2.375%, 05/20/24
Ω 1,000 1,033,937Denmark GovernmentBond
DKK 11,000 1,773,557Ω DKK 4,000 647,312Kommunekredit
EUR 1,700 2,011,903
5,466,709
FINLAND — (2.0%)Finland GovernmentBondΩ EUR 600 768,169Municipality FinanceP.L.C.
GBP 3,000 3,705,694EUR 800 1,009,496
Nordea Bank AbpEUR 800 914,701
6,398,060
FRANCE — (5.1%)Agence Francaise de
DeveloppementEUR 600 753,236
BNP Paribas SAEUR 800 979,943
BPCE SAEUR 700 799,689
Credit Agricole SAEUR 800 989,460
1.000%, 10/18/27
0.500%, 05/25/25
8.125%, 01/28/33
1.500%, 05/18/26
3.625%, 06/19/28
5.375%, 03/18/27
5.250%, 12/07/28
FaceAmount^ Value†
(000)FRANCE — (Continued)Dexia Credit Local SA
EUR 1,250 $ 1,500,996French Republic
Government BondOAT
EUR 1,100 1,292,402Orange SA
EUR 500 1,060,585Pernod Ricard SA
EUR 600 720,086Sanofi
2,000 2,163,357SNCF Mobilites
GBP 1,600 2,525,189SNCF Reseau EPIC
GBP 1,000 1,639,967
1.000%, 05/15/260.900%, 05/15/28
TOTAL IRELAND
1.700%, 09/20/22
1.800%, 09/20/31
3.677%, 02/22/27
FaceAmount^ Value†
(000)IRELAND — (0.4%)Ireland GovernmentBond
EUR 400 $ 478,806EUR 700 838,498
1,317,304
JAPAN — (1.7%)Development Bank of
Japan, Inc.JPY 120,000 1,168,444
Japan GovernmentTwenty Year Bond
JPY 130,000 1,466,052Mitsubishi UFJ
Financial Group, Inc.1,000 1,056,774

DFA Global Sustainability Fixed Income PortfolioCONTINUED
1.375%, 01/13/28
1.250%, 05/25/33
TOTAL FRANCE
2.000%, 10/08/28
1.500%, 02/06/29
0.500%, 02/15/28
1.375%, 05/11/28
1.125%, 12/18/282.750%, 03/19/29
1.375%, 01/30/27
2.050%, 02/16/265.750%, 06/07/32
2.431%, 09/27/21
2.000%, 01/13/25
0.750%, 06/30/28
0.950%, 03/13/28
TOTAL GERMANY
Societe Generale SAEUR 900 1,056,354
Unedic AsseoEUR 500 629,634
16,110,898
GERMANY — (6.2%)Amphenol
TechnologiesHolding GmbH
EUR 600 741,010BMW Finance NV
EUR 1,400 1,696,763Bundesrepublik
DeutschlandBundesanleihe
EUR 2,000 2,418,796Daimler AG
EUR 900 1,082,052Deutsche Bahn
Finance GMBHEUR 1,000 1,213,339EUR 107 147,746
Deutsche TelekomInternationalFinance BV
EUR 800 965,898Kreditanstalt fuer
WiederaufbauJPY 298,000 3,176,781
GBP 1,000 1,885,597Landeskreditbank
Baden-WuerttembergFoerderbank
(r) 1,000 1,001,150Landwirtschaftliche
Rentenbank800 802,860
NRW BankEUR 1,000 1,193,309
State of North Rhine-WestphaliaGermany
EUR 2,500 3,032,932
19,358,233
2.839%, 09/13/26
3.784%, 03/09/26
TOTAL JAPAN
1.200%, 06/30/27
0.625%, 10/16/26
TOTAL LUXEMBOURG
1.000%, 04/16/25
1.000%, 01/12/265.200%, 12/07/283.300%, 04/26/29
1.375%, 02/03/27
1.375%, 01/29/27
1.375%, 01/11/28
5.000%, 11/18/26
1.375%, 05/02/28
2.250%, 11/22/24
1.000%, 03/01/28
0.750%, 07/15/27
Mizuho FinancialGroup, Inc.
600 600,434Sumitomo Mitsui
Financial Group, Inc.1,000 1,061,534
5,353,238
LUXEMBOURG — (0.9%)DH Europe Finance SA
EUR 800 933,804European Financial
Stability FacilityEUR 1,700 2,010,190
2,943,994
NETHERLANDS — (5.7%)ABN AMRO Bank NV
EUR 800 940,741BNG Bank NV
EUR 1,600 1,921,969GBP 1,500 2,487,475AUD 3,000 2,322,217
CooperatieveRabobank UA
EUR 600 729,847Heineken NV
EUR 1,000 1,202,247ING Groep NV
EUR 900 1,075,008Koninklijke KPN NV
GBP 500 702,576Koninklijke Philips NV
EUR 800 968,184Mylan NV
EUR 800 955,032Nederlandse
WaterschapsbankNV
EUR 1,000 1,217,167Netherlands
Government BondΩ EUR 1,000 1,215,630
FaceAmount^ Value†
(000)NETHERLANDS — (Continued)
FaceAmount^ Value†
(000)SWEDEN — (1.8%)

1.000%, 09/06/27
1.125%, 02/12/271.375%, 07/31/29
TOTAL NETHERLANDS
0.625%, 04/20/26
1.750%, 02/17/27
TOTAL NORWAY
2.375%, 01/23/23
1.375%, 12/14/22
5.375%, 02/02/26
TOTAL SPAIN
0.500%, 03/21/29
2.350%, 06/21/27
0.625%, 01/30/29
5.625%, 12/07/28
2.150%, 01/18/27
1.200%, 05/23/33
1.250%, 04/04/33
5.750%, 06/07/32
TOTAL SUPRANATIONALORGANIZATIONOBLIGATIONS
SiemensFinancieringsmaatschappijNV
EUR 800 $ 958,964Unilever NV
EUR 400 480,478EUR 700 862,884
18,040,419
NORWAY — (0.8%)Kommunalbanken A.S.
EUR 1,700 1,985,902Norway Government BondΩ NOK 5,500 640,069
2,625,971
SINGAPORE — (0.1%)Temasek Financial I, Ltd.
320 321,389
SPAIN — (0.6%)Banco Santander SA
EUR 800 929,199Telefonica Emisiones SA
GBP 600 887,930
1,817,129
SUPRANATIONAL ORGANIZATION OBLIGATIONS — (7.5%)African Development Bank
EUR 1,000 1,167,939Asian Development Bank
JPY 780,000 8,690,379Council Of Europe
Development BankEUR 800 947,823
European Bank forReconstruction &Development
GBP 800 1,378,010European Investment Bank
JPY 530,800 5,794,102European StabilityMechanism
EUR 600 761,323European Union
EUR 500 636,462International Bank for
Reconstruction &Development
GBP 2,200 4,147,863
23,523,901
0.750%, 02/22/23
0.400%, 08/29/23
2.250%, 06/01/32
TOTAL SWEDEN
1.500%, 04/10/26
1.250%, 09/01/26
TOTAL SWITZERLAND
2.875%, 05/14/26
5.750%, 11/13/31
4.000%, 12/06/27
4.375%, 01/12/263.250%, 01/17/33
3.125%, 11/21/31
2.625%, 11/06/23
1.500%, 10/22/27
1.000%, 09/12/26
3.400%, 03/08/21
1.500%, 09/12/27
3.250%, 01/20/28
4.800%, 04/05/26
3.625%, 01/14/26
4.000%, 11/26/29
Kommuninvest I SverigeAB
SEK 5,000 $ 533,283Swedbank AB
EUR 1,000 1,125,487Sweden GovernmentBond
SEK 29,500 3,914,565
5,573,335
SWITZERLAND — (0.6%)Credit Suisse AG
EUR 800 969,251UBS Group Funding
Switzerland AGEUR 800 947,465
1,916,716
UNITED KINGDOM — (6.0%)Aon P.L.C.
EUR 500 630,661AstraZeneca P.L.C.
GBP 500 872,977AXIS Specialty FinanceP.L.C.
800 828,127Barclays P.L.C.
1,000 1,032,748GBP 400 477,622
BritishTelecommunicationsP.L.C.
GBP 700 929,549Coca-Cola European
Partners P.L.C.EUR 800 983,450
Diageo Finance P.L.C.EUR 500 609,084
GlaxoSmithKline CapitalP.L.C.
EUR 800 943,859HSBC Holdings P.L.C.
900 912,022Lloyds Banking GroupP.L.C.
EUR 900 1,035,875Nationwide BuildingSociety
GBP 700 944,470Royal Bank of Scotland
Group P.L.C.700 748,015
Santander UK GroupHoldings P.L.C.
GBP 400 524,419Sky, Ltd.
GBP 600 889,450

DFA Global Sustainability Fixed Income PortfolioCONTINUED
1.625%, 10/22/284.750%, 12/07/304.250%, 06/07/32
United Kingdom GiltGBP 900 1,193,447GBP 1,500 2,623,674GBP 1,100 1,888,110
1.875%, 11/20/29
TOTAL UNITEDKINGDOM
1.500%, 09/27/26
4.250%, 11/14/28
3.400%, 06/15/27
3.500%, 11/15/24
2.125%, 06/01/29
3.000%, 10/30/24
1.875%, 06/21/27
2.950%, 09/01/27
4.000%, 09/13/29
4.101%, 03/01/28
4.500%, 12/15/28
1.375%, 05/24/293.050%, 07/31/29
3.300%, 04/01/27
3.875%, 01/12/28
3.825%, 11/25/20
3.500%, 06/15/27
FaceAmount^ Value†
(000)UNITED KINGDOM — (Continued)Vodafone Group P.L.C.
EUR 600 $ 736,890
18,804,449
UNITED STATES — (37.8%)Abbott Ireland FinancingDAC
EUR 800 969,856AbbVie, Inc.
600 641,003Activision Blizzard, Inc.
1,000 1,023,207Aetna, Inc.
693 713,233Allergan Funding SCS
EUR 800 978,378American Express Co.
1,000 1,020,137American International
Group, Inc.EUR 800 968,549
American Water CapitalCorp.# 800 808,359Amgen, Inc.
GBP 700 1,009,042Anthem, Inc.
1,000 1,063,966Aon Corp.
500 554,998Apple, Inc.
EUR 1,600 1,977,900GBP 1,300 1,844,056
Applied Materials, Inc.1,000 1,045,824
Arrow Electronics, Inc.1,000 998,505
AT&T, Inc.CAD 1,200 926,486
Autodesk, Inc.500 508,178
AutoZone, Inc.
3.550%, 03/15/28
1.000%, 05/15/25
4.500%, 03/15/29
2.600%, 07/07/28
4.700%, 03/15/27
4.150%, 03/15/28
3.750%, 03/09/27
3.410%, 06/15/27
4.000%, 01/15/26
3.450%, 11/15/27
1.550%, 03/15/28
1.625%, 03/21/28
3.700%, 03/29/23
3.950%, 05/15/24
5.250%, 05/30/29
1.875%, 09/22/26
0.500%, 03/06/26
5.500%, 11/23/29
3.600%, 02/15/28
3.000%, 05/18/27
FaceAmount^ Value†
(000)UNITED STATES — (Continued)
500 $ 527,104Bristol-Myers Squibb Co.
EUR 800 937,806Brown & Brown, Inc.# 1,000 1,061,436Brown-Forman Corp.
GBP 700 927,957CA, Inc.
1,000 1,029,346Campbell Soup Co.
600 631,896Capital One FinancialCorp.
600 623,502Cardinal Health, Inc.# 1,000 977,137CBS Corp.
600 631,025Celgene Corp.
600 622,542Chubb INA Holdings, Inc.
EUR 800 969,762Citigroup, Inc.
EUR 800 971,548Citizens Bank N.A.
900 936,532CNA Financial Corp.
900 948,176CNO Financial Group,Inc.
1,000 1,082,500Coca Cola Co.
EUR 600 750,553Colgate-Palmolive Co.
EUR 600 690,747Comcast Corp.
GBP 600 993,137Constellation Brands, Inc.
500 521,615Costco Wholesale Corp.
1,500 1,554,578Cox Communications, Inc.

DFA Global Sustainability Fixed Income PortfolioCONTINUED
2.500%, 04/15/21
4.625%, 04/15/26
7.000%, 07/31/28
2.600%, 08/15/26
4.450%, 10/01/28
4.050%, 09/15/25
1.250%, 05/06/25
1.000%, 04/20/27
1.800%, 03/03/27
600 600,988Avnet, Inc.
500 530,235Bank of America Corp.
GBP 600 1,040,838Baxter International, Inc.
1,000 996,331Best Buy Co., Inc.
800 851,859Biogen, Inc.
900 963,073BlackRock, Inc.
EUR 600 712,248BMW US Capital LLC
EUR 900 1,056,937Booking Holdings, Inc.
EUR 500 609,555
3.500%, 08/15/27
3.850%, 05/01/27
1.900%, 03/19/27
4.150%, 11/01/25
3.700%, 05/15/23
3.150%, 11/15/25
2.750%, 01/15/254.750%, 04/15/27
4.500%, 06/20/28
Ω 500 511,662Darden Restaurants, Inc.
1,000 1,036,260Discovery
Communications LLCEUR 800 947,026
Dollar General Corp.600 646,413
Dollar Tree, Inc.1,000 1,032,254
Dover Corp.1,000 1,014,736
DXC Technology Co.GBP 500 621,518
500 537,306E*TRADE Financial Corp.
1,000 1,071,076
3.500%, 04/06/27
3.600%, 06/05/27
1.000%, 01/15/24
1.250%, 10/15/252.000%, 10/15/29
3.400%, 03/01/27
1.625%, 01/11/27
3.500%, 03/15/28
2.125%, 08/15/26
1.000%, 04/27/23
3.250%, 01/05/23
3.650%, 03/01/26
7.125%, 08/07/25
FaceAmount^ Value†
(000)UNITED STATES — (Continued)Eaton Vance Corp.
477 $ 494,362eBay, Inc.
200 205,570Ecolab, Inc.
EUR 100 115,762Emerson Electric Co.
EUR 500 591,018EUR 300 376,329
Express Scripts HoldingCo.
1,000 1,018,350FedEx Corp.
EUR 700 836,660GATX Corp.
600 608,072General Dynamics Corp.
600 587,363General Mills, Inc.
EUR 525 604,498General Motors Financial
Co. Inc.1,000 1,008,409
Gilead Sciences, Inc.600 633,397
Goldman Sachs Group,Inc. (The)
GBP 600 943,909Harley-Davidson, Inc.
4.750%, 03/15/26
4.400%, 03/15/29
2.750%, 05/04/26
3.750%, 04/01/26
3.500%, 11/01/27
4.650%, 12/01/28
3.600%, 04/01/34
3.500%, 06/03/24
2.100%, 12/01/27
1.750%, 05/03/28
3.125%, 02/17/29
4.125%, 11/15/25
3.500%, 03/15/25
FaceAmount^ Value†
(000)UNITED STATES — (Continued)Legg Mason, Inc.
900 $ 971,959Leggett & Platt, Inc.
500 526,446Liberty Mutual Group, Inc.
EUR 1,100 1,379,068Loews Corp.
600 633,603Markel Corp.
800 801,244Marriott International, Inc.
500 553,108Mars, Inc.Ω 1,200 1,291,398Marsh & McLennan Cos.,Inc.
1,000 1,041,177Mastercard, Inc.
EUR 500 646,018McDonald's Corp.
EUR 800 999,756McKesson Corp.
GBP 1,200 1,555,098Mead Johnson NutritionCo.
600 653,597Medtronic, Inc.
445 472,158Merck & Co., Inc.

DFA Global Sustainability Fixed Income PortfolioCONTINUED
3.500%, 07/28/25
4.900%, 10/15/25
2.250%, 02/22/28
4.375%, 09/15/28
1.750%, 03/07/28
2.900%, 01/15/28
3.625%, 05/13/243.500%, 12/18/26
1.250%, 03/10/25
2.250%, 05/25/28
7.500%, 04/01/31
3.600%, 09/01/27
4.000%, 03/15/29
3.800%, 09/15/27
1,000 1,028,202Hewlett Packard
Enterprise Co.900 988,528
Honeywell International,Inc.
EUR 800 1,040,570Hyatt Hotels Corp.
896 957,980International Business
Machines Corp.EUR 800 1,001,083
Johnson & Johnson500 517,363
JPMorgan Chase & Co.378 397,582
GBP 400 554,253Kellogg Co.
EUR 800 937,151Kraft Heinz Foods Co.
EUR 800 973,319Kroger Co. (The)
600 803,584Laboratory Corp. of
America Holdings1,000 1,031,904
Lam Research Corp.800 863,711
Lear Corp.500 496,007
1.875%, 10/15/26
6.500%, 12/15/32
2.400%, 08/08/26
1.250%, 07/15/24
1.375%, 10/27/26
4.600%, 05/23/29
6.950%, 03/15/28
3.200%, 09/16/26
4.000%, 07/13/27
3.400%, 07/08/24
3.600%, 09/01/27
0.875%, 07/18/28
3.450%, 03/15/29
1.400%, 03/13/27
3.100%, 11/15/26
1.200%, 10/30/28
EUR 600 754,890MetLife, Inc.
500 685,376Microsoft Corp.
500 501,514Molson Coors BrewingCo.
EUR 800 921,676Morgan Stanley
EUR 800 949,496Motorola Solutions, Inc.
1,000 1,062,315Nordstrom, Inc.# 500 587,945NVIDIA Corp.
600 619,037ONEOK, Inc.
500 522,050Oracle Corp.
2,000 2,092,200O'Reilly Automotive, Inc.
600 622,424PepsiCo, Inc.
EUR 900 1,057,991Pfizer, Inc.
600 635,532PPG Industries, Inc.
EUR 800 942,365Principal Financial Group,Inc.
800 814,274Procter & Gamble Co.(The)
EUR 1,000 1,217,342
6.250%, 12/01/32
3.878%, 03/27/28
3.450%, 05/20/25
4.200%, 06/30/29
4.200%, 09/15/28
3.700%, 04/11/28
FaceAmount^ Value†
(000)UNITED STATES — (Continued)Progressive Corp. (The)
500 $ 668,454Prudential Financial, Inc.
600 655,019QUALCOMM, Inc.
1,000 1,042,203Quest Diagnostics, Inc.
1,000 1,082,642Roper Technologies, Inc.
1,000 1,084,754salesforce.com, Inc.
1,000 1,082,461
4.750%, 02/26/29
1.100%, 11/09/27
TOTAL UNITEDSTATES
TOTAL BONDS
2.630%, 08/03/26
FaceAmount^ Value†
(000)UNITED STATES — (Continued)Whirlpool Corp.
500 $ 546,523Whirlpool Finance
Luxembourg SarlEUR 650 740,173
119,062,674
288,214,475
AGENCY OBLIGATIONS — (7.5%)Federal Farm CreditBank
1,000 1,030,350

DFA Global Sustainability Fixed Income PortfolioCONTINUED
As of July 31, 2019, DFA Global Sustainability Fixed Income Portfolio had entered into the following forward currency contracts and thenet unrealized forward currency gain (loss) is reflected in the accompanying financial statements:
Currency Purchased Currency Sold CounterpartySettlement
Date
UnrealizedForeign
ExchangeAppreciation
(Depreciation)
4.600%, 06/15/28
4.000%, 11/15/28
3.650%, 03/07/28
2.450%, 08/01/22
3.300%, 07/15/26
4.250%, 04/01/25
1.375%, 09/12/28
2.750%, 06/15/21
4.450%, 06/01/28
2.758%, 10/07/24
1.000%, 11/15/28
3.875%, 12/15/28
0.850%, 06/07/24
2.625%, 12/01/31
0.625%, 09/20/23
3.900%, 08/21/27
3.600%, 11/20/25
5.750%, 12/19/30
1.000%, 02/02/27
Spirit AeroSystems, Inc.1,000 1,067,847
Starbucks Corp.500 547,140
Stryker Corp.1,000 1,067,828
SunTrust Bank1,000 1,001,124
Sysco Corp.1,000 1,032,337
Tapestry, Inc.1,000 1,047,795
Thermo Fisher Scientific,Inc.
EUR 900 1,082,421TJX Cos. Inc
315 318,637Total System Services,Inc.
500 538,769TWDC Enterprises 18Corp.
CAD 1,000 775,746United Parcel Service,Inc.
EUR 800 936,505UnitedHealth Group, Inc.
1,000 1,087,453US Bancorp
EUR 500 576,500Verizon Communications,Inc.
EUR 800 1,082,994VF Corp.
EUR 700 797,032VMware, Inc.
1,100 1,115,124Walgreens Boots Alliance,Inc.
GBP 700 921,186Walmart, Inc.
GBP 1,000 1,768,061Wells Fargo & Co.
EUR 900 1,049,062
3.125%, 09/12/253.250%, 06/09/283.250%, 11/16/28
6.750%, 09/15/296.750%, 03/15/316.250%, 07/15/32
2.000%, 10/05/226.250%, 05/15/29
2.875%, 09/15/242.875%, 02/01/27
TOTAL AGENCYOBLIGATIONS
2.125%, 12/31/22
TOTAL INVESTMENTSECURITIES
DFA Short TermInvestment Fund
(Cost $302,344,373)^^
Federal Home LoanBank
3,000 3,177,3464,400 4,737,609
500 541,930Federal Home Loan
Mortgage Corp.1,600 2,244,4251,200 1,733,226
400 572,186Federal National
MortgageAssociation
2,000 2,007,8541,000 1,352,108
Tennessee ValleyAuthority
1,800 1,875,3974,000 4,175,486
23,447,917
U.S. TREASURY OBLIGATIONS — (0.5%)U.S. Treasury Notes
1,500 1,514,590
313,176,982
Shares
SECURITIES LENDING COLLATERAL — (0.5%)@§
147,984 1,712,326
TOTAL INVESTMENTS — (100.0%)$314,889,308

AustraliaAustriaBelgiumCanadaDenmarkFinlandFranceGermanyIrelandJapanLuxembourgNetherlandsNorwaySingaporeSpainSupranational Organization ObligationsSweden
USD 670,333 NOK 5,699,314 Citibank, N.A. 08/01/19 $ 26,837USD 618,640 EUR 546,670 State Street Bank and Trust 08/02/19 13,476USD 657,326 DKK 4,365,981 State Street Bank and Trust 08/02/19 10,111USD 1,327,428 EUR 1,190,849 State Street Bank and Trust 08/02/19 9,157USD 1,571,011 EUR 1,400,008 State Street Bank and Trust 08/02/19 21,202USD 1,818,879 DKK 11,900,830 Citibank, N.A. 08/02/19 54,696USD 2,098,630 EUR 1,854,385 State Street Bank and Trust 08/02/19 45,825USD 20,591,863 JPY 2,213,472,069 State Street Bank and Trust 08/02/19 245,581USD 105,275,632 EUR 92,298,192 State Street Bank and Trust 08/02/19 3,101,492USD 45,063,791 GBP 36,122,370 State Street Bank and Trust 08/09/19 1,120,938USD 68,062 SEK 644,917 Citibank, N.A. 08/19/19 1,224USD 4,503,780 SEK 42,117,824 State Street Bank and Trust 08/19/19 138,758USD 2,387,357 AUD 3,390,176 State Street Bank and Trust 08/26/19 66,912USD 12,277,195 CAD 16,174,530 State Street Bank and Trust 08/28/19 15,445USD 655,976 NOK 5,721,179 Goldman Sachs International 08/30/19 9,477USD 2,455,224 DKK 16,360,589 Australia and New Zealand Banking Group Ltd. 09/30/19 17,664USD 20,479,300 JPY 2,214,023,314 Citibank, N.A. 09/30/19 36,676USD 109,243,927 EUR 97,517,001 Citibank, N.A. 09/30/19 775,192
Total Appreciation $5,710,663
DKK 16,266,811 USD 2,429,104 Australia and New Zealand Banking Group Ltd. 08/02/19 $ (17,706)EUR 97,290,104 USD 108,488,195 Citibank, N.A. 08/02/19 (788,006)JPY 2,213,472,069 USD 20,388,450 Citibank, N.A. 08/02/19 (42,167)NOK 5,699,314 USD 652,922 Goldman Sachs International 08/01/19 (9,426)
Total (Depreciation) $ (857,305)
Total Appreciation(Depreciation) $4,853,358
Summary of the Portfolio's investments as of July 31, 2019, based on their valuation inputs, is as follows (see Security Valuation Note):
Investments in Securities (Market Value)
Level 1 Level 2 Level 3 Total
Bonds— $ 3,645,404 — $ 3,645,404— 3,868,512 — 3,868,512— 5,089,797 — 5,089,797— 26,976,343 — 26,976,343— 5,466,709 — 5,466,709— 6,398,060 — 6,398,060— 16,110,898 — 16,110,898— 19,358,233 — 19,358,233— 1,317,304 — 1,317,304— 5,353,238 — 5,353,238— 2,943,994 — 2,943,994— 18,040,419 — 18,040,419— 2,625,971 — 2,625,971— 321,389 — 321,389— 1,817,129 — 1,817,129— 23,523,901 — 23,523,901— 5,573,335 — 5,573,335
DFA Global Sustainability Fixed Income PortfolioCONTINUED

SwitzerlandUnited KingdomUnited States
Agency ObligationsU.S. Treasury ObligationsSecurities Lending CollateralForward Currency Contracts**
TOTAL
Investments in Securities (Market Value)
Level 1 Level 2 Level 3 Total
— $ 1,916,716 — $ 1,916,716— 18,804,449 — 18,804,449— 119,062,674 — 119,062,674
— 23,447,917 — 23,447,917— 1,514,590 — 1,514,590— 1,712,326 — 1,712,326— 4,853,358 — 4,853,358
— $319,742,666 — $319,742,666** Valued at the unrealized appreciation/(depreciation) on the investment.
ORGANIZATION
DFA Investment Dimensions Group Inc. (the "Fund") is an open-end management investment company registered under theInvestment Company Act of 1940, whose shares are generally offered to institutional investors, retirement plans and clientsof registered investment advisors. At July 31, 2019, the Fund consisted of one hundred and two operational portfolios, (the"Portfolios") all of which are included in this document. The Fund’s advisor is Dimensional Fund Advisors LP (the "Advisor").Some of the portfolios of the Fund are feeder funds in a master-feeder structure. The master funds are part of other entitiesthat are also managed by the Advisor. The Schedules of Investments for the master funds have been included in thisdocument.
SECURITY VALUATION
The Portfolios use a fair value hierarchy, which prioritizes the inputs-to-valuation techniques used to measure fair value intothree broad levels described below:
• Level 1 - inputs are quoted prices in active markets for identical securities (including equity securities, open-endinvestment companies and futures contracts)
• Level 2 - other significant observable inputs (including quoted prices for similar securities, interest rates, prepaymentspeeds, credit risk, etc.)
• Level 3 - significant unobservable inputs (including the Portfolios' own assumptions in determining the fair value ofinvestments)
The Funds of Funds (International Small Company Portfolio, Global Small Company Portfolio, World ex U.S. Value Portfolio,Selectively Hedged Global Equity Portfolio, Dimensional Retirement Income Fund, Dimensional 2045 Target Date RetirementIncome Fund, Dimensional 2050 Target Date Retirement Income Fund, Dimensional 2055 Target Date Retirement IncomeFund, Dimensional 2060 Target Date Retirement Income Fund, Dimensional 2005 Target Date Retirement Income Fund,Dimensional 2010 Target Date Retirement Income Fund, Dimensional 2015 Target Date Retirement Income Fund,Dimensional 2020 Target Date Retirement Income Fund, Dimensional 2025 Target Date Retirement Income Fund,Dimensional 2030 Target Date Retirement Income Fund, Dimensional 2035 Target Date Retirement Income Fund,Dimensional 2040 Target Date Retirement Income Fund, World Core Equity Portfolio, DFA VA Global Moderate AllocationPortfolio, and VA Equity Allocation Portfolio) invest in the funds indicated on the Schedule of Investments ("UnderlyingFunds"). The DFA Global Real Estate Securities Portfolio may pursue its investment objective by investing its assets in itsUnderlying Funds and/or directly in securities of companies in the real estate industry. Each of the DFA Diversified FixedIncome Portfolio and DFA Global Core Plus Fixed Income Portfolio may pursue its investment objective by investing itsassets in its Underlying Funds and/or directly in fixed income securities. Each Feeder Fund (U.S. Large Cap Value Portfolio,Japanese Small Company Portfolio, Asia Pacific Small Company Portfolio, United Kingdom Small Company Portfolio,Continental Small Company Portfolio, Emerging Markets Portfolio, Emerging Markets Small Cap Portfolio, Emerging MarketsValue Portfolio and Tax-Managed U.S. Marketwide Value Portfolio) invests primarily in a corresponding master fund(s)("Master Fund"). Shares held by the Portfolios in other investment companies (such as the Master Funds and the UnderlyingFunds) are valued at their respective daily net asset values as reported by their administrator. The Portfolios’ investments inthe series of The DFA Investment Trust Company or in Dimensional Emerging Markets Value Fund reflect their proportionateinterest in the net assets of such corresponding Master Fund. These valuations are classified as Level 1 in the hierarchy.

Securities held by the Domestic Equity Portfolios (U.S. Targeted Value Portfolio, U.S. Small Cap Value Portfolio, U.S. CoreEquity 1 Portfolio, U.S. Core Equity 2 Portfolio, U.S. Vector Equity Portfolio, U.S. Small Cap Portfolio, U.S. Micro Cap Portfolio,DFA Real Estate Securities Portfolio, U.S. Large Cap Equity Portfolio, U.S. Social Core Equity 2 Portfolio, U.S. SustainabilityCore 1 Portfolio, Tax Managed U.S. Equity Portfolio, Tax-Managed U.S. Targeted Value Portfolio, Tax-Managed U.S. SmallCap Portfolio, T.A. U.S. Core Equity 2 Portfolio, VA U.S. Targeted Value Portfolio, VA U.S. Large Value Portfolio, U.S. LargeCap Growth Portfolio, U.S. Small Cap Growth Portfolio, and U.S. High Relative Profitability Portfolio) and the InternationalEquity Portfolios (Large Cap International Portfolio, International Core Equity Portfolio, DFA International Real EstateSecurities Portfolio, DFA International Small Cap Value Portfolio, International Vector Equity Portfolio, World ex U.S. TargetedValue Portfolio, World ex U.S. Core Equity Portfolio, Emerging Markets Core Equity Portfolio, International SustainabilityCore 1 Portfolio, International Social Core Equity Portfolio, Emerging Markets Social Core Equity Portfolio, Emerging MarketsSustainability Core 1 Portfolio, Emerging Markets Targeted Value Portfolio, Tax-Managed DFA International Value Portfolio,T.A. World ex U.S. Core Equity Portfolio, VA International Value Portfolio, VA International Small Portfolio, International LargeCap Growth Portfolio, International Small Cap Growth Portfolio, International High Relative Profitability Portfolio and EmergingMarkets Sustainability Core 1 Portfolio), including over-the-counter securities, are valued at the last quoted sale price ofthe day. International equity securities are subject to a fair value factor, as described later in this note. Securities held bythe Domestic Equity Portfolios and the International Equity Portfolios that are listed on Nasdaq are valued at the NasdaqOfficial Closing Price ("NOCP"). If there is no last reported sale price or NOCP for the day, the Domestic Equity Portfoliosand the International Equity Portfolios value the securities within the range of the most recent quoted bid and ask prices.Price information on listed securities is taken from the exchange where the security is primarily traded. Generally, securitiesissued by open-end management investment companies are valued using their respective net asset values or public offeringprices, as appropriate, for purchase orders placed at the close of the New York Stock Exchange (NYSE). These securitiesare generally categorized as Level 1 in the hierarchy.
Securities for which no market quotations are readily available (including restricted securities), or for which market quotationshave become unreliable, are valued in good faith at fair value in accordance with procedures adopted by the Board ofDirectors of the Fund. Fair value pricing may also be used if events that have a significant effect on the value of an investment(as determined in the discretion of the Advisor) occur before the net asset value of the Portfolio is calculated. When fair valuepricing is used, the prices of securities used by the Domestic Equity Portfolios and the International Equity Portfolios maydiffer from the quoted or published prices for the same securities on their primary markets or exchanges. These securities aregenerally categorized as Level 2 in the hierarchy.
The International Equity Portfolios will also apply a fair value price in the circumstances described below. Generally, tradingin foreign securities markets is completed each day at various times prior to the close of the NYSE. For example, tradingin the Japanese securities markets is completed each day at the close of the Tokyo Stock Exchange (normally, 2:00 a.m.ET), which is fourteen hours before the close of the NYSE (normally, 4:00 p.m. ET) and the time at which the net assetvalues of the International Equity Portfolios are computed. Due to the time differences between the closings of the relevantforeign securities exchanges and the pricing of the International Equity Portfolios’ shares (at the close of the NYSE), theInternational Equity Portfolios will fair-value their foreign investments when it is determined that the market quotations for theforeign investments are either unreliable or not readily available. The fair value prices will attempt to reflect the impact of theU.S. financial markets’ perceptions and trading activities on the International Equity Portfolios’ foreign investments since thelast calculated closing prices of the foreign investments on their primary foreign securities markets or exchanges. For thesepurposes, the Board of Directors of the International Equity Portfolios has determined that movements in relevant indices orother appropriate market indicators, after the close of the Tokyo Stock Exchange or the London Stock Exchange, demonstratethat market quotations may be unreliable. Fair valuation of portfolio securities may occur on a daily basis. The fair valuepricing by the International Equity Portfolios uses data furnished by an independent pricing service (and that data draws upon,among other information, the market values of foreign investments). When an International Equity Portfolio uses fair valuepricing, the values assigned to the International Equity Portfolio’s foreign investments may not be the quoted or publishedprices of the investments on their primary markets or exchanges. These securities are generally categorized as Level 2 in thehierarchy.
Debt securities held by Enhanced U.S. Large Company Portfolio, DFA Commodity Strategy Portfolio, DFA One-Year FixedIncome Portfolio, DFA Two-Year Global Fixed Income Portfolio, DFA Selectively Hedged Global Fixed Income Portfolio,DFA Short-Term Government Portfolio, DFA Five-Year Global Fixed Income Portfolio, DFA World ex U.S. GovernmentFixed Income, DFA Intermediate Government Fixed Income Portfolio, DFA Short-Term Extended Quality Portfolio, DFAIntermediate-Term Extended Quality Portfolio, DFA Targeted Credit Portfolio, DFA Investment Grade Portfolio, DFA Inflation-Protected Securities Portfolio, DFA Short-Term Municipal Bond Portfolio, DFA Intermediate-Term Municipal Bond Portfolio,

DFA California Short-Term Municipal Bond Portfolio, DFA California Intermediate-Term Municipal Bond Portfolio, DFA NYMunicipal Bond Fund, DFA Short-Duration Real Return Portfolio, DFA Municipal Real Return Portfolio, DFA Municipal BondPortfolio, DFA LTIP Portfolio, VA Short-Term Fixed Portfolio, VA Global Bond Portfolio, VIT Inflation-Protected SecuritiesPortfolio, DFA Social Fixed Income Portfolio, DFA Diversified Fixed Income Portfolio, DFA MN Municipal Bond Portfolio, DFACalifornia Municipal Real Return Portfolio, DFA Global Sustainability Fixed Income Portfolio and DFA Global Core Plus FixedIncome Portfolio are valued on the basis of evaluated prices provided by one or more pricing services or other reasonablyreliable sources including broker/dealers that typically handle the purchase and sale of such securities. Securities that aretraded over-the-counter and on a stock exchange generally will be valued according to the broadest and most representativemarket, and it is expected that for bonds and other fixed income securities, this ordinarily will be theover-the-counter market. Securities for which quotations are not readily available (including restricted securities), or for whichmarket quotations have become unreliable, are valued in good faith at fair value in accordance with procedures adopted bythe Board of Directors of the Fund. These valuations are generally categorized as Level 2 in the hierarchy.
Listed derivatives, such as futures, that are actively traded are valued based on quoted prices from the exchange and arecategorized as Level 1 in the hierarchy. Over-the-counter derivative contracts, which include forward currency contracts, donot require material subjectivity as pricing inputs are observed from quoted markets and are categorized as Level 2 in thehierarchy.
Swap agreements will be valued at the price provided by an independent third-party pricing service or source. If a price isnot available from an independent third-party pricing service or source, the swap agreement will be valued in good faith atfair value in accordance with procedures adopted by the Board. These securities are generally categorized as Level 2 in thehierarchy.
A summary of the inputs used to value the Portfolios' investments by each major security type, industry and/or country isdisclosed previously in this note. A valuation hierarchy table has been included at the end of the Schedule of Investments forthe Portfolios (except for the Feeder Funds). The methodology or inputs used for valuing securities are not necessarily anindication of the risk associated with investing in those securities.
FINANCIAL INSTRUMENTS
In accordance with the Portfolios' investment objectives and policies, the Portfolios may invest either directly or indirectly(through their investments in a corresponding Master/Underlying Fund), in certain financial instruments that have off-balancesheet risk in excess of the amounts recognized in the financial statements and concentrations of credit and market risk. Theseinstruments and their significant corresponding risks are described below:
1. TREASURY INFLATION-PROTECTED SECURITIES (TIPS): VIT Inflation-Protected Securities Portfolio, DFA Inflation-Protected Securities Portfolio, and DFA Short-Duration Real Return Portfolio may purchase TIPS, which are securitiesissued by the U.S. Treasury. Because the interest and/or principal payments on an inflation-protected security are adjustedperiodically for changes in inflation, the income distributed by the Portfolio may be irregular. In addition, the current marketvalue of inflation-protected securities is not guaranteed and will fluctuate.
2. FOREIGN MARKET RISKS: Investments in foreign markets may involve certain considerations and risks not typicallyassociated with investments in the United States of America, including the possibility of future political and economicdevelopments and the level of foreign governmental supervision and regulation of foreign securities markets. These marketsare generally smaller, less liquid and more volatile than the major securities markets in the United States of America.Consequently, acquisition and disposition of international securities held by the Portfolios may be inhibited.
Derivative Financial Instruments
Summarized below are the specific types of derivative instruments used by the Portfolios:
3. FORWARD CURRENCY CONTRACTS: The Portfolios listed below may acquire and sell forward currency contracts tohedge against adverse changes in the relationship of the U.S. dollar to foreign currencies (foreign exchange rate risk) orto transfer balances from one currency to another currency. The Selectively Hedged Global Equity Portfolio and EnhancedU.S Large Company Portfolio may hedge some or all of the currency exposure of its foreign securities by entering intoforward currency contracts. The decision to hedge the Selectively Hedged Global Equity Portfolio’s and Enhanced U.S. LargeCompany Portfolio’s currency exposure with respect to a foreign market will be based primarily on the Portfolio’s existingexposure to a given foreign currency. Each contract is valued daily and the change in value is recorded by the Portfolio asan unrealized gain or loss, which is presented in the Statements of Operations as the change in unrealized appreciation ordepreciation of forward currency contracts. When the contract is closed or offset with the same counterparty, the Portfolio

records a realized gain or loss equal to the change in the value of the contract when it was opened and the value at the timeit was closed or offset. This is presented in the Statements of Operations as a net realized gain or loss on forward currencycontracts. Risks may arise upon entering into these contracts from the potential inability of counterparties to meet the termsof their contracts and from unanticipated movements in the value of foreign currency relative to the U.S. dollar.
4. FUTURES CONTRACTS: Each Portfolio listed below may purchase or sell futures contracts and options on futurescontracts for equity securities and indices to adjust market exposure based on actual or expected cash inflows to or outflowsfrom the Portfolio. The Portfolios, however, do not intend to sell futures contracts to establish short positions in individualsecurities. The Enhanced U.S. Large Company Portfolio may also use futures contracts and options thereon to hedge againstsecurities prices or as part of its overall investment strategy. The Selectively Hedged Global Equity Portfolio may also usefutures contracts to hedge some or all of the currency exposure of its foreign securities. Upon entering into a futures contract,the Portfolios deposit cash or pledge U.S. Government securities to a broker in an amount equal to the minimum "initialmargin" requirements of the exchange on which the contract is traded . Subsequent payments are received from or paid to thebroker each day, based on the daily fluctuation in the market value of the contract. These receipts or payments are known as"variation margin" and are recorded daily by the Portfolios as unrealized gains or losses until the contracts are closed. Whenthe contracts are closed, the Portfolios record a realized gain or loss, which is presented in the Statements of Operations asa net realized gain or loss on futures, equal to the difference between the value of the contract at the time it was opened andthe value at the time it was closed.
The DFA Commodity Strategy Portfolio may enter into commodity, foreign currency, interest rate and commodity or securitiesindex futures contracts and purchase and write (sell) related options traded on exchanges designated by the CommodityFutures Trading Commission ("CFTC") or, consistent with CFTC regulations, on foreign exchanges. The DFA CommodityStrategy Portfolio invests in futures contracts on individual commodities or commodity indices and options on them throughthe Portfolio’s investment in the Dimensional Cayman Commodity Fund I, LTD., the "Subsidiary."
A commodity futures contract provides for the future sale by one party and the future purchase by the other party of a specifiedamount of a commodity, such as an energy, agricultural or metal commodity, at a specified price, date, time and place. Aforeign currency futures contract provides for the future sale by one party and the future purchase by the other party of acertain amount of a specified non-U.S. currency at a specified price, date, time and place. An interest rate futures contractprovides for the future sale by one party and the purchase by the other party of a certain amount of a specific interest-rate-sensitive financial instrument (debt security) at a specified price, date, time and place. Securities and commodities indexesare typically capitalization-or production-weighted, respectively. A securities index or commodities index futures contract isan agreement to be settled by delivery of an amount of cash equal to a specified multiplier times the difference between thevalue of the index at the close of the last trading day on the contract and the price at which the agreement is made. Theclearing house of the exchange on which a futures contract is entered into becomes the counterparty to each purchaser andseller of the futures contract.
Payments, known as "variation margin", to and from the broker will be made daily as the currency, financial instrument orindex underlying the futures contract fluctuates, making the long and short positions in the futures contract more or lessvaluable, a process known as "marking-to-market". As a result of the small margin deposit that is required, a small change inthe market price of a futures contract can produce major losses.
At any time prior to the expiration of a futures contract, a Portfolio may elect to close the position by taking an oppositeposition, which will operate to terminate the Portfolio’s existing position in the contract. Positions in futures contracts andoptions on futures contracts (described below) may be closed out only on the exchange on which they were entered into (orthrough a linked exchange). However, there is no assurance that an active market will exist at any particular time. Once thedaily fluctuation limit has been reached in a particular contract, most futures exchanges restrict trades at a price beyond thatlimit or trading may be suspended for specified periods during the day. Such restrictions may prevent prompt liquidation offutures positions at an advantageous price, potentially subjecting the Portfolio to substantial losses. In such event and in theevent of adverse price movements, the Portfolio would be required to make daily cash payments of variation margin. Lossesincurred in futures transactions and the costs of these transactions will affect the Portfolio’s performance.
The price volatility of commodity futures contracts has been historically greater than that for traditional securities, such asstocks and bonds, and there are a variety of factors associated with commodity futures contracts which may subject thePortfolio’s investments in the contracts to greater volatility than investments in traditional securities.
Risks may arise upon entrance into futures contracts from potential imperfect price correlations between the futures contractsand the underlying securities, from the possibility of an illiquid secondary market for these instruments and from the possibility

that the Portfolios could lose more than the initial margin requirements. The Portfolios entering into stock index futures aresubject to equity price risk from those futures contracts. Counterparty credit risk relatedto exchange-traded futures is minimal because the exchange’s clearinghouse, as counterparty to all exchange-traded futures,guarantees the futures against default. Risks may also arise upon entering into commodity-linked derivative instruments. Thevalue of commodity-linked derivative instruments may be affected by changes in overall market movements, commodity indexvolatility, changes in interest rates or factors affecting an industry or commodity.
5. OPTIONS ON FUTURES CONTRACTS: The DFA Commodity Strategy Portfolio may purchase and write put and calloptions on foreign currency, interest rate and stock and commodity index futures contracts and may enter into closingtransactions with respect to such options to terminate existing positions. There is no guarantee that such closing transactionscan be effected; the ability to establish and close out positions on such options will be subject to the existence of a liquidmarket.
An option on a currency, interest rate or commodity or securities index futures contract, as contrasted with the directinvestment in such a contract, gives the purchaser the right, in return for the premium paid, to assume a position in a futurescontract at a specified exercise price at any time prior to the expiration date of the option. The writer of the option is requiredupon exercise to assume an offsetting futures position (a short position if the option is a call and a long position if the optionis a put). Upon exercise of an option, the delivery of the futures position by the writer of the option to the holder of the optionwill be accompanied by delivery of the accumulated balance in the writer’s futures margin account, which represents theamount by which the market price of the futures contract exceeds, in the case of a call, or is less than, in the case of a put,the exercise price of the option on the futures contract. The potential loss related to the purchase of an option on a futurescontract is limited to the premium paid for the option (plus transaction costs). The value of the option changes daily and thatchange is reflected in the net asset value of the Portfolio.
The DFA Commodity Strategy Portfolio may enter into options and futures transactions for several purposes, includinggenerating current income to offset expenses or increase return and as hedges to reduce investment risk, generally by makingan investment expected to move in the opposite direction of a portfolio position. A hedge is designed to offset a loss in aportfolio position with a gain in the hedged position; at the same time, however, a properly correlated hedge will result in again in the portfolio position being offset by a loss in the hedged position.
6. COMMODITY-LINKED DERIVATIVES: DFA Commodity Strategy Portfolio may gain exposure to commodity markets byinvesting up to 25% of the Portfolio’s total assets in the Subsidiary. The Subsidiary may invest without limitation in swapagreements, commodity options, futures, options on futures and structured notes. The prices of commodity-linked derivativeinstruments may move in different directions than investments in traditional equity securities, fixed income securities andcommodity spot prices. The accompanying consolidated schedule of investments includes investments of DFA CommodityStrategy Portfolio and its wholly-owned Subsidiary. The accompanying consolidated schedule of investments includesinvestments of DFA Commodity Strategy Portfolio and its wholly-owned Subsidiary. As of July 31, 2019, the DFA CommodityStrategy Portfolio held $351,957,354 in the Subsidiary, representing 21.55% of DFA Commodity Strategy Portfolio’s totalassets.
7. SWAP AGREEMENTS: The DFA Short-Duration Real Return Portfolio and DFA Municipal Real Return Portfolio mayenter into credit default swap agreements. Swap agreements are two-party contracts entered into primarily by institutionalinvestors for periods ranging from a few weeks to more than one year. Some types of swap agreements are negotiatedbilaterally and traded over-the-counter between the two parties (uncleared swaps), while other swaps are transacted througha futures commission merchant ("FCM") and cleared through a clearinghouse that serves as a central counterparty (clearedswaps), and may be traded on swap execution facilities (exchanges). The most common types of credit default swaps andinterest rate swaps are subject to mandatory central clearing and exchange trading.
The Portfolios may enter into a credit default swap on a single security or instrument (sometimes referred to as a "CDS"transaction) or on a basket or index of securities (sometimes referred to as a "CDX" transaction). The "buyer" in a creditdefault contract typically is obligated to pay the "seller" a periodic stream of payments over the term of the contract, providedthat no credit event with respect to any underlying reference obligation has occurred. If a credit event occurs, the sellertypically must pay the buyer the "par value" (full notional value) of the reference obligation in exchange for the referenceobligation. The Portfolios may be either the buyer or the seller in the transaction. If a Portfolio is a buyer and no creditevent occurs, the Portfolio may lose its investment and recover nothing. However, if a credit event occurs, the buyer typicallyreceives full notional value for a reference obligation that may have little or no value. As a seller, a Portfolio typically receivesa fixed rate of income throughout the term of the contract, which

typically is between six months and three years, provided a credit event does not occur. If a credit event occurs, the sellertypically must pay the buyer the full notional amount of the reference obligation. The most common types of CDX are subjectto mandatory central clearing and exchange-trading.
Credit default swaps involve greater risks than if the Portfolios had invested in the reference obligation directly, since, inaddition to general market risks, credit default swaps are subject to illiquidity risk, counterparty risk and credit risk. A buyeralso will lose its investment and recover nothing should no credit event occur and the swap is held to its termination date. If acredit event were to occur, the value of any deliverable obligation received by the seller, coupled with the up-front or periodicpayments previously received, may be less than the full notional value the seller pays to the buyer, resulting in a loss of valueto the Portfolio. When a Portfolio acts as a seller of a credit default swap, the Portfolio is exposed to many of the same risksof leverage since, if a credit event occurs, the seller may be required to pay the buyer the full notional value of the contractnet of any amounts owed by the buyer related to its delivery of deliverable obligations.
The DFA Short-Duration Real Return Portfolio and DFA Municipal Real Return Portfolio may also enter into inflation swapagreements to seek inflation protection. Inflation swap agreements are contracts in which one party agrees to pay thecumulative percentage increase in a price index (the Consumer Price Index with respect to CPI swaps) over the term of theswap (with some lag on the inflation index), and the other pays a compounded fixed rate. Inflation swap agreements may beused by the DFA Short-Duration Real Return Portfolio and DFA Municipal Real Return Portfolio to hedge the inflation risk innominal bonds (i.e., non-inflation-indexed bonds) thereby creating "synthetic" inflation-indexed bonds.
Among other reasons, one factor that may lead to changes in the values of inflation swap agreements are changes in realinterest rates. Real interest rates are tied to the relationship between nominal interest rates and the rate of inflation. If nominalinterest rates increase at a faster rate than inflation, real interest rates may rise, which may lead to a change in the valueof an inflation swap agreement. Additionally, payments received by the DFA Short-Duration Real Return Portfolio and DFAMunicipal Real Return Portfolio from inflation swap agreements will result in taxable income, either as ordinary income orcapital gains, which will increase the amount of taxable distributions received by shareholders. Inflation swap agreements arenot currently subject to mandatory central clearing and exchange-trading.
The DFA Municipal Real Return Portfolio may also enter into interest rate swaps to hedge against changes in interest rates.Interest rate swaps involve the exchange by the Portfolio with another party of their respective commitments to receive or payinterest (e.g., an exchange of fixed rate payments for floating rate payments) with respect to a notional amount of principal.
Uncleared swaps are typically executed bilaterally with a swap dealer rather than traded on exchanges. Parties to unclearedswaps face greater counterparty credit risk than those engaging in cleared swaps since performance of uncleared swapobligations is the responsibility only of the swap counterparty rather than a clearing house, as is the case with cleared swaps.As a result, a Portfolio bears the risk of loss of the amount expected to be received under a swap agreement in the event ofthe default, insolvency or bankruptcy of a swap agreement counterparty beyond any collateral received. In such an event, thePortfolio will have contractual remedies pursuant to the swap agreements, but bankruptcy and insolvency laws could affectthe Portfolio’s rights as a creditor.
The Dodd-Frank Wall Street Reform and Consumer Protection Act of 2010 (the "Dodd-Frank Act") and implementing rulesadopted by the CFTC currently require the clearing and exchange-trading of the most common types of credit default indexswaps and interest rate swaps, and it is expected that additional categories of swaps will in the future be designated assubject to mandatory clearing and trade execution requirements. Central clearing is intended to reduce counterparty creditrisk and increase liquidity, but central clearing does not eliminate these risks completely. There is also a risk of loss by aPortfolio of the initial and variation margin deposits in the event of bankruptcy of the FCM with which the Portfolio has an openposition, or the central counterparty in a swap contract. The assets of a Portfolio may not be fully protected in the event of thebankruptcy of the FCM or central counterparty because the Portfolio might be limited to recovering only a pro rata share of allavailable funds and margin segregated on behalf of an FCM’s customers.
The Advisor and the Fund do not believe that a Portfolio’s obligations under swap contracts are senior securities and,accordingly, the Portfolio will not treat them as being subject to the Portfolio’s borrowing or senior securities restrictions.However, with respect to swap contracts that provide for the netting of payments, the net amount of the excess, if any, of thePortfolio’s obligations over its entitlements with respect to each swap contract will be accruedon a daily basis and an amount of segregated assets having an aggregate market value at least equal to the accrued excesswill be maintained to cover the transactions in accordance with SEC positions. With respect to swap contracts that do notprovide for the netting of payments by the counterparties, the full notional amount for which the Portfolio is obligated underthe swap contract with respect to each swap contract will be accrued on a daily basis and assets having an aggregate
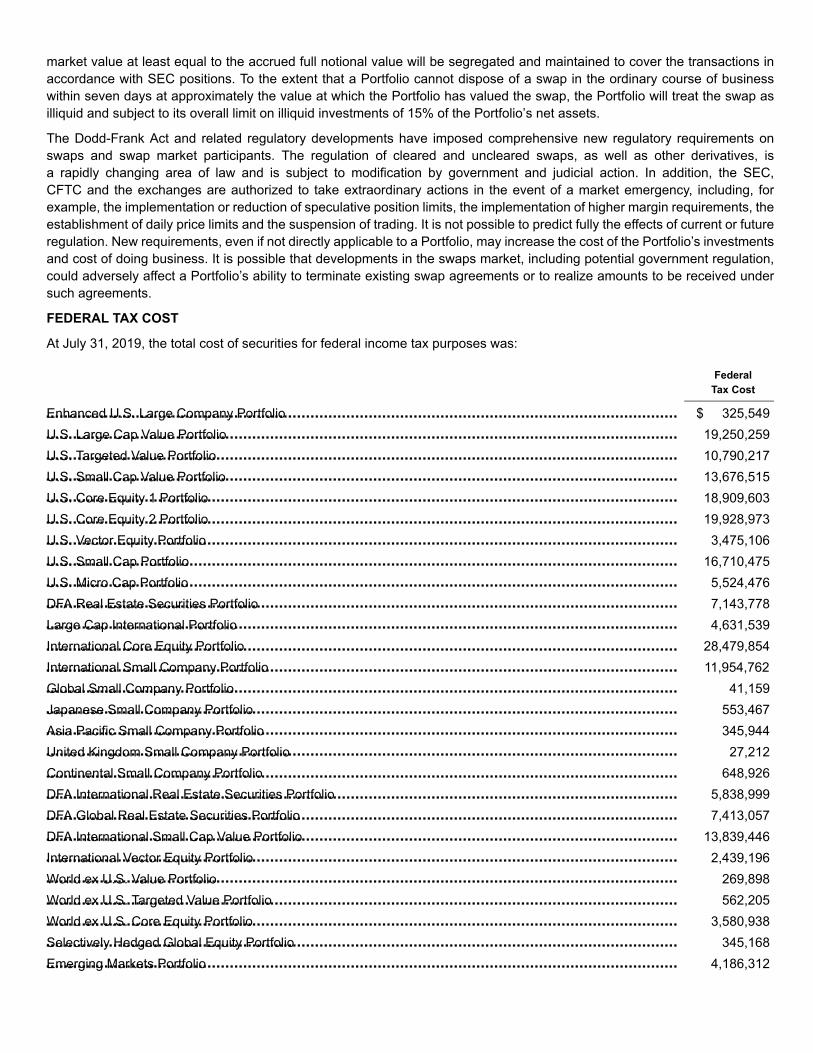
Enhanced U.S. Large Company PortfolioU.S. Large Cap Value PortfolioU.S. Targeted Value PortfolioU.S. Small Cap Value PortfolioU.S. Core Equity 1 PortfolioU.S. Core Equity 2 PortfolioU.S. Vector Equity PortfolioU.S. Small Cap PortfolioU.S. Micro Cap PortfolioDFA Real Estate Securities PortfolioLarge Cap International PortfolioInternational Core Equity PortfolioInternational Small Company PortfolioGlobal Small Company PortfolioJapanese Small Company PortfolioAsia Pacific Small Company PortfolioUnited Kingdom Small Company PortfolioContinental Small Company PortfolioDFA International Real Estate Securities PortfolioDFA Global Real Estate Securities PortfolioDFA International Small Cap Value PortfolioInternational Vector Equity PortfolioWorld ex U.S. Value PortfolioWorld ex U.S. Targeted Value PortfolioWorld ex U.S. Core Equity PortfolioSelectively Hedged Global Equity PortfolioEmerging Markets Portfolio
market value at least equal to the accrued full notional value will be segregated and maintained to cover the transactions inaccordance with SEC positions. To the extent that a Portfolio cannot dispose of a swap in the ordinary course of businesswithin seven days at approximately the value at which the Portfolio has valued the swap, the Portfolio will treat the swap asilliquid and subject to its overall limit on illiquid investments of 15% of the Portfolio’s net assets.
The Dodd-Frank Act and related regulatory developments have imposed comprehensive new regulatory requirements onswaps and swap market participants. The regulation of cleared and uncleared swaps, as well as other derivatives, isa rapidly changing area of law and is subject to modification by government and judicial action. In addition, the SEC,CFTC and the exchanges are authorized to take extraordinary actions in the event of a market emergency, including, forexample, the implementation or reduction of speculative position limits, the implementation of higher margin requirements, theestablishment of daily price limits and the suspension of trading. It is not possible to predict fully the effects of current or futureregulation. New requirements, even if not directly applicable to a Portfolio, may increase the cost of the Portfolio’s investmentsand cost of doing business. It is possible that developments in the swaps market, including potential government regulation,could adversely affect a Portfolio’s ability to terminate existing swap agreements or to realize amounts to be received undersuch agreements.
FEDERAL TAX COST
At July 31, 2019, the total cost of securities for federal income tax purposes was:
FederalTax Cost
$ 325,54919,250,25910,790,21713,676,51518,909,60319,928,973
3,475,10616,710,475
5,524,4767,143,7784,631,539
28,479,85411,954,762
41,159553,467345,944
27,212648,926
5,838,9997,413,057
13,839,4462,439,196
269,898562,205
3,580,938345,168
4,186,312

Emerging Markets Small Cap Portfolio
Emerging Markets Value PortfolioEmerging Markets Core Equity PortfolioU.S. Large Cap Equity PortfolioDFA Commodity Strategy PortfolioDFA One-Year Fixed Income PortfolioDFA Two-Year Global Fixed Income PortfolioDFA Selectively Hedged Global Fixed Income PortfolioDFA Short-Term Government PortfolioDFA Five-Year Global Fixed Income PortfolioDFA World ex U.S. Government Fixed Income PortfolioDFA Intermediate Government Fixed Income PortfolioDFA Short-Term Extended Quality PortfolioDFA Intermediate-Term Extended Quality PortfolioDFA Targeted Credit PortfolioDFA Investment Grade PortfolioDFA Inflation-Protected Securities PortfolioDFA Short-Term Municipal Bond PortfolioDFA Intermediate-Term Municipal Bond PortfolioDFA California Short-Term Municipal Bond PortfolioDFA California Intermediate-Term Municipal Bond PortfolioDFA NY Municipal Bond PortfolioDimensional Retirement Income FundDimensional 2045 Target Date Retirement Income FundDimensional 2050 Target Date Retirement Income FundDimensional 2055 Target Date Retirement Income FundDimensional 2060 Target Date Retirement Income FundDimensional 2005 Target Date Retirement Income FundDimensional 2010 Target Date Retirement Income FundDimensional 2015 Target Date Retirement Income FundDimensional 2020 Target Date Retirement Income FundDimensional 2025 Target Date Retirement Income FundDimensional 2030 Target Date Retirement Income FundDimensional 2035 Target Date Retirement Income FundDimensional 2040 Target Date Retirement Income FundDFA Short-Duration Real Return PortfolioDFA Municipal Real Return PortfolioDFA Municipal Bond PortfolioWorld Core Equity PortfolioDFA LTIP PortfolioU.S. Social Core Equity 2 Portfolio
6,691,621
FederalTax Cost
$17,136,35726,073,482
1,251,3232,458,8817,692,4485,371,4101,207,2172,376,516
15,007,7911,355,2295,159,9476,068,5051,757,513
756,2519,633,7934,600,4532,535,4211,949,1271,228,580
505,962116,27917,59566,98854,38227,13518,561
6,70318,33346,927
106,815144,379138,988111,41693,373
1,488,995826,753487,873758,685200,539923,380

U.S. Sustainability Core 1 PortfolioInternational Sustainability Core 1 PortfolioInternational Social Core Equity PortfolioEmerging Markets Social Core Equity PortfolioTax-Managed U.S. Marketwide Value PortfolioTax-Managed U.S. Equity PortfolioTax-Managed U.S. Targeted Value PortfolioTax-Managed U.S. Small Cap Portfolio
T.A. U.S. Core Equity 2 PortfolioTax-Managed DFA International Value PortfolioT.A. World ex U.S. Core Equity PortfolioVA U.S. Targeted Value PortfolioVA U.S. Large Value PortfolioVA International Value PortfolioVA International Small PortfolioVA Short-Term Fixed PortfolioVA Global Bond PortfolioVIT Inflation-Protected Securities PortfolioDFA VA Global Moderate Allocation PortfolioU.S. Large Cap Growth PortfolioU.S. Small Cap Growth PortfolioInternational Large Cap Growth PortfolioInternational Small Cap Growth PortfolioDFA Social Fixed Income PortfolioDFA Diversified Fixed Income PortfolioU.S. High Relative Profitability PortfolioInternational High Relative Profitability PortfolioVA Equity Allocation PortfolioDFA MN Municipal Bond PortfolioDFA California Municipal Real Return PortfolioDFA Global Core Plus Fixed Income PortfolioEmerging Markets Sustainability Core 1 PortfolioEmerging Markets Targeted Value PortfolioDFA Global Sustainability Fixed Income Portfolio
1,531,7581,185,8441,168,9541,267,4222,967,6241,991,6183,517,6052,229,218
FederalTax Cost
$ 6,376,6983,654,3903,418,191
349,100450,737324,507249,050319,675390,087154,669112,228
1,529,558587,383332,972190,202281,083983,406
1,291,142547,726
60,30669,998
131,2471,274,843
245,333114,419302,344
RECENTLY ISSUED ACCOUNTING STANDARDS
In March 2017, the Financial Accounting Standards Board (FASB) issued Accounting Standards Update (ASU) 2017-08which changes the amortization period for a callable debt security from the maturity date to the earliest call date. TheASU is effective for annual periods beginning after December 15, 2018, and interim periods within those annual periods.Management has evaluated the requirements of this update and does not expect any material impact to the Fund's financialstatements.

In August 2018, the FASB issued ASU No. 2018-13, “Fair Value Measurements” (“ASU 2018-13”). This update makes certainremovals from, changes to and additions to existing disclosure requirements for fair value measurement. ASU 2018-13does not change fair value measurements already required or permitted by existing standards. ASU 2018-13 is effectivefor financial statements issued for fiscal years beginning after December 15, 2019, and interim periods within those fiscalyears. The Portfolios’ early adoption of certain of the ASU 2018-13 disclosure requirements are reflected within thesefinancial statements prepared as of April 30, 2019. Management does not believe that adoption of the remaining disclosurerequirements within ASU 2018-13 will materially impact the Portfolios’ financial statements.
In August 2018, the SEC adopted amendments to certain financial statement disclosure requirements to conform them toGAAP for investment companies. These amendments made certain removals from, changes to and additions to existingdisclosure requirements under Regulation S-X. These amendments became effective for filings made with the SEC afterNovember 5, 2018. The Portfolios’ adoption of these amendments, effective with the financial statements prepared as ofOctober 31, 2018, required modified disclosures reflected herein, but had no effect on the Portfolios’ net assets or results ofoperations.
OTHER
The Portfolios are subject to claims and suits that arise from time to time in the ordinary course of business. Althoughmanagement currently believes that resolving claims against us, individually or in aggregate, will not have a material adverseimpact on our financial position, our results of operations, or our cash flows, these matters are subject to inherent uncertaintiesand management’s view of these matters may change in the future.
The U.S. Large Cap Value Series, The Tax-Managed U.S. Marketwide Value Series and VA U.S. Large Value Portfoliohave been named as defendants in a multi-district litigation pending in the United States District Court for the SouthernDistrict of New York (the "Court"), captioned IN RE TRIBUNE COMPANY FRAUDULENT CONVEYANCE LITIGATION, No.11-MD-2296-RJS (the "Tribune MDL"). The Tribune MDL arises from the 2007 leveraged buyout of The Tribune Company("Tribune") (the "LBO") and Tribune’s subsequent bankruptcy and reorganization. In connection with the LBO, thousandsof Tribune shareholders, including The U.S. Large Cap Value Series, The Tax-Managed U.S. Marketwide Value Series andVA U.S. Large Value Portfolio sold Tribune shares back to Tribune for $34 per share. The Tribune MDL includes a seriesof lawsuits brought by individual creditors of Tribune (the "Individual Creditor Actions") and a lawsuit brought by a court-appointed trustee (the "Trustee") on behalf of the committee of unsecured creditors of Tribune (the "Committee Action,"and with the Individual Creditor Actions, collectively referred to as the "Lawsuits"). The Lawsuits seek to unwind the LBOstock repurchases as fraudulent transfers and recover the stock repurchase proceeds paid to the Tribune shareholders whoparticipated in the LBO.
On September 23, 2013, the Court entered an order dismissing the Individual Creditor Actions in their entirety on the groundsthat the individual creditor plaintiffs lacked standing to pursue their claims. The parties appealed the Court’s dismissal orderto the United States Court of Appeals for the Second Circuit (the “Second Circuit”) and on March 29, 2016, the Second Circuitaffirmed the dismissal, albeit on the grounds that the individual creditor plaintiffs’ claims were preempted by the BankruptcyCode’s safe harbor for securities transactions. The individual creditor plaintiffs filed a petition for certiorari with the SupremeCourt of the United States (the Supreme Court ), seeking review of the Second Circuit’s ruling. Thereafter, the individualcreditor plaintiffs moved the Second Circuit to review its prior ruling in light of the Supreme Court’s decision in MERITMANAGEMENT GROUP, LP v. FTI CONSULTING, INC., 138 S.Ct. 883 (2018) (“Merit Mgmt.”), which addressed the scope ofthe Bankruptcy Code’s safe harbor for securities transactions. The Second Circuit agreed to review the matter and withdrewits mandate with respect to the affirmance of the dismissal order. Consequently, the Supreme Court dismissed the individualcreditor plaintiffs’ petition for certiorari. The Second Circuit’s review is pending.
On January 6, 2017, the Court granted the shareholder defendants’ motion to dismiss the claims against them in theCommittee Action. The Trustee has advised that he intends to appeal the dismissal order to the Second Circuit. The Trusteealso moved for leave from the District Court to file an amended complaint to assert new constructive fraudulent transferclaims against the shareholder defendants in light of the Merit Mgmt. decision. The District Court denied the motion, rulingthat the proposed amendment would unduly prejudice the shareholder defendants and would be futile because the Trustee’sproposed constructive fraudulent transfer claims would be barred by the Bankruptcy Code’s safe harbor for securitiestransactions, notwithstanding the Merit Mgmt. decision.
Litigation counsel to The U.S. Large Cap Value Series, The Tax-Managed U.S. Marketwide Value Series and VA U.S. LargeValue Portfolio in the Lawsuits has advised management that it does not believe that it is possible to predict with anyreasonable certainty the probable outcome of the Lawsuits or quantify the ultimate exposure to The U.S. Large Cap Value

Series, The Tax-Managed U.S. Marketwide Value Series and VA U.S. Large Value Portfolio arising from the Lawsuits. UntilThe U.S. Large Cap Value Series, The Tax-Managed U.S. Marketwide Value Series and VA U.S. Large Value Portfolio can doso, no reduction of the respective net asset values of The U.S. Large Cap Value Series, The Tax-Managed U.S. MarketwideValue Series and VA U.S. Large Value Portfolio will be made relating to the Lawsuits. However, even if the plaintiffs in theLawsuits were to obtain the full recovery the plaintiffs seek, the amount would be less than 1% of the respective net assetvalues of The U.S. Large Cap Value Series, The Tax-Managed U.S. Marketwide Value Series and VA U.S. Large ValuePortfolio at this time.
The U.S. Large Cap Value Series, The Tax-Managed U.S. Marketwide Value Series and VA U.S. Large Value Portfolio alsocannot quantify the cost of the Lawsuits that could potentially be deducted from their respective net asset values. Therefore,at this time, those investors buying or redeeming shares of The U.S. Large Cap Value Series, The Tax-Managed U.S.Marketwide Value Series and VA U.S. Large Value Portfolio will pay or receive, as the case may be, a price based on therespective net asset values of The U.S. Large Cap Value Series, The Tax-Managed U.S. Marketwide Value Series and VAU.S. Large Value Portfolio, with no adjustment relating to the Lawsuits. The attorneys’ fees and costs relating to the Lawsuitswill be borne by The U.S. Large Cap Value Series,The Tax-Managed U.S. Marketwide Value Series and VA U.S. Large Value Portfolio as incurred and in a manner similar toany other expenses incurred by The U.S. Large Cap Value Series , The Tax-Managed U.S. Marketwide Value Series and VAU.S. Large Value Portfolio.
SUBSEQUENT EVENT EVALUATIONS
Management has evaluated the impact of all subsequent events on the Portfolios through the date on which the financialstatements were issued and has determined that there are no subsequent events requiring recognition or disclosure in theSchedules of Investments.