VALIC Co I Form NPORT-P Filed 2021-10-29
752
Business Address HARBORSIDE 5 185 HUDSON STREET, SUITE 3300 JERSEY CITY NJ 07311 201-324-6378 Mailing Address HARBORSIDE 5 185 HUDSON STREET, SUITE 3300 JERSEY CITY NJ 07311 SECURITIES AND EXCHANGE COMMISSION FORM NPORT-P Filing Date: 2021-10-29 | Period of Report: 2021-08-31 SEC Accession No. 0001752724-21-231169 (HTML Version on secdatabase.com) FILER VALIC Co I CIK:719423| IRS No.: 720029692 | State of Incorp.:MD | Fiscal Year End: 0531 Type: NPORT-P | Act: 40 | File No.: 811-03738 | Film No.: 211361202 Copyright © 2021 www.secdatabase.com . All Rights Reserved. Please Consider the Environment Before Printing This Document
-
Upload
khangminh22 -
Category
Documents
-
view
2 -
download
0
Transcript of VALIC Co I Form NPORT-P Filed 2021-10-29
Business AddressHARBORSIDE 5185 HUDSON STREET,SUITE 3300JERSEY CITY NJ 07311201-324-6378
Mailing AddressHARBORSIDE 5185 HUDSON STREET,SUITE 3300JERSEY CITY NJ 07311
SECURITIES AND EXCHANGE COMMISSION
FORM NPORT-P
Filing Date: 2021-10-29 | Period of Report: 2021-08-31SEC Accession No. 0001752724-21-231169
(HTML Version on secdatabase.com)
FILERVALIC Co ICIK:719423| IRS No.: 720029692 | State of Incorp.:MD | Fiscal Year End: 0531Type: NPORT-P | Act: 40 | File No.: 811-03738 | Film No.: 211361202
Copyright © 2021 www.secdatabase.com. All Rights Reserved.Please Consider the Environment Before Printing This Document
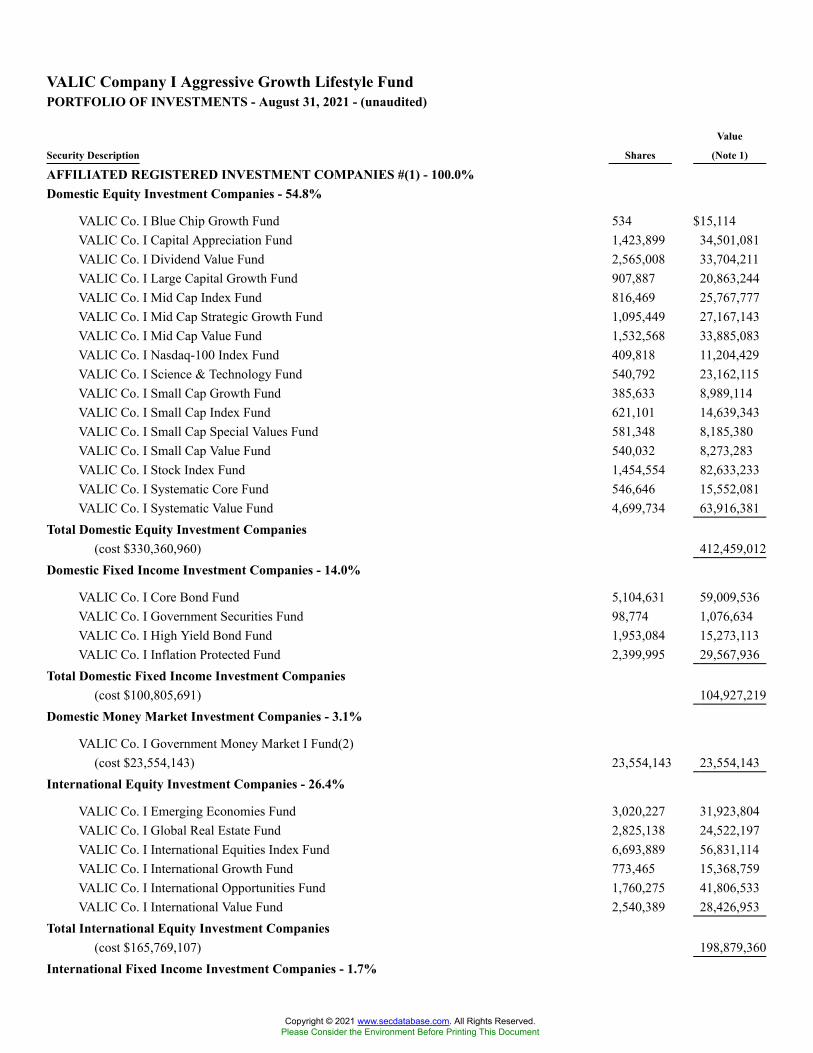
VALIC Company I Aggressive Growth Lifestyle FundPORTFOLIO OF INVESTMENTS - August 31, 2021 - (unaudited)
Security Description Shares
Value
(Note 1)
AFFILIATED REGISTERED INVESTMENT COMPANIES #(1) - 100.0%Domestic Equity Investment Companies - 54.8%
VALIC Co. I Blue Chip Growth Fund 534 $15,114VALIC Co. I Capital Appreciation Fund 1,423,899 34,501,081VALIC Co. I Dividend Value Fund 2,565,008 33,704,211VALIC Co. I Large Capital Growth Fund 907,887 20,863,244VALIC Co. I Mid Cap Index Fund 816,469 25,767,777VALIC Co. I Mid Cap Strategic Growth Fund 1,095,449 27,167,143VALIC Co. I Mid Cap Value Fund 1,532,568 33,885,083VALIC Co. I Nasdaq-100 Index Fund 409,818 11,204,429VALIC Co. I Science & Technology Fund 540,792 23,162,115VALIC Co. I Small Cap Growth Fund 385,633 8,989,114VALIC Co. I Small Cap Index Fund 621,101 14,639,343VALIC Co. I Small Cap Special Values Fund 581,348 8,185,380VALIC Co. I Small Cap Value Fund 540,032 8,273,283VALIC Co. I Stock Index Fund 1,454,554 82,633,233VALIC Co. I Systematic Core Fund 546,646 15,552,081VALIC Co. I Systematic Value Fund 4,699,734 63,916,381
Total Domestic Equity Investment Companies(cost $330,360,960) 412,459,012
Domestic Fixed Income Investment Companies - 14.0%
VALIC Co. I Core Bond Fund 5,104,631 59,009,536VALIC Co. I Government Securities Fund 98,774 1,076,634VALIC Co. I High Yield Bond Fund 1,953,084 15,273,113VALIC Co. I Inflation Protected Fund 2,399,995 29,567,936
Total Domestic Fixed Income Investment Companies(cost $100,805,691) 104,927,219
Domestic Money Market Investment Companies - 3.1%
VALIC Co. I Government Money Market I Fund(2)(cost $23,554,143) 23,554,143 23,554,143
International Equity Investment Companies - 26.4%
VALIC Co. I Emerging Economies Fund 3,020,227 31,923,804VALIC Co. I Global Real Estate Fund 2,825,138 24,522,197VALIC Co. I International Equities Index Fund 6,693,889 56,831,114VALIC Co. I International Growth Fund 773,465 15,368,759VALIC Co. I International Opportunities Fund 1,760,275 41,806,533VALIC Co. I International Value Fund 2,540,389 28,426,953
Total International Equity Investment Companies(cost $165,769,107) 198,879,360
International Fixed Income Investment Companies - 1.7%
Copyright © 2021 www.secdatabase.com. All Rights Reserved.Please Consider the Environment Before Printing This Document

VALIC Co. I International Government Bond Fund(cost $11,536,639) 987,122 12,378,516
TOTAL INVESTMENTS(cost $632,026,540) 100.0 % 752,198,250
Liabilities in excess of other assets (0.0 ) (122,395 )NET ASSETS 100.0 % $752,075,855
# The Aggressive Growth Lifestyle Fund invests in various VALIC Company I Funds. Additional information on the underlyingfunds including such funds� prospectuses and shareholder reports are available at our website, www.valic.com.
(1) See Note 3.(2) The 7-day yield as of August 31, 2021 is 0.01%.
The following is a summary of the inputs used to value the Fund�s net assets as of August 31,2021 (see Note 1):
Level 1 - Unadjusted
Quoted Prices
Level 2 - Other
Observable Inputs
Level 3 - Significant
Unobservable Inputs Total
ASSETS:Investments at Value:*Affiliated Registered Investment
Companies $ 752,198,250 $ � $ � $752,198,250
* For a detailed presentation of investments, please refer to the Portfolio of Investments.
See Notes to Portfolio of Investments
Copyright © 2021 www.secdatabase.com. All Rights Reserved.Please Consider the Environment Before Printing This Document
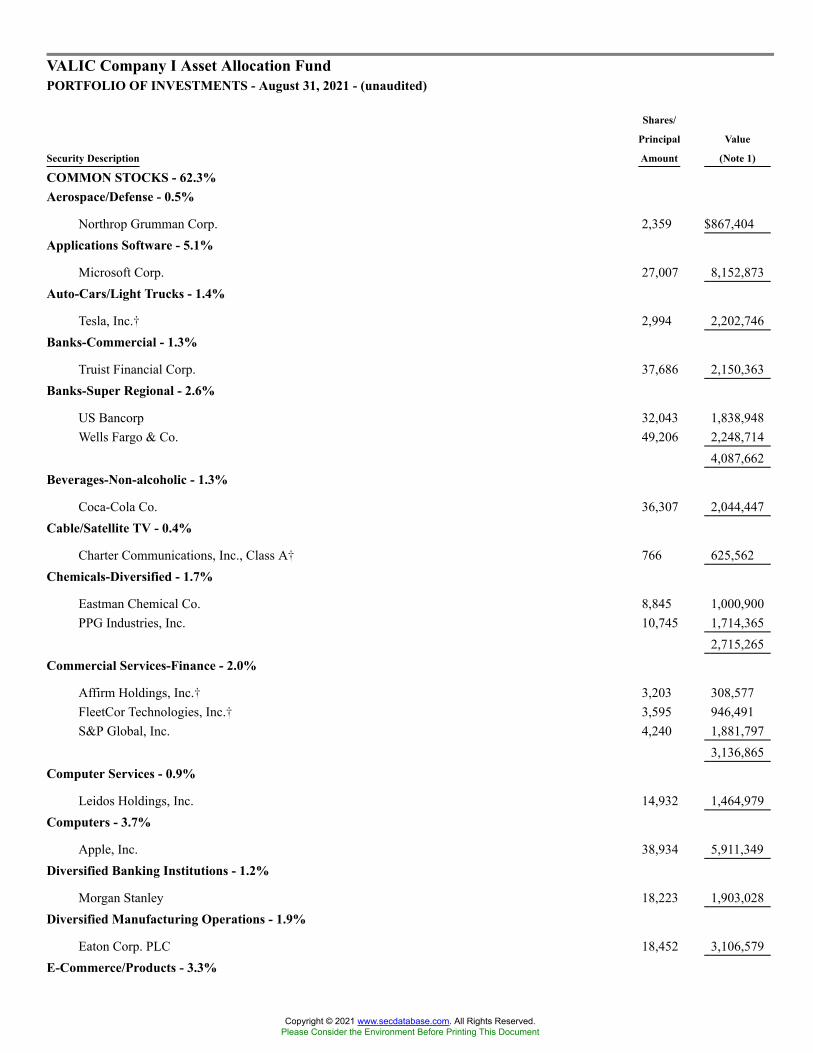
VALIC Company I Asset Allocation FundPORTFOLIO OF INVESTMENTS - August 31, 2021 - (unaudited)
Security Description
Shares/
Principal
Amount
Value
(Note 1)
COMMON STOCKS - 62.3%Aerospace/Defense - 0.5%
Northrop Grumman Corp. 2,359 $867,404Applications Software - 5.1%
Microsoft Corp. 27,007 8,152,873Auto-Cars/Light Trucks - 1.4%
Tesla, Inc.� 2,994 2,202,746Banks-Commercial - 1.3%
Truist Financial Corp. 37,686 2,150,363Banks-Super Regional - 2.6%
US Bancorp 32,043 1,838,948Wells Fargo & Co. 49,206 2,248,714
4,087,662Beverages-Non-alcoholic - 1.3%
Coca-Cola Co. 36,307 2,044,447Cable/Satellite TV - 0.4%
Charter Communications, Inc., Class A� 766 625,562Chemicals-Diversified - 1.7%
Eastman Chemical Co. 8,845 1,000,900PPG Industries, Inc. 10,745 1,714,365
2,715,265Commercial Services-Finance - 2.0%
Affirm Holdings, Inc.� 3,203 308,577FleetCor Technologies, Inc.� 3,595 946,491S&P Global, Inc. 4,240 1,881,797
3,136,865Computer Services - 0.9%
Leidos Holdings, Inc. 14,932 1,464,979Computers - 3.7%
Apple, Inc. 38,934 5,911,349Diversified Banking Institutions - 1.2%
Morgan Stanley 18,223 1,903,028Diversified Manufacturing Operations - 1.9%
Eaton Corp. PLC 18,452 3,106,579E-Commerce/Products - 3.3%
Copyright © 2021 www.secdatabase.com. All Rights Reserved.Please Consider the Environment Before Printing This Document

Amazon.com, Inc.� 1,516 5,261,718Electric-Integrated - 2.6%
NextEra Energy, Inc. 30,642 2,573,622Xcel Energy, Inc. 23,496 1,615,350
4,188,972Electronic Components-Semiconductors - 0.6%
Advanced Micro Devices, Inc.� 8,698 963,043Enterprise Software/Service - 0.4%
Ceridian HCM Holding, Inc.� 5,670 637,024Finance-Credit Card - 2.4%
Mastercard, Inc., Class A 11,166 3,866,004Hotels/Motels - 1.1%
Marriott International, Inc., Class A� 13,188 1,782,226Insurance-Property/Casualty - 0.5%
Progressive Corp. 7,612 733,340Internet Application Software - 0.3%
Shopify, Inc., Class A� 287 437,612Internet Content-Entertainment - 0.8%
Facebook, Inc., Class A� 3,532 1,339,970Investment Management/Advisor Services - 0.8%
Ameriprise Financial, Inc. 4,883 1,332,620Machinery-Farming - 1.0%
Deere & Co. 4,060 1,534,802Medical Instruments - 1.5%
Boston Scientific Corp.� 30,801 1,390,665Intuitive Surgical, Inc.� 893 940,829
2,331,494Medical-Biomedical/Gene - 1.4%
Biogen, Inc.� 2,987 1,012,324Regeneron Pharmaceuticals, Inc.� 1,761 1,185,858
2,198,182Medical-Drugs - 3.8%
AbbVie, Inc. 23,493 2,837,484Bristol-Myers Squibb Co. 27,985 1,871,077Eli Lilly & Co. 5,371 1,387,276
6,095,837Medical-HMO - 0.4%
Centene Corp.� 9,739 613,362Oil Companies-Exploration & Production - 0.2%
Pioneer Natural Resources Co. 1,797 268,957
Copyright © 2021 www.secdatabase.com. All Rights Reserved.Please Consider the Environment Before Printing This Document
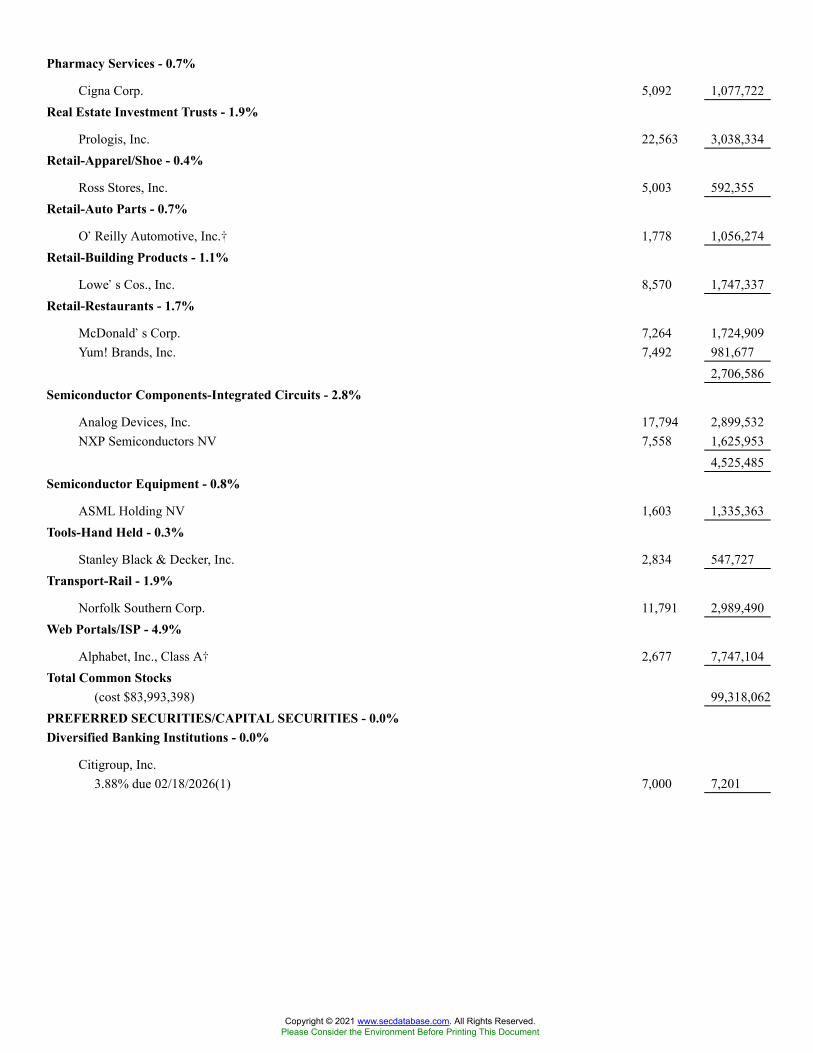
Pharmacy Services - 0.7%
Cigna Corp. 5,092 1,077,722Real Estate Investment Trusts - 1.9%
Prologis, Inc. 22,563 3,038,334Retail-Apparel/Shoe - 0.4%
Ross Stores, Inc. 5,003 592,355Retail-Auto Parts - 0.7%
O�Reilly Automotive, Inc.� 1,778 1,056,274Retail-Building Products - 1.1%
Lowe�s Cos., Inc. 8,570 1,747,337Retail-Restaurants - 1.7%
McDonald�s Corp. 7,264 1,724,909Yum! Brands, Inc. 7,492 981,677
2,706,586Semiconductor Components-Integrated Circuits - 2.8%
Analog Devices, Inc. 17,794 2,899,532NXP Semiconductors NV 7,558 1,625,953
4,525,485Semiconductor Equipment - 0.8%
ASML Holding NV 1,603 1,335,363Tools-Hand Held - 0.3%
Stanley Black & Decker, Inc. 2,834 547,727Transport-Rail - 1.9%
Norfolk Southern Corp. 11,791 2,989,490Web Portals/ISP - 4.9%
Alphabet, Inc., Class A� 2,677 7,747,104Total Common Stocks
(cost $83,993,398) 99,318,062PREFERRED SECURITIES/CAPITAL SECURITIES - 0.0%Diversified Banking Institutions - 0.0%
Citigroup, Inc.3.88% due 02/18/2026(1) 7,000 7,201
Copyright © 2021 www.secdatabase.com. All Rights Reserved.Please Consider the Environment Before Printing This Document
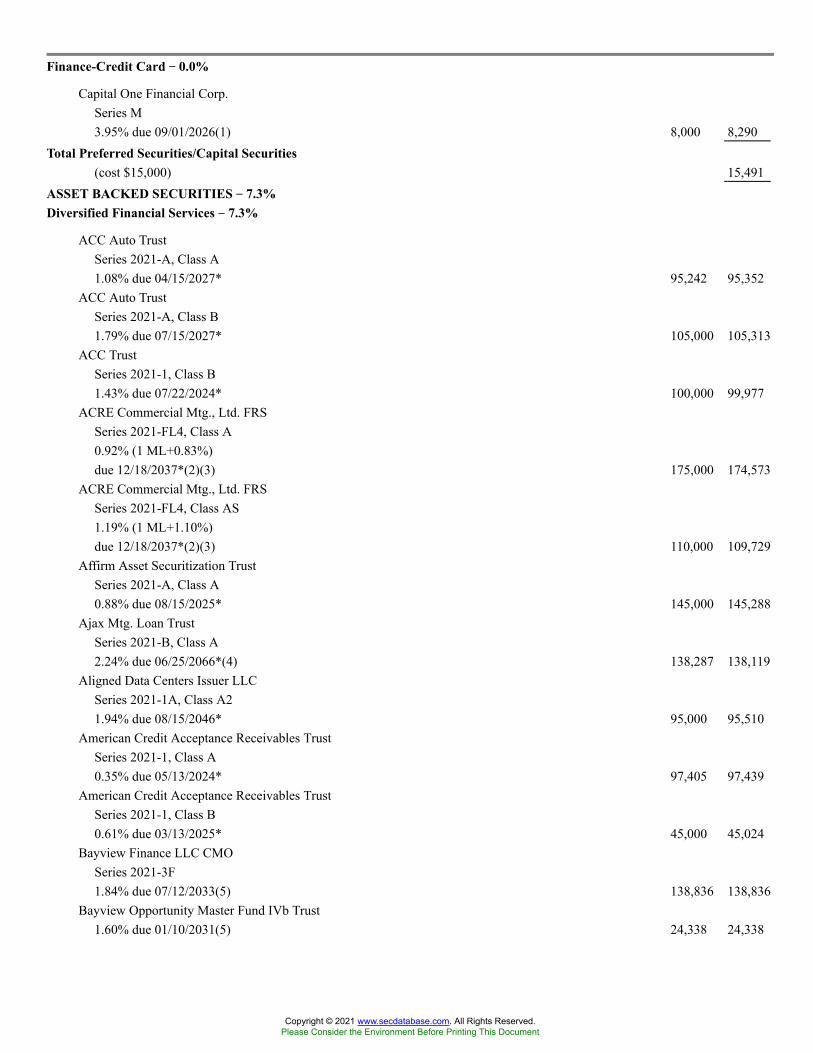
Finance-Credit Card �� 0.0%
Capital One Financial Corp.Series M3.95% due 09/01/2026(1) 8,000 8,290
Total Preferred Securities/Capital Securities(cost $15,000) 15,491
ASSET BACKED SECURITIES �� 7.3%Diversified Financial Services �� 7.3%
ACC Auto TrustSeries 2021-A, Class A1.08% due 04/15/2027* 95,242 95,352
ACC Auto TrustSeries 2021-A, Class B1.79% due 07/15/2027* 105,000 105,313
ACC TrustSeries 2021-1, Class B1.43% due 07/22/2024* 100,000 99,977
ACRE Commercial Mtg., Ltd. FRSSeries 2021-FL4, Class A0.92% (1 ML+0.83%)due 12/18/2037*(2)(3) 175,000 174,573
ACRE Commercial Mtg., Ltd. FRSSeries 2021-FL4, Class AS1.19% (1 ML+1.10%)due 12/18/2037*(2)(3) 110,000 109,729
Affirm Asset Securitization TrustSeries 2021-A, Class A0.88% due 08/15/2025* 145,000 145,288
Ajax Mtg. Loan TrustSeries 2021-B, Class A2.24% due 06/25/2066*(4) 138,287 138,119
Aligned Data Centers Issuer LLCSeries 2021-1A, Class A21.94% due 08/15/2046* 95,000 95,510
American Credit Acceptance Receivables TrustSeries 2021-1, Class A0.35% due 05/13/2024* 97,405 97,439
American Credit Acceptance Receivables TrustSeries 2021-1, Class B0.61% due 03/13/2025* 45,000 45,024
Bayview Finance LLC CMOSeries 2021-3F1.84% due 07/12/2033(5) 138,836 138,836
Bayview Opportunity Master Fund IVb Trust1.60% due 01/10/2031(5) 24,338 24,338
Copyright © 2021 www.secdatabase.com. All Rights Reserved.Please Consider the Environment Before Printing This Document

BPR Trust FRSSeries 2021-KEN, Class A1.35% (1 ML+1.25%)due 02/15/2029*(2) 145,000 145,000
Business Jet Securities LLCSeries 2021-1A, Class A2.16% due 04/15/2036* 113,902 114,679
Business Jet Securities LLCSeries 2021-1A, Class B2.92% due 04/15/2036* 148,180 149,947
BVRT Financing TrustSeries 2021-2F, Class M11.57% due 01/10/2032(5) 15,141 15,141
BVRT Financing Trust FRSSeries 2021-CRT21.85% due 11/10/2032(5) 25,725 25,725
Cascade MH Asset TrustSeries 2021-MH1, Class A11.75% due 02/25/2046*(6) 167,260 168,276
CF Hippolyta LLCSeries 2021-1A, Class A11.53% due 03/15/2061* 99,414 101,302
CFMT LLC VRSSeries 2021-HB5, Class A0.80% due 02/25/2031*(6)(7) 169,512 169,539
CPS Auto Receivables TrustSeries 2021-A, Class A0.35% due 01/16/2024* 75,827 75,838
CPS Auto Receivables TrustSeries 2021-A, Class B0.61% due 02/18/2025* 105,000 105,185
CPS Auto Receivables TrustSeries 2021-A, Class C0.83% due 09/15/2026* 300,000 300,355
CPS Auto Receivables TrustSeries 2021-B, Class C1.23% due 03/15/2027* 100,000 100,381
Credit Acceptance Auto Loan TrustSeries 2021-2A, Class A0.96% due 02/15/2030* 250,000 251,120
Credito Real USA Auto Receivables TrustSeries 2021-1A, Class A1.35% due 02/16/2027* 48,158 48,180
Crossroads Asset TrustSeries 2021-A, Class A10.37% due 12/20/2021* 17,544 17,546
Crossroads Asset TrustSeries 2021-A, Class A20.82% due 03/20/2024* 100,000 100,121
Copyright © 2021 www.secdatabase.com. All Rights Reserved.Please Consider the Environment Before Printing This Document

Crossroads Asset TrustSeries 2021-A, Class B1.12% due 06/20/2025* 205,000 205,275
CSMC Trust VRSSeries 2021-RPL1, Class A11.67% due 09/27/2060*(6)(7) 165,897 166,591
DataBank Issuer LLCSeries 2021-1A, Class A22.06% due 02/27/2051* 175,000 175,667
Diamond Resorts Owner TrustSeries 2021-1A, Class A1.51% due 11/21/2033* 171,636 172,612
Drive Auto Receivables TrustSeries 2017-1, Class D3.84% due 03/15/2023 7,249 7,264
DT Auto Owner TrustSeries 2021-1A, Class C0.84% due 10/15/2026* 50,000 50,066
Copyright © 2021 www.secdatabase.com. All Rights Reserved.Please Consider the Environment Before Printing This Document
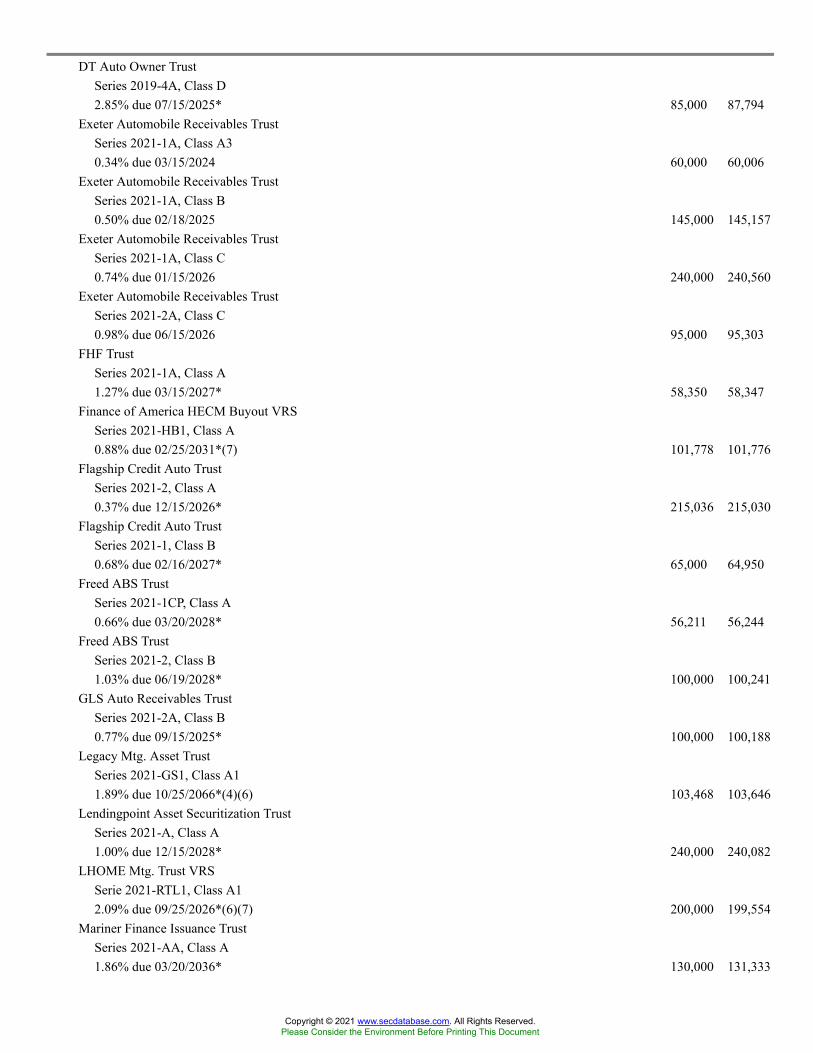
DT Auto Owner TrustSeries 2019-4A, Class D2.85% due 07/15/2025* 85,000 87,794
Exeter Automobile Receivables TrustSeries 2021-1A, Class A30.34% due 03/15/2024 60,000 60,006
Exeter Automobile Receivables TrustSeries 2021-1A, Class B0.50% due 02/18/2025 145,000 145,157
Exeter Automobile Receivables TrustSeries 2021-1A, Class C0.74% due 01/15/2026 240,000 240,560
Exeter Automobile Receivables TrustSeries 2021-2A, Class C0.98% due 06/15/2026 95,000 95,303
FHF TrustSeries 2021-1A, Class A1.27% due 03/15/2027* 58,350 58,347
Finance of America HECM Buyout VRSSeries 2021-HB1, Class A0.88% due 02/25/2031*(7) 101,778 101,776
Flagship Credit Auto TrustSeries 2021-2, Class A0.37% due 12/15/2026* 215,036 215,030
Flagship Credit Auto TrustSeries 2021-1, Class B0.68% due 02/16/2027* 65,000 64,950
Freed ABS TrustSeries 2021-1CP, Class A0.66% due 03/20/2028* 56,211 56,244
Freed ABS TrustSeries 2021-2, Class B1.03% due 06/19/2028* 100,000 100,241
GLS Auto Receivables TrustSeries 2021-2A, Class B0.77% due 09/15/2025* 100,000 100,188
Legacy Mtg. Asset TrustSeries 2021-GS1, Class A11.89% due 10/25/2066*(4)(6) 103,468 103,646
Lendingpoint Asset Securitization TrustSeries 2021-A, Class A1.00% due 12/15/2028* 240,000 240,082
LHOME Mtg. Trust VRSSerie 2021-RTL1, Class A12.09% due 09/25/2026*(6)(7) 200,000 199,554
Mariner Finance Issuance TrustSeries 2021-AA, Class A1.86% due 03/20/2036* 130,000 131,333
Copyright © 2021 www.secdatabase.com. All Rights Reserved.Please Consider the Environment Before Printing This Document

Marlette Funding TrustSeries 2021-1A, Class B1.00% due 06/16/2031* 101,000 101,253
Mercury Financial Credit Card Master TrustSeries 2021-1A, Class A1.54% due 03/20/2026* 140,000 140,506
Mission Lane Credit Card Master TrustSeries 2021-A, Class A1.59% due 09/15/2026* 110,000 110,083
NRZ Excess Spread-Collateralized NotesSeries 2021-FNT1, Class A2.98% due 03/25/2026* 128,375 128,130
NRZ Excess Spread-Collateralized NotesSeries 2021-FNT2, Class A3.23% due 05/25/2026* 193,663 193,548
Octane Receivables TrustSeries 2021-1A, Class A0.93% due 03/22/2027* 100,004 100,098
Oportun Funding XIV LLCSeries 2021-A, Class A1.21% due 03/08/2028* 100,000 100,346
Oportun Funding XIV LLCSeries 2021-A, Class B1.76% due 03/08/2028* 245,000 245,814
Oportun Issuance TrustSeries 2021-B, Class A1.47% due 05/08/2031* 255,000 255,616
Pagaya AI Debt Selection TrustSeries 2021-1, Class A1.18% due 11/15/2027* 406,488 407,541
Pagaya AI Debt Selection TrustSeries 2021-HG1, Class A1.22% due 01/16/2029* 204,616 204,919
Pretium Mtg. Credit Partners I LLCSeries 2021-NPL1, Class A12.24% due 09/27/2060*(4) 216,549 216,785
Progress Residential TrustSeries 2021-SFR2, Class D2.20% due 04/19/2038* 267,000 267,927
PRPM LLC VRSSeries 2021-2, Class A12.12% due 03/25/2026*(6)(7) 238,054 238,621
Regional Management Issuance TrustSeries 2021-1, Class A1.68% due 03/17/2031* 125,000 125,537
SLG Office TrustSeries 2021-OVA, Class A2.59% due 07/15/2041*(2) 110,000 115,716
Copyright © 2021 www.secdatabase.com. All Rights Reserved.Please Consider the Environment Before Printing This Document

Theorem Funding TrustSeries 2021-1A, Class A1.21% due 12/15/2027* 205,000 205,064
Towd Point Mtg. Trust VRSSeries 2021-R1, Class A12.92% due 11/30/2060*(6)(7) 237,372 242,435
Tricolor Auto Securitization TrustSeries 2021-1A, Class B1.00% due 06/17/2024* 120,000 120,011
Tricolor Auto Securitization TrustSeries 2021-1A, Class C1.33% due 09/16/2024* 115,000 115,022
Copyright © 2021 www.secdatabase.com. All Rights Reserved.Please Consider the Environment Before Printing This Document

United Auto Credit Securitization TrustSeries 2021-1, Class C0.84% due 06/10/2026* 115,000 114,995
Upstart Pass-Through TrustSeries 2021-ST2, Class A2.50% due 04/20/2027* 86,262 87,243
Upstart Securitization TrustSeries 2021-1, Class A0.87% due 03/20/2031* 107,011 107,224
US Auto FundingSeries 2021-1A, Class B1.49% due 03/17/2025* 100,000 99,977
VCAT LLC VRSSeries 2021-NPL2, Class A12.12% due 03/27/2051*(4)(6) 87,124 87,393
Veros Auto Receivables TrustSeries 2021-1, Class A0.92% due 10/15/2026* 104,012 104,031
VOLT XCII LLCSeries 2021-NPL1, Class A11.89% due 02/27/2051*(4) 96,579 96,635
VOLT XCIII LLCSeries 2021-NPL2, Class A11.89% due 02/27/2051*(4) 276,970 278,001
VOLT XCIV LLCSeries 2021-NPL3, Class A12.24% due 02/27/2051*(4) 236,792 237,136
VOLT XCV LLCSeries 2021-NPL4, Class A12.24% due 03/27/2051*(4) 176,778 177,148
VOLT XCVI LLCSeries 2021-NPL5, Class A12.12% due 03/27/2051*(4) 180,920 181,106
VOLT XCVII LLCSeries 2021-NPL6, Class A12.24% due 04/25/2051*(4) 201,260 201,428
Westlake Automobile Receivables TrustSeries 2021-1A, Class C0.95% due 03/16/2026* 190,000 190,194
Total Asset Backed Securities(cost $11,508,489) 11,533,002
U.S. CORPORATE BONDS & NOTES - 11.0%Aerospace/Defense - 0.3%
Boeing Co.Senior Notes1.43% due 02/04/2024 10,000 10,023
Copyright © 2021 www.secdatabase.com. All Rights Reserved.Please Consider the Environment Before Printing This Document

Boeing Co.Senior Notes2.20% due 02/04/2026 5,000 5,020
Boeing Co.Senior Notes2.70% due 02/01/2027 270,000 280,150
Boeing Co.Senior Notes3.45% due 11/01/2028 19,000 20,346
Northrop Grumman Corp.Senior Notes3.85% due 04/15/2045 68,000 78,948
Raytheon Technologies Corp.Senior Notes2.25% due 07/01/2030 86,000 87,923
482,410Agricultural Operations - 0.0%
Bunge Ltd. Finance Corp.Company Guar. Notes2.75% due 05/14/2031 45,000 46,225
Airlines - 0.3%
American Airlines Pass-Through TrustPass-Through Certs.Series 2016-3, Class A3.00% due 04/15/2030 119,495 120,353
American Airlines Pass-Through TrustPass-Through Certs.Series 2019-1, Class AA3.15% due 08/15/2033 110,246 112,601
United Airlines Pass-Through TrustPass-Through Certs.Series 2016-2, Class A3.10% due 04/07/2030 28,524 28,360
United Airlines Pass-Through TrustPass-Through Certs.Series 2019-2, Class B3.50% due 11/01/2029 53,747 53,308
United Airlines Pass-Through TrustPass-Through Certs.Series 2016-2, Class B3.65% due 04/07/2027 56,019 55,855
United Airlines Pass-Through TrustPass-Through Certs.Series 2016-1, Class B3.65% due 07/07/2027 58,119 58,098
Copyright © 2021 www.secdatabase.com. All Rights Reserved.Please Consider the Environment Before Printing This Document
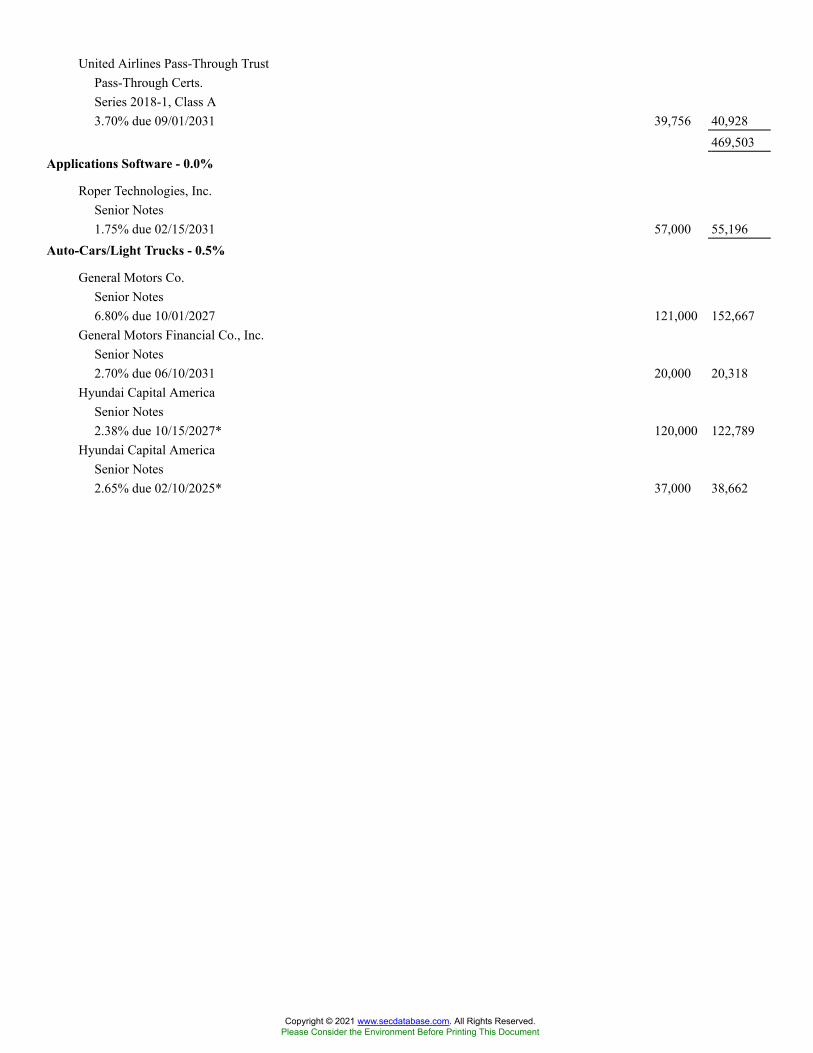
United Airlines Pass-Through TrustPass-Through Certs.Series 2018-1, Class A3.70% due 09/01/2031 39,756 40,928
469,503Applications Software - 0.0%
Roper Technologies, Inc.Senior Notes1.75% due 02/15/2031 57,000 55,196
Auto-Cars/Light Trucks - 0.5%
General Motors Co.Senior Notes6.80% due 10/01/2027 121,000 152,667
General Motors Financial Co., Inc.Senior Notes2.70% due 06/10/2031 20,000 20,318
Hyundai Capital AmericaSenior Notes2.38% due 10/15/2027* 120,000 122,789
Hyundai Capital AmericaSenior Notes2.65% due 02/10/2025* 37,000 38,662
Copyright © 2021 www.secdatabase.com. All Rights Reserved.Please Consider the Environment Before Printing This Document

Hyundai Capital AmericaSenior Notes3.00% due 02/10/2027* 200,000 211,993
Nissan Motor Acceptance Corp.Senior Notes2.80% due 01/13/2022* 186,000 187,471
733,900Banks-Super Regional - 0.2%
KeyCorpSenior Notes2.25% due 04/06/2027 140,000 145,949
Wells Fargo & Co.Senior Notes3.07% due 04/30/2041 69,000 72,370
Wells Fargo & Co.Sub. Notes4.10% due 06/03/2026 131,000 147,215
365,534Beverages-Non-alcoholic - 0.1%
Keurig Dr Pepper, Inc.Company Guar. Notes3.20% due 05/01/2030 94,000 102,164
Brewery - 0.2%
Anheuser-Busch InBev Worldwide, Inc.Company Guar. Notes3.75% due 07/15/2042 239,000 262,836
Broadcast Services/Program - 0.1%
Discovery Communications LLCCompany Guar. Notes3.63% due 05/15/2030 94,000 103,002
Building Products-Cement - 0.0%
Martin Marietta Materials, Inc.Senior Notes2.50% due 03/15/2030 57,000 58,969
Building Products-Wood - 0.0%
Masco Corp.Senior Notes2.00% due 10/01/2030 57,000 56,219
Building-Residential/Commercial - 0.1%
Lennar Corp.Company Guar. Notes5.00% due 06/15/2027 84,000 97,752
Cable/Satellite TV - 0.4%
Copyright © 2021 www.secdatabase.com. All Rights Reserved.Please Consider the Environment Before Printing This Document

Charter Communications Operating LLC/Charter Communications Operating CapitalSenior Sec. Notes2.80% due 04/01/2031 180,000 184,512
Charter Communications Operating LLC/Charter Communications Operating CapitalSenior Sec. Notes3.50% due 06/01/2041 35,000 35,360
Comcast Corp.Company Guar. Notes1.50% due 02/15/2031 170,000 162,755
Comcast Corp.Company Guar. Notes3.25% due 11/01/2039 154,000 167,576
Cox Communications, Inc.Company Guar. Notes1.80% due 10/01/2030* 142,000 137,329
687,532Cellular Telecom - 0.1%
T-Mobile USA, Inc.Senior Sec. Notes2.55% due 02/15/2031 142,000 144,824
T-Mobile USA, Inc.Senior Sec. Notes3.00% due 02/15/2041 87,000 86,417
231,241Chemicals-Diversified - 0.1%
LYB International Finance III LLCCompany Guar. Notes1.25% due 10/01/2025 140,000 140,158
Chemicals-Specialty - 0.1%
International Flavors & FragrancesCompany Guar. Notes3.47% due 12/01/2050* 154,000 167,266
Computer Services - 0.2%
International Business Machines Corp.Senior Notes4.00% due 06/20/2042 105,000 124,332
Leidos, Inc.Company Guar. Notes2.30% due 02/15/2031 141,000 138,988
263,320Computer Software - 0.0%
Citrix Systems, Inc.Senior Notes1.25% due 03/01/2026 10,000 9,889
Computers - 0.1%
Copyright © 2021 www.secdatabase.com. All Rights Reserved.Please Consider the Environment Before Printing This Document

Dell International LLC/EMC Corp.Senior Sec. Notes6.20% due 07/15/2030 141,000 181,129
Containers-Paper/Plastic - 0.0%
Graphic Packaging International LLCSenior Sec. Notes1.51% due 04/15/2026* 33,000 33,022
Diagnostic Equipment - 0.0%
Thermo Fisher Scientific, Inc.Senior Notes2.00% due 10/15/2031 40,000 39,970
Diversified Banking Institutions - 1.3%
Bank of America Corp.Senior Notes2.68% due 06/19/2041 144,000 141,778
Copyright © 2021 www.secdatabase.com. All Rights Reserved.Please Consider the Environment Before Printing This Document
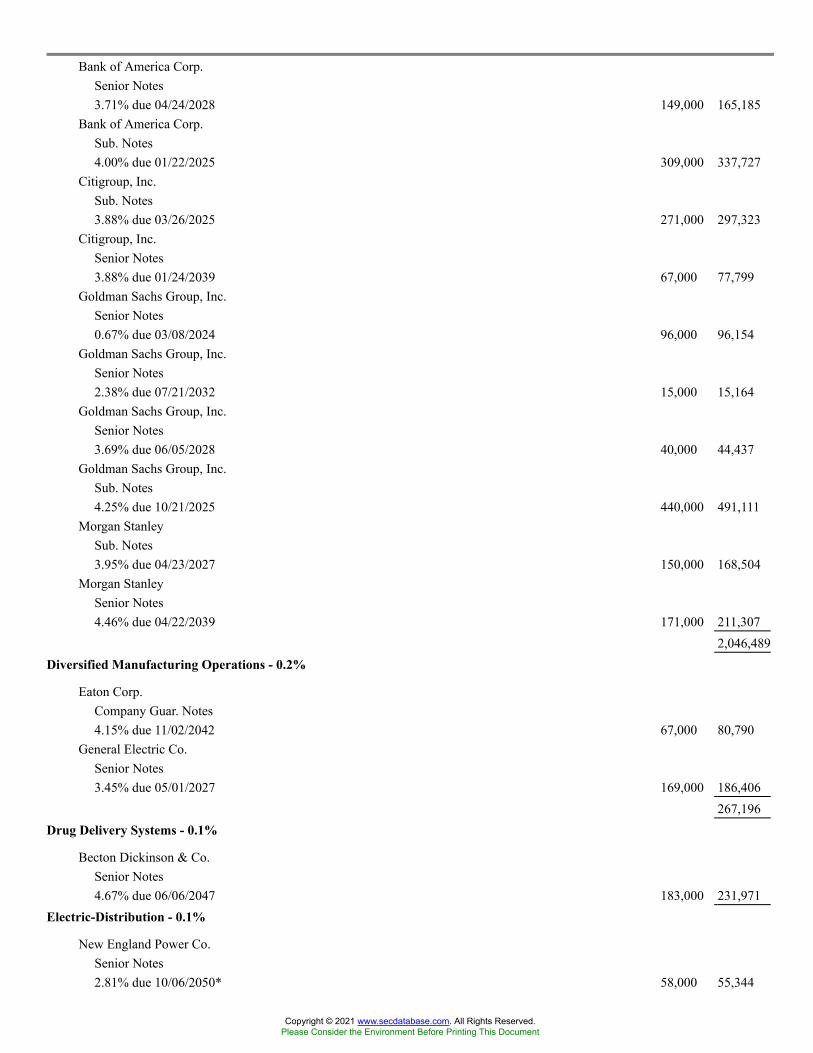
Bank of America Corp.Senior Notes3.71% due 04/24/2028 149,000 165,185
Bank of America Corp.Sub. Notes4.00% due 01/22/2025 309,000 337,727
Citigroup, Inc.Sub. Notes3.88% due 03/26/2025 271,000 297,323
Citigroup, Inc.Senior Notes3.88% due 01/24/2039 67,000 77,799
Goldman Sachs Group, Inc.Senior Notes0.67% due 03/08/2024 96,000 96,154
Goldman Sachs Group, Inc.Senior Notes2.38% due 07/21/2032 15,000 15,164
Goldman Sachs Group, Inc.Senior Notes3.69% due 06/05/2028 40,000 44,437
Goldman Sachs Group, Inc.Sub. Notes4.25% due 10/21/2025 440,000 491,111
Morgan StanleySub. Notes3.95% due 04/23/2027 150,000 168,504
Morgan StanleySenior Notes4.46% due 04/22/2039 171,000 211,307
2,046,489Diversified Manufacturing Operations - 0.2%
Eaton Corp.Company Guar. Notes4.15% due 11/02/2042 67,000 80,790
General Electric Co.Senior Notes3.45% due 05/01/2027 169,000 186,406
267,196Drug Delivery Systems - 0.1%
Becton Dickinson & Co.Senior Notes4.67% due 06/06/2047 183,000 231,971
Electric-Distribution - 0.1%
New England Power Co.Senior Notes2.81% due 10/06/2050* 58,000 55,344
Copyright © 2021 www.secdatabase.com. All Rights Reserved.Please Consider the Environment Before Printing This Document

Oklahoma Gas and Electric Co.Senior Notes0.55% due 05/26/2023 20,000 20,008
75,352Electric-Generation - 0.1%
Emera US Finance LPCompany Guar. Notes4.75% due 06/15/2046 174,000 206,743
Electric-Integrated - 0.8%
Duke Energy Corp.Senior Notes3.40% due 06/15/2029 160,000 175,400
Edison InternationalSenior Notes5.75% due 06/15/2027 17,000 19,434
Evergy, Inc.Senior Notes2.90% due 09/15/2029 151,000 161,449
Exelon Generation Co. LLCSenior Notes3.25% due 06/01/2025 299,000 321,437
Jersey Central Power & Light Co.Senior Notes4.30% due 01/15/2026* 65,000 72,343
OGE Energy Corp.Senior Notes0.70% due 05/26/2023 15,000 15,009
Pacific Gas & Electric Co.Senior Sec. Notes1.37% due 03/10/2023 80,000 79,760
Pacific Gas & Electric Co.1st Mtg. Notes4.30% due 03/15/2045 10,000 9,802
PacifiCorp1st Mtg. Notes4.15% due 02/15/2050 183,000 222,579
Southern California Edison Co.1st Mtg. Notes1.20% due 02/01/2026 112,000 111,547
WEC Energy Group, Inc.Senior Notes1.38% due 10/15/2027 140,000 138,384
1,327,144Electronic Components-Semiconductors - 0.2%
Broadcom, Inc.Company Guar. Notes4.15% due 11/15/2030 198,000 222,761
Copyright © 2021 www.secdatabase.com. All Rights Reserved.Please Consider the Environment Before Printing This Document

Microchip Technology, Inc.Senior Sec. Notes0.97% due 02/15/2024* 47,000 47,056
Microchip Technology, Inc.Senior Sec. Notes0.98% due 09/01/2024* 40,000 39,968
Xilinx, Inc.Senior Notes2.38% due 06/01/2030 25,000 25,691
335,476Enterprise Software/Service - 0.1%
Oracle Corp.Senior Notes3.80% due 11/15/2037 163,000 178,403
Finance-Credit Card - 0.1%
Capital One Financial Corp.Senior Notes3.80% due 01/31/2028 94,000 105,600
Copyright © 2021 www.secdatabase.com. All Rights Reserved.Please Consider the Environment Before Printing This Document

Finance-Leasing Companies - 0.1%
Air Lease Corp.Senior Notes1.88% due 08/15/2026 10,000 10,034
Air Lease Corp.Senior Notes3.38% due 07/01/2025 129,000 138,120
148,154Food-Meat Products - 0.1%
Smithfield Foods, Inc.Senior Notes3.00% due 10/15/2030* 122,000 124,327
Tyson Foods, Inc.Senior Notes3.55% due 06/02/2027 94,000 104,770
229,097Food-Misc./Diversified - 0.1%
Conagra Brands, Inc.Senior Notes1.38% due 11/01/2027 141,000 138,319
Food-Wholesale/Distribution - 0.1%
Sysco Corp.Company Guar. Notes2.40% due 02/15/2030 122,000 125,696
Gas-Distribution - 0.1%
Atmos Energy Corp.Senior Notes0.63% due 03/09/2023 15,000 15,002
CenterPoint Energy Resources Corp.Senior Notes1.75% due 10/01/2030 141,000 137,337
152,339Independent Power Producers - 0.3%
Alexander Funding TrustSenior Sec. Notes1.84% due 11/15/2023* 74,000 75,401
NRG Energy, Inc.Senior Sec. Notes2.00% due 12/02/2025* 47,000 48,012
NRG Energy, Inc.Senior Sec. Notes2.45% due 12/02/2027* 308,000 313,106
436,519Insurance Brokers - 0.0%
Copyright © 2021 www.secdatabase.com. All Rights Reserved.Please Consider the Environment Before Printing This Document

Brown & Brown, Inc.Senior Notes2.38% due 03/15/2031 56,000 56,713
Insurance-Life/Health - 0.2%
Athene Global FundingSec. Notes2.75% due 06/25/2024* 56,000 59,004
Copyright © 2021 www.secdatabase.com. All Rights Reserved.Please Consider the Environment Before Printing This Document

Insurance-Life/Health (continued)
Empower Finance 2020 LPCompany Guar. Notes3.08% due 09/17/2051* 68,000 70,770
F&G Global FundingSec. Notes1.75% due 06/30/2026* 25,000 25,420
Northwestern Mutual Global FundingSenior Sec. Notes1.70% due 06/01/2028* 25,000 25,563
Teachers Insurance & Annuity Association of AmericaSub. Notes3.30% due 05/15/2050* 58,000 62,352
243,109Insurance-Mutual - 0.1%
New York Life Insurance Co.Sub. Notes3.75% due 05/15/2050* 68,000 78,405
Machinery-General Industrial - 0.0%
Otis Worldwide Corp.Senior Notes3.11% due 02/15/2040 67,000 70,028
Medical Products - 0.0%
Zimmer Biomet Holdings, Inc.Senior Notes3.55% due 03/20/2030 66,000 73,027
Medical-Biomedical/Gene - 0.2%
Amgen, Inc.Senior Notes3.15% due 02/21/2040 68,000 71,423
Gilead Sciences, Inc.Senior Notes2.60% due 10/01/2040 143,000 139,017
Regeneron Pharmaceuticals, Inc.Senior Notes1.75% due 09/15/2030 56,000 53,882
264,322Medical-Drugs - 0.3%
AbbVie, Inc.Senior Notes2.95% due 11/21/2026 19,000 20,476
AbbVie, Inc.Senior Notes3.20% due 11/21/2029 47,000 51,357
Copyright © 2021 www.secdatabase.com. All Rights Reserved.Please Consider the Environment Before Printing This Document

AbbVie, Inc.Senior Notes4.05% due 11/21/2039 277,000 325,081
Bristol-Myers Squibb Co.Senior Notes4.13% due 06/15/2039 48,000 58,659
455,573Medical-Generic Drugs - 0.2%
Utah Acquisition Sub, Inc.Company Guar. Notes3.95% due 06/15/2026 159,000 176,265
Viatris, Inc.Company Guar. Notes3.85% due 06/22/2040* 153,000 165,616
341,881
Copyright © 2021 www.secdatabase.com. All Rights Reserved.Please Consider the Environment Before Printing This Document

Medical-HMO - 0.0%
Anthem, Inc.Senior Notes2.25% due 05/15/2030 57,000 58,030
Medical-Hospitals - 0.2%
HCA, Inc.Senior Sec. Notes3.50% due 07/15/2051 15,000 15,303
HCA, Inc.Senior Sec. Notes5.25% due 06/15/2026 158,000 182,603
MedStar Health, Inc.Sec. Notes3.63% due 08/15/2049 46,000 51,671
Universal Health Services, Inc.Senior Sec. Notes2.65% due 01/15/2032* 25,000 25,151
274,728Metal-Diversified - 0.1%
Glencore Funding LLCCompany Guar. Notes2.50% due 09/01/2030* 75,000 74,862
Multimedia - 0.2%
Viacom, Inc.Senior Notes4.38% due 03/15/2043 96,000 112,162
Viacom, Inc.Senior Notes5.85% due 09/01/2043 10,000 13,877
Walt Disney Co.Company Guar. Notes3.50% due 05/13/2040 96,000 107,903
233,942Oil Companies-Exploration & Production - 0.1%
Cimarex Energy Co.Senior Notes3.90% due 05/15/2027 46,000 50,806
Diamondback Energy, Inc.Company Guar. Notes3.25% due 12/01/2026 74,000 79,296
Pioneer Natural Resources Co.Senior Notes1.90% due 08/15/2030 57,000 55,015
185,117Oil Companies-Integrated - 0.1%
Copyright © 2021 www.secdatabase.com. All Rights Reserved.Please Consider the Environment Before Printing This Document
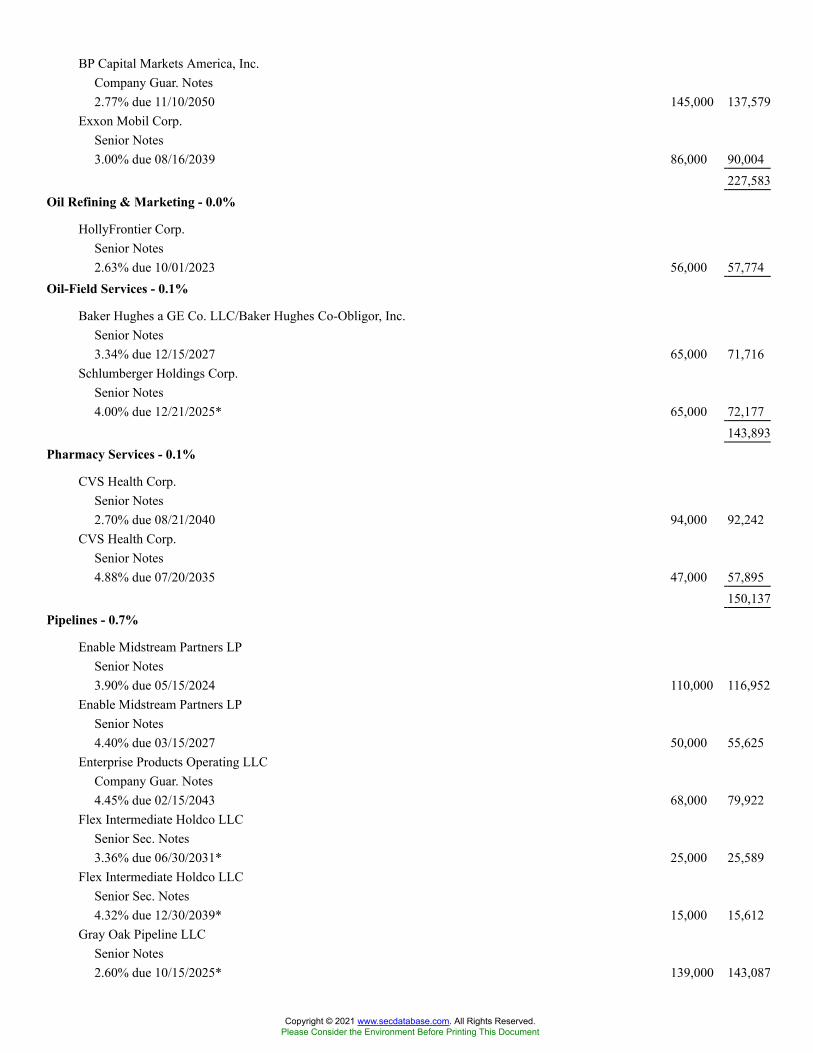
BP Capital Markets America, Inc.Company Guar. Notes2.77% due 11/10/2050 145,000 137,579
Exxon Mobil Corp.Senior Notes3.00% due 08/16/2039 86,000 90,004
227,583Oil Refining & Marketing - 0.0%
HollyFrontier Corp.Senior Notes2.63% due 10/01/2023 56,000 57,774
Oil-Field Services - 0.1%
Baker Hughes a GE Co. LLC/Baker Hughes Co-Obligor, Inc.Senior Notes3.34% due 12/15/2027 65,000 71,716
Schlumberger Holdings Corp.Senior Notes4.00% due 12/21/2025* 65,000 72,177
143,893Pharmacy Services - 0.1%
CVS Health Corp.Senior Notes2.70% due 08/21/2040 94,000 92,242
CVS Health Corp.Senior Notes4.88% due 07/20/2035 47,000 57,895
150,137Pipelines - 0.7%
Enable Midstream Partners LPSenior Notes3.90% due 05/15/2024 110,000 116,952
Enable Midstream Partners LPSenior Notes4.40% due 03/15/2027 50,000 55,625
Enterprise Products Operating LLCCompany Guar. Notes4.45% due 02/15/2043 68,000 79,922
Flex Intermediate Holdco LLCSenior Sec. Notes3.36% due 06/30/2031* 25,000 25,589
Flex Intermediate Holdco LLCSenior Sec. Notes4.32% due 12/30/2039* 15,000 15,612
Gray Oak Pipeline LLCSenior Notes2.60% due 10/15/2025* 139,000 143,087
Copyright © 2021 www.secdatabase.com. All Rights Reserved.Please Consider the Environment Before Printing This Document

Gray Oak Pipeline LLCSenior Notes3.45% due 10/15/2027* 41,000 43,682
MPLX LPSenior Notes2.65% due 08/15/2030 141,000 143,186
NGPL PipeCo LLCSenior Notes3.25% due 07/15/2031* 25,000 25,826
ONEOK, Inc.Company Guar. Notes2.20% due 09/15/2025 19,000 19,535
Plains All American Pipeline LP/PAA Finance Corp.Senior Notes4.65% due 10/15/2025 84,000 93,614
Sabine Pass Liquefaction LLCSenior Sec. Notes5.63% due 03/01/2025 65,000 74,081
Energy Transfer LPSenior Notes3.90% due 07/15/2026 84,000 92,229
Copyright © 2021 www.secdatabase.com. All Rights Reserved.Please Consider the Environment Before Printing This Document
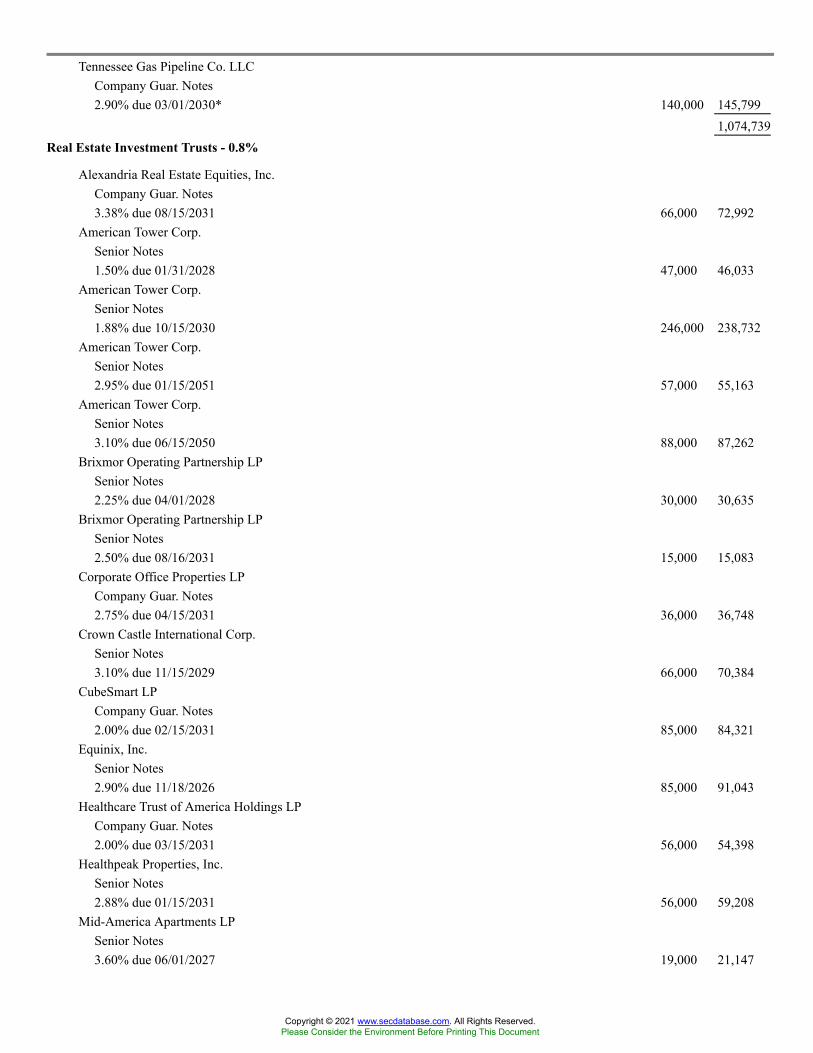
Tennessee Gas Pipeline Co. LLCCompany Guar. Notes2.90% due 03/01/2030* 140,000 145,799
1,074,739Real Estate Investment Trusts - 0.8%
Alexandria Real Estate Equities, Inc.Company Guar. Notes3.38% due 08/15/2031 66,000 72,992
American Tower Corp.Senior Notes1.50% due 01/31/2028 47,000 46,033
American Tower Corp.Senior Notes1.88% due 10/15/2030 246,000 238,732
American Tower Corp.Senior Notes2.95% due 01/15/2051 57,000 55,163
American Tower Corp.Senior Notes3.10% due 06/15/2050 88,000 87,262
Brixmor Operating Partnership LPSenior Notes2.25% due 04/01/2028 30,000 30,635
Brixmor Operating Partnership LPSenior Notes2.50% due 08/16/2031 15,000 15,083
Corporate Office Properties LPCompany Guar. Notes2.75% due 04/15/2031 36,000 36,748
Crown Castle International Corp.Senior Notes3.10% due 11/15/2029 66,000 70,384
CubeSmart LPCompany Guar. Notes2.00% due 02/15/2031 85,000 84,321
Equinix, Inc.Senior Notes2.90% due 11/18/2026 85,000 91,043
Healthcare Trust of America Holdings LPCompany Guar. Notes2.00% due 03/15/2031 56,000 54,398
Healthpeak Properties, Inc.Senior Notes2.88% due 01/15/2031 56,000 59,208
Mid-America Apartments LPSenior Notes3.60% due 06/01/2027 19,000 21,147
Copyright © 2021 www.secdatabase.com. All Rights Reserved.Please Consider the Environment Before Printing This Document

Office Properties Income TrustSenior Notes2.40% due 02/01/2027 45,000 45,018
UDR, Inc.Company Guar. Notes2.10% due 08/01/2032 57,000 55,652
WP Carey, Inc.Senior Notes2.40% due 02/01/2031 141,000 141,690
1,205,509Retail-Auto Parts - 0.1%
AutoZone, Inc.Senior Notes3.63% due 04/15/2025 84,000 91,471
O�Reilly Automotive, Inc.Senior Notes3.90% due 06/01/2029 66,000 74,972
166,443Retail-Building Products - 0.1%
Lowe�s Cos., Inc.Senior Notes3.70% due 04/15/2046 67,000 74,757
Retail-Convenience Store - 0.1%
7-Eleven, Inc.Senior Notes0.63% due 02/10/2023* 85,000 84,907
Retail-Discount - 0.1%
Dollar General Corp.Senior Notes4.13% due 04/03/2050 67,000 80,258
Retail-Major Department Stores - 0.0%
Nordstrom, Inc.Senior Notes4.25% due 08/01/2031# 47,000 48,860
Retail-Regional Department Stores - 0.0%
Kohl�s Corp.Senior Notes3.38% due 05/01/2031# 44,000 46,179
Software Tools - 0.1%
VMware, Inc.Senior Notes1.40% due 08/15/2026 47,000 46,948
VMware, Inc.Senior Notes4.70% due 05/15/2030 94,000 112,339
Copyright © 2021 www.secdatabase.com. All Rights Reserved.Please Consider the Environment Before Printing This Document

159,287Steel-Producers - 0.0%
Steel Dynamics, Inc.Senior Notes1.65% due 10/15/2027 56,000 55,997
Telephone-Integrated - 0.4%
AT&T, Inc.Senior Notes2.75% due 06/01/2031 180,000 188,472
AT&T, Inc.Senior Notes3.50% due 06/01/2041 87,000 91,610
AT&T, Inc.Senior Notes3.55% due 09/15/2055* 15,000 15,329
Copyright © 2021 www.secdatabase.com. All Rights Reserved.Please Consider the Environment Before Printing This Document

Verizon Communications, Inc.Senior Notes2.65% due 11/20/2040 57,000 55,265
Verizon Communications, Inc.Senior Notes3.15% due 03/22/2030 151,000 163,825
Verizon Communications, Inc.Senior Notes3.85% due 11/01/2042 96,000 109,599
624,100Tobacco - 0.1%
Altria Group, Inc.Company Guar. Notes2.45% due 02/04/2032 50,000 48,884
BAT Capital Corp.Company Guar. Notes2.26% due 03/25/2028 113,000 113,576
BAT Capital Corp.Company Guar. Notes3.73% due 09/25/2040 38,000 37,687
200,147Toys - 0.0%
Hasbro, Inc.Senior Notes3.90% due 11/19/2029 47,000 52,490
Transport-Rail - 0.0%
Kansas City SouthernCompany Guar. Notes4.70% due 05/01/2048 22,000 27,430
Total U.S. Corporate Bonds & Notes(cost $17,650,940) 17,481,962
FOREIGN CORPORATE BONDS & NOTES - 1.2%Banks-Commercial - 0.1%
Bank of MontrealSub. Notes4.34% due 10/05/2028 149,000 159,345
Cellular Telecom - 0.0%
Rogers Communications, Inc.Company Guar. Notes3.70% due 11/15/2049 68,000 72,106
Commercial Services-Finance - 0.0%
IHS Markit, Ltd.Senior Notes4.25% due 05/01/2029 44,000 50,881
Diversified Banking Institutions - 0.3%
Copyright © 2021 www.secdatabase.com. All Rights Reserved.Please Consider the Environment Before Printing This Document
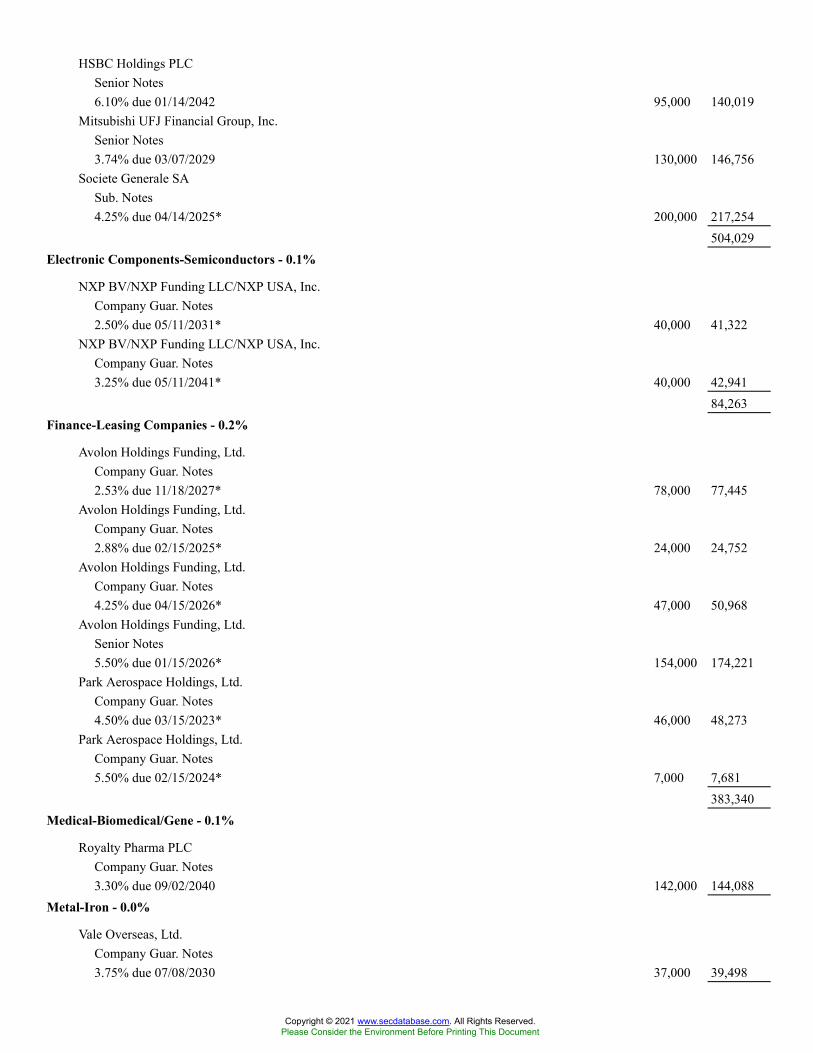
HSBC Holdings PLCSenior Notes6.10% due 01/14/2042 95,000 140,019
Mitsubishi UFJ Financial Group, Inc.Senior Notes3.74% due 03/07/2029 130,000 146,756
Societe Generale SASub. Notes4.25% due 04/14/2025* 200,000 217,254
504,029Electronic Components-Semiconductors - 0.1%
NXP BV/NXP Funding LLC/NXP USA, Inc.Company Guar. Notes2.50% due 05/11/2031* 40,000 41,322
NXP BV/NXP Funding LLC/NXP USA, Inc.Company Guar. Notes3.25% due 05/11/2041* 40,000 42,941
84,263Finance-Leasing Companies - 0.2%
Avolon Holdings Funding, Ltd.Company Guar. Notes2.53% due 11/18/2027* 78,000 77,445
Avolon Holdings Funding, Ltd.Company Guar. Notes2.88% due 02/15/2025* 24,000 24,752
Avolon Holdings Funding, Ltd.Company Guar. Notes4.25% due 04/15/2026* 47,000 50,968
Avolon Holdings Funding, Ltd.Senior Notes5.50% due 01/15/2026* 154,000 174,221
Park Aerospace Holdings, Ltd.Company Guar. Notes4.50% due 03/15/2023* 46,000 48,273
Park Aerospace Holdings, Ltd.Company Guar. Notes5.50% due 02/15/2024* 7,000 7,681
383,340Medical-Biomedical/Gene - 0.1%
Royalty Pharma PLCCompany Guar. Notes3.30% due 09/02/2040 142,000 144,088
Metal-Iron - 0.0%
Vale Overseas, Ltd.Company Guar. Notes3.75% due 07/08/2030 37,000 39,498
Copyright © 2021 www.secdatabase.com. All Rights Reserved.Please Consider the Environment Before Printing This Document

Oil Companies-Integrated - 0.0%
TotalEnergies Capital International SACompany Guar. Bonds2.99% due 06/29/2041 58,000 60,088
Pipelines - 0.1%
TransCanada PipeLines, Ltd.Senior Notes4.10% due 04/15/2030 66,000 75,593
Real Estate Investment Trusts - 0.1%
Scentre Group Trust 1/Scentre Group Trust 2Company Guar. Notes3.63% due 01/28/2026* 140,000 152,981
Copyright © 2021 www.secdatabase.com. All Rights Reserved.Please Consider the Environment Before Printing This Document
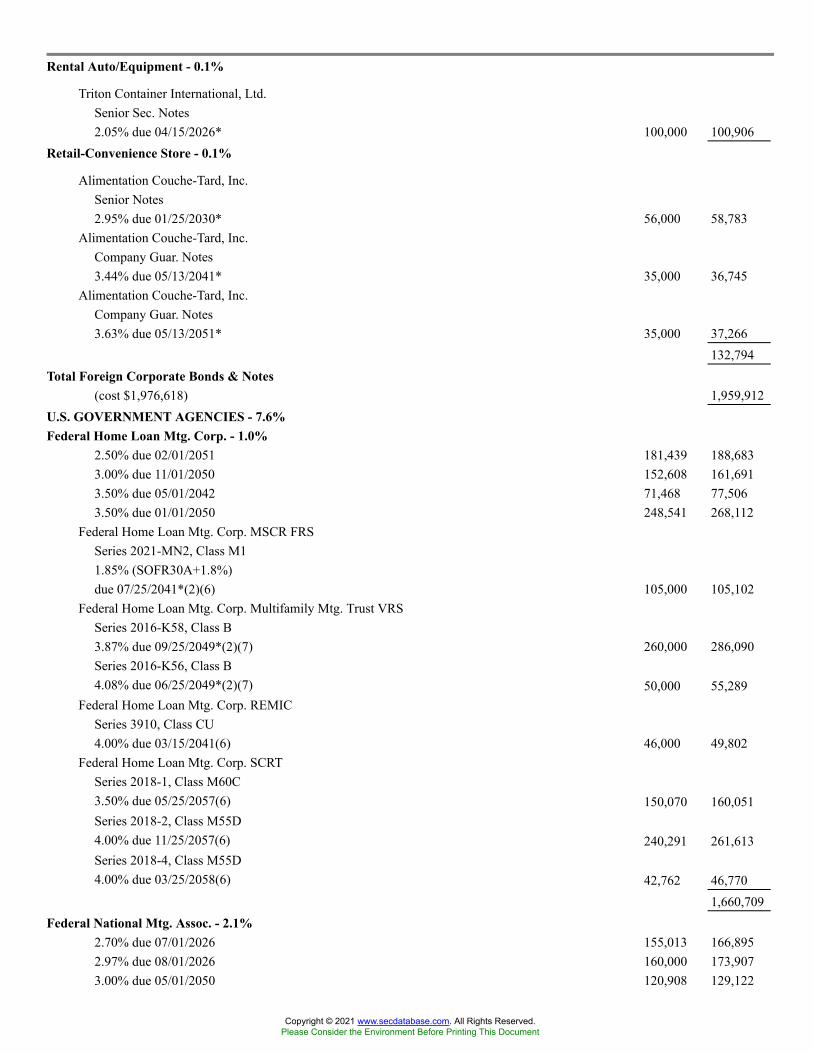
Rental Auto/Equipment - 0.1%
Triton Container International, Ltd.Senior Sec. Notes2.05% due 04/15/2026* 100,000 100,906
Retail-Convenience Store - 0.1%
Alimentation Couche-Tard, Inc.Senior Notes2.95% due 01/25/2030* 56,000 58,783
Alimentation Couche-Tard, Inc.Company Guar. Notes3.44% due 05/13/2041* 35,000 36,745
Alimentation Couche-Tard, Inc.Company Guar. Notes3.63% due 05/13/2051* 35,000 37,266
132,794Total Foreign Corporate Bonds & Notes
(cost $1,976,618) 1,959,912U.S. GOVERNMENT AGENCIES - 7.6%Federal Home Loan Mtg. Corp. - 1.0%
2.50% due 02/01/2051 181,439 188,6833.00% due 11/01/2050 152,608 161,6913.50% due 05/01/2042 71,468 77,5063.50% due 01/01/2050 248,541 268,112
Federal Home Loan Mtg. Corp. MSCR FRSSeries 2021-MN2, Class M11.85% (SOFR30A+1.8%)due 07/25/2041*(2)(6) 105,000 105,102
Federal Home Loan Mtg. Corp. Multifamily Mtg. Trust VRSSeries 2016-K58, Class B3.87% due 09/25/2049*(2)(7) 260,000 286,090Series 2016-K56, Class B4.08% due 06/25/2049*(2)(7) 50,000 55,289
Federal Home Loan Mtg. Corp. REMICSeries 3910, Class CU4.00% due 03/15/2041(6) 46,000 49,802
Federal Home Loan Mtg. Corp. SCRTSeries 2018-1, Class M60C3.50% due 05/25/2057(6) 150,070 160,051Series 2018-2, Class M55D4.00% due 11/25/2057(6) 240,291 261,613Series 2018-4, Class M55D4.00% due 03/25/2058(6) 42,762 46,770
1,660,709Federal National Mtg. Assoc. - 2.1%
2.70% due 07/01/2026 155,013 166,8952.97% due 08/01/2026 160,000 173,9073.00% due 05/01/2050 120,908 129,122
Copyright © 2021 www.secdatabase.com. All Rights Reserved.Please Consider the Environment Before Printing This Document
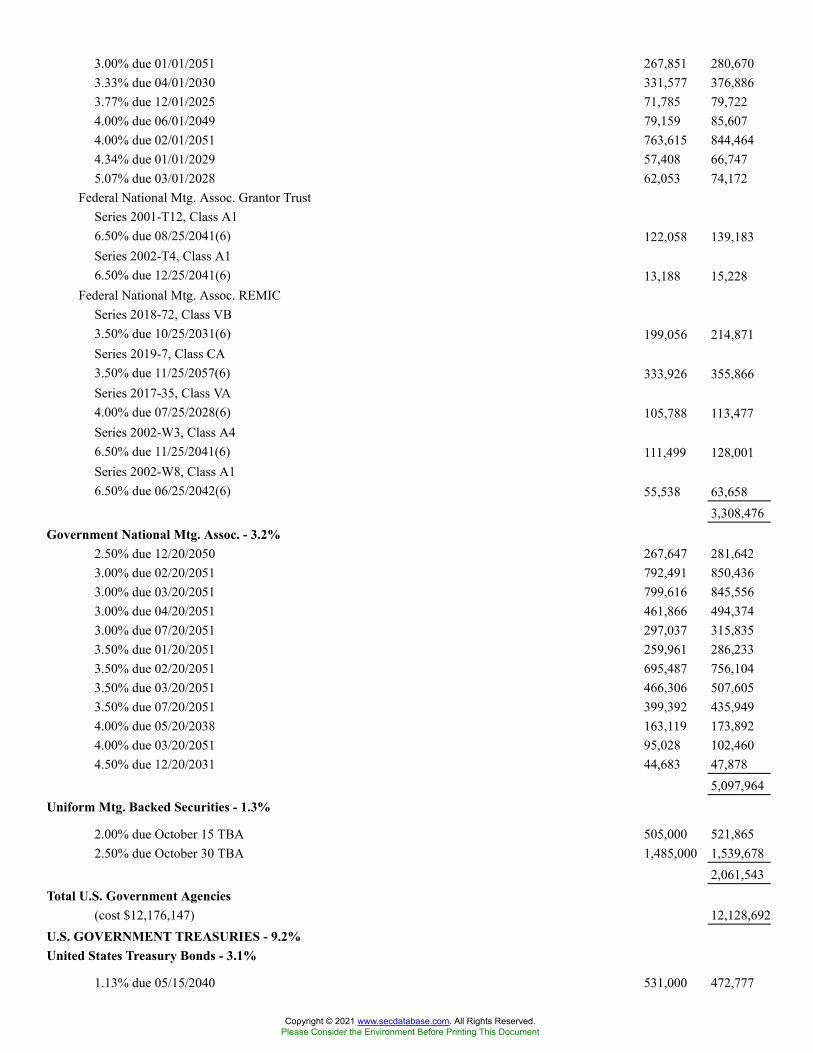
3.00% due 01/01/2051 267,851 280,6703.33% due 04/01/2030 331,577 376,8863.77% due 12/01/2025 71,785 79,7224.00% due 06/01/2049 79,159 85,6074.00% due 02/01/2051 763,615 844,4644.34% due 01/01/2029 57,408 66,7475.07% due 03/01/2028 62,053 74,172
Federal National Mtg. Assoc. Grantor TrustSeries 2001-T12, Class A16.50% due 08/25/2041(6) 122,058 139,183Series 2002-T4, Class A16.50% due 12/25/2041(6) 13,188 15,228
Federal National Mtg. Assoc. REMICSeries 2018-72, Class VB3.50% due 10/25/2031(6) 199,056 214,871Series 2019-7, Class CA3.50% due 11/25/2057(6) 333,926 355,866Series 2017-35, Class VA4.00% due 07/25/2028(6) 105,788 113,477Series 2002-W3, Class A46.50% due 11/25/2041(6) 111,499 128,001Series 2002-W8, Class A16.50% due 06/25/2042(6) 55,538 63,658
3,308,476Government National Mtg. Assoc. - 3.2%
2.50% due 12/20/2050 267,647 281,6423.00% due 02/20/2051 792,491 850,4363.00% due 03/20/2051 799,616 845,5563.00% due 04/20/2051 461,866 494,3743.00% due 07/20/2051 297,037 315,8353.50% due 01/20/2051 259,961 286,2333.50% due 02/20/2051 695,487 756,1043.50% due 03/20/2051 466,306 507,6053.50% due 07/20/2051 399,392 435,9494.00% due 05/20/2038 163,119 173,8924.00% due 03/20/2051 95,028 102,4604.50% due 12/20/2031 44,683 47,878
5,097,964Uniform Mtg. Backed Securities - 1.3%
2.00% due October 15 TBA 505,000 521,8652.50% due October 30 TBA 1,485,000 1,539,678
2,061,543Total U.S. Government Agencies
(cost $12,176,147) 12,128,692U.S. GOVERNMENT TREASURIES - 9.2%United States Treasury Bonds - 3.1%
1.13% due 05/15/2040 531,000 472,777
Copyright © 2021 www.secdatabase.com. All Rights Reserved.Please Consider the Environment Before Printing This Document
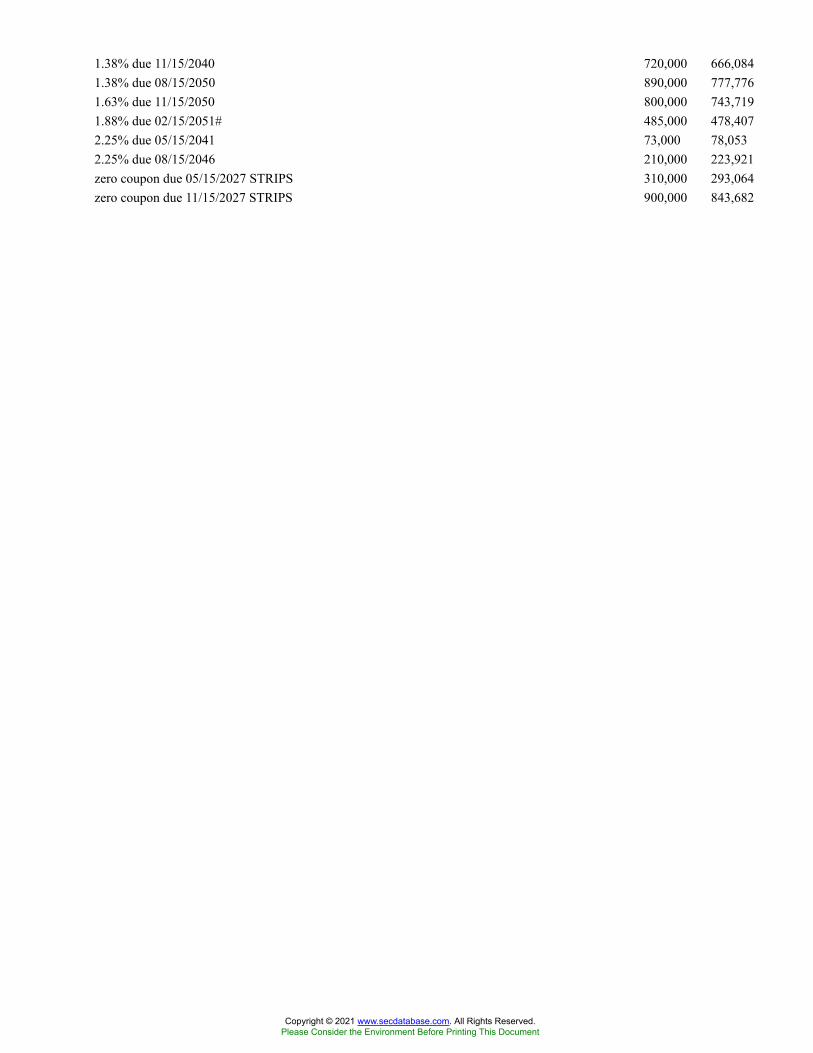
1.38% due 11/15/2040 720,000 666,0841.38% due 08/15/2050 890,000 777,7761.63% due 11/15/2050 800,000 743,7191.88% due 02/15/2051# 485,000 478,4072.25% due 05/15/2041 73,000 78,0532.25% due 08/15/2046 210,000 223,921zero coupon due 05/15/2027 STRIPS 310,000 293,064zero coupon due 11/15/2027 STRIPS 900,000 843,682
Copyright © 2021 www.secdatabase.com. All Rights Reserved.Please Consider the Environment Before Printing This Document
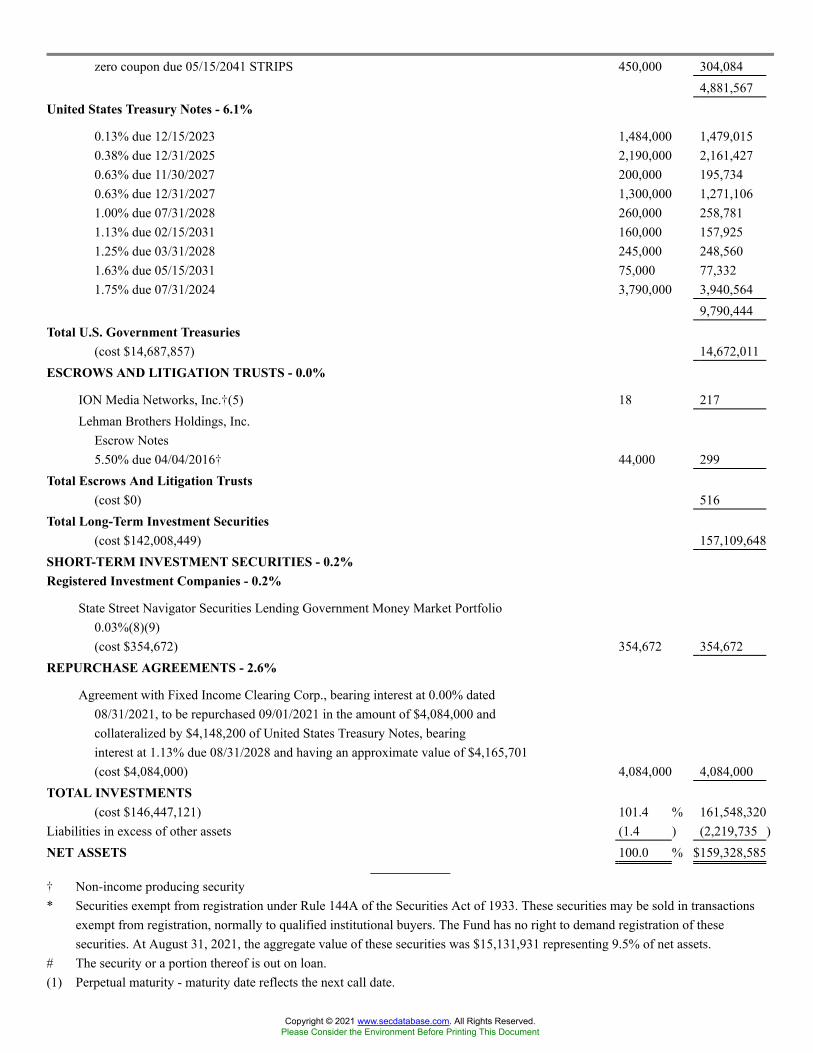
zero coupon due 05/15/2041 STRIPS 450,000 304,0844,881,567
United States Treasury Notes - 6.1%
0.13% due 12/15/2023 1,484,000 1,479,0150.38% due 12/31/2025 2,190,000 2,161,4270.63% due 11/30/2027 200,000 195,7340.63% due 12/31/2027 1,300,000 1,271,1061.00% due 07/31/2028 260,000 258,7811.13% due 02/15/2031 160,000 157,9251.25% due 03/31/2028 245,000 248,5601.63% due 05/15/2031 75,000 77,3321.75% due 07/31/2024 3,790,000 3,940,564
9,790,444Total U.S. Government Treasuries
(cost $14,687,857) 14,672,011ESCROWS AND LITIGATION TRUSTS - 0.0%
ION Media Networks, Inc.�(5) 18 217Lehman Brothers Holdings, Inc.
Escrow Notes5.50% due 04/04/2016� 44,000 299
Total Escrows And Litigation Trusts(cost $0) 516
Total Long-Term Investment Securities(cost $142,008,449) 157,109,648
SHORT-TERM INVESTMENT SECURITIES - 0.2%Registered Investment Companies - 0.2%
State Street Navigator Securities Lending Government Money Market Portfolio0.03%(8)(9)(cost $354,672) 354,672 354,672
REPURCHASE AGREEMENTS - 2.6%
Agreement with Fixed Income Clearing Corp., bearing interest at 0.00% dated08/31/2021, to be repurchased 09/01/2021 in the amount of $4,084,000 andcollateralized by $4,148,200 of United States Treasury Notes, bearinginterest at 1.13% due 08/31/2028 and having an approximate value of $4,165,701(cost $4,084,000) 4,084,000 4,084,000
TOTAL INVESTMENTS(cost $146,447,121) 101.4 % 161,548,320
Liabilities in excess of other assets (1.4 ) (2,219,735 )NET ASSETS 100.0 % $159,328,585
� Non-income producing security* Securities exempt from registration under Rule 144A of the Securities Act of 1933. These securities may be sold in transactions
exempt from registration, normally to qualified institutional buyers. The Fund has no right to demand registration of thesesecurities. At August 31, 2021, the aggregate value of these securities was $15,131,931 representing 9.5% of net assets.
# The security or a portion thereof is out on loan.(1) Perpetual maturity - maturity date reflects the next call date.
Copyright © 2021 www.secdatabase.com. All Rights Reserved.Please Consider the Environment Before Printing This Document
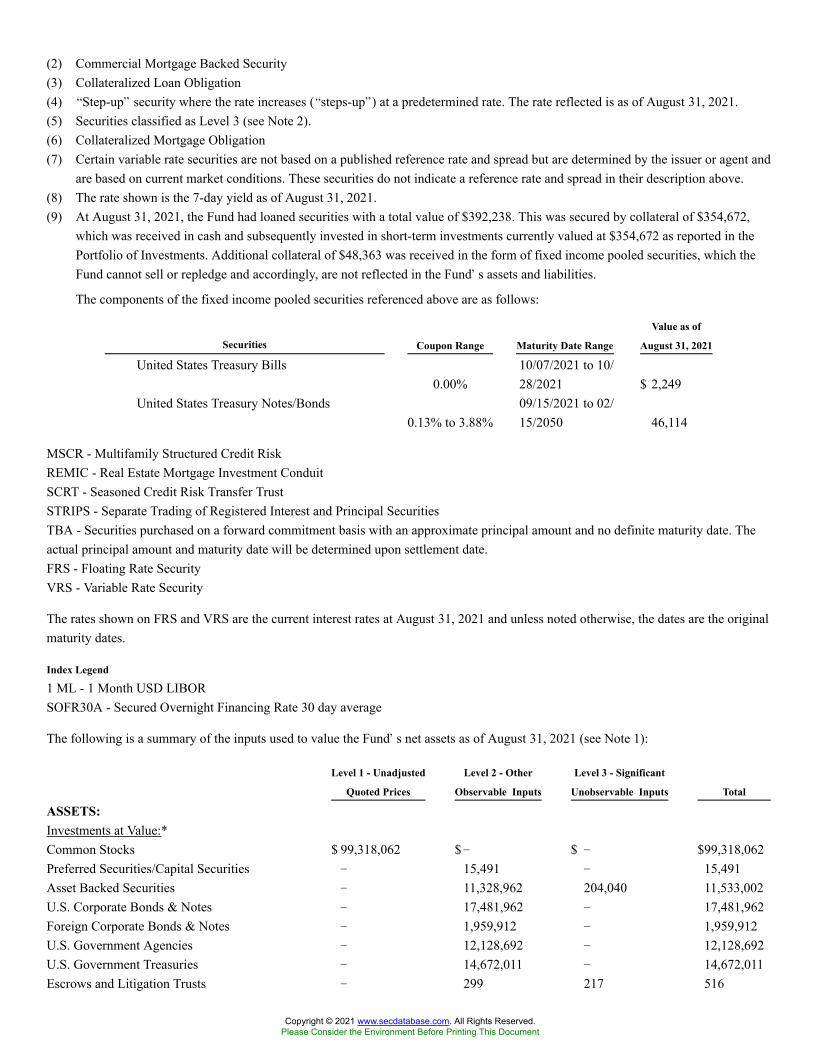
(2) Commercial Mortgage Backed Security(3) Collateralized Loan Obligation(4) �Step-up� security where the rate increases (�steps-up�) at a predetermined rate. The rate reflected is as of August 31, 2021.(5) Securities classified as Level 3 (see Note 2).(6) Collateralized Mortgage Obligation(7) Certain variable rate securities are not based on a published reference rate and spread but are determined by the issuer or agent and
are based on current market conditions. These securities do not indicate a reference rate and spread in their description above.(8) The rate shown is the 7-day yield as of August 31, 2021.(9) At August 31, 2021, the Fund had loaned securities with a total value of $392,238. This was secured by collateral of $354,672,
which was received in cash and subsequently invested in short-term investments currently valued at $354,672 as reported in thePortfolio of Investments. Additional collateral of $48,363 was received in the form of fixed income pooled securities, which theFund cannot sell or repledge and accordingly, are not reflected in the Fund�s assets and liabilities.
The components of the fixed income pooled securities referenced above are as follows:
Securities Coupon Range Maturity Date Range
Value as of
August 31, 2021
United States Treasury Bills0.00%
10/07/2021 to 10/28/2021 $ 2,249
United States Treasury Notes/Bonds0.13% to 3.88%
09/15/2021 to 02/15/2050 46,114
MSCR - Multifamily Structured Credit RiskREMIC - Real Estate Mortgage Investment ConduitSCRT - Seasoned Credit Risk Transfer TrustSTRIPS - Separate Trading of Registered Interest and Principal SecuritiesTBA - Securities purchased on a forward commitment basis with an approximate principal amount and no definite maturity date. Theactual principal amount and maturity date will be determined upon settlement date.FRS - Floating Rate SecurityVRS - Variable Rate Security
The rates shown on FRS and VRS are the current interest rates at August 31, 2021 and unless noted otherwise, the dates are the originalmaturity dates.
Index Legend
1 ML - 1 Month USD LIBORSOFR30A - Secured Overnight Financing Rate 30 day average
The following is a summary of the inputs used to value the Fund�s net assets as of August 31, 2021 (see Note 1):
Level 1 - Unadjusted
Quoted Prices
Level 2 - Other
Observable Inputs
Level 3 - Significant
Unobservable Inputs Total
ASSETS:Investments at Value:*Common Stocks $ 99,318,062 $ � $ � $99,318,062Preferred Securities/Capital Securities � 15,491 � 15,491Asset Backed Securities � 11,328,962 204,040 11,533,002U.S. Corporate Bonds & Notes � 17,481,962 � 17,481,962Foreign Corporate Bonds & Notes � 1,959,912 � 1,959,912U.S. Government Agencies � 12,128,692 � 12,128,692U.S. Government Treasuries � 14,672,011 � 14,672,011Escrows and Litigation Trusts � 299 217 516
Copyright © 2021 www.secdatabase.com. All Rights Reserved.Please Consider the Environment Before Printing This Document
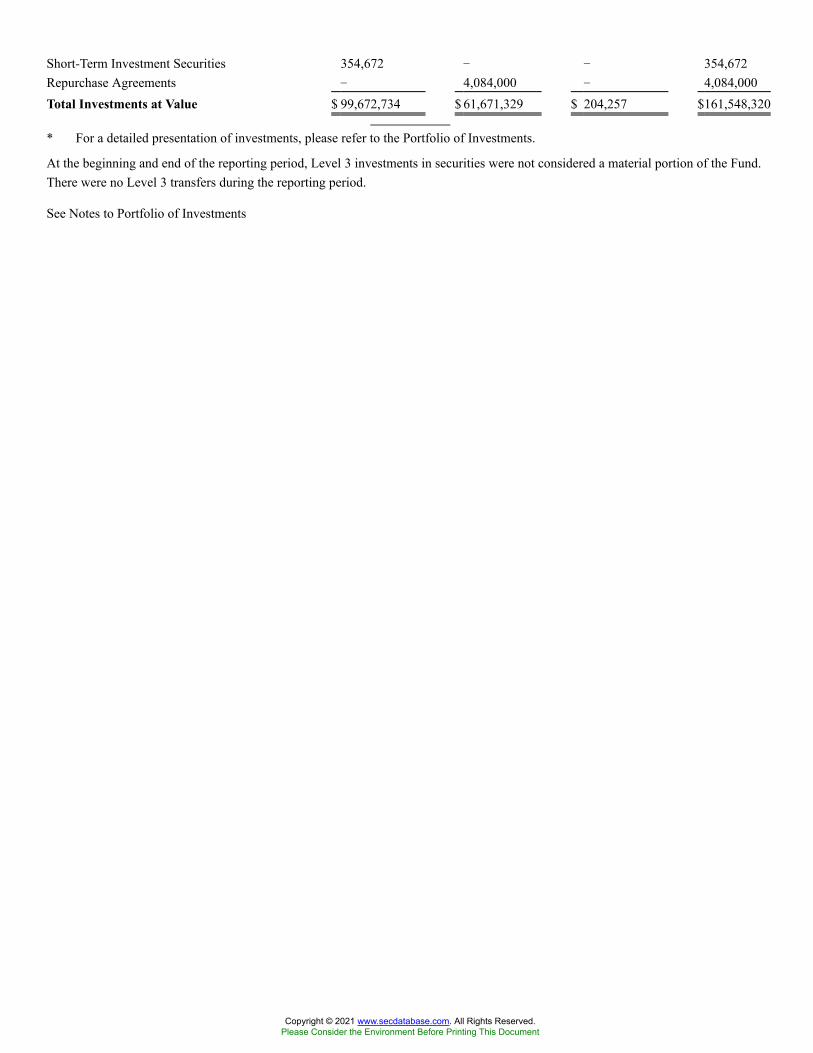
Short-Term Investment Securities 354,672 � � 354,672Repurchase Agreements � 4,084,000 � 4,084,000Total Investments at Value $ 99,672,734 $ 61,671,329 $ 204,257 $161,548,320
* For a detailed presentation of investments, please refer to the Portfolio of Investments.
At the beginning and end of the reporting period, Level 3 investments in securities were not considered a material portion of the Fund.There were no Level 3 transfers during the reporting period.
See Notes to Portfolio of Investments
Copyright © 2021 www.secdatabase.com. All Rights Reserved.Please Consider the Environment Before Printing This Document

VALIC Company I Blue Chip Growth FundPORTFOLIO OF INVESTMENTS - August 31, 2021 - (unaudited)
Security Description Shares
Value
(Note 1)
COMMON STOCKS - 98.8%Applications Software - 11.2%
Intuit, Inc. 40,898 $23,152,767Microsoft Corp. 225,805 68,166,013Roper Technologies, Inc. 9,970 4,818,302ServiceNow, Inc.� 41,032 26,409,836
122,546,918Athletic Footwear - 0.8%
NIKE, Inc., Class B 56,103 9,242,408Cellular Telecom - 0.2%
T-Mobile US, Inc.� 18,584 2,546,380Coatings/Paint - 0.1%
Sherwin-Williams Co. 1,857 563,915Commercial Services - 0.6%
Cintas Corp. 3,618 1,431,896CoStar Group, Inc.� 58,400 4,948,816
6,380,712Commercial Services-Finance - 5.6%
Affirm Holdings, Inc.� 46,538 4,483,471Equifax, Inc. 5,000 1,361,300Global Payments, Inc. 64,221 10,444,903PayPal Holdings, Inc.� 89,519 25,840,555S&P Global, Inc. 16,870 7,487,243Square, Inc., Class A� 37,710 10,108,920TransUnion 15,210 1,848,471
61,574,863Communications Software - 0.8%
Zoom Video Communications, Inc., Class A� 30,049 8,699,186Computer Aided Design - 1.0%
Synopsys, Inc.� 32,292 10,728,694Computer Data Security - 0.8%
Crowdstrike Holdings, Inc., Class A� 7,122 2,001,282Fortinet, Inc.� 21,696 6,837,277
8,838,559Computer Software - 1.1%
Datadog, Inc., Class A� 16,253 2,239,663MongoDB, Inc.� 14,062 5,509,913Snowflake, Inc., Class A� 6,053 1,842,231
Copyright © 2021 www.secdatabase.com. All Rights Reserved.Please Consider the Environment Before Printing This Document
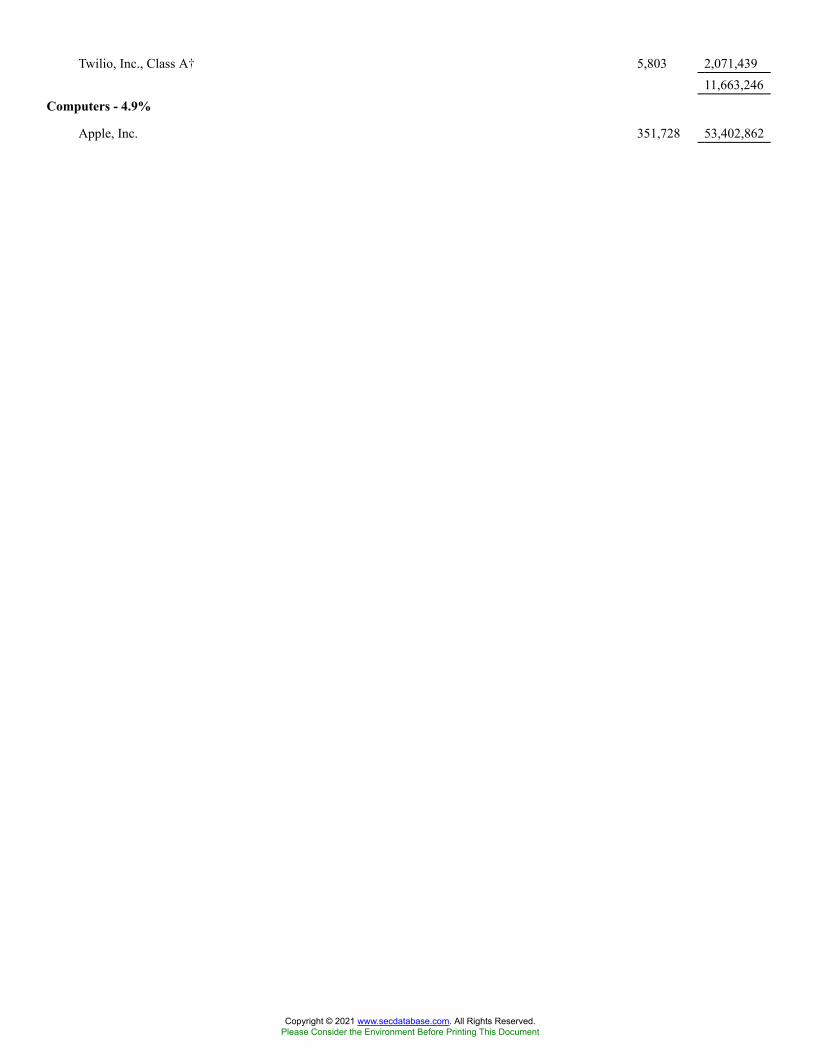
Twilio, Inc., Class A� 5,803 2,071,43911,663,246
Computers - 4.9%
Apple, Inc. 351,728 53,402,862
Copyright © 2021 www.secdatabase.com. All Rights Reserved.Please Consider the Environment Before Printing This Document
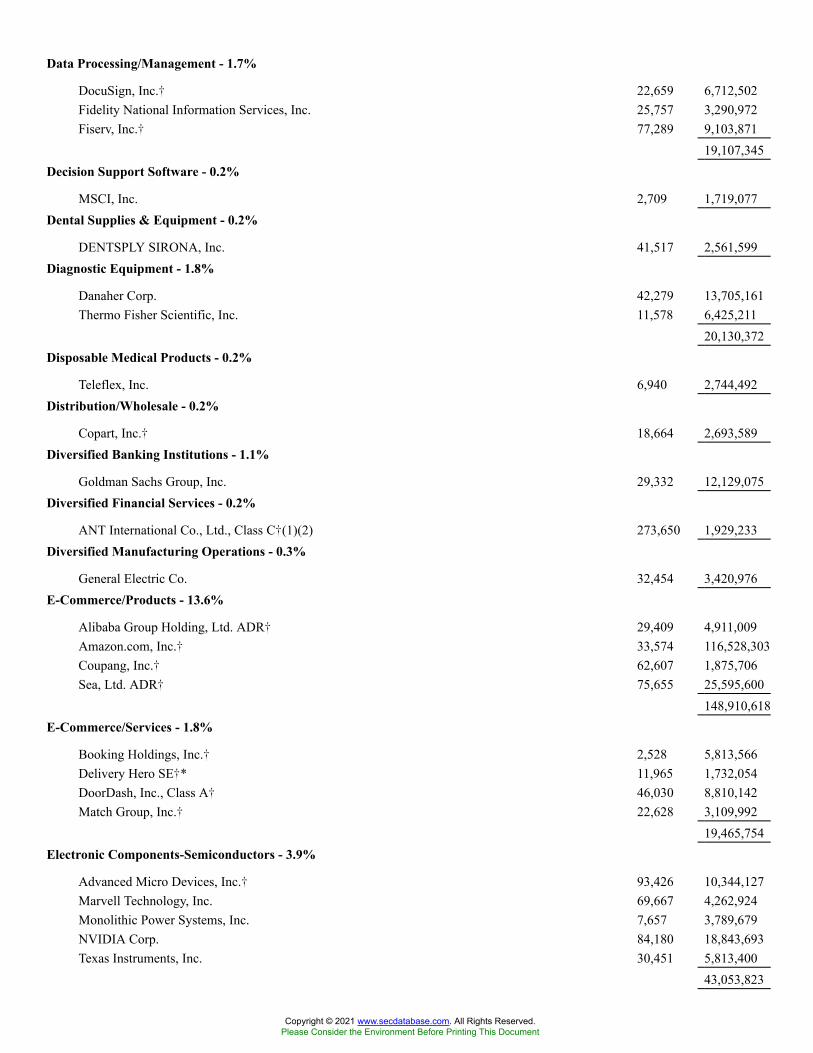
Data Processing/Management - 1.7%
DocuSign, Inc.� 22,659 6,712,502Fidelity National Information Services, Inc. 25,757 3,290,972Fiserv, Inc.� 77,289 9,103,871
19,107,345Decision Support Software - 0.2%
MSCI, Inc. 2,709 1,719,077Dental Supplies & Equipment - 0.2%
DENTSPLY SIRONA, Inc. 41,517 2,561,599Diagnostic Equipment - 1.8%
Danaher Corp. 42,279 13,705,161Thermo Fisher Scientific, Inc. 11,578 6,425,211
20,130,372Disposable Medical Products - 0.2%
Teleflex, Inc. 6,940 2,744,492Distribution/Wholesale - 0.2%
Copart, Inc.� 18,664 2,693,589Diversified Banking Institutions - 1.1%
Goldman Sachs Group, Inc. 29,332 12,129,075Diversified Financial Services - 0.2%
ANT International Co., Ltd., Class C�(1)(2) 273,650 1,929,233Diversified Manufacturing Operations - 0.3%
General Electric Co. 32,454 3,420,976E-Commerce/Products - 13.6%
Alibaba Group Holding, Ltd. ADR� 29,409 4,911,009Amazon.com, Inc.� 33,574 116,528,303Coupang, Inc.� 62,607 1,875,706Sea, Ltd. ADR� 75,655 25,595,600
148,910,618E-Commerce/Services - 1.8%
Booking Holdings, Inc.� 2,528 5,813,566Delivery Hero SE�* 11,965 1,732,054DoorDash, Inc., Class A� 46,030 8,810,142Match Group, Inc.� 22,628 3,109,992
19,465,754Electronic Components-Semiconductors - 3.9%
Advanced Micro Devices, Inc.� 93,426 10,344,127Marvell Technology, Inc. 69,667 4,262,924Monolithic Power Systems, Inc. 7,657 3,789,679NVIDIA Corp. 84,180 18,843,693Texas Instruments, Inc. 30,451 5,813,400
43,053,823
Copyright © 2021 www.secdatabase.com. All Rights Reserved.Please Consider the Environment Before Printing This Document
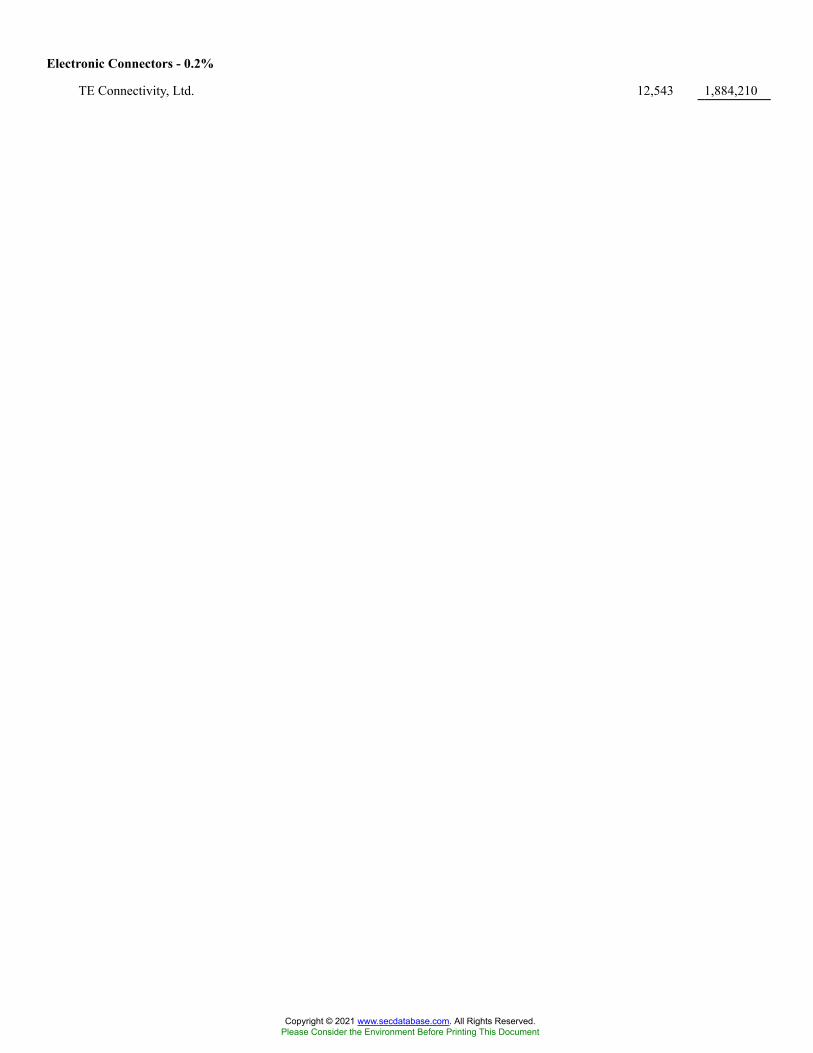
Electronic Connectors - 0.2%
TE Connectivity, Ltd. 12,543 1,884,210
Copyright © 2021 www.secdatabase.com. All Rights Reserved.Please Consider the Environment Before Printing This Document

Enterprise Software/Service - 1.9%
Atlassian Corp. PLC, Class A� 13,598 4,991,282Bill.com Holdings, Inc.� 15,175 4,163,868Coupa Software, Inc.� 10,626 2,601,351Paycom Software, Inc.� 2,543 1,243,273salesforce.com, Inc.� 12,866 3,412,964Veeva Systems, Inc., Class A� 12,099 4,016,626
20,429,364Finance-Credit Card - 4.9%
Mastercard, Inc., Class A 60,661 21,002,658Visa, Inc., Class A 145,072 33,235,995
54,238,653Finance-Investment Banker/Broker - 0.4%
Charles Schwab Corp. 63,091 4,596,179Industrial Gases - 0.3%
Linde PLC 9,028 2,840,119Insurance Brokers - 0.2%
Marsh & McLennan Cos., Inc. 13,016 2,046,115Insurance-Multi-line - 0.3%
Chubb, Ltd. 17,783 3,270,649
Copyright © 2021 www.secdatabase.com. All Rights Reserved.Please Consider the Environment Before Printing This Document

Internet Application Software - 0.8%
Shopify, Inc., Class A� 5,468 8,337,497Internet Content-Entertainment - 12.9%
Facebook, Inc., Class A� 223,604 84,830,885Netflix, Inc.� 34,926 19,879,530Pinterest, Inc., Class A� 148,095 8,229,639Roku, Inc.� 4,642 1,635,841Snap, Inc., Class A� 303,305 23,084,544Spotify Technology SA� 16,647 3,901,058
141,561,497Internet Content-Information/News - 1.0%
Tencent Holdings, Ltd. 175,400 10,852,205Vimeo, Inc.� 15,265 581,902
11,434,107Medical Instruments - 1.7%
Intuitive Surgical, Inc.� 17,963 18,925,098Medical Products - 1.0%
Align Technology, Inc.� 2,916 2,067,444Stryker Corp. 32,871 9,108,554
11,175,998Medical-Biomedical/Gene - 0.0%
Exact Sciences Corp.� 715 74,632Medical-Drugs - 1.9%
AstraZeneca PLC ADR 40,800 2,377,824Eli Lilly & Co. 46,694 12,060,593Zoetis, Inc. 30,675 6,274,878
20,713,295Medical-HMO - 2.0%
Humana, Inc. 8,384 3,399,041UnitedHealth Group, Inc. 44,448 18,502,369
21,901,410Medical-Hospitals - 0.9%
HCA Healthcare, Inc. 36,894 9,333,444Multimedia - 0.5%
Walt Disney Co.� 30,514 5,532,188Retail-Apparel/Shoe - 1.6%
Lululemon Athletica, Inc.� 22,215 8,889,776Ross Stores, Inc. 73,074 8,651,962
17,541,738Retail-Automobile - 1.3%
Carvana Co.� 44,888 14,725,957Retail-Discount - 0.7%
Copyright © 2021 www.secdatabase.com. All Rights Reserved.Please Consider the Environment Before Printing This Document

Dollar General Corp. 34,070 7,594,544Retail-Major Department Stores - 0.2%
TJX Cos., Inc. 27,006 1,963,876
Copyright © 2021 www.secdatabase.com. All Rights Reserved.Please Consider the Environment Before Printing This Document
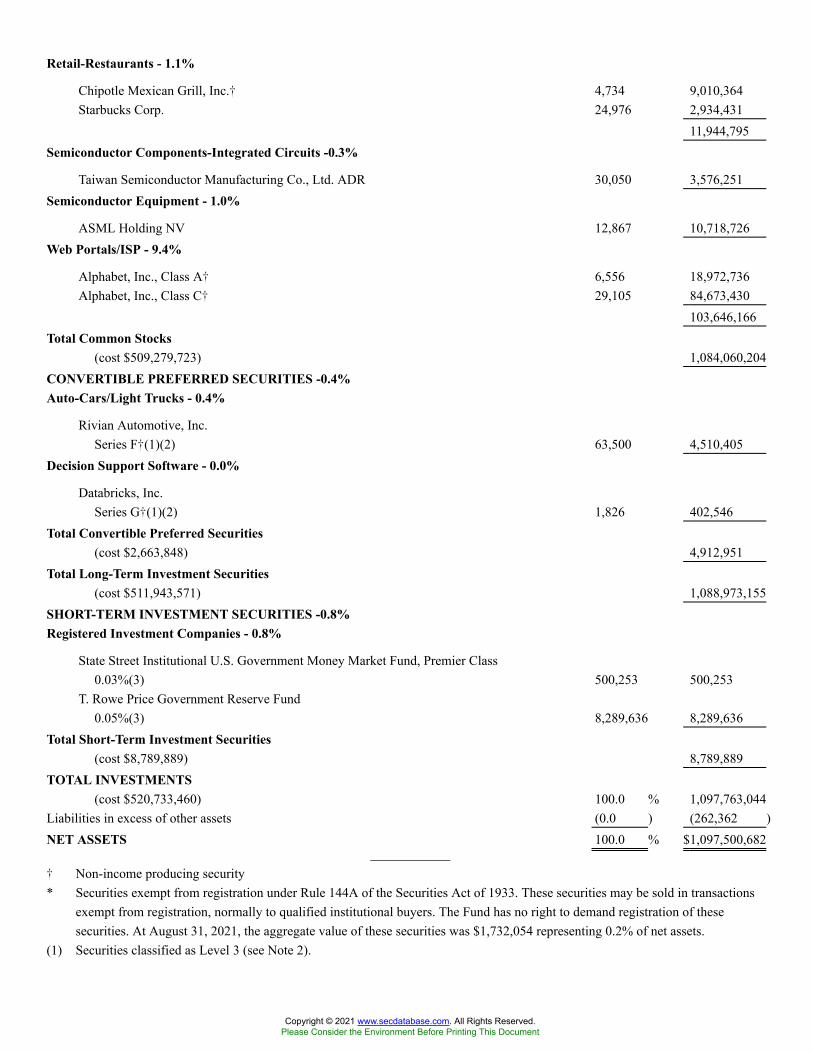
Retail-Restaurants - 1.1%
Chipotle Mexican Grill, Inc.� 4,734 9,010,364Starbucks Corp. 24,976 2,934,431
11,944,795Semiconductor Components-Integrated Circuits -0.3%
Taiwan Semiconductor Manufacturing Co., Ltd. ADR 30,050 3,576,251Semiconductor Equipment - 1.0%
ASML Holding NV 12,867 10,718,726Web Portals/ISP - 9.4%
Alphabet, Inc., Class A� 6,556 18,972,736Alphabet, Inc., Class C� 29,105 84,673,430
103,646,166Total Common Stocks
(cost $509,279,723) 1,084,060,204CONVERTIBLE PREFERRED SECURITIES -0.4%Auto-Cars/Light Trucks - 0.4%
Rivian Automotive, Inc.Series F�(1)(2) 63,500 4,510,405
Decision Support Software - 0.0%
Databricks, Inc.Series G�(1)(2) 1,826 402,546
Total Convertible Preferred Securities(cost $2,663,848) 4,912,951
Total Long-Term Investment Securities(cost $511,943,571) 1,088,973,155
SHORT-TERM INVESTMENT SECURITIES -0.8%Registered Investment Companies - 0.8%
State Street Institutional U.S. Government Money Market Fund, Premier Class0.03%(3) 500,253 500,253
T. Rowe Price Government Reserve Fund0.05%(3) 8,289,636 8,289,636
Total Short-Term Investment Securities(cost $8,789,889) 8,789,889
TOTAL INVESTMENTS(cost $520,733,460) 100.0 % 1,097,763,044
Liabilities in excess of other assets (0.0 ) (262,362 )NET ASSETS 100.0 % $1,097,500,682
� Non-income producing security* Securities exempt from registration under Rule 144A of the Securities Act of 1933. These securities may be sold in transactions
exempt from registration, normally to qualified institutional buyers. The Fund has no right to demand registration of thesesecurities. At August 31, 2021, the aggregate value of these securities was $1,732,054 representing 0.2% of net assets.
(1) Securities classified as Level 3 (see Note 2).
Copyright © 2021 www.secdatabase.com. All Rights Reserved.Please Consider the Environment Before Printing This Document

(2) Denotes a restricted security that: (a) cannot be offered for public sale without first being registered, or being able to takeadvantage of an exemption from registration, under the Securities Act of 1933, as amended (the �1933 Act�); (b) is subject to acontractual restriction on public sales; or (c) is otherwise subject to a restriction on sales by operation of applicable law. Restrictedsecurities are valued pursuant to Note 1. Certain restricted securities held by the Fund may not be sold except in exempttransactions or in a public offering registered under the 1933 Act. The Fund has no right to demand registration of these securities.The risk of investing in certain restricted securities is greater than the risk of investing in the securities of widely held, publiclytraded companies. To the extent applicable, lack of a secondary market and resale restrictions may result in the inability of a Fundto sell a security at a fair price and may substantially delay the sale of the security. In addition, certain restricted securities mayexhibit greater price volatility than securities for which secondary markets exist. As of August 31, 2021, the Fund held thefollowing restricted securities:
Description
Acquisition
Date Shares
Acquisition
Cost Value
Value
Per Share
% of
Net Assets
Common StocksANT International Co., Ltd., Class C 06/07/
2018 273,650 $1,535,177 $1,929,233 $7.05 0.18 %
Convertible Preferred SecuritiesDatabricks, Inc.
Series G 02/01/2021 1,826 323,874 402,546 220.45 0.04 %
Rivian Automotive, Inc.Series F 01/19/
2021 63,500 2,339,975 4,510,405 71.03 0.40 %$6,842,184 0.62 %
(3) The rate shown is the 7-day yield as of August 31, 2021.ADR - American Depositary Receipt
The following is a summary of the inputs used to value the Fund�s net assets as of August 31, 2021 (see Note 1):
Level 1 - Unadjusted
Quoted Prices
Level 2 - Other
Observable Inputs
Level 3 - Significant
Unobservable Inputs Total
ASSETS:Investments at Value:*Common Stocks:
Diversified Financial Services $� $ � $ 1,929,233 $1,929,233Other Industries 1,082,130,971 � � 1,082,130,971
Convertible Preferred Securities � � 4,912,951 4,912,951Short-Term Investment Securities 8,789,889 � � 8,789,889Total Investments at Value $1,090,920,860 $ � $ 6,842,184 $1,097,763,044
* For a detailed presentation of investments, please refer to the Portfolio of Investments.
At the beginning and end of the reporting period, Level 3 investments in securities were not considered a material portion of the Fund.There were no Level 3 transfers during the reporting period.
See Notes to Portfolio of Investments
Copyright © 2021 www.secdatabase.com. All Rights Reserved.Please Consider the Environment Before Printing This Document
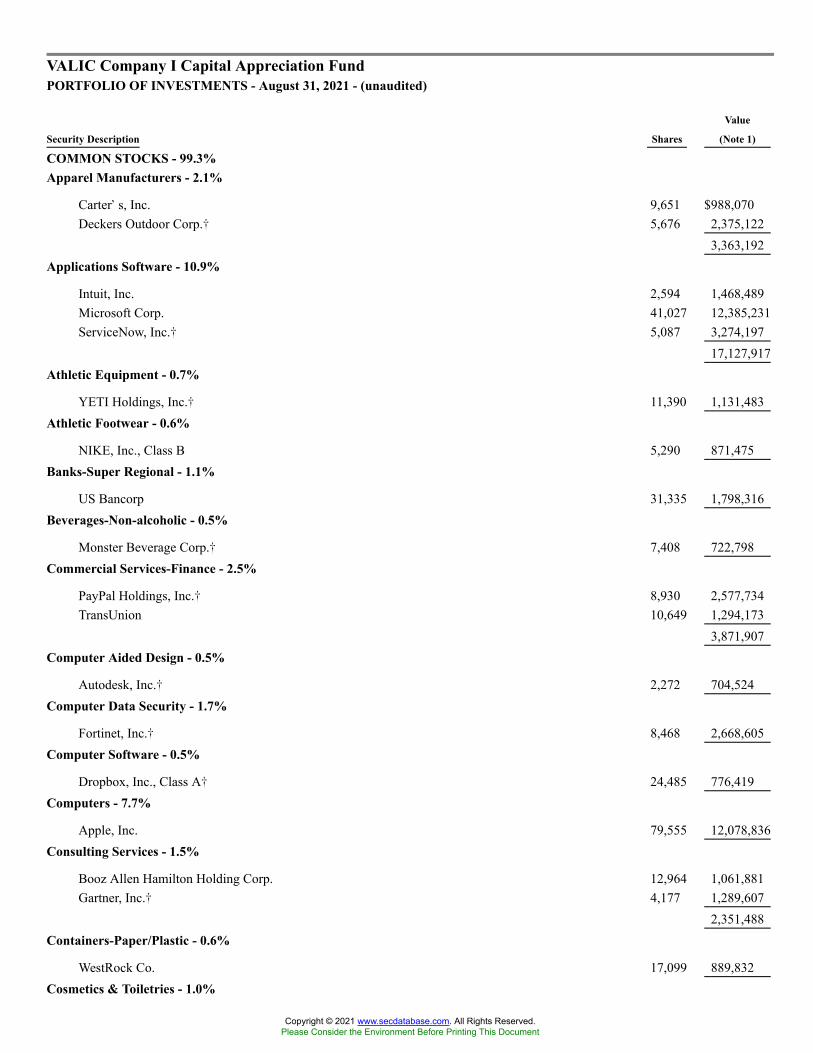
VALIC Company I Capital Appreciation FundPORTFOLIO OF INVESTMENTS - August 31, 2021 - (unaudited)
Security Description Shares
Value
(Note 1)
COMMON STOCKS - 99.3%Apparel Manufacturers - 2.1%
Carter�s, Inc. 9,651 $988,070Deckers Outdoor Corp.� 5,676 2,375,122
3,363,192Applications Software - 10.9%
Intuit, Inc. 2,594 1,468,489Microsoft Corp. 41,027 12,385,231ServiceNow, Inc.� 5,087 3,274,197
17,127,917Athletic Equipment - 0.7%
YETI Holdings, Inc.� 11,390 1,131,483Athletic Footwear - 0.6%
NIKE, Inc., Class B 5,290 871,475Banks-Super Regional - 1.1%
US Bancorp 31,335 1,798,316Beverages-Non-alcoholic - 0.5%
Monster Beverage Corp.� 7,408 722,798Commercial Services-Finance - 2.5%
PayPal Holdings, Inc.� 8,930 2,577,734TransUnion 10,649 1,294,173
3,871,907Computer Aided Design - 0.5%
Autodesk, Inc.� 2,272 704,524Computer Data Security - 1.7%
Fortinet, Inc.� 8,468 2,668,605Computer Software - 0.5%
Dropbox, Inc., Class A� 24,485 776,419Computers - 7.7%
Apple, Inc. 79,555 12,078,836Consulting Services - 1.5%
Booz Allen Hamilton Holding Corp. 12,964 1,061,881Gartner, Inc.� 4,177 1,289,607
2,351,488Containers-Paper/Plastic - 0.6%
WestRock Co. 17,099 889,832Cosmetics & Toiletries - 1.0%
Copyright © 2021 www.secdatabase.com. All Rights Reserved.Please Consider the Environment Before Printing This Document
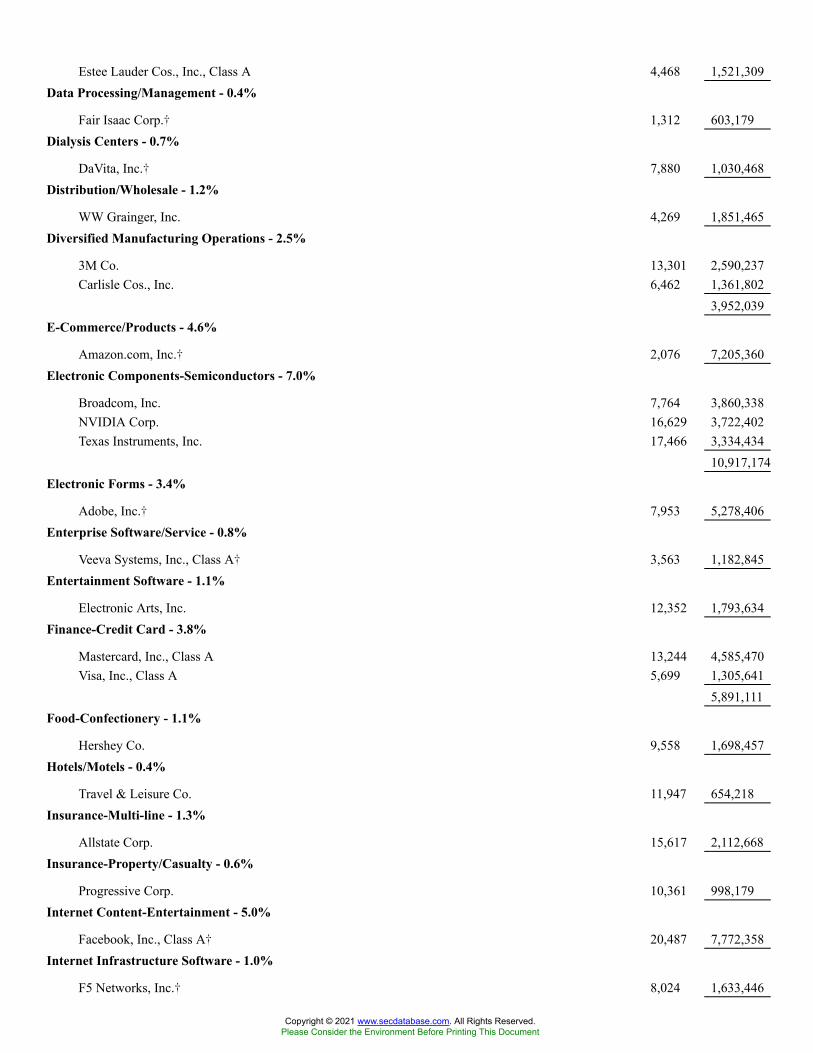
Estee Lauder Cos., Inc., Class A 4,468 1,521,309Data Processing/Management - 0.4%
Fair Isaac Corp.� 1,312 603,179Dialysis Centers - 0.7%
DaVita, Inc.� 7,880 1,030,468Distribution/Wholesale - 1.2%
WW Grainger, Inc. 4,269 1,851,465Diversified Manufacturing Operations - 2.5%
3M Co. 13,301 2,590,237Carlisle Cos., Inc. 6,462 1,361,802
3,952,039E-Commerce/Products - 4.6%
Amazon.com, Inc.� 2,076 7,205,360Electronic Components-Semiconductors - 7.0%
Broadcom, Inc. 7,764 3,860,338NVIDIA Corp. 16,629 3,722,402Texas Instruments, Inc. 17,466 3,334,434
10,917,174Electronic Forms - 3.4%
Adobe, Inc.� 7,953 5,278,406Enterprise Software/Service - 0.8%
Veeva Systems, Inc., Class A� 3,563 1,182,845Entertainment Software - 1.1%
Electronic Arts, Inc. 12,352 1,793,634Finance-Credit Card - 3.8%
Mastercard, Inc., Class A 13,244 4,585,470Visa, Inc., Class A 5,699 1,305,641
5,891,111Food-Confectionery - 1.1%
Hershey Co. 9,558 1,698,457Hotels/Motels - 0.4%
Travel & Leisure Co. 11,947 654,218Insurance-Multi-line - 1.3%
Allstate Corp. 15,617 2,112,668Insurance-Property/Casualty - 0.6%
Progressive Corp. 10,361 998,179Internet Content-Entertainment - 5.0%
Facebook, Inc., Class A� 20,487 7,772,358Internet Infrastructure Software - 1.0%
F5 Networks, Inc.� 8,024 1,633,446
Copyright © 2021 www.secdatabase.com. All Rights Reserved.Please Consider the Environment Before Printing This Document
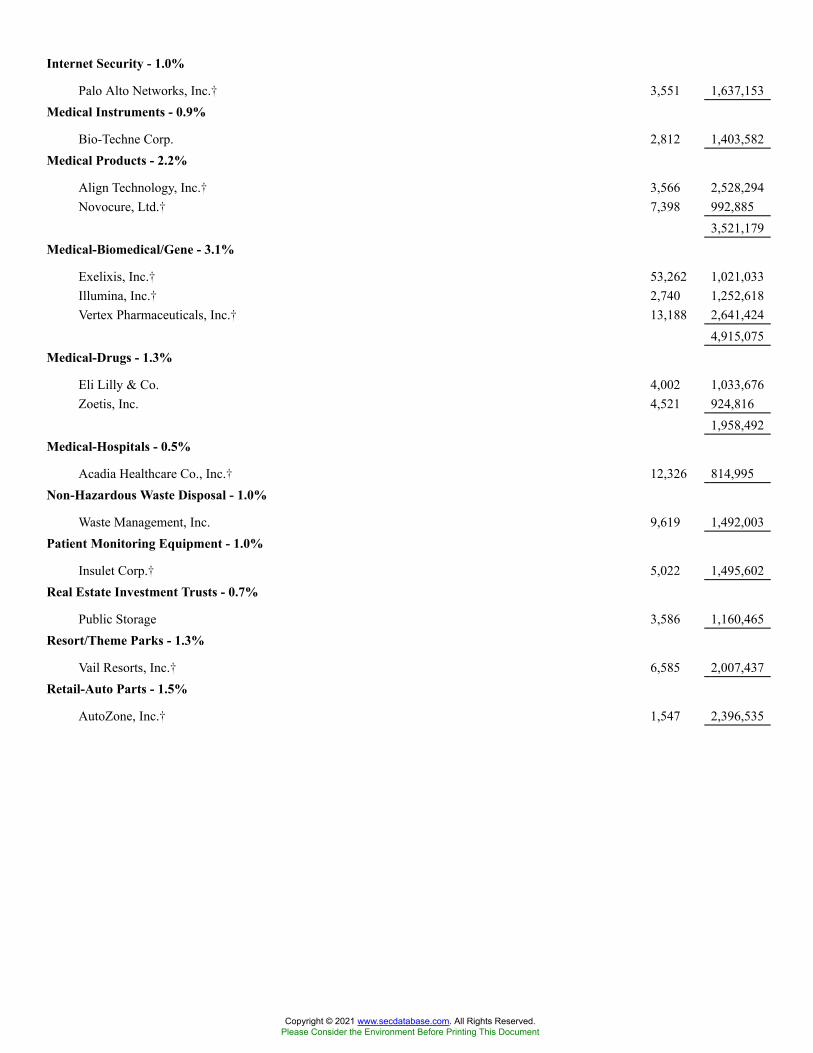
Internet Security - 1.0%
Palo Alto Networks, Inc.� 3,551 1,637,153Medical Instruments - 0.9%
Bio-Techne Corp. 2,812 1,403,582Medical Products - 2.2%
Align Technology, Inc.� 3,566 2,528,294Novocure, Ltd.� 7,398 992,885
3,521,179Medical-Biomedical/Gene - 3.1%
Exelixis, Inc.� 53,262 1,021,033Illumina, Inc.� 2,740 1,252,618Vertex Pharmaceuticals, Inc.� 13,188 2,641,424
4,915,075Medical-Drugs - 1.3%
Eli Lilly & Co. 4,002 1,033,676Zoetis, Inc. 4,521 924,816
1,958,492Medical-Hospitals - 0.5%
Acadia Healthcare Co., Inc.� 12,326 814,995Non-Hazardous Waste Disposal - 1.0%
Waste Management, Inc. 9,619 1,492,003Patient Monitoring Equipment - 1.0%
Insulet Corp.� 5,022 1,495,602Real Estate Investment Trusts - 0.7%
Public Storage 3,586 1,160,465Resort/Theme Parks - 1.3%
Vail Resorts, Inc.� 6,585 2,007,437Retail-Auto Parts - 1.5%
AutoZone, Inc.� 1,547 2,396,535
Copyright © 2021 www.secdatabase.com. All Rights Reserved.Please Consider the Environment Before Printing This Document
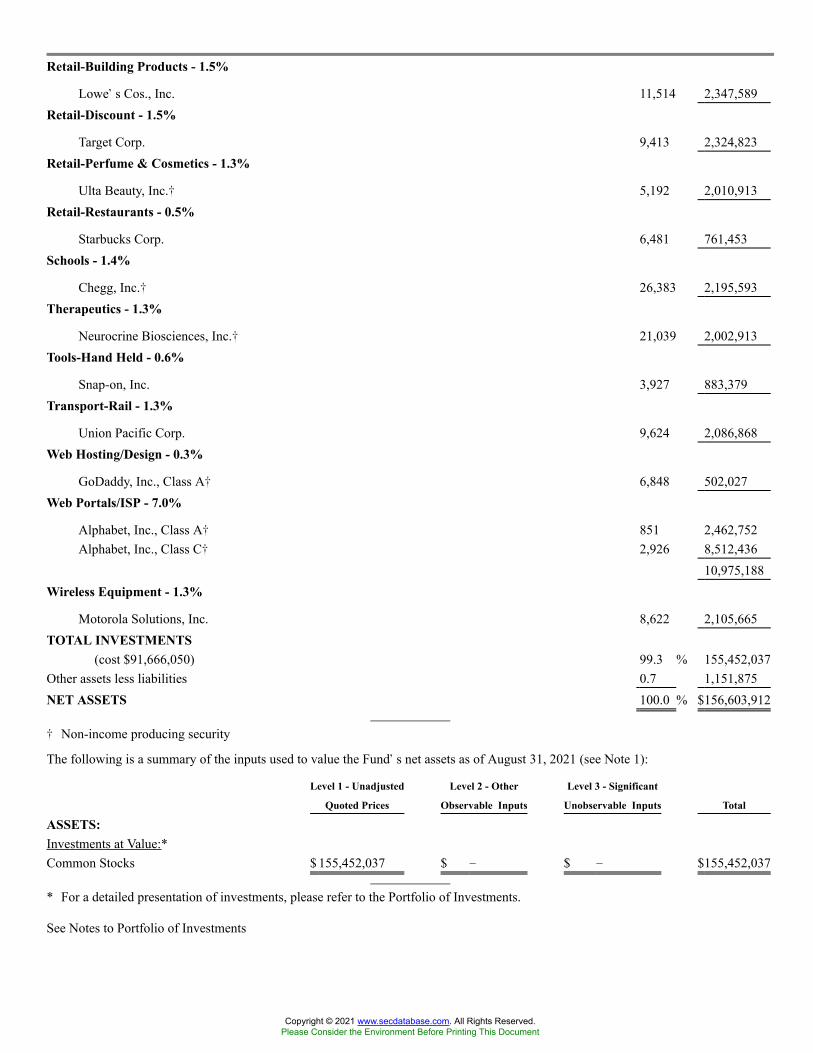
Retail-Building Products - 1.5%
Lowe�s Cos., Inc. 11,514 2,347,589Retail-Discount - 1.5%
Target Corp. 9,413 2,324,823Retail-Perfume & Cosmetics - 1.3%
Ulta Beauty, Inc.� 5,192 2,010,913Retail-Restaurants - 0.5%
Starbucks Corp. 6,481 761,453Schools - 1.4%
Chegg, Inc.� 26,383 2,195,593Therapeutics - 1.3%
Neurocrine Biosciences, Inc.� 21,039 2,002,913Tools-Hand Held - 0.6%
Snap-on, Inc. 3,927 883,379Transport-Rail - 1.3%
Union Pacific Corp. 9,624 2,086,868Web Hosting/Design - 0.3%
GoDaddy, Inc., Class A� 6,848 502,027Web Portals/ISP - 7.0%
Alphabet, Inc., Class A� 851 2,462,752Alphabet, Inc., Class C� 2,926 8,512,436
10,975,188Wireless Equipment - 1.3%
Motorola Solutions, Inc. 8,622 2,105,665TOTAL INVESTMENTS
(cost $91,666,050) 99.3 % 155,452,037Other assets less liabilities 0.7 1,151,875NET ASSETS 100.0 % $156,603,912
� Non-income producing security
The following is a summary of the inputs used to value the Fund�s net assets as of August 31, 2021 (see Note 1):
Level 1 - Unadjusted
Quoted Prices
Level 2 - Other
Observable Inputs
Level 3 - Significant
Unobservable Inputs Total
ASSETS:Investments at Value:*Common Stocks $ 155,452,037 $ � $ � $155,452,037
* For a detailed presentation of investments, please refer to the Portfolio of Investments.
See Notes to Portfolio of Investments
Copyright © 2021 www.secdatabase.com. All Rights Reserved.Please Consider the Environment Before Printing This Document
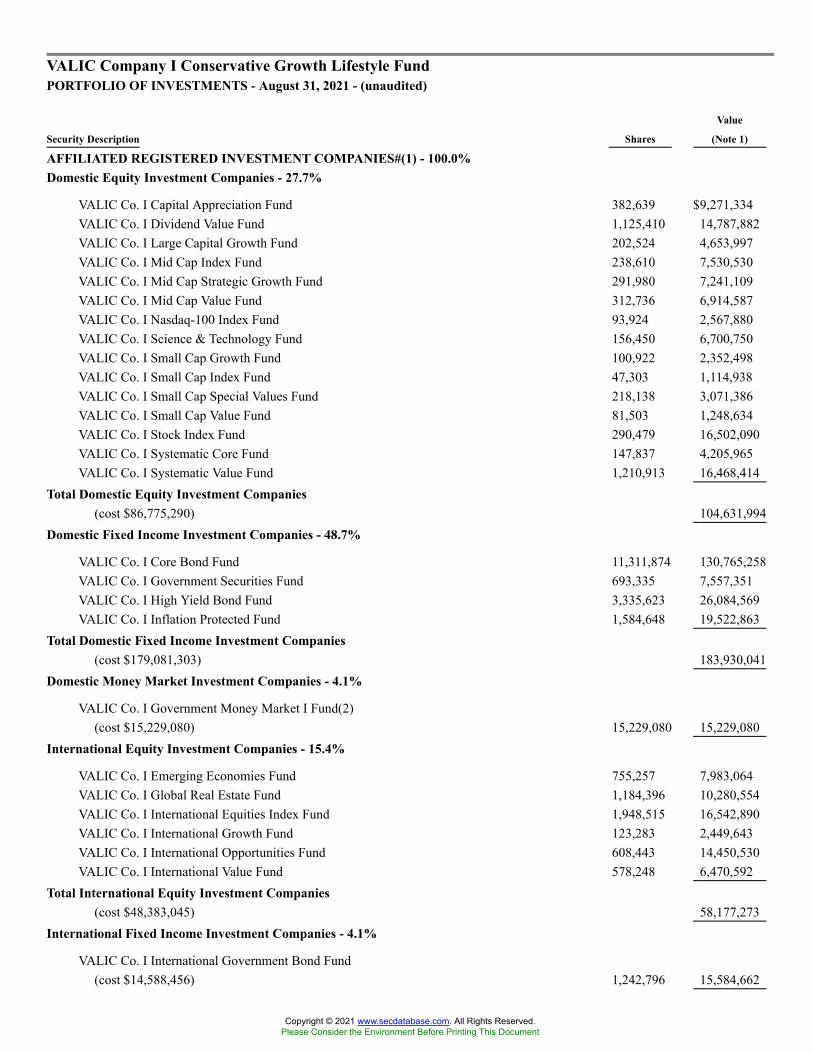
VALIC Company I Conservative Growth Lifestyle FundPORTFOLIO OF INVESTMENTS - August 31, 2021 - (unaudited)
Security Description Shares
Value
(Note 1)
AFFILIATED REGISTERED INVESTMENT COMPANIES#(1) - 100.0%Domestic Equity Investment Companies - 27.7%
VALIC Co. I Capital Appreciation Fund 382,639 $9,271,334VALIC Co. I Dividend Value Fund 1,125,410 14,787,882VALIC Co. I Large Capital Growth Fund 202,524 4,653,997VALIC Co. I Mid Cap Index Fund 238,610 7,530,530VALIC Co. I Mid Cap Strategic Growth Fund 291,980 7,241,109VALIC Co. I Mid Cap Value Fund 312,736 6,914,587VALIC Co. I Nasdaq-100 Index Fund 93,924 2,567,880VALIC Co. I Science & Technology Fund 156,450 6,700,750VALIC Co. I Small Cap Growth Fund 100,922 2,352,498VALIC Co. I Small Cap Index Fund 47,303 1,114,938VALIC Co. I Small Cap Special Values Fund 218,138 3,071,386VALIC Co. I Small Cap Value Fund 81,503 1,248,634VALIC Co. I Stock Index Fund 290,479 16,502,090VALIC Co. I Systematic Core Fund 147,837 4,205,965VALIC Co. I Systematic Value Fund 1,210,913 16,468,414
Total Domestic Equity Investment Companies(cost $86,775,290) 104,631,994
Domestic Fixed Income Investment Companies - 48.7%
VALIC Co. I Core Bond Fund 11,311,874 130,765,258VALIC Co. I Government Securities Fund 693,335 7,557,351VALIC Co. I High Yield Bond Fund 3,335,623 26,084,569VALIC Co. I Inflation Protected Fund 1,584,648 19,522,863
Total Domestic Fixed Income Investment Companies(cost $179,081,303) 183,930,041
Domestic Money Market Investment Companies - 4.1%
VALIC Co. I Government Money Market I Fund(2)(cost $15,229,080) 15,229,080 15,229,080
International Equity Investment Companies - 15.4%
VALIC Co. I Emerging Economies Fund 755,257 7,983,064VALIC Co. I Global Real Estate Fund 1,184,396 10,280,554VALIC Co. I International Equities Index Fund 1,948,515 16,542,890VALIC Co. I International Growth Fund 123,283 2,449,643VALIC Co. I International Opportunities Fund 608,443 14,450,530VALIC Co. I International Value Fund 578,248 6,470,592
Total International Equity Investment Companies(cost $48,383,045) 58,177,273
International Fixed Income Investment Companies - 4.1%
VALIC Co. I International Government Bond Fund(cost $14,588,456) 1,242,796 15,584,662
Copyright © 2021 www.secdatabase.com. All Rights Reserved.Please Consider the Environment Before Printing This Document

TOTAL INVESTMENTS(cost $344,057,174) 100.0 % 377,553,050
Liabilities in excess of other assets (0.0 ) (85,962 )NET ASSETS 100.0 % $377,467,088
# The Conservative Growth Lifestyle Fund invests in various VALIC Company I Funds. Additional Information on the underlyingfunds including such funds� prospectuses and shareholder reports is available at our website, www.valic.com.
(1) See Note 3.(2) The 7-day yield as of August 31, 2021 is 0.01%.
The following is a summary of the inputs used to value the Fund�s net assets as of August 31, 2021 (see Note 1):
Level 1 - Unadjusted
Quoted Prices
Level 2 - Other
Observable Inputs
Level 3 - Significant
Unobservable Inputs Total
ASSETS:Investments at Value:*Affiliated Registered Investment
Companies $ 377,553,050 $ � $ � $377,553,050
* For a detailed presentation of investments, please refer to the Portfolio of Investments.
See Notes to Portfolio of Investments
Copyright © 2021 www.secdatabase.com. All Rights Reserved.Please Consider the Environment Before Printing This Document

VALIC Company I Core Bond FundPORTFOLIO OF INVESTMENTS - August 31, 2021 - (unaudited)
Security Description
Principal
Amount/
Shares
Value
(Note 1)
ASSET BACKED SECURITIES - 2.1%Diversified Financial Services - 2.1%
American Express Credit Account Master TrustSeries 2019-2, Class A2.67% due 11/15/2024 $2,000,000 $2,031,190
AmeriCredit Automobile Receivables TrustSeries 2019-1, Class A32.97% due 11/20/2023 389,690 391,325
BA Credit Card TrustSeries 2019-A1, Class A11.74% due 01/15/2025 1,500,000 1,522,908
BANKSeries 2019-BN16, Class A23.93% due 02/15/2052(1) 3,457,000 3,654,469
Benchmark Mtg. TrustSeries 2018-B1, Class A23.57% due 01/15/2051(1) 1,419,000 1,457,103
Benchmark Mtg. TrustSeries 2019-B9, Class AAB3.93% due 03/15/2052(1) 4,335,000 4,861,539
BX Commercial Mtg. Trust FRSSeries 2019-IMC, Class A1.10% (1 ML+1.00%)due 04/15/2034*(1) 3,300,000 3,299,999
CAMB Commercial Mtg. Trust FRSSeries 2019-LIFE, Class A1.17% (1 ML+1.07%)due 12/15/2037*(1) 750,000 751,423
Capital One Multi-Asset Execution TrustSeries 2021-A1, Class A10.55% due 07/15/2026 2,700,000 2,705,995
Capital One Multi-Asset Execution TrustSeries 2021-A2, Class A21.39% due 07/15/2030 1,850,000 1,858,246
Capital One Prime Auto Receivables TrustSeries 2019-2, Class A31.92% due 05/15/2024 687,127 694,307
CarMax Auto Owner TrustSeries 2019-3, Class A32.18% due 08/15/2024 1,253,973 1,270,722
CarMax Auto Owner TrustSeries 2019-2, Class A32.68% due 03/15/2024 890,046 902,382
Copyright © 2021 www.secdatabase.com. All Rights Reserved.Please Consider the Environment Before Printing This Document

CarMax Auto Owner TrustSeries 2018-4, Class A33.36% due 09/15/2023 689,927 698,103
Chase Mtg. Finance Trust VRSSeries 2016-SH2, Class M23.75% due 12/25/2045*(2)(3) 1,384,026 1,415,251
Citigroup Commercial Mtg. Trust VRSSeries 2018-C5, Class A44.23% due 06/10/2051(1)(3) 1,000,000 1,157,340
COMM Mtg. Trust VRSSeries 2015-CR22, Class XA1.02% due 03/10/2048(1)(3)(4) 4,040,952 91,904
COMM Mtg. Trust VRSSeries 2016-787S, Class B3.96% due 02/10/2036*(1)(3) 1,629,000 1,758,932
CSAIL Commercial Mtg. TrustSeries 2017-C8, Class A22.99% due 06/15/2050(1) 2,159,578 2,179,131
CSAIL Commercial Mtg. TrustSeries 2019-C17, Class A23.00% due 09/15/2052(1) 1,900,000 1,989,180
CSAIL Commercial Mtg. TrustSeries 2015-C1, Class A43.51% due 04/15/2050(1) 490,000 527,709
Discover Card Execution Note TrustSeries 2019-A1, Class A13.04% due 07/15/2024 400,000 404,300
GM Financial Consumer Automobile Receivables TrustSeries 2019-3, Class A32.18% due 04/16/2024 783,723 791,295
Hertz Vehicle Financing LLCSeries 2021-1A, Class A1.21% due 12/26/2025* 1,400,000 1,407,723
Honda Auto Receivables Owner TrustSeries 2020-3, Class A40.46% due 04/19/2027 1,490,000 1,492,283
Honda Auto Receivables Owner TrustSeries 2020-2, Class A41.09% due 10/15/2026 800,000 811,594
Honda Auto Receivables Owner TrustSeries 2019-1, Class A32.83% due 03/20/2023 403,736 407,408
MSDB Trust VRSSeries 2017-712F, Class A3.43% due 07/11/2039*(1)(3) 5,310,000 5,715,394
MTRO Commercial Mtg. Trust FRSSeries 2019-TECH, Class A1.00% (1 ML+0.90%)due 12/15/2033*(1) 3,750,000 3,745,305
Copyright © 2021 www.secdatabase.com. All Rights Reserved.Please Consider the Environment Before Printing This Document
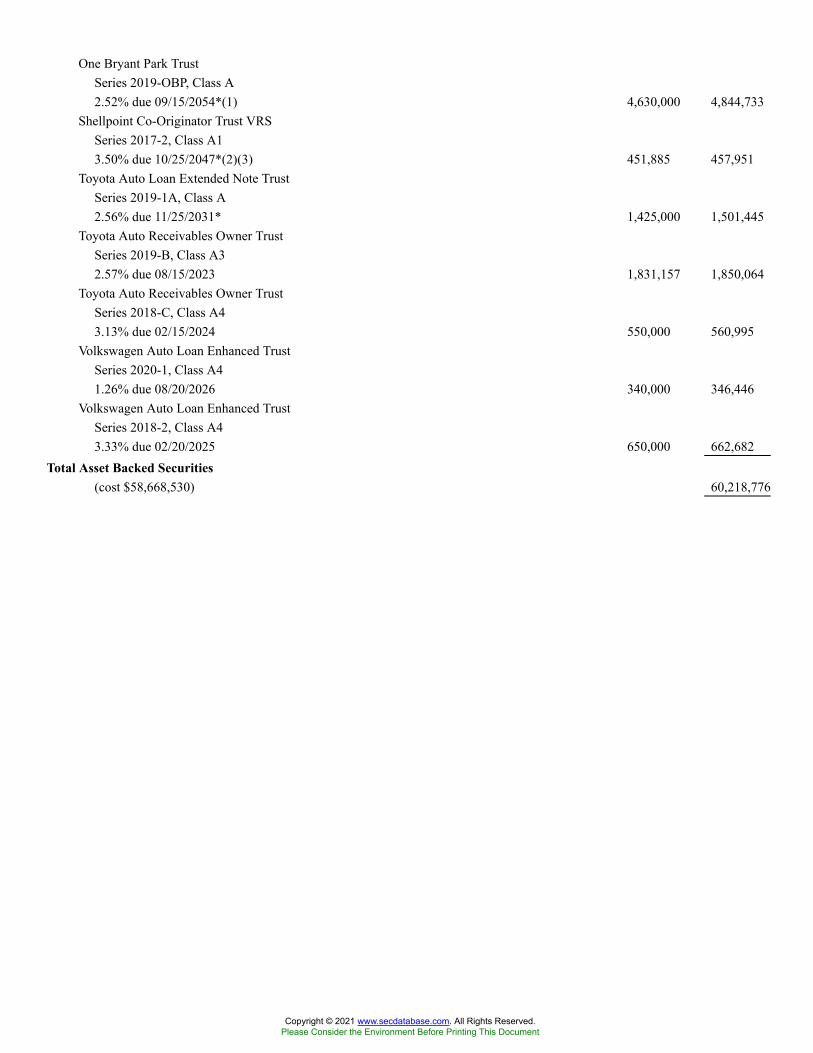
One Bryant Park TrustSeries 2019-OBP, Class A2.52% due 09/15/2054*(1) 4,630,000 4,844,733
Shellpoint Co-Originator Trust VRSSeries 2017-2, Class A13.50% due 10/25/2047*(2)(3) 451,885 457,951
Toyota Auto Loan Extended Note TrustSeries 2019-1A, Class A2.56% due 11/25/2031* 1,425,000 1,501,445
Toyota Auto Receivables Owner TrustSeries 2019-B, Class A32.57% due 08/15/2023 1,831,157 1,850,064
Toyota Auto Receivables Owner TrustSeries 2018-C, Class A43.13% due 02/15/2024 550,000 560,995
Volkswagen Auto Loan Enhanced TrustSeries 2020-1, Class A41.26% due 08/20/2026 340,000 346,446
Volkswagen Auto Loan Enhanced TrustSeries 2018-2, Class A43.33% due 02/20/2025 650,000 662,682
Total Asset Backed Securities(cost $58,668,530) 60,218,776
Copyright © 2021 www.secdatabase.com. All Rights Reserved.Please Consider the Environment Before Printing This Document

U.S. CONVERTIBLE BONDS & NOTES - 0.1%Oil Field Machinery & Equipment - 0.1%
Hi-Crush, Inc.Senior Sec. Notes10.00% due 04/09/2026(5)(6)(7)(cost $692,677) 755,096 995,972
U.S. CORPORATE BONDS & NOTES - 31.6%Aerospace/Defense - 0.1%
BAE Systems Holdings, Inc.Company Guar. Notes3.85% due 12/15/2025* 1,329,000 1,461,904
Lockheed Martin Corp.Senior Notes2.80% due 06/15/2050 15,000 15,337
1,477,241Aerospace/Defense-Equipment - 0.1%
Moog, Inc.Company Guar. Notes4.25% due 12/15/2027* 1,337,000 1,373,768
Spirit AeroSystems, Inc.Sec. Notes7.50% due 04/15/2025* 1,043,000 1,104,276
2,478,044Airlines - 0.2%
American Airlines, Inc.Senior Sec. Notes11.75% due 07/15/2025* 2,496,000 3,098,784
British Airways Pass Through TrustPass-Through Certs.2.90% due 09/15/2036* 1,582,000 1,599,604
United Airlines Holdings, Inc.Company Guar. Notes4.88% due 01/15/2025# 409,000 418,714
United Airlines, Inc.Senior Sec. Notes4.38% due 04/15/2026* 405,000 420,147
United Airlines, Inc.Senior Sec. Notes4.63% due 04/15/2029* 1,255,000 1,302,314
6,839,563Applications Software - 0.0%
SS&C Technologies, Inc.Company Guar. Notes5.50% due 09/30/2027* 920,000 974,234
Auction Houses/Art Dealers - 0.1%
Copyright © 2021 www.secdatabase.com. All Rights Reserved.Please Consider the Environment Before Printing This Document
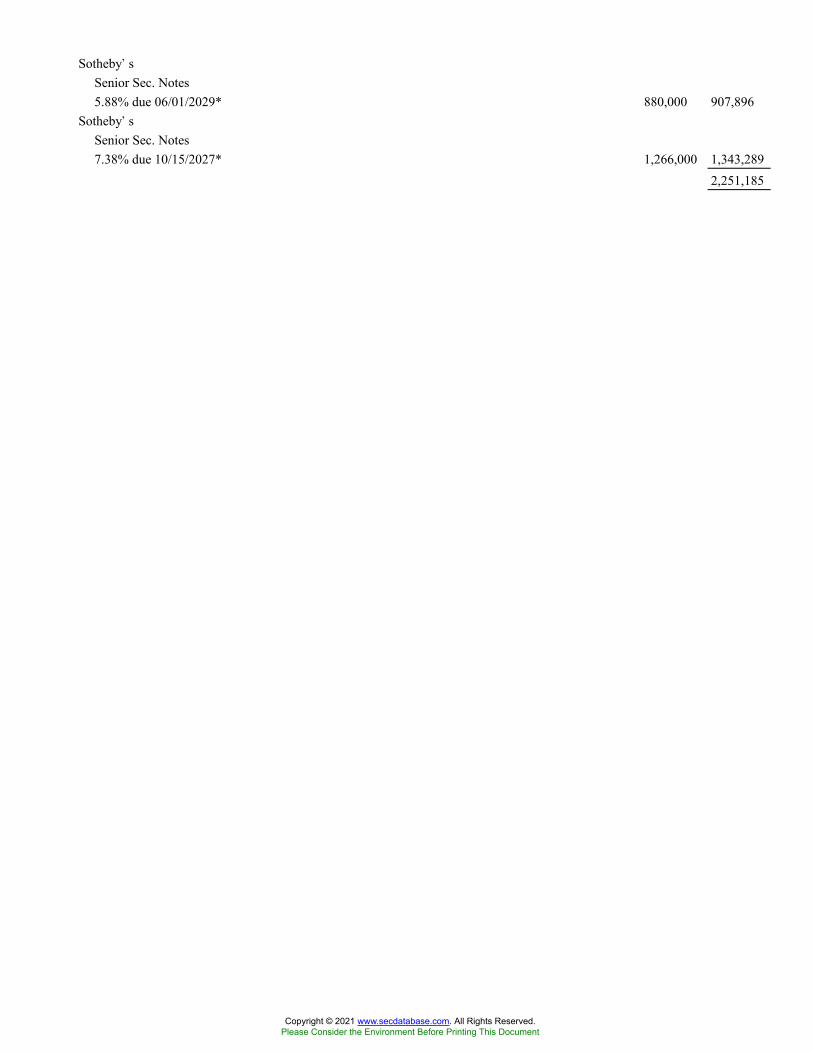
Sotheby�sSenior Sec. Notes5.88% due 06/01/2029* 880,000 907,896
Sotheby�sSenior Sec. Notes7.38% due 10/15/2027* 1,266,000 1,343,289
2,251,185
Copyright © 2021 www.secdatabase.com. All Rights Reserved.Please Consider the Environment Before Printing This Document

Auto Repair Centers - 0.1%
Metis Merger Sub LLCSenior Notes6.50% due 05/15/2029* 1,425,000 1,425,000
Auto-Cars/Light Trucks - 0.8%
BMW US Capital LLCCompany Guar. Notes3.90% due 04/09/2025* 2,695,000 2,961,656
Ford Motor Co.Senior Notes4.75% due 01/15/2043 3,113,000 3,358,149
Ford Motor Co.Senior Notes6.63% due 10/01/2028 2,173,000 2,596,539
Ford Motor Co.Senior Notes7.45% due 07/16/2031 178,000 234,232
Ford Motor Credit Co. LLCSenior Notes2.90% due 02/16/2028 1,162,000 1,157,643
Ford Motor Credit Co. LLCSenior Notes4.00% due 11/13/2030 3,547,000 3,751,768
General Motors Financial Co., Inc.Senior Notes2.70% due 06/10/2031 1,184,000 1,202,839
General Motors Financial Co., Inc.Senior Notes2.75% due 06/20/2025 2,106,000 2,212,219
Hyundai Capital AmericaSenior Notes3.40% due 06/20/2024* 1,812,000 1,924,245
Toyota Motor Credit Corp.Senior Notes1.90% due 04/06/2028 2,753,000 2,824,860
22,224,150Auto-Heavy Duty Trucks - 0.1%
Allison Transmission, Inc.Company Guar. Notes3.75% due 01/30/2031* 1,484,000 1,482,145
JB Poindexter & Co., Inc.Senior Notes7.13% due 04/15/2026* 661,000 697,355
PACCAR Financial Corp.Senior Notes0.80% due 06/08/2023 1,245,000 1,255,315
3,434,815
Copyright © 2021 www.secdatabase.com. All Rights Reserved.Please Consider the Environment Before Printing This Document
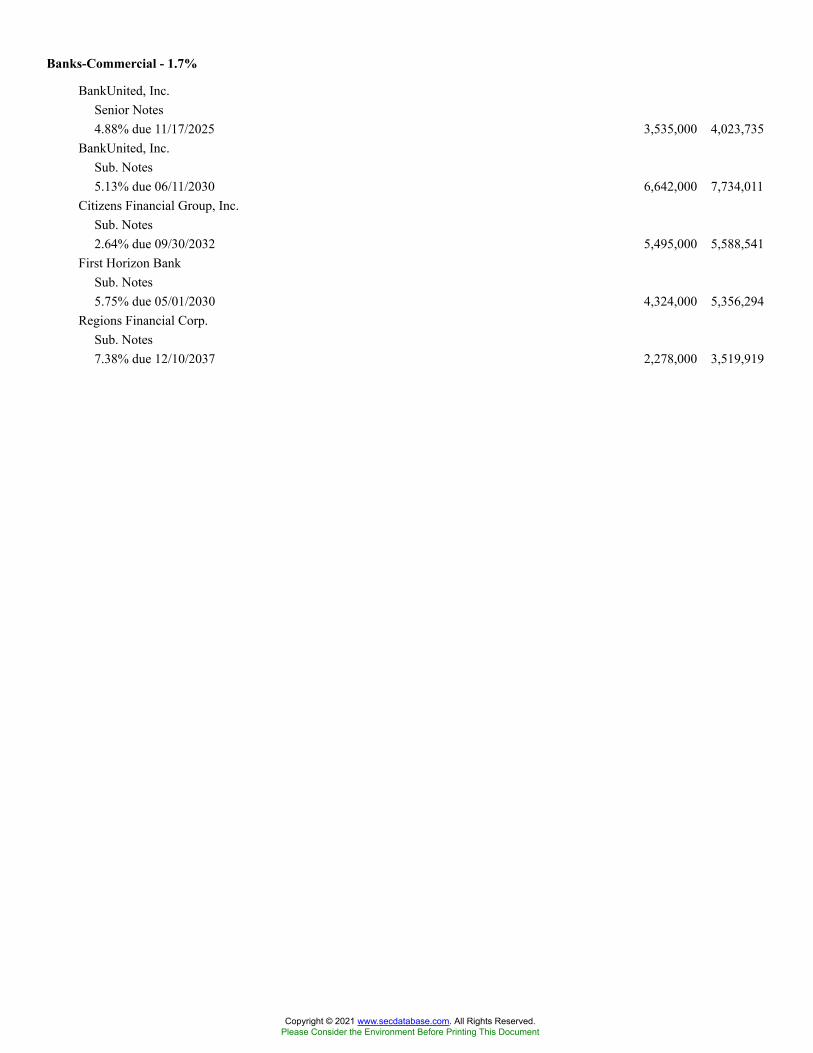
Banks-Commercial - 1.7%
BankUnited, Inc.Senior Notes4.88% due 11/17/2025 3,535,000 4,023,735
BankUnited, Inc.Sub. Notes5.13% due 06/11/2030 6,642,000 7,734,011
Citizens Financial Group, Inc.Sub. Notes2.64% due 09/30/2032 5,495,000 5,588,541
First Horizon BankSub. Notes5.75% due 05/01/2030 4,324,000 5,356,294
Regions Financial Corp.Sub. Notes7.38% due 12/10/2037 2,278,000 3,519,919
Copyright © 2021 www.secdatabase.com. All Rights Reserved.Please Consider the Environment Before Printing This Document

Santander Holdings USA, Inc.Senior Notes3.24% due 10/05/2026 1,137,000 1,219,240
Signature BankSub. Notes4.00% due 10/15/2030 4,154,000 4,465,822
SunTrust BankSenior Notes3.20% due 04/01/2024 459,000 489,870
SVB Financial GroupSenior Notes2.10% due 05/15/2028# 1,749,000 1,787,496
Synovus BankSenior Notes2.29% due 02/10/2023 1,222,000 1,229,187
Texas Capital Bancshares, Inc.Sub. Notes4.00% (H15T5Y+3.15%)due 05/06/2031 2,228,000 2,329,533
Valley National BancorpSub. Notes3.00% due 06/15/2031 2,171,000 2,215,185
Zions Bancorp NASub. Notes3.25% due 10/29/2029 7,001,000 7,406,240
47,365,073Banks-Super Regional - 0.5%
Bank of America NASenior Notes3.34% due 01/25/2023 480,000 485,796
Wells Fargo & Co.Senior Notes2.39% due 06/02/2028 895,000 933,592
Wells Fargo & Co.Senior Notes3.07% due 04/30/2041 2,681,000 2,811,938
Wells Fargo & Co.Sub. Notes4.30% due 07/22/2027 6,589,000 7,552,048
Wells Fargo & Co.Sub. Notes4.65% due 11/04/2044 555,000 692,485
Wells Fargo & Co.Sub. Notes5.61% due 01/15/2044 1,038,000 1,436,554
13,912,413Batteries/Battery Systems - 0.1%
Copyright © 2021 www.secdatabase.com. All Rights Reserved.Please Consider the Environment Before Printing This Document

Energizer Holdings, Inc.Company Guar. Notes4.38% due 03/31/2029* 1,313,000 1,316,768
EnerSysCompany Guar. Notes4.38% due 12/15/2027* 799,000 838,950
2,155,718
Copyright © 2021 www.secdatabase.com. All Rights Reserved.Please Consider the Environment Before Printing This Document
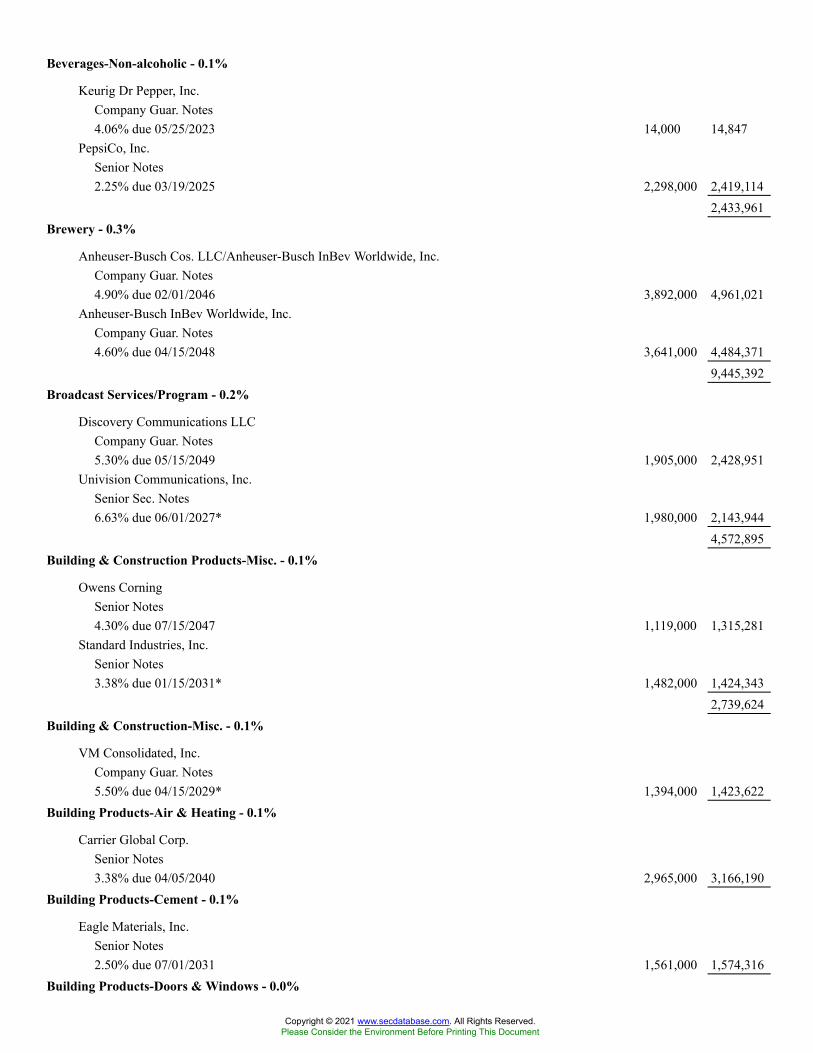
Beverages-Non-alcoholic - 0.1%
Keurig Dr Pepper, Inc.Company Guar. Notes4.06% due 05/25/2023 14,000 14,847
PepsiCo, Inc.Senior Notes2.25% due 03/19/2025 2,298,000 2,419,114
2,433,961Brewery - 0.3%
Anheuser-Busch Cos. LLC/Anheuser-Busch InBev Worldwide, Inc.Company Guar. Notes4.90% due 02/01/2046 3,892,000 4,961,021
Anheuser-Busch InBev Worldwide, Inc.Company Guar. Notes4.60% due 04/15/2048 3,641,000 4,484,371
9,445,392Broadcast Services/Program - 0.2%
Discovery Communications LLCCompany Guar. Notes5.30% due 05/15/2049 1,905,000 2,428,951
Univision Communications, Inc.Senior Sec. Notes6.63% due 06/01/2027* 1,980,000 2,143,944
4,572,895Building & Construction Products-Misc. - 0.1%
Owens CorningSenior Notes4.30% due 07/15/2047 1,119,000 1,315,281
Standard Industries, Inc.Senior Notes3.38% due 01/15/2031* 1,482,000 1,424,343
2,739,624Building & Construction-Misc. - 0.1%
VM Consolidated, Inc.Company Guar. Notes5.50% due 04/15/2029* 1,394,000 1,423,622
Building Products-Air & Heating - 0.1%
Carrier Global Corp.Senior Notes3.38% due 04/05/2040 2,965,000 3,166,190
Building Products-Cement - 0.1%
Eagle Materials, Inc.Senior Notes2.50% due 07/01/2031 1,561,000 1,574,316
Building Products-Doors & Windows - 0.0%
Copyright © 2021 www.secdatabase.com. All Rights Reserved.Please Consider the Environment Before Printing This Document

Griffon Corp.Company Guar. Notes5.75% due 03/01/2028 1,038,000 1,101,515
Copyright © 2021 www.secdatabase.com. All Rights Reserved.Please Consider the Environment Before Printing This Document
Building Products-Wood - 0.1%
Masco Corp.Senior Notes3.13% due 02/15/2051 1,637,000 1,644,961
Copyright © 2021 www.secdatabase.com. All Rights Reserved.Please Consider the Environment Before Printing This Document
Cable/Satellite TV - 0.8%
Block Communications, Inc.Company Guar. Notes4.88% due 03/01/2028* 1,380,000 1,416,197
CCO Holdings LLC/CCO Holdings Capital Corp.Senior Notes4.50% due 08/15/2030* 1,330,000 1,389,664
CCO Holdings LLC/CCO Holdings Capital Corp.Senior Notes5.00% due 02/01/2028* 361,000 378,184
CCO Holdings LLC/CCO Holdings Capital Corp.Senior Notes5.38% due 06/01/2029* 1,006,000 1,099,055
Charter Communications Operating LLC/Charter Communications Operating CapitalSenior Sec. Notes3.50% due 06/01/2041 783,000 791,060
Charter Communications Operating LLC/Charter Communications Operating CapitalSenior Sec. Notes3.85% due 04/01/2061 3,589,000 3,566,844
Charter Communications Operating LLC/Charter Communications Operating CapitalSenior Sec. Notes4.80% due 03/01/2050 1,969,000 2,297,193
Charter Communications Operating LLC/Charter Communications Operating CapitalSenior Sec. Notes5.38% due 04/01/2038 244,000 301,682
Charter Communications Operating LLC/Charter Communications Operating CapitalSenior Sec. Notes6.38% due 10/23/2035 874,000 1,168,643
Comcast Corp.Company Guar. Notes3.30% due 02/01/2027 2,183,000 2,397,575
Comcast Corp.Company Guar. Notes3.90% due 03/01/2038 567,000 660,815
Comcast Corp.Company Guar. Notes4.60% due 10/15/2038 1,564,000 1,965,718
CSC Holdings LLCSenior Notes4.63% due 12/01/2030* 335,000 328,451
CSC Holdings LLCCompany Guar. Bonds5.38% due 02/01/2028* 856,000 900,940
CSC Holdings LLCCompany Guar. Notes5.50% due 04/15/2027* 1,105,000 1,155,971
Copyright © 2021 www.secdatabase.com. All Rights Reserved.Please Consider the Environment Before Printing This Document
Time Warner Cable LLCSenior Sec. Notes6.55% due 05/01/2037 2,493,000 3,400,221
23,218,213Casino Services - 0.0%
Caesars Entertainment, Inc.Senior Sec. Notes6.25% due 07/01/2025* 1,305,000 1,379,320
Copyright © 2021 www.secdatabase.com. All Rights Reserved.Please Consider the Environment Before Printing This Document
Cellular Telecom - 0.2%
T-Mobile USA, Inc.Senior Sec. Notes3.00% due 02/15/2041 2,376,000 2,360,069
T-Mobile USA, Inc.Senior Sec. Notes3.60% due 11/15/2060 1,170,000 1,204,948
T-Mobile USA, Inc.Senior Sec. Notes3.60% due 11/15/2060* 1,215,000 1,251,292
4,816,309Chemicals-Diversified - 0.2%
Celanese US Holdings LLCCompany Guar. Notes1.40% due 08/05/2026 1,126,000 1,124,254
Westlake Chemical Corp.Senior Notes3.13% due 08/15/2051 2,261,000 2,190,942
Westlake Chemical Corp.Senior Notes3.38% due 08/15/2061 2,128,000 2,050,233
5,365,429Chemicals-Specialty - 0.1%
Ecolab, Inc.Senior Notes2.38% due 08/10/2022 1,883,000 1,917,957
Ecolab, Inc.Senior Notes2.75% due 08/18/2055* 816,000 806,641
Minerals Technologies, Inc.Company Guar. Notes5.00% due 07/01/2028* 921,000 964,748
3,689,346Circuit Boards - 0.0%
TTM Technologies, Inc.Company Guar. Notes4.00% due 03/01/2029* 1,388,000 1,405,350
Coal - 0.1%
SunCoke Energy, Inc.Senior Sec. Notes4.88% due 06/30/2029* 1,409,000 1,427,106
Coatings/Paint - 0.1%
RPM International, Inc.Senior Notes4.55% due 03/01/2029 2,703,000 3,129,282
Copyright © 2021 www.secdatabase.com. All Rights Reserved.Please Consider the Environment Before Printing This Document

Commercial Services - 0.0%
Nielsen Finance LLC/Nielsen Finance Co.Company Guar. Notes5.63% due 10/01/2028* 392,000 412,090
Nielsen Finance LLC/Nielsen Finance Co.Company Guar. Notes5.88% due 10/01/2030* 892,000 954,413
1,366,503Commercial Services-Finance - 0.3%
Automatic Data Processing, Inc.Senior Notes1.70% due 05/15/2028 1,130,000 1,150,282
Block Financial LLCCompany Guar. Notes2.50% due 07/15/2028 2,471,000 2,523,803
MoneyGram International, Inc.Senior Sec. Notes5.38% due 08/01/2026* 1,715,000 1,749,300
MPH Acquisition Holdings LLCCompany Guar. Notes5.75% due 11/01/2028*# 2,173,000 2,074,867
Paysafe Finance PLC/Paysafe Holdings US Corp.Senior Sec. Notes4.00% due 06/15/2029* 1,415,000 1,361,584
8,859,836Computer Services - 0.1%
Ahead DB Holdings LLCCompany Guar. Notes6.63% due 05/01/2028* 1,430,000 1,455,025
Banff Merger Sub, Inc.Senior Notes9.75% due 09/01/2026* 908,000 952,265
Leidos, Inc.Company Guar. Notes3.63% due 05/15/2025 1,330,000 1,439,486
3,846,776Computer Software - 0.0%
Rackspace Technology Global, Inc.Senior Sec. Notes3.50% due 02/15/2028* 996,000 956,160
Computers - 0.5%
Apple, Inc.Senior Notes1.40% due 08/05/2028 2,305,000 2,300,998
Copyright © 2021 www.secdatabase.com. All Rights Reserved.Please Consider the Environment Before Printing This Document
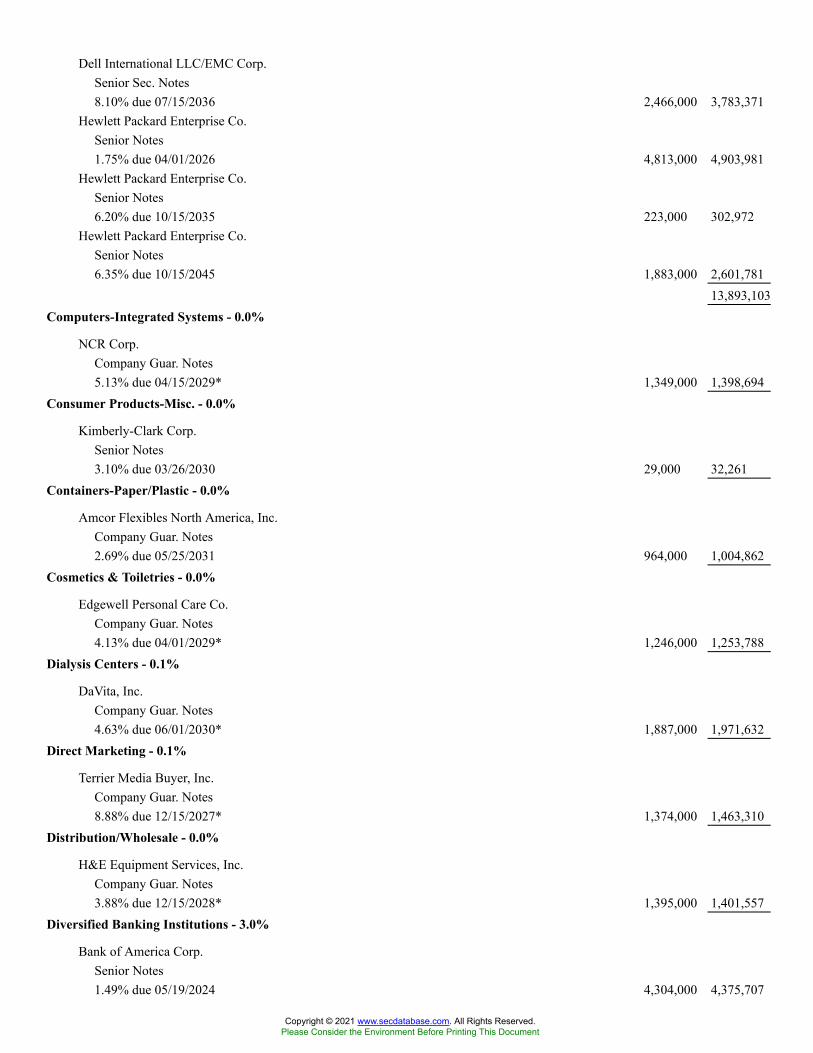
Dell International LLC/EMC Corp.Senior Sec. Notes8.10% due 07/15/2036 2,466,000 3,783,371
Hewlett Packard Enterprise Co.Senior Notes1.75% due 04/01/2026 4,813,000 4,903,981
Hewlett Packard Enterprise Co.Senior Notes6.20% due 10/15/2035 223,000 302,972
Hewlett Packard Enterprise Co.Senior Notes6.35% due 10/15/2045 1,883,000 2,601,781
13,893,103Computers-Integrated Systems - 0.0%
NCR Corp.Company Guar. Notes5.13% due 04/15/2029* 1,349,000 1,398,694
Consumer Products-Misc. - 0.0%
Kimberly-Clark Corp.Senior Notes3.10% due 03/26/2030 29,000 32,261
Containers-Paper/Plastic - 0.0%
Amcor Flexibles North America, Inc.Company Guar. Notes2.69% due 05/25/2031 964,000 1,004,862
Cosmetics & Toiletries - 0.0%
Edgewell Personal Care Co.Company Guar. Notes4.13% due 04/01/2029* 1,246,000 1,253,788
Dialysis Centers - 0.1%
DaVita, Inc.Company Guar. Notes4.63% due 06/01/2030* 1,887,000 1,971,632
Direct Marketing - 0.1%
Terrier Media Buyer, Inc.Company Guar. Notes8.88% due 12/15/2027* 1,374,000 1,463,310
Distribution/Wholesale - 0.0%
H&E Equipment Services, Inc.Company Guar. Notes3.88% due 12/15/2028* 1,395,000 1,401,557
Diversified Banking Institutions - 3.0%
Bank of America Corp.Senior Notes1.49% due 05/19/2024 4,304,000 4,375,707
Copyright © 2021 www.secdatabase.com. All Rights Reserved.Please Consider the Environment Before Printing This Document
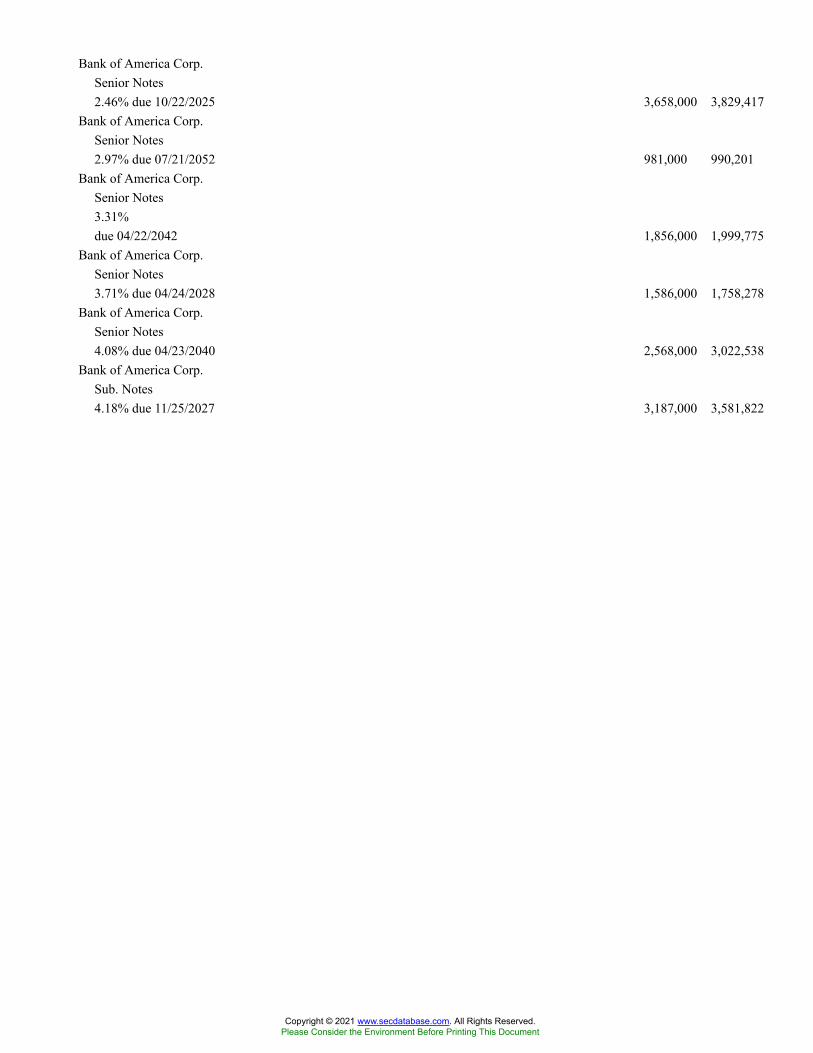
Bank of America Corp.Senior Notes2.46% due 10/22/2025 3,658,000 3,829,417
Bank of America Corp.Senior Notes2.97% due 07/21/2052 981,000 990,201
Bank of America Corp.Senior Notes3.31%due 04/22/2042 1,856,000 1,999,775
Bank of America Corp.Senior Notes3.71% due 04/24/2028 1,586,000 1,758,278
Bank of America Corp.Senior Notes4.08% due 04/23/2040 2,568,000 3,022,538
Bank of America Corp.Sub. Notes4.18% due 11/25/2027 3,187,000 3,581,822
Copyright © 2021 www.secdatabase.com. All Rights Reserved.Please Consider the Environment Before Printing This Document

Bank of America Corp.Sub. Notes6.11% due 01/29/2037 2,494,000 3,430,524
Citigroup, Inc.Senior Notes0.98% due 05/01/2025 1,769,000 1,777,234
Citigroup, Inc.Senior Notes2.67% due 01/29/2031 412,000 428,177
Citigroup, Inc.Senior Notes3.67% due 07/24/2028 2,005,000 2,222,440
Citigroup, Inc.Sub. Notes4.45% due 09/29/2027 2,344,000 2,683,437
Citigroup, Inc.Sub. Notes5.88% due 02/22/2033 2,279,000 3,002,142
Citigroup, Inc.Sub. Notes6.00% due 10/31/2033 5,453,000 7,251,435
Goldman Sachs Group, Inc.Senior Notes1.54% due 09/10/2027 2,357,000 2,368,430
Goldman Sachs Group, Inc.Senior Notes2.38% due 07/21/2032 1,653,000 1,671,066
Goldman Sachs Group, Inc.Senior Notes3.21% due 04/22/2042 1,547,000 1,633,828
Goldman Sachs Group, Inc.Senior Notes3.50% due 11/16/2026 3,548,000 3,862,869
Goldman Sachs Group, Inc.Senior Notes3.80% due 03/15/2030 651,000 734,190
Goldman Sachs Group, Inc.Sub. Notes6.75% due 10/01/2037 3,448,000 5,024,652
JPMorgan Chase & Co.Senior Notes0.65% due 09/16/2024 2,972,000 2,980,440
JPMorgan Chase & Co.Senior Notes1.58% due 04/22/2027 949,000 958,033
JPMorgan Chase & Co.Senior Notes2.01% due 03/13/2026 6,891,000 7,107,263
Copyright © 2021 www.secdatabase.com. All Rights Reserved.Please Consider the Environment Before Printing This Document
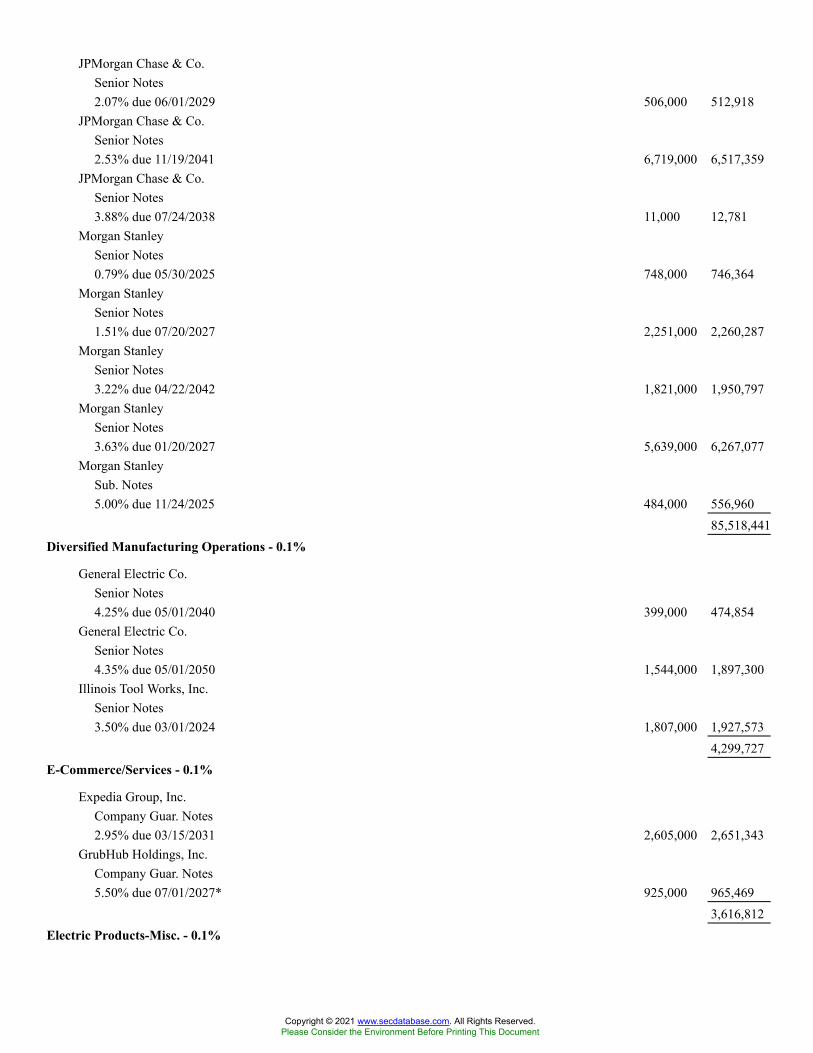
JPMorgan Chase & Co.Senior Notes2.07% due 06/01/2029 506,000 512,918
JPMorgan Chase & Co.Senior Notes2.53% due 11/19/2041 6,719,000 6,517,359
JPMorgan Chase & Co.Senior Notes3.88% due 07/24/2038 11,000 12,781
Morgan StanleySenior Notes0.79% due 05/30/2025 748,000 746,364
Morgan StanleySenior Notes1.51% due 07/20/2027 2,251,000 2,260,287
Morgan StanleySenior Notes3.22% due 04/22/2042 1,821,000 1,950,797
Morgan StanleySenior Notes3.63% due 01/20/2027 5,639,000 6,267,077
Morgan StanleySub. Notes5.00% due 11/24/2025 484,000 556,960
85,518,441Diversified Manufacturing Operations - 0.1%
General Electric Co.Senior Notes4.25% due 05/01/2040 399,000 474,854
General Electric Co.Senior Notes4.35% due 05/01/2050 1,544,000 1,897,300
Illinois Tool Works, Inc.Senior Notes3.50% due 03/01/2024 1,807,000 1,927,573
4,299,727E-Commerce/Services - 0.1%
Expedia Group, Inc.Company Guar. Notes2.95% due 03/15/2031 2,605,000 2,651,343
GrubHub Holdings, Inc.Company Guar. Notes5.50% due 07/01/2027* 925,000 965,469
3,616,812Electric Products-Misc. - 0.1%
Copyright © 2021 www.secdatabase.com. All Rights Reserved.Please Consider the Environment Before Printing This Document
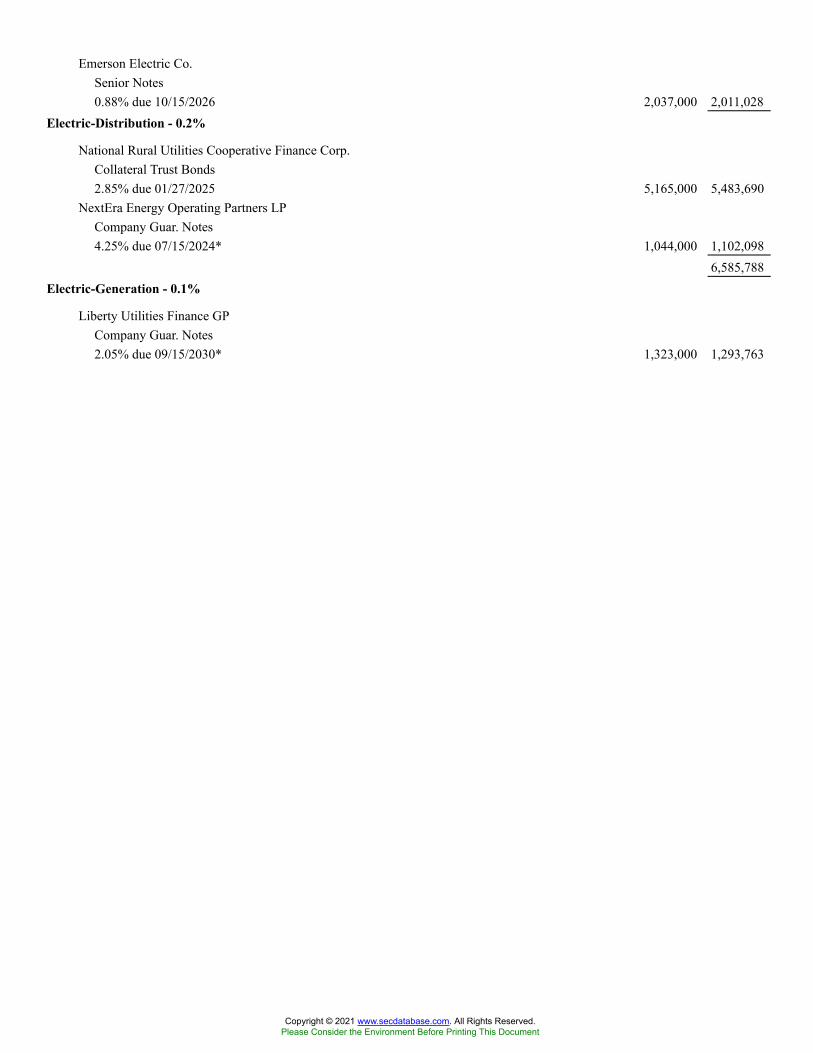
Emerson Electric Co.Senior Notes0.88% due 10/15/2026 2,037,000 2,011,028
Electric-Distribution - 0.2%
National Rural Utilities Cooperative Finance Corp.Collateral Trust Bonds2.85% due 01/27/2025 5,165,000 5,483,690
NextEra Energy Operating Partners LPCompany Guar. Notes4.25% due 07/15/2024* 1,044,000 1,102,098
6,585,788Electric-Generation - 0.1%
Liberty Utilities Finance GPCompany Guar. Notes2.05% due 09/15/2030* 1,323,000 1,293,763
Copyright © 2021 www.secdatabase.com. All Rights Reserved.Please Consider the Environment Before Printing This Document
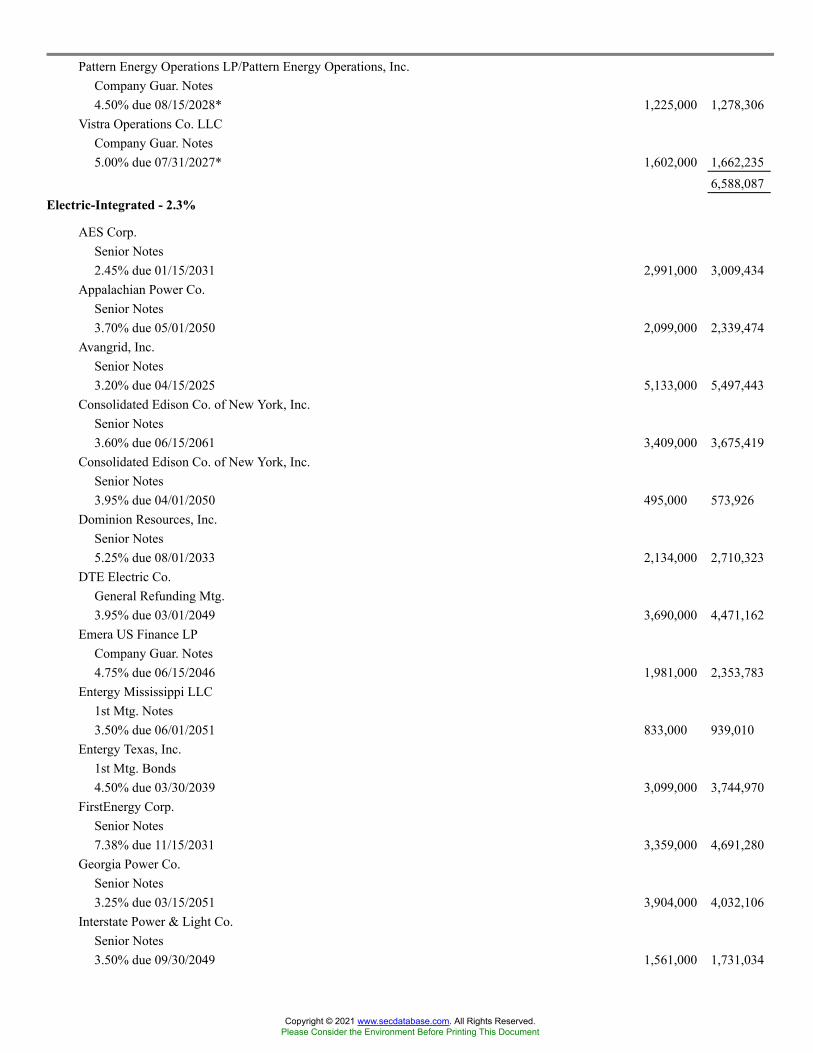
Pattern Energy Operations LP/Pattern Energy Operations, Inc.Company Guar. Notes4.50% due 08/15/2028* 1,225,000 1,278,306
Vistra Operations Co. LLCCompany Guar. Notes5.00% due 07/31/2027* 1,602,000 1,662,235
6,588,087Electric-Integrated - 2.3%
AES Corp.Senior Notes2.45% due 01/15/2031 2,991,000 3,009,434
Appalachian Power Co.Senior Notes3.70% due 05/01/2050 2,099,000 2,339,474
Avangrid, Inc.Senior Notes3.20% due 04/15/2025 5,133,000 5,497,443
Consolidated Edison Co. of New York, Inc.Senior Notes3.60% due 06/15/2061 3,409,000 3,675,419
Consolidated Edison Co. of New York, Inc.Senior Notes3.95% due 04/01/2050 495,000 573,926
Dominion Resources, Inc.Senior Notes5.25% due 08/01/2033 2,134,000 2,710,323
DTE Electric Co.General Refunding Mtg.3.95% due 03/01/2049 3,690,000 4,471,162
Emera US Finance LPCompany Guar. Notes4.75% due 06/15/2046 1,981,000 2,353,783
Entergy Mississippi LLC1st Mtg. Notes3.50% due 06/01/2051 833,000 939,010
Entergy Texas, Inc.1st Mtg. Bonds4.50% due 03/30/2039 3,099,000 3,744,970
FirstEnergy Corp.Senior Notes7.38% due 11/15/2031 3,359,000 4,691,280
Georgia Power Co.Senior Notes3.25% due 03/15/2051 3,904,000 4,032,106
Interstate Power & Light Co.Senior Notes3.50% due 09/30/2049 1,561,000 1,731,034
Copyright © 2021 www.secdatabase.com. All Rights Reserved.Please Consider the Environment Before Printing This Document
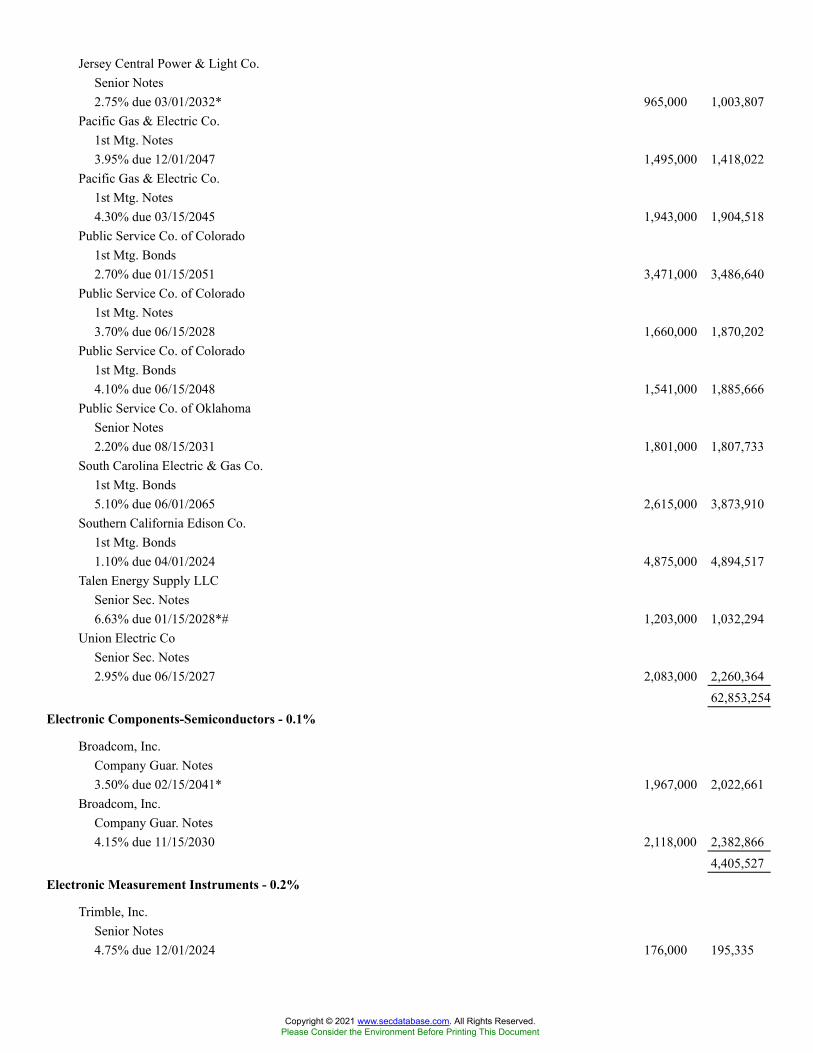
Jersey Central Power & Light Co.Senior Notes2.75% due 03/01/2032* 965,000 1,003,807
Pacific Gas & Electric Co.1st Mtg. Notes3.95% due 12/01/2047 1,495,000 1,418,022
Pacific Gas & Electric Co.1st Mtg. Notes4.30% due 03/15/2045 1,943,000 1,904,518
Public Service Co. of Colorado1st Mtg. Bonds2.70% due 01/15/2051 3,471,000 3,486,640
Public Service Co. of Colorado1st Mtg. Notes3.70% due 06/15/2028 1,660,000 1,870,202
Public Service Co. of Colorado1st Mtg. Bonds4.10% due 06/15/2048 1,541,000 1,885,666
Public Service Co. of OklahomaSenior Notes2.20% due 08/15/2031 1,801,000 1,807,733
South Carolina Electric & Gas Co.1st Mtg. Bonds5.10% due 06/01/2065 2,615,000 3,873,910
Southern California Edison Co.1st Mtg. Bonds1.10% due 04/01/2024 4,875,000 4,894,517
Talen Energy Supply LLCSenior Sec. Notes6.63% due 01/15/2028*# 1,203,000 1,032,294
Union Electric CoSenior Sec. Notes2.95% due 06/15/2027 2,083,000 2,260,364
62,853,254Electronic Components-Semiconductors - 0.1%
Broadcom, Inc.Company Guar. Notes3.50% due 02/15/2041* 1,967,000 2,022,661
Broadcom, Inc.Company Guar. Notes4.15% due 11/15/2030 2,118,000 2,382,866
4,405,527Electronic Measurement Instruments - 0.2%
Trimble, Inc.Senior Notes4.75% due 12/01/2024 176,000 195,335
Copyright © 2021 www.secdatabase.com. All Rights Reserved.Please Consider the Environment Before Printing This Document
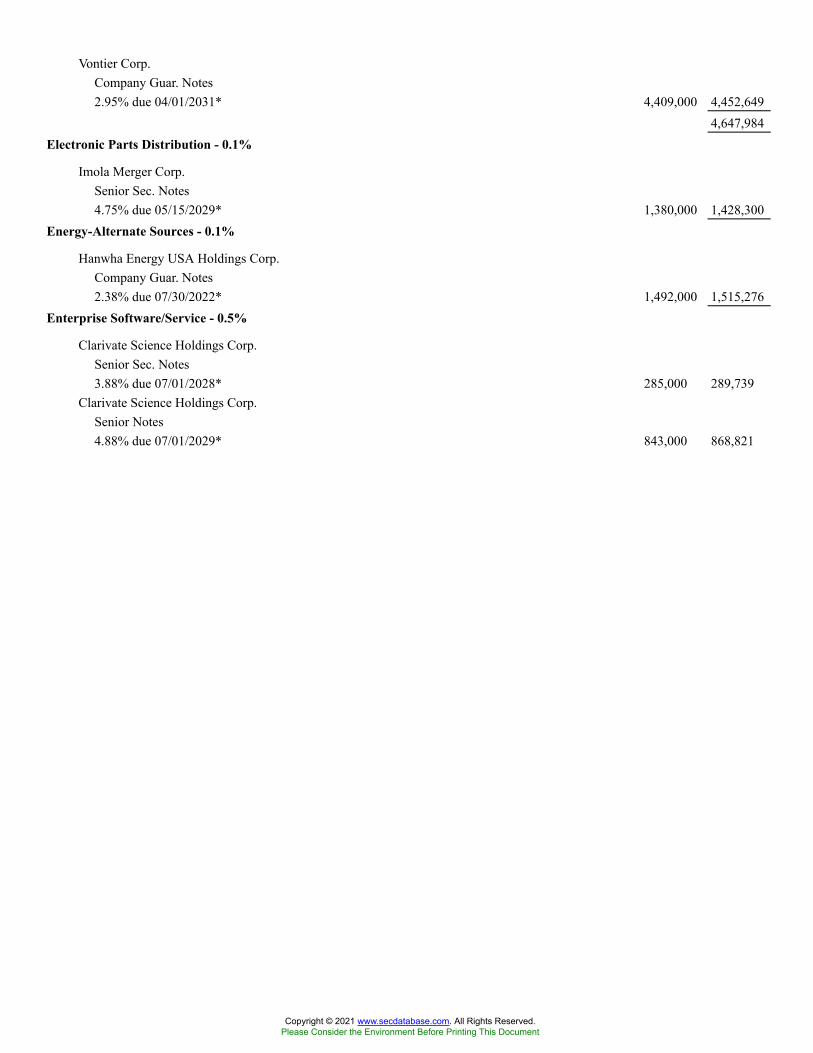
Vontier Corp.Company Guar. Notes2.95% due 04/01/2031* 4,409,000 4,452,649
4,647,984Electronic Parts Distribution - 0.1%
Imola Merger Corp.Senior Sec. Notes4.75% due 05/15/2029* 1,380,000 1,428,300
Energy-Alternate Sources - 0.1%
Hanwha Energy USA Holdings Corp.Company Guar. Notes2.38% due 07/30/2022* 1,492,000 1,515,276
Enterprise Software/Service - 0.5%
Clarivate Science Holdings Corp.Senior Sec. Notes3.88% due 07/01/2028* 285,000 289,739
Clarivate Science Holdings Corp.Senior Notes4.88% due 07/01/2029* 843,000 868,821
Copyright © 2021 www.secdatabase.com. All Rights Reserved.Please Consider the Environment Before Printing This Document
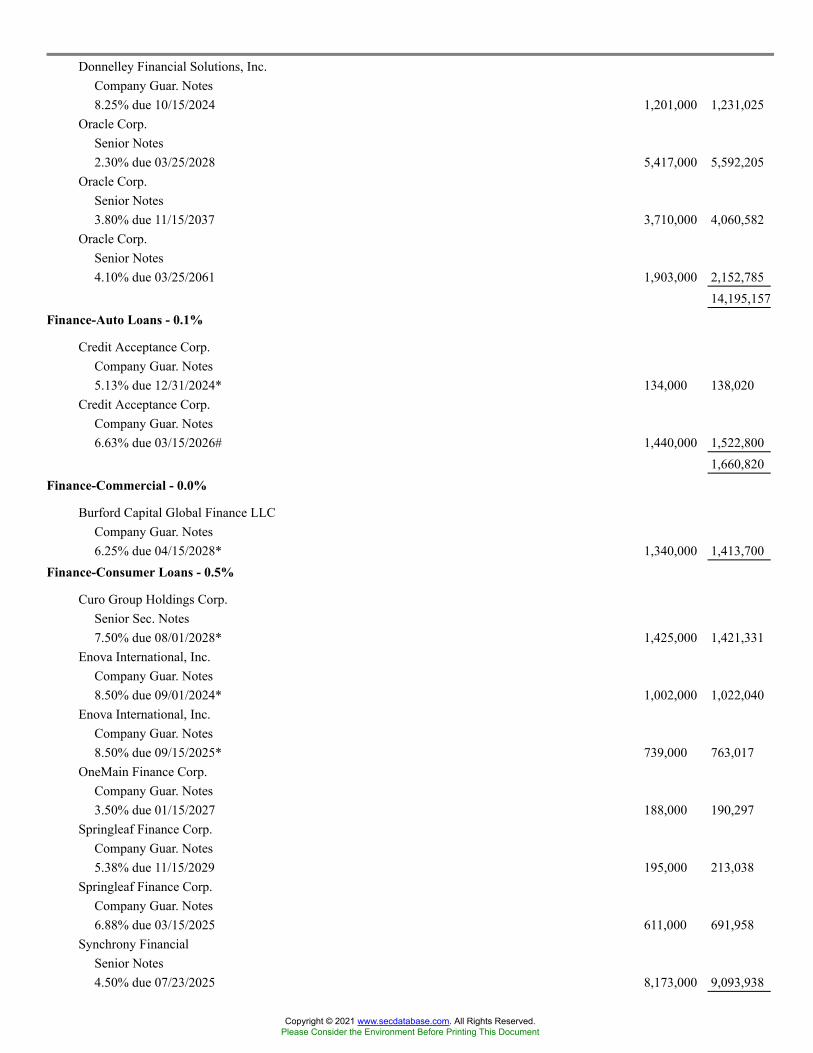
Donnelley Financial Solutions, Inc.Company Guar. Notes8.25% due 10/15/2024 1,201,000 1,231,025
Oracle Corp.Senior Notes2.30% due 03/25/2028 5,417,000 5,592,205
Oracle Corp.Senior Notes3.80% due 11/15/2037 3,710,000 4,060,582
Oracle Corp.Senior Notes4.10% due 03/25/2061 1,903,000 2,152,785
14,195,157Finance-Auto Loans - 0.1%
Credit Acceptance Corp.Company Guar. Notes5.13% due 12/31/2024* 134,000 138,020
Credit Acceptance Corp.Company Guar. Notes6.63% due 03/15/2026# 1,440,000 1,522,800
1,660,820Finance-Commercial - 0.0%
Burford Capital Global Finance LLCCompany Guar. Notes6.25% due 04/15/2028* 1,340,000 1,413,700
Finance-Consumer Loans - 0.5%
Curo Group Holdings Corp.Senior Sec. Notes7.50% due 08/01/2028* 1,425,000 1,421,331
Enova International, Inc.Company Guar. Notes8.50% due 09/01/2024* 1,002,000 1,022,040
Enova International, Inc.Company Guar. Notes8.50% due 09/15/2025* 739,000 763,017
OneMain Finance Corp.Company Guar. Notes3.50% due 01/15/2027 188,000 190,297
Springleaf Finance Corp.Company Guar. Notes5.38% due 11/15/2029 195,000 213,038
Springleaf Finance Corp.Company Guar. Notes6.88% due 03/15/2025 611,000 691,958
Synchrony FinancialSenior Notes4.50% due 07/23/2025 8,173,000 9,093,938
Copyright © 2021 www.secdatabase.com. All Rights Reserved.Please Consider the Environment Before Printing This Document
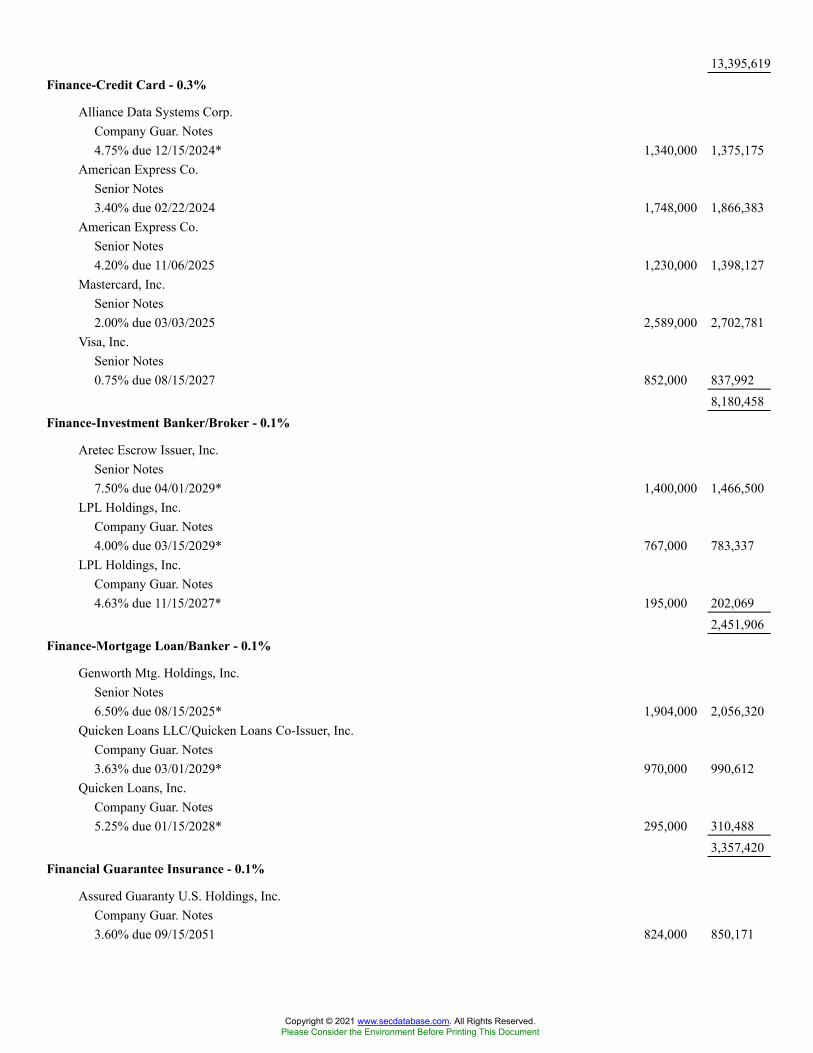
13,395,619Finance-Credit Card - 0.3%
Alliance Data Systems Corp.Company Guar. Notes4.75% due 12/15/2024* 1,340,000 1,375,175
American Express Co.Senior Notes3.40% due 02/22/2024 1,748,000 1,866,383
American Express Co.Senior Notes4.20% due 11/06/2025 1,230,000 1,398,127
Mastercard, Inc.Senior Notes2.00% due 03/03/2025 2,589,000 2,702,781
Visa, Inc.Senior Notes0.75% due 08/15/2027 852,000 837,992
8,180,458Finance-Investment Banker/Broker - 0.1%
Aretec Escrow Issuer, Inc.Senior Notes7.50% due 04/01/2029* 1,400,000 1,466,500
LPL Holdings, Inc.Company Guar. Notes4.00% due 03/15/2029* 767,000 783,337
LPL Holdings, Inc.Company Guar. Notes4.63% due 11/15/2027* 195,000 202,069
2,451,906Finance-Mortgage Loan/Banker - 0.1%
Genworth Mtg. Holdings, Inc.Senior Notes6.50% due 08/15/2025* 1,904,000 2,056,320
Quicken Loans LLC/Quicken Loans Co-Issuer, Inc.Company Guar. Notes3.63% due 03/01/2029* 970,000 990,612
Quicken Loans, Inc.Company Guar. Notes5.25% due 01/15/2028* 295,000 310,488
3,357,420Financial Guarantee Insurance - 0.1%
Assured Guaranty U.S. Holdings, Inc.Company Guar. Notes3.60% due 09/15/2051 824,000 850,171
Copyright © 2021 www.secdatabase.com. All Rights Reserved.Please Consider the Environment Before Printing This Document

NMI Holdings, Inc.Senior Sec. Notes7.38% due 06/01/2025* 711,000 804,319
1,654,490Food-Meat Products - 0.2%
Hormel Foods Corp.Senior Notes0.65% due 06/03/2024 1,400,000 1,402,446
Smithfield Foods, Inc.Company Guar. Notes4.25% due 02/01/2027* 1,620,000 1,775,421
Smithfield Foods, Inc.Senior Notes5.20% due 04/01/2029* 1,806,000 2,108,139
5,286,006Food-Misc./Diversified - 0.3%
Conagra Brands, Inc.Senior Notes7.00% due 10/01/2028 1,863,000 2,467,095
Copyright © 2021 www.secdatabase.com. All Rights Reserved.Please Consider the Environment Before Printing This Document
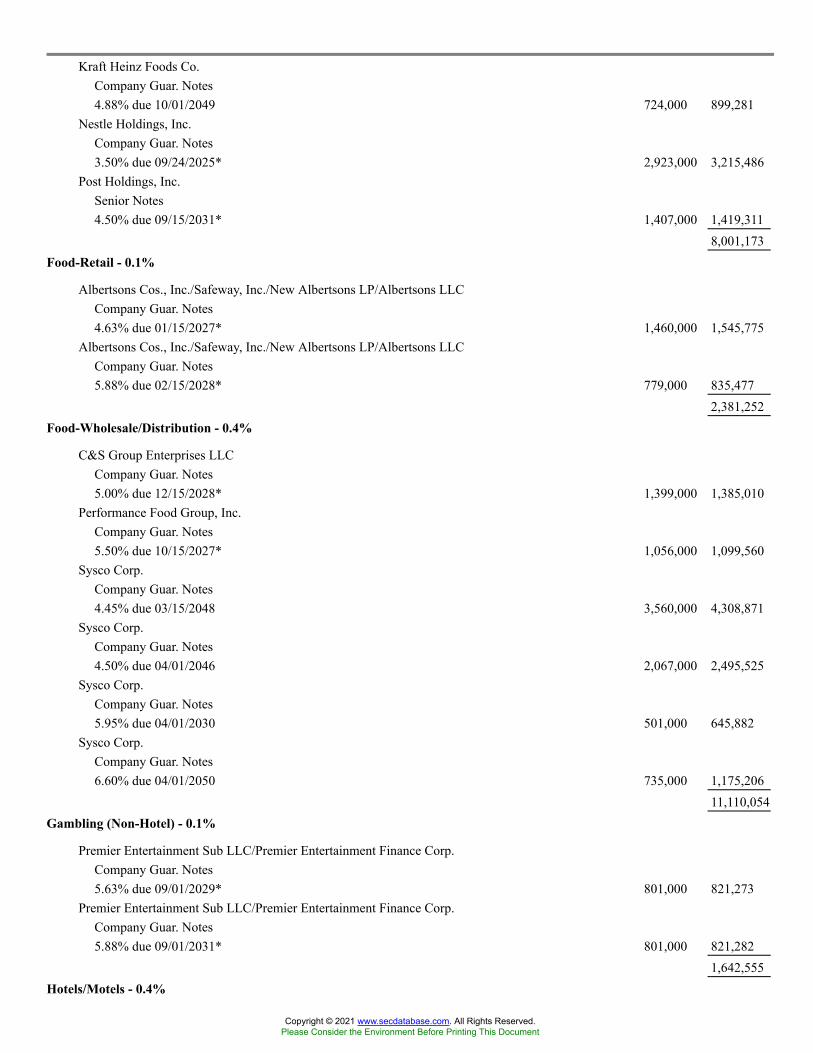
Kraft Heinz Foods Co.Company Guar. Notes4.88% due 10/01/2049 724,000 899,281
Nestle Holdings, Inc.Company Guar. Notes3.50% due 09/24/2025* 2,923,000 3,215,486
Post Holdings, Inc.Senior Notes4.50% due 09/15/2031* 1,407,000 1,419,311
8,001,173Food-Retail - 0.1%
Albertsons Cos., Inc./Safeway, Inc./New Albertsons LP/Albertsons LLCCompany Guar. Notes4.63% due 01/15/2027* 1,460,000 1,545,775
Albertsons Cos., Inc./Safeway, Inc./New Albertsons LP/Albertsons LLCCompany Guar. Notes5.88% due 02/15/2028* 779,000 835,477
2,381,252Food-Wholesale/Distribution - 0.4%
C&S Group Enterprises LLCCompany Guar. Notes5.00% due 12/15/2028* 1,399,000 1,385,010
Performance Food Group, Inc.Company Guar. Notes5.50% due 10/15/2027* 1,056,000 1,099,560
Sysco Corp.Company Guar. Notes4.45% due 03/15/2048 3,560,000 4,308,871
Sysco Corp.Company Guar. Notes4.50% due 04/01/2046 2,067,000 2,495,525
Sysco Corp.Company Guar. Notes5.95% due 04/01/2030 501,000 645,882
Sysco Corp.Company Guar. Notes6.60% due 04/01/2050 735,000 1,175,206
11,110,054Gambling (Non-Hotel) - 0.1%
Premier Entertainment Sub LLC/Premier Entertainment Finance Corp.Company Guar. Notes5.63% due 09/01/2029* 801,000 821,273
Premier Entertainment Sub LLC/Premier Entertainment Finance Corp.Company Guar. Notes5.88% due 09/01/2031* 801,000 821,282
1,642,555Hotels/Motels - 0.4%
Copyright © 2021 www.secdatabase.com. All Rights Reserved.Please Consider the Environment Before Printing This Document
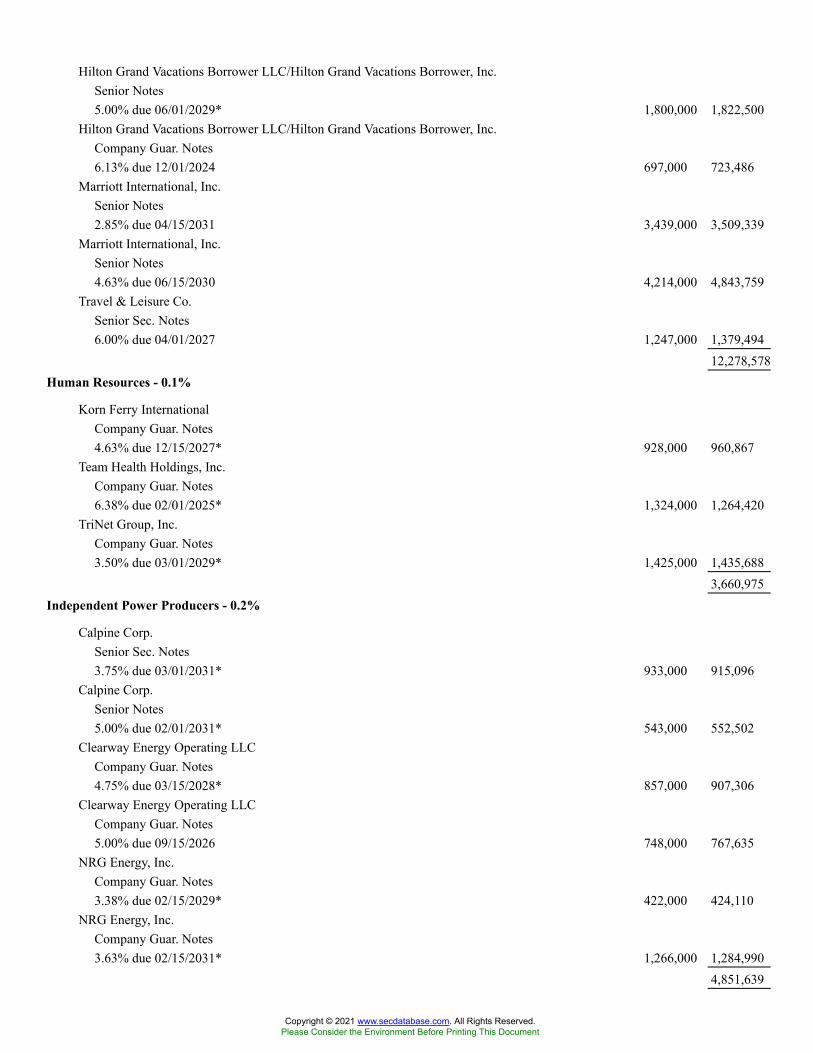
Hilton Grand Vacations Borrower LLC/Hilton Grand Vacations Borrower, Inc.Senior Notes5.00% due 06/01/2029* 1,800,000 1,822,500
Hilton Grand Vacations Borrower LLC/Hilton Grand Vacations Borrower, Inc.Company Guar. Notes6.13% due 12/01/2024 697,000 723,486
Marriott International, Inc.Senior Notes2.85% due 04/15/2031 3,439,000 3,509,339
Marriott International, Inc.Senior Notes4.63% due 06/15/2030 4,214,000 4,843,759
Travel & Leisure Co.Senior Sec. Notes6.00% due 04/01/2027 1,247,000 1,379,494
12,278,578Human Resources - 0.1%
Korn Ferry InternationalCompany Guar. Notes4.63% due 12/15/2027* 928,000 960,867
Team Health Holdings, Inc.Company Guar. Notes6.38% due 02/01/2025* 1,324,000 1,264,420
TriNet Group, Inc.Company Guar. Notes3.50% due 03/01/2029* 1,425,000 1,435,688
3,660,975Independent Power Producers - 0.2%
Calpine Corp.Senior Sec. Notes3.75% due 03/01/2031* 933,000 915,096
Calpine Corp.Senior Notes5.00% due 02/01/2031* 543,000 552,502
Clearway Energy Operating LLCCompany Guar. Notes4.75% due 03/15/2028* 857,000 907,306
Clearway Energy Operating LLCCompany Guar. Notes5.00% due 09/15/2026 748,000 767,635
NRG Energy, Inc.Company Guar. Notes3.38% due 02/15/2029* 422,000 424,110
NRG Energy, Inc.Company Guar. Notes3.63% due 02/15/2031* 1,266,000 1,284,990
4,851,639
Copyright © 2021 www.secdatabase.com. All Rights Reserved.Please Consider the Environment Before Printing This Document
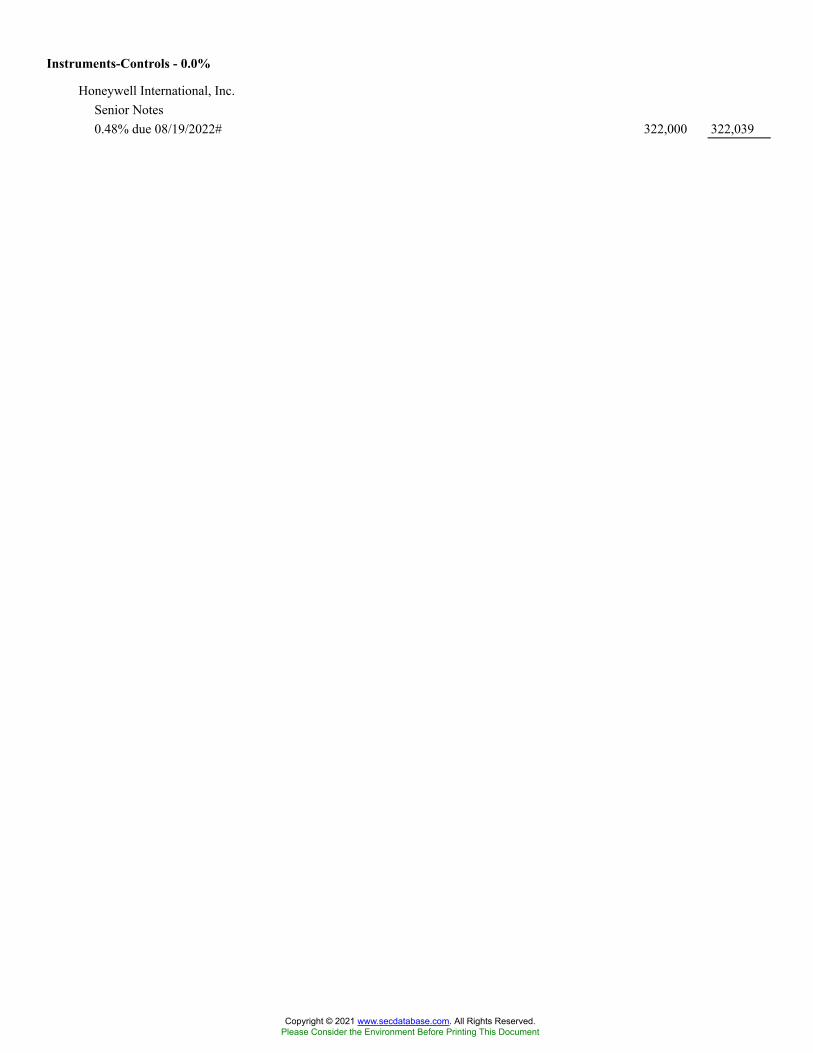
Instruments-Controls - 0.0%
Honeywell International, Inc.Senior Notes0.48% due 08/19/2022# 322,000 322,039
Copyright © 2021 www.secdatabase.com. All Rights Reserved.Please Consider the Environment Before Printing This Document
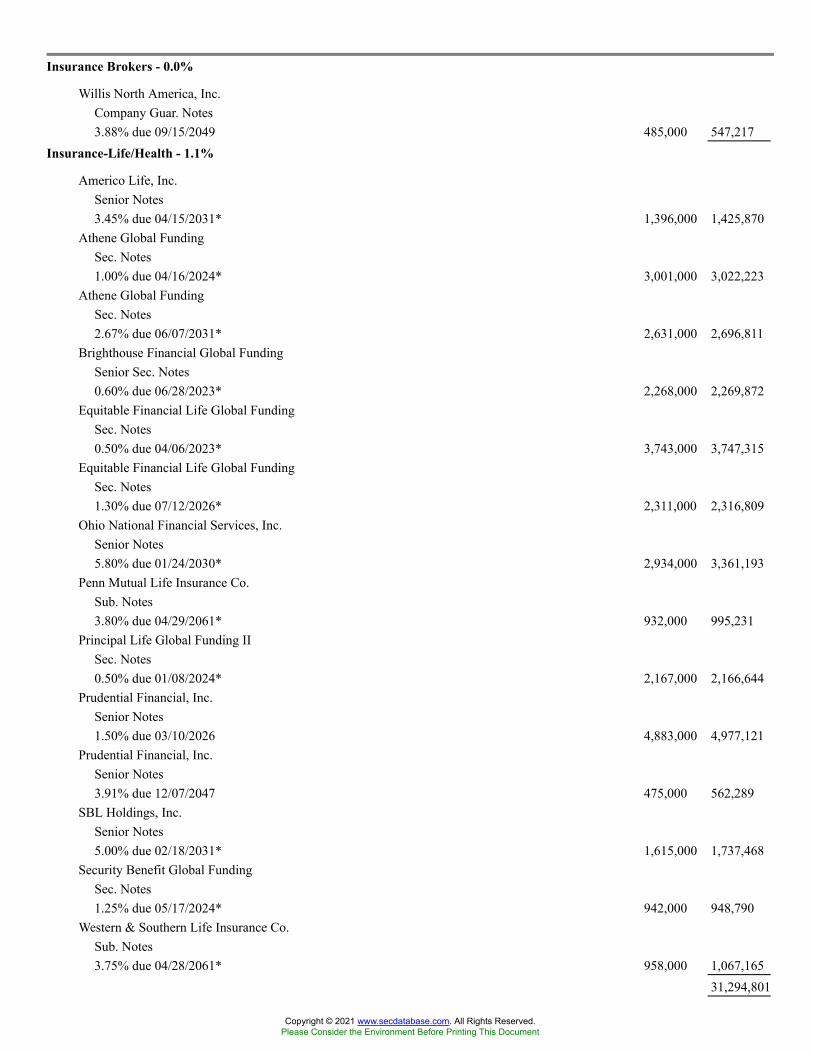
Insurance Brokers - 0.0%
Willis North America, Inc.Company Guar. Notes3.88% due 09/15/2049 485,000 547,217
Insurance-Life/Health - 1.1%
Americo Life, Inc.Senior Notes3.45% due 04/15/2031* 1,396,000 1,425,870
Athene Global FundingSec. Notes1.00% due 04/16/2024* 3,001,000 3,022,223
Athene Global FundingSec. Notes2.67% due 06/07/2031* 2,631,000 2,696,811
Brighthouse Financial Global FundingSenior Sec. Notes0.60% due 06/28/2023* 2,268,000 2,269,872
Equitable Financial Life Global FundingSec. Notes0.50% due 04/06/2023* 3,743,000 3,747,315
Equitable Financial Life Global FundingSec. Notes1.30% due 07/12/2026* 2,311,000 2,316,809
Ohio National Financial Services, Inc.Senior Notes5.80% due 01/24/2030* 2,934,000 3,361,193
Penn Mutual Life Insurance Co.Sub. Notes3.80% due 04/29/2061* 932,000 995,231
Principal Life Global Funding IISec. Notes0.50% due 01/08/2024* 2,167,000 2,166,644
Prudential Financial, Inc.Senior Notes1.50% due 03/10/2026 4,883,000 4,977,121
Prudential Financial, Inc.Senior Notes3.91% due 12/07/2047 475,000 562,289
SBL Holdings, Inc.Senior Notes5.00% due 02/18/2031* 1,615,000 1,737,468
Security Benefit Global FundingSec. Notes1.25% due 05/17/2024* 942,000 948,790
Western & Southern Life Insurance Co.Sub. Notes3.75% due 04/28/2061* 958,000 1,067,165
31,294,801
Copyright © 2021 www.secdatabase.com. All Rights Reserved.Please Consider the Environment Before Printing This Document

Insurance-Mutual - 0.1%
MassMutual Global Funding IISenior Sec. Notes2.75% due 06/22/2024* 1,494,000 1,582,884
Copyright © 2021 www.secdatabase.com. All Rights Reserved.Please Consider the Environment Before Printing This Document
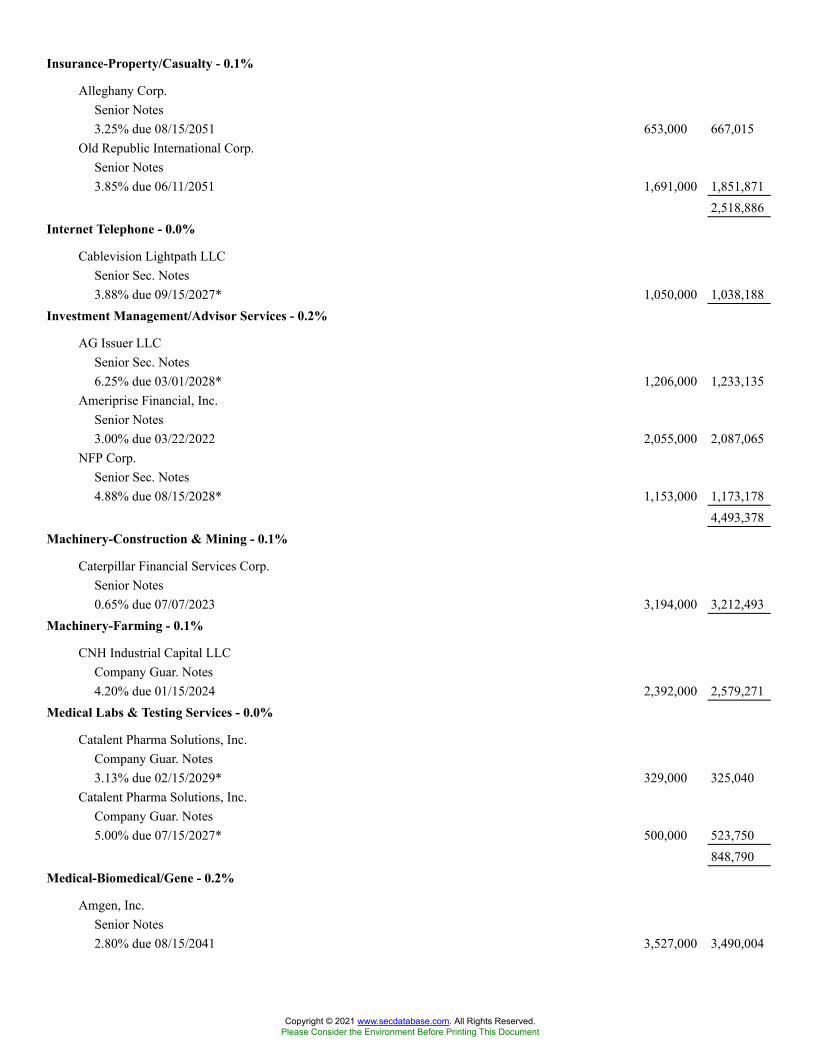
Insurance-Property/Casualty - 0.1%
Alleghany Corp.Senior Notes3.25% due 08/15/2051 653,000 667,015
Old Republic International Corp.Senior Notes3.85% due 06/11/2051 1,691,000 1,851,871
2,518,886Internet Telephone - 0.0%
Cablevision Lightpath LLCSenior Sec. Notes3.88% due 09/15/2027* 1,050,000 1,038,188
Investment Management/Advisor Services - 0.2%
AG Issuer LLCSenior Sec. Notes6.25% due 03/01/2028* 1,206,000 1,233,135
Ameriprise Financial, Inc.Senior Notes3.00% due 03/22/2022 2,055,000 2,087,065
NFP Corp.Senior Sec. Notes4.88% due 08/15/2028* 1,153,000 1,173,178
4,493,378Machinery-Construction & Mining - 0.1%
Caterpillar Financial Services Corp.Senior Notes0.65% due 07/07/2023 3,194,000 3,212,493
Machinery-Farming - 0.1%
CNH Industrial Capital LLCCompany Guar. Notes4.20% due 01/15/2024 2,392,000 2,579,271
Medical Labs & Testing Services - 0.0%
Catalent Pharma Solutions, Inc.Company Guar. Notes3.13% due 02/15/2029* 329,000 325,040
Catalent Pharma Solutions, Inc.Company Guar. Notes5.00% due 07/15/2027* 500,000 523,750
848,790Medical-Biomedical/Gene - 0.2%
Amgen, Inc.Senior Notes2.80% due 08/15/2041 3,527,000 3,490,004
Copyright © 2021 www.secdatabase.com. All Rights Reserved.Please Consider the Environment Before Printing This Document
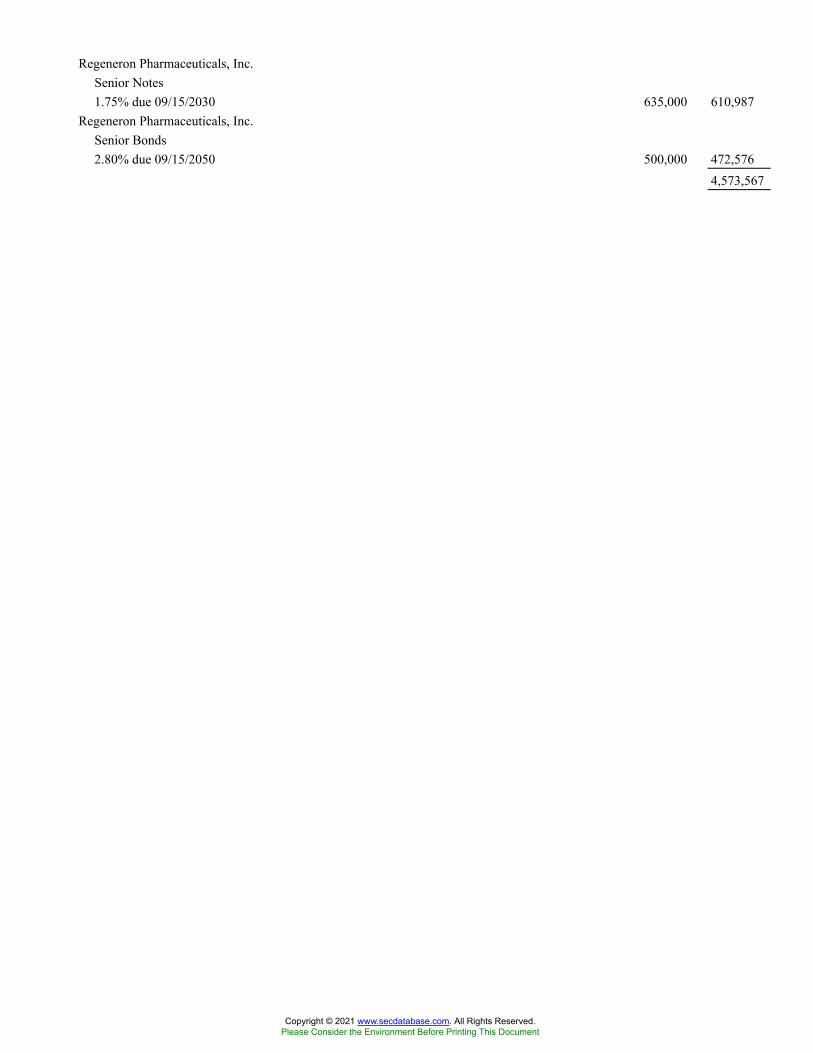
Regeneron Pharmaceuticals, Inc.Senior Notes1.75% due 09/15/2030 635,000 610,987
Regeneron Pharmaceuticals, Inc.Senior Bonds2.80% due 09/15/2050 500,000 472,576
4,573,567
Copyright © 2021 www.secdatabase.com. All Rights Reserved.Please Consider the Environment Before Printing This Document
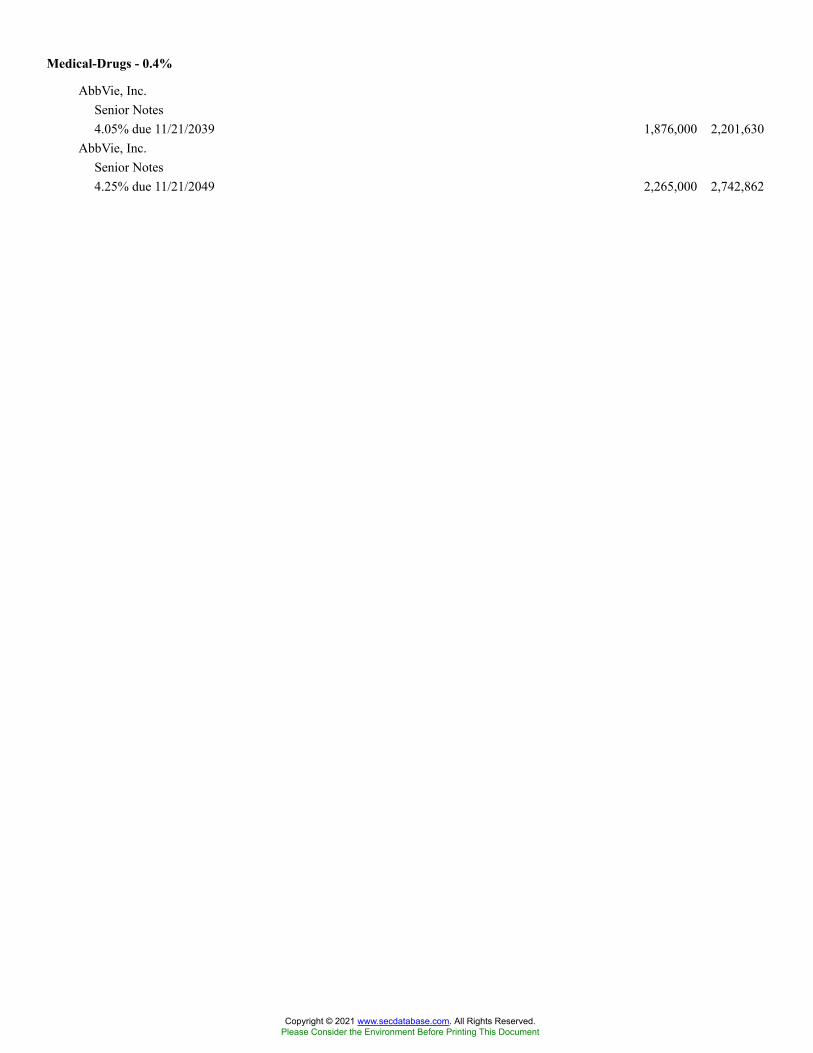
Medical-Drugs - 0.4%
AbbVie, Inc.Senior Notes4.05% due 11/21/2039 1,876,000 2,201,630
AbbVie, Inc.Senior Notes4.25% due 11/21/2049 2,265,000 2,742,862
Copyright © 2021 www.secdatabase.com. All Rights Reserved.Please Consider the Environment Before Printing This Document
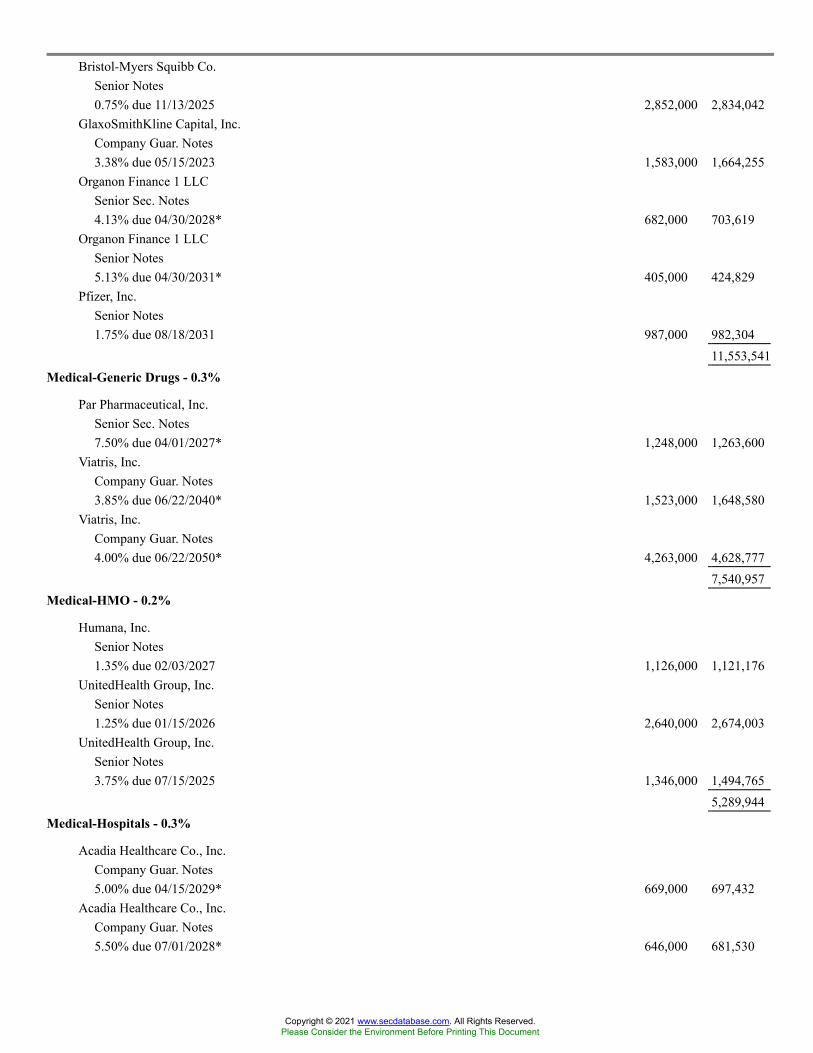
Bristol-Myers Squibb Co.Senior Notes0.75% due 11/13/2025 2,852,000 2,834,042
GlaxoSmithKline Capital, Inc.Company Guar. Notes3.38% due 05/15/2023 1,583,000 1,664,255
Organon Finance 1 LLCSenior Sec. Notes4.13% due 04/30/2028* 682,000 703,619
Organon Finance 1 LLCSenior Notes5.13% due 04/30/2031* 405,000 424,829
Pfizer, Inc.Senior Notes1.75% due 08/18/2031 987,000 982,304
11,553,541Medical-Generic Drugs - 0.3%
Par Pharmaceutical, Inc.Senior Sec. Notes7.50% due 04/01/2027* 1,248,000 1,263,600
Viatris, Inc.Company Guar. Notes3.85% due 06/22/2040* 1,523,000 1,648,580
Viatris, Inc.Company Guar. Notes4.00% due 06/22/2050* 4,263,000 4,628,777
7,540,957Medical-HMO - 0.2%
Humana, Inc.Senior Notes1.35% due 02/03/2027 1,126,000 1,121,176
UnitedHealth Group, Inc.Senior Notes1.25% due 01/15/2026 2,640,000 2,674,003
UnitedHealth Group, Inc.Senior Notes3.75% due 07/15/2025 1,346,000 1,494,765
5,289,944Medical-Hospitals - 0.3%
Acadia Healthcare Co., Inc.Company Guar. Notes5.00% due 04/15/2029* 669,000 697,432
Acadia Healthcare Co., Inc.Company Guar. Notes5.50% due 07/01/2028* 646,000 681,530
Copyright © 2021 www.secdatabase.com. All Rights Reserved.Please Consider the Environment Before Printing This Document

CHS/Community Health Systems, Inc.Senior Sec. Notes5.63% due 03/15/2027* 912,000 962,160
HCA, Inc.Company Guar. Notes3.50% due 09/01/2030 2,599,000 2,788,831
HCA, Inc.Senior Sec. Notes3.50% due 07/15/2051 1,829,000 1,865,979
LifePoint Health, Inc.Senior Sec. Notes4.38% due 02/15/2027* 1,156,000 1,153,110
Tenet Healthcare Corp.Senior Sec. Notes4.63% due 07/15/2024 953,000 966,104
9,115,146Medical-Wholesale Drug Distribution - 0.1%
Cardinal Health, Inc.Senior Notes4.60% due 03/15/2043 2,962,000 3,494,610
Metal-Copper - 0.1%
Freeport-McMoRan, Inc.Company Guar. Notes4.13% due 03/01/2028 367,000 383,515
Freeport-McMoRan, Inc.Company Guar. Notes4.63% due 08/01/2030 503,000 553,929
Freeport-McMoRan, Inc.Company Guar. Notes5.25% due 09/01/2029 527,000 583,231
1,520,675Multimedia - 0.3%
Viacom, Inc.Senior Notes4.38% due 03/15/2043 6,567,000 7,672,592
Walt Disney Co.Company Guar. Bonds2.75% due 09/01/2049 1,989,000 1,978,588
9,651,180Non-Profit Charity - 0.1%
Ford FoundationNotes2.82% due 06/01/2070 1,693,000 1,728,760
Oil Companies-Exploration & Production - 1.2%
Copyright © 2021 www.secdatabase.com. All Rights Reserved.Please Consider the Environment Before Printing This Document
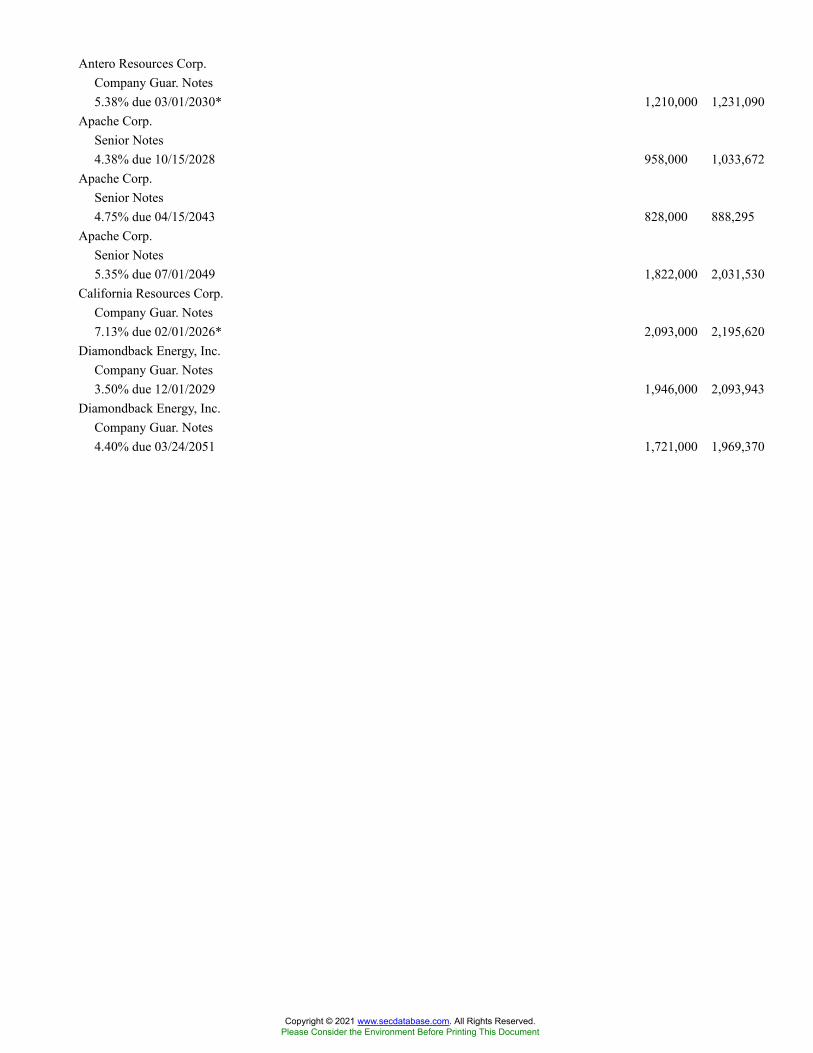
Antero Resources Corp.Company Guar. Notes5.38% due 03/01/2030* 1,210,000 1,231,090
Apache Corp.Senior Notes4.38% due 10/15/2028 958,000 1,033,672
Apache Corp.Senior Notes4.75% due 04/15/2043 828,000 888,295
Apache Corp.Senior Notes5.35% due 07/01/2049 1,822,000 2,031,530
California Resources Corp.Company Guar. Notes7.13% due 02/01/2026* 2,093,000 2,195,620
Diamondback Energy, Inc.Company Guar. Notes3.50% due 12/01/2029 1,946,000 2,093,943
Diamondback Energy, Inc.Company Guar. Notes4.40% due 03/24/2051 1,721,000 1,969,370
Copyright © 2021 www.secdatabase.com. All Rights Reserved.Please Consider the Environment Before Printing This Document
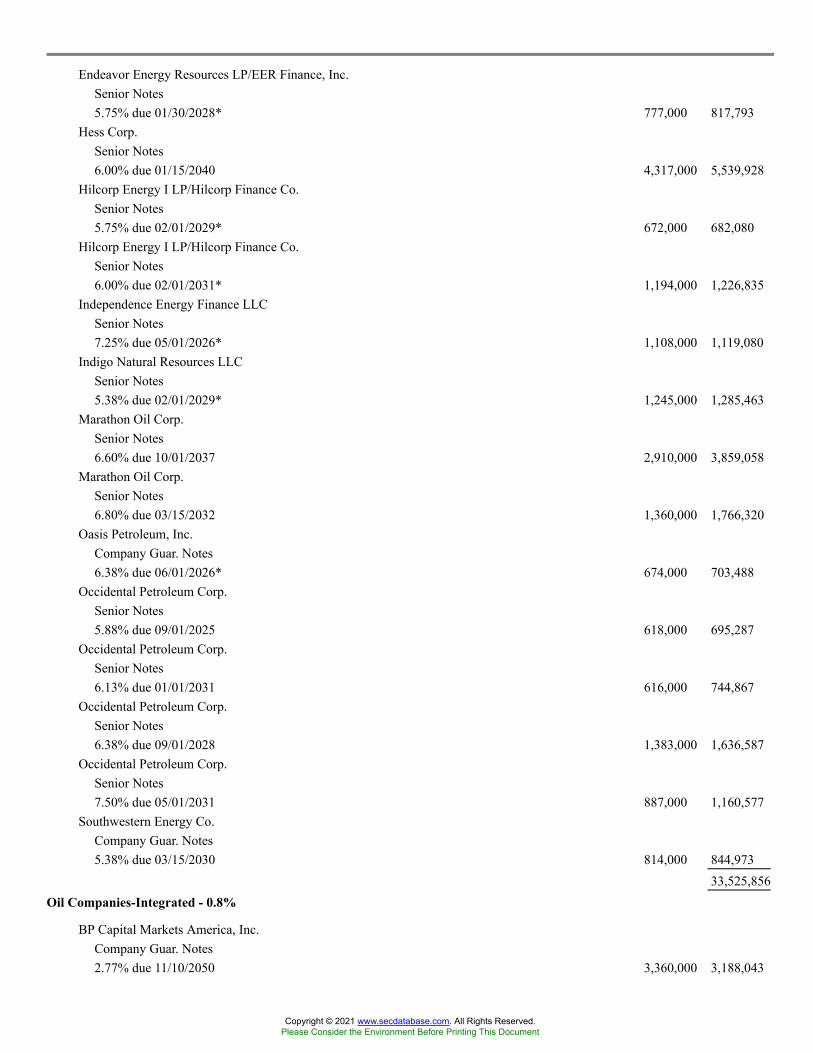
Endeavor Energy Resources LP/EER Finance, Inc.Senior Notes5.75% due 01/30/2028* 777,000 817,793
Hess Corp.Senior Notes6.00% due 01/15/2040 4,317,000 5,539,928
Hilcorp Energy I LP/Hilcorp Finance Co.Senior Notes5.75% due 02/01/2029* 672,000 682,080
Hilcorp Energy I LP/Hilcorp Finance Co.Senior Notes6.00% due 02/01/2031* 1,194,000 1,226,835
Independence Energy Finance LLCSenior Notes7.25% due 05/01/2026* 1,108,000 1,119,080
Indigo Natural Resources LLCSenior Notes5.38% due 02/01/2029* 1,245,000 1,285,463
Marathon Oil Corp.Senior Notes6.60% due 10/01/2037 2,910,000 3,859,058
Marathon Oil Corp.Senior Notes6.80% due 03/15/2032 1,360,000 1,766,320
Oasis Petroleum, Inc.Company Guar. Notes6.38% due 06/01/2026* 674,000 703,488
Occidental Petroleum Corp.Senior Notes5.88% due 09/01/2025 618,000 695,287
Occidental Petroleum Corp.Senior Notes6.13% due 01/01/2031 616,000 744,867
Occidental Petroleum Corp.Senior Notes6.38% due 09/01/2028 1,383,000 1,636,587
Occidental Petroleum Corp.Senior Notes7.50% due 05/01/2031 887,000 1,160,577
Southwestern Energy Co.Company Guar. Notes5.38% due 03/15/2030 814,000 844,973
33,525,856Oil Companies-Integrated - 0.8%
BP Capital Markets America, Inc.Company Guar. Notes2.77% due 11/10/2050 3,360,000 3,188,043
Copyright © 2021 www.secdatabase.com. All Rights Reserved.Please Consider the Environment Before Printing This Document
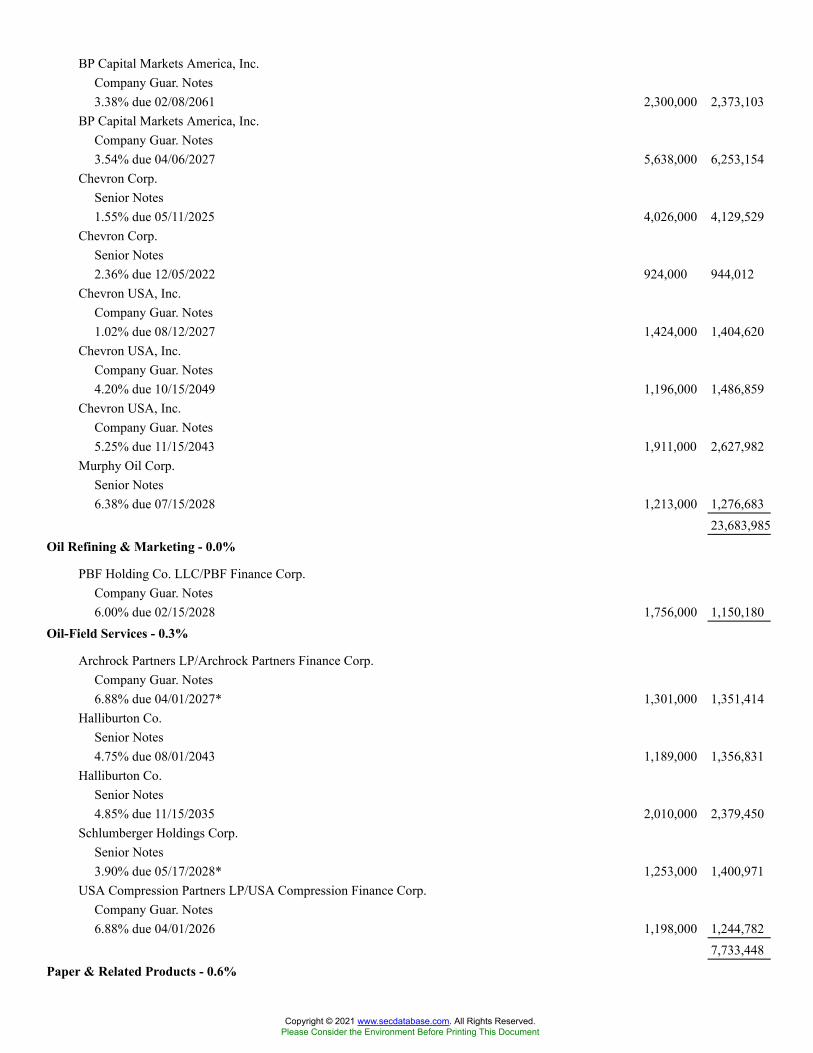
BP Capital Markets America, Inc.Company Guar. Notes3.38% due 02/08/2061 2,300,000 2,373,103
BP Capital Markets America, Inc.Company Guar. Notes3.54% due 04/06/2027 5,638,000 6,253,154
Chevron Corp.Senior Notes1.55% due 05/11/2025 4,026,000 4,129,529
Chevron Corp.Senior Notes2.36% due 12/05/2022 924,000 944,012
Chevron USA, Inc.Company Guar. Notes1.02% due 08/12/2027 1,424,000 1,404,620
Chevron USA, Inc.Company Guar. Notes4.20% due 10/15/2049 1,196,000 1,486,859
Chevron USA, Inc.Company Guar. Notes5.25% due 11/15/2043 1,911,000 2,627,982
Murphy Oil Corp.Senior Notes6.38% due 07/15/2028 1,213,000 1,276,683
23,683,985Oil Refining & Marketing - 0.0%
PBF Holding Co. LLC/PBF Finance Corp.Company Guar. Notes6.00% due 02/15/2028 1,756,000 1,150,180
Oil-Field Services - 0.3%
Archrock Partners LP/Archrock Partners Finance Corp.Company Guar. Notes6.88% due 04/01/2027* 1,301,000 1,351,414
Halliburton Co.Senior Notes4.75% due 08/01/2043 1,189,000 1,356,831
Halliburton Co.Senior Notes4.85% due 11/15/2035 2,010,000 2,379,450
Schlumberger Holdings Corp.Senior Notes3.90% due 05/17/2028* 1,253,000 1,400,971
USA Compression Partners LP/USA Compression Finance Corp.Company Guar. Notes6.88% due 04/01/2026 1,198,000 1,244,782
7,733,448Paper & Related Products - 0.6%
Copyright © 2021 www.secdatabase.com. All Rights Reserved.Please Consider the Environment Before Printing This Document
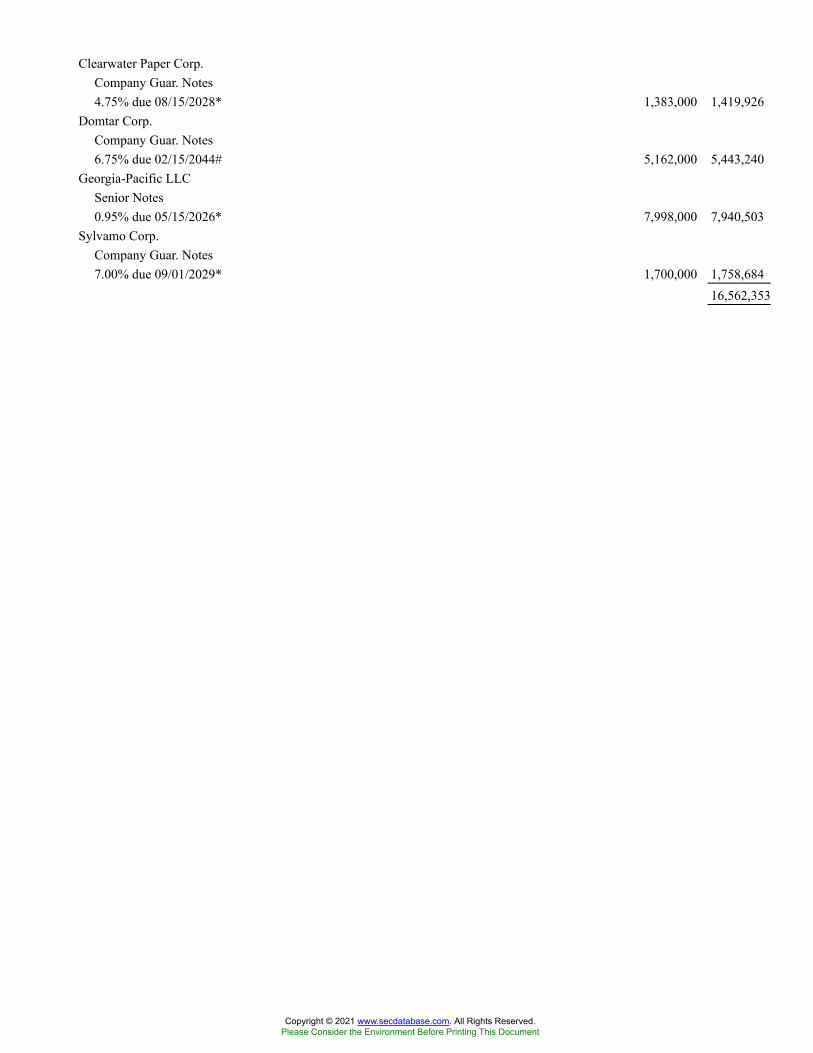
Clearwater Paper Corp.Company Guar. Notes4.75% due 08/15/2028* 1,383,000 1,419,926
Domtar Corp.Company Guar. Notes6.75% due 02/15/2044# 5,162,000 5,443,240
Georgia-Pacific LLCSenior Notes0.95% due 05/15/2026* 7,998,000 7,940,503
Sylvamo Corp.Company Guar. Notes7.00% due 09/01/2029* 1,700,000 1,758,684
16,562,353
Copyright © 2021 www.secdatabase.com. All Rights Reserved.Please Consider the Environment Before Printing This Document
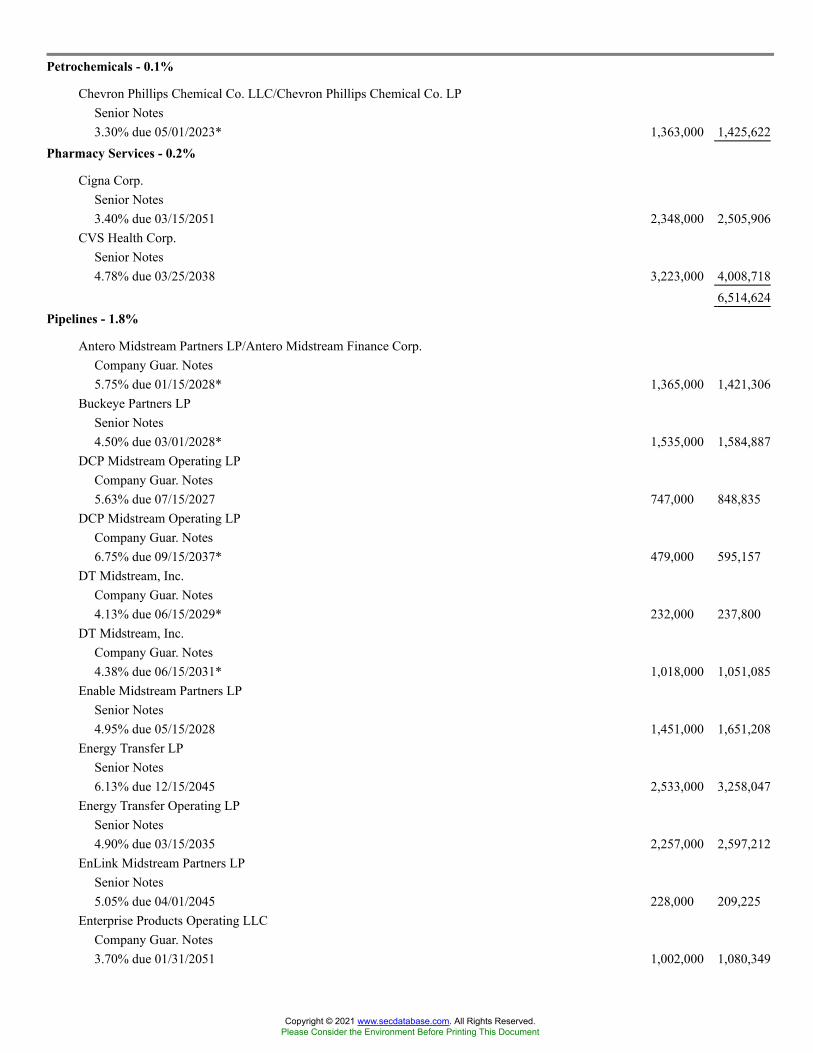
Petrochemicals - 0.1%
Chevron Phillips Chemical Co. LLC/Chevron Phillips Chemical Co. LPSenior Notes3.30% due 05/01/2023* 1,363,000 1,425,622
Pharmacy Services - 0.2%
Cigna Corp.Senior Notes3.40% due 03/15/2051 2,348,000 2,505,906
CVS Health Corp.Senior Notes4.78% due 03/25/2038 3,223,000 4,008,718
6,514,624Pipelines - 1.8%
Antero Midstream Partners LP/Antero Midstream Finance Corp.Company Guar. Notes5.75% due 01/15/2028* 1,365,000 1,421,306
Buckeye Partners LPSenior Notes4.50% due 03/01/2028* 1,535,000 1,584,887
DCP Midstream Operating LPCompany Guar. Notes5.63% due 07/15/2027 747,000 848,835
DCP Midstream Operating LPCompany Guar. Notes6.75% due 09/15/2037* 479,000 595,157
DT Midstream, Inc.Company Guar. Notes4.13% due 06/15/2029* 232,000 237,800
DT Midstream, Inc.Company Guar. Notes4.38% due 06/15/2031* 1,018,000 1,051,085
Enable Midstream Partners LPSenior Notes4.95% due 05/15/2028 1,451,000 1,651,208
Energy Transfer LPSenior Notes6.13% due 12/15/2045 2,533,000 3,258,047
Energy Transfer Operating LPSenior Notes4.90% due 03/15/2035 2,257,000 2,597,212
EnLink Midstream Partners LPSenior Notes5.05% due 04/01/2045 228,000 209,225
Enterprise Products Operating LLCCompany Guar. Notes3.70% due 01/31/2051 1,002,000 1,080,349
Copyright © 2021 www.secdatabase.com. All Rights Reserved.Please Consider the Environment Before Printing This Document
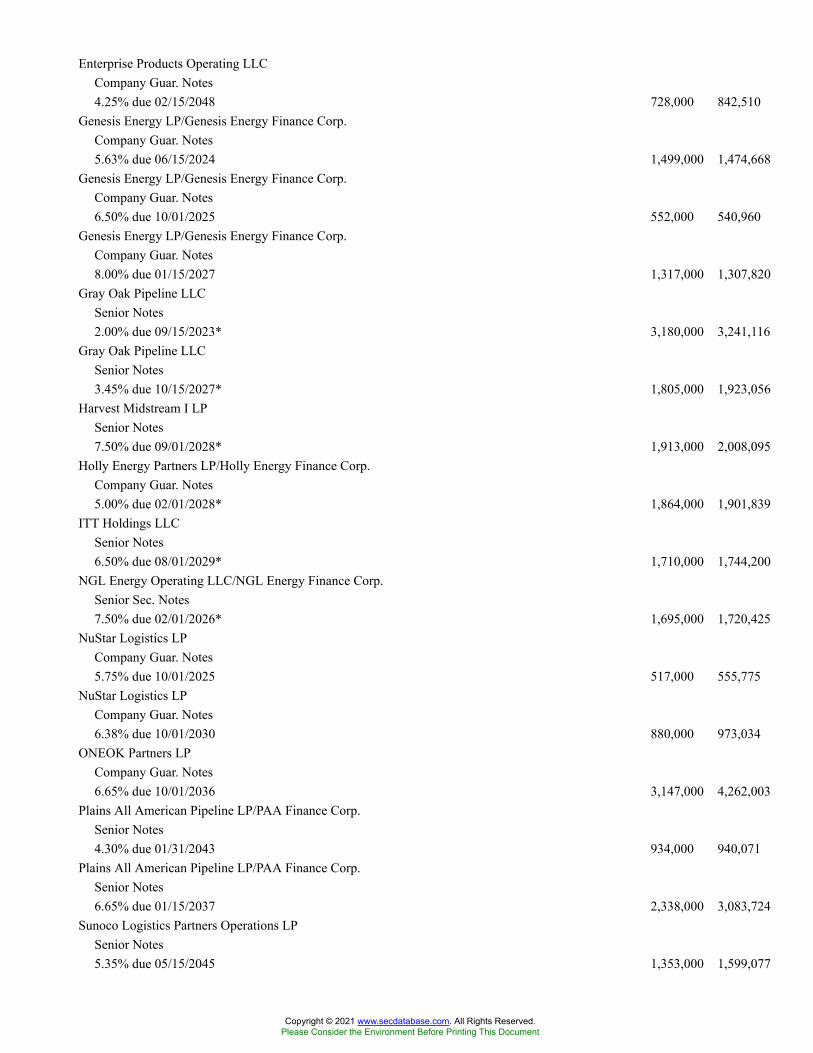
Enterprise Products Operating LLCCompany Guar. Notes4.25% due 02/15/2048 728,000 842,510
Genesis Energy LP/Genesis Energy Finance Corp.Company Guar. Notes5.63% due 06/15/2024 1,499,000 1,474,668
Genesis Energy LP/Genesis Energy Finance Corp.Company Guar. Notes6.50% due 10/01/2025 552,000 540,960
Genesis Energy LP/Genesis Energy Finance Corp.Company Guar. Notes8.00% due 01/15/2027 1,317,000 1,307,820
Gray Oak Pipeline LLCSenior Notes2.00% due 09/15/2023* 3,180,000 3,241,116
Gray Oak Pipeline LLCSenior Notes3.45% due 10/15/2027* 1,805,000 1,923,056
Harvest Midstream I LPSenior Notes7.50% due 09/01/2028* 1,913,000 2,008,095
Holly Energy Partners LP/Holly Energy Finance Corp.Company Guar. Notes5.00% due 02/01/2028* 1,864,000 1,901,839
ITT Holdings LLCSenior Notes6.50% due 08/01/2029* 1,710,000 1,744,200
NGL Energy Operating LLC/NGL Energy Finance Corp.Senior Sec. Notes7.50% due 02/01/2026* 1,695,000 1,720,425
NuStar Logistics LPCompany Guar. Notes5.75% due 10/01/2025 517,000 555,775
NuStar Logistics LPCompany Guar. Notes6.38% due 10/01/2030 880,000 973,034
ONEOK Partners LPCompany Guar. Notes6.65% due 10/01/2036 3,147,000 4,262,003
Plains All American Pipeline LP/PAA Finance Corp.Senior Notes4.30% due 01/31/2043 934,000 940,071
Plains All American Pipeline LP/PAA Finance Corp.Senior Notes6.65% due 01/15/2037 2,338,000 3,083,724
Sunoco Logistics Partners Operations LPSenior Notes5.35% due 05/15/2045 1,353,000 1,599,077
Copyright © 2021 www.secdatabase.com. All Rights Reserved.Please Consider the Environment Before Printing This Document
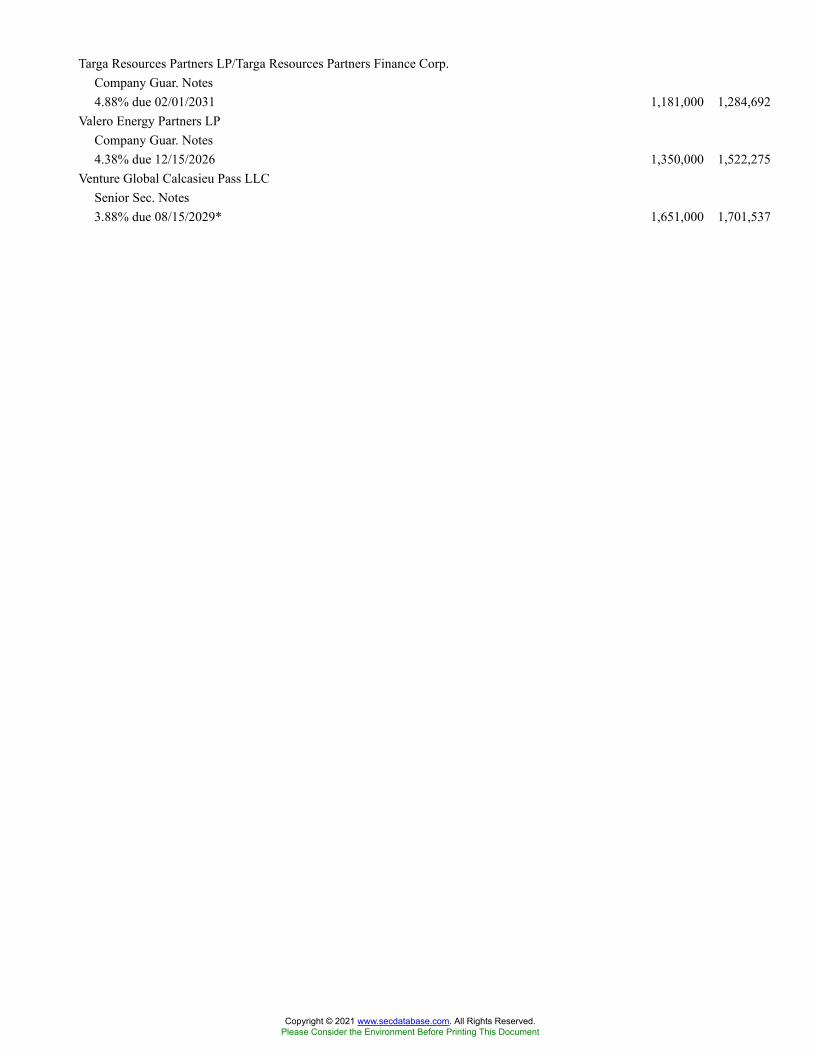
Targa Resources Partners LP/Targa Resources Partners Finance Corp.Company Guar. Notes4.88% due 02/01/2031 1,181,000 1,284,692
Valero Energy Partners LPCompany Guar. Notes4.38% due 12/15/2026 1,350,000 1,522,275
Venture Global Calcasieu Pass LLCSenior Sec. Notes3.88% due 08/15/2029* 1,651,000 1,701,537
Copyright © 2021 www.secdatabase.com. All Rights Reserved.Please Consider the Environment Before Printing This Document
Williams Cos., Inc.Senior Notes5.75% due 06/24/2044 2,864,000 3,818,812
50,980,800Poultry - 0.1%
Pilgrim�s Pride Corp.Company Guar. Notes5.88% due 09/30/2027* 917,000 978,686
Simmons Foods, Inc.Sec. Notes4.63% due 03/01/2029* 964,000 981,015
1,959,701Printing-Commercial - 0.1%
Deluxe Corp.Company Guar. Notes8.00% due 06/01/2029* 1,345,000 1,440,159
Protection/Safety - 0.1%
APX Group, Inc.Company Guar. Notes5.75% due 07/15/2029* 1,425,000 1,425,000
Prime Security Services Borrower LLC/Prime Finance, Inc.Senior Sec. Notes3.38% due 08/31/2027* 973,000 938,901
Prime Security Services Borrower LLC/Prime Finance, Inc.Senior Sec. Notes5.75% due 04/15/2026* 435,000 470,600
2,834,501Real Estate Investment Trusts - 1.2%
Boston Properties LPSenior Notes2.55% due 04/01/2032 1,064,000 1,076,362
Brixmor Operating Partnership LPSenior Notes2.50% due 08/16/2031 736,000 740,096
Columbia Property Trust Operating Partnership LPCompany Guar. Notes4.15% due 04/01/2025 2,217,000 2,396,531
CTR Partnership LP/CareTrust Capital Corp.Company Guar. Notes3.88% due 06/30/2028* 680,000 698,700
Federal Realty Investment TrustSenior Notes1.25% due 02/15/2026 1,450,000 1,446,310
HAT Holdings I LLC/HAT Holdings II LLCCompany Guar. Notes3.38% due 06/15/2026* 715,000 728,621
Copyright © 2021 www.secdatabase.com. All Rights Reserved.Please Consider the Environment Before Printing This Document
HAT Holdings I LLC/HAT Holdings II LLCCompany Guar. Notes6.00% due 04/15/2025* 947,000 997,901
Hospitality Properties TrustSenior Notes4.38% due 02/15/2030 1,747,000 1,678,090
Host Hotels & Resorts LPSenior Notes3.50% due 09/15/2030 4,253,000 4,481,136
Ladder Capital Finance Holdings LLLP/Ladder Capital Finance Corp.Company Guar. Notes4.25% due 02/01/2027* 1,836,000 1,845,180
Ladder Capital Finance Holdings LLLP/Ladder Capital Finance Corp.Company Guar. Notes4.75% due 06/15/2029* 345,000 352,762
Lexington Realty TrustCompany Guar. Notes2.38% due 10/01/2031 1,602,000 1,588,802
MPT Operating Partnership LP/MPT Finance Corp.Company Guar. Notes3.50% due 03/15/2031 694,000 713,501
MPT Operating Partnership LP/MPT Finance Corp.Company Guar. Notes5.00% due 10/15/2027 137,000 145,049
National Health Investors, Inc.Company Guar. Notes3.00% due 02/01/2031 1,430,000 1,416,876
Omega Healthcare Investors, Inc.Company Guar. Notes3.25% due 04/15/2033 3,439,000 3,471,606
Omega Healthcare Investors, Inc.Company Guar. Notes3.38% due 02/01/2031 1,795,000 1,851,606
Park Intermediate Holdings LLC/PK Domestic Property LLC/PK Finance Co-IssuerSenior Sec. Notes4.88% due 05/15/2029* 281,000 288,885
Park Intermediate Holdings LLC/PK Domestic Property LLC/PK Finance Co-IssuerSenior Sec. Notes5.88% due 10/01/2028* 680,000 724,200
Piedmont Operating Partnership LPCompany Guar. Notes3.15% due 08/15/2030 634,000 653,825
Rexford Industrial Realty LPCompany Guar. Notes2.15% due 09/01/2031 1,126,000 1,106,777
Service Properties TrustSenior Notes3.95% due 01/15/2028 48,000 45,600
Copyright © 2021 www.secdatabase.com. All Rights Reserved.Please Consider the Environment Before Printing This Document
Service Properties TrustSenior Notes4.75% due 10/01/2026 148,000 147,630
Service Properties TrustSenior Notes4.95% due 10/01/2029 155,000 152,287
Copyright © 2021 www.secdatabase.com. All Rights Reserved.Please Consider the Environment Before Printing This Document
Service Properties TrustSenior Notes5.25% due 02/15/2026 288,000 295,200
Service Properties TrustCompany Guar. Notes5.50% due 12/15/2027 78,000 83,677
Spirit Realty LPCompany Guar. Notes2.70% due 02/15/2032 522,000 525,822
Starwood Property Trust, Inc.Senior Notes3.63% due 07/15/2026* 350,000 352,187
Starwood Property Trust, Inc.Senior Notes4.75% due 03/15/2025# 1,739,000 1,821,602
Tanger Properties LPSenior Notes2.75% due 09/01/2031 1,127,000 1,099,355
Vornado Realty LPSenior Notes2.15% due 06/01/2026 734,000 751,482
Vornado Realty LPSenior Notes3.40% due 06/01/2031 67,000 70,019
Welltower, Inc.Senior Notes2.80% due 06/01/2031 618,000 646,727
34,394,404Real Estate Management/Services - 0.0%
Cushman & Wakefield US Borrower LLCSenior Sec. Notes6.75% due 05/15/2028* 1,266,000 1,370,964
Real Estate Operations & Development - 0.1%
Kennedy-Wilson, Inc.Company Guar. Notes4.75% due 03/01/2029 1,072,000 1,102,788
Kennedy-Wilson, Inc.Company Guar. Notes4.75% due 02/01/2030 750,000 770,460
1,873,248Recreational Vehicles - 0.1%
Brunswick Corp.Senior Notes2.40% due 08/18/2031 2,027,000 1,990,553
Recycling - 0.0%
Copyright © 2021 www.secdatabase.com. All Rights Reserved.Please Consider the Environment Before Printing This Document

Harsco Corp.Company Guar. Notes5.75% due 07/31/2027* 1,320,000 1,369,500
Rental Auto/Equipment - 0.1%
Ahern Rentals, Inc.Sec. Notes7.38% due 05/15/2023*# 1,495,000 1,458,372
Copyright © 2021 www.secdatabase.com. All Rights Reserved.Please Consider the Environment Before Printing This Document
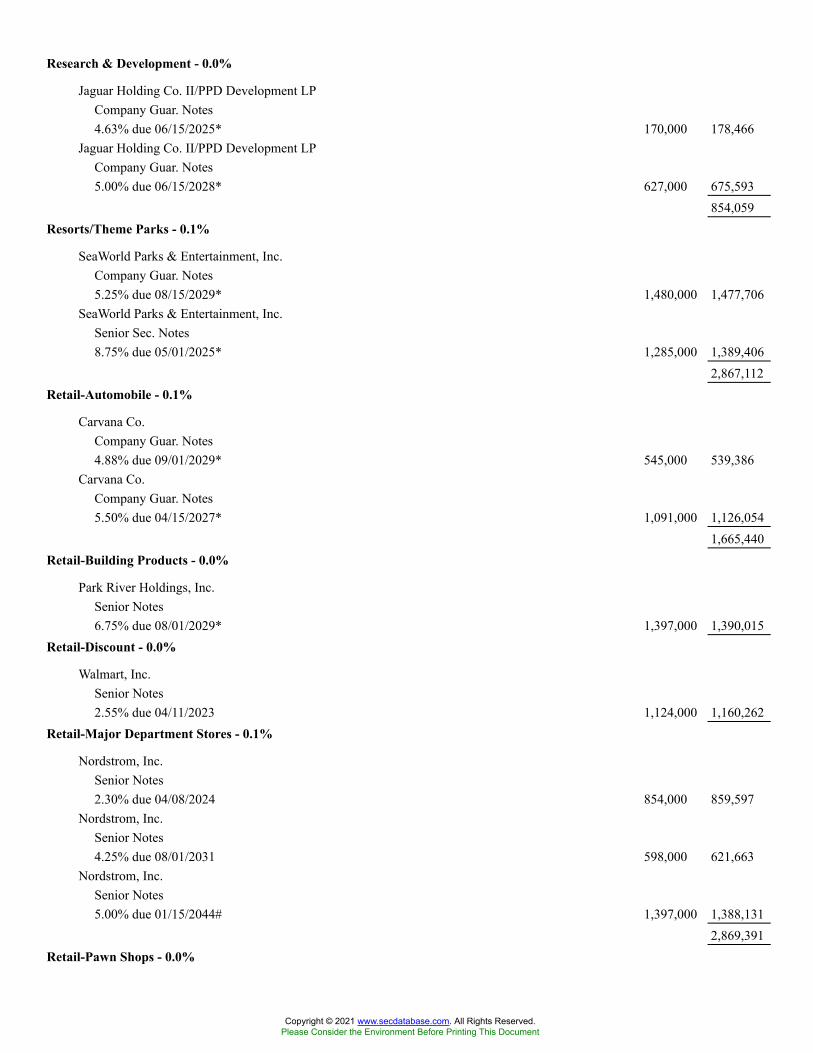
Research & Development - 0.0%
Jaguar Holding Co. II/PPD Development LPCompany Guar. Notes4.63% due 06/15/2025* 170,000 178,466
Jaguar Holding Co. II/PPD Development LPCompany Guar. Notes5.00% due 06/15/2028* 627,000 675,593
854,059Resorts/Theme Parks - 0.1%
SeaWorld Parks & Entertainment, Inc.Company Guar. Notes5.25% due 08/15/2029* 1,480,000 1,477,706
SeaWorld Parks & Entertainment, Inc.Senior Sec. Notes8.75% due 05/01/2025* 1,285,000 1,389,406
2,867,112Retail-Automobile - 0.1%
Carvana Co.Company Guar. Notes4.88% due 09/01/2029* 545,000 539,386
Carvana Co.Company Guar. Notes5.50% due 04/15/2027* 1,091,000 1,126,054
1,665,440Retail-Building Products - 0.0%
Park River Holdings, Inc.Senior Notes6.75% due 08/01/2029* 1,397,000 1,390,015
Retail-Discount - 0.0%
Walmart, Inc.Senior Notes2.55% due 04/11/2023 1,124,000 1,160,262
Retail-Major Department Stores - 0.1%
Nordstrom, Inc.Senior Notes2.30% due 04/08/2024 854,000 859,597
Nordstrom, Inc.Senior Notes4.25% due 08/01/2031 598,000 621,663
Nordstrom, Inc.Senior Notes5.00% due 01/15/2044# 1,397,000 1,388,131
2,869,391Retail-Pawn Shops - 0.0%
Copyright © 2021 www.secdatabase.com. All Rights Reserved.Please Consider the Environment Before Printing This Document
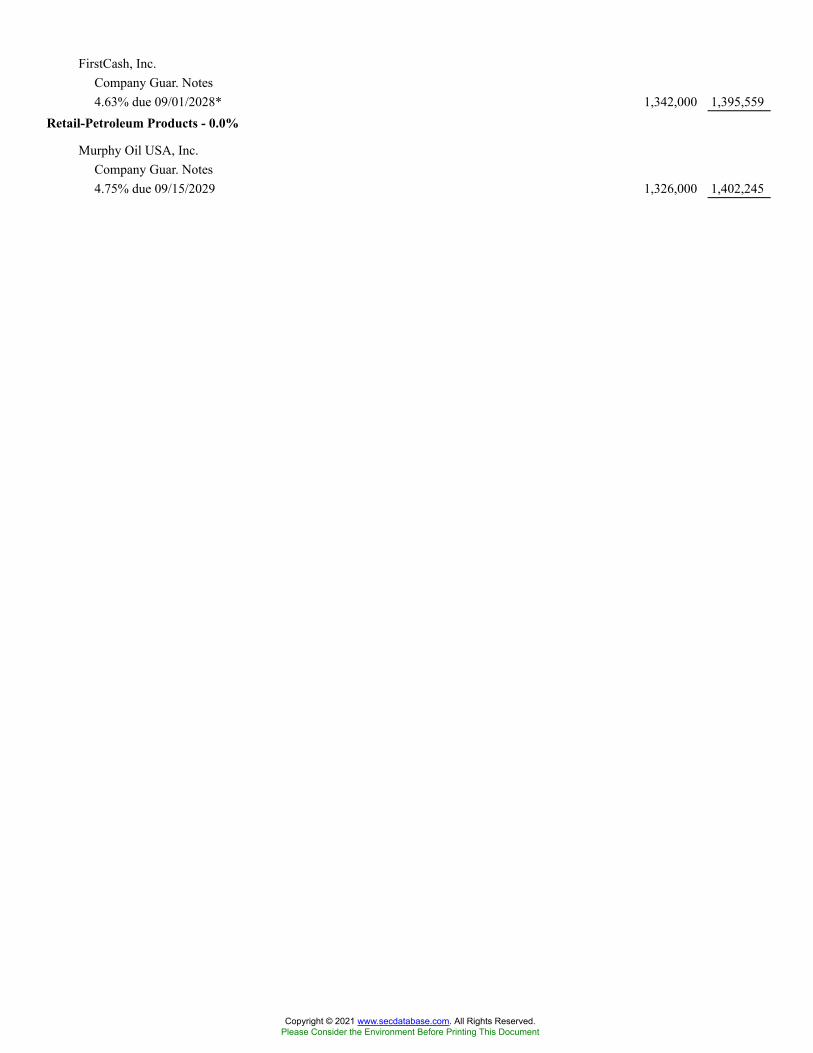
FirstCash, Inc.Company Guar. Notes4.63% due 09/01/2028* 1,342,000 1,395,559
Retail-Petroleum Products - 0.0%
Murphy Oil USA, Inc.Company Guar. Notes4.75% due 09/15/2029 1,326,000 1,402,245
Copyright © 2021 www.secdatabase.com. All Rights Reserved.Please Consider the Environment Before Printing This Document
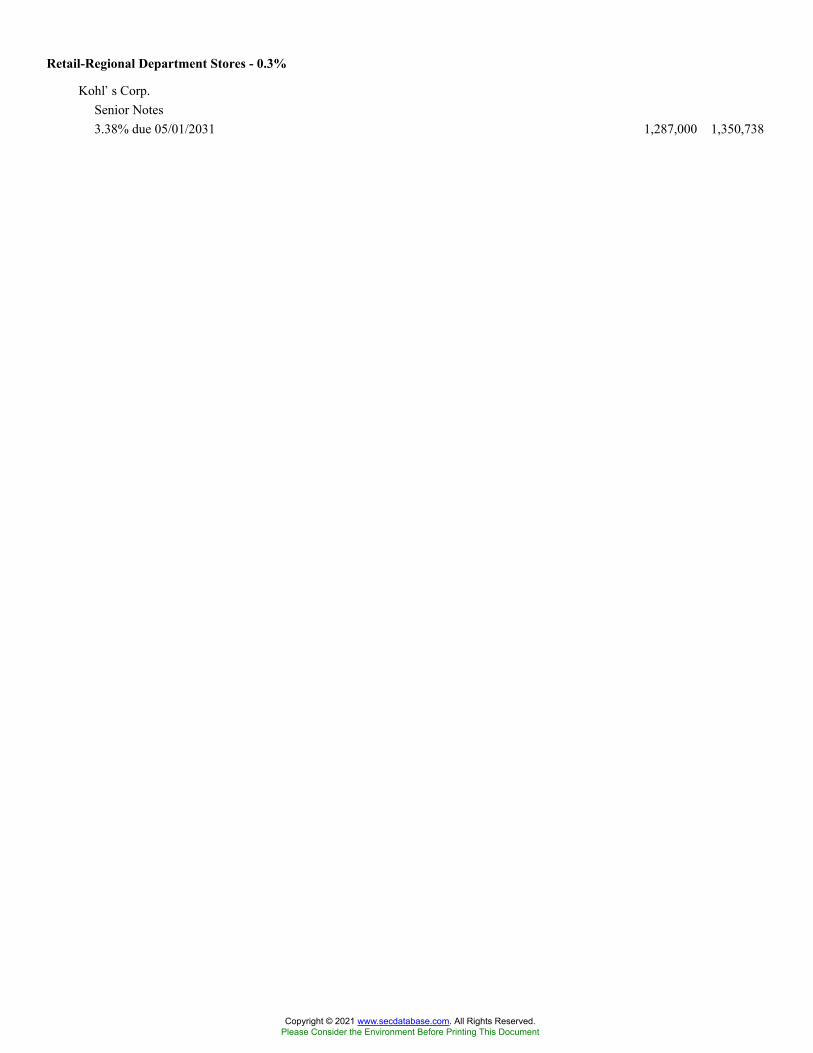
Retail-Regional Department Stores - 0.3%
Kohl�s Corp.Senior Notes3.38% due 05/01/2031 1,287,000 1,350,738
Copyright © 2021 www.secdatabase.com. All Rights Reserved.Please Consider the Environment Before Printing This Document
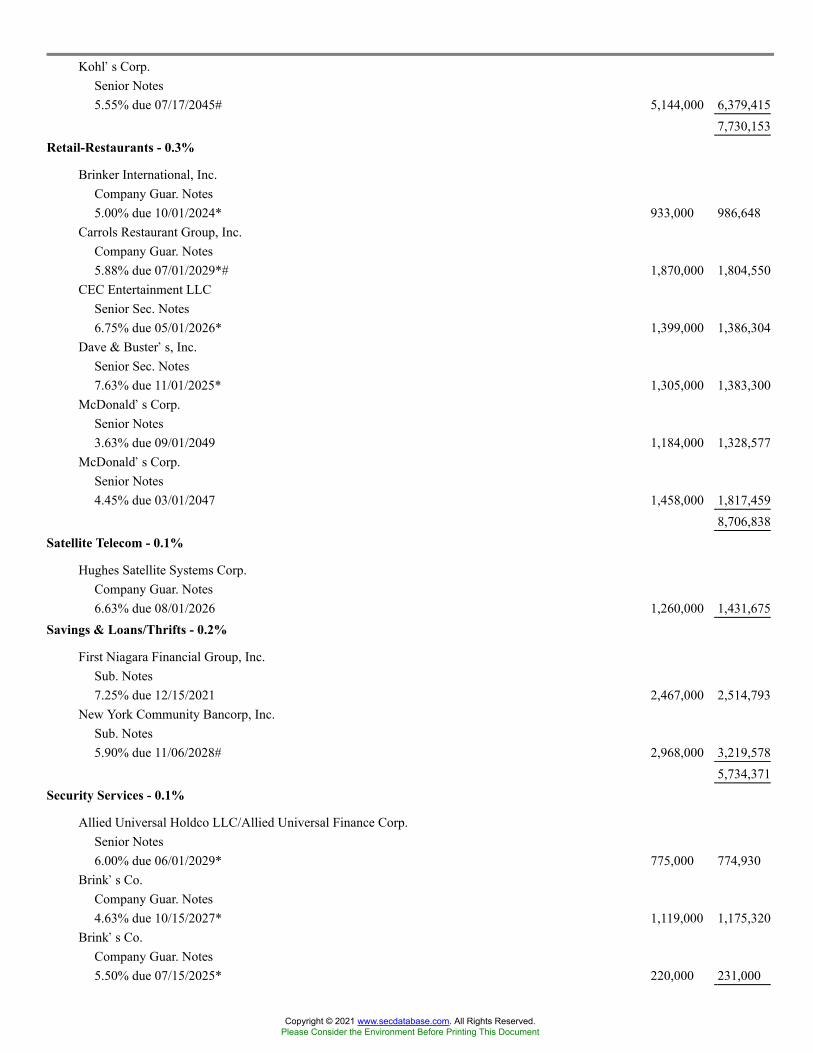
Kohl�s Corp.Senior Notes5.55% due 07/17/2045# 5,144,000 6,379,415
7,730,153Retail-Restaurants - 0.3%
Brinker International, Inc.Company Guar. Notes5.00% due 10/01/2024* 933,000 986,648
Carrols Restaurant Group, Inc.Company Guar. Notes5.88% due 07/01/2029*# 1,870,000 1,804,550
CEC Entertainment LLCSenior Sec. Notes6.75% due 05/01/2026* 1,399,000 1,386,304
Dave & Buster�s, Inc.Senior Sec. Notes7.63% due 11/01/2025* 1,305,000 1,383,300
McDonald�s Corp.Senior Notes3.63% due 09/01/2049 1,184,000 1,328,577
McDonald�s Corp.Senior Notes4.45% due 03/01/2047 1,458,000 1,817,459
8,706,838Satellite Telecom - 0.1%
Hughes Satellite Systems Corp.Company Guar. Notes6.63% due 08/01/2026 1,260,000 1,431,675
Savings & Loans/Thrifts - 0.2%
First Niagara Financial Group, Inc.Sub. Notes7.25% due 12/15/2021 2,467,000 2,514,793
New York Community Bancorp, Inc.Sub. Notes5.90% due 11/06/2028# 2,968,000 3,219,578
5,734,371Security Services - 0.1%
Allied Universal Holdco LLC/Allied Universal Finance Corp.Senior Notes6.00% due 06/01/2029* 775,000 774,930
Brink�s Co.Company Guar. Notes4.63% due 10/15/2027* 1,119,000 1,175,320
Brink�s Co.Company Guar. Notes5.50% due 07/15/2025* 220,000 231,000
Copyright © 2021 www.secdatabase.com. All Rights Reserved.Please Consider the Environment Before Printing This Document
2,181,250Steel-Producers - 0.1%
Cleveland-Cliffs, Inc.Company Guar. Notes4.63% due 03/01/2029*# 645,000 678,863
Cleveland-Cliffs, Inc.Senior Sec. Notes6.75% due 03/15/2026* 775,000 831,187
Cliffs Natural Resources, Inc.Senior Notes6.25% due 10/01/2040 651,000 711,218
Commercial Metals Co.Senior Notes3.88% due 02/15/2031 1,385,000 1,417,471
Periama Holdings LLCCompany Guar. NotesCOMPANY GUARNT5.95% due 04/19/2026 200,000 217,072
3,855,811Telecom Equipment-Fiber Optics - 0.1%
Corning, Inc.Senior Notes5.45% due 11/15/2079 3,061,000 4,323,315
Telecom Services - 0.1%
Frontier Communications Corp.Senior Sec. Notes5.00% due 05/01/2028* 1,365,000 1,426,425
Telephone-Integrated - 1.3%
AT&T, Inc.Senior Notes3.55% due 09/15/2055* 777,000 794,045
AT&T, Inc.Senior Notes4.50% due 05/15/2035 7,913,000 9,386,291
AT&T, Inc.Senior Notes4.75% due 05/15/2046 949,000 1,156,048
AT&T, Inc.Senior Notes4.85% due 07/15/2045 1,721,000 2,129,515
AT&T, Inc.Senior Notes4.90% due 08/15/2037 3,063,000 3,799,592
CenturyLink, Inc.Senior Notes5.13% due 12/15/2026* 1,217,000 1,258,378
Copyright © 2021 www.secdatabase.com. All Rights Reserved.Please Consider the Environment Before Printing This Document

Lumen Technologies, Inc.Senior Notes5.38% due 06/15/2029* 1,565,000 1,606,973
Verizon Communications, Inc.Senior Notes1.68% due 10/30/2030 2,265,000 2,187,892
Verizon Communications, Inc.Senior Notes2.99% due 10/30/2056 5,931,000 5,740,067
Verizon Communications, Inc.Senior Notes3.55% due 03/22/2051 1,229,000 1,333,696
Verizon Communications, Inc.Senior Notes3.70% due 03/22/2061 2,949,000 3,237,494
Verizon Communications, Inc.Senior Notes4.27% due 01/15/2036 1,053,000 1,259,392
Copyright © 2021 www.secdatabase.com. All Rights Reserved.Please Consider the Environment Before Printing This Document
Verizon Communications, Inc.Senior Notes4.40% due 11/01/2034 769,000 926,114
Zayo Group Holdings, Inc.Senior Notes6.13% due 03/01/2028* 1,206,000 1,227,105
36,042,602Television - 0.1%
Belo Corp.Company Guar. Notes7.25% due 09/15/2027 900,000 1,055,250
Belo Corp.Company Guar. Notes7.75% due 06/01/2027 924,000 1,083,390
Gray Television, Inc.Company Guar. Notes4.75% due 10/15/2030* 988,000 976,440
3,115,080Transport-Air Freight - 0.1%
Cargo Aircraft Management, Inc.Company Guar. Notes4.75% due 02/01/2028* 1,476,000 1,526,435
Transport-Equipment & Leasing - 0.1%
GATX Corp.Senior Notes4.35% due 02/15/2024 2,833,000 3,065,462
Transport-Rail - 0.1%
Kansas City SouthernCompany Guar. Notes4.70% due 05/01/2048 1,091,000 1,360,270
Norfolk Southern Corp.Senior Notes2.30% due 05/15/2031 403,000 413,275
Norfolk Southern Corp.Senior Notes4.10% due 05/15/2049 1,995,000 2,408,229
4,181,774Transport-Services - 0.2%
FedEx Corp.Company Guar. Notes2.40% due 05/15/2031 628,000 645,823
FedEx Corp. Pass Through TrustSenior Sec. NotesSeries 2020-1, Class AA1.88% due 08/20/2035 2,274,505 2,279,998
Copyright © 2021 www.secdatabase.com. All Rights Reserved.Please Consider the Environment Before Printing This Document
United Parcel Service, Inc.Senior Notes3.90% due 04/01/2025 1,488,000 1,642,982
4,568,803
Copyright © 2021 www.secdatabase.com. All Rights Reserved.Please Consider the Environment Before Printing This Document
Trucking/Leasing - 0.1%
Penske Truck Leasing Co. LP/PTL Finance Corp.Senior Notes3.40% due 11/15/2026* 2,929,000 3,202,257
Vitamins & Nutrition Products - 0.1%
HLF Financing Sarl LLC/Herbalife International, Inc.Company Guar. Notes4.88% due 06/01/2029* 2,900,000 2,907,250
Water - 0.0%
Essential Utilities, Inc.Senior Bonds3.35% due 04/15/2050 1,204,000 1,262,849
Total U.S. Corporate Bonds & Notes(cost $854,211,969) 895,551,805
FOREIGN CORPORATE BONDS & NOTES - 11.6%Agricultural Chemicals - 0.1%
Consolidated Energy Finance SASenior Notes6.88% due 06/15/2025* 1,361,000 1,405,232
OCI NVSenior Sec. Notes5.25% due 11/01/2024* 1,079,000 1,112,719
2,517,951Agricultural Operations - 0.1%
Viterra Finance BVCompany Guar. Notes3.20% due 04/21/2031* 1,817,000 1,866,322
Airlines - 0.1%
Air CanadaSenior Sec. Notes3.88% due 08/15/2026* 1,430,000 1,438,952
Auto-Cars/Light Trucks - 0.2%
Hyundai Capital Services, Inc.Senior Notes1.25% due 02/08/2026* 1,651,000 1,635,518
Kia Corp.Senior Notes1.00% due 04/16/2024* 1,560,000 1,564,566
Nissan Motor Co., Ltd.Senior Notes3.04% due 09/15/2023* 1,688,000 1,758,458
4,958,542Banks-Commercial - 1.9%
Copyright © 2021 www.secdatabase.com. All Rights Reserved.Please Consider the Environment Before Printing This Document
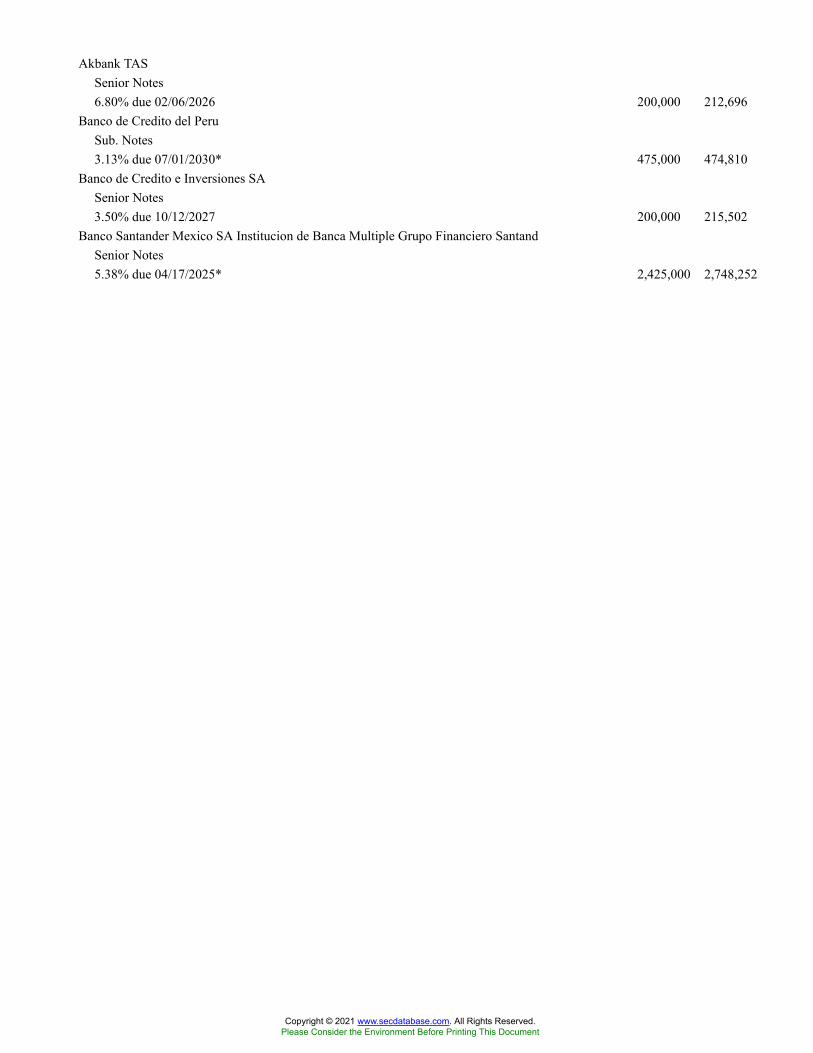
Akbank TASSenior Notes6.80% due 02/06/2026 200,000 212,696
Banco de Credito del PeruSub. Notes3.13% due 07/01/2030* 475,000 474,810
Banco de Credito e Inversiones SASenior Notes3.50% due 10/12/2027 200,000 215,502
Banco Santander Mexico SA Institucion de Banca Multiple Grupo Financiero SantandSenior Notes5.38% due 04/17/2025* 2,425,000 2,748,252
Copyright © 2021 www.secdatabase.com. All Rights Reserved.Please Consider the Environment Before Printing This Document
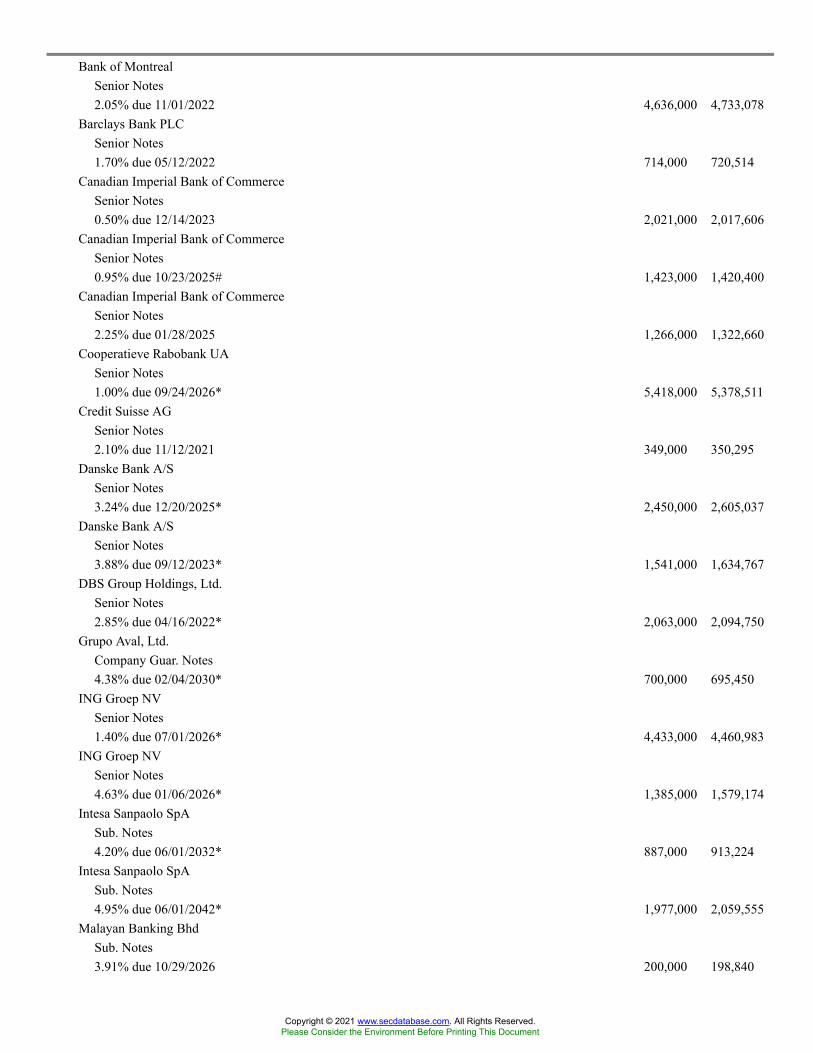
Bank of MontrealSenior Notes2.05% due 11/01/2022 4,636,000 4,733,078
Barclays Bank PLCSenior Notes1.70% due 05/12/2022 714,000 720,514
Canadian Imperial Bank of CommerceSenior Notes0.50% due 12/14/2023 2,021,000 2,017,606
Canadian Imperial Bank of CommerceSenior Notes0.95% due 10/23/2025# 1,423,000 1,420,400
Canadian Imperial Bank of CommerceSenior Notes2.25% due 01/28/2025 1,266,000 1,322,660
Cooperatieve Rabobank UASenior Notes1.00% due 09/24/2026* 5,418,000 5,378,511
Credit Suisse AGSenior Notes2.10% due 11/12/2021 349,000 350,295
Danske Bank A/SSenior Notes3.24% due 12/20/2025* 2,450,000 2,605,037
Danske Bank A/SSenior Notes3.88% due 09/12/2023* 1,541,000 1,634,767
DBS Group Holdings, Ltd.Senior Notes2.85% due 04/16/2022* 2,063,000 2,094,750
Grupo Aval, Ltd.Company Guar. Notes4.38% due 02/04/2030* 700,000 695,450
ING Groep NVSenior Notes1.40% due 07/01/2026* 4,433,000 4,460,983
ING Groep NVSenior Notes4.63% due 01/06/2026* 1,385,000 1,579,174
Intesa Sanpaolo SpASub. Notes4.20% due 06/01/2032* 887,000 913,224
Intesa Sanpaolo SpASub. Notes4.95% due 06/01/2042* 1,977,000 2,059,555
Malayan Banking BhdSub. Notes3.91% due 10/29/2026 200,000 198,840
Copyright © 2021 www.secdatabase.com. All Rights Reserved.Please Consider the Environment Before Printing This Document
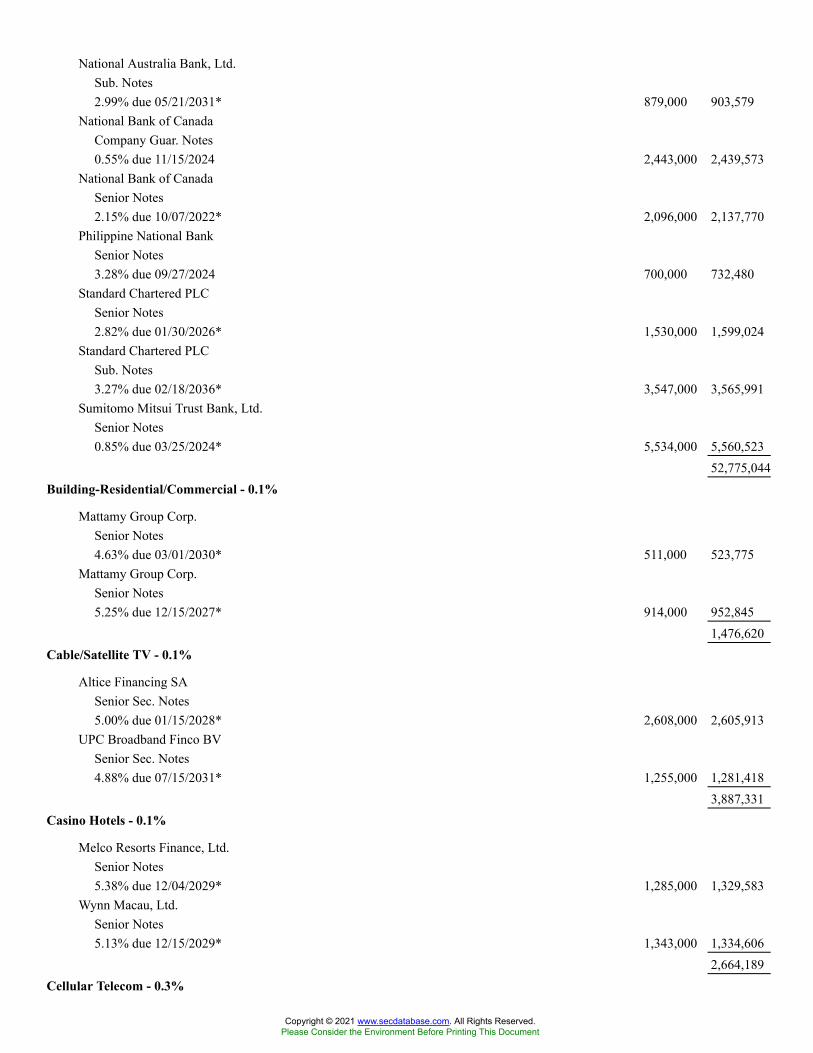
National Australia Bank, Ltd.Sub. Notes2.99% due 05/21/2031* 879,000 903,579
National Bank of CanadaCompany Guar. Notes0.55% due 11/15/2024 2,443,000 2,439,573
National Bank of CanadaSenior Notes2.15% due 10/07/2022* 2,096,000 2,137,770
Philippine National BankSenior Notes3.28% due 09/27/2024 700,000 732,480
Standard Chartered PLCSenior Notes2.82% due 01/30/2026* 1,530,000 1,599,024
Standard Chartered PLCSub. Notes3.27% due 02/18/2036* 3,547,000 3,565,991
Sumitomo Mitsui Trust Bank, Ltd.Senior Notes0.85% due 03/25/2024* 5,534,000 5,560,523
52,775,044Building-Residential/Commercial - 0.1%
Mattamy Group Corp.Senior Notes4.63% due 03/01/2030* 511,000 523,775
Mattamy Group Corp.Senior Notes5.25% due 12/15/2027* 914,000 952,845
1,476,620Cable/Satellite TV - 0.1%
Altice Financing SASenior Sec. Notes5.00% due 01/15/2028* 2,608,000 2,605,913
UPC Broadband Finco BVSenior Sec. Notes4.88% due 07/15/2031* 1,255,000 1,281,418
3,887,331Casino Hotels - 0.1%
Melco Resorts Finance, Ltd.Senior Notes5.38% due 12/04/2029* 1,285,000 1,329,583
Wynn Macau, Ltd.Senior Notes5.13% due 12/15/2029* 1,343,000 1,334,606
2,664,189Cellular Telecom - 0.3%
Copyright © 2021 www.secdatabase.com. All Rights Reserved.Please Consider the Environment Before Printing This Document
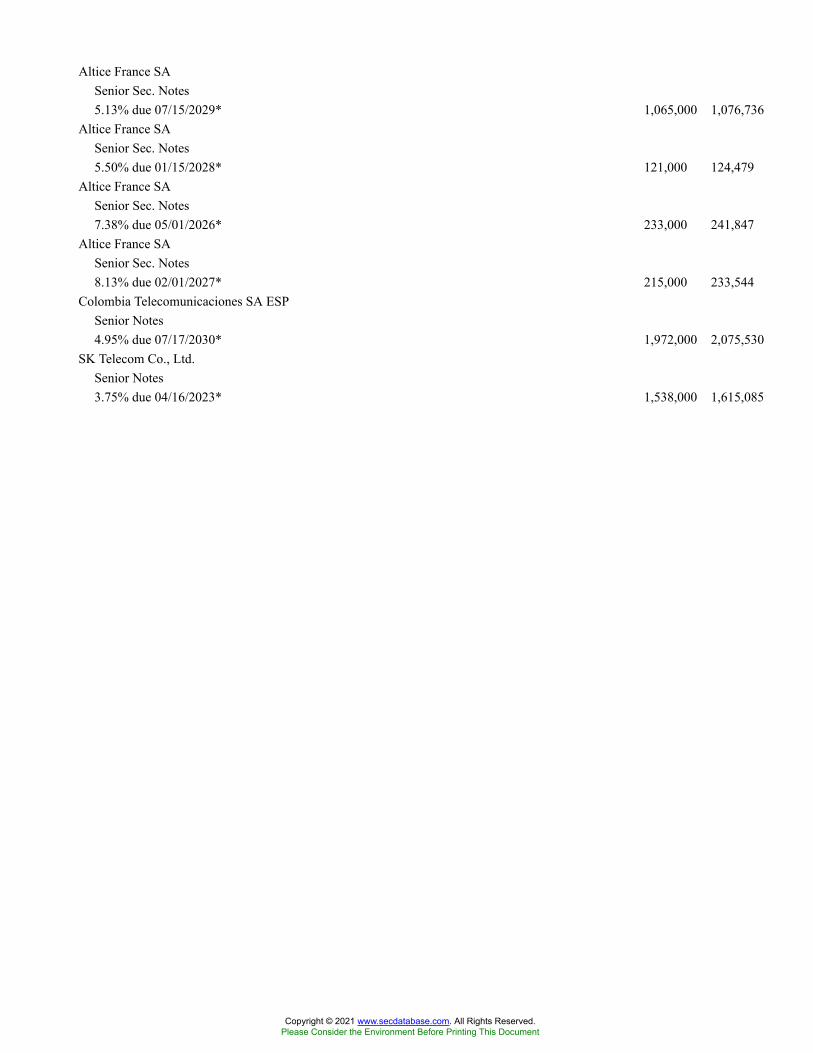
Altice France SASenior Sec. Notes5.13% due 07/15/2029* 1,065,000 1,076,736
Altice France SASenior Sec. Notes5.50% due 01/15/2028* 121,000 124,479
Altice France SASenior Sec. Notes7.38% due 05/01/2026* 233,000 241,847
Altice France SASenior Sec. Notes8.13% due 02/01/2027* 215,000 233,544
Colombia Telecomunicaciones SA ESPSenior Notes4.95% due 07/17/2030* 1,972,000 2,075,530
SK Telecom Co., Ltd.Senior Notes3.75% due 04/16/2023* 1,538,000 1,615,085
Copyright © 2021 www.secdatabase.com. All Rights Reserved.Please Consider the Environment Before Printing This Document
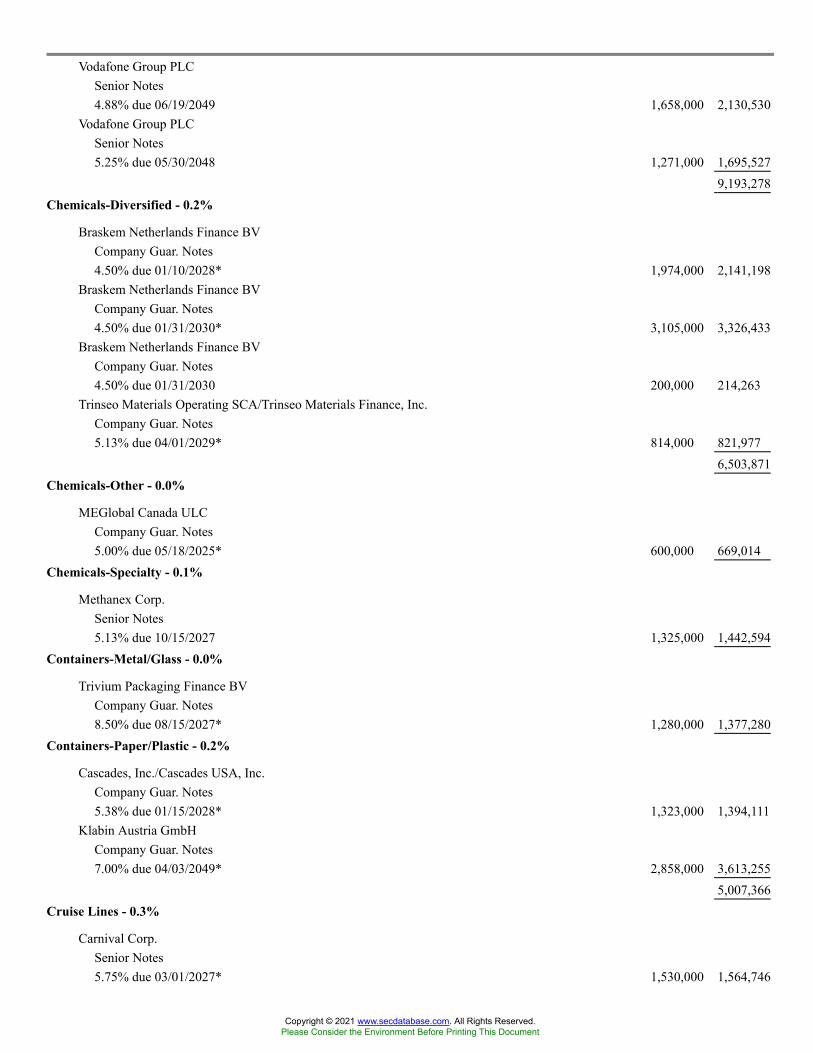
Vodafone Group PLCSenior Notes4.88% due 06/19/2049 1,658,000 2,130,530
Vodafone Group PLCSenior Notes5.25% due 05/30/2048 1,271,000 1,695,527
9,193,278Chemicals-Diversified - 0.2%
Braskem Netherlands Finance BVCompany Guar. Notes4.50% due 01/10/2028* 1,974,000 2,141,198
Braskem Netherlands Finance BVCompany Guar. Notes4.50% due 01/31/2030* 3,105,000 3,326,433
Braskem Netherlands Finance BVCompany Guar. Notes4.50% due 01/31/2030 200,000 214,263
Trinseo Materials Operating SCA/Trinseo Materials Finance, Inc.Company Guar. Notes5.13% due 04/01/2029* 814,000 821,977
6,503,871Chemicals-Other - 0.0%
MEGlobal Canada ULCCompany Guar. Notes5.00% due 05/18/2025* 600,000 669,014
Chemicals-Specialty - 0.1%
Methanex Corp.Senior Notes5.13% due 10/15/2027 1,325,000 1,442,594
Containers-Metal/Glass - 0.0%
Trivium Packaging Finance BVCompany Guar. Notes8.50% due 08/15/2027* 1,280,000 1,377,280
Containers-Paper/Plastic - 0.2%
Cascades, Inc./Cascades USA, Inc.Company Guar. Notes5.38% due 01/15/2028* 1,323,000 1,394,111
Klabin Austria GmbHCompany Guar. Notes7.00% due 04/03/2049* 2,858,000 3,613,255
5,007,366Cruise Lines - 0.3%
Carnival Corp.Senior Notes5.75% due 03/01/2027* 1,530,000 1,564,746
Copyright © 2021 www.secdatabase.com. All Rights Reserved.Please Consider the Environment Before Printing This Document
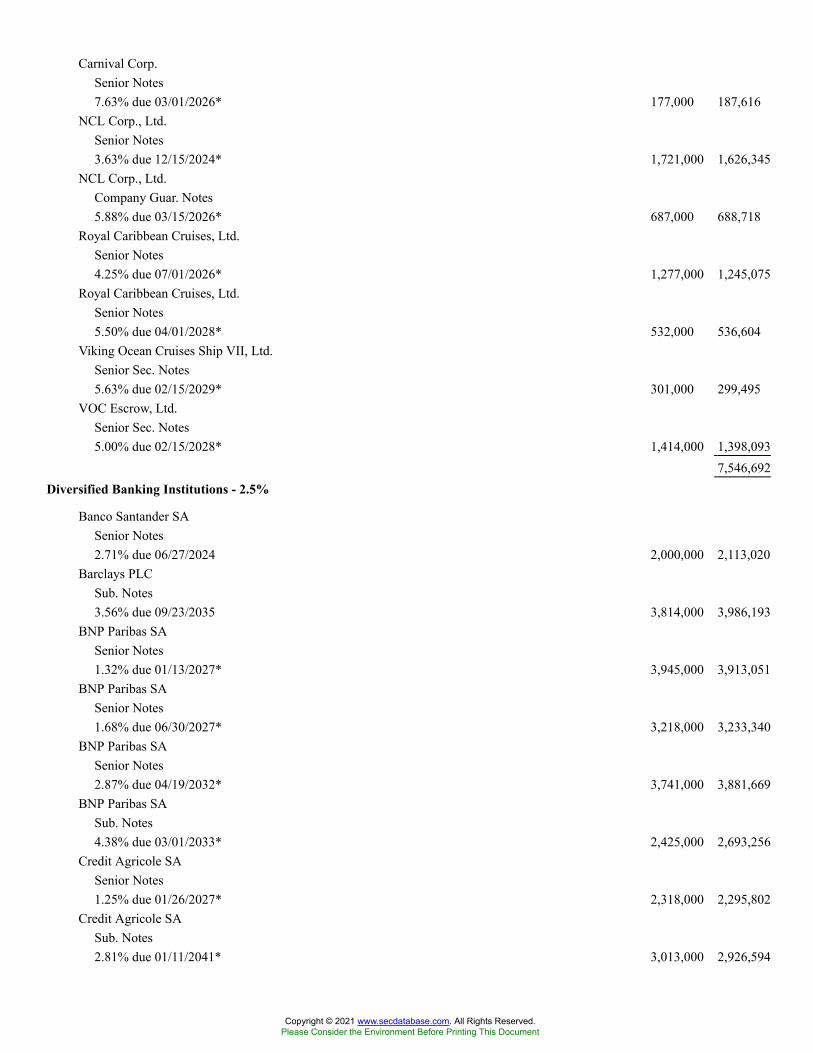
Carnival Corp.Senior Notes7.63% due 03/01/2026* 177,000 187,616
NCL Corp., Ltd.Senior Notes3.63% due 12/15/2024* 1,721,000 1,626,345
NCL Corp., Ltd.Company Guar. Notes5.88% due 03/15/2026* 687,000 688,718
Royal Caribbean Cruises, Ltd.Senior Notes4.25% due 07/01/2026* 1,277,000 1,245,075
Royal Caribbean Cruises, Ltd.Senior Notes5.50% due 04/01/2028* 532,000 536,604
Viking Ocean Cruises Ship VII, Ltd.Senior Sec. Notes5.63% due 02/15/2029* 301,000 299,495
VOC Escrow, Ltd.Senior Sec. Notes5.00% due 02/15/2028* 1,414,000 1,398,093
7,546,692Diversified Banking Institutions - 2.5%
Banco Santander SASenior Notes2.71% due 06/27/2024 2,000,000 2,113,020
Barclays PLCSub. Notes3.56% due 09/23/2035 3,814,000 3,986,193
BNP Paribas SASenior Notes1.32% due 01/13/2027* 3,945,000 3,913,051
BNP Paribas SASenior Notes1.68% due 06/30/2027* 3,218,000 3,233,340
BNP Paribas SASenior Notes2.87% due 04/19/2032* 3,741,000 3,881,669
BNP Paribas SASub. Notes4.38% due 03/01/2033* 2,425,000 2,693,256
Credit Agricole SASenior Notes1.25% due 01/26/2027* 2,318,000 2,295,802
Credit Agricole SASub. Notes2.81% due 01/11/2041* 3,013,000 2,926,594
Copyright © 2021 www.secdatabase.com. All Rights Reserved.Please Consider the Environment Before Printing This Document
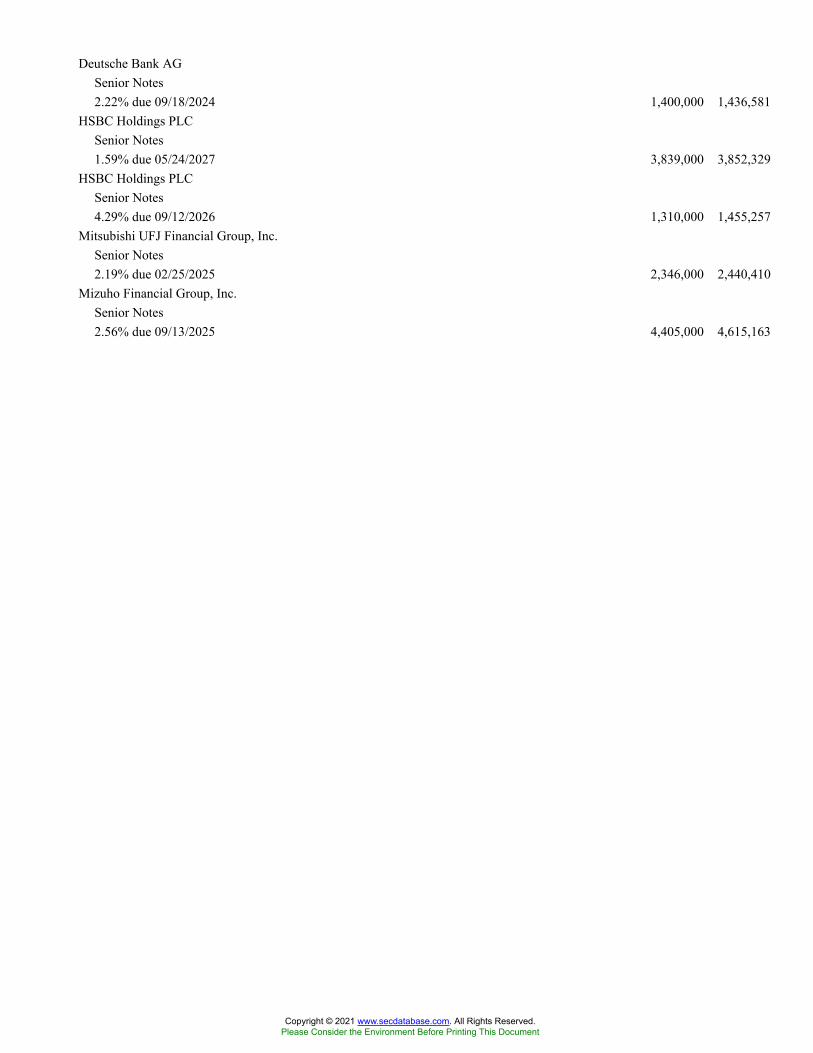
Deutsche Bank AGSenior Notes2.22% due 09/18/2024 1,400,000 1,436,581
HSBC Holdings PLCSenior Notes1.59% due 05/24/2027 3,839,000 3,852,329
HSBC Holdings PLCSenior Notes4.29% due 09/12/2026 1,310,000 1,455,257
Mitsubishi UFJ Financial Group, Inc.Senior Notes2.19% due 02/25/2025 2,346,000 2,440,410
Mizuho Financial Group, Inc.Senior Notes2.56% due 09/13/2025 4,405,000 4,615,163
Copyright © 2021 www.secdatabase.com. All Rights Reserved.Please Consider the Environment Before Printing This Document
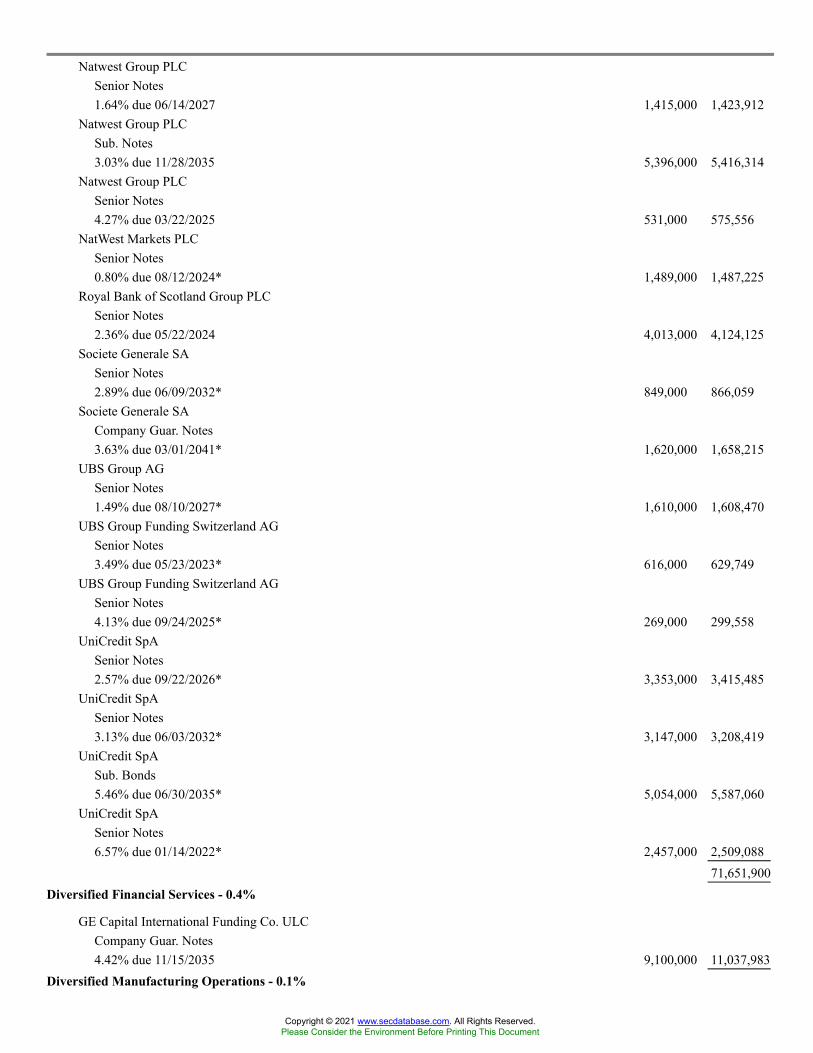
Natwest Group PLCSenior Notes1.64% due 06/14/2027 1,415,000 1,423,912
Natwest Group PLCSub. Notes3.03% due 11/28/2035 5,396,000 5,416,314
Natwest Group PLCSenior Notes4.27% due 03/22/2025 531,000 575,556
NatWest Markets PLCSenior Notes0.80% due 08/12/2024* 1,489,000 1,487,225
Royal Bank of Scotland Group PLCSenior Notes2.36% due 05/22/2024 4,013,000 4,124,125
Societe Generale SASenior Notes2.89% due 06/09/2032* 849,000 866,059
Societe Generale SACompany Guar. Notes3.63% due 03/01/2041* 1,620,000 1,658,215
UBS Group AGSenior Notes1.49% due 08/10/2027* 1,610,000 1,608,470
UBS Group Funding Switzerland AGSenior Notes3.49% due 05/23/2023* 616,000 629,749
UBS Group Funding Switzerland AGSenior Notes4.13% due 09/24/2025* 269,000 299,558
UniCredit SpASenior Notes2.57% due 09/22/2026* 3,353,000 3,415,485
UniCredit SpASenior Notes3.13% due 06/03/2032* 3,147,000 3,208,419
UniCredit SpASub. Bonds5.46% due 06/30/2035* 5,054,000 5,587,060
UniCredit SpASenior Notes6.57% due 01/14/2022* 2,457,000 2,509,088
71,651,900Diversified Financial Services - 0.4%
GE Capital International Funding Co. ULCCompany Guar. Notes4.42% due 11/15/2035 9,100,000 11,037,983
Diversified Manufacturing Operations - 0.1%
Copyright © 2021 www.secdatabase.com. All Rights Reserved.Please Consider the Environment Before Printing This Document
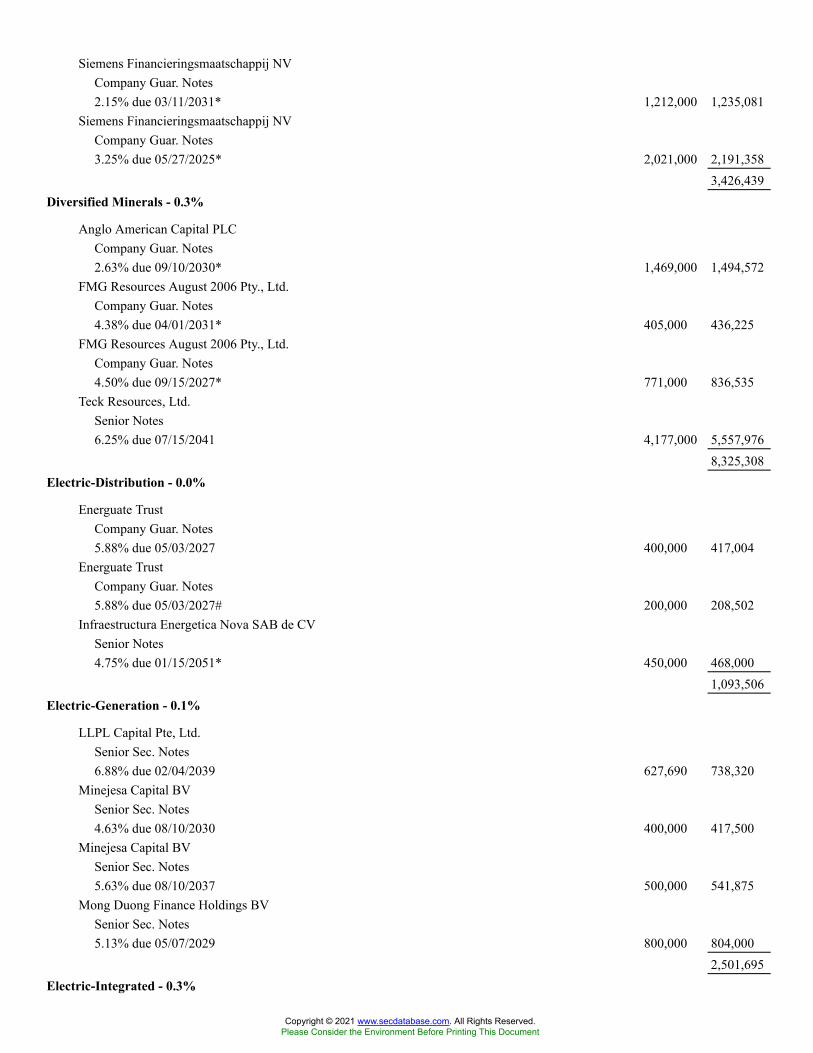
Siemens Financieringsmaatschappij NVCompany Guar. Notes2.15% due 03/11/2031* 1,212,000 1,235,081
Siemens Financieringsmaatschappij NVCompany Guar. Notes3.25% due 05/27/2025* 2,021,000 2,191,358
3,426,439Diversified Minerals - 0.3%
Anglo American Capital PLCCompany Guar. Notes2.63% due 09/10/2030* 1,469,000 1,494,572
FMG Resources August 2006 Pty., Ltd.Company Guar. Notes4.38% due 04/01/2031* 405,000 436,225
FMG Resources August 2006 Pty., Ltd.Company Guar. Notes4.50% due 09/15/2027* 771,000 836,535
Teck Resources, Ltd.Senior Notes6.25% due 07/15/2041 4,177,000 5,557,976
8,325,308Electric-Distribution - 0.0%
Energuate TrustCompany Guar. Notes5.88% due 05/03/2027 400,000 417,004
Energuate TrustCompany Guar. Notes5.88% due 05/03/2027# 200,000 208,502
Infraestructura Energetica Nova SAB de CVSenior Notes4.75% due 01/15/2051* 450,000 468,000
1,093,506Electric-Generation - 0.1%
LLPL Capital Pte, Ltd.Senior Sec. Notes6.88% due 02/04/2039 627,690 738,320
Minejesa Capital BVSenior Sec. Notes4.63% due 08/10/2030 400,000 417,500
Minejesa Capital BVSenior Sec. Notes5.63% due 08/10/2037 500,000 541,875
Mong Duong Finance Holdings BVSenior Sec. Notes5.13% due 05/07/2029 800,000 804,000
2,501,695Electric-Integrated - 0.3%
Copyright © 2021 www.secdatabase.com. All Rights Reserved.Please Consider the Environment Before Printing This Document
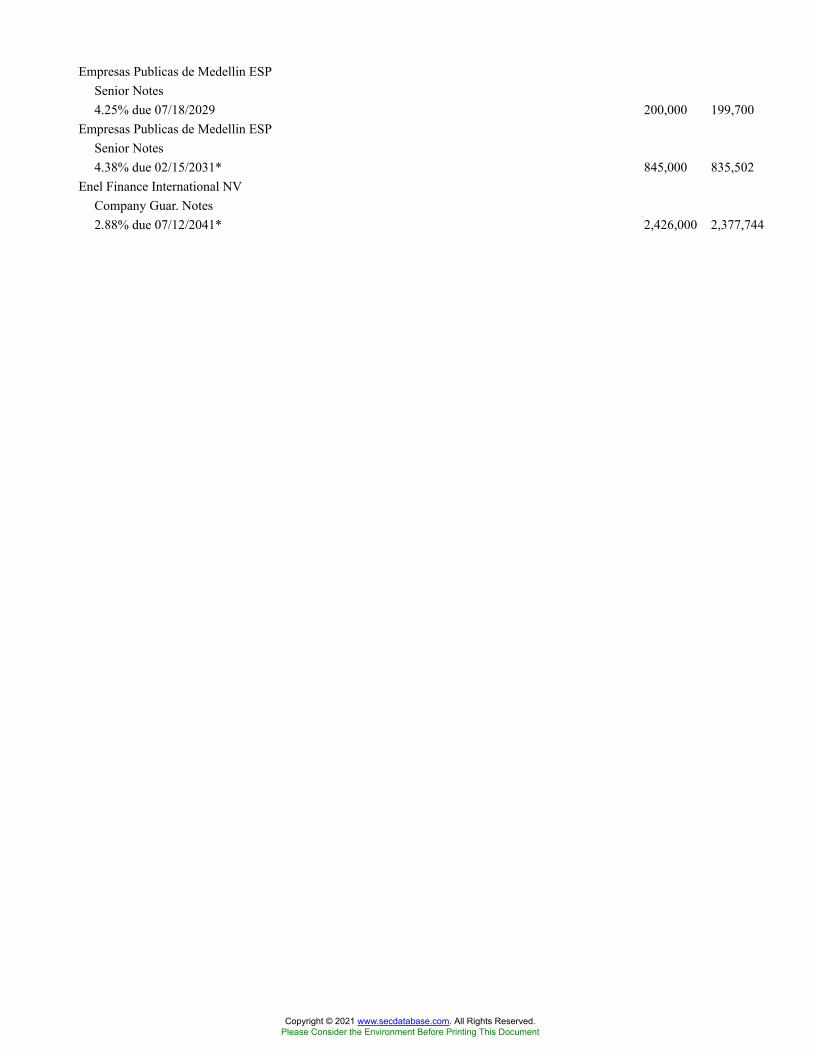
Empresas Publicas de Medellin ESPSenior Notes4.25% due 07/18/2029 200,000 199,700
Empresas Publicas de Medellin ESPSenior Notes4.38% due 02/15/2031* 845,000 835,502
Enel Finance International NVCompany Guar. Notes2.88% due 07/12/2041* 2,426,000 2,377,744
Copyright © 2021 www.secdatabase.com. All Rights Reserved.Please Consider the Environment Before Printing This Document
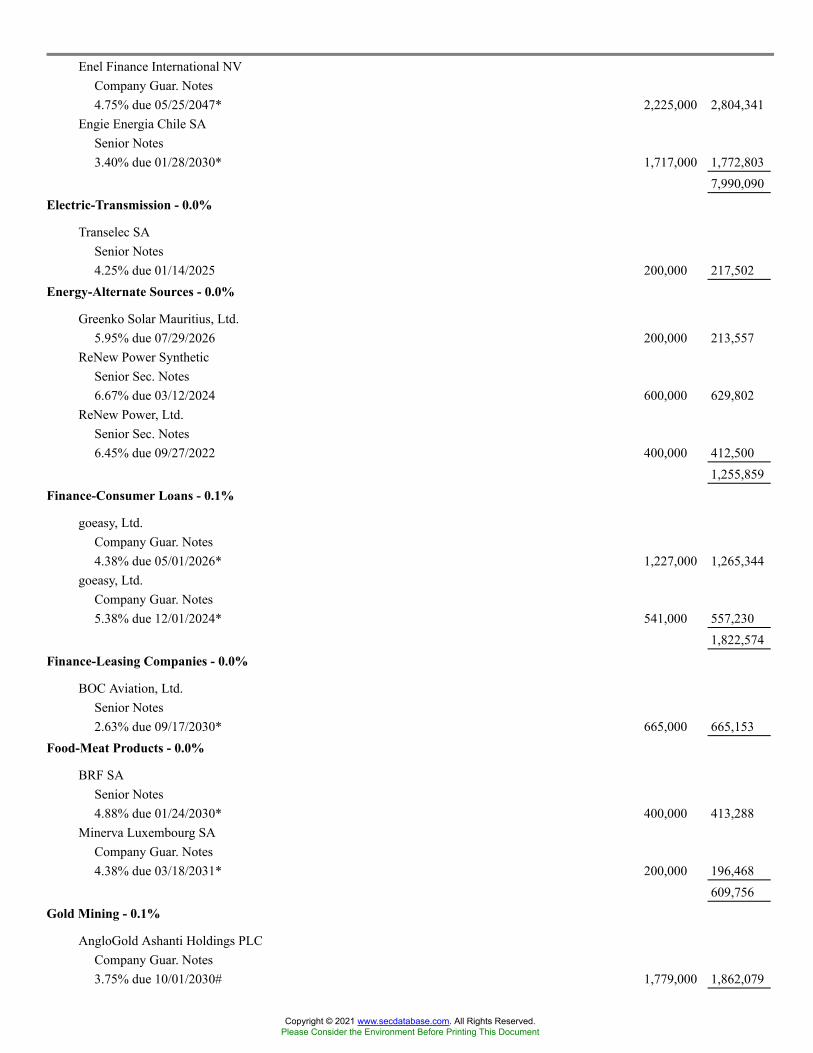
Enel Finance International NVCompany Guar. Notes4.75% due 05/25/2047* 2,225,000 2,804,341
Engie Energia Chile SASenior Notes3.40% due 01/28/2030* 1,717,000 1,772,803
7,990,090Electric-Transmission - 0.0%
Transelec SASenior Notes4.25% due 01/14/2025 200,000 217,502
Energy-Alternate Sources - 0.0%
Greenko Solar Mauritius, Ltd.5.95% due 07/29/2026 200,000 213,557
ReNew Power SyntheticSenior Sec. Notes6.67% due 03/12/2024 600,000 629,802
ReNew Power, Ltd.Senior Sec. Notes6.45% due 09/27/2022 400,000 412,500
1,255,859Finance-Consumer Loans - 0.1%
goeasy, Ltd.Company Guar. Notes4.38% due 05/01/2026* 1,227,000 1,265,344
goeasy, Ltd.Company Guar. Notes5.38% due 12/01/2024* 541,000 557,230
1,822,574Finance-Leasing Companies - 0.0%
BOC Aviation, Ltd.Senior Notes2.63% due 09/17/2030* 665,000 665,153
Food-Meat Products - 0.0%
BRF SASenior Notes4.88% due 01/24/2030* 400,000 413,288
Minerva Luxembourg SACompany Guar. Notes4.38% due 03/18/2031* 200,000 196,468
609,756Gold Mining - 0.1%
AngloGold Ashanti Holdings PLCCompany Guar. Notes3.75% due 10/01/2030# 1,779,000 1,862,079
Copyright © 2021 www.secdatabase.com. All Rights Reserved.Please Consider the Environment Before Printing This Document
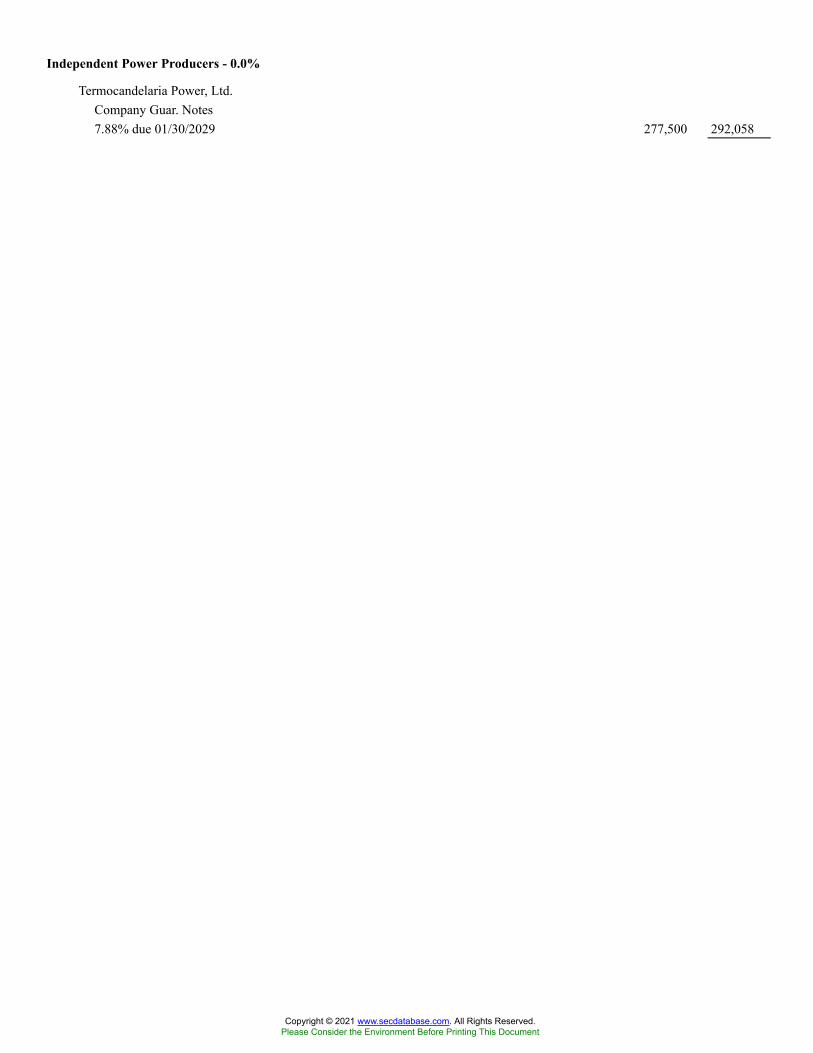
Independent Power Producers - 0.0%
Termocandelaria Power, Ltd.Company Guar. Notes7.88% due 01/30/2029 277,500 292,058
Copyright © 2021 www.secdatabase.com. All Rights Reserved.Please Consider the Environment Before Printing This Document
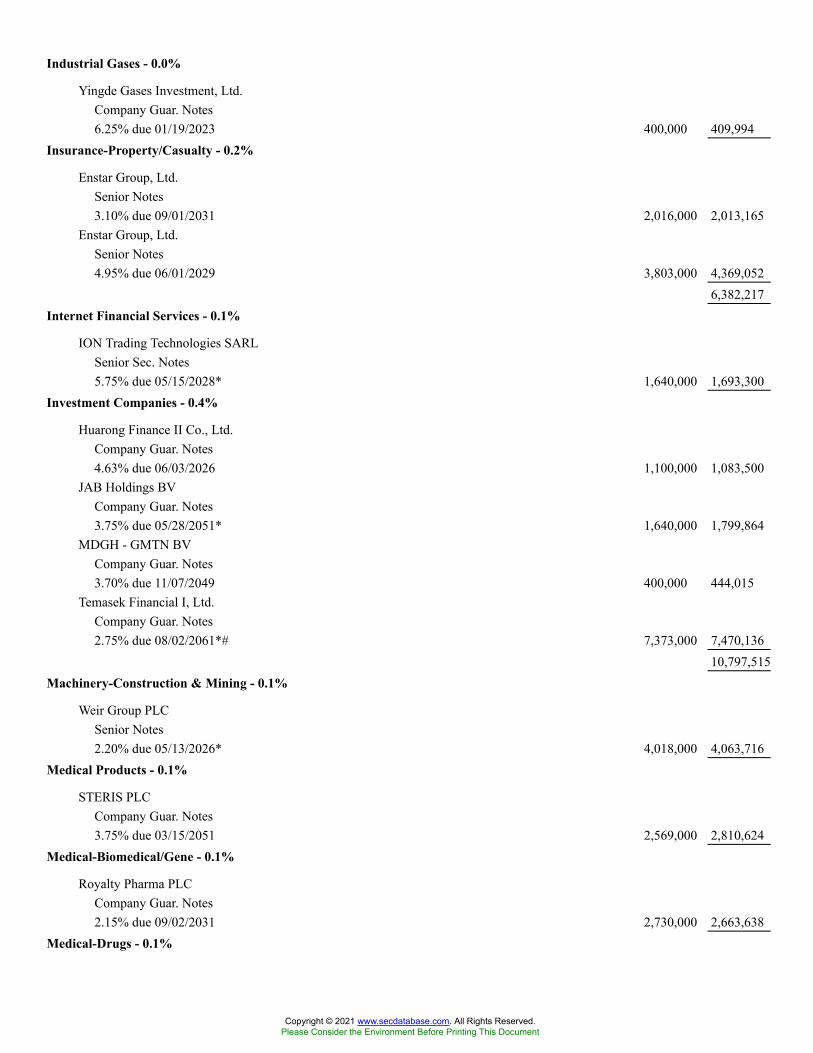
Industrial Gases - 0.0%
Yingde Gases Investment, Ltd.Company Guar. Notes6.25% due 01/19/2023 400,000 409,994
Insurance-Property/Casualty - 0.2%
Enstar Group, Ltd.Senior Notes3.10% due 09/01/2031 2,016,000 2,013,165
Enstar Group, Ltd.Senior Notes4.95% due 06/01/2029 3,803,000 4,369,052
6,382,217Internet Financial Services - 0.1%
ION Trading Technologies SARLSenior Sec. Notes5.75% due 05/15/2028* 1,640,000 1,693,300
Investment Companies - 0.4%
Huarong Finance II Co., Ltd.Company Guar. Notes4.63% due 06/03/2026 1,100,000 1,083,500
JAB Holdings BVCompany Guar. Notes3.75% due 05/28/2051* 1,640,000 1,799,864
MDGH - GMTN BVCompany Guar. Notes3.70% due 11/07/2049 400,000 444,015
Temasek Financial I, Ltd.Company Guar. Notes2.75% due 08/02/2061*# 7,373,000 7,470,136
10,797,515Machinery-Construction & Mining - 0.1%
Weir Group PLCSenior Notes2.20% due 05/13/2026* 4,018,000 4,063,716
Medical Products - 0.1%
STERIS PLCCompany Guar. Notes3.75% due 03/15/2051 2,569,000 2,810,624
Medical-Biomedical/Gene - 0.1%
Royalty Pharma PLCCompany Guar. Notes2.15% due 09/02/2031 2,730,000 2,663,638
Medical-Drugs - 0.1%
Copyright © 2021 www.secdatabase.com. All Rights Reserved.Please Consider the Environment Before Printing This Document

Endo Luxembourg Finance Co. I SARL/Endo US, Inc.Senior Sec. Notes6.13% due 04/01/2029* 535,000 529,650
Copyright © 2021 www.secdatabase.com. All Rights Reserved.Please Consider the Environment Before Printing This Document
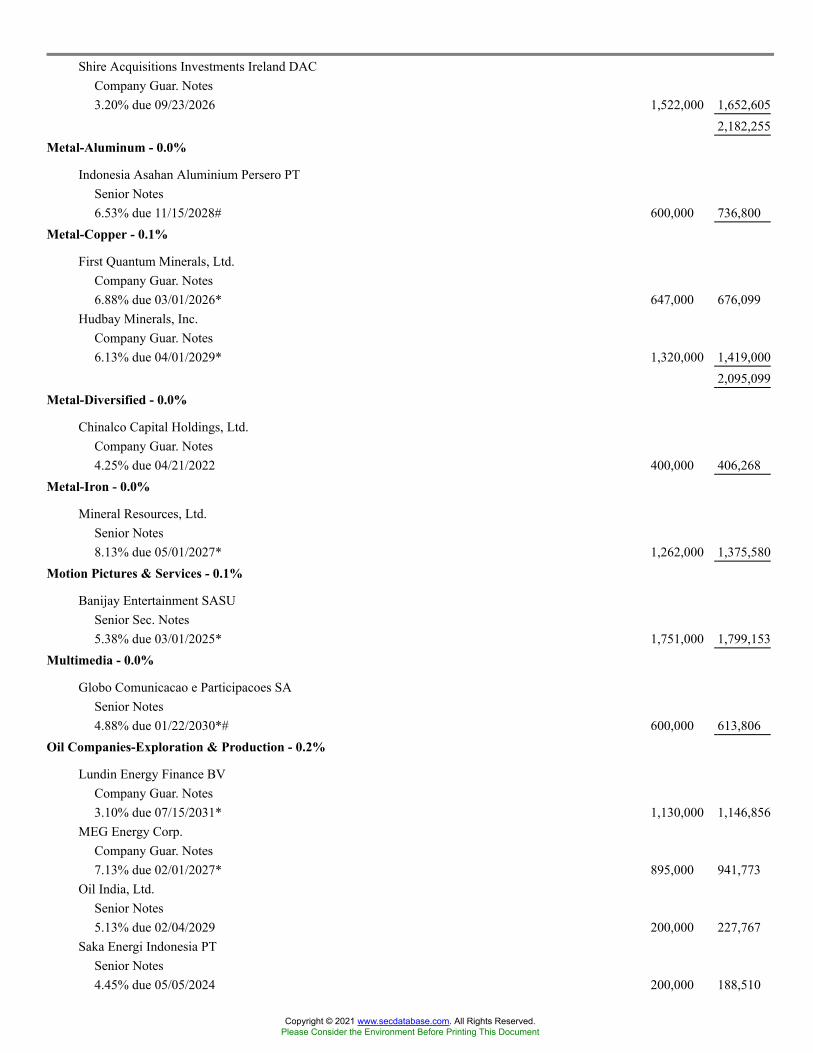
Shire Acquisitions Investments Ireland DACCompany Guar. Notes3.20% due 09/23/2026 1,522,000 1,652,605
2,182,255Metal-Aluminum - 0.0%
Indonesia Asahan Aluminium Persero PTSenior Notes6.53% due 11/15/2028# 600,000 736,800
Metal-Copper - 0.1%
First Quantum Minerals, Ltd.Company Guar. Notes6.88% due 03/01/2026* 647,000 676,099
Hudbay Minerals, Inc.Company Guar. Notes6.13% due 04/01/2029* 1,320,000 1,419,000
2,095,099Metal-Diversified - 0.0%
Chinalco Capital Holdings, Ltd.Company Guar. Notes4.25% due 04/21/2022 400,000 406,268
Metal-Iron - 0.0%
Mineral Resources, Ltd.Senior Notes8.13% due 05/01/2027* 1,262,000 1,375,580
Motion Pictures & Services - 0.1%
Banijay Entertainment SASUSenior Sec. Notes5.38% due 03/01/2025* 1,751,000 1,799,153
Multimedia - 0.0%
Globo Comunicacao e Participacoes SASenior Notes4.88% due 01/22/2030*# 600,000 613,806
Oil Companies-Exploration & Production - 0.2%
Lundin Energy Finance BVCompany Guar. Notes3.10% due 07/15/2031* 1,130,000 1,146,856
MEG Energy Corp.Company Guar. Notes7.13% due 02/01/2027* 895,000 941,773
Oil India, Ltd.Senior Notes5.13% due 02/04/2029 200,000 227,767
Saka Energi Indonesia PTSenior Notes4.45% due 05/05/2024 200,000 188,510
Copyright © 2021 www.secdatabase.com. All Rights Reserved.Please Consider the Environment Before Printing This Document
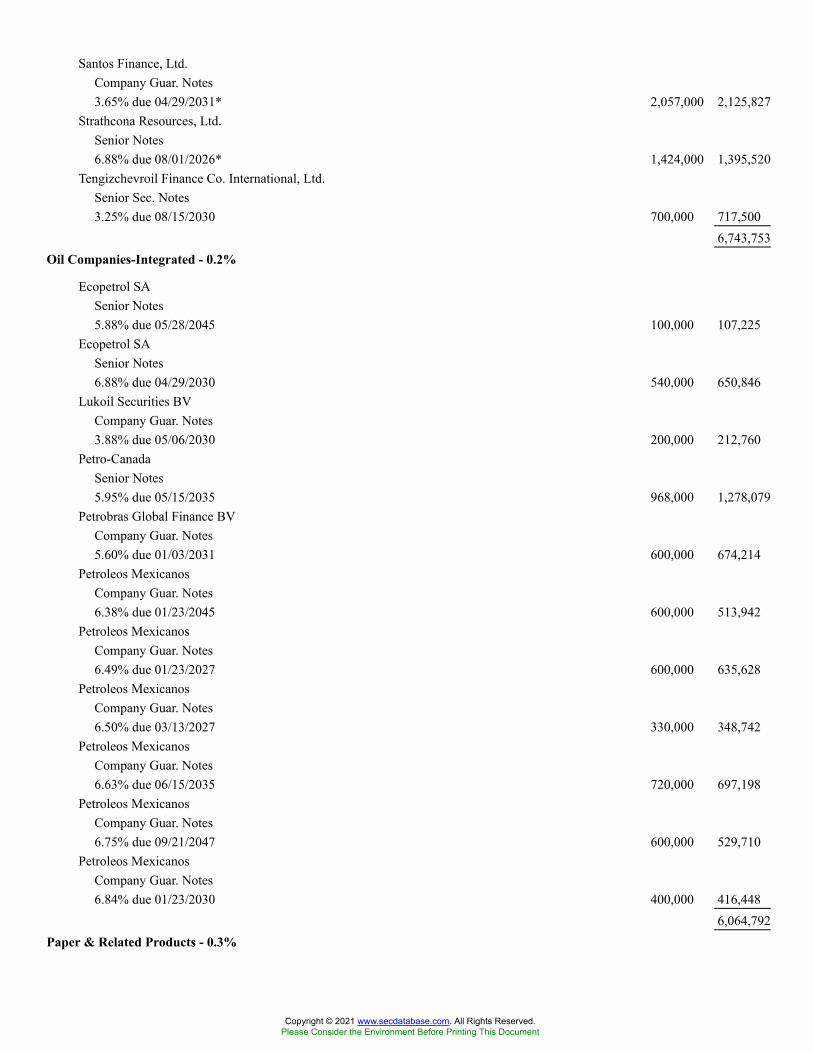
Santos Finance, Ltd.Company Guar. Notes3.65% due 04/29/2031* 2,057,000 2,125,827
Strathcona Resources, Ltd.Senior Notes6.88% due 08/01/2026* 1,424,000 1,395,520
Tengizchevroil Finance Co. International, Ltd.Senior Sec. Notes3.25% due 08/15/2030 700,000 717,500
6,743,753Oil Companies-Integrated - 0.2%
Ecopetrol SASenior Notes5.88% due 05/28/2045 100,000 107,225
Ecopetrol SASenior Notes6.88% due 04/29/2030 540,000 650,846
Lukoil Securities BVCompany Guar. Notes3.88% due 05/06/2030 200,000 212,760
Petro-CanadaSenior Notes5.95% due 05/15/2035 968,000 1,278,079
Petrobras Global Finance BVCompany Guar. Notes5.60% due 01/03/2031 600,000 674,214
Petroleos MexicanosCompany Guar. Notes6.38% due 01/23/2045 600,000 513,942
Petroleos MexicanosCompany Guar. Notes6.49% due 01/23/2027 600,000 635,628
Petroleos MexicanosCompany Guar. Notes6.50% due 03/13/2027 330,000 348,742
Petroleos MexicanosCompany Guar. Notes6.63% due 06/15/2035 720,000 697,198
Petroleos MexicanosCompany Guar. Notes6.75% due 09/21/2047 600,000 529,710
Petroleos MexicanosCompany Guar. Notes6.84% due 01/23/2030 400,000 416,448
6,064,792Paper & Related Products - 0.3%
Copyright © 2021 www.secdatabase.com. All Rights Reserved.Please Consider the Environment Before Printing This Document

Inversiones CMPC SACompany Guar. Notes3.00% due 04/06/2031* 3,013,000 3,065,185
Suzano Austria GmbHCompany Guar. Notes3.13% due 01/15/2032 2,367,000 2,374,101
Suzano Austria GmbHCompany Guar. Notes3.75% due 01/15/2031 2,880,000 3,024,029
8,463,315
Copyright © 2021 www.secdatabase.com. All Rights Reserved.Please Consider the Environment Before Printing This Document
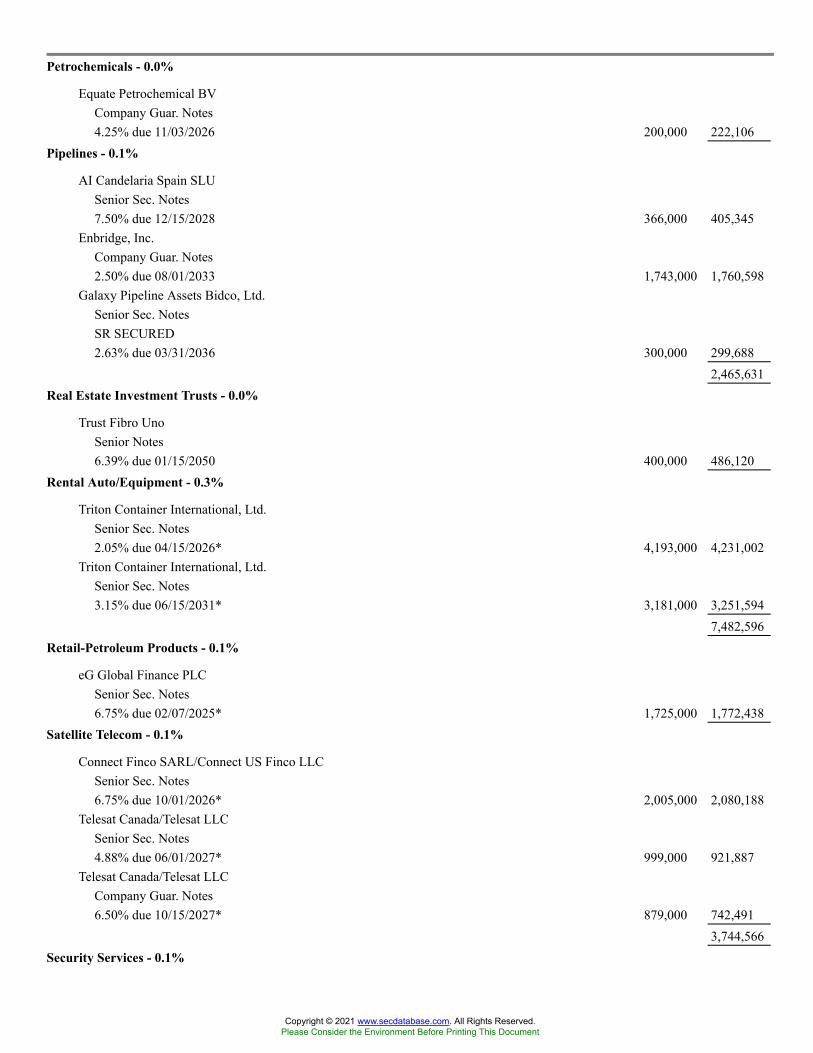
Petrochemicals - 0.0%
Equate Petrochemical BVCompany Guar. Notes4.25% due 11/03/2026 200,000 222,106
Pipelines - 0.1%
AI Candelaria Spain SLUSenior Sec. Notes7.50% due 12/15/2028 366,000 405,345
Enbridge, Inc.Company Guar. Notes2.50% due 08/01/2033 1,743,000 1,760,598
Galaxy Pipeline Assets Bidco, Ltd.Senior Sec. NotesSR SECURED2.63% due 03/31/2036 300,000 299,688
2,465,631Real Estate Investment Trusts - 0.0%
Trust Fibro UnoSenior Notes6.39% due 01/15/2050 400,000 486,120
Rental Auto/Equipment - 0.3%
Triton Container International, Ltd.Senior Sec. Notes2.05% due 04/15/2026* 4,193,000 4,231,002
Triton Container International, Ltd.Senior Sec. Notes3.15% due 06/15/2031* 3,181,000 3,251,594
7,482,596Retail-Petroleum Products - 0.1%
eG Global Finance PLCSenior Sec. Notes6.75% due 02/07/2025* 1,725,000 1,772,438
Satellite Telecom - 0.1%
Connect Finco SARL/Connect US Finco LLCSenior Sec. Notes6.75% due 10/01/2026* 2,005,000 2,080,188
Telesat Canada/Telesat LLCSenior Sec. Notes4.88% due 06/01/2027* 999,000 921,887
Telesat Canada/Telesat LLCCompany Guar. Notes6.50% due 10/15/2027* 879,000 742,491
3,744,566Security Services - 0.1%
Copyright © 2021 www.secdatabase.com. All Rights Reserved.Please Consider the Environment Before Printing This Document
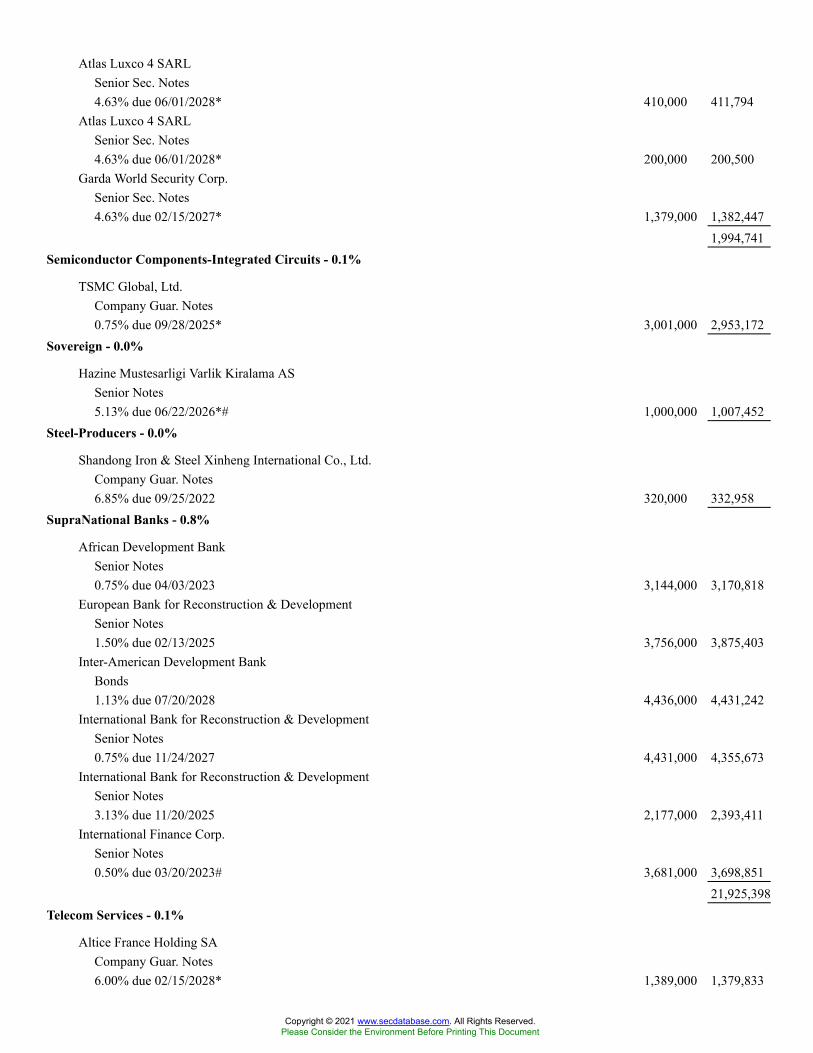
Atlas Luxco 4 SARLSenior Sec. Notes4.63% due 06/01/2028* 410,000 411,794
Atlas Luxco 4 SARLSenior Sec. Notes4.63% due 06/01/2028* 200,000 200,500
Garda World Security Corp.Senior Sec. Notes4.63% due 02/15/2027* 1,379,000 1,382,447
1,994,741Semiconductor Components-Integrated Circuits - 0.1%
TSMC Global, Ltd.Company Guar. Notes0.75% due 09/28/2025* 3,001,000 2,953,172
Sovereign - 0.0%
Hazine Mustesarligi Varlik Kiralama ASSenior Notes5.13% due 06/22/2026*# 1,000,000 1,007,452
Steel-Producers - 0.0%
Shandong Iron & Steel Xinheng International Co., Ltd.Company Guar. Notes6.85% due 09/25/2022 320,000 332,958
SupraNational Banks - 0.8%
African Development BankSenior Notes0.75% due 04/03/2023 3,144,000 3,170,818
European Bank for Reconstruction & DevelopmentSenior Notes1.50% due 02/13/2025 3,756,000 3,875,403
Inter-American Development BankBonds1.13% due 07/20/2028 4,436,000 4,431,242
International Bank for Reconstruction & DevelopmentSenior Notes0.75% due 11/24/2027 4,431,000 4,355,673
International Bank for Reconstruction & DevelopmentSenior Notes3.13% due 11/20/2025 2,177,000 2,393,411
International Finance Corp.Senior Notes0.50% due 03/20/2023# 3,681,000 3,698,851
21,925,398Telecom Services - 0.1%
Altice France Holding SACompany Guar. Notes6.00% due 02/15/2028* 1,389,000 1,379,833
Copyright © 2021 www.secdatabase.com. All Rights Reserved.Please Consider the Environment Before Printing This Document
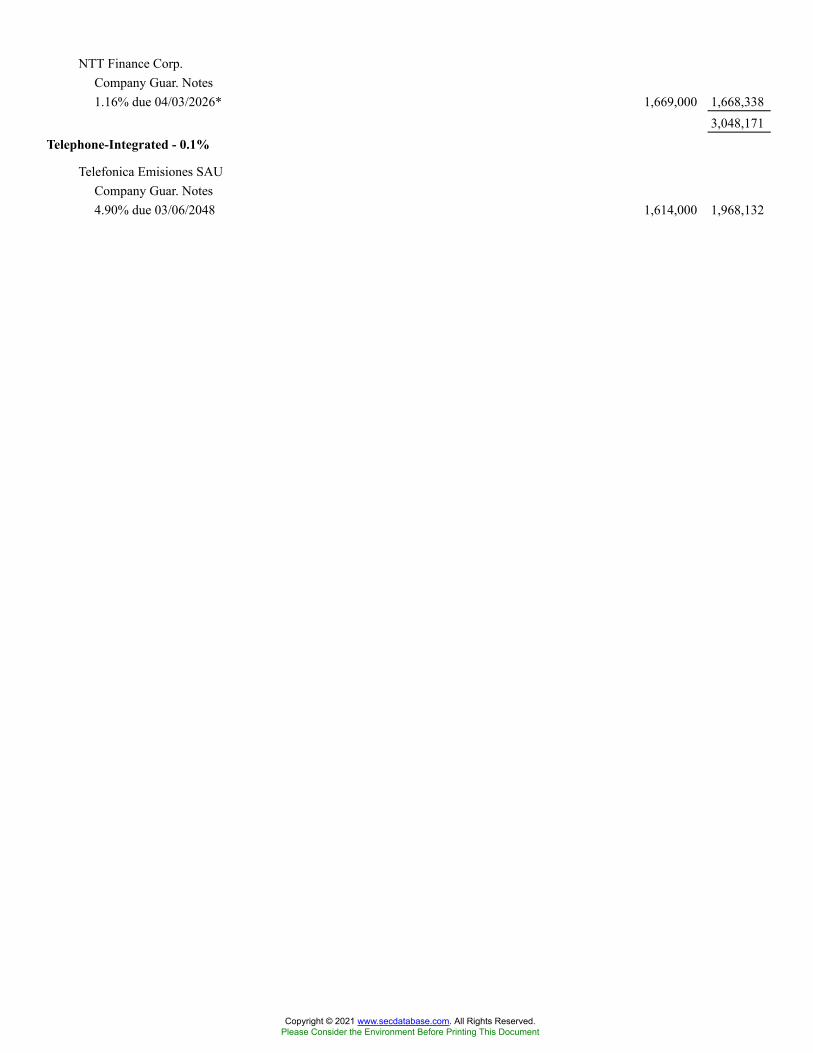
NTT Finance Corp.Company Guar. Notes1.16% due 04/03/2026* 1,669,000 1,668,338
3,048,171Telephone-Integrated - 0.1%
Telefonica Emisiones SAUCompany Guar. Notes4.90% due 03/06/2048 1,614,000 1,968,132
Copyright © 2021 www.secdatabase.com. All Rights Reserved.Please Consider the Environment Before Printing This Document

Telefonica Emisiones SAUCompany Guar. Notes5.21% due 03/08/2047 500,000 626,583
2,594,715Transport-Rail - 0.0%
Canadian Pacific Railway Co.Company Guar. Notes6.13% due 09/15/2115 608,000 957,897
Transport-Services - 0.1%
Rumo Luxembourg SARLCompany Guar. Notes5.25% due 01/10/2028* 780,000 830,864
Yunda Holding Investment, Ltd.Company Guar. NotesCOMPANY GUARNT2.25% due 08/19/2025 600,000 585,287
1,416,151Warehousing & Harbor Transportation Services - 0.0%
DP World PLCSenior Notes4.70% due 09/30/2049 700,000 780,640
Total Foreign Corporate Bonds & Notes(cost $318,776,616) 328,563,525
FOREIGN GOVERNMENT OBLIGATIONS - 4.5%Banks-Special Purpose - 0.3%
BNG Bank NVSenior Notes0.50% due 11/24/2025*# 1,302,000 1,288,654
Industrial Bank of KoreaSenior Notes1.04% due 06/22/2025* 5,134,000 5,139,748
Korea Development BankSenior Notes0.50% due 10/27/2023 1,489,000 1,488,345
7,916,747Sovereign - 4.2%
Arab Republic of EgyptSenior Notes5.75% due 05/29/2024* 2,550,000 2,715,005
Arab Republic of EgyptSenior Notes7.05% due 01/15/2032* 200,000 207,040
Arab Republic of EgyptSenior Notes7.60% due 03/01/2029 1,750,000 1,920,975
Copyright © 2021 www.secdatabase.com. All Rights Reserved.Please Consider the Environment Before Printing This Document

Arab Republic of EgyptSenior Notes8.50% due 01/31/2047 550,000 577,335
Arab Republic of EgyptSenior Notes8.88% due 05/29/2050* 1,900,000 2,044,875
Dominican RepublicSenior Notes4.88% due 09/23/2032 3,200,000 3,360,032
Dominican RepublicSenior Notes5.88% due 01/30/2060* 200,000 203,502
Dominican RepublicSenior Notes5.88% due 01/30/2060 1,100,000 1,119,261
Emirate of Abu DhabiSenior Notes2.50% due 04/16/2025 650,000 689,812
Emirate of Abu DhabiSenior Notes3.13% due 10/11/2027 1,100,000 1,214,136
Emirate of Abu DhabiSenior Notes3.13% due 04/16/2030* 3,650,000 4,019,511
Emirate of Abu DhabiSenior Notes3.13% due 09/30/2049 400,000 411,496
Federal Republic of EthiopiaSenior Notes6.63% due 12/11/2024 850,000 752,267
Federal Republic of NigeriaSenior Notes7.14% due 02/23/2030 500,000 525,944
Federal Republic of NigeriaSenior Notes9.25% due 01/21/2049 250,000 286,878
Federative Republic of BrazilSenior Notes2.88% due 06/06/2025 400,000 413,064
Federative Republic of BrazilSenior Notes3.88% due 06/12/2030 2,100,000 2,105,460
Federative Republic of BrazilSenior Notes4.75% due 01/14/2050 1,600,000 1,515,200
Federative Republic of BrazilSenior Notes5.63% due 01/07/2041 950,000 1,008,900
Copyright © 2021 www.secdatabase.com. All Rights Reserved.Please Consider the Environment Before Printing This Document

Government of RomaniaSenior Notes3.00% due 02/14/2031 150,000 156,425
Government of RomaniaSenior Notes4.00% due 02/14/2051* 1,900,000 2,014,133
Government of UkraineSenior Notes7.25% due 03/15/2033* 1,620,000 1,715,561
Government of UkraineSenior Notes7.25% due 03/15/2033 1,400,000 1,482,583
Government of UkraineSenior Notes7.75% due 09/01/2022 150,000 156,552
Government of UkraineSenior Notes7.75% due 09/01/2023 1,300,000 1,397,890
Copyright © 2021 www.secdatabase.com. All Rights Reserved.Please Consider the Environment Before Printing This Document
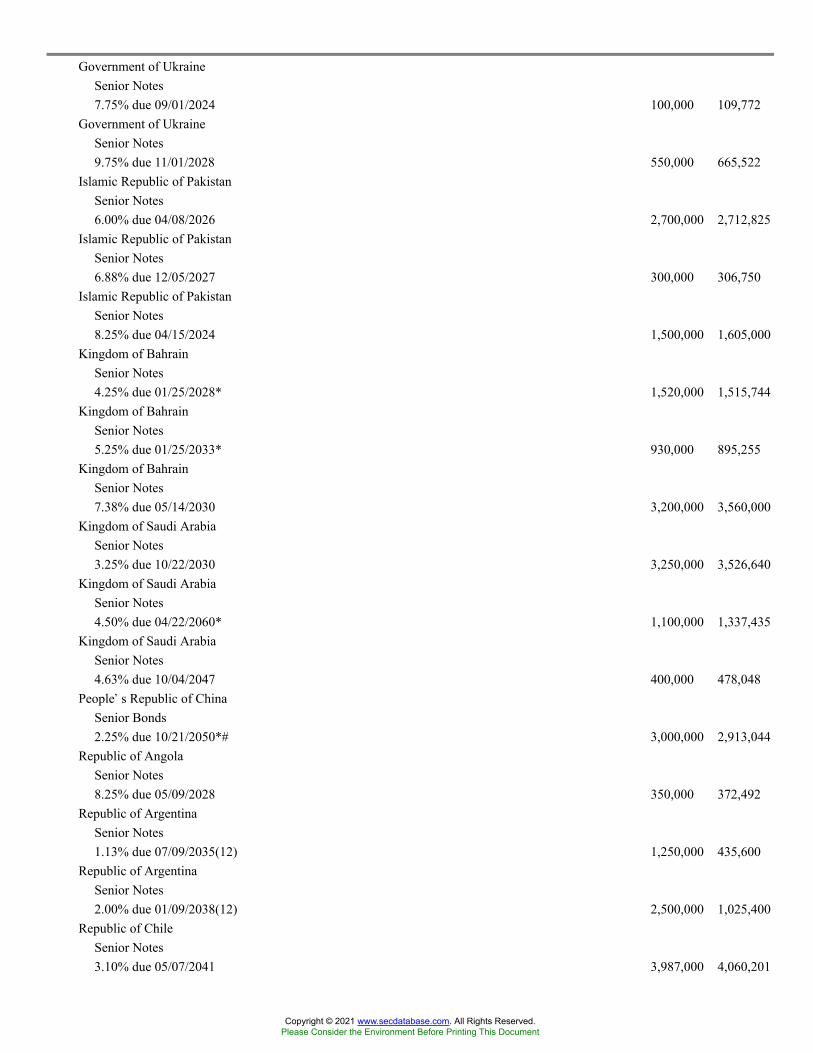
Government of UkraineSenior Notes7.75% due 09/01/2024 100,000 109,772
Government of UkraineSenior Notes9.75% due 11/01/2028 550,000 665,522
Islamic Republic of PakistanSenior Notes6.00% due 04/08/2026 2,700,000 2,712,825
Islamic Republic of PakistanSenior Notes6.88% due 12/05/2027 300,000 306,750
Islamic Republic of PakistanSenior Notes8.25% due 04/15/2024 1,500,000 1,605,000
Kingdom of BahrainSenior Notes4.25% due 01/25/2028* 1,520,000 1,515,744
Kingdom of BahrainSenior Notes5.25% due 01/25/2033* 930,000 895,255
Kingdom of BahrainSenior Notes7.38% due 05/14/2030 3,200,000 3,560,000
Kingdom of Saudi ArabiaSenior Notes3.25% due 10/22/2030 3,250,000 3,526,640
Kingdom of Saudi ArabiaSenior Notes4.50% due 04/22/2060* 1,100,000 1,337,435
Kingdom of Saudi ArabiaSenior Notes4.63% due 10/04/2047 400,000 478,048
People�s Republic of ChinaSenior Bonds2.25% due 10/21/2050*# 3,000,000 2,913,044
Republic of AngolaSenior Notes8.25% due 05/09/2028 350,000 372,492
Republic of ArgentinaSenior Notes1.13% due 07/09/2035(12) 1,250,000 435,600
Republic of ArgentinaSenior Notes2.00% due 01/09/2038(12) 2,500,000 1,025,400
Republic of ChileSenior Notes3.10% due 05/07/2041 3,987,000 4,060,201
Copyright © 2021 www.secdatabase.com. All Rights Reserved.Please Consider the Environment Before Printing This Document
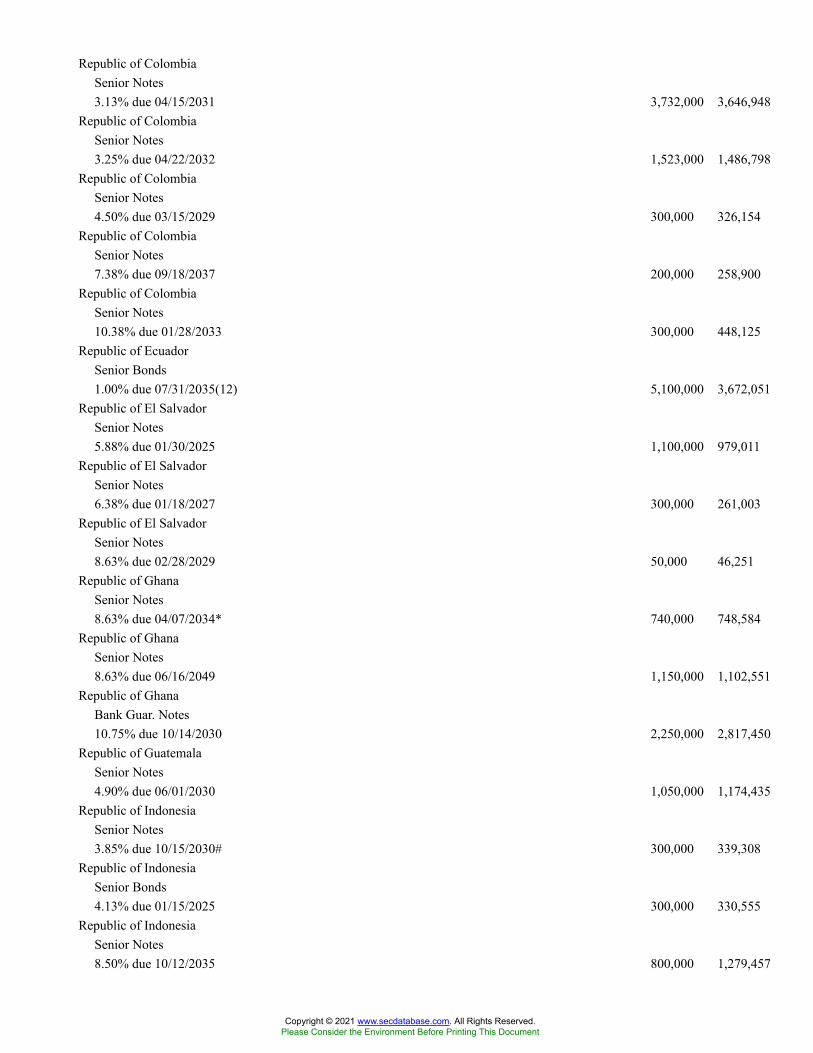
Republic of ColombiaSenior Notes3.13% due 04/15/2031 3,732,000 3,646,948
Republic of ColombiaSenior Notes3.25% due 04/22/2032 1,523,000 1,486,798
Republic of ColombiaSenior Notes4.50% due 03/15/2029 300,000 326,154
Republic of ColombiaSenior Notes7.38% due 09/18/2037 200,000 258,900
Republic of ColombiaSenior Notes10.38% due 01/28/2033 300,000 448,125
Republic of EcuadorSenior Bonds1.00% due 07/31/2035(12) 5,100,000 3,672,051
Republic of El SalvadorSenior Notes5.88% due 01/30/2025 1,100,000 979,011
Republic of El SalvadorSenior Notes6.38% due 01/18/2027 300,000 261,003
Republic of El SalvadorSenior Notes8.63% due 02/28/2029 50,000 46,251
Republic of GhanaSenior Notes8.63% due 04/07/2034* 740,000 748,584
Republic of GhanaSenior Notes8.63% due 06/16/2049 1,150,000 1,102,551
Republic of GhanaBank Guar. Notes10.75% due 10/14/2030 2,250,000 2,817,450
Republic of GuatemalaSenior Notes4.90% due 06/01/2030 1,050,000 1,174,435
Republic of IndonesiaSenior Notes3.85% due 10/15/2030# 300,000 339,308
Republic of IndonesiaSenior Bonds4.13% due 01/15/2025 300,000 330,555
Republic of IndonesiaSenior Notes8.50% due 10/12/2035 800,000 1,279,457
Copyright © 2021 www.secdatabase.com. All Rights Reserved.Please Consider the Environment Before Printing This Document

Republic of ItalySenior Notes3.88% due 05/06/2051 1,662,000 1,867,060
Republic of Ivory CoastSenior Notes5.75% due 12/31/2032(12) 545,556 553,664
Republic of Ivory CoastSenior Notes6.13% due 06/15/2033 1,500,000 1,642,140
Republic of Ivory CoastSenior Notes6.38% due 03/03/2028 2,050,000 2,287,841
Republic of KazakhstanSenior Notes4.88% due 10/14/2044 1,100,000 1,394,782
Republic of KazakhstanSenior Notes5.13% due 07/21/2025 300,000 346,950
Copyright © 2021 www.secdatabase.com. All Rights Reserved.Please Consider the Environment Before Printing This Document
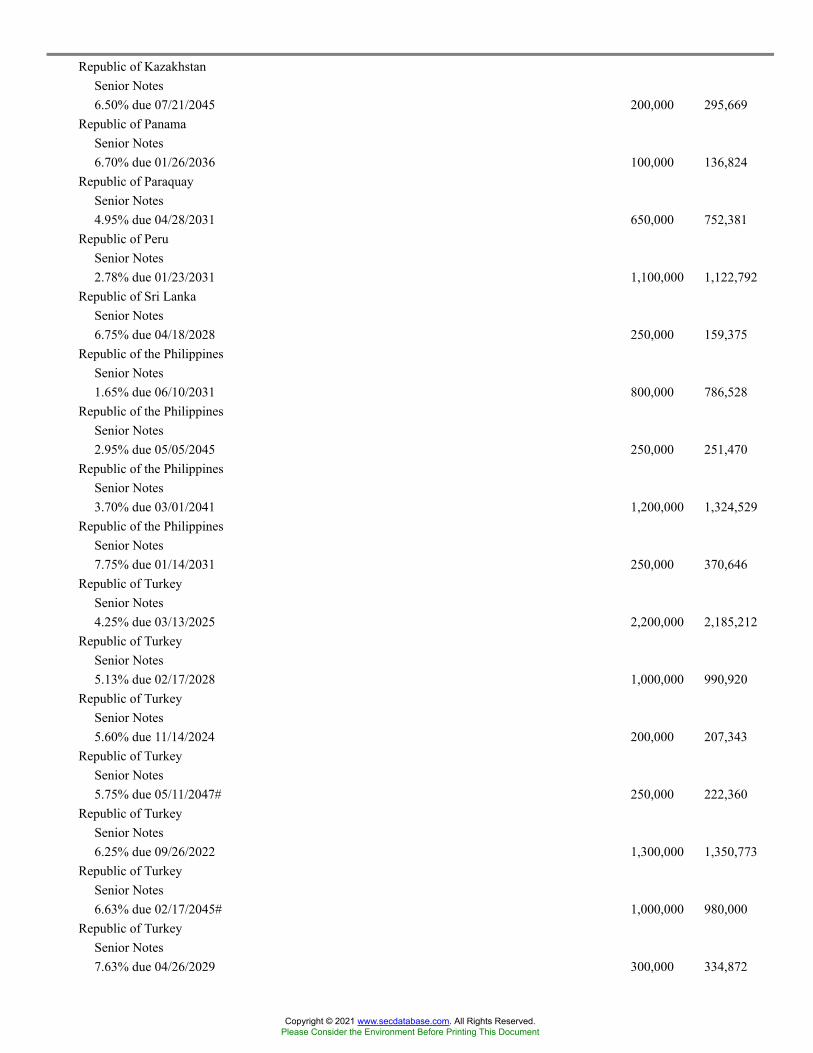
Republic of KazakhstanSenior Notes6.50% due 07/21/2045 200,000 295,669
Republic of PanamaSenior Notes6.70% due 01/26/2036 100,000 136,824
Republic of ParaquaySenior Notes4.95% due 04/28/2031 650,000 752,381
Republic of PeruSenior Notes2.78% due 01/23/2031 1,100,000 1,122,792
Republic of Sri LankaSenior Notes6.75% due 04/18/2028 250,000 159,375
Republic of the PhilippinesSenior Notes1.65% due 06/10/2031 800,000 786,528
Republic of the PhilippinesSenior Notes2.95% due 05/05/2045 250,000 251,470
Republic of the PhilippinesSenior Notes3.70% due 03/01/2041 1,200,000 1,324,529
Republic of the PhilippinesSenior Notes7.75% due 01/14/2031 250,000 370,646
Republic of TurkeySenior Notes4.25% due 03/13/2025 2,200,000 2,185,212
Republic of TurkeySenior Notes5.13% due 02/17/2028 1,000,000 990,920
Republic of TurkeySenior Notes5.60% due 11/14/2024 200,000 207,343
Republic of TurkeySenior Notes5.75% due 05/11/2047# 250,000 222,360
Republic of TurkeySenior Notes6.25% due 09/26/2022 1,300,000 1,350,773
Republic of TurkeySenior Notes6.63% due 02/17/2045# 1,000,000 980,000
Republic of TurkeySenior Notes7.63% due 04/26/2029 300,000 334,872
Copyright © 2021 www.secdatabase.com. All Rights Reserved.Please Consider the Environment Before Printing This Document

Russian FederationSenior Notes4.38% due 03/21/2029 2,200,000 2,513,852
Russian FederationSenior Notes5.25% due 06/23/2047 800,000 1,035,024
State of QatarSenior Notes3.40% due 04/16/2025* 200,000 216,805
State of QatarSenior Notes3.75% due 04/16/2030* 1,800,000 2,050,625
State of QatarSenior Notes3.75% due 04/16/2030 600,000 683,542
State of QatarSenior Notes4.40% due 04/16/2050 1,000,000 1,238,188
State of QatarSenior Notes4.82% due 03/14/2049 2,900,000 3,787,238
Sultanate of OmanSenior Notes5.38% due 03/08/2027 600,000 634,554
Sultanate of OmanSenior Notes6.75% due 10/28/2027* 1,000,000 1,128,680
United Mexican StatesSenior Notes2.66% due 05/24/2031# 1,230,000 1,217,786
United Mexican StatesSenior Notes4.28% due 08/14/2041 6,001,000 6,421,970
United Mexican StatesSenior Notes4.50% due 01/31/2050 200,000 217,192
United Mexican StatesSenior Bonds4.75% due 03/08/2044 1,423,000 1,597,474
United Mexican StatesSenior Notes5.00% due 04/27/2051 1,400,000 1,627,500
120,385,707Total Foreign Government Obligations
(cost $125,838,071) 128,302,454U.S. GOVERNMENT AGENCIES - 39.7%Federal Home Loan Bank - 0.3%
2.13% due 09/14/2029 7,765,000 8,275,2943.25% due 11/16/2028 1,000,000 1,143,861
Copyright © 2021 www.secdatabase.com. All Rights Reserved.Please Consider the Environment Before Printing This Document
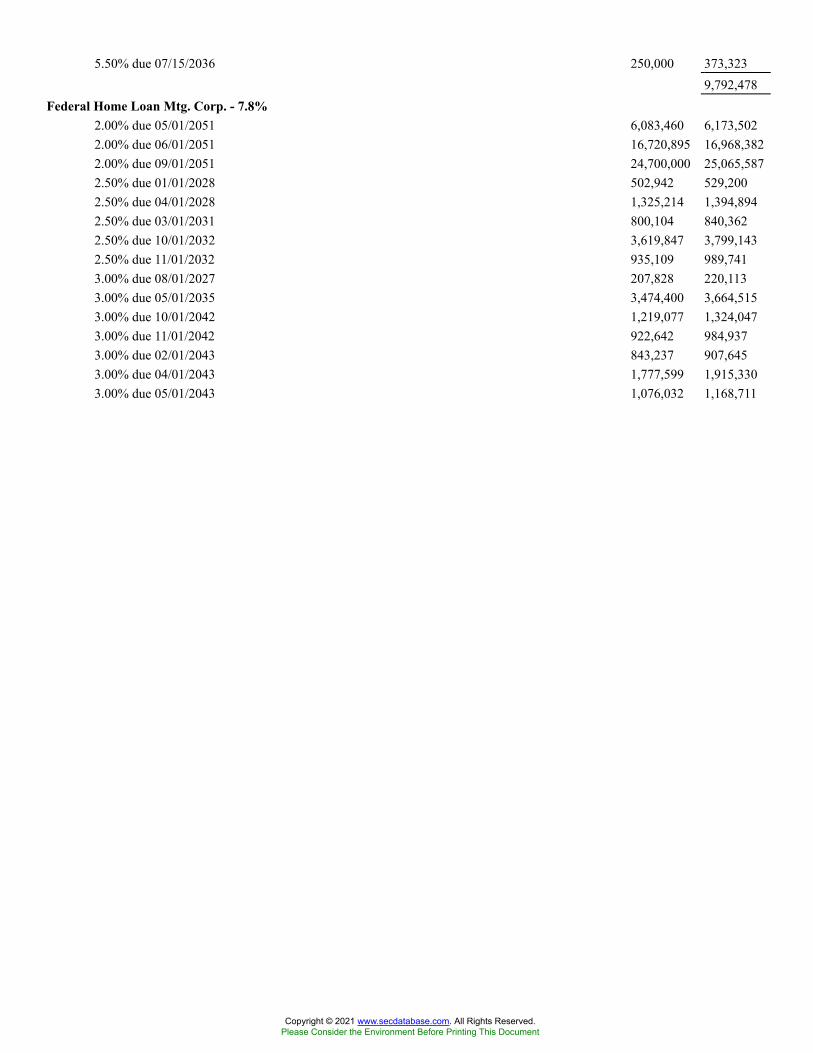
5.50% due 07/15/2036 250,000 373,3239,792,478
Federal Home Loan Mtg. Corp. - 7.8%2.00% due 05/01/2051 6,083,460 6,173,5022.00% due 06/01/2051 16,720,895 16,968,3822.00% due 09/01/2051 24,700,000 25,065,5872.50% due 01/01/2028 502,942 529,2002.50% due 04/01/2028 1,325,214 1,394,8942.50% due 03/01/2031 800,104 840,3622.50% due 10/01/2032 3,619,847 3,799,1432.50% due 11/01/2032 935,109 989,7413.00% due 08/01/2027 207,828 220,1133.00% due 05/01/2035 3,474,400 3,664,5153.00% due 10/01/2042 1,219,077 1,324,0473.00% due 11/01/2042 922,642 984,9373.00% due 02/01/2043 843,237 907,6453.00% due 04/01/2043 1,777,599 1,915,3303.00% due 05/01/2043 1,076,032 1,168,711
Copyright © 2021 www.secdatabase.com. All Rights Reserved.Please Consider the Environment Before Printing This Document
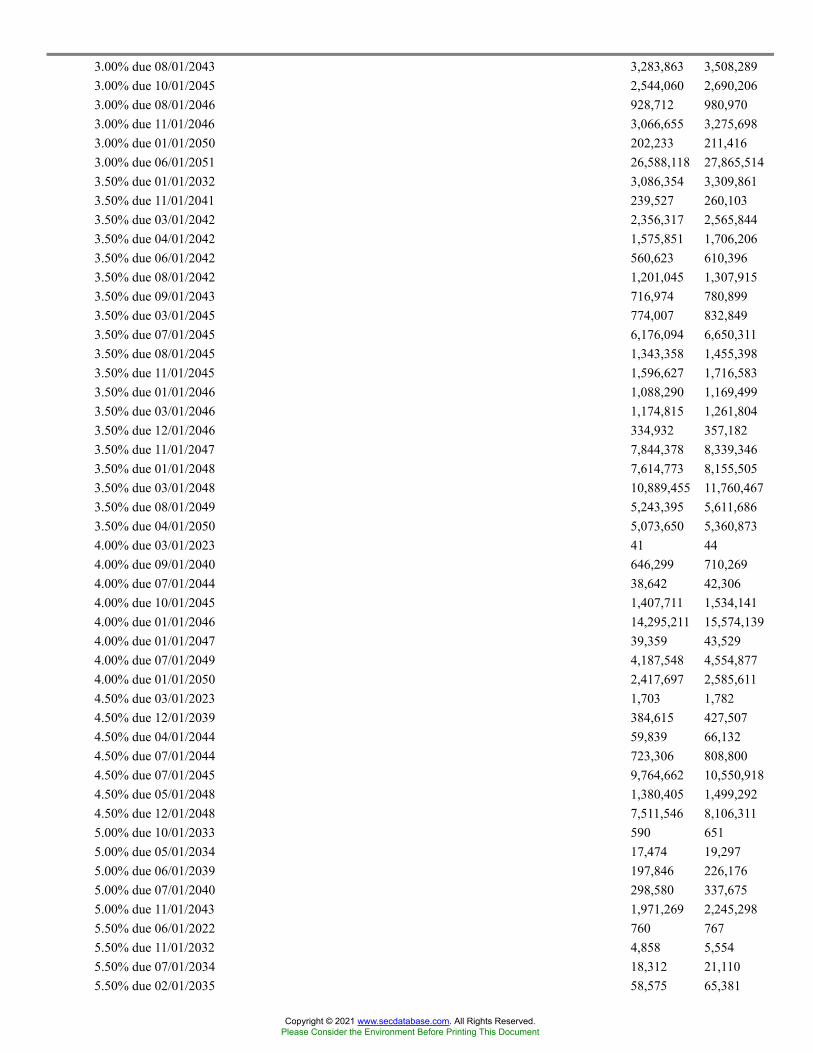
3.00% due 08/01/2043 3,283,863 3,508,2893.00% due 10/01/2045 2,544,060 2,690,2063.00% due 08/01/2046 928,712 980,9703.00% due 11/01/2046 3,066,655 3,275,6983.00% due 01/01/2050 202,233 211,4163.00% due 06/01/2051 26,588,118 27,865,5143.50% due 01/01/2032 3,086,354 3,309,8613.50% due 11/01/2041 239,527 260,1033.50% due 03/01/2042 2,356,317 2,565,8443.50% due 04/01/2042 1,575,851 1,706,2063.50% due 06/01/2042 560,623 610,3963.50% due 08/01/2042 1,201,045 1,307,9153.50% due 09/01/2043 716,974 780,8993.50% due 03/01/2045 774,007 832,8493.50% due 07/01/2045 6,176,094 6,650,3113.50% due 08/01/2045 1,343,358 1,455,3983.50% due 11/01/2045 1,596,627 1,716,5833.50% due 01/01/2046 1,088,290 1,169,4993.50% due 03/01/2046 1,174,815 1,261,8043.50% due 12/01/2046 334,932 357,1823.50% due 11/01/2047 7,844,378 8,339,3463.50% due 01/01/2048 7,614,773 8,155,5053.50% due 03/01/2048 10,889,455 11,760,4673.50% due 08/01/2049 5,243,395 5,611,6863.50% due 04/01/2050 5,073,650 5,360,8734.00% due 03/01/2023 41 444.00% due 09/01/2040 646,299 710,2694.00% due 07/01/2044 38,642 42,3064.00% due 10/01/2045 1,407,711 1,534,1414.00% due 01/01/2046 14,295,211 15,574,1394.00% due 01/01/2047 39,359 43,5294.00% due 07/01/2049 4,187,548 4,554,8774.00% due 01/01/2050 2,417,697 2,585,6114.50% due 03/01/2023 1,703 1,7824.50% due 12/01/2039 384,615 427,5074.50% due 04/01/2044 59,839 66,1324.50% due 07/01/2044 723,306 808,8004.50% due 07/01/2045 9,764,662 10,550,9184.50% due 05/01/2048 1,380,405 1,499,2924.50% due 12/01/2048 7,511,546 8,106,3115.00% due 10/01/2033 590 6515.00% due 05/01/2034 17,474 19,2975.00% due 06/01/2039 197,846 226,1765.00% due 07/01/2040 298,580 337,6755.00% due 11/01/2043 1,971,269 2,245,2985.50% due 06/01/2022 760 7675.50% due 11/01/2032 4,858 5,5545.50% due 07/01/2034 18,312 21,1105.50% due 02/01/2035 58,575 65,381
Copyright © 2021 www.secdatabase.com. All Rights Reserved.Please Consider the Environment Before Printing This Document
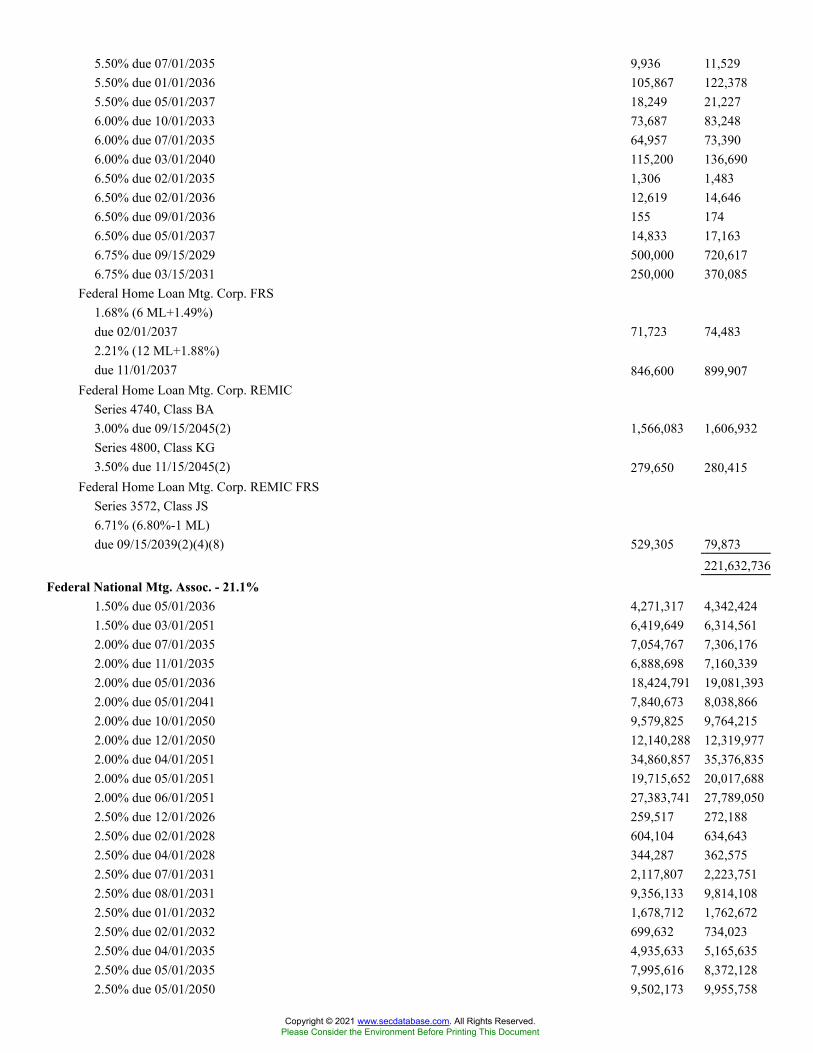
5.50% due 07/01/2035 9,936 11,5295.50% due 01/01/2036 105,867 122,3785.50% due 05/01/2037 18,249 21,2276.00% due 10/01/2033 73,687 83,2486.00% due 07/01/2035 64,957 73,3906.00% due 03/01/2040 115,200 136,6906.50% due 02/01/2035 1,306 1,4836.50% due 02/01/2036 12,619 14,6466.50% due 09/01/2036 155 1746.50% due 05/01/2037 14,833 17,1636.75% due 09/15/2029 500,000 720,6176.75% due 03/15/2031 250,000 370,085
Federal Home Loan Mtg. Corp. FRS1.68% (6 ML+1.49%)due 02/01/2037 71,723 74,4832.21% (12 ML+1.88%)due 11/01/2037 846,600 899,907
Federal Home Loan Mtg. Corp. REMICSeries 4740, Class BA3.00% due 09/15/2045(2) 1,566,083 1,606,932Series 4800, Class KG3.50% due 11/15/2045(2) 279,650 280,415
Federal Home Loan Mtg. Corp. REMIC FRSSeries 3572, Class JS6.71% (6.80%-1 ML)due 09/15/2039(2)(4)(8) 529,305 79,873
221,632,736Federal National Mtg. Assoc. - 21.1%
1.50% due 05/01/2036 4,271,317 4,342,4241.50% due 03/01/2051 6,419,649 6,314,5612.00% due 07/01/2035 7,054,767 7,306,1762.00% due 11/01/2035 6,888,698 7,160,3392.00% due 05/01/2036 18,424,791 19,081,3932.00% due 05/01/2041 7,840,673 8,038,8662.00% due 10/01/2050 9,579,825 9,764,2152.00% due 12/01/2050 12,140,288 12,319,9772.00% due 04/01/2051 34,860,857 35,376,8352.00% due 05/01/2051 19,715,652 20,017,6882.00% due 06/01/2051 27,383,741 27,789,0502.50% due 12/01/2026 259,517 272,1882.50% due 02/01/2028 604,104 634,6432.50% due 04/01/2028 344,287 362,5752.50% due 07/01/2031 2,117,807 2,223,7512.50% due 08/01/2031 9,356,133 9,814,1082.50% due 01/01/2032 1,678,712 1,762,6722.50% due 02/01/2032 699,632 734,0232.50% due 04/01/2035 4,935,633 5,165,6352.50% due 05/01/2035 7,995,616 8,372,1282.50% due 05/01/2050 9,502,173 9,955,758
Copyright © 2021 www.secdatabase.com. All Rights Reserved.Please Consider the Environment Before Printing This Document

2.50% due 06/01/2050 323,572 336,4622.50% due 07/01/2050 7,493,504 7,883,7782.50% due 08/01/2050 3,514,217 3,654,2092.50% due 10/01/2050 1,757,138 1,830,8532.50% due 05/01/2051 14,924,111 15,518,6302.50% due 06/01/2051 25,611,508 26,631,7713.00% due 10/01/2027 219,236 232,1233.00% due 12/01/2027 635,948 674,4823.00% due 01/01/2028 1,066,318 1,130,8813.00% due 03/01/2030 889,228 945,3733.00% due 10/01/2030 1,433,707 1,517,7523.00% due 10/01/2032 3,073,691 3,254,8923.00% due 02/01/2033 12,483,630 13,207,3723.00% due 07/01/2034 619,429 653,5033.00% due 11/01/2039 4,342,680 4,545,6263.00% due 03/01/2042 1,618,769 1,727,665
Copyright © 2021 www.secdatabase.com. All Rights Reserved.Please Consider the Environment Before Printing This Document
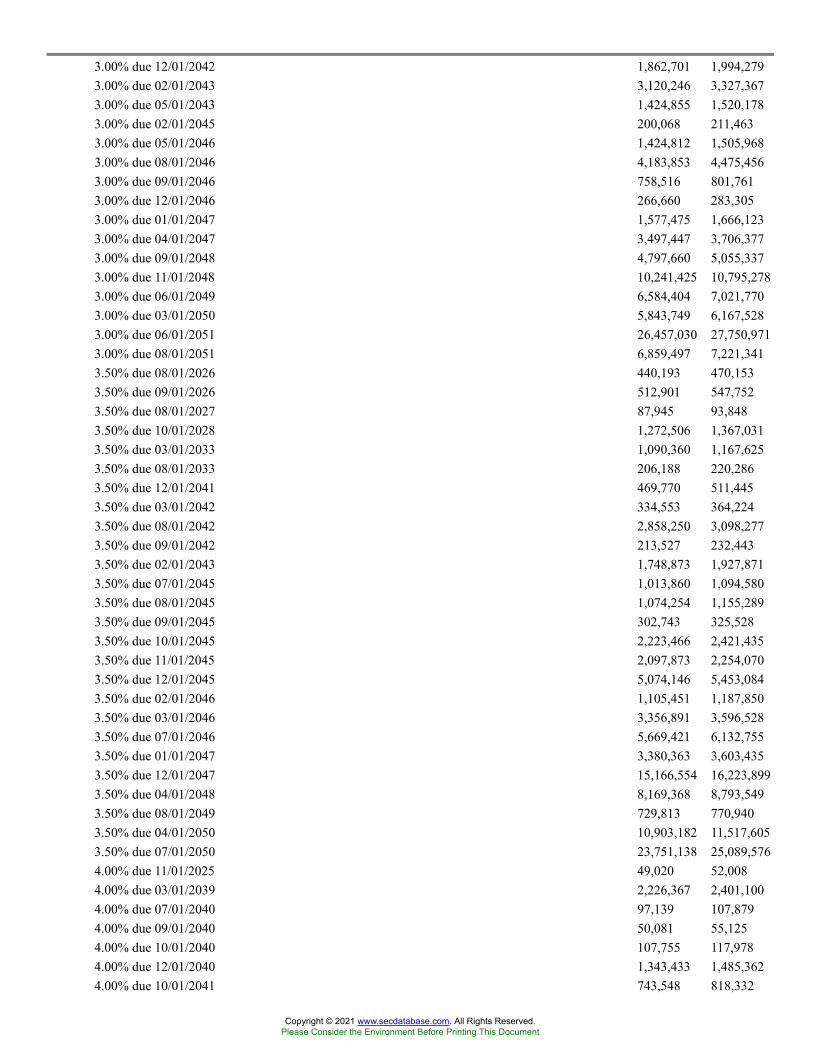
3.00% due 12/01/2042 1,862,701 1,994,2793.00% due 02/01/2043 3,120,246 3,327,3673.00% due 05/01/2043 1,424,855 1,520,1783.00% due 02/01/2045 200,068 211,4633.00% due 05/01/2046 1,424,812 1,505,9683.00% due 08/01/2046 4,183,853 4,475,4563.00% due 09/01/2046 758,516 801,7613.00% due 12/01/2046 266,660 283,3053.00% due 01/01/2047 1,577,475 1,666,1233.00% due 04/01/2047 3,497,447 3,706,3773.00% due 09/01/2048 4,797,660 5,055,3373.00% due 11/01/2048 10,241,425 10,795,2783.00% due 06/01/2049 6,584,404 7,021,7703.00% due 03/01/2050 5,843,749 6,167,5283.00% due 06/01/2051 26,457,030 27,750,9713.00% due 08/01/2051 6,859,497 7,221,3413.50% due 08/01/2026 440,193 470,1533.50% due 09/01/2026 512,901 547,7523.50% due 08/01/2027 87,945 93,8483.50% due 10/01/2028 1,272,506 1,367,0313.50% due 03/01/2033 1,090,360 1,167,6253.50% due 08/01/2033 206,188 220,2863.50% due 12/01/2041 469,770 511,4453.50% due 03/01/2042 334,553 364,2243.50% due 08/01/2042 2,858,250 3,098,2773.50% due 09/01/2042 213,527 232,4433.50% due 02/01/2043 1,748,873 1,927,8713.50% due 07/01/2045 1,013,860 1,094,5803.50% due 08/01/2045 1,074,254 1,155,2893.50% due 09/01/2045 302,743 325,5283.50% due 10/01/2045 2,223,466 2,421,4353.50% due 11/01/2045 2,097,873 2,254,0703.50% due 12/01/2045 5,074,146 5,453,0843.50% due 02/01/2046 1,105,451 1,187,8503.50% due 03/01/2046 3,356,891 3,596,5283.50% due 07/01/2046 5,669,421 6,132,7553.50% due 01/01/2047 3,380,363 3,603,4353.50% due 12/01/2047 15,166,554 16,223,8993.50% due 04/01/2048 8,169,368 8,793,5493.50% due 08/01/2049 729,813 770,9403.50% due 04/01/2050 10,903,182 11,517,6053.50% due 07/01/2050 23,751,138 25,089,5764.00% due 11/01/2025 49,020 52,0084.00% due 03/01/2039 2,226,367 2,401,1004.00% due 07/01/2040 97,139 107,8794.00% due 09/01/2040 50,081 55,1254.00% due 10/01/2040 107,755 117,9784.00% due 12/01/2040 1,343,433 1,485,3624.00% due 10/01/2041 743,548 818,332
Copyright © 2021 www.secdatabase.com. All Rights Reserved.Please Consider the Environment Before Printing This Document
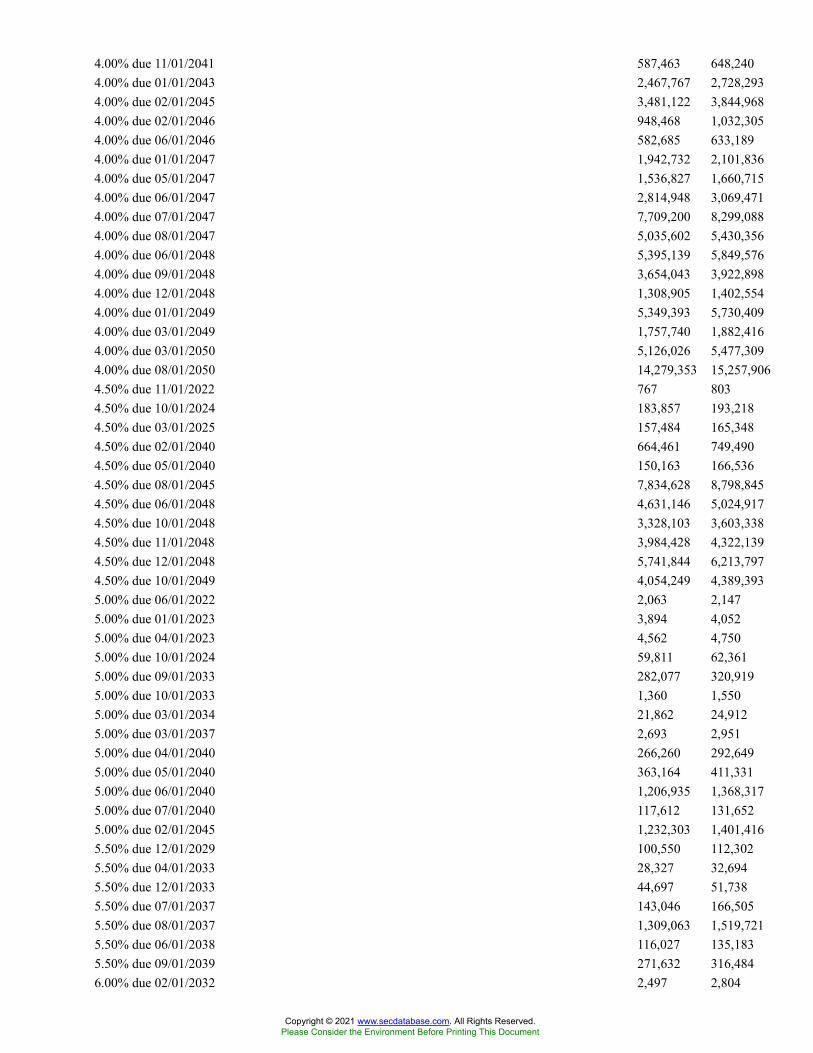
4.00% due 11/01/2041 587,463 648,2404.00% due 01/01/2043 2,467,767 2,728,2934.00% due 02/01/2045 3,481,122 3,844,9684.00% due 02/01/2046 948,468 1,032,3054.00% due 06/01/2046 582,685 633,1894.00% due 01/01/2047 1,942,732 2,101,8364.00% due 05/01/2047 1,536,827 1,660,7154.00% due 06/01/2047 2,814,948 3,069,4714.00% due 07/01/2047 7,709,200 8,299,0884.00% due 08/01/2047 5,035,602 5,430,3564.00% due 06/01/2048 5,395,139 5,849,5764.00% due 09/01/2048 3,654,043 3,922,8984.00% due 12/01/2048 1,308,905 1,402,5544.00% due 01/01/2049 5,349,393 5,730,4094.00% due 03/01/2049 1,757,740 1,882,4164.00% due 03/01/2050 5,126,026 5,477,3094.00% due 08/01/2050 14,279,353 15,257,9064.50% due 11/01/2022 767 8034.50% due 10/01/2024 183,857 193,2184.50% due 03/01/2025 157,484 165,3484.50% due 02/01/2040 664,461 749,4904.50% due 05/01/2040 150,163 166,5364.50% due 08/01/2045 7,834,628 8,798,8454.50% due 06/01/2048 4,631,146 5,024,9174.50% due 10/01/2048 3,328,103 3,603,3384.50% due 11/01/2048 3,984,428 4,322,1394.50% due 12/01/2048 5,741,844 6,213,7974.50% due 10/01/2049 4,054,249 4,389,3935.00% due 06/01/2022 2,063 2,1475.00% due 01/01/2023 3,894 4,0525.00% due 04/01/2023 4,562 4,7505.00% due 10/01/2024 59,811 62,3615.00% due 09/01/2033 282,077 320,9195.00% due 10/01/2033 1,360 1,5505.00% due 03/01/2034 21,862 24,9125.00% due 03/01/2037 2,693 2,9515.00% due 04/01/2040 266,260 292,6495.00% due 05/01/2040 363,164 411,3315.00% due 06/01/2040 1,206,935 1,368,3175.00% due 07/01/2040 117,612 131,6525.00% due 02/01/2045 1,232,303 1,401,4165.50% due 12/01/2029 100,550 112,3025.50% due 04/01/2033 28,327 32,6945.50% due 12/01/2033 44,697 51,7385.50% due 07/01/2037 143,046 166,5055.50% due 08/01/2037 1,309,063 1,519,7215.50% due 06/01/2038 116,027 135,1835.50% due 09/01/2039 271,632 316,4846.00% due 02/01/2032 2,497 2,804
Copyright © 2021 www.secdatabase.com. All Rights Reserved.Please Consider the Environment Before Printing This Document
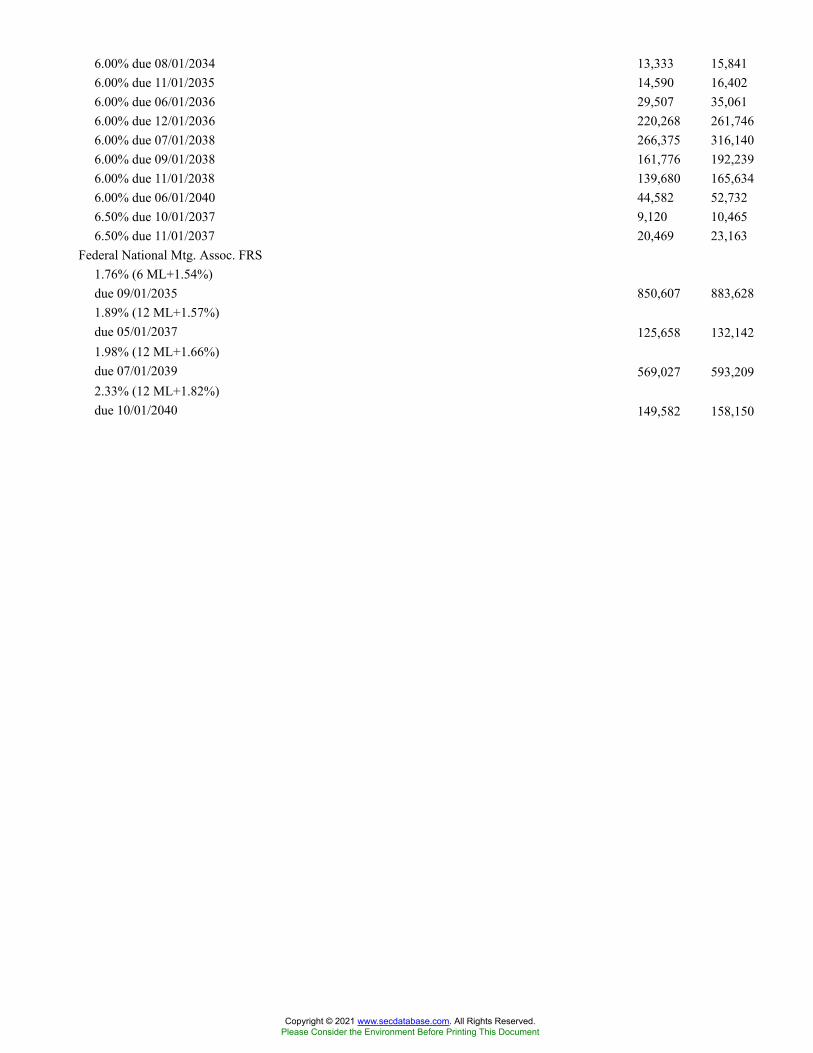
6.00% due 08/01/2034 13,333 15,8416.00% due 11/01/2035 14,590 16,4026.00% due 06/01/2036 29,507 35,0616.00% due 12/01/2036 220,268 261,7466.00% due 07/01/2038 266,375 316,1406.00% due 09/01/2038 161,776 192,2396.00% due 11/01/2038 139,680 165,6346.00% due 06/01/2040 44,582 52,7326.50% due 10/01/2037 9,120 10,4656.50% due 11/01/2037 20,469 23,163
Federal National Mtg. Assoc. FRS1.76% (6 ML+1.54%)due 09/01/2035 850,607 883,6281.89% (12 ML+1.57%)due 05/01/2037 125,658 132,1421.98% (12 ML+1.66%)due 07/01/2039 569,027 593,2092.33% (12 ML+1.82%)due 10/01/2040 149,582 158,150
Copyright © 2021 www.secdatabase.com. All Rights Reserved.Please Consider the Environment Before Printing This Document
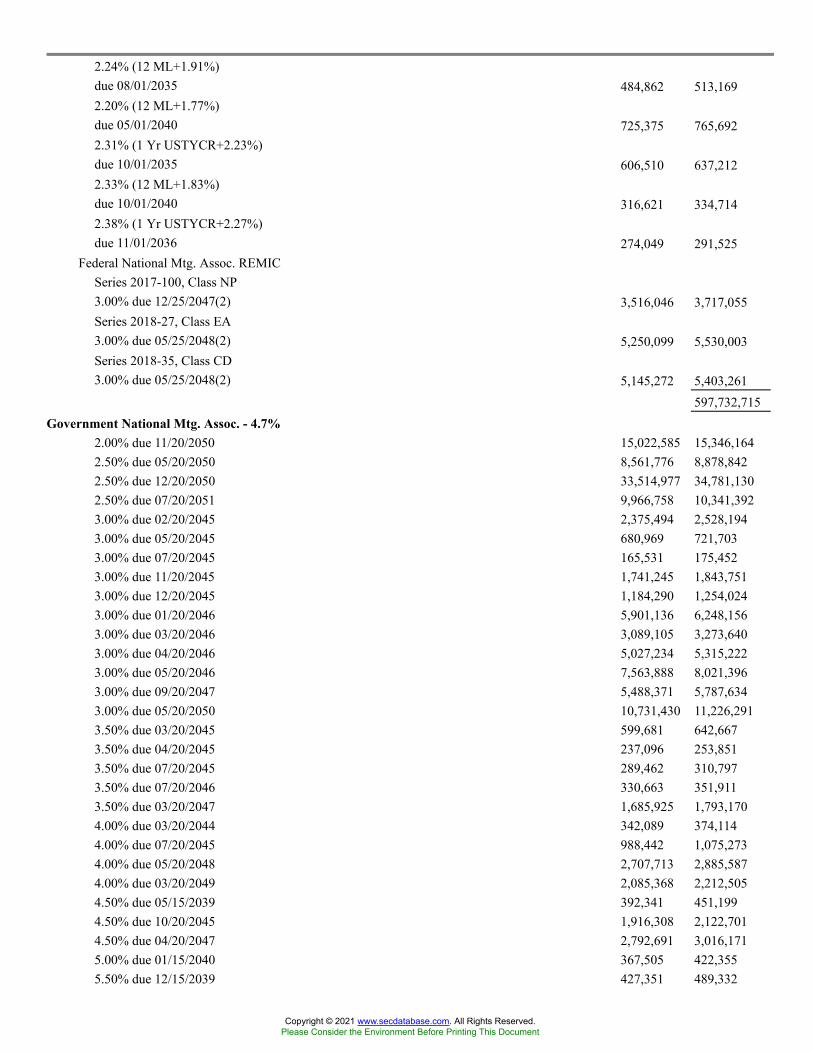
2.24% (12 ML+1.91%)due 08/01/2035 484,862 513,1692.20% (12 ML+1.77%)due 05/01/2040 725,375 765,6922.31% (1 Yr USTYCR+2.23%)due 10/01/2035 606,510 637,2122.33% (12 ML+1.83%)due 10/01/2040 316,621 334,7142.38% (1 Yr USTYCR+2.27%)due 11/01/2036 274,049 291,525
Federal National Mtg. Assoc. REMICSeries 2017-100, Class NP3.00% due 12/25/2047(2) 3,516,046 3,717,055Series 2018-27, Class EA3.00% due 05/25/2048(2) 5,250,099 5,530,003Series 2018-35, Class CD3.00% due 05/25/2048(2) 5,145,272 5,403,261
597,732,715Government National Mtg. Assoc. - 4.7%
2.00% due 11/20/2050 15,022,585 15,346,1642.50% due 05/20/2050 8,561,776 8,878,8422.50% due 12/20/2050 33,514,977 34,781,1302.50% due 07/20/2051 9,966,758 10,341,3923.00% due 02/20/2045 2,375,494 2,528,1943.00% due 05/20/2045 680,969 721,7033.00% due 07/20/2045 165,531 175,4523.00% due 11/20/2045 1,741,245 1,843,7513.00% due 12/20/2045 1,184,290 1,254,0243.00% due 01/20/2046 5,901,136 6,248,1563.00% due 03/20/2046 3,089,105 3,273,6403.00% due 04/20/2046 5,027,234 5,315,2223.00% due 05/20/2046 7,563,888 8,021,3963.00% due 09/20/2047 5,488,371 5,787,6343.00% due 05/20/2050 10,731,430 11,226,2913.50% due 03/20/2045 599,681 642,6673.50% due 04/20/2045 237,096 253,8513.50% due 07/20/2045 289,462 310,7973.50% due 07/20/2046 330,663 351,9113.50% due 03/20/2047 1,685,925 1,793,1704.00% due 03/20/2044 342,089 374,1144.00% due 07/20/2045 988,442 1,075,2734.00% due 05/20/2048 2,707,713 2,885,5874.00% due 03/20/2049 2,085,368 2,212,5054.50% due 05/15/2039 392,341 451,1994.50% due 10/20/2045 1,916,308 2,122,7014.50% due 04/20/2047 2,792,691 3,016,1715.00% due 01/15/2040 367,505 422,3555.50% due 12/15/2039 427,351 489,332
Copyright © 2021 www.secdatabase.com. All Rights Reserved.Please Consider the Environment Before Printing This Document
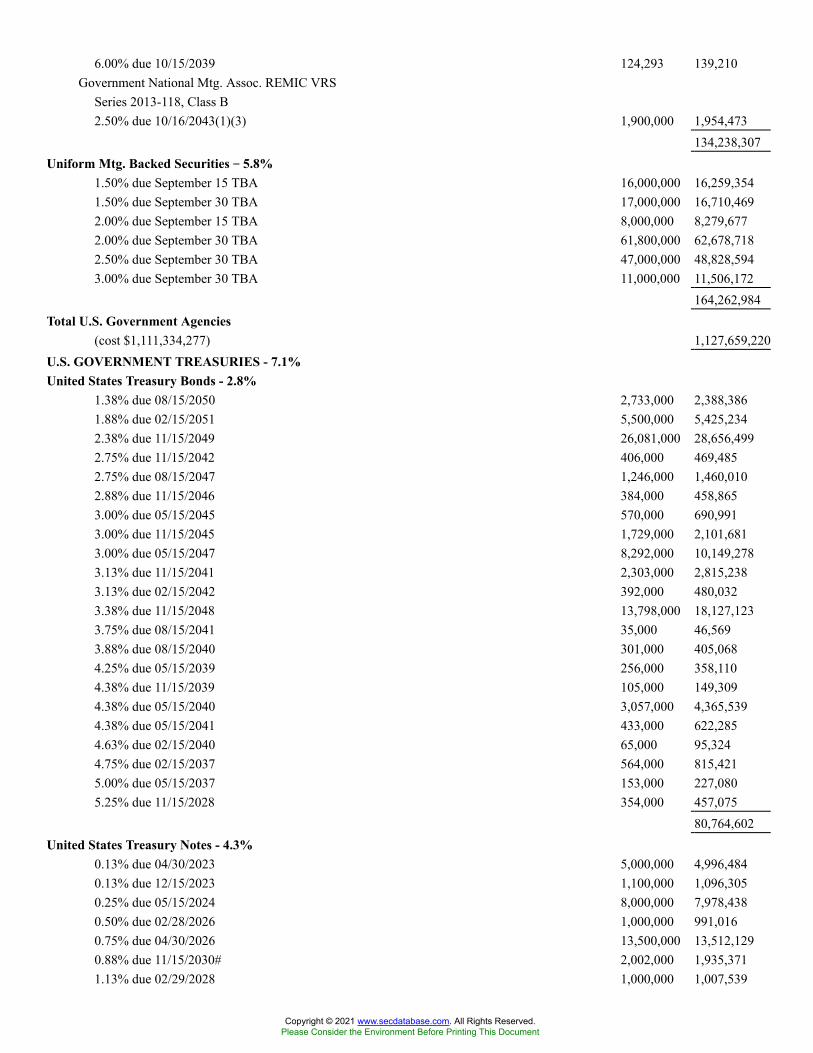
6.00% due 10/15/2039 124,293 139,210Government National Mtg. Assoc. REMIC VRS
Series 2013-118, Class B2.50% due 10/16/2043(1)(3) 1,900,000 1,954,473
134,238,307Uniform Mtg. Backed Securities �� 5.8%
1.50% due September 15 TBA 16,000,000 16,259,3541.50% due September 30 TBA 17,000,000 16,710,4692.00% due September 15 TBA 8,000,000 8,279,6772.00% due September 30 TBA 61,800,000 62,678,7182.50% due September 30 TBA 47,000,000 48,828,5943.00% due September 30 TBA 11,000,000 11,506,172
164,262,984Total U.S. Government Agencies
(cost $1,111,334,277) 1,127,659,220U.S. GOVERNMENT TREASURIES - 7.1%United States Treasury Bonds - 2.8%
1.38% due 08/15/2050 2,733,000 2,388,3861.88% due 02/15/2051 5,500,000 5,425,2342.38% due 11/15/2049 26,081,000 28,656,4992.75% due 11/15/2042 406,000 469,4852.75% due 08/15/2047 1,246,000 1,460,0102.88% due 11/15/2046 384,000 458,8653.00% due 05/15/2045 570,000 690,9913.00% due 11/15/2045 1,729,000 2,101,6813.00% due 05/15/2047 8,292,000 10,149,2783.13% due 11/15/2041 2,303,000 2,815,2383.13% due 02/15/2042 392,000 480,0323.38% due 11/15/2048 13,798,000 18,127,1233.75% due 08/15/2041 35,000 46,5693.88% due 08/15/2040 301,000 405,0684.25% due 05/15/2039 256,000 358,1104.38% due 11/15/2039 105,000 149,3094.38% due 05/15/2040 3,057,000 4,365,5394.38% due 05/15/2041 433,000 622,2854.63% due 02/15/2040 65,000 95,3244.75% due 02/15/2037 564,000 815,4215.00% due 05/15/2037 153,000 227,0805.25% due 11/15/2028 354,000 457,075
80,764,602United States Treasury Notes - 4.3%
0.13% due 04/30/2023 5,000,000 4,996,4840.13% due 12/15/2023 1,100,000 1,096,3050.25% due 05/15/2024 8,000,000 7,978,4380.50% due 02/28/2026 1,000,000 991,0160.75% due 04/30/2026 13,500,000 13,512,1290.88% due 11/15/2030# 2,002,000 1,935,3711.13% due 02/29/2028 1,000,000 1,007,539
Copyright © 2021 www.secdatabase.com. All Rights Reserved.Please Consider the Environment Before Printing This Document

1.13% due 02/15/2031 5,400,000 5,329,9691.38% due 10/15/2022 10,000,000 10,142,1871.38% due 08/31/2023 19,000,000 19,438,6331.38% due 01/31/2025 1,500,000 1,544,5311.50% due 11/30/2024 1,500,000 1,550,7421.50% due 02/15/2030 8,520,000 8,724,6801.63% due 08/15/2022 1,796,000 1,822,2381.63% due 08/31/2022 1,921,000 1,950,565
Copyright © 2021 www.secdatabase.com. All Rights Reserved.Please Consider the Environment Before Printing This Document

1.63% due 12/15/2022 340,000 346,6141.63% due 02/15/2026 4,839,000 5,035,0171.63% due 11/30/2026 1,600,000 1,666,8121.63% due 08/15/2029 10,100,000 10,462,1801.75% due 09/30/2022 5,137,000 5,228,1021.75% due 11/15/2029# 6,700,000 7,003,5942.00% due 02/15/2025 1,729,000 1,817,4092.00% due 11/15/2026 384,000 407,3852.25% due 04/30/2024 167,000 175,4542.25% due 11/15/2024 3,596,000 3,803,1912.25% due 08/15/2027# 576,000 620,4382.38% due 05/15/2029 500,000 545,6052.50% due 01/15/2022 2,401,000 2,422,3842.63% due 02/15/2029 171,000 189,536
121,744,548Total U.S. Government Treasuries
(cost $193,217,153) 202,509,150COMMON STOCKS - 0.0%Oil Field Machinery & Equipment - 0.0%
Hi-Crush, Inc.�(5)(6) 66,782 16,028Pharmacy Services - 0.0%
Akorn, Inc.� 13,495 156,312Total Common Stocks
(cost $264,266) 172,340PREFERRED SECURITIES - 0.0%Sovereign Agency - 0.0%
Federal Home Loan Mtg. Corp.Series Z8.38%�(cost $124,555) 8,067 11,859
PREFERRED SECURITIES/CAPITAL SECURITIES - 1.4%Banks-Money Center - 0.0%
BBVA Bancomer SA5.13% due 01/18/2033* $1,302,000 1,357,218
Building & Construction-Misc. - 0.0%
China Minmetals Corp.3.75% due 11/13/2022(9) 600,000 613,503
Cellular Telecom - 0.0%
Vodafone Group PLC5.13% due 06/04/2081 716,000 740,151
Diversified Banking Institutions - 0.2%
JPMorgan Chase & Co.Series U6.13% due 04/30/2024(9) 2,702,000 2,911,405
Copyright © 2021 www.secdatabase.com. All Rights Reserved.Please Consider the Environment Before Printing This Document

Royal Bank of Scotland Group PLC8.00% due 08/10/2025(9) 1,096,000 1,291,910
Societe Generale SA7.88% due 12/18/2023*(9) 1,754,000 1,944,747
6,148,062
Copyright © 2021 www.secdatabase.com. All Rights Reserved.Please Consider the Environment Before Printing This Document
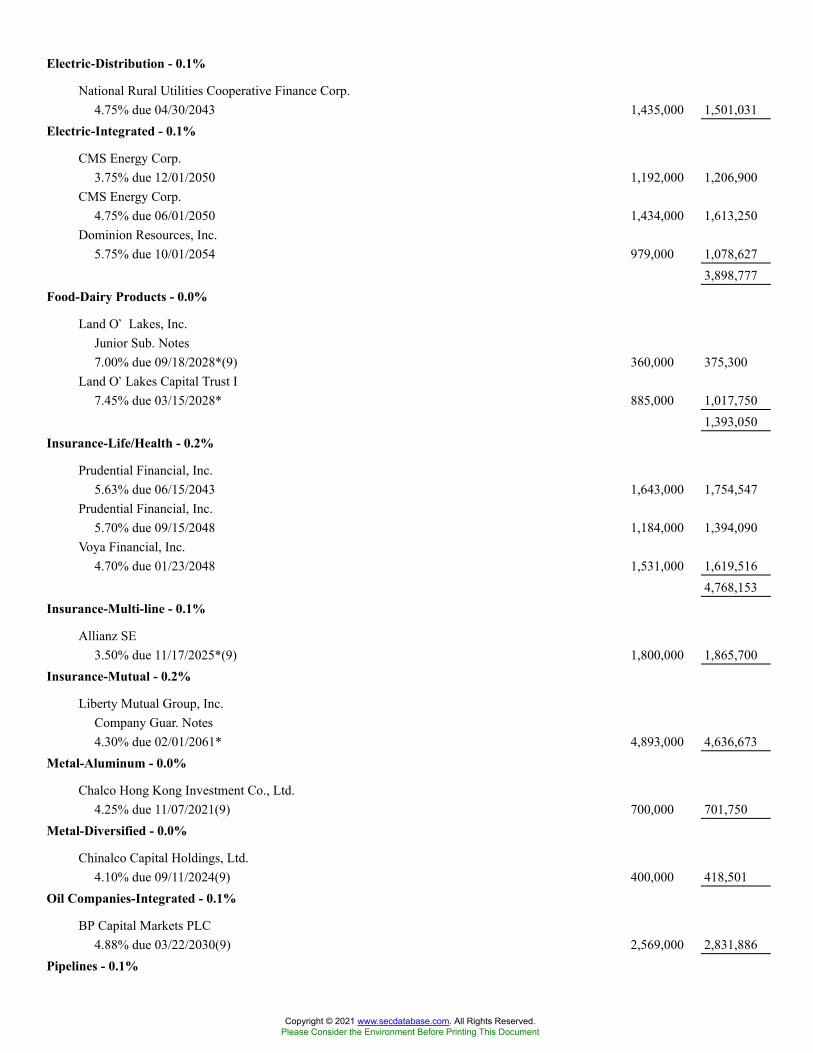
Electric-Distribution - 0.1%
National Rural Utilities Cooperative Finance Corp.4.75% due 04/30/2043 1,435,000 1,501,031
Electric-Integrated - 0.1%
CMS Energy Corp.3.75% due 12/01/2050 1,192,000 1,206,900
CMS Energy Corp.4.75% due 06/01/2050 1,434,000 1,613,250
Dominion Resources, Inc.5.75% due 10/01/2054 979,000 1,078,627
3,898,777Food-Dairy Products - 0.0%
Land O� Lakes, Inc.Junior Sub. Notes7.00% due 09/18/2028*(9) 360,000 375,300
Land O�Lakes Capital Trust I7.45% due 03/15/2028* 885,000 1,017,750
1,393,050Insurance-Life/Health - 0.2%
Prudential Financial, Inc.5.63% due 06/15/2043 1,643,000 1,754,547
Prudential Financial, Inc.5.70% due 09/15/2048 1,184,000 1,394,090
Voya Financial, Inc.4.70% due 01/23/2048 1,531,000 1,619,516
4,768,153Insurance-Multi-line - 0.1%
Allianz SE3.50% due 11/17/2025*(9) 1,800,000 1,865,700
Insurance-Mutual - 0.2%
Liberty Mutual Group, Inc.Company Guar. Notes4.30% due 02/01/2061* 4,893,000 4,636,673
Metal-Aluminum - 0.0%
Chalco Hong Kong Investment Co., Ltd.4.25% due 11/07/2021(9) 700,000 701,750
Metal-Diversified - 0.0%
Chinalco Capital Holdings, Ltd.4.10% due 09/11/2024(9) 400,000 418,501
Oil Companies-Integrated - 0.1%
BP Capital Markets PLC4.88% due 03/22/2030(9) 2,569,000 2,831,886
Pipelines - 0.1%
Copyright © 2021 www.secdatabase.com. All Rights Reserved.Please Consider the Environment Before Printing This Document

EnLink Midstream Partners LP6.00% due 12/15/2022(9) 1,062,000 797,031
Enterprise Products Operating LLC5.25% due 08/16/2077 936,000 977,861
1,774,892
Copyright © 2021 www.secdatabase.com. All Rights Reserved.Please Consider the Environment Before Printing This Document
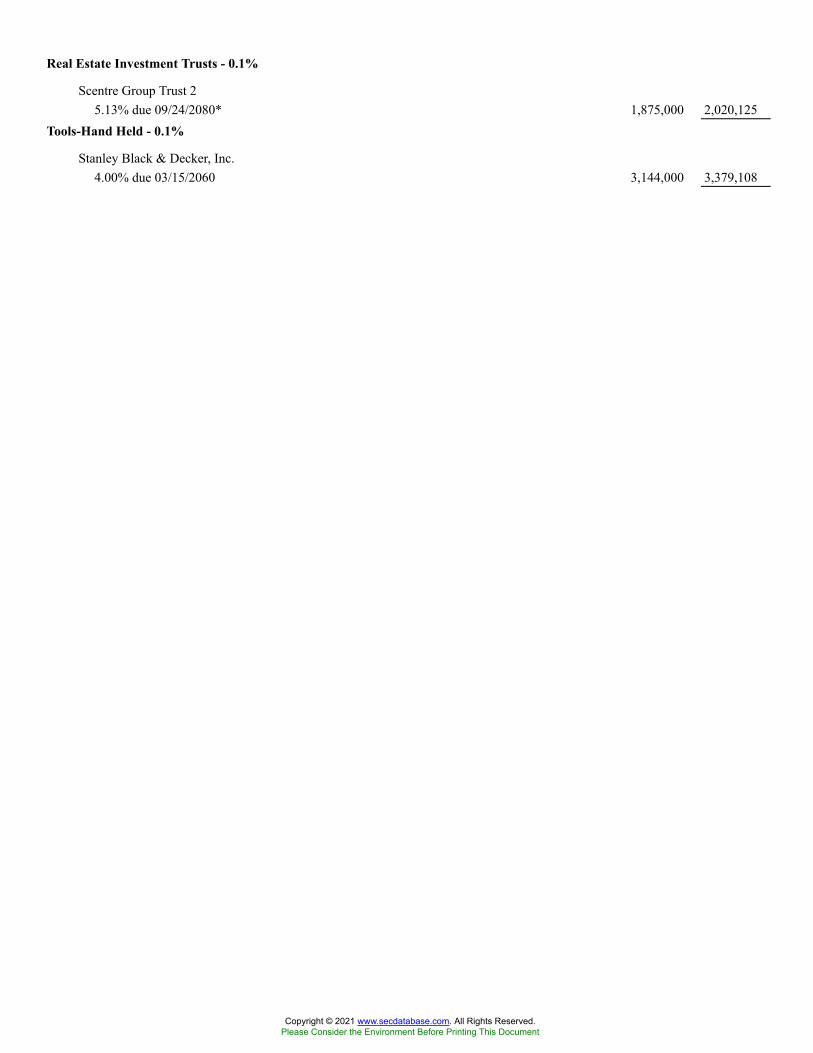
Real Estate Investment Trusts - 0.1%
Scentre Group Trust 25.13% due 09/24/2080* 1,875,000 2,020,125
Tools-Hand Held - 0.1%
Stanley Black & Decker, Inc.4.00% due 03/15/2060 3,144,000 3,379,108
Copyright © 2021 www.secdatabase.com. All Rights Reserved.Please Consider the Environment Before Printing This Document

Transport-Equipment & Leasing - 0.1%
AerCap Global Aviation Trust6.50% due 06/15/2045* 1,529,000 1,658,338
Total Preferred Securities/Capital Securities(cost $37,691,476) 39,706,918
ESCROWS AND LITIGATION TRUSTS - 0.0%
ION Media Networks, Inc.�(5) 395 4,750Lehman Brothers Holdings, Inc.
Escrow Notes5.50% due 04/04/2016� 186,000 1,265
Waterford Gaming LLC/Waterford Gaming Financial Corp.Escrow Notes8.63% due 09/15/2014*�(5) 267,418 1,845
Total Escrows And Litigation Trusts(cost $267,418) 7,860
Total Long-Term Investment Securities(cost $2,701,087,008) 2,783,699,879
SHORT-TERM INVESTMENT SECURITIES - 8.5%Registered Investment Companies - 8.5%
State Street Institutional U.S. Government Money Market Fund, Premier Class0.03%(10) 214,333,127 214,333,127
State Street Navigator Securities Lending Government Money Market Portfolio0.03%(10)(11) 27,533,521 27,533,521
Total Short-Term Investment Securities(cost $241,866,648) 241,866,648
TOTAL INVESTMENTS(cost $2,942,953,656) 106.6 % 3,025,566,527
Liabilities in excess of other assets (6.6 ) (186,948,052 )NET ASSETS 100.0 % $2,838,618,475
* Securities exempt from registration under Rule 144A of the Securities Act of 1933. These securities may be sold in transactionsexempt from registration, normally to qualified institutional buyers. The Fund has no right to demand registration of thesesecurities. At August 31, 2021, the aggregate value of these securities was $517,164,600 representing 18.2% of net assets.
# The security or a portion thereof is out on loan.� Non-income producing security(1) Commercial Mortgage Backed Security(2) Collateralized Mortgage Obligation(3) Certain variable rate securities are not based on a published reference rate and spread but are determined by the issuer or agent and
are based on current market conditions. These securities do not indicate a reference rate and spread in their description above.(4) Interest Only(5) Securities classified as Level 3 (see Note 1).
Copyright © 2021 www.secdatabase.com. All Rights Reserved.Please Consider the Environment Before Printing This Document
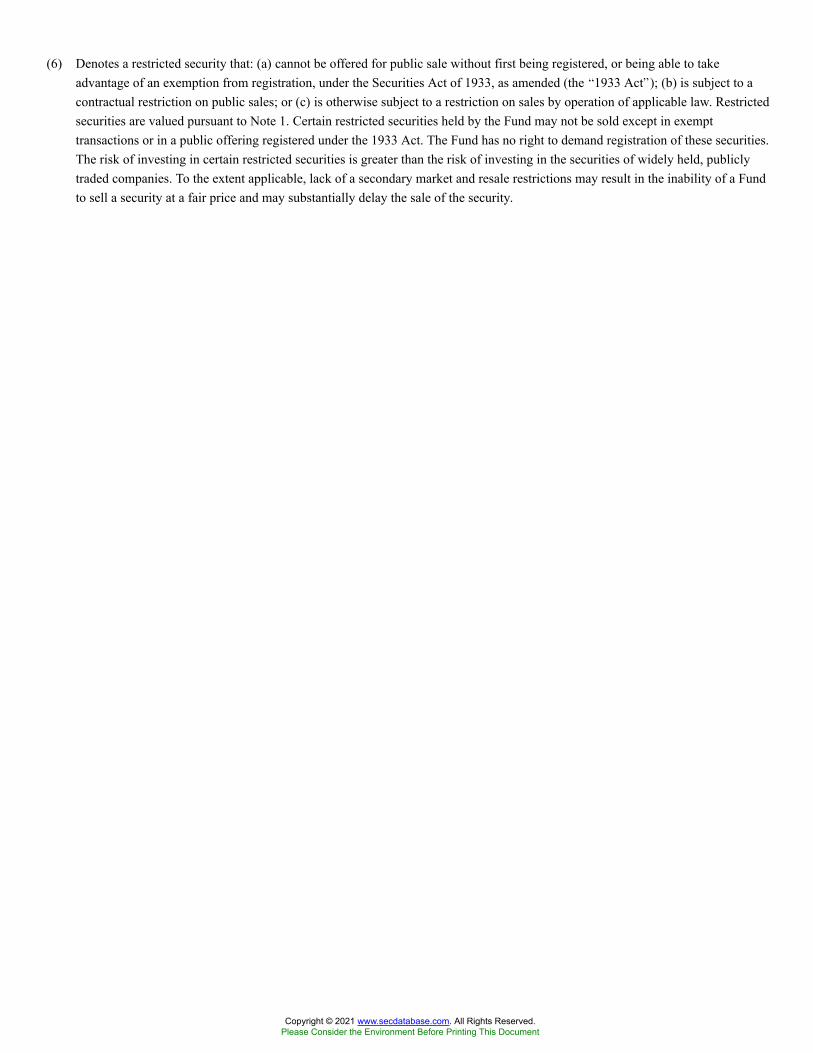
(6) Denotes a restricted security that: (a) cannot be offered for public sale without first being registered, or being able to takeadvantage of an exemption from registration, under the Securities Act of 1933, as amended (the �1933 Act�); (b) is subject to acontractual restriction on public sales; or (c) is otherwise subject to a restriction on sales by operation of applicable law. Restrictedsecurities are valued pursuant to Note 1. Certain restricted securities held by the Fund may not be sold except in exempttransactions or in a public offering registered under the 1933 Act. The Fund has no right to demand registration of these securities.The risk of investing in certain restricted securities is greater than the risk of investing in the securities of widely held, publiclytraded companies. To the extent applicable, lack of a secondary market and resale restrictions may result in the inability of a Fundto sell a security at a fair price and may substantially delay the sale of the security.
Copyright © 2021 www.secdatabase.com. All Rights Reserved.Please Consider the Environment Before Printing This Document
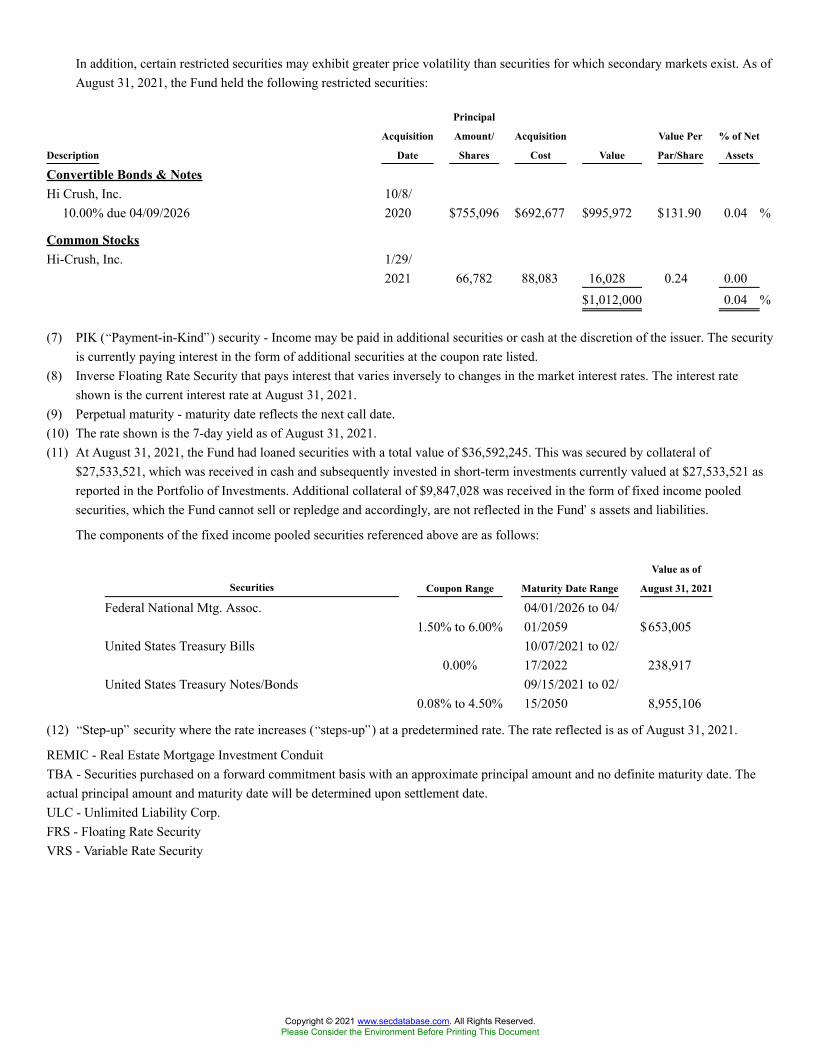
In addition, certain restricted securities may exhibit greater price volatility than securities for which secondary markets exist. As ofAugust 31, 2021, the Fund held the following restricted securities:
Description
Acquisition
Date
Principal
Amount/
Shares
Acquisition
Cost Value
Value Per
Par/Share
% of Net
Assets
Convertible Bonds & NotesHi Crush, Inc.
10.00% due 04/09/202610/8/2020 $755,096 $692,677 $995,972 $131.90 0.04 %
Common StocksHi-Crush, Inc. 1/29/
2021 66,782 88,083 16,028 0.24 0.00$1,012,000 0.04 %
(7) PIK (�Payment-in-Kind�) security - Income may be paid in additional securities or cash at the discretion of the issuer. The securityis currently paying interest in the form of additional securities at the coupon rate listed.
(8) Inverse Floating Rate Security that pays interest that varies inversely to changes in the market interest rates. The interest rateshown is the current interest rate at August 31, 2021.
(9) Perpetual maturity - maturity date reflects the next call date.(10) The rate shown is the 7-day yield as of August 31, 2021.(11) At August 31, 2021, the Fund had loaned securities with a total value of $36,592,245. This was secured by collateral of
$27,533,521, which was received in cash and subsequently invested in short-term investments currently valued at $27,533,521 asreported in the Portfolio of Investments. Additional collateral of $9,847,028 was received in the form of fixed income pooledsecurities, which the Fund cannot sell or repledge and accordingly, are not reflected in the Fund�s assets and liabilities.
The components of the fixed income pooled securities referenced above are as follows:
Securities Coupon Range Maturity Date Range
Value as of
August 31, 2021
Federal National Mtg. Assoc.1.50% to 6.00%
04/01/2026 to 04/01/2059 $653,005
United States Treasury Bills0.00%
10/07/2021 to 02/17/2022 238,917
United States Treasury Notes/Bonds0.08% to 4.50%
09/15/2021 to 02/15/2050 8,955,106
(12) �Step-up� security where the rate increases (�steps-up�) at a predetermined rate. The rate reflected is as of August 31, 2021.
REMIC - Real Estate Mortgage Investment ConduitTBA - Securities purchased on a forward commitment basis with an approximate principal amount and no definite maturity date. Theactual principal amount and maturity date will be determined upon settlement date.ULC - Unlimited Liability Corp.FRS - Floating Rate SecurityVRS - Variable Rate Security
Copyright © 2021 www.secdatabase.com. All Rights Reserved.Please Consider the Environment Before Printing This Document
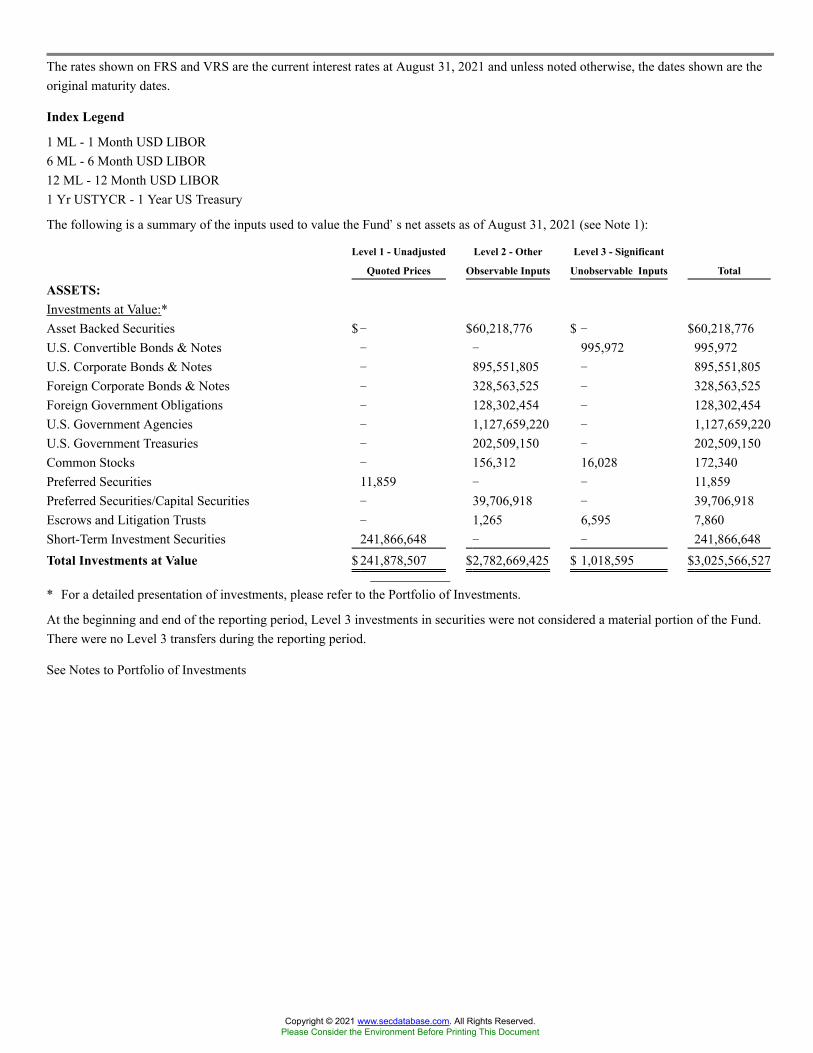
The rates shown on FRS and VRS are the current interest rates at August 31, 2021 and unless noted otherwise, the dates shown are theoriginal maturity dates.
Index Legend
1 ML - 1 Month USD LIBOR6 ML - 6 Month USD LIBOR12 ML - 12 Month USD LIBOR1 Yr USTYCR - 1 Year US Treasury
The following is a summary of the inputs used to value the Fund�s net assets as of August 31, 2021 (see Note 1):
Level 1 - Unadjusted
Quoted Prices
Level 2 - Other
Observable Inputs
Level 3 - Significant
Unobservable Inputs Total
ASSETS:Investments at Value:*Asset Backed Securities $� $60,218,776 $ � $60,218,776U.S. Convertible Bonds & Notes � � 995,972 995,972U.S. Corporate Bonds & Notes � 895,551,805 � 895,551,805Foreign Corporate Bonds & Notes � 328,563,525 � 328,563,525Foreign Government Obligations � 128,302,454 � 128,302,454U.S. Government Agencies � 1,127,659,220 � 1,127,659,220U.S. Government Treasuries � 202,509,150 � 202,509,150Common Stocks � 156,312 16,028 172,340Preferred Securities 11,859 � � 11,859Preferred Securities/Capital Securities � 39,706,918 � 39,706,918Escrows and Litigation Trusts � 1,265 6,595 7,860Short-Term Investment Securities 241,866,648 � � 241,866,648Total Investments at Value $ 241,878,507 $2,782,669,425 $ 1,018,595 $3,025,566,527
* For a detailed presentation of investments, please refer to the Portfolio of Investments.
At the beginning and end of the reporting period, Level 3 investments in securities were not considered a material portion of the Fund.There were no Level 3 transfers during the reporting period.
See Notes to Portfolio of Investments
Copyright © 2021 www.secdatabase.com. All Rights Reserved.Please Consider the Environment Before Printing This Document
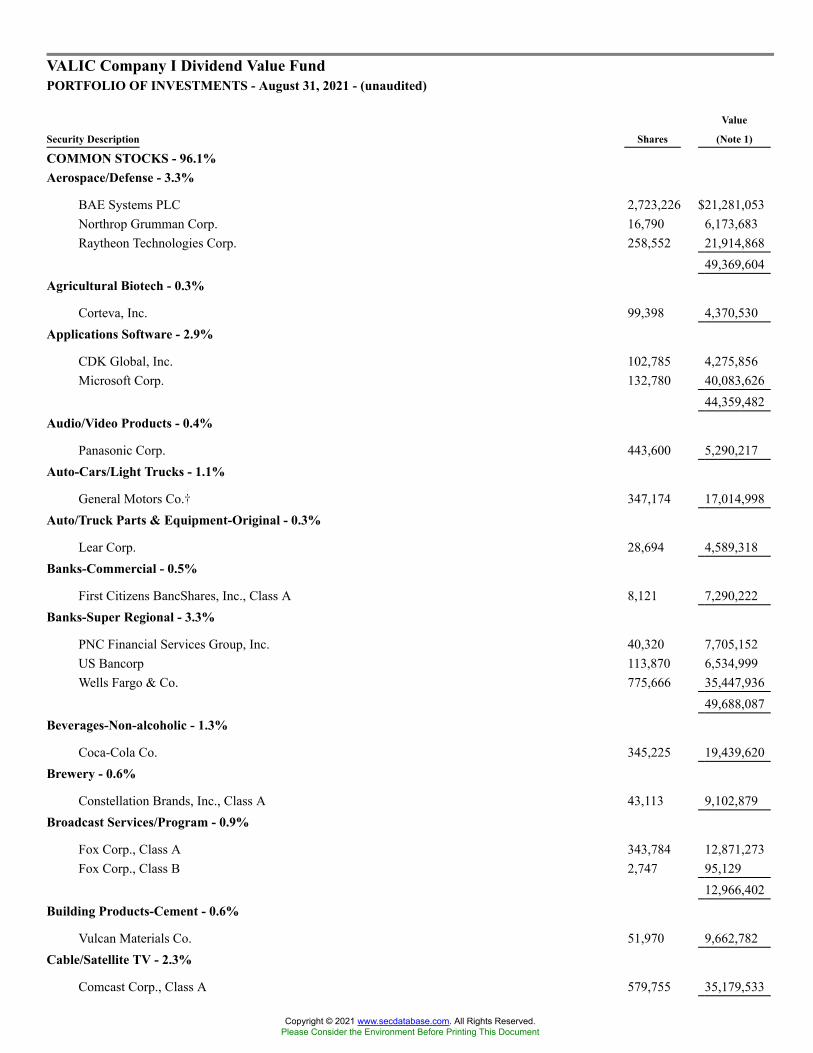
VALIC Company I Dividend Value FundPORTFOLIO OF INVESTMENTS - August 31, 2021 - (unaudited)
Security Description Shares
Value
(Note 1)
COMMON STOCKS - 96.1%Aerospace/Defense - 3.3%
BAE Systems PLC 2,723,226 $21,281,053Northrop Grumman Corp. 16,790 6,173,683Raytheon Technologies Corp. 258,552 21,914,868
49,369,604Agricultural Biotech - 0.3%
Corteva, Inc. 99,398 4,370,530Applications Software - 2.9%
CDK Global, Inc. 102,785 4,275,856Microsoft Corp. 132,780 40,083,626
44,359,482Audio/Video Products - 0.4%
Panasonic Corp. 443,600 5,290,217Auto-Cars/Light Trucks - 1.1%
General Motors Co.� 347,174 17,014,998Auto/Truck Parts & Equipment-Original - 0.3%
Lear Corp. 28,694 4,589,318Banks-Commercial - 0.5%
First Citizens BancShares, Inc., Class A 8,121 7,290,222Banks-Super Regional - 3.3%
PNC Financial Services Group, Inc. 40,320 7,705,152US Bancorp 113,870 6,534,999Wells Fargo & Co. 775,666 35,447,936
49,688,087Beverages-Non-alcoholic - 1.3%
Coca-Cola Co. 345,225 19,439,620Brewery - 0.6%
Constellation Brands, Inc., Class A 43,113 9,102,879Broadcast Services/Program - 0.9%
Fox Corp., Class A 343,784 12,871,273Fox Corp., Class B 2,747 95,129
12,966,402Building Products-Cement - 0.6%
Vulcan Materials Co. 51,970 9,662,782Cable/Satellite TV - 2.3%
Comcast Corp., Class A 579,755 35,179,533
Copyright © 2021 www.secdatabase.com. All Rights Reserved.Please Consider the Environment Before Printing This Document

Cellular Telecom - 0.8%
Rogers Communications, Inc., Class B 241,879 12,323,530Chemicals-Diversified - 1.5%
DuPont de Nemours, Inc. 37,300 2,760,946PPG Industries, Inc. 124,068 19,795,049
22,555,995Chemicals-Specialty - 0.6%
Ecolab, Inc. 40,980 9,235,253Computer Services - 1.6%
Cognizant Technology Solutions Corp., Class A 216,266 16,503,259Leidos Holdings, Inc. 76,894 7,544,070
24,047,329Computers - 1.8%
Apple, Inc. 174,750 26,532,292Containers-Paper/Plastic - 0.4%
Sealed Air Corp. 88,864 5,423,370Cosmetics & Toiletries - 2.1%
Procter & Gamble Co. 81,720 11,636,111Unilever PLC ADR 361,737 20,141,516
31,777,627Data Processing/Management - 0.9%
Fidelity National Information Services, Inc. 107,212 13,698,477Diversified Banking Institutions - 7.6%
Bank of America Corp. 880,972 36,780,581Citigroup, Inc. 473,255 34,031,767JPMorgan Chase & Co. 140,997 22,552,470Morgan Stanley 209,130 21,839,446
115,204,264Diversified Manufacturing Operations - 1.5%
General Electric Co. 151,550 15,974,886Siemens AG 40,995 6,817,341
22,792,227Drug Delivery Systems - 0.4%
Becton Dickinson & Co. 26,810 6,748,077Electric-Distribution - 0.6%
Sempra Energy 65,600 8,682,816Electric-Integrated - 3.9%
Ameren Corp. 67,033 5,880,135American Electric Power Co., Inc. 51,553 4,617,602CenterPoint Energy, Inc. 156,858 3,935,567Edison International 228,315 13,205,740Exelon Corp. 95,066 4,660,135
Copyright © 2021 www.secdatabase.com. All Rights Reserved.Please Consider the Environment Before Printing This Document

NextEra Energy, Inc. 101,860 8,555,221Public Service Enterprise Group, Inc. 295,157 18,872,339
59,726,739Electronic Components-Semiconductors - 1.5%
Broadcom, Inc. 15,100 7,507,871Samsung Electronics Co., Ltd. GDR 2,905 4,751,127Texas Instruments, Inc. 55,560 10,606,960
22,865,958Enterprise Software/Service - 1.7%
Open Text Corp. 87,950 4,822,298Oracle Corp. 95,890 8,546,676SS&C Technologies Holdings, Inc. 168,136 12,721,170
26,090,144Finance-Credit Card - 2.4%
Capital One Financial Corp. 48,255 8,008,882Mastercard, Inc., Class A 25,980 8,995,055Visa, Inc., Class A 86,377 19,788,971
36,792,908Finance-Investment Banker/Broker - 0.9%
Charles Schwab Corp. 176,829 12,881,993Finance-Other Services - 0.2%
Intercontinental Exchange, Inc. 25,243 3,017,296Food-Confectionery - 0.7%
Mondelez International, Inc., Class A 165,260 10,257,688Food-Dairy Products - 0.7%
Danone SA 150,137 10,967,963Food-Misc./Diversified - 0.7%
Nestle SA ADR 89,370 11,286,537
Copyright © 2021 www.secdatabase.com. All Rights Reserved.Please Consider the Environment Before Printing This Document
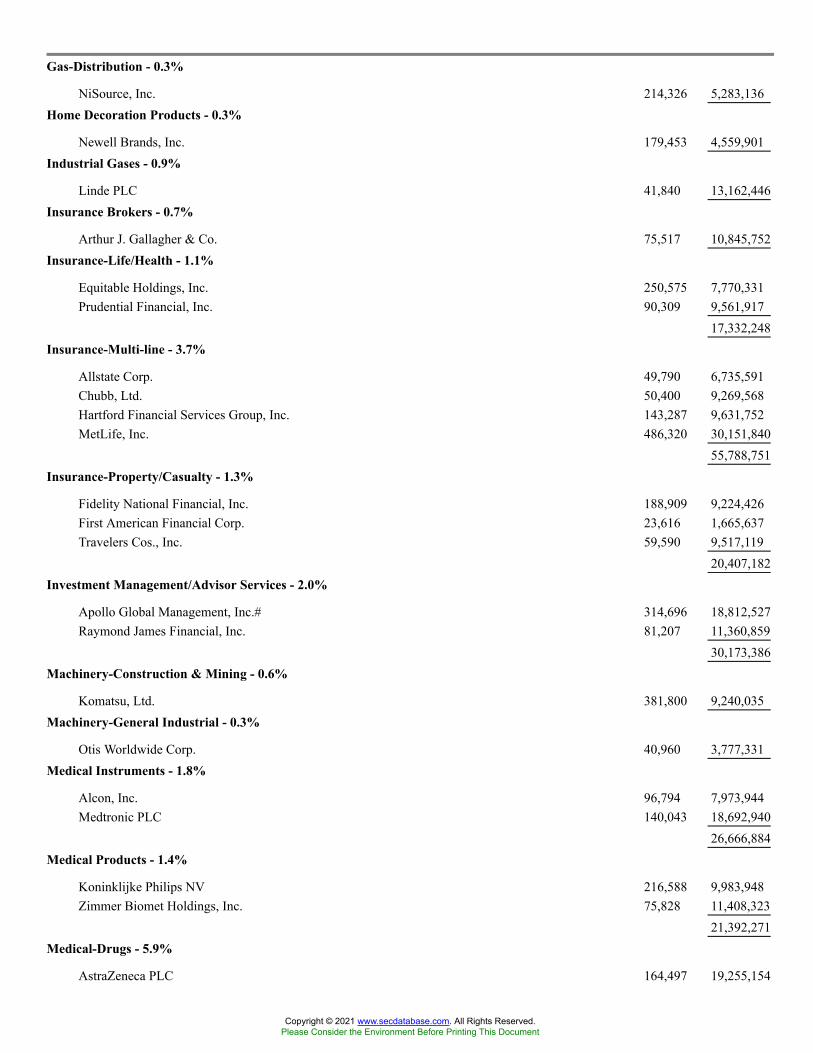
Gas-Distribution - 0.3%
NiSource, Inc. 214,326 5,283,136Home Decoration Products - 0.3%
Newell Brands, Inc. 179,453 4,559,901Industrial Gases - 0.9%
Linde PLC 41,840 13,162,446Insurance Brokers - 0.7%
Arthur J. Gallagher & Co. 75,517 10,845,752Insurance-Life/Health - 1.1%
Equitable Holdings, Inc. 250,575 7,770,331Prudential Financial, Inc. 90,309 9,561,917
17,332,248Insurance-Multi-line - 3.7%
Allstate Corp. 49,790 6,735,591Chubb, Ltd. 50,400 9,269,568Hartford Financial Services Group, Inc. 143,287 9,631,752MetLife, Inc. 486,320 30,151,840
55,788,751Insurance-Property/Casualty - 1.3%
Fidelity National Financial, Inc. 188,909 9,224,426First American Financial Corp. 23,616 1,665,637Travelers Cos., Inc. 59,590 9,517,119
20,407,182Investment Management/Advisor Services - 2.0%
Apollo Global Management, Inc.# 314,696 18,812,527Raymond James Financial, Inc. 81,207 11,360,859
30,173,386Machinery-Construction & Mining - 0.6%
Komatsu, Ltd. 381,800 9,240,035Machinery-General Industrial - 0.3%
Otis Worldwide Corp. 40,960 3,777,331Medical Instruments - 1.8%
Alcon, Inc. 96,794 7,973,944Medtronic PLC 140,043 18,692,940
26,666,884Medical Products - 1.4%
Koninklijke Philips NV 216,588 9,983,948Zimmer Biomet Holdings, Inc. 75,828 11,408,323
21,392,271Medical-Drugs - 5.9%
AstraZeneca PLC 164,497 19,255,154
Copyright © 2021 www.secdatabase.com. All Rights Reserved.Please Consider the Environment Before Printing This Document
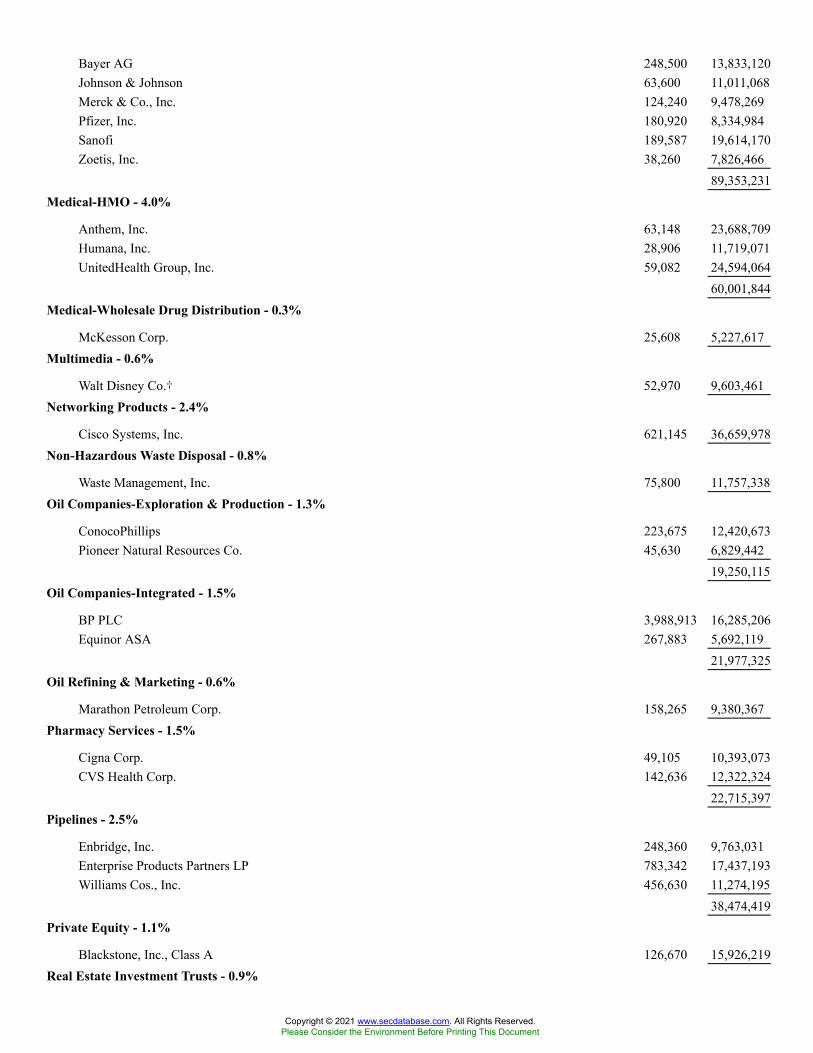
Bayer AG 248,500 13,833,120Johnson & Johnson 63,600 11,011,068Merck & Co., Inc. 124,240 9,478,269Pfizer, Inc. 180,920 8,334,984Sanofi 189,587 19,614,170Zoetis, Inc. 38,260 7,826,466
89,353,231Medical-HMO - 4.0%
Anthem, Inc. 63,148 23,688,709Humana, Inc. 28,906 11,719,071UnitedHealth Group, Inc. 59,082 24,594,064
60,001,844Medical-Wholesale Drug Distribution - 0.3%
McKesson Corp. 25,608 5,227,617Multimedia - 0.6%
Walt Disney Co.� 52,970 9,603,461Networking Products - 2.4%
Cisco Systems, Inc. 621,145 36,659,978Non-Hazardous Waste Disposal - 0.8%
Waste Management, Inc. 75,800 11,757,338Oil Companies-Exploration & Production - 1.3%
ConocoPhillips 223,675 12,420,673Pioneer Natural Resources Co. 45,630 6,829,442
19,250,115Oil Companies-Integrated - 1.5%
BP PLC 3,988,913 16,285,206Equinor ASA 267,883 5,692,119
21,977,325Oil Refining & Marketing - 0.6%
Marathon Petroleum Corp. 158,265 9,380,367Pharmacy Services - 1.5%
Cigna Corp. 49,105 10,393,073CVS Health Corp. 142,636 12,322,324
22,715,397Pipelines - 2.5%
Enbridge, Inc. 248,360 9,763,031Enterprise Products Partners LP 783,342 17,437,193Williams Cos., Inc. 456,630 11,274,195
38,474,419Private Equity - 1.1%
Blackstone, Inc., Class A 126,670 15,926,219Real Estate Investment Trusts - 0.9%
Copyright © 2021 www.secdatabase.com. All Rights Reserved.Please Consider the Environment Before Printing This Document
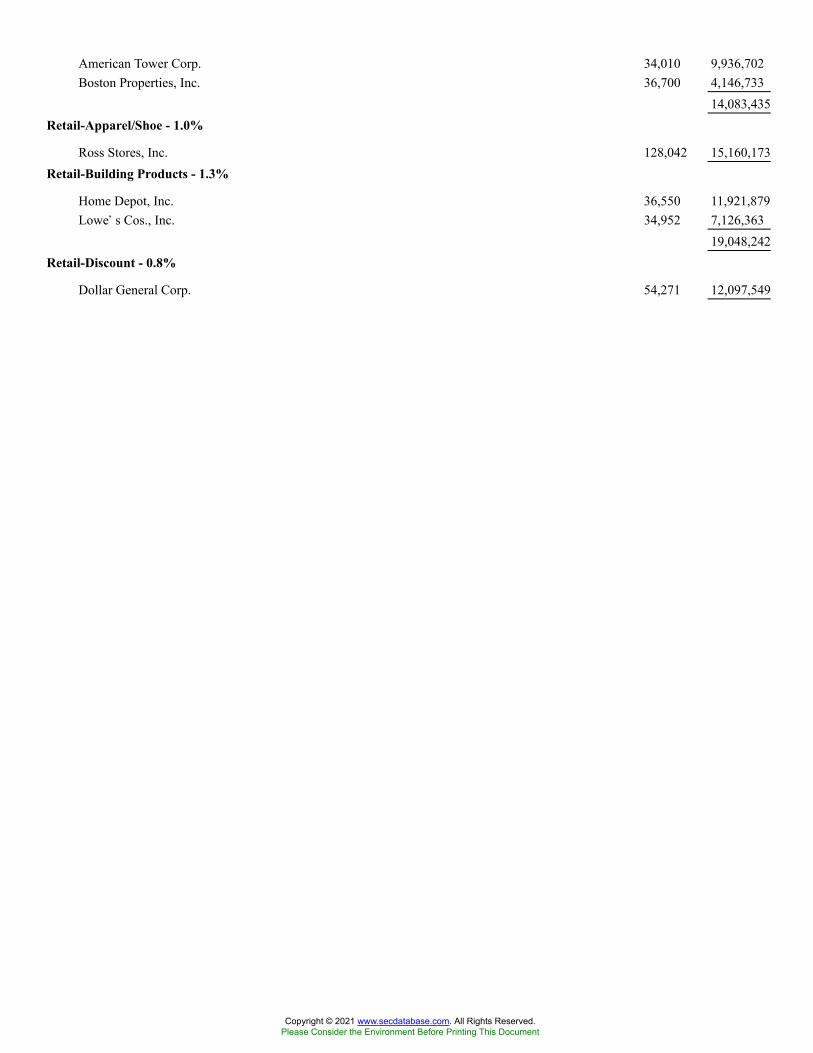
American Tower Corp. 34,010 9,936,702Boston Properties, Inc. 36,700 4,146,733
14,083,435Retail-Apparel/Shoe - 1.0%
Ross Stores, Inc. 128,042 15,160,173Retail-Building Products - 1.3%
Home Depot, Inc. 36,550 11,921,879Lowe�s Cos., Inc. 34,952 7,126,363
19,048,242Retail-Discount - 0.8%
Dollar General Corp. 54,271 12,097,549
Copyright © 2021 www.secdatabase.com. All Rights Reserved.Please Consider the Environment Before Printing This Document
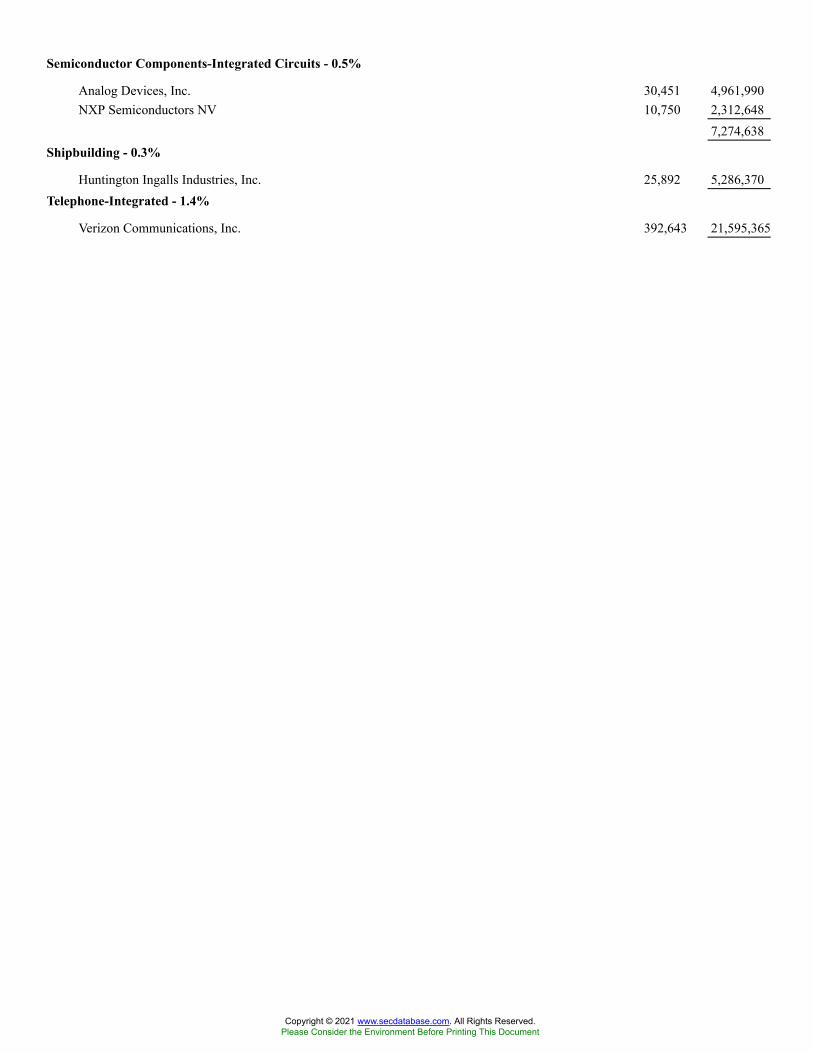
Semiconductor Components-Integrated Circuits - 0.5%
Analog Devices, Inc. 30,451 4,961,990NXP Semiconductors NV 10,750 2,312,648
7,274,638Shipbuilding - 0.3%
Huntington Ingalls Industries, Inc. 25,892 5,286,370Telephone-Integrated - 1.4%
Verizon Communications, Inc. 392,643 21,595,365
Copyright © 2021 www.secdatabase.com. All Rights Reserved.Please Consider the Environment Before Printing This Document
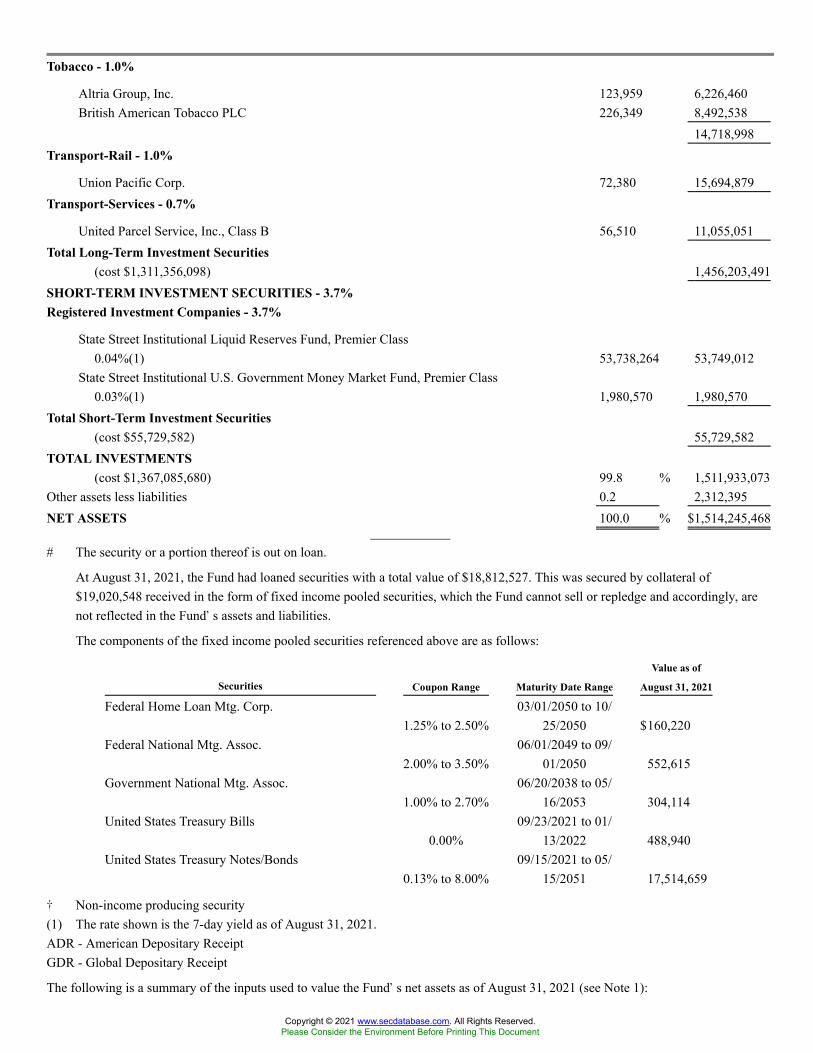
Tobacco - 1.0%
Altria Group, Inc. 123,959 6,226,460British American Tobacco PLC 226,349 8,492,538
14,718,998Transport-Rail - 1.0%
Union Pacific Corp. 72,380 15,694,879Transport-Services - 0.7%
United Parcel Service, Inc., Class B 56,510 11,055,051Total Long-Term Investment Securities
(cost $1,311,356,098) 1,456,203,491SHORT-TERM INVESTMENT SECURITIES - 3.7%Registered Investment Companies - 3.7%
State Street Institutional Liquid Reserves Fund, Premier Class0.04%(1) 53,738,264 53,749,012
State Street Institutional U.S. Government Money Market Fund, Premier Class0.03%(1) 1,980,570 1,980,570
Total Short-Term Investment Securities(cost $55,729,582) 55,729,582
TOTAL INVESTMENTS(cost $1,367,085,680) 99.8 % 1,511,933,073
Other assets less liabilities 0.2 2,312,395NET ASSETS 100.0 % $1,514,245,468
# The security or a portion thereof is out on loan.
At August 31, 2021, the Fund had loaned securities with a total value of $18,812,527. This was secured by collateral of$19,020,548 received in the form of fixed income pooled securities, which the Fund cannot sell or repledge and accordingly, arenot reflected in the Fund�s assets and liabilities.
The components of the fixed income pooled securities referenced above are as follows:
Securities Coupon Range Maturity Date Range
Value as of
August 31, 2021
Federal Home Loan Mtg. Corp.1.25% to 2.50%
03/01/2050 to 10/25/2050 $160,220
Federal National Mtg. Assoc.2.00% to 3.50%
06/01/2049 to 09/01/2050 552,615
Government National Mtg. Assoc.1.00% to 2.70%
06/20/2038 to 05/16/2053 304,114
United States Treasury Bills0.00%
09/23/2021 to 01/13/2022 488,940
United States Treasury Notes/Bonds0.13% to 8.00%
09/15/2021 to 05/15/2051 17,514,659
� Non-income producing security(1) The rate shown is the 7-day yield as of August 31, 2021.ADR - American Depositary ReceiptGDR - Global Depositary Receipt
The following is a summary of the inputs used to value the Fund�s net assets as of August 31, 2021 (see Note 1):
Copyright © 2021 www.secdatabase.com. All Rights Reserved.Please Consider the Environment Before Printing This Document
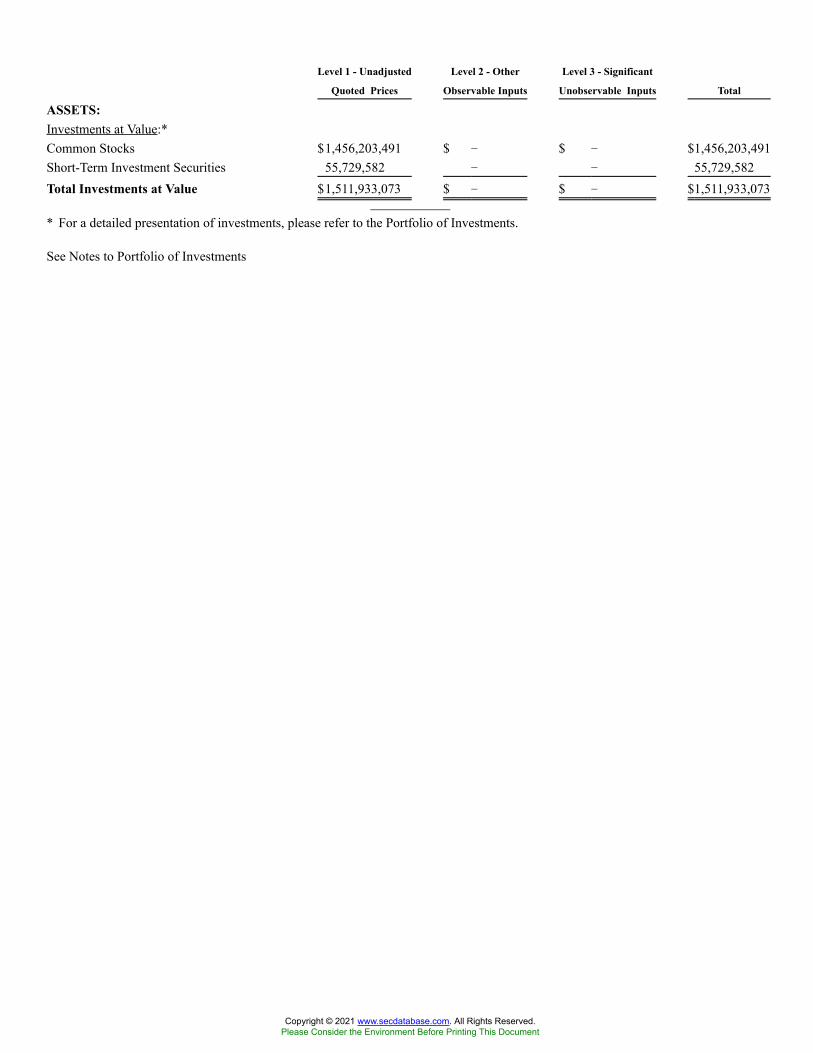
Level 1 - Unadjusted
Quoted Prices
Level 2 - Other
Observable Inputs
Level 3 - Significant
Unobservable Inputs Total
ASSETS:Investments at Value:*Common Stocks $1,456,203,491 $ � $ � $1,456,203,491Short-Term Investment Securities 55,729,582 � � 55,729,582Total Investments at Value $1,511,933,073 $ � $ � $1,511,933,073
* For a detailed presentation of investments, please refer to the Portfolio of Investments.
See Notes to Portfolio of Investments
Copyright © 2021 www.secdatabase.com. All Rights Reserved.Please Consider the Environment Before Printing This Document
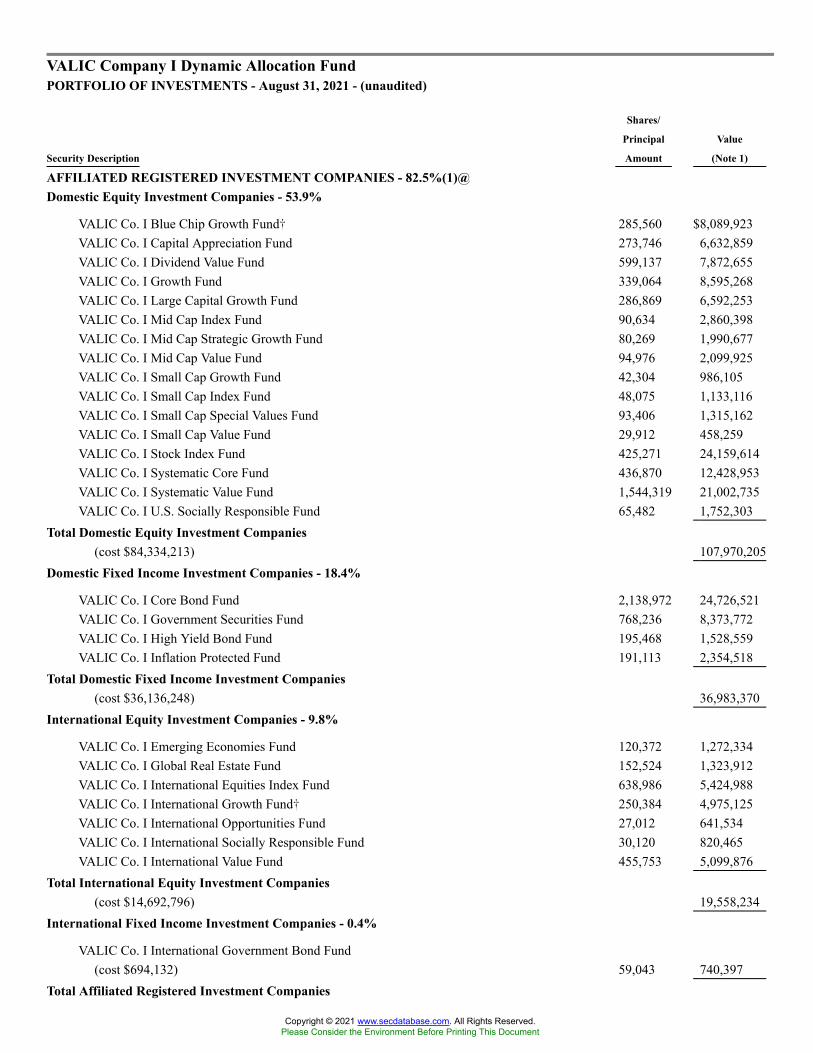
VALIC Company I Dynamic Allocation FundPORTFOLIO OF INVESTMENTS - August 31, 2021 - (unaudited)
Security Description
Shares/
Principal
Amount
Value
(Note 1)
AFFILIATED REGISTERED INVESTMENT COMPANIES - 82.5%(1)@Domestic Equity Investment Companies - 53.9%
VALIC Co. I Blue Chip Growth Fund� 285,560 $8,089,923VALIC Co. I Capital Appreciation Fund 273,746 6,632,859VALIC Co. I Dividend Value Fund 599,137 7,872,655VALIC Co. I Growth Fund 339,064 8,595,268VALIC Co. I Large Capital Growth Fund 286,869 6,592,253VALIC Co. I Mid Cap Index Fund 90,634 2,860,398VALIC Co. I Mid Cap Strategic Growth Fund 80,269 1,990,677VALIC Co. I Mid Cap Value Fund 94,976 2,099,925VALIC Co. I Small Cap Growth Fund 42,304 986,105VALIC Co. I Small Cap Index Fund 48,075 1,133,116VALIC Co. I Small Cap Special Values Fund 93,406 1,315,162VALIC Co. I Small Cap Value Fund 29,912 458,259VALIC Co. I Stock Index Fund 425,271 24,159,614VALIC Co. I Systematic Core Fund 436,870 12,428,953VALIC Co. I Systematic Value Fund 1,544,319 21,002,735VALIC Co. I U.S. Socially Responsible Fund 65,482 1,752,303
Total Domestic Equity Investment Companies(cost $84,334,213) 107,970,205
Domestic Fixed Income Investment Companies - 18.4%
VALIC Co. I Core Bond Fund 2,138,972 24,726,521VALIC Co. I Government Securities Fund 768,236 8,373,772VALIC Co. I High Yield Bond Fund 195,468 1,528,559VALIC Co. I Inflation Protected Fund 191,113 2,354,518
Total Domestic Fixed Income Investment Companies(cost $36,136,248) 36,983,370
International Equity Investment Companies - 9.8%
VALIC Co. I Emerging Economies Fund 120,372 1,272,334VALIC Co. I Global Real Estate Fund 152,524 1,323,912VALIC Co. I International Equities Index Fund 638,986 5,424,988VALIC Co. I International Growth Fund� 250,384 4,975,125VALIC Co. I International Opportunities Fund 27,012 641,534VALIC Co. I International Socially Responsible Fund 30,120 820,465VALIC Co. I International Value Fund 455,753 5,099,876
Total International Equity Investment Companies(cost $14,692,796) 19,558,234
International Fixed Income Investment Companies - 0.4%
VALIC Co. I International Government Bond Fund(cost $694,132) 59,043 740,397
Total Affiliated Registered Investment Companies
Copyright © 2021 www.secdatabase.com. All Rights Reserved.Please Consider the Environment Before Printing This Document
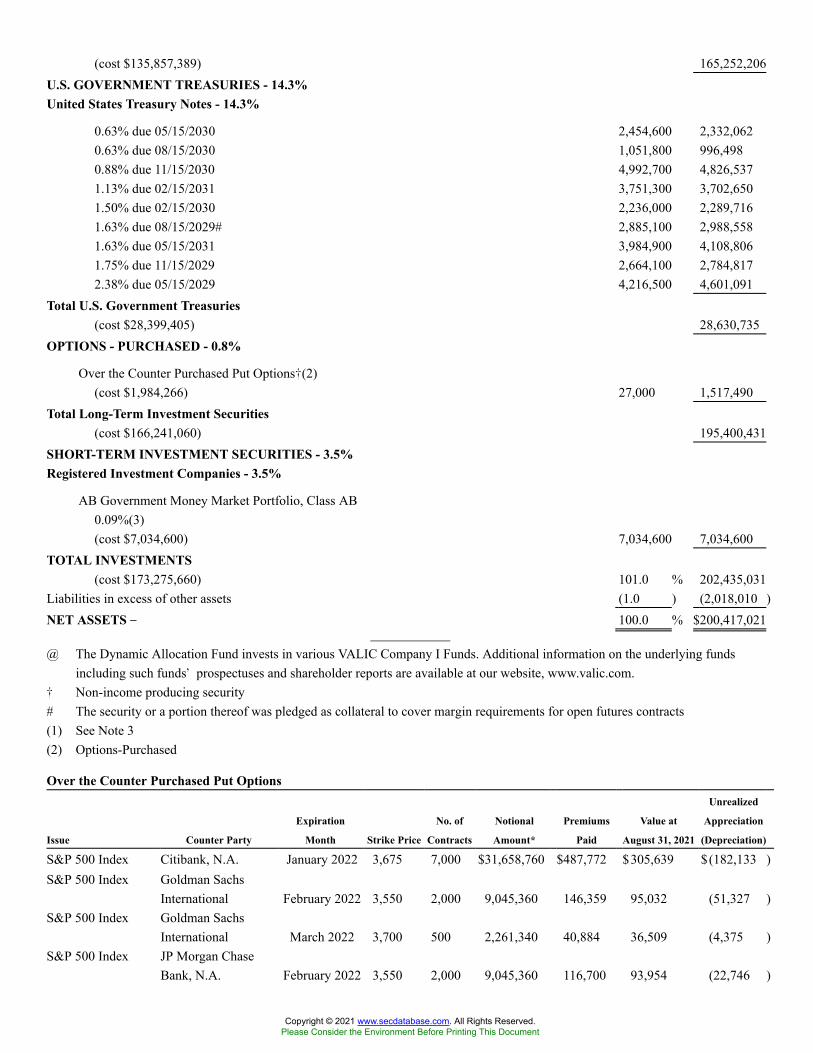
(cost $135,857,389) 165,252,206U.S. GOVERNMENT TREASURIES - 14.3%United States Treasury Notes - 14.3%
0.63% due 05/15/2030 2,454,600 2,332,0620.63% due 08/15/2030 1,051,800 996,4980.88% due 11/15/2030 4,992,700 4,826,5371.13% due 02/15/2031 3,751,300 3,702,6501.50% due 02/15/2030 2,236,000 2,289,7161.63% due 08/15/2029# 2,885,100 2,988,5581.63% due 05/15/2031 3,984,900 4,108,8061.75% due 11/15/2029 2,664,100 2,784,8172.38% due 05/15/2029 4,216,500 4,601,091
Total U.S. Government Treasuries(cost $28,399,405) 28,630,735
OPTIONS - PURCHASED - 0.8%
Over the Counter Purchased Put Options�(2)(cost $1,984,266) 27,000 1,517,490
Total Long-Term Investment Securities(cost $166,241,060) 195,400,431
SHORT-TERM INVESTMENT SECURITIES - 3.5%Registered Investment Companies - 3.5%
AB Government Money Market Portfolio, Class AB0.09%(3)(cost $7,034,600) 7,034,600 7,034,600
TOTAL INVESTMENTS(cost $173,275,660) 101.0 % 202,435,031
Liabilities in excess of other assets (1.0 ) (2,018,010 )NET ASSETS �� 100.0 % $200,417,021
@ The Dynamic Allocation Fund invests in various VALIC Company I Funds. Additional information on the underlying fundsincluding such funds� prospectuses and shareholder reports are available at our website, www.valic.com.
� Non-income producing security# The security or a portion thereof was pledged as collateral to cover margin requirements for open futures contracts(1) See Note 3(2) Options-Purchased
Over the Counter Purchased Put Options
Issue Counter Party
Expiration
Month Strike Price
No. of
Contracts
Notional
Amount*
Premiums
Paid
Value at
August 31, 2021
Unrealized
Appreciation
(Depreciation)
S&P 500 Index Citibank, N.A. January 2022 3,675 7,000 $31,658,760 $487,772 $305,639 $(182,133 )S&P 500 Index Goldman Sachs
International February 2022 3,550 2,000 9,045,360 146,359 95,032 (51,327 )S&P 500 Index Goldman Sachs
International March 2022 3,700 500 2,261,340 40,884 36,509 (4,375 )S&P 500 Index JP Morgan Chase
Bank, N.A. February 2022 3,550 2,000 9,045,360 116,700 93,954 (22,746 )
Copyright © 2021 www.secdatabase.com. All Rights Reserved.Please Consider the Environment Before Printing This Document
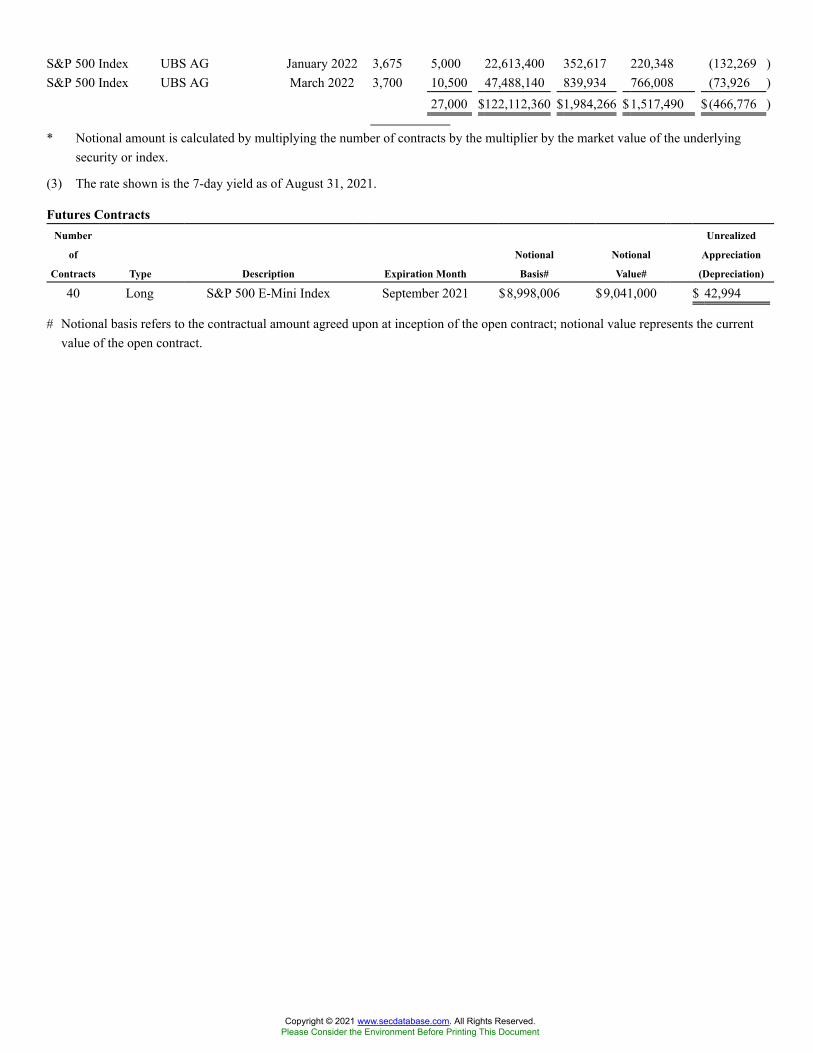
S&P 500 Index UBS AG January 2022 3,675 5,000 22,613,400 352,617 220,348 (132,269 )S&P 500 Index UBS AG March 2022 3,700 10,500 47,488,140 839,934 766,008 (73,926 )
27,000 $122,112,360 $1,984,266 $1,517,490 $(466,776 )
* Notional amount is calculated by multiplying the number of contracts by the multiplier by the market value of the underlyingsecurity or index.
(3) The rate shown is the 7-day yield as of August 31, 2021.
Futures ContractsNumber
of
Contracts Type Description Expiration Month
Notional
Basis#
Notional
Value#
Unrealized
Appreciation
(Depreciation)
40 Long S&P 500 E-Mini Index September 2021 $8,998,006 $9,041,000 $ 42,994
# Notional basis refers to the contractual amount agreed upon at inception of the open contract; notional value represents the currentvalue of the open contract.
Copyright © 2021 www.secdatabase.com. All Rights Reserved.Please Consider the Environment Before Printing This Document
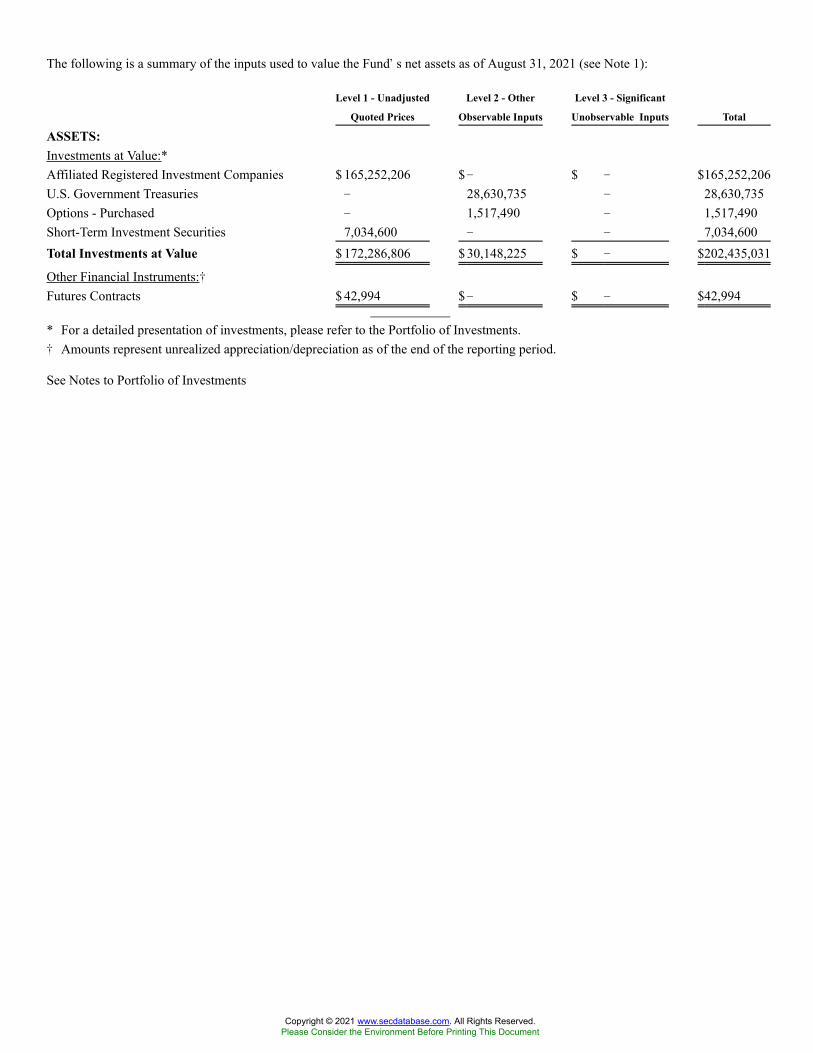
The following is a summary of the inputs used to value the Fund�s net assets as of August 31, 2021 (see Note 1):
Level 1 - Unadjusted
Quoted Prices
Level 2 - Other
Observable Inputs
Level 3 - Significant
Unobservable Inputs Total
ASSETS:Investments at Value:*Affiliated Registered Investment Companies $ 165,252,206 $� $ � $165,252,206U.S. Government Treasuries � 28,630,735 � 28,630,735Options - Purchased � 1,517,490 � 1,517,490Short-Term Investment Securities 7,034,600 � � 7,034,600Total Investments at Value $ 172,286,806 $ 30,148,225 $ � $202,435,031
Other Financial Instruments:�Futures Contracts $ 42,994 $� $ � $42,994
* For a detailed presentation of investments, please refer to the Portfolio of Investments.� Amounts represent unrealized appreciation/depreciation as of the end of the reporting period.
See Notes to Portfolio of Investments
Copyright © 2021 www.secdatabase.com. All Rights Reserved.Please Consider the Environment Before Printing This Document

VALIC Company I Emerging Economies FundPORTFOLIO OF INVESTMENTS - August 31, 2021
Security Description Shares
Value
(Note 1)
COMMON STOCKS - 99.2%Bermuda - 0.7%
Brilliance China Automotive Holdings, Ltd.�(1) 4,556,000 $3,062,389Kunlun Energy Co., Ltd. 3,214,000 3,405,147
6,467,536Brazil - 3.0%
Banco do Brasil SA 1,315,893 7,743,990Sao Martinho SA 421,156 2,617,768SLC Agricola SA 253,323 1,995,896Vale SA ADR 850,345 16,216,079
28,573,733Cayman Islands - 17.3%
Alibaba Group Holding, Ltd.� 1,900,044 40,431,926Bosideng International Holdings, Ltd.# 5,622,000 4,597,383Chailease Holding Co., Ltd. 1,081,400 10,399,015China Hongqiao Group, Ltd. 3,922,000 5,849,629China Lesso Group Holdings, Ltd. 1,517,000 3,245,650China Medical System Holdings, Ltd. 1,295,000 2,537,567China Yongda Automobiles Services Holdings, Ltd. 1,371,000 2,298,676Country Garden Services Holdings Co., Ltd. 1,300,000 9,903,632Haitian International Holdings, Ltd. 704,000 2,697,439Longfor Group Holdings, Ltd.* 1,086,500 4,707,848Meituan, Class B�* 227,700 7,289,960SITC International Holdings Co., Ltd. 733,000 3,194,968Tencent Holdings, Ltd. 798,600 49,410,323Topsports International Holdings, Ltd.* 3,449,000 4,558,785Xinyi Glass Holdings, Ltd. 861,000 3,620,043Xtep International Holdings, Ltd.# 1,946,000 3,317,792Zhongsheng Group Holdings, Ltd. 602,000 5,031,212
163,091,848Chile - 0.3%
Falabella SA 697,680 2,763,330China - 13.9%
Anhui Conch Cement Co., Ltd. 1,142,500 6,184,450BOE Technology Group Co., Ltd., Class A 4,759,600 4,285,938China Construction Bank Corp. 19,542,000 14,121,086China Vanke Co., Ltd. 2,066,400 5,579,515Chongqing Brewery Co., Ltd., Class A� 258,094 5,596,589ENN Natural Gas Co., Ltd., Class A 1,121,235 3,549,398Fuyao Glass Industry Group Co., Ltd.* 730,000 4,495,947GF Securities Co., Ltd. 5,448,600 9,695,803
Copyright © 2021 www.secdatabase.com. All Rights Reserved.Please Consider the Environment Before Printing This Document

Industrial Bank Co., Ltd., Class A 2,827,530 8,093,406Inner Mongolia Yili Industrial Group Co., Ltd., Class A 418,800 2,203,767LONGi Green Energy Technology Co., Ltd., Class A 547,680 7,580,680PICC Property & Casualty Co., Ltd. 7,620,000 6,887,682Ping An Bank Co., Ltd., Class A 3,427,299 9,438,965Postal Savings Bank of China Co., Ltd.* 8,077,000 5,826,070Sany Heavy Industry Co., Ltd., Class A 1,097,511 4,454,096Seazen Holdings Co., Ltd., Class A 409,353 2,128,722TBEA Co., Ltd., Class A 1,722,700 6,538,221Weichai Power Co., Ltd. 1,993,881 5,029,919Wuliangye Yibin Co., Ltd., Class A 70,900 2,212,499Xiamen C & D, Inc., Class A 1,612,098 1,940,544Zhuzhou Kibing Group Co., Ltd., Class A 2,705,973 11,421,423Zoomlion Heavy Industry Science and Technology Co., Ltd. 3,426,400 3,264,518
130,529,238Hong Kong - 1.5%
China Resources Beer Holdings Co., Ltd. 604,000 4,970,267Lenovo Group, Ltd.# 7,886,000 8,740,309
13,710,576India - 6.5%
Bharat Electronics, Ltd. 2,503,791 6,375,438GAIL India, Ltd. 3,641,327 7,326,794HDFC Bank, Ltd. ADR 77,862 6,097,373Hindalco Industries, Ltd. 478,359 3,079,529Housing Development Finance Corp., Ltd. 431,608 16,521,794Mindtree, Ltd. 185,434 9,207,249Tech Mahindra, Ltd. 606,994 12,056,739
60,664,916Malaysia - 0.5%
Public Bank Bhd 4,870,000 4,896,945Mexico - 2.2%
Arca Continental SAB de CV 517,858 3,335,754Grupo Aeroportuario del Sureste SAB de CV, Class B� 160,093 2,863,962Grupo Financiero Banorte SAB de CV, Class O 1,135,201 7,493,208Grupo Mexico SAB de CV, Class B 1,483,785 6,879,609
20,572,533Poland - 0.3%
Powszechny Zaklad Ubezpieczen SA� 283,200 3,001,950Russia - 8.7%
Alrosa PJSC� 3,294,282 6,556,290Gazprom PJSC ADR# 1,549,124 12,857,729Lukoil PJSC ADR 165,919 14,194,370Magnitogorsk Iron & Steel Works PJSC� 5,847,261 5,890,876MMC Norilsk Nickel PJSC ADR# 339,058 11,138,055Rosneft OAO� 1,218,510 8,876,715
Copyright © 2021 www.secdatabase.com. All Rights Reserved.Please Consider the Environment Before Printing This Document
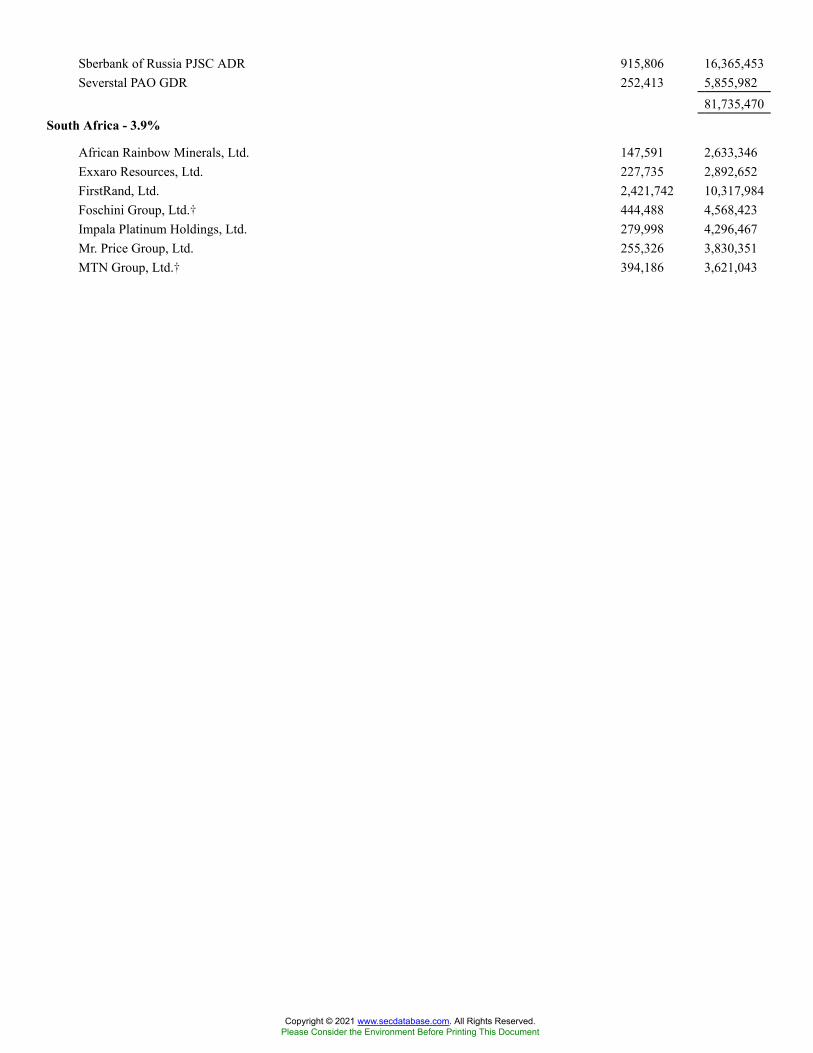
Sberbank of Russia PJSC ADR 915,806 16,365,453Severstal PAO GDR 252,413 5,855,982
81,735,470South Africa - 3.9%
African Rainbow Minerals, Ltd. 147,591 2,633,346Exxaro Resources, Ltd. 227,735 2,892,652FirstRand, Ltd. 2,421,742 10,317,984Foschini Group, Ltd.� 444,488 4,568,423Impala Platinum Holdings, Ltd. 279,998 4,296,467Mr. Price Group, Ltd. 255,326 3,830,351MTN Group, Ltd.� 394,186 3,621,043
Copyright © 2021 www.secdatabase.com. All Rights Reserved.Please Consider the Environment Before Printing This Document

Woolworths Holdings, Ltd.� 1,064,989 4,666,48736,826,753
South Korea - 17.8%
AfreecaTV Co., Ltd. 29,764 3,935,332BGF retail Co., Ltd. 18,191 2,800,546CJ CheilJedang Corp. 11,568 4,524,635GS Engineering & Construction Corp. 73,050 2,819,429Hana Financial Group, Inc. 278,108 10,805,783Hankook Tire & Technology Co., Ltd. 79,194 3,182,923Industrial Bank of Korea 508,693 4,518,986Kakao Corp. 81,691 10,920,786Kia Corp. 149,953 11,006,081KIWOOM Securities Co., Ltd. 42,135 4,288,180LG Chem, Ltd. 16,370 10,702,023Osstem Implant Co., Ltd. 15,144 2,093,737POSCO# 24,163 7,023,098Samsung Electro-Mechanics Co., Ltd. 44,425 7,069,225Samsung Electronics Co., Ltd. 624,110 41,286,159Samsung Securities Co. Ltd. 111,211 4,743,097Shinhan Financial Group Co., Ltd. 298,347 9,996,792SK Hynix, Inc. 228,415 20,980,808SK Telecom Co., Ltd. 17,390 4,469,550
167,167,170Taiwan - 17.1%
ASE Technology Holding Co., Ltd. 1,495,000 6,931,910AU Optronics Corp. 6,765,000 4,296,246Cathay Financial Holding Co., Ltd. 3,708,000 7,974,337Evergreen Marine Corp Taiwan, Ltd. 1,002,000 4,917,170Far Eastern New Century Corp. 2,493,000 2,703,183Fubon Financial Holding Co., Ltd. 4,063,000 12,461,616Giant Manufacturing Co., Ltd. 249,000 3,009,905Lite-On Technology Corp. 1,139,000 2,515,265Micro-Star International Co., Ltd. 770,000 3,625,850Nanya Technology Corp. 1,531,000 3,668,191Novatek Microelectronics Corp. 295,000 4,779,440Realtek Semiconductor Corp. 271,000 5,417,360Taiwan Semiconductor Manufacturing Co., Ltd. 2,621,000 58,068,956Taiwan Semiconductor Manufacturing Co., Ltd. ADR 126,085 15,005,376Uni-President Enterprises Corp. 1,800,000 4,695,906United Microelectronics Corp. 3,152,000 7,176,690Yageo Corp. 225,000 3,892,958Yuanta Financial Holding Co., Ltd. 11,178,520 10,084,002
161,224,361Thailand - 2.3%
Kasikornbank PCL 2,013,400 7,651,951PTT Exploration & Production PCL 2,571,800 8,896,477Siam Cement PCL 402,800 5,373,583
Copyright © 2021 www.secdatabase.com. All Rights Reserved.Please Consider the Environment Before Printing This Document
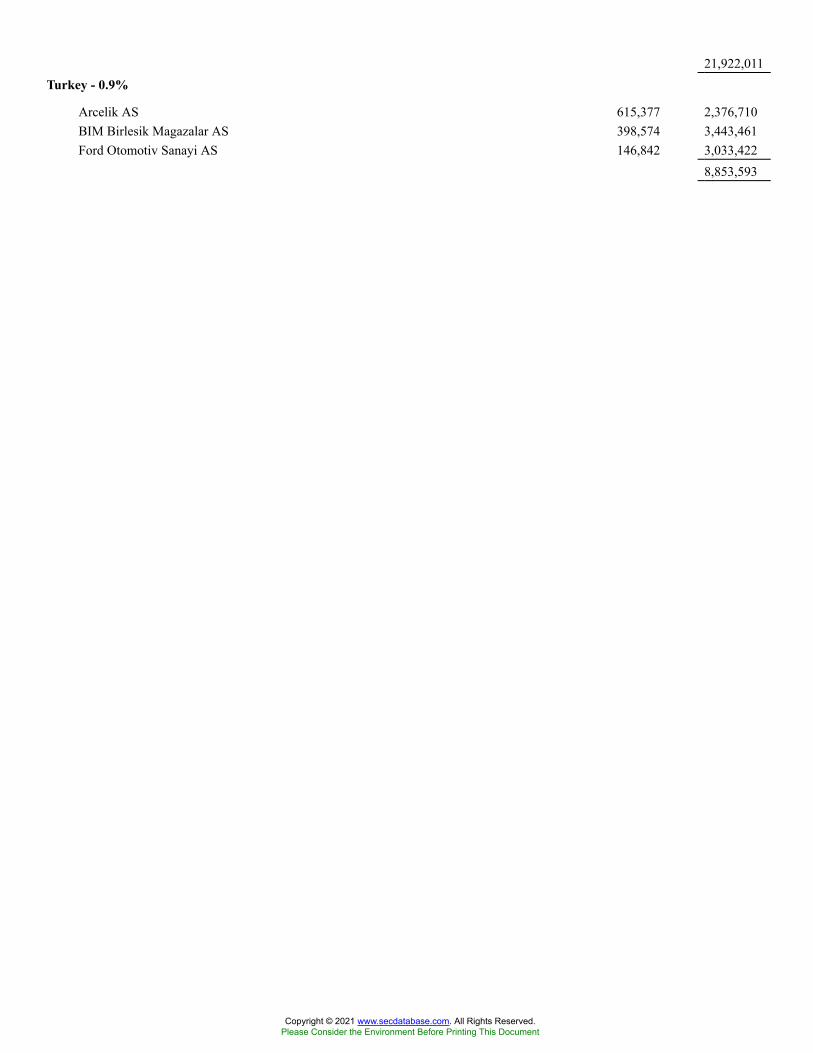
21,922,011Turkey - 0.9%
Arcelik AS 615,377 2,376,710BIM Birlesik Magazalar AS 398,574 3,443,461Ford Otomotiv Sanayi AS 146,842 3,033,422
8,853,593
Copyright © 2021 www.secdatabase.com. All Rights Reserved.Please Consider the Environment Before Printing This Document
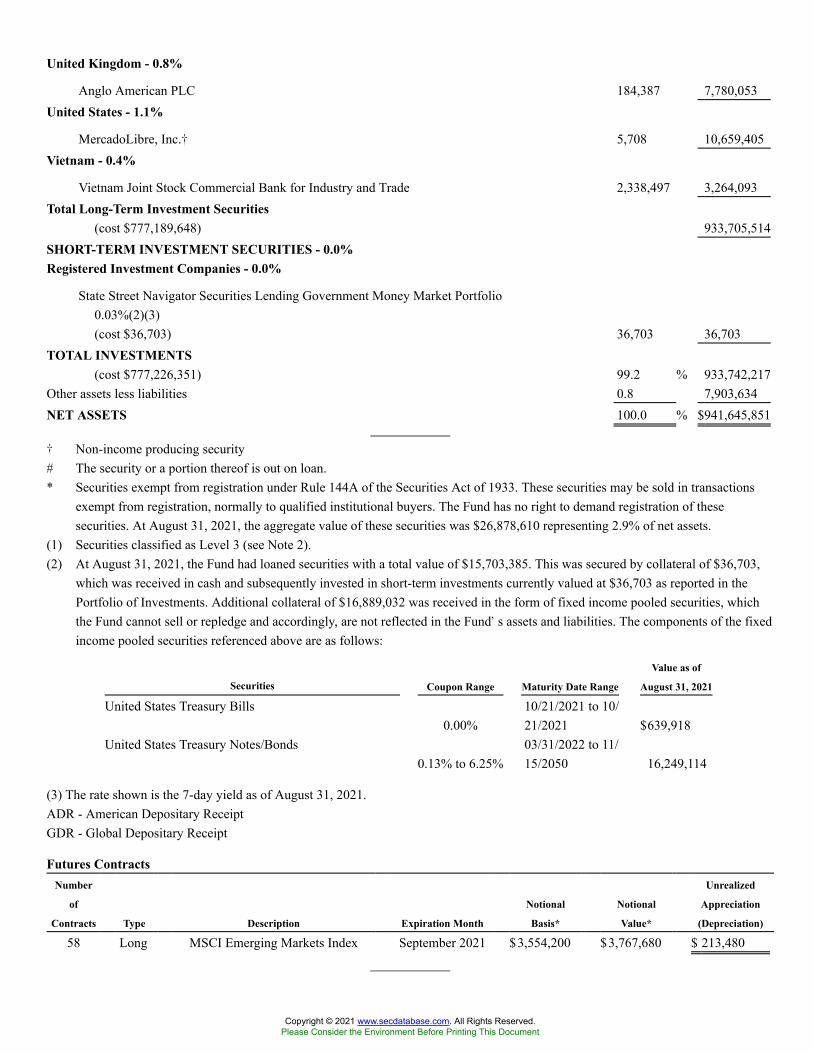
United Kingdom - 0.8%
Anglo American PLC 184,387 7,780,053United States - 1.1%
MercadoLibre, Inc.� 5,708 10,659,405Vietnam - 0.4%
Vietnam Joint Stock Commercial Bank for Industry and Trade 2,338,497 3,264,093Total Long-Term Investment Securities
(cost $777,189,648) 933,705,514SHORT-TERM INVESTMENT SECURITIES - 0.0%Registered Investment Companies - 0.0%
State Street Navigator Securities Lending Government Money Market Portfolio0.03%(2)(3)(cost $36,703) 36,703 36,703
TOTAL INVESTMENTS(cost $777,226,351) 99.2 % 933,742,217
Other assets less liabilities 0.8 7,903,634NET ASSETS 100.0 % $941,645,851
� Non-income producing security# The security or a portion thereof is out on loan.* Securities exempt from registration under Rule 144A of the Securities Act of 1933. These securities may be sold in transactions
exempt from registration, normally to qualified institutional buyers. The Fund has no right to demand registration of thesesecurities. At August 31, 2021, the aggregate value of these securities was $26,878,610 representing 2.9% of net assets.
(1) Securities classified as Level 3 (see Note 2).(2) At August 31, 2021, the Fund had loaned securities with a total value of $15,703,385. This was secured by collateral of $36,703,
which was received in cash and subsequently invested in short-term investments currently valued at $36,703 as reported in thePortfolio of Investments. Additional collateral of $16,889,032 was received in the form of fixed income pooled securities, whichthe Fund cannot sell or repledge and accordingly, are not reflected in the Fund�s assets and liabilities. The components of the fixedincome pooled securities referenced above are as follows:
Securities Coupon Range Maturity Date Range
Value as of
August 31, 2021
United States Treasury Bills0.00%
10/21/2021 to 10/21/2021 $639,918
United States Treasury Notes/Bonds0.13% to 6.25%
03/31/2022 to 11/15/2050 16,249,114
(3) The rate shown is the 7-day yield as of August 31, 2021.ADR - American Depositary ReceiptGDR - Global Depositary Receipt
Futures ContractsNumber
of
Contracts Type Description Expiration Month
Notional
Basis*
Notional
Value*
Unrealized
Appreciation
(Depreciation)
58 Long MSCI Emerging Markets Index September 2021 $3,554,200 $3,767,680 $ 213,480
Copyright © 2021 www.secdatabase.com. All Rights Reserved.Please Consider the Environment Before Printing This Document
* Notional basis refers to the contractual amount agreed upon at inception of the open contract; notional value represents the currentvalue of the open contract.
Copyright © 2021 www.secdatabase.com. All Rights Reserved.Please Consider the Environment Before Printing This Document
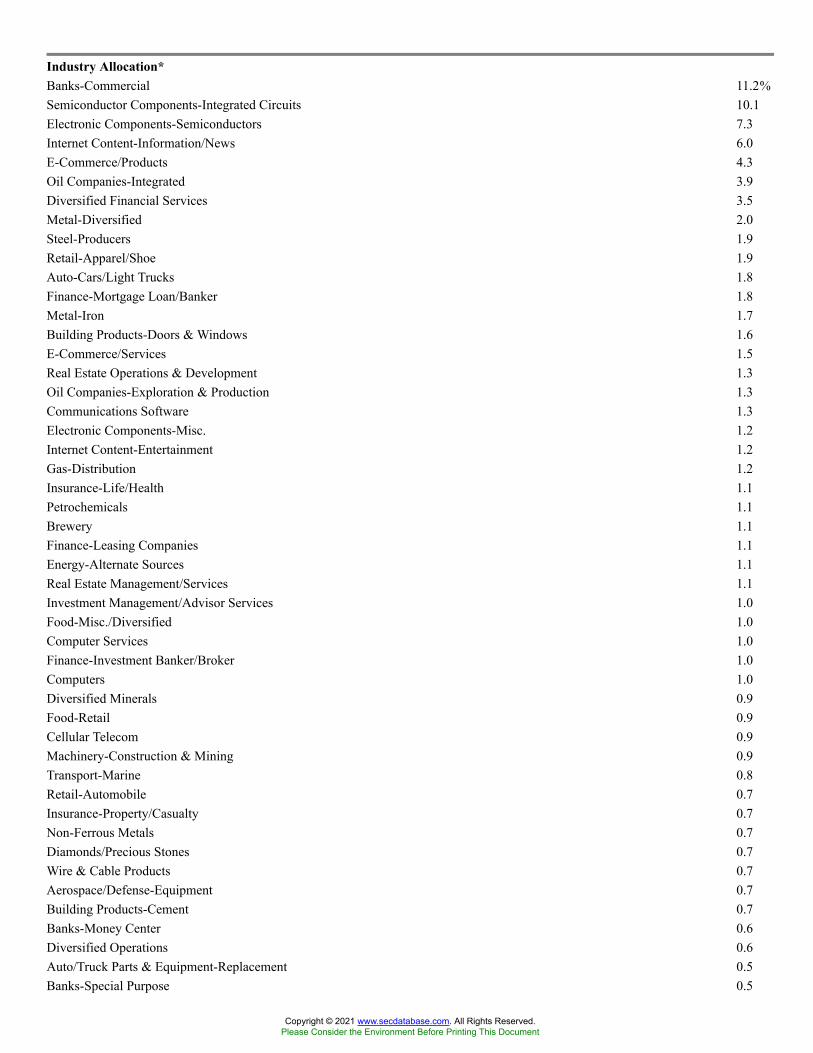
Industry Allocation*Banks-Commercial 11.2%Semiconductor Components-Integrated Circuits 10.1Electronic Components-Semiconductors 7.3Internet Content-Information/News 6.0E-Commerce/Products 4.3Oil Companies-Integrated 3.9Diversified Financial Services 3.5Metal-Diversified 2.0Steel-Producers 1.9Retail-Apparel/Shoe 1.9Auto-Cars/Light Trucks 1.8Finance-Mortgage Loan/Banker 1.8Metal-Iron 1.7Building Products-Doors & Windows 1.6E-Commerce/Services 1.5Real Estate Operations & Development 1.3Oil Companies-Exploration & Production 1.3Communications Software 1.3Electronic Components-Misc. 1.2Internet Content-Entertainment 1.2Gas-Distribution 1.2Insurance-Life/Health 1.1Petrochemicals 1.1Brewery 1.1Finance-Leasing Companies 1.1Energy-Alternate Sources 1.1Real Estate Management/Services 1.1Investment Management/Advisor Services 1.0Food-Misc./Diversified 1.0Computer Services 1.0Finance-Investment Banker/Broker 1.0Computers 1.0Diversified Minerals 0.9Food-Retail 0.9Cellular Telecom 0.9Machinery-Construction & Mining 0.9Transport-Marine 0.8Retail-Automobile 0.7Insurance-Property/Casualty 0.7Non-Ferrous Metals 0.7Diamonds/Precious Stones 0.7Wire & Cable Products 0.7Aerospace/Defense-Equipment 0.7Building Products-Cement 0.7Banks-Money Center 0.6Diversified Operations 0.6Auto/Truck Parts & Equipment-Replacement 0.5Banks-Special Purpose 0.5
Copyright © 2021 www.secdatabase.com. All Rights Reserved.Please Consider the Environment Before Printing This Document
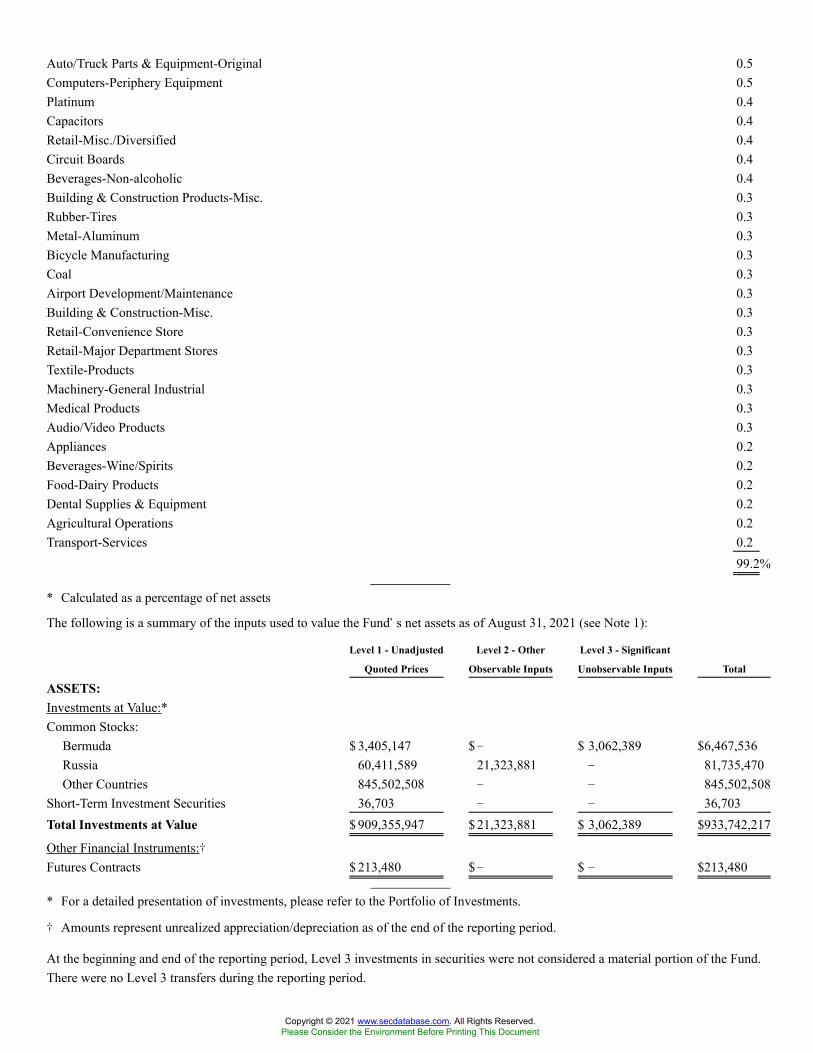
Auto/Truck Parts & Equipment-Original 0.5Computers-Periphery Equipment 0.5Platinum 0.4Capacitors 0.4Retail-Misc./Diversified 0.4Circuit Boards 0.4Beverages-Non-alcoholic 0.4Building & Construction Products-Misc. 0.3Rubber-Tires 0.3Metal-Aluminum 0.3Bicycle Manufacturing 0.3Coal 0.3Airport Development/Maintenance 0.3Building & Construction-Misc. 0.3Retail-Convenience Store 0.3Retail-Major Department Stores 0.3Textile-Products 0.3Machinery-General Industrial 0.3Medical Products 0.3Audio/Video Products 0.3Appliances 0.2Beverages-Wine/Spirits 0.2Food-Dairy Products 0.2Dental Supplies & Equipment 0.2Agricultural Operations 0.2Transport-Services 0.2
99.2%
* Calculated as a percentage of net assets
The following is a summary of the inputs used to value the Fund�s net assets as of August 31, 2021 (see Note 1):
Level 1 - Unadjusted
Quoted Prices
Level 2 - Other
Observable Inputs
Level 3 - Significant
Unobservable Inputs Total
ASSETS:Investments at Value:*Common Stocks:
Bermuda $ 3,405,147 $� $ 3,062,389 $6,467,536Russia 60,411,589 21,323,881 � 81,735,470Other Countries 845,502,508 � � 845,502,508
Short-Term Investment Securities 36,703 � � 36,703Total Investments at Value $ 909,355,947 $ 21,323,881 $ 3,062,389 $933,742,217
Other Financial Instruments:�Futures Contracts $ 213,480 $� $ � $213,480
* For a detailed presentation of investments, please refer to the Portfolio of Investments.
� Amounts represent unrealized appreciation/depreciation as of the end of the reporting period.
At the beginning and end of the reporting period, Level 3 investments in securities were not considered a material portion of the Fund.There were no Level 3 transfers during the reporting period.
Copyright © 2021 www.secdatabase.com. All Rights Reserved.Please Consider the Environment Before Printing This Document

See Notes to Portfolio of Investments
Copyright © 2021 www.secdatabase.com. All Rights Reserved.Please Consider the Environment Before Printing This Document
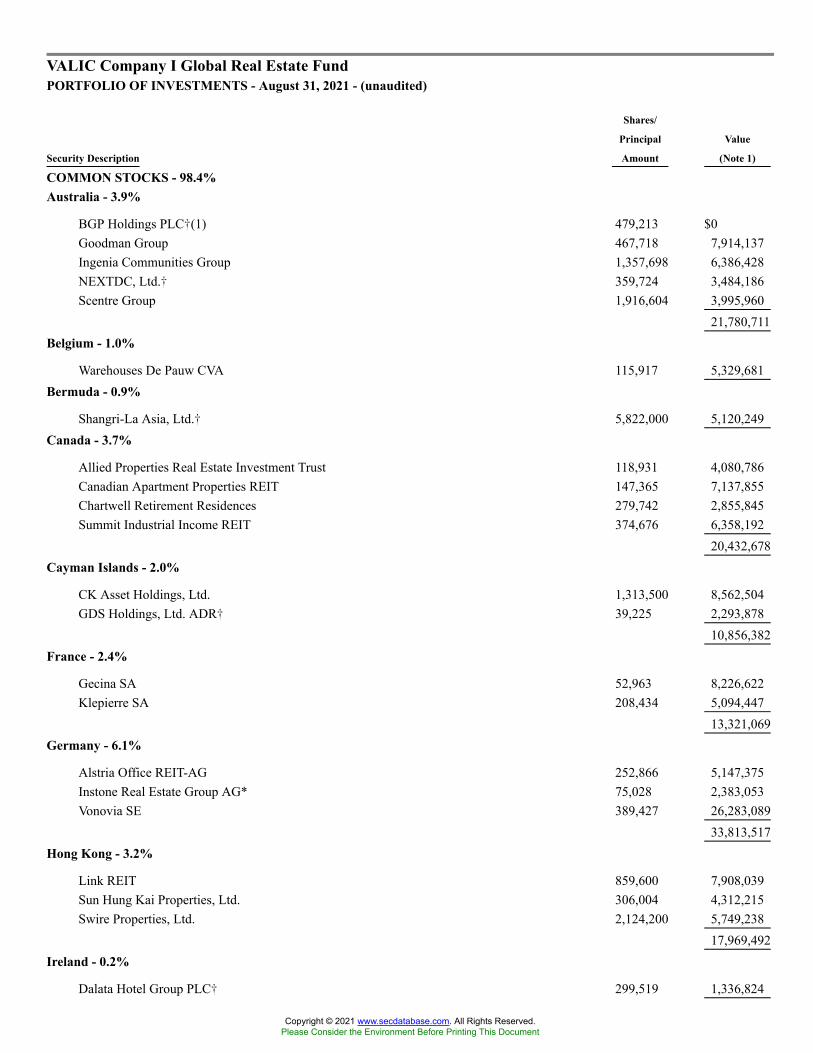
VALIC Company I Global Real Estate FundPORTFOLIO OF INVESTMENTS - August 31, 2021 - (unaudited)
Security Description
Shares/
Principal
Amount
Value
(Note 1)
COMMON STOCKS - 98.4%Australia - 3.9%
BGP Holdings PLC�(1) 479,213 $0Goodman Group 467,718 7,914,137Ingenia Communities Group 1,357,698 6,386,428NEXTDC, Ltd.� 359,724 3,484,186Scentre Group 1,916,604 3,995,960
21,780,711Belgium - 1.0%
Warehouses De Pauw CVA 115,917 5,329,681Bermuda - 0.9%
Shangri-La Asia, Ltd.� 5,822,000 5,120,249Canada - 3.7%
Allied Properties Real Estate Investment Trust 118,931 4,080,786Canadian Apartment Properties REIT 147,365 7,137,855Chartwell Retirement Residences 279,742 2,855,845Summit Industrial Income REIT 374,676 6,358,192
20,432,678Cayman Islands - 2.0%
CK Asset Holdings, Ltd. 1,313,500 8,562,504GDS Holdings, Ltd. ADR� 39,225 2,293,878
10,856,382France - 2.4%
Gecina SA 52,963 8,226,622Klepierre SA 208,434 5,094,447
13,321,069Germany - 6.1%
Alstria Office REIT-AG 252,866 5,147,375Instone Real Estate Group AG* 75,028 2,383,053Vonovia SE 389,427 26,283,089
33,813,517Hong Kong - 3.2%
Link REIT 859,600 7,908,039Sun Hung Kai Properties, Ltd. 306,004 4,312,215Swire Properties, Ltd. 2,124,200 5,749,238
17,969,492Ireland - 0.2%
Dalata Hotel Group PLC� 299,519 1,336,824
Copyright © 2021 www.secdatabase.com. All Rights Reserved.Please Consider the Environment Before Printing This Document
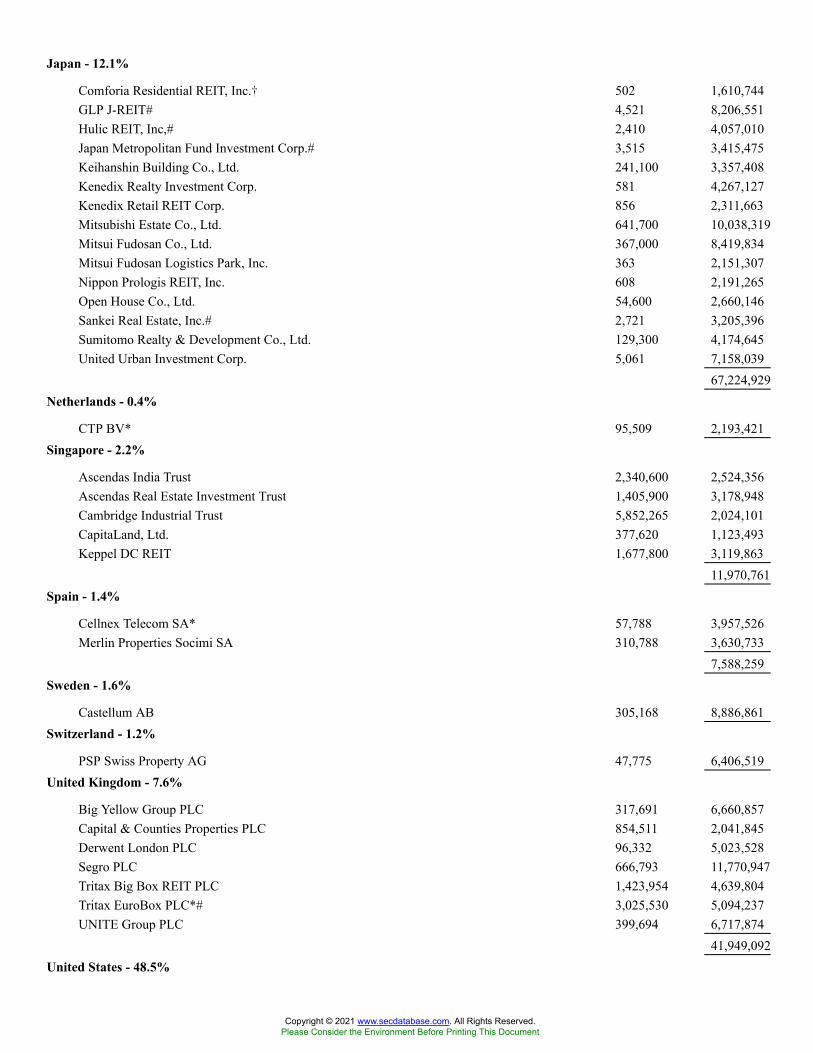
Japan - 12.1%
Comforia Residential REIT, Inc.� 502 1,610,744GLP J-REIT# 4,521 8,206,551Hulic REIT, Inc,# 2,410 4,057,010Japan Metropolitan Fund Investment Corp.# 3,515 3,415,475Keihanshin Building Co., Ltd. 241,100 3,357,408Kenedix Realty Investment Corp. 581 4,267,127Kenedix Retail REIT Corp. 856 2,311,663Mitsubishi Estate Co., Ltd. 641,700 10,038,319Mitsui Fudosan Co., Ltd. 367,000 8,419,834Mitsui Fudosan Logistics Park, Inc. 363 2,151,307Nippon Prologis REIT, Inc. 608 2,191,265Open House Co., Ltd. 54,600 2,660,146Sankei Real Estate, Inc.# 2,721 3,205,396Sumitomo Realty & Development Co., Ltd. 129,300 4,174,645United Urban Investment Corp. 5,061 7,158,039
67,224,929Netherlands - 0.4%
CTP BV* 95,509 2,193,421Singapore - 2.2%
Ascendas India Trust 2,340,600 2,524,356Ascendas Real Estate Investment Trust 1,405,900 3,178,948Cambridge Industrial Trust 5,852,265 2,024,101CapitaLand, Ltd. 377,620 1,123,493Keppel DC REIT 1,677,800 3,119,863
11,970,761Spain - 1.4%
Cellnex Telecom SA* 57,788 3,957,526Merlin Properties Socimi SA 310,788 3,630,733
7,588,259Sweden - 1.6%
Castellum AB 305,168 8,886,861Switzerland - 1.2%
PSP Swiss Property AG 47,775 6,406,519United Kingdom - 7.6%
Big Yellow Group PLC 317,691 6,660,857Capital & Counties Properties PLC 854,511 2,041,845Derwent London PLC 96,332 5,023,528Segro PLC 666,793 11,770,947Tritax Big Box REIT PLC 1,423,954 4,639,804Tritax EuroBox PLC*# 3,025,530 5,094,237UNITE Group PLC 399,694 6,717,874
41,949,092United States - 48.5%
Copyright © 2021 www.secdatabase.com. All Rights Reserved.Please Consider the Environment Before Printing This Document
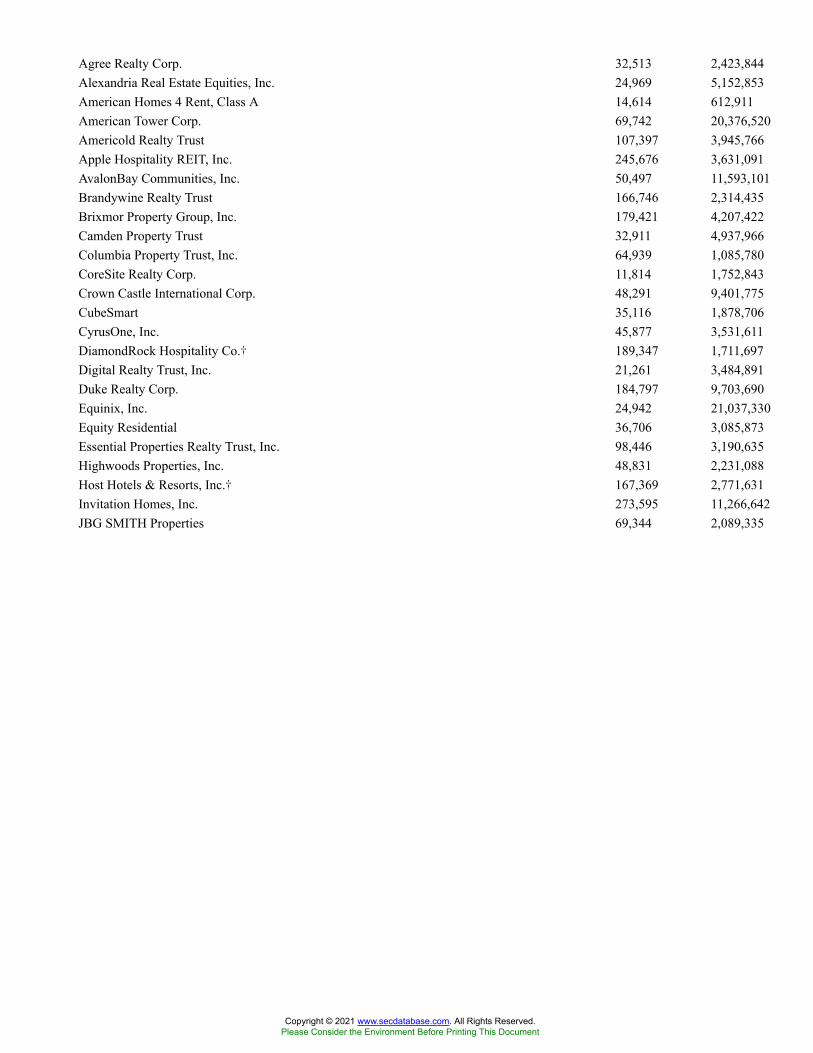
Agree Realty Corp. 32,513 2,423,844Alexandria Real Estate Equities, Inc. 24,969 5,152,853American Homes 4 Rent, Class A 14,614 612,911American Tower Corp. 69,742 20,376,520Americold Realty Trust 107,397 3,945,766Apple Hospitality REIT, Inc. 245,676 3,631,091AvalonBay Communities, Inc. 50,497 11,593,101Brandywine Realty Trust 166,746 2,314,435Brixmor Property Group, Inc. 179,421 4,207,422Camden Property Trust 32,911 4,937,966Columbia Property Trust, Inc. 64,939 1,085,780CoreSite Realty Corp. 11,814 1,752,843Crown Castle International Corp. 48,291 9,401,775CubeSmart 35,116 1,878,706CyrusOne, Inc. 45,877 3,531,611DiamondRock Hospitality Co.� 189,347 1,711,697Digital Realty Trust, Inc. 21,261 3,484,891Duke Realty Corp. 184,797 9,703,690Equinix, Inc. 24,942 21,037,330Equity Residential 36,706 3,085,873Essential Properties Realty Trust, Inc. 98,446 3,190,635Highwoods Properties, Inc. 48,831 2,231,088Host Hotels & Resorts, Inc.� 167,369 2,771,631Invitation Homes, Inc. 273,595 11,266,642JBG SMITH Properties 69,344 2,089,335
Copyright © 2021 www.secdatabase.com. All Rights Reserved.Please Consider the Environment Before Printing This Document
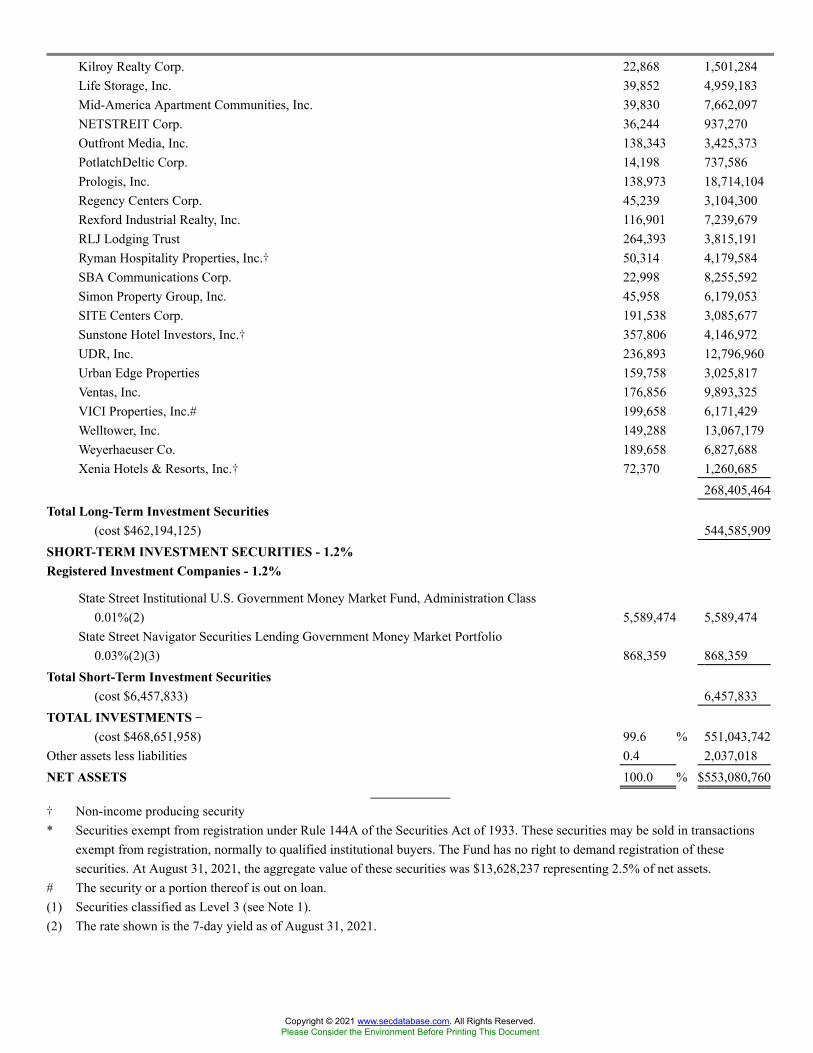
Kilroy Realty Corp. 22,868 1,501,284Life Storage, Inc. 39,852 4,959,183Mid-America Apartment Communities, Inc. 39,830 7,662,097NETSTREIT Corp. 36,244 937,270Outfront Media, Inc. 138,343 3,425,373PotlatchDeltic Corp. 14,198 737,586Prologis, Inc. 138,973 18,714,104Regency Centers Corp. 45,239 3,104,300Rexford Industrial Realty, Inc. 116,901 7,239,679RLJ Lodging Trust 264,393 3,815,191Ryman Hospitality Properties, Inc.� 50,314 4,179,584SBA Communications Corp. 22,998 8,255,592Simon Property Group, Inc. 45,958 6,179,053SITE Centers Corp. 191,538 3,085,677Sunstone Hotel Investors, Inc.� 357,806 4,146,972UDR, Inc. 236,893 12,796,960Urban Edge Properties 159,758 3,025,817Ventas, Inc. 176,856 9,893,325VICI Properties, Inc.# 199,658 6,171,429Welltower, Inc. 149,288 13,067,179Weyerhaeuser Co. 189,658 6,827,688Xenia Hotels & Resorts, Inc.� 72,370 1,260,685
268,405,464Total Long-Term Investment Securities
(cost $462,194,125) 544,585,909SHORT-TERM INVESTMENT SECURITIES - 1.2%Registered Investment Companies - 1.2%
State Street Institutional U.S. Government Money Market Fund, Administration Class0.01%(2) 5,589,474 5,589,474
State Street Navigator Securities Lending Government Money Market Portfolio0.03%(2)(3) 868,359 868,359
Total Short-Term Investment Securities(cost $6,457,833) 6,457,833
TOTAL INVESTMENTS ��(cost $468,651,958) 99.6 % 551,043,742
Other assets less liabilities 0.4 2,037,018NET ASSETS 100.0 % $553,080,760
� Non-income producing security* Securities exempt from registration under Rule 144A of the Securities Act of 1933. These securities may be sold in transactions
exempt from registration, normally to qualified institutional buyers. The Fund has no right to demand registration of thesesecurities. At August 31, 2021, the aggregate value of these securities was $13,628,237 representing 2.5% of net assets.
# The security or a portion thereof is out on loan.(1) Securities classified as Level 3 (see Note 1).(2) The rate shown is the 7-day yield as of August 31, 2021.
Copyright © 2021 www.secdatabase.com. All Rights Reserved.Please Consider the Environment Before Printing This Document

(3) At August 31, 2021, the Fund had loaned securities with a total value of $22,197,950. This was secured by collateral of $868,359,which was received in cash and subsequently invested in short-term investments currently valued at $868,359 as reported in thePortfolio of Investments. Additional collateral of $22,280,959 was received in the form of fixed income pooled securities, whichthe Fund cannot sell or repledge and accordingly, are not reflected in the Fund�s assets and liabilities.
The components of the fixed income pooled securities referenced above are as follows:
Securities Coupon Range Maturity Date Range
Value as of
August 31, 2021
United States Treasury Bills0.00%
09/14/2021 to 02/24/2022 $97,917
United States Treasury Notes/Bonds0.07% to 8.00%
09/15/2021 to 11/15/2050 22,183,042
ADR- American Depositary ReceiptCVA - Certification Van Aandelen (Dutch Cert.)
Copyright © 2021 www.secdatabase.com. All Rights Reserved.Please Consider the Environment Before Printing This Document

Industry Allocation*Real Estate Investment Trusts 76.7 %Real Estate Operations & Development 11.8Real Estate Management/Services 6.6Registered Investment Companies 1.2Hotels/Motels 1.1Telecom Services 1.0Building-Heavy Construction 0.7Building-Residential/Commercial 0.5
99.6%
* Calculated as a percentage of net assets
The following is a summary of the inputs used to value the Fund�s net assets as of August 31, 2021 (See Note 1):
Level 1 - Unadjusted
Quoted Prices
Level 2 - Other
Observable Inputs
Level 3 - Significant
Unobservable Inputs Total
ASSETS:Investments at Value:*Common Stocks:
Australia $ 21,780,711 $ � $ 0 $21,780,711Other Countries 522,805,198 � � 522,805,198
Short-Term Investment Securities 6,457,833 � � 6,457,833Total Investments at Value $ 551,043,742 $ � $ 0 $551,043,742
* For a detailed presentation of investments, please refer to the Portfolio of Investments.
At the beginning and end of the reporting period, Level 3 investments in securities were not considered a material portion of the Fund.There were no Level 3 transfers during the reporting period.
See Notes to Portfolio of Investments
Copyright © 2021 www.secdatabase.com. All Rights Reserved.Please Consider the Environment Before Printing This Document

VALIC Company I Global Strategy FundPORTFOLIO OF INVESTMENTS - August 31, 2021 - (unaudited)
Security Description
Shares/
Principal
Amount(4)
Value
(Note 1)
COMMON STOCKS - 65.1%Australia - 2.2%
AGL Energy, Ltd.# 8,791 $41,480Aurizon Holdings, Ltd. 25,383 70,191BHP Group, Ltd.# 41,975 1,400,537Brambles, Ltd. 19,314 171,104Coles Group, Ltd. 16,327 215,948CSL, Ltd. 5,767 1,316,027Endeavour Group, Ltd. 15,053 80,388Evolution Mining, Ltd. 21,548 61,635Fortescue Metals Group, Ltd. 38,631 593,470Magellan Financial Group, Ltd.# 1,731 54,882Medibank Private, Ltd. 39,209 101,826Newcrest Mining, Ltd. 8,651 156,570REA Group, Ltd. 746 83,771Rio Tinto, Ltd. 6,685 548,019Sonic Healthcare, Ltd. 5,459 173,319Telstra Corp., Ltd. 56,759 159,445Washington H. Soul Pattinson & Co., Ltd.# 915 23,977Wesfarmers, Ltd. 16,635 729,551Woolworths Group, Ltd. 15,053 459,752
6,441,892Austria - 0.0%
OMV AG 1,248 69,155Belgium - 0.0%
Etablissements Franz Colruyt NV 787 44,037Proximus SADP 2,261 44,330
88,367Bermuda - 0.1%
Brilliance China Automotive Holdings, Ltd.�(1) 36,000 24,198CK Infrastructure Holdings, Ltd. 4,000 24,301Hopson Development Holdings, Ltd. 6,300 24,544Invesco, Ltd. 4,523 114,522Nine Dragons Paper Holdings, Ltd. 22,000 30,097Shenzhen International Holdings, Ltd. 10,500 13,690
231,352Brazil - 0.5%
AMBEV SA 50,100 165,682BB Seguridade Participacoes SA 11,800 43,496Bradespar SA (Preference Shares) 1,800 21,983
Copyright © 2021 www.secdatabase.com. All Rights Reserved.Please Consider the Environment Before Printing This Document

Cia Energetica de Minas Gerais (Preference Shares) 6,900 18,028Cia Paranaense de Energia, Class B (Preference Shares) 12,200 16,138CPFL Energia SA 1,300 7,301Engie Brasil Energia SA 2,500 18,155Petrobras Distribuidora SA 4,500 23,663Telefonica Brasil SA 7,000 59,200TIM SA 9,900 23,856
Copyright © 2021 www.secdatabase.com. All Rights Reserved.Please Consider the Environment Before Printing This Document

Vale SA 53,100 1,013,3651,410,867
Canada - 1.9%
Algonquin Power & Utilities Corp. 5,800 90,058Alimentation Couche-Tard, Inc., Class B 7,400 299,015B2Gold Corp. 14,700 56,859Bank of Nova Scotia 7,100 439,793BCE, Inc. 1,500 78,231Canadian Apartment Properties REIT 900 43,593Canadian National Railway Co. 8,300 976,277CCL Industries, Inc., Class B 800 45,667CGI, Inc.� 2,400 214,500Constellation Software, Inc. 300 508,427Dollarama, Inc. 2,900 132,237Empire Co., Ltd., Class A 1,900 61,443Fairfax Financial Holdings, Ltd. 200 88,530Franco-Nevada Corp. 2,200 320,937Hydro One, Ltd.* 3,700 92,086IGM Financial, Inc.# 900 32,821Keyera Corp.# 2,300 55,383Kirkland Lake Gold, Ltd. 3,900 155,518Magna International, Inc. 3,800 300,078Metro, Inc.# 2,900 147,730Power Corp. of Canada 6,745 232,772Quebecor, Inc., Class B# 2,100 52,398RioCan Real Estate Investment Trust 2,300 40,854Rogers Communications, Inc., Class B 4,000 203,797Saputo, Inc. 2,600 73,138Shaw Communications, Inc., Class B 5,200 153,035TC Energy Corp. 5,600 265,874TELUS Corp. (Non Voting Shares)# 5,000 115,200West Fraser Timber Co., Ltd. 700 54,051Wheaton Precious Metals Corp. 4,900 220,833
5,551,135Cayman Islands - 0.6%
360 DigiTech, Inc. ADR� 500 11,400Agile Group Holdings, Ltd. 6,000 6,881China Conch Venture Holdings, Ltd. 21,500 87,908China Feihe, Ltd.* 28,000 50,690China Hongqiao Group, Ltd. 23,500 35,050China Lesso Group Holdings, Ltd. 12,000 25,674China Medical System Holdings, Ltd. 22,000 43,109China Overseas Property Holdings, Ltd.# 10,000 8,537China Resources Cement Holdings, Ltd. 40,000 39,242CK Asset Holdings, Ltd. 28,000 182,528CK Hutchison Holdings, Ltd. 24,500 178,770Country Garden Services Holdings Co., Ltd. 17,000 129,509Dali Foods Group Co., Ltd.* 29,500 16,538
Copyright © 2021 www.secdatabase.com. All Rights Reserved.Please Consider the Environment Before Printing This Document

Haitian International Holdings, Ltd. 6,000 22,990Hello Group, Inc. ADR 900 11,826Hengan International Group Co., Ltd. 4,000 23,195Kingboard Holdings, Ltd. 9,500 46,722Kingboard Laminates Holdings, Ltd. 13,000 25,574Lee & Man Paper Manufacturing, Ltd. 18,000 15,807NetEase, Inc. ADR 3,675 358,018Perennial Energy Holdings, Ltd.# 25,000 5,497Seazen Group, Ltd. 24,000 21,292Smoore International Holdings, Ltd.* 8,000 42,842Uni-President China Holdings, Ltd. 8,000 7,581Vipshop Holdings, Ltd. ADR� 3,686 54,516Want Want China Holdings, Ltd. 47,000 31,968WH Group, Ltd.#* 85,500 74,205Wharf Real Estate Investment Co., Ltd. 14,000 69,393
Copyright © 2021 www.secdatabase.com. All Rights Reserved.Please Consider the Environment Before Printing This Document
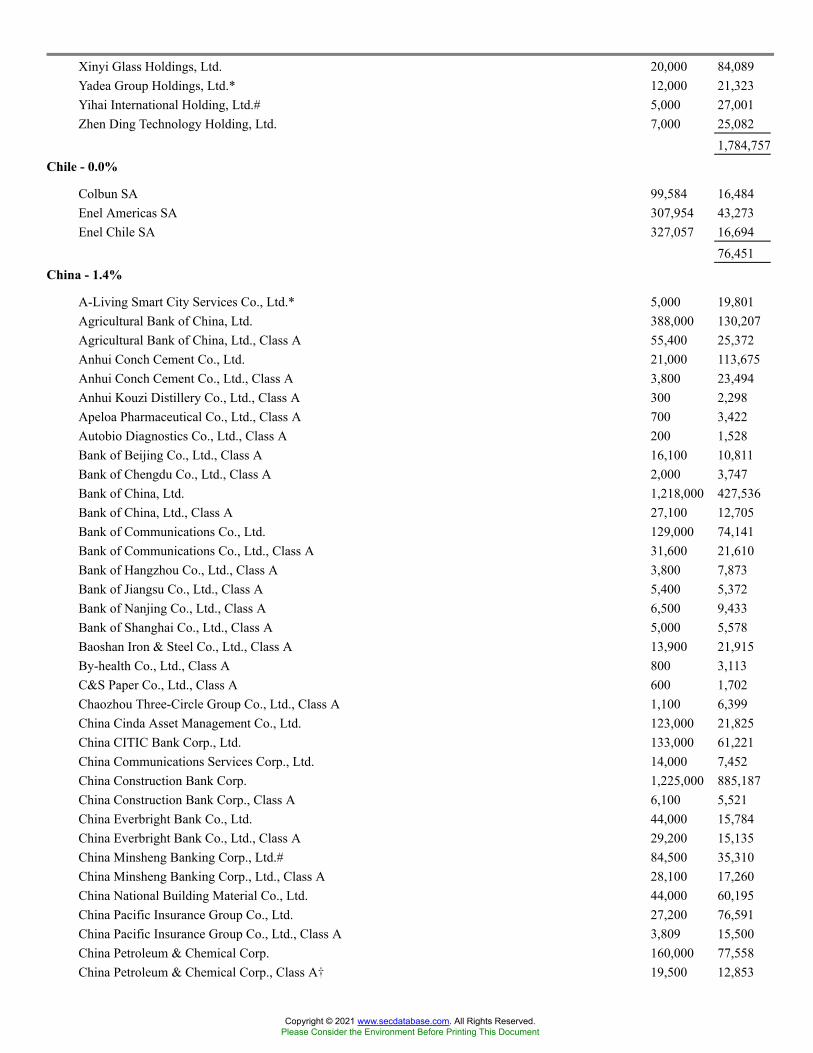
Xinyi Glass Holdings, Ltd. 20,000 84,089Yadea Group Holdings, Ltd.* 12,000 21,323Yihai International Holding, Ltd.# 5,000 27,001Zhen Ding Technology Holding, Ltd. 7,000 25,082
1,784,757Chile - 0.0%
Colbun SA 99,584 16,484Enel Americas SA 307,954 43,273Enel Chile SA 327,057 16,694
76,451China - 1.4%
A-Living Smart City Services Co., Ltd.* 5,000 19,801Agricultural Bank of China, Ltd. 388,000 130,207Agricultural Bank of China, Ltd., Class A 55,400 25,372Anhui Conch Cement Co., Ltd. 21,000 113,675Anhui Conch Cement Co., Ltd., Class A 3,800 23,494Anhui Kouzi Distillery Co., Ltd., Class A 300 2,298Apeloa Pharmaceutical Co., Ltd., Class A 700 3,422Autobio Diagnostics Co., Ltd., Class A 200 1,528Bank of Beijing Co., Ltd., Class A 16,100 10,811Bank of Chengdu Co., Ltd., Class A 2,000 3,747Bank of China, Ltd. 1,218,000 427,536Bank of China, Ltd., Class A 27,100 12,705Bank of Communications Co., Ltd. 129,000 74,141Bank of Communications Co., Ltd., Class A 31,600 21,610Bank of Hangzhou Co., Ltd., Class A 3,800 7,873Bank of Jiangsu Co., Ltd., Class A 5,400 5,372Bank of Nanjing Co., Ltd., Class A 6,500 9,433Bank of Shanghai Co., Ltd., Class A 5,000 5,578Baoshan Iron & Steel Co., Ltd., Class A 13,900 21,915By-health Co., Ltd., Class A 800 3,113C&S Paper Co., Ltd., Class A 600 1,702Chaozhou Three-Circle Group Co., Ltd., Class A 1,100 6,399China Cinda Asset Management Co., Ltd. 123,000 21,825China CITIC Bank Corp., Ltd. 133,000 61,221China Communications Services Corp., Ltd. 14,000 7,452China Construction Bank Corp. 1,225,000 885,187China Construction Bank Corp., Class A 6,100 5,521China Everbright Bank Co., Ltd. 44,000 15,784China Everbright Bank Co., Ltd., Class A 29,200 15,135China Minsheng Banking Corp., Ltd.# 84,500 35,310China Minsheng Banking Corp., Ltd., Class A 28,100 17,260China National Building Material Co., Ltd. 44,000 60,195China Pacific Insurance Group Co., Ltd. 27,200 76,591China Pacific Insurance Group Co., Ltd., Class A 3,809 15,500China Petroleum & Chemical Corp. 160,000 77,558China Petroleum & Chemical Corp., Class A� 19,500 12,853
Copyright © 2021 www.secdatabase.com. All Rights Reserved.Please Consider the Environment Before Printing This Document
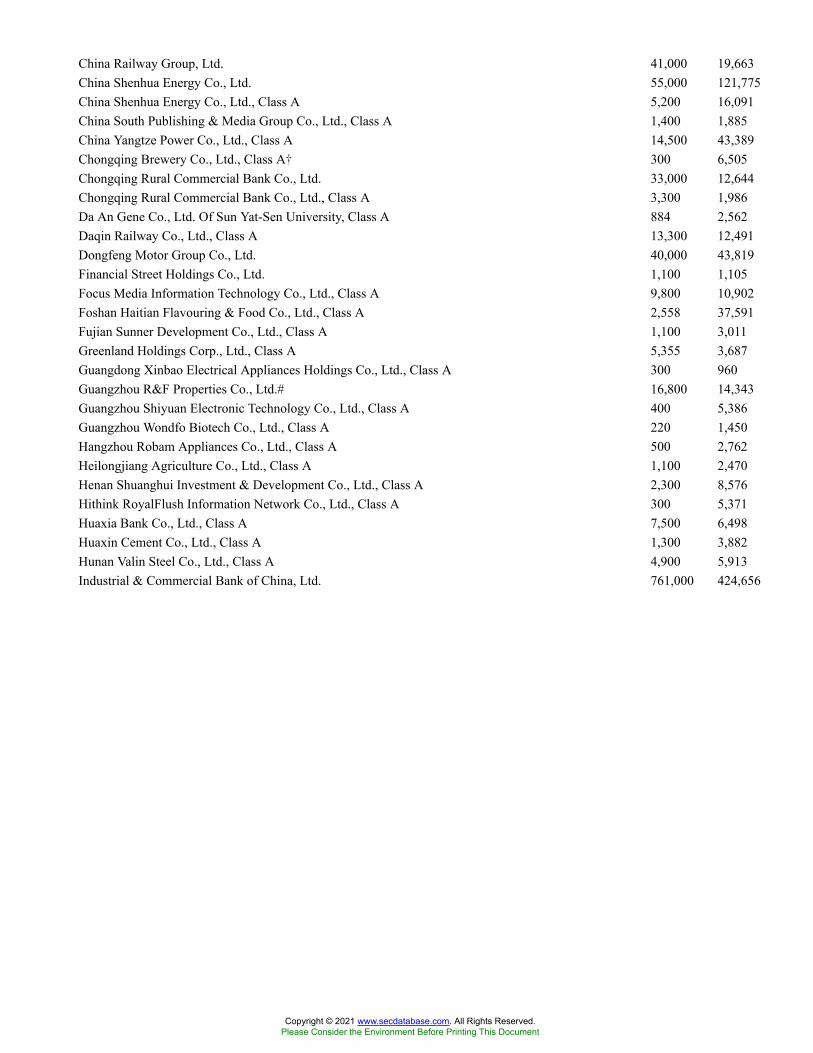
China Railway Group, Ltd. 41,000 19,663China Shenhua Energy Co., Ltd. 55,000 121,775China Shenhua Energy Co., Ltd., Class A 5,200 16,091China South Publishing & Media Group Co., Ltd., Class A 1,400 1,885China Yangtze Power Co., Ltd., Class A 14,500 43,389Chongqing Brewery Co., Ltd., Class A� 300 6,505Chongqing Rural Commercial Bank Co., Ltd. 33,000 12,644Chongqing Rural Commercial Bank Co., Ltd., Class A 3,300 1,986Da An Gene Co., Ltd. Of Sun Yat-Sen University, Class A 884 2,562Daqin Railway Co., Ltd., Class A 13,300 12,491Dongfeng Motor Group Co., Ltd. 40,000 43,819Financial Street Holdings Co., Ltd. 1,100 1,105Focus Media Information Technology Co., Ltd., Class A 9,800 10,902Foshan Haitian Flavouring & Food Co., Ltd., Class A 2,558 37,591Fujian Sunner Development Co., Ltd., Class A 1,100 3,011Greenland Holdings Corp., Ltd., Class A 5,355 3,687Guangdong Xinbao Electrical Appliances Holdings Co., Ltd., Class A 300 960Guangzhou R&F Properties Co., Ltd.# 16,800 14,343Guangzhou Shiyuan Electronic Technology Co., Ltd., Class A 400 5,386Guangzhou Wondfo Biotech Co., Ltd., Class A 220 1,450Hangzhou Robam Appliances Co., Ltd., Class A 500 2,762Heilongjiang Agriculture Co., Ltd., Class A 1,100 2,470Henan Shuanghui Investment & Development Co., Ltd., Class A 2,300 8,576Hithink RoyalFlush Information Network Co., Ltd., Class A 300 5,371Huaxia Bank Co., Ltd., Class A 7,500 6,498Huaxin Cement Co., Ltd., Class A 1,300 3,882Hunan Valin Steel Co., Ltd., Class A 4,900 5,913Industrial & Commercial Bank of China, Ltd. 761,000 424,656
Copyright © 2021 www.secdatabase.com. All Rights Reserved.Please Consider the Environment Before Printing This Document

Industrial & Commercial Bank of China, Ltd., Class A 39,100 27,949Inner Mongolia Junzheng Energy & Chemical Industry Group Co., Ltd., Class A 6,100 5,484Inner Mongolia Yili Industrial Group Co., Ltd., Class A 3,600 18,944Intco Medical Technology Co., Ltd., Class A 200 3,162Jafron Biomedical Co., Ltd., Class A 600 4,547Jason Furniture Hangzhou Co., Ltd., Class A 200 2,129Jiangsu Expressway Co., Ltd. 16,000 16,602Jiangsu Hengli Hydraulic Co., Ltd., Class A 700 10,287Jiangsu Yanghe Brewery Joint-Stock Co., Ltd., Class A 800 20,738Jiangsu Zhongtian Technology Co., Ltd., Class A 1,800 2,264Jiangxi Zhengbang Technology Co., Ltd., Class A 2,100 2,778Juewei Food Co., Ltd., Class A 400 3,898Kingfa Sci & Tech Co., Ltd., Class A 900 2,257Kunlun Tech Co., Ltd., Class A 800 2,083Kweichow Moutai Co., Ltd., Class A 900 216,951Luzhou Laojiao Co., Ltd., Class A 1,000 26,303Maxscend Microelectronics Co., Ltd., Class A 100 5,864Muyuan Foods Co., Ltd., Class A 3,858 25,256NanJi E-Commerce Co., Ltd., Class A 1,700 2,075New China Life Insurance Co., Ltd. 5,400 15,900New Hope Liuhe Co., Ltd., Class A� 2,900 4,909Ningxia Baofeng Energy Group Co., Ltd., Class A 2,300 5,715Offcn Education Technology Co., Ltd., Class A� 1,300 2,114Ovctek China, Inc., Class A 540 5,581People�s Insurance Co. Group of China, Ltd. 83,000 25,612Perfect World Co., Ltd., Class A 1,200 2,492PetroChina Co., Ltd. 140,000 61,383PICC Property & Casualty Co., Ltd. 64,000 57,849Postal Savings Bank of China Co., Ltd.* 99,000 71,410RiseSun Real Estate Development Co., Ltd., Class A 3,200 2,352Seazen Holdings Co., Ltd., Class A 1,500 7,800Shaanxi Coal Industry Co., Ltd., Class A 7,600 16,121Shandong Buchang Pharmaceuticals Co., Ltd., Class A 800 2,333Shandong Hualu Hengsheng Chemical Co., Ltd., Class A 1,520 8,565Shandong Sun Paper Industry JSC, Ltd., Class A 1,600 3,045Shanghai Pharmaceuticals Holding Co., Ltd. 6,900 13,698Shanghai Pudong Development Bank Co., Ltd., Class A 19,200 26,885Shanxi Lu�an Environmental Energy Development Co., Ltd., Class A 2,000 4,920Shanxi Xinghuacun Fen Wine Factory Co., Ltd., Class A 700 30,057Shenzhen Goodix Technology Co., Ltd., Class A 300 4,835Shenzhen Mindray Bio-Medical Electronics Co., Ltd., Class A 800 40,599Shenzhen Salubris Pharmaceuticals Co., Ltd., Class A� 800 3,137Sichuan Chuantou Energy Co., Ltd., Class A 2,500 4,402Sichuan Swellfun Co., Ltd., Class A 300 5,399Suofeiya Home Collection Co., Ltd., Class A 300 860Tangshan Jidong Cement Co., Ltd., Class A 800 1,572Toly Bread Co., Ltd., Class A 600 2,525Tonghua Dongbao Pharmaceutical Co., Ltd., Class A 1,100 1,784Tongkun Group Co., Ltd., Class A 1,300 4,807
Copyright © 2021 www.secdatabase.com. All Rights Reserved.Please Consider the Environment Before Printing This Document

Topchoice Medical Corp., Class A� 200 7,272Weifu High-Technology Group Co., Ltd., Class A 700 2,508Weihai Guangwei Composites Co., Ltd., Class A 300 3,390Wens Foodstuffs Group Co., Ltd., Class A 6,600 13,255Wuhu Sanqi Interactive Entertainment Network Technology Group Co., Ltd., Class A 2,000 5,276Wuliangye Yibin Co., Ltd., Class A 2,500 78,015Xiamen C & D, Inc., Class A 1,900 2,287Yanzhou Coal Mining Co., Ltd. 18,000 31,429Yanzhou Coal Mining Co., Ltd., Class A 1,500 5,925Yealink Network Technology Corp., Ltd., Class A 600 7,984Yintai Gold Co., Ltd., Class A 1,000 1,371Yunda Holding Co., Ltd., Class A 1,790 4,268Zhejiang Expressway Co., Ltd. 16,000 14,030Zhejiang Longsheng Group Co., Ltd., Class A 1,800 3,768Zhejiang NHU Co., Ltd., Class A 1,700 7,567Zhejiang Semir Garment Co., Ltd., Class A 1,600 2,342Zhejiang Supor Co., Ltd., Class A 400 3,020Zhejiang Weixing New Building Materials Co., Ltd., Class A 1,200 3,669Zhejiang Wolwo Bio-Pharmaceutical Co., Ltd., Class A 300 2,378Zhengzhou Yutong Bus Co., Ltd., Class A� 1,100 2,093Zhuzhou Kibing Group Co., Ltd., Class A 900 3,799
4,104,375
Copyright © 2021 www.secdatabase.com. All Rights Reserved.Please Consider the Environment Before Printing This Document

Czech Republic - 0.0%
CEZ AS 973 30,666Denmark - 1.1%
AP Moller � Maersk A/S, Series B 36 102,143Coloplast A/S, Class B 2,020 349,913Genmab A/S� 388 183,706Novo Nordisk A/S, Class B 22,466 2,239,038Novozymes A/S, Class B 2,195 177,323Pandora A/S 1,629 195,018
3,247,141Egypt - 0.0%
Eastern Co. SAE 19,431 14,542Fawry for Banking & Payment Technology Services SAE� 3,032 3,225
17,767Finland - 0.3%
Elisa Oyj 1,877 120,210Kone Oyj, Class B 3,606 299,067Orion Oyj, Class B 1,603 65,357UPM-Kymmene Oyj 5,158 209,689
694,323France - 0.4%
BioMerieux 389 47,700Hermes International 386 567,205Ipsen SA 379 37,895Klepierre SA 2,028 49,567Orange SA 12,823 145,654Sartorius Stedim Biotech 272 164,950
1,012,971Germany - 0.1%
Fuchs Petrolub SE (Preference Shares) 754 38,158HelloFresh SE� 1,486 160,159Porsche Automobil Holding SE (Preference Shares) 2,012 203,738
402,055Greece - 0.0%
Hellenic Telecommunications Organization SA 2,683 52,794JUMBO SA 1,204 18,908
71,702Hong Kong - 0.3%
Beijing Enterprises Holdings, Ltd. 5,000 17,229China Merchants Port Holdings Co., Ltd. 14,000 23,581China Resources Power Holdings Co., Ltd. 18,000 44,251China Taiping Insurance Holdings Co., Ltd. 17,600 25,707CLP Holdings, Ltd. 10,000 99,969Guangdong Investment, Ltd. 32,000 44,436
Copyright © 2021 www.secdatabase.com. All Rights Reserved.Please Consider the Environment Before Printing This Document
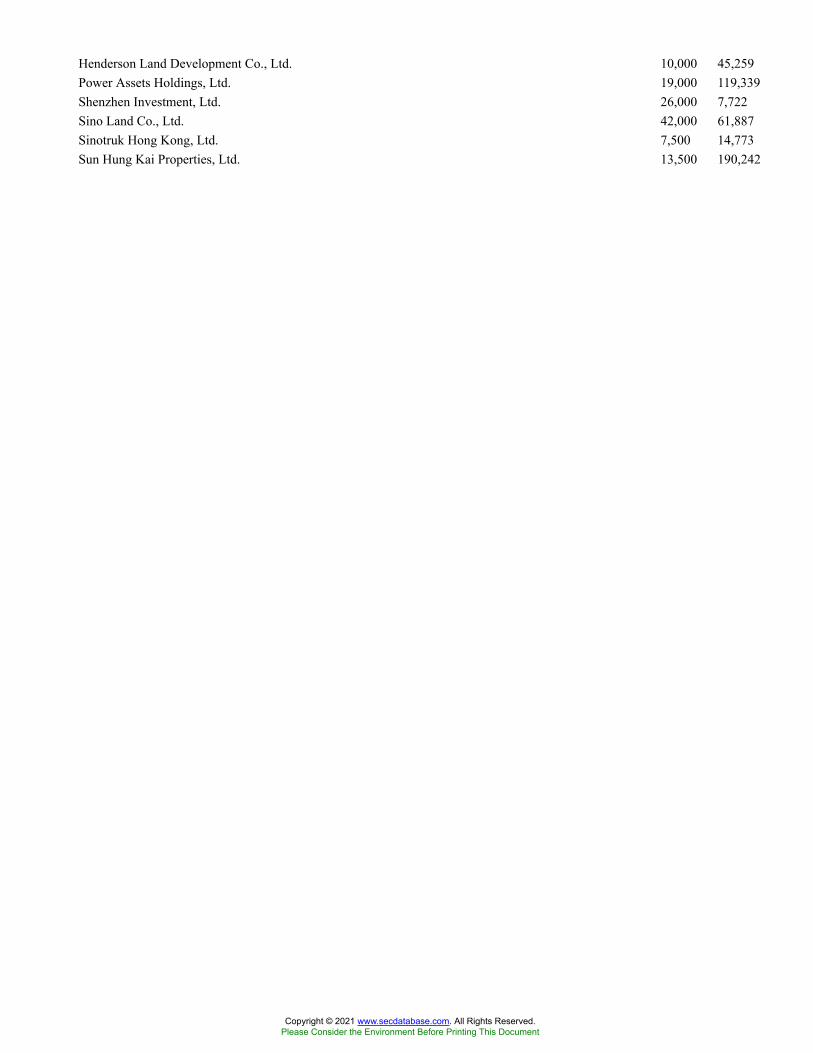
Henderson Land Development Co., Ltd. 10,000 45,259Power Assets Holdings, Ltd. 19,000 119,339Shenzhen Investment, Ltd. 26,000 7,722Sino Land Co., Ltd. 42,000 61,887Sinotruk Hong Kong, Ltd. 7,500 14,773Sun Hung Kai Properties, Ltd. 13,500 190,242
Copyright © 2021 www.secdatabase.com. All Rights Reserved.Please Consider the Environment Before Printing This Document
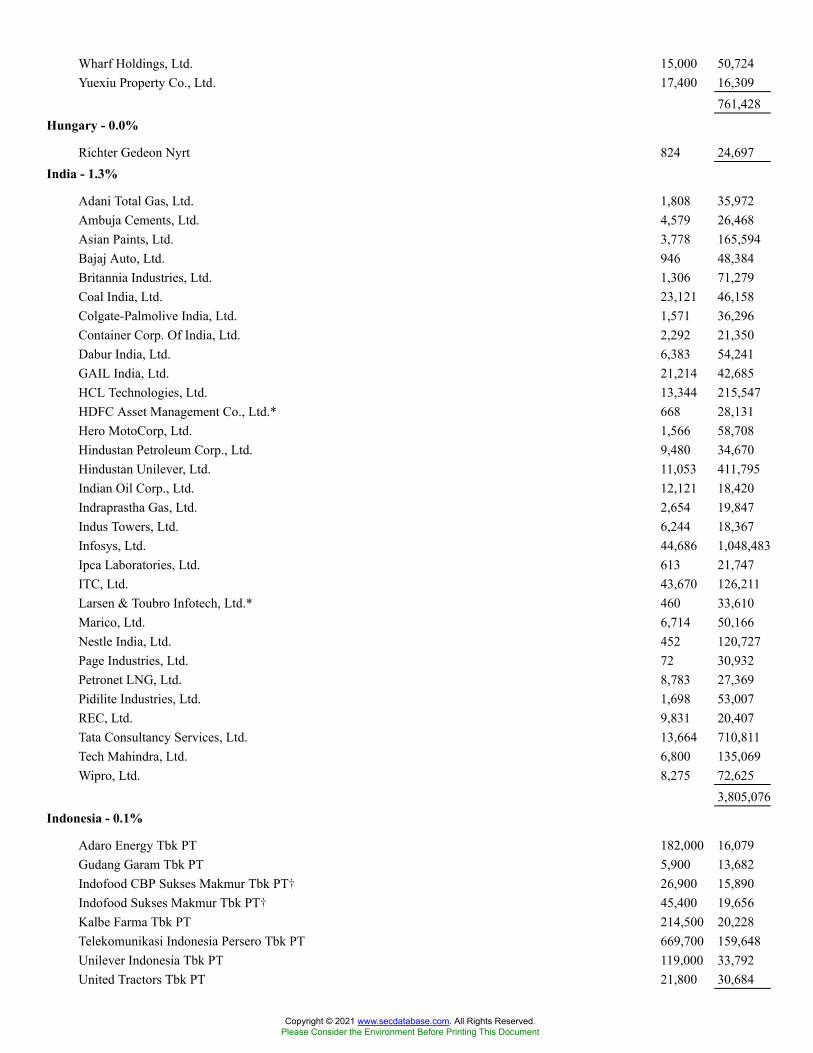
Wharf Holdings, Ltd. 15,000 50,724Yuexiu Property Co., Ltd. 17,400 16,309
761,428Hungary - 0.0%
Richter Gedeon Nyrt 824 24,697India - 1.3%
Adani Total Gas, Ltd. 1,808 35,972Ambuja Cements, Ltd. 4,579 26,468Asian Paints, Ltd. 3,778 165,594Bajaj Auto, Ltd. 946 48,384Britannia Industries, Ltd. 1,306 71,279Coal India, Ltd. 23,121 46,158Colgate-Palmolive India, Ltd. 1,571 36,296Container Corp. Of India, Ltd. 2,292 21,350Dabur India, Ltd. 6,383 54,241GAIL India, Ltd. 21,214 42,685HCL Technologies, Ltd. 13,344 215,547HDFC Asset Management Co., Ltd.* 668 28,131Hero MotoCorp, Ltd. 1,566 58,708Hindustan Petroleum Corp., Ltd. 9,480 34,670Hindustan Unilever, Ltd. 11,053 411,795Indian Oil Corp., Ltd. 12,121 18,420Indraprastha Gas, Ltd. 2,654 19,847Indus Towers, Ltd. 6,244 18,367Infosys, Ltd. 44,686 1,048,483Ipca Laboratories, Ltd. 613 21,747ITC, Ltd. 43,670 126,211Larsen & Toubro Infotech, Ltd.* 460 33,610Marico, Ltd. 6,714 50,166Nestle India, Ltd. 452 120,727Page Industries, Ltd. 72 30,932Petronet LNG, Ltd. 8,783 27,369Pidilite Industries, Ltd. 1,698 53,007REC, Ltd. 9,831 20,407Tata Consultancy Services, Ltd. 13,664 710,811Tech Mahindra, Ltd. 6,800 135,069Wipro, Ltd. 8,275 72,625
3,805,076Indonesia - 0.1%
Adaro Energy Tbk PT 182,000 16,079Gudang Garam Tbk PT 5,900 13,682Indofood CBP Sukses Makmur Tbk PT� 26,900 15,890Indofood Sukses Makmur Tbk PT� 45,400 19,656Kalbe Farma Tbk PT 214,500 20,228Telekomunikasi Indonesia Persero Tbk PT 669,700 159,648Unilever Indonesia Tbk PT 119,000 33,792United Tractors Tbk PT 21,800 30,684
Copyright © 2021 www.secdatabase.com. All Rights Reserved.Please Consider the Environment Before Printing This Document
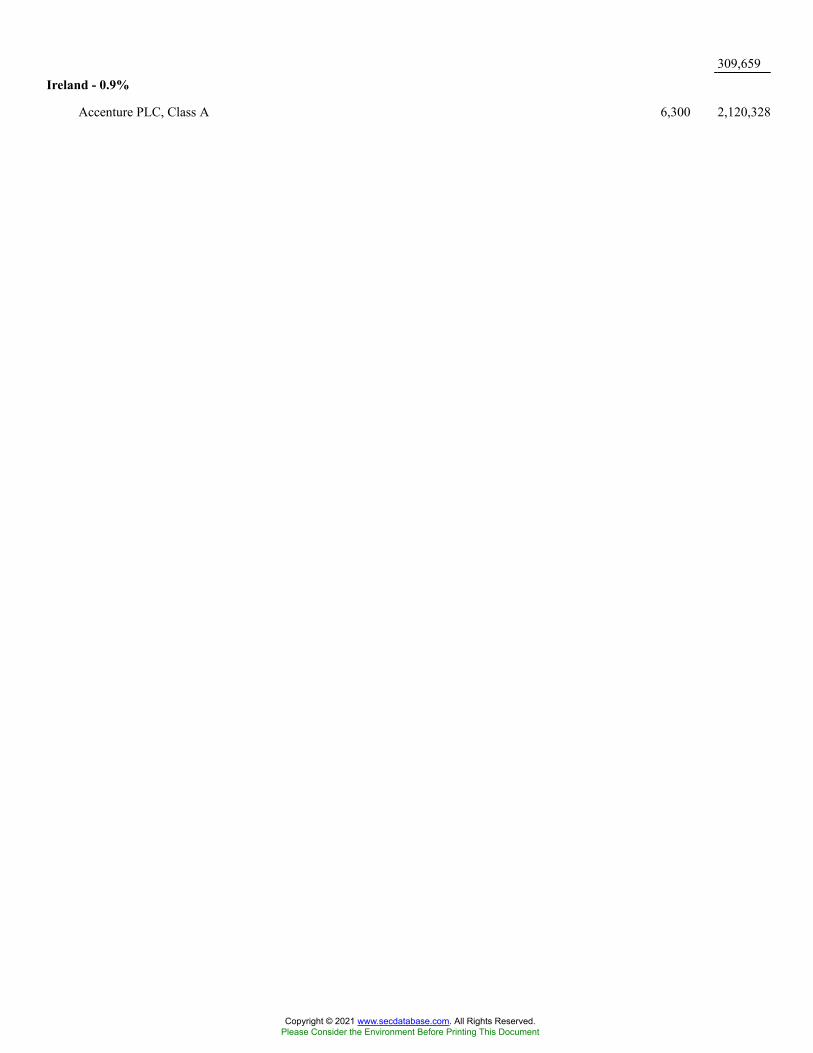
309,659Ireland - 0.9%
Accenture PLC, Class A 6,300 2,120,328
Copyright © 2021 www.secdatabase.com. All Rights Reserved.Please Consider the Environment Before Printing This Document
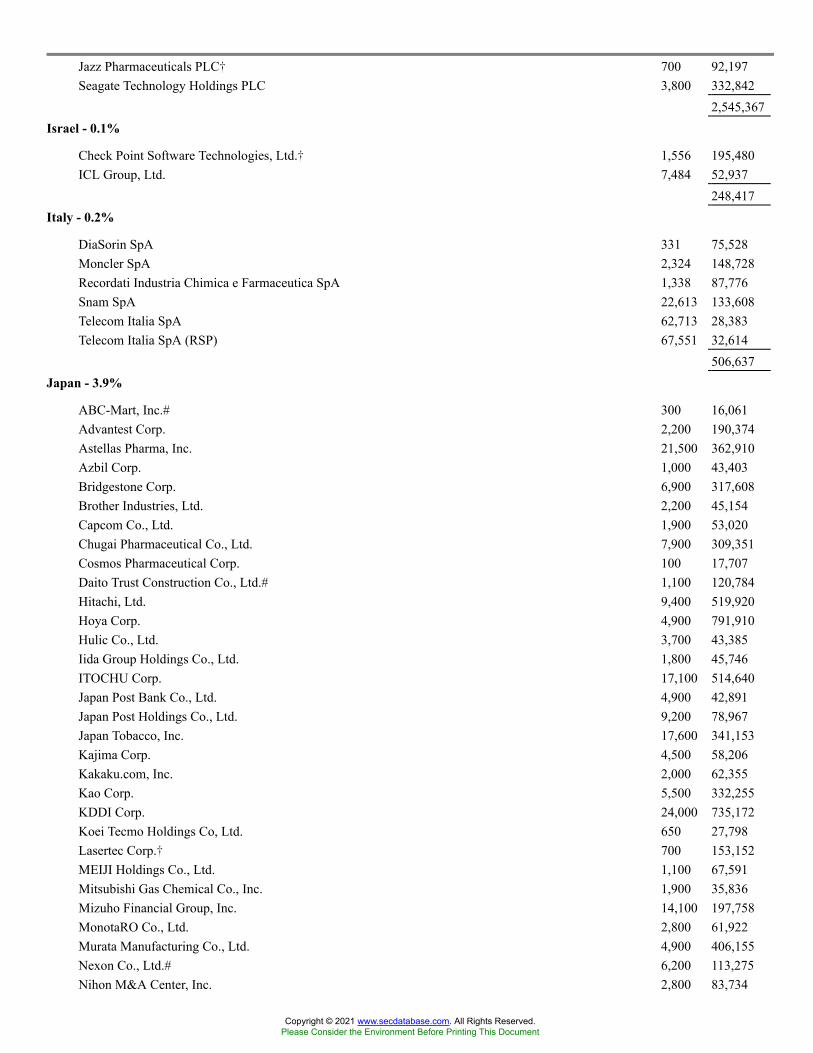
Jazz Pharmaceuticals PLC� 700 92,197Seagate Technology Holdings PLC 3,800 332,842
2,545,367Israel - 0.1%
Check Point Software Technologies, Ltd.� 1,556 195,480ICL Group, Ltd. 7,484 52,937
248,417Italy - 0.2%
DiaSorin SpA 331 75,528Moncler SpA 2,324 148,728Recordati Industria Chimica e Farmaceutica SpA 1,338 87,776Snam SpA 22,613 133,608Telecom Italia SpA 62,713 28,383Telecom Italia SpA (RSP) 67,551 32,614
506,637Japan - 3.9%
ABC-Mart, Inc.# 300 16,061Advantest Corp. 2,200 190,374Astellas Pharma, Inc. 21,500 362,910Azbil Corp. 1,000 43,403Bridgestone Corp. 6,900 317,608Brother Industries, Ltd. 2,200 45,154Capcom Co., Ltd. 1,900 53,020Chugai Pharmaceutical Co., Ltd. 7,900 309,351Cosmos Pharmaceutical Corp. 100 17,707Daito Trust Construction Co., Ltd.# 1,100 120,784Hitachi, Ltd. 9,400 519,920Hoya Corp. 4,900 791,910Hulic Co., Ltd. 3,700 43,385Iida Group Holdings Co., Ltd. 1,800 45,746ITOCHU Corp. 17,100 514,640Japan Post Bank Co., Ltd. 4,900 42,891Japan Post Holdings Co., Ltd. 9,200 78,967Japan Tobacco, Inc. 17,600 341,153Kajima Corp. 4,500 58,206Kakaku.com, Inc. 2,000 62,355Kao Corp. 5,500 332,255KDDI Corp. 24,000 735,172Koei Tecmo Holdings Co, Ltd. 650 27,798Lasertec Corp.� 700 153,152MEIJI Holdings Co., Ltd. 1,100 67,591Mitsubishi Gas Chemical Co., Inc. 1,900 35,836Mizuho Financial Group, Inc. 14,100 197,758MonotaRO Co., Ltd. 2,800 61,922Murata Manufacturing Co., Ltd. 4,900 406,155Nexon Co., Ltd.# 6,200 113,275Nihon M&A Center, Inc. 2,800 83,734
Copyright © 2021 www.secdatabase.com. All Rights Reserved.Please Consider the Environment Before Printing This Document

Nintendo Co., Ltd. 1,400 673,181Nippon Telegraph & Telephone Corp. 19,800 528,408Nitori Holdings Co., Ltd. 800 149,652Nitto Denko Corp. 1,400 106,386Nomura Research Institute, Ltd. 3,200 120,275Obayashi Corp. 8,200 67,529OBIC Co., Ltd. 800 152,343Ono Pharmaceutical Co., Ltd. 3,200 76,906Oracle Corp. Japan 500 41,085Pigeon Corp.# 1,000 28,951Sekisui House, Ltd. 8,200 163,456Seven & I Holdings Co., Ltd.# 4,400 192,574SG Holdings Co., Ltd. 2,700 73,430Shimano, Inc. 700 205,517Shimizu Corp. 5,000 35,904Shionogi & Co., Ltd. 3,500 221,170SoftBank Corp. 38,400 514,315Sumitomo Mitsui Financial Group, Inc. 11,700 404,233Taisei Corp. 1,900 59,496Tokyo Electron, Ltd. 2,000 858,792Tosoh Corp. 3,600 65,380Toyo Suisan Kaisha, Ltd. 800 33,123Tsuruha Holdings, Inc. 400 50,357USS Co., Ltd. 2,300 38,070Welcia Holdings Co., Ltd.# 900 31,782ZOZO, Inc. 1,900 72,449
11,154,957Jersey - 0.2%
Ferguson PLC 2,369 342,150Polymetal International PLC# 4,842 96,394
438,544Malaysia - 0.1%
AMMB Holdings Bhd� 17,000 12,391DiGi.Com Bhd 45,400 48,054Fraser & Neave Holdings Bhd 1,500 10,060Hartalega Holdings Bhd 24,600 43,673Kossan Rubber Industries 19,200 14,318MISC Bhd 8,200 14,203Nestle Malaysia Bhd 1,000 32,403Petronas Gas Bhd 10,700 43,243RHB Bank Bhd 10,200 13,716Sime Darby Bhd 17,400 9,878Supermax Corp. Bhd 21,393 16,983Top Glove Corp. Bhd 88,400 85,061Westports Holdings Bhd 12,300 13,019
357,002Mexico - 0.2%
Copyright © 2021 www.secdatabase.com. All Rights Reserved.Please Consider the Environment Before Printing This Document

Arca Continental SAB de CV 2,400 15,459Fibra Uno Administracion SA de CV 33,100 37,313Grupo Mexico SAB de CV, Class B 31,000 143,732Kimberly-Clark de Mexico SAB de CV, Class A 21,300 37,798Megacable Holdings SAB de CV 3,900 13,597Wal-Mart de Mexico SAB de CV 62,700 222,497
470,396Netherlands - 1.5%
Adyen NV�* 161 519,831ASML Holding NV 2,588 2,152,798Ferrari NV 1,386 300,629Koninklijke Ahold Delhaize NV 13,819 466,171Koninklijke KPN NV 29,291 93,865
Copyright © 2021 www.secdatabase.com. All Rights Reserved.Please Consider the Environment Before Printing This Document
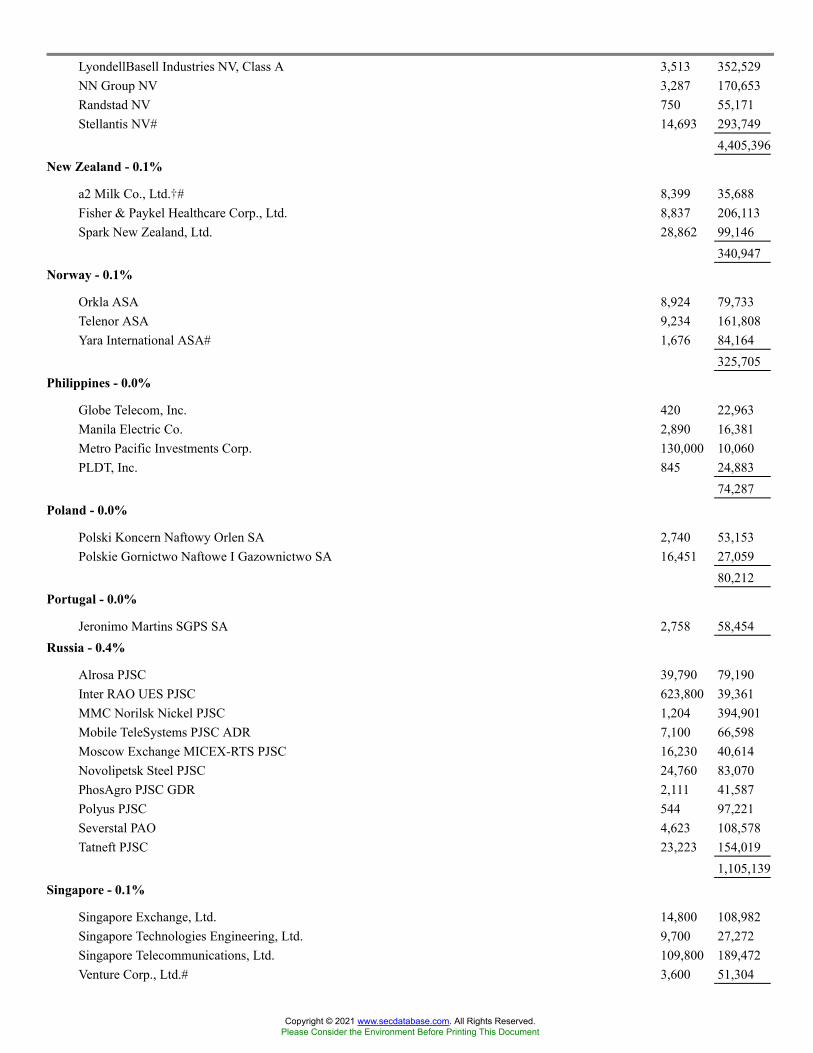
LyondellBasell Industries NV, Class A 3,513 352,529NN Group NV 3,287 170,653Randstad NV 750 55,171Stellantis NV# 14,693 293,749
4,405,396New Zealand - 0.1%
a2 Milk Co., Ltd.�# 8,399 35,688Fisher & Paykel Healthcare Corp., Ltd. 8,837 206,113Spark New Zealand, Ltd. 28,862 99,146
340,947Norway - 0.1%
Orkla ASA 8,924 79,733Telenor ASA 9,234 161,808Yara International ASA# 1,676 84,164
325,705Philippines - 0.0%
Globe Telecom, Inc. 420 22,963Manila Electric Co. 2,890 16,381Metro Pacific Investments Corp. 130,000 10,060PLDT, Inc. 845 24,883
74,287Poland - 0.0%
Polski Koncern Naftowy Orlen SA 2,740 53,153Polskie Gornictwo Naftowe I Gazownictwo SA 16,451 27,059
80,212Portugal - 0.0%
Jeronimo Martins SGPS SA 2,758 58,454Russia - 0.4%
Alrosa PJSC 39,790 79,190Inter RAO UES PJSC 623,800 39,361MMC Norilsk Nickel PJSC 1,204 394,901Mobile TeleSystems PJSC ADR 7,100 66,598Moscow Exchange MICEX-RTS PJSC 16,230 40,614Novolipetsk Steel PJSC 24,760 83,070PhosAgro PJSC GDR 2,111 41,587Polyus PJSC 544 97,221Severstal PAO 4,623 108,578Tatneft PJSC 23,223 154,019
1,105,139Singapore - 0.1%
Singapore Exchange, Ltd. 14,800 108,982Singapore Technologies Engineering, Ltd. 9,700 27,272Singapore Telecommunications, Ltd. 109,800 189,472Venture Corp., Ltd.# 3,600 51,304
Copyright © 2021 www.secdatabase.com. All Rights Reserved.Please Consider the Environment Before Printing This Document
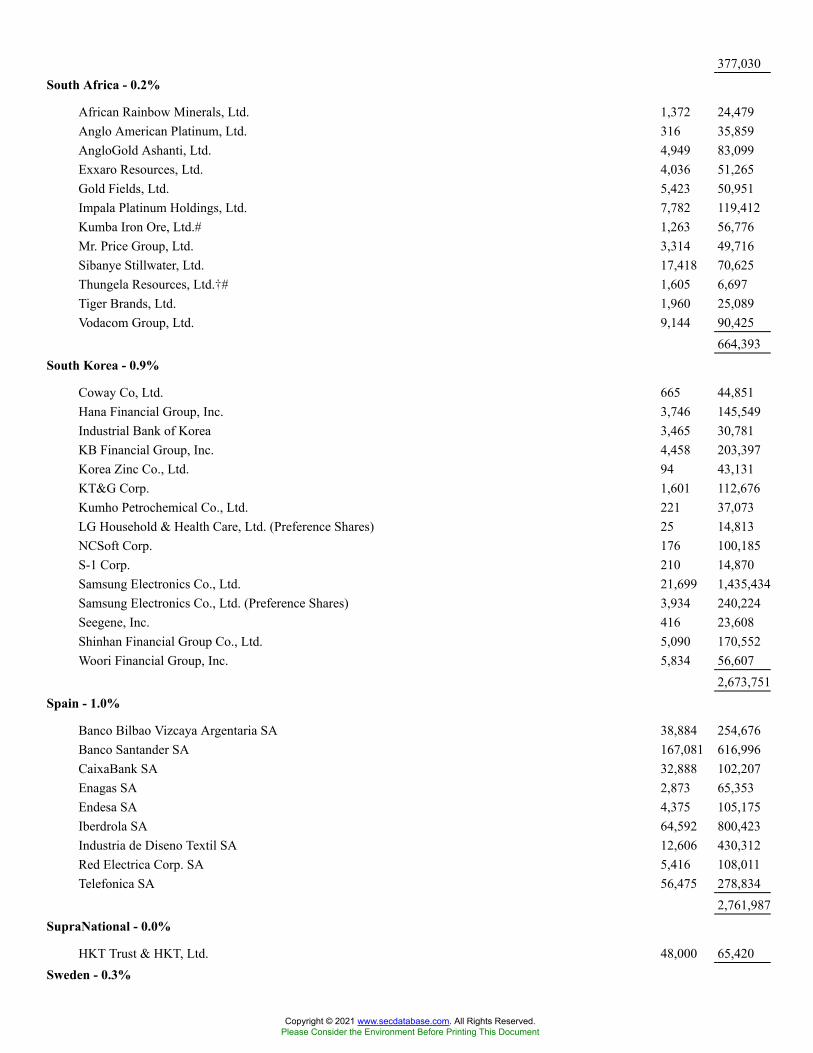
377,030South Africa - 0.2%
African Rainbow Minerals, Ltd. 1,372 24,479Anglo American Platinum, Ltd. 316 35,859AngloGold Ashanti, Ltd. 4,949 83,099Exxaro Resources, Ltd. 4,036 51,265Gold Fields, Ltd. 5,423 50,951Impala Platinum Holdings, Ltd. 7,782 119,412Kumba Iron Ore, Ltd.# 1,263 56,776Mr. Price Group, Ltd. 3,314 49,716Sibanye Stillwater, Ltd. 17,418 70,625Thungela Resources, Ltd.�# 1,605 6,697Tiger Brands, Ltd. 1,960 25,089Vodacom Group, Ltd. 9,144 90,425
664,393South Korea - 0.9%
Coway Co, Ltd. 665 44,851Hana Financial Group, Inc. 3,746 145,549Industrial Bank of Korea 3,465 30,781KB Financial Group, Inc. 4,458 203,397Korea Zinc Co., Ltd. 94 43,131KT&G Corp. 1,601 112,676Kumho Petrochemical Co., Ltd. 221 37,073LG Household & Health Care, Ltd. (Preference Shares) 25 14,813NCSoft Corp. 176 100,185S-1 Corp. 210 14,870Samsung Electronics Co., Ltd. 21,699 1,435,434Samsung Electronics Co., Ltd. (Preference Shares) 3,934 240,224Seegene, Inc. 416 23,608Shinhan Financial Group Co., Ltd. 5,090 170,552Woori Financial Group, Inc. 5,834 56,607
2,673,751Spain - 1.0%
Banco Bilbao Vizcaya Argentaria SA 38,884 254,676Banco Santander SA 167,081 616,996CaixaBank SA 32,888 102,207Enagas SA 2,873 65,353Endesa SA 4,375 105,175Iberdrola SA 64,592 800,423Industria de Diseno Textil SA 12,606 430,312Red Electrica Corp. SA 5,416 108,011Telefonica SA 56,475 278,834
2,761,987SupraNational - 0.0%
HKT Trust & HKT, Ltd. 48,000 65,420Sweden - 0.3%
Copyright © 2021 www.secdatabase.com. All Rights Reserved.Please Consider the Environment Before Printing This Document
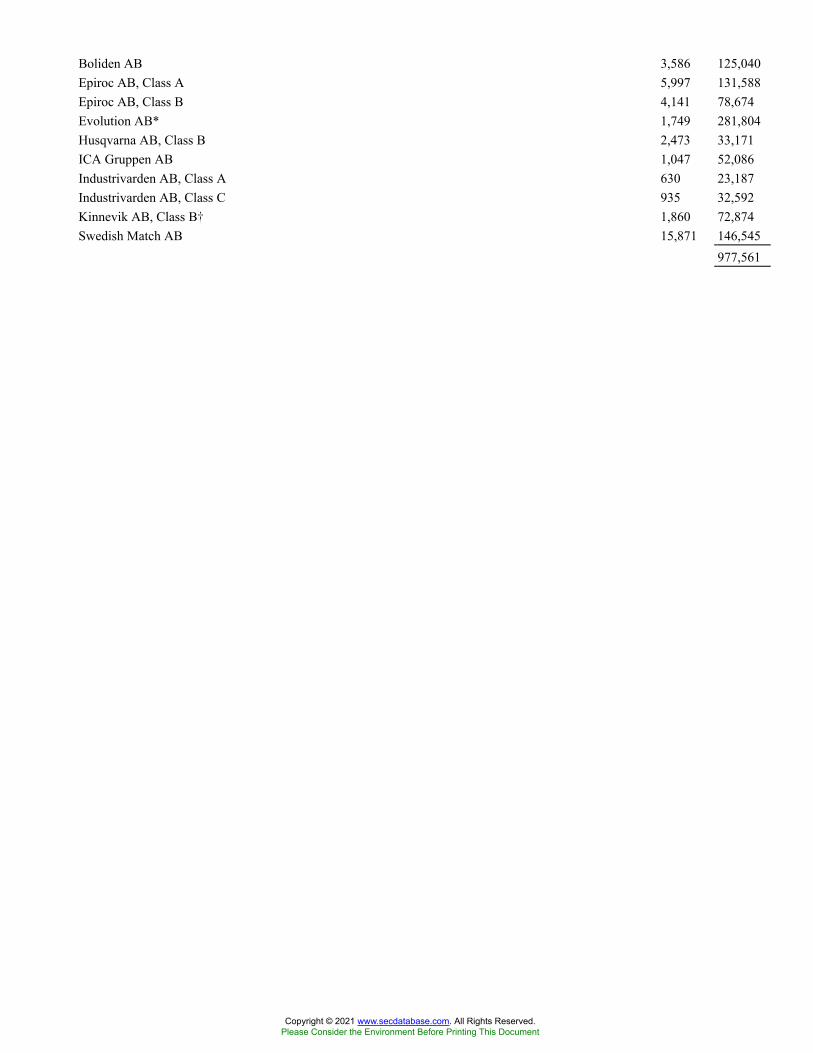
Boliden AB 3,586 125,040Epiroc AB, Class A 5,997 131,588Epiroc AB, Class B 4,141 78,674Evolution AB* 1,749 281,804Husqvarna AB, Class B 2,473 33,171ICA Gruppen AB 1,047 52,086Industrivarden AB, Class A 630 23,187Industrivarden AB, Class C 935 32,592Kinnevik AB, Class B� 1,860 72,874Swedish Match AB 15,871 146,545
977,561
Copyright © 2021 www.secdatabase.com. All Rights Reserved.Please Consider the Environment Before Printing This Document

Switzerland - 3.0%
EMS-Chemie Holding AG 112 121,387Garmin, Ltd. 1,975 344,499Geberit AG 484 404,430Kuehne & Nagel International AG 540 197,602Logitech International SA# 2,214 226,392Nestle SA 14,893 1,882,300Novartis AG 20,550 1,902,740Partners Group Holding AG 329 583,452Roche Holding AG (BR) 108 48,354Roche Holding AG (NES) 5,255 2,110,321SGS SA 54 169,710Swisscom AG 330 193,658TE Connectivity, Ltd. 3,592 539,590
8,724,435Taiwan - 1.4%
Accton Technology Corp. 5,000 50,607Acer, Inc. 18,000 16,367Advantech Co., Ltd. 3,000 41,785Asia Cement Corp. 23,000 37,263Asustek Computer, Inc. 7,000 81,837China Development Financial Holding Corp. 144,000 73,784Chunghwa Telecom Co., Ltd. 45,000 181,861Compal Electronics, Inc. 25,000 20,658Eclat Textile Co., Ltd. 1,000 20,099Far EasTone Telecommunications Co., Ltd. 18,000 40,009Feng TAY Enterprise Co., Ltd. 4,200 32,735Fubon Financial Holding Co., Ltd. 39,000 119,617Globalwafers Co., Ltd. 3,000 94,178Largan Precision Co., Ltd. 1,000 96,704Lite-On Technology Corp. 27,000 59,624Micro-Star International Co., Ltd. 8,000 37,671Nien Made Enterprise Co., Ltd. 2,000 29,877Novatek Microelectronics Corp. 8,000 129,612Pegatron Corp. 17,000 39,750Powertech Technology, Inc. 8,000 32,475Quanta Computer, Inc. 15,000 42,434Ruentex Development Co., Ltd. 8,000 20,005Synnex Technology International Corp. 14,000 27,178Taiwan Cement Corp. 56,050 97,989Taiwan Mobile Co., Ltd. 19,000 69,244Taiwan Semiconductor Manufacturing Co., Ltd. 89,914 1,992,069United Microelectronics Corp. 101,000 229,964Vanguard International Semiconductor Corp. 11,000 58,744Wan Hai Lines, Ltd. 4,000 35,795Wiwynn Corp. 1,000 35,001WPG Holdings, Ltd. 19,000 33,182
3,878,118
Copyright © 2021 www.secdatabase.com. All Rights Reserved.Please Consider the Environment Before Printing This Document
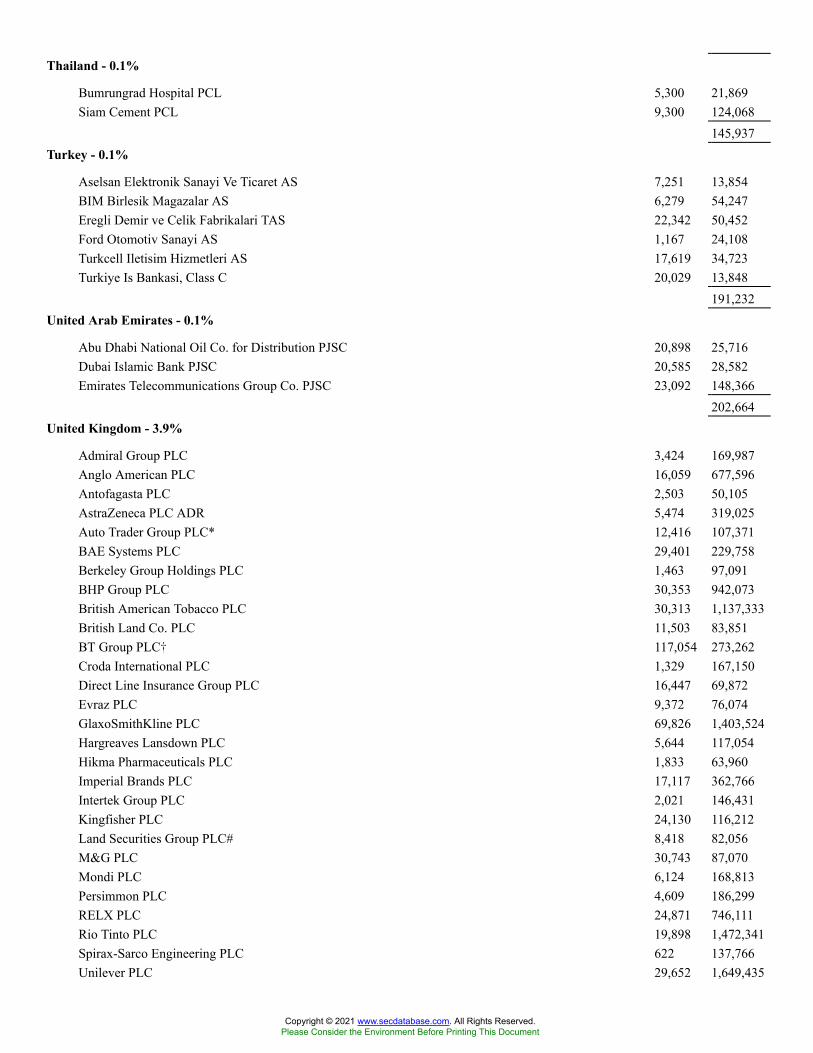
Thailand - 0.1%
Bumrungrad Hospital PCL 5,300 21,869Siam Cement PCL 9,300 124,068
145,937Turkey - 0.1%
Aselsan Elektronik Sanayi Ve Ticaret AS 7,251 13,854BIM Birlesik Magazalar AS 6,279 54,247Eregli Demir ve Celik Fabrikalari TAS 22,342 50,452Ford Otomotiv Sanayi AS 1,167 24,108Turkcell Iletisim Hizmetleri AS 17,619 34,723Turkiye Is Bankasi, Class C 20,029 13,848
191,232United Arab Emirates - 0.1%
Abu Dhabi National Oil Co. for Distribution PJSC 20,898 25,716Dubai Islamic Bank PJSC 20,585 28,582Emirates Telecommunications Group Co. PJSC 23,092 148,366
202,664United Kingdom - 3.9%
Admiral Group PLC 3,424 169,987Anglo American PLC 16,059 677,596Antofagasta PLC 2,503 50,105AstraZeneca PLC ADR 5,474 319,025Auto Trader Group PLC* 12,416 107,371BAE Systems PLC 29,401 229,758Berkeley Group Holdings PLC 1,463 97,091BHP Group PLC 30,353 942,073British American Tobacco PLC 30,313 1,137,333British Land Co. PLC 11,503 83,851BT Group PLC� 117,054 273,262Croda International PLC 1,329 167,150Direct Line Insurance Group PLC 16,447 69,872Evraz PLC 9,372 76,074GlaxoSmithKline PLC 69,826 1,403,524Hargreaves Lansdown PLC 5,644 117,054Hikma Pharmaceuticals PLC 1,833 63,960Imperial Brands PLC 17,117 362,766Intertek Group PLC 2,021 146,431Kingfisher PLC 24,130 116,212Land Securities Group PLC# 8,418 82,056M&G PLC 30,743 87,070Mondi PLC 6,124 168,813Persimmon PLC 4,609 186,299RELX PLC 24,871 746,111Rio Tinto PLC 19,898 1,472,341Spirax-Sarco Engineering PLC 622 137,766Unilever PLC 29,652 1,649,435
Copyright © 2021 www.secdatabase.com. All Rights Reserved.Please Consider the Environment Before Printing This Document

WM Morrison Supermarkets PLC 23,808 94,92411,235,310
United States - 36.0%
3M Co. 6,373 1,241,078A.O. Smith Corp. 1,466 106,608AbbVie, Inc. 15,451 1,866,172ABIOMED, Inc.� 483 175,793Adobe, Inc.� 3,729 2,474,937Air Products & Chemicals, Inc. 2,435 656,257
Copyright © 2021 www.secdatabase.com. All Rights Reserved.Please Consider the Environment Before Printing This Document
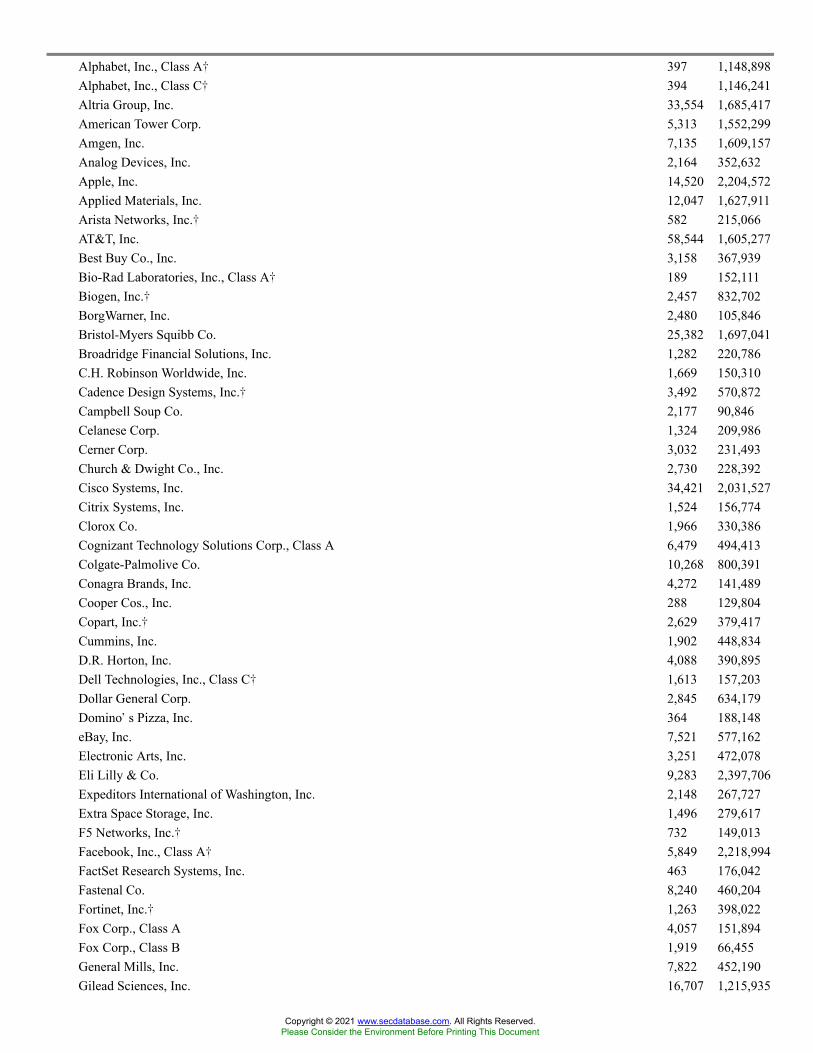
Alphabet, Inc., Class A� 397 1,148,898Alphabet, Inc., Class C� 394 1,146,241Altria Group, Inc. 33,554 1,685,417American Tower Corp. 5,313 1,552,299Amgen, Inc. 7,135 1,609,157Analog Devices, Inc. 2,164 352,632Apple, Inc. 14,520 2,204,572Applied Materials, Inc. 12,047 1,627,911Arista Networks, Inc.� 582 215,066AT&T, Inc. 58,544 1,605,277Best Buy Co., Inc. 3,158 367,939Bio-Rad Laboratories, Inc., Class A� 189 152,111Biogen, Inc.� 2,457 832,702BorgWarner, Inc. 2,480 105,846Bristol-Myers Squibb Co. 25,382 1,697,041Broadridge Financial Solutions, Inc. 1,282 220,786C.H. Robinson Worldwide, Inc. 1,669 150,310Cadence Design Systems, Inc.� 3,492 570,872Campbell Soup Co. 2,177 90,846Celanese Corp. 1,324 209,986Cerner Corp. 3,032 231,493Church & Dwight Co., Inc. 2,730 228,392Cisco Systems, Inc. 34,421 2,031,527Citrix Systems, Inc. 1,524 156,774Clorox Co. 1,966 330,386Cognizant Technology Solutions Corp., Class A 6,479 494,413Colgate-Palmolive Co. 10,268 800,391Conagra Brands, Inc. 4,272 141,489Cooper Cos., Inc. 288 129,804Copart, Inc.� 2,629 379,417Cummins, Inc. 1,902 448,834D.R. Horton, Inc. 4,088 390,895Dell Technologies, Inc., Class C� 1,613 157,203Dollar General Corp. 2,845 634,179Domino�s Pizza, Inc. 364 188,148eBay, Inc. 7,521 577,162Electronic Arts, Inc. 3,251 472,078Eli Lilly & Co. 9,283 2,397,706Expeditors International of Washington, Inc. 2,148 267,727Extra Space Storage, Inc. 1,496 279,617F5 Networks, Inc.� 732 149,013Facebook, Inc., Class A� 5,849 2,218,994FactSet Research Systems, Inc. 463 176,042Fastenal Co. 8,240 460,204Fortinet, Inc.� 1,263 398,022Fox Corp., Class A 4,057 151,894Fox Corp., Class B 1,919 66,455General Mills, Inc. 7,822 452,190Gilead Sciences, Inc. 16,707 1,215,935
Copyright © 2021 www.secdatabase.com. All Rights Reserved.Please Consider the Environment Before Printing This Document
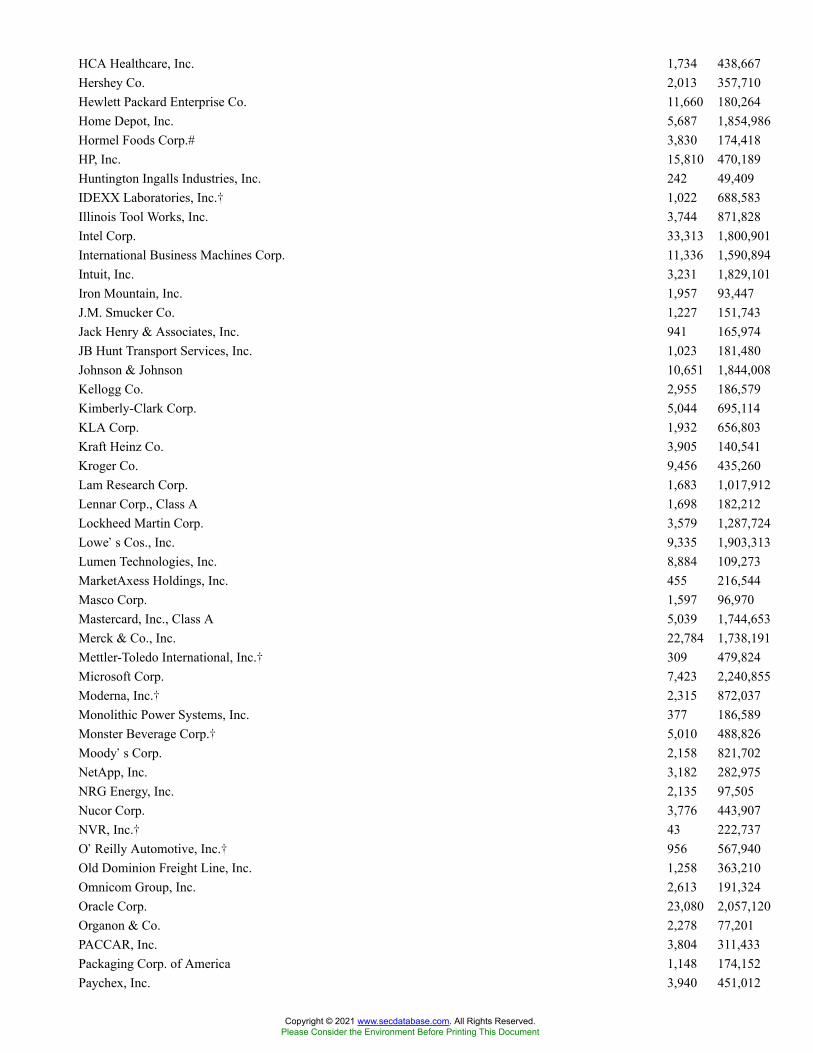
HCA Healthcare, Inc. 1,734 438,667Hershey Co. 2,013 357,710Hewlett Packard Enterprise Co. 11,660 180,264Home Depot, Inc. 5,687 1,854,986Hormel Foods Corp.# 3,830 174,418HP, Inc. 15,810 470,189Huntington Ingalls Industries, Inc. 242 49,409IDEXX Laboratories, Inc.� 1,022 688,583Illinois Tool Works, Inc. 3,744 871,828Intel Corp. 33,313 1,800,901International Business Machines Corp. 11,336 1,590,894Intuit, Inc. 3,231 1,829,101Iron Mountain, Inc. 1,957 93,447J.M. Smucker Co. 1,227 151,743Jack Henry & Associates, Inc. 941 165,974JB Hunt Transport Services, Inc. 1,023 181,480Johnson & Johnson 10,651 1,844,008Kellogg Co. 2,955 186,579Kimberly-Clark Corp. 5,044 695,114KLA Corp. 1,932 656,803Kraft Heinz Co. 3,905 140,541Kroger Co. 9,456 435,260Lam Research Corp. 1,683 1,017,912Lennar Corp., Class A 1,698 182,212Lockheed Martin Corp. 3,579 1,287,724Lowe�s Cos., Inc. 9,335 1,903,313Lumen Technologies, Inc. 8,884 109,273MarketAxess Holdings, Inc. 455 216,544Masco Corp. 1,597 96,970Mastercard, Inc., Class A 5,039 1,744,653Merck & Co., Inc. 22,784 1,738,191Mettler-Toledo International, Inc.� 309 479,824Microsoft Corp. 7,423 2,240,855Moderna, Inc.� 2,315 872,037Monolithic Power Systems, Inc. 377 186,589Monster Beverage Corp.� 5,010 488,826Moody�s Corp. 2,158 821,702NetApp, Inc. 3,182 282,975NRG Energy, Inc. 2,135 97,505Nucor Corp. 3,776 443,907NVR, Inc.� 43 222,737O�Reilly Automotive, Inc.� 956 567,940Old Dominion Freight Line, Inc. 1,258 363,210Omnicom Group, Inc. 2,613 191,324Oracle Corp. 23,080 2,057,120Organon & Co. 2,278 77,201PACCAR, Inc. 3,804 311,433Packaging Corp. of America 1,148 174,152Paychex, Inc. 3,940 451,012
Copyright © 2021 www.secdatabase.com. All Rights Reserved.Please Consider the Environment Before Printing This Document

PepsiCo, Inc. 12,331 1,928,445Pfizer, Inc. 45,259 2,085,082Philip Morris International, Inc. 18,707 1,926,821Pool Corp. 380 187,834PPL Corp. 8,039 235,945Procter & Gamble Co. 13,220 1,882,396Progressive Corp. 6,457 622,067Public Storage 2,575 833,296PulteGroup, Inc. 3,278 176,553QUALCOMM, Inc. 12,343 1,810,595Quest Diagnostics, Inc. 833 127,307Regeneron Pharmaceuticals, Inc.� 1,335 898,989Robert Half International, Inc. 1,626 168,128Rockwell Automation, Inc. 1,322 430,245Rollins, Inc. 2,686 104,539S&P Global, Inc. 3,632 1,611,954Sealed Air Corp. 947 57,795SEI Investments Co. 1,182 74,241
Copyright © 2021 www.secdatabase.com. All Rights Reserved.Please Consider the Environment Before Printing This Document
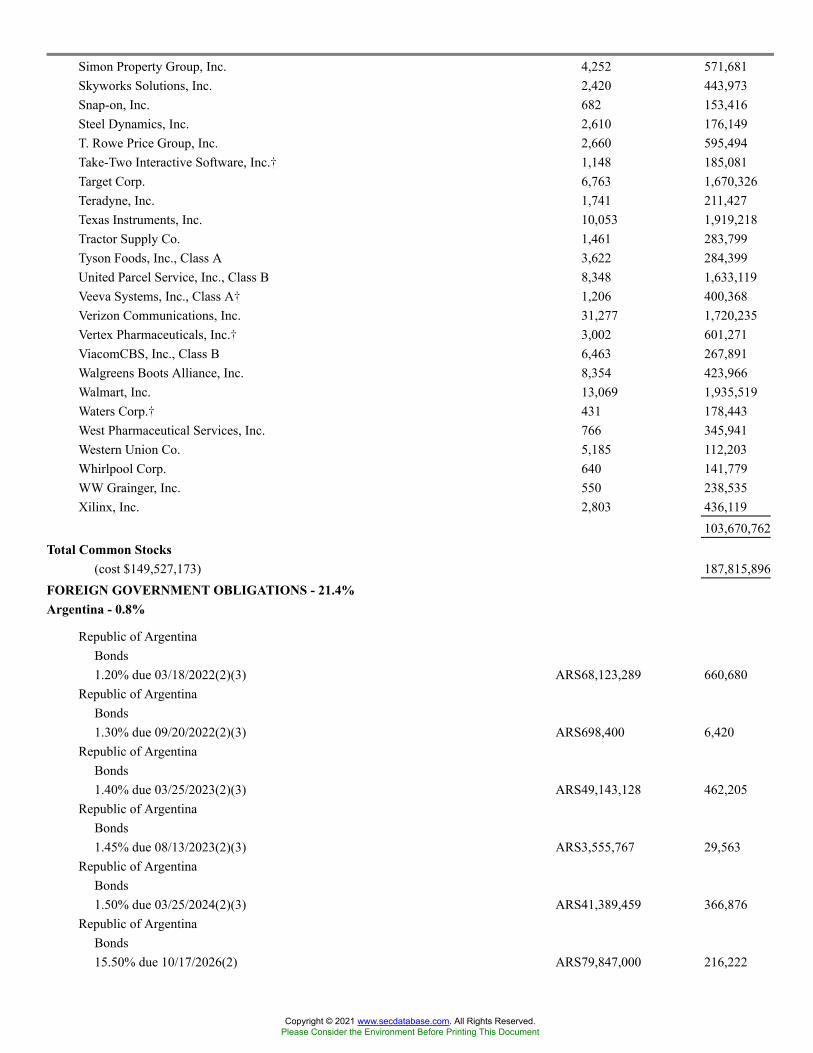
Simon Property Group, Inc. 4,252 571,681Skyworks Solutions, Inc. 2,420 443,973Snap-on, Inc. 682 153,416Steel Dynamics, Inc. 2,610 176,149T. Rowe Price Group, Inc. 2,660 595,494Take-Two Interactive Software, Inc.� 1,148 185,081Target Corp. 6,763 1,670,326Teradyne, Inc. 1,741 211,427Texas Instruments, Inc. 10,053 1,919,218Tractor Supply Co. 1,461 283,799Tyson Foods, Inc., Class A 3,622 284,399United Parcel Service, Inc., Class B 8,348 1,633,119Veeva Systems, Inc., Class A� 1,206 400,368Verizon Communications, Inc. 31,277 1,720,235Vertex Pharmaceuticals, Inc.� 3,002 601,271ViacomCBS, Inc., Class B 6,463 267,891Walgreens Boots Alliance, Inc. 8,354 423,966Walmart, Inc. 13,069 1,935,519Waters Corp.� 431 178,443West Pharmaceutical Services, Inc. 766 345,941Western Union Co. 5,185 112,203Whirlpool Corp. 640 141,779WW Grainger, Inc. 550 238,535Xilinx, Inc. 2,803 436,119
103,670,762Total Common Stocks
(cost $149,527,173) 187,815,896FOREIGN GOVERNMENT OBLIGATIONS - 21.4%Argentina - 0.8%
Republic of ArgentinaBonds1.20% due 03/18/2022(2)(3) ARS68,123,289 660,680
Republic of ArgentinaBonds1.30% due 09/20/2022(2)(3) ARS698,400 6,420
Republic of ArgentinaBonds1.40% due 03/25/2023(2)(3) ARS49,143,128 462,205
Republic of ArgentinaBonds1.45% due 08/13/2023(2)(3) ARS3,555,767 29,563
Republic of ArgentinaBonds1.50% due 03/25/2024(2)(3) ARS41,389,459 366,876
Republic of ArgentinaBonds15.50% due 10/17/2026(2) ARS79,847,000 216,222
Copyright © 2021 www.secdatabase.com. All Rights Reserved.Please Consider the Environment Before Printing This Document

Republic of ArgentinaBonds16.00% due 10/17/2023(2) ARS45,555,800 179,029
Republic of ArgentinaNotes18.20% due 10/03/2021(2) ARS40,723,000 249,392
Copyright © 2021 www.secdatabase.com. All Rights Reserved.Please Consider the Environment Before Printing This Document

Republic of Argentina FRSBonds36.14% (BADLARPP+2.00%) due 04/03/2022(2) ARS2,800,000 16,887
2,187,274Brazil - 2.7%
Brazil Letras do Tesouro NacionalBillszero coupon due 01/01/2025 BRL20,970,000 2,984,451
Federative Republic of BrazilNoteszero coupon due 01/01/2024 BRL2,930,000 460,724
Federative Republic of BrazilNoteszero coupon due 07/01/2024 BRL15,600,000 2,336,433
Federative Republic of BrazilSeries FNotes10.00% due 01/01/2025 BRL1,700,000 338,487
Federative Republic of BrazilSeries FNotes10.00% due 01/01/2027 BRL6,920,000 1,361,487
Federative Republic of BrazilNotes10.00% due 01/01/2029 BRL730,000 142,411
Federative Republic of BrazilNotes10.00% due 01/01/2031 BRL1,160,000 222,603
7,846,596Colombia - 1.3%
Republic of ColombiaSenior Notes4.38% due 03/21/2023 COP64,000,000 17,022
Republic of ColombiaBonds5.75% due 11/03/2027 COP724,000,000 185,824
Republic of ColombiaBonds6.00% due 04/28/2028 COP 2,472,300,000 634,634
Republic of ColombiaBonds6.25% due 11/26/2025 COP1,052,000,000 285,281
Republic of ColombiaBonds7.50% due 08/26/2026 COP6,465,700,000 1,821,771
Republic of ColombiaBonds7.75% due 09/18/2030 COP204,000,000 56,969
Copyright © 2021 www.secdatabase.com. All Rights Reserved.Please Consider the Environment Before Printing This Document

Republic of ColombiaBonds10.00% due 07/24/2024 COP1,920,000,000 578,605
3,580,106
Copyright © 2021 www.secdatabase.com. All Rights Reserved.Please Consider the Environment Before Printing This Document
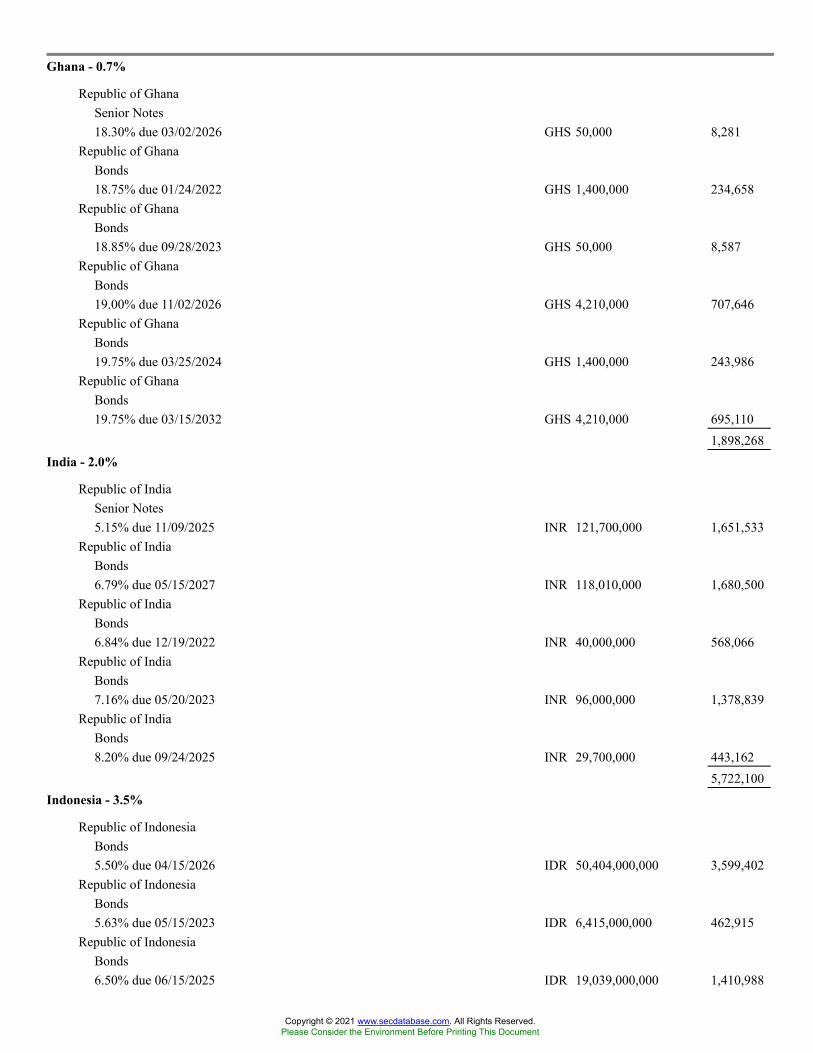
Ghana - 0.7%
Republic of GhanaSenior Notes18.30% due 03/02/2026 GHS 50,000 8,281
Republic of GhanaBonds18.75% due 01/24/2022 GHS 1,400,000 234,658
Republic of GhanaBonds18.85% due 09/28/2023 GHS 50,000 8,587
Republic of GhanaBonds19.00% due 11/02/2026 GHS 4,210,000 707,646
Republic of GhanaBonds19.75% due 03/25/2024 GHS 1,400,000 243,986
Republic of GhanaBonds19.75% due 03/15/2032 GHS 4,210,000 695,110
1,898,268India - 2.0%
Republic of IndiaSenior Notes5.15% due 11/09/2025 INR 121,700,000 1,651,533
Republic of IndiaBonds6.79% due 05/15/2027 INR 118,010,000 1,680,500
Republic of IndiaBonds6.84% due 12/19/2022 INR 40,000,000 568,066
Republic of IndiaBonds7.16% due 05/20/2023 INR 96,000,000 1,378,839
Republic of IndiaBonds8.20% due 09/24/2025 INR 29,700,000 443,162
5,722,100Indonesia - 3.5%
Republic of IndonesiaBonds5.50% due 04/15/2026 IDR 50,404,000,000 3,599,402
Republic of IndonesiaBonds5.63% due 05/15/2023 IDR 6,415,000,000 462,915
Republic of IndonesiaBonds6.50% due 06/15/2025 IDR 19,039,000,000 1,410,988
Copyright © 2021 www.secdatabase.com. All Rights Reserved.Please Consider the Environment Before Printing This Document
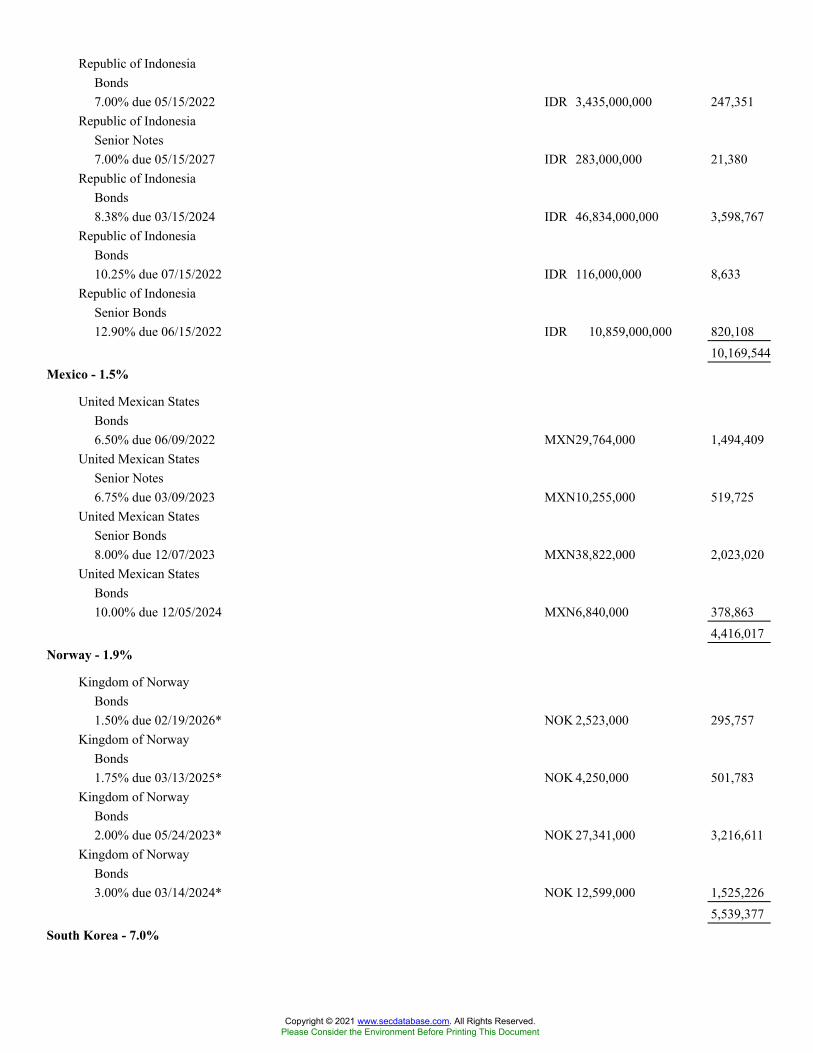
Republic of IndonesiaBonds7.00% due 05/15/2022 IDR 3,435,000,000 247,351
Republic of IndonesiaSenior Notes7.00% due 05/15/2027 IDR 283,000,000 21,380
Republic of IndonesiaBonds8.38% due 03/15/2024 IDR 46,834,000,000 3,598,767
Republic of IndonesiaBonds10.25% due 07/15/2022 IDR 116,000,000 8,633
Republic of IndonesiaSenior Bonds12.90% due 06/15/2022 IDR 10,859,000,000 820,108
10,169,544Mexico - 1.5%
United Mexican StatesBonds6.50% due 06/09/2022 MXN29,764,000 1,494,409
United Mexican StatesSenior Notes6.75% due 03/09/2023 MXN10,255,000 519,725
United Mexican StatesSenior Bonds8.00% due 12/07/2023 MXN38,822,000 2,023,020
United Mexican StatesBonds10.00% due 12/05/2024 MXN6,840,000 378,863
4,416,017Norway - 1.9%
Kingdom of NorwayBonds1.50% due 02/19/2026* NOK 2,523,000 295,757
Kingdom of NorwayBonds1.75% due 03/13/2025* NOK 4,250,000 501,783
Kingdom of NorwayBonds2.00% due 05/24/2023* NOK 27,341,000 3,216,611
Kingdom of NorwayBonds3.00% due 03/14/2024* NOK 12,599,000 1,525,226
5,539,377South Korea - 7.0%
Copyright © 2021 www.secdatabase.com. All Rights Reserved.Please Consider the Environment Before Printing This Document
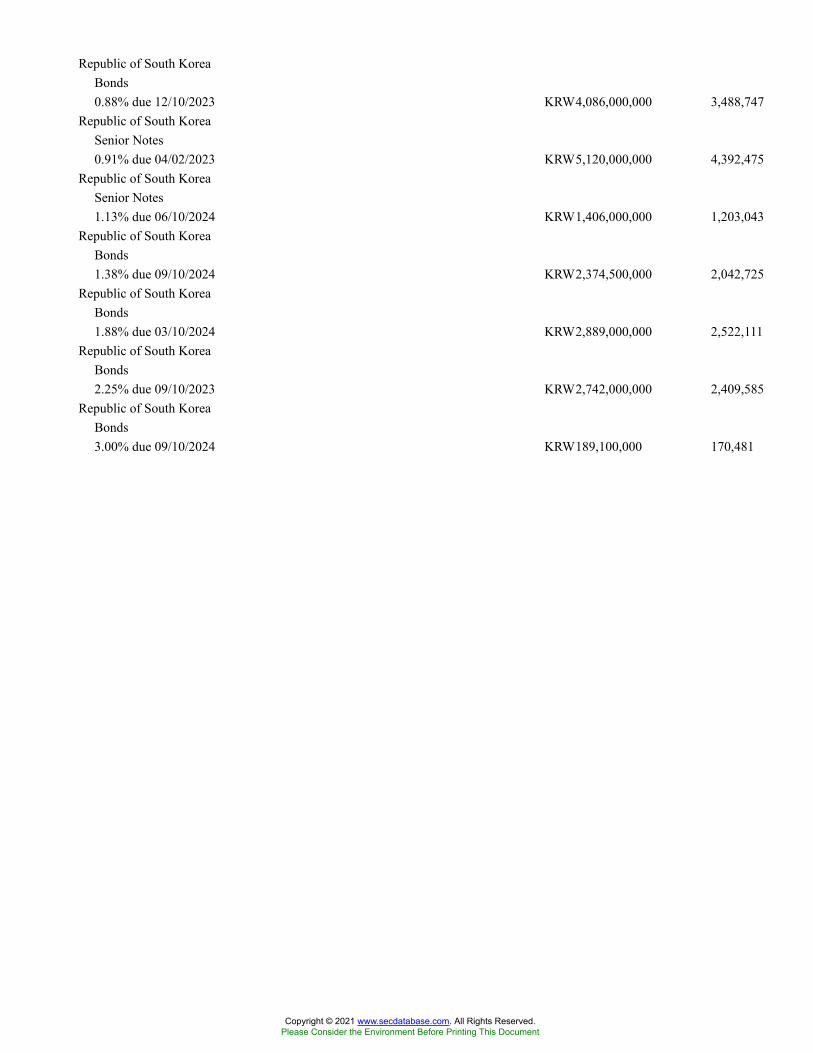
Republic of South KoreaBonds0.88% due 12/10/2023 KRW4,086,000,000 3,488,747
Republic of South KoreaSenior Notes0.91% due 04/02/2023 KRW5,120,000,000 4,392,475
Republic of South KoreaSenior Notes1.13% due 06/10/2024 KRW1,406,000,000 1,203,043
Republic of South KoreaBonds1.38% due 09/10/2024 KRW2,374,500,000 2,042,725
Republic of South KoreaBonds1.88% due 03/10/2024 KRW2,889,000,000 2,522,111
Republic of South KoreaBonds2.25% due 09/10/2023 KRW2,742,000,000 2,409,585
Republic of South KoreaBonds3.00% due 09/10/2024 KRW189,100,000 170,481
Copyright © 2021 www.secdatabase.com. All Rights Reserved.Please Consider the Environment Before Printing This Document

Republic of South KoreaBonds3.38% due 09/10/2023 KRW 4,345,000,000 3,902,054
20,131,221Total Foreign Government Obligations
(cost $72,727,699) 61,490,503U.S. GOVERNMENT TREASURIES - 0.6%
United States Treasury Notes1.63% due 10/31/2026 1,210,000 1,260,4792.13% due 05/31/2026 550,000 585,471
Total U.S. Government Treasuries(cost $1,822,492) 1,845,950
Total Long-Term Investment Securities(cost $224,077,364) 251,152,349
SHORT-TERM INVESTMENT SECURITIES - 11.1%Foreign Government Obligations - 5.3%
Republic of Argentina(2)(3)(7)due 09/13/2021 ARS 4,567,804 36,944due 02/28/2022 ARS 8,002,290 56,044due 04/18/2022 ARS 24,107,100 161,546due 06/30/2022 ARS 3,063,951 18,657
273,191Government of Japan
(0.10)-(0.11)% due 09/13/2021 JPY 165,900,000 1,508,027(0.11)% due 10/25/2021 JPY 57,100,000 519,108(0.11)% due 12/10/2021 JPY 5,200,000 47,282(0.13)% due 12/20/2021 JPY 175,150,000 1,592,645(0.13)-(0.15)% due 02/10/2022 JPY 704,000,000 6,402,814
10,069,876Republic of Singapore
0.29% due 11/19/2021 SGD 4,410,000 3,278,3780.30% due 10/15/2021 SGD 2,040,000 1,516,8920.32% due 11/12/2021 SGD 290,000 215,595
5,010,86515,353,932
Registered Investment Companies - 0.2%
State Street Navigator SecuritiesLending Government Money Market Portfolio0.03%(5)(6) 502,680 502,680
U.S. Government Agencies - 1.9%
Federal Home Loan BankDisc. Notes0.01% due 09/01/2021 5,590,000 5,590,000
U.S. Government Treasuries - 3.7%
United States Treasury Bills
Copyright © 2021 www.secdatabase.com. All Rights Reserved.Please Consider the Environment Before Printing This Document
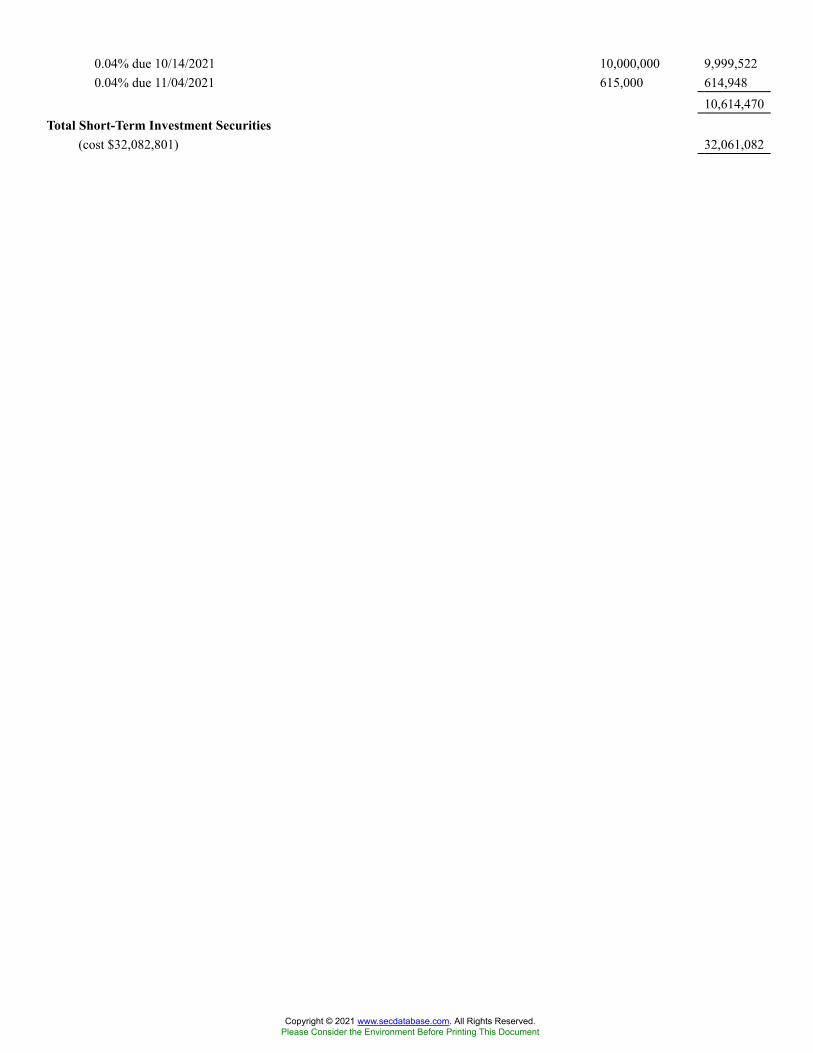
0.04% due 10/14/2021 10,000,000 9,999,5220.04% due 11/04/2021 615,000 614,948
10,614,470Total Short-Term Investment Securities
(cost $32,082,801) 32,061,082
Copyright © 2021 www.secdatabase.com. All Rights Reserved.Please Consider the Environment Before Printing This Document
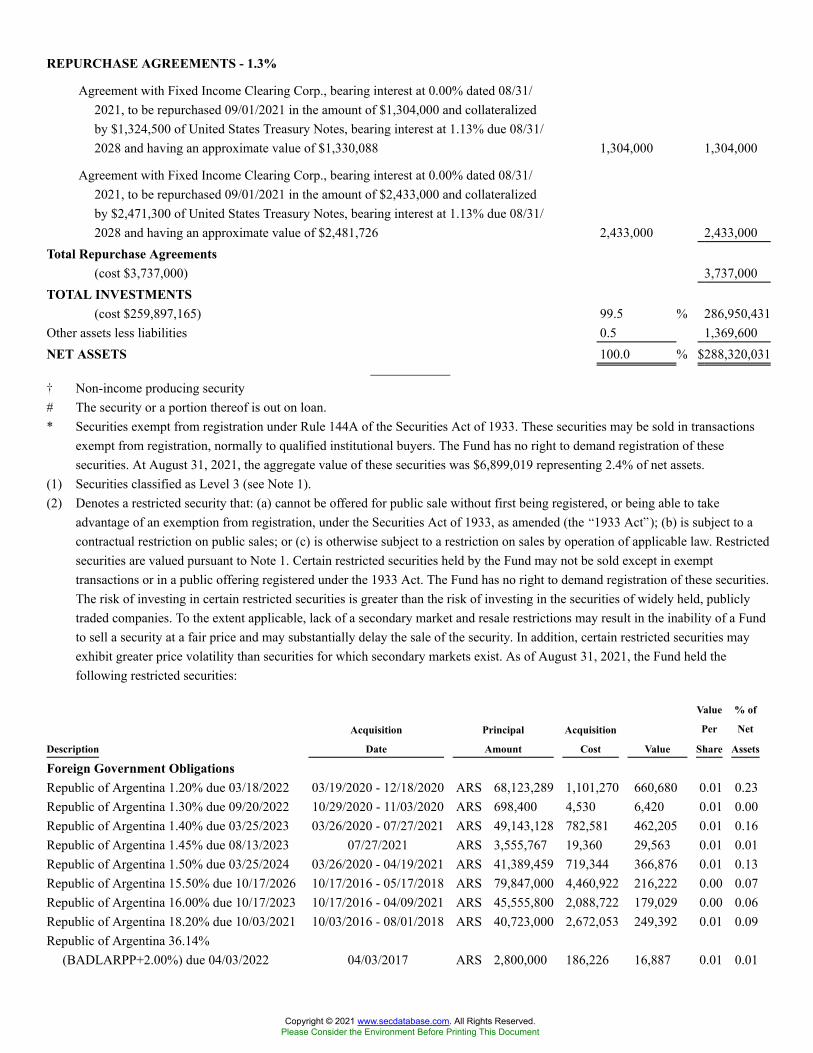
REPURCHASE AGREEMENTS - 1.3%
Agreement with Fixed Income Clearing Corp., bearing interest at 0.00% dated 08/31/2021, to be repurchased 09/01/2021 in the amount of $1,304,000 and collateralizedby $1,324,500 of United States Treasury Notes, bearing interest at 1.13% due 08/31/2028 and having an approximate value of $1,330,088 1,304,000 1,304,000
Agreement with Fixed Income Clearing Corp., bearing interest at 0.00% dated 08/31/2021, to be repurchased 09/01/2021 in the amount of $2,433,000 and collateralizedby $2,471,300 of United States Treasury Notes, bearing interest at 1.13% due 08/31/2028 and having an approximate value of $2,481,726 2,433,000 2,433,000
Total Repurchase Agreements(cost $3,737,000) 3,737,000
TOTAL INVESTMENTS(cost $259,897,165) 99.5 % 286,950,431
Other assets less liabilities 0.5 1,369,600NET ASSETS 100.0 % $288,320,031
� Non-income producing security# The security or a portion thereof is out on loan.* Securities exempt from registration under Rule 144A of the Securities Act of 1933. These securities may be sold in transactions
exempt from registration, normally to qualified institutional buyers. The Fund has no right to demand registration of thesesecurities. At August 31, 2021, the aggregate value of these securities was $6,899,019 representing 2.4% of net assets.
(1) Securities classified as Level 3 (see Note 1).(2) Denotes a restricted security that: (a) cannot be offered for public sale without first being registered, or being able to take
advantage of an exemption from registration, under the Securities Act of 1933, as amended (the �1933 Act�); (b) is subject to acontractual restriction on public sales; or (c) is otherwise subject to a restriction on sales by operation of applicable law. Restrictedsecurities are valued pursuant to Note 1. Certain restricted securities held by the Fund may not be sold except in exempttransactions or in a public offering registered under the 1933 Act. The Fund has no right to demand registration of these securities.The risk of investing in certain restricted securities is greater than the risk of investing in the securities of widely held, publiclytraded companies. To the extent applicable, lack of a secondary market and resale restrictions may result in the inability of a Fundto sell a security at a fair price and may substantially delay the sale of the security. In addition, certain restricted securities mayexhibit greater price volatility than securities for which secondary markets exist. As of August 31, 2021, the Fund held thefollowing restricted securities:
Acquisition Principal Acquisition
Value
Per
% of
Net
Description Date Amount Cost Value Share Assets
Foreign Government ObligationsRepublic of Argentina 1.20% due 03/18/2022 03/19/2020 - 12/18/2020 ARS 68,123,289 1,101,270 660,680 0.01 0.23Republic of Argentina 1.30% due 09/20/2022 10/29/2020 - 11/03/2020 ARS 698,400 4,530 6,420 0.01 0.00Republic of Argentina 1.40% due 03/25/2023 03/26/2020 - 07/27/2021 ARS 49,143,128 782,581 462,205 0.01 0.16Republic of Argentina 1.45% due 08/13/2023 07/27/2021 ARS 3,555,767 19,360 29,563 0.01 0.01Republic of Argentina 1.50% due 03/25/2024 03/26/2020 - 04/19/2021 ARS 41,389,459 719,344 366,876 0.01 0.13Republic of Argentina 15.50% due 10/17/2026 10/17/2016 - 05/17/2018 ARS 79,847,000 4,460,922 216,222 0.00 0.07Republic of Argentina 16.00% due 10/17/2023 10/17/2016 - 04/09/2021 ARS 45,555,800 2,088,722 179,029 0.00 0.06Republic of Argentina 18.20% due 10/03/2021 10/03/2016 - 08/01/2018 ARS 40,723,000 2,672,053 249,392 0.01 0.09Republic of Argentina 36.14%
(BADLARPP+2.00%) due 04/03/2022 04/03/2017 ARS 2,800,000 186,226 16,887 0.01 0.01
Copyright © 2021 www.secdatabase.com. All Rights Reserved.Please Consider the Environment Before Printing This Document
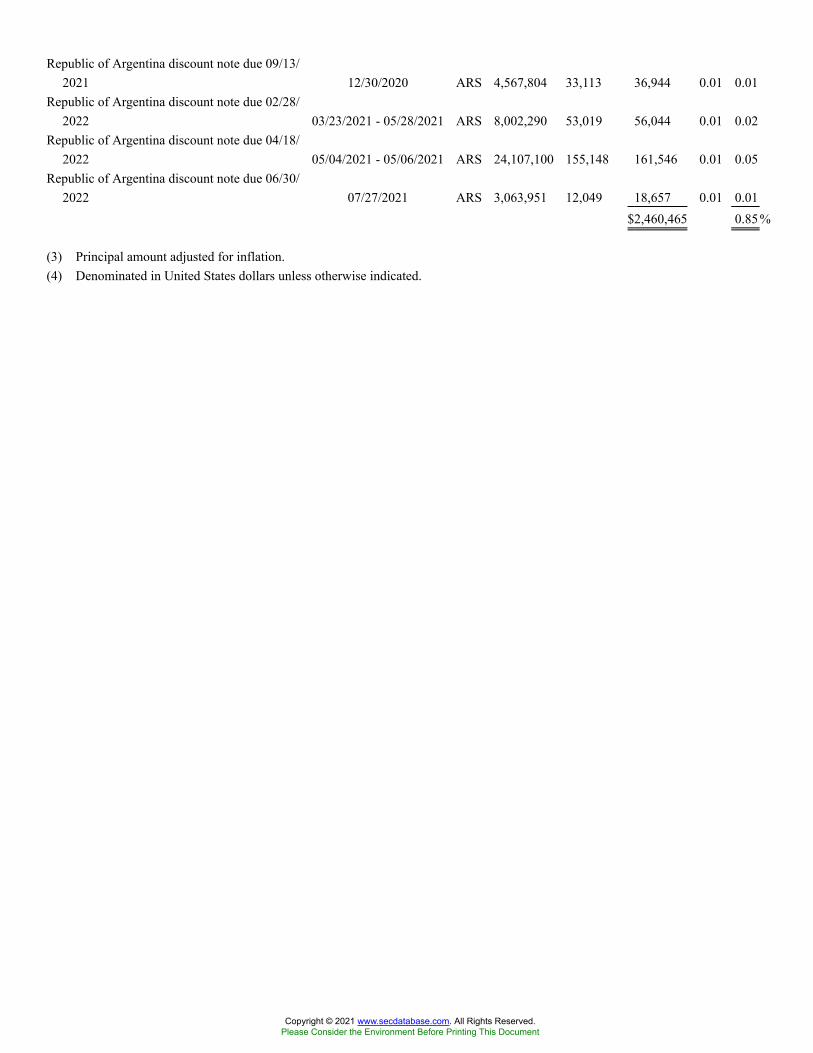
Republic of Argentina discount note due 09/13/2021 12/30/2020 ARS 4,567,804 33,113 36,944 0.01 0.01
Republic of Argentina discount note due 02/28/2022 03/23/2021 - 05/28/2021 ARS 8,002,290 53,019 56,044 0.01 0.02
Republic of Argentina discount note due 04/18/2022 05/04/2021 - 05/06/2021 ARS 24,107,100 155,148 161,546 0.01 0.05
Republic of Argentina discount note due 06/30/2022 07/27/2021 ARS 3,063,951 12,049 18,657 0.01 0.01
$2,460,465 0.85%
(3) Principal amount adjusted for inflation.(4) Denominated in United States dollars unless otherwise indicated.
Copyright © 2021 www.secdatabase.com. All Rights Reserved.Please Consider the Environment Before Printing This Document
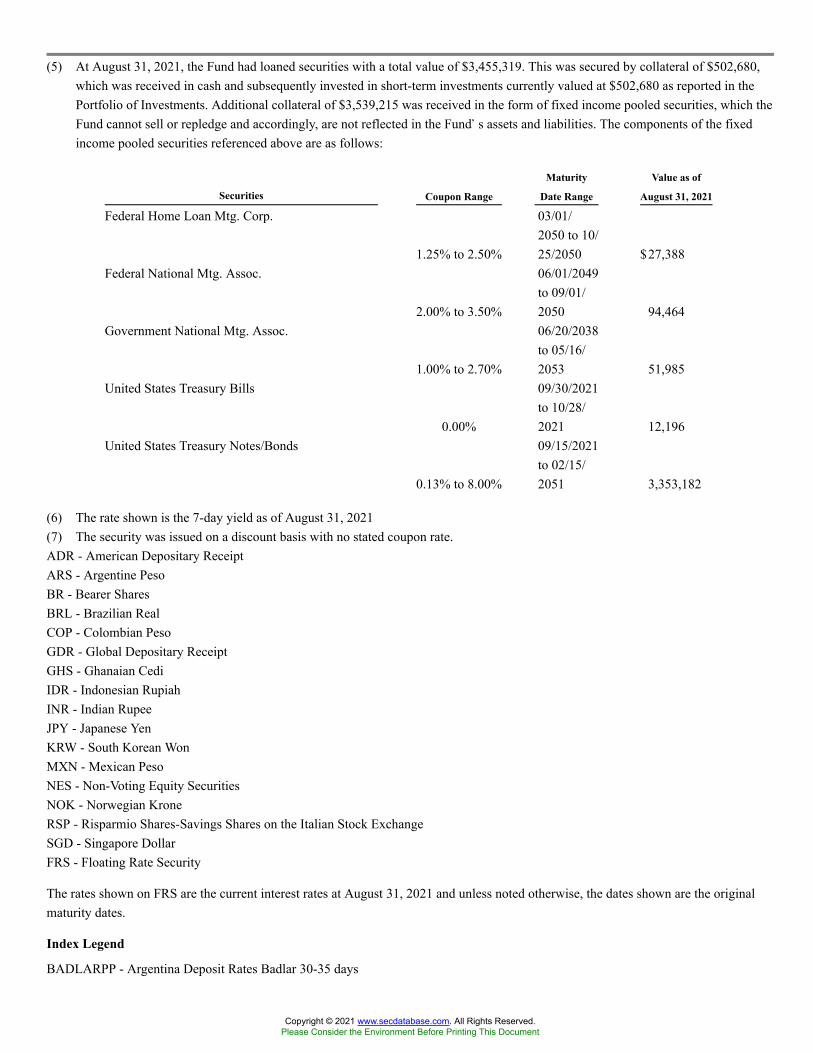
(5) At August 31, 2021, the Fund had loaned securities with a total value of $3,455,319. This was secured by collateral of $502,680,which was received in cash and subsequently invested in short-term investments currently valued at $502,680 as reported in thePortfolio of Investments. Additional collateral of $3,539,215 was received in the form of fixed income pooled securities, which theFund cannot sell or repledge and accordingly, are not reflected in the Fund�s assets and liabilities. The components of the fixedincome pooled securities referenced above are as follows:
Securities Coupon Range
Maturity
Date Range
Value as of
August 31, 2021
Federal Home Loan Mtg. Corp.
1.25% to 2.50%
03/01/2050 to 10/25/2050 $27,388
Federal National Mtg. Assoc.
2.00% to 3.50%
06/01/2049to 09/01/2050 94,464
Government National Mtg. Assoc.
1.00% to 2.70%
06/20/2038to 05/16/2053 51,985
United States Treasury Bills
0.00%
09/30/2021to 10/28/2021 12,196
United States Treasury Notes/Bonds
0.13% to 8.00%
09/15/2021to 02/15/2051 3,353,182
(6) The rate shown is the 7-day yield as of August 31, 2021(7) The security was issued on a discount basis with no stated coupon rate.ADR - American Depositary ReceiptARS - Argentine PesoBR - Bearer SharesBRL - Brazilian RealCOP - Colombian PesoGDR - Global Depositary ReceiptGHS - Ghanaian CediIDR - Indonesian RupiahINR - Indian RupeeJPY - Japanese YenKRW - South Korean WonMXN - Mexican PesoNES - Non-Voting Equity SecuritiesNOK - Norwegian KroneRSP - Risparmio Shares-Savings Shares on the Italian Stock ExchangeSGD - Singapore DollarFRS - Floating Rate Security
The rates shown on FRS are the current interest rates at August 31, 2021 and unless noted otherwise, the dates shown are the originalmaturity dates.
Index Legend
BADLARPP - Argentina Deposit Rates Badlar 30-35 days
Copyright © 2021 www.secdatabase.com. All Rights Reserved.Please Consider the Environment Before Printing This Document

Forward Foreign Currency Contracts
Counterparty
Contract to
Deliver In Exchange For
Delivery
Date
Unrealized
Appreciation
Unrealized
(Depreciation)
Bank of America, N.A.EUR 454,552 USD 546,385
10/18/2021 $9,189 $�
EUR 154,519 CAD 230,00010/19/2021 � (329 )
EUR 36,820 USD 43,64210/29/2021 119 �
EUR 431,144 USD 507,40702/25/2022 � (3,617 )
USD 1,345,280 CNH 8,641,07009/10/2021 � (7,207 )
USD 1,610,471 CNH 10,360,16009/13/2021 � (6,641 )
USD 304,875 NZD 430,00009/21/2021 � (1,876 )
9,308 (19,670 )Citibank N.A.
AUD 3,160,000 USD 2,345,09010/20/2021 32,781 �
EUR 910,000 USD 1,076,56010/18/2021 1,109 �
EUR 590,000 USD 708,14210/21/2021 10,832 �
EUR 590,000 USD 713,09810/22/2021 15,774 �
EUR 544,800 USD 658,35810/26/2021 14,408 �
EUR 89,576 USD 105,99101/12/2022 � (68 )
MXN 7,890,500 USD 393,62010/01/2021 2,251 �
MXN 7,890,500 USD 391,93811/01/2021 2,203 �
MXN 63,810,000 USD 3,156,56711/16/2021 11,071 �
USD 96,502 INR 7,256,50009/08/2021 2,842 �
USD 118,019 INR 8,747,00009/09/2021 1,721 �
USD 2,079,320 CNH 13,357,30009/10/2021 � (10,937 )
USD 2,348,518 JPY 258,580,00010/20/2021 2,821 �
USD 71,266 INR 5,428,30011/10/2021 2,585 �
USD 354,325 NZD 500,00012/21/2021 � (2,280 )
Copyright © 2021 www.secdatabase.com. All Rights Reserved.Please Consider the Environment Before Printing This Document

USD 753,921 CNH 4,948,74001/12/2022 5,047 �
105,445 (13,285 )Deutsche Bank AG
EUR 304,360 NOK 3,276,80009/15/2021 17,441 �
EUR 271,305 SEK 2,792,00009/15/2021 3,151 �
EUR 210,571 SEK 2,140,07509/16/2021 � (677 )
EUR 60,000 USD 71,23510/04/2021 345 �
EUR 490,506 SEK 5,000,11710/13/2021 � (36 )
EUR 528,245 SEK 5,360,10010/18/2021 � (2,943 )
EUR 1,007,967 NOK 10,160,00010/19/2021 � (22,722 )
EUR 1,104,432 SEK 11,210,10010/19/2021 � (5,772 )
EUR 2,400,000 USD 2,837,46710/19/2021 1,059 �
EUR 362,080 SEK 3,686,88311/17/2021 � (685 )
EUR 1,417,461 SEK 14,293,53412/13/2021 � (19,433 )
EUR 913,645 SEK 9,244,07512/16/2021 � (8,975 )
EUR 356,606 USD 421,65101/27/2022 � (729 )
EUR 277,096 USD 326,40202/28/2022 � (2,057 )
EUR 275,795 SEK 2,788,70006/15/2022 � (3,700 )
EUR 1,557,779 NOK 15,973,00006/20/2022 � (19,541 )
21,996 (87,270 )Goldman Sachs International
CLP 179,572,759 USD 229,13509/01/2021 � (2,918 )
CLP 240,271,972 USD 308,83309/15/2021 � (1,503 )
USD 246,668 CLP 179,572,75909/01/2021 � (14,616 )
USD 331,096 CLP 240,271,97209/15/2021 � (20,761 )
USD 47,533 CLP 34,870,00009/29/2021 � (2,519 )
USD 90,593 CLP 69,832,32310/04/2021 � (462 )
Copyright © 2021 www.secdatabase.com. All Rights Reserved.Please Consider the Environment Before Printing This Document
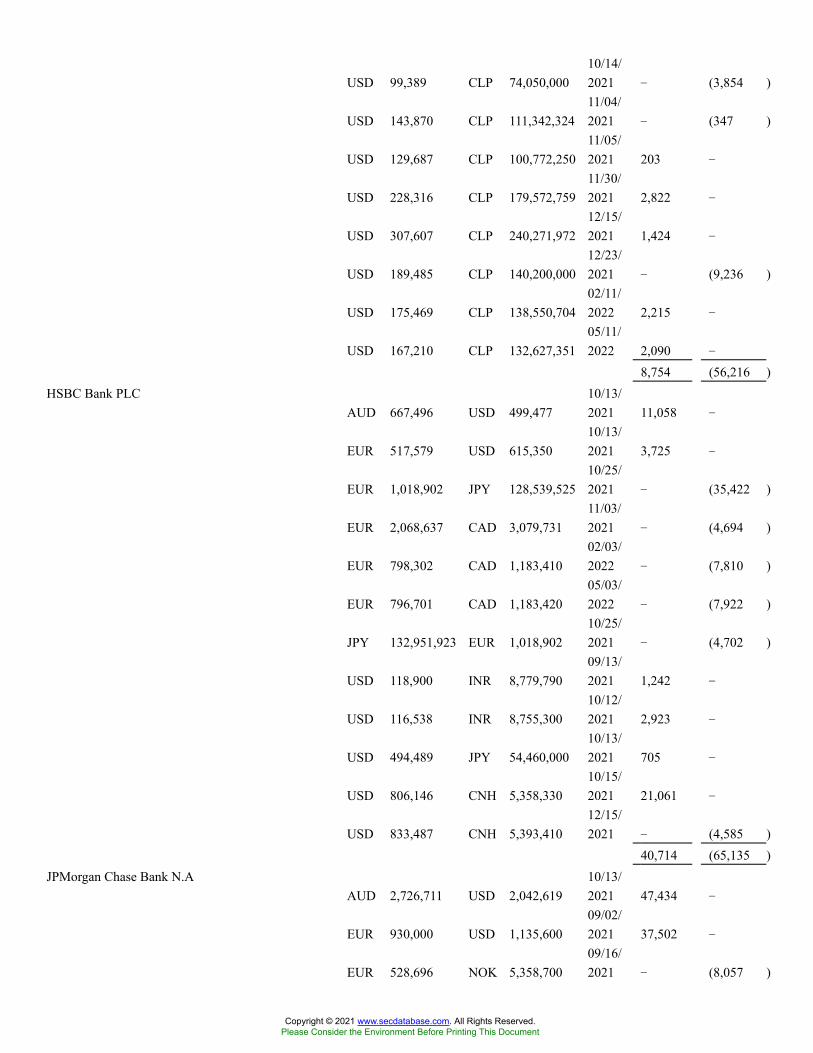
USD 99,389 CLP 74,050,00010/14/2021 � (3,854 )
USD 143,870 CLP 111,342,32411/04/2021 � (347 )
USD 129,687 CLP 100,772,25011/05/2021 203 �
USD 228,316 CLP 179,572,75911/30/2021 2,822 �
USD 307,607 CLP 240,271,97212/15/2021 1,424 �
USD 189,485 CLP 140,200,00012/23/2021 � (9,236 )
USD 175,469 CLP 138,550,70402/11/2022 2,215 �
USD 167,210 CLP 132,627,35105/11/2022 2,090 �
8,754 (56,216 )HSBC Bank PLC
AUD 667,496 USD 499,47710/13/2021 11,058 �
EUR 517,579 USD 615,35010/13/2021 3,725 �
EUR 1,018,902 JPY 128,539,52510/25/2021 � (35,422 )
EUR 2,068,637 CAD 3,079,73111/03/2021 � (4,694 )
EUR 798,302 CAD 1,183,41002/03/2022 � (7,810 )
EUR 796,701 CAD 1,183,42005/03/2022 � (7,922 )
JPY 132,951,923 EUR 1,018,90210/25/2021 � (4,702 )
USD 118,900 INR 8,779,79009/13/2021 1,242 �
USD 116,538 INR 8,755,30010/12/2021 2,923 �
USD 494,489 JPY 54,460,00010/13/2021 705 �
USD 806,146 CNH 5,358,33010/15/2021 21,061 �
USD 833,487 CNH 5,393,41012/15/2021 � (4,585 )
40,714 (65,135 )JPMorgan Chase Bank N.A
AUD 2,726,711 USD 2,042,61910/13/2021 47,434 �
EUR 930,000 USD 1,135,60009/02/2021 37,502 �
EUR 528,696 NOK 5,358,70009/16/2021 � (8,057 )
Copyright © 2021 www.secdatabase.com. All Rights Reserved.Please Consider the Environment Before Printing This Document
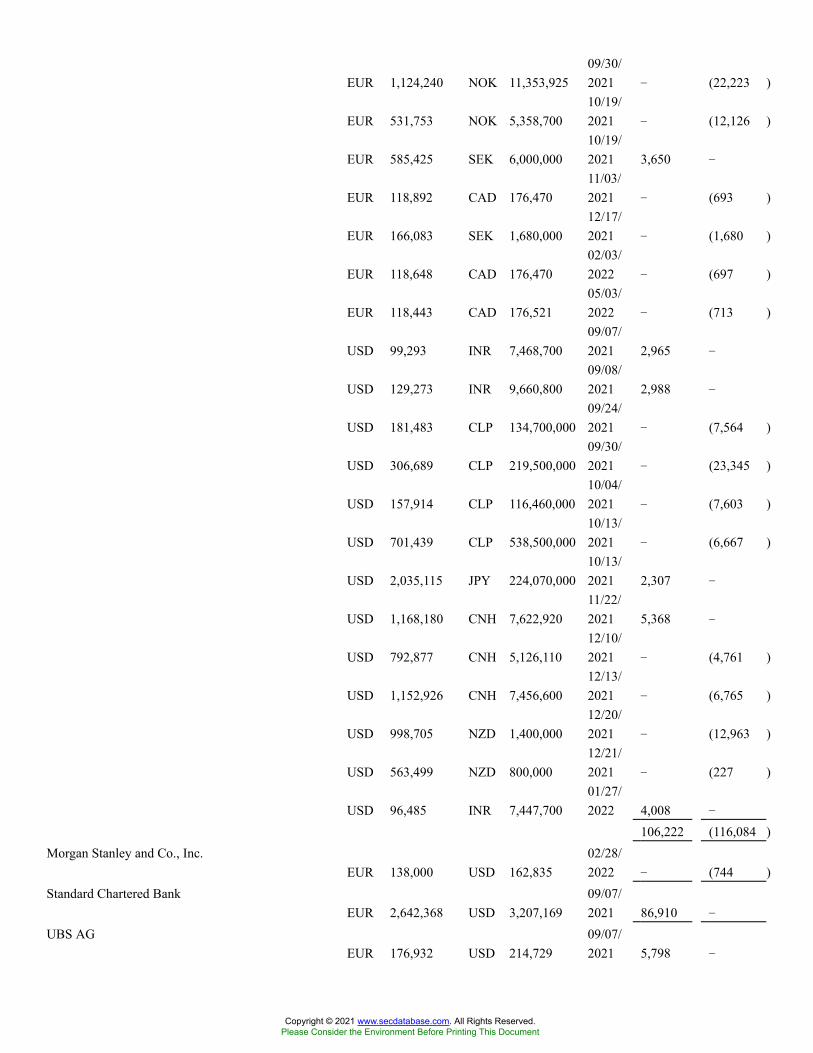
EUR 1,124,240 NOK 11,353,92509/30/2021 � (22,223 )
EUR 531,753 NOK 5,358,70010/19/2021 � (12,126 )
EUR 585,425 SEK 6,000,00010/19/2021 3,650 �
EUR 118,892 CAD 176,47011/03/2021 � (693 )
EUR 166,083 SEK 1,680,00012/17/2021 � (1,680 )
EUR 118,648 CAD 176,47002/03/2022 � (697 )
EUR 118,443 CAD 176,52105/03/2022 � (713 )
USD 99,293 INR 7,468,70009/07/2021 2,965 �
USD 129,273 INR 9,660,80009/08/2021 2,988 �
USD 181,483 CLP 134,700,00009/24/2021 � (7,564 )
USD 306,689 CLP 219,500,00009/30/2021 � (23,345 )
USD 157,914 CLP 116,460,00010/04/2021 � (7,603 )
USD 701,439 CLP 538,500,00010/13/2021 � (6,667 )
USD 2,035,115 JPY 224,070,00010/13/2021 2,307 �
USD 1,168,180 CNH 7,622,92011/22/2021 5,368 �
USD 792,877 CNH 5,126,11012/10/2021 � (4,761 )
USD 1,152,926 CNH 7,456,60012/13/2021 � (6,765 )
USD 998,705 NZD 1,400,00012/20/2021 � (12,963 )
USD 563,499 NZD 800,00012/21/2021 � (227 )
USD 96,485 INR 7,447,70001/27/2022 4,008 �
106,222 (116,084 )Morgan Stanley and Co., Inc.
EUR 138,000 USD 162,83502/28/2022 � (744 )
Standard Chartered BankEUR 2,642,368 USD 3,207,169
09/07/2021 86,910 �
UBS AGEUR 176,932 USD 214,729
09/07/2021 5,798 �
Copyright © 2021 www.secdatabase.com. All Rights Reserved.Please Consider the Environment Before Printing This Document
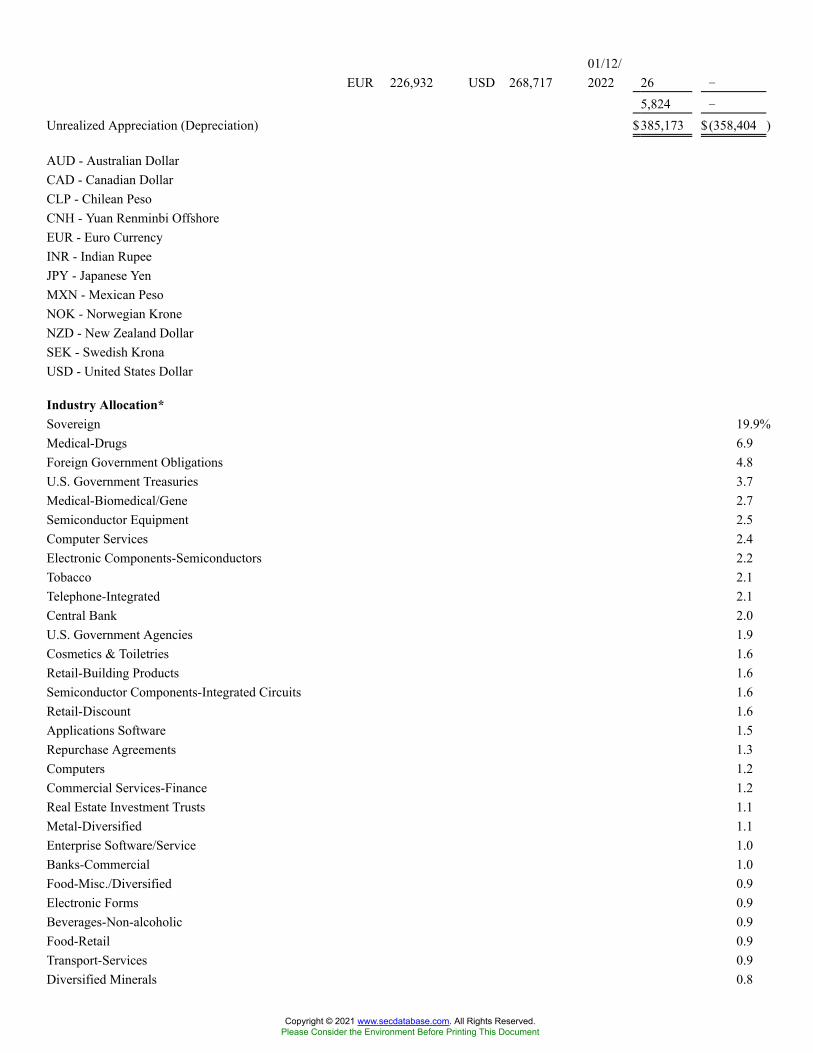
EUR 226,932 USD 268,71701/12/2022 26 �
5,824 �
Unrealized Appreciation (Depreciation) $385,173 $(358,404 )
AUD - Australian DollarCAD - Canadian DollarCLP - Chilean PesoCNH - Yuan Renminbi OffshoreEUR - Euro CurrencyINR - Indian RupeeJPY - Japanese YenMXN - Mexican PesoNOK - Norwegian KroneNZD - New Zealand DollarSEK - Swedish KronaUSD - United States Dollar
Industry Allocation*Sovereign 19.9%Medical-Drugs 6.9Foreign Government Obligations 4.8U.S. Government Treasuries 3.7Medical-Biomedical/Gene 2.7Semiconductor Equipment 2.5Computer Services 2.4Electronic Components-Semiconductors 2.2Tobacco 2.1Telephone-Integrated 2.1Central Bank 2.0U.S. Government Agencies 1.9Cosmetics & Toiletries 1.6Retail-Building Products 1.6Semiconductor Components-Integrated Circuits 1.6Retail-Discount 1.6Applications Software 1.5Repurchase Agreements 1.3Computers 1.2Commercial Services-Finance 1.2Real Estate Investment Trusts 1.1Metal-Diversified 1.1Enterprise Software/Service 1.0Banks-Commercial 1.0Food-Misc./Diversified 0.9Electronic Forms 0.9Beverages-Non-alcoholic 0.9Food-Retail 0.9Transport-Services 0.9Diversified Minerals 0.8
Copyright © 2021 www.secdatabase.com. All Rights Reserved.Please Consider the Environment Before Printing This Document

Internet Content-Entertainment 0.8Networking Products 0.8Web Portals/ISP 0.8Diversified Manufacturing Operations 0.7Diversified Banking Institutions 0.7Cellular Telecom 0.7Finance-Credit Card 0.6United States Treasury Notes 0.6Metal-Iron 0.6Electronic Components-Misc. 0.6Distribution/Wholesale 0.6Electric-Integrated 0.6Building-Residential/Commercial 0.6Aerospace/Defense 0.5Commercial Services 0.5Medical Products 0.4Entertainment Software 0.4Telecom Services 0.4Investment Management/Advisor Services 0.4Data Processing/Management 0.4Transport-Rail 0.3Consumer Products-Misc. 0.3Gold Mining 0.3Chemicals-Diversified 0.3Auto-Cars/Light Trucks 0.3Steel-Producers 0.3Insurance-Property/Casualty 0.3Insurance-Life/Health 0.3Soap & Cleaning Preparation 0.3Retail-Apparel/Shoe 0.3Diversified Financial Services 0.3Auto-Heavy Duty Trucks 0.2Real Estate Operations & Development 0.2Diagnostic Kits 0.2E-Commerce/Products 0.2Toys 0.2Industrial Gases 0.2Computers-Memory Devices 0.2Apparel Manufacturers 0.2Computer Data Security 0.2Private Equity 0.2Computer Aided Design 0.2Retail-Auto Parts 0.2Food-Confectionery 0.2Food-Meat Products 0.2Transport-Truck 0.2Electronic Connectors 0.2Machinery-Electrical 0.2Import/Export 0.2
Copyright © 2021 www.secdatabase.com. All Rights Reserved.Please Consider the Environment Before Printing This Document
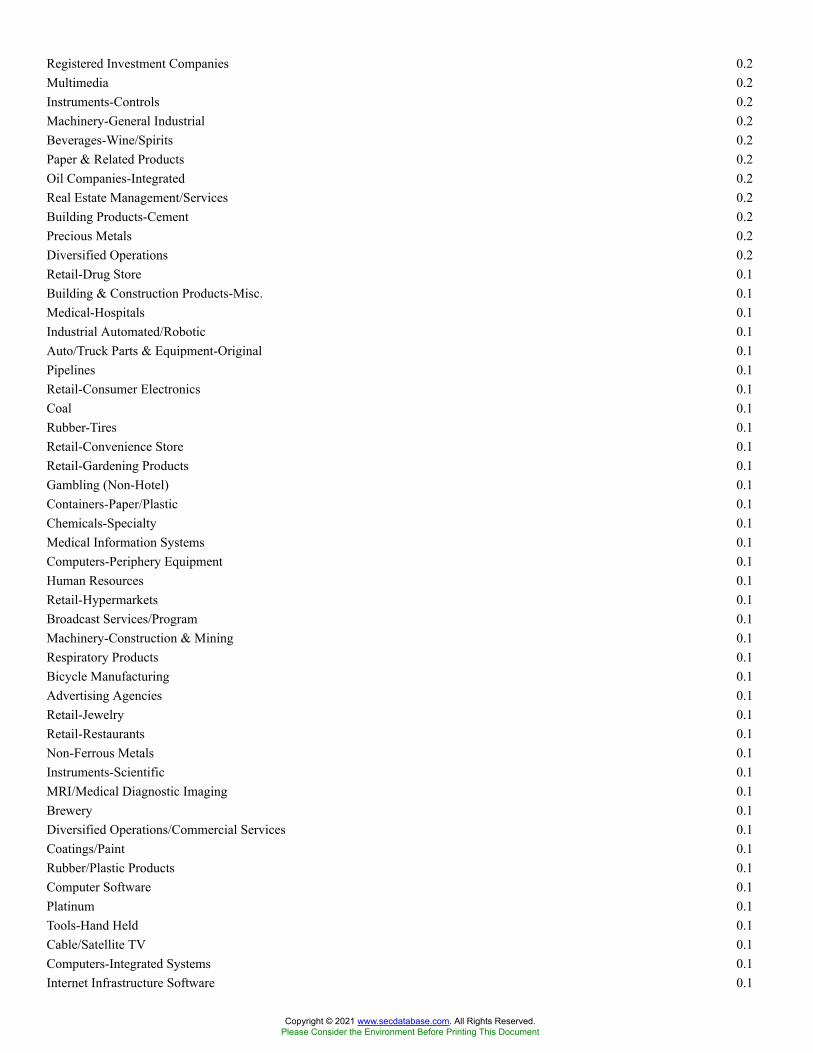
Registered Investment Companies 0.2Multimedia 0.2Instruments-Controls 0.2Machinery-General Industrial 0.2Beverages-Wine/Spirits 0.2Paper & Related Products 0.2Oil Companies-Integrated 0.2Real Estate Management/Services 0.2Building Products-Cement 0.2Precious Metals 0.2Diversified Operations 0.2Retail-Drug Store 0.1Building & Construction Products-Misc. 0.1Medical-Hospitals 0.1Industrial Automated/Robotic 0.1Auto/Truck Parts & Equipment-Original 0.1Pipelines 0.1Retail-Consumer Electronics 0.1Coal 0.1Rubber-Tires 0.1Retail-Convenience Store 0.1Retail-Gardening Products 0.1Gambling (Non-Hotel) 0.1Containers-Paper/Plastic 0.1Chemicals-Specialty 0.1Medical Information Systems 0.1Computers-Periphery Equipment 0.1Human Resources 0.1Retail-Hypermarkets 0.1Broadcast Services/Program 0.1Machinery-Construction & Mining 0.1Respiratory Products 0.1Bicycle Manufacturing 0.1Advertising Agencies 0.1Retail-Jewelry 0.1Retail-Restaurants 0.1Non-Ferrous Metals 0.1Instruments-Scientific 0.1MRI/Medical Diagnostic Imaging 0.1Brewery 0.1Diversified Operations/Commercial Services 0.1Coatings/Paint 0.1Rubber/Plastic Products 0.1Computer Software 0.1Platinum 0.1Tools-Hand Held 0.1Cable/Satellite TV 0.1Computers-Integrated Systems 0.1Internet Infrastructure Software 0.1
Copyright © 2021 www.secdatabase.com. All Rights Reserved.Please Consider the Environment Before Printing This Document

Communications Software 0.1Gas-Transportation 0.1Electric-Transmission 0.1Photo Equipment & Supplies 0.1Non-Hazardous Waste Disposal 0.1Building Products-Doors & Windows 0.1
99.5%
* Calculated as a percentage of net assets
The following is a summary of the inputs used to value the Fund�s net assets as of August 31, 2021 (see Note 1):
Level 1 - Unadjusted
Quoted Prices
Level 2 - Other
Observable Inputs
Level 3 - Significant
Unobservable Inputs Total
ASSETS:Investments at Value:*Common Stocks:
Bermuda $ 207,154 $ � $ 24,198 $231,352Other Countries 187,584,544 � � 187,584,544
Foreign Government Obligations � 61,490,503 � 61,490,503U.S. Government Treasuries � 1,845,950 � 1,845,950Short-Term Investment Securities:
Registered Investment Companies 502,680 � � 502,680Other Short-Term Investments � 31,558,402 � 31,558,402
Repurchase Agreements � 3,737,000 � 3,737,000Total Investments at Value $ 188,294,378 $ 98,631,855 $ 24,198 $286,950,431
Other Financial Instruments:�Forward Foreign Currency Contracts $� $ 385,173 $ � $385,173
LIABILITIES:Other Financial Instruments:�
Forward Foreign Currency Contracts $� $ 358,404 $ � $358,404
* For a detailed presentation of investments, please refer to the Portfolio of Investments.� Amounts represent unrealized appreciation/depreciation as of the end of the reporting period.
At the end of the reporting period, Level 3 investments in securities were not considered a material portion of the Fund.There were no Level 3 transfers during the reporting period.
See Notes to Portfolio of Investments
Copyright © 2021 www.secdatabase.com. All Rights Reserved.Please Consider the Environment Before Printing This Document

VALIC Company I Government Securities FundPORTFOLIO OF INVESTMENTS - August 31, 2021 - (unaudited)
Security Description
Shares/
Principal
Amount
Value
(Note 1)
ASSET BACKED SECURITIES - 9.7%Diversified Financial Services - 9.7%
ACC Auto TrustSeries 2021-A, Class A1.08% due 04/15/2027* $400,015 $400,479
ACC TrustSeries 2021-1, Class A0.74% due 11/20/2023* 496,911 496,899
AMSR TrustSeries 2020-SFR3, Class A1.36% due 09/17/2037* 568,738 569,337
AMSR TrustSeries 2021-SFR2, Class A1.53% due 08/17/2026* 1,000,000 1,002,490
AMSR Trust VRSSeries 2021-SFR1, Class A1.95% due 06/17/2038*(1) 300,000 304,610
BANKSeries 2021-BN35, Class A52.29% due 08/15/2031(2) 1,250,000 1,287,121
BANKSeries 2020-BN26, Class A42.40% due 03/15/2063(2) 500,000 521,510
BBCMS TrustSeries 2015-VFM, Class A12.47% due 03/10/2036*(2) 236,305 241,058
Citigroup Commercial Mtg. TrustSeries 2020-GC46, Class A52.72% due 02/15/2053(2) 1,250,000 1,330,037
COMM Mtg. Trust VRSSeries 2012-CR2, Class XA1.77% due 08/15/2045(1)(2)(3) 731,185 5,022
COMM Mtg. Trust VRSSeries 2020-CBM, Class A12.31% due 02/10/2037*(1)(2) 600,000 609,187
DT Auto Owner TrustSeries 2021-3A, Class A0.33% due 04/15/2025* 640,000 640,030
Eleven Madison Mtg. Trust VRSSeries 2015-11MD, Class A3.67% due 09/10/2035*(1)(2) 398,000 432,483
Copyright © 2021 www.secdatabase.com. All Rights Reserved.Please Consider the Environment Before Printing This Document

FirstKey Homes TrustSeries 2021-SFR1, Class A1.54% due 08/17/2038* 1,325,000 1,329,621
GS Mtg. Securities Corp. TrustSeries 2017-GS7, ClassA43.43% due 08/10/2050(2) 1,100,000 1,215,976
Progress Residential TrustSeries 2021-SFR6, Class A1.52% due 07/17/2038* 1,000,000 1,003,359
Progress Residential TrustSeries 2021-SFR4, Class A1.56% due 05/17/2038* 700,000 704,132
SLG Office TrustSeries 2021-OVA, Class A2.59% due 07/15/2041*(2) 1,000,000 1,051,964
Sofi Professional Loan Program TrustSeries 2018-B, Class A2FX3.34% due 08/25/2047* 563,134 577,827
UBS Commercial Mtg. TrustSeries 2018-C14, Class A24.26% due 12/15/2051(2) 1,500,000 1,597,121
UBS-BAMLL TrustSeries 2012-WRM, Class A3.66% due 06/10/2030*(2) 217,000 218,173
US Auto FundingSeries 2021-1A, Class A0.79% due 07/15/2024* 1,090,000 1,090,403
Total Asset Backed Securities(cost $16,360,887) 16,628,839
U.S. CORPORATE BONDS & NOTES - 4.5%Airlines - 0.5%
American Airlines Pass-Through TrustPass-Through Certs.Series 2016-3, Class A3.00% due 04/15/2030 595,879 600,162
American Airlines Pass-Through TrustPass-Through Certs.Series 2017-2, Class AA3.35% due 04/15/2031 273,906 278,954
879,116Banks-Super Regional - 0.5%
Wells Fargo & Co.Senior Notes2.16% due 02/11/2026 900,000 934,304
Diversified Banking Institutions - 0.4%
Copyright © 2021 www.secdatabase.com. All Rights Reserved.Please Consider the Environment Before Printing This Document
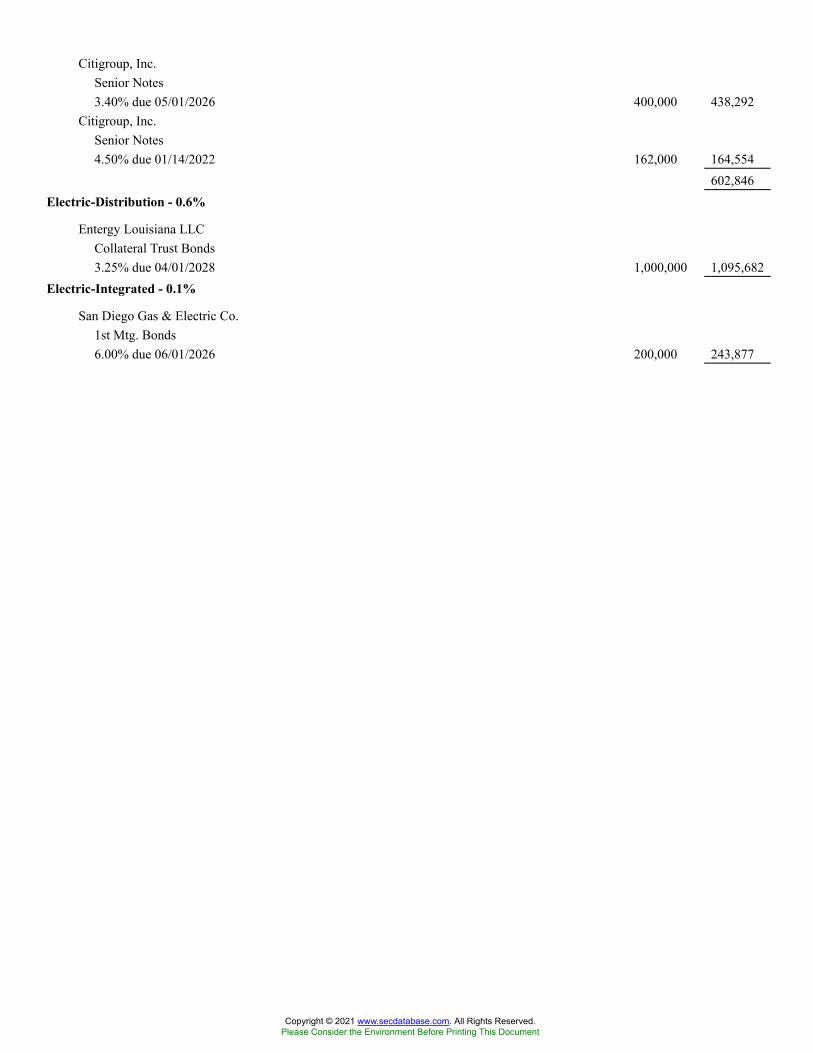
Citigroup, Inc.Senior Notes3.40% due 05/01/2026 400,000 438,292
Citigroup, Inc.Senior Notes4.50% due 01/14/2022 162,000 164,554
602,846Electric-Distribution - 0.6%
Entergy Louisiana LLCCollateral Trust Bonds3.25% due 04/01/2028 1,000,000 1,095,682
Electric-Integrated - 0.1%
San Diego Gas & Electric Co.1st Mtg. Bonds6.00% due 06/01/2026 200,000 243,877
Copyright © 2021 www.secdatabase.com. All Rights Reserved.Please Consider the Environment Before Printing This Document

Electronic Components-Semiconductors - 0.6%
NVIDIA Corp.Senior Notes2.00% due 06/15/2031 1,000,000 1,009,371
Finance-Credit Card - 0.1%
American Express Co.Sub. Notes3.63% due 12/05/2024 104,000 113,236
Medical-Biomedical/Gene - 0.1%
Gilead Sciences, Inc.Senior Notes3.50% due 02/01/2025 144,000 155,856
Medical-Drugs - 0.1%
AbbVie, Inc.Senior Notes3.45% due 03/15/2022 126,000 127,469
Copyright © 2021 www.secdatabase.com. All Rights Reserved.Please Consider the Environment Before Printing This Document
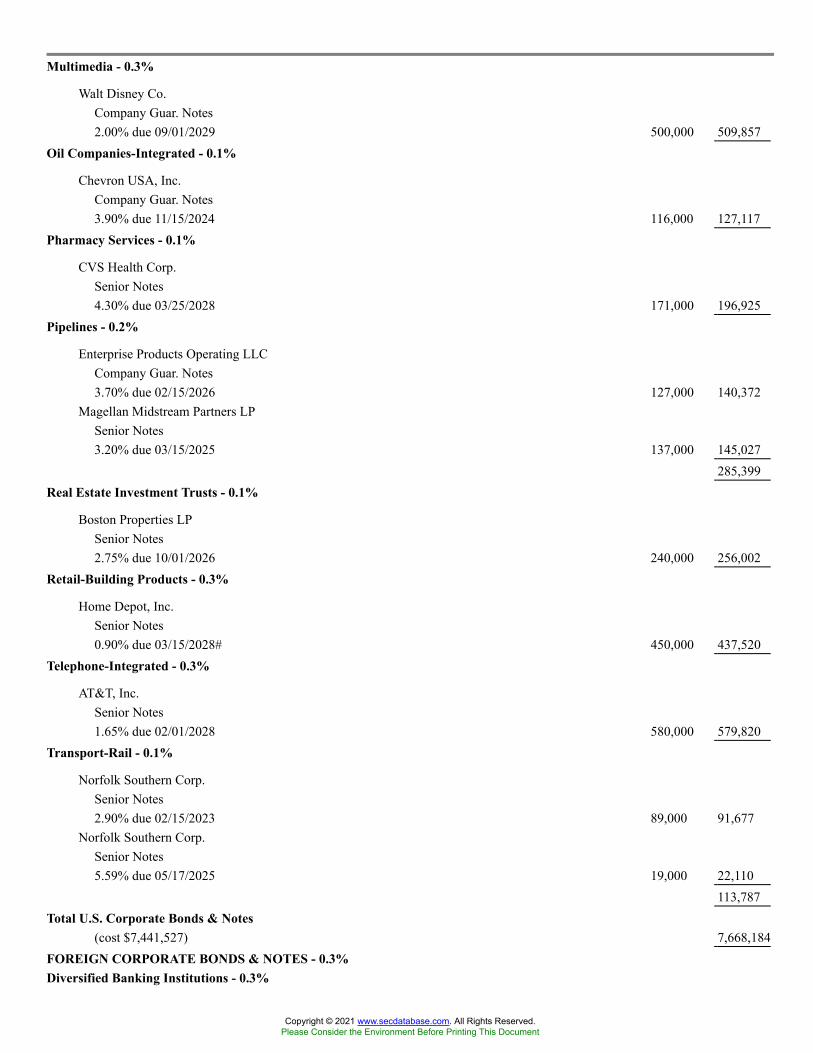
Multimedia - 0.3%
Walt Disney Co.Company Guar. Notes2.00% due 09/01/2029 500,000 509,857
Oil Companies-Integrated - 0.1%
Chevron USA, Inc.Company Guar. Notes3.90% due 11/15/2024 116,000 127,117
Pharmacy Services - 0.1%
CVS Health Corp.Senior Notes4.30% due 03/25/2028 171,000 196,925
Pipelines - 0.2%
Enterprise Products Operating LLCCompany Guar. Notes3.70% due 02/15/2026 127,000 140,372
Magellan Midstream Partners LPSenior Notes3.20% due 03/15/2025 137,000 145,027
285,399Real Estate Investment Trusts - 0.1%
Boston Properties LPSenior Notes2.75% due 10/01/2026 240,000 256,002
Retail-Building Products - 0.3%
Home Depot, Inc.Senior Notes0.90% due 03/15/2028# 450,000 437,520
Telephone-Integrated - 0.3%
AT&T, Inc.Senior Notes1.65% due 02/01/2028 580,000 579,820
Transport-Rail - 0.1%
Norfolk Southern Corp.Senior Notes2.90% due 02/15/2023 89,000 91,677
Norfolk Southern Corp.Senior Notes5.59% due 05/17/2025 19,000 22,110
113,787Total U.S. Corporate Bonds & Notes
(cost $7,441,527) 7,668,184FOREIGN CORPORATE BONDS & NOTES - 0.3%Diversified Banking Institutions - 0.3%
Copyright © 2021 www.secdatabase.com. All Rights Reserved.Please Consider the Environment Before Printing This Document

Mitsubishi UFJ Financial Group, Inc.Senior Notes2.76% due 09/13/2026 217,000 231,147
Mizuho Financial Group, Inc.Senior Notes2.95% due 02/28/2022 363,000 367,806
Copyright © 2021 www.secdatabase.com. All Rights Reserved.Please Consider the Environment Before Printing This Document

Total Foreign Corporate Bonds & Notes(cost $580,000) 598,953
U.S. GOVERNMENT AGENCIES - 41.6%Federal Farm Credit Bank - 1.0%
3.33% due 04/28/2037 500,000 595,0643.35% due 10/21/2025 1,000,000 1,110,185
1,705,249Federal Home Loan Mtg. Corp. - 8.5%
2.50% due 05/01/2050 628,252 655,3353.50% due 06/01/2033 691,127 739,5794.50% due 09/01/2039 182,044 202,2944.50% due 11/01/2039 101,726 113,6464.50% due 02/01/2040 150,838 168,5144.50% due 04/01/2040 15,768 17,6784.50% due 06/01/2040 25,163 27,7054.50% due 08/01/2040 168,491 188,8554.50% due 03/01/2041 476,350 528,0934.50% due 04/01/2041 87,025 97,2144.50% due 06/01/2041 132,717 147,4675.00% due 10/01/2034 19,525 21,4045.50% due 12/01/2036 9,354 10,4756.00% due 11/01/2033 45,047 53,5306.50% due 02/01/2032 13,518 15,3718.00% due 08/01/2030 89 1008.00% due 06/01/2031 592 601
Federal Home Loan Mtg. Corp. FRS2.25% (12 ML+1.83%)due 12/01/2035 5,055 5,134
Federal Home Loan Mtg. Corp. STRIPSSeries 264, Class 303.00% due 07/15/2042(4) 401,331 421,134
Federal Home Loan Mtg. Corp. Multifamily Structured Pass Through Certs.Series K130, Class A21.72% due 06/25/2031(2) 670,000 684,811Series KJ14, Class A22.81% due 09/25/2024(2) 591,000 624,576
Federal Home Loan Mtg. Corp. REMICSeries 4594, Class GN2.50% due 02/15/2045(4) 518,662 540,882Series 3981, Class PA3.00% due 04/15/2031(4) 92,328 95,114Series 4097, Class YK3.00% due 08/15/2032(4) 1,750,000 1,909,650Series 4150, Class IG3.00% due 01/15/2033(3)(4) 1,827,171 146,369Series 4838, Class CY3.00% due 01/15/2038(4) 1,000,000 1,101,159
Copyright © 2021 www.secdatabase.com. All Rights Reserved.Please Consider the Environment Before Printing This Document
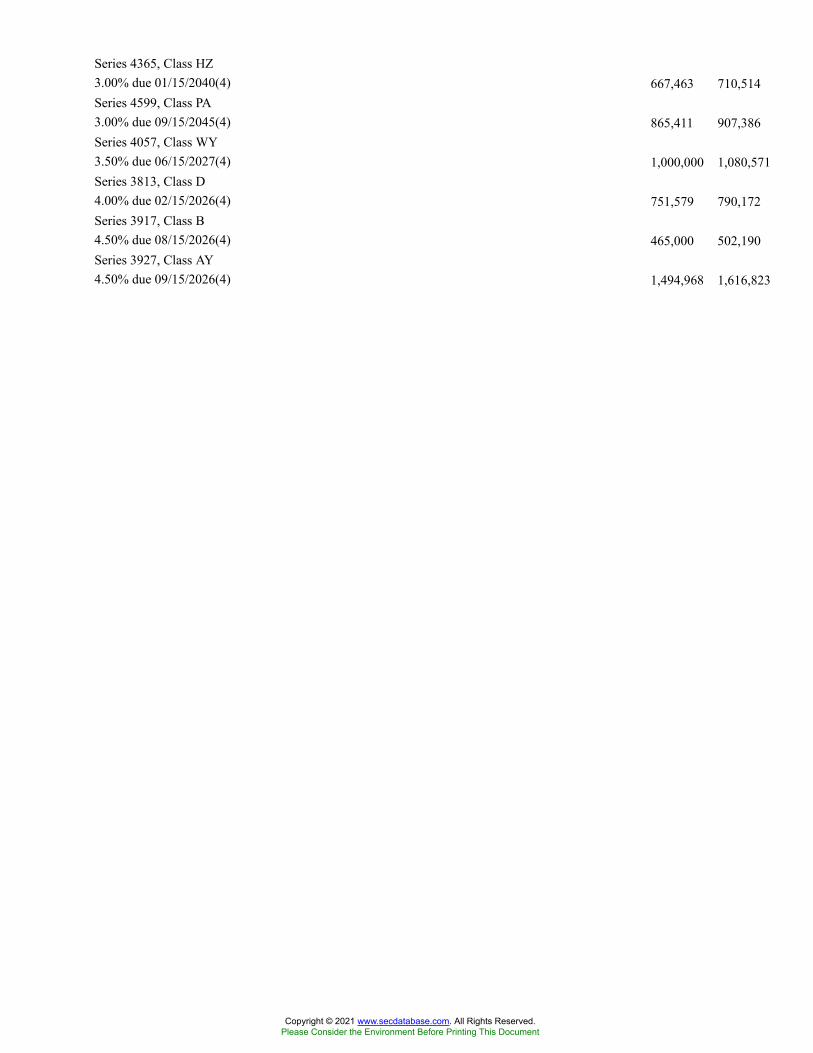
Series 4365, Class HZ3.00% due 01/15/2040(4) 667,463 710,514Series 4599, Class PA3.00% due 09/15/2045(4) 865,411 907,386Series 4057, Class WY3.50% due 06/15/2027(4) 1,000,000 1,080,571Series 3813, Class D4.00% due 02/15/2026(4) 751,579 790,172Series 3917, Class B4.50% due 08/15/2026(4) 465,000 502,190Series 3927, Class AY4.50% due 09/15/2026(4) 1,494,968 1,616,823
Copyright © 2021 www.secdatabase.com. All Rights Reserved.Please Consider the Environment Before Printing This Document
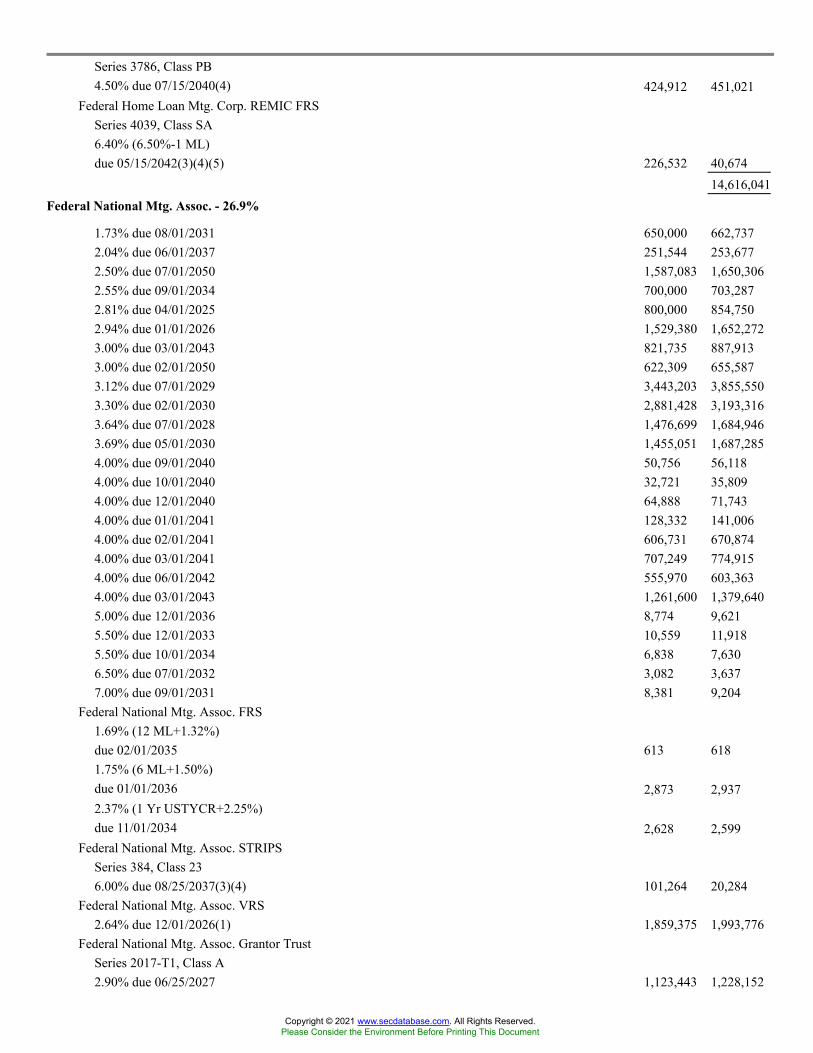
Series 3786, Class PB4.50% due 07/15/2040(4) 424,912 451,021
Federal Home Loan Mtg. Corp. REMIC FRSSeries 4039, Class SA6.40% (6.50%-1 ML)due 05/15/2042(3)(4)(5) 226,532 40,674
14,616,041Federal National Mtg. Assoc. - 26.9%
1.73% due 08/01/2031 650,000 662,7372.04% due 06/01/2037 251,544 253,6772.50% due 07/01/2050 1,587,083 1,650,3062.55% due 09/01/2034 700,000 703,2872.81% due 04/01/2025 800,000 854,7502.94% due 01/01/2026 1,529,380 1,652,2723.00% due 03/01/2043 821,735 887,9133.00% due 02/01/2050 622,309 655,5873.12% due 07/01/2029 3,443,203 3,855,5503.30% due 02/01/2030 2,881,428 3,193,3163.64% due 07/01/2028 1,476,699 1,684,9463.69% due 05/01/2030 1,455,051 1,687,2854.00% due 09/01/2040 50,756 56,1184.00% due 10/01/2040 32,721 35,8094.00% due 12/01/2040 64,888 71,7434.00% due 01/01/2041 128,332 141,0064.00% due 02/01/2041 606,731 670,8744.00% due 03/01/2041 707,249 774,9154.00% due 06/01/2042 555,970 603,3634.00% due 03/01/2043 1,261,600 1,379,6405.00% due 12/01/2036 8,774 9,6215.50% due 12/01/2033 10,559 11,9185.50% due 10/01/2034 6,838 7,6306.50% due 07/01/2032 3,082 3,6377.00% due 09/01/2031 8,381 9,204
Federal National Mtg. Assoc. FRS1.69% (12 ML+1.32%)due 02/01/2035 613 6181.75% (6 ML+1.50%)due 01/01/2036 2,873 2,9372.37% (1 Yr USTYCR+2.25%)due 11/01/2034 2,628 2,599
Federal National Mtg. Assoc. STRIPSSeries 384, Class 236.00% due 08/25/2037(3)(4) 101,264 20,284
Federal National Mtg. Assoc. VRS2.64% due 12/01/2026(1) 1,859,375 1,993,776
Federal National Mtg. Assoc. Grantor TrustSeries 2017-T1, Class A2.90% due 06/25/2027 1,123,443 1,228,152
Copyright © 2021 www.secdatabase.com. All Rights Reserved.Please Consider the Environment Before Printing This Document
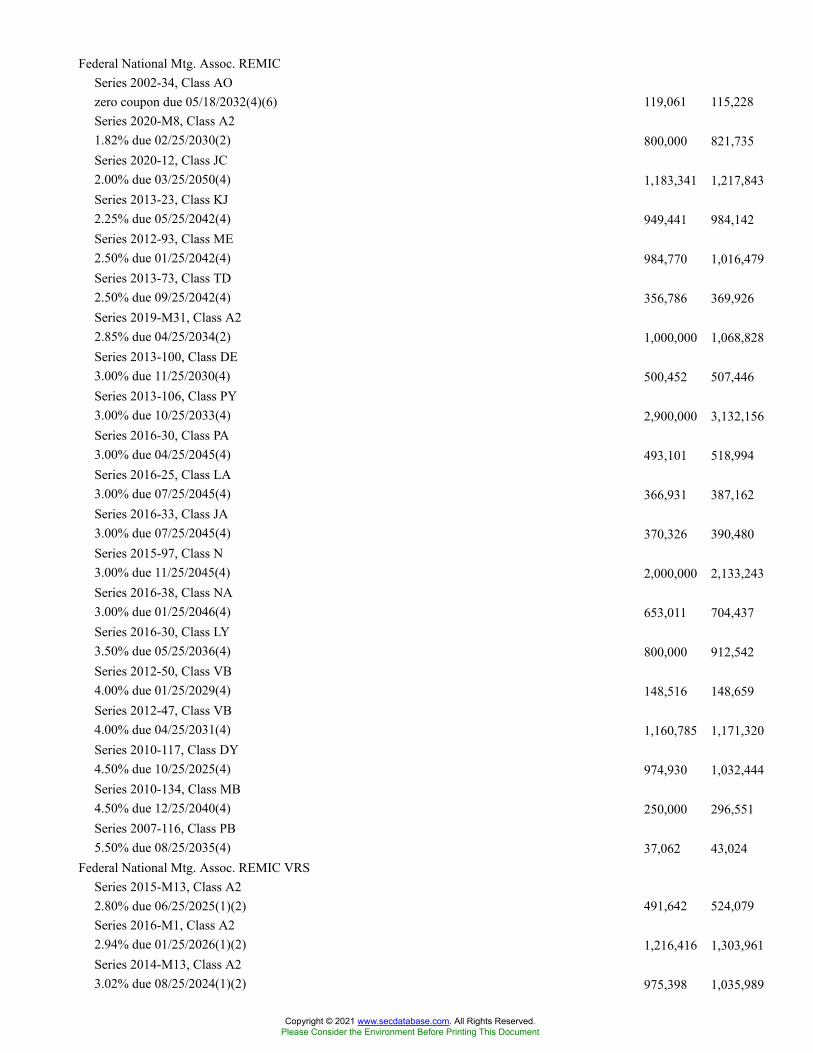
Federal National Mtg. Assoc. REMICSeries 2002-34, Class AOzero coupon due 05/18/2032(4)(6) 119,061 115,228Series 2020-M8, Class A21.82% due 02/25/2030(2) 800,000 821,735Series 2020-12, Class JC2.00% due 03/25/2050(4) 1,183,341 1,217,843Series 2013-23, Class KJ2.25% due 05/25/2042(4) 949,441 984,142Series 2012-93, Class ME2.50% due 01/25/2042(4) 984,770 1,016,479Series 2013-73, Class TD2.50% due 09/25/2042(4) 356,786 369,926Series 2019-M31, Class A22.85% due 04/25/2034(2) 1,000,000 1,068,828Series 2013-100, Class DE3.00% due 11/25/2030(4) 500,452 507,446Series 2013-106, Class PY3.00% due 10/25/2033(4) 2,900,000 3,132,156Series 2016-30, Class PA3.00% due 04/25/2045(4) 493,101 518,994Series 2016-25, Class LA3.00% due 07/25/2045(4) 366,931 387,162Series 2016-33, Class JA3.00% due 07/25/2045(4) 370,326 390,480Series 2015-97, Class N3.00% due 11/25/2045(4) 2,000,000 2,133,243Series 2016-38, Class NA3.00% due 01/25/2046(4) 653,011 704,437Series 2016-30, Class LY3.50% due 05/25/2036(4) 800,000 912,542Series 2012-50, Class VB4.00% due 01/25/2029(4) 148,516 148,659Series 2012-47, Class VB4.00% due 04/25/2031(4) 1,160,785 1,171,320Series 2010-117, Class DY4.50% due 10/25/2025(4) 974,930 1,032,444Series 2010-134, Class MB4.50% due 12/25/2040(4) 250,000 296,551Series 2007-116, Class PB5.50% due 08/25/2035(4) 37,062 43,024
Federal National Mtg. Assoc. REMIC VRSSeries 2015-M13, Class A22.80% due 06/25/2025(1)(2) 491,642 524,079Series 2016-M1, Class A22.94% due 01/25/2026(1)(2) 1,216,416 1,303,961Series 2014-M13, Class A23.02% due 08/25/2024(1)(2) 975,398 1,035,989
Copyright © 2021 www.secdatabase.com. All Rights Reserved.Please Consider the Environment Before Printing This Document
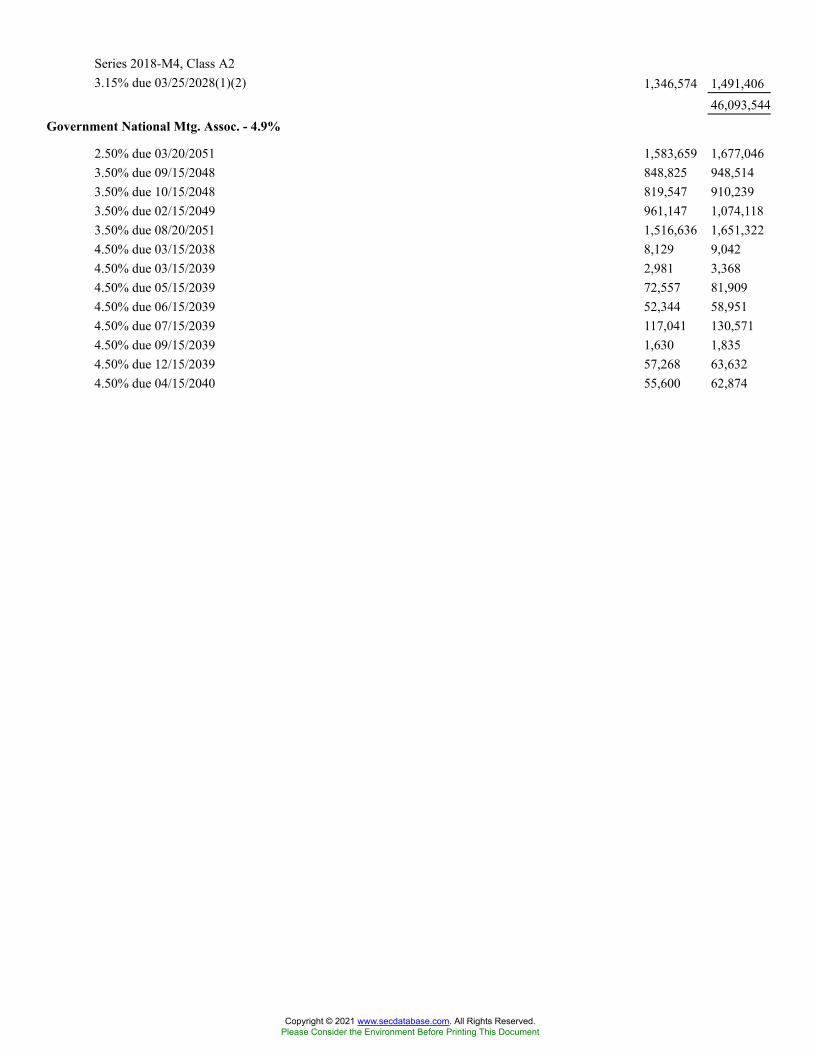
Series 2018-M4, Class A23.15% due 03/25/2028(1)(2) 1,346,574 1,491,406
46,093,544Government National Mtg. Assoc. - 4.9%
2.50% due 03/20/2051 1,583,659 1,677,0463.50% due 09/15/2048 848,825 948,5143.50% due 10/15/2048 819,547 910,2393.50% due 02/15/2049 961,147 1,074,1183.50% due 08/20/2051 1,516,636 1,651,3224.50% due 03/15/2038 8,129 9,0424.50% due 03/15/2039 2,981 3,3684.50% due 05/15/2039 72,557 81,9094.50% due 06/15/2039 52,344 58,9514.50% due 07/15/2039 117,041 130,5714.50% due 09/15/2039 1,630 1,8354.50% due 12/15/2039 57,268 63,6324.50% due 04/15/2040 55,600 62,874
Copyright © 2021 www.secdatabase.com. All Rights Reserved.Please Consider the Environment Before Printing This Document
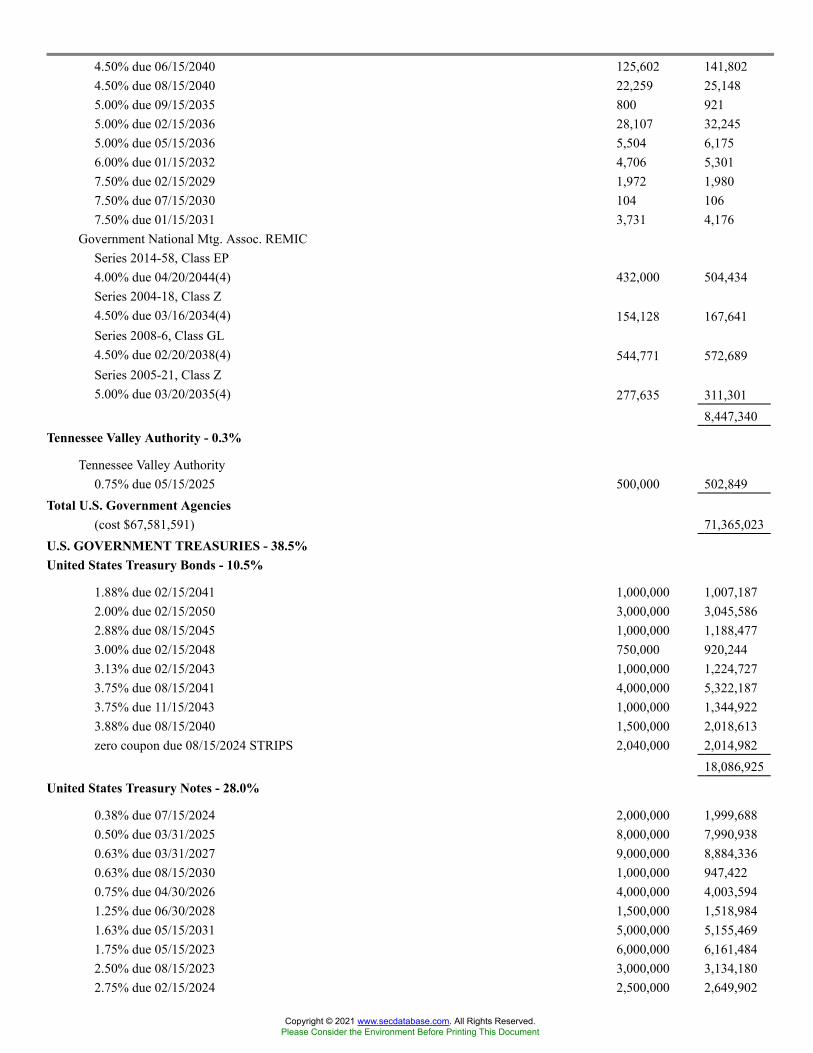
4.50% due 06/15/2040 125,602 141,8024.50% due 08/15/2040 22,259 25,1485.00% due 09/15/2035 800 9215.00% due 02/15/2036 28,107 32,2455.00% due 05/15/2036 5,504 6,1756.00% due 01/15/2032 4,706 5,3017.50% due 02/15/2029 1,972 1,9807.50% due 07/15/2030 104 1067.50% due 01/15/2031 3,731 4,176
Government National Mtg. Assoc. REMICSeries 2014-58, Class EP4.00% due 04/20/2044(4) 432,000 504,434Series 2004-18, Class Z4.50% due 03/16/2034(4) 154,128 167,641Series 2008-6, Class GL4.50% due 02/20/2038(4) 544,771 572,689Series 2005-21, Class Z5.00% due 03/20/2035(4) 277,635 311,301
8,447,340Tennessee Valley Authority - 0.3%
Tennessee Valley Authority0.75% due 05/15/2025 500,000 502,849
Total U.S. Government Agencies(cost $67,581,591) 71,365,023
U.S. GOVERNMENT TREASURIES - 38.5%United States Treasury Bonds - 10.5%
1.88% due 02/15/2041 1,000,000 1,007,1872.00% due 02/15/2050 3,000,000 3,045,5862.88% due 08/15/2045 1,000,000 1,188,4773.00% due 02/15/2048 750,000 920,2443.13% due 02/15/2043 1,000,000 1,224,7273.75% due 08/15/2041 4,000,000 5,322,1873.75% due 11/15/2043 1,000,000 1,344,9223.88% due 08/15/2040 1,500,000 2,018,613zero coupon due 08/15/2024 STRIPS 2,040,000 2,014,982
18,086,925United States Treasury Notes - 28.0%
0.38% due 07/15/2024 2,000,000 1,999,6880.50% due 03/31/2025 8,000,000 7,990,9380.63% due 03/31/2027 9,000,000 8,884,3360.63% due 08/15/2030 1,000,000 947,4220.75% due 04/30/2026 4,000,000 4,003,5941.25% due 06/30/2028 1,500,000 1,518,9841.63% due 05/15/2031 5,000,000 5,155,4691.75% due 05/15/2023 6,000,000 6,161,4842.50% due 08/15/2023 3,000,000 3,134,1802.75% due 02/15/2024 2,500,000 2,649,902
Copyright © 2021 www.secdatabase.com. All Rights Reserved.Please Consider the Environment Before Printing This Document
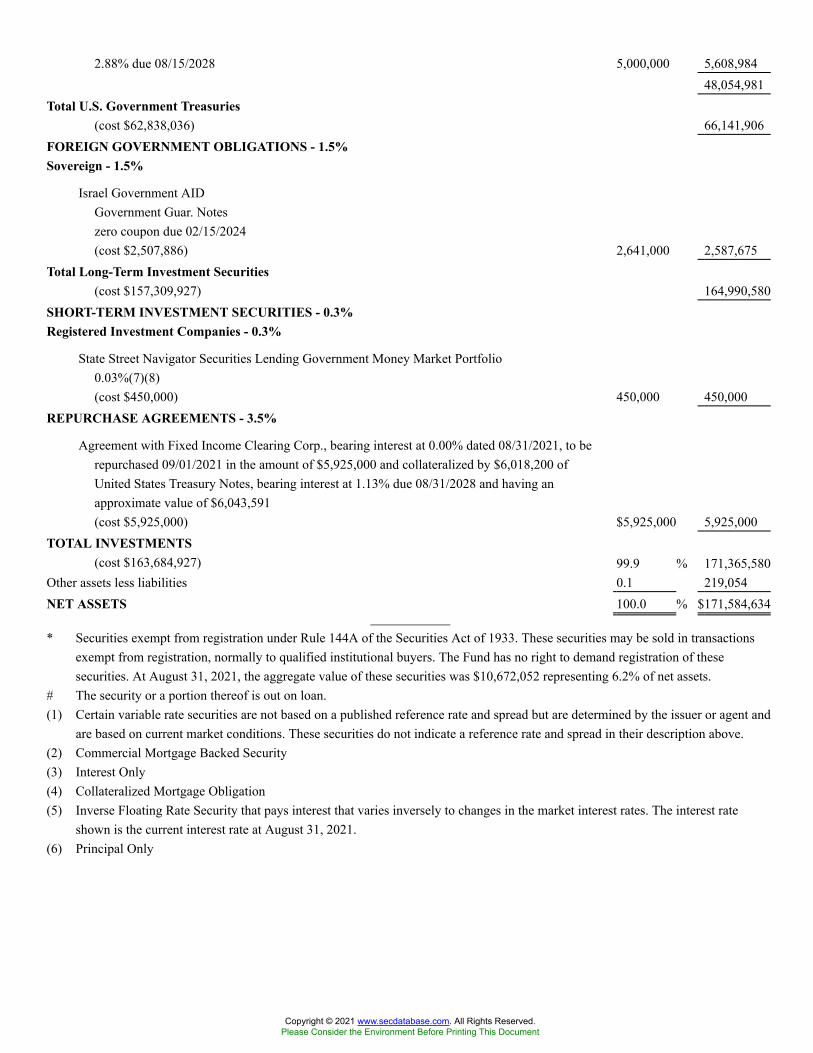
2.88% due 08/15/2028 5,000,000 5,608,98448,054,981
Total U.S. Government Treasuries(cost $62,838,036) 66,141,906
FOREIGN GOVERNMENT OBLIGATIONS - 1.5%Sovereign - 1.5%
Israel Government AIDGovernment Guar. Noteszero coupon due 02/15/2024(cost $2,507,886) 2,641,000 2,587,675
Total Long-Term Investment Securities(cost $157,309,927) 164,990,580
SHORT-TERM INVESTMENT SECURITIES - 0.3%Registered Investment Companies - 0.3%
State Street Navigator Securities Lending Government Money Market Portfolio0.03%(7)(8)(cost $450,000) 450,000 450,000
REPURCHASE AGREEMENTS - 3.5%
Agreement with Fixed Income Clearing Corp., bearing interest at 0.00% dated 08/31/2021, to berepurchased 09/01/2021 in the amount of $5,925,000 and collateralized by $6,018,200 ofUnited States Treasury Notes, bearing interest at 1.13% due 08/31/2028 and having anapproximate value of $6,043,591(cost $5,925,000) $5,925,000 5,925,000
TOTAL INVESTMENTS(cost $163,684,927) 99.9 % 171,365,580
Other assets less liabilities 0.1 219,054NET ASSETS 100.0 % $171,584,634
* Securities exempt from registration under Rule 144A of the Securities Act of 1933. These securities may be sold in transactionsexempt from registration, normally to qualified institutional buyers. The Fund has no right to demand registration of thesesecurities. At August 31, 2021, the aggregate value of these securities was $10,672,052 representing 6.2% of net assets.
# The security or a portion thereof is out on loan.(1) Certain variable rate securities are not based on a published reference rate and spread but are determined by the issuer or agent and
are based on current market conditions. These securities do not indicate a reference rate and spread in their description above.(2) Commercial Mortgage Backed Security(3) Interest Only(4) Collateralized Mortgage Obligation(5) Inverse Floating Rate Security that pays interest that varies inversely to changes in the market interest rates. The interest rate
shown is the current interest rate at August 31, 2021.(6) Principal Only
Copyright © 2021 www.secdatabase.com. All Rights Reserved.Please Consider the Environment Before Printing This Document
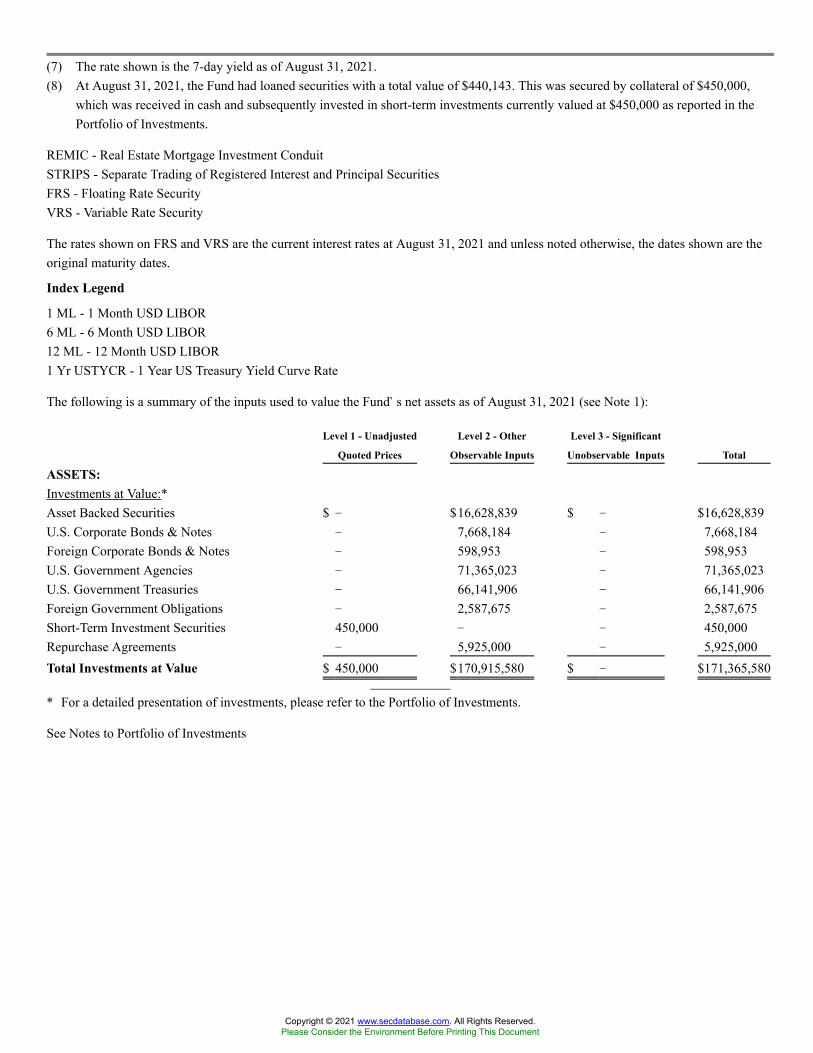
(7) The rate shown is the 7-day yield as of August 31, 2021.(8) At August 31, 2021, the Fund had loaned securities with a total value of $440,143. This was secured by collateral of $450,000,
which was received in cash and subsequently invested in short-term investments currently valued at $450,000 as reported in thePortfolio of Investments.
REMIC - Real Estate Mortgage Investment ConduitSTRIPS - Separate Trading of Registered Interest and Principal SecuritiesFRS - Floating Rate SecurityVRS - Variable Rate Security
The rates shown on FRS and VRS are the current interest rates at August 31, 2021 and unless noted otherwise, the dates shown are theoriginal maturity dates.
Index Legend
1 ML - 1 Month USD LIBOR6 ML - 6 Month USD LIBOR12 ML - 12 Month USD LIBOR1 Yr USTYCR - 1 Year US Treasury Yield Curve Rate
The following is a summary of the inputs used to value the Fund�s net assets as of August 31, 2021 (see Note 1):
Level 1 - Unadjusted
Quoted Prices
Level 2 - Other
Observable Inputs
Level 3 - Significant
Unobservable Inputs Total
ASSETS:Investments at Value:*Asset Backed Securities $ � $16,628,839 $ � $16,628,839U.S. Corporate Bonds & Notes � 7,668,184 � 7,668,184Foreign Corporate Bonds & Notes � 598,953 � 598,953U.S. Government Agencies � 71,365,023 � 71,365,023U.S. Government Treasuries � 66,141,906 � 66,141,906Foreign Government Obligations � 2,587,675 � 2,587,675Short-Term Investment Securities 450,000 � � 450,000Repurchase Agreements � 5,925,000 � 5,925,000Total Investments at Value $ 450,000 $170,915,580 $ � $171,365,580
* For a detailed presentation of investments, please refer to the Portfolio of Investments.
See Notes to Portfolio of Investments
Copyright © 2021 www.secdatabase.com. All Rights Reserved.Please Consider the Environment Before Printing This Document
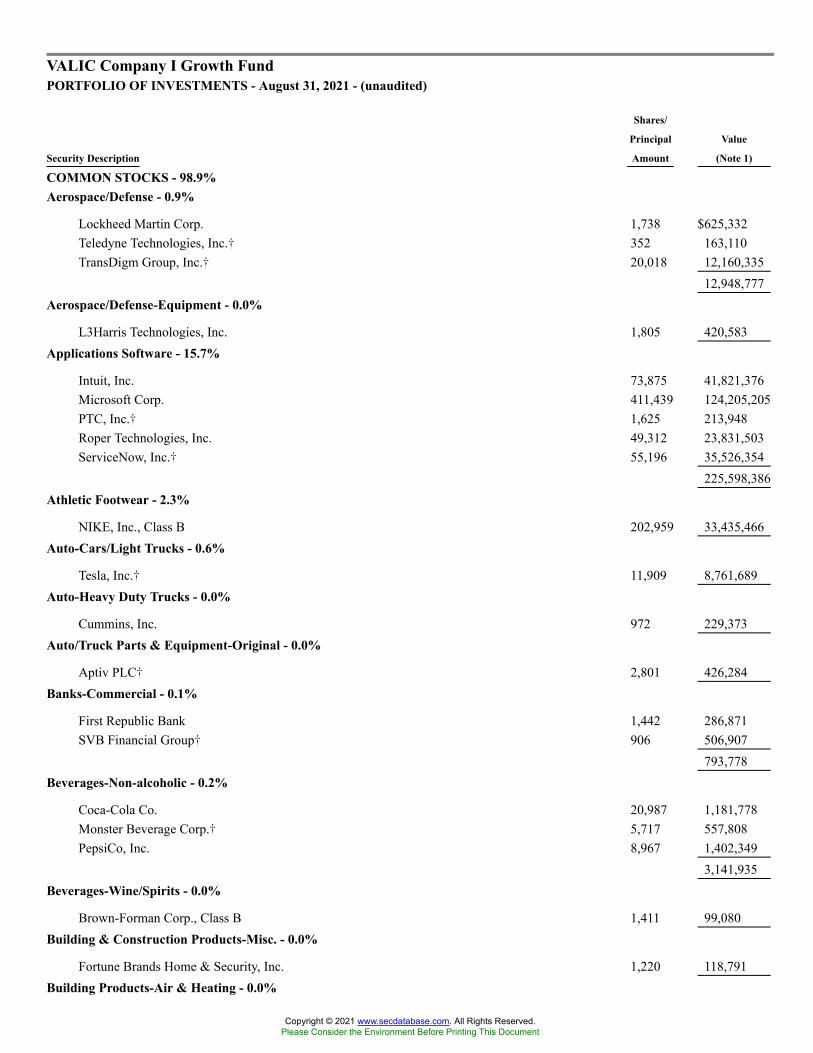
VALIC Company I Growth FundPORTFOLIO OF INVESTMENTS - August 31, 2021 - (unaudited)
Security Description
Shares/
Principal
Amount
Value
(Note 1)
COMMON STOCKS - 98.9%Aerospace/Defense - 0.9%
Lockheed Martin Corp. 1,738 $625,332Teledyne Technologies, Inc.� 352 163,110TransDigm Group, Inc.� 20,018 12,160,335
12,948,777Aerospace/Defense-Equipment - 0.0%
L3Harris Technologies, Inc. 1,805 420,583Applications Software - 15.7%
Intuit, Inc. 73,875 41,821,376Microsoft Corp. 411,439 124,205,205PTC, Inc.� 1,625 213,948Roper Technologies, Inc. 49,312 23,831,503ServiceNow, Inc.� 55,196 35,526,354
225,598,386Athletic Footwear - 2.3%
NIKE, Inc., Class B 202,959 33,435,466Auto-Cars/Light Trucks - 0.6%
Tesla, Inc.� 11,909 8,761,689Auto-Heavy Duty Trucks - 0.0%
Cummins, Inc. 972 229,373Auto/Truck Parts & Equipment-Original - 0.0%
Aptiv PLC� 2,801 426,284Banks-Commercial - 0.1%
First Republic Bank 1,442 286,871SVB Financial Group� 906 506,907
793,778Beverages-Non-alcoholic - 0.2%
Coca-Cola Co. 20,987 1,181,778Monster Beverage Corp.� 5,717 557,808PepsiCo, Inc. 8,967 1,402,349
3,141,935Beverages-Wine/Spirits - 0.0%
Brown-Forman Corp., Class B 1,411 99,080Building & Construction Products-Misc. - 0.0%
Fortune Brands Home & Security, Inc. 1,220 118,791Building Products-Air & Heating - 0.0%
Copyright © 2021 www.secdatabase.com. All Rights Reserved.Please Consider the Environment Before Printing This Document
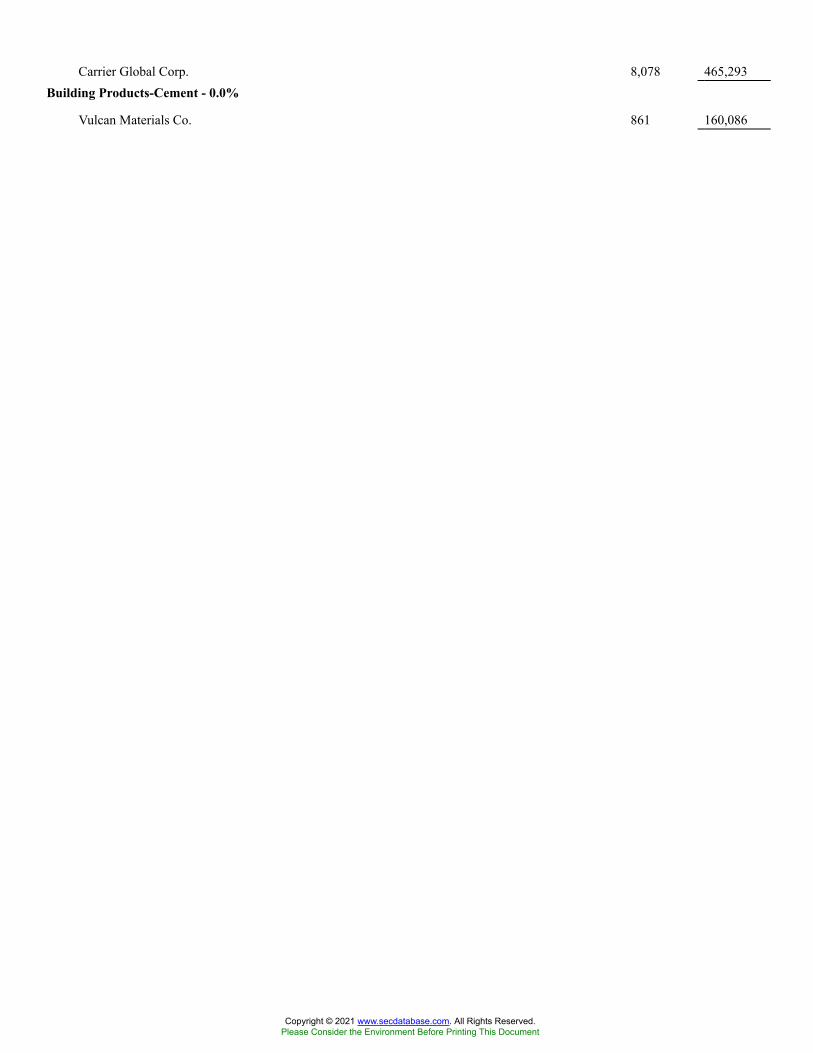
Carrier Global Corp. 8,078 465,293Building Products-Cement - 0.0%
Vulcan Materials Co. 861 160,086
Copyright © 2021 www.secdatabase.com. All Rights Reserved.Please Consider the Environment Before Printing This Document

Building Products-Wood - 0.0%
Masco Corp. 1,726 104,803Building-Maintenance & Services - 0.0%
Rollins, Inc. 3,422 133,184Building-Residential/Commercial - 0.0%
D.R. Horton, Inc. 3,042 290,876PulteGroup, Inc. 2,084 112,244
403,120Cable/Satellite TV - 0.3%
Charter Communications, Inc., Class A� 2,128 1,737,852Comcast Corp., Class A 31,173 1,891,578
3,629,430Casino Services - 0.0%
Caesars Entertainment, Inc.� 1,871 190,150Cellular Telecom - 0.1%
T-Mobile US, Inc.� 6,249 856,238Chemicals-Diversified - 0.0%
Dow, Inc. 5,656 355,762FMC Corp. 1,992 186,511
542,273Chemicals-Specialty - 0.1%
Albemarle Corp. 1,804 427,079Ecolab, Inc. 1,768 398,436
825,515Coatings/Paint - 1.1%
Sherwin-Williams Co. 50,645 15,379,367Commercial Services - 0.0%
Cintas Corp. 900 356,193Quanta Services, Inc. 1,249 127,523
483,716Commercial Services-Finance - 4.7%
Adyen NV�#* 6,648 21,464,811Automatic Data Processing, Inc. 3,156 659,730Equifax, Inc. 940 255,925FleetCor Technologies, Inc.� 554 145,857IHS Markit, Ltd. 3,763 453,818MarketAxess Holdings, Inc. 587 279,365Moody�s Corp. 1,791 681,959PayPal Holdings, Inc.� 18,152 5,239,756S&P Global, Inc. 87,171 38,688,233
67,869,454Computer Aided Design - 0.2%
Copyright © 2021 www.secdatabase.com. All Rights Reserved.Please Consider the Environment Before Printing This Document

ANSYS, Inc.� 1,346 491,775Autodesk, Inc.� 3,399 1,053,996Cadence Design Systems, Inc.� 4,299 702,800Synopsys, Inc.� 2,357 783,090
3,031,661
Copyright © 2021 www.secdatabase.com. All Rights Reserved.Please Consider the Environment Before Printing This Document
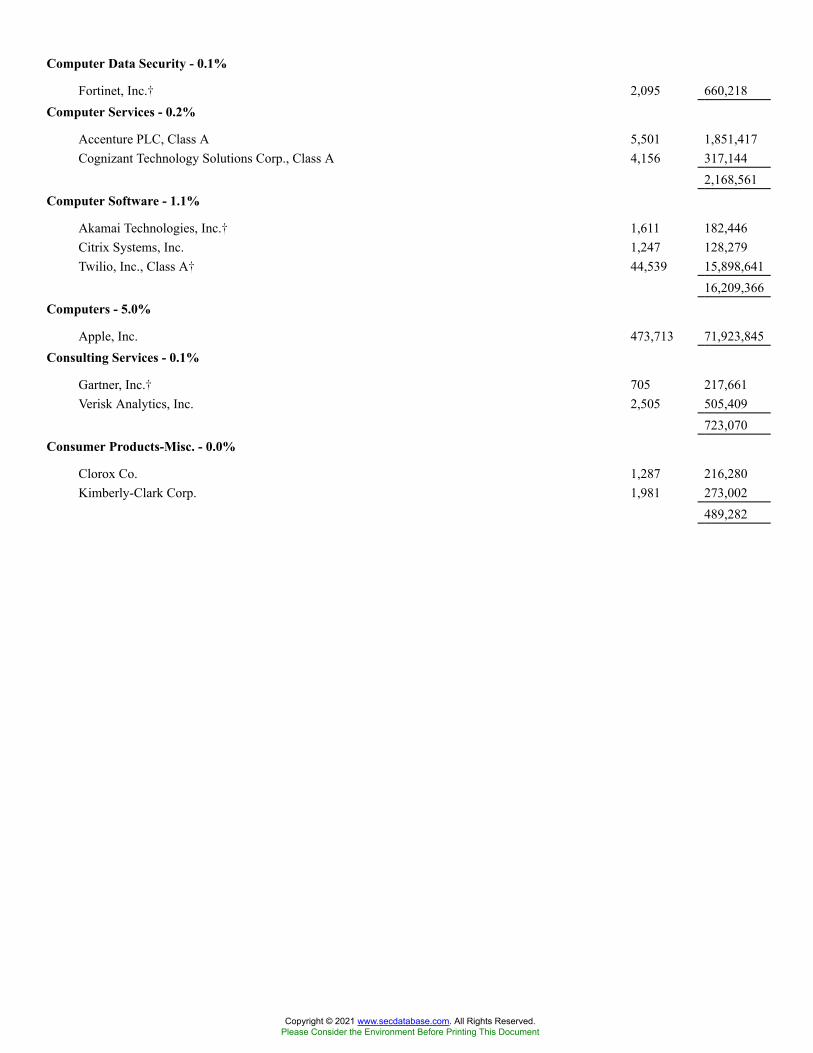
Computer Data Security - 0.1%
Fortinet, Inc.� 2,095 660,218Computer Services - 0.2%
Accenture PLC, Class A 5,501 1,851,417Cognizant Technology Solutions Corp., Class A 4,156 317,144
2,168,561Computer Software - 1.1%
Akamai Technologies, Inc.� 1,611 182,446Citrix Systems, Inc. 1,247 128,279Twilio, Inc., Class A� 44,539 15,898,641
16,209,366Computers - 5.0%
Apple, Inc. 473,713 71,923,845Consulting Services - 0.1%
Gartner, Inc.� 705 217,661Verisk Analytics, Inc. 2,505 505,409
723,070Consumer Products-Misc. - 0.0%
Clorox Co. 1,287 216,280Kimberly-Clark Corp. 1,981 273,002
489,282
Copyright © 2021 www.secdatabase.com. All Rights Reserved.Please Consider the Environment Before Printing This Document
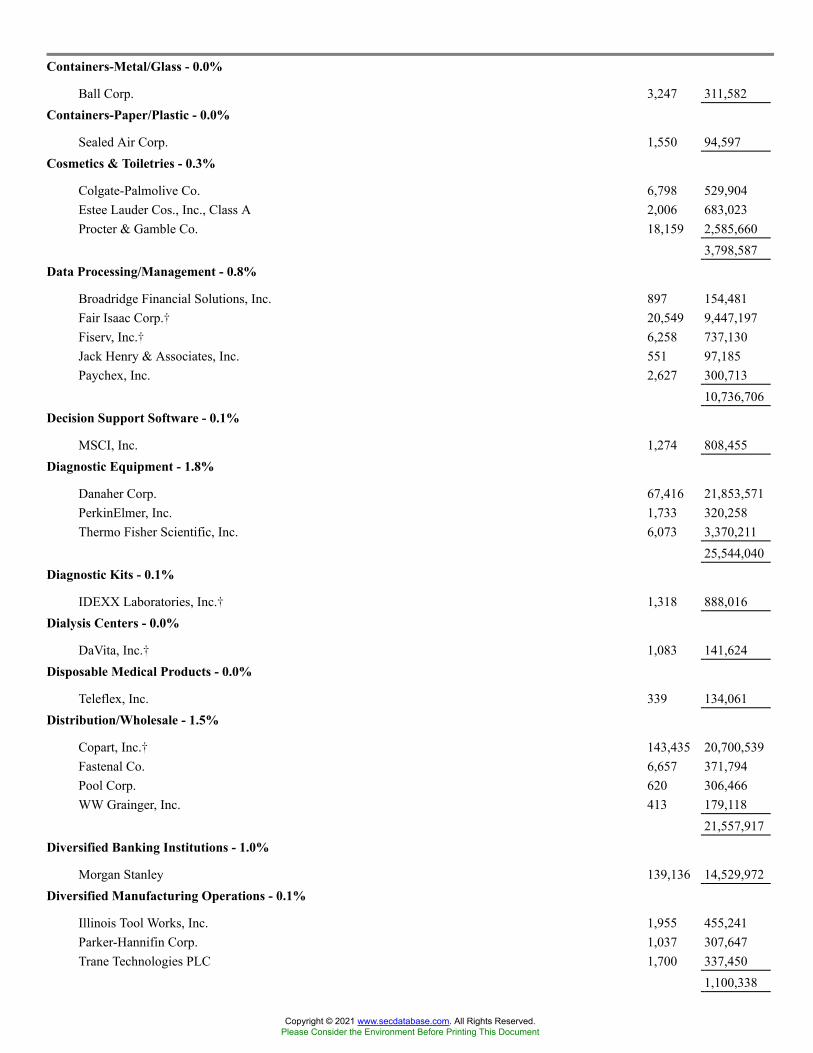
Containers-Metal/Glass - 0.0%
Ball Corp. 3,247 311,582Containers-Paper/Plastic - 0.0%
Sealed Air Corp. 1,550 94,597Cosmetics & Toiletries - 0.3%
Colgate-Palmolive Co. 6,798 529,904Estee Lauder Cos., Inc., Class A 2,006 683,023Procter & Gamble Co. 18,159 2,585,660
3,798,587Data Processing/Management - 0.8%
Broadridge Financial Solutions, Inc. 897 154,481Fair Isaac Corp.� 20,549 9,447,197Fiserv, Inc.� 6,258 737,130Jack Henry & Associates, Inc. 551 97,185Paychex, Inc. 2,627 300,713
10,736,706Decision Support Software - 0.1%
MSCI, Inc. 1,274 808,455Diagnostic Equipment - 1.8%
Danaher Corp. 67,416 21,853,571PerkinElmer, Inc. 1,733 320,258Thermo Fisher Scientific, Inc. 6,073 3,370,211
25,544,040Diagnostic Kits - 0.1%
IDEXX Laboratories, Inc.� 1,318 888,016Dialysis Centers - 0.0%
DaVita, Inc.� 1,083 141,624Disposable Medical Products - 0.0%
Teleflex, Inc. 339 134,061Distribution/Wholesale - 1.5%
Copart, Inc.� 143,435 20,700,539Fastenal Co. 6,657 371,794Pool Corp. 620 306,466WW Grainger, Inc. 413 179,118
21,557,917Diversified Banking Institutions - 1.0%
Morgan Stanley 139,136 14,529,972Diversified Manufacturing Operations - 0.1%
Illinois Tool Works, Inc. 1,955 455,241Parker-Hannifin Corp. 1,037 307,647Trane Technologies PLC 1,700 337,450
1,100,338
Copyright © 2021 www.secdatabase.com. All Rights Reserved.Please Consider the Environment Before Printing This Document

Drug Delivery Systems - 0.1%
DexCom, Inc.� 1,494 790,953
Copyright © 2021 www.secdatabase.com. All Rights Reserved.Please Consider the Environment Before Printing This Document
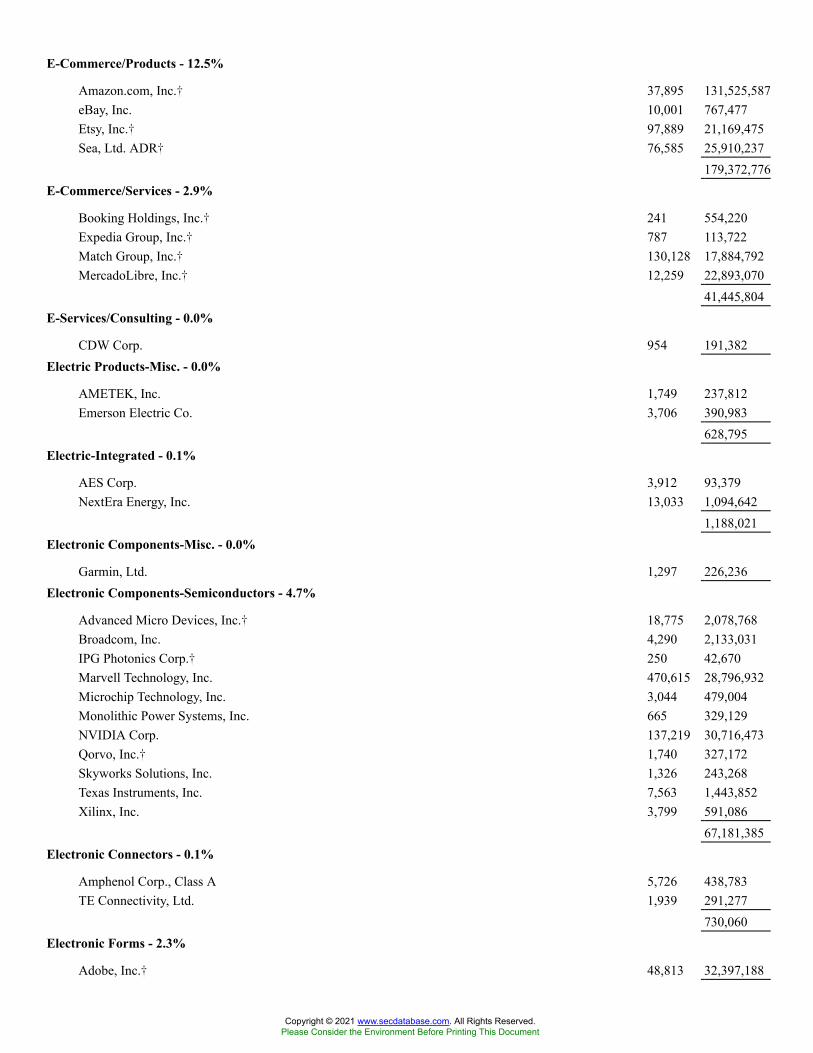
E-Commerce/Products - 12.5%
Amazon.com, Inc.� 37,895 131,525,587eBay, Inc. 10,001 767,477Etsy, Inc.� 97,889 21,169,475Sea, Ltd. ADR� 76,585 25,910,237
179,372,776E-Commerce/Services - 2.9%
Booking Holdings, Inc.� 241 554,220Expedia Group, Inc.� 787 113,722Match Group, Inc.� 130,128 17,884,792MercadoLibre, Inc.� 12,259 22,893,070
41,445,804E-Services/Consulting - 0.0%
CDW Corp. 954 191,382Electric Products-Misc. - 0.0%
AMETEK, Inc. 1,749 237,812Emerson Electric Co. 3,706 390,983
628,795Electric-Integrated - 0.1%
AES Corp. 3,912 93,379NextEra Energy, Inc. 13,033 1,094,642
1,188,021Electronic Components-Misc. - 0.0%
Garmin, Ltd. 1,297 226,236Electronic Components-Semiconductors - 4.7%
Advanced Micro Devices, Inc.� 18,775 2,078,768Broadcom, Inc. 4,290 2,133,031IPG Photonics Corp.� 250 42,670Marvell Technology, Inc. 470,615 28,796,932Microchip Technology, Inc. 3,044 479,004Monolithic Power Systems, Inc. 665 329,129NVIDIA Corp. 137,219 30,716,473Qorvo, Inc.� 1,740 327,172Skyworks Solutions, Inc. 1,326 243,268Texas Instruments, Inc. 7,563 1,443,852Xilinx, Inc. 3,799 591,086
67,181,385Electronic Connectors - 0.1%
Amphenol Corp., Class A 5,726 438,783TE Connectivity, Ltd. 1,939 291,277
730,060Electronic Forms - 2.3%
Adobe, Inc.� 48,813 32,397,188
Copyright © 2021 www.secdatabase.com. All Rights Reserved.Please Consider the Environment Before Printing This Document
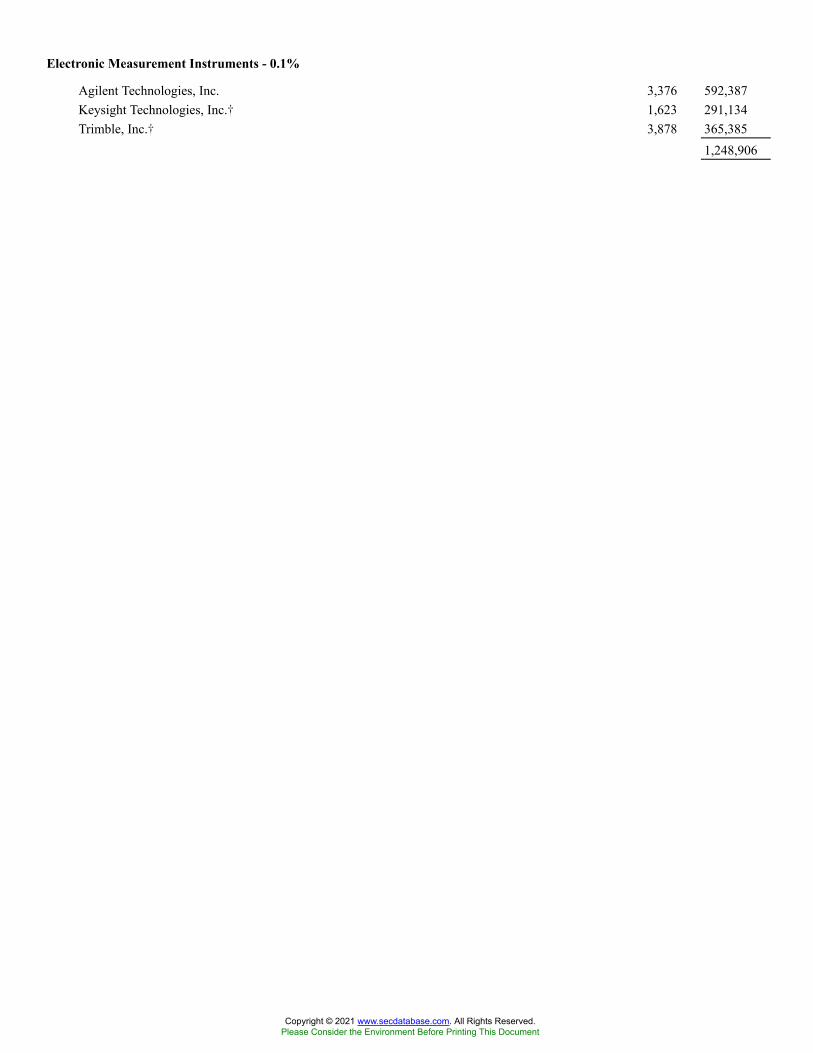
Electronic Measurement Instruments - 0.1%
Agilent Technologies, Inc. 3,376 592,387Keysight Technologies, Inc.� 1,623 291,134Trimble, Inc.� 3,878 365,385
1,248,906
Copyright © 2021 www.secdatabase.com. All Rights Reserved.Please Consider the Environment Before Printing This Document

Electronic Security Devices - 0.0%
Allegion PLC 584 84,090Energy-Alternate Sources - 0.0%
Enphase Energy, Inc.� 2,097 364,312Engineering/R&D Services - 0.0%
Jacobs Engineering Group, Inc. 1,247 168,295Enterprise Software/Service - 0.4%
Oracle Corp. 15,440 1,376,167Paycom Software, Inc.� 759 371,075salesforce.com, Inc.� 14,922 3,958,359Tyler Technologies, Inc.� 629 305,506
6,011,107
Copyright © 2021 www.secdatabase.com. All Rights Reserved.Please Consider the Environment Before Printing This Document
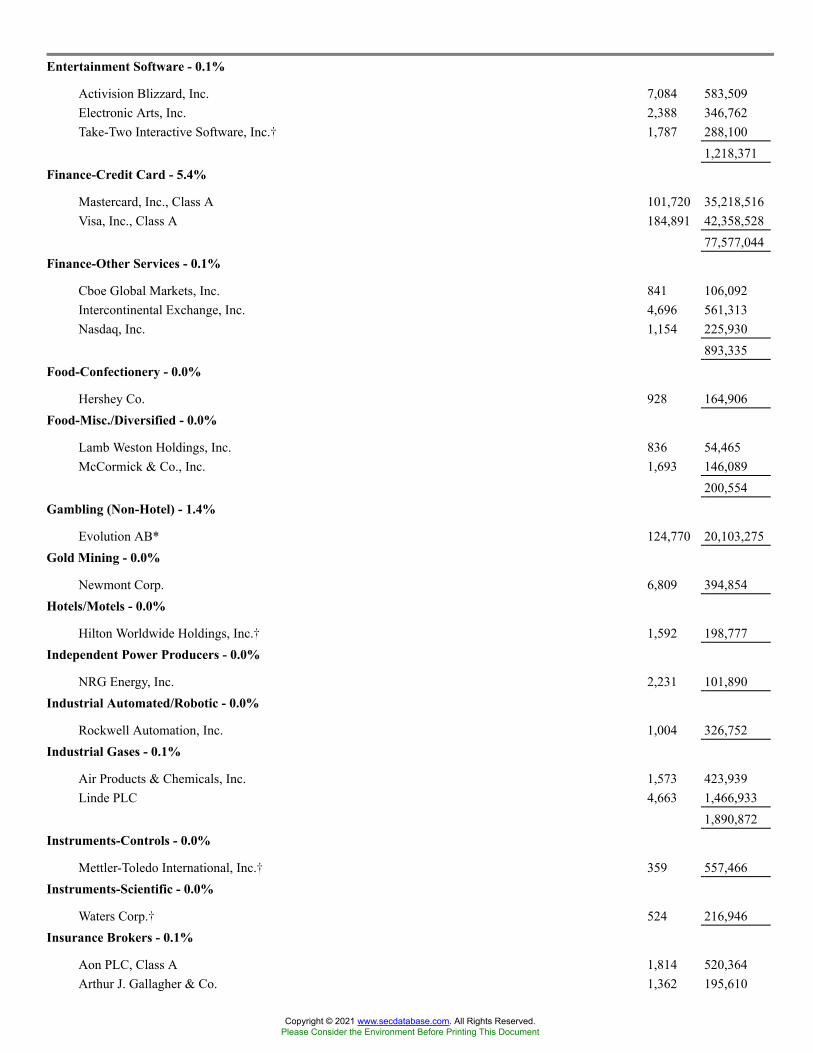
Entertainment Software - 0.1%
Activision Blizzard, Inc. 7,084 583,509Electronic Arts, Inc. 2,388 346,762Take-Two Interactive Software, Inc.� 1,787 288,100
1,218,371Finance-Credit Card - 5.4%
Mastercard, Inc., Class A 101,720 35,218,516Visa, Inc., Class A 184,891 42,358,528
77,577,044Finance-Other Services - 0.1%
Cboe Global Markets, Inc. 841 106,092Intercontinental Exchange, Inc. 4,696 561,313Nasdaq, Inc. 1,154 225,930
893,335Food-Confectionery - 0.0%
Hershey Co. 928 164,906Food-Misc./Diversified - 0.0%
Lamb Weston Holdings, Inc. 836 54,465McCormick & Co., Inc. 1,693 146,089
200,554Gambling (Non-Hotel) - 1.4%
Evolution AB* 124,770 20,103,275Gold Mining - 0.0%
Newmont Corp. 6,809 394,854Hotels/Motels - 0.0%
Hilton Worldwide Holdings, Inc.� 1,592 198,777Independent Power Producers - 0.0%
NRG Energy, Inc. 2,231 101,890Industrial Automated/Robotic - 0.0%
Rockwell Automation, Inc. 1,004 326,752Industrial Gases - 0.1%
Air Products & Chemicals, Inc. 1,573 423,939Linde PLC 4,663 1,466,933
1,890,872Instruments-Controls - 0.0%
Mettler-Toledo International, Inc.� 359 557,466Instruments-Scientific - 0.0%
Waters Corp.� 524 216,946Insurance Brokers - 0.1%
Aon PLC, Class A 1,814 520,364Arthur J. Gallagher & Co. 1,362 195,610
Copyright © 2021 www.secdatabase.com. All Rights Reserved.Please Consider the Environment Before Printing This Document
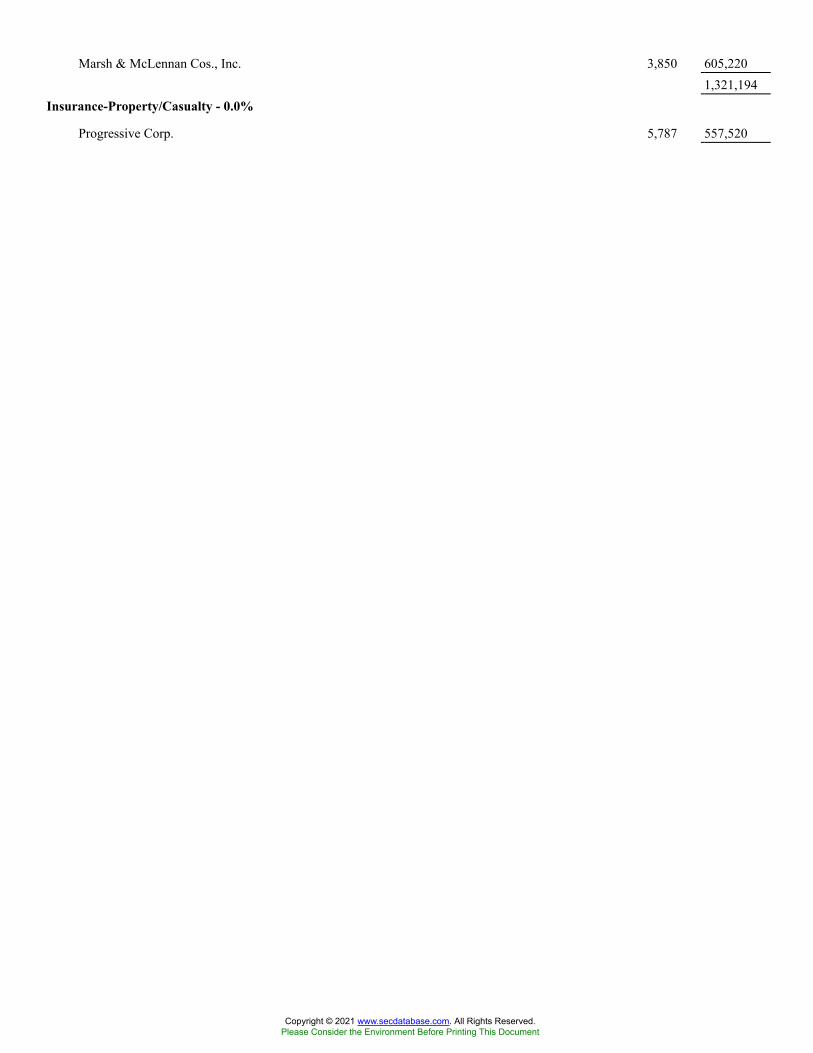
Marsh & McLennan Cos., Inc. 3,850 605,2201,321,194
Insurance-Property/Casualty - 0.0%
Progressive Corp. 5,787 557,520
Copyright © 2021 www.secdatabase.com. All Rights Reserved.Please Consider the Environment Before Printing This Document
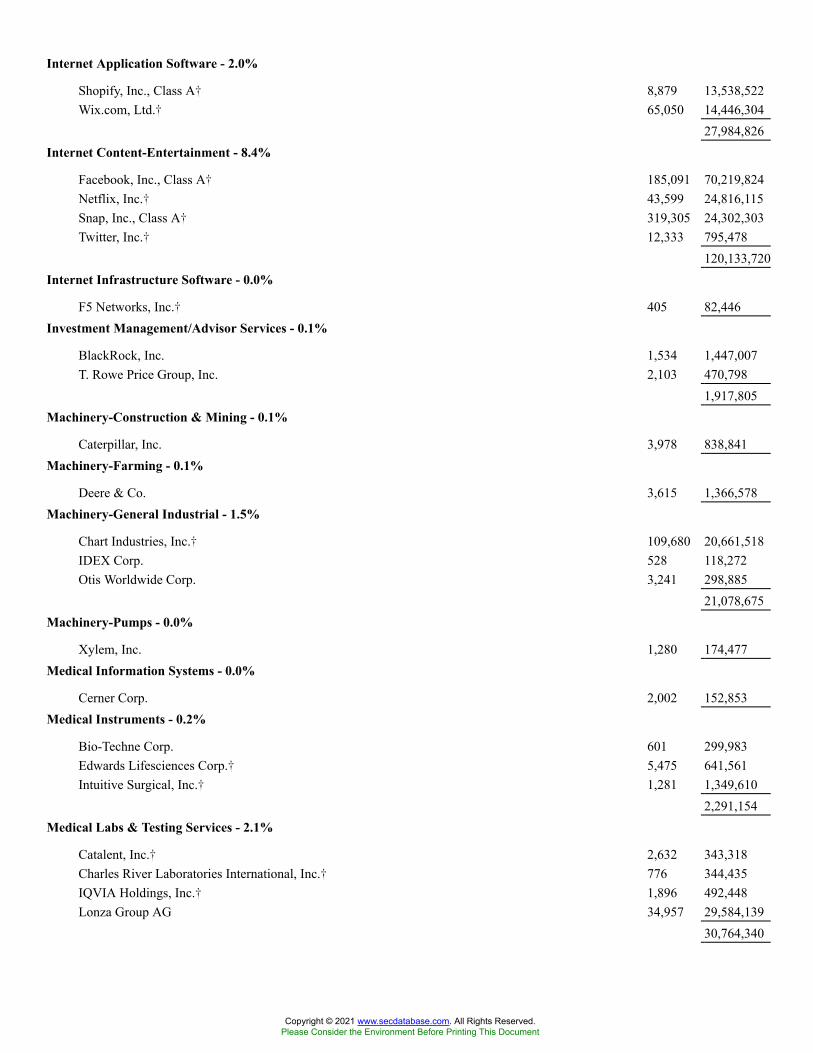
Internet Application Software - 2.0%
Shopify, Inc., Class A� 8,879 13,538,522Wix.com, Ltd.� 65,050 14,446,304
27,984,826Internet Content-Entertainment - 8.4%
Facebook, Inc., Class A� 185,091 70,219,824Netflix, Inc.� 43,599 24,816,115Snap, Inc., Class A� 319,305 24,302,303Twitter, Inc.� 12,333 795,478
120,133,720Internet Infrastructure Software - 0.0%
F5 Networks, Inc.� 405 82,446Investment Management/Advisor Services - 0.1%
BlackRock, Inc. 1,534 1,447,007T. Rowe Price Group, Inc. 2,103 470,798
1,917,805Machinery-Construction & Mining - 0.1%
Caterpillar, Inc. 3,978 838,841Machinery-Farming - 0.1%
Deere & Co. 3,615 1,366,578Machinery-General Industrial - 1.5%
Chart Industries, Inc.� 109,680 20,661,518IDEX Corp. 528 118,272Otis Worldwide Corp. 3,241 298,885
21,078,675Machinery-Pumps - 0.0%
Xylem, Inc. 1,280 174,477Medical Information Systems - 0.0%
Cerner Corp. 2,002 152,853Medical Instruments - 0.2%
Bio-Techne Corp. 601 299,983Edwards Lifesciences Corp.� 5,475 641,561Intuitive Surgical, Inc.� 1,281 1,349,610
2,291,154Medical Labs & Testing Services - 2.1%
Catalent, Inc.� 2,632 343,318Charles River Laboratories International, Inc.� 776 344,435IQVIA Holdings, Inc.� 1,896 492,448Lonza Group AG 34,957 29,584,139
30,764,340
Copyright © 2021 www.secdatabase.com. All Rights Reserved.Please Consider the Environment Before Printing This Document
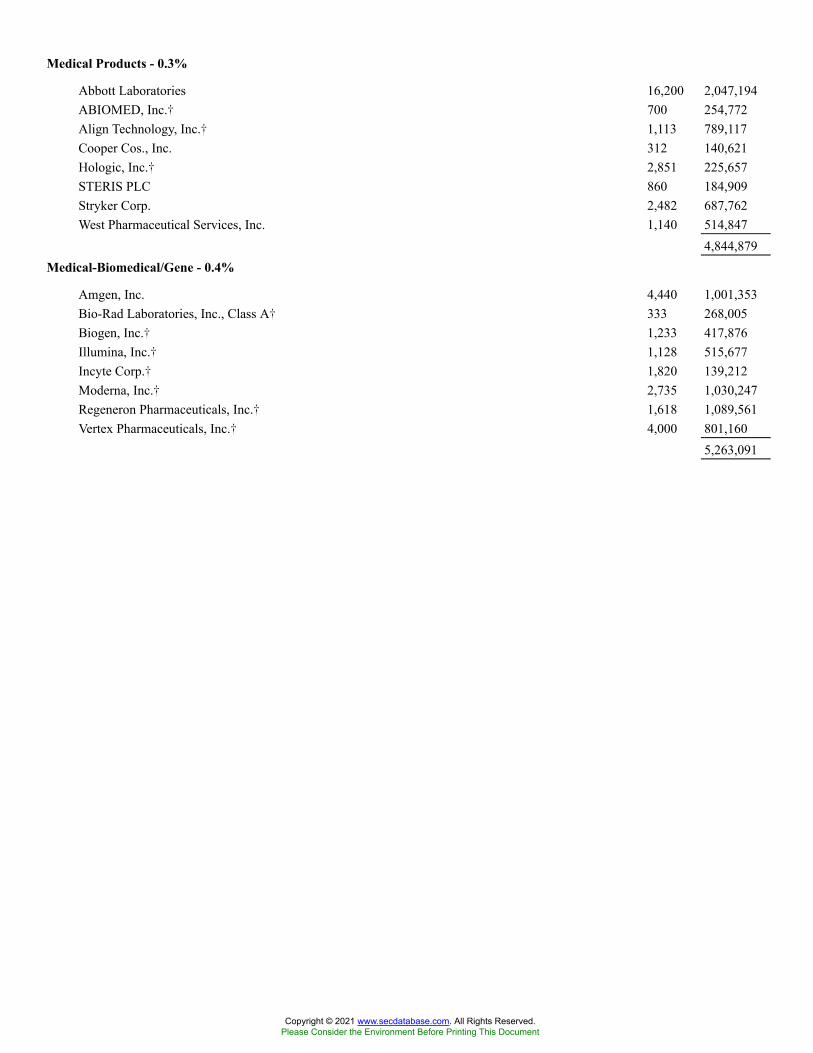
Medical Products - 0.3%
Abbott Laboratories 16,200 2,047,194ABIOMED, Inc.� 700 254,772Align Technology, Inc.� 1,113 789,117Cooper Cos., Inc. 312 140,621Hologic, Inc.� 2,851 225,657STERIS PLC 860 184,909Stryker Corp. 2,482 687,762West Pharmaceutical Services, Inc. 1,140 514,847
4,844,879Medical-Biomedical/Gene - 0.4%
Amgen, Inc. 4,440 1,001,353Bio-Rad Laboratories, Inc., Class A� 333 268,005Biogen, Inc.� 1,233 417,876Illumina, Inc.� 1,128 515,677Incyte Corp.� 1,820 139,212Moderna, Inc.� 2,735 1,030,247Regeneron Pharmaceuticals, Inc.� 1,618 1,089,561Vertex Pharmaceuticals, Inc.� 4,000 801,160
5,263,091
Copyright © 2021 www.secdatabase.com. All Rights Reserved.Please Consider the Environment Before Printing This Document

Medical-Drugs - 2.1%
AbbVie, Inc. 20,197 2,439,394Bristol-Myers Squibb Co. 17,950 1,200,137Eli Lilly & Co. 7,503 1,937,950Johnson & Johnson 16,277 2,818,037Merck & Co., Inc. 18,781 1,432,802Organon & Co. 1,877 63,611Zoetis, Inc. 97,223 19,887,937
29,779,868Medical-HMO - 0.3%
Humana, Inc. 1,036 420,015UnitedHealth Group, Inc. 7,583 3,156,576
3,576,591Metal-Copper - 0.0%
Freeport-McMoRan, Inc. 14,041 510,952Networking Products - 0.0%
Arista Networks, Inc.� 850 314,100Non-Hazardous Waste Disposal - 0.0%
Waste Management, Inc. 2,340 362,957Office Automation & Equipment - 0.0%
Zebra Technologies Corp., Class A� 604 354,651Office Supplies & Forms - 0.0%
Avery Dennison Corp. 539 121,485Oil Companies-Exploration & Production - 0.0%
Hess Corp. 2,248 154,550Power Converter/Supply Equipment - 0.0%
Generac Holdings, Inc.� 973 425,182Racetracks - 0.0%
Penn National Gaming, Inc.�# 1,377 111,675Real Estate Investment Trusts - 0.3%
American Tower Corp. 3,583 1,046,845Crown Castle International Corp. 4,007 780,123Duke Realty Corp. 2,376 124,764Equinix, Inc. 803 677,290Extra Space Storage, Inc. 992 185,415Public Storage 1,012 327,493SBA Communications Corp. 1,098 394,149
3,536,079Rental Auto/Equipment - 0.0%
United Rentals, Inc.� 1,118 394,263Respiratory Products - 0.0%
ResMed, Inc. 2,248 653,111
Copyright © 2021 www.secdatabase.com. All Rights Reserved.Please Consider the Environment Before Printing This Document

Retail-Apparel/Shoe - 0.0%
Victoria�s Secret & Co.� 1 0
Copyright © 2021 www.secdatabase.com. All Rights Reserved.Please Consider the Environment Before Printing This Document
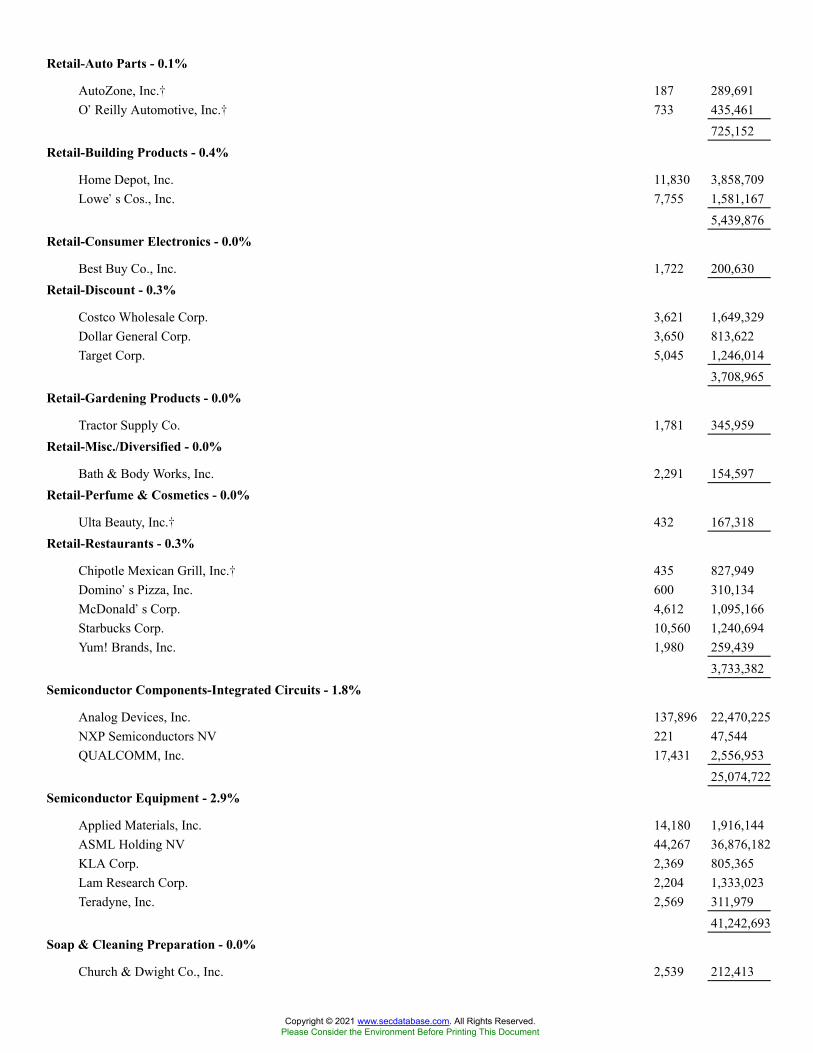
Retail-Auto Parts - 0.1%
AutoZone, Inc.� 187 289,691O�Reilly Automotive, Inc.� 733 435,461
725,152Retail-Building Products - 0.4%
Home Depot, Inc. 11,830 3,858,709Lowe�s Cos., Inc. 7,755 1,581,167
5,439,876Retail-Consumer Electronics - 0.0%
Best Buy Co., Inc. 1,722 200,630Retail-Discount - 0.3%
Costco Wholesale Corp. 3,621 1,649,329Dollar General Corp. 3,650 813,622Target Corp. 5,045 1,246,014
3,708,965Retail-Gardening Products - 0.0%
Tractor Supply Co. 1,781 345,959Retail-Misc./Diversified - 0.0%
Bath & Body Works, Inc. 2,291 154,597Retail-Perfume & Cosmetics - 0.0%
Ulta Beauty, Inc.� 432 167,318Retail-Restaurants - 0.3%
Chipotle Mexican Grill, Inc.� 435 827,949Domino�s Pizza, Inc. 600 310,134McDonald�s Corp. 4,612 1,095,166Starbucks Corp. 10,560 1,240,694Yum! Brands, Inc. 1,980 259,439
3,733,382Semiconductor Components-Integrated Circuits - 1.8%
Analog Devices, Inc. 137,896 22,470,225NXP Semiconductors NV 221 47,544QUALCOMM, Inc. 17,431 2,556,953
25,074,722Semiconductor Equipment - 2.9%
Applied Materials, Inc. 14,180 1,916,144ASML Holding NV 44,267 36,876,182KLA Corp. 2,369 805,365Lam Research Corp. 2,204 1,333,023Teradyne, Inc. 2,569 311,979
41,242,693Soap & Cleaning Preparation - 0.0%
Church & Dwight Co., Inc. 2,539 212,413
Copyright © 2021 www.secdatabase.com. All Rights Reserved.Please Consider the Environment Before Printing This Document
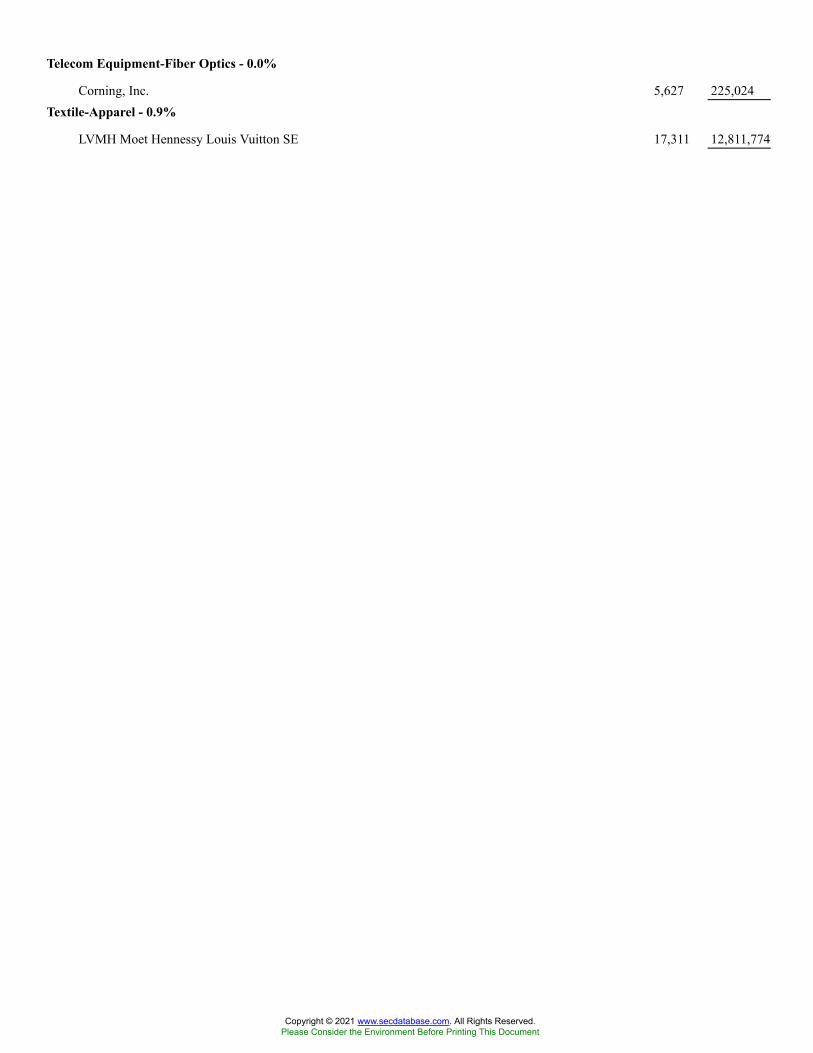
Telecom Equipment-Fiber Optics - 0.0%
Corning, Inc. 5,627 225,024Textile-Apparel - 0.9%
LVMH Moet Hennessy Louis Vuitton SE 17,311 12,811,774
Copyright © 2021 www.secdatabase.com. All Rights Reserved.Please Consider the Environment Before Printing This Document
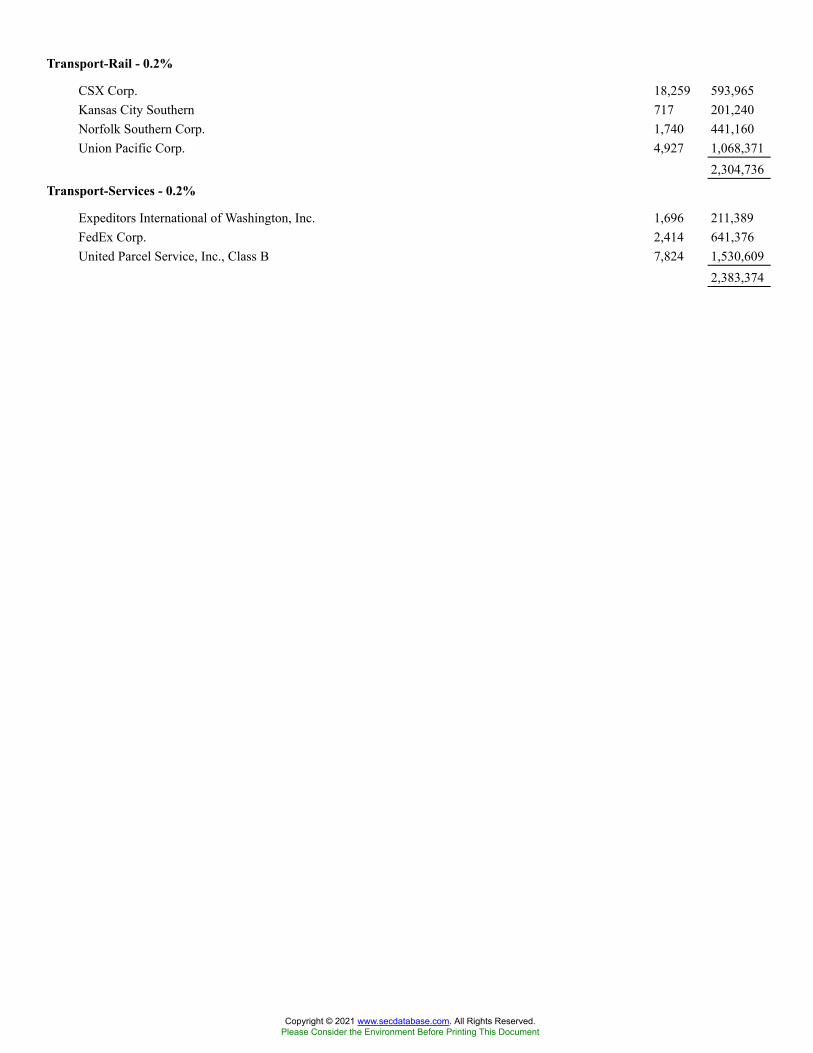
Transport-Rail - 0.2%
CSX Corp. 18,259 593,965Kansas City Southern 717 201,240Norfolk Southern Corp. 1,740 441,160Union Pacific Corp. 4,927 1,068,371
2,304,736Transport-Services - 0.2%
Expeditors International of Washington, Inc. 1,696 211,389FedEx Corp. 2,414 641,376United Parcel Service, Inc., Class B 7,824 1,530,609
2,383,374
Copyright © 2021 www.secdatabase.com. All Rights Reserved.Please Consider the Environment Before Printing This Document
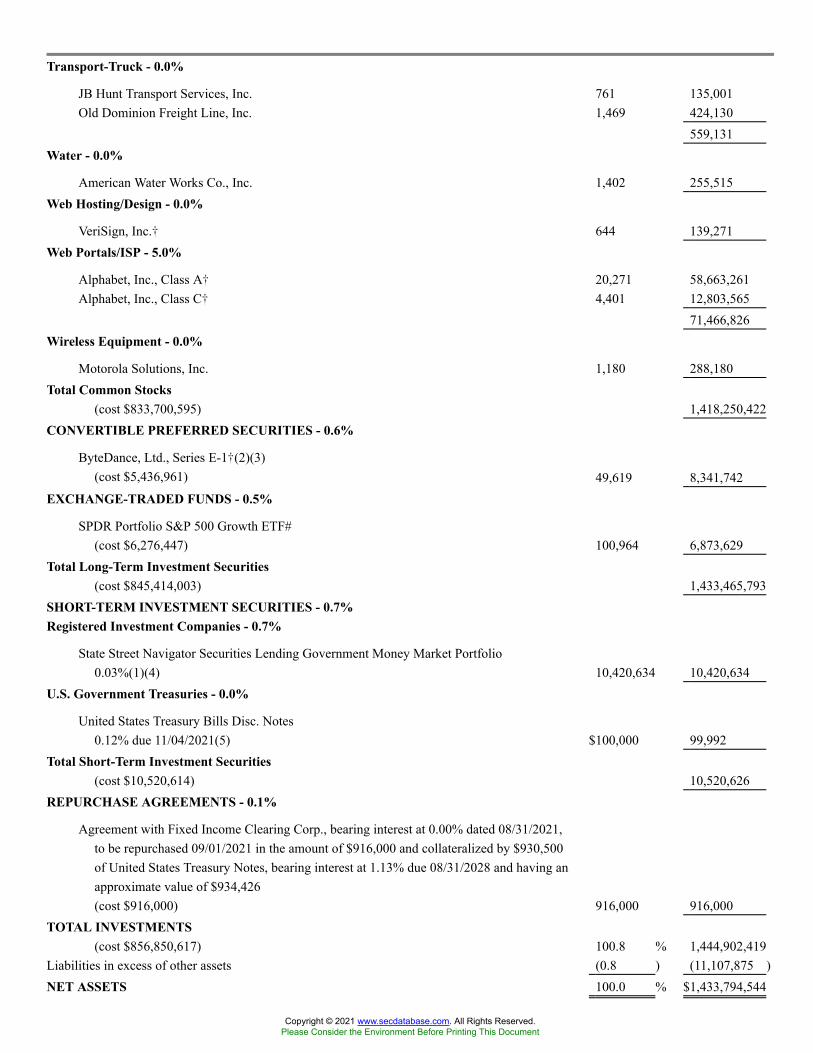
Transport-Truck - 0.0%
JB Hunt Transport Services, Inc. 761 135,001Old Dominion Freight Line, Inc. 1,469 424,130
559,131Water - 0.0%
American Water Works Co., Inc. 1,402 255,515Web Hosting/Design - 0.0%
VeriSign, Inc.� 644 139,271Web Portals/ISP - 5.0%
Alphabet, Inc., Class A� 20,271 58,663,261Alphabet, Inc., Class C� 4,401 12,803,565
71,466,826Wireless Equipment - 0.0%
Motorola Solutions, Inc. 1,180 288,180Total Common Stocks
(cost $833,700,595) 1,418,250,422CONVERTIBLE PREFERRED SECURITIES - 0.6%
ByteDance, Ltd., Series E-1�(2)(3)(cost $5,436,961) 49,619 8,341,742
EXCHANGE-TRADED FUNDS - 0.5%
SPDR Portfolio S&P 500 Growth ETF#(cost $6,276,447) 100,964 6,873,629
Total Long-Term Investment Securities(cost $845,414,003) 1,433,465,793
SHORT-TERM INVESTMENT SECURITIES - 0.7%Registered Investment Companies - 0.7%
State Street Navigator Securities Lending Government Money Market Portfolio0.03%(1)(4) 10,420,634 10,420,634
U.S. Government Treasuries - 0.0%
United States Treasury Bills Disc. Notes0.12% due 11/04/2021(5) $100,000 99,992
Total Short-Term Investment Securities(cost $10,520,614) 10,520,626
REPURCHASE AGREEMENTS - 0.1%
Agreement with Fixed Income Clearing Corp., bearing interest at 0.00% dated 08/31/2021,to be repurchased 09/01/2021 in the amount of $916,000 and collateralized by $930,500of United States Treasury Notes, bearing interest at 1.13% due 08/31/2028 and having anapproximate value of $934,426(cost $916,000) 916,000 916,000
TOTAL INVESTMENTS(cost $856,850,617) 100.8 % 1,444,902,419
Liabilities in excess of other assets (0.8 ) (11,107,875 )NET ASSETS 100.0 % $1,433,794,544
Copyright © 2021 www.secdatabase.com. All Rights Reserved.Please Consider the Environment Before Printing This Document

� Non-income producing security# The security or a portion thereof is out on loan.* Securities exempt from registration under Rule 144A of the Securities Act of 1933. These securities may be sold in transactions
exempt from registration, normally to qualified institutional buyers. The Fund has no right to demand registration of thesesecurities. At August 31, 2021, the aggregate value of these securities was $41,568,086 representing 2.9% of net assets.
(1) At August 31, 2021, the Fund had loaned securities with a total value of $10,186,986. This was secured by collateral of$10,420,634, which was received in cash and subsequently invested in short-term investments currently valued at $10,420,634 asreported in the Portfolio of Investments. Additional collateral $115,622 received in the form of fixed income pooled securities,which the Fund cannot sell or repledge and accordingly, are not reflected in the Fund�s assets and liabilities.
Securities Coupon Range Maturity Date Range
Value as of
August 31, 2021
Federal Home Loan Mtg. Corp.1.25% to 2.50%
03/01/2050 to 10/25/2050 $ 17,728
Federal National Mtg. Assoc.2.00% to 3.50%
06/01/2049 to 09/01/2050 61,147
Government National Mtg. Assoc.1.00% to 2.70%
06/20/2038 to 05/16/2053 33,650
United States Treasury Notes/Bonds0.13% to 1.75%
01/31/2022 to 11/15/2029 3,097
(2) Securities classified as Level 3 (see Note 1).(3) Denotes a restricted security that: (a) cannot be offered for public sale without first being registered, or being able to take
advantage of an exemption from registration, under the Securities Act of 1933, as amended (the �1933 Act�); (b) is subject to acontractual restriction on public sales; or (c) is otherwise subject to a restriction on sales by operation of applicable law. Restrictedsecurities are valued pursuant to Note 1. Certain restricted securities held by the Fund may not be sold except in exempttransactions or in a public offering registered under the 1933 Act. The Fund has no right to demand registration of these securities.The risk of investing in certain restricted securities is greater than the risk of investing in the securities of widely held, publiclytraded companies. To the extent applicable, lack of a secondary market and resale restrictions may result in the inability of a Fundto sell a security at a fair price and may substantially delay the sale of the security. In addition, certain restricted securities mayexhibit greater price volatility than securities for which secondary markets exist. As of August 31, 2021, the Fund held thefollowing restricted securities:
Restricted Table
Description
Acquisition
Date Shares
Acquisition
Cost Value
Value
Per
Share
% of
Net
Assets
Common StocksByteDance, Ltd., Series E-1 12/10/
2020 49,619 $5,439,961 $8,341,742 $168.12 0.60%
(4) The rate shown is the 7-day yield as of August 31, 2021.(5) The security or a portion thereof was pledge as collateral to cover margin requirements for open futures contracts.ADR- American Depositary ReceiptETF - Exchange-Traded Funds
Futures ContractsNumber
of
Contracts Type Description Expiration Month
Notional
Basis*
Notional
Value*
Unrealized
Appreciation
(Depreciation)
Copyright © 2021 www.secdatabase.com. All Rights Reserved.Please Consider the Environment Before Printing This Document

4 Long S&P 500 E-Mini Index September 2021 $848,947 $904,100 $ 55,153
* Notional basis refers to the contractual amount agreed upon at inception of the open contract; notional value represents the currentvalue of the open contract.
The following is a summary of the inputs used to value the Fund�s net assets as of August 31, 2021 (see Note 1):
Level 1 - Unadjusted
Quoted Prices
Level 2 - Other
Observable Inputs
Level 3 - Significant
Unobservable Inputs Total
ASSETS:Investments at Value:*Common Stocks $1,418,250,422 $ � $ � $1,418,250,422Convertible Preferred Securities � � 8,341,742 8,341,742Exchange-Traded Funds 6,873,629 � � 6,873,629Short-Term Investment Securities:
Registered Investment Companies 10,420,634 � � 10,420,634U.S Government Treasuries � 99,992 � 99,992
Repurchase Agreements � 916,000 � 916,000Total Investments at Value $1,435,544,685 $ 1,015,992 $ 8,341,742 $1,444,902,419
Other Financial Instruments:�Futures Contracts $55,153 $ � $ � $55,153
* For a detailed presentation of investments, please refer to the Portfolio of Investments.� Amounts represent unrealized appreciation/depreciation as of the end of the reporting period.
At the end of the reporting period, Level 3 investments in securities were not considered a material portion of the Fund.
There were no material Level 3 transfers during the reporting period.
See Notes to Portfolio of Investments
Copyright © 2021 www.secdatabase.com. All Rights Reserved.Please Consider the Environment Before Printing This Document
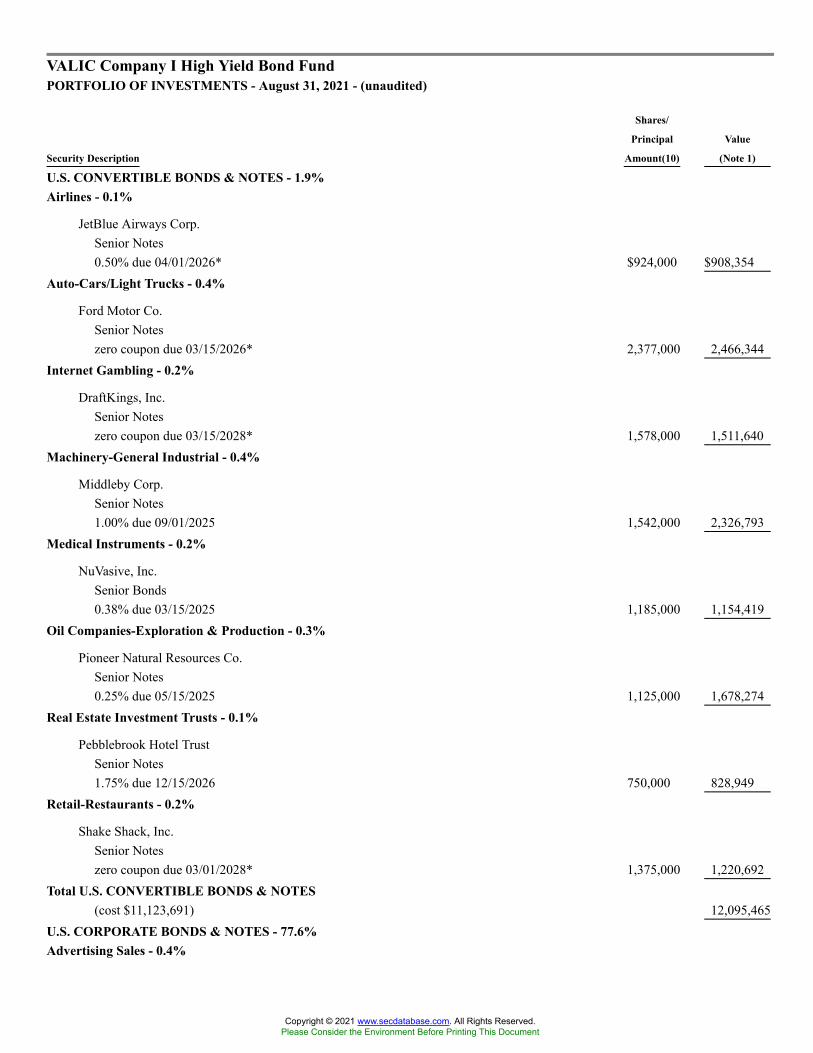
VALIC Company I High Yield Bond FundPORTFOLIO OF INVESTMENTS - August 31, 2021 - (unaudited)
Security Description
Shares/
Principal
Amount(10)
Value
(Note 1)
U.S. CONVERTIBLE BONDS & NOTES - 1.9%Airlines - 0.1%
JetBlue Airways Corp.Senior Notes0.50% due 04/01/2026* $924,000 $908,354
Auto-Cars/Light Trucks - 0.4%
Ford Motor Co.Senior Noteszero coupon due 03/15/2026* 2,377,000 2,466,344
Internet Gambling - 0.2%
DraftKings, Inc.Senior Noteszero coupon due 03/15/2028* 1,578,000 1,511,640
Machinery-General Industrial - 0.4%
Middleby Corp.Senior Notes1.00% due 09/01/2025 1,542,000 2,326,793
Medical Instruments - 0.2%
NuVasive, Inc.Senior Bonds0.38% due 03/15/2025 1,185,000 1,154,419
Oil Companies-Exploration & Production - 0.3%
Pioneer Natural Resources Co.Senior Notes0.25% due 05/15/2025 1,125,000 1,678,274
Real Estate Investment Trusts - 0.1%
Pebblebrook Hotel TrustSenior Notes1.75% due 12/15/2026 750,000 828,949
Retail-Restaurants - 0.2%
Shake Shack, Inc.Senior Noteszero coupon due 03/01/2028* 1,375,000 1,220,692
Total U.S. CONVERTIBLE BONDS & NOTES(cost $11,123,691) 12,095,465
U.S. CORPORATE BONDS & NOTES - 77.6%Advertising Sales - 0.4%
Copyright © 2021 www.secdatabase.com. All Rights Reserved.Please Consider the Environment Before Printing This Document

Lamar Media Corp.Company Guar. Notes3.75% due 02/15/2028 2,210,000 2,270,598
Copyright © 2021 www.secdatabase.com. All Rights Reserved.Please Consider the Environment Before Printing This Document

Aerospace/Defense-Equipment - 1.2%
TransDigm, Inc.Company Guar. Notes5.50% due 11/15/2027 2,330,000 2,385,338
TransDigm, Inc.Senior Sec. Notes6.25% due 03/15/2026* 4,210,000 4,425,762
TransDigm, Inc.Senior Sec. Notes8.00% due 12/15/2025* 845,000 904,150
7,715,250Apparel Manufacturers - 0.3%
PVH Corp.Senior Notes4.63% due 07/10/2025 1,720,000 1,912,623
Applications Software - 1.1%
CDK Global, Inc.Senior Notes5.25% due 05/15/2029* 1,620,000 1,761,296
PTC, Inc.Company Guar. Notes3.63% due 02/15/2025* 355,000 362,988
PTC, Inc.Company Guar. Notes4.00% due 02/15/2028* 390,000 403,163
SS&C Technologies, Inc.Company Guar. Notes5.50% due 09/30/2027* 4,215,000 4,463,474
6,990,921Auto-Cars/Light Trucks - 3.2%
Ford Motor Co.Senior Notes4.35% due 12/08/2026 555,000 597,840
Ford Motor Co.Senior Notes8.50% due 04/21/2023 2,395,000 2,649,469
Ford Motor Credit Co. LLCSenior Notes3.09% due 01/09/2023 1,885,000 1,920,344
Ford Motor Credit Co. LLCSenior Notes3.35% due 11/01/2022 1,015,000 1,037,330
Ford Motor Credit Co. LLCSenior Notes3.37% due 11/17/2023 2,165,000 2,234,280
Copyright © 2021 www.secdatabase.com. All Rights Reserved.Please Consider the Environment Before Printing This Document
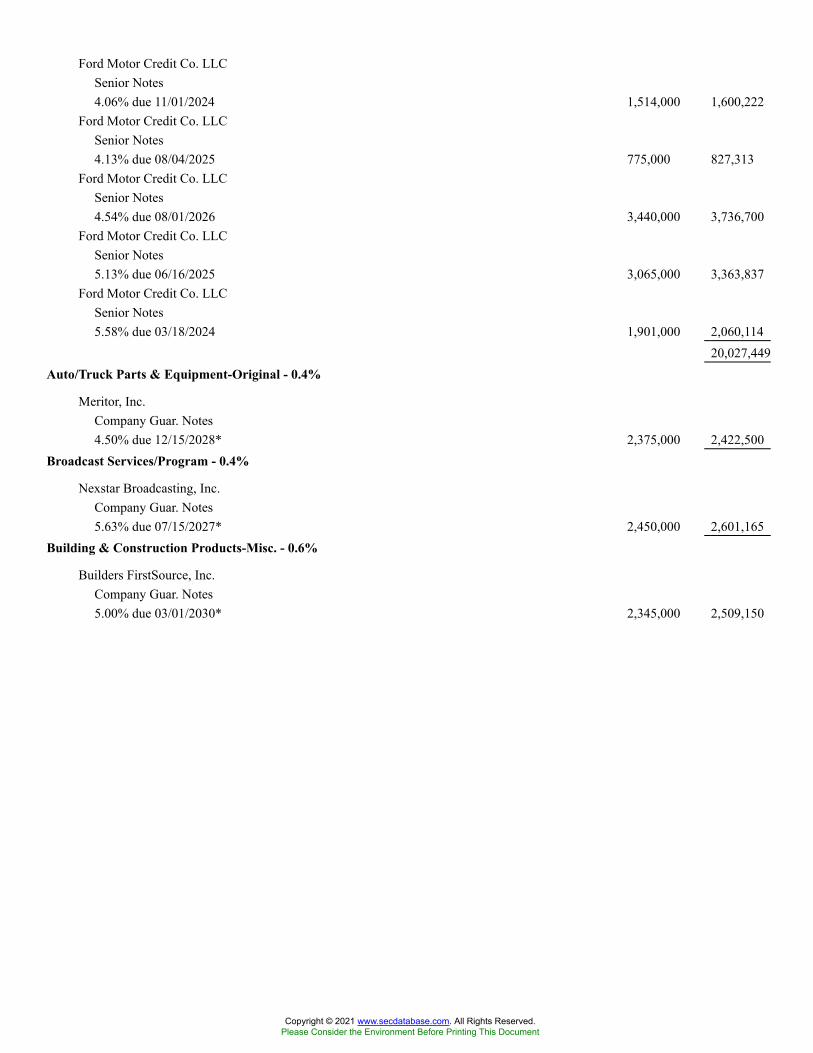
Ford Motor Credit Co. LLCSenior Notes4.06% due 11/01/2024 1,514,000 1,600,222
Ford Motor Credit Co. LLCSenior Notes4.13% due 08/04/2025 775,000 827,313
Ford Motor Credit Co. LLCSenior Notes4.54% due 08/01/2026 3,440,000 3,736,700
Ford Motor Credit Co. LLCSenior Notes5.13% due 06/16/2025 3,065,000 3,363,837
Ford Motor Credit Co. LLCSenior Notes5.58% due 03/18/2024 1,901,000 2,060,114
20,027,449Auto/Truck Parts & Equipment-Original - 0.4%
Meritor, Inc.Company Guar. Notes4.50% due 12/15/2028* 2,375,000 2,422,500
Broadcast Services/Program - 0.4%
Nexstar Broadcasting, Inc.Company Guar. Notes5.63% due 07/15/2027* 2,450,000 2,601,165
Building & Construction Products-Misc. - 0.6%
Builders FirstSource, Inc.Company Guar. Notes5.00% due 03/01/2030* 2,345,000 2,509,150
Copyright © 2021 www.secdatabase.com. All Rights Reserved.Please Consider the Environment Before Printing This Document
Victors Merger Corp.Senior Notes6.38% due 05/15/2029* 1,170,000 1,161,225
3,670,375Building-Mobile Home/Manufactured Housing - 0.4%
Williams Scotsman International, Inc.Senior Sec. Notes4.63% due 08/15/2028* 2,559,000 2,654,963
Building-Residential/Commercial - 2.8%
Adams Homes, Inc.Company Guar. Notes7.50% due 02/15/2025* 455,000 476,044
Ashton Woods USA LLC/Ashton Woods Finance Co.Senior Notes4.63% due 08/01/2029* 1,315,000 1,315,000
Ashton Woods USA LLC/Ashton Woods Finance Co.Senior Notes6.63% due 01/15/2028* 2,000,000 2,125,000
Century Communities, Inc.Company Guar. Notes3.88% due 08/15/2029* 3,465,000 3,517,668
KB HomeCompany Guar. Notes4.80% due 11/15/2029 755,000 836,163
M/I Homes, Inc.Company Guar. Notes3.95% due 02/15/2030* 1,910,000 1,930,112
M/I Homes, Inc.Company Guar. Notes4.95% due 02/01/2028 1,145,000 1,199,387
STL Holding Co. LLCSenior Notes7.50% due 02/15/2026* 1,840,000 1,950,400
Taylor Morrison Communities, Inc.Senior Notes5.13% due 08/01/2030* 430,000 470,411
Taylor Morrison Communities, Inc.Company Guar. Notes5.75% due 01/15/2028* 3,460,000 3,901,150
17,721,335Cable/Satellite TV - 4.6%
CCO Holdings LLC/CCO Holdings Capital Corp.Senior Notes4.25% due 02/01/2031* 3,695,000 3,791,994
CCO Holdings LLC/CCO Holdings Capital Corp.Senior Notes4.25% due 01/15/2034* 3,200,000 3,228,800
Copyright © 2021 www.secdatabase.com. All Rights Reserved.Please Consider the Environment Before Printing This Document
CCO Holdings LLC/CCO Holdings Capital Corp.Senior Notes4.50% due 08/15/2030* 1,605,000 1,677,000
CCO Holdings LLC/CCO Holdings Capital Corp.Senior Notes4.50% due 05/01/2032 1,240,000 1,295,614
CCO Holdings LLC/CCO Holdings Capital Corp.Senior Notes5.75% due 02/15/2026* 2,167,000 2,229,301
CSC Holdings LLCSenior Notes5.25% due 06/01/2024 1,900,000 2,049,625
CSC Holdings LLCCompany Guar. Notes5.50% due 04/15/2027* 825,000 863,055
CSC Holdings LLCCompany Guar. Notes6.50% due 02/01/2029* 2,850,000 3,145,687
DISH DBS Corp.Company Guar. Notes5.00% due 03/15/2023 2,345,000 2,447,594
DISH DBS Corp.Company Guar. Notes5.88% due 07/15/2022 1,800,000 1,861,524
DISH DBS Corp.Company Guar. Notes5.88% due 11/15/2024 2,275,000 2,445,625
DISH DBS Corp.Company Guar. Notes7.38% due 07/01/2028# 1,350,000 1,452,772
DISH DBS Corp.Company Guar. Notes7.75% due 07/01/2026 990,000 1,133,996
Sirius XM Radio, Inc.Company Guar. Notes3.13% due 09/01/2026* 1,325,000 1,350,043
28,972,630Casino Hotels - 0.9%
Sugarhouse HSP Gaming Prop Mezz LP/Sugarhouse HSP Gaming Finance Corp.Senior Sec. Notes5.88% due 05/15/2025* 1,560,000 1,559,064
Wynn Las Vegas LLCCompany Guar. Notes5.50% due 03/01/2025* 2,560,000 2,713,600
Wynn Las Vegas LLC/Wynn Las Vegas Capital Corp.Company Guar. Notes5.25% due 05/15/2027*# 1,290,000 1,354,500
5,627,164
Copyright © 2021 www.secdatabase.com. All Rights Reserved.Please Consider the Environment Before Printing This Document

Casino Services - 0.7%
Caesars Entertainment, Inc.Senior Sec. Notes6.25% due 07/01/2025* 2,490,000 2,631,805
Caesars Entertainment, Inc.Senior Notes8.13% due 07/01/2027* 1,390,000 1,536,367
4,168,172
Copyright © 2021 www.secdatabase.com. All Rights Reserved.Please Consider the Environment Before Printing This Document
Cellular Telecom - 2.5%
Sprint Corp.Company Guar. Notes7.13% due 06/15/2024 4,114,000 4,731,100
Sprint Corp.Company Guar. Notes7.63% due 02/15/2025 1,425,000 1,686,844
Sprint Corp.Company Guar. Notes7.88% due 09/15/2023 2,025,000 2,294,224
T-Mobile USA, Inc.Company Guar. Notes2.25% due 02/15/2026 1,110,000 1,133,587
T-Mobile USA, Inc.Company Guar. Notes2.25% due 02/15/2026* 2,255,000 2,302,919
T-Mobile USA, Inc.Company Guar. Notes2.63% due 04/15/2026 3,825,000 3,930,187
16,078,861Commercial Services - 0.4%
Nielsen Finance LLC/Nielsen Finance Co.Company Guar. Notes4.50% due 07/15/2029* 2,703,000 2,678,403
Computer Services - 0.8%
Presidio Holdings, Inc.Senior Sec. Notes4.88% due 02/01/2027* 3,231,000 3,344,085
Presidio Holdings, Inc.Company Guar. Notes8.25% due 02/01/2028* 1,340,000 1,454,503
4,798,588Containers-Metal/Glass - 1.4%
BWAY Holding Co.Senior Notes7.25% due 04/15/2025* 1,525,000 1,507,539
Owens-Brockway Glass Container, Inc.Company Guar. Notes5.38% due 01/15/2025*# 3,090,000 3,314,674
Silgan Holdings, Inc.Company Guar. Notes2.25% due 06/01/2028 EUR 3,400,000 4,036,631
8,858,844Containers-Paper/Plastic - 1.0%
Copyright © 2021 www.secdatabase.com. All Rights Reserved.Please Consider the Environment Before Printing This Document
Berry Global Escrow Corp.Sec. Notes5.63% due 07/15/2027* 1,835,000 1,931,337
Flex Acquisition Co., Inc.Senior Notes6.88% due 01/15/2025* 3,020,000 3,050,200
Flex Acquisition Co., Inc.Senior Notes7.88% due 07/15/2026* 1,340,000 1,407,000
6,388,537Diagnostic Equipment - 0.4%
Avantor Funding, Inc.Company Guar. Notes4.63% due 07/15/2028* 2,505,000 2,648,787
Distribution/Wholesale - 0.7%
ABC Supply Co., Inc.Senior Sec. Notes4.00% due 01/15/2028* 1,225,000 1,265,302
G-III Apparel Group, Ltd.Senior Sec. Notes7.88% due 08/15/2025* 1,780,000 1,924,625
IAA Spinco, Inc.Senior Notes5.50% due 06/15/2027* 1,200,000 1,252,500
4,442,427E-Commerce/Services - 0.4%
Go Daddy Operating Co. LLC/GD Finance Co., Inc.Company Guar. Notes3.50% due 03/01/2029* 2,230,000 2,202,125
Electronic Parts Distribution - 0.6%
Imola Merger Corp.Senior Sec. Notes4.75% due 05/15/2029* 3,785,000 3,917,475
Enterprise Software/Service - 0.4%
BY Crown Parent LLC/BY Bond Finance, Inc.Senior Sec. Notes4.25% due 01/31/2026* 825,000 868,313
Open Text Holdings, Inc.Company Guar. Notes4.13% due 02/15/2030* 1,525,000 1,605,596
2,473,909Finance-Auto Loans - 0.5%
Credit Acceptance Corp.Company Guar. Notes5.13% due 12/31/2024* 1,470,000 1,514,100
Copyright © 2021 www.secdatabase.com. All Rights Reserved.Please Consider the Environment Before Printing This Document
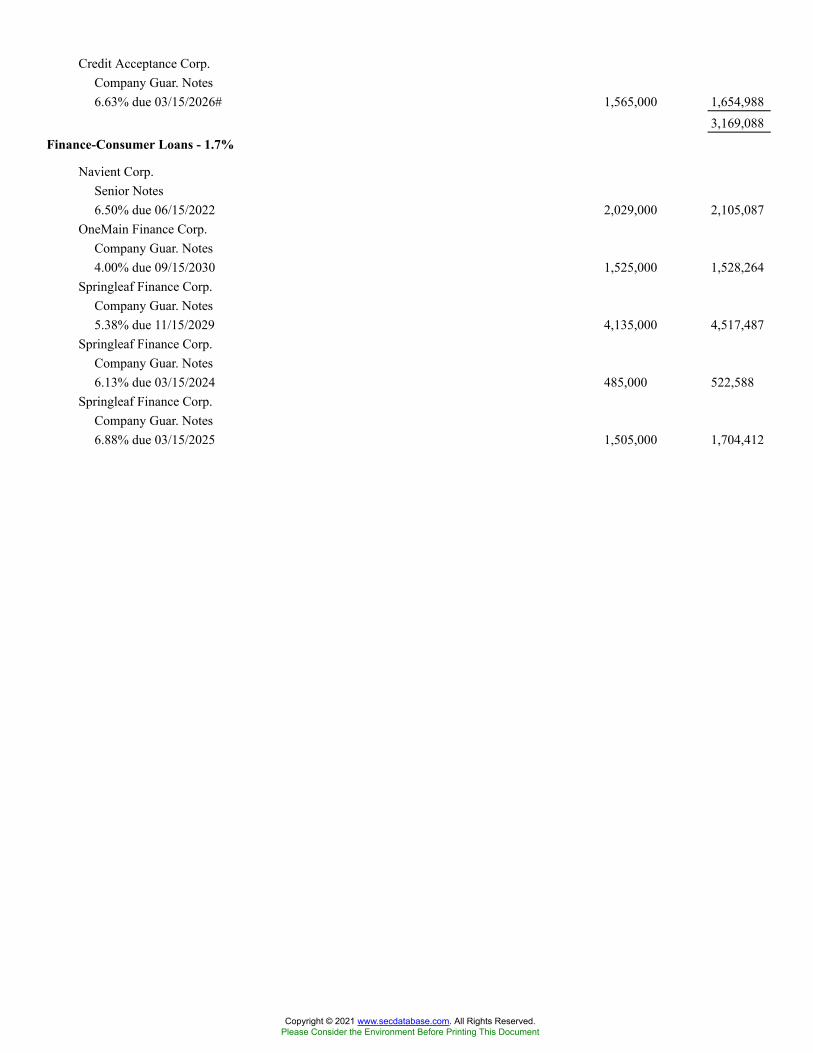
Credit Acceptance Corp.Company Guar. Notes6.63% due 03/15/2026# 1,565,000 1,654,988
3,169,088Finance-Consumer Loans - 1.7%
Navient Corp.Senior Notes6.50% due 06/15/2022 2,029,000 2,105,087
OneMain Finance Corp.Company Guar. Notes4.00% due 09/15/2030 1,525,000 1,528,264
Springleaf Finance Corp.Company Guar. Notes5.38% due 11/15/2029 4,135,000 4,517,487
Springleaf Finance Corp.Company Guar. Notes6.13% due 03/15/2024 485,000 522,588
Springleaf Finance Corp.Company Guar. Notes6.88% due 03/15/2025 1,505,000 1,704,412
Copyright © 2021 www.secdatabase.com. All Rights Reserved.Please Consider the Environment Before Printing This Document
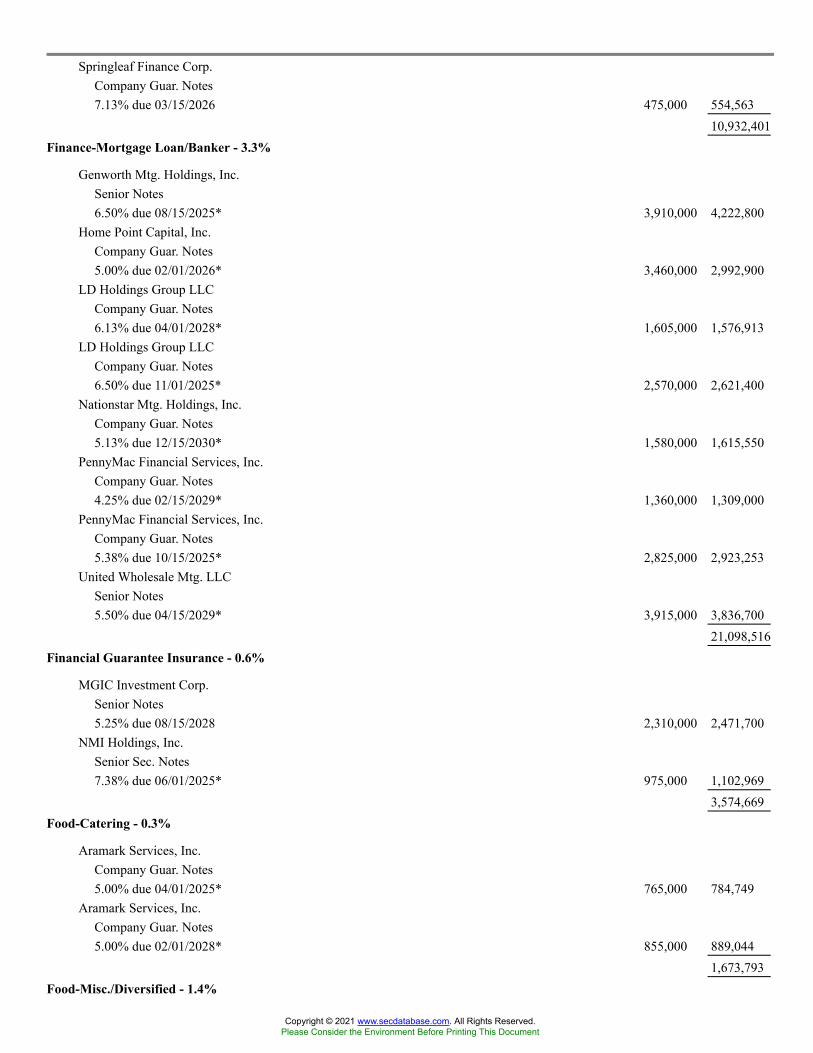
Springleaf Finance Corp.Company Guar. Notes7.13% due 03/15/2026 475,000 554,563
10,932,401Finance-Mortgage Loan/Banker - 3.3%
Genworth Mtg. Holdings, Inc.Senior Notes6.50% due 08/15/2025* 3,910,000 4,222,800
Home Point Capital, Inc.Company Guar. Notes5.00% due 02/01/2026* 3,460,000 2,992,900
LD Holdings Group LLCCompany Guar. Notes6.13% due 04/01/2028* 1,605,000 1,576,913
LD Holdings Group LLCCompany Guar. Notes6.50% due 11/01/2025* 2,570,000 2,621,400
Nationstar Mtg. Holdings, Inc.Company Guar. Notes5.13% due 12/15/2030* 1,580,000 1,615,550
PennyMac Financial Services, Inc.Company Guar. Notes4.25% due 02/15/2029* 1,360,000 1,309,000
PennyMac Financial Services, Inc.Company Guar. Notes5.38% due 10/15/2025* 2,825,000 2,923,253
United Wholesale Mtg. LLCSenior Notes5.50% due 04/15/2029* 3,915,000 3,836,700
21,098,516Financial Guarantee Insurance - 0.6%
MGIC Investment Corp.Senior Notes5.25% due 08/15/2028 2,310,000 2,471,700
NMI Holdings, Inc.Senior Sec. Notes7.38% due 06/01/2025* 975,000 1,102,969
3,574,669Food-Catering - 0.3%
Aramark Services, Inc.Company Guar. Notes5.00% due 04/01/2025* 765,000 784,749
Aramark Services, Inc.Company Guar. Notes5.00% due 02/01/2028* 855,000 889,044
1,673,793Food-Misc./Diversified - 1.4%
Copyright © 2021 www.secdatabase.com. All Rights Reserved.Please Consider the Environment Before Printing This Document

B&G Foods, Inc.Company Guar. Notes5.25% due 09/15/2027 3,140,000 3,260,890
Post Holdings, Inc.Company Guar. Notes5.63% due 01/15/2028* 2,974,000 3,130,135
Post Holdings, Inc.Company Guar. Notes5.75% due 03/01/2027* 1,440,000 1,507,248
TreeHouse Foods, Inc.Company Guar. Notes4.00% due 09/01/2028 979,000 943,609
8,841,882Food-Wholesale/Distribution - 0.5%
Performance Food Group, Inc.Company Guar. Notes4.25% due 08/01/2029* 1,525,000 1,530,170
Performance Food Group, Inc.Company Guar. Notes5.50% due 10/15/2027* 1,765,000 1,837,806
3,367,976Funeral Services & Related Items - 0.3%
Service Corp. InternationalSenior Notes4.63% due 12/15/2027 735,000 777,042
Service Corp. InternationalSenior Notes5.13% due 06/01/2029 725,000 790,576
1,567,618Gambling (Non-Hotel) - 1.0%
Caesars Resort Collection LLC/CRC Finco, Inc.Company Guar. Notes5.25% due 10/15/2025* 2,880,000 2,920,896
Caesars Resort Collection LLC/CRC Finco, Inc.Senior Sec. Notes5.75% due 07/01/2025* 640,000 672,000
Jacobs Entertainment, Inc.Sec. Notes7.88% due 02/01/2024* 2,695,000 2,816,275
6,409,171Gas-Distribution - 0.7%
AmeriGas Partners LP/AmeriGas Finance Corp.Senior Notes5.50% due 05/20/2025 751,000 825,161
Copyright © 2021 www.secdatabase.com. All Rights Reserved.Please Consider the Environment Before Printing This Document
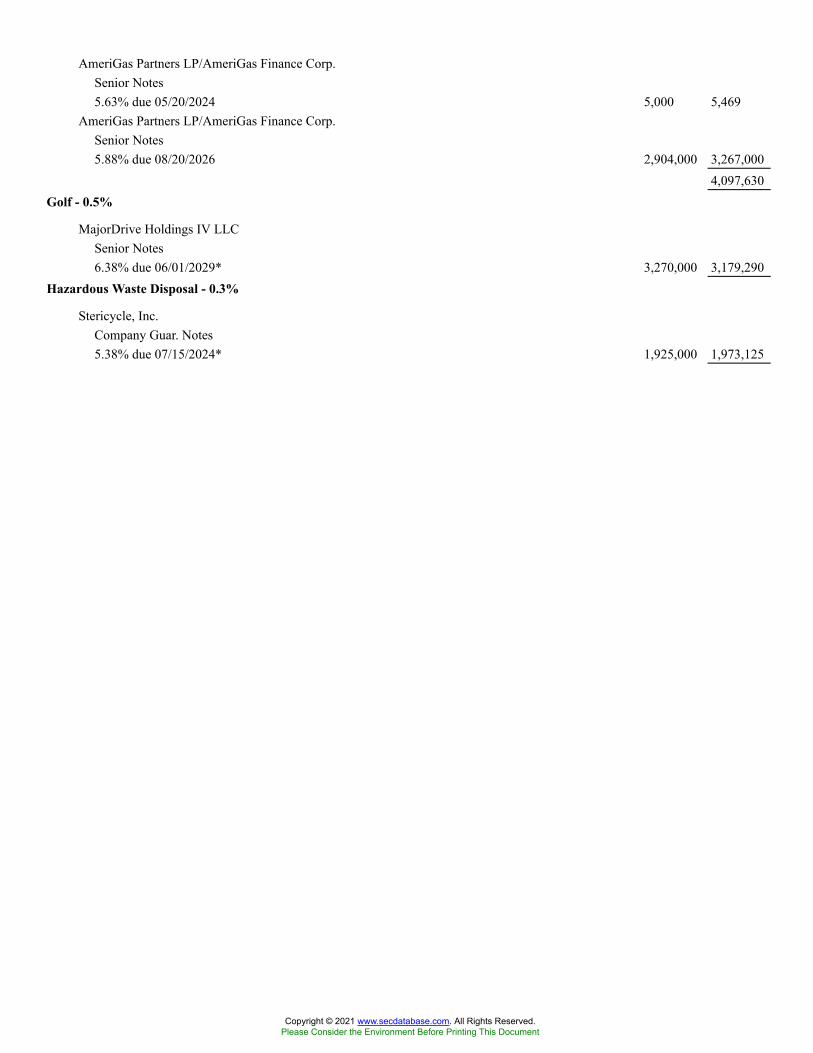
AmeriGas Partners LP/AmeriGas Finance Corp.Senior Notes5.63% due 05/20/2024 5,000 5,469
AmeriGas Partners LP/AmeriGas Finance Corp.Senior Notes5.88% due 08/20/2026 2,904,000 3,267,000
4,097,630Golf - 0.5%
MajorDrive Holdings IV LLCSenior Notes6.38% due 06/01/2029* 3,270,000 3,179,290
Hazardous Waste Disposal - 0.3%
Stericycle, Inc.Company Guar. Notes5.38% due 07/15/2024* 1,925,000 1,973,125
Copyright © 2021 www.secdatabase.com. All Rights Reserved.Please Consider the Environment Before Printing This Document
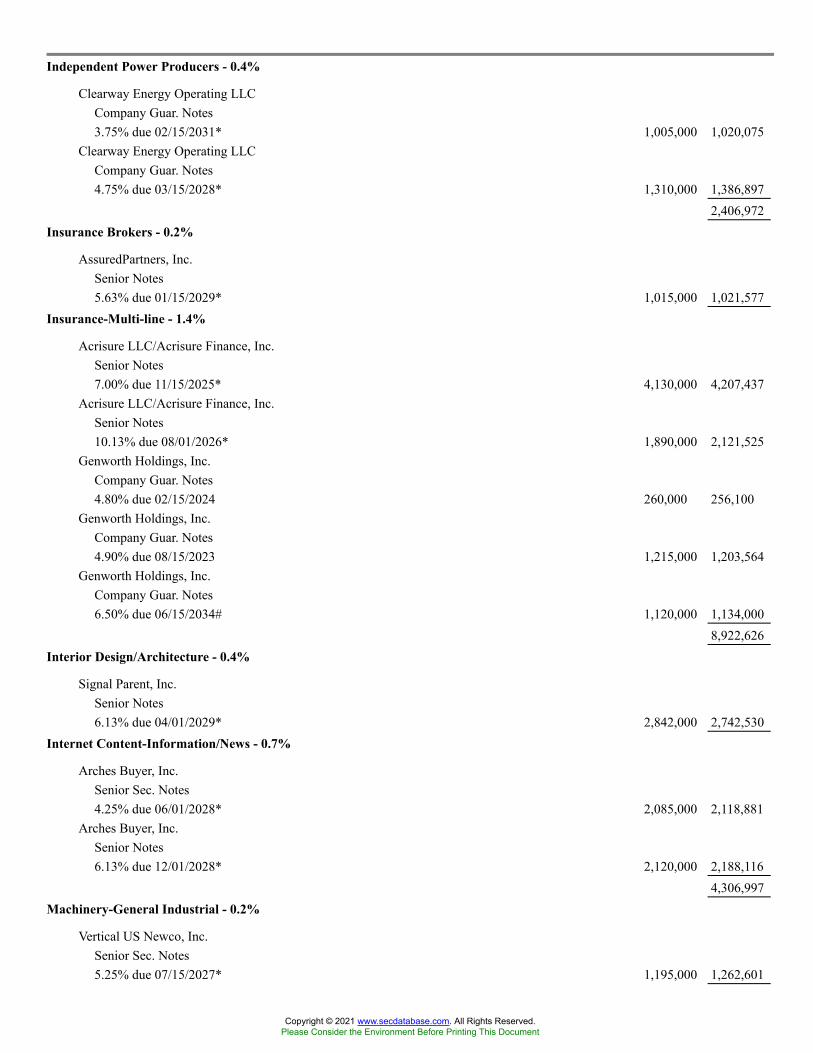
Independent Power Producers - 0.4%
Clearway Energy Operating LLCCompany Guar. Notes3.75% due 02/15/2031* 1,005,000 1,020,075
Clearway Energy Operating LLCCompany Guar. Notes4.75% due 03/15/2028* 1,310,000 1,386,897
2,406,972Insurance Brokers - 0.2%
AssuredPartners, Inc.Senior Notes5.63% due 01/15/2029* 1,015,000 1,021,577
Insurance-Multi-line - 1.4%
Acrisure LLC/Acrisure Finance, Inc.Senior Notes7.00% due 11/15/2025* 4,130,000 4,207,437
Acrisure LLC/Acrisure Finance, Inc.Senior Notes10.13% due 08/01/2026* 1,890,000 2,121,525
Genworth Holdings, Inc.Company Guar. Notes4.80% due 02/15/2024 260,000 256,100
Genworth Holdings, Inc.Company Guar. Notes4.90% due 08/15/2023 1,215,000 1,203,564
Genworth Holdings, Inc.Company Guar. Notes6.50% due 06/15/2034# 1,120,000 1,134,000
8,922,626Interior Design/Architecture - 0.4%
Signal Parent, Inc.Senior Notes6.13% due 04/01/2029* 2,842,000 2,742,530
Internet Content-Information/News - 0.7%
Arches Buyer, Inc.Senior Sec. Notes4.25% due 06/01/2028* 2,085,000 2,118,881
Arches Buyer, Inc.Senior Notes6.13% due 12/01/2028* 2,120,000 2,188,116
4,306,997Machinery-General Industrial - 0.2%
Vertical US Newco, Inc.Senior Sec. Notes5.25% due 07/15/2027* 1,195,000 1,262,601
Copyright © 2021 www.secdatabase.com. All Rights Reserved.Please Consider the Environment Before Printing This Document
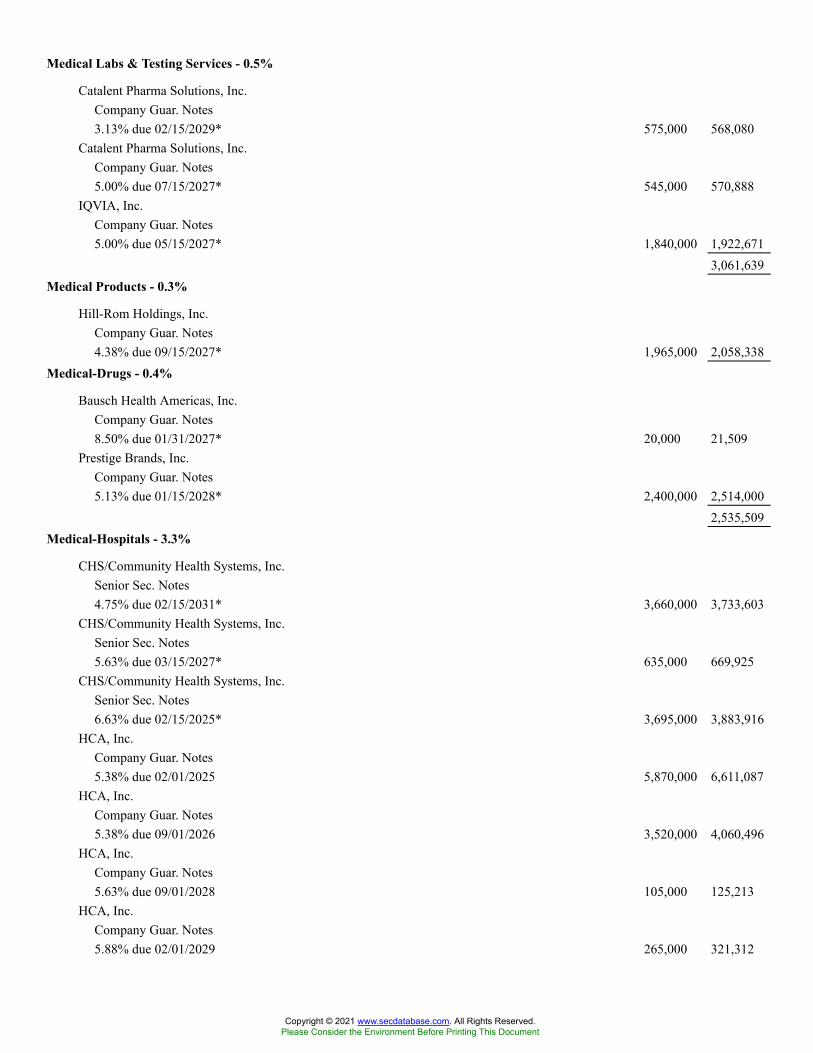
Medical Labs & Testing Services - 0.5%
Catalent Pharma Solutions, Inc.Company Guar. Notes3.13% due 02/15/2029* 575,000 568,080
Catalent Pharma Solutions, Inc.Company Guar. Notes5.00% due 07/15/2027* 545,000 570,888
IQVIA, Inc.Company Guar. Notes5.00% due 05/15/2027* 1,840,000 1,922,671
3,061,639Medical Products - 0.3%
Hill-Rom Holdings, Inc.Company Guar. Notes4.38% due 09/15/2027* 1,965,000 2,058,338
Medical-Drugs - 0.4%
Bausch Health Americas, Inc.Company Guar. Notes8.50% due 01/31/2027* 20,000 21,509
Prestige Brands, Inc.Company Guar. Notes5.13% due 01/15/2028* 2,400,000 2,514,000
2,535,509Medical-Hospitals - 3.3%
CHS/Community Health Systems, Inc.Senior Sec. Notes4.75% due 02/15/2031* 3,660,000 3,733,603
CHS/Community Health Systems, Inc.Senior Sec. Notes5.63% due 03/15/2027* 635,000 669,925
CHS/Community Health Systems, Inc.Senior Sec. Notes6.63% due 02/15/2025* 3,695,000 3,883,916
HCA, Inc.Company Guar. Notes5.38% due 02/01/2025 5,870,000 6,611,087
HCA, Inc.Company Guar. Notes5.38% due 09/01/2026 3,520,000 4,060,496
HCA, Inc.Company Guar. Notes5.63% due 09/01/2028 105,000 125,213
HCA, Inc.Company Guar. Notes5.88% due 02/01/2029 265,000 321,312
Copyright © 2021 www.secdatabase.com. All Rights Reserved.Please Consider the Environment Before Printing This Document
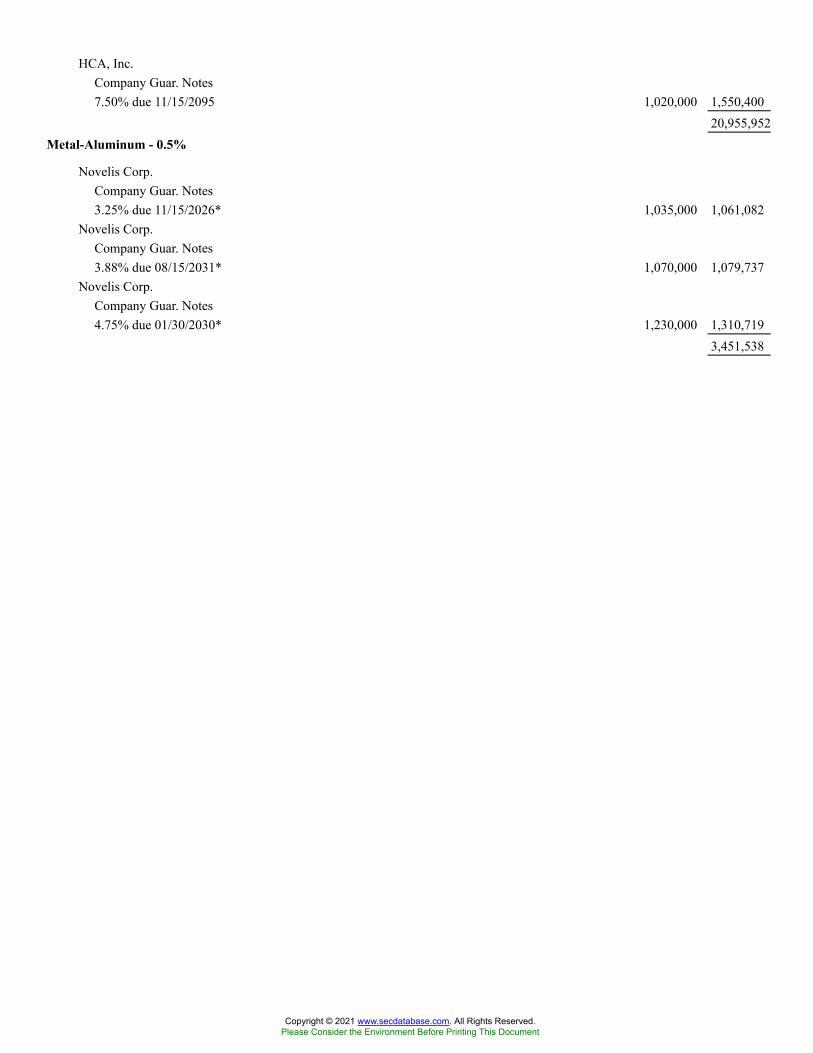
HCA, Inc.Company Guar. Notes7.50% due 11/15/2095 1,020,000 1,550,400
20,955,952Metal-Aluminum - 0.5%
Novelis Corp.Company Guar. Notes3.25% due 11/15/2026* 1,035,000 1,061,082
Novelis Corp.Company Guar. Notes3.88% due 08/15/2031* 1,070,000 1,079,737
Novelis Corp.Company Guar. Notes4.75% due 01/30/2030* 1,230,000 1,310,719
3,451,538
Copyright © 2021 www.secdatabase.com. All Rights Reserved.Please Consider the Environment Before Printing This Document
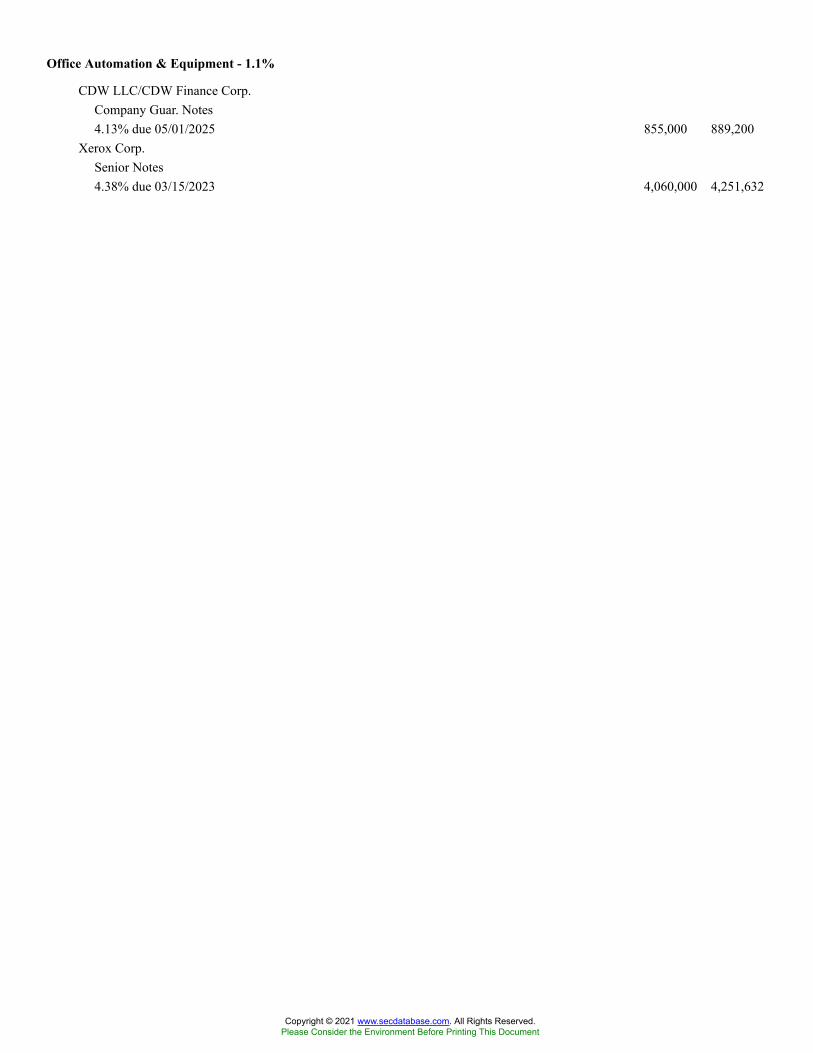
Office Automation & Equipment - 1.1%
CDW LLC/CDW Finance Corp.Company Guar. Notes4.13% due 05/01/2025 855,000 889,200
Xerox Corp.Senior Notes4.38% due 03/15/2023 4,060,000 4,251,632
Copyright © 2021 www.secdatabase.com. All Rights Reserved.Please Consider the Environment Before Printing This Document
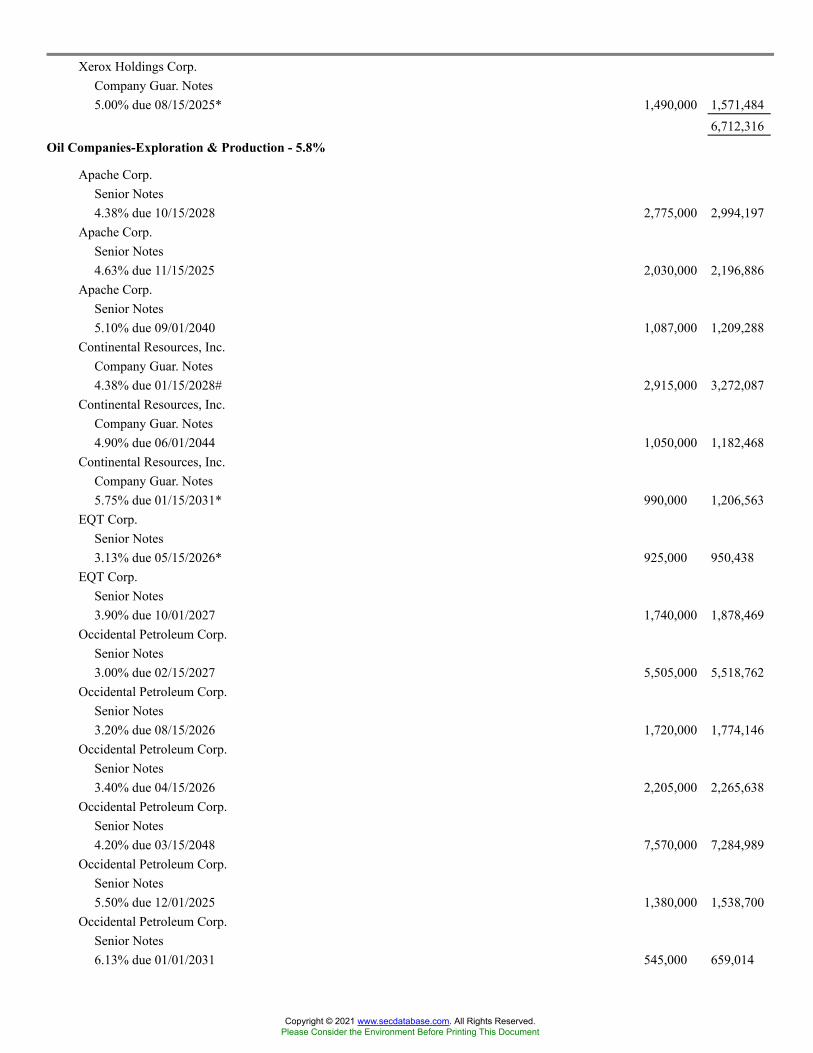
Xerox Holdings Corp.Company Guar. Notes5.00% due 08/15/2025* 1,490,000 1,571,484
6,712,316Oil Companies-Exploration & Production - 5.8%
Apache Corp.Senior Notes4.38% due 10/15/2028 2,775,000 2,994,197
Apache Corp.Senior Notes4.63% due 11/15/2025 2,030,000 2,196,886
Apache Corp.Senior Notes5.10% due 09/01/2040 1,087,000 1,209,288
Continental Resources, Inc.Company Guar. Notes4.38% due 01/15/2028# 2,915,000 3,272,087
Continental Resources, Inc.Company Guar. Notes4.90% due 06/01/2044 1,050,000 1,182,468
Continental Resources, Inc.Company Guar. Notes5.75% due 01/15/2031* 990,000 1,206,563
EQT Corp.Senior Notes3.13% due 05/15/2026* 925,000 950,438
EQT Corp.Senior Notes3.90% due 10/01/2027 1,740,000 1,878,469
Occidental Petroleum Corp.Senior Notes3.00% due 02/15/2027 5,505,000 5,518,762
Occidental Petroleum Corp.Senior Notes3.20% due 08/15/2026 1,720,000 1,774,146
Occidental Petroleum Corp.Senior Notes3.40% due 04/15/2026 2,205,000 2,265,638
Occidental Petroleum Corp.Senior Notes4.20% due 03/15/2048 7,570,000 7,284,989
Occidental Petroleum Corp.Senior Notes5.50% due 12/01/2025 1,380,000 1,538,700
Occidental Petroleum Corp.Senior Notes6.13% due 01/01/2031 545,000 659,014
Copyright © 2021 www.secdatabase.com. All Rights Reserved.Please Consider the Environment Before Printing This Document

Occidental Petroleum Corp.Senior Notes6.38% due 09/01/2028 288,000 340,808
Ovintiv Exploration, Inc.Company Guar. Notes5.63% due 07/01/2024 1,320,000 1,471,148
Range Resources Corp.Company Guar. Notes8.25% due 01/15/2029* 735,000 815,894
36,559,495Oil Refining & Marketing - 0.4%
Sunoco LP/Sunoco Finance Corp.Company Guar. Notes5.88% due 03/15/2028 375,000 396,094
Sunoco LP/Sunoco Finance Corp.Company Guar. Notes6.00% due 04/15/2027 1,900,000 1,985,329
2,381,423Pipelines - 8.0%
Antero Midstream Partners LP/Antero Midstream Finance Corp.Company Guar. Notes5.75% due 01/15/2028* 3,005,000 3,128,956
Buckeye Partners LPSenior Notes3.95% due 12/01/2026 2,401,000 2,478,312
Buckeye Partners LPSenior Notes4.13% due 03/01/2025* 945,000 976,894
Buckeye Partners LPSenior Notes4.13% due 12/01/2027 765,000 784,125
Buckeye Partners LPSenior Notes4.50% due 03/01/2028* 960,000 991,200
Cheniere Energy Partners LPCompany Guar. Notes4.50% due 10/01/2029 1,379,000 1,485,872
Cheniere Energy, Inc.Senior Sec. Notes4.63% due 10/15/2028 1,695,000 1,788,225
DCP Midstream Operating LPCompany Guar. Notes5.38% due 07/15/2025 5,105,000 5,621,881
DT Midstream, Inc.Company Guar. Notes4.13% due 06/15/2029* 3,123,000 3,201,075
Copyright © 2021 www.secdatabase.com. All Rights Reserved.Please Consider the Environment Before Printing This Document
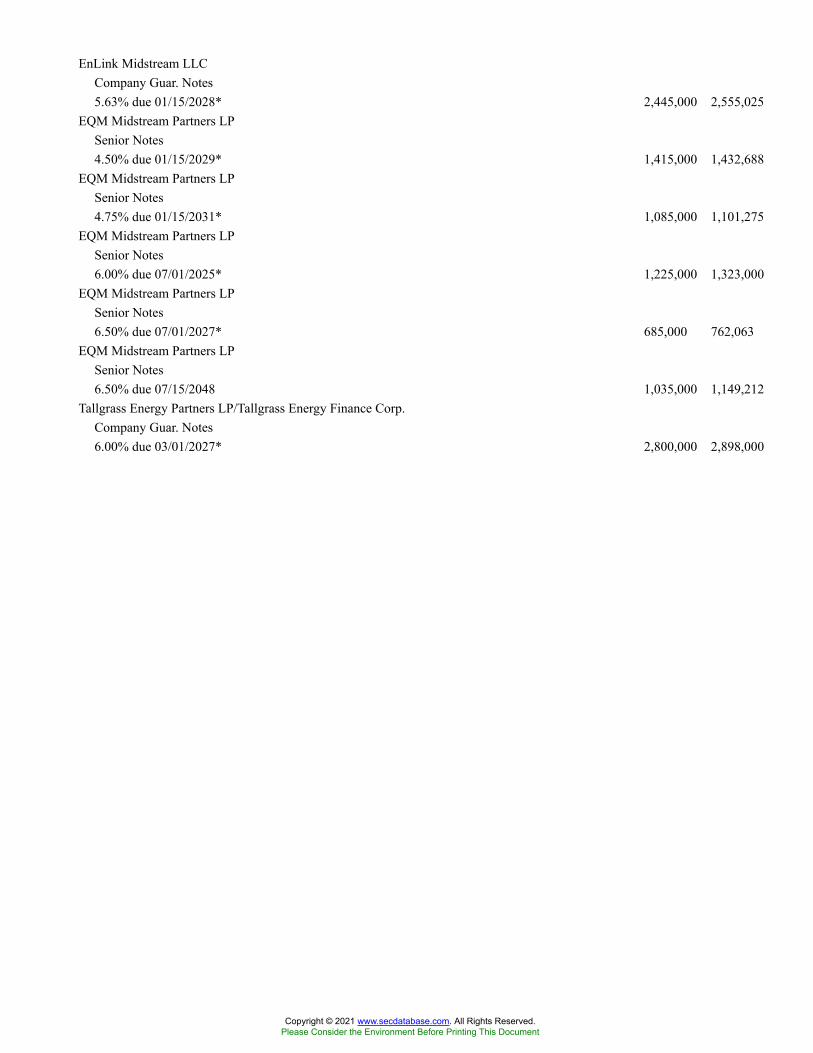
EnLink Midstream LLCCompany Guar. Notes5.63% due 01/15/2028* 2,445,000 2,555,025
EQM Midstream Partners LPSenior Notes4.50% due 01/15/2029* 1,415,000 1,432,688
EQM Midstream Partners LPSenior Notes4.75% due 01/15/2031* 1,085,000 1,101,275
EQM Midstream Partners LPSenior Notes6.00% due 07/01/2025* 1,225,000 1,323,000
EQM Midstream Partners LPSenior Notes6.50% due 07/01/2027* 685,000 762,063
EQM Midstream Partners LPSenior Notes6.50% due 07/15/2048 1,035,000 1,149,212
Tallgrass Energy Partners LP/Tallgrass Energy Finance Corp.Company Guar. Notes6.00% due 03/01/2027* 2,800,000 2,898,000
Copyright © 2021 www.secdatabase.com. All Rights Reserved.Please Consider the Environment Before Printing This Document

Targa Resources Partners LP/Targa Resources Partners Finance Corp.Company Guar. Notes4.00% due 01/15/2032* 1,330,000 1,388,188
Targa Resources Partners LP / Targa Resources Partners Finance Corp.Company Guar. Notes4.88% due 02/01/2031 2,415,000 2,627,037
Targa Resources Partners LP/Targa Resources Partners Finance Corp.Company Guar. Notes6.50% due 07/15/2027 3,385,000 3,665,007
Venture Global Calcasieu Pass LLCSenior Sec. Notes3.88% due 08/15/2029* 1,700,000 1,752,037
Venture Global Calcasieu Pass LLCSenior Sec. Notes4.13% due 08/15/2031* 1,335,000 1,401,750
Western Midstream Operating LPSenior Notes4.35% due 02/01/2025 1,200,000 1,260,984
Western Midstream Operating LPSenior Notes5.30% due 02/01/2030 4,725,000 5,264,170
Western Midstream Operating LPSenior Notes6.50% due 02/01/2050 1,375,000 1,621,049
50,658,025Protection/Safety - 0.6%
APX Group, Inc.Senior Sec. Notes6.75% due 02/15/2027* 540,000 575,775
APX Group, Inc.Company Guar. Notes7.63% due 09/01/2023 3,215,000 3,276,085
3,851,860Racetracks - 1.1%
Penn National Gaming, Inc.Senior Notes4.13% due 07/01/2029* 720,000 719,100
Penn National Gaming, Inc.Senior Notes5.63% due 01/15/2027* 5,255,000 5,438,925
Speedway Motorsports LLC/Speedway Funding II, Inc.Senior Notes4.88% due 11/01/2027* 758,000 776,927
6,934,952Real Estate Investment Trusts - 2.2%
Copyright © 2021 www.secdatabase.com. All Rights Reserved.Please Consider the Environment Before Printing This Document

FelCor Lodging LPCompany Guar. Notes6.00% due 06/01/2025 2,645,000 2,703,190
Ladder Capital Finance Holdings LLLP/Ladder Capital Finance Corp.Company Guar. Notes4.25% due 02/01/2027* 3,095,000 3,110,475
Ladder Capital Finance Holdings LLLP/Ladder Capital Finance Corp.Company Guar. Notes5.25% due 10/01/2025* 310,000 313,875
Service Properties TrustCompany Guar. Notes7.50% due 09/15/2025 3,875,000 4,376,581
VICI Properties LP/VICI Note Co., Inc.Company Guar. Notes3.50% due 02/15/2025* 250,000 256,250
VICI Properties LP/VICI Note Co., Inc.Company Guar. Notes3.75% due 02/15/2027* 165,000 171,600
VICI Properties LP/VICI Note Co., Inc.Company Guar. Notes4.13% due 08/15/2030* 188,000 200,690
VICI Properties LP/VICI Note Co., Inc.Company Guar. Notes4.25% due 12/01/2026* 1,295,000 1,360,291
VICI Properties LP/VICI Note Co., Inc.Company Guar. Notes4.63% due 12/01/2029* 1,085,000 1,179,938
13,672,890Rental Auto/Equipment - 2.0%
Ashtead Capital, Inc.Company Guar. Notes4.00% due 05/01/2028* 2,890,000 3,069,504
Herc Holdings, Inc.Company Guar. Notes5.50% due 07/15/2027* 3,230,000 3,405,066
United Rentals North America, Inc.Company Guar. Notes3.75% due 01/15/2032 710,000 725,087
United Rentals North America, Inc.Company Guar. Notes4.88% due 01/15/2028 4,165,000 4,414,900
United Rentals North America, Inc.Company Guar. Notes5.88% due 09/15/2026 1,025,000 1,056,160
12,670,717Retail-Apparel/Shoe - 0.7%
Copyright © 2021 www.secdatabase.com. All Rights Reserved.Please Consider the Environment Before Printing This Document

L Brands, Inc.Company Guar. Notes5.25% due 02/01/2028 1,785,000 1,999,191
L Brands, Inc.Company Guar. Notes6.63% due 10/01/2030* 2,045,000 2,356,863
4,356,054Retail-Arts & Crafts - 0.6%
Michaels Cos., Inc.Senior Sec. Notes5.25% due 05/01/2028* 2,160,000 2,216,700
Copyright © 2021 www.secdatabase.com. All Rights Reserved.Please Consider the Environment Before Printing This Document
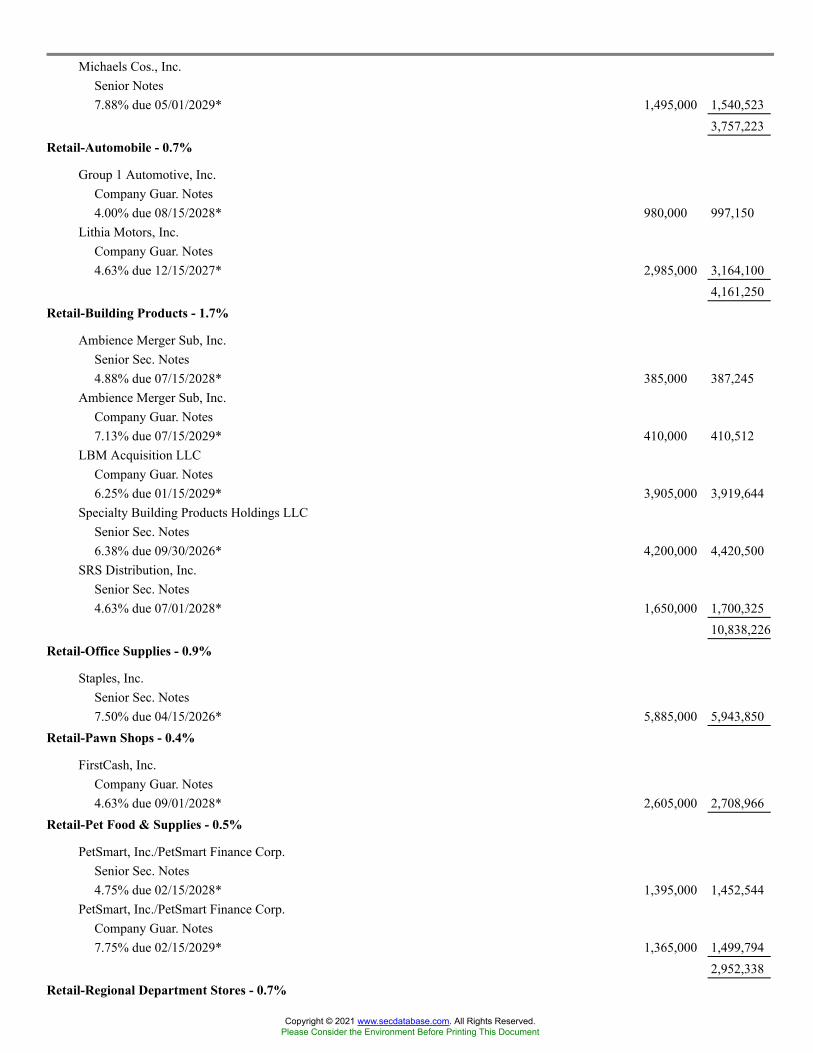
Michaels Cos., Inc.Senior Notes7.88% due 05/01/2029* 1,495,000 1,540,523
3,757,223Retail-Automobile - 0.7%
Group 1 Automotive, Inc.Company Guar. Notes4.00% due 08/15/2028* 980,000 997,150
Lithia Motors, Inc.Company Guar. Notes4.63% due 12/15/2027* 2,985,000 3,164,100
4,161,250Retail-Building Products - 1.7%
Ambience Merger Sub, Inc.Senior Sec. Notes4.88% due 07/15/2028* 385,000 387,245
Ambience Merger Sub, Inc.Company Guar. Notes7.13% due 07/15/2029* 410,000 410,512
LBM Acquisition LLCCompany Guar. Notes6.25% due 01/15/2029* 3,905,000 3,919,644
Specialty Building Products Holdings LLCSenior Sec. Notes6.38% due 09/30/2026* 4,200,000 4,420,500
SRS Distribution, Inc.Senior Sec. Notes4.63% due 07/01/2028* 1,650,000 1,700,325
10,838,226Retail-Office Supplies - 0.9%
Staples, Inc.Senior Sec. Notes7.50% due 04/15/2026* 5,885,000 5,943,850
Retail-Pawn Shops - 0.4%
FirstCash, Inc.Company Guar. Notes4.63% due 09/01/2028* 2,605,000 2,708,966
Retail-Pet Food & Supplies - 0.5%
PetSmart, Inc./PetSmart Finance Corp.Senior Sec. Notes4.75% due 02/15/2028* 1,395,000 1,452,544
PetSmart, Inc./PetSmart Finance Corp.Company Guar. Notes7.75% due 02/15/2029* 1,365,000 1,499,794
2,952,338Retail-Regional Department Stores - 0.7%
Copyright © 2021 www.secdatabase.com. All Rights Reserved.Please Consider the Environment Before Printing This Document

Macy�s Retail Holdings LLCCompany Guar. Notes2.88% due 02/15/2023 56,000 56,980
Macy�s Retail Holdings LLCCompany Guar. Notes3.63% due 06/01/2024# 499,000 517,712
Macy�s Retail Holdings LLCCompany Guar. Notes4.30% due 02/15/2043 345,000 301,013
Macy�s Retail Holdings LLCCompany Guar. Notes4.50% due 12/15/2034 150,000 146,807
Macy�s Retail Holdings LLCCompany Guar. Notes5.13% due 01/15/2042 75,000 71,250
Macy�s Retail Holdings LLCCompany Guar. Notes5.88% due 04/01/2029*# 1,410,000 1,540,566
NMG Holding Co., Inc./Neiman Marcus Group LLCSenior Sec. Notes7.13% due 04/01/2026* 1,435,000 1,519,306
4,153,634Retail-Restaurants - 0.6%
Bloomin� Brands, Inc./OSI Restaurant Partners LLCCompany Guar. Notes5.13% due 04/15/2029* 1,180,000 1,228,530
KFC Holding Co./Pizza Hut Holdings LLC/Taco Bell of America LLCCompany Guar. Notes4.75% due 06/01/2027* 1,830,000 1,918,102
Yum! Brands, Inc.Senior Notes4.75% due 01/15/2030* 770,000 849,888
3,996,520Steel Pipe & Tube - 0.2%
Advanced Drainage Systems, Inc.Company Guar. Notes5.00% due 09/30/2027* 1,195,000 1,242,800
Telecom Services - 1.5%
Embarq Corp.Senior Notes8.00% due 06/01/2036 1,705,000 1,794,512
Frontier Communications Corp.Senior Sec. Notes5.00% due 05/01/2028* 1,450,000 1,515,250
Frontier Communications Corp.Senior Sec. Notes5.88% due 10/15/2027* 1,550,000 1,651,661
Copyright © 2021 www.secdatabase.com. All Rights Reserved.Please Consider the Environment Before Printing This Document
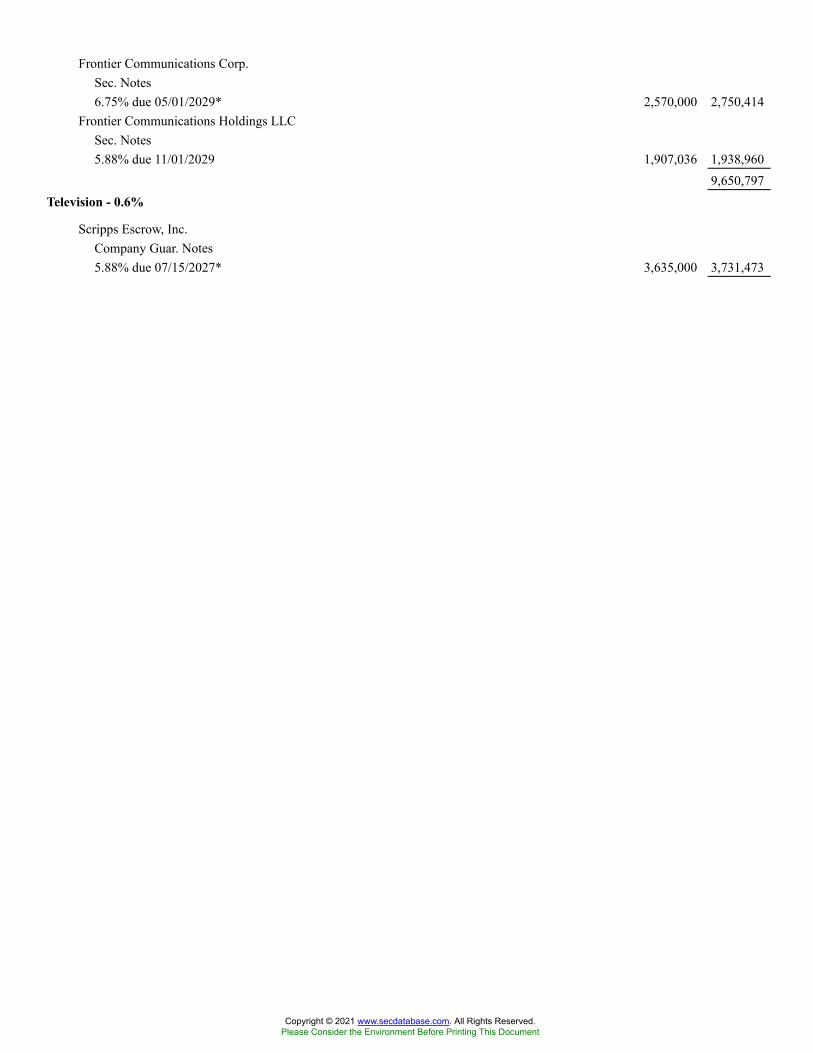
Frontier Communications Corp.Sec. Notes6.75% due 05/01/2029* 2,570,000 2,750,414
Frontier Communications Holdings LLCSec. Notes5.88% due 11/01/2029 1,907,036 1,938,960
9,650,797Television - 0.6%
Scripps Escrow, Inc.Company Guar. Notes5.88% due 07/15/2027* 3,635,000 3,731,473
Copyright © 2021 www.secdatabase.com. All Rights Reserved.Please Consider the Environment Before Printing This Document
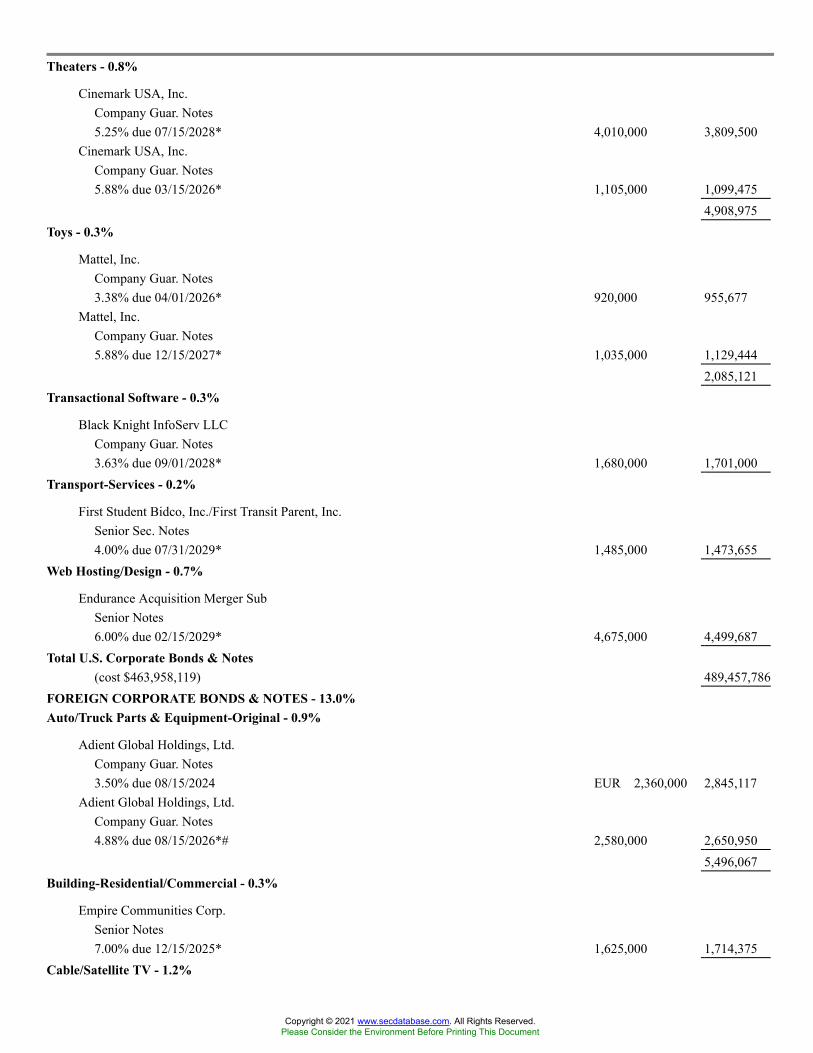
Theaters - 0.8%
Cinemark USA, Inc.Company Guar. Notes5.25% due 07/15/2028* 4,010,000 3,809,500
Cinemark USA, Inc.Company Guar. Notes5.88% due 03/15/2026* 1,105,000 1,099,475
4,908,975Toys - 0.3%
Mattel, Inc.Company Guar. Notes3.38% due 04/01/2026* 920,000 955,677
Mattel, Inc.Company Guar. Notes5.88% due 12/15/2027* 1,035,000 1,129,444
2,085,121Transactional Software - 0.3%
Black Knight InfoServ LLCCompany Guar. Notes3.63% due 09/01/2028* 1,680,000 1,701,000
Transport-Services - 0.2%
First Student Bidco, Inc./First Transit Parent, Inc.Senior Sec. Notes4.00% due 07/31/2029* 1,485,000 1,473,655
Web Hosting/Design - 0.7%
Endurance Acquisition Merger SubSenior Notes6.00% due 02/15/2029* 4,675,000 4,499,687
Total U.S. Corporate Bonds & Notes(cost $463,958,119) 489,457,786
FOREIGN CORPORATE BONDS & NOTES - 13.0%Auto/Truck Parts & Equipment-Original - 0.9%
Adient Global Holdings, Ltd.Company Guar. Notes3.50% due 08/15/2024 EUR 2,360,000 2,845,117
Adient Global Holdings, Ltd.Company Guar. Notes4.88% due 08/15/2026*# 2,580,000 2,650,950
5,496,067Building-Residential/Commercial - 0.3%
Empire Communities Corp.Senior Notes7.00% due 12/15/2025* 1,625,000 1,714,375
Cable/Satellite TV - 1.2%
Copyright © 2021 www.secdatabase.com. All Rights Reserved.Please Consider the Environment Before Printing This Document
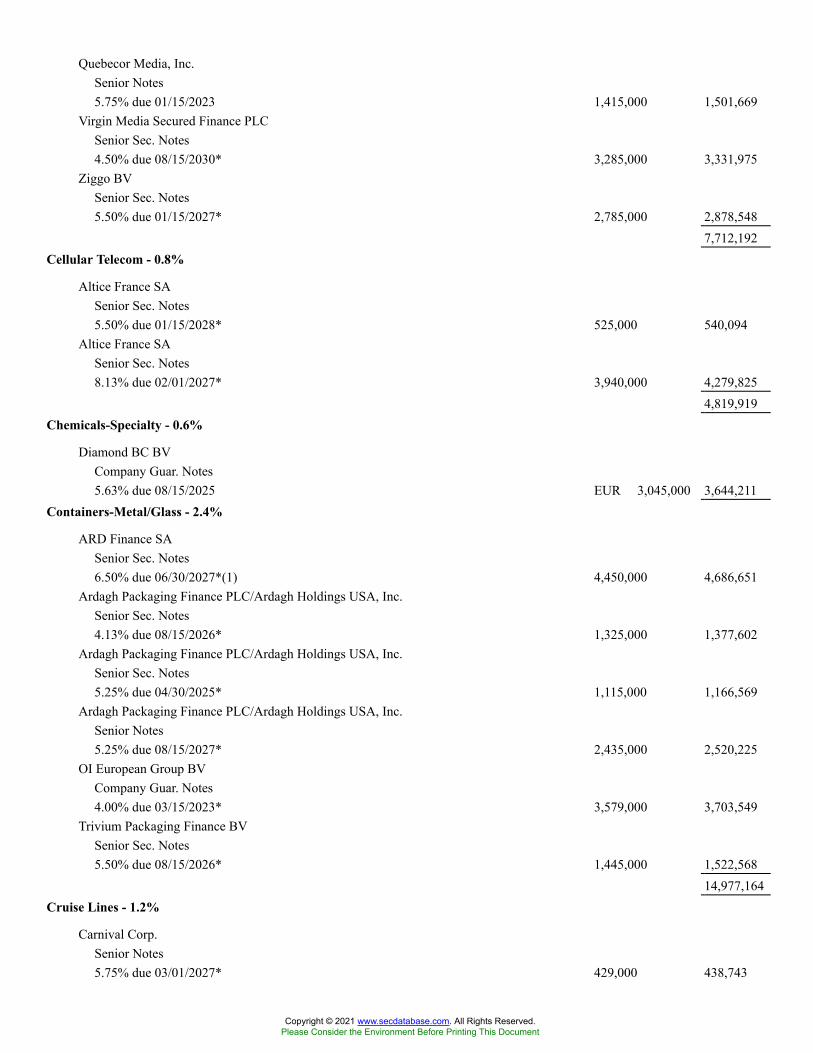
Quebecor Media, Inc.Senior Notes5.75% due 01/15/2023 1,415,000 1,501,669
Virgin Media Secured Finance PLCSenior Sec. Notes4.50% due 08/15/2030* 3,285,000 3,331,975
Ziggo BVSenior Sec. Notes5.50% due 01/15/2027* 2,785,000 2,878,548
7,712,192Cellular Telecom - 0.8%
Altice France SASenior Sec. Notes5.50% due 01/15/2028* 525,000 540,094
Altice France SASenior Sec. Notes8.13% due 02/01/2027* 3,940,000 4,279,825
4,819,919Chemicals-Specialty - 0.6%
Diamond BC BVCompany Guar. Notes5.63% due 08/15/2025 EUR 3,045,000 3,644,211
Containers-Metal/Glass - 2.4%
ARD Finance SASenior Sec. Notes6.50% due 06/30/2027*(1) 4,450,000 4,686,651
Ardagh Packaging Finance PLC/Ardagh Holdings USA, Inc.Senior Sec. Notes4.13% due 08/15/2026* 1,325,000 1,377,602
Ardagh Packaging Finance PLC/Ardagh Holdings USA, Inc.Senior Sec. Notes5.25% due 04/30/2025* 1,115,000 1,166,569
Ardagh Packaging Finance PLC/Ardagh Holdings USA, Inc.Senior Notes5.25% due 08/15/2027* 2,435,000 2,520,225
OI European Group BVCompany Guar. Notes4.00% due 03/15/2023* 3,579,000 3,703,549
Trivium Packaging Finance BVSenior Sec. Notes5.50% due 08/15/2026* 1,445,000 1,522,568
14,977,164Cruise Lines - 1.2%
Carnival Corp.Senior Notes5.75% due 03/01/2027* 429,000 438,743
Copyright © 2021 www.secdatabase.com. All Rights Reserved.Please Consider the Environment Before Printing This Document
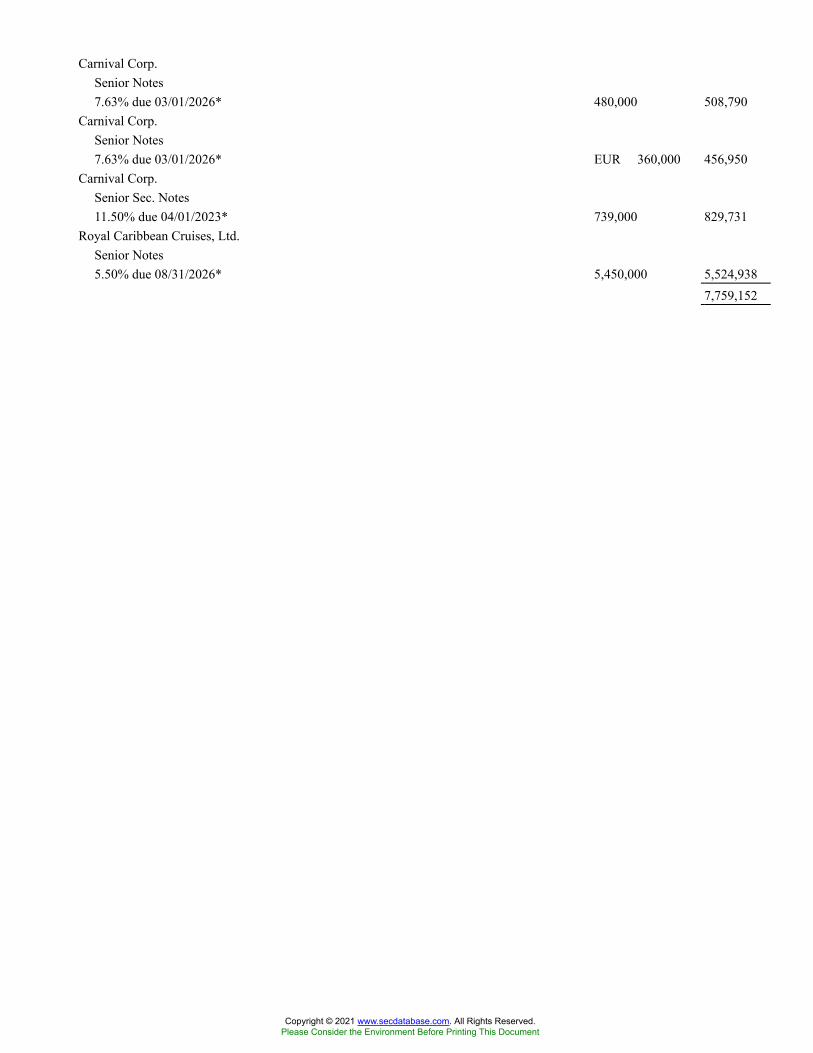
Carnival Corp.Senior Notes7.63% due 03/01/2026* 480,000 508,790
Carnival Corp.Senior Notes7.63% due 03/01/2026* EUR 360,000 456,950
Carnival Corp.Senior Sec. Notes11.50% due 04/01/2023* 739,000 829,731
Royal Caribbean Cruises, Ltd.Senior Notes5.50% due 08/31/2026* 5,450,000 5,524,938
7,759,152
Copyright © 2021 www.secdatabase.com. All Rights Reserved.Please Consider the Environment Before Printing This Document
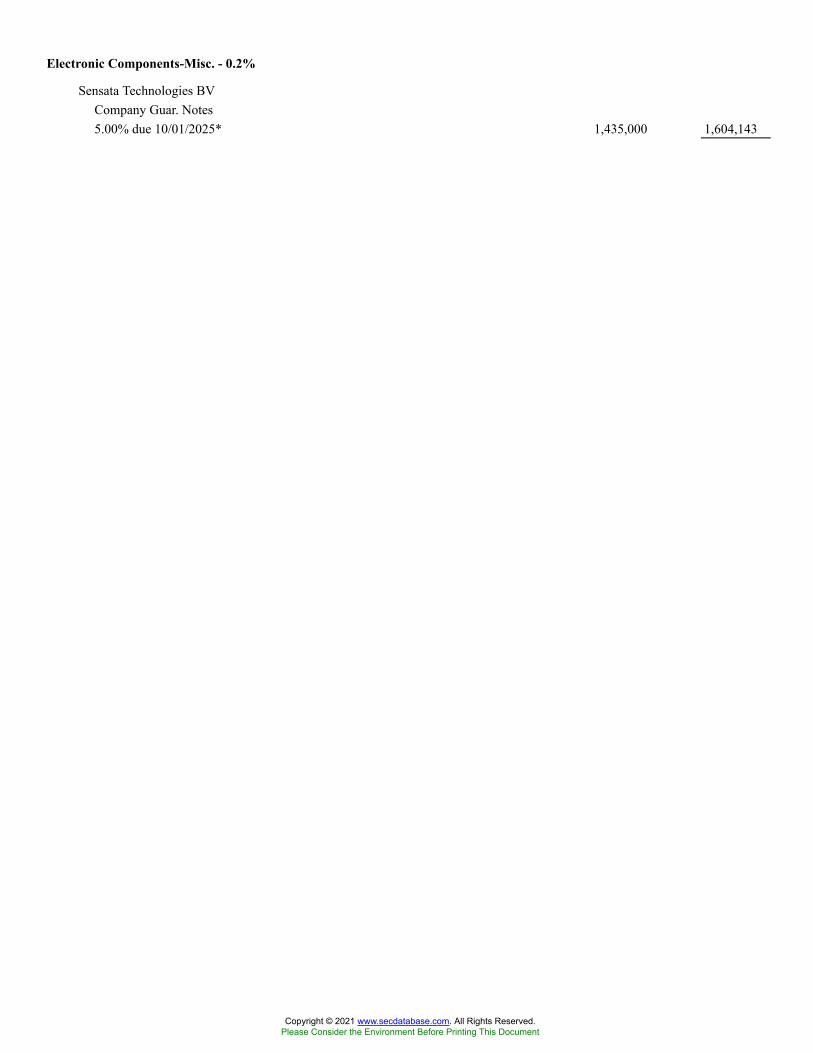
Electronic Components-Misc. - 0.2%
Sensata Technologies BVCompany Guar. Notes5.00% due 10/01/2025* 1,435,000 1,604,143
Copyright © 2021 www.secdatabase.com. All Rights Reserved.Please Consider the Environment Before Printing This Document

Enterprise Software/Service - 0.3%
Open Text Corp.Company Guar. Notes3.88% due 02/15/2028* 1,790,000 1,843,700
Finance-Consumer Loans - 0.6%
goeasy, Ltd.Company Guar. Notes4.38% due 05/01/2026* 1,210,000 1,247,813
goeasy, Ltd.Company Guar. Notes5.38% due 12/01/2024* 2,300,000 2,369,000
3,616,813Medical-Drugs - 1.9%
Bausch Health Cos., Inc.Company Guar. Notes5.00% due 01/30/2028* 4,180,000 3,986,675
Bausch Health Cos., Inc.Company Guar. Notes5.00% due 02/15/2029* 2,575,000 2,407,625
Bausch Health Cos., Inc.Company Guar. Notes7.00% due 01/15/2028* 2,480,000 2,570,185
Valeant Pharmaceuticals International, Inc.Company Guar. Notes6.13% due 04/15/2025* 2,617,000 2,675,882
Valeant Pharmaceuticals International, Inc.Company Guar. Notes9.00% due 12/15/2025* 445,000 473,369
12,113,736Metal-Aluminum - 0.6%
Constellium NVCompany Guar. Notes5.88% due 02/15/2026* 3,240,000 3,325,212
Constellium SECompany Guar. Notes3.75% due 04/15/2029* 415,000 412,801
Constellium SECompany Guar. Notes5.63% due 06/15/2028* 250,000 264,375
4,002,388Oil & Gas Drilling - 0.2%
Transocean, Inc.Company Guar. Notes6.80% due 03/15/2038 2,115,000 1,152,675
Retail-Restaurants - 1.4%
Copyright © 2021 www.secdatabase.com. All Rights Reserved.Please Consider the Environment Before Printing This Document
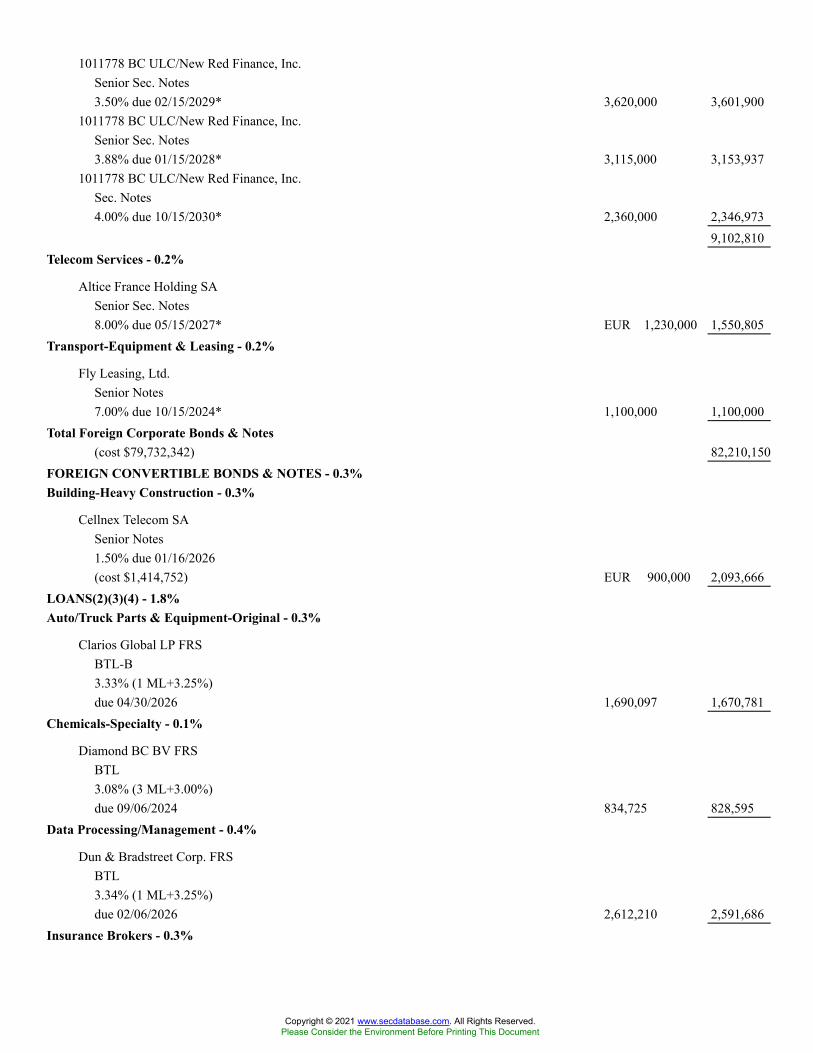
1011778 BC ULC/New Red Finance, Inc.Senior Sec. Notes3.50% due 02/15/2029* 3,620,000 3,601,900
1011778 BC ULC/New Red Finance, Inc.Senior Sec. Notes3.88% due 01/15/2028* 3,115,000 3,153,937
1011778 BC ULC/New Red Finance, Inc.Sec. Notes4.00% due 10/15/2030* 2,360,000 2,346,973
9,102,810Telecom Services - 0.2%
Altice France Holding SASenior Sec. Notes8.00% due 05/15/2027* EUR 1,230,000 1,550,805
Transport-Equipment & Leasing - 0.2%
Fly Leasing, Ltd.Senior Notes7.00% due 10/15/2024* 1,100,000 1,100,000
Total Foreign Corporate Bonds & Notes(cost $79,732,342) 82,210,150
FOREIGN CONVERTIBLE BONDS & NOTES - 0.3%Building-Heavy Construction - 0.3%
Cellnex Telecom SASenior Notes1.50% due 01/16/2026(cost $1,414,752) EUR 900,000 2,093,666
LOANS(2)(3)(4) - 1.8%Auto/Truck Parts & Equipment-Original - 0.3%
Clarios Global LP FRSBTL-B3.33% (1 ML+3.25%)due 04/30/2026 1,690,097 1,670,781
Chemicals-Specialty - 0.1%
Diamond BC BV FRSBTL3.08% (3 ML+3.00%)due 09/06/2024 834,725 828,595
Data Processing/Management - 0.4%
Dun & Bradstreet Corp. FRSBTL3.34% (1 ML+3.25%)due 02/06/2026 2,612,210 2,591,686
Insurance Brokers - 0.3%
Copyright © 2021 www.secdatabase.com. All Rights Reserved.Please Consider the Environment Before Printing This Document

HUB International, Ltd. FRSBTL-B2.88% (3 ML+2.75%)due 04/25/2025 1,658,700 1,638,908
Theaters - 0.7%
Crown Finance US, Inc. FRSBTL3.50% (6 ML+2.50%)due 02/28/2025 2,527,747 1,967,429
Crown Finance US, Inc. FRSBTLcoupon TBDdue 02/28/2025 2,616,864 2,036,791
4,004,220
Copyright © 2021 www.secdatabase.com. All Rights Reserved.Please Consider the Environment Before Printing This Document
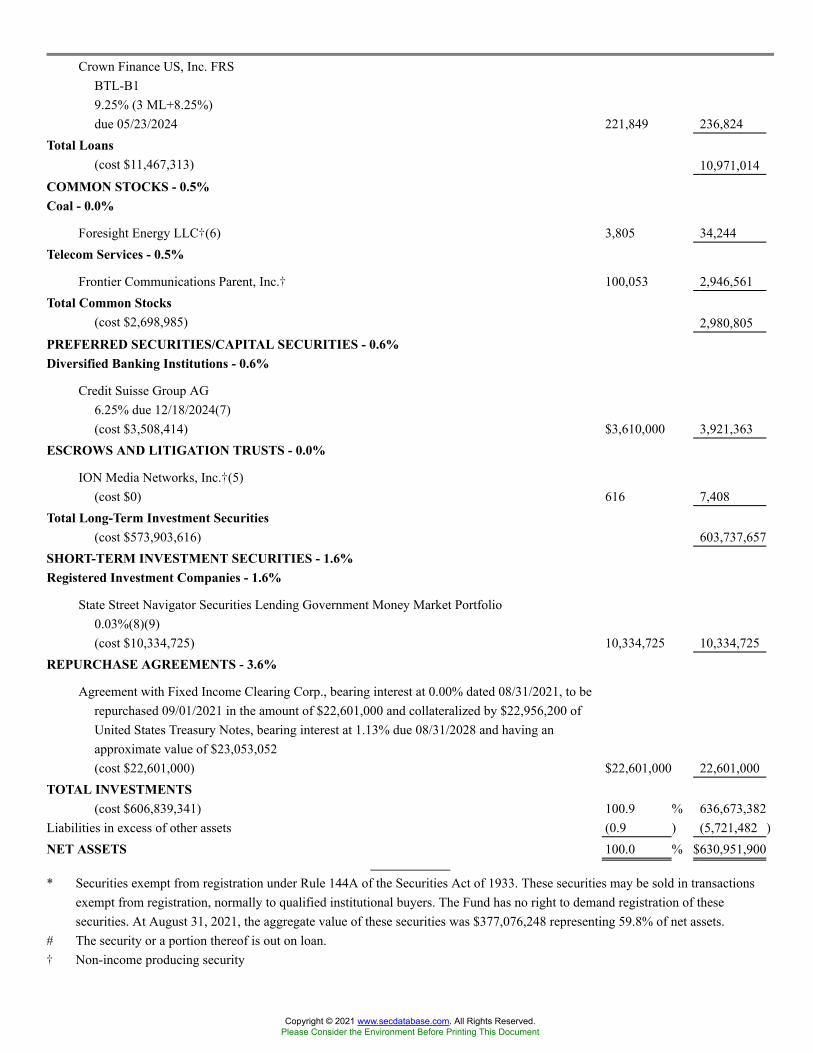
Crown Finance US, Inc. FRSBTL-B19.25% (3 ML+8.25%)due 05/23/2024 221,849 236,824
Total Loans(cost $11,467,313) 10,971,014
COMMON STOCKS - 0.5%Coal - 0.0%
Foresight Energy LLC�(6) 3,805 34,244Telecom Services - 0.5%
Frontier Communications Parent, Inc.� 100,053 2,946,561Total Common Stocks
(cost $2,698,985) 2,980,805PREFERRED SECURITIES/CAPITAL SECURITIES - 0.6%Diversified Banking Institutions - 0.6%
Credit Suisse Group AG6.25% due 12/18/2024(7)(cost $3,508,414) $3,610,000 3,921,363
ESCROWS AND LITIGATION TRUSTS - 0.0%
ION Media Networks, Inc.�(5)(cost $0) 616 7,408
Total Long-Term Investment Securities(cost $573,903,616) 603,737,657
SHORT-TERM INVESTMENT SECURITIES - 1.6%Registered Investment Companies - 1.6%
State Street Navigator Securities Lending Government Money Market Portfolio0.03%(8)(9)(cost $10,334,725) 10,334,725 10,334,725
REPURCHASE AGREEMENTS - 3.6%
Agreement with Fixed Income Clearing Corp., bearing interest at 0.00% dated 08/31/2021, to berepurchased 09/01/2021 in the amount of $22,601,000 and collateralized by $22,956,200 ofUnited States Treasury Notes, bearing interest at 1.13% due 08/31/2028 and having anapproximate value of $23,053,052(cost $22,601,000) $22,601,000 22,601,000
TOTAL INVESTMENTS(cost $606,839,341) 100.9 % 636,673,382
Liabilities in excess of other assets (0.9 ) (5,721,482 )NET ASSETS 100.0 % $630,951,900
* Securities exempt from registration under Rule 144A of the Securities Act of 1933. These securities may be sold in transactionsexempt from registration, normally to qualified institutional buyers. The Fund has no right to demand registration of thesesecurities. At August 31, 2021, the aggregate value of these securities was $377,076,248 representing 59.8% of net assets.
# The security or a portion thereof is out on loan.� Non-income producing security
Copyright © 2021 www.secdatabase.com. All Rights Reserved.Please Consider the Environment Before Printing This Document

(1) PIK (�Payment-in-Kind�) security -- Income may be paid in additional securities or cash at the discretion of the issuer. Thesecurity is currently paying interest in cash at the coupon rate listed.
(2) The Fund invests in senior loans which generally pay interest at rates which are periodically re-determined by reference to a baselending rate plus a premium. These base lending rates are generally either the lending rate offered by one or more major Europeanbanks, such as the London Inter-Bank Offered Rate (�LIBOR�) or the prime rate offered by one or more major United Statesbanks, or the certificate of deposit rate. Senior loans are generally considered to be restrictive in that the Fund is ordinarilycontractually obligated to receive approval from the Agent Bank and/or borrower prior to the disposition of a senior loan.
(3) All loans in the Fund were purchased through assignment agreements unless otherwise indicated.(4) Senior loans in the Fund are generally subject to mandatory and/or optional prepayment. Because of these mandatory prepayment
conditions and because there may be significant economic incentives for a borrower to prepay, prepayments may occur. As aresult, the actual remaining maturity may be substantially less than the stated maturities shown.
(5) Securities classified as Level 3 (see Note 1).(6) Denotes a restricted security that: (a) cannot be offered for public sale without first being registered, or being able to take
advantage of an exemption from registration, under the Securities Act of 1933, as amended (the �1933 Act�); (b) is subject to acontractual restriction on public sales; or (c) is otherwise subject to a restriction on sales by operation of applicable law. Restrictedsecurities are valued pursuant to Note 1. Certain restricted securities held by the Fund may not be sold except in exempttransactions or in a public offering registered under the 1933 Act. The Fund has no right to demand registration of these securities.The risk of investing in certain restricted securities is greater than the risk of investing in the securities of widely held, publiclytraded companies. To the extent applicable, lack of a secondary market and resale restrictions may result in the inability of a Fundto sell a security at a fair price and may substantially delay the sale of the security. In addition, certain restricted securities mayexhibit greater price volatility than securities for which secondary markets exist. As of August 31, 2021, the Fund held thefollowing restricted securities:
Description
Acquisition
Date Shares
Acquisition
Cost Value
Value
Per Share
% of Net
Assets
Common StocksForesight Energy LLC 08/25/
2020 3,805 $ 2,584 $ 34,244 $ 9.00 0.01 %
(7) Perpetual maturity - maturity date reflects the next call date.(8) The rate shown is the 7-day yield as of August 31, 2021.(9) At August 31, 2021, the Fund had loaned securities with a total value of $10,137,739. This was secured by collateral of
$10,334,725, which was received in cash and subsequently invested in short-term investments currently valued at $10,334,725 asreported in the Portfolio of Investments. Additional collateral of $10,613 was received in the form of fixed income pooledsecurities, which the Fund cannot sell or repledge and accordingly, are not reflected in the Fund�s assets and liabilities.
The components of the fixed income pooled securities referenced above are as follows:
Securities Coupon Range Maturity Date Range
Value as of
August 31, 2021
United States Treasury Bills0.00%
10/07/2021 to 10/28/2021 $ 494
United States Treasury Notes/Bonds0.13% to 3.88%
09/15/2021 to 02/15/2050 10,119
Copyright © 2021 www.secdatabase.com. All Rights Reserved.Please Consider the Environment Before Printing This Document

(10) Denominated in United States dollars unless otherwise indicated.
BTL - Bank Term LoanFRS - Floating Rate Security
The rates shown on FRS are the current interest rates at August 31, 2021 and unless noted otherwise, the dates shown are the originalmaturity dates.
Currency Legend
EUR - Euro Currency
Index Legend
1 ML- 1 Month USD Libor3 ML- 3 Month USD Libor6 ML- 6 Month USD Libor
Forward Foreign Currency Contracts
Counterparty
Contract to
Deliver In Exchange For
Delivery
Date
Unrealized
Appreciation
Unrealized
(Depreciation)
Citibank N.A.EUR 11,937,000 USD 14,035,113
09/30/2021 $ � $ (67,312 )
EUR - Euro CurrencyUSD - United States Dollar
The following is a summary of the inputs used to value the Fund�s net assets as of August 31, 2021 (see Note 1):
Level 1 - Unadjusted
Quoted Prices
Level 2 - Other
Observable Inputs
Level 3 - Significant
Unobservable Inputs Total
ASSETS:Investments at Value:*U.S. Convertible Bonds & Notes $ � $12,095,465 $ � $12,095,465U.S. Corporate Bonds & Notes � 489,457,786 � 489,457,786Foreign Corporate Bonds & Notes � 82,210,150 � 82,210,150Foreign Convertible Bonds & Notes � 2,093,666 � 2,093,666Loans � 10,971,014 � 10,971,014Common Stocks:
Coal � 34,244 � 34,244Other Industries 2,946,561 � � 2,946,561
Preferred Securities/Capital Securities � 3,921,363 � 3,921,363Escrows and Litigation Trusts � � 7,408 7,408Short-Term Investment Securities 10,334,725 � � 10,334,725Repurchase Agreements � 22,601,000 � 22,601,000Total Investments at Value $ 13,281,286 $623,384,688 $ 7,408 $636,673,382
LIABILITIES:Other Financial Instruments:+
Forward Foreign Currency Contracts $ � $67,312 $ � $67,312
* For a detailed presentation of investments, please refer to the Portfolio of Investments.+ Amounts represent unrealized appreciation/depreciation as of the end of the reporting period.
Copyright © 2021 www.secdatabase.com. All Rights Reserved.Please Consider the Environment Before Printing This Document

At the beginning and end of the reporting period, Level 3 investments were not considered a material portion of the Fund. There wereno material Level 3 transfers during the reporting period.
See Notes to Portfolio of Investments
Copyright © 2021 www.secdatabase.com. All Rights Reserved.Please Consider the Environment Before Printing This Document
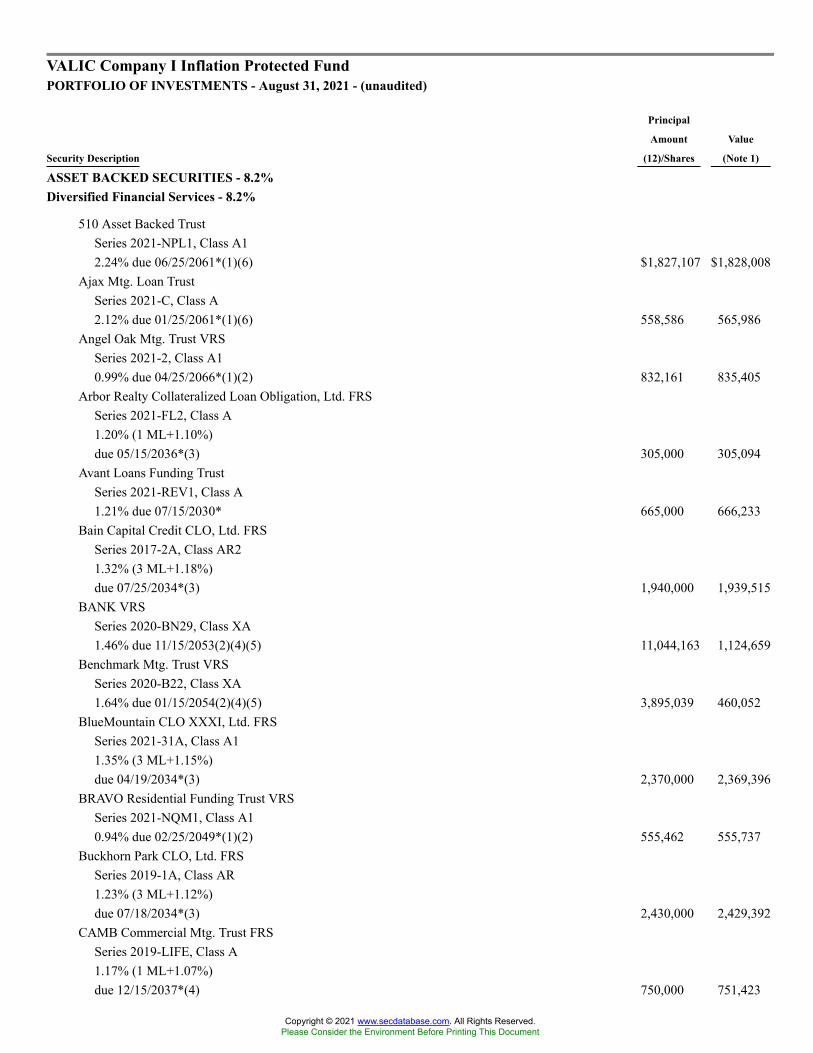
VALIC Company I Inflation Protected FundPORTFOLIO OF INVESTMENTS - August 31, 2021 - (unaudited)
Security Description
Principal
Amount
(12)/Shares
Value
(Note 1)
ASSET BACKED SECURITIES - 8.2%Diversified Financial Services - 8.2%
510 Asset Backed TrustSeries 2021-NPL1, Class A12.24% due 06/25/2061*(1)(6) $1,827,107 $1,828,008
Ajax Mtg. Loan TrustSeries 2021-C, Class A2.12% due 01/25/2061*(1)(6) 558,586 565,986
Angel Oak Mtg. Trust VRSSeries 2021-2, Class A10.99% due 04/25/2066*(1)(2) 832,161 835,405
Arbor Realty Collateralized Loan Obligation, Ltd. FRSSeries 2021-FL2, Class A1.20% (1 ML+1.10%)due 05/15/2036*(3) 305,000 305,094
Avant Loans Funding TrustSeries 2021-REV1, Class A1.21% due 07/15/2030* 665,000 666,233
Bain Capital Credit CLO, Ltd. FRSSeries 2017-2A, Class AR21.32% (3 ML+1.18%)due 07/25/2034*(3) 1,940,000 1,939,515
BANK VRSSeries 2020-BN29, Class XA1.46% due 11/15/2053(2)(4)(5) 11,044,163 1,124,659
Benchmark Mtg. Trust VRSSeries 2020-B22, Class XA1.64% due 01/15/2054(2)(4)(5) 3,895,039 460,052
BlueMountain CLO XXXI, Ltd. FRSSeries 2021-31A, Class A11.35% (3 ML+1.15%)due 04/19/2034*(3) 2,370,000 2,369,396
BRAVO Residential Funding Trust VRSSeries 2021-NQM1, Class A10.94% due 02/25/2049*(1)(2) 555,462 555,737
Buckhorn Park CLO, Ltd. FRSSeries 2019-1A, Class AR1.23% (3 ML+1.12%)due 07/18/2034*(3) 2,430,000 2,429,392
CAMB Commercial Mtg. Trust FRSSeries 2019-LIFE, Class A1.17% (1 ML+1.07%)due 12/15/2037*(4) 750,000 751,423
Copyright © 2021 www.secdatabase.com. All Rights Reserved.Please Consider the Environment Before Printing This Document
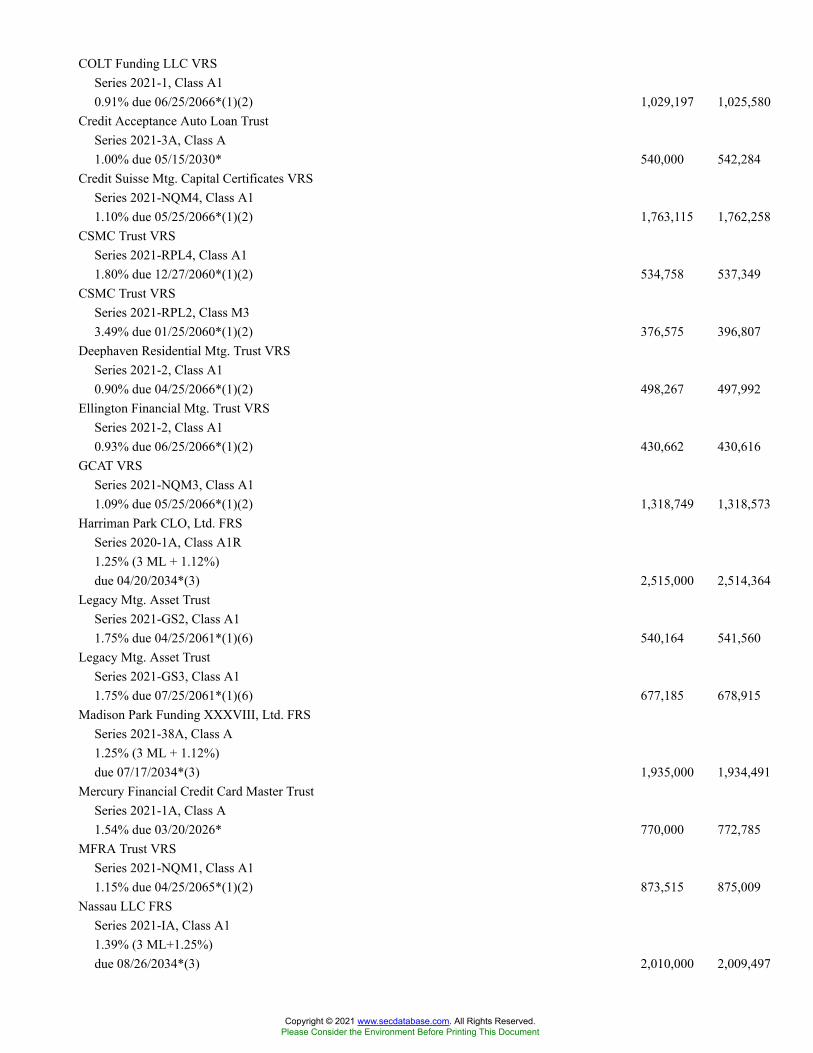
COLT Funding LLC VRSSeries 2021-1, Class A10.91% due 06/25/2066*(1)(2) 1,029,197 1,025,580
Credit Acceptance Auto Loan TrustSeries 2021-3A, Class A1.00% due 05/15/2030* 540,000 542,284
Credit Suisse Mtg. Capital Certificates VRSSeries 2021-NQM4, Class A11.10% due 05/25/2066*(1)(2) 1,763,115 1,762,258
CSMC Trust VRSSeries 2021-RPL4, Class A11.80% due 12/27/2060*(1)(2) 534,758 537,349
CSMC Trust VRSSeries 2021-RPL2, Class M33.49% due 01/25/2060*(1)(2) 376,575 396,807
Deephaven Residential Mtg. Trust VRSSeries 2021-2, Class A10.90% due 04/25/2066*(1)(2) 498,267 497,992
Ellington Financial Mtg. Trust VRSSeries 2021-2, Class A10.93% due 06/25/2066*(1)(2) 430,662 430,616
GCAT VRSSeries 2021-NQM3, Class A11.09% due 05/25/2066*(1)(2) 1,318,749 1,318,573
Harriman Park CLO, Ltd. FRSSeries 2020-1A, Class A1R1.25% (3 ML + 1.12%)due 04/20/2034*(3) 2,515,000 2,514,364
Legacy Mtg. Asset TrustSeries 2021-GS2, Class A11.75% due 04/25/2061*(1)(6) 540,164 541,560
Legacy Mtg. Asset TrustSeries 2021-GS3, Class A11.75% due 07/25/2061*(1)(6) 677,185 678,915
Madison Park Funding XXXVIII, Ltd. FRSSeries 2021-38A, Class A1.25% (3 ML + 1.12%)due 07/17/2034*(3) 1,935,000 1,934,491
Mercury Financial Credit Card Master TrustSeries 2021-1A, Class A1.54% due 03/20/2026* 770,000 772,785
MFRA Trust VRSSeries 2021-NQM1, Class A11.15% due 04/25/2065*(1)(2) 873,515 875,009
Nassau LLC FRSSeries 2021-IA, Class A11.39% (3 ML+1.25%)due 08/26/2034*(3) 2,010,000 2,009,497
Copyright © 2021 www.secdatabase.com. All Rights Reserved.Please Consider the Environment Before Printing This Document

Navient Private Education Refi Loan TrustSeries 2021-EA, Class A0.97% due 12/16/2069* 715,000 715,449
New Residential Mtg. Loan Trust VRSSeries 2021-NQ2R, Class A10.94% due 10/25/2058*(1)(2) 637,183 638,311
NMLT Trust VRSSeries 2021-INV1, Class A11.19% due 05/25/2056*(1)(2) 1,631,291 1,633,290
OZLM XVIII, Ltd. FRSSeries 2018-18A, Class A1.15% (3 ML+1.02%)due 04/15/2031*(3) 1,365,000 1,365,525
Preston Ridge Partners Mtg.Series 2020-6, Class A12.36% due 11/25/2025*(1)(6) 379,327 381,906
Preston Ridge Partners Mtg.Series 2020-3, Class A12.86% due 09/25/2025*(1)(6) 1,356,426 1,359,536
Pretium Mtg. Credit Partners I LLC VRSSeries 2021-NPL2, Class A11.99% due 06/27/2060*(2) 991,107 991,214
Copyright © 2021 www.secdatabase.com. All Rights Reserved.Please Consider the Environment Before Printing This Document
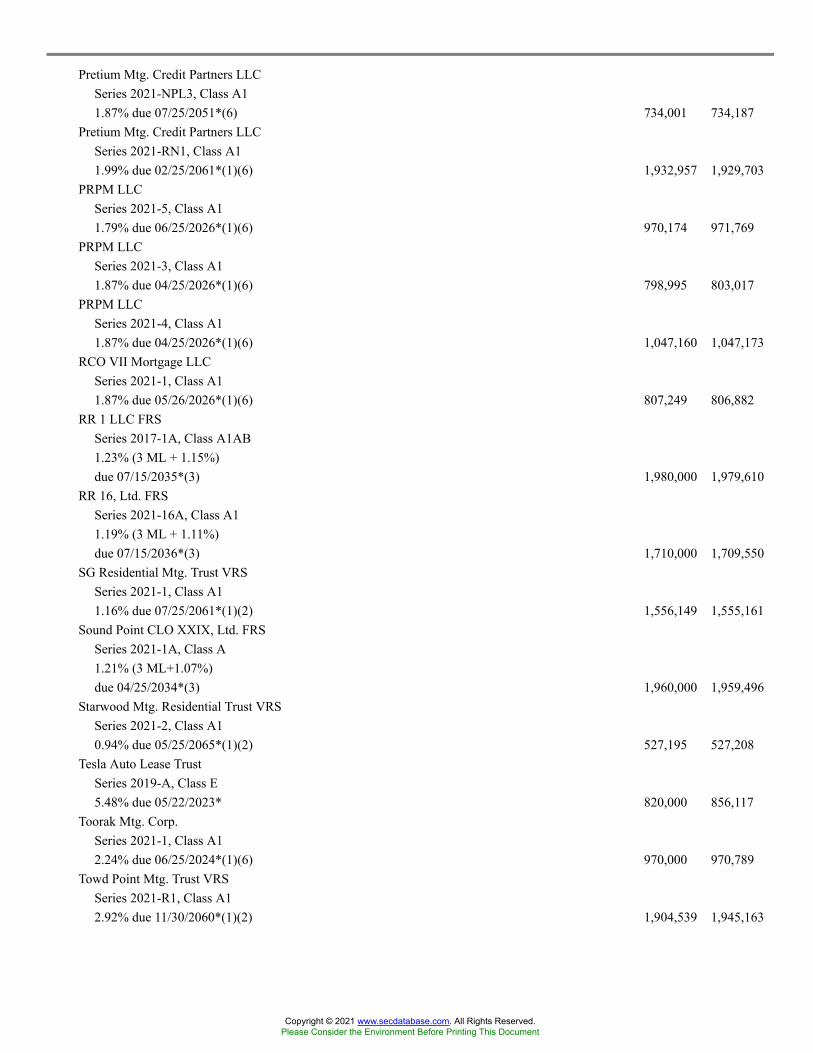
Pretium Mtg. Credit Partners LLCSeries 2021-NPL3, Class A11.87% due 07/25/2051*(6) 734,001 734,187
Pretium Mtg. Credit Partners LLCSeries 2021-RN1, Class A11.99% due 02/25/2061*(1)(6) 1,932,957 1,929,703
PRPM LLCSeries 2021-5, Class A11.79% due 06/25/2026*(1)(6) 970,174 971,769
PRPM LLCSeries 2021-3, Class A11.87% due 04/25/2026*(1)(6) 798,995 803,017
PRPM LLCSeries 2021-4, Class A11.87% due 04/25/2026*(1)(6) 1,047,160 1,047,173
RCO VII Mortgage LLCSeries 2021-1, Class A11.87% due 05/26/2026*(1)(6) 807,249 806,882
RR 1 LLC FRSSeries 2017-1A, Class A1AB1.23% (3 ML + 1.15%)due 07/15/2035*(3) 1,980,000 1,979,610
RR 16, Ltd. FRSSeries 2021-16A, Class A11.19% (3 ML + 1.11%)due 07/15/2036*(3) 1,710,000 1,709,550
SG Residential Mtg. Trust VRSSeries 2021-1, Class A11.16% due 07/25/2061*(1)(2) 1,556,149 1,555,161
Sound Point CLO XXIX, Ltd. FRSSeries 2021-1A, Class A1.21% (3 ML+1.07%)due 04/25/2034*(3) 1,960,000 1,959,496
Starwood Mtg. Residential Trust VRSSeries 2021-2, Class A10.94% due 05/25/2065*(1)(2) 527,195 527,208
Tesla Auto Lease TrustSeries 2019-A, Class E5.48% due 05/22/2023* 820,000 856,117
Toorak Mtg. Corp.Series 2021-1, Class A12.24% due 06/25/2024*(1)(6) 970,000 970,789
Towd Point Mtg. Trust VRSSeries 2021-R1, Class A12.92% due 11/30/2060*(1)(2) 1,904,539 1,945,163
Copyright © 2021 www.secdatabase.com. All Rights Reserved.Please Consider the Environment Before Printing This Document

Traingle Re, Ltd. FRSSeries 2020-1, Class M1A3.08% (1 ML+3.00%)due 10/25/2030*(1) 478,201 478,719
Tricolor Auto Securitization TrustSeries 2021-1A, Class B1.00% due 06/17/2024* 710,000 710,068
VCAT LLCSeries 2021-NPL3, Class A11.74% due 05/25/2051*(6) 1,055,872 1,054,927
VCAT LLCSeries 2021-NPL2, Class A12.12% due 03/27/2051*(1)(6) 278,796 279,657
Venture 37 CLO, Ltd. FRSSeries 2019-37A, Class A1R1.28% (3 ML+1.15%)due 07/15/2032*(3) 2,040,000 2,039,998
Venture XIII CLO, Ltd. FRSSeries 2021-43A, Class A11.38% (3 ML+1.24%)due 04/15/2034*(3) 760,000 759,805
Vericrest Opportunity Loan TransfereeSeries 2021-NPL7, Class A12.12% due 04/25/2051*(6) 270,560 271,337
Verus Securitization Trust VRSSeries 2021-2, Class A11.03% due 02/25/2066*(1)(2) 645,895 645,177
VOLT XCIV LLCSeries 2021-NPL3, Class A12.24% due 02/27/2051*(6) 1,045,832 1,047,349
Wellfleet CLO X, Ltd. FRSSeries 2019-XA, Class A1R1.34% (3 ML+1.17%)due 07/20/2032*(3) 1,530,000 1,529,607
Wendy�s Funding LLCSeries 2021-1A, Class A2I2.37% due 06/15/2051* 1,735,000 1,757,954
Westlake Automobile Receivables TrustSeries 2020-3A, Class D1.65% due 02/17/2026* 780,000 792,606
Wingstop Funding LLCSeries 2020-1A, Class A22.84% due 12/05/2050* 314,213 324,855
Total Asset Backed Securities(cost $66,166,097) 66,242,095
U.S. CORPORATE BONDS & NOTES - 3.5%Apparel Manufacturers - 0.2%
Copyright © 2021 www.secdatabase.com. All Rights Reserved.Please Consider the Environment Before Printing This Document
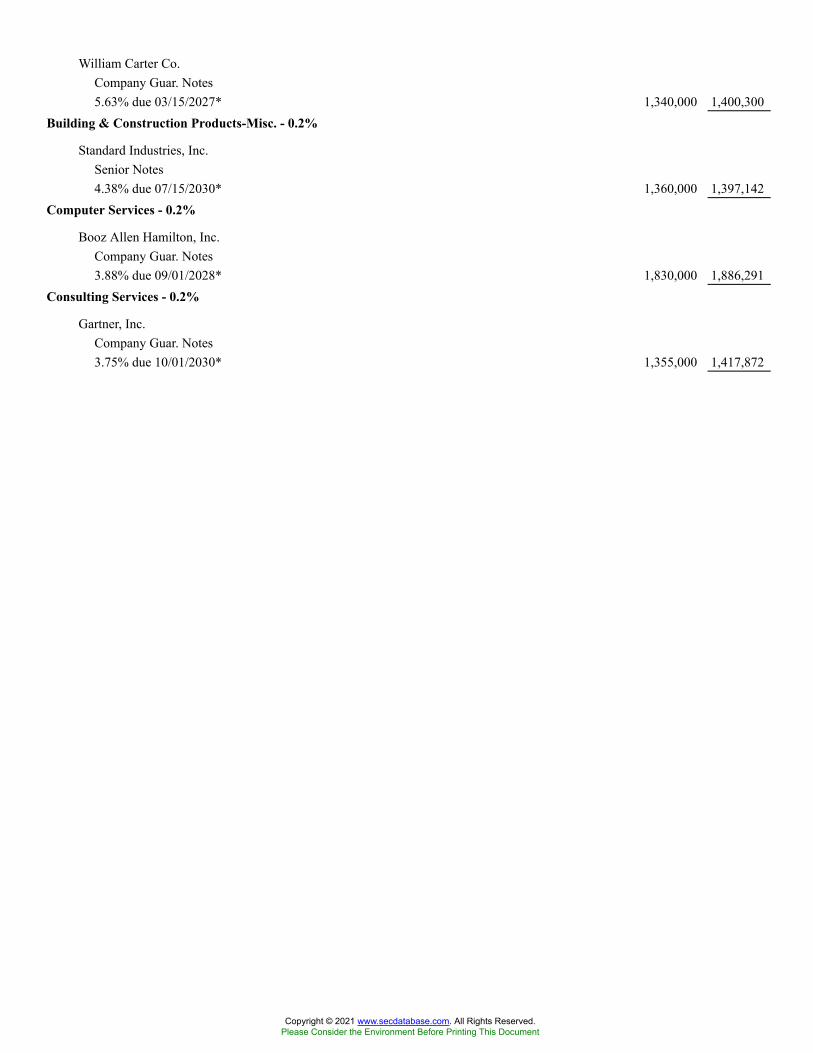
William Carter Co.Company Guar. Notes5.63% due 03/15/2027* 1,340,000 1,400,300
Building & Construction Products-Misc. - 0.2%
Standard Industries, Inc.Senior Notes4.38% due 07/15/2030* 1,360,000 1,397,142
Computer Services - 0.2%
Booz Allen Hamilton, Inc.Company Guar. Notes3.88% due 09/01/2028* 1,830,000 1,886,291
Consulting Services - 0.2%
Gartner, Inc.Company Guar. Notes3.75% due 10/01/2030* 1,355,000 1,417,872
Copyright © 2021 www.secdatabase.com. All Rights Reserved.Please Consider the Environment Before Printing This Document

Decision Support Software - 0.2%
MSCI, Inc.Company Guar. Notes3.88% due 02/15/2031* 1,585,000 1,691,987
Electronic Components-Semiconductors - 0.2%
Broadcom, Inc.Company Guar. Notes2.45% due 02/15/2031* 1,800,000 1,781,358
Finance-Leasing Companies - 0.1%
BOC Aviation USA Corp.Company Guar. Notes1.63% due 04/29/2024* 1,185,000 1,197,544
Food-Meat Products - 0.2%
NBM US Holdings, Inc.Company Guar. Notes7.00% due 05/14/2026 1,595,000 1,697,239
Funeral Services & Related Items - 0.2%
Service Corp. InternationalSenior Notes3.38% due 08/15/2030 1,360,000 1,369,112
Internet Security - 0.1%
NortonLifeLock, Inc.Senior Notes5.00% due 04/15/2025* 760,000 768,299
Office Automation & Equipment - 0.2%
CDW LLC/CDW Finance Corp.Company Guar. Notes3.25% due 02/15/2029 1,386,000 1,424,115
Oil Companies-Exploration & Production - 0.4%
Apache Corp.Senior Notes4.25% due 01/15/2030# 1,800,000 1,937,376
Hess Corp.Senior Notes7.88% due 10/01/2029 1,325,000 1,818,606
3,755,982Oil Companies-Integrated - 0.4%
BP Capital Markets America, Inc.Company Guar. Notes3.00% due 02/24/2050 3,161,000 3,121,030
Pipelines - 0.2%
Copyright © 2021 www.secdatabase.com. All Rights Reserved.Please Consider the Environment Before Printing This Document
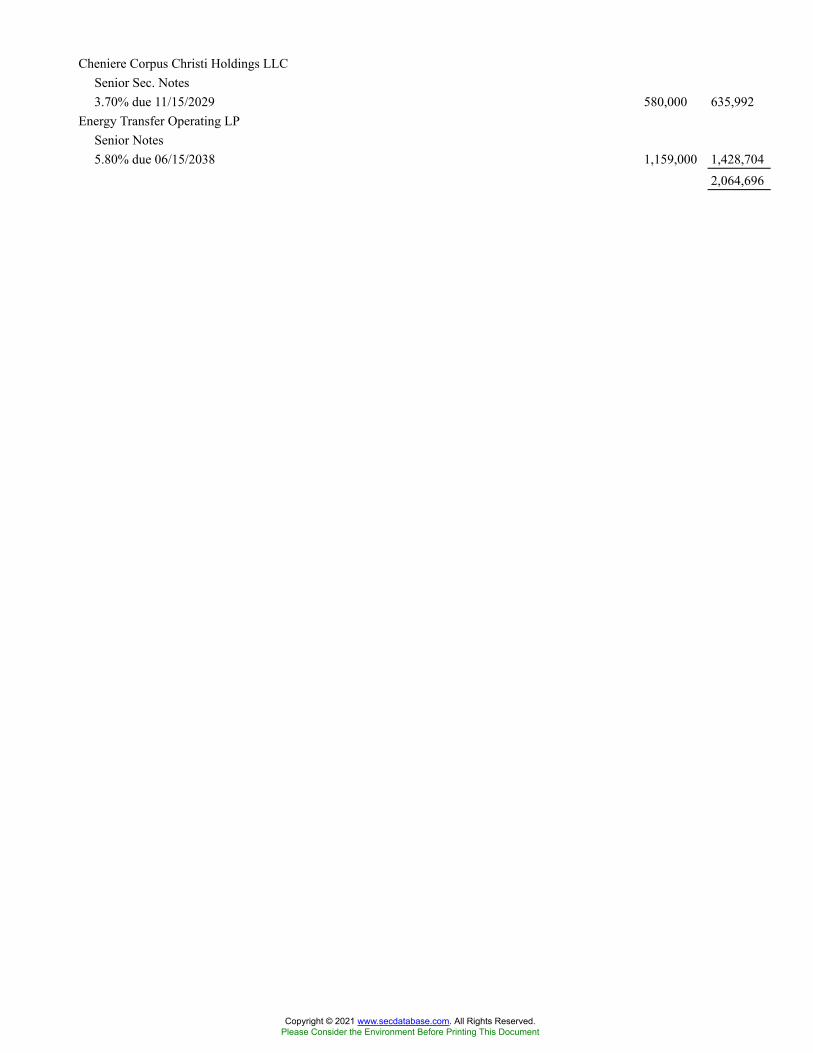
Cheniere Corpus Christi Holdings LLCSenior Sec. Notes3.70% due 11/15/2029 580,000 635,992
Energy Transfer Operating LPSenior Notes5.80% due 06/15/2038 1,159,000 1,428,704
2,064,696
Copyright © 2021 www.secdatabase.com. All Rights Reserved.Please Consider the Environment Before Printing This Document

Retail-Pawn Shops - 0.2%
FirstCash, Inc.Company Guar. Notes4.63% due 09/01/2028* 1,345,000 1,398,679
Transactional Software - 0.1%
Black Knight InfoServ LLCCompany Guar. Notes3.63% due 09/01/2028* 772,000 781,650
Trucking/Leasing - 0.2%
Penske Truck Leasing Co. LP/PTL Finance Corp.Senior Notes3.35% due 11/01/2029* 1,398,000 1,511,858
Total U.S. Corporate Bonds & Notes(cost $28,058,897) 28,665,154
FOREIGN CORPORATE BONDS & NOTES - 0.5%Energy-Alternate Sources - 0.1%
FS Luxembourg SarlSenior Sec. Notes10.00% due 12/15/2025* 400,000 450,004
Networking Products - 0.1%
Nokia OyjSenior Notes4.38% due 06/12/2027 855,000 948,571
Oil Companies-Integrated - 0.3%
Petrobras Global Finance BVCompany Guar. Notes5.60% due 01/03/2031 1,490,000 1,674,298
Petroleos MexicanosCompany Guar. Notes5.95% due 01/28/2031 880,000 862,655
2,536,953Total Foreign Corporate Bonds & Notes
(cost $3,898,837) 3,935,528U.S. GOVERNMENT AGENCIES - 0.2%Federal Home Loan Mtg. Corp. - 0.1%
Federal Home Loan Mtg. Corp. REMIC FRSSeries 4012, Class NF0.55% (1 ML+0.45%)due 12/15/2038(1) 51,668 51,727Series 3925, Class FL0.55% (1 ML+0.45%)due 01/15/2041(1) 393,940 395,725Series 4001, Class FM0.60% (1 ML+0.50%)due 02/15/2042(1) 214,420 216,676
Copyright © 2021 www.secdatabase.com. All Rights Reserved.Please Consider the Environment Before Printing This Document
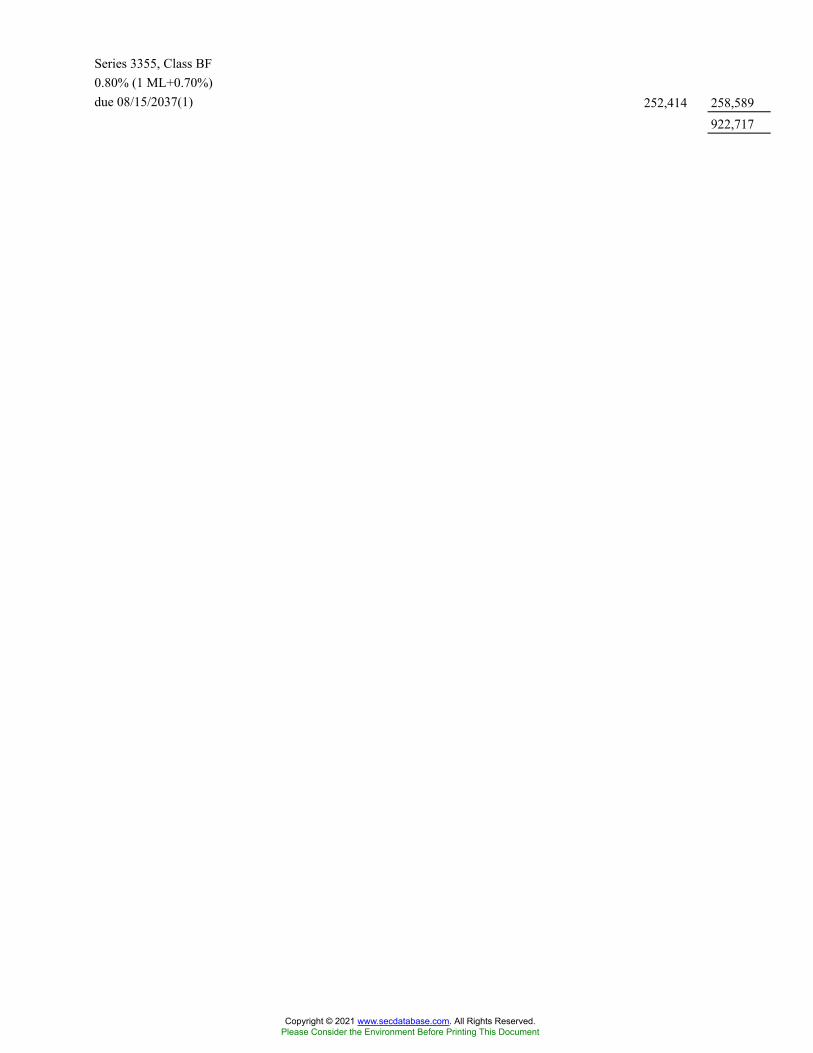
Series 3355, Class BF0.80% (1 ML+0.70%)due 08/15/2037(1) 252,414 258,589
922,717
Copyright © 2021 www.secdatabase.com. All Rights Reserved.Please Consider the Environment Before Printing This Document
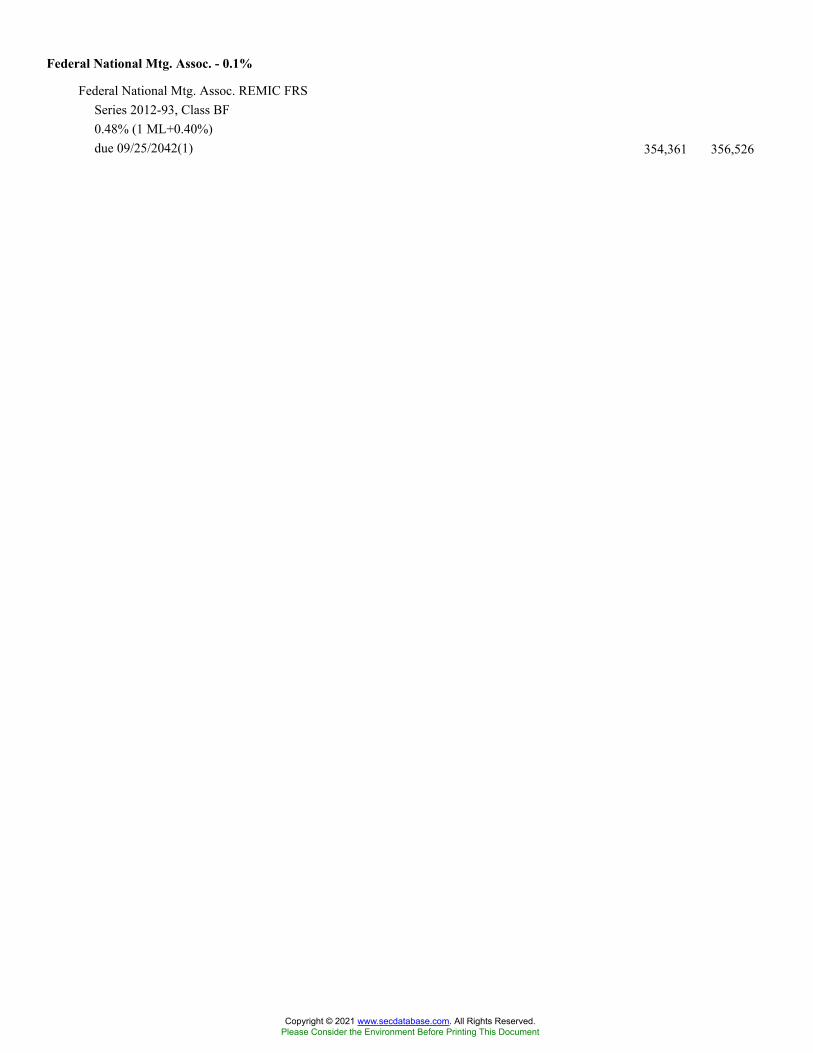
Federal National Mtg. Assoc. - 0.1%
Federal National Mtg. Assoc. REMIC FRSSeries 2012-93, Class BF0.48% (1 ML+0.40%)due 09/25/2042(1) 354,361 356,526
Copyright © 2021 www.secdatabase.com. All Rights Reserved.Please Consider the Environment Before Printing This Document
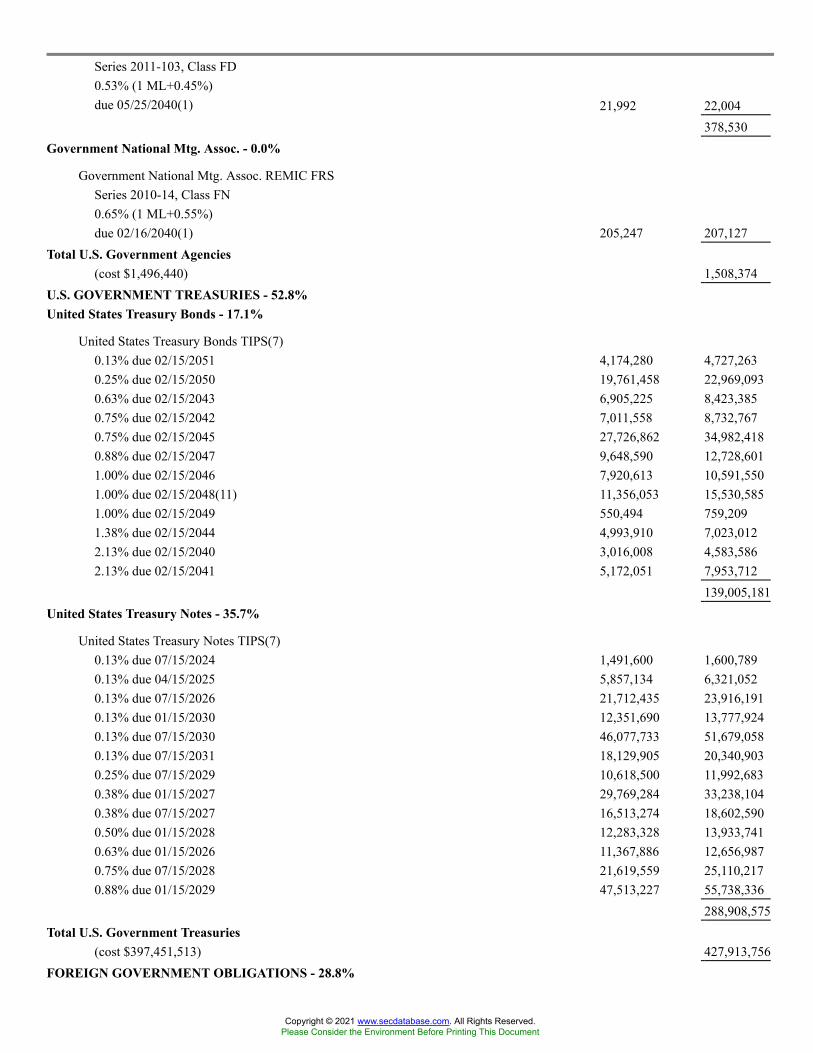
Series 2011-103, Class FD0.53% (1 ML+0.45%)due 05/25/2040(1) 21,992 22,004
378,530Government National Mtg. Assoc. - 0.0%
Government National Mtg. Assoc. REMIC FRSSeries 2010-14, Class FN0.65% (1 ML+0.55%)due 02/16/2040(1) 205,247 207,127
Total U.S. Government Agencies(cost $1,496,440) 1,508,374
U.S. GOVERNMENT TREASURIES - 52.8%United States Treasury Bonds - 17.1%
United States Treasury Bonds TIPS(7)0.13% due 02/15/2051 4,174,280 4,727,2630.25% due 02/15/2050 19,761,458 22,969,0930.63% due 02/15/2043 6,905,225 8,423,3850.75% due 02/15/2042 7,011,558 8,732,7670.75% due 02/15/2045 27,726,862 34,982,4180.88% due 02/15/2047 9,648,590 12,728,6011.00% due 02/15/2046 7,920,613 10,591,5501.00% due 02/15/2048(11) 11,356,053 15,530,5851.00% due 02/15/2049 550,494 759,2091.38% due 02/15/2044 4,993,910 7,023,0122.13% due 02/15/2040 3,016,008 4,583,5862.13% due 02/15/2041 5,172,051 7,953,712
139,005,181United States Treasury Notes - 35.7%
United States Treasury Notes TIPS(7)0.13% due 07/15/2024 1,491,600 1,600,7890.13% due 04/15/2025 5,857,134 6,321,0520.13% due 07/15/2026 21,712,435 23,916,1910.13% due 01/15/2030 12,351,690 13,777,9240.13% due 07/15/2030 46,077,733 51,679,0580.13% due 07/15/2031 18,129,905 20,340,9030.25% due 07/15/2029 10,618,500 11,992,6830.38% due 01/15/2027 29,769,284 33,238,1040.38% due 07/15/2027 16,513,274 18,602,5900.50% due 01/15/2028 12,283,328 13,933,7410.63% due 01/15/2026 11,367,886 12,656,9870.75% due 07/15/2028 21,619,559 25,110,2170.88% due 01/15/2029 47,513,227 55,738,336
288,908,575Total U.S. Government Treasuries
(cost $397,451,513) 427,913,756FOREIGN GOVERNMENT OBLIGATIONS - 28.8%
Copyright © 2021 www.secdatabase.com. All Rights Reserved.Please Consider the Environment Before Printing This Document
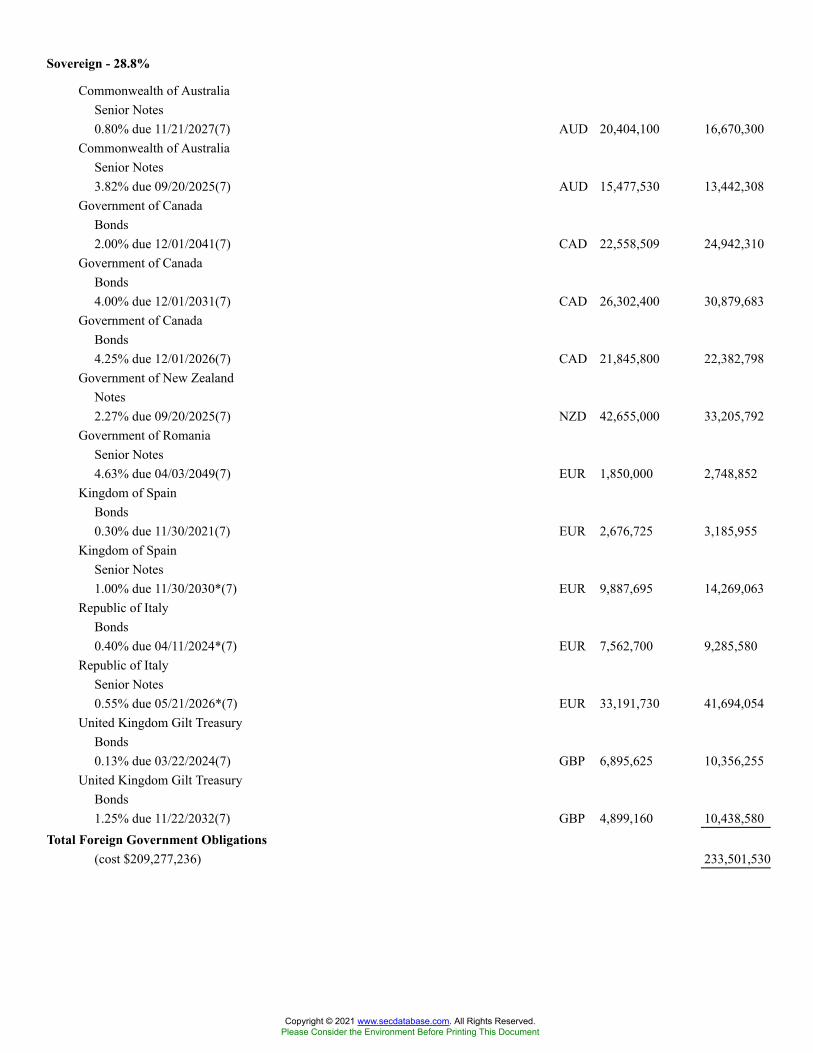
Sovereign - 28.8%
Commonwealth of AustraliaSenior Notes0.80% due 11/21/2027(7) AUD 20,404,100 16,670,300
Commonwealth of AustraliaSenior Notes3.82% due 09/20/2025(7) AUD 15,477,530 13,442,308
Government of CanadaBonds2.00% due 12/01/2041(7) CAD 22,558,509 24,942,310
Government of CanadaBonds4.00% due 12/01/2031(7) CAD 26,302,400 30,879,683
Government of CanadaBonds4.25% due 12/01/2026(7) CAD 21,845,800 22,382,798
Government of New ZealandNotes2.27% due 09/20/2025(7) NZD 42,655,000 33,205,792
Government of RomaniaSenior Notes4.63% due 04/03/2049(7) EUR 1,850,000 2,748,852
Kingdom of SpainBonds0.30% due 11/30/2021(7) EUR 2,676,725 3,185,955
Kingdom of SpainSenior Notes1.00% due 11/30/2030*(7) EUR 9,887,695 14,269,063
Republic of ItalyBonds0.40% due 04/11/2024*(7) EUR 7,562,700 9,285,580
Republic of ItalySenior Notes0.55% due 05/21/2026*(7) EUR 33,191,730 41,694,054
United Kingdom Gilt TreasuryBonds0.13% due 03/22/2024(7) GBP 6,895,625 10,356,255
United Kingdom Gilt TreasuryBonds1.25% due 11/22/2032(7) GBP 4,899,160 10,438,580
Total Foreign Government Obligations(cost $209,277,236) 233,501,530
Copyright © 2021 www.secdatabase.com. All Rights Reserved.Please Consider the Environment Before Printing This Document
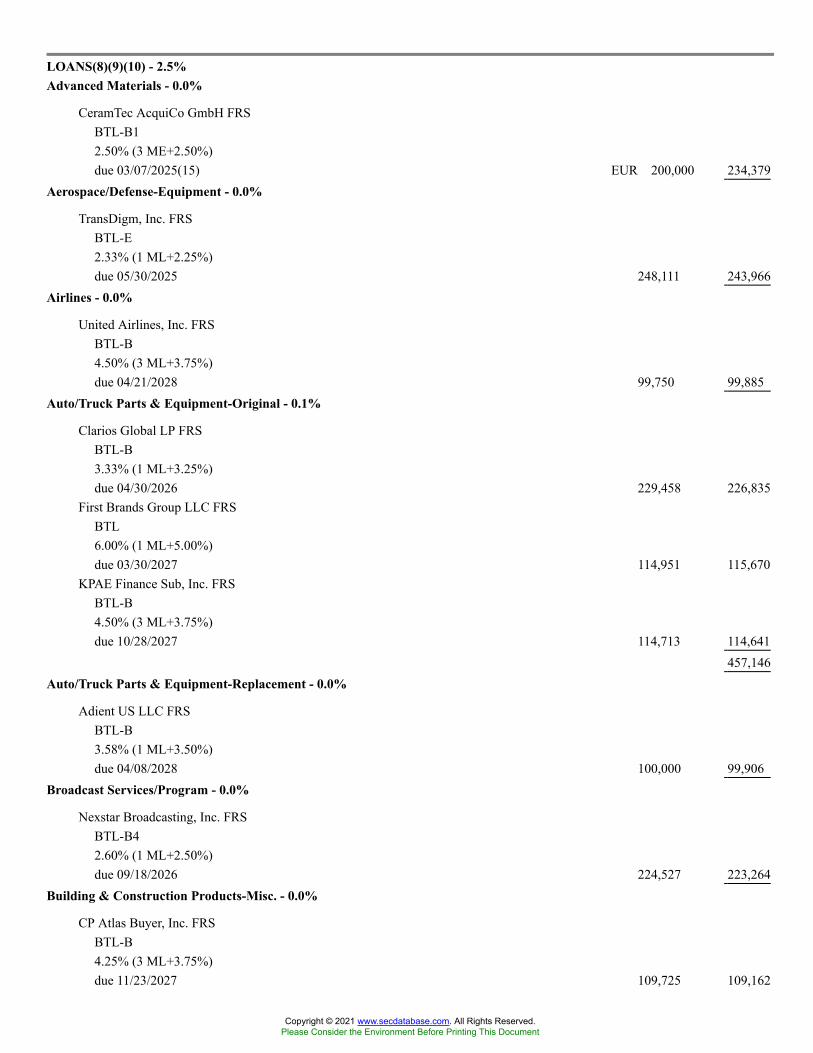
LOANS(8)(9)(10) - 2.5%Advanced Materials - 0.0%
CeramTec AcquiCo GmbH FRSBTL-B12.50% (3 ME+2.50%)due 03/07/2025(15) EUR 200,000 234,379
Aerospace/Defense-Equipment - 0.0%
TransDigm, Inc. FRSBTL-E2.33% (1 ML+2.25%)due 05/30/2025 248,111 243,966
Airlines - 0.0%
United Airlines, Inc. FRSBTL-B4.50% (3 ML+3.75%)due 04/21/2028 99,750 99,885
Auto/Truck Parts & Equipment-Original - 0.1%
Clarios Global LP FRSBTL-B3.33% (1 ML+3.25%)due 04/30/2026 229,458 226,835
First Brands Group LLC FRSBTL6.00% (1 ML+5.00%)due 03/30/2027 114,951 115,670
KPAE Finance Sub, Inc. FRSBTL-B4.50% (3 ML+3.75%)due 10/28/2027 114,713 114,641
457,146Auto/Truck Parts & Equipment-Replacement - 0.0%
Adient US LLC FRSBTL-B3.58% (1 ML+3.50%)due 04/08/2028 100,000 99,906
Broadcast Services/Program - 0.0%
Nexstar Broadcasting, Inc. FRSBTL-B42.60% (1 ML+2.50%)due 09/18/2026 224,527 223,264
Building & Construction Products-Misc. - 0.0%
CP Atlas Buyer, Inc. FRSBTL-B4.25% (3 ML+3.75%)due 11/23/2027 109,725 109,162
Copyright © 2021 www.secdatabase.com. All Rights Reserved.Please Consider the Environment Before Printing This Document

Standard Industries, Inc. FRSBTL-BTBD due 12/06/2021 125,000 124,601
233,763
Copyright © 2021 www.secdatabase.com. All Rights Reserved.Please Consider the Environment Before Printing This Document
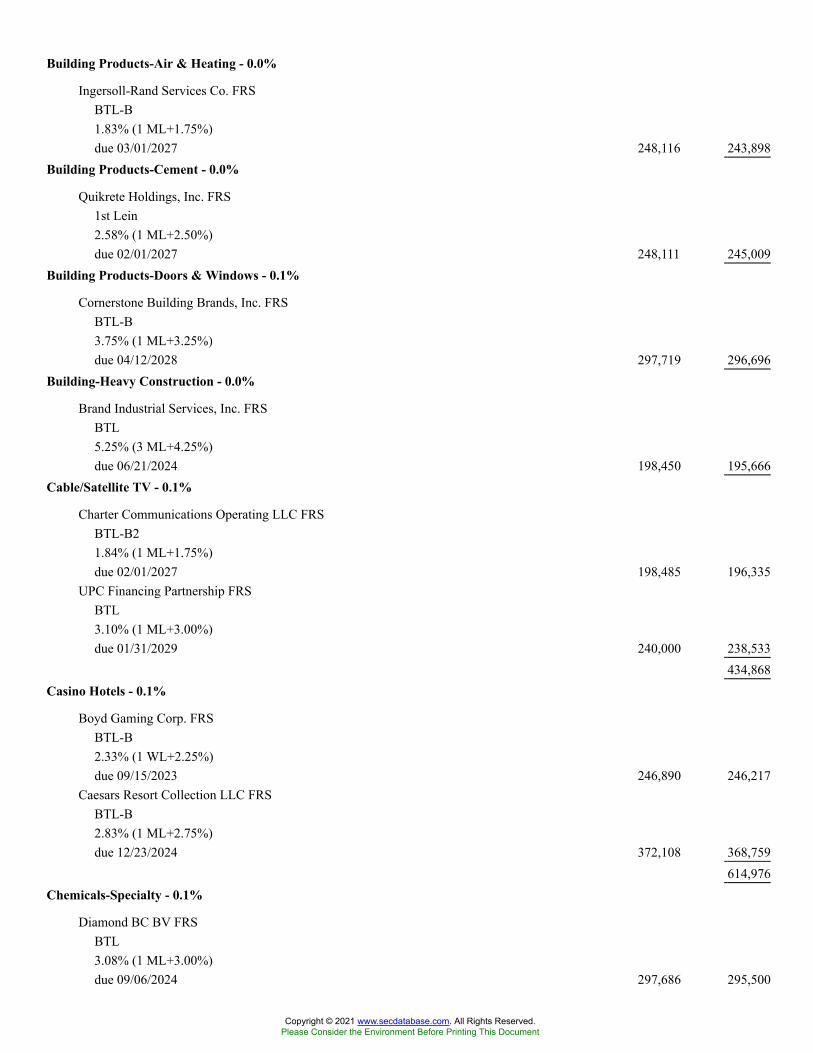
Building Products-Air & Heating - 0.0%
Ingersoll-Rand Services Co. FRSBTL-B1.83% (1 ML+1.75%)due 03/01/2027 248,116 243,898
Building Products-Cement - 0.0%
Quikrete Holdings, Inc. FRS1st Lein2.58% (1 ML+2.50%)due 02/01/2027 248,111 245,009
Building Products-Doors & Windows - 0.1%
Cornerstone Building Brands, Inc. FRSBTL-B3.75% (1 ML+3.25%)due 04/12/2028 297,719 296,696
Building-Heavy Construction - 0.0%
Brand Industrial Services, Inc. FRSBTL5.25% (3 ML+4.25%)due 06/21/2024 198,450 195,666
Cable/Satellite TV - 0.1%
Charter Communications Operating LLC FRSBTL-B21.84% (1 ML+1.75%)due 02/01/2027 198,485 196,335
UPC Financing Partnership FRSBTL3.10% (1 ML+3.00%)due 01/31/2029 240,000 238,533
434,868Casino Hotels - 0.1%
Boyd Gaming Corp. FRSBTL-B2.33% (1 WL+2.25%)due 09/15/2023 246,890 246,217
Caesars Resort Collection LLC FRSBTL-B2.83% (1 ML+2.75%)due 12/23/2024 372,108 368,759
614,976Chemicals-Specialty - 0.1%
Diamond BC BV FRSBTL3.08% (1 ML+3.00%)due 09/06/2024 297,686 295,500
Copyright © 2021 www.secdatabase.com. All Rights Reserved.Please Consider the Environment Before Printing This Document
Starfruit US HoldCo. LLC FRSBTL-B2.84% (1 ML+2.75%)due 10/01/2025 207,977 205,464
Copyright © 2021 www.secdatabase.com. All Rights Reserved.Please Consider the Environment Before Printing This Document

Tronox Finance LLC FRSBTL-B2.65% (3 ML+2.50%)due 03/13/2028 245,193 242,490
743,454Commercial Services - 0.1%
Amentum Government Services Holdings LLC FRSBTL-B5.50% (3 ML+4.75%)due 01/29/2027 279,300 280,260
WW International, Inc. FRSBTL-B4.00% (1 ML+3.50%)due 04/13/2028 100,000 99,550
379,810Commercial Services-Finance - 0.1%
EVO Payments International LLC FRSBTL3.34% (1 ML+3.25%)due 12/22/2023 297,498 296,847
MPH Acquisition Holdings LLC FRSBTL-BTBD due 12/17/2021 200,000 198,450
Copyright © 2021 www.secdatabase.com. All Rights Reserved.Please Consider the Environment Before Printing This Document
WEX, Inc. FRSBTL2.33% (1 ML+2.25%)due 03/31/2028 214,463 212,291
707,588Computer Services - 0.0%
Peraton Corp. FRSBTL-B4.50% (1 ML+3.75%)due 02/01/2028 109,725 109,702
Consulting Services - 0.0%
AlixPartners LLP FRSBTL-B3.25% (1 ML+2.75%)due 02/04/2028 209,475 208,166
Containers-Paper/Plastic - 0.1%
Flex Acquisition Co., Inc. FRSBTL4.00% (3 ML+3.50%)due 02/23/2028 295,774 293,714
Proampac PG Borrower LLC FRSBTL4.50% (3 ML+3.75%)due 11/03/2025 349,125 348,689
642,403Cosmetics & Toiletries - 0.0%
Sunshine Luxembourg VII SARL FRSBTL-B34.50% (3 ML+3.75%)due 10/01/2026 198,997 199,154
Data Processing/Management - 0.1%
CCC Information Services, Inc. FRS1st Lien4.00% (1 ML+3.00%)due 04/29/2024 135,227 135,101
Dun & Bradstreet Corp. FRSBTL3.34% (1 ML+3.25%)due 02/06/2026 472,188 468,477
603,578Diagnostic Equipment - 0.1%
Avantor, Inc. FRSBTL-B52.75% (1 ML+2.25%)due 11/08/2027 452,725 451,933
Copyright © 2021 www.secdatabase.com. All Rights Reserved.Please Consider the Environment Before Printing This Document
Distribution/Wholesale - 0.1%
American Builders & Contractors Supply Co., Inc. FRSBTL2.08% (1 ML+2.00%)due 01/15/2027 248,106 246,048
Core & Main LP FRSBTL-B2.59% (1 ML+2.50%)due 07/27/2028 248,072 245,281
Univar Solutions USA, Inc. FRSBTL-B62.08% (1 ML+2.00%)due 06/03/2028 225,000 223,192
714,521Electric-Integrated - 0.0%
Exgen Renewables IV LLC FRSBTL3.50% (1 ML+2.50%)due 12/15/2027 122,187 121,816
Enterprise Software/Service - 0.1%
E2open LLC FRSBTL-B3.75% (3 ML+3.25%)due 02/04/2028 244,388 243,395
Hyland Software, Inc. FRSBTL4.25% (1 ML+3.50%)due 07/01/2024 248,087 248,242
Ultimate Software Group, Inc. FRS1st Lien3.83% (1 ML+3.75%)due 05/04/2026 248,106 248,168
739,805Finance-Credit Card - 0.1%
Blackhawk Network Holdings, Inc. FRS1st Lien3.08% (1 ML+3.00%)due 06/15/2025 248,082 244,929
FleetCor Technologies Operating Co., LLC FRSBTL-B41.83% (1 ML+1.75%)due 04/28/2028 100,000 99,464
344,393Finance-Investment Banker/Broker - 0.0%
Copyright © 2021 www.secdatabase.com. All Rights Reserved.Please Consider the Environment Before Printing This Document
Deerfield Dakota Holding LLC FRSBTL4.75% (1 ML+3.75%)due 04/09/2027 99,248 99,301
Food-Baking - 0.0%
Hostess Brands, LLC FRSBTL3.00% (2 ML+2.25%)due 08/03/2025 248,106 246,517
Food-Catering - 0.0%
Aramark Services, Inc. FRSBTL-B11.83% (1 ML+1.75%)due 03/11/2025 250,000 245,000
Food-Misc./Diversified - 0.0%
Froneri US, Inc. FRSBTL2.33% (1 ML+2.25%)due 01/29/2027 248,120 244,166
Copyright © 2021 www.secdatabase.com. All Rights Reserved.Please Consider the Environment Before Printing This Document
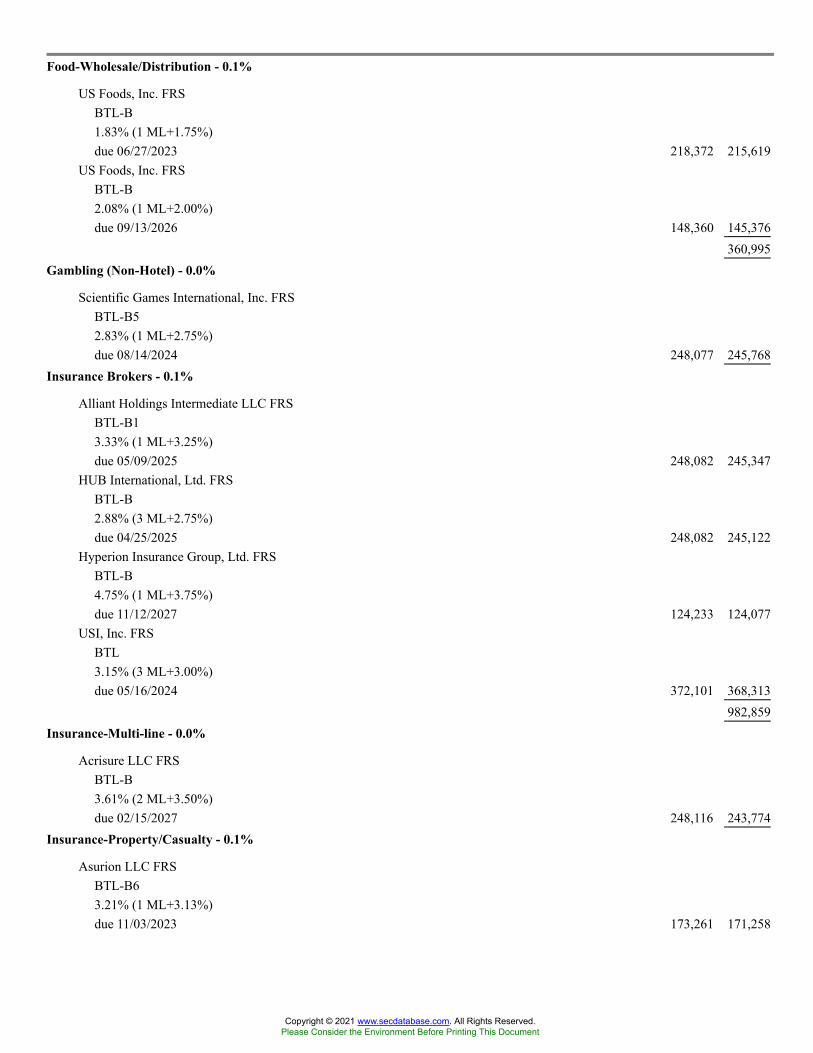
Food-Wholesale/Distribution - 0.1%
US Foods, Inc. FRSBTL-B1.83% (1 ML+1.75%)due 06/27/2023 218,372 215,619
US Foods, Inc. FRSBTL-B2.08% (1 ML+2.00%)due 09/13/2026 148,360 145,376
360,995Gambling (Non-Hotel) - 0.0%
Scientific Games International, Inc. FRSBTL-B52.83% (1 ML+2.75%)due 08/14/2024 248,077 245,768
Insurance Brokers - 0.1%
Alliant Holdings Intermediate LLC FRSBTL-B13.33% (1 ML+3.25%)due 05/09/2025 248,082 245,347
HUB International, Ltd. FRSBTL-B2.88% (3 ML+2.75%)due 04/25/2025 248,082 245,122
Hyperion Insurance Group, Ltd. FRSBTL-B4.75% (1 ML+3.75%)due 11/12/2027 124,233 124,077
USI, Inc. FRSBTL3.15% (3 ML+3.00%)due 05/16/2024 372,101 368,313
982,859Insurance-Multi-line - 0.0%
Acrisure LLC FRSBTL-B3.61% (2 ML+3.50%)due 02/15/2027 248,116 243,774
Insurance-Property/Casualty - 0.1%
Asurion LLC FRSBTL-B63.21% (1 ML+3.13%)due 11/03/2023 173,261 171,258
Copyright © 2021 www.secdatabase.com. All Rights Reserved.Please Consider the Environment Before Printing This Document

Asurion LLC FRSBTL-B73.08% (1 ML+3.00%)due 11/03/2024 148,849 146,244
Sedgwick Claims Management Services, Inc. FRSBTL3.33% (1 ML+3.25%)due 12/31/2025 248,092 244,603
562,105
Copyright © 2021 www.secdatabase.com. All Rights Reserved.Please Consider the Environment Before Printing This Document
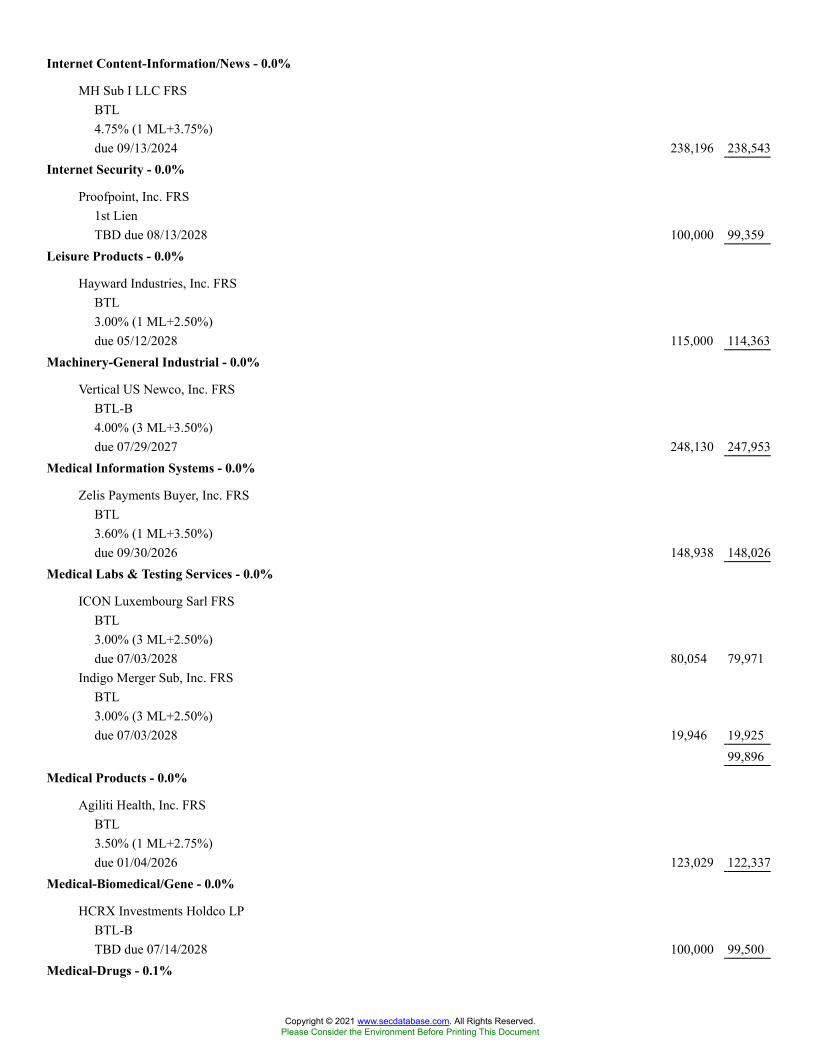
Internet Content-Information/News - 0.0%
MH Sub I LLC FRSBTL4.75% (1 ML+3.75%)due 09/13/2024 238,196 238,543
Internet Security - 0.0%
Proofpoint, Inc. FRS1st LienTBD due 08/13/2028 100,000 99,359
Leisure Products - 0.0%
Hayward Industries, Inc. FRSBTL3.00% (1 ML+2.50%)due 05/12/2028 115,000 114,363
Machinery-General Industrial - 0.0%
Vertical US Newco, Inc. FRSBTL-B4.00% (3 ML+3.50%)due 07/29/2027 248,130 247,953
Medical Information Systems - 0.0%
Zelis Payments Buyer, Inc. FRSBTL3.60% (1 ML+3.50%)due 09/30/2026 148,938 148,026
Medical Labs & Testing Services - 0.0%
ICON Luxembourg Sarl FRSBTL3.00% (3 ML+2.50%)due 07/03/2028 80,054 79,971
Indigo Merger Sub, Inc. FRSBTL3.00% (3 ML+2.50%)due 07/03/2028 19,946 19,925
99,896Medical Products - 0.0%
Agiliti Health, Inc. FRSBTL3.50% (1 ML+2.75%)due 01/04/2026 123,029 122,337
Medical-Biomedical/Gene - 0.0%
HCRX Investments Holdco LPBTL-BTBD due 07/14/2028 100,000 99,500
Medical-Drugs - 0.1%
Copyright © 2021 www.secdatabase.com. All Rights Reserved.Please Consider the Environment Before Printing This Document

Bausch Health Americas, Inc. FRSBTL3.08% (1 ML+3.00%)due 06/02/2025 242,011 241,043
Copyright © 2021 www.secdatabase.com. All Rights Reserved.Please Consider the Environment Before Printing This Document
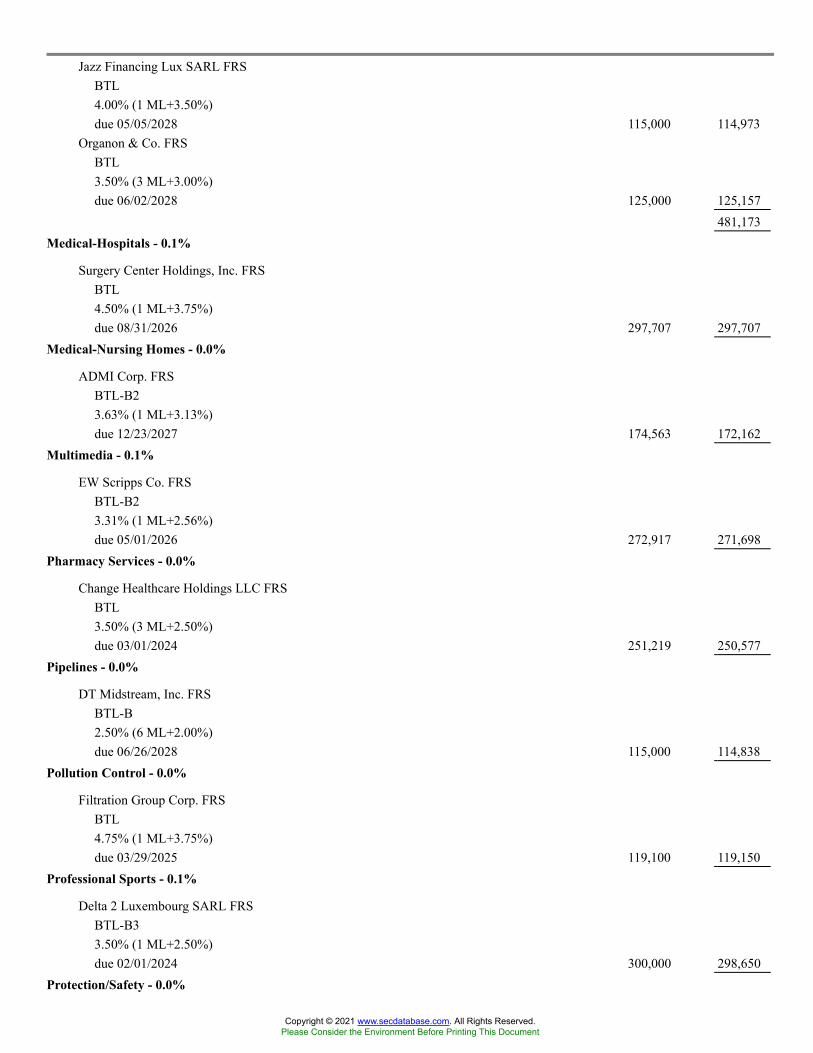
Jazz Financing Lux SARL FRSBTL4.00% (1 ML+3.50%)due 05/05/2028 115,000 114,973
Organon & Co. FRSBTL3.50% (3 ML+3.00%)due 06/02/2028 125,000 125,157
481,173Medical-Hospitals - 0.1%
Surgery Center Holdings, Inc. FRSBTL4.50% (1 ML+3.75%)due 08/31/2026 297,707 297,707
Medical-Nursing Homes - 0.0%
ADMI Corp. FRSBTL-B23.63% (1 ML+3.13%)due 12/23/2027 174,563 172,162
Multimedia - 0.1%
EW Scripps Co. FRSBTL-B23.31% (1 ML+2.56%)due 05/01/2026 272,917 271,698
Pharmacy Services - 0.0%
Change Healthcare Holdings LLC FRSBTL3.50% (3 ML+2.50%)due 03/01/2024 251,219 250,577
Pipelines - 0.0%
DT Midstream, Inc. FRSBTL-B2.50% (6 ML+2.00%)due 06/26/2028 115,000 114,838
Pollution Control - 0.0%
Filtration Group Corp. FRSBTL4.75% (1 ML+3.75%)due 03/29/2025 119,100 119,150
Professional Sports - 0.1%
Delta 2 Luxembourg SARL FRSBTL-B33.50% (1 ML+2.50%)due 02/01/2024 300,000 298,650
Protection/Safety - 0.0%
Copyright © 2021 www.secdatabase.com. All Rights Reserved.Please Consider the Environment Before Printing This Document
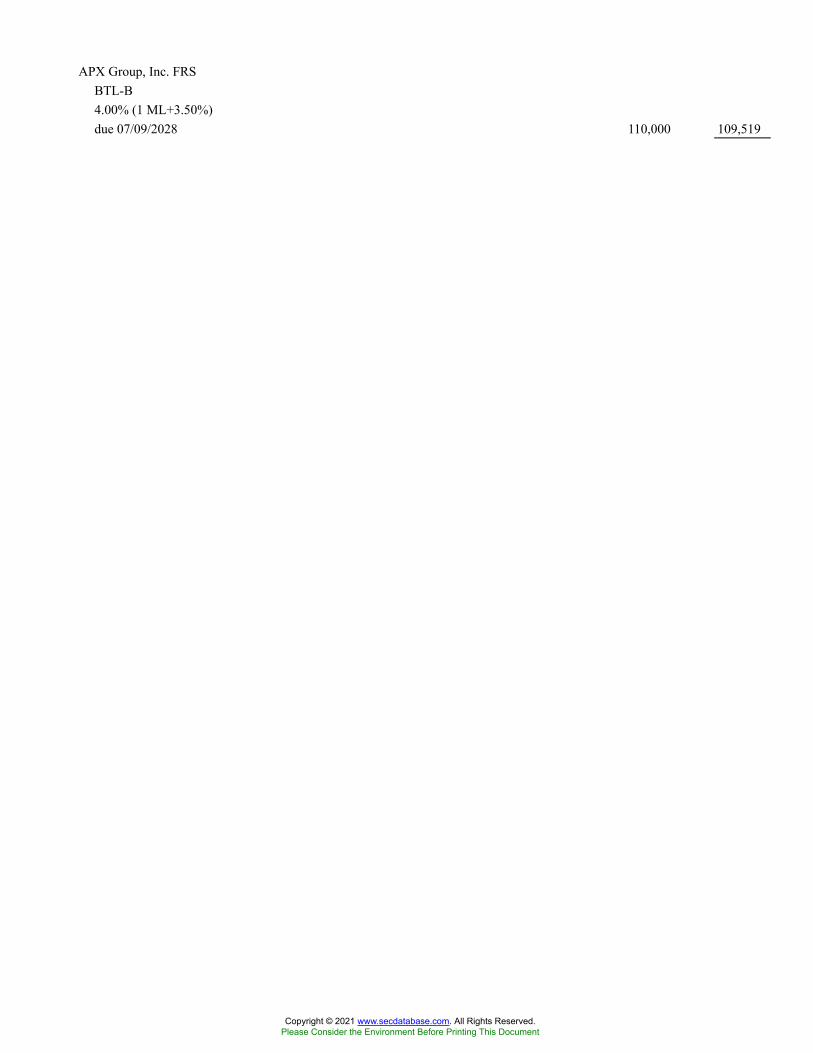
APX Group, Inc. FRSBTL-B4.00% (1 ML+3.50%)due 07/09/2028 110,000 109,519
Copyright © 2021 www.secdatabase.com. All Rights Reserved.Please Consider the Environment Before Printing This Document
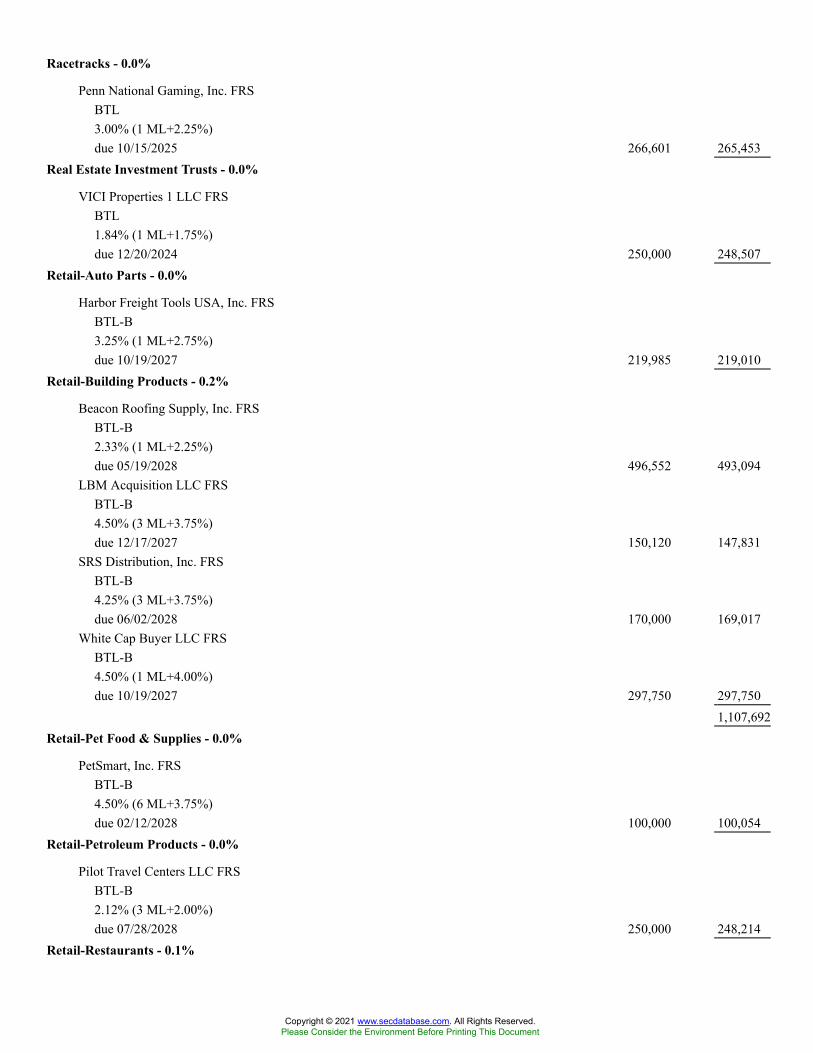
Racetracks - 0.0%
Penn National Gaming, Inc. FRSBTL3.00% (1 ML+2.25%)due 10/15/2025 266,601 265,453
Real Estate Investment Trusts - 0.0%
VICI Properties 1 LLC FRSBTL1.84% (1 ML+1.75%)due 12/20/2024 250,000 248,507
Retail-Auto Parts - 0.0%
Harbor Freight Tools USA, Inc. FRSBTL-B3.25% (1 ML+2.75%)due 10/19/2027 219,985 219,010
Retail-Building Products - 0.2%
Beacon Roofing Supply, Inc. FRSBTL-B2.33% (1 ML+2.25%)due 05/19/2028 496,552 493,094
LBM Acquisition LLC FRSBTL-B4.50% (3 ML+3.75%)due 12/17/2027 150,120 147,831
SRS Distribution, Inc. FRSBTL-B4.25% (3 ML+3.75%)due 06/02/2028 170,000 169,017
White Cap Buyer LLC FRSBTL-B4.50% (1 ML+4.00%)due 10/19/2027 297,750 297,750
1,107,692Retail-Pet Food & Supplies - 0.0%
PetSmart, Inc. FRSBTL-B4.50% (6 ML+3.75%)due 02/12/2028 100,000 100,054
Retail-Petroleum Products - 0.0%
Pilot Travel Centers LLC FRSBTL-B2.12% (3 ML+2.00%)due 07/28/2028 250,000 248,214
Retail-Restaurants - 0.1%
Copyright © 2021 www.secdatabase.com. All Rights Reserved.Please Consider the Environment Before Printing This Document

1011778 BC ULC FRSBTL-B1.83% (1 ML+1.75%)due 11/19/2026 272,922 268,097
IRB Holding Corp. FRSBTL4.25% (3 ML+3.25%)due 12/15/2027 159,200 159,041
427,138
Copyright © 2021 www.secdatabase.com. All Rights Reserved.Please Consider the Environment Before Printing This Document
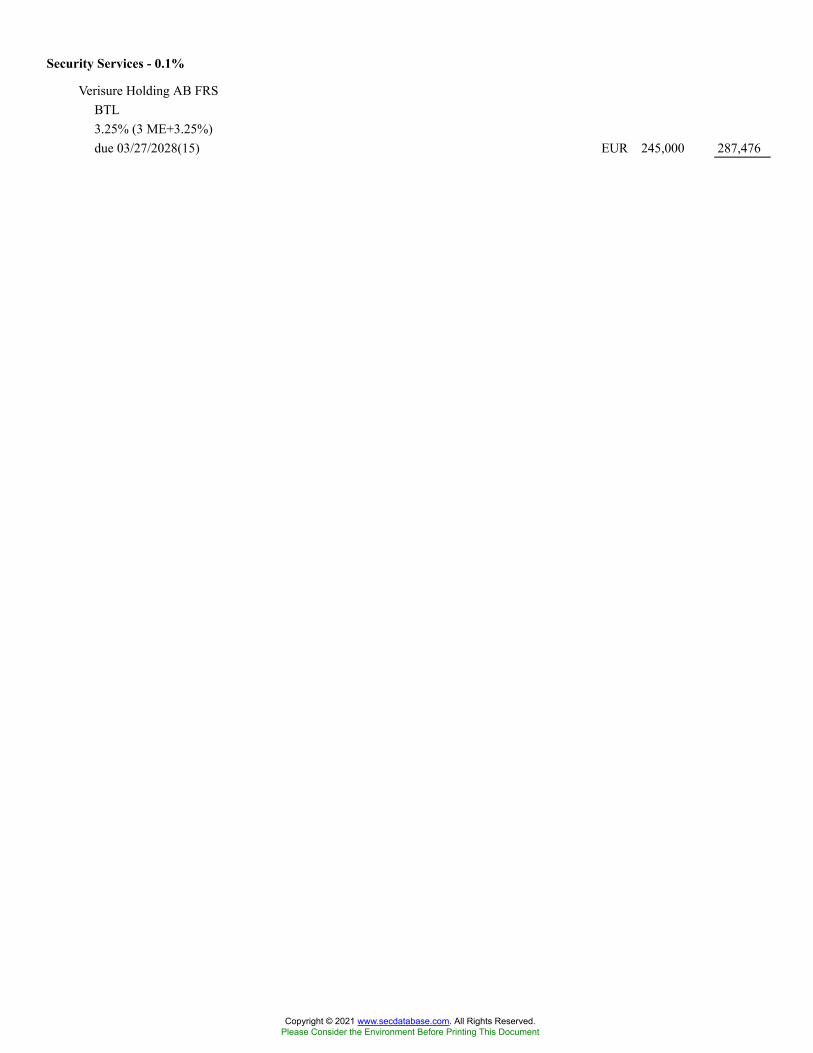
Security Services - 0.1%
Verisure Holding AB FRSBTL3.25% (3 ME+3.25%)due 03/27/2028(15) EUR 245,000 287,476
Copyright © 2021 www.secdatabase.com. All Rights Reserved.Please Consider the Environment Before Printing This Document
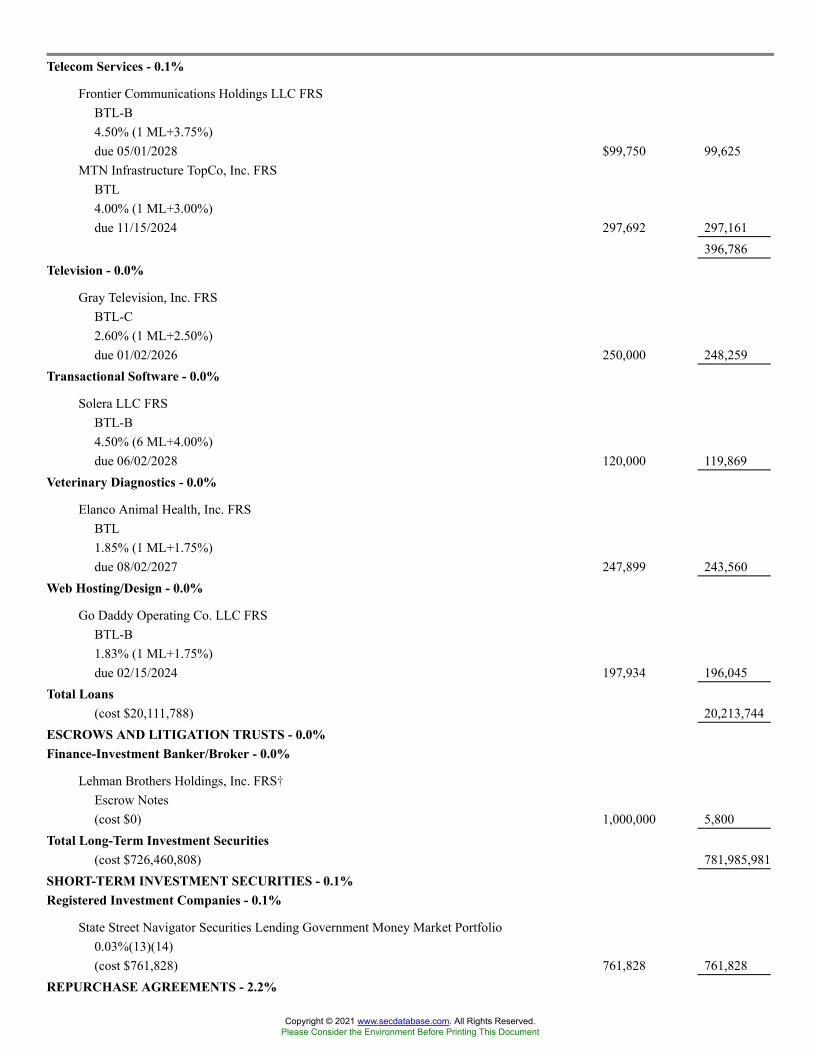
Telecom Services - 0.1%
Frontier Communications Holdings LLC FRSBTL-B4.50% (1 ML+3.75%)due 05/01/2028 $99,750 99,625
MTN Infrastructure TopCo, Inc. FRSBTL4.00% (1 ML+3.00%)due 11/15/2024 297,692 297,161
396,786Television - 0.0%
Gray Television, Inc. FRSBTL-C2.60% (1 ML+2.50%)due 01/02/2026 250,000 248,259
Transactional Software - 0.0%
Solera LLC FRSBTL-B4.50% (6 ML+4.00%)due 06/02/2028 120,000 119,869
Veterinary Diagnostics - 0.0%
Elanco Animal Health, Inc. FRSBTL1.85% (1 ML+1.75%)due 08/02/2027 247,899 243,560
Web Hosting/Design - 0.0%
Go Daddy Operating Co. LLC FRSBTL-B1.83% (1 ML+1.75%)due 02/15/2024 197,934 196,045
Total Loans(cost $20,111,788) 20,213,744
ESCROWS AND LITIGATION TRUSTS - 0.0%Finance-Investment Banker/Broker - 0.0%
Lehman Brothers Holdings, Inc. FRS�Escrow Notes(cost $0) 1,000,000 5,800
Total Long-Term Investment Securities(cost $726,460,808) 781,985,981
SHORT-TERM INVESTMENT SECURITIES - 0.1%Registered Investment Companies - 0.1%
State Street Navigator Securities Lending Government Money Market Portfolio0.03%(13)(14)(cost $761,828) 761,828 761,828
REPURCHASE AGREEMENTS - 2.2%
Copyright © 2021 www.secdatabase.com. All Rights Reserved.Please Consider the Environment Before Printing This Document

Agreement with Fixed Income Clearing Corp., bearing interest at 0.00% dated 08/31/2021, tobe repurchased 09/01/2021 in the amount of $17,756,000 and collateralized by$18,035,100 of United States Treasury Notes, bearing interest at 1.13% due 08/31/2028and having an approximate value of $18,111,190.(cost $17,756,000) 17,756,000 17,756,000
TOTAL INVESTMENTS(cost $744,978,636) 98.8 % 800,503,809
Other assets less liabilities 1.2 9,445,027NET ASSETS 100.0 % $809,948,836
* Securities exempt from registration under Rule 144A of the Securities Act of 1933. These securities may be sold in transactionsexempt from registration, normally to qualified institutional buyers. The Fund has no right to demand registration of thesesecurities. At August 31, 2021, the aggregate value of these securities was $145,589,065 representing 18.0% of net assets.
# The security or a portion thereof is out on loan.� Non-income producing security(1) Collateralized Mortgage Obligation(2) Certain variable rate securities are not based on a published reference rate and spread but are determined by the issuer or agent and
are based on current market conditions. These securities do not indicate a reference rate and spread in their description above.(3) Collateralized Loan Obligation(4) Commercial Mortgage Backed Security(5) Interest Only(6) �Step-up� security where the rate increases (�steps-up�) at a predetermined rate. The rate reflected is as of August 31, 2021.(7) Principal amount of security is adjusted for inflation.(8) The Fund invests in senior loans which generally pay interest at rates which are periodically re-determined by reference to a base
lending rate plus a premium. These base lending rates are generally either the lending rate offered by one or more major Europeanbanks, such as the London Inter-Bank Offered Rate (�LIBOR�) or the prime rate offered by one or more major United Statesbanks, or the certificate of deposit rate. Senior loans are generally considered to be restrictive in that the Fund is ordinarilycontractually obligated to receive approval from the Agent Bank and/or borrower prior to the disposition of a senior loan.
(9) Senior loans in the Fund are generally subject to mandatory and/or optional prepayment. Because of these mandatory prepaymentconditions and because there may be significant economic incentives for a borrower to prepay, prepayments may occur. As aresult, the actual remaining maturity may be substantially less than the stated maturities shown.
(10) All loans in the Fund were purchased through assignment agreements unless otherwise indicated.(11) The security or a portion thereof was pledged as collateral to cover margin requirements for open futures contracts.(12) Denominated in United States dollars unless otherwise indicated.(13) At August 31, 2021, the Fund had loaned securities with a total value of $1,946,938. This was secured by collateral of $761,828,
which was received in cash and subsequently invested in short-term investments currently valued at $761,828 as reported in thePortfolio of Investments. Additional collateral of $1,221,132 was received in the form of fixed income pooled securities, which theFund cannot sell or repledge and accordingly, are not reflected in the Fund�s assets and liabilities. The components of the fixedincome pooled securities referenced above are as follows:
Securities Coupon Range Maturity Date Range
Value as of
August 31, 2021
United States Treasury Bills0.00%
10/12/2021 to 02/17/2022 $28,152
United States Treasury Notes/Bonds0.08% to 3.75%
01/15/2022 to 02/15/2046 1,192,980
(14) The rate shown is the 7-day yield as of August 31, 2021.
Copyright © 2021 www.secdatabase.com. All Rights Reserved.Please Consider the Environment Before Printing This Document

(15) The referenced Index is less than 0.00% at the period end. The loan has an interest rate floor whereby the floating rate used in thecoupon rate calculation cannot be less than zero.
BTL - Bank Term LoanCLO - Collateralized Loan ObligationREMIC - Real Estate Mortgage Investment ConduitTBD - Senior loan purchased on a when-issued or delayed-delivery basis. Certain details associated with this purchase are not knownprior to the settlement date of the transaction. In addition, senior loans typically trade without accrued interest and therefore a couponrate is not available prior to the settlement.TIPS - Treasury Inflation Protected SecuritiesFRS - Floating Rate SecurityVRS - Variable Rate Security
The rates shown on FRS and VRS are the current interest rates as of August 31, 2021 and unless noted otherwise, the dates shown arethe original maturity dates.
Index Legend
1 ML - 1 Month USD LIBOR1 WL- 1 Week LIBOR2 ML- 2 Month USD LIBOR3 ML- 3 Month USD LIBOR6 ML- 6 Month USD LIBORAUD - Australian DollarCAD - Canadian DollarEUR - Euro CurrencyGBP - British PoundNZD - New Zealand Dollar
Copyright © 2021 www.secdatabase.com. All Rights Reserved.Please Consider the Environment Before Printing This Document

Forward Foreign Currency Contracts
Counterparty
Contract to
Deliver In Exchange For
Delivery
Date
Unrealized
Appreciation
Unrealized
Depreciation
BNP Paribas SACAD 48,081,000 USD 39,837,122
09/15/2021 $1,728,475 $ �
GBP 15,101,000 USD 21,344,53909/15/2021 582,262 �
2,310,737 �
Citibank N.A.EUR 58,321,000 USD 71,037,719
09/15/2021 2,158,028 �
EUR 444,000 USD 522,04009/30/2021 � (2,504 )
2,158,028 (2,504 )Morgan Stanley and Co. International Plc
AUD 40,907,000 USD 31,747,39109/15/2021 1,819,619 �
NZD 47,660,000 USD 34,391,12209/15/2021 807,497 �
2,627,116 �
State Street Bank and Trust Co.CAD 48,081,000 USD 39,829,862
09/15/2021 1,721,215 �
Net Unrealized Appreciation/(Depreciation) $8,817,096 $ (2,504 )
AUD - Australian DollarCAD - Canadian DollarEUR - Euro CurrencyGBP - British PoundNZD - New Zealand DollarUSD - U.S. Dollar
Futures ContractsNumber
of
Contracts Type Description Expiration Month
Notional
Basis*
Notional
Value*
Unrealized
Appreciation
623 Short Canada 10 Year Bond December 2021 $72,478,154 $72,158,673 $ 319,48180 Short Euro-BTP September 2021 14,640,017 14,479,779 160,23830 Short Euro-BUXL 30 Year Bonds September 2021 7,683,820 7,527,992 155,828159 Short Long GILT December 2021 28,226,782 28,033,414 193,368109 Long U.S. Treasury 10 Year Notes December 2021 14,536,894 14,546,391 9,49721 Long U.S. Treasury 10 Year Ultra Notes December 2021 3,106,585 3,108,328 1,743
$ 840,155
Unrealized
(Depreciation)
252 Short Australian 10 Year Bonds September 2021 $26,836,467 $26,879,963 $ (43,496 )174 Short Euro-Bund September 2021 35,276,532 36,046,304 (769,772 )124 Long U.S. Treasury Long Bonds December 2021 20,271,399 20,208,125 (63,274 )34 Long U.S. Treasury Ultra Bonds December 2021 6,732,640 6,707,562 (25,078 )
$ (901,620 )
Copyright © 2021 www.secdatabase.com. All Rights Reserved.Please Consider the Environment Before Printing This Document
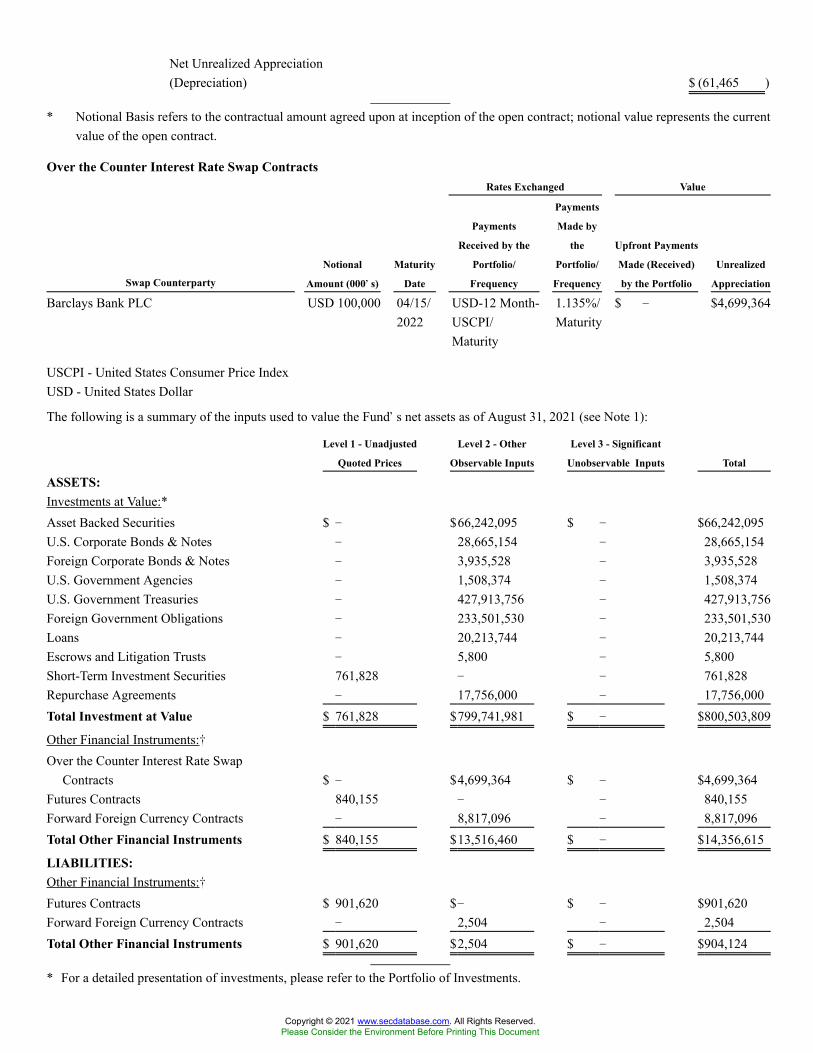
Net Unrealized Appreciation(Depreciation) $ (61,465 )
* Notional Basis refers to the contractual amount agreed upon at inception of the open contract; notional value represents the currentvalue of the open contract.
Over the Counter Interest Rate Swap ContractsRates Exchanged Value
Swap CounterpartyNotional
Amount (000��s)
Maturity
Date
Payments
Received by the
Portfolio/
Frequency
Payments
Made by
the
Portfolio/
Frequency
Upfront Payments
Made (Received)
by the Portfolio
Unrealized
Appreciation
Barclays Bank PLC USD 100,000 04/15/2022
USD-12 Month-USCPI/Maturity
1.135%/Maturity
$ � $4,699,364
USCPI - United States Consumer Price IndexUSD - United States Dollar
The following is a summary of the inputs used to value the Fund�s net assets as of August 31, 2021 (see Note 1):
Level 1 - Unadjusted
Quoted Prices
Level 2 - Other
Observable Inputs
Level 3 - Significant
Unobservable Inputs Total
ASSETS:Investments at Value:*Asset Backed Securities $ � $66,242,095 $ � $66,242,095U.S. Corporate Bonds & Notes � 28,665,154 � 28,665,154Foreign Corporate Bonds & Notes � 3,935,528 � 3,935,528U.S. Government Agencies � 1,508,374 � 1,508,374U.S. Government Treasuries � 427,913,756 � 427,913,756Foreign Government Obligations � 233,501,530 � 233,501,530Loans � 20,213,744 � 20,213,744Escrows and Litigation Trusts � 5,800 � 5,800Short-Term Investment Securities 761,828 � � 761,828Repurchase Agreements � 17,756,000 � 17,756,000Total Investment at Value $ 761,828 $799,741,981 $ � $800,503,809
Other Financial Instruments:�Over the Counter Interest Rate Swap
Contracts $ � $4,699,364 $ � $4,699,364Futures Contracts 840,155 � � 840,155Forward Foreign Currency Contracts � 8,817,096 � 8,817,096Total Other Financial Instruments $ 840,155 $13,516,460 $ � $14,356,615
LIABILITIES:Other Financial Instruments:�Futures Contracts $ 901,620 $� $ � $901,620Forward Foreign Currency Contracts � 2,504 � 2,504Total Other Financial Instruments $ 901,620 $2,504 $ � $904,124
* For a detailed presentation of investments, please refer to the Portfolio of Investments.
Copyright © 2021 www.secdatabase.com. All Rights Reserved.Please Consider the Environment Before Printing This Document

� Amounts represent unrealized appreciation/depreciation as of the end of the reporting period.
See Notes to Portfolio of Investments
Copyright © 2021 www.secdatabase.com. All Rights Reserved.Please Consider the Environment Before Printing This Document
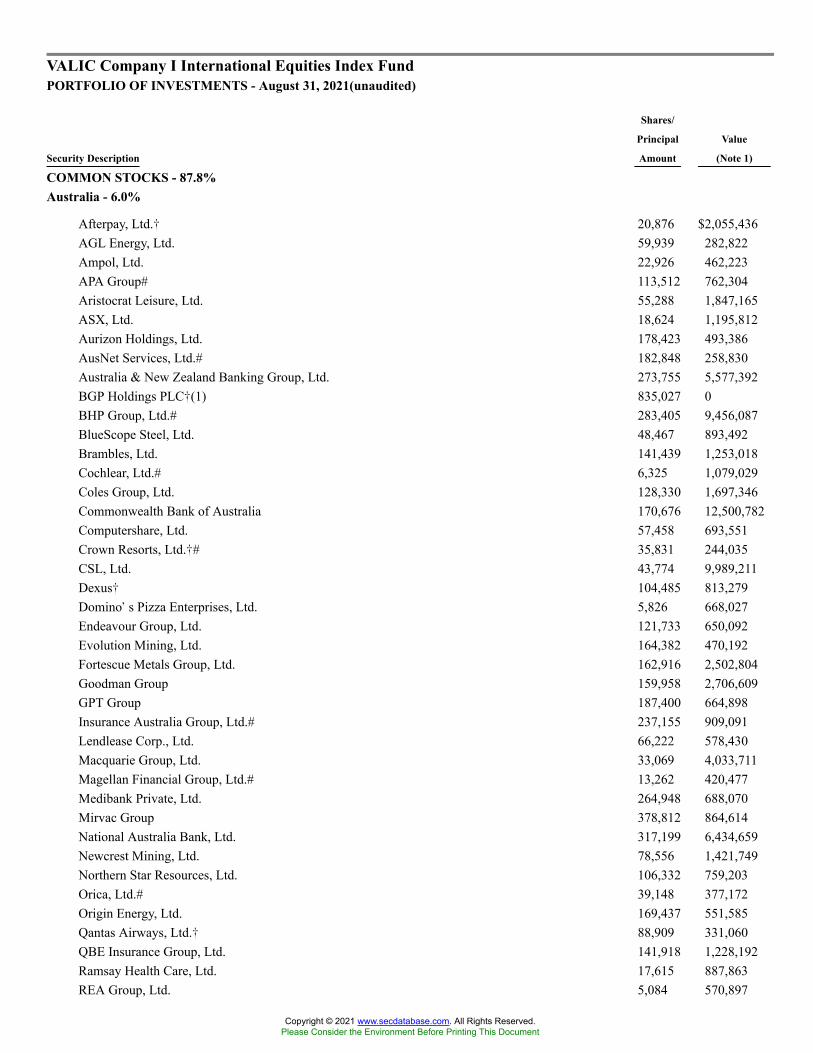
VALIC Company I International Equities Index FundPORTFOLIO OF INVESTMENTS - August 31, 2021(unaudited)
Security Description
Shares/
Principal
Amount
Value
(Note 1)
COMMON STOCKS - 87.8%Australia - 6.0%
Afterpay, Ltd.� 20,876 $2,055,436AGL Energy, Ltd. 59,939 282,822Ampol, Ltd. 22,926 462,223APA Group# 113,512 762,304Aristocrat Leisure, Ltd. 55,288 1,847,165ASX, Ltd. 18,624 1,195,812Aurizon Holdings, Ltd. 178,423 493,386AusNet Services, Ltd.# 182,848 258,830Australia & New Zealand Banking Group, Ltd. 273,755 5,577,392BGP Holdings PLC�(1) 835,027 0BHP Group, Ltd.# 283,405 9,456,087BlueScope Steel, Ltd. 48,467 893,492Brambles, Ltd. 141,439 1,253,018Cochlear, Ltd.# 6,325 1,079,029Coles Group, Ltd. 128,330 1,697,346Commonwealth Bank of Australia 170,676 12,500,782Computershare, Ltd. 57,458 693,551Crown Resorts, Ltd.�# 35,831 244,035CSL, Ltd. 43,774 9,989,211Dexus� 104,485 813,279Domino�s Pizza Enterprises, Ltd. 5,826 668,027Endeavour Group, Ltd. 121,733 650,092Evolution Mining, Ltd. 164,382 470,192Fortescue Metals Group, Ltd. 162,916 2,502,804Goodman Group 159,958 2,706,609GPT Group 187,400 664,898Insurance Australia Group, Ltd.# 237,155 909,091Lendlease Corp., Ltd. 66,222 578,430Macquarie Group, Ltd. 33,069 4,033,711Magellan Financial Group, Ltd.# 13,262 420,477Medibank Private, Ltd. 264,948 688,070Mirvac Group 378,812 864,614National Australia Bank, Ltd. 317,199 6,434,659Newcrest Mining, Ltd. 78,556 1,421,749Northern Star Resources, Ltd. 106,332 759,203Orica, Ltd.# 39,148 377,172Origin Energy, Ltd. 169,437 551,585Qantas Airways, Ltd.� 88,909 331,060QBE Insurance Group, Ltd. 141,918 1,228,192Ramsay Health Care, Ltd. 17,615 887,863REA Group, Ltd. 5,084 570,897
Copyright © 2021 www.secdatabase.com. All Rights Reserved.Please Consider the Environment Before Printing This Document

Reece, Ltd. 27,966 427,174Rio Tinto, Ltd. 35,712 2,927,579Santos, Ltd. 180,361 798,255Scentre Group 499,339 1,041,080SEEK, Ltd. 32,265 768,056Sonic Healthcare, Ltd. 43,672 1,386,554South32, Ltd. 459,931 1,056,492Stockland 229,648 776,155Suncorp Group, Ltd. 123,200 1,124,784Sydney Airport�# 127,218 741,738Tabcorp Holdings, Ltd. 213,300 747,430Telstra Corp., Ltd. 400,467 1,124,972Transurban Group 263,408 2,738,211Treasury Wine Estates, Ltd. 69,406 641,275Vicinity Centres# 372,257 471,121Washington H. Soul Pattinson & Co., Ltd.# 10,364 271,579Wesfarmers, Ltd. 109,080 4,783,857Westpac Banking Corp. 352,936 6,666,472WiseTech Global, Ltd. 14,066 497,418Woodside Petroleum, Ltd. 92,571 1,319,868Woolworths Group, Ltd. 121,733 3,717,994
113,302,659Austria - 0.2%
Erste Group Bank AG 26,877 1,074,548OMV AG 14,168 785,086Raiffeisen Bank International AG 14,241 342,018Verbund AG# 6,551 717,430voestalpine AG 11,166 506,276
3,425,358Belgium - 0.7%
Ageas SA/NV 16,845 842,331Anheuser-Busch InBev SA NV 73,304 4,499,929Elia Group SA NV 2,972 373,378Etablissements Franz Colruyt NV 5,239 293,152Groupe Bruxelles Lambert SA 10,866 1,245,796KBC Group NV 24,053 2,026,098Proximus SADP 14,634 286,920Sofina SA 1,483 655,594Solvay SA 7,131 934,191UCB SA 12,163 1,391,339Umicore SA 18,964 1,248,116
13,796,844Bermuda - 0.1%
CK Infrastructure Holdings, Ltd. 64,000 388,816Hongkong Land Holdings, Ltd. 112,300 471,660Jardine Matheson Holdings, Ltd. 20,786 1,129,096
1,989,572
Copyright © 2021 www.secdatabase.com. All Rights Reserved.Please Consider the Environment Before Printing This Document

Cayman Islands - 0.5%
Budweiser Brewing Co. APAC, Ltd.* 165,600 414,349Chow Tai Fook Jewellery Group, Ltd. 192,400 389,874CK Asset Holdings, Ltd. 193,308 1,260,145CK Hutchison Holdings, Ltd. 259,808 1,895,750ESR Cayman, Ltd.�* 191,400 583,248Futu Holdings, Ltd. ADR�# 4,816 458,435Melco Resorts & Entertainment, Ltd. ADR� 20,645 284,075Sands China, Ltd.� 233,600 749,387Sea, Ltd. ADR� 1,326 448,612WH Group, Ltd.#* 922,000 800,198Wharf Real Estate Investment Co., Ltd. 161,000 798,019Wynn Macau, Ltd.� 150,000 168,950Xinyi Glass Holdings, Ltd. 175,000 735,781
8,986,823Denmark - 2.4%
Ambu A/S, Class B 16,113 509,367AP Moller - Maersk A/S, Series A 306 828,380AP Moller - Maersk A/S, Series B 590 1,674,018Carlsberg A/S, Class B 9,910 1,730,025Chr. Hansen Holding A/S 10,148 936,461Coloplast A/S, Class B 11,429 1,979,778Danske Bank A/S 66,357 1,115,222Demant A/S� 10,420 590,635DSV PANALPINA A/S 19,915 5,075,033Genmab A/S� 6,306 2,985,693
Copyright © 2021 www.secdatabase.com. All Rights Reserved.Please Consider the Environment Before Printing This Document

GN Store Nord A/S 12,319 926,927Novo Nordisk A/S, Class B 165,659 16,510,139Novozymes A/S, Class B 20,023 1,617,558Orsted A/S* 18,199 2,892,445Pandora A/S 9,621 1,151,795ROCKWOOL International A/S, Class B 827 437,647Tryg A/S 34,639 857,698Vestas Wind Systems A/S 97,154 3,922,750
45,741,571Finland - 1.2%
Elisa Oyj 13,684 876,377Fortum Oyj 42,729 1,297,633Kesko Oyj, Class B 26,276 1,084,648Kone Oyj, Class B 32,699 2,711,921Neste Oyj 40,701 2,476,895Nokia Oyj� 518,706 3,111,309Nordea Bank Abp 311,699 3,663,329Orion Oyj, Class B 10,207 416,153Sampo Oyj, Class A 47,981 2,478,028Stora Enso Oyj, Class R 55,967 1,095,327UPM-Kymmene Oyj 51,348 2,087,462Wartsila Oyj Abp 45,541 645,539
21,944,621France - 9.3%
Accor SA� 16,345 562,770Aeroports de Paris� 2,856 335,334Air Liquide SA 45,571 8,169,127Alstom SA 26,783 1,151,115Amundi SA* 5,847 553,343Arkema SA 5,906 783,823Atos SE 9,524 494,351AXA SA 186,129 5,226,176BioMerieux 3,985 488,644BNP Paribas SA 108,213 6,865,219Bollore SA 85,031 503,006Bouygues SA 21,979 919,469Bureau Veritas SA 28,278 938,572Capgemini SE 15,426 3,463,441Carrefour SA 58,994 1,173,724Cie de Saint-Gobain 48,684 3,528,922Cie Generale des Etablissements Michelin SCA 16,299 2,637,534CNP Assurances 16,514 282,637Covivio 5,005 475,846Credit Agricole SA 112,240 1,618,160Danone SA 62,754 4,584,370Dassault Aviation SA 241 271,756Dassault Systemes SE 63,553 3,624,819
Copyright © 2021 www.secdatabase.com. All Rights Reserved.Please Consider the Environment Before Printing This Document

Edenred 23,723 1,344,525Eiffage SA 8,014 832,892Electricite de France SA 44,734 606,106Engie SA 175,714 2,517,079EssilorLuxottica SA 27,452 5,389,145Eurazeo SE 3,800 390,805Faurecia SE 11,287 544,280Gecina SA 4,418 686,238Getlink SE 42,330 680,494Hermes International 3,046 4,475,926Iliad SA 1,427 306,657Ipsen SA 3,628 362,749Kering SA 7,217 5,743,475Klepierre SA 19,856 485,311L�Oreal SA 24,238 11,341,721La Francaise des Jeux SAEM* 9,187 475,231Legrand SA 25,729 2,944,384LVMH Moet Hennessy Louis Vuitton SE 26,707 19,765,701Orange SA 191,933 2,180,132Orpea SA 4,974 626,067Pernod Ricard SA 20,154 4,234,649Publicis Groupe SA 21,451 1,406,226Remy Cointreau SA� 2,186 430,531Renault SA� 18,492 686,693Safran SA 32,881 4,125,465Sanofi 109,007 11,277,576Sartorius Stedim Biotech 2,661 1,613,719Schneider Electric SE 51,827 9,258,766SCOR SE 15,254 468,110SEB SA 2,662 418,669Societe Generale SA 77,994 2,454,237Sodexo SA� 8,511 703,657Suez SA 33,249 771,435Teleperformance 5,651 2,498,154Thales SA 10,263 1,041,425TotalEnergies SE 240,352 10,598,352Ubisoft Entertainment SA� 8,910 567,265Valeo SA 22,092 628,130Veolia Environnement SA 51,845 1,778,325Vinci SA 51,217 5,496,527Vivendi SE 68,459 2,612,522Wendel SE 2,582 374,685Worldline SA�* 22,858 2,031,507
175,827,701Germany - 8.1%
adidas AG 18,316 6,497,720Allianz SE 39,664 9,318,887BASF SE 88,362 6,835,929
Copyright © 2021 www.secdatabase.com. All Rights Reserved.Please Consider the Environment Before Printing This Document

Bayer AG 94,513 5,261,206Bayerische Motoren Werke AG 31,853 3,022,752Bayerische Motoren Werke AG (Preference Shares) 5,470 457,922Bechtle AG 7,881 569,682Beiersdorf AG 9,697 1,176,461Brenntag SE 14,863 1,499,429Carl Zeiss Meditec AG 3,872 855,396Commerzbank AG� 96,386 604,320Continental AG� 10,583 1,422,281Covestro AG* 18,587 1,204,869Daimler AG 82,339 6,943,582Delivery Hero SE�* 15,107 2,186,889Deutsche Bank AG� 198,833 2,471,681Deutsche Boerse AG 18,279 3,153,267Deutsche Lufthansa AG�# 28,753 288,067Deutsche Post AG 95,363 6,708,702
Copyright © 2021 www.secdatabase.com. All Rights Reserved.Please Consider the Environment Before Printing This Document

Deutsche Telekom AG 320,653 6,818,030Deutsche Wohnen SE 32,888 2,041,037E.ON SE 215,991 2,850,742Evonik Industries AG 20,174 681,265Fresenius Medical Care AG & Co. KGaA 19,723 1,514,648Fresenius SE & Co. KGaA 40,228 2,092,341Fuchs Petrolub SE (Preference Shares) 6,686 338,358GEA Group AG 14,760 681,604Hannover Rueck SE 5,801 1,068,185HeidelbergCement AG 14,316 1,244,107HelloFresh SE� 15,890 1,712,607Henkel AG & Co. KGaA 9,998 899,552Henkel AG & Co. KGaA (Preference Shares) 17,140 1,674,497Infineon Technologies AG 125,635 5,350,011KION Group AG 6,942 742,791Knorr-Bremse AG 6,978 837,523LANXESS AG 7,993 582,686LEG Immobilien SE 6,936 1,105,608Merck KGaA 12,434 2,953,908MTU Aero Engines AG 5,132 1,177,686Muenchener Rueckversicherungs-Gesellschaft AG 13,478 3,937,958Nemetschek SE 5,556 544,632Porsche Automobil Holding SE (Preference Shares) 14,731 1,491,678Puma SE 10,157 1,232,868Rational AG 492 562,688RWE AG 61,803 2,414,707SAP SE 100,460 15,119,075Sartorius AG (Preference Shares) 2,521 1,660,983Scout24 AG* 8,618 724,510Siemens AG 73,596 12,238,786Siemens Energy AG� 38,449 1,115,899Siemens Healthineers AG* 25,855 1,798,117Symrise AG 12,377 1,762,466TeamViewer AG�* 15,475 515,456Telefonica Deutschland Holding AG 100,159 281,111Uniper SE 8,801 349,476United Internet AG 9,332 403,397Volkswagen AG 3,123 1,044,295Volkswagen AG (Preference Shares) 17,854 4,243,629Vonovia SE 51,719 3,490,603Zalando SE�* 20,505 2,271,019
154,049,581Hong Kong - 2.1%
AIA Group, Ltd. 1,163,600 13,906,437Bank of East Asia, Ltd. 126,200 211,592BOC Hong Kong Holdings, Ltd. 356,000 1,080,251CLP Holdings, Ltd. 157,500 1,574,504Galaxy Entertainment Group, Ltd.� 209,000 1,339,597
Copyright © 2021 www.secdatabase.com. All Rights Reserved.Please Consider the Environment Before Printing This Document
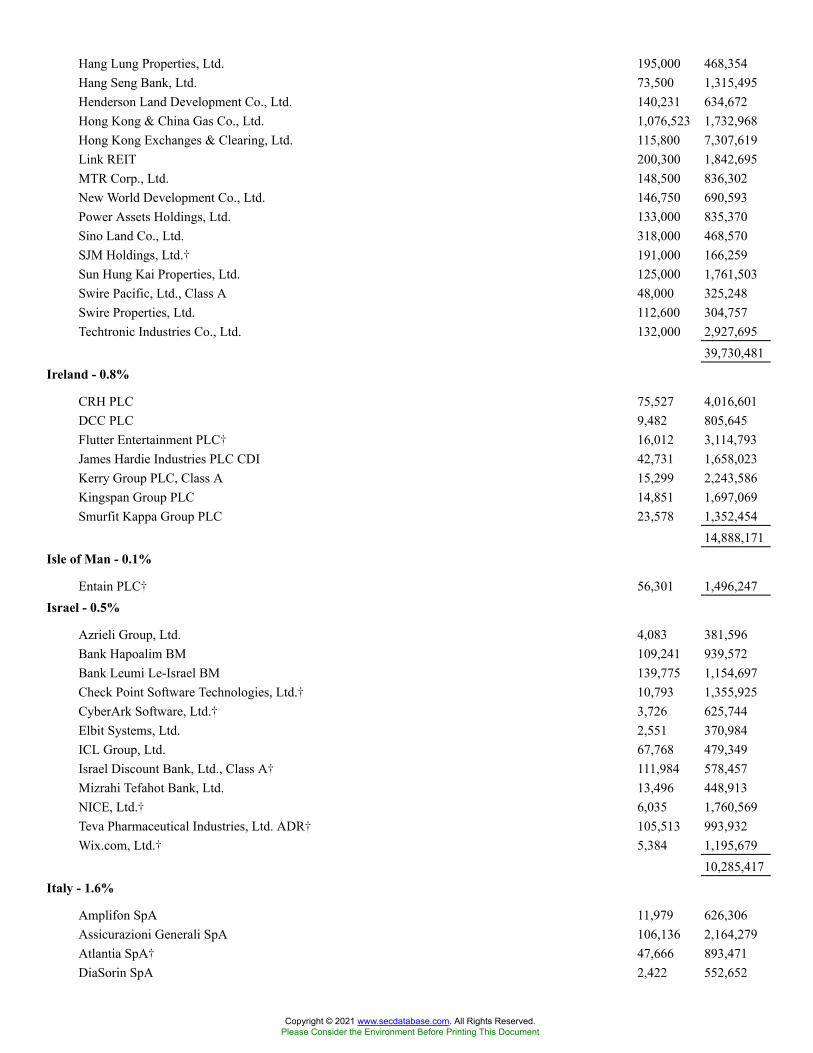
Hang Lung Properties, Ltd. 195,000 468,354Hang Seng Bank, Ltd. 73,500 1,315,495Henderson Land Development Co., Ltd. 140,231 634,672Hong Kong & China Gas Co., Ltd. 1,076,523 1,732,968Hong Kong Exchanges & Clearing, Ltd. 115,800 7,307,619Link REIT 200,300 1,842,695MTR Corp., Ltd. 148,500 836,302New World Development Co., Ltd. 146,750 690,593Power Assets Holdings, Ltd. 133,000 835,370Sino Land Co., Ltd. 318,000 468,570SJM Holdings, Ltd.� 191,000 166,259Sun Hung Kai Properties, Ltd. 125,000 1,761,503Swire Pacific, Ltd., Class A 48,000 325,248Swire Properties, Ltd. 112,600 304,757Techtronic Industries Co., Ltd. 132,000 2,927,695
39,730,481Ireland - 0.8%
CRH PLC 75,527 4,016,601DCC PLC 9,482 805,645Flutter Entertainment PLC� 16,012 3,114,793James Hardie Industries PLC CDI 42,731 1,658,023Kerry Group PLC, Class A 15,299 2,243,586Kingspan Group PLC 14,851 1,697,069Smurfit Kappa Group PLC 23,578 1,352,454
14,888,171Isle of Man - 0.1%
Entain PLC� 56,301 1,496,247Israel - 0.5%
Azrieli Group, Ltd. 4,083 381,596Bank Hapoalim BM 109,241 939,572Bank Leumi Le-Israel BM 139,775 1,154,697Check Point Software Technologies, Ltd.� 10,793 1,355,925CyberArk Software, Ltd.� 3,726 625,744Elbit Systems, Ltd. 2,551 370,984ICL Group, Ltd. 67,768 479,349Israel Discount Bank, Ltd., Class A� 111,984 578,457Mizrahi Tefahot Bank, Ltd. 13,496 448,913NICE, Ltd.� 6,035 1,760,569Teva Pharmaceutical Industries, Ltd. ADR� 105,513 993,932Wix.com, Ltd.� 5,384 1,195,679
10,285,417Italy - 1.6%
Amplifon SpA 11,979 626,306Assicurazioni Generali SpA 106,136 2,164,279Atlantia SpA� 47,666 893,471DiaSorin SpA 2,422 552,652
Copyright © 2021 www.secdatabase.com. All Rights Reserved.Please Consider the Environment Before Printing This Document
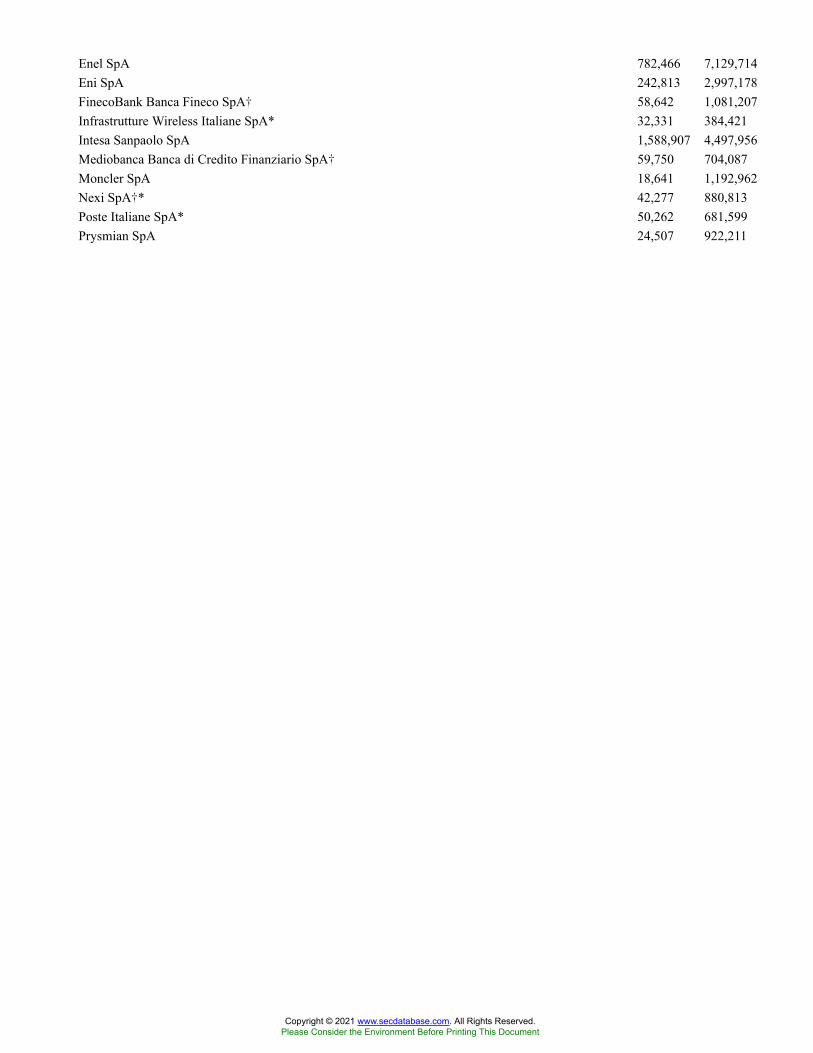
Enel SpA 782,466 7,129,714Eni SpA 242,813 2,997,178FinecoBank Banca Fineco SpA� 58,642 1,081,207Infrastrutture Wireless Italiane SpA* 32,331 384,421Intesa Sanpaolo SpA 1,588,907 4,497,956Mediobanca Banca di Credito Finanziario SpA� 59,750 704,087Moncler SpA 18,641 1,192,962Nexi SpA�* 42,277 880,813Poste Italiane SpA* 50,262 681,599Prysmian SpA 24,507 922,211
Copyright © 2021 www.secdatabase.com. All Rights Reserved.Please Consider the Environment Before Printing This Document
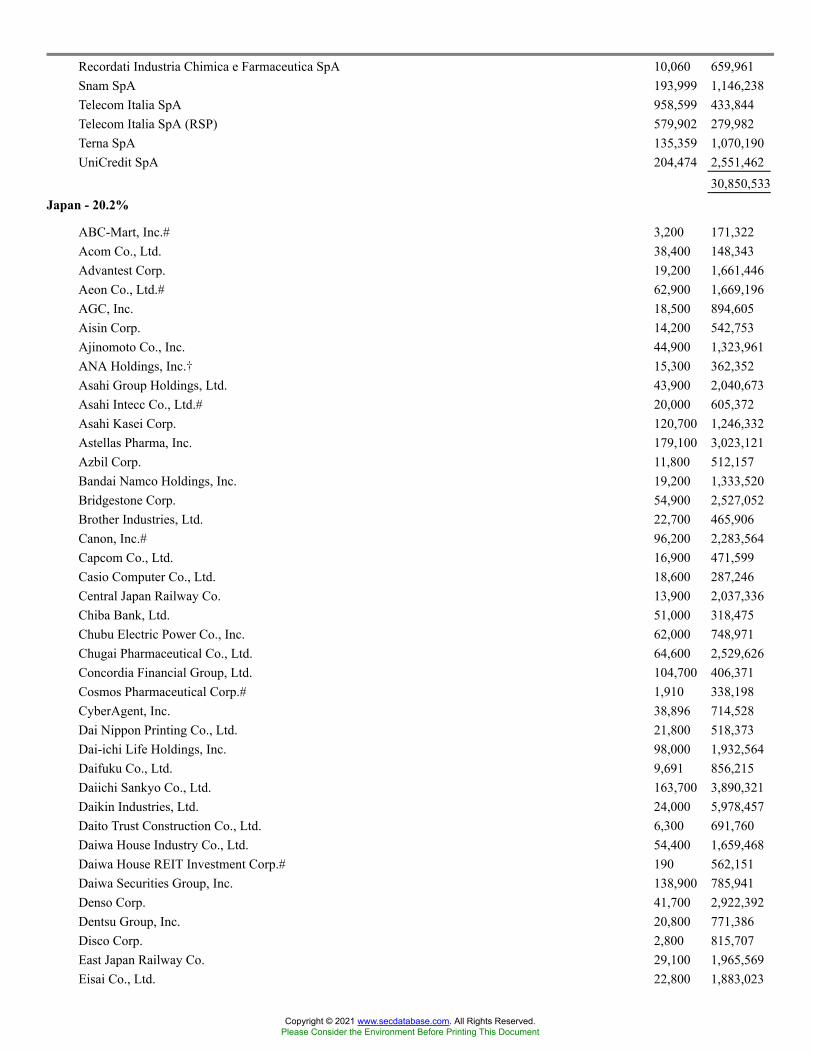
Recordati Industria Chimica e Farmaceutica SpA 10,060 659,961Snam SpA 193,999 1,146,238Telecom Italia SpA 958,599 433,844Telecom Italia SpA (RSP) 579,902 279,982Terna SpA 135,359 1,070,190UniCredit SpA 204,474 2,551,462
30,850,533Japan - 20.2%
ABC-Mart, Inc.# 3,200 171,322Acom Co., Ltd. 38,400 148,343Advantest Corp. 19,200 1,661,446Aeon Co., Ltd.# 62,900 1,669,196AGC, Inc. 18,500 894,605Aisin Corp. 14,200 542,753Ajinomoto Co., Inc. 44,900 1,323,961ANA Holdings, Inc.� 15,300 362,352Asahi Group Holdings, Ltd. 43,900 2,040,673Asahi Intecc Co., Ltd.# 20,000 605,372Asahi Kasei Corp. 120,700 1,246,332Astellas Pharma, Inc. 179,100 3,023,121Azbil Corp. 11,800 512,157Bandai Namco Holdings, Inc. 19,200 1,333,520Bridgestone Corp. 54,900 2,527,052Brother Industries, Ltd. 22,700 465,906Canon, Inc.# 96,200 2,283,564Capcom Co., Ltd. 16,900 471,599Casio Computer Co., Ltd. 18,600 287,246Central Japan Railway Co. 13,900 2,037,336Chiba Bank, Ltd. 51,000 318,475Chubu Electric Power Co., Inc. 62,000 748,971Chugai Pharmaceutical Co., Ltd. 64,600 2,529,626Concordia Financial Group, Ltd. 104,700 406,371Cosmos Pharmaceutical Corp.# 1,910 338,198CyberAgent, Inc. 38,896 714,528Dai Nippon Printing Co., Ltd. 21,800 518,373Dai-ichi Life Holdings, Inc. 98,000 1,932,564Daifuku Co., Ltd. 9,691 856,215Daiichi Sankyo Co., Ltd. 163,700 3,890,321Daikin Industries, Ltd. 24,000 5,978,457Daito Trust Construction Co., Ltd. 6,300 691,760Daiwa House Industry Co., Ltd. 54,400 1,659,468Daiwa House REIT Investment Corp.# 190 562,151Daiwa Securities Group, Inc. 138,900 785,941Denso Corp. 41,700 2,922,392Dentsu Group, Inc. 20,800 771,386Disco Corp. 2,800 815,707East Japan Railway Co. 29,100 1,965,569Eisai Co., Ltd. 22,800 1,883,023
Copyright © 2021 www.secdatabase.com. All Rights Reserved.Please Consider the Environment Before Printing This Document

ENEOS Holdings, Inc. 295,300 1,143,729FANUC Corp. 18,400 4,012,326Fast Retailing Co., Ltd.# 5,600 3,691,424Fuji Electric Co., Ltd. 12,300 532,741FUJIFILM Holdings Corp. 34,600 2,851,909Fujitsu, Ltd. 18,900 3,487,434GLP J-REIT# 397 720,637GMO Payment Gateway, Inc. 3,900 512,957Hakuhodo DY Holdings, Inc.# 22,500 354,020Hamamatsu Photonics KK 13,500 787,802Hankyu Hanshin Holdings, Inc. 22,100 661,905Harmonic Drive Systems, Inc.# 4,200 232,496Hikari Tsushin, Inc. 2,000 350,316Hino Motors, Ltd. 27,600 239,084Hirose Electric Co., Ltd. 3,135 522,334Hisamitsu Pharmaceutical Co., Inc.# 4,900 196,419Hitachi Construction Machinery Co., Ltd. 10,300 295,382Hitachi Metals, Ltd.�# 20,700 399,832Hitachi, Ltd. 93,100 5,149,421Honda Motor Co., Ltd. 156,800 4,763,220Hoshizaki Corp. 5,200 488,261Hoya Corp. 35,900 5,801,954Hulic Co., Ltd. 25,900 303,695Ibiden Co., Ltd. 10,100 545,326Idemitsu Kosan Co., Ltd. 19,976 478,995Iida Group Holdings Co., Ltd. 14,200 360,889Inpex Corp. 98,500 678,662Isuzu Motors, Ltd. 53,100 671,865Ito En, Ltd. 5,143 325,367ITOCHU Corp. 114,300 3,439,961Itochu Techno-Solutions Corp. 9,300 287,838Japan Airlines Co., Ltd.� 13,900 295,777Japan Exchange Group, Inc. 49,000 1,166,486Japan Metropolitan Fund Investment Corp.# 672 652,973Japan Post Bank Co., Ltd.# 39,000 341,381Japan Post Holdings Co., Ltd. 151,500 1,300,381Japan Post Insurance Co., Ltd. 21,600 391,692Japan Real Estate Investment Corp. 119 736,618Japan Tobacco, Inc. 115,400 2,236,881JFE Holdings, Inc. 47,300 767,445JSR Corp. 19,600 679,671Kajima Corp. 43,300 560,068Kakaku.com, Inc. 12,900 402,191Kansai Electric Power Co., Inc. 67,800 680,989Kansai Paint Co., Ltd. 17,000 440,549Kao Corp. 46,400 2,803,021KDDI Corp. 155,100 4,751,052Keio Corp. 9,900 532,727Keisei Electric Railway Co., Ltd. 12,500 384,607
Copyright © 2021 www.secdatabase.com. All Rights Reserved.Please Consider the Environment Before Printing This Document
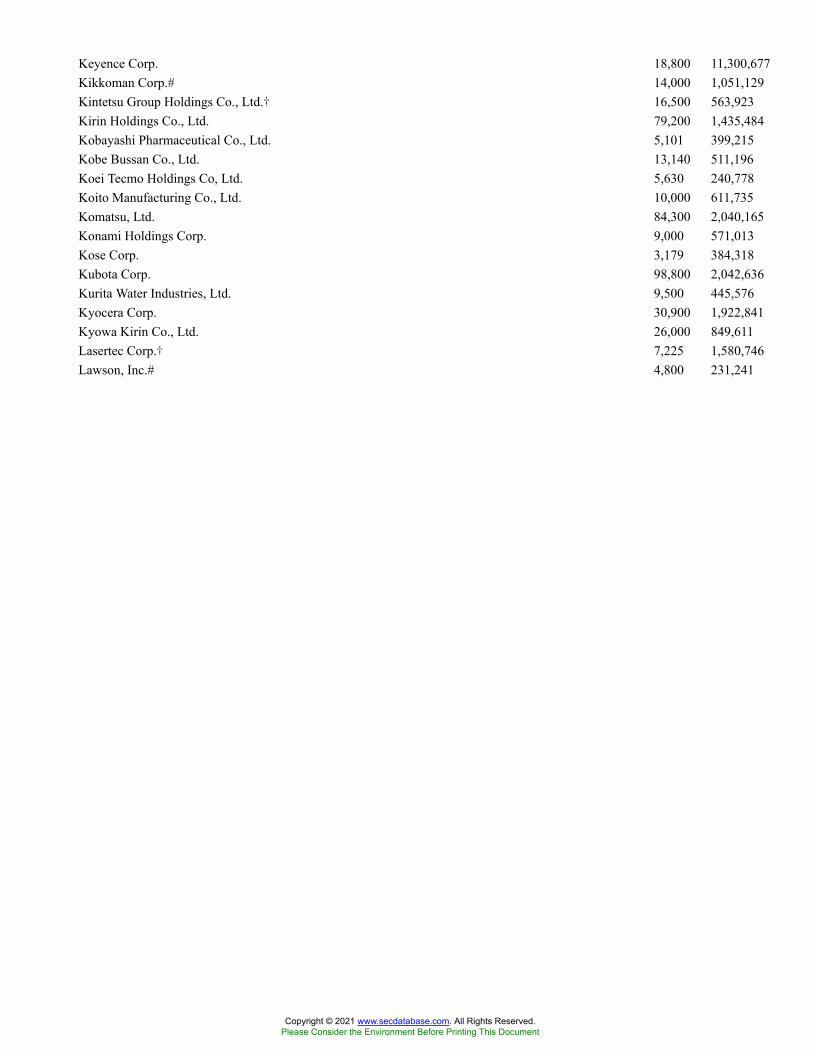
Keyence Corp. 18,800 11,300,677Kikkoman Corp.# 14,000 1,051,129Kintetsu Group Holdings Co., Ltd.� 16,500 563,923Kirin Holdings Co., Ltd. 79,200 1,435,484Kobayashi Pharmaceutical Co., Ltd. 5,101 399,215Kobe Bussan Co., Ltd. 13,140 511,196Koei Tecmo Holdings Co, Ltd. 5,630 240,778Koito Manufacturing Co., Ltd. 10,000 611,735Komatsu, Ltd. 84,300 2,040,165Konami Holdings Corp. 9,000 571,013Kose Corp. 3,179 384,318Kubota Corp. 98,800 2,042,636Kurita Water Industries, Ltd. 9,500 445,576Kyocera Corp. 30,900 1,922,841Kyowa Kirin Co., Ltd. 26,000 849,611Lasertec Corp.� 7,225 1,580,746Lawson, Inc.# 4,800 231,241
Copyright © 2021 www.secdatabase.com. All Rights Reserved.Please Consider the Environment Before Printing This Document

Lion Corp. 21,500 366,036LIXIL Corp. 25,600 745,789M3, Inc. 42,400 2,852,360Makita Corp. 21,500 1,235,104Marubeni Corp. 150,500 1,197,817Mazda Motor Corp.� 54,700 474,831McDonald�s Holdings Co. Japan, Ltd.# 7,700 367,450Medipal Holdings Corp. 17,700 338,346MEIJI Holdings Co., Ltd. 11,700 718,920Mercari, Inc.�# 9,800 484,588Minebea Mitsumi, Inc. 34,900 898,711MISUMI Group, Inc. 27,300 1,083,166Mitsubishi Chemical Holdings Corp. 123,200 1,081,549Mitsubishi Corp. 121,500 3,656,651Mitsubishi Electric Corp. 175,600 2,402,998Mitsubishi Estate Co., Ltd. 113,800 1,780,210Mitsubishi Gas Chemical Co., Inc. 15,200 286,688Mitsubishi HC Capital, Inc. 63,500 339,967Mitsubishi Heavy Industries, Ltd. 30,800 814,409Mitsubishi UFJ Financial Group, Inc. 1,176,000 6,353,810Mitsui & Co., Ltd. 148,600 3,280,911Mitsui Chemicals, Inc. 17,700 611,371Mitsui Fudosan Co., Ltd. 88,200 2,023,513Miura Co., Ltd. 8,436 378,801Mizuho Financial Group, Inc. 232,120 3,255,567MonotaRO Co., Ltd. 24,100 532,975MS&AD Insurance Group Holdings, Inc. 42,800 1,383,030Murata Manufacturing Co., Ltd. 55,300 4,583,745Nabtesco Corp. 10,900 431,977NEC Corp. 23,700 1,245,157Nexon Co., Ltd.# 46,900 856,874NGK Insulators, Ltd. 24,800 411,398NH Foods, Ltd. 7,900 306,263Nidec Corp. 43,000 4,932,600Nihon M&A Center, Inc. 29,148 871,671Nintendo Co., Ltd. 10,800 5,193,110Nippon Building Fund, Inc. 143 929,373Nippon Express Co., Ltd. 7,400 503,804Nippon Paint Holdings Co., Ltd. 68,400 851,153Nippon Prologis REIT, Inc. 198 713,603Nippon Sanso Holdings Corp. 14,600 354,333Nippon Shinyaku Co., Ltd. 4,700 381,503Nippon Steel Corp. 82,300 1,681,683Nippon Telegraph & Telephone Corp. 123,800 3,303,884Nippon Yusen KK 15,600 1,257,756Nissan Chemical Corp. 11,800 661,782Nissan Motor Co., Ltd.� 223,300 1,174,195Nisshin Seifun Group, Inc. 19,100 313,197Nissin Foods Holdings Co., Ltd. 6,100 474,626
Copyright © 2021 www.secdatabase.com. All Rights Reserved.Please Consider the Environment Before Printing This Document
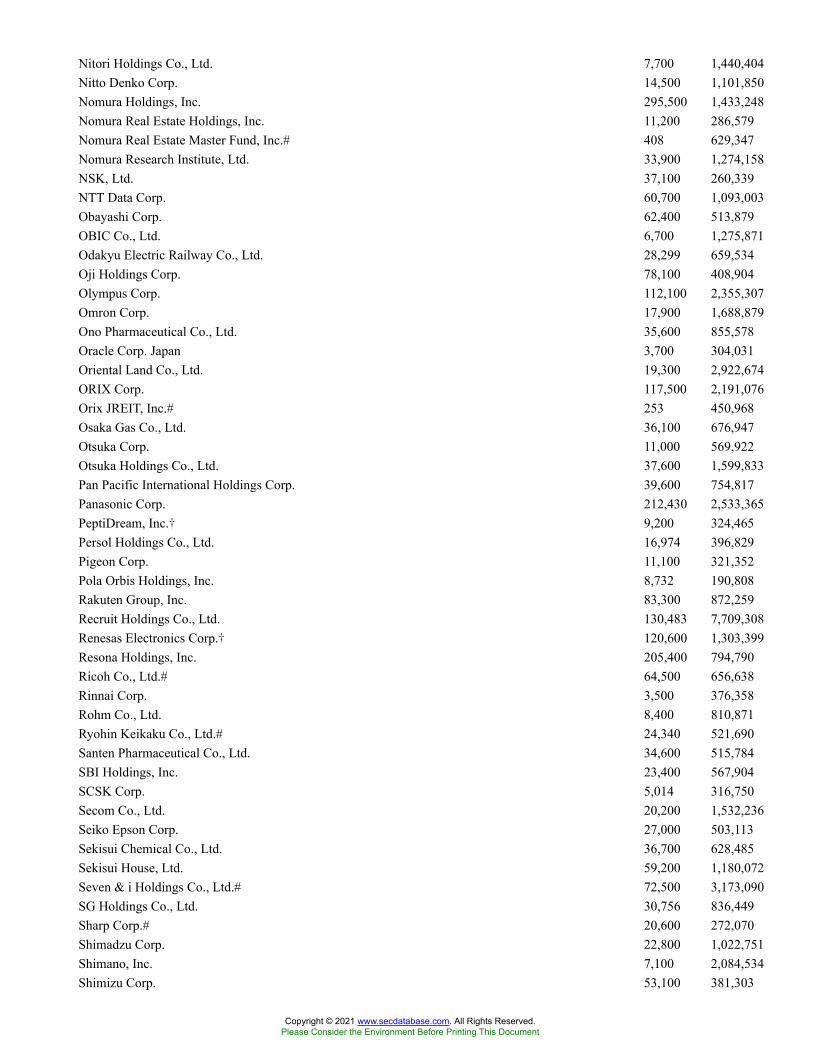
Nitori Holdings Co., Ltd. 7,700 1,440,404Nitto Denko Corp. 14,500 1,101,850Nomura Holdings, Inc. 295,500 1,433,248Nomura Real Estate Holdings, Inc. 11,200 286,579Nomura Real Estate Master Fund, Inc.# 408 629,347Nomura Research Institute, Ltd. 33,900 1,274,158NSK, Ltd. 37,100 260,339NTT Data Corp. 60,700 1,093,003Obayashi Corp. 62,400 513,879OBIC Co., Ltd. 6,700 1,275,871Odakyu Electric Railway Co., Ltd. 28,299 659,534Oji Holdings Corp. 78,100 408,904Olympus Corp. 112,100 2,355,307Omron Corp. 17,900 1,688,879Ono Pharmaceutical Co., Ltd. 35,600 855,578Oracle Corp. Japan 3,700 304,031Oriental Land Co., Ltd. 19,300 2,922,674ORIX Corp. 117,500 2,191,076Orix JREIT, Inc.# 253 450,968Osaka Gas Co., Ltd. 36,100 676,947Otsuka Corp. 11,000 569,922Otsuka Holdings Co., Ltd. 37,600 1,599,833Pan Pacific International Holdings Corp. 39,600 754,817Panasonic Corp. 212,430 2,533,365PeptiDream, Inc.� 9,200 324,465Persol Holdings Co., Ltd. 16,974 396,829Pigeon Corp. 11,100 321,352Pola Orbis Holdings, Inc. 8,732 190,808Rakuten Group, Inc. 83,300 872,259Recruit Holdings Co., Ltd. 130,483 7,709,308Renesas Electronics Corp.� 120,600 1,303,399Resona Holdings, Inc. 205,400 794,790Ricoh Co., Ltd.# 64,500 656,638Rinnai Corp. 3,500 376,358Rohm Co., Ltd. 8,400 810,871Ryohin Keikaku Co., Ltd.# 24,340 521,690Santen Pharmaceutical Co., Ltd. 34,600 515,784SBI Holdings, Inc. 23,400 567,904SCSK Corp. 5,014 316,750Secom Co., Ltd. 20,200 1,532,236Seiko Epson Corp. 27,000 503,113Sekisui Chemical Co., Ltd. 36,700 628,485Sekisui House, Ltd. 59,200 1,180,072Seven & i Holdings Co., Ltd.# 72,500 3,173,090SG Holdings Co., Ltd. 30,756 836,449Sharp Corp.# 20,600 272,070Shimadzu Corp. 22,800 1,022,751Shimano, Inc. 7,100 2,084,534Shimizu Corp. 53,100 381,303
Copyright © 2021 www.secdatabase.com. All Rights Reserved.Please Consider the Environment Before Printing This Document
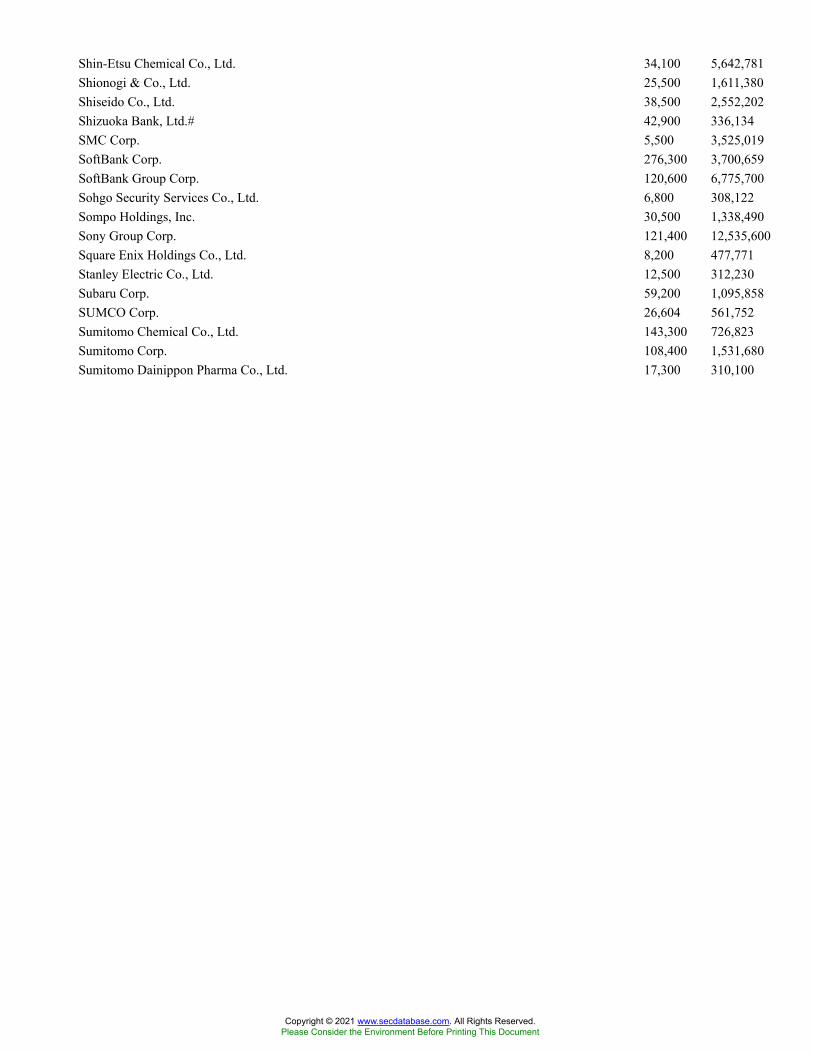
Shin-Etsu Chemical Co., Ltd. 34,100 5,642,781Shionogi & Co., Ltd. 25,500 1,611,380Shiseido Co., Ltd. 38,500 2,552,202Shizuoka Bank, Ltd.# 42,900 336,134SMC Corp. 5,500 3,525,019SoftBank Corp. 276,300 3,700,659SoftBank Group Corp. 120,600 6,775,700Sohgo Security Services Co., Ltd. 6,800 308,122Sompo Holdings, Inc. 30,500 1,338,490Sony Group Corp. 121,400 12,535,600Square Enix Holdings Co., Ltd. 8,200 477,771Stanley Electric Co., Ltd. 12,500 312,230Subaru Corp. 59,200 1,095,858SUMCO Corp. 26,604 561,752Sumitomo Chemical Co., Ltd. 143,300 726,823Sumitomo Corp. 108,400 1,531,680Sumitomo Dainippon Pharma Co., Ltd. 17,300 310,100
Copyright © 2021 www.secdatabase.com. All Rights Reserved.Please Consider the Environment Before Printing This Document

Sumitomo Electric Industries, Ltd. 72,600 970,398Sumitomo Metal Mining Co., Ltd. 23,800 913,795Sumitomo Mitsui Financial Group, Inc. 125,600 4,339,459Sumitomo Mitsui Trust Holdings, Inc. 32,500 1,062,901Sumitomo Realty & Development Co., Ltd. 29,700 958,909Suntory Beverage & Food, Ltd. 13,300 532,532Suzuki Motor Corp. 35,400 1,530,359Sysmex Corp. 16,100 1,832,223T&D Holdings, Inc. 51,800 628,578Taisei Corp. 18,300 573,045Taisho Pharmaceutical Holdings Co., Ltd. 3,300 192,574Takeda Pharmaceutical Co., Ltd. 151,600 5,069,640TDK Corp. 12,500 1,314,593Terumo Corp. 62,100 2,594,862THK Co., Ltd. 11,600 269,189TIS, Inc. 21,456 606,537Tobu Railway Co., Ltd. 18,100 472,346Toho Co., Ltd. 10,800 467,282Toho Gas Co., Ltd. 7,100 331,073Tohoku Electric Power Co., Inc. 41,100 314,559Tokio Marine Holdings, Inc. 60,700 2,966,722Tokyo Century Corp. 3,516 201,024Tokyo Electric Power Co. Holdings, Inc.� 146,800 385,631Tokyo Electron, Ltd. 14,400 6,183,302Tokyo Gas Co., Ltd. 36,100 694,338Tokyu Corp. 48,100 662,378Toppan, Inc. 25,300 434,641Toray Industries, Inc. 133,400 899,478Toshiba Corp. 39,400 1,710,085Tosoh Corp. 25,000 454,029TOTO, Ltd. 13,600 740,481Toyo Suisan Kaisha, Ltd. 8,500 351,929Toyota Industries Corp. 14,100 1,190,647Toyota Motor Corp. 204,000 17,786,375Toyota Tsusho Corp. 20,500 906,535Trend Micro, Inc. 12,900 707,058Tsuruha Holdings, Inc. 3,804 478,893Unicharm Corp. 38,800 1,729,539United Urban Investment Corp. 284 401,676USS Co., Ltd. 21,099 349,237Welcia Holdings Co., Ltd. 9,100 321,352West Japan Railway Co. 15,700 858,530Yakult Honsha Co., Ltd. 12,400 714,593Yamada Holdings Co., Ltd. 65,100 279,892Yamaha Corp. 12,900 760,996Yamaha Motor Co., Ltd. 27,000 687,179Yamato Holdings Co., Ltd. 28,000 712,630Yaskawa Electric Corp.# 23,100 1,129,646Yokogawa Electric Corp. 21,900 342,987
Copyright © 2021 www.secdatabase.com. All Rights Reserved.Please Consider the Environment Before Printing This Document
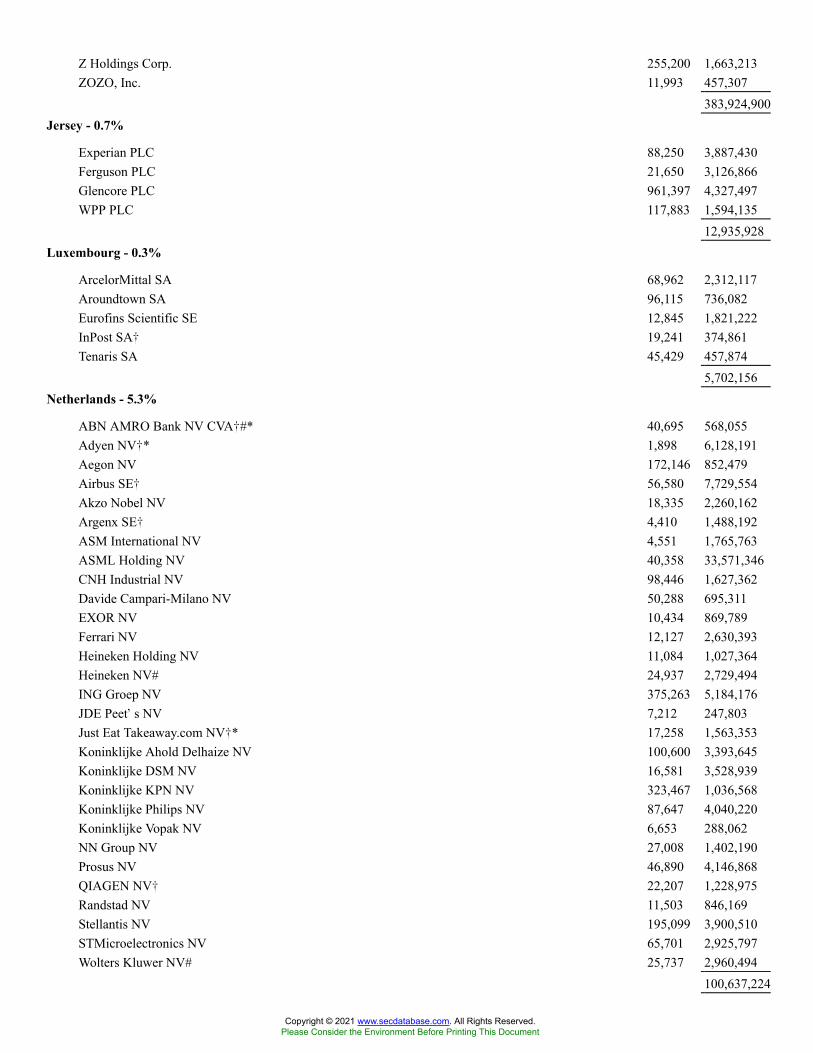
Z Holdings Corp. 255,200 1,663,213ZOZO, Inc. 11,993 457,307
383,924,900Jersey - 0.7%
Experian PLC 88,250 3,887,430Ferguson PLC 21,650 3,126,866Glencore PLC 961,397 4,327,497WPP PLC 117,883 1,594,135
12,935,928Luxembourg - 0.3%
ArcelorMittal SA 68,962 2,312,117Aroundtown SA 96,115 736,082Eurofins Scientific SE 12,845 1,821,222InPost SA� 19,241 374,861Tenaris SA 45,429 457,874
5,702,156Netherlands - 5.3%
ABN AMRO Bank NV CVA�#* 40,695 568,055Adyen NV�* 1,898 6,128,191Aegon NV 172,146 852,479Airbus SE� 56,580 7,729,554Akzo Nobel NV 18,335 2,260,162Argenx SE� 4,410 1,488,192ASM International NV 4,551 1,765,763ASML Holding NV 40,358 33,571,346CNH Industrial NV 98,446 1,627,362Davide Campari-Milano NV 50,288 695,311EXOR NV 10,434 869,789Ferrari NV 12,127 2,630,393Heineken Holding NV 11,084 1,027,364Heineken NV# 24,937 2,729,494ING Groep NV 375,263 5,184,176JDE Peet�s NV 7,212 247,803Just Eat Takeaway.com NV�* 17,258 1,563,353Koninklijke Ahold Delhaize NV 100,600 3,393,645Koninklijke DSM NV 16,581 3,528,939Koninklijke KPN NV 323,467 1,036,568Koninklijke Philips NV 87,647 4,040,220Koninklijke Vopak NV 6,653 288,062NN Group NV 27,008 1,402,190Prosus NV 46,890 4,146,868QIAGEN NV� 22,207 1,228,975Randstad NV 11,503 846,169Stellantis NV 195,099 3,900,510STMicroelectronics NV 65,701 2,925,797Wolters Kluwer NV# 25,737 2,960,494
100,637,224
Copyright © 2021 www.secdatabase.com. All Rights Reserved.Please Consider the Environment Before Printing This Document

New Zealand - 0.3%
a2 Milk Co., Ltd.�# 71,443 303,564Auckland International Airport, Ltd.� 120,424 611,817Fisher & Paykel Healthcare Corp., Ltd. 55,448 1,293,265Mercury NZ, Ltd. 65,530 307,069Meridian Energy, Ltd. 123,267 456,016Ryman Healthcare, Ltd.# 40,886 445,984Spark New Zealand, Ltd. 178,159 612,006Xero, Ltd.� 12,703 1,410,844
5,440,565
Copyright © 2021 www.secdatabase.com. All Rights Reserved.Please Consider the Environment Before Printing This Document

Norway - 0.5%
Adevinta ASA� 26,358 530,540DNB Bank ASA 89,492 1,889,839Equinor ASA 94,021 1,997,808Gjensidige Forsikring ASA 19,241 449,918Mowi ASA 42,287 1,132,777Norsk Hydro ASA 129,381 893,170Orkla ASA 72,257 645,590Schibsted ASA, Class A 7,035 375,448Schibsted ASA, Class B 9,366 435,861Telenor ASA 67,317 1,179,601Yara International ASA# 16,767 841,990
10,372,542Papua New Guinea - 0.0%
Oil Search, Ltd. 189,904 519,577Portugal - 0.1%
Banco Espirito Santo SA�(1) 213,818 0EDP - Energias de Portugal SA 267,062 1,466,932Galp Energia SGPS SA 48,224 493,902Jeronimo Martins SGPS SA 24,216 513,245
2,474,079Singapore - 0.9%
Ascendas Real Estate Investment Trust 309,424 699,653CapitaLand Integrated Commercial Trust 435,952 667,977CapitaLand, Ltd. 253,800 755,104City Developments, Ltd. 39,300 199,942DBS Group Holdings, Ltd. 173,500 3,867,600Genting Singapore, Ltd. 581,800 331,048Keppel Corp., Ltd. 140,100 541,872Mapletree Commercial Trust 207,400 313,156Mapletree Logistics Trust 288,378 435,425Oversea-Chinese Banking Corp., Ltd. 323,000 2,746,023Singapore Airlines, Ltd.� 128,849 484,939Singapore Exchange, Ltd. 77,400 569,943Singapore Technologies Engineering, Ltd. 150,200 422,296Singapore Telecommunications, Ltd. 794,400 1,370,827United Overseas Bank, Ltd. 113,400 2,157,590UOL Group, Ltd. 44,600 232,214Venture Corp., Ltd. 26,552 378,397Wilmar International, Ltd. 184,800 569,059
16,743,065South Africa - 0.0%
Thungela Resources, Ltd.�# 11,690 48,778Spain - 2.1%
ACS Actividades de Construccion y Servicios SA# 23,595 636,875
Copyright © 2021 www.secdatabase.com. All Rights Reserved.Please Consider the Environment Before Printing This Document
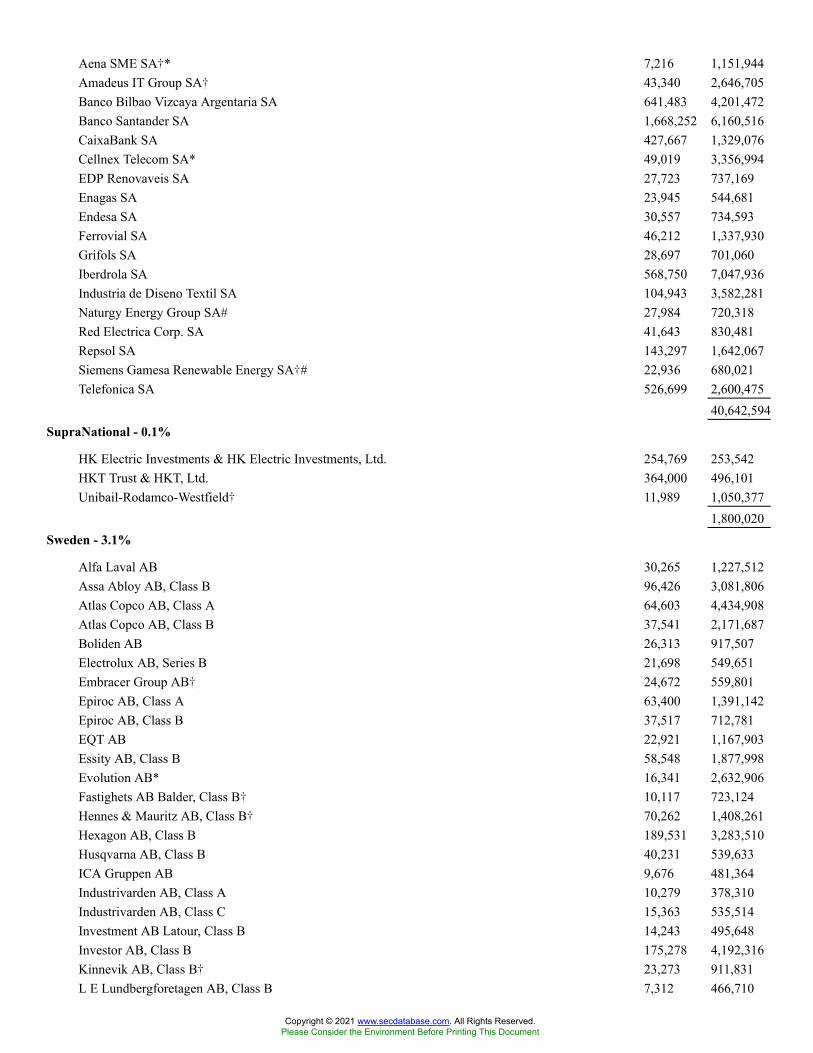
Aena SME SA�* 7,216 1,151,944Amadeus IT Group SA� 43,340 2,646,705Banco Bilbao Vizcaya Argentaria SA 641,483 4,201,472Banco Santander SA 1,668,252 6,160,516CaixaBank SA 427,667 1,329,076Cellnex Telecom SA* 49,019 3,356,994EDP Renovaveis SA 27,723 737,169Enagas SA 23,945 544,681Endesa SA 30,557 734,593Ferrovial SA 46,212 1,337,930Grifols SA 28,697 701,060Iberdrola SA 568,750 7,047,936Industria de Diseno Textil SA 104,943 3,582,281Naturgy Energy Group SA# 27,984 720,318Red Electrica Corp. SA 41,643 830,481Repsol SA 143,297 1,642,067Siemens Gamesa Renewable Energy SA�# 22,936 680,021Telefonica SA 526,699 2,600,475
40,642,594SupraNational - 0.1%
HK Electric Investments & HK Electric Investments, Ltd. 254,769 253,542HKT Trust & HKT, Ltd. 364,000 496,101Unibail-Rodamco-Westfield� 11,989 1,050,377
1,800,020Sweden - 3.1%
Alfa Laval AB 30,265 1,227,512Assa Abloy AB, Class B 96,426 3,081,806Atlas Copco AB, Class A 64,603 4,434,908Atlas Copco AB, Class B 37,541 2,171,687Boliden AB 26,313 917,507Electrolux AB, Series B 21,698 549,651Embracer Group AB� 24,672 559,801Epiroc AB, Class A 63,400 1,391,142Epiroc AB, Class B 37,517 712,781EQT AB 22,921 1,167,903Essity AB, Class B 58,548 1,877,998Evolution AB* 16,341 2,632,906Fastighets AB Balder, Class B� 10,117 723,124Hennes & Mauritz AB, Class B� 70,262 1,408,261Hexagon AB, Class B 189,531 3,283,510Husqvarna AB, Class B 40,231 539,633ICA Gruppen AB 9,676 481,364Industrivarden AB, Class A 10,279 378,310Industrivarden AB, Class C 15,363 535,514Investment AB Latour, Class B 14,243 495,648Investor AB, Class B 175,278 4,192,316Kinnevik AB, Class B� 23,273 911,831L E Lundbergforetagen AB, Class B 7,312 466,710
Copyright © 2021 www.secdatabase.com. All Rights Reserved.Please Consider the Environment Before Printing This Document
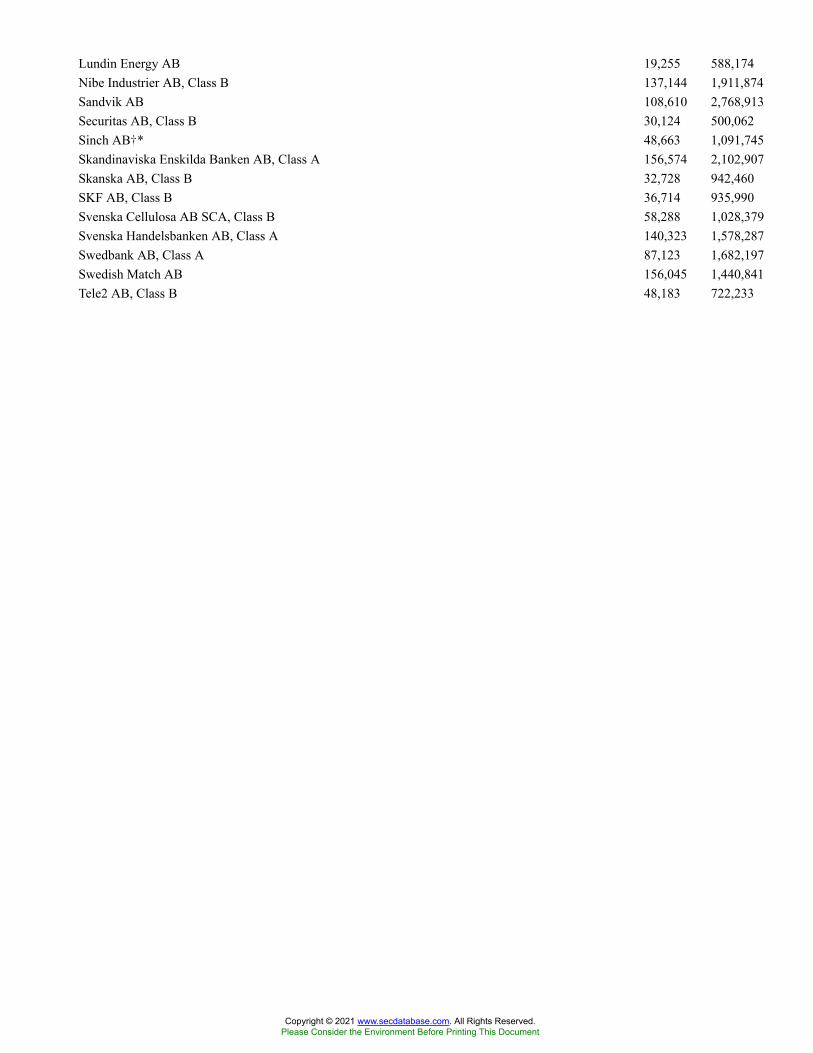
Lundin Energy AB 19,255 588,174Nibe Industrier AB, Class B 137,144 1,911,874Sandvik AB 108,610 2,768,913Securitas AB, Class B 30,124 500,062Sinch AB�* 48,663 1,091,745Skandinaviska Enskilda Banken AB, Class A 156,574 2,102,907Skanska AB, Class B 32,728 942,460SKF AB, Class B 36,714 935,990Svenska Cellulosa AB SCA, Class B 58,288 1,028,379Svenska Handelsbanken AB, Class A 140,323 1,578,287Swedbank AB, Class A 87,123 1,682,197Swedish Match AB 156,045 1,440,841Tele2 AB, Class B 48,183 722,233
Copyright © 2021 www.secdatabase.com. All Rights Reserved.Please Consider the Environment Before Printing This Document

Telefonaktiebolaget LM Ericsson, Class B 280,800 3,328,815Telia Co. AB 255,738 1,097,699Volvo AB, Class A 19,266 446,294Volvo AB, Class B 137,535 3,110,115
59,418,808Switzerland - 8.8%
ABB, Ltd. 166,869 6,180,941Adecco Group AG 14,909 829,987Alcon, Inc. 48,073 3,960,281Baloise Holding AG 4,460 711,554Banque Cantonale Vaudoise 2,898 245,891Barry Callebaut AG 343 874,215Chocoladefabriken Lindt & Spruengli AG 10 1,221,949Chocoladefabriken Lindt & Spruengli AG (Participation Certificate) 99 1,164,324Cie Financiere Richemont SA 50,218 5,538,649Clariant AG 20,758 437,034Coca-Cola HBC AG 19,278 696,800Credit Suisse Group AG 235,485 2,497,954EMS-Chemie Holding AG 674 730,489Geberit AG 3,563 2,977,240Givaudan SA 889 4,460,775Holcim, Ltd. 50,366 2,870,986Julius Baer Group, Ltd. 21,531 1,471,843Kuehne & Nagel International AG 5,196 1,901,370Logitech International SA# 16,653 1,702,852Lonza Group AG 7,165 6,063,746Nestle SA 277,165 35,030,387Novartis AG 213,609 19,778,222Partners Group Holding AG 2,183 3,871,353Roche Holding AG (BR) 3,078 1,378,084Roche Holding AG (NES) 67,590 27,143,022Schindler Holding AG (Participation Certificate) 3,917 1,265,246Schindler Holding AG 1,936 603,791SGS SA 582 1,829,097Sika AG# 13,640 4,916,805Sonova Holding AG 5,301 2,043,410Straumann Holding AG 994 1,921,245Swatch Group AG (TRQX) 5,062 278,320Swatch Group AG (XEGT) 2,783 784,680Swiss Life Holding AG 3,079 1,605,821Swiss Prime Site AG 7,308 781,675Swiss Re AG 29,018 2,670,005Swisscom AG 2,491 1,461,822Temenos AG 6,425 1,020,142UBS Group AG 352,696 5,885,007Vifor Pharma AG 4,689 667,699Zurich Insurance Group AG 14,475 6,354,300
167,829,013
Copyright © 2021 www.secdatabase.com. All Rights Reserved.Please Consider the Environment Before Printing This Document
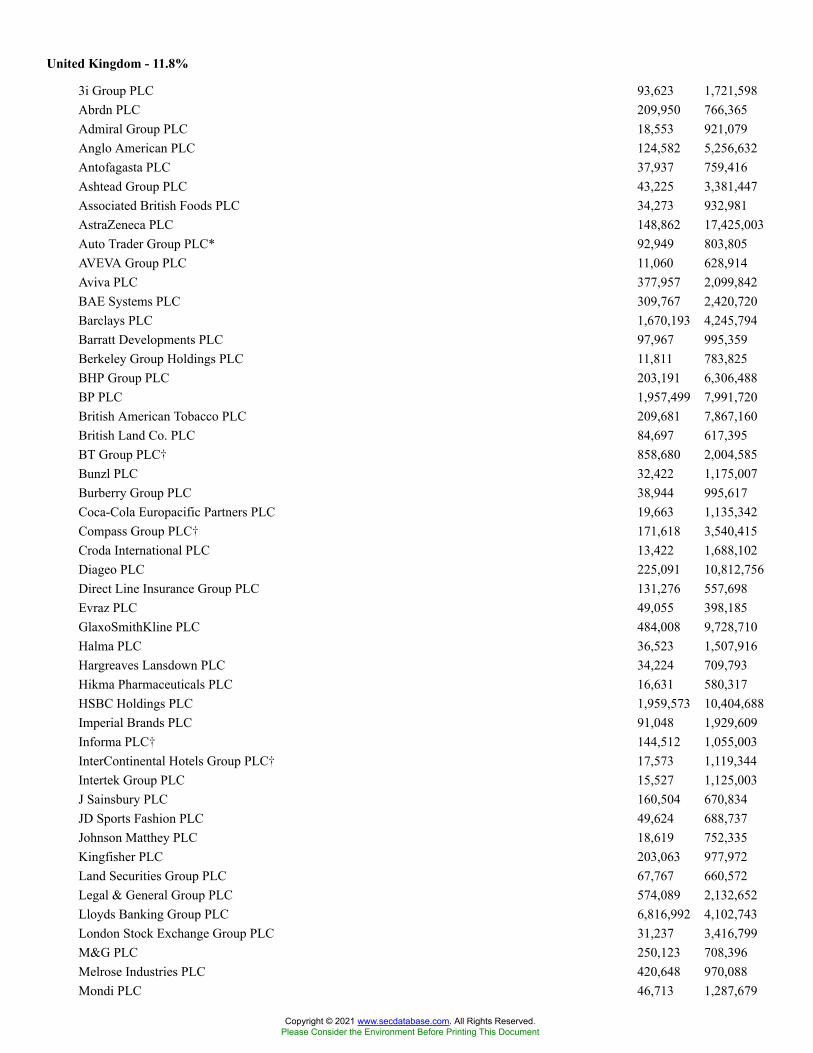
United Kingdom - 11.8%
3i Group PLC 93,623 1,721,598Abrdn PLC 209,950 766,365Admiral Group PLC 18,553 921,079Anglo American PLC 124,582 5,256,632Antofagasta PLC 37,937 759,416Ashtead Group PLC 43,225 3,381,447Associated British Foods PLC 34,273 932,981AstraZeneca PLC 148,862 17,425,003Auto Trader Group PLC* 92,949 803,805AVEVA Group PLC 11,060 628,914Aviva PLC 377,957 2,099,842BAE Systems PLC 309,767 2,420,720Barclays PLC 1,670,193 4,245,794Barratt Developments PLC 97,967 995,359Berkeley Group Holdings PLC 11,811 783,825BHP Group PLC 203,191 6,306,488BP PLC 1,957,499 7,991,720British American Tobacco PLC 209,681 7,867,160British Land Co. PLC 84,697 617,395BT Group PLC� 858,680 2,004,585Bunzl PLC 32,422 1,175,007Burberry Group PLC 38,944 995,617Coca-Cola Europacific Partners PLC 19,663 1,135,342Compass Group PLC� 171,618 3,540,415Croda International PLC 13,422 1,688,102Diageo PLC 225,091 10,812,756Direct Line Insurance Group PLC 131,276 557,698Evraz PLC 49,055 398,185GlaxoSmithKline PLC 484,008 9,728,710Halma PLC 36,523 1,507,916Hargreaves Lansdown PLC 34,224 709,793Hikma Pharmaceuticals PLC 16,631 580,317HSBC Holdings PLC 1,959,573 10,404,688Imperial Brands PLC 91,048 1,929,609Informa PLC� 144,512 1,055,003InterContinental Hotels Group PLC� 17,573 1,119,344Intertek Group PLC 15,527 1,125,003J Sainsbury PLC 160,504 670,834JD Sports Fashion PLC 49,624 688,737Johnson Matthey PLC 18,619 752,335Kingfisher PLC 203,063 977,972Land Securities Group PLC 67,767 660,572Legal & General Group PLC 574,089 2,132,652Lloyds Banking Group PLC 6,816,992 4,102,743London Stock Exchange Group PLC 31,237 3,416,799M&G PLC 250,123 708,396Melrose Industries PLC 420,648 970,088Mondi PLC 46,713 1,287,679
Copyright © 2021 www.secdatabase.com. All Rights Reserved.Please Consider the Environment Before Printing This Document

National Grid PLC 341,448 4,418,837Natwest Group PLC 468,486 1,372,573Next PLC 12,791 1,391,029Ocado Group PLC�# 46,825 1,295,916Pearson PLC 72,508 765,202Persimmon PLC 30,697 1,240,791Phoenix Group Holdings PLC 62,485 535,547Prudential PLC 251,048 5,229,074Reckitt Benckiser Group PLC 68,572 5,221,960RELX PLC 185,906 5,577,037Rentokil Initial PLC 178,395 1,423,526Rio Tinto PLC 107,969 7,989,105Rolls-Royce Holdings PLC� 805,003 1,271,223
Copyright © 2021 www.secdatabase.com. All Rights Reserved.Please Consider the Environment Before Printing This Document

Royal Dutch Shell PLC, Class A 394,559 7,765,850Royal Dutch Shell PLC, Class B 356,553 7,014,861Sage Group PLC 105,461 1,076,139Schroders PLC 11,959 621,501Segro PLC 114,636 2,023,678Severn Trent PLC 22,981 872,666Smith & Nephew PLC 84,384 1,618,414Smiths Group PLC 38,132 756,242Spirax-Sarco Engineering PLC 7,094 1,571,238SSE PLC 100,261 2,250,301St James�s Place PLC 51,776 1,146,066Standard Chartered PLC 258,093 1,613,809Taylor Wimpey PLC 350,722 881,926Tesco PLC 743,827 2,609,293Unilever PLC (Euronext Amsterdam) 131,900 7,342,409Unilever PLC (LSE) 121,046 6,733,358United Utilities Group PLC 65,600 953,761Vodafone Group PLC 2,581,588 4,328,722Whitbread PLC� 19,417 856,390WM Morrison Supermarkets PLC 231,825 924,301
223,455,185Total Common Stocks
(cost $1,284,024,189) 1,668,260,013EXCHANGE-TRADED FUNDS - 4.2%United States - 4.2%
iShares MSCI EAFE ETF(cost $66,588,180) 974,300 78,567,552
WARRANTS�� - 0.0%Switzerland - 0.0%
Cie Financiere Richemont SAExpires 11/22/2023(cost $0) 94,272 48,384
Total Long-Term Investment Securities(cost $1,350,612,369) 1,746,875,949
SHORT-TERM INVESTMENT SECURITIES - 1.8%Registered Investment Companies - 0.8%
State Street Navigator Securities Lending Government Money Market Portfolio0.03%(2)(3) 14,634,761 14,634,761
U.S. Government Treasuries - 1.0%United States Treasury Bills
0.08% due 02/24/2022(4) $6,000,000 5,998,3870.09% due 12/02/2021(4) 2,900,000 2,899,6650.10% due 11/04/2021(4) 8,000,000 7,999,3240.10% due 12/30/2021(4) 750,000 749,8750.12% due 10/07/2021(4) 2,500,000 2,499,894
20,147,145Total Short-Term Investment Securities
Copyright © 2021 www.secdatabase.com. All Rights Reserved.Please Consider the Environment Before Printing This Document

(cost $34,779,814) 34,781,906REPURCHASE AGREEMENTS - 6.4%
Agreement with Fixed Income Clearing Corp., bearing interest at 0.00% dated 08/31/2021,to be repurchased 09/01/2021 in the amount of $121,258,000 and collateralized by$123,163,600 of United States Treasury Notes, bearing interest at 1.13% due 08/31/2028and having an approximate value of $123,683,227(cost $121,258,000) 121,258,000 121,258,000
TOTAL INVESTMENTS(cost $1,506,650,183) 100.2 % 1,902,915,855
Liabilities in excess of other assets (0.2 ) (3,043,711 )NET ASSETS 100.0 % $1,899,872,144
� Non-income producing security# The security or a portion thereof is out on loan.* Securities exempt from registration under Rule 144A of the Securities Act of 1933. These securities may be sold in transactions
exempt from registration, normally to qualified institutional buyers. The Fund has no right to demand registration of thesesecurities. At August 31, 2021, the aggregate value of these securities was $35,695,007 representing 1.9% of net assets.
(1) Securities classified as Level 3 (see Note 1).(2) At August 31, 2021, the Fund had loaned securities with a total value of $45,589,275. This was secured by collateral of
$14,634,761, which was received in cash and subsequently invested in short-term investments currently valued at $14,634,761 asreported in the Portfolio of Investments. Additional collateral of $33,536,069 was received in the form of fixed income pooledsecurities, which the Fund cannot sell or repledge and accordingly, are not reflected in the Fund�s assets and liabilities.
The components of the fixed income pooled securities referenced above are as follows:
Securities Coupon Range Maturity Date Range
Value as of
August 31, 2021
United States Treasury Bills0.00%
09/30/2021 to 10/28/2021 $216,855
United States Treasury Notes/Bonds0.13% to 8.00%
09/30/2021 to 08/15/2050 33,319,214
(3) The rate shown is the 7-day yield as of August 31, 2021.(4) The security or a portion thereof was pledged as collateral to cover margin requirements of open futures contracts.
ADR - American Depositary ReceiptBR - Bearer SharesCDI - Chess Depositary InterestCVA - Certification Van Aandelen (Dutch Cert.)ETF - Exchange-Traded FundsEuronext Amsterdam - Euronext Stock Exchange, AmsterdamLSE - London Stock ExchangeNES - Non-Voting Equity SecuritiesRSP - Risparmio Shares-Savings Shares on the Italian Stock ExchangeTRQX - Turquoise Stock ExchangeXEGT - Equiduct Stock Exchange
Copyright © 2021 www.secdatabase.com. All Rights Reserved.Please Consider the Environment Before Printing This Document

Futures ContractsNumber
of
Contracts Type Description Expiration Month Notional Basis* Notional Value*
Unrealized
Appreciation
(Depreciation)
1,315 Long MSCI EAFE Index September 2021 $ 155,672,492 $ 154,611,125 $ (1,061,367 )
* Notional basis refers to the contractual amount agreed upon at inception of the open contract; notional value represents the currentvalue of the open contract.
Copyright © 2021 www.secdatabase.com. All Rights Reserved.Please Consider the Environment Before Printing This Document
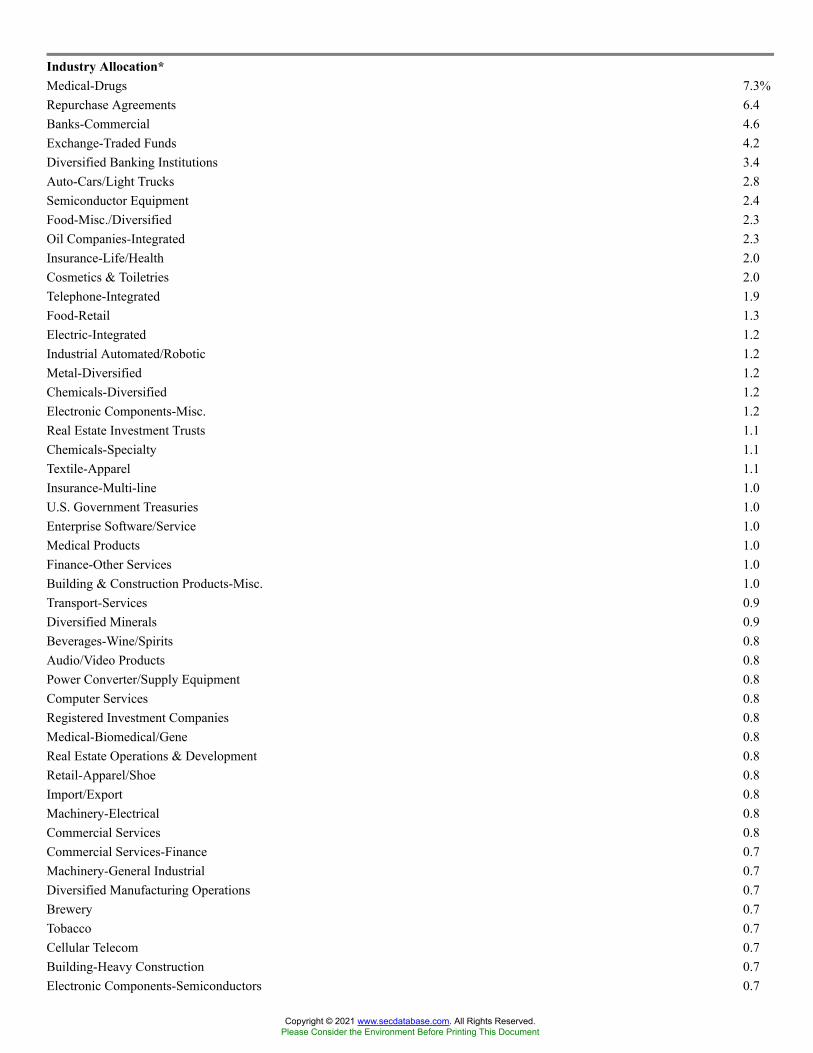
Industry Allocation*Medical-Drugs 7.3%Repurchase Agreements 6.4Banks-Commercial 4.6Exchange-Traded Funds 4.2Diversified Banking Institutions 3.4Auto-Cars/Light Trucks 2.8Semiconductor Equipment 2.4Food-Misc./Diversified 2.3Oil Companies-Integrated 2.3Insurance-Life/Health 2.0Cosmetics & Toiletries 2.0Telephone-Integrated 1.9Food-Retail 1.3Electric-Integrated 1.2Industrial Automated/Robotic 1.2Metal-Diversified 1.2Chemicals-Diversified 1.2Electronic Components-Misc. 1.2Real Estate Investment Trusts 1.1Chemicals-Specialty 1.1Textile-Apparel 1.1Insurance-Multi-line 1.0U.S. Government Treasuries 1.0Enterprise Software/Service 1.0Medical Products 1.0Finance-Other Services 1.0Building & Construction Products-Misc. 1.0Transport-Services 0.9Diversified Minerals 0.9Beverages-Wine/Spirits 0.8Audio/Video Products 0.8Power Converter/Supply Equipment 0.8Computer Services 0.8Registered Investment Companies 0.8Medical-Biomedical/Gene 0.8Real Estate Operations & Development 0.8Retail-Apparel/Shoe 0.8Import/Export 0.8Machinery-Electrical 0.8Commercial Services 0.8Commercial Services-Finance 0.7Machinery-General Industrial 0.7Diversified Manufacturing Operations 0.7Brewery 0.7Tobacco 0.7Cellular Telecom 0.7Building-Heavy Construction 0.7Electronic Components-Semiconductors 0.7
Copyright © 2021 www.secdatabase.com. All Rights Reserved.Please Consider the Environment Before Printing This Document
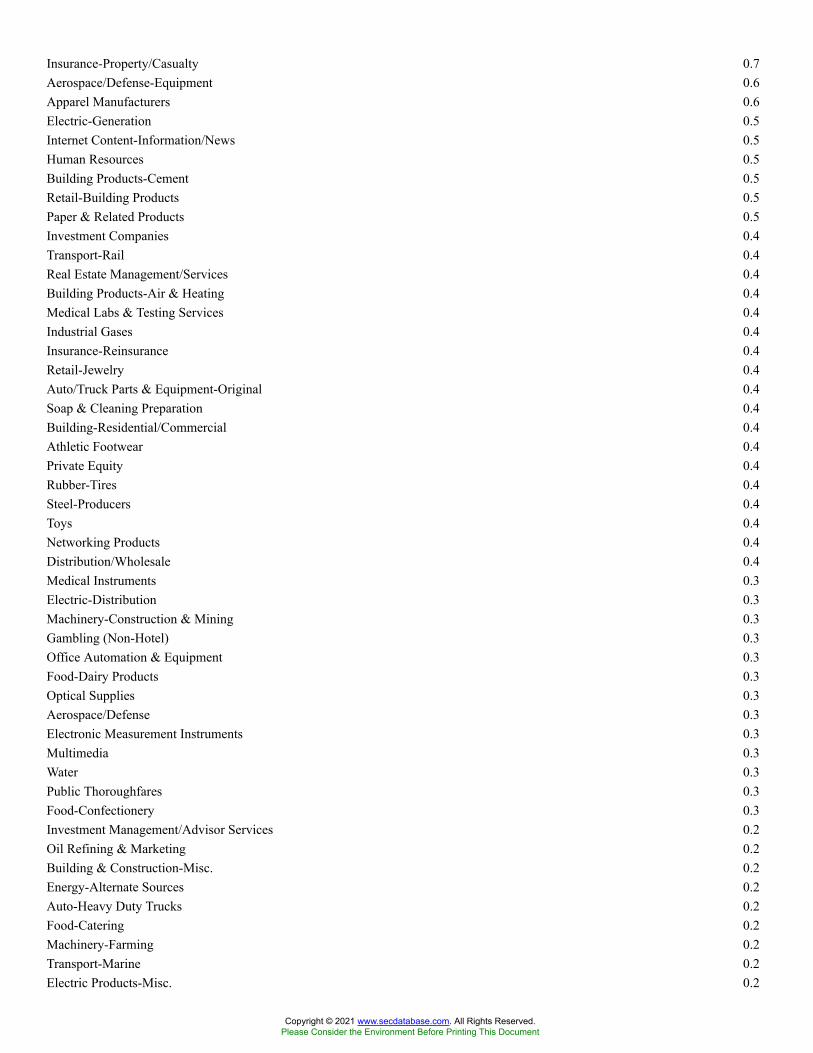
Insurance-Property/Casualty 0.7Aerospace/Defense-Equipment 0.6Apparel Manufacturers 0.6Electric-Generation 0.5Internet Content-Information/News 0.5Human Resources 0.5Building Products-Cement 0.5Retail-Building Products 0.5Paper & Related Products 0.5Investment Companies 0.4Transport-Rail 0.4Real Estate Management/Services 0.4Building Products-Air & Heating 0.4Medical Labs & Testing Services 0.4Industrial Gases 0.4Insurance-Reinsurance 0.4Retail-Jewelry 0.4Auto/Truck Parts & Equipment-Original 0.4Soap & Cleaning Preparation 0.4Building-Residential/Commercial 0.4Athletic Footwear 0.4Private Equity 0.4Rubber-Tires 0.4Steel-Producers 0.4Toys 0.4Networking Products 0.4Distribution/Wholesale 0.4Medical Instruments 0.3Electric-Distribution 0.3Machinery-Construction & Mining 0.3Gambling (Non-Hotel) 0.3Office Automation & Equipment 0.3Food-Dairy Products 0.3Optical Supplies 0.3Aerospace/Defense 0.3Electronic Measurement Instruments 0.3Multimedia 0.3Water 0.3Public Thoroughfares 0.3Food-Confectionery 0.3Investment Management/Advisor Services 0.2Oil Refining & Marketing 0.2Building & Construction-Misc. 0.2Energy-Alternate Sources 0.2Auto-Heavy Duty Trucks 0.2Food-Catering 0.2Machinery-Farming 0.2Transport-Marine 0.2Electric Products-Misc. 0.2
Copyright © 2021 www.secdatabase.com. All Rights Reserved.Please Consider the Environment Before Printing This Document
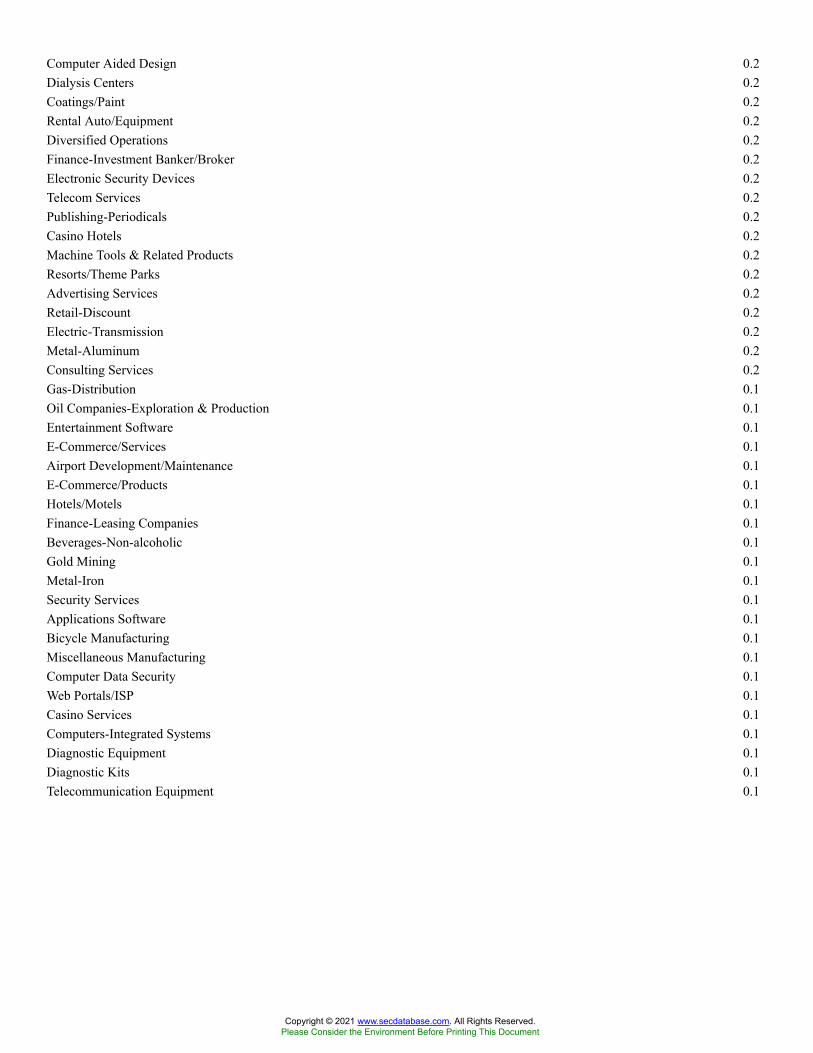
Computer Aided Design 0.2Dialysis Centers 0.2Coatings/Paint 0.2Rental Auto/Equipment 0.2Diversified Operations 0.2Finance-Investment Banker/Broker 0.2Electronic Security Devices 0.2Telecom Services 0.2Publishing-Periodicals 0.2Casino Hotels 0.2Machine Tools & Related Products 0.2Resorts/Theme Parks 0.2Advertising Services 0.2Retail-Discount 0.2Electric-Transmission 0.2Metal-Aluminum 0.2Consulting Services 0.2Gas-Distribution 0.1Oil Companies-Exploration & Production 0.1Entertainment Software 0.1E-Commerce/Services 0.1Airport Development/Maintenance 0.1E-Commerce/Products 0.1Hotels/Motels 0.1Finance-Leasing Companies 0.1Beverages-Non-alcoholic 0.1Gold Mining 0.1Metal-Iron 0.1Security Services 0.1Applications Software 0.1Bicycle Manufacturing 0.1Miscellaneous Manufacturing 0.1Computer Data Security 0.1Web Portals/ISP 0.1Casino Services 0.1Computers-Integrated Systems 0.1Diagnostic Equipment 0.1Diagnostic Kits 0.1Telecommunication Equipment 0.1
Copyright © 2021 www.secdatabase.com. All Rights Reserved.Please Consider the Environment Before Printing This Document

Computers-Periphery Equipment 0.1Building Products-Doors & Windows 0.1Machinery-Material Handling 0.1Advertising Agencies 0.1Internet Gambling 0.1Fisheries 0.1Building-Maintenance & Services 0.1MRI/Medical Diagnostic Imaging 0.1Semiconductor Components-Integrated Circuits 0.1Respiratory Products 0.1Diversified Operations/Commercial Services 0.1Tools-Hand Held 0.1Filtration/Separation Products 0.1Metal Processors & Fabrication 0.1Internet Application Software 0.1Gas-Transportation 0.1Communications Software 0.1Metal Products-Distribution 0.1Electronics-Military 0.1Medical-Generic Drugs 0.1Wire & Cable Products 0.1Medical-Hospitals 0.1Food-Meat Products 0.1Leisure Products 0.1
100.2%
* Calculated as a percentage of net assets
The following is a summary of the inputs used to value the Fund�s net assets as of August 31, 2021 (see Note 1):
Level 1 - Unadjusted
Quoted Prices
Level 2 - Other
Observable Inputs
Level 3 - Significant
Unobservable Inputs Total
ASSETS:Investments at Value:*Common Stocks:
Australia $113,302,659 $� $ 0 $113,302,659Portugal 2,474,079 � 0 2,474,079Other Countries 1,552,483,275 � � 1,552,483,275
Exchange-Traded Funds 78,567,552 � � 78,567,552Warrants 48,384 � � 48,384Short-Term Investment Securities:
Registered Investment Companies 14,634,761 � � 14,634,761U.S. Government Treasuries � 20,147,145 � 20,147,145
Repurchase Agreements � 121,258,000 � 121,258,000Total Investments at Value $1,761,510,710 $141,405,145 $ 0 $1,902,915,855
LIABILITIES:Other Financial Instruments:�Futures Contracts $1,061,367 $� $ � $1,061,367
Copyright © 2021 www.secdatabase.com. All Rights Reserved.Please Consider the Environment Before Printing This Document
* For a detailed presentation of investments, please refer to the Portfolio of Investments.� Amounts represent unrealized appreciation/depreciation as of the end of the reporting period.
At the beginning and end of the reporting period, Level 3 investments in securities were not considered a material portion of the Fund.There were no Level 3 transfers during the reporting period.
See Notes to Portfolio of Investments
Copyright © 2021 www.secdatabase.com. All Rights Reserved.Please Consider the Environment Before Printing This Document

VALIC Company I International Government Bond FundPORTFOLIO OF INVESTMENTS - August 31, 2021 (unaudited)
Security Description
Principal
Amount(1)/
Shares
Value
(Note 1)
FOREIGN CORPORATE BONDS & NOTES - 7.0%Austria - 0.1%
Suzano Austria GmbHCompany Guar. Notes3.75% due 01/15/2031 $200,000 $210,002
Bermuda - 0.2%
Tengizchevroil Finance Co. International, Ltd.Senior Sec. Notes3.25% due 08/15/2030 400,000 410,000
Brazil - 0.4%
BRF SASenior Notes4.88% due 01/24/2030* 300,000 309,966
Globo Comunicacao e Participacoes SASenior Notes4.88% due 01/22/2030*# 400,000 409,204
719,170British Virgin Islands - 0.7%
Huarong Finance II Co., Ltd.Company Guar. Notes4.63% due 06/03/2026 400,000 394,000
Yingde Gases Investment, Ltd.Company Guar. Notes6.25% due 01/19/2023 400,000 409,994
Yunda Holding Investment, Ltd.Company Guar. Notes2.25% due 08/19/2025 420,000 409,701
1,213,695Cayman Islands - 0.3%
Grupo Aval, Ltd.Company Guar. Notes4.38% due 02/04/2030* 255,000 253,343
Lamar Funding, Ltd.Company Guar. Notes3.96% due 05/07/2025 280,000 280,000
533,343Chile - 0.3%
Banco de Credito e Inversiones SASenior Notes3.50% due 10/12/2027# 510,000 549,530
Copyright © 2021 www.secdatabase.com. All Rights Reserved.Please Consider the Environment Before Printing This Document

Colombia - 0.6%
Colombia Telecomunicaciones SA ESPSenior Notes4.95% due 07/17/2030* 210,000 221,025
Ecopetrol SASenior Notes5.88% due 05/28/2045 175,000 187,645
Ecopetrol SASenior Notes6.88% due 04/29/2030 300,000 361,581
Empresas Publicas de Medellin ESPSenior Notes4.38% due 02/15/2031* 240,000 237,302
1,007,553India - 0.4%
Oil India, Ltd.Senior Notes5.13% due 02/04/2029 200,000 227,767
ReNew Power, Ltd.Senior Sec. Notes6.45% due 09/27/2022 430,000 443,437
671,204Indonesia - 0.3%
Indonesia Asahan Aluminium Persero PTSenior Notes6.53% due 11/15/2028# 200,000 245,600
Saka Energi Indonesia PTSenior Notes4.45% due 05/05/2024 400,000 377,020
622,620Luxembourg - 0.3%
Minerva Luxembourg SACompany Guar. Notes4.38% due 03/18/2031*# 400,000 392,936
Rumo Luxembourg SARLCompany Guar. Notes5.25% due 01/10/2028* 220,000 234,346
627,282Mexico - 1.4%
Infraestructura Energetica Nova SAB de CVSenior Notes4.75% due 01/15/2051* 250,000 260,000
Petroleos MexicanosCompany Guar. Notes5.35% due 02/12/2028 340,000 338,300
Copyright © 2021 www.secdatabase.com. All Rights Reserved.Please Consider the Environment Before Printing This Document

Petroleos MexicanosCompany Guar. Notes6.38% due 01/23/2045 500,000 428,285
Petroleos MexicanosCompany Guar. Notes6.50% due 03/13/2027 200,000 211,359
Petroleos MexicanosCompany Guar. Notes6.63% due 06/15/2035 690,000 668,148
Petroleos MexicanosCompany Guar. Bonds6.63% due 06/15/2038 300,000 277,020
Petroleos MexicanosCompany Guar. Notes6.75% due 09/21/2047 500,000 441,425
2,624,537Netherlands - 0.8%
Braskem Netherlands Finance BVCompany Guar. Notes4.50% due 01/31/2030 300,000 321,394
Minejesa Capital BVSenior Sec. Notes5.63% due 08/10/2037 250,000 270,938
Mong Duong Finance Holdings BVSenior Sec. Notes5.13% due 05/07/2029 420,000 422,100
Copyright © 2021 www.secdatabase.com. All Rights Reserved.Please Consider the Environment Before Printing This Document
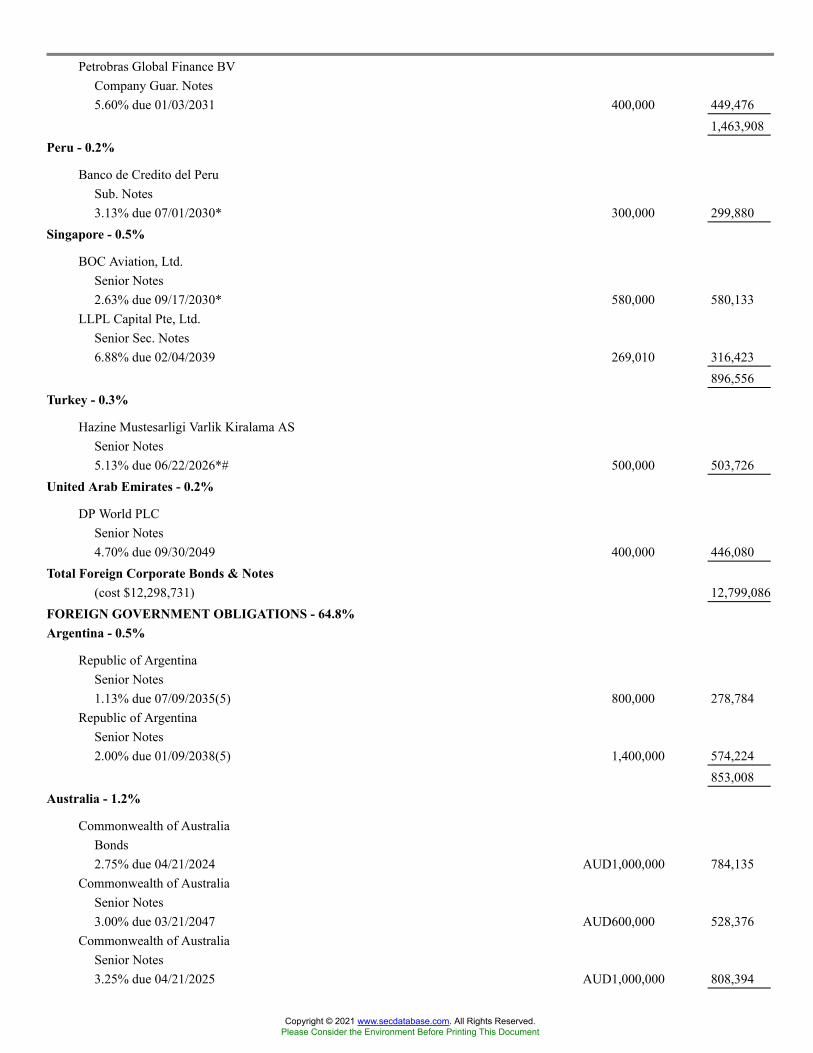
Petrobras Global Finance BVCompany Guar. Notes5.60% due 01/03/2031 400,000 449,476
1,463,908Peru - 0.2%
Banco de Credito del PeruSub. Notes3.13% due 07/01/2030* 300,000 299,880
Singapore - 0.5%
BOC Aviation, Ltd.Senior Notes2.63% due 09/17/2030* 580,000 580,133
LLPL Capital Pte, Ltd.Senior Sec. Notes6.88% due 02/04/2039 269,010 316,423
896,556Turkey - 0.3%
Hazine Mustesarligi Varlik Kiralama ASSenior Notes5.13% due 06/22/2026*# 500,000 503,726
United Arab Emirates - 0.2%
DP World PLCSenior Notes4.70% due 09/30/2049 400,000 446,080
Total Foreign Corporate Bonds & Notes(cost $12,298,731) 12,799,086
FOREIGN GOVERNMENT OBLIGATIONS - 64.8%Argentina - 0.5%
Republic of ArgentinaSenior Notes1.13% due 07/09/2035(5) 800,000 278,784
Republic of ArgentinaSenior Notes2.00% due 01/09/2038(5) 1,400,000 574,224
853,008Australia - 1.2%
Commonwealth of AustraliaBonds2.75% due 04/21/2024 AUD1,000,000 784,135
Commonwealth of AustraliaSenior Notes3.00% due 03/21/2047 AUD600,000 528,376
Commonwealth of AustraliaSenior Notes3.25% due 04/21/2025 AUD1,000,000 808,394
Copyright © 2021 www.secdatabase.com. All Rights Reserved.Please Consider the Environment Before Printing This Document
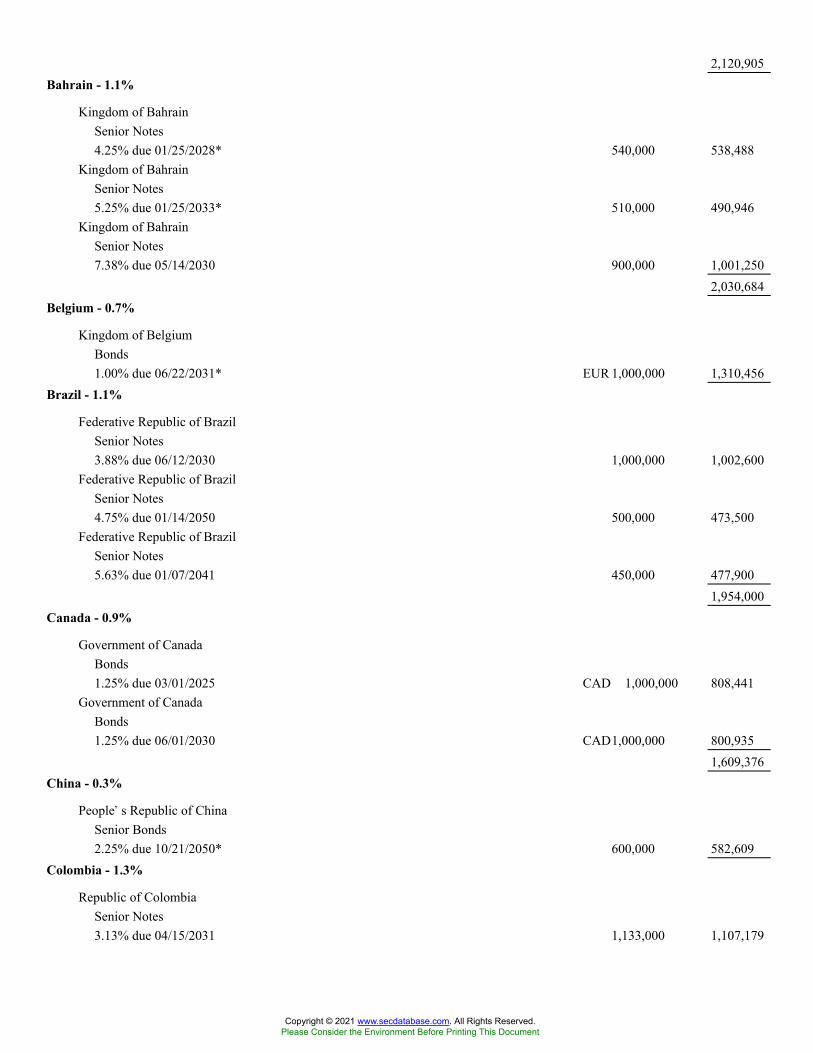
2,120,905Bahrain - 1.1%
Kingdom of BahrainSenior Notes4.25% due 01/25/2028* 540,000 538,488
Kingdom of BahrainSenior Notes5.25% due 01/25/2033* 510,000 490,946
Kingdom of BahrainSenior Notes7.38% due 05/14/2030 900,000 1,001,250
2,030,684Belgium - 0.7%
Kingdom of BelgiumBonds1.00% due 06/22/2031* EUR 1,000,000 1,310,456
Brazil - 1.1%
Federative Republic of BrazilSenior Notes3.88% due 06/12/2030 1,000,000 1,002,600
Federative Republic of BrazilSenior Notes4.75% due 01/14/2050 500,000 473,500
Federative Republic of BrazilSenior Notes5.63% due 01/07/2041 450,000 477,900
1,954,000Canada - 0.9%
Government of CanadaBonds1.25% due 03/01/2025 CAD 1,000,000 808,441
Government of CanadaBonds1.25% due 06/01/2030 CAD1,000,000 800,935
1,609,376China - 0.3%
People�s Republic of ChinaSenior Bonds2.25% due 10/21/2050* 600,000 582,609
Colombia - 1.3%
Republic of ColombiaSenior Notes3.13% due 04/15/2031 1,133,000 1,107,179
Copyright © 2021 www.secdatabase.com. All Rights Reserved.Please Consider the Environment Before Printing This Document

Republic of ColombiaSenior Notes4.50% due 03/15/2029 500,000 543,590
Republic of ColombiaSenior Notes5.00% due 06/15/2045 400,000 417,928
Republic of ColombiaSenior Bonds7.38% due 09/18/2037 300,000 388,350
2,457,047Dominican Republic - 1.3%
Dominican RepublicSenior Notes4.88% due 09/23/2032 1,120,000 1,176,011
Dominican RepublicSenior Notes5.88% due 01/30/2060* 450,000 457,880
Copyright © 2021 www.secdatabase.com. All Rights Reserved.Please Consider the Environment Before Printing This Document

Dominican RepublicSenior Notes5.88% due 01/30/2060 700,000 712,257
2,346,148Ecuador - 0.6%
Republic of EcuadorSenior Bonds1.00% due 07/31/2035(5) 1,580,000 1,137,616
Egypt - 1.6%
Arab Republic of EgyptSenior Notes5.63% due 04/16/2030 EUR500,000 591,509
Arab Republic of EgyptSenior Notes5.75% due 05/29/2024* 550,000 585,589
Arab Republic of EgyptSenior Notes7.60% due 03/01/2029 770,000 845,229
Arab Republic of EgyptSenior Notes8.50% due 01/31/2047 937,000 983,569
3,005,896El Salvador - 0.4%
Republic of El SalvadorSenior Notes5.88% due 01/30/2025 500,000 445,005
Republic of El SalvadorSenior Notes6.38% due 01/18/2027 420,000 365,404
810,409Ethiopia - 0.4%
Federal Republic of EthiopiaSenior Notes6.63% due 12/11/2024 900,000 796,518
France - 4.7%
Government of FranceBonds0.50% due 05/25/2029 EUR 1,050,000 1,314,175
Government of FranceBonds1.25% due 05/25/2034 EUR500,000 672,539
Government of FranceBonds1.25% due 05/25/2036* EUR1,000,000 1,349,610
Copyright © 2021 www.secdatabase.com. All Rights Reserved.Please Consider the Environment Before Printing This Document

Government of FranceBonds1.75% due 06/25/2039* EUR1,750,000 2,569,072
Government of FranceBonds1.75% due 05/25/2066* EUR250,000 388,815
Government of FranceBonds5.50% due 04/25/2029 EUR450,347 771,144
Government of FranceBonds6.00% due 10/25/2025 EUR1,000,000 1,508,291
8,573,646Germany - 4.9%
Federal Republic of GermanyBonds0.25% due 02/15/2029 EUR700,000 878,395
Federal Republic of GermanyBonds0.50% due 02/15/2026 EUR1,000,000 1,246,471
Federal Republic of GermanyBonds0.50% due 02/15/2028 EUR1,000,000 1,268,773
Federal Republic of GermanyBonds1.50% due 02/15/2023 EUR1,000,000 1,219,852
Federal Republic of GermanyBonds2.50% due 07/04/2044 EUR600,000 1,127,508
Federal Republic of GermanyBonds2.50% due 08/15/2046 EUR1,000,000 1,921,799
Federal Republic of GermanyBonds4.75% due 07/04/2034 EUR50,000 98,650
Federal Republic of GermanyBonds5.50% due 01/04/2031 EUR600,000 1,117,144
8,878,592Ghana - 1.3%
Republic of GhanaSenior Notes8.63% due 04/07/2034* 370,000 374,292
Republic of GhanaSenior Notes8.63% due 06/16/2049 580,000 556,069
Copyright © 2021 www.secdatabase.com. All Rights Reserved.Please Consider the Environment Before Printing This Document

Republic of GhanaSenior Notes8.75% due 03/11/2061* 314,000 301,095
Republic of GhanaBank Guar. Notes10.75% due 10/14/2030 850,000 1,064,370
2,295,826Guatemala - 0.7%
Republic of GuatemalaSenior Notes4.90% due 06/01/2030 1,150,000 1,286,287
Indonesia - 0.4%
Republic of IndonesiaSenior Notes3.85% due 10/15/2030# 300,000 339,308
Republic of IndonesiaSenior Bonds4.13% due 01/15/2025 400,000 440,740
780,048
Copyright © 2021 www.secdatabase.com. All Rights Reserved.Please Consider the Environment Before Printing This Document
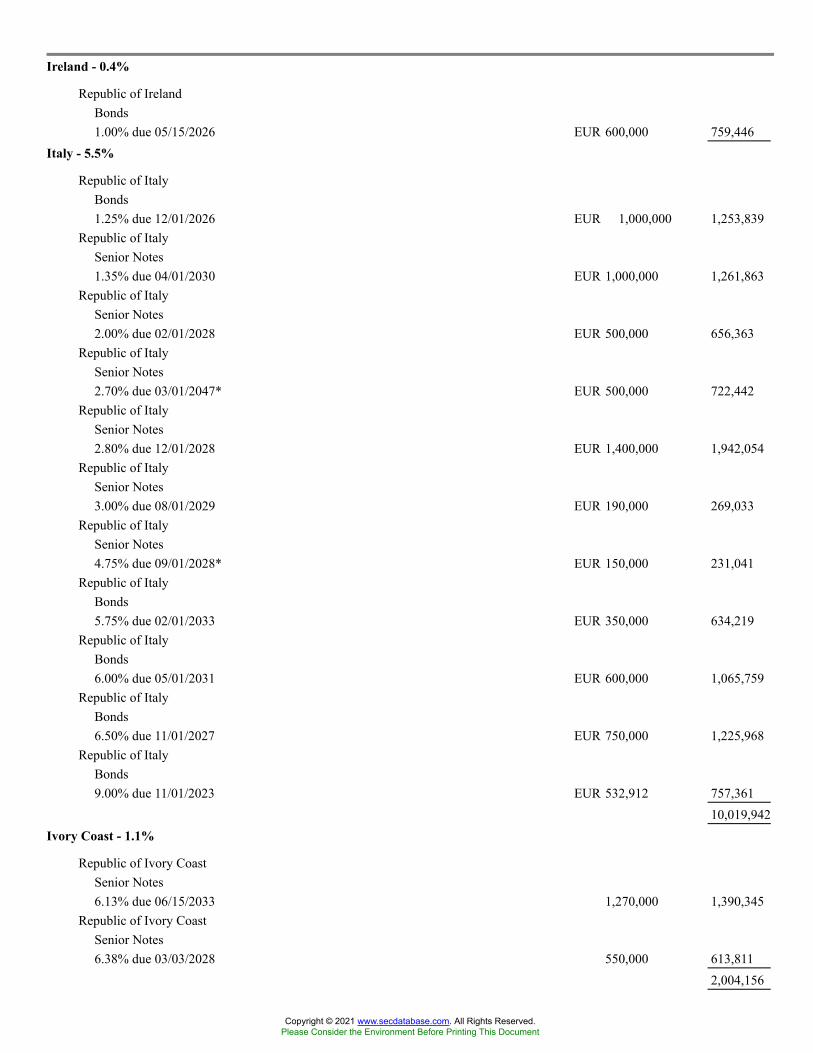
Ireland - 0.4%
Republic of IrelandBonds1.00% due 05/15/2026 EUR 600,000 759,446
Italy - 5.5%
Republic of ItalyBonds1.25% due 12/01/2026 EUR 1,000,000 1,253,839
Republic of ItalySenior Notes1.35% due 04/01/2030 EUR 1,000,000 1,261,863
Republic of ItalySenior Notes2.00% due 02/01/2028 EUR 500,000 656,363
Republic of ItalySenior Notes2.70% due 03/01/2047* EUR 500,000 722,442
Republic of ItalySenior Notes2.80% due 12/01/2028 EUR 1,400,000 1,942,054
Republic of ItalySenior Notes3.00% due 08/01/2029 EUR 190,000 269,033
Republic of ItalySenior Notes4.75% due 09/01/2028* EUR 150,000 231,041
Republic of ItalyBonds5.75% due 02/01/2033 EUR 350,000 634,219
Republic of ItalyBonds6.00% due 05/01/2031 EUR 600,000 1,065,759
Republic of ItalyBonds6.50% due 11/01/2027 EUR 750,000 1,225,968
Republic of ItalyBonds9.00% due 11/01/2023 EUR 532,912 757,361
10,019,942Ivory Coast - 1.1%
Republic of Ivory CoastSenior Notes6.13% due 06/15/2033 1,270,000 1,390,345
Republic of Ivory CoastSenior Notes6.38% due 03/03/2028 550,000 613,811
2,004,156
Copyright © 2021 www.secdatabase.com. All Rights Reserved.Please Consider the Environment Before Printing This Document
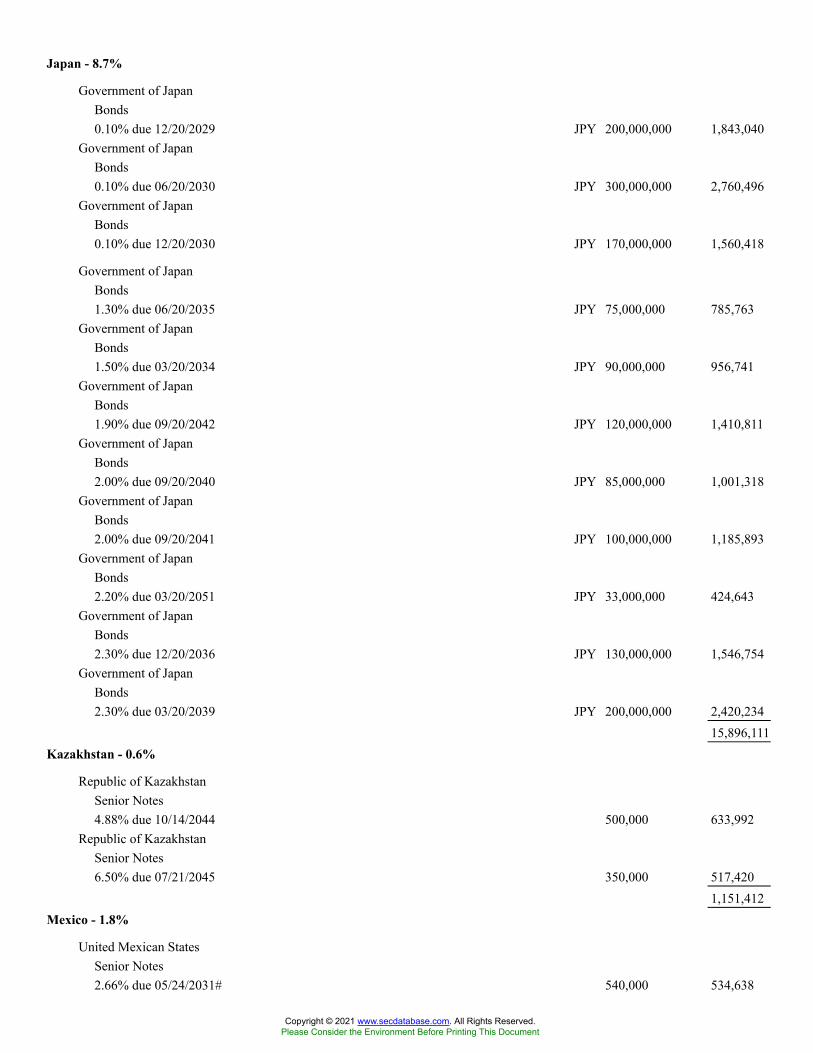
Japan - 8.7%
Government of JapanBonds0.10% due 12/20/2029 JPY 200,000,000 1,843,040
Government of JapanBonds0.10% due 06/20/2030 JPY 300,000,000 2,760,496
Government of JapanBonds0.10% due 12/20/2030 JPY 170,000,000 1,560,418
Government of JapanBonds1.30% due 06/20/2035 JPY 75,000,000 785,763
Government of JapanBonds1.50% due 03/20/2034 JPY 90,000,000 956,741
Government of JapanBonds1.90% due 09/20/2042 JPY 120,000,000 1,410,811
Government of JapanBonds2.00% due 09/20/2040 JPY 85,000,000 1,001,318
Government of JapanBonds2.00% due 09/20/2041 JPY 100,000,000 1,185,893
Government of JapanBonds2.20% due 03/20/2051 JPY 33,000,000 424,643
Government of JapanBonds2.30% due 12/20/2036 JPY 130,000,000 1,546,754
Government of JapanBonds2.30% due 03/20/2039 JPY 200,000,000 2,420,234
15,896,111Kazakhstan - 0.6%
Republic of KazakhstanSenior Notes4.88% due 10/14/2044 500,000 633,992
Republic of KazakhstanSenior Notes6.50% due 07/21/2045 350,000 517,420
1,151,412Mexico - 1.8%
United Mexican StatesSenior Notes2.66% due 05/24/2031# 540,000 534,638
Copyright © 2021 www.secdatabase.com. All Rights Reserved.Please Consider the Environment Before Printing This Document
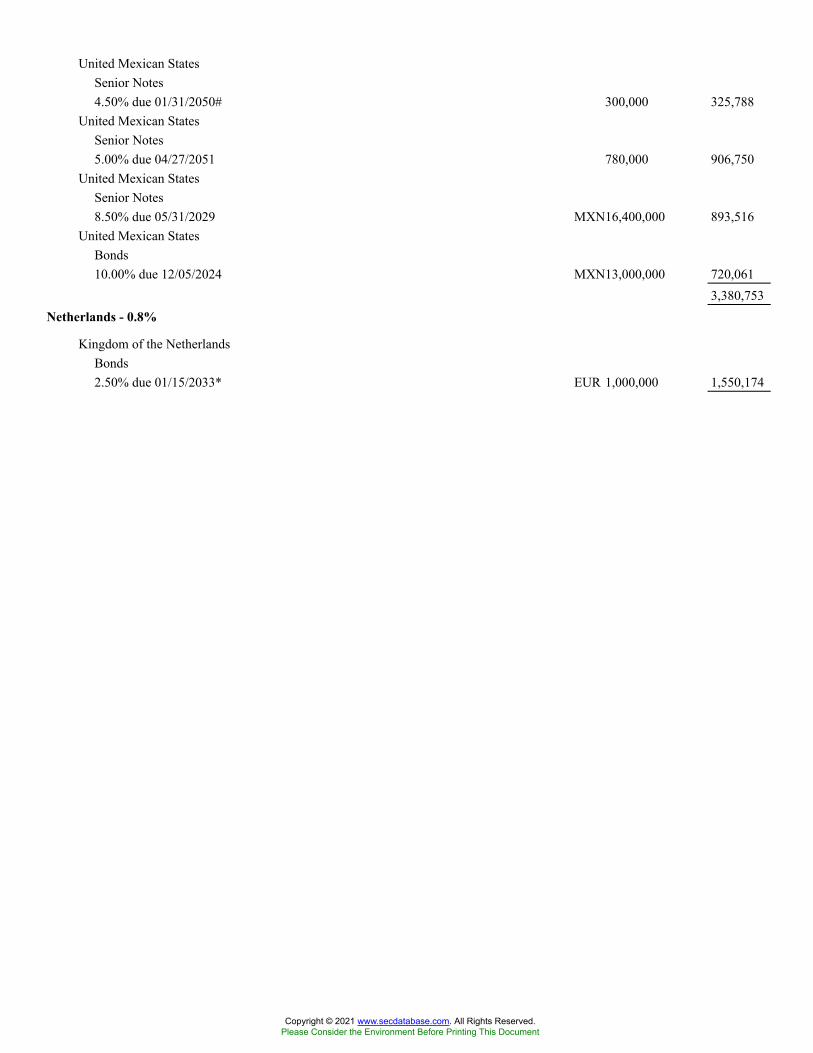
United Mexican StatesSenior Notes4.50% due 01/31/2050# 300,000 325,788
United Mexican StatesSenior Notes5.00% due 04/27/2051 780,000 906,750
United Mexican StatesSenior Notes8.50% due 05/31/2029 MXN16,400,000 893,516
United Mexican StatesBonds10.00% due 12/05/2024 MXN13,000,000 720,061
3,380,753Netherlands - 0.8%
Kingdom of the NetherlandsBonds2.50% due 01/15/2033* EUR 1,000,000 1,550,174
Copyright © 2021 www.secdatabase.com. All Rights Reserved.Please Consider the Environment Before Printing This Document
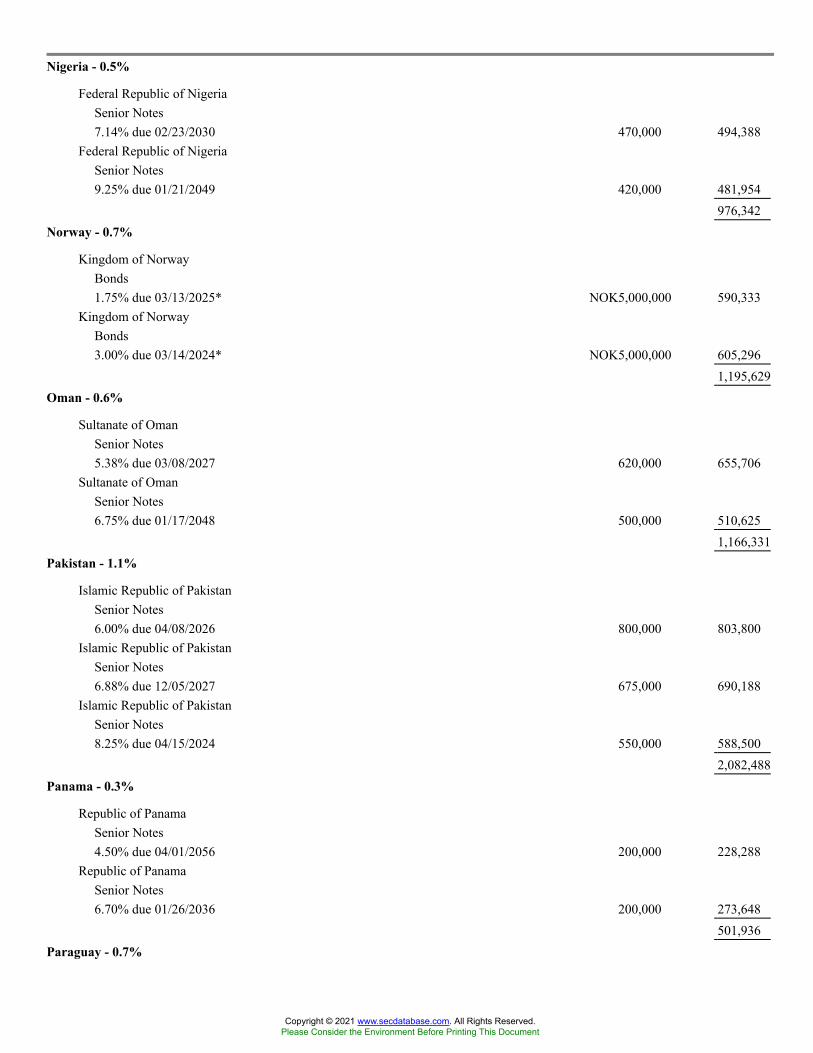
Nigeria - 0.5%
Federal Republic of NigeriaSenior Notes7.14% due 02/23/2030 470,000 494,388
Federal Republic of NigeriaSenior Notes9.25% due 01/21/2049 420,000 481,954
976,342Norway - 0.7%
Kingdom of NorwayBonds1.75% due 03/13/2025* NOK5,000,000 590,333
Kingdom of NorwayBonds3.00% due 03/14/2024* NOK5,000,000 605,296
1,195,629Oman - 0.6%
Sultanate of OmanSenior Notes5.38% due 03/08/2027 620,000 655,706
Sultanate of OmanSenior Notes6.75% due 01/17/2048 500,000 510,625
1,166,331Pakistan - 1.1%
Islamic Republic of PakistanSenior Notes6.00% due 04/08/2026 800,000 803,800
Islamic Republic of PakistanSenior Notes6.88% due 12/05/2027 675,000 690,188
Islamic Republic of PakistanSenior Notes8.25% due 04/15/2024 550,000 588,500
2,082,488Panama - 0.3%
Republic of PanamaSenior Notes4.50% due 04/01/2056 200,000 228,288
Republic of PanamaSenior Notes6.70% due 01/26/2036 200,000 273,648
501,936Paraguay - 0.7%
Copyright © 2021 www.secdatabase.com. All Rights Reserved.Please Consider the Environment Before Printing This Document

Republic of ParaquaySenior Notes4.95% due 04/28/2031 1,100,000 1,273,261
Peru - 0.3%
Republic of PeruSenior Notes2.78% due 01/23/2031 500,000 510,360
Philippines - 0.4%
Republic of the PhilippinesSenior Notes2.95% due 05/05/2045 350,000 352,058
Republic of the PhilippinesSenior Notes3.75% due 01/14/2029 400,000 456,159
808,217Poland - 0.6%
Republic of PolandBonds2.50% due 07/25/2027 PLN 4,000,000 1,112,541
Qatar - 2.0%
State of QatarSenior Notes3.40% due 04/16/2025* 480,000 520,333
State of QatarSenior Notes4.40% due 04/16/2050* 880,000 1,089,605
State of QatarSenior Notes4.82% due 03/14/2049 1,190,000 1,554,073
State of QatarSenior Notes5.10% due 04/23/2048 420,000 565,441
3,729,452Romania - 0.7%
Government of RomaniaSenior Notes3.00% due 02/14/2031 260,000 271,136
Government of RomaniaSenior Notes4.00% due 02/14/2051* 500,000 530,035
Government of RomaniaSenior Notes4.00% due 02/14/2051 440,000 466,431
1,267,602Russia - 0.7%
Copyright © 2021 www.secdatabase.com. All Rights Reserved.Please Consider the Environment Before Printing This Document
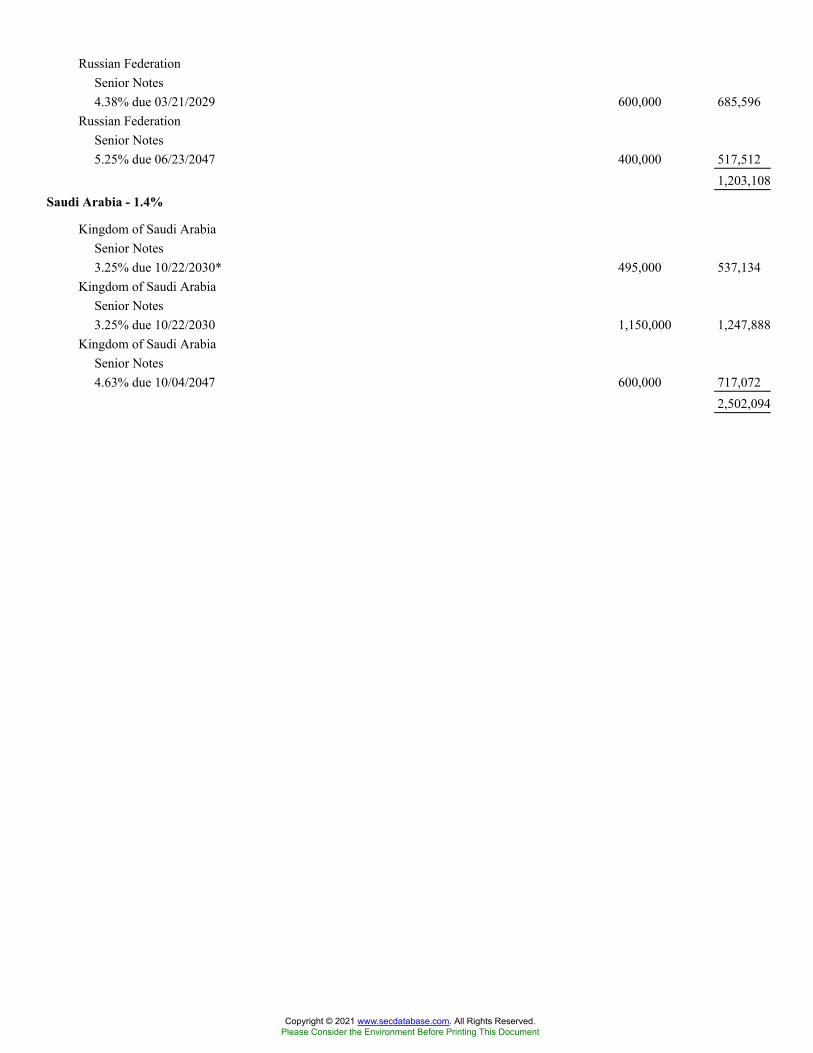
Russian FederationSenior Notes4.38% due 03/21/2029 600,000 685,596
Russian FederationSenior Notes5.25% due 06/23/2047 400,000 517,512
1,203,108Saudi Arabia - 1.4%
Kingdom of Saudi ArabiaSenior Notes3.25% due 10/22/2030* 495,000 537,134
Kingdom of Saudi ArabiaSenior Notes3.25% due 10/22/2030 1,150,000 1,247,888
Kingdom of Saudi ArabiaSenior Notes4.63% due 10/04/2047 600,000 717,072
2,502,094
Copyright © 2021 www.secdatabase.com. All Rights Reserved.Please Consider the Environment Before Printing This Document
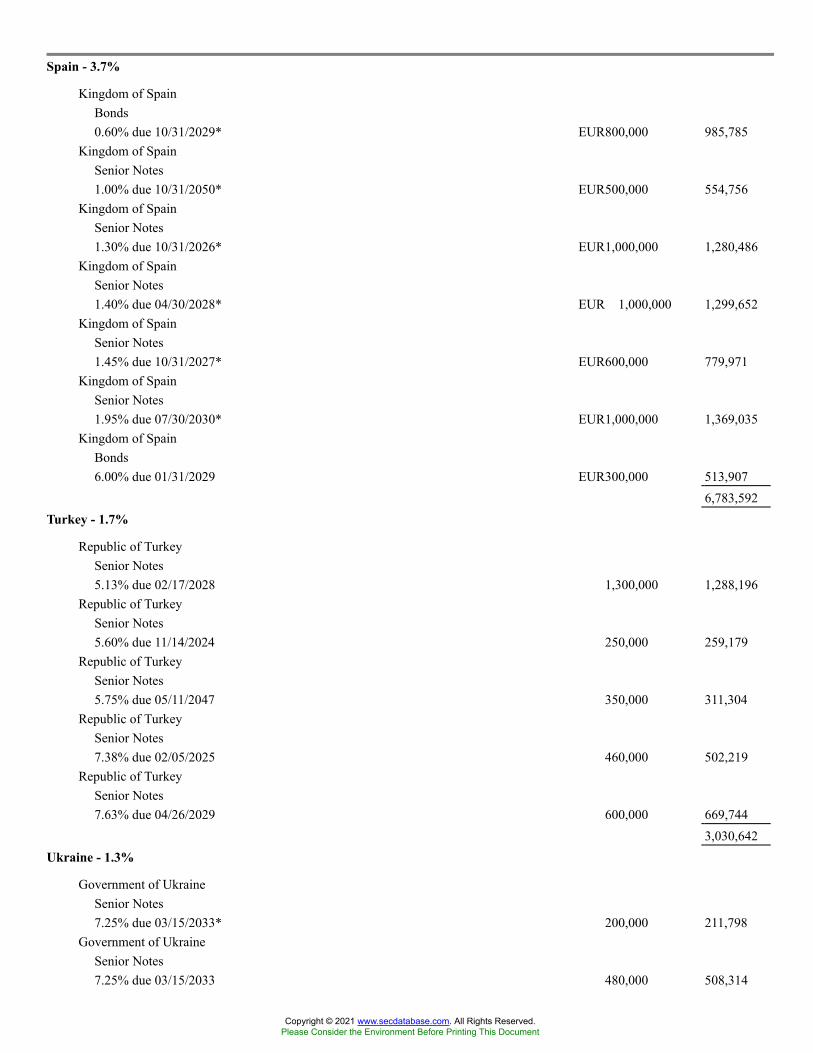
Spain - 3.7%
Kingdom of SpainBonds0.60% due 10/31/2029* EUR800,000 985,785
Kingdom of SpainSenior Notes1.00% due 10/31/2050* EUR500,000 554,756
Kingdom of SpainSenior Notes1.30% due 10/31/2026* EUR1,000,000 1,280,486
Kingdom of SpainSenior Notes1.40% due 04/30/2028* EUR 1,000,000 1,299,652
Kingdom of SpainSenior Notes1.45% due 10/31/2027* EUR600,000 779,971
Kingdom of SpainSenior Notes1.95% due 07/30/2030* EUR1,000,000 1,369,035
Kingdom of SpainBonds6.00% due 01/31/2029 EUR300,000 513,907
6,783,592Turkey - 1.7%
Republic of TurkeySenior Notes5.13% due 02/17/2028 1,300,000 1,288,196
Republic of TurkeySenior Notes5.60% due 11/14/2024 250,000 259,179
Republic of TurkeySenior Notes5.75% due 05/11/2047 350,000 311,304
Republic of TurkeySenior Notes7.38% due 02/05/2025 460,000 502,219
Republic of TurkeySenior Notes7.63% due 04/26/2029 600,000 669,744
3,030,642Ukraine - 1.3%
Government of UkraineSenior Notes7.25% due 03/15/2033* 200,000 211,798
Government of UkraineSenior Notes7.25% due 03/15/2033 480,000 508,314
Copyright © 2021 www.secdatabase.com. All Rights Reserved.Please Consider the Environment Before Printing This Document

Government of UkraineSenior Notes7.75% due 09/01/2022 370,000 386,161
Government of UkraineSenior Notes7.75% due 09/01/2023 450,000 483,885
Government of UkraineSenior Notes9.75% due 11/01/2028 700,000 847,028
2,437,186United Arab Emirates - 1.1%
Emirate of Abu DhabiSenior Notes2.50% due 04/16/2025*# 510,000 541,237
Emirate of Abu DhabiSenior Notes3.13% due 10/11/2027 1,050,000 1,158,948
Emirate of Abu DhabiSenior Bonds3.88% due 04/16/2050* 215,000 251,157
1,951,342United Kingdom - 4.7%
United Kingdom Gilt TreasuryBonds1.25% due 07/22/2027 GBP850,000 1,226,703
United Kingdom Gilt TreasuryBonds1.63% due 10/22/2028 GBP1,800,000 2,674,327
United Kingdom Gilt TreasuryBonds2.25% due 09/07/2023 GBP300,000 429,731
United Kingdom Gilt TreasuryBonds3.25% due 01/22/2044 GBP400,000 788,471
United Kingdom Gilt TreasuryNotes3.75% due 07/22/2052 GBP200,000 470,842
United Kingdom Gilt TreasuryBonds4.25% due 06/07/2032 GBP300,000 562,425
United Kingdom Gilt TreasuryBonds4.25% due 03/07/2036 GBP300,000 600,251
United Kingdom Gilt TreasuryBonds4.25% due 12/07/2055 GBP200,000 531,605
Copyright © 2021 www.secdatabase.com. All Rights Reserved.Please Consider the Environment Before Printing This Document
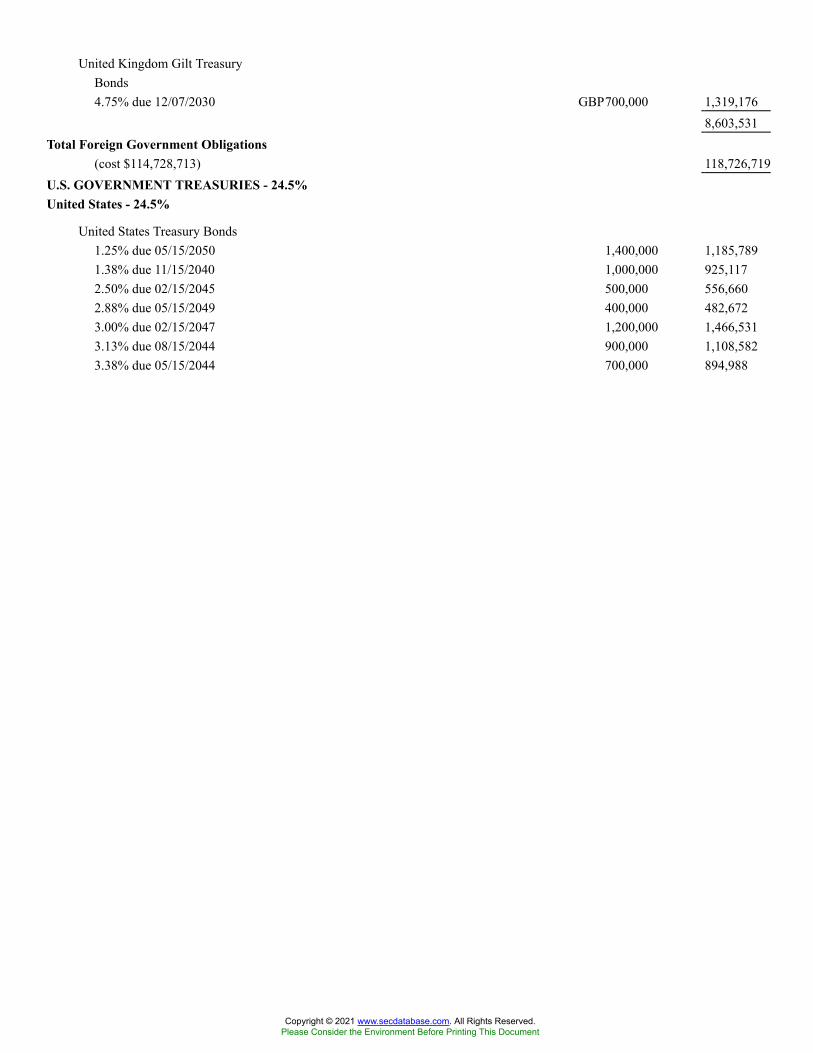
United Kingdom Gilt TreasuryBonds4.75% due 12/07/2030 GBP700,000 1,319,176
8,603,531Total Foreign Government Obligations
(cost $114,728,713) 118,726,719U.S. GOVERNMENT TREASURIES - 24.5%United States - 24.5%
United States Treasury Bonds1.25% due 05/15/2050 1,400,000 1,185,7891.38% due 11/15/2040 1,000,000 925,1172.50% due 02/15/2045 500,000 556,6602.88% due 05/15/2049 400,000 482,6723.00% due 02/15/2047 1,200,000 1,466,5313.13% due 08/15/2044 900,000 1,108,5823.38% due 05/15/2044 700,000 894,988
Copyright © 2021 www.secdatabase.com. All Rights Reserved.Please Consider the Environment Before Printing This Document
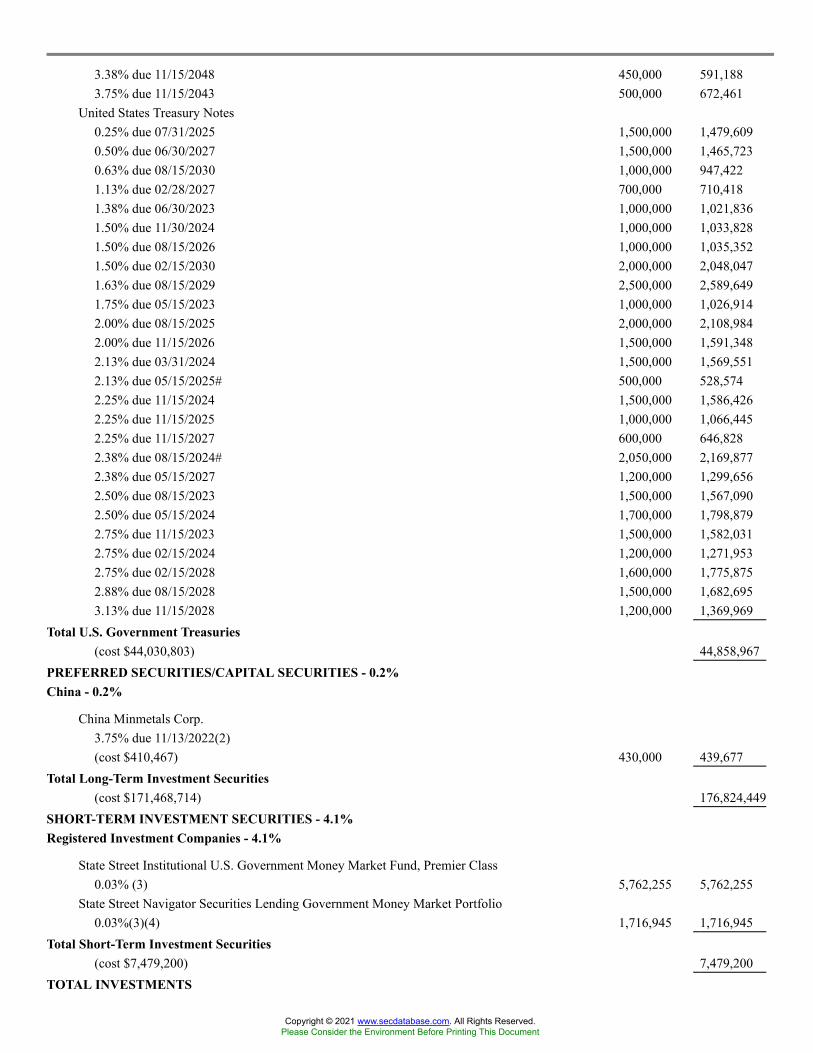
3.38% due 11/15/2048 450,000 591,1883.75% due 11/15/2043 500,000 672,461
United States Treasury Notes0.25% due 07/31/2025 1,500,000 1,479,6090.50% due 06/30/2027 1,500,000 1,465,7230.63% due 08/15/2030 1,000,000 947,4221.13% due 02/28/2027 700,000 710,4181.38% due 06/30/2023 1,000,000 1,021,8361.50% due 11/30/2024 1,000,000 1,033,8281.50% due 08/15/2026 1,000,000 1,035,3521.50% due 02/15/2030 2,000,000 2,048,0471.63% due 08/15/2029 2,500,000 2,589,6491.75% due 05/15/2023 1,000,000 1,026,9142.00% due 08/15/2025 2,000,000 2,108,9842.00% due 11/15/2026 1,500,000 1,591,3482.13% due 03/31/2024 1,500,000 1,569,5512.13% due 05/15/2025# 500,000 528,5742.25% due 11/15/2024 1,500,000 1,586,4262.25% due 11/15/2025 1,000,000 1,066,4452.25% due 11/15/2027 600,000 646,8282.38% due 08/15/2024# 2,050,000 2,169,8772.38% due 05/15/2027 1,200,000 1,299,6562.50% due 08/15/2023 1,500,000 1,567,0902.50% due 05/15/2024 1,700,000 1,798,8792.75% due 11/15/2023 1,500,000 1,582,0312.75% due 02/15/2024 1,200,000 1,271,9532.75% due 02/15/2028 1,600,000 1,775,8752.88% due 08/15/2028 1,500,000 1,682,6953.13% due 11/15/2028 1,200,000 1,369,969
Total U.S. Government Treasuries(cost $44,030,803) 44,858,967
PREFERRED SECURITIES/CAPITAL SECURITIES - 0.2%China - 0.2%
China Minmetals Corp.3.75% due 11/13/2022(2)(cost $410,467) 430,000 439,677
Total Long-Term Investment Securities(cost $171,468,714) 176,824,449
SHORT-TERM INVESTMENT SECURITIES - 4.1%Registered Investment Companies - 4.1%
State Street Institutional U.S. Government Money Market Fund, Premier Class0.03% (3) 5,762,255 5,762,255
State Street Navigator Securities Lending Government Money Market Portfolio0.03%(3)(4) 1,716,945 1,716,945
Total Short-Term Investment Securities(cost $7,479,200) 7,479,200
TOTAL INVESTMENTS
Copyright © 2021 www.secdatabase.com. All Rights Reserved.Please Consider the Environment Before Printing This Document
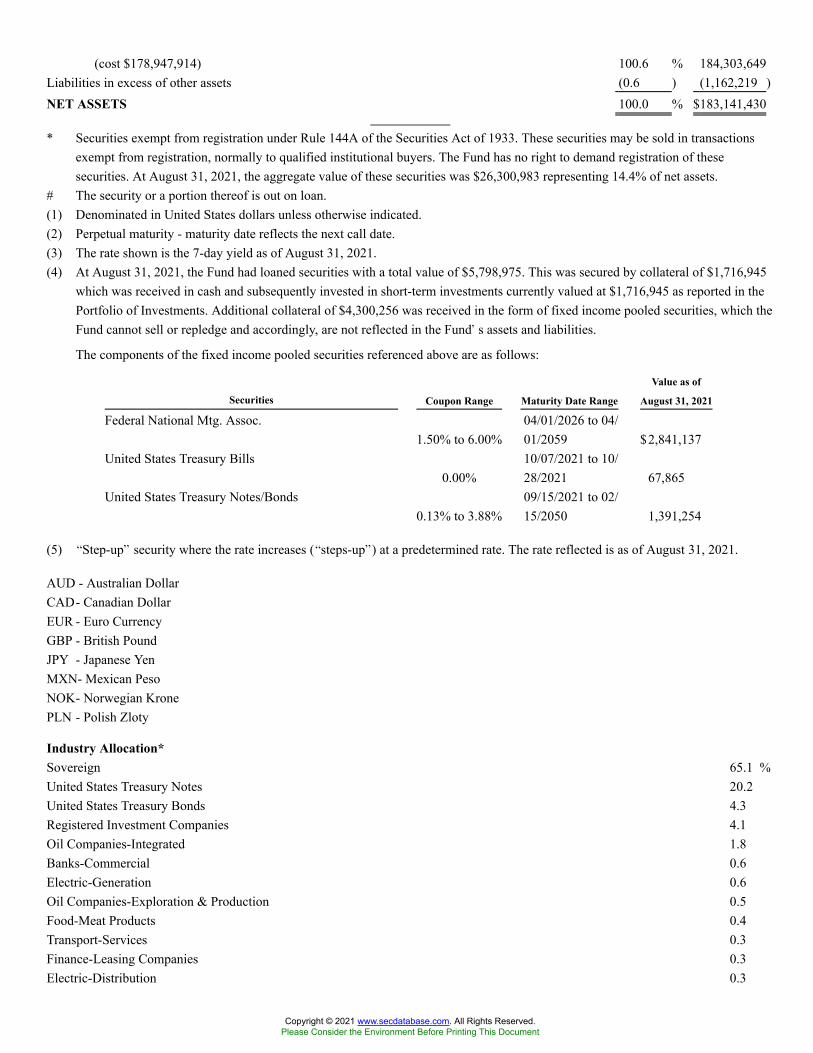
(cost $178,947,914) 100.6 % 184,303,649Liabilities in excess of other assets (0.6 ) (1,162,219 )NET ASSETS 100.0 % $183,141,430
* Securities exempt from registration under Rule 144A of the Securities Act of 1933. These securities may be sold in transactionsexempt from registration, normally to qualified institutional buyers. The Fund has no right to demand registration of thesesecurities. At August 31, 2021, the aggregate value of these securities was $26,300,983 representing 14.4% of net assets.
# The security or a portion thereof is out on loan.(1) Denominated in United States dollars unless otherwise indicated.(2) Perpetual maturity - maturity date reflects the next call date.(3) The rate shown is the 7-day yield as of August 31, 2021.(4) At August 31, 2021, the Fund had loaned securities with a total value of $5,798,975. This was secured by collateral of $1,716,945
which was received in cash and subsequently invested in short-term investments currently valued at $1,716,945 as reported in thePortfolio of Investments. Additional collateral of $4,300,256 was received in the form of fixed income pooled securities, which theFund cannot sell or repledge and accordingly, are not reflected in the Fund�s assets and liabilities.
The components of the fixed income pooled securities referenced above are as follows:
Securities Coupon Range Maturity Date Range
Value as of
August 31, 2021
Federal National Mtg. Assoc.1.50% to 6.00%
04/01/2026 to 04/01/2059 $2,841,137
United States Treasury Bills0.00%
10/07/2021 to 10/28/2021 67,865
United States Treasury Notes/Bonds0.13% to 3.88%
09/15/2021 to 02/15/2050 1,391,254
(5) �Step-up� security where the rate increases (�steps-up�) at a predetermined rate. The rate reflected is as of August 31, 2021.
AUD - Australian DollarCAD- Canadian DollarEUR - Euro CurrencyGBP - British PoundJPY - Japanese YenMXN- Mexican PesoNOK- Norwegian KronePLN - Polish Zloty
Industry Allocation*Sovereign 65.1 %United States Treasury Notes 20.2United States Treasury Bonds 4.3Registered Investment Companies 4.1Oil Companies-Integrated 1.8Banks-Commercial 0.6Electric-Generation 0.6Oil Companies-Exploration & Production 0.5Food-Meat Products 0.4Transport-Services 0.3Finance-Leasing Companies 0.3Electric-Distribution 0.3
Copyright © 2021 www.secdatabase.com. All Rights Reserved.Please Consider the Environment Before Printing This Document

Energy-Alternate Sources 0.3Industrial Gases 0.3Warehousing & Harbor Transportation Services 0.2Building & Construction-Misc. 0.2Multimedia 0.2Investment Companies 0.2Chemicals-Diversified 0.2Electric-Integrated 0.2Metal-Aluminum 0.1Cellular Telecom 0.1Paper & Related Products 0.1
100.6%
* Calculated as a percentage of net assets
The following is a summary of the inputs used to value the Fund�s net assets as of August 31, 2021 (see Note 1):
Level 1 - Unadjusted
Quoted Prices
Level 2 - Other
Observable Inputs
Level 3 - Significant
Unobservable Inputs Total
ASSETS:Investments at Value:*Foreign Corporate Bonds & Notes $ � $12,799,086 $ � $12,799,086Foreign Government Obligations � 118,726,719 � 118,726,719U.S. Government Treasuries � 44,858,967 � 44,858,967Preferred Securities/Capital Securities � 439,677 � 439,677Short-Term Investment Securities 7,479,200 � � 7,479,200Total Investments at Value $ 7,479,200 $176,824,449 $ � $184,303,649
* For a detailed presentation of investments, please refer to the Portfolio of Investments.
See Notes to Portfolio of Investments
Copyright © 2021 www.secdatabase.com. All Rights Reserved.Please Consider the Environment Before Printing This Document
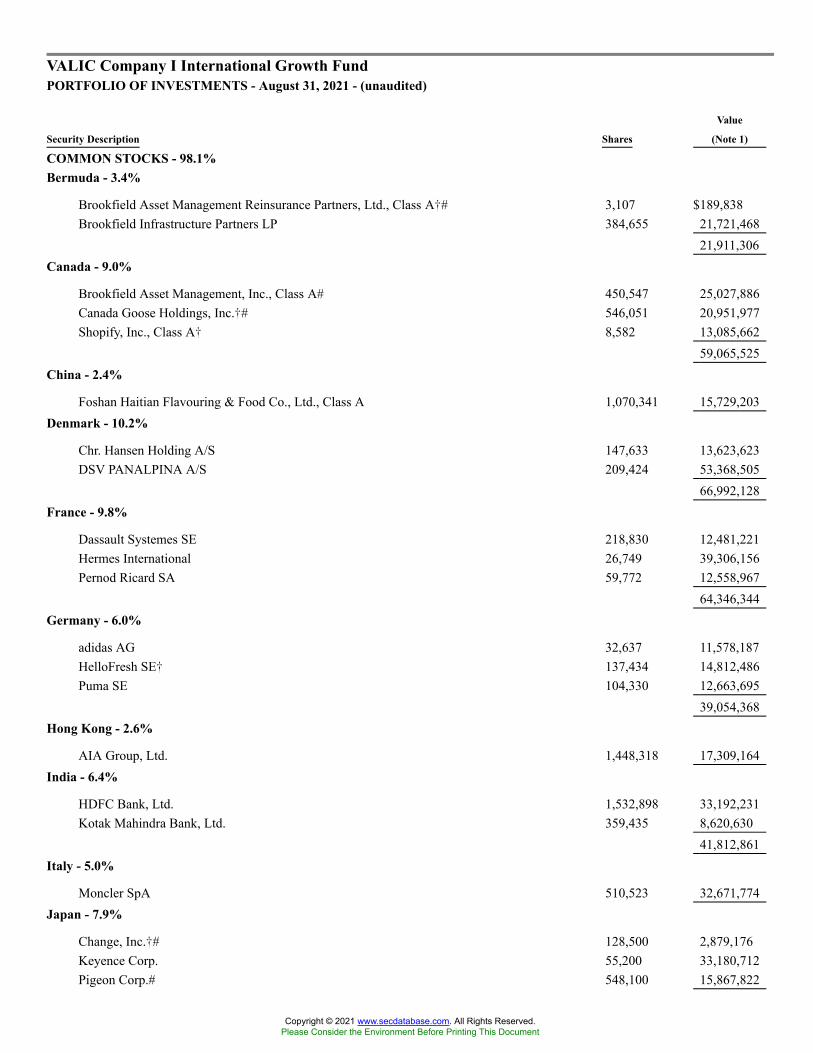
VALIC Company I International Growth FundPORTFOLIO OF INVESTMENTS - August 31, 2021 - (unaudited)
Security Description Shares
Value
(Note 1)
COMMON STOCKS - 98.1%Bermuda - 3.4%
Brookfield Asset Management Reinsurance Partners, Ltd., Class A�# 3,107 $189,838Brookfield Infrastructure Partners LP 384,655 21,721,468
21,911,306Canada - 9.0%
Brookfield Asset Management, Inc., Class A# 450,547 25,027,886Canada Goose Holdings, Inc.�# 546,051 20,951,977Shopify, Inc., Class A� 8,582 13,085,662
59,065,525China - 2.4%
Foshan Haitian Flavouring & Food Co., Ltd., Class A 1,070,341 15,729,203Denmark - 10.2%
Chr. Hansen Holding A/S 147,633 13,623,623DSV PANALPINA A/S 209,424 53,368,505
66,992,128France - 9.8%
Dassault Systemes SE 218,830 12,481,221Hermes International 26,749 39,306,156Pernod Ricard SA 59,772 12,558,967
64,346,344Germany - 6.0%
adidas AG 32,637 11,578,187HelloFresh SE� 137,434 14,812,486Puma SE 104,330 12,663,695
39,054,368Hong Kong - 2.6%
AIA Group, Ltd. 1,448,318 17,309,164India - 6.4%
HDFC Bank, Ltd. 1,532,898 33,192,231Kotak Mahindra Bank, Ltd. 359,435 8,620,630
41,812,861Italy - 5.0%
Moncler SpA 510,523 32,671,774Japan - 7.9%
Change, Inc.�# 128,500 2,879,176Keyence Corp. 55,200 33,180,712Pigeon Corp.# 548,100 15,867,822
Copyright © 2021 www.secdatabase.com. All Rights Reserved.Please Consider the Environment Before Printing This Document

51,927,710Netherlands - 11.5%
Adyen NV�* 6,084 19,643,789ASML Holding NV 48,631 40,453,148Davide Campari-Milano NV 1,106,686 15,301,691
75,398,628
Copyright © 2021 www.secdatabase.com. All Rights Reserved.Please Consider the Environment Before Printing This Document
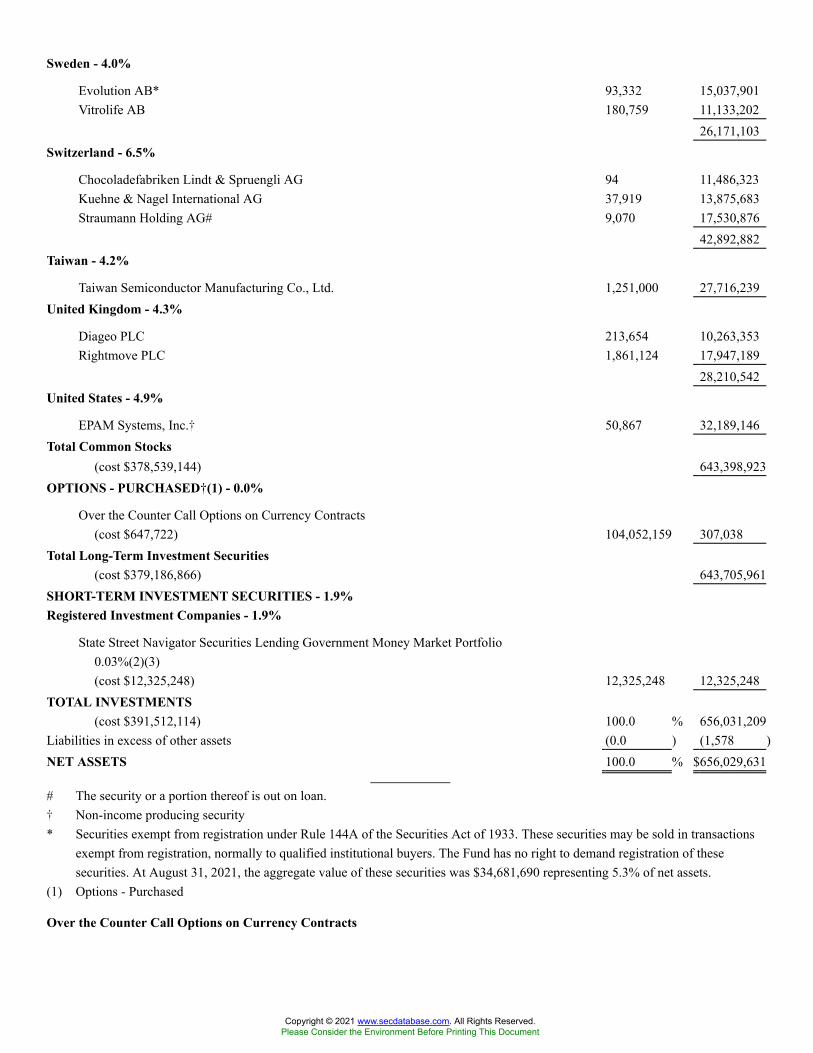
Sweden - 4.0%
Evolution AB* 93,332 15,037,901Vitrolife AB 180,759 11,133,202
26,171,103Switzerland - 6.5%
Chocoladefabriken Lindt & Spruengli AG 94 11,486,323Kuehne & Nagel International AG 37,919 13,875,683Straumann Holding AG# 9,070 17,530,876
42,892,882Taiwan - 4.2%
Taiwan Semiconductor Manufacturing Co., Ltd. 1,251,000 27,716,239United Kingdom - 4.3%
Diageo PLC 213,654 10,263,353Rightmove PLC 1,861,124 17,947,189
28,210,542United States - 4.9%
EPAM Systems, Inc.� 50,867 32,189,146Total Common Stocks
(cost $378,539,144) 643,398,923OPTIONS - PURCHASED��(1) - 0.0%
Over the Counter Call Options on Currency Contracts(cost $647,722) 104,052,159 307,038
Total Long-Term Investment Securities(cost $379,186,866) 643,705,961
SHORT-TERM INVESTMENT SECURITIES - 1.9%Registered Investment Companies - 1.9%
State Street Navigator Securities Lending Government Money Market Portfolio0.03%(2)(3)(cost $12,325,248) 12,325,248 12,325,248
TOTAL INVESTMENTS(cost $391,512,114) 100.0 % 656,031,209
Liabilities in excess of other assets (0.0 ) (1,578 )NET ASSETS 100.0 % $656,029,631
# The security or a portion thereof is out on loan.� Non-income producing security* Securities exempt from registration under Rule 144A of the Securities Act of 1933. These securities may be sold in transactions
exempt from registration, normally to qualified institutional buyers. The Fund has no right to demand registration of thesesecurities. At August 31, 2021, the aggregate value of these securities was $34,681,690 representing 5.3% of net assets.
(1) Options - Purchased
Over the Counter Call Options on Currency Contracts
Copyright © 2021 www.secdatabase.com. All Rights Reserved.Please Consider the Environment Before Printing This Document
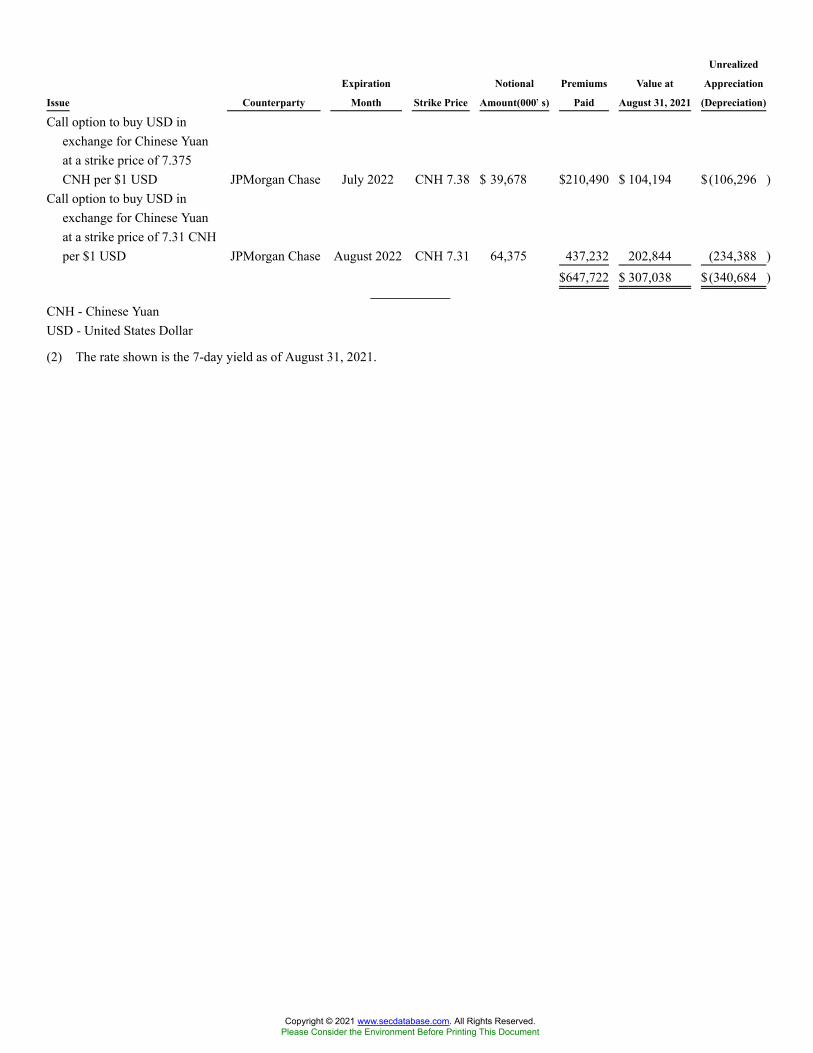
Issue Counterparty
Expiration
Month Strike Price
Notional
Amount(000��s)
Premiums
Paid
Value at
August 31, 2021
Unrealized
Appreciation
(Depreciation)
Call option to buy USD inexchange for Chinese Yuanat a strike price of 7.375CNH per $1 USD JPMorgan Chase July 2022 CNH 7.38 $ 39,678 $210,490 $ 104,194 $(106,296 )
Call option to buy USD inexchange for Chinese Yuanat a strike price of 7.31 CNHper $1 USD JPMorgan Chase August 2022 CNH 7.31 64,375 437,232 202,844 (234,388 )
$647,722 $ 307,038 $(340,684 )
CNH - Chinese YuanUSD - United States Dollar
(2) The rate shown is the 7-day yield as of August 31, 2021.
Copyright © 2021 www.secdatabase.com. All Rights Reserved.Please Consider the Environment Before Printing This Document
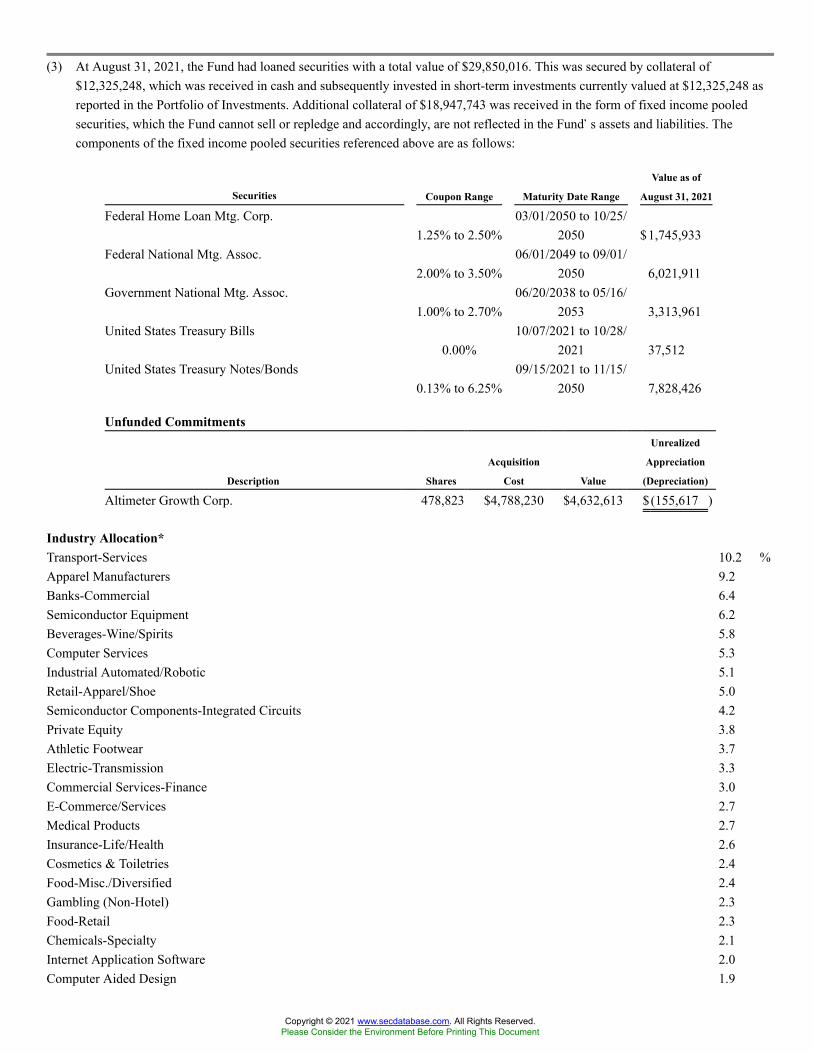
(3) At August 31, 2021, the Fund had loaned securities with a total value of $29,850,016. This was secured by collateral of$12,325,248, which was received in cash and subsequently invested in short-term investments currently valued at $12,325,248 asreported in the Portfolio of Investments. Additional collateral of $18,947,743 was received in the form of fixed income pooledsecurities, which the Fund cannot sell or repledge and accordingly, are not reflected in the Fund�s assets and liabilities. Thecomponents of the fixed income pooled securities referenced above are as follows:
Securities Coupon Range Maturity Date Range
Value as of
August 31, 2021
Federal Home Loan Mtg. Corp.1.25% to 2.50%
03/01/2050 to 10/25/2050 $1,745,933
Federal National Mtg. Assoc.2.00% to 3.50%
06/01/2049 to 09/01/2050 6,021,911
Government National Mtg. Assoc.1.00% to 2.70%
06/20/2038 to 05/16/2053 3,313,961
United States Treasury Bills0.00%
10/07/2021 to 10/28/2021 37,512
United States Treasury Notes/Bonds0.13% to 6.25%
09/15/2021 to 11/15/2050 7,828,426
Unfunded Commitments
Description Shares
Acquisition
Cost Value
Unrealized
Appreciation
(Depreciation)
Altimeter Growth Corp. 478,823 $4,788,230 $4,632,613 $(155,617 )
Industry Allocation*Transport-Services 10.2 %Apparel Manufacturers 9.2Banks-Commercial 6.4Semiconductor Equipment 6.2Beverages-Wine/Spirits 5.8Computer Services 5.3Industrial Automated/Robotic 5.1Retail-Apparel/Shoe 5.0Semiconductor Components-Integrated Circuits 4.2Private Equity 3.8Athletic Footwear 3.7Electric-Transmission 3.3Commercial Services-Finance 3.0E-Commerce/Services 2.7Medical Products 2.7Insurance-Life/Health 2.6Cosmetics & Toiletries 2.4Food-Misc./Diversified 2.4Gambling (Non-Hotel) 2.3Food-Retail 2.3Chemicals-Specialty 2.1Internet Application Software 2.0Computer Aided Design 1.9
Copyright © 2021 www.secdatabase.com. All Rights Reserved.Please Consider the Environment Before Printing This Document
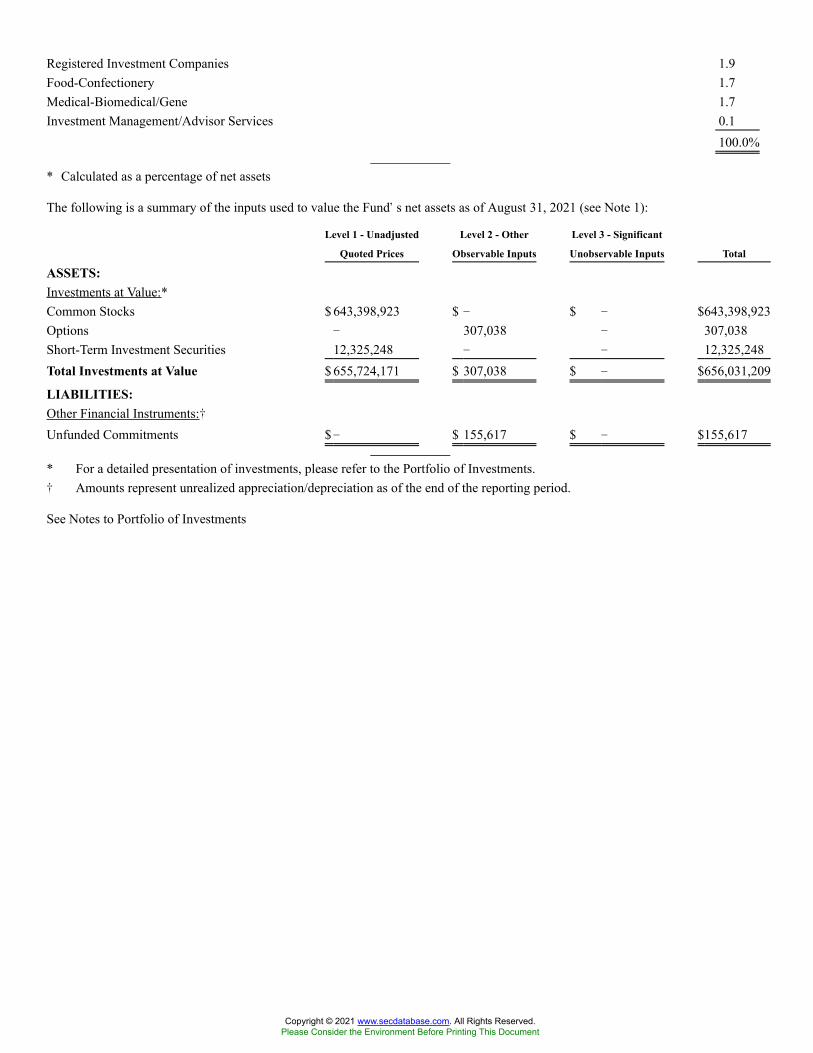
Registered Investment Companies 1.9Food-Confectionery 1.7Medical-Biomedical/Gene 1.7Investment Management/Advisor Services 0.1
100.0%
* Calculated as a percentage of net assets
The following is a summary of the inputs used to value the Fund�s net assets as of August 31, 2021 (see Note 1):
Level 1 - Unadjusted
Quoted Prices
Level 2 - Other
Observable Inputs
Level 3 - Significant
Unobservable Inputs Total
ASSETS:Investments at Value:*Common Stocks $ 643,398,923 $ � $ � $643,398,923Options � 307,038 � 307,038Short-Term Investment Securities 12,325,248 � � 12,325,248Total Investments at Value $ 655,724,171 $ 307,038 $ � $656,031,209
LIABILITIES:Other Financial Instruments:�Unfunded Commitments $� $ 155,617 $ � $155,617
* For a detailed presentation of investments, please refer to the Portfolio of Investments.� Amounts represent unrealized appreciation/depreciation as of the end of the reporting period.
See Notes to Portfolio of Investments
Copyright © 2021 www.secdatabase.com. All Rights Reserved.Please Consider the Environment Before Printing This Document
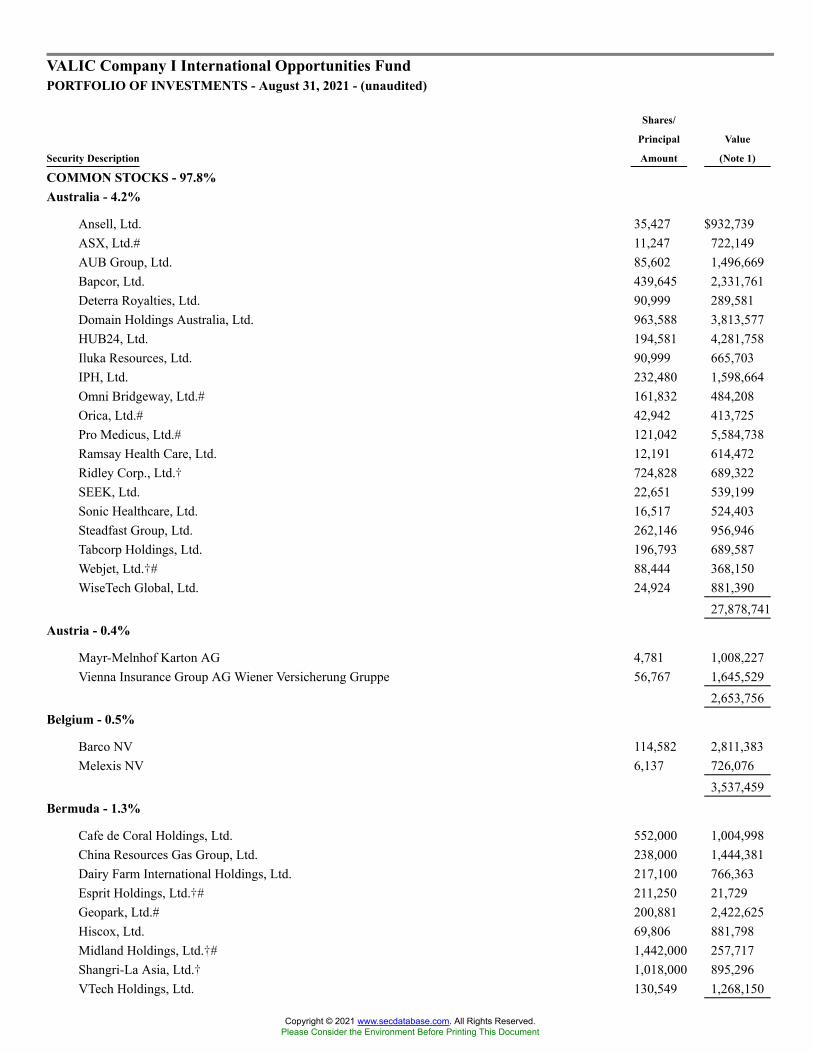
VALIC Company I International Opportunities FundPORTFOLIO OF INVESTMENTS - August 31, 2021 - (unaudited)
Security Description
Shares/
Principal
Amount
Value
(Note 1)
COMMON STOCKS - 97.8%Australia - 4.2%
Ansell, Ltd. 35,427 $932,739ASX, Ltd.# 11,247 722,149AUB Group, Ltd. 85,602 1,496,669Bapcor, Ltd. 439,645 2,331,761Deterra Royalties, Ltd. 90,999 289,581Domain Holdings Australia, Ltd. 963,588 3,813,577HUB24, Ltd. 194,581 4,281,758Iluka Resources, Ltd. 90,999 665,703IPH, Ltd. 232,480 1,598,664Omni Bridgeway, Ltd.# 161,832 484,208Orica, Ltd.# 42,942 413,725Pro Medicus, Ltd.# 121,042 5,584,738Ramsay Health Care, Ltd. 12,191 614,472Ridley Corp., Ltd.� 724,828 689,322SEEK, Ltd. 22,651 539,199Sonic Healthcare, Ltd. 16,517 524,403Steadfast Group, Ltd. 262,146 956,946Tabcorp Holdings, Ltd. 196,793 689,587Webjet, Ltd.�# 88,444 368,150WiseTech Global, Ltd. 24,924 881,390
27,878,741Austria - 0.4%
Mayr-Melnhof Karton AG 4,781 1,008,227Vienna Insurance Group AG Wiener Versicherung Gruppe 56,767 1,645,529
2,653,756Belgium - 0.5%
Barco NV 114,582 2,811,383Melexis NV 6,137 726,076
3,537,459Bermuda - 1.3%
Cafe de Coral Holdings, Ltd. 552,000 1,004,998China Resources Gas Group, Ltd. 238,000 1,444,381Dairy Farm International Holdings, Ltd. 217,100 766,363Esprit Holdings, Ltd.�# 211,250 21,729Geopark, Ltd.# 200,881 2,422,625Hiscox, Ltd. 69,806 881,798Midland Holdings, Ltd.�# 1,442,000 257,717Shangri-La Asia, Ltd.� 1,018,000 895,296VTech Holdings, Ltd. 130,549 1,268,150
Copyright © 2021 www.secdatabase.com. All Rights Reserved.Please Consider the Environment Before Printing This Document
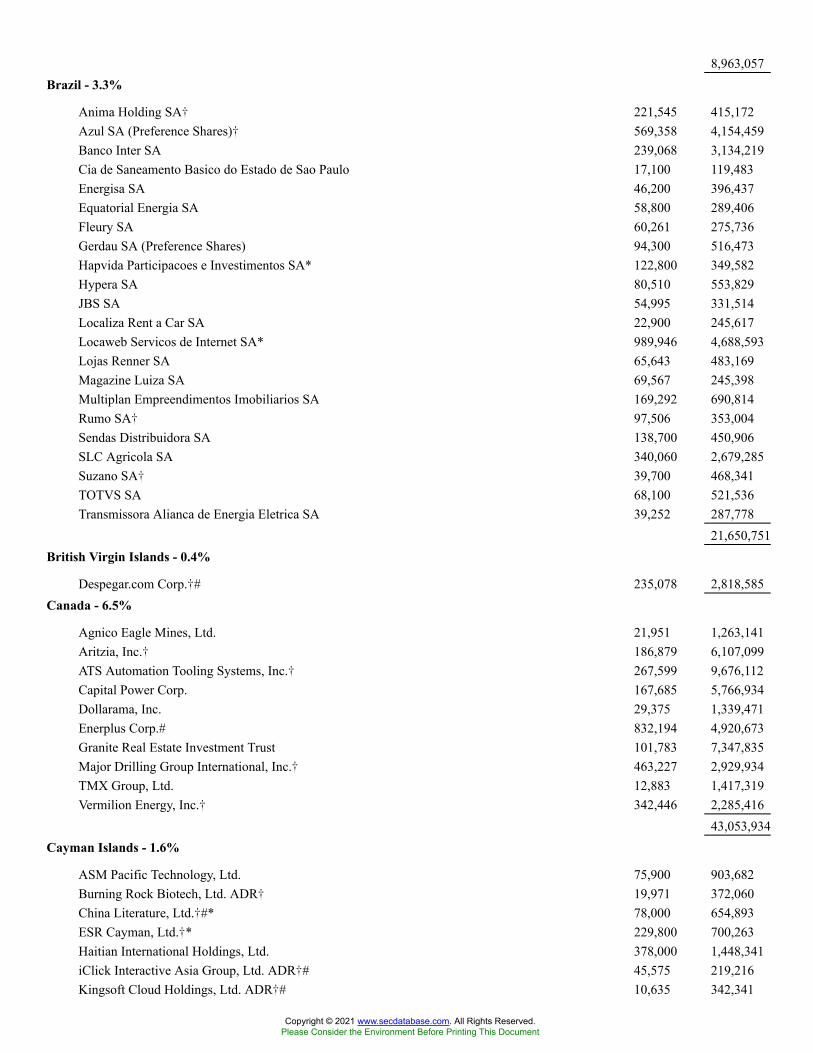
8,963,057Brazil - 3.3%
Anima Holding SA� 221,545 415,172Azul SA (Preference Shares)� 569,358 4,154,459Banco Inter SA 239,068 3,134,219Cia de Saneamento Basico do Estado de Sao Paulo 17,100 119,483Energisa SA 46,200 396,437Equatorial Energia SA 58,800 289,406Fleury SA 60,261 275,736Gerdau SA (Preference Shares) 94,300 516,473Hapvida Participacoes e Investimentos SA* 122,800 349,582Hypera SA 80,510 553,829JBS SA 54,995 331,514Localiza Rent a Car SA 22,900 245,617Locaweb Servicos de Internet SA* 989,946 4,688,593Lojas Renner SA 65,643 483,169Magazine Luiza SA 69,567 245,398Multiplan Empreendimentos Imobiliarios SA 169,292 690,814Rumo SA� 97,506 353,004Sendas Distribuidora SA 138,700 450,906SLC Agricola SA 340,060 2,679,285Suzano SA� 39,700 468,341TOTVS SA 68,100 521,536Transmissora Alianca de Energia Eletrica SA 39,252 287,778
21,650,751British Virgin Islands - 0.4%
Despegar.com Corp.�# 235,078 2,818,585Canada - 6.5%
Agnico Eagle Mines, Ltd. 21,951 1,263,141Aritzia, Inc.� 186,879 6,107,099ATS Automation Tooling Systems, Inc.� 267,599 9,676,112Capital Power Corp. 167,685 5,766,934Dollarama, Inc. 29,375 1,339,471Enerplus Corp.# 832,194 4,920,673Granite Real Estate Investment Trust 101,783 7,347,835Major Drilling Group International, Inc.� 463,227 2,929,934TMX Group, Ltd. 12,883 1,417,319Vermilion Energy, Inc.� 342,446 2,285,416
43,053,934Cayman Islands - 1.6%
ASM Pacific Technology, Ltd. 75,900 903,682Burning Rock Biotech, Ltd. ADR� 19,971 372,060China Literature, Ltd.�#* 78,000 654,893ESR Cayman, Ltd.�* 229,800 700,263Haitian International Holdings, Ltd. 378,000 1,448,341iClick Interactive Asia Group, Ltd. ADR�# 45,575 219,216Kingsoft Cloud Holdings, Ltd. ADR�# 10,635 342,341
Copyright © 2021 www.secdatabase.com. All Rights Reserved.Please Consider the Environment Before Printing This Document
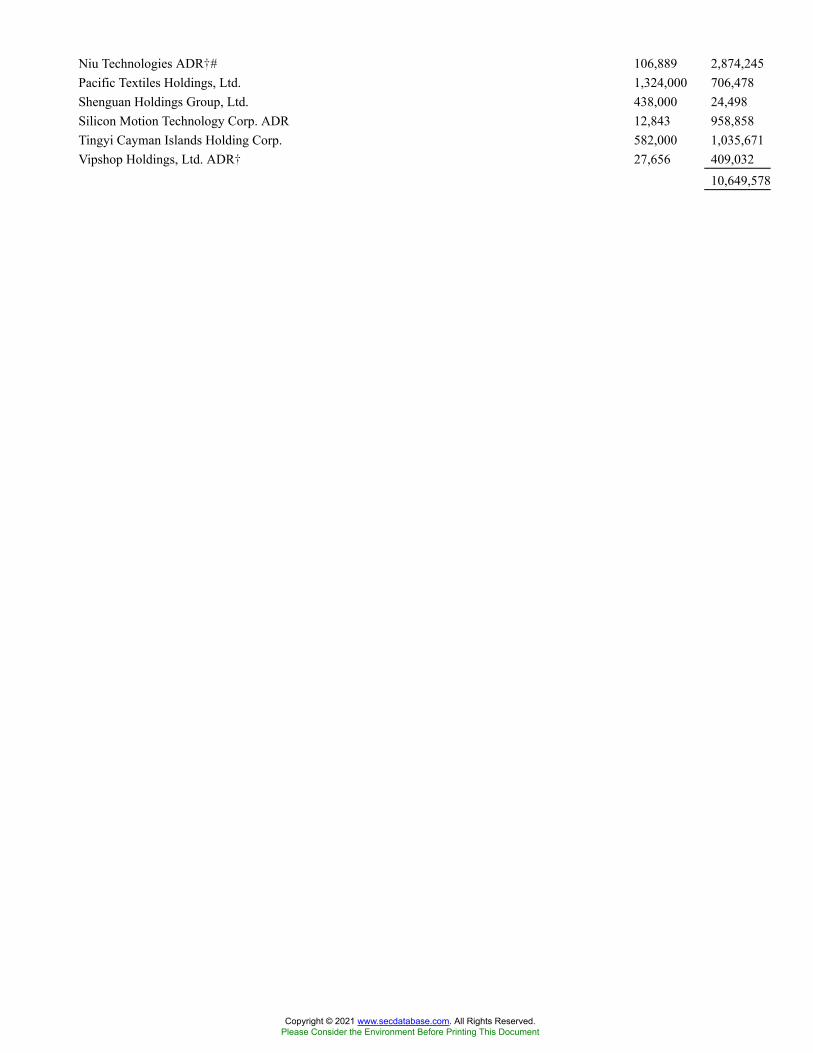
Niu Technologies ADR�# 106,889 2,874,245Pacific Textiles Holdings, Ltd. 1,324,000 706,478Shenguan Holdings Group, Ltd. 438,000 24,498Silicon Motion Technology Corp. ADR 12,843 958,858Tingyi Cayman Islands Holding Corp. 582,000 1,035,671Vipshop Holdings, Ltd. ADR� 27,656 409,032
10,649,578
Copyright © 2021 www.secdatabase.com. All Rights Reserved.Please Consider the Environment Before Printing This Document

Chile - 0.1%
Aguas Andinas SA, Class A 1,295,693 289,881Banco Santander Chile 5,650,995 298,599
588,480China - 0.1%
Yunnan Baiyao Group Co., Ltd., Class A 31,900 437,742Zhejiang Supor Co., Ltd., Class A 52,000 392,542
830,284
Copyright © 2021 www.secdatabase.com. All Rights Reserved.Please Consider the Environment Before Printing This Document

Colombia - 0.0%
Bancolombia SA ADR 6,646 220,980Cyprus - 0.8%
HeadHunter Group PLC ADR 101,859 5,399,546Denmark - 0.7%
Carlsberg A/S, Class B 4,739 827,305Demant A/S� 9,719 550,901Dfds A/S� 5,366 306,716Jyske Bank A/S� 9,839 430,071Royal Unibrew A/S 18,512 2,390,788SimCorp A/S 2,022 275,713
4,781,494Faroe Islands - 0.3%
Bakkafrost P/F 21,434 1,883,988Finland - 0.7%
Valmet Oyj 117,254 4,701,684France - 1.9%
Alten SA 5,897 971,323Cie Plastic Omnium SA 11,102 334,534Legrand SA 21,397 2,448,637LISI 21,633 715,209SEB SA 5,796 911,571SOITEC� 19,502 4,660,664Somfy SA 3,797 738,849Verallia SA* 6,262 228,027Virbac SA 3,136 1,325,614
12,334,428Germany - 7.6%
Amadeus Fire AG 5,915 1,215,240CANCOM SE 15,102 993,582CTS Eventim AG & Co. KGaA� 32,963 2,125,869Deutsche Wohnen SE 11,285 700,350Duerr AG 97,532 4,799,909Evotec SE� 106,039 5,271,156flatexDEGIRO AG� 22,730 2,361,784GEA Group AG 52,092 2,405,564Gerresheimer AG 17,291 1,836,451Hella GmbH & Co. KGaA� 4,263 304,730K+S AG� 352,252 5,020,175LEG Immobilien SE 28,618 4,561,747MTU Aero Engines AG 1,375 315,533Rational AG 93 106,362Salzgitter AG� 106,247 3,994,366Scout24 AG* 16,038 1,348,306Steico SE 23,813 3,390,936
Copyright © 2021 www.secdatabase.com. All Rights Reserved.Please Consider the Environment Before Printing This Document

Symrise AG 28,729 4,090,967TAG Immobilien AG 172,334 5,833,870
50,676,897Gibraltar - 0.5%
888 Holdings PLC 633,613 3,550,697
Copyright © 2021 www.secdatabase.com. All Rights Reserved.Please Consider the Environment Before Printing This Document
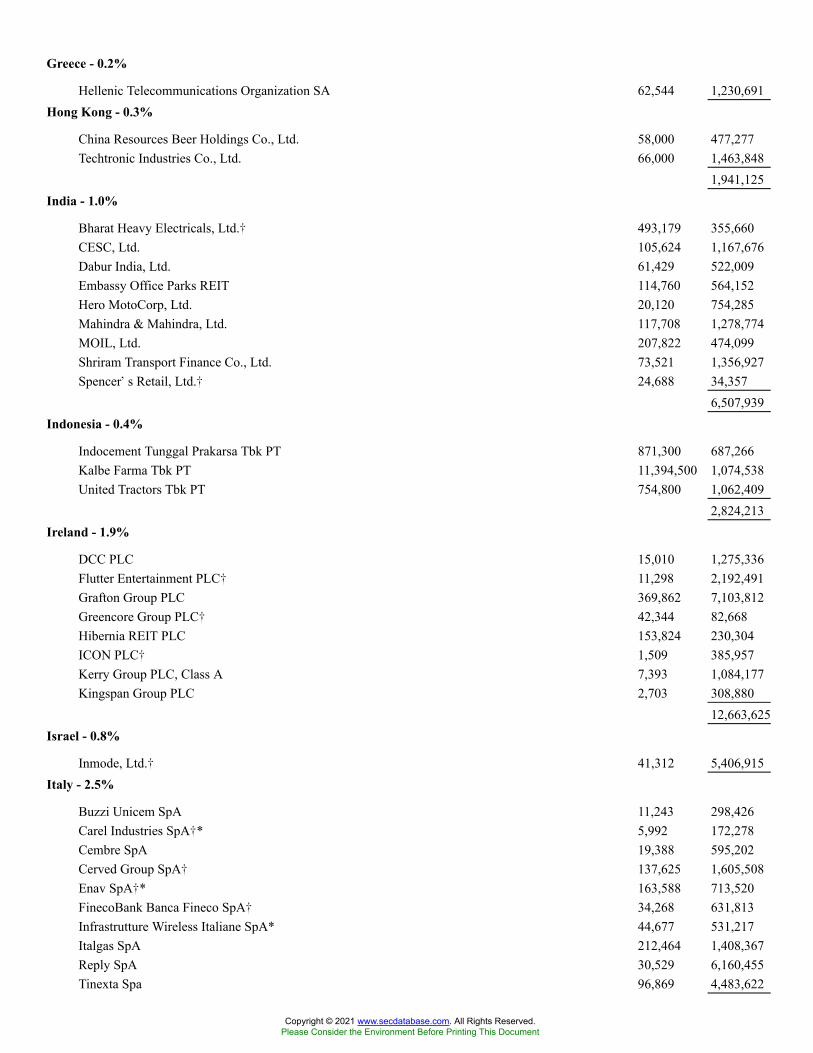
Greece - 0.2%
Hellenic Telecommunications Organization SA 62,544 1,230,691Hong Kong - 0.3%
China Resources Beer Holdings Co., Ltd. 58,000 477,277Techtronic Industries Co., Ltd. 66,000 1,463,848
1,941,125India - 1.0%
Bharat Heavy Electricals, Ltd.� 493,179 355,660CESC, Ltd. 105,624 1,167,676Dabur India, Ltd. 61,429 522,009Embassy Office Parks REIT 114,760 564,152Hero MotoCorp, Ltd. 20,120 754,285Mahindra & Mahindra, Ltd. 117,708 1,278,774MOIL, Ltd. 207,822 474,099Shriram Transport Finance Co., Ltd. 73,521 1,356,927Spencer�s Retail, Ltd.� 24,688 34,357
6,507,939Indonesia - 0.4%
Indocement Tunggal Prakarsa Tbk PT 871,300 687,266Kalbe Farma Tbk PT 11,394,500 1,074,538United Tractors Tbk PT 754,800 1,062,409
2,824,213Ireland - 1.9%
DCC PLC 15,010 1,275,336Flutter Entertainment PLC� 11,298 2,192,491Grafton Group PLC 369,862 7,103,812Greencore Group PLC� 42,344 82,668Hibernia REIT PLC 153,824 230,304ICON PLC� 1,509 385,957Kerry Group PLC, Class A 7,393 1,084,177Kingspan Group PLC 2,703 308,880
12,663,625Israel - 0.8%
Inmode, Ltd.� 41,312 5,406,915Italy - 2.5%
Buzzi Unicem SpA 11,243 298,426Carel Industries SpA�* 5,992 172,278Cembre SpA 19,388 595,202Cerved Group SpA� 137,625 1,605,508Enav SpA�* 163,588 713,520FinecoBank Banca Fineco SpA� 34,268 631,813Infrastrutture Wireless Italiane SpA* 44,677 531,217Italgas SpA 212,464 1,408,367Reply SpA 30,529 6,160,455Tinexta Spa 96,869 4,483,622
Copyright © 2021 www.secdatabase.com. All Rights Reserved.Please Consider the Environment Before Printing This Document

16,600,408Japan - 22.2%
ABC-Mart, Inc.# 6,500 347,998Aeon Delight Co., Ltd.# 10,000 323,592AEON Financial Service Co., Ltd.# 85,500 1,006,431Air Water, Inc. 26,800 432,152Amano Corp. 8,441 214,372Argo Graphics, Inc. 23,200 691,687Ariake Japan Co., Ltd. 4,500 254,829As One Corp. 6,000 891,697Asante, Inc. 5,700 90,721Asics Corp. 203,500 4,319,161
Copyright © 2021 www.secdatabase.com. All Rights Reserved.Please Consider the Environment Before Printing This Document
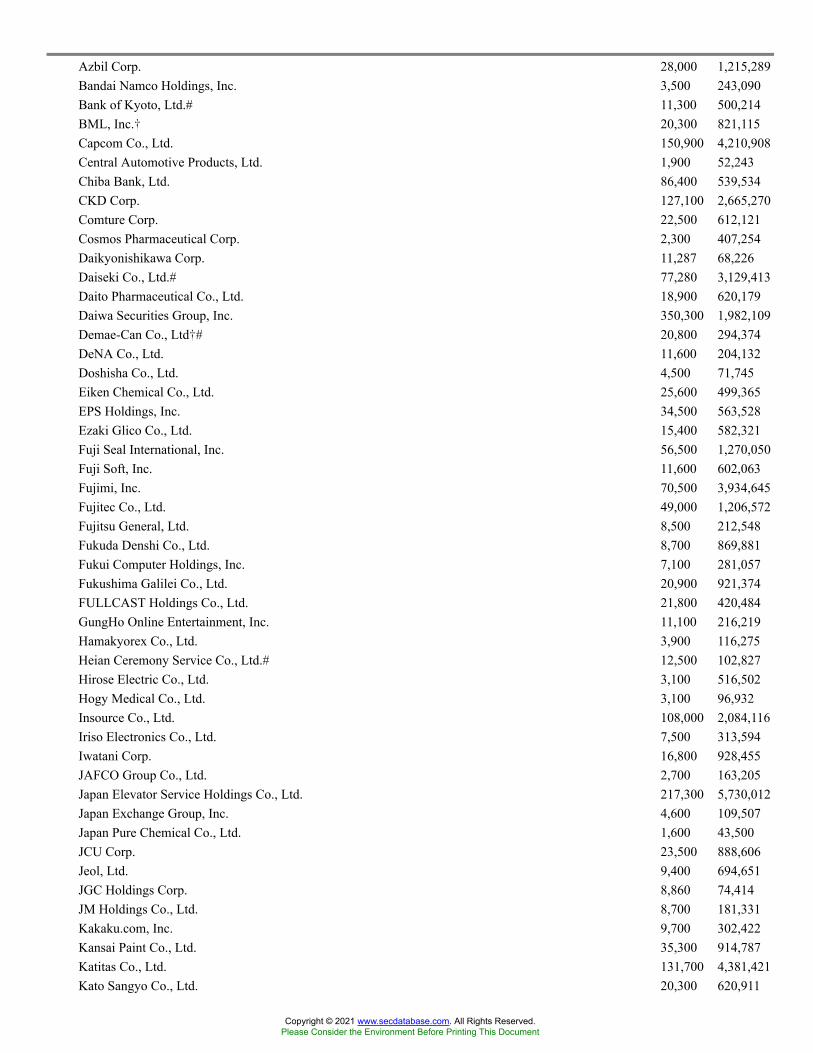
Azbil Corp. 28,000 1,215,289Bandai Namco Holdings, Inc. 3,500 243,090Bank of Kyoto, Ltd.# 11,300 500,214BML, Inc.� 20,300 821,115Capcom Co., Ltd. 150,900 4,210,908Central Automotive Products, Ltd. 1,900 52,243Chiba Bank, Ltd. 86,400 539,534CKD Corp. 127,100 2,665,270Comture Corp. 22,500 612,121Cosmos Pharmaceutical Corp. 2,300 407,254Daikyonishikawa Corp. 11,287 68,226Daiseki Co., Ltd.# 77,280 3,129,413Daito Pharmaceutical Co., Ltd. 18,900 620,179Daiwa Securities Group, Inc. 350,300 1,982,109Demae-Can Co., Ltd�# 20,800 294,374DeNA Co., Ltd. 11,600 204,132Doshisha Co., Ltd. 4,500 71,745Eiken Chemical Co., Ltd. 25,600 499,365EPS Holdings, Inc. 34,500 563,528Ezaki Glico Co., Ltd. 15,400 582,321Fuji Seal International, Inc. 56,500 1,270,050Fuji Soft, Inc. 11,600 602,063Fujimi, Inc. 70,500 3,934,645Fujitec Co., Ltd. 49,000 1,206,572Fujitsu General, Ltd. 8,500 212,548Fukuda Denshi Co., Ltd. 8,700 869,881Fukui Computer Holdings, Inc. 7,100 281,057Fukushima Galilei Co., Ltd. 20,900 921,374FULLCAST Holdings Co., Ltd. 21,800 420,484GungHo Online Entertainment, Inc. 11,100 216,219Hamakyorex Co., Ltd. 3,900 116,275Heian Ceremony Service Co., Ltd.# 12,500 102,827Hirose Electric Co., Ltd. 3,100 516,502Hogy Medical Co., Ltd. 3,100 96,932Insource Co., Ltd. 108,000 2,084,116Iriso Electronics Co., Ltd. 7,500 313,594Iwatani Corp. 16,800 928,455JAFCO Group Co., Ltd. 2,700 163,205Japan Elevator Service Holdings Co., Ltd. 217,300 5,730,012Japan Exchange Group, Inc. 4,600 109,507Japan Pure Chemical Co., Ltd. 1,600 43,500JCU Corp. 23,500 888,606Jeol, Ltd. 9,400 694,651JGC Holdings Corp. 8,860 74,414JM Holdings Co., Ltd. 8,700 181,331Kakaku.com, Inc. 9,700 302,422Kansai Paint Co., Ltd. 35,300 914,787Katitas Co., Ltd. 131,700 4,381,421Kato Sangyo Co., Ltd. 20,300 620,911
Copyright © 2021 www.secdatabase.com. All Rights Reserved.Please Consider the Environment Before Printing This Document
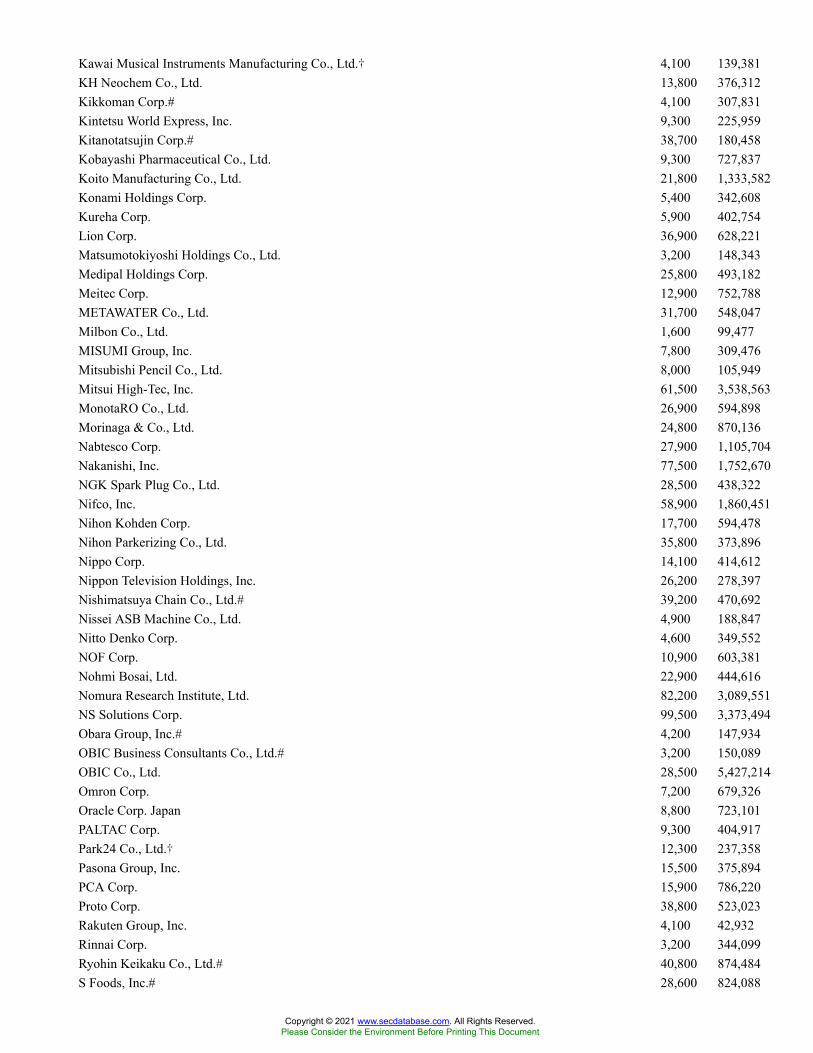
Kawai Musical Instruments Manufacturing Co., Ltd.� 4,100 139,381KH Neochem Co., Ltd. 13,800 376,312Kikkoman Corp.# 4,100 307,831Kintetsu World Express, Inc. 9,300 225,959Kitanotatsujin Corp.# 38,700 180,458Kobayashi Pharmaceutical Co., Ltd. 9,300 727,837Koito Manufacturing Co., Ltd. 21,800 1,333,582Konami Holdings Corp. 5,400 342,608Kureha Corp. 5,900 402,754Lion Corp. 36,900 628,221Matsumotokiyoshi Holdings Co., Ltd. 3,200 148,343Medipal Holdings Corp. 25,800 493,182Meitec Corp. 12,900 752,788METAWATER Co., Ltd. 31,700 548,047Milbon Co., Ltd. 1,600 99,477MISUMI Group, Inc. 7,800 309,476Mitsubishi Pencil Co., Ltd. 8,000 105,949Mitsui High-Tec, Inc. 61,500 3,538,563MonotaRO Co., Ltd. 26,900 594,898Morinaga & Co., Ltd. 24,800 870,136Nabtesco Corp. 27,900 1,105,704Nakanishi, Inc. 77,500 1,752,670NGK Spark Plug Co., Ltd. 28,500 438,322Nifco, Inc. 58,900 1,860,451Nihon Kohden Corp. 17,700 594,478Nihon Parkerizing Co., Ltd. 35,800 373,896Nippo Corp. 14,100 414,612Nippon Television Holdings, Inc. 26,200 278,397Nishimatsuya Chain Co., Ltd.# 39,200 470,692Nissei ASB Machine Co., Ltd. 4,900 188,847Nitto Denko Corp. 4,600 349,552NOF Corp. 10,900 603,381Nohmi Bosai, Ltd. 22,900 444,616Nomura Research Institute, Ltd. 82,200 3,089,551NS Solutions Corp. 99,500 3,373,494Obara Group, Inc.# 4,200 147,934OBIC Business Consultants Co., Ltd.# 3,200 150,089OBIC Co., Ltd. 28,500 5,427,214Omron Corp. 7,200 679,326Oracle Corp. Japan 8,800 723,101PALTAC Corp. 9,300 404,917Park24 Co., Ltd.� 12,300 237,358Pasona Group, Inc. 15,500 375,894PCA Corp. 15,900 786,220Proto Corp. 38,800 523,023Rakuten Group, Inc. 4,100 42,932Rinnai Corp. 3,200 344,099Ryohin Keikaku Co., Ltd.# 40,800 874,484S Foods, Inc.# 28,600 824,088
Copyright © 2021 www.secdatabase.com. All Rights Reserved.Please Consider the Environment Before Printing This Document
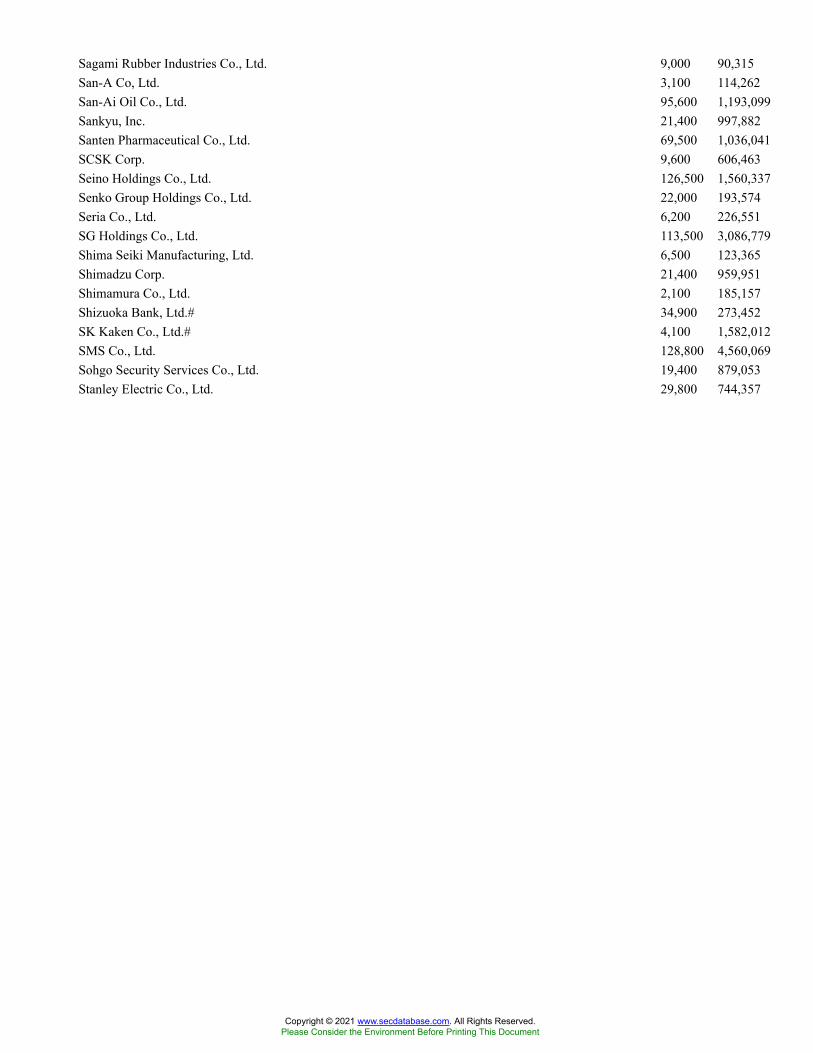
Sagami Rubber Industries Co., Ltd. 9,000 90,315San-A Co, Ltd. 3,100 114,262San-Ai Oil Co., Ltd. 95,600 1,193,099Sankyu, Inc. 21,400 997,882Santen Pharmaceutical Co., Ltd. 69,500 1,036,041SCSK Corp. 9,600 606,463Seino Holdings Co., Ltd. 126,500 1,560,337Senko Group Holdings Co., Ltd. 22,000 193,574Seria Co., Ltd. 6,200 226,551SG Holdings Co., Ltd. 113,500 3,086,779Shima Seiki Manufacturing, Ltd. 6,500 123,365Shimadzu Corp. 21,400 959,951Shimamura Co., Ltd. 2,100 185,157Shizuoka Bank, Ltd.# 34,900 273,452SK Kaken Co., Ltd.# 4,100 1,582,012SMS Co., Ltd. 128,800 4,560,069Sohgo Security Services Co., Ltd. 19,400 879,053Stanley Electric Co., Ltd. 29,800 744,357
Copyright © 2021 www.secdatabase.com. All Rights Reserved.Please Consider the Environment Before Printing This Document

Sugi Holdings Co., Ltd.# 8,000 618,098Sundrug Co., Ltd. 28,800 956,815Suzuken Co., Ltd. 11,600 344,789T Hasegawa Co., Ltd. 105,700 2,682,492Taisei Lamick Co, Ltd. 7,600 191,908Taiyo Yuden Co., Ltd. 103,600 5,876,144Takasago International Corp. 5,400 142,001Takuma Co., Ltd. 33,100 499,441TechnoPro Holdings, Inc. 143,300 3,843,824Temairazu, Inc. 7,200 367,150Terumo Corp. 17,600 735,420THK Co., Ltd. 4,300 99,785Toei Co., Ltd. 2,800 498,841Toho Co., Ltd. 20,700 895,623Tokyo Seimitsu Co., Ltd. 76,200 3,338,490Toshiba TEC Corp. 7,300 312,530TOTO, Ltd. 4,600 250,457Toyo Seikan Group Holdings, Ltd. 48,000 668,418Toyo Tire Corp. 172,700 3,070,501Trancom Co., Ltd. 3,200 243,167Tsugami Corp. 182,200 2,590,199Unicharm Corp. 30,100 1,341,730USS Co., Ltd. 68,400 1,132,177Yamato Holdings Co., Ltd. 64,300 1,636,504Zojirushi Corp. 5,800 91,206ZOZO, Inc. 45,500 1,734,968Zuken, Inc.# 19,100 633,686
148,267,658Jersey - 0.1%
Breedon Group PLC 593,716 847,289Luxembourg - 1.4%
Allegro.eu SA�* 10,879 201,694B&M European Value Retail SA 35,273 271,087Befesa SA* 62,359 5,058,410Eurofins Scientific SE 1,210 171,559Globant SA� 1,511 486,965Ternium SA ADR 63,505 3,453,402
9,643,117Mauritius - 0.1%
MakeMyTrip, Ltd.�# 36,496 942,327Mexico - 1.0%
Bolsa Mexicana de Valores SAB de CV 136,900 284,243Corp Inmobiliaria Vesta SAB de CV 84,465 157,121Genomma Lab Internacional SAB de CV, Class B� 404,851 390,458Gruma SAB de CV, Class B 28,917 329,427Grupo Aeroportuario del Centro Norte SAB de CV�# 547,766 3,301,487
Copyright © 2021 www.secdatabase.com. All Rights Reserved.Please Consider the Environment Before Printing This Document
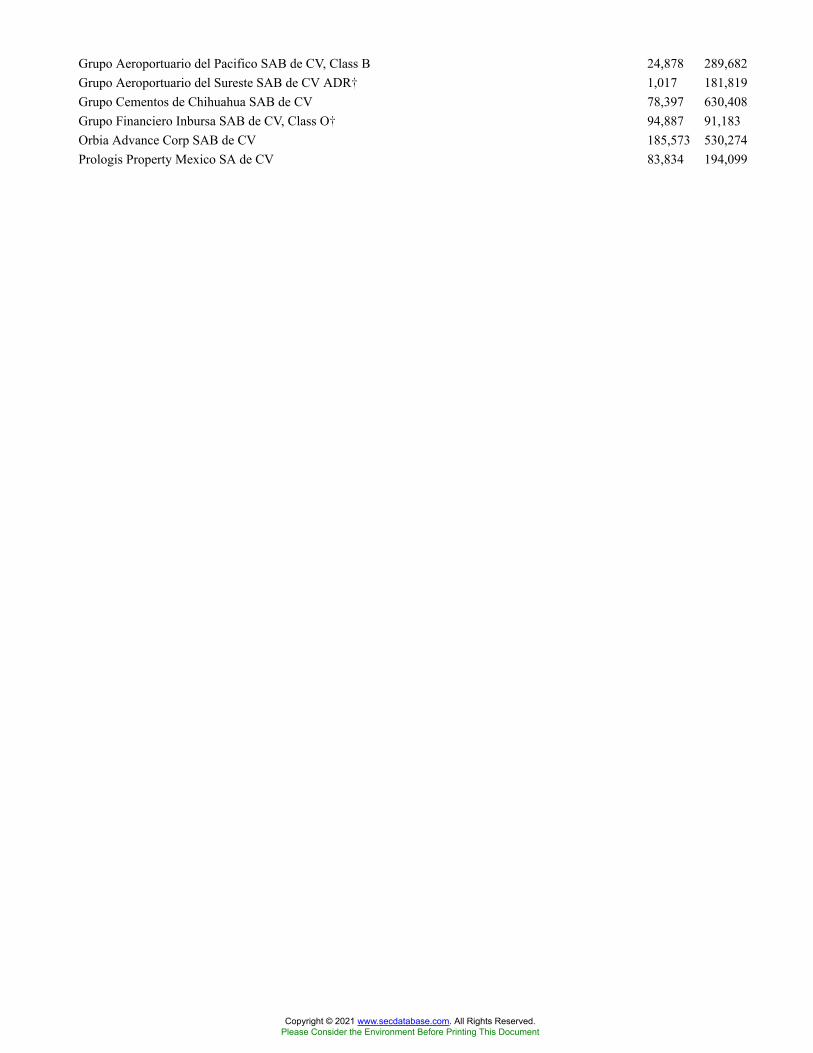
Grupo Aeroportuario del Pacifico SAB de CV, Class B 24,878 289,682Grupo Aeroportuario del Sureste SAB de CV ADR� 1,017 181,819Grupo Cementos de Chihuahua SAB de CV 78,397 630,408Grupo Financiero Inbursa SAB de CV, Class O� 94,887 91,183Orbia Advance Corp SAB de CV 185,573 530,274Prologis Property Mexico SA de CV 83,834 194,099
Copyright © 2021 www.secdatabase.com. All Rights Reserved.Please Consider the Environment Before Printing This Document

Telesites SAB de CV�# 204,200 187,1806,567,381
Netherlands - 2.3%
Aalberts NV 15,638 976,776ASM International NV 5,802 2,251,145Euronext NV* 8,087 938,163IMCD NV 38,595 7,603,532Just Eat Takeaway.com NV (Euronext Amsterdam)�* 30,109 2,727,489Just Eat Takeaway.com NV (LSE)�#* 2,608 235,180Wolters Kluwer NV# 7,216 830,047
15,562,332New Zealand - 0.3%
Auckland International Airport, Ltd.� 94,647 480,857Freightways, Ltd. 63,749 574,986Mainfreight, Ltd. 8,947 592,623
1,648,466Norway - 0.8%
Borregaard ASA 2,021 52,883TOMRA Systems ASA 85,432 5,251,156
5,304,039Papua New Guinea - 0.1%
Oil Search, Ltd. 229,637 628,286Peru - 0.0%
Cia de Minas Buenaventura SAA ADR� 13,862 103,965Philippines - 0.3%
Metropolitan Bank & Trust Co. 928,872 843,920Universal Robina Corp. 417,810 1,266,447
2,110,367Portugal - 0.1%
Galp Energia SGPS SA 14,106 144,471NOS SGPS SA 94,557 398,584
543,055Russia - 0.4%
Detsky Mir PJSC� 975,613 1,846,150Moscow Exchange MICEX-RTS PJSC� 219,145 548,388
2,394,538Singapore - 0.7%
Ascendas India Trust 428,400 462,033City Developments, Ltd. 99,400 505,706Mapletree Commercial Trust 696,600 1,051,804Singapore Technologies Engineering, Ltd. 422,400 1,187,602
Copyright © 2021 www.secdatabase.com. All Rights Reserved.Please Consider the Environment Before Printing This Document

Venture Corp., Ltd. 93,063 $1,326,2584,533,403
South Africa - 1.3%
AVI, Ltd. 143,709 751,674Transaction Capital, Ltd. 1,544,452 4,037,026Woolworths Holdings, Ltd.� 884,355 3,874,998
8,663,698South Korea - 4.5%
Amorepacific Corp. 5,843 1,146,477Doosan Bobcat, Inc.� 25,719 961,593Doosan Fuel Cell Co., Ltd.� 75,743 3,586,434Douzone Bizon Co., Ltd. 6,403 471,065Hansae Co., Ltd. 167,361 2,980,727LEENO Industrial, Inc. 28,748 4,418,382LG Innotek Co., Ltd. 17,875 3,314,610LS Electric Co., Ltd. 21,818 1,290,883NHN KCP Corp.� 42,892 1,790,481OCI Co., Ltd.�# 52,707 5,773,245Orion Corp. 11,292 1,231,996Samsung Fire & Marine Insurance Co., Ltd. 6,837 1,332,668TK Corp. 28,263 304,703Wonik QnC Corp.� 67,518 1,656,723
30,259,987Spain - 1.2%
Amadeus IT Group SA� 25,438 1,553,458Cellnex Telecom SA#* 80,176 5,490,735Viscofan SA 13,590 959,575
8,003,768Sweden - 2.8%
Catena AB 29,144 1,882,829Essity AB, Class B 30,918 991,732Intrum AB 102,221 3,051,426Karnov Group AB 42,982 279,924MIPS AB 59,785 6,647,435Saab AB, Series B 20,257 603,758Swedish Match AB 115,225 1,063,930Thule Group AB* 23,172 1,264,740Tobii AB� 357,350 2,822,127
18,607,901Switzerland - 1.5%
DKSH Holding AG 1,641 127,857Julius Baer Group, Ltd. 14,009 957,645Kardex Holding AG 3,437 921,413Partners Group Holding AG 107 189,755SIG Combibloc Group AG 75,414 2,309,155Sika AG 6,303 2,272,040
Copyright © 2021 www.secdatabase.com. All Rights Reserved.Please Consider the Environment Before Printing This Document
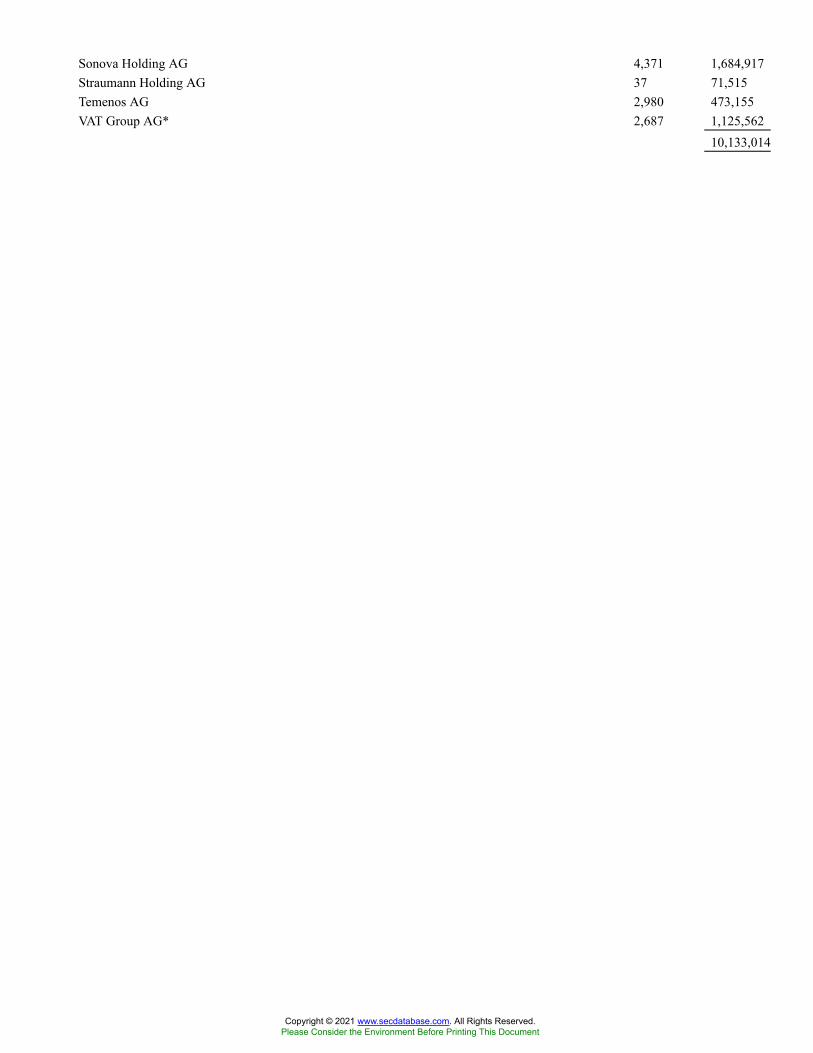
Sonova Holding AG 4,371 1,684,917Straumann Holding AG 37 71,515Temenos AG 2,980 473,155VAT Group AG* 2,687 1,125,562
10,133,014
Copyright © 2021 www.secdatabase.com. All Rights Reserved.Please Consider the Environment Before Printing This Document

Taiwan - 2.2%
Advantech Co., Ltd. 69,571 969,001Chroma ATE, Inc. 212,000 1,373,121E.Sun Financial Holding Co., Ltd. 1,244,881 1,194,863Kindom Development Co., Ltd. 1,168,100 1,791,338Merida Industry Co., Ltd. 311,000 3,579,808Tripod Technology Corp. 290,000 1,198,152Voltronic Power Technology Corp. 22,675 1,014,560Wafer Works Corp. 1,096,000 2,784,145Win Semiconductors Corp. 38,000 453,173
14,358,161Thailand - 0.1%
AEON Thana Sinsap Thailand PCL 87,600 538,115Turkey - 0.0%
Selcuk Ecza Deposu Ticaret ve Sanayi AS 76,428 83,812United Kingdom - 16.3%
4imprint Group PLC� 5,557 219,269Abcam PLC� 17,718 376,112Admiral Group PLC 7,615 378,053Allfunds Group Plc� 22,936 413,321Aston Martin Lagonda Global Holdings PLC�* 132,315 3,645,542Auto Trader Group PLC* 138,814 1,200,437Babcock International Group PLC� 49,861 248,910Bellway PLC 21,532 1,041,739Big Yellow Group PLC 37,099 777,835Britvic PLC 23,447 314,302Bunzl PLC 27,702 1,003,950Burberry Group PLC 20,555 525,496Cairn Energy PLC 72,986 192,963Coats Group PLC 191,461 200,845Compass Group PLC� 47,224 974,214ConvaTec Group PLC* 135,701 420,525Countryside Properties PLC�* 694,511 5,375,797Cranswick PLC 18,941 1,032,788Croda International PLC 47,979 6,034,381Dechra Pharmaceuticals PLC 98,616 7,104,508Electrocomponents PLC 713,920 10,443,511EMIS Group PLC 17,500 332,508Endeavour Mining PLC 85,889 2,098,805Essentra PLC 288,750 1,151,265Forterra PLC* 548,129 2,377,593Future PLC 227,673 12,051,126Great Portland Estates PLC 337,923 3,626,152Greggs PLC� 62,529 2,615,147Halma PLC 24,033 992,244Hargreaves Lansdown PLC 27,553 571,439Helios Towers PLC� 111,128 267,373
Copyright © 2021 www.secdatabase.com. All Rights Reserved.Please Consider the Environment Before Printing This Document
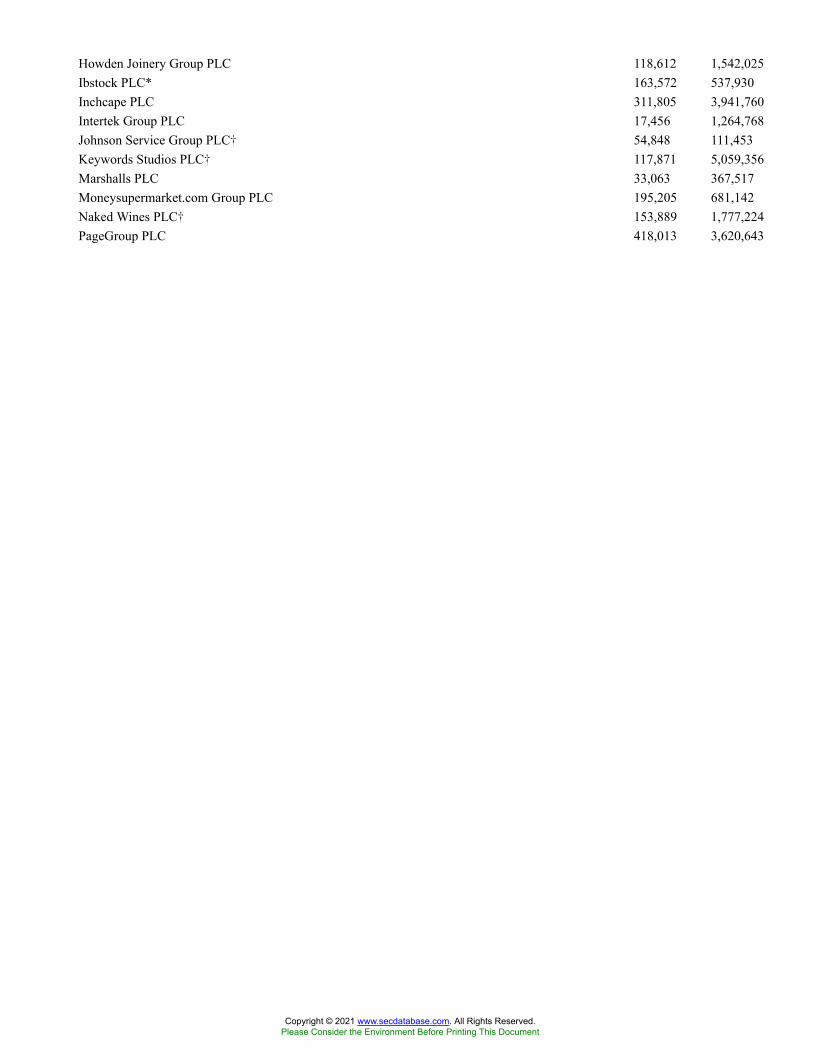
Howden Joinery Group PLC 118,612 1,542,025Ibstock PLC* 163,572 537,930Inchcape PLC 311,805 3,941,760Intertek Group PLC 17,456 1,264,768Johnson Service Group PLC� 54,848 111,453Keywords Studios PLC� 117,871 5,059,356Marshalls PLC 33,063 367,517Moneysupermarket.com Group PLC 195,205 681,142Naked Wines PLC� 153,889 1,777,224PageGroup PLC 418,013 3,620,643
Copyright © 2021 www.secdatabase.com. All Rights Reserved.Please Consider the Environment Before Printing This Document
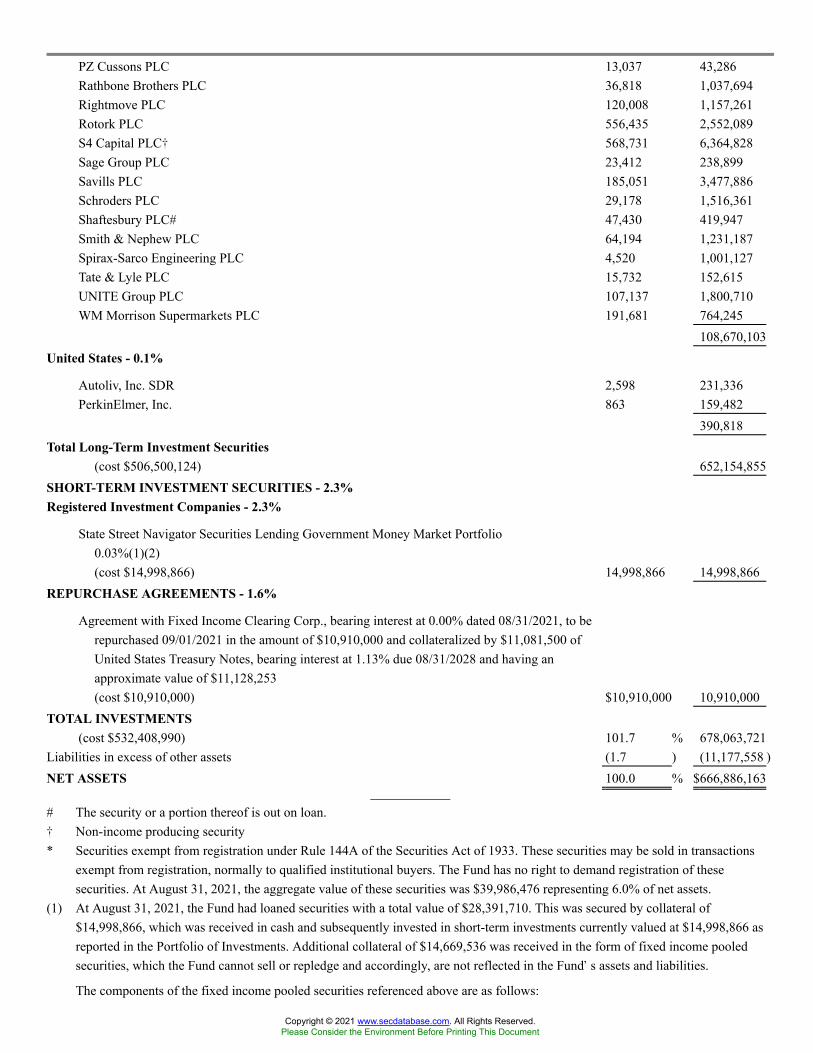
PZ Cussons PLC 13,037 43,286Rathbone Brothers PLC 36,818 1,037,694Rightmove PLC 120,008 1,157,261Rotork PLC 556,435 2,552,089S4 Capital PLC� 568,731 6,364,828Sage Group PLC 23,412 238,899Savills PLC 185,051 3,477,886Schroders PLC 29,178 1,516,361Shaftesbury PLC# 47,430 419,947Smith & Nephew PLC 64,194 1,231,187Spirax-Sarco Engineering PLC 4,520 1,001,127Tate & Lyle PLC 15,732 152,615UNITE Group PLC 107,137 1,800,710WM Morrison Supermarkets PLC 191,681 764,245
108,670,103United States - 0.1%
Autoliv, Inc. SDR 2,598 231,336PerkinElmer, Inc. 863 159,482
390,818Total Long-Term Investment Securities
(cost $506,500,124) 652,154,855SHORT-TERM INVESTMENT SECURITIES - 2.3%Registered Investment Companies - 2.3%
State Street Navigator Securities Lending Government Money Market Portfolio0.03%(1)(2)(cost $14,998,866) 14,998,866 14,998,866
REPURCHASE AGREEMENTS - 1.6%
Agreement with Fixed Income Clearing Corp., bearing interest at 0.00% dated 08/31/2021, to berepurchased 09/01/2021 in the amount of $10,910,000 and collateralized by $11,081,500 ofUnited States Treasury Notes, bearing interest at 1.13% due 08/31/2028 and having anapproximate value of $11,128,253(cost $10,910,000) $10,910,000 10,910,000
TOTAL INVESTMENTS(cost $532,408,990) 101.7 % 678,063,721
Liabilities in excess of other assets (1.7 ) (11,177,558 )NET ASSETS 100.0 % $666,886,163
# The security or a portion thereof is out on loan.� Non-income producing security* Securities exempt from registration under Rule 144A of the Securities Act of 1933. These securities may be sold in transactions
exempt from registration, normally to qualified institutional buyers. The Fund has no right to demand registration of thesesecurities. At August 31, 2021, the aggregate value of these securities was $39,986,476 representing 6.0% of net assets.
(1) At August 31, 2021, the Fund had loaned securities with a total value of $28,391,710. This was secured by collateral of$14,998,866, which was received in cash and subsequently invested in short-term investments currently valued at $14,998,866 asreported in the Portfolio of Investments. Additional collateral of $14,669,536 was received in the form of fixed income pooledsecurities, which the Fund cannot sell or repledge and accordingly, are not reflected in the Fund�s assets and liabilities.
The components of the fixed income pooled securities referenced above are as follows:
Copyright © 2021 www.secdatabase.com. All Rights Reserved.Please Consider the Environment Before Printing This Document

Securities Coupon Range Maturity Date Range
Value as of
August 31, 2021
United States Treasury Bills0.00%
09/23/2021 to 01/13/2022 $1,537,388
United States Treasury Notes/Bonds0.13% to 8.00%
09/15/2021 to 05/15/2051 13,132,148
(2) The rate shown is the 7-day yield as of August 31, 2021.ADR - American Depositary ReceiptEuronext Amsterdam - Euronext Stock Exchange, AmsterdamLSE - London Stock ExchangeSDR - Swedish Depositary Receipt
Copyright © 2021 www.secdatabase.com. All Rights Reserved.Please Consider the Environment Before Printing This Document

Industry Allocation*Machinery-General Industrial 4.5%Internet Content-Information/News 3.3E-Commerce/Services 3.2Chemicals-Diversified 2.8Real Estate Operations & Development 2.4Building & Construction Products-Misc. 2.3Real Estate Investment Trusts 2.3Registered Investment Companies 2.3Computer Services 2.1Electronic Components-Misc. 1.8Repurchase Agreements 1.6Retail-Building Products 1.6Oil Companies-Exploration & Production 1.6Electronic Parts Distribution 1.6Recycling 1.6Chemicals-Specialty 1.5Medical Products 1.5Electronic Components-Semiconductors 1.4Veterinary Products 1.3Commercial Services 1.2Food-Retail 1.2Investment Management/Advisor Services 1.2Steel-Producers 1.2Computers-Integrated Systems 1.2Retail-Apparel/Shoe 1.2Electronic Measurement Instruments 1.1Medical Labs & Testing Services 1.1Distribution/Wholesale 1.1Finance-Other Services 1.1Building-Heavy Construction 1.0Applications Software 1.0Athletic Equipment 1.0Transport-Services 1.0Electric Products-Misc. 1.0Building-Residential/Commercial 1.0Advertising Services 1.0Containers-Paper/Plastic 1.0E-Services/Consulting 0.9Energy-Alternate Sources 0.9Electric-Generation 0.9Human Resources 0.9Circuit Boards 0.9Medical Information Systems 0.8Industrial Automated/Robotic 0.8Computer Software 0.8Airport Development/Maintenance 0.8Banks-Commercial 0.8Medical-Drugs 0.8
Copyright © 2021 www.secdatabase.com. All Rights Reserved.Please Consider the Environment Before Printing This Document

Entertainment Software 0.7Machinery-Electrical 0.7Metal Processors & Fabrication 0.7Food-Misc./Diversified 0.7Cosmetics & Toiletries 0.7Athletic Footwear 0.7Semiconductor Equipment 0.6Consulting Services 0.6Airlines 0.6E-Commerce/Products 0.6Brewery 0.6Engineering/R&D Services 0.6Auto/Truck Parts & Equipment-Original 0.6Mining Services 0.5Auto-Cars/Light Trucks 0.5Motorcycle/Motor Scooter 0.5Bicycle Manufacturing 0.5Internet Gambling 0.5Apparel Manufacturers 0.5Gold Mining 0.5Banks-Regional 0.5Hazardous Waste Disposal 0.5Rubber-Tires 0.5Building Products-Cement 0.5Chemicals-Plastics 0.5Coatings/Paint 0.4Medical Instruments 0.4Gambling (Non-Hotel) 0.4Gas-Distribution 0.4Computers-Periphery Equipment 0.4Containers-Metal/Glass 0.4Food-Confectionery 0.4Agricultural Operations 0.4Retail-Misc./Diversified 0.4Enterprise Software/Service 0.4Insurance-Property/Casualty 0.4Machinery-Material Handling 0.4Machinery-Pumps 0.4Schools 0.4Insurance Brokers 0.4Internet Brokers 0.4Retail-Auto Parts 0.4Transport-Truck 0.3Food-Meat Products 0.3Retail-Drug Store 0.3Theaters 0.3Finance-Investment Banker/Broker 0.3Fisheries 0.3Retail-Major Department Stores 0.3
Copyright © 2021 www.secdatabase.com. All Rights Reserved.Please Consider the Environment Before Printing This Document

Dental Supplies & Equipment 0.3Food-Flour & Grain 0.3Medical-Wholesale Drug Distribution 0.3Medical-Biomedical/Gene 0.3Retail-Discount 0.2Real Estate Management/Services 0.2Insurance-Multi-line 0.2Internet Financial Services 0.2Home Furnishings 0.2Machine Tools & Related Products 0.2Leisure Products 0.2Hotels/Motels 0.2Motion Pictures & Services 0.2Finance-Commercial 0.2Auto-Heavy Duty Trucks 0.2Oil Refining & Marketing 0.2Audio/Video Products 0.2Telephone-Integrated 0.2Diversified Financial Services 0.2Retail-Automobile 0.2Tobacco 0.2Retail-Restaurants 0.2Diversified Manufacturing Operations 0.2Electronic Connectors 0.2Appliances 0.1Electric-Integrated 0.1Miscellaneous Manufacturing 0.1Food-Catering 0.1Computer Aided Design 0.1Computers 0.1Machinery-Construction & Mining 0.1Disposable Medical Products 0.1Retail-Propane Distribution 0.1Aerospace/Defense 0.1Textile-Products 0.1E-Marketing/Info 0.1Security Services 0.1Publishing-Periodicals 0.1
Copyright © 2021 www.secdatabase.com. All Rights Reserved.Please Consider the Environment Before Printing This Document
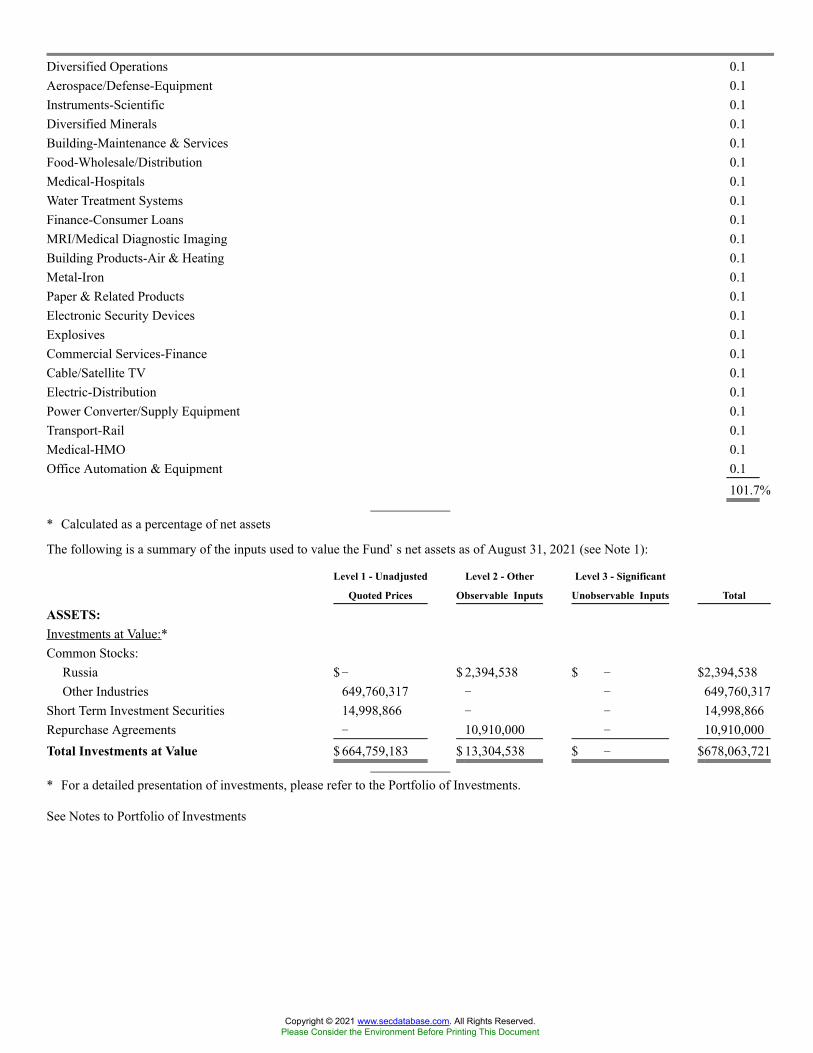
Diversified Operations 0.1Aerospace/Defense-Equipment 0.1Instruments-Scientific 0.1Diversified Minerals 0.1Building-Maintenance & Services 0.1Food-Wholesale/Distribution 0.1Medical-Hospitals 0.1Water Treatment Systems 0.1Finance-Consumer Loans 0.1MRI/Medical Diagnostic Imaging 0.1Building Products-Air & Heating 0.1Metal-Iron 0.1Paper & Related Products 0.1Electronic Security Devices 0.1Explosives 0.1Commercial Services-Finance 0.1Cable/Satellite TV 0.1Electric-Distribution 0.1Power Converter/Supply Equipment 0.1Transport-Rail 0.1Medical-HMO 0.1Office Automation & Equipment 0.1
101.7%
* Calculated as a percentage of net assets
The following is a summary of the inputs used to value the Fund�s net assets as of August 31, 2021 (see Note 1):
Level 1 - Unadjusted
Quoted Prices
Level 2 - Other
Observable Inputs
Level 3 - Significant
Unobservable Inputs Total
ASSETS:Investments at Value:*Common Stocks:
Russia $� $ 2,394,538 $ � $2,394,538Other Industries 649,760,317 � � 649,760,317
Short Term Investment Securities 14,998,866 � � 14,998,866Repurchase Agreements � 10,910,000 � 10,910,000Total Investments at Value $ 664,759,183 $ 13,304,538 $ � $678,063,721
* For a detailed presentation of investments, please refer to the Portfolio of Investments.
See Notes to Portfolio of Investments
Copyright © 2021 www.secdatabase.com. All Rights Reserved.Please Consider the Environment Before Printing This Document
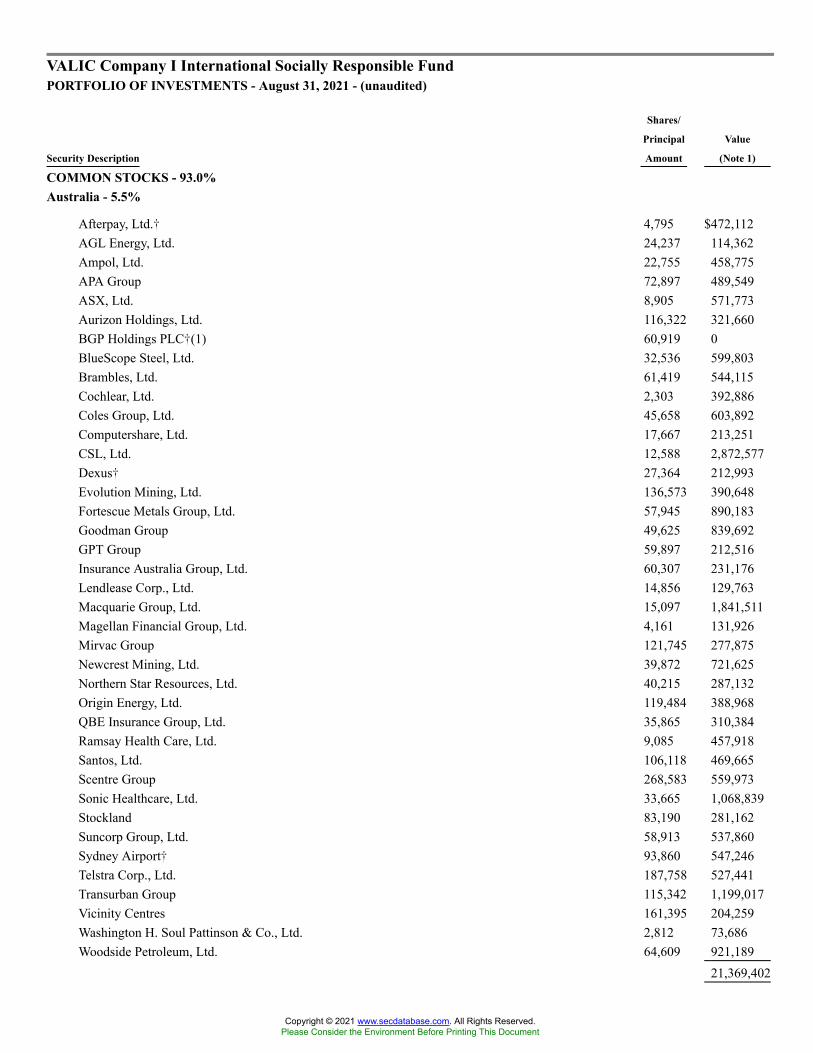
VALIC Company I International Socially Responsible FundPORTFOLIO OF INVESTMENTS - August 31, 2021 - (unaudited)
Security Description
Shares/
Principal
Amount
Value
(Note 1)
COMMON STOCKS - 93.0%Australia - 5.5%
Afterpay, Ltd.� 4,795 $472,112AGL Energy, Ltd. 24,237 114,362Ampol, Ltd. 22,755 458,775APA Group 72,897 489,549ASX, Ltd. 8,905 571,773Aurizon Holdings, Ltd. 116,322 321,660BGP Holdings PLC�(1) 60,919 0BlueScope Steel, Ltd. 32,536 599,803Brambles, Ltd. 61,419 544,115Cochlear, Ltd. 2,303 392,886Coles Group, Ltd. 45,658 603,892Computershare, Ltd. 17,667 213,251CSL, Ltd. 12,588 2,872,577Dexus� 27,364 212,993Evolution Mining, Ltd. 136,573 390,648Fortescue Metals Group, Ltd. 57,945 890,183Goodman Group 49,625 839,692GPT Group 59,897 212,516Insurance Australia Group, Ltd. 60,307 231,176Lendlease Corp., Ltd. 14,856 129,763Macquarie Group, Ltd. 15,097 1,841,511Magellan Financial Group, Ltd. 4,161 131,926Mirvac Group 121,745 277,875Newcrest Mining, Ltd. 39,872 721,625Northern Star Resources, Ltd. 40,215 287,132Origin Energy, Ltd. 119,484 388,968QBE Insurance Group, Ltd. 35,865 310,384Ramsay Health Care, Ltd. 9,085 457,918Santos, Ltd. 106,118 469,665Scentre Group 268,583 559,973Sonic Healthcare, Ltd. 33,665 1,068,839Stockland 83,190 281,162Suncorp Group, Ltd. 58,913 537,860Sydney Airport� 93,860 547,246Telstra Corp., Ltd. 187,758 527,441Transurban Group 115,342 1,199,017Vicinity Centres 161,395 204,259Washington H. Soul Pattinson & Co., Ltd. 2,812 73,686Woodside Petroleum, Ltd. 64,609 921,189
21,369,402
Copyright © 2021 www.secdatabase.com. All Rights Reserved.Please Consider the Environment Before Printing This Document
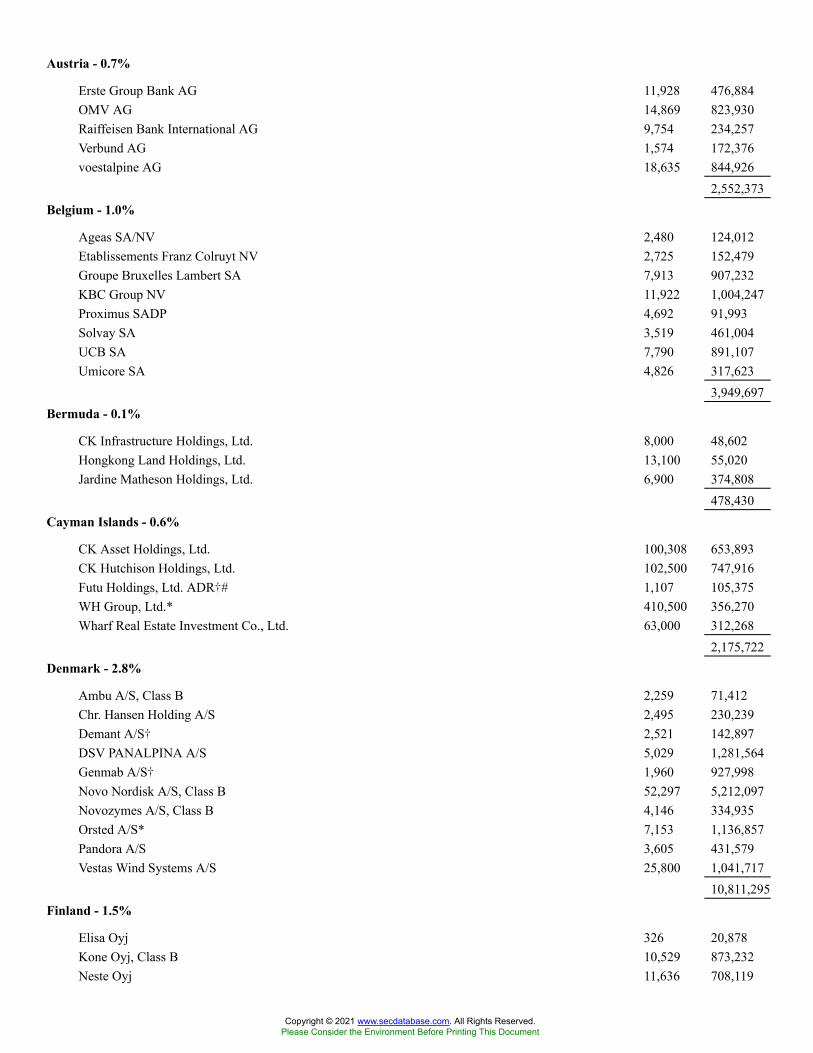
Austria - 0.7%
Erste Group Bank AG 11,928 476,884OMV AG 14,869 823,930Raiffeisen Bank International AG 9,754 234,257Verbund AG 1,574 172,376voestalpine AG 18,635 844,926
2,552,373Belgium - 1.0%
Ageas SA/NV 2,480 124,012Etablissements Franz Colruyt NV 2,725 152,479Groupe Bruxelles Lambert SA 7,913 907,232KBC Group NV 11,922 1,004,247Proximus SADP 4,692 91,993Solvay SA 3,519 461,004UCB SA 7,790 891,107Umicore SA 4,826 317,623
3,949,697Bermuda - 0.1%
CK Infrastructure Holdings, Ltd. 8,000 48,602Hongkong Land Holdings, Ltd. 13,100 55,020Jardine Matheson Holdings, Ltd. 6,900 374,808
478,430Cayman Islands - 0.6%
CK Asset Holdings, Ltd. 100,308 653,893CK Hutchison Holdings, Ltd. 102,500 747,916Futu Holdings, Ltd. ADR�# 1,107 105,375WH Group, Ltd.* 410,500 356,270Wharf Real Estate Investment Co., Ltd. 63,000 312,268
2,175,722Denmark - 2.8%
Ambu A/S, Class B 2,259 71,412Chr. Hansen Holding A/S 2,495 230,239Demant A/S� 2,521 142,897DSV PANALPINA A/S 5,029 1,281,564Genmab A/S� 1,960 927,998Novo Nordisk A/S, Class B 52,297 5,212,097Novozymes A/S, Class B 4,146 334,935Orsted A/S* 7,153 1,136,857Pandora A/S 3,605 431,579Vestas Wind Systems A/S 25,800 1,041,717
10,811,295Finland - 1.5%
Elisa Oyj 326 20,878Kone Oyj, Class B 10,529 873,232Neste Oyj 11,636 708,119
Copyright © 2021 www.secdatabase.com. All Rights Reserved.Please Consider the Environment Before Printing This Document

Nokia Oyj� 152,820 916,647Nordea Bank Abp 120,356 1,414,517Orion Oyj, Class B 5,337 217,597Sampo Oyj, Class A 10,291 531,489Stora Enso Oyj, Class R 29,179 571,060UPM-Kymmene Oyj 15,629 635,370
5,888,909France - 10.7%
Accor SA� 11,321 389,790Aeroports de Paris� 2,191 257,254Air Liquide SA 16,043 2,875,893Alstom SA 5,293 227,490Amundi SA* 2,158 204,227Arkema SA 3,390 449,908Atos SE 4,039 209,647AXA SA 83,127 2,334,060BioMerieux 978 119,923BNP Paribas SA 32,172 2,041,047Bouygues SA 20,457 855,798Bureau Veritas SA 11,342 376,451Capgemini SE 6,216 1,395,614Carrefour SA 30,703 610,856Cie de Saint-Gobain 19,284 1,397,825Cie Generale des Etablissements Michelin SCA 8,063 1,304,770CNP Assurances 21,011 359,603Covivio 1,969 187,201Danone SA 26,826 1,959,721Dassault Systemes SE 26,465 1,509,462Edenred 9,427 534,285
Copyright © 2021 www.secdatabase.com. All Rights Reserved.Please Consider the Environment Before Printing This Document

Eiffage SA 5,801 602,896EssilorLuxottica SA 11,616 2,280,355Eurazeo SE 2,742 281,997Faurecia SE 3,671 177,022Gecina SA 1,516 235,477Getlink SE 25,363 407,734Hermes International 1,974 2,900,682Iliad SA 696 149,568Ipsen SA 3,567 356,650Klepierre SA 9,974 243,780L�Oreal SA 9,614 4,498,693Legrand SA 7,901 904,177Orpea SA 2,407 302,964Publicis Groupe SA 8,806 577,280Sartorius Stedim Biotech 1,193 723,475Schneider Electric SE 15,774 2,817,986SCOR SE 5,706 175,104Societe Generale SA 28,467 895,771Sodexo SA� 5,579 461,250Suez SA 10,167 235,892Ubisoft Entertainment SA� 1,173 74,680Valeo SA 4,108 116,801Veolia Environnement SA 29,894 1,025,388Vivendi SE 17,589 671,229Wendel SE 1,296 188,068Worldline SA�* 6,156 547,115
41,452,859Germany - 7.1%
Allianz SE 11,296 2,653,947Bayerische Motoren Werke AG 11,850 1,124,528Bayerische Motoren Werke AG (Preference Shares) 3,618 302,882Beiersdorf AG 7,890 957,231Brenntag SE 2,328 234,856Carl Zeiss Meditec AG 784 173,200Commerzbank AG� 82,999 520,386Covestro AG* 5,143 333,386Deutsche Boerse AG 6,431 1,109,397Deutsche Telekom AG 90,537 1,925,084Deutsche Wohnen SE 13,175 817,644Evonik Industries AG 7,131 240,810Hannover Rueck SE 1,588 292,411HeidelbergCement AG 6,394 555,659Henkel AG & Co. KGaA 4,067 365,921Henkel AG & Co. KGaA (Preference Shares) 11,051 1,079,631Infineon Technologies AG 31,111 1,324,824KION Group AG 1,657 177,298Knorr-Bremse AG 1,092 131,065LANXESS AG 1,378 100,456
Copyright © 2021 www.secdatabase.com. All Rights Reserved.Please Consider the Environment Before Printing This Document

Merck KGaA 7,895 1,875,591Muenchener Rueckversicherungs-Gesellschaft AG 5,480 1,601,128Puma SE 5,373 652,181SAP SE 29,046 4,371,378Sartorius AG 1,091 718,815Siemens Healthineers AG* 13,335 927,399Symrise AG 3,680 524,026TeamViewer AG�* 2,071 68,983Telefonica Deutschland Holding AG 103,732 291,139United Internet AG 4,962 214,494Vonovia SE 21,094 1,423,670Zalando SE�* 4,104 454,536
27,543,956Hong Kong - 2.6%
AIA Group, Ltd. 289,000 3,453,902BOC Hong Kong Holdings, Ltd. 122,500 371,716Hang Lung Properties, Ltd. 49,000 117,689Hang Seng Bank, Ltd. 21,300 381,225Henderson Land Development Co., Ltd. 86,503 391,504Hong Kong & China Gas Co., Ltd. 235,252 378,705Hong Kong Exchanges & Clearing, Ltd. 28,700 1,811,128Link REIT 37,300 343,148MTR Corp., Ltd. 74,500 419,559New World Development Co., Ltd. 47,250 222,354Power Assets Holdings, Ltd. 42,500 266,942Sun Hung Kai Properties, Ltd. 49,500 697,555Swire Pacific, Ltd., Class A 30,000 203,280Swire Properties, Ltd. 52,400 141,823Techtronic Industries Co., Ltd. 30,000 665,385
9,865,915Ireland - 0.9%
CRH PLC 26,317 1,399,564DCC PLC 7,134 606,146James Hardie Industries PLC 5,924 229,860Kerry Group PLC, Class A 7,667 1,124,359Smurfit Kappa Group PLC 3,428 196,633
3,556,562Israel - 0.5%
Bank Hapoalim BM 44,435 382,181Bank Leumi Le-Israel BM 60,220 497,484Check Point Software Technologies, Ltd.� 3,586 450,509NICE, Ltd.� 1,058 308,647Wix.com, Ltd.� 920 204,314
1,843,135Italy - 1.9%
Amplifon SpA 4,307 225,186
Copyright © 2021 www.secdatabase.com. All Rights Reserved.Please Consider the Environment Before Printing This Document

Assicurazioni Generali SpA 79,530 1,621,741DiaSorin SpA 833 190,074FinecoBank Banca Fineco SpA� 13,965 257,478Mediobanca Banca di Credito Finanziario SpA� 54,420 641,279Moncler SpA 8,838 565,603Nexi SpA�* 7,610 158,549Poste Italiane SpA* 43,183 585,601Prysmian SpA 6,421 241,626Recordati Industria Chimica e Farmaceutica SpA 10,503 689,023Snam SpA 185,780 1,097,676
Copyright © 2021 www.secdatabase.com. All Rights Reserved.Please Consider the Environment Before Printing This Document
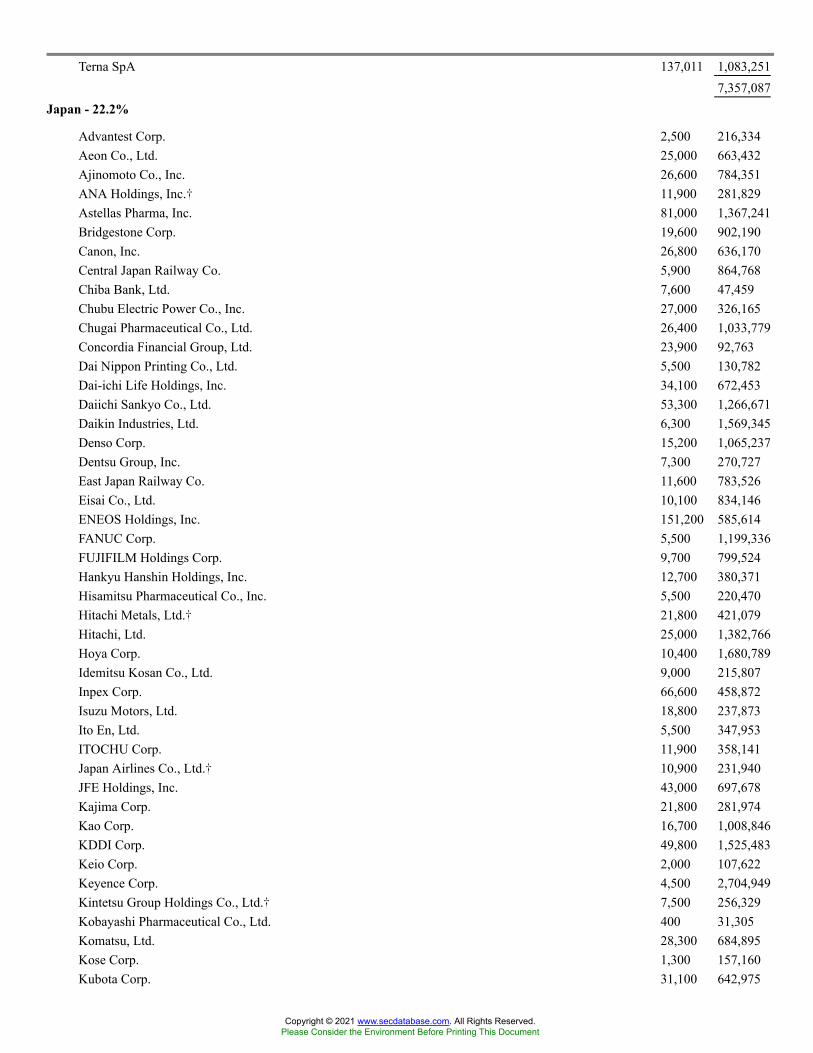
Terna SpA 137,011 1,083,2517,357,087
Japan - 22.2%
Advantest Corp. 2,500 216,334Aeon Co., Ltd. 25,000 663,432Ajinomoto Co., Inc. 26,600 784,351ANA Holdings, Inc.� 11,900 281,829Astellas Pharma, Inc. 81,000 1,367,241Bridgestone Corp. 19,600 902,190Canon, Inc. 26,800 636,170Central Japan Railway Co. 5,900 864,768Chiba Bank, Ltd. 7,600 47,459Chubu Electric Power Co., Inc. 27,000 326,165Chugai Pharmaceutical Co., Ltd. 26,400 1,033,779Concordia Financial Group, Ltd. 23,900 92,763Dai Nippon Printing Co., Ltd. 5,500 130,782Dai-ichi Life Holdings, Inc. 34,100 672,453Daiichi Sankyo Co., Ltd. 53,300 1,266,671Daikin Industries, Ltd. 6,300 1,569,345Denso Corp. 15,200 1,065,237Dentsu Group, Inc. 7,300 270,727East Japan Railway Co. 11,600 783,526Eisai Co., Ltd. 10,100 834,146ENEOS Holdings, Inc. 151,200 585,614FANUC Corp. 5,500 1,199,336FUJIFILM Holdings Corp. 9,700 799,524Hankyu Hanshin Holdings, Inc. 12,700 380,371Hisamitsu Pharmaceutical Co., Inc. 5,500 220,470Hitachi Metals, Ltd.� 21,800 421,079Hitachi, Ltd. 25,000 1,382,766Hoya Corp. 10,400 1,680,789Idemitsu Kosan Co., Ltd. 9,000 215,807Inpex Corp. 66,600 458,872Isuzu Motors, Ltd. 18,800 237,873Ito En, Ltd. 5,500 347,953ITOCHU Corp. 11,900 358,141Japan Airlines Co., Ltd.� 10,900 231,940JFE Holdings, Inc. 43,000 697,678Kajima Corp. 21,800 281,974Kao Corp. 16,700 1,008,846KDDI Corp. 49,800 1,525,483Keio Corp. 2,000 107,622Keyence Corp. 4,500 2,704,949Kintetsu Group Holdings Co., Ltd.� 7,500 256,329Kobayashi Pharmaceutical Co., Ltd. 400 31,305Komatsu, Ltd. 28,300 684,895Kose Corp. 1,300 157,160Kubota Corp. 31,100 642,975
Copyright © 2021 www.secdatabase.com. All Rights Reserved.Please Consider the Environment Before Printing This Document
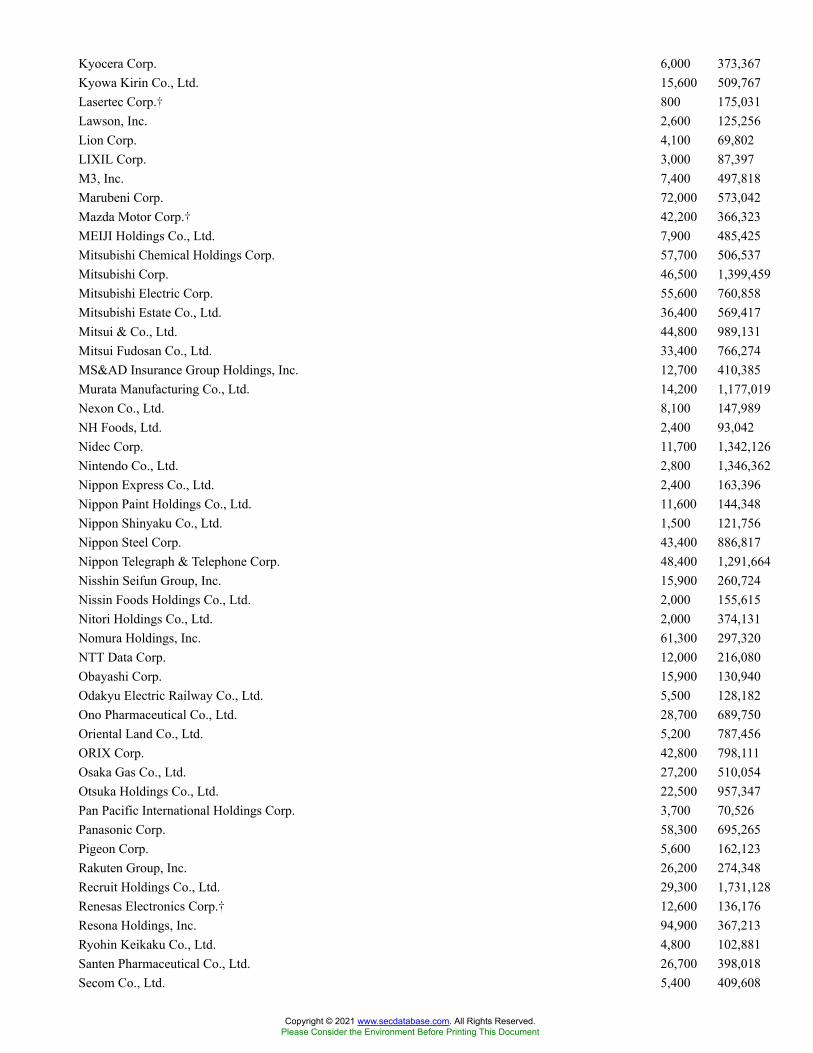
Kyocera Corp. 6,000 373,367Kyowa Kirin Co., Ltd. 15,600 509,767Lasertec Corp.� 800 175,031Lawson, Inc. 2,600 125,256Lion Corp. 4,100 69,802LIXIL Corp. 3,000 87,397M3, Inc. 7,400 497,818Marubeni Corp. 72,000 573,042Mazda Motor Corp.� 42,200 366,323MEIJI Holdings Co., Ltd. 7,900 485,425Mitsubishi Chemical Holdings Corp. 57,700 506,537Mitsubishi Corp. 46,500 1,399,459Mitsubishi Electric Corp. 55,600 760,858Mitsubishi Estate Co., Ltd. 36,400 569,417Mitsui & Co., Ltd. 44,800 989,131Mitsui Fudosan Co., Ltd. 33,400 766,274MS&AD Insurance Group Holdings, Inc. 12,700 410,385Murata Manufacturing Co., Ltd. 14,200 1,177,019Nexon Co., Ltd. 8,100 147,989NH Foods, Ltd. 2,400 93,042Nidec Corp. 11,700 1,342,126Nintendo Co., Ltd. 2,800 1,346,362Nippon Express Co., Ltd. 2,400 163,396Nippon Paint Holdings Co., Ltd. 11,600 144,348Nippon Shinyaku Co., Ltd. 1,500 121,756Nippon Steel Corp. 43,400 886,817Nippon Telegraph & Telephone Corp. 48,400 1,291,664Nisshin Seifun Group, Inc. 15,900 260,724Nissin Foods Holdings Co., Ltd. 2,000 155,615Nitori Holdings Co., Ltd. 2,000 374,131Nomura Holdings, Inc. 61,300 297,320NTT Data Corp. 12,000 216,080Obayashi Corp. 15,900 130,940Odakyu Electric Railway Co., Ltd. 5,500 128,182Ono Pharmaceutical Co., Ltd. 28,700 689,750Oriental Land Co., Ltd. 5,200 787,456ORIX Corp. 42,800 798,111Osaka Gas Co., Ltd. 27,200 510,054Otsuka Holdings Co., Ltd. 22,500 957,347Pan Pacific International Holdings Corp. 3,700 70,526Panasonic Corp. 58,300 695,265Pigeon Corp. 5,600 162,123Rakuten Group, Inc. 26,200 274,348Recruit Holdings Co., Ltd. 29,300 1,731,128Renesas Electronics Corp.� 12,600 136,176Resona Holdings, Inc. 94,900 367,213Ryohin Keikaku Co., Ltd. 4,800 102,881Santen Pharmaceutical Co., Ltd. 26,700 398,018Secom Co., Ltd. 5,400 409,608
Copyright © 2021 www.secdatabase.com. All Rights Reserved.Please Consider the Environment Before Printing This Document
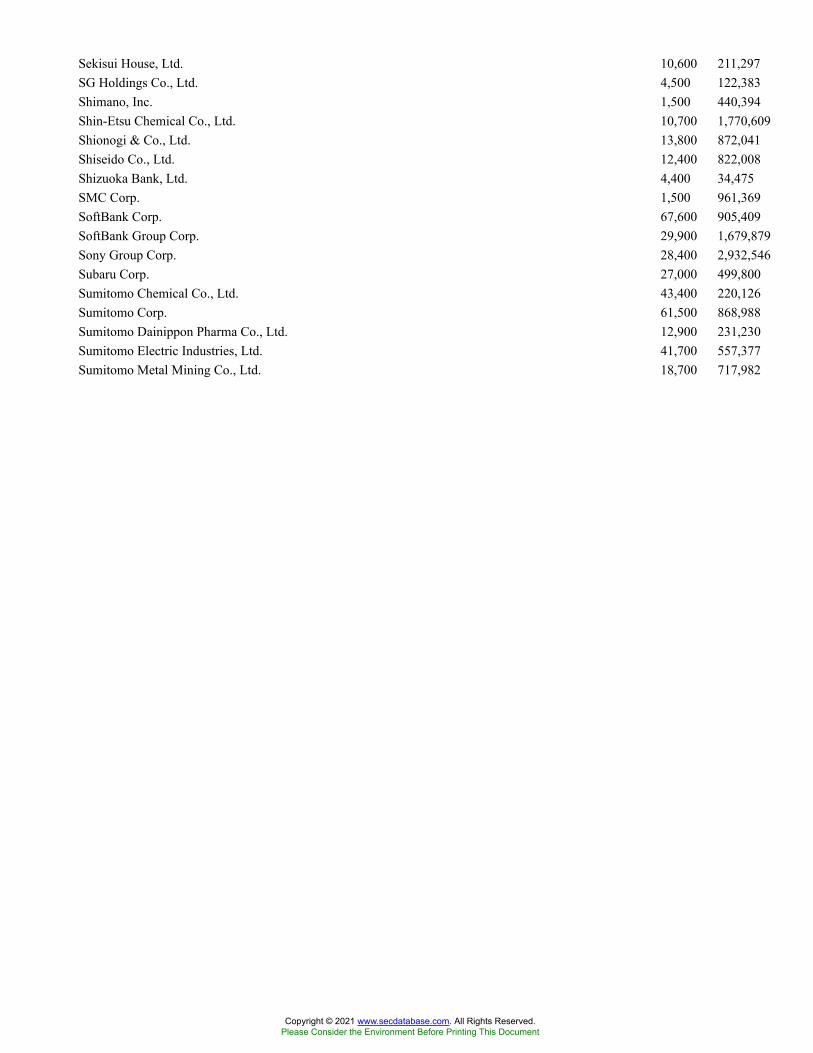
Sekisui House, Ltd. 10,600 211,297SG Holdings Co., Ltd. 4,500 122,383Shimano, Inc. 1,500 440,394Shin-Etsu Chemical Co., Ltd. 10,700 1,770,609Shionogi & Co., Ltd. 13,800 872,041Shiseido Co., Ltd. 12,400 822,008Shizuoka Bank, Ltd. 4,400 34,475SMC Corp. 1,500 961,369SoftBank Corp. 67,600 905,409SoftBank Group Corp. 29,900 1,679,879Sony Group Corp. 28,400 2,932,546Subaru Corp. 27,000 499,800Sumitomo Chemical Co., Ltd. 43,400 220,126Sumitomo Corp. 61,500 868,988Sumitomo Dainippon Pharma Co., Ltd. 12,900 231,230Sumitomo Electric Industries, Ltd. 41,700 557,377Sumitomo Metal Mining Co., Ltd. 18,700 717,982
Copyright © 2021 www.secdatabase.com. All Rights Reserved.Please Consider the Environment Before Printing This Document

Sumitomo Mitsui Financial Group, Inc. 57,700 1,993,525Sumitomo Realty & Development Co., Ltd. 10,700 345,466Suntory Beverage & Food, Ltd. 16,600 664,664Sysmex Corp. 4,500 512,112Taisho Pharmaceutical Holdings Co., Ltd. 5,700 332,627Terumo Corp. 18,500 773,026Tobu Railway Co., Ltd. 3,900 101,776Toho Gas Co., Ltd. 600 27,978Tohoku Electric Power Co., Inc. 17,300 132,406Tokio Marine Holdings, Inc. 18,200 889,528Tokyo Electron, Ltd. 3,000 1,288,188Tokyo Gas Co., Ltd. 24,100 463,533Tokyu Corp. 31,300 431,028Toppan Printing Co., Ltd. 7,800 134,000Toray Industries, Inc. 40,700 274,429TOTO, Ltd. 800 43,558Toyo Suisan Kaisha, Ltd. 2,100 86,947Toyota Industries Corp. 8,600 726,210Toyota Motor Corp. 57,400 5,004,598Toyota Tsusho Corp. 5,000 221,106Unicharm Corp. 17,100 762,245Welcia Holdings Co., Ltd. 1,400 49,439West Japan Railway Co. 7,300 399,189Yakult Honsha Co., Ltd. 6,100 351,534Z Holdings Corp. 72,600 473,155
85,792,103Jersey - 0.6%
Ferguson PLC 8,169 1,179,832WPP PLC 73,697 996,607
2,176,439Luxembourg - 0.4%
Aroundtown SA 42,482 325,342Eurofins Scientific SE 2,284 323,836Tenaris SA 86,430 871,118
1,520,296Netherlands - 5.8%
ABN AMRO Bank NV CVA�* 39,130 546,209Adyen NV�* 463 1,494,917Akzo Nobel NV 7,213 889,149Argenx SE� 1,326 447,470ASM International NV 589 228,529ASML Holding NV(XAMS) 9,680 8,052,199CNH Industrial NV 42,088 695,736EXOR NV 7,779 648,465Ferrari NV 4,589 995,372ING Groep NV 123,160 1,701,428JDE Peet�s NV 8,986 308,758
Copyright © 2021 www.secdatabase.com. All Rights Reserved.Please Consider the Environment Before Printing This Document
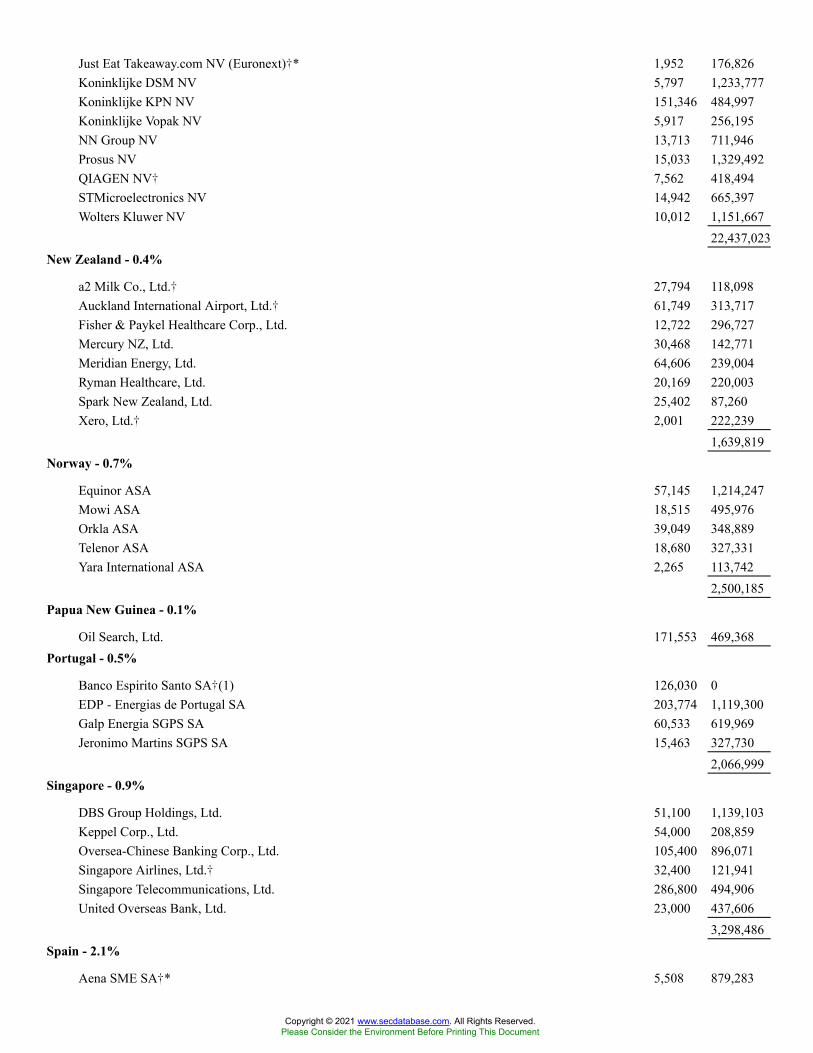
Just Eat Takeaway.com NV (Euronext)�* 1,952 176,826Koninklijke DSM NV 5,797 1,233,777Koninklijke KPN NV 151,346 484,997Koninklijke Vopak NV 5,917 256,195NN Group NV 13,713 711,946Prosus NV 15,033 1,329,492QIAGEN NV� 7,562 418,494STMicroelectronics NV 14,942 665,397Wolters Kluwer NV 10,012 1,151,667
22,437,023New Zealand - 0.4%
a2 Milk Co., Ltd.� 27,794 118,098Auckland International Airport, Ltd.� 61,749 313,717Fisher & Paykel Healthcare Corp., Ltd. 12,722 296,727Mercury NZ, Ltd. 30,468 142,771Meridian Energy, Ltd. 64,606 239,004Ryman Healthcare, Ltd. 20,169 220,003Spark New Zealand, Ltd. 25,402 87,260Xero, Ltd.� 2,001 222,239
1,639,819Norway - 0.7%
Equinor ASA 57,145 1,214,247Mowi ASA 18,515 495,976Orkla ASA 39,049 348,889Telenor ASA 18,680 327,331Yara International ASA 2,265 113,742
2,500,185Papua New Guinea - 0.1%
Oil Search, Ltd. 171,553 469,368Portugal - 0.5%
Banco Espirito Santo SA�(1) 126,030 0EDP - Energias de Portugal SA 203,774 1,119,300Galp Energia SGPS SA 60,533 619,969Jeronimo Martins SGPS SA 15,463 327,730
2,066,999Singapore - 0.9%
DBS Group Holdings, Ltd. 51,100 1,139,103Keppel Corp., Ltd. 54,000 208,859Oversea-Chinese Banking Corp., Ltd. 105,400 896,071Singapore Airlines, Ltd.� 32,400 121,941Singapore Telecommunications, Ltd. 286,800 494,906United Overseas Bank, Ltd. 23,000 437,606
3,298,486Spain - 2.1%
Aena SME SA�* 5,508 879,283
Copyright © 2021 www.secdatabase.com. All Rights Reserved.Please Consider the Environment Before Printing This Document
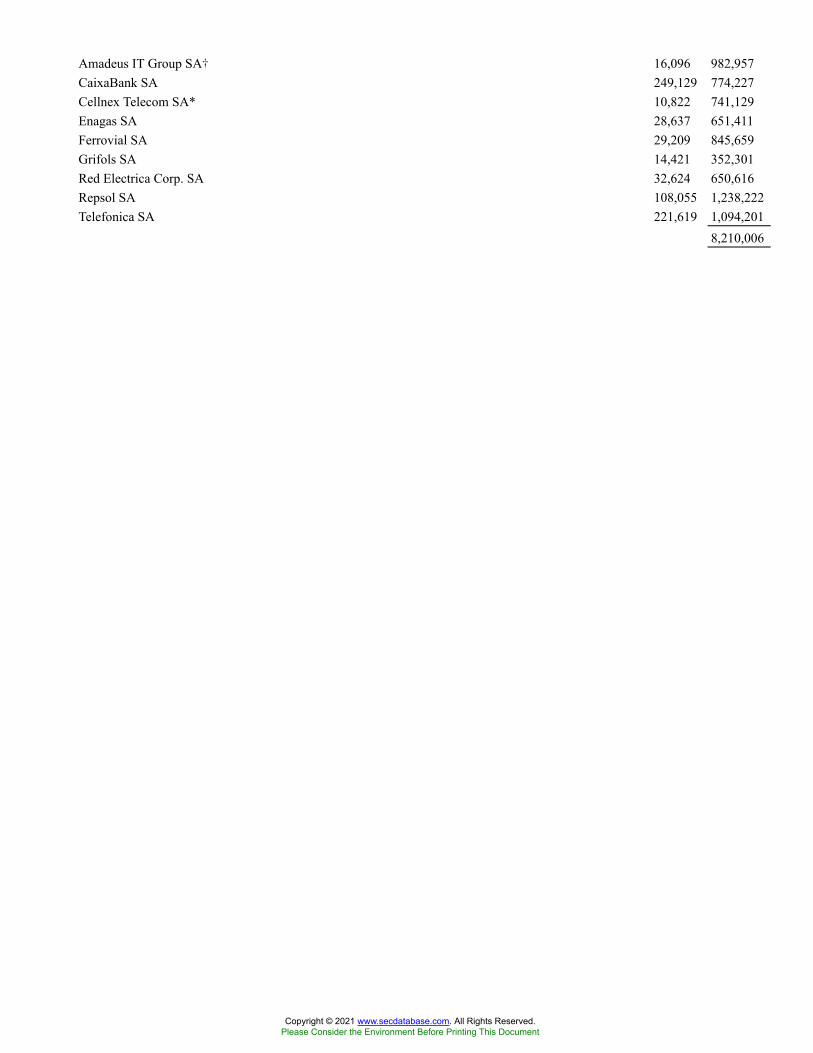
Amadeus IT Group SA� 16,096 982,957CaixaBank SA 249,129 774,227Cellnex Telecom SA* 10,822 741,129Enagas SA 28,637 651,411Ferrovial SA 29,209 845,659Grifols SA 14,421 352,301Red Electrica Corp. SA 32,624 650,616Repsol SA 108,055 1,238,222Telefonica SA 221,619 1,094,201
8,210,006
Copyright © 2021 www.secdatabase.com. All Rights Reserved.Please Consider the Environment Before Printing This Document

SupraNational - 0.1%
Unibail-Rodamco-Westfield�(Euronext Amsterdam) 4,823 422,551
Sweden - 3.1%
Assa Abloy AB, Class B 25,431 812,783Boliden AB 25,834 900,805Epiroc AB, Class B 21,039 399,718EQT AB 2,981 151,892Essity AB, Class B 32,404 1,039,397Hennes & Mauritz AB, Class B� 26,557 532,282Hexagon AB, Class B 37,268 645,646ICA Gruppen AB 1,334 66,364Industrivarden AB, Class C 2,897 100,982Investor AB, Class B 96,330 2,304,030Sandvik AB 35,081 894,358Skandinaviska Enskilda Banken AB, Class A 73,479 986,878Svenska Handelsbanken AB, Class A 76,802 863,833Telefonaktiebolaget LM Ericsson, Class B 85,577 1,014,494Volvo AB, Class B 56,354 1,274,348
11,987,810Switzerland - 8.3%
ABB, Ltd. 68,987 2,555,325Adecco Group AG 6,390 355,733Alcon, Inc. 18,897 1,556,745Baloise Holding AG 3,074 490,430Clariant AG 9,453 199,021Coca-Cola HBC AG 23,738 858,005EMS-Chemie Holding AG 527 571,168Geberit AG 1,682 1,405,478Givaudan SA 392 1,966,956Julius Baer Group, Ltd. 13,110 896,190Kuehne & Nagel International AG 2,781 1,017,650Logitech International SA 4,027 411,781Lonza Group AG 2,782 2,354,409Partners Group Holding AG 1,054 1,869,174Schindler Holding AG 208 64,870Schindler Holding AG
(Participation Certificate) 3,233 1,044,304SGS SA 297 933,405Sika AG 5,507 1,985,106Sonova Holding AG 2,258 870,406Straumann Holding AG 438 846,585Swatch Group AG 3,862 1,088,909Swiss Life Holding AG 2,493 1,300,199Swiss Prime Site AG 3,176 339,710Swiss Re AG 16,111 1,482,406Swisscom AG 2,494 1,463,582
Copyright © 2021 www.secdatabase.com. All Rights Reserved.Please Consider the Environment Before Printing This Document

Temenos AG 2,364 375,349Vifor Pharma AG 4,519 643,492Zurich Insurance Group AG 7,269 3,190,978
32,137,366United Kingdom - 11.9%
3i Group PLC 53,376 981,511Admiral Group PLC 6,009 298,322Antofagasta PLC 35,889 718,419Ashtead Group PLC 16,466 1,288,118Auto Trader Group PLC* 43,124 372,928AVEVA Group PLC 3,754 213,467Aviva PLC 216,098 1,200,591Barratt Developments PLC 40,740 413,924Berkeley Group Holdings PLC 5,208 345,624British Land Co. PLC 68,607 500,108BT Group PLC� 351,250 819,992Bunzl PLC 12,952 469,394Burberry Group PLC 30,068 768,699Coca-Cola Europacific Partners PLC 13,835 798,833Compass Group PLC� 65,477 1,350,766Croda International PLC 5,840 734,504Direct Line Insurance Group PLC 60,310 256,214Evraz PLC 82,142 666,756Halma PLC 19,227 793,820Hargreaves Lansdown PLC 16,693 346,206Hikma Pharmaceuticals PLC 12,805 446,814HSBC Holdings PLC 496,814 2,637,919Informa PLC� 86,273 629,832InterContinental Hotels Group PLC� 9,815 625,184Intertek Group PLC 10,290 745,558J Sainsbury PLC 145,700 608,960JD Sports Fashion PLC 11,413 158,402Johnson Matthey PLC 12,186 492,398Kingfisher PLC 92,209 444,088Land Securities Group PLC 60,048 585,329Legal & General Group PLC 274,430 1,019,465London Stock Exchange Group PLC 11,172 1,222,028M&G PLC 76,708 217,252Mondi PLC 27,379 754,722National Grid PLC 169,869 2,198,354Natwest Group PLC 168,701 494,261Next PLC 7,684 835,640Ocado Group PLC� 13,059 361,417Pearson PLC 30,291 319,671Persimmon PLC 13,547 547,578Prudential PLC 71,564 1,490,605Reckitt Benckiser Group PLC 20,345 1,549,332RELX PLC 76,313 2,289,331
Copyright © 2021 www.secdatabase.com. All Rights Reserved.Please Consider the Environment Before Printing This Document
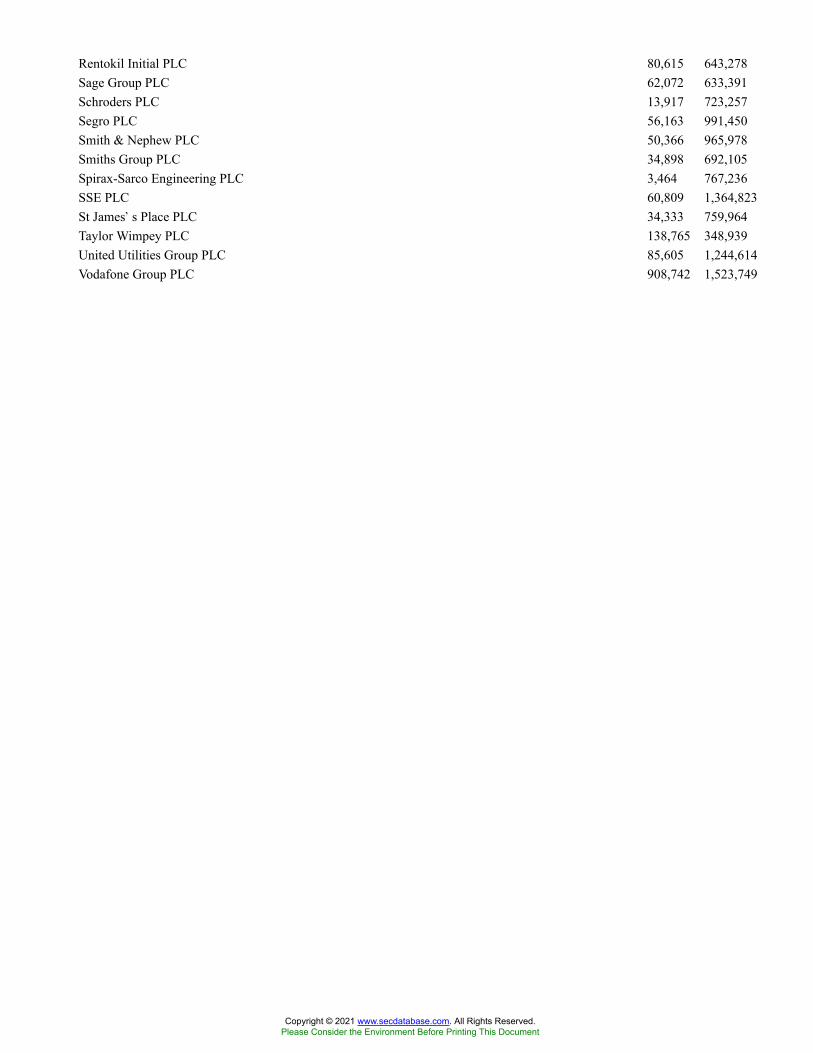
Rentokil Initial PLC 80,615 643,278Sage Group PLC 62,072 633,391Schroders PLC 13,917 723,257Segro PLC 56,163 991,450Smith & Nephew PLC 50,366 965,978Smiths Group PLC 34,898 692,105Spirax-Sarco Engineering PLC 3,464 767,236SSE PLC 60,809 1,364,823St James�s Place PLC 34,333 759,964Taylor Wimpey PLC 138,765 348,939United Utilities Group PLC 85,605 1,244,614Vodafone Group PLC 908,742 1,523,749
Copyright © 2021 www.secdatabase.com. All Rights Reserved.Please Consider the Environment Before Printing This Document
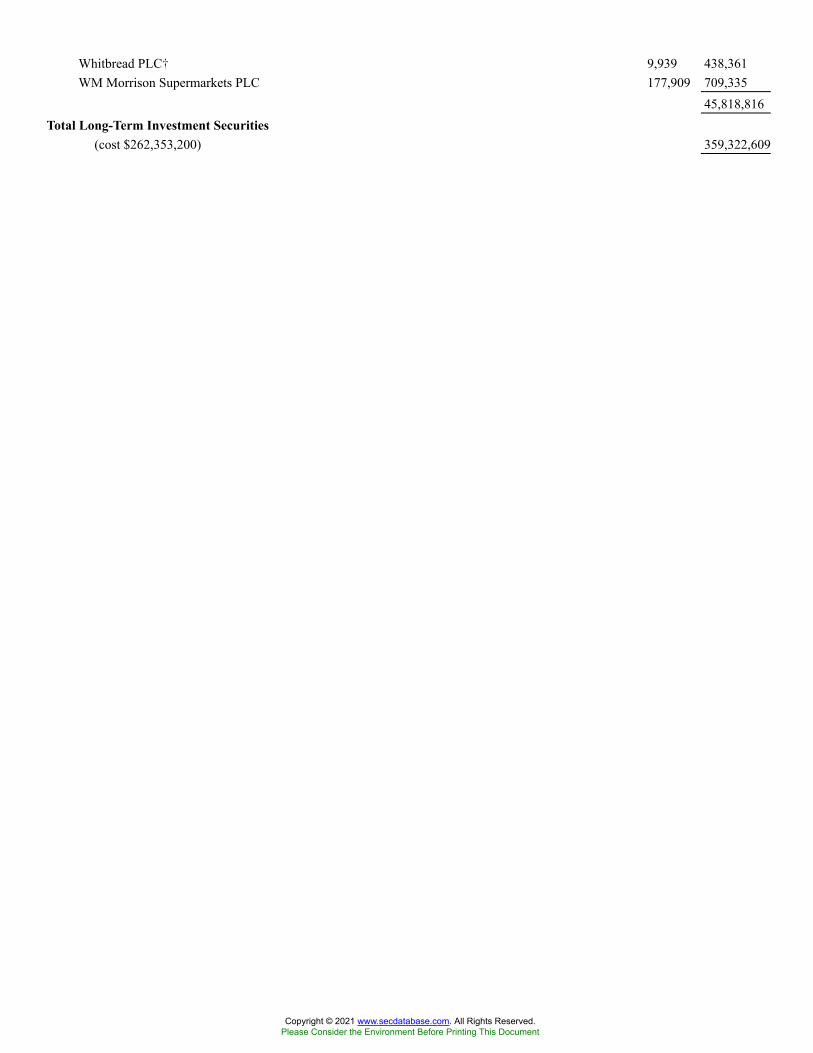
Whitbread PLC� 9,939 438,361WM Morrison Supermarkets PLC 177,909 709,335
45,818,816Total Long-Term Investment Securities
(cost $262,353,200) 359,322,609
Copyright © 2021 www.secdatabase.com. All Rights Reserved.Please Consider the Environment Before Printing This Document
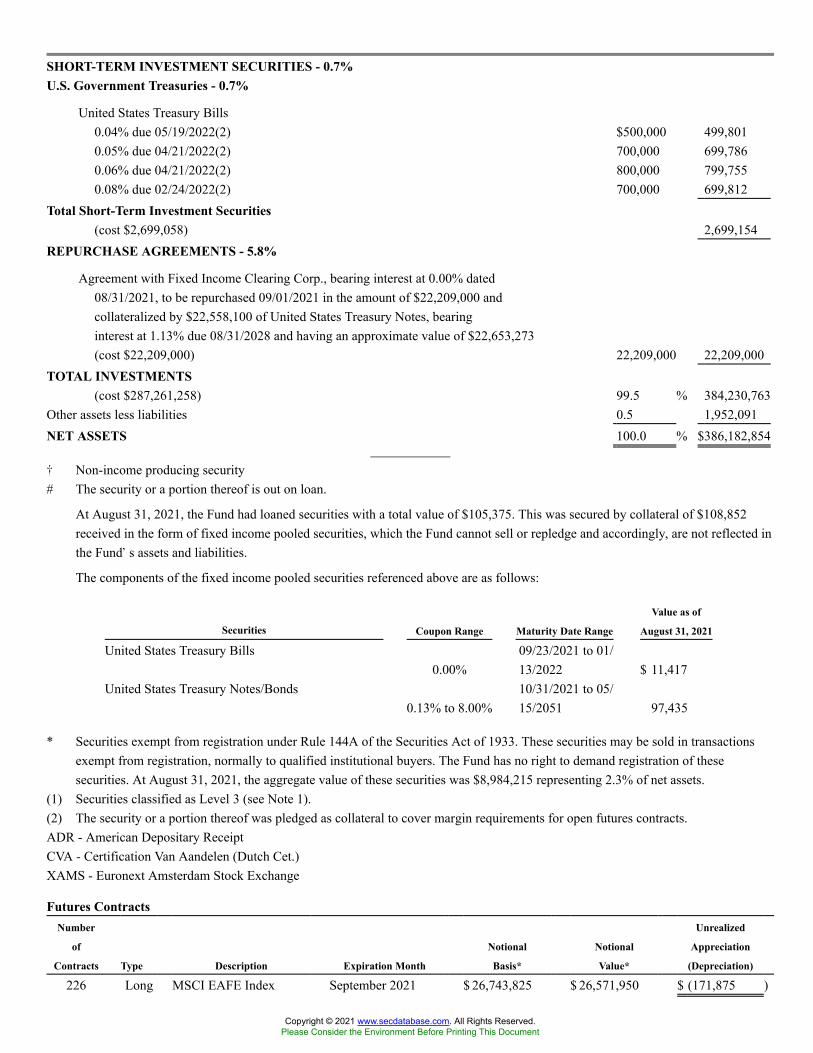
SHORT-TERM INVESTMENT SECURITIES - 0.7%U.S. Government Treasuries - 0.7%
United States Treasury Bills0.04% due 05/19/2022(2) $500,000 499,8010.05% due 04/21/2022(2) 700,000 699,7860.06% due 04/21/2022(2) 800,000 799,7550.08% due 02/24/2022(2) 700,000 699,812
Total Short-Term Investment Securities(cost $2,699,058) 2,699,154
REPURCHASE AGREEMENTS - 5.8%
Agreement with Fixed Income Clearing Corp., bearing interest at 0.00% dated08/31/2021, to be repurchased 09/01/2021 in the amount of $22,209,000 andcollateralized by $22,558,100 of United States Treasury Notes, bearinginterest at 1.13% due 08/31/2028 and having an approximate value of $22,653,273(cost $22,209,000) 22,209,000 22,209,000
TOTAL INVESTMENTS(cost $287,261,258) 99.5 % 384,230,763
Other assets less liabilities 0.5 1,952,091NET ASSETS 100.0 % $386,182,854
� Non-income producing security# The security or a portion thereof is out on loan.
At August 31, 2021, the Fund had loaned securities with a total value of $105,375. This was secured by collateral of $108,852received in the form of fixed income pooled securities, which the Fund cannot sell or repledge and accordingly, are not reflected inthe Fund�s assets and liabilities.
The components of the fixed income pooled securities referenced above are as follows:
Securities Coupon Range Maturity Date Range
Value as of
August 31, 2021
United States Treasury Bills0.00%
09/23/2021 to 01/13/2022 $ 11,417
United States Treasury Notes/Bonds0.13% to 8.00%
10/31/2021 to 05/15/2051 97,435
* Securities exempt from registration under Rule 144A of the Securities Act of 1933. These securities may be sold in transactionsexempt from registration, normally to qualified institutional buyers. The Fund has no right to demand registration of thesesecurities. At August 31, 2021, the aggregate value of these securities was $8,984,215 representing 2.3% of net assets.
(1) Securities classified as Level 3 (see Note 1).(2) The security or a portion thereof was pledged as collateral to cover margin requirements for open futures contracts.ADR - American Depositary ReceiptCVA - Certification Van Aandelen (Dutch Cet.)XAMS - Euronext Amsterdam Stock Exchange
Futures ContractsNumber
of
Contracts Type Description Expiration Month
Notional
Basis*
Notional
Value*
Unrealized
Appreciation
(Depreciation)
226 Long MSCI EAFE Index September 2021 $ 26,743,825 $ 26,571,950 $ (171,875 )
Copyright © 2021 www.secdatabase.com. All Rights Reserved.Please Consider the Environment Before Printing This Document

* Notional basis refers to the contractual amount agreed upon at inception of the open contract; notional value represents the currentvalue of the open contract.
Copyright © 2021 www.secdatabase.com. All Rights Reserved.Please Consider the Environment Before Printing This Document
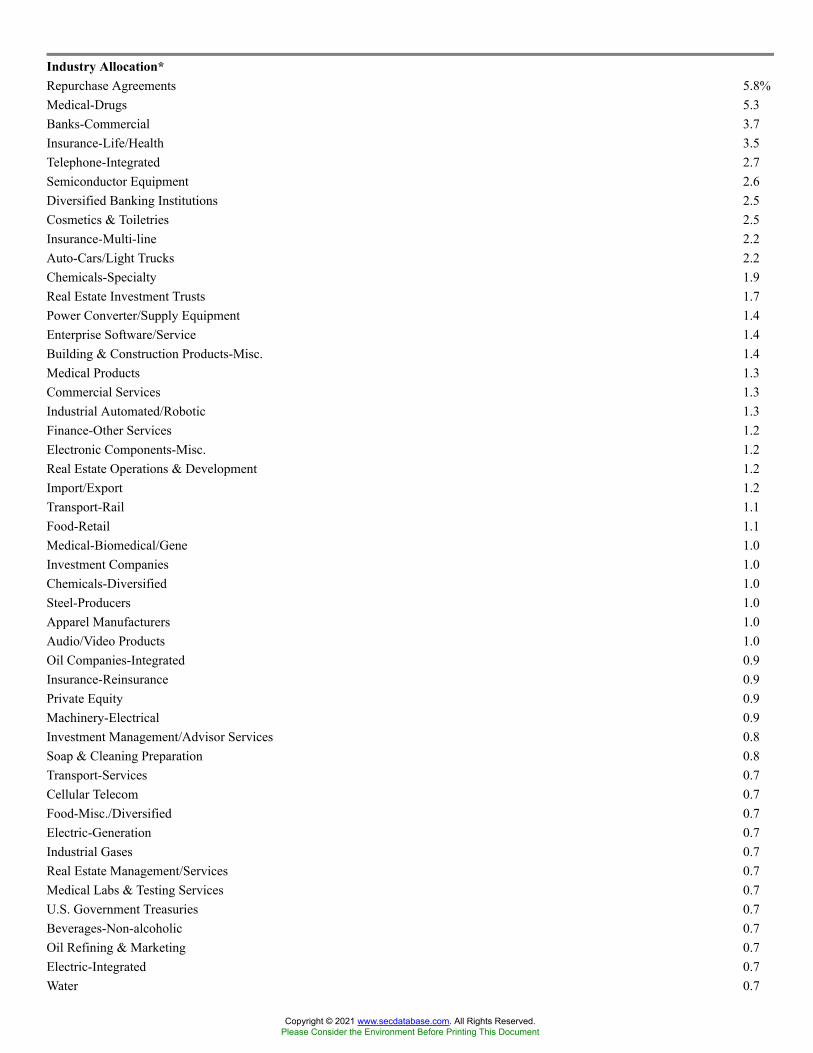
Industry Allocation*Repurchase Agreements 5.8%Medical-Drugs 5.3Banks-Commercial 3.7Insurance-Life/Health 3.5Telephone-Integrated 2.7Semiconductor Equipment 2.6Diversified Banking Institutions 2.5Cosmetics & Toiletries 2.5Insurance-Multi-line 2.2Auto-Cars/Light Trucks 2.2Chemicals-Specialty 1.9Real Estate Investment Trusts 1.7Power Converter/Supply Equipment 1.4Enterprise Software/Service 1.4Building & Construction Products-Misc. 1.4Medical Products 1.3Commercial Services 1.3Industrial Automated/Robotic 1.3Finance-Other Services 1.2Electronic Components-Misc. 1.2Real Estate Operations & Development 1.2Import/Export 1.2Transport-Rail 1.1Food-Retail 1.1Medical-Biomedical/Gene 1.0Investment Companies 1.0Chemicals-Diversified 1.0Steel-Producers 1.0Apparel Manufacturers 1.0Audio/Video Products 1.0Oil Companies-Integrated 0.9Insurance-Reinsurance 0.9Private Equity 0.9Machinery-Electrical 0.9Investment Management/Advisor Services 0.8Soap & Cleaning Preparation 0.8Transport-Services 0.7Cellular Telecom 0.7Food-Misc./Diversified 0.7Electric-Generation 0.7Industrial Gases 0.7Real Estate Management/Services 0.7Medical Labs & Testing Services 0.7U.S. Government Treasuries 0.7Beverages-Non-alcoholic 0.7Oil Refining & Marketing 0.7Electric-Integrated 0.7Water 0.7
Copyright © 2021 www.secdatabase.com. All Rights Reserved.Please Consider the Environment Before Printing This Document

Computer Services 0.7Commercial Services-Finance 0.6Auto/Truck Parts & Equipment-Original 0.6Food-Dairy Products 0.6Machinery-General Industrial 0.6Optical Supplies 0.6Electric-Distribution 0.6Paper & Related Products 0.6Insurance-Property/Casualty 0.6Human Resources 0.6Retail-Apparel/Shoe 0.5Oil Companies-Exploration & Production 0.5Rubber-Tires 0.5Gas-Distribution 0.5Airport Development/Maintenance 0.5Building & Construction-Misc. 0.5Electronic Components-Semiconductors 0.5Machinery-Construction & Mining 0.5Networking Products 0.5Distribution/Wholesale 0.5Building-Residential/Commercial 0.5Building-Heavy Construction 0.5Electric-Transmission 0.5Multimedia 0.5Internet Content-Information/News 0.4Building Products-Cement 0.4Food-Catering 0.4Medical Instruments 0.4Building Products-Air & Heating 0.4Retail-Jewelry 0.4Electronic Measurement Instruments 0.4Auto-Heavy Duty Trucks 0.4Computer Aided Design 0.4Hotels/Motels 0.4Office Automation & Equipment 0.4Gold Mining 0.4Toys 0.4Machinery-Farming 0.4Diversified Operations 0.4Rental Auto/Equipment 0.3Public Thoroughfares 0.3Publishing-Periodicals 0.3Gas-Transportation 0.3MRI/Medical Diagnostic Imaging 0.3Energy-Alternate Sources 0.3Advertising Agencies 0.3Coatings/Paint 0.2Electric Products-Misc. 0.2Metal-Diversified 0.2
Copyright © 2021 www.secdatabase.com. All Rights Reserved.Please Consider the Environment Before Printing This Document

Metal-Iron 0.2Steel Pipe & Tube 0.2Advertising Services 0.2Telecom Services 0.2Retail-Building Products 0.2Electronic Security Devices 0.2Finance-Leasing Companies 0.2Resorts/Theme Parks 0.2Pipelines 0.2Retail-Discount 0.2Metal-Copper 0.2Diversified Minerals 0.2Applications Software 0.2Diversified Manufacturing Operations 0.2Machine Tools & Related Products 0.2Athletic Footwear 0.2Building-Maintenance & Services 0.2Airlines 0.2Web Portals/ISP 0.1Diagnostic Kits 0.1Fisheries 0.1Chemicals-Plastics 0.1Diversified Operations/Commercial Services 0.1Diagnostic Equipment 0.1Medical-Hospitals 0.1Computer Data Security 0.1Bicycle Manufacturing 0.1Steel-Specialty 0.1Computers-Periphery Equipment 0.1Security Services 0.1Finance-Investment Banker/Broker 0.1Consulting Services 0.1E-Commerce/Services 0.1Miscellaneous Manufacturing 0.1Food-Meat Products 0.1Coffee 0.1Telecommunication Equipment 0.1Medical-Nursing Homes 0.1
Copyright © 2021 www.secdatabase.com. All Rights Reserved.Please Consider the Environment Before Printing This Document
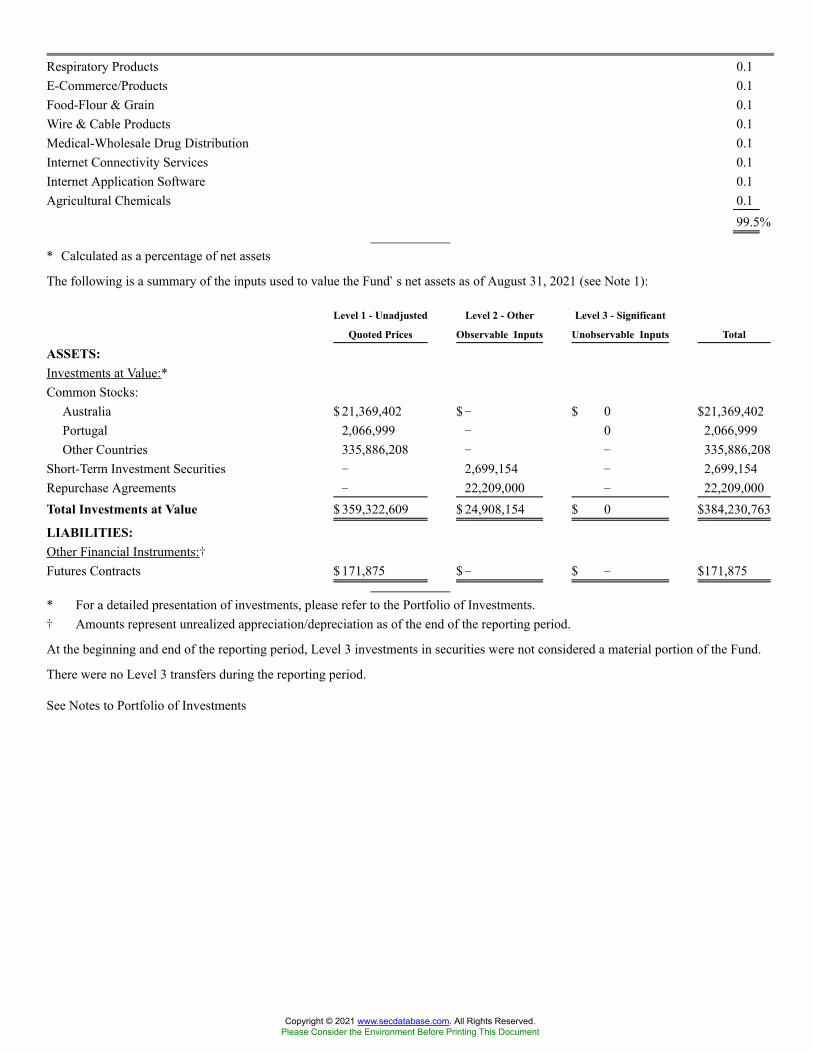
Respiratory Products 0.1E-Commerce/Products 0.1Food-Flour & Grain 0.1Wire & Cable Products 0.1Medical-Wholesale Drug Distribution 0.1Internet Connectivity Services 0.1Internet Application Software 0.1Agricultural Chemicals 0.1
99.5%
* Calculated as a percentage of net assets
The following is a summary of the inputs used to value the Fund�s net assets as of August 31, 2021 (see Note 1):
Level 1 - Unadjusted
Quoted Prices
Level 2 - Other
Observable Inputs
Level 3 - Significant
Unobservable Inputs Total
ASSETS:Investments at Value:*Common Stocks:
Australia $ 21,369,402 $ � $ 0 $21,369,402Portugal 2,066,999 � 0 2,066,999Other Countries 335,886,208 � � 335,886,208
Short-Term Investment Securities � 2,699,154 � 2,699,154Repurchase Agreements � 22,209,000 � 22,209,000Total Investments at Value $ 359,322,609 $ 24,908,154 $ 0 $384,230,763
LIABILITIES:Other Financial Instruments:�Futures Contracts $ 171,875 $ � $ � $171,875
* For a detailed presentation of investments, please refer to the Portfolio of Investments.� Amounts represent unrealized appreciation/depreciation as of the end of the reporting period.
At the beginning and end of the reporting period, Level 3 investments in securities were not considered a material portion of the Fund.
There were no Level 3 transfers during the reporting period.
See Notes to Portfolio of Investments
Copyright © 2021 www.secdatabase.com. All Rights Reserved.Please Consider the Environment Before Printing This Document

VALIC Company I International Value FundPORTFOLIO OF INVESTMENTS - August 31, 2021 - (unaudited)
Security Description Shares
Value
(Note 1)
COMMON STOCKS - 96.6%Australia - 2.3%
Qantas Airways, Ltd.� 4,344,254 $16,176,213Brazil - 0.9%
CPFL Energia SA 1,134,000 6,368,717British Virgin Islands - 2.2%
Nomad Foods, Ltd.� 588,933 15,541,942Canada - 1.7%
Home Capital Group, Inc.� 180,300 5,652,015Lundin Mining Corp. 812,650 6,569,992
12,222,007Cayman Islands - 8.7%
Alibaba Group Holding, Ltd.� 540,488 11,501,297China Resources Land, Ltd. 2,130,000 7,928,498Sands China, Ltd.� 3,476,800 11,153,548Topsports International Holdings, Ltd.* 11,779,000 15,569,129Xinyi Glass Holdings, Ltd. 3,700,000 15,556,513
61,708,985China - 5.6%
LONGi Green Energy Technology Co., Ltd., Class A 634,260 8,779,072Midea Group Co., Ltd., Class A 1,369,512 13,984,991Oppein Home Group, Inc., Class A 279,520 6,681,805Shanghai Pharmaceuticals Holding Co., Ltd. 5,146,100 10,216,174
39,662,042Denmark - 2.0%
Danske Bank A/S 859,783 14,449,848France - 4.6%
Cie de Saint-Gobain 259,021 18,775,466Faurecia SE 16,940 814,078Sanofi 122,317 12,654,593
32,244,137Germany - 3.0%
METRO AG 296,336 3,946,859Rheinmetall AG 84,014 8,217,693Siemens AG 50,873 8,460,022Siemens Energy AG� 25,437 738,254
21,362,828India - 3.1%
Copyright © 2021 www.secdatabase.com. All Rights Reserved.Please Consider the Environment Before Printing This Document

Tech Mahindra, Ltd. 1,100,398 21,857,236Ireland - 1.3%
Greencore Group PLC� 4,758,147 9,289,269Israel - 1.0%
Check Point Software Technologies, Ltd.� 56,643 7,116,060Italy - 0.6%
Prysmian SpA 113,798 4,282,278Japan - 11.4%
Daiwa Securities Group, Inc. 1,707,700 9,662,712Hitachi, Ltd. 366,400 20,265,818Mitsubishi UFJ Financial Group, Inc. 3,394,900 18,342,304ORIX Corp. 1,060,900 19,783,087Takeda Pharmaceutical Co., Ltd. 374,200 12,513,583
80,567,504Jersey - 1.4%
Man Group PLC 3,233,734 9,629,819Luxembourg - 4.0%
ArcelorMittal SA 280,740 9,412,485Samsonite International SA�* 8,895,300 18,619,918
28,032,403Netherlands - 7.5%
Koninklijke Philips NV 255,222 11,764,840NN Group NV 371,912 19,308,778OCI NV�# 425,888 10,389,242Stellantis NV 596,832 11,932,144
53,395,004Norway - 2.6%
DNB Bank ASA 881,089 18,606,313South Korea - 7.2%
Coway Co, Ltd. 241,730 16,303,666Hana Financial Group, Inc. 280,730 10,907,660Samsung Electronics Co., Ltd. 214,862 14,213,563SK Telecom Co., Ltd. 35,822 9,206,914
50,631,803Switzerland - 2.9%
Holcim, Ltd. 362,556 20,666,583Thailand - 2.7%
Siam Commercial Bank PCL 5,718,900 18,895,923United Kingdom - 13.2%
ConvaTec Group PLC* 3,211,121 9,950,982Fresnillo PLC 200,705 2,356,522Informa PLC� 1,393,028 10,169,737
Copyright © 2021 www.secdatabase.com. All Rights Reserved.Please Consider the Environment Before Printing This Document
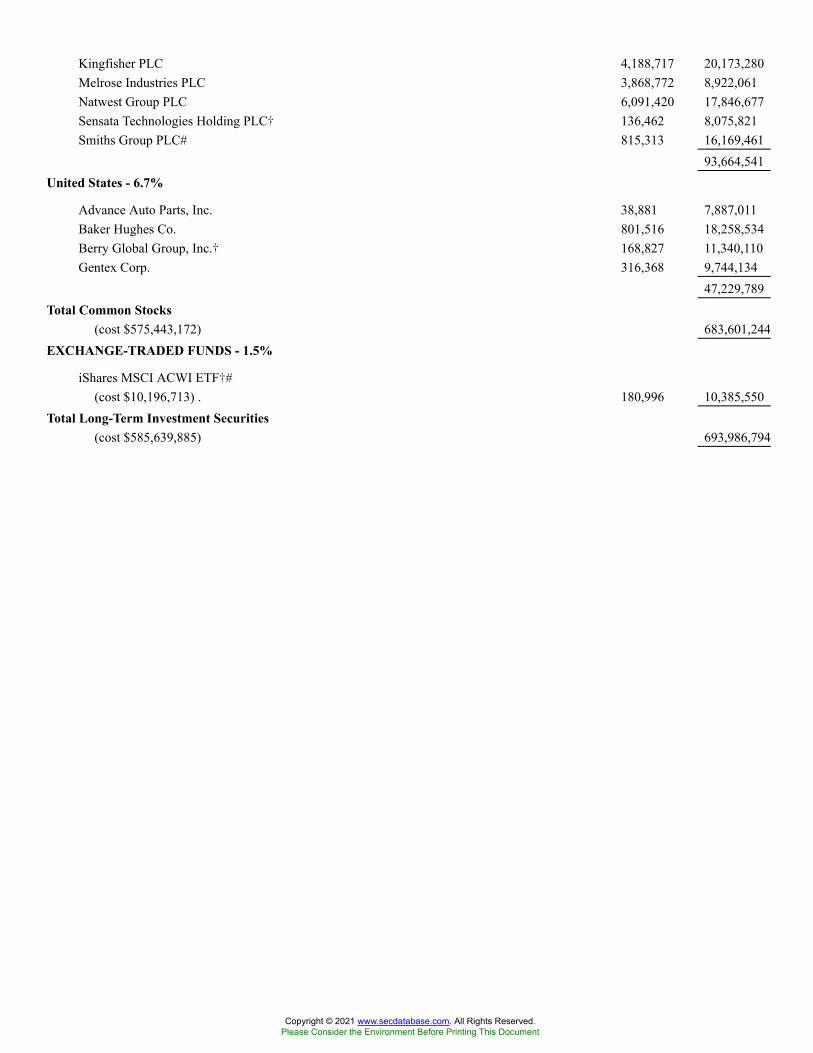
Kingfisher PLC 4,188,717 20,173,280Melrose Industries PLC 3,868,772 8,922,061Natwest Group PLC 6,091,420 17,846,677Sensata Technologies Holding PLC� 136,462 8,075,821Smiths Group PLC# 815,313 16,169,461
93,664,541United States - 6.7%
Advance Auto Parts, Inc. 38,881 7,887,011Baker Hughes Co. 801,516 18,258,534Berry Global Group, Inc.� 168,827 11,340,110Gentex Corp. 316,368 9,744,134
47,229,789Total Common Stocks
(cost $575,443,172) 683,601,244EXCHANGE-TRADED FUNDS - 1.5%
iShares MSCI ACWI ETF�#(cost $10,196,713) . 180,996 10,385,550
Total Long-Term Investment Securities(cost $585,639,885) 693,986,794
Copyright © 2021 www.secdatabase.com. All Rights Reserved.Please Consider the Environment Before Printing This Document

SHORT-TERM INVESTMENT SECURITIES - 2.6%Registered Investment Companies - 2.6%
State Street Institutional U.S. Government Money Market Fund, Premier Class 0.03%(1) 15,394,491 15,394,491State Street Navigator Securities Lending Government Money Market Portfolio 0.03%(1)(2) 3,096,850 3,096,850
Total Short-Term Investment Securities(cost $18,491,341) 18,491,341
TOTAL INVESTMENTS(cost $604,131,226) 100.7 % 712,478,135
Liabilities in excess of other assets (0.7 ) (4,665,513 )NET ASSETS 100.0 % $707,812,622
� Non-income producing security# The security or a portion thereof is out on loan.* Securities exempt from registration under Rule 144A of the Securities Act of 1933. These securities may be sold in transactions
exempt from registration, normally to qualified institutional buyers. The Fund has no right to demand registration of thesesecurities. At August 31, 2021, the aggregate value of these securities was $44,140,029 representing 6.2% of net assets.
(1) The rate shown is the 7-day yield as of August 31, 2021.(2) At August 31, 2021, the Fund had loaned securities with a total value of $3,589,514. This was secured by collateral of $3,096,850,
which was received in cash and subsequently invested in short-term investments currently valued at $3,096,850 as reported in thePortfolio of Investments. Additional collateral of $568,939 was received in the form of fixed income pooled securities, which theFund cannot sell or repledge and accordingly, are not reflected in the Fund�s assets and liabilities. The components of the fixedincome pooled securities referenced above are as follows:
Securities Coupon Range Maturity Date Range
Value as of
August 31, 2021
United States Treasury Notes/Bonds0.13% to 3.00%
09/30/2021 to 08/15/2049 $ 568,939
ETF - Exchange-Traded Funds
Industry Allocation*Banks-Commercial 7.3 %Diversified Banking Institutions 5.1Appliances 4.3Medical-Drugs 3.6Food-Misc./Diversified 3.5Diversified Manufacturing Operations 3.5Communications Software 3.1Medical Products 3.0Machinery-Electrical 2.9Building Products-Cement 2.9Retail-Building Products 2.9Finance-Leasing Companies 2.8Insurance-Life/Health 2.7Building & Construction Products-Misc. 2.7Apparel Manufacturers 2.7Registered Investment Companies 2.6Oil-Field Services 2.6Airlines 2.3
Copyright © 2021 www.secdatabase.com. All Rights Reserved.Please Consider the Environment Before Printing This Document
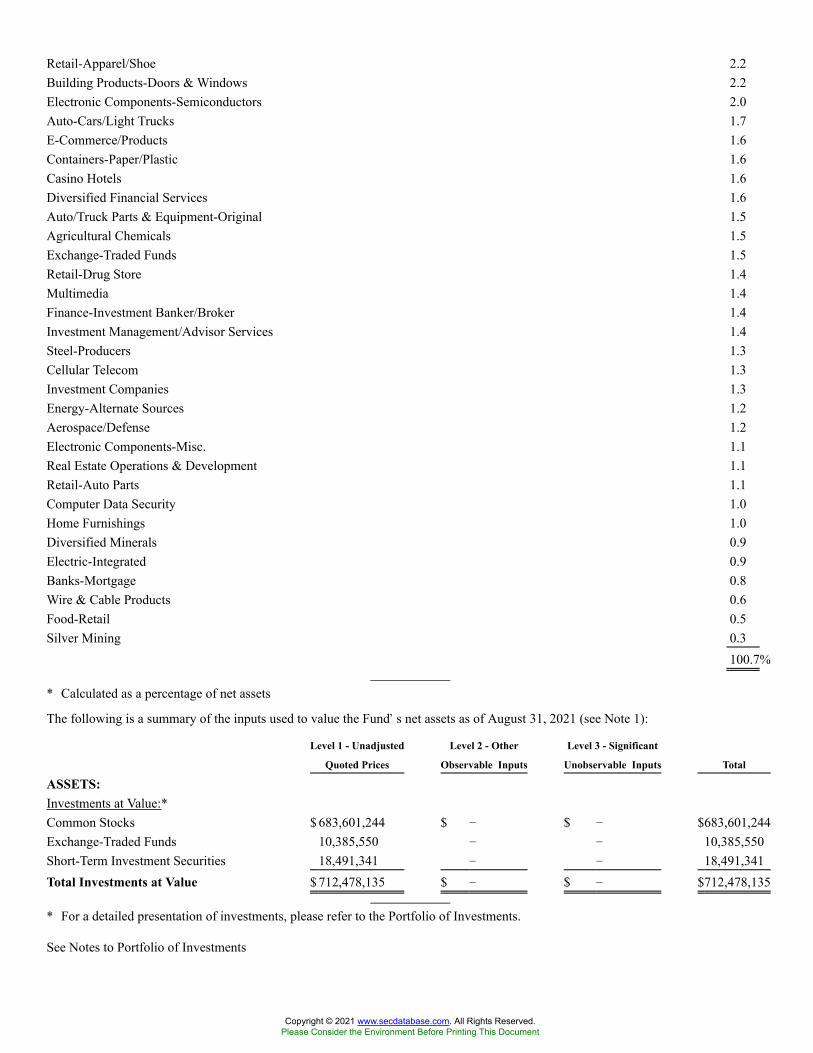
Retail-Apparel/Shoe 2.2Building Products-Doors & Windows 2.2Electronic Components-Semiconductors 2.0Auto-Cars/Light Trucks 1.7E-Commerce/Products 1.6Containers-Paper/Plastic 1.6Casino Hotels 1.6Diversified Financial Services 1.6Auto/Truck Parts & Equipment-Original 1.5Agricultural Chemicals 1.5Exchange-Traded Funds 1.5Retail-Drug Store 1.4Multimedia 1.4Finance-Investment Banker/Broker 1.4Investment Management/Advisor Services 1.4Steel-Producers 1.3Cellular Telecom 1.3Investment Companies 1.3Energy-Alternate Sources 1.2Aerospace/Defense 1.2Electronic Components-Misc. 1.1Real Estate Operations & Development 1.1Retail-Auto Parts 1.1Computer Data Security 1.0Home Furnishings 1.0Diversified Minerals 0.9Electric-Integrated 0.9Banks-Mortgage 0.8Wire & Cable Products 0.6Food-Retail 0.5Silver Mining 0.3
100.7%
* Calculated as a percentage of net assets
The following is a summary of the inputs used to value the Fund�s net assets as of August 31, 2021 (see Note 1):
Level 1 - Unadjusted
Quoted Prices
Level 2 - Other
Observable Inputs
Level 3 - Significant
Unobservable Inputs Total
ASSETS:Investments at Value:*Common Stocks $ 683,601,244 $ � $ � $683,601,244Exchange-Traded Funds 10,385,550 � � 10,385,550Short-Term Investment Securities 18,491,341 � � 18,491,341Total Investments at Value $ 712,478,135 $ � $ � $712,478,135
* For a detailed presentation of investments, please refer to the Portfolio of Investments.
See Notes to Portfolio of Investments
Copyright © 2021 www.secdatabase.com. All Rights Reserved.Please Consider the Environment Before Printing This Document
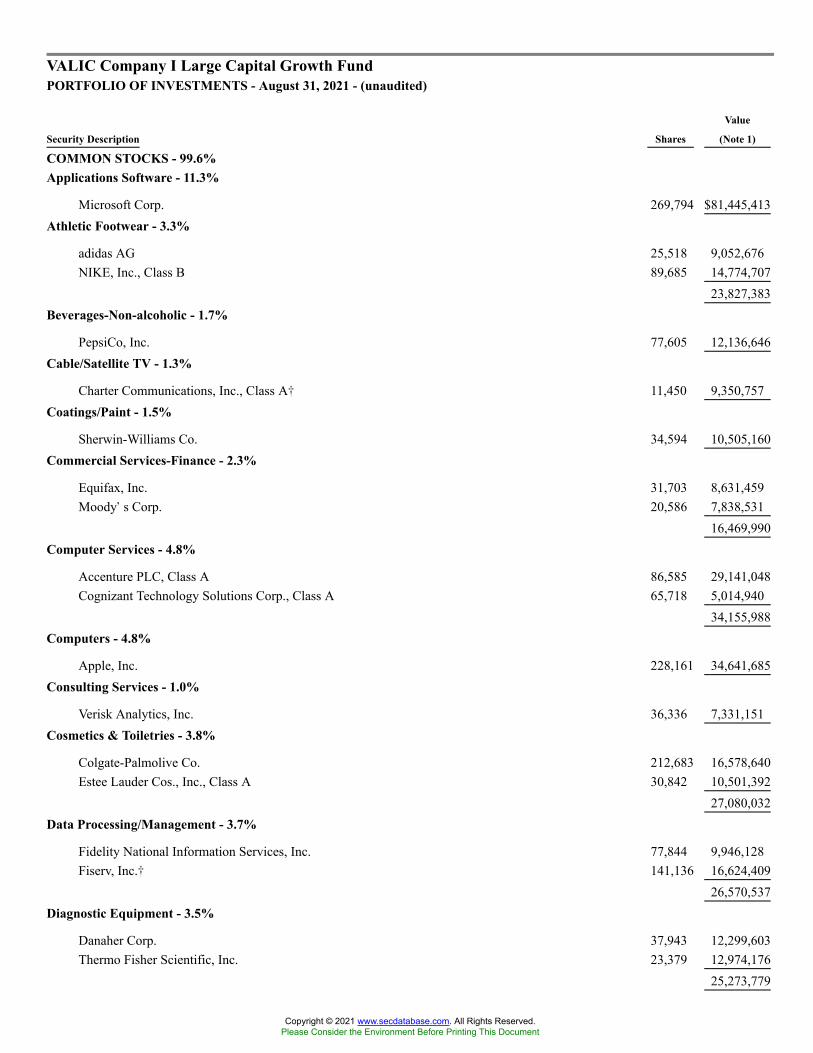
VALIC Company I Large Capital Growth FundPORTFOLIO OF INVESTMENTS - August 31, 2021 - (unaudited)
Security Description Shares
Value
(Note 1)
COMMON STOCKS - 99.6%Applications Software - 11.3%
Microsoft Corp. 269,794 $81,445,413Athletic Footwear - 3.3%
adidas AG 25,518 9,052,676NIKE, Inc., Class B 89,685 14,774,707
23,827,383Beverages-Non-alcoholic - 1.7%
PepsiCo, Inc. 77,605 12,136,646Cable/Satellite TV - 1.3%
Charter Communications, Inc., Class A� 11,450 9,350,757Coatings/Paint - 1.5%
Sherwin-Williams Co. 34,594 10,505,160Commercial Services-Finance - 2.3%
Equifax, Inc. 31,703 8,631,459Moody�s Corp. 20,586 7,838,531
16,469,990Computer Services - 4.8%
Accenture PLC, Class A 86,585 29,141,048Cognizant Technology Solutions Corp., Class A 65,718 5,014,940
34,155,988Computers - 4.8%
Apple, Inc. 228,161 34,641,685Consulting Services - 1.0%
Verisk Analytics, Inc. 36,336 7,331,151Cosmetics & Toiletries - 3.8%
Colgate-Palmolive Co. 212,683 16,578,640Estee Lauder Cos., Inc., Class A 30,842 10,501,392
27,080,032Data Processing/Management - 3.7%
Fidelity National Information Services, Inc. 77,844 9,946,128Fiserv, Inc.� 141,136 16,624,409
26,570,537Diagnostic Equipment - 3.5%
Danaher Corp. 37,943 12,299,603Thermo Fisher Scientific, Inc. 23,379 12,974,176
25,273,779
Copyright © 2021 www.secdatabase.com. All Rights Reserved.Please Consider the Environment Before Printing This Document

Drug Delivery Systems - 1.6%
Becton Dickinson & Co. 46,275 11,647,418E-Commerce/Products - 1.4%
Alibaba Group Holding, Ltd.� 479,352 10,200,356Electric-Integrated - 0.6%
Xcel Energy, Inc. 63,863 4,390,581Electronic Components-Semiconductors - 1.1%
Texas Instruments, Inc. 40,831 7,795,046Electronic Connectors - 3.7%
Amphenol Corp., Class A 203,431 15,588,918TE Connectivity, Ltd. 73,168 10,991,297
26,580,215Electronic Measurement Instruments - 2.1%
Agilent Technologies, Inc. 36,073 6,329,729Fortive Corp. 114,015 8,422,288
14,752,017Entertainment Software - 2.0%
Electronic Arts, Inc. 98,242 14,265,721Finance-Credit Card - 3.8%
Mastercard, Inc., Class A 22,497 7,789,137Visa, Inc., Class A 83,992 19,242,567
27,031,704Finance-Investment Banker/Broker - 1.9%
Charles Schwab Corp. 192,016 13,988,366Insurance Brokers - 4.5%
Aon PLC, Class A 72,392 20,766,369Marsh & McLennan Cos., Inc. 72,613 11,414,764
32,181,133Internet Content-Information/News - 1.0%
Tencent Holdings, Ltd. 111,200 6,880,075Machinery-General Industrial - 1.3%
Otis Worldwide Corp. 100,958 9,310,347Medical Instruments - 3.3%
Boston Scientific Corp.� 378,800 17,102,820Medtronic PLC 52,025 6,944,297
24,047,117Medical Labs & Testing Services - 1.2%
ICON PLC� 35,099 8,977,271Medical Products - 3.8%
Abbott Laboratories 50,447 6,374,987STERIS PLC 35,671 7,669,622
Copyright © 2021 www.secdatabase.com. All Rights Reserved.Please Consider the Environment Before Printing This Document

Stryker Corp. 48,331 13,392,52027,437,129
Medical-Drugs - 0.4%
Roche Holding AG 6,622 2,659,285Pharmacy Services - 0.8%
Cigna Corp. 26,073 5,518,350Private Equity - 0.7%
Blackstone, Inc. 40,137 5,046,425Real Estate Investment Trusts - 2.1%
American Tower Corp. 51,134 14,939,821Retail-Apparel/Shoe - 1.3%
Ross Stores, Inc. 81,078 9,599,635Retail-Discount - 1.7%
Dollarama, Inc. 260,836 11,893,865Retail-Major Department Stores - 1.0%
TJX Cos., Inc. 102,873 7,480,925Retail-Restaurants - 1.3%
Starbucks Corp. 80,466 9,453,950Semiconductor Components-Integrated Circuits - 1.8%
Analog Devices, Inc. 44,841 7,306,841Taiwan Semiconductor Manufacturing Co., Ltd. ADR 45,488 5,413,527
12,720,368Soap & Cleaning Preparation - 1.2%
Church & Dwight Co., Inc. 104,773 8,765,309
Copyright © 2021 www.secdatabase.com. All Rights Reserved.Please Consider the Environment Before Printing This Document
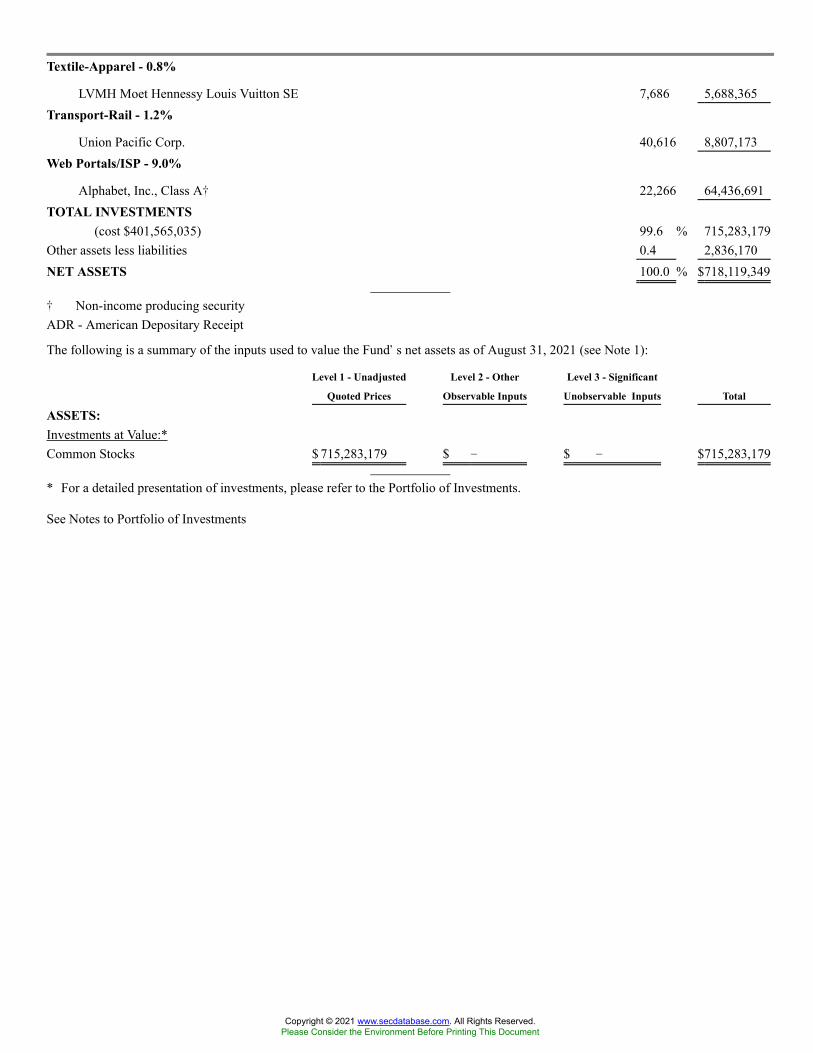
Textile-Apparel - 0.8%
LVMH Moet Hennessy Louis Vuitton SE 7,686 5,688,365Transport-Rail - 1.2%
Union Pacific Corp. 40,616 8,807,173Web Portals/ISP - 9.0%
Alphabet, Inc., Class A� 22,266 64,436,691TOTAL INVESTMENTS
(cost $401,565,035) 99.6 % 715,283,179Other assets less liabilities 0.4 2,836,170NET ASSETS 100.0 % $718,119,349
� Non-income producing securityADR - American Depositary Receipt
The following is a summary of the inputs used to value the Fund�s net assets as of August 31, 2021 (see Note 1):
Level 1 - Unadjusted
Quoted Prices
Level 2 - Other
Observable Inputs
Level 3 - Significant
Unobservable Inputs Total
ASSETS:Investments at Value:*Common Stocks $ 715,283,179 $ � $ � $715,283,179
* For a detailed presentation of investments, please refer to the Portfolio of Investments.
See Notes to Portfolio of Investments
Copyright © 2021 www.secdatabase.com. All Rights Reserved.Please Consider the Environment Before Printing This Document
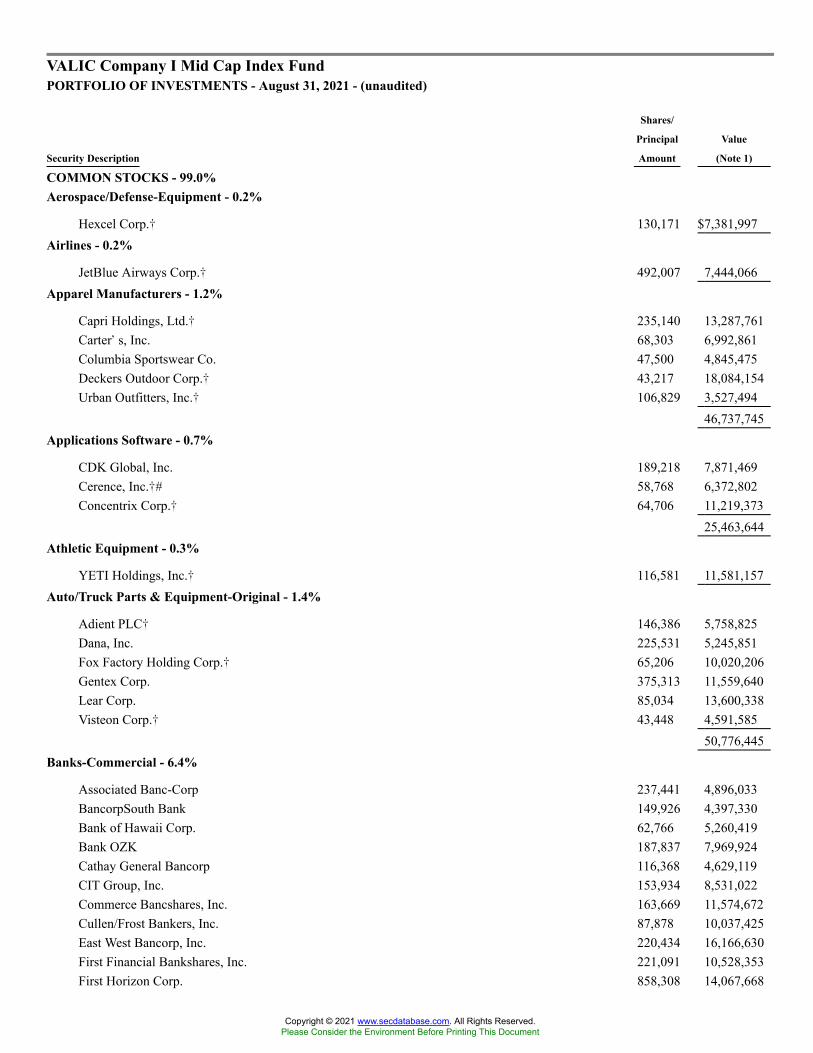
VALIC Company I Mid Cap Index FundPORTFOLIO OF INVESTMENTS - August 31, 2021 - (unaudited)
Security Description
Shares/
Principal
Amount
Value
(Note 1)
COMMON STOCKS - 99.0%Aerospace/Defense-Equipment - 0.2%
Hexcel Corp.� 130,171 $7,381,997Airlines - 0.2%
JetBlue Airways Corp.� 492,007 7,444,066Apparel Manufacturers - 1.2%
Capri Holdings, Ltd.� 235,140 13,287,761Carter�s, Inc. 68,303 6,992,861Columbia Sportswear Co. 47,500 4,845,475Deckers Outdoor Corp.� 43,217 18,084,154Urban Outfitters, Inc.� 106,829 3,527,494
46,737,745Applications Software - 0.7%
CDK Global, Inc. 189,218 7,871,469Cerence, Inc.�# 58,768 6,372,802Concentrix Corp.� 64,706 11,219,373
25,463,644Athletic Equipment - 0.3%
YETI Holdings, Inc.� 116,581 11,581,157Auto/Truck Parts & Equipment-Original - 1.4%
Adient PLC� 146,386 5,758,825Dana, Inc. 225,531 5,245,851Fox Factory Holding Corp.� 65,206 10,020,206Gentex Corp. 375,313 11,559,640Lear Corp. 85,034 13,600,338Visteon Corp.� 43,448 4,591,585
50,776,445Banks-Commercial - 6.4%
Associated Banc-Corp 237,441 4,896,033BancorpSouth Bank 149,926 4,397,330Bank of Hawaii Corp. 62,766 5,260,419Bank OZK 187,837 7,969,924Cathay General Bancorp 116,368 4,629,119CIT Group, Inc. 153,934 8,531,022Commerce Bancshares, Inc. 163,669 11,574,672Cullen/Frost Bankers, Inc. 87,878 10,037,425East West Bancorp, Inc. 220,434 16,166,630First Financial Bankshares, Inc. 221,091 10,528,353First Horizon Corp. 858,308 14,067,668
Copyright © 2021 www.secdatabase.com. All Rights Reserved.Please Consider the Environment Before Printing This Document

FNB Corp. 496,277 5,796,515Fulton Financial Corp. 252,666 4,004,756Glacier Bancorp, Inc. 148,402 7,903,891Hancock Whitney Corp. 134,875 6,198,855Home BancShares, Inc. 235,649 5,219,625International Bancshares Corp. 86,638 3,628,399PacWest Bancorp 181,670 7,730,059Pinnacle Financial Partners, Inc. 118,240 11,459,821Prosperity Bancshares, Inc. 144,414 10,091,650Signature Bank 89,541 23,220,668Synovus Financial Corp. 230,902 9,951,876Texas Capital Bancshares, Inc.� 78,596 5,343,742UMB Financial Corp. 67,557 6,186,870Umpqua Holdings Corp. 342,815 6,674,608United Bankshares, Inc. 208,474 7,573,860Valley National Bancorp 630,685 8,224,132Webster Financial Corp. 140,499 7,098,010Wintrust Financial Corp. 88,631 6,633,144
240,999,076Batteries/Battery Systems - 0.2%
Energizer Holdings, Inc. 90,298 3,552,323EnerSys 66,554 5,629,803
9,182,126Brewery - 0.2%
Boston Beer Co., Inc., Class A� 14,451 8,240,105Building & Construction Products-Misc. - 1.9%
Builders FirstSource, Inc.� 321,855 17,151,653Louisiana-Pacific Corp. 158,886 10,079,728Owens Corning 162,318 15,509,485Simpson Manufacturing Co., Inc. 67,485 7,635,928Trex Co., Inc.� 179,256 19,675,138
70,051,932Building & Construction-Misc. - 0.6%
EMCOR Group, Inc. 84,772 10,299,798TopBuild Corp.� 51,372 11,239,680
21,539,478Building Products-Air & Heating - 0.5%
Lennox International, Inc. 53,417 17,904,310Building Products-Cement - 0.5%
Eagle Materials, Inc. 65,852 10,328,228MDU Resources Group, Inc. 312,627 10,057,210
20,385,438Building-Heavy Construction - 0.3%
Arcosa, Inc. 1 51Dycom Industries, Inc.� 47,826 3,602,732
Copyright © 2021 www.secdatabase.com. All Rights Reserved.Please Consider the Environment Before Printing This Document

MasTec, Inc.� 87,756 8,024,40911,627,192
Building-Mobile Home/Manufactured Housing - 0.3%
Thor Industries, Inc. 86,031 9,758,496Building-Residential/Commercial - 0.7%
KB Home 138,082 5,941,668Taylor Morrison Home Corp.� 200,378 5,628,618Toll Brothers, Inc. 174,454 11,175,523Tri Pointe Homes, Inc.� 184,014 4,374,013
27,119,822Cable/Satellite TV - 0.5%
Cable One, Inc. 8,440 17,720,540Casino Hotels - 0.2%
Boyd Gaming Corp.� 125,394 7,695,430Casino Services - 0.2%
Scientific Games Corp.� 88,082 6,372,733Chemicals-Diversified - 0.3%
Olin Corp. 222,643 11,096,527Chemicals-Specialty - 1.3%
Ashland Global Holdings, Inc. 84,900 7,735,239Cabot Corp. 88,001 4,699,253Chemours Co. 257,203 8,618,872Ingevity Corp.� 62,199 5,000,178Minerals Technologies, Inc. 52,412 4,121,680NewMarket Corp. 11,377 3,978,878Sensient Technologies Corp. 65,696 5,705,698
Copyright © 2021 www.secdatabase.com. All Rights Reserved.Please Consider the Environment Before Printing This Document

Valvoline, Inc. 281,368 8,486,05948,345,857
Coatings/Paint - 0.4%
RPM International, Inc. 201,241 16,560,122Commercial Services - 0.7%
GXO Logistics, Inc.� 157,960 12,919,548John Wiley & Sons, Inc., Class A 67,655 3,930,755LiveRamp Holdings, Inc.� 106,303 5,208,847Progyny, Inc.� 57,773 3,227,778WW International, Inc.� 74,537 1,613,726
26,900,654Commercial Services-Finance - 0.7%
H&R Block, Inc. 281,917 7,231,171Sabre Corp.�# 496,400 5,574,572WEX, Inc.� 69,521 12,761,970
25,567,713Computer Aided Design - 0.4%
Aspen Technology, Inc.� 105,685 13,686,208Computer Data Security - 0.2%
Qualys, Inc.� 52,306 6,139,678Computer Services - 1.3%
CACI International, Inc., Class A� 36,595 9,424,676Genpact, Ltd. 270,687 14,043,242KBR, Inc. 219,631 8,552,431MAXIMUS, Inc. 95,519 8,318,750Science Applications International Corp. 90,074 7,586,933
47,926,032Computer Software - 0.7%
Envestnet, Inc.� 84,565 6,754,207J2 Global, Inc.� 65,937 9,079,525Teradata Corp.� 170,302 9,313,816
25,147,548Computers-Integrated Systems - 0.3%
NCR Corp.� 203,399 8,640,390NetScout Systems, Inc.� 114,601 3,142,359
11,782,749Computers-Other - 0.3%
Lumentum Holdings, Inc.� 117,937 10,218,062Consulting Services - 0.3%
FTI Consulting, Inc.� 53,174 7,428,939R1 RCM, Inc.� 214,769 4,235,245
11,664,184Consumer Products-Misc. - 0.2%
Copyright © 2021 www.secdatabase.com. All Rights Reserved.Please Consider the Environment Before Printing This Document

Helen of Troy, Ltd.� 37,992 9,087,306Containers-Metal/Glass - 0.2%
Greif, Inc., Class A 41,216 2,609,797Silgan Holdings, Inc. 121,796 5,167,804
7,777,601
Copyright © 2021 www.secdatabase.com. All Rights Reserved.Please Consider the Environment Before Printing This Document
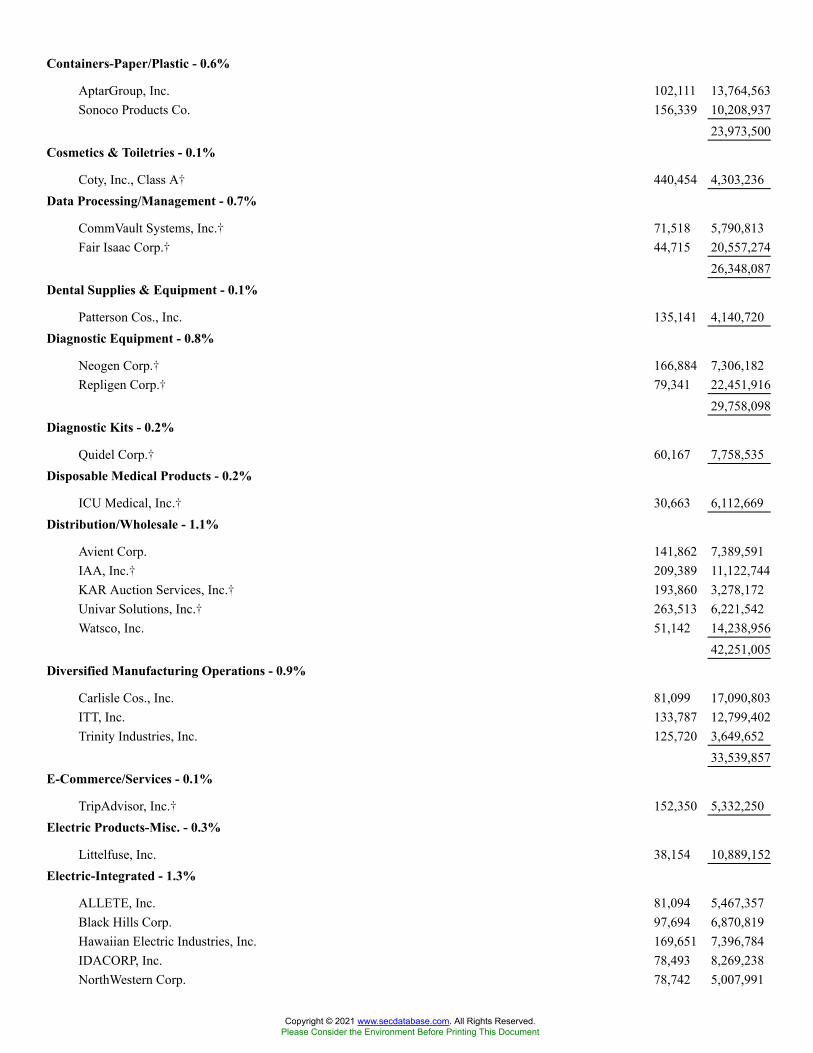
Containers-Paper/Plastic - 0.6%
AptarGroup, Inc. 102,111 13,764,563Sonoco Products Co. 156,339 10,208,937
23,973,500Cosmetics & Toiletries - 0.1%
Coty, Inc., Class A� 440,454 4,303,236Data Processing/Management - 0.7%
CommVault Systems, Inc.� 71,518 5,790,813Fair Isaac Corp.� 44,715 20,557,274
26,348,087Dental Supplies & Equipment - 0.1%
Patterson Cos., Inc. 135,141 4,140,720Diagnostic Equipment - 0.8%
Neogen Corp.� 166,884 7,306,182Repligen Corp.� 79,341 22,451,916
29,758,098Diagnostic Kits - 0.2%
Quidel Corp.� 60,167 7,758,535Disposable Medical Products - 0.2%
ICU Medical, Inc.� 30,663 6,112,669Distribution/Wholesale - 1.1%
Avient Corp. 141,862 7,389,591IAA, Inc.� 209,389 11,122,744KAR Auction Services, Inc.� 193,860 3,278,172Univar Solutions, Inc.� 263,513 6,221,542Watsco, Inc. 51,142 14,238,956
42,251,005Diversified Manufacturing Operations - 0.9%
Carlisle Cos., Inc. 81,099 17,090,803ITT, Inc. 133,787 12,799,402Trinity Industries, Inc. 125,720 3,649,652
33,539,857E-Commerce/Services - 0.1%
TripAdvisor, Inc.� 152,350 5,332,250Electric Products-Misc. - 0.3%
Littelfuse, Inc. 38,154 10,889,152Electric-Integrated - 1.3%
ALLETE, Inc. 81,094 5,467,357Black Hills Corp. 97,694 6,870,819Hawaiian Electric Industries, Inc. 169,651 7,396,784IDACORP, Inc. 78,493 8,269,238NorthWestern Corp. 78,742 5,007,991
Copyright © 2021 www.secdatabase.com. All Rights Reserved.Please Consider the Environment Before Printing This Document
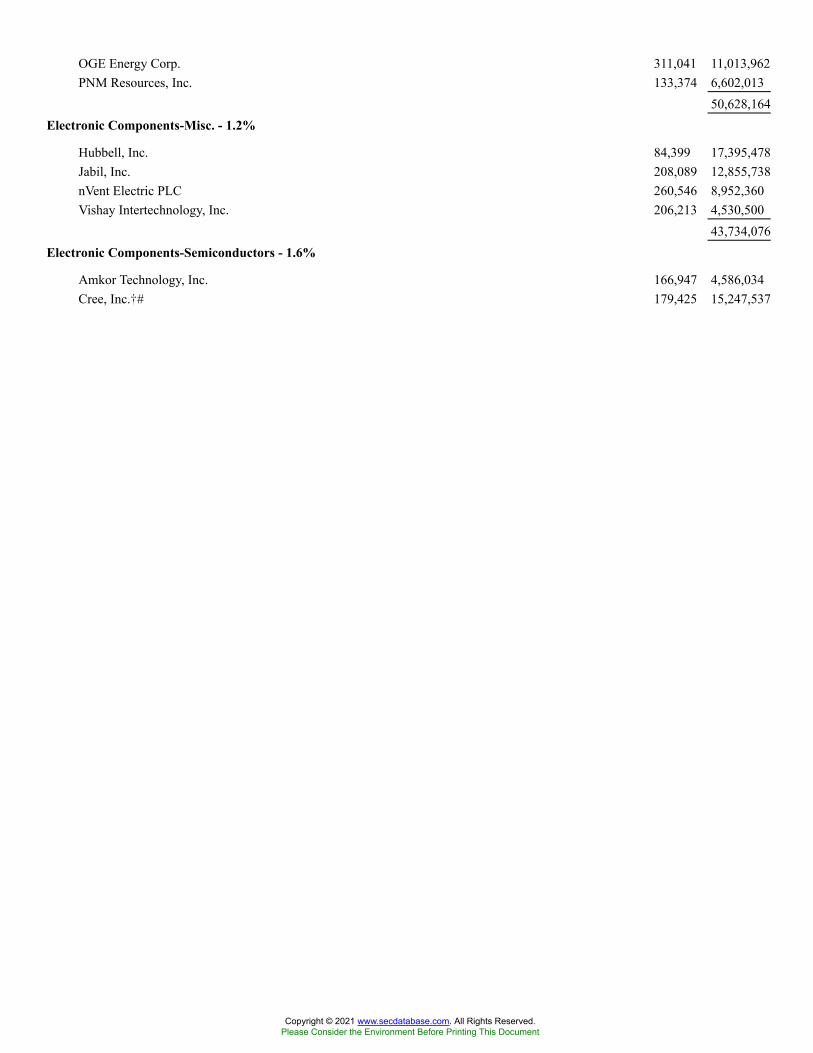
OGE Energy Corp. 311,041 11,013,962PNM Resources, Inc. 133,374 6,602,013
50,628,164Electronic Components-Misc. - 1.2%
Hubbell, Inc. 84,399 17,395,478Jabil, Inc. 208,089 12,855,738nVent Electric PLC 260,546 8,952,360Vishay Intertechnology, Inc. 206,213 4,530,500
43,734,076Electronic Components-Semiconductors - 1.6%
Amkor Technology, Inc. 166,947 4,586,034Cree, Inc.�# 179,425 15,247,537
Copyright © 2021 www.secdatabase.com. All Rights Reserved.Please Consider the Environment Before Printing This Document
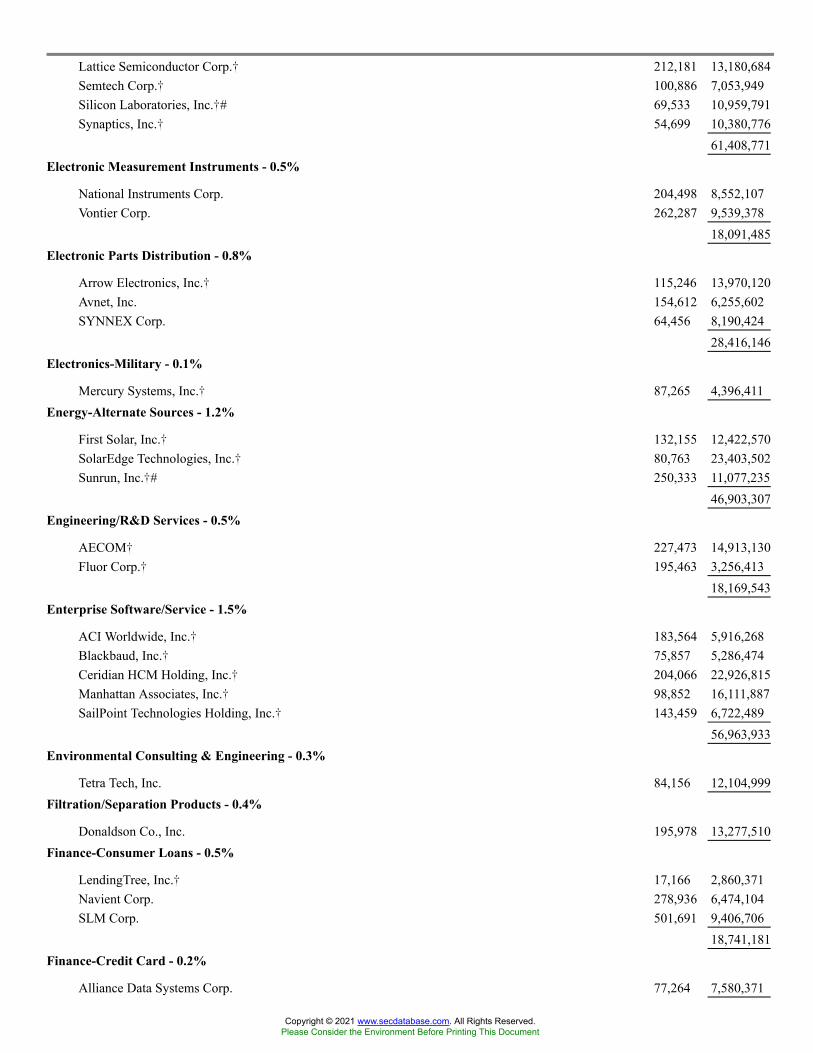
Lattice Semiconductor Corp.� 212,181 13,180,684Semtech Corp.� 100,886 7,053,949Silicon Laboratories, Inc.�# 69,533 10,959,791Synaptics, Inc.� 54,699 10,380,776
61,408,771Electronic Measurement Instruments - 0.5%
National Instruments Corp. 204,498 8,552,107Vontier Corp. 262,287 9,539,378
18,091,485Electronic Parts Distribution - 0.8%
Arrow Electronics, Inc.� 115,246 13,970,120Avnet, Inc. 154,612 6,255,602SYNNEX Corp. 64,456 8,190,424
28,416,146Electronics-Military - 0.1%
Mercury Systems, Inc.� 87,265 4,396,411Energy-Alternate Sources - 1.2%
First Solar, Inc.� 132,155 12,422,570SolarEdge Technologies, Inc.� 80,763 23,403,502Sunrun, Inc.�# 250,333 11,077,235
46,903,307Engineering/R&D Services - 0.5%
AECOM� 227,473 14,913,130Fluor Corp.� 195,463 3,256,413
18,169,543Enterprise Software/Service - 1.5%
ACI Worldwide, Inc.� 183,564 5,916,268Blackbaud, Inc.� 75,857 5,286,474Ceridian HCM Holding, Inc.� 204,066 22,926,815Manhattan Associates, Inc.� 98,852 16,111,887SailPoint Technologies Holding, Inc.� 143,459 6,722,489
56,963,933Environmental Consulting & Engineering - 0.3%
Tetra Tech, Inc. 84,156 12,104,999Filtration/Separation Products - 0.4%
Donaldson Co., Inc. 195,978 13,277,510Finance-Consumer Loans - 0.5%
LendingTree, Inc.� 17,166 2,860,371Navient Corp. 278,936 6,474,104SLM Corp. 501,691 9,406,706
18,741,181Finance-Credit Card - 0.2%
Alliance Data Systems Corp. 77,264 7,580,371
Copyright © 2021 www.secdatabase.com. All Rights Reserved.Please Consider the Environment Before Printing This Document
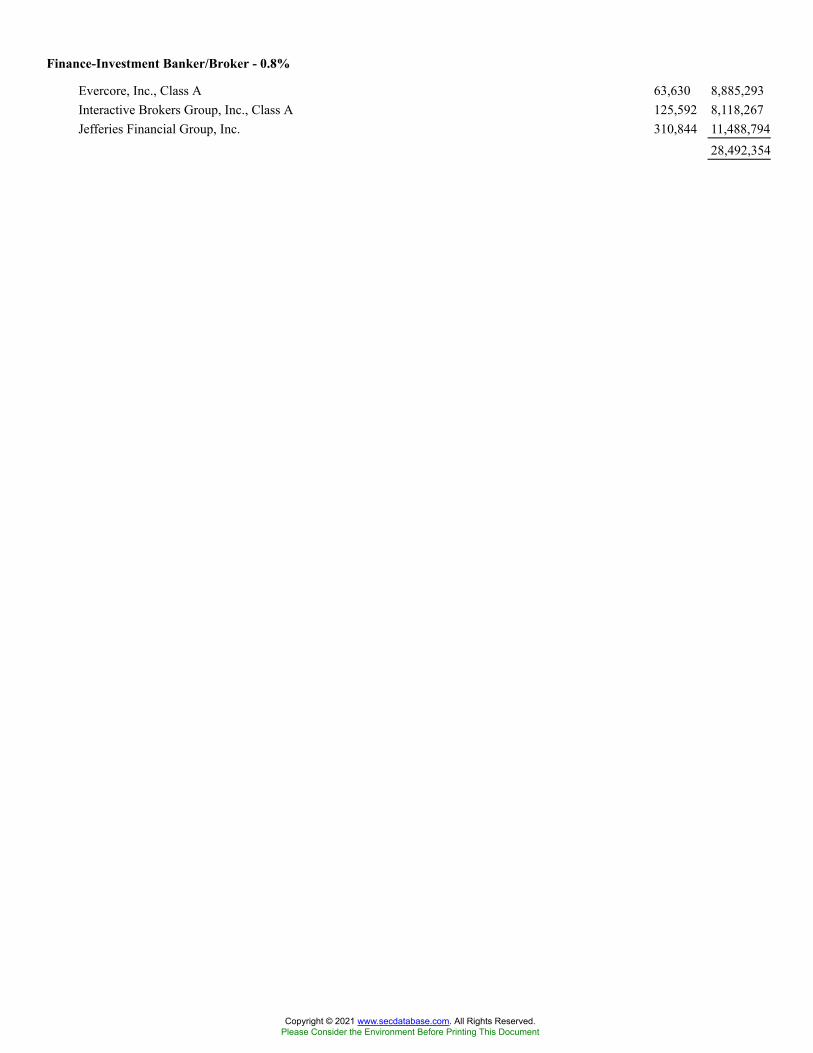
Finance-Investment Banker/Broker - 0.8%
Evercore, Inc., Class A 63,630 8,885,293Interactive Brokers Group, Inc., Class A 125,592 8,118,267Jefferies Financial Group, Inc. 310,844 11,488,794
28,492,354
Copyright © 2021 www.secdatabase.com. All Rights Reserved.Please Consider the Environment Before Printing This Document
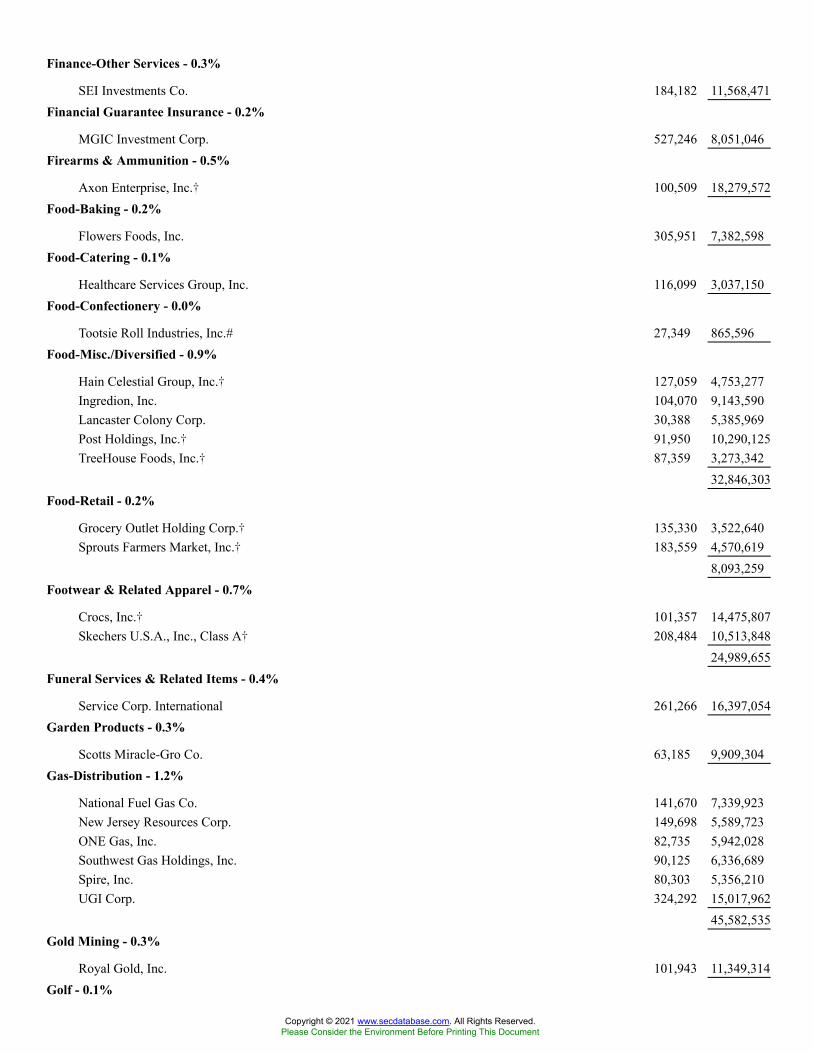
Finance-Other Services - 0.3%
SEI Investments Co. 184,182 11,568,471Financial Guarantee Insurance - 0.2%
MGIC Investment Corp. 527,246 8,051,046Firearms & Ammunition - 0.5%
Axon Enterprise, Inc.� 100,509 18,279,572Food-Baking - 0.2%
Flowers Foods, Inc. 305,951 7,382,598Food-Catering - 0.1%
Healthcare Services Group, Inc. 116,099 3,037,150Food-Confectionery - 0.0%
Tootsie Roll Industries, Inc.# 27,349 865,596Food-Misc./Diversified - 0.9%
Hain Celestial Group, Inc.� 127,059 4,753,277Ingredion, Inc. 104,070 9,143,590Lancaster Colony Corp. 30,388 5,385,969Post Holdings, Inc.� 91,950 10,290,125TreeHouse Foods, Inc.� 87,359 3,273,342
32,846,303Food-Retail - 0.2%
Grocery Outlet Holding Corp.� 135,330 3,522,640Sprouts Farmers Market, Inc.� 183,559 4,570,619
8,093,259Footwear & Related Apparel - 0.7%
Crocs, Inc.� 101,357 14,475,807Skechers U.S.A., Inc., Class A� 208,484 10,513,848
24,989,655Funeral Services & Related Items - 0.4%
Service Corp. International 261,266 16,397,054Garden Products - 0.3%
Scotts Miracle-Gro Co. 63,185 9,909,304Gas-Distribution - 1.2%
National Fuel Gas Co. 141,670 7,339,923New Jersey Resources Corp. 149,698 5,589,723ONE Gas, Inc. 82,735 5,942,028Southwest Gas Holdings, Inc. 90,125 6,336,689Spire, Inc. 80,303 5,356,210UGI Corp. 324,292 15,017,962
45,582,535Gold Mining - 0.3%
Royal Gold, Inc. 101,943 11,349,314Golf - 0.1%
Copyright © 2021 www.secdatabase.com. All Rights Reserved.Please Consider the Environment Before Printing This Document

Callaway Golf Co.� 180,780 5,072,687Hazardous Waste Disposal - 0.5%
Clean Harbors, Inc.� 78,003 8,004,668Stericycle, Inc.� 142,583 9,923,777
17,928,445Health Care Cost Containment - 0.2%
HealthEquity, Inc.� 129,555 8,313,544Home Furnishings - 0.5%
Herman Miller, Inc. 114,609 4,817,016Tempur Sealy International, Inc. 284,611 12,722,112
17,539,128
Copyright © 2021 www.secdatabase.com. All Rights Reserved.Please Consider the Environment Before Printing This Document

Hotels/Motels - 0.6%
Choice Hotels International, Inc. 44,893 5,358,428Travel & Leisure Co. 133,915 7,333,185Wyndham Hotels & Resorts, Inc. 145,128 10,550,806
23,242,419Human Resources - 1.1%
ASGN, Inc.� 82,665 9,274,186Insperity, Inc. 55,889 6,166,792ManpowerGroup, Inc. 84,725 10,287,310Paylocity Holding Corp.� 58,410 15,723,972
41,452,260Industrial Automated/Robotic - 0.9%
Cognex Corp. 274,422 24,319,278Colfax Corp.� 183,307 8,829,898
33,149,176Instruments-Controls - 0.3%
Woodward, Inc. 91,104 11,018,118Insurance Brokers - 0.6%
Brown & Brown, Inc. 363,498 21,101,059Insurance-Life/Health - 0.6%
Brighthouse Financial, Inc.� 133,311 6,526,906CNO Financial Group, Inc. 204,436 5,000,505Primerica, Inc. 61,281 9,372,316
20,899,727Insurance-Multi-line - 0.6%
American Financial Group, Inc. 107,109 14,774,615Kemper Corp. 94,308 6,469,529
21,244,144Insurance-Property/Casualty - 1.8%
Alleghany Corp.� 21,640 14,643,572First American Financial Corp. 170,521 12,026,846Hanover Insurance Group, Inc. 55,779 7,882,130Kinsale Capital Group, Inc. 33,320 6,059,242Mercury General Corp. 41,298 2,465,904Old Republic International Corp. 440,389 11,450,114RLI Corp. 61,810 6,751,506Selective Insurance Group, Inc. 93,269 7,794,490
69,073,804Insurance-Reinsurance - 0.9%
Essent Group, Ltd. 175,354 8,255,666Reinsurance Group of America, Inc. 105,639 12,235,109RenaissanceRe Holdings, Ltd. 77,130 12,088,585
32,579,360
Copyright © 2021 www.secdatabase.com. All Rights Reserved.Please Consider the Environment Before Printing This Document

Internet Content-Information/News - 0.1%
Yelp, Inc.� 108,813 4,190,389Internet Security - 0.2%
Mimecast, Ltd.� 92,149 6,432,922Investment Management/Advisor Services - 1.0%
Affiliated Managers Group, Inc. 64,697 11,005,607Federated Hermes, Inc. 145,369 4,917,833Janus Henderson Group PLC 265,128 11,495,950Stifel Financial Corp. 163,294 11,283,615
38,703,005Lasers-System/Components - 0.5%
Coherent, Inc.� 38,117 9,631,022II-VI, Inc.�# 162,974 10,264,103
19,895,125Lighting Products & Systems - 0.6%
Acuity Brands, Inc. 55,480 10,237,724Universal Display Corp. 66,657 13,903,984
24,141,708Machine Tools & Related Products - 0.5%
Kennametal, Inc. 129,901 4,829,719Lincoln Electric Holdings, Inc. 92,513 12,915,740
17,745,459Machinery-Construction & Mining - 0.5%
Oshkosh Corp. 106,620 12,216,520Terex Corp. 108,459 5,536,832
17,753,352Machinery-Electrical - 0.2%
Regal Beloit Corp. 63,133 9,433,333Machinery-Farming - 0.8%
AGCO Corp. 96,009 13,212,759Toro Co. 166,360 18,289,618
31,502,377Machinery-General Industrial - 1.2%
Crane Co. 77,145 7,851,047Middleby Corp.� 86,443 15,813,882Nordson Corp. 83,972 20,035,719
43,700,648Machinery-Pumps - 1.0%
Curtiss-Wright Corp. 63,612 7,746,670Flowserve Corp. 202,490 7,870,786Graco, Inc. 263,277 20,646,182
36,263,638
Copyright © 2021 www.secdatabase.com. All Rights Reserved.Please Consider the Environment Before Printing This Document
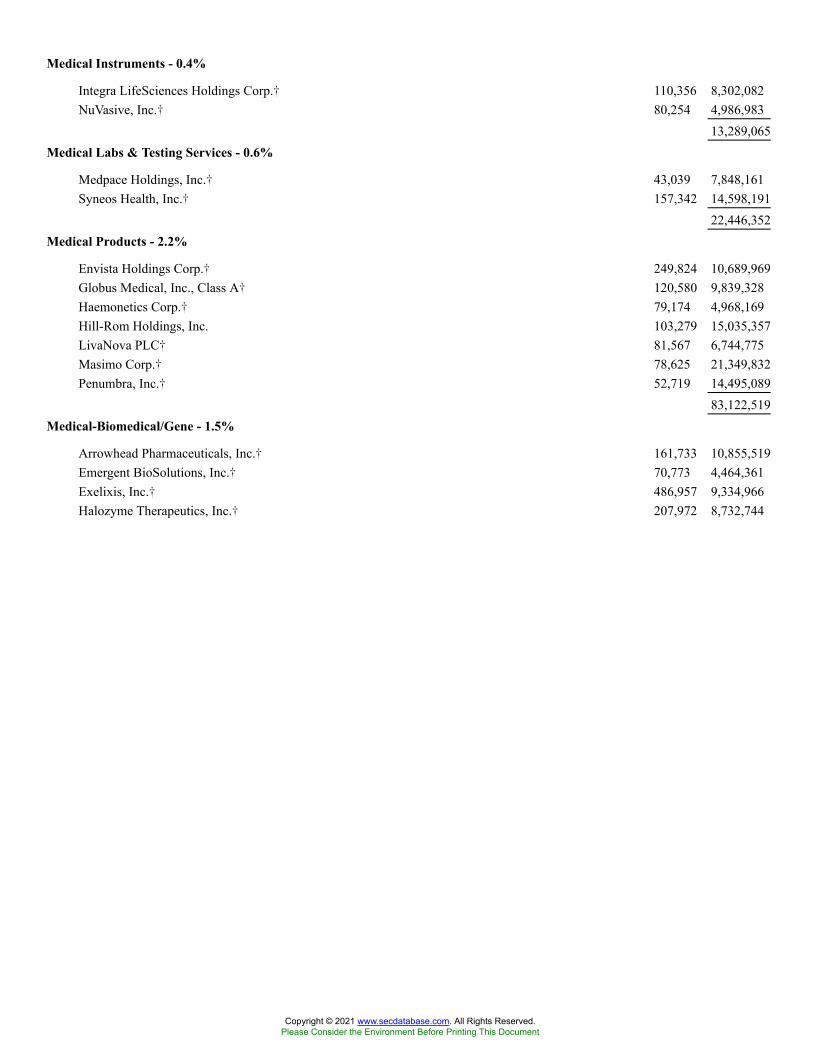
Medical Instruments - 0.4%
Integra LifeSciences Holdings Corp.� 110,356 8,302,082NuVasive, Inc.� 80,254 4,986,983
13,289,065Medical Labs & Testing Services - 0.6%
Medpace Holdings, Inc.� 43,039 7,848,161Syneos Health, Inc.� 157,342 14,598,191
22,446,352Medical Products - 2.2%
Envista Holdings Corp.� 249,824 10,689,969Globus Medical, Inc., Class A� 120,580 9,839,328Haemonetics Corp.� 79,174 4,968,169Hill-Rom Holdings, Inc. 103,279 15,035,357LivaNova PLC� 81,567 6,744,775Masimo Corp.� 78,625 21,349,832Penumbra, Inc.� 52,719 14,495,089
83,122,519Medical-Biomedical/Gene - 1.5%
Arrowhead Pharmaceuticals, Inc.� 161,733 10,855,519Emergent BioSolutions, Inc.� 70,773 4,464,361Exelixis, Inc.� 486,957 9,334,966Halozyme Therapeutics, Inc.� 207,972 8,732,744
Copyright © 2021 www.secdatabase.com. All Rights Reserved.Please Consider the Environment Before Printing This Document

Ligand Pharmaceuticals, Inc.� 25,875 3,423,262Nektar Therapeutics� 283,281 4,385,190United Therapeutics Corp.� 69,606 14,956,937
56,152,979Medical-Drugs - 0.3%
Jazz Pharmaceuticals PLC� 93,381 12,299,212Medical-HMO - 0.6%
Molina Healthcare, Inc.� 90,745 24,389,534Medical-Hospitals - 0.6%
Acadia Healthcare Co., Inc.� 139,441 9,219,839Tenet Healthcare Corp.� 165,936 12,503,278
21,723,117Medical-Outpatient/Home Medical - 0.8%
Amedisys, Inc.� 50,612 9,284,771Chemed Corp. 24,784 11,814,533LHC Group, Inc.� 49,204 9,189,339
30,288,643Metal Processors & Fabrication - 0.2%
Timken Co. 106,259 7,814,287Metal Products-Distribution - 0.1%
Worthington Industries, Inc. 54,345 3,149,293Motorcycle/Motor Scooter - 0.2%
Harley-Davidson, Inc. 238,774 9,438,736Multilevel Direct Selling - 0.1%
Nu Skin Enterprises, Inc., Class A 77,758 3,936,110Multimedia - 0.6%
FactSet Research Systems, Inc. 58,817 22,363,400Office Automation & Equipment - 0.1%
Xerox Holdings Corp. 250,536 5,639,565Oil Companies-Exploration & Production - 0.6%
Cimarex Energy Co. 159,774 10,260,686CNX Resources Corp.� 342,267 3,888,153EQT Corp.� 433,688 7,949,501
22,098,340Oil Companies-Integrated - 0.1%
Murphy Oil Corp. 225,519 4,794,534Oil Refining & Marketing - 0.2%
HollyFrontier Corp. 232,219 7,507,640Oil-Field Services - 0.2%
ChampionX Corp.� 290,953 6,787,933Optical Supplies - 0.3%
Copyright © 2021 www.secdatabase.com. All Rights Reserved.Please Consider the Environment Before Printing This Document
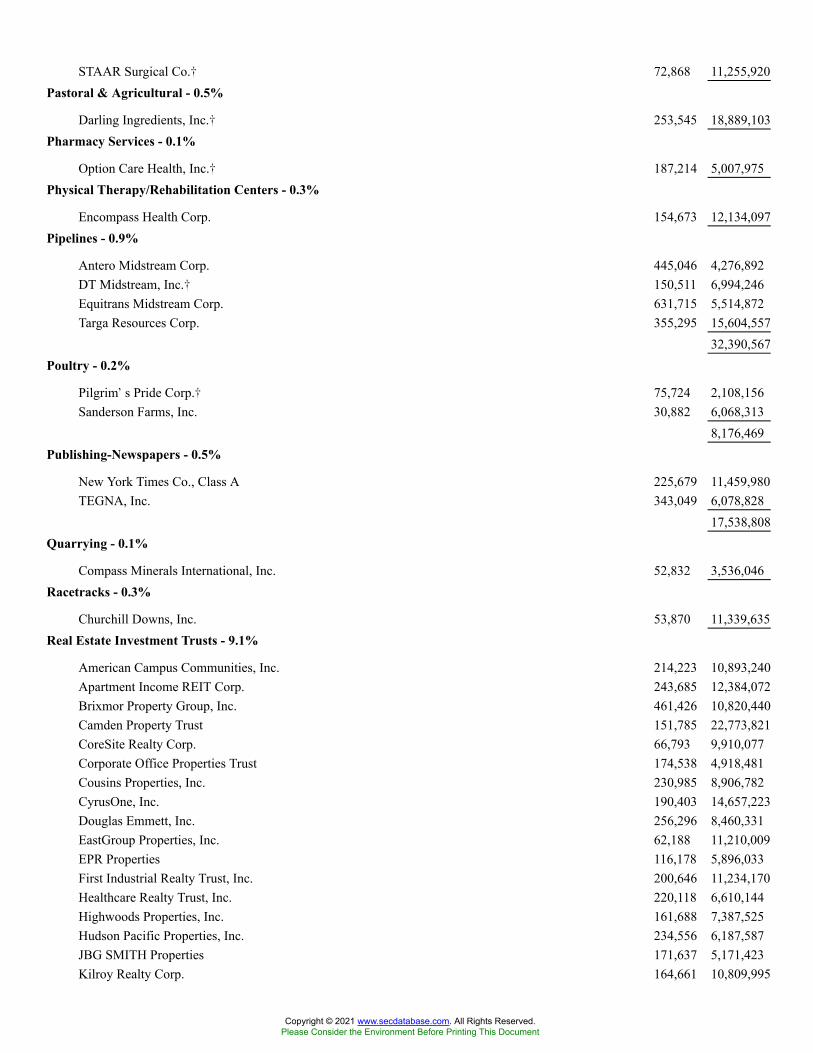
STAAR Surgical Co.� 72,868 11,255,920Pastoral & Agricultural - 0.5%
Darling Ingredients, Inc.� 253,545 18,889,103Pharmacy Services - 0.1%
Option Care Health, Inc.� 187,214 5,007,975Physical Therapy/Rehabilitation Centers - 0.3%
Encompass Health Corp. 154,673 12,134,097Pipelines - 0.9%
Antero Midstream Corp. 445,046 4,276,892DT Midstream, Inc.� 150,511 6,994,246Equitrans Midstream Corp. 631,715 5,514,872Targa Resources Corp. 355,295 15,604,557
32,390,567Poultry - 0.2%
Pilgrim�s Pride Corp.� 75,724 2,108,156Sanderson Farms, Inc. 30,882 6,068,313
8,176,469Publishing-Newspapers - 0.5%
New York Times Co., Class A 225,679 11,459,980TEGNA, Inc. 343,049 6,078,828
17,538,808Quarrying - 0.1%
Compass Minerals International, Inc. 52,832 3,536,046Racetracks - 0.3%
Churchill Downs, Inc. 53,870 11,339,635Real Estate Investment Trusts - 9.1%
American Campus Communities, Inc. 214,223 10,893,240Apartment Income REIT Corp. 243,685 12,384,072Brixmor Property Group, Inc. 461,426 10,820,440Camden Property Trust 151,785 22,773,821CoreSite Realty Corp. 66,793 9,910,077Corporate Office Properties Trust 174,538 4,918,481Cousins Properties, Inc. 230,985 8,906,782CyrusOne, Inc. 190,403 14,657,223Douglas Emmett, Inc. 256,296 8,460,331EastGroup Properties, Inc. 62,188 11,210,009EPR Properties 116,178 5,896,033First Industrial Realty Trust, Inc. 200,646 11,234,170Healthcare Realty Trust, Inc. 220,118 6,610,144Highwoods Properties, Inc. 161,688 7,387,525Hudson Pacific Properties, Inc. 234,556 6,187,587JBG SMITH Properties 171,637 5,171,423Kilroy Realty Corp. 164,661 10,809,995
Copyright © 2021 www.secdatabase.com. All Rights Reserved.Please Consider the Environment Before Printing This Document

Lamar Advertising Co., Class A 134,703 15,333,242Life Storage, Inc. 119,421 14,860,749Macerich Co. 259,928 4,439,570Medical Properties Trust, Inc. 913,975 18,718,208National Retail Properties, Inc. 272,825 12,989,198National Storage Affiliates Trust 120,765 6,913,796Omega Healthcare Investors, Inc. 365,714 12,262,390Park Hotels & Resorts, Inc.� 367,472 7,033,414Pebblebrook Hotel Trust 204,153 4,497,491Physicians Realty Trust 334,807 6,197,278PotlatchDeltic Corp. 104,174 5,411,839PS Business Parks, Inc. 31,226 4,909,664Rayonier, Inc. 216,032 7,945,657Rexford Industrial Realty, Inc. 208,312 12,900,762Sabra Health Care REIT, Inc. 335,523 5,368,368SL Green Realty Corp.# 107,765 7,552,171Spirit Realty Capital, Inc. 178,634 9,247,882
Copyright © 2021 www.secdatabase.com. All Rights Reserved.Please Consider the Environment Before Printing This Document
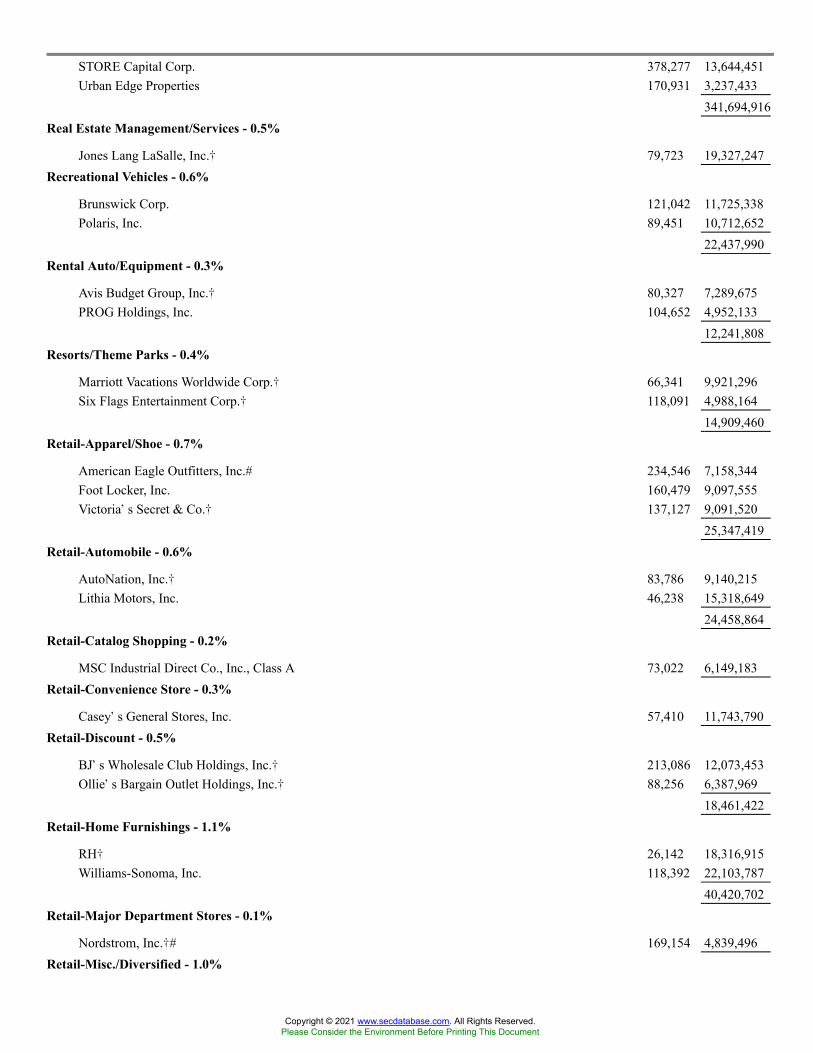
STORE Capital Corp. 378,277 13,644,451Urban Edge Properties 170,931 3,237,433
341,694,916Real Estate Management/Services - 0.5%
Jones Lang LaSalle, Inc.� 79,723 19,327,247Recreational Vehicles - 0.6%
Brunswick Corp. 121,042 11,725,338Polaris, Inc. 89,451 10,712,652
22,437,990Rental Auto/Equipment - 0.3%
Avis Budget Group, Inc.� 80,327 7,289,675PROG Holdings, Inc. 104,652 4,952,133
12,241,808Resorts/Theme Parks - 0.4%
Marriott Vacations Worldwide Corp.� 66,341 9,921,296Six Flags Entertainment Corp.� 118,091 4,988,164
14,909,460Retail-Apparel/Shoe - 0.7%
American Eagle Outfitters, Inc.# 234,546 7,158,344Foot Locker, Inc. 160,479 9,097,555Victoria�s Secret & Co.� 137,127 9,091,520
25,347,419Retail-Automobile - 0.6%
AutoNation, Inc.� 83,786 9,140,215Lithia Motors, Inc. 46,238 15,318,649
24,458,864Retail-Catalog Shopping - 0.2%
MSC Industrial Direct Co., Inc., Class A 73,022 6,149,183Retail-Convenience Store - 0.3%
Casey�s General Stores, Inc. 57,410 11,743,790Retail-Discount - 0.5%
BJ�s Wholesale Club Holdings, Inc.� 213,086 12,073,453Ollie�s Bargain Outlet Holdings, Inc.� 88,256 6,387,969
18,461,422Retail-Home Furnishings - 1.1%
RH� 26,142 18,316,915Williams-Sonoma, Inc. 118,392 22,103,787
40,420,702Retail-Major Department Stores - 0.1%
Nordstrom, Inc.�# 169,154 4,839,496Retail-Misc./Diversified - 1.0%
Copyright © 2021 www.secdatabase.com. All Rights Reserved.Please Consider the Environment Before Printing This Document
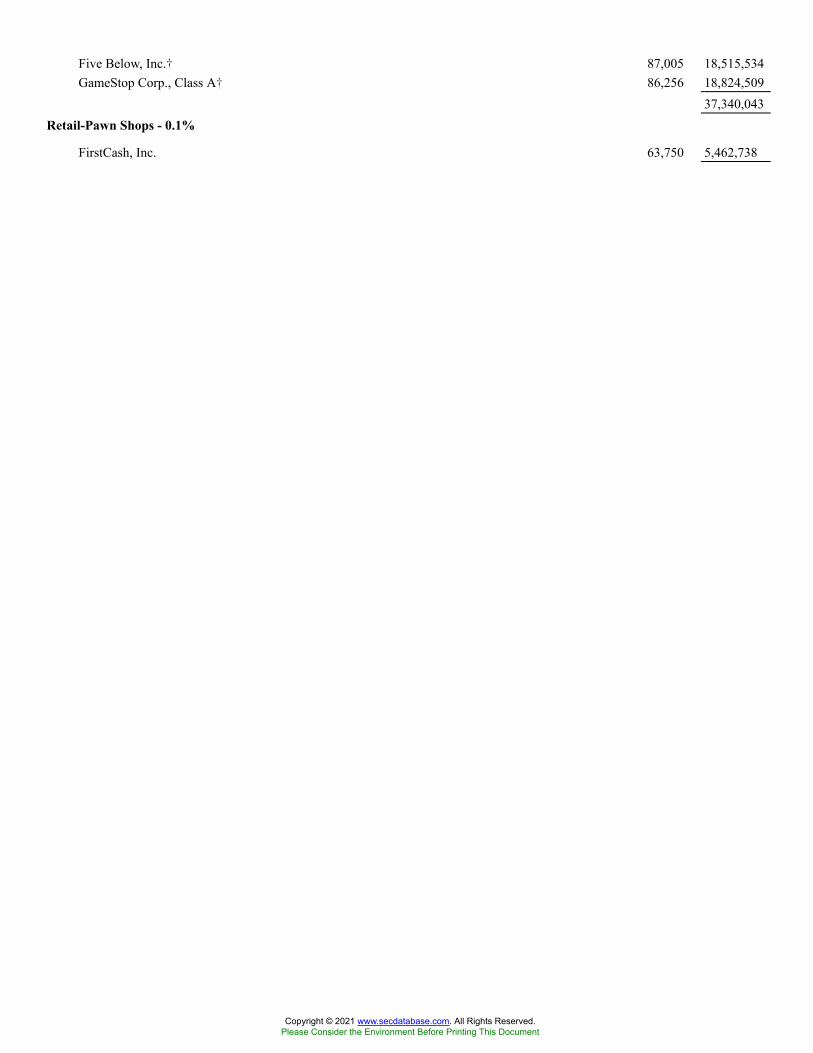
Five Below, Inc.� 87,005 18,515,534GameStop Corp., Class A� 86,256 18,824,509
37,340,043Retail-Pawn Shops - 0.1%
FirstCash, Inc. 63,750 5,462,738
Copyright © 2021 www.secdatabase.com. All Rights Reserved.Please Consider the Environment Before Printing This Document

Retail-Petroleum Products - 0.2%
Murphy USA, Inc. 38,907 6,041,479Retail-Regional Department Stores - 0.4%
Kohl�s Corp. 242,762 13,934,539Retail-Restaurants - 1.1%
Cracker Barrel Old Country Store, Inc. 36,866 5,293,220Jack in the Box, Inc. 34,539 3,659,752Papa John�s International, Inc. 51,401 6,555,170Texas Roadhouse, Inc. 101,868 9,677,460Wendy�s Co. 275,167 6,334,344Wingstop, Inc. 46,207 7,944,370
39,464,316Retail-Sporting Goods - 0.4%
Dick�s Sporting Goods, Inc.# 101,830 14,338,682Rubber-Tires - 0.2%
Goodyear Tire & Rubber Co.� 433,596 6,868,161Satellite Telecom - 0.2%
Iridium Communications, Inc.� 182,518 8,123,876Savings & Loans/Thrifts - 0.5%
New York Community Bancorp, Inc. 722,640 9,047,453Sterling Bancorp 299,271 6,850,313Washington Federal, Inc. 112,505 3,746,416
19,644,182Schools - 0.3%
Graham Holdings Co., Class B 6,275 3,870,483Grand Canyon Education, Inc.� 72,013 6,419,239
10,289,722Security Services - 0.2%
Brink�s Co. 77,311 6,042,628Semiconductor Components-Integrated Circuits - 0.2%
Cirrus Logic, Inc.� 89,385 7,478,843Semiconductor Equipment - 0.8%
Brooks Automation, Inc. 115,447 9,808,377CMC Materials, Inc. 45,456 6,028,375MKS Instruments, Inc. 86,016 12,659,835
28,496,587Steel Pipe & Tube - 0.2%
Valmont Industries, Inc. 33,018 8,216,859Steel-Producers - 1.9%
Cleveland-Cliffs, Inc.� 713,917 16,755,632Commercial Metals Co. 187,254 6,108,225Reliance Steel & Aluminum Co. 98,993 14,852,910
Copyright © 2021 www.secdatabase.com. All Rights Reserved.Please Consider the Environment Before Printing This Document
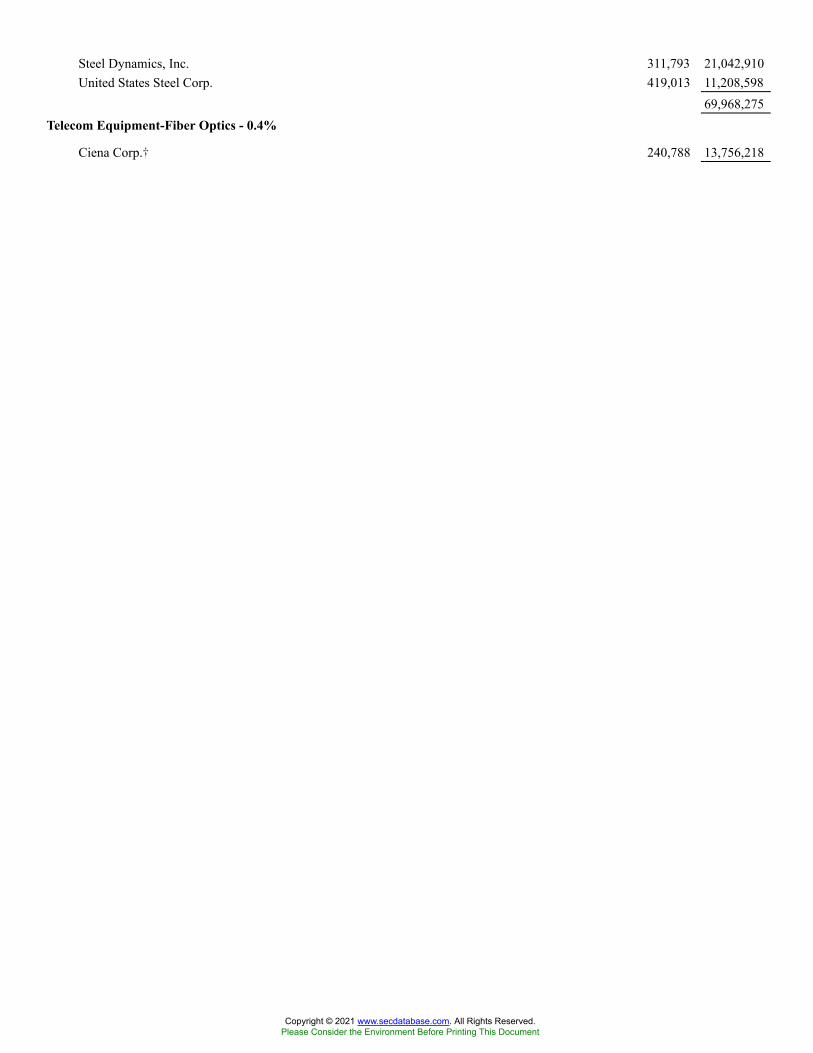
Steel Dynamics, Inc. 311,793 21,042,910United States Steel Corp. 419,013 11,208,598
69,968,275Telecom Equipment-Fiber Optics - 0.4%
Ciena Corp.� 240,788 13,756,218
Copyright © 2021 www.secdatabase.com. All Rights Reserved.Please Consider the Environment Before Printing This Document
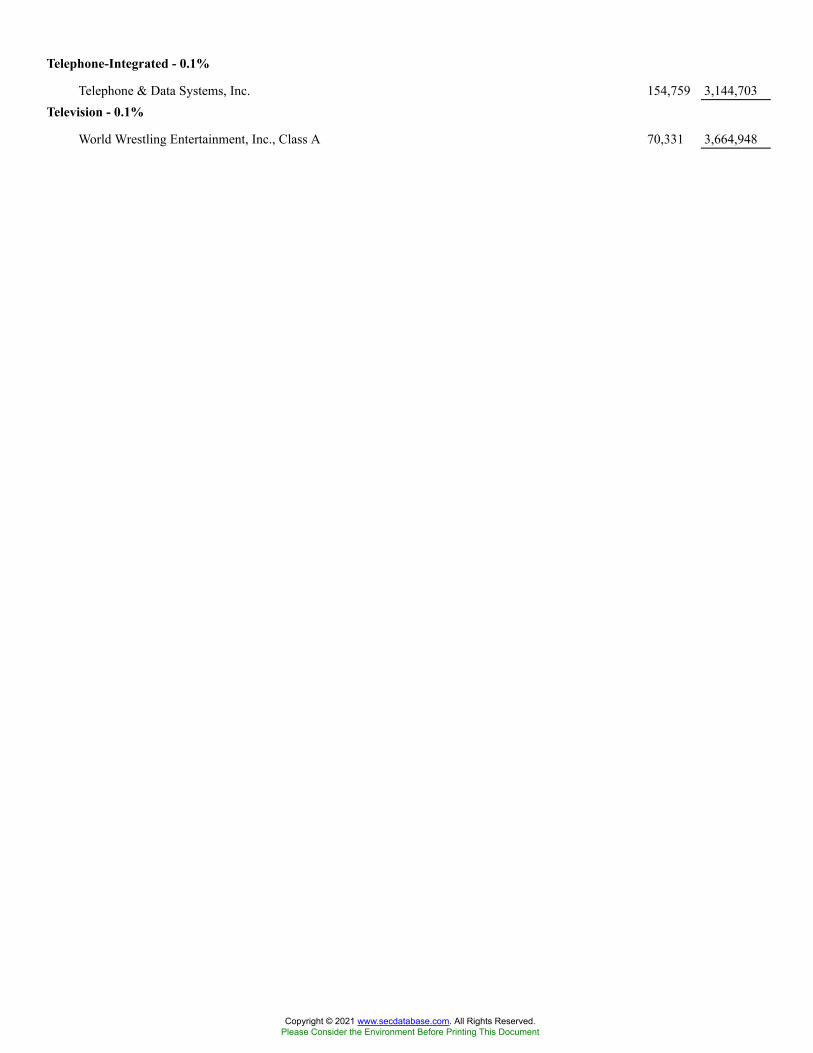
Telephone-Integrated - 0.1%
Telephone & Data Systems, Inc. 154,759 3,144,703Television - 0.1%
World Wrestling Entertainment, Inc., Class A 70,331 3,664,948
Copyright © 2021 www.secdatabase.com. All Rights Reserved.Please Consider the Environment Before Printing This Document

Therapeutics - 0.4%
Neurocrine Biosciences, Inc.� 146,910 13,985,832Tools-Hand Held - 0.2%
MSA Safety, Inc. 56,600 9,216,744Toys - 0.3%
Mattel, Inc.� 541,946 11,570,547Transport-Equipment & Leasing - 0.1%
GATX Corp. 55,006 5,042,950Transport-Marine - 0.1%
Kirby Corp.� 93,394 5,004,984Transport-Services - 0.2%
Ryder System, Inc. 83,706 6,653,790Transport-Truck - 1.3%
Knight-Swift Transportation Holdings, Inc. 190,313 9,882,954Landstar System, Inc. 59,682 10,028,366Saia, Inc.� 40,919 9,825,879Werner Enterprises, Inc. 88,649 4,180,687XPO Logistics, Inc.� 157,960 13,728,304
47,646,190Water - 0.5%
Essential Utilities, Inc. 347,341 17,238,534Wire & Cable Products - 0.1%
Belden, Inc. 69,518 3,979,906Wireless Equipment - 0.1%
ViaSat, Inc.� 105,757 5,461,291Total Long-Term Investment Securities
(cost $2,338,832,038) 3,711,544,760SHORT-TERM INVESTMENT SECURITIES - 0.7%Registered Investment Companies - 0.5%
State Street Navigator Securities Lending Government Money Market Portfolio0.03%(1)(2) 19,909,807 19,909,807
U.S. Government Treasuries - 0.2%
United States Treasury Bills0.07% due 03/24/2022(3) $400,000 399,9090.09% due 12/30/2021(3) 1,700,000 1,699,7170.10% due 12/30/2021(3) 1,700,000 1,699,7170.14% due 09/09/2021(3) 1,500,000 1,499,987
5,299,330Total Short-Term Investment Securities
(cost $25,208,535) 25,209,137
Copyright © 2021 www.secdatabase.com. All Rights Reserved.Please Consider the Environment Before Printing This Document
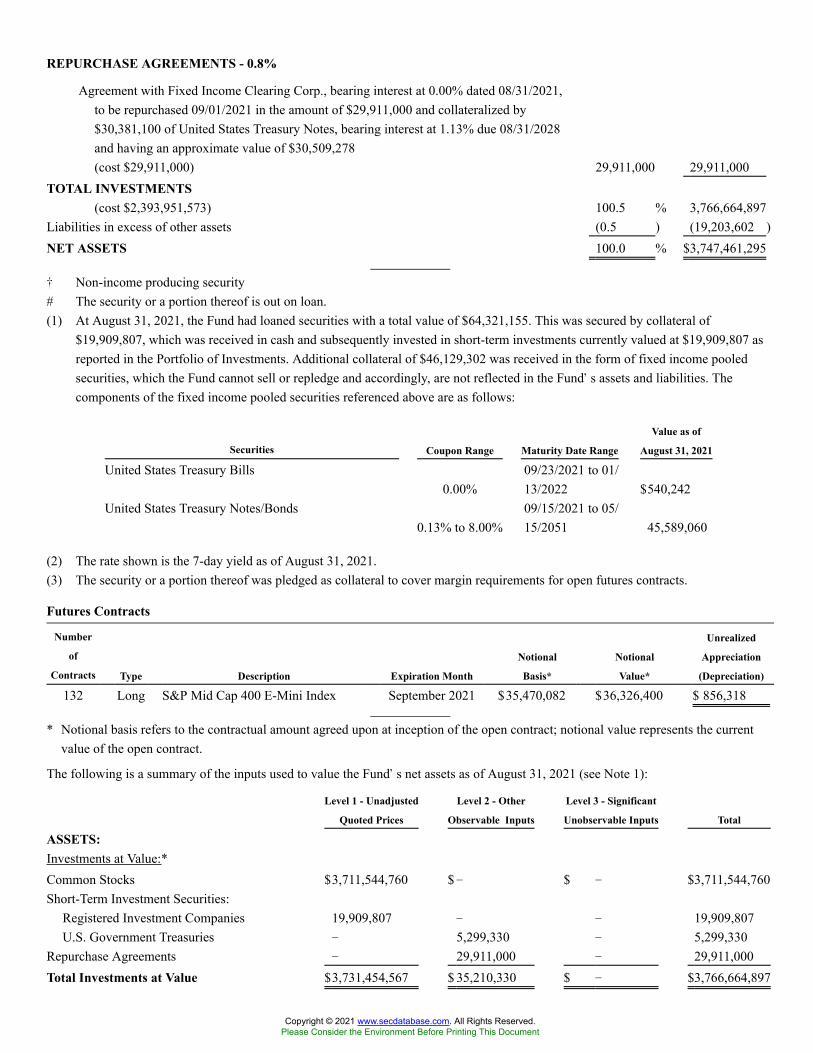
REPURCHASE AGREEMENTS - 0.8%
Agreement with Fixed Income Clearing Corp., bearing interest at 0.00% dated 08/31/2021,to be repurchased 09/01/2021 in the amount of $29,911,000 and collateralized by$30,381,100 of United States Treasury Notes, bearing interest at 1.13% due 08/31/2028and having an approximate value of $30,509,278(cost $29,911,000) 29,911,000 29,911,000
TOTAL INVESTMENTS(cost $2,393,951,573) 100.5 % 3,766,664,897
Liabilities in excess of other assets (0.5 ) (19,203,602 )NET ASSETS 100.0 % $3,747,461,295
� Non-income producing security# The security or a portion thereof is out on loan.(1) At August 31, 2021, the Fund had loaned securities with a total value of $64,321,155. This was secured by collateral of
$19,909,807, which was received in cash and subsequently invested in short-term investments currently valued at $19,909,807 asreported in the Portfolio of Investments. Additional collateral of $46,129,302 was received in the form of fixed income pooledsecurities, which the Fund cannot sell or repledge and accordingly, are not reflected in the Fund�s assets and liabilities. Thecomponents of the fixed income pooled securities referenced above are as follows:
Securities Coupon Range Maturity Date Range
Value as of
August 31, 2021
United States Treasury Bills0.00%
09/23/2021 to 01/13/2022 $540,242
United States Treasury Notes/Bonds0.13% to 8.00%
09/15/2021 to 05/15/2051 45,589,060
(2) The rate shown is the 7-day yield as of August 31, 2021.(3) The security or a portion thereof was pledged as collateral to cover margin requirements for open futures contracts.
Futures Contracts
Number
of
Contracts Type Description Expiration Month
Notional
Basis*
Notional
Value*
Unrealized
Appreciation
(Depreciation)
132 Long S&P Mid Cap 400 E-Mini Index September 2021 $35,470,082 $36,326,400 $ 856,318
* Notional basis refers to the contractual amount agreed upon at inception of the open contract; notional value represents the currentvalue of the open contract.
The following is a summary of the inputs used to value the Fund�s net assets as of August 31, 2021 (see Note 1):
Level 1 - Unadjusted
Quoted Prices
Level 2 - Other
Observable Inputs
Level 3 - Significant
Unobservable Inputs Total
ASSETS:Investments at Value:*Common Stocks $3,711,544,760 $ � $ � $3,711,544,760Short-Term Investment Securities:
Registered Investment Companies 19,909,807 � � 19,909,807U.S. Government Treasuries � 5,299,330 � 5,299,330
Repurchase Agreements � 29,911,000 � 29,911,000Total Investments at Value $3,731,454,567 $ 35,210,330 $ � $3,766,664,897
Copyright © 2021 www.secdatabase.com. All Rights Reserved.Please Consider the Environment Before Printing This Document

Other Financial Instruments:�Futures Contracts $856,318 $ � $ � $856,318
* For a detailed presentation of investments, please refer to the Portfolio of Investments.� Amounts represent unrealized appreciation/depreciation as of the end of the reporting period.
See Notes to Portfolio of Investments
Copyright © 2021 www.secdatabase.com. All Rights Reserved.Please Consider the Environment Before Printing This Document

VALIC Company I Mid Cap Strategic Growth FundPORTFOLIO OF INVESTMENTS - August 31, 2021 (unaudited)
Security Description Shares
Value
(Note1)
COMMON STOCKS - 98.3%Advertising Services - 0.7%
Trade Desk, Inc., Class A� 73,760 $5,904,488Aerospace/Defense - 1.3%
Teledyne Technologies, Inc.� 17,051 7,901,092TransDigm Group, Inc.� 6,585 4,000,190
11,901,282Aerospace/Defense-Equipment - 0.9%
L3Harris Technologies, Inc. 34,845 8,119,233Airlines - 0.5%
Ryanair Holdings PLC ADR� 45,744 4,926,629Apparel Manufacturers - 1.7%
Capri Holdings, Ltd.� 135,150 7,637,327Gildan Activewear, Inc. 201,021 7,729,257
15,366,584Athletic Equipment - 0.7%
YETI Holdings, Inc.� 62,110 6,170,007Auction Houses/Art Dealers - 0.9%
Ritchie Bros. Auctioneers, Inc. 129,091 8,079,806Audio/Video Products - 0.4%
Dolby Laboratories, Inc., Class A 33,682 3,338,223Auto-Cars/Light Trucks - 0.4%
General Motors Co.� 65,340 3,202,313Auto/Truck Parts & Equipment-Original - 0.3%
Visteon Corp.� 26,622 2,813,413Banks-Commercial - 1.4%
First Republic Bank 40,615 8,079,948SVB Financial Group� 8,692 4,863,174
12,943,122Broadcast Services/Program - 0.6%
Liberty Media Corp. - Liberty Formula One, Series C� 107,594 5,437,801Building & Construction-Misc. - 0.4%
Frontdoor, Inc.� 82,153 3,583,514Building Products-Air & Heating - 0.5%
Johnson Controls International PLC 56,852 4,252,530Building-Maintenance & Services - 0.5%
Copyright © 2021 www.secdatabase.com. All Rights Reserved.Please Consider the Environment Before Printing This Document
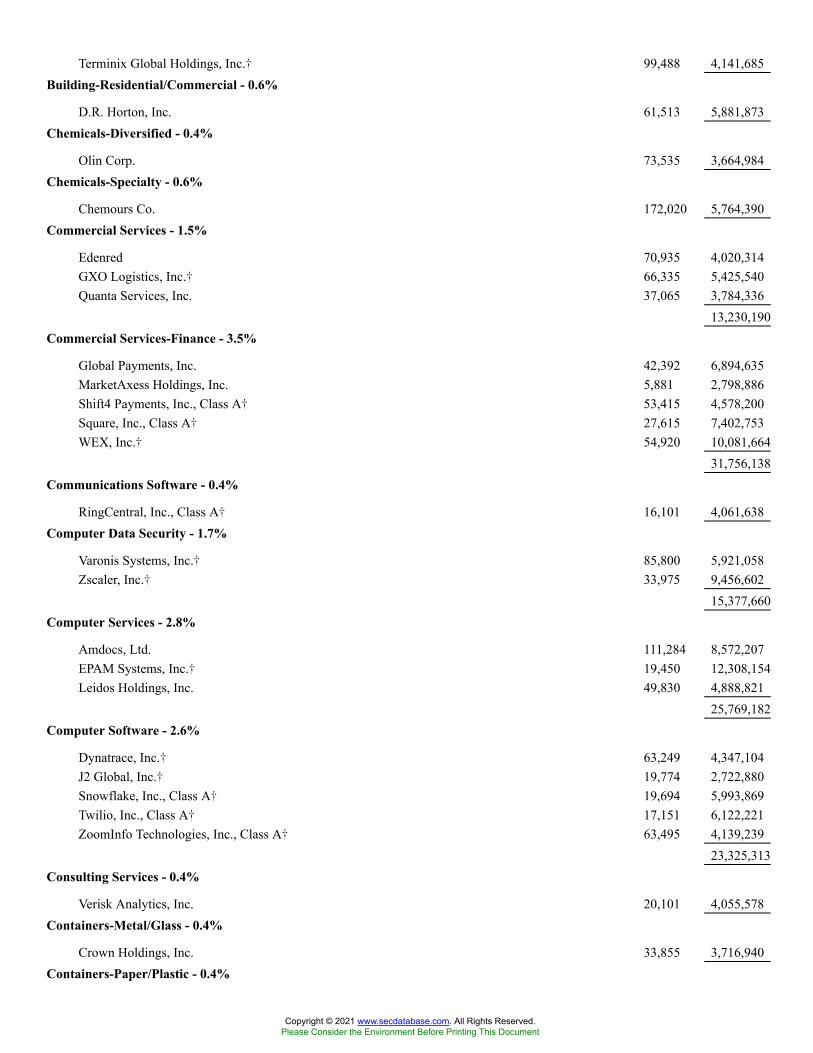
Terminix Global Holdings, Inc.� 99,488 4,141,685Building-Residential/Commercial - 0.6%
D.R. Horton, Inc. 61,513 5,881,873Chemicals-Diversified - 0.4%
Olin Corp. 73,535 3,664,984Chemicals-Specialty - 0.6%
Chemours Co. 172,020 5,764,390Commercial Services - 1.5%
Edenred 70,935 4,020,314GXO Logistics, Inc.� 66,335 5,425,540Quanta Services, Inc. 37,065 3,784,336
13,230,190Commercial Services-Finance - 3.5%
Global Payments, Inc. 42,392 6,894,635MarketAxess Holdings, Inc. 5,881 2,798,886Shift4 Payments, Inc., Class A� 53,415 4,578,200Square, Inc., Class A� 27,615 7,402,753WEX, Inc.� 54,920 10,081,664
31,756,138Communications Software - 0.4%
RingCentral, Inc., Class A� 16,101 4,061,638Computer Data Security - 1.7%
Varonis Systems, Inc.� 85,800 5,921,058Zscaler, Inc.� 33,975 9,456,602
15,377,660Computer Services - 2.8%
Amdocs, Ltd. 111,284 8,572,207EPAM Systems, Inc.� 19,450 12,308,154Leidos Holdings, Inc. 49,830 4,888,821
25,769,182Computer Software - 2.6%
Dynatrace, Inc.� 63,249 4,347,104J2 Global, Inc.� 19,774 2,722,880Snowflake, Inc., Class A� 19,694 5,993,869Twilio, Inc., Class A� 17,151 6,122,221ZoomInfo Technologies, Inc., Class A� 63,495 4,139,239
23,325,313Consulting Services - 0.4%
Verisk Analytics, Inc. 20,101 4,055,578Containers-Metal/Glass - 0.4%
Crown Holdings, Inc. 33,855 3,716,940Containers-Paper/Plastic - 0.4%
Copyright © 2021 www.secdatabase.com. All Rights Reserved.Please Consider the Environment Before Printing This Document
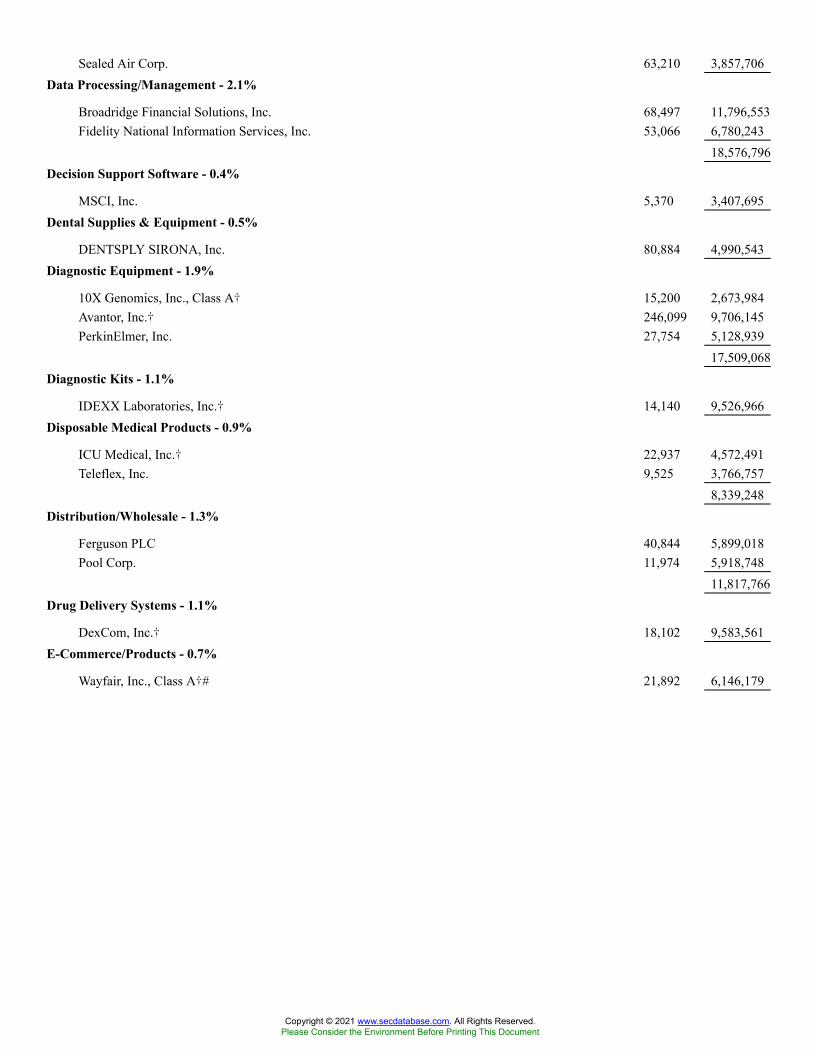
Sealed Air Corp. 63,210 3,857,706Data Processing/Management - 2.1%
Broadridge Financial Solutions, Inc. 68,497 11,796,553Fidelity National Information Services, Inc. 53,066 6,780,243
18,576,796Decision Support Software - 0.4%
MSCI, Inc. 5,370 3,407,695Dental Supplies & Equipment - 0.5%
DENTSPLY SIRONA, Inc. 80,884 4,990,543Diagnostic Equipment - 1.9%
10X Genomics, Inc., Class A� 15,200 2,673,984Avantor, Inc.� 246,099 9,706,145PerkinElmer, Inc. 27,754 5,128,939
17,509,068Diagnostic Kits - 1.1%
IDEXX Laboratories, Inc.� 14,140 9,526,966Disposable Medical Products - 0.9%
ICU Medical, Inc.� 22,937 4,572,491Teleflex, Inc. 9,525 3,766,757
8,339,248Distribution/Wholesale - 1.3%
Ferguson PLC 40,844 5,899,018Pool Corp. 11,974 5,918,748
11,817,766Drug Delivery Systems - 1.1%
DexCom, Inc.� 18,102 9,583,561E-Commerce/Products - 0.7%
Wayfair, Inc., Class A�# 21,892 6,146,179
Copyright © 2021 www.secdatabase.com. All Rights Reserved.Please Consider the Environment Before Printing This Document
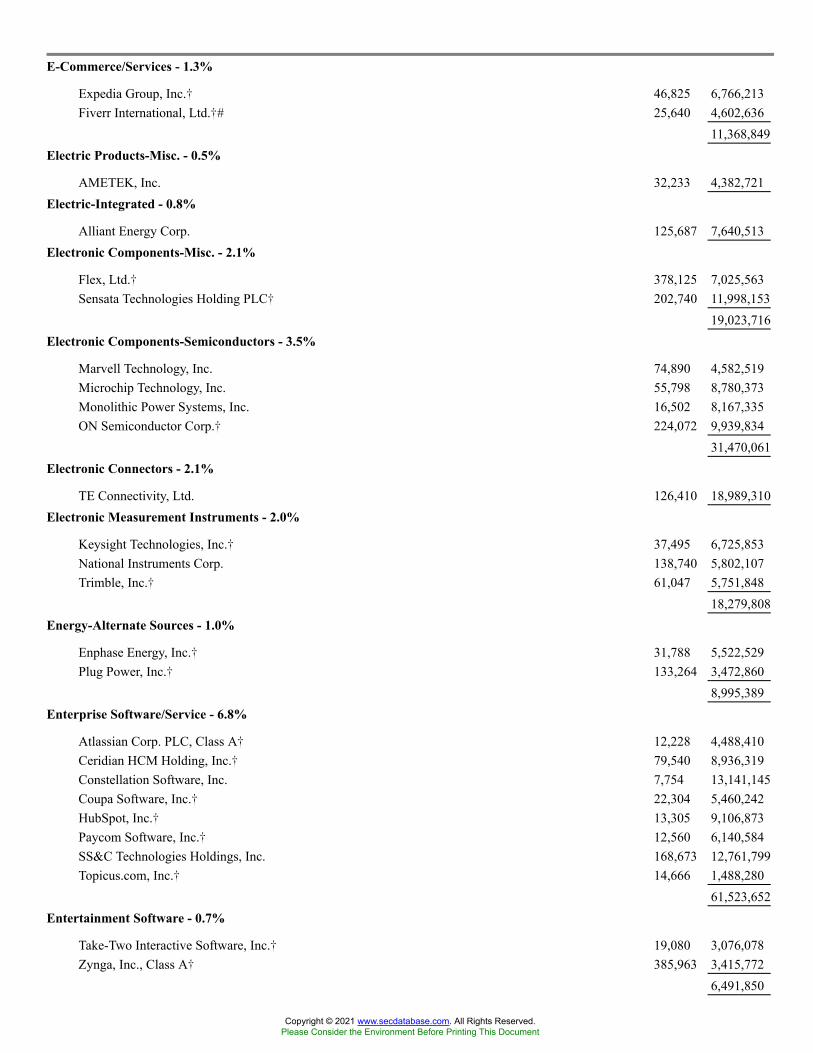
E-Commerce/Services - 1.3%
Expedia Group, Inc.� 46,825 6,766,213Fiverr International, Ltd.�# 25,640 4,602,636
11,368,849Electric Products-Misc. - 0.5%
AMETEK, Inc. 32,233 4,382,721Electric-Integrated - 0.8%
Alliant Energy Corp. 125,687 7,640,513Electronic Components-Misc. - 2.1%
Flex, Ltd.� 378,125 7,025,563Sensata Technologies Holding PLC� 202,740 11,998,153
19,023,716Electronic Components-Semiconductors - 3.5%
Marvell Technology, Inc. 74,890 4,582,519Microchip Technology, Inc. 55,798 8,780,373Monolithic Power Systems, Inc. 16,502 8,167,335ON Semiconductor Corp.� 224,072 9,939,834
31,470,061Electronic Connectors - 2.1%
TE Connectivity, Ltd. 126,410 18,989,310Electronic Measurement Instruments - 2.0%
Keysight Technologies, Inc.� 37,495 6,725,853National Instruments Corp. 138,740 5,802,107Trimble, Inc.� 61,047 5,751,848
18,279,808Energy-Alternate Sources - 1.0%
Enphase Energy, Inc.� 31,788 5,522,529Plug Power, Inc.� 133,264 3,472,860
8,995,389Enterprise Software/Service - 6.8%
Atlassian Corp. PLC, Class A� 12,228 4,488,410Ceridian HCM Holding, Inc.� 79,540 8,936,319Constellation Software, Inc. 7,754 13,141,145Coupa Software, Inc.� 22,304 5,460,242HubSpot, Inc.� 13,305 9,106,873Paycom Software, Inc.� 12,560 6,140,584SS&C Technologies Holdings, Inc. 168,673 12,761,799Topicus.com, Inc.� 14,666 1,488,280
61,523,652Entertainment Software - 0.7%
Take-Two Interactive Software, Inc.� 19,080 3,076,078Zynga, Inc., Class A� 385,963 3,415,772
6,491,850
Copyright © 2021 www.secdatabase.com. All Rights Reserved.Please Consider the Environment Before Printing This Document
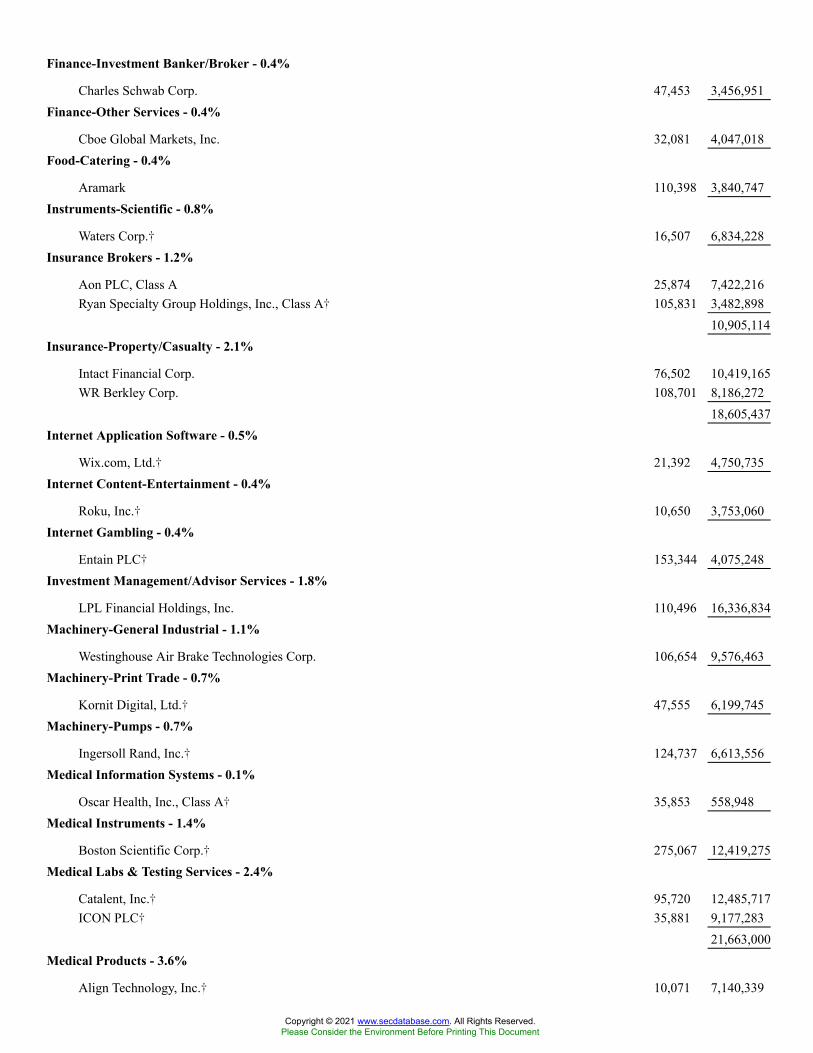
Finance-Investment Banker/Broker - 0.4%
Charles Schwab Corp. 47,453 3,456,951Finance-Other Services - 0.4%
Cboe Global Markets, Inc. 32,081 4,047,018Food-Catering - 0.4%
Aramark 110,398 3,840,747Instruments-Scientific - 0.8%
Waters Corp.� 16,507 6,834,228Insurance Brokers - 1.2%
Aon PLC, Class A 25,874 7,422,216Ryan Specialty Group Holdings, Inc., Class A� 105,831 3,482,898
10,905,114Insurance-Property/Casualty - 2.1%
Intact Financial Corp. 76,502 10,419,165WR Berkley Corp. 108,701 8,186,272
18,605,437Internet Application Software - 0.5%
Wix.com, Ltd.� 21,392 4,750,735Internet Content-Entertainment - 0.4%
Roku, Inc.� 10,650 3,753,060Internet Gambling - 0.4%
Entain PLC� 153,344 4,075,248Investment Management/Advisor Services - 1.8%
LPL Financial Holdings, Inc. 110,496 16,336,834Machinery-General Industrial - 1.1%
Westinghouse Air Brake Technologies Corp. 106,654 9,576,463Machinery-Print Trade - 0.7%
Kornit Digital, Ltd.� 47,555 6,199,745Machinery-Pumps - 0.7%
Ingersoll Rand, Inc.� 124,737 6,613,556Medical Information Systems - 0.1%
Oscar Health, Inc., Class A� 35,853 558,948Medical Instruments - 1.4%
Boston Scientific Corp.� 275,067 12,419,275Medical Labs & Testing Services - 2.4%
Catalent, Inc.� 95,720 12,485,717ICON PLC� 35,881 9,177,283
21,663,000Medical Products - 3.6%
Align Technology, Inc.� 10,071 7,140,339
Copyright © 2021 www.secdatabase.com. All Rights Reserved.Please Consider the Environment Before Printing This Document
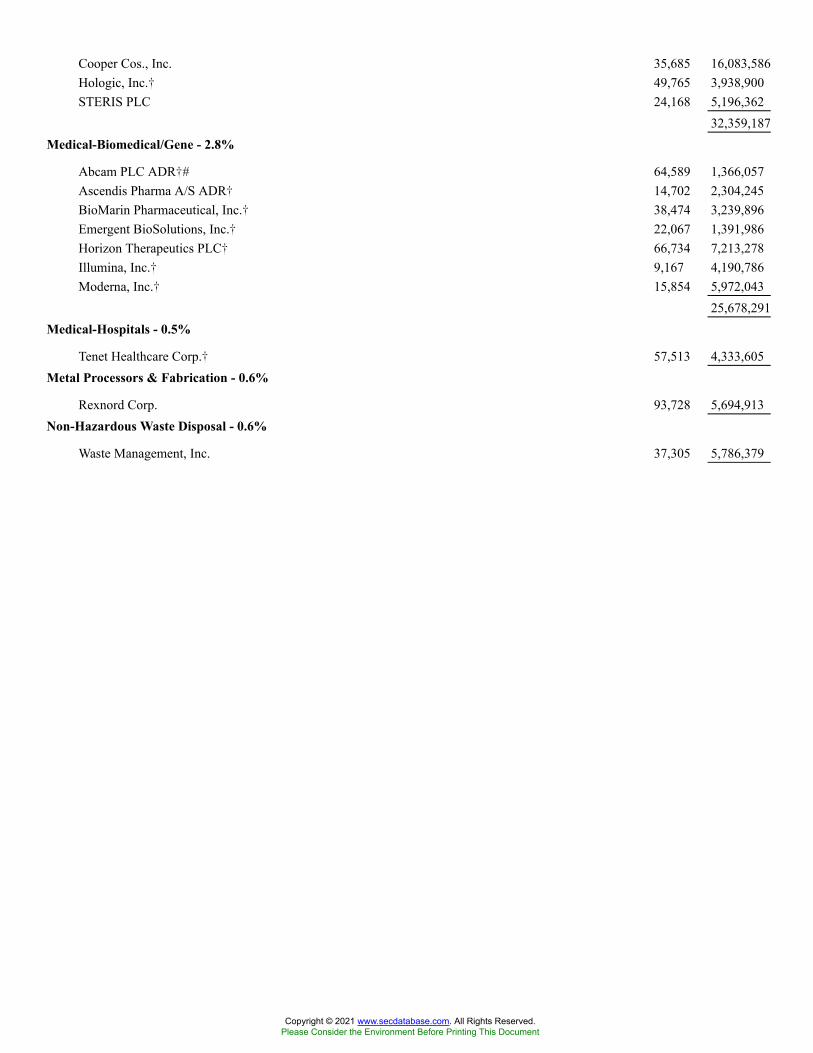
Cooper Cos., Inc. 35,685 16,083,586Hologic, Inc.� 49,765 3,938,900STERIS PLC 24,168 5,196,362
32,359,187Medical-Biomedical/Gene - 2.8%
Abcam PLC ADR�# 64,589 1,366,057Ascendis Pharma A/S ADR� 14,702 2,304,245BioMarin Pharmaceutical, Inc.� 38,474 3,239,896Emergent BioSolutions, Inc.� 22,067 1,391,986Horizon Therapeutics PLC� 66,734 7,213,278Illumina, Inc.� 9,167 4,190,786Moderna, Inc.� 15,854 5,972,043
25,678,291Medical-Hospitals - 0.5%
Tenet Healthcare Corp.� 57,513 4,333,605Metal Processors & Fabrication - 0.6%
Rexnord Corp. 93,728 5,694,913Non-Hazardous Waste Disposal - 0.6%
Waste Management, Inc. 37,305 5,786,379
Copyright © 2021 www.secdatabase.com. All Rights Reserved.Please Consider the Environment Before Printing This Document

Oil Companies-Exploration & Production - 0.3%
Diamondback Energy, Inc. 33,171 2,558,811Oil Refining & Marketing - 0.3%
Valero Energy Corp. 45,172 2,995,355Paper & Related Products - 0.4%
International Paper Co. 67,935 4,082,214Power Converter/Supply Equipment - 0.9%
Generac Holdings, Inc.� 18,608 8,131,324Printing-Commercial - 0.2%
Cimpress PLC� 21,899 2,079,967Real Estate Investment Trusts - 1.2%
Lamar Advertising Co., Class A 95,884 10,914,476Real Estate Management/Services - 0.3%
Redfin Corp.�# 57,630 2,799,089Rental Auto/Equipment - 0.5%
United Rentals, Inc.� 13,301 4,690,598Retail-Apparel/Shoe - 1.1%
Burlington Stores, Inc.� 13,030 3,902,355Lululemon Athletica, Inc.� 14,510 5,806,466
9,708,821Retail-Automobile - 1.3%
CarMax, Inc.� 77,446 9,697,014Vroom, Inc.�# 76,482 2,054,306
11,751,320Retail-Floor Coverings - 0.5%
Floor & Decor Holdings, Inc., Class A� 37,911 4,674,426Retail-Home Furnishings - 0.9%
RH� 11,955 8,376,510Retail-Restaurants - 0.5%
Wingstop, Inc. 26,508 4,557,520Schools - 0.1%
Coursera, Inc.� 14,292 549,813Semiconductor Components-Integrated Circuits - 0.9%
Analog Devices, Inc. 21,345 3,478,168NXP Semiconductors NV 20,013 4,305,396
7,783,564Semiconductor Equipment - 3.3%
Entegris, Inc. 51,280 6,160,779KLA Corp. 37,910 12,887,884Lam Research Corp. 17,620 10,656,928
Copyright © 2021 www.secdatabase.com. All Rights Reserved.Please Consider the Environment Before Printing This Document

29,705,591Telecommunication Equipment - 1.5%
NICE, Ltd. ADR�# 45,755 13,300,979Therapeutics - 0.6%
Neurocrine Biosciences, Inc.� 35,639 3,392,833Sarepta Therapeutics, Inc.� 24,471 1,911,674
5,304,507Transport-Truck - 1.8%
JB Hunt Transport Services, Inc. 66,899 11,867,882XPO Logistics, Inc.� 51,180 4,448,054
16,315,936Veterinary Diagnostics - 0.5%
Elanco Animal Health, Inc.� 130,089 4,342,371Web Hosting/Design - 1.0%
GoDaddy, Inc., Class A� 125,130 9,173,280Total Long-Term Investment Securities
(cost $707,357,237) 889,991,119SHORT-TERM INVESTMENT SECURITIES - 0.3%Registered Investment Companies - 0.3%
State Street Navigator Securities Lending Government Money Market Portfolio0.03%(1)(2)(cost $2,635,986) 2,635,986 2,635,986
TOTAL INVESTMENTS(cost $709,993,223) 98.6 % 892,627,105
Other assets less liabilities 1.4 13,092,468NET ASSETS 100.0 % $905,719,573
� Non-income producing security# The security or a portion thereof is out on loan.(1) The rate shown is the 7-day yield as of August 31, 2021.(2) At August 31, 2021, the Fund had loaned securities with a total value of $28,838,628. This was secured by collateral of $2,635,986
which was received in cash and subsequently invested in short-term investments currently valued at $2,635,986 as reported in thePortfolio of Investments. Additional collateral of $27,788,763 was received in the form of fixed income pooled securities, whichthe Fund cannot sell or repledge and accordingly, are not reflected in the Fund�s assets and liabilities.
The components of the fixed income pooled securities referenced above are as follows:
Securities Coupon Range Maturity Date Range
Value as of
August 31, 2021
Federal Home Loan Mtg. Corp.1.25% to 2.50%
03/01/2050 to 10/25/2050 $114,181
Federal National Mtg. Assoc.2.00% to 3.50%
06/01/2049 to 09/01/2050 393,823
Government National Mtg. Assoc.1.00% to 2.70%
06/20/2038 to 05/16/2053 216,728
United States Treasury Bills0.00%
09/14/2021 to 02/24/2022 2,142,414
Copyright © 2021 www.secdatabase.com. All Rights Reserved.Please Consider the Environment Before Printing This Document
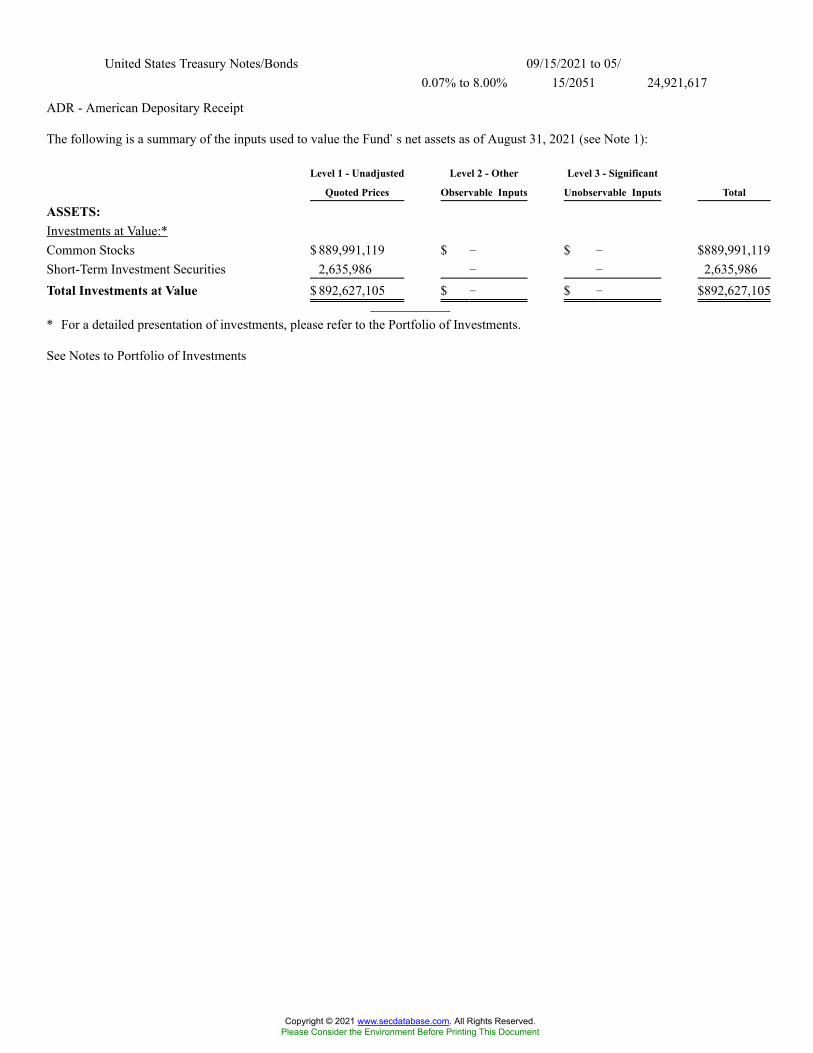
United States Treasury Notes/Bonds0.07% to 8.00%
09/15/2021 to 05/15/2051 24,921,617
ADR - American Depositary Receipt
The following is a summary of the inputs used to value the Fund�s net assets as of August 31, 2021 (see Note 1):
Level 1 - Unadjusted
Quoted Prices
Level 2 - Other
Observable Inputs
Level 3 - Significant
Unobservable Inputs Total
ASSETS:Investments at Value:*Common Stocks $ 889,991,119 $ � $ � $889,991,119Short-Term Investment Securities 2,635,986 � � 2,635,986Total Investments at Value $ 892,627,105 $ � $ � $892,627,105
* For a detailed presentation of investments, please refer to the Portfolio of Investments.
See Notes to Portfolio of Investments
Copyright © 2021 www.secdatabase.com. All Rights Reserved.Please Consider the Environment Before Printing This Document

VALIC Company I Mid Cap Value FundPORTFOLIO OF INVESTMENTS - August 31, 2021 - (unaudited)
Security Description
Shares/
Principal
Amount
Value
(Note 1)
COMMON STOCKS - 98.9%Aerospace/Defense - 0.8%
General Dynamics Corp. 18,960 $3,797,877Spirit AeroSystems Holdings, Inc., Class A 92,461 3,628,170
7,426,047Aerospace/Defense-Equipment - 1.6%
Hexcel Corp.� 59,814 3,392,052Howmet Aerospace, Inc. 161,148 5,116,449L3Harris Technologies, Inc. 19,273 4,490,802Moog, Inc., Class A 32,972 2,619,295
15,618,598Agricultural Biotech - 0.4%
Corteva, Inc. 90,042 3,959,147Agricultural Chemicals - 0.2%
Mosaic Co. 60,001 1,930,832Airlines - 0.9%
Alaska Air Group, Inc.� 57,693 3,308,117JetBlue Airways Corp.� 237,884 3,599,185Southwest Airlines Co.� 34,754 1,730,054
8,637,356Apparel Manufacturers - 0.5%
Carter�s, Inc. 29,876 3,058,705Columbia Sportswear Co. 21,427 2,185,768
5,244,473Appliances - 0.5%
Whirlpool Corp. 22,609 5,008,572Auto-Heavy Duty Trucks - 0.3%
Cummins, Inc. 13,024 3,073,404Auto/Truck Parts & Equipment-Original - 1.5%
Allison Transmission Holdings, Inc. 61,300 2,266,874Gentex Corp. 213,623 6,579,588Lear Corp. 17,616 2,817,503Meritor, Inc.� 131,434 3,117,615
14,781,580Banks-Commercial - 6.4%
Ameris Bancorp 82,778 4,075,989Atlantic Union Bankshares Corp. 165,754 6,132,898
Copyright © 2021 www.secdatabase.com. All Rights Reserved.Please Consider the Environment Before Printing This Document

BancorpSouth Bank 252,533 7,406,793East West Bancorp, Inc. 89,820 6,587,399South State Corp. 83,676 5,738,500Synovus Financial Corp. 163,696 7,055,298Triumph Bancorp, Inc.� 17,533 1,441,563Truist Financial Corp. 123,675 7,056,895Western Alliance Bancorp 77,226 7,534,168Zions Bancorp NA 150,260 8,700,054
61,729,557Banks-Fiduciary - 0.3%
State Street Corp. 32,269 2,998,113Banks-Super Regional - 3.0%
Fifth Third Bancorp 288,723 11,219,776Huntington Bancshares, Inc. 626,545 9,730,244KeyCorp 387,171 7,867,314
28,817,334Beverages-Non-alcoholic - 0.5%
Coca-Cola Europacific Partners PLC 76,763 4,432,296Building & Construction Products-Misc. - 0.8%
Builders FirstSource, Inc.� 88,936 4,739,400Owens Corning 26,017 2,485,924
7,225,324Building Products-Cement - 0.5%
Buzzi Unicem SpA 108,343 2,875,778Eagle Materials, Inc. 14,229 2,231,676
5,107,454Building Products-Doors & Windows - 0.8%
JELD-WEN Holding, Inc.� 197,955 5,451,681PGT Innovations, Inc.� 109,528 2,325,279
7,776,960Building Products-Wood - 0.3%
Masco Corp. 42,782 2,597,723Building-Mobile Home/Manufactured Housing - 0.2%
Thor Industries, Inc. 14,422 1,635,887Building-Residential/Commercial - 0.2%
Lennar Corp., Class A 21,927 2,352,986Cable/Satellite TV - 0.2%
Altice USA, Inc., Class A� 60,535 1,661,080Casino Hotels - 0.5%
Boyd Gaming Corp.� 41,636 2,555,201Las Vegas Sands Corp.� 58,100 2,591,841
5,147,042
Copyright © 2021 www.secdatabase.com. All Rights Reserved.Please Consider the Environment Before Printing This Document

Chemicals-Diversified - 2.3%
Celanese Corp. 41,103 6,518,936DuPont de Nemours, Inc. 61,135 4,525,213FMC Corp. 85,861 8,039,165PPG Industries, Inc. 16,803 2,680,919
21,764,233Chemicals-Specialty - 0.8%
Ingevity Corp.� 21,708 1,745,106Rogers Corp.� 25,564 5,430,049
7,175,155Commercial Services-Finance - 0.9%
EVERTEC, Inc. 72,474 3,351,923Global Payments, Inc. 15,332 2,493,596H&R Block, Inc. 120,813 3,098,853
8,944,372Computer Services - 1.5%
Cognizant Technology Solutions Corp., Class A 29,771 2,271,825Leidos Holdings, Inc. 98,098 9,624,395Science Applications International Corp. 28,035 2,361,388
14,257,608Computers-Memory Devices - 0.8%
NetApp, Inc. 41,254 3,668,718Western Digital Corp.� 59,580 3,765,456
7,434,174Computers-Other - 0.9%
Lumentum Holdings, Inc.� 98,154 8,504,063Containers-Metal/Glass - 1.1%
Crown Holdings, Inc. 94,059 10,326,738Cruise Lines - 0.2%
Carnival Corp.� 29,353 708,581
Copyright © 2021 www.secdatabase.com. All Rights Reserved.Please Consider the Environment Before Printing This Document
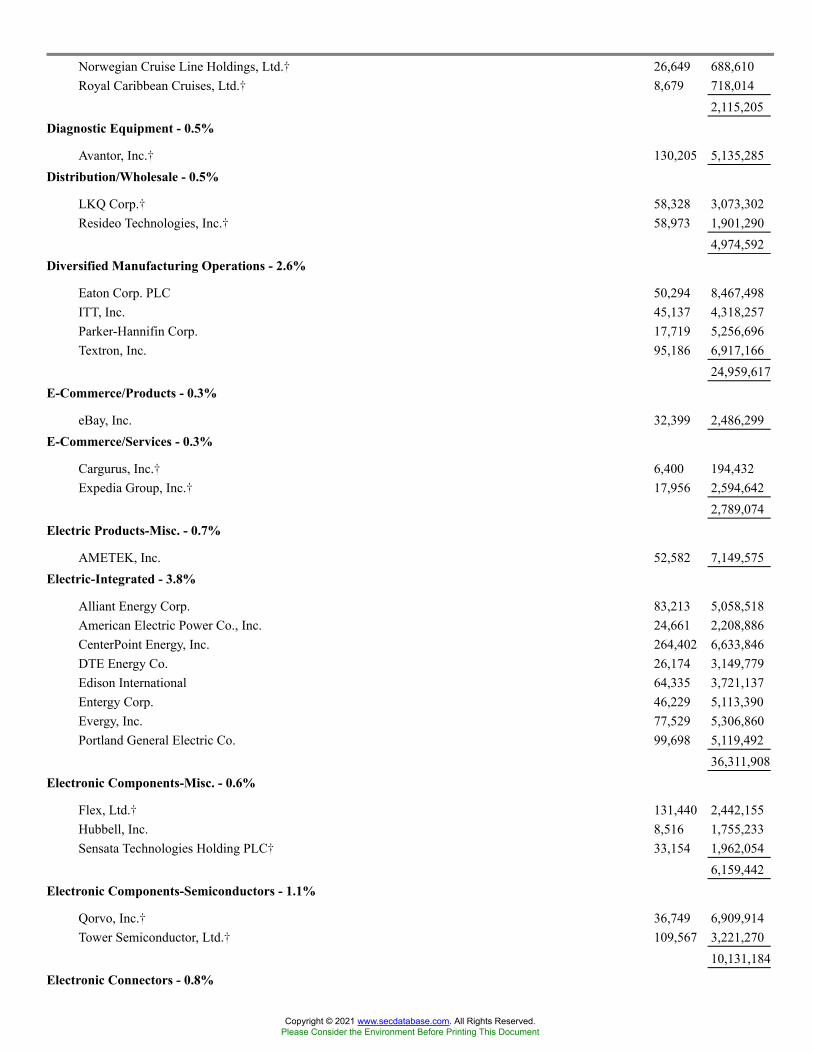
Norwegian Cruise Line Holdings, Ltd.� 26,649 688,610Royal Caribbean Cruises, Ltd.� 8,679 718,014
2,115,205Diagnostic Equipment - 0.5%
Avantor, Inc.� 130,205 5,135,285Distribution/Wholesale - 0.5%
LKQ Corp.� 58,328 3,073,302Resideo Technologies, Inc.� 58,973 1,901,290
4,974,592Diversified Manufacturing Operations - 2.6%
Eaton Corp. PLC 50,294 8,467,498ITT, Inc. 45,137 4,318,257Parker-Hannifin Corp. 17,719 5,256,696Textron, Inc. 95,186 6,917,166
24,959,617E-Commerce/Products - 0.3%
eBay, Inc. 32,399 2,486,299E-Commerce/Services - 0.3%
Cargurus, Inc.� 6,400 194,432Expedia Group, Inc.� 17,956 2,594,642
2,789,074Electric Products-Misc. - 0.7%
AMETEK, Inc. 52,582 7,149,575Electric-Integrated - 3.8%
Alliant Energy Corp. 83,213 5,058,518American Electric Power Co., Inc. 24,661 2,208,886CenterPoint Energy, Inc. 264,402 6,633,846DTE Energy Co. 26,174 3,149,779Edison International 64,335 3,721,137Entergy Corp. 46,229 5,113,390Evergy, Inc. 77,529 5,306,860Portland General Electric Co. 99,698 5,119,492
36,311,908Electronic Components-Misc. - 0.6%
Flex, Ltd.� 131,440 2,442,155Hubbell, Inc. 8,516 1,755,233Sensata Technologies Holding PLC� 33,154 1,962,054
6,159,442Electronic Components-Semiconductors - 1.1%
Qorvo, Inc.� 36,749 6,909,914Tower Semiconductor, Ltd.� 109,567 3,221,270
10,131,184Electronic Connectors - 0.8%
Copyright © 2021 www.secdatabase.com. All Rights Reserved.Please Consider the Environment Before Printing This Document
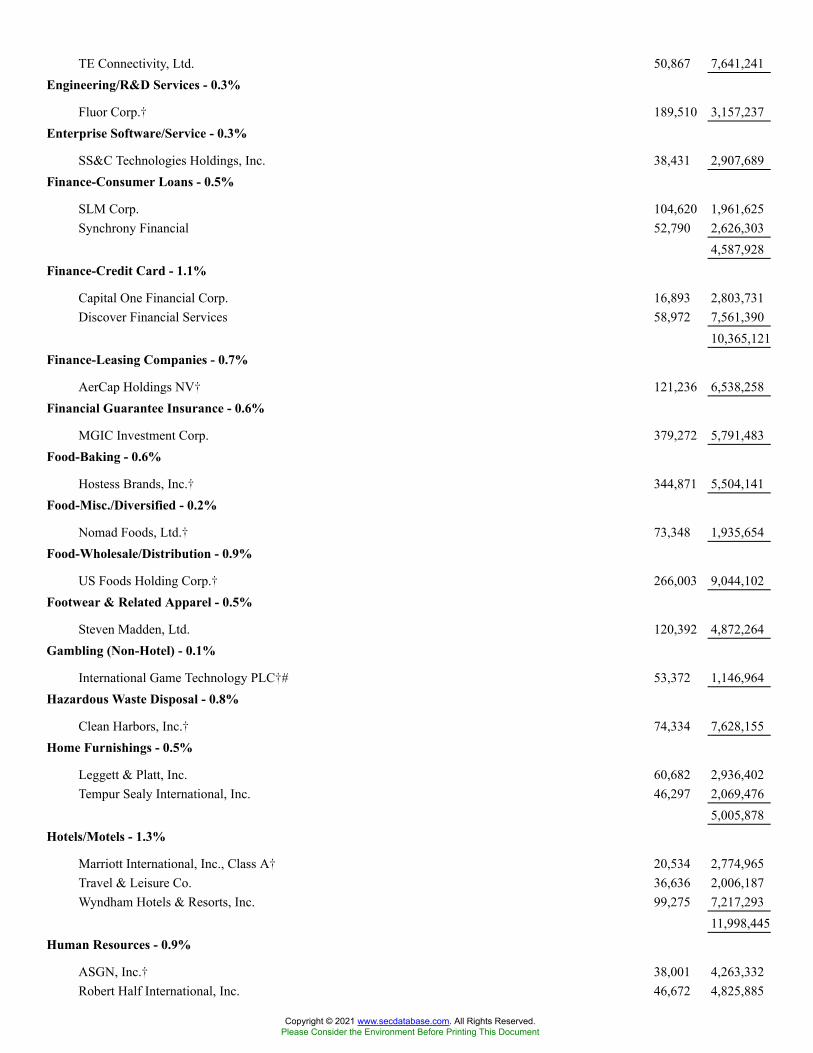
TE Connectivity, Ltd. 50,867 7,641,241Engineering/R&D Services - 0.3%
Fluor Corp.� 189,510 3,157,237Enterprise Software/Service - 0.3%
SS&C Technologies Holdings, Inc. 38,431 2,907,689Finance-Consumer Loans - 0.5%
SLM Corp. 104,620 1,961,625Synchrony Financial 52,790 2,626,303
4,587,928Finance-Credit Card - 1.1%
Capital One Financial Corp. 16,893 2,803,731Discover Financial Services 58,972 7,561,390
10,365,121Finance-Leasing Companies - 0.7%
AerCap Holdings NV� 121,236 6,538,258Financial Guarantee Insurance - 0.6%
MGIC Investment Corp. 379,272 5,791,483Food-Baking - 0.6%
Hostess Brands, Inc.� 344,871 5,504,141Food-Misc./Diversified - 0.2%
Nomad Foods, Ltd.� 73,348 1,935,654Food-Wholesale/Distribution - 0.9%
US Foods Holding Corp.� 266,003 9,044,102Footwear & Related Apparel - 0.5%
Steven Madden, Ltd. 120,392 4,872,264Gambling (Non-Hotel) - 0.1%
International Game Technology PLC�# 53,372 1,146,964Hazardous Waste Disposal - 0.8%
Clean Harbors, Inc.� 74,334 7,628,155Home Furnishings - 0.5%
Leggett & Platt, Inc. 60,682 2,936,402Tempur Sealy International, Inc. 46,297 2,069,476
5,005,878Hotels/Motels - 1.3%
Marriott International, Inc., Class A� 20,534 2,774,965Travel & Leisure Co. 36,636 2,006,187Wyndham Hotels & Resorts, Inc. 99,275 7,217,293
11,998,445Human Resources - 0.9%
ASGN, Inc.� 38,001 4,263,332Robert Half International, Inc. 46,672 4,825,885
Copyright © 2021 www.secdatabase.com. All Rights Reserved.Please Consider the Environment Before Printing This Document
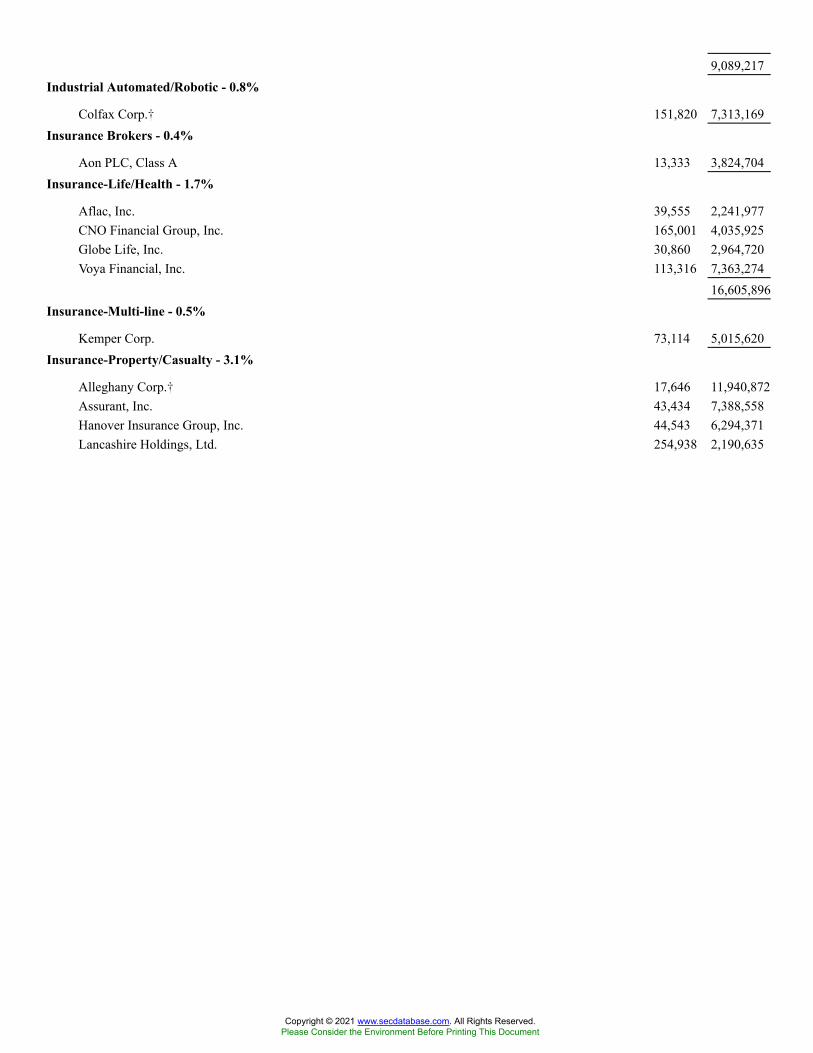
9,089,217Industrial Automated/Robotic - 0.8%
Colfax Corp.� 151,820 7,313,169Insurance Brokers - 0.4%
Aon PLC, Class A 13,333 3,824,704Insurance-Life/Health - 1.7%
Aflac, Inc. 39,555 2,241,977CNO Financial Group, Inc. 165,001 4,035,925Globe Life, Inc. 30,860 2,964,720Voya Financial, Inc. 113,316 7,363,274
16,605,896Insurance-Multi-line - 0.5%
Kemper Corp. 73,114 5,015,620Insurance-Property/Casualty - 3.1%
Alleghany Corp.� 17,646 11,940,872Assurant, Inc. 43,434 7,388,558Hanover Insurance Group, Inc. 44,543 6,294,371Lancashire Holdings, Ltd. 254,938 2,190,635
Copyright © 2021 www.secdatabase.com. All Rights Reserved.Please Consider the Environment Before Printing This Document
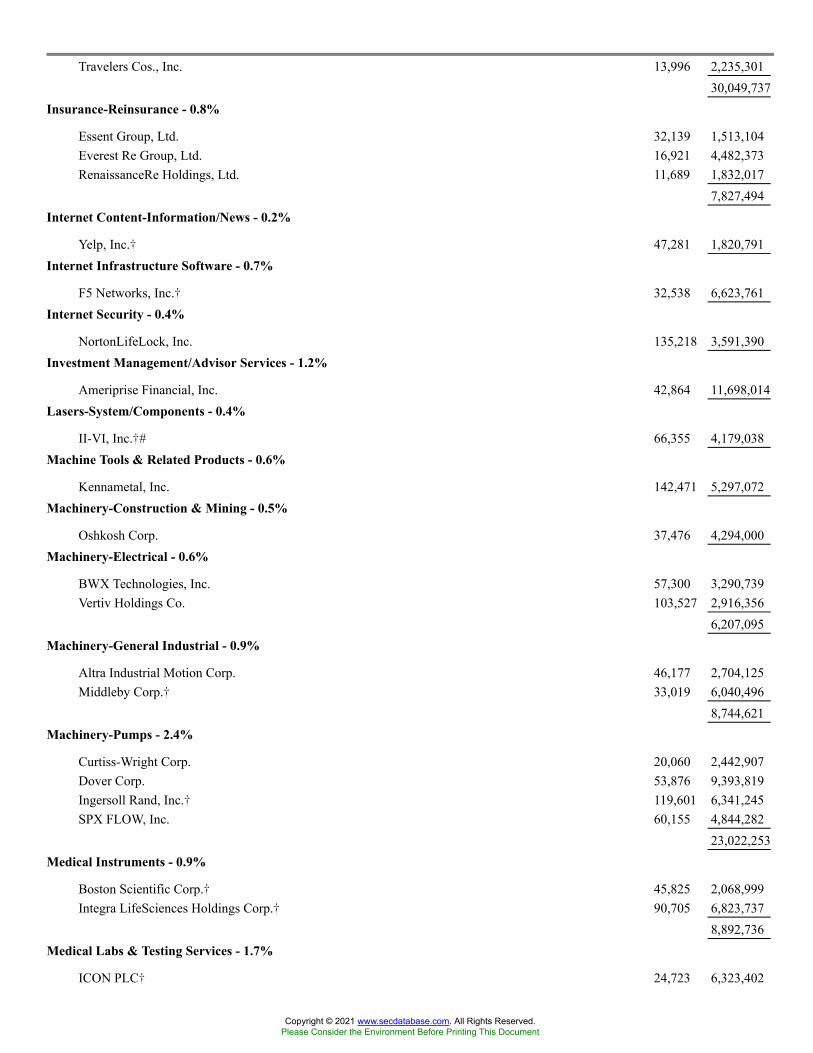
Travelers Cos., Inc. 13,996 2,235,30130,049,737
Insurance-Reinsurance - 0.8%
Essent Group, Ltd. 32,139 1,513,104Everest Re Group, Ltd. 16,921 4,482,373RenaissanceRe Holdings, Ltd. 11,689 1,832,017
7,827,494Internet Content-Information/News - 0.2%
Yelp, Inc.� 47,281 1,820,791Internet Infrastructure Software - 0.7%
F5 Networks, Inc.� 32,538 6,623,761Internet Security - 0.4%
NortonLifeLock, Inc. 135,218 3,591,390Investment Management/Advisor Services - 1.2%
Ameriprise Financial, Inc. 42,864 11,698,014Lasers-System/Components - 0.4%
II-VI, Inc.�# 66,355 4,179,038Machine Tools & Related Products - 0.6%
Kennametal, Inc. 142,471 5,297,072Machinery-Construction & Mining - 0.5%
Oshkosh Corp. 37,476 4,294,000Machinery-Electrical - 0.6%
BWX Technologies, Inc. 57,300 3,290,739Vertiv Holdings Co. 103,527 2,916,356
6,207,095Machinery-General Industrial - 0.9%
Altra Industrial Motion Corp. 46,177 2,704,125Middleby Corp.� 33,019 6,040,496
8,744,621Machinery-Pumps - 2.4%
Curtiss-Wright Corp. 20,060 2,442,907Dover Corp. 53,876 9,393,819Ingersoll Rand, Inc.� 119,601 6,341,245SPX FLOW, Inc. 60,155 4,844,282
23,022,253Medical Instruments - 0.9%
Boston Scientific Corp.� 45,825 2,068,999Integra LifeSciences Holdings Corp.� 90,705 6,823,737
8,892,736Medical Labs & Testing Services - 1.7%
ICON PLC� 24,723 6,323,402
Copyright © 2021 www.secdatabase.com. All Rights Reserved.Please Consider the Environment Before Printing This Document

Laboratory Corp. of America Holdings� 7,147 2,168,257Syneos Health, Inc.� 85,276 7,911,907
16,403,566Medical Products - 1.4%
Haemonetics Corp.� 44,014 2,761,879Hill-Rom Holdings, Inc. 36,902 5,372,193Zimmer Biomet Holdings, Inc. 34,572 5,201,357
13,335,429Medical-Drugs - 0.1%
Jazz Pharmaceuticals PLC� 10,218 1,345,813Medical-HMO - 1.8%
Centene Corp.� 54,731 3,446,958Humana, Inc. 11,532 4,675,304Molina Healthcare, Inc.� 32,403 8,708,954
16,831,216Medical-Hospitals - 1.4%
Acadia Healthcare Co., Inc.� 60,438 3,996,161HCA Healthcare, Inc. 15,996 4,046,668Universal Health Services, Inc., Class B 36,290 5,652,530
13,695,359Medical-Wholesale Drug Distribution - 0.5%
AmerisourceBergen Corp. 39,875 4,873,124Metal Processors & Fabrication - 0.7%
Rexnord Corp. 103,428 6,284,285Motorcycle/Motor Scooter - 0.5%
Harley-Davidson, Inc. 120,879 4,778,347Office Automation & Equipment - 0.2%
Xerox Holdings Corp. 81,500 1,834,565Office Supplies & Forms - 0.2%
Avery Dennison Corp. 9,975 2,248,265Oil & Gas Drilling - 0.2%
Helmerich & Payne, Inc. 76,703 2,064,845Oil Companies-Exploration & Production - 2.0%
ConocoPhillips 90,636 5,033,017Diamondback Energy, Inc. 129,545 9,993,102Pioneer Natural Resources Co. 26,030 3,895,910
18,922,029Oil Refining & Marketing - 1.2%
Delek US Holdings, Inc. 160,324 2,743,144HollyFrontier Corp. 78,628 2,542,043Marathon Petroleum Corp. 75,209 4,457,637Valero Energy Corp. 31,806 2,109,056
Copyright © 2021 www.secdatabase.com. All Rights Reserved.Please Consider the Environment Before Printing This Document
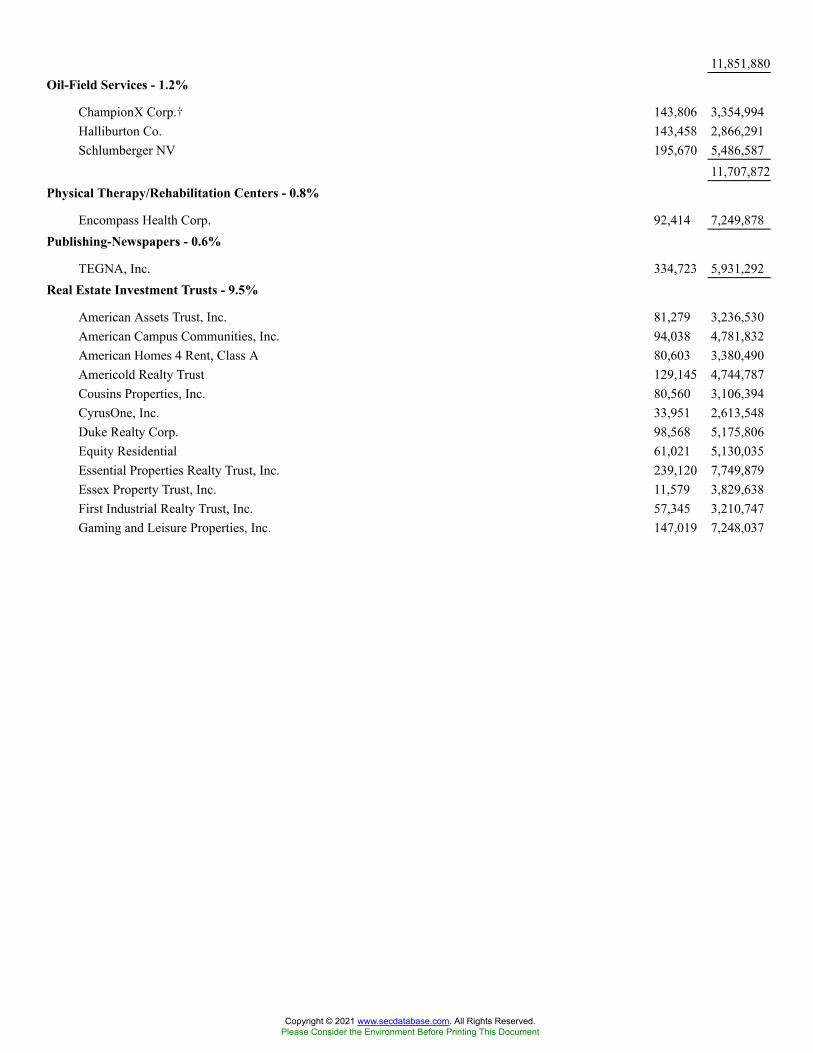
11,851,880Oil-Field Services - 1.2%
ChampionX Corp.� 143,806 3,354,994Halliburton Co. 143,458 2,866,291Schlumberger NV 195,670 5,486,587
11,707,872Physical Therapy/Rehabilitation Centers - 0.8%
Encompass Health Corp. 92,414 7,249,878Publishing-Newspapers - 0.6%
TEGNA, Inc. 334,723 5,931,292Real Estate Investment Trusts - 9.5%
American Assets Trust, Inc. 81,279 3,236,530American Campus Communities, Inc. 94,038 4,781,832American Homes 4 Rent, Class A 80,603 3,380,490Americold Realty Trust 129,145 4,744,787Cousins Properties, Inc. 80,560 3,106,394CyrusOne, Inc. 33,951 2,613,548Duke Realty Corp. 98,568 5,175,806Equity Residential 61,021 5,130,035Essential Properties Realty Trust, Inc. 239,120 7,749,879Essex Property Trust, Inc. 11,579 3,829,638First Industrial Realty Trust, Inc. 57,345 3,210,747Gaming and Leisure Properties, Inc. 147,019 7,248,037
Copyright © 2021 www.secdatabase.com. All Rights Reserved.Please Consider the Environment Before Printing This Document

Healthpeak Properties, Inc. 81,987 2,951,532Host Hotels & Resorts, Inc.� 386,179 6,395,124Kilroy Realty Corp. 40,127 2,634,338Lamar Advertising Co., Class A 22,905 2,607,276Life Storage, Inc. 36,603 4,554,877Regency Centers Corp. 68,869 4,725,791Ryman Hospitality Properties, Inc.� 90,509 7,518,583Welltower, Inc. 62,665 5,485,067
91,080,311Recreational Vehicles - 0.3%
Polaris, Inc. 25,146 3,011,485Resort/Theme Parks - 0.5%
Six Flags Entertainment Corp.� 114,429 4,833,481Retail-Apparel/Shoe - 0.6%
Foot Locker, Inc. 46,837 2,655,189Ross Stores, Inc. 29,632 3,508,429
6,163,618Retail-Auto Parts - 0.9%
AutoZone, Inc.� 5,275 8,171,766Retail-Consumer Electronics - 0.2%
Best Buy Co., Inc. 13,911 1,620,771Retail-Perfume & Cosmetics - 0.4%
Ulta Beauty, Inc.� 8,627 3,341,323Retail-Restaurants - 0.9%
Bloomin� Brands, Inc.� 107,698 2,885,229Darden Restaurants, Inc. 17,363 2,615,736Denny�s Corp.� 201,489 3,332,628
8,833,593Savings & Loans/Thrifts - 0.5%
Sterling Bancorp 204,523 4,681,531Semiconductor Components-Integrated Circuits - 0.7%
NXP Semiconductors NV 31,352 6,744,756Semiconductor Equipment - 0.8%
KLA Corp. 7,931 2,696,223MKS Instruments, Inc. 33,187 4,884,462
7,580,685Shipbuilding - 0.3%
Huntington Ingalls Industries, Inc. 14,086 2,875,939Steel-Producers - 0.6%
Reliance Steel & Aluminum Co. 38,130 5,721,025Telecom Equipment-Fiber Optics - 0.4%
Copyright © 2021 www.secdatabase.com. All Rights Reserved.Please Consider the Environment Before Printing This Document

Ciena Corp.� 63,700 3,639,181Telecommunication Equipment - 0.2%
CommScope Holding Co., Inc.� 99,033 1,564,721Textile-Home Furnishings - 0.5%
Mohawk Industries, Inc.� 23,202 4,588,428
Copyright © 2021 www.secdatabase.com. All Rights Reserved.Please Consider the Environment Before Printing This Document

Theaters - 0.3%
Live Nation Entertainment, Inc.�# 29,268 2,537,536Toys - 0.4%
Hasbro, Inc. 43,418 4,268,424Transport-Services - 0.3%
Expeditors International of Washington, Inc. 20,635 2,571,946Transport-Truck - 0.4%
Knight-Swift Transportation Holdings, Inc. 70,132 3,641,955Wireless Equipment - 0.2%
Maxar Technologies, Inc. 56,158 1,785,263Total Long-Term Investment Securities
(cost $707,759,766) 948,616,960SHORT-TERM INVESTMENT SECURITIES - 0.9%Registered Investment Companies - 0.9%
State Street Institutional Liquid Reserves Fund, Administration Class0.00%(1)(cost $8,853,377) 8,851,653 8,852,538
REPURCHASE AGREEMENTS - 0.3%
Agreement with Fixed Income Clearing Corp., bearing interest at 0.00% dated 08/31/2021, to berepurchased 09/01/2021 in the amount of $2,955,000 and collateralized by $3,001,500 ofUnited States Treasury Notes, bearing interest at 1.13% due 08/31/2028 and having anapproximate value of $3,014,163(cost $2,955,000) $2,955,000 2,955,000
TOTAL INVESTMENTS(cost $719,568,143) 100.1 % 960,424,498
Liabilities in excess of other assets (0.1 ) (803,312 )NET ASSETS 100.0 % $959,621,186
� Non-income producing security# The security or a portion thereof is out on loan.
At August 31 ,2021, the Fund had loaned securities with a total value of $6,379,420. This was secured by collateral of $6,531,877,received in the form of fixed income pooled securities, which the Fund cannot sell or repledge and accordingly, are not reflected inthe Fund�s assets and liabilities.
The components of the fixed income pooled securities referenced above are as follows:
Securities Coupon Range Maturity Date Range
Value as of
August 31, 2021
United States Treasury Bills0.00%
09/14/2021 to 02/24/2022 $413,571
United States Treasury Notes/Bonds0.07% to 8.00%
09/15/2021 to 05/15/2051 6,118,306
(1) The rate shown is the 7-day yield as of August 31, 2021.
The following is a summary of the inputs used to value the Fund�s net assets as of August 31, 2021 (see Note 1):
Copyright © 2021 www.secdatabase.com. All Rights Reserved.Please Consider the Environment Before Printing This Document
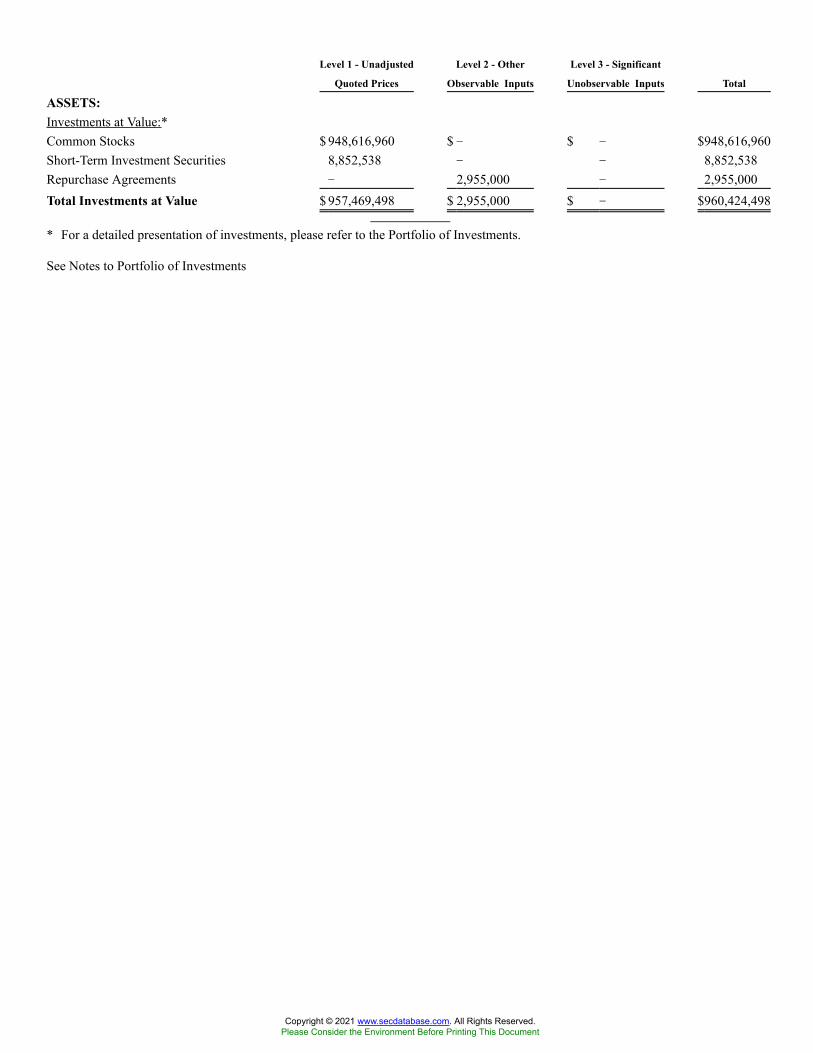
Level 1 - Unadjusted
Quoted Prices
Level 2 - Other
Observable Inputs
Level 3 - Significant
Unobservable Inputs Total
ASSETS:Investments at Value:*Common Stocks $ 948,616,960 $ � $ � $948,616,960Short-Term Investment Securities 8,852,538 � � 8,852,538Repurchase Agreements � 2,955,000 � 2,955,000Total Investments at Value $ 957,469,498 $ 2,955,000 $ � $960,424,498
* For a detailed presentation of investments, please refer to the Portfolio of Investments.
See Notes to Portfolio of Investments
Copyright © 2021 www.secdatabase.com. All Rights Reserved.Please Consider the Environment Before Printing This Document
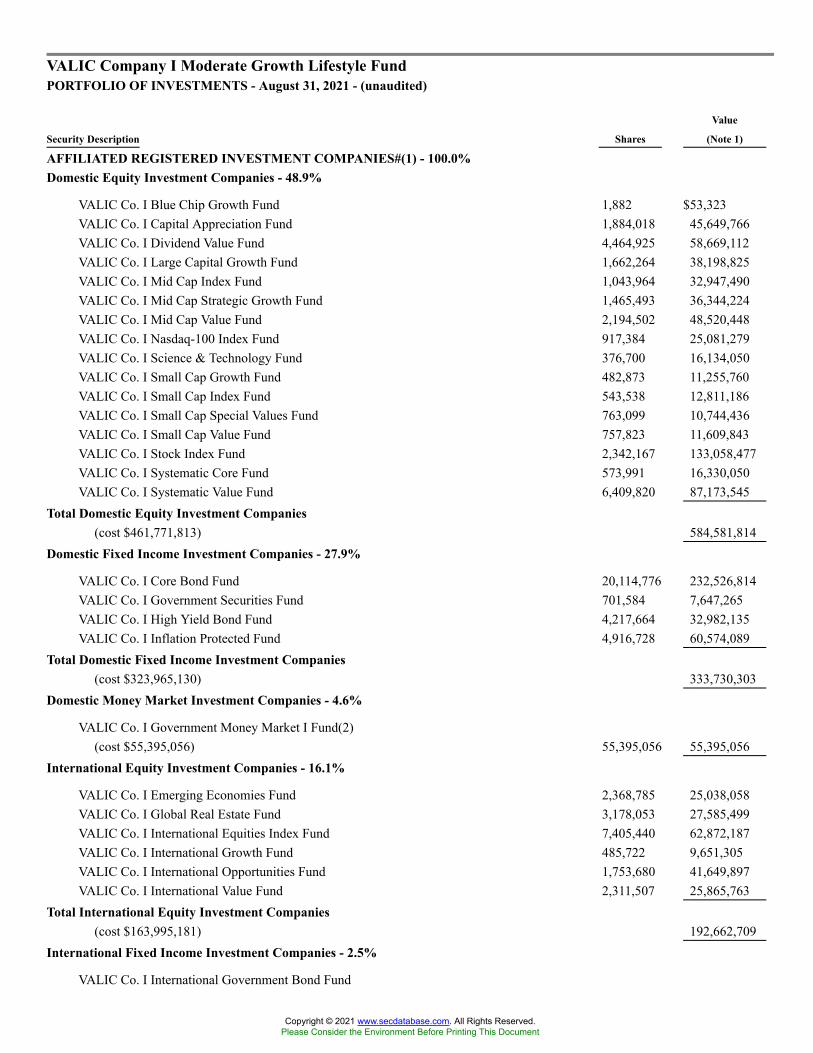
VALIC Company I Moderate Growth Lifestyle FundPORTFOLIO OF INVESTMENTS - August 31, 2021 - (unaudited)
Security Description Shares
Value
(Note 1)
AFFILIATED REGISTERED INVESTMENT COMPANIES#(1) - 100.0%Domestic Equity Investment Companies - 48.9%
VALIC Co. I Blue Chip Growth Fund 1,882 $53,323VALIC Co. I Capital Appreciation Fund 1,884,018 45,649,766VALIC Co. I Dividend Value Fund 4,464,925 58,669,112VALIC Co. I Large Capital Growth Fund 1,662,264 38,198,825VALIC Co. I Mid Cap Index Fund 1,043,964 32,947,490VALIC Co. I Mid Cap Strategic Growth Fund 1,465,493 36,344,224VALIC Co. I Mid Cap Value Fund 2,194,502 48,520,448VALIC Co. I Nasdaq-100 Index Fund 917,384 25,081,279VALIC Co. I Science & Technology Fund 376,700 16,134,050VALIC Co. I Small Cap Growth Fund 482,873 11,255,760VALIC Co. I Small Cap Index Fund 543,538 12,811,186VALIC Co. I Small Cap Special Values Fund 763,099 10,744,436VALIC Co. I Small Cap Value Fund 757,823 11,609,843VALIC Co. I Stock Index Fund 2,342,167 133,058,477VALIC Co. I Systematic Core Fund 573,991 16,330,050VALIC Co. I Systematic Value Fund 6,409,820 87,173,545
Total Domestic Equity Investment Companies(cost $461,771,813) 584,581,814
Domestic Fixed Income Investment Companies - 27.9%
VALIC Co. I Core Bond Fund 20,114,776 232,526,814VALIC Co. I Government Securities Fund 701,584 7,647,265VALIC Co. I High Yield Bond Fund 4,217,664 32,982,135VALIC Co. I Inflation Protected Fund 4,916,728 60,574,089
Total Domestic Fixed Income Investment Companies(cost $323,965,130) 333,730,303
Domestic Money Market Investment Companies - 4.6%
VALIC Co. I Government Money Market I Fund(2)(cost $55,395,056) 55,395,056 55,395,056
International Equity Investment Companies - 16.1%
VALIC Co. I Emerging Economies Fund 2,368,785 25,038,058VALIC Co. I Global Real Estate Fund 3,178,053 27,585,499VALIC Co. I International Equities Index Fund 7,405,440 62,872,187VALIC Co. I International Growth Fund 485,722 9,651,305VALIC Co. I International Opportunities Fund 1,753,680 41,649,897VALIC Co. I International Value Fund 2,311,507 25,865,763
Total International Equity Investment Companies(cost $163,995,181) 192,662,709
International Fixed Income Investment Companies - 2.5%
VALIC Co. I International Government Bond Fund
Copyright © 2021 www.secdatabase.com. All Rights Reserved.Please Consider the Environment Before Printing This Document
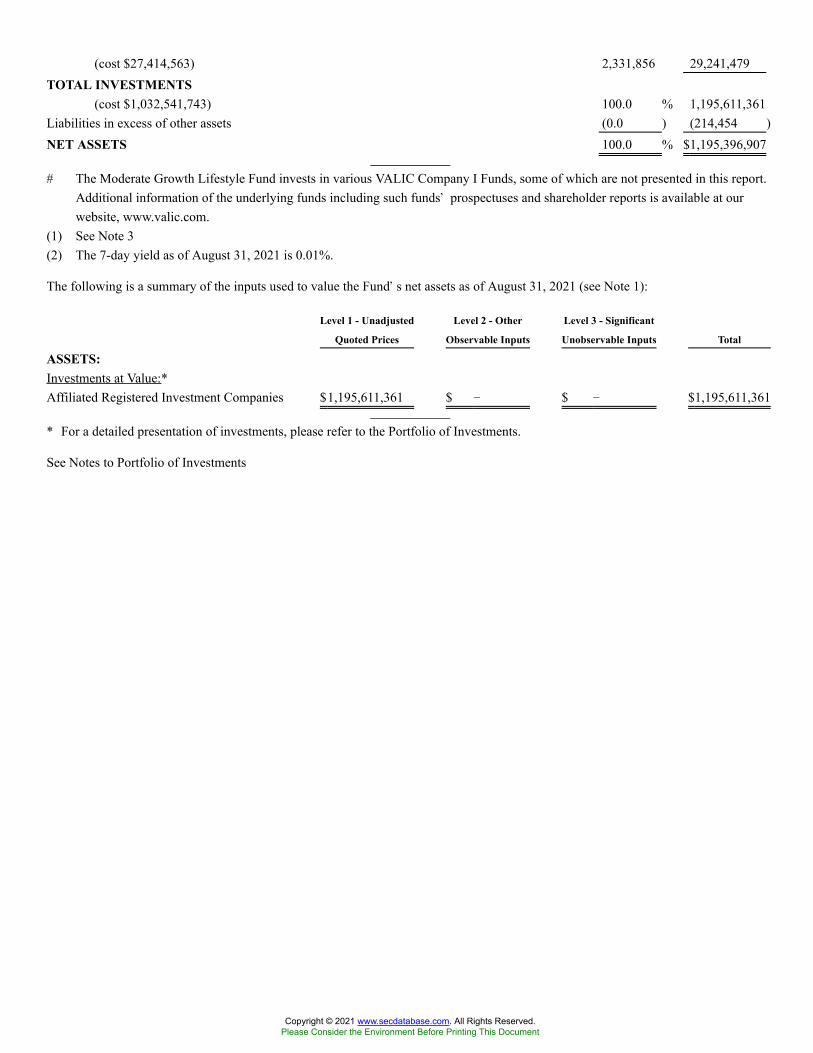
(cost $27,414,563) 2,331,856 29,241,479TOTAL INVESTMENTS
(cost $1,032,541,743) 100.0 % 1,195,611,361Liabilities in excess of other assets (0.0 ) (214,454 )NET ASSETS 100.0 % $1,195,396,907
# The Moderate Growth Lifestyle Fund invests in various VALIC Company I Funds, some of which are not presented in this report.Additional information of the underlying funds including such funds� prospectuses and shareholder reports is available at ourwebsite, www.valic.com.
(1) See Note 3(2) The 7-day yield as of August 31, 2021 is 0.01%.
The following is a summary of the inputs used to value the Fund�s net assets as of August 31, 2021 (see Note 1):
Level 1 - Unadjusted
Quoted Prices
Level 2 - Other
Observable Inputs
Level 3 - Significant
Unobservable Inputs Total
ASSETS:Investments at Value:*Affiliated Registered Investment Companies $1,195,611,361 $ � $ � $1,195,611,361
* For a detailed presentation of investments, please refer to the Portfolio of Investments.
See Notes to Portfolio of Investments
Copyright © 2021 www.secdatabase.com. All Rights Reserved.Please Consider the Environment Before Printing This Document

VALIC Company I Nasdaq-100 Index FundPORTFOLIO OF INVESTMENTS - August 31, 2021 - (unaudited)
Security Description Shares
Value
(Note 1)
COMMON STOCKS - 97.5%Applications Software - 10.9%
Intuit, Inc. 17,150 $9,708,787Microsoft Corp. 310,624 93,771,173
103,479,960Athletic Equipment - 0.2%
Peloton Interactive, Inc., Class A� 16,866 1,689,805Auto-Cars/Light Trucks - 3.8%
Tesla, Inc.� 49,168 36,173,881Auto-Heavy Duty Trucks - 0.2%
PACCAR, Inc. 21,788 1,783,784Beverages-Non-alcoholic - 2.1%
Keurig Dr Pepper, Inc. 88,956 3,173,060Monster Beverage Corp.� 33,173 3,236,690PepsiCo, Inc. 86,711 13,560,733
19,970,483Broadcast Services/Program - 0.1%
Fox Corp., Class A 20,519 768,231Fox Corp., Class B 15,895 550,444
1,318,675Cable/Satellite TV - 3.0%
Charter Communications, Inc., Class A� 11,841 9,670,071Comcast Corp., Class A 287,745 17,460,367Sirius XM Holdings, Inc.# 256,737 1,609,741
28,740,179Cellular Telecom - 1.1%
T-Mobile US, Inc.� 78,253 10,722,226Commercial Services - 0.3%
Cintas Corp. 6,593 2,609,312Commercial Services-Finance - 2.8%
Automatic Data Processing, Inc. 26,706 5,582,622PayPal Holdings, Inc.� 73,726 21,281,747
26,864,369Communications Software - 0.4%
Zoom Video Communications, Inc., Class A� 14,829 4,292,996Computer Aided Design - 1.3%
ANSYS, Inc.� 5,470 1,998,519
Copyright © 2021 www.secdatabase.com. All Rights Reserved.Please Consider the Environment Before Printing This Document
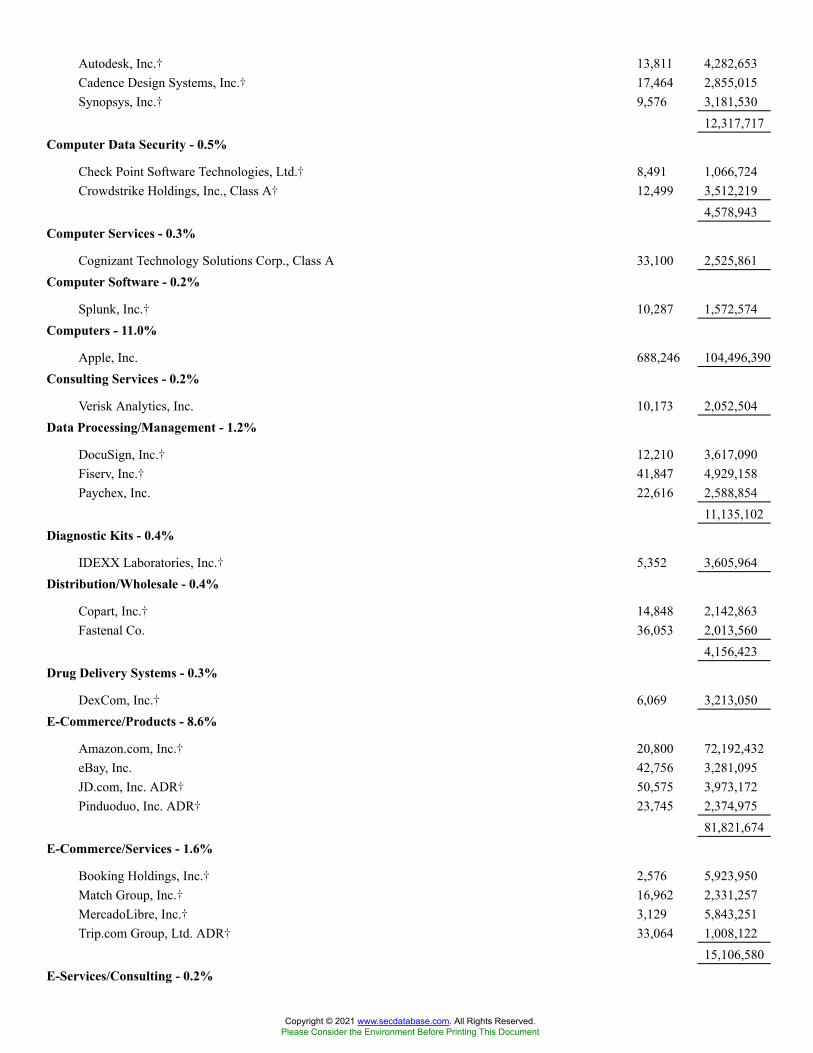
Autodesk, Inc.� 13,811 4,282,653Cadence Design Systems, Inc.� 17,464 2,855,015Synopsys, Inc.� 9,576 3,181,530
12,317,717Computer Data Security - 0.5%
Check Point Software Technologies, Ltd.� 8,491 1,066,724Crowdstrike Holdings, Inc., Class A� 12,499 3,512,219
4,578,943Computer Services - 0.3%
Cognizant Technology Solutions Corp., Class A 33,100 2,525,861Computer Software - 0.2%
Splunk, Inc.� 10,287 1,572,574Computers - 11.0%
Apple, Inc. 688,246 104,496,390Consulting Services - 0.2%
Verisk Analytics, Inc. 10,173 2,052,504Data Processing/Management - 1.2%
DocuSign, Inc.� 12,210 3,617,090Fiserv, Inc.� 41,847 4,929,158Paychex, Inc. 22,616 2,588,854
11,135,102Diagnostic Kits - 0.4%
IDEXX Laboratories, Inc.� 5,352 3,605,964Distribution/Wholesale - 0.4%
Copart, Inc.� 14,848 2,142,863Fastenal Co. 36,053 2,013,560
4,156,423Drug Delivery Systems - 0.3%
DexCom, Inc.� 6,069 3,213,050E-Commerce/Products - 8.6%
Amazon.com, Inc.� 20,800 72,192,432eBay, Inc. 42,756 3,281,095JD.com, Inc. ADR� 50,575 3,973,172Pinduoduo, Inc. ADR� 23,745 2,374,975
81,821,674E-Commerce/Services - 1.6%
Booking Holdings, Inc.� 2,576 5,923,950Match Group, Inc.� 16,962 2,331,257MercadoLibre, Inc.� 3,129 5,843,251Trip.com Group, Ltd. ADR� 33,064 1,008,122
15,106,580E-Services/Consulting - 0.2%
Copyright © 2021 www.secdatabase.com. All Rights Reserved.Please Consider the Environment Before Printing This Document

CDW Corp. 8,799 1,765,167Electric-Integrated - 0.8%
American Electric Power Co., Inc. 31,364 2,809,273Exelon Corp. 61,328 3,006,299Xcel Energy, Inc. 33,778 2,322,238
8,137,810Electronic Components-Semiconductors - 10.1%
Advanced Micro Devices, Inc.� 76,255 8,442,954Broadcom, Inc. 25,625 12,741,006Intel Corp. 253,425 13,700,156Marvell Technology, Inc. 51,418 3,146,267Microchip Technology, Inc. 17,167 2,701,399Micron Technology, Inc.� 70,380 5,187,006NVIDIA Corp. 156,400 35,010,140Skyworks Solutions, Inc. 10,361 1,900,829Texas Instruments, Inc. 57,960 11,065,144Xilinx, Inc. 15,429 2,400,598
96,295,499Electronic Forms - 2.1%
Adobe, Inc.� 29,999 19,910,336Enterprise Software/Service - 0.7%
Atlassian Corp. PLC, Class A� 8,490 3,116,339Workday, Inc., Class A� 11,862 3,240,224
6,356,563Entertainment Software - 0.9%
Activision Blizzard, Inc. 48,766 4,016,855Electronic Arts, Inc. 17,961 2,608,117NetEase, Inc. ADR 18,910 1,842,212
8,467,184
Copyright © 2021 www.secdatabase.com. All Rights Reserved.Please Consider the Environment Before Printing This Document
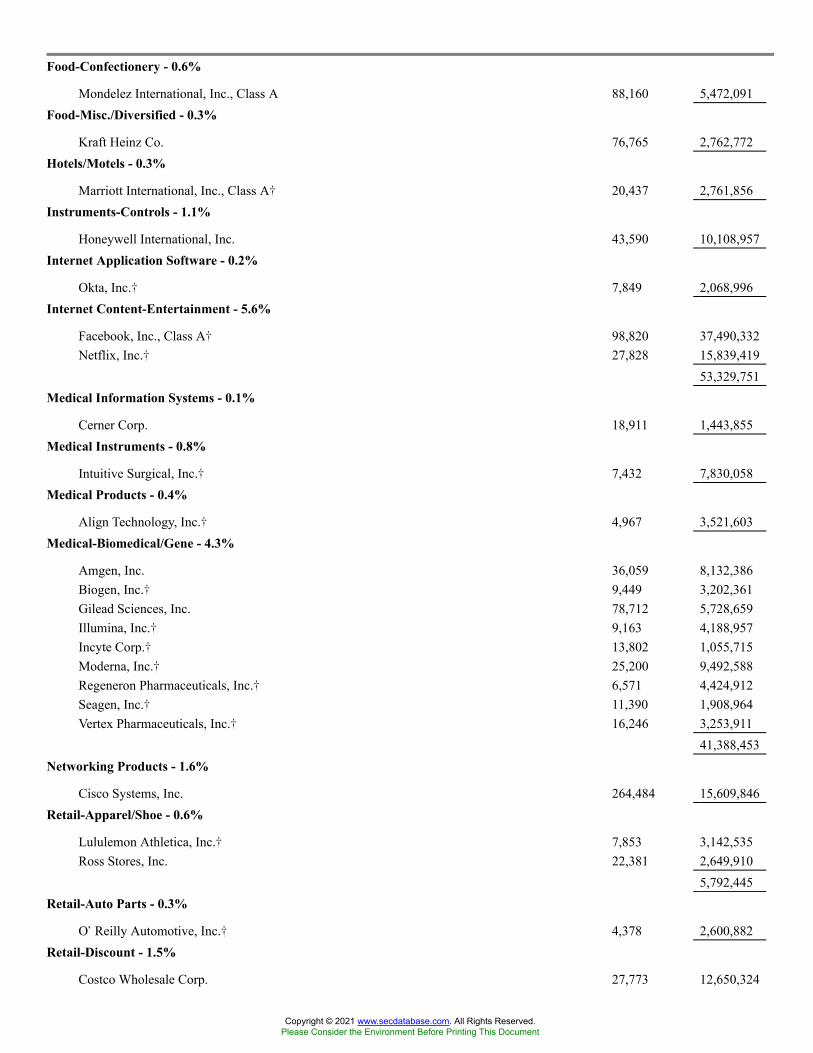
Food-Confectionery - 0.6%
Mondelez International, Inc., Class A 88,160 5,472,091Food-Misc./Diversified - 0.3%
Kraft Heinz Co. 76,765 2,762,772Hotels/Motels - 0.3%
Marriott International, Inc., Class A� 20,437 2,761,856Instruments-Controls - 1.1%
Honeywell International, Inc. 43,590 10,108,957Internet Application Software - 0.2%
Okta, Inc.� 7,849 2,068,996Internet Content-Entertainment - 5.6%
Facebook, Inc., Class A� 98,820 37,490,332Netflix, Inc.� 27,828 15,839,419
53,329,751Medical Information Systems - 0.1%
Cerner Corp. 18,911 1,443,855Medical Instruments - 0.8%
Intuitive Surgical, Inc.� 7,432 7,830,058Medical Products - 0.4%
Align Technology, Inc.� 4,967 3,521,603Medical-Biomedical/Gene - 4.3%
Amgen, Inc. 36,059 8,132,386Biogen, Inc.� 9,449 3,202,361Gilead Sciences, Inc. 78,712 5,728,659Illumina, Inc.� 9,163 4,188,957Incyte Corp.� 13,802 1,055,715Moderna, Inc.� 25,200 9,492,588Regeneron Pharmaceuticals, Inc.� 6,571 4,424,912Seagen, Inc.� 11,390 1,908,964Vertex Pharmaceuticals, Inc.� 16,246 3,253,911
41,388,453Networking Products - 1.6%
Cisco Systems, Inc. 264,484 15,609,846Retail-Apparel/Shoe - 0.6%
Lululemon Athletica, Inc.� 7,853 3,142,535Ross Stores, Inc. 22,381 2,649,910
5,792,445Retail-Auto Parts - 0.3%
O�Reilly Automotive, Inc.� 4,378 2,600,882Retail-Discount - 1.5%
Costco Wholesale Corp. 27,773 12,650,324
Copyright © 2021 www.secdatabase.com. All Rights Reserved.Please Consider the Environment Before Printing This Document

Dollar Tree, Inc.� 14,557 1,317,99113,968,315
Retail-Drug Store - 0.3%
Walgreens Boots Alliance, Inc. 54,249 2,753,137Retail-Restaurants - 0.9%
Starbucks Corp. 73,950 8,688,385Semiconductor Components-Integrated Circuits - 1.9%
Analog Devices, Inc. 23,149 3,772,129NXP Semiconductors NV 17,306 3,723,040QUALCOMM, Inc. 70,793 10,384,625
17,879,794Semiconductor Equipment - 2.2%
Applied Materials, Inc. 57,362 7,751,327ASML Holding NV 4,986 4,153,538KLA Corp. 9,620 3,270,415Lam Research Corp. 8,951 5,413,744
20,589,024Transport-Rail - 0.5%
CSX Corp. 142,605 4,638,941Web Hosting/Design - 0.2%
VeriSign, Inc.� 7,068 1,528,526Web Portals/ISP - 8.1%
Alphabet, Inc., Class A� 12,404 35,896,556Alphabet, Inc., Class C� 13,345 38,823,808Baidu, Inc. ADR� 16,261 2,553,302
77,273,666Total Long-Term Investment Securities
(cost $264,785,623) 927,172,364SHORT-TERM INVESTMENT SECURITIES - 0.5%Registered Investment Companies - 0.0%
State Street Navigator Securities Lending Government Money Market Portfolio0.03%(1)(2) 408,375 408,375
U.S. Government Treasuries - 0.5%
United States Treasury Bills0.04% due 05/19/2022(3) 1,200,000 1,199,5230.06% due 04/21/2022(3) 3,500,000 3,498,929
4,698,452Total Short-Term Investment Securities
(cost $5,106,767) 5,106,827REPURCHASE AGREEMENTS - 2.1%
Copyright © 2021 www.secdatabase.com. All Rights Reserved.Please Consider the Environment Before Printing This Document
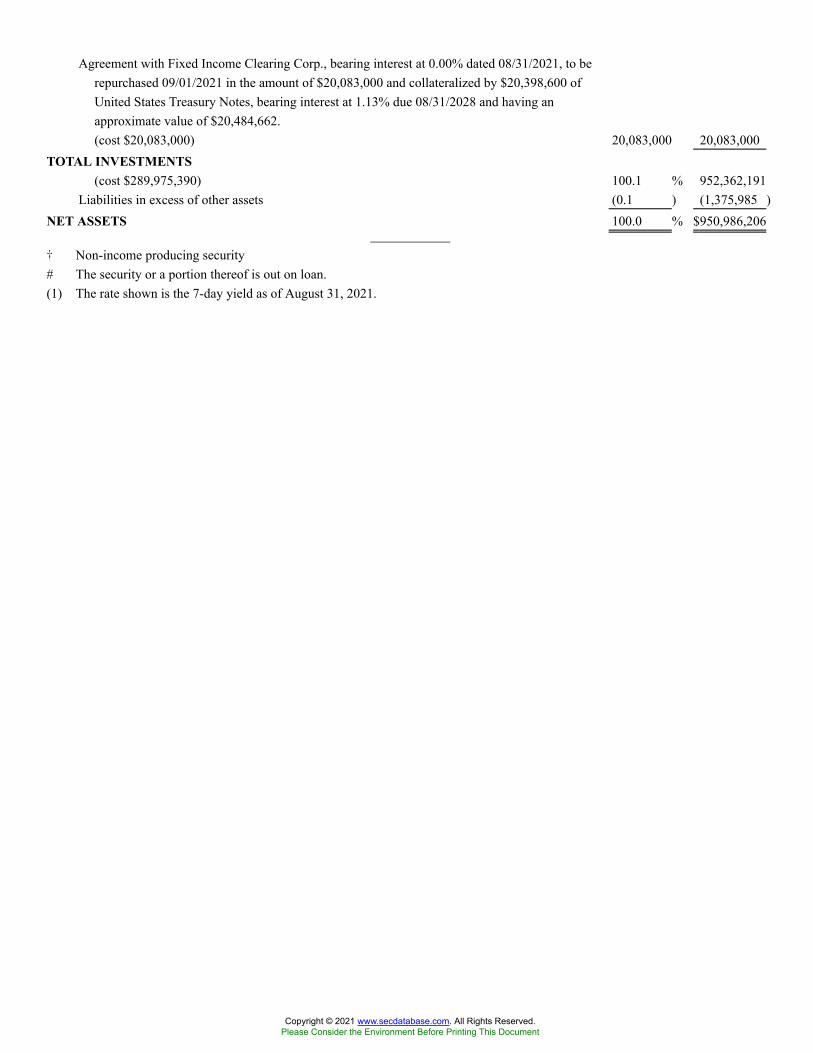
Agreement with Fixed Income Clearing Corp., bearing interest at 0.00% dated 08/31/2021, to berepurchased 09/01/2021 in the amount of $20,083,000 and collateralized by $20,398,600 ofUnited States Treasury Notes, bearing interest at 1.13% due 08/31/2028 and having anapproximate value of $20,484,662.(cost $20,083,000) 20,083,000 20,083,000
TOTAL INVESTMENTS(cost $289,975,390) 100.1 % 952,362,191
Liabilities in excess of other assets (0.1 ) (1,375,985 )NET ASSETS 100.0 % $950,986,206
� Non-income producing security# The security or a portion thereof is out on loan.(1) The rate shown is the 7-day yield as of August 31, 2021.
Copyright © 2021 www.secdatabase.com. All Rights Reserved.Please Consider the Environment Before Printing This Document

(2) At August 31, 2021, the Fund had loaned securities with a total value of $1,609,741. This was secured by collateral of $408,375,which was received in cash and subsequently invested in short-term investments currently valued at $408,375 as reported in thePortfolio of Investments. Additional collateral of $1,242,775 was received in the form of fixed income pooled securities, which theFund cannot sell or repledge and accordingly, are not reflected in the Fund�s assets and liabilities. The components of the fixedincome pooled securities referenced above are as follows:
Securities Coupon Range Maturity Date Range
Value as of
August 31, 2021
United States Treasury Bills0.00%
10/07/2021 to 10/28/2021 $ 4,269
United States Treasury Notes/Bonds0.13% to 6.88%
09/15/2021 to 11/15/2050 1,238,506
(3) The security or a portion thereof was pledged as collateral to cover margin requirements for open futures contracts.ADR - American Depositary Receipt
Futures ContractsNumber
of
Contracts Type Description Expiration Month
Notional
Basis*
Notional
Value*
Unrealized
Appreciation
(Depreciation)
79 Long NASDAQ 100 E-Mini Index September 2021 $22,575,680 $24,620,350 $2,044,670
* Notional basis refers to the contractual amount agreed upon at inception of the open contract; notional value represents the currentvalue of the open contract.
The following is a summary of the inputs used to value the Fund�s net assets as of August 31, 2021 (see Note 1):
Level 1 - Unadjusted
Quoted Prices
Level 2 - Other
Observable Inputs
Level 3 - Significant
Unobservable Inputs Total
ASSETS:Investments at Value:*Common Stocks $ 927,172,364 $ � $ � $927,172,364Short-Term Investment Securities:
Registered Investment Companies 408,375 � � 408,375U.S. Government Treasuries � 4,698,452 � 4,698,452
Repurchase Agreements � 20,083,000 � 20,083,000Total Investments at Value $ 927,580,739 $ 24,781,452 $ � $952,362,191
Other Financial Instruments:�Futures Contracts $ 2,044,670 $ � $ � $2,044,670
* For a detailed presentation of investments, please refer to the Portfolio of Investments.� Amounts represent unrealized appreciation/depreciation as of the end of the reporting period.
See Notes to Portfolio of Investments
Copyright © 2021 www.secdatabase.com. All Rights Reserved.Please Consider the Environment Before Printing This Document
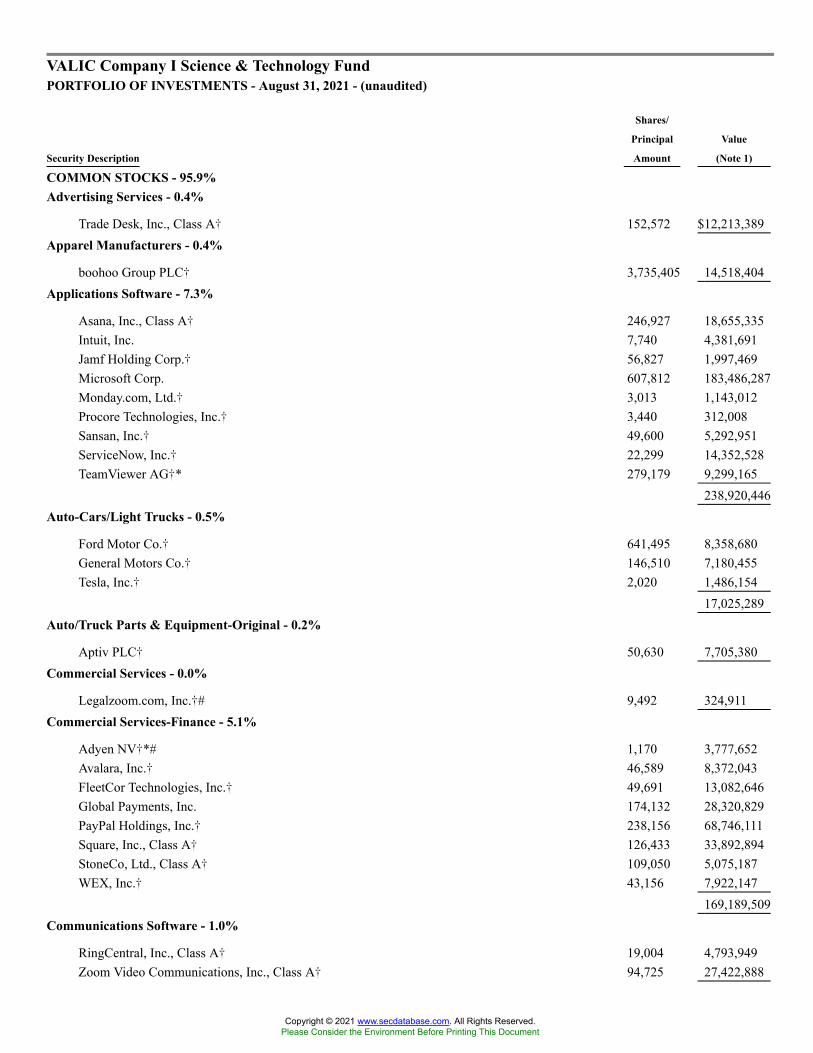
VALIC Company I Science & Technology FundPORTFOLIO OF INVESTMENTS - August 31, 2021 - (unaudited)
Security Description
Shares/
Principal
Amount
Value
(Note 1)
COMMON STOCKS - 95.9%Advertising Services - 0.4%
Trade Desk, Inc., Class A� 152,572 $12,213,389Apparel Manufacturers - 0.4%
boohoo Group PLC� 3,735,405 14,518,404Applications Software - 7.3%
Asana, Inc., Class A� 246,927 18,655,335Intuit, Inc. 7,740 4,381,691Jamf Holding Corp.� 56,827 1,997,469Microsoft Corp. 607,812 183,486,287Monday.com, Ltd.� 3,013 1,143,012Procore Technologies, Inc.� 3,440 312,008Sansan, Inc.� 49,600 5,292,951ServiceNow, Inc.� 22,299 14,352,528TeamViewer AG�* 279,179 9,299,165
238,920,446Auto-Cars/Light Trucks - 0.5%
Ford Motor Co.� 641,495 8,358,680General Motors Co.� 146,510 7,180,455Tesla, Inc.� 2,020 1,486,154
17,025,289Auto/Truck Parts & Equipment-Original - 0.2%
Aptiv PLC� 50,630 7,705,380Commercial Services - 0.0%
Legalzoom.com, Inc.�# 9,492 324,911Commercial Services-Finance - 5.1%
Adyen NV�*# 1,170 3,777,652Avalara, Inc.� 46,589 8,372,043FleetCor Technologies, Inc.� 49,691 13,082,646Global Payments, Inc. 174,132 28,320,829PayPal Holdings, Inc.� 238,156 68,746,111Square, Inc., Class A� 126,433 33,892,894StoneCo, Ltd., Class A� 109,050 5,075,187WEX, Inc.� 43,156 7,922,147
169,189,509Communications Software - 1.0%
RingCentral, Inc., Class A� 19,004 4,793,949Zoom Video Communications, Inc., Class A� 94,725 27,422,888
Copyright © 2021 www.secdatabase.com. All Rights Reserved.Please Consider the Environment Before Printing This Document

32,216,837Computer Aided Design - 0.1%
Altair Engineering, Inc., Class A� 21,220 1,570,068Autodesk, Inc.� 9,600 2,976,864
4,546,932Computer Data Security - 4.2%
Crowdstrike Holdings, Inc., Class A� 164,665 46,270,865Fortinet, Inc.� 51,836 16,335,597KnowBe4, Inc., Class A� 78,310 1,927,209McAfee Corp., Class A 234,567 6,230,100Rapid7, Inc.� 42,463 5,160,104Varonis Systems, Inc.� 241,034 16,633,756Zscaler, Inc.� 167,975 46,754,161
139,311,792Computer Services - 1.4%
DXC Technology Co.� 316,280 11,613,802EPAM Systems, Inc.� 18,535 11,729,133Genpact, Ltd. 344,707 17,883,399Infosys, Ltd. ADR 138,462 3,298,165
44,524,499Computer Software - 4.6%
Citrix Systems, Inc. 380,340 39,125,576Cloudflare, Inc., Class A� 25,245 3,048,081Datadog, Inc., Class A� 76,080 10,483,824MongoDB, Inc.� 84,470 33,097,880SentinelOne, Inc., Class A� 73,920 4,725,706Snowflake, Inc., Class A� 26,789 8,153,232Twilio, Inc., Class A� 96,265 34,362,754ZoomInfo Technologies, Inc., Class A� 293,835 19,155,104
152,152,157Computers - 1.4%
Apple, Inc. 300,995 45,700,071Computers-Memory Devices - 2.1%
NetApp, Inc. 76,545 6,807,147Pure Storage, Inc., Class A� 1,426,799 36,854,218Seagate Technology Holdings PLC 121,020 10,600,142Western Digital Corp.� 218,345 13,799,404
68,060,911Computers-Other - 0.1%
Lumentum Holdings, Inc.� 36,376 3,151,617Data Processing/Management - 0.5%
DocuSign, Inc.� 21,365 6,329,167Fidelity National Information Services, Inc. 33,365 4,263,046Fiserv, Inc.� 40,130 4,726,913
Copyright © 2021 www.secdatabase.com. All Rights Reserved.Please Consider the Environment Before Printing This Document
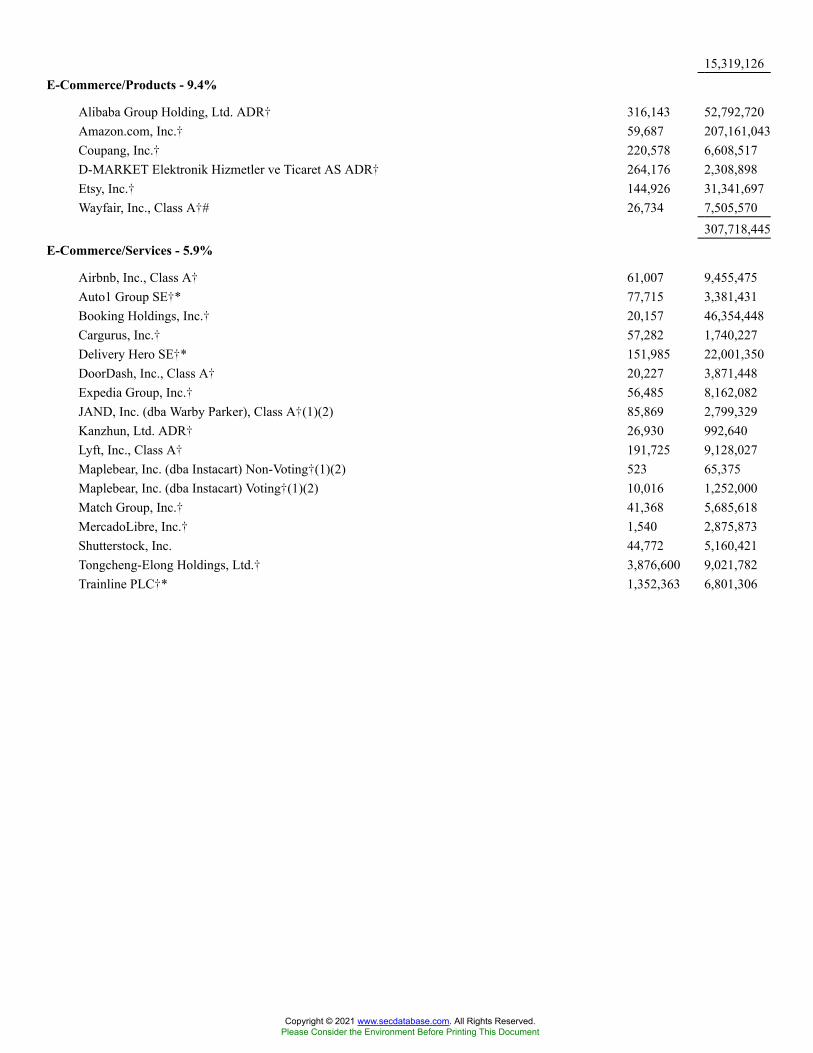
15,319,126E-Commerce/Products - 9.4%
Alibaba Group Holding, Ltd. ADR� 316,143 52,792,720Amazon.com, Inc.� 59,687 207,161,043Coupang, Inc.� 220,578 6,608,517D-MARKET Elektronik Hizmetler ve Ticaret AS ADR� 264,176 2,308,898Etsy, Inc.� 144,926 31,341,697Wayfair, Inc., Class A�# 26,734 7,505,570
307,718,445E-Commerce/Services - 5.9%
Airbnb, Inc., Class A� 61,007 9,455,475Auto1 Group SE�* 77,715 3,381,431Booking Holdings, Inc.� 20,157 46,354,448Cargurus, Inc.� 57,282 1,740,227Delivery Hero SE�* 151,985 22,001,350DoorDash, Inc., Class A� 20,227 3,871,448Expedia Group, Inc.� 56,485 8,162,082JAND, Inc. (dba Warby Parker), Class A�(1)(2) 85,869 2,799,329Kanzhun, Ltd. ADR� 26,930 992,640Lyft, Inc., Class A� 191,725 9,128,027Maplebear, Inc. (dba Instacart) Non-Voting�(1)(2) 523 65,375Maplebear, Inc. (dba Instacart) Voting�(1)(2) 10,016 1,252,000Match Group, Inc.� 41,368 5,685,618MercadoLibre, Inc.� 1,540 2,875,873Shutterstock, Inc. 44,772 5,160,421Tongcheng-Elong Holdings, Ltd.� 3,876,600 9,021,782Trainline PLC�* 1,352,363 6,801,306
Copyright © 2021 www.secdatabase.com. All Rights Reserved.Please Consider the Environment Before Printing This Document
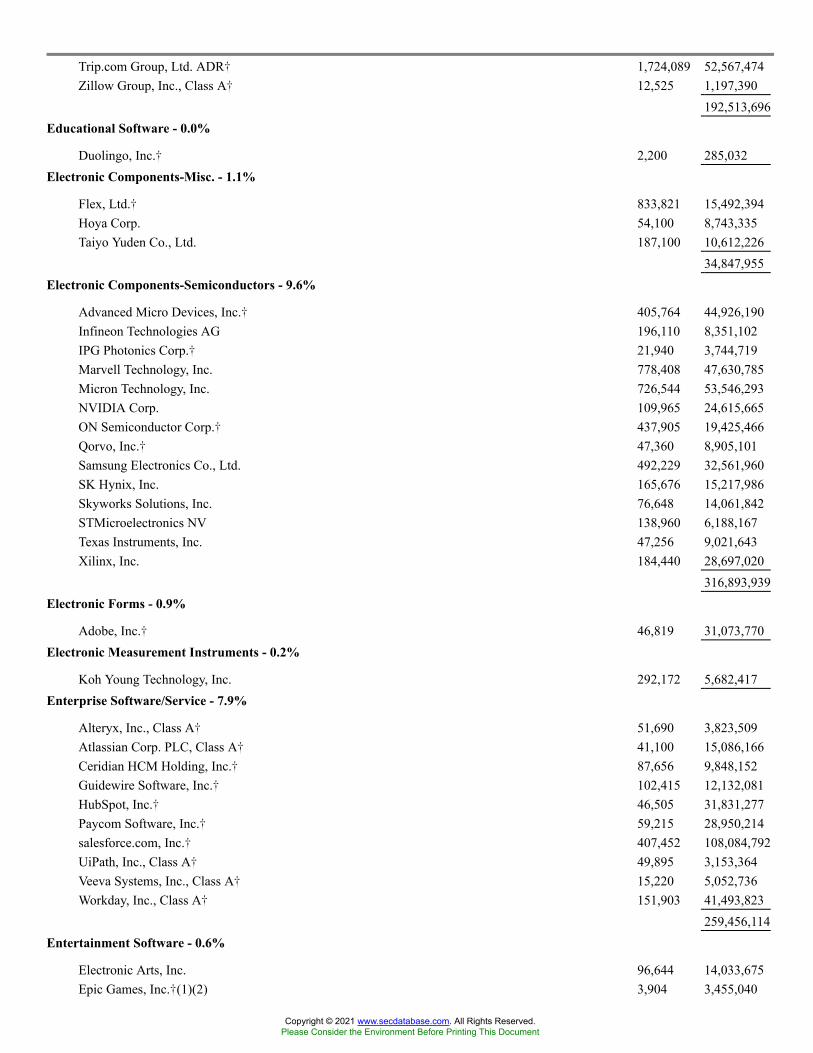
Trip.com Group, Ltd. ADR� 1,724,089 52,567,474Zillow Group, Inc., Class A� 12,525 1,197,390
192,513,696Educational Software - 0.0%
Duolingo, Inc.� 2,200 285,032Electronic Components-Misc. - 1.1%
Flex, Ltd.� 833,821 15,492,394Hoya Corp. 54,100 8,743,335Taiyo Yuden Co., Ltd. 187,100 10,612,226
34,847,955Electronic Components-Semiconductors - 9.6%
Advanced Micro Devices, Inc.� 405,764 44,926,190Infineon Technologies AG 196,110 8,351,102IPG Photonics Corp.� 21,940 3,744,719Marvell Technology, Inc. 778,408 47,630,785Micron Technology, Inc. 726,544 53,546,293NVIDIA Corp. 109,965 24,615,665ON Semiconductor Corp.� 437,905 19,425,466Qorvo, Inc.� 47,360 8,905,101Samsung Electronics Co., Ltd. 492,229 32,561,960SK Hynix, Inc. 165,676 15,217,986Skyworks Solutions, Inc. 76,648 14,061,842STMicroelectronics NV 138,960 6,188,167Texas Instruments, Inc. 47,256 9,021,643Xilinx, Inc. 184,440 28,697,020
316,893,939Electronic Forms - 0.9%
Adobe, Inc.� 46,819 31,073,770Electronic Measurement Instruments - 0.2%
Koh Young Technology, Inc. 292,172 5,682,417Enterprise Software/Service - 7.9%
Alteryx, Inc., Class A� 51,690 3,823,509Atlassian Corp. PLC, Class A� 41,100 15,086,166Ceridian HCM Holding, Inc.� 87,656 9,848,152Guidewire Software, Inc.� 102,415 12,132,081HubSpot, Inc.� 46,505 31,831,277Paycom Software, Inc.� 59,215 28,950,214salesforce.com, Inc.� 407,452 108,084,792UiPath, Inc., Class A� 49,895 3,153,364Veeva Systems, Inc., Class A� 15,220 5,052,736Workday, Inc., Class A� 151,903 41,493,823
259,456,114Entertainment Software - 0.6%
Electronic Arts, Inc. 96,644 14,033,675Epic Games, Inc.�(1)(2) 3,904 3,455,040
Copyright © 2021 www.secdatabase.com. All Rights Reserved.Please Consider the Environment Before Printing This Document

Take-Two Interactive Software, Inc.� 18,100 2,918,08220,406,797
Finance-Credit Card - 0.8%
Mastercard, Inc., Class A 7,670 2,655,584Visa, Inc., Class A 109,847 25,165,948
27,821,532Finance-Other Services - 0.2%
Money Forward, Inc.�# 81,500 6,563,559Industrial Automated/Robotic - 0.0%
Cognex Corp. 16,200 1,435,644Internet Application Software - 1.3%
Okta, Inc.� 25,790 6,798,244Shopify, Inc., Class A� 23,523 35,867,400
42,665,644Internet Content-Entertainment - 6.0%
Facebook, Inc., Class A� 362,894 137,674,726Mail.Ru Group, Ltd. GDR� 1,078,057 21,690,507Pinterest, Inc., Class A� 177,400 9,858,118Snap, Inc., Class A� 369,024 28,086,416
197,309,767Internet Content-Information/News - 1.1%
Bright Health Group, Inc.Lock-up shares�(2) 181,044 1,592,644
Deliveroo PLC�* 1,904,761 9,123,763Kuaishou Technology�* 20,200 219,468Naspers, Ltd., Class N 50,679 8,652,193Prosus NV 104,166 9,212,254Tencent Holdings, Ltd. 93,271 5,770,787
34,571,109Internet Infrastructure Software - 0.3%
F5 Networks, Inc.� 44,342 9,026,701Internet Security - 0.7%
FireEye, Inc.� 65,350 1,188,716NortonLifeLock, Inc. 370,376 9,837,187Palo Alto Networks, Inc.� 23,260 10,723,790
21,749,693Machinery-Electrical - 0.1%
Bloom Energy Corp., Class A�# 84,585 1,811,811Medical Information Systems - 0.4%
Alignment Healthcare PartnersLock-up shares�(2) 131,699 2,210,765
Copyright © 2021 www.secdatabase.com. All Rights Reserved.Please Consider the Environment Before Printing This Document

Doximity, Inc.Class BLock-up shares�(2) 129,570 11,324,418
13,535,183Medical Instruments - 0.2%
Intuitive Surgical, Inc.� 6,194 6,525,751Medical-Biomedical/Gene - 0.0%
Flame Biosciences, Inc.�(1)(2) 48,560 318,068Longboard Pharmaceuticals, Inc.
Lock-Up Shares�(2) 32,938 293,510Verily Life Sciences LLC
Series B�(1)(2) 6,986 913,2101,524,788
Copyright © 2021 www.secdatabase.com. All Rights Reserved.Please Consider the Environment Before Printing This Document
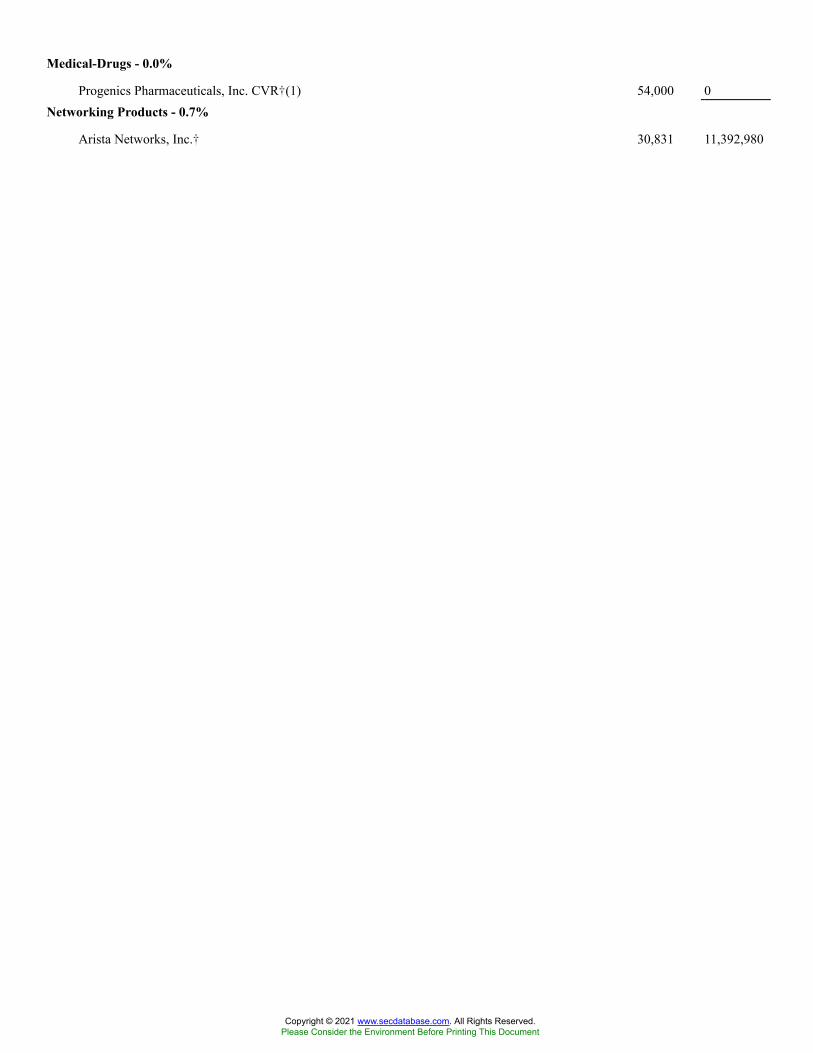
Medical-Drugs - 0.0%
Progenics Pharmaceuticals, Inc. CVR�(1) 54,000 0Networking Products - 0.7%
Arista Networks, Inc.� 30,831 11,392,980
Copyright © 2021 www.secdatabase.com. All Rights Reserved.Please Consider the Environment Before Printing This Document
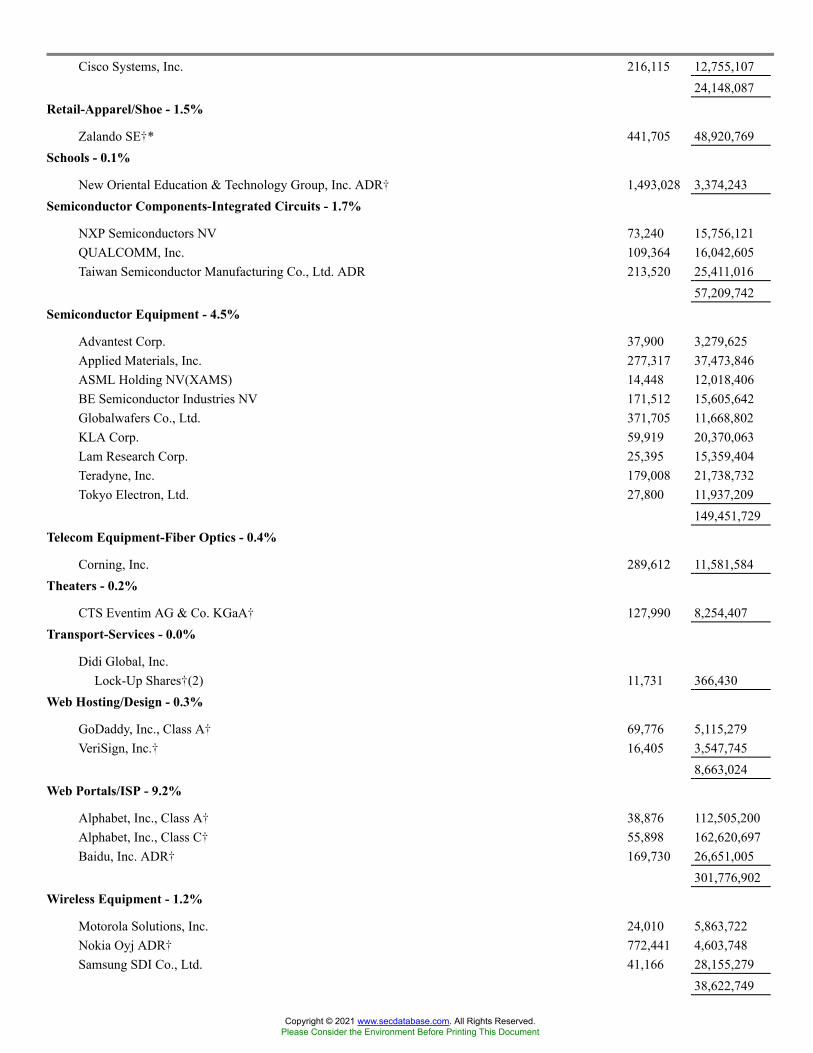
Cisco Systems, Inc. 216,115 12,755,10724,148,087
Retail-Apparel/Shoe - 1.5%
Zalando SE�* 441,705 48,920,769Schools - 0.1%
New Oriental Education & Technology Group, Inc. ADR� 1,493,028 3,374,243Semiconductor Components-Integrated Circuits - 1.7%
NXP Semiconductors NV 73,240 15,756,121QUALCOMM, Inc. 109,364 16,042,605Taiwan Semiconductor Manufacturing Co., Ltd. ADR 213,520 25,411,016
57,209,742Semiconductor Equipment - 4.5%
Advantest Corp. 37,900 3,279,625Applied Materials, Inc. 277,317 37,473,846ASML Holding NV(XAMS) 14,448 12,018,406BE Semiconductor Industries NV 171,512 15,605,642Globalwafers Co., Ltd. 371,705 11,668,802KLA Corp. 59,919 20,370,063Lam Research Corp. 25,395 15,359,404Teradyne, Inc. 179,008 21,738,732Tokyo Electron, Ltd. 27,800 11,937,209
149,451,729Telecom Equipment-Fiber Optics - 0.4%
Corning, Inc. 289,612 11,581,584Theaters - 0.2%
CTS Eventim AG & Co. KGaA� 127,990 8,254,407Transport-Services - 0.0%
Didi Global, Inc.Lock-Up Shares�(2) 11,731 366,430
Web Hosting/Design - 0.3%
GoDaddy, Inc., Class A� 69,776 5,115,279VeriSign, Inc.� 16,405 3,547,745
8,663,024Web Portals/ISP - 9.2%
Alphabet, Inc., Class A� 38,876 112,505,200Alphabet, Inc., Class C� 55,898 162,620,697Baidu, Inc. ADR� 169,730 26,651,005
301,776,902Wireless Equipment - 1.2%
Motorola Solutions, Inc. 24,010 5,863,722Nokia Oyj ADR� 772,441 4,603,748Samsung SDI Co., Ltd. 41,166 28,155,279
38,622,749
Copyright © 2021 www.secdatabase.com. All Rights Reserved.Please Consider the Environment Before Printing This Document

Total Common Stocks(cost $2,498,175,096) 3,150,670,283
CONVERTIBLE PREFERRED SECURITIES - 1.2%Applications Software - 0.1%
Color Health, Inc.Series D-1�(1)(2) 26,210 1,200,156
Copyright © 2021 www.secdatabase.com. All Rights Reserved.Please Consider the Environment Before Printing This Document
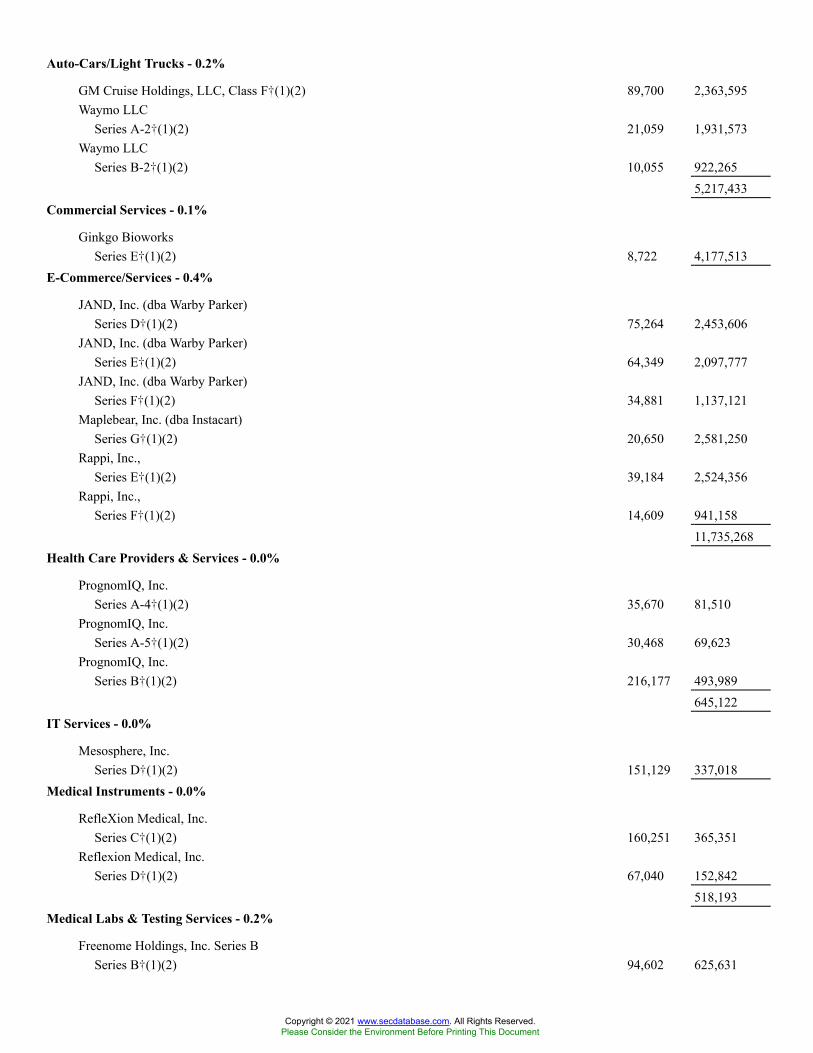
Auto-Cars/Light Trucks - 0.2%
GM Cruise Holdings, LLC, Class F�(1)(2) 89,700 2,363,595Waymo LLC
Series A-2�(1)(2) 21,059 1,931,573Waymo LLC
Series B-2�(1)(2) 10,055 922,2655,217,433
Commercial Services - 0.1%
Ginkgo BioworksSeries E�(1)(2) 8,722 4,177,513
E-Commerce/Services - 0.4%
JAND, Inc. (dba Warby Parker)Series D�(1)(2) 75,264 2,453,606
JAND, Inc. (dba Warby Parker)Series E�(1)(2) 64,349 2,097,777
JAND, Inc. (dba Warby Parker)Series F�(1)(2) 34,881 1,137,121
Maplebear, Inc. (dba Instacart)Series G�(1)(2) 20,650 2,581,250
Rappi, Inc.,Series E�(1)(2) 39,184 2,524,356
Rappi, Inc.,Series F�(1)(2) 14,609 941,158
11,735,268Health Care Providers & Services - 0.0%
PrognomIQ, Inc.Series A-4�(1)(2) 35,670 81,510
PrognomIQ, Inc.Series A-5�(1)(2) 30,468 69,623
PrognomIQ, Inc.Series B�(1)(2) 216,177 493,989
645,122IT Services - 0.0%
Mesosphere, Inc.Series D�(1)(2) 151,129 337,018
Medical Instruments - 0.0%
RefleXion Medical, Inc.Series C�(1)(2) 160,251 365,351
Reflexion Medical, Inc.Series D�(1)(2) 67,040 152,842
518,193Medical Labs & Testing Services - 0.2%
Freenome Holdings, Inc. Series BSeries B�(1)(2) 94,602 625,631
Copyright © 2021 www.secdatabase.com. All Rights Reserved.Please Consider the Environment Before Printing This Document
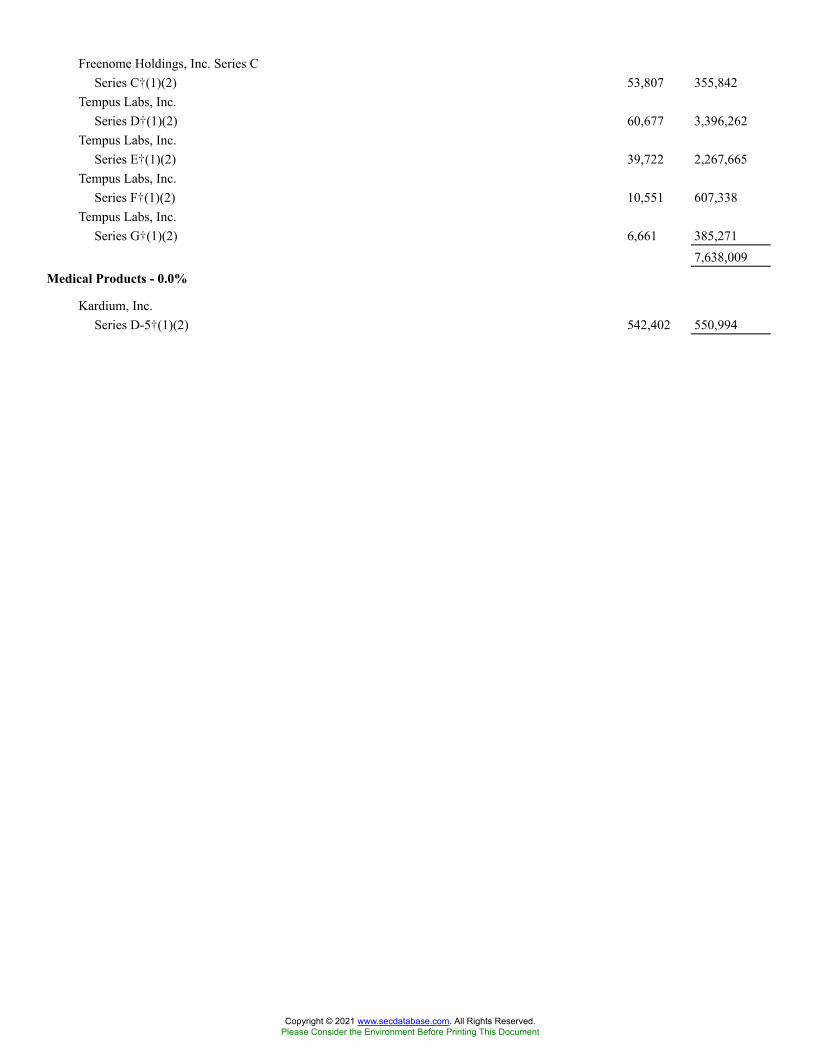
Freenome Holdings, Inc. Series CSeries C�(1)(2) 53,807 355,842
Tempus Labs, Inc.Series D�(1)(2) 60,677 3,396,262
Tempus Labs, Inc.Series E�(1)(2) 39,722 2,267,665
Tempus Labs, Inc.Series F�(1)(2) 10,551 607,338
Tempus Labs, Inc.Series G�(1)(2) 6,661 385,271
7,638,009Medical Products - 0.0%
Kardium, Inc.Series D-5�(1)(2) 542,402 550,994
Copyright © 2021 www.secdatabase.com. All Rights Reserved.Please Consider the Environment Before Printing This Document
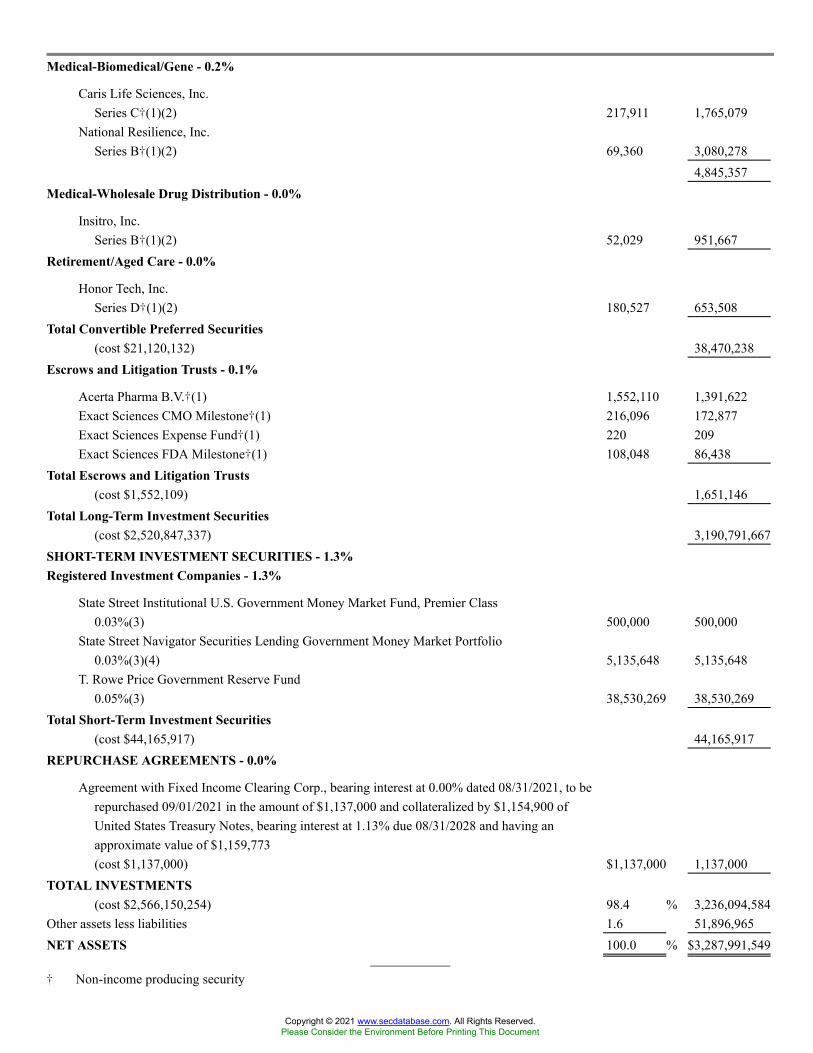
Medical-Biomedical/Gene - 0.2%
Caris Life Sciences, Inc.Series C�(1)(2) 217,911 1,765,079
National Resilience, Inc.Series B�(1)(2) 69,360 3,080,278
4,845,357Medical-Wholesale Drug Distribution - 0.0%
Insitro, Inc.Series B�(1)(2) 52,029 951,667
Retirement/Aged Care - 0.0%
Honor Tech, Inc.Series D�(1)(2) 180,527 653,508
Total Convertible Preferred Securities(cost $21,120,132) 38,470,238
Escrows and Litigation Trusts - 0.1%
Acerta Pharma B.V.�(1) 1,552,110 1,391,622Exact Sciences CMO Milestone�(1) 216,096 172,877Exact Sciences Expense Fund�(1) 220 209Exact Sciences FDA Milestone�(1) 108,048 86,438
Total Escrows and Litigation Trusts(cost $1,552,109) 1,651,146
Total Long-Term Investment Securities(cost $2,520,847,337) 3,190,791,667
SHORT-TERM INVESTMENT SECURITIES - 1.3%Registered Investment Companies - 1.3%
State Street Institutional U.S. Government Money Market Fund, Premier Class0.03%(3) 500,000 500,000
State Street Navigator Securities Lending Government Money Market Portfolio0.03%(3)(4) 5,135,648 5,135,648
T. Rowe Price Government Reserve Fund0.05%(3) 38,530,269 38,530,269
Total Short-Term Investment Securities(cost $44,165,917) 44,165,917
REPURCHASE AGREEMENTS - 0.0%
Agreement with Fixed Income Clearing Corp., bearing interest at 0.00% dated 08/31/2021, to berepurchased 09/01/2021 in the amount of $1,137,000 and collateralized by $1,154,900 ofUnited States Treasury Notes, bearing interest at 1.13% due 08/31/2028 and having anapproximate value of $1,159,773(cost $1,137,000) $1,137,000 1,137,000
TOTAL INVESTMENTS(cost $2,566,150,254) 98.4 % 3,236,094,584
Other assets less liabilities 1.6 51,896,965NET ASSETS 100.0 % $3,287,991,549
� Non-income producing security
Copyright © 2021 www.secdatabase.com. All Rights Reserved.Please Consider the Environment Before Printing This Document
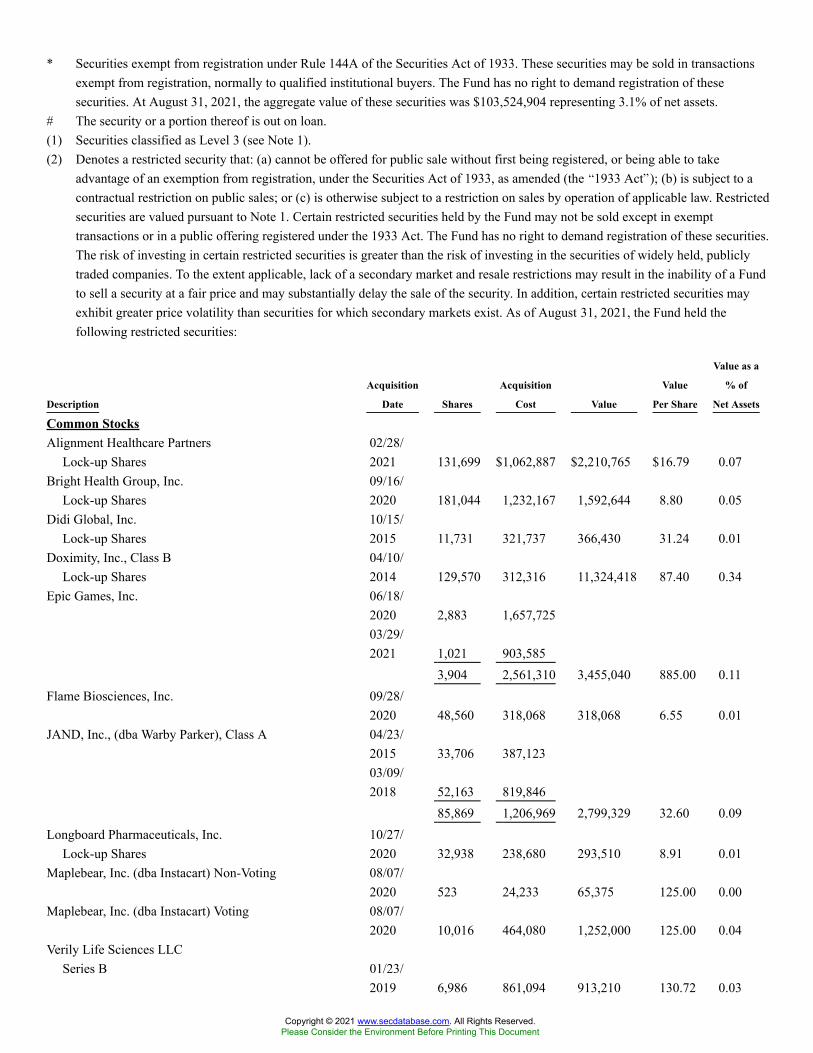
* Securities exempt from registration under Rule 144A of the Securities Act of 1933. These securities may be sold in transactionsexempt from registration, normally to qualified institutional buyers. The Fund has no right to demand registration of thesesecurities. At August 31, 2021, the aggregate value of these securities was $103,524,904 representing 3.1% of net assets.
# The security or a portion thereof is out on loan.(1) Securities classified as Level 3 (see Note 1).(2) Denotes a restricted security that: (a) cannot be offered for public sale without first being registered, or being able to take
advantage of an exemption from registration, under the Securities Act of 1933, as amended (the �1933 Act�); (b) is subject to acontractual restriction on public sales; or (c) is otherwise subject to a restriction on sales by operation of applicable law. Restrictedsecurities are valued pursuant to Note 1. Certain restricted securities held by the Fund may not be sold except in exempttransactions or in a public offering registered under the 1933 Act. The Fund has no right to demand registration of these securities.The risk of investing in certain restricted securities is greater than the risk of investing in the securities of widely held, publiclytraded companies. To the extent applicable, lack of a secondary market and resale restrictions may result in the inability of a Fundto sell a security at a fair price and may substantially delay the sale of the security. In addition, certain restricted securities mayexhibit greater price volatility than securities for which secondary markets exist. As of August 31, 2021, the Fund held thefollowing restricted securities:
Description
Acquisition
Date Shares
Acquisition
Cost Value
Value
Per Share
Value as a
% of
Net Assets
Common StocksAlignment Healthcare Partners
Lock-up Shares02/28/2021 131,699 $1,062,887 $2,210,765 $16.79 0.07
Bright Health Group, Inc.Lock-up Shares
09/16/2020 181,044 1,232,167 1,592,644 8.80 0.05
Didi Global, Inc.Lock-up Shares
10/15/2015 11,731 321,737 366,430 31.24 0.01
Doximity, Inc., Class BLock-up Shares
04/10/2014 129,570 312,316 11,324,418 87.40 0.34
Epic Games, Inc. 06/18/2020 2,883 1,657,72503/29/2021 1,021 903,585
3,904 2,561,310 3,455,040 885.00 0.11Flame Biosciences, Inc. 09/28/
2020 48,560 318,068 318,068 6.55 0.01JAND, Inc., (dba Warby Parker), Class A 04/23/
2015 33,706 387,12303/09/2018 52,163 819,846
85,869 1,206,969 2,799,329 32.60 0.09Longboard Pharmaceuticals, Inc.
Lock-up Shares10/27/2020 32,938 238,680 293,510 8.91 0.01
Maplebear, Inc. (dba Instacart) Non-Voting 08/07/2020 523 24,233 65,375 125.00 0.00
Maplebear, Inc. (dba Instacart) Voting 08/07/2020 10,016 464,080 1,252,000 125.00 0.04
Verily Life Sciences LLCSeries B 01/23/
2019 6,986 861,094 913,210 130.72 0.03
Copyright © 2021 www.secdatabase.com. All Rights Reserved.Please Consider the Environment Before Printing This Document

Convertible Preferred SecuritiesCaris Life Sciences, Inc.
Series C 08/14/2020 217,911 601,434 1,765,079 8.10 0.05
Color Health, Inc.Series D-1 01/13/
2020 26,210 543,971 1,200,156 45.79 0.04Freenome Holdings, Inc.
Series B 06/24/2019 94,602 431,111 625,631 6.61 0.02
Freenome Holdings, Inc.Series C 08/14/
2020 53,807 355,842 355,842 6.61 0.01Ginkgo Bioworks
Series E 09/09/2019 6,443 967,67409/30/2019 2,279 324,284
8,722 1,291,958 4,177,513 478.96 0.13GM Cruise Holdings, LLC
Class F 05/07/2019 89,700 1,637,025 2,363,595 26.35 0.07
Honor Tech, Inc.Series D 10/16/
2020 180,527 434,723 653,508 3.62 0.02Insitro, Inc.
Series B 05/21/2020 52,029 324,177 951,667 18.29 0.03
JAND, Inc., (dba Warby Parker),Series D 04/23/
2015 75,264 864,429 2,453,606 32.60 0.07JAND, Inc., (dba Warby Parker),
Series E 03/09/2018 64,349 1,011,373 2,097,777 32.60 0.06
JAND, Inc., (dba Warby Parker),Series F 04/03/
2020 34,881 679,939 1,137,121 32.60 0.03Kardium, Inc.
Series D-5 11/29/2018 542,402 525,533 550,994 1.02 0.02
Maplebear, Inc., (dba Instacart)Series G 07/02/
2020 20,650 993,098 2,581,250 125.00 0.08Mesophere, Inc.
Series D 05/04/2018 151,129 1,670,656 337,018 2.23 0.01
National Resilience, Inc.Series B 10/23/
2020 69,360 947,458 3,080,278 44.41 0.09
Copyright © 2021 www.secdatabase.com. All Rights Reserved.Please Consider the Environment Before Printing This Document

PrognomIQ, Inc.Series A-4 11/15/
2019 35,670 81,510 81,510 2.29 0.00PrognomIQ, Inc.
Series A-5 05/12/2020 30,468 69,623 69,623 2.29 0.00
PrognomIQ, Inc.Series B 09/11/
2020 216,177 493,989 493,989 2.29 0.02Rappi, Inc.,
Series E 09/08/2020 39,184 2,341,089 2,524,356 64.42 0.08
Rappi, Inc.,Series F 07/08/
2021 14,609 941,158 941,158 64.42 0.03RefleXion Medical, Inc.
Series C 04/03/2018 160,251 271,145 365,351 2.28 0.01
RefleXion Medical, Inc.Series D 04/04/
2020 67,040 127,808 152,842 2.28 0.00Tempus Labs, Inc.
Series D 03/16/2018 60,677 568,780 3,396,262 55.97 0.10
Tempus Labs, Inc.Series E 08/23/
2018 39,722 665,058 2,267,665 57.09 0.07Tempus Labs, Inc.
Series F 04/30/2019 10,551 261,239 607,338 57.56 0.02
Tempus Labs, Inc.Series G 02/06/
2020 6,661 255,465 385,271 57.84 0.01Waymo LLC
Series A-2 05/08/2020 21,059 1,808,277 1,931,573 91.72 0.06
Waymo LLCSeries B-2 06/11/
2021 10,055 922,265 922,265 91.72 0.03$63,061,027 1.92 %
(3) The rate shown is the 7-day yield as of August 31, 2021.(4) At August 31, 2021, the Fund had loaned securities with a total value of $16,043,696. This was secured by collateral of $5,135,648
which was received in cash and subsequently invested in short-term investments currently valued at $5,135,648 as reported in thePortfolio of Investments. Additional collateral of $11,779,692 was received in the form of fixed income pooled securities, whichthe Fund cannot sell or repledge and accordingly are not reflected in the Fund�s assets and liabilities.
The components of the fixed income pooled securities referenced above are as follows:
Copyright © 2021 www.secdatabase.com. All Rights Reserved.Please Consider the Environment Before Printing This Document

Securities Coupon Range
Maturity
Date Range
Value as of
August 31,
2021
United States Treasury Bills
0.00%
09/14/2021 to 02/
24/2022 $478,478United States Treasury Notes/Bonds
0.07% to 8.00%
09/30/2021to 08/15/
2050 11,301,214
ADR - American Depositary ReceiptCVR - Contingent Value RightsGDR - Global Depositary Receipt
The following is a summary of the inputs used to value the Fund�s net assets as of August 31, 2021 (see Note 1):
Level 1 - Unadjusted
Quoted Prices
Level 2- Other
Observable Inputs
Level 3 - Significant
Unobservable Inputs Total
ASSETS:Investments at Value:*Common Stocks:
E-Commerce/Services 188,396,992 � 4,116,704 192,513,696Entertainment Software 16,951,757 � 3,455,040 20,406,797Internet Content-Information/News 32,978,465 1,592,644 � 34,571,109Medical Information Systems � 13,535,183 � 13,535,183Medical-Biomedical/Gene � 293,510 1,231,278 1,524,788Medical-Drugs � � 0 0Transport-Services � 366,430 � 366,430Other Industries 2,887,752,280 � � 2,887,752,280
Convertible Preferred Securities � � 38,470,238 38,470,238Escrows and Litigation Trusts � � 1,651,146 1,651,146Short-Term Investment Securities 44,165,917 � � 44,165,917Repurchase Agreements � 1,137,000 � 1,137,000Total Investments at Value $3,170,245,411 $ 16,924,767 $ 48,924,406 $3,236,094,584
* For a detailed presentation of investments, please refer to the Portfolio of Investments.
The following is a reconciliation of Level 3 assets for which significant unobservable inputs were used to determine fair value:
Common Stocks
Convertible Preferred
Securities
Escrow and Litigation
Trusts
Balance as of May 31, 2021 $8,167,707 38,494,347 $ 1,458,535Accrued Discounts � � �
Accrued Premiums � � �
Realized Gain � � 1,302,256Realized Loss � � �
Change in unrealized appreciation (1) 692,911 11,621,947 19,449Change in unrealized depreciation (1) (57,596 ) (225,986 ) (1,129,094 )Net Purchases � 1,863,422 1,552,110Net Sales � � (1,552,110 )Transfers into Level 3 � � �
Transfers out of Level 3 (2) � (13,283,492 ) �
Copyright © 2021 www.secdatabase.com. All Rights Reserved.Please Consider the Environment Before Printing This Document

Balance as of August 31, 2021 $8,803,022 38,470,238 $ 1,651,146
(1) The total change in unrealized appreciation (depreciation) attributable to Level 3 investments still held at August 31, 2021includes:
Common Stocks
Convertible Preferred
Securities
Escrow and Litigation
Trusts
$ 649,528 $ 4,046,594 $ (141,039 )
(2) Private Convertible Preferred Securities were converted to Common Stock Lockup Shares following the Companies� IPO listings.Securities are now valued using Level 2 Inputs.
Any differences between the change in appreciation (depreciation) in the Level 3 reconciliation and the total change in unrealizedappreciation (depreciation) is attributable to securities sold/no longer held at August 31, 2021.
The following is quantitative information about Level 3 fair value measurements:
Description
Fair Value at
8/31/21
Valuation
Technique(s) Unobservable Input (1) Range (weighted average)#
Common Stocks $5,090,483 Market Approach Market Transaction Price* $6.55-$885.00 ($633.43019)
$2,799,329 Market Approach Transaction Price* $24.5310Sales Multiple* 6.3xGross Profit Multiple* 9.65xDiscount for Lack ofMarketability 10.0%
$913,210 Market Approach Transaction Price* $136.9300Sales Multiple* 20.35xDiscount for Lack ofMarketability 10.0%
$0 Income ApproachEstimated Future CashDistribution* $0.00
Convertible PreferredSecurities $21,610,666 Market Approach Market Transaction Price* $1.01584 -$125.00000 ($50.90983)
$6,656,536 Market Approach Market Transaction Price* $57.3069Future Dividend PayoutAdjustment (2.3%)-0.9% ((1.22%))
$4,177,513 Market Approach Last Sale of AcquiringCompany* $9.9700Conversion Ratio* 48.0404x
$337,018 Market Approach Transaction Price* $11.0500Sales Multiple* 3.6x
Copyright © 2021 www.secdatabase.com. All Rights Reserved.Please Consider the Environment Before Printing This Document

Gross Profit Multiple* 4.6xDiscount for Lack ofMarketability 10.0%
$5,688,504 Market Approach Transaction Price* $24.5310Sales Multiple* 6.3xGross Profit Multiple* 9.65xDiscount for Lack ofMarketability 10.0%
Escrow and LitigationTrusts
$1,651,146 Income Approach Estimated Future CashDistribution* $0.8000-$0.9500 ($0.83943)
(1) The significant unobservable inputs regarding the Level 3 securities in the table above are attributable to private securities andinclude assumptions made from non-public financial statements, private transactions, and/or market comparables. For thoseunobservable inputs indicated with *, a significant increase (decrease) in any of those inputs in isolation may result in asignificantly higher (lower) fair value measurement, while the remaining unobservable inputs have an inverse relationship.
# The average represents the arithmetic average of the inputs and is weighted by the relative fair value or notional amount.
See Notes to Portfolio of Investments
Copyright © 2021 www.secdatabase.com. All Rights Reserved.Please Consider the Environment Before Printing This Document
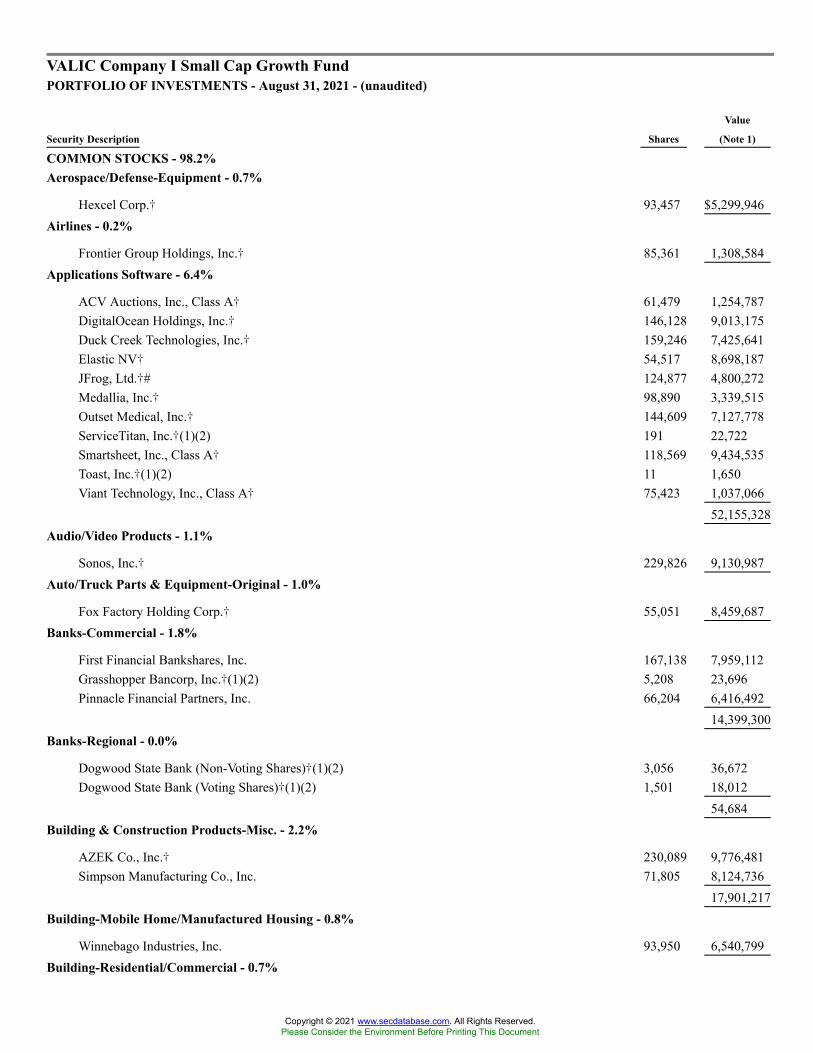
VALIC Company I Small Cap Growth FundPORTFOLIO OF INVESTMENTS - August 31, 2021 - (unaudited)
Security Description Shares
Value
(Note 1)
COMMON STOCKS - 98.2%Aerospace/Defense-Equipment - 0.7%
Hexcel Corp.� 93,457 $5,299,946Airlines - 0.2%
Frontier Group Holdings, Inc.� 85,361 1,308,584Applications Software - 6.4%
ACV Auctions, Inc., Class A� 61,479 1,254,787DigitalOcean Holdings, Inc.� 146,128 9,013,175Duck Creek Technologies, Inc.� 159,246 7,425,641Elastic NV� 54,517 8,698,187JFrog, Ltd.�# 124,877 4,800,272Medallia, Inc.� 98,890 3,339,515Outset Medical, Inc.� 144,609 7,127,778ServiceTitan, Inc.�(1)(2) 191 22,722Smartsheet, Inc., Class A� 118,569 9,434,535Toast, Inc.�(1)(2) 11 1,650Viant Technology, Inc., Class A� 75,423 1,037,066
52,155,328Audio/Video Products - 1.1%
Sonos, Inc.� 229,826 9,130,987Auto/Truck Parts & Equipment-Original - 1.0%
Fox Factory Holding Corp.� 55,051 8,459,687Banks-Commercial - 1.8%
First Financial Bankshares, Inc. 167,138 7,959,112Grasshopper Bancorp, Inc.�(1)(2) 5,208 23,696Pinnacle Financial Partners, Inc. 66,204 6,416,492
14,399,300Banks-Regional - 0.0%
Dogwood State Bank (Non-Voting Shares)�(1)(2) 3,056 36,672Dogwood State Bank (Voting Shares)�(1)(2) 1,501 18,012
54,684Building & Construction Products-Misc. - 2.2%
AZEK Co., Inc.� 230,089 9,776,481Simpson Manufacturing Co., Inc. 71,805 8,124,736
17,901,217Building-Mobile Home/Manufactured Housing - 0.8%
Winnebago Industries, Inc. 93,950 6,540,799Building-Residential/Commercial - 0.7%
Copyright © 2021 www.secdatabase.com. All Rights Reserved.Please Consider the Environment Before Printing This Document
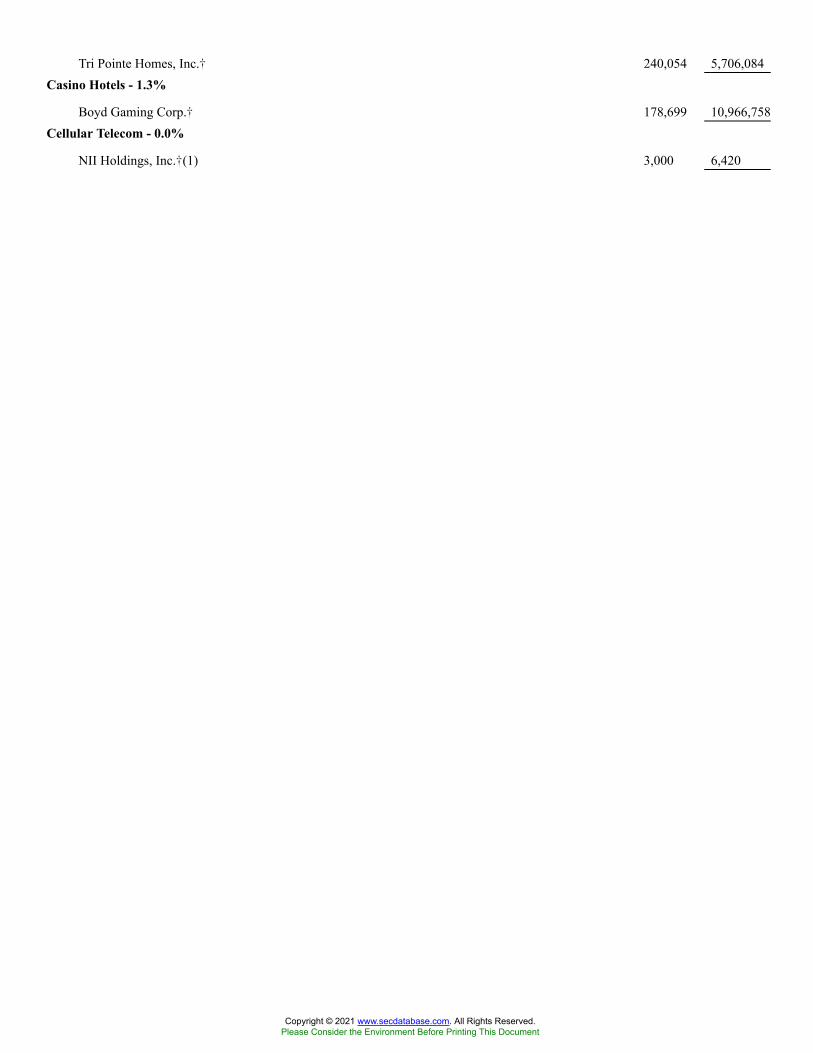
Tri Pointe Homes, Inc.� 240,054 5,706,084Casino Hotels - 1.3%
Boyd Gaming Corp.� 178,699 10,966,758Cellular Telecom - 0.0%
NII Holdings, Inc.�(1) 3,000 6,420
Copyright © 2021 www.secdatabase.com. All Rights Reserved.Please Consider the Environment Before Printing This Document
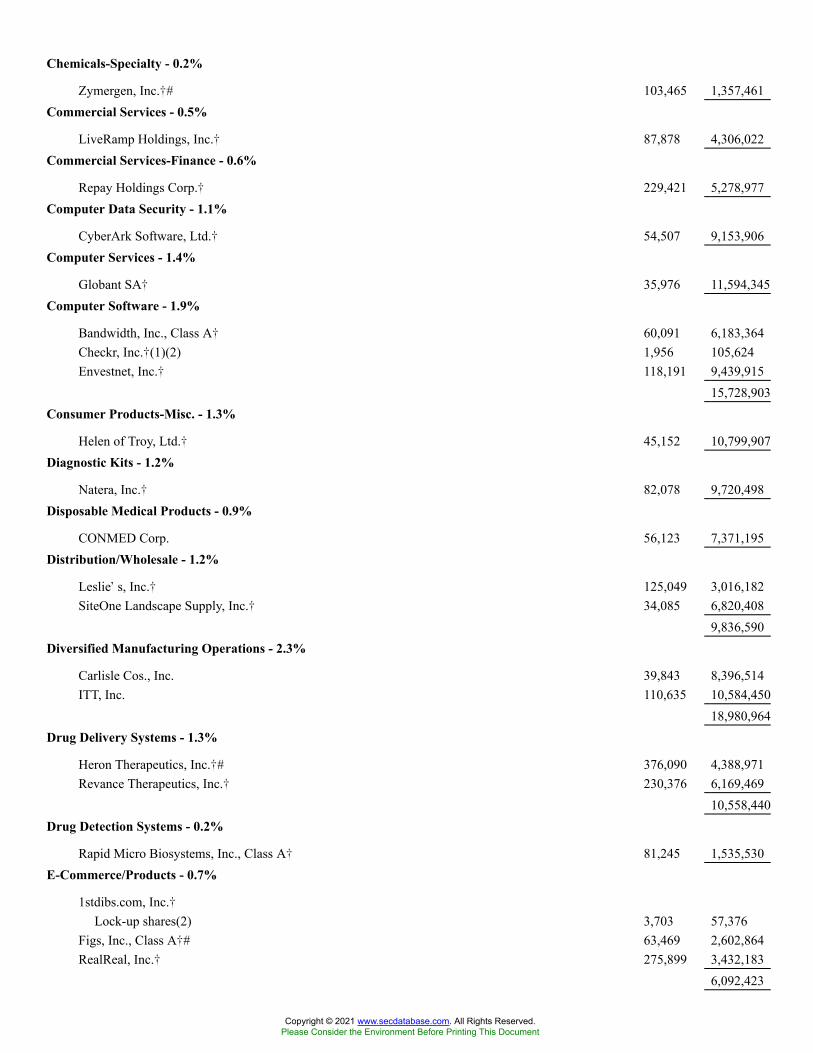
Chemicals-Specialty - 0.2%
Zymergen, Inc.�# 103,465 1,357,461Commercial Services - 0.5%
LiveRamp Holdings, Inc.� 87,878 4,306,022Commercial Services-Finance - 0.6%
Repay Holdings Corp.� 229,421 5,278,977Computer Data Security - 1.1%
CyberArk Software, Ltd.� 54,507 9,153,906Computer Services - 1.4%
Globant SA� 35,976 11,594,345Computer Software - 1.9%
Bandwidth, Inc., Class A� 60,091 6,183,364Checkr, Inc.�(1)(2) 1,956 105,624Envestnet, Inc.� 118,191 9,439,915
15,728,903Consumer Products-Misc. - 1.3%
Helen of Troy, Ltd.� 45,152 10,799,907Diagnostic Kits - 1.2%
Natera, Inc.� 82,078 9,720,498Disposable Medical Products - 0.9%
CONMED Corp. 56,123 7,371,195Distribution/Wholesale - 1.2%
Leslie�s, Inc.� 125,049 3,016,182SiteOne Landscape Supply, Inc.� 34,085 6,820,408
9,836,590Diversified Manufacturing Operations - 2.3%
Carlisle Cos., Inc. 39,843 8,396,514ITT, Inc. 110,635 10,584,450
18,980,964Drug Delivery Systems - 1.3%
Heron Therapeutics, Inc.�# 376,090 4,388,971Revance Therapeutics, Inc.� 230,376 6,169,469
10,558,440Drug Detection Systems - 0.2%
Rapid Micro Biosystems, Inc., Class A� 81,245 1,535,530E-Commerce/Products - 0.7%
1stdibs.com, Inc.�Lock-up shares(2) 3,703 57,376
Figs, Inc., Class A�# 63,469 2,602,864RealReal, Inc.� 275,899 3,432,183
6,092,423
Copyright © 2021 www.secdatabase.com. All Rights Reserved.Please Consider the Environment Before Printing This Document
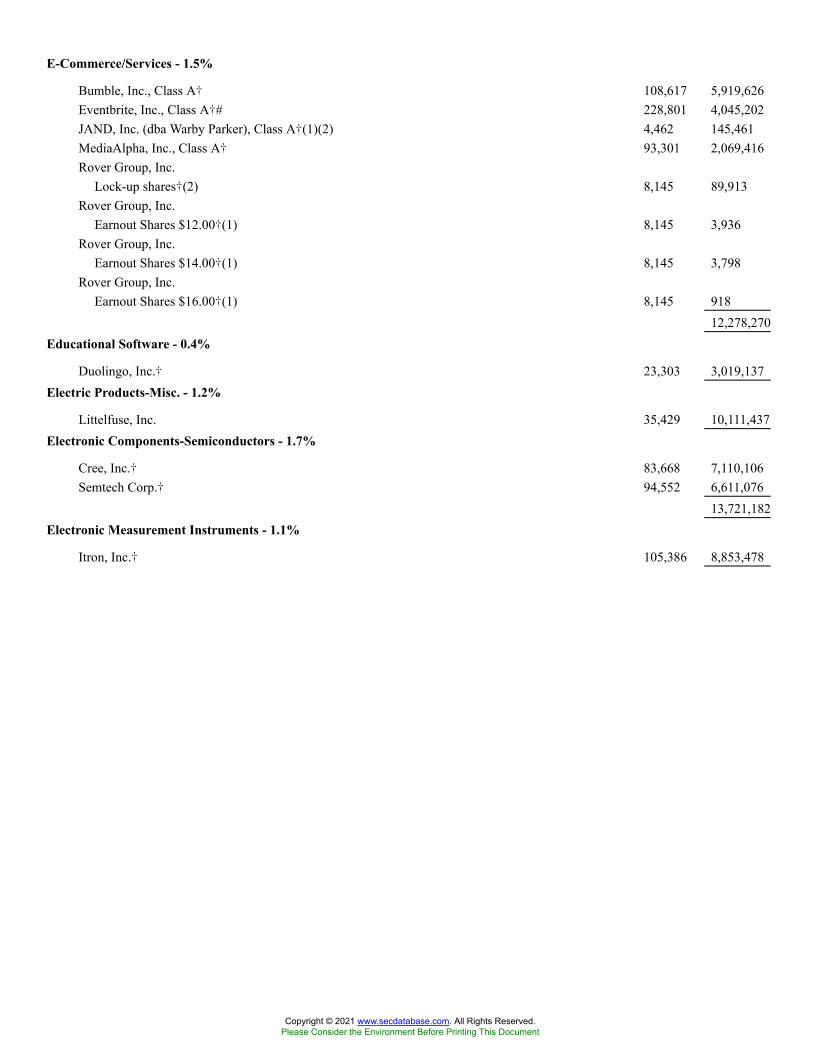
E-Commerce/Services - 1.5%
Bumble, Inc., Class A� 108,617 5,919,626Eventbrite, Inc., Class A�# 228,801 4,045,202JAND, Inc. (dba Warby Parker), Class A�(1)(2) 4,462 145,461MediaAlpha, Inc., Class A� 93,301 2,069,416Rover Group, Inc.
Lock-up shares�(2) 8,145 89,913Rover Group, Inc.
Earnout Shares $12.00�(1) 8,145 3,936Rover Group, Inc.
Earnout Shares $14.00�(1) 8,145 3,798Rover Group, Inc.
Earnout Shares $16.00�(1) 8,145 91812,278,270
Educational Software - 0.4%
Duolingo, Inc.� 23,303 3,019,137Electric Products-Misc. - 1.2%
Littelfuse, Inc. 35,429 10,111,437Electronic Components-Semiconductors - 1.7%
Cree, Inc.� 83,668 7,110,106Semtech Corp.� 94,552 6,611,076
13,721,182Electronic Measurement Instruments - 1.1%
Itron, Inc.� 105,386 8,853,478
Copyright © 2021 www.secdatabase.com. All Rights Reserved.Please Consider the Environment Before Printing This Document
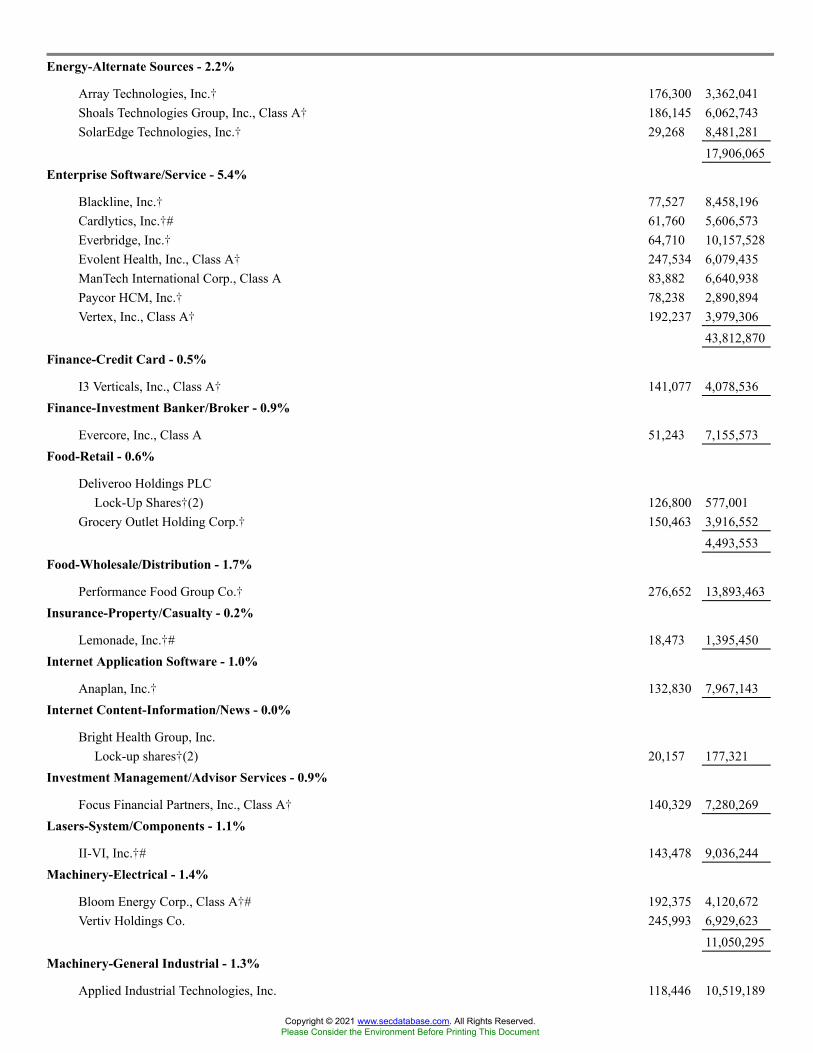
Energy-Alternate Sources - 2.2%
Array Technologies, Inc.� 176,300 3,362,041Shoals Technologies Group, Inc., Class A� 186,145 6,062,743SolarEdge Technologies, Inc.� 29,268 8,481,281
17,906,065Enterprise Software/Service - 5.4%
Blackline, Inc.� 77,527 8,458,196Cardlytics, Inc.�# 61,760 5,606,573Everbridge, Inc.� 64,710 10,157,528Evolent Health, Inc., Class A� 247,534 6,079,435ManTech International Corp., Class A 83,882 6,640,938Paycor HCM, Inc.� 78,238 2,890,894Vertex, Inc., Class A� 192,237 3,979,306
43,812,870Finance-Credit Card - 0.5%
I3 Verticals, Inc., Class A� 141,077 4,078,536Finance-Investment Banker/Broker - 0.9%
Evercore, Inc., Class A 51,243 7,155,573Food-Retail - 0.6%
Deliveroo Holdings PLCLock-Up Shares�(2) 126,800 577,001
Grocery Outlet Holding Corp.� 150,463 3,916,5524,493,553
Food-Wholesale/Distribution - 1.7%
Performance Food Group Co.� 276,652 13,893,463Insurance-Property/Casualty - 0.2%
Lemonade, Inc.�# 18,473 1,395,450Internet Application Software - 1.0%
Anaplan, Inc.� 132,830 7,967,143Internet Content-Information/News - 0.0%
Bright Health Group, Inc.Lock-up shares�(2) 20,157 177,321
Investment Management/Advisor Services - 0.9%
Focus Financial Partners, Inc., Class A� 140,329 7,280,269Lasers-System/Components - 1.1%
II-VI, Inc.�# 143,478 9,036,244Machinery-Electrical - 1.4%
Bloom Energy Corp., Class A�# 192,375 4,120,672Vertiv Holdings Co. 245,993 6,929,623
11,050,295Machinery-General Industrial - 1.3%
Applied Industrial Technologies, Inc. 118,446 10,519,189
Copyright © 2021 www.secdatabase.com. All Rights Reserved.Please Consider the Environment Before Printing This Document

Machinery-Pumps - 0.6%
Graco, Inc. 61,964 4,859,217Medical Information Systems - 0.0%
Alignment Healthcare PartnersLock-up shares�(2) 11,460 192,373
Medical Instruments - 1.0%
NuVasive, Inc.� 132,957 8,261,948Medical Labs & Testing Services - 0.5%
Personalis, Inc.� 196,110 4,153,610Medical Products - 3.0%
iRhythm Technologies, Inc.� 64,691 3,092,230Nevro Corp.� 55,767 6,803,574Shockwave Medical, Inc.� 67,539 14,467,529
24,363,333Medical-Biomedical/Gene - 13.7%
ACADIA Pharmaceuticals, Inc.� 158,238 2,770,747ADC Therapeutics SA� 160,209 4,673,297Allogene Therapeutics, Inc.� 67,334 1,605,916Amicus Therapeutics, Inc.� 577,649 6,579,422Apellis Pharmaceuticals, Inc.� 35,285 2,323,517Arrowhead Pharmaceuticals, Inc.� 124,465 8,354,091Atara Biotherapeutics, Inc.� 283,969 4,253,856Avrobio, Inc.� 201,792 1,343,935Berkeley Lights, Inc.�# 72,888 2,591,897Biohaven Pharmaceutical Holding Co., Ltd.� 88,206 11,576,155Blueprint Medicines Corp.� 76,835 7,166,400Bridgebio Pharma, Inc.�# 95,509 4,785,956Cogent Biosciences, Inc. CVR�(1) 30,000 0Fate Therapeutics, Inc.� 62,659 4,589,772FibroGen, Inc.� 112,496 1,308,328Flame Biosciences, Inc.�(1)(2) 3,800 24,890Generation Bio Co.� 57,394 1,434,850Halozyme Therapeutics, Inc.� 261,002 10,959,474Intercept Pharmaceuticals, Inc.�# 3,046 45,416Kronos Bio, Inc.�# 100,723 2,106,118Orchard Therapeutics PLC ADR�# 194,843 537,767Proteostasis Therapeutics, Inc. CVR�#(1) 60,500 0REGENXBIO, Inc.� 122,253 3,948,772Relay Therapeutics, Inc.� 100,464 3,217,862Restorbio, Inc. CVR�(1) 4,285 0REVOLUTION Medicines, Inc.� 85,910 2,499,122Rubius Therapeutics, Inc.� 135,148 2,935,415Sage Therapeutics, Inc.� 44,023 2,034,303Sana Biotechnology, Inc.�# 89,566 2,148,688Seer, Inc.�# 57,789 2,310,404Twist Bioscience Corp.� 79,168 8,962,609
Copyright © 2021 www.secdatabase.com. All Rights Reserved.Please Consider the Environment Before Printing This Document
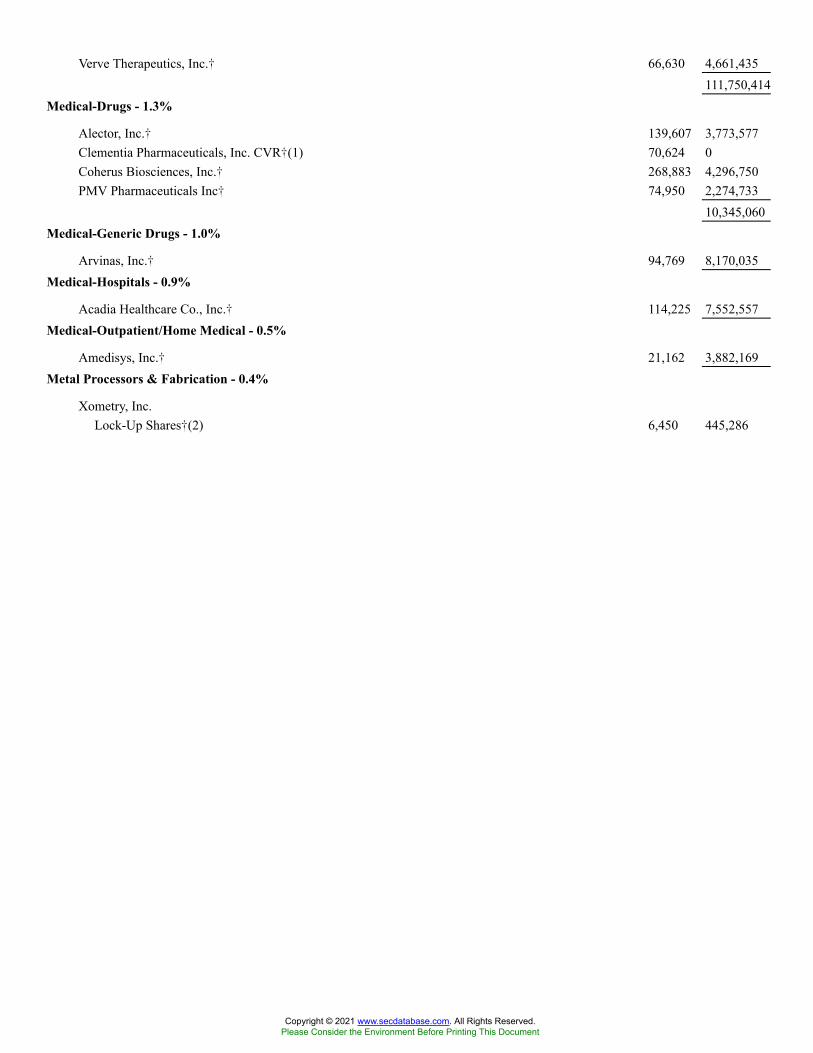
Verve Therapeutics, Inc.� 66,630 4,661,435111,750,414
Medical-Drugs - 1.3%
Alector, Inc.� 139,607 3,773,577Clementia Pharmaceuticals, Inc. CVR�(1) 70,624 0Coherus Biosciences, Inc.� 268,883 4,296,750PMV Pharmaceuticals Inc� 74,950 2,274,733
10,345,060Medical-Generic Drugs - 1.0%
Arvinas, Inc.� 94,769 8,170,035Medical-Hospitals - 0.9%
Acadia Healthcare Co., Inc.� 114,225 7,552,557Medical-Outpatient/Home Medical - 0.5%
Amedisys, Inc.� 21,162 3,882,169Metal Processors & Fabrication - 0.4%
Xometry, Inc.Lock-Up Shares�(2) 6,450 445,286
Copyright © 2021 www.secdatabase.com. All Rights Reserved.Please Consider the Environment Before Printing This Document
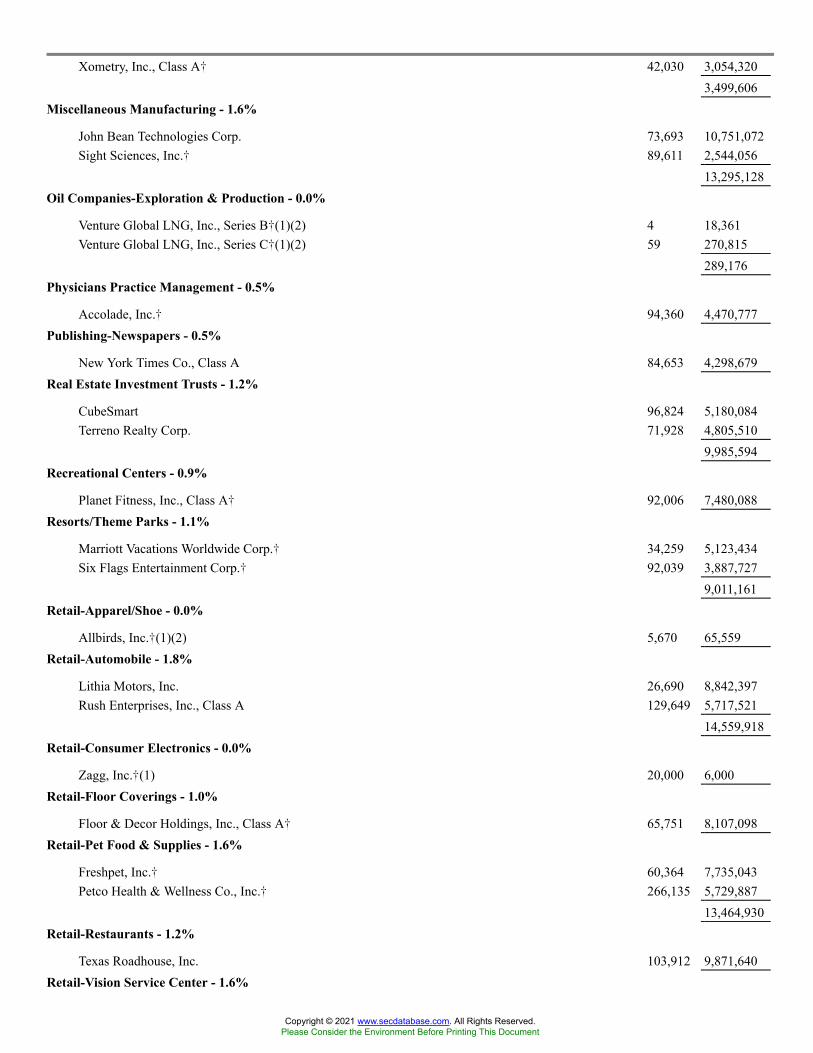
Xometry, Inc., Class A� 42,030 3,054,3203,499,606
Miscellaneous Manufacturing - 1.6%
John Bean Technologies Corp. 73,693 10,751,072Sight Sciences, Inc.� 89,611 2,544,056
13,295,128Oil Companies-Exploration & Production - 0.0%
Venture Global LNG, Inc., Series B�(1)(2) 4 18,361Venture Global LNG, Inc., Series C�(1)(2) 59 270,815
289,176Physicians Practice Management - 0.5%
Accolade, Inc.� 94,360 4,470,777Publishing-Newspapers - 0.5%
New York Times Co., Class A 84,653 4,298,679Real Estate Investment Trusts - 1.2%
CubeSmart 96,824 5,180,084Terreno Realty Corp. 71,928 4,805,510
9,985,594Recreational Centers - 0.9%
Planet Fitness, Inc., Class A� 92,006 7,480,088Resorts/Theme Parks - 1.1%
Marriott Vacations Worldwide Corp.� 34,259 5,123,434Six Flags Entertainment Corp.� 92,039 3,887,727
9,011,161Retail-Apparel/Shoe - 0.0%
Allbirds, Inc.�(1)(2) 5,670 65,559Retail-Automobile - 1.8%
Lithia Motors, Inc. 26,690 8,842,397Rush Enterprises, Inc., Class A 129,649 5,717,521
14,559,918Retail-Consumer Electronics - 0.0%
Zagg, Inc.�(1) 20,000 6,000Retail-Floor Coverings - 1.0%
Floor & Decor Holdings, Inc., Class A� 65,751 8,107,098Retail-Pet Food & Supplies - 1.6%
Freshpet, Inc.� 60,364 7,735,043Petco Health & Wellness Co., Inc.� 266,135 5,729,887
13,464,930Retail-Restaurants - 1.2%
Texas Roadhouse, Inc. 103,912 9,871,640Retail-Vision Service Center - 1.6%
Copyright © 2021 www.secdatabase.com. All Rights Reserved.Please Consider the Environment Before Printing This Document
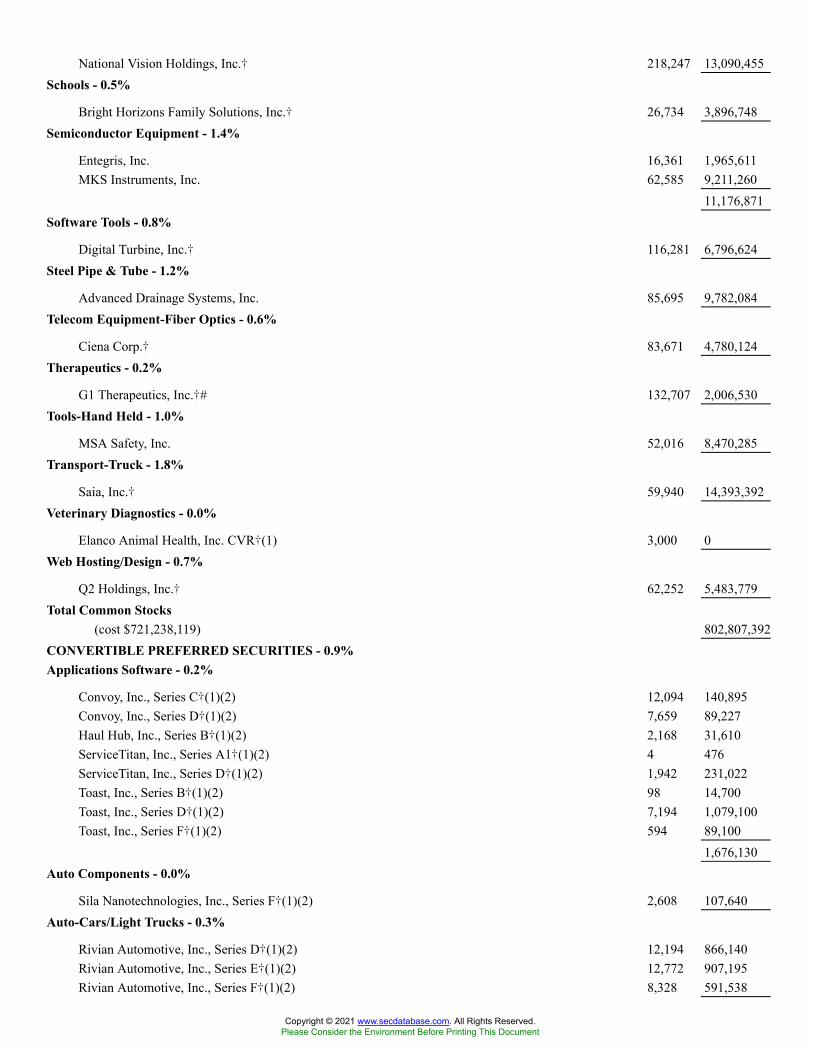
National Vision Holdings, Inc.� 218,247 13,090,455Schools - 0.5%
Bright Horizons Family Solutions, Inc.� 26,734 3,896,748Semiconductor Equipment - 1.4%
Entegris, Inc. 16,361 1,965,611MKS Instruments, Inc. 62,585 9,211,260
11,176,871Software Tools - 0.8%
Digital Turbine, Inc.� 116,281 6,796,624Steel Pipe & Tube - 1.2%
Advanced Drainage Systems, Inc. 85,695 9,782,084Telecom Equipment-Fiber Optics - 0.6%
Ciena Corp.� 83,671 4,780,124Therapeutics - 0.2%
G1 Therapeutics, Inc.�# 132,707 2,006,530Tools-Hand Held - 1.0%
MSA Safety, Inc. 52,016 8,470,285Transport-Truck - 1.8%
Saia, Inc.� 59,940 14,393,392Veterinary Diagnostics - 0.0%
Elanco Animal Health, Inc. CVR�(1) 3,000 0Web Hosting/Design - 0.7%
Q2 Holdings, Inc.� 62,252 5,483,779Total Common Stocks
(cost $721,238,119) 802,807,392CONVERTIBLE PREFERRED SECURITIES - 0.9%Applications Software - 0.2%
Convoy, Inc., Series C�(1)(2) 12,094 140,895Convoy, Inc., Series D�(1)(2) 7,659 89,227Haul Hub, Inc., Series B�(1)(2) 2,168 31,610ServiceTitan, Inc., Series A1�(1)(2) 4 476ServiceTitan, Inc., Series D�(1)(2) 1,942 231,022Toast, Inc., Series B�(1)(2) 98 14,700Toast, Inc., Series D�(1)(2) 7,194 1,079,100Toast, Inc., Series F�(1)(2) 594 89,100
1,676,130Auto Components - 0.0%
Sila Nanotechnologies, Inc., Series F�(1)(2) 2,608 107,640Auto-Cars/Light Trucks - 0.3%
Rivian Automotive, Inc., Series D�(1)(2) 12,194 866,140Rivian Automotive, Inc., Series E�(1)(2) 12,772 907,195Rivian Automotive, Inc., Series F�(1)(2) 8,328 591,538
Copyright © 2021 www.secdatabase.com. All Rights Reserved.Please Consider the Environment Before Printing This Document

2,364,873Computer Software - 0.1%
Checkr, Inc., Series C�(1)(2) 2,998 161,892Checkr, Inc., Series D�(1)(2) 4,084 220,536
382,428E-Commerce/Services - 0.1%
Farmer�s Business Network, Inc., Series C�(1)(2) 8,287 515,102JAND, Inc. (dba Warby Parker) Series E�(1)(2) 5,505 179,463
Copyright © 2021 www.secdatabase.com. All Rights Reserved.Please Consider the Environment Before Printing This Document
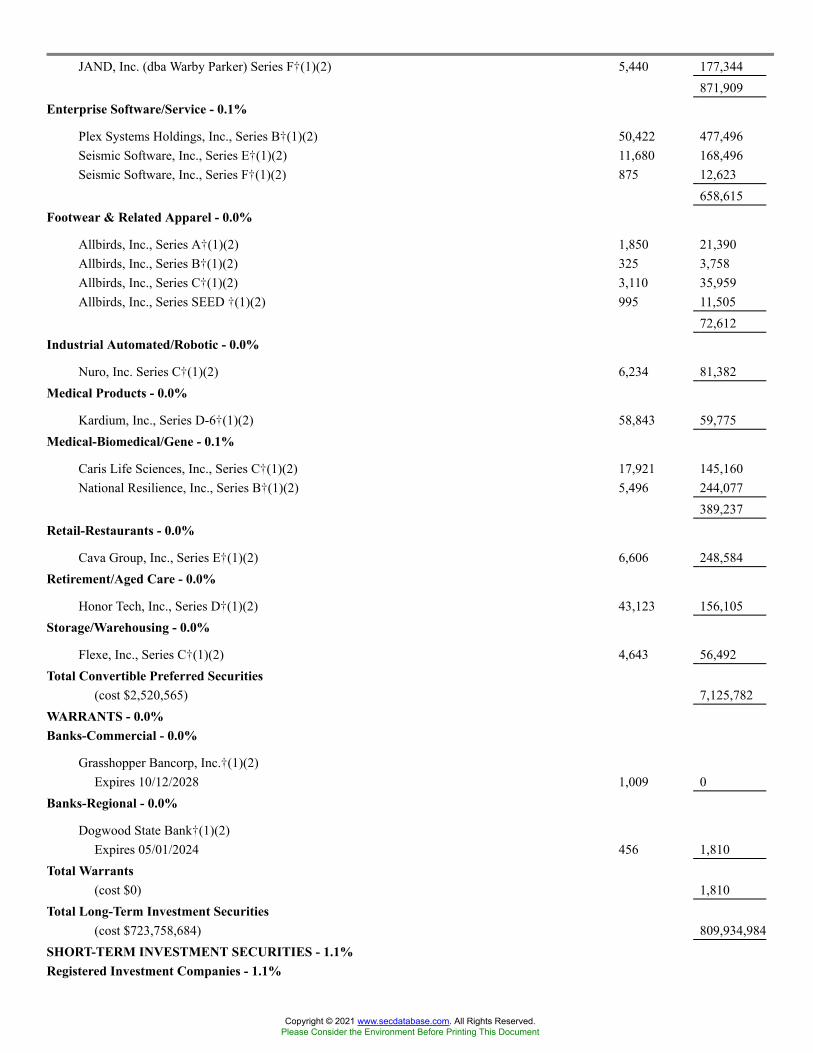
JAND, Inc. (dba Warby Parker) Series F�(1)(2) 5,440 177,344871,909
Enterprise Software/Service - 0.1%
Plex Systems Holdings, Inc., Series B�(1)(2) 50,422 477,496Seismic Software, Inc., Series E�(1)(2) 11,680 168,496Seismic Software, Inc., Series F�(1)(2) 875 12,623
658,615Footwear & Related Apparel - 0.0%
Allbirds, Inc., Series A�(1)(2) 1,850 21,390Allbirds, Inc., Series B�(1)(2) 325 3,758Allbirds, Inc., Series C�(1)(2) 3,110 35,959Allbirds, Inc., Series SEED �(1)(2) 995 11,505
72,612Industrial Automated/Robotic - 0.0%
Nuro, Inc. Series C�(1)(2) 6,234 81,382Medical Products - 0.0%
Kardium, Inc., Series D-6�(1)(2) 58,843 59,775Medical-Biomedical/Gene - 0.1%
Caris Life Sciences, Inc., Series C�(1)(2) 17,921 145,160National Resilience, Inc., Series B�(1)(2) 5,496 244,077
389,237Retail-Restaurants - 0.0%
Cava Group, Inc., Series E�(1)(2) 6,606 248,584Retirement/Aged Care - 0.0%
Honor Tech, Inc., Series D�(1)(2) 43,123 156,105Storage/Warehousing - 0.0%
Flexe, Inc., Series C�(1)(2) 4,643 56,492Total Convertible Preferred Securities
(cost $2,520,565) 7,125,782WARRANTS - 0.0%Banks-Commercial - 0.0%
Grasshopper Bancorp, Inc.�(1)(2)Expires 10/12/2028 1,009 0
Banks-Regional - 0.0%
Dogwood State Bank�(1)(2)Expires 05/01/2024 456 1,810
Total Warrants(cost $0) 1,810
Total Long-Term Investment Securities(cost $723,758,684) 809,934,984
SHORT-TERM INVESTMENT SECURITIES - 1.1%Registered Investment Companies - 1.1%
Copyright © 2021 www.secdatabase.com. All Rights Reserved.Please Consider the Environment Before Printing This Document
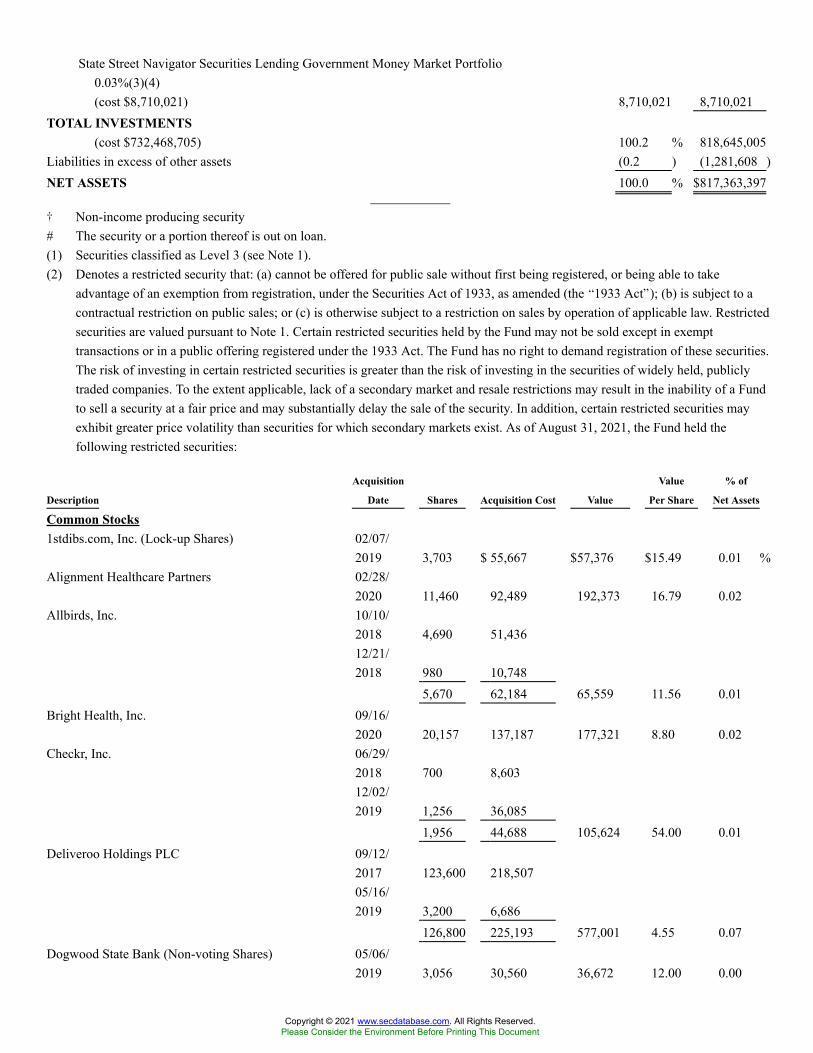
State Street Navigator Securities Lending Government Money Market Portfolio0.03%(3)(4)(cost $8,710,021) 8,710,021 8,710,021
TOTAL INVESTMENTS(cost $732,468,705) 100.2 % 818,645,005
Liabilities in excess of other assets (0.2 ) (1,281,608 )NET ASSETS 100.0 % $817,363,397
� Non-income producing security# The security or a portion thereof is out on loan.(1) Securities classified as Level 3 (see Note 1).(2) Denotes a restricted security that: (a) cannot be offered for public sale without first being registered, or being able to take
advantage of an exemption from registration, under the Securities Act of 1933, as amended (the �1933 Act�); (b) is subject to acontractual restriction on public sales; or (c) is otherwise subject to a restriction on sales by operation of applicable law. Restrictedsecurities are valued pursuant to Note 1. Certain restricted securities held by the Fund may not be sold except in exempttransactions or in a public offering registered under the 1933 Act. The Fund has no right to demand registration of these securities.The risk of investing in certain restricted securities is greater than the risk of investing in the securities of widely held, publiclytraded companies. To the extent applicable, lack of a secondary market and resale restrictions may result in the inability of a Fundto sell a security at a fair price and may substantially delay the sale of the security. In addition, certain restricted securities mayexhibit greater price volatility than securities for which secondary markets exist. As of August 31, 2021, the Fund held thefollowing restricted securities:
Description
Acquisition
Date Shares Acquisition Cost Value
Value
Per Share
% of
Net Assets
Common Stocks1stdibs.com, Inc. (Lock-up Shares) 02/07/
2019 3,703 $ 55,667 $57,376 $15.49 0.01 %Alignment Healthcare Partners 02/28/
2020 11,460 92,489 192,373 16.79 0.02Allbirds, Inc. 10/10/
2018 4,690 51,43612/21/2018 980 10,748
5,670 62,184 65,559 11.56 0.01Bright Health, Inc. 09/16/
2020 20,157 137,187 177,321 8.80 0.02Checkr, Inc. 06/29/
2018 700 8,60312/02/2019 1,256 36,085
1,956 44,688 105,624 54.00 0.01Deliveroo Holdings PLC 09/12/
2017 123,600 218,50705/16/2019 3,200 6,686
126,800 225,193 577,001 4.55 0.07Dogwood State Bank (Non-voting Shares) 05/06/
2019 3,056 30,560 36,672 12.00 0.00
Copyright © 2021 www.secdatabase.com. All Rights Reserved.Please Consider the Environment Before Printing This Document
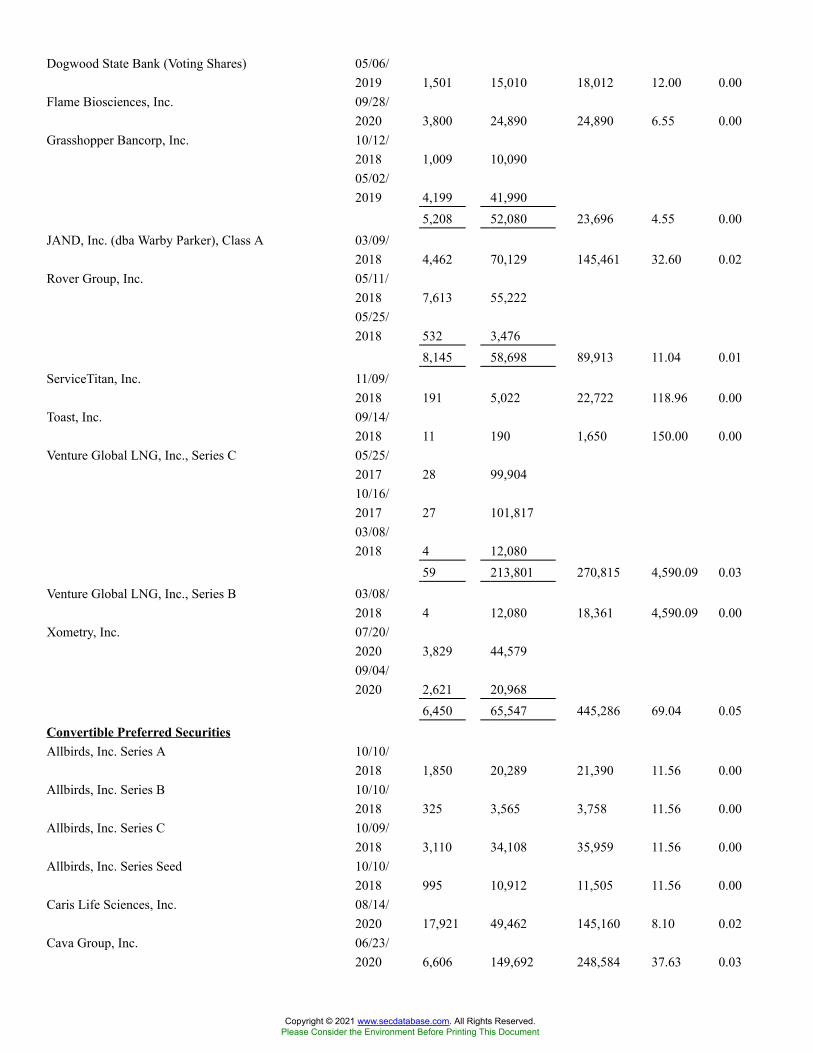
Dogwood State Bank (Voting Shares) 05/06/2019 1,501 15,010 18,012 12.00 0.00
Flame Biosciences, Inc. 09/28/2020 3,800 24,890 24,890 6.55 0.00
Grasshopper Bancorp, Inc. 10/12/2018 1,009 10,09005/02/2019 4,199 41,990
5,208 52,080 23,696 4.55 0.00JAND, Inc. (dba Warby Parker), Class A 03/09/
2018 4,462 70,129 145,461 32.60 0.02Rover Group, Inc. 05/11/
2018 7,613 55,22205/25/2018 532 3,476
8,145 58,698 89,913 11.04 0.01ServiceTitan, Inc. 11/09/
2018 191 5,022 22,722 118.96 0.00Toast, Inc. 09/14/
2018 11 190 1,650 150.00 0.00Venture Global LNG, Inc., Series C 05/25/
2017 28 99,90410/16/2017 27 101,81703/08/2018 4 12,080
59 213,801 270,815 4,590.09 0.03Venture Global LNG, Inc., Series B 03/08/
2018 4 12,080 18,361 4,590.09 0.00Xometry, Inc. 07/20/
2020 3,829 44,57909/04/2020 2,621 20,968
6,450 65,547 445,286 69.04 0.05Convertible Preferred SecuritiesAllbirds, Inc. Series A 10/10/
2018 1,850 20,289 21,390 11.56 0.00Allbirds, Inc. Series B 10/10/
2018 325 3,565 3,758 11.56 0.00Allbirds, Inc. Series C 10/09/
2018 3,110 34,108 35,959 11.56 0.00Allbirds, Inc. Series Seed 10/10/
2018 995 10,912 11,505 11.56 0.00Caris Life Sciences, Inc. 08/14/
2020 17,921 49,462 145,160 8.10 0.02Cava Group, Inc. 06/23/
2020 6,606 149,692 248,584 37.63 0.03
Copyright © 2021 www.secdatabase.com. All Rights Reserved.Please Consider the Environment Before Printing This Document
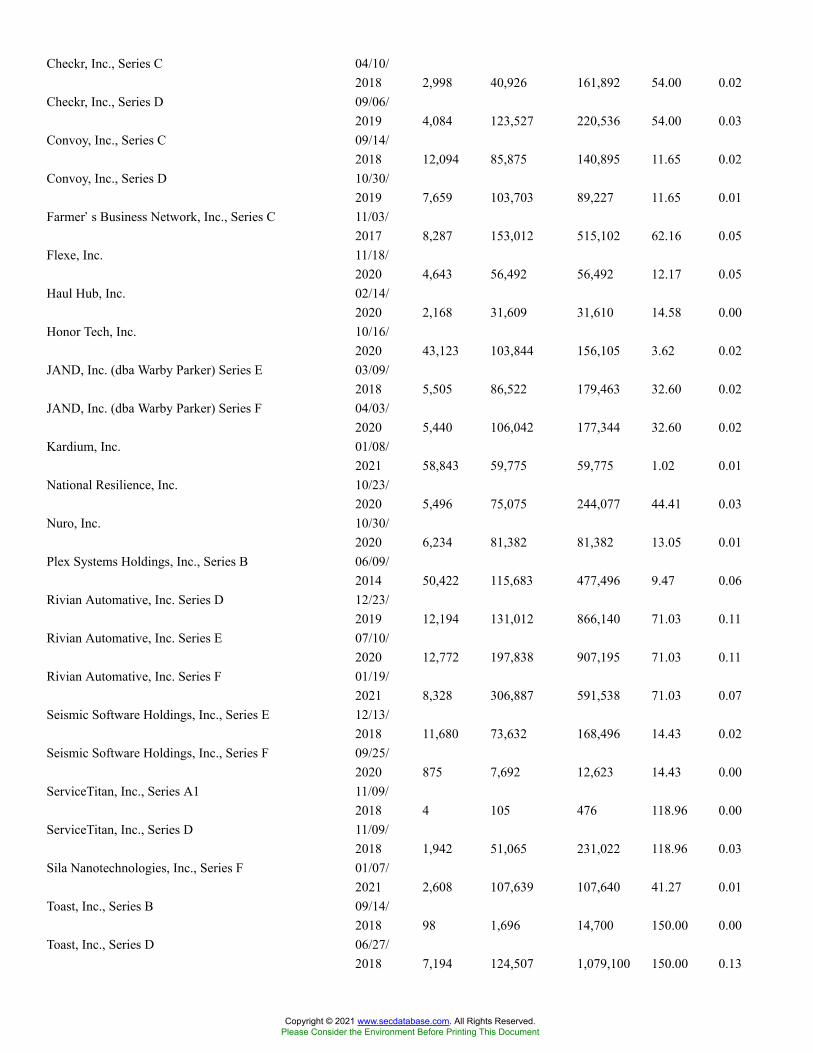
Checkr, Inc., Series C 04/10/2018 2,998 40,926 161,892 54.00 0.02
Checkr, Inc., Series D 09/06/2019 4,084 123,527 220,536 54.00 0.03
Convoy, Inc., Series C 09/14/2018 12,094 85,875 140,895 11.65 0.02
Convoy, Inc., Series D 10/30/2019 7,659 103,703 89,227 11.65 0.01
Farmer�s Business Network, Inc., Series C 11/03/2017 8,287 153,012 515,102 62.16 0.05
Flexe, Inc. 11/18/2020 4,643 56,492 56,492 12.17 0.05
Haul Hub, Inc. 02/14/2020 2,168 31,609 31,610 14.58 0.00
Honor Tech, Inc. 10/16/2020 43,123 103,844 156,105 3.62 0.02
JAND, Inc. (dba Warby Parker) Series E 03/09/2018 5,505 86,522 179,463 32.60 0.02
JAND, Inc. (dba Warby Parker) Series F 04/03/2020 5,440 106,042 177,344 32.60 0.02
Kardium, Inc. 01/08/2021 58,843 59,775 59,775 1.02 0.01
National Resilience, Inc. 10/23/2020 5,496 75,075 244,077 44.41 0.03
Nuro, Inc. 10/30/2020 6,234 81,382 81,382 13.05 0.01
Plex Systems Holdings, Inc., Series B 06/09/2014 50,422 115,683 477,496 9.47 0.06
Rivian Automative, Inc. Series D 12/23/2019 12,194 131,012 866,140 71.03 0.11
Rivian Automative, Inc. Series E 07/10/2020 12,772 197,838 907,195 71.03 0.11
Rivian Automative, Inc. Series F 01/19/2021 8,328 306,887 591,538 71.03 0.07
Seismic Software Holdings, Inc., Series E 12/13/2018 11,680 73,632 168,496 14.43 0.02
Seismic Software Holdings, Inc., Series F 09/25/2020 875 7,692 12,623 14.43 0.00
ServiceTitan, Inc., Series A1 11/09/2018 4 105 476 118.96 0.00
ServiceTitan, Inc., Series D 11/09/2018 1,942 51,065 231,022 118.96 0.03
Sila Nanotechnologies, Inc., Series F 01/07/2021 2,608 107,639 107,640 41.27 0.01
Toast, Inc., Series B 09/14/2018 98 1,696 14,700 150.00 0.00
Toast, Inc., Series D 06/27/2018 7,194 124,507 1,079,100 150.00 0.13
Copyright © 2021 www.secdatabase.com. All Rights Reserved.Please Consider the Environment Before Printing This Document
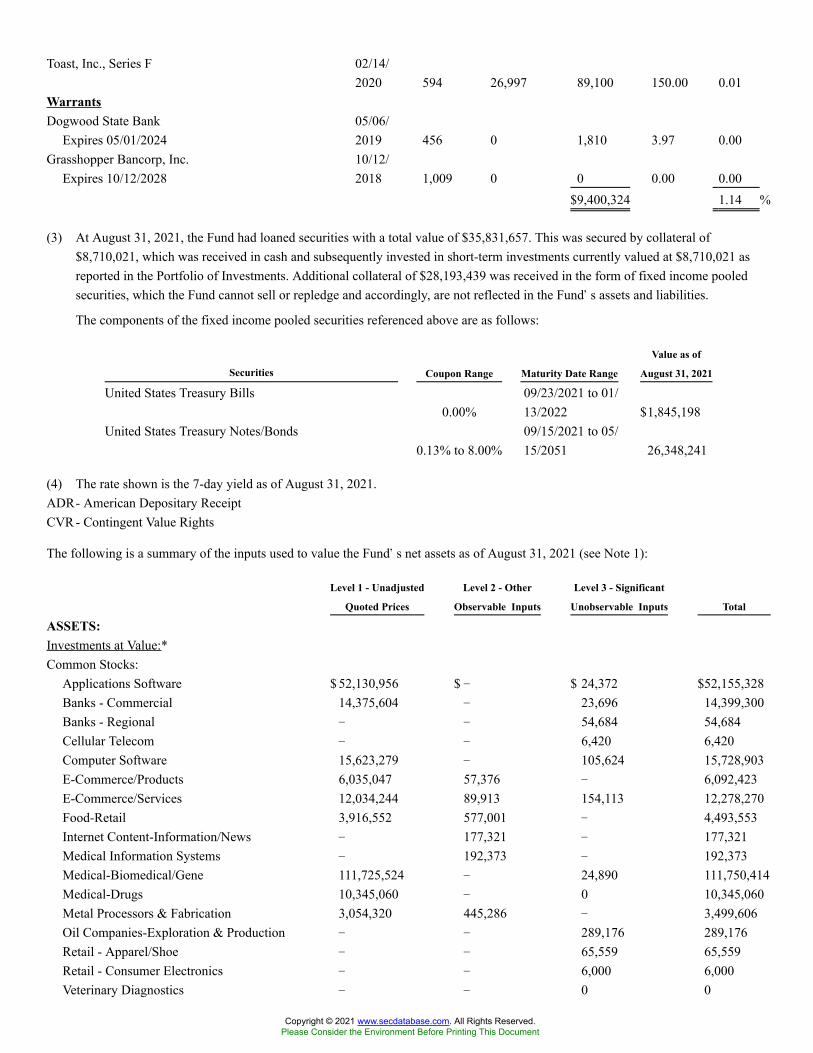
Toast, Inc., Series F 02/14/2020 594 26,997 89,100 150.00 0.01
WarrantsDogwood State Bank
Expires 05/01/202405/06/2019 456 0 1,810 3.97 0.00
Grasshopper Bancorp, Inc.Expires 10/12/2028
10/12/2018 1,009 0 0 0.00 0.00
$9,400,324 1.14 %
(3) At August 31, 2021, the Fund had loaned securities with a total value of $35,831,657. This was secured by collateral of$8,710,021, which was received in cash and subsequently invested in short-term investments currently valued at $8,710,021 asreported in the Portfolio of Investments. Additional collateral of $28,193,439 was received in the form of fixed income pooledsecurities, which the Fund cannot sell or repledge and accordingly, are not reflected in the Fund�s assets and liabilities.
The components of the fixed income pooled securities referenced above are as follows:
Securities Coupon Range Maturity Date Range
Value as of
August 31, 2021
United States Treasury Bills0.00%
09/23/2021 to 01/13/2022 $1,845,198
United States Treasury Notes/Bonds0.13% to 8.00%
09/15/2021 to 05/15/2051 26,348,241
(4) The rate shown is the 7-day yield as of August 31, 2021.ADR- American Depositary ReceiptCVR - Contingent Value Rights
The following is a summary of the inputs used to value the Fund�s net assets as of August 31, 2021 (see Note 1):
Level 1 - Unadjusted
Quoted Prices
Level 2 - Other
Observable Inputs
Level 3 - Significant
Unobservable Inputs Total
ASSETS:Investments at Value:*Common Stocks:
Applications Software $ 52,130,956 $ � $ 24,372 $52,155,328Banks - Commercial 14,375,604 � 23,696 14,399,300Banks - Regional � � 54,684 54,684Cellular Telecom � � 6,420 6,420Computer Software 15,623,279 � 105,624 15,728,903E-Commerce/Products 6,035,047 57,376 � 6,092,423E-Commerce/Services 12,034,244 89,913 154,113 12,278,270Food-Retail 3,916,552 577,001 � 4,493,553Internet Content-Information/News � 177,321 � 177,321Medical Information Systems � 192,373 � 192,373Medical-Biomedical/Gene 111,725,524 � 24,890 111,750,414Medical-Drugs 10,345,060 � 0 10,345,060Metal Processors & Fabrication 3,054,320 445,286 � 3,499,606Oil Companies-Exploration & Production � � 289,176 289,176Retail - Apparel/Shoe � � 65,559 65,559Retail - Consumer Electronics � � 6,000 6,000Veterinary Diagnostics � � 0 0
Copyright © 2021 www.secdatabase.com. All Rights Reserved.Please Consider the Environment Before Printing This Document
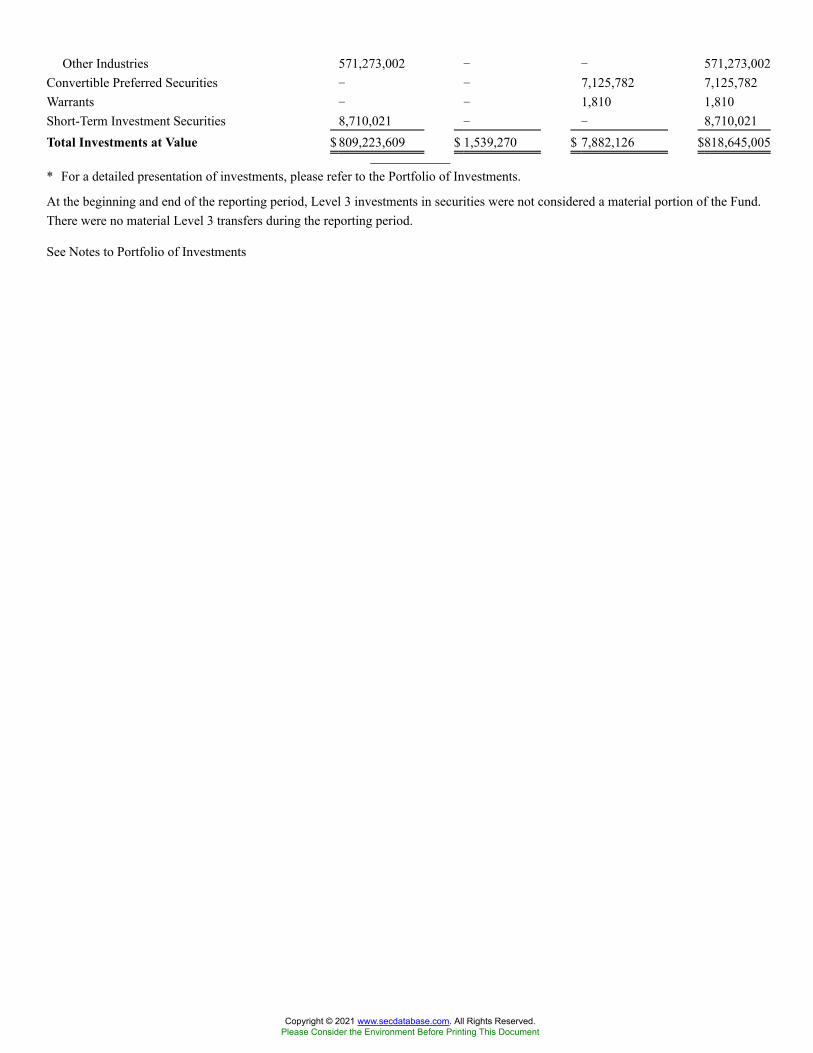
Other Industries 571,273,002 � � 571,273,002Convertible Preferred Securities � � 7,125,782 7,125,782Warrants � � 1,810 1,810Short-Term Investment Securities 8,710,021 � � 8,710,021Total Investments at Value $ 809,223,609 $ 1,539,270 $ 7,882,126 $818,645,005
* For a detailed presentation of investments, please refer to the Portfolio of Investments.
At the beginning and end of the reporting period, Level 3 investments in securities were not considered a material portion of the Fund.There were no material Level 3 transfers during the reporting period.
See Notes to Portfolio of Investments
Copyright © 2021 www.secdatabase.com. All Rights Reserved.Please Consider the Environment Before Printing This Document

VALIC Company I Small Cap Index FundPORTFOLIO OF INVESTMENTS - August 31, 2021 - (unaudited)
Security Description
Shares/
Principal
Amount
Value
(Note 1)
COMMON STOCKS - 93.3%Advanced Materials - 0.1%
Haynes International, Inc. 5,704 $223,882Lydall, Inc.� 7,983 494,787Materion Corp. 9,299 679,106Meta Materials, Inc.� 28,082 130,581
1,528,356Advertising Sales - 0.1%
Boston Omaha Corp., Class A� 7,956 284,427Clear Channel Outdoor Holdings, Inc.� 165,753 435,930
720,357Advertising Services - 0.0%
Advantage Solutions, Inc.�# 34,866 303,683Fluent, Inc.� 19,783 53,810National CineMedia, Inc. 26,853 68,744Stagwell, Inc.� 28,523 199,090
625,327Aerospace/Defense - 0.2%
AeroVironment, Inc.� 10,260 1,050,214AerSale Corp.� 4,125 55,811Kratos Defense & Security Solutions, Inc.� 55,991 1,384,097National Presto Industries, Inc. 2,335 195,066
2,685,188Aerospace/Defense-Equipment - 0.4%
AAR Corp.� 15,522 525,420Aerojet Rocketdyne Holdings, Inc. 34,173 1,418,863Astronics Corp.� 10,954 146,345Barnes Group, Inc. 21,609 1,030,101Ducommun, Inc.� 4,965 261,655Kaman Corp. 12,610 492,799Moog, Inc., Class A 13,211 1,049,482Park Aerospace Corp. 8,917 130,010Triumph Group, Inc.� 23,542 434,585
5,489,260Agricultural Chemicals - 0.0%
Intrepid Potash, Inc.� 4,544 140,909Marrone Bio Innovations, Inc.�# 45,721 45,721
186,630Agricultural Operations - 0.1%
Copyright © 2021 www.secdatabase.com. All Rights Reserved.Please Consider the Environment Before Printing This Document
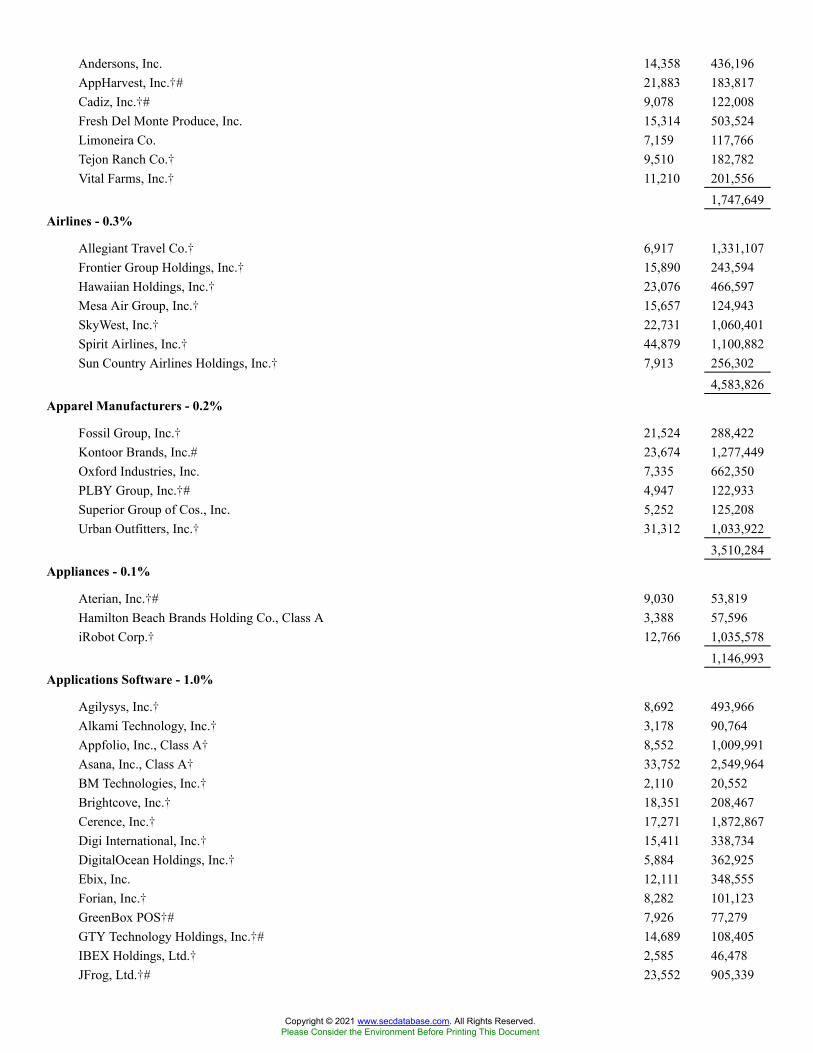
Andersons, Inc. 14,358 436,196AppHarvest, Inc.�# 21,883 183,817Cadiz, Inc.�# 9,078 122,008Fresh Del Monte Produce, Inc. 15,314 503,524Limoneira Co. 7,159 117,766Tejon Ranch Co.� 9,510 182,782Vital Farms, Inc.� 11,210 201,556
1,747,649Airlines - 0.3%
Allegiant Travel Co.� 6,917 1,331,107Frontier Group Holdings, Inc.� 15,890 243,594Hawaiian Holdings, Inc.� 23,076 466,597Mesa Air Group, Inc.� 15,657 124,943SkyWest, Inc.� 22,731 1,060,401Spirit Airlines, Inc.� 44,879 1,100,882Sun Country Airlines Holdings, Inc.� 7,913 256,302
4,583,826Apparel Manufacturers - 0.2%
Fossil Group, Inc.� 21,524 288,422Kontoor Brands, Inc.# 23,674 1,277,449Oxford Industries, Inc. 7,335 662,350PLBY Group, Inc.�# 4,947 122,933Superior Group of Cos., Inc. 5,252 125,208Urban Outfitters, Inc.� 31,312 1,033,922
3,510,284Appliances - 0.1%
Aterian, Inc.�# 9,030 53,819Hamilton Beach Brands Holding Co., Class A 3,388 57,596iRobot Corp.� 12,766 1,035,578
1,146,993Applications Software - 1.0%
Agilysys, Inc.� 8,692 493,966Alkami Technology, Inc.� 3,178 90,764Appfolio, Inc., Class A� 8,552 1,009,991Asana, Inc., Class A� 33,752 2,549,964BM Technologies, Inc.� 2,110 20,552Brightcove, Inc.� 18,351 208,467Cerence, Inc.� 17,271 1,872,867Digi International, Inc.� 15,411 338,734DigitalOcean Holdings, Inc.� 5,884 362,925Ebix, Inc. 12,111 348,555Forian, Inc.� 8,282 101,123GreenBox POS�# 7,926 77,279GTY Technology Holdings, Inc.�# 14,689 108,405IBEX Holdings, Ltd.� 2,585 46,478JFrog, Ltd.�# 23,552 905,339
Copyright © 2021 www.secdatabase.com. All Rights Reserved.Please Consider the Environment Before Printing This Document

Model N, Inc.� 15,871 538,186ON24, Inc.� 4,110 92,927Outset Medical, Inc.� 20,879 1,029,126PDF Solutions, Inc.� 13,543 304,988Phreesia, Inc.� 17,397 1,244,755Porch Group, Inc.� 7,242 144,840Smith Micro Software, Inc.� 20,297 101,282Sprout Social, Inc., Class A� 20,162 2,451,699Viant Technology, Inc., Class A� 4,899 67,361
14,510,573Athletic Equipment - 0.1%
Clarus Corp. 11,034 298,911Nautilus, Inc.� 13,594 154,972Vista Outdoor, Inc.� 26,676 1,089,714
1,543,597Audio/Video Products - 0.2%
Daktronics, Inc.� 16,761 102,074Kopin Corp.�# 35,416 208,246Sonos, Inc.� 54,883 2,180,502Universal Electronics, Inc.� 6,084 307,364VOXX International Corp.� 7,103 74,368
2,872,554Auto Repair Centers - 0.1%
Monro, Inc. 15,146 861,959Auto-Cars/Light Trucks - 0.1%
Arcimoto, Inc.�# 12,496 155,200Canoo, Inc.�# 36,413 262,538Fisker, Inc.� 72,443 1,010,580Lordstown Motors Corp., Class A�# 51,176 336,738
1,765,056
Copyright © 2021 www.secdatabase.com. All Rights Reserved.Please Consider the Environment Before Printing This Document
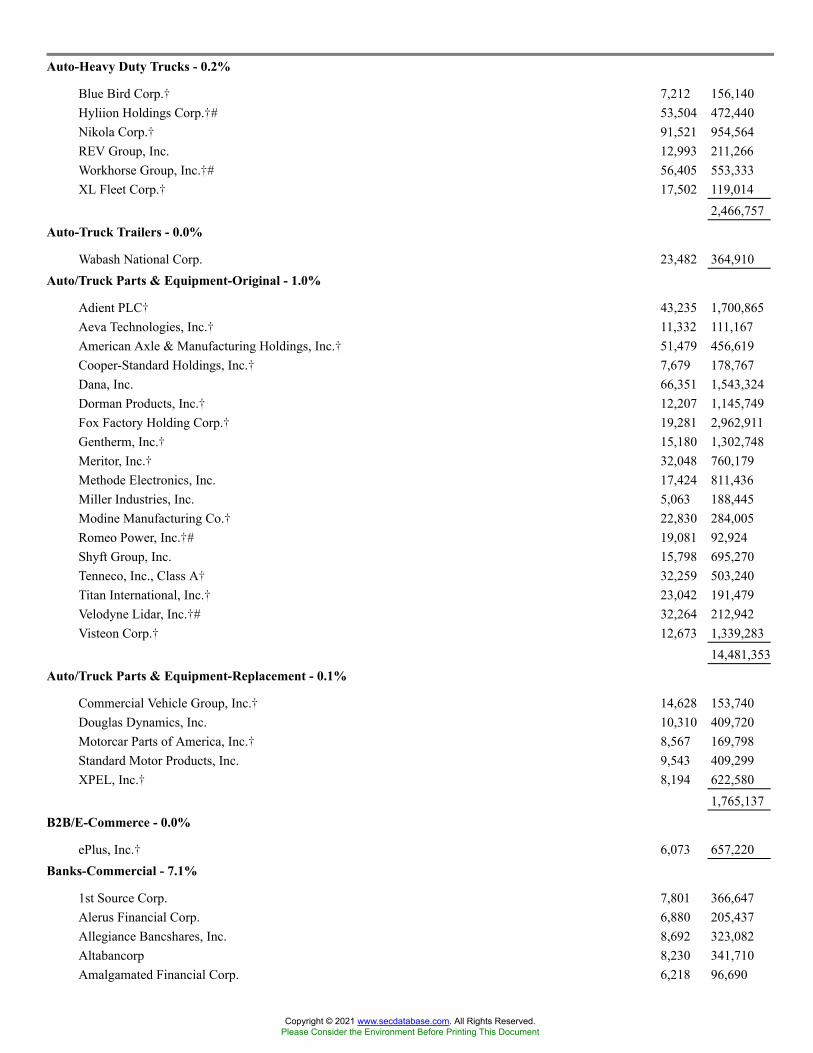
Auto-Heavy Duty Trucks - 0.2%
Blue Bird Corp.� 7,212 156,140Hyliion Holdings Corp.�# 53,504 472,440Nikola Corp.� 91,521 954,564REV Group, Inc. 12,993 211,266Workhorse Group, Inc.�# 56,405 553,333XL Fleet Corp.� 17,502 119,014
2,466,757Auto-Truck Trailers - 0.0%
Wabash National Corp. 23,482 364,910Auto/Truck Parts & Equipment-Original - 1.0%
Adient PLC� 43,235 1,700,865Aeva Technologies, Inc.� 11,332 111,167American Axle & Manufacturing Holdings, Inc.� 51,479 456,619Cooper-Standard Holdings, Inc.� 7,679 178,767Dana, Inc. 66,351 1,543,324Dorman Products, Inc.� 12,207 1,145,749Fox Factory Holding Corp.� 19,281 2,962,911Gentherm, Inc.� 15,180 1,302,748Meritor, Inc.� 32,048 760,179Methode Electronics, Inc. 17,424 811,436Miller Industries, Inc. 5,063 188,445Modine Manufacturing Co.� 22,830 284,005Romeo Power, Inc.�# 19,081 92,924Shyft Group, Inc. 15,798 695,270Tenneco, Inc., Class A� 32,259 503,240Titan International, Inc.� 23,042 191,479Velodyne Lidar, Inc.�# 32,264 212,942Visteon Corp.� 12,673 1,339,283
14,481,353Auto/Truck Parts & Equipment-Replacement - 0.1%
Commercial Vehicle Group, Inc.� 14,628 153,740Douglas Dynamics, Inc. 10,310 409,720Motorcar Parts of America, Inc.� 8,567 169,798Standard Motor Products, Inc. 9,543 409,299XPEL, Inc.� 8,194 622,580
1,765,137B2B/E-Commerce - 0.0%
ePlus, Inc.� 6,073 657,220Banks-Commercial - 7.1%
1st Source Corp. 7,801 366,647Alerus Financial Corp. 6,880 205,437Allegiance Bancshares, Inc. 8,692 323,082Altabancorp 8,230 341,710Amalgamated Financial Corp. 6,218 96,690
Copyright © 2021 www.secdatabase.com. All Rights Reserved.Please Consider the Environment Before Printing This Document

American National Bankshares, Inc. 4,842 165,500Ameris Bancorp 30,354 1,494,631Arrow Financial Corp. 6,122 225,596Associated Banc-Corp 69,106 1,424,966Atlantic Capital Bancshares, Inc.� 8,981 217,610Atlantic Union Bankshares Corp. 35,974 1,331,038BancFirst Corp. 7,839 443,374Bancorp, Inc.� 23,882 588,930BancorpSouth Bank 46,520 1,364,432Bank First Corp. 3,049 216,479Bank of Marin Bancorp 7,299 264,224Bank of N.T. Butterfield & Son, Ltd. 22,900 762,799BankUnited, Inc. 42,520 1,787,116Banner Corp. 15,828 905,362Bar Harbor Bankshares 6,741 184,703Blue Ridge Bankshares, Inc. 7,916 140,509Bridgewater Bancshares, Inc.� 9,610 157,123Bryn Mawr Bank Corp. 9,029 368,383Business First Bancshares, Inc. 8,850 211,692Byline Bancorp, Inc. 11,648 286,541Cadence BanCorp 56,162 1,208,045Cambridge Bancorp 3,114 266,994Camden National Corp. 6,726 313,902Capital Bancorp, Inc. 3,538 83,921Capital City Bank Group, Inc. 6,144 142,479Capstar Financial Holdings, Inc. 9,344 196,598Carter Bankshares, Inc.� 11,821 144,098Cathay General Bancorp 34,910 1,388,720CBTX, Inc. 8,399 228,621Central Pacific Financial Corp. 12,616 319,311Century Bancorp, Inc., Class A 1,246 142,455CIT Group, Inc. 45,315 2,511,357Citizens & Northern Corp. 7,085 177,763City Holding Co. 7,067 550,519Civista Bancshares, Inc. 7,093 166,827CNB Financial Corp. 7,338 180,368Coastal Financial Corp.� 4,318 126,820Columbia Banking System, Inc. 32,849 1,194,390Community Bank System, Inc. 24,441 1,808,634Community Trust Bancorp, Inc. 7,099 295,744ConnectOne Bancorp, Inc. 17,025 487,085CrossFirst Bankshares, Inc.� 21,532 284,653Customers Bancorp, Inc.� 13,642 564,915CVB Financial Corp. 58,994 1,201,118Dime Community Bancshares, Inc. 16,021 528,693Eagle Bancorp, Inc. 14,439 833,130Eastern Bankshares, Inc. 78,403 1,550,811Enterprise Bancorp, Inc. 4,231 142,796Enterprise Financial Services Corp. 16,346 734,099
Copyright © 2021 www.secdatabase.com. All Rights Reserved.Please Consider the Environment Before Printing This Document

Equity Bancshares, Inc., Class A� 6,170 197,934Farmers National Banc Corp. 11,873 185,219FB Financial Corp. 15,205 626,294Fidelity D&D Bancorp, Inc. 1,831 98,782Financial Institutions, Inc. 7,148 227,020First Bancorp 12,856 536,867First Bancorp, Inc. 4,725 140,285First BanCorp/Puerto Rico 98,375 1,252,314First Bancshares, Inc. 9,246 374,648First Bank 7,113 94,745First Busey Corp. 23,196 549,745First Commonwealth Financial Corp. 43,565 588,999First Community Bankshares, Inc. 7,835 244,765First Financial Bancorp 43,912 1,032,371First Financial Bankshares, Inc. 59,279 2,822,866First Financial Corp. 5,506 222,608First Foundation, Inc. 18,133 435,736First Internet Bancorp 4,244 126,132
Copyright © 2021 www.secdatabase.com. All Rights Reserved.Please Consider the Environment Before Printing This Document

First Interstate BancSystem, Inc., Class A 18,689 823,437First Merchants Corp. 24,704 1,016,570First Mid Bancshares, Inc. 7,590 310,431First Midwest Bancorp, Inc. 51,993 973,829First of Long Island Corp. 10,447 221,476Five Star Bancorp 2,415 57,670Flagstar Bancorp, Inc. 23,792 1,176,752Fulton Financial Corp. 72,560 1,150,076German American Bancorp, Inc. 11,278 421,346Glacier Bancorp, Inc. 43,747 2,329,965Great Southern Bancorp, Inc. 4,833 263,254Great Western Bancorp, Inc. 25,289 782,947Guaranty Bancshares, Inc. 3,643 125,028Hancock Whitney Corp. 39,492 1,815,052Hanmi Financial Corp. 13,926 268,493HarborOne Bancorp, Inc. 23,050 325,696HBT Financial, Inc. 4,371 71,466Heartland Financial USA, Inc. 18,398 865,258Heritage Commerce Corp. 26,676 300,639Heritage Financial Corp. 16,193 412,112Hilltop Holdings, Inc. 29,481 986,729Home BancShares, Inc. 69,615 1,541,972HomeStreet, Inc. 9,486 387,503Hope Bancorp, Inc. 54,287 748,618Horizon Bancorp, Inc. 19,549 348,950Howard Bancorp, Inc.� 6,015 119,698Independent Bank Corp. 15,043 1,153,798Independent Bank Corp. 9,536 199,684International Bancshares Corp. 24,542 1,027,819Kearny Financial Corp. 33,335 423,021Lakeland Bancorp, Inc. 22,318 376,728Lakeland Financial Corp. 11,137 739,608Live Oak Bancshares, Inc. 14,387 880,628Luther Burbank Corp. 7,125 92,411Macatawa Bank Corp. 11,990 98,438Mercantile Bank Corp. 7,218 225,202Merchants Bancorp 4,494 164,795Meta Financial Group, Inc. 14,351 705,926Metrocity Bankshares, Inc. 8,666 179,473Metropolitan Bank Holding Corp.� 3,508 274,676Mid Penn Bancorp, Inc.# 4,486 119,283Midland States Bancorp, Inc. 9,911 250,748MidWestOne Financial Group, Inc. 6,609 194,040MVB Financial Corp. 4,490 177,535NBT Bancorp, Inc. 19,258 690,592Nicolet Bankshares, Inc.� 4,075 311,371Northrim BanCorp, Inc. 2,766 116,089OFG Bancorp 23,198 552,344
Copyright © 2021 www.secdatabase.com. All Rights Reserved.Please Consider the Environment Before Printing This Document
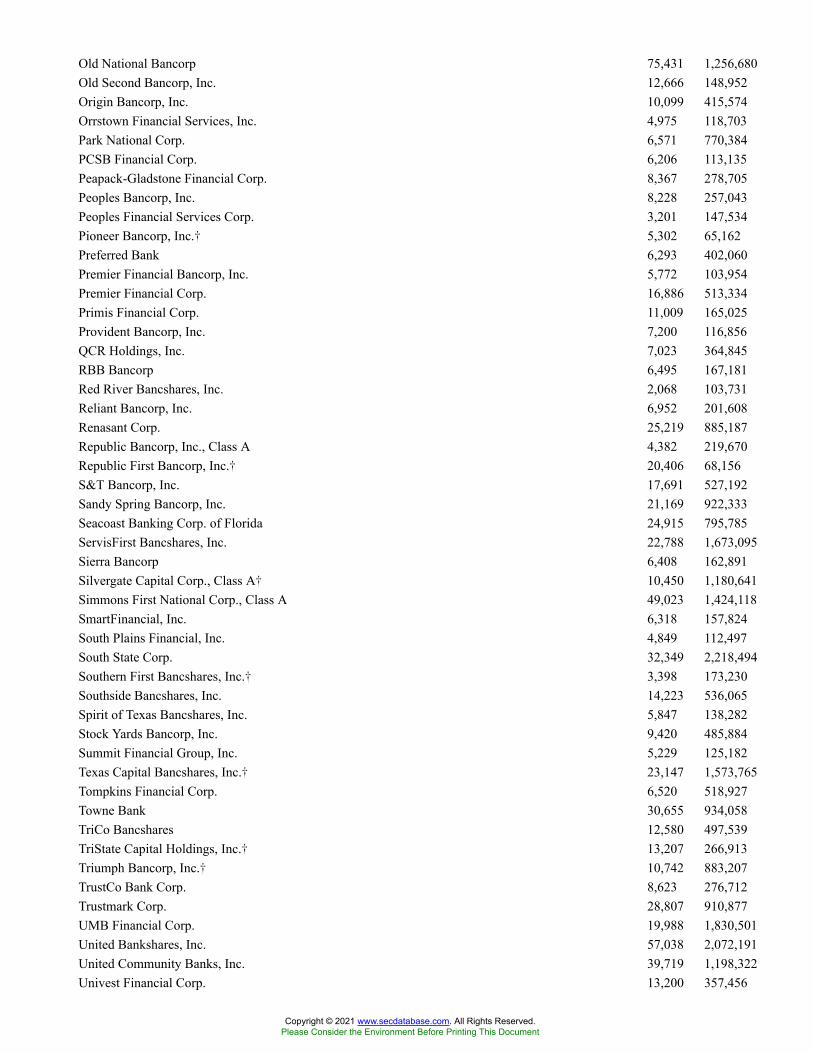
Old National Bancorp 75,431 1,256,680Old Second Bancorp, Inc. 12,666 148,952Origin Bancorp, Inc. 10,099 415,574Orrstown Financial Services, Inc. 4,975 118,703Park National Corp. 6,571 770,384PCSB Financial Corp. 6,206 113,135Peapack-Gladstone Financial Corp. 8,367 278,705Peoples Bancorp, Inc. 8,228 257,043Peoples Financial Services Corp. 3,201 147,534Pioneer Bancorp, Inc.� 5,302 65,162Preferred Bank 6,293 402,060Premier Financial Bancorp, Inc. 5,772 103,954Premier Financial Corp. 16,886 513,334Primis Financial Corp. 11,009 165,025Provident Bancorp, Inc. 7,200 116,856QCR Holdings, Inc. 7,023 364,845RBB Bancorp 6,495 167,181Red River Bancshares, Inc. 2,068 103,731Reliant Bancorp, Inc. 6,952 201,608Renasant Corp. 25,219 885,187Republic Bancorp, Inc., Class A 4,382 219,670Republic First Bancorp, Inc.� 20,406 68,156S&T Bancorp, Inc. 17,691 527,192Sandy Spring Bancorp, Inc. 21,169 922,333Seacoast Banking Corp. of Florida 24,915 795,785ServisFirst Bancshares, Inc. 22,788 1,673,095Sierra Bancorp 6,408 162,891Silvergate Capital Corp., Class A� 10,450 1,180,641Simmons First National Corp., Class A 49,023 1,424,118SmartFinancial, Inc. 6,318 157,824South Plains Financial, Inc. 4,849 112,497South State Corp. 32,349 2,218,494Southern First Bancshares, Inc.� 3,398 173,230Southside Bancshares, Inc. 14,223 536,065Spirit of Texas Bancshares, Inc. 5,847 138,282Stock Yards Bancorp, Inc. 9,420 485,884Summit Financial Group, Inc. 5,229 125,182Texas Capital Bancshares, Inc.� 23,147 1,573,765Tompkins Financial Corp. 6,520 518,927Towne Bank 30,655 934,058TriCo Bancshares 12,580 497,539TriState Capital Holdings, Inc.� 13,207 266,913Triumph Bancorp, Inc.� 10,742 883,207TrustCo Bank Corp. 8,623 276,712Trustmark Corp. 28,807 910,877UMB Financial Corp. 19,988 1,830,501United Bankshares, Inc. 57,038 2,072,191United Community Banks, Inc. 39,719 1,198,322Univest Financial Corp. 13,200 357,456
Copyright © 2021 www.secdatabase.com. All Rights Reserved.Please Consider the Environment Before Printing This Document

Valley National Bancorp 182,835 2,384,168Veritex Holdings, Inc. 21,710 780,040Washington Trust Bancorp, Inc. 7,812 416,067WesBanco, Inc. 29,813 1,013,642West BanCorp, Inc. 7,337 224,439Westamerica BanCorp 11,890 674,639
102,536,401Banks-Mortgage - 0.1%
Walker & Dunlop, Inc. 13,348 1,482,295Banks-Super Regional - 0.1%
Independent Bank Group, Inc. 17,179 1,209,917National Bank Holdings Corp., Class A 13,485 505,687
1,715,604Batteries/Battery Systems - 0.2%
Energizer Holdings, Inc. 31,069 1,222,254EnerSys 19,574 1,655,765
2,878,019
Copyright © 2021 www.secdatabase.com. All Rights Reserved.Please Consider the Environment Before Printing This Document

Beverages-Non-alcoholic - 0.3%
Celsius Holdings, Inc.� 20,758 1,697,174Coca-Cola Consolidated, Inc. 2,146 871,620National Beverage Corp. 10,720 499,016NewAge, Inc.� 60,761 106,939Primo Water Corp. 71,783 1,274,866
4,449,615Beverages-Wine/Spirits - 0.0%
Duckhorn Portfolio, Inc.� 9,211 197,944MGP Ingredients, Inc.# 6,469 422,426
620,370Broadcast Services/Program - 0.0%
CuriosityStream, Inc.�# 11,875 148,438Hemisphere Media Group, Inc.� 7,263 89,480
237,918Building & Construction Products-Misc. - 0.5%
American Woodmark Corp.� 7,752 546,206Caesarstone, Ltd. 10,322 134,186Forterra, Inc.� 13,284 306,063Gibraltar Industries, Inc.� 14,975 1,118,034Patrick Industries, Inc. 10,368 846,132Simpson Manufacturing Co., Inc. 19,886 2,250,101Summit Materials, Inc., Class A� 53,550 1,803,029
7,003,751Building & Construction-Misc. - 0.6%
Comfort Systems USA, Inc. 16,273 1,236,423Concrete Pumping Holdings, Inc.�# 11,776 97,859EMCOR Group, Inc. 24,693 3,000,199IES Holdings, Inc.� 3,952 193,253Latham Group, Inc.�# 10,593 232,728MYR Group, Inc.� 7,536 783,819NV5 Global, Inc.� 5,846 617,630WillScot Mobile Mini Holdings Corp.� 85,292 2,524,643
8,686,554Building Products-Air & Heating - 0.2%
AAON, Inc. 19,141 1,303,694SPX Corp.� 20,017 1,250,662
2,554,356Building Products-Doors & Windows - 0.3%
Apogee Enterprises, Inc. 11,548 496,333Cornerstone Building Brands, Inc.� 24,988 415,300Griffon Corp. 21,212 513,330JELD-WEN Holding, Inc.� 38,340 1,055,884Masonite International Corp.� 11,203 1,340,775
Copyright © 2021 www.secdatabase.com. All Rights Reserved.Please Consider the Environment Before Printing This Document

PGT Innovations, Inc.� 26,700 566,841View, Inc.�# 38,673 193,752
4,582,215Building Products-Wood - 0.2%
Boise Cascade Co. 17,977 1,039,969UFP Industries, Inc. 27,484 2,063,499
3,103,468Building-Heavy Construction - 0.4%
Arcosa, Inc. 22,115 1,123,884Construction Partners, Inc., Class A� 12,999 435,077Dycom Industries, Inc.� 13,641 1,027,576Granite Construction, Inc. 20,883 846,597Great Lakes Dredge & Dock Corp.� 29,557 446,606Primoris Services Corp. 24,410 627,337Sterling Construction Co., Inc.� 12,697 292,793Tutor Perini Corp.� 18,831 271,543
5,071,413Building-Maintenance & Services - 0.1%
ABM Industries, Inc. 30,755 1,522,988BrightView Holdings, Inc.� 18,689 286,502
1,809,490Building-Mobile Home/Manufactured Housing - 0.4%
Cavco Industries, Inc.� 4,215 1,076,933LCI Industries 11,313 1,602,600Skyline Champion Corp.� 23,978 1,503,900Winnebago Industries, Inc. 14,765 1,027,939
5,211,372Building-Residential/Commercial - 0.9%
Beazer Homes USA, Inc.� 13,365 250,059Century Communities, Inc. 13,703 960,580Forestar Group, Inc.� 7,785 161,850Green Brick Partners, Inc.� 14,031 350,635Hovnanian Enterprises, Inc., Class A� 2,336 253,947Installed Building Products, Inc. 10,829 1,344,745KB Home 40,940 1,761,648Landsea Homes Corp.� 2,739 24,076LGI Homes, Inc.� 10,125 1,623,341M/I Homes, Inc.� 13,043 839,839MDC Holdings, Inc. 26,100 1,363,725Meritage Homes Corp.� 17,110 1,908,449Taylor Morrison Home Corp.� 57,310 1,609,838Tri Pointe Homes, Inc.� 53,680 1,275,974
13,728,706Cable/Satellite TV - 0.1%
Liberty Latin America, Ltd., Class A� 19,568 279,040
Copyright © 2021 www.secdatabase.com. All Rights Reserved.Please Consider the Environment Before Printing This Document
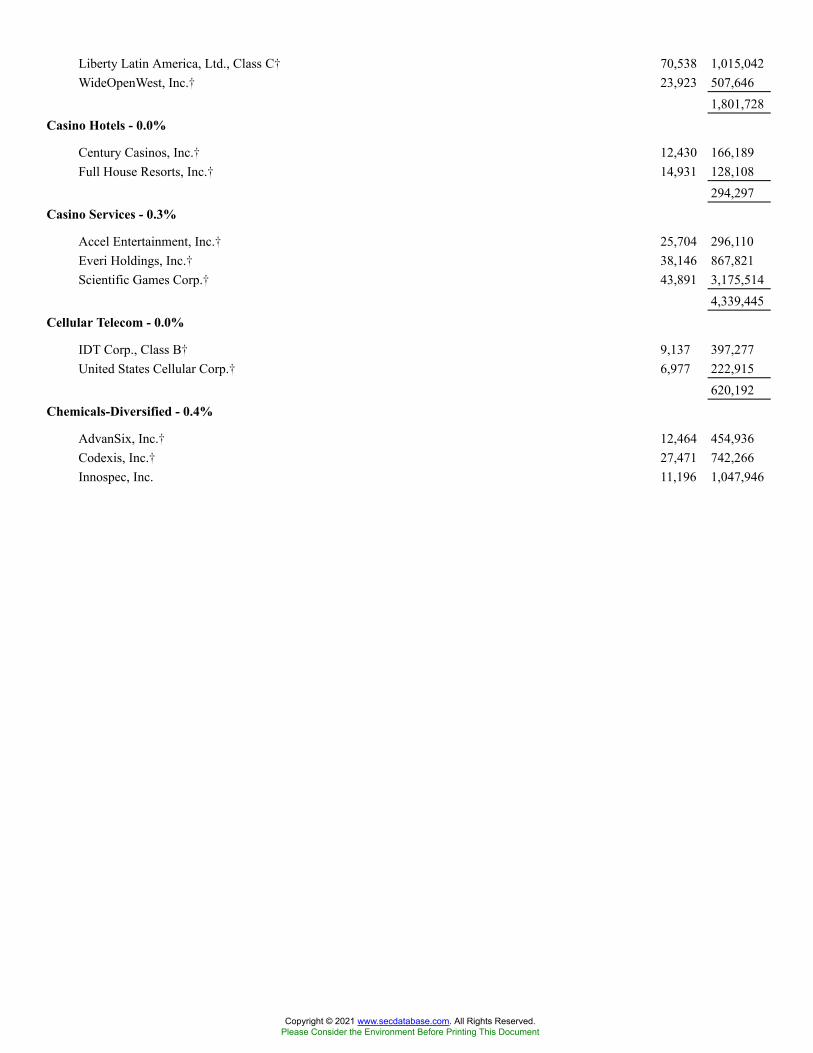
Liberty Latin America, Ltd., Class C� 70,538 1,015,042WideOpenWest, Inc.� 23,923 507,646
1,801,728Casino Hotels - 0.0%
Century Casinos, Inc.� 12,430 166,189Full House Resorts, Inc.� 14,931 128,108
294,297Casino Services - 0.3%
Accel Entertainment, Inc.� 25,704 296,110Everi Holdings, Inc.� 38,146 867,821Scientific Games Corp.� 43,891 3,175,514
4,339,445Cellular Telecom - 0.0%
IDT Corp., Class B� 9,137 397,277United States Cellular Corp.� 6,977 222,915
620,192Chemicals-Diversified - 0.4%
AdvanSix, Inc.� 12,464 454,936Codexis, Inc.� 27,471 742,266Innospec, Inc. 11,196 1,047,946
Copyright © 2021 www.secdatabase.com. All Rights Reserved.Please Consider the Environment Before Printing This Document
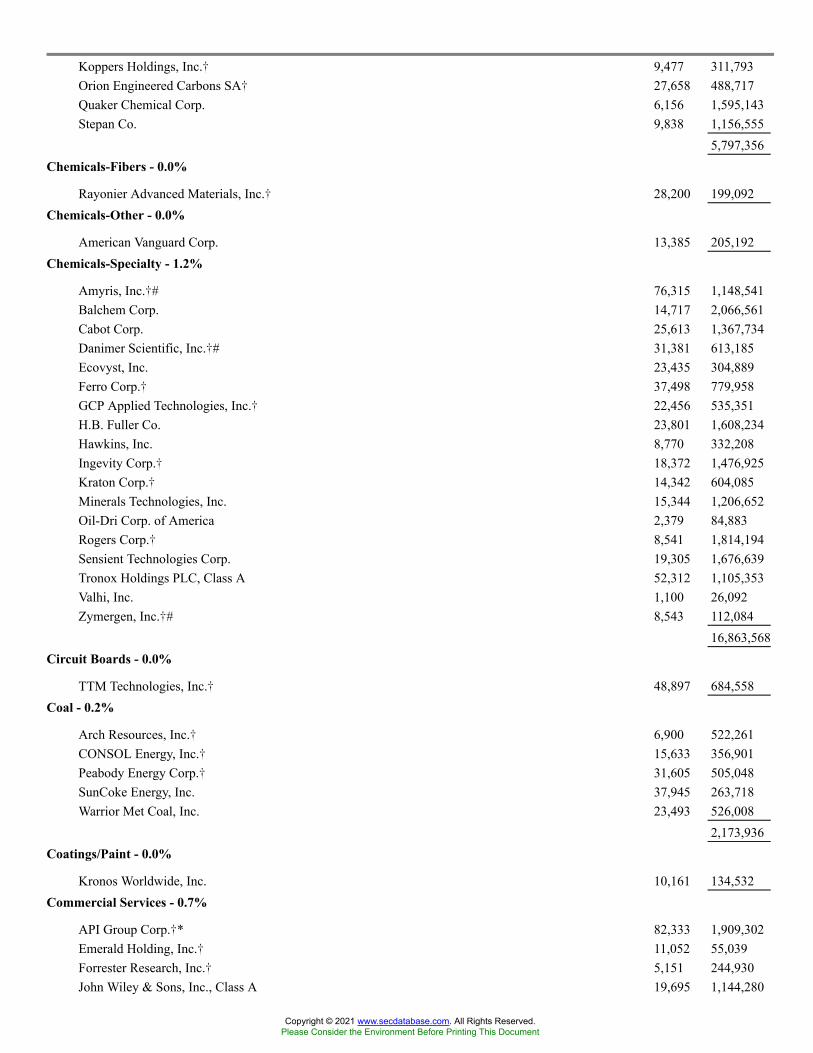
Koppers Holdings, Inc.� 9,477 311,793Orion Engineered Carbons SA� 27,658 488,717Quaker Chemical Corp. 6,156 1,595,143Stepan Co. 9,838 1,156,555
5,797,356Chemicals-Fibers - 0.0%
Rayonier Advanced Materials, Inc.� 28,200 199,092Chemicals-Other - 0.0%
American Vanguard Corp. 13,385 205,192Chemicals-Specialty - 1.2%
Amyris, Inc.�# 76,315 1,148,541Balchem Corp. 14,717 2,066,561Cabot Corp. 25,613 1,367,734Danimer Scientific, Inc.�# 31,381 613,185Ecovyst, Inc. 23,435 304,889Ferro Corp.� 37,498 779,958GCP Applied Technologies, Inc.� 22,456 535,351H.B. Fuller Co. 23,801 1,608,234Hawkins, Inc. 8,770 332,208Ingevity Corp.� 18,372 1,476,925Kraton Corp.� 14,342 604,085Minerals Technologies, Inc. 15,344 1,206,652Oil-Dri Corp. of America 2,379 84,883Rogers Corp.� 8,541 1,814,194Sensient Technologies Corp. 19,305 1,676,639Tronox Holdings PLC, Class A 52,312 1,105,353Valhi, Inc. 1,100 26,092Zymergen, Inc.�# 8,543 112,084
16,863,568Circuit Boards - 0.0%
TTM Technologies, Inc.� 48,897 684,558Coal - 0.2%
Arch Resources, Inc.� 6,900 522,261CONSOL Energy, Inc.� 15,633 356,901Peabody Energy Corp.� 31,605 505,048SunCoke Energy, Inc. 37,945 263,718Warrior Met Coal, Inc. 23,493 526,008
2,173,936Coatings/Paint - 0.0%
Kronos Worldwide, Inc. 10,161 134,532Commercial Services - 0.7%
API Group Corp.�* 82,333 1,909,302Emerald Holding, Inc.� 11,052 55,039Forrester Research, Inc.� 5,151 244,930John Wiley & Sons, Inc., Class A 19,695 1,144,280
Copyright © 2021 www.secdatabase.com. All Rights Reserved.Please Consider the Environment Before Printing This Document
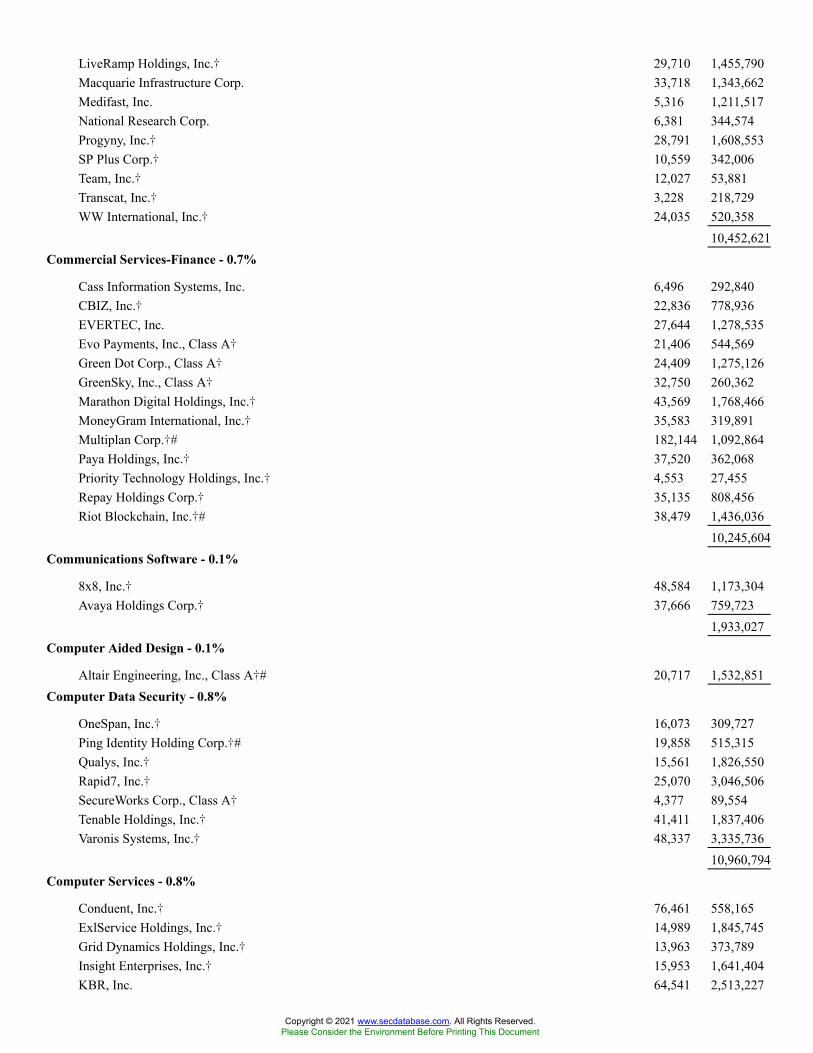
LiveRamp Holdings, Inc.� 29,710 1,455,790Macquarie Infrastructure Corp. 33,718 1,343,662Medifast, Inc. 5,316 1,211,517National Research Corp. 6,381 344,574Progyny, Inc.� 28,791 1,608,553SP Plus Corp.� 10,559 342,006Team, Inc.� 12,027 53,881Transcat, Inc.� 3,228 218,729WW International, Inc.� 24,035 520,358
10,452,621Commercial Services-Finance - 0.7%
Cass Information Systems, Inc. 6,496 292,840CBIZ, Inc.� 22,836 778,936EVERTEC, Inc. 27,644 1,278,535Evo Payments, Inc., Class A� 21,406 544,569Green Dot Corp., Class A� 24,409 1,275,126GreenSky, Inc., Class A� 32,750 260,362Marathon Digital Holdings, Inc.� 43,569 1,768,466MoneyGram International, Inc.� 35,583 319,891Multiplan Corp.�# 182,144 1,092,864Paya Holdings, Inc.� 37,520 362,068Priority Technology Holdings, Inc.� 4,553 27,455Repay Holdings Corp.� 35,135 808,456Riot Blockchain, Inc.�# 38,479 1,436,036
10,245,604Communications Software - 0.1%
8x8, Inc.� 48,584 1,173,304Avaya Holdings Corp.� 37,666 759,723
1,933,027Computer Aided Design - 0.1%
Altair Engineering, Inc., Class A�# 20,717 1,532,851Computer Data Security - 0.8%
OneSpan, Inc.� 16,073 309,727Ping Identity Holding Corp.�# 19,858 515,315Qualys, Inc.� 15,561 1,826,550Rapid7, Inc.� 25,070 3,046,506SecureWorks Corp., Class A� 4,377 89,554Tenable Holdings, Inc.� 41,411 1,837,406Varonis Systems, Inc.� 48,337 3,335,736
10,960,794Computer Services - 0.8%
Conduent, Inc.� 76,461 558,165ExlService Holdings, Inc.� 14,989 1,845,745Grid Dynamics Holdings, Inc.� 13,963 373,789Insight Enterprises, Inc.� 15,953 1,641,404KBR, Inc. 64,541 2,513,227
Copyright © 2021 www.secdatabase.com. All Rights Reserved.Please Consider the Environment Before Printing This Document
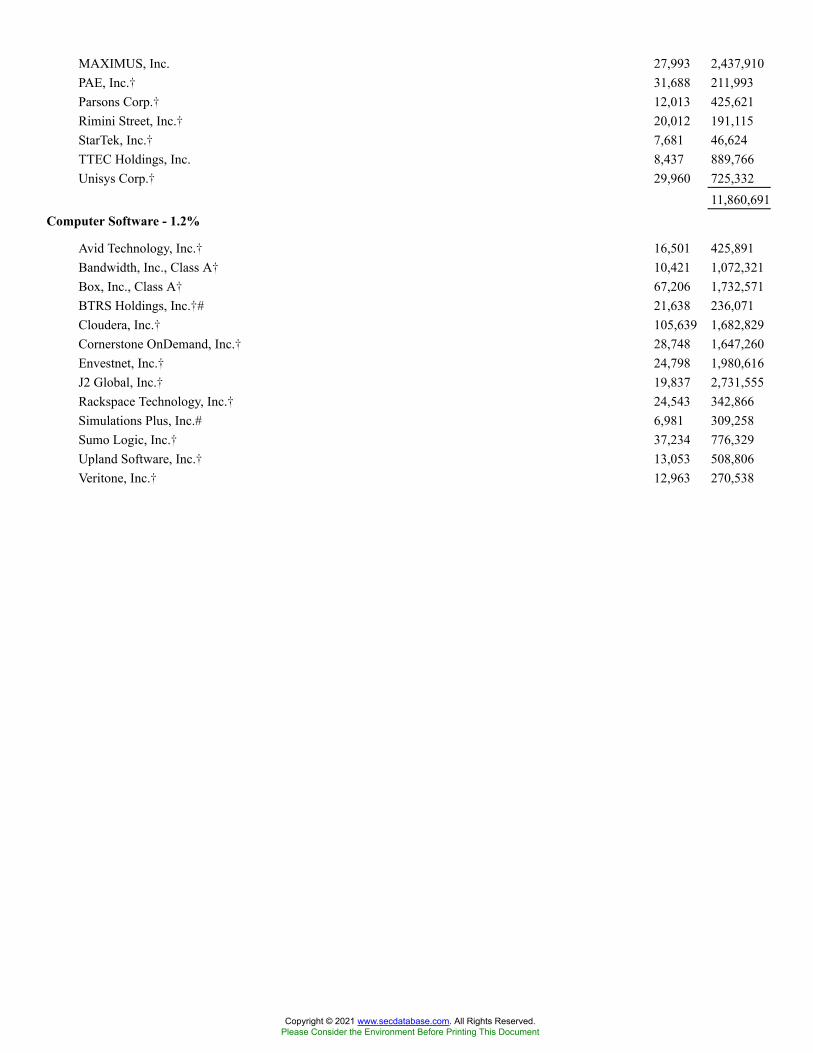
MAXIMUS, Inc. 27,993 2,437,910PAE, Inc.� 31,688 211,993Parsons Corp.� 12,013 425,621Rimini Street, Inc.� 20,012 191,115StarTek, Inc.� 7,681 46,624TTEC Holdings, Inc. 8,437 889,766Unisys Corp.� 29,960 725,332
11,860,691Computer Software - 1.2%
Avid Technology, Inc.� 16,501 425,891Bandwidth, Inc., Class A� 10,421 1,072,321Box, Inc., Class A� 67,206 1,732,571BTRS Holdings, Inc.�# 21,638 236,071Cloudera, Inc.� 105,639 1,682,829Cornerstone OnDemand, Inc.� 28,748 1,647,260Envestnet, Inc.� 24,798 1,980,616J2 Global, Inc.� 19,837 2,731,555Rackspace Technology, Inc.� 24,543 342,866Simulations Plus, Inc.# 6,981 309,258Sumo Logic, Inc.� 37,234 776,329Upland Software, Inc.� 13,053 508,806Veritone, Inc.� 12,963 270,538
Copyright © 2021 www.secdatabase.com. All Rights Reserved.Please Consider the Environment Before Printing This Document

Verra Mobility Corp.�# 61,196 949,150Xperi Holding Corp. 47,906 1,023,751Yext, Inc.� 50,692 685,356Zuora, Inc., Class A� 47,884 813,070
17,188,238Computers-Integrated Systems - 0.2%
Cantaloupe, Inc.� 26,593 272,312Diebold Nixdorf, Inc.� 32,842 357,321NetScout Systems, Inc.� 32,030 878,263PAR Technology Corp.�# 10,824 735,274Super Micro Computer, Inc.� 19,701 719,875Telos Corp.�# 7,879 260,007
3,223,052Computers-Memory Devices - 0.0%
Quantum Corp.� 25,492 159,070Computers-Other - 0.2%
3D Systems Corp.� 55,412 1,686,741Corsair Gaming, Inc.�# 12,273 355,303Desktop Metal, Inc.� 38,153 316,670ExOne Co.� 7,779 190,975PlayAGS, Inc.� 12,538 102,686Rekor Systems, Inc.� 14,320 156,374Vuzix Corp.� 26,782 354,326
3,163,075Computers-Periphery Equipment - 0.0%
iCAD, Inc.� 9,990 120,480Mitek Systems, Inc.� 19,152 428,430
548,910Computers-Voice Recognition - 0.1%
Vocera Communications, Inc.� 15,582 755,571Consulting Services - 0.3%
Acacia Research Corp.� 22,374 136,258CRA International, Inc. 3,246 301,846Franklin Covey Co.� 5,690 247,344GP Strategies Corp.� 5,747 118,848Hackett Group, Inc. 11,369 222,832HireQuest, Inc.# 2,320 43,036Huron Consulting Group, Inc.� 10,204 503,772ICF International, Inc. 8,443 790,771Kelly Services, Inc., Class A 16,069 312,381R1 RCM, Inc.� 60,069 1,184,561Vectrus, Inc.� 5,261 264,681
4,126,330Consumer Products-Misc. - 0.4%
Copyright © 2021 www.secdatabase.com. All Rights Reserved.Please Consider the Environment Before Printing This Document
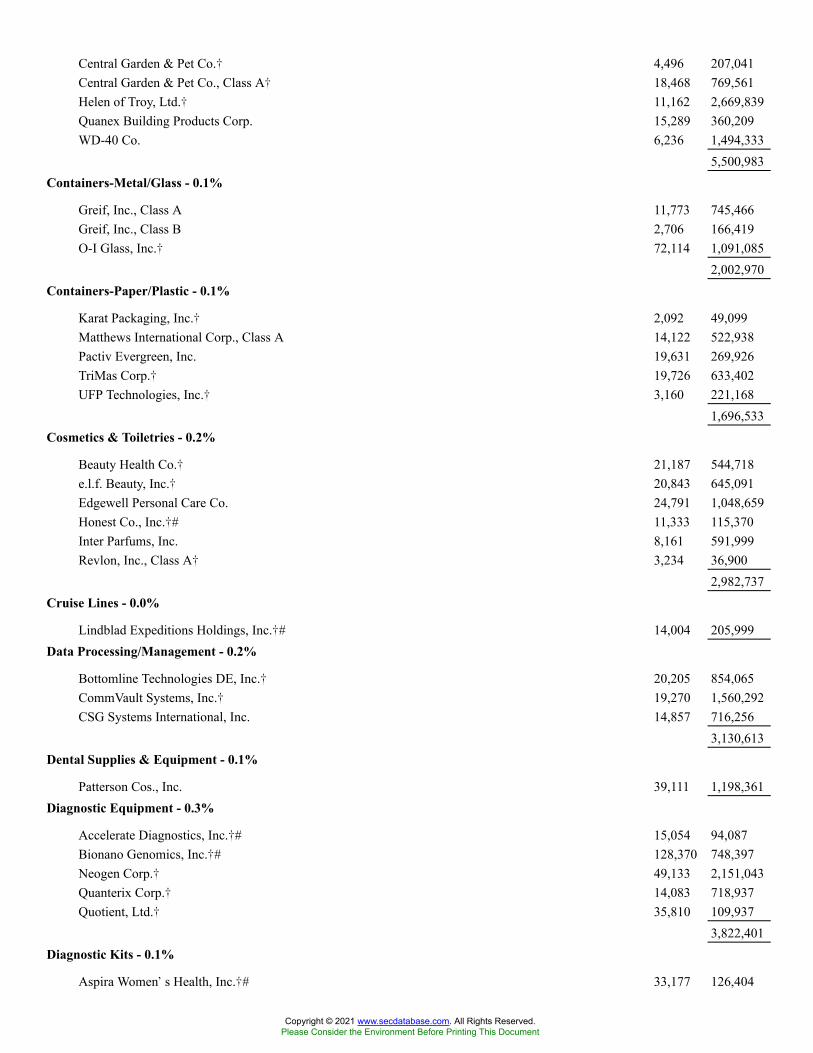
Central Garden & Pet Co.� 4,496 207,041Central Garden & Pet Co., Class A� 18,468 769,561Helen of Troy, Ltd.� 11,162 2,669,839Quanex Building Products Corp. 15,289 360,209WD-40 Co. 6,236 1,494,333
5,500,983Containers-Metal/Glass - 0.1%
Greif, Inc., Class A 11,773 745,466Greif, Inc., Class B 2,706 166,419O-I Glass, Inc.� 72,114 1,091,085
2,002,970Containers-Paper/Plastic - 0.1%
Karat Packaging, Inc.� 2,092 49,099Matthews International Corp., Class A 14,122 522,938Pactiv Evergreen, Inc. 19,631 269,926TriMas Corp.� 19,726 633,402UFP Technologies, Inc.� 3,160 221,168
1,696,533Cosmetics & Toiletries - 0.2%
Beauty Health Co.� 21,187 544,718e.l.f. Beauty, Inc.� 20,843 645,091Edgewell Personal Care Co. 24,791 1,048,659Honest Co., Inc.�# 11,333 115,370Inter Parfums, Inc. 8,161 591,999Revlon, Inc., Class A� 3,234 36,900
2,982,737Cruise Lines - 0.0%
Lindblad Expeditions Holdings, Inc.�# 14,004 205,999Data Processing/Management - 0.2%
Bottomline Technologies DE, Inc.� 20,205 854,065CommVault Systems, Inc.� 19,270 1,560,292CSG Systems International, Inc. 14,857 716,256
3,130,613Dental Supplies & Equipment - 0.1%
Patterson Cos., Inc. 39,111 1,198,361Diagnostic Equipment - 0.3%
Accelerate Diagnostics, Inc.�# 15,054 94,087Bionano Genomics, Inc.�# 128,370 748,397Neogen Corp.� 49,133 2,151,043Quanterix Corp.� 14,083 718,937Quotient, Ltd.� 35,810 109,937
3,822,401Diagnostic Kits - 0.1%
Aspira Women�s Health, Inc.�# 33,177 126,404
Copyright © 2021 www.secdatabase.com. All Rights Reserved.Please Consider the Environment Before Printing This Document
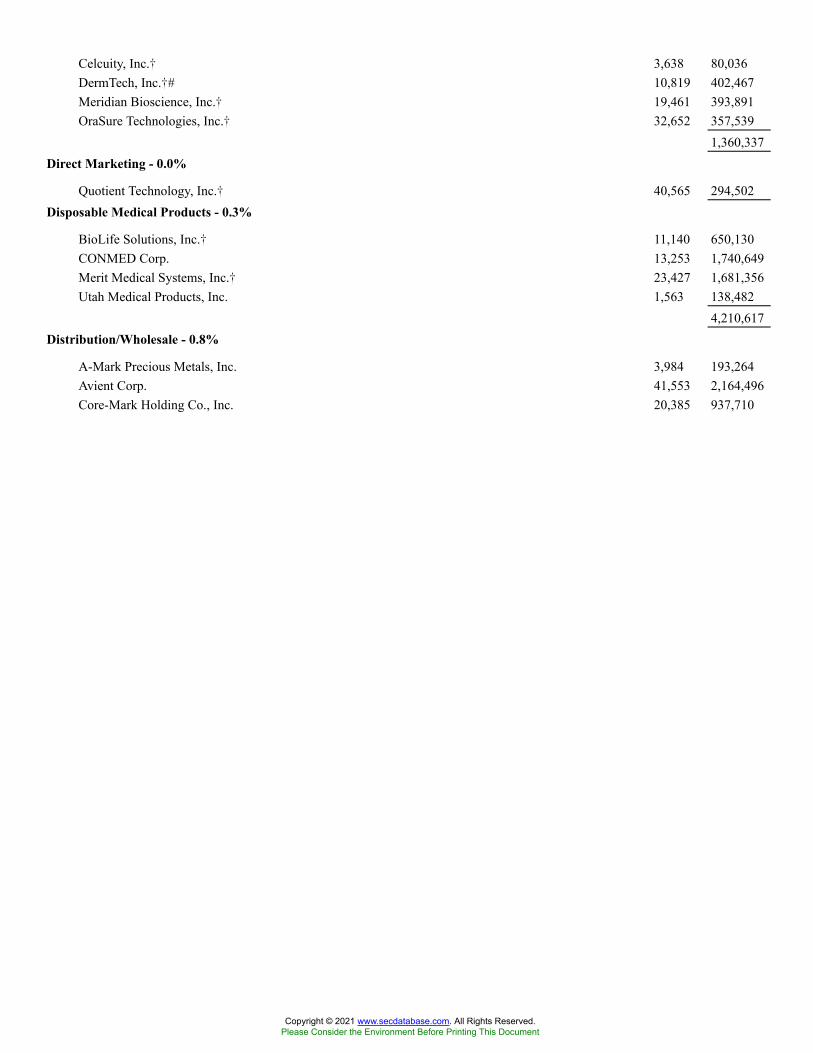
Celcuity, Inc.� 3,638 80,036DermTech, Inc.�# 10,819 402,467Meridian Bioscience, Inc.� 19,461 393,891OraSure Technologies, Inc.� 32,652 357,539
1,360,337Direct Marketing - 0.0%
Quotient Technology, Inc.� 40,565 294,502Disposable Medical Products - 0.3%
BioLife Solutions, Inc.� 11,140 650,130CONMED Corp. 13,253 1,740,649Merit Medical Systems, Inc.� 23,427 1,681,356Utah Medical Products, Inc. 1,563 138,482
4,210,617Distribution/Wholesale - 0.8%
A-Mark Precious Metals, Inc. 3,984 193,264Avient Corp. 41,553 2,164,496Core-Mark Holding Co., Inc. 20,385 937,710
Copyright © 2021 www.secdatabase.com. All Rights Reserved.Please Consider the Environment Before Printing This Document
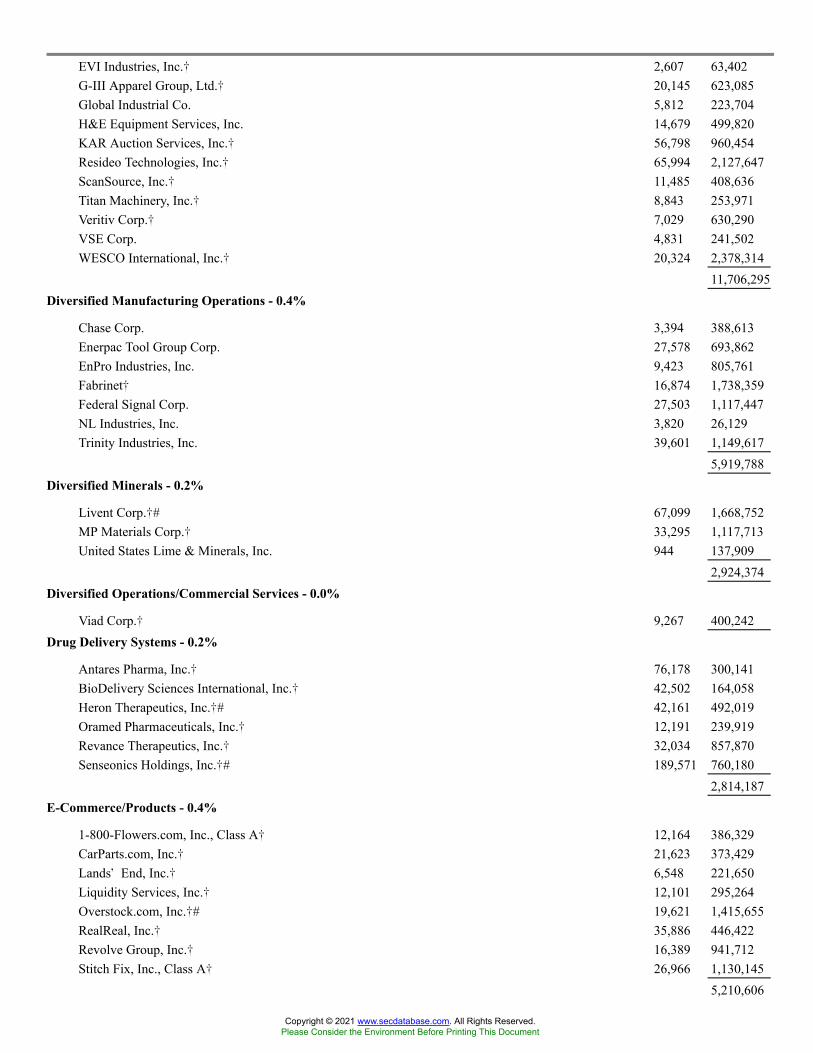
EVI Industries, Inc.� 2,607 63,402G-III Apparel Group, Ltd.� 20,145 623,085Global Industrial Co. 5,812 223,704H&E Equipment Services, Inc. 14,679 499,820KAR Auction Services, Inc.� 56,798 960,454Resideo Technologies, Inc.� 65,994 2,127,647ScanSource, Inc.� 11,485 408,636Titan Machinery, Inc.� 8,843 253,971Veritiv Corp.� 7,029 630,290VSE Corp. 4,831 241,502WESCO International, Inc.� 20,324 2,378,314
11,706,295Diversified Manufacturing Operations - 0.4%
Chase Corp. 3,394 388,613Enerpac Tool Group Corp. 27,578 693,862EnPro Industries, Inc. 9,423 805,761Fabrinet� 16,874 1,738,359Federal Signal Corp. 27,503 1,117,447NL Industries, Inc. 3,820 26,129Trinity Industries, Inc. 39,601 1,149,617
5,919,788Diversified Minerals - 0.2%
Livent Corp.�# 67,099 1,668,752MP Materials Corp.� 33,295 1,117,713United States Lime & Minerals, Inc. 944 137,909
2,924,374Diversified Operations/Commercial Services - 0.0%
Viad Corp.� 9,267 400,242Drug Delivery Systems - 0.2%
Antares Pharma, Inc.� 76,178 300,141BioDelivery Sciences International, Inc.� 42,502 164,058Heron Therapeutics, Inc.�# 42,161 492,019Oramed Pharmaceuticals, Inc.� 12,191 239,919Revance Therapeutics, Inc.� 32,034 857,870Senseonics Holdings, Inc.�# 189,571 760,180
2,814,187E-Commerce/Products - 0.4%
1-800-Flowers.com, Inc., Class A� 12,164 386,329CarParts.com, Inc.� 21,623 373,429Lands� End, Inc.� 6,548 221,650Liquidity Services, Inc.� 12,101 295,264Overstock.com, Inc.�# 19,621 1,415,655RealReal, Inc.� 35,886 446,422Revolve Group, Inc.� 16,389 941,712Stitch Fix, Inc., Class A� 26,966 1,130,145
5,210,606
Copyright © 2021 www.secdatabase.com. All Rights Reserved.Please Consider the Environment Before Printing This Document
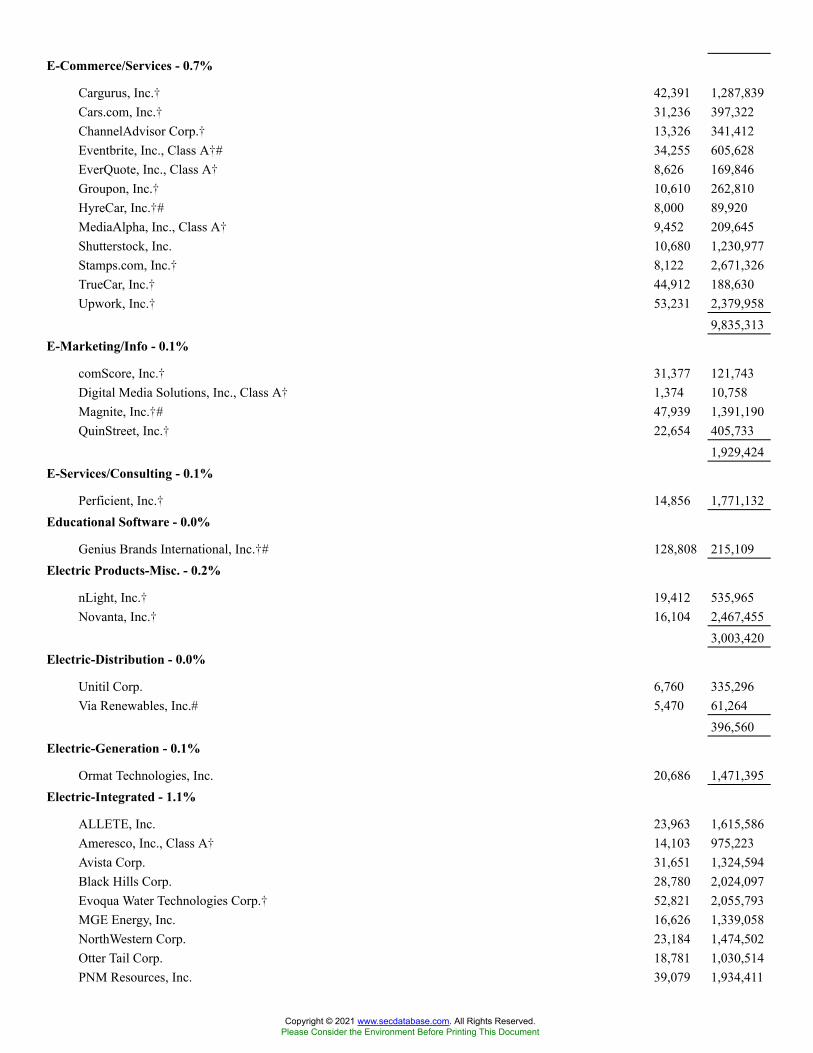
E-Commerce/Services - 0.7%
Cargurus, Inc.� 42,391 1,287,839Cars.com, Inc.� 31,236 397,322ChannelAdvisor Corp.� 13,326 341,412Eventbrite, Inc., Class A�# 34,255 605,628EverQuote, Inc., Class A� 8,626 169,846Groupon, Inc.� 10,610 262,810HyreCar, Inc.�# 8,000 89,920MediaAlpha, Inc., Class A� 9,452 209,645Shutterstock, Inc. 10,680 1,230,977Stamps.com, Inc.� 8,122 2,671,326TrueCar, Inc.� 44,912 188,630Upwork, Inc.� 53,231 2,379,958
9,835,313E-Marketing/Info - 0.1%
comScore, Inc.� 31,377 121,743Digital Media Solutions, Inc., Class A� 1,374 10,758Magnite, Inc.�# 47,939 1,391,190QuinStreet, Inc.� 22,654 405,733
1,929,424E-Services/Consulting - 0.1%
Perficient, Inc.� 14,856 1,771,132Educational Software - 0.0%
Genius Brands International, Inc.�# 128,808 215,109Electric Products-Misc. - 0.2%
nLight, Inc.� 19,412 535,965Novanta, Inc.� 16,104 2,467,455
3,003,420Electric-Distribution - 0.0%
Unitil Corp. 6,760 335,296Via Renewables, Inc.# 5,470 61,264
396,560Electric-Generation - 0.1%
Ormat Technologies, Inc. 20,686 1,471,395Electric-Integrated - 1.1%
ALLETE, Inc. 23,963 1,615,586Ameresco, Inc., Class A� 14,103 975,223Avista Corp. 31,651 1,324,594Black Hills Corp. 28,780 2,024,097Evoqua Water Technologies Corp.� 52,821 2,055,793MGE Energy, Inc. 16,626 1,339,058NorthWestern Corp. 23,184 1,474,502Otter Tail Corp. 18,781 1,030,514PNM Resources, Inc. 39,079 1,934,411
Copyright © 2021 www.secdatabase.com. All Rights Reserved.Please Consider the Environment Before Printing This Document
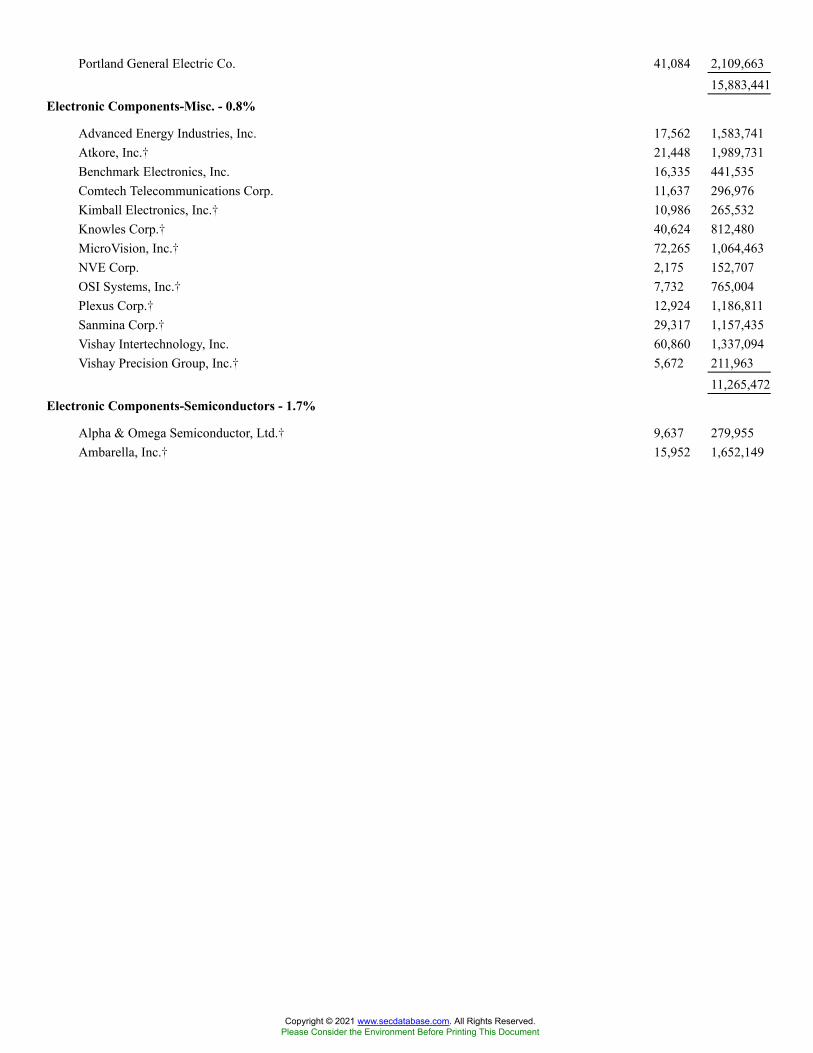
Portland General Electric Co. 41,084 2,109,66315,883,441
Electronic Components-Misc. - 0.8%
Advanced Energy Industries, Inc. 17,562 1,583,741Atkore, Inc.� 21,448 1,989,731Benchmark Electronics, Inc. 16,335 441,535Comtech Telecommunications Corp. 11,637 296,976Kimball Electronics, Inc.� 10,986 265,532Knowles Corp.� 40,624 812,480MicroVision, Inc.� 72,265 1,064,463NVE Corp. 2,175 152,707OSI Systems, Inc.� 7,732 765,004Plexus Corp.� 12,924 1,186,811Sanmina Corp.� 29,317 1,157,435Vishay Intertechnology, Inc. 60,860 1,337,094Vishay Precision Group, Inc.� 5,672 211,963
11,265,472Electronic Components-Semiconductors - 1.7%
Alpha & Omega Semiconductor, Ltd.� 9,637 279,955Ambarella, Inc.� 15,952 1,652,149
Copyright © 2021 www.secdatabase.com. All Rights Reserved.Please Consider the Environment Before Printing This Document

Amkor Technology, Inc. 46,594 1,279,937Atomera, Inc.�# 9,265 228,567AXT, Inc.� 18,222 169,647CEVA, Inc.� 10,280 496,010CTS Corp. 14,570 511,115Diodes, Inc.� 19,898 1,926,723DSP Group, Inc.� 10,294 225,439EMCORE Corp.� 16,668 124,677Impinj, Inc.�# 8,517 496,456Lattice Semiconductor Corp.� 61,943 3,847,899MACOM Technology Solutions Holdings, Inc.� 22,224 1,349,219Ouster, Inc.�# 13,252 111,317Photronics, Inc.� 28,127 423,874Rambus, Inc.� 51,151 1,217,394Semtech Corp.� 29,520 2,064,038Silicon Laboratories, Inc.� 20,270 3,194,957SiTime Corp.� 5,873 1,250,009SMART Global Holdings, Inc.� 6,480 314,021Synaptics, Inc.� 16,106 3,056,597
24,220,000Electronic Connectors - 0.1%
Vicor Corp.� 9,631 1,188,176Electronic Measurement Instruments - 0.3%
Badger Meter, Inc. 13,330 1,427,510FARO Technologies, Inc.� 8,301 572,271Itron, Inc.� 20,647 1,734,554Luna Innovations, Inc.� 13,904 149,746Mesa Laboratories, Inc.# 2,235 596,566Stoneridge, Inc.� 11,906 277,410
4,758,057Electronic Security Devices - 0.0%
Identiv, Inc.� 9,429 167,459Napco Security Technologies, Inc.� 6,616 258,884
426,343Energy-Alternate Sources - 0.6%
Advent Technologies Holdings, Inc.�# 7,792 57,661Aemetis, Inc.�# 10,591 117,772Alto Ingredients, Inc.� 32,638 166,127Array Technologies, Inc.� 58,293 1,111,647Beam Global�# 4,013 124,965Cleanspark, Inc.� 14,940 206,172Eos Energy Enterprises, Inc.�# 8,016 103,567FuelCell Energy, Inc.�# 148,407 926,060FutureFuel Corp. 11,795 94,478Gevo, Inc.� 89,079 554,962Green Plains, Inc.� 19,566 686,767
Copyright © 2021 www.secdatabase.com. All Rights Reserved.Please Consider the Environment Before Printing This Document
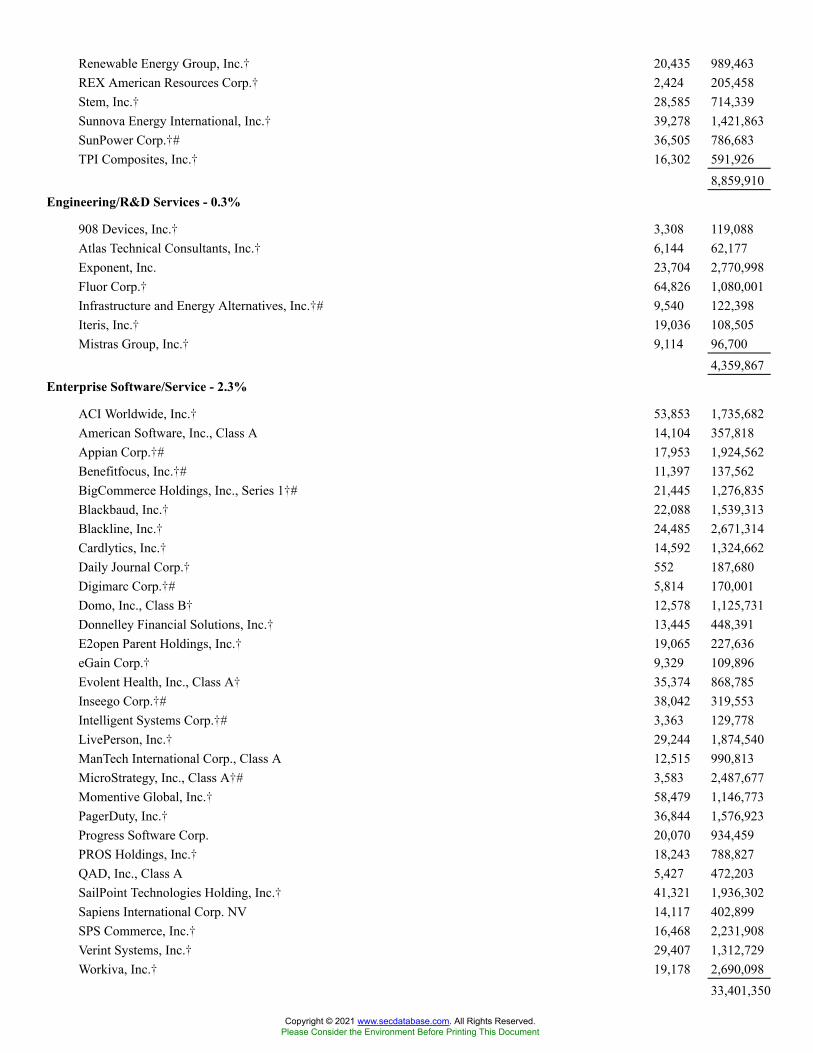
Renewable Energy Group, Inc.� 20,435 989,463REX American Resources Corp.� 2,424 205,458Stem, Inc.� 28,585 714,339Sunnova Energy International, Inc.� 39,278 1,421,863SunPower Corp.�# 36,505 786,683TPI Composites, Inc.� 16,302 591,926
8,859,910Engineering/R&D Services - 0.3%
908 Devices, Inc.� 3,308 119,088Atlas Technical Consultants, Inc.� 6,144 62,177Exponent, Inc. 23,704 2,770,998Fluor Corp.� 64,826 1,080,001Infrastructure and Energy Alternatives, Inc.�# 9,540 122,398Iteris, Inc.� 19,036 108,505Mistras Group, Inc.� 9,114 96,700
4,359,867Enterprise Software/Service - 2.3%
ACI Worldwide, Inc.� 53,853 1,735,682American Software, Inc., Class A 14,104 357,818Appian Corp.�# 17,953 1,924,562Benefitfocus, Inc.�# 11,397 137,562BigCommerce Holdings, Inc., Series 1�# 21,445 1,276,835Blackbaud, Inc.� 22,088 1,539,313Blackline, Inc.� 24,485 2,671,314Cardlytics, Inc.� 14,592 1,324,662Daily Journal Corp.� 552 187,680Digimarc Corp.�# 5,814 170,001Domo, Inc., Class B� 12,578 1,125,731Donnelley Financial Solutions, Inc.� 13,445 448,391E2open Parent Holdings, Inc.� 19,065 227,636eGain Corp.� 9,329 109,896Evolent Health, Inc., Class A� 35,374 868,785Inseego Corp.�# 38,042 319,553Intelligent Systems Corp.�# 3,363 129,778LivePerson, Inc.� 29,244 1,874,540ManTech International Corp., Class A 12,515 990,813MicroStrategy, Inc., Class A�# 3,583 2,487,677Momentive Global, Inc.� 58,479 1,146,773PagerDuty, Inc.� 36,844 1,576,923Progress Software Corp. 20,070 934,459PROS Holdings, Inc.� 18,243 788,827QAD, Inc., Class A 5,427 472,203SailPoint Technologies Holding, Inc.� 41,321 1,936,302Sapiens International Corp. NV 14,117 402,899SPS Commerce, Inc.� 16,468 2,231,908Verint Systems, Inc.� 29,407 1,312,729Workiva, Inc.� 19,178 2,690,098
33,401,350
Copyright © 2021 www.secdatabase.com. All Rights Reserved.Please Consider the Environment Before Printing This Document
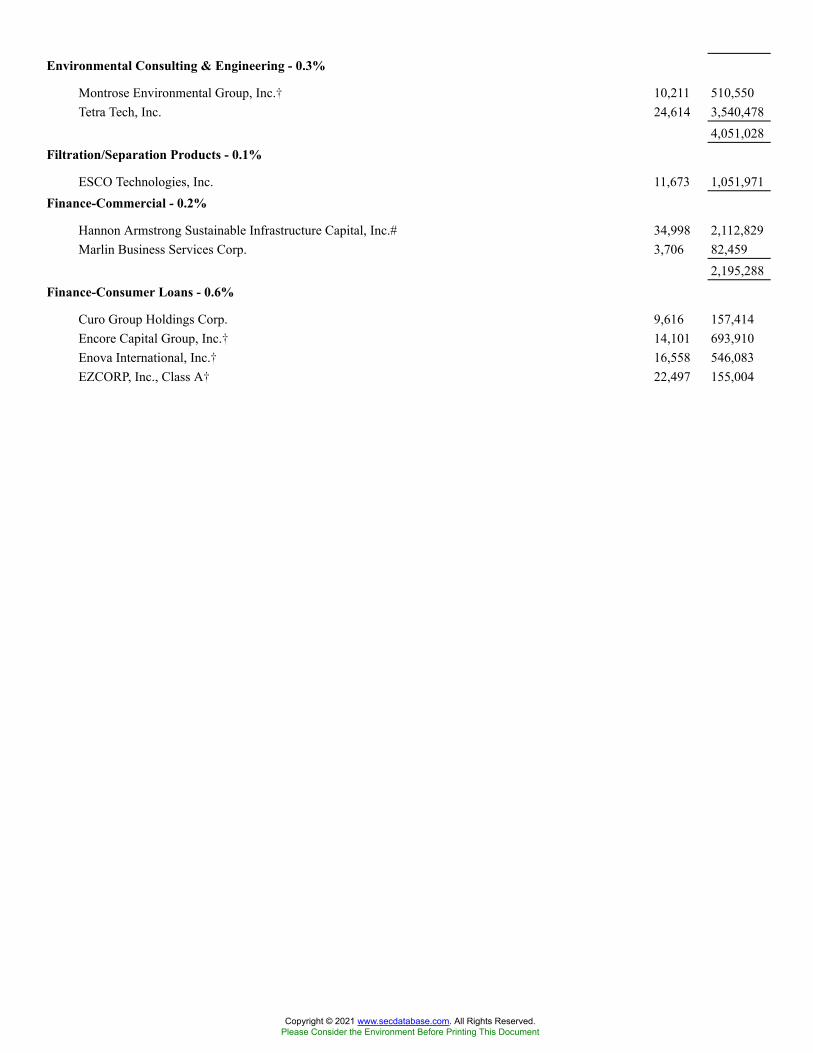
Environmental Consulting & Engineering - 0.3%
Montrose Environmental Group, Inc.� 10,211 510,550Tetra Tech, Inc. 24,614 3,540,478
4,051,028Filtration/Separation Products - 0.1%
ESCO Technologies, Inc. 11,673 1,051,971Finance-Commercial - 0.2%
Hannon Armstrong Sustainable Infrastructure Capital, Inc.# 34,998 2,112,829Marlin Business Services Corp. 3,706 82,459
2,195,288Finance-Consumer Loans - 0.6%
Curo Group Holdings Corp. 9,616 157,414Encore Capital Group, Inc.� 14,101 693,910Enova International, Inc.� 16,558 546,083EZCORP, Inc., Class A� 22,497 155,004
Copyright © 2021 www.secdatabase.com. All Rights Reserved.Please Consider the Environment Before Printing This Document
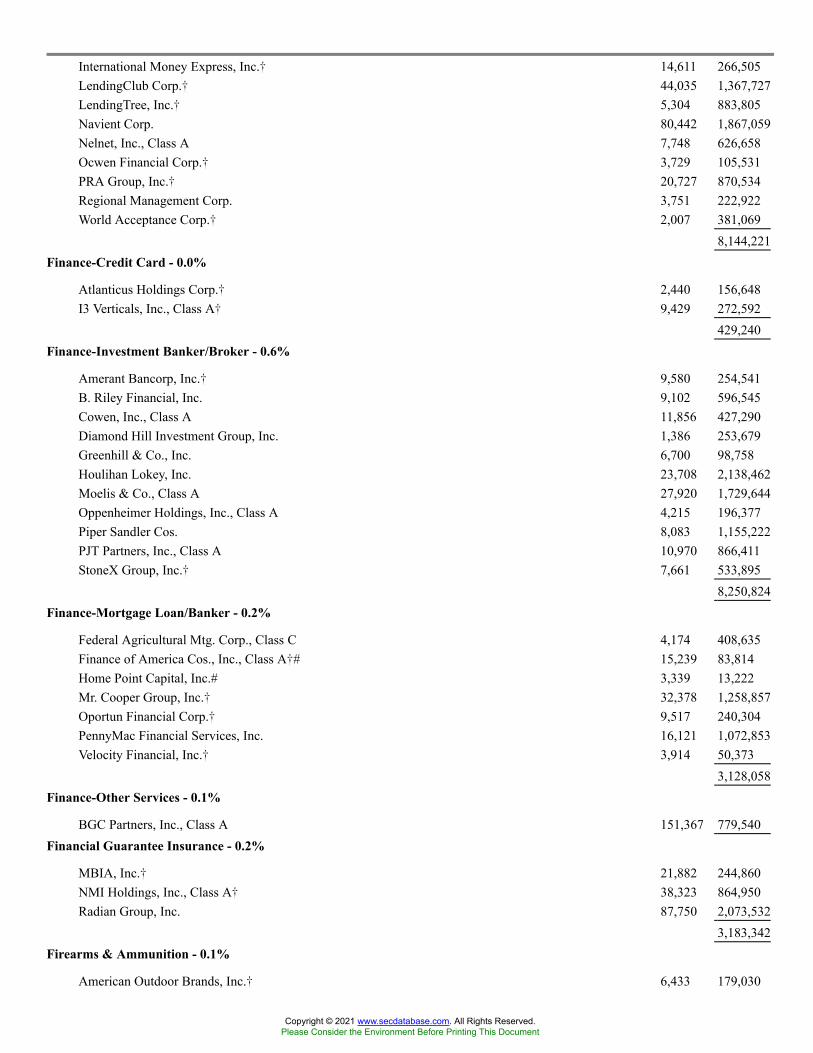
International Money Express, Inc.� 14,611 266,505LendingClub Corp.� 44,035 1,367,727LendingTree, Inc.� 5,304 883,805Navient Corp. 80,442 1,867,059Nelnet, Inc., Class A 7,748 626,658Ocwen Financial Corp.� 3,729 105,531PRA Group, Inc.� 20,727 870,534Regional Management Corp. 3,751 222,922World Acceptance Corp.� 2,007 381,069
8,144,221Finance-Credit Card - 0.0%
Atlanticus Holdings Corp.� 2,440 156,648I3 Verticals, Inc., Class A� 9,429 272,592
429,240Finance-Investment Banker/Broker - 0.6%
Amerant Bancorp, Inc.� 9,580 254,541B. Riley Financial, Inc. 9,102 596,545Cowen, Inc., Class A 11,856 427,290Diamond Hill Investment Group, Inc. 1,386 253,679Greenhill & Co., Inc. 6,700 98,758Houlihan Lokey, Inc. 23,708 2,138,462Moelis & Co., Class A 27,920 1,729,644Oppenheimer Holdings, Inc., Class A 4,215 196,377Piper Sandler Cos. 8,083 1,155,222PJT Partners, Inc., Class A 10,970 866,411StoneX Group, Inc.� 7,661 533,895
8,250,824Finance-Mortgage Loan/Banker - 0.2%
Federal Agricultural Mtg. Corp., Class C 4,174 408,635Finance of America Cos., Inc., Class A�# 15,239 83,814Home Point Capital, Inc.# 3,339 13,222Mr. Cooper Group, Inc.� 32,378 1,258,857Oportun Financial Corp.� 9,517 240,304PennyMac Financial Services, Inc. 16,121 1,072,853Velocity Financial, Inc.� 3,914 50,373
3,128,058Finance-Other Services - 0.1%
BGC Partners, Inc., Class A 151,367 779,540Financial Guarantee Insurance - 0.2%
MBIA, Inc.� 21,882 244,860NMI Holdings, Inc., Class A� 38,323 864,950Radian Group, Inc. 87,750 2,073,532
3,183,342Firearms & Ammunition - 0.1%
American Outdoor Brands, Inc.� 6,433 179,030
Copyright © 2021 www.secdatabase.com. All Rights Reserved.Please Consider the Environment Before Printing This Document
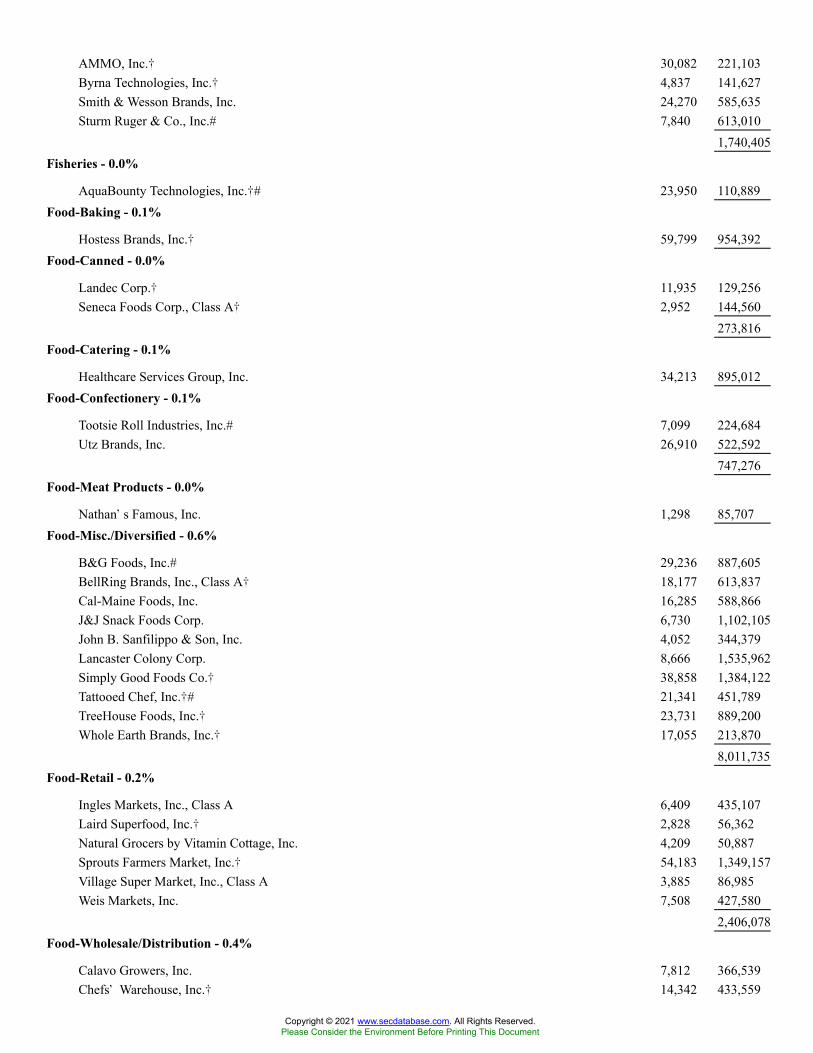
AMMO, Inc.� 30,082 221,103Byrna Technologies, Inc.� 4,837 141,627Smith & Wesson Brands, Inc. 24,270 585,635Sturm Ruger & Co., Inc.# 7,840 613,010
1,740,405Fisheries - 0.0%
AquaBounty Technologies, Inc.�# 23,950 110,889Food-Baking - 0.1%
Hostess Brands, Inc.� 59,799 954,392Food-Canned - 0.0%
Landec Corp.� 11,935 129,256Seneca Foods Corp., Class A� 2,952 144,560
273,816Food-Catering - 0.1%
Healthcare Services Group, Inc. 34,213 895,012Food-Confectionery - 0.1%
Tootsie Roll Industries, Inc.# 7,099 224,684Utz Brands, Inc. 26,910 522,592
747,276Food-Meat Products - 0.0%
Nathan�s Famous, Inc. 1,298 85,707Food-Misc./Diversified - 0.6%
B&G Foods, Inc.# 29,236 887,605BellRing Brands, Inc., Class A� 18,177 613,837Cal-Maine Foods, Inc. 16,285 588,866J&J Snack Foods Corp. 6,730 1,102,105John B. Sanfilippo & Son, Inc. 4,052 344,379Lancaster Colony Corp. 8,666 1,535,962Simply Good Foods Co.� 38,858 1,384,122Tattooed Chef, Inc.�# 21,341 451,789TreeHouse Foods, Inc.� 23,731 889,200Whole Earth Brands, Inc.� 17,055 213,870
8,011,735Food-Retail - 0.2%
Ingles Markets, Inc., Class A 6,409 435,107Laird Superfood, Inc.� 2,828 56,362Natural Grocers by Vitamin Cottage, Inc. 4,209 50,887Sprouts Farmers Market, Inc.� 54,183 1,349,157Village Super Market, Inc., Class A 3,885 86,985Weis Markets, Inc. 7,508 427,580
2,406,078Food-Wholesale/Distribution - 0.4%
Calavo Growers, Inc. 7,812 366,539Chefs� Warehouse, Inc.� 14,342 433,559
Copyright © 2021 www.secdatabase.com. All Rights Reserved.Please Consider the Environment Before Printing This Document
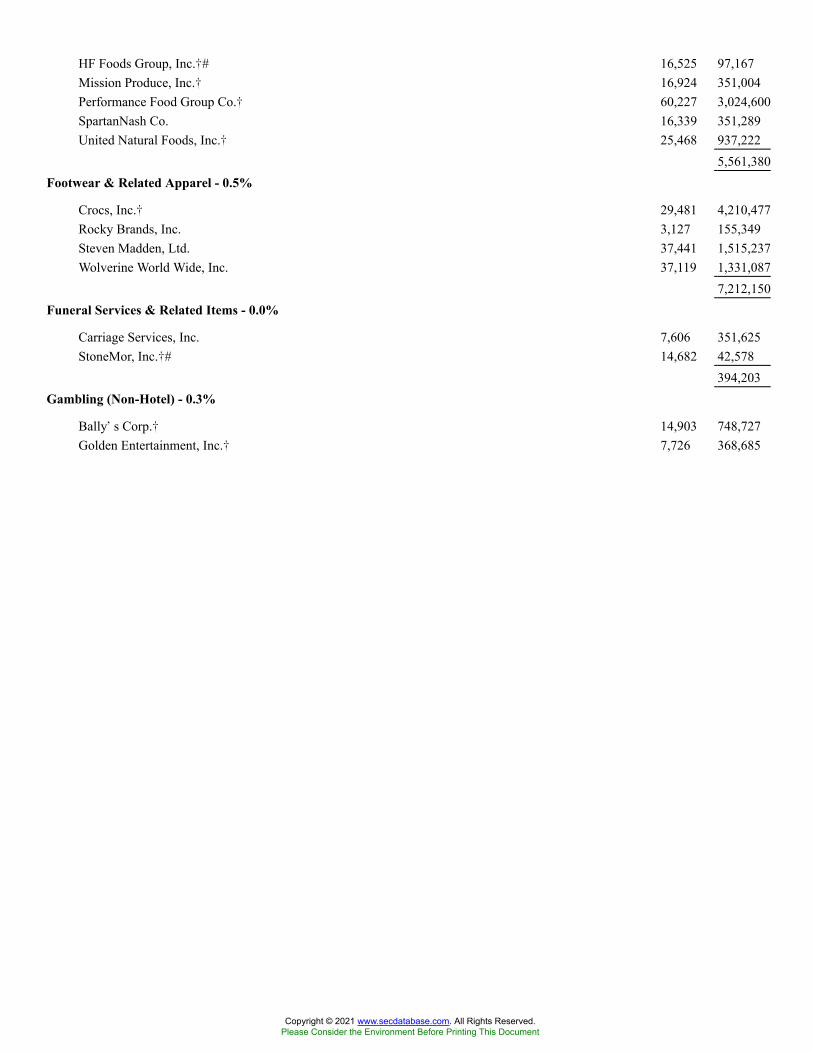
HF Foods Group, Inc.�# 16,525 97,167Mission Produce, Inc.� 16,924 351,004Performance Food Group Co.� 60,227 3,024,600SpartanNash Co. 16,339 351,289United Natural Foods, Inc.� 25,468 937,222
5,561,380Footwear & Related Apparel - 0.5%
Crocs, Inc.� 29,481 4,210,477Rocky Brands, Inc. 3,127 155,349Steven Madden, Ltd. 37,441 1,515,237Wolverine World Wide, Inc. 37,119 1,331,087
7,212,150Funeral Services & Related Items - 0.0%
Carriage Services, Inc. 7,606 351,625StoneMor, Inc.�# 14,682 42,578
394,203Gambling (Non-Hotel) - 0.3%
Bally�s Corp.� 14,903 748,727Golden Entertainment, Inc.� 7,726 368,685
Copyright © 2021 www.secdatabase.com. All Rights Reserved.Please Consider the Environment Before Printing This Document

International Game Technology PLC�# 45,637 980,739Monarch Casino & Resort, Inc.� 5,928 375,657Red Rock Resorts, Inc., Class A� 28,139 1,317,187Rush Street Interactive, Inc.� 23,882 355,364
4,146,359Gas-Distribution - 0.7%
Chesapeake Utilities Corp. 7,867 1,028,217New Jersey Resources Corp. 44,103 1,646,806Northwest Natural Holding Co. 13,933 716,853ONE Gas, Inc. 24,073 1,728,923South Jersey Industries, Inc.# 47,021 1,166,591Southwest Gas Holdings, Inc. 26,491 1,862,582Spire, Inc. 23,143 1,543,638
9,693,610Gas-Transportation - 0.1%
Brookfield Infrastructure Corp., Class A# 16,709 1,062,692Gold Mining - 0.1%
Novagold Resources, Inc.� 108,262 782,734Perpetua Resources Corp.� 12,231 62,011
844,745Golf - 0.2%
Acushnet Holdings Corp. 15,648 781,774Callaway Golf Co.� 52,824 1,482,242Drive Shack, Inc.�# 37,700 102,921
2,366,937Hazardous Waste Disposal - 0.1%
Centrus Energy Corp., Class A�# 4,313 124,689Heritage-Crystal Clean, Inc.� 7,131 210,650Sharps Compliance Corp.� 6,567 59,037US Ecology, Inc.� 14,376 515,380
909,756Health Care Cost Containment - 0.2%
CorVel Corp.� 4,026 663,525HealthEquity, Inc.� 37,335 2,395,787
3,059,312Healthcare Safety Devices - 0.0%
Retractable Technologies, Inc.�# 7,911 101,894Home Furnishings - 0.3%
Casper Sleep, Inc.�# 13,251 65,990Ethan Allen Interiors, Inc. 10,283 246,998Flexsteel Industries, Inc. 3,031 105,842Herman Miller, Inc. 33,943 1,426,624Hooker Furniture Corp. 5,351 166,737Lovesac Co.� 5,829 329,688
Copyright © 2021 www.secdatabase.com. All Rights Reserved.Please Consider the Environment Before Printing This Document
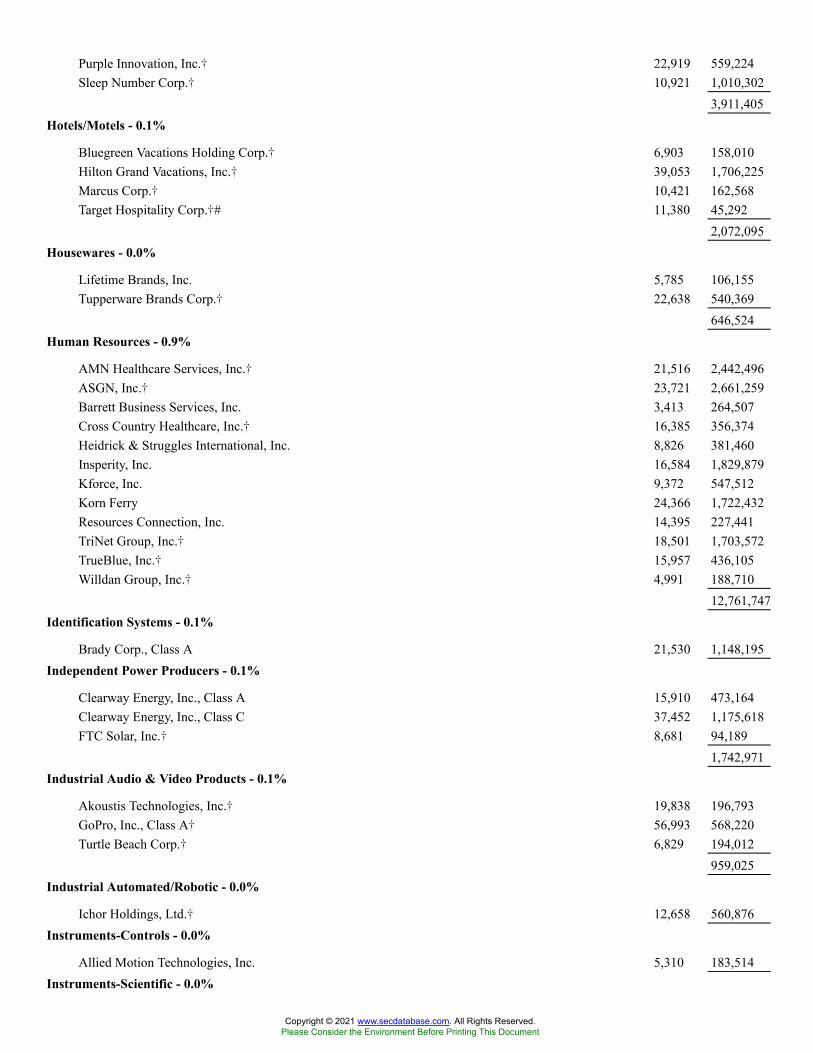
Purple Innovation, Inc.� 22,919 559,224Sleep Number Corp.� 10,921 1,010,302
3,911,405Hotels/Motels - 0.1%
Bluegreen Vacations Holding Corp.� 6,903 158,010Hilton Grand Vacations, Inc.� 39,053 1,706,225Marcus Corp.� 10,421 162,568Target Hospitality Corp.�# 11,380 45,292
2,072,095Housewares - 0.0%
Lifetime Brands, Inc. 5,785 106,155Tupperware Brands Corp.� 22,638 540,369
646,524Human Resources - 0.9%
AMN Healthcare Services, Inc.� 21,516 2,442,496ASGN, Inc.� 23,721 2,661,259Barrett Business Services, Inc. 3,413 264,507Cross Country Healthcare, Inc.� 16,385 356,374Heidrick & Struggles International, Inc. 8,826 381,460Insperity, Inc. 16,584 1,829,879Kforce, Inc. 9,372 547,512Korn Ferry 24,366 1,722,432Resources Connection, Inc. 14,395 227,441TriNet Group, Inc.� 18,501 1,703,572TrueBlue, Inc.� 15,957 436,105Willdan Group, Inc.� 4,991 188,710
12,761,747Identification Systems - 0.1%
Brady Corp., Class A 21,530 1,148,195Independent Power Producers - 0.1%
Clearway Energy, Inc., Class A 15,910 473,164Clearway Energy, Inc., Class C 37,452 1,175,618FTC Solar, Inc.� 8,681 94,189
1,742,971Industrial Audio & Video Products - 0.1%
Akoustis Technologies, Inc.� 19,838 196,793GoPro, Inc., Class A� 56,993 568,220Turtle Beach Corp.� 6,829 194,012
959,025Industrial Automated/Robotic - 0.0%
Ichor Holdings, Ltd.� 12,658 560,876Instruments-Controls - 0.0%
Allied Motion Technologies, Inc. 5,310 183,514Instruments-Scientific - 0.0%
Copyright © 2021 www.secdatabase.com. All Rights Reserved.Please Consider the Environment Before Printing This Document

Fluidigm Corp.� 34,219 246,719Insurance Brokers - 0.2%
BRP Group, Inc., Class A� 21,065 793,097Crawford & Co., Class A 7,430 74,077eHealth, Inc.� 11,143 430,677Goosehead Insurance, Inc., Class A 8,082 1,186,276Selectquote, Inc.� 61,168 584,155Trean Insurance Group, Inc.� 8,052 82,211
3,150,493Insurance-Life/Health - 0.4%
American Equity Investment Life Holding Co. 38,966 1,234,833American National Group, Inc. 3,402 654,885CNO Financial Group, Inc. 59,937 1,466,059Independence Holding Co. 1,954 97,661National Western Life Group, Inc., Class A 1,171 259,564Trupanion, Inc.� 17,428 1,596,056
5,309,058
Copyright © 2021 www.secdatabase.com. All Rights Reserved.Please Consider the Environment Before Printing This Document

Insurance-Multi-line - 0.1%
Citizens, Inc.�# 22,780 135,997Genworth Financial, Inc., Class A� 231,420 867,825
1,003,822Insurance-Property/Casualty - 1.0%
Ambac Financial Group, Inc.� 20,767 292,607AMERISAFE, Inc. 8,748 503,447Donegal Group, Inc., Class A 6,647 100,104Employers Holdings, Inc. 13,001 535,251Enstar Group, Ltd.� 6,279 1,448,377HCI Group, Inc.# 2,585 288,641Heritage Insurance Holdings, Inc. 11,789 82,523Horace Mann Educators Corp. 19,046 780,886Investors Title Co. 593 113,773James River Group Holdings, Ltd. 16,337 601,038Kinsale Capital Group, Inc. 9,816 1,785,040MetroMile, Inc.�# 16,757 67,028NI Holdings, Inc.� 3,913 76,382Palomar Holdings, Inc.� 11,216 1,007,197ProAssurance Corp. 24,531 625,540RLI Corp. 18,266 1,995,195Safety Insurance Group, Inc. 6,607 537,215Selective Insurance Group, Inc. 27,124 2,266,753State Auto Financial Corp. 8,059 407,624Stewart Information Services Corp. 12,181 766,794Tiptree, Inc. 10,363 104,770United Fire Group, Inc. 9,597 249,138United Insurance Holdings Corp. 9,277 35,345Universal Insurance Holdings, Inc. 12,373 176,192
14,846,860Insurance-Reinsurance - 0.3%
Argo Group International Holdings, Ltd. 14,470 765,463Essent Group, Ltd. 50,536 2,379,235Greenlight Capital Re, Ltd., Class A� 12,444 104,903Maiden Holdings, Ltd.� 31,725 99,299SiriusPoint, Ltd.� 40,406 396,383
3,745,283Internet Application Software - 0.0%
Tucows, Inc., Class A� 4,293 318,154VirnetX Holding Corp.�# 28,948 129,977
448,131Internet Connectivity Services - 0.1%
Cogent Communications Holdings, Inc. 19,466 1,412,842Internet Content-Entertainment - 0.0%
Limelight Networks, Inc.�# 57,030 153,981
Copyright © 2021 www.secdatabase.com. All Rights Reserved.Please Consider the Environment Before Printing This Document

Internet Content-Information/News - 0.3%
FuboTV, Inc.�# 60,016 1,749,467HealthStream, Inc.� 11,541 350,731LiveXLive Media, Inc.� 24,168 82,896TechTarget, Inc.� 11,646 985,019Yelp, Inc.� 33,079 1,273,872
4,441,985Internet Financial Services - 0.1%
Open Lending Corp., Class A� 47,589 1,759,365Internet Gambling - 0.1%
Esports Technologies, Inc.� 1,105 35,901GAN, Ltd.�# 18,309 313,084Golden Nugget Online Gaming, Inc.� 14,565 314,604NeoGames SA� 2,545 104,880
768,469Internet Security - 0.1%
Mimecast, Ltd.� 27,222 1,900,368Zix Corp.� 24,418 188,995
2,089,363Investment Companies - 0.0%
Altus Midstream Co., Class A# 1,488 96,988Investment Management/Advisor Services - 0.8%
Artisan Partners Asset Management, Inc., Class A 26,717 1,388,215AssetMark Financial Holdings, Inc.� 8,184 219,904Associated Capital Group, Inc., Class A 784 28,906Blucora, Inc.� 22,186 364,072BrightSphere Investment Group, Inc. 26,470 719,719Cohen & Steers, Inc. 11,351 995,596Columbia Financial, Inc.� 18,324 330,382Federated Hermes, Inc. 43,211 1,461,828Focus Financial Partners, Inc., Class A� 23,585 1,223,590GAMCO Investors, Inc., Class A 2,410 65,817GCM Grosvenor, Inc., Class A 14,931 166,033Hamilton Lane, Inc., Class A 15,528 1,336,495Pzena Investment Management, Inc., Class A 7,708 84,094Sculptor Capital Management, Inc. 9,839 278,444StepStone Group, Inc., Class A 17,040 815,705Virtus Investment Partners, Inc. 3,331 1,041,604WisdomTree Investments, Inc. 63,366 399,840
10,920,244Lasers-System/Components - 0.2%
II-VI, Inc.�# 47,740 3,006,665Leisure Products - 0.0%
Escalade, Inc. 4,665 107,762
Copyright © 2021 www.secdatabase.com. All Rights Reserved.Please Consider the Environment Before Printing This Document

Johnson Outdoors, Inc., Class A 2,389 274,233381,995
Linen Supply & Related Items - 0.1%
UniFirst Corp. 6,884 1,576,918Machine Tools & Related Products - 0.1%
Kennametal, Inc. 38,157 1,418,677Luxfer Holdings PLC 12,979 277,102
1,695,779Machinery-Construction & Mining - 0.2%
Astec Industries, Inc. 10,349 632,738Hyster-Yale Materials Handling, Inc. 4,560 267,261Manitowoc Co, Inc.� 15,668 379,949Terex Corp. 31,233 1,594,445
2,874,393Machinery-Electrical - 0.3%
Argan, Inc. 6,808 315,210Babcock & Wilcox Enterprises, Inc.� 25,332 184,924
Copyright © 2021 www.secdatabase.com. All Rights Reserved.Please Consider the Environment Before Printing This Document
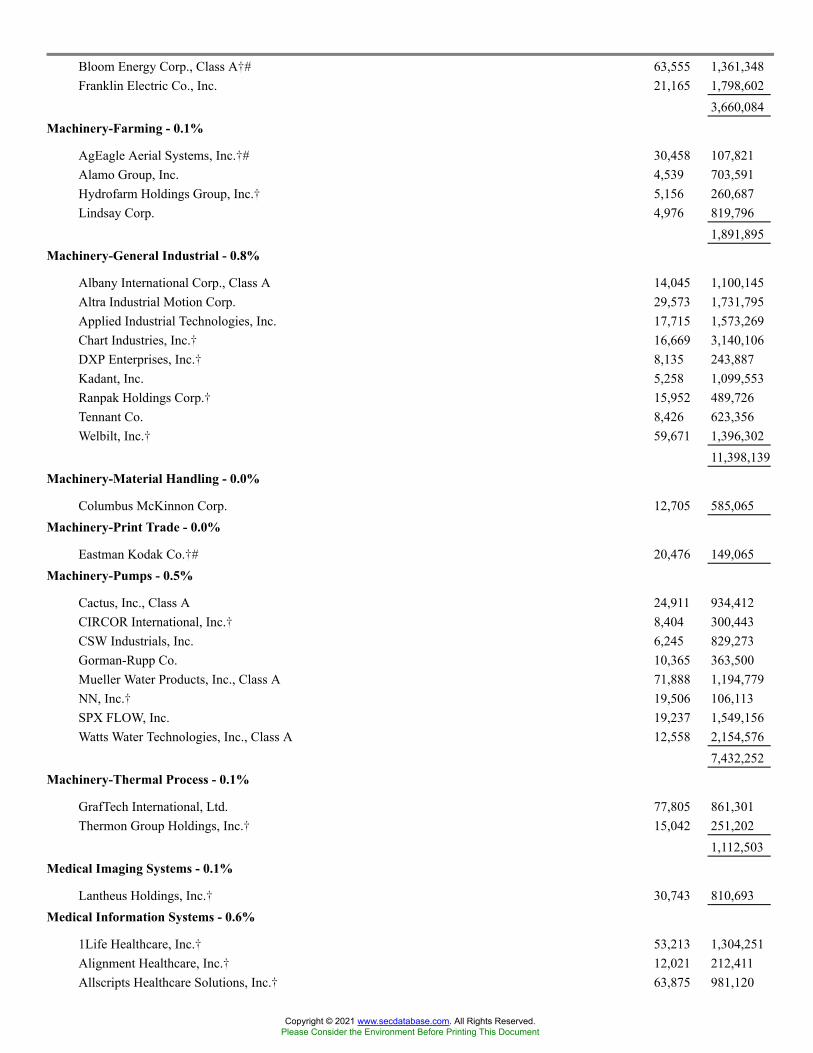
Bloom Energy Corp., Class A�# 63,555 1,361,348Franklin Electric Co., Inc. 21,165 1,798,602
3,660,084Machinery-Farming - 0.1%
AgEagle Aerial Systems, Inc.�# 30,458 107,821Alamo Group, Inc. 4,539 703,591Hydrofarm Holdings Group, Inc.� 5,156 260,687Lindsay Corp. 4,976 819,796
1,891,895Machinery-General Industrial - 0.8%
Albany International Corp., Class A 14,045 1,100,145Altra Industrial Motion Corp. 29,573 1,731,795Applied Industrial Technologies, Inc. 17,715 1,573,269Chart Industries, Inc.� 16,669 3,140,106DXP Enterprises, Inc.� 8,135 243,887Kadant, Inc. 5,258 1,099,553Ranpak Holdings Corp.� 15,952 489,726Tennant Co. 8,426 623,356Welbilt, Inc.� 59,671 1,396,302
11,398,139Machinery-Material Handling - 0.0%
Columbus McKinnon Corp. 12,705 585,065Machinery-Print Trade - 0.0%
Eastman Kodak Co.�# 20,476 149,065Machinery-Pumps - 0.5%
Cactus, Inc., Class A 24,911 934,412CIRCOR International, Inc.� 8,404 300,443CSW Industrials, Inc. 6,245 829,273Gorman-Rupp Co. 10,365 363,500Mueller Water Products, Inc., Class A 71,888 1,194,779NN, Inc.� 19,506 106,113SPX FLOW, Inc. 19,237 1,549,156Watts Water Technologies, Inc., Class A 12,558 2,154,576
7,432,252Machinery-Thermal Process - 0.1%
GrafTech International, Ltd. 77,805 861,301Thermon Group Holdings, Inc.� 15,042 251,202
1,112,503Medical Imaging Systems - 0.1%
Lantheus Holdings, Inc.� 30,743 810,693Medical Information Systems - 0.6%
1Life Healthcare, Inc.� 53,213 1,304,251Alignment Healthcare, Inc.� 12,021 212,411Allscripts Healthcare Solutions, Inc.� 63,875 981,120
Copyright © 2021 www.secdatabase.com. All Rights Reserved.Please Consider the Environment Before Printing This Document
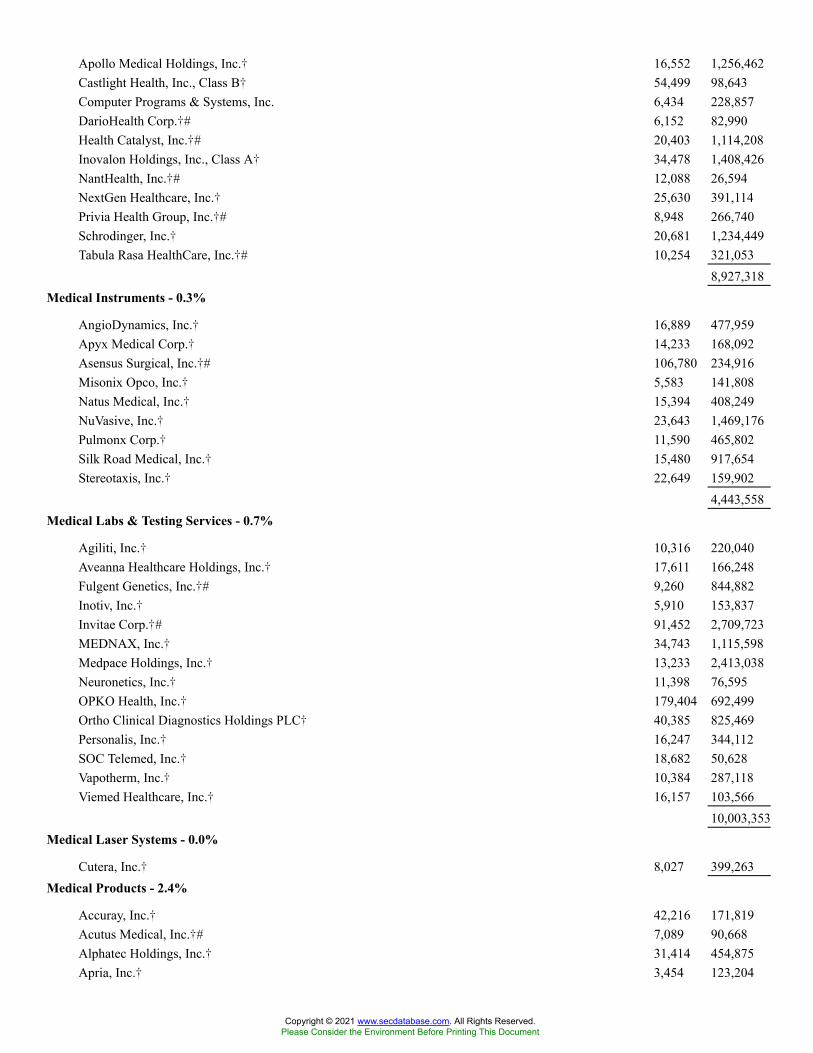
Apollo Medical Holdings, Inc.� 16,552 1,256,462Castlight Health, Inc., Class B� 54,499 98,643Computer Programs & Systems, Inc. 6,434 228,857DarioHealth Corp.�# 6,152 82,990Health Catalyst, Inc.�# 20,403 1,114,208Inovalon Holdings, Inc., Class A� 34,478 1,408,426NantHealth, Inc.�# 12,088 26,594NextGen Healthcare, Inc.� 25,630 391,114Privia Health Group, Inc.�# 8,948 266,740Schrodinger, Inc.� 20,681 1,234,449Tabula Rasa HealthCare, Inc.�# 10,254 321,053
8,927,318Medical Instruments - 0.3%
AngioDynamics, Inc.� 16,889 477,959Apyx Medical Corp.� 14,233 168,092Asensus Surgical, Inc.�# 106,780 234,916Misonix Opco, Inc.� 5,583 141,808Natus Medical, Inc.� 15,394 408,249NuVasive, Inc.� 23,643 1,469,176Pulmonx Corp.� 11,590 465,802Silk Road Medical, Inc.� 15,480 917,654Stereotaxis, Inc.� 22,649 159,902
4,443,558Medical Labs & Testing Services - 0.7%
Agiliti, Inc.� 10,316 220,040Aveanna Healthcare Holdings, Inc.� 17,611 166,248Fulgent Genetics, Inc.�# 9,260 844,882Inotiv, Inc.� 5,910 153,837Invitae Corp.�# 91,452 2,709,723MEDNAX, Inc.� 34,743 1,115,598Medpace Holdings, Inc.� 13,233 2,413,038Neuronetics, Inc.� 11,398 76,595OPKO Health, Inc.� 179,404 692,499Ortho Clinical Diagnostics Holdings PLC� 40,385 825,469Personalis, Inc.� 16,247 344,112SOC Telemed, Inc.� 18,682 50,628Vapotherm, Inc.� 10,384 287,118Viemed Healthcare, Inc.� 16,157 103,566
10,003,353Medical Laser Systems - 0.0%
Cutera, Inc.� 8,027 399,263Medical Products - 2.4%
Accuray, Inc.� 42,216 171,819Acutus Medical, Inc.�# 7,089 90,668Alphatec Holdings, Inc.� 31,414 454,875Apria, Inc.� 3,454 123,204
Copyright © 2021 www.secdatabase.com. All Rights Reserved.Please Consider the Environment Before Printing This Document
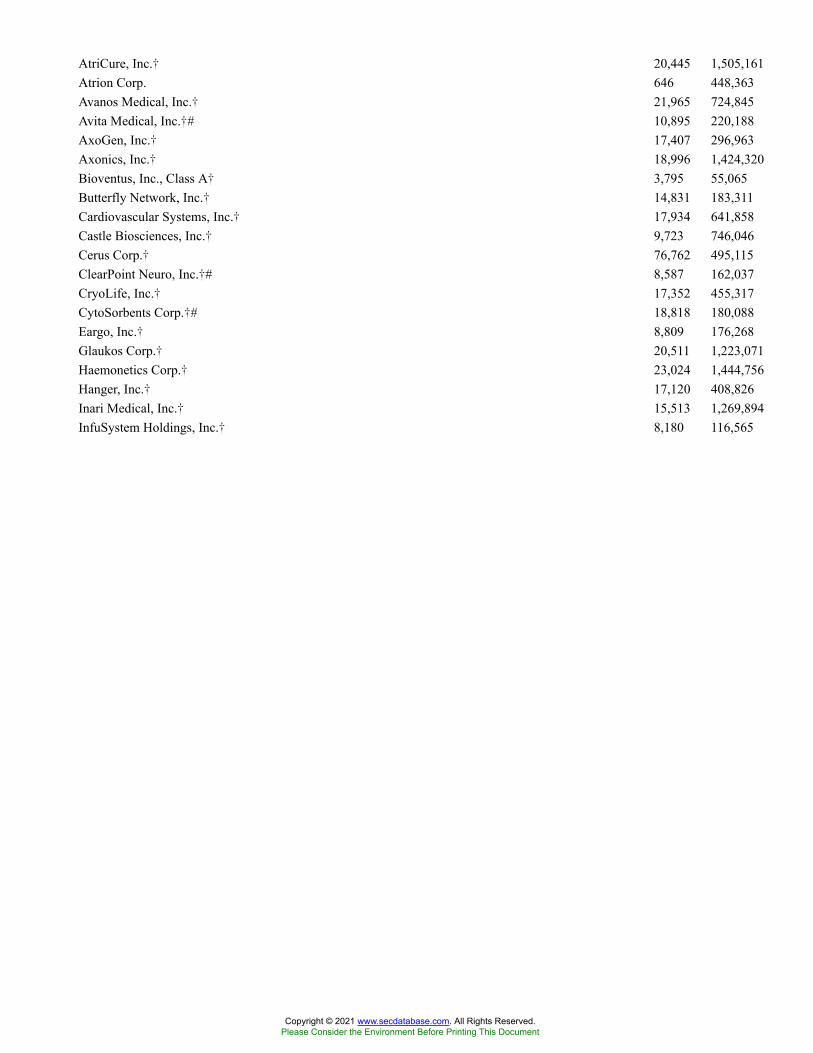
AtriCure, Inc.� 20,445 1,505,161Atrion Corp. 646 448,363Avanos Medical, Inc.� 21,965 724,845Avita Medical, Inc.�# 10,895 220,188AxoGen, Inc.� 17,407 296,963Axonics, Inc.� 18,996 1,424,320Bioventus, Inc., Class A� 3,795 55,065Butterfly Network, Inc.� 14,831 183,311Cardiovascular Systems, Inc.� 17,934 641,858Castle Biosciences, Inc.� 9,723 746,046Cerus Corp.� 76,762 495,115ClearPoint Neuro, Inc.�# 8,587 162,037CryoLife, Inc.� 17,352 455,317CytoSorbents Corp.�# 18,818 180,088Eargo, Inc.� 8,809 176,268Glaukos Corp.� 20,511 1,223,071Haemonetics Corp.� 23,024 1,444,756Hanger, Inc.� 17,120 408,826Inari Medical, Inc.� 15,513 1,269,894InfuSystem Holdings, Inc.� 8,180 116,565
Copyright © 2021 www.secdatabase.com. All Rights Reserved.Please Consider the Environment Before Printing This Document
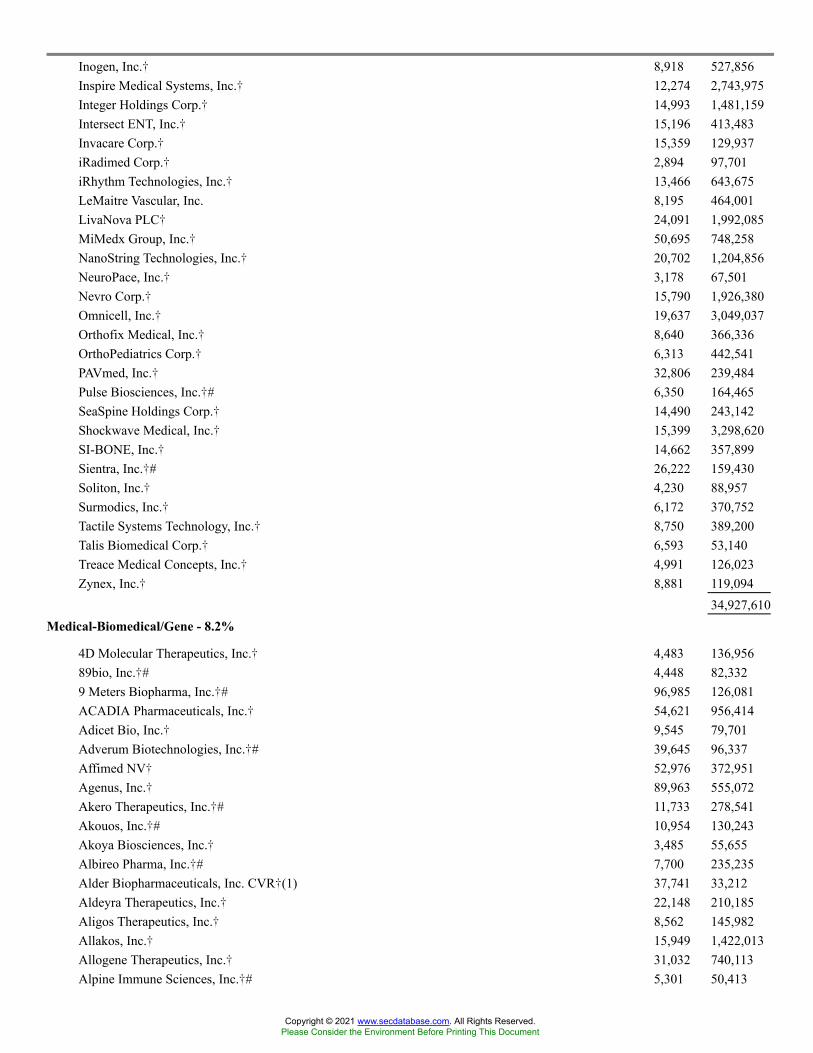
Inogen, Inc.� 8,918 527,856Inspire Medical Systems, Inc.� 12,274 2,743,975Integer Holdings Corp.� 14,993 1,481,159Intersect ENT, Inc.� 15,196 413,483Invacare Corp.� 15,359 129,937iRadimed Corp.� 2,894 97,701iRhythm Technologies, Inc.� 13,466 643,675LeMaitre Vascular, Inc. 8,195 464,001LivaNova PLC� 24,091 1,992,085MiMedx Group, Inc.� 50,695 748,258NanoString Technologies, Inc.� 20,702 1,204,856NeuroPace, Inc.� 3,178 67,501Nevro Corp.� 15,790 1,926,380Omnicell, Inc.� 19,637 3,049,037Orthofix Medical, Inc.� 8,640 366,336OrthoPediatrics Corp.� 6,313 442,541PAVmed, Inc.� 32,806 239,484Pulse Biosciences, Inc.�# 6,350 164,465SeaSpine Holdings Corp.� 14,490 243,142Shockwave Medical, Inc.� 15,399 3,298,620SI-BONE, Inc.� 14,662 357,899Sientra, Inc.�# 26,222 159,430Soliton, Inc.� 4,230 88,957Surmodics, Inc.� 6,172 370,752Tactile Systems Technology, Inc.� 8,750 389,200Talis Biomedical Corp.� 6,593 53,140Treace Medical Concepts, Inc.� 4,991 126,023Zynex, Inc.� 8,881 119,094
34,927,610Medical-Biomedical/Gene - 8.2%
4D Molecular Therapeutics, Inc.� 4,483 136,95689bio, Inc.�# 4,448 82,3329 Meters Biopharma, Inc.�# 96,985 126,081ACADIA Pharmaceuticals, Inc.� 54,621 956,414Adicet Bio, Inc.� 9,545 79,701Adverum Biotechnologies, Inc.�# 39,645 96,337Affimed NV� 52,976 372,951Agenus, Inc.� 89,963 555,072Akero Therapeutics, Inc.�# 11,733 278,541Akouos, Inc.�# 10,954 130,243Akoya Biosciences, Inc.� 3,485 55,655Albireo Pharma, Inc.�# 7,700 235,235Alder Biopharmaceuticals, Inc. CVR�(1) 37,741 33,212Aldeyra Therapeutics, Inc.� 22,148 210,185Aligos Therapeutics, Inc.� 8,562 145,982Allakos, Inc.� 15,949 1,422,013Allogene Therapeutics, Inc.� 31,032 740,113Alpine Immune Sciences, Inc.�# 5,301 50,413
Copyright © 2021 www.secdatabase.com. All Rights Reserved.Please Consider the Environment Before Printing This Document
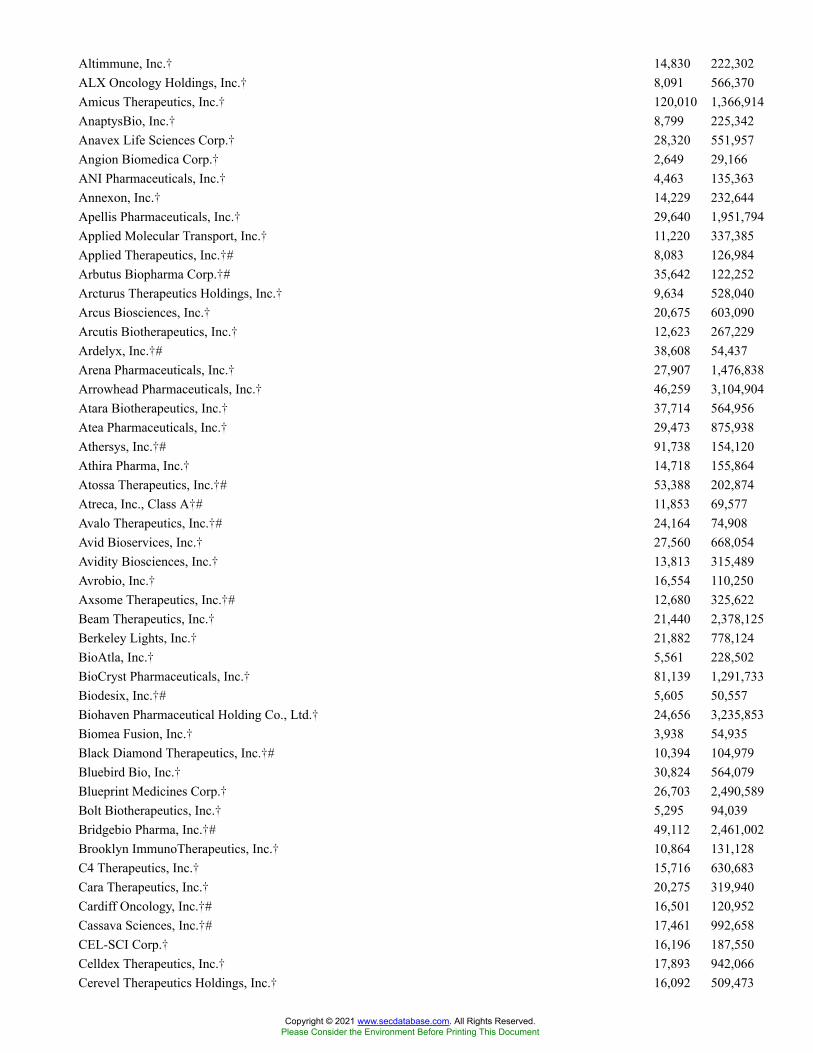
Altimmune, Inc.� 14,830 222,302ALX Oncology Holdings, Inc.� 8,091 566,370Amicus Therapeutics, Inc.� 120,010 1,366,914AnaptysBio, Inc.� 8,799 225,342Anavex Life Sciences Corp.� 28,320 551,957Angion Biomedica Corp.� 2,649 29,166ANI Pharmaceuticals, Inc.� 4,463 135,363Annexon, Inc.� 14,229 232,644Apellis Pharmaceuticals, Inc.� 29,640 1,951,794Applied Molecular Transport, Inc.� 11,220 337,385Applied Therapeutics, Inc.�# 8,083 126,984Arbutus Biopharma Corp.�# 35,642 122,252Arcturus Therapeutics Holdings, Inc.� 9,634 528,040Arcus Biosciences, Inc.� 20,675 603,090Arcutis Biotherapeutics, Inc.� 12,623 267,229Ardelyx, Inc.�# 38,608 54,437Arena Pharmaceuticals, Inc.� 27,907 1,476,838Arrowhead Pharmaceuticals, Inc.� 46,259 3,104,904Atara Biotherapeutics, Inc.� 37,714 564,956Atea Pharmaceuticals, Inc.� 29,473 875,938Athersys, Inc.�# 91,738 154,120Athira Pharma, Inc.� 14,718 155,864Atossa Therapeutics, Inc.�# 53,388 202,874Atreca, Inc., Class A�# 11,853 69,577Avalo Therapeutics, Inc.�# 24,164 74,908Avid Bioservices, Inc.� 27,560 668,054Avidity Biosciences, Inc.� 13,813 315,489Avrobio, Inc.� 16,554 110,250Axsome Therapeutics, Inc.�# 12,680 325,622Beam Therapeutics, Inc.� 21,440 2,378,125Berkeley Lights, Inc.� 21,882 778,124BioAtla, Inc.� 5,561 228,502BioCryst Pharmaceuticals, Inc.� 81,139 1,291,733Biodesix, Inc.�# 5,605 50,557Biohaven Pharmaceutical Holding Co., Ltd.� 24,656 3,235,853Biomea Fusion, Inc.� 3,938 54,935Black Diamond Therapeutics, Inc.�# 10,394 104,979Bluebird Bio, Inc.� 30,824 564,079Blueprint Medicines Corp.� 26,703 2,490,589Bolt Biotherapeutics, Inc.� 5,295 94,039Bridgebio Pharma, Inc.�# 49,112 2,461,002Brooklyn ImmunoTherapeutics, Inc.� 10,864 131,128C4 Therapeutics, Inc.� 15,716 630,683Cara Therapeutics, Inc.� 20,275 319,940Cardiff Oncology, Inc.�# 16,501 120,952Cassava Sciences, Inc.�# 17,461 992,658CEL-SCI Corp.� 16,196 187,550Celldex Therapeutics, Inc.� 17,893 942,066Cerevel Therapeutics Holdings, Inc.� 16,092 509,473
Copyright © 2021 www.secdatabase.com. All Rights Reserved.Please Consider the Environment Before Printing This Document

ChemoCentryx, Inc.� 24,640 389,558Chinook Therapeutics, Inc.� 14,352 194,613ChromaDex Corp.�# 21,388 182,440Clene, Inc.�# 10,442 83,536Codiak Biosciences, Inc.�# 7,166 123,255Cogent Biosciences, Inc.�# 16,956 140,396Cortexyme, Inc.� 9,104 876,715Crinetics Pharmaceuticals, Inc.�# 16,646 392,346Cue Biopharma, Inc.� 13,589 162,932Cullinan Oncology, Inc.� 6,034 170,279Curis, Inc.� 39,523 349,779Cymabay Therapeutics, Inc.�# 31,630 125,255CytomX Therapeutics, Inc.� 29,598 151,542Deciphera Pharmaceuticals, Inc.� 17,960 565,740Denali Therapeutics, Inc.� 41,520 2,208,864Design Therapeutics, Inc.�# 6,150 96,678Dicerna Pharmaceuticals, Inc.� 31,422 646,665Dynavax Technologies Corp.�# 49,200 957,432Dyne Therapeutics, Inc.�# 13,705 232,026Edgewise Therapeutics, Inc.� 5,631 89,195
Copyright © 2021 www.secdatabase.com. All Rights Reserved.Please Consider the Environment Before Printing This Document

Editas Medicine, Inc.� 31,210 1,984,644Eiger BioPharmaceuticals, Inc.�# 14,610 118,925Emergent BioSolutions, Inc.� 22,358 1,410,343Epizyme, Inc.�# 40,974 211,426Esperion Therapeutics, Inc.� 11,980 155,980Evelo Biosciences, Inc.�# 13,860 157,588Evolus, Inc.� 14,720 156,032Exagen, Inc.� 4,944 69,710EyePoint Pharmaceuticals, Inc.� 9,642 105,483Fate Therapeutics, Inc.� 36,591 2,680,291FibroGen, Inc.� 39,297 457,024Finch Therapeutics Group, Inc.� 3,454 48,874Forma Therapeutics Holdings, Inc.�# 14,674 352,616Forte Biosciences, Inc.�# 5,148 151,454Frequency Therapeutics, Inc.�# 14,599 112,704Gemini Therapeutics, Inc.�# 9,997 49,185Generation Bio Co.� 19,996 499,900Geron Corp.�# 137,607 199,530Global Blood Therapeutics, Inc.� 27,313 783,610Gossamer Bio, Inc.�# 28,375 282,048Greenwich Lifesciences, Inc.�# 1,842 73,717GT Biopharma, Inc.� 10,883 96,750Halozyme Therapeutics, Inc.� 64,316 2,700,629Harvard Bioscience, Inc.� 17,574 145,161Homology Medicines, Inc.� 19,143 137,638Humanigen, Inc.�# 20,468 339,359iBio, Inc.�# 98,623 125,251IGM Biosciences, Inc.� 3,680 262,053Ikena Oncology, Inc.�# 4,138 53,256Immunic, Inc.� 7,078 69,718ImmunityBio, Inc.� 30,521 347,329ImmunoGen, Inc.� 89,168 539,466Immunovant, Inc.� 17,120 148,259Impel Neuropharma, Inc.�# 2,456 46,639Infinity Pharmaceuticals, Inc.�# 39,946 141,409Inhibrx, Inc.� 12,739 363,316Innoviva, Inc.� 28,878 440,678Inovio Pharmaceuticals, Inc.� 94,357 815,244Inozyme Pharma, Inc.�# 6,566 101,248Insmed, Inc.� 47,122 1,321,301Instil Bio, Inc.� 7,954 149,933Intercept Pharmaceuticals, Inc.�# 12,791 190,714Intra-Cellular Therapies, Inc.� 32,253 1,070,800iTeos Therapeutics, Inc.� 9,217 261,302IVERIC bio, Inc.� 41,334 436,900Kadmon Holdings, Inc.� 79,101 433,473Kaleido Biosciences, Inc.� 8,840 54,278Karuna Therapeutics, Inc.� 10,132 1,204,695Karyopharm Therapeutics, Inc.�# 32,856 190,565
Copyright © 2021 www.secdatabase.com. All Rights Reserved.Please Consider the Environment Before Printing This Document
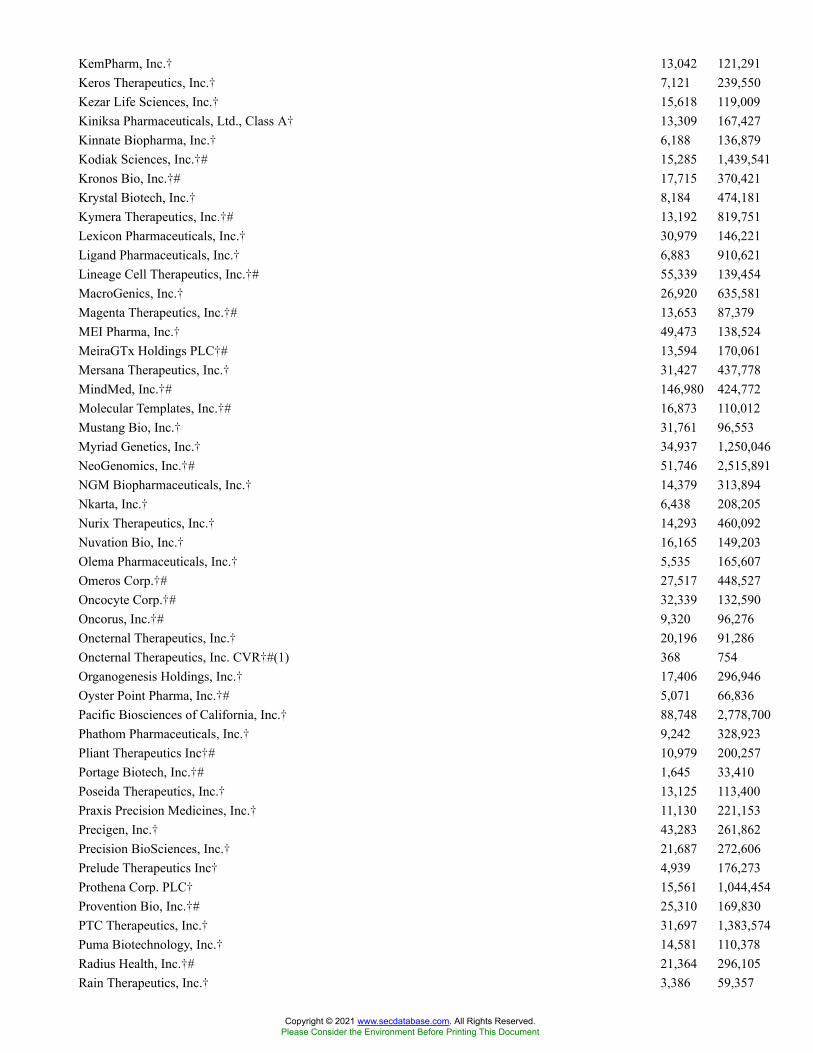
KemPharm, Inc.� 13,042 121,291Keros Therapeutics, Inc.� 7,121 239,550Kezar Life Sciences, Inc.� 15,618 119,009Kiniksa Pharmaceuticals, Ltd., Class A� 13,309 167,427Kinnate Biopharma, Inc.� 6,188 136,879Kodiak Sciences, Inc.�# 15,285 1,439,541Kronos Bio, Inc.�# 17,715 370,421Krystal Biotech, Inc.� 8,184 474,181Kymera Therapeutics, Inc.�# 13,192 819,751Lexicon Pharmaceuticals, Inc.� 30,979 146,221Ligand Pharmaceuticals, Inc.� 6,883 910,621Lineage Cell Therapeutics, Inc.�# 55,339 139,454MacroGenics, Inc.� 26,920 635,581Magenta Therapeutics, Inc.�# 13,653 87,379MEI Pharma, Inc.� 49,473 138,524MeiraGTx Holdings PLC�# 13,594 170,061Mersana Therapeutics, Inc.� 31,427 437,778MindMed, Inc.�# 146,980 424,772Molecular Templates, Inc.�# 16,873 110,012Mustang Bio, Inc.� 31,761 96,553Myriad Genetics, Inc.� 34,937 1,250,046NeoGenomics, Inc.�# 51,746 2,515,891NGM Biopharmaceuticals, Inc.� 14,379 313,894Nkarta, Inc.� 6,438 208,205Nurix Therapeutics, Inc.� 14,293 460,092Nuvation Bio, Inc.� 16,165 149,203Olema Pharmaceuticals, Inc.� 5,535 165,607Omeros Corp.�# 27,517 448,527Oncocyte Corp.�# 32,339 132,590Oncorus, Inc.�# 9,320 96,276Oncternal Therapeutics, Inc.� 20,196 91,286Oncternal Therapeutics, Inc. CVR�#(1) 368 754Organogenesis Holdings, Inc.� 17,406 296,946Oyster Point Pharma, Inc.�# 5,071 66,836Pacific Biosciences of California, Inc.� 88,748 2,778,700Phathom Pharmaceuticals, Inc.� 9,242 328,923Pliant Therapeutics Inc�# 10,979 200,257Portage Biotech, Inc.�# 1,645 33,410Poseida Therapeutics, Inc.� 13,125 113,400Praxis Precision Medicines, Inc.� 11,130 221,153Precigen, Inc.� 43,283 261,862Precision BioSciences, Inc.� 21,687 272,606Prelude Therapeutics Inc� 4,939 176,273Prothena Corp. PLC� 15,561 1,044,454Provention Bio, Inc.�# 25,310 169,830PTC Therapeutics, Inc.� 31,697 1,383,574Puma Biotechnology, Inc.� 14,581 110,378Radius Health, Inc.�# 21,364 296,105Rain Therapeutics, Inc.� 3,386 59,357
Copyright © 2021 www.secdatabase.com. All Rights Reserved.Please Consider the Environment Before Printing This Document
RAPT Therapeutics, Inc.� 8,201 268,173Recursion Pharmaceuticals, Inc., Class A� 9,642 243,171REGENXBIO, Inc.� 18,013 581,820Relay Therapeutics, Inc.� 26,716 855,714Replimune Group, Inc.� 12,217 388,012REVOLUTION Medicines, Inc.� 27,105 788,484Rigel Pharmaceuticals, Inc.�# 77,971 296,290Rocket Pharmaceuticals, Inc.�# 18,128 620,159Rubius Therapeutics, Inc.� 20,575 446,889Sana Biotechnology, Inc.�# 12,252 293,925Sangamo Therapeutics, Inc.� 53,644 531,612Scholar Rock Holding Corp.� 12,624 499,027Seelos Therapeutics, Inc.�# 34,597 76,113Seer, Inc.�# 6,920 276,662Selecta Biosciences, Inc.� 40,763 176,911Sensei Biotherapeutics, Inc.� 3,474 37,450Sesen Bio, Inc.� 78,016 73,951Shattuck Labs, Inc.� 12,139 256,497Sigilon Therapeutics, Inc.� 3,367 20,000
Copyright © 2021 www.secdatabase.com. All Rights Reserved.Please Consider the Environment Before Printing This Document

Silverback Therapeutics, Inc.�# 5,805 127,710Solid Biosciences, Inc.� 27,211 73,742Sorrento Therapeutics, Inc.�# 124,417 1,119,753SpringWorks Therapeutics, Inc.� 13,324 1,000,632Spruce Biosciences, Inc.�# 3,963 30,396SQZ Biotechnologies Co.�# 10,389 138,174Stoke Therapeutics, Inc.� 8,711 228,054Surface Oncology, Inc.� 15,184 96,115Sutro Biopharma, Inc.� 19,787 429,774Syndax Pharmaceuticals, Inc.� 20,520 358,895Talaris Therapeutics, Inc.� 4,065 47,195Tarsus Pharmaceuticals, Inc.� 3,847 101,946Taysha Gene Therapies, Inc.�# 10,159 201,961TCR2 Therapeutics, Inc.� 13,920 233,438Terns Pharmaceuticals, Inc.� 3,977 53,530TG Therapeutics, Inc.�# 58,499 1,583,568Theravance Biopharma, Inc.�# 24,329 201,931Tobira Therapeutics, Inc. CVR�(1) 4,989 0Translate Bio, Inc.� 30,593 1,144,178TransMedics Group, Inc.� 11,828 386,539Travere Therapeutics, Inc.� 26,603 580,744Trillium Therapeutics, Inc.� 44,640 769,147Turning Point Therapeutics, Inc.� 20,984 1,616,188Twist Bioscience Corp.� 21,547 2,439,336UroGen Pharma, Ltd.�# 8,902 156,853Vaxart, Inc.� 54,515 487,909VBI Vaccines, Inc.�# 84,974 306,756Veracyte, Inc.� 30,790 1,481,307Verastem, Inc.� 78,664 208,460Vericel Corp.� 21,218 1,149,379Veru, Inc.� 28,841 257,262Viking Therapeutics, Inc.�# 31,218 206,351Vincerx Pharma, Inc.� 2,147 33,665Vir Biotechnology, Inc.� 27,433 1,413,897Viracta Therapeutics, Inc.� 16,544 152,536VistaGen Therapeutics, Inc.� 87,306 265,410Vor BioPharma, Inc.� 5,207 76,491WaVe Life Sciences, Ltd.� 17,119 108,363Werewolf Therapeutics, Inc.� 3,454 61,481XBiotech, Inc. 6,859 109,538Xencor, Inc.� 25,801 873,880XOMA Corp.�# 2,749 85,549Y-mAbs Therapeutics, Inc.� 15,948 490,879Zentalis Pharmaceuticals, Inc.� 15,173 1,034,647ZIOPHARM Oncology, Inc.�# 95,659 155,924
118,724,544Medical-Drugs - 2.1%
Aclaris Therapeutics, Inc.� 19,813 321,169
Copyright © 2021 www.secdatabase.com. All Rights Reserved.Please Consider the Environment Before Printing This Document

Aduro Biotech Holding, Inc. CVR�(1) 6,346 0Aeglea BioTherapeutics, Inc.� 18,443 133,712Aerie Pharmaceuticals, Inc.� 19,319 288,046Alector, Inc.� 26,290 710,619Alkermes PLC� 73,208 2,288,482Allovir, Inc.�# 13,460 259,105Amphastar Pharmaceuticals, Inc.� 16,890 332,057Ampio Pharmaceuticals, Inc.�# 86,803 142,357Athenex, Inc.�# 39,461 144,033Beyondspring, Inc.� 10,222 320,051Bioxcel Therapeutics, Inc.�# 6,975 205,414Catalyst Pharmaceuticals, Inc.� 44,312 244,159Chimerix, Inc.� 33,314 236,529Citius Pharmaceuticals, Inc.� 51,821 116,597Clovis Oncology, Inc.�# 45,458 219,108Coherus Biosciences, Inc.� 29,269 467,719Collegium Pharmaceutical, Inc.� 16,062 329,753Corcept Therapeutics, Inc.� 44,122 938,916Cytokinetics, Inc.� 35,415 1,167,633Durect Corp.�# 103,238 143,501Eagle Pharmaceuticals, Inc.� 5,302 282,968Enanta Pharmaceuticals, Inc.� 8,792 502,902Foghorn Therapeutics, Inc.�# 8,926 115,859Fortress Biotech, Inc.� 32,688 107,543Fulcrum Therapeutics, Inc.� 10,108 300,208Gritstone bio, Inc.� 18,427 169,528Harmony Biosciences Holdings, Inc.� 10,201 345,712Harpoon Therapeutics, Inc.� 8,536 80,921Hookipa Pharma, Inc.�# 8,760 60,356Ideaya Biosciences, Inc.� 12,809 301,011Intellia Therapeutics, Inc.� 30,923 4,964,069Ironwood Pharmaceuticals, Inc.� 66,298 868,504Jounce Therapeutics, Inc.� 15,044 93,574Kala Pharmaceuticals, Inc.�# 22,065 74,580KalVista Pharmaceuticals, Inc.� 9,072 185,432Kura Oncology, Inc.� 28,999 535,322Landos Biopharma, Inc.� 2,949 39,163Madrigal Pharmaceuticals, Inc.� 5,181 428,728Marinus Pharmaceuticals, Inc.�# 16,855 208,328Mirum Pharmaceuticals, Inc.� 1,645 26,731Morphic Holding, Inc.� 9,462 596,201Neoleukin Therapeutics, Inc.� 16,068 130,954NexImmune, Inc.� 3,084 43,423Ocular Therapeutix, Inc.� 34,981 369,399ORIC Pharmaceuticals, Inc.� 13,466 297,464Pacira BioSciences, Inc.� 19,921 1,181,116Paratek Pharmaceuticals, Inc.�# 20,893 116,165Passage Bio, Inc.� 16,925 203,438PetIQ, Inc.�# 12,048 312,646
Copyright © 2021 www.secdatabase.com. All Rights Reserved.Please Consider the Environment Before Printing This Document
Phibro Animal Health Corp., Class A 9,329 226,601PMV Pharmaceuticals Inc� 11,970 363,289Prestige Consumer Healthcare, Inc.� 22,858 1,311,821Progenics Pharmaceuticals, Inc. CVR�(1) 41,888 0Protagonist Therapeutics, Inc.� 18,866 915,001Reata Pharmaceuticals, Inc., Class A�# 12,529 1,334,464Relmada Therapeutics, Inc.� 6,847 163,712Reneo Pharmaceuticals, Inc.�# 2,878 31,859Rhythm Pharmaceuticals, Inc.� 20,103 261,540Seres Therapeutics, Inc.�# 31,762 203,594SIGA Technologies, Inc.� 22,596 147,552Spectrum Pharmaceuticals, Inc.� 70,599 165,908Spero Therapeutics, Inc.�# 11,043 212,578Summit Therapeutics, Inc.�# 10,258 81,756Supernus Pharmaceuticals, Inc.� 22,418 617,167Syros Pharmaceuticals, Inc.�# 26,272 139,242TherapeuticsMD, Inc.�# 165,067 131,228Tonix Pharmaceuticals Holding Corp.�# 149,083 105,238Trevena, Inc.�# 74,629 98,510Vanda Pharmaceuticals, Inc.� 25,008 418,634
Copyright © 2021 www.secdatabase.com. All Rights Reserved.Please Consider the Environment Before Printing This Document
Vaxcyte, Inc.� 18,139 475,786Verrica Pharmaceuticals, Inc.�# 5,977 66,942Zogenix, Inc.�# 25,593 379,032
29,802,659Medical-Generic Drugs - 0.2%
Amneal Pharmaceuticals, Inc.� 45,507 256,659Arvinas, Inc.� 19,919 1,717,217Endo International PLC� 104,607 239,550Prometheus Biosciences, Inc.� 5,158 112,548
2,325,974Medical-HMO - 0.1%
Magellan Health, Inc.� 10,833 1,025,018Ontrak, Inc.� 3,930 47,632Tivity Health, Inc.� 20,086 466,999Triple-S Management Corp., Class B� 10,381 368,526
1,908,175Medical-Hospitals - 0.5%
Community Health Systems, Inc.� 56,709 698,088Select Medical Holdings Corp. 50,431 1,743,399Surgery Partners, Inc.� 14,465 711,678Tenet Healthcare Corp.� 48,474 3,652,516
6,805,681Medical-Nursing Homes - 0.2%
Ensign Group, Inc. 23,983 1,958,692Innovage Holding Corp.� 8,365 125,726National HealthCare Corp. 5,732 423,308Pennant Group, Inc.� 11,698 357,608
2,865,334Medical-Outpatient/Home Medical - 0.4%
Addus HomeCare Corp.� 7,025 631,688American Well Corp., Class A� 88,847 951,551Joint Corp.� 6,245 638,052LHC Group, Inc.� 13,939 2,603,248ModivCare, Inc.� 5,671 1,118,661
5,943,200Medical-Wholesale Drug Distribution - 0.2%
AdaptHealth Corp.� 35,972 864,767Covetrus, Inc.� 47,235 1,067,038Owens & Minor, Inc. 33,106 1,234,192
3,165,997Metal Processors & Fabrication - 0.7%
AZZ, Inc. 11,351 607,846Helios Technologies, Inc. 14,759 1,204,630Lawson Products, Inc.� 2,172 114,573
Copyright © 2021 www.secdatabase.com. All Rights Reserved.Please Consider the Environment Before Printing This Document

Mayville Engineering Co., Inc.� 4,088 60,993Mueller Industries, Inc. 25,645 1,144,023Park-Ohio Holdings Corp. 3,882 100,078Proto Labs, Inc.� 12,683 940,571RBC Bearings, Inc.� 11,289 2,613,629Rexnord Corp. 54,755 3,326,914Standex International Corp. 5,516 547,408Tredegar Corp. 11,961 158,842
10,819,507Metal Products-Distribution - 0.1%
Olympic Steel, Inc. 4,277 116,591Ryerson Holding Corp. 7,499 173,602Worthington Industries, Inc. 15,808 916,073
1,206,266Metal-Aluminum - 0.3%
Arconic Corp.� 50,387 1,737,848Century Aluminum Co.� 23,443 300,539Constellium SE� 56,029 1,132,906Kaiser Aluminum Corp. 7,214 910,840
4,082,133Metal-Diversified - 0.0%
PolyMet Mining Corp.�# 13,175 44,400Miscellaneous Manufacturing - 0.3%
Hillenbrand, Inc. 34,310 1,592,670John Bean Technologies Corp. 14,324 2,089,729
3,682,399Motion Pictures & Services - 0.1%
Chicken Soup For The Soul Entertainment, Inc.� 5,250 127,365Eros STX Global Corp.�# 144,973 115,978IMAX Corp.� 22,744 357,308Lions Gate Entertainment Corp., Class A� 26,580 343,414Lions Gate Entertainment Corp., Class B� 52,592 618,482
1,562,547MRI/Medical Diagnostic Imaging - 0.0%
RadNet, Inc.� 20,423 641,486Multilevel Direct Selling - 0.1%
Nu Skin Enterprises, Inc., Class A 22,684 1,148,264Multimedia - 0.0%
E.W. Scripps Co., Class A 26,154 484,895Entravision Communications Corp., Class A 27,101 188,894
673,789Networking Products - 0.2%
A10 Networks, Inc.� 27,425 380,933
Copyright © 2021 www.secdatabase.com. All Rights Reserved.Please Consider the Environment Before Printing This Document
Calix, Inc.� 24,929 1,161,691Extreme Networks, Inc.� 56,336 610,119Infinera Corp.� 81,206 687,815NeoPhotonics Corp.� 23,018 214,988NETGEAR, Inc.� 13,761 491,681
3,547,227Night Clubs - 0.0%
RCI Hospitality Holdings, Inc. 3,811 246,229Non-Ferrous Metals - 0.1%
Energy Fuels, Inc.�# 64,352 348,144Ur-Energy, Inc.� 82,576 107,349Uranium Energy Corp.�# 96,861 243,121
698,614Non-Hazardous Waste Disposal - 0.2%
Casella Waste Systems, Inc., Class A� 22,456 1,661,519Covanta Holding Corp. 54,677 1,096,274
2,757,793
Copyright © 2021 www.secdatabase.com. All Rights Reserved.Please Consider the Environment Before Printing This Document
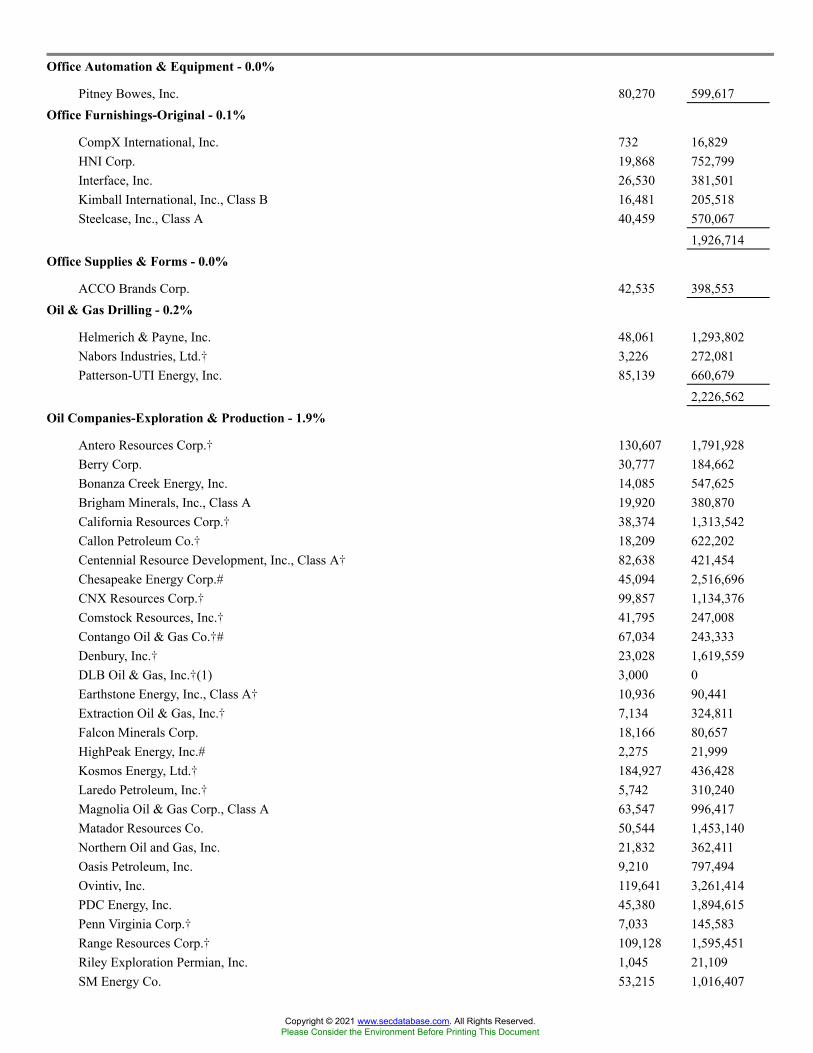
Office Automation & Equipment - 0.0%
Pitney Bowes, Inc. 80,270 599,617Office Furnishings-Original - 0.1%
CompX International, Inc. 732 16,829HNI Corp. 19,868 752,799Interface, Inc. 26,530 381,501Kimball International, Inc., Class B 16,481 205,518Steelcase, Inc., Class A 40,459 570,067
1,926,714Office Supplies & Forms - 0.0%
ACCO Brands Corp. 42,535 398,553Oil & Gas Drilling - 0.2%
Helmerich & Payne, Inc. 48,061 1,293,802Nabors Industries, Ltd.� 3,226 272,081Patterson-UTI Energy, Inc. 85,139 660,679
2,226,562Oil Companies-Exploration & Production - 1.9%
Antero Resources Corp.� 130,607 1,791,928Berry Corp. 30,777 184,662Bonanza Creek Energy, Inc. 14,085 547,625Brigham Minerals, Inc., Class A 19,920 380,870California Resources Corp.� 38,374 1,313,542Callon Petroleum Co.� 18,209 622,202Centennial Resource Development, Inc., Class A� 82,638 421,454Chesapeake Energy Corp.# 45,094 2,516,696CNX Resources Corp.� 99,857 1,134,376Comstock Resources, Inc.� 41,795 247,008Contango Oil & Gas Co.�# 67,034 243,333Denbury, Inc.� 23,028 1,619,559DLB Oil & Gas, Inc.�(1) 3,000 0Earthstone Energy, Inc., Class A� 10,936 90,441Extraction Oil & Gas, Inc.� 7,134 324,811Falcon Minerals Corp. 18,166 80,657HighPeak Energy, Inc.# 2,275 21,999Kosmos Energy, Ltd.� 184,927 436,428Laredo Petroleum, Inc.� 5,742 310,240Magnolia Oil & Gas Corp., Class A 63,547 996,417Matador Resources Co. 50,544 1,453,140Northern Oil and Gas, Inc. 21,832 362,411Oasis Petroleum, Inc. 9,210 797,494Ovintiv, Inc. 119,641 3,261,414PDC Energy, Inc. 45,380 1,894,615Penn Virginia Corp.� 7,033 145,583Range Resources Corp.� 109,128 1,595,451Riley Exploration Permian, Inc. 1,045 21,109SM Energy Co. 53,215 1,016,407
Copyright © 2021 www.secdatabase.com. All Rights Reserved.Please Consider the Environment Before Printing This Document
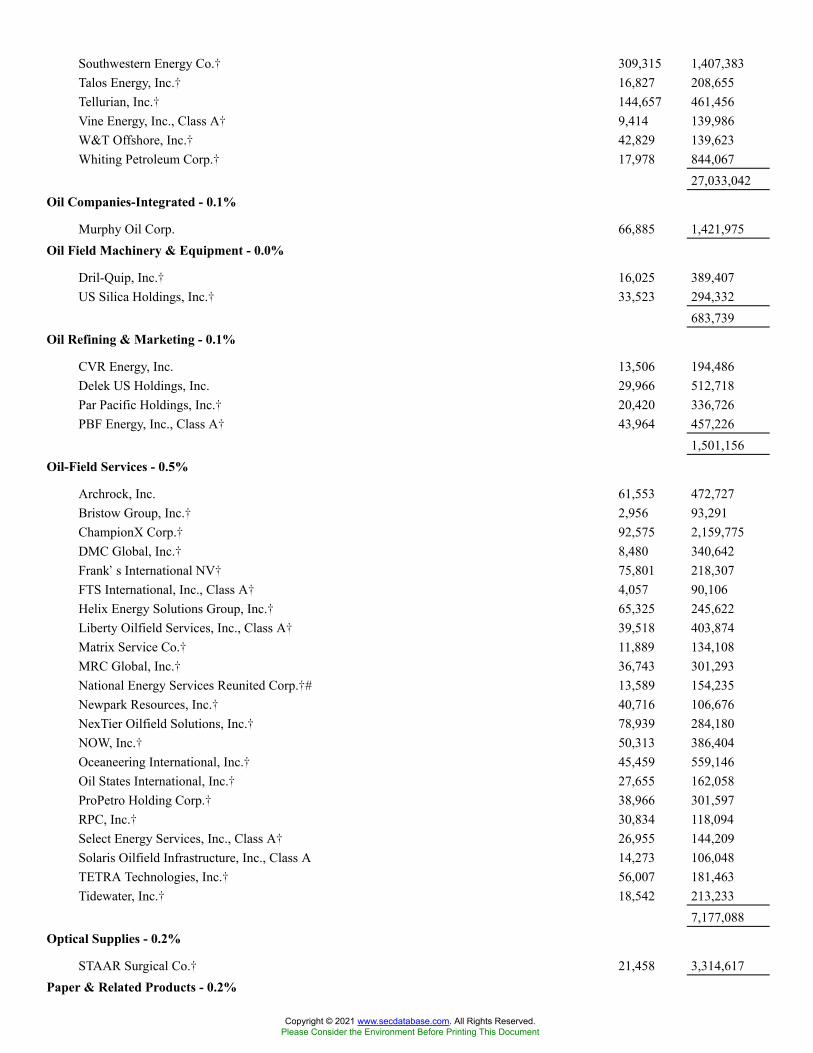
Southwestern Energy Co.� 309,315 1,407,383Talos Energy, Inc.� 16,827 208,655Tellurian, Inc.� 144,657 461,456Vine Energy, Inc., Class A� 9,414 139,986W&T Offshore, Inc.� 42,829 139,623Whiting Petroleum Corp.� 17,978 844,067
27,033,042Oil Companies-Integrated - 0.1%
Murphy Oil Corp. 66,885 1,421,975Oil Field Machinery & Equipment - 0.0%
Dril-Quip, Inc.� 16,025 389,407US Silica Holdings, Inc.� 33,523 294,332
683,739Oil Refining & Marketing - 0.1%
CVR Energy, Inc. 13,506 194,486Delek US Holdings, Inc. 29,966 512,718Par Pacific Holdings, Inc.� 20,420 336,726PBF Energy, Inc., Class A� 43,964 457,226
1,501,156Oil-Field Services - 0.5%
Archrock, Inc. 61,553 472,727Bristow Group, Inc.� 2,956 93,291ChampionX Corp.� 92,575 2,159,775DMC Global, Inc.� 8,480 340,642Frank�s International NV� 75,801 218,307FTS International, Inc., Class A� 4,057 90,106Helix Energy Solutions Group, Inc.� 65,325 245,622Liberty Oilfield Services, Inc., Class A� 39,518 403,874Matrix Service Co.� 11,889 134,108MRC Global, Inc.� 36,743 301,293National Energy Services Reunited Corp.�# 13,589 154,235Newpark Resources, Inc.� 40,716 106,676NexTier Oilfield Solutions, Inc.� 78,939 284,180NOW, Inc.� 50,313 386,404Oceaneering International, Inc.� 45,459 559,146Oil States International, Inc.� 27,655 162,058ProPetro Holding Corp.� 38,966 301,597RPC, Inc.� 30,834 118,094Select Energy Services, Inc., Class A� 26,955 144,209Solaris Oilfield Infrastructure, Inc., Class A 14,273 106,048TETRA Technologies, Inc.� 56,007 181,463Tidewater, Inc.� 18,542 213,233
7,177,088Optical Supplies - 0.2%
STAAR Surgical Co.� 21,458 3,314,617Paper & Related Products - 0.2%
Copyright © 2021 www.secdatabase.com. All Rights Reserved.Please Consider the Environment Before Printing This Document
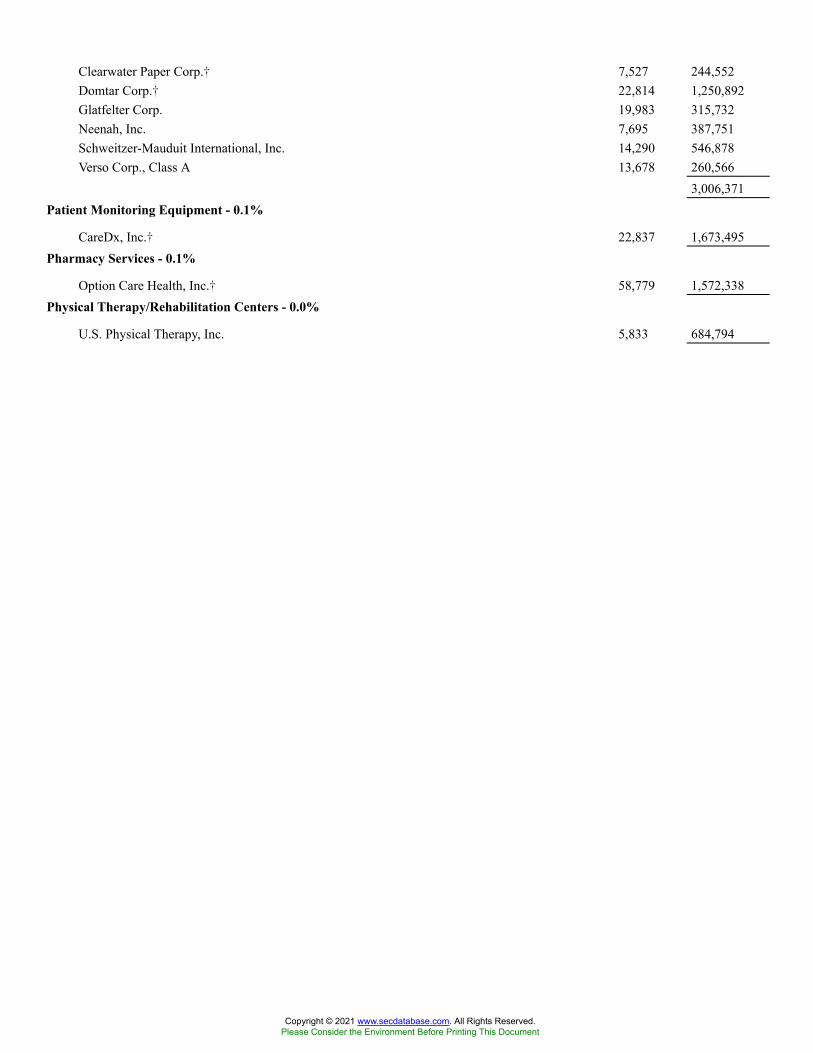
Clearwater Paper Corp.� 7,527 244,552Domtar Corp.� 22,814 1,250,892Glatfelter Corp. 19,983 315,732Neenah, Inc. 7,695 387,751Schweitzer-Mauduit International, Inc. 14,290 546,878Verso Corp., Class A 13,678 260,566
3,006,371Patient Monitoring Equipment - 0.1%
CareDx, Inc.� 22,837 1,673,495Pharmacy Services - 0.1%
Option Care Health, Inc.� 58,779 1,572,338Physical Therapy/Rehabilitation Centers - 0.0%
U.S. Physical Therapy, Inc. 5,833 684,794
Copyright © 2021 www.secdatabase.com. All Rights Reserved.Please Consider the Environment Before Printing This Document
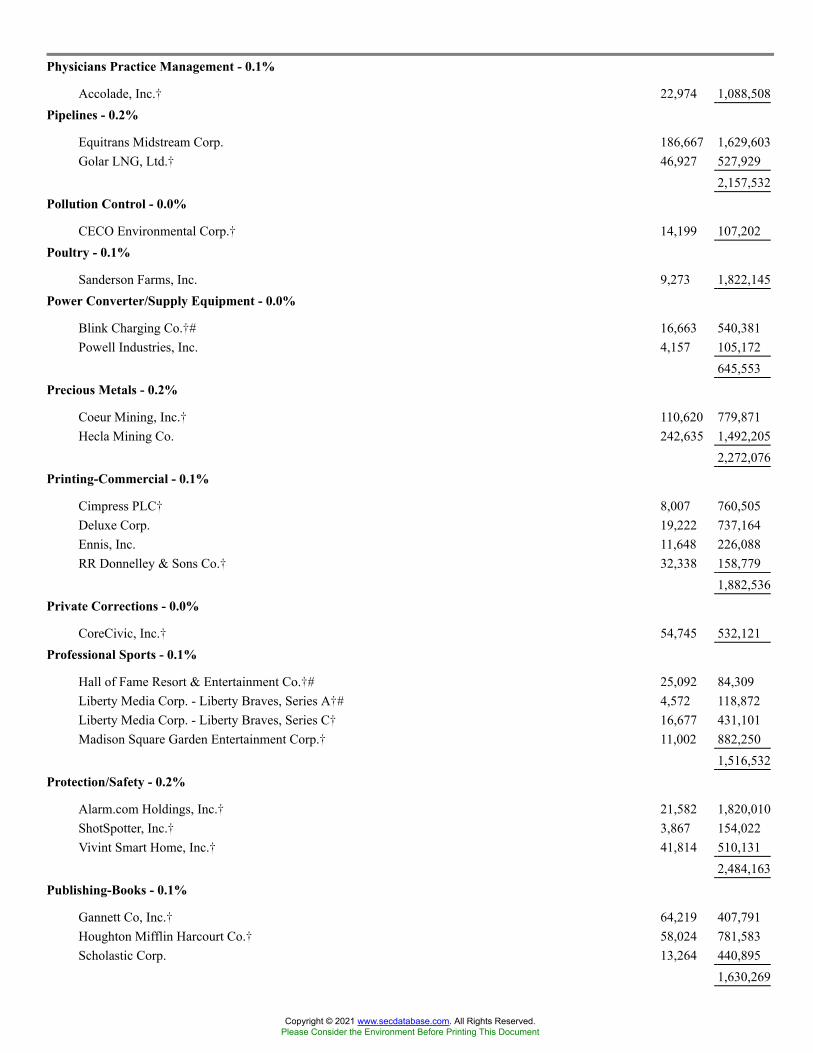
Physicians Practice Management - 0.1%
Accolade, Inc.� 22,974 1,088,508Pipelines - 0.2%
Equitrans Midstream Corp. 186,667 1,629,603Golar LNG, Ltd.� 46,927 527,929
2,157,532Pollution Control - 0.0%
CECO Environmental Corp.� 14,199 107,202Poultry - 0.1%
Sanderson Farms, Inc. 9,273 1,822,145Power Converter/Supply Equipment - 0.0%
Blink Charging Co.�# 16,663 540,381Powell Industries, Inc. 4,157 105,172
645,553Precious Metals - 0.2%
Coeur Mining, Inc.� 110,620 779,871Hecla Mining Co. 242,635 1,492,205
2,272,076Printing-Commercial - 0.1%
Cimpress PLC� 8,007 760,505Deluxe Corp. 19,222 737,164Ennis, Inc. 11,648 226,088RR Donnelley & Sons Co.� 32,338 158,779
1,882,536Private Corrections - 0.0%
CoreCivic, Inc.� 54,745 532,121Professional Sports - 0.1%
Hall of Fame Resort & Entertainment Co.�# 25,092 84,309Liberty Media Corp. - Liberty Braves, Series A�# 4,572 118,872Liberty Media Corp. - Liberty Braves, Series C� 16,677 431,101Madison Square Garden Entertainment Corp.� 11,002 882,250
1,516,532Protection/Safety - 0.2%
Alarm.com Holdings, Inc.� 21,582 1,820,010ShotSpotter, Inc.� 3,867 154,022Vivint Smart Home, Inc.� 41,814 510,131
2,484,163Publishing-Books - 0.1%
Gannett Co, Inc.� 64,219 407,791Houghton Mifflin Harcourt Co.� 58,024 781,583Scholastic Corp. 13,264 440,895
1,630,269
Copyright © 2021 www.secdatabase.com. All Rights Reserved.Please Consider the Environment Before Printing This Document
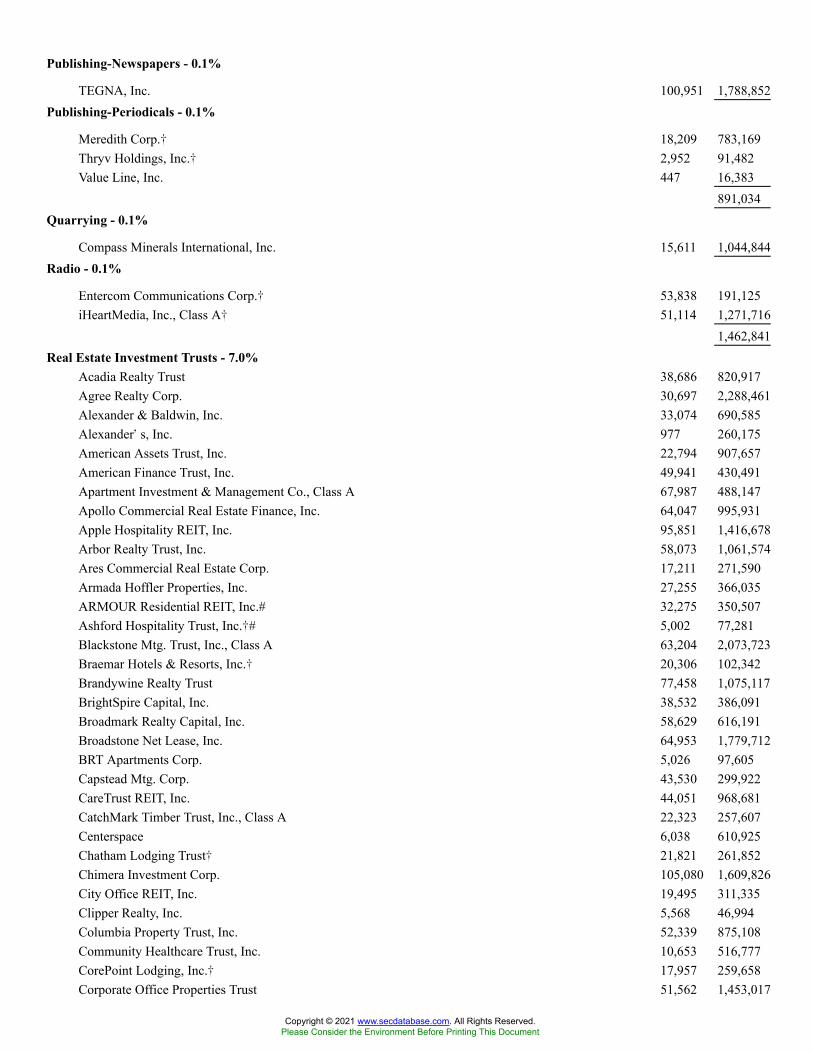
Publishing-Newspapers - 0.1%
TEGNA, Inc. 100,951 1,788,852Publishing-Periodicals - 0.1%
Meredith Corp.� 18,209 783,169Thryv Holdings, Inc.� 2,952 91,482Value Line, Inc. 447 16,383
891,034Quarrying - 0.1%
Compass Minerals International, Inc. 15,611 1,044,844Radio - 0.1%
Entercom Communications Corp.� 53,838 191,125iHeartMedia, Inc., Class A� 51,114 1,271,716
1,462,841Real Estate Investment Trusts - 7.0%
Acadia Realty Trust 38,686 820,917Agree Realty Corp. 30,697 2,288,461Alexander & Baldwin, Inc. 33,074 690,585Alexander�s, Inc. 977 260,175American Assets Trust, Inc. 22,794 907,657American Finance Trust, Inc. 49,941 430,491Apartment Investment & Management Co., Class A 67,987 488,147Apollo Commercial Real Estate Finance, Inc. 64,047 995,931Apple Hospitality REIT, Inc. 95,851 1,416,678Arbor Realty Trust, Inc. 58,073 1,061,574Ares Commercial Real Estate Corp. 17,211 271,590Armada Hoffler Properties, Inc. 27,255 366,035ARMOUR Residential REIT, Inc.# 32,275 350,507Ashford Hospitality Trust, Inc.�# 5,002 77,281Blackstone Mtg. Trust, Inc., Class A 63,204 2,073,723Braemar Hotels & Resorts, Inc.� 20,306 102,342Brandywine Realty Trust 77,458 1,075,117BrightSpire Capital, Inc. 38,532 386,091Broadmark Realty Capital, Inc. 58,629 616,191Broadstone Net Lease, Inc. 64,953 1,779,712BRT Apartments Corp. 5,026 97,605Capstead Mtg. Corp. 43,530 299,922CareTrust REIT, Inc. 44,051 968,681CatchMark Timber Trust, Inc., Class A 22,323 257,607Centerspace 6,038 610,925Chatham Lodging Trust� 21,821 261,852Chimera Investment Corp. 105,080 1,609,826City Office REIT, Inc. 19,495 311,335Clipper Realty, Inc. 5,568 46,994Columbia Property Trust, Inc. 52,339 875,108Community Healthcare Trust, Inc. 10,653 516,777CorePoint Lodging, Inc.� 17,957 259,658Corporate Office Properties Trust 51,562 1,453,017
Copyright © 2021 www.secdatabase.com. All Rights Reserved.Please Consider the Environment Before Printing This Document

CTO Realty Growth, Inc. 2,717 152,397DiamondRock Hospitality Co.� 95,472 863,067DigitalBridge Group, Inc.�# 218,229 1,505,780Diversified Healthcare Trust 108,323 406,211Dynex Capital, Inc. 13,875 246,420Easterly Government Properties, Inc. 38,487 822,467EastGroup Properties, Inc. 18,147 3,271,178Ellington Financial, Inc. 18,735 346,972Empire State Realty Trust, Inc., Class A 65,272 670,343Equity Commonwealth 53,536 1,410,138Essential Properties Realty Trust, Inc. 53,434 1,731,796Farmland Partners, Inc. 12,227 149,781Four Corners Property Trust, Inc. 34,727 993,539Franklin Street Properties Corp. 47,098 226,070GEO Group, Inc.# 53,770 416,718Getty Realty Corp. 18,190 575,350Gladstone Commercial Corp. 16,461 372,512Gladstone Land Corp. 11,503 270,896
Copyright © 2021 www.secdatabase.com. All Rights Reserved.Please Consider the Environment Before Printing This Document
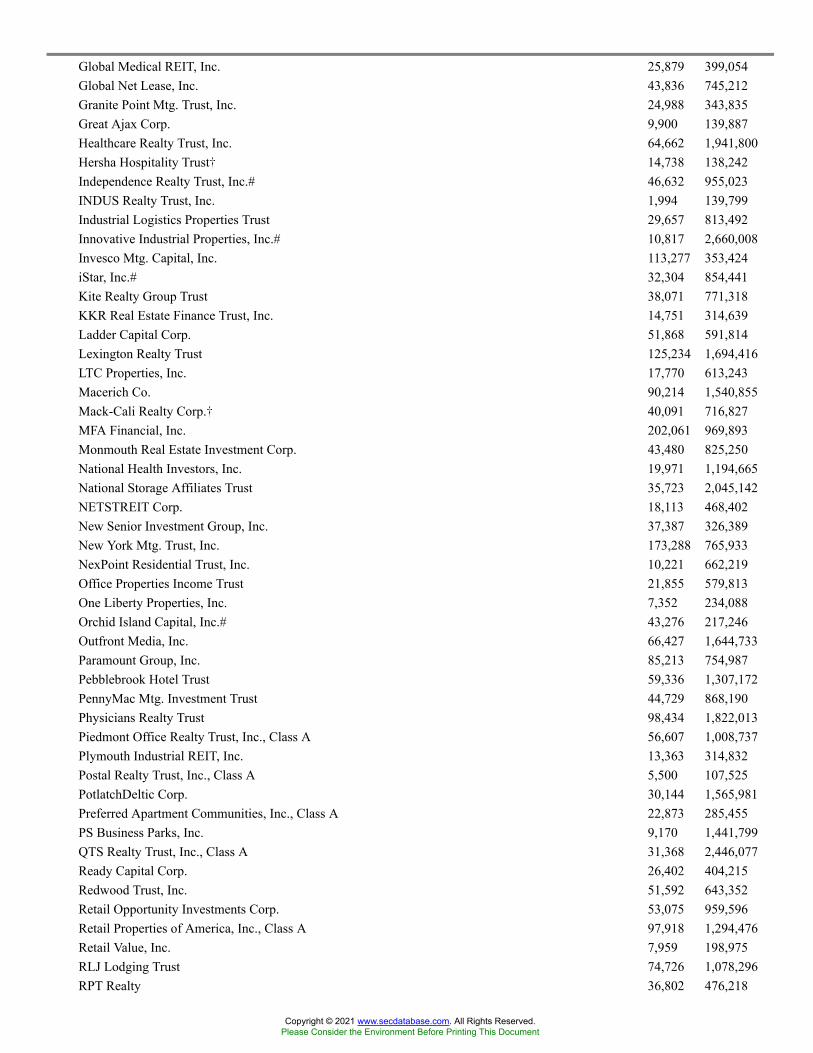
Global Medical REIT, Inc. 25,879 399,054Global Net Lease, Inc. 43,836 745,212Granite Point Mtg. Trust, Inc. 24,988 343,835Great Ajax Corp. 9,900 139,887Healthcare Realty Trust, Inc. 64,662 1,941,800Hersha Hospitality Trust� 14,738 138,242Independence Realty Trust, Inc.# 46,632 955,023INDUS Realty Trust, Inc. 1,994 139,799Industrial Logistics Properties Trust 29,657 813,492Innovative Industrial Properties, Inc.# 10,817 2,660,008Invesco Mtg. Capital, Inc. 113,277 353,424iStar, Inc.# 32,304 854,441Kite Realty Group Trust 38,071 771,318KKR Real Estate Finance Trust, Inc. 14,751 314,639Ladder Capital Corp. 51,868 591,814Lexington Realty Trust 125,234 1,694,416LTC Properties, Inc. 17,770 613,243Macerich Co. 90,214 1,540,855Mack-Cali Realty Corp.� 40,091 716,827MFA Financial, Inc. 202,061 969,893Monmouth Real Estate Investment Corp. 43,480 825,250National Health Investors, Inc. 19,971 1,194,665National Storage Affiliates Trust 35,723 2,045,142NETSTREIT Corp. 18,113 468,402New Senior Investment Group, Inc. 37,387 326,389New York Mtg. Trust, Inc. 173,288 765,933NexPoint Residential Trust, Inc. 10,221 662,219Office Properties Income Trust 21,855 579,813One Liberty Properties, Inc. 7,352 234,088Orchid Island Capital, Inc.# 43,276 217,246Outfront Media, Inc. 66,427 1,644,733Paramount Group, Inc. 85,213 754,987Pebblebrook Hotel Trust 59,336 1,307,172PennyMac Mtg. Investment Trust 44,729 868,190Physicians Realty Trust 98,434 1,822,013Piedmont Office Realty Trust, Inc., Class A 56,607 1,008,737Plymouth Industrial REIT, Inc. 13,363 314,832Postal Realty Trust, Inc., Class A 5,500 107,525PotlatchDeltic Corp. 30,144 1,565,981Preferred Apartment Communities, Inc., Class A 22,873 285,455PS Business Parks, Inc. 9,170 1,441,799QTS Realty Trust, Inc., Class A 31,368 2,446,077Ready Capital Corp. 26,402 404,215Redwood Trust, Inc. 51,592 643,352Retail Opportunity Investments Corp. 53,075 959,596Retail Properties of America, Inc., Class A 97,918 1,294,476Retail Value, Inc. 7,959 198,975RLJ Lodging Trust 74,726 1,078,296RPT Realty 36,802 476,218
Copyright © 2021 www.secdatabase.com. All Rights Reserved.Please Consider the Environment Before Printing This Document

Ryman Hospitality Properties, Inc.� 24,550 2,039,368Sabra Health Care REIT, Inc. 98,435 1,574,960Safehold, Inc. 8,167 731,845Saul Centers, Inc. 5,400 248,832Seritage Growth Properties, Class A�# 16,707 270,152Service Properties Trust 74,911 856,233SITE Centers Corp. 79,091 1,274,156STAG Industrial, Inc.# 73,453 3,103,389Summit Hotel Properties, Inc.� 47,350 441,302Sunstone Hotel Investors, Inc.� 98,107 1,137,060Tanger Factory Outlet Centers, Inc. 45,278 757,048Terreno Realty Corp. 31,297 2,090,953TPG RE Finance Trust, Inc. 27,405 345,303Two Harbors Investment Corp. 143,273 945,602UMH Properties, Inc. 18,455 437,384Uniti Group, Inc. 88,770 1,160,224Universal Health Realty Income Trust 5,857 346,910Urban Edge Properties 52,852 1,001,017Urstadt Biddle Properties, Inc., Class A 13,587 259,240Washington Real Estate Investment Trust 38,649 971,636Whitestone REIT 18,282 179,346Xenia Hotels & Resorts, Inc.� 52,010 906,014
102,177,119Real Estate Management/Services - 0.5%
Cushman & Wakefield PLC�# 53,563 971,633eXp World Holdings, Inc.# 28,326 1,298,747Fathom Holdings, Inc.�# 2,353 67,249Marcus & Millichap, Inc.� 10,836 424,988Newmark Group, Inc., Class A 68,104 927,576RE/MAX Holdings, Inc., Class A 8,448 282,923Realogy Holdings Corp.� 52,576 922,709Redfin Corp.�# 46,431 2,255,154RMR Group, Inc., Class A 6,964 322,712
7,473,691Real Estate Operations & Development - 0.2%
FRP Holdings, Inc.� 3,049 175,927Kennedy-Wilson Holdings, Inc. 54,811 1,205,294Legacy Housing Corp.� 3,670 71,932McGrath RentCorp 11,023 769,185Radius Global Infrastructure, Inc., Class A� 20,075 358,941Rafael Holdings, Inc., Class B�# 4,447 186,107St. Joe Co. 15,209 703,721
3,471,107Recreational Centers - 0.0%
OneSpaWorld Holdings, Ltd.� 24,122 253,281Recreational Vehicles - 0.1%
Copyright © 2021 www.secdatabase.com. All Rights Reserved.Please Consider the Environment Before Printing This Document
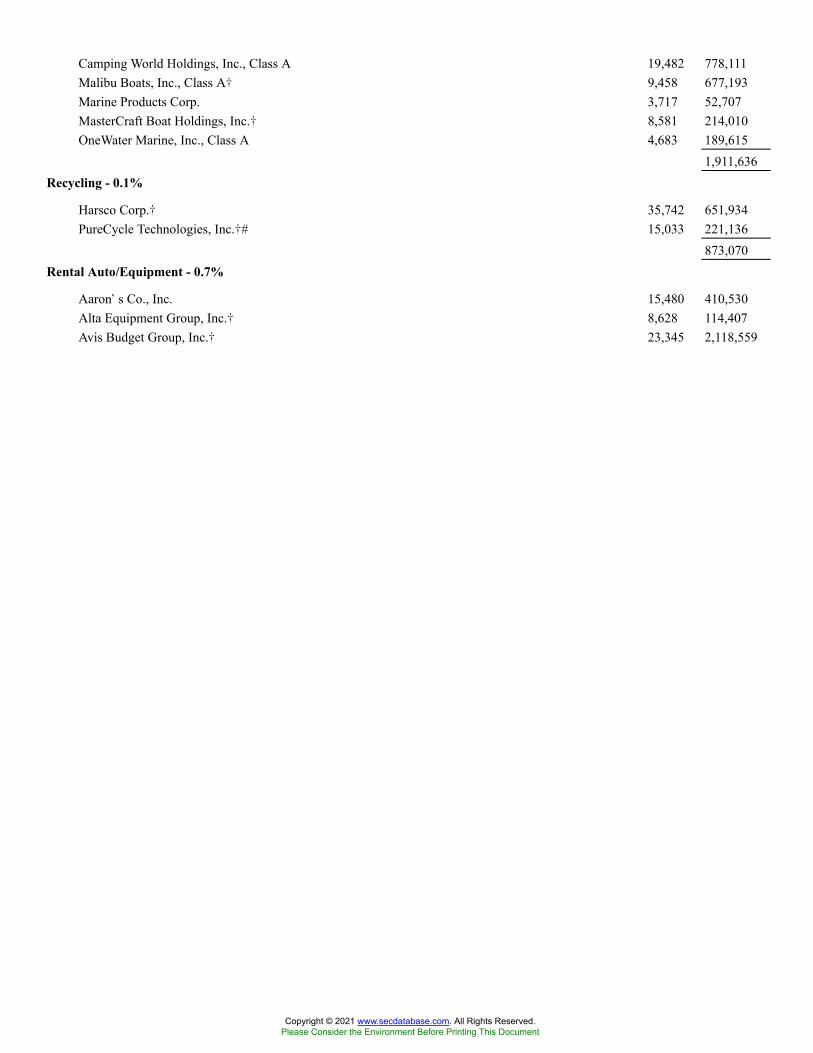
Camping World Holdings, Inc., Class A 19,482 778,111Malibu Boats, Inc., Class A� 9,458 677,193Marine Products Corp. 3,717 52,707MasterCraft Boat Holdings, Inc.� 8,581 214,010OneWater Marine, Inc., Class A 4,683 189,615
1,911,636Recycling - 0.1%
Harsco Corp.� 35,742 651,934PureCycle Technologies, Inc.�# 15,033 221,136
873,070Rental Auto/Equipment - 0.7%
Aaron�s Co., Inc. 15,480 410,530Alta Equipment Group, Inc.� 8,628 114,407Avis Budget Group, Inc.� 23,345 2,118,559
Copyright © 2021 www.secdatabase.com. All Rights Reserved.Please Consider the Environment Before Printing This Document

CAI International, Inc. 7,425 415,577Custom Truck One Source, Inc.�# 5,938 50,889Herc Holdings, Inc.� 11,391 1,497,347PROG Holdings, Inc. 30,639 1,449,837Rent-A-Center, Inc. 30,091 1,898,140Textainer Group Holdings, Ltd.� 21,875 726,688Triton International, Ltd. 30,465 1,667,045
10,349,019Resort/Theme Parks - 0.1%
SeaWorld Entertainment, Inc.� 23,508 1,156,359Retail-Apparel/Shoe - 0.6%
Abercrombie & Fitch Co., Class A� 28,003 1,001,387American Eagle Outfitters, Inc.# 69,468 2,120,163Boot Barn Holdings, Inc.� 13,115 1,170,907Buckle, Inc. 13,582 526,031Caleres, Inc. 16,818 413,555Cato Corp., Class A 9,029 155,841Chico�s FAS, Inc.� 54,905 283,859Children�s Place, Inc.� 6,417 557,252Designer Brands, Inc., Class A� 27,438 397,851Duluth Holdings, Inc., Class B� 5,541 86,218Genesco, Inc.� 6,691 415,043Guess?, Inc. 18,374 444,467Shoe Carnival, Inc. 8,060 308,537Tilly�s, Inc., Class A 10,345 161,072Vera Bradley, Inc.� 11,744 134,586Winmark Corp. 1,610 337,504
8,514,273Retail-Appliances - 0.0%
Conn�s, Inc.� 8,149 200,465Retail-Arts & Crafts - 0.0%
JOANN, Inc.# 5,296 72,608Retail-Automobile - 0.4%
America�s Car-Mart, Inc.� 2,769 358,115Asbury Automotive Group, Inc.� 8,836 1,645,617CarLotz, Inc.�# 19,839 81,538Group 1 Automotive, Inc. 8,022 1,327,160Lazydays Holdings, Inc.� 3,353 82,383Rush Enterprises, Inc., Class A 19,278 850,160Rush Enterprises, Inc., Class B 2,995 126,958Shift Technologies, Inc.�# 28,325 210,738Sonic Automotive, Inc., Class A# 9,989 504,844
5,187,513Retail-Bedding - 0.1%
Bed Bath & Beyond, Inc.� 50,099 1,379,726
Copyright © 2021 www.secdatabase.com. All Rights Reserved.Please Consider the Environment Before Printing This Document
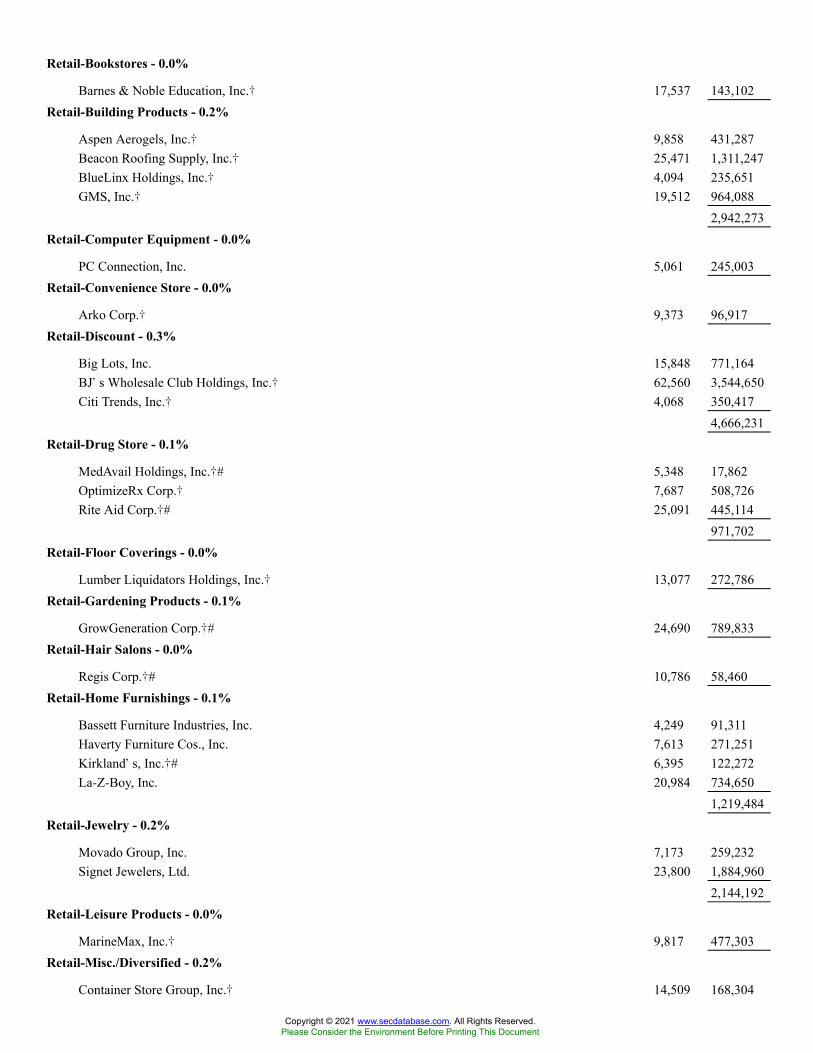
Retail-Bookstores - 0.0%
Barnes & Noble Education, Inc.� 17,537 143,102Retail-Building Products - 0.2%
Aspen Aerogels, Inc.� 9,858 431,287Beacon Roofing Supply, Inc.� 25,471 1,311,247BlueLinx Holdings, Inc.� 4,094 235,651GMS, Inc.� 19,512 964,088
2,942,273Retail-Computer Equipment - 0.0%
PC Connection, Inc. 5,061 245,003Retail-Convenience Store - 0.0%
Arko Corp.� 9,373 96,917Retail-Discount - 0.3%
Big Lots, Inc. 15,848 771,164BJ�s Wholesale Club Holdings, Inc.� 62,560 3,544,650Citi Trends, Inc.� 4,068 350,417
4,666,231Retail-Drug Store - 0.1%
MedAvail Holdings, Inc.�# 5,348 17,862OptimizeRx Corp.� 7,687 508,726Rite Aid Corp.�# 25,091 445,114
971,702Retail-Floor Coverings - 0.0%
Lumber Liquidators Holdings, Inc.� 13,077 272,786Retail-Gardening Products - 0.1%
GrowGeneration Corp.�# 24,690 789,833Retail-Hair Salons - 0.0%
Regis Corp.�# 10,786 58,460Retail-Home Furnishings - 0.1%
Bassett Furniture Industries, Inc. 4,249 91,311Haverty Furniture Cos., Inc. 7,613 271,251Kirkland�s, Inc.�# 6,395 122,272La-Z-Boy, Inc. 20,984 734,650
1,219,484Retail-Jewelry - 0.2%
Movado Group, Inc. 7,173 259,232Signet Jewelers, Ltd. 23,800 1,884,960
2,144,192Retail-Leisure Products - 0.0%
MarineMax, Inc.� 9,817 477,303Retail-Misc./Diversified - 0.2%
Container Store Group, Inc.� 14,509 168,304
Copyright © 2021 www.secdatabase.com. All Rights Reserved.Please Consider the Environment Before Printing This Document
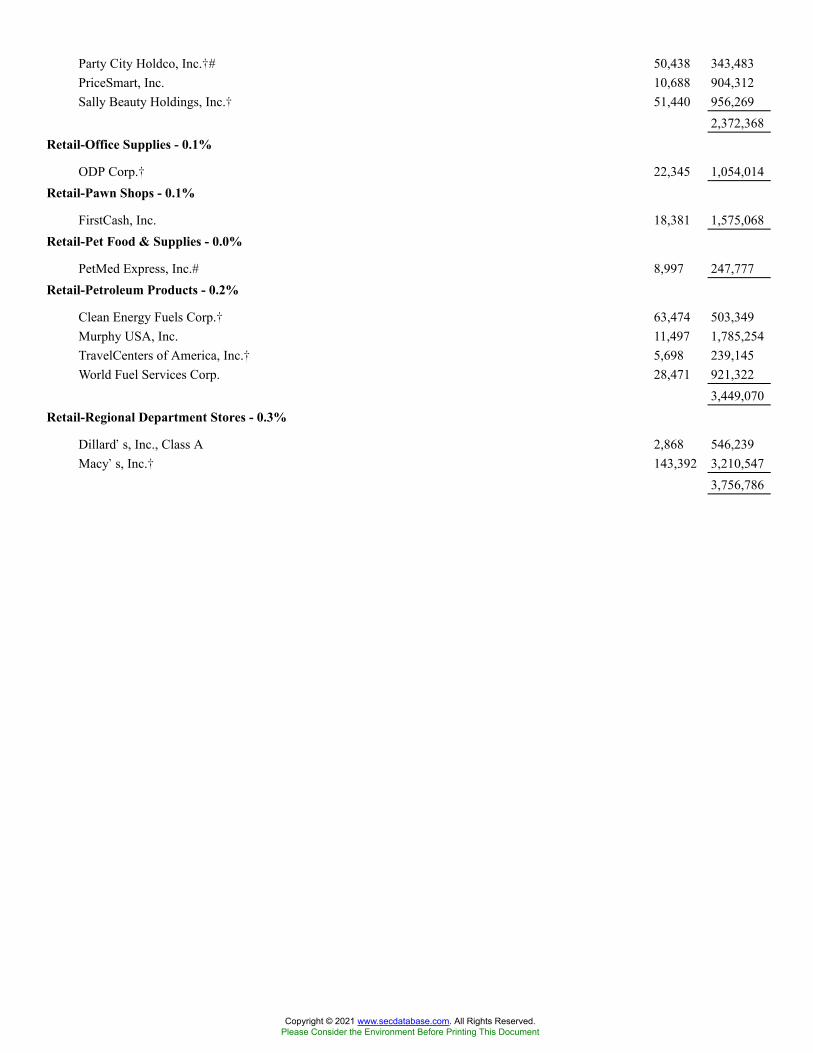
Party City Holdco, Inc.�# 50,438 343,483PriceSmart, Inc. 10,688 904,312Sally Beauty Holdings, Inc.� 51,440 956,269
2,372,368Retail-Office Supplies - 0.1%
ODP Corp.� 22,345 1,054,014Retail-Pawn Shops - 0.1%
FirstCash, Inc. 18,381 1,575,068Retail-Pet Food & Supplies - 0.0%
PetMed Express, Inc.# 8,997 247,777Retail-Petroleum Products - 0.2%
Clean Energy Fuels Corp.� 63,474 503,349Murphy USA, Inc. 11,497 1,785,254TravelCenters of America, Inc.� 5,698 239,145World Fuel Services Corp. 28,471 921,322
3,449,070Retail-Regional Department Stores - 0.3%
Dillard�s, Inc., Class A 2,868 546,239Macy�s, Inc.� 143,392 3,210,547
3,756,786
Copyright © 2021 www.secdatabase.com. All Rights Reserved.Please Consider the Environment Before Printing This Document

Retail-Restaurants - 1.4%
Biglari Holdings, Inc., Class B� 370 64,695BJ�s Restaurants, Inc.� 10,283 439,701Bloomin� Brands, Inc.� 40,433 1,083,200Brinker International, Inc.� 20,735 1,104,553Cannae Holdings, Inc.� 39,867 1,272,555Carrols Restaurant Group, Inc. 15,255 63,308Cheesecake Factory, Inc.� 19,770 922,271Chuy�s Holdings, Inc.� 9,084 293,050Cracker Barrel Old Country Store, Inc. 10,826 1,554,397Dave & Buster�s Entertainment, Inc.� 19,726 738,147Del Taco Restaurants, Inc. 13,628 119,926Denny�s Corp.� 28,596 472,978Dine Brands Global, Inc.� 7,439 615,354El Pollo Loco Holdings, Inc.� 8,694 157,709Fiesta Restaurant Group, Inc.� 8,057 96,765Jack in the Box, Inc. 10,491 1,111,626Kura Sushi USA, Inc., Class A�# 1,561 79,314Noodles & Co.� 18,560 233,670ONE Group Hospitality, Inc.� 8,918 99,436Papa John�s International, Inc. 15,098 1,925,448Red Robin Gourmet Burgers, Inc.� 7,109 174,028Ruth�s Hospitality Group, Inc.� 15,353 314,583Shake Shack, Inc., Class A� 17,082 1,481,864Texas Roadhouse, Inc. 31,951 3,035,345Wingstop, Inc. 13,623 2,342,202
19,796,125Retail-Sporting Goods - 0.2%
Academy Sports & Outdoors, Inc.� 28,223 1,249,432Big 5 Sporting Goods Corp.# 9,501 264,128Hibbett, Inc. 7,415 709,541Sportsman�s Warehouse Holdings, Inc.� 19,867 352,441Zumiez, Inc.� 9,964 400,453
2,975,995Retail-Vision Service Center - 0.2%
National Vision Holdings, Inc.� 37,257 2,234,675Retail-Vitamins & Nutrition Supplements - 0.0%
Franchise Group, Inc. 12,933 449,163Retirement/Aged Care - 0.0%
Brookdale Senior Living, Inc.� 84,465 616,595Rubber-Tires - 0.1%
Goodyear Tire & Rubber Co.� 126,153 1,998,264Rubber/Plastic Products - 0.2%
Myers Industries, Inc. 16,482 375,790Raven Industries, Inc.� 16,278 949,821
Copyright © 2021 www.secdatabase.com. All Rights Reserved.Please Consider the Environment Before Printing This Document

Trinseo SA 17,764 922,4842,248,095
Satellite Telecom - 0.3%
EchoStar Corp., Class A� 18,869 509,463Globalstar, Inc.�# 277,073 551,375Gogo, Inc.�# 26,977 362,841Iridium Communications, Inc.� 54,547 2,427,887KVH Industries, Inc.� 6,917 73,113Loral Space & Communications, Inc.# 5,860 246,178
4,170,857Savings & Loans/Thrifts - 0.9%
Axos Financial, Inc.� 26,042 1,262,516Banc of California, Inc. 20,605 370,272Berkshire Hills Bancorp, Inc. 23,263 596,231Brookline Bancorp, Inc. 35,045 524,624Capitol Federal Financial, Inc. 59,313 684,472Flushing Financial Corp. 13,461 308,661FS Bancorp, Inc. 3,352 114,538Hingham Institution for Savings 661 214,494Home Bancorp, Inc. 3,490 130,596HomeTrust Bancshares, Inc. 6,936 192,959Investors Bancorp, Inc. 104,422 1,494,279Meridian Bancorp, Inc. 21,338 443,404Northfield Bancorp, Inc. 20,882 352,906Northwest Bancshares, Inc. 55,866 727,375OceanFirst Financial Corp. 26,993 573,871Pacific Premier Bancorp, Inc. 42,793 1,710,008Provident Financial Services, Inc. 34,643 764,571Southern Missouri Bancorp, Inc. 3,528 159,183Washington Federal, Inc. 32,942 1,096,969Waterstone Financial, Inc. 9,879 200,346WSFS Financial Corp. 21,457 974,362
12,896,637Schools - 0.4%
2U, Inc.�# 32,740 1,212,362Adtalem Global Education, Inc.� 22,598 836,126American Public Education, Inc.� 8,490 223,287Coursera, Inc.� 5,500 211,585Graham Holdings Co., Class B 1,769 1,091,137Laureate Education, Inc., Class A� 48,250 768,622Perdoceo Education Corp.� 32,116 352,634Strategic Education, Inc. 11,129 871,178Stride, Inc.� 18,387 629,571
6,196,502Security Services - 0.1%
Brink�s Co. 22,212 1,736,090
Copyright © 2021 www.secdatabase.com. All Rights Reserved.Please Consider the Environment Before Printing This Document
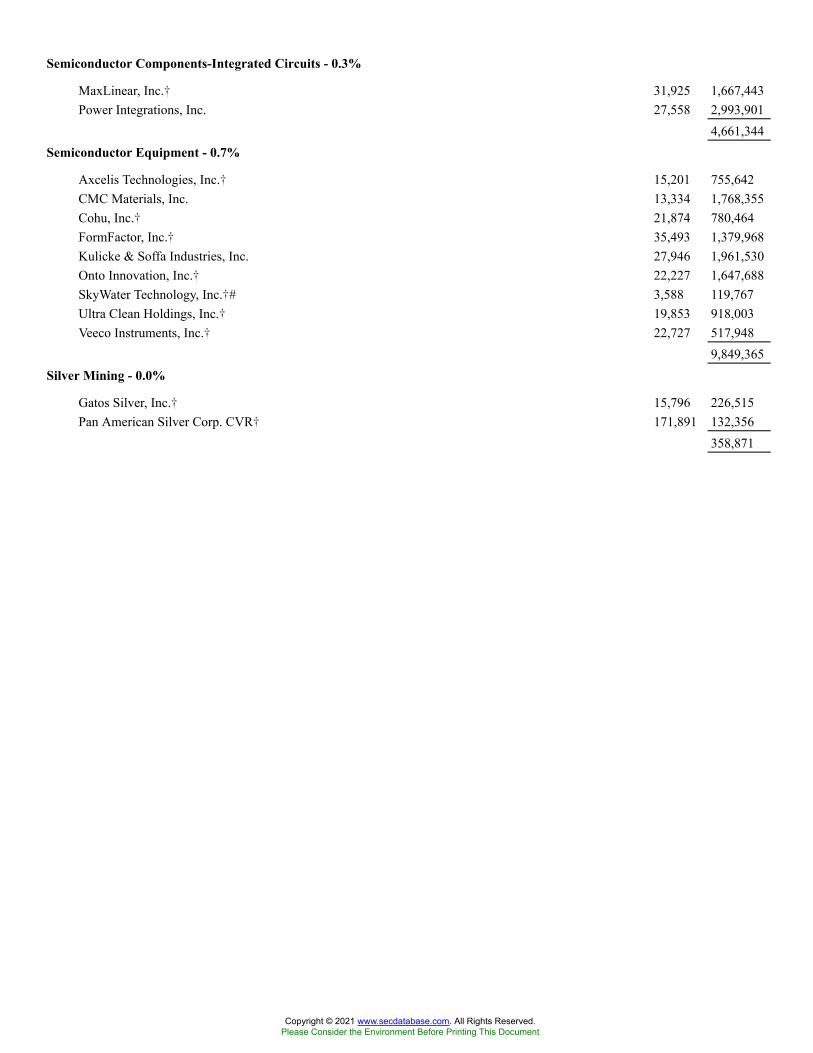
Semiconductor Components-Integrated Circuits - 0.3%
MaxLinear, Inc.� 31,925 1,667,443Power Integrations, Inc. 27,558 2,993,901
4,661,344Semiconductor Equipment - 0.7%
Axcelis Technologies, Inc.� 15,201 755,642CMC Materials, Inc. 13,334 1,768,355Cohu, Inc.� 21,874 780,464FormFactor, Inc.� 35,493 1,379,968Kulicke & Soffa Industries, Inc. 27,946 1,961,530Onto Innovation, Inc.� 22,227 1,647,688SkyWater Technology, Inc.�# 3,588 119,767Ultra Clean Holdings, Inc.� 19,853 918,003Veeco Instruments, Inc.� 22,727 517,948
9,849,365Silver Mining - 0.0%
Gatos Silver, Inc.� 15,796 226,515Pan American Silver Corp. CVR� 171,891 132,356
358,871
Copyright © 2021 www.secdatabase.com. All Rights Reserved.Please Consider the Environment Before Printing This Document
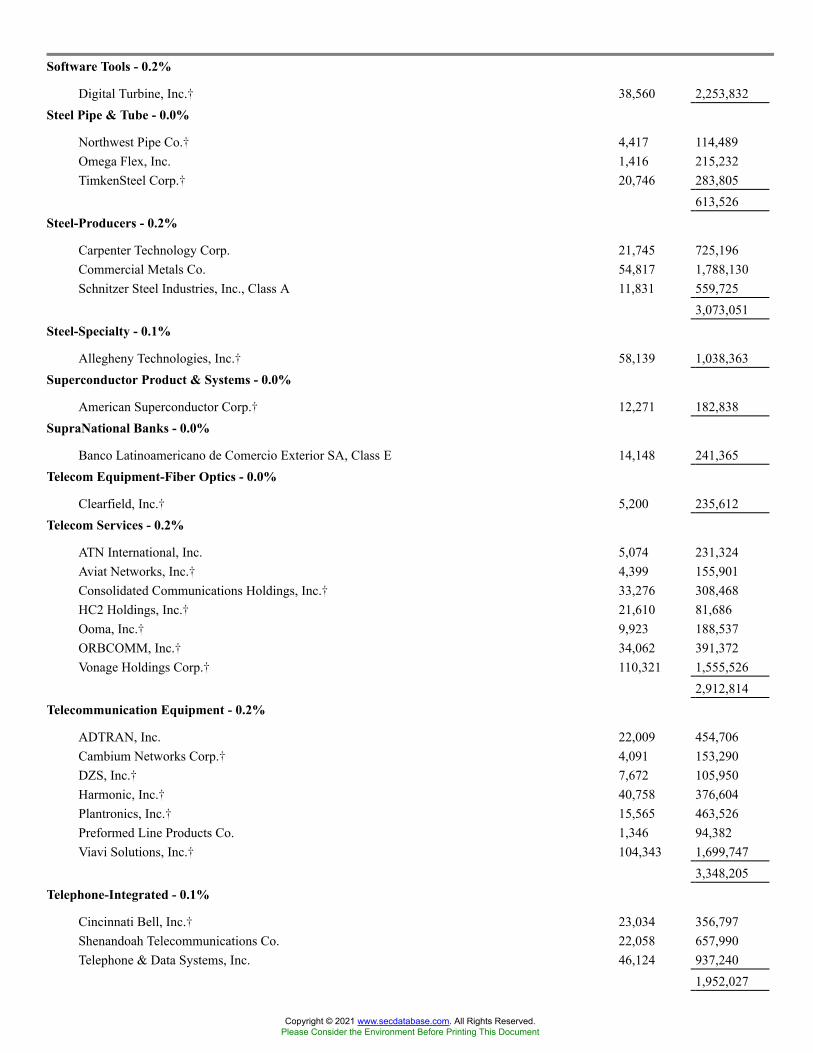
Software Tools - 0.2%
Digital Turbine, Inc.� 38,560 2,253,832Steel Pipe & Tube - 0.0%
Northwest Pipe Co.� 4,417 114,489Omega Flex, Inc. 1,416 215,232TimkenSteel Corp.� 20,746 283,805
613,526Steel-Producers - 0.2%
Carpenter Technology Corp. 21,745 725,196Commercial Metals Co. 54,817 1,788,130Schnitzer Steel Industries, Inc., Class A 11,831 559,725
3,073,051Steel-Specialty - 0.1%
Allegheny Technologies, Inc.� 58,139 1,038,363Superconductor Product & Systems - 0.0%
American Superconductor Corp.� 12,271 182,838SupraNational Banks - 0.0%
Banco Latinoamericano de Comercio Exterior SA, Class E 14,148 241,365Telecom Equipment-Fiber Optics - 0.0%
Clearfield, Inc.� 5,200 235,612Telecom Services - 0.2%
ATN International, Inc. 5,074 231,324Aviat Networks, Inc.� 4,399 155,901Consolidated Communications Holdings, Inc.� 33,276 308,468HC2 Holdings, Inc.� 21,610 81,686Ooma, Inc.� 9,923 188,537ORBCOMM, Inc.� 34,062 391,372Vonage Holdings Corp.� 110,321 1,555,526
2,912,814Telecommunication Equipment - 0.2%
ADTRAN, Inc. 22,009 454,706Cambium Networks Corp.� 4,091 153,290DZS, Inc.� 7,672 105,950Harmonic, Inc.� 40,758 376,604Plantronics, Inc.� 15,565 463,526Preformed Line Products Co. 1,346 94,382Viavi Solutions, Inc.� 104,343 1,699,747
3,348,205Telephone-Integrated - 0.1%
Cincinnati Bell, Inc.� 23,034 356,797Shenandoah Telecommunications Co. 22,058 657,990Telephone & Data Systems, Inc. 46,124 937,240
1,952,027
Copyright © 2021 www.secdatabase.com. All Rights Reserved.Please Consider the Environment Before Printing This Document

Television - 0.2%
AMC Networks, Inc., Class A� 13,279 631,151Gray Television, Inc. 39,003 886,928Sinclair Broadcast Group, Inc., Class A# 20,963 629,100
2,147,179Textile-Apparel - 0.0%
Unifi, Inc.� 6,055 140,718Theaters - 0.7%
AMC Entertainment Holdings, Inc., Class A�# 185,887 8,760,854Cinemark Holdings, Inc.�# 49,326 879,483
9,640,337Therapeutics - 0.2%
Agios Pharmaceuticals, Inc.�# 28,115 1,256,178Akebia Therapeutics, Inc.� 72,922 214,391Anika Therapeutics, Inc.� 6,586 284,054CorMedix, Inc.�# 17,293 111,713Flexion Therapeutics, Inc.�# 21,976 131,416G1 Therapeutics, Inc.�# 17,891 270,512MannKind Corp.�# 112,682 540,874Ocugen, Inc.� 84,270 639,609Outlook Therapeutics, Inc.� 39,966 110,306
3,559,053Tobacco - 0.2%
22nd Century Group, Inc.�# 68,904 245,987Greenlane Holdings, Inc., Class A�# 7,446 18,913Turning Point Brands, Inc. 6,648 330,805Universal Corp. 11,034 558,320Vector Group, Ltd. 65,558 984,681
2,138,706Toys - 0.0%
Funko, Inc., Class A�# 12,099 241,254Traffic Management Sys - 0.0%
Arlo Technologies, Inc.� 37,156 230,367Transport-Air Freight - 0.1%
Air Transport Services Group, Inc.� 26,936 737,777Atlas Air Worldwide Holdings, Inc.� 13,140 961,454
1,699,231Transport-Equipment & Leasing - 0.2%
GATX Corp. 16,119 1,477,790Greenbrier Cos., Inc. 14,752 650,563Willis Lease Finance Corp.� 1,251 47,100
2,175,453Transport-Marine - 0.2%
Copyright © 2021 www.secdatabase.com. All Rights Reserved.Please Consider the Environment Before Printing This Document
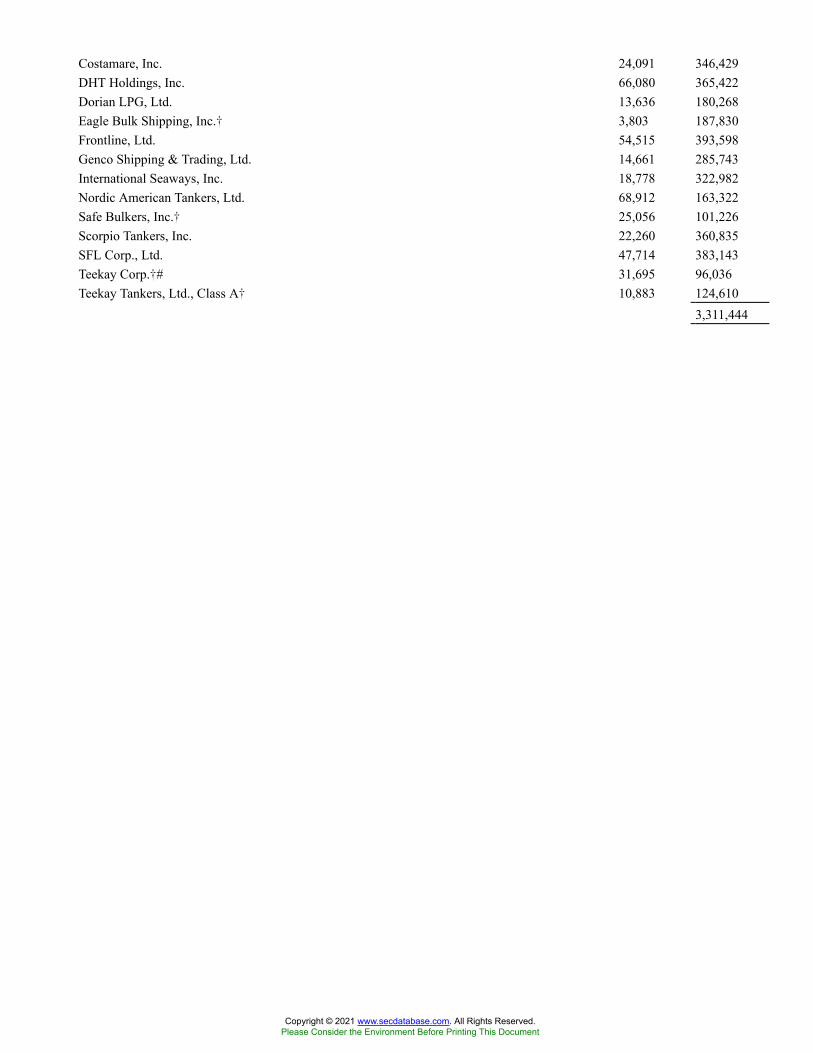
Costamare, Inc. 24,091 346,429DHT Holdings, Inc. 66,080 365,422Dorian LPG, Ltd. 13,636 180,268Eagle Bulk Shipping, Inc.� 3,803 187,830Frontline, Ltd. 54,515 393,598Genco Shipping & Trading, Ltd. 14,661 285,743International Seaways, Inc. 18,778 322,982Nordic American Tankers, Ltd. 68,912 163,322Safe Bulkers, Inc.� 25,056 101,226Scorpio Tankers, Inc. 22,260 360,835SFL Corp., Ltd. 47,714 383,143Teekay Corp.�# 31,695 96,036Teekay Tankers, Ltd., Class A� 10,883 124,610
3,311,444
Copyright © 2021 www.secdatabase.com. All Rights Reserved.Please Consider the Environment Before Printing This Document

Transport-Services - 0.4%
AFC Gamma, Inc. 3,310 70,536CryoPort, Inc.�# 18,510 1,176,681Echo Global Logistics, Inc.� 12,024 395,349Forward Air Corp. 12,408 1,094,013Hub Group, Inc., Class A� 15,110 1,060,722Ideanomics, Inc.�# 186,456 468,005Matson, Inc. 19,612 1,552,682Radiant Logistics, Inc.� 17,913 122,704Universal Logistics Holdings, Inc. 3,495 76,436
6,017,128Transport-Truck - 0.4%
ArcBest Corp. 11,553 770,932Covenant Logistics Group, Inc.� 5,605 136,538Daseke, Inc.� 19,171 181,166Heartland Express, Inc. 21,774 365,368Marten Transport, Ltd. 27,160 423,424P.A.M. Transportation Services, Inc.� 1,658 57,980Saia, Inc.� 12,110 2,907,974US Xpress Enterprises, Inc., Class A� 12,277 107,301Werner Enterprises, Inc. 28,603 1,348,918Yellow Corp.� 22,977 139,930
6,439,531Travel Services - 0.0%
Liberty TripAdvisor Holdings, Inc., Class A� 33,250 124,355Veterinary Diagnostics - 0.1%
Heska Corp.� 4,372 1,159,892Vitamins & Nutrition Products - 0.0%
Nature�s Sunshine Products, Inc. 5,413 92,671USANA Health Sciences, Inc.� 5,799 562,677
655,348Water - 0.4%
American States Water Co. 16,837 1,552,540Artesian Resources Corp., Class A 3,715 146,408California Water Service Group 23,189 1,473,661Global Water Resources, Inc. 5,772 115,440Middlesex Water Co. 7,886 862,807SJW Group 12,631 875,707York Water Co. 5,944 306,532
5,333,095Water Treatment Systems - 0.0%
Energy Recovery, Inc.� 19,246 393,196Pure Cycle Corp.� 8,784 131,321
524,517
Copyright © 2021 www.secdatabase.com. All Rights Reserved.Please Consider the Environment Before Printing This Document
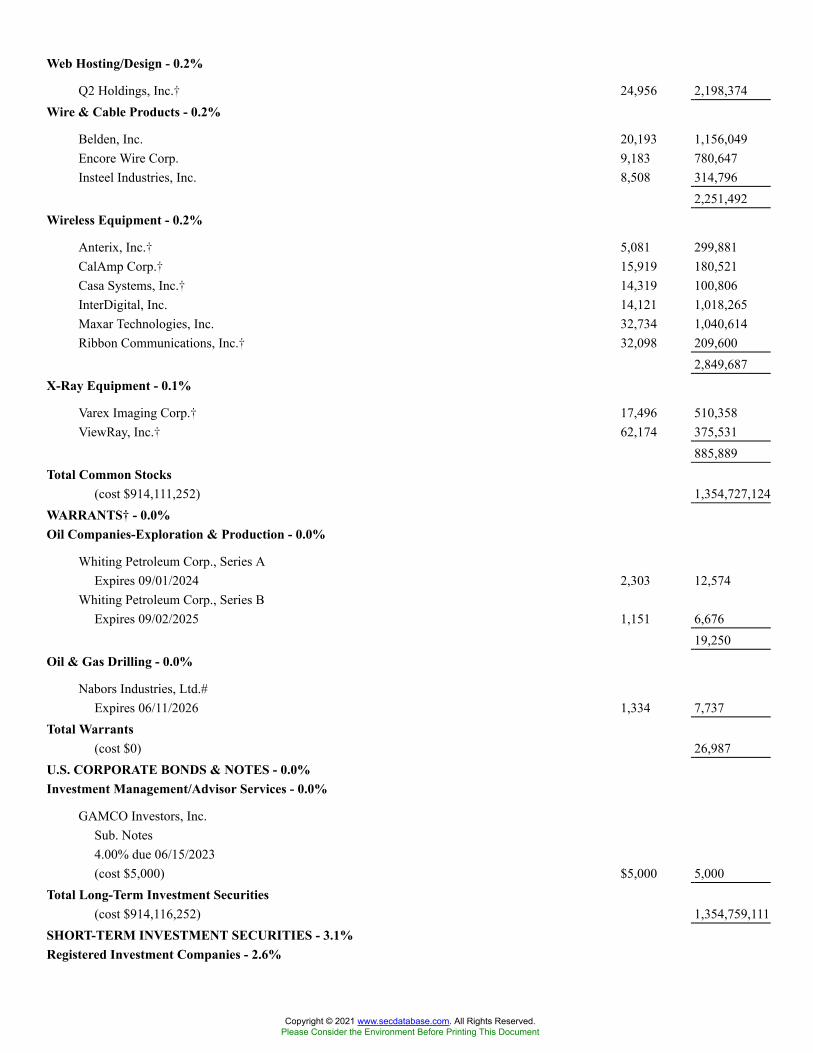
Web Hosting/Design - 0.2%
Q2 Holdings, Inc.� 24,956 2,198,374Wire & Cable Products - 0.2%
Belden, Inc. 20,193 1,156,049Encore Wire Corp. 9,183 780,647Insteel Industries, Inc. 8,508 314,796
2,251,492Wireless Equipment - 0.2%
Anterix, Inc.� 5,081 299,881CalAmp Corp.� 15,919 180,521Casa Systems, Inc.� 14,319 100,806InterDigital, Inc. 14,121 1,018,265Maxar Technologies, Inc. 32,734 1,040,614Ribbon Communications, Inc.� 32,098 209,600
2,849,687X-Ray Equipment - 0.1%
Varex Imaging Corp.� 17,496 510,358ViewRay, Inc.� 62,174 375,531
885,889Total Common Stocks
(cost $914,111,252) 1,354,727,124WARRANTS�� - 0.0%Oil Companies-Exploration & Production - 0.0%
Whiting Petroleum Corp., Series AExpires 09/01/2024 2,303 12,574
Whiting Petroleum Corp., Series BExpires 09/02/2025 1,151 6,676
19,250Oil & Gas Drilling - 0.0%
Nabors Industries, Ltd.#Expires 06/11/2026 1,334 7,737
Total Warrants(cost $0) 26,987
U.S. CORPORATE BONDS & NOTES - 0.0%Investment Management/Advisor Services - 0.0%
GAMCO Investors, Inc.Sub. Notes4.00% due 06/15/2023(cost $5,000) $5,000 5,000
Total Long-Term Investment Securities(cost $914,116,252) 1,354,759,111
SHORT-TERM INVESTMENT SECURITIES - 3.1%Registered Investment Companies - 2.6%
Copyright © 2021 www.secdatabase.com. All Rights Reserved.Please Consider the Environment Before Printing This Document

State Street Navigator Securities Lending Government Money Market Portfolio0.03%(2)(3) 37,948,494 37,948,494
U.S. Government Treasuries - 0.5%
United States Treasury Bills0.04% due 05/19/2022(4) $3,000,000 2,998,8080.07% due 06/16/2022(4) 600,000 599,6880.07% due 07/14/2022(4) 950,000 949,4580.08% due 08/11/2022(4) 2,500,000 2,498,3280.12% due 10/07/2021(4) 300,000 299,987
7,346,269Total Short-Term Investment Securities
(cost $45,294,901) 45,294,763
Copyright © 2021 www.secdatabase.com. All Rights Reserved.Please Consider the Environment Before Printing This Document
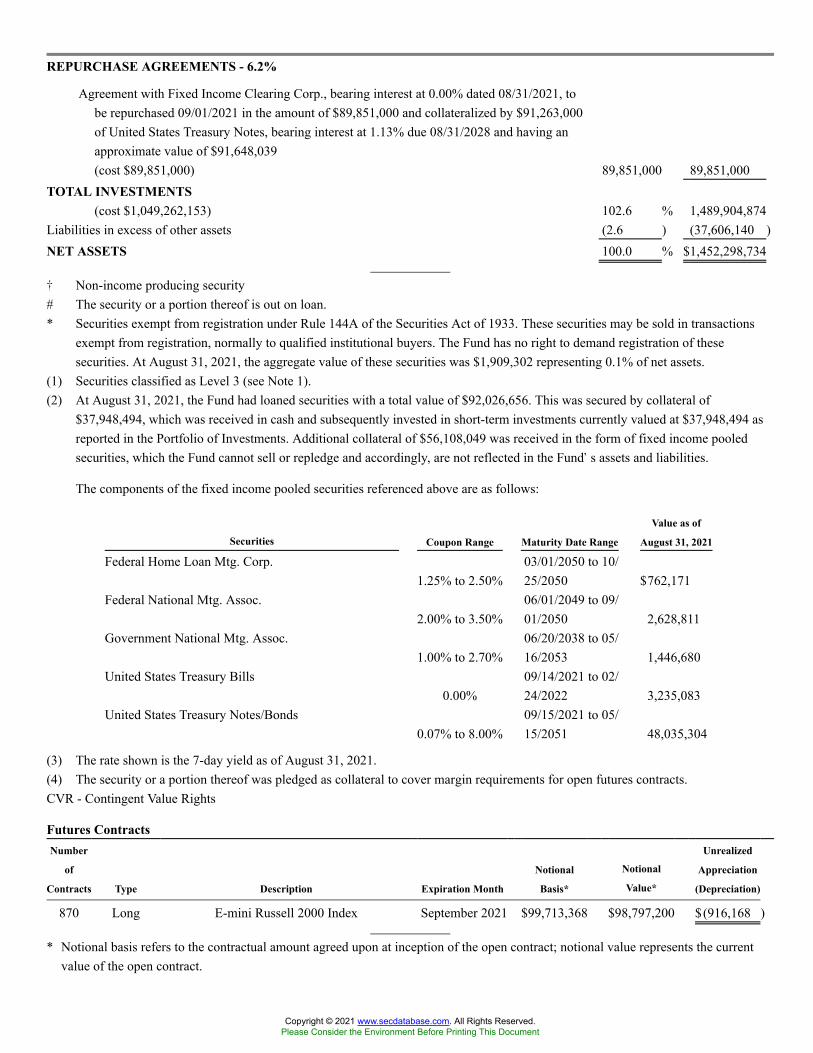
REPURCHASE AGREEMENTS - 6.2%
Agreement with Fixed Income Clearing Corp., bearing interest at 0.00% dated 08/31/2021, tobe repurchased 09/01/2021 in the amount of $89,851,000 and collateralized by $91,263,000of United States Treasury Notes, bearing interest at 1.13% due 08/31/2028 and having anapproximate value of $91,648,039(cost $89,851,000) 89,851,000 89,851,000
TOTAL INVESTMENTS(cost $1,049,262,153) 102.6 % 1,489,904,874
Liabilities in excess of other assets (2.6 ) (37,606,140 )NET ASSETS 100.0 % $1,452,298,734
� Non-income producing security# The security or a portion thereof is out on loan.* Securities exempt from registration under Rule 144A of the Securities Act of 1933. These securities may be sold in transactions
exempt from registration, normally to qualified institutional buyers. The Fund has no right to demand registration of thesesecurities. At August 31, 2021, the aggregate value of these securities was $1,909,302 representing 0.1% of net assets.
(1) Securities classified as Level 3 (see Note 1).(2) At August 31, 2021, the Fund had loaned securities with a total value of $92,026,656. This was secured by collateral of
$37,948,494, which was received in cash and subsequently invested in short-term investments currently valued at $37,948,494 asreported in the Portfolio of Investments. Additional collateral of $56,108,049 was received in the form of fixed income pooledsecurities, which the Fund cannot sell or repledge and accordingly, are not reflected in the Fund�s assets and liabilities.
The components of the fixed income pooled securities referenced above are as follows:
Securities Coupon Range Maturity Date Range
Value as of
August 31, 2021
Federal Home Loan Mtg. Corp.1.25% to 2.50%
03/01/2050 to 10/25/2050 $762,171
Federal National Mtg. Assoc.2.00% to 3.50%
06/01/2049 to 09/01/2050 2,628,811
Government National Mtg. Assoc.1.00% to 2.70%
06/20/2038 to 05/16/2053 1,446,680
United States Treasury Bills0.00%
09/14/2021 to 02/24/2022 3,235,083
United States Treasury Notes/Bonds0.07% to 8.00%
09/15/2021 to 05/15/2051 48,035,304
(3) The rate shown is the 7-day yield as of August 31, 2021.(4) The security or a portion thereof was pledged as collateral to cover margin requirements for open futures contracts.CVR - Contingent Value Rights
Futures ContractsNumber
of
Contracts Type Description Expiration Month
Notional
Basis*
Notional
Value*
Unrealized
Appreciation
(Depreciation)
870 Long E-mini Russell 2000 Index September 2021 $99,713,368 $98,797,200 $(916,168 )
* Notional basis refers to the contractual amount agreed upon at inception of the open contract; notional value represents the currentvalue of the open contract.
Copyright © 2021 www.secdatabase.com. All Rights Reserved.Please Consider the Environment Before Printing This Document

The following is a summary of the inputs used to value the Fund�s net assets as of August 31, 2021 (see Note 1):
Level 1 - Unadjusted
Quoted Prices
Level 2 - Other
Observable Inputs
Level 3 - Significant
Unobservable Inputs Total
ASSETS:Investments at Value:*Common Stocks:
Medical-Biomedical/Gene $118,690,578 $ � $ 33,966 $118,724,544Medical-Drugs 29,802,659 � 0 29,802,659Oil Companies-Exploration & Production 27,033,042 � 0 27,033,042Other Industries 1,179,166,879 � � 1,179,166,879
Warrants 26,987 � � 26,987U.S. Corporate Bonds & Notes � 5,000 � 5,000Short-Term Investment Securities:
Registered Investment Companies 37,948,494 � � 37,948,494U.S. Government Treasuries � 7,346,269 � 7,346,269
Repurchase Agreements � 89,851,000 � 89,851,000Total Investments at Value $1,392,668,639 $ 97,202,269 $ 33,966 $1,489,904,874
LIABILITIES:Other Financial Instruments:�Futures Contracts $916,168 $ � $ � $916,168
* For a detailed presentation of investments, please refer to the Portfolio of Investments.� Amounts represent unrealized appreciation/depreciation as of the end of the reporting period.
At the beginning and end of the reporting period, Level 3 investments in securities were not considered a material portion of the Fund.There were no Level 3 transfers during the reporting period.
See Notes to Portfolio of Investments
Copyright © 2021 www.secdatabase.com. All Rights Reserved.Please Consider the Environment Before Printing This Document

VALIC Company I Small Cap Special Values FundPORTFOLIO OF INVESTMENTS - August 31, 2021 - (unaudited)
Security Description Shares
Value
(Note 1)
COMMON STOCKS - 99.0%Apparel Manufacturers - 0.3%
Delta Apparel, Inc.� 27,588 $834,537Applications Software - 1.0%
Concentrix Corp.� 14,893 2,582,297Auto/Truck Parts & Equipment-Original - 1.1%
Holley, Inc.�# 246,058 2,878,879Auto/Truck Parts & Equipment-Replacement - 1.1%
Douglas Dynamics, Inc. 74,398 2,956,577Banks-Commercial - 8.6%
Associated Banc-Corp 88,069 1,815,983CVB Financial Corp. 81,098 1,651,155First Citizens BancShares, Inc., Class A 6,432 5,774,006First Hawaiian, Inc. 52,172 1,456,120Hancock Whitney Corp. 48,229 2,216,605Renasant Corp. 57,570 2,020,707South State Corp. 29,334 2,011,726UMB Financial Corp. 65,034 5,955,814
22,902,116Beverages-Non-alcoholic - 0.8%
Primo Water Corp. 124,713 2,214,903Building & Construction Products-Misc. - 0.8%
Simpson Manufacturing Co., Inc. 19,050 2,155,507Building Products-Cement - 3.2%
Eagle Materials, Inc. 54,768 8,589,813Building Products-Doors & Windows - 1.0%
Griffon Corp. 81,724 1,977,721JELD-WEN Holding, Inc.� 23,652 651,376
2,629,097Building Products-Wood - 0.2%
UFP Industries, Inc. 6,128 460,090Chemicals-Diversified - 2.6%
Innospec, Inc. 74,014 6,927,710Chemicals-Specialty - 2.4%
Ecovyst, Inc. 117,262 1,525,579Element Solutions, Inc. 44,054 1,001,347Minerals Technologies, Inc. 8,357 657,194
Copyright © 2021 www.secdatabase.com. All Rights Reserved.Please Consider the Environment Before Printing This Document
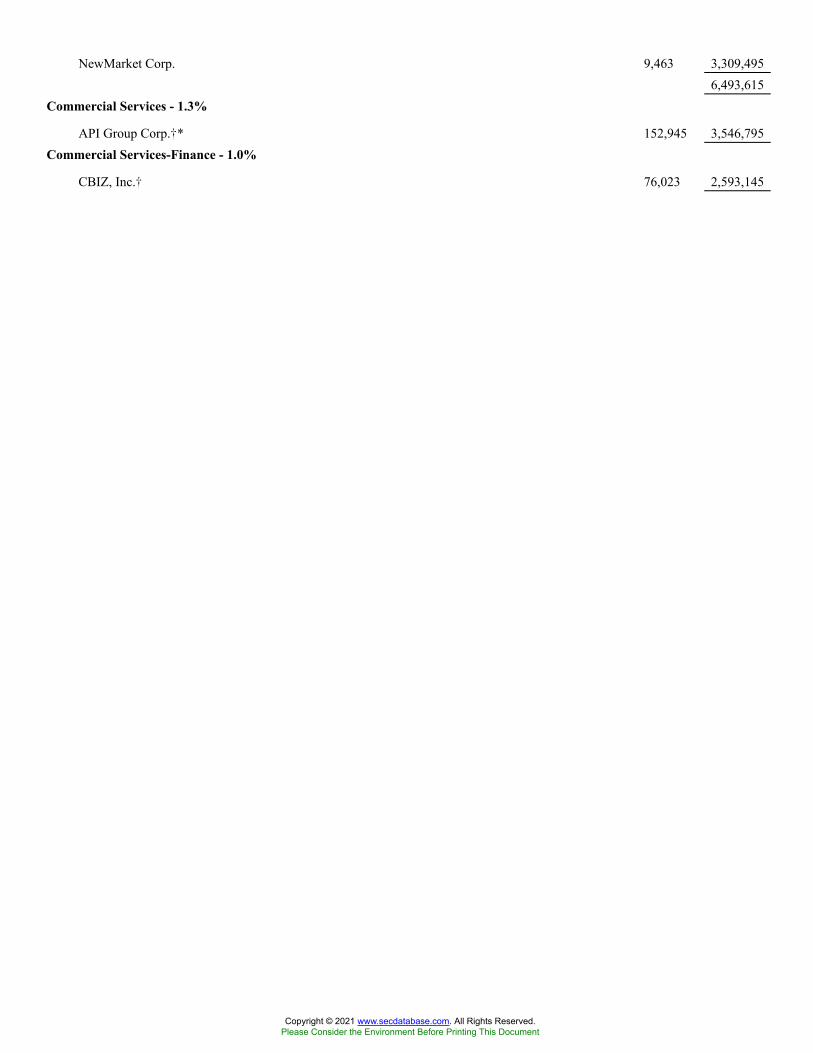
NewMarket Corp. 9,463 3,309,4956,493,615
Commercial Services - 1.3%
API Group Corp.�* 152,945 3,546,795Commercial Services-Finance - 1.0%
CBIZ, Inc.� 76,023 2,593,145
Copyright © 2021 www.secdatabase.com. All Rights Reserved.Please Consider the Environment Before Printing This Document
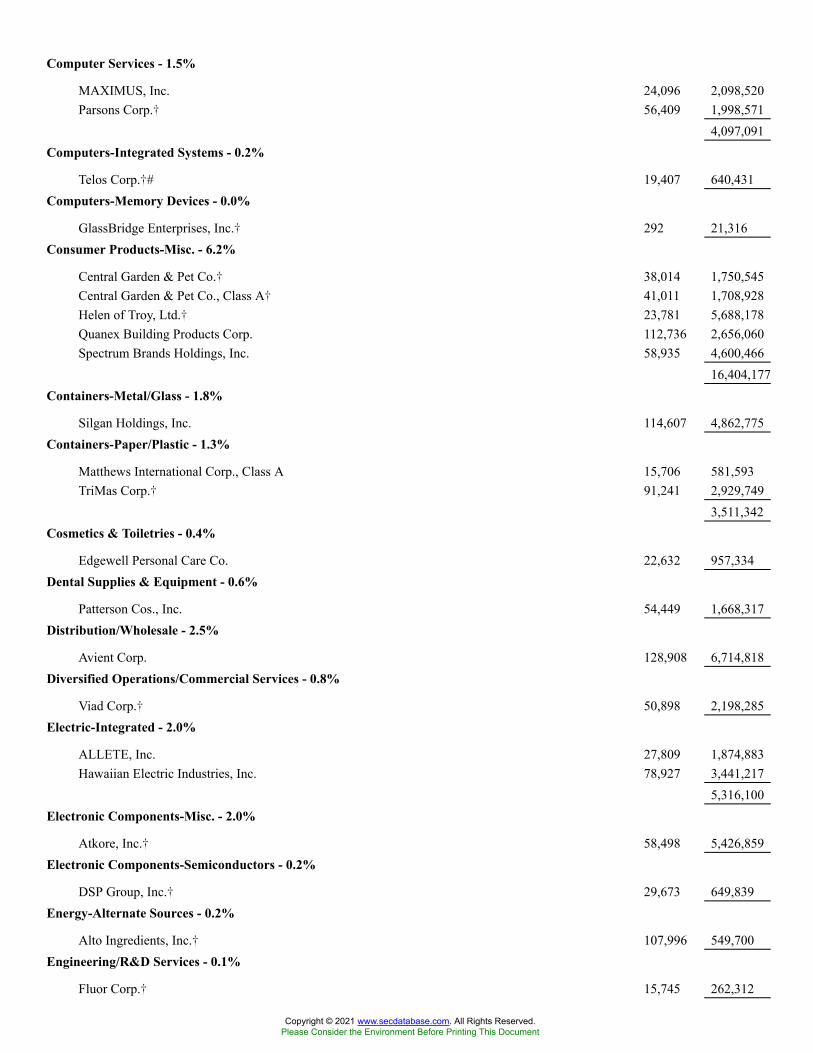
Computer Services - 1.5%
MAXIMUS, Inc. 24,096 2,098,520Parsons Corp.� 56,409 1,998,571
4,097,091Computers-Integrated Systems - 0.2%
Telos Corp.�# 19,407 640,431Computers-Memory Devices - 0.0%
GlassBridge Enterprises, Inc.� 292 21,316Consumer Products-Misc. - 6.2%
Central Garden & Pet Co.� 38,014 1,750,545Central Garden & Pet Co., Class A� 41,011 1,708,928Helen of Troy, Ltd.� 23,781 5,688,178Quanex Building Products Corp. 112,736 2,656,060Spectrum Brands Holdings, Inc. 58,935 4,600,466
16,404,177Containers-Metal/Glass - 1.8%
Silgan Holdings, Inc. 114,607 4,862,775Containers-Paper/Plastic - 1.3%
Matthews International Corp., Class A 15,706 581,593TriMas Corp.� 91,241 2,929,749
3,511,342Cosmetics & Toiletries - 0.4%
Edgewell Personal Care Co. 22,632 957,334Dental Supplies & Equipment - 0.6%
Patterson Cos., Inc. 54,449 1,668,317Distribution/Wholesale - 2.5%
Avient Corp. 128,908 6,714,818Diversified Operations/Commercial Services - 0.8%
Viad Corp.� 50,898 2,198,285Electric-Integrated - 2.0%
ALLETE, Inc. 27,809 1,874,883Hawaiian Electric Industries, Inc. 78,927 3,441,217
5,316,100Electronic Components-Misc. - 2.0%
Atkore, Inc.� 58,498 5,426,859Electronic Components-Semiconductors - 0.2%
DSP Group, Inc.� 29,673 649,839Energy-Alternate Sources - 0.2%
Alto Ingredients, Inc.� 107,996 549,700Engineering/R&D Services - 0.1%
Fluor Corp.� 15,745 262,312
Copyright © 2021 www.secdatabase.com. All Rights Reserved.Please Consider the Environment Before Printing This Document
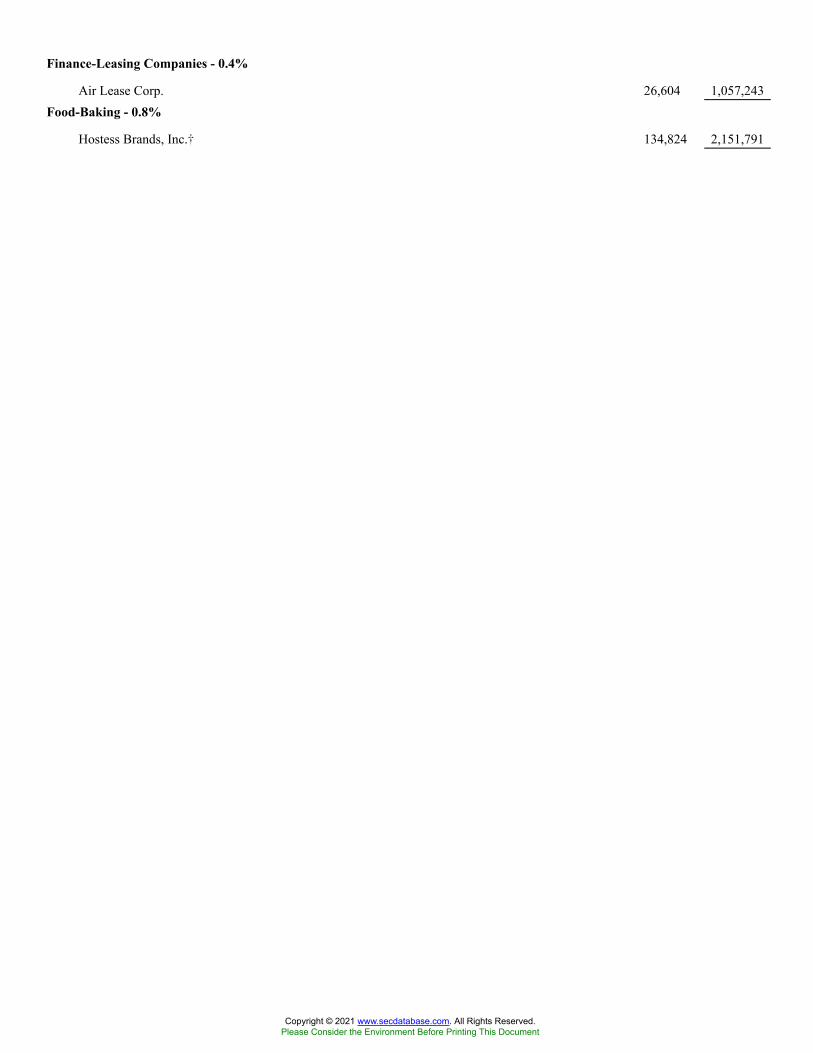
Finance-Leasing Companies - 0.4%
Air Lease Corp. 26,604 1,057,243Food-Baking - 0.8%
Hostess Brands, Inc.� 134,824 2,151,791
Copyright © 2021 www.secdatabase.com. All Rights Reserved.Please Consider the Environment Before Printing This Document

Food-Catering - 0.9%
Healthcare Services Group, Inc. 96,076 2,513,348Food-Confectionery - 0.8%
Tootsie Roll Industries, Inc.# 31,678 1,002,609Utz Brands, Inc. 52,283 1,015,336
2,017,945Food-Misc./Diversified - 4.3%
J&J Snack Foods Corp. 42,850 7,017,116Nomad Foods, Ltd.� 165,528 4,368,284
11,385,400Footwear & Related Apparel - 0.7%
Steven Madden, Ltd. 44,136 1,786,184Gambling (Non-Hotel) - 0.3%
Bally�s Corp.� 14,679 737,473Housewares - 0.8%
Tupperware Brands Corp.� 94,310 2,251,180Human Resources - 1.2%
Korn Ferry 45,533 3,218,728Insurance-Life/Health - 0.5%
CNO Financial Group, Inc. 23,250 568,695
Copyright © 2021 www.secdatabase.com. All Rights Reserved.Please Consider the Environment Before Printing This Document

National Western Life Group, Inc., Class A 3,132 694,2391,262,934
Insurance-Property/Casualty - 4.3%
Enstar Group, Ltd.� 13,221 3,049,688Hanover Insurance Group, Inc. 25,968 3,669,538ProAssurance Corp. 55,571 1,417,061Stewart Information Services Corp. 54,600 3,437,070
11,573,357Investment Companies - 1.0%
Apollo Investment Corp. 84,839 1,166,536New Mountain Finance Corp. 111,132 1,485,835
2,652,371Investment Management/Advisor Services - 0.2%
Westwood Holdings Group, Inc. 27,461 611,831Machinery-Electrical - 2.7%
Babcock & Wilcox Enterprises, Inc.� 96,551 704,823Franklin Electric Co., Inc. 74,988 6,372,480
7,077,303Machinery-Farming - 0.6%
Alamo Group, Inc. 10,917 1,692,244Machinery-General Industrial - 1.2%
Kadant, Inc. 14,700 3,074,064Machinery-Material Handling - 0.7%
Columbus McKinnon Corp. 40,798 1,878,748Machinery-Pumps - 2.0%
CSW Industrials, Inc. 37,987 5,044,294NN, Inc.� 44,233 240,627
5,284,921Medical Instruments - 0.5%
Natus Medical, Inc.� 48,457 1,285,080Medical Labs & Testing Services - 0.3%
Ortho Clinical Diagnostics Holdings PLC� 45,180 923,479Medical-Drugs - 0.8%
Prestige Consumer Healthcare, Inc.� 36,665 2,104,204Medical-Generic Drugs - 0.1%
Perrigo Co. PLC 3,945 161,548Medical-Hospitals - 0.1%
ATI Physical Therapy, Inc.�# 36,151 155,449Medical-Wholesale Drug Distribution - 1.6%
Owens & Minor, Inc. 87,072 3,246,044Premier, Inc., Class A 29,446 1,094,802
Copyright © 2021 www.secdatabase.com. All Rights Reserved.Please Consider the Environment Before Printing This Document
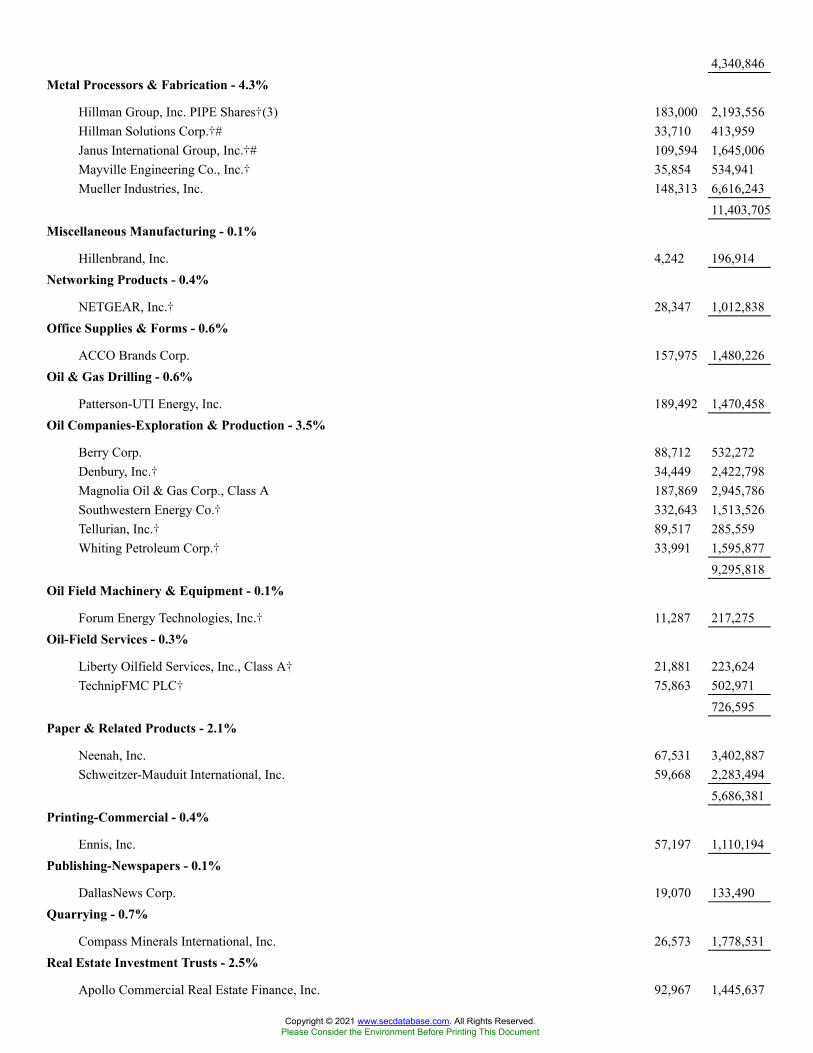
4,340,846Metal Processors & Fabrication - 4.3%
Hillman Group, Inc. PIPE Shares�(3) 183,000 2,193,556Hillman Solutions Corp.�# 33,710 413,959Janus International Group, Inc.�# 109,594 1,645,006Mayville Engineering Co., Inc.� 35,854 534,941Mueller Industries, Inc. 148,313 6,616,243
11,403,705Miscellaneous Manufacturing - 0.1%
Hillenbrand, Inc. 4,242 196,914Networking Products - 0.4%
NETGEAR, Inc.� 28,347 1,012,838Office Supplies & Forms - 0.6%
ACCO Brands Corp. 157,975 1,480,226Oil & Gas Drilling - 0.6%
Patterson-UTI Energy, Inc. 189,492 1,470,458Oil Companies-Exploration & Production - 3.5%
Berry Corp. 88,712 532,272Denbury, Inc.� 34,449 2,422,798Magnolia Oil & Gas Corp., Class A 187,869 2,945,786Southwestern Energy Co.� 332,643 1,513,526Tellurian, Inc.� 89,517 285,559Whiting Petroleum Corp.� 33,991 1,595,877
9,295,818Oil Field Machinery & Equipment - 0.1%
Forum Energy Technologies, Inc.� 11,287 217,275Oil-Field Services - 0.3%
Liberty Oilfield Services, Inc., Class A� 21,881 223,624TechnipFMC PLC� 75,863 502,971
726,595Paper & Related Products - 2.1%
Neenah, Inc. 67,531 3,402,887Schweitzer-Mauduit International, Inc. 59,668 2,283,494
5,686,381Printing-Commercial - 0.4%
Ennis, Inc. 57,197 1,110,194Publishing-Newspapers - 0.1%
DallasNews Corp. 19,070 133,490Quarrying - 0.7%
Compass Minerals International, Inc. 26,573 1,778,531Real Estate Investment Trusts - 2.5%
Apollo Commercial Real Estate Finance, Inc. 92,967 1,445,637
Copyright © 2021 www.secdatabase.com. All Rights Reserved.Please Consider the Environment Before Printing This Document
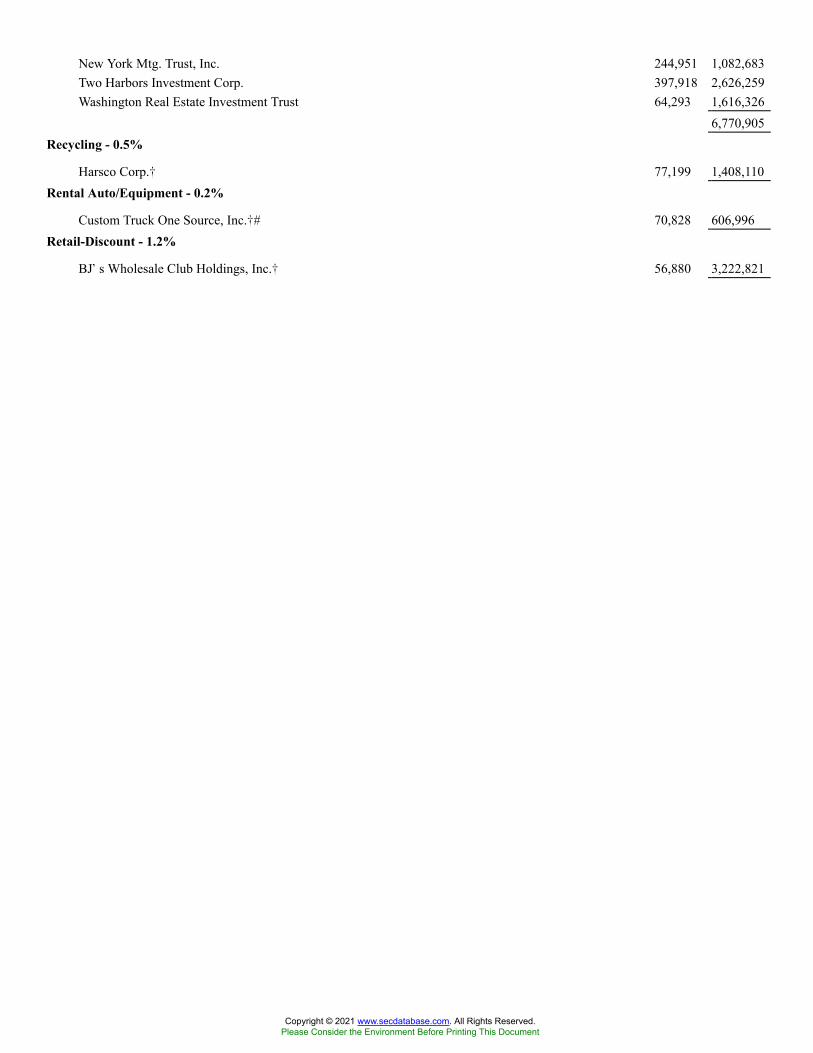
New York Mtg. Trust, Inc. 244,951 1,082,683Two Harbors Investment Corp. 397,918 2,626,259Washington Real Estate Investment Trust 64,293 1,616,326
6,770,905Recycling - 0.5%
Harsco Corp.� 77,199 1,408,110Rental Auto/Equipment - 0.2%
Custom Truck One Source, Inc.�# 70,828 606,996Retail-Discount - 1.2%
BJ�s Wholesale Club Holdings, Inc.� 56,880 3,222,821
Copyright © 2021 www.secdatabase.com. All Rights Reserved.Please Consider the Environment Before Printing This Document

Retail-Restaurants - 3.8%
Denny�s Corp.� 202,918 3,356,264Dine Brands Global, Inc.� 42,480 3,513,946
Copyright © 2021 www.secdatabase.com. All Rights Reserved.Please Consider the Environment Before Printing This Document
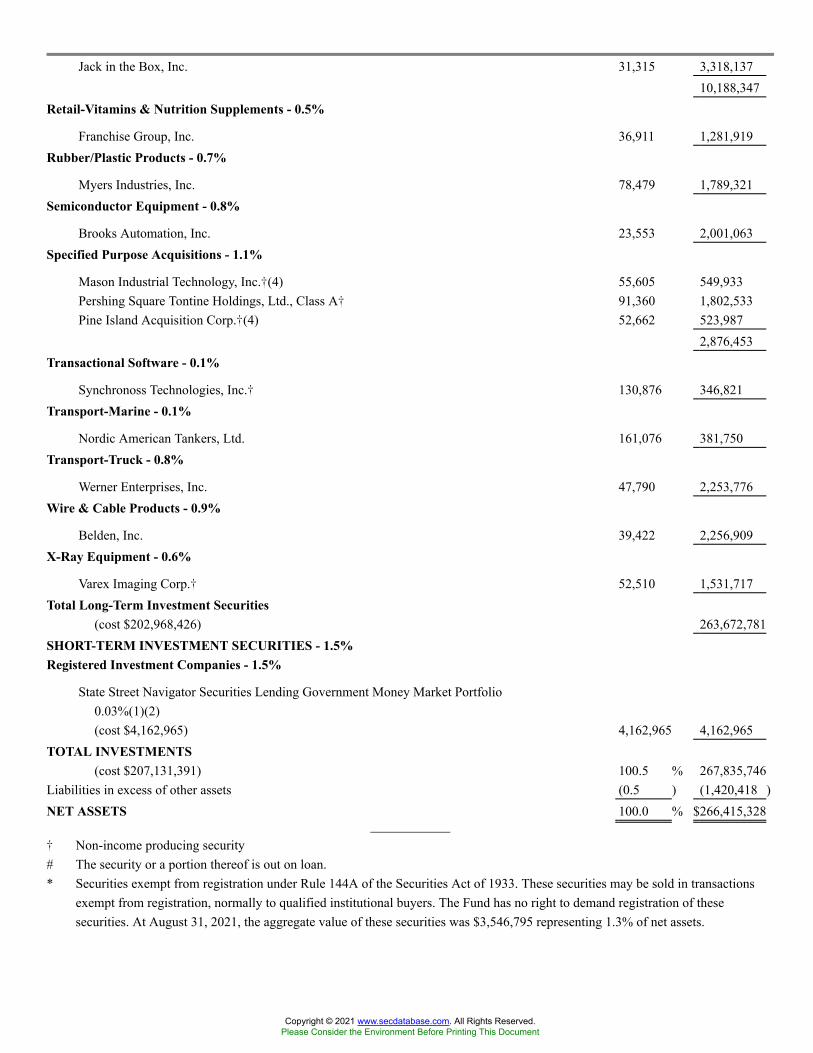
Jack in the Box, Inc. 31,315 3,318,13710,188,347
Retail-Vitamins & Nutrition Supplements - 0.5%
Franchise Group, Inc. 36,911 1,281,919Rubber/Plastic Products - 0.7%
Myers Industries, Inc. 78,479 1,789,321Semiconductor Equipment - 0.8%
Brooks Automation, Inc. 23,553 2,001,063Specified Purpose Acquisitions - 1.1%
Mason Industrial Technology, Inc.�(4) 55,605 549,933Pershing Square Tontine Holdings, Ltd., Class A� 91,360 1,802,533Pine Island Acquisition Corp.�(4) 52,662 523,987
2,876,453Transactional Software - 0.1%
Synchronoss Technologies, Inc.� 130,876 346,821Transport-Marine - 0.1%
Nordic American Tankers, Ltd. 161,076 381,750Transport-Truck - 0.8%
Werner Enterprises, Inc. 47,790 2,253,776Wire & Cable Products - 0.9%
Belden, Inc. 39,422 2,256,909X-Ray Equipment - 0.6%
Varex Imaging Corp.� 52,510 1,531,717Total Long-Term Investment Securities
(cost $202,968,426) 263,672,781SHORT-TERM INVESTMENT SECURITIES - 1.5%Registered Investment Companies - 1.5%
State Street Navigator Securities Lending Government Money Market Portfolio0.03%(1)(2)(cost $4,162,965) 4,162,965 4,162,965
TOTAL INVESTMENTS(cost $207,131,391) 100.5 % 267,835,746
Liabilities in excess of other assets (0.5 ) (1,420,418 )NET ASSETS 100.0 % $266,415,328
� Non-income producing security# The security or a portion thereof is out on loan.* Securities exempt from registration under Rule 144A of the Securities Act of 1933. These securities may be sold in transactions
exempt from registration, normally to qualified institutional buyers. The Fund has no right to demand registration of thesesecurities. At August 31, 2021, the aggregate value of these securities was $3,546,795 representing 1.3% of net assets.
Copyright © 2021 www.secdatabase.com. All Rights Reserved.Please Consider the Environment Before Printing This Document
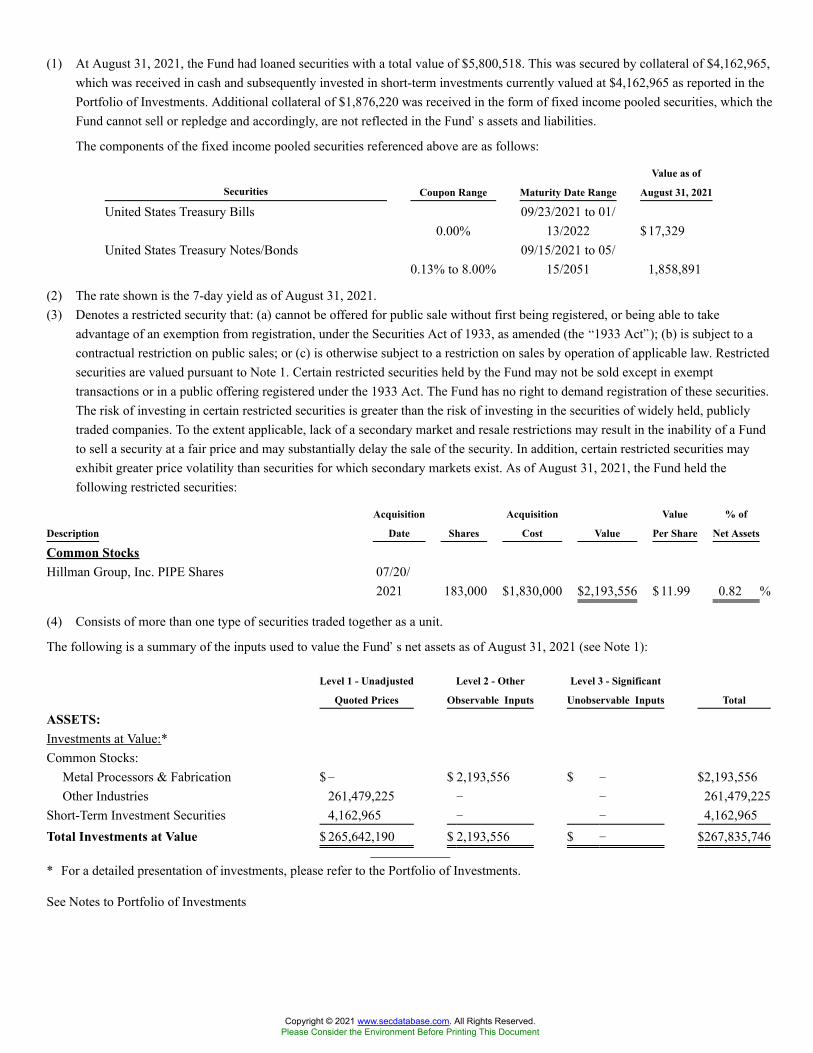
(1) At August 31, 2021, the Fund had loaned securities with a total value of $5,800,518. This was secured by collateral of $4,162,965,which was received in cash and subsequently invested in short-term investments currently valued at $4,162,965 as reported in thePortfolio of Investments. Additional collateral of $1,876,220 was received in the form of fixed income pooled securities, which theFund cannot sell or repledge and accordingly, are not reflected in the Fund�s assets and liabilities.
The components of the fixed income pooled securities referenced above are as follows:
Securities Coupon Range Maturity Date Range
Value as of
August 31, 2021
United States Treasury Bills0.00%
09/23/2021 to 01/13/2022 $17,329
United States Treasury Notes/Bonds0.13% to 8.00%
09/15/2021 to 05/15/2051 1,858,891
(2) The rate shown is the 7-day yield as of August 31, 2021.(3) Denotes a restricted security that: (a) cannot be offered for public sale without first being registered, or being able to take
advantage of an exemption from registration, under the Securities Act of 1933, as amended (the �1933 Act�); (b) is subject to acontractual restriction on public sales; or (c) is otherwise subject to a restriction on sales by operation of applicable law. Restrictedsecurities are valued pursuant to Note 1. Certain restricted securities held by the Fund may not be sold except in exempttransactions or in a public offering registered under the 1933 Act. The Fund has no right to demand registration of these securities.The risk of investing in certain restricted securities is greater than the risk of investing in the securities of widely held, publiclytraded companies. To the extent applicable, lack of a secondary market and resale restrictions may result in the inability of a Fundto sell a security at a fair price and may substantially delay the sale of the security. In addition, certain restricted securities mayexhibit greater price volatility than securities for which secondary markets exist. As of August 31, 2021, the Fund held thefollowing restricted securities:
Description
Acquisition
Date Shares
Acquisition
Cost Value
Value
Per Share
% of
Net Assets
Common StocksHillman Group, Inc. PIPE Shares 07/20/
2021 183,000 $1,830,000 $2,193,556 $11.99 0.82 %
(4) Consists of more than one type of securities traded together as a unit.
The following is a summary of the inputs used to value the Fund�s net assets as of August 31, 2021 (see Note 1):
Level 1 - Unadjusted
Quoted Prices
Level 2 - Other
Observable Inputs
Level 3 - Significant
Unobservable Inputs Total
ASSETS:Investments at Value:*Common Stocks:
Metal Processors & Fabrication $� $ 2,193,556 $ � $2,193,556Other Industries 261,479,225 � � 261,479,225
Short-Term Investment Securities 4,162,965 � � 4,162,965Total Investments at Value $ 265,642,190 $ 2,193,556 $ � $267,835,746
* For a detailed presentation of investments, please refer to the Portfolio of Investments.
See Notes to Portfolio of Investments
Copyright © 2021 www.secdatabase.com. All Rights Reserved.Please Consider the Environment Before Printing This Document
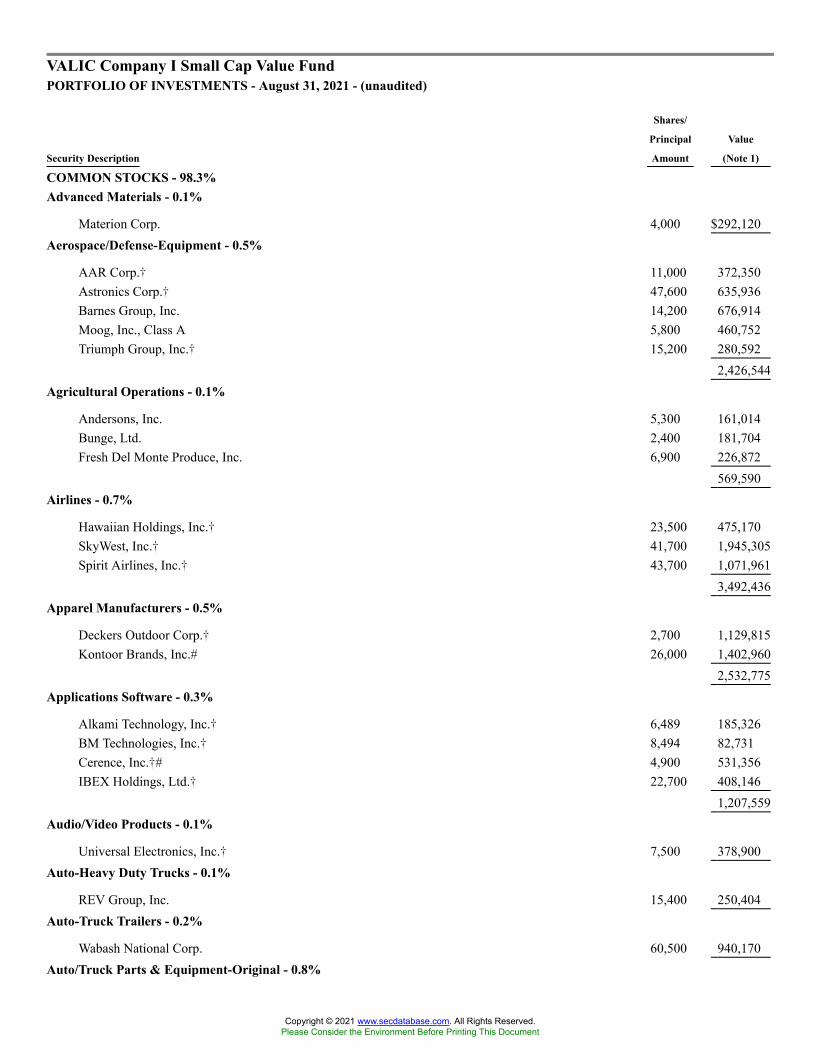
VALIC Company I Small Cap Value FundPORTFOLIO OF INVESTMENTS - August 31, 2021 - (unaudited)
Security Description
Shares/
Principal
Amount
Value
(Note 1)
COMMON STOCKS - 98.3%Advanced Materials - 0.1%
Materion Corp. 4,000 $292,120Aerospace/Defense-Equipment - 0.5%
AAR Corp.� 11,000 372,350Astronics Corp.� 47,600 635,936Barnes Group, Inc. 14,200 676,914Moog, Inc., Class A 5,800 460,752Triumph Group, Inc.� 15,200 280,592
2,426,544Agricultural Operations - 0.1%
Andersons, Inc. 5,300 161,014Bunge, Ltd. 2,400 181,704Fresh Del Monte Produce, Inc. 6,900 226,872
569,590Airlines - 0.7%
Hawaiian Holdings, Inc.� 23,500 475,170SkyWest, Inc.� 41,700 1,945,305Spirit Airlines, Inc.� 43,700 1,071,961
3,492,436Apparel Manufacturers - 0.5%
Deckers Outdoor Corp.� 2,700 1,129,815Kontoor Brands, Inc.# 26,000 1,402,960
2,532,775Applications Software - 0.3%
Alkami Technology, Inc.� 6,489 185,326BM Technologies, Inc.� 8,494 82,731Cerence, Inc.�# 4,900 531,356IBEX Holdings, Ltd.� 22,700 408,146
1,207,559Audio/Video Products - 0.1%
Universal Electronics, Inc.� 7,500 378,900Auto-Heavy Duty Trucks - 0.1%
REV Group, Inc. 15,400 250,404Auto-Truck Trailers - 0.2%
Wabash National Corp. 60,500 940,170Auto/Truck Parts & Equipment-Original - 0.8%
Copyright © 2021 www.secdatabase.com. All Rights Reserved.Please Consider the Environment Before Printing This Document
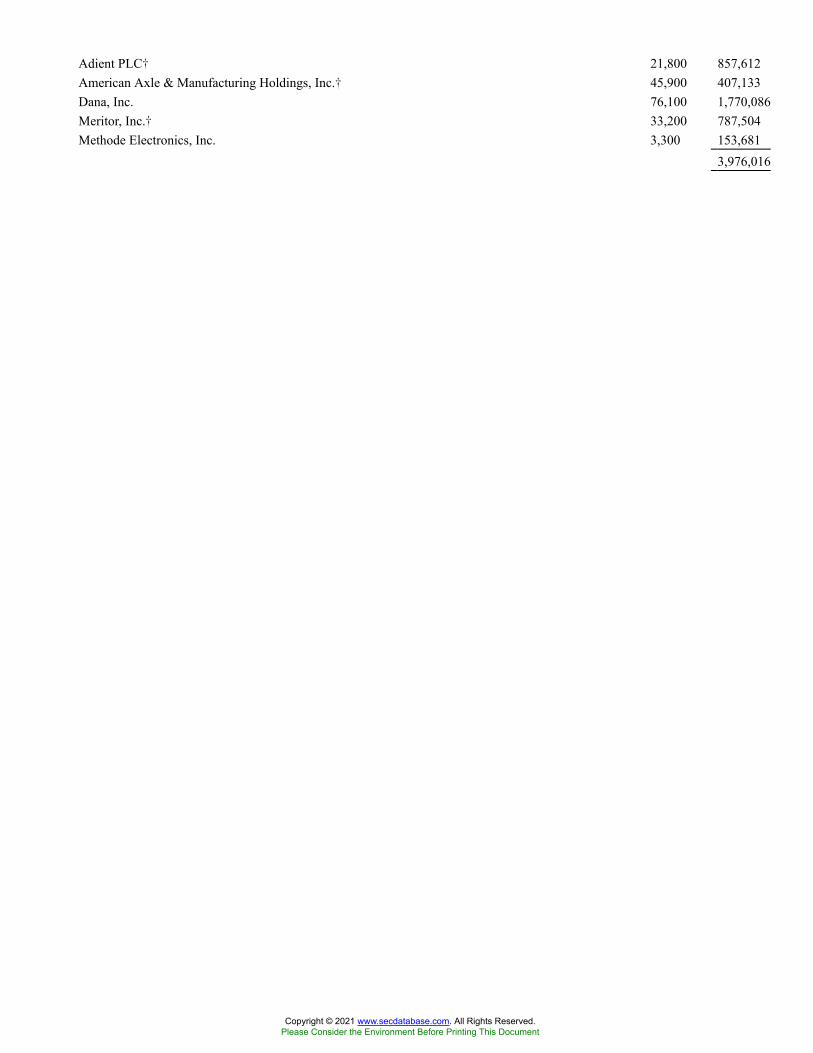
Adient PLC� 21,800 857,612American Axle & Manufacturing Holdings, Inc.� 45,900 407,133Dana, Inc. 76,100 1,770,086Meritor, Inc.� 33,200 787,504Methode Electronics, Inc. 3,300 153,681
3,976,016
Copyright © 2021 www.secdatabase.com. All Rights Reserved.Please Consider the Environment Before Printing This Document
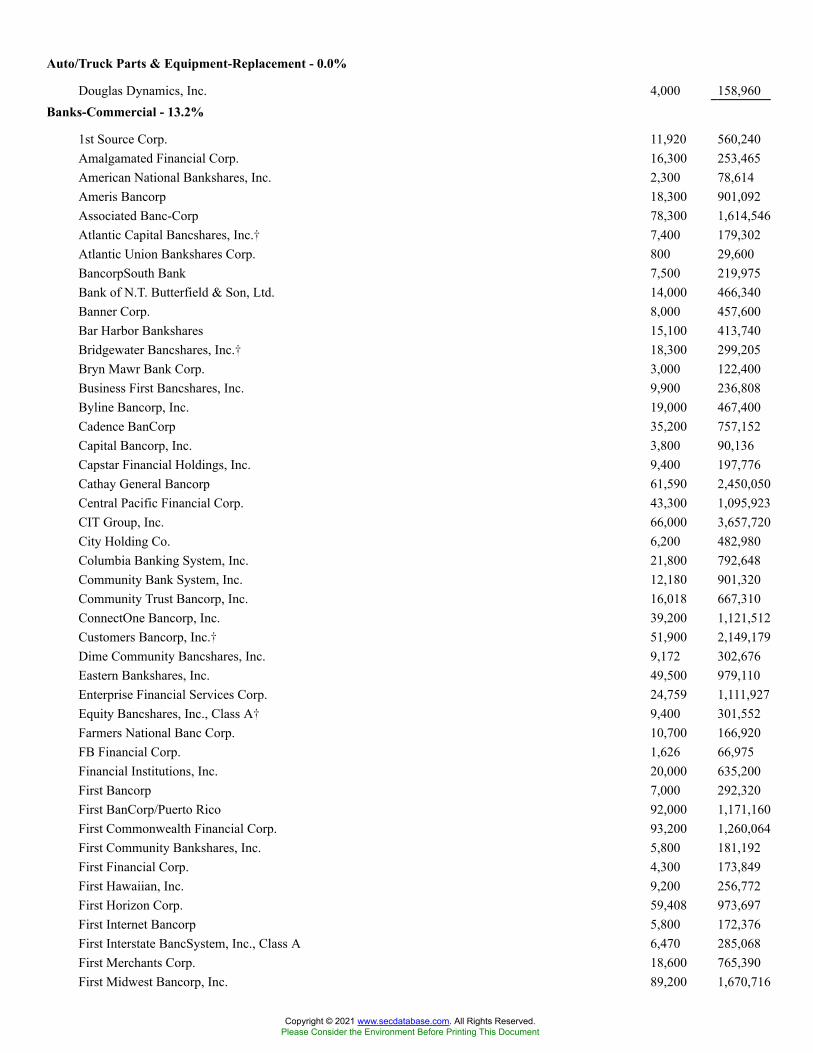
Auto/Truck Parts & Equipment-Replacement - 0.0%
Douglas Dynamics, Inc. 4,000 158,960Banks-Commercial - 13.2%
1st Source Corp. 11,920 560,240Amalgamated Financial Corp. 16,300 253,465American National Bankshares, Inc. 2,300 78,614Ameris Bancorp 18,300 901,092Associated Banc-Corp 78,300 1,614,546Atlantic Capital Bancshares, Inc.� 7,400 179,302Atlantic Union Bankshares Corp. 800 29,600BancorpSouth Bank 7,500 219,975Bank of N.T. Butterfield & Son, Ltd. 14,000 466,340Banner Corp. 8,000 457,600Bar Harbor Bankshares 15,100 413,740Bridgewater Bancshares, Inc.� 18,300 299,205Bryn Mawr Bank Corp. 3,000 122,400Business First Bancshares, Inc. 9,900 236,808Byline Bancorp, Inc. 19,000 467,400Cadence BanCorp 35,200 757,152Capital Bancorp, Inc. 3,800 90,136Capstar Financial Holdings, Inc. 9,400 197,776Cathay General Bancorp 61,590 2,450,050Central Pacific Financial Corp. 43,300 1,095,923CIT Group, Inc. 66,000 3,657,720City Holding Co. 6,200 482,980Columbia Banking System, Inc. 21,800 792,648Community Bank System, Inc. 12,180 901,320Community Trust Bancorp, Inc. 16,018 667,310ConnectOne Bancorp, Inc. 39,200 1,121,512Customers Bancorp, Inc.� 51,900 2,149,179Dime Community Bancshares, Inc. 9,172 302,676Eastern Bankshares, Inc. 49,500 979,110Enterprise Financial Services Corp. 24,759 1,111,927Equity Bancshares, Inc., Class A� 9,400 301,552Farmers National Banc Corp. 10,700 166,920FB Financial Corp. 1,626 66,975Financial Institutions, Inc. 20,000 635,200First Bancorp 7,000 292,320First BanCorp/Puerto Rico 92,000 1,171,160First Commonwealth Financial Corp. 93,200 1,260,064First Community Bankshares, Inc. 5,800 181,192First Financial Corp. 4,300 173,849First Hawaiian, Inc. 9,200 256,772First Horizon Corp. 59,408 973,697First Internet Bancorp 5,800 172,376First Interstate BancSystem, Inc., Class A 6,470 285,068First Merchants Corp. 18,600 765,390First Midwest Bancorp, Inc. 89,200 1,670,716
Copyright © 2021 www.secdatabase.com. All Rights Reserved.Please Consider the Environment Before Printing This Document
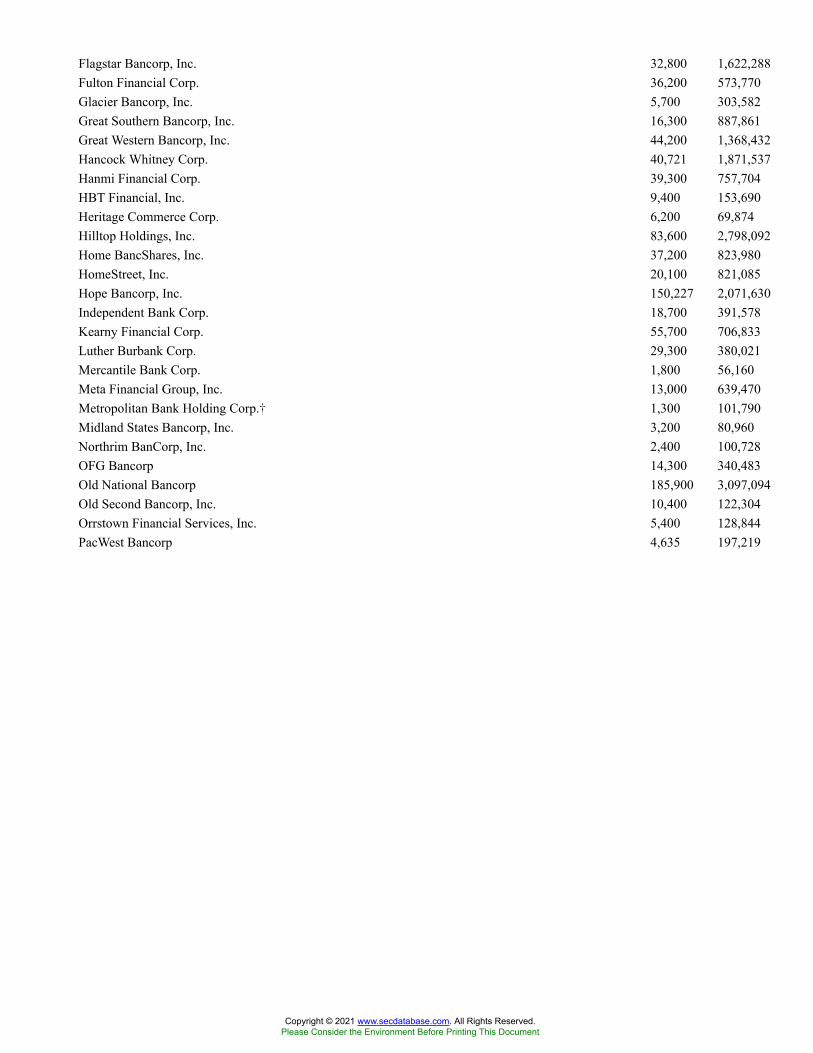
Flagstar Bancorp, Inc. 32,800 1,622,288Fulton Financial Corp. 36,200 573,770Glacier Bancorp, Inc. 5,700 303,582Great Southern Bancorp, Inc. 16,300 887,861Great Western Bancorp, Inc. 44,200 1,368,432Hancock Whitney Corp. 40,721 1,871,537Hanmi Financial Corp. 39,300 757,704HBT Financial, Inc. 9,400 153,690Heritage Commerce Corp. 6,200 69,874Hilltop Holdings, Inc. 83,600 2,798,092Home BancShares, Inc. 37,200 823,980HomeStreet, Inc. 20,100 821,085Hope Bancorp, Inc. 150,227 2,071,630Independent Bank Corp. 18,700 391,578Kearny Financial Corp. 55,700 706,833Luther Burbank Corp. 29,300 380,021Mercantile Bank Corp. 1,800 56,160Meta Financial Group, Inc. 13,000 639,470Metropolitan Bank Holding Corp.� 1,300 101,790Midland States Bancorp, Inc. 3,200 80,960Northrim BanCorp, Inc. 2,400 100,728OFG Bancorp 14,300 340,483Old National Bancorp 185,900 3,097,094Old Second Bancorp, Inc. 10,400 122,304Orrstown Financial Services, Inc. 5,400 128,844PacWest Bancorp 4,635 197,219
Copyright © 2021 www.secdatabase.com. All Rights Reserved.Please Consider the Environment Before Printing This Document
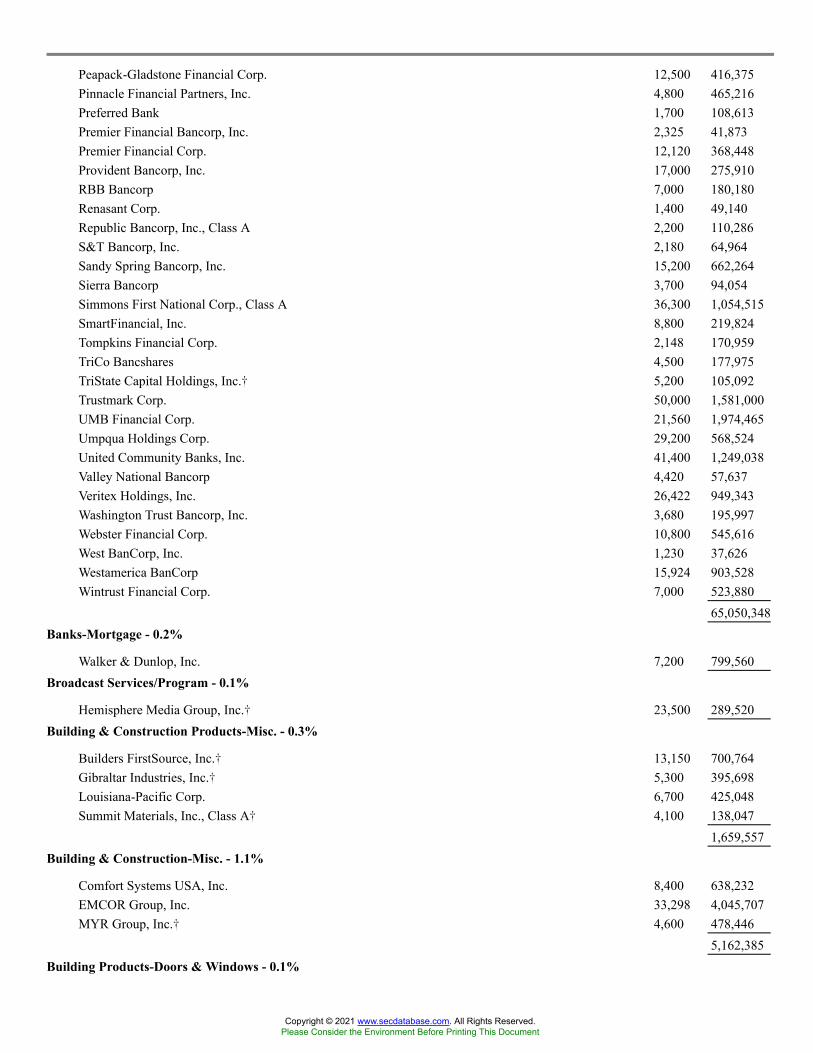
Peapack-Gladstone Financial Corp. 12,500 416,375Pinnacle Financial Partners, Inc. 4,800 465,216Preferred Bank 1,700 108,613Premier Financial Bancorp, Inc. 2,325 41,873Premier Financial Corp. 12,120 368,448Provident Bancorp, Inc. 17,000 275,910RBB Bancorp 7,000 180,180Renasant Corp. 1,400 49,140Republic Bancorp, Inc., Class A 2,200 110,286S&T Bancorp, Inc. 2,180 64,964Sandy Spring Bancorp, Inc. 15,200 662,264Sierra Bancorp 3,700 94,054Simmons First National Corp., Class A 36,300 1,054,515SmartFinancial, Inc. 8,800 219,824Tompkins Financial Corp. 2,148 170,959TriCo Bancshares 4,500 177,975TriState Capital Holdings, Inc.� 5,200 105,092Trustmark Corp. 50,000 1,581,000UMB Financial Corp. 21,560 1,974,465Umpqua Holdings Corp. 29,200 568,524United Community Banks, Inc. 41,400 1,249,038Valley National Bancorp 4,420 57,637Veritex Holdings, Inc. 26,422 949,343Washington Trust Bancorp, Inc. 3,680 195,997Webster Financial Corp. 10,800 545,616West BanCorp, Inc. 1,230 37,626Westamerica BanCorp 15,924 903,528Wintrust Financial Corp. 7,000 523,880
65,050,348Banks-Mortgage - 0.2%
Walker & Dunlop, Inc. 7,200 799,560Broadcast Services/Program - 0.1%
Hemisphere Media Group, Inc.� 23,500 289,520Building & Construction Products-Misc. - 0.3%
Builders FirstSource, Inc.� 13,150 700,764Gibraltar Industries, Inc.� 5,300 395,698Louisiana-Pacific Corp. 6,700 425,048Summit Materials, Inc., Class A� 4,100 138,047
1,659,557Building & Construction-Misc. - 1.1%
Comfort Systems USA, Inc. 8,400 638,232EMCOR Group, Inc. 33,298 4,045,707MYR Group, Inc.� 4,600 478,446
5,162,385Building Products-Doors & Windows - 0.1%
Copyright © 2021 www.secdatabase.com. All Rights Reserved.Please Consider the Environment Before Printing This Document

Cornerstone Building Brands, Inc.� 24,300 403,866Building Products-Wood - 0.3%
Boise Cascade Co. 13,000 752,050UFP Industries, Inc. 8,500 638,180
1,390,230Building-Heavy Construction - 1.3%
Arcosa, Inc. 16,900 858,858Great Lakes Dredge & Dock Corp.� 27,000 407,970MasTec, Inc.� 23,450 2,144,268Primoris Services Corp. 54,700 1,405,790Sterling Construction Co., Inc.� 19,400 447,364Tutor Perini Corp.� 64,100 924,322
6,188,572Building-Maintenance & Services - 0.7%
ABM Industries, Inc. 68,900 3,411,928Building-Residential/Commercial - 1.0%
Meritage Homes Corp.� 6,000 669,240Taylor Morrison Home Corp.� 31,800 893,262Tri Pointe Homes, Inc.� 143,600 3,413,372
4,975,874Cable/Satellite TV - 0.3%
Liberty Latin America, Ltd., Class A� 54,300 774,318Liberty Latin America, Ltd., Class C� 64,150 923,119
1,697,437Casino Services - 0.1%
Scientific Games Corp.� 3,700 267,695Chemicals-Diversified - 0.3%
AdvanSix, Inc.� 4,800 175,200Koppers Holdings, Inc.� 20,800 684,320Orion Engineered Carbons SA� 22,400 395,808Stepan Co. 3,600 423,216
1,678,544Chemicals-Specialty - 0.9%
Ecovyst, Inc. 18,700 243,287H.B. Fuller Co. 16,100 1,087,877Minerals Technologies, Inc. 17,160 1,349,462Tronox Holdings PLC, Class A 92,500 1,954,525
4,635,151Circuit Boards - 0.2%
TTM Technologies, Inc.� 75,100 1,051,400Coal - 0.5%
Arch Resources, Inc.� 11,800 893,142SunCoke Energy, Inc. 95,300 662,335
Copyright © 2021 www.secdatabase.com. All Rights Reserved.Please Consider the Environment Before Printing This Document
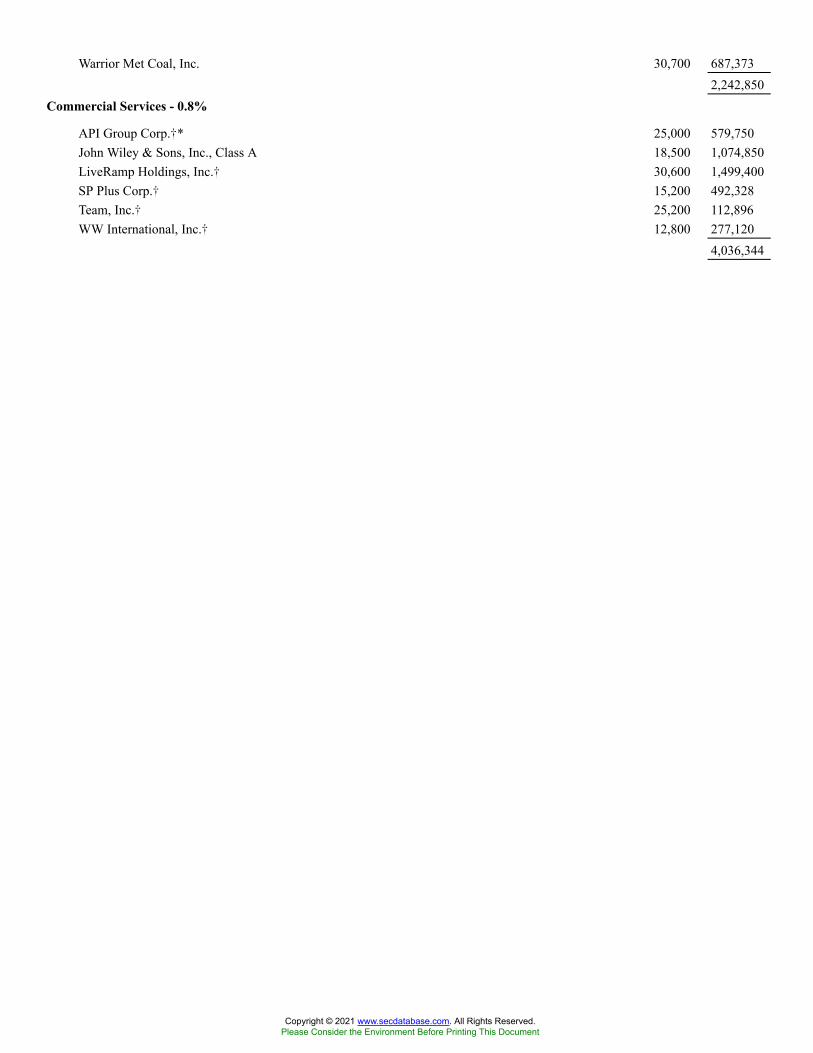
Warrior Met Coal, Inc. 30,700 687,3732,242,850
Commercial Services - 0.8%
API Group Corp.�* 25,000 579,750John Wiley & Sons, Inc., Class A 18,500 1,074,850LiveRamp Holdings, Inc.� 30,600 1,499,400SP Plus Corp.� 15,200 492,328Team, Inc.� 25,200 112,896WW International, Inc.� 12,800 277,120
4,036,344
Copyright © 2021 www.secdatabase.com. All Rights Reserved.Please Consider the Environment Before Printing This Document
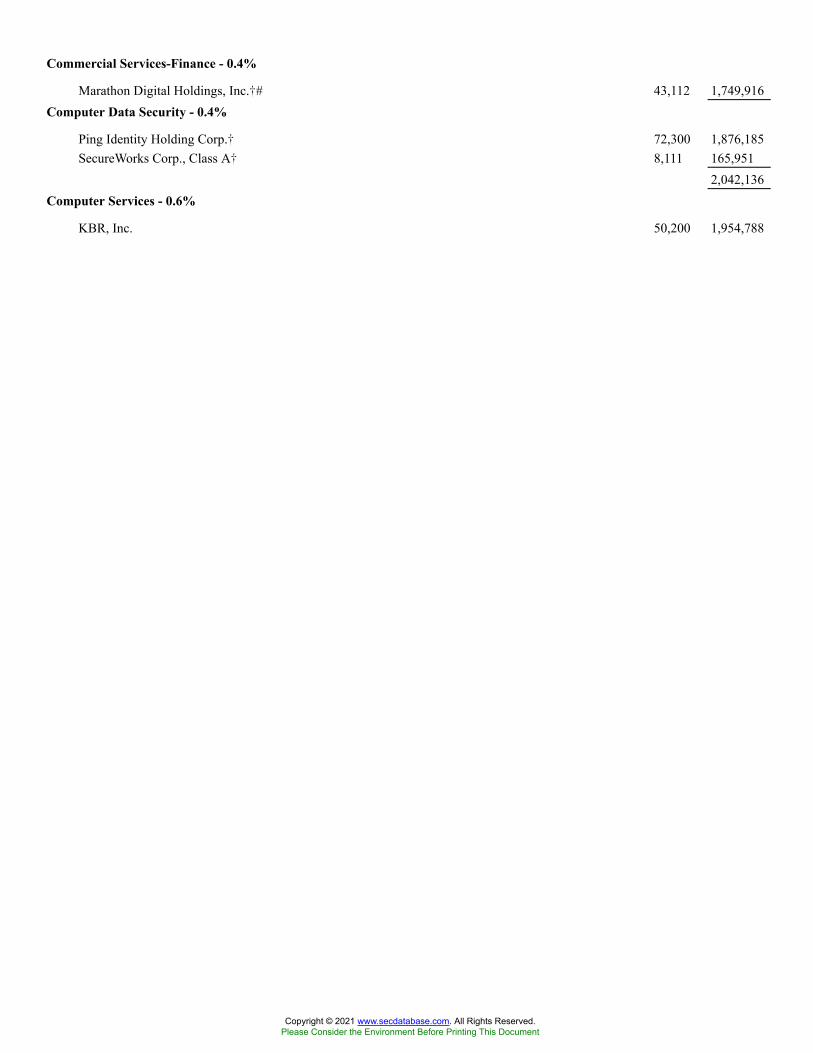
Commercial Services-Finance - 0.4%
Marathon Digital Holdings, Inc.�# 43,112 1,749,916Computer Data Security - 0.4%
Ping Identity Holding Corp.� 72,300 1,876,185SecureWorks Corp., Class A� 8,111 165,951
2,042,136Computer Services - 0.6%
KBR, Inc. 50,200 1,954,788
Copyright © 2021 www.secdatabase.com. All Rights Reserved.Please Consider the Environment Before Printing This Document

StarTek, Inc.� 46,200 280,434Unisys Corp.� 20,200 489,042
2,724,264Computer Software - 0.1%
Xperi Holding Corp. 31,600 675,292Computers-Integrated Systems - 0.5%
Diebold Nixdorf, Inc.� 84,300 917,184NetScout Systems, Inc.� 46,200 1,266,804Super Micro Computer, Inc.� 11,600 423,864
2,607,852Consulting Services - 0.5%
GP Strategies Corp.� 11,800 244,024Huron Consulting Group, Inc.� 12,100 597,377Kelly Services, Inc., Class A 70,900 1,378,296
2,219,697Consumer Products-Misc. - 0.5%
Central Garden & Pet Co., Class A� 36,600 1,525,122Quanex Building Products Corp. 23,100 544,236Spectrum Brands Holdings, Inc. 2,500 195,150
2,264,508Containers-Metal/Glass - 0.2%
Greif, Inc., Class A 15,300 968,796Containers-Paper/Plastic - 0.0%
TriMas Corp.� 3,300 105,963Cosmetics & Toiletries - 0.3%
Edgewell Personal Care Co. 22,200 939,060Honest Co., Inc.�# 31,705 322,757
1,261,817Data Processing/Management - 0.2%
CSG Systems International, Inc. 20,800 1,002,768Disposable Medical Products - 0.1%
Utah Medical Products, Inc. 6,100 540,460Distribution/Wholesale - 1.8%
Avient Corp. 37,600 1,958,584Core-Mark Holding Co., Inc. 20,900 961,400G-III Apparel Group, Ltd.� 49,900 1,543,407KAR Auction Services, Inc.� 3,100 52,421Resideo Technologies, Inc.� 2,000 64,480ScanSource, Inc.� 46,800 1,665,144Veritiv Corp.� 15,100 1,354,017WESCO International, Inc.� 12,400 1,451,048
9,050,501
Copyright © 2021 www.secdatabase.com. All Rights Reserved.Please Consider the Environment Before Printing This Document
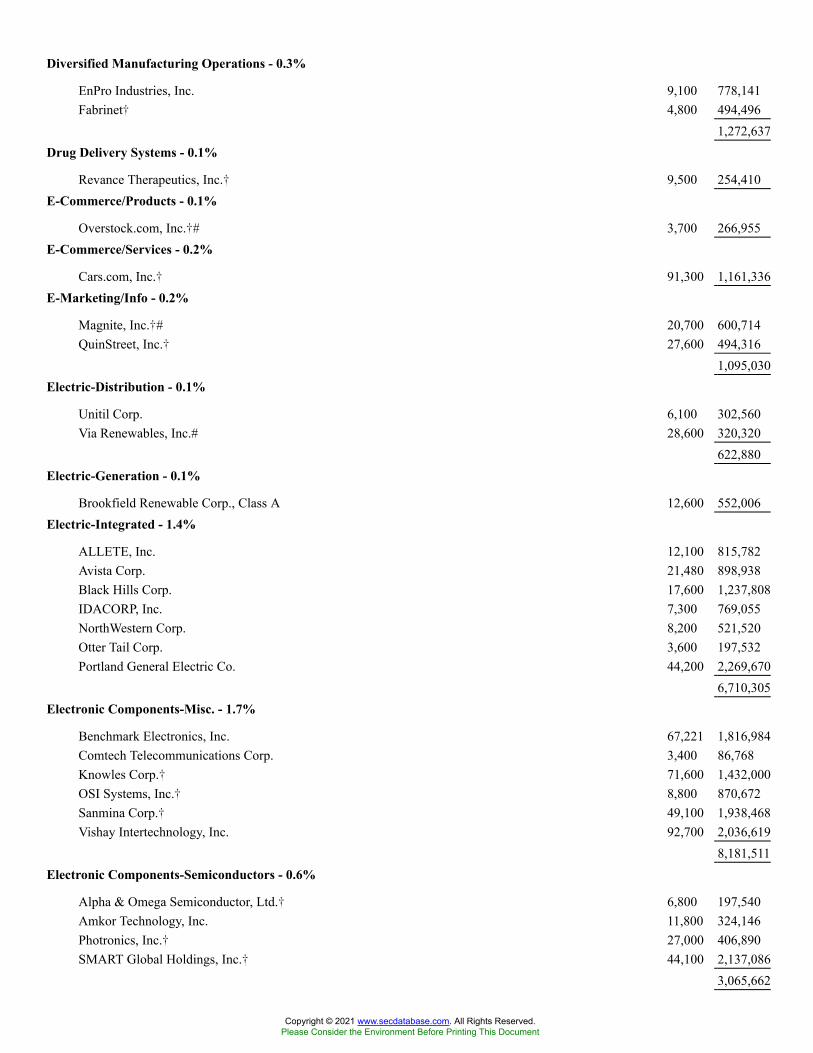
Diversified Manufacturing Operations - 0.3%
EnPro Industries, Inc. 9,100 778,141Fabrinet� 4,800 494,496
1,272,637Drug Delivery Systems - 0.1%
Revance Therapeutics, Inc.� 9,500 254,410E-Commerce/Products - 0.1%
Overstock.com, Inc.�# 3,700 266,955E-Commerce/Services - 0.2%
Cars.com, Inc.� 91,300 1,161,336E-Marketing/Info - 0.2%
Magnite, Inc.�# 20,700 600,714QuinStreet, Inc.� 27,600 494,316
1,095,030Electric-Distribution - 0.1%
Unitil Corp. 6,100 302,560Via Renewables, Inc.# 28,600 320,320
622,880Electric-Generation - 0.1%
Brookfield Renewable Corp., Class A 12,600 552,006Electric-Integrated - 1.4%
ALLETE, Inc. 12,100 815,782Avista Corp. 21,480 898,938Black Hills Corp. 17,600 1,237,808IDACORP, Inc. 7,300 769,055NorthWestern Corp. 8,200 521,520Otter Tail Corp. 3,600 197,532Portland General Electric Co. 44,200 2,269,670
6,710,305Electronic Components-Misc. - 1.7%
Benchmark Electronics, Inc. 67,221 1,816,984Comtech Telecommunications Corp. 3,400 86,768Knowles Corp.� 71,600 1,432,000OSI Systems, Inc.� 8,800 870,672Sanmina Corp.� 49,100 1,938,468Vishay Intertechnology, Inc. 92,700 2,036,619
8,181,511Electronic Components-Semiconductors - 0.6%
Alpha & Omega Semiconductor, Ltd.� 6,800 197,540Amkor Technology, Inc. 11,800 324,146Photronics, Inc.� 27,000 406,890SMART Global Holdings, Inc.� 44,100 2,137,086
3,065,662
Copyright © 2021 www.secdatabase.com. All Rights Reserved.Please Consider the Environment Before Printing This Document
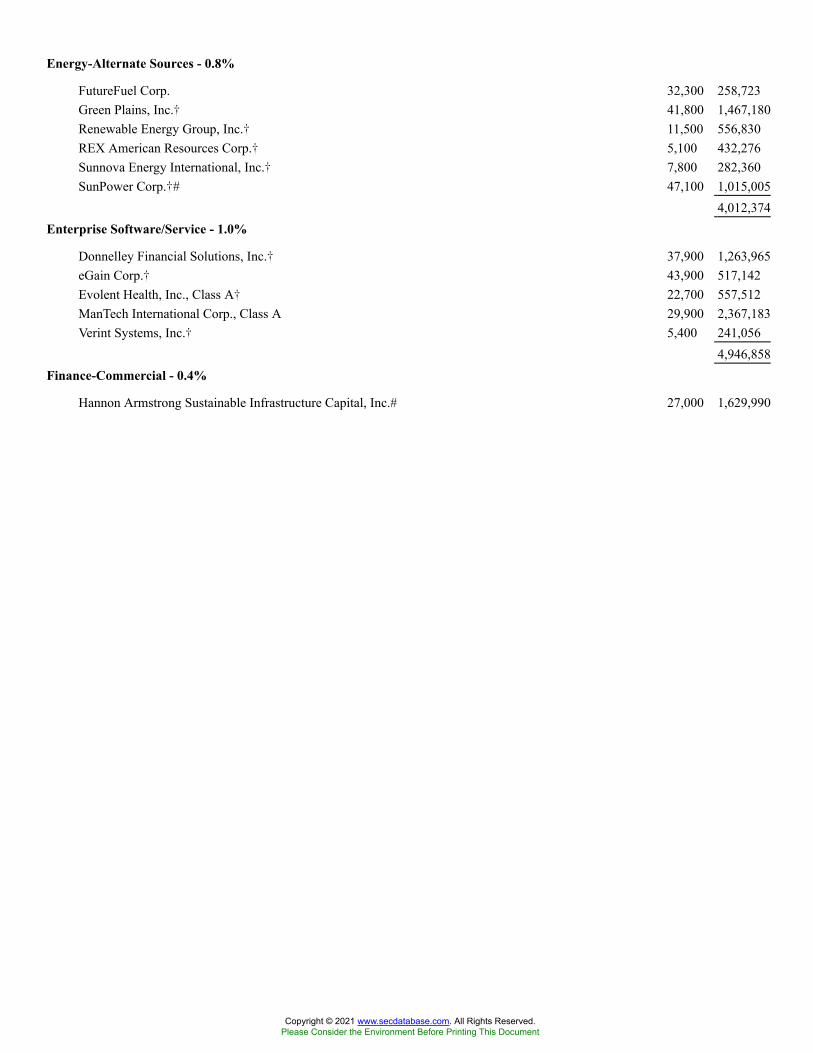
Energy-Alternate Sources - 0.8%
FutureFuel Corp. 32,300 258,723Green Plains, Inc.� 41,800 1,467,180Renewable Energy Group, Inc.� 11,500 556,830REX American Resources Corp.� 5,100 432,276Sunnova Energy International, Inc.� 7,800 282,360SunPower Corp.�# 47,100 1,015,005
4,012,374Enterprise Software/Service - 1.0%
Donnelley Financial Solutions, Inc.� 37,900 1,263,965eGain Corp.� 43,900 517,142Evolent Health, Inc., Class A� 22,700 557,512ManTech International Corp., Class A 29,900 2,367,183Verint Systems, Inc.� 5,400 241,056
4,946,858Finance-Commercial - 0.4%
Hannon Armstrong Sustainable Infrastructure Capital, Inc.# 27,000 1,629,990
Copyright © 2021 www.secdatabase.com. All Rights Reserved.Please Consider the Environment Before Printing This Document

Marlin Business Services Corp. 7,800 173,550Finance-Consumer Loans - 0.9%
EZCORP, Inc., Class A� 25,600 176,384Navient Corp. 129,100 2,996,411Nelnet, Inc., Class A 11,300 913,944Regional Management Corp. 3,200 190,176
4,276,915Finance-Investment Banker/Broker - 0.4%
Cowen, Inc., Class A 28,155 1,014,706Piper Sandler Cos. 6,300 900,396
1,915,102Finance-Mortgage Loan/Banker - 0.6%
Mr. Cooper Group, Inc.� 48,300 1,877,904Oportun Financial Corp.� 12,900 325,725PennyMac Financial Services, Inc. 10,300 685,465
2,889,094Financial Guarantee Insurance - 0.8%
MGIC Investment Corp. 51,600 787,932NMI Holdings, Inc., Class A� 28,700 647,759Radian Group, Inc. 106,000 2,504,780
3,940,471Food-Canned - 0.1%
Seneca Foods Corp., Class A� 7,000 342,790Food-Catering - 0.1%
Healthcare Services Group, Inc. 16,000 418,560Food-Misc./Diversified - 0.7%
BellRing Brands, Inc., Class A� 107,700 3,637,029Food-Retail - 0.4%
Sprouts Farmers Market, Inc.� 75,000 1,867,500Food-Wholesale/Distribution - 0.2%
SpartanNash Co. 29,600 636,400United Natural Foods, Inc.� 12,200 448,960
1,085,360Footwear & Related Apparel - 0.1%
Wolverine World Wide, Inc. 16,500 591,690Gas-Distribution - 1.4%
Chesapeake Utilities Corp. 700 91,490New Jersey Resources Corp. 34,300 1,280,762Northwest Natural Holding Co. 3,000 154,350ONE Gas, Inc. 9,600 689,472Southwest Gas Holdings, Inc. 28,840 2,027,740Spire, Inc. 40,700 2,714,690
Copyright © 2021 www.secdatabase.com. All Rights Reserved.Please Consider the Environment Before Printing This Document

6,958,504Gas-Transportation - 0.1%
Brookfield Infrastructure Corp., Class A# 10,000 636,000Hazardous Waste Disposal - 0.1%
Heritage-Crystal Clean, Inc.� 9,400 277,676Home Furnishings - 0.5%
Herman Miller, Inc. 46,544 1,956,244Hooker Furniture Corp. 7,800 243,048Sleep Number Corp.� 4,800 444,048
2,643,340Housewares - 0.1%
Lifetime Brands, Inc. 28,600 524,810Tupperware Brands Corp.�# 4,000 95,480
620,290Human Resources - 1.7%
Barrett Business Services, Inc. 16,700 1,294,250Heidrick & Struggles International, Inc. 45,100 1,949,222Insperity, Inc. 1,000 110,340Korn Ferry 36,300 2,566,047TrueBlue, Inc.� 82,200 2,246,526
8,166,385Independent Power Producers - 0.7%
Clearway Energy, Inc., Class A 49,800 1,481,052Clearway Energy, Inc., Class C 43,100 1,352,909Vistra Corp. 39,429 752,700
3,586,661Insurance-Life/Health - 0.6%
American Equity Investment Life Holding Co. 35,200 1,115,488CNO Financial Group, Inc. 67,020 1,639,309
2,754,797Insurance-Property/Casualty - 0.7%
Employers Holdings, Inc. 5,400 222,318First American Financial Corp. 7,575 534,265Heritage Insurance Holdings, Inc. 25,300 177,100Horace Mann Educators Corp. 7,880 323,080ProAssurance Corp. 16,300 415,650RLI Corp. 500 54,615Selective Insurance Group, Inc. 5,000 417,850Stewart Information Services Corp. 20,250 1,274,737
3,419,615Insurance-Reinsurance - 0.8%
Argo Group International Holdings, Ltd. 19,975 1,056,678Essent Group, Ltd. 61,500 2,895,420
Copyright © 2021 www.secdatabase.com. All Rights Reserved.Please Consider the Environment Before Printing This Document

3,952,098Internet Content-Information/News - 0.1%
Yelp, Inc.� 18,300 704,733Investment Management/Advisor Services - 0.8%
Artisan Partners Asset Management, Inc., Class A 5,500 285,780Blucora, Inc.� 13,000 213,330Federated Hermes, Inc. 25,400 859,282Stifel Financial Corp. 20,950 1,447,645Virtus Investment Partners, Inc. 4,150 1,297,705
4,103,742Lasers-System/Components - 0.1%
II-VI, Inc.�# 10,900 686,482
Copyright © 2021 www.secdatabase.com. All Rights Reserved.Please Consider the Environment Before Printing This Document

Machinery-Construction & Mining - 0.6%
Manitowoc Co, Inc.� 30,400 737,200Terex Corp. 40,800 2,082,840
2,820,040Machinery-Electrical - 0.5%
Argan, Inc. 43,900 2,032,570Bloom Energy Corp., Class A�# 7,700 164,934
2,197,504Machinery-Farming - 0.3%
AGCO Corp. 9,260 1,274,361Machinery-General Industrial - 0.3%
Altra Industrial Motion Corp. 24,400 1,428,864DXP Enterprises, Inc.� 5,100 152,898
1,581,762Machinery-Material Handling - 0.1%
Columbus McKinnon Corp. 7,400 340,770Machinery-Thermal Process - 0.1%
Thermon Group Holdings, Inc.� 14,600 243,820Medical Imaging Systems - 0.2%
Lantheus Holdings, Inc.� 40,800 1,075,896Medical Information Systems - 0.8%
Allscripts Healthcare Solutions, Inc.� 202,900 3,116,544Computer Programs & Systems, Inc. 3,000 106,710NextGen Healthcare, Inc.� 49,700 758,422
3,981,676Medical Instruments - 0.3%
AngioDynamics, Inc.� 17,100 483,930Natus Medical, Inc.� 37,400 991,848
1,475,778Medical Labs & Testing Services - 0.2%
MEDNAX, Inc.� 27,000 866,970Medical Products - 0.5%
Apria, Inc.� 16,300 581,421Bioventus, Inc., Class A� 28,100 407,731Integer Holdings Corp.� 13,800 1,363,302Orthofix Medical, Inc.� 4,000 169,600Talis Biomedical Corp.� 3,300 26,598
2,548,652Medical-Biomedical/Gene - 4.3%
89bio, Inc.�# 13,000 240,630Acceleron Pharma, Inc.� 4,300 575,684Akero Therapeutics, Inc.�# 9,300 220,782
Copyright © 2021 www.secdatabase.com. All Rights Reserved.Please Consider the Environment Before Printing This Document
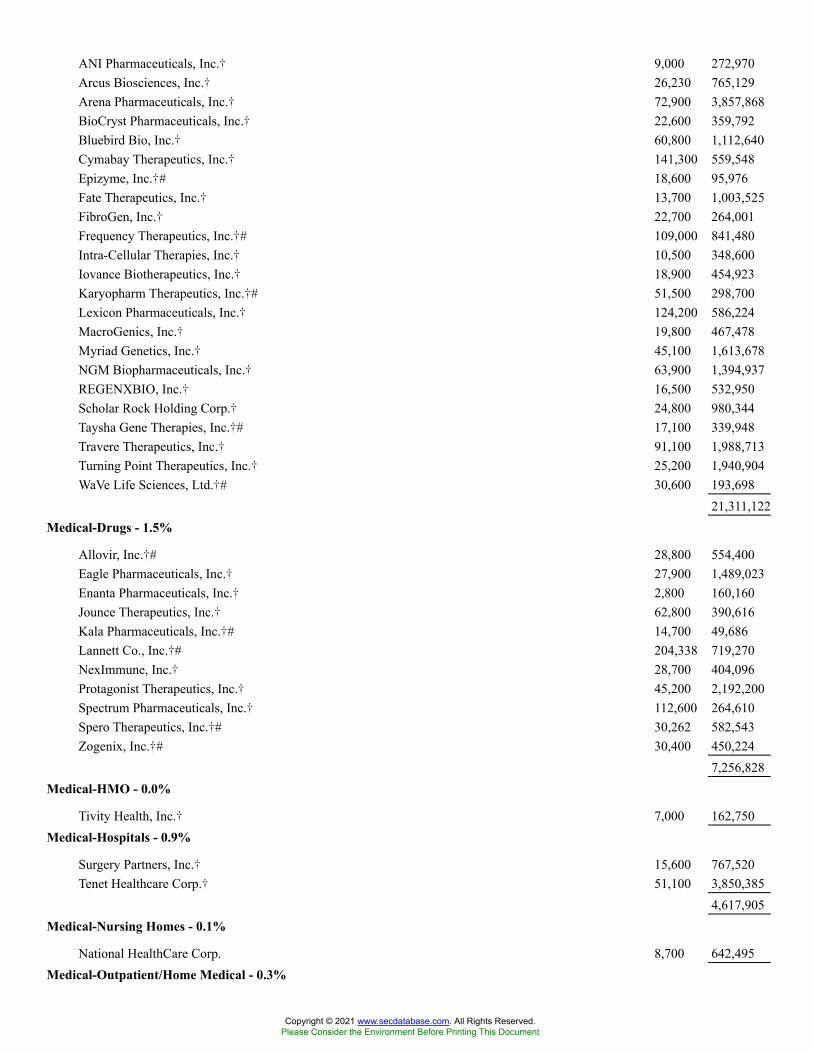
ANI Pharmaceuticals, Inc.� 9,000 272,970Arcus Biosciences, Inc.� 26,230 765,129Arena Pharmaceuticals, Inc.� 72,900 3,857,868BioCryst Pharmaceuticals, Inc.� 22,600 359,792Bluebird Bio, Inc.� 60,800 1,112,640Cymabay Therapeutics, Inc.� 141,300 559,548Epizyme, Inc.�# 18,600 95,976Fate Therapeutics, Inc.� 13,700 1,003,525FibroGen, Inc.� 22,700 264,001Frequency Therapeutics, Inc.�# 109,000 841,480Intra-Cellular Therapies, Inc.� 10,500 348,600Iovance Biotherapeutics, Inc.� 18,900 454,923Karyopharm Therapeutics, Inc.�# 51,500 298,700Lexicon Pharmaceuticals, Inc.� 124,200 586,224MacroGenics, Inc.� 19,800 467,478Myriad Genetics, Inc.� 45,100 1,613,678NGM Biopharmaceuticals, Inc.� 63,900 1,394,937REGENXBIO, Inc.� 16,500 532,950Scholar Rock Holding Corp.� 24,800 980,344Taysha Gene Therapies, Inc.�# 17,100 339,948Travere Therapeutics, Inc.� 91,100 1,988,713Turning Point Therapeutics, Inc.� 25,200 1,940,904WaVe Life Sciences, Ltd.�# 30,600 193,698
21,311,122Medical-Drugs - 1.5%
Allovir, Inc.�# 28,800 554,400Eagle Pharmaceuticals, Inc.� 27,900 1,489,023Enanta Pharmaceuticals, Inc.� 2,800 160,160Jounce Therapeutics, Inc.� 62,800 390,616Kala Pharmaceuticals, Inc.�# 14,700 49,686Lannett Co., Inc.�# 204,338 719,270NexImmune, Inc.� 28,700 404,096Protagonist Therapeutics, Inc.� 45,200 2,192,200Spectrum Pharmaceuticals, Inc.� 112,600 264,610Spero Therapeutics, Inc.�# 30,262 582,543Zogenix, Inc.�# 30,400 450,224
7,256,828Medical-HMO - 0.0%
Tivity Health, Inc.� 7,000 162,750Medical-Hospitals - 0.9%
Surgery Partners, Inc.� 15,600 767,520Tenet Healthcare Corp.� 51,100 3,850,385
4,617,905Medical-Nursing Homes - 0.1%
National HealthCare Corp. 8,700 642,495Medical-Outpatient/Home Medical - 0.3%
Copyright © 2021 www.secdatabase.com. All Rights Reserved.Please Consider the Environment Before Printing This Document

ModivCare, Inc.� 6,600 1,301,916Medical-Wholesale Drug Distribution - 0.3%
AdaptHealth Corp.� 26,900 646,676Owens & Minor, Inc. 19,300 719,504
1,366,180Metal Processors & Fabrication - 0.1%
AZZ, Inc. 6,400 342,720Mueller Industries, Inc. 1,200 53,532
396,252Metal Products-Distribution - 0.1%
Worthington Industries, Inc. 4,840 280,478
Copyright © 2021 www.secdatabase.com. All Rights Reserved.Please Consider the Environment Before Printing This Document

Metal-Aluminum - 0.9%
Alcoa Corp.� 25,000 1,109,250Arconic Corp.� 55,200 1,903,848Kaiser Aluminum Corp. 9,975 1,259,444
4,272,542Motion Pictures & Services - 0.2%
IMAX Corp.� 42,200 662,962
Copyright © 2021 www.secdatabase.com. All Rights Reserved.Please Consider the Environment Before Printing This Document
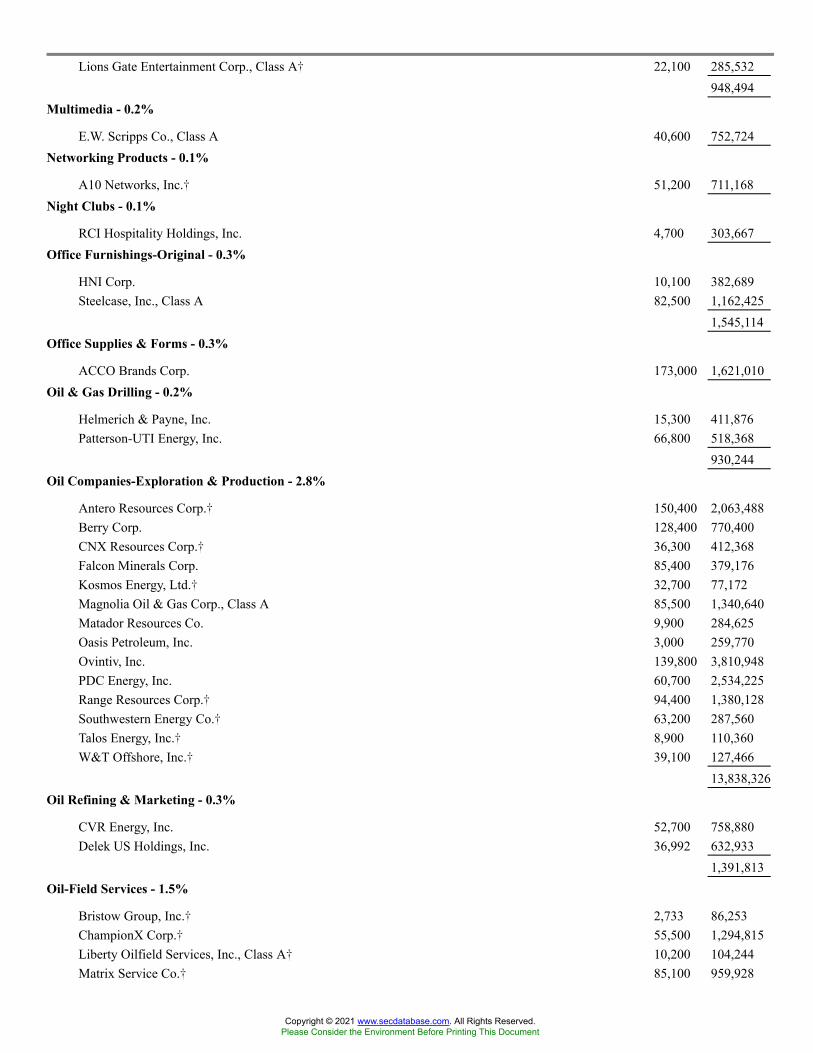
Lions Gate Entertainment Corp., Class A� 22,100 285,532948,494
Multimedia - 0.2%
E.W. Scripps Co., Class A 40,600 752,724Networking Products - 0.1%
A10 Networks, Inc.� 51,200 711,168Night Clubs - 0.1%
RCI Hospitality Holdings, Inc. 4,700 303,667Office Furnishings-Original - 0.3%
HNI Corp. 10,100 382,689Steelcase, Inc., Class A 82,500 1,162,425
1,545,114Office Supplies & Forms - 0.3%
ACCO Brands Corp. 173,000 1,621,010Oil & Gas Drilling - 0.2%
Helmerich & Payne, Inc. 15,300 411,876Patterson-UTI Energy, Inc. 66,800 518,368
930,244Oil Companies-Exploration & Production - 2.8%
Antero Resources Corp.� 150,400 2,063,488Berry Corp. 128,400 770,400CNX Resources Corp.� 36,300 412,368Falcon Minerals Corp. 85,400 379,176Kosmos Energy, Ltd.� 32,700 77,172Magnolia Oil & Gas Corp., Class A 85,500 1,340,640Matador Resources Co. 9,900 284,625Oasis Petroleum, Inc. 3,000 259,770Ovintiv, Inc. 139,800 3,810,948PDC Energy, Inc. 60,700 2,534,225Range Resources Corp.� 94,400 1,380,128Southwestern Energy Co.� 63,200 287,560Talos Energy, Inc.� 8,900 110,360W&T Offshore, Inc.� 39,100 127,466
13,838,326Oil Refining & Marketing - 0.3%
CVR Energy, Inc. 52,700 758,880Delek US Holdings, Inc. 36,992 632,933
1,391,813Oil-Field Services - 1.5%
Bristow Group, Inc.� 2,733 86,253ChampionX Corp.� 55,500 1,294,815Liberty Oilfield Services, Inc., Class A� 10,200 104,244Matrix Service Co.� 85,100 959,928
Copyright © 2021 www.secdatabase.com. All Rights Reserved.Please Consider the Environment Before Printing This Document
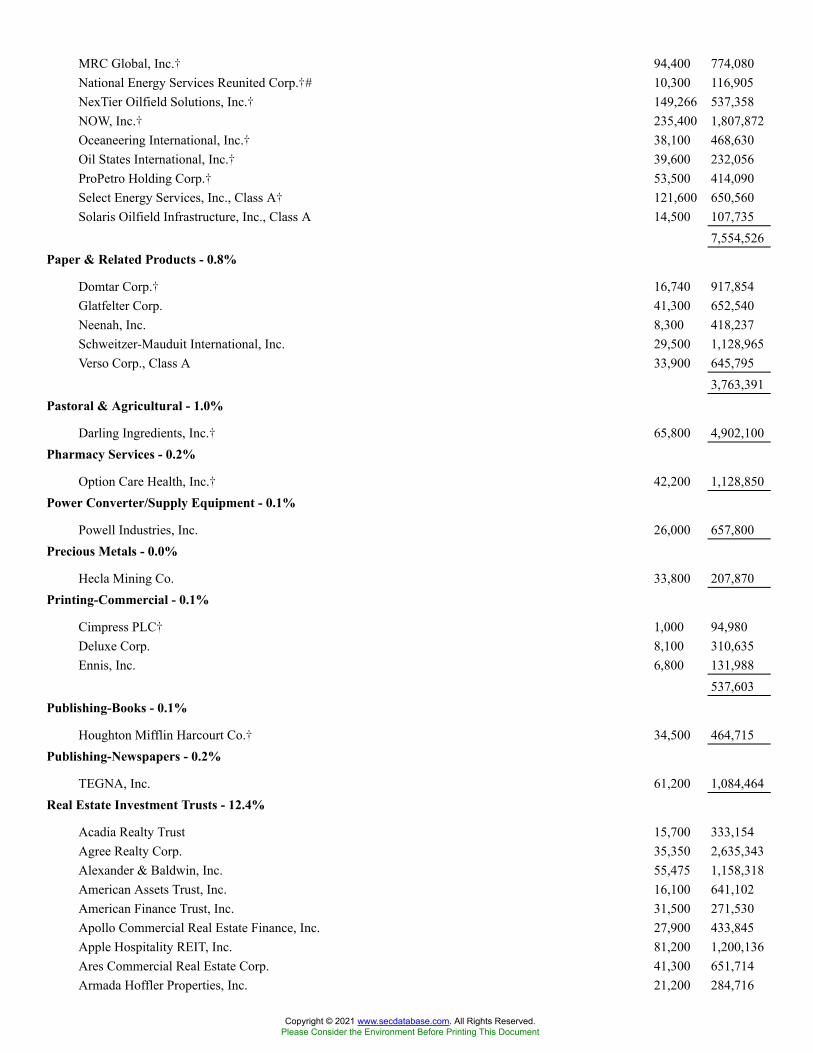
MRC Global, Inc.� 94,400 774,080National Energy Services Reunited Corp.�# 10,300 116,905NexTier Oilfield Solutions, Inc.� 149,266 537,358NOW, Inc.� 235,400 1,807,872Oceaneering International, Inc.� 38,100 468,630Oil States International, Inc.� 39,600 232,056ProPetro Holding Corp.� 53,500 414,090Select Energy Services, Inc., Class A� 121,600 650,560Solaris Oilfield Infrastructure, Inc., Class A 14,500 107,735
7,554,526Paper & Related Products - 0.8%
Domtar Corp.� 16,740 917,854Glatfelter Corp. 41,300 652,540Neenah, Inc. 8,300 418,237Schweitzer-Mauduit International, Inc. 29,500 1,128,965Verso Corp., Class A 33,900 645,795
3,763,391Pastoral & Agricultural - 1.0%
Darling Ingredients, Inc.� 65,800 4,902,100Pharmacy Services - 0.2%
Option Care Health, Inc.� 42,200 1,128,850Power Converter/Supply Equipment - 0.1%
Powell Industries, Inc. 26,000 657,800Precious Metals - 0.0%
Hecla Mining Co. 33,800 207,870Printing-Commercial - 0.1%
Cimpress PLC� 1,000 94,980Deluxe Corp. 8,100 310,635Ennis, Inc. 6,800 131,988
537,603Publishing-Books - 0.1%
Houghton Mifflin Harcourt Co.� 34,500 464,715Publishing-Newspapers - 0.2%
TEGNA, Inc. 61,200 1,084,464Real Estate Investment Trusts - 12.4%
Acadia Realty Trust 15,700 333,154Agree Realty Corp. 35,350 2,635,343Alexander & Baldwin, Inc. 55,475 1,158,318American Assets Trust, Inc. 16,100 641,102American Finance Trust, Inc. 31,500 271,530Apollo Commercial Real Estate Finance, Inc. 27,900 433,845Apple Hospitality REIT, Inc. 81,200 1,200,136Ares Commercial Real Estate Corp. 41,300 651,714Armada Hoffler Properties, Inc. 21,200 284,716
Copyright © 2021 www.secdatabase.com. All Rights Reserved.Please Consider the Environment Before Printing This Document
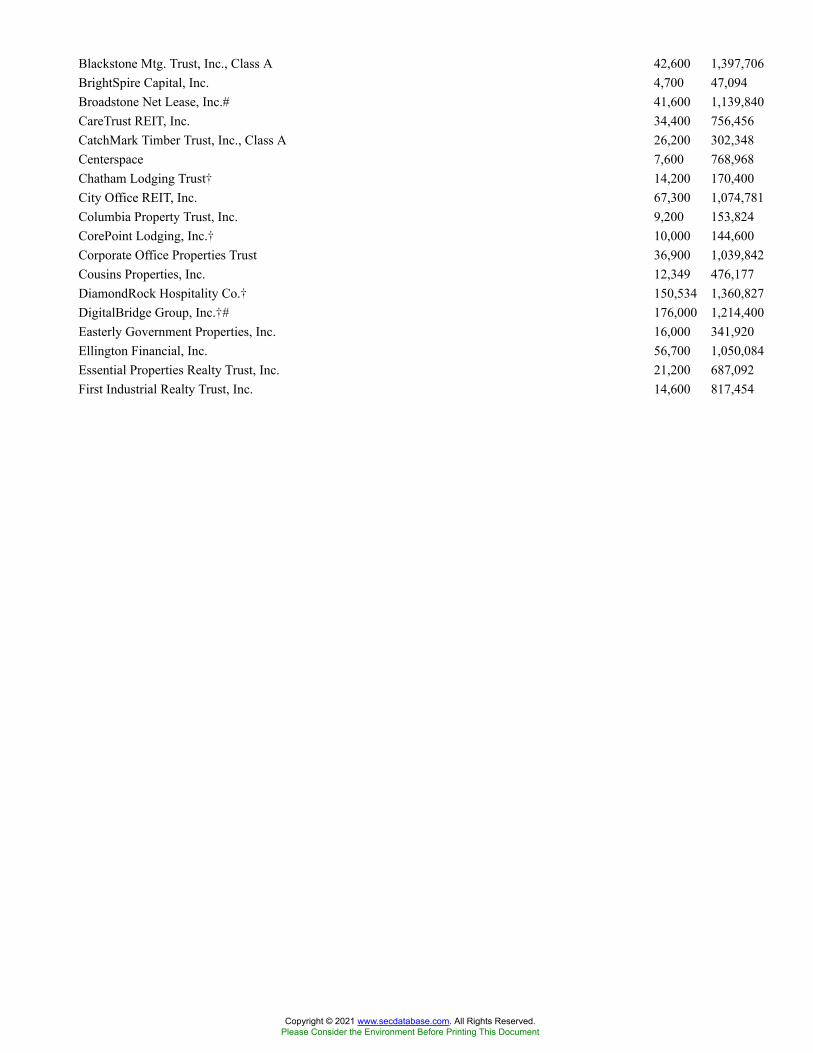
Blackstone Mtg. Trust, Inc., Class A 42,600 1,397,706BrightSpire Capital, Inc. 4,700 47,094Broadstone Net Lease, Inc.# 41,600 1,139,840CareTrust REIT, Inc. 34,400 756,456CatchMark Timber Trust, Inc., Class A 26,200 302,348Centerspace 7,600 768,968Chatham Lodging Trust� 14,200 170,400City Office REIT, Inc. 67,300 1,074,781Columbia Property Trust, Inc. 9,200 153,824CorePoint Lodging, Inc.� 10,000 144,600Corporate Office Properties Trust 36,900 1,039,842Cousins Properties, Inc. 12,349 476,177DiamondRock Hospitality Co.� 150,534 1,360,827DigitalBridge Group, Inc.�# 176,000 1,214,400Easterly Government Properties, Inc. 16,000 341,920Ellington Financial, Inc. 56,700 1,050,084Essential Properties Realty Trust, Inc. 21,200 687,092First Industrial Realty Trust, Inc. 14,600 817,454
Copyright © 2021 www.secdatabase.com. All Rights Reserved.Please Consider the Environment Before Printing This Document

Four Corners Property Trust, Inc. 34,400 984,184Getty Realty Corp. 37,346 1,181,254Gladstone Commercial Corp. 52,500 1,188,075Global Medical REIT, Inc. 9,500 146,490Global Net Lease, Inc. 41,700 708,900Granite Point Mtg. Trust, Inc. 15,700 216,032Great Ajax Corp. 5,800 81,954Healthcare Realty Trust, Inc. 38,200 1,147,146Highwoods Properties, Inc. 9,600 438,624Independence Realty Trust, Inc. 53,800 1,101,824Industrial Logistics Properties Trust 11,700 320,931Innovative Industrial Properties, Inc.# 2,300 565,593Kite Realty Group Trust 42,800 867,128KKR Real Estate Finance Trust, Inc. 53,400 1,139,022Ladder Capital Corp. 98,500 1,123,885Lexington Realty Trust 123,900 1,676,367MFA Financial, Inc. 113,100 542,880New Senior Investment Group, Inc. 128,800 1,124,424NexPoint Residential Trust, Inc. 1,131 73,278Paramount Group, Inc. 28,200 249,852PennyMac Mtg. Investment Trust 61,000 1,184,010Physicians Realty Trust 77,400 1,432,674Piedmont Office Realty Trust, Inc., Class A 56,200 1,001,484Plymouth Industrial REIT, Inc. 15,500 365,180PotlatchDeltic Corp. 35,300 1,833,835QTS Realty Trust, Inc., Class A 2,700 210,546Ready Capital Corp. 33,200 508,292Redwood Trust, Inc. 159,900 1,993,953Retail Opportunity Investments Corp. 63,800 1,153,504Retail Properties of America, Inc., Class A 70,000 925,400RLJ Lodging Trust 21,726 313,506Ryman Hospitality Properties, Inc.� 4,400 365,508Sabra Health Care REIT, Inc. 118,900 1,902,400SITE Centers Corp. 68,100 1,097,091STAG Industrial, Inc.# 83,300 3,519,425Summit Hotel Properties, Inc.� 33,300 310,356Sunstone Hotel Investors, Inc.� 185,472 2,149,621Terreno Realty Corp. 23,100 1,543,311TPG RE Finance Trust, Inc. 58,300 734,580UMH Properties, Inc. 35,600 843,720Urban Edge Properties 33,500 634,490Urstadt Biddle Properties, Inc., Class A 13,300 253,764Xenia Hotels & Resorts, Inc.� 70,200 1,222,884
60,931,048Real Estate Management/Services - 0.5%
Newmark Group, Inc., Class A 60,929 829,853Realogy Holdings Corp.� 90,500 1,588,275
2,418,128
Copyright © 2021 www.secdatabase.com. All Rights Reserved.Please Consider the Environment Before Printing This Document
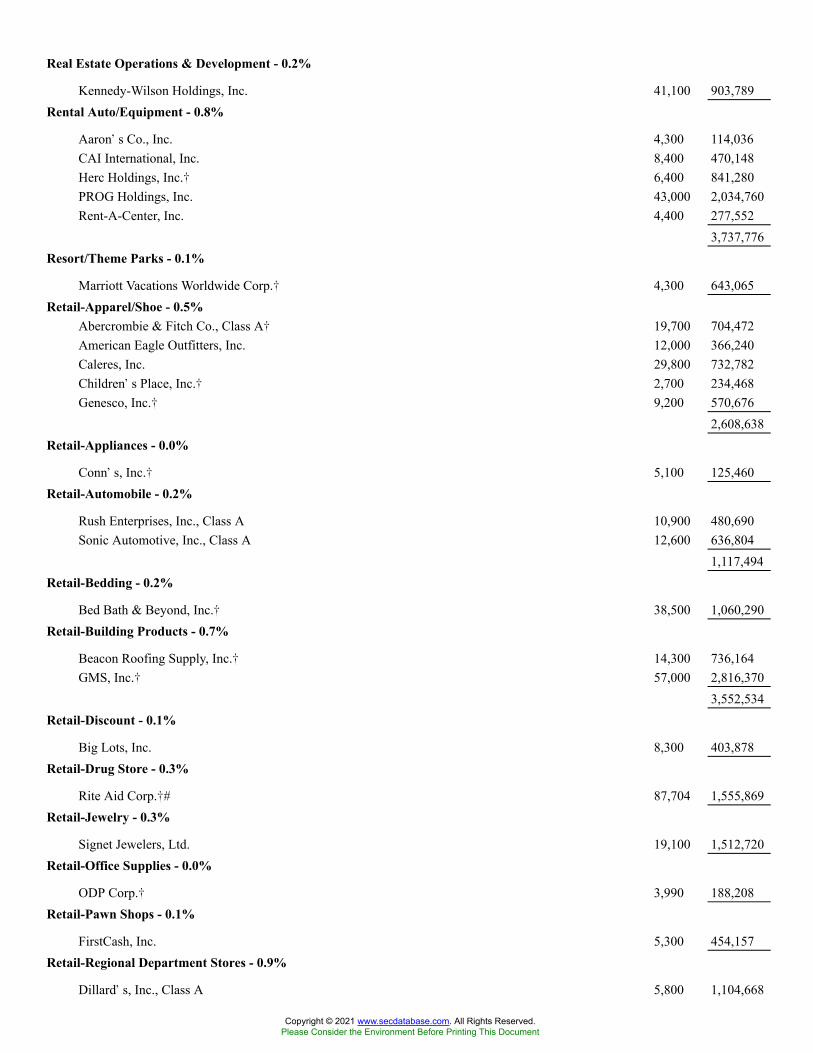
Real Estate Operations & Development - 0.2%
Kennedy-Wilson Holdings, Inc. 41,100 903,789Rental Auto/Equipment - 0.8%
Aaron�s Co., Inc. 4,300 114,036CAI International, Inc. 8,400 470,148Herc Holdings, Inc.� 6,400 841,280PROG Holdings, Inc. 43,000 2,034,760Rent-A-Center, Inc. 4,400 277,552
3,737,776Resort/Theme Parks - 0.1%
Marriott Vacations Worldwide Corp.� 4,300 643,065Retail-Apparel/Shoe - 0.5%
Abercrombie & Fitch Co., Class A� 19,700 704,472American Eagle Outfitters, Inc. 12,000 366,240Caleres, Inc. 29,800 732,782Children�s Place, Inc.� 2,700 234,468Genesco, Inc.� 9,200 570,676
2,608,638Retail-Appliances - 0.0%
Conn�s, Inc.� 5,100 125,460Retail-Automobile - 0.2%
Rush Enterprises, Inc., Class A 10,900 480,690Sonic Automotive, Inc., Class A 12,600 636,804
1,117,494Retail-Bedding - 0.2%
Bed Bath & Beyond, Inc.� 38,500 1,060,290Retail-Building Products - 0.7%
Beacon Roofing Supply, Inc.� 14,300 736,164GMS, Inc.� 57,000 2,816,370
3,552,534Retail-Discount - 0.1%
Big Lots, Inc. 8,300 403,878Retail-Drug Store - 0.3%
Rite Aid Corp.�# 87,704 1,555,869Retail-Jewelry - 0.3%
Signet Jewelers, Ltd. 19,100 1,512,720Retail-Office Supplies - 0.0%
ODP Corp.� 3,990 188,208Retail-Pawn Shops - 0.1%
FirstCash, Inc. 5,300 454,157Retail-Regional Department Stores - 0.9%
Dillard�s, Inc., Class A 5,800 1,104,668
Copyright © 2021 www.secdatabase.com. All Rights Reserved.Please Consider the Environment Before Printing This Document

Macy�s, Inc.� 151,500 3,392,0854,496,753
Retail-Restaurants - 0.2%
Del Taco Restaurants, Inc. 38,200 336,160Dine Brands Global, Inc.� 4,300 355,696Fiesta Restaurant Group, Inc.� 9,400 112,894
804,750Retail-Sporting Goods - 0.1%
Zumiez, Inc.� 15,800 635,002Rubber-Tires - 0.4%
Goodyear Tire & Rubber Co.� 128,585 2,036,786
Copyright © 2021 www.secdatabase.com. All Rights Reserved.Please Consider the Environment Before Printing This Document
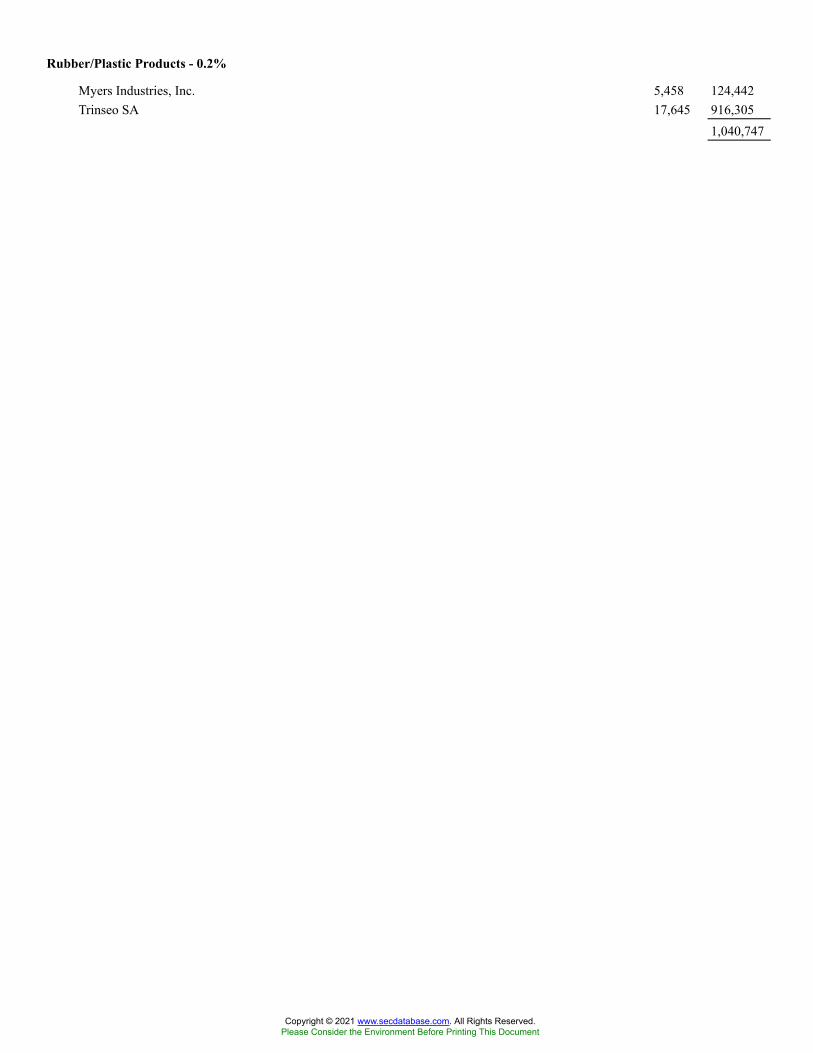
Rubber/Plastic Products - 0.2%
Myers Industries, Inc. 5,458 124,442Trinseo SA 17,645 916,305
1,040,747
Copyright © 2021 www.secdatabase.com. All Rights Reserved.Please Consider the Environment Before Printing This Document
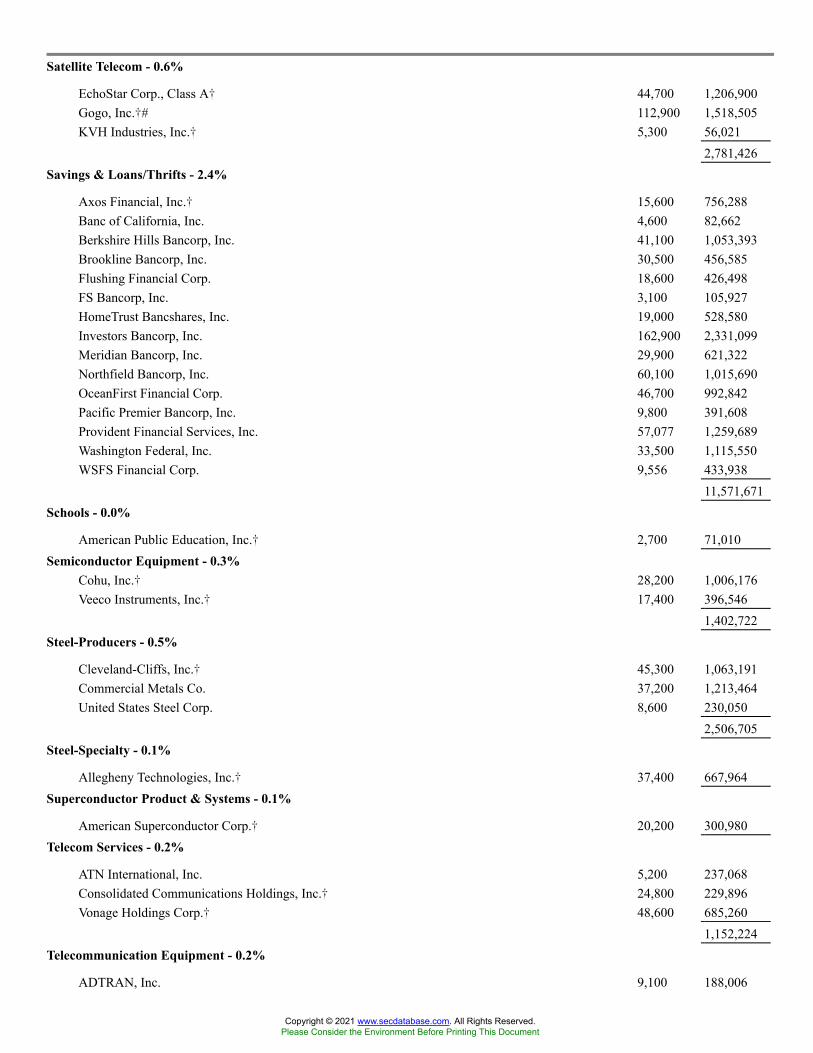
Satellite Telecom - 0.6%
EchoStar Corp., Class A� 44,700 1,206,900Gogo, Inc.�# 112,900 1,518,505KVH Industries, Inc.� 5,300 56,021
2,781,426Savings & Loans/Thrifts - 2.4%
Axos Financial, Inc.� 15,600 756,288Banc of California, Inc. 4,600 82,662Berkshire Hills Bancorp, Inc. 41,100 1,053,393Brookline Bancorp, Inc. 30,500 456,585Flushing Financial Corp. 18,600 426,498FS Bancorp, Inc. 3,100 105,927HomeTrust Bancshares, Inc. 19,000 528,580Investors Bancorp, Inc. 162,900 2,331,099Meridian Bancorp, Inc. 29,900 621,322Northfield Bancorp, Inc. 60,100 1,015,690OceanFirst Financial Corp. 46,700 992,842Pacific Premier Bancorp, Inc. 9,800 391,608Provident Financial Services, Inc. 57,077 1,259,689Washington Federal, Inc. 33,500 1,115,550WSFS Financial Corp. 9,556 433,938
11,571,671Schools - 0.0%
American Public Education, Inc.� 2,700 71,010Semiconductor Equipment - 0.3%
Cohu, Inc.� 28,200 1,006,176Veeco Instruments, Inc.� 17,400 396,546
1,402,722Steel-Producers - 0.5%
Cleveland-Cliffs, Inc.� 45,300 1,063,191Commercial Metals Co. 37,200 1,213,464United States Steel Corp. 8,600 230,050
2,506,705Steel-Specialty - 0.1%
Allegheny Technologies, Inc.� 37,400 667,964Superconductor Product & Systems - 0.1%
American Superconductor Corp.� 20,200 300,980Telecom Services - 0.2%
ATN International, Inc. 5,200 237,068Consolidated Communications Holdings, Inc.� 24,800 229,896Vonage Holdings Corp.� 48,600 685,260
1,152,224Telecommunication Equipment - 0.2%
ADTRAN, Inc. 9,100 188,006
Copyright © 2021 www.secdatabase.com. All Rights Reserved.Please Consider the Environment Before Printing This Document

Harmonic, Inc.� 80,200 741,048929,054
Television - 1.1%
AMC Networks, Inc., Class A� 42,400 2,015,272Gray Television, Inc. 84,200 1,914,708Sinclair Broadcast Group, Inc., Class A# 51,800 1,554,518
5,484,498Theaters - 0.9%
AMC Entertainment Holdings, Inc., Class A�# 77,900 3,671,427Cinemark Holdings, Inc.�# 44,700 797,001
4,468,428Therapeutics - 0.2%
Akebia Therapeutics, Inc.� 372,700 1,095,738Transport-Air Freight - 0.1%
Atlas Air Worldwide Holdings, Inc.� 6,700 490,239Transport-Marine - 0.3%
Costamare, Inc. 87,500 1,258,250Dorian LPG, Ltd. 22,300 294,806International Seaways, Inc. 7,700 132,440
1,685,496Transport-Services - 1.1%
Echo Global Logistics, Inc.� 81,400 2,676,432Forward Air Corp. 1,000 88,170Hub Group, Inc., Class A� 37,600 2,639,520Radiant Logistics, Inc.� 23,000 157,550
5,561,672Transport-Truck - 0.8%
ArcBest Corp. 51,420 3,431,257Covenant Logistics Group, Inc.� 4,100 99,876Werner Enterprises, Inc. 11,100 523,476
4,054,609Travel Services - 0.4%
Liberty TripAdvisor Holdings, Inc., Class A� 499,900 1,869,626Water - 0.4%
American States Water Co. 23,400 2,157,714X-Ray Equipment - 0.1%
Varex Imaging Corp.� 10,900 317,953Total Long-Term Investment Securities
(cost $391,242,850) 482,957,440SHORT-TERM INVESTMENT SECURITIES - 1.5%Registered Investment Companies - 1.5%
Copyright © 2021 www.secdatabase.com. All Rights Reserved.Please Consider the Environment Before Printing This Document

State Street Navigator Securities Lending Government Money Market Portfolio0.03%(1)(2)(cost $7,530,666) 7,530,666 7,530,666
REPURCHASE AGREEMENTS - 1.6%Agreement with Fixed Income Clearing Corp., bearing interest at 0.00% dated 08/31/2021, to be
repurchased 09/01/2021 in the amount of $7,884,000 and collateralized by $8,008,000 of UnitedStates Treasury Notes, bearing interest at 1.13% due 08/31/2028 and having an approximate valueof $8,041,786(cost $7,884,000) $7,884,000 7,884,000
Copyright © 2021 www.secdatabase.com. All Rights Reserved.Please Consider the Environment Before Printing This Document
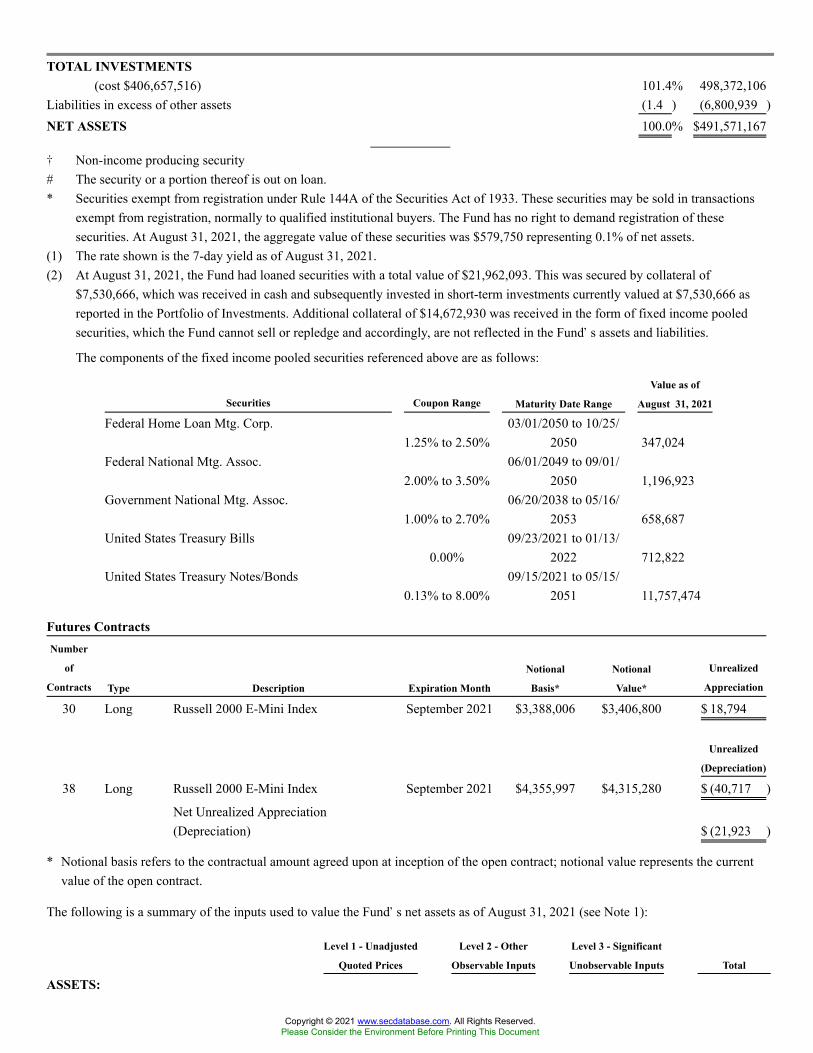
TOTAL INVESTMENTS(cost $406,657,516) 101.4% 498,372,106
Liabilities in excess of other assets (1.4 ) (6,800,939 )NET ASSETS 100.0% $491,571,167
� Non-income producing security# The security or a portion thereof is out on loan.* Securities exempt from registration under Rule 144A of the Securities Act of 1933. These securities may be sold in transactions
exempt from registration, normally to qualified institutional buyers. The Fund has no right to demand registration of thesesecurities. At August 31, 2021, the aggregate value of these securities was $579,750 representing 0.1% of net assets.
(1) The rate shown is the 7-day yield as of August 31, 2021.(2) At August 31, 2021, the Fund had loaned securities with a total value of $21,962,093. This was secured by collateral of
$7,530,666, which was received in cash and subsequently invested in short-term investments currently valued at $7,530,666 asreported in the Portfolio of Investments. Additional collateral of $14,672,930 was received in the form of fixed income pooledsecurities, which the Fund cannot sell or repledge and accordingly, are not reflected in the Fund�s assets and liabilities.
The components of the fixed income pooled securities referenced above are as follows:
Securities Coupon Range Maturity Date Range
Value as of
August 31, 2021
Federal Home Loan Mtg. Corp.1.25% to 2.50%
03/01/2050 to 10/25/2050 347,024
Federal National Mtg. Assoc.2.00% to 3.50%
06/01/2049 to 09/01/2050 1,196,923
Government National Mtg. Assoc.1.00% to 2.70%
06/20/2038 to 05/16/2053 658,687
United States Treasury Bills0.00%
09/23/2021 to 01/13/2022 712,822
United States Treasury Notes/Bonds0.13% to 8.00%
09/15/2021 to 05/15/2051 11,757,474
Futures ContractsNumber
of
Contracts Type Description Expiration Month
Notional
Basis*
Notional
Value*
Unrealized
Appreciation
30 Long Russell 2000 E-Mini Index September 2021 $3,388,006 $3,406,800 $ 18,794
Unrealized
(Depreciation)
38 Long Russell 2000 E-Mini Index September 2021 $4,355,997 $4,315,280 $ (40,717 )
Net Unrealized Appreciation(Depreciation) $ (21,923 )
* Notional basis refers to the contractual amount agreed upon at inception of the open contract; notional value represents the currentvalue of the open contract.
The following is a summary of the inputs used to value the Fund�s net assets as of August 31, 2021 (see Note 1):
Level 1 - Unadjusted
Quoted Prices
Level 2 - Other
Observable Inputs
Level 3 - Significant
Unobservable Inputs Total
ASSETS:
Copyright © 2021 www.secdatabase.com. All Rights Reserved.Please Consider the Environment Before Printing This Document

Investments at Value:*Common Stocks $ 482,957,440 $ � $ � $482,957,440Short-Term Investment Securities 7,530,666 � � 7,530,666Repurchase Agreements � 7,884,000 � 7,884,000Total Investments at Value $ 490,488,106 $ 7,884,000 $ � $498,372,106
Other Financial Instruments:+Futures Contracts $ 18,794 $ � $ � $18,794
LIABILITIES:Other Financial Instruments:+Futures Contracts $ 40,717 $ � $ � $40,717
* For a detailed presentation of investments, please refer to the Portfolio of Investments.+ Amounts represent unrealized appreciation/depreciation as of the end of the reporting period.
See Notes to Portfolio of Investments
Copyright © 2021 www.secdatabase.com. All Rights Reserved.Please Consider the Environment Before Printing This Document

VALIC Company I Stock Index FundPORTFOLIO OF INVESTMENTS - August 31, 2021 - (unaudited)
Security Description
Shares/
Principal
Amount
Value
(Note 1)
COMMON STOCKS - 98.4%Advertising Agencies - 0.1%
Interpublic Group of Cos., Inc. 64,712 $2,409,228Omnicom Group, Inc. 35,382 2,590,670
4,999,898Aerospace/Defense - 1.3%
Boeing Co.� 90,433 19,850,044General Dynamics Corp. 37,657 7,543,074Lockheed Martin Corp. 40,235 14,476,553Northrop Grumman Corp. 24,626 9,054,980Raytheon Technologies Corp. 249,241 21,125,667Teledyne Technologies, Inc.� 7,640 3,540,223TransDigm Group, Inc.� 9,030 5,485,454
81,075,995Aerospace/Defense-Equipment - 0.2%
Howmet Aerospace, Inc. 64,304 2,041,652L3Harris Technologies, Inc. 33,722 7,857,563
9,899,215Agricultural Biotech - 0.1%
Corteva, Inc. 121,258 5,331,714Agricultural Chemicals - 0.1%
CF Industries Holdings, Inc. 35,289 1,602,826Mosaic Co. 56,854 1,829,562
3,432,388Agricultural Operations - 0.1%
Archer-Daniels-Midland Co. 91,910 5,514,600Airlines - 0.2%
Alaska Air Group, Inc.� 20,478 1,174,209American Airlines Group, Inc.� 105,512 2,103,909Delta Air Lines, Inc.� 105,226 4,255,339Southwest Airlines Co.� 97,285 4,842,847United Airlines Holdings, Inc.� 53,231 2,475,774
14,852,078Apparel Manufacturers - 0.2%
Hanesbrands, Inc. 57,431 1,072,811PVH Corp.� 11,724 1,228,558Ralph Lauren Corp. 7,937 921,724Tapestry, Inc. 45,873 1,849,599
Copyright © 2021 www.secdatabase.com. All Rights Reserved.Please Consider the Environment Before Printing This Document
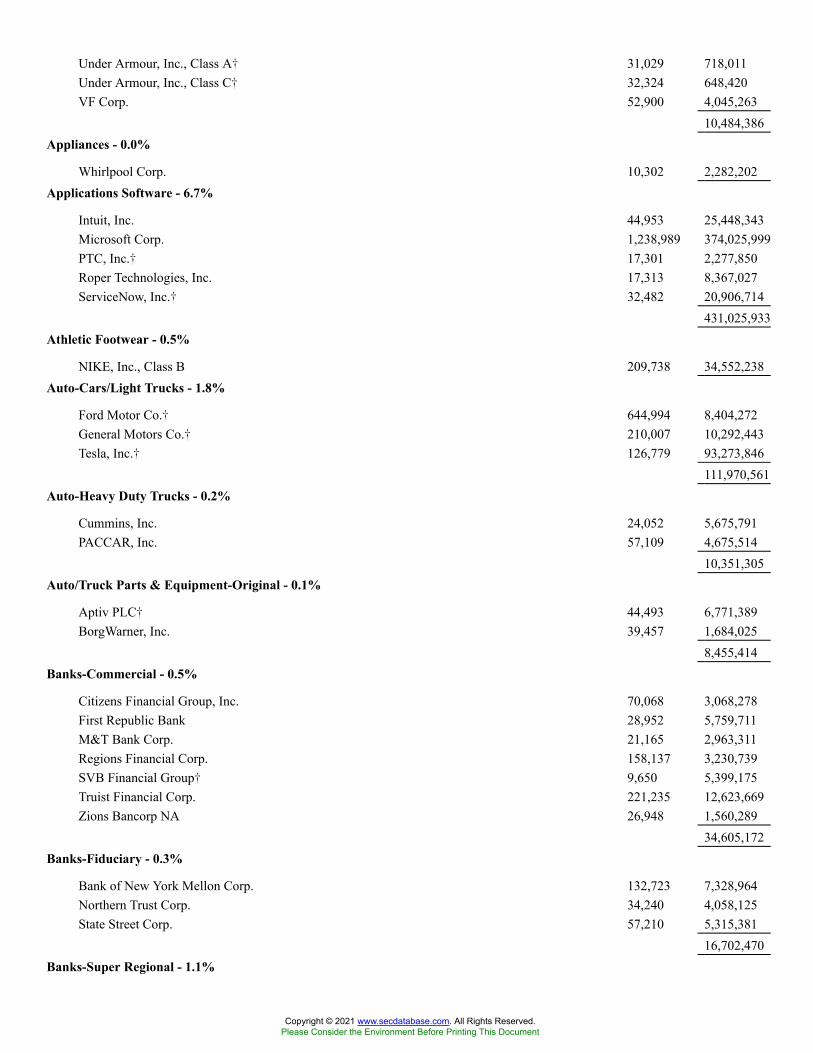
Under Armour, Inc., Class A� 31,029 718,011Under Armour, Inc., Class C� 32,324 648,420VF Corp. 52,900 4,045,263
10,484,386Appliances - 0.0%
Whirlpool Corp. 10,302 2,282,202Applications Software - 6.7%
Intuit, Inc. 44,953 25,448,343Microsoft Corp. 1,238,989 374,025,999PTC, Inc.� 17,301 2,277,850Roper Technologies, Inc. 17,313 8,367,027ServiceNow, Inc.� 32,482 20,906,714
431,025,933Athletic Footwear - 0.5%
NIKE, Inc., Class B 209,738 34,552,238Auto-Cars/Light Trucks - 1.8%
Ford Motor Co.� 644,994 8,404,272General Motors Co.� 210,007 10,292,443Tesla, Inc.� 126,779 93,273,846
111,970,561Auto-Heavy Duty Trucks - 0.2%
Cummins, Inc. 24,052 5,675,791PACCAR, Inc. 57,109 4,675,514
10,351,305Auto/Truck Parts & Equipment-Original - 0.1%
Aptiv PLC� 44,493 6,771,389BorgWarner, Inc. 39,457 1,684,025
8,455,414Banks-Commercial - 0.5%
Citizens Financial Group, Inc. 70,068 3,068,278First Republic Bank 28,952 5,759,711M&T Bank Corp. 21,165 2,963,311Regions Financial Corp. 158,137 3,230,739SVB Financial Group� 9,650 5,399,175Truist Financial Corp. 221,235 12,623,669Zions Bancorp NA 26,948 1,560,289
34,605,172Banks-Fiduciary - 0.3%
Bank of New York Mellon Corp. 132,723 7,328,964Northern Trust Corp. 34,240 4,058,125State Street Corp. 57,210 5,315,381
16,702,470Banks-Super Regional - 1.1%
Copyright © 2021 www.secdatabase.com. All Rights Reserved.Please Consider the Environment Before Printing This Document

Comerica, Inc. 22,967 1,697,491Fifth Third Bancorp 115,807 4,500,260Huntington Bancshares, Inc. 242,727 3,769,550KeyCorp 159,656 3,244,210PNC Financial Services Group, Inc. 69,891 13,356,170US Bancorp 223,005 12,798,257Wells Fargo & Co. 679,997 31,075,863
70,441,801Beverages-Non-alcoholic - 1.2%
Coca-Cola Co. 638,368 35,946,502Monster Beverage Corp.� 60,866 5,938,696PepsiCo, Inc. 227,287 35,545,414
77,430,612Beverages-Wine/Spirits - 0.0%
Brown-Forman Corp., Class B 30,047 2,109,900Brewery - 0.1%
Constellation Brands, Inc., Class A 27,802 5,870,114Molson Coors Beverage Co., Class B 30,986 1,472,765
7,342,879Broadcast Services/Program - 0.1%
Discovery, Inc., Class A� 27,745 800,166Discovery, Inc., Class C� 49,423 1,363,581Fox Corp., Class A 53,783 2,013,635Fox Corp., Class B 24,999 865,715
5,043,097Building & Construction Products-Misc. - 0.0%
Fortune Brands Home & Security, Inc. 22,772 2,217,310Building Products-Air & Heating - 0.3%
Carrier Global Corp. 134,379 7,740,231
Copyright © 2021 www.secdatabase.com. All Rights Reserved.Please Consider the Environment Before Printing This Document

Johnson Controls International PLC 117,904 8,819,21916,559,450
Building Products-Cement - 0.1%
Martin Marietta Materials, Inc. 10,260 3,911,625Vulcan Materials Co. 21,824 4,057,736
7,969,361Building Products-Wood - 0.0%
Masco Corp. 41,750 2,535,060Building-Maintenance & Services - 0.0%
Rollins, Inc. 36,431 1,417,895Building-Residential/Commercial - 0.2%
D.R. Horton, Inc. 53,965 5,160,133Lennar Corp., Class A 45,365 4,868,118NVR, Inc.� 569 2,947,386PulteGroup, Inc. 43,508 2,343,341
15,318,978Cable/Satellite TV - 1.0%
Charter Communications, Inc., Class A� 22,657 18,503,066Comcast Corp., Class A 754,234 45,766,919DISH Network Corp., Class A� 40,873 1,781,654
66,051,639Casino Hotels - 0.1%
Las Vegas Sands Corp.� 54,041 2,410,769MGM Resorts International 66,978 2,854,602Wynn Resorts, Ltd.� 17,314 1,760,661
7,026,032Casino Services - 0.1%
Caesars Entertainment, Inc.� 34,332 3,489,161Cellular Telecom - 0.2%
T-Mobile US, Inc.� 96,405 13,209,413Chemicals-Diversified - 0.5%
Celanese Corp. 18,529 2,938,699Dow, Inc. 122,884 7,729,404DuPont de Nemours, Inc. 87,541 6,479,785Eastman Chemical Co. 22,458 2,541,347FMC Corp. 21,201 1,985,050LyondellBasell Industries NV, Class A 42,352 4,250,023PPG Industries, Inc. 39,003 6,222,929
32,147,237Chemicals-Specialty - 0.3%
Albemarle Corp. 19,202 4,545,881Ecolab, Inc. 40,924 9,222,633International Flavors & Fragrances, Inc. 40,948 6,203,622
Copyright © 2021 www.secdatabase.com. All Rights Reserved.Please Consider the Environment Before Printing This Document

19,972,136Coatings/Paint - 0.2%
Sherwin-Williams Co. 39,376 11,957,310Commercial Services - 0.1%
Cintas Corp. 14,517 5,745,393Nielsen Holdings PLC 58,975 1,265,604Quanta Services, Inc. 22,923 2,340,438
9,351,435Commercial Services-Finance - 2.0%
Automatic Data Processing, Inc. 70,000 14,632,800Equifax, Inc. 20,021 5,450,917FleetCor Technologies, Inc.� 13,712 3,610,095Global Payments, Inc. 48,565 7,898,612IHS Markit, Ltd. 61,626 7,432,096MarketAxess Holdings, Inc. 6,249 2,974,024Moody�s Corp. 26,484 10,084,313PayPal Holdings, Inc.� 193,250 55,783,545S&P Global, Inc. 39,630 17,588,586
125,454,988Computer Aided Design - 0.5%
ANSYS, Inc.� 14,337 5,238,166Autodesk, Inc.� 36,193 11,223,088Cadence Design Systems, Inc.� 45,777 7,483,624Synopsys, Inc.� 25,096 8,337,895
32,282,773Computer Data Security - 0.1%
Fortinet, Inc.� 22,299 7,027,307Computer Services - 1.0%
Accenture PLC, Class A 104,568 35,193,406Cognizant Technology Solutions Corp., Class A 86,762 6,620,808DXC Technology Co.� 41,918 1,539,229International Business Machines Corp. 146,990 20,628,577Leidos Holdings, Inc. 21,868 2,145,469
66,127,489Computer Software - 0.1%
Akamai Technologies, Inc.� 26,813 3,036,572Citrix Systems, Inc. 20,426 2,101,223
5,137,795Computers - 6.3%
Apple, Inc. 2,580,502 391,797,619Hewlett Packard Enterprise Co. 214,833 3,321,318HP, Inc. 197,614 5,877,040
400,995,977Computers-Memory Devices - 0.1%
Copyright © 2021 www.secdatabase.com. All Rights Reserved.Please Consider the Environment Before Printing This Document

NetApp, Inc. 36,619 3,256,528Seagate Technology Holdings PLC 32,756 2,869,098Western Digital Corp.� 50,413 3,186,101
9,311,727Consulting Services - 0.2%
Gartner, Inc.� 14,160 4,371,758Verisk Analytics, Inc. 26,665 5,379,931
9,751,689Consumer Products-Misc. - 0.2%
Clorox Co. 20,460 3,438,303Kimberly-Clark Corp. 55,510 7,649,833
11,088,136Containers-Metal/Glass - 0.1%
Ball Corp. 54,000 5,181,840Containers-Paper/Plastic - 0.1%
Amcor PLC 253,635 3,259,210Packaging Corp. of America 15,627 2,370,616Sealed Air Corp. 25,003 1,525,933
Copyright © 2021 www.secdatabase.com. All Rights Reserved.Please Consider the Environment Before Printing This Document
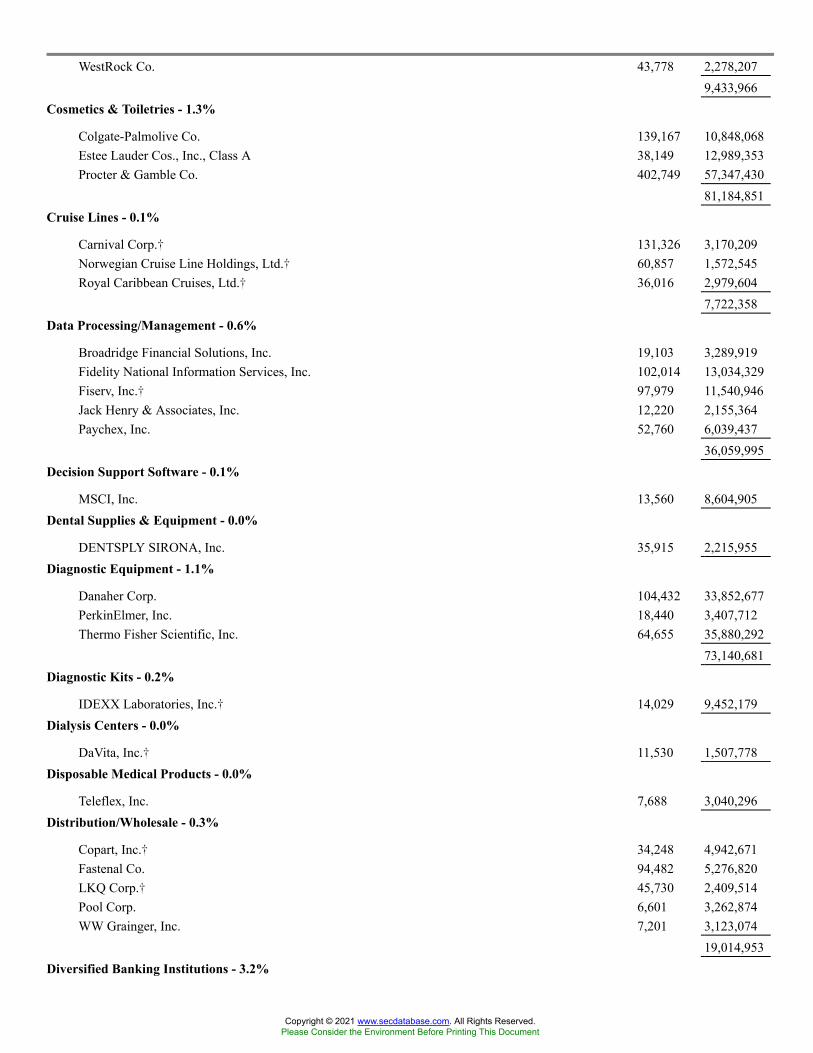
WestRock Co. 43,778 2,278,2079,433,966
Cosmetics & Toiletries - 1.3%
Colgate-Palmolive Co. 139,167 10,848,068Estee Lauder Cos., Inc., Class A 38,149 12,989,353Procter & Gamble Co. 402,749 57,347,430
81,184,851Cruise Lines - 0.1%
Carnival Corp.� 131,326 3,170,209Norwegian Cruise Line Holdings, Ltd.� 60,857 1,572,545Royal Caribbean Cruises, Ltd.� 36,016 2,979,604
7,722,358Data Processing/Management - 0.6%
Broadridge Financial Solutions, Inc. 19,103 3,289,919Fidelity National Information Services, Inc. 102,014 13,034,329Fiserv, Inc.� 97,979 11,540,946Jack Henry & Associates, Inc. 12,220 2,155,364Paychex, Inc. 52,760 6,039,437
36,059,995Decision Support Software - 0.1%
MSCI, Inc. 13,560 8,604,905Dental Supplies & Equipment - 0.0%
DENTSPLY SIRONA, Inc. 35,915 2,215,955Diagnostic Equipment - 1.1%
Danaher Corp. 104,432 33,852,677PerkinElmer, Inc. 18,440 3,407,712Thermo Fisher Scientific, Inc. 64,655 35,880,292
73,140,681Diagnostic Kits - 0.2%
IDEXX Laboratories, Inc.� 14,029 9,452,179Dialysis Centers - 0.0%
DaVita, Inc.� 11,530 1,507,778Disposable Medical Products - 0.0%
Teleflex, Inc. 7,688 3,040,296Distribution/Wholesale - 0.3%
Copart, Inc.� 34,248 4,942,671Fastenal Co. 94,482 5,276,820LKQ Corp.� 45,730 2,409,514Pool Corp. 6,601 3,262,874WW Grainger, Inc. 7,201 3,123,074
19,014,953Diversified Banking Institutions - 3.2%
Copyright © 2021 www.secdatabase.com. All Rights Reserved.Please Consider the Environment Before Printing This Document
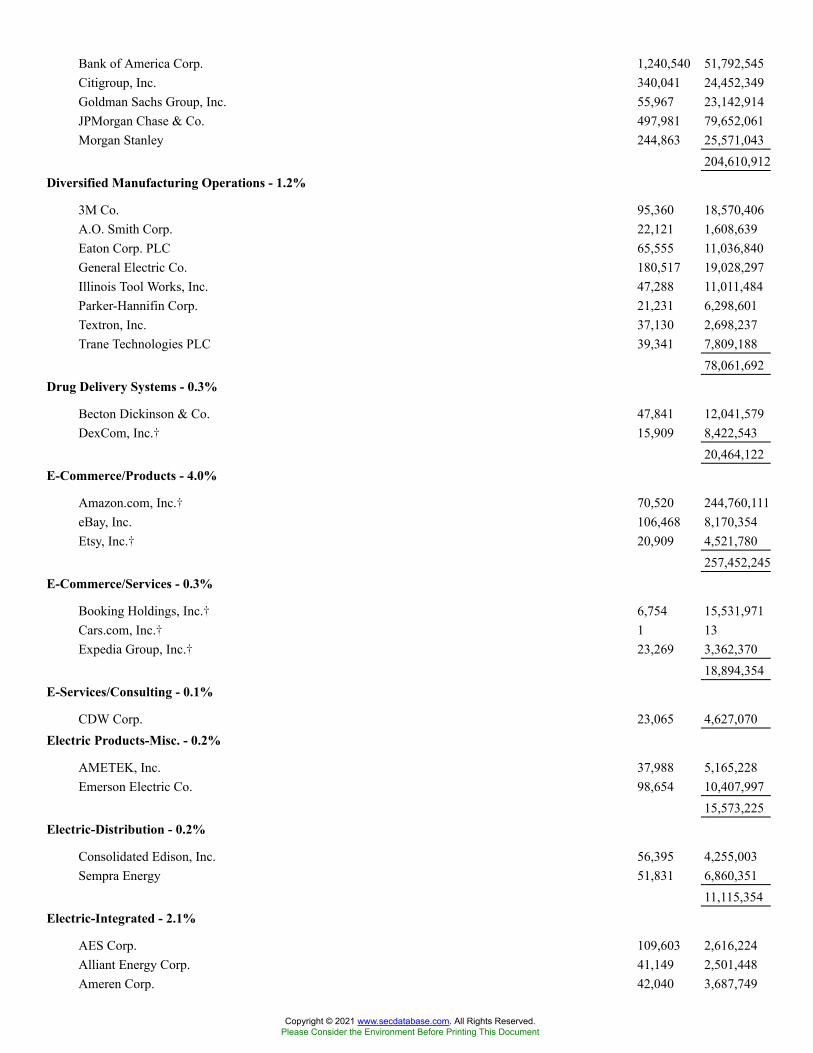
Bank of America Corp. 1,240,540 51,792,545Citigroup, Inc. 340,041 24,452,349Goldman Sachs Group, Inc. 55,967 23,142,914JPMorgan Chase & Co. 497,981 79,652,061Morgan Stanley 244,863 25,571,043
204,610,912Diversified Manufacturing Operations - 1.2%
3M Co. 95,360 18,570,406A.O. Smith Corp. 22,121 1,608,639Eaton Corp. PLC 65,555 11,036,840General Electric Co. 180,517 19,028,297Illinois Tool Works, Inc. 47,288 11,011,484Parker-Hannifin Corp. 21,231 6,298,601Textron, Inc. 37,130 2,698,237Trane Technologies PLC 39,341 7,809,188
78,061,692Drug Delivery Systems - 0.3%
Becton Dickinson & Co. 47,841 12,041,579DexCom, Inc.� 15,909 8,422,543
20,464,122E-Commerce/Products - 4.0%
Amazon.com, Inc.� 70,520 244,760,111eBay, Inc. 106,468 8,170,354Etsy, Inc.� 20,909 4,521,780
257,452,245E-Commerce/Services - 0.3%
Booking Holdings, Inc.� 6,754 15,531,971Cars.com, Inc.� 1 13Expedia Group, Inc.� 23,269 3,362,370
18,894,354E-Services/Consulting - 0.1%
CDW Corp. 23,065 4,627,070Electric Products-Misc. - 0.2%
AMETEK, Inc. 37,988 5,165,228Emerson Electric Co. 98,654 10,407,997
15,573,225Electric-Distribution - 0.2%
Consolidated Edison, Inc. 56,395 4,255,003Sempra Energy 51,831 6,860,351
11,115,354Electric-Integrated - 2.1%
AES Corp. 109,603 2,616,224Alliant Energy Corp. 41,149 2,501,448Ameren Corp. 42,040 3,687,749
Copyright © 2021 www.secdatabase.com. All Rights Reserved.Please Consider the Environment Before Printing This Document
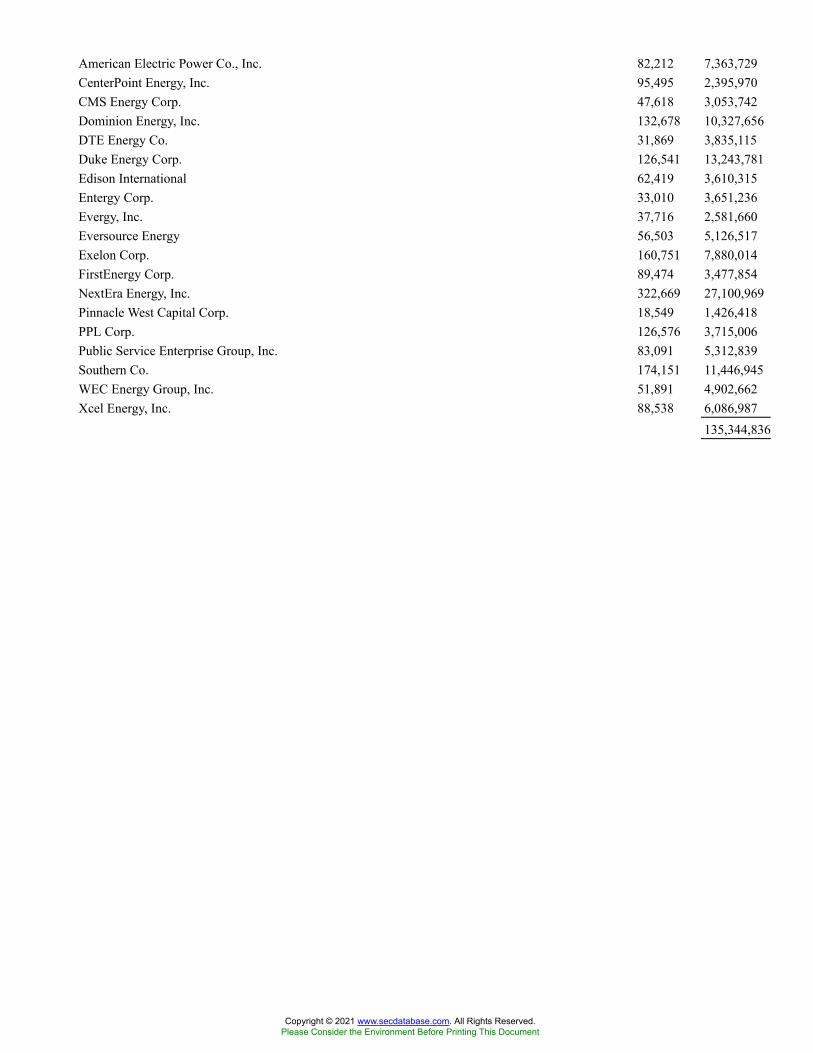
American Electric Power Co., Inc. 82,212 7,363,729CenterPoint Energy, Inc. 95,495 2,395,970CMS Energy Corp. 47,618 3,053,742Dominion Energy, Inc. 132,678 10,327,656DTE Energy Co. 31,869 3,835,115Duke Energy Corp. 126,541 13,243,781Edison International 62,419 3,610,315Entergy Corp. 33,010 3,651,236Evergy, Inc. 37,716 2,581,660Eversource Energy 56,503 5,126,517Exelon Corp. 160,751 7,880,014FirstEnergy Corp. 89,474 3,477,854NextEra Energy, Inc. 322,669 27,100,969Pinnacle West Capital Corp. 18,549 1,426,418PPL Corp. 126,576 3,715,006Public Service Enterprise Group, Inc. 83,091 5,312,839Southern Co. 174,151 11,446,945WEC Energy Group, Inc. 51,891 4,902,662Xcel Energy, Inc. 88,538 6,086,987
135,344,836
Copyright © 2021 www.secdatabase.com. All Rights Reserved.Please Consider the Environment Before Printing This Document

Electronic Components-Misc. - 0.1%
Garmin, Ltd. 24,655 4,300,572Electronic Components-Semiconductors - 3.9%
Advanced Micro Devices, Inc.� 199,878 22,130,492Broadcom, Inc. 67,169 33,397,099Intel Corp. 664,276 35,910,761IPG Photonics Corp.� 5,905 1,007,865Microchip Technology, Inc. 44,997 7,080,728Micron Technology, Inc.� 184,479 13,596,102Monolithic Power Systems, Inc. 7,076 3,502,125NVIDIA Corp. 409,952 91,767,755Qorvo, Inc.� 18,521 3,482,504Skyworks Solutions, Inc. 27,159 4,982,590Texas Instruments, Inc. 151,925 29,004,002Xilinx, Inc. 40,443 6,292,526
252,154,549Electronic Connectors - 0.2%
Amphenol Corp., Class A 98,312 7,533,649TE Connectivity, Ltd. 54,324 8,160,551
15,694,200Electronic Forms - 0.8%
Adobe, Inc.� 78,634 52,189,386Electronic Measurement Instruments - 0.3%
Agilent Technologies, Inc. 49,918 8,759,112Fortive Corp. 55,690 4,113,820Keysight Technologies, Inc.� 30,306 5,436,290Trimble, Inc.� 41,285 3,889,873
22,199,095Electronic Security Devices - 0.0%
Allegion PLC 14,802 2,131,340Energy-Alternate Sources - 0.1%
Enphase Energy, Inc.� 22,324 3,878,349Engineering/R&D Services - 0.0%
Jacobs Engineering Group, Inc. 21,421 2,890,978Enterprise Software/Service - 1.2%
Oracle Corp. 298,846 26,636,144Paycom Software, Inc.� 8,081 3,950,801salesforce.com, Inc.� 158,865 42,142,119Tyler Technologies, Inc.� 6,702 3,255,161
75,984,225Entertainment Software - 0.3%
Activision Blizzard, Inc. 127,824 10,528,863Electronic Arts, Inc. 47,081 6,836,632
Copyright © 2021 www.secdatabase.com. All Rights Reserved.Please Consider the Environment Before Printing This Document
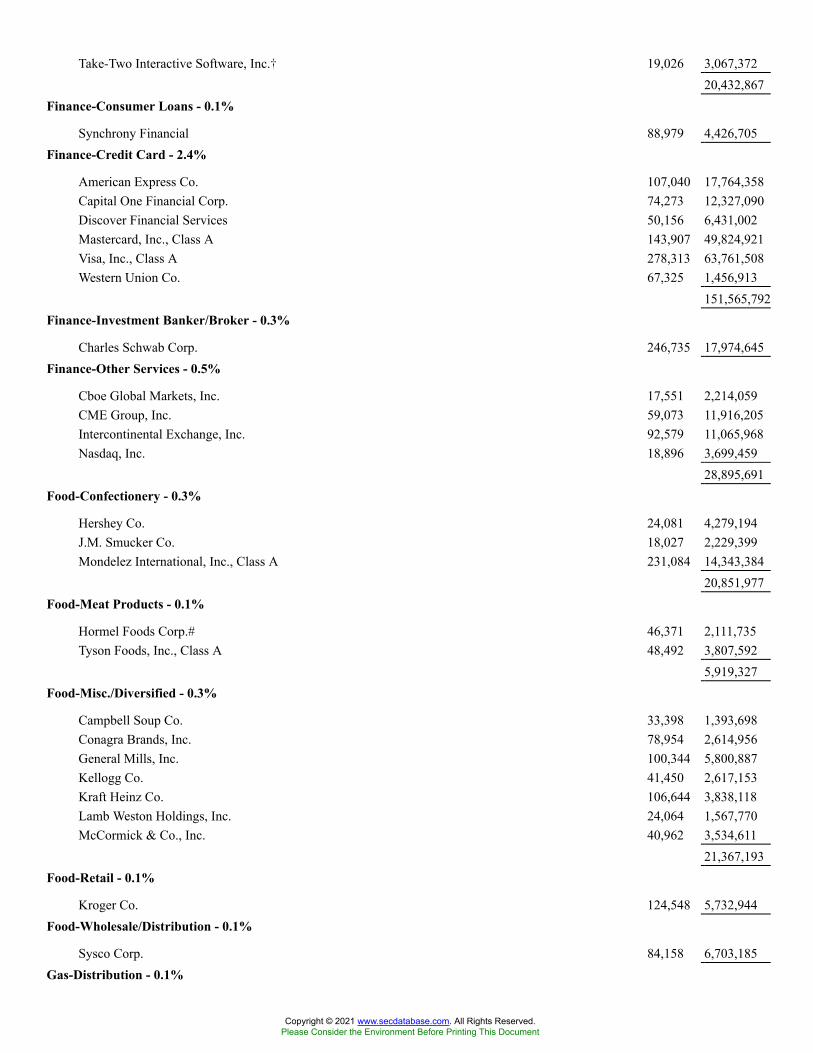
Take-Two Interactive Software, Inc.� 19,026 3,067,37220,432,867
Finance-Consumer Loans - 0.1%
Synchrony Financial 88,979 4,426,705Finance-Credit Card - 2.4%
American Express Co. 107,040 17,764,358Capital One Financial Corp. 74,273 12,327,090Discover Financial Services 50,156 6,431,002Mastercard, Inc., Class A 143,907 49,824,921Visa, Inc., Class A 278,313 63,761,508Western Union Co. 67,325 1,456,913
151,565,792Finance-Investment Banker/Broker - 0.3%
Charles Schwab Corp. 246,735 17,974,645Finance-Other Services - 0.5%
Cboe Global Markets, Inc. 17,551 2,214,059CME Group, Inc. 59,073 11,916,205Intercontinental Exchange, Inc. 92,579 11,065,968Nasdaq, Inc. 18,896 3,699,459
28,895,691Food-Confectionery - 0.3%
Hershey Co. 24,081 4,279,194J.M. Smucker Co. 18,027 2,229,399Mondelez International, Inc., Class A 231,084 14,343,384
20,851,977Food-Meat Products - 0.1%
Hormel Foods Corp.# 46,371 2,111,735Tyson Foods, Inc., Class A 48,492 3,807,592
5,919,327Food-Misc./Diversified - 0.3%
Campbell Soup Co. 33,398 1,393,698Conagra Brands, Inc. 78,954 2,614,956General Mills, Inc. 100,344 5,800,887Kellogg Co. 41,450 2,617,153Kraft Heinz Co. 106,644 3,838,118Lamb Weston Holdings, Inc. 24,064 1,567,770McCormick & Co., Inc. 40,962 3,534,611
21,367,193Food-Retail - 0.1%
Kroger Co. 124,548 5,732,944Food-Wholesale/Distribution - 0.1%
Sysco Corp. 84,158 6,703,185Gas-Distribution - 0.1%
Copyright © 2021 www.secdatabase.com. All Rights Reserved.Please Consider the Environment Before Printing This Document
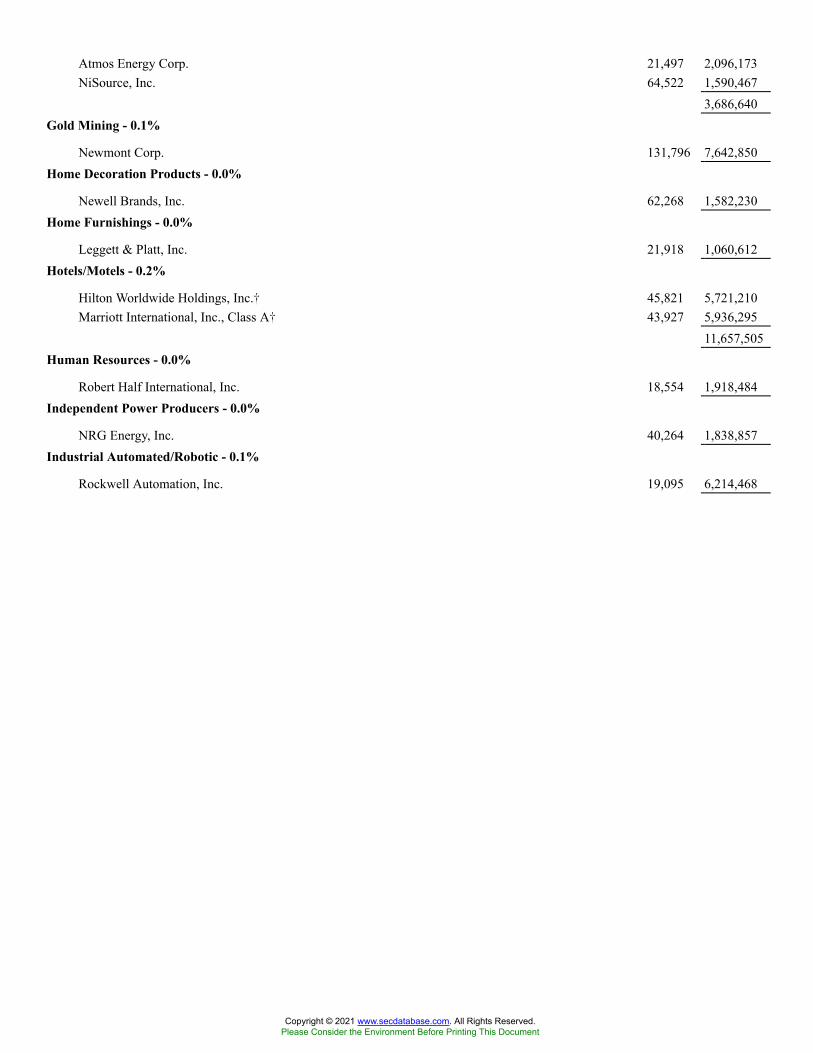
Atmos Energy Corp. 21,497 2,096,173NiSource, Inc. 64,522 1,590,467
3,686,640Gold Mining - 0.1%
Newmont Corp. 131,796 7,642,850Home Decoration Products - 0.0%
Newell Brands, Inc. 62,268 1,582,230Home Furnishings - 0.0%
Leggett & Platt, Inc. 21,918 1,060,612Hotels/Motels - 0.2%
Hilton Worldwide Holdings, Inc.� 45,821 5,721,210Marriott International, Inc., Class A� 43,927 5,936,295
11,657,505Human Resources - 0.0%
Robert Half International, Inc. 18,554 1,918,484Independent Power Producers - 0.0%
NRG Energy, Inc. 40,264 1,838,857Industrial Automated/Robotic - 0.1%
Rockwell Automation, Inc. 19,095 6,214,468
Copyright © 2021 www.secdatabase.com. All Rights Reserved.Please Consider the Environment Before Printing This Document
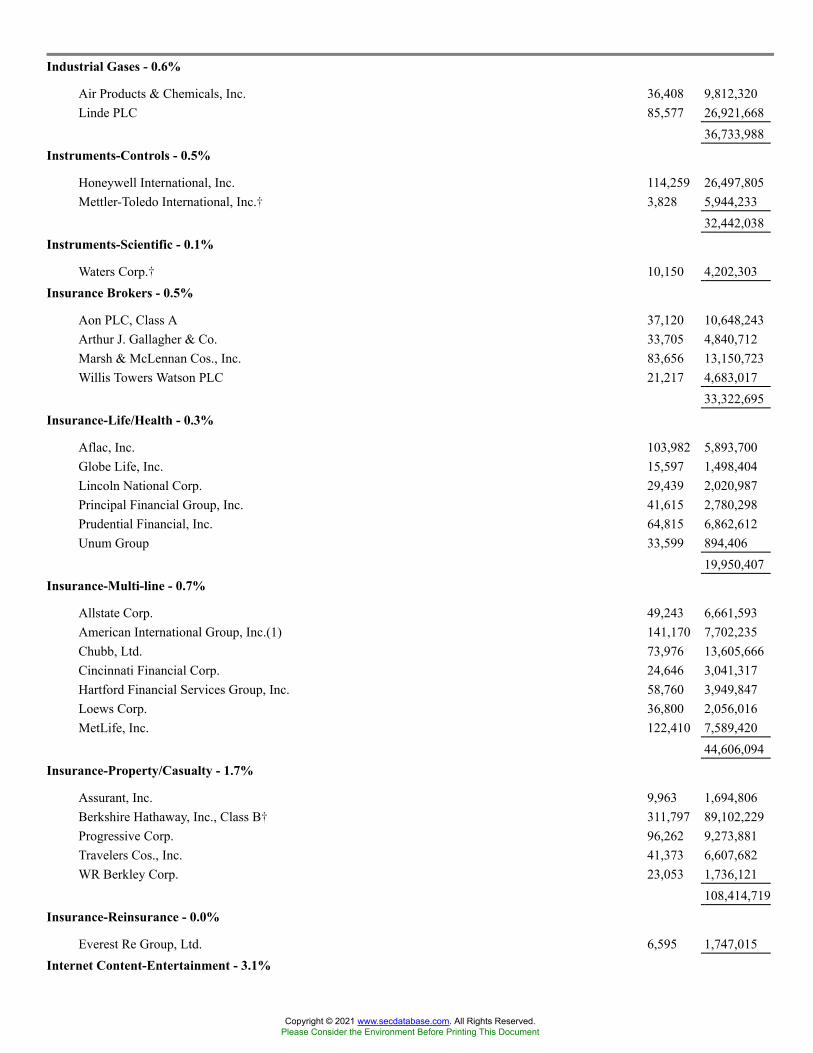
Industrial Gases - 0.6%
Air Products & Chemicals, Inc. 36,408 9,812,320Linde PLC 85,577 26,921,668
36,733,988Instruments-Controls - 0.5%
Honeywell International, Inc. 114,259 26,497,805Mettler-Toledo International, Inc.� 3,828 5,944,233
32,442,038Instruments-Scientific - 0.1%
Waters Corp.� 10,150 4,202,303Insurance Brokers - 0.5%
Aon PLC, Class A 37,120 10,648,243Arthur J. Gallagher & Co. 33,705 4,840,712Marsh & McLennan Cos., Inc. 83,656 13,150,723Willis Towers Watson PLC 21,217 4,683,017
33,322,695Insurance-Life/Health - 0.3%
Aflac, Inc. 103,982 5,893,700Globe Life, Inc. 15,597 1,498,404Lincoln National Corp. 29,439 2,020,987Principal Financial Group, Inc. 41,615 2,780,298Prudential Financial, Inc. 64,815 6,862,612Unum Group 33,599 894,406
19,950,407Insurance-Multi-line - 0.7%
Allstate Corp. 49,243 6,661,593American International Group, Inc.(1) 141,170 7,702,235Chubb, Ltd. 73,976 13,605,666Cincinnati Financial Corp. 24,646 3,041,317Hartford Financial Services Group, Inc. 58,760 3,949,847Loews Corp. 36,800 2,056,016MetLife, Inc. 122,410 7,589,420
44,606,094Insurance-Property/Casualty - 1.7%
Assurant, Inc. 9,963 1,694,806Berkshire Hathaway, Inc., Class B� 311,797 89,102,229Progressive Corp. 96,262 9,273,881Travelers Cos., Inc. 41,373 6,607,682WR Berkley Corp. 23,053 1,736,121
108,414,719Insurance-Reinsurance - 0.0%
Everest Re Group, Ltd. 6,595 1,747,015Internet Content-Entertainment - 3.1%
Copyright © 2021 www.secdatabase.com. All Rights Reserved.Please Consider the Environment Before Printing This Document

Facebook, Inc., Class A� 394,164 149,537,938Netflix, Inc.� 72,942 41,517,857Twitter, Inc.� 131,297 8,468,657
199,524,452Internet Infrastructure Software - 0.0%
F5 Networks, Inc.� 9,807 1,996,411Internet Security - 0.0%
NortonLifeLock, Inc. 95,404 2,533,930Investment Management/Advisor Services - 0.6%
Ameriprise Financial, Inc. 19,067 5,203,575BlackRock, Inc. 23,335 22,011,672Franklin Resources, Inc. 44,800 1,453,312Invesco, Ltd. 62,248 1,576,119Raymond James Financial, Inc. 20,120 2,814,788T. Rowe Price Group, Inc. 37,319 8,354,605
41,414,071Machinery-Construction & Mining - 0.3%
Caterpillar, Inc. 90,115 19,002,550Machinery-Farming - 0.3%
Deere & Co. 51,316 19,398,987Machinery-General Industrial - 0.2%
IDEX Corp. 12,492 2,798,208Otis Worldwide Corp. 66,360 6,119,719Westinghouse Air Brake Technologies Corp. 29,225 2,624,113
11,542,040Machinery-Pumps - 0.2%
Dover Corp. 23,677 4,128,322Ingersoll Rand, Inc.� 63,891 3,387,501Xylem, Inc. 29,618 4,037,229
11,553,052Medical Information Systems - 0.1%
Cerner Corp. 49,568 3,784,517Medical Instruments - 1.2%
Bio-Techne Corp. 6,398 3,193,498Boston Scientific Corp.� 233,748 10,553,722Edwards Lifesciences Corp.� 102,263 11,983,178Intuitive Surgical, Inc.� 19,479 20,522,295Medtronic PLC 221,327 29,542,728
75,795,421Medical Labs & Testing Services - 0.4%
Catalent, Inc.� 28,022 3,655,190Charles River Laboratories International, Inc.� 8,267 3,669,391IQVIA Holdings, Inc.� 31,529 8,189,027
Copyright © 2021 www.secdatabase.com. All Rights Reserved.Please Consider the Environment Before Printing This Document

Laboratory Corp. of America Holdings� 16,062 4,872,890Quest Diagnostics, Inc. 21,491 3,284,469
23,670,967Medical Products - 1.4%
Abbott Laboratories 292,298 36,937,698ABIOMED, Inc.� 7,451 2,711,866Align Technology, Inc.� 11,846 8,398,814Baxter International, Inc. 82,722 6,305,071Cooper Cos., Inc. 8,101 3,651,202Henry Schein, Inc.� 23,146 1,749,606Hologic, Inc.� 42,152 3,336,331STERIS PLC 16,062 3,453,490Stryker Corp. 53,920 14,941,232West Pharmaceutical Services, Inc. 12,145 5,484,925Zimmer Biomet Holdings, Inc. 34,297 5,159,984
92,130,219Medical-Biomedical/Gene - 1.6%
Amgen, Inc. 94,518 21,316,644Bio-Rad Laboratories, Inc., Class A� 3,546 2,853,892Biogen, Inc.� 24,767 8,393,784Gilead Sciences, Inc. 206,320 15,015,970
Copyright © 2021 www.secdatabase.com. All Rights Reserved.Please Consider the Environment Before Printing This Document

Illumina, Inc.� 24,018 10,980,069Incyte Corp.� 30,752 2,352,220Moderna, Inc.� 50,201 18,910,215Regeneron Pharmaceuticals, Inc.� 17,223 11,597,968Vertex Pharmaceuticals, Inc.� 42,585 8,529,350
99,950,112Medical-Drugs - 4.1%
AbbVie, Inc. 290,554 35,093,112Bristol-Myers Squibb Co. 367,495 24,570,716Eli Lilly & Co. 130,945 33,821,784Johnson & Johnson 433,210 75,001,647Merck & Co., Inc. 416,539 31,777,761Organon & Co. 41,625 1,410,671Pfizer, Inc. 920,854 42,423,744Zoetis, Inc. 78,102 15,976,545
260,075,980Medical-Generic Drugs - 0.1%
Perrigo Co. PLC 21,970 899,671Viatris, Inc. 198,831 2,908,898
3,808,569Medical-HMO - 1.5%
Anthem, Inc. 40,278 15,109,486Centene Corp.� 95,863 6,037,452Humana, Inc. 21,224 8,604,634UnitedHealth Group, Inc. 155,245 64,623,836
94,375,408Medical-Hospitals - 0.2%
HCA Healthcare, Inc. 43,234 10,937,337Universal Health Services, Inc., Class B 12,827 1,997,934
12,935,271Medical-Wholesale Drug Distribution - 0.2%
AmerisourceBergen Corp. 24,330 2,973,370Cardinal Health, Inc. 47,731 2,505,400McKesson Corp. 26,023 5,312,335
10,791,105Metal-Copper - 0.1%
Freeport-McMoRan, Inc. 241,088 8,773,192Multimedia - 0.9%
ViacomCBS, Inc., Class B 99,623 4,129,373Walt Disney Co.� 298,896 54,189,845
58,319,218Networking Products - 0.7%
Arista Networks, Inc.� 9,040 3,340,551Cisco Systems, Inc. 693,262 40,916,323
Copyright © 2021 www.secdatabase.com. All Rights Reserved.Please Consider the Environment Before Printing This Document

44,256,874Non-Hazardous Waste Disposal - 0.2%
Republic Services, Inc. 34,638 4,299,615Waste Management, Inc. 63,887 9,909,512
14,209,127Office Automation & Equipment - 0.1%
Zebra Technologies Corp., Class A� 8,803 5,168,857Office Supplies & Forms - 0.1%
Avery Dennison Corp. 13,655 3,077,700Oil Companies-Exploration & Production - 0.6%
APA Corp. 62,178 1,211,227Cabot Oil & Gas Corp. 65,747 1,044,720ConocoPhillips 221,988 12,326,994Devon Energy Corp. 97,991 2,895,634Diamondback Energy, Inc. 29,775 2,296,843EOG Resources, Inc. 96,007 6,482,393Hess Corp. 45,156 3,104,475Marathon Oil Corp. 129,656 1,523,458Occidental Petroleum Corp. 138,198 3,550,306Pioneer Natural Resources Co. 38,125 5,706,169
40,142,219Oil Companies-Integrated - 1.1%
Chevron Corp. 317,951 30,768,118Exxon Mobil Corp. 696,442 37,970,018
68,738,136Oil Field Machinery & Equipment - 0.0%
NOV, Inc.� 64,263 846,344Oil Refining & Marketing - 0.2%
Marathon Petroleum Corp. 104,799 6,211,437Phillips 66 72,031 5,120,684Valero Energy Corp. 67,244 4,458,949
15,791,070Oil-Field Services - 0.2%
Baker Hughes Co. 119,664 2,725,946Halliburton Co. 146,364 2,924,353Schlumberger NV 230,035 6,450,181
12,100,480Paper & Related Products - 0.1%
International Paper Co. 64,444 3,872,440Pharmacy Services - 0.5%
Cigna Corp. 56,449 11,947,431CVS Health Corp. 216,584 18,710,692
30,658,123
Copyright © 2021 www.secdatabase.com. All Rights Reserved.Please Consider the Environment Before Printing This Document
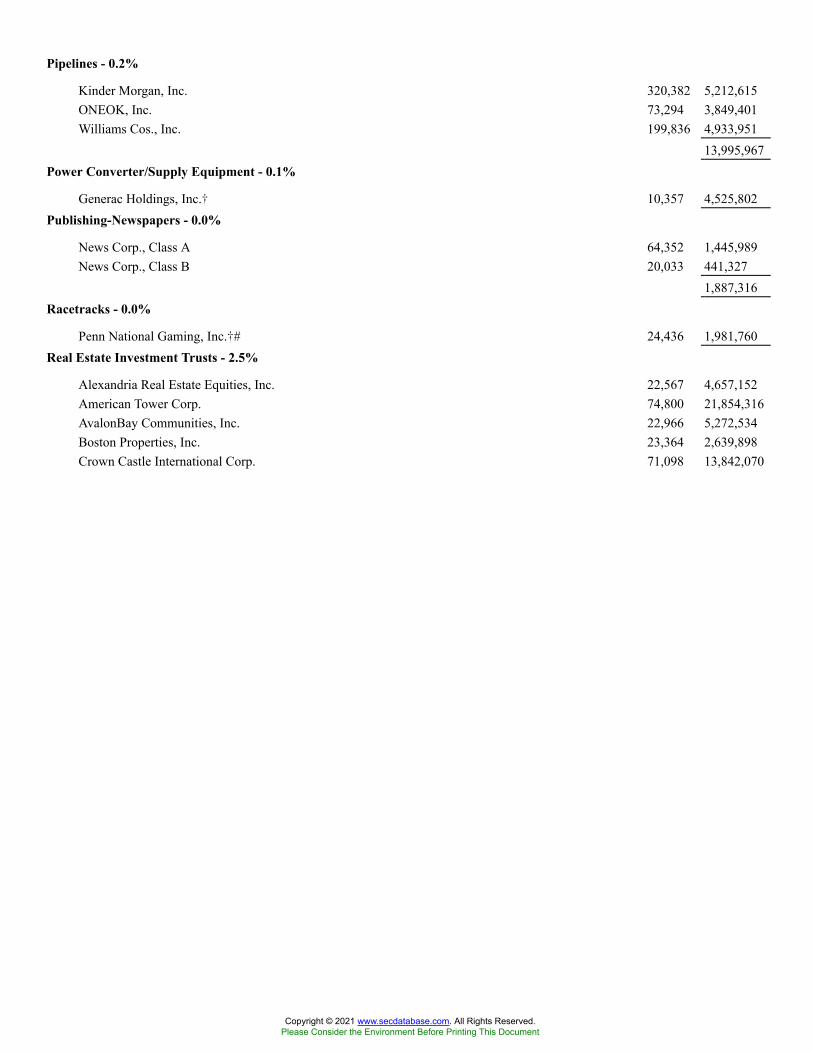
Pipelines - 0.2%
Kinder Morgan, Inc. 320,382 5,212,615ONEOK, Inc. 73,294 3,849,401Williams Cos., Inc. 199,836 4,933,951
13,995,967Power Converter/Supply Equipment - 0.1%
Generac Holdings, Inc.� 10,357 4,525,802Publishing-Newspapers - 0.0%
News Corp., Class A 64,352 1,445,989News Corp., Class B 20,033 441,327
1,887,316Racetracks - 0.0%
Penn National Gaming, Inc.�# 24,436 1,981,760Real Estate Investment Trusts - 2.5%
Alexandria Real Estate Equities, Inc. 22,567 4,657,152American Tower Corp. 74,800 21,854,316AvalonBay Communities, Inc. 22,966 5,272,534Boston Properties, Inc. 23,364 2,639,898Crown Castle International Corp. 71,098 13,842,070
Copyright © 2021 www.secdatabase.com. All Rights Reserved.Please Consider the Environment Before Printing This Document
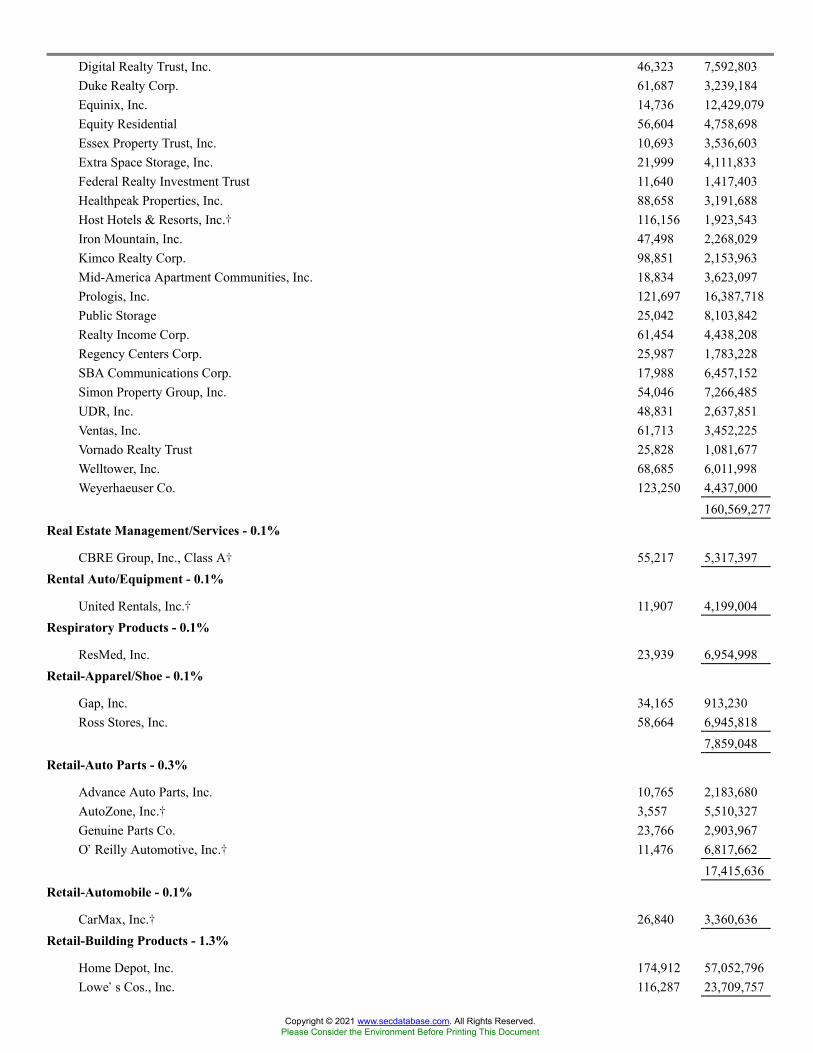
Digital Realty Trust, Inc. 46,323 7,592,803Duke Realty Corp. 61,687 3,239,184Equinix, Inc. 14,736 12,429,079Equity Residential 56,604 4,758,698Essex Property Trust, Inc. 10,693 3,536,603Extra Space Storage, Inc. 21,999 4,111,833Federal Realty Investment Trust 11,640 1,417,403Healthpeak Properties, Inc. 88,658 3,191,688Host Hotels & Resorts, Inc.� 116,156 1,923,543Iron Mountain, Inc. 47,498 2,268,029Kimco Realty Corp. 98,851 2,153,963Mid-America Apartment Communities, Inc. 18,834 3,623,097Prologis, Inc. 121,697 16,387,718Public Storage 25,042 8,103,842Realty Income Corp. 61,454 4,438,208Regency Centers Corp. 25,987 1,783,228SBA Communications Corp. 17,988 6,457,152Simon Property Group, Inc. 54,046 7,266,485UDR, Inc. 48,831 2,637,851Ventas, Inc. 61,713 3,452,225Vornado Realty Trust 25,828 1,081,677Welltower, Inc. 68,685 6,011,998Weyerhaeuser Co. 123,250 4,437,000
160,569,277Real Estate Management/Services - 0.1%
CBRE Group, Inc., Class A� 55,217 5,317,397Rental Auto/Equipment - 0.1%
United Rentals, Inc.� 11,907 4,199,004Respiratory Products - 0.1%
ResMed, Inc. 23,939 6,954,998Retail-Apparel/Shoe - 0.1%
Gap, Inc. 34,165 913,230Ross Stores, Inc. 58,664 6,945,818
7,859,048Retail-Auto Parts - 0.3%
Advance Auto Parts, Inc. 10,765 2,183,680AutoZone, Inc.� 3,557 5,510,327Genuine Parts Co. 23,766 2,903,967O�Reilly Automotive, Inc.� 11,476 6,817,662
17,415,636Retail-Automobile - 0.1%
CarMax, Inc.� 26,840 3,360,636Retail-Building Products - 1.3%
Home Depot, Inc. 174,912 57,052,796Lowe�s Cos., Inc. 116,287 23,709,757
Copyright © 2021 www.secdatabase.com. All Rights Reserved.Please Consider the Environment Before Printing This Document

80,762,553Retail-Consumer Electronics - 0.1%
Best Buy Co., Inc. 36,672 4,272,655Retail-Discount - 1.5%
Costco Wholesale Corp. 72,723 33,124,599Dollar General Corp. 38,857 8,661,614Dollar Tree, Inc.� 38,157 3,454,735Target Corp. 81,385 20,100,467Walmart, Inc. 225,875 33,452,088
98,793,503Retail-Drug Store - 0.1%
Walgreens Boots Alliance, Inc. 118,024 5,989,718Retail-Gardening Products - 0.1%
Tractor Supply Co. 18,961 3,683,174Retail-Major Department Stores - 0.2%
TJX Cos., Inc. 198,394 14,427,212Retail-Misc./Diversified - 0.0%
Bath & Body Works, Inc. 43,553 2,938,956Retail-Perfume & Cosmetics - 0.1%
Ulta Beauty, Inc.� 9,008 3,488,888Retail-Restaurants - 1.2%
Chipotle Mexican Grill, Inc.� 4,631 8,814,321Darden Restaurants, Inc. 21,524 3,242,591Domino�s Pizza, Inc. 6,387 3,301,377McDonald�s Corp. 122,750 29,148,215Starbucks Corp. 193,837 22,773,909Yum! Brands, Inc. 49,006 6,421,256
73,701,669Savings & Loans/Thrifts - 0.0%
People�s United Financial, Inc. 70,348 1,155,818Semiconductor Components-Integrated Circuits - 0.8%
Analog Devices, Inc. 88,487 14,418,893NXP Semiconductors NV 45,363 9,758,942QUALCOMM, Inc. 185,563 27,220,237
51,398,072Semiconductor Equipment - 0.7%
Applied Materials, Inc. 150,961 20,399,360KLA Corp. 25,215 8,572,091Lam Research Corp. 23,462 14,190,287Teradyne, Inc. 27,351 3,321,506
46,483,244Shipbuilding - 0.0%
Copyright © 2021 www.secdatabase.com. All Rights Reserved.Please Consider the Environment Before Printing This Document
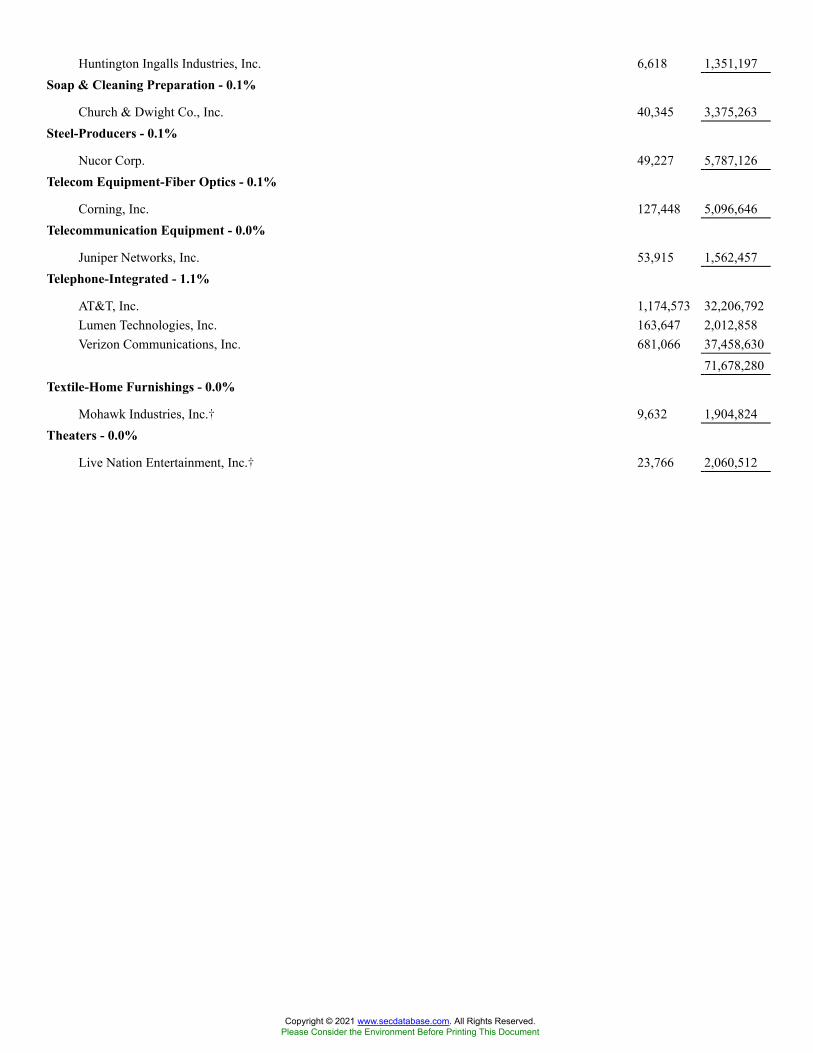
Huntington Ingalls Industries, Inc. 6,618 1,351,197Soap & Cleaning Preparation - 0.1%
Church & Dwight Co., Inc. 40,345 3,375,263Steel-Producers - 0.1%
Nucor Corp. 49,227 5,787,126Telecom Equipment-Fiber Optics - 0.1%
Corning, Inc. 127,448 5,096,646Telecommunication Equipment - 0.0%
Juniper Networks, Inc. 53,915 1,562,457Telephone-Integrated - 1.1%
AT&T, Inc. 1,174,573 32,206,792Lumen Technologies, Inc. 163,647 2,012,858Verizon Communications, Inc. 681,066 37,458,630
71,678,280Textile-Home Furnishings - 0.0%
Mohawk Industries, Inc.� 9,632 1,904,824Theaters - 0.0%
Live Nation Entertainment, Inc.� 23,766 2,060,512
Copyright © 2021 www.secdatabase.com. All Rights Reserved.Please Consider the Environment Before Printing This Document

Tobacco - 0.7%
Altria Group, Inc. 304,441 15,292,071Philip Morris International, Inc. 256,389 26,408,067
41,700,138Tools-Hand Held - 0.1%
Snap-on, Inc. 8,896 2,001,155Stanley Black & Decker, Inc. 26,567 5,134,604
7,135,759Toys - 0.0%
Hasbro, Inc. 21,047 2,069,131Transport-Rail - 0.8%
CSX Corp. 373,791 12,159,421Kansas City Southern 14,959 4,198,542Norfolk Southern Corp. 41,166 10,437,228Union Pacific Corp. 109,282 23,696,709
50,491,900Transport-Services - 0.6%
C.H. Robinson Worldwide, Inc. 21,877 1,970,242Expeditors International of Washington, Inc. 27,783 3,462,873FedEx Corp. 40,158 10,669,579United Parcel Service, Inc., Class B 118,990 23,278,014
39,380,708Transport-Truck - 0.1%
JB Hunt Transport Services, Inc. 13,733 2,436,234Old Dominion Freight Line, Inc. 15,643 4,516,447
6,952,681Water - 0.1%
American Water Works Co., Inc. 29,853 5,440,709Water Treatment Systems - 0.0%
Pentair PLC 27,341 2,109,632Web Hosting/Design - 0.1%
VeriSign, Inc.� 16,303 3,525,687Web Portals/ISP - 4.4%
Alphabet, Inc., Class A� 49,474 143,175,282Alphabet, Inc., Class C� 46,844 136,280,439
279,455,721Wireless Equipment - 0.1%
Motorola Solutions, Inc. 27,911 6,816,424Total Long-Term Investment Securities
(cost $2,114,669,309) 6,302,615,588SHORT-TERM INVESTMENT SECURITIES - 0.1%U.S. Government Treasuries - 0.1%
Copyright © 2021 www.secdatabase.com. All Rights Reserved.Please Consider the Environment Before Printing This Document
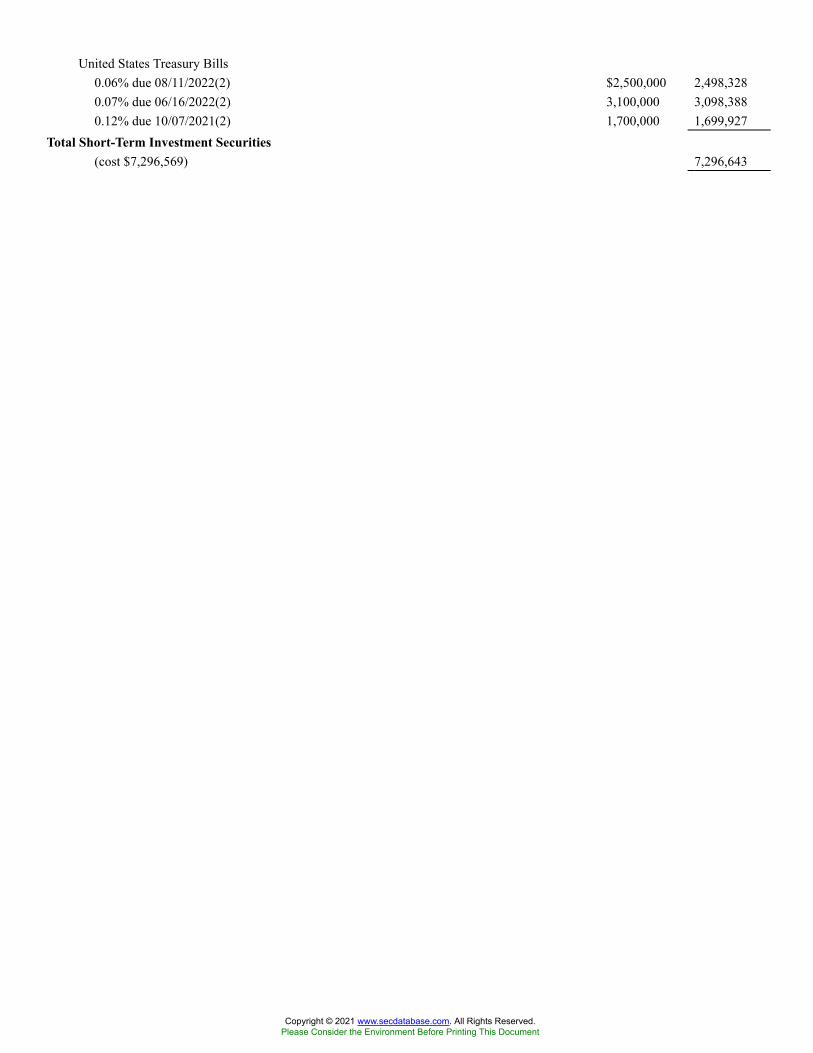
United States Treasury Bills0.06% due 08/11/2022(2) $2,500,000 2,498,3280.07% due 06/16/2022(2) 3,100,000 3,098,3880.12% due 10/07/2021(2) 1,700,000 1,699,927
Total Short-Term Investment Securities(cost $7,296,569) 7,296,643
Copyright © 2021 www.secdatabase.com. All Rights Reserved.Please Consider the Environment Before Printing This Document
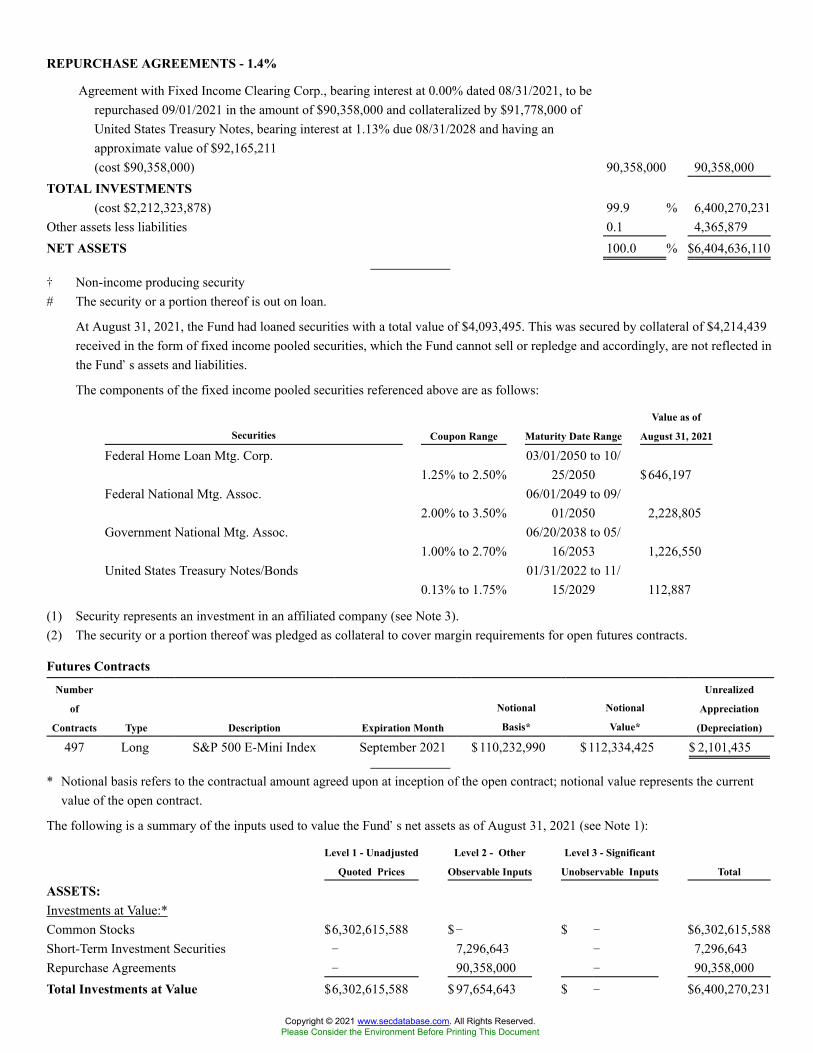
REPURCHASE AGREEMENTS - 1.4%
Agreement with Fixed Income Clearing Corp., bearing interest at 0.00% dated 08/31/2021, to berepurchased 09/01/2021 in the amount of $90,358,000 and collateralized by $91,778,000 ofUnited States Treasury Notes, bearing interest at 1.13% due 08/31/2028 and having anapproximate value of $92,165,211(cost $90,358,000) 90,358,000 90,358,000
TOTAL INVESTMENTS(cost $2,212,323,878) 99.9 % 6,400,270,231
Other assets less liabilities 0.1 4,365,879NET ASSETS 100.0 % $6,404,636,110
� Non-income producing security# The security or a portion thereof is out on loan.
At August 31, 2021, the Fund had loaned securities with a total value of $4,093,495. This was secured by collateral of $4,214,439received in the form of fixed income pooled securities, which the Fund cannot sell or repledge and accordingly, are not reflected inthe Fund�s assets and liabilities.
The components of the fixed income pooled securities referenced above are as follows:
Securities Coupon Range Maturity Date Range
Value as of
August 31, 2021
Federal Home Loan Mtg. Corp.1.25% to 2.50%
03/01/2050 to 10/25/2050 $646,197
Federal National Mtg. Assoc.2.00% to 3.50%
06/01/2049 to 09/01/2050 2,228,805
Government National Mtg. Assoc.1.00% to 2.70%
06/20/2038 to 05/16/2053 1,226,550
United States Treasury Notes/Bonds0.13% to 1.75%
01/31/2022 to 11/15/2029 112,887
(1) Security represents an investment in an affiliated company (see Note 3).(2) The security or a portion thereof was pledged as collateral to cover margin requirements for open futures contracts.
Futures ContractsNumber
of
Contracts Type Description Expiration Month
Notional
Basis*
Notional
Value*
Unrealized
Appreciation
(Depreciation)
497 Long S&P 500 E-Mini Index September 2021 $110,232,990 $112,334,425 $ 2,101,435
* Notional basis refers to the contractual amount agreed upon at inception of the open contract; notional value represents the currentvalue of the open contract.
The following is a summary of the inputs used to value the Fund�s net assets as of August 31, 2021 (see Note 1):
Level 1 - Unadjusted
Quoted Prices
Level 2 - Other
Observable Inputs
Level 3 - Significant
Unobservable Inputs Total
ASSETS:Investments at Value:*Common Stocks $6,302,615,588 $� $ � $6,302,615,588Short-Term Investment Securities � 7,296,643 � 7,296,643Repurchase Agreements � 90,358,000 � 90,358,000Total Investments at Value $6,302,615,588 $ 97,654,643 $ � $6,400,270,231
Copyright © 2021 www.secdatabase.com. All Rights Reserved.Please Consider the Environment Before Printing This Document

Other Financial Instruments:�Futures Contracts $2,101,435 $� $ � $2,101,435
* For a detailed presentation of investments, please refer to the Portfolio of Investments.� Amounts represent unrealized appreciation/depreciation as of the end of the reporting period.
See Notes to Portfolio of Investments
Copyright © 2021 www.secdatabase.com. All Rights Reserved.Please Consider the Environment Before Printing This Document
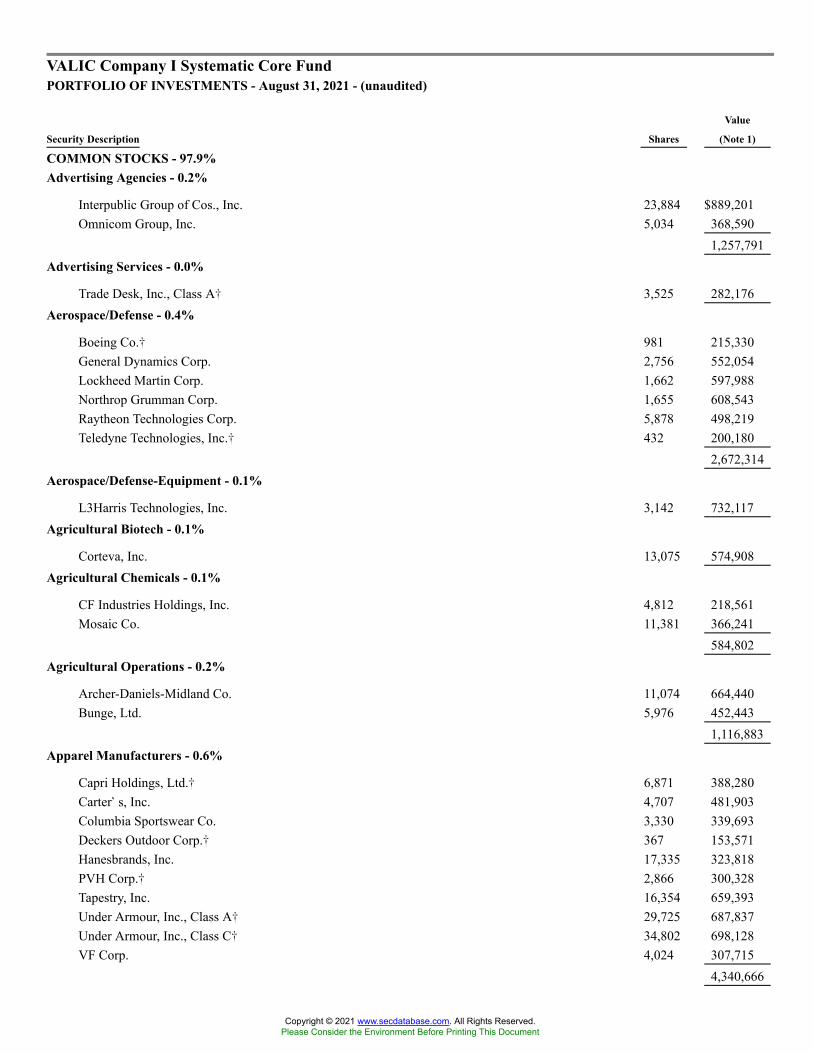
VALIC Company I Systematic Core FundPORTFOLIO OF INVESTMENTS - August 31, 2021 - (unaudited)
Security Description Shares
Value
(Note 1)
COMMON STOCKS - 97.9%Advertising Agencies - 0.2%
Interpublic Group of Cos., Inc. 23,884 $889,201Omnicom Group, Inc. 5,034 368,590
1,257,791Advertising Services - 0.0%
Trade Desk, Inc., Class A� 3,525 282,176Aerospace/Defense - 0.4%
Boeing Co.� 981 215,330General Dynamics Corp. 2,756 552,054Lockheed Martin Corp. 1,662 597,988Northrop Grumman Corp. 1,655 608,543Raytheon Technologies Corp. 5,878 498,219Teledyne Technologies, Inc.� 432 200,180
2,672,314Aerospace/Defense-Equipment - 0.1%
L3Harris Technologies, Inc. 3,142 732,117Agricultural Biotech - 0.1%
Corteva, Inc. 13,075 574,908Agricultural Chemicals - 0.1%
CF Industries Holdings, Inc. 4,812 218,561Mosaic Co. 11,381 366,241
584,802Agricultural Operations - 0.2%
Archer-Daniels-Midland Co. 11,074 664,440Bunge, Ltd. 5,976 452,443
1,116,883Apparel Manufacturers - 0.6%
Capri Holdings, Ltd.� 6,871 388,280Carter�s, Inc. 4,707 481,903Columbia Sportswear Co. 3,330 339,693Deckers Outdoor Corp.� 367 153,571Hanesbrands, Inc. 17,335 323,818PVH Corp.� 2,866 300,328Tapestry, Inc. 16,354 659,393Under Armour, Inc., Class A� 29,725 687,837Under Armour, Inc., Class C� 34,802 698,128VF Corp. 4,024 307,715
4,340,666
Copyright © 2021 www.secdatabase.com. All Rights Reserved.Please Consider the Environment Before Printing This Document
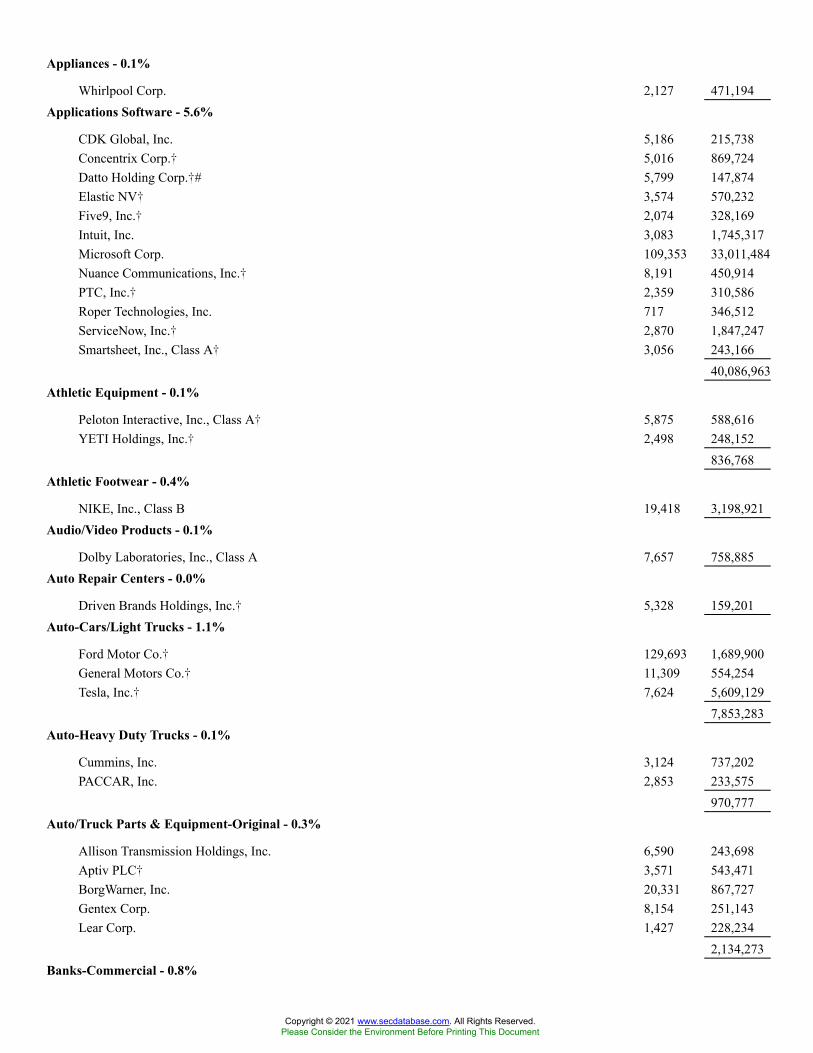
Appliances - 0.1%
Whirlpool Corp. 2,127 471,194Applications Software - 5.6%
CDK Global, Inc. 5,186 215,738Concentrix Corp.� 5,016 869,724Datto Holding Corp.�# 5,799 147,874Elastic NV� 3,574 570,232Five9, Inc.� 2,074 328,169Intuit, Inc. 3,083 1,745,317Microsoft Corp. 109,353 33,011,484Nuance Communications, Inc.� 8,191 450,914PTC, Inc.� 2,359 310,586Roper Technologies, Inc. 717 346,512ServiceNow, Inc.� 2,870 1,847,247Smartsheet, Inc., Class A� 3,056 243,166
40,086,963Athletic Equipment - 0.1%
Peloton Interactive, Inc., Class A� 5,875 588,616YETI Holdings, Inc.� 2,498 248,152
836,768Athletic Footwear - 0.4%
NIKE, Inc., Class B 19,418 3,198,921Audio/Video Products - 0.1%
Dolby Laboratories, Inc., Class A 7,657 758,885Auto Repair Centers - 0.0%
Driven Brands Holdings, Inc.� 5,328 159,201Auto-Cars/Light Trucks - 1.1%
Ford Motor Co.� 129,693 1,689,900General Motors Co.� 11,309 554,254Tesla, Inc.� 7,624 5,609,129
7,853,283Auto-Heavy Duty Trucks - 0.1%
Cummins, Inc. 3,124 737,202PACCAR, Inc. 2,853 233,575
970,777Auto/Truck Parts & Equipment-Original - 0.3%
Allison Transmission Holdings, Inc. 6,590 243,698Aptiv PLC� 3,571 543,471BorgWarner, Inc. 20,331 867,727Gentex Corp. 8,154 251,143Lear Corp. 1,427 228,234
2,134,273Banks-Commercial - 0.8%
Copyright © 2021 www.secdatabase.com. All Rights Reserved.Please Consider the Environment Before Printing This Document

Bank OZK 6,836 290,051Citizens Financial Group, Inc. 8,160 357,326East West Bancorp, Inc. 3,898 285,879First Citizens BancShares, Inc., Class A 307 275,594First Horizon Corp. 13,743 225,248FNB Corp. 14,502 169,383M&T Bank Corp. 1,071 149,951Pinnacle Financial Partners, Inc. 2,712 262,847Popular, Inc. 5,631 427,618Regions Financial Corp. 10,439 213,269Signature Bank 1,386 359,431SVB Financial Group� 855 478,373Synovus Financial Corp. 5,759 248,213Truist Financial Corp. 11,429 652,139Umpqua Holdings Corp. 7,604 148,050Webster Financial Corp. 3,194 161,361Western Alliance Bancorp 2,935 286,339Wintrust Financial Corp. 3,630 271,669Zions Bancorp NA 4,908 284,173
5,546,914Banks-Fiduciary - 0.2%
Bank of New York Mellon Corp. 15,339 847,020Northern Trust Corp. 1,304 154,550State Street Corp. 6,285 583,939
1,585,509Banks-Super Regional - 0.5%
Comerica, Inc. 2,871 212,196Fifth Third Bancorp 8,333 323,820Huntington Bancshares, Inc. 9,786 151,977KeyCorp 11,620 236,118PNC Financial Services Group, Inc. 3,560 680,316US Bancorp 8,799 504,975
Copyright © 2021 www.secdatabase.com. All Rights Reserved.Please Consider the Environment Before Printing This Document
Wells Fargo & Co. 32,492 1,484,8843,594,286
Beverages-Non-alcoholic - 0.6%
Coca-Cola Co. 22,417 1,262,301Keurig Dr Pepper, Inc. 9,664 344,715Monster Beverage Corp.� 9,040 882,033PepsiCo, Inc. 13,644 2,133,785
4,622,834Beverages-Wine/Spirits - 0.1%
Brown-Forman Corp., Class A 3,573 236,533Brown-Forman Corp., Class B 4,466 313,602
550,135Brewery - 0.2%
Boston Beer Co., Inc., Class A� 792 451,607Constellation Brands, Inc., Class A 1,088 229,720Molson Coors Beverage Co., Class B 16,217 770,794
1,452,121Broadcast Services/Program - 0.4%
Discovery, Inc., Class C� 20,405 562,974Fox Corp., Class A 20,639 772,724Fox Corp., Class B 18,427 638,127Liberty Media Corp. - Liberty Formula One, Series A� 6,950 317,546Liberty Media Corp. - Liberty Formula One, Series C� 7,663 387,288
2,678,659Building & Construction Products-Misc. - 0.3%
Fortune Brands Home & Security, Inc. 1,996 194,350Louisiana-Pacific Corp. 5,622 356,660Owens Corning 7,543 720,734Trex Co., Inc.� 8,582 941,960
2,213,704Building & Construction-Misc. - 0.1%
Frontdoor, Inc.� 16,701 728,498Building Products-Air & Heating - 0.4%
Carrier Global Corp. 14,232 819,763Johnson Controls International PLC 15,255 1,141,074Lennox International, Inc. 2,316 776,277
2,737,114Building Products-Cement - 0.2%
Eagle Materials, Inc. 1,531 240,122Martin Marietta Materials, Inc. 879 335,119MDU Resources Group, Inc. 15,287 491,783Vulcan Materials Co. 1,198 222,744
1,289,768Building Products-Wood - 0.1%
Copyright © 2021 www.secdatabase.com. All Rights Reserved.Please Consider the Environment Before Printing This Document
Masco Corp. 11,900 722,568Building-Heavy Construction - 0.1%
MasTec, Inc.� 5,884 538,033Building-Maintenance & Services - 0.2%
Rollins, Inc. 22,823 888,271Terminix Global Holdings, Inc.� 6,205 258,314
1,146,585Building-Mobile Home/Manufactured Housing - 0.1%
Thor Industries, Inc. 3,557 403,470Building-Residential/Commercial - 0.4%
D.R. Horton, Inc. 3,812 364,503Lennar Corp., Class A 6,744 723,699Lennar Corp., Class B 5,953 521,007NVR, Inc.� 32 165,758PulteGroup, Inc. 7,717 415,638Toll Brothers, Inc. 11,791 755,331
2,945,936Cable/Satellite TV - 0.9%
Cable One, Inc. 138 289,743Charter Communications, Inc., Class A� 1,637 1,336,873Comcast Corp., Class A 50,371 3,056,512Liberty Broadband Corp., Class A� 2,244 416,868Liberty Broadband Corp., Class C� 2,464 471,413Sirius XM Holdings, Inc.# 95,215 596,998
6,168,407Casino Hotels - 0.1%
Boyd Gaming Corp.� 7,007 430,020MGM Resorts International 5,141 219,109
649,129Cellular Telecom - 0.1%
T-Mobile US, Inc.� 4,274 585,623Chemicals-Diversified - 0.6%
Celanese Corp. 2,610 413,946Dow, Inc. 11,749 739,012DuPont de Nemours, Inc. 12,079 894,088Eastman Chemical Co. 5,316 601,558FMC Corp. 1,603 150,089LyondellBasell Industries NV, Class A 2,294 230,203Olin Corp. 7,094 353,565PPG Industries, Inc. 3,215 512,953Westlake Chemical Corp. 5,320 464,702
4,360,116Chemicals-Specialty - 0.4%
Copyright © 2021 www.secdatabase.com. All Rights Reserved.Please Consider the Environment Before Printing This Document

Albemarle Corp. 2,039 482,713Chemours Co. 15,373 515,149Ecolab, Inc. 1,578 355,618Element Solutions, Inc. 21,697 493,173International Flavors & Fragrances, Inc. 1,246 188,769NewMarket Corp. 726 253,904Valvoline, Inc. 12,903 389,154
2,678,480Coatings/Paint - 0.3%
Axalta Coating Systems, Ltd.� 9,228 281,823RPM International, Inc. 6,328 520,731Sherwin-Williams Co. 4,982 1,512,884
2,315,438Commercial Services - 0.3%
Cintas Corp. 1,542 610,277CoStar Group, Inc.� 1,920 162,701GXO Logistics, Inc.� 2,930 239,645
Copyright © 2021 www.secdatabase.com. All Rights Reserved.Please Consider the Environment Before Printing This Document
Nielsen Holdings PLC 12,343 264,881Quanta Services, Inc. 10,811 1,103,803
2,381,307Commercial Services-Finance - 1.7%
Automatic Data Processing, Inc. 3,013 629,838Equifax, Inc. 1,024 278,794Euronet Worldwide, Inc.� 1,267 168,802FleetCor Technologies, Inc.� 1,809 476,274Global Payments, Inc. 3,619 588,594H&R Block, Inc. 44,770 1,148,350IHS Markit, Ltd. 3,539 426,803MarketAxess Holdings, Inc. 1,190 566,345Moody�s Corp. 3,663 1,394,761Morningstar, Inc. 2,370 635,136PayPal Holdings, Inc.� 11,076 3,197,198S&P Global, Inc. 3,886 1,724,685Square, Inc., Class A� 3,515 942,266TransUnion 1,580 192,017
12,369,863Communications Software - 0.2%
RingCentral, Inc., Class A� 1,914 482,826Zoom Video Communications, Inc., Class A� 2,623 759,358
1,242,184Computer Aided Design - 0.6%
ANSYS, Inc.� 671 245,157Aspen Technology, Inc.� 3,741 484,460Autodesk, Inc.� 3,547 1,099,889Cadence Design Systems, Inc.� 8,207 1,341,680Synopsys, Inc.� 2,583 858,176
4,029,362Computer Data Security - 0.3%
Crowdstrike Holdings, Inc., Class A� 2,301 646,581Fortinet, Inc.� 3,570 1,125,050McAfee Corp., Class A 19,092 507,083Zscaler, Inc.� 744 207,085
2,485,799Computer Services - 1.7%
Accenture PLC, Class A 10,511 3,537,582Amdocs, Ltd. 16,280 1,254,049CACI International, Inc., Class A� 2,604 670,634Cognizant Technology Solutions Corp., Class A 17,885 1,364,804DXC Technology Co.� 23,239 853,336EPAM Systems, Inc.� 1,548 979,590Genpact, Ltd. 19,906 1,032,723International Business Machines Corp. 14,664 2,057,946Leidos Holdings, Inc. 3,080 302,179
Copyright © 2021 www.secdatabase.com. All Rights Reserved.Please Consider the Environment Before Printing This Document

Science Applications International Corp. 5,245 441,78612,494,629
Computer Software - 0.8%
Akamai Technologies, Inc.� 4,818 545,639Citrix Systems, Inc. 6,366 654,871Cloudflare, Inc., Class A� 4,181 504,814Datadog, Inc., Class A� 2,095 288,691Dropbox, Inc., Class A� 30,409 964,269MongoDB, Inc.� 1,076 421,609Nutanix, Inc., Class A� 17,308 638,838Teradata Corp.� 25,032 1,369,000Twilio, Inc., Class A� 617 220,244
5,607,975Computers - 5.0%
Apple, Inc. 224,540 34,091,908Dell Technologies, Inc., Class C� 8,527 831,042Hewlett Packard Enterprise Co. 42,828 662,121HP, Inc. 25,149 747,931
36,333,002Computers-Integrated Systems - 0.1%
NCR Corp.� 8,595 365,116Computers-Memory Devices - 0.2%
NetApp, Inc. 8,897 791,210Pure Storage, Inc., Class A� 16,385 423,225
1,214,435Consulting Services - 0.3%
Booz Allen Hamilton Holding Corp. 4,215 345,251Gartner, Inc.� 4,004 1,236,195Verisk Analytics, Inc. 1,521 306,877
1,888,323Consumer Products-Misc. - 0.4%
Clorox Co. 6,027 1,012,837Kimberly-Clark Corp. 7,024 967,977Reynolds Consumer Products, Inc. 7,431 210,149Spectrum Brands Holdings, Inc. 9,848 768,735
2,959,698Containers-Metal/Glass - 0.2%
Ardagh Group SA 10,044 263,856Ball Corp. 2,924 280,587Crown Holdings, Inc. 2,710 297,531Silgan Holdings, Inc. 9,501 403,127
1,245,101Containers-Paper/Plastic - 0.4%
Amcor PLC 15,603 200,498
Copyright © 2021 www.secdatabase.com. All Rights Reserved.Please Consider the Environment Before Printing This Document
AptarGroup, Inc. 1,807 243,584Berry Global Group, Inc.� 12,453 836,468Graphic Packaging Holding Co. 9,181 188,394Packaging Corp. of America 2,188 331,920Sealed Air Corp. 4,345 265,175Sonoco Products Co. 4,900 319,970Westrock Co. 16,399 853,404
3,239,413Cosmetics & Toiletries - 1.0%
Colgate-Palmolive Co. 16,341 1,273,781Estee Lauder Cos., Inc., Class A 5,224 1,778,719Procter & Gamble Co. 30,261 4,308,864
7,361,364Data Processing/Management - 0.8%
Broadridge Financial Solutions, Inc. 2,260 389,217DocuSign, Inc.� 4,551 1,348,188Fair Isaac Corp.� 1,588 730,067
Copyright © 2021 www.secdatabase.com. All Rights Reserved.Please Consider the Environment Before Printing This Document

Fidelity National Information Services, Inc. 8,517 1,088,217Fiserv, Inc.� 8,901 1,048,449Jack Henry & Associates, Inc. 3,021 532,844Paychex, Inc. 3,559 407,399
5,544,381Decision Support Software - 0.0%
MSCI, Inc. 434 275,408Dental Supplies & Equipment - 0.0%
DENTSPLY SIRONA, Inc. 2,363 145,797Diagnostic Equipment - 0.9%
10X Genomics, Inc., Class A� 1,749 307,684Danaher Corp. 6,196 2,008,496PerkinElmer, Inc. 5,114 945,067Thermo Fisher Scientific, Inc. 5,200 2,885,740
6,146,987Diagnostic Kits - 0.5%
IDEXX Laboratories, Inc.� 3,152 2,123,692QIAGEN NV�# 8,738 487,755Quidel Corp.� 8,080 1,041,916
3,653,363Dialysis Centers - 0.1%
DaVita, Inc.� 4,206 550,019Disposable Medical Products - 0.1%
ICU Medical, Inc.� 881 175,627Teleflex, Inc. 562 222,249
397,876Distribution/Wholesale - 1.0%
Copart, Inc.� 1,828 263,817Fastenal Co. 21,258 1,187,259IAA, Inc.� 3,091 164,194Leslie�s, Inc.� 36,082 870,298LKQ Corp.� 21,009 1,106,964Pool Corp. 3,167 1,565,448Univar Solutions, Inc.� 13,870 327,471Watsco, Inc. 3,078 856,977WW Grainger, Inc. 2,727 1,182,700
7,525,128Diversified Banking Institutions - 2.0%
Bank of America Corp. 79,934 3,337,244Citigroup, Inc. 23,956 1,722,676JPMorgan Chase & Co. 41,744 6,676,953Morgan Stanley 22,478 2,347,378
14,084,251Diversified Manufacturing Operations - 1.0%
Copyright © 2021 www.secdatabase.com. All Rights Reserved.Please Consider the Environment Before Printing This Document
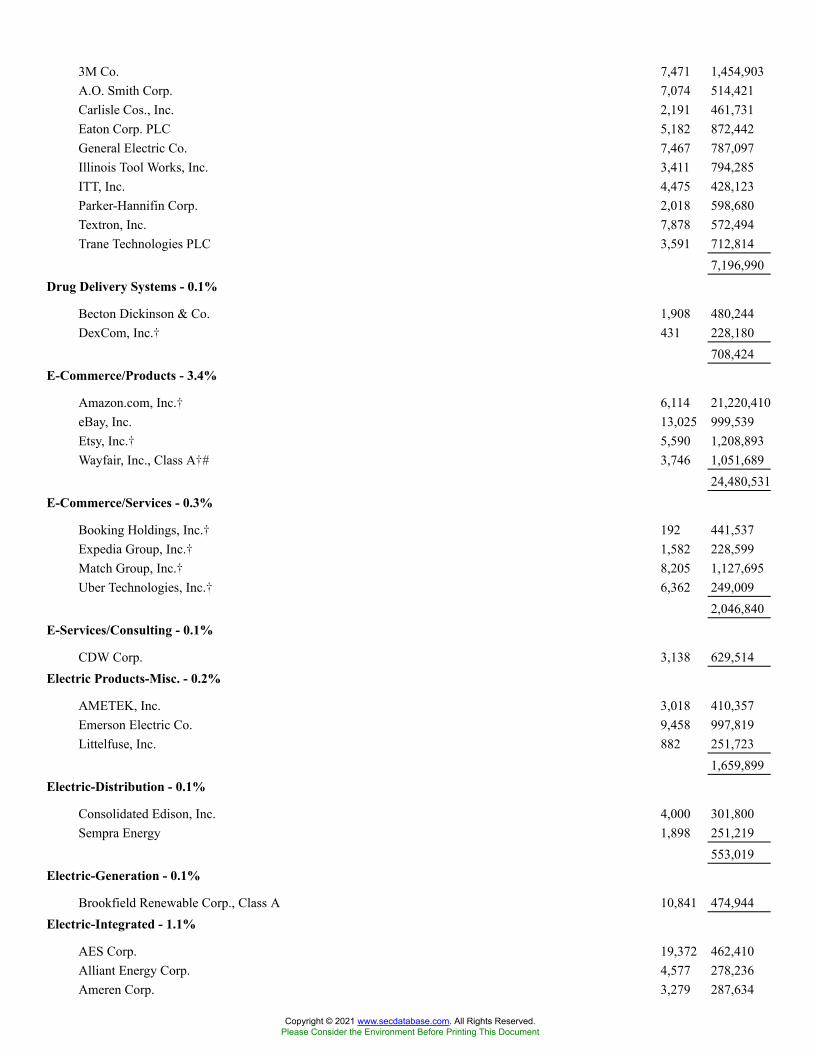
3M Co. 7,471 1,454,903A.O. Smith Corp. 7,074 514,421Carlisle Cos., Inc. 2,191 461,731Eaton Corp. PLC 5,182 872,442General Electric Co. 7,467 787,097Illinois Tool Works, Inc. 3,411 794,285ITT, Inc. 4,475 428,123Parker-Hannifin Corp. 2,018 598,680Textron, Inc. 7,878 572,494Trane Technologies PLC 3,591 712,814
7,196,990Drug Delivery Systems - 0.1%
Becton Dickinson & Co. 1,908 480,244DexCom, Inc.� 431 228,180
708,424E-Commerce/Products - 3.4%
Amazon.com, Inc.� 6,114 21,220,410eBay, Inc. 13,025 999,539Etsy, Inc.� 5,590 1,208,893Wayfair, Inc., Class A�# 3,746 1,051,689
24,480,531E-Commerce/Services - 0.3%
Booking Holdings, Inc.� 192 441,537Expedia Group, Inc.� 1,582 228,599Match Group, Inc.� 8,205 1,127,695Uber Technologies, Inc.� 6,362 249,009
2,046,840E-Services/Consulting - 0.1%
CDW Corp. 3,138 629,514Electric Products-Misc. - 0.2%
AMETEK, Inc. 3,018 410,357Emerson Electric Co. 9,458 997,819Littelfuse, Inc. 882 251,723
1,659,899Electric-Distribution - 0.1%
Consolidated Edison, Inc. 4,000 301,800Sempra Energy 1,898 251,219
553,019Electric-Generation - 0.1%
Brookfield Renewable Corp., Class A 10,841 474,944Electric-Integrated - 1.1%
AES Corp. 19,372 462,410Alliant Energy Corp. 4,577 278,236Ameren Corp. 3,279 287,634
Copyright © 2021 www.secdatabase.com. All Rights Reserved.Please Consider the Environment Before Printing This Document
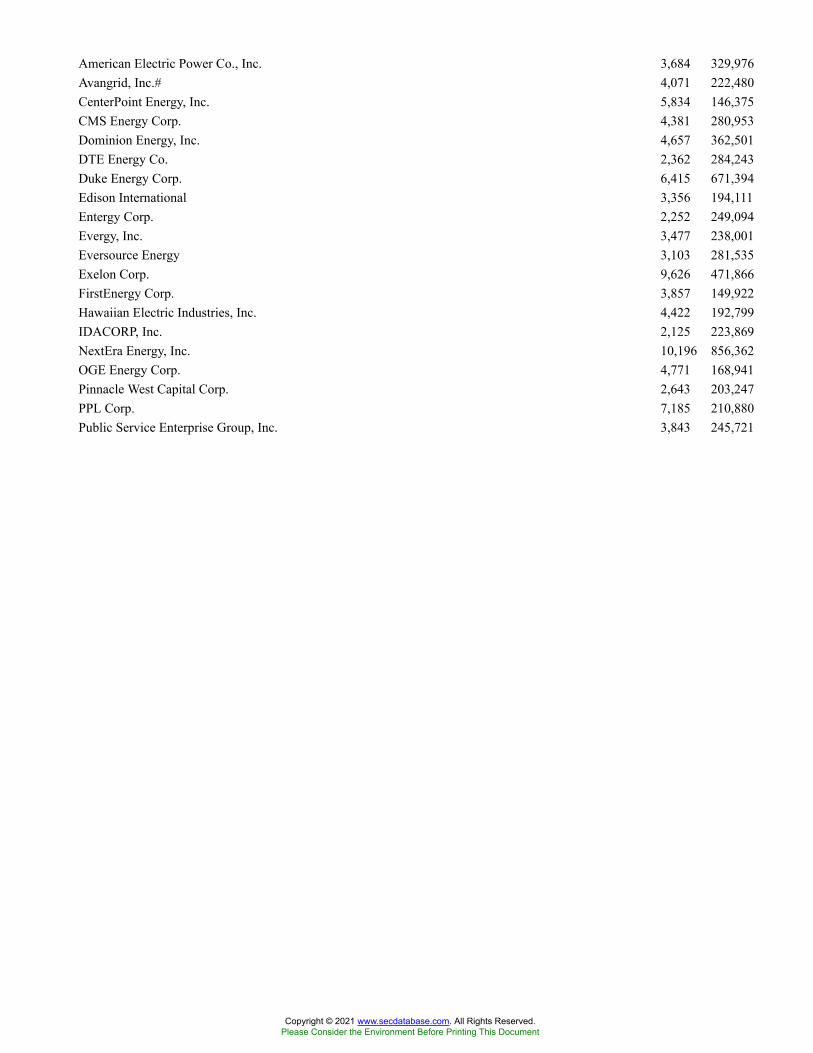
American Electric Power Co., Inc. 3,684 329,976Avangrid, Inc.# 4,071 222,480CenterPoint Energy, Inc. 5,834 146,375CMS Energy Corp. 4,381 280,953Dominion Energy, Inc. 4,657 362,501DTE Energy Co. 2,362 284,243Duke Energy Corp. 6,415 671,394Edison International 3,356 194,111Entergy Corp. 2,252 249,094Evergy, Inc. 3,477 238,001Eversource Energy 3,103 281,535Exelon Corp. 9,626 471,866FirstEnergy Corp. 3,857 149,922Hawaiian Electric Industries, Inc. 4,422 192,799IDACORP, Inc. 2,125 223,869NextEra Energy, Inc. 10,196 856,362OGE Energy Corp. 4,771 168,941Pinnacle West Capital Corp. 2,643 203,247PPL Corp. 7,185 210,880Public Service Enterprise Group, Inc. 3,843 245,721
Copyright © 2021 www.secdatabase.com. All Rights Reserved.Please Consider the Environment Before Printing This Document

Southern Co. 9,840 646,783WEC Energy Group, Inc. 3,111 293,927Xcel Energy, Inc. 4,382 301,262
8,254,522Electronic Components-Misc. - 0.3%
Garmin, Ltd. 5,255 916,630Hubbell, Inc. 1,522 313,699Jabil, Inc. 2,549 157,477nVent Electric PLC 7,973 273,952Sensata Technologies Holding PLC� 4,742 280,632
1,942,390Electronic Components-Semiconductors - 3.1%
Advanced Micro Devices, Inc.� 14,808 1,639,542Broadcom, Inc. 5,497 2,733,163Intel Corp. 70,198 3,794,904Marvell Technology, Inc. 4,841 296,221Microchip Technology, Inc. 3,003 472,552Micron Technology, Inc.� 9,335 687,989Monolithic Power Systems, Inc. 956 473,153NVIDIA Corp. 33,488 7,496,289ON Semiconductor Corp.� 18,197 807,219Qorvo, Inc.� 3,734 702,104Skyworks Solutions, Inc. 3,097 568,176Texas Instruments, Inc. 12,446 2,376,066Xilinx, Inc. 3,665 570,237
22,617,615Electronic Connectors - 0.1%
Amphenol Corp., Class A 4,845 371,272Electronic Forms - 0.6%
Adobe, Inc.� 6,332 4,202,548Electronic Measurement Instruments - 0.5%
Agilent Technologies, Inc. 5,655 992,283Fortive Corp. 3,978 293,855Keysight Technologies, Inc.� 5,029 902,102National Instruments Corp. 18,271 764,093Trimble, Inc.� 4,758 448,299Vontier Corp. 4,727 171,921
3,572,553Electronic Parts Distribution - 0.4%
Arrow Electronics, Inc.� 9,263 1,122,861Avnet, Inc. 11,855 479,653SYNNEX Corp. 7,673 975,008
2,577,522Electronic Security Devices - 0.1%
Copyright © 2021 www.secdatabase.com. All Rights Reserved.Please Consider the Environment Before Printing This Document
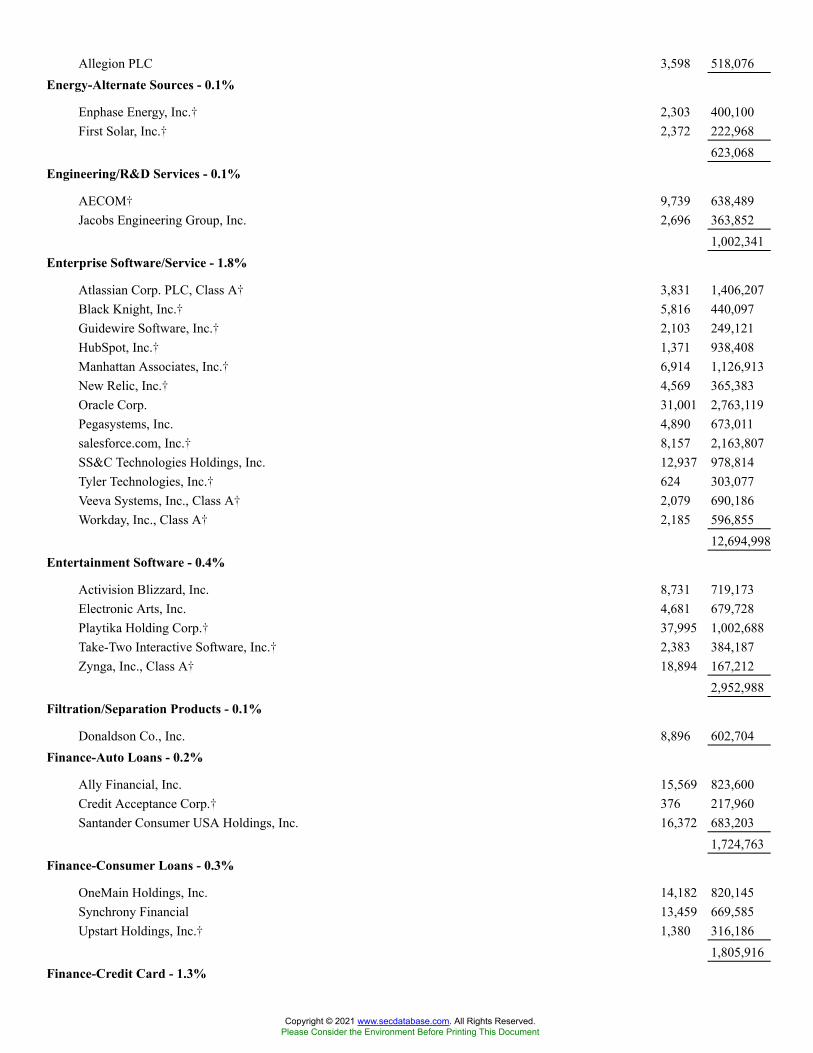
Allegion PLC 3,598 518,076Energy-Alternate Sources - 0.1%
Enphase Energy, Inc.� 2,303 400,100First Solar, Inc.� 2,372 222,968
623,068Engineering/R&D Services - 0.1%
AECOM� 9,739 638,489Jacobs Engineering Group, Inc. 2,696 363,852
1,002,341Enterprise Software/Service - 1.8%
Atlassian Corp. PLC, Class A� 3,831 1,406,207Black Knight, Inc.� 5,816 440,097Guidewire Software, Inc.� 2,103 249,121HubSpot, Inc.� 1,371 938,408Manhattan Associates, Inc.� 6,914 1,126,913New Relic, Inc.� 4,569 365,383Oracle Corp. 31,001 2,763,119Pegasystems, Inc. 4,890 673,011salesforce.com, Inc.� 8,157 2,163,807SS&C Technologies Holdings, Inc. 12,937 978,814Tyler Technologies, Inc.� 624 303,077Veeva Systems, Inc., Class A� 2,079 690,186Workday, Inc., Class A� 2,185 596,855
12,694,998Entertainment Software - 0.4%
Activision Blizzard, Inc. 8,731 719,173Electronic Arts, Inc. 4,681 679,728Playtika Holding Corp.� 37,995 1,002,688Take-Two Interactive Software, Inc.� 2,383 384,187Zynga, Inc., Class A� 18,894 167,212
2,952,988Filtration/Separation Products - 0.1%
Donaldson Co., Inc. 8,896 602,704Finance-Auto Loans - 0.2%
Ally Financial, Inc. 15,569 823,600Credit Acceptance Corp.� 376 217,960Santander Consumer USA Holdings, Inc. 16,372 683,203
1,724,763Finance-Consumer Loans - 0.3%
OneMain Holdings, Inc. 14,182 820,145Synchrony Financial 13,459 669,585Upstart Holdings, Inc.� 1,380 316,186
1,805,916Finance-Credit Card - 1.3%
Copyright © 2021 www.secdatabase.com. All Rights Reserved.Please Consider the Environment Before Printing This Document
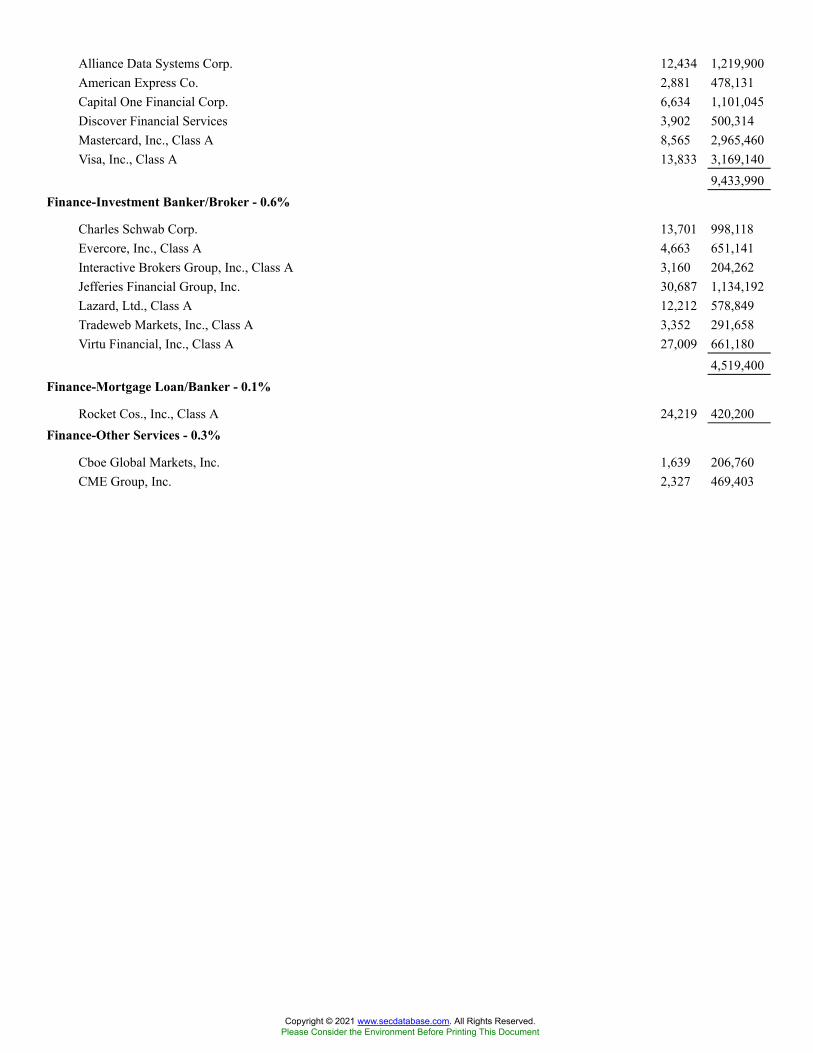
Alliance Data Systems Corp. 12,434 1,219,900American Express Co. 2,881 478,131Capital One Financial Corp. 6,634 1,101,045Discover Financial Services 3,902 500,314Mastercard, Inc., Class A 8,565 2,965,460Visa, Inc., Class A 13,833 3,169,140
9,433,990Finance-Investment Banker/Broker - 0.6%
Charles Schwab Corp. 13,701 998,118Evercore, Inc., Class A 4,663 651,141Interactive Brokers Group, Inc., Class A 3,160 204,262Jefferies Financial Group, Inc. 30,687 1,134,192Lazard, Ltd., Class A 12,212 578,849Tradeweb Markets, Inc., Class A 3,352 291,658Virtu Financial, Inc., Class A 27,009 661,180
4,519,400Finance-Mortgage Loan/Banker - 0.1%
Rocket Cos., Inc., Class A 24,219 420,200Finance-Other Services - 0.3%
Cboe Global Markets, Inc. 1,639 206,760CME Group, Inc. 2,327 469,403
Copyright © 2021 www.secdatabase.com. All Rights Reserved.Please Consider the Environment Before Printing This Document
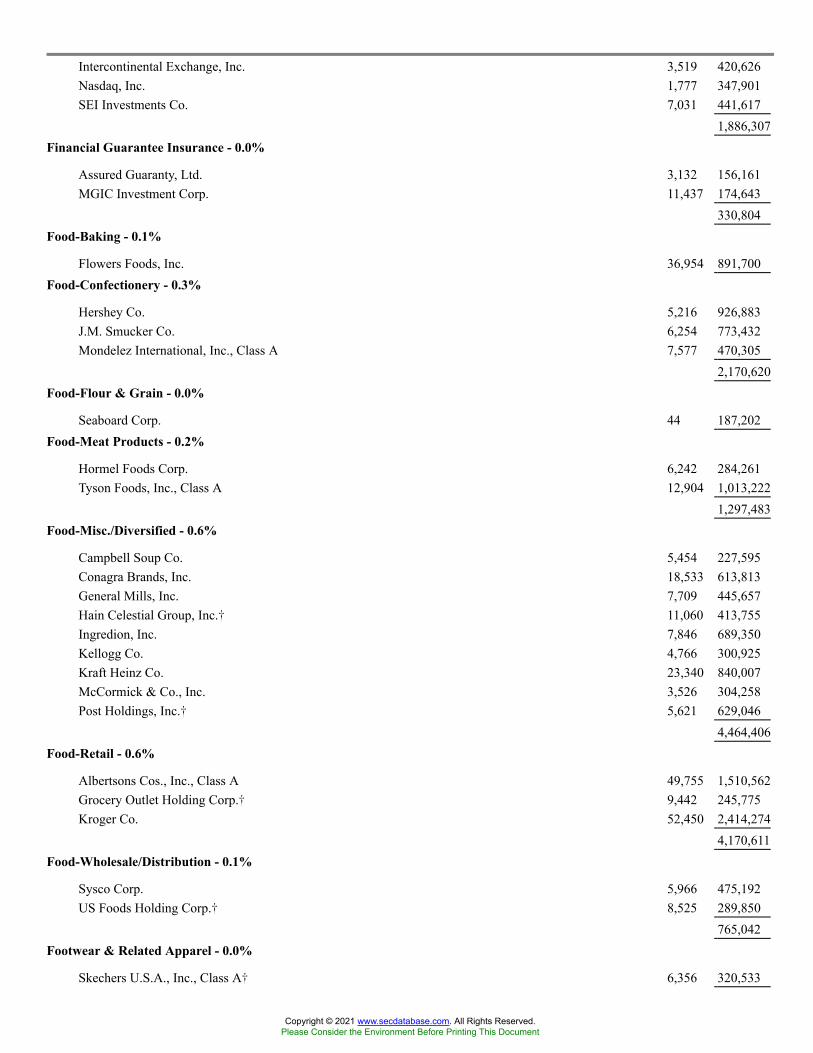
Intercontinental Exchange, Inc. 3,519 420,626Nasdaq, Inc. 1,777 347,901SEI Investments Co. 7,031 441,617
1,886,307Financial Guarantee Insurance - 0.0%
Assured Guaranty, Ltd. 3,132 156,161MGIC Investment Corp. 11,437 174,643
330,804Food-Baking - 0.1%
Flowers Foods, Inc. 36,954 891,700Food-Confectionery - 0.3%
Hershey Co. 5,216 926,883J.M. Smucker Co. 6,254 773,432Mondelez International, Inc., Class A 7,577 470,305
2,170,620Food-Flour & Grain - 0.0%
Seaboard Corp. 44 187,202Food-Meat Products - 0.2%
Hormel Foods Corp. 6,242 284,261Tyson Foods, Inc., Class A 12,904 1,013,222
1,297,483Food-Misc./Diversified - 0.6%
Campbell Soup Co. 5,454 227,595Conagra Brands, Inc. 18,533 613,813General Mills, Inc. 7,709 445,657Hain Celestial Group, Inc.� 11,060 413,755Ingredion, Inc. 7,846 689,350Kellogg Co. 4,766 300,925Kraft Heinz Co. 23,340 840,007McCormick & Co., Inc. 3,526 304,258Post Holdings, Inc.� 5,621 629,046
4,464,406Food-Retail - 0.6%
Albertsons Cos., Inc., Class A 49,755 1,510,562Grocery Outlet Holding Corp.� 9,442 245,775Kroger Co. 52,450 2,414,274
4,170,611Food-Wholesale/Distribution - 0.1%
Sysco Corp. 5,966 475,192US Foods Holding Corp.� 8,525 289,850
765,042Footwear & Related Apparel - 0.0%
Skechers U.S.A., Inc., Class A� 6,356 320,533
Copyright © 2021 www.secdatabase.com. All Rights Reserved.Please Consider the Environment Before Printing This Document

Funeral Services & Related Items - 0.1%
Service Corp. International 15,605 979,370Garden Products - 0.1%
Scotts Miracle-Gro Co. 2,735 428,930Gas-Distribution - 0.2%
Atmos Energy Corp. 2,375 231,586National Fuel Gas Co. 3,650 189,107NiSource, Inc. 8,506 209,673UGI Corp. 18,245 844,926
1,475,292Gold Mining - 0.0%
Newmont Corp. 5,352 310,362Hazardous Waste Disposal - 0.0%
Stericycle, Inc.� 4,011 279,166Healthcare Safety Devices - 0.0%
Tandem Diabetes Care, Inc.� 2,347 263,263Home Decoration Products - 0.1%
Newell Brands, Inc. 15,736 399,852Home Furnishings - 0.1%
Tempur Sealy International, Inc. 23,820 1,064,754Hotels/Motels - 0.1%
Choice Hotels International, Inc. 1,223 145,977Hilton Worldwide Holdings, Inc.� 2,440 304,658Travel + Leisure Co. 4,408 241,382Wyndham Hotels & Resorts, Inc. 2,438 177,243
869,260Human Resources - 0.2%
ManpowerGroup, Inc. 4,600 558,532Robert Half International, Inc. 11,142 1,152,083
1,710,615Independent Power Producers - 0.2%
NRG Energy, Inc. 20,043 915,364Vistra Corp. 34,591 660,342
1,575,706Industrial Automated/Robotic - 0.2%
Cognex Corp. 4,077 361,304Colfax Corp.� 5,939 286,081Rockwell Automation, Inc. 2,057 669,451
1,316,836Industrial Gases - 0.0%
Air Products & Chemicals, Inc. 1,015 273,553
Copyright © 2021 www.secdatabase.com. All Rights Reserved.Please Consider the Environment Before Printing This Document

Instruments-Controls - 0.3%
Honeywell International, Inc. 5,292 1,227,268Mettler-Toledo International, Inc.� 796 1,236,052
2,463,320Instruments-Scientific - 0.2%
Waters Corp.� 2,674 1,107,089Insurance Brokers - 0.5%
Aon PLC, Class A 4,551 1,305,500Arthur J. Gallagher & Co. 4,359 626,040Brown & Brown, Inc. 5,466 317,301Marsh & McLennan Cos., Inc. 6,495 1,021,014
3,269,855Insurance-Life/Health - 0.4%
Aflac, Inc. 9,153 518,792Athene Holding, Ltd., Class A� 5,576 373,425Equitable Holdings, Inc. 5,965 184,975Primerica, Inc. 1,666 254,798Principal Financial Group, Inc. 4,995 333,716Prudential Financial, Inc. 3,249 344,004Unum Group 11,560 307,727
Copyright © 2021 www.secdatabase.com. All Rights Reserved.Please Consider the Environment Before Printing This Document
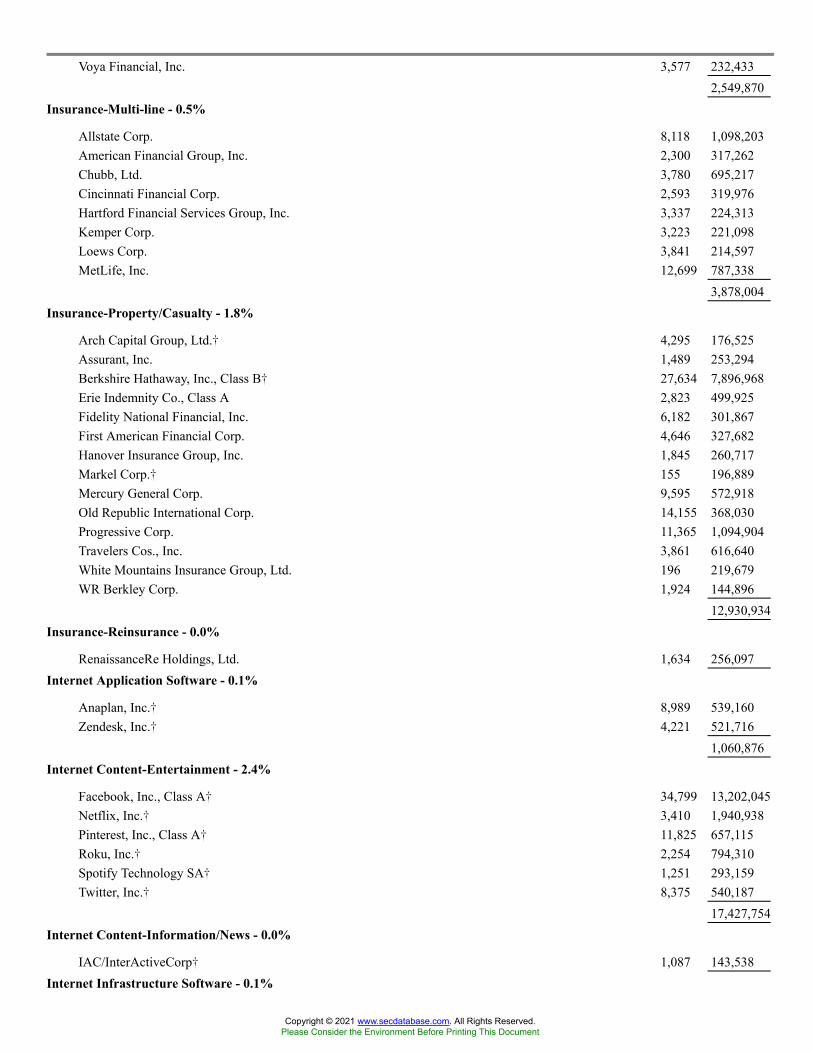
Voya Financial, Inc. 3,577 232,4332,549,870
Insurance-Multi-line - 0.5%
Allstate Corp. 8,118 1,098,203American Financial Group, Inc. 2,300 317,262Chubb, Ltd. 3,780 695,217Cincinnati Financial Corp. 2,593 319,976Hartford Financial Services Group, Inc. 3,337 224,313Kemper Corp. 3,223 221,098Loews Corp. 3,841 214,597MetLife, Inc. 12,699 787,338
3,878,004Insurance-Property/Casualty - 1.8%
Arch Capital Group, Ltd.� 4,295 176,525Assurant, Inc. 1,489 253,294Berkshire Hathaway, Inc., Class B� 27,634 7,896,968Erie Indemnity Co., Class A 2,823 499,925Fidelity National Financial, Inc. 6,182 301,867First American Financial Corp. 4,646 327,682Hanover Insurance Group, Inc. 1,845 260,717Markel Corp.� 155 196,889Mercury General Corp. 9,595 572,918Old Republic International Corp. 14,155 368,030Progressive Corp. 11,365 1,094,904Travelers Cos., Inc. 3,861 616,640White Mountains Insurance Group, Ltd. 196 219,679WR Berkley Corp. 1,924 144,896
12,930,934Insurance-Reinsurance - 0.0%
RenaissanceRe Holdings, Ltd. 1,634 256,097Internet Application Software - 0.1%
Anaplan, Inc.� 8,989 539,160Zendesk, Inc.� 4,221 521,716
1,060,876Internet Content-Entertainment - 2.4%
Facebook, Inc., Class A� 34,799 13,202,045Netflix, Inc.� 3,410 1,940,938Pinterest, Inc., Class A� 11,825 657,115Roku, Inc.� 2,254 794,310Spotify Technology SA� 1,251 293,159Twitter, Inc.� 8,375 540,187
17,427,754Internet Content-Information/News - 0.0%
IAC/InterActiveCorp� 1,087 143,538Internet Infrastructure Software - 0.1%
Copyright © 2021 www.secdatabase.com. All Rights Reserved.Please Consider the Environment Before Printing This Document
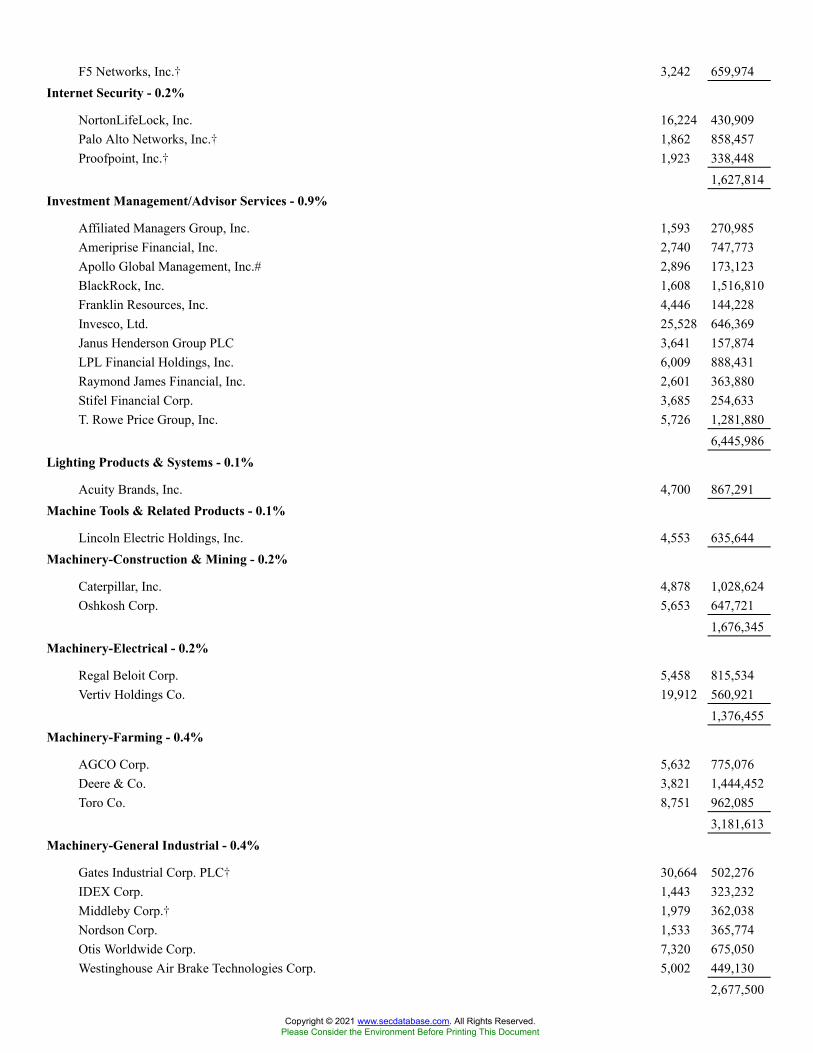
F5 Networks, Inc.� 3,242 659,974Internet Security - 0.2%
NortonLifeLock, Inc. 16,224 430,909Palo Alto Networks, Inc.� 1,862 858,457Proofpoint, Inc.� 1,923 338,448
1,627,814Investment Management/Advisor Services - 0.9%
Affiliated Managers Group, Inc. 1,593 270,985Ameriprise Financial, Inc. 2,740 747,773Apollo Global Management, Inc.# 2,896 173,123BlackRock, Inc. 1,608 1,516,810Franklin Resources, Inc. 4,446 144,228Invesco, Ltd. 25,528 646,369Janus Henderson Group PLC 3,641 157,874LPL Financial Holdings, Inc. 6,009 888,431Raymond James Financial, Inc. 2,601 363,880Stifel Financial Corp. 3,685 254,633T. Rowe Price Group, Inc. 5,726 1,281,880
6,445,986Lighting Products & Systems - 0.1%
Acuity Brands, Inc. 4,700 867,291Machine Tools & Related Products - 0.1%
Lincoln Electric Holdings, Inc. 4,553 635,644Machinery-Construction & Mining - 0.2%
Caterpillar, Inc. 4,878 1,028,624Oshkosh Corp. 5,653 647,721
1,676,345Machinery-Electrical - 0.2%
Regal Beloit Corp. 5,458 815,534Vertiv Holdings Co. 19,912 560,921
1,376,455Machinery-Farming - 0.4%
AGCO Corp. 5,632 775,076Deere & Co. 3,821 1,444,452Toro Co. 8,751 962,085
3,181,613Machinery-General Industrial - 0.4%
Gates Industrial Corp. PLC� 30,664 502,276IDEX Corp. 1,443 323,232Middleby Corp.� 1,979 362,038Nordson Corp. 1,533 365,774Otis Worldwide Corp. 7,320 675,050Westinghouse Air Brake Technologies Corp. 5,002 449,130
2,677,500
Copyright © 2021 www.secdatabase.com. All Rights Reserved.Please Consider the Environment Before Printing This Document

Machinery-Pumps - 0.3%
Curtiss-Wright Corp. 1,760 214,333Dover Corp. 3,321 579,049Graco, Inc. 9,552 749,068Ingersoll Rand, Inc.� 7,675 406,928Xylem, Inc. 4,018 547,694
2,497,072Medical Information Systems - 0.2%
Cerner Corp. 13,562 1,035,459Signify Health, Inc., Class A� 5,639 146,557
1,182,016Medical Instruments - 0.5%
Bio-Techne Corp. 736 367,367Boston Scientific Corp.� 6,851 309,323Bruker Corp. 3,378 298,311Edwards Lifesciences Corp.� 11,171 1,309,018Intuitive Surgical, Inc.� 467 492,012
Copyright © 2021 www.secdatabase.com. All Rights Reserved.Please Consider the Environment Before Printing This Document

Medtronic PLC 8,189 1,093,0683,869,099
Medical Labs & Testing Services - 0.6%
Catalent, Inc.� 1,611 210,139Charles River Laboratories International, Inc.� 1,552 688,871IQVIA Holdings, Inc.� 2,005 520,759Laboratory Corp. of America Holdings� 3,942 1,195,924PPD, Inc.� 6,536 302,682Quest Diagnostics, Inc. 6,548 1,000,731Syneos Health, Inc.� 7,457 691,860
4,610,966Medical Products - 1.5%
Abbott Laboratories 18,389 2,323,818ABIOMED, Inc.� 2,701 983,056Align Technology, Inc.� 1,237 877,033Baxter International, Inc. 4,167 317,609Cooper Cos., Inc. 683 307,835Envista Holdings Corp.� 6,689 286,222Globus Medical, Inc., Class A� 3,891 317,506Henry Schein, Inc.� 10,640 804,278Hill-Rom Holdings, Inc. 2,104 306,300Hologic, Inc.� 12,848 1,016,919Masimo Corp.� 2,661 722,568Novocure, Ltd.� 3,311 444,369Penumbra, Inc.� 2,216 609,289STERIS PLC 1,380 296,714Stryker Corp. 1,603 444,191West Pharmaceutical Services, Inc. 1,764 796,658Zimmer Biomet Holdings, Inc. 1,167 175,575
11,029,940Medical-Biomedical/Gene - 1.6%
Amgen, Inc. 6,919 1,560,442Bio-Rad Laboratories, Inc., Class A� 509 409,653Biogen, Inc.� 4,568 1,548,141Certara, Inc.� 5,574 187,119Exelixis, Inc.� 17,733 339,942Gilead Sciences, Inc. 18,145 1,320,593Illumina, Inc.� 998 456,246Incyte Corp.� 10,830 828,387Maravai LifeSciences Holdings, Inc., Class A� 2,956 174,936Moderna, Inc.� 3,608 1,359,098Regeneron Pharmaceuticals, Inc.� 754 507,744Sage Therapeutics, Inc.� 12,031 555,952Seagen, Inc.� 4,050 678,780United Therapeutics Corp.� 4,221 907,008Vertex Pharmaceuticals, Inc.� 5,098 1,021,078
11,855,119
Copyright © 2021 www.secdatabase.com. All Rights Reserved.Please Consider the Environment Before Printing This Document
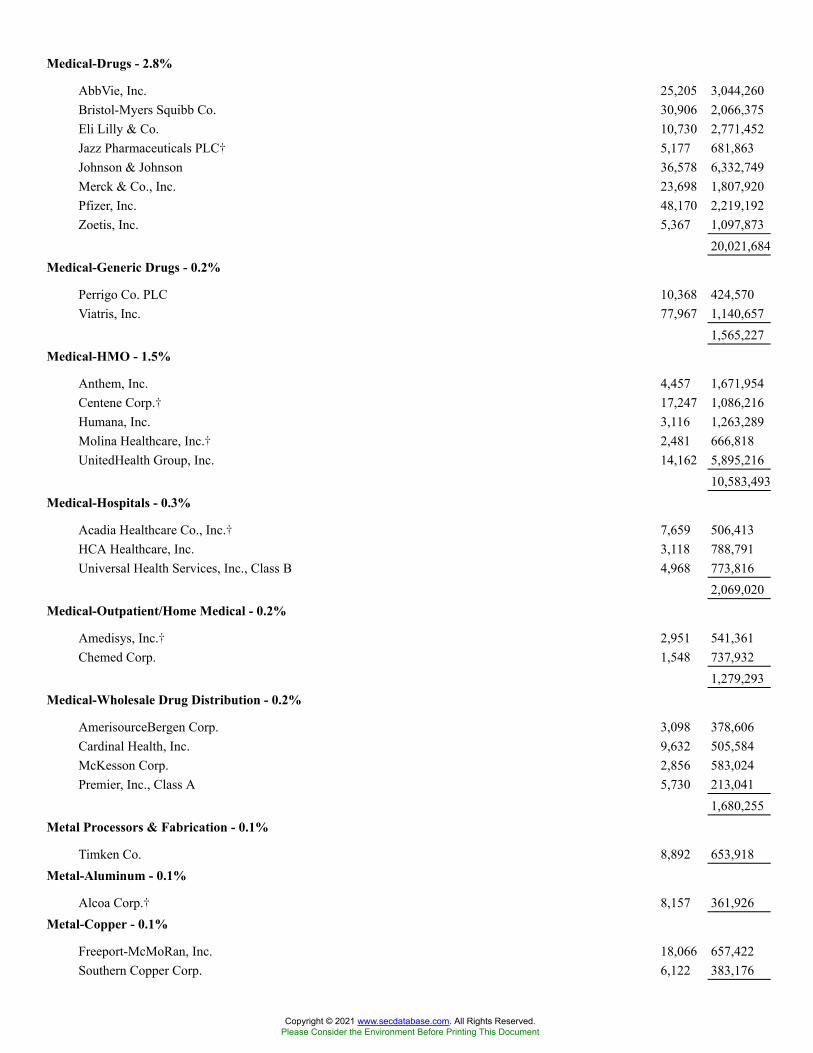
Medical-Drugs - 2.8%
AbbVie, Inc. 25,205 3,044,260Bristol-Myers Squibb Co. 30,906 2,066,375Eli Lilly & Co. 10,730 2,771,452Jazz Pharmaceuticals PLC� 5,177 681,863Johnson & Johnson 36,578 6,332,749Merck & Co., Inc. 23,698 1,807,920Pfizer, Inc. 48,170 2,219,192Zoetis, Inc. 5,367 1,097,873
20,021,684Medical-Generic Drugs - 0.2%
Perrigo Co. PLC 10,368 424,570Viatris, Inc. 77,967 1,140,657
1,565,227Medical-HMO - 1.5%
Anthem, Inc. 4,457 1,671,954Centene Corp.� 17,247 1,086,216Humana, Inc. 3,116 1,263,289Molina Healthcare, Inc.� 2,481 666,818UnitedHealth Group, Inc. 14,162 5,895,216
10,583,493Medical-Hospitals - 0.3%
Acadia Healthcare Co., Inc.� 7,659 506,413HCA Healthcare, Inc. 3,118 788,791Universal Health Services, Inc., Class B 4,968 773,816
2,069,020Medical-Outpatient/Home Medical - 0.2%
Amedisys, Inc.� 2,951 541,361Chemed Corp. 1,548 737,932
1,279,293Medical-Wholesale Drug Distribution - 0.2%
AmerisourceBergen Corp. 3,098 378,606Cardinal Health, Inc. 9,632 505,584McKesson Corp. 2,856 583,024Premier, Inc., Class A 5,730 213,041
1,680,255Metal Processors & Fabrication - 0.1%
Timken Co. 8,892 653,918Metal-Aluminum - 0.1%
Alcoa Corp.� 8,157 361,926Metal-Copper - 0.1%
Freeport-McMoRan, Inc. 18,066 657,422Southern Copper Corp. 6,122 383,176
Copyright © 2021 www.secdatabase.com. All Rights Reserved.Please Consider the Environment Before Printing This Document
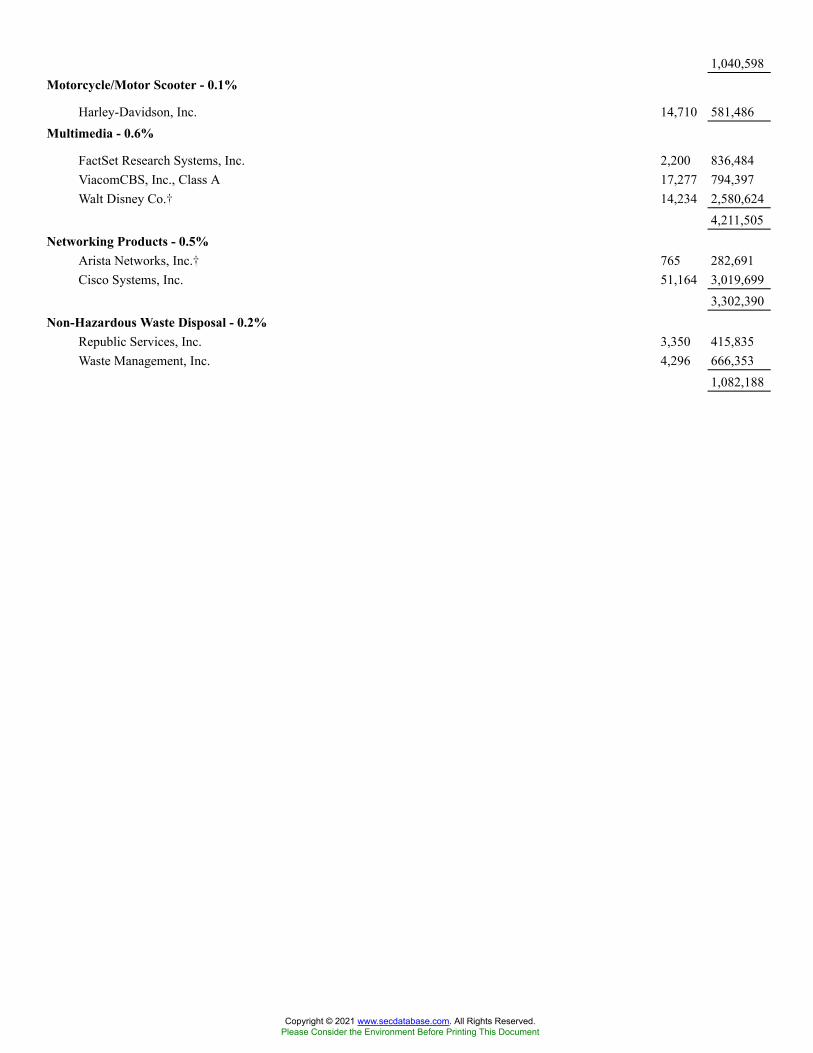
1,040,598Motorcycle/Motor Scooter - 0.1%
Harley-Davidson, Inc. 14,710 581,486Multimedia - 0.6%
FactSet Research Systems, Inc. 2,200 836,484ViacomCBS, Inc., Class A 17,277 794,397Walt Disney Co.� 14,234 2,580,624
4,211,505Networking Products - 0.5%
Arista Networks, Inc.� 765 282,691Cisco Systems, Inc. 51,164 3,019,699
3,302,390Non-Hazardous Waste Disposal - 0.2%
Republic Services, Inc. 3,350 415,835Waste Management, Inc. 4,296 666,353
1,082,188
Copyright © 2021 www.secdatabase.com. All Rights Reserved.Please Consider the Environment Before Printing This Document

Office Automation & Equipment - 0.2%
Xerox Holdings Corp. 19,780 445,248Zebra Technologies Corp., Class A� 1,882 1,105,054
1,550,302Office Supplies & Forms - 0.1%
Avery Dennison Corp. 2,456 553,558Oil Companies-Exploration & Production - 0.2%
APA Corp. 10,081 196,378Cimarex Energy Co. 5,259 337,733ConocoPhillips 2,602 144,489Continental Resources, Inc. 5,273 207,123Devon Energy Corp. 4,936 145,859EQT Corp.� 12,333 226,064Marathon Oil Corp. 22,003 258,535Pioneer Natural Resources Co. 1,267 189,632
1,705,813Oil Companies-Integrated - 0.4%
Chevron Corp. 10,728 1,038,149Exxon Mobil Corp. 30,052 1,638,435
2,676,584Oil Field Machinery & Equipment - 0.1%
NOV, Inc.� 70,309 925,970Oil Refining & Marketing - 0.0%
Marathon Petroleum Corp. 3,557 210,823Oil-Field Services - 0.1%
Baker Hughes Co. 6,827 155,519Halliburton Co. 20,193 403,456
558,975Paper & Related Products - 0.1%
International Paper Co. 14,344 861,931Pastoral & Agricultural - 0.0%
Darling Ingredients, Inc.� 4,640 345,680Patient Monitoring Equipment - 0.0%
Insulet Corp.� 598 178,090Pharmacy Services - 0.5%
Cigna Corp. 5,635 1,192,648CVS Health Corp. 24,055 2,078,111
3,270,759Physical Therapy/Rehabilitation Centers - 0.0%
Encompass Health Corp. 2,379 186,633Pipelines - 0.3%
Copyright © 2021 www.secdatabase.com. All Rights Reserved.Please Consider the Environment Before Printing This Document
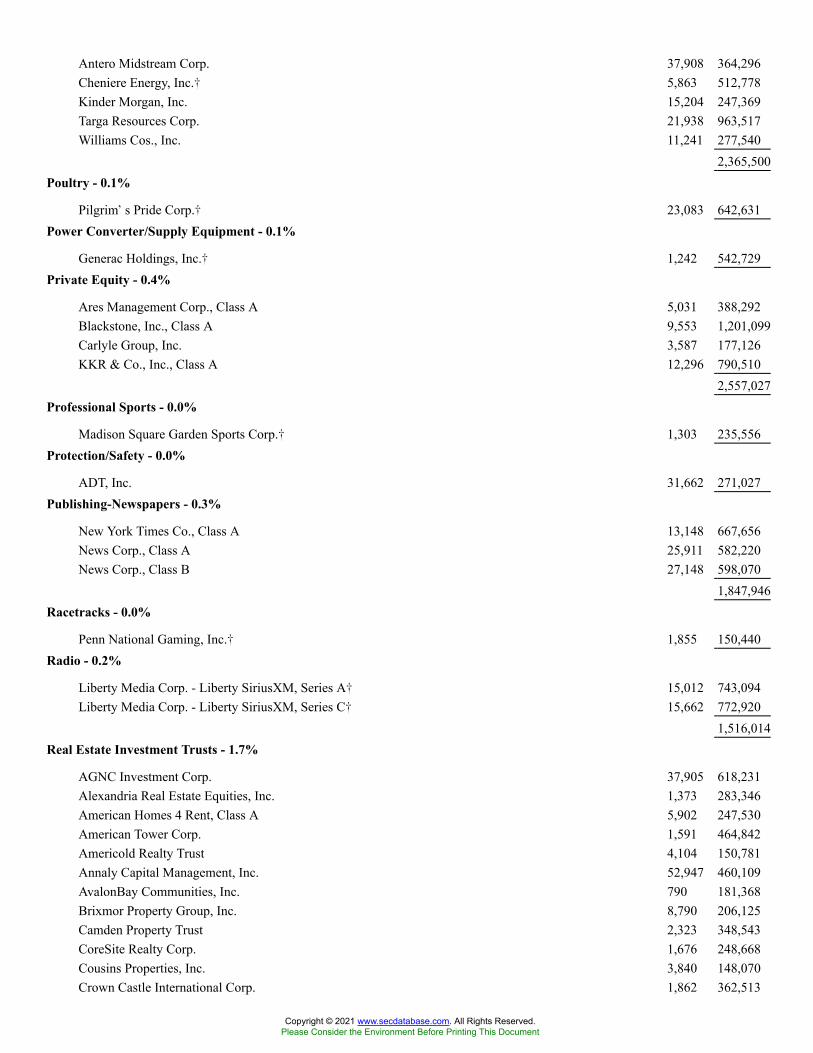
Antero Midstream Corp. 37,908 364,296Cheniere Energy, Inc.� 5,863 512,778Kinder Morgan, Inc. 15,204 247,369Targa Resources Corp. 21,938 963,517Williams Cos., Inc. 11,241 277,540
2,365,500Poultry - 0.1%
Pilgrim�s Pride Corp.� 23,083 642,631Power Converter/Supply Equipment - 0.1%
Generac Holdings, Inc.� 1,242 542,729Private Equity - 0.4%
Ares Management Corp., Class A 5,031 388,292Blackstone, Inc., Class A 9,553 1,201,099Carlyle Group, Inc. 3,587 177,126KKR & Co., Inc., Class A 12,296 790,510
2,557,027Professional Sports - 0.0%
Madison Square Garden Sports Corp.� 1,303 235,556Protection/Safety - 0.0%
ADT, Inc. 31,662 271,027Publishing-Newspapers - 0.3%
New York Times Co., Class A 13,148 667,656News Corp., Class A 25,911 582,220News Corp., Class B 27,148 598,070
1,847,946Racetracks - 0.0%
Penn National Gaming, Inc.� 1,855 150,440Radio - 0.2%
Liberty Media Corp. - Liberty SiriusXM, Series A� 15,012 743,094Liberty Media Corp. - Liberty SiriusXM, Series C� 15,662 772,920
1,516,014Real Estate Investment Trusts - 1.7%
AGNC Investment Corp. 37,905 618,231Alexandria Real Estate Equities, Inc. 1,373 283,346American Homes 4 Rent, Class A 5,902 247,530American Tower Corp. 1,591 464,842Americold Realty Trust 4,104 150,781Annaly Capital Management, Inc. 52,947 460,109AvalonBay Communities, Inc. 790 181,368Brixmor Property Group, Inc. 8,790 206,125Camden Property Trust 2,323 348,543CoreSite Realty Corp. 1,676 248,668Cousins Properties, Inc. 3,840 148,070Crown Castle International Corp. 1,862 362,513
Copyright © 2021 www.secdatabase.com. All Rights Reserved.Please Consider the Environment Before Printing This Document
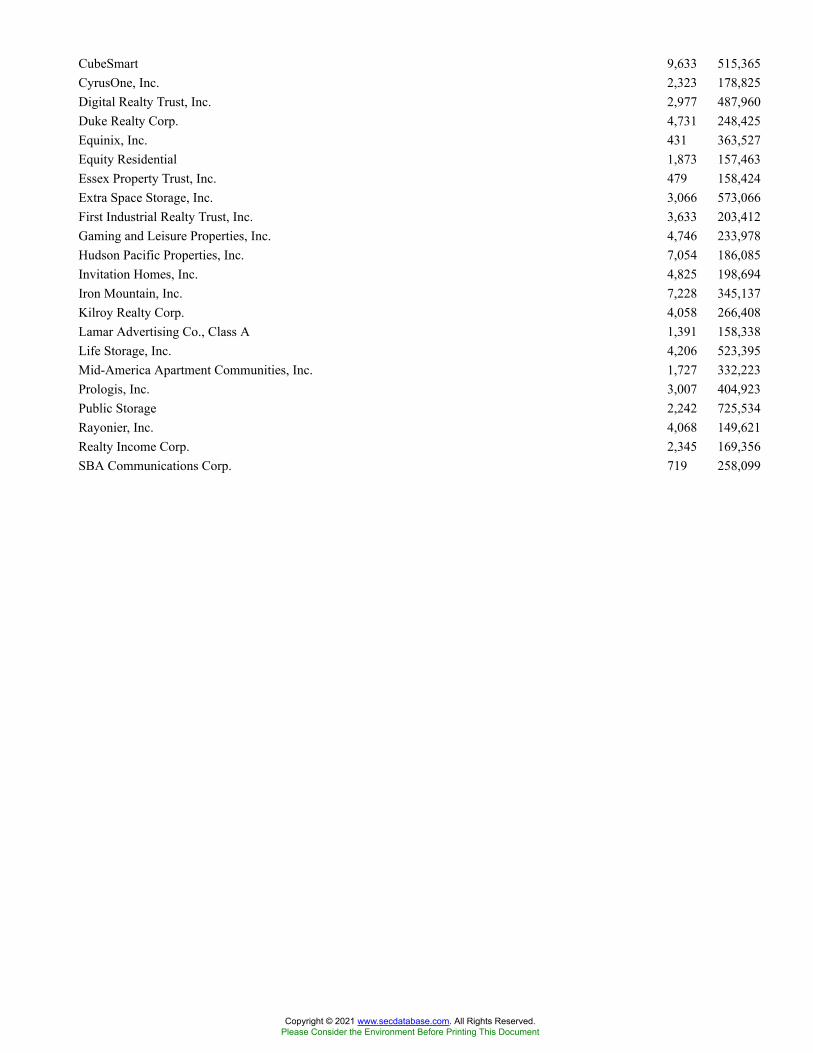
CubeSmart 9,633 515,365CyrusOne, Inc. 2,323 178,825Digital Realty Trust, Inc. 2,977 487,960Duke Realty Corp. 4,731 248,425Equinix, Inc. 431 363,527Equity Residential 1,873 157,463Essex Property Trust, Inc. 479 158,424Extra Space Storage, Inc. 3,066 573,066First Industrial Realty Trust, Inc. 3,633 203,412Gaming and Leisure Properties, Inc. 4,746 233,978Hudson Pacific Properties, Inc. 7,054 186,085Invitation Homes, Inc. 4,825 198,694Iron Mountain, Inc. 7,228 345,137Kilroy Realty Corp. 4,058 266,408Lamar Advertising Co., Class A 1,391 158,338Life Storage, Inc. 4,206 523,395Mid-America Apartment Communities, Inc. 1,727 332,223Prologis, Inc. 3,007 404,923Public Storage 2,242 725,534Rayonier, Inc. 4,068 149,621Realty Income Corp. 2,345 169,356SBA Communications Corp. 719 258,099
Copyright © 2021 www.secdatabase.com. All Rights Reserved.Please Consider the Environment Before Printing This Document
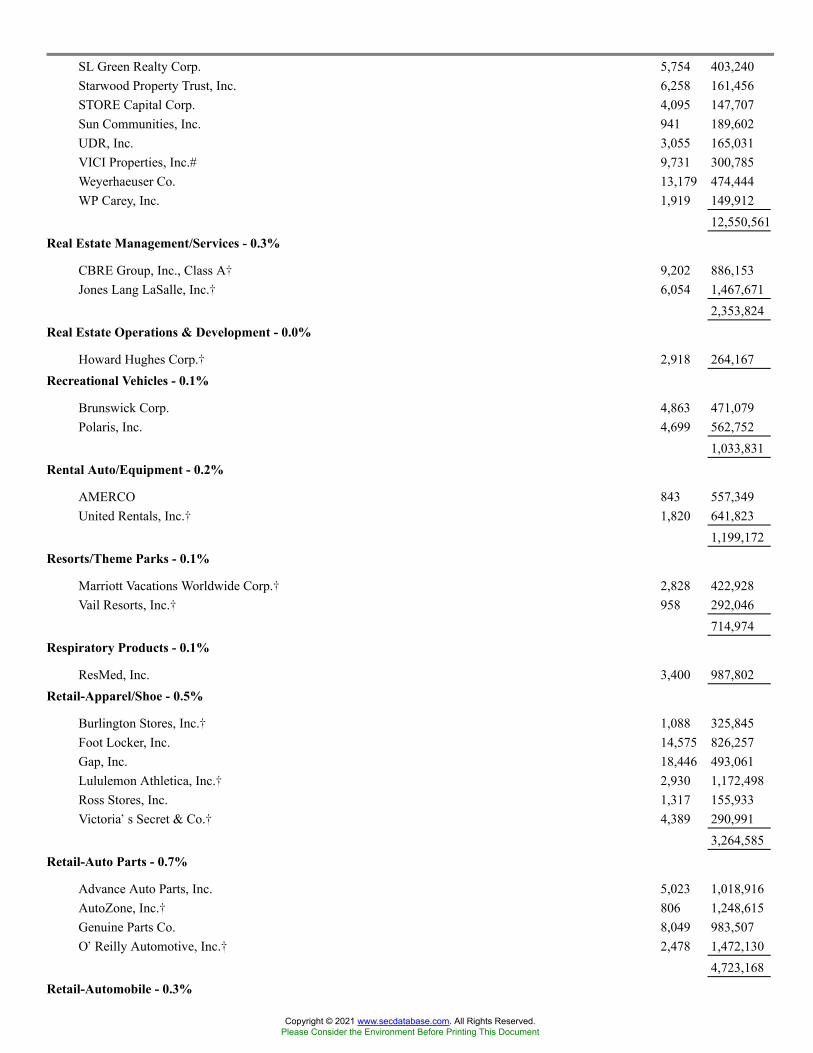
SL Green Realty Corp. 5,754 403,240Starwood Property Trust, Inc. 6,258 161,456STORE Capital Corp. 4,095 147,707Sun Communities, Inc. 941 189,602UDR, Inc. 3,055 165,031VICI Properties, Inc.# 9,731 300,785Weyerhaeuser Co. 13,179 474,444WP Carey, Inc. 1,919 149,912
12,550,561Real Estate Management/Services - 0.3%
CBRE Group, Inc., Class A� 9,202 886,153Jones Lang LaSalle, Inc.� 6,054 1,467,671
2,353,824Real Estate Operations & Development - 0.0%
Howard Hughes Corp.� 2,918 264,167Recreational Vehicles - 0.1%
Brunswick Corp. 4,863 471,079Polaris, Inc. 4,699 562,752
1,033,831Rental Auto/Equipment - 0.2%
AMERCO 843 557,349United Rentals, Inc.� 1,820 641,823
1,199,172Resorts/Theme Parks - 0.1%
Marriott Vacations Worldwide Corp.� 2,828 422,928Vail Resorts, Inc.� 958 292,046
714,974Respiratory Products - 0.1%
ResMed, Inc. 3,400 987,802Retail-Apparel/Shoe - 0.5%
Burlington Stores, Inc.� 1,088 325,845Foot Locker, Inc. 14,575 826,257Gap, Inc. 18,446 493,061Lululemon Athletica, Inc.� 2,930 1,172,498Ross Stores, Inc. 1,317 155,933Victoria�s Secret & Co.� 4,389 290,991
3,264,585Retail-Auto Parts - 0.7%
Advance Auto Parts, Inc. 5,023 1,018,916AutoZone, Inc.� 806 1,248,615Genuine Parts Co. 8,049 983,507O�Reilly Automotive, Inc.� 2,478 1,472,130
4,723,168Retail-Automobile - 0.3%
Copyright © 2021 www.secdatabase.com. All Rights Reserved.Please Consider the Environment Before Printing This Document

AutoNation, Inc.� 11,602 1,265,662CarMax, Inc.� 1,165 145,870Penske Automotive Group, Inc. 10,864 976,999
2,388,531Retail-Building Products - 1.1%
Home Depot, Inc. 15,903 5,187,241Lowe�s Cos., Inc. 13,409 2,733,961
7,921,202Retail-Catalog Shopping - 0.3%
MSC Industrial Direct Co., Inc., Class A 11,954 1,006,646Qurate Retail, Inc., Series A 88,265 973,563
1,980,209Retail-Consumer Electronics - 0.2%
Best Buy Co., Inc. 11,790 1,373,653Retail-Convenience Store - 0.1%
Casey�s General Stores, Inc. 3,951 808,217Retail-Discount - 1.5%
Costco Wholesale Corp. 4,925 2,243,288Dollar General Corp. 4,797 1,069,299Dollar Tree, Inc.� 7,817 707,751Ollie�s Bargain Outlet Holdings, Inc.�# 4,259 308,267Target Corp. 12,513 3,090,461Walmart, Inc. 23,787 3,522,855
10,941,921Retail-Drug Store - 0.1%
Walgreens Boots Alliance, Inc. 13,747 697,660Retail-Floor Coverings - 0.1%
Floor & Decor Holdings, Inc., Class A� 5,604 690,973Retail-Gardening Products - 0.2%
Tractor Supply Co. 7,060 1,371,405Retail-Home Furnishings - 0.1%
Williams-Sonoma, Inc. 5,638 1,052,615Retail-Major Department Stores - 0.1%
Nordstrom, Inc.�# 7,326 209,597TJX Cos., Inc. 6,003 436,538
646,135Retail-Misc./Diversified - 0.2%
Bath & Body Works, Inc. 13,167 888,509Five Below, Inc.� 2,130 453,285GameStop Corp., Class A� 1,832 399,816
1,741,610Retail-Perfume & Cosmetics - 0.1%
Copyright © 2021 www.secdatabase.com. All Rights Reserved.Please Consider the Environment Before Printing This Document
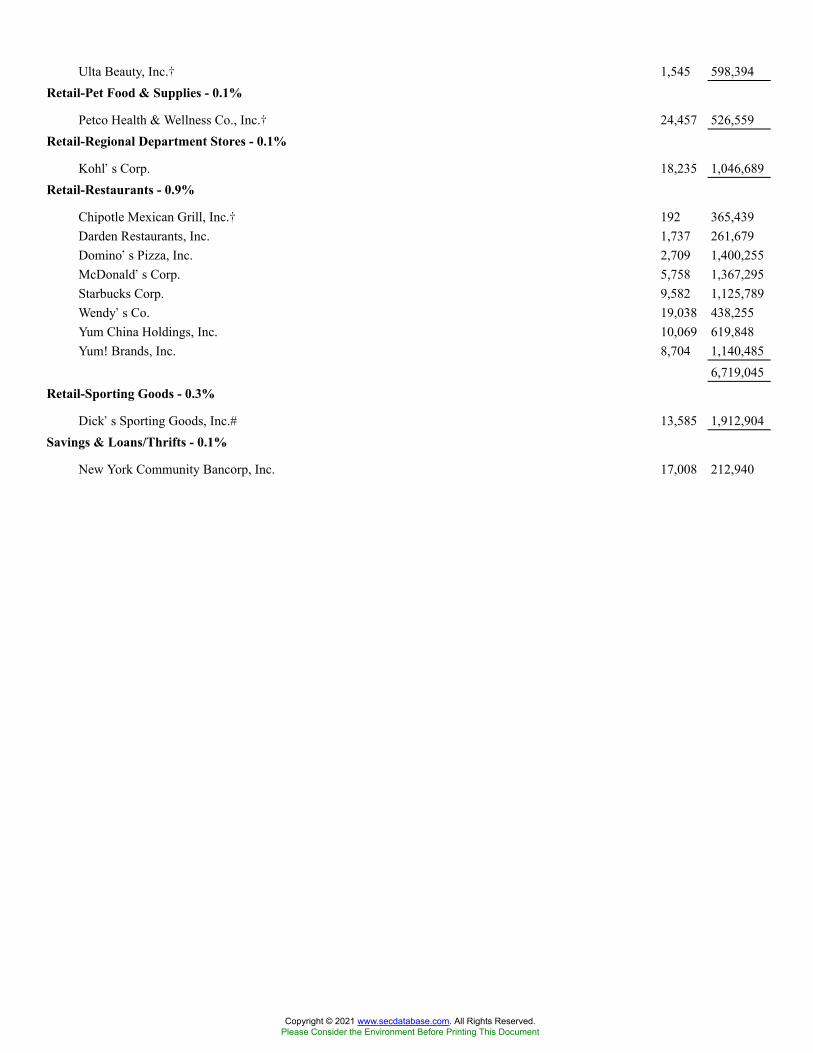
Ulta Beauty, Inc.� 1,545 598,394Retail-Pet Food & Supplies - 0.1%
Petco Health & Wellness Co., Inc.� 24,457 526,559Retail-Regional Department Stores - 0.1%
Kohl�s Corp. 18,235 1,046,689Retail-Restaurants - 0.9%
Chipotle Mexican Grill, Inc.� 192 365,439Darden Restaurants, Inc. 1,737 261,679Domino�s Pizza, Inc. 2,709 1,400,255McDonald�s Corp. 5,758 1,367,295Starbucks Corp. 9,582 1,125,789Wendy�s Co. 19,038 438,255Yum China Holdings, Inc. 10,069 619,848Yum! Brands, Inc. 8,704 1,140,485
6,719,045Retail-Sporting Goods - 0.3%
Dick�s Sporting Goods, Inc.# 13,585 1,912,904Savings & Loans/Thrifts - 0.1%
New York Community Bancorp, Inc. 17,008 212,940
Copyright © 2021 www.secdatabase.com. All Rights Reserved.Please Consider the Environment Before Printing This Document
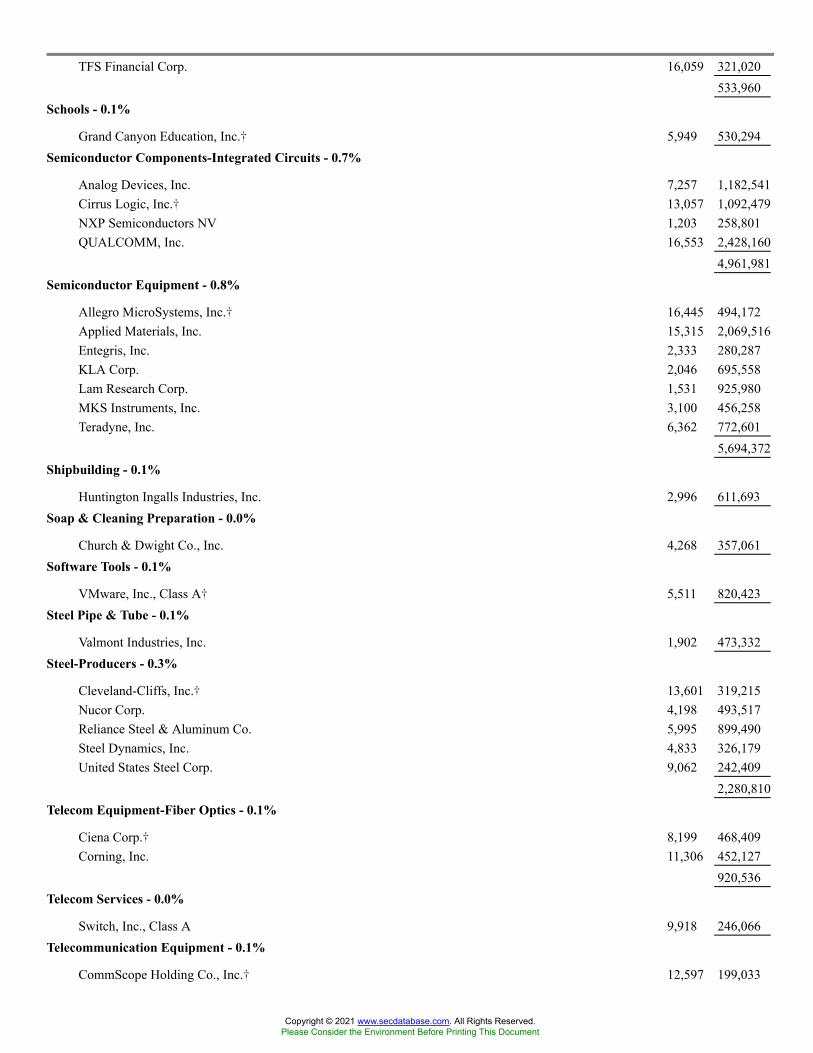
TFS Financial Corp. 16,059 321,020533,960
Schools - 0.1%
Grand Canyon Education, Inc.� 5,949 530,294Semiconductor Components-Integrated Circuits - 0.7%
Analog Devices, Inc. 7,257 1,182,541Cirrus Logic, Inc.� 13,057 1,092,479NXP Semiconductors NV 1,203 258,801QUALCOMM, Inc. 16,553 2,428,160
4,961,981Semiconductor Equipment - 0.8%
Allegro MicroSystems, Inc.� 16,445 494,172Applied Materials, Inc. 15,315 2,069,516Entegris, Inc. 2,333 280,287KLA Corp. 2,046 695,558Lam Research Corp. 1,531 925,980MKS Instruments, Inc. 3,100 456,258Teradyne, Inc. 6,362 772,601
5,694,372Shipbuilding - 0.1%
Huntington Ingalls Industries, Inc. 2,996 611,693Soap & Cleaning Preparation - 0.0%
Church & Dwight Co., Inc. 4,268 357,061Software Tools - 0.1%
VMware, Inc., Class A� 5,511 820,423Steel Pipe & Tube - 0.1%
Valmont Industries, Inc. 1,902 473,332Steel-Producers - 0.3%
Cleveland-Cliffs, Inc.� 13,601 319,215Nucor Corp. 4,198 493,517Reliance Steel & Aluminum Co. 5,995 899,490Steel Dynamics, Inc. 4,833 326,179United States Steel Corp. 9,062 242,409
2,280,810Telecom Equipment-Fiber Optics - 0.1%
Ciena Corp.� 8,199 468,409Corning, Inc. 11,306 452,127
920,536Telecom Services - 0.0%
Switch, Inc., Class A 9,918 246,066Telecommunication Equipment - 0.1%
CommScope Holding Co., Inc.� 12,597 199,033
Copyright © 2021 www.secdatabase.com. All Rights Reserved.Please Consider the Environment Before Printing This Document
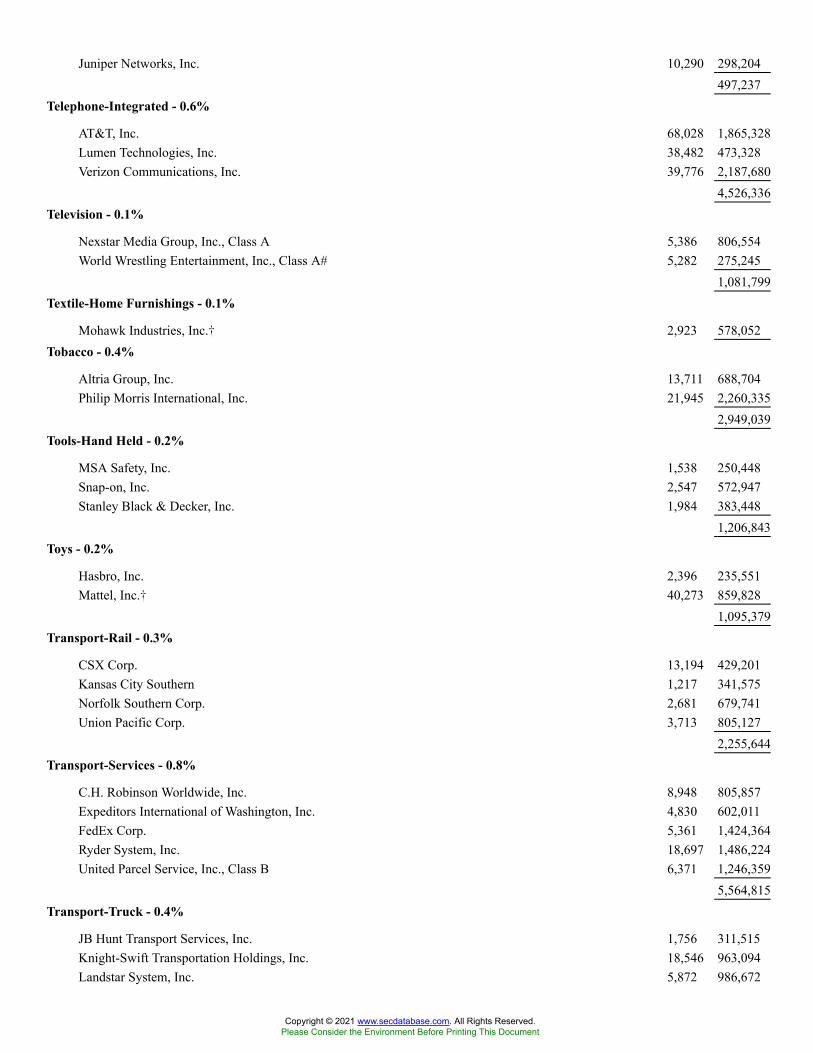
Juniper Networks, Inc. 10,290 298,204497,237
Telephone-Integrated - 0.6%
AT&T, Inc. 68,028 1,865,328Lumen Technologies, Inc. 38,482 473,328Verizon Communications, Inc. 39,776 2,187,680
4,526,336Television - 0.1%
Nexstar Media Group, Inc., Class A 5,386 806,554World Wrestling Entertainment, Inc., Class A# 5,282 275,245
1,081,799Textile-Home Furnishings - 0.1%
Mohawk Industries, Inc.� 2,923 578,052Tobacco - 0.4%
Altria Group, Inc. 13,711 688,704Philip Morris International, Inc. 21,945 2,260,335
2,949,039Tools-Hand Held - 0.2%
MSA Safety, Inc. 1,538 250,448Snap-on, Inc. 2,547 572,947Stanley Black & Decker, Inc. 1,984 383,448
1,206,843Toys - 0.2%
Hasbro, Inc. 2,396 235,551Mattel, Inc.� 40,273 859,828
1,095,379Transport-Rail - 0.3%
CSX Corp. 13,194 429,201Kansas City Southern 1,217 341,575Norfolk Southern Corp. 2,681 679,741Union Pacific Corp. 3,713 805,127
2,255,644Transport-Services - 0.8%
C.H. Robinson Worldwide, Inc. 8,948 805,857Expeditors International of Washington, Inc. 4,830 602,011FedEx Corp. 5,361 1,424,364Ryder System, Inc. 18,697 1,486,224United Parcel Service, Inc., Class B 6,371 1,246,359
5,564,815Transport-Truck - 0.4%
JB Hunt Transport Services, Inc. 1,756 311,515Knight-Swift Transportation Holdings, Inc. 18,546 963,094Landstar System, Inc. 5,872 986,672
Copyright © 2021 www.secdatabase.com. All Rights Reserved.Please Consider the Environment Before Printing This Document

Old Dominion Freight Line, Inc. 1,568 452,713Schneider National, Inc., Class B 10,400 234,416XPO Logistics, Inc.� 2,930 254,646
3,203,056Vitamins & Nutrition Products - 0.1%
Herbalife Nutrition, Ltd.� 18,002 924,223Water - 0.1%
American Water Works Co., Inc. 1,828 333,153Essential Utilities, Inc. 4,808 238,621
571,774Water Treatment Systems - 0.1%
Pentair PLC 6,924 534,256Web Hosting/Design - 0.2%
GoDaddy, Inc., Class A� 4,961 363,691VeriSign, Inc.� 4,961 1,072,866
1,436,557
Copyright © 2021 www.secdatabase.com. All Rights Reserved.Please Consider the Environment Before Printing This Document
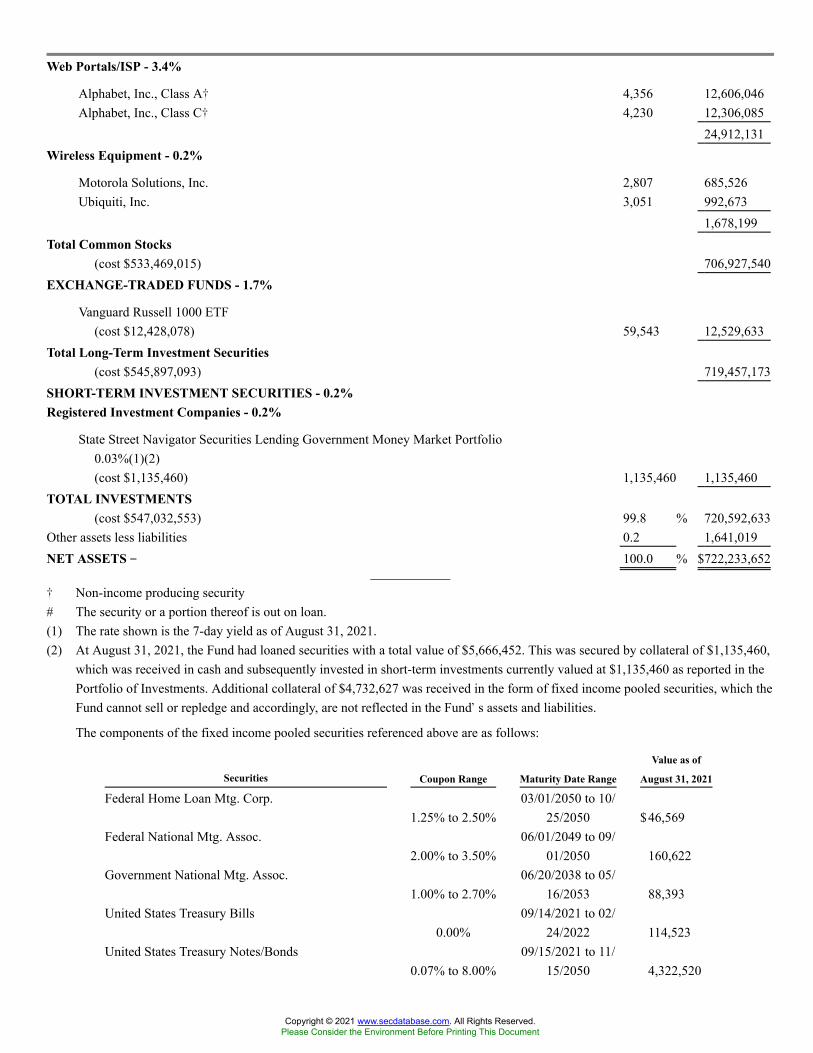
Web Portals/ISP - 3.4%
Alphabet, Inc., Class A� 4,356 12,606,046Alphabet, Inc., Class C� 4,230 12,306,085
24,912,131Wireless Equipment - 0.2%
Motorola Solutions, Inc. 2,807 685,526Ubiquiti, Inc. 3,051 992,673
1,678,199Total Common Stocks
(cost $533,469,015) 706,927,540EXCHANGE-TRADED FUNDS - 1.7%
Vanguard Russell 1000 ETF(cost $12,428,078) 59,543 12,529,633
Total Long-Term Investment Securities(cost $545,897,093) 719,457,173
SHORT-TERM INVESTMENT SECURITIES - 0.2%Registered Investment Companies - 0.2%
State Street Navigator Securities Lending Government Money Market Portfolio0.03%(1)(2)(cost $1,135,460) 1,135,460 1,135,460
TOTAL INVESTMENTS(cost $547,032,553) 99.8 % 720,592,633
Other assets less liabilities 0.2 1,641,019NET ASSETS �� 100.0 % $722,233,652
� Non-income producing security# The security or a portion thereof is out on loan.(1) The rate shown is the 7-day yield as of August 31, 2021.(2) At August 31, 2021, the Fund had loaned securities with a total value of $5,666,452. This was secured by collateral of $1,135,460,
which was received in cash and subsequently invested in short-term investments currently valued at $1,135,460 as reported in thePortfolio of Investments. Additional collateral of $4,732,627 was received in the form of fixed income pooled securities, which theFund cannot sell or repledge and accordingly, are not reflected in the Fund�s assets and liabilities.
The components of the fixed income pooled securities referenced above are as follows:
Securities Coupon Range Maturity Date Range
Value as of
August 31, 2021
Federal Home Loan Mtg. Corp.1.25% to 2.50%
03/01/2050 to 10/25/2050 $46,569
Federal National Mtg. Assoc.2.00% to 3.50%
06/01/2049 to 09/01/2050 160,622
Government National Mtg. Assoc.1.00% to 2.70%
06/20/2038 to 05/16/2053 88,393
United States Treasury Bills0.00%
09/14/2021 to 02/24/2022 114,523
United States Treasury Notes/Bonds0.07% to 8.00%
09/15/2021 to 11/15/2050 4,322,520
Copyright © 2021 www.secdatabase.com. All Rights Reserved.Please Consider the Environment Before Printing This Document

ETF - Exchange-Traded Funds
The following is a summary of the inputs used to value the Fund�s net assets as of August 31, 2021 (see Note 1):
Level 1 - Unadjusted
Quoted Prices
Level 2 - Other
Observable Inputs
Level 3 - Significant
Unobservable Inputs Total
ASSETS:Investments at Value:*Common Stocks $ 706,927,540 $ � $ � $706,927,540Exchange-Traded Funds 12,529,633 � � 12,529,633Short-Term Investment Securities 1,135,460 � � 1,135,460Total Investments at Value $ 720,592,633 $ � $ � $720,592,633
* For a detailed presentation of investments, please refer to the Portfolio of Investments.
See Notes to Portfolio of Investments
Copyright © 2021 www.secdatabase.com. All Rights Reserved.Please Consider the Environment Before Printing This Document

VALIC Company I Systematic Value FundPORTFOLIO OF INVESTMENTS - August 31, 2021 - (unaudited)
Security Description
Shares/
Principal
Amount
Value
(Note 1)
COMMON STOCKS - 99.0%Advertising Agencies - 1.7%
Omnicom Group, Inc. 126,146 $9,236,410Aerospace/Defense - 2.4%
General Dynamics Corp. 18,078 3,621,204Raytheon Technologies Corp. 64,890 5,500,076TransDigm Group, Inc.� 6,221 3,779,071
12,900,351Applications Software - 0.4%
Jamf Holding Corp.� 28,600 1,005,290N-Able, Inc.�# 70,372 952,133
1,957,423Auto Repair Centers - 0.1%
Driven Brands Holdings, Inc.� 12,581 375,920Auto-Cars/Light Trucks - 0.1%
Ford Motor Co.� 22,247 289,878Auto/Truck Parts & Equipment-Original - 0.9%
BorgWarner, Inc. 67,284 2,871,681Lear Corp. 10,943 1,750,224
4,621,905Banks-Fiduciary - 0.6%
Bank of New York Mellon Corp. 58,403 3,225,014Banks-Super Regional - 0.8%
KeyCorp 206,812 4,202,420Beverages-Non-alcoholic - 1.8%
Coca-Cola Co. 2,855 160,765Keurig Dr Pepper, Inc. 88,205 3,146,272Monster Beverage Corp.� 10,166 991,897PepsiCo, Inc. 32,172 5,031,379
9,330,313Building & Construction-Misc. - 0.1%
Frontdoor, Inc.� 18,387 802,041Building-Maintenance & Services - 0.1%
Rollins, Inc. 10,796 420,180Building-Mobile Home/Manufactured Housing - 0.1%
Thor Industries, Inc. 4,754 539,246
Copyright © 2021 www.secdatabase.com. All Rights Reserved.Please Consider the Environment Before Printing This Document
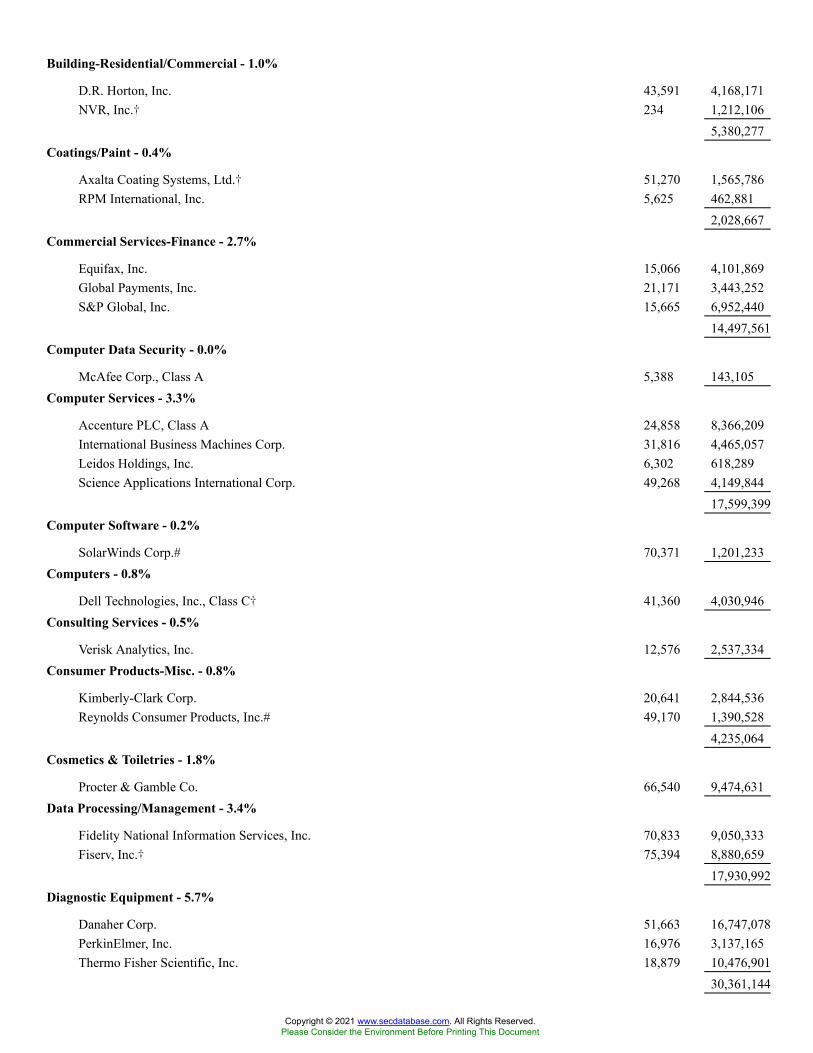
Building-Residential/Commercial - 1.0%
D.R. Horton, Inc. 43,591 4,168,171NVR, Inc.� 234 1,212,106
5,380,277Coatings/Paint - 0.4%
Axalta Coating Systems, Ltd.� 51,270 1,565,786RPM International, Inc. 5,625 462,881
2,028,667Commercial Services-Finance - 2.7%
Equifax, Inc. 15,066 4,101,869Global Payments, Inc. 21,171 3,443,252S&P Global, Inc. 15,665 6,952,440
14,497,561Computer Data Security - 0.0%
McAfee Corp., Class A 5,388 143,105Computer Services - 3.3%
Accenture PLC, Class A 24,858 8,366,209International Business Machines Corp. 31,816 4,465,057Leidos Holdings, Inc. 6,302 618,289Science Applications International Corp. 49,268 4,149,844
17,599,399Computer Software - 0.2%
SolarWinds Corp.# 70,371 1,201,233Computers - 0.8%
Dell Technologies, Inc., Class C� 41,360 4,030,946Consulting Services - 0.5%
Verisk Analytics, Inc. 12,576 2,537,334Consumer Products-Misc. - 0.8%
Kimberly-Clark Corp. 20,641 2,844,536Reynolds Consumer Products, Inc.# 49,170 1,390,528
4,235,064Cosmetics & Toiletries - 1.8%
Procter & Gamble Co. 66,540 9,474,631Data Processing/Management - 3.4%
Fidelity National Information Services, Inc. 70,833 9,050,333Fiserv, Inc.� 75,394 8,880,659
17,930,992Diagnostic Equipment - 5.7%
Danaher Corp. 51,663 16,747,078PerkinElmer, Inc. 16,976 3,137,165Thermo Fisher Scientific, Inc. 18,879 10,476,901
30,361,144
Copyright © 2021 www.secdatabase.com. All Rights Reserved.Please Consider the Environment Before Printing This Document
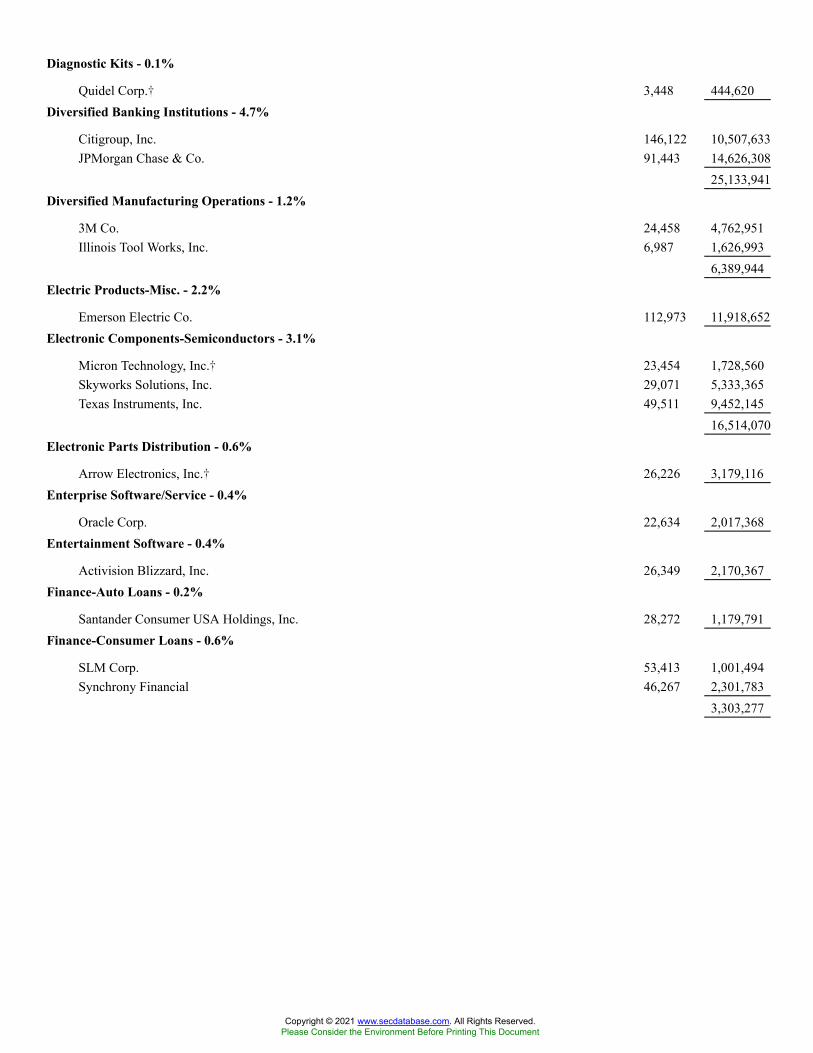
Diagnostic Kits - 0.1%
Quidel Corp.� 3,448 444,620Diversified Banking Institutions - 4.7%
Citigroup, Inc. 146,122 10,507,633JPMorgan Chase & Co. 91,443 14,626,308
25,133,941Diversified Manufacturing Operations - 1.2%
3M Co. 24,458 4,762,951Illinois Tool Works, Inc. 6,987 1,626,993
6,389,944Electric Products-Misc. - 2.2%
Emerson Electric Co. 112,973 11,918,652Electronic Components-Semiconductors - 3.1%
Micron Technology, Inc.� 23,454 1,728,560Skyworks Solutions, Inc. 29,071 5,333,365Texas Instruments, Inc. 49,511 9,452,145
16,514,070Electronic Parts Distribution - 0.6%
Arrow Electronics, Inc.� 26,226 3,179,116Enterprise Software/Service - 0.4%
Oracle Corp. 22,634 2,017,368Entertainment Software - 0.4%
Activision Blizzard, Inc. 26,349 2,170,367Finance-Auto Loans - 0.2%
Santander Consumer USA Holdings, Inc. 28,272 1,179,791Finance-Consumer Loans - 0.6%
SLM Corp. 53,413 1,001,494Synchrony Financial 46,267 2,301,783
3,303,277
Copyright © 2021 www.secdatabase.com. All Rights Reserved.Please Consider the Environment Before Printing This Document

Finance-Credit Card - 1.8%
American Express Co. 14,953 2,481,600Capital One Financial Corp. 34,142 5,666,548Discover Financial Services 10,903 1,397,982
9,546,130Finance-Investment Banker/Broker - 0.7%
Charles Schwab Corp. 34,332 2,501,086Virtu Financial, Inc., Class A 54,408 1,331,908
3,832,994Finance-Other Services - 1.5%
Intercontinental Exchange, Inc. 68,841 8,228,565Food-Confectionery - 0.8%
Mondelez International, Inc., Class A 68,644 4,260,733Food-Misc./Diversified - 1.0%
Campbell Soup Co. 29,413 1,227,405General Mills, Inc. 43,083 2,490,628Kellogg Co. 24,229 1,529,819
5,247,852Gas-Distribution - 0.6%
National Fuel Gas Co. 63,882 3,309,726Independent Power Producers - 0.8%
NRG Energy, Inc. 93,892 4,288,048Industrial Automated/Robotic - 0.0%
Colfax Corp.� 3,329 160,358Insurance Brokers - 3.5%
Arthur J. Gallagher & Co. 48,206 6,923,346Brown & Brown, Inc. 76,928 4,465,670Marsh & McLennan Cos., Inc. 44,975 7,070,070
18,459,086Insurance-Life/Health - 2.5%
Aflac, Inc. 103,055 5,841,157Athene Holding, Ltd., Class A� 37,625 2,519,746Equitable Holdings, Inc. 77,116 2,391,367Lincoln National Corp. 16,249 1,115,494Voya Financial, Inc. 19,918 1,294,272
13,162,036Insurance-Multi-line - 2.1%
Allstate Corp. 23,198 3,138,225Loews Corp. 53,716 3,001,113MetLife, Inc. 77,992 4,835,504
10,974,842Insurance-Property/Casualty - 1.2%
Copyright © 2021 www.secdatabase.com. All Rights Reserved.Please Consider the Environment Before Printing This Document
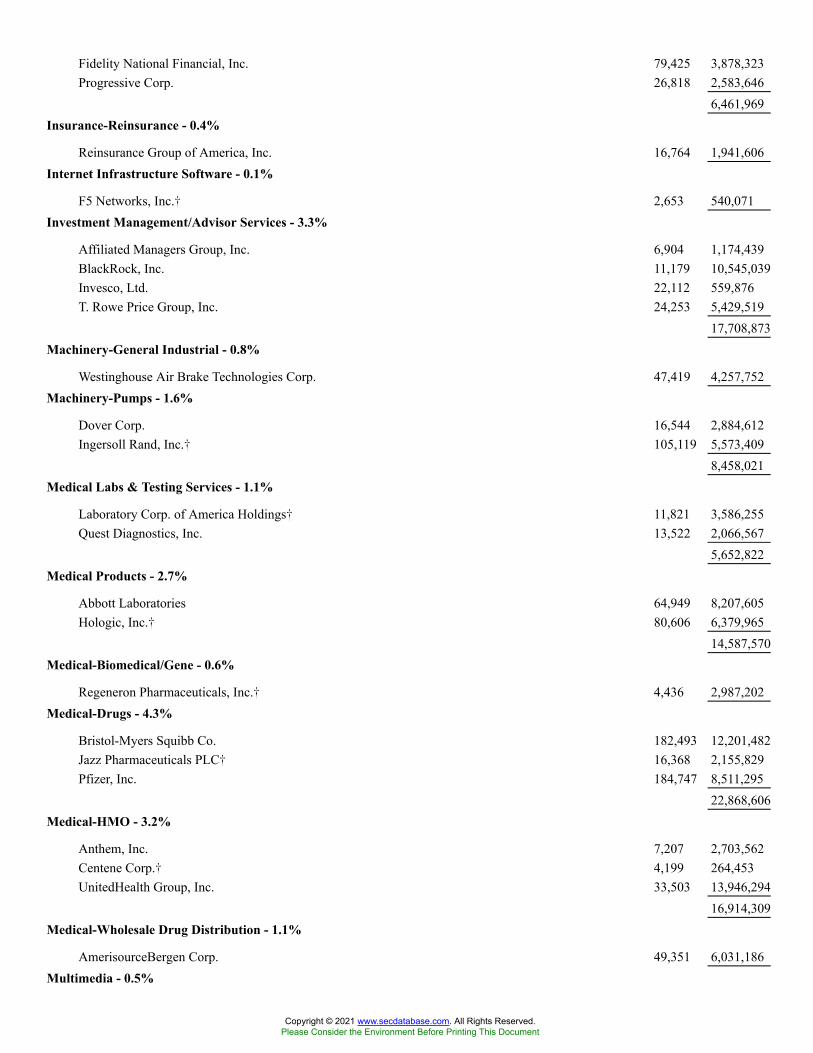
Fidelity National Financial, Inc. 79,425 3,878,323Progressive Corp. 26,818 2,583,646
6,461,969Insurance-Reinsurance - 0.4%
Reinsurance Group of America, Inc. 16,764 1,941,606Internet Infrastructure Software - 0.1%
F5 Networks, Inc.� 2,653 540,071Investment Management/Advisor Services - 3.3%
Affiliated Managers Group, Inc. 6,904 1,174,439BlackRock, Inc. 11,179 10,545,039Invesco, Ltd. 22,112 559,876T. Rowe Price Group, Inc. 24,253 5,429,519
17,708,873Machinery-General Industrial - 0.8%
Westinghouse Air Brake Technologies Corp. 47,419 4,257,752Machinery-Pumps - 1.6%
Dover Corp. 16,544 2,884,612Ingersoll Rand, Inc.� 105,119 5,573,409
8,458,021Medical Labs & Testing Services - 1.1%
Laboratory Corp. of America Holdings� 11,821 3,586,255Quest Diagnostics, Inc. 13,522 2,066,567
5,652,822Medical Products - 2.7%
Abbott Laboratories 64,949 8,207,605Hologic, Inc.� 80,606 6,379,965
14,587,570Medical-Biomedical/Gene - 0.6%
Regeneron Pharmaceuticals, Inc.� 4,436 2,987,202Medical-Drugs - 4.3%
Bristol-Myers Squibb Co. 182,493 12,201,482Jazz Pharmaceuticals PLC� 16,368 2,155,829Pfizer, Inc. 184,747 8,511,295
22,868,606Medical-HMO - 3.2%
Anthem, Inc. 7,207 2,703,562Centene Corp.� 4,199 264,453UnitedHealth Group, Inc. 33,503 13,946,294
16,914,309Medical-Wholesale Drug Distribution - 1.1%
AmerisourceBergen Corp. 49,351 6,031,186Multimedia - 0.5%
Copyright © 2021 www.secdatabase.com. All Rights Reserved.Please Consider the Environment Before Printing This Document

ViacomCBS, Inc., Class B 58,607 2,429,260Oil Companies-Exploration & Production - 2.6%
APA Corp. 53,765 1,047,342Cimarex Energy Co. 12,965 832,612Devon Energy Corp. 282,585 8,350,387Marathon Oil Corp. 301,833 3,546,538
13,776,879Private Equity - 0.3%
Ares Management Corp., Class A 17,760 1,370,717Real Estate Investment Trusts - 1.9%
Healthcare Trust of America, Inc., Class A 95,906 2,908,829Omega Healthcare Investors, Inc. 36,132 1,211,506SBA Communications Corp. 2,278 817,734Simon Property Group, Inc. 1,175 157,979STORE Capital Corp. 16,210 584,695VEREIT, Inc. 21,382 1,080,432VICI Properties, Inc.# 42,207 1,304,618Vornado Realty Trust 29,491 1,235,083WP Carey, Inc. 11,010 860,101
10,160,977
Copyright © 2021 www.secdatabase.com. All Rights Reserved.Please Consider the Environment Before Printing This Document

Real Estate Management/Services - 1.2%
CBRE Group, Inc., Class A� 66,414 6,395,668Recreational Vehicles - 0.1%
Polaris, Inc. 5,626 673,770Retail-Catalog Shopping - 0.1%
Qurate Retail, Inc., Series A 38,738 427,280Retail-Discount - 2.5%
Ollie�s Bargain Outlet Holdings, Inc.�# 19,822 1,434,716Walmart, Inc. 80,214 11,879,694
13,314,410Retail-Restaurants - 1.2%
McDonald�s Corp. 20,580 4,886,927Yum! Brands, Inc. 12,914 1,692,121
6,579,048Savings & Loans/Thrifts - 0.3%
New York Community Bancorp, Inc. 107,447 1,345,236Steel-Producers - 1.3%
Nucor Corp. 15,232 1,790,674Steel Dynamics, Inc. 79,767 5,383,475
7,174,149Telephone-Integrated - 0.6%
Lumen Technologies, Inc. 257,412 3,166,168Tobacco - 3.4%
Altria Group, Inc. 219,688 11,034,928Philip Morris International, Inc. 68,526 7,058,178
18,093,106Tools-Hand Held - 1.1%
Stanley Black & Decker, Inc. 30,953 5,982,286Transport-Services - 1.1%
C.H. Robinson Worldwide, Inc. 27,515 2,478,001Expeditors International of Washington, Inc. 20,773 2,589,147Ryder System, Inc. 9,301 739,336
5,806,484Transport-Truck - 0.3%
Knight-Swift Transportation Holdings, Inc. 32,324 1,678,585Vitamins & Nutrition Products - 0.1%
Herbalife Nutrition, Ltd.� 10,331 530,394Web Hosting/Design - 0.1%
GoDaddy, Inc., Class A� 5,105 374,248Web Portals/ISP - 1.4%
Copyright © 2021 www.secdatabase.com. All Rights Reserved.Please Consider the Environment Before Printing This Document
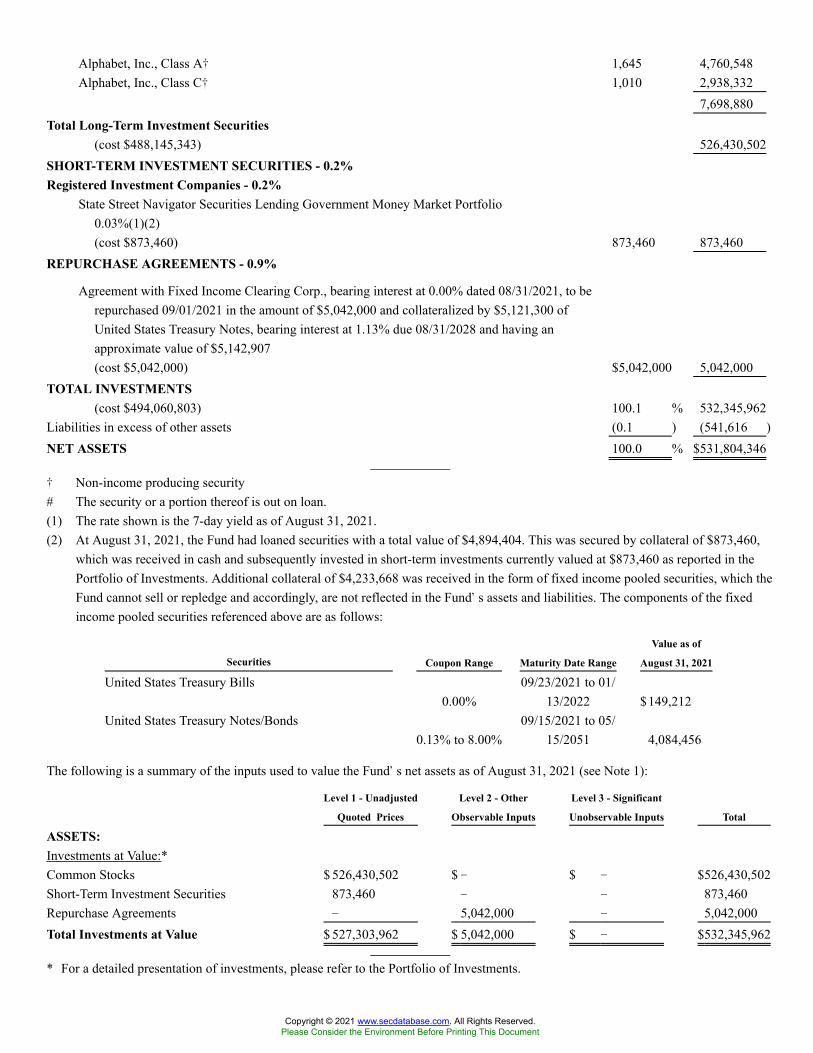
Alphabet, Inc., Class A� 1,645 4,760,548Alphabet, Inc., Class C� 1,010 2,938,332
7,698,880Total Long-Term Investment Securities
(cost $488,145,343) 526,430,502SHORT-TERM INVESTMENT SECURITIES - 0.2%Registered Investment Companies - 0.2%
State Street Navigator Securities Lending Government Money Market Portfolio0.03%(1)(2)(cost $873,460) 873,460 873,460
REPURCHASE AGREEMENTS - 0.9%
Agreement with Fixed Income Clearing Corp., bearing interest at 0.00% dated 08/31/2021, to berepurchased 09/01/2021 in the amount of $5,042,000 and collateralized by $5,121,300 ofUnited States Treasury Notes, bearing interest at 1.13% due 08/31/2028 and having anapproximate value of $5,142,907(cost $5,042,000) $5,042,000 5,042,000
TOTAL INVESTMENTS(cost $494,060,803) 100.1 % 532,345,962
Liabilities in excess of other assets (0.1 ) (541,616 )NET ASSETS 100.0 % $531,804,346
� Non-income producing security# The security or a portion thereof is out on loan.(1) The rate shown is the 7-day yield as of August 31, 2021.(2) At August 31, 2021, the Fund had loaned securities with a total value of $4,894,404. This was secured by collateral of $873,460,
which was received in cash and subsequently invested in short-term investments currently valued at $873,460 as reported in thePortfolio of Investments. Additional collateral of $4,233,668 was received in the form of fixed income pooled securities, which theFund cannot sell or repledge and accordingly, are not reflected in the Fund�s assets and liabilities. The components of the fixedincome pooled securities referenced above are as follows:
Securities Coupon Range Maturity Date Range
Value as of
August 31, 2021
United States Treasury Bills0.00%
09/23/2021 to 01/13/2022 $149,212
United States Treasury Notes/Bonds0.13% to 8.00%
09/15/2021 to 05/15/2051 4,084,456
The following is a summary of the inputs used to value the Fund�s net assets as of August 31, 2021 (see Note 1):
Level 1 - Unadjusted
Quoted Prices
Level 2 - Other
Observable Inputs
Level 3 - Significant
Unobservable Inputs Total
ASSETS:Investments at Value:*Common Stocks $ 526,430,502 $ � $ � $526,430,502Short-Term Investment Securities 873,460 � � 873,460Repurchase Agreements � 5,042,000 � 5,042,000Total Investments at Value $ 527,303,962 $ 5,042,000 $ � $532,345,962
* For a detailed presentation of investments, please refer to the Portfolio of Investments.
Copyright © 2021 www.secdatabase.com. All Rights Reserved.Please Consider the Environment Before Printing This Document

See Notes to Portfolio of Investments
Copyright © 2021 www.secdatabase.com. All Rights Reserved.Please Consider the Environment Before Printing This Document
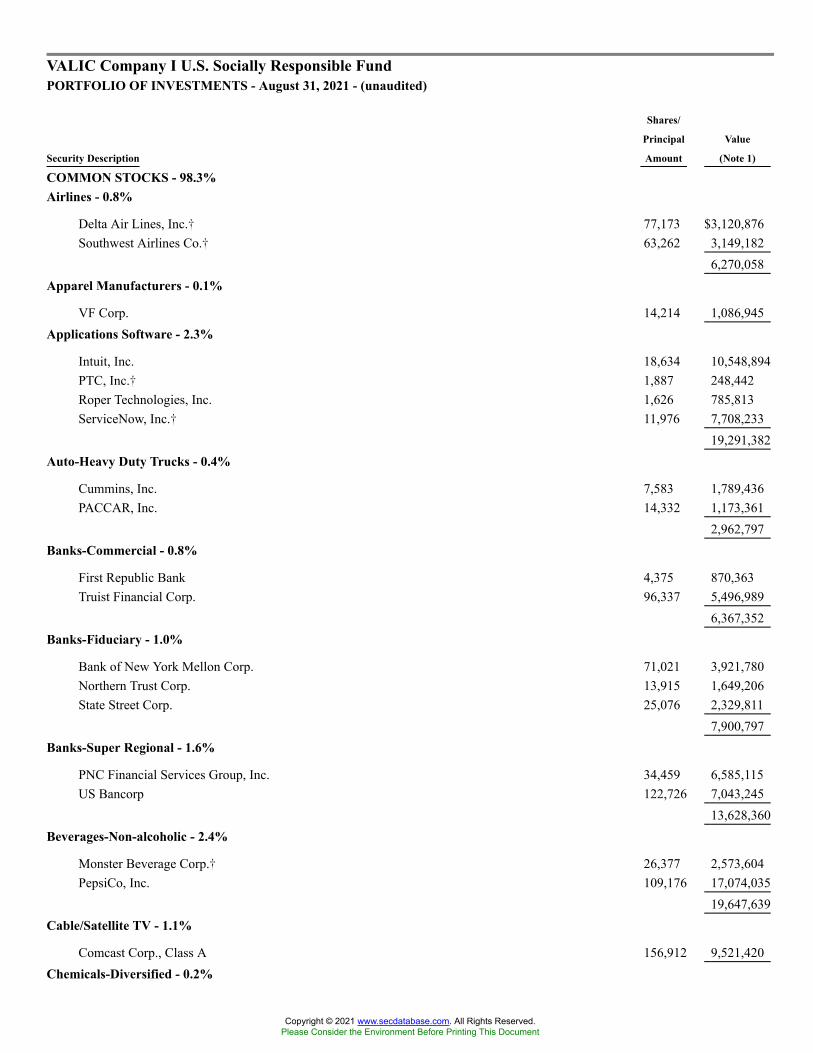
VALIC Company I U.S. Socially Responsible FundPORTFOLIO OF INVESTMENTS - August 31, 2021 - (unaudited)
Security Description
Shares/
Principal
Amount
Value
(Note 1)
COMMON STOCKS - 98.3%Airlines - 0.8%
Delta Air Lines, Inc.� 77,173 $3,120,876Southwest Airlines Co.� 63,262 3,149,182
6,270,058Apparel Manufacturers - 0.1%
VF Corp. 14,214 1,086,945Applications Software - 2.3%
Intuit, Inc. 18,634 10,548,894PTC, Inc.� 1,887 248,442Roper Technologies, Inc. 1,626 785,813ServiceNow, Inc.� 11,976 7,708,233
19,291,382Auto-Heavy Duty Trucks - 0.4%
Cummins, Inc. 7,583 1,789,436PACCAR, Inc. 14,332 1,173,361
2,962,797Banks-Commercial - 0.8%
First Republic Bank 4,375 870,363Truist Financial Corp. 96,337 5,496,989
6,367,352Banks-Fiduciary - 1.0%
Bank of New York Mellon Corp. 71,021 3,921,780Northern Trust Corp. 13,915 1,649,206State Street Corp. 25,076 2,329,811
7,900,797Banks-Super Regional - 1.6%
PNC Financial Services Group, Inc. 34,459 6,585,115US Bancorp 122,726 7,043,245
13,628,360Beverages-Non-alcoholic - 2.4%
Monster Beverage Corp.� 26,377 2,573,604PepsiCo, Inc. 109,176 17,074,035
19,647,639Cable/Satellite TV - 1.1%
Comcast Corp., Class A 156,912 9,521,420Chemicals-Diversified - 0.2%
Copyright © 2021 www.secdatabase.com. All Rights Reserved.Please Consider the Environment Before Printing This Document

LyondellBasell Industries NV, Class A 2,294 230,203PPG Industries, Inc. 10,009 1,596,936
1,827,139Chemicals-Specialty - 0.5%
Ecolab, Inc. 14,663 3,304,454International Flavors & Fragrances, Inc. 3,042 460,863
3,765,317Coatings/Paint - 0.3%
Sherwin-Williams Co. 7,133 2,166,078Commercial Services - 0.1%
Cintas Corp. 1,185 468,987Commercial Services-Finance - 4.2%
Automatic Data Processing, Inc. 23,246 4,859,344IHS Markit, Ltd. 19,208 2,316,485MarketAxess Holdings, Inc. 1,448 689,132Moody�s Corp. 15,904 6,055,766PayPal Holdings, Inc.� 43,304 12,500,132S&P Global, Inc. 19,662 8,726,389
35,147,248Computer Aided Design - 2.0%
ANSYS, Inc.� 7,626 2,786,236Autodesk, Inc.� 15,834 4,909,965Cadence Design Systems, Inc.� 25,248 4,127,543Synopsys, Inc.� 15,363 5,104,203
16,927,947Computer Data Security - 0.4%
Fortinet, Inc.� 10,977 3,459,292Computer Software - 0.1%
Akamai Technologies, Inc.� 3,780 428,085Citrix Systems, Inc. 3,916 402,839
830,924Computers - 1.4%
Hewlett Packard Enterprise Co. 305,226 4,718,794HP, Inc. 228,775 6,803,768
11,522,562Computers-Memory Devices - 0.8%
NetApp, Inc. 38,773 3,448,083Seagate Technology Holdings PLC 20,410 1,787,712Western Digital Corp.� 20,933 1,322,965
6,558,760Consulting Services - 0.3%
Verisk Analytics, Inc. 12,916 2,605,932Consumer Products-Misc. - 0.3%
Copyright © 2021 www.secdatabase.com. All Rights Reserved.Please Consider the Environment Before Printing This Document

Clorox Co. 5,270 885,624Kimberly-Clark Corp. 13,835 1,906,601
2,792,225Containers-Metal/Glass - 0.2%
Ball Corp. 15,312 1,469,340Containers-Paper/Plastic - 0.2%
Amcor PLC 16,359 210,213Packaging Corp. of America 3,379 512,594WestRock Co. 20,492 1,066,404
1,789,211Cosmetics & Toiletries - 1.2%
Colgate-Palmolive Co. 55,926 4,359,432Estee Lauder Cos., Inc., Class A 17,655 6,011,351
10,370,783Data Processing/Management - 1.3%
Fidelity National Information Services, Inc. 37,262 4,760,966Fiserv, Inc.� 36,856 4,341,268Paychex, Inc. 15,749 1,802,788
10,905,022Decision Support Software - 0.4%
MSCI, Inc. 5,681 3,605,049Dental Supplies & Equipment - 0.1%
DENTSPLY SIRONA, Inc. 11,035 680,859Diagnostic Equipment - 2.9%
Danaher Corp. 39,158 12,693,457Thermo Fisher Scientific, Inc. 20,962 11,632,862
24,326,319
Copyright © 2021 www.secdatabase.com. All Rights Reserved.Please Consider the Environment Before Printing This Document
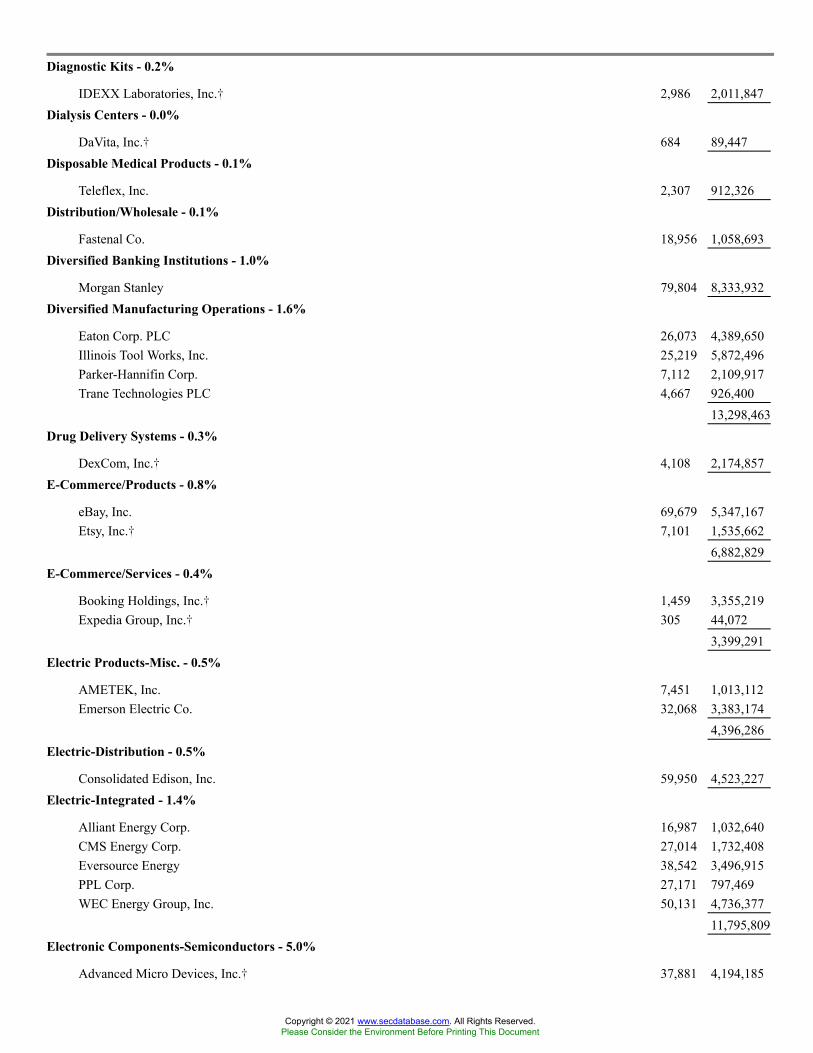
Diagnostic Kits - 0.2%
IDEXX Laboratories, Inc.� 2,986 2,011,847Dialysis Centers - 0.0%
DaVita, Inc.� 684 89,447Disposable Medical Products - 0.1%
Teleflex, Inc. 2,307 912,326Distribution/Wholesale - 0.1%
Fastenal Co. 18,956 1,058,693Diversified Banking Institutions - 1.0%
Morgan Stanley 79,804 8,333,932Diversified Manufacturing Operations - 1.6%
Eaton Corp. PLC 26,073 4,389,650Illinois Tool Works, Inc. 25,219 5,872,496Parker-Hannifin Corp. 7,112 2,109,917Trane Technologies PLC 4,667 926,400
13,298,463Drug Delivery Systems - 0.3%
DexCom, Inc.� 4,108 2,174,857E-Commerce/Products - 0.8%
eBay, Inc. 69,679 5,347,167Etsy, Inc.� 7,101 1,535,662
6,882,829E-Commerce/Services - 0.4%
Booking Holdings, Inc.� 1,459 3,355,219Expedia Group, Inc.� 305 44,072
3,399,291Electric Products-Misc. - 0.5%
AMETEK, Inc. 7,451 1,013,112Emerson Electric Co. 32,068 3,383,174
4,396,286Electric-Distribution - 0.5%
Consolidated Edison, Inc. 59,950 4,523,227Electric-Integrated - 1.4%
Alliant Energy Corp. 16,987 1,032,640CMS Energy Corp. 27,014 1,732,408Eversource Energy 38,542 3,496,915PPL Corp. 27,171 797,469WEC Energy Group, Inc. 50,131 4,736,377
11,795,809Electronic Components-Semiconductors - 5.0%
Advanced Micro Devices, Inc.� 37,881 4,194,185
Copyright © 2021 www.secdatabase.com. All Rights Reserved.Please Consider the Environment Before Printing This Document
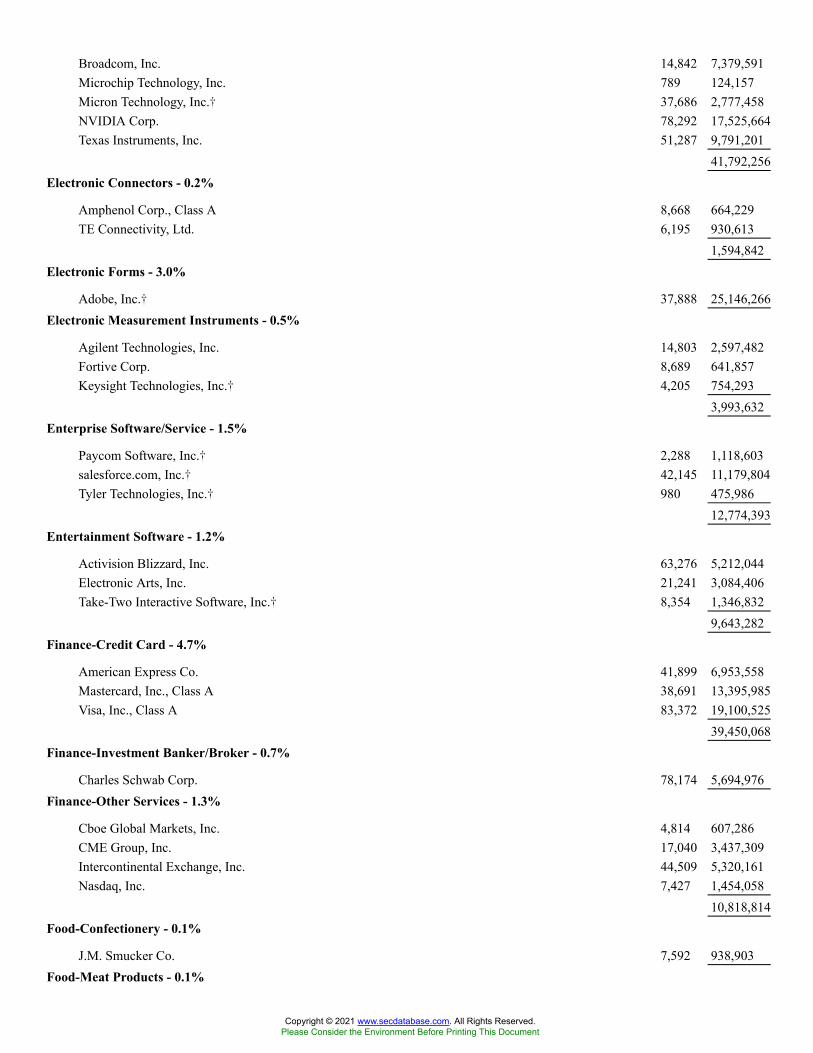
Broadcom, Inc. 14,842 7,379,591Microchip Technology, Inc. 789 124,157Micron Technology, Inc.� 37,686 2,777,458NVIDIA Corp. 78,292 17,525,664Texas Instruments, Inc. 51,287 9,791,201
41,792,256Electronic Connectors - 0.2%
Amphenol Corp., Class A 8,668 664,229TE Connectivity, Ltd. 6,195 930,613
1,594,842Electronic Forms - 3.0%
Adobe, Inc.� 37,888 25,146,266Electronic Measurement Instruments - 0.5%
Agilent Technologies, Inc. 14,803 2,597,482Fortive Corp. 8,689 641,857Keysight Technologies, Inc.� 4,205 754,293
3,993,632Enterprise Software/Service - 1.5%
Paycom Software, Inc.� 2,288 1,118,603salesforce.com, Inc.� 42,145 11,179,804Tyler Technologies, Inc.� 980 475,986
12,774,393Entertainment Software - 1.2%
Activision Blizzard, Inc. 63,276 5,212,044Electronic Arts, Inc. 21,241 3,084,406Take-Two Interactive Software, Inc.� 8,354 1,346,832
9,643,282Finance-Credit Card - 4.7%
American Express Co. 41,899 6,953,558Mastercard, Inc., Class A 38,691 13,395,985Visa, Inc., Class A 83,372 19,100,525
39,450,068Finance-Investment Banker/Broker - 0.7%
Charles Schwab Corp. 78,174 5,694,976Finance-Other Services - 1.3%
Cboe Global Markets, Inc. 4,814 607,286CME Group, Inc. 17,040 3,437,309Intercontinental Exchange, Inc. 44,509 5,320,161Nasdaq, Inc. 7,427 1,454,058
10,818,814Food-Confectionery - 0.1%
J.M. Smucker Co. 7,592 938,903Food-Meat Products - 0.1%
Copyright © 2021 www.secdatabase.com. All Rights Reserved.Please Consider the Environment Before Printing This Document

Hormel Foods Corp.# 23,720 1,080,209Food-Misc./Diversified - 0.8%
Campbell Soup Co. 8,539 356,332General Mills, Inc. 38,374 2,218,401Kellogg Co. 2,068 130,574Kraft Heinz Co. 73,569 2,647,748Lamb Weston Holdings, Inc. 261 17,004McCormick & Co., Inc. 14,516 1,252,586
6,622,645Food-Retail - 0.2%
Kroger Co. 32,790 1,509,324Gas-Distribution - 0.0%
NiSource, Inc. 10,208 251,627Gold Mining - 0.3%
Newmont Corp. 35,501 2,058,703Industrial Automated/Robotic - 0.1%
Rockwell Automation, Inc. 2,409 784,009Industrial Gases - 1.2%
Air Products & Chemicals, Inc. 10,678 2,877,828Linde PLC 23,383 7,356,058
10,233,886
Copyright © 2021 www.secdatabase.com. All Rights Reserved.Please Consider the Environment Before Printing This Document

Instruments-Controls - 0.1%
Mettler-Toledo International, Inc.� 590 916,170Instruments-Scientific - 0.0%
Waters Corp.� 273 113,027Insurance Brokers - 0.9%
Aon PLC, Class A 8,674 2,488,224Marsh & McLennan Cos., Inc. 24,135 3,794,022Willis Towers Watson PLC 3,613 797,461
7,079,707Insurance-Life/Health - 0.8%
Aflac, Inc. 49,366 2,798,065Prudential Financial, Inc. 32,823 3,475,299
6,273,364Insurance-Multi-line - 1.1%
Allstate Corp. 17,245 2,332,904Chubb, Ltd. 30,832 5,670,621Hartford Financial Services Group, Inc. 4,404 296,037Loews Corp. 11,657 651,276
8,950,838Insurance-Property/Casualty - 0.6%
Progressive Corp. 22,971 2,213,026Travelers Cos., Inc. 19,409 3,099,812
5,312,838Internet Content-Entertainment - 1.1%
Netflix, Inc.� 13,225 7,527,538Twitter, Inc.� 19,729 1,272,520
8,800,058Internet Security - 0.0%
NortonLifeLock, Inc. 10,498 278,827Investment Management/Advisor Services - 1.7%
BlackRock, Inc. 10,680 10,074,337Franklin Resources, Inc. 19,286 625,638Invesco, Ltd. 13,465 340,934T. Rowe Price Group, Inc. 13,206 2,956,427
13,997,336Machinery-Construction & Mining - 0.7%
Caterpillar, Inc. 28,531 6,016,332Machinery-Farming - 0.8%
Deere & Co. 16,832 6,363,001Machinery-General Industrial - 0.1%
Otis Worldwide Corp. 12,230 1,127,851Westinghouse Air Brake Technologies Corp. 681 61,147
Copyright © 2021 www.secdatabase.com. All Rights Reserved.Please Consider the Environment Before Printing This Document
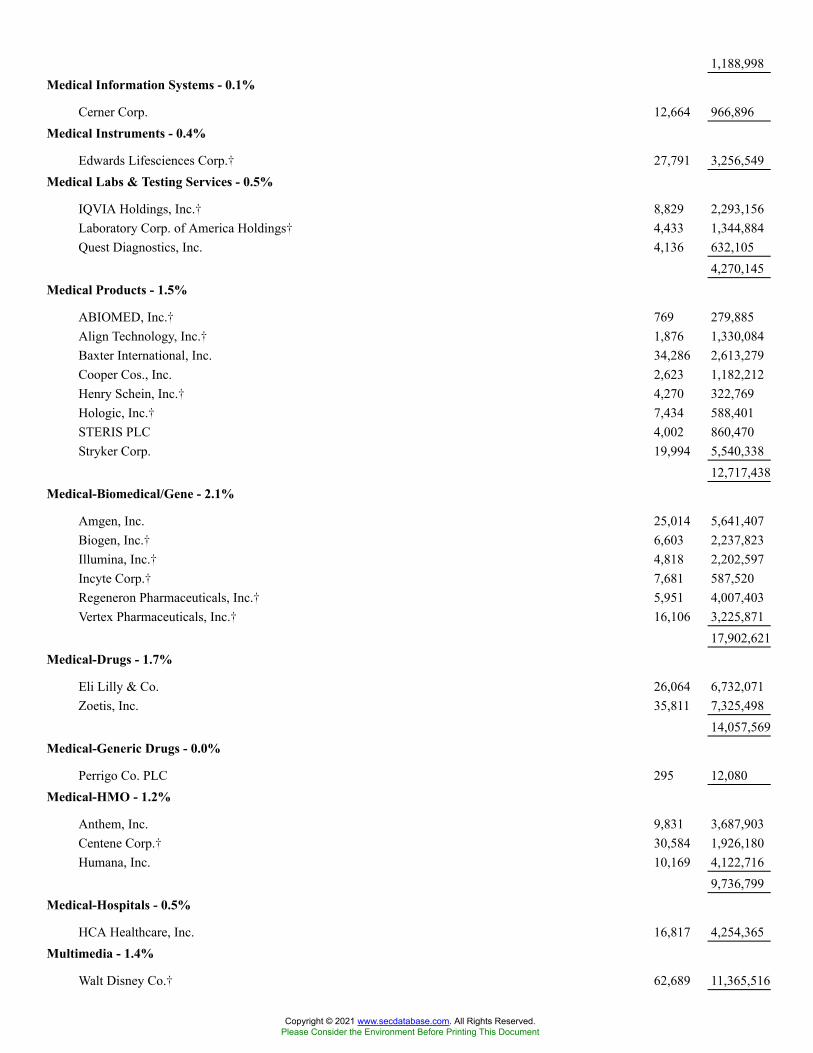
1,188,998Medical Information Systems - 0.1%
Cerner Corp. 12,664 966,896Medical Instruments - 0.4%
Edwards Lifesciences Corp.� 27,791 3,256,549Medical Labs & Testing Services - 0.5%
IQVIA Holdings, Inc.� 8,829 2,293,156Laboratory Corp. of America Holdings� 4,433 1,344,884Quest Diagnostics, Inc. 4,136 632,105
4,270,145Medical Products - 1.5%
ABIOMED, Inc.� 769 279,885Align Technology, Inc.� 1,876 1,330,084Baxter International, Inc. 34,286 2,613,279Cooper Cos., Inc. 2,623 1,182,212Henry Schein, Inc.� 4,270 322,769Hologic, Inc.� 7,434 588,401STERIS PLC 4,002 860,470Stryker Corp. 19,994 5,540,338
12,717,438Medical-Biomedical/Gene - 2.1%
Amgen, Inc. 25,014 5,641,407Biogen, Inc.� 6,603 2,237,823Illumina, Inc.� 4,818 2,202,597Incyte Corp.� 7,681 587,520Regeneron Pharmaceuticals, Inc.� 5,951 4,007,403Vertex Pharmaceuticals, Inc.� 16,106 3,225,871
17,902,621Medical-Drugs - 1.7%
Eli Lilly & Co. 26,064 6,732,071Zoetis, Inc. 35,811 7,325,498
14,057,569Medical-Generic Drugs - 0.0%
Perrigo Co. PLC 295 12,080Medical-HMO - 1.2%
Anthem, Inc. 9,831 3,687,903Centene Corp.� 30,584 1,926,180Humana, Inc. 10,169 4,122,716
9,736,799Medical-Hospitals - 0.5%
HCA Healthcare, Inc. 16,817 4,254,365Multimedia - 1.4%
Walt Disney Co.� 62,689 11,365,516
Copyright © 2021 www.secdatabase.com. All Rights Reserved.Please Consider the Environment Before Printing This Document

Networking Products - 1.8%
Cisco Systems, Inc. 254,276 15,007,370Non-Hazardous Waste Disposal - 0.4%
Waste Management, Inc. 23,058 3,576,526Oil Companies-Exploration & Production - 0.8%
Cabot Oil & Gas Corp. 4,548 72,268Devon Energy Corp. 14,493 428,268EOG Resources, Inc. 33,574 2,266,917Hess Corp. 17,779 1,222,306Occidental Petroleum Corp. 48,842 1,254,751Pioneer Natural Resources Co. 9,885 1,479,488
6,723,998Oil Refining & Marketing - 0.2%
Valero Energy Corp. 22,476 1,490,384Oil-Field Services - 0.4%
Baker Hughes Co. 27,604 628,819Schlumberger NV 97,305 2,728,432
3,357,251
Copyright © 2021 www.secdatabase.com. All Rights Reserved.Please Consider the Environment Before Printing This Document

Paper & Related Products - 0.1%
International Paper Co. 6,582 395,512Pipelines - 0.7%
Kinder Morgan, Inc. 177,059 2,880,750ONEOK, Inc. 14,349 753,610Williams Cos., Inc. 78,319 1,933,696
5,568,056Real Estate Investment Trusts - 2.3%
American Tower Corp. 18,261 5,335,316Crown Castle International Corp. 19,453 3,787,305Digital Realty Trust, Inc. 5,341 875,443Equinix, Inc. 2,441 2,058,862Equity Residential 3,759 316,019Prologis, Inc. 34,534 4,650,348Public Storage 4,632 1,498,962SBA Communications Corp. 1,596 572,916
19,095,171Rental Auto/Equipment - 0.0%
United Rentals, Inc.� 608 214,411Respiratory Products - 0.2%
ResMed, Inc. 6,542 1,900,647Retail-Apparel/Shoe - 0.1%
Ross Stores, Inc. 7,921 937,846Retail-Auto Parts - 0.1%
Genuine Parts Co. 5,229 638,931Retail-Building Products - 2.1%
Home Depot, Inc. 37,607 12,266,651Lowe�s Cos., Inc. 27,377 5,581,897
17,848,548Retail-Discount - 0.9%
Dollar General Corp. 11,176 2,491,242Target Corp. 20,293 5,011,965
7,503,207Retail-Drug Store - 0.2%
Walgreens Boots Alliance, Inc. 32,892 1,669,269Retail-Major Department Stores - 0.4%
TJX Cos., Inc. 44,225 3,216,042Retail-Restaurants - 1.5%
McDonald�s Corp. 24,531 5,825,131Starbucks Corp. 54,517 6,405,203
12,230,334Semiconductor Components-Integrated Circuits - 0.9%
Copyright © 2021 www.secdatabase.com. All Rights Reserved.Please Consider the Environment Before Printing This Document
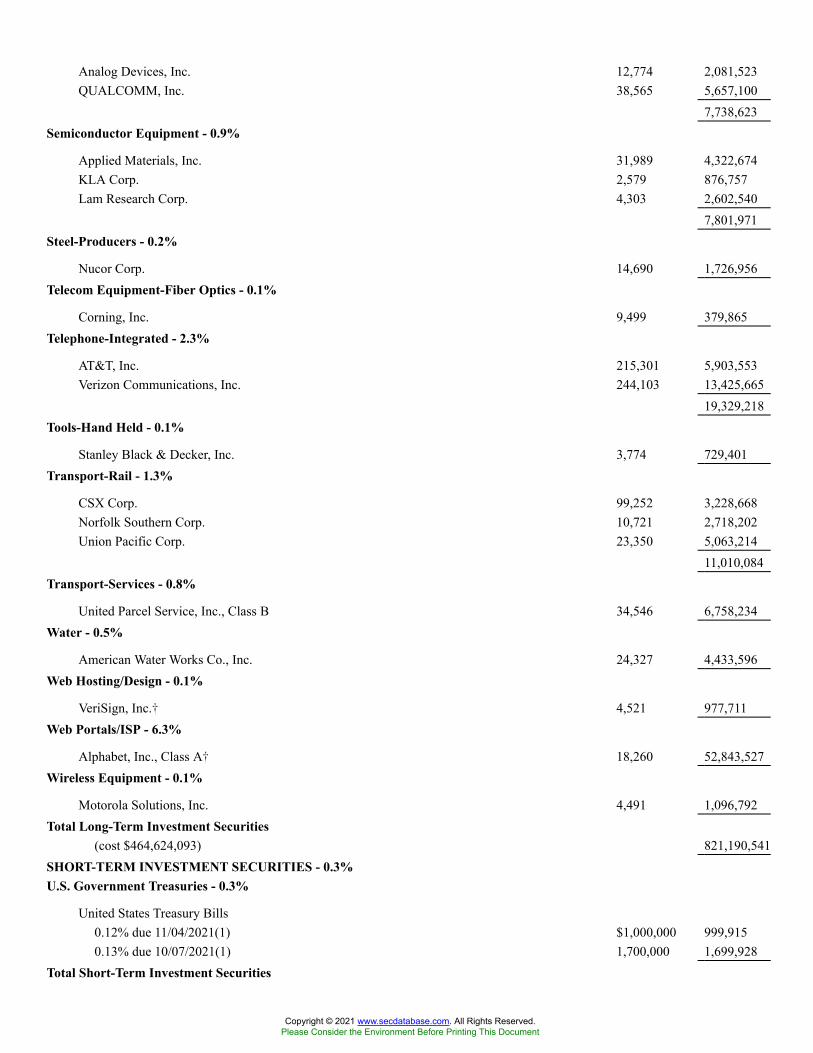
Analog Devices, Inc. 12,774 2,081,523QUALCOMM, Inc. 38,565 5,657,100
7,738,623Semiconductor Equipment - 0.9%
Applied Materials, Inc. 31,989 4,322,674KLA Corp. 2,579 876,757Lam Research Corp. 4,303 2,602,540
7,801,971Steel-Producers - 0.2%
Nucor Corp. 14,690 1,726,956Telecom Equipment-Fiber Optics - 0.1%
Corning, Inc. 9,499 379,865Telephone-Integrated - 2.3%
AT&T, Inc. 215,301 5,903,553Verizon Communications, Inc. 244,103 13,425,665
19,329,218Tools-Hand Held - 0.1%
Stanley Black & Decker, Inc. 3,774 729,401Transport-Rail - 1.3%
CSX Corp. 99,252 3,228,668Norfolk Southern Corp. 10,721 2,718,202Union Pacific Corp. 23,350 5,063,214
11,010,084Transport-Services - 0.8%
United Parcel Service, Inc., Class B 34,546 6,758,234Water - 0.5%
American Water Works Co., Inc. 24,327 4,433,596Web Hosting/Design - 0.1%
VeriSign, Inc.� 4,521 977,711Web Portals/ISP - 6.3%
Alphabet, Inc., Class A� 18,260 52,843,527Wireless Equipment - 0.1%
Motorola Solutions, Inc. 4,491 1,096,792Total Long-Term Investment Securities
(cost $464,624,093) 821,190,541SHORT-TERM INVESTMENT SECURITIES - 0.3%U.S. Government Treasuries - 0.3%
United States Treasury Bills0.12% due 11/04/2021(1) $1,000,000 999,9150.13% due 10/07/2021(1) 1,700,000 1,699,928
Total Short-Term Investment Securities
Copyright © 2021 www.secdatabase.com. All Rights Reserved.Please Consider the Environment Before Printing This Document

(cost $2,699,578) 2,699,843REPURCHASE AGREEMENTS - 1.4%
Agreement with Fixed Income Clearing Corp., bearing interest at 0.00% dated 08/31/2021, to berepurchased 09/01/2021 in the amount of $11,934,000 and collateralized by $12,121,600 ofUnited States Treasury Notes, bearing interest at 1.13% due 08/31/2028 and having anapproximate value of $12,172,741(cost $11,934,000) 11,934,000 11,934,000
TOTAL INVESTMENTS(cost $479,257,671) 100.0 % 835,824,384
Other assets less liabilities 0.0 26,703NET ASSETS 100.0 % $835,851,087
� Non-income producing security# The security or a portion thereof is out on loan.
Copyright © 2021 www.secdatabase.com. All Rights Reserved.Please Consider the Environment Before Printing This Document
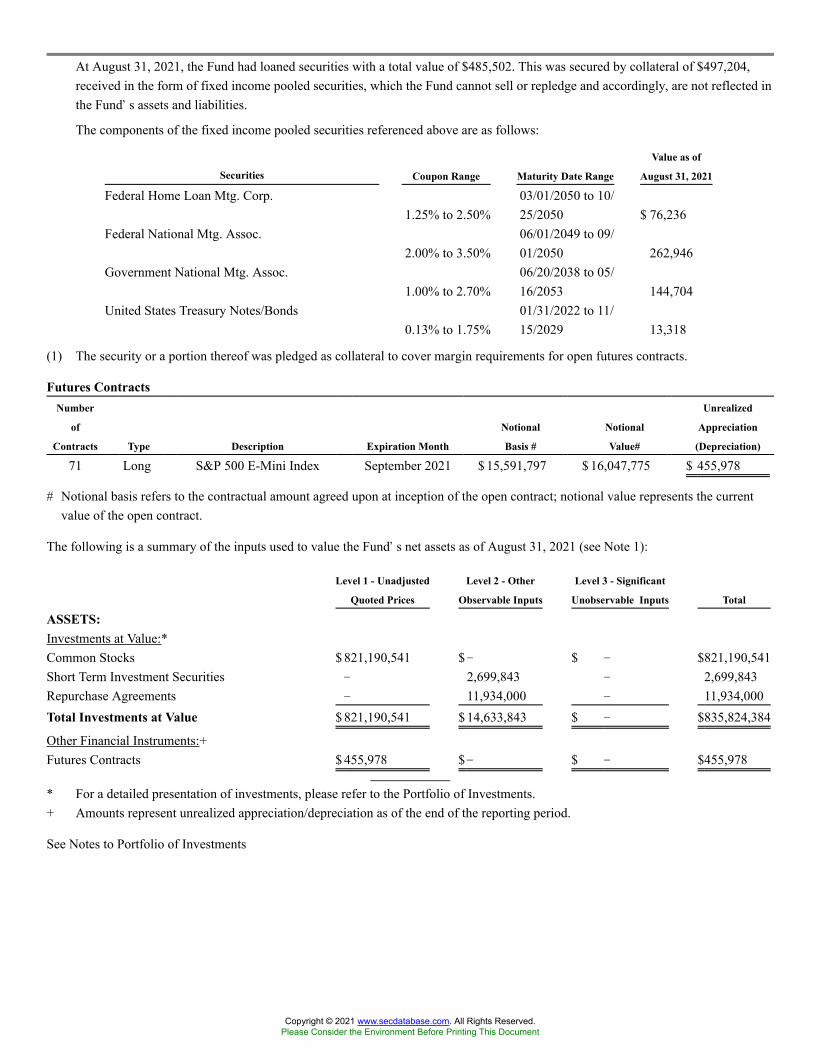
At August 31, 2021, the Fund had loaned securities with a total value of $485,502. This was secured by collateral of $497,204,received in the form of fixed income pooled securities, which the Fund cannot sell or repledge and accordingly, are not reflected inthe Fund�s assets and liabilities.
The components of the fixed income pooled securities referenced above are as follows:
Securities Coupon Range Maturity Date Range
Value as of
August 31, 2021
Federal Home Loan Mtg. Corp.1.25% to 2.50%
03/01/2050 to 10/25/2050 $ 76,236
Federal National Mtg. Assoc.2.00% to 3.50%
06/01/2049 to 09/01/2050 262,946
Government National Mtg. Assoc.1.00% to 2.70%
06/20/2038 to 05/16/2053 144,704
United States Treasury Notes/Bonds0.13% to 1.75%
01/31/2022 to 11/15/2029 13,318
(1) The security or a portion thereof was pledged as collateral to cover margin requirements for open futures contracts.
Futures ContractsNumber
of
Contracts Type Description Expiration Month
Notional
Basis #
Notional
Value#
Unrealized
Appreciation
(Depreciation)
71 Long S&P 500 E-Mini Index September 2021 $ 15,591,797 $ 16,047,775 $ 455,978
# Notional basis refers to the contractual amount agreed upon at inception of the open contract; notional value represents the currentvalue of the open contract.
The following is a summary of the inputs used to value the Fund�s net assets as of August 31, 2021 (see Note 1):
Level 1 - Unadjusted
Quoted Prices
Level 2 - Other
Observable Inputs
Level 3 - Significant
Unobservable Inputs Total
ASSETS:Investments at Value:*Common Stocks $ 821,190,541 $� $ � $821,190,541Short Term Investment Securities � 2,699,843 � 2,699,843Repurchase Agreements � 11,934,000 � 11,934,000Total Investments at Value $ 821,190,541 $ 14,633,843 $ � $835,824,384
Other Financial Instruments:+Futures Contracts $ 455,978 $� $ � $455,978
* For a detailed presentation of investments, please refer to the Portfolio of Investments.+ Amounts represent unrealized appreciation/depreciation as of the end of the reporting period.
See Notes to Portfolio of Investments
Copyright © 2021 www.secdatabase.com. All Rights Reserved.Please Consider the Environment Before Printing This Document
NOTES TO PORTFOLIO OF INVESTMENTS - August 31, 2021 - (unaudited)
Note 1. Security Valuation
In accordance with the authoritative guidance on fair value measurements and disclosures under U.S. generally acceptedaccounting principles (�GAAP�), the Funds disclose the fair value of their investments in a hierarchy that prioritizes the inputs tovaluation techniques used to measure the fair value. In accordance with GAAP, fair value is defined as the price that the Funds wouldreceive upon selling an asset or transferring a liability in a timely transaction to an independent third party in the principal or mostadvantageous market. GAAP establishes a three-tier hierarchy to provide more transparency around the inputs used to measure fairvalue and to establish classification of fair value measurements for disclosure purposes. Inputs refer broadly to the assumptions thatmarket participants would use in pricing the asset or liability, including assumptions about risk. Inputs may be observable orunobservable. Observable inputs are inputs that reflect the assumptions market participants would use in pricing the asset or liabilitydeveloped based on market data obtained from sources independent of the reporting entity. Unobservable inputs are inputs that reflectthe reporting entity�s own assumptions about the assumptions market participants would use in pricing the asset or liability developedbased on the best information available in the circumstances. The three-tiers are as follows:
Level 1�Unadjusted quoted prices in active markets for identical securities
Level 2�Other significant observable inputs (including quoted prices for similar securities, interest rates, prepayment speeds, creditrisk, referenced indices, quoted prices in inactive markets, adjusted quoted prices in active markets, adjusted quoted prices on foreignequity securities that were adjusted in accordance with pricing procedures approved by the Board of Directors (the �Board�) , etc.)
Level 3�Significant unobservable inputs (includes inputs that reflect the Funds� own assumptions about the assumptions marketparticipants would use in pricing the security, developed based on the best information available under the circumstances)
Changes in valuation techniques may result in transfers in or out of an investment�s assigned Level within the hierarchy. Themethodology used for valuing investments is not necessarily an indication of the risk associated with investing in those investments andthe determination of the significance of a particular input to the fair value measurement in its entirety requires judgment andconsideration of factors specific to each security.
Copyright © 2021 www.secdatabase.com. All Rights Reserved.Please Consider the Environment Before Printing This Document
The availability of observable inputs can vary from security to security and is affected by a wide variety of factors, including, forexample, the type of security, whether the security is recently issued and not yet established in the marketplace, the liquidity of markets,and other characteristics particular to the security. To the extent that valuation is based on models or inputs that are less observable orunobservable in the market, the determination of fair value requires more judgment. Accordingly, the degree of judgment exercised indetermining fair value is greatest for instruments categorized in Level 3.
The summary of each Fund�s assets and liabilities classified in the fair value hierarchy as of August 31, 2021, is reported on aschedule at the end of each Fund�s Portfolio of Investments.
Stocks are generally valued based upon closing sales prices reported on recognized securities exchanges on which the securitiesare principally traded and are generally categorized as Level 1. Stocks listed on the NASDAQ are valued using the NASDAQ OfficialClosing Price (�NOCP�). Generally, the NOCP will be the last sale price unless the reported trade for the stock is outside the range ofthe bid/ask price. In such cases, the NOCP will be normalized to the nearer of the bid or ask price. For listed securities having no salesreported and for unlisted securities, such securities will be valued based upon the last reported bid price.
As of the close of regular trading on the New York Stock Exchange (�NYSE�), securities traded primarily on security exchangesoutside the United States are valued at the last sale price on such exchanges on the day of valuation, or if there is no sale on the day ofvaluation, at the last-reported bid price. If a security�s price is available from more than one exchange, the Funds use the exchange thatis the primary market for the security. Such securities are generally categorized as Level 1. However, depending on the foreign market,closing prices may be up to 15 hours old when they are used to price a Fund�s shares, and a Fund may determine that certain closingprices do not reflect the fair value of the security. This determination will be based on the review of a number of factors, includingdevelopments in foreign markets, the performance of U.S. securities markets, and the performance of instruments trading in U.S.markets that represent foreign securities and baskets of foreign securities. If a Fund determines that closing prices do not reflect the fairvalue of the securities, the Fund will adjust the previous closing prices in accordance with pricing procedures approved by the Board toreflect what it believes to be the fair value of the securities as of the close of regular trading on the NYSE. The Funds may also fairvalue securities in other situations, for example, when a particular foreign market is closed but a Fund is open. For foreign equitysecurities and foreign equity futures contracts, the Funds use an outside pricing service to provide it with closing market prices andinformation used for adjusting those prices, and when so adjusted, such securities and futures are generally categorized as Level 2.
Bonds, debentures, and other debt securities are valued at evaluated bid prices obtained for the day of valuation from a Board-approved pricing service, and are generally categorized as Level 2. The pricing service may use valuation models or matrix pricingwhich considers information with respect to comparable bond and note transactions, quotations from bond dealers, or by reference toother securities that are considered comparable in such characteristics as rating, interest rate, maturity date, option adjusted spreadmodels, prepayments projections, interest rate spreads, and yield curves to determine current value. If a price is unavailable from aBoard-approved pricing service, the securities may be priced at the mean of two independent quotes obtained from brokers.
Investments in registered investment companies that do not trade on an exchange are valued at the end of day net asset value pershare. Investments in registered investment companies that trade on an exchange are valued at the last sales price or official closingprice as of the close of the customary trading session on the exchange where the security is principally traded. Investments in registeredinvestment companies are generally categorized as Level 1.
Futures contracts traded on national securities exchanges are valued at the quoted daily settlement price established by theexchange on which they trade reported by a Board approved pricing service, and are generally categorized as Level 1. Swap contractstraded on national securities exchanges are valued at the closing price of the exchange on which they are traded or if a closing price ofthe exchange is not available, the swap will be valued using a mid valuation provided by a Board-approved pricing service, and aregenerally categorized as Level 2. Swap contracts traded over the counter (�OTC�) are valued at a mid valuation provided by a Board-approved pricing service, and are generally categorized as Level 2. Option contracts traded on national securities exchanges are valuedat the mean of the last bid and ask price reported by a Board-approved pricing service as of the close of the exchange on which they aretraded, and are generally categorized as Level 1. Option contracts traded in the OTC market are valued at the mid valuation provided bya Board-approved pricing service, and are generally categorized as Level 2. Forward foreign currency contracts (�forward contracts�)are valued at the 4:00 p.m. Eastern Time forward rate and are generally categorized as Level 2.
Copyright © 2021 www.secdatabase.com. All Rights Reserved.Please Consider the Environment Before Printing This Document

Other securities are valued on the basis of last sale or bid price (if a last sale price is not available) which is, in the opinion of theAdviser, the broadest and most representative market, that may be either a securities exchange or OTC market, and are generallycategorized as Level 1 or Level 2.
The Board is responsible for the share valuation process and has adopted policies and procedures (the �PRC Procedures�) forvaluing the securities and other assets held by the Funds, including procedures for the fair valuation of securities and other assets forwhich market quotations are not readily available or are unreliable. The PRC Procedures provide for the establishment of a pricingreview committee, which is responsible for, among other things, making certain determinations in connection with the Series� fairvaluation procedures. Securities for which market quotations are not readily available or the values of which may be significantlyimpacted by the occurrence of developments or significant events are generally categorized as Level 3. There is no single standard formaking fair value determinations, which may result in prices that vary from those of other funds.
Note 2. Derivative Instruments
Forward Foreign Currency Contracts: During the period, the Global Strategy Fund used forward contracts to protect the valueof securities and related receivables and payables against changes in future foreign exchange rates and to enhance return. The HighYield Bond Fund used forward contracts to protect the value of securities and related receivables and payables against changes in futureforeign exchange rates. The Inflation Protected Fund used forward contracts to attempt to protect the value of securities and relatedreceivables and payables against changes in future foreign exchange rates, to manage and/or gain exposure to certain foreign currenciesand to enhance return.
Copyright © 2021 www.secdatabase.com. All Rights Reserved.Please Consider the Environment Before Printing This Document
A forward contract is an agreement between two parties to buy or sell currency at a set price on a future date. The market value ofthe contract will fluctuate with changes in currency exchange rates. The contract is marked-to-market daily using the forward rate andthe cumulative change in market value is recorded by a Fund as unrealized appreciation or depreciation. On the settlement date, a Fundrecords either realized gains or losses equal to the difference between the value of the contract at the time it was opened and the value atthe time it was closed.
Risks to a Fund of entering into forward contracts include counterparty risk, market risk and illiquidity risk. Counterparty riskarises upon entering into these contracts from the potential inability of counterparties to meet the terms of their contracts. If thecounterparty defaults, a Fund�s loss will generally consist of the net amount of contractual payments that the Fund has not yet receivedthough the Fund�s maximum exposure due to counterparty risk could extend to the notional amount of the contract. Market risk is therisk that the value of the forward contract will depreciate due to unfavorable changes in the exchange rates. These contracts may involvemarket risk in excess of the unrealized appreciation or depreciation reported on the Portfolio of Investments. Illiquidity risk arisesbecause the secondary market for forwards may have less liquidity relative to markets for other securities. Currency transactions arealso subject to risks different from those of other portfolio transactions. Because currency control is of great importance to the issuinggovernments and influences economic planning and policy, purchases and sales of currency and related instruments can be adverselyaffected by government exchange controls, limitations or restrictions on repatriation of currency, and manipulations or exchangerestrictions imposed by governments.
Forward foreign currency contracts outstanding at the end of the period, if any, are reported on a schedule at the end of eachFund�s Portfolio of Investments.
Futures: During the period, the Asset Allocation Fund and Dynamic Allocation Fund used futures contracts to increase ordecrease exposure to equity or bond markets or to hedge against changes in interest rates, prices of stocks, bonds or other instruments,or currency rates. The Emerging Economies Fund, Small Cap Value Fund and U.S. Socially Responsible Fund used futures contracts toequitize cash, providing exposure to equity markets. The Growth Fund, International Equities Index Fund, International SociallyResponsible Fund, Mid Cap Index Fund, Nasdaq-100® Index Fund, Small Cap Index Fund and Stock Index Fund used futures contractsto increase or decrease exposure to equity markets. The Inflation Protected Fund used futures contracts to manage duration and yieldcurve positioning and to increase exposure to equity or bond markets.
A futures contract is an agreement between two parties to buy and sell a financial instrument at a set price on a future date. Uponentering into a futures transaction, a Fund will be required to segregate an initial margin payment of cash or other liquid securities withthe futures commission merchant (the �broker�). Subsequent payments are made or received by a Fund as a result of changes in thevalue of the contract and/or changes in the value of the initial margin requirement. When a contract is closed, a Fund records a realizedgain or loss equal to the difference between the value of the contract at the time it was opened and the value at the time it was closed.
The primary risk to a Fund of entering into futures contracts is market risk. Market risk is the risk that there will be an unfavorablechange in the interest rate, value or currency rate of the underlying security or securities. Futures contracts involve, to varying degrees,risk of loss in excess of the variation margin. There may also be trading restrictions or limitations imposed by an exchange, andgovernment regulations may restrict trading in futures contracts. While a Fund will generally only purchase exchange-traded futures,due to market conditions, there may not always be a liquid secondary market for a futures contract and, as a result, the Fund may beunable to close out its futures contracts at a time which is advantageous. In addition, if a Fund has insufficient cash to meet marginrequirements, the Fund may need to sell other investments, including at disadvantageous times. There is generally minimal counterpartyrisk to a Fund since the futures contracts are generally exchange-traded.
Futures contracts outstanding at the end of the period, if any, are reported on a schedule at the end of each Fund�s Portfolio ofInvestments.
Options: During the period, the Dynamic Allocation Fund used options contracts to facilitate trading, increase market exposure,generate income or seek protection against a decline in the value of the Fund�s securities or an increase in prices of securities that maybe purchased. The International Growth Fund used options to hedge against the decline in value of a currency.
Copyright © 2021 www.secdatabase.com. All Rights Reserved.Please Consider the Environment Before Printing This Document
An option is a contract conveying a right to buy or sell a financial instrument at a specified price during a stipulated period. Whena Fund writes a call or a put option, it receives a premium which is equal to the current market value of the option written. If a Fundpurchases a call or a put option, it pays a premium which reflects the current market value of the option. The option position is markedto market daily and its value fluctuates based upon the value of the underlying financial instrument, time to expiration, cost ofborrowing funds, and volatility of the value of the underlying financial instrument. If an option which a Fund has written either expireson its stipulated expiration date, or if the Fund enters into a closing purchase transaction, the Fund realizes a gain (or loss if the cost of aclosing purchase transaction exceeds the premium received when the option was written) without regard to any unrealized gain or losson the underlying security, and the liability related to such options is extinguished. If a call option which a Fund has written is exercised,the Fund realizes a gain or loss from the sale of the underlying security and the proceeds from such sale are increased by the premiumoriginally received. If a put option which a Fund has written is exercised, the amount of the premium originally received reduces thecost of the security which the Fund purchased upon exercise of the option. Options may be traded on a national securities exchange or inthe OTC market.
Risks to a Fund of entering into option contracts include counterparty risk, market risk and, with respect to OTC options,illiquidity risk. Counterparty risk arises from the potential inability of counterparties to meet the terms of their contracts. If thecounterparty defaults, a Fund�s loss will consist of the net amount of contractual payments that the Fund has not yet received. Marketrisk is the risk that there will be an unfavorable change in the value of the underlying securities. There is also the risk a Fund may not beable to enter into a closing transaction because of an illiquid market. In addition, unlisted options are not traded on an exchange and maynot be as actively traded as listed options, making the valuation of such securities more difficult. An unlisted option also entails a greaterrisk that the party on the other side of the option transaction may default, which would make it impossible to close out an unlisted optionposition in some cases, and profits related to the transaction lost thereby.
Option contracts outstanding at the end of the period, if any, are reported on a schedule at the end of each Fund�s Portfolio ofInvestments.
Copyright © 2021 www.secdatabase.com. All Rights Reserved.Please Consider the Environment Before Printing This Document
Swap Contracts: Certain Funds may enter into credit default, interest rate, equity and/or total return swap contracts. Swapcontracts are privately negotiated in the OTC market and may be entered into as a bilateral contract or a centrally cleared contract(�centrally cleared swaps�). In a centrally cleared swap, immediately following execution of the swap contract, the swap contract isnovated to a central counterparty (the �CCP�) and a Fund faces the CCP through a broker. Upon entering into a centrally cleared swap,a Fund is required to deposit initial margin with the broker in the form of cash or securities in an amount that varies depending on thesize and risk profile of the particular swap. Securities deposited as initial margin are designated on the Portfolio of Investments. Unlikea bilateral swap contract, for centrally cleared swaps, a Fund has no credit exposure to the counterparty as the CCP stands between theFunds and the counterparty. Swaps are marked-to-market daily and the changes in value are recorded as an unrealized gain (loss). Thedaily change in valuation of swap contracts, if any, is recorded as unrealized appreciation (depreciation) on swap contracts. When theswap is terminated, a Fund will record a realized gain or loss equal to the difference between the proceeds from (or cost of) the closingtransaction and the Fund�s basis in the contract, if any. Generally, the basis of the contracts is the premium received or paid. Upfrontpayments and receipts on swap contracts are amortized on a daily basis. Net periodic payments made or received by a Fund are includedas part of realized gain (loss).
Interest Rate Swap Agreements: During the period, the Inflation Protected Fund used interest rate swap agreements to manage exposureto fluctuations in interest rates and to make active interest rate anticipation decisions.
Interest rate swaps involve the exchange by a Fund with another party of their respective commitments to pay or receive interestwith respect to the notional amount of principal. Since interest rate swaps are individually negotiated, a Fund expects to achieve anacceptable degree of correlation between their respective portfolio investments and their interest rate positions. A Fund will enter intointerest rate swaps only on a net basis, which means that the two payment streams are netted out, with the Funds receiving or paying, asthe case may be, only the net amount of the two payments.
Interest rate swaps do not involve the delivery of securities, other underlying assets or principal. Accordingly, the risk of loss withrespect to interest rate swaps is limited to the net amount of interest payments that a Fund is contractually obligated to make. If the otherparty to an interest rate swap defaults, a Fund�s risk of loss consists of the net discounted amount of interest payments that the Fund iscontractually entitled to receive, if any. The use of interest rate swaps is a highly specialized activity which involves investmenttechniques and risks different from those associated with ordinary Fund securities transactions.
Interest rate swap contracts outstanding at the end of the period, if any, are reported on a schedule at the end of each Fund�sPortfolio of Investments.
Risks of Entering into Swap Agreements: Risks to a Fund of entering into credit default swaps, total return swaps and interest rateswaps, include credit risk, market risk, counterparty risk, liquidity risk and documentation risk. By entering into swap agreements, aFund may be exposed to risk of potential loss due to unfavorable changes in interest rates, the price of the underlying security or index,or the underlying referenced asset�s perceived or actual credit, that the counterparty may default on its obligation to perform or thepossibility that there is no liquid market for these agreements. There is also the risk that the parties may disagree as to the meaning ofcontractual terms in the swap agreement. In addition, to the extent that a subadviser does not accurately analyze and predict theunderlying economic factors influencing the value of the swap, a Portfolio may suffer a loss.
Master Agreements: Certain Funds that hold derivative instruments and other financial instruments may be a party to ISDA(International Swaps and Derivatives Association, Inc.) Master Agreements or similar agreements (�Master Agreements�) with certaincounterparties that govern such instruments. Master Agreements may contain provisions regarding, among other things, the parties�general obligations, representations, agreements, collateral requirements, events of default and early termination. Collateral can be in theform of cash or securities as agreed to by a Fund and applicable counterparty. Collateral requirements are generally determined based ona Fund�s net position with each counterparty. Master Agreements may also include certain provisions that require a Fund to postadditional collateral upon the occurrence of certain events, such as when the Fund�s net assets fall below a specified level. In addition,Master Agreements typically specify certain standard termination events, such as failure of a party to pay or deliver, credit supportdefaults and other events of default. Termination events applicable to a Fund may also occur upon a decline in the Fund�s net assetsbelow a specified level over a certain period of time. Additional termination events applicable to counterparties may occur upon adecline in a counterparty�s long-term and short-term credit ratings below a specified level, or upon a decline in the ratings of a
Copyright © 2021 www.secdatabase.com. All Rights Reserved.Please Consider the Environment Before Printing This Document
counterparty�s credit support provider. Upon the occurrence of a termination event, the other party may elect to terminate early andcause settlement of all instruments outstanding pursuant to a particular Master Agreement, including the payment of any losses andcosts resulting from such early termination, as reasonably determined by the terminating party. Any decision by one or more of aFund�s counterparties to elect early termination could cause the Fund to accelerate the payment of liabilities, which settlement amountscould be in excess of the amount of assets that are already posted as collateral. Typically, the Master Agreement will permit a single netpayment in the event of default. Note, however, that bankruptcy or insolvency laws of a particular jurisdiction may impose restrictionson or prohibitions against the right of offset in bankruptcy, insolvency or other events. As a result, the early termination with respect toderivative instruments subject to Master Agreements that are in a net liability position could be material to a Fund�s financialstatements.
Copyright © 2021 www.secdatabase.com. All Rights Reserved.Please Consider the Environment Before Printing This Document

Note 3. Transactions with Affiliates
As disclosed in the Portfolio of Investments, certain Funds owned shares of various VALIC Co. I Funds and securities issued byAmerican International Group, Inc. or an affiliate thereof. During the period ended August 31, 2021, transactions in these securitieswere as follows:
Aggressive Growth Lifestyle Fund
Security Income
Capital Gain
Distribution
Received
Value
at 05/31/2021
Cost of
Purchases ��
Proceeds
from Sales
Realized
Gain/(Loss)
Change in
Unrealized
Gain/(Loss)
Value
at 08/31/2021
VALIC Co. I Blue Chip Growth Fund $ � $ � $13,423 $� $� $� $1,691 $15,114
VALIC Co. I Capital Appreciation Fund � � 30,870,138 � � � 3,630,943 34,501,081
VALIC Co. I Core Bond Fund � � 37,238,100 22,496,460 1,500,210 64,601 710,585 59,009,536
VALIC Co. I Dividend Value Fund � � 41,395,162 � 7,414,091 439,472 (716,332 ) 33,704,211
VALIC Co. I Emerging Economies Fund � � 44,862,338 � 12,167,340 2,529,360 (3,300,554 ) 31,923,804
VALIC Co. I Global Real Estate Fund � � 23,024,874 � � � 1,497,323 24,522,197
VALIC Co. I Government Money Market I
Fund 526 � 14,321,389 9,232,754 � � � 23,554,143
VALIC Co. I Government Securities Fund � � 2,095,217 � 1,038,084 29,517 (10,016 ) 1,076,634
VALIC Co. I High Yield Bond Fund � � 14,999,681 � � � 273,432 15,273,113
VALIC Co. I Inflation Protected Fund � � 34,553,103 � 5,931,909 629,509 317,233 29,567,936
VALIC Co. I International Equities Index
Fund � � 57,196,210 938,476 1,704,323 227,653 173,098 56,831,114
VALIC Co. I International Government Bond
Fund � � 13,401,015 � 1,112,233 43,280 46,454 12,378,516
VALIC Co. I International Growth Fund � � 14,811,864 � � � 556,895 15,368,759
VALIC Co. I International Opportunities
Fund � � 40,609,546 � � � 1,196,987 41,806,533
VALIC Co. I International Value Fund � � 29,138,261 � � � (711,308 ) 28,426,953
VALIC Co. I Large Capital Growth Fund � � 14,749,225 4,447,977 � � 1,666,042 20,863,244
VALIC Co. I Mid Cap Index Fund � � 25,914,450 536,273 973,899 129,801 161,152 25,767,777
VALIC Co. I Mid Cap Strategic Growth Fund � � 25,370,606 � � � 1,796,537 27,167,143
VALIC Co. I Mid Cap Value Fund � � 43,131,604 � 8,897,386 215,632 (564,767 ) 33,885,083
VALIC Co. I Nasdaq-100® Index Fund � � 6,348,394 3,706,648 � � 1,149,387 11,204,429
VALIC Co. I Science & Technology Fund � � 21,290,975 � � � 1,871,140 23,162,115
VALIC Co. I Small Cap Growth Fund � � 8,811,723 � � � 177,391 8,989,114
VALIC Co. I Small Cap Index Fund � � 18,375,648 244,649 4,127,044 1,446,712 (1,300,622 ) 14,639,343
VALIC Co. I Small Cap Special Values Fund � � 10,679,501 � 2,417,965 356,918 (433,074 ) 8,185,380
VALIC Co. I Small Cap Value Fund � � 15,027,011 � 6,814,263 1,153,783 (1,093,248 ) 8,273,283
VALIC Co. I Stock Index Fund � � 61,846,976 18,838,002 3,316,253 588,055 4,676,453 82,633,233
VALIC Co. I Systematic Core Fund � � 14,546,252 � � � 1,005,829 15,552,081
VALIC Co. I Systematic Value Fund � � 68,322,770 � 6,672,602 1,642,151 624,062 63,916,381
$ 526 $ � $ 732,945,456 $ 60,441,239 $ 64,087,602 $ 9,496,444 $ 13,402,713 $ 752,198,250
Conservative Growth Lifestyle Fund
Security Income
Capital Gain
Distribution
Received
Value
at 05/31/2021
Cost of
Purchases ��
Proceeds
from Sales
Realized
Gain/(Loss)
Change in
Unrealized
Gain/(Loss)
Value
at 08/31/2021
Copyright © 2021 www.secdatabase.com. All Rights Reserved.Please Consider the Environment Before Printing This Document
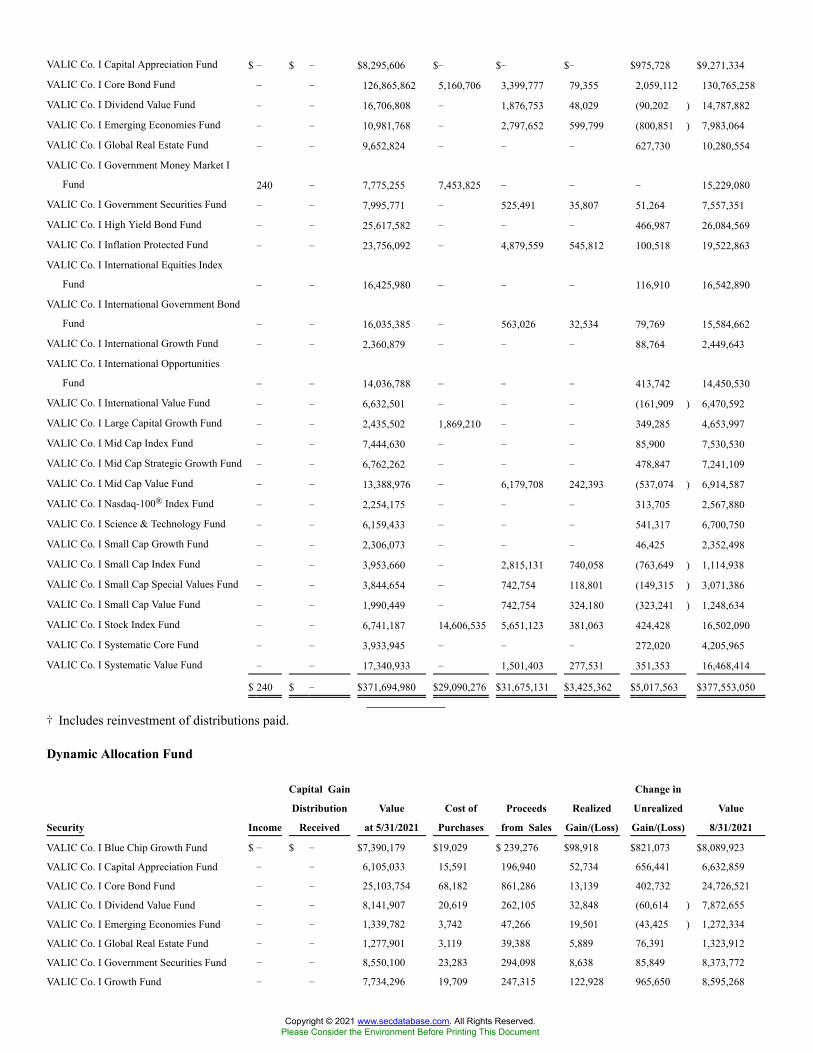
VALIC Co. I Capital Appreciation Fund $ � $ � $8,295,606 $� $� $� $975,728 $9,271,334
VALIC Co. I Core Bond Fund � � 126,865,862 5,160,706 3,399,777 79,355 2,059,112 130,765,258
VALIC Co. I Dividend Value Fund � � 16,706,808 � 1,876,753 48,029 (90,202 ) 14,787,882
VALIC Co. I Emerging Economies Fund � � 10,981,768 � 2,797,652 599,799 (800,851 ) 7,983,064
VALIC Co. I Global Real Estate Fund � � 9,652,824 � � � 627,730 10,280,554
VALIC Co. I Government Money Market I
Fund 240 � 7,775,255 7,453,825 � � � 15,229,080
VALIC Co. I Government Securities Fund � � 7,995,771 � 525,491 35,807 51,264 7,557,351
VALIC Co. I High Yield Bond Fund � � 25,617,582 � � � 466,987 26,084,569
VALIC Co. I Inflation Protected Fund � � 23,756,092 � 4,879,559 545,812 100,518 19,522,863
VALIC Co. I International Equities Index
Fund � � 16,425,980 � � � 116,910 16,542,890
VALIC Co. I International Government Bond
Fund � � 16,035,385 � 563,026 32,534 79,769 15,584,662
VALIC Co. I International Growth Fund � � 2,360,879 � � � 88,764 2,449,643
VALIC Co. I International Opportunities
Fund � � 14,036,788 � � � 413,742 14,450,530
VALIC Co. I International Value Fund � � 6,632,501 � � � (161,909 ) 6,470,592
VALIC Co. I Large Capital Growth Fund � � 2,435,502 1,869,210 � � 349,285 4,653,997
VALIC Co. I Mid Cap Index Fund � � 7,444,630 � � � 85,900 7,530,530
VALIC Co. I Mid Cap Strategic Growth Fund � � 6,762,262 � � � 478,847 7,241,109
VALIC Co. I Mid Cap Value Fund � � 13,388,976 � 6,179,708 242,393 (537,074 ) 6,914,587
VALIC Co. I Nasdaq-100® Index Fund � � 2,254,175 � � � 313,705 2,567,880
VALIC Co. I Science & Technology Fund � � 6,159,433 � � � 541,317 6,700,750
VALIC Co. I Small Cap Growth Fund � � 2,306,073 � � � 46,425 2,352,498
VALIC Co. I Small Cap Index Fund � � 3,953,660 � 2,815,131 740,058 (763,649 ) 1,114,938
VALIC Co. I Small Cap Special Values Fund � � 3,844,654 � 742,754 118,801 (149,315 ) 3,071,386
VALIC Co. I Small Cap Value Fund � � 1,990,449 � 742,754 324,180 (323,241 ) 1,248,634
VALIC Co. I Stock Index Fund � � 6,741,187 14,606,535 5,651,123 381,063 424,428 16,502,090
VALIC Co. I Systematic Core Fund � � 3,933,945 � � � 272,020 4,205,965
VALIC Co. I Systematic Value Fund � � 17,340,933 � 1,501,403 277,531 351,353 16,468,414
$ 240 $ � $371,694,980 $29,090,276 $31,675,131 $3,425,362 $5,017,563 $377,553,050
� Includes reinvestment of distributions paid.
Dynamic Allocation Fund
Security Income
Capital Gain
Distribution
Received
Value
at 5/31/2021
Cost of
Purchases
Proceeds
from Sales
Realized
Gain/(Loss)
Change in
Unrealized
Gain/(Loss)
Value
8/31/2021
VALIC Co. I Blue Chip Growth Fund $ � $ � $7,390,179 $19,029 $ 239,276 $98,918 $821,073 $8,089,923
VALIC Co. I Capital Appreciation Fund � � 6,105,033 15,591 196,940 52,734 656,441 6,632,859
VALIC Co. I Core Bond Fund � � 25,103,754 68,182 861,286 13,139 402,732 24,726,521
VALIC Co. I Dividend Value Fund � � 8,141,907 20,619 262,105 32,848 (60,614 ) 7,872,655
VALIC Co. I Emerging Economies Fund � � 1,339,782 3,742 47,266 19,501 (43,425 ) 1,272,334
VALIC Co. I Global Real Estate Fund � � 1,277,901 3,119 39,388 5,889 76,391 1,323,912
VALIC Co. I Government Securities Fund � � 8,550,100 23,283 294,098 8,638 85,849 8,373,772
VALIC Co. I Growth Fund � � 7,734,296 19,709 247,315 122,928 965,650 8,595,268
Copyright © 2021 www.secdatabase.com. All Rights Reserved.Please Consider the Environment Before Printing This Document

VALIC Co. I High Yield Bond Fund � � 1,549,030 4,157 52,517 2,920 24,969 1,528,559
VALIC Co. I Inflation Protected Fund � � 2,360,922 6,236 78,776 7,996 58,140 2,354,518
VALIC Co. I International Equities Index
Fund � � 5,551,984 14,136 178,559 55,769 (18,342 ) 5,424,988
VALIC Co. I International Government Bond
Fund � � 759,199 2,079 26,259 506 4,872 740,397
VALIC Co. I International Growth Fund � � 5,541,066 12,782 758,437 286,376 (106,662 ) 4,975,125
VALIC Co. I International Opportunities
Fund � � 72,850 576,467 20,444 3,752 8,909 641,534
VALIC Co. I International Socially
Responsible Fund � � 829,307 2,078 26,259 (2,228 ) 17,567 820,465
VALIC Co. I International Value Fund � � 5,260,933 148,815 175,612 53,817 (188,077 ) 5,099,876
VALIC Co. I Large Capital Growth Fund � � 6,203,784 15,590 196,940 82,662 487,157 6,592,253
VALIC Co. I Mid Cap Index Fund � � 2,913,637 7,276 91,906 13,059 18,332 2,860,398
VALIC Co. I Mid Cap Strategic Growth Fund � � 1,913,147 4,837 60,556 (9,007 ) 142,256 1,990,677
VALIC Co. I Mid Cap Value Fund � � 2,176,213 5,557 70,738 (279 ) (10,828 ) 2,099,925
VALIC Co. I Small Cap Growth Fund � � 995,702 2,578 31,752 8,632 10,945 986,105
VALIC Co. I Small Cap Index Fund � � 1,165,514 3,118 39,388 3,356 516 1,133,116
VALIC Co. I Small Cap Special Values Fund � � 1,286,344 93,477 44,479 3,461 (23,641 ) 1,315,162
VALIC Co. I Small Cap Value Fund � � 432,525 51,219 15,675 4,215 (14,025 ) 458,259
VALIC Co. I Stock Index Fund � � 23,301,236 58,205 985,244 331,842 1,453,575 24,159,614
VALIC Co. I Systematic Core Fund � � 11,963,536 29,934 378,126 49,356 764,253 12,428,953
VALIC Co. I Systematic Value Fund � � 20,838,379 49,778 629,888 36,726 707,740 21,002,735
VALIC Co. I U.S. Socially Responsible Fund � � 1,674,023 4,157 52,517 1,814 124,826 1,752,303
� � $ 162,432,283 $ 1,265,750 $ 6,101,746 $ 1,289,340 $ 6,366,579 $ 165,252,206
Moderate Growth Lifestyle Fund
Security Income
Capital Gain
Distribution
Received
Value
at 05/31/2021
Cost of
Purchases ��
Proceeds
from Sales
Realized
Gain/(Loss)
Change in
Unrealized
Gain/(Loss)
Value
at 08/31/2021
VALIC Co. I Blue Chip Growth Fund $ � $ � $47,356 $� $� $� $5,967 $53,323
VALIC Co. I Capital Appreciation Fund � � 40,845,519 � � � 4,804,247 45,649,766
VALIC Co. I Core Bond Fund � � 202,263,304 32,845,032 6,098,305 237,333 3,279,450 232,526,814
VALIC Co. I Dividend Value Fund � � 67,860,566 � 8,878,216 1,076,900 (1,390,138 ) 58,669,112
VALIC Co. I Emerging Economies Fund � � 48,163,327 � 22,370,983 5,453,878 (6,208,164 ) 25,038,058
VALIC Co. I Global Real Estate Fund � � 25,901,131 � � � 1,684,368 27,585,499
VALIC Co. I Government Money Market I
Fund 953 � 30,145,254 25,249,802 � � � 55,395,056
VALIC Co. I Government Securities Fund � � 9,208,170 � 1,657,303 112,929 (16,531 ) 7,647,265
VALIC Co. I High Yield Bond Fund � � 32,391,662 � � � 590,473 32,982,135
VALIC Co. I Inflation Protected Fund � � 63,533,184 � 4,735,150 525,698 1,250,357 60,574,089
VALIC Co. I International Equities Index
Fund � � 64,002,576 9,359,187 10,942,136 1,474,629 (1,022,069 ) 62,872,187
VALIC Co. I International Government Bond
Fund � � 30,805,868 � 1,775,682 60,066 151,227 29,241,479
VALIC Co. I International Growth Fund � � 9,301,585 � � � 349,720 9,651,305
VALIC Co. I International Opportunities
Fund � � 40,457,394 � � � 1,192,503 41,649,897
Copyright © 2021 www.secdatabase.com. All Rights Reserved.Please Consider the Environment Before Printing This Document
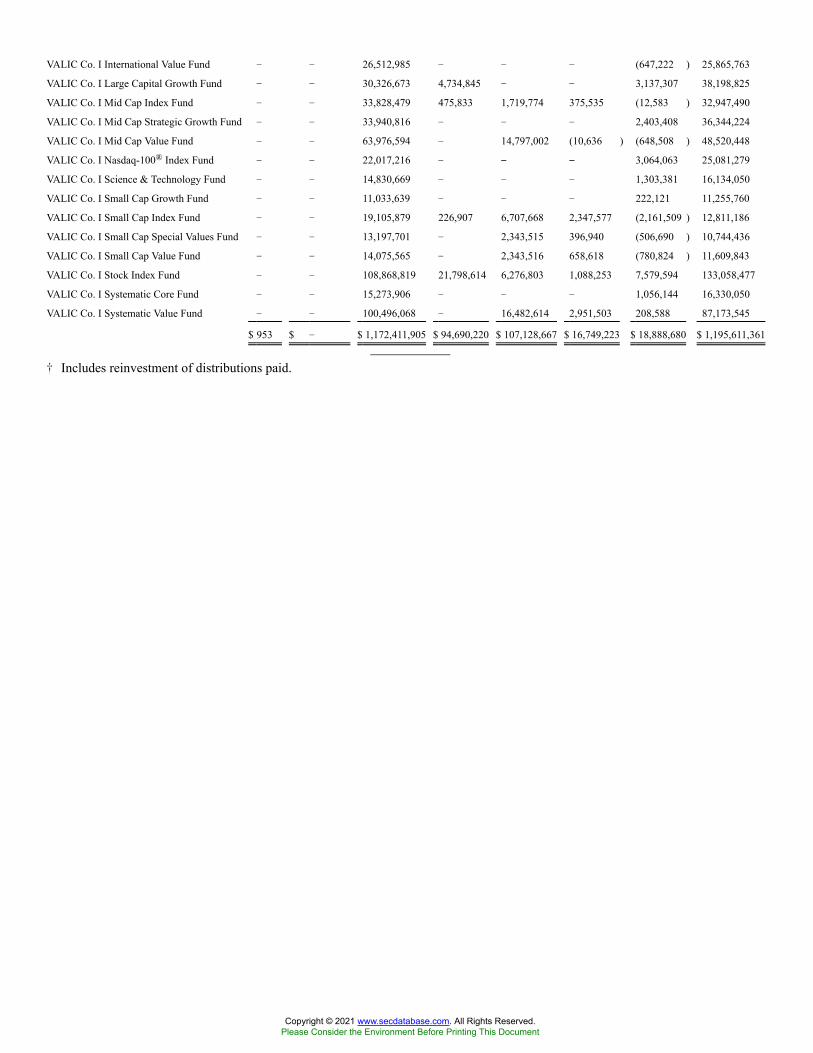
VALIC Co. I International Value Fund � � 26,512,985 � � � (647,222 ) 25,865,763
VALIC Co. I Large Capital Growth Fund � � 30,326,673 4,734,845 � � 3,137,307 38,198,825
VALIC Co. I Mid Cap Index Fund � � 33,828,479 475,833 1,719,774 375,535 (12,583 ) 32,947,490
VALIC Co. I Mid Cap Strategic Growth Fund � � 33,940,816 � � � 2,403,408 36,344,224
VALIC Co. I Mid Cap Value Fund � � 63,976,594 � 14,797,002 (10,636 ) (648,508 ) 48,520,448
VALIC Co. I Nasdaq-100® Index Fund � � 22,017,216 � �� �� 3,064,063 25,081,279
VALIC Co. I Science & Technology Fund � � 14,830,669 � � � 1,303,381 16,134,050
VALIC Co. I Small Cap Growth Fund � � 11,033,639 � � � 222,121 11,255,760
VALIC Co. I Small Cap Index Fund � � 19,105,879 226,907 6,707,668 2,347,577 (2,161,509 ) 12,811,186
VALIC Co. I Small Cap Special Values Fund � � 13,197,701 � 2,343,515 396,940 (506,690 ) 10,744,436
VALIC Co. I Small Cap Value Fund � � 14,075,565 � 2,343,516 658,618 (780,824 ) 11,609,843
VALIC Co. I Stock Index Fund � � 108,868,819 21,798,614 6,276,803 1,088,253 7,579,594 133,058,477
VALIC Co. I Systematic Core Fund � � 15,273,906 � � � 1,056,144 16,330,050
VALIC Co. I Systematic Value Fund � � 100,496,068 � 16,482,614 2,951,503 208,588 87,173,545
$ 953 $ � $ 1,172,411,905 $ 94,690,220 $ 107,128,667 $ 16,749,223 $ 18,888,680 $ 1,195,611,361
� Includes reinvestment of distributions paid.
Copyright © 2021 www.secdatabase.com. All Rights Reserved.Please Consider the Environment Before Printing This Document

Stock Index Fund
Security Income
Capital Gain
Distribution
Received
Value
at 05/31/2021
Cost of
Purchases
Proceeds
from Sales
Realized
Gain/(Loss)
Change in
Unrealized
Gain/(Loss)
Value
at 08/31/2021
American International Group, Inc.
Common Stock $45,998 $ � $ 7,678,920 $ � $ 204,551 $ 65,652 $ 162,214 $ 7,702,235
ADDITIONAL INFORMATION
Additional information is available in the VALIC Company I�s Annual and Semi-annual reports which may be obtained withoutcharge from the EDGAR database on the Securities and Exchange Commission�s website at http://www.sec.gov.
Copyright © 2021 www.secdatabase.com. All Rights Reserved.Please Consider the Environment Before Printing This Document