Filing # 41899838 E-Filed 05/24/2016 01:31:29 PM
179
IN THE CIRCUIT COURT OF THE SECOND JUDICIAL CIRCUIT IN AND FOR LEON COUNTY STATE OF FLORIDA CITIZENS FOR STRONG SCHOOLS, INC.; FUND EDUCATION NOW; EUNICE BARNUM; JANIYAH WILLIAMS; JACQUE WILLIAMS; SHEILA ANDREWS; ROSE NOGUERAS; and ALFREDO NOGUERAS; Plaintiffs, vs. Case No. 09-CA-4534 FLORIDA STATE BOARD OF EDUCATION; ANDY GARDINER, in his official capacity as the Florida Senate President; STEVE CRISAFULLI, in his official capacity as the Florida Speaker of the House of Representatives; and PAM STEWART, in her official capacity as Florida Commissioner of Education; Defendants. and CELESTE JOHNSON; DEAUNDRICE KITCHEN; KENIA PALACIOS; MARGOT LOGAN; KAREN TOLBERT; and MARIAN KLINGER; Intervenors/Defendants / APPENDIX FOR FINDINGS OF FACT Filing # 41899838 E-Filed 05/24/2016 01:31:29 PM
-
Upload
khangminh22 -
Category
Documents
-
view
1 -
download
0
Transcript of Filing # 41899838 E-Filed 05/24/2016 01:31:29 PM
IN THE CIRCUIT COURT OF THE SECOND JUDICIAL CIRCUIT
IN AND FOR LEON COUNTY
STATE OF FLORIDA
CITIZENS FOR STRONG SCHOOLS, INC.;
FUND EDUCATION NOW;
EUNICE BARNUM;
JANIYAH WILLIAMS;
JACQUE WILLIAMS;
SHEILA ANDREWS;
ROSE NOGUERAS; and
ALFREDO NOGUERAS;
Plaintiffs,
vs. Case No. 09-CA-4534
FLORIDA STATE BOARD OF EDUCATION;
ANDY GARDINER, in his official capacity as the
Florida Senate President;
STEVE CRISAFULLI, in his official capacity as
the Florida Speaker of the House of Representatives;
and PAM STEWART, in her official capacity
as Florida Commissioner of Education;
Defendants.
and
CELESTE JOHNSON; DEAUNDRICE KITCHEN;
KENIA PALACIOS; MARGOT LOGAN;
KAREN TOLBERT; and MARIAN KLINGER;
Intervenors/Defendants
/
APPENDIX FOR
FINDINGS OF FACT
Filing # 41899838 E-Filed 05/24/2016 01:31:29 PM
i
TABLE OF CONTENTS
FINDINGS OF FACT..........................................................................................................1
Findings Related to the Structure of Florida‘s System of Free Public I.
Schools .........................................................................................................1
Findings Related to the Conditions Necessary to Ensure that All II.
Children are Allowed the Opportunity to Obtain High Quality
Education ...................................................................................................10
A. Personnel Needed ...............................................................................12
B. Instructional Time ...............................................................................14
C. Resources Are Necessary to Provide a High Quality Education ........15
Findings Related to Florida‘s K–12 Education Policies and Programs .....15 III.
Content Standards ..........................................................................16 A.
Aligned Assessments and Accountability System .........................31 B.
School Grading and Accountability ...............................................44 C.
Retention and Promotion ...............................................................47 D.
Graduation Requirements ..............................................................52 E.
Teacher Quality and Educator Policies ..........................................55 F.
School Improvement and Differentiated Accountability ...............64 G.
Discipline Policies .........................................................................70 H.
Findings Related to Student Performance and Outcomes ..........................71 IV.
National Assessment of Educational Progress (―NAEP‖) .............72 A.
International Assessments ..............................................................79 B.
State Assessments ..........................................................................80 C.
Advanced Placement ......................................................................85 D.
Graduation and Drop-Out Rates ....................................................87 E.
Non-Promotion/Retention Rates ....................................................91 F.

ii
Findings Related to Florida‘s School Funding System..............................92 V.
Overview ........................................................................................92 A.
The Florida Education Finance Program (―FEFP‖) .......................93 B.
State Categorical Funding ............................................................105 C.
Non-FEFP State Funding .............................................................106 D.
Capital Outlay Funding ................................................................107 E.
Local Funding and School District Capacity - (Subject to F.
Voter Approval) ...........................................................................113
Federal Funding ...........................................................................115 G.
The State Budget Process.............................................................118 H.
Florida‘s Commitment to Funding Education .............................121 I.
―Cost Studies‖ ..............................................................................130 J.
Findings Related to Resources in Florida Schools and School VI.
Districts ....................................................................................................134
Budgets and Expenditures............................................................134 A.
School District Programs and Accomplishments ........................139 B.
Accreditation of Districts and Schools ........................................141 C.
Availability of Effective Teachers ...............................................144 D.
Compliance with Class Size.........................................................146 E.
District and School Improvement Plans ......................................147 F.
Facilities .......................................................................................147 G.
Instructional Resources ................................................................150 H.
Findings Related to Special Programs and Populations ..........................151 VII.
Career and Technical Education ..................................................151 A.
Virtual Education .........................................................................152 B.
Enhancement Programs and Dual Enrollment .............................153 C.
iii
English Language Learners..........................................................154 D.
Students with Disabilities ............................................................157 E.
Students Eligible for Free-and-Reduced-Price Lunch .................160 F.
Students Experiencing Homelessness ..........................................161 G.
Findings Related to Choice Programs......................................................163 VIII.
Charter Schools ............................................................................163 A.
Florida Tax Credit Scholarship Program .....................................165 B.
McKay Scholarship for Students with Disabilities ......................167 C.
Findings Related to Causation .................................................................169 IX.
FINDINGS OF FACT1
Findings Related to the Structure of Florida’s System of Free Public Schools I.
Florida‘s K–12 system of free public schools is a large and complex system 1.
comprised of 67 locally-elected school boards that operate, control and supervise over 4,000
schools, and educate more than 2.7 million students as of the 2014–15 school year.2
The Florida student population is among the most diverse in the nation,3 with a 2.
majority of students who are ethnic and racial minorities;4 58% of students who are eligible for
free-and-reduced-price lunch (an indicator of poverty);5 13% of students who have disabilities
and receive special education services;6 and 10% of students who are English language learners
(―ELLs‖).7
Students are educated in a wide variety of programs and settings, including 3.
traditional elementary, middle and high schools; charter schools; dual enrollment programs in
which students attend part of their school day at a college or university; online education through
multiple virtual school options; career and technical education with industry certifications;
acceleration programs such as Advanced Placement, International Baccalaureate, Advanced
International Certificate of Education; and schools of choice which specialize in particular
1 Any ―finding of fact‖ that should more appropriately be characterized as a conclusion of law
shall be considered a conclusion of law.
2 Exs. 3350, 5330, 5342; Tr. Vol. 26 at 3956:15–23, 3948:15–19 (Test. of P. Stewart).
3 Exs. 4058, 4059, 4060, 4061.
4 Exs. 186, 3351, 3356.
5 Ex. 3355.
6 Ex. 3354.
7 Ex. 3353.
2
subject areas or meet a need in the community, e.g., performing arts or Science, Technology,
Engineering and Mathematics (―STEM‖) magnet schools.8
Florida also provides a program to be used for private school tuition for students 4.
with disabilities through the McKay Scholarship Program as well as a scholarship program for
students from low income families and children in the foster care system through the Florida Tax
Credit Scholarship Program.
Education policies, programs, and funding decisions are developed and 5.
implemented throughout the State as the result of input and action of multiple stakeholders,
including the Florida Legislature, the State Board of Education, the Commissioner of Education,
the Florida Department of Education, locally-elected school boards, locally-elected or appointed
school superintendents, as well as school district administrators, school principals, classroom
teachers, and the public at large. In addition, education policies, programs, and funding in
Florida are impacted by the requirements of federal law.9
Teachers, teachers‘ unions, parents, students, postsecondary education preparation 6.
and leadership programs, community groups, and advocacy groups are also key stakeholders
who are actively involved in providing input and influencing education policies, programs, and
funding decisions at both the state and local levels.10
The Florida Legislature has the exclusive constitutional authority to fix 7.
appropriations for the state budget. Art. VII, §1, Fla. Const. The Florida Legislature is
authorized to appropriate state funds to school districts ―upon such conditions as may be
8 Ex. 5342; Tr. Vol. 26 at 3948:12–3953:12 (Test. of P. Stewart).
9 Exs. 5330, 5342; Ex. 3683 at 00103643; Tr. Vol. 26 at 3954:1–3958:2 (Test. of P. Stewart); Tr.
Vol. 33 at 4944:21–4947:10 (Test. of L. Champion).
10 Ex. 5330; Ex. 3683 at 00103643; Tr. Vol. 26 at 3954:1–3958:2 (Test. of P. Stewart); Tr. Vol.
33 at 4944:21–4947:10 (Test. of L. Champion).
3
provided by general law. These conditions may include the use of relative ad valorem
assessment levels determined by a state agency designated by general law.‖ Art. VII, §8, Fla.
Const.
At the state level, the Florida Legislature establishes education policies through 8.
the passage of laws and the state budget. Each year, the Legislature as a whole, and specific
education and appropriation committees, consider input from constituents and education
stakeholders, including from the Department of Education, local school boards and officials,
superintendents, and many other individuals, community groups, advocacy groups, and experts
in educational matters. Education policy and funding levels are determined in the context of a
constitutional requirement of a balanced budget, economic conditions, requirements of state and
federal law as well as the priorities and needs of the State as expressed by the voters.11
The Executive Branch of the State of Florida is led by the Governor. The 9.
Governor‘s office includes staff assigned to education issues and an Office of Policy and Budget
with an education unit. The Governor impacts education policy and funding in several ways,
including by appointment of the State Board of Education, the exercise of authority to sign or
veto legislation, and through the authority to propose an education budget and related policy
initiatives.12
The State Board of Education is a seven-member board appointed by the 10.
Governor to staggered four-year terms, subject to confirmation by the Senate.13
The State
11 Ex. 3436; Ex. 3683 at 00103643; Tr. Vol. 26 at 4050:20–4052:6 (Test. of P. Stewart); Tr. Vol.
33 at 4944:21–4947:10 (Test. of L. Champion). The budgeting process is described in detail in
Section IV.C, below.
12 §§ 1001.01–.03, Fla. Stat.; Ex. 3683 at 00103643; Ex. 5330; Tr. Vol. 26 at 3954:18–3955:5
(Test. of P. Stewart); Tr. Vol. 33 at 4944:21–4947:10 (Test. of L. Champion).
13 Art. IX, § 2, Fla. Const.; § 1001.01, Fla. Stat.
4
Board‘s responsibilities include adopting education objectives and strategic plans for public
education in Florida, supervising the Department of Education, submitting an annual Legislative
Budget Request, adopting uniform student content standards, and implementing the state testing
and accountability system. Standards, testing, and accountability are implemented through rules,
which require public input.14
The State Board of Education appoints the Florida Commissioner of Education, 11.
who is the chief executive officer of the Department of Education. The Commissioner is
responsible for supporting the State Board of Education in strategic planning, budget
development, assessment and accountability, administration, and managing the day-to-day
operations of the Department of Education.15
The Florida Department of Education has over 1,000 employees and is 12.
responsible for the enforcement of education law and regulations, and for promoting and
implementing education policies and programs at the state level. This role includes development
of student content standards, selection and implementation of state testing programs,
implementation of school accountability and support for school improvement, certification of
educators and approval of educator preparation programs, administration of the Florida
Education Finance Program (―FEFP‖), and administration and monitoring of federal education
grants.16
The State Board of Education shall ―have such supervision of the system of free 13.
public education as is provided by law.‖ Art. IX, § 2, Fla. Const. The district school system
14 §§ 1001.01–.02, Fla. Stat.; Tr. Vol. 26 at 3958:16–3959:11 (Test. of P. Stewart).
15 §§ 1001.10–.11, Fla. Stat.; Tr. Vol. 26 at 3932:1–19 (Test. of P. Stewart).
16 §§ 1001.20–.29, Fla. Stat.; Tr. Vol. 26 at 3958:16–23, 3966:25–3967:10, 3970:1–4, 3970:9–
3971:1 (Test. of P. Stewart); Tr. Vol. 33 at 4944:21–4947:10, 4934:16–24 (Test. of L.
Champion).
5
―shall be considered as part of the state system of public education.‖ § 1001.32, Fla. Stat.
(2015). The State Board of Education ―shall enforce compliance with law and state board rule
by all school districts.‖ § 1001.03(8), Fla. Stat. (2015).
The State Board of Education is required to adopt and submit to the Legislature a 14.
coordinated K-20 budget, as provided in § 216.023, Fla. Stat., which includes expenditure
requirements of the State Board of Education, the Department of Education, and the
Commissioner of Education. § 1001.02(2)(e), Fla. Stat. (2015). Florida Statute section 216.023
requires agencies to submit budget requests based on the agency‘s ―independent judgment of its
needs.‖
The State Board of Education is required to ―perform such other duties as may be 15.
necessary for the enforcement of laws and rules relating to the state system of public education,‖
§ 1001.02(f); adopt rules within statutory authority, § 1001.02(n); ―authorize the allocation of
resources within law and rule,‖ § 1001.02(o); ―enforce system-wide education goals and policies
except as otherwise provided by law,‖ § 1001.02(r); and ―establish accountability standards for
existing legislative performance goals, standards, and measures, and order the development of
mechanisms to implement new legislative goals, standards, and measures,‖ § 1001.02(t).
The State Board of Education is responsible for developing and revising the 16.
public K-12 curricular standards, certification requirements for all K-12 personnel, identification
of critical teacher shortage areas, and system-wide enforcement of law and state board of
education rules. § 1001.03, Fla. Stat. (2015).
The Commissioner is required to ―annually report the state‘s educational 17.
performance on state and national measures and shall recommend to the State Board of
6
Education performance goals addressing the educational needs of the state.‖ § 1001.11(2), Fla.
Stat. (2015).
The Department of Education is ―an administrative and supervisory agency under 18.
the implementation direction of the State Board of Education.‖ § 1001.20(1), Fla. Stat. (2015).
Under Article IX, Section 4(b) of the Florida Constitution, local boards of 19.
education are charged with the operation, control, and supervision of all free public schools
within their respective school districts, as well as determining the rate of school district taxes
within the limits prescribed by the Constitution.17
School boards have a minimum of five
members and are elected to four-year terms within their local communities.18
The Florida Legislature recognizes that ―Public education is a cooperative 20.
function of the state and local educational authorities. The state retains responsibility for
establishing a system of public education through laws, standards, and rules to assure efficient
operation of a K-20 system of public education and adequate educational opportunities for all
individuals. Local educational authorities have a duty to fully and faithfully comply with state
laws, standards, and rules and to efficiently use the resources available to them to assist the state
in allowing adequate educational opportunities.‖ § 1000.03(3), Fla. Stat. (2015). School boards
are responsible for implementing state requirements, but make many important decisions
regarding the actual delivery of education and the operation of schools, such as establishing
schools and attendance zones, enrollment, provision of instruction, curriculum, student progress
and retention, and student discipline. School boards also are responsible for the recruiting,
17 Art. IX, § 4(b), Fla. Const.; see also §§ 1001.30–.33, Fla. Stat.
18 §§ 1001.34–.362, Fla. Stat.; Tr. Vol. 26 at 3956:18–23 (Test. of P. Stewart).
7
hiring, assignment, and evaluation of teachers and all other staff, the construction and
maintenance of school facilities, budgeting and taxing, collective bargaining, and salaries.19
As of the 2015–16 school year, local school boards employed over 170,000 21.
teachers and over 150,000 other staff, and managed budgets in excess of $26 billion.20
Florida school district superintendents are either appointed or elected.21
In the 67 22.
county school districts, 25 superintendents are appointed by their respective school boards, and
42 superintendents are elected by the voters. Superintendents are responsible for managing the
day-to-day operations of a school district, and make decisions based on local needs and
preferences, as well as input and direction from their school boards, educators, parents and
community groups.22
The Court notes and emphasizes the extremely important role of local school 23.
boards and school district personnel within the constitutional structure of the education system in
Florida, as summarized above and detailed in Section V of these findings. The decisions these
boards and personnel make directly impact the quality of education that students experience.
School boards and school district personnel make critical decisions about the management of
schools and the allocation of resources that are consequential and do not involve Defendants in
this case.
Federal law and policies also impact the education system in Florida in many 24.
ways, including, for example, by imposing requirements for the education of students with
19 §§ 1001.41–.42, 1001.43, Fla. Stat.; Tr. Vol. 26 at 3973:7–17, 3974:23–3975:13, 3977:4–9,
3975:24–3976:6, 3977:15–17 (Test. of P. Stewart).
20 Exs. 3481, 3482, 3483; Tr. Vol. 26 at 3953:8–12, 4058:8–14 (Test. of P. Stewart); Tr. Vol. 32
at 4855:3–7, 4861:4–7 (Test. of L. Champion).
21 Art. IX, § 5, Fla. Const.
22 §§ 1001.49–.51, Fla. Stat.; Tr. Vol. 26 at 3956:24–3957:2, 3973:7–17 (Test. of P. Stewart).
8
disabilities (Individuals with Disabilities Education Act (―IDEA‖)23
) and Section 504 of the
Rehabilitation Act of 197324
), ELLs (Title III of the Elementary and Secondary Education Act25
),
and homeless students (McKinney-Vento Homeless Assistance Act26
), among other student
groups and programs.27
Compliance with federal law, however, does not equate with whether
the State has fulfilled their duties under Florida‘s Constitution.
The federal government also imposes many requirements in exchange for federal 25.
grant dollars and other support.28
Pursuant to the Elementary and Secondary Education Act of
1965 (―ESEA‖), as reauthorized by the No Child Left Behind Act of 2002 (―NCLB‖), federal
law requires states to develop and implement academic standards, annually test students against
such standards and have plans to hold schools accountable for meeting the standards over time.29
NCLB also required that students be given the opportunity to transfer from schools that did not
meet adequate yearly progress (―AYP‖) to schools that did meet AYP requirements.30
In
addition, all states must participate in a national testing program called the National Assessment
of Educational Progress (―NAEP‖ or the ―Nation‘s Report Card‖) in which many states,
including Florida, have participated for many years.31
23 20 U.S.C. §§ 1400–1482.
24 29 U.S.C. § 794.
25 20 U.S.C. §§ 6801–7014.
26 42 U.S.C. §§ 11431–11435.
27 Tr. Vol. 26 at 3977:18–3978:8 (Test. of P. Stewart).
28 Tr. Vol. 26 at 3957:3–14 (Test. of P. Stewart).
29 20 U.S.C. § 6311(b); Tr. Vol. 26 at 3978:22–3979:9 (Test. of P. Stewart); Tr. Vol. 29 at
4329:2–25 (Test. of J. Copa).
30 20 U.S.C. § 6316, repealed by Every Student Succeeds Act, Pub. L. No. 114-95, 129 Stat.
1814 (2015).
31 20 U.S.C. § 6311(a)(1)(b), (g)(2)(D); Exs. 1358, 1390, 1391; Tr. Vol. 26 at 3996:3–6 (Test. of
P. Stewart); Tr. Vol. 29 at 4455:4–4456:1 (Test. of J. Copa).
9
Specifically as to statewide annual assessments, states must measure proficiency 26.
of students in, at a minimum, English language arts, math, and reading no less than once during
each age band: grades 3-5, grades 6-9, and grades 10-12.32
In late 2015, NCLB was replaced by the Every Student Succeeds Act (―ESSA‖) 27.
and requires, among other things, the development of college and career readiness standards,
annual statewide testing of all students, student performance targets and school ratings,
accountability and interventions for low performing schools, evaluation of teachers based on
student learning, and programs to replicate effective charter schools.33
It should be noted that many of the education policies and programs about which 28.
Plaintiffs complain in this case, including the assessment and accountability system, teacher
evaluations tied to student performance, charter schools, and other choice programs, are either
mandated or incentivized by federal policy and funding.34
The U.S. Department of Education monitors school district and states‘ compliance 29.
with federal educational requirements on a periodic basis.35
Pursuant to this federal monitoring, the record reflects that Florida is in 30.
compliance with federal requirements as related to the education services for students with
disabilities, ELLs, and homeless students.36
32 No Child Left Behind Act, PL-107-110 (Jan. 8, 2002), (NCLB), Sec. 1111(b)(3).
33 Every Student Succeeds Act, Pub. L. No. 114-95, 129 Stat. 1814 (2015); Ex. 4048; Tr. Vol. 29
at 4328:10–4331:18 (Test. of J. Copa).
34 Tr. Vol. 26 at 3978:22–3979:9 (Test. of P. Stewart); Tr. Vol. 29 at 4324:3–19, 4334:8–10,
4363:8–11, 4370:19–4371:8 (Test. of J. Copa); Tr. Vol. 31 at 4659:19–4660:11 (Test. of M.
Tappen); Tr. Vol. 32 at 4758:11–22, 4763:22–4764:7 (Test. of K. Hebda); Tr. Vol. 36 at
5307:22–5310:5 (Test. of A. Miller).
35 Exs. 1406, 1409, 1410, 1411, 1412, 1471, 1472.
10
The Court finds that there is a similar record of compliance for federally funded 31.
programs at the school district level.37
Findings Related to the Conditions Necessary to Ensure that All Children are II.
Allowed the Opportunity to Obtain High Quality Education
In order to provide educational opportunity to all children as the Florida 32.
Constitution requires, school districts need to respond to children‘s needs at whatever level they
are to make that educational opportunity meaningful.38
A considerable number of children come to school not ready to learn, without 33.
having the background that more privileged children have.39
There is a clear disparity in the
performance of economically disadvantaged students versus those who are not economically
disadvantaged.40
While not every student who comes from poverty household starts school behind 34.
their wealthier peers, significant numbers do. Students living in poverty require a variety of
additional resources in order to succeed at school. They have not been exposed to the same
vocabulary and background knowledge and have less parental involvement.41
They need
36 Exs. 1409, 1410, 1411, 1412, 1471, 1472; Tr. Vol. 8 at 1220:25–1221:8, 1233:4–1235:4 (Test.
of L. Allen); Tr. Vol. 31 at 4657:23–4658:3, 4687:2–3 (Test. of M. Tappen).
37 Ex. 0338; Tr. Vol. 31 at 4657:23–4658:16, 4659:15–18 (Test. of M. Tappen); Tr. Vol. 5 at
719:7–20 (Test. of N. Vitti); Tr. Vol. 6 at 902:21–904:6, 906:11–907:4 (Test. of O. Roberts); Tr.
Vol. 7 at 1015:7–1020:18 (Test. of G. Littleton); Tr. Vol. 8 at 1087:10–1088:17 (Test. of N.
Marks); Tr. Vol. 11 at 1513:5–13 (Dep. Test. of M. Burke); Tr. Vol. 22 at 3280:19–3281:14
(Test. of D. Robinson); Tr. Vol. 23 at 3505:24–3506:2 (Dep. Test. of J. Hiltz); Tr. Vol. 24 at
3639:14–3670:10, 3563:2–8 (Dep. Test. of J. Marte).
38 Rebell, v.2, 103:19-24.
39 Bowles, v.19, 2773:23-2774:8; Cook, v.13, 1889:19-1890:8.
40 Roberts, v.6, 761:4-25; also see Ex. 5343.
41 Vitti, v.5, 596:21-25; 597:1-6

11
language development, hands-on opportunities, and opportunities to play42
and access to
experiences and activities as simple as being read fairy tales.43
Children from high poverty backgrounds are much less likely to experience 35.
supportive practices. Families often lack access to the social and political networks that allow
them to be effective advocates for their children.44
It is important to emphasize that poverty is
not an excuse, children can achieve regardless of socio-economic background, but often this
requires extra resources that the state funding formula does not provide.45
Former Commissioner Frank Brogan, a witness for the State, explained: 36.
… poverty is clearly a challenge, continues to be, for children all over the
country, but at the end of the day, it‘s not a stop point. It is a challenge to be
overcome, and that‘s why public education, in part, exists, is to help children of
all color, all socioeconomics, all family structure, native tongue, socioeconomic
levels, come together in a public education system and find ways to achieve at a
level that will give them their opportunity to live, not just dream the great
American dream.46
There are conditions that are necessary for school districts to establish in order to 37.
ensure that all children who are behind academically can ―catch up,‖ which may include smaller
class sizes, additional time learning, and services to address academic, mental health and
behavior issues.47
42 Roberts, v.6, 769:25-770:11; Bowles, v.19, 2774:9-19.
43 Cook, v.13, 1892:15-1893:7.
44 Hanushek, v.28, 4294:13-22.
45 Vitti, v.5, 597:7-12.
46 Brogan, v.37, 5551:10-20.
47 Vitti, v.5, 597:16-25; 597:1-5.
12
A. Personnel Needed
In addition to effective teachers, there is a team of professionals who are 38.
necessary to support the needs of low performing students. For students to be able to achieve
academically, behavioral supports and social-development tools are needed in school in order to
help students achieve academically.48
Behavior specialists analyze students‘ misbehaviors in school, draft behavior 39.
intervention plans, assist teachers in redirecting the misbehaviors, and teach students to learn
appropriate behaviors.49
The importance of behavior specialists is recognized by the State as
they are a required component of school district leadership teams for schools that are in district-
managed turnaround status.50
Mental health counselors help students deal with anger and other issues that they 40.
bring to school51
and school-related impacts of abuse, neglect and trauma.52
The role of these
counselors is not to substitute for other professionals who provide counseling outside of school,
but to specifically address the barriers to focusing in class.53
Social workers assist in making home to school connections.54
Supporting 41.
parents is part of the school‘s responsibility if schools are going to prepare students to be
48 Roberts, v.6, 763:3-25; 765:12-25; 766:1-25; 771:10-24. also see Ex. 5343.
49 Roberts, v.6, 788:3-13; Roy, v.9, 1287:25-1288:12; Cook, v.13, 1891:10-14; 1896:6-1898:3;
1929:14-24.
50 Ex. 1976, at 58806. See also section on turnaround schools.
51 Vitti, v.6, 742:16-23; Roberts, v.6, 788:14-16; Marks, v.7, 1072:4-1073:6; Roy, v.9, 1291:9-
24; Cook, v.13, 1893:21-1894:11; Romano, v.13, 2013:16-24.
52 Roberts, v.6, 770:12-20; Cook, v.13, 1890:9-22.
53 Robinson, v.22, 3235:19-21.
54 Roberts, v.6, 771:10-772:18; 787:15-788:2; Vitti, v.6, 742:16-23, 771:10; Littleton, v.7,
984:23; Roy, v.9, 1288:21-1289:11; Cook, v.13, 1900:5-14; Robinson, v.22, 3234:16-3235:18,
13
productive citizens.55
Social workers can assist those children who are moved from relative to
relative and do not have someone equipped to help with a student‘s education.56
Guidance counselors should assist with academic goal setting57
and be career 42.
counselors for graduation.58
Guidance counselors at times are required to focus on testing and
proctoring.59
Academic coaches assist teachers of low performing students and interventionists 43.
assist the students in remediation.60
Class aides or paraprofessionals enable teachers to provide small group or 44.
individualized instruction.61
Nurses are needed to attend to a myriad of medical issues.62
45.
Tutors provide individualized homework help.63
46.
Media specialists help students in computer labs. They also are needed after 47.
school for students who need to take online courses but do not have computers at home.64
55 Roberts, v.6, 771:19-773:5.
56 Roy, v.9, 1256:3-15.
57 Roberts, v.6, 788:25-789:25; Roy, v.9, 1287:13-15.
58 Marks, v.7, 1076:9-23.
59 Cook, v.13, 1915:10-18; Guerrieri, v.20, 2991:1-12.
60 Vitti, v.5, 632:22-633:5, v.6, 742:5-15; 790:16-791:17; Marks, v.7, 1073:7-21; Roy, v.9,
1288:13-20.
61 Roberts, v.6, 790:1-15; Roy, v.9, 1287:20-24; Cook, v.13, 1898:9-1899:25.
62 Vitti, v.6, 742:16-23: Littleton, v.7, 984:23-985:11.
63 Marks, v.7, 1074:7-16.
64 Boyd, v.16, 2425:9-17; 2465:16-23.
14
B. Instructional Time
School district witnesses agree that smaller class sizes, small group instruction, 48.
and individualized instruction are vital for providing the intensive instruction that is necessary
for students who are under-performing.65
Schools on the State‘s 300 Lowest Performing List benefit from an extra hour, but 49.
there are low performing students who would benefit who are not at a school on the list.66
Sufficient instructional time, extended day (before and after school) and extended school year
(summer) are strategies that would benefit low performing students.67
Summer programs are
important for children in poverty because they tend to regress even if they made progress during
the school year.68
Teachers need time and professional development to learn new standards.69
50.
Understandably, teachers complain that constant changes to standards impede their ability to
learn and teach the new standards.70
65 Roberts, v.6, 773:23-774:6, 786:23-787:11, 790:1-15; Marks, v.7, 1059:11-24; Vitti, v.5,
597:13-20, 632:22-633:5, v.6, 742:5-15; Robinson, v.22, 3241:21-3242:14, Cook, v.13, 1899:2-
25, 1903:21-1904:23; Guerrieri, v.20, 3010:21-3011:8; Flynt, v.21, 3151:3-7; Yariv, v.18,
2726:16-2727:25.
66 Roy, v.9, 1280:15-1281:9; Roberts, v.6, 796:25-797:9.
67 Rebell, v.2, 105:1-7; Vitti, v.6, 742:5-15; Roy, v.9, 1284:20-24; Cook, v.13, 1892:9-14; Boyd,
v.16, 2455:9-25; Roberts, v.6, 780:13-781:22, 815:7-11; Marks, v.7, 1060:14-1061:3; Robinson,
v.22, 3234:16-20.
68 Hanushek, v.28, 4294:23-4295:5.
69 Roberts, v.6, 775:3-776:11, 816:8-817:22, 879:22-880:10; Roy, v.9, 1284:24-1285:2;
Robinson, v.22, 3234:16-23.
70 Roy, v.9, 1278:22-1280:3.
15
C. Resources Are Necessary to Provide a High Quality Education
Clearly, some amount of resources are necessary for school districts to fulfill their
constitutional duty to operate a high quality system of public education. Time costs money.71
People cost money.72
The education of Florida‘s children is very important.
Findings Related to Florida’s K–12 Education Policies and Programs III.
Plaintiffs‘ challenges to various aspects of Florida‘s assessment and 51.
accountability system are many. Florida has been a national leader in educational reform.
Florida was early in the assignment of ―A‖–―F‖ letter grades to schools as part of its
accountability system and these policies have spread throughout the nation.73
Federal law and
policies now require all states to adopt state content standards and assess their students annually
in English language arts and mathematics in all grades between 3 and 8 and once in high
school.74
The No Child Left Behind Act (―NCLB‖) also required that students be assessed in
science at least once in elementary, once in middle, and once in high school.75
The federal Race
to the Top program focused on moving to more rigorous college and career ready standards,
assessment, school improvement, and linking student performance and growth to teacher
evaluations.76
High standards, assessment, and accountability have been a nationwide
movement, not policies unique to Florida, although Florida was a leader in adopting such
71 Roy, v.9, 1285:12-17.
72 Roberts, v.6, 791:18-793:4; Marks, v.8, 1076:24-1077:1; Yariv, v.18, 2723:18-2724:9;
Hanushek, v.28, 4282:19-25; Vitti, v.5, 597:21-598:8.
73 Tr. Vol. 37 at 5580:13–5582:6 (Dep. Test. of F. Brogan); Ex. 3505.
74 20 U.S.C. § 6311(b)(1), (b)(3)(B)(vii); Tr. Vol. 26 at 3978:22–3979:9 (Test. of P. Stewart); Tr.
Vol. 29 at 4329:2–25 (Test. of J. Copa).
75 20 U.S.C. § 6311(b)(3)(B)(v)(II).
76 Exs. 1413, 3782, 3366, 3781, 3774.
16
policies.77
(The improvements in student achievement in Florida provide additional support for
the reasonableness of Florida‘s education policies, including its assessment and accountability
system.)
Florida requires more testing than federal law requires. In December 2015, the 52.
Every Student Succeeds Act (ESSA) modified the testing standards for students. ESSA required,
―Each State plan shall demonstrate that the State educational agency, in consultation with local
educational agencies, has implemented a set of high-quality student academic assessments in
mathematics, reading or language arts, and science. The State retains the right to implement such
assessments in any other subject chosen by the State. S-1177-2, Sec. 1111(b)(2)(A).
Assessments are required for mathematics and reading or language arts, and that they are
administered in each of grades 3 through 8, and at least once in grades 9 through 12. In the case
of science, is to be administered not less than one time during grades 3 through 5, grades 6
through 9; and grades 10 through 12. Id. at (b)(2)(v)(I). For any other subject chosen by the
State, the assessment will be administered at the discretion of the State. Id. at (b)(2)(v)(III).78
Content Standards A.
The Florida Legislature and the State Board of Education have provided specific 53.
substantive content to the term ―education‖ in Article IX of the Florida Constitution by
specifying the ―core content knowledge and skills that K-12 public school students are expected
to acquire.‖ The Legislature directs that the standards ―must be rigorous and relevant‖ and
―[c]urricular content for all subjects must integrate critical-thinking, problem-solving, and
workforce-literacy skills; communication, reading, and writing skills; mathematics skills;
77 Tr. Vol. 37 at 5580:13–5582:6 (Dep. Test. of F. Brogan); Tr. Vol. 26 at 3978:22–3979:9 (Test.
of P. Stewart); Tr. Vol. 29 at 4329:2–25 (Test. of J. Copa).
78 Stewart, v.26, 4085:18-4086:3.
17
collaboration skills; contextual and applied-learning skills; technology-literacy skills;
information and media-literacy skills; and civic-engagement skills.‖ The State Board of
Education adopted the content standards consistent with this direction.79
The Commissioner of Education explained that the importance of having content 54.
standards is that the State has a standard by which it can measure whether or not education is
appropriate, whether the education that is occurring is standard across the state, and how students
are performing.80
Content standards define what children should be taught at each grade level for 55.
each subject area and what children should know and understand by the end of the year.81
The purpose and importance of uniform statewide standards is to ensure all 56.
students are being taught the same content (due to consistent standards and course instruction)
and to measure whether children are learning or not through the accountability system.82
Florida has been a leading state in the development and implementation of 57.
standards for all students. Florida was an early implementer of standards-based education, which
has since become a national movement and part of federal law and policy. As detailed below,
Florida‘s standards are , research-based and provide equitable access to rigorous content to all
students, including low-income students, minority students, students with disabilities, and
English language learners (―ELLs‖).83
79 § 1003.41(1), Fla. Stat. (2015); see also Fla. Admin. Code Rule 6A-1.09401; Stewart, v.26,
3958:16-3959:12; Ex. 3343-2.
80 Stewart, v.26, 3969:6-13; Brogan, v.37, 5507:20-5508:21.
81 Vitti, v.5, 653:20-654:10.
82 Tappen, v.30, 4622:5-19.
83 Tr. Vol. 26 at 3960:4–7 (Test. of P. Stewart); Tr. Vol. 30 at 4621:19–4623:1 (Test. of M.
Tappen); Tr. Vol. 37 at 5541:2–5543:12 (Dep. Test. of F. Brogan).
18
Standards are the center of an accountability system. They define what students 58.
should know and be able to do in each content area and at each grade level. Standards describe
the ―what‖ that students need to learn (e.g., ―Tell and write time to the nearest minute and
measure time intervals in minutes.‖), but standards do not define ―how‖ a teacher must instruct
to teach the standard or what materials (―curriculum‖) must be used.84
Florida law requires the
State Board of Education to establish the standards that specify the core content, knowledge, and
skills that K–12 public school students are expected to acquire, and each local school board is
required to provide the courses, the instruction, and the curriculum for students to master these
standards.85
Florida‘s standards encompass not only the core subject areas of science, social 59.
studies, mathematics, and English language arts, but also visual and performing arts, physical
and health education, and foreign languages, as well as career and technical education.86
Moreover, high-school graduates must earn credits in science, social studies, mathematics, and
English language arts, as well as in fine or performing arts, speech and debate, or practical arts;
physical education; and eight credits in electives as offered by the school district.87
Florida‘s
implementation of an accountability system has not resulted in a ―narrow[ing of] the curriculum‖
as alleged by Plaintiffs88
—there are over 13,500 courses offered to Florida students, including
college-level and other advanced courses, career and technical courses, STEM courses, and
84 Tr. Vol. 22 at 3338:25–3339:9 (Test. of M. Tappen); Exs. 3342, 3343, 3344, 3345, 3362,
1802, 1803, 1804.
85 §§ 1003.41, 1003.42, Fla. Stat.; Tr. Vol. 26 at 3973:7–21 (Test. of P. Stewart); Exs. 3342,
3343, 3343-2, 3344, 3345, 3362, 1802, 1803, 1804.
86 § 1003.41, Fla. Stat; Exs. 3342, 3343.
87 § 1003.4282(3), Fla. Stat.
88 2d Am. Compl. ¶ 116.
19
many electives ranging from dance and theater to world languages.89
All school districts provide
the courses required by Florida law and for students to receive a high-school diploma.90
Each district school board is required to ―provide all courses required for middle 60.
grades promotion, high school graduation, and appropriate instruction designed to ensure that
students meet State Board of Education adopted standards in the following subject areas: reading
and other language arts, mathematics, science, social studies, foreign languages, health and
physical education, and the arts.‖ § 1003.42(1), Fla. Stat. (2015).
Federal law requires that states apply the same challenging academic content and 61.
achievement standards to all students, including students with disabilities, and also that each
State adopt English language acquisition standards for ELLs.91
For Florida students with
significant cognitive disabilities, experts in exceptional student education draft ―access points‖
aligned to the state standards that are reviewed and then also approved and adopted by the State
Board. Districts hire teachers to teach the access points to these students.92
For Florida‘s ELLs,
the State adopts English language acquisition standards, aligned to the State Board-adopted
English language arts standards. This ensures that ELLs attain English proficiency and meet the
same content area standards that all students are expected to meet.93
There is a lengthy process that the Department of Education engages in associated 62.
with establishing standards that includes convening content experts and drafting the standards.
89 Tr. Vol. 31 at 4677:1–4682:6 (Test. of M. Tappen); Ex. 3380.
90 Tr. Vol. 26 at 3973:22–3974:18 (Test. of P. Stewart).
91 20 U.S.C. § 3611(b)(1); Tr. Vol. 31 at 4655:2–4656.17, 4659:19–4660:11, 4668:3–25 (Test. of
M. Tappen).
92 Tr. Vol. 20 at 2980:2–22 (Test. of C. Guerrieri); Exs. 3343-2, 3393, 3395.
93 Tr. Vol. 31 at 4655:2–4656:17, 4659:19–4660:11, 4665:6–4665:22 (Test. of M. Tappen).
20
The State Board of Education then goes through the rulemaking process which includes a public
notice and comments period.94
Florida began the development of its first set of ―Sunshine State Standards‖ in 63.
1991 as part of the Education Reform and Accountability Act: Blueprint 2000.95
Under the
leadership of Education Commissioner Frank Brogan, the first set of standards, the Sunshine
State Standards grades K–12, were adopted in seven content areas (language arts, mathematics,
science, social studies, foreign languages, the arts, and health & physical education) in 1996.96
This first set of Florida content standards were developed by teachers from around the state who
were brought together to identify the content to be taught at each grade level or for each high
school course.97
Professional development and technical assistance specific to implementation
of the Sunshine State Standards was provided to district content-area leaders by the Florida
Department of Education, six regional Area Centers for Educational Enhancement and state
university staff.98
The Next Generation Sunshine State Standards (―NGSSS‖) were adopted in 2007 64.
and 2008, depending on content area (in same 7 subjects as the Sunshine State Standards). The
purpose of changing was that the Sunshine State Standards were ―a mile wide and an inch deep‖.
They were also not internationally benchmarked, but based on what Florida educators thought
94 Stewart, v.26, 3958:16-3959:11.
95 Ex. 3520; Tr. Vol. 22 at 3324:9–3326:4 (Test. of M. Tappen).
96 Exs. 3345, 5344; Tr. Vol. 37 at 5541:2–5543:12 (Dep. Test. of F. Brogan).
97 Tr. Vol. 26 at 3959:19–3960.3 (Test. of P. Stewart); Tr. Vol. 30 at 4617:20–4618:3 (Test. of
M. Tappen); Tr. Vol. 37 at 5541:2–5543:12 (Dep. Test. of F. Brogan).
98 Tr. Vol. 30 at 4579:17–4584:24 (Test. of M. Tappen).
21
should be taught. The new standards were shifted to have fewer standards at each grade level,
but with more depth.99
NGSSS were instrumental in development of the Common Core standards and 65.
depending on the grade level, up to 85% of the NGSS were used in the Common Core
Standards.100
In 2010, the State Board of Education adopted the Common Core standards. The 66.
Board developed a timeline for implementation, and it was to be phased in starting with
kindergarten and then it moved up each year until they were to have it as a blended model of
NGSSS and Common Core in all of the grades.101
Due to public criticism of the Common Core standards, the State reviewed public 67.
input and convened a panel of experts to make some changes to the Common Core standards and
in February 2014, the State Board adopted the Florida Standards.102
One of the primary differences between NGSS and Common Core, and then the 68.
Florida Standards, was higher order thinking. In the past, students would read a passage and
would be asked the question ―What color was Sara‘s dress?‖ And in the Common Core (and
now the Florida Standards), students would read the same passage but they would be asked,
―Why, on this particular day, did Sara choose to wear a yellow dress?‖103
The development of the NGSSS, Common Core, and now the Florida Standards 69.
was done by internationally benchmarking what the top content in the top-performing nations
99 Stewart, v.26, 3960:10-3961:5; Tappen, v.30, 4617:5-4618:3.
100 Stewart, v.26, 3962:24-3963:13.
101 Stewart, v.26, 3961:10-3962:14.
102 Stewart, v.26, 3962:1-14.
103 Stewart, v.26, 3963:19-3964:5.

22
are, and then identifying what should be in the standards. The purpose of this was to raise the
bar for the content standards to address the fact that the United States had fallen behind other
nations in the world regarding student performance.104
The NGSSS for all content areas other than English Language Arts and Math 70.
have remained in place since 2009.
When standards change, it is important to ensure there is a period of time for 71.
professional development prior to full implementation of the standards. The State works to
develop professional development tools. Because of the size of the State, the Department
typically uses a ―train-the trainer‖ model or identifies a district lead.105
Beginning in 2007, in line with research indicating, among other things, that other 72.
countries were outperforming the U.S. on international assessments and that top-performing
countries have higher standards and fewer standards per grade level, Florida began development
of a new set of more rigorous state content standards, the ―Next Generation Sunshine State
Standards.‖106
The Florida Legislature adopted a comprehensive standards-development process 73.
to include the following: research on other states‘ and nations‘ standards, particularly those
considered to be exceptionally rigorous and to result in high student achievement; a process by
which renowned experts in the content area advised the state on the process and reviewed the
product; writers to include postsecondary content experts, experts in the field and educators; and
104 Tappen, v.30, 4617:5-19., 4618:20-4619:3.
105 Tappen, v.30, 4604:18-20, 4608:24-4610:24.
106 Exs. 3346, 5344; Tr. Vol. 22 at 3326:13–23, 3342:21–3343:25 (Test. of M. Tappen); Tr. Vol.
26 at 3960:9–3961:2 (Test. of P. Stewart); Tr. Vol. 30 at 4617:5–19 (Test. of M. Tappen).

23
review and comment from educators at all levels, leaders in business and industry, and the
public.107
The Next Generation Sunshine State Standards in English language arts and 74.
mathematics, adopted in 2010, incorporated the nationally developed Common Core State
Standards and were rated as ―too close to call‖ when compared with the rigor of Common Core
State Standards.108
In 2014, Governor Rick Scott requested a public and expert review of the English 75.
language arts and mathematics standards, which incorporated the Common Core State
Standards.109
Four public hearings took place and a web-based review system was provided for
public comment. Based on the comments collected at the hearings, provided in emails and
provided in the web-based review system, experts in the content areas made recommendations to
strengthen the standards. Prior to formal adoption by the State Board of Education in February
2014, an additional public hearing took place to provide the public an opportunity to review the
ninety-nine improvements to the standards.110
These standards were referred to as the ―Florida
Standards‖ in English language arts and mathematics.111
In addition to the implementation of a more rigorous standards-development 76.
process, in 2009, the Florida Department of Education aligned other requirements of the K–12
system.112
When new standards are adopted, course descriptions that include the new standards
107 § 1003.41, Fla. Stat.; Tr. Vol. 30 at 4606:4–4611:12 (Test. of M. Tappen); Ex. 3346.
108 Exs. 3344, 5344; Tr. Vol. 22 at 3345:19–3346:12 (Test. of M. Tappen).
109 Tr. Vol. 26 at 3962:1–23 (Test. of P. Stewart); Tr. Vol. 22 at 3347:3–20 (Test. of M. Tappen).
110 Tr. Vol. 26 at 3962:1–23 (Test. of P. Stewart); Tr. Vol. 22 at 3347:3–20 (Test. of M. Tappen).
111 Exs. 3342, 3343.
112 Tr. Vol. 30 at 4606.4–4611.12 (Test. of M. Tappen); Ex. 3346.
24
must be approved the year prior to the year teachers are required to teach from those course
descriptions.113
Teacher certification exams also must be reviewed and revised to reflect the
needs of teacher preparation and expectations to teach the new more rigorous content.114
Florida‘s statewide instructional materials schedule was revised so that state funding dedicated to
instructional materials would match the year the school districts are required to implement new
standards.115
In addition, the Department increased available professional development directly 77.
related to implementation of the standards.116
As much as possible, Department staff provided
support upon request to local school districts, although districts are not required to participate in
professional development opportunities offered by the State.117
All school districts were
provided services by the Just Read, Florida! Office, with over half the districts being visited
more than once by staff members to support implementation of research-based reading
instruction.118
With the implementation of the new more rigorous standards in 2010, the
Department provided summer professional development to all districts and all schools in the
state.119
Professional development activities were offered the summers of 2011, 2012, and 2013,
and school districts applied for additional Race to the Top funds to supplement their professional
113 § 1003.42., Fla. Stat.
114 § 1012.56(4), Fla. Stat.
115 Tr. Vol. 30 at 4604:2–17 (Test. of M. Tappen); Exs. 3346, 3477.
116 Tr. Vol. 30 at 4604:18–4605:2, 4608:24–4609:24 (Test. of M. Tappen); Tr. Vol. 32 at
4785:22–4786:1 (Test. of K. Hebda).
117 Tr. Vol. 30 at 4604:18–4605:2, 4608:24–4609:24, 4619:10–4621:18 (Test. of M. Tappen); Tr.
Vol. 32 at 4783:7–4785:21 (Test. of K. Hebda).
118 Ex. 3400; see § 1001.215, Fla. Stat.; Tr. Vol. 32 at 4785:2–10 (Test. of K. Hebda).
119 Tr. Vol. 30 at 4619:10–4621:18 (Test. of M. Tappen).
25
development programs in the summer of 2014.120
All of these activities took place prior to full
implementation of the new standards and aligned assessment.121
After standards are adopted, the Department of Education builds course 78.
descriptions. In Florida, there is an instructional materials adoption process and the State works
to match the timing of the new materials with the cycle for instructional materials (there is an
appropriation annually by the Legislature to purchase instructional materials on a cycle because
districts do not buy all new materials annually).122
Florida also assures that districts have access to instructional materials aligned to 79.
the standards.123
Florida has had an instructional materials review process for over 30 years.124
Under the current process, materials to teach a content area with new standards are reviewed and
then placed on a State list of adopted materials the year prior to the school districts‘ requirement
to teach the standards.125
Districts are authorized to create their own process for approval of
materials, but Florida law requires that the instructional materials be aligned to the standards,
either through a State process or a local school district process.126
Arts, Music and PE Instruction
The Department of Education interprets Fla. Stat. § 1003.42 to mean that subjects 80.
listed in the statute such as art, music, and PE are not required to be taught (unless required for
120 Id.
121 Id.
122 Tappen, v.30, 4603:19-4604:17, 4606:19-4607:5.
123 Tr. Vol. 30 at 4607:14–22 (Test. of M. Tappen).
124 §§ 1006.28–.31, Fla. Stat.; Tr. Vol. 30 at 4607:23–4608:23 (Test. of M. Tappen).
125 Tr. Vol. 30 at 4607:14–4608:23 (Test. of M. Tappen).
126 § 1006.283, Fla. Stat.
26
middle grades promotion or high school graduation), but when a school district chooses to teach
them, they are required to teach to the standards.127
There are specific requirements for physical education set forth in Fla. Stat. § 81.
1003.455.
Florida has standards in each grade for dance, health education, music, physical 82.
education, theater, and visual arts. These standards ―specify the core content knowledge and
skills that K-12 public school students are expected to acquire.‖ The Legislature specifically set
out requirements for content standards in these areas as follows:
Visual and performing arts, physical education, health, and foreign
language standards must establish specific curricular content and
include distinct grade level expectations for the core content
knowledge and skills that a student is expected to have acquired by
each individual grade level from kindergarten through grade 5. The
standards for grades 6 through 12 may be organized by grade
clusters of more than one grade level.128
The Florida Legislature requires that the Commissioner of Education prepare an 83.
annual report that includes a description of student access to and participation in fine arts courses
(visual arts, music, dance, and theatre), including information about facilities and certifications
of educators providing instruction. The Commissioner is also required to report the manner in
which schools are providing ―the core curricular content for fine arts established in the Next
Generation Sunshine State Standards.‖129
Even though the State has established content standards for arts education, there 84.
are disparities in how arts education is provided by local districts across the State. As discussed
127 Stewart, v.26, 3973:7-3974:18, 4082:1-4085:13.
128 Stewart, v.26, 4083:20-24; Roberts, v.6, 926:7-9; § 1003.41(1) & (2)(e), Fla. Stat. (2015).
129 § 1003.4995, Fla. Stat. (2015).
27
below, due to funding issues, some school districts raise private grants or money through voter-
approved referenda to levy additional property millages to fund arts programs. Other districts do
not fund arts and music in all of their schools.
The Duval School District found that, because of the emphasis on standardized 85.
testing, funding for arts and music has declined as a focus for school districts including Duval.
As part of a new ―Develop the Whole Child‖ initiative, Duval funded a music and art teacher at
every elementary school. The District rebuilt an art and/or music program at each of the middle
schools. The ―Develop the Whole Child‖ initiative recognizes that the school experience in child
development goes beyond standardized testing and often, if provided, students will do better as
far as standardized tests are concerned with additional supports in place.130
Other school districts do not have the financial resources for arts education, 86.
particularly at the elementary school level. In Franklin School District, to address critical
financial issues, the district discontinued elementary art.131
Hernando School District is not able
to offer arts and music in all of the schools.132
Some school districts have levied additional funds through voter-approved 87.
referenda specifically to fund arts and music: Alachua, Marion, Orange, Palm Beach, and
Pinellas. Three school districts tried to pass a voter referendum to raise money to pay for arts
and music instruction, but the referenda failed (Flagler, Lafayette, and Volusia).133
130 Vitti, v.5, 630:12-631:14, 690:21-691:7.
131 Marks, v.7, 1052:5-14, 1054:12-20.
132 Romano, v.13, 1995:16-25, 2016:22-2017:19.
133 Ex. 1204, at 29062-65, 29068, 29430-33, 29524-25, 29532-39, 29567-68, 29206-07, 29385-
92, 29731-33.
28
Alachua School District levied the 1 mill for art, music, PE, magnet programs, 88.
and technology. Prior to the referendum passing, the district had cut back these programs
drastically and would have phased them out the following year had the referendum not passed.134
Palm Beach School District also uses its voter approved millage to fund arts, 89.
music, and PE in all of the elementary schools. The millage also supports its choice programs
(formerly known as magnet schools) which includes two elementary schools of the arts, a middle
school of the arts, and a high school of the arts. The high school of the arts has a private
foundation, and in the past year had more than $1 million pass through the internal school
operating budget that was not funded by the district.135
Sarasota School District, which funds its art, music and drama programs through 90.
funds generated by a voter-approved millage, is nationally recognized for the quality of their
visual and performing arts programs. The Kennedy Center for Performing Arts has recognized
Sarasota‘s arts education as one of the best in America.136
Impact of Changing Standards
In a Florida Association of District School Superintendents (―FADSS‖) letter to 91.
Commissioner Stewart in February 2015 about the upcoming FSA administration, FADSS
specifically raised concerns about the changing standards, noting that since 2011, school districts
have implemented three different sets of education standards: (1) Next Generation Sunshine
State Standards, (2) Common Core Standards, and (3) the recently adopted Florida Standards.
134 Roy, v.9, 1260:17-1261:3, 1262:8-13, 1266:13-1267:1; Boyd, v.16, 2430:18-2433:8; McGriff,
v.20, 2941:1-14, 2941:24-2942:6.
135 Robinson, v.22, 3221:13-3223:17.
136 Weidner, v.25, 3775:3-3776:17; Ex. 1129.

29
FADSS expressed that it had repeatedly voiced concerns that teachers did not have enough time
to teach the standards being assessed in 2015. FADSS stated that:
Full implementation of the standards throughout all grades requires
a multi-year effort of intense teacher professional development,
coupled with the adoption of curriculum and instructional materials
that are accurately aligned with the new state standards. The lack
of a systematic and realistic timeline for all grades to fully
implement the Florida State Standards has been a source of the
conflict and struggle faced by teachers today. These standards are
not the same as the former standards. The previous standards
emphasized the ―what‖ and not the ―why.‖ The new standards
require a whole new way of delivering instruction. Teachers have
not had adequate time or professional development to ensure
student‘s success.137
Changing standards is difficult for a school district to fully implement. The 92.
process includes aligning the new standards with curriculum materials and with teacher training,
and preparing students to ensure they are successful on new assessments. Former Alachua
Superintendent Boyd testified that having four sets of standards over the past 15 years is ―like
turning a battleship with a paddle. Trying to get things moved in another direction when you‘ve
got your resources lined up, your teacher staff development moving in one direction, and then
you have to stop and do something else.‖138
As it relates to changing standards, the most important thing that districts, schools 93.
and students need is time. The teachers need time to learn the standards and how to teach the
standards to the students with new curriculum that is aligned to the new standards. With the
implementation of the Florida Standards, teachers did not have adequate preparation for
professional development to be able to teach the standards. Before students can be expected to
137 Ex. 1876; Roberts, v.6, 814:3-815:18.
138 Boyd, v.16, 2433:21-2435:20, 2436:15-20; see also Littleton, v.7, 945:14-947:18.
30
master the content of the standards, the teachers have to master the standards to a degree of depth
that allows them to teach effectively. Because the standards are more rigorous, teachers need
time to build their expertise so they are ready to deliver the curriculum at the depth and scope
required; otherwise, the students will not benefit from the instruction.139
Alachua Superintendent Owen Roberts described the challenges with failing to 94.
give teachers enough time to learn the new standards before teaching them as ―asking them to
ride a bicycle while they‘re building it. And, basically, that never works because the kids are the
ones who suffer as a result of that.‖140
The students who are primarily affected are the ones in poverty because they do 95.
not have the same support systems in place. Other children will be able to adapt more easily to
the challenges and not be as impacted by the changes.141
The changes in the standards, particularly by increasing the rigor of the standards, 96.
impacts struggling learners. Students who previously received a Level 1 or Level 2 all have to
take the new assessment. They were already struggling, and need more support to ensure that
they do not fall farther behind when the bar is raised and the curriculum and assessments become
more challenging. Bay School Board Member Ginger Littleton described the challenge this way,
―If you‘ve got a journey of 5 miles, you do it one way. If you do a journey of 500 miles, you
prepare differently. So that‘s one of the issues. What we have seen is that the students who are
struggling have more and more difficulty. As they climb up that wall, clawing their way to the
139 Marks, v.7, 1061:24-1062:21; Roy, v.9, 1278:22-1290:3; Roberts, v.6, 816:8-818:15; Boyd,
v.16, 2442:2-23; Hiltz, v.23, 3536:4-3537:16; Thompson (Ella), v.15, 2243:10-2247:5, 2250:12-
23, 2256:3-8; Ex. 2013, at 59247.
140 Roberts, v.6, 775:3-776:11.
141 Roberts, v,6, 816:8-818:15.
31
grade level, it gets … when you make the wall thornier, it simply gets harder to get up the
wall.142
Raising proficiency benchmarks requires providing students with necessary 97.
supports to get them to achieve at those levels. Raising benchmarks and not doing anything
differently just means more children will fail.143
Not doing anything different is largely and
primarily a local School District responsibility.
Aligned Assessments and Accountability System B.
The Commissioner of Education is required to ―design and implement a statewide 98.
program of educational assessment that provides information for the improvement of the
operation and management of the public schools … in accordance with the requirements of
chapter 1008.‖ 144
The content standards adopted by the State Board of Education are the basis for 99.
the statewide assessments. The purpose of the assessments is to test the child‘s understanding of
content standards at the end of the year based on the grade level or subject area.145
Florida‘s statewide assessment and accountability system is research-based and 100.
the result of thorough consideration and stakeholder input, including from Florida educators. As
discussed below, not only are many aspects of the system required by federal law, but Florida‘s
early adoption of an assessment and accountability system was used to shape federal law and
national policy in this area. There is no persuasive evidence that Florida‘s assessment and
accountability system is arbitrary or capricious or in any way prevents students from obtaining a
142 Littleton, v.7, 947:19-24, 949:2-14; Vitti, v.5, 654:14-19, 655:24-656:10.
143 Tobin, v.2, 201:16-24.
144 § 1001.11(5), Fla. Stat. (2015); Stewart, v.26, 3966:25-3967:10.
145 Fla. Admin. Code R. 6A-1.09401; Vitti, v.5, 654:11-13; Tappen, v.30, 4610:12-20.
32
high-quality education; instead, it has been a key aspect of Florida‘s system of continuous
improvement, as detailed below.
Various state policies, discussed in this Section and throughout these findings, 101.
rely upon the use of statewide, standardized assessments. The purpose of an assessment aligned
to the content standards is to ensure that uniform standards are being taught across the state by
measuring how well students are mastering those standards, what progress has been made and
what additional progress needs to be made. The assessment is an extension of the instruction of
the standards, designed to ensure that students are mastering the content defined in the State‘s
content standards and to give the State and local school districts the necessary information to
determine if students have mastered the content and skills necessary for success at the next level
of education, into college and career.146
It is the opportunity for students to demonstrate what
they have learned, and for schools, districts, and teachers to ascertain how well they, as
instructional leaders, have provided students with the necessary instruction aligned to the
standards.147
The purpose of the performance accountability system is to ―assess the 102.
effectiveness‖ of Florida‘s education system by providing answers to the following questions
related to its mission and goals: ―(1) What is the public receiving in return for funds it invests in
education? (2) How effectively is Florida‘s K-20 education system educating its students? (3)
How effectively are the major delivery sectors promoting student achievement? (4) How are
individual schools and postsecondary education institutions performing their responsibility to
146 Ex. 1875 at 5–6; Tr. Vol. 26 at 3968:17–25 (Test. of P. Stewart); Tr. Vol. 29 at 4327:24–
4329:1 (Test. of J. Copa).
147 Id.

33
educate their students as measured by how students are performing and how much they are
learning?‖148
The accountability system is designed to be ―a single, unified system with 103.
multiple components including, but not limited to, student performance in public schools and
school and district grades.‖149
The accountability system is required to measure student progress towards the 104.
following goals:
a. Highest student achievement, as indicated by evidence of student learning
gains at all levels;
b. Seamless articulation and maximum access, as measured by evidence of
progression, readiness, and access by targeted groups of students
identified by the Commissioner of Education;
c. Skilled workforce and economic development, as measured by evidence of
employment and earnings;
d. Quality efficient services, as measured by evidence of return on
investment; and
e. Other goals as identified by law or rule.‖150
In order for an assessment to be a valid measure of student mastery or progress on 105.
those content standards, it must be aligned to those standards.151
148 § 1008.31(1)(a), Fla. Stat. (2015).
149 § 1008.31(1)(b), Fla. Stat. (2015).
150 § 1008.31(2)(c), Fla. Stat. (2015).
151 Copa, v.29, 4340:2-12.
34
The test changes along with the change in standards because the Department of 106.
Education has ―a moral, ethical and legal obligation to make sure that the assessment is aligned
to the standards.‖152
The Florida Standards Assessment (―FSA‖) was first administered in the Spring 107.
of 2015. That assessment is aligned to the Florida Standards. Prior to the FSA, there was the
FCAT 2.0. That test was aligned to the NGSSS. And prior to that was the FCAT, which was
aligned to the Sunshine State Standards.153
The state accountability system is one way to measure whether the State is 108.
allowing all students to obtain a high quality education. It is a State requirement that students
should perform adequately on the state assessments, which are used to determine school grades,
teacher evaluation, district performance, and student level decisions. Because the State has
designed the content standards, the scores for passing, and the assessments themselves to
measure how students are performing and how much they are learning, then these assessments
should be used to determine whether or not there is evidence that the State is providing a high
quality education.154
History of Statewide Assessments
With the goal of ensuring continuous improvement, Florida policymakers have 109.
reformed the criteria used to evaluate students and schools over time. 155
Raising standards and
152 Stewart, v.26, 3968:8-16.
153 Stewart, v.26, 3967:11-3968:7; Tappen, v.22, 3346:16-3347:2.
154 Roberts, v.6, 764:1-19.
155 Tr. Vol. 26 at 3984:11–3986:6 (Test. of P. Stewart); Tr. Vol. 29 at 4331:19–4338:23,
4388:14–4389:24 (Test. of J. Copa).
35
expectations for students and schools has resulted in improved performance of Florida‘s schools
and students.156
Although Florida has used statewide assessments since the 1970s, the current 110.
standards-based assessments began in 1998 with the Florida Comprehensive Assessment Test
(―FCAT‖).157
The FCAT was first administered in 1998 in reading (grades 4, 8 and 10) and
mathematics (grades 5, 8 and 10), and tested mastery of the Sunshine State Standards.158
FCAT
reading and mathematics assessments were expanded to grades 3–10 in 2001, which allowed for
the calculation of student learning gains from year to year.159
Florida‘s policy was a forerunner
of federal law, as the 2002 No Child Left Behind Act (―NCLB‖) required all states to annually
assess students in reading/language arts and mathematics in grades 3–8 and at least once in high
school.160
Florida introduced a science FCAT in 2003, also in compliance with NCLB.161
In 2011, after the transition to the Next Generation Sunshine State Standards, the 111.
state transitioned to FCAT 2.0, which was developed to assess student mastery of the new
156 Tr. Vol. 26 at 3986:7–18 (Test. of P. Stewart); Tr. Vol. 29 at 4444:14–4454:19 (Test. of J.
Copa); Tr. Vol. 35 at 5212:14–5213:6, 5270:13–5271:1 (Test. of J. Greene); Ex. 1813 at
DOE03179, DOE03181–87; Ex. 1875 at 9–11; Exs. 133, 134, 135, 136, 137, 138, 1807, 1808,
1809, 1810, 1811, 1812, 1829, 1830, 1831, 1832, 1833, 1834, 3186, 3187, 4050, 5292, 5328.
157 Ex. 5344; Ex. 1875 at 8; Ex. 4047 at 00122081–83; Tr. Vol. 29 at 4331:19–4338.23 (Test. of
J. Copa).
158 Ex. 5344; Ex. 1875 at 8; Ex. 4047at 00122081–83; Tr. Vol. 22 at 3341:14–3342:9, 3343:9–25
(Test. of M. Tappen); Tr. Vol. 29 at 4331:19–4338.23 (Test. of J. Copa); Tr. Vol. 26 at 3968:2–7
(Test. of P. Stewart).
159 Ex. 4047 at 00122081–83; Tr. Vol. 29 at 4331:19–4338.23 (Test. of J. Copa).
160 Id.; 20 U.S.C. § 6311 (b)(3)(B).
161 Id.
36
standards.162
At the same time, Florida also began implementing End-of-Course assessments
(―EOCs‖) to measure student mastery of content in select middle- and high-school courses.163
The Algebra I EOC began in 2011, with EOCs in Geometry and Biology added in 2012, U.S.
History in 2013, and Civics in 2014.164
In 2014–15, the state transitioned to the Florida Standards Assessment (―FSA‖), 112.
which was developed to assess mastery of the Florida Standards in grades 3–11 for English
language arts and grades 3–8 for mathematics, with EOCs for Algebra I, Algebra II, and
Geometry.165
With respect to the FSA, sample items were made available on the Department‘s
website almost one year before the administration of the test in the spring of 2015.166
Validity, Reliability and Development of Assessments
The statewide, standardized assessments in Florida have been developed, 113.
administered, scored and reported using industry-standard best practices in large-scale
assessment, meeting all professional standards of psychometric quality traditionally associated
with standardized achievement tests.167
Florida employs an inclusive process involving Florida
educators all along the way in areas such as content review, bias and sensitivity review, and
162 Exs. 5344, 4047 at 00122081–83; Tr. Vol. 29 at 4334:13–23 (Test. of J. Copa); Tr. Vol. 22 at
3346:16–3347:2 (Test. of M. Tappen); Tr. Vol. 26 at 3967:24–3968:1 (Test. of P. Stewart); Exs.
4047, 5344.
163 Exs. 5344, 4047 at 00122081–83; Tr. Vol. 29 at 4331:19–4338.23 (Test. of J. Copa).
164 Id.
165 Id.
166 Ex. 1813at DOE03195–200; Tr. Vol. 26 at 4035:6–4039:5 (Test. of P. Stewart).
167 Tr. Vol. 29 at 4340:13–4349:17 (Test. of J. Copa); Exs 112, 113, 1819 at 00052222–25.
37
performance standard setting.168
This inclusive process of involvement substantiates the content
validity of the assessments.169
Plaintiffs have not presented persuasive evidence that Florida‘s statewide 114.
assessments are invalid or unreliable. Indeed, psychometric analyses of Florida‘s statewide,
standardized assessments, including the FCAT, FCAT 2.0, and FSA, have consistently
demonstrated that the assessments are reliable. Third-party reports from the American Institutes
for Research (―AIR‖) and Alpine Testing Solutions, Inc., have concluded that these assessments
are technically sound and meet or exceed professional standards for standardized achievement
tests.170
In an effort to assure content validity of the assessments, the Florida Department 115.
of Education has implemented the following steps for items included on its assessments:
a. educators and citizens judge the standards and skills acceptable;
b. item specifications are written;
c. test items are written according to the guidelines provided by the item
specification;
d. the items are pilot tested using randomly selected groups of students at
appropriate grade levels;
e. all items are reviewed for cultural, ethnic, language, and gender bias and
for issues of general concern to Florida citizens;
f. instructional specialists and practicing teachers review the items;
g. the items are field tested to determine their psychometric properties;
168 Id.
169 Id.
170 Tr. Vol. 29 at 4347:17–4349:17 (Test. of J. Copa); Exs. 2152, 1819, 1820.
38
h. the tests are carefully constructed with items that met specific
psychometric standards; and
i. the constructed tests are equated to the base test to match both content
coverage and test statistics.171
The Department employs various committees of practicing Florida classroom 116.
teachers and curriculum staff to review test items and committees of educational leaders and
citizens to make recommendations.172
These committees are diverse in terms of ethnicity,
gender, geographic region, county size, and county type. For the FSA specifically, the
development of the first-year administration in 2014–15 relied upon a bank of items that were
field tested and then reviewed by Florida content experts to ensure that the items aligned to
Florida standards and were appropriate for Florida students. Work continued with the various
committees of Florida educators to develop assessment items aligned to the Florida Standards for
the 2015–16 and future administrations of the FSA.173
Once tests are administered, they are subject to a lengthy and rigorous scoring 117.
process. The scoring is performed by an outside test-scoring company, using the same process
used across the nation by states with large-scale testing programs. Before results are released,
student and school scores are reviewed for anomalous data that would indicate testing
irregularities.174
Although actual test items cannot be released because they may be used in
171 Tr. Vol. 29 at 4342:4–4347:9 (Test. of J. Copa); Ex. 1819 at 00052224– 42.
172 Tr. Vol. 29 at 4340:2–4347:9 (Test. of J. Copa); Exs. 112, 113, 1819 at 00052222–23.
173 Id.
174 Tr. Vol. 29 at 4356:18–4360:23 (Test. of J. Copa).
39
future years, sample test items are made public to provide students and parents with examples of
the type of questions on the statewide assessments. 175
Administration of Assessments
Florida began moving to computer-based testing in the 2010–11 school year.176
118.
Some assessments are administered by computer and some on paper, depending on the grade and
subject, with additional grade levels and subjects transitioning to computer-based testing each
year.177
For the 2014–15 FSA , each local school district submitted certifications, signed by the
district superintendent, certifying that the district was ready for computer-based administration of
the FSA.178
Plaintiffs‘ contention that students are spending ―too much time‖ testing is not 119.
supported by evidence. The Department sets large spans of dates (testing windows) in which
districts can locally manage the timing of test administration, in order to accommodate districts
with additional time to complete assessments for all students in the district, but these windows do
not indicate the amount of time individual students are actually sitting for tests.179
Plaintiffs have
not presented any evidence of the ―correct‖ amount of time that should be used for student
assessment. Moreover, local districts and schools, and the teachers they hire, are responsible for
175 Tr. Vol. 29 at 4350:22–4351:6 (Test. of J. Copa); Tr. Vol. 26 at 4036:8–14 (Test. of P.
Stewart); Ex. 1813 at DOE03196–96.
176 Tr. Vol. 26 at 4033:25–4034:3 (Test. of P .Stewart); Tr. Vol. 29 at 4355:13–4356:17 (Test. of
J. Copa); Ex. 5344.
177 Tr. Vol. 26 at 4033:25–4034:11 (Test. of P. Stewart); Ex. 5344.
178 Exs. 1716, 1851.
179 Tr. Vol. 29 at 4351:7–4355:3 (Test. of J. Copa); Exs. 114, 115, 116; Ex. 1875 at 00055511,
00055521–23; Ex. 5289.

40
allocating how much classroom time is spent on ―test preparation‖ activities and how staff and
facilities are utilized for the administration of the test during the testing window.180
Nevertheless, the Legislature and the Department have shown that the political 120.
process has been responsive to public concern about ―high-stakes testing.‖ In early 2015, the
Department conducted an investigation into the amount of testing in Florida schools, including
statewide assessments as well as district-, school-, and teacher-developed assessments.181
And
legislation was passed during the 2015 legislative session, and implemented by the Department,
that reduced that amount of assessment required and the impact of the assessments on various
aspects of the accountability system, including teacher evaluation.182
As detailed in the report of the Department‘s investigation, much testing in 121.
Florida‘s schools is determined and required locally by the district or school and not required by
the State.183
Performance-Level Standard Setting (Cut Scores)
Florida law provides for a rigorous and thorough public process for setting 122.
performance standards, with stakeholder input at multiple levels meant to ensure that
expectations are set at the appropriate level to gauge improvement.184
Because the statewide assessments are ―criterion-referenced,‖ rather than ―norm-123.
referenced‖ assessments, performance-level standard setting is an important process each time a
new test, new standards, or achievement-level descriptions change. Florida uses five
180 Id.
181 Ex. 1875.
182 Ch. 2015-6, Fla. Laws.
183 Ex. 1875 at 00055529–32.
184 Tr. Vol. 29 at 4356:18–4360:23 (Test. of J. Copa); Ex. 117; Ex. 4047 at 00122085–98.
41
achievement levels (Levels 1, 2, 3, 4, and 5) to categorize student performance on the statewide
assessments.185
The cut point between Levels 2 and 3 is used to determine ―satisfactory‖
mastery of the standards. Achieving a Level 2 on the FCAT 2.0, for example, indicates that a
student demonstrated ―a below satisfactory level of success with the challenging content of the
Next Generation Sunshine State Standards,‖ while a Level 1 demonstrates ―an inadequate level
of success with the challenging content of the Next Generation Sunshine State Standards.‖
Earning a Level 1 or 2 in reading on the Florida state assessment therefore is not an indication
that a student ―can‘t read‖ or is illiterate.186
Pursuant to § 1008.22, Fla. Stat., the Department has established a multi-step 124.
standard-setting process to recommend achievement levels for the assessments, with multiple
avenues for input and participation. This process occurs after students have sat for the first
administration of any new assessment. For each subject area, the process involves content
experts; an ―educator panel‖ of Florida educators nominated by their superintendents; a ―reactor
panel‖ of Florida education leaders, postsecondary faculty, and business/community leaders; and
public input workshops, all of which are considered by the Commissioner in making
recommended cut points.187
The recommendations are then presented to the Legislature for a 90-
day public review period, at the end of which the State Board of Education may make the final
decision to authorize the cut points.188
185 Tr. Vol. 29 at 4356:18–4360:23 (Test. of J. Copa); Ex. 4047 at 00122085–88.
186 Tr. Vol. 26 at 4054:21–4055:11 (Test. of P .Stewart); Tr. Vol. 29 at 4360:24–4361:21 (Test.
of J. Copa); Ex. 4047 at 0122088.
187 Tr. Vol. 29 at 4356:18–4360:23 (Test. of J. Copa); Ex. 117; Ex. 4047 at 00122089,
00122091–98.
188 Tr. Vol. 26 at 3979:10–3982:3 (Test. of P .Stewart); Tr. Vol. 29 at 4356:18–4360:23 (Test. of
J. Copa); Ex. 4047 at 00122098, 00122105.
42
The current FSA cut scores were set after the 2014–15 administration of the FSA, 125.
with approval of many district superintendents and other stakeholder groups.189
These cut scores
represent a policy choice about performance level standards. The State could have chosen to set
the scores so that more students would be performing at the satisfactory level, but Florida has
made a policy choice to have high performance standards, which have led to improvement over
time, even if the initial cut scores placed the majority of students below the satisfactory level.190
Use of Assessments in the Accountability System
As described above, various State policies rely on the use of statewide, 126.
standardized assessments. The impacts of the assessments on students, schools, districts, and
teachers are summarized below:191
a. Subject to a number of good-cause exemptions, a student must earn a Level 2
or above on the grade 3 English language arts (ELA) assessment to be
promoted to grade 4;192
b. A student must pass the grade 10 ELA assessment, or earn a concordant score
on the SAT or ACT, to graduate from high school;193
189 Tr. Vol. 29 at 4360:14–23 (Test. of J. Copa); Ex. 2158.
190 Tr. Vol. 26 at 3984:11–3986:18 (Test. of P. Stewart); Tr. Vol. 29 at 4331:19–4338:23,
4388:14–4389:24, 4444:14–4454:19 (Test. of J. Copa); Tr. Vol. 35 at 5212:14–5213:6, 5270:13–
5271:1 (Test. of J. Greene); Ex. 1813 at DOE03179, DOE03181–87; Ex. 1875 at 9–11;Ex. 4047
at 00122107–08.
191 Ex. 1875 at 00055518–19.
192 Tr. Vol. 27 at 4092:20–4093:7 (Test. of P. Stewart); Tr. Vol. 31 at 4633:8–4636:2 (Test. of
M. Tappen); Tr. Vol. 30 at 4481:4–4483:7 (Test. of J. Copa).
193 Tr. Vol. 26 at 3990:24–3991:3 (Test. of P. Stewart); Tr. Vol. 30 at 4481:4–4483:7 (Test. of J.
Copa).
43
c. A student must pass the Algebra I EOC, or earn a comparative score on the
Postsecondary Education Readiness Test (―PERT‖), to graduate from high
school;194
d. A student enrolled in a course with a statewide EOC must take the assessment,
and the results count as 30% of the student‘s course grade;195
e. A student who does not meet the specific levels of performance on the
assessment must be provided with additional diagnostic assessments and
remediation;196
f. The achievement and learning gains of students are used to determine school
grades, district grades, and school improvement ratings for alternative
schools;197
g. Schools identified as in need of improvement based on student performance
must provide progress monitoring and receive supports and intervention;198
and
h. For teachers teaching courses associated with the statewide assessment, the
results are used to measure student learning growth and included in the
―performance of students‖ portion of the teacher‘s evaluation.199
194 Tr. Vol. 26 at 3994:24–3995:4 (Test. of P. Stewart); Tr. Vol. 30 at 4481:4–4483:7 (Test. of J.
Copa).
195 Tr. Vol. 26 at 3991:4–8 (Test. of P. Stewart).
196 Ex. 1875 at 00055519.
197 Ex. 1875 at 00055519
198 Ex. 1875 at 00055519; Tr. Vol. 30 at 4596:20–4597:15 (Test. of M. Tappen).
199 Ex. 1875 at 00055519.

44
School Grading and Accountability C.
Florida‘s statewide assessment results are used to implement Florida‘s 127.
accountability system, with the purpose of ensuring that the State, school districts, schools and
teachers are held accountable for improving student achievement. A primary aspect of
accountability is Florida‘s ―school grading‖ system, by which districts and schools receive an A–
F letter grade. The purpose of Florida‘s school grading system is to promote improvement in
student outcomes by communicating the performance of schools in a format consumable by the
public. Through the administration of assessments and the reporting of results through school
accountability, parents, the public and educators are able to identify the areas in which students
are excelling and the areas in which students are struggling.200
An examination of the history of the accountability system reveals that all of the 128.
changes made were rationally based on consideration of many factors, including the previous
results of the system, public input through the political process, and federal law. Indeed, the
history of the State‘s accountability system provides support for the policy of continuous
improvement, as student achievement has increased with the raising of standards and
expectations for students and schools.201
As early as 1995, Florida began identifying ―critically low performing schools,‖ 129.
based on the results of norm-referenced tests, the state writing assessment, and the High School
Competency Test.202
Identifying these schools resulted in a commitment to improving student
200 Tr. Vol. 37 at 5580:13–5582:6 (Dep. Test. of F. Brogan); Tr. Vol. 26 at 3978:22–3979:9
(Test. of P. Stewart); Tr. Vol. 29 at 4329:2–25, 4362:18–4363:7 (Test. of J. Copa).
201 Tr. Vol. 26 at 3991:19–3992:3 (Test. of P. Stewart); Ex. 5344.
202 Tr. Vol. 29 at 4363:12–4364:19 (Test. of J. Copa); Ex. 4047 at 00122081.
45
achievement for all schools and students, as the number of lowest-performing schools dropped
from 158 in the first year of the program to 4 in the fourth and final year of the program.203
School grades based on the statewide standards assessment, then the FCAT, were 130.
first issued in 1999, as part of the A+ Plan for Education.204
While this change to the
accountability system initially resulted in more schools earning a low grade (76 ―F‖ schools in
1999 versus 4 ―critically low performing‖ schools in 1998), the number of ―F‖ schools dropped
to zero by 2001.205
In 2001, the FCAT was first administered to all grades from 3–10, allowing the 131.
school-grades formula to incorporate student progress from year-to-year, known as ―learning
gains.‖206
The 2002 school grades were the first year in which half the school grade was based
on that year‘s student assessment scores and half on learning gains, focusing on the lowest-
performing students, not simply static performance in a given year.207
With this change to the
school grading formula, the number of schools earning an ―F‖ again increased in 2002, although
it again decreased over the following years.208
Additional changes were made in 2005 and 2007, including fully incorporating 132.
the learning gains of ELLs and students with disabilities into the school-grades calculation, with
203 Tr. Vol. 29 at 4382:10–23 (Test. of J. Copa); Ex. 1829.
204 Tr. Vol. 30 at 4573:12–22 (Test. of M. Tappen); Tr. Vol. 29 at 4363:12–4364:19 (Test. of J.
Copa); Ex. 4047 at 00122082.
205 Tr. Vol. 30 at 4584:19–23 (Test. of M. Tappen); Tr. Vol. 29 at 4386:24–4389:24 (Test. of J.
Copa); Exs. 1829, 1830.
206 Tr. Vol. 29 at 4363:12–4364:19 (Test. of J. Copa); Ex. 4047 at 00122082.
207 Id.
208 Tr. Vol. 29 at 4386:24–4389:24 (Test. of J. Copa); Tr. Vol. 30 at 4584:24–4585:17 (Test. of
M. Tappen); Exs. 1829,1830.
46
the purpose of renewing the focus on these student populations.209
Again, the number of ―F‖
schools initially increased after each change but lowered in successive years.210
In 2010, high-school grade calculations were changed to include the high-school 133.
graduation rate as well as student participation and performance in accelerated coursework and
industry certifications.211
Florida‘s graduation rate has maintained a level of improvement over
the past several years as the school accountability system began to include the graduation rate as
a component to evaluate high school performance. With the incentive of measurement in place,
schools across the State have responded favorably, graduating more students, including minority
students.212
A confluence of events in the 2010–11 school year resulted in a number of 134.
changes to the school grading system.213
Not only had the State transitioned to the FCAT 2.0,
aligned with the Next Generation Sunshine State Standards, but in order to comply with federal
law, the state was required to include more students with disabilities and recently-arrived ELLs
in the student achievement (as opposed to the ―learning gain‖) component of its school-grades
calculation.214
In response to these changes, there was a groundswell of public support for
modification to the school grading system to mitigate the impacts. District superintendents
209 Tr. Vol. 29 at 4370:4–4371:2 (Test. of J. Copa); Ex. 4047 at 00122082.
210 Tr. Vol. 29 at 4386:24–4389:24 (Test. of J. Copa); Exs. 1829, 1830.
211 Tr. Vol. 29 at 4363:12–4364:19 (Test. of J. Copa); Ex. 4047 at 00122083.
212 Tr. Vol. 26 at 3991:19–3992:3 (Test. of P. Stewart); Exs. 5328, 5329.
213 Tr. Vol. 29 at 4363:12–4364:19 (Test. of J. Copa); Ex. 4047 at 00122083.
214 Tr. Vol. 29 at 4370:4–4371:12 (Test. of J. Copa).
47
widely supported various mitigation policies, most notably a ―hold harmless‖ policy whereby a
school‘s grade could not drop lower than one grade in a given year.215
Again in response to concerns about these changes and mitigation policies in the 135.
formula and the effect on schools and students, Governor Scott convened a summit in 2013,
resulting in an executive order seeking to ensure that the State‘s accountability system remains
fair and transparent.216
The Legislature subsequently revised § 1008.34, Fla. Stat., to return the
school-grading formula to its more transparent form, with the goal of it yielding more actionable
information to drive improved student outcomes.217
The changes to the school-grading formula, are understandable when considered 136.
in a full context. It is clear that the evolution of the formula was brought about by a variety of
complex factors—including the continuous improvement theory, the input of stakeholders and
district superintendents, and necessities of federal law—all of which led to reasoned decisions
made by Florida‘s educational policymakers with the goal of improving student performance.218
Retention and Promotion D.
Although Florida has implemented laws and regulations with regard to retention 137.
and promotion in limited areas, the vast majority of student requirements for promotion from one
grade level to the next are defined by local school districts in their student progression plans. 219
The only three state-level requirements for promotion are the following:
215 Tr. Vol. 29 at 4371:13–4374.2 (Test. of J. Copa); Tr. Vol. 26 at 4041:5–12 (Test. of P.
Stewart).
216 Tr. Vol. 29 at 4375:6–4378:4 (Test. of J. Copa); Ex. 4047 at 00122109–16.
217 Tr. Vol. 26 at 4051:20–4052:6 (Test. of P. Stewart); Ex. 1813 at DOE03204–06.
218 Tr. Vol. 29 at 4375:6–4378:4 (Test. of J. Copa); Ex. 4047.
219 § 1008.25(2), Fla. Stat.
48
a. Subject to a number of good-cause exemptions, promotion from 3rd grade
requires that students score a Level 2 or above on the state English language
arts assessment aligned to the 3rd grade standards;220
b. Promotion from middle grades requires students to successfully complete
three middle-grades or high-school courses in English language arts,
mathematics, social studies, science and one career and education planning
course;221
and
c. As explained in more detail in Section III.E, graduation from high school
requires students to pass a grade 10 English language arts assessment and an
Algebra I EOC or earn a concordant score on the ACT, SAT, or PERT, and
students must earn the minimum high school credit requirements.222
Districts have flexibility in implementing these requirements, in, for example, 138.
setting courses and curriculum to earn credit.223
Florida requires each school district to establish
a comprehensive plan for student progression that provides specific levels of performance for
each grade below which a student must receive remediation or be retained within an intensive
program that is different from the previous year‘s program and that takes into account the
student‘s learning style.224
The law also requires that, for students who do not obtain a Level 3
on the statewide, standardized reading or mathematics assessment, there must be a determination
of the nature of the student‘s difficulty, the areas of academic need, and strategies for providing
220 Tr. Vol. 27 at 4092:20–25 (Test. of P. Stewart); Tr. Vol. 31 at 4633:8–4636:2 (Test. of M.
Tappen); Tr. Vol. 30 at 4481:4–4483:7 (Test. of J. Copa); § 1008.25(4), Fla. Stat.
221 § 1003.4156, Fla. Stat.
222 Tr. Vol. 26 at 3990:24–3991:3 (Test. of P. Stewart); § 1003.4282(3), Fla. Stat.
223 § 1003.42, Fla. Stat.
224 § 1008.25(2), Fla. Stat.
49
academic support to improve the student‘s performance.225
This statute was recently revised to
provide local school districts with more flexibility in addressing the needs of these students.226
Students scoring a Level 1 on the grade 3 reading assessment are not 139.
automatically retained in 3rd grade. Florida law outlines good cause exemptions that may be
provided to students to be promoted to 4th grade despite scoring a Level l on the statewide
assessment, including for students with disabilities; ELLs; and students who show, through
classroom-level portfolio assessments, that they can read at the level required by the standards.
Data indicate that less than half of all students who score a Level l on the 3rd grade reading
assessment are retained.227
Florida‘s third-grade reading policy is research-based and has been effective in 140.
improving student achievement.228
The policy is in place to ensure that Florida‘s most struggling
readers receive the additional support and intervention so that they are equipped to succeed in
their future schooling and beyond. It is not a punitive policy, but one that has served to be
beneficial, evidenced by Florida‘s improvement for over a decade.229
The third-grade retention policy goes hand-in-hand with other reading supports 141.
required by State policy. Any student who exhibits a substantial deficiency in reading in
kindergarten, grade 1, grade 2, or grade 3 must be given intensive reading instruction
immediately and continue to be provided such instruction until the reading deficiency is
225 § 1008.25(4), Fla. Stat.
226 Tr. Vol. 26 at 3973:7–21 (Test. of P. Stewart); Tr. Vol. 31 at 4630:3–4631:17, 4636:3–4637:2
(Test. of M. Tappen).
227 Tr. Vol. 31 at 4634:11–4636:2 (Test. of M. Tappen); Tr. Vol. 30 at 448622–23 (Test. of J.
Copa); Ex. 1836.
228 Tr. Vol. 35 at 5232:11–5235:19 (Test. of J. Greene); Exs. 270, 1835, 1836.
229 Tr. Vol. 31 at 4637:5–4638:14 (Test. of M. Tappen); Tr. Vol. 30 at 4487:1–4488:22 (Test. of
J. Copa); Tr. Vol. 35 at 5232:11–5235:19 (Test. of J. Greene); Exs. 270, 1835, 1836.
50
remediated.230
A 3rd grade student who is retained must be provided intensive interventions in
reading, including effective instructional strategies, participation in a summer reading camp, and
appropriate teaching methodologies.231
School districts must provide these students during the
school day with 90 minutes of uninterrupted, scientifically research-based reading instruction
that includes reduced teacher-student ratios and is taught by a ―highly effective‖ reading
teacher.232
The Legislature supports school districts with an annual reading appropriation that 142.
is provided once the school district submits a research-based district-wide reading plan to
support student performance in reading. The Department has a dedicated Just Read, Florida!
Office that provides technical assistance to districts as they implement their reading plans. The
Just Read, Florida! Office also provides professional development on the English language arts
standards and has adopted in rule the criteria for the 3rd grade student portfolios that can be used
to promote for good cause 3rd grade students who would otherwise be subject to retention based
on failing to score a Level 2 or higher on the statewide, standardized assessment in English
language arts.233
Students who fail to score a Level 2 are provided summer reading instruction
and have the opportunity to retake the assessment before being retained in the fall.234
Students retained in 3rd grade receive additional instruction to better prepare them 143.
for promotion to 4th grade, and success beyond that.235
Florida data show that struggling
230 § 1008.25(5)(a), (6)(b), Fla. Stat.
231 Tr. Vol. 31 at 4633:8–4636:2 (Test. of M. Tappen); Exs. 2003, 3400, 3401.
232 Tr. Vol. 31 at 4636:3–4637:2 (Test. of M. Tappen); § 1008.25(7)(b), Fla. Stat.
233 Exs. 3400, 3401; § 1001.215, Fla. Stat.
234 Tr. Vol. 31 at 4633:8–4636:2 (Test. of M. Tappen).
235 Tr. Vol. 31 at 4636:3–4637:2 (Test. of M. Tappen).

51
students afforded the extra year in 3rd grade outperformed their struggling counterparts who
were immediately promoted into 4th grade: Of students who scored a Level l in 3rd grade (i.e.,
were potentially subject to in-grade retention), students who were retained in 3rd grade
performed better on the grade 4 reading assessment in 4th grade than those who were promoted
directly from 3rd to 4th grade despite having scored a Level l in 3rd grade (i.e., were promoted
under a good cause exemption).236
Moreover, at least 70% of Florida‘s 4th graders have scored
at or above Basic on NAEP Reading since 2007.237
(See Section IV.A below for a detailed
discussion of Florida‘s NAEP performance.) These 4th grade samples of students have included
Florida‘s most struggling students who have benefitted greatly from an extra year of instruction
in 3rd grade.238
Florida‘s third-grade retention policy also is supported by academic research. Dr. 144.
Jay Greene, a professor of education and head of the Department of Education Reform at the
University of Arkansas, has extensively studied the effect of Florida‘s policy. Dr. Greene‘s
studies, which are published in a peer-reviewed journal, concluded that Florida‘s test-based
retention policy significantly improves the academic achievement of students who are
retained.239
Plaintiffs did not present any evidence countering Dr. Greene‘s findings.
At least a dozen other states have implemented a policy regarding the retention of 145.
third-grade students who do not meet grade-level reading requirements.240
This is further
236 Ex. 1835; Tr. Vol. 30 at 4487:1–4488:22 (Test. of J. Copa).
237 Ex. 1358.
238 Tr. Vol. 30 at 4487:1–4488:22 (Test. of J. Copa).
239 Tr. Vol. 35 at 5232:11–5235:19 (Test. of J. Greene); Ex. 270.
240 Tr. Vol. 35 at 5234:2–4 (Test. of J. Greene).
52
evidence that Florida‘s policy of ensuring that students are reading on grade level before moving
on to grade 4 is rationally based on sound educational policy.
Graduation Requirements E.
Over the past twenty years, Florida legislation has increased high school 146.
graduation requirements for the purpose of ensuring all students are college and career ready
upon graduation.241
This increased rigor is supported by research on job growth and education
requirements in today‘s economy.242
Florida is a leader in emphasizing both the academic core
content requirements and improving its career and technical programs to ensure both result in
high school graduates prepared for college and careers.243
Florida‘s increased graduation requirements include required student credit in the 147.
core content areas of mathematics, science, social studies and English language arts and also
credits in the arts, physical education and a minimum of eight courses that can be dedicated to
areas of student interest or career programs.244
The chart below summarizes the changes in
graduation requirements, based on the 9th grade cohort for each year:245
241 Tr. Vol. 31 at 4640:2–4642:3 (Test. of M. Tappen).
242 Id.
243 Tr. Vol. 31 at 4640:2–4642:3, 4650:1–4654:25 (Test. of M. Tappen).
244 Tr. Vol. 31 at 4640:2–4642:3 (Test. of M. Tappen).
245 Ex.188.
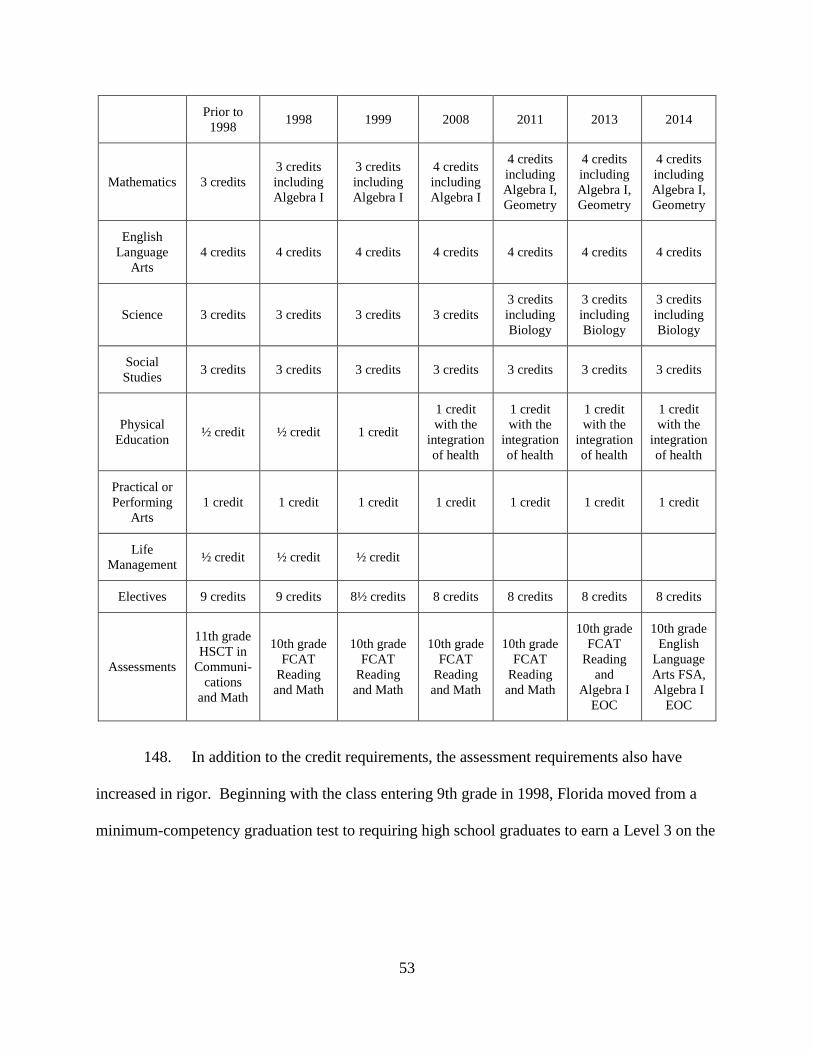
53
Prior to
1998 1998 1999 2008 2011 2013 2014
Mathematics 3 credits
3 credits
including
Algebra I
3 credits
including
Algebra I
4 credits
including
Algebra I
4 credits
including
Algebra I,
Geometry
4 credits
including
Algebra I,
Geometry
4 credits
including
Algebra I,
Geometry
English
Language
Arts
4 credits 4 credits 4 credits 4 credits 4 credits 4 credits 4 credits
Science 3 credits 3 credits 3 credits 3 credits
3 credits
including
Biology
3 credits
including
Biology
3 credits
including
Biology
Social
Studies 3 credits 3 credits 3 credits 3 credits 3 credits 3 credits 3 credits
Physical
Education ½ credit ½ credit 1 credit
1 credit
with the
integration
of health
1 credit
with the
integration
of health
1 credit
with the
integration
of health
1 credit
with the
integration
of health
Practical or
Performing
Arts
1 credit 1 credit 1 credit 1 credit 1 credit 1 credit 1 credit
Life
Management ½ credit ½ credit ½ credit
Electives 9 credits 9 credits 8½ credits 8 credits 8 credits 8 credits 8 credits
Assessments
11th grade
HSCT in
Communi-
cations
and Math
10th grade
FCAT
Reading
and Math
10th grade
FCAT
Reading
and Math
10th grade
FCAT
Reading
and Math
10th grade
FCAT
Reading
and Math
10th grade
FCAT
Reading
and
Algebra I
EOC
10th grade
English
Language
Arts FSA,
Algebra I
EOC
In addition to the credit requirements, the assessment requirements also have 148.
increased in rigor. Beginning with the class entering 9th grade in 1998, Florida moved from a
minimum-competency graduation test to requiring high school graduates to earn a Level 3 on the

54
state assessments in reading and math, and the state-wide standards and assessments have
increased in rigor with the FCAT, FCAT 2.0, and now the FSA.246
Students have multiple opportunities to retake the exams before they are 149.
scheduled to graduate. The current graduation assessments are a 10th grade assessment in
English language arts and an Algebra I assessment that is typically taken by students in 9th
grade. Students have up to five opportunities to pass the grade 10 English language arts
assessment before their scheduled graduation. The Algebra I EOC is offered four times a year;
thus, depending on how early a student takes the assessment, he or she will have multiple
opportunities to retake the assessment if needed.247
Students also have alternative means by which to meet the assessment 150.
requirements for graduation. For example, a student may earn a concordant score on the ACT or
SAT for English language arts and/or a comparative score on the PERT for Algebra I in order to
satisfy the assessment requirements.248
For the group of Florida students scheduled to graduate
in 2013, 20% of those who took the SAT or ACT scored a Level 1 or 2 on the FCAT 2.0.249
Assessments play an important role in ensuring that students have mastered the 151.
required content, and, with multiple avenues to meet that requirement, assessments are not a
barrier to graduation, but rather an assurance that students have learned what is expected.250
246 Tr. Vol. 31 at 4640:2–4642:3 (Test. of M. Tappen); Tr. Vol. 30 at 4482:7–4483:7 (Test. of J.
Copa); Ex. 188.
247 Tr. Vol. 26 at 3990:24–3991:3 (Test. of P. Stewart); Tr. Vol. 30 at 4482:7–4483:7 (Test. of J.
Copa).
248 Tr. Vol. 26 at 4025:20–25 (Test. of P. Stewart); Tr. Vol. 31 at 4699:24–4700:4 (Test. of M.
Tappen); Tr. Vol. 30 at 4482:7–4483:7 (Test. of J. Copa).
249 Tr. Vol. 30 at 4484:7–20 (Test. of J. Copa).
250 Tr. Vol. 26 at 3968:17–25 (Test. of P. Stewart); Tr. Vol. 29 at 4333:23–4334:10 (Test. of J.
Copa).
55
Florida‘s implementation of more rigorous standards and required courses for 152.
graduation is based on the needs of career-readiness in addition to college-readiness. For
example, students interested in military service must sit for the Armed Services Vocational
Aptitude Battery, which includes subtests in areas such as general science, word knowledge,
paragraph comprehension, mathematics knowledge, and mechanical comprehension.251
Students in Florida continue to graduate at higher rates than ever before with 153.
fewer students opting for less rigorous diploma alternatives.252
(See Section IV.E below for
details on improvements in Florida‘s graduation rates over time.)
The rationality of Florida‘s high-school graduation requirements also is supported 154.
by evidence that over half of the states in the nation require students to attain certain scores on
high school assessments in order to receive a high school diploma.253
Florida‘s high-school
graduation requirements represent reasonable policy choices based on research and a desire to
continue Florida‘s improved student performance.254
Teacher Quality and Educator Policies F.
Florida has implemented many statewide programs to ensure that high-quality 155.
teachers are available in Florida‘s school districts.255
Florida‘s approach to educator quality is
designed so that all teachers and school leaders are well-selected, prepared, supported, respected,
and accountable for their students‘ achievement.256
Florida‘s framework for implementation of
251 Tr. Vol. 31 at 4640:2–4643.10 (Test. of M. Tappen).
252 Tr. Vol. 31 at 4644:13–4647:12 (Test. of M. Tappen); Exs. 190, 4050, 5328, 5329.
253 Tr. Vol. 29 at 4445:17–20 (Test. of J. Copa).
254 See Tr. Vol. 31 at 4644:13–4647:12 (Test. of M. Tappen); Exs. 190, 4050, 5328, 5329.
255 Tr. Vol. 31 at 4710:24–4712:14 (Test. K. Hebda).
256 Tr. Vol. 31 at 4712:15–4713:24 (Test. K. Hebda).
56
educator quality appropriately places the state in the role of setting standards, providing technical
assistance, and monitoring and reporting results, while decisions about employment, assignment,
evaluation, and specific compensation of individuals who meet those standards are appropriately
assigned to local school districts.257
This design, the policies enacted to implement it, and the
results yielded, support Florida‘s policies as being rational and research-based.258
Florida‘s teacher quality policies have been rated the best in the nation for 156.
multiple years by the National Council for Teacher Quality, which further supports Florida‘s
policy choices as well-founded and rationally-based.259
Florida‘s teacher quality policies are
also supported by the results on the quality and effectiveness of Florida teachers. In 2012–13,
nearly 98% of Florida teachers were rated ―effective‖ or ―highly effective‖ by their school
districts.260
And in 2013–14, over 94% of classes were taught by teachers rated as ―highly
qualified‖ under federal law.261
Florida has aligned its teacher quality policies to effective classroom instruction 157.
and student learning results, beginning with the Florida Educator Accomplished Practices, which
provide the expectations for all Florida educators.262
These practices were developed in
conjunction with Florida teachers, compiled from research and practical evidence, and adopted
by the State Board of Education. Florida law requires that Florida teachers are trained, certified,
257Ex. 199; Tr. Vol. 31 at 4712:15–4717:7 (Test. of K. Hebda); Tr. Vol. 26 at 3970:9–16,
3973:7–21, 3975:8–13 (Test. of P. Stewart); Tr. Vol. 30 at 4608:24–4609:24 (Test. of M.
Tappen).
258 Tr. Vol. 31 at 4717:8–4718:13 (Test. of K. Hebda).
259 Tr. Vol. 31 at 4734:8–4736:15 (Test. of K. Hebda).
260 Ex. 1883; see also Ex. 1884.
261 Ex. 3368; Tr. Vol. 31 at 4736:16–4737:15 (Test. of K. Hebda).
262 Ex. 3371; Tr. Vol. 31 at 4721:12–4726:1 (Test. of K. Hebda).
57
and evaluated based on these standards, which provides clear and uniform expectations.
Programs to train and evaluate teachers in colleges of education and in school districts are
approved based in part on alignment with the practices.263
Teacher Preparation and Certification
Supported by national research, Florida has designed teacher preparation 158.
programs and certification processes that hold teachers to high standards while affording them a
choice of delivery mechanisms to become qualified. Florida provides a number of pathways to
teacher certification, including directly to a Professional Certificate, or through a Temporary
Certificate to a Professional Certificate, but each pathway requires that teachers meet the same
standards of subject-matter knowledge and hands-on experience, as well as submit to a
background check.264
The U.S. Department of Education has accepted both Florida‘s Temporary
and Professional Certificates as evidence that a teacher has earned ―full‖ certification to meet
―highly qualified‖ status under NCLB.265
The Florida Teacher Certification Examinations have
received national recognition from the National Center for Teacher Quality for their rigor and
alignment to student content standards.266
Florida also provides pathways for teachers certified
in other states to become certified in Florida by demonstrating that they meet Florida‘s
requirements through their state‘s approved preparation program or valid Professional
Certificate.267
Unlike several other states, Florida‘s certificate is not ―permanent‖ but must be
263 Tr. Vol. 26 at 3970:9–16 (Test. of P. Stewart); Tr. Vol. 31 at 4721:12–4726:1, 4737:24–
4740:16 (Test. of K. Hebda) ; Exs. 3370, 3371, 4022.
264 Ex. 4021; Tr. Vol. 31 at 4727:4–4728:2, 4729:12–4734:7 (Test. of K. Hebda).
265 Tr. Vol. 31 at 4728:3–17 (Test. of K. Hebda).
266 Tr. Vol. 31 at 4734:8–4736:15 (Test. of K. Hebda); Ex. 4022.
267 Tr. Vol. 31 at 4727:4–4728:2, 4729:12–4734:7 (Test. of K. Hebda); Ex. 4021.
58
renewed every five years through continuing education or passing a subject-area examination.268
Florida also offers several options for teacher preparation programs and has been recognized as a
leader in accountability for teacher preparation programs in the nation, ensuring that the teacher
preparation programs are aligned with the student content standards used in Florida schools.269
Teacher Evaluation and Professional Development
Florida‘s teacher evaluation and professional development system was created 159.
through collaboration with educators and experts and is designed to focus educators on college
and career readiness for all the students they teach and to provide timely and meaningful
feedback to continually improve teaching practice.270
It is a local school district responsibility to
design and deliver its own professional development and evaluation systems in accordance with
state law.271
Teacher professional development is provided at the district level, although the 160.
Department provides support to districts in the delivery of their professional development
systems through a number of initiatives.272
The Department also has responsibility under state
law to review and approve each district‘s professional development system, which is guided by
Florida‘s Professional Development System Evaluation Protocol, based on Florida‘s Professional
Development Standards. 273
268 Tr. Vol. 31 at 4737:16–23 (Test. of K. Hebda).
269 Tr. Vol. 31 at 4737:24–4740:16 (Test. of K. Hebda).
270 Tr. Vol. 31 at 4737:24–4748:4 (Test. of K. Hebda); Ex. 1887.
271 Tr. Vol. 31 at 4748:6–4750:2, 4751:15–4753:1 (Test. of K. Hebda); Tr. Vol. 26 at 3975:24–
3976:6 (Test. of P. Stewart); Exs. 1887, 1885.
272 Tr. Vol. 30 at 4620:5–4621:17 (Test. of M. Tappen).
273 Tr. Vol. 32 at 4783:3–4786:1 (Test. of K. Hebda); Ex. 3981.
59
As part of its accountability system, Florida requires that, while local school 161.
districts develop and adopt their own teacher-evaluation systems, a certain percentage of a
teacher‘s evaluation must incorporate a student-performance component.274
While Florida law
connects each teacher‘s and principal‘s evaluation to increased compensation and contract
renewal, Florida maintains a system of local control in that performance standards for the final
performance evaluation rating are set by the local school district, and amounts and terms for
compensation and contracts are locally negotiated between each school district and the local
teachers‘ union.275
While Florida has a history of including student performance in teacher 162.
evaluation, its current teacher-evaluation system is supported by, and indeed was required by,
federal law and policy.276
Florida was one of 19 states to be awarded a federal Race to the Top
(―RTT‖) grant, and it was one of 43 states to be granted a flexibility waiver under the Elementary
and Secondary Education Act (―ESEA‖).277
A requirement of both federal programs focused on
linking student performance and growth to teacher evaluations. Florida used part of its RTT
grant to revise its teacher evaluation system to meet these requirements, which were incorporated
in Florida law in the Student Success Act.278
The value-added model and other aspects of the
revised teacher-evaluation system were included in Florida‘s RTT application and the
274 § 1012.34, Fla. Stat.; Tr. Vol. 31 at 4740:17–4748.4 (Test. of K. Hebda); Ex. 1887.
275 Tr. Vol. 31 at 4740:17–4750:2 (Test. of K. Hebda); Tr. Vol. 32 at 4791:19–4795:19 (Test. of
K. Hebda); Ex. 1887.
276 Tr. Vol. 32 at 4763:22–4764:7 (Test. of K. Hebda).
277 Exs. 1413, 1440, 1442, 3363, 3774, 3973.
278 Ch. 2011-1, Fla. Laws.
60
Memorandum of Understanding agreed to by the vast majority of Florida school districts (69 of
72 districts, including lab schools), 49 of these with teachers‘ union support.279
For teachers teaching courses and grade levels covered by the statewide 163.
assessments, the student-performance component must be based on a ―value-added measure,‖ or
―VAM‖ score, which is calculated according to a state-developed formula for measuring student
learning growth.280
For all other teachers, districts are given flexibility in the ways in which
student performance is taken into account for the particular course, including using district-
developed assessments or other student performance measures. Many districts have opted to use
the VAM scores in various ways for teachers who do not teach FSA-tested subjects, but this is
not a state requirement.281
While Florida law requires that teachers be given performance ratings of either 164.
highly effective, effective, needs improvement, developing, or unsatisfactory, the standards and
cut points for earning each of these ratings are decided locally by each school district.282
The
Department provides support for local districts in implementing these decisions, including
development of state model evaluation systems in conjunction with national experts and Florida
educators, as well as providing training with national experts to school districts.283
Florida‘s value-added model is meant to measure the impact of a teacher on 165.
student learning by controlling for other factors that may impact the learning process. In other
words, it is designed to mitigate the influence of differences among the entering class of students
279 Exs. 3781, 3367; Tr. Vol. 32 at 4763:22–4764:7 (Test. of K. Hebda).
280 Tr. Vol. 32 at 4763:22–4764:7 (Test. of K. Hebda).
281 Tr. Vol. 32 at 4764:8–4765:18 (Test. of K. Hebda); Ex. 1849.
282 Tr. Vol. 31 at 4740:17–4748:4 (Test. of K. Hebda); Tr. Vol. 32 at 4767:22–4768:15 (Test. of
K. Hebda); Ex. 1887.
283 Tr. Vol. 31 at 4751:15–4753:1 (Test. of K. Hebda); Ex. 1885.
61
so that schools and teachers do not have advantages or disadvantages simply as a result of the
students who attend a school or are assigned a class.284
Florida‘s model is research-based and was the product of an extensive and 166.
inclusive process of stakeholder input to identify the type of model that should be used and the
factors that should be accounted for in the model. The State formed a Student Growth
Implementation Committee (―SGIC‖), composed of 27 members from across the State, including
teachers, school administrators, district-level administrators, postsecondary education teachers,
representatives from the business community, and parents, for questions, in-depth discussions,
and perspectives from different points of view. The SGIC‘s recommendation was adopted in full
by the Commissioner in June 2011.285
The model adopted by Florida takes into account a number of student factors— 167.
including prior years‘ achievement scores, attendance, mobility, and ELL or disability status—as
well as a school component, which recognizes that there are aspects of the school for which the
teacher should not be held directly accountable.286
Each year that VAM scores are calculated, the Department conducts ―impact 168.
analyses‖ to ensure that the VAM its meeting its goal of leveling the playing field.287
This
impact data indicates that there is no discernible relationship between a teacher‘s VAM score and
the makeup of the teacher‘s class—specifically, the percentage of students that are economically
disadvantaged, the percentage of students with disabilities, the percentage of ELLs, the
percentage of gifted students, the percentage of minority students, and the mean prior academic
284 Tr. Vol. 32 at 4759:6–4763:21 (Test. of K. Hebda); Exs. 1887, 1877, 3982.
285 Tr. Vol. 32 at 4759:6–4763:21 (Test. of K. Hebda); Exs. 1877, 1889, 1887, 3980.
286 Tr. Vol. 30 at 4489:12–4492:2 (Test. of J. Copa); Exs. 1887, 3980, 119.
287 Tr. Vol. 30 at 4496:1–12 (Test. of J. Copa); Exs. 3982, 3983, 120, 121.
62
performance of the class. This means that all teachers have the same opportunity to earn a high
VAM score regardless of the makeup of their assigned classes.288
Several of Plaintiffs‘ witnesses complain about the student-performance 169.
component of teacher evaluation, specifically VAM. These complaints consist almost entirely of
individual teachers lamenting the ―fairness‖ of VAM to teachers, but there is no evidence that
VAM has negatively impacted the quality of education provided to Florida students.289
Indeed,
each of these teachers affirmed that VAM has not negatively impacted the quality of education
or instruction that they provide to their students.290
Moreover, Plaintiffs‘ own witnesses do not
agree on what part, if any, of the teacher evaluation system they think is unfair to teachers—
some do not think student performance has any place in teacher evaluations and want to get rid
of the entire system,291
while others think it should be considered but complain about how it
applies to them under their district‘s chosen system,292
and still others have no objection to
VAM293
or even think it is a good policy.294
These complaints do not support the allegation that
Florida‘s teacher evaluation system is not a rationally-based policy for improving educational
quality.
288 Tr. Vol. 32 at 4775:2–4777:8 (Test. of K. Hebda); Tr. Vol. 30 at 4496:13–4498:7 (Test. of J.
Copa); Exs. 1850, 3982, 120, 121.
289 Tr. Vol. 23 at 3532:3–17, 3499:4–24 (Dep. Test. of J. Hiltz); Tr. Vol. 21 at 3155:22–3156:7
(Test. of L. Flynt); Tr. Vol. 13 at 1919:1–19 (Test. of K. Cook); Ex. 5353 (Dep. of B. Cavallero)
at 17:20–18:1.
290 Tr. Vol. 23 at 3499:20–24 (Dep. Test. of J. Hiltz); Tr. Vol. 21 at 3187:10–3188:11 (Test. of L.
Flynt); Tr. Vol. 13 at 1951:7–15 (Test. of K. Cook); Ex. 5353 (Dep. of B. Cavallero) at 106:11–
19.
291 E.g., Tr. Vol. 21 at 3118:17–21 (Test. of K. Oropeza).
292 E.g., Tr. Vol. 23 at 3532:3–17 (Dep. Test. of J. Hiltz).
293 E.g., Tr. Vol. 20 at 2957:25–2958:3 (Test. of M. McGriff).
294 E.g., Tr. Vol. 5 at 686:2–16 (Test. of N. Vitti).

63
As further basis for the nature of this as a policy debate, in response to 170.
stakeholder concerns about VAM, the Legislature amended the relevant laws in 2015 to reduce
the student-performance component from being at least 50% of the teacher evaluation to at least
33%, as well as to clarify other aspects of the requirement that would reduce reliance on student
assessment.295
Even with this amendment, some districts, in negotiation with their teachers‘
unions, have opted to maintain the student-performance component at 50% of teacher
evaluations.296
Florida‘s teacher-evaluation system and VAM have been challenged by teachers 171.
in both state and federal court and have been upheld by every court that has reviewed them.
Both the First District Court of Appeal and the U.S. Court of Appeals for the Eleventh Circuit
have rejected constitutional challenges to VAM and the Student Success Act.297
Teacher Recruitment, Assignment, and Compensation
The Department provides support to local districts in their teacher recruitment 172.
efforts. Teacher assignment is a district responsibility, and it is often negotiated between the
district and the local union. State law, in compliance with the ESEA, requires that schools with
high percentages of poor or minority students may not have lower percentages of effective
teachers than the district average.298
State law also provides each school principal with the right
to refuse the assignment of a low performing teacher to his or her school if he or she determines
295 Ch. 2015-6 , Fla. Laws; Tr. Vol. 31 at 4740:17–4748:4 (Test. of K. Hebda);
296 Tr. Vol. 21 at 3177:7–3179:21 (Test. of L. Flynt); Tr. Vol. 32 at 4740:17–4748:4, 4766:22–
4767:21 (Test. of K. Hebda); Ex. 1767.
297 See Robinson v. Stewart, 161 So. 3d 589 (Fla. 1st DCA 2015) (en banc), pet. for review
denied, No. SC15-323 (Fla. Sept. 8, 2015); Cook v. Bennett, 792 F.3d 1294 (11th Cir. 2015).
298 Tr. Vol. 26 at 3973:7–17 (Test. of P. Stewart); Tr. Vol. 31 at 4726:2–4727:3 (Test. of K.
Hebda); Tr. Vol. 32 at 4786:2–14 (Test. of K. Hebda); § 1012.2315, Fla. Stat.
64
it is not in the best interest of the students.299
The Department monitors this and other
requirements through the school improvement system.300
Teacher compensation also is determined locally by the school district through 173.
negotiation with the local teachers‘ union.301
Florida has, however, led the way in providing for
performance pay for teachers based on their district-assigned performance rating.302
Teachers
can also earn additional compensation each year they are assigned to a high-needs school, are
teaching in a hard-to-staff grade or subject, or complete additional academic responsibilities.303
These policies provide the alignment of teacher compensation with students who need excellent
teachers the most and to the learning outcomes the State is seeking for all students.304
Florida‘s educator quality policies, including its teacher evaluation system, are 174.
research-based and well-considered.305
School Improvement and Differentiated Accountability G.
Much of Plaintiffs‘ trial presentation focused on the State‘s Differentiated 175.
Accountability program (―DA‖), which aims at directing school-improvement strategies toward
schools identified as lower-performing under the State‘s school grading system. The Court
understands the purpose and structure of DA, the complex system of resources and the supports
299 Tr. Vol. 31 at 4726:2–4727:3 (Test. of K. Hebda); Tr. Vol. 32 at 4786:2–14 (Test. of K.
Hebda).
300 Id.
301 Tr. Vol. 26 at 3975:20–23 (Test. of P. Stewart); Art. I, § 6, Fla. Const.; §§ 447.201, .447.203,
Fla. Stat.
302 Tr. Vol. 32 at 4791:19–4795:19 (Test. of K. Hebda); § 1012.22, Fla. Stat.
303 Id.
304 Tr. Vol. 32 at 4795:21–4797:16 (Test. of K. Hebda).
305 Tr. Vol. 28 at 4218:21–4222:22 (Test. of E. Hanushek); Tr. Vol. 32 at 4795:21–4797:16
(Test. of K. Hebda).
65
available to districts in educating students in these schools. However, a school should not be
allowed to remain indefinitely in the DA program without there being some concern that the
―state‖ is tolerating or being complacent about the inability of the local district to improve that
school‘s performance. This is especially true since the Defendant‘s own evidence suggest that
improvements can be made without additional resources.
Florida law, § 1008.33, Fla. Stat., provides the State Board of Education with 176.
authority to hold schools and districts accountable for student improvement by, among other
things, implementing a state system of school improvement. As part of this system of school
improvement, Florida‘s current DA program was developed in 2008–09 as a pilot program and
enhanced as part of the RTT program and the ESEA flexibility waiver.306
The program employs
staff in five regions of the state to provide district and school administrators with research-based
school-improvement strategies focused on changes in leadership and school culture, not the
infusion of additional resources. Staff provides districts with school improvement planning,
leadership quality improvement, educator quality improvement, professional development,
curriculum alignment and pacing, and use of continuous improvement and monitoring plans to
identify barriers and strategies for school improvement. Schools assigned a ―D‖ or ―F‖ grade
under the State‘s school-grading system receive more intense intervention, which has included
research-based turnaround option plans with demonstrated records of effectiveness.307
306 Tr. Vol. 10 at 1395:5–7, 1449:18–1452:5 (Test. of S. Houston); Exs. 3781, 3973.
307 Exs. 1261, 1948, 1949; Tr. Vol. 26 at 4039:20–4041:18 (Test. of P. Stewart); Tr. Vol. 30 at
4586:25–4588:1, 4591:7–4600:9, 4601:11–4602:1 (Test. of M. Tappen). See generally Tr. Vol.
10 at 1393:2–1466:14 (Test. of S. Houston); Tr. Vol. 12 at 1827:20–1874:7 (Test. of G. Sitter);
Tr. Vol. 14 at 2180:10–2199:13 (Test. of W. Green); Tr. Vol. 15 at 2209:22–2279:13 (Test. of E.
Thompson); Tr. Vol. 19 at 2829:2–2905:11 (Test. of J. Browder); Tr. Vol. 20 at 2911:14–2927:6
(Test. of J. Browder).

66
DA regional support staff does not implement reforms or dictate what reforms 177.
schools or districts must make. The State uniformly applies its school-grading criteria to identify
problem areas in districts and then provides support to districts in identifying research-based
solutions to be implemented by the local school district for long-term, systemic changes.308
Plaintiffs have asserted that there have been reductions in funding for the DA 178.
program. This is true, however, the evidence indicates the RTT funds used to enhance the DA
program were intended to be capacity-building, with the goal of teaching local school district
personnel how to implement school improvement strategies in their own districts, in part to
support the ESEA flexibility waiver.309
The ESEA has now been amended with the Every
Student Succeeds Act, changing the applicable federal requirements, and the Court finds that it is
reasonable that the state program would change as well. 310
The Court also finds that, overall,
implementation of the DA program and subsequent changes to the program are rationally-based
decisions in light of the State‘s overall system of school improvement and accountability.
Section 1008.33, Fla. Stat., requires that the school improvement and 179.
accountability system established by the State Board of Education ―institutes appropriate
measures for enforcing improvement.‖311
The Court finds that Plaintiffs have not made a claim
under this section, nor could they. Section 1008.32, Fla. Stat., which grants the State Board of
Education authority for oversight enforcement of local school districts, makes clear that any
308 Tr. Vol. 10 at 1411:7–23, 1463:2–22 (Test. of S. Houston).
309 Tr. Vol. 10 at 1452:6–1454:2 (Test. of S. Houston).
310 Ex. 4048; Tr. Vol. 10 at 1439:7–1442:14 (Test. of S. Houston).
311 § 1008.33(2)(a)., Fla. Stat.
67
grant of enforcement authority does not ―create a private cause of action or create any rights for
individuals or entities.‖312
Plaintiffs have not pleaded any claim regarding a failure by the State Board to 180.
―enforce public school improvement.‖ Instead, the complaint says nothing about ―differentiated
accountability‖ or ―school improvement‖ and, on the contrary, alleges that the standardized
assessments upon which the entire accountability system is based are ―misuse[d]‖ and that the
system ―fails to recognize the many other factors that affect student achievement.‖313
During her
trial testimony, the Plaintiffs Fund Education Now‘s (―FEN‖) representative specifically
disclaimed asking the Court to require the State to do more to enforce school turnaround314
and
confirmed that, on the contrary, FEN wants the Court to strike down all of the State‘s
accountability statutes.315
And, when pressed by the Court to identify precisely what relief they
are seeking, Plaintiffs‘ counsel asked for ―a declaration that the State has failed to adequately
fund the education system in a way that‘s allowing all students to obtain a high-quality
education,‖316
not a declaration that the State Board of Education is violating § 1008.33.
Nevertheless, the Court finds that the accountability statutes have, overall, been 181.
reasonably complied with, including the requirement that schools with consecutive ―F‖ grades
implement turnaround option plans. Section 1008.33(2)(a) requires that the DA system be read
312 § 1008.32(5), Fla. Stat.
313 2d Am. Compl. ¶¶ 119, 120.
314 Tr. Vol. 21 at 3118:22–3119:15, 3120:12–21 (Test. of K. Oropeza).
315 Tr. Vol. 21 at 3117:18–22 (Test. of K. Oropeza).
316 Tr. Vol. 26 at 3905:19–22; see also Tr. Vol. 26 at 3899:14–21 (―And so it‘s not that you have
to have, you know, an exact dollar amount, but you have to figure out what is it that is required
for us to have a high-quality education, and the State has never done a cost analysis as to what
are the conditions we need to make sure all children are achieving on our standards and how
much does that actually cost?‖).
68
in conjunction with § 1008.34, Fla. Stat., which allows for a transition year for the 2014–15
school grades due to the first administration of the new Florida Standards Assessment.317
In
response to the Court‘s questions about two elementary schools in Pinellas County with multiple
years of ―F‖ grades, Commissioner Pam Stewart testified that, in accordance with §§ 1008.33
and 1008.34, these schools must improve their grade for the current (2015–16) school year or be
required to select a different turnaround option and different implementation plan.318
Moreover,
§ 1008.33 and related statutes place responsibility on the local school districts to implement
school improvement and turnaround option plans.319
Even if a claim could be brought under the
statute, any claim as to the schools in Pinellas County would require that the school district be a
party.
Plaintiffs‘ assertion that schools with high levels of low-income and minority 182.
students are not being given additional resources also is not supported by evidence. In fact,
additional resources are directed to schools with ―D‖ and ―F‖ grades and to schools with higher
levels of poverty, as these schools spend substantially more per pupil than schools with higher
levels of performance and socioeconomic status.320
School improvement plans for two schools
in Pinellas County with four consecutive ―F‖ grades, Maximo Elementary School and Melrose
Elementary School, show that the district has placed many additional resources in these
317 § 1008.34(7)(a), Fla. Stat. (―A school may not be required to select and implement a
turnaround option pursuant to s. 1008.33 in the 2015–2016 school year based on the school‘s
2014–2015 grade or school improvement rating under s. 1008.341, as applicable.‖).
318 Tr. Vol. 26 at 4048:13–4050:3 (Test. of P. Stewart).
319 See, e.g., §§ 1008.33(1)(c), (4)(a), 1008.385(1)(b), (2)(b), 1001.42(18), Fla. Stat.
320 Ex. 262; Tr. Vol. 32 at 4856:15–4860:5 (Test. of L. Champion). These funding differences
are described in more detail in Section IV.B.
69
schools,321
and another low-performing school in the district, Fairmont Park Elementary School,
received a $2.8 million school improvement grant but maintained an ―F‖ grade.322
The evidence
shows that low performance in certain schools is due in large part to local implementation
issues—many schools (61 and 30, respectively) with the same or higher percentages of low-
income and minority students as Maximo and Melrose have had four consecutive years of ―A‖
and ―B‖ grades.323
And an analysis of traditional schools with a majority of minority and a
majority of low-income students shows that, in 2013–14, 37% of these schools were graded ―A‖
or ―B‖ and 37% were graded ―C,‖ while only 17% were graded ―D‖ and only 9% were graded
―F.‖ Over twice as many schools earned an ―A‖ than received an ―F.‖324
While the Court is concerned about schools that may have ―F‖ grades for 183.
consecutive years, the evidence shows that this has occurred in only a small fraction of schools
statewide. For the 2013–14 school year, only 5% of traditional schools in the state had an ―F‖
grade, only 1.37% had been graded ―F‖ for two or more consecutive years, and only 0.07% (two
schools, Maximo and Melrose) had received an ―F‖ for four consecutive years.325
From its
inception in the late 1990s, the evidence shows the State‘s accountability system has been
generally effective in turning schools around, increasing schools from ―D‖ or ―F‖ grades to
grades of ―C‖ or above.326
Although there often is seen an increase in ―D‖ and ―F‖ schools when
changes to the assessments or school grading formula are made, this is part of the system of
321 Exs. 1899, 1901.
322 Tr. Vol. 20 at 2921:13–21 (Test. of J. Browder).
323 Ex. 5345.
324 Ex. 5346.
325 Ex. 5345.
326 Exs. 1261, 1940.
70
continuous improvement, as these schools generally improve in response to the changes.327
These improvements, in combination with the increased performance on state and national
assessments and increased graduation rates over time,328
show that the State‘s system of school
improvement and differentiated accountability is rationally related to the goal of increasing
student achievement. However, the weakest part of the Defendants presentation was in their
handling of local School Districts failure to address the problem of long term ‗F‖ schools at the
local level. At some point in time the State Board should do more if the local School District will
not, especially if Defendants main argument, that ―better teacher effectiveness, not more
resources,‖ is all that is needed. While recognizing that the State Board can only do what the
Legislature authorizes, and also recognizing that there are factors that have to be taken into
consideration in dealing with local school districts, the Defendants response to long term ―F‖
schools, while found to be reasonable by this Court in the overall context of this lawsuit was the
weakest point in the State‘s Educational policy that was presented at trial.
Discipline Policies H.
Plaintiffs‘ contentions regarding suspensions and expulsions in Florida are 184.
unsupported by the weight of the evidence.329
Florida has been successful in decreasing
incidents of student discipline over the past several years. In 2007, the state-wide rate of in-
school suspension was 9.96%, and the state-wide rate of out-of-school suspension was 8.79%.
By 2013, these rates had decreased to 7.31% for in-school suspension and 6.34% for out-of-
school suspension.330
327 Exs. 1829, 1830; Tr. Vol. 29 at 4382:2–4389:24 (Test. of J. Copa).
328 See Sections III.A, C, and E, below.
329 2d Am Compl. ¶¶ 194–95.
330 Tr. Vol. 31 at 4671:15–25 (Test. of M. Tappen); Ex. 187.
71
Student discipline decisions are made at the local district—indeed the 185.
classroom—level. Although Florida law appropriately tasks local school boards with
responsibility and control over student health, safety, and welfare,331
the Florida Department of
Education‘s Office of Safe Schools provides technical assistance and guidance to school districts
in these areas.332
In 2009, the Legislature amended § 1006.13, Fla. Stat., which deals with ―zero 186.
tolerance‖ policies, to ensure implementation of equitable and reasonable discipline policies; to
promote a safe and supportive learning environment in schools; to protect students and staff from
conduct that poses a serious threat to school safety; and to encourage schools to use alternatives
to expulsion or referral to law enforcement agencies by addressing disruptive behavior through
restitution, civil citations, teen courts, neighborhood restorative justice, or similar programs. It
also requires that zero-tolerance policies must apply equally to all students regardless of their
economic status, race or disability.333
With the more recent recognition of inappropriate hazing practices as well as 187.
bullying and harassment, additional legislation and policies have been implemented to increase
student safety.334
Findings Related to Student Performance and Outcomes IV.
Since the implementation of statewide assessment and accountability reforms 188.
beginning in the 1990s, Florida has seen a dramatic increase in student achievement on a variety
331 §§ 1006.07–.12, Fla. Stat.
332 Tr. Vol. 26 at 3977:4–9 (Test. of P. Stewart); Tr. Vol. 31 at 4672:10–4673:12 (Test. of M.
Tappen).
333 Tr. Vol. 31 at 4673:13–4676:19 (Test. of M. Tappen).
334 See, e.g., §§ 1006.135 and 1006.147, Fla. Stat.
72
of measures, including national and international assessments, state assessments, graduation
rates, and Advanced Placement participation and performance.335
Florida has also seen a closing
of ―achievement gaps‖ among low-income and minority students at a rate faster than that of the
rest of the nation.336
National Assessment of Educational Progress (“NAEP”) A.
Florida has seen continual increases in performance on the National Assessment 189.
of Educational Progress (―NAEP‖), known as the ―Nation‘s Report Card,‖ outperforming the
nation in several areas.337
NAEP is an assessment directed by the U.S. Department of
Education‘s National Center for Education Statistics (―NCES‖) to a representative sample of
students across the nation, allowing for state-to-state and state-to-national comparisons over
time.338
All states are required by federal law to participate in the grade 4 and grade 8 190.
NAEP assessments in reading and mathematics,339
and Florida law also requires participation.340
Scores are reported in terms of each state‘s average scale score as well as the percentage of
students meeting specified achievement levels: Basic (defined as ―partial mastery‖); Proficient
(―solid academic performance‖); and Advanced (―superior performance‖); as well as Below
Basic. Since 2003, NAEP has been administered every other year, with 2015 being the most
335 Tr. Vol. 26 at 3988:20–24, 3997:14–21, 3998:19–3999:4, 4000:7–13 (Test. of P. Stewart).
336 Tr. Vol. 26 at 3998:10–3999:4; 3999:18–25 (Test. of P. Stewart).
337 Tr. Vol. 26 at 3997:14–4006:18 (Test. of P. Stewart); Tr. Vol. 28 at 4193:12–15 (Test. of E.
Hanushek); Tr. Vol. 27 at 4176:9–4183:3 (Test. of E. Hanushek).
338 Tr. Vol. 28 at 4273:3–19 (Test. of E. Hanushek); Tr. Vol. 26 at 3995:23–3996:2 (Test. of P.
Stewart).
339 20 U.S.C. § 6311(a)(1)(b), (g)(2)(D); Exs. 1358, 1390, 1391; Tr. Vol. 26 at 3996:3–6 (Test. of
P. Stewart); Tr. Vol. 29 at 4455:4–4456:1 (Test. of J. Copa).
340 § 1008.22(2), Fla. Stat.
73
recent administration. Because NAEP has been administered for a long time period, it allows for
longitudinal comparisons of performance.341
The Court also notes that, while comparing rates of scoring Proficient among 191.
states may be useful, looking at a state‘s rate in isolation does not give a full picture of that
state‘s performance. Proficient on NAEP is a high bar, and even in the state with the highest
overall rates of scoring Proficient, Massachusetts, only 50% of all 4th graders—and 17% of its
Hispanic/Latino 8th graders—scored at or above Proficient in reading on the 2015 NAEP. (By
comparison, 26% of Florida‘s Hispanic/Latino 8th graders scored at or above Proficient in
reading that year.) 342
Florida‘s improvement on NAEP followed the implementation of the reforms 192.
begun in the late 1990s. In 1998, Florida underperformed the nation in the average scale score
achieved by students in grade 4 reading—over 7 points below the national public and ranking
higher than only 5 other states and the District of Columbia. In 2015, the most recent NAEP
administration, Florida‘s average scale score was almost 6 points higher than the national public
and ranked higher than all but 9 other states.343
Similar improvement has been seen in grade 4 mathematics. In 2003 (the first 193.
year Florida participated in the NAEP mathematics assessment), Florida‘s average scale score
was slightly below the national public and ranked higher than only 18 other states and the
341 Tr. Vol. 26 at 3996:3–6, 4004:4–6, 4006:15–18 (Test. of P. Stewart); Tr. Vol. 28 at 4273:3–
19 (Test. of E. Hanushek).
342 Tr. Vol. 26 at 4010:23–4012:1 (Test. of P. Stewart); Exs. 1371, 1364.
343 Tr. Vol. 26 at 3996:12–18, 3997:6–10 (Test. of P. Stewart); Exs. 4053, 5336, 5337.
74
District of Columbia. In 2015, Florida‘s average scale score was almost 3 points higher than the
national public and ranked higher than all but 17 other states.344
It is well-established—as admitted by several of Plaintiffs‘ expert and fact 194.
witnesses—that ―achievement gaps‖ exist throughout the country with respect to student
performance of certain minority and low-income subgroups. For example, NCES has released
statistical analysis reports—―Achievement Gaps: How Black and White Students in Public
Schools Perform in Mathematics and Reading on the National Assessment of Educational
Progress‖ (2009) and ―Achievement Gaps: How Hispanic and White Students in Public Schools
Perform in Mathematics and Reading on the National Assessment of Educational Progress‖
(2011)—detailing the disparities in all states and nationally in the performance of Black/African-
American students and Hispanic/Latino students as compared with White students on NAEP. It
also is well-recognized that there is a similar pattern when comparing the NAEP performance of
students eligible for free-and-reduced-price lunch (low-income students) and non-eligible
students.345
Though these gaps also exist in Florida, the NCES reports, as well as more recent 195.
NAEP data, show that Florida‘s gaps are smaller than the national gaps, and Florida has
outpaced the nation in closing these gaps.346
For example, on NAEP grade 4 reading, between
1998 and 2015,
a. The average scale score for the nation‘s Black/African-American students
increased by 14 points, while the average scale score for Florida‘s
Black/African-American students increased by 27 points. The gap between
344 Tr. Vol. 26 at 4000:24–4001:9 (Test. of P. Stewart); Exs. 4056, 5331, 5332.
345 Exs. 1418, 1419.
346 Exs. 1418, 1419.
75
the nation‘s Black/African-American students and its White students
decreased by 6 points, while Florida‘s gap decreased by 9 points.347
b. The average scale score for the nation‘s Hispanic/Latino students increased by
16 points, while the average scale score for Florida‘s Hispanic/Latino students
increased by 26 points. The gap between the nation‘s Hispanic/Latino
students and its White students decreased by 7 points, while Florida‘s gap
decreased by 8 points.348
c. The average scale score for the nation‘s free-and-reduced-price-lunch-eligible
students increased by 14 points, while the average scale score for Florida‘s
free-and-reduced-price-lunch-eligible students increased by 30 points. The
gap between the nation‘s free-and-reduced-price-lunch-eligible students and
its non-eligible students decreased by 3 points, while Florida‘s gap decreased
by 11 points.349
And on NAEP grade 4 mathematics, between 2003 and 2015, 196.
a. The average scale score for the nation‘s Black/African-American students
increased by 8 points, while the average scale score for Florida‘s
Black/African-American students increased by 13 points. The gap between
the nation‘s Black/African-American students and its White students
decreased by 3 points, while Florida‘s gap decreased by 5 points.350
347 Tr. Vol. 26 at 3998:19–3999:12 (Test. of P. Stewart); Exs. 4052, 5339.
348 Tr. Vol. 26 at 3999:13–4000:13 (Test. of P. Stewart); Exs. 4054, 5340.
349 Tr. Vol. 26 at 3997:14–3999:12 (Test. of P. Stewart); Exs. 4056, 5338.
350 Tr. Vol. 26 at 4001:24–4002:14 (Test. of P. Stewart); Exs. 4055, 5334.
76
b. The average scale score for Florida‘s Hispanic/Latino students increased by 8
percentage points, and the gap between Florida‘s Hispanic/Latino students and
its White students remained less than two thirds the size of the nation‘s gap.351
c. The average scale score for the nation‘s free-and-reduced-price-lunch-eligible
students increased by 8 percentage points, while the average scale score for
Florida‘s free-and-reduced-price-lunch-eligible students increased by 13
percentage points. The gap between the nation‘s free-and-reduced-price-
lunch-eligible students and its non-eligible students actually increased by 1
point, while Florida‘s gap decreased by 4 points.352
Florida was the only state in the nation between 2011 and 2013 to narrow the 197.
achievement gap between both White students and Black/African-American students and White
students and Hispanic/Latino students in grade 4 and grade 8 in both reading and mathematics.353
The following data from the 2015 NAEP also provide evidence of the success of 198.
Florida‘s minority students, low-income students, and students with disabilities:354
a. Florida‘s grade 4 Hispanic/Latino students continued to have the nation‘s
highest percentage of students performing at or above Basic and at or above
Proficient in reading.355
Florida‘s Hispanic/Latino 4th graders also earned the
351 Tr. Vol. 26 at 3999:13–4000:13 (Test. of P. Stewart); Exs. 4057, 5335.
352 Tr. Vol. 26 at 4001:10–23 (Test. of P. Stewart); Exs. 4053, 5333.
353 Ex. 1813 at DOE03184; Tr. Vol. 26 at 4009:3–8 (Test. of P. Stewart).
354 Tr. Vol. 26 at 4003:13–4005:22 (Test. of P. Stewart); Exs. 3337.
355 Exs. 3337, 1366.
77
nation‘s highest average scale score in reading and the highest percentage at
or above Proficient in mathematics.356
b. Florida‘s grade 4 free-and-reduced-price-lunch-eligible students had the
nation‘s highest percentage of students performing at or above Basic in
reading and the highest average scale score in reading.357
c. On grade 8 reading, no states scored significantly higher than Florida‘s
Black/African-American358
and Hispanic/Latino students.359
Florida‘s free-
and-reduced-price-lunch-eligible students360
and students with disabilities361
outperformed the nation at or above Basic in grade 8 reading. Florida‘s
Hispanic/Latino students outperformed their national peers in both grade 4362
and grade 8363
reading at or above Basic and at or above Proficient.
d. On grade 4 reading, nearly all Florida subgroups performed better than their
national counterparts in the percentage of students scoring at or above
Basic.364
No states scored significantly higher than Florida‘s Black/African-
American and Hispanic/Latino students, and only three states scored
significantly higher overall. With an average scale score of 224, Florida‘s
356 Exs. 3337, 1362, 1366.
357 Exs. 3337, 1365.
358 Exs. 3337,1372.
359 Exs. 3337, 1371.
360 Exs. 3337, 1369.
361 Exs. 3337, 1368.
362 Exs. 3337, 1366.
363 Exs. 3337, 1371.
364 Exs. 3337, 1365, 1366, 1367.
78
Hispanic/Latino fourth graders significantly outscored the nation. Florida‘s
Hispanic/Latino grade 4 students led the nation with 71 percent scoring at or
above Basic and 34 percent of Hispanic/Latino 4th graders scored at or above
Proficient.365
e. On grade 4 mathematics, most subgroups in Florida performed better than
their national peers scoring at or above Basic.366
Hispanic/Latino students,
free-and-reduced-price-lunch-eligible students, and students with disabilities
outperformed the nation scoring at or above Proficient.367
Florida‘s
Hispanic/Latino students and students with disabilities had the nation‘s second
highest average scale score in grade 4 mathematics.368
f. For both grade 4 and grade 8 Black/African-American and Hispanic/Latino
students, no state had a significantly higher scale score than Florida.369
Plaintiffs‘ suggestion that Florida‘s gains on NAEP 4th grade reading are skewed 199.
by Florida‘s third-grade retention policy is not supported by the evidence.370
Eventually, these
students go on to 4th grade and are included in the NAEP sampling.371
Moreover, Florida‘s
improvement in fourth grade reading performance began before the retention policy was
implemented in the 2003–04 school year, so the policy cannot explain the increase in
365 Exs. 3337,1366.
366 Exs. 3337, 1360, 1361, 1362, 1363.
367 Exs. 3337, 1362, 1361, 1360.
368 Exs. 3337, 1362, 1360.
369 Ex. 3337.
370 2d Am. Compl. ¶¶ 192–93.
371 Tr. Vol. 28 at 4307:5–15 (Test. of E. Hanushek).
79
performance from 1998 to 2003.372
And Florida has continued to outgain the nation since 2003,
even though the number of students retained in third grade has decreased since that time.373
(See
Section IV.F.) The evidence also shows that other states also have third-grade retention policies,
and Plaintiffs have presented no study or analysis to show the magnitude of Florida‘s third-grade
retention policy as compared to other states, or how it might affect Florida‘s scores as compared
with other states and the national average.374
Both Miami-Dade and Hillsborough Counties were recognized as among the top 200.
five performing urban districts in the nation on NAEP in 2013. Miami-Dade was the top
performing urban district in 4th grade reading, while Hillsborough was third-highest. For 8th
grade reading, Hillsborough was again third-highest, with Miami-Dade ranked fifth.375
For
2015, Miami-Dade was ranked the top performing urban district in the nation on NAEP.376
Florida‘s performance on NAEP provides support for the education policies 201.
implemented by the State and indicate that all Florida students are being provided the
opportunity to obtain a high-quality education.
International Assessments B.
The NCES also coordinates U.S. participation in international assessments, 202.
including the Progress in International Reading Literacy Study (―PIRLS‖) and Trends in
International Mathematics and Science Study (―TIMSS‖). PIRLS is an international comparative
study of the reading literacy of students in the equivalent of U.S. grade 4, and TIMSS provides
372 Exs. 1358, 1356; Tr. Vol. 30 at 4511:11–17 (Test. of J. Copa).
373 Ex. 1836; Tr. Vol. 30 at 4511:11–17 (Test. of J. Copa).
374 Tr. Vol. 30 at 4512:7–13 (Test. of J. Copa); Tr. Vol. 28 at 4307:16–21 (Test. of E. Hanushek).
375 Ex. 1813 at DOE03179.
376 Tr. Vol. 24 at 3601:21–23, 3665:1–13 (Dep. Test. of J. Marte).
80
data on the mathematics and science achievement of U.S. students compared to that of students
in other countries. The results are reported by the NCES. In 2011, 53 national and state
education systems participated in the PIRLS, and more than 60 national and state systems
participated in the TIMSS.377
On the 2011 PIRLS, Florida scored second in the world (below only Hong Kong) 203.
and above the U.S. score.378
On the 2011 TIMSS, Florida scored 9th in the world and above the U.S. score in 204.
grade 4 mathematics, and 7th in the world and above the U.S. score in grade 4 science. For
grade 8, Florida scored above the U.S. score in both mathematics and in science.379
In both
grade 4 and grade 8 mathematics.380
Florida students did not score measurably different from
students in Finland, generally considered among the highest performing nations in the world.381
State Assessments C.
In looking at student performance in reading based on state assessments, Florida 205.
students have made improvement. During the time span of FCAT administration (1999 to 2010),
a consistent upward trajectory is seen. In 2001, the first year FCAT was administered in all
grades between third and tenth, less than half (47%) of all assessed students were reading at or
above achievement Level 3. By 2010, the final year the FCAT was administered, nearly two-
377 Tr. Vol. 27 at 4012:11–16, 4016:25–4017:2 (Test. of P. Stewart); Exs. 4018, 4016, 4017.
378 Tr. Vol. 27 at 4018:23–4019:5 (Test. of P. Stewart); Ex. 4018.
379 Exs. 4016, 4017.
380 Exs. 4019, 4020.
381 Tr. Vol. 27 at 4182:22–24 (Test. of E. Hanushek).
81
thirds (62%) were reading at or above Level 3, an increase of 15 percentage points over that time
period.382
Following the adoption of more rigorous content standards (the Next Generation 206.
Sunshine State Standards), more rigorous assessments (FCAT 2.0), and more rigorous student
expectations (new performance-level cut scores), a new trend line was begun in 2011 through
2014.383
Because of the changes in the standards and assessment, it is not particularly 207.
useful to directly compare year-over-year student performance on FCAT to that on the FCAT
2.0.384
Although student performance on the more rigorous standards and FCAT 2.0
assessments was overall lower than it was in the final year of the former assessment (FCAT), it
generally improved over the four years of administration.385
In 2014, 58% of students across grades 3 through 10 scored at or above Level 3 in 208.
reading on FCAT 2.0, a two percentage point improvement over 2011. Even though more
rigorous standards and assessments were put into place with FCAT 2.0 in 2011, the percent of
students in grades 3 through 10, scoring at or above Level 3 on the FCAT 2.0 Reading
assessment was 11 percentage points higher than in 2001 under the previous assessment.386
The same basic pattern is observed for mathematics. Between 2001 and 2010, the 209.
percent of students in grades 3 through 10 scoring at or above Level 3 on the FCAT Mathematics
382 Tr. Vol. 26 at 4026:21–4027:5 (Test. of P. Stewart); Tr. Vol. 29 at 4447:9–4448:1 (Test. of J.
Copa); Exs. 1807, 1831.
383 Tr. Vol. 26 at 4027:6–13 (Test. of P. Stewart); Tr. Vol. 29 at 4448:2–4448:17 (Test. of J.
Copa;) Exs. 1807, 1831.
384 Tr. Vol. 29 at 4447:9–4448:17 (Test. of J. Copa).
385 Exs. 1807, 1831.
386 Tr. Vol. 26 at 4027:22–4028:2 (Test. of P. Stewart); Tr. Vol. 29 at 4447:9–4448:17 (Test. of
J. Copa); Exs. 1807, 1831.
82
assessment increased 18 percentage points, from 50% in 2001 to 68% in 2010.387
Though more
rigorous standards and assessments were put into place with FCAT 2.0 in 2011, the percent of
students scoring at or above Level 3 in grades 3 through 8 (Florida replaced comprehensive
grade-level mathematics assessments in grades 9 and 10 with End-of-Course assessments
(―EOCs‖) in Algebra I and Geometry in 2011) on the FCAT 2.0 Mathematics assessment was
56%, which is 6 percentage points higher than in 2001 under the previous assessment.388
Although the percentage of students scoring a Level 3 or above on the FCAT 2.0 210.
mathematics assessment did not increase overall between 2011 and 2014, this can be accounted
for by a change in the population of students taking the assessment. In 2013, grade 8 students
taking upper-level mathematics courses were no longer required to take the FCAT 2.0
mathematics assessment and instead took only the applicable mathematics EOC assessment,
generally the Algebra I EOC, so that the highest-performing students were no longer included in
the students taking the FCAT 2.0 mathematics assessment.389
Accordingly, the number of
students scoring a Level 3 or above on the Algebra I EOC increased from 55% in 2011 to 65% in
2014.390
Black and Hispanic student performance increased at a greater rate, with the percentage
of Black students scoring a Level 3 or above going from 36% in 2011 to 50% in 2014, and the
percentage of Hispanic students scoring at Level 3 or above increasing from 50% to 63%.391
Trend data on Florida‘s statewide, standardized assessments in reading and 211.
mathematics also demonstrate improvement in the performance of Florida‘s free-and-reduced-
387 Tr. Vol. 29 at 4448:18–4449:7 (Test. of J. Copa); Exs. 1810, 1832.
388 Tr. Vol. 26 at 4031:2–10 (Test. of P. Stewart); Tr. Vol. 29 at 4448:18–4449:7 (Test. of J.
Copa); Exs. 1810, 1832.
389 Tr. Vol. 29at 4448:25–4449:24 (Test. of J. Copa).
390 Tr. Vol. 29at 4449:25–4451:5 (Test. of J. Copa); Ex. 138.
391 Tr. Vol. 29at 4451:6–4451:23 (Test. of J. Copa).
83
price-lunch-eligible students, a proxy for economically disadvantaged students. In 2001, a
higher percentage of Florida‘s economically disadvantaged students scored at achievement Level
l than scored Level 3 and above on the statewide, standardized assessment in reading. By 2004,
those lines crossed, culminating in a 20 percentage point improvement from 2001 to 2010 in the
percentage of economically disadvantaged students scoring Level 3 and above in reading.392
As was the case with all students in Florida, though more rigorous standards and 212.
assessments were put into place with FCAT 2.0 in 2011, the percent of economically
disadvantaged students scoring at or above grade level on the FCAT 2.0 reading assessment in
2014, the last year of FCAT 2.0, was higher than it was in 2001 under the previous assessment.
In fact, it was 15 percentage points higher in 2014 than in 2001 under the previous assessment.393
The same pattern of improvement occurred in mathematics for Florida‘s 213.
economically disadvantaged students. In 2001, a higher percentage of free-reduced-priced-
lunch-eligible students scored Level l rather than Level 3 and above on the statewide,
standardized assessment in mathematics. By 2010, 58% of Florida‘s economically
disadvantaged students scored Level 3 and above, a 25-percentage-point increase over 2001. In
2014, on the FCAT 2.0 administered for the first time in 2011, 46% of Florida‘s economically
disadvantaged students scored Level 3 and above, which is 13 percentage points higher than in
2001 under the previous assessment.394
The same pattern is also seen in the performance of racial subgroups on the 214.
statewide assessments in reading and mathematics, with the gaps between racial subgroups
392 Tr. Vol. 26 at 4030:2–14, 4031:24–4032:10 (Test. of P. Stewart); Tr. Vol. 29 at 4451:24–
4453:1 (Test. of J. Copa); Exs. 1809, 1812, 1833.
393 Tr. Vol. 29 at 4451:24–4453:1 (Test. of J. Copa); Exs. 1809, 1833.
394 Tr. Vol. 26 at 4030:2–14, 4031:24–4032:10 (Test. of P. Stewart); Tr. Vol. 29 at 4453:2–24
(Test. of J. Copa); Exs. 1812, 1834.
84
narrowing over time. On the reading assessment, the gap between the performance of Black
students and White students decreased from 33 percentage points in 2001 to 28 percentage points
in 2010, the last administration of the FCAT, and the gap also narrowed in the four years of the
administration of the FCAT 2.0. The gap between the performance of Hispanic and White
students decreased from 24 percentage points in 2001 to 14 percentage points in 2010 during the
administration of the FCAT, and it also narrowed during the four years of FCAT 2.0.395
Similarly, on the mathematics assessment, the gap between the performance of 215.
Black students and White students decreased from 36 percentage points in 2001 to 28 percentage
points in 2010. The gap between the performance of Hispanic and White students decreased
from 21 percentage points in 2001 to 13 percentage points in 2010 during the administration of
the FCAT. And, although FCAT 2.0 performance was relatively stable, the percentage of Black
and Hispanic students scoring Level 3 or above on the Algebra I EOC also increased between
2011 and 2014.396
The achievement levels on Florida‘s statewide assessments correlate to levels of 216.
mastery of Florida‘s rigorous content standards, not to external conceptions of literacy and
educational attainment or to other assessments such as NAEP. So that, while earning a Level 1
or 2 in reading on the Florida state assessment is not an indication of illiteracy,397
earning a
Level 3 on Florida‘s state assessment is not the same as Proficient on NAEP.398
NAEP has four
395 Tr. Vol. 29 at 4453:25–4454:11 (Test. of J. Copa); Ex. 1808.
396 Tr. Vol. 29 at 4454:12–19 (Test. of J. Copa); Ex. 1811.
397 Tr. Vol. 26 at 4054:21–4055:11 (Test. of P .Stewart); Tr. Vol. 29 at 4360:24–4361:21 (Test.
of J. Copa); Ex. 4047 at 0122088.
398 Tr. Vol. 29 at 4456:2–4457:18 (Test. of J. Copa); Ex. 4047 at 00122105.
85
scoring categories and Florida has five levels. A level three on Florida‘s state assessment is not
same as Proficient on NAEP; it‘s a little lower from a scoring perspective.
Advanced Placement D.
One aspect of student achievement that Florida has focused on in recent years is 217.
incentivizing more access to college-level coursework for high school students, such as
Advanced Placement (―AP‖) courses.399
Florida has seen an increase in both participation and
performance on AP examinations and is now a national leader in both participation and
performance on AP examinations.400
In 2013, 80,175 Florida graduating high school seniors had taken at least one AP 218.
exam. Students scored a 3 or higher (score needed to earn college credit) on 41,149 exams. By
comparison, in 2003, only 32,566 Florida high school seniors took at least one AP exam, with
only 19,452 scoring a 3 or higher. More graduates succeeded on AP exams in 2013 than took
them in 2003. Participation and success continued to increase in 2015, with approximately
86,000 students taking at least one AP exam and approximately 46,000 scoring a 3 or higher.401
Florida was ranked fifth in the nation for the percentage of 2013 public high 219.
school graduates who took an AP course and scored a 3 or higher (succeeded) on an AP exam.
The percentage of 2013 graduates who took AP courses and succeeded was higher in Florida
(27.3%) than the national average (20.1%). And in 2015, Florida increased to third.402
399 Tr. Vol. 26 at 4023:10–19 (Test. of P. Stewart).
400 Tr. Vol. 26 at 4020:24–4021:8 (Test. of P. Stewart); Tr. Vol. 28 at 4203:13–4204:7 (Test. of
E. Hanushek); Ex. 1813.
401 Exs. 123, 3998; Tr. Vol. 30 at 4473:22–4475:24 (Test. of J. Copa).
402 Tr. Vol. 30 at 4478:25–4479:15 (Test. of J. Copa); Tr. Vol. 26 at 4020:24–4021:8 (Test. of P.
Stewart); Tr. Vol. 28 at 4203:13–4204:7 (Test. of E. Hanushek); Exs. 123, 128, 1813.
86
Florida ranked second in the nation for the increase from 2003 to 2013 in the 220.
percentage of graduates scoring 3 or higher on the AP exam during high school. Florida‘s
percentage increased by 12 points from 15.3% in 2003 to 27.3% in 2013.403
Florida has achieved significant increases in the number of Black/African-221.
American and Hispanic/Latino high school graduates participating and succeeding in AP. For
example, the number of Black/African-American graduates participating in AP nearly
quadrupled between 2003 and 2013, and the number succeeding in AP (earning a 3 or higher)
nearly tripled. The number of Hispanic/Latino graduates participating in AP more than tripled
between 2003 and 2013, and the number succeeding in AP more than doubled. These numbers
continued to increase in 2015.404
Florida has eliminated the AP participation and success gap for its 222.
Hispanic/Latino students. Hispanic/Latino students made up 25.1% of the 2013 graduating class
in Florida, yet they accounted for 27.9% of AP exam takers and 31% of AP exam takers who
scored a 3 or higher.405
Florida also has made progress in narrowing the participation and success gap for 223.
Black/African-American students. In 2003, Black/African-American graduates made up 20.3%
of students in the graduating class but only 9.7% of AP exam takers and 5.7% of AP exam takers
scoring a 3 or higher. In 2013, although making up around the same percentage of the
graduating class (20.6%), Black/African-American students comprised 14.6% of AP exam takers
403 Tr. Vol. 28 at 4203:13–4204:7 (Test. of E. Hanushek); Ex. 123, 129.
404 Exs. 126, 127, 1813, 3998; Tr. Vol. 26 at 4021:19–4022:18 (Test. of P. Stewart); Tr. Vol. 30
at 4475:25–4477:11 (Test. of J. Copa).
405 Exs. 1813, 3997 at 00118679; Tr. Vol. 26 at 4021:19–4022:1 (Test. of P. Stewart).
87
and 7.3% of AP exam takers scoring a 3 or higher. These numbers continued to increase in
2015.406
Florida has also increased AP exam participation and success among low-income 224.
graduates. In 2003, only 7.5% of graduates who had taken AP exams were low-income. By
2013 that percentage had risen to 35.2%. Success among graduates who had taken an AP exam
and who were low-income has also increased significantly. In 2003, only 7.2% of low-income
graduates scored a 3 or higher on an AP exam, compared to 31% in 2013. These numbers
continued to increase in 2015.407
These percentages translate to large increases in the number of Black/African-225.
American, Hispanic/Latino, and low-income high school graduates participating and succeeding
in AP. For example, the number of Black/African-American graduates participating in AP
nearly quadrupled between 2003 and 2013, and the number earning a 3 or higher nearly tripled.
The number of Hispanic/Latino graduates participating in AP more than tripled between 2003
and 2013, and the number succeeding in AP more than doubled. The number of low-income
students participating in AP increased by a factor of over 11 between 2003 and 2013, and the
number of low-income students scoring a 3 or higher increased more than ten-fold.408
Graduation and Drop-Out Rates E.
Florida‘s graduation rate is a four-year cohort graduation rate. A cohort is defined 226.
as a group of students on the same schedule to graduate. The graduation rate, which follows the
federally mandated calculation methodology, measures the percentage of students who graduate
406 Exs. 124, 125, 1813; Tr. Vol. 26 at 4022:9–18 (Test. of P. Stewart); Tr. Vol. 30 at 4475:25–
4477:11 (Test. of J. Copa).
407 Exs. 3998, 1813; Tr. Vol. 26 at 4022:19–24, 4023:2–7 (Test. of P. Stewart); Tr. Vol. 30 at
4475:25–4477:11 (Test. of J. Copa).
408 Exs. 123, 124, 125, 126, 127, 3998.
88
within four years of their first enrollment in ninth grade. Subsequent to their enrollment in ninth
grade, students who transfer to another school outside the Florida K–12 public school system and
deceased students are removed from the calculation, while entering transfer students are included
in the graduation rate for the class with which they are scheduled to graduate, based on their date
of enrollment. 409
Florida‘s federally-compliant graduation rates show continuous improvement 227.
over time, including improvement among Black/African-American and Hispanic/Latino
students.410
In 2014–15, the most recent year for which data is available, Florida‘s high school 228.
graduation rate increased to 77.8%, an increase of 1.7 percentage points over the previous year,
and a rise of over 25 percentage points since 1998–99, the first year for which comparable data is
available.411
While all states show an ―achievement gap‖ in graduation rates among certain 229.
subgroups, including Black/African-American students and Hispanic/Latino students as
compared with White students,412
Florida has made significant progress in closing these gaps.
Graduation rates for Florida‘s Black/African-American and Hispanic/Latino students have risen
at faster rates than those for Florida‘s White students.413
409 Ex. 4050; Tr. Vol. 29 at 4443:14–4444:13 (Test. of J. Copa).
410 Exs. 4050, 5328, 5329; Tr. Vol. 26 at 3988:20–24 (Test. of P. Stewart).
411 Exs. 4050, 5329; Tr. Vol. 26 at 3988:20–24 (Test. of P. Stewart); Tr. Vol. 29 at 4444:14–
4445:5 (Test. of J. Copa).
412 Ex. 4289.
413 Ex. 5328; Tr. Vol. 26 at 3992:9–22 (Test. of P. Stewart); Tr. Vol. 29 at 4445:21–4447:2 (Test.
of J. Copa).

89
In 2014–15, the graduation rates for Florida‘s Black/African-American students 230.
increased to 67.9%, an increase of 3.2 percentage points over the previous year, and a rise of
over 22 percentage points since 2003–04, the first year for which subgroup data is available.414
In 2014–15, the graduation rates for Florida‘s Hispanic/Latino students increased 231.
to 76.7%, an increase of 1.7 percentage points over the previous year, and a rise of over 21
percentage points since 2003–04, the first year for which subgroup data is available.415
Between 2003–04 and 2014–15, the graduation rate for Florida‘s White students 232.
increased at a rate of 25%, the graduation rate for Florida‘s Hispanic/Latino students increased at
a rate of 40%, and the graduation rate for Florida‘s Black/African-American student‘s increased
at a rate of 49%.416
Between 2003–04 and 2014–15, the gap between the graduation rate for Florida‘s 233.
White students and its Hispanic/Latino students has almost been cut in half, decreasing from 11.5
percentage points to 6.0 percentage points. In that same time, the gap between the graduation
rate for Florida‘s White students and its Black/African-American students decreased from 20.4
percentage points to 14.8 percentage points.417
Due to the differences in graduation requirements for each state, as well as the 234.
unique demographic composition of each state‘s student population, comparisons of graduation
rates across states are not probative. Though the federal regulations have introduced uniformity
into the method of calculating graduation rates, there remains much variability in the way states
define ―graduates,‖ and, for this reason, the United States Department of Education specifically
414 Ex. 5328.
415 Ex. 5328.
416 Ex. 5341; Tr. Vol. 26 at 3993:3–12 (Test. of P. Stewart).
417 Ex. 5328; Tr. Vol. 26 at 3992:9–22 (Test. of P. Stewart).
90
warns against comparing graduation rates among states.418
Florida has consistently implemented
higher standards for graduation since 1999, while other states vary in their requirements for a
diploma. For example, many other states do not require students to take Algebra I before
graduating high school.419
Therefore, comparing graduation rates across states is less useful than
comparing a given state‘s graduation rate trends over time using a consistent method for
calculating the rates. In Florida‘s case, improvement in graduation rates over time is even more
telling because the standards for graduation have increased while the rates have gone up.420
Similarly, state-to-state comparisons of scores on college-admissions exams like 235.
the SAT and ACT are not probative because of states‘ varying participation rates and student
populations. The College Board ―strongly discourages‖ making such comparisons, noting that
they are ―not valid.‖421
In Florida, a relatively higher percentage of students take the SAT and
ACT than in many other states. In addition, as discussed in Section III.E above, Florida allows
concordant scores on the SAT and ACT as alternatives for the passing the grade 10 English
language arts statewide, standardized assessment. For the most recent year available,
approximately 20% of Florida students who took the SAT or ACT also scored a Level 1 or 2 on
the grade 10 English language arts assessment.422
For that reason, Florida‘s population of SAT
and ACT test-takers is likely to include more of the state‘s lower-performing students, who may
never take these exams in other states without such a policy.423
418 Ex. 1407 at 00045402; Tr. Vol. 30 at 4558:14–4559:18 (Test. of J. Copa).
419 Tr. Vol. 26 at 3994:4–17 (Test. of. P. Stewart).
420 Exs. 4050, 5328, 5329; Tr. Vol. 26 at 3994:4–17, 3991:19–3992:3 (Test. of P. Stewart).
421 Ex. 4307 at 00123355.
422 Tr. Vol. 30 at 4484:3–20 (Test. of J. Copa).
423 Tr. Vol. 26 at 4025:1–4026:3 (Test. of P. Stewart).
91
While the graduation rate has increased over the past decade, Florida‘s drop-out 236.
rate has declined. The 9th–12th grade single-year drop-out rate decreased from 3.0% in 2004–05
to 1.9% in 2013–14. The rate for Black/African-American students decreased from 3.9% in
2004–05 to 3.0% in 2013–14, and the rate for Hispanic/Latino students decreased from to 3.6%
in 2004–05 to 2.0% in 2013–14.424
Non-Promotion/Retention Rates F.
Plaintiffs‘ various complaints about Florida‘s retention policies and rates of 237.
student retention425
—and specifically the allegation that ―Florida started retaining increased
numbers of students to repeat grade 3 beginning in the 2003–04 school year‖426
—are not
supported by the weight of the evidence.
The number of students retained in Florida schools has decreased since the 2003–238.
04 school year, the year in which the State‘s third-grade reading policy was implemented.
Between 2003–04 and 2013–14, the number of students retained in 3rd grade actually decreased
by almost a third. During this same period, the number of students retained in 4th grade was cut
almost in half, and the number retained in 5th grade decreased by almost two thirds.427
At the end of the 2003–04 school year, 201,684 students were not promoted to the 239.
next grade level, a rate of over 8% of the total public school student population. By 2013–14,
though the total number of students in Florida schools had increased, the number of students
424 Exs. 2893, 2897, 3194.
425 E.g., 2d Am. Compl. ¶¶ 176–77.
426 2d Am. Compl. ¶ 192.
427 Exs. 1816, 1817; Tr. Vol. 31 at 4637:3–4638:14 (Test. of M. Tappen).
92
retained in-grade had decreased to a ten-year low. The percent of students retained in Florida
after the 2013–14 school year was less than 4% of Florida‘s student population.428
There also has been a significant decrease in the number and rate of students 240.
retained in 9th grade over the past ten years. (Grade 9 promotion policies are school district
decisions, and there are no state-level promotion requirements for 9th grade.429
) In the 2003–04
school year, school districts were retaining almost one out of four 9th grade students. Between
2003–04 and 2013–14, the number of students retained in ninth grade decreased by over three
quarters.430
As detailed above, Florida‘s policies, including its third-grade retention policy, 241.
have resulted in a greater number of students graduating high school, fewer students dropping
out, and fewer students being retained, all of which supports the finding that Florida students are
being provided the opportunity to obtain a high quality education.
Findings Related to Florida’s School Funding System V.
Overview A.
Funding for Florida‘s K–12 public schools is comprised of state, local and federal 242.
dollars.431
In the 2015–16 school year, over $19.7 billion in state and local funding is available
to operate public schools, plus over $2.9 billion for capital outlay.432
The amount of operating funds available to Florida school districts in 2015–16 243.
was the highest level of funding in Florida history. The level of per pupil funding, $7,105 per
428 Exs. 1805, 1816, 1817, 1853, 1854.
429 See Section II.D, above.
430 Ex. 1816; Tr. Vol. 31 at 4630:1–4631:17 (Test. of. M. Tappen).
431 Tr. Vol. 26 at 4057:3–14 (Test. of P. Stewart); § 1001.01(4), Fla. Stat.
432 Ex. 3683 at 00103646; Ex.3445;Tr. Vol. 26 at 4058:8–14 (Test. of P. Stewart); Tr. Vol. 32 at
4855:3–7, 4899:18–4900:10 (Test. of L. Champion).
93
student, was the second highest in Florida history, only slightly below the 2007–08 level at the
height of the pre-recession economy.433
Funding for education (pre-K–12 and colleges and universities) constitutes the 244.
single largest component of the state‘s general revenue budget. Since 1997–98, 52.2% of the
general revenue budget has, on average, been dedicated to education. During this same period,
the next largest share of the general revenue budget was for human services (including the
Medicaid program) (26.9%); followed by the criminal justice and corrections system (13.7%);
general government (4.4%); natural resources, environment and transportation (1.7%); and the
judicial branch (1.1%).434
The Florida Education Finance Program (―FEFP‖), described in detail below, 245.
consistently comprises over 35% of the general revenue budget.435
The Florida Education Finance Program (“FEFP”) B.
The primary mechanism for funding the operating costs of Florida K–12 schools 246.
is the Florida Education Finance Program (―FEFP‖), a complex funding formula that includes
state and local funds.436
Originally enacted in 1973, the key principles of the FEFP are as
follows:
[T]o guarantee to each student in the Florida public education system the
availability of programs and services appropriate to his educational needs that are
substantially equal to those available to any similar student notwithstanding
geographic differences and varying local economic factors.437
433 Ex. 3683 at 00103647; Tr. Vol. 26 at 4058:21–4059:1 (Test. of P. Stewart); Tr. Vol. 33 at
4947:11–25 (Test. of L. Champion); Tr. Vol. 32 at 4870:13–24 (Test. of L. Champion).
434 Ex. 230; Tr. Vol. 34 at 5043:12–5046:17 (Test. of A. Baker).
435 Ex. 230.
436 Tr. Vol. 26 at 4057:3–14 (Test. of P. Stewart); Tr. Vol. 32 at 4806:14–22 (Test. of L.
Champion).
437 Ex. 3680 at 00103463.

94
The FEFP has been amended over time, but the key principles noted above have 247.
remained in place.438
To equalize educational opportunities, the FEFP formula recognizes: (1)
varying local property tax bases; (2) varying education program costs; (3) varying costs of living;
and (4) varying costs for equivalent educational costs due to sparsity and dispersion of the
student population.439
The FEFP is generally recognized as one of the most equalizing school funding 248.
formulas in the nation.440
The FEFP considers and provides funding on the basis of the actual
cost of providing educational services in various settings, and in different parts of the state.441
The Court is not persuaded by Plaintiffs‘ assertions that FEFP does not contain an 249.
express weighting for poverty.442
Plaintiffs‘ own expert witness testified that many other states
do not provide an express weighting for poverty, while many others, as Florida, provide
additional funding for lower performing students or schools.443
As discussed below, the FEFP
directs funds to districts and schools with higher percentages of low-income students as well as
to lower-performing schools.
438 Tr. Vol. 32 at 4806:14–4807:22 (Test. of L. Champion).
439 Ex. 3680 at 00103463; Tr. Vol. 26 at 4057:3–23 (Test. of P. Stewart); Tr. Vol. 32 at 4806:14–
4807:22, 4841:14–4842:19, 4813:13–4814:22, 4820:20–4822:6, 4826:11–4828:9 (Test. of L.
Champion).
440 Tr. Vol. 16 at 2361:15–2362:7 (Test. of J. Hall); Tr. Vol. 32 at 4807:3–6 (Test. of L.
Champion).
441 Tr. Vol. 32 at 4807:7–22 (Test. of L. Champion).
442 See 2d Am. Compl. ¶ 31.
443 Tr. Vol. 2 at 153:18–154:21, 155:15–158:1 (Test. of M. Rebell) (discussing Verstegen,
Deborah A., Public Education Finance Systems in the United States and Funding Policies for
Populations with Special Educational Needs, Education Policy Analysis Archives, Vol. 19 No.
21, at 17–18 (2011), available at http://epaa.asu.edu/ojs/article/view/769/923)).
95
The FEFP, through its highly equalizing components, provides additional state 250.
funding to school districts with low property wealth, which is an indication of relative poverty in
the state. As of the 2014–15 school year, 50 out of the 67 local school districts received a
majority of their FEFP funds from the state, with Union County receiving the highest percentage
at 91.06% and Monroe County receiving the lowest percentage at 19.54%.444
Overall, the state
provided approximately 56% of operating funds to school districts in the 2014–15 school year.445
In addition, as discussed in more detail below, various components of the formula 251.
provide funds targeted to address low student performance through supplemental academic
instruction and the state‘s reading program.446
The FEFP provides local school districts with flexibility to direct funds to schools 252.
with a high percentage of students in poverty. Program funds in excess of expenditure
requirements under the formula may be directed to any school or program at the discretion of the
district.447
Upon analysis of the actual expenditure of FEFP funds across the state, more 253.
funds are available to and spent in schools with the highest percentage of students in poverty. In
the 2013–14 school year, schools with the highest percentage of students in poverty spent $785,
or over 11% more per FTE student, in state and local funds, than schools with the lowest
444 Ex. 3417; Tr. Vol. 32 at 4855:12–4856:14 (Test. of L. Champion).
445 Ex. 3441; Tr. Vol. 32 at 4874:19–4876:24 (Test. of L. Champion).
446 Tr. Vol. 32 at 4833:1–4834:11, 4832:2–25 (Test. of L. Champion).
447 Ex. 3424; Tr. Vol. 33 at 4961:11–16 (Test. of L. Champion); Tr. Vol. 32 at 4895:6–4896:13
(Test. of L. Champion).
96
percentage of students in poverty. When federal funds are included, $1,579 or nearly 22% more
per FTE student, was spent in high poverty schools.448
Similarly, more funds are available to and spent in lower-performing schools than 254.
in higher-performing schools. According to the most recent analysis, schools graded ―D‖ or ―F‖
expend approximately $1,200 more per student on average than ―A‖ and ―B‖ schools.449
The FEFP also results in a K–12 education system that has been recognized as 255.
one of the most efficient in the nation. Over the past two decades, Florida has achieved the
second greatest achievement gains on NAEP tests while expenditure increases during this period
have been lower than in other states.450
The Court therefore finds that Plaintiffs‘ assertions that the FEFP is deficient 256.
because it does not consider the cost of educating students, does not appropriately provide
funding for students in poverty, or does not generate adequate funding to provide students with
an opportunity to receive a high quality education is not supported by the evidence.
FEFP funds are generated primarily by multiplying the number of full time 257.
equivalent students (―FTE‖) in each of the funded education programs by cost factors to obtain
weighted FTE students. Weighted FTE students are then multiplied by a base student allocation
and by a district cost differential to determine the base funding from state and local funds.
Program cost factors are established by the Legislature and represent relative cost differences
among the FEFP programs. These costs factors are computed annually based on the actual cost
experience in schools.451
448 Ex. 262; Tr. Vol. 32 at 4856:15–4859:13 (Test. of L. Champion).
449 Tr. Vol. 32 at 4859:14–4860:5 (Test. of L. Champion).
450 Ex. 197; Tr. Vol. 28 at 4200:2–4202:19 (Test. of E. Hanushek).
451 Ex. 3680 at 00103463; Tr. Vol. 32 at 4809:6–4825:19 (Test. of L. Champion).

97
The specific components of the FEFP formula are:452
258.
a. Full Time Equivalent Student. An FTE student for FEFP funding purposes is
one student in membership in one or more FEFP programs for a school year or
its equivalent. Student membership surveys are conducted according to a
schedule provided by the Commissioner of Education, typically in July,
October, February and June, and reported by school districts to the
Department of Education.453
Districts with material numbers of students
coming in or out of the district at certain times of the year may request an
alternative survey week from the Department to more accurately reflect their
student membership.454
b. Program Cost Factors. The FEFP recognizes the different costs of educating
students in various school programs through the program cost factor
calculation. Program cost factors are derived from actual school district
expenditures on the programs within the FEFP. School districts report all of
their direct and indirect costs to the Department of Education through a
program cost report. The total aggregate costs of an educational program are
divided by the FTE students for the program to derive an index of relative
452 Ex. 3437, a detailed flowchart that illustrates the calculation of FEFP funding for the 2015–
16 school year.
453 Ex. 3680 at 00103471–74; Tr. Vol. 32 at 4809:6–4813:12 (Test. of L. Champion).
454 Tr. Vol. 32 at 4811:20–4812:9 (Test. of L. Champion). Additionally, contrary to the belief of
one of Plaintiffs‘ district witnesses, Tr. Vol. 18 at 2686:11–25 (Test. of K. Ferree), students
educated by the district in non-school settings, such as juvenile justice facilities, residential
treatment facilities, or hospitals, are eligible to be counted in the districts‘ FTE, Tr. Vol. 32 at
4812:10–4813:12 (Test. of L. Champion).
98
costs, with the cost per FTE of ―Basic, Grades 4–8,‖ established as the 1.000
base. The program cost factors for the 2014–15 school year are as follows:455
Basic Programs Grade Levels Cost Factor
101 K–3 1.126
102 4–8 1.000
103 9–12 1.004
Exceptional Student
Education Programs Grade Levels Cost Factor
111 K–3 1.126
112 4–8 1.000
113 9–12 1.004
254 K–12 3.548
255 K–12 5.104
English for
Speakers of Other
Languages Programs Grade Levels Cost Factor
130 K–12 1.147
Career Education Grade Levels Cost Factor
300 9–12 1.004
c. Weighted FTE. The multiplication of the FTE students for an FEFP program
by its respective cost factor produces ―weighted FTE.‖ This calculation
weights the FTE to reflect the relative costs of the programs as represented by
the program cost factors. To provide for the planned use of FEFP funds, the
Legislature has established the following combination of programs during the
180-day regular school year and summer school: ―Group 1‖ (basic education
program) and ―Group 2‖ (Exceptional Student Education for support levels
455 Ex. 3414; Ex. 3680 at 00103474–75; Tr. Vol. 32 at 4813:13–4814:22 (Test. of L. Champion).
99
254 and 255, English for Speakers of Other Languages, and Grades 9–12
Career Education programs).456
d. Recalibrated FTE. All FTE enrollment is capped at 1.0 FTE, except for FTE
reported for Department of Juvenile Justice (DJJ) students beyond the 180-day
school year.457
e. Weighted FTE Cap. Program Group 2 has an enrollment ceiling (cap) that is
established based on each district‘s estimate of FTE in each FEFP program.
The appropriated FTE in each program is multiplied by the program‘s cost
factor. The resulting weighted FTE, aggregated by group, establishes the
group cap. After actual FTE is reported, districts with Group 2 FTE in excess
of the cap receive basic funding.458
f. Additional Weighted FTE. Students may generate FTE in addition to FTE
generated through course enrollment. The additional FTE is generated by
small districts to offset the expenditures of high-cost programs that serve a
small number of students. In addition, in order to promote the offering of
rigorous and accelerated course work, additional FTE is generated for
successful performance in Advanced Placement courses, International
Baccalaureate courses, and Advanced International Certificate of Education
courses, and for earning industry certifications and early graduation.459
456 Ex. 3680 at 00103474–75; Tr. Vol. 32 at 4814:23–4816:1 Tr. Vol. 33 at 4960:9–24 (Test. of
L. Champion).
457 Ex. 3680 at 00103473–74.
458 Ex. 3680 at 00103475; Tr. Vol. 33 at 4960:9–24 (Test. of L. Champion).
459 Ex. 3680 at 00103475–77; Tr. Vol. 32 at 4816:2–4819:3 (Test. of L. Champion).

100
g. Base Student Allocation (―BSA‖). The base student allocation is determined
annually by the Legislature in the context of the overall state budget and is a
component in the calculation of base funding. For the 2015–16 school year,
the BSA was $4,154.45 (second calculation), which is the highest BSA in the
history of the FEFP.460
h. District Cost Differential (―DCD‖). The FEFP recognizes differences in cost
of living throughout the state through the district cost differential calculation.
The Commissioner of Education is required to annually compute DCDs by
adding each district‘s Florida Price Level Index for the most recent three years
and dividing the sum by three. The result is multiplied by .8 and divided by
100 and .2 is added to the product. This serves to limit the factor‘s adjustment
to 80% of the index, which is the approximate percentage of district salary
costs to total operating costs. The three-year averaging reduces the immediate
impact on districts of sudden changes in the index. Since 2000, the Florida
Price Level Index has been calculated by the Bureau of Economic and
Business Research at the University of Florida. For the 2014–15 school year,
Madison County had the lowest DCD (.9261) and Palm Beach County had the
highest (1.0290).461
i. Base Funding. Base Funding is calculated by multiplying the weighted FTE
students by the BSA and the DCD.462
460 Ex. 3680 at 00103477; Tr. Vol. 32 at 4819:4–4820:13 (Test. of L. Champion).
461 Ex. 3680 at 00103477–78; Tr. Vol. 32 at Trial Tr. 4820:14–4822:17 (Test. of L. Champion).
462 Ex. 3680 at 00103478; Tr. Vol. 32 at 4822:18–4825:19 (Test. of L. Champion).
101
j. Supplemental Allocation for DJJ Programs. The total weighted FTE student
membership in juvenile justice education programs in each school district is
multiplied by the amount of the state average class size reduction factor
multiplied by the district‘s DCD.463
k. Declining Enrollment Supplement. Districts that experience enrollment
decline receive supplemental funding that is determined by comparing the
unweighted FTE for the current year to the unweighted FTE of the prior year.
Twenty-five percent of the decline is multiplied by the prior year base funding
per unweighted FTE.464
l. Sparsity Supplement. The FEFP recognizes the relatively higher operating
costs of smaller districts due to sparse student population through a detailed
statutory formula.465
m. State-Funded Discretionary Contribution. Developmental research schools
(lab schools) and the Florida Virtual School are established as separate school
districts for purposes of FEFP funding. Those schools are allocated state
funds in lieu of discretionary local tax revenue that is generated for district
students by the tax base of the district where the school is located.466
n. .748 Mills Discretionary Compression. If any school district levies the full
.748 mill levy and generates an amount of funds per unweighted FTE student
that is less than the state average amount per unweighted FTE student, the
463 Ex. 3680 at 00103478; Tr. Vol. 32 at 4825:21–4826:19 (Test. of L. Champion).
464 Ex. 3680 at 00103478; Tr. Vol. 32 at 4826:20–4827:10 (Test. of L. Champion).
465 Ex. 3680 at 00103478–79; Tr. Vol. 32 at 4827:11–4828:9 (Test. of L. Champion).
466 Ex. 3680 at 00103479; Tr. Vol. 32 at 4828:10–4829:2 (Test. of L. Champion).
102
school district receives a discretionary millage compression supplement that,
when added to the funds generated by the district‘s .748 mill levy, is equal to
the state average.467
o. Safe Schools. State funds are provided to school districts for various safe
schools activities, including after school programs for middle school students,
middle and high school programs for correction of specific discipline
problems, implementation of conflict resolution strategies, anger and
aggression management strategies, alternative school programs, suicide
prevention programs, bullying prevention and intervention, school resource
officers, and detection dogs. All school districts receive a minimum
allocation. Additional funds are allocated to districts based on the latest
official Florida Crime Index provided by the Florida Department of Law
Enforcement and on each district‘s share of the state‘s total unweighted
student enrollment.468
p. Reading Program. State funds are provided for a comprehensive, district-wide
system of research-based reading instruction. A portion of the funds is to be
used to provide an additional hour of intensive reading instruction for students
in the 300 lowest performing elementary schools in the state. All districts
receive a minimum allocation of funds plus additional funds based on each
district‘s proportion of the total K–12 base funding.469
467 Ex. 3680 at 00103479; Tr. Vol. 32 at 4829:3–4830:16 (Test. of L. Champion).
468 Ex. 3680 at 00103479; Tr. Vol. 32 at 4830:18–4832:1 (Test. of L. Champion).
469 Ex. 3680 at 00103479–80; Tr. Vol. 32 at 4832:2–25 (Test. of L. Champion).
103
q. Supplemental Academic Instruction. State funds are provided to supplement
academic instruction, with a portion of these funds to be used to provide an
additional hour of intensive reading instruction for students in the 300 lowest-
performing elementary schools in the state.470
r. ESE Guaranteed Allocation. Additional state funds are provided for services
related to the special needs of students where level of service is less than
support Levels 4 and 5.471
s. Instructional Materials. State funds are provided for the purchase of
instructional materials and instructional content, as well as electronic devices
and technology equipment and infrastructure. This funding also provides
dollars for library/media materials, science lab material and supplies, dual
enrollment instructional material and digital instructional materials for
students with disabilities.472
t. Florida Teachers Classroom Supply Assistance Program. This program
provides approximately $250 for each classroom teacher for the purchase of
classroom instructional materials and supplies for use in teaching students.
State funds are allocated to districts based on the prorated total of each school
district‘s share of the total unweighted FTE student allotment.473
u. Student Transportation. State funds are provided for the safe and efficient
transportation services in school districts in support of student learning. A
470 Ex. 3680 at 00103480; Tr. Vol. 32 at 4833:1–4834:20 (Test. of L. Champion).
471 Ex. 3680 at 00103480; Tr. Vol. 32 at 4834:21–4837:17 (Test. of L. Champion).
472 Ex. 3680 at 00103480; Tr. Vol. 32 at 4837:18–4838:13 (Test. of L. Champion).
473 Ex. 3680 at 00103481; Tr. Vol. 32 at 4838:14–4839:10 (Test. of L. Champion).
104
detailed statutory formula allocates these funds to school districts and includes
indices to reward efficient bus utilization, compensate for rural population
density and adjust funding based on cost of living.474
v. Virtual Education Contribution. State funds are provided for virtual education
programs when certain FEFP components do not generate at least $5,230 per
FTE (as of the 2014–15 school year).475
w. Digital Classrooms Allocation. State funds are provided to school districts to
support school and district efforts and strategies to improve student
performance outcomes by integrating technology in classroom teaching and
learning.476
x. Required Local Effort (―RLE‖). In order to participate in the FEFP, school
districts are required to tax at a minimum level in support of their schools.
The amount of RLE is set annually and the RLE millage rate is calculated by
the Commissioner of Education on the basis of the certified tax roll from the
Department of Revenue. Adjustments are made to offset variations among
school districts in levels of property assessment. Millage rates are adjusted to
ensure that RLE does not exceed 90% of a district‘s total FEFP entitlement.477
y. Adjustments. When the enrollment projected as determined by FTE
student membership surveys exceeds the appropriated or projected FTE, FEFP
474 Ex. 3680 at 00103481; Tr. Vol. 32 at 4839:11–4840:3 (Test. of L. Champion).
475 Ex. 3680 at 00103481; Tr. Vol. 32 at 4840:4–11 (Test. of L. Champion).
476 Ex. 3680 at 00103470; Tr. Vol. 32 at 4840:12–4841:2 (Test. of L. Champion).
477 Ex. 3680 at 00103481–82; Tr. Vol. 32 at 4841:14–4843:8 (Test. of L. Champion).
105
amounts are prorated to preserve equity in the distribution of the appropriation
of FEFP funds.478
State Categorical Funding C.
In addition to the formula components of the FEFP, certain categorical state 259.
funding is also provided to school districts as part of the Florida school funding system. These
include the class size reduction appropriation and district lottery and school recognition program
funds.479
a. Class Size Reduction. Pursuant to the voter-approved amendment to Article
IX, Section 1 of the Florida Constitution in 2002, additional operating and
capital outlay funds have been appropriated to school districts since the 2003–
04 school year. Beginning with the 2010–11 school year, Florida classrooms
could have no more than 18 students in grades pre-K through grade 3, 22
students in grades 4–8, and 25 students in grades 9–12. The class size
reduction appropriation for the 2015–16 school year was in excess of $3
billion in state funds and is used primarily to hire teachers to meet class size
requirements.480
b. District Lottery and School Recognition Program Funds. These funds provide
an incentive to school districts to maintain or improve their letter grade under
the state‘s accountability system. In particular, schools that maintain an ―A‖
letter grade, improve a letter grade or improve more than one letter grade and
maintain the improvement in the following year, receive additional funds per
478 Ex. 3680 at 00103482; Tr. Vol. 32 at 4843:9–4844:2 (Test. of L. Champion).
479 Ex. 3680 at 00103482.
480 Exs. 132, 131, 3680 at 00103482; Tr. Vol. 32 at 4844:21–4851:1 (Test. of L. Champion).
106
FTE student in that school. The funds are used at the discretion of each
school‘s staff and the School Advisory Council.481
With respect to the class size reduction amendment, the Court finds that the State 260.
has provided sufficient funding to school districts to meet the requirements of the amendment.
From the 2003–04 school year to the 2010–11 school year, the State provided school districts
with $18.7 billion in capital and operating funds. The cost of implementing the class size
reduction requirements, as determined by the Office of Demographic and Economic Research,
was estimated to be approximately $18.4 billion during this time frame. Thus, funding exceeded
estimated costs by over $300 million.482
In addition to the provision of adequate funding for districts to achieve the 261.
specified class size reduction, the Court finds that the various school district witnesses called by
Plaintiffs confirm that their respective districts meet class size requirements.483
Non-FEFP State Funding D.
Another component of the Florida school funding system includes an annual 262.
appropriation category called ―Non-FEFP.‖ The Non-FEFP appropriation provides funds for
student mentoring programs, assistance to low performing schools, support for exceptional
education programs, regional education consortium services, teacher professional development,
481 Ex. 3680 at 00103482–83; Tr. Vol. 32 at 4851:2–22 (Test. of L. Champion).
482 Exs. 131, 132, 3680; Tr. Vol. 32 at 4844:21–4851:1 (Test. of L. Champion).
483 Tr. Vol. 5 at 677:15–21 (Test. of N. Vitti); Tr. Vol. 6 at 840:18–841:7 (Test. of O. Roberts);
Tr. Vol. 7 at 1030:25–1031:2 (Test. of G. Littleton); Tr. Vol. 8 at 1086:15–1087:9 (Test. of N.
Marks); Tr. Vol. 9 at 1331:10–17 (Test. of E. Roy); Tr. Vol. 11 at 1553:21–1554:3 (Dep. Test. of
M. Burke); Tr. Vol. 14 at 2057:13–23 (Test. of L. Romano); Tr. Vol. 18 at 2648:4–20 (Test. of
K. Ferree); Tr. Vol. 22 at 3281:17–3282:1 (Test. of D. Robinson); Tr. Vol. 23 at 3466:15–18
(Dep. Test. of R. Collins); Tr. Vol. 24 at 3629:23–3630:1 (Dep. Test. of J. Marte); Tr. Vol. 25at
3749:19–22 (Dep. Test. of A. Weidner); Tr. Vol. 36 at 5480:12–19 (Dep. Test. of K. Blocker);
Ex. 5364 (Dep. of C. Morrison) at 94:14–21; Ex. 5366 (Dep. of J. Preston) at 35:4–23.
107
after school programs and other initiatives. In 2014–15, the amount provided for these programs
totaled over $304 million.484
In 2015–16, overall State funding for K–12 is at its highest level ever, with the 263.
highest portion from the State on a per-pupil basis.485
In addition to funding within the K–12 system, there are numerous portions of the 264.
state budget that address the needs of school-aged children and families, including healthcare,
mental health and social worker services, counseling and family support, the Department of
Juvenile Justice, the Department of Children and Families, community health, and early
childhood education.486
Capital Outlay Funding E.
In addition to the FEFP, categorical and Non-FEFP funds described above, the 265.
Florida school funding system includes significant expenditures for capital outlay (at both the
state and local levels), as well as additional operating funds from local sources as determined by
local boards of education.487
According to a 2016 national report, Florida ranked among the top three states in 266.
the nation, exceeding the target for adequate building maintenance and construction funding.488
And in a 2010 report from the National Clearinghouse for Educational Facilities, Florida ranked
484 Ex. 3416; Tr. Vol. 32 at 4860:9–4868:2 (Test. of L. Champion).
485 Ex. 3683 at 00103646–47; Tr. Vol. 32 at 4855:3–11 (Test. of L. Champion).
486 Ex. 230; Tr. Vol. 34 at 5043:15–5046:7 (Test. of A. Baker); Tr. Vol. 16 at 2372:2–
2375:22(Test. of J. Hall).
487 Tr. Vol. 32 at 4898:1–4915:14 (Test. of L. Champion).
488 Tr. Vol. 36 at 5406:7–20 (Test. of J. Ratliff).
108
among the top five states in average per-student capital outlay and first in the nation in states
with over one million students.489
In Florida, as in most other states, capital outlay funding has historically been 267.
provided primarily from local sources.490
The primary state source for capital outlay in Florida is the Public Education 268.
Capital Outlay (―PECO‖) program. PECO funds are dedicated to funding capital projects and
related debt service for all levels of public education (K–12 public schools and colleges and
universities). The PECO program is established by Article XII, Section 9 of the Florida
Constitution, and is funded by gross receipts taxes on electricity, gas fuels, and
telecommunications and television services.491
Because the fund source of gross receipt taxes has generally been declining, there 269.
has been fluctuation in the amounts available for capital outlay. Additionally, the funding stream
had been bondable in past years, but there has not been a bonding of PECO dollars since 2010–
11. These factors combined have caused a decrease in the amount of PECO dollars available for
capital outlay in the past several years. 492
In 2014–15, K–12 public schools received $128 million in PECO appropriations 270.
for maintenance, repair, and renovation, and almost $60 million for special facilities, discussed
further below.493
489 Ex. 4027 at 00121409; Tr. Vol. 32 at 4905:3–10 (Test. of L. Champion).
490 Ex. 4027 at 00121393; Tr. Vol. 32 at 4905:14–4906:3 (Test. of L. Champion).
491 Ex. 3680 at 00103485; Tr. Vol. 32 at 4898:5–15 (Test. of L. Champion).
492 Tr. Vol. 32 at 4907:2–25 (Test. of L. Champion).
493 Ex. 3680 at 00103485–86; Tr. Vol. 32 at 4908:8–16 (Test. of L. Champion).

109
In addition to PECO, Capital Outlay and Debt Service (―CO&DS‖) is a state 271.
source of school district and Florida College System capital outlay revenue, which is derived
from the first proceeds of motor vehicle license tag revenue each year.494
In 2013–14, $17.8
million was distributed to Florida public school districts and $87.8 million was paid for debt
service for previously-issued bonds that benefitted public schools and Florida colleges.495
The special facility construction account is funded with PECO dollars and 272.
provides necessary construction funds to school districts that have urgent construction needs but
lack sufficient resources at present and cannot reasonably anticipate sufficient resources within
three years to fund such needs. Typically, small rural school districts qualify for this funding.496
From fiscal years 1981–82 to 2015–16, the special facility construction account has funded
construction projects totaling over $1 billion. Approximately 72% of the total amount was
funded by the state and 28% by local school districts.497
As noted above, the State provided school districts with both operating and capital 273.
outlay funds to meet the class size reduction requirements of Article IX of the Florida
Constitution. The capital outlay portion of that funding from 2003–04 to 2007–08 exceeded $2.5
billion.498
State law permits local boards of education to raise significant amounts of capital 274.
outlay funds at the local level. Historically, these funds have been the primary source of funding
for support of K–12 public schools‘ capital expenditures. The three primary local funds sources
494 Ex. 3680 at 00103487, Tr. Vol. 32 at 4898:5–14 (Test. of L. Champion).
495 Ex. 3445.
496 Tr. Vol. 32 at 4902:13–4903:2 (Test. of L. Champion).
497 Exs. 3440, 3728; Tr. Vol. 32 at 4913:5–25 (Test. of L. Champion).
498 Exs. 131, 2880; Tr. Vol. 32 at 4844:21–4851:1 (Test. of L. Champion).
110
are discretionary capital improvement revenue levy, school capital outlay surtax (half-cent sales
tax), and the local government infrastructure surtax.499
Florida school districts generate funding for capital outlay primarily from the 275.
Local Capital Improvement Revenue (―LCIR‖) levy, which is currently limited to 1.5 mills.500
Prior to 2008–09, authority existed to levy up to 2.0 mills. In the midst of decreased operating
revenue caused by the Great Recession, school districts determined that certain capital outlay and
maintenance items could be deferred without significant impact and, therefore, advocated to the
Legislature to redirect or transfer a portion of the LCIR levy to operations. The LCIR levy
authority was decreased by .25 mills in 2008–09 and by .25 mills in 2009–10. The RLE
operating millage in the FEFP was increased by an equivalent amount of revenue in each of the
years of the LCIR decrease, thus there was no loss in revenue to school districts as a result of this
change.501
The LCIR is a non-voted tax that may be used for remodeling and new 276.
construction projects that are recommended and approved in a five-year educational plant
survey; to rent or lease portable buildings; for maintenance, renovation and repair; for school bus
purchases; for the purchase or replacement of equipment; for the purchase, lease-purchase or
lease of new and replacement equipment hardware devices necessary for gaining access to, or
enhancing the use of electronic content and resources; for enterprise software applications; for
the payment of premiums for property and casualty insurance; and for the purchase, lease-
purchase or lease of school district vehicles.502
499 Tr. Vol. 32 at 4898:16–4899:10; 4900:20–4901:2 (Test. of L. Champion).
500 § 1011.71(2), Fla. Stat.; Tr. Vol. 32 at 4898:16–4899:6 (Test. of L. Champion).
501 Tr. Vol. 32 at 4888:16–4889:19 (Test. of L. Champion).
502 Tr. Vol. 32 at 4888:8–15, 4890:2–11 (Test. of L. Champion).
111
The School Capital Outlay Surtax (Half-Cent Sales Tax) is a voted sales tax, 277.
initiated by a local board of education, not to exceed .5 percent.503
It must be approved by a
majority of electors in the county.504
The tax proceeds must be used for fixed capital
expenditures or fixed capital assets associated with construction, reconstruction, or improvement
of school facilities and campuses that have a useful life or expectancy of five years or more, and
any land acquisition, improvement, and design and engineering costs associated with such
facilities and campuses. The funds may also be used for retrofitting and technology
implementation.505
The Local Government Infrastructure Surtax is a sales tax that may be levied by 278.
the governing authority in each county after approval by majority vote of electors in the county.
The sales tax may be .5 percent or 1.0 percent.506
The proceeds of the tax are distributed to the
county, municipalities within the county, and/or school districts according to an interlocal
agreement. The revenue generated from this surtax must be used for construction,
reconstruction, or improvement of public facilities with a life expectancy of five or more years
and any land acquisition or improvement costs.507
In the 2013–14 school year, 22 districts levied the School Capital Outlay Sales 279.
Surtax or the Local Government Infrastructure Surtax.508
503 § 212.055(6), Fla. Stat.; Tr. Vol. 32 at 4900:20–4901:2 (Test. of L. Champion).
504 Tr. Vol. 33 at 4934:12–15 (Test. of L. Champion).
505 Tr. Vol. 32 at 4900:20–4901:2 (Test. of L. Champion).
506 § 212.055(2), Fla. Stat.
507 Tr. Vol. 32 at 4900:20–4901:2 (Test. of L. Champion)
508 Ex. 3444.
112
In addition to the LCIR, the School Capital Outlay Sales Surtax, and the Local 280.
Government Infrastructure Surtax, school districts are authorized to sell bonds for capital outlay
projects to be repaid from local property taxes.509
School districts can also obtain funding for
capital purposes from impact fees assessed at the local level.510
Finally, school districts are
permitted to use up to .25 mills of their 748 discretionary operating millage for capital outlay
purposes.511
Only one school district—Miami-Dade County—currently utilizes this provision.512
For the 2013–14 school year, funding from all sources for fixed capital outlay for 281.
Florida K–12 public schools is summarized below:513
LCIR $2,009,792,890
Voted debt service 67,604,185
Local Government Infrastructure and
School Capital Outlay Surtaxes
495,979,857
Impact fees 202,651,023
Racing commission funds514
14,133,061
CO&DS 88,391,715
PECO-maintenance 6,000,000
PECO-charter schools 90,604,553
K–12 PECO special facility construction 7,870,913
509 §§ 200.001(3)(e), Fla. Stat.; Art. VII, § 12, Fla. Const.; Tr. Vol. 32 at 4894:13–16 (Test. of L.
Champion).
510 § 63.31801, Fla. Stat.; Tr. Vol. 32 at 4901:17–24 (Test. of L. Champion).
511 § 1011.71(3)(a), Fla. Stat.; Tr. Vol. 32 at 4893:17–25 (Test. of L. Champion).
512 Ex. 3418; Tr. Vol. 33 at 4922:24–4923:10 (Test. of L. Champion).
513 Ex. 3445.
514 Racing Commission Funds (pari-mutuel taxes) are authorized in Article VII, Section 7 of the
Florida Constitution. Florida law, § 212.20(6)(d)6.a., Fla. Stat., directs the distribution of
$29,915,500 to be divided equally among the counties in lieu of pari-mutuel taxes, beginning
July 1, 2000. If a local or special law required that any moneys accruing to a county in fiscal
year 1999–2000 under the then-existing provisions of § 550.135, Fla. Stat., be paid directly to the
district school board, special district, or a municipal government, such payment must continue
until the local or special law is amended or repealed.
113
$2,983,028,197
As noted in the table above, the LCIR levy is the primary source of capital outlay 282.
funds for school districts. These funds are not required to be shared with charter schools, and
only three school districts provide such funding to their respective charter schools.515
Thus, the
principal source of capital outlay for charter schools has been through state PECO funds.516
In
the 2013–14 school year, on a per student basis, charters received approximately $476 per
student for capital outlay while traditional schools received approximately $1,202 per student for
capital outlay.517
Local Funding and School District Capacity - (Subject to Voter Approval) F.
The local funding sources discussed above include the RLE millage, the .748 283.
discretionary operating millage, the .25 millage levy for capital purposes, the LCIR levy, the
School Capital Outlay Surtax and the Local Government Infrastructure Surtax, voted debt
service millage and impact fees. As set forth below, subject to voter approval, school districts
can raise additional revenue through discretionary levies for operating or capital outlay, for a
period of time not to exceed two or four years.518
Article VII, § 9(b) of the Florida Constitution establishes a 10 mill limit for 284.
school purposes, which applies to the RLE millage, the .748 discretionary operating millage, the
.25 mills levy for capital purposes, the LCIR and the discretionary levy that may not exceed four
515 Tr. Vol. 32 at 4908:2–4909:12 (Test. of L. Champion).
516 Id.
517 Tr. Vol. 32 at 4909:13–4911:16 (Test. of L. Champion).
518 § 1011.73, Fla. Stat.
114
years. The limit does not apply to capital outlay surtaxes, voted millage for debt service, or the
discretionary millage levy that may not exceed two years.519
The discretionary levy that may not exceed four years may be levied for 285.
operations only and is subject to the 10 mill limit.520
In the 2014–15 school year, 16 districts
levied this millage, which generated over $274 million for operating purposes.521
The discretionary levy that may not exceed two years may be levied for operating 286.
or capital outlay purposes and is not subject to the 10 mill limit.522
No school districts currently
levy this millage.523
In 2014, ten school districts held voter referenda on either ad valorem millage 287.
levies for operating/capital outlay purposes or sales surtax proposals. Nine out of the ten
proposals were approved by local voters.524
As of the 2014–15 school year, no school districts levied up to the 10 mill limit 288.
imposed by the Florida Constitution.525
Accordingly, there is local revenue capacity available to
school districts under Florida law if school districts determined a need for additional revenue.526
However, it must be remembered that much of this funding capacity requires voter approval
before it can be utilized.
519 Ex. 3418; Tr. Vol. 33 at 4921:22–4925:25 (Test. of L. Champion).
520 § 1011.73(2), Fla. Stat.
521 Ex. 3418; Tr. Vol. 33 at 4923:11–4925:4 (Test. of L. Champion).
522 § 1011.73(1), Fla. Stat.
523 Ex. 3418; Tr. Vol. 33 at 4925:5–7, 4925:21–25 (Test. of L. Champion).
524 Ex. 3429; Tr. Vol. 33 at 4933:18–4934:11 (Test. of L. Champion). The voters in the one
school district that rejected a referenda in 2014—Hernando County—approved a revised capital
outlay surtax proposal in September 2015. Tr. Vol. 33 at 4933:18–4934:11 (Test. of L.
Champion); Tr. Vol. 14 at 2102:2–2103:23 (Test. of L. Romano).
525 Ex. 3446.
526 Ex. 3446; Tr. Vol. 33 at 4929:23–25 (Test. of L. Champion).
115
If all school districts in the state levied to the full 10 mill limit, for the 2014–15 289.
school year, districts could have raised an additional $3.78 billion or approximately $1,401 per
FTE student. To put in context, with total FEFP revenue in 2014–15 of $18.9 billion, an
additional $3.78 billion would result in approximately 20% more funding for school districts.527
Similarly, in the 2014–15 school year, 45 school districts did not levy either the 290.
School Capital Outlay Surtax or the Local Government Infrastructure Surtax.528
If these districts
were to levy a one-half cent sales tax, an additional $1.04 billion, or over $578 per capital-outlay
FTE student, would be generated for these districts.529
Some school districts have decided to reduce property tax rates, resulting in 291.
lowered tax bills for homeowners.530
Federal Funding G.
The Florida school funding system also includes the administration and allocation 292.
of significant federal funding.531
The two primary categories of federal funds administered by
the Florida Department of Education are entitlement grants and discretionary grants.
Entitlement grants are those for which the federal government establishes the 293.
specific purposes and requirements of each grant and which must be disbursed in accordance
527 Ex. 3446; Tr. Vol. 33 at 4929:23–25 (Test. of L. Champion).
528 Ex. 3444.
529 Ex. 3444; Tr. Vol. 33 at 4932:13–4933:1 (Test. of L. Champion).
530 E.g., Tr. Vol. 6 at 832:3–12 (Test. of O. Roberts); Tr. Vol.24 at 3636:4–9, 3651:5–10,
3657:16–3658:13 (Dep. Test. of J. Marte); Exs. 1771, 1743, 1746; Tr. Vol. 11 at 1567:10–
1570:10 (Dep. Test. of M. Burke).
531 Ex. 3433; Tr. Vol. 26 at 3957:3–9 (Test. of P. Stewart).
116
with a specified formula or procedure. In 2014–15, total elementary and secondary federal
entitlement grant funds totaled $1.8 billion.532
Discretionary grants are grants for which the U.S. Department of Education has 294.
discretion regarding how much to award, to which recipients, and for what purpose. These
grants are generally awarded on a competitive basis.533
Race to the Top (―RTT‖) is an example
of a federal competitive grant. That grant was awarded to the state of Florida beginning in the
2010–11 school year, as discussed in more detail below.534
The largest federal entitlement grant is Title I, Part A of the ESEA (approximately 295.
$777 million in 2014–15), which provides assistance to schools with high numbers or
percentages of children from low income families to help ensure that children meet challenging
state academic standards.535
The next largest federal entitlement grant is the Grants to State programs 296.
(approximately $634 million in 2014–15), which provides formula grants to assist states in
meeting the excess costs of providing special education services to children with disabilities
between the ages of 3 and 21.536
Other significant federal entitlement grants include funding for the improvement 297.
of teacher quality (approximately $103 million in 2014–15), 21st Century Community Learning
Centers (approximately $59 million in 2014–15), and English language learners education
532 Ex. 3433.
533 Tr. Vol. 33 at 4985:21–4986:8 (Test. of L. Champion).
534 Ex. 3774.
535 Ex. 3433; Tr. Vol. 26 at 3971:2–3972:6 (Test. of P. Stewart); Tr. Vol. 33 at 4934:25–4935:10
(Test. of L. Champion).
536 Ex. 3433; Tr. Vol. 33 at 4938:2–11 (Test. of L. Champion).

117
(approximately $43 million in 2014–15).537
A federal entitlement grant is also provided for
homeless children and youth education (approximately $3 million in 2014–15).538
There are many requirements associated with the receipt of federal entitlement 298.
grants.539
Generally, a state must submit for approval an extensive plan for administration of the
funds.540
Discretionary grants generally require the submission of an application or proposal,
which may or may not be selected for funding at the amount the state requests.541
The Florida Department of Education has several offices and staff with the 299.
responsibility for the administration of federal funds.542
These include the Budget Office; the
Comptroller‘s Office; and the Bureau of Contracts, Grants and Procurement.543
The U.S. Department of Education monitors the State‘s compliance with various 300.
federal grant programs and laws, including those under ESEA Title I, the McKinney-Vento
Homeless Assistance Act, and the Individuals with Disabilities Education Act.544
In 2010, the U.S. Department of Education awarded the state of Florida a $700 301.
million RTT grant.545
The RTT was a competitive grant program that was part of the American 302.
Recovery and Reinvestment Act of 2009 (―ARRA‖).546
The RTT grant program recognized
537 Ex. 3433; Tr. Vol. 33 at 4936:24–4937:15 (Test. of L. Champion).
538 Ex. 3433; Tr. Vol. 33 at 4937:16–18 (Test. of L. Champion).
539 Tr. Vol. 26 at 3957:3–9 (Test. of P. Stewart).
540 Tr. Vol. 33 at 4938:24–4939:10 (Test. of L. Champion); e.g., Exs. 3973, 3395, 3405.
541 E.g., Exs. 3782, 3366, 3781.
542 Tr. Vol. 33 at 4934:20–24 (Test. of L. Champion).
543 Tr. Vol. 32 at 4802:16–21 (Test. of L. Champion).
544 Exs. 1406, 1409, 1410, 1411, 1412, 1471, 1472; Tr. Vol. 8 at 1220:25–1221:8, 1233:4–
1235:4 (Test. of L. Allen); Tr. Vol. 31 at 4657:23–4658:3, 4687:2–3 (Test. of M. Tappen).
545 Ex. 3774.
118
states with a demonstrated record of and commitment to internationally-benchmarked education
standards, high quality assessments aligned to rigorous education standards, data systems to
analyze student performance for the purpose of continuous improvement, improving the quality
of school leaders and teachers, support for struggling schools, and an emphasis on STEM
education.547
The U.S. Department of Education ranked Florida fourth out of 35 states that 303.
applied for funding in phase II of the RTT competition, and awarded the state $700 million over
a five-year grant period.548
Of the $700 million RTT grant award, $350 million was utilized for state-level 304.
projects and $350 million was allocated to school districts for identified projects in areas such as
improvement in low performing schools, professional development, STEM education, and
technology.549
Palm Beach County, a district from which Plaintiffs presented two witnesses
testifying about an alleged lack of funding, did not participate in the grant,550
voluntarily
forgoing around $37 million.551
The State Budget Process H.
In Florida, state budgeting is a year-round process involving professional staff of 305.
the various agencies of state government, legislative staff, the Governor‘s office as well as
546Tr. Vol. 20 at 3013:1–3 (Test. of H. Edenfield)
547 Exs. 1413, 3782, 3366, 3781, 3774; Tr. Vol. 20 at 3043:4–3044:4 (Test. of H. Edenfield).
548 Exs. 1413, 3774; Tr. Vol. 20 at 3013:12–20 (Test. of H. Edenfield).
549 Ex. 3434; Tr. Vol. 33 at 4941:11–19 (Test. of L. Champion); Tr. Vol. 20 at 3014:18–3015:1
(Test. of H. Edenfield).
550 Tr. Vol. 10 at 1507:1–19 (Dep. Test. of M. Burke); Tr. Vol. 22 at 3268:11–22 (Test. of D.
Robinson).
551 Ex. 3434; Tr. Vol. 33 at 4942:4–21 (Test. of L. Champion).
119
elected officials.552
The process is public and includes extensive opportunities for input and
comment by interested stakeholders.553
The state budgeting process is largely prescribed by the Florida Constitution and, 306.
of course, impacted by general economic conditions in the state and nation.554
The Florida Constitution requires the Legislature to prepare a balanced budget 307.
each year,555
and also requires that the state budget be developed in reference to a long range
financial outlook, which is to be based on major workload and revenue estimates.556
The
Constitution also places limits on the amount and types of revenues that can be raised.557
Florida relies on consensus estimating conferences to develop official economic, 308.
demographic, resource-demand, and revenue forecasts for use in developing the state budget.
The four principals for each conference are designated professional staff representing the
Governor‘s office, the Senate, the House of Representatives, and the Legislative Office of
Economic and Demographic Research.558
The Education Estimating Conferences develop forecasts as to public school 309.
enrollment, public schools capital outlay, FTE student enrollment, Florida College System
enrollment, and postsecondary financial aid. 559
552 Ex. 3683 at 00103643; Ex. 3436; Tr. Vol. 26 at 4059:11–4060:1 (Test. of P. Stewart); Tr.
Vol. 33 at 4945:12–4947:6 (Test. of L. Champion).
553 Tr. Vol. 26 at 4060:18–25 (Test. of P. Stewart); Tr. Vol. 33 at 4945:12–4947:6 (Test. of L.
Champion).
554 Ex. 219; Tr. Vol. 33 at 5015:15–5016:21 (Test. of A. Baker).
555 Art. III, § 19(a), Art. VII, § 1(c), (d), Fla. Const.
556 Art. III, § 19(c), Fla. Const.
557 See, e.g., Art. VII, § 5, Fla. Const.
558 Ex. 3436 at 42-6; Tr. Vol. 33 at 4998:1–4999:5 (Test. of A. Baker).
559 Ex. 3436 at 42-6; Tr. Vol. 33 at 5016:22–5018:7 (Test. of A. Baker).
120
The estimating conferences hold public meetings and provide the executive and 310.
legislative branches with professionally-developed projections upon which policy judgments and
budget decisions can be based.560
The education budget process includes the development of a Legislative Budget 311.
Request (―LBR‖) by the Department of Education. The LBR is based on input from
professionals within the Department, as well as educators and finance officers from school
districts throughout the state, and reflects educational priorities and programs for which funding
is requested. The LBR is reviewed and adopted by the State Board of Education and submitted
to the Governor and Legislature.561
The Governor prepares a budget based on estimating conference data and includes 312.
his or her policy and budget priorities. The budget is provided to the Legislature.562
The legislative phase of the budget process involves hearings before the 313.
appropriation committees which publicly review the State Board‘s LBR and the Governor‘s
recommended budget. Many organizations interested in education, such as the Florida School
Boards Association, the Florida Education Association, and the Florida Association of District
School Superintendents, provide the legislative committees and staff with position statements
and advocacy for their various education policy and budget priorities and preferences.563
The Legislature, after consideration of the agency budget requests, the Governor‘s 314.
recommended budget, information from the estimating conferences, and extensive public input,
adopts a budget and an appropriations act, which is then submitted to the Governor for signature
560 Tr. Vol. 33 at 4998:1–4999:5 (Test. of A. Baker).
561 Ex. 3436 at 42-2, 42-3, 42-5; Tr. Vol. 33 at 4945:9–4947:6 (Test. of L. Champion).
562 Ex. 3436 at 42-2; Tr. Vol. 33 at 4946:7–11 (Test. of L. Champion).
563 Ex. 3436 at 42-2, 42-3; Tr. Vol. 33 at 4945:14–4946:21 (Test. of L. Champion).

121
or veto of specific policy or budget items that he or she determines are not in the best interest of
the state.564
Florida’s Commitment to Funding Education I.
As discussed in detail below, the State has consistently prioritized funding 315.
education in the budgeting and appropriations process, despite fluctuations in the amount of
available revenue due to economic conditions.
The first sections of every appropriations act start with appropriations for 316.
education,565
and the Legislature has enacted laws seeking to protect or minimize the disruption
to education funding when the State is in a deficit scenario. For example, when the State budget
must be reduced due to overstatement of general-revenue projections, Florida law sets forth a
process to ensure that education is impacted less than other areas of the budget funded by general
revenues.566
Since 1997–98, funding for education has been the single largest component of 317.
the general revenue budget, and funding for K–12 schools, primarily through the FEFP, has been
the largest component of the education portion of the state budget.567
During the early to mid-2000s, the state experienced extraordinary economic 318.
upheaval due to the effect of the housing/real estate boom, its subsequent collapse and the Great
Recession.568
Based on gross domestic product (―GDP‖) and personal income measures, Florida
was one of the fastest growing states from 2000 to 2006, but the state experienced much more
564 Ex. 3436 at 42-2, 42-3.
565 Tr. Vol. 34 at 5089:22–5090:4 (Test. of A. Baker).
566 §§ 216.221(5)(c)(1.), 215.16, Fla. Stat.
567 Exs. 230, 254, 255; Tr. Vol. 34 at 5043:12–5049:20 (Test. of A. Baker).
568 Tr. Vol. 33 at 5005:8–5007:15 (Test. of A. Baker).
122
severe impacts than the nation as a whole as a result of the housing/real estate collapse. From
2008 to 2011, the state experienced four years of negative GDP.569
In 2009, the state
experienced negative personal income growth.570
The state‘s unemployment rate was only 3.3%
in 2006 and soared to 11.4% in 2009–10.571
Home foreclosure filings went from a low of 57,288
in 2005–06 to a high of 403,473 in 2008–09.572
The economic conditions described above resulted in record state revenues in the 319.
years leading up to the housing/real estate collapse. General revenue collections reached peak
levels in fiscal year 2005–06. However, the state experienced three consecutive years of year-
over-year decline in general revenue as the housing market collapsed: 2006–07 (-2.5%); 2007–
08 (-8.7%); and 2008–09 (-12.8 %). Prior to this period, there had not been a single year of loss
over the prior year during Florida‘s modern period of state budgeting.573
Although the Great Recession technically ended in June 2009, the extreme 320.
financial and economic stress experienced in Florida during these years did not reach bottom
until the spring of 2010, followed by two years of extremely fragile growth.574
Despite the historic downturn in the economy and projected shortfall in state 321.
revenues, the Legislature took steps to preserve education funding.575
In total, the appropriated
general revenue budget shrank more than $8 billion from 2007–08 to 2009–10. Although
569 Ex. 214; Tr. Vol. 33 at 5011:12–5012:15 (Test. of A. Baker).
570 Ex. 215; Tr. Vol. 33 at 5012:16–5013:7 (Test. of A. Baker).
571 Ex. 217; Tr. Vol. 33 at 5013:8–5014:5 (Test. of A. Baker).
572 Ex. 213; Tr. Vol. 33 at 5010:17–5011:11 (Test. of A. Baker).
573 Ex. 224; Tr. Vol. 33 at 5014:6–5015:14 (Test. of A. Baker).
574 Tr. Vol. 33 at 5005:5–5007:15 (Test. of A. Baker).
575 Ex. 220; Tr. Vol. 33 at 5018:16–5023:4 (Test. of A. Baker).
123
general revenue funding for the FEFP was also reduced, the reductions were proportionally less
than the budget as a whole.576
The Legislature also took extraordinary steps to shore up the general revenue 322.
budget by redirecting available trust fund balances and spending down the state‘s reserves by
reducing unallocated general revenue balances and taking loans from the Budget Stabilization
Fund and Lawton Chiles Endowment Fund. These steps provided hundreds of millions of
dollars to the general revenue budget during the economic downturn.577
Another factor that mitigated the effects of the Great Recession on Florida‘s K–12 323.
schools is that the FEFP is based on a combination of state and local revenues, primarily ad
valorem property taxes. Losses in real property taxable value and tax collections lagged the
losses in state general revenue sources.578
The effects of the housing collapse on the ability to
raise property taxes for school districts did not significantly impact the FEFP until the 2009–10
school year. The loss of real property taxable value and state general revenue was partially
offset by the federal stimulus funding provided as part of the American Recovery and
Reinvestment Act of 2009. These federal dollars were intended to stabilize state and local fiscal
conditions.579
Florida received $1.78 billion in ARRA stabilization funds in fiscal years 2009–324.
10 and 2010–11. By agreement with the federal government, Florida committed to maintain the
funding level for education at all levels (K–12 and higher education) at or above the percentage
of the overall state budget spent on education in the 2008–09 fiscal year. Florida exceeded this
576 Exs. 229, 254, 255, 257; Tr. Vol. 34 at 5043:12–5054:13 (Test. of A. Baker).
577 Ex. 225; Tr. Vol. 33 at 5033:10–5037:21 (Test. of A. Baker).
578 Ex. 260; Tr. Vol. 34 at 5054:14–5057:2 (Test. of A. Baker).
579 Id.
124
requirement by funding K–12 education, alone, in 2009–10 and 2010–11 at a higher percentage
of the overall state budget than was spent on all education sectors in 2008–09.580
As Florida entered into economic recovery, however, funding for the FEFP has 325.
increased each year since fiscal year 2012–13.581
Gains in FEFP appropriations since fiscal year
2011–12 have outpaced gains to general revenue appropriations as a whole.582
Because of the extraordinary and historic economic fluctuations from fiscal years 326.
2002–03 through 2011–12, no time series or trend analysis using any one of these years, or the
period collectively, provides a valid or meaningful benchmark for analyzing education funding
in Florida. In this regard, Plaintiffs‘ focus on budgeted funding levels in the 2007–08 school
year as a benchmark against which to measure the adequacy of funding for Florida schools, is
misplaced.583
Indeed, according to one of Plaintiffs‘ expert witnesses, many states have not
returned education spending to pre-recession levels.584
Nevertheless, Florida‘s state portion of
the FEFP is the highest ever on a per-student basis.585
A more appropriate analysis of Florida‘s support of K–12 education is to examine 327.
longer periods of time that extend back to the pre-economic boom and bust cycle discussed
above.586
When analyzed over an extended period, it is evident that funding per FTE 328.
student under the FEFP has steadily increased over time:587
580 Ex. 3422; Tr. Vol. 32 at 4871:18–4873:18 (Test. of L. Champion).
581 Ex. 3439.
582 Exs. 234, 255, 257; Tr. Vol. 34 at 5046:18–5052:5 (Test. of A. Baker).
583 Tr. Vol. 34 at 5057:3–5058:10 (Test. of A. Baker).
584 Tr. Vol. 17 at 2751:16–2572:4 (Test. of D. Farrie).
585 Ex. 3439.
586 Tr. Vol. 34 at 5057:3–5060:19 (Test. of A. Baker).
125
a. From 1990–91 through 1999–2000 (pre-housing/real estate boom), FTE
student funding increased an average of 1.98% per year.
b. From 2000–01 through 2007–08 (housing/real estate boom years), per FTE
student funding increased an average of 5.1% per year. However, these
funding increases were skewed based on inflated real estate values that were
unsustainable.
c. From 2008–09 through 2012–13 (Great Recession and period of declining real
estate values), per FTE funding decreased an average of 2.1% per year.
d. When combining the economic boom and bust years of 2000 to 2013, per FTE
funding increased by 2.3%, which is a higher rate of increase than the annual
rate of increase during the 1990s.
From 2013–14 to 2015–16, per student FTE increased an average of 3.69% per year.588
In 15 of the 17 years during the period from 1998–99 to 2014–15, FEFP funding 329.
per student outpaced the Consumer Price Index (―CPI‖).589
By fiscal year 2014–15, actual appropriations for the FEFP were above what the 330.
funding level would have been if the Legislature had relied solely on CPI increases and FTE
student growth to determine FEFP funding levels since 1997–98.590
Thus, despite the volatility of the overall economy and severe impact of the Great 331.
Recession on the state of Florida, funding for education has been remarkably stable, has
587 Ex. 3439; Tr. Vol. 32 at 4868:9–4869:5 (Test. of L. Champion).
588 Id.
589 Ex. 249; Tr. Vol. 34 at 5058:22–5060:19 (Test. of A. Baker).
590 Ex. 249; Tr. Vol. 34 at 5059:14–5060:19 (Test. of A. Baker).
126
increased over time, and has been prioritized by state and locally elected officials and
policymakers.591
Although the FEFP does not set any particular mix or balance of state and local 332.
revenues, in only two out of the twenty-five years from 1990–91 to 2014–15, have local funds
comprised a majority of FEFP funding. That occurred in fiscal years 2008–09 and 2009–10,
when the reduction in real property taxable values lagged the reduction in state general
revenues.592
In the period 1990–91 to 2014–15, the state-local mix of FEFP funds has ranged 333.
from a high of 62% state (1997–98) to a low of 45% state (2009–10). As of the 2014–15 fiscal
year, state funds comprised 56% of total FEFP funds.593
During the Great Recession and in its aftermath, the state and local school 334.
districts reasonably managed budgets while maintaining instructional services to the classroom.
In this regard, the evidence shows that school districts maintained healthy financial reserves as
measured by the percentage of assigned and unassigned fund balance in the general fund as a
percentage of revenue in the general fund.594
This ratio is defined as the ―financial condition
ratio.‖595
The Department of Education monitors the financial condition ratio and considers 335.
a ratio of between 3% and 5% to be acceptable in most instances. As of February 1, 2009,
591 Ex. 3439; Tr. Vol. 33 at 4968:9–4969:7 (Test. of L. Champion); Exs. 230, 254, 255, 257; Tr.
Vol. 34 at 5043:12–5054:13, 5063:17–5064:13 (Test. of A. Baker).
592 Ex. 3683; Tr. Vol. 32 at 4875:5–19 (Test. of L. Champion); Ex. 260; Tr. Vol. 34 at 5054:14–
5057:2 (Test. of A. Baker).
593 Ex. 3683; Tr. Vol. 32 at 4875:5–19 (Test. of L. Champion).
594 Ex. 3442; Tr. Vol. 32 at 4880:22–4882:3 (Test of L. Champion).
595 Ex. 3442; Tr. Vol. 32 at 4878:23–4879:5 (Test of L. Champion).

127
school districts were required to notify the Commissioner of Education if the financial condition
ratio was projected to fall below 3%, and to submit a fiscal recovery plan if the ratio was
projected to fall below 2%.596
As shown below, during the economic downturn, the statewide financial condition 336.
ratio for all school districts combined increased, and has remained strong:597
Fiscal Year Financial Condition Ratio
2007–08 7.73%
2008–09 8.37%
2009–10 10.01%
2010–11 12.97%
2011–12 12.06%
2012–13 10.49%
2013–14 9.46%
At the same time, sufficient funding was provided by the State to meet class size 337.
requirements (as discussed in Section V.C). In addition, during the period 2004–05 to 2013–14,
the ratio of students per instructional staff improved from 14.9 to 14.0, indicating that more
instructional staff were available in schools throughout the state.598
Finally, the quality of
teaching staff has remained strong—as of the 2012–13 school year, nearly 98% of teachers were
rated ―highly effective‖ or ―effective‖ by their supervisors.599
And in the 2013–14 school year,
some 94% of classrooms were taught by teachers designated as ―highly qualified‖ under state
and federal law.600
With respect to Plaintiffs‘ allegation that Florida‘s funding for education should 338.
be evaluated and compared to funding systems and levels in other states, the Court finds that
596 Ex. 3442; Tr. Vol. 32 at 4878:23–4879:15 (Test of L. Champion).
597 Id.
598 Ex. 3412; Tr. Vol. 32 at 4874:2–18 (Test of L. Champion).
599 Exs. 1883, 1884.
600 Ex. 3368.
128
such comparisons, while probative, are not always helpful as a meaningful comparisons. For,
example, Plaintiffs‘ focus is on various methodologies which compare Florida‘s educational
spending with other states, all of which seem to show Florida at or near the bottom.601
On the
other hand Defendants want to focus on student success on national test scores, especially, when
compared to other states who spend more money on education than Florida. So, while this Court
will utilize State to State comparisons, it must be treated with the same caution that should
always accompany the examination of statistical data. In other words, while helpful, statistical
comparisons are not always capable of exact and accurate comparisons. What follows, in
paragraphs 349-342, are comparative data analyses by the Defendants which the Court did find
to be helpful in trying to understand why Plaintiffs multi-state comparison of Florida‘s
―inadequate funding‖602
are not the whole story. Spending standing alone, is not the full measure
of the matter under review.
The largest expenditure in Florida school districts (over 80%) is attributable to 339.
staff salaries and benefits.603
Yet, as detailed in Section VI below, the evidence indicates that
sufficient funding has been provided to hire sufficient numbers of teachers to meet class size
requirements, to continue to lower students to instructional staff ratios, to hire and retain teachers
rated ―highly effective‖ or ―effective‖ by their supervisors, and to staff classrooms with ―highly
qualified‖ teachers. At the same time, school districts have, overall, maintained healthy and
stable financial condition ratios.
601 Ex. 1704. 4314, 4035; Tr. Vol. 15 at 2341:17-2342:17 (Test of J. Hall); 17 at 2514:3-2516:16
(Test of D. Farrie)
602 Id.
603 Tr. Vol. 32 at 4822:7–13 (Test of L. Champion).
129
The evidence also indicates that teacher salaries in Florida, which are set at the 340.
local school district level through collective bargaining, are competitive compared to salaries in
comparable professions in the state. Based on recent U.S. Department of Labor data, elementary
school teachers in Florida make an average of 110% of the average salary of comparable
occupations, middle school teachers in Florida make 93% of the average salary in comparable
occupations, and high school teachers in Florida make 106% of the average salary in comparable
professions.604
The weight of the evidence does indicate that the level of teacher pay in Florida
is sufficient to retain a qualified and competent teacher workforce. However, to attract teachers
to enter into and continue in the teaching profession, Florida‘s educational policy will need to
continue to address their needs. This is especially true because teachers are the most valuable
resource in the classroom, and students with poor social skills and developmental issues present
a challenge to even the most experienced, dedicated and skilled teachers.
Furthermore, national rankings of education spending relied on by Plaintiffs do 341.
not take account of or control for important differences that impact such rankings, such as cost of
living (Florida has a relatively lower cost of living compared to high-spending northeastern
states); sources and level of personal income (Florida has a relatively high percentage of income
from Social Security and retirement plans); and the share of school age population of the total
population in a state (Florida has a relatively lower proportion of school-age residents to total
residents). Without controlling for these differences, cross-state funding rankings do not provide
an apples-to-apples comparison.605
604 Exs. 200, 201, 202; Tr. Vol. 34 at 5068:10–5069:18, 5072:18–5074:22 (Test. of A. Baker).
605 Ex. 240; Tr. Vol. 34 at 5064:15–5067:22, 5070:1– 5072:17 (Test. of A. Baker).

130
In addition, national rankings presented by Plaintiffs that purport to rank the 342.
―fairness‖ of school funding systems are not connected in any way to student performance
outcomes.606
These rankings also fail as a reasonable measure because they are not based on
current spending of schools.607
According to Dr. Hanusheks‘s testimony, the extent these
rankings are based on simply spending more money without a demonstrated connection to
achievement results, they are meaningless.608
“Cost Studies” J.
Plaintiffs assert that the State should conduct a ―cost analysis‖ to determine the 343.
amount of funding to ―institute a high quality education system‖ and request that the Court order
Defendants to ―conduct studies to determine what resources and standards are necessary to
provide a high quality education.‖609
Even if there were no constitutional concerns regarding such a request, the weight 344.
of the evidence shows that cost studies are neither a superior method to Florida‘s processes for
budgeting and appropriating public funds to schools, nor have such studies been shown to be a
valid or reliable method for determining the sufficiency of public-education funding.610
As discussed in Section V.H above, the Florida budgeting and appropriations 345.
process is a constitutionally prescribed process that requires a balanced budget, requires budgets
to be prepared in accordance with a long-range financial outlook, and limits revenues that can be
606 Tr. Vol. 17 at 2552:16–2552:12 (Test. of D. Farrie).
607 Tr. Vol. 17 at 2541:4–9 (Test. of D. Farrie).
608 Exs. 175, 176, 177, 178, 179, 180, 181, 182, 286, 287, 288, 289; Tr. Vol. 28 at 4235:7–
4243:17 (Test. of E. Hanushek).
609 2d Am. Compl. ¶ 28, Prayer for Relief ¶ c(2).
610 Ex. 283; Tr. Vol. 28 at 4223:1–4236:8 (Test. of E. Hanushek).

131
raised.611
The process also includes substantive input from the Department of Education and
State Board of Education, reflecting education policy priorities and objectives in a legislative
budget request, input from the Governor‘s office, the Legislature, educational stakeholders and
interest groups, and the public at large. The state budgeting process considers the cost and
effectiveness of particular programmatic initiatives, and it considers growth in student
enrollment (a major driver of cost) as well as actual school-district experience in providing
various education programs.612
In addition, the FEFP has numerous cost-based elements, including the number of 346.
students to be educated (―FTE‖), program cost factors, the District Cost Differential, sparsity and
declining enrollment supplements, transportation, and the class-size-reduction categorical.613
Thus, Plaintiffs‘ assertion that the state education-funding system does not consider costs is
incorrect and is without evidentiary support.
The weight of the evidence demonstrates that Florida‘s funding system directs 347.
more funds to schools with high numbers of economically disadvantaged students and to schools
with low student performance.614
With respect to Plaintiffs‘ criticism that the FEFP does not
weigh expressly for poverty, Plaintiffs‘ own expert witnesses admitted that many states do not do
so or even allocate additional funds, as Florida does, for students with English-language-learning
or special-education needs.615
As detailed above, Florida‘s funding system also results in
611 Art. III, § 19(a), (c), Art. VII, § 1(c), (d), Fla. Const.
612 Tr. Vol. 33 at 4945:12–4947:2 (Test. of L. Champion).
613 Ex. 3680; Tr. Vol. 32 at 4807:7–22 (Test. of L. Champion).
614 Ex. 262; Tr. Vol. 32 at 4856:15–4860:5 (Test. of L. Champion).
615 Tr. Vol. 2 at 153:18–154:21, 155:15–157:20 (Test. of M. Rebell) (discussing Verstegen,
Deborah A., Public Education Finance Systems in the United States and Funding Policies for
Populations with Special Educational Needs, Education Policy Analysis Archives, Vol. 19 No.
132
adequate funding for school districts to hire and retain adequate numbers of well-qualified
teachers and to meet class-size requirements. (See also Section VI, discussing the availability of
resources in school districts throughout Florida.)
There is insufficient evidentiary support for Plaintiffs‘ allegations that a lack of 348.
resources has adversely affected student performance. To the contrary, as discussed in Sections
IV and IX of these findings, student performance in Florida has steadily improved during periods
of school budget increases and school budget cuts, and Florida has outperformed many states
that spend considerably more per student. As discussed in Section IX, statistical analyses
demonstrate a lack of connection between the level of resources available to Florida schools and
student outcomes. The sufficiency of the funding available to Florida schools is also
demonstrated by the growing charter-school market, in which charter-school operators continue
to voluntarily operate schools on fewer dollars per student than are available to traditional public
schools.616
Plaintiffs‘ assertion that the state funding system does not result in sufficient funding
for Florida‘s public schools is not supported by the weight of the evidence.
The evidence indicates that when districts have had more funds in the past, they 349.
have spent the funds in ways that have not been demonstrated to improve student performance
outcomes, such as across-the-board pay raises.617
Therefore, testimony about the desire for
additional funds from Plaintiffs‘ school-district witnesses does not provide persuasive support
for Plaintiffs‘ assertions that more funding is needed to improve student performance.
21, at 17–18 (2011), available at http://epaa.asu.edu/ojs/article/view/769/923); Tr. Vol. 17 at
2555:20–2557:19 (Test. of D. Farrie).
616 Tr. Vol. 36 at 5351:4–5352:9 (Test. of A. Miller).
617 See, e.g., Tr. Vol. 8 at 1115:12–1117:2 (Test. of N. Marks); Tr. Vol. 9 at 1345:8–1346:11
(Test. of E. Roy); Tr. Vol. 22 at 3278:7–3279:2 (Test. of D. Robinson); Tr. Vol. 24 at 3642:6–
3643:6, 3563:24–3564:12 (Dep. Test. of J. Marte).
133
This type of testimony also illustrates the problem with cost studies: specifically, 350.
such studies purport to calculate costs based on inefficiencies built into current school
operations. All of the various cost study approaches (i.e., ―professional judgment,‖ ―evidence-
based,‖ ―successful schools,‖ ―cost function‖), assume the general structure of teacher salaries
and that the only policy to be considered is a general pay increase for existing staff—both
effective and ineffective staff. Existing programs—both effective and ineffective—are retained
in estimating costs.618
The various cost study approaches lack scientifically sound methodologies and 351.
have been shown to produce estimates of funding levels that are not connected to actual student
outcomes.619
For example, a professional judgment study conducted in the state of North Dakota
produced recommended spending patterns that could be compared with student achievement.
The schools that were furthest below the amount recommended by the professional-judgment
study produced the highest achievement, while those schools with supposedly sufficient funds,
produced the lowest achievement.620
Systematic analyses of the results of costs studies also indicate a huge variation in 352.
the level of spending that is recommended by such studies. Even after controlling for regional
cost differences, and expressing spending in constant dollars, cost studies have produced
estimates ranging from $5,000 per student to over $15,000 per student.621
In the cost studies that
were conducted in the New York adequacy litigation, for example, the estimated additional
funding ―needed‖ ranged from slightly over $1.9 billion to over $5.6 billion, or almost a 300%
618 Tr. Vol. 28 at 4227:24–4233:23 (Test. of E. Hanushek).
619 Tr. Vol. 28 at 4227:24–4232:8 (Test. of E. Hanushek).
620 Tr. Vol. 28 at 4228:18–4229:19 (Test. of E. Hanushek).
621 Ex. 283; Tr. Vol. 28 at 4232:15–4234:16 (Test. of E. Hanushek).
134
difference.622
And in adequacy litigation in Texas, cost studies were presented recommending
additional state spending ranging from $563 million on the low end to $6.171 billion on the high
end.623
These wide variations undercut the validity and reliability of cost studies.
Moreover, cost studies and subsequent funding based thereon in New York have 353.
not led to the projected levels of student performance.624
The weight of the evidence indicates
that such studies are not a reasonable or desirable alternative to the Florida school budgeting and
funding processes.
Findings Related to Resources in Florida Schools and School Districts VI.
Budgets and Expenditures A.
Florida law provides local school districts with adequate funding to allow students 354.
the opportunity to obtain a high-quality education. The evidence shows that Florida school
districts generally have healthy fund balances, strong financial ratings from outside firms such as
Moody‘s and Fitch, and the capacity to raise additional funding if the local school board and/or
the local communities desire to do so.625
And in recent years, districts statewide have annually
rolled over around $350 million in state and federal funding.626
For these reasons, the Court
finds, that overall, complaints from local school district officials about a lack of funding not
622 Tr. Vol. 2 at 136:10–23 (Test. of M. Rebell).
623 See Neeley v. W. Orange-Cove Consol. Indep. Sch. Dist., 176 S.W.3d 746, 769–70 (Tex.
2005).
624 Exs. 166, 197; Tr. Vol. 28 at 4200:2–4201:5, 4218:21–4222:14 (Test. of E. Hanushek); Tr.
Vol. 2 at 142:1–145:7 (Test of M. Rebell).
625 Exs. 3442, 3446; Tr. Vol. 32 at 4880:22–4881:9 (Test. of L. Champion); Tr. Vol. 33 at
4929:23–25 (Test. of L. Champion); Tr. Vol. 22 at 3259:8–10 (Test. of D. Robinson); Tr. Vol. 11
at 1564:24–1565:9 (Dep. Test. of M. Burke); Tr. Vol. 36 at 5477:6–11 (Dep. Test. of K.
Blocker).
626 Tr. Vol. 33 at 4939:17–4941:10 (Test. of L. Champion).
135
persuasive—any lack of resources is more the result of local school board and district budgeting
and resource-allocation choices, than a lack of funding made available by the State.
The vast majority of school districts have healthy reserve funds, which they were 355.
able to maintain throughout the recession.627
These funds are available for use by local school
boards to purchase additional resources, services, programs, or staff that the board feels is
necessary or desirable to educate the students in its district. State policy requires that districts
maintain a certain ―financial condition ratio,‖ equivalent to roughly 3% of the district‘s general
fund revenues.628
Many school districts have board policies to maintain balances in excess of the
required minimum, such as 5% of revenues. Most of the school districts focused on by Plaintiffs
have balances well over this minimum, some over 10% of revenues, while at the same time
witnesses from these districts complain of a lack of resources.629
For the few districts whose reserves have fallen below the state minimum, the 356.
State sent staff into the districts to assist the district administrators with accounting and
budgeting as well as identifying inefficiencies or other costs-saving and revenue-generating
opportunities.630
Many other districts with similar student enrollment and similar taxable values
have not had these issues and have been able to maintain healthy fund balances.631
Evidence
shows that, in districts with reserves that fell below the state minimum, the financial situation
627 Ex. 3442; Trial Tr. Vol. 32 at 4880:22–4881:9 (Test. of L. Champion)
628 Tr. Vol. 33 at 4978:23–4979:17 (Test. of L. Champion).
629 Tr. Vol. 5 at 664:5–665:12 (Test. of N. Vitti); Tr. Vol. 6 at 834:6–22 (Test. of O. Roberts);
Tr. Vol. 11 at 1562:13–1564:23 (Dep. Test. of M. Burke); Tr. Vol. 22 at 3258:9–3260:15 (Test.
of D. Robinson); Tr. Vol. 24 at 3687:1–12 (Dep. Test. of J. Marte); Ex. 5364 (Dep. of. C.
Morrison) at 50:9–25.
630 Tr. Vol. 32 at 4884:17–4885:10 (Test. of L. Champion); Tr. Vol. 7 at 1051:3–20 (Test. of N.
Marks); Tr. Vol. 17 at 2599:20–2600:20, 2613:5–6 (Test. of K. Ferree).
631 Tr. Vol. 32 at 4885:11–4886:17 (Test. of L. Champion); Tr. Vol. 18 at 2672:24–2678:12
(Test. of K. Ferree); Exs. 3419, 3442.
136
was the result of ineffective local choices, such as a failure to reduce staff or consider school
consolidation in response to shifting populations and/or lower student enrollment, and that these
fund balances have returned to healthy levels.632
Although many districts implemented cost-saving measures during the recession 357.
beginning in 2008, witnesses testified that any cuts were kept away from the classroom—for
example, by reorganization of staff at the district administration level.633
And any programs that
were cut have been restored during the economic recovery. Testimony from district witnesses
about a supposed need for additional funding is complicated due to local political tolerances
related to property taxes. Although all of the school districts in Florida have excess capacity for
generating revenue through local property taxes or sales surtaxes, many of the district witnesses
testified that they had not considered any voter referenda to increase local taxes, analyzed how
much additional revenue would be raised, or studied voter support for such measures.634
Many
cited the ―political heat‖ on locally elected board members and superintendents involved in
raising additional revenue, while at the same time bemoaning a lack of additional revenue from
the State.635
This all strongly suggests that these are political issues about local tax policy
versus legislative request for more state funding.
632 Tr. Vol. 32 at 4884:17–4885:10 (Test. of L. Champion).
633 E.g., Tr. Vol. 5 at 669:9– 670:15 (Test. of N. Vitti); Tr. Vol. 24 at 3650:1–13 (Dep. Test. of J.
Marte); Ex. 5364 (Dep. of. C. Morrison) at 119:8–120:4; Tr. Vol. 36 at 5460:3–16, 5466:7–20,
5467:23–5468:3 (Dep. Test. of K. Blocker); Tr. Vol. 7 at 994:4–7 (Test. of G. Littleton).
634 Ex. 3446; Tr. Vol. 33 at 4929:23–25 (Test. of L. Champion).
635 E.g., Tr. Vol. 22 at 3301:22–3302:25 (Test. of D. Robinson); Tr. Vol. 6 at 847:25–848:21
(Test. of O. Roberts); Tr. Vol. 25 at 3739:10–20 (Dep. Test. of A. Weidner).
137
Many school districts have had successful referenda to raise additional millage or 358.
sales tax revenue.636
Others, such as Citrus County, have had referenda that failed, but testimony
shows that the district was still able to maintain a high-quality education provided to students.637
Another example of the impact of local choices on revenue is Hernando County, which is just
south of Citrus County and has a similar student population. After several years of receiving
additional capital outlay funds through a half-penny sales tax, rather than asking voters to renew
the expiring half-penny sales tax, the district decided to partner with the county and city
governments on a referendum for an additional full penny, half of which would be used by the
school district in part to provide an iPad to each student. The referendum failed, but another
referendum a year later was put to the voters, this time asking only for the half-penny sales tax to
fund school facilities improvements, which passed by a wide margin.638
School district witnesses also reported that some local boards of education 359.
voluntarily forgo additional revenue that could be raised at the sole discretion of the school
board, i.e., without voter approval. For example, the school board of Indian River County chose
not to assess an additional .25 ―critical millage‖ authorized by the Legislature in 2009–10
because, according to the school district‘s finance officer, the board did not feel that the
administration had explained why the money was needed.639
And Palm Beach County chose not
to participate in the Race to the Top grant,640
forgoing an additional $37 million that could have
636 Ex. 3429; Tr. Vol. 33 at 4933:22–4934:8 (Test. of L. Champion).
637 Tr. Vol. 36 at 5458:5– 5483:25 (Dep. Test. of K. Blocker).
638 Tr. Vol. 33 at 4933:22–4934:8 (Test. of L. Champion); Tr. Vol. 14 at 2102:2–2103:23 (Test.
of L. Romano).
639 Ex. 5364 (Dep. of C. Morrison) at 131:15–132:12, 132:19–133:3.
640 Tr. Vol. 10 at 1507:1–19 (Dep. Test. of M. Burke); Tr. Vol. 22 at 3268:11–22 (Test. of D.
Robinson).
138
been spent on improving achievement in low performing schools, professional development for
teachers, and other projects.641
As another example of the impact of district choices, the superintendent from 360.
Alachua County, which levies an additional voted mill for operating expenses, complained of a
lack of funding to implement a seven-period day in high schools.642
At the same time, Duval
County, which does not have any voted millage or sales surtax, has been able to fund an eight-
period day.643
Not only does the evidence show the important effect of policy choices among 361.
districts, but it also shows the impact of policy choices made by different superintendents in the
same district. Superintendents and administrators from Duval, Miami-Dade, Hernando, and
Alachua counties all testified about initiatives implemented when a new superintendent was
brought into the district.644
Some of these related to programs that the new superintendent felt
would be more effective, while others dealt with greater efficiencies in district administration, or
in consolidating schools to save costs and better focus resources. For example, the incoming
superintendent in Duval County redirected millions of dollars from the central office to the
classrooms.645
The Miami-Dade finance officer testified about budget mismanagement under the
previous superintendent, which was corrected by the current administration.646
In each case,
641 Tr. Vol. 33 at 4942:4–21(Test. of L. Champion).
642 Tr. Vol. 6 at 797:23–798:8 (Test. of O. Roberts).
643 Tr. Vol. 5 at 694:2–14 (Test. of N. Vitti).
644 E.g., Tr. Vol. 5 at 688:7– 706:18 (Test. of N. Vitti); Tr. Vol. 24 at 3564:2– 3602:9 (Dep. Test.
of J. Marte); Tr. Vol. 6 at 869:12–870:10 (Test. of O. Roberts).
645 Tr. Vol. 5 at 669:9– 670:15 (Test. of N. Vitti).
646 Tr. Vol. 24 at 3625:18–3626:2 (Dep. Test. of J. Marte).
139
there is no reason that these policies could not have been implemented earlier, using resources
more efficiently and effectively.647
In Alachua County, the incoming superintendent commissioned an external 362.
review by the Florida Association of District School Superintendents, which made several
recommendations for more effective and efficient operation of the district, many of which have
been or are being adopted.648
Additionally, before his arrival, an audit by the Auditor General
found major concerns regarding the transportation department, including large numbers of
students improperly being counted as riding district buses.649
A study was also done in Sarasota
County by an outside consulting firm, MGT of America, which made numerous
recommendations for more efficient and effective use of district funds.650
The State has limited responsibility or control over the choices made by local 363.
school boards when it comes to local taxation, budgeting, expenditures, and management
practices, all of which are properly the role of local boards under the Constitution.651
School District Programs and Accomplishments B.
Defendants introduced into evidence business records from 25 school districts—364.
comprising over two million of the State‘s approximately 2.7 million K–12 public school
students—describing their ―high quality‖ educational offerings, resources, and accomplishments.
These districts include all of those on which Plaintiffs have focused in this case, including
647 See, e.g., Tr. Vol. 5 at 688:7– 706:18 (Test. of N. Vitti); Tr. Vol. 6 at 874:23–875:3 (Test. of
O. Roberts).
648 Ex. 1722; Tr. Vol. 6 at 850:19– 859:10 (Test. of O. Roberts).
649 Ex. 3734; Tr. Vol. 6 at 859:11–861:2 (Test. of O. Roberts).
650 Ex. 1119; Tr. Vol. 25 at 3738:15–3774:18 (Dep. Test. of A. Weidner).
651 Art. IX, § 4, Fla. Const.
140
schools attended by the children of Plaintiffs.652
While these documents admittedly are putting
each district‘s ―best foot forward,‖ they set forth a detailed array of educational offerings and
accomplishments of the districts and their students. As such, the documentary evidence
presented by Defendants undercuts the credibility of complaints from Plaintiffs‘ school district
witnesses about school resources.
Among other things, the evidence shows that these school districts offer a variety 365.
of choice and magnet programs and schools; STEM, STEAM, and robotics programs; college
and career enhancement programs such as Advanced Placement, International Baccalaureate,
Cambridge, and career and technical education with industry certification; dual enrollment; and
arts, music, and many other elective and extracurricular programs. Moreover, district materials
indicate that these programs have been increasing in availability and participation through the
recession, not decreasing.653
Districts across the State also have received many national recognitions and 366.
awards. A large number of Florida high schools are recognized among the best in the nation by
652 Exs. 311–18 (Alachua); Exs. 344–47 (Bay); Exs. 352–53, 367–71 (Brevard); Exs. 373–76
(Broward); Exs. 384–88 (Citrus); Exs. 69, 563–65, 585 (Miami-Dade); Exs. 624–29 (Dixie);
Exs. 784–87, 814 (Duval); Exs. 70, 835–40 (Flagler); Ex. 842 (Franklin); Exs. 873–81
(Gadsden); Exs. 71, 72, 906–11 (Hernando); Exs. 73, 74, 927–32 (Hillsborough); Exs. 75, 76,
938–41 (Indian River); Exs. 1000–06 (Leon); Exs. 77, 1019–26, 1029, 1032, 1035 (Orange);
Exs. 1038–44 (Osceola); Exs. 1046–49, 1053 (Palm Beach); Exs. 1070–74 (Pasco); Exs. 1098,
1077 (Polk); Exs. 1103–07, 78–81 (Santa Rosa); Exs. 1111–16, 1122, 1129, 1132 (Sarasota);
Exs. 1135–41 (Seminole); Exs. 1148–51 (St. Lucie); Exs. 1190–99 (Volusia).
653 Id. See generally Tr. Vol. 5 at 660:23–734:6 (Test. of N. Vitti); Tr. Vol. 6 at 824:7–915:12
(Test. of O. Roberts); Tr. Vol. 9 at 1300:19–1351:2 (Test. of E. Roy); Tr. Vol. 14 at 2025:14–
2117:10 (Test. of L. Romano); Tr. Vol. 16 at 2456:13–2478:9 (Test. of D. Boyd); Tr. Vol. 22 at
3249:23–3315:2 (Test. of D. Robinson); Tr. Vol. 24 at 3551:9–3665:13 (Dep. Test. of J. Marte).
141
Newsweek, U.S. News & World Report, and the Washington Post.654
(See also Section VI.C
below.)
Two Florida school districts—Miami-Dade in 2012 and Orange in 2014—have 367.
been recipients of the prestigious Broad Prize, a national award given each year to the urban
school district most successful in increasing student performance and closing achievement
gaps.655
Palm Beach was a finalist for the prize in 2012, losing out to Miami-Dade.656
Miami-
Dade‘s superintendent was named National Superintendent of the Year in 2014, and
Hillsborough‘s superintendent was one of four finalists for the award in 2015.657
Accreditation of Districts and Schools C.
All Florida school districts have achieved accreditation through AdvancED, 368.
formerly known as the Southern Association of Colleges and Schools (―SACS‖), for at least all
of their high schools, and in many districts, all schools are accredited through either school- or
district-level accreditation.658
AdvancED is an outside, non-profit, non-partisan organization that
conducts rigorous, on-site external reviews of pre-K–12 schools and school systems across the
United States and in 70 other countries.659
Testimony from AdvancEd‘s representative confirms that AdvancED‘s process 369.
and standards are thorough, rigorous, and based on decades of research and experience in school
accreditation. Before accrediting a school or district, or renewing accreditation as required every
654 Id.
655 Exs. 564, 3341, 2892; Tr. Vol. 24 at 3602:2–4, 3630:11–3632:4 (Dep. Test. of J. Marte); Tr.
Vol. 23 at 3470:3–22 (Dep. Test. of R. Collins).
656 Exs.1048, 88 at 9; Tr. Vol. 22 at 3305:6–19, 3311:22–3312:18 (Test. of D. Robinson).
657 Ex. 2891.
658 Exs. 11, 12.
659 Tr. Vol. 34 at 5097:15–5098:19 (Dep. Test. of A. Bohling); Exs. 1, 2, 3, 5, 6, 7.
142
five years, AdvancED requires the school or district to submit a self-assessment report supported
by evidence certifying that it meets AdvancED‘s Standards for Quality. AdvancED then sends a
team of independent reviewers, comprised of educators, administrators, and educational experts,
into the district and/or schools. The review team not only visits the school district‘s physical
facilities, but the reviewers conduct multiple stakeholder interviews, getting input from teachers,
administrators, and parents. The review team produces an external review report, detailing the
evidence of meeting the standards, including the resources and programs available.660
Among the five accreditation standards for quality schools are ―Standard 3: 370.
Teaching and Assessing for Learning,‖ which ensures that ―The school‘s curriculum,
instructional design, and assessment practices guide and ensure teacher effectiveness and student
learning.‖661
Further, ―Standard 4: Resources and Support Systems,‖ requires that ―The school
has resources and provides services that support its purpose and direction to ensure success for
all students.‖662
(Standards 3 and 4 for school districts similarly require that ―The system‘s
curriculum, instructional design, and assessment practices guide and ensure teacher effectiveness
and student learning across all grades and courses,‖ and that ―The system has resources and
provides services in all schools that support its purpose and direction to ensure success for all
students.‖)663
The following indicators are used to evaluate whether a school meets Standard
4:664
660 Tr. Vol. 34 at 5097:1–14, 5099:9–5100:1, 5120:15– 5125:10 (Dep. Test. of A. Bohling).
661 Ex. 2 at 00000014.
662 Id.
663 Ex. 3 at 00000023.
664 Ex. 2 at 00000019–20.
143
4.1 ―Qualified professional and support staff are sufficient in number to fulfill
their roles and responsibilities necessary to support the school‘s purpose,
direction, and the educational program.‖
4.2 ―Instructional time, material resources, and fiscal resources are sufficient
to support the purpose and direction of the school.‖
4.3 ―The school maintains facilities, services, and equipment to provide a safe,
clean, and healthy environment for all students and staff.‖
4.4 ―Students and school personnel use a range of media and information
resources to support the school‘s educational programs.
4.5 ―The technology infrastructure supports the school‘s teaching, learning,
and operational needs.‖
4.6 ―The school provides support services to meet the physical, social, and
emotional needs of the student population being served.‖
4.7 ―The school provides services that support the counseling, assessment,
referral, educational, and career planning needs of all students.‖
In order to be accredited, schools must meet all of the accreditation standards as 371.
determined by AdvancED.665
In addition, all accredited districts and schools certify that they
meet these standards and also that they will notify AdvancED of any changes to their ability to
meet the standards.666
Plaintiffs‘ assertion that some of the thousands of accredited schools in
Florida have ―D‖ and ―F‖ grades is interesting.667
However, as explained by AdvancED‘s
665 Tr. Vol. 34 at 5112:4–14, 5116:7–16 (Dep. Test. of A. Bohling)
666 Ex. 10; see, e.g., Ex. 14 at 246–47.
667 Tr. Vol. 34 at 5147:10–14 (Dep. Test. of A. Bohling).
144
representative as well as one of Plaintiffs‘ superintendent witnesses, the accreditation process
looks at inputs—whether schools have the resources, systems, and policies in place to meet their
mission—not only at student performance.668
The statements made by schools and districts in
the accreditation and public documents confirming all of the resources and programs they have
available are at somewhat at variance with their testimony at trial about a need for more
resources.669
The accreditation of Florida schools and districts provides further support that the 372.
resources available are adequate to provide students with a high-quality educational opportunity.
Availability of Effective Teachers D.
Plaintiffs have presented no evidence showing that Florida schools are not able to 373.
hire and retain high-quality educators. For the 2012–13 school year, nearly 98% of teachers
were rated ―effective‖ or ―highly effective‖ by their school districts under the district‘s chosen
evaluation protocol.670
Moreover, for the 2013–14 school year, over 94% of courses were taught
by teachers meeting the ―highly qualified‖ standard under the No Child Left Behind Act.671
The comprehensive annual financial reports of many of the school districts upon 374.
which Plaintiffs focus show that, over the past decade and through the recession, student-to-
teacher ratios remained constant, and in many cases, decreased (i.e., fewer students per teacher).
These reports also show that teacher salaries were either maintained or increased.672
Indeed,
668 Tr. Vol. 34 at 5144:16–5145:12 (Dep. Test. of A. Bohling); Tr. Vol. 6 at 753:1–754:14 (Test.
of O. Roberts).
669 See, e.g., Exs. 14, 30, 71, 82, 84, 87, 88, 89, 94, 95.
670 Exs. 1883, 1884.
671 Ex. 3368.
672 Ex. 367 at 00180–81; Ex. 373 at 00009432–33; Ex. 563 at 149–51; Ex. 787 at 00015868,
00015882; Ex. 906 at 00017732–34; Ex. 932 at 00018452–53; Ex. 939 at 00018893–94; Ex.
145
testimony and documents from Duval and Miami-Dade counties, for example, highlight their
record increases in teacher salary and their focus on protecting teachers and teacher pay during
the recession, and the years since.673
It also is important to note that teacher recruitment, hiring, assignment, training, 375.
evaluation, and compensation-setting are responsibility of the local school districts, not of the
State.674
The role of local teachers‘ unions as to these matters also cannot be ignored. Teachers
are guaranteed the right to collectively bargain under the Florida Constitution and statute.675
School districts must negotiate and reach agreement with the local unions on almost all aspects
of teacher employment, including discipline and removal of ineffective teachers.676
Many school
districts go beyond what is required to be negotiated and include the entire teacher evaluation
instrument as part of their collective bargaining agreement, including the standards for a rating of
―effective‖ or ―highly effective.‖677
There is no evidence that any State teacher quality or funding policies has resulted 376.
in a lack of effective teachers to educate Florida‘s public school students. The State has
implemented numerous policies and laws to assist and support districts in identifying, retaining,
and appropriately placing effective teachers (and identifying and dealing with non-effective
1035 at 00021525–26; Ex. 1038 at 00021767–69; Ex. 1053 at 00022938, 00022941; Ex. 1070 at
00023843–45; Ex. 1098 at 00025335–36; Ex. 1122 at 00026986, 00026988; Ex. 1190 at
00028622–23.
673 Exs. 1740, 1753, 1754; Tr. Vol. 5 at 673:3–674:22 (Test. of N. Vitti); Tr. Vol. 24 at 3642:15–
3643:6.
674 Ex. 199; Tr. Vol. 31 at 4712:15–4717:7 (Test. of K. Hebda); Tr. Vol. 26 at 3970:9–16,
3973:7–21, 3975:8–13 (Test. of P. Stewart); Tr. Vol. 30 at 4608:24–4609:24 (Test. of M.
Tappen).
675 Art. I, § 6, Fla. Const.; §§ 447.201, .447.203, Fla. Stat.
676 Tr. Vol. 31 at 4720:2–4721:6 (Test. of K. Hebda).
677 Tr. Vol. 32 at 4765:19–4767:21 (Test. of K. Hebda); Ex. 1768.
146
teachers), including aligning teacher evaluations to student performance, allowing for increased
pay for teachers in hard-to-staff schools, and ending teacher tenure.
Many districts employ reading and math ―coaches‖ who assist teachers in 377.
improving the delivery of education to students. Districts also employ many other professional
staff such as counselors, psychologists, social workers, behavioral specialists, media specialists,
and IT professionals, who also support teachers and student learning.678
Compliance with Class Size E.
As detailed in Section V.C above, the State has consistently provided additional 378.
funding for school districts to meet the class-size requirements of the Florida Constitution.679
There is no credible evidence that lack of funding has caused districts to be out of 379.
compliance with class-size requirements. School district witnesses—from Duval, Alachua, Bay,
Franklin, Palm Beach, Hernando, Gadsden, Orange, Miami-Dade, Sarasota, Citrus, Indian River,
and Brevard—all testified that their districts have met and are meeting class-size requirements.680
Evidence shows that any issues with class-size compliance were quickly remedied and, in any
event, were the result of district management decisions, not a lack of state funding.681
678 Exs. 3478, 3479, 3480, 3481, 3482, 3483.
679 Exs. 131, 132, 2880, 3680 at 00103482; Tr. Vol. 32 at 4844:21–4851:1 (Test. of L.
Champion); see also Exs. 2875, 2876, 2877. 2878, 2879.
680 Tr. Vol. 5 at 677:15–21 (Test. of N. Vitti); Tr. Vol. 6 at 840:18–841:7 (Test. of O. Roberts);
Tr. Vol. 7 at 1030:25–1031:2 (Test. of G. Littleton); Tr. Vol. 8 at 1086:15–1087:9 (Test. of N.
Marks); Tr. Vol. 9 at 1331:10–17 (Test. of E. Roy); Tr. Vol. 11 at 1553:21–1554:3 (Dep. Test. of
M. Burke); Tr. Vol. 14 at 2057:13–23 (Test. of L. Romano); Tr. Vol. 18 at 2648:4–20 (Test. of
K. Ferree); Tr. Vol. 22 at 3281:17–3282:1 (Test. of D. Robinson); Tr. Vol. 23 at 3466:15–18
(Dep. Test. of R. Collins); Tr. Vol. 24 at 3629:23–3630:1 (Dep. Test. of J. Marte); Tr. Vol. 25at
3749:19–22 (Dep. Test. of A. Weidner); Tr. Vol. 36 at 5480:12–19 (Dep. Test. of K. Blocker);
Ex. 5364 (Dep. of C. Morrison) at 94:14–21; Ex. 5366 (Dep. of J. Preston) at 35:4–23.
681 Tr. Vol. 14 at 2058:1–20 (Test. of L. Romano); Tr. Vol. 18 at 2648:4–20 (Test. of K. Ferree).

147
District and School Improvement Plans F.
As described in Section III.G above, the State‘s school improvement and 380.
differentiated accountability (―DA‖) systems require that districts and schools develop and
maintain district and school improvement plans to increase student achievement at lower-
performing schools.682
These plans, which are developed by schools and districts with the support of the 381.
Department‘s office of school improvement and DA staff, identify barriers to student
performance based on the needs of that individual school or district, strategies to overcome those
barriers, and resources available to implement these strategies.683
These plans provide districts
and schools with the opportunity to identify resources to help their lower-performing students
and to prepare district and school budgets to ensure that these resources are available.684
Facilities G.
In paragraph 42 of the Second Amended Complaint, Plaintiffs alleged that the 382.
State ―has not provided sufficient funding to meet school districts‘ school repair and
maintenance needs‖ and that ―[m]any districts have school facilities that are in need of serious
repair, including roofs that have collapsed and moldy, ‗sick‘ buildings.‖ On Defendants‘ motion,
682 Exs. 1261, 1948, 1949; Tr. Vol. 26 at 4039:20–4041:18 (Test. of P. Stewart); Tr. Vol. 30 at
4586:25–4588:1, 4591:7–4600:9, 4601:11–4602:1 (Test. of M. Tappen).
683 See, e.g., Exs. 305, 306, 309, 342, 351, 372, 378, 379, 382, 393, 394, 397, 308, 350, 395, 396,
397, 398, 399, 400, 401, 402, 403, 404, 405, 406, 407, 408, 409, 586, 587, 588, 589, 590, 591,
630, 632, 632, 633, 634, 635, 636, 637, 638, 639, 640, 641, 642, 643, 831, 833, 841, 898, 901,
902, 903, 904, 905, 925, 926, 933, 935, 936, 937, 968, 969, 971, 972, 973, 974, 975, 976, 1007,
1009, 1010, 1011, 1012, 1013, 1014, 1015, 1016, 1017, 1036, 1037, 1045, 1067, 1068, 1069,
1075, 1076, 1101, 1102, 1109, 1134, 1146, 1147, 1158, 1159, 1160, 1161, 1162, 1163, 1164,
1200, 1201, 1927, 1959, 1963, 1964, 1965.
684 Tr. Vol. 10 at 1418:16–1419:9, 1450:3–1451:5 (Test. of S. Houston); Tr. Vol. 12 at 1864:15–
1865:16, 1873:11– 1874:7 (Test. of G. Sitter); Tr. Vol. 30 at 4586:25–4588:1, 4591:7–4600:9,
4601:11–4602:1 (Test. of M. Tappen).
148
the Court required Plaintiffs to specifically identify any such facility conditions. In response to
the conditions then identified by Plaintiffs, one of Defendants‘ expert witnesses, John S. Ratliff,
a certified Florida building-code inspector and former Florida facilities director for the Santa
Rosa County School District, with over 30 years of experience working with and managing that
district‘s facilities program,685
conducted an in-depth study of the facilities and districts
identified by Plaintiffs. In addition to reviewing the school districts‘ financial reports, work
plans, five-year facility surveys, and other documents, Mr. Ratliff interviewed facilities
personnel in each school district with alleged facilities problems identified by Plaintiffs and
personally inspected every school with alleged facilities problems in two districts.686
Based on his experience and his study of the specific facilities that Plaintiffs 383.
identified, Mr. Ratliff testified that all of the districts identified by Plaintiffs—as well as
Florida‘s school districts in general—have access to sufficient resources to provide safe, secure,
and well-maintained facilities.687
Furthermore, with respect to the specific facilities issues that Plaintiffs identified, 384.
Mr. Ratliff concluded that none of them posed any safety or security concerns, would
detrimentally affect the delivery of educational services, or constituted a critical facilities issue
that would require the removal of students from the site.688
685 Tr. Vol. 36 at 5377:11–5378:4, 5379:3–25 (Test. of J. Ratliff).
686 Tr. Vol. 36 at 5412:24–5416:25 (Test. of J. Ratliff).
687 Tr. Vol. 36 at 5406:21–5407:17, 5428:19–5429:7 (Test. of J. Ratliff).
688 Ex. 303; Tr. Vol. 36 at 5418:5421:6 (Test. of J. Ratliff).
149
In fact, some of the maintenance issues identified by Plaintiffs had already been 385.
addressed and repaired—or related solely to schools that had been closed or facilities that were
not being used to educate students.689
It should be noted that building and maintaining educational facilities are 386.
quintessentially local responsibilities. Local school districts typically own Florida‘s school
facilities, and district personnel make myriad decisions about school location, utilization, student
assignment, contractor and material selection, repair, maintenance, cleaning, and other issues that
greatly affect the efficiency and effectiveness of the facilities program and the resources
available in any given year.690
Furthermore, local school boards make important decisions about the level of 387.
taxation to support district capital plans. As discussed in Section V.E above, state law provides
school districts with several mechanisms to raise funds for capital outlay. The amount of capital
funding available in Florida is considerable—over $2.9 billion in the 2013–14 school year.691
And according to the evidence in the record, no school district has taken full advantage of all the
capital funding sources available in Florida.692
The weight of the evidence also shows that given available sources of capital 388.
funding, the key to a successful school-facilities program is effective management practices. For
example, a report commissioned by the Alachua County School District showed that it had
budgeted almost twice as much for facilities maintenance as the similarly sized Santa Rosa
689 Tr. Vol. 36 at 5421:9–24, 5426:5–5428:18 (Test. of J. Ratliff).
690 See, e.g., Tr. Vol. 36 at 5388:7–5391:21 (Test. of J. Ratliff).
691 Ex. 4345; Tr. Vol. 32 at 4899:25–4900:10 (Test. of L. Champion).
692 Tr. Vol. 36 at 5405:18–23 (Test. of. J. Ratliff).

150
County School District.693
Mr. Ratliff testified that after his visits to schools in Alachua County,
it was hard for him to see where and how the additional money in Alachua County had been
spent.694
There is no persuasive evidence that Florida‘s school facilities are not safe, 389.
secure, and in compliance with applicable codes and standards; that any maintenance issues have
not been or cannot be addressed as prioritized by individual school districts; or that there are any
facilities problems that negatively impact the education of students.
Based on witness testimony, school-district documents, and the expert testimony 390.
of Mr. Ratliff, the Court finds that school districts in Florida have access to sufficient resources
to provide safe, secure, and well-maintained facilities. The Court also finds no credible evidence
of ―collapsed roofs‖ or ―sick‖ or ―moldy‖ buildings as alleged by Plaintiffs.695
Instructional Resources H.
Witnesses testified that their schools and classrooms are equipped with suitable 391.
textbooks and instructional materials, and they have appropriate technology, including
computers, laptops, and smart boards, for use by their students and teachers.696
Under the State‘s
693 Ex. 1722 at 00049701.
694 Tr. Vol. 36 at 5431:14–5434:18 (Test. of J. Ratliff); cf. Tr. Vol. 36 at 5478:17–5479:22 (Dep.
Test. of K. Blocker) (testifying that all facilities projects in the Citrus County School District had
an identified source of funding).
695 Plaintiffs themselves stated before trial that any collapsed roofs and sick or moldy buildings
had been repaired. Pls.‘ Resp. to Order Compelling Additional Information (May 22, 2015).
696 See generally Tr. Vol. 5 at 660:23–734:6 (Test. of N. Vitti); Tr. Vol. 6 at 824:7–915:12 (Test.
of O. Roberts); Tr. Vol. 7 at 986:19–1032:13 (Test. of L. Romano); Tr. Vol. 14 at 2025:14–
2117:10 (Test. of L. Romano); Tr. Vol. 16 at 2456:13–2478:9 (Test. of D. Boyd); Tr. Vol. 22 at
3249:23–3315:2 (Test. of D. Robinson); Tr. Vol. 24 at 3551:9–3665:13 (Dep. Test. of J. Marte);
Tr. Vol. 23 at 3489:14–3541:18 (Dep. Test. of J. Hiltz); Ex. 5353 (Dep. of B. Cavallero) at
34:22–35:4, 35:8–22.
151
Digital Classrooms Plan, all districts have developed detailed technology plans and are working
toward the goal of having a one-to-one student-to-device ratio in their districts.697
The sufficiency and adequacy of instructional resources also is confirmed by the 392.
certifications made by schools and districts in their submissions to AdvancED in the
accreditation process.698
Findings Related to Special Programs and Populations VII.
The Court finds that Florida‘s education policies and funding system are 393.
providing adequate resources for students to access to a variety of choice and enrichment
programs and to support the education of all students.
Career and Technical Education A.
Florida has developed a leading career and technical education (―CTE‖) system to 394.
prepare students to be college and career ready by equipping them with core academic skills and
with relevant technical skills validated by industry in a specific career pathway. Rather than
―vocational education,‖ CTE focuses on meeting the needs of Florida‘s economy by preparing
students for today‘s high-skill, high-demand careers.699
The State has partnered with employers
to define the career pathways and skills critical to Florida‘s economy. 700
Section 1003.491, Fla.
Stat., requires articulated programs of study that align high school programs with postsecondary
certificates and degrees offered through technical centers and state colleges. The State also
697 Exs. 3475, 3476.
698 E.g., Exs. 14, 30, 71, 82, 84, 87, 88, 89, 94, 95.
699 Tr. Vol. 31 at 4650:1–25 (Test. of M. Tappen).
700 Id.; Tr. Vol. 26 at 3951:7–3952:2 (Test. of P. Stewart).
152
provides Gold Standard Career Pathways articulation agreements, through which high school
students can earn a guaranteed number of college credits toward their AAS or AS degree.701
Florida‘s focus on CTE has allowed increasing numbers of Florida students the 395.
ability to earn industry certifications through postsecondary institutions while still in middle or
high school.702
The number of students earning industry certifications increased from 803
students in 2008 to 63,328 students in 2014.703
Virtual Education B.
Florida has been a national leader in ensuring by law that all students have full- 396.
and part-time virtual school options, with funding following each student down to the course
level. In addition to many district virtual education programs and fully online schools, Florida
Virtual School is the largest state school in the country, with over 2 million course completions
since opening in 1997.704
Since that time, the number of Florida students enrolled either full- or part-time in 397.
virtual courses increased from 307 during the 1998–99 school year to 241,299 during the 2013–
14 school year.705
Florida‘s virtual course catalog includes almost 9,000 different course
offerings, in subject areas ranging from AP Calculus to ―Art in World Cultures.‖706
Through virtual education, a student in one district who does not have access to a 398.
particular course at his home school can enroll in the course virtually. This breaks down barriers
701 Exs. 3381, 3382, 3383, 3384, 3385, 3396; Tr. Vol. 31 at 4649:3–16 (Test. of M. Tappen).
702 Tr. Vol. 26 at 3951:7–3952:2 (Test. of P. Stewart); Tr. Vol. 31 at 4651:17–4652:14, 4653:22–
4654:13 (Test. of M. Tappen).
703 Ex. 290 at 00005382; Tr. Vol. 31 at 4651:12–4652:14 (Test. of M. Tappen).
704 Exs. 195, 3389; Tr. Vol. at 4679:18–4680:9 (Test. of M. Tappen).
705 Ex. 195; Tr. Vol. at 4680:24–4681:22 (Test. of M. Tappen).
706 Ex. 3389; Tr. Vol. 26 at 3952:3–3953:7 (Test. of P. Stewart).
153
to access, particularly for students in rural areas, who are now open to a wider range of course
offerings. It also allows students who want to catch up, be remediated, or accelerate access to do
so throughout the school year.707
As described above, the evidence shows that Florida‘s high-quality virtual 399.
education programs offer families and students a greater variety of options to meet their
individual learning needs and goals.
Enhancement Programs and Dual Enrollment C.
Through its accountability system, incentive funding, and other policies, the State 400.
has encouraged school districts to offer more access to college-level coursework for high school
students.708
Students in Florida schools have access to a wide variety of nationally recognized
enrichment programs, including Advanced Placement (―AP‖), International Baccalaureate
(―IB‖), and Cambridge Advanced International Certificate of Education (―AICE‖), offering more
options for increased educational rigor for Florida students, as well as the opportunity to earn
free college credit.709
For example, as detailed above in Section IV.D, Florida has seen an increase in 401.
both participation and performance on AP examinations over the past decade. This evidence
indicates that Florida is now a national leader in both participation and performance on AP
examinations, including among low-income students and traditionally underrepresented
minorities.710
707 Tr. Vol. 26 at 3952:3–3953:7 (Test. of P. Stewart); Tr. Vol. 31 at 4680:10–23 (Test. of M.
Tappen).
708 Tr. Vol. 26 at 4023:10–19 (Test. of P. Stewart).
709 Tr. Vol. 26 at 3949:20–3951:6 (Test. of P. Stewart); Tr. Vol. 31 at 4648:8–4649:25 (Test. of
M. Tappen).
710 Exs. 3997, 3998, 123, 124, 125, 126, 127.
154
Newsweek magazine annually ranks the top schools in the nation based on 402.
graduation rates; college acceptance rates; AP rates; AP or honors courses taken per student;
average SAT, ACT, and AP scores; and the percent of students enrolled in at least one AP
course. The school districts on which Plaintiffs focus—e.g., Alachua, Orange, Miami-Dade,
Palm Beach, Duval—also have confirmed their AP, IB, and AICE offerings, as well as their
national rankings in Newsweek, U.S. News & World Report, and the Washington Post.711
Florida students also have the opportunity to earn free college credit through a 403.
variety of dual-enrollment courses offered through Florida high schools.712
This allows students
the opportunity to obtain an AA degree while still in high school.713
English Language Learners D.
In addition to weighted student funding through FEFP, Florida‘s English language 404.
learners (―ELLs‖) benefit from additional funding through federal ESEA Title III dollars, based
on the number of ELLs in the school district.714
Although school districts determine how to instruct their ELLs—through 405.
bilingual, inclusion, sheltered or dual language programs—all instructional programs for ELLs
must be staffed with certified teachers, and a paraprofessional who speaks the ELLs‘ home
711 See generally Tr. Vol. 5 at 660:23–734:6 (Test. of N. Vitti); Tr. Vol. 6 at 824:7–915:12 (Test.
of O. Roberts); Tr. Vol. 9 at 1300:19–1351:2 (Test. of E. Roy); Tr. Vol. 16 at 2456:13–2478:9
(Test. of D. Boyd); Tr. Vol. 22 at 3249:23–3315:2 (Test. of D. Robinson); Tr. Vol. 24 at 3551:9–
3665:13 (Dep. Test. of J. Marte); Tr. Vol. 23 at 3406:11–3487:14 (Dep. Test. of R. Collins).
712 Exs. 3387, 3388, 3391, 3392; Tr. Vol. 31 at 4649:3–25 (Test. of M. Tappen).
713 Tr. Vol. 31 at 4649:3–16 (Test. of M. Tappen).
714 Tr. Vol. 31 at 4658:4–16 (Test. of M. Tappen); Tr. Vol. 33 at 4937:13–15 (Test. of L.
Champion).

155
language must be available in the classroom to support instruction if there are fifteen or more
students who speak that same home language.715
Much of the education of ELLs in Florida is dictated by a 1990 consent decree 406.
issued in LULAC v. State Board of Education. The consent decree serves as the framework for
Florida‘s compliance with state and federal laws regarding the education of ELLs and ensuring
that these students have equal access to all educational programs. The consent decree dictates,
among other things, the certification and professional development required of teachers who
teach ELLs, including in their core academic courses as well as their English for Speakers of
Other Languages (―ESOL‖) courses.716
There also are requirements for bilingual aides or
teachers when fifteen or more students speaking the same language are in the same school or
classroom.717
The consent decree also requires that students entering the public schools be 407.
immediately given a home language survey, and if the child reports that their primary home
language is not English, they are further assessed for eligibility to be immediately served in an
ESOL program. At that point in time, there are services that must be provided by teachers who
are ESOL endorsed or certified.718
These students also received an ELL plan that defines the
services and the type of educational program that will be provided for that student.719
715 Tr. Vol. 31 at 4655:2–4659:14 (Test. of M. Tappen); Exs. 3398, 3399.
716 Exs. 3510, 3364; Tr. Vol. 31 at 4655:2–4657:22 (Test. of M. Tappen).
717 Tr. Vol. 31 at 4659:7–14 (Test. of M. Tappen).
718 Tr. Vol. 31 at 4655:12–4656:6 (Test. of M. Tappen).
719 Tr. Vol. 31 at 4658:17–4659:3 (Test. of M. Tappen).
156
In addition to federal funding for ELL students under Title III, weighted state 408.
funding is provided to support the instruction of these students.720
Districts are required to
submit a Title III plan to show their compliance with these requirements and plans for spending
the additional funding. Districts also must provide an ESOL plan to show that they are meeting
the requirements of the consent decree and other applicable laws.721
District witnesses all
testified that they have ESOL plans and comply with all laws related to education of ELL
students.722
In accordance with federal law, ELL students are given access to the Florida 409.
Standards, including standards in English language acquisition and they are assessed on the
Comprehensive English Language Learning Assessment (―CELLA‖).723
Federal law also
requires that ELLs are tested on the statewide standards assessment—FCAT, FCAT 2.0, and now
the FSA—and that their scores are included in the state‘s accountability system.724
Once ELL students exit the ESOL program, they are no longer counted as ELLs. 410.
To exit from ESOL, Florida requires that students pass each subtest of the CELLA and also earn
a Level 3 or above on the Florida statewide standards assessment in reading.725
Because students
who earn a Level 3 or above on the statewide assessment are no longer counted as ELLs, it is not
720 Ex. 3680 at 00103474; Tr. Vol. 32 at 4813:13–4814:22 (Test. of L. Champion).
721 Tr. Vol. 31 at 4658:4–16 (Test. of M. Tappen); e.g., Ex. 337.
722 Ex. 338; Tr. Vol. 5 at 719:7–12 (Test. of N. Vitti); Tr. Vol. 6 at 906:11–907:4 (Test. of O.
Roberts); Tr. Vol. 7 at 1015:6–1017:19 (Test. of G. Littleton).
723 Exs. 3540; Tr. Vol. 31 at 4659:19–4660:25 (Test. of M. Tappen).
724 20 U.S.C. § 6311(b)(3)(B)(vii)(III).
725 Fla. Admin. Code R. 6A-6.0903(2)(a); Tr. Vol. 31 at 4665:20–22 (Test. of M. Tappen).
157
appropriate to look at performance of ELLs on the statewide assessment as an indicator of
educational quality.726
A review of the performance of former ELLs who have exited the ESOL program 411.
shows that these students passed the state assessment at the same rate as the total student
population on the 2014 FCAT 2.0 in reading, and at a higher rate than the total student
population on the 2014 FCAT 2.0 in mathematics.727
Another indicator of the quality of the education provided to ELLs in Florida is 412.
the length of time students spend in the ESOL program. Less than a quarter of Florida‘s ELLs
spend three or more years receiving ESOL services, which research shows to be an indicator for
on-time graduation.728
The Court finds that the evidence reflects that the State has adequately provided 413.
for a system of schools to provide ELLs with the opportunity to obtain a high-quality education.
Students with Disabilities E.
Federal law—the Individuals with Disabilities Education Act (―IDEA‖)—414.
provides a complex regulatory framework for assuring that students with disabilities are provided
with a free and appropriate public education (―FAPE‖). The IDEA places obligations on local
school districts (specifically termed local educational agencies or ―LEAs‖) to provide students
with disabilities with FAPE. The State‘s role is to provide technical support to districts and to
adopt laws and rules in compliance with the IDEA.729
726 Tr. Vol. 31 at 4663:3–4665:2 (Test. of M. Tappen).
727 Ex. 193; Tr. Vol. 31 at 4666:4–19 (Test. of M. Tappen).
728 Ex. 194; Tr. Vol. 31 at 4666:20–4668:2 (Test. of M. Tappen).
729 20 U.S.C. §§ 1412, 1413, 1416; Exs. 3393, 3395, 3396, 3397.
158
In accordance with the IDEA, state law requires that LEAs identify students with 415.
disabilities and provide all identified students with an individual educational plan (―IEP‖) that
provides additional services or accommodations based on the student‘s individual needs.730
As
detailed in Section V.B above, the State‘s weighted funding formula provides additional funding
to districts for the education of students with disabilities, and these districts also receive federal
funding under the IDEA.731
There is no evidence that the state of Florida or any school districts in the state are 416.
not providing FAPE in compliance with the IDEA. The U.S. Department of Education monitors
compliance with federal law and has rated Florida as meeting requirements for the support of
students with disabilities and the use of IDEA funds.732
Moreover, none of the school district
witnesses called by Plaintiffs testified that they had any reason to believe that their schools or
districts were not providing FAPE or otherwise out of compliance with the IDEA.733
As described in Section III.A above, Florida also complies with federal law in 417.
providing that students with disabilities be given access to the same content standards as all
students.734
Students with significant cognitive disabilities are provided instruction in the
content of the Florida Standards appropriate to their abilities through access points. Performance
in the access points is measured through the Florida Standards Alternate Assessment.735
730 Tr. Vol. 31 at 4668:3–25 (Test. of M. Tappen).
731 Exs. 3424, 3433; Ex. 3680 at 00103474–75, 00103480.
732 Exs. 1409, 1410, 1411.
733 Tr. Vol. 5 at 719:13–16 (Test. of N. Vitti); Tr. Vol. 6 at 902:21–903:22 (Test. of O. Roberts);
Tr. Vol. 7 at 1015:7–11 (Test. of L. Littleton); Tr. Vol. 10 at 1513:5–13 (Dep. Test. of M.
Burke); Tr. Vol. 22 at 3280:19–3281:14 (Test. of D. Robinson); Tr. Vol. 23 at 3505:24–3506:2
(Dep. Test. of J. Hiltz); Tr. Vol. 24 at 3640:3–10, 3563:2–8 (Dep. Test. of J. Marte).
734 Tr. Vol. 31 at 4668:3–4670:14 (Test. of M. Tappen).
735 Tr. Vol. 20 at 2987:18–25, 2980:2–12 (Test. of C. Guerrieri); Exs. 1827, 2110, 2117.
159
Students with significant cognitive disabilities work towards the same diploma as all other
students, with the opportunity for alternate means to meet the requirements.736
In addition to federal accountability for education of students with disabilities, in 418.
2005, Florida began including the progress of students with disabilities in its school-grading
formula, with the purpose of ensuring that schools and districts would be held accountable for
providing these students with the services and accommodations necessary for them to reach their
potential.737
Florida‘s inclusion of students with disabilities in its accountability system is
supported by national research finding that schools accountable for the students-with-disabilities
subgroup were more likely than schools without accountability to move students with disabilities
from self-contained classrooms to the regular classrooms.738
Placement in the least restrictive
environment is a goal of exceptional student education under the IDEA,739
and Florida‘s policies
have resulted in an increase in the percentage of students with disabilities placed in the regular
classroom setting, from 53% in 2005–06 to 71.3% in 2013–14. In 2012–13, Florida had the
highest percentage of students with disabilities in regular classrooms of the seven largest states in
the nation, and also was higher than the national average.740
Contrary to Plaintiffs‘ allegations regarding education of students with 419.
disabilities, the fact that students with disabilities succeed at a lower rate than their non-disabled
peers on statewide assessments is not determinative of whether the State is providing for a
system in which these students may obtain a high-quality education. Nationwide results on
736 Tr. Vol. 31 at 4644:13–4647:17, 4668:3–18 (Test. of M. Tappen); Ex. 190.
737 Tr. Vol. 29 at 4370:4–4371:8 (Test. of J. Copa).
738 Tr. Vol. 31 at 4669:3–4670:14 (Test. of M. Tappen).
739 20 U.S.C. § 1412(a)(5).
740 Exs. 191, 192; Tr. Vol. 31 at 4668:3–4670:14 (Test. of M. Tappen).
160
NAEP show that students with disabilities succeed at a lower rate than their non-disabled peers
throughout the nation, and Florida‘s students with disabilities perform at a higher level than
students nationally in several areas on NAEP.741
Based on the weight of this evidence, the Court finds that Florida has made 420.
strides in serving its students with disabilities, as evidenced by a greater percentage of students
with disabilities earning a standard high school diploma and a greater percentage of students with
disabilities being educated in the least restrictive environment—the regular classroom, with their
peers, having access to the same quality standards and instructional materials.
Students Eligible for Free-and-Reduced-Price Lunch F.
Students in poverty also benefit from ESEA Title I dollars, which support school 421.
improvement efforts in Title I schools. The local districts and schools may choose to allocate
these funds in a variety of ways, including providing additional teachers, professional
development, extra time for teaching, parent involvement activities, and other activities designed
to raise student achievement.742
The Court finds that Florida‘s policies and funding mechanisms are adequate to 422.
provide a system that allows low-income students to obtain a high-quality education. As
described in Section IV.A above, Florida‘s low-income students (identified as students eligible
for free-and-reduced-price lunch) continually outperform low-income students in other states on
NAEP. For example, Florida‘s low-income grade 4 students performed at higher levels than
students in all other states in reading in 2013 and 2015 (the most recent two administrations),743
741 Exs. 3337, 1360, 1370; Tr. Vol. 26 at 4044:15–19, 4006:18–22 (Test. of P. Stewart).
742 Tr. Vol. 26 at 3971:7–3972:8 (Test. of P. Stewart); Tr. Vol. 33 at 4935:7–4936:11 (Test. of L.
Champion); Ex. 3394; 20 U.S.C. §§ 6311–6339.
743 Exs. 139, 158, 1345, 1346, 1365.
161
and they made more gains than low-income students in any other state between 1998 and
2013.744
Students Experiencing Homelessness G.
Plaintiffs also assert that the lower performance on state assessments of Florida‘s 423.
students experiencing homelessness is evidence that the State is not meeting its obligations under
Article IX. The weight of the evidence, discussed below, does not indicate that the State‘s
accountability or funding policies are denying homeless students the opportunity to obtain a high
quality education.
The Court specifically rejects Plaintiffs‘ contentions that the lower performance 424.
on state assessments by homeless students as compared with non-homeless students is evidence
that Florida is not providing for a high-quality school system. Evidence shows that there are
many non-school factors that lead to lower performance by homeless students than their stably-
housed peers, and that this pattern is prevalent throughout the country.745
Federal law, the McKinney-Vento Homeless Assistance Act (―McKinney-425.
Vento‖), requires school districts to make sure homeless students have the same access to
education as non-homeless students.746
The Department has an office responsible for providing
districts with technical support in complying with McKinney-Vento and with administering
federal grants through McKinney-Vento.747
The U.S. Department of Education monitors states
744 Exs. 160, 162.
745 Tr. Vol. 2 at 229:2–6; 284:5–11 (Test. of K. Tobin).
746 42 U.S.C. §§ 11431, 11432.
747 Tr. Vol. 8 at 1152:18–1153:6 (Test. of L. Allen); Exs.3402, 3403, 3404, 3405.
162
for compliance with McKinney-Vento, and has found in multiple years that the state of Florida is
meeting the requirements of federal law.748
Plaintiffs‘ focus on the State‘s administration of federal McKinney-Vento sub-426.
grants, which make up a fraction of 1% of district budgets, also is misplaced. The fact that there
are no other funding sources specifically allocated to the education of homeless students is not
the sole determinant. The State has reasonable and well-considered accountability and education
policies to ensure that all students, including homeless students, are given access to the same
high-quality education. Districts are funded through the FEFP, which provides funding for each
student, including homeless students,749
and additional weighted or categorical funding is
provided for students, including homeless students, with greater needs, such as students with
disabilities, ELL students, and low-performing students.750
Districts are responsible for
allocating resources based on the needs of the students in their district, including their homeless
students. The State is not required to dictate specific funding streams and resources to be used
for each subgroup of possibly at-risk students. This is appropriately a job for the local districts
that are responsible for educating the individual students, and district witnesses confirmed that
their districts are providing appropriate services to their students experiencing homelessness.751
Additionally, many of Plaintiffs‘ contentions pertaining to homeless students—427.
and low-income students in general—appear to address the students‘ needs for social services,
748 Exs. 1471, 1472; Tr. Vol. 8 at 1233:4–1235:4 (Test. of L. Allen).
749 Tr. Vol. 8 at 1184:7–1185:21 (Test. of L. Allen); Tr. Vol. 6 at 719:21–24 (Test. of N. Vitti).
750 Exs. 3414, 3680 at 00103474–80; Tr. Vol. 32 at 4813:18–4816:19 (Test. of L. Champion); Tr.
Vol. 8 at 1184:7–1185:21 (Test. of L. Allen).
751 Tr. Vol. 5 at 719:17–20 (Test. of N. Vitti); Tr. Vol. 6 at 903:24–904:6 (Test. of O. Roberts);
Tr. Vol. 7 at 1015:7–11 (Test. of G. Littleton); Tr. Vol. 24 at 3639:14–3640:2 (Dep. Test. of J.
Marte).
163
not specifically their educational needs. The Legislature provides for the needs of homeless and
low-income students and their families through a variety of other, non-education social-services
programs.752
Findings Related to Choice Programs VIII.
Charter Schools A.
Under Florida law, charter schools are ―part of the state‘s program of public 428.
education,‖ and ―[a]ll charter schools in Florida are public schools.‖753
Plaintiffs allege that
charter schools ―create[] an inefficient duplication of expenditures‖ and ―suffer financial
mismanagement or other financial problems.‖754
Charter schools have existed in Florida since 1996755
and are subject to the same 429.
major requirements as traditional public schools, including requirements related to academic
standards, state assessments, school grading, teacher certification, teacher evaluation, public
meetings, public records, and background screening.756
Charter schools are also required to
admit students via a random selection process if the schools are oversubscribed.757
Charter schools are subject to the supervision and oversight of local school 430.
boards, including oversight related to academic and financial performance. With the limited
exception of three developmental laboratory charter schools under § 1002.32, Fla. Stat., all
752 Ex. 230; Tr. Vol. 34 at 5043:15–5046:7 (Test. of A. Baker); Tr. Vol. 16 at 2372:2–
2375:22(Test. of J. Hall).
753 § 1002.33(1), Fla. Stat.
754 2d Am. Compl. ¶¶ 144, 145.
755 Ex. 2859; Tr. Vol. 36 at 5305:15–5306:15 (Test. of A. Miller).
756 § 1002.33(9)(a)–(f), (9)(k)(1), (16)(a)–(b), Fla. Stat.; Tr. Vol. 36 at 5304:4–14, 5310:6–
5311:24 (Test. of A. Miller).
757 § 1002.33(10)(b), Fla. Stat.; Tr. Vol. 36 at 5326:15–5327:1 (Test. of A. Miller).
164
charter schools in Florida are authorized by local school boards, which are responsible for
reviewing and approving (or denying) applications for new charter schools.758
Although an applicant whose charter-school application is denied by a local 431.
school board may appeal that decision to the Florida State Board of Education, successful
appeals (i.e., those in which the State Board overturns a local board‘s denial of the application)
are rare. From 2005 through 2013, the annual percentage of total charter-school applications that
the State Board approved after a local board‘s denial ranged from 0% to a high of only 4.2%.759
Local school boards also have the authority to close local charter schools for poor 432.
academic or financial performance, violations of the law, or other good cause.760
Funding for students in charter schools is provided in the same manner as for 433.
students in traditional public schools, which results in approximately equal operational funding,
though charter schools generally do not have access to local capital funding. Additionally, a
portion of the charter schools‘ FTE funding is held back by the local school district for
administrative costs.761
Charter schools may elect to contract with management companies to provide 434.
services to the school, but they must disclose their intent to do so in their charter-school
applications. If a local school board approves such an application, the management company is
758 § 1002.33(5), (6)(a)–(b), Fla. Stat.; Tr. Vol. 36 at 5313:10–5316:13 (Test. of A. Miller).
759 § 1002.33(6)(c), Fla. Stat.; Ex. 205; Tr. Vol. 36 at 5317:6–5320:15 (Test. of A. Miller).
760 § 1002.33(8)(a), Fla. Stat.; Tr. Vol. 36 at 5321:17–5322:10 (Test. of A, Miller).
761 § 1002.33(17), (19), 20(a), Fla. Stat.; Tr. Vol. 32 at 4908:8–4913:4 (Test. of L. Champion);
Tr. Vol. 36 at 5329:10–5334:3 (Test. of A. Miller); Ex. 210.
165
responsible to the charter school‘s governing board, which in turn is ultimately responsible to its
students and the local school district.762
Plaintiffs did not present specific, credible evidence of ―financial mismanagement 435.
or other financial problems‖ at charter schools, nor did they establish that charter schools have
any negative impact or in any way interfere with the quality of education being provided in
traditional public schools. Florida‘s charter schools serve similar student populations as
traditional public schools,763
and students enrolled in these schools are generally performing
better on average than similar students enrolled in Florida‘s traditional public schools.764
Research both in Florida and nationally supports the finding that charter schools can lead to
better student outcomes and contribute to the overall quality of the public school system.765
The State can rationally conclude that charter schools are an appropriate part of 436.
Florida‘s system of free public schools and do not undermine the uniformity, efficiency, safety,
security, or quality of that system.766
Florida Tax Credit Scholarship Program B.
The Court granted Defendant‘s Motion for Summary Judgment as to the Florida 437.
Tax Credit Scholarship Program (the ―FTC Program‖) on December 17, 2015. However, the
Court did permit Plaintiff the opportunity to present evidence as to the overall impact to local
School District budgets because of the lack of funds due to the FTC Program.
762 Fla. Admin. Code R. 6A-7.0786 (incorporating Model Florida Charter School Application by
reference); Ex. 2860 at 00071221; Tr. Vol. 36 at 5314:10–5316:13 (Test. of A. Miller).
763 Ex. 2873 at 00071390; Tr. Vol. 36 at 5325:6–5326:14 (Test. of A. Miller).
764 Exs. 2873, 2829, 2861, 2902, 2903, 2904, 2905, 2906; Tr. Vol. 36 at 5335:15–5339:23 (Test.
of A. Miller).
765 Exs. 130, 204; Tr. Vol. 35 at 5217:15–5227:1 (Test. of J. Greene).
766 See Tr. Vol. 35 at 5217:15–21 (Test. of J. Greene).

166
The Florida Tax Credit Scholarship Program (the ―FTC Program‖) allows Florida 438.
taxpayers to apply for tax credits ―to make private, voluntary contributions‖ to fund scholarships
for children attending eligible K–12 private schools.767
Plaintiffs allege that the FTC Program
violates the uniformity and efficiency requirements of Article IX, Section 1(a) by diverting
public funds to private schools that are not subject to the same requirements as schools within the
State‘s system of free public schools.
The Court has previously found that the FTC Program, which allows third parties 439.
to obtain tax credits for making private donations, does not involve public funds, legislative
appropriations, or the State‘s ―provision‖ for a ―system of free public schools‖ under Article IX.
Because the private donations that fund the FTC Program are not legislative appropriations, the
Court has previously determined that Plaintiffs lack taxpayer standing to assert a challenge to
this program under Florida law.768
Plaintiffs have also failed to prove any special injury that would allow them to 440.
challenge the FTC Program.769
Despite Plaintiffs‘ assertion ―that the State may be fairly treated as itself engaging 441.
in the funding of private school vouchers,‖770
any connection between the FTC Program and
appropriations to support Florida‘s system of free public schools—not to mention the overall
767 § 1002.395(1)(b)(1), Fla. Stat.
768 Order Granting in Part and Denying in Part Intervenors–Defendants Mot. Partial J. on
Pleadings for Failure to State Claim on Which Relief Can Be Granted (Dec. 17, 2015); Order
Granting Motions to Dismiss with Prejudice, McCall v. Scott, No. 2014 CA 002282, 2015 WL
3945409, at ¶ 5 (Fla. 2d Cir. Ct. May 18, 2015).
769 Order Granting in Part and Denying in Part Intervenors–Defendants Mot. Partial J. on
Pleadings for Failure to State Claim on Which Relief Can Be Granted (Dec. 17, 2015); Order
Granting Motions to Dismiss with Prejudice, McCall v. Scott, No. 2014 CA 002282, 2015 WL
3945409, at ¶ 6 (Fla. 2d Cir. Ct. May 18, 2015).
770 2d Am. Compl. ¶ 78.
167
quality of that system—is purely speculative. There was no persuasive evidence presented that
the FTC Program has any direct or indirect impact on public-school funding or on the
uniformity, efficiency, safety, security, or quality of Florida‘s public schools.771
Although Plaintiffs have not shown that the FTC Program involves legislative 442.
appropriations or the diversion of public money that otherwise would have been used to fund
public schools, any such diversion, even if proved, would not have a material negative impact on
Florida‘s system of free public schools.772
Even if tax credits resulted in a decrease in the
number of students attending the public schools, local school districts are not responsible for
educating students who attend private schools.773
McKay Scholarship for Students with Disabilities C.
The John M. McKay Scholarships for Students with Disabilities Program (the 443.
―McKay Program‖) is designed for ―Students with Disabilities‖—who have specific needs
identified through an ―individual educational plan‖ or ―504 accommodation plan‖—and
primarily allows them to apply for scholarships to attend eligible private schools.774
The McKay
Program also allows students with disabilities to transfer from one public school to another.775
Plaintiffs allege that the McKay Program, like the FTC Program (but which is funded through
legislative appropriations), diverts public funds to private schools.776
771 Order Granting in Part and Denying in Part Intervenors–Defendants Mot. Partial J. on
Pleadings for Failure to State Claim on Which Relief Can Be Granted (Dec. 17, 2015); Order
Granting Motions to Dismiss with Prejudice, McCall v. Scott, No. 2014 CA 002282, 2015 WL
3945409, at ¶¶ 6–7 (Fla. 2d Cir. Ct. May 18, 2015).
772 Tr. Vol. 36 at 5340:9–12 (Test. of A. Miller); Ex. 3154.
773 Tr. Vol. 36 at 5340:17–5341:6, 5344:9–19 (Test. of A. Miller).
774 § 1002.39(1), Fla. Stat.; Ex. 3151; Tr. Vol. 36 at 5344:20–5345:5 (Test. of A. Miller).
775 § 1002.39(1), Fla. Stat.; Ex. 3151; Tr. Vol. 36 at 5344:20–5345:5 (Test. of A. Miller).
776 2d Am. Compl. ¶ 110.

168
―Students with Disabilities‖ for the purposes of McKay Program eligibility 444.
―include K–12 students who are documented as having an intellectual disability; a speech
impairment; a language impairment; a hearing impairment, including deafness; a visual
impairment, including blindness; a dual sensory impairment; an orthopedic impairment; and
other health impairment; an emotional or behavioral disability; a specific learning disability,
including, but not limited to, dyslexia, dyscalculia, or developmental aphasia; a traumatic brain
injury; a developmental delay; or autism spectrum disorder.‖777
The McKay Program allows children with disabilities and their families to choose 445.
a public or private school that best meets the student‘s individualized, special needs.778
Parents‘
decisions to send individual children with special needs to private school do not implicate the
uniformity of the broader public school system—regardless of whether some of those parents
accept scholarship funds from the State.779
The evidence does not show that the McKay Program has a material, negative 446.
impact on public-school funding or on the uniformity, efficiency, safety, security, or quality of
Florida‘s public schools. There are approximately 30,000 students who participate in the
McKay Program (compared to roughly 2.7 million students in Florida‘s public schools), and the
total funding for the McKay Program amounts to a very small fraction of school district budgets
statewide.780
As with the FTC Program, local school districts are not responsible for educating
777 § 1002.39(1), Fla. Stat.
778 Ex. 3151.
779 See Bush v. Holmes, 919 So. 2d 392, 412 (Fla. 2006) (―Other educational programs, such as
the program for exceptional students at issue in Scavella, are structurally different from the
[Opportunity Scholarship Program struck down in Holmes], which provides a systematic private
school alternative to the public school system mandated by our constitution.‖ (emphasis added)).
780 Exs. 209, 3151; Tr. Vol. 36 at 5347:14–18, 5349:7–14 (Test. of A. Miller).
169
students who attend private schools,781
and Plaintiffs have not shown that the McKay Program
causes any material financial losses that would impair school districts‘ ability to provide
opportunities for a high-quality education in accordance with Florida law.
Similarly, research has shown that the McKay Program has a positive effect on 447.
the public schools, both in terms of lessening the incentive to over-identify students and by
increasing the quality of services of the students with disabilities in the public schools.782
The Court therefore finds that the McKay Program is rationally related to the goal 448.
of increasing the quality and efficiency of the Florida public school system.783
Findings Related to Causation IX.
Plaintiffs allege that the overall level of funding in Florida is not sufficient to 449.
provide a uniform, efficient, safe, secure and high quality system of public education.784
Plaintiffs assert that the performance outcomes for certain groups of students indicate that school
funding is insufficient.785
Plaintiffs, however, have not met their burden of proving a causal relationship 450.
between the level of resources available to schools in Florida and student outcomes. Indeed, as
described below, the weight of the evidence presented on that issue establishes a lack of any
causal relationship between additional financial resources and improved student outcomes.
Defendants presented the findings of Dr. Eric Hanushek, a professor of education 451.
and economics at Stanford University. Dr. Hanushek presented both national research findings
781 Tr. Vol. 36 at 5345:6–11 (Test. of A. Miller).
782 Tr. Vol. 35 at 5230:12–5321:6 (Test. of J. Greene).
783 See Tr. Vol. 35 at 5231:7–17 (Test. of J. Greene).
784 2d Am. Compl. ¶ 30.
785 See, e.g., id. ¶¶ 32, 45, 152, 154–55.
170
as well as those focused on Florida. Dr. Hanushek‘s analyses indicate that despite a large
infusion of additional resources into U.S. public schools over the past 50 years, including a
quadrupling of spending between 1960 and 2010 (after adjusting for inflation), math and reading
performance of students on the National Assessment of Educational Progress (―NAEP‖)786
has
shown virtually no change since 1970.787
Econometric evidence presented by Dr. Hanushek indicates that the manner in 452.
which schools historically spend additional resources, i.e., increasing teacher pay, lowering
pupil-teacher ratios, or increasing the percentage of teachers with advanced degrees and
experience, has not systematically led to higher levels of student performance.788
Dr. Hanushek analyzed student performance and spending in Florida compared to 453.
the rest of the nation. Dr. Hanushek‘s analysis indicates that on grade 4 NAEP reading tests
Florida had impressive results overall compared to other states, the second largest performance
increases from 1992 to 2013, and accomplished this improvement with the lowest per pupil
expenditure increases in the nation. In this regard, Florida is among the most efficient education
systems in the nation.789
Dr. Hanushek also found that the gains in grade 4 NAEP reading scores for 454.
students eligible for free and reduced price lunch were larger in Florida than in any other state
between 1998 and 2013. As of 2013, Florida students eligible for free and reduced price lunch
786 See Section IV.A for an explanation of NAEP.
787 Exs. 278, 164, 165; Tr. Vol. 27 at 4152:8–4156:9 (Test. of E. Hanushek).
788 Exs. 280, 185, 198; Tr. Vol. 27 at 4158:8–22, 4162:3–4172:15 (Test. of E. Hanushek); Tr.
Vol. 28 at 4205:5–4206:5 (Test. of E. Hanushek).
789 Exs. 154, 155 ,156, 157, 158, 159, 197; Tr. Vol. 27 at 4176:9–4183:3 (Test. of E. Hanushek);
Tr. Vol. 28 at 4193:12–4195:1, 4199:22–4202:3 (Test. of E. Hanushek); see also Exs. 140, 141,
142, 143, 144.
171
outperformed similarly disadvantaged students in all other states.790
(See also Section IV.A
above.)
Dr. Hanushek presented analyses showing that over time, Florida has narrowed 455.
achievement gaps—by race, ethnicity and economic position—at a greater pace than other states.
Although achievement gaps exist in all states, and have over an extended period of time,
achievement gaps in Florida are consistently lower than achievement gaps in the rest of the
nation.791
(See also Section III.A above.)
Florida has also emphasized college readiness. Dr. Hanushek presented analyses 456.
showing that between 2003 and 2013, Florida had the second highest gains among all states of
students scoring a 3 or above on Advanced Placement exams.792
(See also Section IV.D above.)
Another analysis presented by Dr. Hanushek compared the performance and 457.
spending in Florida compared to New York, a demographically similar state that experienced
large increases in education spending as the result of an adequacy lawsuit in the early 2000s.793
In particular, Dr. Hanushek‘s analysis showed that in 2002, Florida grade 4 NAEP reading scores
were well below New York‘s scores, and that from 2002 and 2013, New York per pupil spending
increased by several thousand dollars per pupil to nearly $20,000 per pupil. In Florida, by
contrast, per pupil spending remained relatively stable from 2002 and 2013 but, by 2013, Florida
students surpassed New York students on the grade 4 NAEP reading test.794
790 Exs. 160, 158; Tr. Vol. 28 at 4195:3–15 (Test. of E. Hanushek).
791 Exs. 161, 162, 196; Tr. Vol. 28 at 4195:17–4199:21 (Test. of E. Hanushek); see also Exs.
145, 146, 147, 148, 149, 150, 151, 152, 153.
792 Exs. 128, 129; Tr. Vol. 28 at 4202:20–4204:7 (Test. of E. Hanushek).
793 Ex. 282; Tr. Vol. 28 at 4218:21–4220:10 (Test. of E. Hanushek).
794 Ex. 166; Tr. Vol. 28 at 4220:11–4222:22 (Test. of E. Hanushek).
172
The Court accepts Dr. Hanushek‘s conclusions and finds that his analyses 458.
corroborate other evidence refuting Plaintiffs‘ assertions that Florida‘s system of public schools
is not efficient and that the level of resources in Florida has negatively impacted student
outcomes.795
In addition to Dr. Hanushek, Defendants presented findings of Dr. Jay Greene, a 459.
professor of education and head of the Department of Education Reform at the University of
Arkansas. Dr. Greene statistically analyzed school district-level variables throughout the state of
Florida, including per-pupil spending, teacher characteristics, and discipline rates, and found no
relationship between these variables and student outcomes.796
Specifically, Dr. Greene examined school district per-pupil expenditures and 460.
percentages of students proficient on the Florida Comprehensive Assessment Test (―FCAT‖)797
for grades 3 through 10 in reading and math; grades 5, 8, and 11 in science; as well as high-
school graduation rates, for school years 2007–08 to 2012–13. The analysis revealed no
connection between higher amounts of funding available in school districts and better student
performance.798
Dr. Greene also conducted regression analyses of spending and performance data, 461.
controlling for student demographic differences and prior levels of achievement across school
districts. The demographic characteristics that were controlled included the proportion of
minority students, proportion of students receiving free or reduced price lunch, the proportion of
795 See Tr. Vol. 28 at 4204:8–22 (Test. of E. Hanushek).
796 Tr. Vol. 35 at 5176:25–5177:15, 5209:3–15 (Test. of J. Greene).
797 See Section II.B for an explanation of the FCAT and subsequent statewide, standardized
assessments.
798 Exs. 265, 266, 267, 268; Tr. Vol. 35 at 5177:16–5183:9 (Test. of J. Greene).
173
students classified as English language learners (―ELL‖), and the proportion of students with a
disability who had an individual educational plan (―IEP‖), as well as academic outcomes in the
prior year. The purpose of these analyses was to examine whether school districts would have
better student outcomes if they had more resources, assuming school districts had the same
demographic composition and prior year‘s academic outcomes. Dr. Greene‘s regression
analyses revealed that there is no pattern between the level of spending in Florida school districts
and student performance on the FCAT or high school graduation rates.799
In addition, Dr. Greene evaluated the assertion by Plaintiffs that teacher 462.
qualifications and experience characteristics impact student performance, and that districts with
high-minority and low-income student populations have a lower percentage of qualified,
experienced teachers. Consistent with his other findings, Dr. Greene found no statistical
relationship between the proportion of novice (first-year teachers) or ―highly qualified‖ teachers,
as defined by the Florida Department of Education, and student performance on the FCAT or
high school graduation rates. Likewise, Dr. Greene found no statistical relationship between the
percentage of minority and low-income students in a district and the proportion of novice or
highly qualified teachers.800
Dr. Greene also addressed Plaintiffs‘ assertion that high suspension rates are 463.
attributable to a lack of school district resources and lead to lower student performance
outcomes. As above, Dr. Greene conducted regression analyses that controlled for student
demographic characteristics and prior student outcomes. Dr. Greene found no relationship
799 Exs. 271, 272; Tr. Vol. 35 at 5183:10–5190:19, 5192:18–5196:20 (Test. of J. Greene).
800 Exs. 273, 274, 275, 276; Tr. Vol. 35 at 5196:22–5200:4, 5201:22–5205:4 (Test. of J. Greene).

174
between the rate at which students are given out-of-school suspensions in Florida school districts
and FCAT reading, math, or science proficiency, or graduation rates.801
Finally, Dr. Greene concluded that, based on the continued improvement in 464.
student performance over time, sufficient funding is available to Florida school districts. Dr.
Greene explained that the decrease in the percent of students performing at or above Level 3
after the change to the FCAT 2.0 does not indicate a change in the quality of the system but
instead is the product of a policy judgment made by the State about where to set performance
standards.802
The Court accepts Dr. Greene‘s conclusions and finds that they corroborate other 465.
evidence in the case showing the lack of causal relationship between the level of resources
available in Florida schools and student outcomes, as well as evidence showing that the level of
resources available is sufficient for a high quality system.803
Although Plaintiffs bear the burden of proof in this case, neither Plaintiffs‘ expert 466.
witnesses nor their school-district witnesses presented analyses or studies rebutting the work of
Drs. Hanushek and Greene. In fact, the weight of the evidence shows that despite budget
cutbacks associated with the Great Recession, student performance continued to improve in the
period 2007–08 to 2014–15.804
801 Exs. 277, 279; Tr. Vol. 35 at 5206:20–5209:2 (Test. of J. Greene).
802 Tr. Vol. 35 at 5190:20–5192:7, 5211:–17–5213:6, 5273:3–5274:14 (Test. of J. Greene); Ex.
269.
803 See Tr. Vol. 35 at 5209:3–15, 5213:7–5215:4 (Test. of J. Greene).
804 See, e.g., Ex. 785; Tr. Vol. 5 at 686:24–699:18 (Test. of N. Vitti); Ex. 1048; Tr. Vol. 22 at
3291:23–3292:9, 3305:6–3306:6 (Test. of D. Robinson); Ex. 564; Tr. Vol. 24 at 3600:24–
3602:9, 3630:2–3632:4 (Dep. Test. of J. Marte); Ex. 390 at 00010443; Tr. Vol. 36 at 5474:9–
5475:19 (Dep. Test. of K. Blocker).
175
As discussed in Section IV and the discussion of Dr. Hanushek‘s testimony 467.
above, the Florida high school graduation rate is at an all-time high and has increased by over 25
points since 1998–99 and 17 points since 2007–08;805
NAEP scores continue to rise;
achievement gaps have narrowed; and more students are taking and succeeding in rigorous
Advanced Placement, International Baccalaureate, and other advanced high-school course work
than ever before. The State as a whole is performing at a higher level and has improved on
multiple measures of student performance at a faster pace than many other states in the nation.
All of this has been achieved notwithstanding the economic downturn and its impact on school-
district budgets.
Plaintiffs have failed to address causation as it relates to differences in student 468.
performance across schools and school districts in Florida. Under the Florida Constitution, local
school boards, not the State, are primarily responsible for the operation, control, and supervision
of schools.806
Dr. Greene‘s testimony and other evidence shows that some school districts in
Florida are better managed and more effective at improving student performance than other
districts, notwithstanding similar student demographics and funding levels.
The Court therefore finds that Plaintiffs have failed to satisfy their burden of 469.
proof on the causation issue.
805 Ex. 4050.
806 See generally Art. IX, § 4(b), Fla. Const.