RUSSELL INVESTMENT CO (Form: NQ, Filing Date
522
Business Address 1301 SECOND AVENUE 18TH FLOOR SEATTLE WA 98101 800-787-7354 Mailing Address 1301 SECOND AVENUE 18TH FLOOR SEATTLE WA 98101 SECURITIES AND EXCHANGE COMMISSION FORM N-Q Quarterly schedule of portfolio holdings of registered management investment company filed on Form N-Q Filing Date: 2012-03-30 | Period of Report: 2012-01-31 SEC Accession No. 0001193125-12-143518 (HTML Version on secdatabase.com) FILER RUSSELL INVESTMENT CO CIK:351601| IRS No.: 911151059 | State of Incorp.:MA | Fiscal Year End: 1031 Type: N-Q | Act: 40 | File No.: 811-03153 | Film No.: 12729092 Copyright © 2012 www.secdatabase.com . All Rights Reserved. Please Consider the Environment Before Printing This Document
-
Upload
khangminh22 -
Category
Documents
-
view
77 -
download
0
Transcript of RUSSELL INVESTMENT CO (Form: NQ, Filing Date

Business Address1301 SECOND AVENUE18TH FLOORSEATTLE WA 98101800-787-7354
Mailing Address1301 SECOND AVENUE18TH FLOORSEATTLE WA 98101
SECURITIES AND EXCHANGE COMMISSION
FORM N-QQuarterly schedule of portfolio holdings of registered management investment company filed
on Form N-Q
Filing Date: 2012-03-30 | Period of Report: 2012-01-31SEC Accession No. 0001193125-12-143518
(HTML Version on secdatabase.com)
FILERRUSSELL INVESTMENT COCIK:351601| IRS No.: 911151059 | State of Incorp.:MA | Fiscal Year End: 1031Type: N-Q | Act: 40 | File No.: 811-03153 | Film No.: 12729092
Copyright © 2012 www.secdatabase.com. All Rights Reserved.Please Consider the Environment Before Printing This Document

Table of ContentsOMB APPROVAL
OMB Number: 3235-0578Expires: April 30, 2013Estimated average burden 5.6
UNITED STATESSECURITIES AND EXCHANGE COMMISSION
Washington, D.C. 20549
FORM N-Q
QUARTERLY SCHEDULE OF PORTFOLIO HOLDINGS OF REGISTEREDMANAGEMENT INVESTMENT COMPANIES
Investment Company Act file number: 811-03153
Russell Investment Company(Exact name of registrant as specified in charter)
1301 2nd Avenue 18th Floor, Seattle Washington 98101(Address of principal executive offices) (Zip code)
Mary Beth Rhoden, Secretary and Chief Legal Officer1301 2nd Avenue
18th FloorSeattle, Washington 98101
206-505-4846(Name and address of agent for service)
Registrant��s telephone number, including area code: 206-505-7877
Date of fiscal year end: October 31Date of reporting period: November 1, 2011 �� January 31, 2012
Copyright © 2012 www.secdatabase.com. All Rights Reserved.Please Consider the Environment Before Printing This Document

Table of ContentsItem 1. Schedule of Investments
Copyright © 2012 www.secdatabase.com. All Rights Reserved.Please Consider the Environment Before Printing This Document

Table of Contents
2012 QUARTERLY REPORT
Russell Funds
JANUARY 31, 2012
FUND SHARE CLASS
U.S. Equity Funds
Russell U.S. Core Equity Fund A, C, E, I, S, Y
Russell U.S. Quantitative Equity Fund A, C, E, I, S, Y
Russell U.S. Growth Fund C, E, I, S
Russell U.S. Value Fund C, E, I, S
Russell U.S. Small Cap Equity Fund
(formerly, Russell U.S. Small & Mid Cap Fund)
A, C, E, I, S, Y
International and Global Equity Funds
Russell International Developed Markets Fund A, C, E, I, S, Y
Russell Global Equity Fund A, C, E, S, Y
Russell Emerging Markets Fund A, C, E, S, Y
Tax-Managed Equity Funds
Russell Tax-Managed U.S. Large Cap Fund A, C, E, S
Russell Tax-Managed U.S. Mid & Small Cap Fund A, C, E, S
Taxable Fixed Income Funds
Russell Global Opportunistic Credit Fund
(formerly, Russell Global Credit Strategies Fund)
A, C, E, S, Y
Russell Strategic Bond Fund A, C, E, I, S, Y
Russell Investment Grade Bond Fund A, C, E, I, S, Y
Russell Short Duration Bond Fund A, C, E, S, Y
Tax Exempt Fixed Income Fund
Russell Tax Exempt Bond Fund A, C, E, S
Real Asset Funds
Russell Commodity Strategies Fund A, C, E, S, Y
Russell Global Infrastructure Fund A, C, E, S, Y
Russell Global Real Estate Securities Fund A, C, E, S, Y
Money Market Funds
Copyright © 2012 www.secdatabase.com. All Rights Reserved.Please Consider the Environment Before Printing This Document

Russell Money Market Fund A, S
Copyright © 2012 www.secdatabase.com. All Rights Reserved.Please Consider the Environment Before Printing This Document

Table of Contents
Russell Investment CompanyRussell Investment Company is a series investment companywith 36 different investment portfolios referred to as Funds.This Quarterly Report reports on 19 of these Funds.
Copyright © 2012 www.secdatabase.com. All Rights Reserved.Please Consider the Environment Before Printing This Document
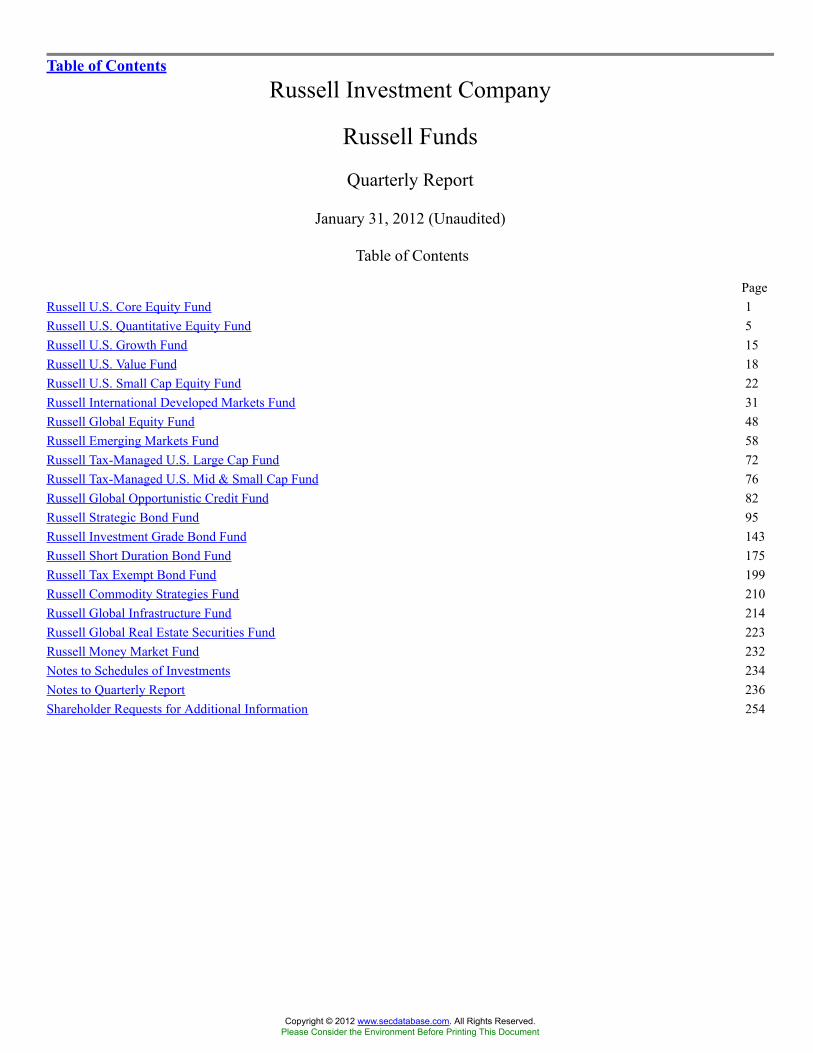
Table of Contents
Russell Investment Company
Russell Funds
Quarterly Report
January 31, 2012 (Unaudited)
Table of Contents
PageRussell U.S. Core Equity Fund 1Russell U.S. Quantitative Equity Fund 5Russell U.S. Growth Fund 15Russell U.S. Value Fund 18Russell U.S. Small Cap Equity Fund 22Russell International Developed Markets Fund 31Russell Global Equity Fund 48Russell Emerging Markets Fund 58Russell Tax-Managed U.S. Large Cap Fund 72Russell Tax-Managed U.S. Mid & Small Cap Fund 76Russell Global Opportunistic Credit Fund 82Russell Strategic Bond Fund 95Russell Investment Grade Bond Fund 143Russell Short Duration Bond Fund 175Russell Tax Exempt Bond Fund 199Russell Commodity Strategies Fund 210Russell Global Infrastructure Fund 214Russell Global Real Estate Securities Fund 223Russell Money Market Fund 232Notes to Schedules of Investments 234Notes to Quarterly Report 236Shareholder Requests for Additional Information 254
Copyright © 2012 www.secdatabase.com. All Rights Reserved.Please Consider the Environment Before Printing This Document
Table of ContentsRussell Investment Company - Russell Funds.
Copyright © Russell Investments 2012. All rights reserved.
Russell Investments is a Washington, USA corporation, which operates through subsidiaries worldwide and is a subsidiary of TheNorthwestern Mutual Life Insurance Company.
Fund objectives, risks, charges and expenses should be carefully considered before investing. A prospectuscontaining this and other important information must precede or accompany this material. Please read theprospectus carefully before investing.
Securities distributed through Russell Financial Services, Inc., member FINRA and part of Russell Investments.
Copyright © 2012 www.secdatabase.com. All Rights Reserved.Please Consider the Environment Before Printing This Document

Table of Contents
Russell Investment CompanyRussell U.S. Core Equity Fund
Schedule of Investments �� January 31, 2012 (Unaudited)Amounts in thousands (except share amounts)
Principal
Amount ($)
or Shares
Market
Value
$
Common Stocks - 92.1%Consumer Discretionary - 16.2%Aegean Marine Petroleum Network,
Inc. 304,135 1,548
Amazon.com, Inc. (Æ) 185,785 36,124
Apollo Group, Inc. Class A (Æ)(Ñ) 215,309 11,284
AutoZone, Inc. (Æ) 21,800 7,584
Bed Bath & Beyond, Inc. (Æ)(Ñ) 118,890 7,217
Big Lots, Inc. (Æ) 111,450 4,401
BorgWarner, Inc. (Æ)(Ñ) 24,100 1,799
Carnival Corp. (Ñ) 164,535 4,969
CBS Corp. Class B 240,700 6,855
Chipotle Mexican Grill, Inc. Class A
(Æ) 6,700 2,461
Coach, Inc. 55,900 3,916
Comcast Corp. Class A (Æ) 1,182,354 30,371
eBay, Inc. (Æ) 1,098,366 34,708
Estee Lauder Cos., Inc. (The) Class A 102,252 5,924
Ford Motor Co. (Ñ) 623,776 7,747
General Motors Co. (Æ) 195,300 4,691
Hanesbrands, Inc. (Æ) 137,800 3,390
Home Depot, Inc. 348,693 15,479
International Game Technology 315,900 5,032
JC Penney Co., Inc. (Ñ) 51,065 2,122
Johnson Controls, Inc. 1,046,011 33,232
KB Home (Ñ) 394,158 3,555
Las Vegas Sands Corp. 495,000 24,309
Lear Corp. 275,500 11,543
Limited Brands, Inc. (Ñ) 254,300 10,645
Lowe�s Cos., Inc. 659,500 17,694
Lululemon Athletica, Inc. (Æ) 29,600 1,869
Macy�s, Inc. 345,588 11,643
Marriott International, Inc. Class A (Ñ) 59,525 2,051
McDonald�s Corp. 69,300 6,864
MGM Resorts International (Æ)(Ñ) 78,200 1,021
Michael Kors Holdings, Ltd. (Æ) 24,391 755
Principal
Amount ($)
or Shares
Market
Value
$
Consumer Staples - 6.5%Archer-Daniels-Midland Co. 568,550 16,278
Cia de Bebidas das Americas - ADR 525,600 19,127
Coca-Cola Co. (The) 615,441 41,561
Colgate-Palmolive Co. 240,441 21,813
CVS Caremark Corp. 328,400 13,711
Energizer Holdings, Inc. (Æ) 137,800 10,627
General Mills, Inc. 155,700 6,201
Green Mountain Coffee Roasters,
Inc. (Æ)(Ñ) 16,700 891
Hershey Co. (The) 65,394 3,994
Molson Coors Brewing Co. Class B 317,031 13,597
PepsiCo, Inc. 290,300 19,064
Procter & Gamble Co. (The) 730,500 46,051
Ralcorp Holdings, Inc. (Æ) 105,060 9,187
Safeway, Inc. (Ñ) 333,538 7,331
Sysco Corp. 274,300 8,259
Whole Foods Market, Inc. (Ñ) 150,370 11,132
248,824
Energy - 10.2%Alpha Natural Resources, Inc. (Æ) 103,779 2,088
Anadarko Petroleum Corp. 178,800 14,433
Apache Corp. 127,833 12,640
Arch Coal, Inc. (Ñ) 775,129 11,185
Baker Hughes, Inc. 45,000 2,211
BP PLC - ADR 126,460 5,806
Cabot Oil & Gas Corp. 171,470 5,470
Chesapeake Energy Corp. 291,135 6,152
Chevron Corp. 186,016 19,174
ConocoPhillips 433,819 29,591
Consol Energy, Inc. 670,205 23,953
Devon Energy Corp. 232,061 14,808
Dresser-Rand Group, Inc. (Æ) 94,400 4,836
Ensco PLC - ADR 72,120 3,796
EQT Corp. 62,766 3,171
Exxon Mobil Corp. 515,700 43,185
Copyright © 2012 www.secdatabase.com. All Rights Reserved.Please Consider the Environment Before Printing This Document

Russell U.S. Core Equity Fund 1
Newell Rubbermaid, Inc. 475,200 8,777
Nike, Inc. Class B 66,500 6,915
NVR, Inc. (Æ) 18,322 12,702
Orient-Express Hotels, Ltd. Class A
(Æ)(Ñ) 243,425 2,059
priceline.com, Inc. (Æ) 14,443 7,647
Snap-on, Inc. 87,665 4,954
Stanley Black & Decker, Inc. 130,200 9,137
Starbucks Corp. 694,272 33,277
Starwood Hotels & Resorts Worldwide,
Inc. (ö) 306,100 16,603
Tesla Motors, Inc. (Æ)(Ñ) 89,100 2,590
Tiffany & Co. 75,100 4,791
Time Warner, Inc. 1,155,280 42,815
Toll Brothers, Inc. (Æ)(Ñ) 311,590 6,796
Tractor Supply Co. 22,400 1,809
Ulta Salon Cosmetics & Fragrance,
Inc. (Æ) 27,400 2,088
VF Corp. 54,278 7,137
Viacom, Inc. Class B 644,494 30,317
VistaPrint NV (Æ)(Ñ) 145,500 5,206
Wal-Mart Stores, Inc. 898,817 55,151
Walt Disney Co. (The) 160,400 6,240
Yum! Brands, Inc. 416,150 26,355
616,169
FMC Technologies, Inc. (Æ) 36,200 1,850
Forest Oil Corp. (Æ)(Ñ) 456,200 5,931
Halliburton Co. 291,976 10,739
Hess Corp. 212,900 11,986
Marathon Petroleum Corp. 396,475 15,153
National Oilwell Varco, Inc. 441,890 32,691
Noble Corp. (Æ) 82,200 2,864
Noble Energy, Inc. 37,400 3,765
Occidental Petroleum Corp. 256,200 25,561
Peabody Energy Corp. 334,780 11,413
Range Resources Corp. 97,900 5,631
Schlumberger, Ltd. 460,122 34,587
Southwestern Energy Co. (Æ) 292,600 9,112
Valero Energy Corp. 241,395 5,791
Weatherford International, Ltd. (Æ) 474,300 7,940
387,513
Financial Services - 14.9%ACE, Ltd. 264,677 18,422
Allstate Corp. (The) 487,064 14,052
Copyright © 2012 www.secdatabase.com. All Rights Reserved.Please Consider the Environment Before Printing This Document

Table of Contents
Russell Investment CompanyRussell U.S. Core Equity FundSchedule of Investments, continued �� January 31, 2012 (Unaudited)Amounts in thousands (except share amounts)
Principal
Amount ($)
or Shares
Market
Value
$
Amarin Corp PLC - ADR (Æ)(Ñ) 342,700 2,796
American Express Co. 280,100 14,044
American Tower Corp 47,500 3,017
Ameriprise Financial, Inc. 263,134 14,091
Assured Guaranty, Ltd. (Ñ) 341,339 5,294
Bank of New York Mellon Corp.
(The) (Ñ) 347,800 7,001
BB&T Corp. 631,400 17,168
BlackRock, Inc. Class A 80,050 14,569
Brown & Brown, Inc. 38,219 871
Capital One Financial Corp. 580,551 26,560
Citigroup, Inc. 1,057,150 32,476
Discover Financial Services 274,972 7,474
Goldman Sachs Group, Inc. (The) 52,500 5,852
Hartford Financial Services Group, Inc. 731,500 12,816
Huntington Bancshares, Inc. 478,050 2,730
iShares Russell 1000 Value Index
Fund (Ñ) 14,473 954
Janus Capital Group, Inc. (Ñ) 625,400 4,922
Jefferies Group, Inc. (Ñ) 214,100 3,256
JPMorgan Chase & Co. 2,221,512 82,862
Lincoln National Corp. (Ñ) 319,220 6,876
Mastercard, Inc. Class A 26,937 9,578
MetLife, Inc. 1,159,743 40,974
Morgan Stanley (Ñ) 224,100 4,179
PNC Financial Services Group, Inc. 254,513 14,996
Prudential Financial, Inc. 452,315 25,891
Regions Financial Corp. (Ñ) 1,033,950 5,397
RenaissanceRe Holdings, Ltd. 94,743 6,927
State Street Corp. 449,300 17,604
Sunstone Hotel Investors, Inc.
(Æ)(Ñ)(ö) 667,520 6,201
SunTrust Banks, Inc. 627,198 12,901
Travelers Cos., Inc. (The) 146,318 8,530
Visa, Inc. Class A 290,613 29,247
Wells Fargo & Co. 2,686,016 78,459
Principal
Amount ($)
or Shares
Market
Value
$
Medco Health Solutions, Inc. (Æ) 31,500 1,954
Medtronic, Inc. 192,101 7,409
Merck & Co., Inc. 734,706 28,110
Mylan, Inc. (Æ) 810,347 16,815
Novo Nordisk A/S - ADR 118,200 14,087
Perrigo Co. 72,000 6,883
Pfizer, Inc. 5,113,409 109,427
Quest Diagnostics, Inc. 179,000 10,396
Sanofi - ADR 420,600 15,617
Stryker Corp. 57,500 3,187
Teva Pharmaceutical Industries, Ltd. -
ADR 138,800 6,264
UnitedHealth Group, Inc. 293,550 15,203
Valeant Pharmaceuticals International,
Inc. (Æ) 121,000 5,867
Warner Chilcott PLC Class A (Æ) 251,300 4,239
Watson Pharmaceuticals, Inc.
Class B (Æ) 11,105 651
445,413
Materials and Processing - 4.4%Air Products & Chemicals, Inc. 79,000 6,954
Ball Corp. 221,048 8,678
Celanese Corp. Class A 104,300 5,081
Ecolab, Inc. 348,052 21,036
EI du Pont de Nemours & Co. 48,500 2,468
Freeport-McMoRan Copper & Gold,
Inc. 269,100 12,435
International Paper Co. 77,150 2,403
LyondellBasell Industries NV Class A 75,925 3,272
Masco Corp. 103,800 1,253
Monsanto Co. 771,208 63,278
Mosaic Co. (The) 98,900 5,536
Newmont Mining Corp. 193,300 11,884
Praxair, Inc. 90,300 9,590
Precision Castparts Corp. (Ñ) 30,200 4,943
Sherwin-Williams Co. (The) 19,300 1,882
Copyright © 2012 www.secdatabase.com. All Rights Reserved.Please Consider the Environment Before Printing This Document

2 Russell U.S. Core Equity Fund
Willis Group Holdings PLC 3,610 140
XL Group PLC Class A 271,350 5,500
564,627
Health Care - 11.7%Abbott Laboratories 94,900 5,139
Alexion Pharmaceuticals, Inc. (Æ) 44,800 3,439
Allergan, Inc. 159,181 13,994
AmerisourceBergen Corp. Class A 142,500 5,553
Amgen, Inc. 377,631 25,645
Baxter International, Inc. 244,300 13,554
Biogen Idec, Inc. (Æ) 79,600 9,386
Brookdale Senior Living, Inc. Class A
(Æ) 391,995 6,899
Cardinal Health, Inc. 70,500 3,034
Celgene Corp. (Æ) 93,200 6,776
Cerner Corp. (Æ) 431,591 26,280
Community Health Systems, Inc.
(Æ)(Ñ) 389,400 7,282
Covidien PLC 299,250 15,411
Dentsply International, Inc. (Ñ) 264,000 9,963
Express Scripts, Inc. Class A (Æ) 66,300 3,392
Gilead Sciences, Inc. (Æ) 248,339 12,129
Hospira, Inc. (Æ)(Ñ) 65,000 2,240
Intuitive Surgical, Inc. (Æ) 27,200 12,509
Johnson & Johnson 253,058 16,679
Teck Resources, Ltd. Class B (Æ) 123,800 5,239
165,932
Producer Durables - 9.2%Accenture PLC Class A (Ñ) 103,700 5,946
AECOM Technology Corp. (Æ)(Ñ) 131,900 3,019
Automatic Data Processing, Inc. 396,681 21,730
Boeing Co. (The) 502,164 37,251
Caterpillar, Inc. 169,200 18,463
Corrections Corp. of America (Æ) 474,448 11,164
Cummins, Inc. (Ñ) 164,200 17,077
Danaher Corp. 204,500 10,738
Danone - ADR (Ñ) 1,144,300 14,189
Deere & Co. 100,645 8,671
Delta Air Lines, Inc. (Æ) 188,000 1,983
Dover Corp. 153,530 9,735
Eaton Corp. 108,900 5,339
FedEx Corp. (Ñ) 123,400 11,290
General Electric Co. 1,594,250 29,828
Honeywell International, Inc. 769,385 44,655
Ingersoll-Rand PLC 124,150 4,338
Joy Global, Inc. 93,370 8,468
Lexmark International, Inc. Class A (Ñ) 164,300 5,734
Copyright © 2012 www.secdatabase.com. All Rights Reserved.Please Consider the Environment Before Printing This Document

Table of Contents
Russell Investment CompanyRussell U.S. Core Equity FundSchedule of Investments, continued �� January 31, 2012 (Unaudited)Amounts in thousands (except share amounts)
Principal
Amount ($)
or Shares
Market
Value
$
Magna International, Inc. Class A 155,660 6,435
Manpower, Inc. 59,300 2,379
Monster Worldwide, Inc. (Æ)(Ñ) 318,020 2,290
Navistar International Corp. (Æ) 174,283 7,545
Norfolk Southern Corp. 142,900 10,317
PACCAR, Inc. 43,600 1,927
Pentair, Inc. (Ñ) 207,201 7,629
Raytheon Co. 255,858 12,279
Republic Services, Inc. Class A (Ñ) 113,200 3,315
Spirit Aerosystems Holdings, Inc.
Class A (Æ)(Ñ) 296,400 6,740
Terex Corp. (Æ)(Ñ) 145,965 2,890
Union Pacific Corp. (Ñ) 31,000 3,544
United Continental Holdings, Inc.
(Æ)(Ñ) 337,200 7,789
United Technologies Corp. 64,600 5,061
349,758
Technology - 18.4%Altera Corp. 163,100 6,490
Analog Devices, Inc. 180,800 7,075
Apple, Inc. (Æ) 228,167 104,154
Applied Materials, Inc. 1,973,460 24,234
Avago Technologies, Ltd. 167,900 5,698
Avnet, Inc. (Æ) 149,975 5,230
BCE, Inc. (Ñ) 92,200 3,762
Broadcom Corp. Class A 97,700 3,355
Check Point Software Technologies,
Ltd. (Æ) 87,600 4,931
Cisco Systems, Inc. 3,801,983 74,633
Citrix Systems, Inc. (Æ) 106,100 6,919
Cognizant Technology Solutions Corp.
Class A (Æ) 89,727 6,438
Dell, Inc. (Æ) 871,102 15,009
Electronic Arts, Inc. (Æ) 160,600 2,982
EMC Corp. (Æ) 618,700 15,938
Principal
Amount ($)
or Shares
Market
Value
$
VMware, Inc. Class A (Æ) 70,200 6,407
Vodafone Group PLC - ADR (Ñ) 1,106,450 29,974
Xilinx, Inc. 89,700 3,216
700,670
Utilities - 0.6%FirstEnergy Corp. 86,743 3,662
GenOn Energy, Inc. (Æ) 1,730,470 3,686
NII Holdings, Inc. (Æ) 41,300 831
Verizon Communications, Inc. 168,600 6,349
Xylem, Inc. 262,700 6,807
21,335
Total Common Stocks(cost $3,021,566) 3,500,241
Short-Term Investments - 6.0%Russell U.S. Cash Management Fund 227,140,815(¥) 227,141
Total Short-Term Investments(cost $227,141) 227,141
Other Securities - 1.0%Russell Investment Company
Liquidating Trust (×) 3,276,885 (¥) 3,331
Russell U.S. Cash Collateral Fund
(×) 35,770,194 (¥) 35,770
Total Other Securities(cost $39,047) 39,101
Total Investments - 99.1%(identified cost $3,287,754) 3,766,483
Other Assets and Liabilities,Net - 0.9% 33,313
Net Assets - 100.0% 3,799,796
Copyright © 2012 www.secdatabase.com. All Rights Reserved.Please Consider the Environment Before Printing This Document
See accompanying notes which are an integral part of this quarterly report.
Russell U.S. Core Equity Fund 3
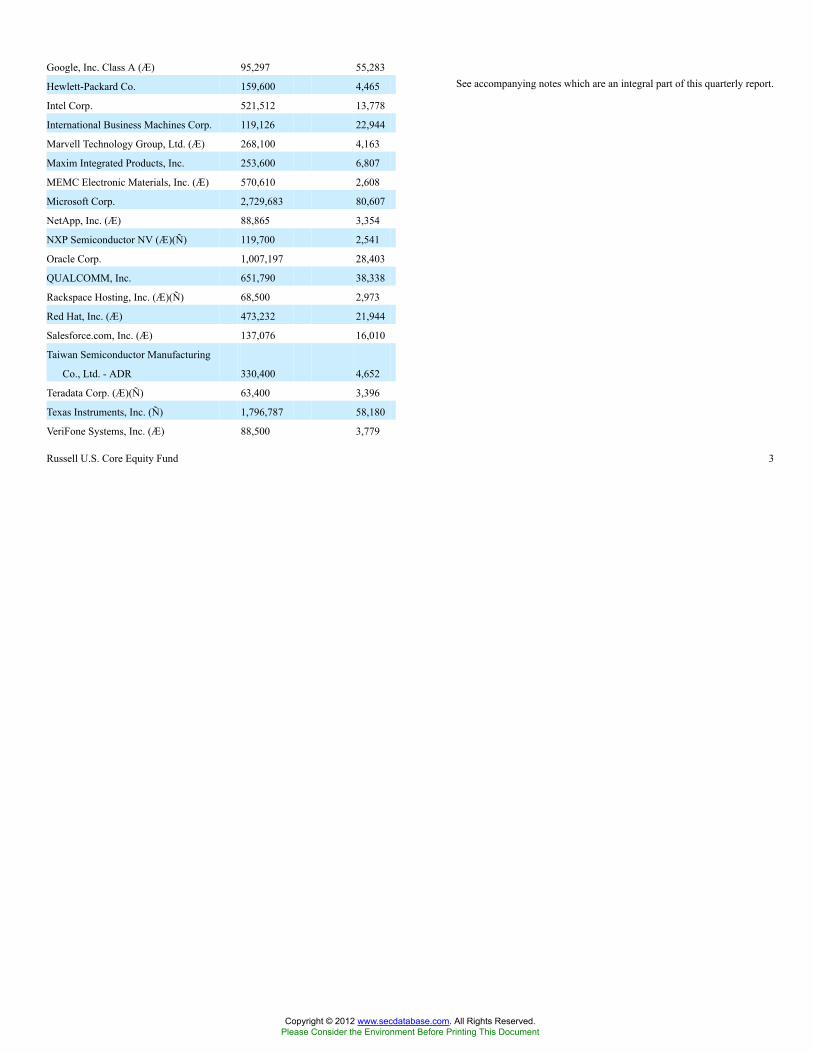
Google, Inc. Class A (Æ) 95,297 55,283
Hewlett-Packard Co. 159,600 4,465
Intel Corp. 521,512 13,778
International Business Machines Corp. 119,126 22,944
Marvell Technology Group, Ltd. (Æ) 268,100 4,163
Maxim Integrated Products, Inc. 253,600 6,807
MEMC Electronic Materials, Inc. (Æ) 570,610 2,608
Microsoft Corp. 2,729,683 80,607
NetApp, Inc. (Æ) 88,865 3,354
NXP Semiconductor NV (Æ)(Ñ) 119,700 2,541
Oracle Corp. 1,007,197 28,403
QUALCOMM, Inc. 651,790 38,338
Rackspace Hosting, Inc. (Æ)(Ñ) 68,500 2,973
Red Hat, Inc. (Æ) 473,232 21,944
Salesforce.com, Inc. (Æ) 137,076 16,010
Taiwan Semiconductor Manufacturing
Co., Ltd. - ADR 330,400 4,652
Teradata Corp. (Æ)(Ñ) 63,400 3,396
Texas Instruments, Inc. (Ñ) 1,796,787 58,180
VeriFone Systems, Inc. (Æ) 88,500 3,779
Copyright © 2012 www.secdatabase.com. All Rights Reserved.Please Consider the Environment Before Printing This Document

Table of Contents
Russell Investment CompanyRussell U.S. Core Equity FundSchedule of Investments, continued �� January 31, 2012 (Unaudited)Amounts in thousands (except contract amounts)
Futures ContractsNumber of
Contracts
Notional
Amount
Expiration
Date
Unrealized
Appreciation
(Depreciation)
$
Long PositionsRussell 1000 Mini Index Futures (CME) 343 USD 24,843 03/12 1,111
S&P 500 E-Mini Index Futures (CME) 3,675 USD 240,382 03/12 5,447
S&P 500 Index Futures (CME) 90 USD 29,435 03/12 1,336
Total Unrealized Appreciation (Depreciation) on Open Futures Contracts (å) 7,894
Presentation of Portfolio Holdings �� January 31, 2012 (Unaudited)
Amounts in thousands
Market Value
Portfolio Summary Level 1 Level 2 Level 3 Total
Common Stocks
Consumer Discretionary $616,169 $� $ � $616,169
Consumer Staples 248,824 � � 248,824
Energy 387,513 � � 387,513
Financial Services 564,627 � � 564,627
Health Care 445,413 � � 445,413
Materials and Processing 165,932 � � 165,932
Producer Durables 349,758 � � 349,758
Technology 700,670 � � 700,670
Utilities 21,335 � � 21,335
Short-Term Investments � 227,141 � 227,141
Other Securities � 39,101 � 39,101
Total Investments 3,500,241 266,242 � 3,766,483
Other Financial Instruments
Futures Contracts 7,894 � � 7,894
Total Other Financial Instruments* $7,894 $� $ � $7,894
* Other financial instruments reflected, such as futures, forwards, interest rate swaps, and credit default swaps are valued at the unrealized appreciation/depreciation
on the instruments.
For a description of the levels see note 2 in the Notes to Quarterly Report.
Copyright © 2012 www.secdatabase.com. All Rights Reserved.Please Consider the Environment Before Printing This Document

See accompanying notes which are an integral part of this quarterly report.
4 Russell U.S. Core Equity Fund
Copyright © 2012 www.secdatabase.com. All Rights Reserved.Please Consider the Environment Before Printing This Document

Table of Contents
Russell Investment CompanyRussell U.S. Quantitative Equity Fund
Schedule of Investments �� January 31, 2012 (Unaudited)Amounts in thousands (except share amounts)
Principal
Amount ($)
or Shares
Market
Value
$
Common Stocks - 105.9%Consumer Discretionary - 15.5%Aaron�s, Inc. Class A 31,400 836
Abercrombie & Fitch Co. Class A 95,400 4,383
Advance Auto Parts, Inc. 35,700 2,736
Amazon.com, Inc. (Æ) 28,851 5,610
AMC Networks, Inc. Class A (Æ) 128,231 5,483
Apollo Group, Inc. Class A (Æ) 225,800 11,834
Arbitron, Inc. 22,166 792
AutoNation, Inc. (Æ) 13,800 493
AutoZone, Inc. (Æ)(Û) 68,690 23,896
Bed Bath & Beyond, Inc. (Æ) 81,300 4,935
Best Buy Co., Inc. 77,200 1,849
Big Lots, Inc. (Æ) 5,900 233
BorgWarner, Inc. (Æ) 12,200 910
Bridgepoint Education, Inc. (Æ) 69,619 1,712
Brinker International, Inc. 4,700 121
Cablevision Systems Corp. Class A 250,260 3,641
CBS Corp. Class B 281,700 8,023
Charter Communications, Inc.
Class A (Æ) 21,400 1,233
Chico�s FAS, Inc. 46,700 534
Chipotle Mexican Grill, Inc.
Class A (Æ)(Û) 14,320 5,260
Coach, Inc. (Û) 309,743 21,697
Comcast Corp. Class A (Û) 322,900 8,586
Costco Wholesale Corp. (Û) 69,500 5,718
Darden Restaurants, Inc. 21,600 991
DeVry, Inc. 24,300 918
Dillard�s, Inc. Class A 9,000 398
DIRECTV, Inc. Class A (Æ)(Û) 637,643 28,700
Discovery Communications, Inc.
Class A (Æ) 58,200 2,496
DISH Network Corp. Class A 153,800 4,294
Dollar General Corp. (Æ) 51,139 2,179
Dollar Tree, Inc. (Æ)(Û) 91,126 7,728
Principal
Amount ($)
or Shares
Market
Value
$
ITT Educational Services, Inc. (Æ) 59,010 3,887
JC Penney Co., Inc. 500 21
John Wiley & Sons, Inc. Class A 21,100 958
Lear Corp. 177,544 7,439
Lennar Corp. Class A 17,700 380
Liberty Global, Inc. Class A (Æ) 32,700 1,500
Liberty Media Corp. - Liberty Capital
Class A (Æ) 25,138 2,072
Limited Brands, Inc. (Û) 281,934 11,802
LKQ Corp. (Æ) 22,800 743
Lowe�s Cos., Inc. 73,400 1,969
Macy�s, Inc. 358,900 12,091
Marriott International, Inc. Class A 87,505 3,015
McDonald�s Corp. 66,730 6,610
McGraw-Hill Cos., Inc. (The) (Û) 173,531 7,982
Netflix, Inc. (Æ) 3,700 445
News Corp. Class A 6,900 130
Nielsen Holdings NV (Æ) 12,000 348
Nike, Inc. Class B 161,079 16,751
Nordstrom, Inc. 5,200 257
Nu Skin Enterprises, Inc. Class A 108,300 5,410
NVR, Inc. (Æ) 300 208
Omnicom Group, Inc. 7,000 319
Orchard Supply Hardware Stores
Corp. Class A (Æ) 252 5
O�Reilly Automotive, Inc. (Æ) 12,400 1,011
Panera Bread Co. Class A (Æ) 4,633 687
Penn National Gaming, Inc. (Æ) 9,900 405
PetSmart, Inc. 119,368 6,353
Polaris Industries, Inc. 94,572 6,090
priceline.com, Inc. (Æ) 2,500 1,324
PulteGroup, Inc. (Æ) 93,400 696
PVH Corp. 2,900 224
Ralph Lauren Corp. Class A 10,700 1,626
Ross Stores, Inc. 60,000 3,049
Sally Beauty Holdings, Inc. (Æ) 8,400 173
Scholastic Corp. 17,800 525
Copyright © 2012 www.secdatabase.com. All Rights Reserved.Please Consider the Environment Before Printing This Document
Russell U.S. Quantitative Equity Fund 5
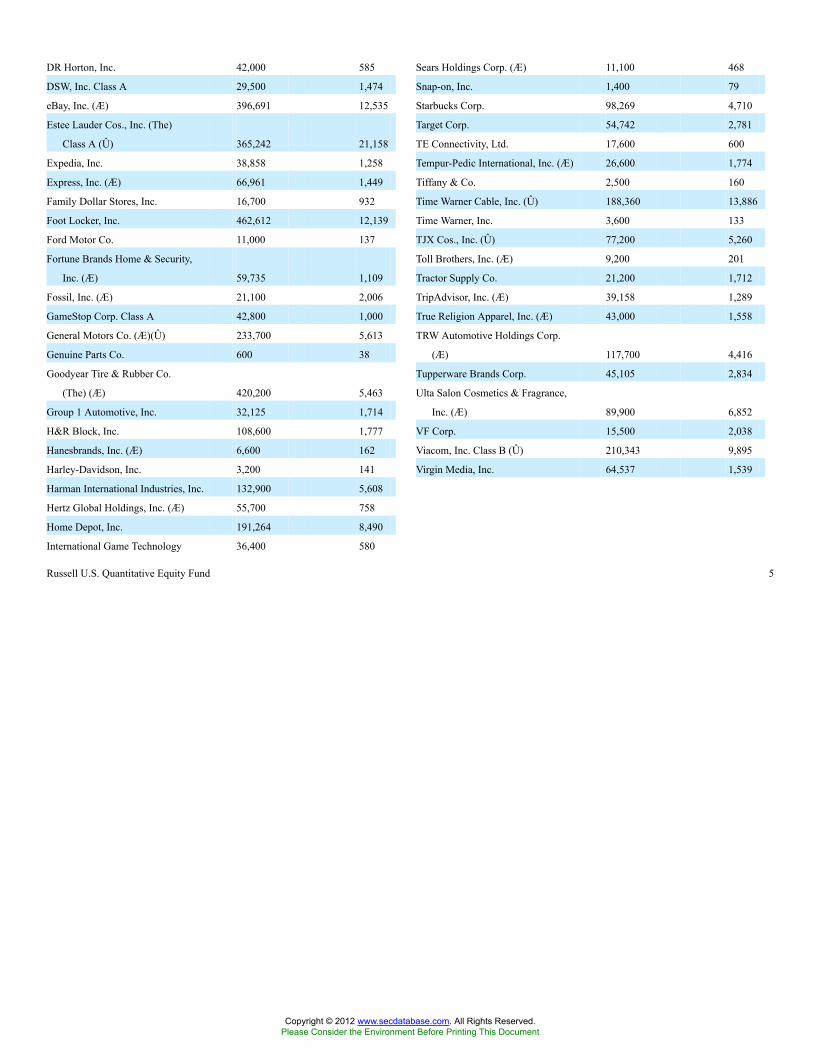
DR Horton, Inc. 42,000 585
DSW, Inc. Class A 29,500 1,474
eBay, Inc. (Æ) 396,691 12,535
Estee Lauder Cos., Inc. (The)
Class A (Û) 365,242 21,158
Expedia, Inc. 38,858 1,258
Express, Inc. (Æ) 66,961 1,449
Family Dollar Stores, Inc. 16,700 932
Foot Locker, Inc. 462,612 12,139
Ford Motor Co. 11,000 137
Fortune Brands Home & Security,
Inc. (Æ) 59,735 1,109
Fossil, Inc. (Æ) 21,100 2,006
GameStop Corp. Class A 42,800 1,000
General Motors Co. (Æ)(Û) 233,700 5,613
Genuine Parts Co. 600 38
Goodyear Tire & Rubber Co.
(The) (Æ) 420,200 5,463
Group 1 Automotive, Inc. 32,125 1,714
H&R Block, Inc. 108,600 1,777
Hanesbrands, Inc. (Æ) 6,600 162
Harley-Davidson, Inc. 3,200 141
Harman International Industries, Inc. 132,900 5,608
Hertz Global Holdings, Inc. (Æ) 55,700 758
Home Depot, Inc. 191,264 8,490
International Game Technology 36,400 580
Sears Holdings Corp. (Æ) 11,100 468
Snap-on, Inc. 1,400 79
Starbucks Corp. 98,269 4,710
Target Corp. 54,742 2,781
TE Connectivity, Ltd. 17,600 600
Tempur-Pedic International, Inc. (Æ) 26,600 1,774
Tiffany & Co. 2,500 160
Time Warner Cable, Inc. (Û) 188,360 13,886
Time Warner, Inc. 3,600 133
TJX Cos., Inc. (Û) 77,200 5,260
Toll Brothers, Inc. (Æ) 9,200 201
Tractor Supply Co. 21,200 1,712
TripAdvisor, Inc. (Æ) 39,158 1,289
True Religion Apparel, Inc. (Æ) 43,000 1,558
TRW Automotive Holdings Corp.
(Æ) 117,700 4,416
Tupperware Brands Corp. 45,105 2,834
Ulta Salon Cosmetics & Fragrance,
Inc. (Æ) 89,900 6,852
VF Corp. 15,500 2,038
Viacom, Inc. Class B (Û) 210,343 9,895
Virgin Media, Inc. 64,537 1,539
Copyright © 2012 www.secdatabase.com. All Rights Reserved.Please Consider the Environment Before Printing This Document

Table of Contents
Russell Investment CompanyRussell U.S. Quantitative Equity FundSchedule of Investments, continued �� January 31, 2012 (Unaudited)Amounts in thousands (except share amounts)
Principal
Amount ($)
or Shares
Market
Value
$
Wal-Mart Stores, Inc. 149,900 9,198
Walt Disney Co. (The) 22,610 880
Washington Post Co. (The) Class B 800 303
Weight Watchers International, Inc. 10,500 799
Wendy�s Co. (The) 85,000 399
Wyndham Worldwide Corp. 229,500 9,125
Wynn Resorts, Ltd. 9,900 1,141
Yum! Brands, Inc. 44,200 2,799
447,679
Consumer Staples - 10.3%Altria Group, Inc. 129,800 3,686
Andersons, Inc. (The) 11,000 446
Bunge, Ltd. 89,446 5,123
Campbell Soup Co. (Û) 22,300 707
Church & Dwight Co., Inc. 122,702 5,567
Clorox Co. (The) 40,862 2,806
Coca-Cola Co. (The) 116,258 7,851
Coca-Cola Enterprises, Inc. (Û) 126,100 3,378
Colgate-Palmolive Co. (Û) 245,669 22,287
ConAgra Foods, Inc. (Û) 510,900 13,626
Constellation Brands, Inc. Class A (Æ) 116,460 2,434
Corn Products International, Inc. 9,900 549
CVS Caremark Corp. (Û) 260,700 10,884
Dean Foods Co. (Æ) 538,959 5,799
Dr Pepper Snapple Group, Inc. 688,792 26,739
Energizer Holdings, Inc. (Æ) 2,300 177
Flowers Foods, Inc. 194,200 3,758
General Mills, Inc. 6,000 239
Green Mountain Coffee Roasters,
Inc. (Æ) 7,700 411
Herbalife, Ltd. 147,300 8,526
Hershey Co. (The) (Û) 135,000 8,246
HJ Heinz Co. (Û) 70,400 3,650
Hormel Foods Corp. 50,800 1,462
JM Smucker Co. (The) 16,300 1,284
Principal
Amount ($)
or Shares
Market
Value
$
Energy - 13.7%Anadarko Petroleum Corp. 8,400 678
Apache Corp. 863 85
Atwood Oceanics, Inc. (Æ) 6,900 317
Baker Hughes, Inc. 48,119 2,364
Cabot Oil & Gas Corp. 170,600 5,442
Cameron International Corp. (Æ) 2,600 138
CARBO Ceramics, Inc. 2,500 243
Chesapeake Energy Corp. 22,200 469
Chevron Corp. (Û) 622,970 64,216
Cloud Peak Energy, Inc. (Æ) 73,200 1,387
Concho Resources, Inc. (Æ) 600 64
ConocoPhillips (Û) 338,812 23,110
Consol Energy, Inc. 4,100 147
Continental Resources, Inc. (Æ) 2,100 169
Core Laboratories NV 9,470 1,006
Denbury Resources, Inc. (Æ) 18,700 353
Devon Energy Corp. 6,800 434
Diamond Offshore Drilling, Inc. 58,200 3,626
Dresser-Rand Group, Inc. (Æ) 6,700 343
El Paso Corp. 314,322 8,446
EOG Resources, Inc. 1,300 138
EQT Corp. 49,000 2,475
Exxon Mobil Corp. (Û) 886,414 74,228
FMC Technologies, Inc. (Æ) 1,800 92
Forest Oil Corp. (Æ) 128,494 1,670
Halliburton Co. (Û) 517,535 19,035
Helmerich & Payne, Inc. 82,400 5,085
Hess Corp. (Û) 60,600 3,412
HollyFrontier Corp. 278,480 8,171
Hubbell, Inc. Class B 9,600 691
Kinder Morgan, Inc. 8,000 260
Marathon Oil Corp. (Û) 827,274 25,968
Marathon Petroleum Corp. (Û) 520,725 19,902
Murphy Oil Corp. (Û) 129,400 7,712
Nabors Industries, Ltd. (Æ) 275,000 5,120
National Oilwell Varco, Inc. 31,300 2,316
Copyright © 2012 www.secdatabase.com. All Rights Reserved.Please Consider the Environment Before Printing This Document

6 Russell U.S. Quantitative Equity Fund
Kellogg Co. 30,200 1,495
Kimberly-Clark Corp. 2,000 143
Kraft Foods, Inc. Class A 61,000 2,336
Kroger Co. (The) (Û) 419,818 9,975
Lorillard, Inc. (Û) 90,300 9,697
McCormick & Co., Inc. 18,500 935
Mead Johnson Nutrition Co. Class A 97,724 7,240
Monster Beverage Corp (Æ)(Û) 128,110 13,389
PepsiCo, Inc. 63,571 4,175
Philip Morris International, Inc. (Û) 650,871 48,666
Procter & Gamble Co. (The) (Û) 338,041 21,310
Ralcorp Holdings, Inc. (Æ) 19,900 1,740
Reynolds American, Inc. 36,500 1,432
Safeway, Inc. 3,900 86
Sara Lee Corp. 479,264 9,178
Smithfield Foods, Inc. (Æ) 160,700 3,588
SUPERVALU, Inc. 454,100 3,138
Sysco Corp. 19,800 596
Tyson Foods, Inc. Class A 639,530 11,921
Walgreen Co. (Û) 149,000 4,971
Whole Foods Market, Inc. (Û) 31,000 2,295
297,941
Noble Energy, Inc. (Û) 42,600 4,289
Occidental Petroleum Corp. 1,700 170
Oceaneering International, Inc. 180,795 8,785
Oil States International, Inc. (Æ) 12,600 1,004
Parker Drilling Co. (Æ) 127,826 831
Patterson-UTI Energy, Inc. 435,410 8,216
Peabody Energy Corp. 98,286 3,351
Pioneer Natural Resources Co. 6,100 606
Plains Exploration & Production
Co. (Æ) 24,100 909
QEP Resources, Inc. 75,100 2,151
Range Resources Corp. (Û) 111,100 6,390
Rosetta Resources, Inc. (Æ) 14,800 710
Rowan Cos., Inc. (Æ) 3,100 105
SandRidge Energy, Inc. (Æ) 128,700 1,001
Schlumberger, Ltd. 46,439 3,491
SM Energy Co. 78,911 5,727
Southwestern Energy Co. (Æ) 17,100 532
Spectra Energy Corp. 19,800 624
Sunoco, Inc. 48,600 1,864
Superior Energy Services, Inc. (Æ) 161,800 4,613
Copyright © 2012 www.secdatabase.com. All Rights Reserved.Please Consider the Environment Before Printing This Document
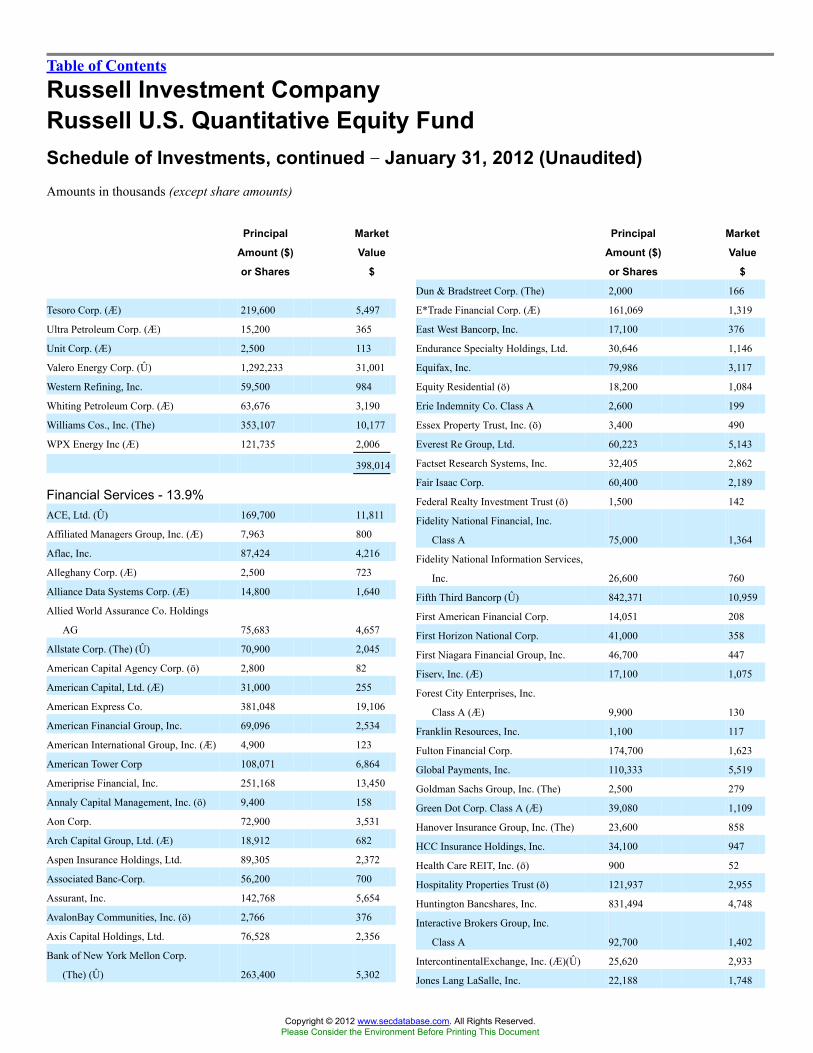
Table of Contents
Russell Investment CompanyRussell U.S. Quantitative Equity FundSchedule of Investments, continued �� January 31, 2012 (Unaudited)Amounts in thousands (except share amounts)
Principal
Amount ($)
or Shares
Market
Value
$
Tesoro Corp. (Æ) 219,600 5,497
Ultra Petroleum Corp. (Æ) 15,200 365
Unit Corp. (Æ) 2,500 113
Valero Energy Corp. (Û) 1,292,233 31,001
Western Refining, Inc. 59,500 984
Whiting Petroleum Corp. (Æ) 63,676 3,190
Williams Cos., Inc. (The) 353,107 10,177
WPX Energy Inc (Æ) 121,735 2,006
398,014
Financial Services - 13.9%ACE, Ltd. (Û) 169,700 11,811
Affiliated Managers Group, Inc. (Æ) 7,963 800
Aflac, Inc. 87,424 4,216
Alleghany Corp. (Æ) 2,500 723
Alliance Data Systems Corp. (Æ) 14,800 1,640
Allied World Assurance Co. Holdings
AG 75,683 4,657
Allstate Corp. (The) (Û) 70,900 2,045
American Capital Agency Corp. (ö) 2,800 82
American Capital, Ltd. (Æ) 31,000 255
American Express Co. 381,048 19,106
American Financial Group, Inc. 69,096 2,534
American International Group, Inc. (Æ) 4,900 123
American Tower Corp 108,071 6,864
Ameriprise Financial, Inc. 251,168 13,450
Annaly Capital Management, Inc. (ö) 9,400 158
Aon Corp. 72,900 3,531
Arch Capital Group, Ltd. (Æ) 18,912 682
Aspen Insurance Holdings, Ltd. 89,305 2,372
Associated Banc-Corp. 56,200 700
Assurant, Inc. 142,768 5,654
AvalonBay Communities, Inc. (ö) 2,766 376
Axis Capital Holdings, Ltd. 76,528 2,356
Bank of New York Mellon Corp.
(The) (Û) 263,400 5,302
Principal
Amount ($)
or Shares
Market
Value
$
Dun & Bradstreet Corp. (The) 2,000 166
E*Trade Financial Corp. (Æ) 161,069 1,319
East West Bancorp, Inc. 17,100 376
Endurance Specialty Holdings, Ltd. 30,646 1,146
Equifax, Inc. 79,986 3,117
Equity Residential (ö) 18,200 1,084
Erie Indemnity Co. Class A 2,600 199
Essex Property Trust, Inc. (ö) 3,400 490
Everest Re Group, Ltd. 60,223 5,143
Factset Research Systems, Inc. 32,405 2,862
Fair Isaac Corp. 60,400 2,189
Federal Realty Investment Trust (ö) 1,500 142
Fidelity National Financial, Inc.
Class A 75,000 1,364
Fidelity National Information Services,
Inc. 26,600 760
Fifth Third Bancorp (Û) 842,371 10,959
First American Financial Corp. 14,051 208
First Horizon National Corp. 41,000 358
First Niagara Financial Group, Inc. 46,700 447
Fiserv, Inc. (Æ) 17,100 1,075
Forest City Enterprises, Inc.
Class A (Æ) 9,900 130
Franklin Resources, Inc. 1,100 117
Fulton Financial Corp. 174,700 1,623
Global Payments, Inc. 110,333 5,519
Goldman Sachs Group, Inc. (The) 2,500 279
Green Dot Corp. Class A (Æ) 39,080 1,109
Hanover Insurance Group, Inc. (The) 23,600 858
HCC Insurance Holdings, Inc. 34,100 947
Health Care REIT, Inc. (ö) 900 52
Hospitality Properties Trust (ö) 121,937 2,955
Huntington Bancshares, Inc. 831,494 4,748
Interactive Brokers Group, Inc.
Class A 92,700 1,402
IntercontinentalExchange, Inc. (Æ)(Û) 25,620 2,933
Jones Lang LaSalle, Inc. 22,188 1,748
Copyright © 2012 www.secdatabase.com. All Rights Reserved.Please Consider the Environment Before Printing This Document

Russell U.S. Quantitative Equity Fund 7
BB&T Corp. 23,400 636
Berkshire Hathaway, Inc. Class B (Æ) 58,900 4,616
Boston Properties, Inc. (ö) 1,100 114
Broadridge Financial Solutions, Inc. 24,000 575
Brown & Brown, Inc. 3,900 89
Camden Property Trust (ö) 39,756 2,564
Capital One Financial Corp. 16,300 746
Capitol Federal Financial, Inc. 54,300 627
CBOE Holdings, Inc. 20,900 535
CBRE Group, Inc. Class A (Æ) 8,600 166
Charles Schwab Corp. (The) (Û) 309,646 3,607
Chubb Corp. (The) (Û) 103,800 6,997
Cincinnati Financial Corp. 4,900 160
Citigroup, Inc. 110,040 3,380
CNA Financial Corp. 4,362 120
Comerica, Inc. 7,900 219
Commerce Bancshares, Inc. 25,955 1,008
CommonWealth REIT (ö) 82,200 1,617
Cullen/Frost Bankers, Inc. 3,300 184
DDR Corp. (ö) 49,821 691
Digital Realty Trust, Inc. (ö) 11,300 801
Discover Financial Services 317,400 8,627
Douglas Emmett, Inc. (ö) 7,900 165
JPMorgan Chase & Co. (Û) 995,017 37,114
Kemper Corp. 12,000 357
KeyCorp 1,757,216 13,654
Lazard, Ltd. Class A 700 20
Legg Mason, Inc. 4,600 117
Leucadia National Corp. 69,600 1,932
Lincoln National Corp. 164,600 3,545
Loews Corp. 8,200 306
M&T Bank Corp. 2,500 199
Markel Corp. (Æ) 900 363
Marsh & McLennan Cos., Inc. 69,400 2,192
Mastercard, Inc. Class A (Û) 49,030 17,434
MBIA, Inc. (Æ) 16,300 201
MetLife, Inc. 6,600 233
Moody�s Corp. 133,100 4,955
Morgan Stanley 1,006,300 18,768
New York Community Bancorp, Inc. 11,500 146
NYSE Euronext 13,200 351
PartnerRe, Ltd. - ADR 68,900 4,507
People�s United Financial, Inc. 104,300 1,286
Piedmont Office Realty Trust, Inc.
Class A (ö) 31,500 583
Plum Creek Timber Co., Inc. (ö) 13,100 508
PNC Financial Services Group, Inc. 161,700 9,527
Copyright © 2012 www.secdatabase.com. All Rights Reserved.Please Consider the Environment Before Printing This Document

Table of Contents
Russell Investment CompanyRussell U.S. Quantitative Equity FundSchedule of Investments, continued �� January 31, 2012 (Unaudited)Amounts in thousands (except share amounts)
Principal
Amount ($)
or Shares
Market
Value
$
Popular, Inc. (Æ) 512,804 805
Principal Financial Group, Inc. 4,900 134
Progressive Corp. (The) 29,700 602
ProLogis, Inc. (ö) 2,600 82
Protective Life Corp. 43,800 1,095
Prudential Financial, Inc. (Û) 45,400 2,599
Public Storage (ö) 30,290 4,206
Raymond James Financial, Inc. 35,541 1,244
Rayonier, Inc. (ö) 133,900 6,123
Regions Financial Corp. 459,100 2,397
Reinsurance Group of America, Inc.
Class A 55,058 3,000
RenaissanceRe Holdings, Ltd. 5,600 409
Simon Property Group, Inc. (ö) 68,240 9,271
SL Green Realty Corp. (ö) 1,900 140
SLM Corp. 10,600 158
State Street Corp. 3,400 133
Symetra Financial Corp. 72,100 665
Taubman Centers, Inc. (ö) 13,917 933
TCF Financial Corp. 39,900 401
TD Ameritrade Holding Corp. 16,100 259
Torchmark Corp. 99,276 4,534
Total System Services, Inc. 187,400 4,018
Travelers Cos., Inc. (The) (Û) 202,700 11,817
UDR, Inc. (ö) 2,800 73
Unum Group 46,600 1,064
US Bancorp 132,800 3,748
Validus Holdings, Ltd. 70,859 2,272
Valley National Bancorp 33,700 402
Ventas, Inc. (ö) 25,591 1,492
Visa, Inc. Class A 62,100 6,250
Waddell & Reed Financial, Inc.
Class A 97,816 2,685
Washington Federal, Inc. 30,700 484
Wells Fargo & Co. (Û) 671,911 19,627
Western Union Co. (The) 68,500 1,308
Principal
Amount ($)
or Shares
Market
Value
$
Boston Scientific Corp. (Æ)(Û) 947,200 5,645
Bristol-Myers Squibb Co. 165,000 5,320
Cardinal Health, Inc. (Û) 576,849 24,822
CareFusion Corp. (Æ) 183,000 4,383
Catalyst Health Solutions, Inc. (Æ) 3,800 208
Celgene Corp. (Æ) 117,300 8,528
Cepheid, Inc. (Æ) 8,925 393
Cerner Corp. (Æ)(Û) 104,220 6,346
Charles River Laboratories
International, Inc. (Æ) 113,700 3,840
Cigna Corp. 220,790 9,898
Cooper Cos., Inc. (The) 16,600 1,198
Covance, Inc. (Æ) 14,000 613
Coventry Health Care, Inc. (Æ) 74,900 2,252
Covidien PLC 48,900 2,518
CR Bard, Inc. 59,600 5,514
DaVita, Inc. (Æ) 1,600 131
Dentsply International, Inc. 20,000 755
Edwards Lifesciences Corp. (Æ) 7,300 603
Eli Lilly & Co. (Û) 428,545 17,030
Endo Pharmaceuticals Holdings,
Inc. (Æ) 54,000 2,007
Gen-Probe, Inc. (Æ) 14,900 997
Gilead Sciences, Inc. (Æ)(Û) 343,100 16,757
HCA Holdings, Inc. (Æ) 6,200 152
Health Net, Inc. (Æ) 10,508 397
Henry Schein, Inc. (Æ) 19,300 1,368
Hill-Rom Holdings, Inc. 14,687 485
Hologic, Inc. (Æ) 37,400 763
Humana, Inc. (Û) 302,882 26,963
IDEXX Laboratories, Inc. (Æ) 4,200 355
Illumina, Inc. (Æ) 10,900 564
Intuitive Surgical, Inc. (Æ) 10,000 4,599
Jazz Pharmaceuticals PLC (Æ) 34,500 1,604
Johnson & Johnson (Û) 229,400 15,120
Laboratory Corp. of America
Holdings (Æ) 14,000 1,279
Copyright © 2012 www.secdatabase.com. All Rights Reserved.Please Consider the Environment Before Printing This Document
8 Russell U.S. Quantitative Equity Fund
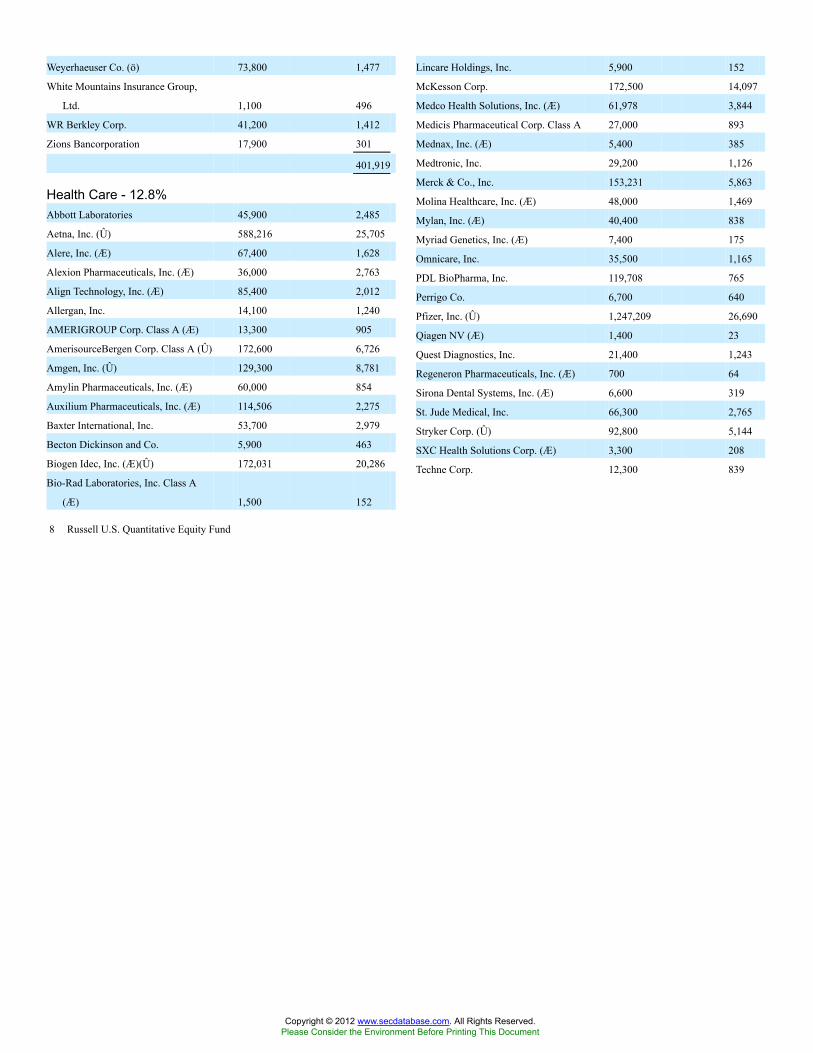
Weyerhaeuser Co. (ö) 73,800 1,477
White Mountains Insurance Group,
Ltd. 1,100 496
WR Berkley Corp. 41,200 1,412
Zions Bancorporation 17,900 301
401,919
Health Care - 12.8%Abbott Laboratories 45,900 2,485
Aetna, Inc. (Û) 588,216 25,705
Alere, Inc. (Æ) 67,400 1,628
Alexion Pharmaceuticals, Inc. (Æ) 36,000 2,763
Align Technology, Inc. (Æ) 85,400 2,012
Allergan, Inc. 14,100 1,240
AMERIGROUP Corp. Class A (Æ) 13,300 905
AmerisourceBergen Corp. Class A (Û) 172,600 6,726
Amgen, Inc. (Û) 129,300 8,781
Amylin Pharmaceuticals, Inc. (Æ) 60,000 854
Auxilium Pharmaceuticals, Inc. (Æ) 114,506 2,275
Baxter International, Inc. 53,700 2,979
Becton Dickinson and Co. 5,900 463
Biogen Idec, Inc. (Æ)(Û) 172,031 20,286
Bio-Rad Laboratories, Inc. Class A
(Æ) 1,500 152
Lincare Holdings, Inc. 5,900 152
McKesson Corp. 172,500 14,097
Medco Health Solutions, Inc. (Æ) 61,978 3,844
Medicis Pharmaceutical Corp. Class A 27,000 893
Mednax, Inc. (Æ) 5,400 385
Medtronic, Inc. 29,200 1,126
Merck & Co., Inc. 153,231 5,863
Molina Healthcare, Inc. (Æ) 48,000 1,469
Mylan, Inc. (Æ) 40,400 838
Myriad Genetics, Inc. (Æ) 7,400 175
Omnicare, Inc. 35,500 1,165
PDL BioPharma, Inc. 119,708 765
Perrigo Co. 6,700 640
Pfizer, Inc. (Û) 1,247,209 26,690
Qiagen NV (Æ) 1,400 23
Quest Diagnostics, Inc. 21,400 1,243
Regeneron Pharmaceuticals, Inc. (Æ) 700 64
Sirona Dental Systems, Inc. (Æ) 6,600 319
St. Jude Medical, Inc. 66,300 2,765
Stryker Corp. (Û) 92,800 5,144
SXC Health Solutions Corp. (Æ) 3,300 208
Techne Corp. 12,300 839
Copyright © 2012 www.secdatabase.com. All Rights Reserved.Please Consider the Environment Before Printing This Document

Table of Contents
Russell Investment CompanyRussell U.S. Quantitative Equity FundSchedule of Investments, continued �� January 31, 2012 (Unaudited)Amounts in thousands (except share amounts)
Principal
Amount ($)
or Shares
Market
Value
$
Teleflex, Inc. 12,600 771
Thermo Fisher Scientific, Inc. (Æ) 13,000 688
Thoratec Corp. (Æ) 19,000 559
UnitedHealth Group, Inc. (Û) 243,500 12,611
Universal American Corp. 32,800 360
Universal Health Services, Inc. Class
B 4,600 190
Varian Medical Systems, Inc. (Æ) 2,600 171
VCA Antech, Inc. (Æ) 6,200 139
Vertex Pharmaceuticals, Inc. (Æ) 27,300 1,009
Warner Chilcott PLC Class A (Æ) 295,700 4,988
Watson Pharmaceuticals, Inc.
Class B (Æ) 101,981 5,979
WellCare Health Plans, Inc. (Æ) 59,700 3,568
WellPoint, Inc. (Û) 191,000 12,285
Zimmer Holdings, Inc. 101,408 6,161
370,847
Materials and Processing - 4.7%AbitibiBowater, Inc. (Æ) 24,600 356
Agrium, Inc. 47,200 3,788
Air Products & Chemicals, Inc. 2,600 229
Airgas, Inc. 89,470 7,062
Albemarle Corp. 2,700 174
Alcoa, Inc. (Û) 355,100 3,608
Allegheny Technologies, Inc. 2,600 118
Allied Nevada Gold Corp. (Æ) 1,000 36
Aptargroup, Inc. 7,000 367
Ashland, Inc. 9,800 618
Ball Corp. 49,100 1,928
Brown-Forman Corp. Class B - ADR 15,800 1,283
Carpenter Technology Corp. 16,400 861
Celanese Corp. Class A 16,200 789
CF Industries Holdings, Inc. 98,549 17,481
Chemtura Corp. (Æ) 22,800 320
Cliffs Natural Resources, Inc. 53,800 3,887
Principal
Amount ($)
or Shares
Market
Value
$
Reliance Steel & Aluminum Co. 2,300 122
Rockwood Holdings, Inc. (Æ) 6,000 303
Royal Gold, Inc. 12,400 944
Sealed Air Corp. 113,627 2,265
Sigma-Aldrich Corp. 5,500 374
Timken Co. 55,545 2,712
Titanium Metals Corp. 12,600 194
Valspar Corp. 57,800 2,499
WR Grace & Co. (Æ) 115,896 6,205
134,851
Producer Durables - 10.9%3M Co. 5,500 477
Accenture PLC Class A (Û) 164,800 9,450
AGCO Corp. (Æ) 233,900 11,913
Agilent Technologies, Inc. 21,600 917
Alliant Techsystems, Inc. 18,262 1,085
Ametek, Inc. 15,700 738
AO Smith Corp. 59,587 2,531
Automatic Data Processing, Inc. 62,200 3,407
Boeing Co. (The) (Û) 124,900 9,265
Booz Allen Hamilton Holding Corp.
Class A (Æ) 28,400 500
Brink�s Co. (The) 7,700 217
Carlisle Cos., Inc. 20,500 978
Caterpillar, Inc. 208,401 22,741
CH Robinson Worldwide, Inc. 5,400 372
Chicago Bridge & Iron Co. NV 20,743 883
Cintas Corp. 51,200 1,897
Convergys Corp. (Æ) 36,539 486
Con-way, Inc. 140,616 4,463
Copa Holdings SA Class A 10,300 702
Copart, Inc. (Æ) 20,300 955
Corporate Executive Board Co. (The) 24,400 960
Crane Co. 3,200 154
CSX Corp. (Û) 319,600 7,207
Cummins, Inc. 2,900 302
Copyright © 2012 www.secdatabase.com. All Rights Reserved.Please Consider the Environment Before Printing This Document
Russell U.S. Quantitative Equity Fund 9
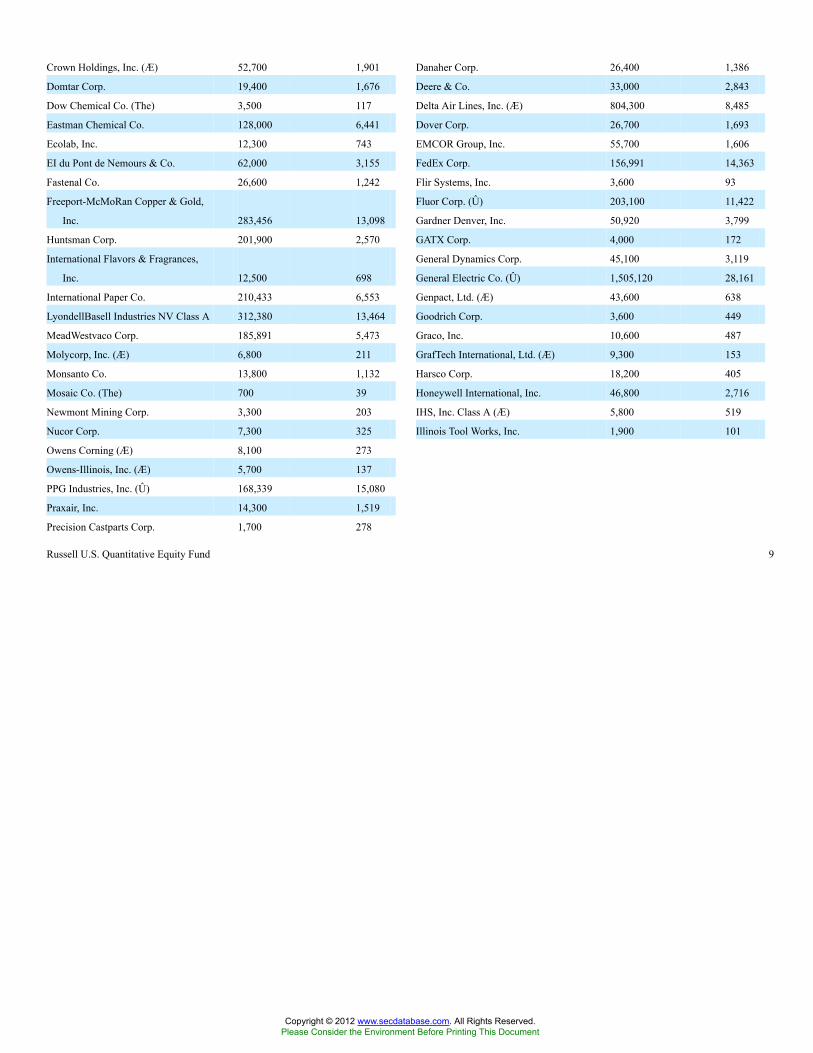
Crown Holdings, Inc. (Æ) 52,700 1,901
Domtar Corp. 19,400 1,676
Dow Chemical Co. (The) 3,500 117
Eastman Chemical Co. 128,000 6,441
Ecolab, Inc. 12,300 743
EI du Pont de Nemours & Co. 62,000 3,155
Fastenal Co. 26,600 1,242
Freeport-McMoRan Copper & Gold,
Inc. 283,456 13,098
Huntsman Corp. 201,900 2,570
International Flavors & Fragrances,
Inc. 12,500 698
International Paper Co. 210,433 6,553
LyondellBasell Industries NV Class A 312,380 13,464
MeadWestvaco Corp. 185,891 5,473
Molycorp, Inc. (Æ) 6,800 211
Monsanto Co. 13,800 1,132
Mosaic Co. (The) 700 39
Newmont Mining Corp. 3,300 203
Nucor Corp. 7,300 325
Owens Corning (Æ) 8,100 273
Owens-Illinois, Inc. (Æ) 5,700 137
PPG Industries, Inc. (Û) 168,339 15,080
Praxair, Inc. 14,300 1,519
Precision Castparts Corp. 1,700 278
Danaher Corp. 26,400 1,386
Deere & Co. 33,000 2,843
Delta Air Lines, Inc. (Æ) 804,300 8,485
Dover Corp. 26,700 1,693
EMCOR Group, Inc. 55,700 1,606
FedEx Corp. 156,991 14,363
Flir Systems, Inc. 3,600 93
Fluor Corp. (Û) 203,100 11,422
Gardner Denver, Inc. 50,920 3,799
GATX Corp. 4,000 172
General Dynamics Corp. 45,100 3,119
General Electric Co. (Û) 1,505,120 28,161
Genpact, Ltd. (Æ) 43,600 638
Goodrich Corp. 3,600 449
Graco, Inc. 10,600 487
GrafTech International, Ltd. (Æ) 9,300 153
Harsco Corp. 18,200 405
Honeywell International, Inc. 46,800 2,716
IHS, Inc. Class A (Æ) 5,800 519
Illinois Tool Works, Inc. 1,900 101
Copyright © 2012 www.secdatabase.com. All Rights Reserved.Please Consider the Environment Before Printing This Document

Table of Contents
Russell Investment CompanyRussell U.S. Quantitative Equity FundSchedule of Investments, continued �� January 31, 2012 (Unaudited)Amounts in thousands (except share amounts)
Principal
Amount ($)
or Shares
Market
Value
$
Iron Mountain, Inc. 67,800 2,090
Itron, Inc. (Æ) 66,270 2,571
ITT Corp. 4,200 91
JB Hunt Transport Services, Inc. 8,000 409
Joy Global, Inc. (Û) 6,300 571
Kansas City Southern (Æ) 1,000 69
KBR, Inc. (Û) 169,100 5,435
Kennametal, Inc. 7,400 319
Kirby Corp. (Æ) 13,200 881
Knight Transportation, Inc. 68,600 1,208
L-3 Communications Holdings, Inc. 39,200 2,773
Landstar System, Inc. 17,600 900
Lexmark International, Inc. Class A 18,067 631
Lockheed Martin Corp. (Û) 95,600 7,870
Manpower, Inc. 115,500 4,633
MAXIMUS, Inc. 1,100 50
Mettler-Toledo International, Inc. (Æ) 1,300 228
MSC Industrial Direct Co., Inc.
Class A 63,429 4,822
National Instruments Corp. 2,800 75
Navistar International Corp. (Æ) 73,600 3,186
Norfolk Southern Corp. 71,800 5,184
Northrop Grumman Corp. 124,900 7,250
Orbital Sciences Corp. (Æ) 58,000 840
Parker Hannifin Corp. 225,674 18,207
Paychex, Inc. 76,700 2,416
Pentair, Inc. 9,300 342
Quanta Services, Inc. (Æ) 7,200 155
Raytheon Co. (Û) 163,100 7,827
Rockwell Automation, Inc. 18,700 1,456
Roper Industries, Inc. 5,800 542
Ryder System, Inc. 57,146 3,216
Spirit Aerosystems Holdings, Inc.
Class A (Æ) 500 11
Stericycle, Inc. (Æ) 17,300 1,454
Synopsys, Inc. (Æ) 195,033 5,691
Principal
Amount ($)
or Shares
Market
Value
$
Technology - 17.2%Activision Blizzard, Inc. (Û) 1,168,900 14,424
Adobe Systems, Inc. (Æ) 66,100 2,046
Altera Corp. 15,700 625
Amdocs, Ltd. (Æ) 189,500 5,579
Apple, Inc. (Æ)(Û) 251,101 114,623
Ariba, Inc. (Æ) 4,100 112
Arrow Electronics, Inc. (Æ) 23,800 983
Atmel Corp. (Æ) 53,400 518
Autodesk, Inc. (Æ) 152,200 5,479
Avago Technologies, Ltd. 48,700 1,653
Avnet, Inc. (Æ) 90,600 3,159
AVX Corp. 4,689 62
BMC Software, Inc. (Æ) 275,700 9,991
CA, Inc. (Û) 201,700 5,200
Cadence Design Systems, Inc. (Æ) 538,744 5,689
Cisco Systems, Inc. (Û) 1,538,037 30,192
Citrix Systems, Inc. (Æ) 2,800 183
Cognizant Technology Solutions Corp.
Class A (Æ) 13,300 954
Computer Sciences Corp. 179,843 4,645
Compuware Corp. (Æ) 33,729 264
Comverse Technology, Inc. (Æ) 142,100 895
Crown Castle International Corp. (Æ) 39,300 1,905
Cypress Semiconductor Corp. 30,400 523
Dell, Inc. (Æ) 29,000 500
DST Systems, Inc. 5,000 244
Electronic Arts, Inc. (Æ) 374,188 6,949
EMC Corp. (Æ) 24,200 623
Equinix, Inc. (Æ) 4,200 504
F5 Networks, Inc. (Æ) 25,700 3,077
Fairchild Semiconductor International,
Inc. Class A (Æ) 1,400 19
Fortinet, Inc. (Æ) 238,200 5,433
Gartner, Inc. (Æ) 80,300 3,044
Google, Inc. Class A (Æ) 6,080 3,527
Hewlett-Packard Co. (Û) 62,800 1,757
Copyright © 2012 www.secdatabase.com. All Rights Reserved.Please Consider the Environment Before Printing This Document

10 Russell U.S. Quantitative Equity Fund
Textron, Inc. 202,100 5,149
Thomas & Betts Corp. (Æ) 22,468 1,604
Tidewater, Inc. 2,500 135
Toro Co. (The) 7,591 481
Towers Watson & Co. Class A 6,800 407
TransDigm Group, Inc. (Æ) 17,400 1,819
Trinity Industries, Inc. 11,500 362
Tyco International, Ltd. 96,797 4,932
Union Pacific Corp. (Û) 167,060 19,097
United Parcel Service, Inc. Class B 1,600 121
United Technologies Corp. 91,772 7,190
URS Corp. 94,134 3,874
UTi Worldwide, Inc. 83,305 1,240
Verisk Analytics, Inc. Class A (Æ) 5,500 220
Wabtec Corp. 2,800 193
Waste Connections, Inc. 26,250 848
Waste Management, Inc. 3,800 132
Werner Enterprises, Inc. 160,904 4,204
WESCO International, Inc. (Æ) 1,100 69
WW Grainger, Inc. 29,655 5,656
316,346
IAC/InterActiveCorp 197,187 8,493
Informatica Corp. (Æ) 20,600 871
Integrated Device Technology, Inc. (Æ) 234,100 1,484
Intel Corp. (Û) 770,600 20,359
International Business Machines
Corp. (Û) 145,430 28,010
Intuit, Inc. 214,102 12,084
IPG Photonics Corp. (Æ) 4,300 227
Jabil Circuit, Inc. 290,500 6,583
JDS Uniphase Corp. (Æ) 51,910 659
Lambda TD Software, Inc. (Æ) 118,736 1,186
LSI Corp. (Æ)(Û) 1,551,834 11,747
Maxim Integrated Products, Inc. 155,400 4,171
Mentor Graphics Corp. (Æ) 165,389 2,294
Microchip Technology, Inc. 39,300 1,450
MICROS Systems, Inc. (Æ) 7,300 363
Microsoft Corp. (Û) 1,792,382 52,929
MKS Instruments, Inc. 12,200 368
Motorola Solutions, Inc. (Û) 164,353 7,628
NCR Corp. (Æ) 130,212 2,439
NetApp, Inc. (Æ)(Û) 112,370 4,241
Copyright © 2012 www.secdatabase.com. All Rights Reserved.Please Consider the Environment Before Printing This Document

Table of Contents
Russell Investment CompanyRussell U.S. Quantitative Equity FundSchedule of Investments, continued �� January 31, 2012 (Unaudited)Amounts in thousands (except share amounts)
Principal
Amount ($)
or Shares
Market
Value
$
NetSuite, Inc. (Æ) 27,700 1,160
NeuStar, Inc. Class A (Æ) 7,346 268
Novellus Systems, Inc. (Æ) 40,470 1,908
Nuance Communications, Inc. (Æ) 34,600 987
NVIDIA Corp. (Æ) 31,700 468
ON Semiconductor Corp. (Æ) 23,000 200
Oracle Corp. 609,315 17,183
PMC - Sierra, Inc. (Æ) 449,500 2,922
Polycom, Inc. (Æ) 127,600 2,546
QUALCOMM, Inc. (Û) 172,200 10,129
Rackspace Hosting, Inc. (Æ) 3,700 161
Red Hat, Inc. (Æ) 85,897 3,983
Research In Motion, Ltd. (Æ) 95,700 1,591
SAIC, Inc. (Æ) 382,800 4,923
Salesforce.com, Inc. (Æ) 1,500 175
SanDisk Corp. (Æ) 3,500 161
Solera Holdings, Inc. 1,500 72
Symantec Corp. (Æ)(Û) 1,167,300 20,066
Tellabs, Inc. 510,462 1,940
Teradata Corp. (Æ) 36,200 1,939
Texas Instruments, Inc. 46,600 1,509
TIBCO Software, Inc. (Æ) 13,100 341
Unisys Corp. (Æ) 56,859 1,192
VeriSign, Inc. 1,700 63
VMware, Inc. Class A (Æ)(Û) 53,530 4,886
Western Digital Corp. (Æ) 328,200 11,930
Xilinx, Inc. 36,200 1,298
496,968
Utilities - 6.9%AES Corp. (The) (Æ) 512,000 6,533
AGL Resources, Inc. 33,100 1,374
Alliant Energy Corp. 13,700 581
Ameren Corp. 352,209 11,144
American Electric Power Co., Inc. 39,700 1,571
American Water Works Co., Inc. 67,712 2,284
Principal
Amount ($)
or Shares
Market
Value
$
MDU Resources Group, Inc. 8,100 173
MetroPCS Communications,
Inc. (Æ) 388,775 3,437
National Fuel Gas Co. 3,900 196
Nexen, Inc. 102,800 1,842
NextEra Energy, Inc. 42,300 2,532
NII Holdings, Inc. (Æ) 262,370 5,276
NiSource, Inc. 237,686 5,403
Northeast Utilities 42,700 1,484
NRG Energy, Inc. (Æ) 56,800 959
NSTAR 26,200 1,177
NV Energy, Inc. 417,157 6,758
OGE Energy Corp. 8,500 449
ONEOK, Inc. 32,900 2,736
Pepco Holdings, Inc. 25,800 507
PG&E Corp. 230,757 9,383
Pinnacle West Capital Corp. 45,355 2,143
PPL Corp. 65,500 1,820
Progress Energy, Inc. Class D 52,431 2,849
Public Service Enterprise Group,
Inc. (Û) 187,500 5,689
Questar Corp. 40,600 783
Sempra Energy 31,300 1,781
Southern Co. 16,300 743
Southern Union Co. 37,700 1,635
Sprint Nextel Corp. (Æ) 655,700 1,390
Telephone and Data Systems, Inc. 107,068 2,816
Time Warner Telecom, Inc.
Class A (Æ) 21,800 439
Vectren Corp. 5,900 169
Verizon Communications, Inc. (Û) 734,246 27,652
Westar Energy, Inc. 17,100 486
Wisconsin Energy Corp. 84,249 2,864
Xcel Energy, Inc. 34,200 910
Xylem, Inc. 123,136 3,190
198,403
Copyright © 2012 www.secdatabase.com. All Rights Reserved.Please Consider the Environment Before Printing This Document
Russell U.S. Quantitative Equity Fund 11
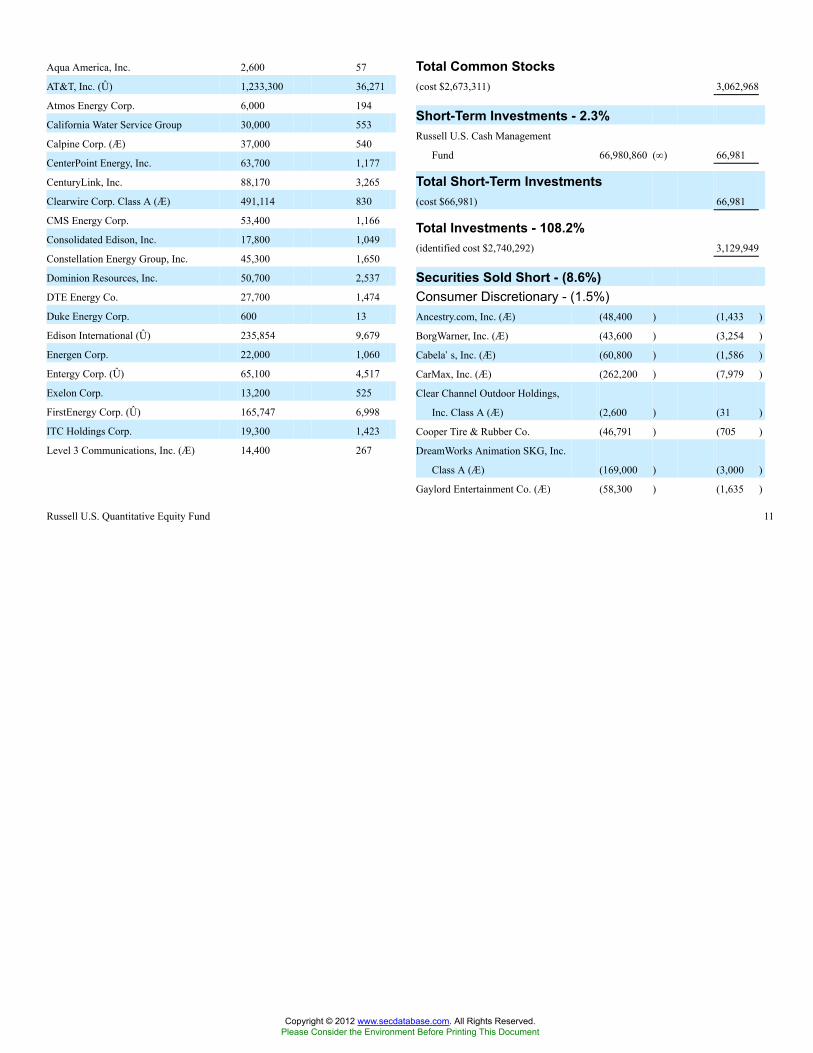
Aqua America, Inc. 2,600 57
AT&T, Inc. (Û) 1,233,300 36,271
Atmos Energy Corp. 6,000 194
California Water Service Group 30,000 553
Calpine Corp. (Æ) 37,000 540
CenterPoint Energy, Inc. 63,700 1,177
CenturyLink, Inc. 88,170 3,265
Clearwire Corp. Class A (Æ) 491,114 830
CMS Energy Corp. 53,400 1,166
Consolidated Edison, Inc. 17,800 1,049
Constellation Energy Group, Inc. 45,300 1,650
Dominion Resources, Inc. 50,700 2,537
DTE Energy Co. 27,700 1,474
Duke Energy Corp. 600 13
Edison International (Û) 235,854 9,679
Energen Corp. 22,000 1,060
Entergy Corp. (Û) 65,100 4,517
Exelon Corp. 13,200 525
FirstEnergy Corp. (Û) 165,747 6,998
ITC Holdings Corp. 19,300 1,423
Level 3 Communications, Inc. (Æ) 14,400 267
Total Common Stocks(cost $2,673,311) 3,062,968
Short-Term Investments - 2.3%Russell U.S. Cash Management
Fund 66,980,860 (¥) 66,981
Total Short-Term Investments(cost $66,981) 66,981
Total Investments - 108.2%(identified cost $2,740,292) 3,129,949
Securities Sold Short - (8.6%)Consumer Discretionary - (1.5%)Ancestry.com, Inc. (Æ) (48,400 ) (1,433 )
BorgWarner, Inc. (Æ) (43,600 ) (3,254 )
Cabela�s, Inc. (Æ) (60,800 ) (1,586 )
CarMax, Inc. (Æ) (262,200 ) (7,979 )
Clear Channel Outdoor Holdings,
Inc. Class A (Æ) (2,600 ) (31 )
Cooper Tire & Rubber Co. (46,791 ) (705 )
DreamWorks Animation SKG, Inc.
Class A (Æ) (169,000 ) (3,000 )
Gaylord Entertainment Co. (Æ) (58,300 ) (1,635 )
Copyright © 2012 www.secdatabase.com. All Rights Reserved.Please Consider the Environment Before Printing This Document
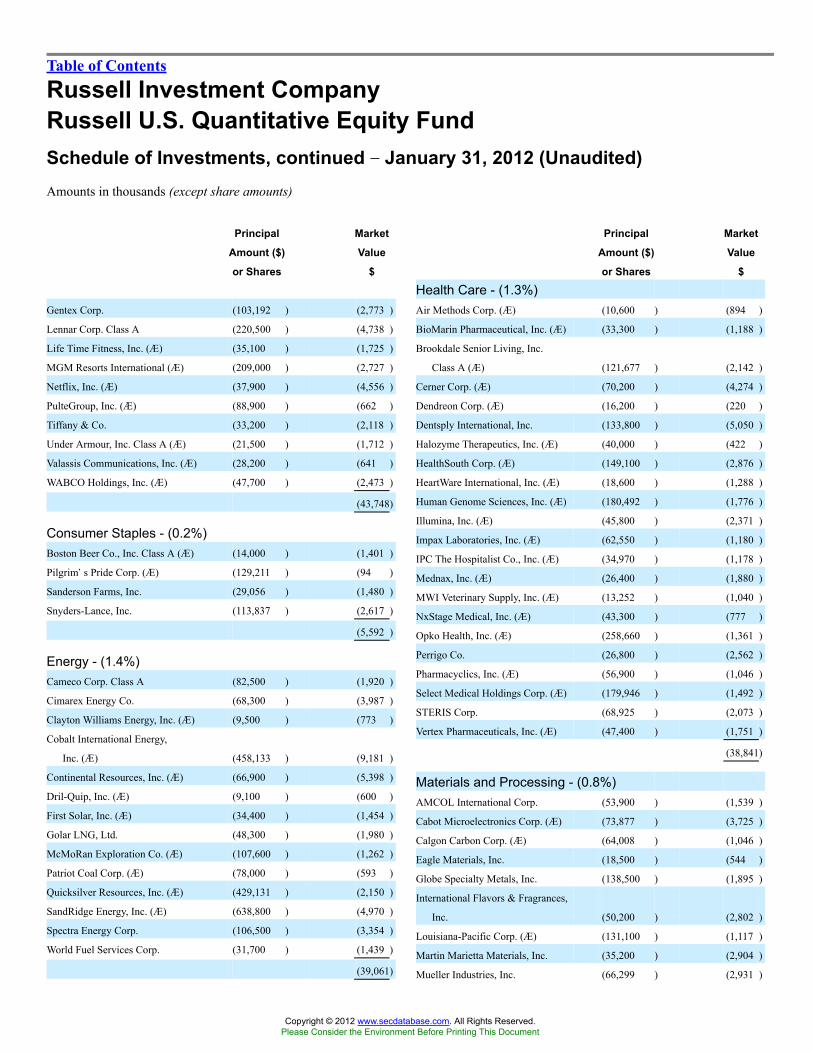
Table of Contents
Russell Investment CompanyRussell U.S. Quantitative Equity FundSchedule of Investments, continued �� January 31, 2012 (Unaudited)Amounts in thousands (except share amounts)
Principal
Amount ($)
or Shares
Market
Value
$
Gentex Corp. (103,192 ) (2,773 )
Lennar Corp. Class A (220,500 ) (4,738 )
Life Time Fitness, Inc. (Æ) (35,100 ) (1,725 )
MGM Resorts International (Æ) (209,000 ) (2,727 )
Netflix, Inc. (Æ) (37,900 ) (4,556 )
PulteGroup, Inc. (Æ) (88,900 ) (662 )
Tiffany & Co. (33,200 ) (2,118 )
Under Armour, Inc. Class A (Æ) (21,500 ) (1,712 )
Valassis Communications, Inc. (Æ) (28,200 ) (641 )
WABCO Holdings, Inc. (Æ) (47,700 ) (2,473 )
(43,748)
Consumer Staples - (0.2%)Boston Beer Co., Inc. Class A (Æ) (14,000 ) (1,401 )
Pilgrim�s Pride Corp. (Æ) (129,211 ) (94 )
Sanderson Farms, Inc. (29,056 ) (1,480 )
Snyders-Lance, Inc. (113,837 ) (2,617 )
(5,592 )
Energy - (1.4%)Cameco Corp. Class A (82,500 ) (1,920 )
Cimarex Energy Co. (68,300 ) (3,987 )
Clayton Williams Energy, Inc. (Æ) (9,500 ) (773 )
Cobalt International Energy,
Inc. (Æ) (458,133 ) (9,181 )
Continental Resources, Inc. (Æ) (66,900 ) (5,398 )
Dril-Quip, Inc. (Æ) (9,100 ) (600 )
First Solar, Inc. (Æ) (34,400 ) (1,454 )
Golar LNG, Ltd. (48,300 ) (1,980 )
McMoRan Exploration Co. (Æ) (107,600 ) (1,262 )
Patriot Coal Corp. (Æ) (78,000 ) (593 )
Quicksilver Resources, Inc. (Æ) (429,131 ) (2,150 )
SandRidge Energy, Inc. (Æ) (638,800 ) (4,970 )
Spectra Energy Corp. (106,500 ) (3,354 )
World Fuel Services Corp. (31,700 ) (1,439 )
(39,061)
Principal
Amount ($)
or Shares
Market
Value
$
Health Care - (1.3%)Air Methods Corp. (Æ) (10,600 ) (894 )
BioMarin Pharmaceutical, Inc. (Æ) (33,300 ) (1,188 )
Brookdale Senior Living, Inc.
Class A (Æ) (121,677 ) (2,142 )
Cerner Corp. (Æ) (70,200 ) (4,274 )
Dendreon Corp. (Æ) (16,200 ) (220 )
Dentsply International, Inc. (133,800 ) (5,050 )
Halozyme Therapeutics, Inc. (Æ) (40,000 ) (422 )
HealthSouth Corp. (Æ) (149,100 ) (2,876 )
HeartWare International, Inc. (Æ) (18,600 ) (1,288 )
Human Genome Sciences, Inc. (Æ) (180,492 ) (1,776 )
Illumina, Inc. (Æ) (45,800 ) (2,371 )
Impax Laboratories, Inc. (Æ) (62,550 ) (1,180 )
IPC The Hospitalist Co., Inc. (Æ) (34,970 ) (1,178 )
Mednax, Inc. (Æ) (26,400 ) (1,880 )
MWI Veterinary Supply, Inc. (Æ) (13,252 ) (1,040 )
NxStage Medical, Inc. (Æ) (43,300 ) (777 )
Opko Health, Inc. (Æ) (258,660 ) (1,361 )
Perrigo Co. (26,800 ) (2,562 )
Pharmacyclics, Inc. (Æ) (56,900 ) (1,046 )
Select Medical Holdings Corp. (Æ) (179,946 ) (1,492 )
STERIS Corp. (68,925 ) (2,073 )
Vertex Pharmaceuticals, Inc. (Æ) (47,400 ) (1,751 )
(38,841)
Materials and Processing - (0.8%)AMCOL International Corp. (53,900 ) (1,539 )
Cabot Microelectronics Corp. (Æ) (73,877 ) (3,725 )
Calgon Carbon Corp. (Æ) (64,008 ) (1,046 )
Eagle Materials, Inc. (18,500 ) (544 )
Globe Specialty Metals, Inc. (138,500 ) (1,895 )
International Flavors & Fragrances,
Inc. (50,200 ) (2,802 )
Louisiana-Pacific Corp. (Æ) (131,100 ) (1,117 )
Martin Marietta Materials, Inc. (35,200 ) (2,904 )
Mueller Industries, Inc. (66,299 ) (2,931 )
Copyright © 2012 www.secdatabase.com. All Rights Reserved.Please Consider the Environment Before Printing This Document

12 Russell U.S. Quantitative Equity Fund
Financial Services - (1.1%)Astoria Financial Corp. (119,000 ) (991 )
Cincinnati Financial Corp. (89,100 ) (2,912 )
CIT Group, Inc. (Æ) (34,700 ) (1,324 )
CoreLogic, Inc. (Æ) (175,518 ) (2,492 )
Eaton Vance Corp. (92,506 ) (2,377 )
Erie Indemnity Co. Class A (10,221 ) (784 )
Financial Engines, Inc. (Æ) (38,000 ) (910 )
First Cash Financial Services,
Inc. (Æ) (34,991 ) (1,408 )
Greenhill & Co., Inc. (29,300 ) (1,364 )
Howard Hughes Corp. (The) (Æ) (35,041 ) (1,816 )
Iberiabank Corp. (11,765 ) (615 )
MSCI, Inc. Class A (Æ) (39,500 ) (1,287 )
New York Community Bancorp, Inc. (371,900 ) (4,719 )
Plum Creek Timber Co., Inc. (ö) (94,100 ) (3,649 )
Weyerhaeuser Co. (ö) (174,700 ) (3,498 )
Wright Express Corp. (Æ) (18,500 ) (1,012 )
(31,158)
Sigma-Aldrich Corp. (23,600 ) (1,606 )
Stillwater Mining Co. (Æ) (46,528 ) (599 )
Titanium Metals Corp. (52,500 ) (808 )
(21,516)
Producer Durables - (0.9%)Canadian Pacific Railway, Ltd. (35,200 ) (2,511 )
Darling International, Inc. (Æ) (120,200 ) (1,837 )
FARO Technologies, Inc. (Æ) (5,700 ) (309 )
Geo Group, Inc. (The) (Æ) (121,921 ) (2,143 )
GrafTech International, Ltd. (Æ) (117,600 ) (1,931 )
IHS, Inc. Class A (Æ) (47,900 ) (4,286 )
Mettler-Toledo International,
Inc. (Æ) (20,200 ) (3,545 )
National Instruments Corp. (108,400 ) (2,917 )
Stericycle, Inc. (Æ) (43,300 ) (3,638 )
Waste Management, Inc. (100,400 ) (3,490 )
(26,607)
Copyright © 2012 www.secdatabase.com. All Rights Reserved.Please Consider the Environment Before Printing This Document
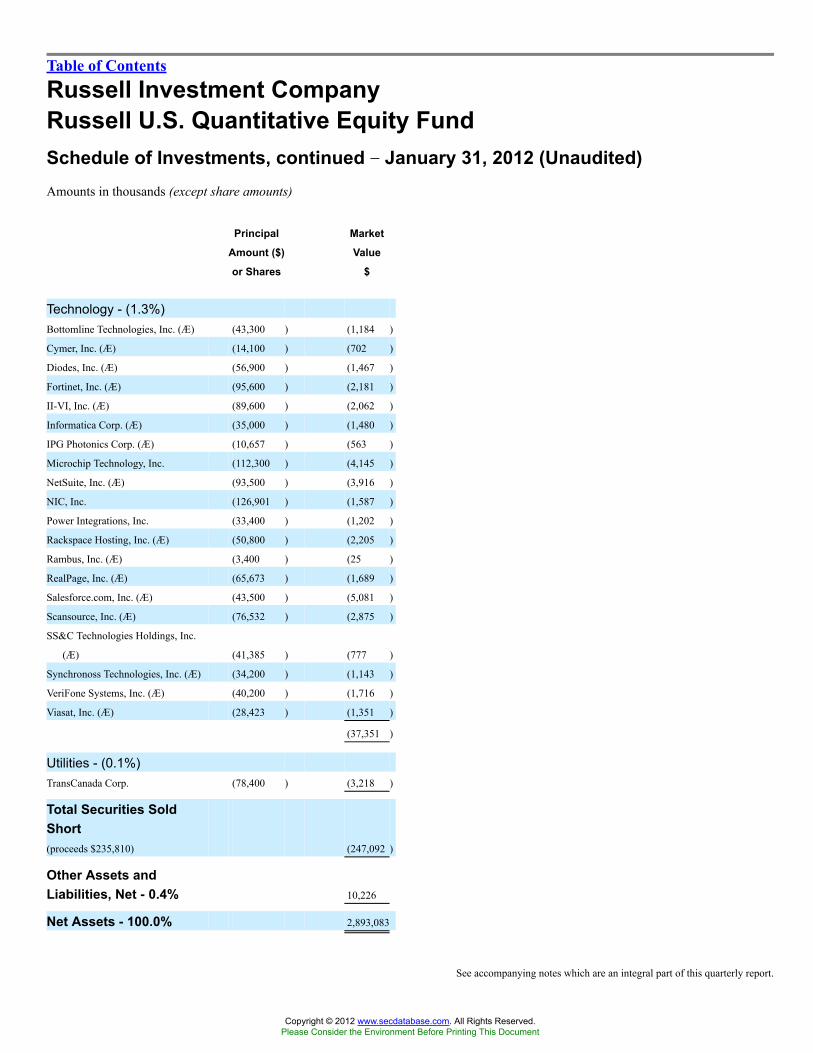
Table of Contents
Russell Investment CompanyRussell U.S. Quantitative Equity FundSchedule of Investments, continued �� January 31, 2012 (Unaudited)Amounts in thousands (except share amounts)
See accompanying notes which are an integral part of this quarterly report.
Principal
Amount ($)
or Shares
Market
Value
$
Technology - (1.3%)Bottomline Technologies, Inc. (Æ) (43,300 ) (1,184 )
Cymer, Inc. (Æ) (14,100 ) (702 )
Diodes, Inc. (Æ) (56,900 ) (1,467 )
Fortinet, Inc. (Æ) (95,600 ) (2,181 )
II-VI, Inc. (Æ) (89,600 ) (2,062 )
Informatica Corp. (Æ) (35,000 ) (1,480 )
IPG Photonics Corp. (Æ) (10,657 ) (563 )
Microchip Technology, Inc. (112,300 ) (4,145 )
NetSuite, Inc. (Æ) (93,500 ) (3,916 )
NIC, Inc. (126,901 ) (1,587 )
Power Integrations, Inc. (33,400 ) (1,202 )
Rackspace Hosting, Inc. (Æ) (50,800 ) (2,205 )
Rambus, Inc. (Æ) (3,400 ) (25 )
RealPage, Inc. (Æ) (65,673 ) (1,689 )
Salesforce.com, Inc. (Æ) (43,500 ) (5,081 )
Scansource, Inc. (Æ) (76,532 ) (2,875 )
SS&C Technologies Holdings, Inc.
(Æ) (41,385 ) (777 )
Synchronoss Technologies, Inc. (Æ) (34,200 ) (1,143 )
VeriFone Systems, Inc. (Æ) (40,200 ) (1,716 )
Viasat, Inc. (Æ) (28,423 ) (1,351 )
(37,351 )
Utilities - (0.1%)TransCanada Corp. (78,400 ) (3,218 )
Total Securities SoldShort(proceeds $235,810) (247,092 )
Other Assets andLiabilities, Net - 0.4% 10,226
Net Assets - 100.0% 2,893,083
Copyright © 2012 www.secdatabase.com. All Rights Reserved.Please Consider the Environment Before Printing This Document

Russell U.S. Quantitative Equity Fund 13
Copyright © 2012 www.secdatabase.com. All Rights Reserved.Please Consider the Environment Before Printing This Document

Table of Contents
Russell Investment CompanyRussell U.S. Quantitative Equity FundSchedule of Investments, continued �� January 31, 2012 (Unaudited)Amounts in thousands (except contract amounts)
Futures ContractsNumber of
Contracts
Notional
Amount
Expiration
Date
Unrealized
Appreciation
(Depreciation)
$
Long PositionsRussell 1000 Mini Index Futures (CME) 126 USD 9,126 03/12 529
S&P 500 E-Mini Index Futures (CME) 740 USD 48,404 03/12 1,560
S&P 500 Index Futures (CME) 48 USD 15,698 03/12 718
S&P Midcap 400 E-Mini Index Futures (CME) 63 USD 5,890 03/12 433
Total Unrealized Appreciation (Depreciation) on Open Futures Contracts (å) 3,240
Presentation of Portfolio Holdings �� January 31, 2012 (Unaudited)Amounts in thousands
Market Value
Portfolio Summary Level 1 Level 2 Level 3 Total
Common Stocks
Consumer Discretionary $447,679 $� $ � $447,679
Consumer Staples 297,941 � � 297,941
Energy 398,014 � � 398,014
Financial Services 401,919 � � 401,919
Health Care 370,847 � � 370,847
Materials and Processing 134,851 � � 134,851
Producer Durables 316,346 � � 316,346
Technology 496,968 � � 496,968
Utilities 198,403 � � 198,403
Short-Term Investments � 66,981 � 66,981
Total Investments 3,062,968 66,981 � 3,129,949
Securities Sold Short* (247,071 ) (21 ) � (247,092 )
Other Financial Instruments
Futures Contracts 3,240 � � 3,240
Total Other Financial Instruments** $3,240 $� $ � $3,240
* Refer to Schedule of Investments for detailed sector breakout.
** Other financial instruments reflected, such as futures, forwards, and swap contracts which are valued at the unrealized appreciation/depreciation on the instruments.
Copyright © 2012 www.secdatabase.com. All Rights Reserved.Please Consider the Environment Before Printing This Document

For a description of the levels see note 2 in the Notes to Quarterly Report.
See accompanying notes which are an integral part of this quarterly report.
14 Russell U.S. Quantitative Equity Fund
Copyright © 2012 www.secdatabase.com. All Rights Reserved.Please Consider the Environment Before Printing This Document

Table of Contents
Russell Investment CompanyRussell U.S. Growth Fund
Schedule of Investments �� January 31, 2012 (Unaudited)Amounts in thousands (except share amounts)
Principal
Amount ($)
or Shares
Market
Value
$
Common Stocks - 94.4%Consumer Discretionary - 19.3%Amazon.com, Inc. (Æ) 5,572 1,083
Bed Bath & Beyond, Inc. (Æ)(Ñ) 4,249 258
CBS Corp. Class B 12,200 347
Diageo PLC - ADR 4,778 423
Dick�s Sporting Goods, Inc. (Ñ) 5,514 227
Dollar General Corp. (Æ)(Ñ) 4,876 208
eBay, Inc. (Æ) 27,852 880
Estee Lauder Cos., Inc. (The)
Class A (Ñ) 7,020 407
Ford Motor Co. (Ñ) 22,000 273
Guess?, Inc. (Ñ) 2,509 75
Hanesbrands, Inc. (Æ)(Ñ) 7,100 175
Hertz Global Holdings, Inc. (Æ)(Ñ) 27,000 367
Home Depot, Inc. 7,000 311
Johnson Controls, Inc. 26,398 839
Las Vegas Sands Corp. 5,900 290
Limited Brands, Inc. (Ñ) 11,500 481
Lowe�s Cos., Inc. 13,600 365
Lululemon Athletica, Inc. (Æ) 1,000 63
McDonald�s Corp. 2,400 238
MGM Resorts International (Æ)(Ñ) 4,600 60
Michael Kors Holdings, Ltd. (Æ) 118 4
Nike, Inc. Class B 2,300 239
priceline.com, Inc. (Æ) 500 265
Snap-on, Inc. 4,400 249
Stanley Black & Decker, Inc. 3,100 217
Starbucks Corp. 18,890 905
Starwood Hotels & Resorts
Worldwide, Inc. (Ñ)(ö) 10,870 589
Tiffany & Co. 5,857 374
TJX Cos., Inc. (Ñ) 2,346 160
Tractor Supply Co. 900 73
Ulta Salon Cosmetics & Fragrance,
Inc. (Æ) 1,000 76
Principal
Amount ($)
or Shares
Market
Value
$
Cobalt International Energy,
Inc. (Æ)(Ñ) 15,502 311
Dresser-Rand Group, Inc. (Æ) 4,300 220
Ensco PLC - ADR 2,542 134
Exxon Mobil Corp. 12,183 1,020
FMC Technologies, Inc. (Æ) 1,300 66
Forest Oil Corp. (Æ)(Ñ) 23,200 302
Hess Corp. 4,436 250
National Oilwell Varco, Inc. 13,280 982
Noble Energy, Inc. 1,300 131
Occidental Petroleum Corp. 1,900 189
Schlumberger, Ltd. 16,944 1,274
Weatherford International, Ltd. (Æ) 12,700 213
6,342
Financial Services - 7.3%Amarin Corp PLC - ADR (Æ)(Ñ) 16,800 137
American Express Co. 5,200 261
Bank of New York Mellon Corp.
(The) (Ñ) 8,400 169
Capital One Financial Corp. 3,647 167
Discover Financial Services 9,653 262
Goldman Sachs Group, Inc. (The) 2,348 262
Hartford Financial Services Group,
Inc. 18,400 322
Lincoln National Corp. 15,200 328
Mastercard, Inc. Class A 900 320
State Street Corp. 17,050 668
Visa, Inc. Class A 10,962 1,103
Wells Fargo & Co. 11,700 342
Western Union Co. (The) 14,928 285
4,626
Health Care - 10.2%Alexion Pharmaceuticals, Inc. (Æ) 1,600 123
Allergan, Inc. (Ñ) 3,300 290
Amgen, Inc. 5,100 346
Copyright © 2012 www.secdatabase.com. All Rights Reserved.Please Consider the Environment Before Printing This Document

Russell U.S. Growth Fund 15
VF Corp. 3,590 472
VistaPrint NV (Æ)(Ñ) 5,050 181
Walt Disney Co. (The) 6,082 237
Yum! Brands, Inc. 13,550 858
12,269
Consumer Staples - 6.4%British American Tobacco PLC -
ADR 3,266 301
Cia de Bebidas das Americas - ADR 17,430 634
Coca-Cola Co. (The) 13,350 901
Colgate-Palmolive Co. 8,970 814
General Mills, Inc. 10,070 401
Hershey Co. (The) 2,318 142
PepsiCo, Inc. 7,290 479
Procter & Gamble Co. (The) 2,600 164
Whole Foods Market, Inc. (Ñ) 3,400 252
4,088
Energy - 10.0%Anadarko Petroleum Corp. 6,599 533
Apache Corp. 5,300 524
Cabot Oil & Gas Corp. 6,066 193
Biogen Idec, Inc. (Æ) 1,100 130
Celgene Corp. (Æ) 4,700 342
Cerner Corp. (Æ) 10,550 642
Dentsply International, Inc. (Ñ) 9,610 363
Express Scripts, Inc. Class A
(Æ)(Ñ) 3,000 154
Gilead Sciences, Inc. (Æ) 11,157 545
Intuitive Surgical, Inc. (Æ) 1,030 474
Medco Health Solutions, Inc. (Æ) 6,145 381
Mylan, Inc. (Æ) 27,310 567
Myriad Genetics, Inc. (Æ) 6,269 148
Novo Nordisk A/S - ADR 4,110 490
NuVasive, Inc. (Æ) 11,378 176
Perrigo Co. (Ñ) 2,630 251
Pfizer, Inc. 14,600 312
Valeant Pharmaceuticals
International, Inc. (Æ) 2,000 97
Warner Chilcott PLC Class A (Æ) 12,300 208
WellPoint, Inc. 7,343 472
6,511
Materials and Processing - 7.0%Air Products & Chemicals, Inc. 4,000 352
Copyright © 2012 www.secdatabase.com. All Rights Reserved.Please Consider the Environment Before Printing This Document

Table of Contents
Russell Investment CompanyRussell U.S. Growth FundSchedule of Investments, continued �� January 31, 2012 (Unaudited)Amounts in thousands (except share amounts)
Principal
Amount ($)
or Shares
Market
Value
$
Albemarle Corp. 1,300 84
Ecolab, Inc. 11,390 688
EI du Pont de Nemours & Co. 5,800 295
Freeport-McMoRan Copper &
Gold, Inc. 9,359 432
LyondellBasell Industries NV
Class A 2,300 99
Masco Corp. (Ñ) 3,700 45
Monsanto Co. 16,672 1,368
Mosaic Co. (The) 7,317 410
Praxair, Inc. 3,230 343
Sherwin-Williams Co. (The) (Ñ) 700 68
Teck Resources, Ltd. Class B (Æ) 6,300 267
4,451
Producer Durables - 10.6%Accenture PLC Class A (Ñ) 9,500 545
Automatic Data Processing, Inc. 11,810 647
Burberry Group PLC (Æ) 7,284 312
Caterpillar, Inc. 6,800 742
Cooper Industries PLC 2,981 176
CSX Corp. 8,802 198
Cummins, Inc. 1,900 198
Danaher Corp. 7,100 373
Danone - ADR 40,380 501
Deere & Co. 3,500 301
FedEx Corp. (Ñ) 6,300 576
Fluor Corp. 6,474 364
General Dynamics Corp. 4,769 330
Joy Global, Inc. 3,350 304
Pentair, Inc. (Ñ) 8,600 317
Rockwell Automation, Inc. 2,151 167
Terex Corp. (Æ)(Ñ) 7,394 146
Union Pacific Corp. (Ñ) 1,100 126
United Continental Holdings, Inc.
(Æ)(Ñ) 17,400 402
Principal
Amount ($)
or Shares
Market
Value
$
NetApp, Inc. (Æ) 3,100 117
OpenTable, Inc. (Æ)(Ñ) 4,912 237
Oracle Corp. 23,300 657
QUALCOMM, Inc. 26,864 1,580
Red Hat, Inc. (Æ) 12,240 568
Salesforce.com, Inc. (Æ)(Ñ) 5,074 593
Taiwan Semiconductor
Manufacturing Co., Ltd. - ADR 21,600 304
Teradata Corp. (Æ) 2,400 128
Texas Instruments, Inc. (Ñ) 14,397 466
VMware, Inc. Class A (Æ) 1,500 137
14,602
Utilities - 0.6%Xylem, Inc. 13,500 350
Total Common Stocks(cost $48,934) 59,965
Short-Term Investments- 4.9%Russell U.S. Cash Management
Fund 3,142,655 (¥) 3,143
Total Short-TermInvestments(cost $3,143) 3,143
Other Securities - 3.1%Russell Investment Company
Liquidating Trust (×) 190,441 (¥) 194
Russell U.S. Cash Collateral
Fund (×) 1,766,226 (¥) 1,766
Total Other Securities(cost $1,957) 1,960
Total Investments - 102.4%(identified cost $54,034) 65,067
Copyright © 2012 www.secdatabase.com. All Rights Reserved.Please Consider the Environment Before Printing This Document

See accompanying notes which are an integral part of this quarterly report.
16 Russell U.S. Growth Fund
6,725
Technology - 23.0%Acme Packet, Inc. (Æ)(Ñ) 7,210 211
Advanced Micro Devices,
Inc. (Æ)(Ñ) 17,300 116
Altera Corp. 8,100 322
Analog Devices, Inc. 9,700 379
Apple, Inc. (Æ) 7,746 3,536
Avago Technologies, Ltd. 3,900 132
Baidu, Inc. - ADR (Æ) 1,471 188
Citrix Systems, Inc. (Æ) 8,871 578
Cognizant Technology Solutions
Corp. Class A (Æ) 3,133 225
Electronic Arts, Inc. (Æ) 5,700 106
EMC Corp. (Æ)(Ñ) 13,800 355
F5 Networks, Inc. (Æ) 2,900 347
Google, Inc. Class A (Æ) 3,177 1,843
International Business Machines
Corp. 3,700 713
Maxim Integrated Products, Inc. 12,900 346
Micron Technology, Inc. (Æ)(Ñ) 9,188 70
Microsoft Corp. 11,784 348
Other Assets and Liabilities,Net - (2.4%) (1,549 )
Net Assets - 100.0% 63,518
Copyright © 2012 www.secdatabase.com. All Rights Reserved.Please Consider the Environment Before Printing This Document

Table of Contents
Russell Investment CompanyRussell U.S. Growth FundSchedule of Investments, continued �� January 31, 2012 (Unaudited)Amounts in thousands (except contract amounts)
Futures ContractsNumber of
Contracts
Notional
Amount
Expiration
Date
Unrealized
Appreciation
(Depreciation)
$
Long PositionsS&P 500 E-Mini Index Futures (CME) 54 USD 3,532 03/12 23
Total Unrealized Appreciation (Depreciation) on Open Futures Contracts (å) 23
Presentation of Portfolio Holdings �� January 31, 2012 (Unaudited)
Amounts in thousands
Market Value
Portfolio Summary Level 1 Level 2 Level 3 Total
Common Stocks
Consumer Discretionary $12,269 $� $ � $12,269
Consumer Staples 4,088 � � 4,088
Energy 6,342 � � 6,342
Financial Services 4,626 � � 4,626
Health Care 6,511 � � 6,511
Materials and Processing 4,451 � � 4,451
Producer Durables 6,725 � � 6,725
Technology 14,602 � � 14,602
Utilities 350 � � 350
Short-Term Investments � 3,143 � 3,143
Other Securities � 1,960 � 1,960
Total Investments 59,964 5,103 � 65,067
Other Financial Instruments
Futures Contracts 23 � � 23
Total Other Financial Instruments* $23 $� $ � $23
* Other financial instruments reflected, such as futures, forwards, interest rate swaps, and credit default swaps are valued at the unrealized appreciation/depreciation
on the instruments.
For a description of the levels see note 2 in the Notes to Quarterly Report.
See accompanying notes which are an integral part of this quarterly report.
Copyright © 2012 www.secdatabase.com. All Rights Reserved.Please Consider the Environment Before Printing This Document

Russell U.S. Growth Fund 17
Copyright © 2012 www.secdatabase.com. All Rights Reserved.Please Consider the Environment Before Printing This Document

Table of Contents
Russell Investment CompanyRussell U.S. Value Fund
Schedule of Investments �� January 31, 2012 (Unaudited)Amounts in thousands (except share amounts)
Principal
Amount ($)
or Shares
Market
Value
$
Common Stocks - 93.9%Consumer Discretionary - 9.0%Advance Auto Parts, Inc. (Ñ) 400 31
American Eagle Outfitters, Inc. 25,100 354
AutoZone, Inc. (Æ) 880 306
Avon Products, Inc. 15,900 282
Best Buy Co., Inc. (Ñ) 2,800 67
Big Lots, Inc. (Æ) 11,185 442
CBS Corp. Class B 9,100 259
Cinemark Holdings, Inc. (Ñ) 1,400 28
Coach, Inc. 600 42
Comcast Corp. Class A 2,800 74
DeVry, Inc. 1,300 49
Dillard�s, Inc. Class A (Ñ) 1,500 66
DISH Network Corp. Class A 3,900 109
Embraer SA - ADR (Æ) 9,000 247
Express, Inc. (Æ)(Ñ) 1,700 37
Foot Locker, Inc. 8,600 226
Ford Motor Co. (Ñ) 1,300 16
Gannett Co., Inc. 7,000 99
Gap, Inc. (The) (Ñ) 23,500 446
Harman International Industries,
Inc. 100 4
Hertz Global Holdings, Inc.
(Æ)(Ñ) 13,300 181
Home Depot, Inc. 4,100 182
Johnson Controls, Inc. 13,400 426
Kohl�s Corp. 5,900 271
Koninklijke Philips Electronics NV 18,100 367
Lear Corp. 5,200 218
Lowe�s Cos., Inc. 3,900 105
Macy�s, Inc. 36,690 1,236
PVH Corp. 1,500 116
Sally Beauty Holdings, Inc. (Æ) 2,400 49
Signet Jewelers, Ltd. 1,800 82
Target Corp. 6,900 350
Principal
Amount ($)
or Shares
Market
Value
$
Energy - 11.6%Anadarko Petroleum Corp. 2,425 196
Apache Corp. 1,625 161
Arch Coal, Inc. (Ñ) 20,400 294
Baker Hughes, Inc. 4,500 221
Chesapeake Energy Corp. 17,015 360
Chevron Corp. 23,875 2,461
ConocoPhillips 19,475 1,328
Exxon Mobil Corp. 5,500 461
Hubbell, Inc. Class B 200 14
Kinder Morgan, Inc. (Ñ) 6,900 224
Marathon Oil Corp. 17,000 534
Marathon Petroleum Corp. 15,500 592
Murphy Oil Corp. 7,300 435
Nabors Industries, Ltd. (Æ)(Ñ) 5,200 97
National Oilwell Varco, Inc. 3,325 246
Noble Corp. (Æ) 8,365 292
Oil States International, Inc. (Æ)(Ñ) 1,900 151
Statoil ASA - ADR 15,100 381
Suncor Energy, Inc. 4,600 159
Tesoro Corp. (Æ)(Ñ) 8,300 208
Total SA - ADR (Ñ) 4,500 238
Transocean, Ltd. 4,480 212
Valero Energy Corp. 40,795 979
10,244
Financial Services - 23.9%Aflac, Inc. 3,600 174
Allied World Assurance Co.
Holdings AG 1,000 62
Allstate Corp. (The) 35,230 1,016
American Capital, Ltd. (Æ) 8,300 68
American Financial Group, Inc. 4,300 158
Ameriprise Financial, Inc. 9,400 503
Assurant, Inc. 5,600 222
Assured Guaranty, Ltd. (Ñ) 2,600 40
Bank of America Corp. 17,800 127
Copyright © 2012 www.secdatabase.com. All Rights Reserved.Please Consider the Environment Before Printing This Document

18 Russell U.S. Value Fund
Time Warner Cable, Inc. 800 59
TRW Automotive Holdings
Corp. (Æ)(Ñ) 3,300 124
Wal-Mart Stores, Inc. 12,250 752
Wyndham Worldwide Corp. (Ñ) 5,900 234
7,936
Consumer Staples - 4.8%Archer-Daniels-Midland Co. 15,445 442
Clorox Co. (The) 3,300 227
ConAgra Foods, Inc. 12,900 344
Constellation Brands, Inc. Class
A (Æ) 7,200 150
CVS Caremark Corp. 13,000 543
Dr Pepper Snapple Group, Inc. 3,000 116
Herbalife, Ltd. 2,950 171
Kraft Foods, Inc. Class A 5,000 192
Philip Morris International, Inc. 6,100 456
Safeway, Inc. (Ñ) 42,645 937
Smithfield Foods, Inc. (Æ)(Ñ) 15,200 339
Tyson Foods, Inc. Class A 19,300 360
4,277
Bank of New York Mellon Corp.
(The) 15,300 308
BB&T Corp. 17,000 462
BlackRock, Inc. Class A 575 105
Capital One Financial Corp. 4,050 185
CBL & Associates Properties,
Inc. (Ñ)(ö) 6,600 115
Chubb Corp. (The) (Ñ) 1,900 128
Citigroup, Inc. 14,380 442
Comerica, Inc. 3,600 100
CommonWealth REIT (ö) 600 12
Cullen/Frost Bankers, Inc. (Ñ) 3,900 217
Discover Financial Services 20,400 554
Equity Lifestyle Properties, Inc. (ö) 800 56
Everest Re Group, Ltd. 800 68
Fifth Third Bancorp 16,675 217
First Republic Bank (Æ) 700 21
Goldman Sachs Group, Inc. (The) 6,515 726
Hartford Financial Services Group,
Inc. 39,745 696
Hospitality Properties Trust (Ñ)(ö) 2,000 48
JPMorgan Chase & Co. 85,490 3,189
KeyCorp 80,300 624
Copyright © 2012 www.secdatabase.com. All Rights Reserved.Please Consider the Environment Before Printing This Document

Table of Contents
Russell Investment CompanyRussell U.S. Value FundSchedule of Investments, continued �� January 31, 2012 (Unaudited)Amounts in thousands (except share amounts)
Principal
Amount ($)
or Shares
Market
Value
$
Lincoln National Corp. 17,200 370
Mercury General Corp. 5,100 223
MetLife, Inc. 27,830 983
Morgan Stanley (Ñ) 46,200 862
Northern Trust Corp. 8,700 359
People�s United Financial, Inc. (Ñ) 14,900 184
PNC Financial Services Group, Inc. 27,610 1,627
ProAssurance Corp. 500 41
Protective Life Corp. (Ñ) 2,600 65
Prudential Financial, Inc. 16,655 953
Public Storage (Ñ)(ö) 1,430 199
Raymond James Financial, Inc. (Ñ) 800 28
Rayonier, Inc. (Ñ)(ö) 3,150 144
Simon Property Group, Inc. (ö) 3,290 447
SLM Corp. 15,400 230
SunTrust Banks, Inc. 14,200 292
Torchmark Corp. 2,500 114
Travelers Cos., Inc. (The) 3,500 204
Unum Group 6,100 139
US Bancorp 14,100 398
Valley National Bancorp (Ñ) 15,708 187
Wells Fargo & Co. 59,470 1,737
XL Group PLC Class A 34,065 691
21,120
Health Care - 12.2%Abbott Laboratories 14,780 800
Aetna, Inc. 10,000 437
Amgen, Inc. 19,230 1,306
Baxter International, Inc. 6,100 338
Biogen Idec, Inc. (Æ) 580 68
Bristol-Myers Squibb Co. 12,175 393
Cigna Corp. 3,000 135
Community Health Systems,
Inc. (Æ)(Ñ) 39,190 733
Eli Lilly & Co. 7,500 298
Principal
Amount ($)
or Shares
Market
Value
$
EI du Pont de Nemours & Co. 2,240 114
Freeport-McMoRan Copper & Gold,
Inc. 13,800 638
Huntsman Corp. 29,900 381
International Paper Co. 7,755 241
LyondellBasell Industries NV Class A 10,700 461
Martin Marietta Materials, Inc. (Ñ) 3,500 289
Nucor Corp. (Ñ) 9,300 414
Owens Corning (Æ) 3,300 111
Sealed Air Corp. 19,700 393
Steel Dynamics, Inc. 20,000 319
Timken Co. 3,587 175
5,346
Producer Durables - 11.6%AECOM Technology Corp. (Æ) 13,255 303
AGCO Corp. (Æ)(Ñ) 4,800 244
Boeing Co. (The) 5,205 386
Caterpillar, Inc. 1,825 199
Chicago Bridge & Iron Co. NV 3,500 149
Corrections Corp. of America (Æ) 1,400 33
Crane Co. 2,000 96
Cummins, Inc. 850 88
Delta Air Lines, Inc. (Æ) 17,100 180
Eaton Corp. 2,700 132
Emerson Electric Co. 9,300 478
FedEx Corp. (Ñ) 500 46
Fluor Corp. 1,100 62
General Dynamics Corp. 3,300 228
General Electric Co. 102,770 1,923
Harsco Corp. 11,200 249
Illinois Tool Works, Inc. (Ñ) 9,300 493
Ingersoll-Rand PLC 12,405 433
KBR, Inc. 2,500 80
Lockheed Martin Corp. 3,800 313
MSC Industrial Direct Co., Inc.
Class A 2,100 160
Copyright © 2012 www.secdatabase.com. All Rights Reserved.Please Consider the Environment Before Printing This Document
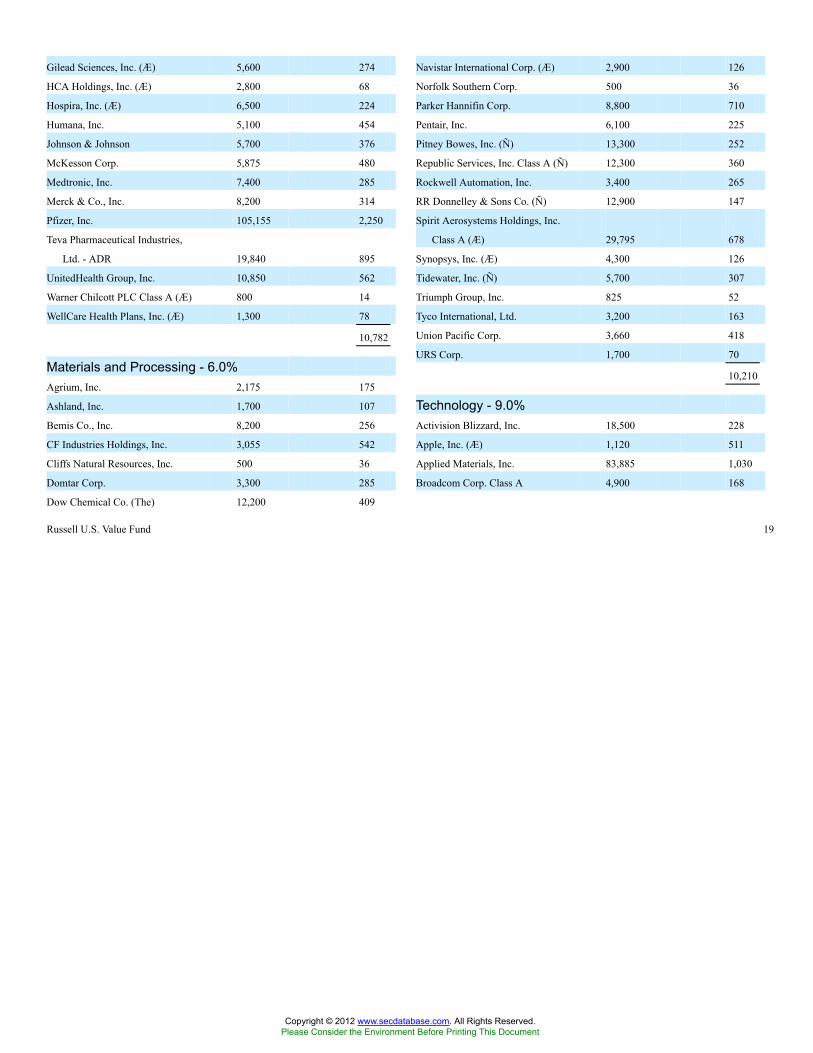
Russell U.S. Value Fund 19
Gilead Sciences, Inc. (Æ) 5,600 274
HCA Holdings, Inc. (Æ) 2,800 68
Hospira, Inc. (Æ) 6,500 224
Humana, Inc. 5,100 454
Johnson & Johnson 5,700 376
McKesson Corp. 5,875 480
Medtronic, Inc. 7,400 285
Merck & Co., Inc. 8,200 314
Pfizer, Inc. 105,155 2,250
Teva Pharmaceutical Industries,
Ltd. - ADR 19,840 895
UnitedHealth Group, Inc. 10,850 562
Warner Chilcott PLC Class A (Æ) 800 14
WellCare Health Plans, Inc. (Æ) 1,300 78
10,782
Materials and Processing - 6.0%Agrium, Inc. 2,175 175
Ashland, Inc. 1,700 107
Bemis Co., Inc. 8,200 256
CF Industries Holdings, Inc. 3,055 542
Cliffs Natural Resources, Inc. 500 36
Domtar Corp. 3,300 285
Dow Chemical Co. (The) 12,200 409
Navistar International Corp. (Æ) 2,900 126
Norfolk Southern Corp. 500 36
Parker Hannifin Corp. 8,800 710
Pentair, Inc. 6,100 225
Pitney Bowes, Inc. (Ñ) 13,300 252
Republic Services, Inc. Class A (Ñ) 12,300 360
Rockwell Automation, Inc. 3,400 265
RR Donnelley & Sons Co. (Ñ) 12,900 147
Spirit Aerosystems Holdings, Inc.
Class A (Æ) 29,795 678
Synopsys, Inc. (Æ) 4,300 126
Tidewater, Inc. (Ñ) 5,700 307
Triumph Group, Inc. 825 52
Tyco International, Ltd. 3,200 163
Union Pacific Corp. 3,660 418
URS Corp. 1,700 70
10,210
Technology - 9.0%Activision Blizzard, Inc. 18,500 228
Apple, Inc. (Æ) 1,120 511
Applied Materials, Inc. 83,885 1,030
Broadcom Corp. Class A 4,900 168
Copyright © 2012 www.secdatabase.com. All Rights Reserved.Please Consider the Environment Before Printing This Document
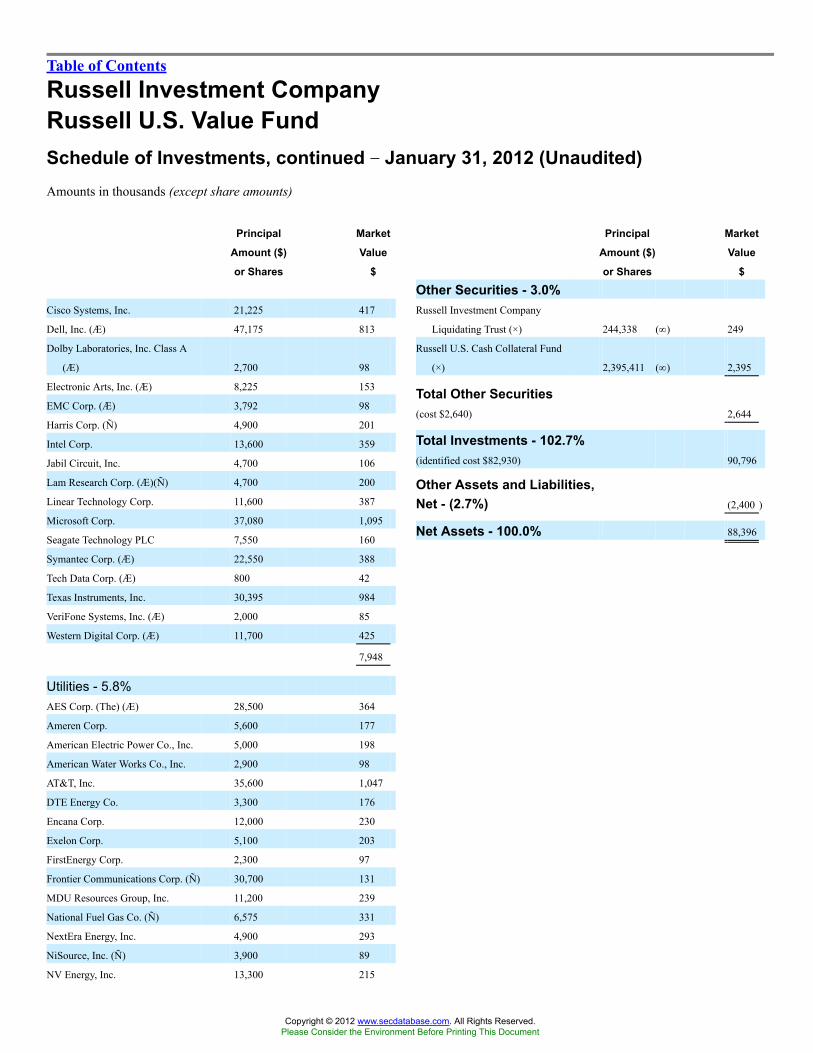
Table of Contents
Russell Investment CompanyRussell U.S. Value FundSchedule of Investments, continued �� January 31, 2012 (Unaudited)Amounts in thousands (except share amounts)
Principal
Amount ($)
or Shares
Market
Value
$
Cisco Systems, Inc. 21,225 417
Dell, Inc. (Æ) 47,175 813
Dolby Laboratories, Inc. Class A
(Æ) 2,700 98
Electronic Arts, Inc. (Æ) 8,225 153
EMC Corp. (Æ) 3,792 98
Harris Corp. (Ñ) 4,900 201
Intel Corp. 13,600 359
Jabil Circuit, Inc. 4,700 106
Lam Research Corp. (Æ)(Ñ) 4,700 200
Linear Technology Corp. 11,600 387
Microsoft Corp. 37,080 1,095
Seagate Technology PLC 7,550 160
Symantec Corp. (Æ) 22,550 388
Tech Data Corp. (Æ) 800 42
Texas Instruments, Inc. 30,395 984
VeriFone Systems, Inc. (Æ) 2,000 85
Western Digital Corp. (Æ) 11,700 425
7,948
Utilities - 5.8%AES Corp. (The) (Æ) 28,500 364
Ameren Corp. 5,600 177
American Electric Power Co., Inc. 5,000 198
American Water Works Co., Inc. 2,900 98
AT&T, Inc. 35,600 1,047
DTE Energy Co. 3,300 176
Encana Corp. 12,000 230
Exelon Corp. 5,100 203
FirstEnergy Corp. 2,300 97
Frontier Communications Corp. (Ñ) 30,700 131
MDU Resources Group, Inc. 11,200 239
National Fuel Gas Co. (Ñ) 6,575 331
NextEra Energy, Inc. 4,900 293
NiSource, Inc. (Ñ) 3,900 89
NV Energy, Inc. 13,300 215
Principal
Amount ($)
or Shares
Market
Value
$
Other Securities - 3.0%Russell Investment Company
Liquidating Trust (×) 244,338 (¥) 249
Russell U.S. Cash Collateral Fund
(×) 2,395,411 (¥) 2,395
Total Other Securities(cost $2,640) 2,644
Total Investments - 102.7%(identified cost $82,930) 90,796
Other Assets and Liabilities,Net - (2.7%) (2,400 )
Net Assets - 100.0% 88,396
Copyright © 2012 www.secdatabase.com. All Rights Reserved.Please Consider the Environment Before Printing This Document
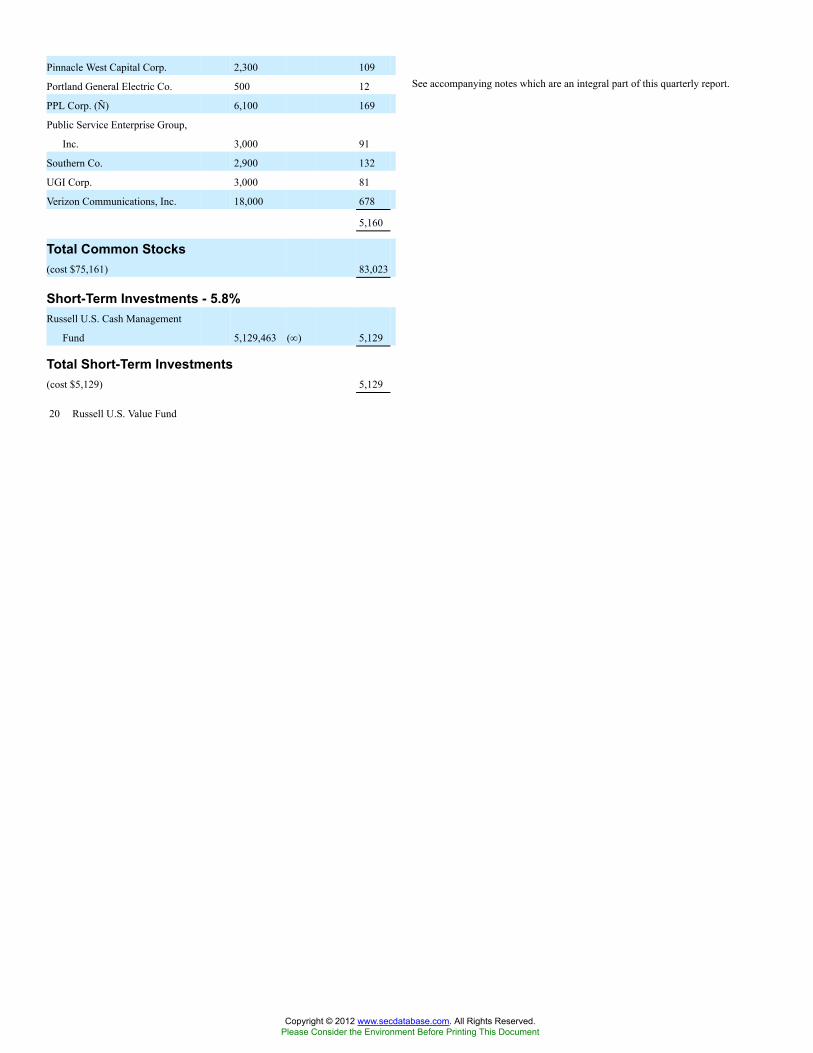
See accompanying notes which are an integral part of this quarterly report.
20 Russell U.S. Value Fund
Pinnacle West Capital Corp. 2,300 109
Portland General Electric Co. 500 12
PPL Corp. (Ñ) 6,100 169
Public Service Enterprise Group,
Inc. 3,000 91
Southern Co. 2,900 132
UGI Corp. 3,000 81
Verizon Communications, Inc. 18,000 678
5,160
Total Common Stocks(cost $75,161) 83,023
Short-Term Investments - 5.8%Russell U.S. Cash Management
Fund 5,129,463 (¥) 5,129
Total Short-Term Investments(cost $5,129) 5,129
Copyright © 2012 www.secdatabase.com. All Rights Reserved.Please Consider the Environment Before Printing This Document

Table of Contents
Russell Investment CompanyRussell U.S. Value FundSchedule of Investments, continued �� January 31, 2012 (Unaudited)Amounts in thousands (except contract amounts)
Futures ContractsNumber of
Contracts
Notional
Amount
Expiration
Date
Unrealized
Appreciation
(Depreciation)
$
Long PositionsS&P 500 E-Mini Index Futures (CME) 81 USD 5,298 03/12 133
Total Unrealized Appreciation (Depreciation) on Open Futures Contracts (å) 133
Presentation of Portfolio Holdings �� January 31, 2012 (Unaudited)
Amounts in thousands
Market Value
Portfolio Summary Level 1 Level 2 Level 3 Total
Common Stocks
Consumer Discretionary $7,936 $� $ � $7,936
Consumer Staples 4,277 � � 4,277
Energy 10,244 � � 10,244
Financial Services 21,120 � � 21,120
Health Care 10,782 � � 10,782
Materials and Processing 5,346 � � 5,346
Producer Durables 10,210 � � 10,210
Technology 7,948 � � 7,948
Utilities 5,160 � � 5,160
Short-Term Investments � 5,129 � 5,129
Other Securities � 2,644 � 2,644
Total Investments 83,023 7,773 � 90,796
Other Financial Instruments
Futures Contracts 133 � � 133
Total Other Financial Instruments* $133 $� $ � $133
* Other financial instruments reflected, such as futures, forwards, interest rate swaps, and credit default swaps are valued at the unrealized appreciation/depreciation
on the instruments.
For a description of the levels see note 2 in the Notes to Quarterly Report.
Copyright © 2012 www.secdatabase.com. All Rights Reserved.Please Consider the Environment Before Printing This Document

See accompanying notes which are an integral part of this quarterly report.
Russell U.S. Value Fund 21
Copyright © 2012 www.secdatabase.com. All Rights Reserved.Please Consider the Environment Before Printing This Document

Table of Contents
Russell Investment CompanyRussell U.S. Small Cap Equity Fund
Schedule of Investments �� January 31, 2012 (Unaudited)Amounts in thousands (except share amounts)
Principal
Amount ($)
or Shares
Market
Value
$
Common Stocks - 96.8%Consumer Discretionary - 15.0%Aaron�s, Inc. Class A 18,800 500
Abercrombie & Fitch Co. Class A 27,620 1,269
Aeropostale, Inc. (Æ) 52,200 855
AFC Enterprises, Inc. (Æ) 48,100 810
Amerco, Inc. 15,649 1,514
American Axle & Manufacturing
Holdings, Inc. (Æ) 309,855 3,737
American Eagle Outfitters, Inc. 110,150 1,552
America�s Car-Mart, Inc. (Æ) 100,190 3,801
Ameristar Casinos, Inc. 42,700 835
Arctic Cat, Inc. (Æ) 108,014 3,223
Avis Budget Group, Inc. (Æ) 100,700 1,445
Bally Technologies, Inc. (Æ) 121,850 5,145
Bebe Stores, Inc. 112,590 986
Belo Corp. Class A 232,700 1,729
BJ�s Restaurants, Inc. (Æ) 100,442 5,025
Body Central Corp. (Æ) 180,685 4,857
Boston Pizza Royalties Income
Fund 249,400 3,723
Bravo Brio Restaurant Group,
Inc. (Æ) 92,740 1,785
Brown Shoe Co., Inc. (Ñ) 76,960 727
Buffalo Wild Wings, Inc. (Æ) 14,094 938
Build-A-Bear Workshop, Inc. Class
A (Æ) 24,745 202
Callaway Golf Co. 627,750 4,206
Caribou Coffee Co., Inc. (Æ) 147,640 2,504
Carmike Cinemas, Inc. (Æ) 85,900 612
Carter�s, Inc. (Æ) 11,500 482
Cato Corp. (The) Class A 123,100 3,300
Cenveo, Inc. (Æ)(Ñ) 128,965 432
Charming Shoppes, Inc. (Æ) 212,100 1,052
Chico�s FAS, Inc. 306,710 3,509
Christopher & Banks Corp. 144,027 298
Principal
Amount ($)
or Shares
Market
Value
$
Harman International Industries,
Inc. 46,700 1,971
HealthStream, Inc. (Æ) 28,870 536
Hibbett Sports, Inc. (Æ) 54,210 2,598
Hillenbrand, Inc. 114,433 2,683
HomeAway, Inc. (Æ)(Ñ) 38,779 1,049
HOT Topic, Inc. 496,993 3,638
Iconix Brand Group, Inc. (Æ) 39,000 718
Imax Corp. (Æ)(Ñ) 52,335 1,084
Interval Leisure Group, Inc. (Æ) 78,300 1,065
Isle of Capri Casinos, Inc. (Æ) 198,237 1,007
Jack in the Box, Inc. (Æ) 104,200 2,209
Jones Group, Inc. (The) 561,030 5,122
Kenneth Cole Productions, Inc.
Class A (Æ) 160,947 1,978
Krispy Kreme Doughnuts, Inc. (Æ) 61,100 448
Leapfrog Enterprises, Inc. Class A
(Æ) 92,047 533
Lear Corp. 8,800 369
Lennar Corp. Class B (Ñ) 121,700 2,094
LIN TV Corp. Class A (Æ) 238,685 962
Lincoln Educational Services Corp. 59,814 522
Lithia Motors, Inc. Class A 113,650 2,524
Liz Claiborne, Inc. (Æ)(Ñ) 71,000 660
Matthews International Corp.
Class A 45,928 1,514
MDC Holdings, Inc. (Ñ) 86,818 1,721
MDC Partners, Inc. Class A 322,727 4,221
Men�s Wearhouse, Inc. (The) 44,363 1,530
Meredith Corp. (Ñ) 215,629 6,790
Movado Group, Inc. 28,400 523
Multimedia Games Holding Co.,
Inc. (Æ) 139,714 1,055
NVR, Inc. (Æ) 530 367
Orbitz Worldwide, Inc. (Æ) 155,150 568
Orient-Express Hotels, Ltd. Class
A (Æ) 94,000 795
Copyright © 2012 www.secdatabase.com. All Rights Reserved.Please Consider the Environment Before Printing This Document

22 Russell U.S. Small Cap Equity Fund
Collective Brands, Inc. (Æ)(Ñ) 128,000 2,132
Columbia Sportswear Co. (Ñ) 40,440 1,854
Conn�s, Inc. (Æ)(Ñ) 56,419 654
Constant Contact, Inc. (Æ)(Ñ) 143,770 3,591
Cooper Tire & Rubber Co. 305,630 4,603
Cost Plus, Inc. (Æ) 48,390 656
Courier Corp. 5,900 73
Cracker Barrel Old Country Store,
Inc. 18,900 992
Crocs, Inc. (Æ) 292,623 5,566
CSS Industries, Inc. 2,600 56
Dana Holding Corp. 43,630 648
Delta Apparel, Inc. (Æ) 1,800 28
Domino�s Pizza, Inc. (Æ) 49,800 1,626
DSW, Inc. Class A 14,900 745
Einstein Noah Restaurant Group,
Inc. 150,700 2,244
EW Scripps Co. Class A (Æ) 33,100 280
Federal-Mogul Corp. (Æ) 39,500 655
Finish Line, Inc. (The) Class A 216,305 4,575
Francesca�s Holdings Corp. (Æ)(Ñ) 105,890 2,348
Fred�s, Inc. Class A 90,068 1,329
Gaylord Entertainment Co. (Æ) 45,390 1,273
Genesco, Inc. (Æ) 69,910 4,269
Gentex Corp. 65,228 1,753
Group 1 Automotive, Inc. 75,669 4,036
Oxford Industries, Inc. 17,480 890
Pacific Sunwear of California, Inc.
(Æ) 29,436 53
Panera Bread Co. Class A (Æ) 12,360 1,832
Papa John�s International, Inc. (Æ) 20,000 775
Penn National Gaming, Inc. (Æ) 44,917 1,839
Penske Automotive Group, Inc. 8,700 195
Perry Ellis International, Inc. (Æ) 35,345 549
PF Chang�s China Bistro, Inc. 33,900 1,104
Pier 1 Imports, Inc. (Æ) 263,834 4,103
Pinnacle Entertainment, Inc. (Æ) 133,000 1,290
Pizza Pizza Royalty Income Fund 80,800 730
RadioShack Corp. 245,375 1,762
Red Robin Gourmet Burgers, Inc.
(Æ) 14,400 442
Regis Corp. 150,720 2,583
Rent-A-Center, Inc. Class A 44,400 1,502
Rue21, Inc. (Æ)(Ñ) 41,870 1,014
Second Cup, Ltd. (The) 24,300 162
Select Comfort Corp. (Æ) 7,900 198
Shuffle Master, Inc. (Æ) 284,009 3,635
Sinclair Broadcast Group, Inc.
Class A 125,000 1,535
Skechers U.S.A., Inc. Class A (Æ) 76,283 928
Smith & Wesson Holding Corp. (Æ) 235,126 1,209
Snap-on, Inc. 49,100 2,775
Sotheby�s Class A 108,190 3,628
Stamps.com, Inc. (Æ)(Ñ) 15,900 493
Standard Motor Products, Inc. 99,020 2,049
Copyright © 2012 www.secdatabase.com. All Rights Reserved.Please Consider the Environment Before Printing This Document

Table of Contents
Russell Investment CompanyRussell U.S. Small Cap Equity FundSchedule of Investments, continued �� January 31, 2012 (Unaudited)Amounts in thousands (except share amounts)
Principal
Amount ($)
or Shares
Market
Value
$
Steven Madden, Ltd. (Æ) 71,801 2,954
Stewart Enterprises, Inc. Class A (Ñ) 187,400 1,153
Sturm Ruger & Co., Inc. 13,485 535
Superior Industries International, Inc. 75,512 1,372
Teavana Holdings, Inc. (Æ)(Ñ) 191,212 3,629
Tenneco, Inc. (Æ) 32,499 1,043
True Religion Apparel, Inc. (Æ) 28,500 1,033
Ulta Salon Cosmetics & Fragrance,
Inc. (Æ) 32,202 2,454
Under Armour, Inc. Class A (Æ) 24,378 1,941
ValueClick, Inc. (Æ) 251,975 4,394
VOXX International Corp. Class A
(Æ) 17,700 225
Warnaco Group, Inc. (The) (Æ) 9,750 568
Wendy�s Co. (The) 95,389 447
Williams-Sonoma, Inc. 52,900 1,897
WMS Industries, Inc. (Æ) 43,715 957
Wolverine World Wide, Inc. 48,715 1,904
XO Group, Inc. (Æ) 8,300 68
Zale Corp. (Æ)(Ñ) 19,000 54
223,796
Consumer Staples - 2.5%Andersons, Inc. (The) 74,421 3,018
Calavo Growers, Inc. 20,100 547
Casey�s General Stores, Inc. 78,800 4,014
Chefs� Warehouse Holdings, Inc. (Æ) 30,030 635
Core-Mark Holding Co., Inc. 26,445 1,074
Corn Products International, Inc. 26,000 1,443
Cott Corp. (Æ) 77,360 544
Dean Foods Co. (Æ) 326,600 3,514
Flowers Foods, Inc. 127,500 2,467
Fresh Del Monte Produce, Inc. 64,304 1,574
Fresh Market, Inc. (The) (Æ)(Ñ) 43,638 1,879
Hain Celestial Group, Inc. (The) (Æ) 18,700 722
Heckmann Corp. (Æ)(Ñ) 66,390 339
Principal
Amount ($)
or Shares
Market
Value
$
Flotek Industries, Inc. (Æ)(Ñ) 44,725 525
GeoResources, Inc. (Æ) 18,700 572
Gulfport Energy Corp. (Æ) 47,552 1,563
Helix Energy Solutions Group, Inc.
(Æ) 14,200 234
Helmerich & Payne, Inc. 13,400 827
Hercules Offshore, Inc. (Æ) 310,785 1,395
Hornbeck Offshore Services,
Inc. (Æ)(Ñ) 83,100 2,716
Key Energy Services, Inc. (Æ) 55,520 804
Lufkin Industries, Inc. 43,839 3,298
Magnum Hunter Resources
Corp. (Æ)(Ñ) 166,925 983
Mitcham Industries, Inc. (Æ) 26,770 588
Nabors Industries, Ltd. (Æ) 137,542 2,561
Newpark Resources, Inc. (Æ) 591,435 4,814
Northern Oil and Gas, Inc. (Æ)(Ñ) 59,998 1,500
Oasis Petroleum, Inc. (Æ)(Ñ) 34,795 1,174
Oil States International, Inc. (Æ) 14,200 1,132
Pacific Drilling SA (Æ) 177,530 1,704
Parker Drilling Co. (Æ) 80,700 524
Patterson-UTI Energy, Inc. 180,438 3,405
Petroquest Energy, Inc. (Æ)(Ñ) 429,600 2,758
Pioneer Drilling Co. (Æ) 135,000 1,204
Plains Exploration & Production
Co. (Æ) 49,700 1,875
Precision Drilling Corp. (Æ) 171,508 1,753
RAM Energy Resources, Inc. (Æ)(Ñ) 177,560 648
Rosetta Resources, Inc. (Æ) 56,480 2,710
Rowan Cos., Inc. (Æ) 81,445 2,770
SEACOR Holdings, Inc. (Æ)(Ñ) 6,100 558
SM Energy Co. 22,600 1,640
Stone Energy Corp. (Æ) 41,600 1,167
Superior Energy Services, Inc.
(Æ)(Ñ) 189,512 5,403
Triangle Petroleum Corp. (Æ)(Ñ) 45,500 311
Unit Corp. (Æ) 77,210 3,494
Copyright © 2012 www.secdatabase.com. All Rights Reserved.Please Consider the Environment Before Printing This Document

Russell U.S. Small Cap Equity Fund 23
Nash Finch Co. 18,198 532
Pantry, Inc. (The) (Æ) 26,000 313
Peet�s Coffee & Tea, Inc. (Æ)(Ñ) 7,125 433
Smart Balance, Inc. (Æ) 807,104 4,278
SUPERVALU, Inc. (Ñ) 214,973 1,485
Susser Holdings Corp. (Æ) 54,690 1,304
TreeHouse Foods, Inc. (Æ)(Ñ) 135,320 7,651
37,766
Energy - 5.4%Alon USA Energy, Inc. 45,678 441
Approach Resources, Inc. (Æ)(Ñ) 115,937 4,073
Arch Coal, Inc. 110,800 1,599
Atwood Oceanics, Inc. (Æ) 51,200 2,354
Berry Petroleum Co. Class A 73,000 3,286
C&J Energy Services, Inc. (Æ)(Ñ) 44,505 741
Cal Dive International, Inc. (Æ) 465,600 1,401
Carrizo Oil & Gas, Inc. (Æ) 112,300 2,728
Cloud Peak Energy, Inc. (Æ) 58,400 1,107
Crimson Exploration, Inc. (Æ) 4,308 13
Crosstex Energy, Inc. 47,900 602
Dawson Geophysical Co. (Æ) 57,420 2,044
Delek US Holdings, Inc. 118,735 1,495
USEC, Inc. (Æ)(Ñ) 494,593 945
Western Refining, Inc. 35,871 593
80,032
Financial Services - 19.8%Allied World Assurance Co. Holdings
AG 32,000 1,969
American Assets Trust, Inc. (ö) 74,855 1,657
American Campus Communities,
Inc. (ö) 58,650 2,510
American Equity Investment Life
Holding Co. 268,300 3,094
American Financial Group, Inc. 31,600 1,159
Ameriprise Financial, Inc. 42,001 2,249
Arch Capital Group, Ltd. (Æ) 36,100 1,301
Ares Capital Corp. 84,192 1,334
Argo Group International Holdings,
Ltd. 113,445 3,268
Assurant, Inc. 62,000 2,455
Assured Guaranty, Ltd. 76,700 1,190
Axis Capital Holdings, Ltd. 66,600 2,050
Banco Latinoamericano de Comercio
Exterior SA Class E 47,130 872
Bancorp, Inc. (Æ) 45,500 365
Bank of the Ozarks, Inc. 130,400 3,650
Banner Corp. 27,100 532
Berkshire Hills Bancorp, Inc. 16,500 373
BioMed Realty Trust, Inc. (ö) 230,399 4,279
Copyright © 2012 www.secdatabase.com. All Rights Reserved.Please Consider the Environment Before Printing This Document
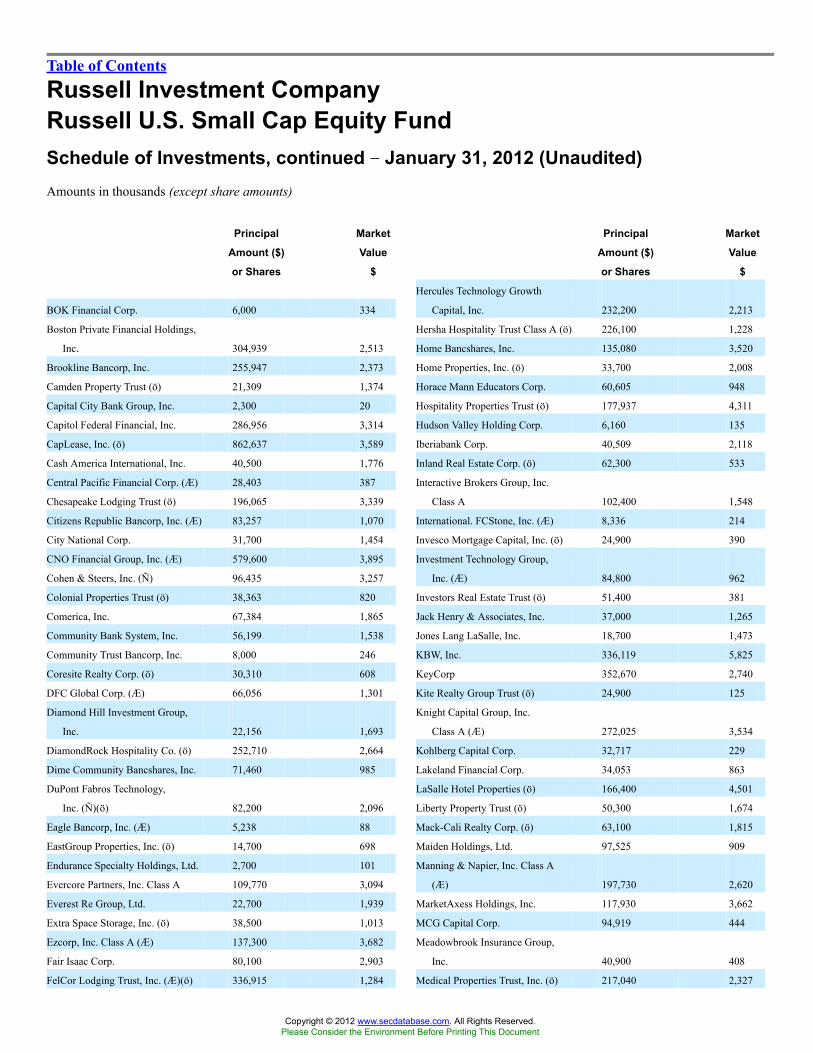
Table of Contents
Russell Investment CompanyRussell U.S. Small Cap Equity FundSchedule of Investments, continued �� January 31, 2012 (Unaudited)Amounts in thousands (except share amounts)
Principal
Amount ($)
or Shares
Market
Value
$
BOK Financial Corp. 6,000 334
Boston Private Financial Holdings,
Inc. 304,939 2,513
Brookline Bancorp, Inc. 255,947 2,373
Camden Property Trust (ö) 21,309 1,374
Capital City Bank Group, Inc. 2,300 20
Capitol Federal Financial, Inc. 286,956 3,314
CapLease, Inc. (ö) 862,637 3,589
Cash America International, Inc. 40,500 1,776
Central Pacific Financial Corp. (Æ) 28,403 387
Chesapeake Lodging Trust (ö) 196,065 3,339
Citizens Republic Bancorp, Inc. (Æ) 83,257 1,070
City National Corp. 31,700 1,454
CNO Financial Group, Inc. (Æ) 579,600 3,895
Cohen & Steers, Inc. (Ñ) 96,435 3,257
Colonial Properties Trust (ö) 38,363 820
Comerica, Inc. 67,384 1,865
Community Bank System, Inc. 56,199 1,538
Community Trust Bancorp, Inc. 8,000 246
Coresite Realty Corp. (ö) 30,310 608
DFC Global Corp. (Æ) 66,056 1,301
Diamond Hill Investment Group,
Inc. 22,156 1,693
DiamondRock Hospitality Co. (ö) 252,710 2,664
Dime Community Bancshares, Inc. 71,460 985
DuPont Fabros Technology,
Inc. (Ñ)(ö) 82,200 2,096
Eagle Bancorp, Inc. (Æ) 5,238 88
EastGroup Properties, Inc. (ö) 14,700 698
Endurance Specialty Holdings, Ltd. 2,700 101
Evercore Partners, Inc. Class A 109,770 3,094
Everest Re Group, Ltd. 22,700 1,939
Extra Space Storage, Inc. (ö) 38,500 1,013
Ezcorp, Inc. Class A (Æ) 137,300 3,682
Fair Isaac Corp. 80,100 2,903
FelCor Lodging Trust, Inc. (Æ)(ö) 336,915 1,284
Principal
Amount ($)
or Shares
Market
Value
$
Hercules Technology Growth
Capital, Inc. 232,200 2,213
Hersha Hospitality Trust Class A (ö) 226,100 1,228
Home Bancshares, Inc. 135,080 3,520
Home Properties, Inc. (ö) 33,700 2,008
Horace Mann Educators Corp. 60,605 948
Hospitality Properties Trust (ö) 177,937 4,311
Hudson Valley Holding Corp. 6,160 135
Iberiabank Corp. 40,509 2,118
Inland Real Estate Corp. (ö) 62,300 533
Interactive Brokers Group, Inc.
Class A 102,400 1,548
International. FCStone, Inc. (Æ) 8,336 214
Invesco Mortgage Capital, Inc. (ö) 24,900 390
Investment Technology Group,
Inc. (Æ) 84,800 962
Investors Real Estate Trust (ö) 51,400 381
Jack Henry & Associates, Inc. 37,000 1,265
Jones Lang LaSalle, Inc. 18,700 1,473
KBW, Inc. 336,119 5,825
KeyCorp 352,670 2,740
Kite Realty Group Trust (ö) 24,900 125
Knight Capital Group, Inc.
Class A (Æ) 272,025 3,534
Kohlberg Capital Corp. 32,717 229
Lakeland Financial Corp. 34,053 863
LaSalle Hotel Properties (ö) 166,400 4,501
Liberty Property Trust (ö) 50,300 1,674
Mack-Cali Realty Corp. (ö) 63,100 1,815
Maiden Holdings, Ltd. 97,525 909
Manning & Napier, Inc. Class A
(Æ) 197,730 2,620
MarketAxess Holdings, Inc. 117,930 3,662
MCG Capital Corp. 94,919 444
Meadowbrook Insurance Group,
Inc. 40,900 408
Medical Properties Trust, Inc. (ö) 217,040 2,327
Copyright © 2012 www.secdatabase.com. All Rights Reserved.Please Consider the Environment Before Printing This Document

24 Russell U.S. Small Cap Equity Fund
Fidelity National Financial, Inc.
Class A 109,800 1,997
Financial Engines, Inc. (Æ)(Ñ) 41,600 996
First American Financial Corp. 181,850 2,695
First Cash Financial Services, Inc.
(Æ) 14,700 592
First Connecticut Bancorp, Inc. 1,700 23
First Financial Bankshares, Inc. (Ñ) 72,064 2,456
First Industrial Realty Trust,
Inc. (Æ)(ö) 46,500 534
First Interstate Bancsystem, Inc.
Class A 6,000 83
FirstMerit Corp. 43,100 676
Flagstone Reinsurance Holdings SA 450,974 3,937
FNB Corp. 233,450 2,736
Forestar Group, Inc. (Æ) 142,807 2,273
Franklin Street Properties Corp. (ö) 272,969 2,782
Fulton Financial Corp. 161,300 1,498
FXCM, Inc. Class A (Ñ) 56,900 599
Gain Capital Holdings, Inc. 7,900 50
GFI Group, Inc. 69,274 321
Global Cash Access Holdings,
Inc. (Æ) 889,425 4,714
Great Southern Bancorp, Inc. 2,000 49
Greenhill & Co., Inc. (Ñ) 110,940 5,165
Hancock Holding Co. 44,268 1,470
Hanmi Financial Corp. (Æ) 24,483 202
Hanover Insurance Group, Inc.
(The) 63,030 2,292
Healthcare Realty Trust, Inc. (ö) 286,575 6,038
Medley Capital Corp. 7,900 88
MFA Financial, Inc. (ö) 44,000 323
MI Developments, Inc. 111,400 3,896
Mid-America Apartment
Communities, Inc. (ö) 30,800 1,969
MoneyGram International, Inc. (Æ) 163,200 3,029
MPG Office Trust, Inc. (Æ)(ö) 4,400 11
Nelnet, Inc. Class A 85,100 2,098
New Mountain Finance Corp. 9,100 120
NorthStar Realty Finance Corp.
(Ñ)(ö) 87,200 434
One Liberty Properties, Inc. (ö) 6,900 120
Park Sterling Corp. (Æ) 326,140 1,429
Pebblebrook Hotel Trust (ö) 18,500 410
PennantPark Investment Corp. 122,469 1,263
Pennsylvania Real Estate
Investment Trust (ö) 24,200 297
PennyMac Mortgage Investment
Trust (ö) 36,400 645
Peoples Bancorp, Inc. 900 14
Piper Jaffray Cos. (Æ) 91,852 2,044
Portfolio Recovery Associates,
Inc. (Æ) 14,150 919
Post Properties, Inc. (ö) 23,200 1,037
PrivateBancorp, Inc. Class A 94,231 1,332
ProAssurance Corp. 22,370 1,826
Prosperity Bancshares, Inc. 122,630 5,090
Protective Life Corp. 82,871 2,073
PS Business Parks, Inc. (ö) 58,100 3,610
Copyright © 2012 www.secdatabase.com. All Rights Reserved.Please Consider the Environment Before Printing This Document

Table of Contents
Russell Investment CompanyRussell U.S. Small Cap Equity FundSchedule of Investments, continued �� January 31, 2012 (Unaudited)Amounts in thousands (except share amounts)
Principal
Amount ($)
or Shares
Market
Value
$
Raymond James Financial, Inc. 39,569 1,385
Reinsurance Group of America, Inc.
Class A 29,000 1,580
Resource Capital Corp. (ö) 145,220 850
RLI Corp. 21,700 1,548
Sabra Health Care REIT, Inc. (ö) 43,543 619
SCBT Financial Corp. 1,200 37
Selective Insurance Group, Inc. 120,100 2,159
Signature Bank (Æ) 142,593 8,292
Southside Bancshares, Inc. 22,100 473
State Bank Financial Corp. (Æ) 43,300 692
StellarOne Corp. 189,229 2,324
Sterling Bancorp Class N 184,632 1,763
Strategic Hotels & Resorts,
Inc. (Æ)(ö) 105,500 655
Sunstone Hotel Investors, Inc. (Æ)(ö) 126,300 1,173
SVB Financial Group (Æ) 128,384 7,451
SWS Group, Inc. (Æ) 6,500 48
Symetra Financial Corp. 171,982 1,586
Synovus Financial Corp. 333,040 579
Territorial Bancorp, Inc. 10,162 210
Texas Capital Bancshares, Inc. (Æ) 194,449 6,168
THL Credit, Inc. 8,100 106
Trustco Bank Corp. NY 62,148 347
UMB Financial Corp. 97,343 3,755
United Bankshares, Inc. (Ñ) 62,900 1,756
United Financial Bancorp, Inc. 9,100 147
Universal Health Realty Income
Trust (ö) 9,200 368
Urstadt Biddle Properties, Inc.
Class A (ö) 7,000 137
Validus Holdings, Ltd. 32,000 1,026
Valley National Bancorp (Ñ) 149,000 1,776
Virtus Investment Partners, Inc. (Æ) 53,408 4,239
Walter Investment Management Corp. 29,100 545
Washington Banking Co. 7,053 93
Principal
Amount ($)
or Shares
Market
Value
$
Array Biopharma, Inc. (Æ) 59,537 164
Athenahealth, Inc. (Æ)(Ñ) 82,937 4,825
BioMimetic Therapeutics, Inc. (Æ) 8,253 16
Bio-Reference Labs, Inc. (Æ)(Ñ) 33,515 649
Cambrex Corp. (Æ) 67,600 531
Cantel Medical Corp. 57,575 1,818
Catalyst Health Solutions, Inc. (Æ) 218,558 11,968
Centene Corp. (Æ) 103,280 4,668
Cepheid, Inc. (Æ) 86,339 3,804
Chemed Corp. 29,200 1,639
Clovis Oncology, Inc. (Æ) 26,253 499
Computer Programs & Systems, Inc. 68,332 3,912
CONMED Corp. (Æ) 71,327 2,097
Cooper Cos., Inc. (The) 27,236 1,965
Corvel Corp. (Æ) 39,750 1,935
Curis, Inc. (Æ)(Ñ) 105,305 521
Cynosure, Inc. Class A (Æ) 121,736 1,696
Durect Corp. (Æ) 75,100 59
Dyax Corp. (Æ) 40,613 66
Dynavax Technologies Corp. (Æ)(Ñ) 144,900 504
Endologix, Inc. (Æ) 54,500 707
Epocrates, Inc. (Æ)(Ñ) 26,645 258
Exact Sciences Corp. (Æ) 62,200 581
Greatbatch, Inc. (Æ) 81,175 1,901
Haemonetics Corp. (Æ) 52,500 3,410
Halozyme Therapeutics, Inc. (Æ) 49,700 525
Hanger Orthopedic Group, Inc.
(Æ)(Ñ) 236,912 4,641
Health Management Associates, Inc.
Class A (Æ) 54,600 350
Health Net, Inc. (Æ) 44,312 1,672
Hill-Rom Holdings, Inc. 46,200 1,525
HMS Holdings Corp. (Æ) 190,154 6,277
Hologic, Inc. (Æ) 104,400 2,129
Icon PLC - ADR (Æ) 188,300 3,674
Idenix Pharmaceuticals, Inc. (Æ) 46,470 622
Impax Laboratories, Inc. (Æ) 130,940 2,471
Copyright © 2012 www.secdatabase.com. All Rights Reserved.Please Consider the Environment Before Printing This Document

Russell U.S. Small Cap Equity Fund 25
Washington Federal, Inc. 374,644 5,904
Webster Financial Corp. 185,000 3,922
WesBanco, Inc. 3,000 60
Western Alliance Bancorp (Æ) 138,770 1,109
Wilshire Bancorp, Inc. (Æ) 24,701 86
WSFS Financial Corp. 14,099 549
XL Group PLC Class A 172,000 3,486
Zions Bancorporation 30,600 515
294,316
Health Care - 11.1%Abiomed, Inc. (Æ) 27,300 505
Acadia Healthcare Co., Inc. (Æ) 43,465 532
Achillion Pharmaceuticals, Inc. (Æ) 68,780 763
Aegerion Pharmaceuticals, Inc. (Æ) 26,700 459
Affymax, Inc. (Æ) 59,100 472
Affymetrix, Inc. (Æ) 189,165 910
Akorn, Inc. (Æ) 132,240 1,515
Alere, Inc. (Æ) 101,125 2,442
Allos Therapeutics, Inc. (Æ) 155,825 242
AMERIGROUP Corp. Class A (Æ) 55,470 3,773
Analogic Corp. 34,885 1,979
Arena Pharmaceuticals, Inc. (Æ) 110,100 195
Arqule, Inc. (Æ) 58,560 468
Insulet Corp. (Æ) 153,800 2,994
IPC The Hospitalist Co., Inc. (Æ) 55,480 1,869
Jazz Pharmaceuticals PLC (Æ) 21,505 1,000
Kindred Healthcare, Inc. (Æ) 75,100 921
Medicines Co. (The) (Æ) 99,273 1,997
Medicis Pharmaceutical Corp.
Class A 49,753 1,646
Merit Medical Systems, Inc. (Æ) 207,797 2,932
Metropolitan Health Networks,
Inc. (Æ) 68,210 547
Molina Healthcare, Inc. (Æ) 85,700 2,623
Myriad Genetics, Inc. (Æ) 59,200 1,401
Neurocrine Biosciences, Inc. (Æ) 51,360 478
NuVasive, Inc. (Æ) 52,100 808
NxStage Medical, Inc. (Æ) 128,441 2,304
Omnicell, Inc. (Æ) 98,770 1,529
Optimer Pharmaceuticals, Inc.
(Æ)(Ñ) 31,100 403
OraSure Technologies, Inc. (Æ) 50,235 559
Orthofix International NV (Æ) 83,000 3,332
Par Pharmaceutical Cos., Inc. (Æ) 43,000 1,553
PerkinElmer, Inc. 61,000 1,463
Pharmacyclics, Inc. (Æ)(Ñ) 26,400 485
PharMerica Corp. (Æ)(Ñ) 46,700 586
Copyright © 2012 www.secdatabase.com. All Rights Reserved.Please Consider the Environment Before Printing This Document

Table of Contents
Russell Investment CompanyRussell U.S. Small Cap Equity FundSchedule of Investments, continued �� January 31, 2012 (Unaudited)Amounts in thousands (except share amounts)
Principal
Amount ($)
or Shares
Market
Value
$
Progenics Pharmaceuticals, Inc. (Æ) 74,020 714
Quality Systems, Inc. 163,406 6,628
Questcor Pharmaceuticals, Inc. (Æ) 67,934 2,407
Quidel Corp. (Æ) 29,800 426
Raptor Pharmaceutical Corp. (Æ)(Ñ) 80,600 577
RTI Biologics, Inc. (Æ) 312,655 1,079
Salix Pharmaceuticals, Ltd. (Æ) 55,863 2,693
Santarus, Inc. (Æ) 66,438 326
Sequenom, Inc. (Æ)(Ñ) 187,600 809
Spectranetics Corp. (Æ) 62,600 521
Spectrum Pharmaceuticals, Inc. (Æ) 33,960 478
Staar Surgical Co. (Æ) 53,520 583
STERIS Corp. 148,380 4,463
SurModics, Inc. (Æ) 9,900 143
SXC Health Solutions Corp. (Æ) 146,029 9,209
Synergetics USA, Inc. (Æ) 75,700 493
Tenet Healthcare Corp. (Æ) 152,500 807
Triple-S Management Corp.
Class B (Æ) 39,368 840
Universal American Corp. 233,677 2,568
Viropharma, Inc. (Æ) 26,200 781
WellCare Health Plans, Inc. (Æ) 32,500 1,942
Wright Medical Group, Inc. (Æ) 207,800 3,522
XenoPort, Inc. (Æ)(Ñ) 60,300 253
Zalicus, Inc. (Æ)(Ñ) 267,100 286
Zoll Medical Corp. (Æ) 44,900 3,079
165,391
Materials and Processing - 6.5%AK Steel Holding Corp. (Ñ) 360,204 3,400
AMCOL International Corp. 38,700 1,105
American Vanguard Corp. 41,220 620
Apogee Enterprises, Inc. 188,260 2,589
Armtec Infrastructure, Inc. (Æ) 353,480 744
Buckeye Technologies, Inc. 30,062 1,008
Cabot Corp. 205,096 7,424
Principal
Amount ($)
or Shares
Market
Value
$
Mueller Water Products, Inc. Class A 620,300 1,700
Myers Industries, Inc. 7,500 100
Neenah Paper, Inc. 7,600 181
Noranda Aluminum Holding Corp. 63,660 668
Olympic Steel, Inc. 5,275 136
OM Group, Inc. (Æ) 98,969 2,685
Packaging Corp. of America 64,000 1,801
PH Glatfelter Co. 37,800 559
PolyOne Corp. 264,760 3,818
RBC Bearings, Inc. (Æ) 19,355 876
Rockwood Holdings, Inc. (Æ) 16,800 848
RTI International Metals, Inc. (Æ) 113,011 2,844
Sensient Technologies Corp. 62,975 2,495
TPC Group, Inc. (Æ) 113,016 3,713
UFP Technologies, Inc. (Æ) 101,202 1,552
Universal Forest Products, Inc. (Ñ) 77,320 2,456
Universal Stainless & Alloy (Æ) 10,310 410
Uranium Energy Corp. (Æ)(Ñ) 591,236 2,128
Vista Gold Corp. (Æ) 96,860 365
WR Grace & Co. (Æ) 32,500 1,740
96,837
Producer Durables - 17.2%ACCO Brands Corp. (Æ) 54,320 583
Accuride Corp. (Æ) 224,200 1,679
Actuant Corp. Class A 38,235 969
ADA-ES, Inc. (Æ)(Ñ) 23,100 507
Advisory Board Co. (The) (Æ) 84,182 6,421
Aegion Corp. Class A (Æ) 50,100 855
AGCO Corp. (Æ) 82,457 4,200
Alexander & Baldwin, Inc. (Ñ) 46,034 2,177
Alliant Techsystems, Inc. 27,500 1,634
AM Castle & Co. (Æ) 183,843 1,906
American Railcar Industries, Inc. (Æ) 19,050 497
AO Smith Corp. 28,350 1,204
Argan, Inc. 36,359 527
Arkansas Best Corp. 147,276 2,669
Copyright © 2012 www.secdatabase.com. All Rights Reserved.Please Consider the Environment Before Printing This Document

26 Russell U.S. Small Cap Equity Fund
Carpenter Technology Corp. 20,100 1,055
Chemtura Corp. (Æ) 86,700 1,218
Clarcor, Inc. 56,250 2,892
Clearwater Paper Corp. (Æ) 19,600 716
Comfort Systems USA, Inc. 4,847 58
Commercial Metals Co. 322,890 4,630
Cytec Industries, Inc. 38,987 1,944
Eagle Materials, Inc. 115,020 3,383
Globe Specialty Metals, Inc. 222,140 3,039
Haynes International, Inc. 7,200 437
HB Fuller Co. 116,415 3,332
Headwaters, Inc. (Æ) 110,179 292
Hexcel Corp. (Æ) 57,279 1,436
Innospec, Inc. (Æ) 74,800 2,421
Interline Brands, Inc. (Æ) 133,113 2,264
Kaiser Aluminum Corp. (Ñ) 80,650 3,982
KapStone Paper and Packaging
Corp. (Æ) 111,400 1,945
Kaydon Corp. 95,180 3,248
Koppers Holdings, Inc. 88,600 3,366
Kraton Performance Polymers,
Inc. (Æ) 96,540 2,746
Lennox International, Inc. 82,365 2,982
Minerals Technologies, Inc. 23,425 1,486
Astec Industries, Inc. (Æ) 63,260 2,139
Astronics Corp. (Æ) 22,970 765
Barnes Group, Inc. 109,800 2,777
Barrett Business Services, Inc. 6,700 129
BE Aerospace, Inc. (Æ) 94,480 3,987
Blount International, Inc. (Æ) 59,500 977
Booz Allen Hamilton Holding Corp.
Class A (Æ) 74,700 1,315
Brady Corp. Class A 92,890 3,007
Brink�s Co. (The) 47,500 1,339
Bristow Group, Inc. 187,294 9,189
Cascade Corp. 10,035 570
Celadon Group, Inc. 52,300 782
Chart Industries, Inc. (Æ) 102,753 5,730
Chicago Bridge & Iron Co. NV 102,300 4,356
CIRCOR International, Inc. 90,945 3,448
Columbus McKinnon Corp. (Æ) 16,538 264
Consolidated Graphics, Inc. (Æ) 7,740 393
Con-way, Inc. 156,090 4,954
Corporate Executive Board Co. (The) 61,225 2,408
Copyright © 2012 www.secdatabase.com. All Rights Reserved.Please Consider the Environment Before Printing This Document
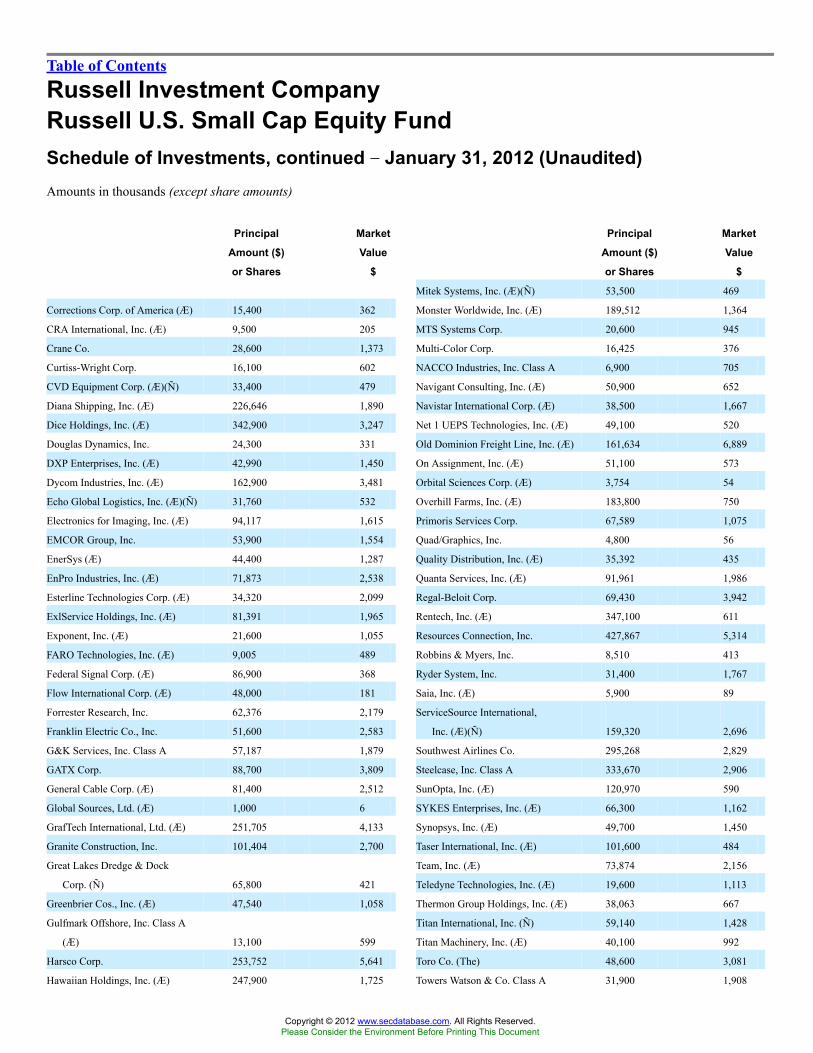
Table of Contents
Russell Investment CompanyRussell U.S. Small Cap Equity FundSchedule of Investments, continued �� January 31, 2012 (Unaudited)Amounts in thousands (except share amounts)
Principal
Amount ($)
or Shares
Market
Value
$
Corrections Corp. of America (Æ) 15,400 362
CRA International, Inc. (Æ) 9,500 205
Crane Co. 28,600 1,373
Curtiss-Wright Corp. 16,100 602
CVD Equipment Corp. (Æ)(Ñ) 33,400 479
Diana Shipping, Inc. (Æ) 226,646 1,890
Dice Holdings, Inc. (Æ) 342,900 3,247
Douglas Dynamics, Inc. 24,300 331
DXP Enterprises, Inc. (Æ) 42,990 1,450
Dycom Industries, Inc. (Æ) 162,900 3,481
Echo Global Logistics, Inc. (Æ)(Ñ) 31,760 532
Electronics for Imaging, Inc. (Æ) 94,117 1,615
EMCOR Group, Inc. 53,900 1,554
EnerSys (Æ) 44,400 1,287
EnPro Industries, Inc. (Æ) 71,873 2,538
Esterline Technologies Corp. (Æ) 34,320 2,099
ExlService Holdings, Inc. (Æ) 81,391 1,965
Exponent, Inc. (Æ) 21,600 1,055
FARO Technologies, Inc. (Æ) 9,005 489
Federal Signal Corp. (Æ) 86,900 368
Flow International Corp. (Æ) 48,000 181
Forrester Research, Inc. 62,376 2,179
Franklin Electric Co., Inc. 51,600 2,583
G&K Services, Inc. Class A 57,187 1,879
GATX Corp. 88,700 3,809
General Cable Corp. (Æ) 81,400 2,512
Global Sources, Ltd. (Æ) 1,000 6
GrafTech International, Ltd. (Æ) 251,705 4,133
Granite Construction, Inc. 101,404 2,700
Great Lakes Dredge & Dock
Corp. (Ñ) 65,800 421
Greenbrier Cos., Inc. (Æ) 47,540 1,058
Gulfmark Offshore, Inc. Class A
(Æ) 13,100 599
Harsco Corp. 253,752 5,641
Hawaiian Holdings, Inc. (Æ) 247,900 1,725
Principal
Amount ($)
or Shares
Market
Value
$
Mitek Systems, Inc. (Æ)(Ñ) 53,500 469
Monster Worldwide, Inc. (Æ) 189,512 1,364
MTS Systems Corp. 20,600 945
Multi-Color Corp. 16,425 376
NACCO Industries, Inc. Class A 6,900 705
Navigant Consulting, Inc. (Æ) 50,900 652
Navistar International Corp. (Æ) 38,500 1,667
Net 1 UEPS Technologies, Inc. (Æ) 49,100 520
Old Dominion Freight Line, Inc. (Æ) 161,634 6,889
On Assignment, Inc. (Æ) 51,100 573
Orbital Sciences Corp. (Æ) 3,754 54
Overhill Farms, Inc. (Æ) 183,800 750
Primoris Services Corp. 67,589 1,075
Quad/Graphics, Inc. 4,800 56
Quality Distribution, Inc. (Æ) 35,392 435
Quanta Services, Inc. (Æ) 91,961 1,986
Regal-Beloit Corp. 69,430 3,942
Rentech, Inc. (Æ) 347,100 611
Resources Connection, Inc. 427,867 5,314
Robbins & Myers, Inc. 8,510 413
Ryder System, Inc. 31,400 1,767
Saia, Inc. (Æ) 5,900 89
ServiceSource International,
Inc. (Æ)(Ñ) 159,320 2,696
Southwest Airlines Co. 295,268 2,829
Steelcase, Inc. Class A 333,670 2,906
SunOpta, Inc. (Æ) 120,970 590
SYKES Enterprises, Inc. (Æ) 66,300 1,162
Synopsys, Inc. (Æ) 49,700 1,450
Taser International, Inc. (Æ) 101,600 484
Team, Inc. (Æ) 73,874 2,156
Teledyne Technologies, Inc. (Æ) 19,600 1,113
Thermon Group Holdings, Inc. (Æ) 38,063 667
Titan International, Inc. (Ñ) 59,140 1,428
Titan Machinery, Inc. (Æ) 40,100 992
Toro Co. (The) 48,600 3,081
Towers Watson & Co. Class A 31,900 1,908
Copyright © 2012 www.secdatabase.com. All Rights Reserved.Please Consider the Environment Before Printing This Document
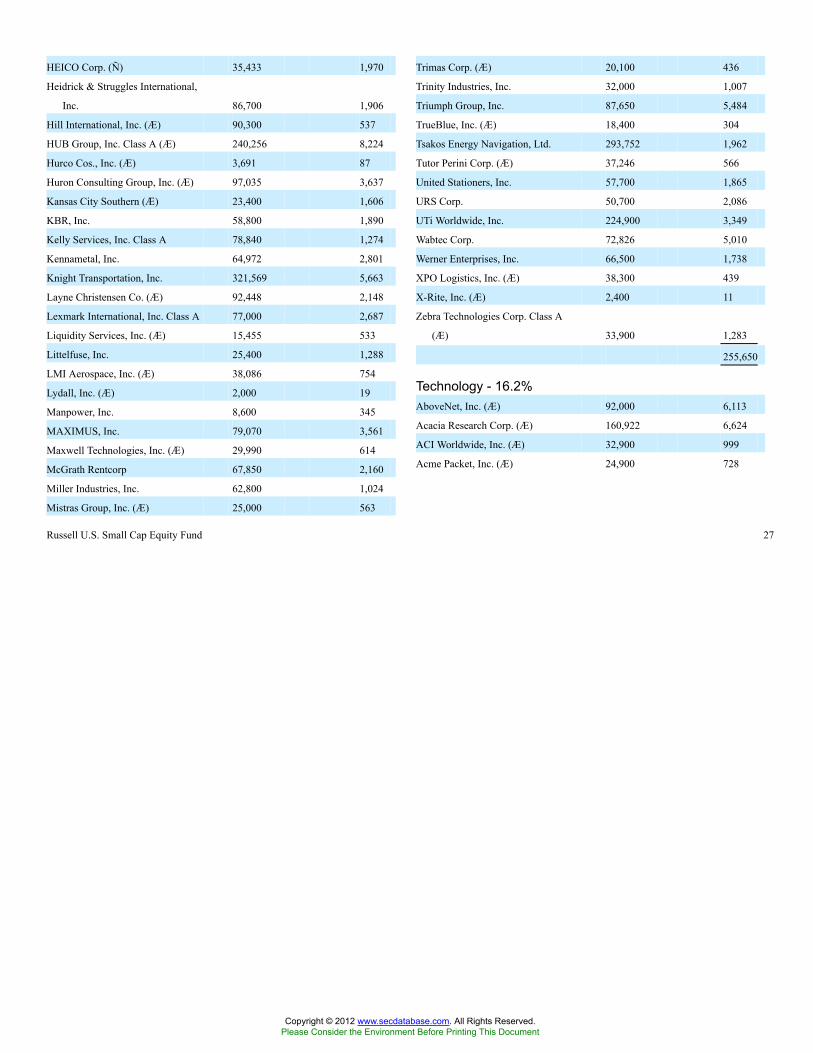
Russell U.S. Small Cap Equity Fund 27
HEICO Corp. (Ñ) 35,433 1,970
Heidrick & Struggles International,
Inc. 86,700 1,906
Hill International, Inc. (Æ) 90,300 537
HUB Group, Inc. Class A (Æ) 240,256 8,224
Hurco Cos., Inc. (Æ) 3,691 87
Huron Consulting Group, Inc. (Æ) 97,035 3,637
Kansas City Southern (Æ) 23,400 1,606
KBR, Inc. 58,800 1,890
Kelly Services, Inc. Class A 78,840 1,274
Kennametal, Inc. 64,972 2,801
Knight Transportation, Inc. 321,569 5,663
Layne Christensen Co. (Æ) 92,448 2,148
Lexmark International, Inc. Class A 77,000 2,687
Liquidity Services, Inc. (Æ) 15,455 533
Littelfuse, Inc. 25,400 1,288
LMI Aerospace, Inc. (Æ) 38,086 754
Lydall, Inc. (Æ) 2,000 19
Manpower, Inc. 8,600 345
MAXIMUS, Inc. 79,070 3,561
Maxwell Technologies, Inc. (Æ) 29,990 614
McGrath Rentcorp 67,850 2,160
Miller Industries, Inc. 62,800 1,024
Mistras Group, Inc. (Æ) 25,000 563
Trimas Corp. (Æ) 20,100 436
Trinity Industries, Inc. 32,000 1,007
Triumph Group, Inc. 87,650 5,484
TrueBlue, Inc. (Æ) 18,400 304
Tsakos Energy Navigation, Ltd. 293,752 1,962
Tutor Perini Corp. (Æ) 37,246 566
United Stationers, Inc. 57,700 1,865
URS Corp. 50,700 2,086
UTi Worldwide, Inc. 224,900 3,349
Wabtec Corp. 72,826 5,010
Werner Enterprises, Inc. 66,500 1,738
XPO Logistics, Inc. (Æ) 38,300 439
X-Rite, Inc. (Æ) 2,400 11
Zebra Technologies Corp. Class A
(Æ) 33,900 1,283
255,650
Technology - 16.2%AboveNet, Inc. (Æ) 92,000 6,113
Acacia Research Corp. (Æ) 160,922 6,624
ACI Worldwide, Inc. (Æ) 32,900 999
Acme Packet, Inc. (Æ) 24,900 728
Copyright © 2012 www.secdatabase.com. All Rights Reserved.Please Consider the Environment Before Printing This Document

Table of Contents
Russell Investment CompanyRussell U.S. Small Cap Equity FundSchedule of Investments, continued �� January 31, 2012 (Unaudited)Amounts in thousands (except share amounts)
Principal
Amount ($)
or Shares
Market
Value
$
Actuate Corp. (Æ) 39,732 229
ADTRAN, Inc. 53,725 1,860
Agilysys, Inc. (Æ) 63,470 517
Akamai Technologies, Inc. (Æ) 40,171 1,295
Allot Communications, Ltd. (Æ) 250,239 3,944
American Software, Inc. Class A
(Æ) 160,620 1,441
Anadigics, Inc. (Æ) 146,876 404
Anixter International, Inc. (Æ) 42,100 2,758
Ansys, Inc. (Æ) 15,187 919
Ariba, Inc. (Æ) 119,869 3,272
Arris Group, Inc. (Æ) 32,200 376
Aruba Networks, Inc. (Æ)(Ñ) 185,212 4,108
ATMI, Inc. (Æ) 24,295 568
AuthenTec, Inc. (Æ) 115,220 401
Aviat Networks, Inc. (Æ) 316,414 702
Axcelis Technologies, Inc. (Æ) 120,500 217
Bankrate, Inc. (Æ) 116,486 2,725
Brightpoint, Inc. (Æ) 114,400 1,341
BroadSoft, Inc. (Æ)(Ñ) 66,506 1,854
Brocade Communications Systems,
Inc. (Æ) 247,200 1,387
Brooks Automation, Inc. 214,600 2,300
Cadence Design Systems, Inc. (Æ) 76,700 810
Cavium, Inc. (Æ) 38,335 1,232
Ceva, Inc. (Æ)(Ñ) 109,619 2,961
CIBER, Inc. (Æ) 71,513 311
Ciena Corp. (Æ) 84,000 1,222
Cohu, Inc. (Þ) 207,308 2,722
Concur Technologies, Inc. (Æ) 49,376 2,585
Cornerstone OnDemand, Inc. (Æ) 75,739 1,381
Cray, Inc. (Æ) 39,700 296
Cree, Inc. (Æ) 62,915 1,600
CSG Systems International, Inc. (Æ) 40,800 664
Datalink Corp. (Æ) 51,900 478
Deltek, Inc. (Æ) 50,540 521
Principal
Amount ($)
or Shares
Market
Value
$
Intersil Corp. Class A 418,950 4,717
Intevac, Inc. (Æ) 10,088 84
J2 Global Inc. (Æ)(Ñ) 112,900 3,044
JDA Software Group, Inc. (Æ) 86,000 2,534
Kemet Corp. (Æ) 243,931 2,242
Kenexa Corp. (Æ) 182,060 4,373
Keynote Systems, Inc. 17,200 337
KIT Digital, Inc. (Æ)(Ñ) 100,800 1,092
Kulicke & Soffa Industries, Inc. (Æ) 151,500 1,638
Lattice Semiconductor Corp. (Æ) 80,300 546
LivePerson, Inc. (Æ) 159,500 1,914
LSI Corp. (Æ) 308,400 2,335
LTX-Credence Corp. (Æ) 75,800 506
Manhattan Associates, Inc. (Æ) 25,000 1,097
Mentor Graphics Corp. (Æ) 302,100 4,190
Mercury Computer Systems,
Inc. (Æ) 10,144 136
Methode Electronics, Inc. 262,780 2,609
Micrel, Inc. 419,970 4,855
MICROS Systems, Inc. (Æ) 80,500 4,002
Mindspeed Technologies, Inc. (Æ) 88,723 569
MKS Instruments, Inc. 42,582 1,284
Molex, Inc. (Ñ) 69,738 1,844
Monolithic Power Systems, Inc. (Æ) 30,664 503
Monotype Imaging Holdings,
Inc. (Æ) 32,880 513
Nanometrics, Inc. (Æ) 24,090 488
NCR Corp. (Æ) 75,017 1,405
Netlist, Inc. (Æ) 193,100 626
Netscout Systems, Inc. (Æ) 28,260 584
NetSuite, Inc. (Æ) 59,901 2,509
NeuStar, Inc. Class A (Æ) 32,400 1,183
Newport Corp. (Æ) 155,514 2,872
Novatel Wireless, Inc. (Æ) 61,957 178
Oclaro, Inc. (Æ) 433,505 1,795
OCZ Technology Group, Inc.
(Æ)(Ñ) 64,900 547
Copyright © 2012 www.secdatabase.com. All Rights Reserved.Please Consider the Environment Before Printing This Document

28 Russell U.S. Small Cap Equity Fund
Digimarc Corp. (Æ) 16,019 423
Digital River, Inc. (Æ) 52,275 837
Diodes, Inc. (Æ) 77,500 1,998
DSP Group, Inc. (Æ) 27,626 158
Earthlink, Inc. 594,100 4,283
Electro Scientific Industries, Inc. 276,093 4,191
Emulex Corp. (Æ) 320,200 3,343
Equinix, Inc. (Æ) 36,235 4,347
Extreme Networks (Æ) 88,040 285
Formfactor, Inc. (Æ) 39,847 205
FSI International, Inc. (Æ) 308,130 1,310
Globecomm Systems, Inc. (Æ) 35,500 507
Hittite Microwave Corp. (Æ) 18,461 1,016
Hutchinson Technology, Inc. (Æ) 6,000 11
IAC/InterActiveCorp 71,400 3,075
Immersion Corp. (Æ) 7,498 42
Imperva, Inc. (Æ) 15,810 521
InfoSpace, Inc. (Æ) 47,800 588
Inphi Corp. (Æ) 287,830 4,222
Insight Enterprises, Inc. (Æ) 16,600 306
Integrated Device Technology,
Inc. (Æ) 218,100 1,383
Intermec, Inc. (Æ) 88,303 745
International Rectifier Corp. (Æ) 114,038 2,600
Opnet Technologies, Inc. 80,500 2,854
PDF Solutions, Inc. (Æ) 6,180 39
Perficient, Inc. (Æ) 401,622 4,470
Pericom Semiconductor Corp. (Æ) 8,600 69
Plantronics, Inc. 83,900 3,124
Plexus Corp. (Æ) 135,600 4,915
PLX Technology, Inc. (Æ) 39,400 124
PMC - Sierra, Inc. (Æ) 118,745 772
Procera Networks, Inc. (Æ) 43,700 735
Progress Software Corp. (Æ) 278,030 6,486
PROS Holdings, Inc. (Æ) 32,620 529
QLIK Technologies, Inc. (Æ) 56,261 1,587
Quantum Corp. (Æ) 27,271 69
Quest Software, Inc. (Æ) 152,650 3,106
RealNetworks, Inc. 26,900 275
RealPage, Inc. (Æ) 102,417 2,634
RF Micro Devices, Inc. (Æ) 86,905 434
Saba Software, Inc. (Æ) 53,415 531
Sanmina-SCI Corp. (Æ) 165,300 1,815
Seachange International, Inc. (Æ) 25,188 181
Sigma Designs, Inc. (Æ) 62,018 374
Silicon Image, Inc. (Æ) 126,900 617
Silicon Motion Technology Corp. -
ADR (Æ) 72,746 1,570
Copyright © 2012 www.secdatabase.com. All Rights Reserved.Please Consider the Environment Before Printing This Document

Table of Contents
Russell Investment CompanyRussell U.S. Small Cap Equity FundSchedule of Investments, continued �� January 31, 2012 (Unaudited)Amounts in thousands (except share amounts)
Principal
Amount ($)
or Shares
Market
Value
$
SolarWinds, Inc. (Æ) 47,100 1,489
Sonus Networks, Inc. (Æ) 335,500 866
Sourcefire, Inc. (Æ) 83,280 2,583
Spansion, Inc. Class A (Æ) 67,500 677
SPS Commerce, Inc. (Æ) 142,296 3,590
SRS Labs, Inc. (Æ) 112,300 777
Super Micro Computer, Inc. (Æ) 32,745 553
Synchronoss Technologies, Inc. (Æ) 133,400 4,458
SYNNEX Corp. (Æ) 15,700 568
Syntel, Inc. 40,205 1,886
Taleo Corp. Class A (Æ) 203,684 7,335
Tangoe, Inc. (Æ) 42,430 615
TeleCommunication Systems, Inc.
Class A (Æ) 83,400 195
TeleNav, Inc. (Æ) 22,000 163
Tellabs, Inc. 185,157 704
THQ, Inc. (Æ)(Ñ) 251,549 168
TriQuint Semiconductor, Inc. (Æ) 184,260 1,104
Ultimate Software Group, Inc. (Æ) 41,539 2,770
Ultratech, Inc. (Æ) 15,900 465
Unisys Corp. (Æ) 81,400 1,707
United Online, Inc. 150,300 854
Velti PLC (Æ) 544,992 4,769
VeriFone Systems, Inc. (Æ) 25,686 1,097
Vishay Intertechnology, Inc. (Æ) 251,566 3,089
Volterra Semiconductor Corp. (Æ) 17,190 519
Xyratex, Ltd. 117,121 1,860
241,583
Utilities - 3.1%8x8, Inc. (Æ)(Ñ) 100,705 447
Allete, Inc. 6,205 257
Alliant Energy Corp. 12,300 521
Avista Corp. 77,800 1,972
Black Hills Corp. 135,908 4,588
Bonanza Creek Energy, Inc. (Æ) 31,705 517
Principal
Amount ($)
or Shares
Market
Value
$
Premiere Global Services, Inc. (Æ) 387,073 3,406
Questar Corp. 15,000 289
Telephone and Data Systems, Inc. 12,039 317
UGI Corp. 25,800 694
46,191
Total Common Stocks(cost $1,294,486) 1,441,562
Short-Term Investments - 2.9%Russell U.S. Cash Management Fund 42,908,946 (¥) 42,909
Total Short-Term Investments(cost $42,909) 42,909
Other Securities - 6.1%Russell Investment Company
Liquidating Trust (×) 4,261,935 (¥) 4,332
Russell U.S. Cash Collateral Fund (×) 86,068,516 (¥) 86,069
Total Other Securities(cost $90,330) 90,401
Total Investments - 105.8%(identified cost $1,427,725) 1,574,872
Other Assets and Liabilities,Net - (5.8%) (86,328 )
Net Assets - 100.0% 1,488,544
Copyright © 2012 www.secdatabase.com. All Rights Reserved.Please Consider the Environment Before Printing This Document

See accompanying notes which are an integral part of this quarterly report.
Russell U.S. Small Cap Equity Fund 29
California Water Service Group 157,821 2,912
Cbeyond, Inc. (Æ) 92,800 789
Chesapeake Utilities Corp. 6,300 271
Cleco Corp. 107,500 4,274
Connecticut Water Service, Inc. 6,600 201
Great Plains Energy, Inc. 87,700 1,808
Idacorp, Inc. 7,500 316
inContact, Inc. (Æ) 117,000 585
Laclede Group, Inc. (The) 10,260 428
Northwest Natural Gas Co. 49,299 2,344
NorthWestern Corp. 130,876 4,599
NTELOS Holdings Corp. 46,720 1,067
NV Energy, Inc. 224,100 3,630
OGE Energy Corp. 31,574 1,669
Otter Tail Corp. 26,108 577
Pinnacle West Capital Corp. 34,700 1,640
PNM Resources, Inc. 215,200 3,833
Portland General Electric Co. 89,800 2,240
A portion of the portfolio has been fair valued as of period end.
Copyright © 2012 www.secdatabase.com. All Rights Reserved.Please Consider the Environment Before Printing This Document
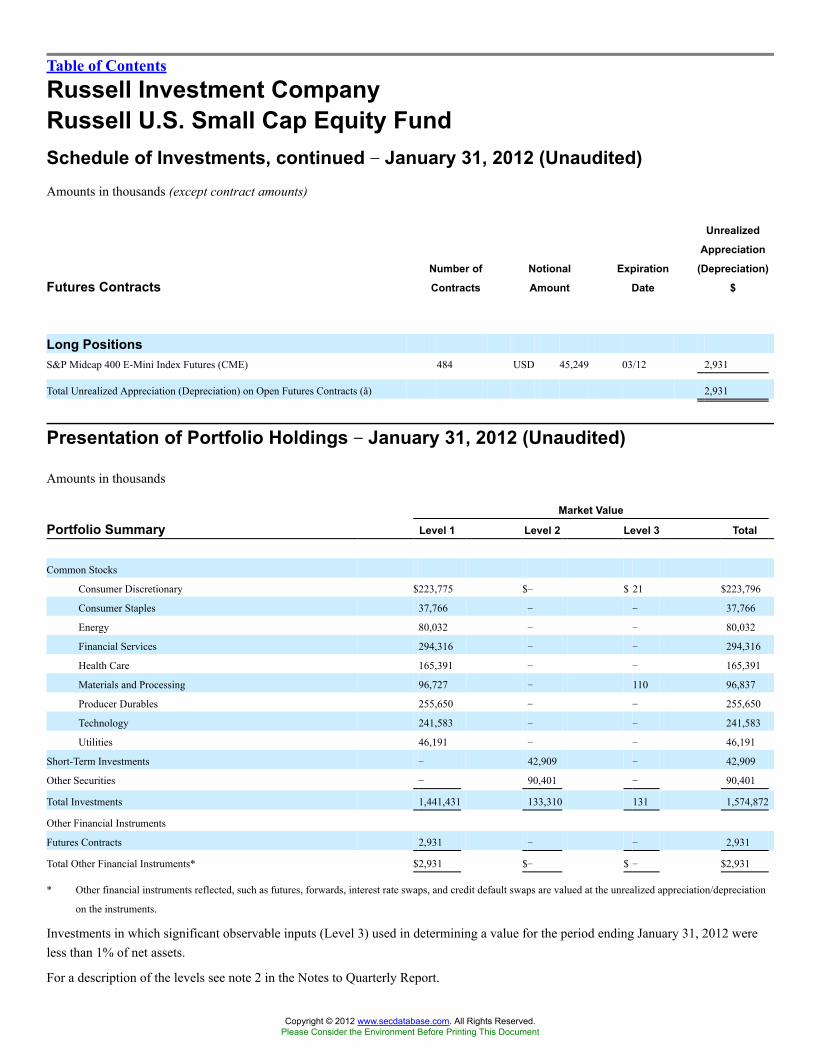
Table of Contents
Russell Investment CompanyRussell U.S. Small Cap Equity FundSchedule of Investments, continued �� January 31, 2012 (Unaudited)Amounts in thousands (except contract amounts)
Futures ContractsNumber of
Contracts
Notional
Amount
Expiration
Date
Unrealized
Appreciation
(Depreciation)
$
Long PositionsS&P Midcap 400 E-Mini Index Futures (CME) 484 USD 45,249 03/12 2,931
Total Unrealized Appreciation (Depreciation) on Open Futures Contracts (å) 2,931
Presentation of Portfolio Holdings �� January 31, 2012 (Unaudited)
Amounts in thousands
Market Value
Portfolio Summary Level 1 Level 2 Level 3 Total
Common Stocks
Consumer Discretionary $223,775 $� $ 21 $223,796
Consumer Staples 37,766 � � 37,766
Energy 80,032 � � 80,032
Financial Services 294,316 � � 294,316
Health Care 165,391 � � 165,391
Materials and Processing 96,727 � 110 96,837
Producer Durables 255,650 � � 255,650
Technology 241,583 � � 241,583
Utilities 46,191 � � 46,191
Short-Term Investments � 42,909 � 42,909
Other Securities � 90,401 � 90,401
Total Investments 1,441,431 133,310 131 1,574,872
Other Financial Instruments
Futures Contracts 2,931 � � 2,931
Total Other Financial Instruments* $2,931 $� $ � $2,931
* Other financial instruments reflected, such as futures, forwards, interest rate swaps, and credit default swaps are valued at the unrealized appreciation/depreciation
on the instruments.
Investments in which significant observable inputs (Level 3) used in determining a value for the period ending January 31, 2012 wereless than 1% of net assets.
For a description of the levels see note 2 in the Notes to Quarterly Report.
Copyright © 2012 www.secdatabase.com. All Rights Reserved.Please Consider the Environment Before Printing This Document

See accompanying notes which are an integral part of this quarterly report.
30 Russell U.S. Small Cap Equity Fund
Copyright © 2012 www.secdatabase.com. All Rights Reserved.Please Consider the Environment Before Printing This Document

Table of Contents
Russell Investment CompanyRussell International Developed Markets Fund
Schedule of Investments �� January 31, 2012 (Unaudited)Amounts in thousands (except share amounts)
Principal
Amount ($)
or Shares
Market
Value
$
Common Stocks - 91.1%Australia - 3.0%AGL Energy, Ltd. 44,390 688
Alumina, Ltd. 102,468 139
Amcor, Ltd. (Æ) 1,897,328 14,181
AMP, Ltd. 2,489,335 11,285
Ansell, Ltd. - GDR 116,424 1,838
Asciano, Ltd. 114,866 573
ASX, Ltd. - ADR 4,999 159
Australia & New Zealand Banking
Group, Ltd. - ADR 66,358 1,508
Bendigo and Adelaide Bank, Ltd. 93,015 819
BGP Holdings PLC (Æ)(Þ)(ö) 559,805 �
BHP Billiton, Ltd. - ADR (Ñ) 255,614 13,346
Billabong International, Ltd. 87,991 176
Caltex Australia, Ltd. 107,731 1,456
CFS Retail Property Trust (Ñ)(ö) 112,154 204
Challenger, Ltd. 29,302 138
Coca-Cola Amatil, Ltd. (Ñ) 172,545 2,116
Commonwealth Bank of Australia -
ADR (Ñ) 57,789 3,108
Computershare, Ltd. 17,281 140
CSL, Ltd. (Ñ) 60,405 1,996
CSR, Ltd. (Ñ) 195,712 426
Dexus Property Group (ö) 228,810 216
Downer EDI, Ltd. (Æ) 191,094 732
Echo Entertainment Group, Ltd. 36,408 140
Fortescue Metals Group, Ltd. (Ñ) 266,186 1,427
Goodman Group (ö) 358,832 244
GPT Group (ö) 75,544 248
Iluka Resources, Ltd. (Ñ) 215,912 4,199
Lend Lease Group 22,716 177
Mirvac Group (Ñ)(ö) 152,662 200
Monadelphous Group, Ltd. (Ñ) 101,229 2,364
Mount Gibson Iron, Ltd. 496,814 746
National Australia Bank, Ltd. - ADR 330,124 8,359
Principal
Amount ($)
or Shares
Market
Value
$
Belgium - 0.9%Ageas (Æ) 255,564 �
Anheuser-Busch InBev NV 355,200 21,538
Belgacom SA (Ñ) 433,398 13,529
KBC Groep NV 137,690 2,611
Solvay SA (Ñ) 23,954 2,362
40,040
Bermuda - 0.8%Brilliance China Automotive Holdings,
Ltd. (Æ)(Ñ) 1,646,000 1,759
Cheung Kong Infrastructure Holdings,
Ltd. (Ñ) 17,000 97
Credicorp, Ltd. 18,580 2,112
Esprit Holdings, Ltd. 408,200 602
Golar LNG, Ltd. 22,103 906
Jardine Matheson Holdings, Ltd. 153,800 7,967
Li & Fung, Ltd. (Ñ) 7,140,000 15,614
NWS Holdings, Ltd. 61,500 100
RenaissanceRe Holdings, Ltd. 106,200 7,764
VTech Holdings, Ltd. (Ñ) 27,300 285
Yue Yuen Industrial Holdings, Ltd. 207,000 634
37,840
Brazil - 1.6%Banco Bradesco SA - ADR 220,800 3,948
BM&FBovespa SA 830,100 5,221
BR Malls Participacoes SA 662,500 7,231
CETIP SA - Balcao Organizado de
Ativos e Derivativos 69,020 1,065
Cia de Bebidas das Americas - ADR 196,485 7,150
Cia Hering 123,350 2,965
Embraer SA - ADR (Æ) 163,280 4,477
Itau Unibanco Holding SA - ADR 285,006 5,689
OGX Petroleo e Gas Participacoes SA
(Æ) 1,554,950 14,729
Copyright © 2012 www.secdatabase.com. All Rights Reserved.Please Consider the Environment Before Printing This Document
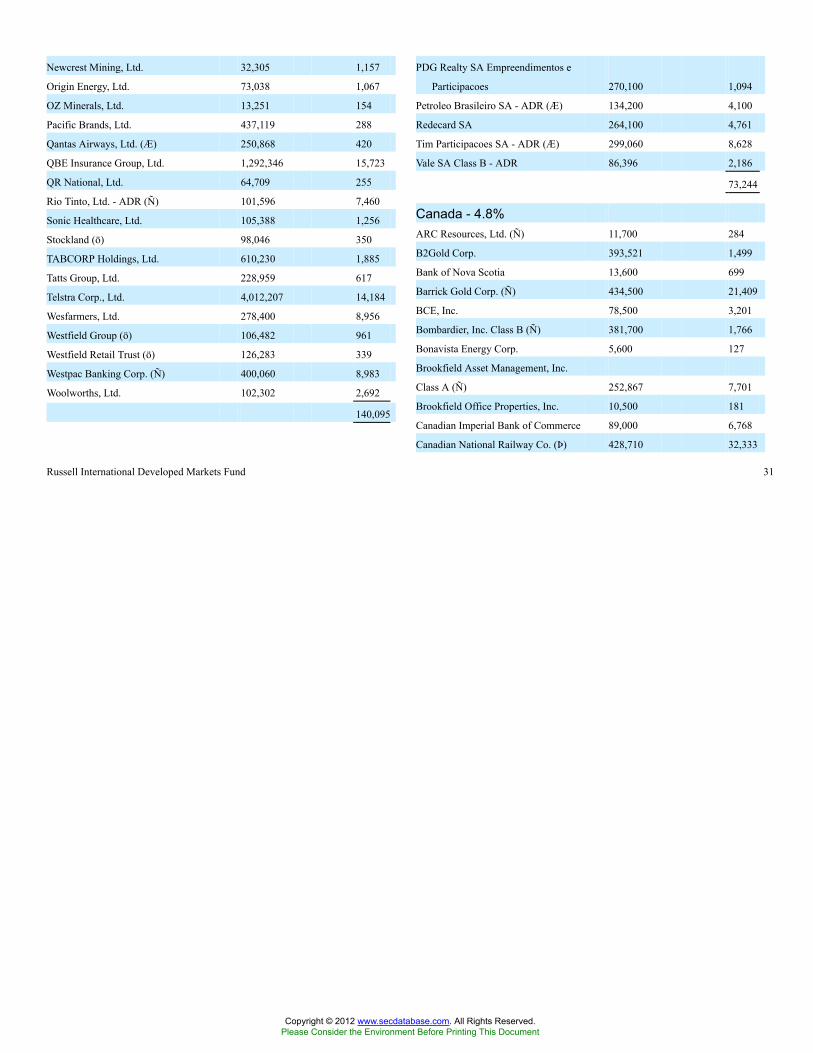
Russell International Developed Markets Fund 31
Newcrest Mining, Ltd. 32,305 1,157
Origin Energy, Ltd. 73,038 1,067
OZ Minerals, Ltd. 13,251 154
Pacific Brands, Ltd. 437,119 288
Qantas Airways, Ltd. (Æ) 250,868 420
QBE Insurance Group, Ltd. 1,292,346 15,723
QR National, Ltd. 64,709 255
Rio Tinto, Ltd. - ADR (Ñ) 101,596 7,460
Sonic Healthcare, Ltd. 105,388 1,256
Stockland (ö) 98,046 350
TABCORP Holdings, Ltd. 610,230 1,885
Tatts Group, Ltd. 228,959 617
Telstra Corp., Ltd. 4,012,207 14,184
Wesfarmers, Ltd. 278,400 8,956
Westfield Group (ö) 106,482 961
Westfield Retail Trust (ö) 126,283 339
Westpac Banking Corp. (Ñ) 400,060 8,983
Woolworths, Ltd. 102,302 2,692
140,095
PDG Realty SA Empreendimentos e
Participacoes 270,100 1,094
Petroleo Brasileiro SA - ADR (Æ) 134,200 4,100
Redecard SA 264,100 4,761
Tim Participacoes SA - ADR (Æ) 299,060 8,628
Vale SA Class B - ADR 86,396 2,186
73,244
Canada - 4.8%ARC Resources, Ltd. (Ñ) 11,700 284
B2Gold Corp. 393,521 1,499
Bank of Nova Scotia 13,600 699
Barrick Gold Corp. (Ñ) 434,500 21,409
BCE, Inc. 78,500 3,201
Bombardier, Inc. Class B (Ñ) 381,700 1,766
Bonavista Energy Corp. 5,600 127
Brookfield Asset Management, Inc.
Class A (Ñ) 252,867 7,701
Brookfield Office Properties, Inc. 10,500 181
Canadian Imperial Bank of Commerce 89,000 6,768
Canadian National Railway Co. (Þ) 428,710 32,333
Copyright © 2012 www.secdatabase.com. All Rights Reserved.Please Consider the Environment Before Printing This Document

Table of Contents
Russell Investment CompanyRussell International Developed Markets FundSchedule of Investments, continued �� January 31, 2012 (Unaudited)Amounts in thousands (except share amounts)
Principal
Amount ($)
or Shares
Market
Value
$
Canadian National Railway Co. 54,000 4,073
Canadian Natural Resources, Ltd. 56,986 2,257
Canadian Oil Sands, Ltd. 20,200 501
Cenovus Energy, Inc. 50,600 1,847
Crew Energy, Inc. (Æ) 67,680 925
Enbridge, Inc. 48,100 1,810
Enerplus Corp. (Ñ) 7,300 174
Finning International, Inc. 136,234 3,721
Goldcorp, Inc. (Æ) 110,652 5,355
Goldcorp, Inc. 58,800 2,844
Great-West Lifeco, Inc. (Ñ) 12,900 285
Imax Corp. (Æ) 130,343 2,699
Imperial Oil, Ltd. 48,000 2,287
Inmet Mining Corp. (Ñ) 15,300 1,022
Intact Financial Corp. 94,500 5,572
Ivanhoe Mines, Ltd. (Æ)(Ñ) 9,900 160
Kinross Gold Corp. 506,500 5,718
Magna International, Inc. Class A (Ñ) 294,200 12,161
Manulife Financial Corp. 204,500 2,388
Methanex Corp. 30,800 839
National Bank of Canada 75,288 5,648
New Gold, Inc. (Æ) 389,750 4,563
Nexen, Inc. 365,500 6,550
Niko Resources, Ltd. 1,800 88
Pacific Rubiales Energy Corp. 263,464 6,629
Penn West Petroleum, Ltd. 18,900 412
Potash Corp. of Saskatchewan, Inc. 71,700 3,351
Power Corp. of Canada 16,300 396
Precision Drilling Corp. (Æ) 188,900 1,939
Progress Energy Resources Corp. 10,000 106
RioCan Real Estate Investment Trust
Class Trust Unit (ö) 6,400 166
Rogers Communications, Inc. Class B
(Ñ) 52,600 2,022
Royal Bank of Canada - GDR (Ñ) 31,200 1,630
Saputo, Inc. - ADR 124,010 5,051
Principal
Amount ($)
or Shares
Market
Value
$
Hengan International Group Co., Ltd.
(Ñ) 382,000 3,416
Melco Crown Entertainment, Ltd. -
ADR (Æ) 286,590 3,196
SA SA International Holdings, Ltd. (Ñ) 3,734,860 2,413
Sands China, Ltd. (Æ)(Ñ) 771,497 2,611
Sany Heavy Equipment International
Holdings Co., Ltd. (Ñ) 2,007,000 1,762
Wynn Macau, Ltd. (Ñ) 59,600 153
35,879
Chile - 0.2%Sociedad Quimica y Minera de Chile
SA - ADR 158,310 9,299
China - 0.6%Anhui Conch Cement Co., Ltd. Class
H (Ñ) 309,803 1,047
China Shenhua Energy Co., Ltd. Class H 1,310,723 5,763
China South Locomotive and Rolling
Stock Corp. 2,269,968 1,496
Huaneng Power International, Inc.
Class H (Ñ) 22,668,000 13,767
Industrial & Commercial Bank of China
Class H (Ñ) 7,189,000 5,033
PICC Property & Casualty Co., Ltd.
Class H (Ñ) 708,200 933
28,039
Curacao - 0.0%Hunter Douglas NV 4,103 158
Czech Republic - 0.1%Komercni Banka AS 28,371 5,421
Denmark - 1.1%Carlsberg A/S Class B 16,351 1,242
Christian Hansen Holding A/S 87,340 2,137
Coloplast A/S Class B (Ñ) 16,856 2,488
Copyright © 2012 www.secdatabase.com. All Rights Reserved.Please Consider the Environment Before Printing This Document

32 Russell International Developed Markets Fund
Sherritt International Corp. 239,000 1,509
Silver Wheaton Corp. 13,800 492
Sino-Forest Corp. (Æ)(Ñ) 383,000 513
Suncor Energy, Inc. 588,740 20,292
SXC Health Solutions Corp. (Æ) 49,562 3,125
TELUS Corp. Class A (Ñ) 6,000 322
Tim Hortons, Inc. (Ñ) 87,303 4,254
TMX Group, Inc. 19,500 834
Toronto-Dominion Bank (The) (Ñ) 140,128 10,836
TransCanada Corp. 71,400 2,937
Trilogy Energy Corp. 28,111 876
Valeant Pharmaceuticals International,
Inc. (Æ) 14,600 707
Yamana Gold, Inc. 140,900 2,438
220,292
Cayman Islands - 0.8%Baidu, Inc. - ADR (Æ) 116,475 14,853
Belle International Holdings, Ltd.
Class A (Ñ) 4,168,000 6,772
Chaoda Modern Agriculture Holdings,
Ltd. (Ñ) 12,120,000 703
Danske Bank A/S (Æ) 455,957 6,659
FLSmidth & Co. A/S 20,460 1,512
Novo Nordisk A/S Class B 234,031 27,672
Novozymes A/S Class B 274,813 7,737
49,447
Finland - 0.6%Metso OYJ 74,272 3,235
Nokia OYJ 1,843,951 9,209
Nokian Renkaat OYJ 99,939 3,570
Stora Enso OYJ Class R 1,449,953 10,318
Wartsila OYJ Abp Class B 44,126 1,487
27,819
France - 7.2%Air Liquide SA Class A 95,420 12,010
Alcatel-Lucent - ADR (Æ)(Ñ) 3,418,406 6,077
Arkema SA 39,737 3,211
AXA SA 476,367 7,231
Copyright © 2012 www.secdatabase.com. All Rights Reserved.Please Consider the Environment Before Printing This Document

Table of Contents
Russell Investment CompanyRussell International Developed Markets FundSchedule of Investments, continued �� January 31, 2012 (Unaudited)Amounts in thousands (except share amounts)
Principal
Amount ($)
or Shares
Market
Value
$
BNP Paribas SA 184,286 7,803
Bouygues SA - ADR 33,967 1,055
Capital Gemini SA 401,075 14,642
Carrefour SA 615,227 14,043
Christian Dior SA 11,786 1,668
Cie de St.-Gobain 322,225 14,339
Cie Generale de Geophysique -
Veritas (Æ) 55,658 1,552
Cie Generale d�Optique Essilor
International SA 124,932 9,151
Credit Agricole SA 652,993 4,024
Danone 186,176 11,491
Dassault Systemes SA 39,433 3,269
France Telecom SA - ADR 1,241,121 18,613
GDF Suez (Æ) 55,671 -
Lagardere SCA 217,506 6,182
Legrand SA - ADR 256,104 8,834
LVMH Moet Hennessy Louis Vuitton
SA - ADR 98,491 15,923
Metropole Television SA 58,091 971
Natixis 895,944 2,754
Pernod-Ricard SA 173,106 16,618
Publicis Groupe SA - ADR 108,624 5,465
Remy Cointreau SA 50,165 4,417
Safran SA 86,710 2,702
Sanofi - ADR 447,767 33,075
Schneider Electric SA 370,148 22,988
Societe BIC SA 8,582 765
Societe Generale SA 368,626 9,820
Technip SA 23,260 2,182
Thales SA 45,775 1,566
Total SA (Ñ) 842,917 44,550
Unibail-Rodamco SE (ö) 34,332 6,592
Valeo SA 60,089 2,821
Vallourec SA 16,793 1,134
Vinci SA 217,061 10,068
Principal
Amount ($)
or Shares
Market
Value
$
GEA Group AG 80,567 2,588
Hannover Rueckversicherung AG 34,443 1,833
Henkel AG & Co. KGaA 118,655 6,165
Infineon Technologies AG - ADR 1,649,004 15,047
K+S AG 44,396 2,117
Kloeckner & Co. SE 42,996 597
Linde AG 141,595 22,466
Merck KGaA 93,966 9,803
RWE AG 488,079 18,668
SAP AG - ADR 489,951 29,602
SGL Carbon SE (Æ)(Ñ) 20,450 1,033
Siemens AG (Ñ) 246,189 23,231
Software AG (Ñ) 73,355 2,390
Volkswagen AG 93,410 15,090
301,617
Hong Kong - 1.6%AIA Group, Ltd. 3,495,800 11,675
Cheung Kong Holdings, Ltd. 116,000 1,562
China Mobile, Ltd. 894,000 9,141
China Unicom Hong Kong, Ltd. (Ñ) 8,760,000 16,130
CLP Holdings, Ltd. 84,500 692
CNOOC, Ltd. 4,350,650 8,942
Emperor Watch & Jewellery, Ltd. (Ñ) 15,250,000 1,947
Hang Lung Group, Ltd. (Ñ) 37,462 238
Hang Lung Properties, Ltd. - ADR 2,516,000 8,646
Hang Seng Bank, Ltd. (Ñ) 44,000 568
HKT Trust / HKT, Ltd. (Æ) 3,847 2
Hong Kong & China Gas Co., Ltd. 350,800 832
Hong Kong Exchanges and Clearing,
Ltd. (Ñ) 47,254 820
Hopewell Holdings, Ltd. 172,500 450
Hutchison Whampoa, Ltd. 56,000 532
Hysan Development Co., Ltd. 61,000 240
iShares FTSE A50 China Index ETF (Ñ) 4,442,000 6,392
Link REIT (The) (ö) 95,500 348
New World Development Co., Ltd. 175,000 192
Copyright © 2012 www.secdatabase.com. All Rights Reserved.Please Consider the Environment Before Printing This Document
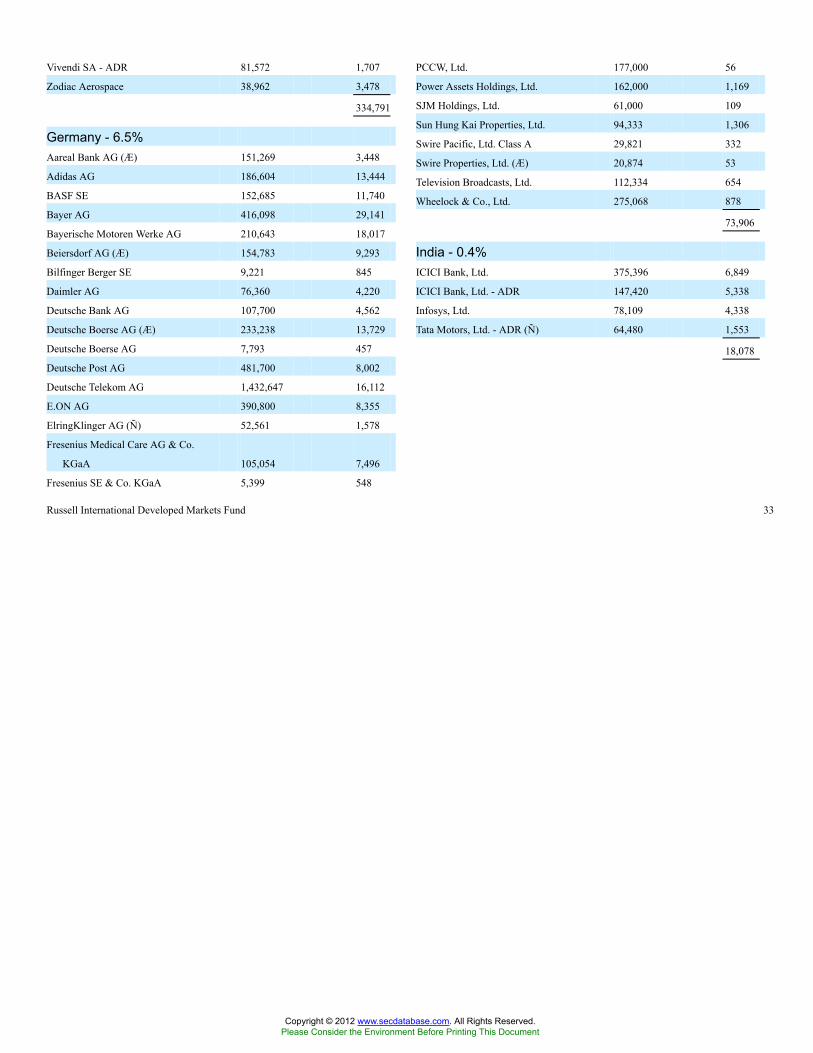
Russell International Developed Markets Fund 33
Vivendi SA - ADR 81,572 1,707
Zodiac Aerospace 38,962 3,478
334,791
Germany - 6.5%Aareal Bank AG (Æ) 151,269 3,448
Adidas AG 186,604 13,444
BASF SE 152,685 11,740
Bayer AG 416,098 29,141
Bayerische Motoren Werke AG 210,643 18,017
Beiersdorf AG (Æ) 154,783 9,293
Bilfinger Berger SE 9,221 845
Daimler AG 76,360 4,220
Deutsche Bank AG 107,700 4,562
Deutsche Boerse AG (Æ) 233,238 13,729
Deutsche Boerse AG 7,793 457
Deutsche Post AG 481,700 8,002
Deutsche Telekom AG 1,432,647 16,112
E.ON AG 390,800 8,355
ElringKlinger AG (Ñ) 52,561 1,578
Fresenius Medical Care AG & Co.
KGaA 105,054 7,496
Fresenius SE & Co. KGaA 5,399 548
PCCW, Ltd. 177,000 56
Power Assets Holdings, Ltd. 162,000 1,169
SJM Holdings, Ltd. 61,000 109
Sun Hung Kai Properties, Ltd. 94,333 1,306
Swire Pacific, Ltd. Class A 29,821 332
Swire Properties, Ltd. (Æ) 20,874 53
Television Broadcasts, Ltd. 112,334 654
Wheelock & Co., Ltd. 275,068 878
73,906
India - 0.4%ICICI Bank, Ltd. 375,396 6,849
ICICI Bank, Ltd. - ADR 147,420 5,338
Infosys, Ltd. 78,109 4,338
Tata Motors, Ltd. - ADR (Ñ) 64,480 1,553
18,078
Copyright © 2012 www.secdatabase.com. All Rights Reserved.Please Consider the Environment Before Printing This Document
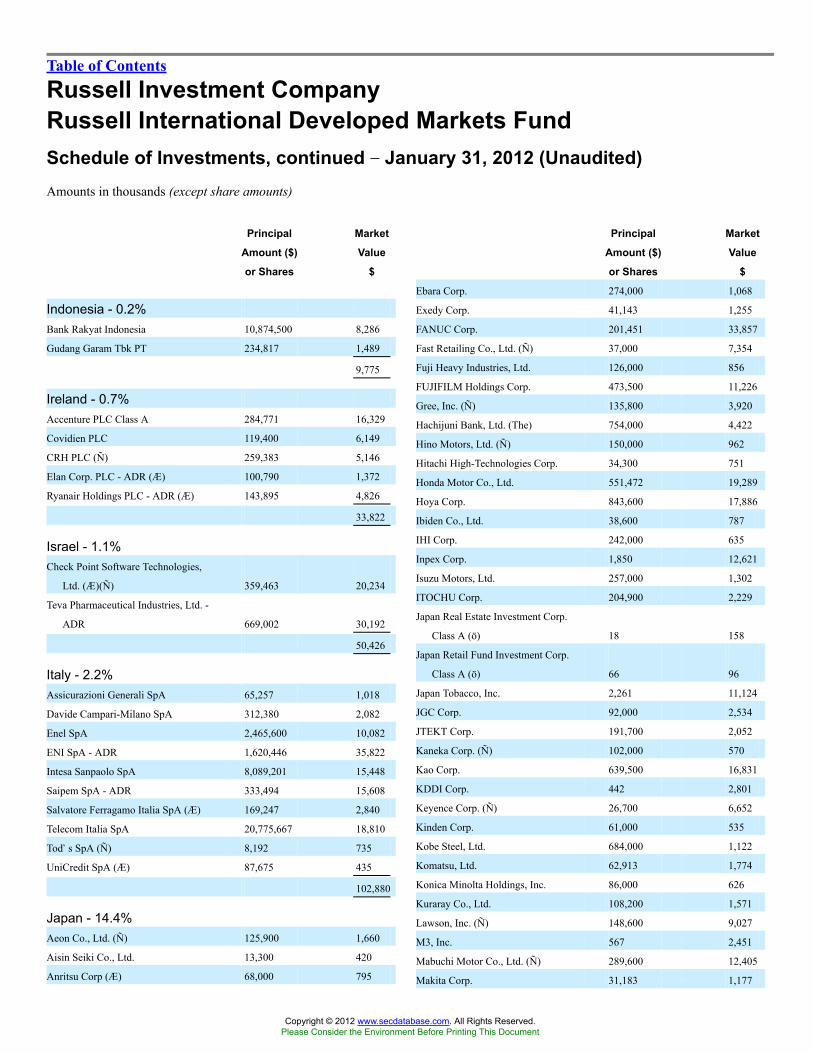
Table of Contents
Russell Investment CompanyRussell International Developed Markets FundSchedule of Investments, continued �� January 31, 2012 (Unaudited)Amounts in thousands (except share amounts)
Principal
Amount ($)
or Shares
Market
Value
$
Indonesia - 0.2%Bank Rakyat Indonesia 10,874,500 8,286
Gudang Garam Tbk PT 234,817 1,489
9,775
Ireland - 0.7%Accenture PLC Class A 284,771 16,329
Covidien PLC 119,400 6,149
CRH PLC (Ñ) 259,383 5,146
Elan Corp. PLC - ADR (Æ) 100,790 1,372
Ryanair Holdings PLC - ADR (Æ) 143,895 4,826
33,822
Israel - 1.1%Check Point Software Technologies,
Ltd. (Æ)(Ñ) 359,463 20,234
Teva Pharmaceutical Industries, Ltd. -
ADR 669,002 30,192
50,426
Italy - 2.2%Assicurazioni Generali SpA 65,257 1,018
Davide Campari-Milano SpA 312,380 2,082
Enel SpA 2,465,600 10,082
ENI SpA - ADR 1,620,446 35,822
Intesa Sanpaolo SpA 8,089,201 15,448
Saipem SpA - ADR 333,494 15,608
Salvatore Ferragamo Italia SpA (Æ) 169,247 2,840
Telecom Italia SpA 20,775,667 18,810
Tod�s SpA (Ñ) 8,192 735
UniCredit SpA (Æ) 87,675 435
102,880
Japan - 14.4%Aeon Co., Ltd. (Ñ) 125,900 1,660
Aisin Seiki Co., Ltd. 13,300 420
Anritsu Corp (Æ) 68,000 795
Principal
Amount ($)
or Shares
Market
Value
$
Ebara Corp. 274,000 1,068
Exedy Corp. 41,143 1,255
FANUC Corp. 201,451 33,857
Fast Retailing Co., Ltd. (Ñ) 37,000 7,354
Fuji Heavy Industries, Ltd. 126,000 856
FUJIFILM Holdings Corp. 473,500 11,226
Gree, Inc. (Ñ) 135,800 3,920
Hachijuni Bank, Ltd. (The) 754,000 4,422
Hino Motors, Ltd. (Ñ) 150,000 962
Hitachi High-Technologies Corp. 34,300 751
Honda Motor Co., Ltd. 551,472 19,289
Hoya Corp. 843,600 17,886
Ibiden Co., Ltd. 38,600 787
IHI Corp. 242,000 635
Inpex Corp. 1,850 12,621
Isuzu Motors, Ltd. 257,000 1,302
ITOCHU Corp. 204,900 2,229
Japan Real Estate Investment Corp.
Class A (ö) 18 158
Japan Retail Fund Investment Corp.
Class A (ö) 66 96
Japan Tobacco, Inc. 2,261 11,124
JGC Corp. 92,000 2,534
JTEKT Corp. 191,700 2,052
Kaneka Corp. (Ñ) 102,000 570
Kao Corp. 639,500 16,831
KDDI Corp. 442 2,801
Keyence Corp. (Ñ) 26,700 6,652
Kinden Corp. 61,000 535
Kobe Steel, Ltd. 684,000 1,122
Komatsu, Ltd. 62,913 1,774
Konica Minolta Holdings, Inc. 86,000 626
Kuraray Co., Ltd. 108,200 1,571
Lawson, Inc. (Ñ) 148,600 9,027
M3, Inc. 567 2,451
Mabuchi Motor Co., Ltd. (Ñ) 289,600 12,405
Makita Corp. 31,183 1,177
Copyright © 2012 www.secdatabase.com. All Rights Reserved.Please Consider the Environment Before Printing This Document

34 Russell International Developed Markets Fund
Asahi Glass Co., Ltd. (Ñ) 109,000 888
Asahi Kasei Corp. 280,000 1,771
Astellas Pharma, Inc. 480,800 19,744
Canon, Inc. 1,168,513 50,438
Capcom Co., Ltd. - GDR 88,337 1,959
Central Japan Railway Co. 323 2,776
Chiyoda Corp. 197,000 2,298
Chubu Electric Power Co., Inc. 9,400 173
Cosmo Oil Co., Ltd. 205,000 597
Credit Saison Co., Ltd. 49,000 997
CyberAgent, Inc. (Ñ) 1,071 3,133
Dai Nippon Printing Co., Ltd. (Ñ) 1,059,000 11,393
Daicel Chemical Industries, Ltd. 228,000 1,430
Daido Steel Co., Ltd. (Ñ) 106,000 694
Dai-ichi Life Insurance Co., Ltd. (The) 5,300 5,563
Daiichi Sankyo Co., Ltd. 37,800 720
Daito Trust Construction Co., Ltd. 63,500 5,982
Daiwa House Industry Co., Ltd. 20,000 253
Dena Co., Ltd. (Ñ) 41,700 1,055
Denso Corp. 296,500 8,811
Marubeni Corp. 1,043,000 7,198
Miraca Holdings, Inc. 49,100 1,838
Mitsubishi Electric Corp. 202,000 1,813
Mitsubishi Estate Co., Ltd. 45,000 718
Mitsubishi Heavy Industries, Ltd. (Ñ) 283,000 1,296
Mitsubishi UFJ Financial Group, Inc. 2,099,800 9,615
Mitsubishi UFJ Lease & Finance Co.,
Ltd. 26,350 1,103
Mitsui & Co., Ltd. 205,800 3,494
Mitsui Chemicals, Inc. 185,000 585
Mitsui Fudosan Co., Ltd. 40,000 658
Mizuho Financial Group, Inc. 774,000 1,168
MS&AD Insurance Group Holdings 647,900 13,286
Nabtesco Corp. (Ñ) 112,590 2,393
NHK Spring Co., Ltd. 127,000 1,218
Nikon Corp. 45,200 1,107
Nintendo Co., Ltd. 133,600 18,124
Nippon Building Fund, Inc. Class A
(ö) 20 179
Nippon Electric Glass Co., Ltd. (Ñ) 142,000 1,237
Nippon Telegraph & Telephone Corp. 21,200 1,060
Nissan Motor Co., Ltd. 1,161,800 10,959
Copyright © 2012 www.secdatabase.com. All Rights Reserved.Please Consider the Environment Before Printing This Document
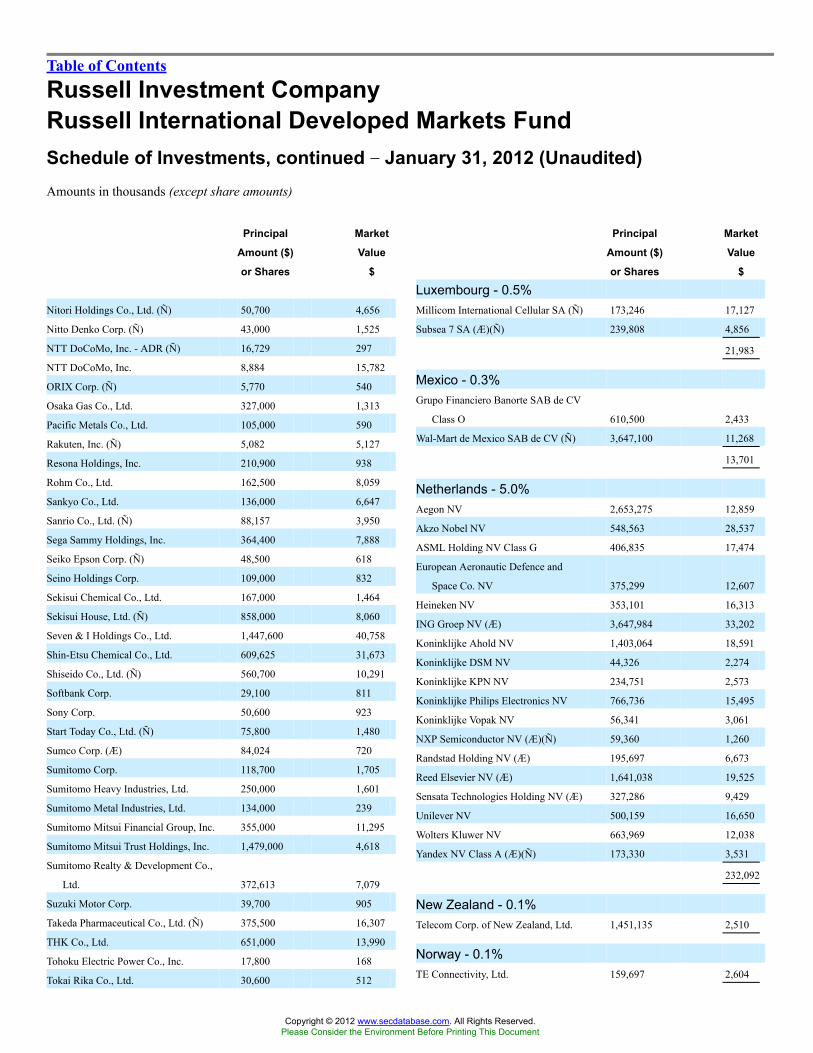
Table of Contents
Russell Investment CompanyRussell International Developed Markets FundSchedule of Investments, continued �� January 31, 2012 (Unaudited)Amounts in thousands (except share amounts)
Principal
Amount ($)
or Shares
Market
Value
$
Nitori Holdings Co., Ltd. (Ñ) 50,700 4,656
Nitto Denko Corp. (Ñ) 43,000 1,525
NTT DoCoMo, Inc. - ADR (Ñ) 16,729 297
NTT DoCoMo, Inc. 8,884 15,782
ORIX Corp. (Ñ) 5,770 540
Osaka Gas Co., Ltd. 327,000 1,313
Pacific Metals Co., Ltd. 105,000 590
Rakuten, Inc. (Ñ) 5,082 5,127
Resona Holdings, Inc. 210,900 938
Rohm Co., Ltd. 162,500 8,059
Sankyo Co., Ltd. 136,000 6,647
Sanrio Co., Ltd. (Ñ) 88,157 3,950
Sega Sammy Holdings, Inc. 364,400 7,888
Seiko Epson Corp. (Ñ) 48,500 618
Seino Holdings Corp. 109,000 832
Sekisui Chemical Co., Ltd. 167,000 1,464
Sekisui House, Ltd. (Ñ) 858,000 8,060
Seven & I Holdings Co., Ltd. 1,447,600 40,758
Shin-Etsu Chemical Co., Ltd. 609,625 31,673
Shiseido Co., Ltd. (Ñ) 560,700 10,291
Softbank Corp. 29,100 811
Sony Corp. 50,600 923
Start Today Co., Ltd. (Ñ) 75,800 1,480
Sumco Corp. (Æ) 84,024 720
Sumitomo Corp. 118,700 1,705
Sumitomo Heavy Industries, Ltd. 250,000 1,601
Sumitomo Metal Industries, Ltd. 134,000 239
Sumitomo Mitsui Financial Group, Inc. 355,000 11,295
Sumitomo Mitsui Trust Holdings, Inc. 1,479,000 4,618
Sumitomo Realty & Development Co.,
Ltd. 372,613 7,079
Suzuki Motor Corp. 39,700 905
Takeda Pharmaceutical Co., Ltd. (Ñ) 375,500 16,307
THK Co., Ltd. 651,000 13,990
Tohoku Electric Power Co., Inc. 17,800 168
Tokai Rika Co., Ltd. 30,600 512
Principal
Amount ($)
or Shares
Market
Value
$
Luxembourg - 0.5%Millicom International Cellular SA (Ñ) 173,246 17,127
Subsea 7 SA (Æ)(Ñ) 239,808 4,856
21,983
Mexico - 0.3%Grupo Financiero Banorte SAB de CV
Class O 610,500 2,433
Wal-Mart de Mexico SAB de CV (Ñ) 3,647,100 11,268
13,701
Netherlands - 5.0%Aegon NV 2,653,275 12,859
Akzo Nobel NV 548,563 28,537
ASML Holding NV Class G 406,835 17,474
European Aeronautic Defence and
Space Co. NV 375,299 12,607
Heineken NV 353,101 16,313
ING Groep NV (Æ) 3,647,984 33,202
Koninklijke Ahold NV 1,403,064 18,591
Koninklijke DSM NV 44,326 2,274
Koninklijke KPN NV 234,751 2,573
Koninklijke Philips Electronics NV 766,736 15,495
Koninklijke Vopak NV 56,341 3,061
NXP Semiconductor NV (Æ)(Ñ) 59,360 1,260
Randstad Holding NV (Æ) 195,697 6,673
Reed Elsevier NV (Æ) 1,641,038 19,525
Sensata Technologies Holding NV (Æ) 327,286 9,429
Unilever NV 500,159 16,650
Wolters Kluwer NV 663,969 12,038
Yandex NV Class A (Æ)(Ñ) 173,330 3,531
232,092
New Zealand - 0.1%Telecom Corp. of New Zealand, Ltd. 1,451,135 2,510
Norway - 0.1%TE Connectivity, Ltd. 159,697 2,604
Copyright © 2012 www.secdatabase.com. All Rights Reserved.Please Consider the Environment Before Printing This Document

Russell International Developed Markets Fund 35
Tokio Marine Holdings, Inc. 576,400 14,436
Tokyo Electric Power Co., Inc. (The) 63,300 174
Tokyo Electron, Ltd. 34,300 1,953
Tokyo Gas Co., Ltd. 220,000 1,016
Tokyu Land Corp. 22,000 91
TonenGeneral Sekiyu KK (Ñ) 69,000 658
Toray Industries, Inc. (Ñ) 563,000 4,225
Toyota Motor Corp. 572,700 21,114
Trend Micro, Inc. (Ñ) 72,500 2,304
Ube Industries, Ltd. 257,000 738
USS Co., Ltd. 18,840 1,799
Yamada Denki Co., Ltd. (Ñ) 97,610 6,224
Yamaha Motor Co., Ltd. 76,700 1,014
665,632
Jersey - 0.7%Glencore International PLC (Ñ) 855,316 5,542
Petrofac, Ltd. (Ñ) 393,226 9,016
Wolseley PLC 154,118 5,335
WPP PLC 920,757 10,817
30,710
Panama - 0.2%Copa Holdings SA Class A 109,074 7,432
Papua New Guinea - 0.0%Oil Search, Ltd. 315,502 2,211
Philippines - 0.0%Metropolitan Bank & Trust - ADR 843,660 1,492
Portugal - 0.0%Jeronimo Martins SGPS SA (Æ) 121,361 2,026
Russia - 0.5%Gazprom OAO - ADR (Æ) 1,065,312 12,890
NovaTek OAO - GDR 27,838 3,750
Copyright © 2012 www.secdatabase.com. All Rights Reserved.Please Consider the Environment Before Printing This Document

Table of Contents
Russell Investment CompanyRussell International Developed Markets FundSchedule of Investments, continued �� January 31, 2012 (Unaudited)Amounts in thousands (except share amounts)
Principal
Amount ($)
or Shares
Market
Value
$
Sberbank of Russia - ADR 547,605 6,571
Uralkali OJSC - GDR 36,657 1,303
24,514
Singapore - 1.0%Ascendas Real Estate Investment
Trust (Æ)(Ñ)(ö) 77,000 114
Avago Technologies, Ltd. 56,400 1,914
CapitaLand, Ltd. (Ñ) 179,000 374
CapitaMall Trust Class A (Ñ)(ö) 112,000 152
Cosco Corp. Singapore, Ltd. (Ñ) 493,000 463
DBS Group Holdings, Ltd. 100,000 1,077
Fraser and Neave, Ltd. (Ñ) 120,000 648
Golden Agri-Resources, Ltd. (Ñ) 2,777,000 1,623
Jardine Cycle & Carriage, Ltd. 20,800 850
Keppel Corp., Ltd. - ADR (Ñ) 1,069,100 9,222
Oversea-Chinese Banking Corp.,
Ltd. (Ñ) 628,100 4,294
SembCorp Industries, Ltd. 81,860 1,030
Singapore Exchange, Ltd. (Ñ) 34,000 176
Singapore Press Holdings, Ltd. 177,000 522
Singapore Technologies Engineering,
Ltd. 81,000 190
Singapore Telecommunications,
Ltd. (Ñ) 5,537,810 13,648
StarHub, Ltd. 39,000 88
United Overseas Bank, Ltd. 750,118 10,341
UOL Group, Ltd. 22,000 80
46,806
South Africa - 0.6%AngloGold Ashanti, Ltd. 220,872 10,138
Gold Fields, Ltd. - ADR 386,415 6,373
Impala Platinum Holdings, Ltd. 151,718 3,331
Mr Price Group, Ltd. 132,670 1,463
MTN Group, Ltd. 259,879 4,426
Principal
Amount ($)
or Shares
Market
Value
$
Iberdrola SA 2,283,479 13,447
Inditex SA 237,083 20,685
Indra Sistemas SA (Ñ) 1,316,100 17,327
Red Electrica Corp. SA 64,041 2,946
Repsol YPF SA - ADR 72,515 1,992
Telefonica SA - ADR 1,138,239 19,847
109,693
Sweden - 0.9%Atlas Copco AB Class A 195,020 4,636
Boliden AB 113,053 1,933
Elekta AB Class B (Ñ) 76,724 3,667
Hennes & Mauritz AB Class B 106,730 3,494
Investor AB Class B 23,074 467
Lundin Petroleum AB (Æ) 100,095 2,254
Sandvik AB 257,404 3,803
Scania AB Class B 104,250 1,796
Skandinaviska Enskilda Banken AB
Class A 584,634 3,676
Swedbank AB Class A 246,966 3,547
Swedish Match AB 169,401 5,899
Tele2 AB Class B 228,896 4,368
Telefonaktiebolaget LM Ericsson
Class B 337,363 3,137
TeliaSonera AB 87,129 579
43,256
Switzerland - 7.1%ABB, Ltd. (Æ) 485,647 10,140
ACE, Ltd. 197,600 13,753
Cie Financiere Richemont SA 136,691 7,737
Credit Suisse Group AG (Æ) 261,221 6,777
Dufry AG (Æ) 26,034 2,956
GAM Holding AG (Æ) 475,446 6,069
Geberit AG (Æ) 12,528 2,587
Givaudan SA (Æ) 3,629 3,389
Julius Baer Group, Ltd. (Æ) 704,761 28,635
Copyright © 2012 www.secdatabase.com. All Rights Reserved.Please Consider the Environment Before Printing This Document
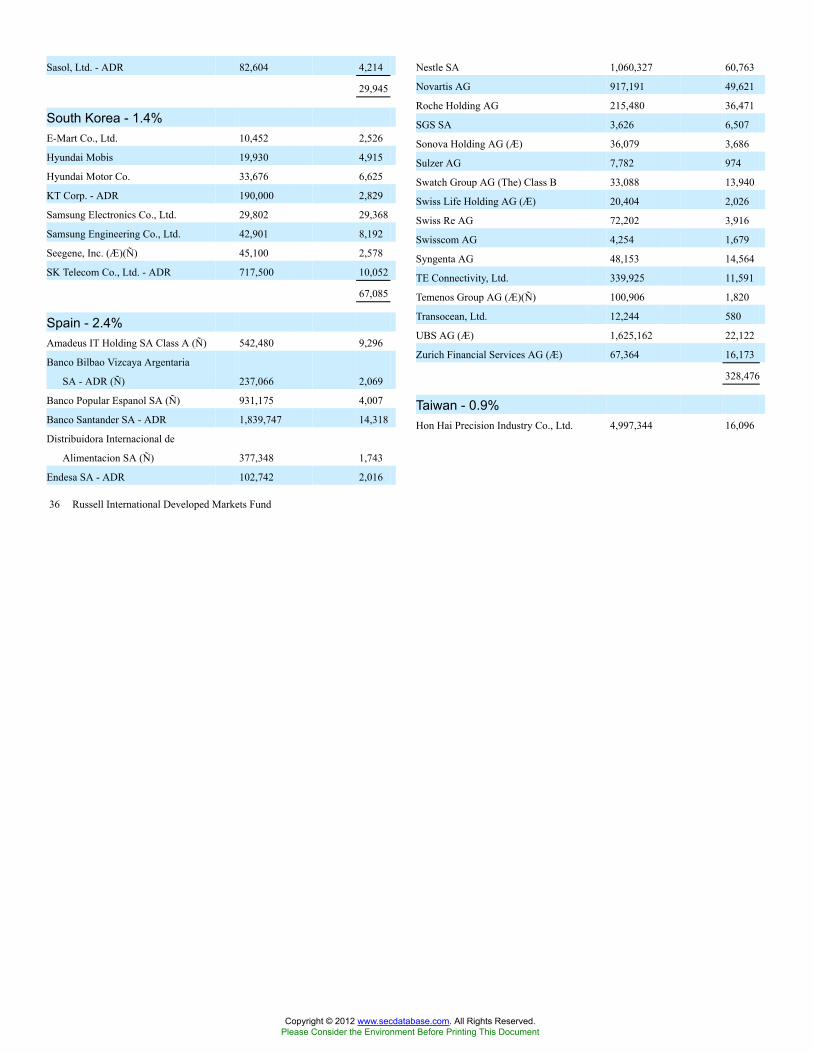
36 Russell International Developed Markets Fund
Sasol, Ltd. - ADR 82,604 4,214
29,945
South Korea - 1.4%E-Mart Co., Ltd. 10,452 2,526
Hyundai Mobis 19,930 4,915
Hyundai Motor Co. 33,676 6,625
KT Corp. - ADR 190,000 2,829
Samsung Electronics Co., Ltd. 29,802 29,368
Samsung Engineering Co., Ltd. 42,901 8,192
Seegene, Inc. (Æ)(Ñ) 45,100 2,578
SK Telecom Co., Ltd. - ADR 717,500 10,052
67,085
Spain - 2.4%Amadeus IT Holding SA Class A (Ñ) 542,480 9,296
Banco Bilbao Vizcaya Argentaria
SA - ADR (Ñ) 237,066 2,069
Banco Popular Espanol SA (Ñ) 931,175 4,007
Banco Santander SA - ADR 1,839,747 14,318
Distribuidora Internacional de
Alimentacion SA (Ñ) 377,348 1,743
Endesa SA - ADR 102,742 2,016
Nestle SA 1,060,327 60,763
Novartis AG 917,191 49,621
Roche Holding AG 215,480 36,471
SGS SA 3,626 6,507
Sonova Holding AG (Æ) 36,079 3,686
Sulzer AG 7,782 974
Swatch Group AG (The) Class B 33,088 13,940
Swiss Life Holding AG (Æ) 20,404 2,026
Swiss Re AG 72,202 3,916
Swisscom AG 4,254 1,679
Syngenta AG 48,153 14,564
TE Connectivity, Ltd. 339,925 11,591
Temenos Group AG (Æ)(Ñ) 100,906 1,820
Transocean, Ltd. 12,244 580
UBS AG (Æ) 1,625,162 22,122
Zurich Financial Services AG (Æ) 67,364 16,173
328,476
Taiwan - 0.9%Hon Hai Precision Industry Co., Ltd. 4,997,344 16,096
Copyright © 2012 www.secdatabase.com. All Rights Reserved.Please Consider the Environment Before Printing This Document

Table of Contents
Russell Investment CompanyRussell International Developed Markets FundSchedule of Investments, continued �� January 31, 2012 (Unaudited)Amounts in thousands (except share amounts)
Principal
Amount ($)
or Shares
Market
Value
$
Hon Hai Precision Industry Co., Ltd. -
GDR 657,812 4,276
HTC Corp. 168,500 2,765
Taiwan Semiconductor Manufacturing
Co., Ltd. - ADR 1,367,761 19,258
42,395
Thailand - 0.1%Kasikornbank PCL 797,000 3,325
United Kingdom - 18.9%Aggreko PLC 65,400 2,159
Amarin Corp PLC - ADR (Æ) 133,310 1,088
Anglo American PLC 48,917 2,023
ARM Holdings PLC 1,398,091 13,428
AstraZeneca PLC - ADR 323,471 15,570
Aviva PLC 1,337,092 7,362
BAE Systems PLC 6,626,895 32,143
Barclays PLC 6,864,099 22,990
BG Group PLC 1,256,838 28,222
BHP Billiton PLC 251,208 8,404
BP PLC 6,563,812 48,701
British American Tobacco PLC 214,176 9,845
British Land Co. PLC (ö) 61,280 472
British Sky Broadcasting Group PLC 1,640,437 17,836
BT Group PLC 272,831 875
Burberry Group PLC 676,236 14,301
Carillion PLC 1,329,665 6,472
Compass Group PLC 3,348,804 31,082
Cookson Group PLC 87,132 792
Diageo PLC 1,130,924 24,985
Dialog Semiconductor PLC (Æ)(Ñ) 133,707 2,886
Experian PLC 2,091,304 28,325
G4S PLC 52,159 221
GKN PLC 523,773 1,730
GlaxoSmithKline PLC - ADR 1,647,295 36,601
Principal
Amount ($)
or Shares
Market
Value
$
Reckitt Benckiser Group PLC 168,434 8,960
Reed Elsevier PLC 623,114 5,155
Rio Tinto PLC (Æ) 272,347 16,330
Rolls-Royce Holdings PLC (Æ)(Þ) 1,491,201 17,283
Royal Bank of Scotland Group PLC -
ADR (Æ) 17,068,880 7,160
Royal Dutch Shell PLC Class A 1,714,209 60,664
Royal Dutch Shell PLC Class B 408,687 14,867
Royal Dutch Shell PLC - ADR (Ñ) 183,500 13,458
Sage Group PLC (The) 64,324 297
Scottish & Southern Energy PLC 133,705 2,577
Severn Trent PLC Class H 64,209 1,543
Shire PLC - ADR (Æ) 692,799 22,991
Smith & Nephew PLC 927,761 8,991
Smiths Group PLC 362,206 5,479
Standard Chartered PLC 1,596,172 38,584
Tate & Lyle PLC 208,844 2,179
Telecity Group PLC (Æ) 236,844 2,415
Tesco PLC 7,567,433 38,112
Travis Perkins PLC 1,195,507 16,522
Tullow Oil PLC 665,270 14,572
Unilever PLC 847,533 27,325
Vedanta Resources PLC 33,054 622
Vodafone Group PLC - ADR (Æ) 16,245,934 43,725
Weir Group PLC (The) (Ñ) 413,545 12,740
Xstrata PLC 842,018 14,257
875,478
United States - 1.4%Aegis Group plc (Æ) 5,173,172 12,863
Citigroup, Inc. 330,146 10,142
Las Vegas Sands Corp. 112,501 5,525
Lululemon Athletica, Inc. (Æ) 31,300 1,976
MercadoLibre, Inc. 98,385 8,599
Newmont Mining Corp. 193,200 11,878
News Corp. Class B 77,600 1,511
Philip Morris International, Inc. 24,900 1,862
Copyright © 2012 www.secdatabase.com. All Rights Reserved.Please Consider the Environment Before Printing This Document

Russell International Developed Markets Fund 37
Hays PLC 1,654,472 1,860
Home Retail Group PLC (Ñ) 8,964,153 15,171
HSBC Holdings PLC 5,180,565 43,292
IMI PLC - ADR 71,844 966
Imperial Tobacco Group PLC 284,652 10,182
Intermediate Capital Group PLC 427,313 1,852
ITV PLC 1,857,763 2,193
J Sainsbury PLC 205,765 935
John Wood Group PLC 35,034 363
Johnson Matthey PLC Class H 155,579 5,028
Kazakhmys PLC 19,581 350
Kesa Electricals PLC (Ñ) 609,143 647
Kingfisher PLC 14,416 58
Land Securities Group PLC (ö) 40,123 426
Legal & General Group PLC 1,146,630 2,085
Lloyds Banking Group PLC (Æ) 5,433,800 2,622
Misys PLC 304,357 1,550
Mondi PLC 324,534 2,583
National Grid PLC 418,784 4,171
Pearson PLC 420,856 7,779
Persimmon PLC Class A 332,576 2,759
Prudential PLC 1,203,479 13,285
Synthes, Inc. (Æ)(Þ) 15,616 2,660
Wynn Resorts, Ltd. 81,237 9,361
66,377
Virgin Islands, British - 0.2%Arcos Dorados Holdings, Inc. Class A 396,011 8,514
Total Common Stocks(cost $4,042,422) 4,221,125
Preferred Stocks - 0.4%Brazil - 0.1%Usinas Siderurgicas de Minas Gerais
SA (Æ) 850,300 5,704
Germany - 0.3%Hugo Boss AG 25,104 2,238
Porsche Automobil Holding SE 125,024 7,665
Copyright © 2012 www.secdatabase.com. All Rights Reserved.Please Consider the Environment Before Printing This Document

Table of Contents
Russell Investment CompanyRussell International Developed Markets FundSchedule of Investments, continued �� January 31, 2012 (Unaudited)Amounts in thousands (except share amounts)
Principal
Amount ($)
or Shares
Market
Value
$
Volkswagen AG 7,204 1,275
11,178
Total Preferred Stocks(cost $17,668) 16,882
Warrants & Rights - 0.2%Switzerland - 0.1%Astra International Tbk PT (Æ)
2013 Warrants 5,966 611
ICICI Bank, Ltd. (Æ)
2015 Warrants 207,900 3,788
4,399
Taiwan - 0.0%Hon Hai Precision Industry Co.,
Ltd. (Æ)(Þ)
2017 Warrants 1,020,600 3,279
United States - 0.1%JPMorgan Structured Notes (Æ)
2016 Warrants 33,340 3,296
Total Warrants & Rights(cost $10,524) 10,974
Short-Term Investments - 6.9%United States - 6.9%Russell U.S. Cash Management Fund 321,618,827(¥) 321,619
Total Short-TermInvestments(cost $321,619) 321,619
Other Securities - 5.9%Russell Investment Company
Liquidating Trust (×) 3,687,385 (¥) 3,749
Russell U.S. Cash Collateral Fund
(×) 269,732,004(¥) 269,732
Copyright © 2012 www.secdatabase.com. All Rights Reserved.Please Consider the Environment Before Printing This Document

See accompanying notes which are an integral part of this quarterly report.
38 Russell International Developed Markets Fund
Total Other Securities(cost $273,419) 273,481
Total Investments - 104.5%(identified cost $4,665,652) 4,844,081
Other Assets and Liabilities,Net - (4.5%) (210,440 )
Net Assets - 100.0% 4,633,641
A portion of the portfolio has been fair valued as of period end.
Copyright © 2012 www.secdatabase.com. All Rights Reserved.Please Consider the Environment Before Printing This Document
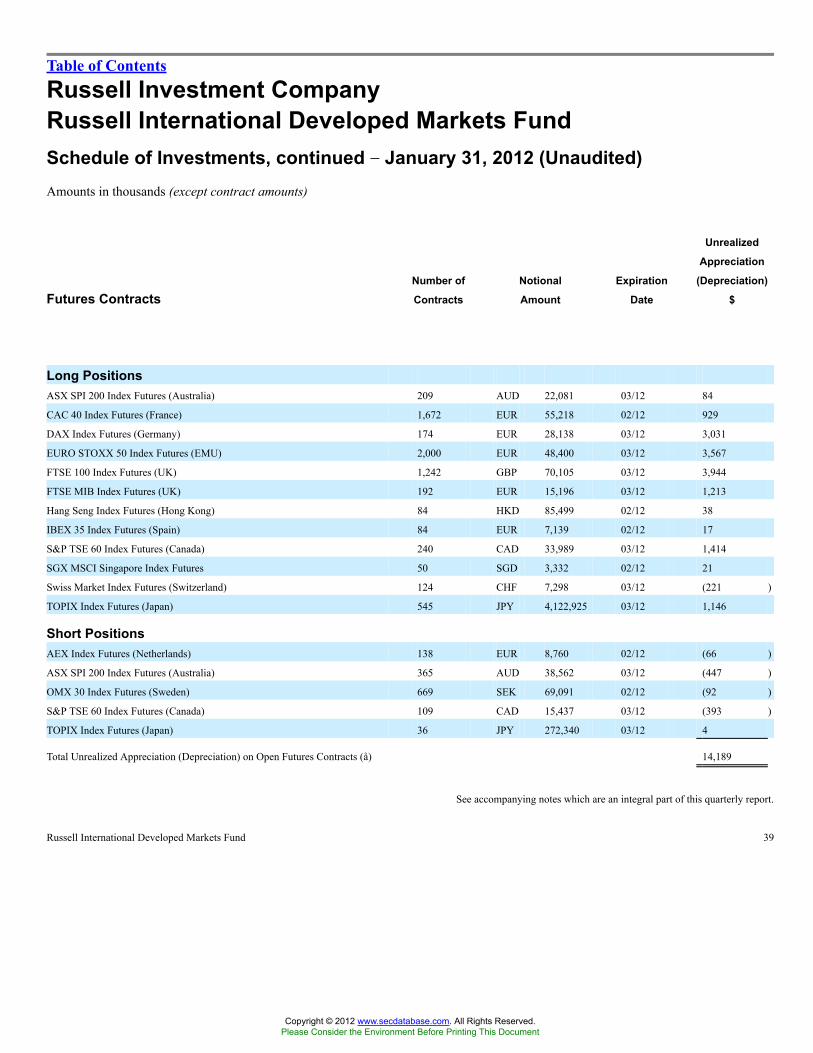
Table of Contents
Russell Investment CompanyRussell International Developed Markets FundSchedule of Investments, continued �� January 31, 2012 (Unaudited)Amounts in thousands (except contract amounts)
Futures ContractsNumber of
Contracts
Notional
Amount
Expiration
Date
Unrealized
Appreciation
(Depreciation)
$
Long PositionsASX SPI 200 Index Futures (Australia) 209 AUD 22,081 03/12 84
CAC 40 Index Futures (France) 1,672 EUR 55,218 02/12 929
DAX Index Futures (Germany) 174 EUR 28,138 03/12 3,031
EURO STOXX 50 Index Futures (EMU) 2,000 EUR 48,400 03/12 3,567
FTSE 100 Index Futures (UK) 1,242 GBP 70,105 03/12 3,944
FTSE MIB Index Futures (UK) 192 EUR 15,196 03/12 1,213
Hang Seng Index Futures (Hong Kong) 84 HKD 85,499 02/12 38
IBEX 35 Index Futures (Spain) 84 EUR 7,139 02/12 17
S&P TSE 60 Index Futures (Canada) 240 CAD 33,989 03/12 1,414
SGX MSCI Singapore Index Futures 50 SGD 3,332 02/12 21
Swiss Market Index Futures (Switzerland) 124 CHF 7,298 03/12 (221 )
TOPIX Index Futures (Japan) 545 JPY 4,122,925 03/12 1,146
Short PositionsAEX Index Futures (Netherlands) 138 EUR 8,760 02/12 (66 )
ASX SPI 200 Index Futures (Australia) 365 AUD 38,562 03/12 (447 )
OMX 30 Index Futures (Sweden) 669 SEK 69,091 02/12 (92 )
S&P TSE 60 Index Futures (Canada) 109 CAD 15,437 03/12 (393 )
TOPIX Index Futures (Japan) 36 JPY 272,340 03/12 4
Total Unrealized Appreciation (Depreciation) on Open Futures Contracts (å) 14,189
See accompanying notes which are an integral part of this quarterly report.
Russell International Developed Markets Fund 39
Copyright © 2012 www.secdatabase.com. All Rights Reserved.Please Consider the Environment Before Printing This Document

Table of Contents
Russell Investment CompanyRussell International Developed Markets FundSchedule of Investments, continued �� January 31, 2012 (Unaudited)Amounts in thousands
Foreign Currency Exchange Contracts
CounterpartyAmount
Sold
Amount
Bought
Settlement
Date
Unrealized
Appreciation
(Depreciation)
$
Bank of America USD 5,071 CHF 4,692 03/21/12 30
Bank of America USD 3,885 EUR 2,980 03/21/12 13
Bank of America USD 13,461 EUR 10,516 03/21/12 296
Bank of America USD 131 MXN 1,710 02/03/12 �
Bank of America USD 240 NOK 1,407 02/03/12 �
Bank of America USD 359 NOK 2,103 02/03/12 �
Bank of America USD 6,311 SEK 43,599 03/21/12 84
Bank of America USD 7,757 SEK 52,400 03/21/12 (71 )
Bank of America CHF 2,308 USD 2,474 03/21/12 (35 )
Bank of America CHF 2,780 USD 2,943 03/21/12 (80 )
Bank of America CHF 5,499 USD 5,796 03/21/12 (182 )
Bank of America EUR 1,868 USD 2,386 03/21/12 (58 )
Bank of America EUR 1,996 USD 2,604 03/21/12 (7 )
Bank of America GBP 1,401 USD 2,190 03/21/12 (17 )
Bank of America GBP 1,532 USD 2,383 03/21/12 (30 )
Bank of America GBP 3,257 USD 5,003 03/21/12 (128 )
Bank of America GBP 4,644 USD 7,175 03/21/12 (140 )
Bank of America NOK 9,620 USD 1,598 03/21/12 (38 )
Bank of America SEK 15,185 USD 2,193 03/21/12 (34 )
Bank of Montreal USD 4,870 CAD 5,055 03/21/12 166
Barclays Bank PLC USD 3,933 AUD 3,877 03/21/12 161
Barclays Bank PLC USD 5,907 CAD 5,975 03/21/12 46
Barclays Bank PLC USD 20,951 EUR 15,638 03/21/12 (493 )
Barclays Bank PLC USD 9,200 GBP 5,861 03/21/12 32
Barclays Bank PLC USD 5 HKD 36 02/01/12 �
Barclays Bank PLC USD 1,698 HKD 13,192 03/21/12 3
Barclays Bank PLC USD 9,831 JPY 761,833 03/21/12 170
Barclays Bank PLC USD 32 SEK 217 02/01/12 �
Barclays Bank PLC AUD 173 USD 184 02/01/12 �
Barclays Bank PLC CAD 6 USD 6 02/01/12 �
Barclays Bank PLC EUR 314 USD 411 02/01/12 1
Barclays Bank PLC GBP 132 USD 205 02/01/12 (2 )
Barclays Bank PLC JPY 202 USD 3 02/01/12 �
Copyright © 2012 www.secdatabase.com. All Rights Reserved.Please Consider the Environment Before Printing This Document

Barclays Bank PLC SGD 23 USD 18 02/01/12 �
Brown Brothers Harriman & Co. USD 1,017 AUD 1,021 03/21/12 61
Brown Brothers Harriman & Co. USD 1,025 AUD 1,000 03/21/12 31
Brown Brothers Harriman & Co. USD 1,969 AUD 1,917 03/21/12 56
Brown Brothers Harriman & Co. USD 2,197 AUD 2,139 03/21/12 62
Brown Brothers Harriman & Co. USD 980 CAD 1,000 03/21/12 16
Brown Brothers Harriman & Co. USD 2,495 CHF 2,332 03/21/12 40
Brown Brothers Harriman & Co. USD 7,011 CHF 6,581 03/21/12 144
Brown Brothers Harriman & Co. USD 1,278 EUR 1,000 03/21/12 30
Brown Brothers Harriman & Co. USD 2,574 EUR 1,968 03/21/12 1
Brown Brothers Harriman & Co. USD 2,594 EUR 2,000 03/21/12 22
Brown Brothers Harriman & Co. USD 1,540 GBP 1,000 03/21/12 35
Brown Brothers Harriman & Co. USD 1,548 GBP 1,000 03/21/12 27
Brown Brothers Harriman & Co. USD 3,827 GBP 2,455 03/21/12 40
Brown Brothers Harriman & Co. USD 5,707 GBP 3,646 03/21/12 36
Brown Brothers Harriman & Co. USD 129 HKD 1,000 03/21/12 �
Brown Brothers Harriman & Co. USD 118 JPY 9,045 03/21/12 1
Brown Brothers Harriman & Co. USD 1,303 JPY 100,000 03/21/12 9
Brown Brothers Harriman & Co. USD 2,271 JPY 176,447 03/21/12 45
Brown Brothers Harriman & Co. USD 3,280 JPY 251,898 03/21/12 27
See accompanying notes which are an integral part of this quarterly report.
40 Russell International Developed Markets Fund
Copyright © 2012 www.secdatabase.com. All Rights Reserved.Please Consider the Environment Before Printing This Document

Table of Contents
Russell Investment CompanyRussell International Developed Markets FundSchedule of Investments, continued �� January 31, 2012 (Unaudited)Amounts in thousands
Foreign Currency Exchange Contracts
CounterpartyAmount
Sold
Amount
Bought
Settlement
Date
Unrealized
Appreciation
(Depreciation)
$
Brown Brothers Harriman & Co. USD 5,350 JPY 415,882 03/21/12 110
Brown Brothers Harriman & Co. USD 1,039 NOK 6,092 03/21/12 (3 )
Brown Brothers Harriman & Co. USD 1,582 NZD 1,956 03/21/12 28
Brown Brothers Harriman & Co. USD 1,582 NZD 1,956 03/21/12 28
Brown Brothers Harriman & Co. USD 1,582 NZD 1,956 03/21/12 28
Brown Brothers Harriman & Co. USD 2,163 NZD 2,756 03/21/12 105
Brown Brothers Harriman & Co. USD 2,476 NZD 3,015 03/21/12 6
Brown Brothers Harriman & Co. USD 4,255 SEK 29,248 03/21/12 35
Brown Brothers Harriman & Co. CAD 250 USD 245 03/21/12 (4 )
Brown Brothers Harriman & Co. EUR 107 USD 141 03/21/12 1
Brown Brothers Harriman & Co. EUR 10,413 USD 13,560 03/21/12 (62 )
Brown Brothers Harriman & Co. GBP 25 USD 39 03/21/12 �
Brown Brothers Harriman & Co. GBP 200 USD 313 03/21/12 (2 )
Brown Brothers Harriman & Co. JPY 50,000 USD 653 03/21/12 (3 )
Brown Brothers Harriman & Co. JPY 226,521 USD 2,944 03/21/12 (30 )
Brown Brothers Harriman & Co. JPY 226,591 USD 2,945 03/21/12 (30 )
Brown Brothers Harriman & Co. JPY 364,079 USD 4,746 03/21/12 (33 )
Brown Brothers Harriman & Co. NOK 27,077 USD 4,528 03/21/12 (78 )
Brown Brothers Harriman & Co. SEK 16,271 USD 2,355 03/21/12 (32 )
Brown Brothers Harriman & Co. SEK 19,350 USD 2,770 03/21/12 (68 )
Citibank AUD 300 USD 309 03/21/12 (8 )
Citibank CAD 450 USD 444 03/21/12 (5 )
Citibank EUR 1,100 USD 1,425 03/21/12 (14 )
Citibank GBP 185 USD 289 03/21/12 (3 )
Citibank HKD 825 USD 106 03/21/12 �
Citibank JPY 42,500 USD 554 03/21/12 (3 )
Commonwealth Bank of Australia USD 3,933 AUD 3,877 03/21/12 161
Commonwealth Bank of Australia USD 20,951 EUR 15,638 03/21/12 (493 )
Commonwealth Bank of Australia USD 16,118 GBP 10,321 03/21/12 139
Commonwealth Bank of Australia USD 9,832 JPY 761,833 03/21/12 169
Commonwealth Bank of Australia USD 9,421 SEK 64,327 03/21/12 14
Commonwealth Bank of Australia USD 2,431 SGD 3,147 03/21/12 71
Commonwealth Bank of Australia AUD 474 USD 479 03/21/12 (22 )
Copyright © 2012 www.secdatabase.com. All Rights Reserved.Please Consider the Environment Before Printing This Document

Commonwealth Bank of Australia AUD 7,939 USD 8,359 04/27/12 8
Commonwealth Bank of Australia CAD 3,634 USD 3,566 03/21/12 (54 )
Commonwealth Bank of Australia CHF 6,272 USD 6,778 03/21/12 (40 )
Commonwealth Bank of Australia DKK 3,316 USD 594 03/21/12 11
Commonwealth Bank of Australia EUR 9,485 USD 12,634 03/21/12 226
Commonwealth Bank of Australia JPY 816,946 USD 10,563 03/21/12 (161 )
Credit Suisse First Boston USD 3,933 AUD 3,877 03/21/12 161
Credit Suisse First Boston USD 5,904 CAD 5,975 03/21/12 49
Credit Suisse First Boston USD 20,951 EUR 15,638 03/21/12 (493 )
Credit Suisse First Boston USD 215 GBP 137 02/01/12 1
Credit Suisse First Boston USD 9,197 GBP 5,861 03/21/12 35
Credit Suisse First Boston USD 429 JPY 32,963 02/01/12 3
Credit Suisse First Boston USD 2,080 NZD 2,707 03/21/12 148
Credit Suisse First Boston USD 9,430 SEK 64,327 03/21/12 5
Credit Suisse First Boston CHF 596 USD 647 02/01/12 �
Credit Suisse First Boston EUR 544 USD 713 02/01/12 2
Credit Suisse First Boston EUR 1,542 USD 2,036 02/01/12 19
Deutsche Bank AG USD 863 AUD 875 03/21/12 61
Deutsche Bank AG USD 2,197 AUD 2,139 03/21/12 62
Deutsche Bank AG USD 2,456 AUD 2,347 03/21/12 23
See accompanying notes which are an integral part of this quarterly report.
Russell International Developed Markets Fund 41
Copyright © 2012 www.secdatabase.com. All Rights Reserved.Please Consider the Environment Before Printing This Document

Table of Contents
Russell Investment CompanyRussell International Developed Markets FundSchedule of Investments, continued �� January 31, 2012 (Unaudited)Amounts in thousands
Foreign Currency Exchange Contracts
CounterpartyAmount
Sold
Amount
Bought
Settlement
Date
Unrealized
Appreciation
(Depreciation)
$
Deutsche Bank AG USD 2,769 AUD 2,752 03/21/12 137
Deutsche Bank AG USD 2,785 AUD 2,768 03/21/12 138
Deutsche Bank AG USD 3,932 AUD 3,877 03/21/12 161
Deutsche Bank AG USD 1,378 CAD 1,400 03/21/12 17
Deutsche Bank AG USD 2,346 CAD 2,387 03/21/12 31
Deutsche Bank AG USD 20,952 EUR 15,638 03/21/12 (493 )
Deutsche Bank AG USD 1,698 HKD 13,192 03/21/12 3
Deutsche Bank AG USD 2,201 JPY 170,942 03/21/12 43
Deutsche Bank AG USD 2,271 JPY 176,447 03/21/12 45
Deutsche Bank AG USD 2,271 JPY 176,447 03/21/12 45
Deutsche Bank AG USD 3,281 JPY 251,994 03/21/12 27
Deutsche Bank AG USD 10,648 NOK 61,897 03/21/12 (118 )
Deutsche Bank AG USD 1,494 NZD 1,873 03/21/12 47
Deutsche Bank AG USD 1,582 NZD 1,956 03/21/12 28
Deutsche Bank AG USD 2,163 NZD 2,756 03/21/12 105
Deutsche Bank AG USD 253 SEK 1,720 02/03/12 �
Deutsche Bank AG USD 9,427 SEK 64,327 03/21/12 8
Deutsche Bank AG AUD 3,761 USD 3,875 03/21/12 (96 )
Deutsche Bank AG AUD 3,761 USD 3,877 03/21/12 (95 )
Deutsche Bank AG EUR 1,000 USD 1,289 03/21/12 (19 )
Deutsche Bank AG GBP 1,000 USD 1,546 03/21/12 (29 )
Deutsche Bank AG JPY 124,679 USD 1,606 03/21/12 (31 )
Deutsche Bank AG JPY 166,815 USD 2,142 03/21/12 (47 )
Deutsche Bank AG JPY 364,203 USD 4,747 03/21/12 (34 )
HSBC Bank PLC USD 3,933 AUD 3,877 03/21/12 161
HSBC Bank PLC USD 5,904 CAD 5,975 03/21/12 48
HSBC Bank PLC USD 20,951 EUR 15,638 03/21/12 (493 )
HSBC Bank PLC USD 9,198 GBP 5,861 03/21/12 35
HSBC Bank PLC USD 16,119 GBP 10,321 03/21/12 138
HSBC Bank PLC USD 1,698 HKD 13,192 03/21/12 3
HSBC Bank PLC USD 9,827 JPY 761,833 03/21/12 174
HSBC Bank PLC USD 10,651 NOK 61,897 03/21/12 (121 )
HSBC Bank PLC USD 9,425 SEK 64,327 03/21/12 11
Copyright © 2012 www.secdatabase.com. All Rights Reserved.Please Consider the Environment Before Printing This Document
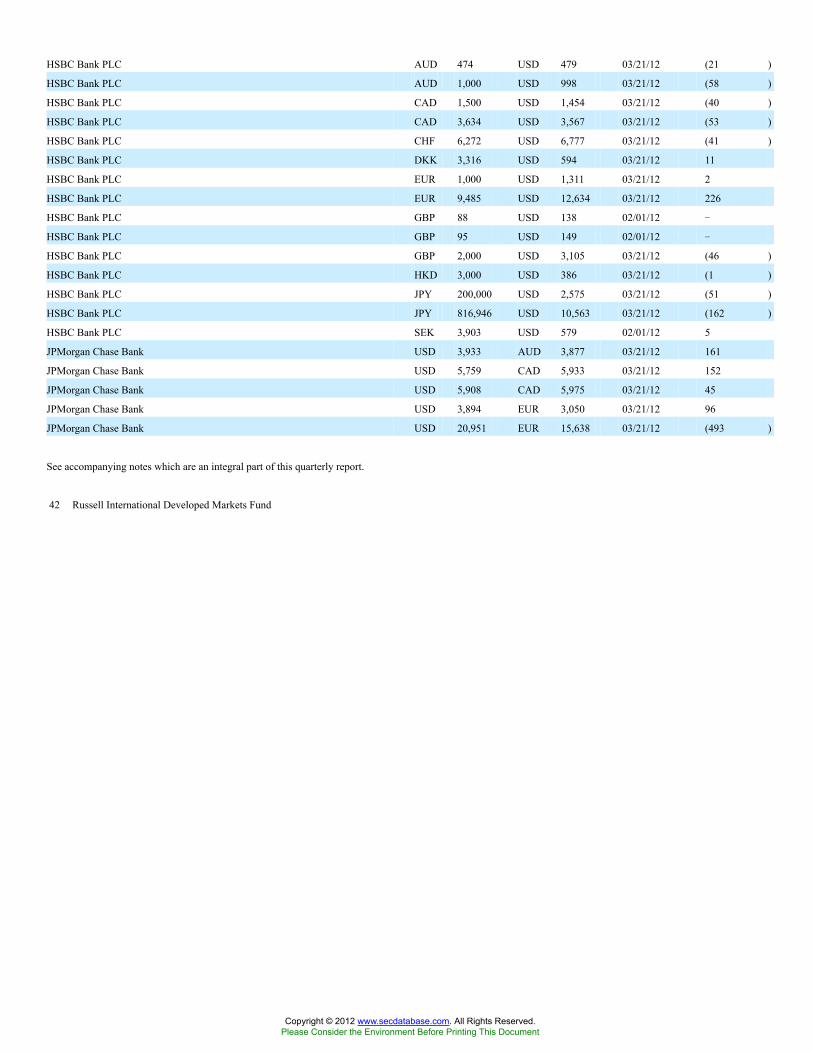
HSBC Bank PLC AUD 474 USD 479 03/21/12 (21 )
HSBC Bank PLC AUD 1,000 USD 998 03/21/12 (58 )
HSBC Bank PLC CAD 1,500 USD 1,454 03/21/12 (40 )
HSBC Bank PLC CAD 3,634 USD 3,567 03/21/12 (53 )
HSBC Bank PLC CHF 6,272 USD 6,777 03/21/12 (41 )
HSBC Bank PLC DKK 3,316 USD 594 03/21/12 11
HSBC Bank PLC EUR 1,000 USD 1,311 03/21/12 2
HSBC Bank PLC EUR 9,485 USD 12,634 03/21/12 226
HSBC Bank PLC GBP 88 USD 138 02/01/12 �
HSBC Bank PLC GBP 95 USD 149 02/01/12 �
HSBC Bank PLC GBP 2,000 USD 3,105 03/21/12 (46 )
HSBC Bank PLC HKD 3,000 USD 386 03/21/12 (1 )
HSBC Bank PLC JPY 200,000 USD 2,575 03/21/12 (51 )
HSBC Bank PLC JPY 816,946 USD 10,563 03/21/12 (162 )
HSBC Bank PLC SEK 3,903 USD 579 02/01/12 5
JPMorgan Chase Bank USD 3,933 AUD 3,877 03/21/12 161
JPMorgan Chase Bank USD 5,759 CAD 5,933 03/21/12 152
JPMorgan Chase Bank USD 5,908 CAD 5,975 03/21/12 45
JPMorgan Chase Bank USD 3,894 EUR 3,050 03/21/12 96
JPMorgan Chase Bank USD 20,951 EUR 15,638 03/21/12 (493 )
See accompanying notes which are an integral part of this quarterly report.
42 Russell International Developed Markets Fund
Copyright © 2012 www.secdatabase.com. All Rights Reserved.Please Consider the Environment Before Printing This Document
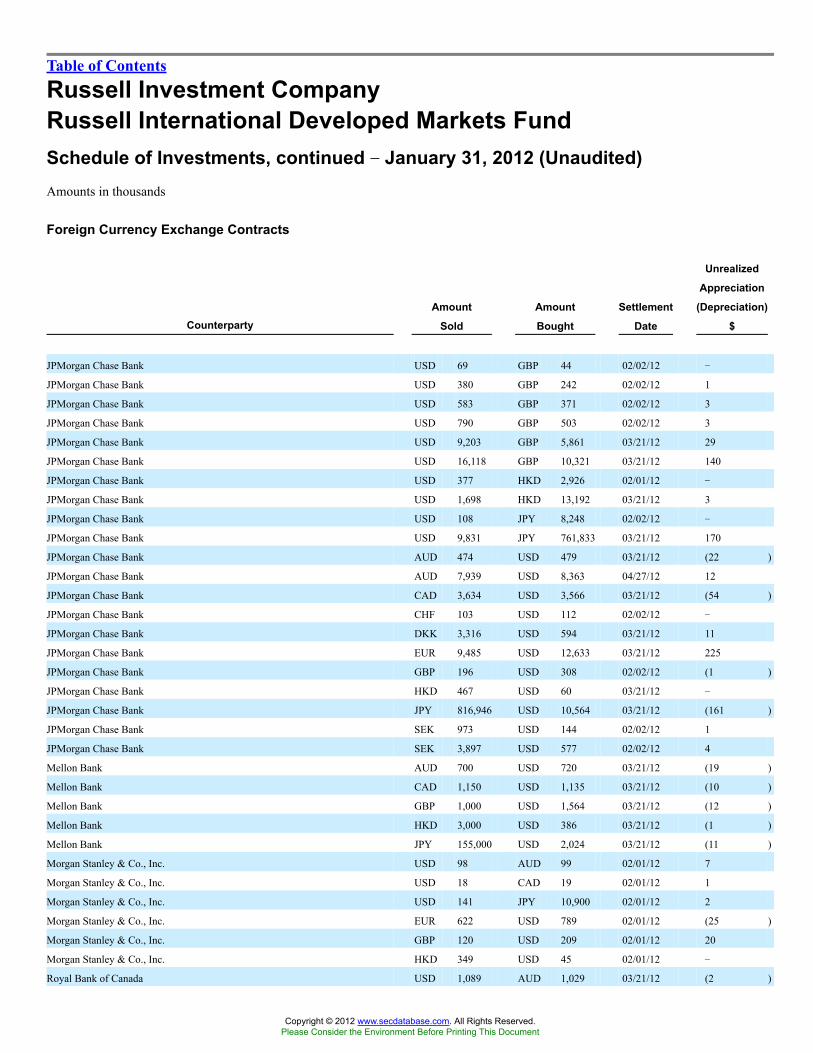
Table of Contents
Russell Investment CompanyRussell International Developed Markets FundSchedule of Investments, continued �� January 31, 2012 (Unaudited)Amounts in thousands
Foreign Currency Exchange Contracts
CounterpartyAmount
Sold
Amount
Bought
Settlement
Date
Unrealized
Appreciation
(Depreciation)
$
JPMorgan Chase Bank USD 69 GBP 44 02/02/12 �
JPMorgan Chase Bank USD 380 GBP 242 02/02/12 1
JPMorgan Chase Bank USD 583 GBP 371 02/02/12 3
JPMorgan Chase Bank USD 790 GBP 503 02/02/12 3
JPMorgan Chase Bank USD 9,203 GBP 5,861 03/21/12 29
JPMorgan Chase Bank USD 16,118 GBP 10,321 03/21/12 140
JPMorgan Chase Bank USD 377 HKD 2,926 02/01/12 �
JPMorgan Chase Bank USD 1,698 HKD 13,192 03/21/12 3
JPMorgan Chase Bank USD 108 JPY 8,248 02/02/12 �
JPMorgan Chase Bank USD 9,831 JPY 761,833 03/21/12 170
JPMorgan Chase Bank AUD 474 USD 479 03/21/12 (22 )
JPMorgan Chase Bank AUD 7,939 USD 8,363 04/27/12 12
JPMorgan Chase Bank CAD 3,634 USD 3,566 03/21/12 (54 )
JPMorgan Chase Bank CHF 103 USD 112 02/02/12 �
JPMorgan Chase Bank DKK 3,316 USD 594 03/21/12 11
JPMorgan Chase Bank EUR 9,485 USD 12,633 03/21/12 225
JPMorgan Chase Bank GBP 196 USD 308 02/02/12 (1 )
JPMorgan Chase Bank HKD 467 USD 60 03/21/12 �
JPMorgan Chase Bank JPY 816,946 USD 10,564 03/21/12 (161 )
JPMorgan Chase Bank SEK 973 USD 144 02/02/12 1
JPMorgan Chase Bank SEK 3,897 USD 577 02/02/12 4
Mellon Bank AUD 700 USD 720 03/21/12 (19 )
Mellon Bank CAD 1,150 USD 1,135 03/21/12 (10 )
Mellon Bank GBP 1,000 USD 1,564 03/21/12 (12 )
Mellon Bank HKD 3,000 USD 386 03/21/12 (1 )
Mellon Bank JPY 155,000 USD 2,024 03/21/12 (11 )
Morgan Stanley & Co., Inc. USD 98 AUD 99 02/01/12 7
Morgan Stanley & Co., Inc. USD 18 CAD 19 02/01/12 1
Morgan Stanley & Co., Inc. USD 141 JPY 10,900 02/01/12 2
Morgan Stanley & Co., Inc. EUR 622 USD 789 02/01/12 (25 )
Morgan Stanley & Co., Inc. GBP 120 USD 209 02/01/12 20
Morgan Stanley & Co., Inc. HKD 349 USD 45 02/01/12 �
Royal Bank of Canada USD 1,089 AUD 1,029 03/21/12 (2 )
Copyright © 2012 www.secdatabase.com. All Rights Reserved.Please Consider the Environment Before Printing This Document

Royal Bank of Canada USD 1,249 AUD 1,227 03/21/12 47
Royal Bank of Canada USD 5,909 CAD 5,975 03/21/12 43
Royal Bank of Canada USD 11,405 CAD 11,619 03/21/12 170
Royal Bank of Canada USD 6,920 CHF 6,495 03/21/12 141
Royal Bank of Canada USD 2,854 EUR 2,191 03/21/12 13
Royal Bank of Canada USD 2,556 GBP 1,649 03/21/12 41
Royal Bank of Canada USD 9,203 GBP 5,861 03/21/12 29
Royal Bank of Canada USD 1,698 HKD 13,192 03/21/12 3
Royal Bank of Canada USD 9,830 JPY 761,833 03/21/12 171
Royal Bank of Canada USD 10,650 NOK 61,897 03/21/12 (121 )
Royal Bank of Canada USD 1,493 NZD 1,871 03/21/12 47
Royal Bank of Canada USD 1,579 NZD 1,953 03/21/12 28
Royal Bank of Canada USD 1,089 SEK 7,558 03/21/12 20
Royal Bank of Canada USD 4,254 SEK 29,245 03/21/12 35
Royal Bank of Canada CAD 8,097 USD 7,981 03/21/12 (85 )
Royal Bank of Canada CHF 5,912 USD 6,317 03/21/12 (110 )
Royal Bank of Canada CHF 6,272 USD 6,776 03/21/12 (42 )
Royal Bank of Canada EUR 10,303 USD 13,421 03/21/12 (58 )
Royal Bank of Canada GBP 2,188 USD 3,397 03/21/12 (49 )
Royal Bank of Canada NOK 2,426 USD 404 03/21/12 (8 )
See accompanying notes which are an integral part of this quarterly report.
Russell International Developed Markets Fund 43
Copyright © 2012 www.secdatabase.com. All Rights Reserved.Please Consider the Environment Before Printing This Document

Table of Contents
Russell Investment CompanyRussell International Developed Markets FundSchedule of Investments, continued �� January 31, 2012 (Unaudited)Amounts in thousands
Foreign Currency Exchange Contracts
CounterpartyAmount
Sold
Amount
Bought
Settlement
Date
Unrealized
Appreciation
(Depreciation)
$
Royal Bank of Canada NOK 9,505 USD 1,595 03/21/12 (22 )
Royal Bank of Canada NOK 27,077 USD 4,527 03/21/12 (80 )
Royal Bank of Canada SEK 18,869 USD 2,701 03/21/12 (67 )
Royal Bank of Scotland PLC USD 10,603 EUR 8,054 03/21/12 (66 )
Royal Bank of Scotland PLC USD 208 GBP 132 03/21/12 �
Royal Bank of Scotland PLC GBP 1,000 USD 1,565 03/21/12 (10 )
Royal Bank of Scotland PLC JPY 166,960 USD 2,176 02/01/12 (15 )
Royal Bank of Scotland PLC SEK 60,659 USD 8,967 03/21/12 69
Royal Bank of Scotland PLC ZAR 6,290 USD 794 02/01/12 (10 )
State Street Bank & Trust Co. USD 94 AUD 89 02/01/12 �
State Street Bank & Trust Co. USD 109 AUD 103 02/01/12 �
State Street Bank & Trust Co. USD 102 AUD 96 03/21/12 �
State Street Bank & Trust Co. USD 507 AUD 500 03/21/12 21
State Street Bank & Trust Co. USD 998 AUD 1,000 03/21/12 58
State Street Bank & Trust Co. USD 107 BRL 187 02/03/12 �
State Street Bank & Trust Co. USD 26 CAD 26 02/01/12 �
State Street Bank & Trust Co. USD 661 CAD 663 03/21/12 (1 )
State Street Bank & Trust Co. USD 971 CAD 1,000 03/21/12 25
State Street Bank & Trust Co. USD 973 CAD 1,000 03/21/12 24
State Street Bank & Trust Co. USD 2,622 CAD 2,620 03/21/12 (12 )
State Street Bank & Trust Co. USD 5,906 CAD 5,975 03/21/12 46
State Street Bank & Trust Co. USD 238 CHF 219 02/03/12 �
State Street Bank & Trust Co. USD 33 DKK 187 03/21/12 �
State Street Bank & Trust Co. USD 35 DKK 199 03/21/12 �
State Street Bank & Trust Co. USD 37 DKK 215 03/21/12 �
State Street Bank & Trust Co. USD 64 DKK 372 03/21/12 1
State Street Bank & Trust Co. USD 115 DKK 655 03/21/12 �
State Street Bank & Trust Co. USD 137 EUR 104 02/01/12 (1 )
State Street Bank & Trust Co. USD 441 EUR 337 02/01/12 �
State Street Bank & Trust Co. USD 577 EUR 440 02/01/12 (1 )
State Street Bank & Trust Co. USD 769 EUR 584 02/02/12 (5 )
State Street Bank & Trust Co. USD 63 EUR 49 03/21/12 1
State Street Bank & Trust Co. USD 202 EUR 159 03/21/12 6
Copyright © 2012 www.secdatabase.com. All Rights Reserved.Please Consider the Environment Before Printing This Document
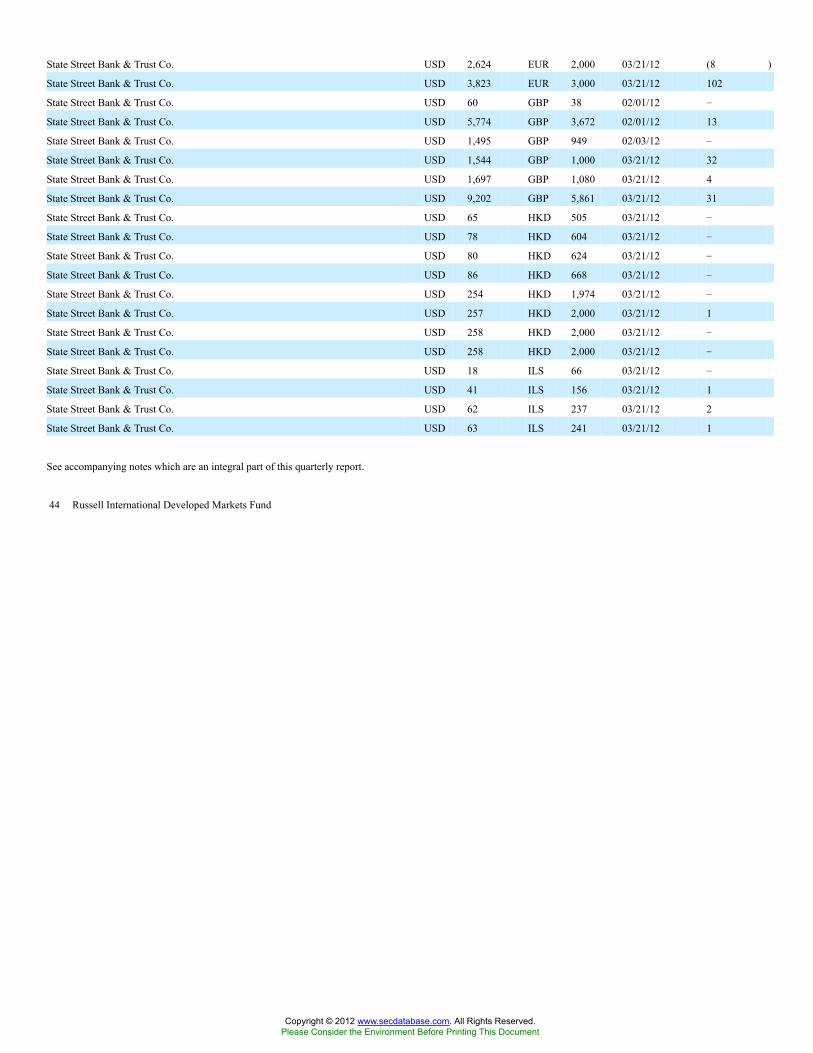
State Street Bank & Trust Co. USD 2,624 EUR 2,000 03/21/12 (8 )
State Street Bank & Trust Co. USD 3,823 EUR 3,000 03/21/12 102
State Street Bank & Trust Co. USD 60 GBP 38 02/01/12 �
State Street Bank & Trust Co. USD 5,774 GBP 3,672 02/01/12 13
State Street Bank & Trust Co. USD 1,495 GBP 949 02/03/12 �
State Street Bank & Trust Co. USD 1,544 GBP 1,000 03/21/12 32
State Street Bank & Trust Co. USD 1,697 GBP 1,080 03/21/12 4
State Street Bank & Trust Co. USD 9,202 GBP 5,861 03/21/12 31
State Street Bank & Trust Co. USD 65 HKD 505 03/21/12 �
State Street Bank & Trust Co. USD 78 HKD 604 03/21/12 �
State Street Bank & Trust Co. USD 80 HKD 624 03/21/12 �
State Street Bank & Trust Co. USD 86 HKD 668 03/21/12 �
State Street Bank & Trust Co. USD 254 HKD 1,974 03/21/12 �
State Street Bank & Trust Co. USD 257 HKD 2,000 03/21/12 1
State Street Bank & Trust Co. USD 258 HKD 2,000 03/21/12 �
State Street Bank & Trust Co. USD 258 HKD 2,000 03/21/12 �
State Street Bank & Trust Co. USD 18 ILS 66 03/21/12 �
State Street Bank & Trust Co. USD 41 ILS 156 03/21/12 1
State Street Bank & Trust Co. USD 62 ILS 237 03/21/12 2
State Street Bank & Trust Co. USD 63 ILS 241 03/21/12 1
See accompanying notes which are an integral part of this quarterly report.
44 Russell International Developed Markets Fund
Copyright © 2012 www.secdatabase.com. All Rights Reserved.Please Consider the Environment Before Printing This Document

Table of Contents
Russell Investment CompanyRussell International Developed Markets FundSchedule of Investments, continued �� January 31, 2012 (Unaudited)Amounts in thousands
Foreign Currency Exchange Contracts
CounterpartyAmount
Sold
Amount
Bought
Settlement
Date
Unrealized
Appreciation
(Depreciation)
$
State Street Bank & Trust Co. USD 76 ILS 293 03/21/12 2
State Street Bank & Trust Co. USD 197 ILS 748 03/21/12 2
State Street Bank & Trust Co. USD 3,570 ILS 13,517 03/21/12 35
State Street Bank & Trust Co. USD 905 JPY 69,401 02/01/12 6
State Street Bank & Trust Co. USD 356 JPY 27,224 02/02/12 2
State Street Bank & Trust Co. USD 525 JPY 40,194 02/02/12 2
State Street Bank & Trust Co. USD 585 JPY 44,791 02/02/12 3
State Street Bank & Trust Co. USD 795 JPY 60,601 02/03/12 �
State Street Bank & Trust Co. USD 1,032 JPY 78,578 02/03/12 (1 )
State Street Bank & Trust Co. USD 1,058 JPY 80,720 02/03/12 1
State Street Bank & Trust Co. USD 181 JPY 14,000 03/21/12 3
State Street Bank & Trust Co. USD 1,285 JPY 100,000 03/21/12 28
State Street Bank & Trust Co. USD 1,301 JPY 100,000 03/21/12 12
State Street Bank & Trust Co. USD 1,302 JPY 100,000 03/21/12 10
State Street Bank & Trust Co. USD 131 SGD 164 02/01/12 (1 )
State Street Bank & Trust Co. USD 49 SGD 62 03/21/12 �
State Street Bank & Trust Co. USD 88 SGD 114 03/21/12 2
State Street Bank & Trust Co. USD 92 SGD 119 03/21/12 3
State Street Bank & Trust Co. USD 113 SGD 145 03/21/12 2
State Street Bank & Trust Co. AUD 96 USD 102 02/01/12 �
State Street Bank & Trust Co. AUD 711 USD 754 02/01/12 (1 )
State Street Bank & Trust Co. AUD 604 USD 637 02/02/12 (5 )
State Street Bank & Trust Co. AUD 391 USD 417 02/03/12 2
State Street Bank & Trust Co. AUD 555 USD 592 02/03/12 3
State Street Bank & Trust Co. AUD 375 USD 378 03/21/12 (18 )
State Street Bank & Trust Co. AUD 1,000 USD 1,006 03/21/12 (50 )
State Street Bank & Trust Co. AUD 1,000 USD 1,031 03/21/12 (25 )
State Street Bank & Trust Co. AUD 7,939 USD 8,342 04/27/12 (8 )
State Street Bank & Trust Co. BRL 64 USD 37 02/01/12 �
State Street Bank & Trust Co. BRL 296 USD 170 02/01/12 �
State Street Bank & Trust Co. BRL 869 USD 498 02/02/12 1
State Street Bank & Trust Co. CAD 663 USD 662 02/01/12 1
State Street Bank & Trust Co. CAD 26 USD 26 03/21/12 �
Copyright © 2012 www.secdatabase.com. All Rights Reserved.Please Consider the Environment Before Printing This Document

State Street Bank & Trust Co. CAD 235 USD 230 03/21/12 (4 )
State Street Bank & Trust Co. CAD 1,000 USD 992 03/21/12 (4 )
State Street Bank & Trust Co. CAD 1,000 USD 985 03/21/12 (11 )
State Street Bank & Trust Co. CAD 1,000 USD 977 03/21/12 (20 )
State Street Bank & Trust Co. DKK 59 USD 11 03/21/12 �
State Street Bank & Trust Co. DKK 179 USD 32 03/21/12 �
State Street Bank & Trust Co. DKK 531 USD 92 03/21/12 (1 )
State Street Bank & Trust Co. DKK 672 USD 116 03/21/12 (3 )
State Street Bank & Trust Co. DKK 726 USD 128 03/21/12 �
State Street Bank & Trust Co. EUR 1 USD 1 02/01/12 �
State Street Bank & Trust Co. EUR 2,530 USD 3,341 02/01/12 32
State Street Bank & Trust Co. EUR 351 USD 459 02/03/12 �
State Street Bank & Trust Co. EUR 1,300 USD 1,736 03/21/12 36
State Street Bank & Trust Co. EUR 1,339 USD 1,769 03/21/12 17
State Street Bank & Trust Co. EUR 2,000 USD 2,616 03/21/12 �
State Street Bank & Trust Co. EUR 2,000 USD 2,535 03/21/12 (81 )
State Street Bank & Trust Co. EUR 2,000 USD 2,610 03/21/12 (7 )
State Street Bank & Trust Co. EUR 2,000 USD 2,564 03/21/12 (53 )
State Street Bank & Trust Co. EUR 2,000 USD 2,611 03/21/12 (6 )
State Street Bank & Trust Co. EUR 3,000 USD 3,916 03/21/12 (8 )
See accompanying notes which are an integral part of this quarterly report.
Russell International Developed Markets Fund 45
Copyright © 2012 www.secdatabase.com. All Rights Reserved.Please Consider the Environment Before Printing This Document
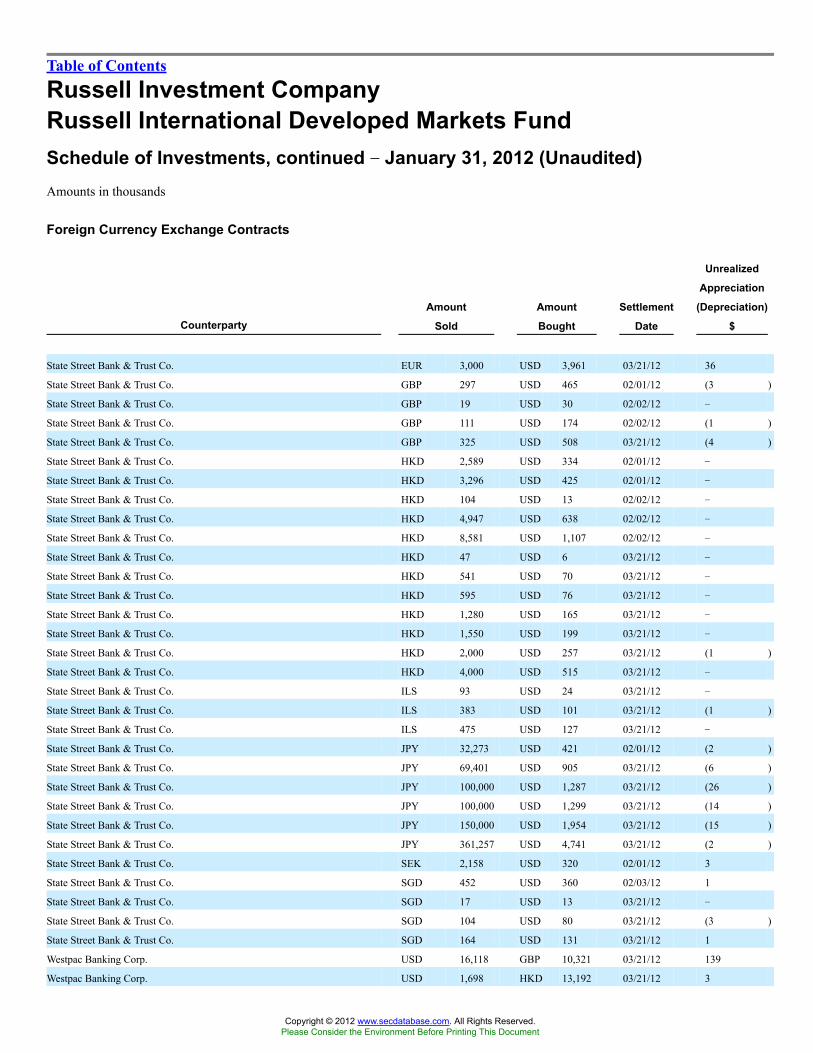
Table of Contents
Russell Investment CompanyRussell International Developed Markets FundSchedule of Investments, continued �� January 31, 2012 (Unaudited)Amounts in thousands
Foreign Currency Exchange Contracts
CounterpartyAmount
Sold
Amount
Bought
Settlement
Date
Unrealized
Appreciation
(Depreciation)
$
State Street Bank & Trust Co. EUR 3,000 USD 3,961 03/21/12 36
State Street Bank & Trust Co. GBP 297 USD 465 02/01/12 (3 )
State Street Bank & Trust Co. GBP 19 USD 30 02/02/12 �
State Street Bank & Trust Co. GBP 111 USD 174 02/02/12 (1 )
State Street Bank & Trust Co. GBP 325 USD 508 03/21/12 (4 )
State Street Bank & Trust Co. HKD 2,589 USD 334 02/01/12 �
State Street Bank & Trust Co. HKD 3,296 USD 425 02/01/12 �
State Street Bank & Trust Co. HKD 104 USD 13 02/02/12 �
State Street Bank & Trust Co. HKD 4,947 USD 638 02/02/12 �
State Street Bank & Trust Co. HKD 8,581 USD 1,107 02/02/12 �
State Street Bank & Trust Co. HKD 47 USD 6 03/21/12 �
State Street Bank & Trust Co. HKD 541 USD 70 03/21/12 �
State Street Bank & Trust Co. HKD 595 USD 76 03/21/12 �
State Street Bank & Trust Co. HKD 1,280 USD 165 03/21/12 �
State Street Bank & Trust Co. HKD 1,550 USD 199 03/21/12 �
State Street Bank & Trust Co. HKD 2,000 USD 257 03/21/12 (1 )
State Street Bank & Trust Co. HKD 4,000 USD 515 03/21/12 �
State Street Bank & Trust Co. ILS 93 USD 24 03/21/12 �
State Street Bank & Trust Co. ILS 383 USD 101 03/21/12 (1 )
State Street Bank & Trust Co. ILS 475 USD 127 03/21/12 �
State Street Bank & Trust Co. JPY 32,273 USD 421 02/01/12 (2 )
State Street Bank & Trust Co. JPY 69,401 USD 905 03/21/12 (6 )
State Street Bank & Trust Co. JPY 100,000 USD 1,287 03/21/12 (26 )
State Street Bank & Trust Co. JPY 100,000 USD 1,299 03/21/12 (14 )
State Street Bank & Trust Co. JPY 150,000 USD 1,954 03/21/12 (15 )
State Street Bank & Trust Co. JPY 361,257 USD 4,741 03/21/12 (2 )
State Street Bank & Trust Co. SEK 2,158 USD 320 02/01/12 3
State Street Bank & Trust Co. SGD 452 USD 360 02/03/12 1
State Street Bank & Trust Co. SGD 17 USD 13 03/21/12 �
State Street Bank & Trust Co. SGD 104 USD 80 03/21/12 (3 )
State Street Bank & Trust Co. SGD 164 USD 131 03/21/12 1
Westpac Banking Corp. USD 16,118 GBP 10,321 03/21/12 139
Westpac Banking Corp. USD 1,698 HKD 13,192 03/21/12 3
Copyright © 2012 www.secdatabase.com. All Rights Reserved.Please Consider the Environment Before Printing This Document
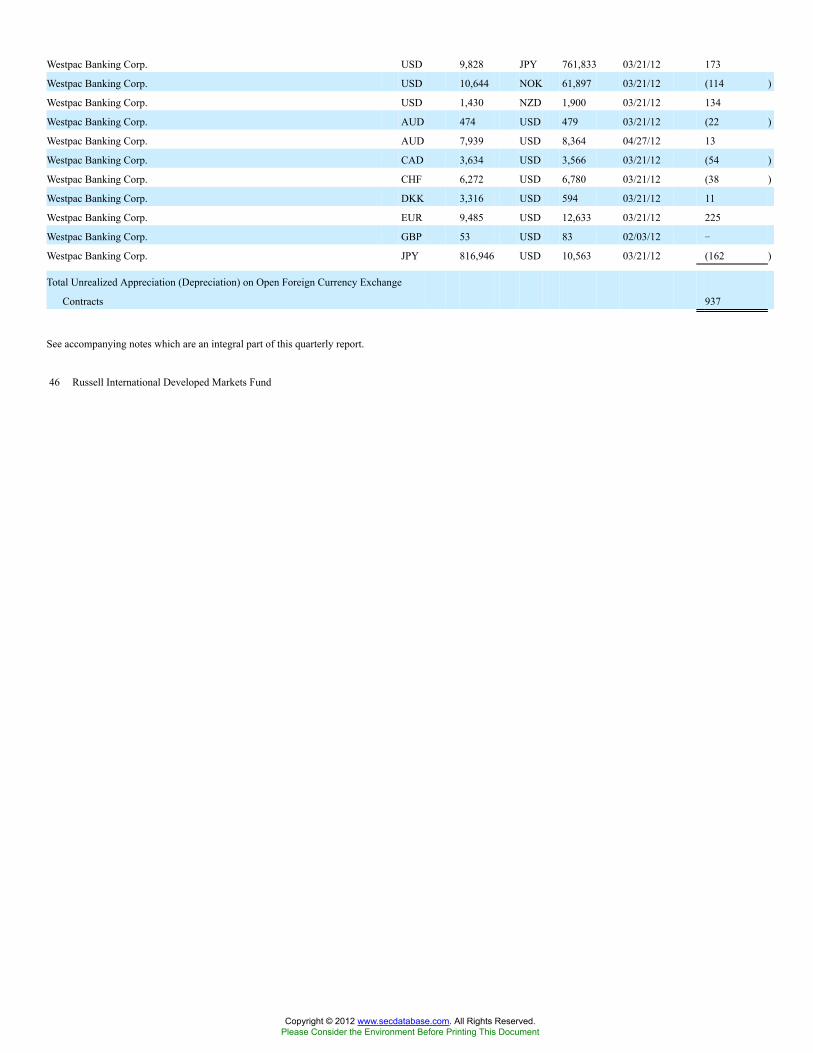
Westpac Banking Corp. USD 9,828 JPY 761,833 03/21/12 173
Westpac Banking Corp. USD 10,644 NOK 61,897 03/21/12 (114 )
Westpac Banking Corp. USD 1,430 NZD 1,900 03/21/12 134
Westpac Banking Corp. AUD 474 USD 479 03/21/12 (22 )
Westpac Banking Corp. AUD 7,939 USD 8,364 04/27/12 13
Westpac Banking Corp. CAD 3,634 USD 3,566 03/21/12 (54 )
Westpac Banking Corp. CHF 6,272 USD 6,780 03/21/12 (38 )
Westpac Banking Corp. DKK 3,316 USD 594 03/21/12 11
Westpac Banking Corp. EUR 9,485 USD 12,633 03/21/12 225
Westpac Banking Corp. GBP 53 USD 83 02/03/12 �
Westpac Banking Corp. JPY 816,946 USD 10,563 03/21/12 (162 )
Total Unrealized Appreciation (Depreciation) on Open Foreign Currency Exchange
Contracts 937
See accompanying notes which are an integral part of this quarterly report.
46 Russell International Developed Markets Fund
Copyright © 2012 www.secdatabase.com. All Rights Reserved.Please Consider the Environment Before Printing This Document

Table of Contents
Russell Investment CompanyRussell International Developed Markets FundPresentation of Portfolio Holdings �� January 31, 2012 (Unaudited)Amounts in thousands
Market Value
Portfolio Summary Level 1 Level 2 Level 3 Total
Common Stocks
Australia $140,095 $� $� $140,095
Belgium 40,040 � � 40,040
Bermuda 37,840 � � 37,840
Brazil 73,244 � � 73,244
Canada 219,779 � 513 220,292
Cayman Islands 35,176 � 703 35,879
Chile 9,299 � � 9,299
China 28,039 � � 28,039
Curacao 158 � � 158
Czech Republic 5,421 � � 5,421
Denmark 49,447 � � 49,447
Finland 27,819 � � 27,819
France 334,791 � � 334,791
Germany 301,617 � � 301,617
Hong Kong 73,906 � � 73,906
India 18,078 � � 18,078
Indonesia 9,775 � � 9,775
Ireland 33,822 � � 33,822
Israel 50,426 � � 50,426
Italy 102,880 � � 102,880
Japan 665,632 � � 665,632
Jersey 30,710 � � 30,710
Luxembourg 21,983 � � 21,983
Mexico 13,701 � � 13,701
Netherlands 232,092 � � 232,092
New Zealand 2,510 � � 2,510
Norway 2,604 � � 2,604
Panama 7,432 � � 7,432
Papua New Guinea 2,211 � � 2,211
Philippines 1,492 � � 1,492
Portugal 2,026 � � 2,026
Russia 24,514 � � 24,514
Singapore 46,806 � � 46,806
South Africa 29,945 � � 29,945
South Korea 67,085 � � 67,085
Spain 109,693 � � 109,693
Copyright © 2012 www.secdatabase.com. All Rights Reserved.Please Consider the Environment Before Printing This Document

Sweden 43,256 � � 43,256
Switzerland 328,476 � � 328,476
Taiwan 42,395 � � 42,395
Thailand 3,325 � � 3,325
United Kingdom 875,478 � � 875,478
United States 66,377 � � 66,377
Virgin Islands, British 8,514 � � 8,514
Preferred Stocks 16,882 � � 16,882
Warrants & Rights � 10,974 � 10,974
Short-Term Investments � 321,619 � 321,619
Other Securities � 273,481 � 273,481
Total Investments 4,236,791 606,074 1,216 4,844,081
Other Financial Instruments
Futures Contracts 14,189 � � 14,189
Foreign Currency Exchange Contracts 67 870 � 937
Total Other Financial Instruments* $14,256 $870 $� $15,126
* Other financial instruments reflected, such as futures, forwards, interest rate swaps, and credit default swaps are valued at the unrealized appreciation/depreciation
on the instruments.
For a description of the levels see note 2 in the Notes to Quarterly Report.
Investments in which significant observable inputs (Level 3) used in determining a value for the period ending January 31, 2012 wereless than 1% of net assets.
See accompanying notes which are an integral part of this quarterly report.
Russell International Developed Markets Fund 47
Copyright © 2012 www.secdatabase.com. All Rights Reserved.Please Consider the Environment Before Printing This Document
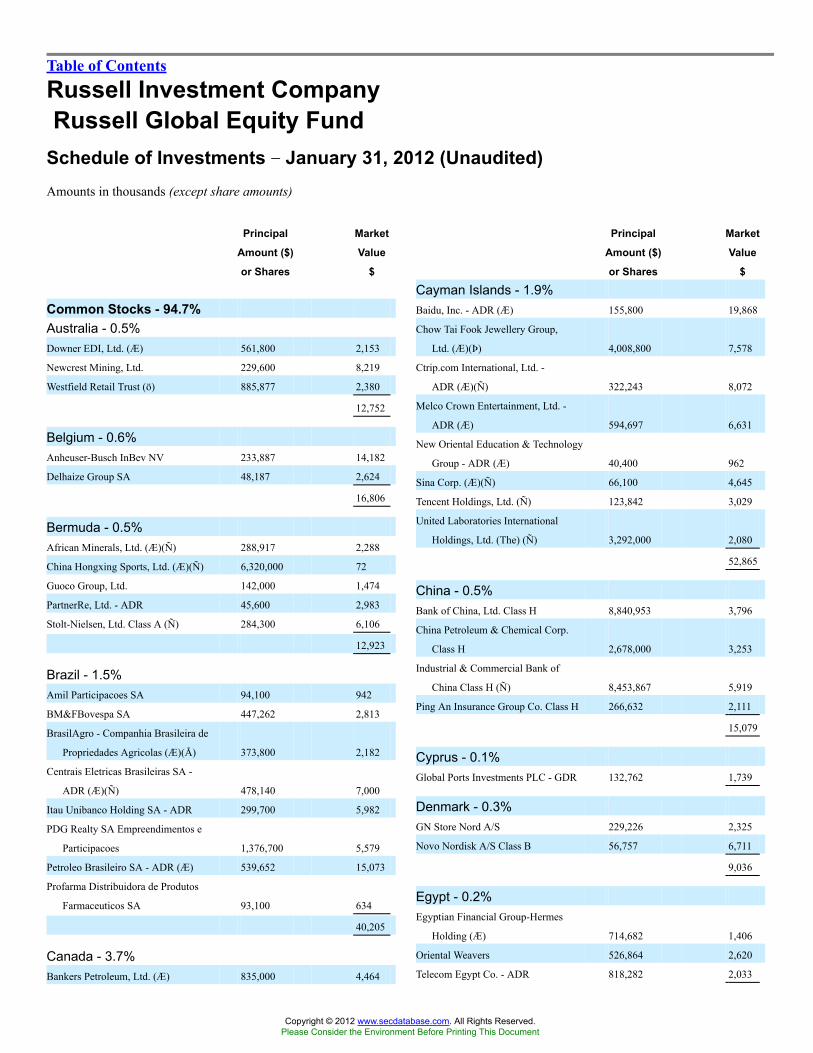
Table of Contents
Russell Investment CompanyRussell Global Equity Fund
Schedule of Investments �� January 31, 2012 (Unaudited)Amounts in thousands (except share amounts)
Principal
Amount ($)
or Shares
Market
Value
$
Common Stocks - 94.7%Australia - 0.5%Downer EDI, Ltd. (Æ) 561,800 2,153
Newcrest Mining, Ltd. 229,600 8,219
Westfield Retail Trust (ö) 885,877 2,380
12,752
Belgium - 0.6%Anheuser-Busch InBev NV 233,887 14,182
Delhaize Group SA 48,187 2,624
16,806
Bermuda - 0.5%African Minerals, Ltd. (Æ)(Ñ) 288,917 2,288
China Hongxing Sports, Ltd. (Æ)(Ñ) 6,320,000 72
Guoco Group, Ltd. 142,000 1,474
PartnerRe, Ltd. - ADR 45,600 2,983
Stolt-Nielsen, Ltd. Class A (Ñ) 284,300 6,106
12,923
Brazil - 1.5%Amil Participacoes SA 94,100 942
BM&FBovespa SA 447,262 2,813
BrasilAgro - Companhia Brasileira de
Propriedades Agricolas (Æ)(Å) 373,800 2,182
Centrais Eletricas Brasileiras SA -
ADR (Æ)(Ñ) 478,140 7,000
Itau Unibanco Holding SA - ADR 299,700 5,982
PDG Realty SA Empreendimentos e
Participacoes 1,376,700 5,579
Petroleo Brasileiro SA - ADR (Æ) 539,652 15,073
Profarma Distribuidora de Produtos
Farmaceuticos SA 93,100 634
40,205
Canada - 3.7%Bankers Petroleum, Ltd. (Æ) 835,000 4,464
Principal
Amount ($)
or Shares
Market
Value
$
Cayman Islands - 1.9%Baidu, Inc. - ADR (Æ) 155,800 19,868
Chow Tai Fook Jewellery Group,
Ltd. (Æ)(Þ) 4,008,800 7,578
Ctrip.com International, Ltd. -
ADR (Æ)(Ñ) 322,243 8,072
Melco Crown Entertainment, Ltd. -
ADR (Æ) 594,697 6,631
New Oriental Education & Technology
Group - ADR (Æ) 40,400 962
Sina Corp. (Æ)(Ñ) 66,100 4,645
Tencent Holdings, Ltd. (Ñ) 123,842 3,029
United Laboratories International
Holdings, Ltd. (The) (Ñ) 3,292,000 2,080
52,865
China - 0.5%Bank of China, Ltd. Class H 8,840,953 3,796
China Petroleum & Chemical Corp.
Class H 2,678,000 3,253
Industrial & Commercial Bank of
China Class H (Ñ) 8,453,867 5,919
Ping An Insurance Group Co. Class H 266,632 2,111
15,079
Cyprus - 0.1%Global Ports Investments PLC - GDR 132,762 1,739
Denmark - 0.3%GN Store Nord A/S 229,226 2,325
Novo Nordisk A/S Class B 56,757 6,711
9,036
Egypt - 0.2%Egyptian Financial Group-Hermes
Holding (Æ) 714,682 1,406
Oriental Weavers 526,864 2,620
Telecom Egypt Co. - ADR 818,282 2,033
Copyright © 2012 www.secdatabase.com. All Rights Reserved.Please Consider the Environment Before Printing This Document

48 Russell Global Equity Fund
Barrick Gold Corp. 271,500 13,374
Cameco Corp. Class A 594,000 13,822
Canadian National Railway Co. (Þ) 275,120 20,750
Dundee Precious Metals, Inc. 584 6
Eastern Platinum, Ltd. (Æ) 5,772,500 3,109
Gabriel Resources, Ltd. (Æ)(Ñ) 347,777 2,116
Kinross Gold Corp. 130,000 1,468
National Bank of Canada 32,500 2,438
Nexen, Inc. 75,300 1,349
Niko Resources, Ltd. 34,200 1,671
Osisko Mining Corp. (Æ)(Þ) 477,700 5,698
Potash Corp. of Saskatchewan, Inc. 353,624 16,528
Shoppers Drug Mart Corp. 113,300 4,689
Ultra Petroleum Corp. (Æ)(Ñ) 240,200 5,772
Uranium Participation Corp. (Æ) 593,100 3,549
Westjet Airlines, Ltd. (Æ) 104,177 1,292
Westjet Airlines, Ltd. 31,200 387
102,482
6,059
Finland - 0.5%Kone OYJ Class B 57,751 3,144
Nokia OYJ 1,344,323 6,714
Nokia OYJ - ADR (Ñ) 729,000 3,674
13,532
France - 5.8%Areva SA (Æ)(Ñ) 76,683 1,864
BNP Paribas SA 492,701 20,862
Casino Guichard Perrachon SA (Æ) 26,875 2,390
Danone 113,584 7,010
EDF SA (Ñ) 425,000 9,795
Eutelsat Communications SA 223,492 8,295
Legrand SA - ADR 663,911 22,900
LVMH Moet Hennessy Louis Vuitton
SA - ADR 150,879 24,393
Pernod-Ricard SA 83,780 8,043
PPR 86,700 13,643
Publicis Groupe SA - ADR (Ñ) 328,910 16,547
Sanofi - ADR 75,125 5,549
Copyright © 2012 www.secdatabase.com. All Rights Reserved.Please Consider the Environment Before Printing This Document

Table of Contents
Russell Investment CompanyRussell Global Equity FundSchedule of Investments, continued �� January 31, 2012 (Unaudited)Amounts in thousands (except share amounts)
Principal
Amount ($)
or Shares
Market
Value
$
Schneider Electric SA 92,511 5,746
Thales SA (Ñ) 215,300 7,366
Total SA 107,575 5,686
160,089
Germany - 3.7%Allianz SE 199,750 21,963
Daimler AG 318,400 17,594
Linde AG 202,460 32,124
Merck KGaA 138,655 14,466
SAP AG - ADR 226,600 13,691
Volkswagen AG 19,958 3,224
103,062
Greece - 0.1%OPAP SA 186,000 1,907
Hong Kong - 0.5%AIA Group, Ltd. 1,203,878 4,021
Cathay Pacific Airways, Ltd. (Ñ) 1,970,600 3,903
Cheung Kong Holdings, Ltd. 293,361 3,949
Galaxy Entertainment Group, Ltd. (Æ) 390,258 851
12,724
Hungary - 0.0%Egis Gyogyszergyar Nyrt 19,150 1,406
India - 0.2%Container Corp. of India 143,498 2,824
GMR Infrastructure, Ltd. (Æ) 4,534,550 2,687
5,511
Indonesia - 0.2%Medco Energi Internasional Tbk PT 6,964,500 1,801
Telekomunikasi Indonesia Tbk PT -
ADR 160,541 4,921
6,722
Principal
Amount ($)
or Shares
Market
Value
$
Chugoku Marine Paints, Ltd. 124,000 789
Daiwa Securities Group, Inc. (Ñ) 6,981,000 25,096
East Japan Railway Co. 160,491 10,391
Futaba Corp. 178,400 2,949
Honda Motor Co., Ltd. (Ñ) 144,700 5,061
Japan Digital Laboratory Co., Ltd. 80,200 884
Japan Steel Works, Ltd. (The) (Ñ) 810,000 6,546
Kamigumi Co., Ltd. 307,000 2,703
Kurita Water Industries, Ltd. (Ñ) 72,800 1,977
Makita Corp. 137,300 5,183
Mitsui & Co., Ltd. 360,500 6,120
MS&AD Insurance Group Holdings 260,000 5,332
Nippon Electric Glass Co., Ltd. 488,200 4,253
Nippon Telegraph & Telephone Corp. 161,300 8,063
Organo Corp. (Ñ) 138,000 1,077
Rohm Co., Ltd. 325,000 16,118
Sanshin Electronics Co., Ltd. 215,900 1,827
Seven & I Holdings Co., Ltd. 219,300 6,174
Softbank Corp. (Ñ) 80,300 2,237
Sony Corp. 285,842 5,217
Sumitomo Mitsui Trust Holdings, Inc. 1,648,999 5,149
Toppan Printing Co., Ltd. (Ñ) 511,000 4,090
Toyota Motor Corp. 509,900 18,798
TV Asahi Corp. 1,862 3,259
West Japan Railway Co. 56,700 2,403
Yamada Denki Co., Ltd. (Ñ) 40,970 2,612
168,923
Jersey - 0.3%Delphi Automotive PLC (Æ) 19,100 513
Polyus Gold International, Ltd. -
GDR (Æ) 2,326,963 7,609
8,122
Lebanon - 0.0%Solidere - GDR 101,008 1,414
Luxembourg - 0.1%
Copyright © 2012 www.secdatabase.com. All Rights Reserved.Please Consider the Environment Before Printing This Document
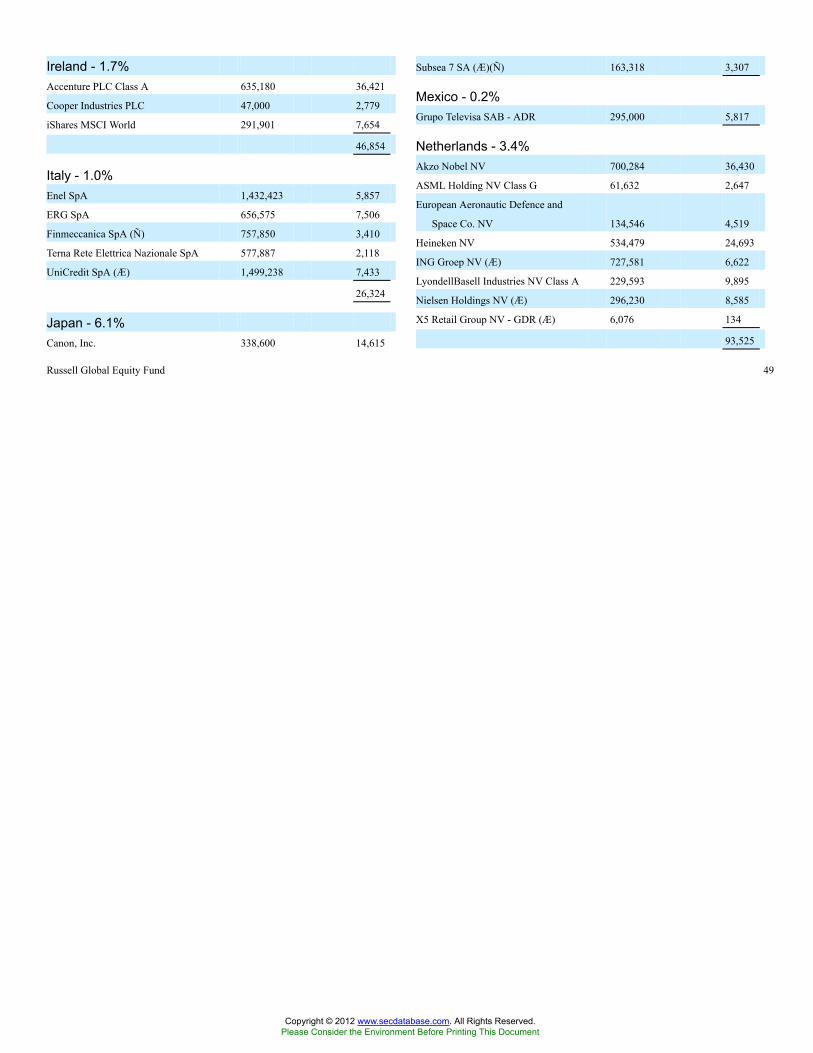
Russell Global Equity Fund 49
Ireland - 1.7%Accenture PLC Class A 635,180 36,421
Cooper Industries PLC 47,000 2,779
iShares MSCI World 291,901 7,654
46,854
Italy - 1.0%Enel SpA 1,432,423 5,857
ERG SpA 656,575 7,506
Finmeccanica SpA (Ñ) 757,850 3,410
Terna Rete Elettrica Nazionale SpA 577,887 2,118
UniCredit SpA (Æ) 1,499,238 7,433
26,324
Japan - 6.1%Canon, Inc. 338,600 14,615
Subsea 7 SA (Æ)(Ñ) 163,318 3,307
Mexico - 0.2%Grupo Televisa SAB - ADR 295,000 5,817
Netherlands - 3.4%Akzo Nobel NV 700,284 36,430
ASML Holding NV Class G 61,632 2,647
European Aeronautic Defence and
Space Co. NV 134,546 4,519
Heineken NV 534,479 24,693
ING Groep NV (Æ) 727,581 6,622
LyondellBasell Industries NV Class A 229,593 9,895
Nielsen Holdings NV (Æ) 296,230 8,585
X5 Retail Group NV - GDR (Æ) 6,076 134
93,525
Copyright © 2012 www.secdatabase.com. All Rights Reserved.Please Consider the Environment Before Printing This Document

Table of Contents
Russell Investment CompanyRussell Global Equity FundSchedule of Investments, continued �� January 31, 2012 (Unaudited)Amounts in thousands (except share amounts)
Principal
Amount ($)
or Shares
Market
Value
$
Norway - 0.5%iLinc Communications, Inc. (Æ) 1,733,106 1,415
Marine Harvest ASA (Ñ) 7,495,000 4,067
Statoil ASA Class N 180,901 4,536
Statoil ASA - ADR 133,750 3,379
13,397
Panama - 0.6%Carnival Corp. 515,600 15,571
Russia - 0.9%Federal Hydrogenerating Co. JSC -
ADR 2,265,000 8,788
Gazprom OAO - ADR (Æ) 895,626 10,837
Gazprom OAO - ADR 99,648 1,201
OGK-3 Class 3 (Æ) 43,500,000 1,401
Rosneft Oil Co. - GDR 430,978 3,176
25,403
Slovenia - 0.1%Krka dd Novo mesto 24,100 1,592
South Africa - 0.5%AngloGold Ashanti, Ltd. - ADR 119,100 5,455
Gold Fields, Ltd. - ADR 219,150 3,614
Impala Platinum Holdings, Ltd. 138,025 3,030
Village Main Reef, Ltd. (Æ) 4,725,406 1,420
13,519
South Korea - 1.6%Hyundai Heavy Industries Co., Ltd. 20,327 5,637
Hyundai Motor Co. 43,476 8,553
Korea Electric Power Corp. - ADR 440,300 5,429
KT Corp. - ADR 380,150 5,660
LG Electronics, Inc. Class H 5,495 405
Samsung Electronics Co., Ltd. 12,949 12,760
SK Telecom Co., Ltd. - ADR 336,425 4,713
Principal
Amount ($)
or Shares
Market
Value
$
Nestle SA 720,984 41,317
Noble Corp. (Æ) 153,300 5,341
Novartis AG 263,884 14,276
Swisscom AG 13,458 5,312
Transocean, Ltd. 40,050 1,894
Tyco International, Ltd. 101,718 5,183
179,946
Thailand - 0.0%Bangkok Bank PCL 169,100 910
Turkey - 0.3%Turkcell Iletisim Hizmetleri AS -
ADR (Æ) 667,000 8,598
United Kingdom - 8.4%ARM Holdings PLC 1,438,099 13,812
Aviva PLC 747,733 4,117
Barclays PLC 3,303,723 11,065
BG Group PLC 442,371 9,934
BHP Billiton PLC 311,661 10,426
BP PLC 1,808,179 13,416
Diageo PLC 1,271,938 28,101
Experian PLC 636,614 8,622
Faroe Petroleum PLC (Æ) 48,845 129
GlaxoSmithKline PLC - ADR 191,494 4,255
Imperial Tobacco Group PLC 356,252 12,743
ITV PLC 2,129,308 2,513
Marks & Spencer Group PLC 736,469 3,793
Reckitt Benckiser Group PLC 483,636 25,729
Rockhopper Exploration PLC (Æ) 442,605 2,373
Rolls-Royce Holdings PLC (Æ)(Þ) 1,077,169 12,484
Royal Bank of Scotland Group PLC -
ADR (Æ) 24,634,058 10,334
Royal Dutch Shell PLC Class B 276,583 10,061
RusPetro PLC (Æ) 863,668 1,803
Standard Chartered PLC 226,967 5,486
Tesco PLC 784,467 3,951
Copyright © 2012 www.secdatabase.com. All Rights Reserved.Please Consider the Environment Before Printing This Document

50 Russell Global Equity Fund
43,157
Spain - 0.7%Banco Santander SA - ADR 1,902,214 14,805
Banco Santander SA (Æ) 41,352 322
Red Electrica Corp. SA 50,958 2,344
Repsol YPF SA - ADR (Ñ) 100,677 2,765
20,236
Switzerland - 6.5%Actelion, Ltd. (Æ) 92,475 3,541
Adecco SA (Æ) 370,900 17,580
Cie Financiere Richemont SA 430,288 24,354
Credit Suisse Group AG (Æ) 738,600 19,161
Givaudan SA (Æ) 14,900 13,913
Holcim, Ltd. (Æ) 194,000 11,054
Julius Baer Group, Ltd. (Æ) 418,900 17,020
Tullow Oil PLC 384,121 8,414
Vodafone Group PLC - ADR (Æ) 3,296,216 8,872
Weir Group PLC (The) 190,719 5,876
WPP PLC 1,241,279 14,582
232,891
United States - 40.9%3M Co. 211,040 18,299
Allscripts Healthcare Solutions, Inc. (Æ) 58,300 1,115
American International Group, Inc. (Æ) 380,000 9,542
Anadarko Petroleum Corp. 85,032 6,864
Apache Corp. 63,900 6,318
Apple, Inc. (Æ) 111,705 50,991
Applied Materials, Inc. 1,473,700 18,097
Arch Coal, Inc. 1,044,120 15,067
Archer-Daniels-Midland Co. 67,125 1,922
Bank of New York Mellon Corp. (The) 876,130 17,636
Copyright © 2012 www.secdatabase.com. All Rights Reserved.Please Consider the Environment Before Printing This Document

Table of Contents
Russell Investment CompanyRussell Global Equity FundSchedule of Investments, continued �� January 31, 2012 (Unaudited)Amounts in thousands (except share amounts)
Principal
Amount ($)
or Shares
Market
Value
$
Baxter International, Inc. 143,800 7,978
Best Buy Co., Inc. 390,250 9,346
Boeing Co. (The) 240,900 17,870
Broadcom Corp. Class A 315,700 10,841
Calpine Corp. (Æ) 412,200 6,018
Cameron International Corp. (Æ) 72,400 3,852
CarMax, Inc. (Æ) 73,000 2,221
Caterpillar, Inc. 48,700 5,314
Chesapeake Energy Corp. 268,000 5,663
Chevron Corp. 75,700 7,803
Cimarex Energy Co. 148,900 8,693
Citigroup, Inc. 349,306 10,731
CME Group, Inc. Class A 61,400 14,706
Coca-Cola Co. (The) 99,671 6,731
Comcast Corp. Class A (Æ) 503,900 12,844
Computer Sciences Corp. 180,500 4,662
Consol Energy, Inc. 104,100 3,721
Corning, Inc. 419,000 5,393
Crown Castle International Corp. (Æ) 80,700 3,912
Dentsply International, Inc. 50,000 1,887
DP World, Ltd. (Æ) 345,855 3,787
Eli Lilly & Co. (Ñ) 258,500 10,273
EMC Corp. (Æ) 293,934 7,572
Emerson Electric Co. 64,300 3,304
Energizer Holdings, Inc. (Æ) 121,072 9,337
Express Scripts, Inc. Class A (Æ) 210,317 10,760
Franklin Resources, Inc. 167,400 17,761
Freeport-McMoRan Copper & Gold,
Inc. 60,700 2,805
General Dynamics Corp. 147,900 10,229
General Electric Co. 248,400 4,648
General Motors Co. (Æ) 441,300 10,600
Goldman Sachs Group, Inc. (The) 157,000 17,501
Google, Inc. Class A (Æ) 32,200 18,680
Groupon, Inc. (Æ)(Ñ) 136,093 2,775
Halliburton Co. 154,681 5,689
Principal
Amount ($)
or Shares
Market
Value
$
Newmont Mining Corp. 257,600 15,837
NVIDIA Corp. (Æ) 140,800 2,080
Occidental Petroleum Corp. 50,900 5,078
Old Republic International Corp. 376,000 3,715
Omnicom Group, Inc. 468,970 21,390
Oracle Corp. 796,380 22,458
Pfizer, Inc. 504,658 10,800
Praxair, Inc. 219,590 23,320
Prudential Financial, Inc. 28,800 1,648
QUALCOMM, Inc. 258,567 15,209
Range Resources Corp. 69,000 3,969
Sotheby�s Class A 271,520 9,104
Southwest Airlines Co. 903,450 8,655
SPDR S&P 500 ETF Trust 42,104 5,524
SPX Corp. 42,439 2,955
St. Jude Medical, Inc. 122,100 5,093
Starwood Hotels & Resorts
Worldwide, Inc. (ö) 269,300 14,607
Texas Instruments, Inc. 253,900 8,221
Thermo Fisher Scientific, Inc. (Æ) 545,650 28,865
TJX Cos., Inc. 99,074 6,751
United Parcel Service, Inc. Class B 431,040 32,608
UnitedHealth Group, Inc. 147,100 7,618
Valero Energy Corp. 174,100 4,177
Vanguard FTSE All-World ex-US ETF
Class U 100,400 4,254
Viacom, Inc. Class B 180,762 8,503
Visa, Inc. Class A 491,009 49,415
VMware, Inc. Class A (Æ) 45,162 4,122
Walgreen Co. 635,870 21,213
Walt Disney Co. (The) 918,438 35,727
Waters Corp. (Æ) 240,990 20,862
WellPoint, Inc. 195,000 12,542
Wells Fargo & Co. 620,300 18,119
Western Digital Corp. (Æ) 285,000 10,360
X5 Retail Group NV - GDR (Æ) 162,823 3,585
1,130,646
Copyright © 2012 www.secdatabase.com. All Rights Reserved.Please Consider the Environment Before Printing This Document
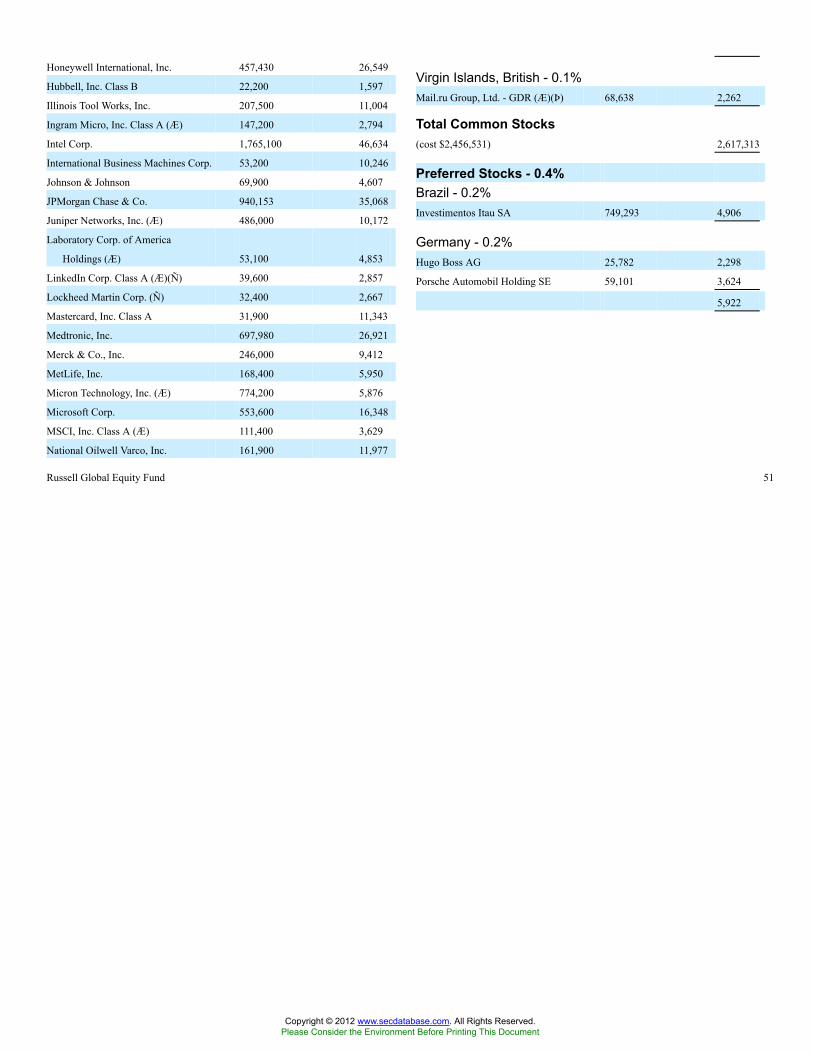
Russell Global Equity Fund 51
Honeywell International, Inc. 457,430 26,549
Hubbell, Inc. Class B 22,200 1,597
Illinois Tool Works, Inc. 207,500 11,004
Ingram Micro, Inc. Class A (Æ) 147,200 2,794
Intel Corp. 1,765,100 46,634
International Business Machines Corp. 53,200 10,246
Johnson & Johnson 69,900 4,607
JPMorgan Chase & Co. 940,153 35,068
Juniper Networks, Inc. (Æ) 486,000 10,172
Laboratory Corp. of America
Holdings (Æ) 53,100 4,853
LinkedIn Corp. Class A (Æ)(Ñ) 39,600 2,857
Lockheed Martin Corp. (Ñ) 32,400 2,667
Mastercard, Inc. Class A 31,900 11,343
Medtronic, Inc. 697,980 26,921
Merck & Co., Inc. 246,000 9,412
MetLife, Inc. 168,400 5,950
Micron Technology, Inc. (Æ) 774,200 5,876
Microsoft Corp. 553,600 16,348
MSCI, Inc. Class A (Æ) 111,400 3,629
National Oilwell Varco, Inc. 161,900 11,977
Virgin Islands, British - 0.1%Mail.ru Group, Ltd. - GDR (Æ)(Þ) 68,638 2,262
Total Common Stocks(cost $2,456,531) 2,617,313
Preferred Stocks - 0.4%Brazil - 0.2%Investimentos Itau SA 749,293 4,906
Germany - 0.2%Hugo Boss AG 25,782 2,298
Porsche Automobil Holding SE 59,101 3,624
5,922
Copyright © 2012 www.secdatabase.com. All Rights Reserved.Please Consider the Environment Before Printing This Document

Table of Contents
Russell Investment CompanyRussell Global Equity FundSchedule of Investments, continued �� January 31, 2012 (Unaudited)Amounts in thousands (except share amounts)
See accompanying notes which are an integral part of this quarterly report.
Principal
Amount ($)
or Shares
Market
Value
$
South Korea - 0.0%LG Electronics, Inc. 58,230 1,358
Total Preferred Stocks(cost $13,466) 12,186
Short-Term Investments - 4.4%United States - 4.4%Russell U.S. Cash Management Fund 120,564,605(¥) 120,565
Total Short-TermInvestments(cost $120,565) 120,565
Other Securities - 2.8%Russell Investment Company
Liquidating Trust (×) 2,004,024 (¥) 2,038
Russell U.S. Cash Collateral
Fund (×) 76,218,394 (¥) 76,218
Total Other Securities(cost $78,222) 78,256
Total Investments - 102.3%(identified cost $2,668,784) 2,828,320
Other Assets and Liabilities,Net - (2.3%) (63,974 )
Net Assets - 100.0% 2,764,346
Copyright © 2012 www.secdatabase.com. All Rights Reserved.Please Consider the Environment Before Printing This Document

52 Russell Global Equity Fund
A portion of the portfolio has been fair valued as of period end.
Copyright © 2012 www.secdatabase.com. All Rights Reserved.Please Consider the Environment Before Printing This Document

Table of Contents
Russell Investment CompanyRussell Global Equity FundSchedule of Investments, continued �� January 31, 2012 (Unaudited)Amounts in thousands (except contract amounts)
Futures ContractsNumber of
Contracts
Notional
AmountExpiration
Date
Unrealized
Appreciation
(Depreciation)
$
Long PositionsASX SPI 200 Index Futures (Australia) 51 AUD 5,388 03/12 220
FTSE 100 Index Futures (UK) 154 GBP 8,693 03/12 569
HANG SENG Index Futures (Hong Kong) 18 HKD 18,321 02/12 8
S&P 500 E-Mini Index Futures (CME) 1,060 USD 69,335 03/12 2,997
S&P 500 Index Futures (CME) 40 USD 13,082 03/12 598
S&P Midcap 400 E-Mini Index Futures (CME) 80 USD 7,479 03/12 496
S&P TSE 60 Index Futures (Canada) 60 CAD 8,497 03/12 482
TOPIX Index Futures (Japan) 134 JPY 1,013,710 03/12 341
Total Unrealized Appreciation (Depreciation) on Open Futures Contracts (å) 5,711
See accompanying notes which are an integral part of this quarterly report.
Russell Global Equity Fund 53
Copyright © 2012 www.secdatabase.com. All Rights Reserved.Please Consider the Environment Before Printing This Document
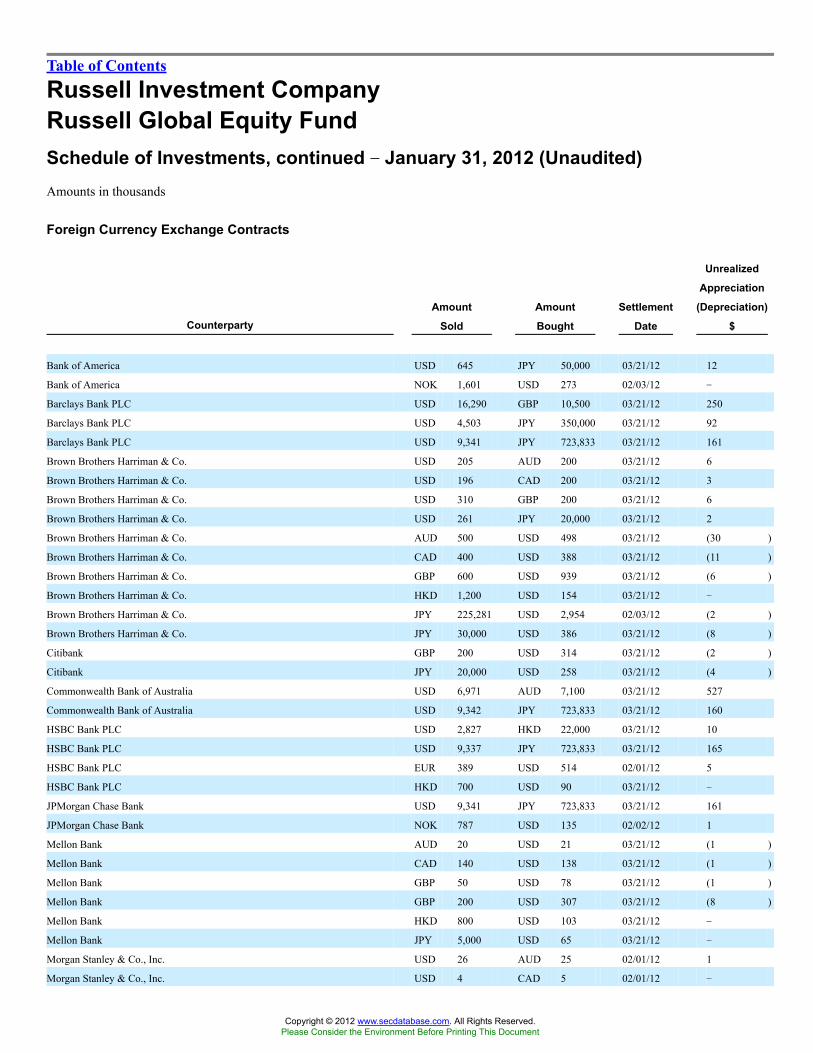
Table of Contents
Russell Investment CompanyRussell Global Equity FundSchedule of Investments, continued �� January 31, 2012 (Unaudited)Amounts in thousands
Foreign Currency Exchange Contracts
CounterpartyAmount
Sold
Amount
Bought
Settlement
Date
Unrealized
Appreciation
(Depreciation)
$
Bank of America USD 645 JPY 50,000 03/21/12 12
Bank of America NOK 1,601 USD 273 02/03/12 �
Barclays Bank PLC USD 16,290 GBP 10,500 03/21/12 250
Barclays Bank PLC USD 4,503 JPY 350,000 03/21/12 92
Barclays Bank PLC USD 9,341 JPY 723,833 03/21/12 161
Brown Brothers Harriman & Co. USD 205 AUD 200 03/21/12 6
Brown Brothers Harriman & Co. USD 196 CAD 200 03/21/12 3
Brown Brothers Harriman & Co. USD 310 GBP 200 03/21/12 6
Brown Brothers Harriman & Co. USD 261 JPY 20,000 03/21/12 2
Brown Brothers Harriman & Co. AUD 500 USD 498 03/21/12 (30 )
Brown Brothers Harriman & Co. CAD 400 USD 388 03/21/12 (11 )
Brown Brothers Harriman & Co. GBP 600 USD 939 03/21/12 (6 )
Brown Brothers Harriman & Co. HKD 1,200 USD 154 03/21/12 �
Brown Brothers Harriman & Co. JPY 225,281 USD 2,954 02/03/12 (2 )
Brown Brothers Harriman & Co. JPY 30,000 USD 386 03/21/12 (8 )
Citibank GBP 200 USD 314 03/21/12 (2 )
Citibank JPY 20,000 USD 258 03/21/12 (4 )
Commonwealth Bank of Australia USD 6,971 AUD 7,100 03/21/12 527
Commonwealth Bank of Australia USD 9,342 JPY 723,833 03/21/12 160
HSBC Bank PLC USD 2,827 HKD 22,000 03/21/12 10
HSBC Bank PLC USD 9,337 JPY 723,833 03/21/12 165
HSBC Bank PLC EUR 389 USD 514 02/01/12 5
HSBC Bank PLC HKD 700 USD 90 03/21/12 �
JPMorgan Chase Bank USD 9,341 JPY 723,833 03/21/12 161
JPMorgan Chase Bank NOK 787 USD 135 02/02/12 1
Mellon Bank AUD 20 USD 21 03/21/12 (1 )
Mellon Bank CAD 140 USD 138 03/21/12 (1 )
Mellon Bank GBP 50 USD 78 03/21/12 (1 )
Mellon Bank GBP 200 USD 307 03/21/12 (8 )
Mellon Bank HKD 800 USD 103 03/21/12 �
Mellon Bank JPY 5,000 USD 65 03/21/12 �
Morgan Stanley & Co., Inc. USD 26 AUD 25 02/01/12 1
Morgan Stanley & Co., Inc. USD 4 CAD 5 02/01/12 �
Copyright © 2012 www.secdatabase.com. All Rights Reserved.Please Consider the Environment Before Printing This Document
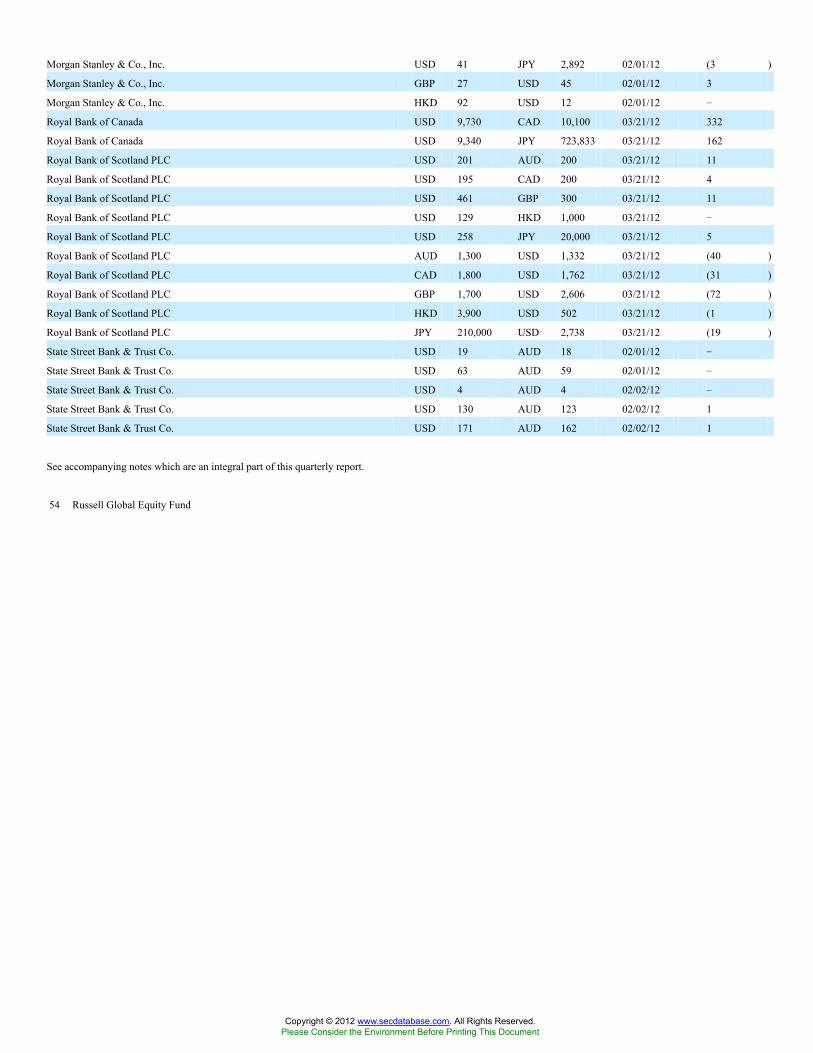
Morgan Stanley & Co., Inc. USD 41 JPY 2,892 02/01/12 (3 )
Morgan Stanley & Co., Inc. GBP 27 USD 45 02/01/12 3
Morgan Stanley & Co., Inc. HKD 92 USD 12 02/01/12 �
Royal Bank of Canada USD 9,730 CAD 10,100 03/21/12 332
Royal Bank of Canada USD 9,340 JPY 723,833 03/21/12 162
Royal Bank of Scotland PLC USD 201 AUD 200 03/21/12 11
Royal Bank of Scotland PLC USD 195 CAD 200 03/21/12 4
Royal Bank of Scotland PLC USD 461 GBP 300 03/21/12 11
Royal Bank of Scotland PLC USD 129 HKD 1,000 03/21/12 �
Royal Bank of Scotland PLC USD 258 JPY 20,000 03/21/12 5
Royal Bank of Scotland PLC AUD 1,300 USD 1,332 03/21/12 (40 )
Royal Bank of Scotland PLC CAD 1,800 USD 1,762 03/21/12 (31 )
Royal Bank of Scotland PLC GBP 1,700 USD 2,606 03/21/12 (72 )
Royal Bank of Scotland PLC HKD 3,900 USD 502 03/21/12 (1 )
Royal Bank of Scotland PLC JPY 210,000 USD 2,738 03/21/12 (19 )
State Street Bank & Trust Co. USD 19 AUD 18 02/01/12 �
State Street Bank & Trust Co. USD 63 AUD 59 02/01/12 �
State Street Bank & Trust Co. USD 4 AUD 4 02/02/12 �
State Street Bank & Trust Co. USD 130 AUD 123 02/02/12 1
State Street Bank & Trust Co. USD 171 AUD 162 02/02/12 1
See accompanying notes which are an integral part of this quarterly report.
54 Russell Global Equity Fund
Copyright © 2012 www.secdatabase.com. All Rights Reserved.Please Consider the Environment Before Printing This Document

Table of Contents
Russell Investment CompanyRussell Global Equity FundSchedule of Investments, continued �� January 31, 2012 (Unaudited)Amounts in thousands
Foreign Currency Exchange Contracts
CounterpartyAmount
Sold
Amount
Bought
Settlement
Date
Unrealized
Appreciation
(Depreciation)
$
State Street Bank & Trust Co. USD 3 AUD 2 02/03/12 �
State Street Bank & Trust Co. USD 13,809 AUD 12,971 02/15/12 (58 )
State Street Bank & Trust Co. USD 102 AUD 100 03/21/12 4
State Street Bank & Trust Co. USD 103 AUD 100 03/21/12 2
State Street Bank & Trust Co. USD 104 AUD 100 03/21/12 2
State Street Bank & Trust Co. USD 106 AUD 100 03/21/12 �
State Street Bank & Trust Co. USD 201 AUD 200 03/21/12 10
State Street Bank & Trust Co. USD 203 AUD 200 03/21/12 8
State Street Bank & Trust Co. USD 18,350 CAD 18,345 02/15/12 (60 )
State Street Bank & Trust Co. USD 98 CAD 100 03/21/12 1
State Street Bank & Trust Co. USD 196 CAD 200 03/21/12 3
State Street Bank & Trust Co. USD 197 CAD 200 03/21/12 2
State Street Bank & Trust Co. USD 199 CAD 200 03/21/12 �
State Street Bank & Trust Co. USD 292 CAD 300 03/21/12 7
State Street Bank & Trust Co. USD 391 CAD 400 03/21/12 7
State Street Bank & Trust Co. USD 12,886 CHF 11,828 02/15/12 (35 )
State Street Bank & Trust Co. USD 2,580 EUR 1,956 02/15/12 (21 )
State Street Bank & Trust Co. USD 7,545 EUR 5,721 02/15/12 (61 )
State Street Bank & Trust Co. USD 7,404 GBP 4,693 02/02/12 (8 )
State Street Bank & Trust Co. USD 2 GBP 1 02/15/12 �
State Street Bank & Trust Co. USD 1,567 GBP 999 02/15/12 7
State Street Bank & Trust Co. USD 308 GBP 200 03/21/12 7
State Street Bank & Trust Co. USD 311 GBP 200 03/21/12 4
State Street Bank & Trust Co. USD 313 GBP 200 03/21/12 3
State Street Bank & Trust Co. USD 315 GBP 200 03/21/12 �
State Street Bank & Trust Co. USD 463 GBP 300 03/21/12 10
State Street Bank & Trust Co. USD 64 HKD 500 03/21/12 �
State Street Bank & Trust Co. USD 64 HKD 500 03/21/12 �
State Street Bank & Trust Co. USD 64 HKD 500 03/21/12 �
State Street Bank & Trust Co. USD 64 HKD 500 03/21/12 �
State Street Bank & Trust Co. USD 64 HKD 500 03/21/12 �
State Street Bank & Trust Co. USD 129 HKD 1,000 03/21/12 �
State Street Bank & Trust Co. USD 965 ILS 3,629 02/15/12 4
Copyright © 2012 www.secdatabase.com. All Rights Reserved.Please Consider the Environment Before Printing This Document

State Street Bank & Trust Co. USD 14,913 JPY 1,147,594 02/15/12 145
State Street Bank & Trust Co. USD 259 JPY 20,000 03/21/12 3
State Street Bank & Trust Co. USD 260 JPY 20,000 03/21/12 2
State Street Bank & Trust Co. USD 391 JPY 30,000 03/21/12 3
State Street Bank & Trust Co. USD 521 JPY 40,000 03/21/12 4
State Street Bank & Trust Co. USD 641 JPY 50,000 03/21/12 15
State Street Bank & Trust Co. USD 2,581 JPY 200,000 03/21/12 44
State Street Bank & Trust Co. USD 4,949 SEK 33,517 02/15/12 (25 )
State Street Bank & Trust Co. USD 2,163 SGD 2,711 02/15/12 (7 )
State Street Bank & Trust Co. AUD 100 USD 100 03/21/12 (6 )
State Street Bank & Trust Co. AUD 100 USD 105 03/21/12 (1 )
State Street Bank & Trust Co. AUD 150 USD 153 03/21/12 (5 )
State Street Bank & Trust Co. AUD 200 USD 205 03/21/12 (6 )
State Street Bank & Trust Co. AUD 300 USD 316 03/21/12 (1 )
State Street Bank & Trust Co. AUD 300 USD 318 03/21/12 1
State Street Bank & Trust Co. CAD 200 USD 196 03/21/12 (3 )
State Street Bank & Trust Co. CAD 200 USD 194 03/21/12 (5 )
State Street Bank & Trust Co. CAD 200 USD 198 03/21/12 (1 )
State Street Bank & Trust Co. CAD 350 USD 341 03/21/12 (8 )
State Street Bank & Trust Co. CAD 400 USD 399 03/21/12 1
See accompanying notes which are an integral part of this quarterly report.
Russell Global Equity Fund 55
Copyright © 2012 www.secdatabase.com. All Rights Reserved.Please Consider the Environment Before Printing This Document

Table of Contents
Russell Investment CompanyRussell Global Equity FundSchedule of Investments, continued �� January 31, 2012 (Unaudited)Amounts in thousands
Foreign Currency Exchange Contracts
CounterpartyAmount
Sold
Amount
Bought
Settlement
Date
Unrealized
Appreciation
(Depreciation)
$
State Street Bank & Trust Co. CAD 500 USD 498 03/21/12 �
State Street Bank & Trust Co. DKK 34,857 USD 6,168 02/15/12 34
State Street Bank & Trust Co. EUR 5,721 USD 7,545 02/02/12 62
State Street Bank & Trust Co. EUR 2,913 USD 3,818 02/15/12 8
State Street Bank & Trust Co. EUR 4,849 USD 6,207 02/15/12 (137 )
State Street Bank & Trust Co. EUR 13,407 USD 17,632 02/15/12 94
State Street Bank & Trust Co. GBP 999 USD 1,567 02/01/12 (7 )
State Street Bank & Trust Co. GBP 4,693 USD 7,403 02/15/12 8
State Street Bank & Trust Co. GBP 17,315 USD 27,198 02/15/12 (84 )
State Street Bank & Trust Co. GBP 100 USD 156 03/21/12 (2 )
State Street Bank & Trust Co. GBP 100 USD 153 03/21/12 (4 )
State Street Bank & Trust Co. GBP 100 USD 153 03/21/12 (4 )
State Street Bank & Trust Co. GBP 100 USD 157 03/21/12 (1 )
State Street Bank & Trust Co. GBP 150 USD 229 03/21/12 (7 )
State Street Bank & Trust Co. GBP 300 USD 472 03/21/12 (1 )
State Street Bank & Trust Co. GBP 400 USD 628 03/21/12 (2 )
State Street Bank & Trust Co. HKD 27,611 USD 3,560 02/15/12 �
State Street Bank & Trust Co. HKD 185,017 USD 23,855 02/15/12 (2 )
State Street Bank & Trust Co. HKD 700 USD 90 03/21/12 �
State Street Bank & Trust Co. HKD 1,100 USD 142 03/21/12 �
State Street Bank & Trust Co. HKD 1,200 USD 155 03/21/12 �
State Street Bank & Trust Co. JPY 10,000 USD 130 03/21/12 (1 )
State Street Bank & Trust Co. JPY 20,000 USD 257 03/21/12 (6 )
State Street Bank & Trust Co. JPY 40,000 USD 522 03/21/12 (3 )
State Street Bank & Trust Co. JPY 40,000 USD 520 03/21/12 (5 )
State Street Bank & Trust Co. JPY 50,000 USD 652 03/21/12 (4 )
State Street Bank & Trust Co. JPY 60,000 USD 786 03/21/12 (1 )
State Street Bank & Trust Co. NOK 19,412 USD 3,337 02/15/12 30
Westpac Banking Corp. USD 9,338 JPY 723,833 03/21/12 164
Westpac Banking Corp. JPY 3,450,000 USD 44,333 03/21/12 (956 )
Total Unrealized Appreciation (Depreciation) on Open Foreign Currency Exchange Contracts 1,013
See accompanying notes which are an integral part of this quarterly report.
Copyright © 2012 www.secdatabase.com. All Rights Reserved.Please Consider the Environment Before Printing This Document

56 Russell Global Equity Fund
Copyright © 2012 www.secdatabase.com. All Rights Reserved.Please Consider the Environment Before Printing This Document

Table of Contents
Russell Investment CompanyRussell Global Equity FundPresentation of Portfolio Holdings �� January 31, 2012 (Unaudited)
Market Value
Portfolio Summary Level 1 Level 2 Level 3 Total
Common Stocks
Australia $12,752 $� $� $12,752
Belgium 16,806 � � 16,806
Bermuda 12,851 � 72 12,923
Brazil 40,205 � � 40,205
Canada 101,190 � 1,292 102,482
Cayman Islands 52,865 � � 52,865
China 15,079 � � 15,079
Cyprus 1,739 � � 1,739
Denmark 9,036 � � 9,036
Egypt 6,059 � � 6,059
Finland 13,532 � � 13,532
France 160,089 � � 160,089
Germany 103,062 � � 103,062
Greece 1,907 � � 1,907
Hong Kong 12,724 � � 12,724
Hungary 1,406 � � 1,406
India 5,511 � � 5,511
Indonesia 6,722 � � 6,722
Ireland 46,854 � � 46,854
Italy 26,324 � � 26,324
Japan 168,923 � � 168,923
Jersey 8,122 � � 8,122
Lebanon 1,414 � � 1,414
Luxembourg 3,307 � � 3,307
Mexico 5,817 � � 5,817
Netherlands 93,525 � � 93,525
Norway 13,397 � � 13,397
Panama 15,571 � � 15,571
Russia 25,403 � � 25,403
Slovenia 1,592 � � 1,592
South Africa 13,519 � � 13,519
South Korea 43,157 � � 43,157
Spain 19,914 � 322 20,236
Switzerland 179,946 � � 179,946
Thailand 910 � � 910
Turkey 8,598 � � 8,598
United Kingdom 232,891 � � 232,891
Copyright © 2012 www.secdatabase.com. All Rights Reserved.Please Consider the Environment Before Printing This Document

United States 1,130,646 � � 1,130,646
Virgin Islands, British 2,262 � � 2,262
Preferred Stocks 12,186 � � 12,186
Short-Term Investments � 120,565 � 120,565
Other Securities � 78,256 � 78,256
Total Investments 2,627,813 198,821 1,686 2,828,320
Other Financial Instruments
Futures Contracts 5,711 � � 5,711
Foreign Currency Exchange Contracts 54 959 � 1,013
Total Other Financial Instruments* $5,765 $959 $� $6,724
* Other financial instruments reflected, such as futures, forwards, interest rate swaps, and credit default swaps are valued at the unrealized appreciation/depreciation
on the instruments.
For a description of the levels see note 2 in the Notes to Quarterly Report.
Investments in which significant observable inputs (Level 3) used in determining a value for the period ending January 31, 2012 wereless than 1% of net assets.
See accompanying notes which are an integral part of this quarterly report.
Russell Global Equity Fund 57
Copyright © 2012 www.secdatabase.com. All Rights Reserved.Please Consider the Environment Before Printing This Document
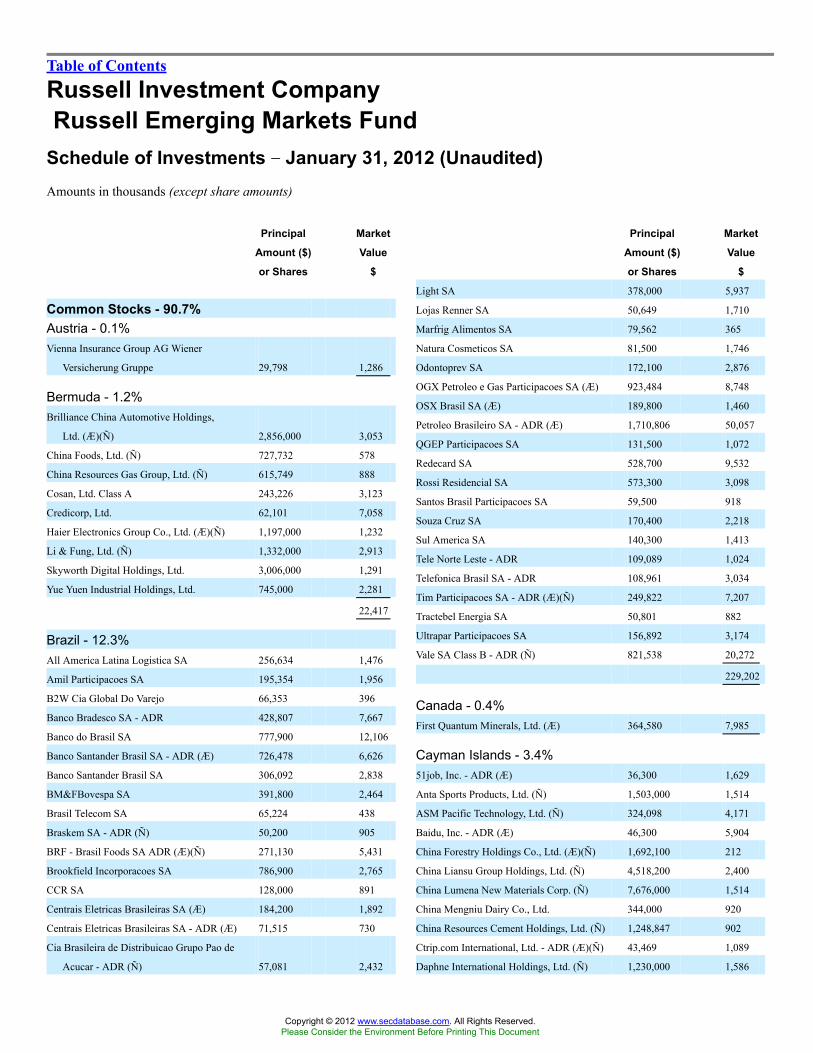
Table of Contents
Russell Investment CompanyRussell Emerging Markets Fund
Schedule of Investments �� January 31, 2012 (Unaudited)Amounts in thousands (except share amounts)
Principal
Amount ($)
or Shares
Market
Value
$
Common Stocks - 90.7%Austria - 0.1%Vienna Insurance Group AG Wiener
Versicherung Gruppe 29,798 1,286
Bermuda - 1.2%Brilliance China Automotive Holdings,
Ltd. (Æ)(Ñ) 2,856,000 3,053
China Foods, Ltd. (Ñ) 727,732 578
China Resources Gas Group, Ltd. (Ñ) 615,749 888
Cosan, Ltd. Class A 243,226 3,123
Credicorp, Ltd. 62,101 7,058
Haier Electronics Group Co., Ltd. (Æ)(Ñ) 1,197,000 1,232
Li & Fung, Ltd. (Ñ) 1,332,000 2,913
Skyworth Digital Holdings, Ltd. 3,006,000 1,291
Yue Yuen Industrial Holdings, Ltd. 745,000 2,281
22,417
Brazil - 12.3%All America Latina Logistica SA 256,634 1,476
Amil Participacoes SA 195,354 1,956
B2W Cia Global Do Varejo 66,353 396
Banco Bradesco SA - ADR 428,807 7,667
Banco do Brasil SA 777,900 12,106
Banco Santander Brasil SA - ADR (Æ) 726,478 6,626
Banco Santander Brasil SA 306,092 2,838
BM&FBovespa SA 391,800 2,464
Brasil Telecom SA 65,224 438
Braskem SA - ADR (Ñ) 50,200 905
BRF - Brasil Foods SA ADR (Æ)(Ñ) 271,130 5,431
Brookfield Incorporacoes SA 786,900 2,765
CCR SA 128,000 891
Centrais Eletricas Brasileiras SA (Æ) 184,200 1,892
Centrais Eletricas Brasileiras SA - ADR (Æ) 71,515 730
Cia Brasileira de Distribuicao Grupo Pao de
Acucar - ADR (Ñ) 57,081 2,432
Principal
Amount ($)
or Shares
Market
Value
$
Light SA 378,000 5,937
Lojas Renner SA 50,649 1,710
Marfrig Alimentos SA 79,562 365
Natura Cosmeticos SA 81,500 1,746
Odontoprev SA 172,100 2,876
OGX Petroleo e Gas Participacoes SA (Æ) 923,484 8,748
OSX Brasil SA (Æ) 189,800 1,460
Petroleo Brasileiro SA - ADR (Æ) 1,710,806 50,057
QGEP Participacoes SA 131,500 1,072
Redecard SA 528,700 9,532
Rossi Residencial SA 573,300 3,098
Santos Brasil Participacoes SA 59,500 918
Souza Cruz SA 170,400 2,218
Sul America SA 140,300 1,413
Tele Norte Leste - ADR 109,089 1,024
Telefonica Brasil SA - ADR 108,961 3,034
Tim Participacoes SA - ADR (Æ)(Ñ) 249,822 7,207
Tractebel Energia SA 50,801 882
Ultrapar Participacoes SA 156,892 3,174
Vale SA Class B - ADR (Ñ) 821,538 20,272
229,202
Canada - 0.4%First Quantum Minerals, Ltd. (Æ) 364,580 7,985
Cayman Islands - 3.4%51job, Inc. - ADR (Æ) 36,300 1,629
Anta Sports Products, Ltd. (Ñ) 1,503,000 1,514
ASM Pacific Technology, Ltd. (Ñ) 324,098 4,171
Baidu, Inc. - ADR (Æ) 46,300 5,904
China Forestry Holdings Co., Ltd. (Æ)(Ñ) 1,692,100 212
China Liansu Group Holdings, Ltd. (Ñ) 4,518,200 2,400
China Lumena New Materials Corp. (Ñ) 7,676,000 1,514
China Mengniu Dairy Co., Ltd. 344,000 920
China Resources Cement Holdings, Ltd. (Ñ) 1,248,847 902
Ctrip.com International, Ltd. - ADR (Æ)(Ñ) 43,469 1,089
Daphne International Holdings, Ltd. (Ñ) 1,230,000 1,586
Copyright © 2012 www.secdatabase.com. All Rights Reserved.Please Consider the Environment Before Printing This Document
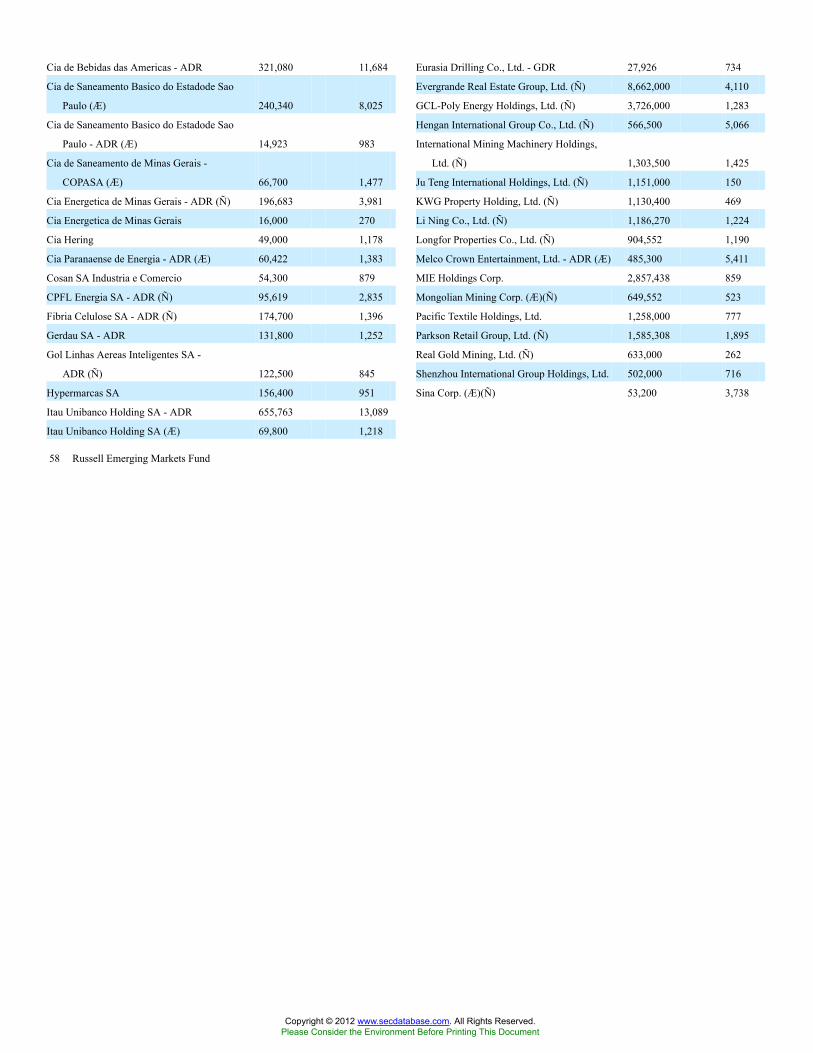
58 Russell Emerging Markets Fund
Cia de Bebidas das Americas - ADR 321,080 11,684
Cia de Saneamento Basico do Estadode Sao
Paulo (Æ) 240,340 8,025
Cia de Saneamento Basico do Estadode Sao
Paulo - ADR (Æ) 14,923 983
Cia de Saneamento de Minas Gerais -
COPASA (Æ) 66,700 1,477
Cia Energetica de Minas Gerais - ADR (Ñ) 196,683 3,981
Cia Energetica de Minas Gerais 16,000 270
Cia Hering 49,000 1,178
Cia Paranaense de Energia - ADR (Æ) 60,422 1,383
Cosan SA Industria e Comercio 54,300 879
CPFL Energia SA - ADR (Ñ) 95,619 2,835
Fibria Celulose SA - ADR (Ñ) 174,700 1,396
Gerdau SA - ADR 131,800 1,252
Gol Linhas Aereas Inteligentes SA -
ADR (Ñ) 122,500 845
Hypermarcas SA 156,400 951
Itau Unibanco Holding SA - ADR 655,763 13,089
Itau Unibanco Holding SA (Æ) 69,800 1,218
Eurasia Drilling Co., Ltd. - GDR 27,926 734
Evergrande Real Estate Group, Ltd. (Ñ) 8,662,000 4,110
GCL-Poly Energy Holdings, Ltd. (Ñ) 3,726,000 1,283
Hengan International Group Co., Ltd. (Ñ) 566,500 5,066
International Mining Machinery Holdings,
Ltd. (Ñ) 1,303,500 1,425
Ju Teng International Holdings, Ltd. (Ñ) 1,151,000 150
KWG Property Holding, Ltd. (Ñ) 1,130,400 469
Li Ning Co., Ltd. (Ñ) 1,186,270 1,224
Longfor Properties Co., Ltd. (Ñ) 904,552 1,190
Melco Crown Entertainment, Ltd. - ADR (Æ) 485,300 5,411
MIE Holdings Corp. 2,857,438 859
Mongolian Mining Corp. (Æ)(Ñ) 649,552 523
Pacific Textile Holdings, Ltd. 1,258,000 777
Parkson Retail Group, Ltd. (Ñ) 1,585,308 1,895
Real Gold Mining, Ltd. (Ñ) 633,000 262
Shenzhou International Group Holdings, Ltd. 502,000 716
Sina Corp. (Æ)(Ñ) 53,200 3,738
Copyright © 2012 www.secdatabase.com. All Rights Reserved.Please Consider the Environment Before Printing This Document
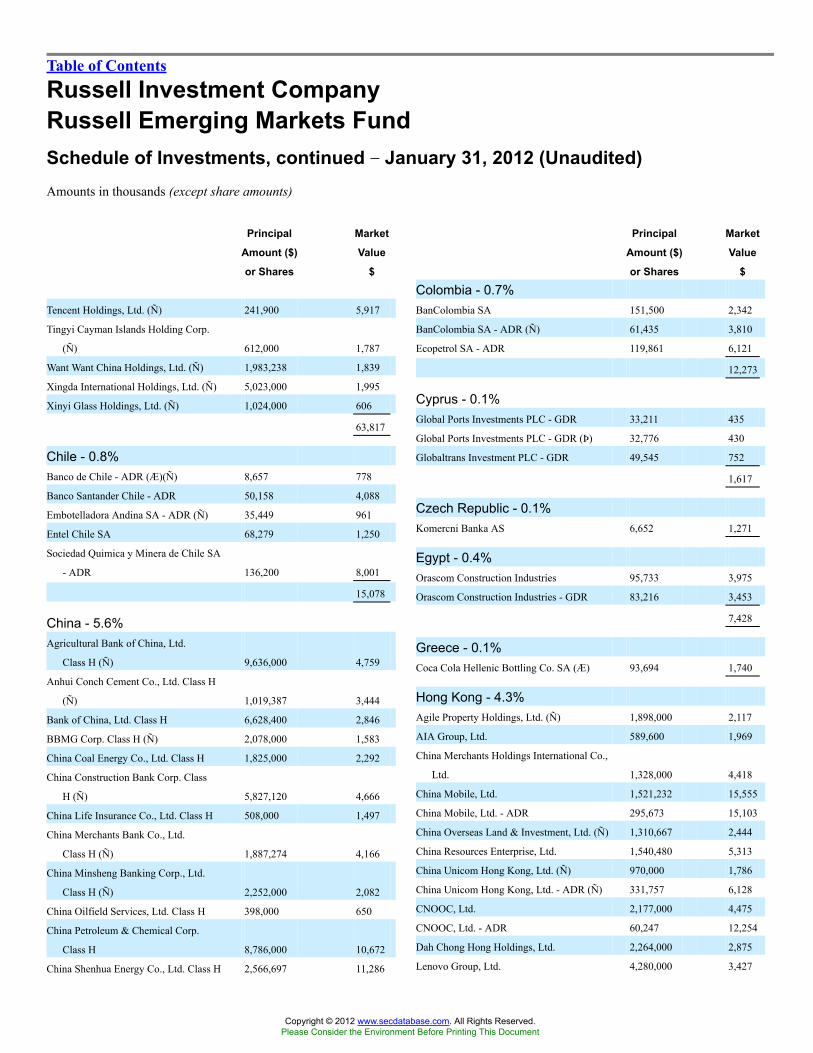
Table of Contents
Russell Investment CompanyRussell Emerging Markets FundSchedule of Investments, continued �� January 31, 2012 (Unaudited)Amounts in thousands (except share amounts)
Principal
Amount ($)
or Shares
Market
Value
$
Tencent Holdings, Ltd. (Ñ) 241,900 5,917
Tingyi Cayman Islands Holding Corp.
(Ñ) 612,000 1,787
Want Want China Holdings, Ltd. (Ñ) 1,983,238 1,839
Xingda International Holdings, Ltd. (Ñ) 5,023,000 1,995
Xinyi Glass Holdings, Ltd. (Ñ) 1,024,000 606
63,817
Chile - 0.8%Banco de Chile - ADR (Æ)(Ñ) 8,657 778
Banco Santander Chile - ADR 50,158 4,088
Embotelladora Andina SA - ADR (Ñ) 35,449 961
Entel Chile SA 68,279 1,250
Sociedad Quimica y Minera de Chile SA
- ADR 136,200 8,001
15,078
China - 5.6%Agricultural Bank of China, Ltd.
Class H (Ñ) 9,636,000 4,759
Anhui Conch Cement Co., Ltd. Class H
(Ñ) 1,019,387 3,444
Bank of China, Ltd. Class H 6,628,400 2,846
BBMG Corp. Class H (Ñ) 2,078,000 1,583
China Coal Energy Co., Ltd. Class H 1,825,000 2,292
China Construction Bank Corp. Class
H (Ñ) 5,827,120 4,666
China Life Insurance Co., Ltd. Class H 508,000 1,497
China Merchants Bank Co., Ltd.
Class H (Ñ) 1,887,274 4,166
China Minsheng Banking Corp., Ltd.
Class H (Ñ) 2,252,000 2,082
China Oilfield Services, Ltd. Class H 398,000 650
China Petroleum & Chemical Corp.
Class H 8,786,000 10,672
China Shenhua Energy Co., Ltd. Class H 2,566,697 11,286
Principal
Amount ($)
or Shares
Market
Value
$
Colombia - 0.7%BanColombia SA 151,500 2,342
BanColombia SA - ADR (Ñ) 61,435 3,810
Ecopetrol SA - ADR 119,861 6,121
12,273
Cyprus - 0.1%Global Ports Investments PLC - GDR 33,211 435
Global Ports Investments PLC - GDR (Þ) 32,776 430
Globaltrans Investment PLC - GDR 49,545 752
1,617
Czech Republic - 0.1%Komercni Banka AS 6,652 1,271
Egypt - 0.4%Orascom Construction Industries 95,733 3,975
Orascom Construction Industries - GDR 83,216 3,453
7,428
Greece - 0.1%Coca Cola Hellenic Bottling Co. SA (Æ) 93,694 1,740
Hong Kong - 4.3%Agile Property Holdings, Ltd. (Ñ) 1,898,000 2,117
AIA Group, Ltd. 589,600 1,969
China Merchants Holdings International Co.,
Ltd. 1,328,000 4,418
China Mobile, Ltd. 1,521,232 15,555
China Mobile, Ltd. - ADR 295,673 15,103
China Overseas Land & Investment, Ltd. (Ñ) 1,310,667 2,444
China Resources Enterprise, Ltd. 1,540,480 5,313
China Unicom Hong Kong, Ltd. (Ñ) 970,000 1,786
China Unicom Hong Kong, Ltd. - ADR (Ñ) 331,757 6,128
CNOOC, Ltd. 2,177,000 4,475
CNOOC, Ltd. - ADR 60,247 12,254
Dah Chong Hong Holdings, Ltd. 2,264,000 2,875
Lenovo Group, Ltd. 4,280,000 3,427
Copyright © 2012 www.secdatabase.com. All Rights Reserved.Please Consider the Environment Before Printing This Document

Russell Emerging Markets Fund 59
China Telecom Corp., Ltd. Class H 11,730,000 6,594
China Telecom Corp., Ltd. - ADR (Ñ) 38,114 2,138
Dongfeng Motor Group Co., Ltd. Class
H (Ñ) 5,582,000 10,437
Industrial & Commercial Bank of China
Class H (Ñ) 11,823,550 8,278
Jiangsu Expressway Co., Ltd. Class H 2,887,000 2,878
Jiangxi Copper Co., Ltd. Class H (Ñ) 791,000 2,013
PetroChina Co., Ltd. Class H 3,704,000 5,416
PetroChina Co., Ltd. - ADR 11,400 1,659
PICC Property & Casualty Co., Ltd.
Class H (Ñ) 2,372,000 3,126
Shandong Weigao Group Medical
Polymer Co., Ltd. Class H 2,268,000 2,088
Tsingtao Brewery Co., Ltd. Class H (Ñ) 302,000 1,632
Weiqiao Textile Co. Class H (Ñ) 540,500 278
Wumart Stores, Inc. Class H (Ñ) 727,000 1,502
Yantai Changyu Pioneer Wine Co., Ltd.
Class B 59,532 624
Yanzhou Coal Mining Co., Ltd.
Class H (Ñ) 780,000 1,871
Yanzhou Coal Mining Co., Ltd. - ADR 32,946 784
Zhaojin Mining Industry Co., Ltd. 946,000 1,698
Zoomlion Heavy Industry Science and
Technology Co., Ltd. (Ñ) 509,000 685
103,644
Shenzhen Investment, Ltd. 2,477,600 518
Soho China, Ltd. (Ñ) 1,500,000 984
79,366
Hungary - 0.6%Magyar Telekom
Telecommunications PLC 277,741 660
MOL Hungarian Oil and Gas PLC (Æ)(Ñ) 42,756 3,573
MOL Hungarian Oil and Gas PLC -
ADR (Æ) 4,213 169
OTP Bank PLC (Ñ) 243,534 4,344
Richter Gedeon Nyrt 10,073 1,657
10,403
Copyright © 2012 www.secdatabase.com. All Rights Reserved.Please Consider the Environment Before Printing This Document
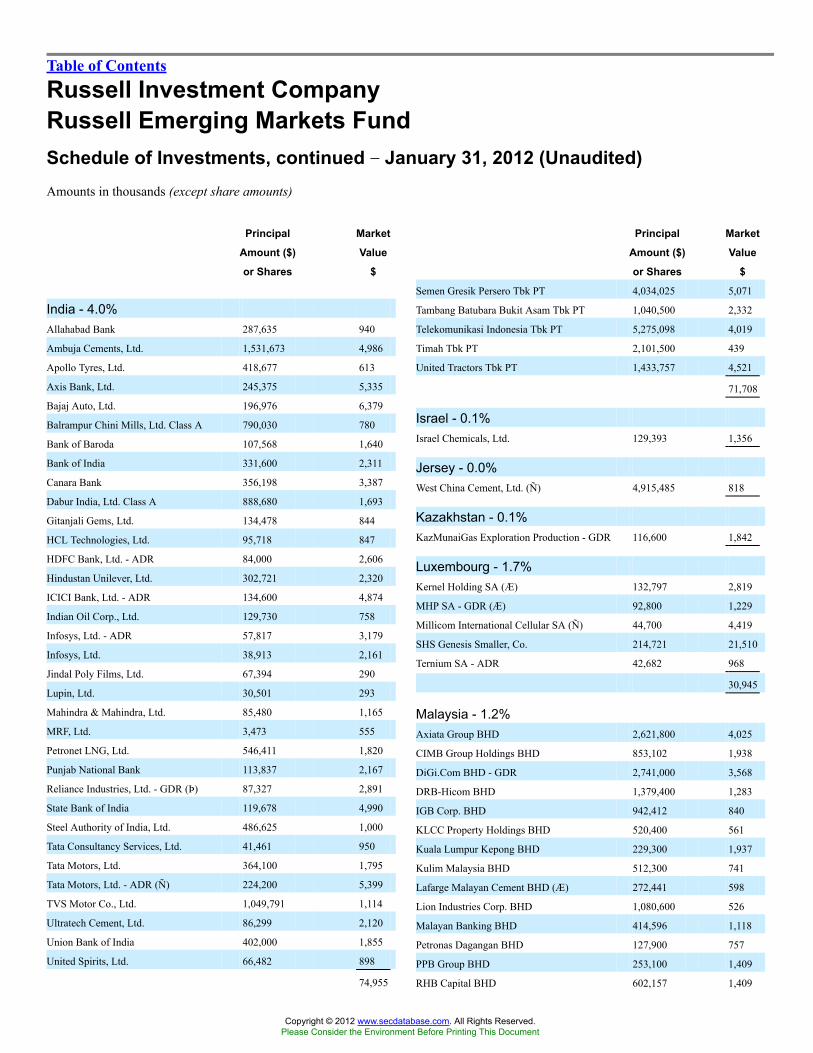
Table of Contents
Russell Investment CompanyRussell Emerging Markets FundSchedule of Investments, continued �� January 31, 2012 (Unaudited)Amounts in thousands (except share amounts)
Principal
Amount ($)
or Shares
Market
Value
$
India - 4.0%Allahabad Bank 287,635 940
Ambuja Cements, Ltd. 1,531,673 4,986
Apollo Tyres, Ltd. 418,677 613
Axis Bank, Ltd. 245,375 5,335
Bajaj Auto, Ltd. 196,976 6,379
Balrampur Chini Mills, Ltd. Class A 790,030 780
Bank of Baroda 107,568 1,640
Bank of India 331,600 2,311
Canara Bank 356,198 3,387
Dabur India, Ltd. Class A 888,680 1,693
Gitanjali Gems, Ltd. 134,478 844
HCL Technologies, Ltd. 95,718 847
HDFC Bank, Ltd. - ADR 84,000 2,606
Hindustan Unilever, Ltd. 302,721 2,320
ICICI Bank, Ltd. - ADR 134,600 4,874
Indian Oil Corp., Ltd. 129,730 758
Infosys, Ltd. - ADR 57,817 3,179
Infosys, Ltd. 38,913 2,161
Jindal Poly Films, Ltd. 67,394 290
Lupin, Ltd. 30,501 293
Mahindra & Mahindra, Ltd. 85,480 1,165
MRF, Ltd. 3,473 555
Petronet LNG, Ltd. 546,411 1,820
Punjab National Bank 113,837 2,167
Reliance Industries, Ltd. - GDR (Þ) 87,327 2,891
State Bank of India 119,678 4,990
Steel Authority of India, Ltd. 486,625 1,000
Tata Consultancy Services, Ltd. 41,461 950
Tata Motors, Ltd. 364,100 1,795
Tata Motors, Ltd. - ADR (Ñ) 224,200 5,399
TVS Motor Co., Ltd. 1,049,791 1,114
Ultratech Cement, Ltd. 86,299 2,120
Union Bank of India 402,000 1,855
United Spirits, Ltd. 66,482 898
74,955
Principal
Amount ($)
or Shares
Market
Value
$
Semen Gresik Persero Tbk PT 4,034,025 5,071
Tambang Batubara Bukit Asam Tbk PT 1,040,500 2,332
Telekomunikasi Indonesia Tbk PT 5,275,098 4,019
Timah Tbk PT 2,101,500 439
United Tractors Tbk PT 1,433,757 4,521
71,708
Israel - 0.1%Israel Chemicals, Ltd. 129,393 1,356
Jersey - 0.0%West China Cement, Ltd. (Ñ) 4,915,485 818
Kazakhstan - 0.1%KazMunaiGas Exploration Production - GDR 116,600 1,842
Luxembourg - 1.7%Kernel Holding SA (Æ) 132,797 2,819
MHP SA - GDR (Æ) 92,800 1,229
Millicom International Cellular SA (Ñ) 44,700 4,419
SHS Genesis Smaller, Co. 214,721 21,510
Ternium SA - ADR 42,682 968
30,945
Malaysia - 1.2%Axiata Group BHD 2,621,800 4,025
CIMB Group Holdings BHD 853,102 1,938
DiGi.Com BHD - GDR 2,741,000 3,568
DRB-Hicom BHD 1,379,400 1,283
IGB Corp. BHD 942,412 840
KLCC Property Holdings BHD 520,400 561
Kuala Lumpur Kepong BHD 229,300 1,937
Kulim Malaysia BHD 512,300 741
Lafarge Malayan Cement BHD (Æ) 272,441 598
Lion Industries Corp. BHD 1,080,600 526
Malayan Banking BHD 414,596 1,118
Petronas Dagangan BHD 127,900 757
PPB Group BHD 253,100 1,409
RHB Capital BHD 602,157 1,409
Copyright © 2012 www.secdatabase.com. All Rights Reserved.Please Consider the Environment Before Printing This Document

60 Russell Emerging Markets Fund
Indonesia - 3.9%AKR Corporindo TBK PT 1,954,500 794
Alam Sutera Realty Tbk PT 41,004,000 2,212
Astra International Tbk PT 1,427,500 12,528
Bakrie Sumatera Plantations Tbk PT 14,276,000 460
Bank Bukopin Tbk PT 11,685,500 806
Bank Danamon Indonesia Tbk PT 1,342,962 676
Bank Negara Indonesia Persero Tbk PT 7,191,170 2,900
Bank Rakyat Indonesia Persero Tbk PT 20,770,058 15,826
Charoen Pokphand Indonesia Tbk PT 8,633,984 2,401
Gajah Tunggal Tbk PT 1,891,000 610
Gudang Garam Tbk PT 169,500 1,075
Harum Energy Tbk PT 3,322,500 2,809
Indocement Tunggal Prakarsa Tbk PT 2,018,071 3,805
Indofood Sukses Makmur Tbk PT 2,140,000 1,143
Jasa Marga PT 2,437,000 1,186
Kalbe Farma Tbk PT 8,374,500 3,284
Mitra Adiperkasa Tbk PT 272,000 172
Perusahaan Gas Negara PT 5,912,000 2,219
Ramayana Lestari Sentosa Tbk PT 5,097,992 420
UEM Land Holdings BHD (Æ) 2,163,600 1,650
22,360
Mexico - 3.9%Alfa SAB de CV Class A (Ñ) 259,500 3,407
America Movil SAB de CV - ADR 670,433 15,561
Cemex SAB de CV (Æ) 836,100 566
Cemex SAB de CV - ADR (Æ)(Ñ) 596,482 4,062
Coca-Cola Femsa SAB de CV - ADR 42,000 4,116
Corp. Moctezuma SAB de CV (Ñ) 300,663 692
Desarrolladora Homex SAB de CV (Æ)(Ñ) 228,700 770
Desarrolladora Homex SAB de CV -
ADR (Æ) 20,458 413
El Puerto de Liverpool SAB de CV 6,054 46
Empresas ICA SAB de CV - ADR (Æ)(Ñ) 153,000 995
Fomento Economico Mexicano SAB de CV -
ADR 120,256 8,480
Copyright © 2012 www.secdatabase.com. All Rights Reserved.Please Consider the Environment Before Printing This Document

Table of Contents
Russell Investment CompanyRussell Emerging Markets FundSchedule of Investments, continued �� January 31, 2012 (Unaudited)Amounts in thousands (except share amounts)
Principal
Amount ($)
or Shares
Market
Value
$
Fomento Economico Mexicano SAB de
CV 108,700 762
Genomma Lab Internacional SAB de
CV Class B (Æ) 447,200 981
Gruma SAB de CV Class B (Æ) 305,880 677
Grupo Aeroportuario del Sureste SA de
CV Class B (Ñ) 109,400 718
Grupo Aeroportuario del Sureste SAB
de CV - ADR 45,268 2,982
Grupo Financiero Banorte SAB de CV
Class O (Ñ) 1,156,067 4,607
Grupo Financiero Inbursa SA Class
O (Ñ) 1,197,154 2,463
Grupo Televisa SAB - ADR 170,600 3,364
Industrias Penoles SAB de CV 19,300 923
Megacable Holdings SAB de CV (Æ) 324,803 675
Promotora y Operadora de
Infraestructura SAB de CV (Æ) 77,300 353
Wal-Mart de Mexico SAB de CV 2,246,890 6,942
Wal-Mart de Mexico SAB de CV - ADR 232,200 7,159
71,714
Nigeria - 0.3%First City Monument Bank PLC 16,265,148 414
Guaranty Trust Bank PLC 9,264,158 804
Guaranty Trust Bank PLC - GDR 172,487 811
Nigerian Breweries PLC 1,913,948 1,128
United Bank for Africa PLC Class A (ö) 21,809,472 271
Zenith Bank PLC 28,604,000 2,210
5,638
Panama - 0.1%Copa Holdings SA Class A 28,500 1,942
Peru - 0.1%Cia de Minas Buenaventura SA - ADR 41,600 1,785
Principal
Amount ($)
or Shares
Market
Value
$
Russia - 7.5%Gazprom OAO - ADR 3,373,459 40,650
Gazprom OAO - ADR (Æ) 614,870 7,440
LSR Group - GDR 188,078 897
Lukoil OAO - ADR (Æ) 574,240 33,501
Lukoil OAO - ADR 104,286 6,106
Magnit OJSC (Å) 30,428 3,311
Magnit OJSC (Æ) 11,005 1,197
MMC Norilsk Nickel OJSC - ADR (Ñ) 57,961 1,113
Mobile Telesystems OJSC - ADR 79,000 1,324
Nomos-Bank - GDR (Æ)(Þ) 39,852 474
Nomos-Bank - GDR (Æ) 23,995 286
NovaTek OAO - GDR 29,269 3,942
Novorossiysk Commercial Sea Port
PJSC - GDR 127,338 889
Novorossiysk Commercial Sea Port
PJSC - GDR (Þ) 23,647 165
Raspadskaya 392,707 1,379
Rosneft Oil Co. - GDR 1,172,331 8,640
Sberbank of Russia 5,940,618 17,717
Sberbank of Russia - ADR 73,500 882
Severstal OAO - GDR 102,644 1,476
Surgutneftegas OJSC - ADR 482,783 4,485
Uralkali OJSC - GDR 52,000 1,848
VTB Bank OJSC - GDR 226,097 1,058
138,780
Singapore - 0.0%SunVic Chemical Holdings, Ltd. (Ñ) 530,000 223
South Africa - 5.8%ABSA Group, Ltd. 134,346 2,547
Anglo American Platinum, Ltd. (Ñ) 15,585 1,104
AngloGold Ashanti, Ltd. 96,251 4,418
ArcelorMittal South Africa, Ltd. Class
H (Ñ) 163,833 1,428
Aspen Pharmacare Holdings, Ltd. (Æ) 158,553 2,021
Copyright © 2012 www.secdatabase.com. All Rights Reserved.Please Consider the Environment Before Printing This Document

Russell Emerging Markets Fund 61
Philippines - 1.1%Aboitiz Power Corp. 1,014,900 715
Alliance Global Group, Inc. 11,609,500 2,978
DMCI Holdings, Inc. 4,139,900 4,441
Megaworld Corp. 41,094,000 1,638
Metropolitan Bank & Trust - ADR 1,896,162 3,354
Philex Mining Corp. 1,187,200 645
Philippine Long Distance Telephone Co. 30,070 1,918
Philippine Long Distance Telephone Co.
- ADR 21,340 1,355
Semirara Mining Corp. Class A 627,240 3,297
Universal Robina Corp. 271,600 340
20,681
Poland - 1.0%Bank Pekao SA 65,959 3,221
KGHM Polska Miedz SA 271,524 11,747
Polski Koncern Naftowy Orlen S.A. (Æ) 147,056 1,673
Tauron Polska Energia SA 125,400 210
Telekomunikacja Polska SA 420,564 2,255
19,106
Astral Foods, Ltd. 112,396 1,732
Bidvest Group, Ltd. (Æ) 256,881 5,513
Exxaro Resources, Ltd. (Ñ) 290,220 7,161
FirstRand, Ltd. 1,998,322 5,762
Grindrod, Ltd. 101,240 193
Impala Platinum Holdings, Ltd. 259,350 5,693
Imperial Holdings, Ltd. 277,561 4,919
Kumba Iron Ore, Ltd. (Ñ) 25,872 1,774
Lewis Group, Ltd. 108,800 1,035
Liberty Holdings, Ltd. 38,887 424
Life Healthcare Group Holdings, Ltd. 520,613 1,411
Mondi, Ltd. 153,465 1,226
Mr Price Group, Ltd. (Ñ) 323,040 3,562
MTN Group, Ltd. (Ñ) 480,658 8,186
Pick n Pay Stores, Ltd. 210,245 1,226
Remgro, Ltd. 193,965 3,155
RMB Holdings, Ltd. (Ñ) 330,602 1,231
Sanlam, Ltd. 536,437 2,070
Sasol, Ltd. - ADR 259,138 13,239
Shoprite Holdings, Ltd. - ADR (Ñ) 426,623 7,092
Spar Group, Ltd. (The) - ADR (Ñ) 73,494 1,041
Copyright © 2012 www.secdatabase.com. All Rights Reserved.Please Consider the Environment Before Printing This Document

Table of Contents
Russell Investment CompanyRussell Emerging Markets FundSchedule of Investments, continued �� January 31, 2012 (Unaudited)Amounts in thousands (except share amounts)
Principal
Amount ($)
or Shares
Market
Value
$
Standard Bank Group, Ltd. 827,744 11,341
Truworths International, Ltd. 118,519 1,185
Vodacom Group, Ltd. - ADR (Ñ) 346,880 4,273
Woolworths Holdings, Ltd. 275,152 1,478
107,440
South Korea - 13.2%Amorepacific Corp. (Ñ) 2,996 2,670
Amorepacific Group (Ñ) 2,899 665
Cheil Industries, Inc. 29,638 2,652
CJ CheilJedang Corp. 4,000 1,097
CJ E&M Corp. (Æ)(Ñ) 7,000 199
Daesang Corp. (Æ) 55,560 730
Daum Communications Corp. (Æ) 1,866 219
DGB Financial Group, Inc. 135,060 1,797
Dong-A Pharmaceutical Co., Ltd. Class A 8,792 746
Dongbu Insurance Co., Ltd. 35,040 1,497
Dongwon F&B Co., Ltd. 10,420 595
Golfzon Co., Ltd. (Ñ) 31,198 1,652
Hana Financial Group, Inc. 140,860 4,815
Hanjin Shipping Co., Ltd. (Æ)(Ñ) 51,950 624
Hankook Tire Co., Ltd. 87,150 3,479
Himart Co., Ltd. (Ñ) 5,315 360
Honam Petrochemical Corp. (Æ) 10,536 3,437
Hynix Semiconductor, Inc. Class
QUICS (Æ)(Ñ) 381,900 9,128
Hyosung Corp. 51,356 2,862
Hyundai Heavy Industries Co., Ltd. 11,670 3,236
Hyundai Marine & Fire Insurance Co., Ltd. 81,850 2,404
Hyundai Mobis (Ñ) 26,921 6,638
Hyundai Motor Co. 87,162 17,148
Iljin Materials Co., Ltd. 92,320 1,504
KB Financial Group, Inc. - ADR 116,270 4,407
KB Financial Group, Inc. 92,249 3,498
KCC Corp. 8,110 2,187
Kia Motors Corp. 241,265 14,497
Principal
Amount ($)
or Shares
Market
Value
$
NHN Corp. 8,656 1,634
NongShim Co., Ltd. (Ñ) 4,320 909
OCI Co., Ltd. (Æ) 8,410 1,958
Paradise Co., Ltd. (Ñ) 27,069 227
Poongsan Corp. (Æ)(Ñ) 2,230 63
POSCO - ADR (Ñ) 12,100 1,110
Samsung Electro-Mechanics Co., Ltd.
(Ñ) 20,935 1,716
Samsung Electronics Co., Ltd. 51,259 50,513
Samsung Electronics Co., Ltd. - GDR 40,585 15,178
Samsung Fire & Marine Insurance Co.,
Ltd. 55,981 10,839
Samsung Life Insurance Co., Ltd. (Þ) 33,163 2,474
Samsung SDI Co., Ltd. (Ñ) 15,615 1,939
Samyang Corp. (Æ)(Ñ) 3,786 174
Samyang Holdings Corp. (Ñ) 4,030 320
Shinhan Financial Group Co., Ltd. 106,869 4,257
SK Holdings Co., Ltd. 10,989 1,374
SK Telecom Co., Ltd. - ADR 210,000 2,942
SK Telecom Co., Ltd. 13,563 1,721
SKC Co., Ltd. (Ñ) 51,020 2,194
Sungwoo Hitech Co., Ltd. (Æ) 22,982 276
Taeyoung Engineering & Construction
Co., Ltd. 49,760 254
245,186
Taiwan - 6.4%Advanced Semiconductor Engineering,
Inc. 3,798,355 3,992
Advanced Semiconductor Engineering,
Inc. - ADR (Ñ) 743,379 3,918
Altek Corp. 2,935,657 2,391
Asia Polymer Corp. 1,201,250 1,543
AU Optronics Corp. 6,891,202 3,680
Catcher Technology Co., Ltd. 191,000 1,188
Cathay Financial Holding Co., Ltd. 1,544,500 1,762
Chinatrust Financial Holding Co., Ltd. 1,662,502 1,073
Copyright © 2012 www.secdatabase.com. All Rights Reserved.Please Consider the Environment Before Printing This Document

62 Russell Emerging Markets Fund
KIWOOM Securities Co., Ltd. 38,266 1,993
Korea Electric Power Corp. (Æ) 250,263 6,216
KP Chemical Corp. (Æ)(Ñ) 87,120 1,280
KT Corp. - ADR 200,000 2,978
KT Corp. 144,100 4,284
KT Skylife Co., Ltd. (Æ) 16,500 338
KT&G Corp. 72,663 5,084
LG Chem, Ltd. 5,020 1,671
LG Display Co., Ltd. (Æ) 328,530 8,613
LG Display Co., Ltd. - ADR (Ñ) 85,600 1,103
LG Electronics, Inc. Class H (Ñ) 56,430 4,154
LG Fashion Corp. 15,850 643
LG Uplus Corp. (Æ) 53,310 299
LIG Insurance Co., Ltd. 45,570 984
Lotte Chilsung Beverage Co., Ltd. (Æ)(Ñ) 2,345 2,662
Lotte Confectionery Co., Ltd. (Æ) 1,466 2,219
Lotte Shopping Co., Ltd. 4,912 1,677
Lumens Co., Ltd. (Æ) 77,367 532
MegaStudy Co., Ltd. 5,960 572
Meritz Fire & Marine Insurance Co., Ltd. 82,146 863
Neowiz Games Corp. (Æ) 5,579 206
Chunghwa Telecom Co., Ltd. 728,000 2,367
Chunghwa Telecom Co., Ltd. - ADR 115,500 3,743
Delta Electronics, Inc. 557,970 1,443
Gigabyte Technology Co., Ltd. 1,261,000 1,019
HannStar Display Corp. (Æ) 4,767,000 333
Hiwin Technologies Corp. 230,000 2,126
Hon Hai Precision Industry Co., Ltd. 2,323,524 7,484
HTC Corp. 31,450 516
Largan Precision Co., Ltd. 175,000 3,762
LITE-ON IT Corp. 462,279 454
Lite-On Technology Corp. 1,496,669 1,897
Macronix International 2,878,634 1,265
MediaTek, Inc. 209,022 1,996
Merry Electronics Co., Ltd. 676,000 816
Pegatron Corp. 3,044,000 3,683
Powertech Technology, Inc. 1,780,805 4,454
President Chain Store Corp. 212,000 1,139
Quanta Computer, Inc. 1,241,000 2,651
Richtek Technology Corp. 97,706 545
Standard Foods Corp. 259,000 880
Star Comgistic Capital Co., Ltd. 977,200 613
Synnex Technology International Corp. 2,642,121 6,519
Taishin Financial Holding Co., Ltd. 3,198,970 1,189
Copyright © 2012 www.secdatabase.com. All Rights Reserved.Please Consider the Environment Before Printing This Document

Table of Contents
Russell Investment CompanyRussell Emerging Markets FundSchedule of Investments, continued �� January 31, 2012 (Unaudited)Amounts in thousands (except share amounts)
Principal
Amount ($)
or Shares
Market
Value
$
Taiwan Semiconductor Manufacturing
Co., Ltd. 10,111,133 26,826
Taiwan Semiconductor Manufacturing
Co., Ltd. - ADR 362,400 5,102
Uni-President Enterprises Corp. 2,691,874 3,976
United Microelectronics Corp. 6,667,795 3,493
Vanguard International Semiconductor
Corp. 1,588,000 644
Wistron Corp. 2,799,348 4,201
Yageo Corp. 3,955,000 1,216
Yulon Motor Co., Ltd. 1,036,000 2,027
117,926
Thailand - 3.1%Advanced Info Service PCL 529,600 2,586
Airports of Thailand PCL 120,500 206
Bangkok Bank PCL 537,900 2,883
Bangkok Dusit Medical Services PCL
Class F (Æ) 2,511,800 6,234
Bangkok Life Assurance PCL 875,300 1,387
Bank of Ayudhya PCL 3,216,890 2,320
Banpu PCL 95,350 1,819
Charoen Pokphand Foods PCL 592,400 670
CP ALL PCL 1,946,100 3,681
Delta Electronics Thai PCL 1,980,600 1,371
Hana Microelectronics PCL 456,900 270
Italian-Thai Development PCL 3,221,800 365
Jasmine International PCL 6,094,200 398
LPN Development PCL 950,400 430
PTT Exploration & Production PCL 974,700 5,579
PTT PCL 604,700 6,648
Ratchaburi Electricity Generating
Holding PCL 189,600 270
SC Asset Corp. PCL 617,900 290
Siam Cement PCL 118,100 1,321
Siam Commercial Bank PCL 1,711,101 6,695
Principal
Amount ($)
or Shares
Market
Value
$
Kardemir Karabuk Demir Celik Sanayi
ve Ticaret AS Class D (Æ) 1,001,465 468
Koza Altin Isletmeleri AS 319,335 5,661
Koza Anadolu Metal Madencilik
Isletmeleri AS (Æ) 408,938 879
Migros Ticaret AS (Æ) 198,325 1,518
Selcuk Ecza Deposu Ticaret ve Sanayi
A.S. 535,035 488
Tofas Turk Otomobil Fabrikasi AS 182,100 773
Turkcell Iletisim Hizmetleri AS -
ADR (Æ) 113,400 1,462
Turkiye Garanti Bankasi AS 1,281,619 4,631
Turkiye Halk Bankasi AS 686,604 4,521
Turkiye Is Bankasi Class C 1,042,243 2,176
Turkiye Sise ve Cam Fabrikalari AS 3,114,403 6,397
Turkiye Vakiflar Bankasi Tao Class D 1,310,840 2,132
Vestel Elektronik Sanayi ve Ticaret
A.S. (Æ) 770,946 894
Yapi ve Kredi Bankasi AS (Æ) 983,125 1,826
50,054
United Kingdom - 3.6%Anglo American PLC (Ñ) 391,737 16,278
Anglo American PLC - ADR 75,700 1,566
Genesis Indian Investment Co., Ltd. 354,987 23,827
Hikma Pharmaceuticals PLC 240,082 2,716
New World Resources PLC Class A (Ñ) 163,508 1,212
SABMiller PLC - ADR 356,912 13,592
Tullow Oil PLC 366,051 8,018
67,209
United States - 0.8%Avon Products, Inc. 410,000 7,286
Sohu.com, Inc. (Æ)(Ñ) 33,307 1,986
Winbond Electronics Corp. (Æ) 3,366,000 548
X5 Retail Group NV - GDR (Æ) 234,954 5,173
14,993
Copyright © 2012 www.secdatabase.com. All Rights Reserved.Please Consider the Environment Before Printing This Document
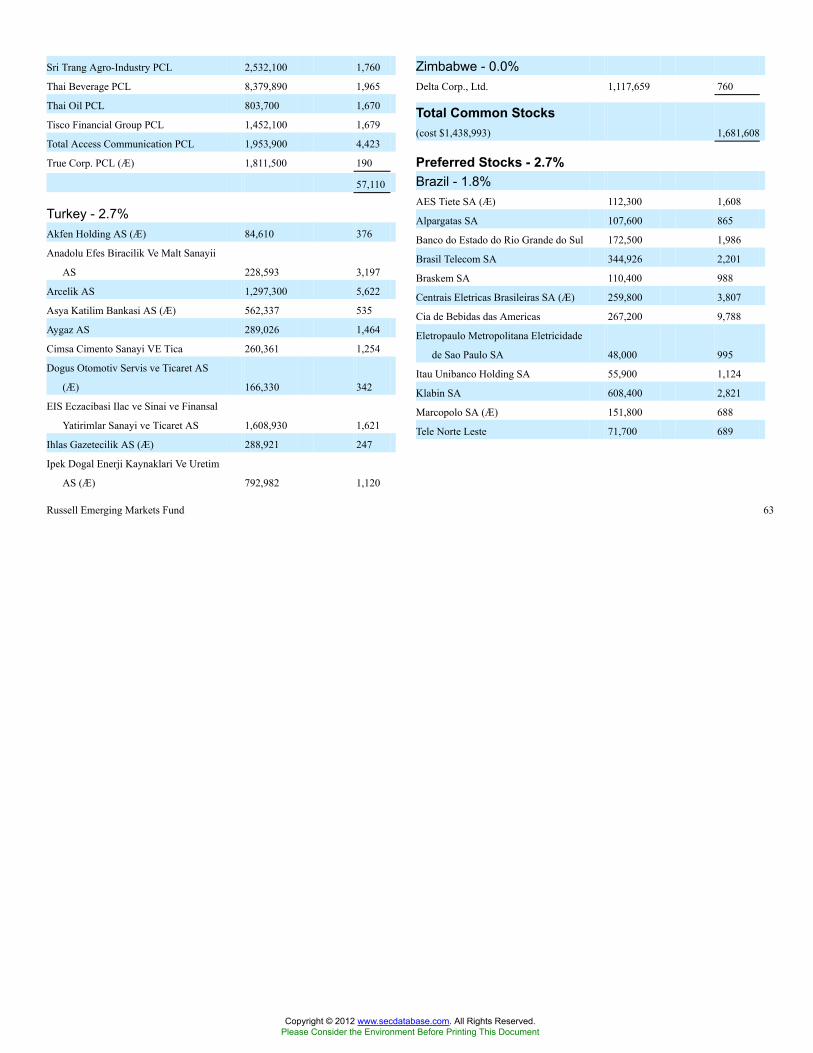
Russell Emerging Markets Fund 63
Sri Trang Agro-Industry PCL 2,532,100 1,760
Thai Beverage PCL 8,379,890 1,965
Thai Oil PCL 803,700 1,670
Tisco Financial Group PCL 1,452,100 1,679
Total Access Communication PCL 1,953,900 4,423
True Corp. PCL (Æ) 1,811,500 190
57,110
Turkey - 2.7%Akfen Holding AS (Æ) 84,610 376
Anadolu Efes Biracilik Ve Malt Sanayii
AS 228,593 3,197
Arcelik AS 1,297,300 5,622
Asya Katilim Bankasi AS (Æ) 562,337 535
Aygaz AS 289,026 1,464
Cimsa Cimento Sanayi VE Tica 260,361 1,254
Dogus Otomotiv Servis ve Ticaret AS
(Æ) 166,330 342
EIS Eczacibasi Ilac ve Sinai ve Finansal
Yatirimlar Sanayi ve Ticaret AS 1,608,930 1,621
Ihlas Gazetecilik AS (Æ) 288,921 247
Ipek Dogal Enerji Kaynaklari Ve Uretim
AS (Æ) 792,982 1,120
Zimbabwe - 0.0%Delta Corp., Ltd. 1,117,659 760
Total Common Stocks(cost $1,438,993) 1,681,608
Preferred Stocks - 2.7%Brazil - 1.8%AES Tiete SA (Æ) 112,300 1,608
Alpargatas SA 107,600 865
Banco do Estado do Rio Grande do Sul 172,500 1,986
Brasil Telecom SA 344,926 2,201
Braskem SA 110,400 988
Centrais Eletricas Brasileiras SA (Æ) 259,800 3,807
Cia de Bebidas das Americas 267,200 9,788
Eletropaulo Metropolitana Eletricidade
de Sao Paulo SA 48,000 995
Itau Unibanco Holding SA 55,900 1,124
Klabin SA 608,400 2,821
Marcopolo SA (Æ) 151,800 688
Tele Norte Leste 71,700 689
Copyright © 2012 www.secdatabase.com. All Rights Reserved.Please Consider the Environment Before Printing This Document

Table of Contents
Russell Investment CompanyRussell Emerging Markets FundSchedule of Investments, continued �� January 31, 2012 (Unaudited)Amounts in thousands (except share amounts)
Principal
Amount ($)
or Shares
Market
Value
$
Telefonica Brasil SA 110 3
Telemar Norte Leste SA 27,000 695
Vale SA Class Preference 182,700 4,464
32,722
Chile - 0.1%Embotelladora Andina SA 140,785 653
Embotelladora Andina SA Class A 13,200 50
703
Colombia - 0.0%BanColombia SA 7,200 111
Russia - 0.2%AK Transneft OAO 2,136 4,073
South Korea - 0.6%Hyundai Motor Co. 23,736 1,391
LG Electronics, Inc. 39,920 931
Samsung Electronics Co., Ltd. 15,572 9,149
11,471
Total Preferred Stocks(cost $35,663) 49,080
Warrants & Rights - 0.3%Germany - 0.3%Commercial Bank of Qatar QSC (The) (Æ)
2017 Warrants 201,378 4,567
Deutsche Bank AG (Æ)
2012 Warrants 27,507 743
5,310
Turkey - 0.0%Ipek Dogal Enerji Kaynaklari (Æ)
2012 Rights 792,982 674
Total Warrants & Rights(cost $5,464) 5,984
Principal
Amount ($)
or Shares
Market
Value
$
United States - 0.0%Citigroup Global Markets Holdings,
Inc.
Series 2
Zero coupon due 10/28/13 317 602
Total Certificates ofParticipation(cost $10,577) 6,098
Short-Term Investments - 4.4%United Kingdom - 0.2%HSBC Bank PLC
Series 4
Zero coupon due 03/12/12 9,340 3,350
United States - 4.2%Russell U.S. Cash Management Fund 78,957,236 (¥) 78,957
Total Short-TermInvestments(cost $87,638) 82,307
Other Securities - 8.9%Russell Investment Company
Liquidating Trust (×) 1,624,769 (¥) 1,652
Russell U.S. Cash Collateral
Fund (×) 163,968,496(¥) 163,968
Total Other Securities(cost $165,593) 165,620
Total Investments - 107.3%(identified cost $1,743,928) 1,990,697
Other Assets and Liabilities,Net - (7.3%) (135,872 )
Net Assets - 100.0% 1,854,825
Copyright © 2012 www.secdatabase.com. All Rights Reserved.Please Consider the Environment Before Printing This Document

See accompanying notes which are an integral part of this quarterly report.
64 Russell Emerging Markets Fund
Certificates of Participation - 0.3%United Kingdom - 0.3%Credit Suisse International
Participation Notes
Zero coupon due 03/14/12 773 10
HSBC Bank PLC
Series 0005
Zero coupon due 09/23/13 7,040 2,572
Jarir Marketing, Co.
Zero coupon due 03/27/12 3,160 853
Zero coupon due 06/04/12 5,550 2,061
5,496
A portion of the portfolio has been fair valued as of period end.
Copyright © 2012 www.secdatabase.com. All Rights Reserved.Please Consider the Environment Before Printing This Document
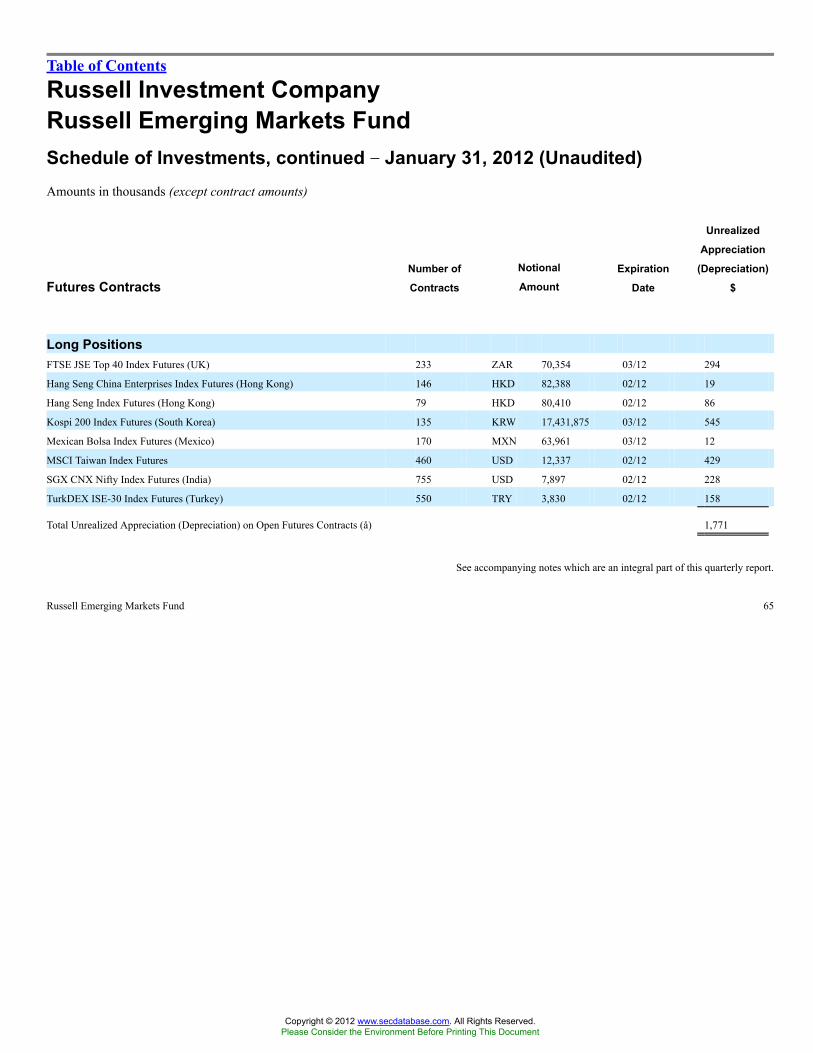
Table of Contents
Russell Investment CompanyRussell Emerging Markets FundSchedule of Investments, continued �� January 31, 2012 (Unaudited)Amounts in thousands (except contract amounts)
Futures ContractsNumber of
Contracts
Notional
AmountExpiration
Date
Unrealized
Appreciation
(Depreciation)
$
Long PositionsFTSE JSE Top 40 Index Futures (UK) 233 ZAR 70,354 03/12 294
Hang Seng China Enterprises Index Futures (Hong Kong) 146 HKD 82,388 02/12 19
Hang Seng Index Futures (Hong Kong) 79 HKD 80,410 02/12 86
Kospi 200 Index Futures (South Korea) 135 KRW 17,431,875 03/12 545
Mexican Bolsa Index Futures (Mexico) 170 MXN 63,961 03/12 12
MSCI Taiwan Index Futures 460 USD 12,337 02/12 429
SGX CNX Nifty Index Futures (India) 755 USD 7,897 02/12 228
TurkDEX ISE-30 Index Futures (Turkey) 550 TRY 3,830 02/12 158
Total Unrealized Appreciation (Depreciation) on Open Futures Contracts (å) 1,771
See accompanying notes which are an integral part of this quarterly report.
Russell Emerging Markets Fund 65
Copyright © 2012 www.secdatabase.com. All Rights Reserved.Please Consider the Environment Before Printing This Document
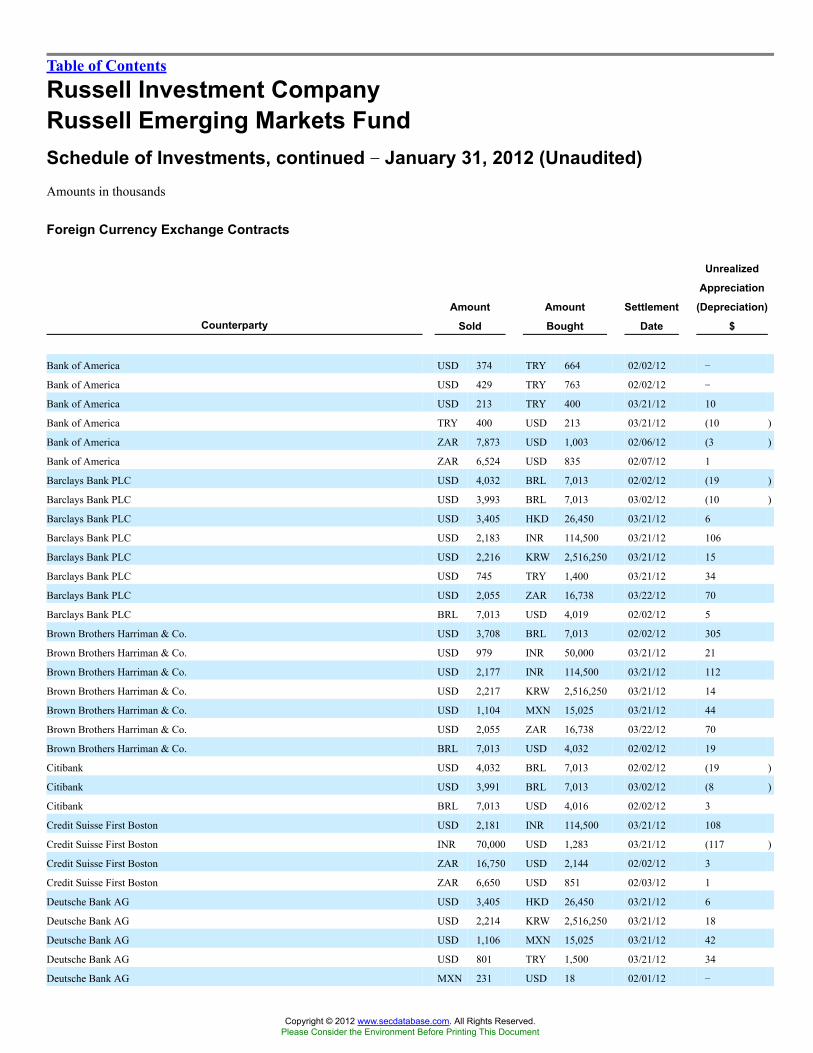
Table of Contents
Russell Investment CompanyRussell Emerging Markets FundSchedule of Investments, continued �� January 31, 2012 (Unaudited)Amounts in thousands
Foreign Currency Exchange Contracts
CounterpartyAmount
Sold
Amount
Bought
Settlement
Date
Unrealized
Appreciation
(Depreciation)
$
Bank of America USD 374 TRY 664 02/02/12 �
Bank of America USD 429 TRY 763 02/02/12 �
Bank of America USD 213 TRY 400 03/21/12 10
Bank of America TRY 400 USD 213 03/21/12 (10 )
Bank of America ZAR 7,873 USD 1,003 02/06/12 (3 )
Bank of America ZAR 6,524 USD 835 02/07/12 1
Barclays Bank PLC USD 4,032 BRL 7,013 02/02/12 (19 )
Barclays Bank PLC USD 3,993 BRL 7,013 03/02/12 (10 )
Barclays Bank PLC USD 3,405 HKD 26,450 03/21/12 6
Barclays Bank PLC USD 2,183 INR 114,500 03/21/12 106
Barclays Bank PLC USD 2,216 KRW 2,516,250 03/21/12 15
Barclays Bank PLC USD 745 TRY 1,400 03/21/12 34
Barclays Bank PLC USD 2,055 ZAR 16,738 03/22/12 70
Barclays Bank PLC BRL 7,013 USD 4,019 02/02/12 5
Brown Brothers Harriman & Co. USD 3,708 BRL 7,013 02/02/12 305
Brown Brothers Harriman & Co. USD 979 INR 50,000 03/21/12 21
Brown Brothers Harriman & Co. USD 2,177 INR 114,500 03/21/12 112
Brown Brothers Harriman & Co. USD 2,217 KRW 2,516,250 03/21/12 14
Brown Brothers Harriman & Co. USD 1,104 MXN 15,025 03/21/12 44
Brown Brothers Harriman & Co. USD 2,055 ZAR 16,738 03/22/12 70
Brown Brothers Harriman & Co. BRL 7,013 USD 4,032 02/02/12 19
Citibank USD 4,032 BRL 7,013 02/02/12 (19 )
Citibank USD 3,991 BRL 7,013 03/02/12 (8 )
Citibank BRL 7,013 USD 4,016 02/02/12 3
Credit Suisse First Boston USD 2,181 INR 114,500 03/21/12 108
Credit Suisse First Boston INR 70,000 USD 1,283 03/21/12 (117 )
Credit Suisse First Boston ZAR 16,750 USD 2,144 02/02/12 3
Credit Suisse First Boston ZAR 6,650 USD 851 02/03/12 1
Deutsche Bank AG USD 3,405 HKD 26,450 03/21/12 6
Deutsche Bank AG USD 2,214 KRW 2,516,250 03/21/12 18
Deutsche Bank AG USD 1,106 MXN 15,025 03/21/12 42
Deutsche Bank AG USD 801 TRY 1,500 03/21/12 34
Deutsche Bank AG MXN 231 USD 18 02/01/12 �
Copyright © 2012 www.secdatabase.com. All Rights Reserved.Please Consider the Environment Before Printing This Document
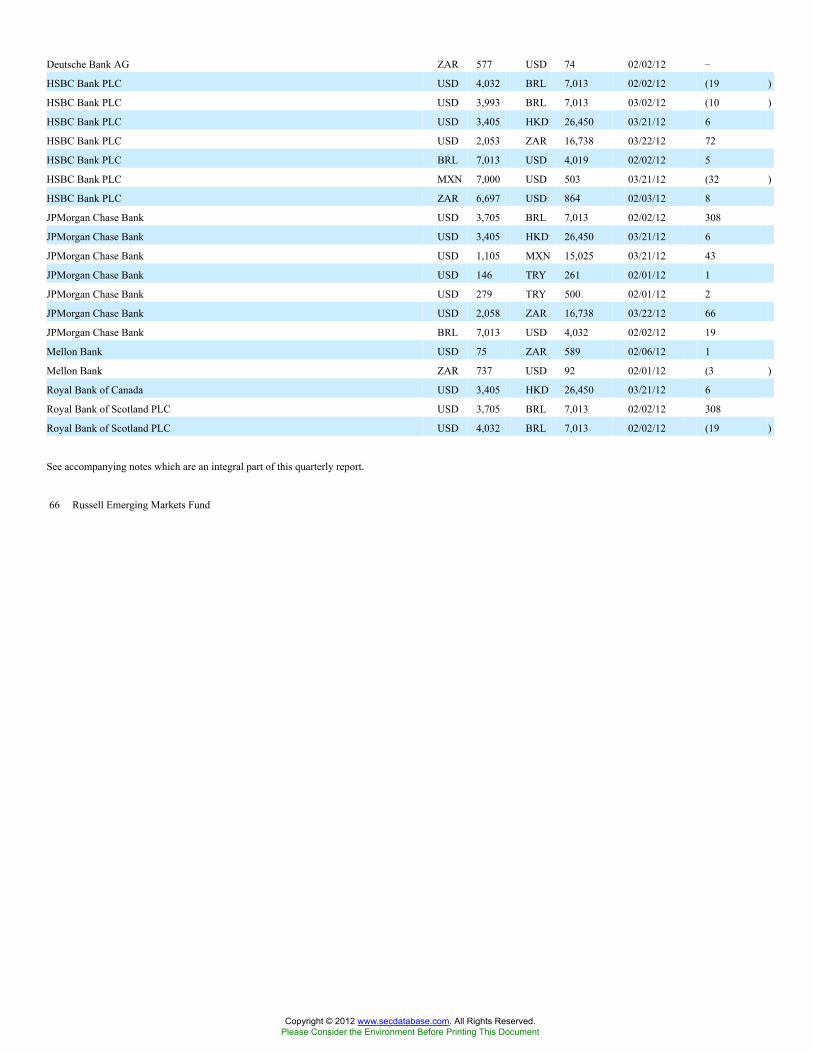
Deutsche Bank AG ZAR 577 USD 74 02/02/12 �
HSBC Bank PLC USD 4,032 BRL 7,013 02/02/12 (19 )
HSBC Bank PLC USD 3,993 BRL 7,013 03/02/12 (10 )
HSBC Bank PLC USD 3,405 HKD 26,450 03/21/12 6
HSBC Bank PLC USD 2,053 ZAR 16,738 03/22/12 72
HSBC Bank PLC BRL 7,013 USD 4,019 02/02/12 5
HSBC Bank PLC MXN 7,000 USD 503 03/21/12 (32 )
HSBC Bank PLC ZAR 6,697 USD 864 02/03/12 8
JPMorgan Chase Bank USD 3,705 BRL 7,013 02/02/12 308
JPMorgan Chase Bank USD 3,405 HKD 26,450 03/21/12 6
JPMorgan Chase Bank USD 1,105 MXN 15,025 03/21/12 43
JPMorgan Chase Bank USD 146 TRY 261 02/01/12 1
JPMorgan Chase Bank USD 279 TRY 500 02/01/12 2
JPMorgan Chase Bank USD 2,058 ZAR 16,738 03/22/12 66
JPMorgan Chase Bank BRL 7,013 USD 4,032 02/02/12 19
Mellon Bank USD 75 ZAR 589 02/06/12 1
Mellon Bank ZAR 737 USD 92 02/01/12 (3 )
Royal Bank of Canada USD 3,405 HKD 26,450 03/21/12 6
Royal Bank of Scotland PLC USD 3,705 BRL 7,013 02/02/12 308
Royal Bank of Scotland PLC USD 4,032 BRL 7,013 02/02/12 (19 )
See accompanying notes which are an integral part of this quarterly report.
66 Russell Emerging Markets Fund
Copyright © 2012 www.secdatabase.com. All Rights Reserved.Please Consider the Environment Before Printing This Document

Table of Contents
Russell Investment CompanyRussell Emerging Markets FundSchedule of Investments, continued �� January 31, 2012 (Unaudited)Amounts in thousands
Foreign Currency Exchange Contracts
CounterpartyAmount
Sold
Amount
Bought
Settlement
Date
Unrealized
Appreciation
(Depreciation)
$
Royal Bank of Scotland PLC USD 3,990 BRL 7,013 03/02/12 (7 )
Royal Bank of Scotland PLC BRL 7,013 USD 4,016 02/02/12 2
Royal Bank of Scotland PLC BRL 7,013 USD 4,032 02/02/12 19
State Street Bank & Trust Co. USD 2 BRL 3 02/01/12 �
State Street Bank & Trust Co. USD 8 BRL 14 02/01/12 �
State Street Bank & Trust Co. USD 150 BRL 261 02/01/12 �
State Street Bank & Trust Co. USD 154 BRL 269 02/01/12 �
State Street Bank & Trust Co. USD 172 BRL 301 02/01/12 �
State Street Bank & Trust Co. USD 14 BRL 24 02/02/12 �
State Street Bank & Trust Co. USD 39 BRL 67 02/02/12 �
State Street Bank & Trust Co. USD 89 BRL 156 02/02/12 �
State Street Bank & Trust Co. USD 132 BRL 230 02/02/12 �
State Street Bank & Trust Co. USD 201 BRL 351 02/02/12 �
State Street Bank & Trust Co. USD 270 BRL 471 02/02/12 (1 )
State Street Bank & Trust Co. USD 287 BRL 500 02/02/12 (1 )
State Street Bank & Trust Co. USD 360 BRL 627 02/02/12 (1 )
State Street Bank & Trust Co. USD 452 BRL 788 02/02/12 (1 )
State Street Bank & Trust Co. USD 3,708 BRL 7,013 02/02/12 305
State Street Bank & Trust Co. USD 7 HKD 56 02/01/12 �
State Street Bank & Trust Co. USD 19 HKD 146 02/01/12 �
State Street Bank & Trust Co. USD 30 HKD 230 02/01/12 �
State Street Bank & Trust Co. USD 63 HKD 489 02/01/12 �
State Street Bank & Trust Co. USD 84 HKD 650 02/01/12 �
State Street Bank & Trust Co. USD 575 HKD 4,460 02/01/12 �
State Street Bank & Trust Co. USD 9 HKD 72 02/02/12 �
State Street Bank & Trust Co. USD 18 HKD 139 02/02/12 �
State Street Bank & Trust Co. USD 28 HKD 216 02/02/12 �
State Street Bank & Trust Co. USD 149 HKD 1,157 02/02/12 �
State Street Bank & Trust Co. USD 535 HKD 4,151 02/02/12 �
State Street Bank & Trust Co. USD 1,289 HKD 10,000 03/21/12 1
State Street Bank & Trust Co. USD 101 IDR 910,119 02/02/12 �
State Street Bank & Trust Co. USD 2,182 INR 114,500 03/21/12 107
State Street Bank & Trust Co. USD 47 KRW 52,442 02/01/12 �
Copyright © 2012 www.secdatabase.com. All Rights Reserved.Please Consider the Environment Before Printing This Document
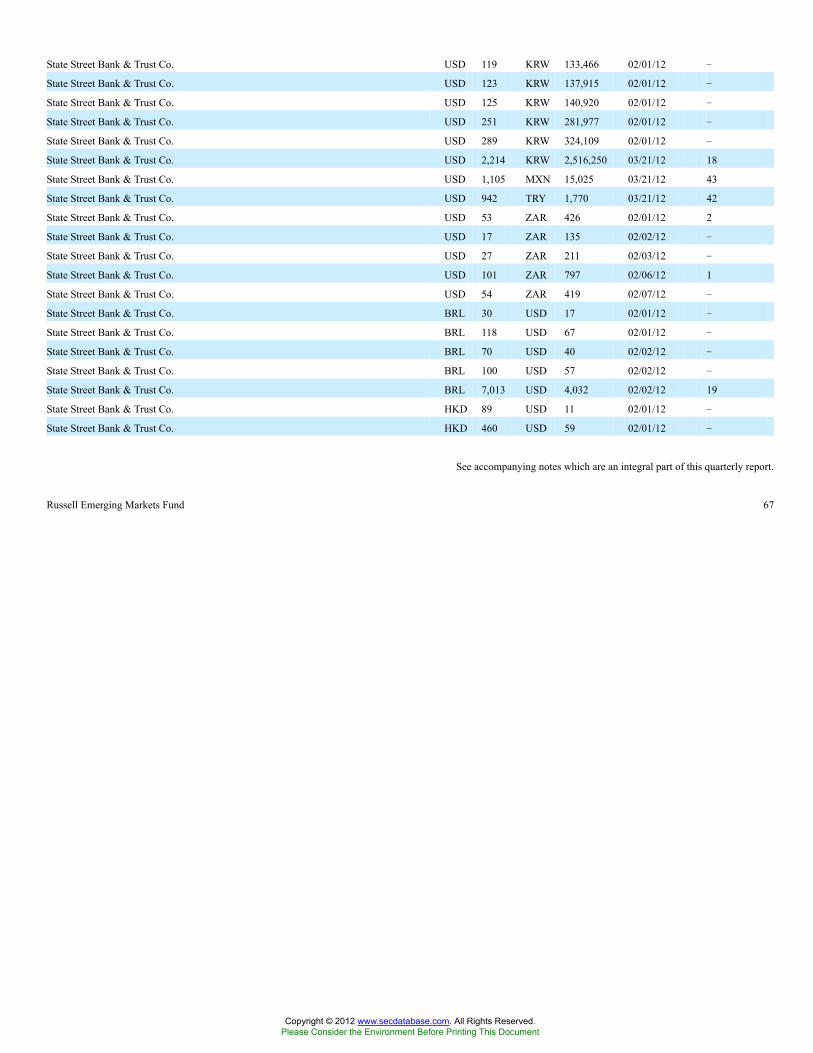
State Street Bank & Trust Co. USD 119 KRW 133,466 02/01/12 �
State Street Bank & Trust Co. USD 123 KRW 137,915 02/01/12 �
State Street Bank & Trust Co. USD 125 KRW 140,920 02/01/12 �
State Street Bank & Trust Co. USD 251 KRW 281,977 02/01/12 �
State Street Bank & Trust Co. USD 289 KRW 324,109 02/01/12 �
State Street Bank & Trust Co. USD 2,214 KRW 2,516,250 03/21/12 18
State Street Bank & Trust Co. USD 1,105 MXN 15,025 03/21/12 43
State Street Bank & Trust Co. USD 942 TRY 1,770 03/21/12 42
State Street Bank & Trust Co. USD 53 ZAR 426 02/01/12 2
State Street Bank & Trust Co. USD 17 ZAR 135 02/02/12 �
State Street Bank & Trust Co. USD 27 ZAR 211 02/03/12 �
State Street Bank & Trust Co. USD 101 ZAR 797 02/06/12 1
State Street Bank & Trust Co. USD 54 ZAR 419 02/07/12 �
State Street Bank & Trust Co. BRL 30 USD 17 02/01/12 �
State Street Bank & Trust Co. BRL 118 USD 67 02/01/12 �
State Street Bank & Trust Co. BRL 70 USD 40 02/02/12 �
State Street Bank & Trust Co. BRL 100 USD 57 02/02/12 �
State Street Bank & Trust Co. BRL 7,013 USD 4,032 02/02/12 19
State Street Bank & Trust Co. HKD 89 USD 11 02/01/12 �
State Street Bank & Trust Co. HKD 460 USD 59 02/01/12 �
See accompanying notes which are an integral part of this quarterly report.
Russell Emerging Markets Fund 67
Copyright © 2012 www.secdatabase.com. All Rights Reserved.Please Consider the Environment Before Printing This Document

Table of Contents
Russell Investment CompanyRussell Emerging Markets FundSchedule of Investments, continued �� January 31, 2012 (Unaudited)Amounts in thousands
Foreign Currency Exchange Contracts
CounterpartyAmount
Sold
Amount
Bought
Settlement
Date
Unrealized
Appreciation
(Depreciation)
$
State Street Bank & Trust Co. HKD 58 USD 8 02/02/12 �
State Street Bank & Trust Co. HKD 1,059 USD 136 02/02/12 �
State Street Bank & Trust Co. HKD 9,000 USD 1,157 03/21/12 (4 )
State Street Bank & Trust Co. HKD 15,000 USD 1,929 03/21/12 (5 )
State Street Bank & Trust Co. IDR 105,101 USD 12 02/01/12 �
State Street Bank & Trust Co. IDR 226,433 USD 25 02/01/12 �
State Street Bank & Trust Co. IDR 1,522,981 USD 169 02/02/12 (1 )
State Street Bank & Trust Co. INR 30,000 USD 558 03/21/12 (42 )
State Street Bank & Trust Co. KRW 1,000,000 USD 860 03/21/12 (27 )
State Street Bank & Trust Co. MXN 78 USD 6 02/01/12 �
State Street Bank & Trust Co. MYR 26 USD 9 02/02/12 �
State Street Bank & Trust Co. PLN 1,271 USD 396 02/01/12 2
State Street Bank & Trust Co. THB 1,775 USD 57 02/01/12 �
State Street Bank & Trust Co. THB 25,357 USD 809 02/01/12 (11 )
State Street Bank & Trust Co. THB 1,884 USD 61 02/02/12 �
UBS AG USD 65 ZAR 511 02/07/12 �
UBS AG HKD 1,501 USD 194 02/02/12 �
UBS AG MXN 236 USD 18 02/02/12 �
Westpac Banking Corp. USD 3,405 HKD 26,450 03/21/12 6
Total Unrealized Appreciation (Depreciation) on Open Foreign Currency Exchange Contracts 2,095
See accompanying notes which are an integral part of this quarterly report.
68 Russell Emerging Markets Fund
Copyright © 2012 www.secdatabase.com. All Rights Reserved.Please Consider the Environment Before Printing This Document

Table of Contents
Russell Investment CompanyRussell Emerging Markets FundSchedule of Investments, continued �� January 31, 2012 (Unaudited)Amounts in thousands
Index Swaps
Fund Receives
Underlying Security Counterparty
Notional
Amount Terms
Termination
Date
Market
Value
$
Bovespa Index Future Goldman Sachs BRL 25,278 Total Return of Underlying Security at
Termination
02/15/12 1,327
Total Market Value of Open Index Swap Contracts Premiums Paid (Received) - $�(å) 1,327
See accompanying notes which are an integral part of this quarterly report.
Russell Emerging Markets Fund 69
Copyright © 2012 www.secdatabase.com. All Rights Reserved.Please Consider the Environment Before Printing This Document

Table of Contents
Russell Investment CompanyRussell Emerging Markets FundPresentation of Portfolio Holdings �� January 31, 2012 (Unaudited)Amounts in thousands
Market Value
Portfolio Summary Level 1 Level 2 Level 3 Total
Common Stocks
Austria $1,286 $� $� $1,286
Bermuda 22,417 � � 22,417
Brazil 229,202 � � 229,202
Canada 7,985 � � 7,985
Cayman Islands 63,343 � 474 63,817
Chile 15,078 � � 15,078
China 103,644 � � 103,644
Colombia 12,273 � � 12,273
Cyprus 1,187 � 430 1,617
Czech Republic 1,271 � � 1,271
Egypt 7,428 � � 7,428
Greece 1,740 � � 1,740
Hong Kong 79,366 � � 79,366
Hungary 10,403 � � 10,403
India 74,955 � � 74,955
Indonesia 71,708 � � 71,708
Israel 1,356 � � 1,356
Jersey 818 � � 818
Kazakhstan 1,842 � � 1,842
Luxembourg 30,945 � � 30,945
Malaysia 22,360 � � 22,360
Mexico 71,714 � � 71,714
Nigeria 5,638 � � 5,638
Panama 1,942 � � 1,942
Peru 1,785 � � 1,785
Philippines 20,681 � � 20,681
Poland 19,106 � � 19,106
Russia 137,109 � 1,671 138,780
Singapore 223 � � 223
South Africa 107,440 � � 107,440
South Korea 245,186 � � 245,186
Taiwan 117,926 � � 117,926
Thailand 57,110 � � 57,110
Turkey 49,604 674 � 50,278
United Kingdom 43,382 � 23,827 67,209
United States 14,993 � � 14,993
Copyright © 2012 www.secdatabase.com. All Rights Reserved.Please Consider the Environment Before Printing This Document

Zimbabwe 760 � � 760
Preferred Stocks 49,080 � � 49,080
Warrants & Rights � 5,310 � 5,310
Certificates of Participation � 6,088 10 6,098
Short-Term Investments � 82,307 � 82,307
Other Securities � 165,620 � 165,620
Total Investments 1,704,286 259,999 26,412 1,990,697
Other Financial Instruments
Futures Contracts 1,771 � � 1,771
Foreign Currency Exchange Contracts 19 2,076 � 2,095
Index Swaps � 1,327 � 1,327
Total Other Financial Instruments* $1,790 $3,403 $� $5,193
* Other financial instruments reflected, such as futures, forwards, interest rate swaps, and credit default swaps are valued at the unrealized appreciation/depreciation
on the instruments.
For a description of the levels see note 2 in the Notes to Quarterly Report.
See accompanying notes which are an integral part of this quarterly report.
70 Russell Emerging Markets Fund
Copyright © 2012 www.secdatabase.com. All Rights Reserved.Please Consider the Environment Before Printing This Document

Table of Contents
Russell Investment CompanyRussell Emerging Markets FundPresentation of Portfolio Holdings, continued �� January 31, 2012 (Unaudited)Amounts in thousands
A reconciliation of investments in which significant unobservable inputs (Level 3) were used in determining a value for the periodending January 31, 2012 were as follows:
Category andSubcategory
Beginning
Balance
11/1/2011
Gross
Purchases
Gross
Sales
Realized
Gain/
(Loss)
Net
Transfers
into
Level 3
Net
Transfers
out of
Level 3
Net change
in Unrealized
Appreciation/
(Depreciation)
Ending
Balance
at
1/31/
2012
Unrealized
Appreciation/
(Depreciation) on
Investments still
held as of
1/31/2012
Common Stock
Cayman
Islands $ 785 $ � $� $ � $ � $ � $ (311 ) $474 $ 311
Cyprus 525 � � � � � (95 ) 430 (95 )
Russia 498 1,064 149 21 � � 237 1,671 237
South Korea 263 141 160 � � 320 76 � �
United
Kingdom 25,832 � 847 (201 ) � � (957 ) 23,827 (957 )
Certificates of
Participation 11 � � � � � (1 ) 10 (1 )
Total Investments 27,914 1,205 1,156 (180 ) � 320 (1,051 ) 26,412 (505 )
See accompanying notes which are an integral part of this quarterly report.
Russell Emerging Markets Fund 71
Copyright © 2012 www.secdatabase.com. All Rights Reserved.Please Consider the Environment Before Printing This Document
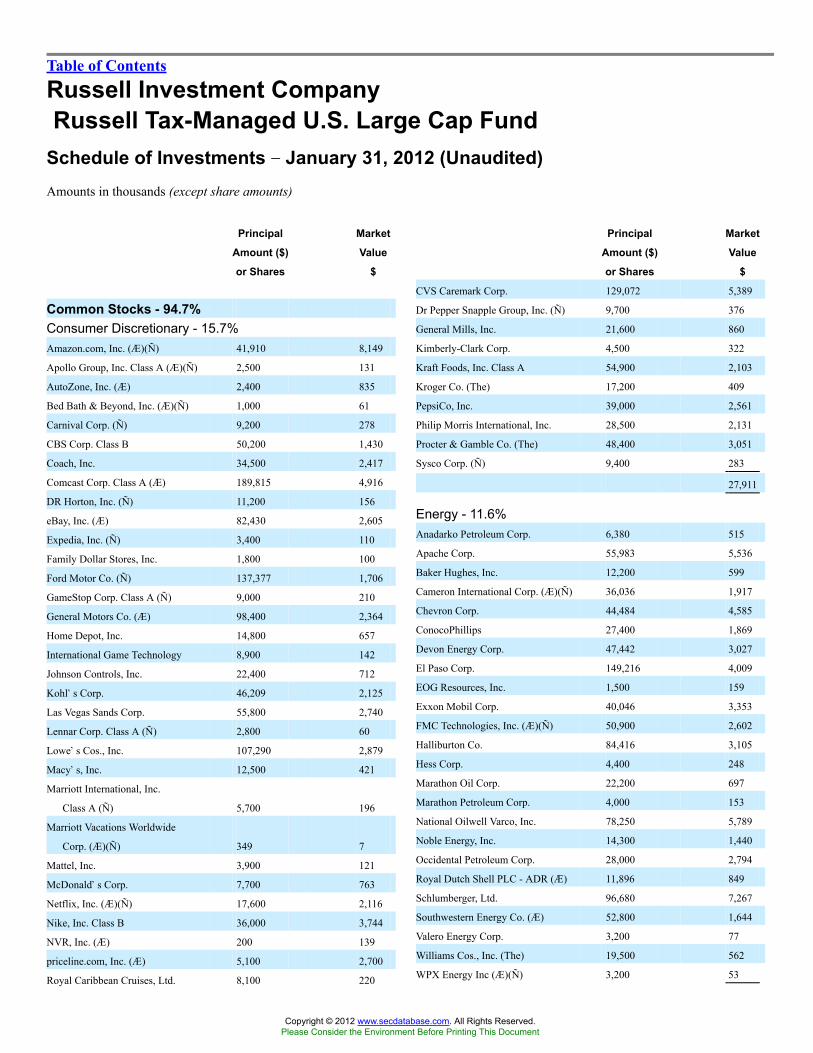
Table of Contents
Russell Investment CompanyRussell Tax-Managed U.S. Large Cap Fund
Schedule of Investments �� January 31, 2012 (Unaudited)Amounts in thousands (except share amounts)
Principal
Amount ($)
or Shares
Market
Value
$
Common Stocks - 94.7%Consumer Discretionary - 15.7%Amazon.com, Inc. (Æ)(Ñ) 41,910 8,149
Apollo Group, Inc. Class A (Æ)(Ñ) 2,500 131
AutoZone, Inc. (Æ) 2,400 835
Bed Bath & Beyond, Inc. (Æ)(Ñ) 1,000 61
Carnival Corp. (Ñ) 9,200 278
CBS Corp. Class B 50,200 1,430
Coach, Inc. 34,500 2,417
Comcast Corp. Class A (Æ) 189,815 4,916
DR Horton, Inc. (Ñ) 11,200 156
eBay, Inc. (Æ) 82,430 2,605
Expedia, Inc. (Ñ) 3,400 110
Family Dollar Stores, Inc. 1,800 100
Ford Motor Co. (Ñ) 137,377 1,706
GameStop Corp. Class A (Ñ) 9,000 210
General Motors Co. (Æ) 98,400 2,364
Home Depot, Inc. 14,800 657
International Game Technology 8,900 142
Johnson Controls, Inc. 22,400 712
Kohl�s Corp. 46,209 2,125
Las Vegas Sands Corp. 55,800 2,740
Lennar Corp. Class A (Ñ) 2,800 60
Lowe�s Cos., Inc. 107,290 2,879
Macy�s, Inc. 12,500 421
Marriott International, Inc.
Class A (Ñ) 5,700 196
Marriott Vacations Worldwide
Corp. (Æ)(Ñ) 349 7
Mattel, Inc. 3,900 121
McDonald�s Corp. 7,700 763
Netflix, Inc. (Æ)(Ñ) 17,600 2,116
Nike, Inc. Class B 36,000 3,744
NVR, Inc. (Æ) 200 139
priceline.com, Inc. (Æ) 5,100 2,700
Royal Caribbean Cruises, Ltd. 8,100 220
Principal
Amount ($)
or Shares
Market
Value
$
CVS Caremark Corp. 129,072 5,389
Dr Pepper Snapple Group, Inc. (Ñ) 9,700 376
General Mills, Inc. 21,600 860
Kimberly-Clark Corp. 4,500 322
Kraft Foods, Inc. Class A 54,900 2,103
Kroger Co. (The) 17,200 409
PepsiCo, Inc. 39,000 2,561
Philip Morris International, Inc. 28,500 2,131
Procter & Gamble Co. (The) 48,400 3,051
Sysco Corp. (Ñ) 9,400 283
27,911
Energy - 11.6%Anadarko Petroleum Corp. 6,380 515
Apache Corp. 55,983 5,536
Baker Hughes, Inc. 12,200 599
Cameron International Corp. (Æ)(Ñ) 36,036 1,917
Chevron Corp. 44,484 4,585
ConocoPhillips 27,400 1,869
Devon Energy Corp. 47,442 3,027
El Paso Corp. 149,216 4,009
EOG Resources, Inc. 1,500 159
Exxon Mobil Corp. 40,046 3,353
FMC Technologies, Inc. (Æ)(Ñ) 50,900 2,602
Halliburton Co. 84,416 3,105
Hess Corp. 4,400 248
Marathon Oil Corp. 22,200 697
Marathon Petroleum Corp. 4,000 153
National Oilwell Varco, Inc. 78,250 5,789
Noble Energy, Inc. 14,300 1,440
Occidental Petroleum Corp. 28,000 2,794
Royal Dutch Shell PLC - ADR (Æ) 11,896 849
Schlumberger, Ltd. 96,680 7,267
Southwestern Energy Co. (Æ) 52,800 1,644
Valero Energy Corp. 3,200 77
Williams Cos., Inc. (The) 19,500 562
WPX Energy Inc (Æ)(Ñ) 3,200 53
Copyright © 2012 www.secdatabase.com. All Rights Reserved.Please Consider the Environment Before Printing This Document

72 Russell Tax-Managed U.S. Large Cap Fund
Starbucks Corp. 105,300 5,047
Starwood Hotels & Resorts
Worldwide, Inc. (Ñ)(ö) 37,710 2,045
Target Corp. 11,700 594
TE Connectivity, Ltd. 13,400 457
Time Warner, Inc. 82,800 3,069
TJX Cos., Inc. 10,500 715
TripAdvisor, Inc. (Æ)(Ñ) 3,400 112
VF Corp. 4,700 618
Viacom, Inc. Class B 59,300 2,789
VistaPrint NV (Æ)(Ñ) 17,540 628
WABCO Holdings, Inc. (Æ) 18,240 946
Wal-Mart Stores, Inc. 16,000 982
Walt Disney Co. (The) 7,200 280
Wyndham Worldwide Corp. 108,309 4,306
Yum! Brands, Inc. 63,450 4,018
71,816
Consumer Staples - 6.1%Altria Group, Inc. 6,800 193
Cia de Bebidas das Americas - ADR 70,750 2,575
Coca-Cola Co. (The) 70,300 4,747
Colgate-Palmolive Co. 32,090 2,911
52,849
Financial Services - 14.4%ACE, Ltd. 35,322 2,458
Aflac, Inc. (Ñ) 5,500 265
Alexandria Real Estate Equities,
Inc. (ö) 2,100 152
Allstate Corp. (The) 15,400 444
American Express Co. 19,500 978
American Tower Corp 2,400 152
Aon Corp. 36,400 1,763
Bank of America Corp. 117,500 838
Berkshire Hathaway, Inc. Class B (Æ) 10,100 792
BlackRock, Inc. Class A 1,700 309
Brandywine Realty Trust (ö) 13,800 147
Capital One Financial Corp. 23,500 1,075
Charles Schwab Corp. (The) (Ñ) 131,700 1,534
Citigroup, Inc. 118,200 3,631
CME Group, Inc. Class A 1,500 359
Discover Financial Services 8,700 237
Duke Realty Corp. (Ñ)(ö) 11,500 154
Copyright © 2012 www.secdatabase.com. All Rights Reserved.Please Consider the Environment Before Printing This Document

Table of Contents
Russell Investment CompanyRussell Tax-Managed U.S. Large Cap FundSchedule of Investments, continued �� January 31, 2012 (Unaudited)Amounts in thousands (except share amounts)
Principal
Amount ($)
or Shares
Market
Value
$
DuPont Fabros Technology, Inc.
(Ñ)(ö) 3,000 77
Everest Re Group, Ltd. 2,300 196
Genworth Financial, Inc. Class A (Æ) 154,000 1,187
Goldman Sachs Group, Inc. (The) 41,106 4,582
Hartford Financial Services Group,
Inc. 133,700 2,342
HCP, Inc. (ö) 2,100 88
IntercontinentalExchange, Inc. (Æ) 21,700 2,484
Invesco, Ltd. 28,400 641
JPMorgan Chase & Co. 124,449 4,642
Loews Corp. 43,700 1,631
Mastercard, Inc. Class A 8,461 3,009
MetLife, Inc. 170,598 6,027
Morgan Stanley (Ñ) 17,300 323
ProLogis, Inc. (ö) 9,600 304
Prudential Financial, Inc. 13,400 767
Regency Centers Corp. (ö) 2,800 116
Senior Housing Properties Trust (ö) 21,000 476
Simon Property Group, Inc. (ö) 4,268 580
State Street Corp. 73,330 2,873
SunTrust Banks, Inc. 6,200 128
Unum Group 87,200 1,991
US Bancorp 23,200 655
Ventas, Inc. (Ñ)(ö) 4,400 257
Visa, Inc. Class A 82,405 8,293
Wells Fargo & Co. 235,632 6,883
65,840
Health Care - 13.8%Abbott Laboratories 78,685 4,261
Aetna, Inc. 4,000 175
Alexion Pharmaceuticals, Inc. (Æ) 47,700 3,661
Allergan, Inc. 32,300 2,840
Amgen, Inc. 24,704 1,678
Baxter International, Inc. 4,800 266
Principal
Amount ($)
or Shares
Market
Value
$
UnitedHealth Group, Inc. 73,228 3,792
Vertex Pharmaceuticals, Inc. (Æ) 6,600 244
62,886
Materials and Processing - 5.5%Air Products & Chemicals, Inc. 8,800 775
Alcoa, Inc. (Ñ) 21,400 217
AngloGold Ashanti, Ltd. - ADR 68,400 3,133
Ball Corp. 6,500 255
Barrick Gold Corp. 48,200 2,374
CF Industries Holdings, Inc. (Ñ) 2,500 444
Dow Chemical Co. (The) (Ñ) 9,600 322
Ecolab, Inc. (Ñ) 42,850 2,590
EI du Pont de Nemours & Co. 32,500 1,654
Freeport-McMoRan Copper & Gold,
Inc. 17,900 827
Monsanto Co. 34,220 2,808
Mosaic Co. (The) 62,863 3,518
Newmont Mining Corp. 4,800 295
PPG Industries, Inc. 4,400 394
Praxair, Inc. 50,614 5,375
24,981
Producer Durables - 8.4%3M Co. 10,900 945
Accenture PLC Class A (Ñ) 8,800 505
Automatic Data Processing, Inc. 45,700 2,503
CSX Corp. 145,431 3,280
Danone - ADR (Ñ) 147,040 1,823
Deere & Co. 1,500 129
Emerson Electric Co. 27,800 1,428
FedEx Corp. (Ñ) 1,300 119
Fluor Corp. 16,000 900
General Electric Co. 125,000 2,339
Genpact, Ltd. (Æ) 4,800 70
Honeywell International, Inc. 15,900 923
Ingersoll-Rand PLC 30,800 1,076
Copyright © 2012 www.secdatabase.com. All Rights Reserved.Please Consider the Environment Before Printing This Document

Russell Tax-Managed U.S. Large Cap Fund 73
Becton Dickinson and Co. 5,200 408
Biogen Idec, Inc. (Æ) 10,500 1,238
Cardinal Health, Inc. 1,000 43
Celgene Corp. (Æ) 19,500 1,418
Cerner Corp. (Æ) 40,260 2,451
Covidien PLC 88,848 4,576
Dentsply International, Inc. (Ñ) 35,190 1,328
Express Scripts, Inc. Class A (Æ)(Ñ) 38,099 1,949
Humana, Inc. 9,800 872
Illumina, Inc. (Æ)(Ñ) 32,400 1,677
Intuitive Surgical, Inc. (Æ) 8,260 3,799
Johnson & Johnson 6,584 434
McKesson Corp. 8,800 719
Merck & Co., Inc. 109,700 4,197
Mylan, Inc. (Æ) 125,960 2,614
Novo Nordisk A/S - ADR 16,120 1,921
PerkinElmer, Inc. (Ñ) 2,100 50
Perrigo Co. (Ñ) 13,120 1,254
Pfizer, Inc. 225,000 4,815
Regeneron Pharmaceuticals,
Inc. (Æ)(Ñ) 28,900 2,626
Sanofi - ADR 77,800 2,889
Teva Pharmaceutical Industries, Ltd. -
ADR 36,700 1,656
Thermo Fisher Scientific, Inc. (Æ) 57,364 3,035
Joy Global, Inc. 10,810 980
Norfolk Southern Corp. 12,500 903
PACCAR, Inc. 53,100 2,347
Parker Hannifin Corp. 800 65
Pitney Bowes, Inc. (Ñ) 46,600 884
Raytheon Co. 28,000 1,344
Textron, Inc. (Ñ) 4,000 102
Tyco International, Ltd. 56,743 2,891
Union Pacific Corp. 28,100 3,212
United Parcel Service, Inc. Class B
(Ñ) 36,036 2,726
United Technologies Corp. 57,946 4,540
WW Grainger, Inc. 13,500 2,575
38,609
Technology - 16.3%Adobe Systems, Inc. (Æ)(Ñ) 11,900 368
Altera Corp. 12,500 497
Apple, Inc. (Æ) 34,980 15,968
Applied Materials, Inc. 100 1
ASML Holding NV Class G 54,000 2,321
Copyright © 2012 www.secdatabase.com. All Rights Reserved.Please Consider the Environment Before Printing This Document

Table of Contents
Russell Investment CompanyRussell Tax-Managed U.S. Large Cap FundSchedule of Investments, continued �� January 31, 2012 (Unaudited)Amounts in thousands (except share amounts)
Principal
Amount ($)
or Shares
Market
Value
$
Broadcom Corp. Class A 8,900 306
CA, Inc. 151,600 3,908
Cisco Systems, Inc. 188,800 3,706
Cognizant Technology Solutions
Corp. Class A (Æ) 11,600 832
Corning, Inc. 16,800 216
Crown Castle International
Corp. (Æ)(Ñ) 5,400 262
EMC Corp. (Æ)(Ñ) 30,600 788
F5 Networks, Inc. (Æ) 25,100 3,005
Freescale Semiconductor Holdings I,
Ltd. (Æ)(Ñ) 14,600 233
Google, Inc. Class A (Æ) 15,130 8,777
Hewlett-Packard Co. 10,400 291
International Business Machines
Corp. 27,513 5,299
Juniper Networks, Inc. (Æ) 6,200 130
Lam Research Corp. (Æ)(Ñ) 9,600 409
Marvell Technology Group, Ltd. (Æ) 18,800 292
Microsoft Corp. 194,500 5,744
Motorola Solutions, Inc. 28,300 1,313
NetApp, Inc. (Æ) 300 11
Novellus Systems, Inc. (Æ)(Ñ) 6,600 311
OpenTable, Inc. (Æ)(Ñ) 12,300 593
Oracle Corp. 139,072 3,922
QUALCOMM, Inc. 97,000 5,706
Red Hat, Inc. (Æ)(Ñ) 47,390 2,198
Salesforce.com, Inc. (Æ)(Ñ) 48,330 5,645
SanDisk Corp. (Æ) 7,300 335
Texas Instruments, Inc. 10,700 346
Xilinx, Inc. (Ñ) 20,800 746
Yahoo!, Inc. (Æ) 8,200 127
Zynga, Inc. Class A (Æ)(Ñ) 3,700 39
74,645
Utilities - 2.9%
Principal
Amount ($)
or Shares
Market
Value
$
Talisman Energy, Inc. 179,000 2,134
Verizon Communications, Inc. 57,500 2,165
13,026
Total Common Stocks(cost $339,113) 432,563
Short-Term Investments - 5.1%Russell U.S. Cash Management
Fund 23,606,778 (¥) 23,607
Total Short-Term Investments(cost $23,607) 23,607
Other Securities - 3.1%Russell Investment Company
Liquidating Trust (×) 591,954 (¥) 602
Russell U.S. Cash Collateral Fund
(×) 13,448,556 (¥) 13,449
Total Other Securities(cost $14,041) 14,051
Total Investments - 102.9%(identified cost $376,761) 470,221
Other Assets and Liabilities,Net - (2.9%) (13,307 )
Net Assets - 100.0% 456,914
Copyright © 2012 www.secdatabase.com. All Rights Reserved.Please Consider the Environment Before Printing This Document

See accompanying notes which are an integral part of this quarterly report.
74 Russell Tax-Managed U.S. Large Cap Fund
AGL Resources, Inc. 12,000 498
Ameren Corp. 2,400 76
American Electric Power Co., Inc. 13,700 542
AT&T, Inc. 35,856 1,055
Canadian Natural Resources, Ltd. 50,000 1,981
CenterPoint Energy, Inc. 10,400 192
CMS Energy Corp. (Ñ) 13,500 295
Constellation Energy Group, Inc. 4,200 153
Dominion Resources, Inc. 3,100 155
DTE Energy Co. 1,800 96
Exelon Corp. 2,500 99
FirstEnergy Corp. 2,900 122
NextEra Energy, Inc. (Ñ) 15,200 910
Northeast Utilities 12,300 427
NRG Energy, Inc. (Æ)(Ñ) 36,100 609
NV Energy, Inc. 18,100 293
OGE Energy Corp. (Ñ) 2,500 132
ONEOK, Inc. 1,300 108
PG&E Corp. (Ñ) 6,100 248
PPL Corp. (Ñ) 21,700 603
Sprint Nextel Corp. (Æ) 62,500 133
Copyright © 2012 www.secdatabase.com. All Rights Reserved.Please Consider the Environment Before Printing This Document
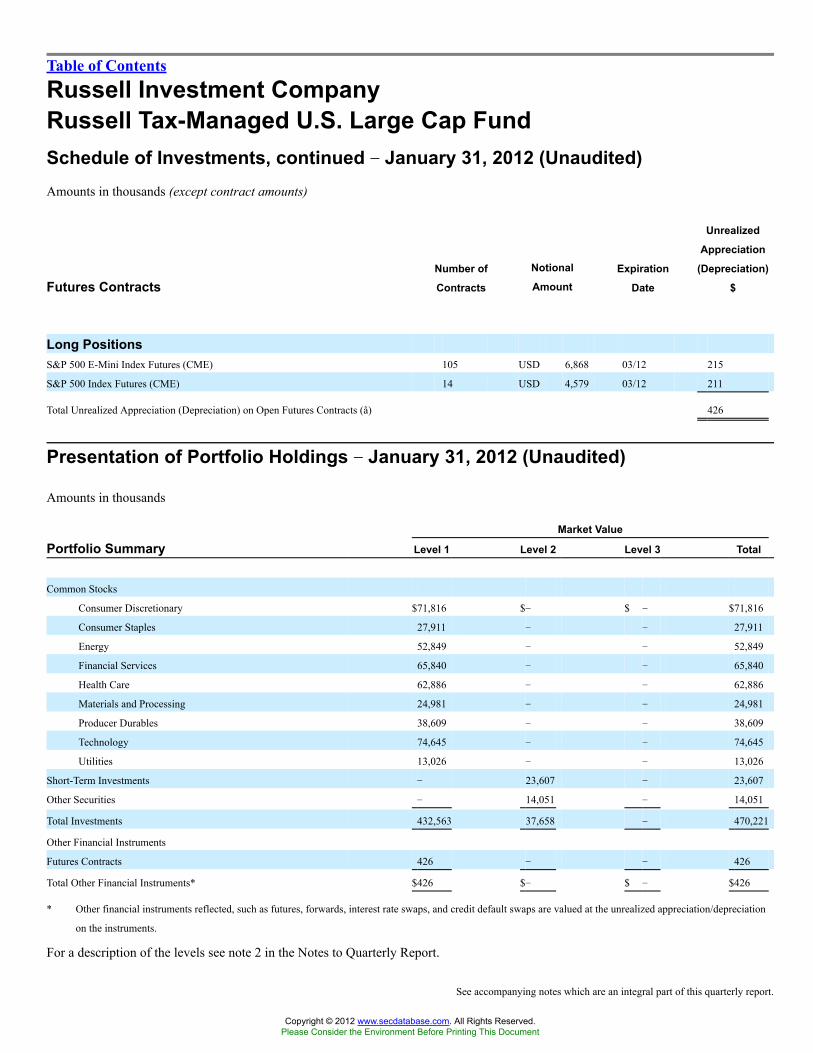
Table of Contents
Russell Investment CompanyRussell Tax-Managed U.S. Large Cap FundSchedule of Investments, continued �� January 31, 2012 (Unaudited)Amounts in thousands (except contract amounts)
Futures ContractsNumber of
Contracts
Notional
AmountExpiration
Date
Unrealized
Appreciation
(Depreciation)
$
Long PositionsS&P 500 E-Mini Index Futures (CME) 105 USD 6,868 03/12 215
S&P 500 Index Futures (CME) 14 USD 4,579 03/12 211
Total Unrealized Appreciation (Depreciation) on Open Futures Contracts (å) 426
Presentation of Portfolio Holdings �� January 31, 2012 (Unaudited)
Amounts in thousands
Market Value
Portfolio Summary Level 1 Level 2 Level 3 Total
Common Stocks
Consumer Discretionary $71,816 $� $ � $71,816
Consumer Staples 27,911 � � 27,911
Energy 52,849 � � 52,849
Financial Services 65,840 � � 65,840
Health Care 62,886 � � 62,886
Materials and Processing 24,981 � � 24,981
Producer Durables 38,609 � � 38,609
Technology 74,645 � � 74,645
Utilities 13,026 � � 13,026
Short-Term Investments � 23,607 � 23,607
Other Securities � 14,051 � 14,051
Total Investments 432,563 37,658 � 470,221
Other Financial Instruments
Futures Contracts 426 � � 426
Total Other Financial Instruments* $426 $� $ � $426
* Other financial instruments reflected, such as futures, forwards, interest rate swaps, and credit default swaps are valued at the unrealized appreciation/depreciation
on the instruments.
For a description of the levels see note 2 in the Notes to Quarterly Report.
See accompanying notes which are an integral part of this quarterly report.
Copyright © 2012 www.secdatabase.com. All Rights Reserved.Please Consider the Environment Before Printing This Document

Russell Tax-Managed U.S. Large Cap Fund 75
Copyright © 2012 www.secdatabase.com. All Rights Reserved.Please Consider the Environment Before Printing This Document

Table of Contents
Russell Investment CompanyRussell Tax-Managed U.S. Mid & Small Cap Fund
Schedule of Investments �� January 31, 2012 (Unaudited)Amounts in thousands (except share amounts)
Principal
Amount ($)
or Shares
Market
Value
$
Common Stocks - 95.7%Consumer Discretionary - 16.7%1-800-Flowers.com, Inc. Class A
(Æ) 1,461 4
Aaron�s, Inc. Class A 25,259 672
Abercrombie & Fitch Co. Class A 7,145 328
Aeropostale, Inc. (Æ)(Ñ) 6,007 98
American Public Education, Inc.
(Æ)(Ñ) 2,054 83
Amerigon, Inc. (Æ)(Ñ) 57,940 889
ANN, Inc. (Æ)(Ñ) 20,873 506
Arbitron, Inc. 13,531 483
Barnes & Noble, Inc. (Æ)(Ñ) 7,464 90
Beazer Homes USA, Inc. (Æ)(Ñ) 22,791 70
Biglari Holdings, Inc. (Æ) 264 105
BJ�s Restaurants, Inc. (Æ) 12,600 630
Body Central Corp. (Æ) 18,000 484
Bravo Brio Restaurant Group, Inc.
(Æ) 15,796 304
Brinker International, Inc. (Ñ) 7,033 182
Buffalo Wild Wings, Inc. (Æ) 11,100 739
Cabela�s, Inc. (Æ) 19,428 507
Callaway Golf Co. (Ñ) 14,281 96
Capella Education Co. (Æ) 11,494 487
Caribou Coffee Co., Inc. (Æ)(Ñ) 18,425 312
CarMax, Inc. (Æ)(Ñ) 6,268 191
Carter�s, Inc. (Æ) 12,280 515
Cato Corp. (The) Class A 21,680 581
Cedar Fair, LP 1,871 48
Cheesecake Factory, Inc. (The)
(Æ)(Ñ) 14,850 439
Chico�s FAS, Inc. 11,111 127
Coinstar, Inc. (Æ)(Ñ) 10,419 518
Cooper Tire & Rubber Co. (Ñ) 17,050 257
Crocs, Inc. (Æ) 14,490 276
Dana Holding Corp. 9,122 135
Principal
Amount ($)
or Shares
Market
Value
$
Meredith Corp. (Ñ) 16,175 509
Monro Muffler Brake, Inc. (Ñ) 22,150 929
Nutrisystem, Inc. (Ñ) 8,434 100
Penn National Gaming, Inc. (Æ)(Ñ) 4,710 193
Pool Corp. (Ñ) 5,175 176
PulteGroup, Inc. (Æ)(Ñ) 13,601 101
PVH Corp. 1,437 111
Red Robin Gourmet Burgers, Inc.
(Æ) 2,331 72
Ross Stores, Inc. 3,131 159
Scientific Games Corp. Class A (Æ) 34,890 390
Service Corp. International 12,050 134
Shoe Carnival, Inc. (Æ) 4,376 111
Shutterfly, Inc. (Æ) 8,000 190
Signet Jewelers, Ltd. 3,997 182
Snap-on, Inc. 8,445 477
Steven Madden, Ltd. (Æ)(Ñ) 11,445 471
Teavana Holdings, Inc. (Æ)(Ñ) 45,930 872
Tenneco, Inc. (Æ)(Ñ) 17,583 564
Tiffany & Co. 1,713 109
TiVo, Inc. (Æ)(Ñ) 8,638 90
Tractor Supply Co. 10,235 827
Tupperware Brands Corp. 3,498 220
Under Armour, Inc. Class A (Æ)(Ñ) 1,650 131
ValueClick, Inc. (Æ) 40,446 705
Vera Bradley, Inc. (Æ)(Ñ) 6,550 235
Weyco Group, Inc. (Ñ) 1,174 30
Wolverine World Wide, Inc. 2,368 93
World Wrestling Entertainment, Inc.
Class A (Ñ) 4,575 43
Wyndham Worldwide Corp. (Ñ) 5,420 216
25,685
Consumer Staples - 3.6%Casey�s General Stores, Inc. 15,672 798
Constellation Brands, Inc. Class A
(Æ) 3,659 77
Copyright © 2012 www.secdatabase.com. All Rights Reserved.Please Consider the Environment Before Printing This Document
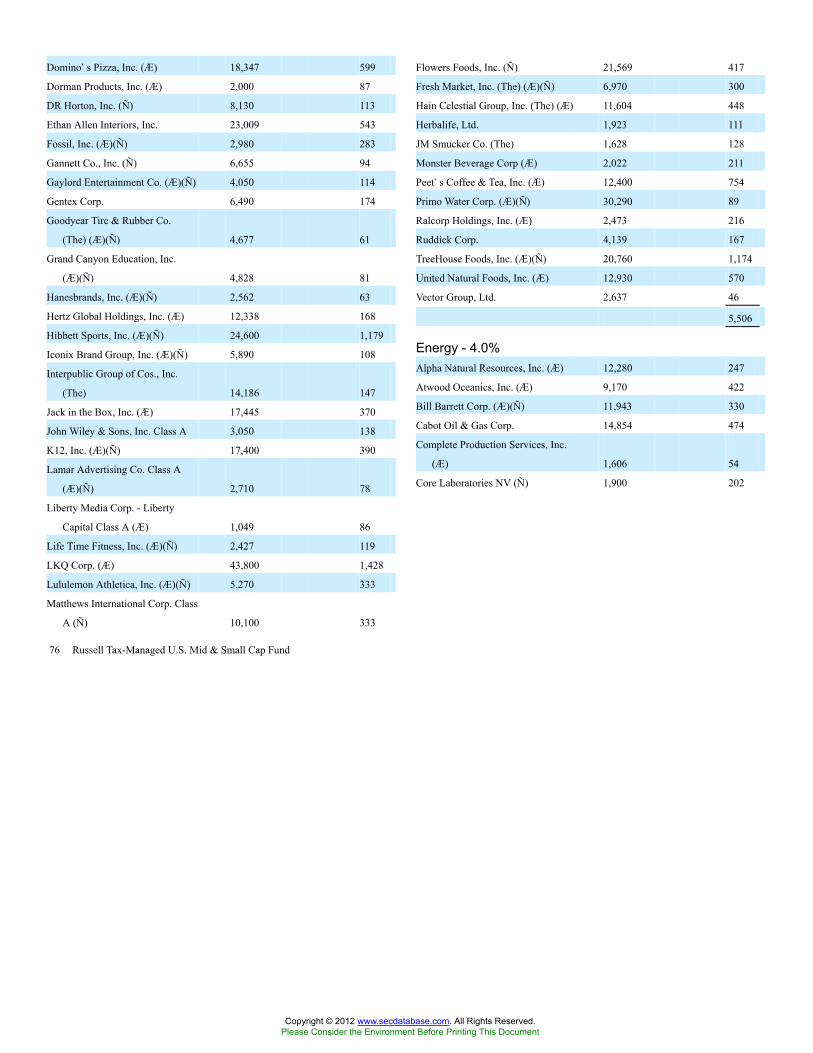
76 Russell Tax-Managed U.S. Mid & Small Cap Fund
Domino�s Pizza, Inc. (Æ) 18,347 599
Dorman Products, Inc. (Æ) 2,000 87
DR Horton, Inc. (Ñ) 8,130 113
Ethan Allen Interiors, Inc. 23,009 543
Fossil, Inc. (Æ)(Ñ) 2,980 283
Gannett Co., Inc. (Ñ) 6,655 94
Gaylord Entertainment Co. (Æ)(Ñ) 4,050 114
Gentex Corp. 6,490 174
Goodyear Tire & Rubber Co.
(The) (Æ)(Ñ) 4,677 61
Grand Canyon Education, Inc.
(Æ)(Ñ) 4,828 81
Hanesbrands, Inc. (Æ)(Ñ) 2,562 63
Hertz Global Holdings, Inc. (Æ) 12,338 168
Hibbett Sports, Inc. (Æ)(Ñ) 24,600 1,179
Iconix Brand Group, Inc. (Æ)(Ñ) 5,890 108
Interpublic Group of Cos., Inc.
(The) 14,186 147
Jack in the Box, Inc. (Æ) 17,445 370
John Wiley & Sons, Inc. Class A 3,050 138
K12, Inc. (Æ)(Ñ) 17,400 390
Lamar Advertising Co. Class A
(Æ)(Ñ) 2,710 78
Liberty Media Corp. - Liberty
Capital Class A (Æ) 1,049 86
Life Time Fitness, Inc. (Æ)(Ñ) 2,427 119
LKQ Corp. (Æ) 43,800 1,428
Lululemon Athletica, Inc. (Æ)(Ñ) 5,270 333
Matthews International Corp. Class
A (Ñ) 10,100 333
Flowers Foods, Inc. (Ñ) 21,569 417
Fresh Market, Inc. (The) (Æ)(Ñ) 6,970 300
Hain Celestial Group, Inc. (The) (Æ) 11,604 448
Herbalife, Ltd. 1,923 111
JM Smucker Co. (The) 1,628 128
Monster Beverage Corp (Æ) 2,022 211
Peet�s Coffee & Tea, Inc. (Æ) 12,400 754
Primo Water Corp. (Æ)(Ñ) 30,290 89
Ralcorp Holdings, Inc. (Æ) 2,473 216
Ruddick Corp. 4,139 167
TreeHouse Foods, Inc. (Æ)(Ñ) 20,760 1,174
United Natural Foods, Inc. (Æ) 12,930 570
Vector Group, Ltd. 2,637 46
5,506
Energy - 4.0%Alpha Natural Resources, Inc. (Æ) 12,280 247
Atwood Oceanics, Inc. (Æ) 9,170 422
Bill Barrett Corp. (Æ)(Ñ) 11,943 330
Cabot Oil & Gas Corp. 14,854 474
Complete Production Services, Inc.
(Æ) 1,606 54
Core Laboratories NV (Ñ) 1,900 202
Copyright © 2012 www.secdatabase.com. All Rights Reserved.Please Consider the Environment Before Printing This Document
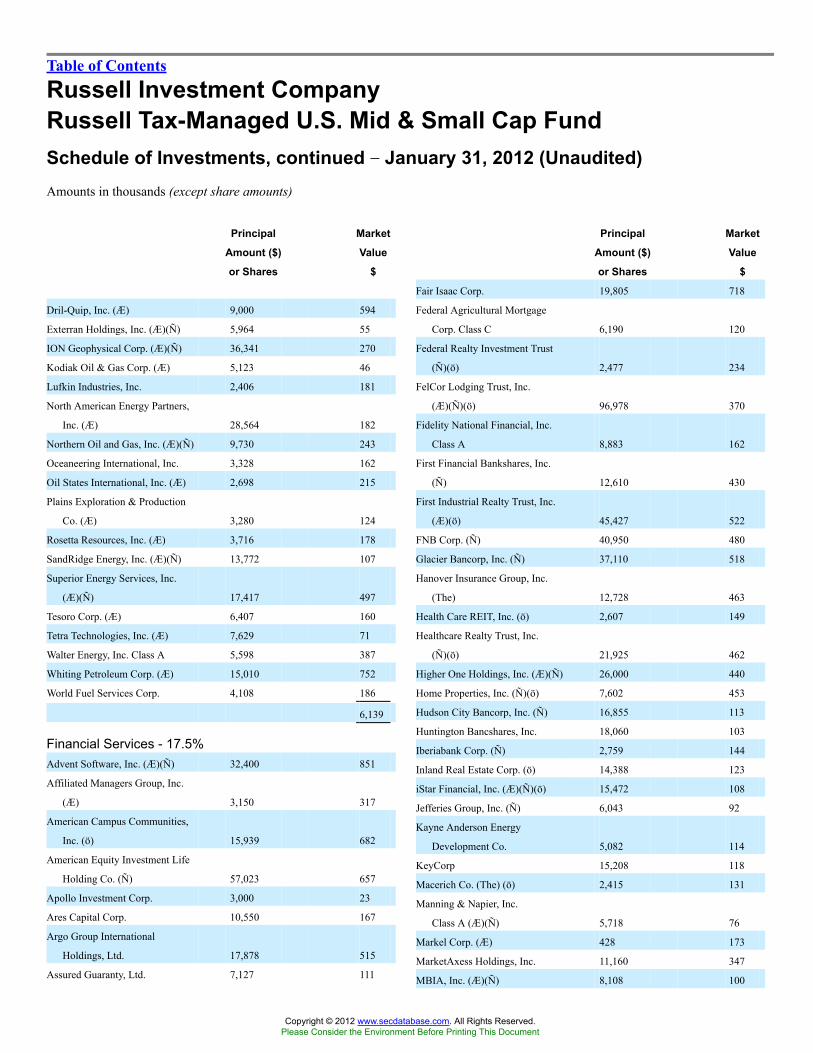
Table of Contents
Russell Investment CompanyRussell Tax-Managed U.S. Mid & Small Cap FundSchedule of Investments, continued �� January 31, 2012 (Unaudited)Amounts in thousands (except share amounts)
Principal
Amount ($)
or Shares
Market
Value
$
Dril-Quip, Inc. (Æ) 9,000 594
Exterran Holdings, Inc. (Æ)(Ñ) 5,964 55
ION Geophysical Corp. (Æ)(Ñ) 36,341 270
Kodiak Oil & Gas Corp. (Æ) 5,123 46
Lufkin Industries, Inc. 2,406 181
North American Energy Partners,
Inc. (Æ) 28,564 182
Northern Oil and Gas, Inc. (Æ)(Ñ) 9,730 243
Oceaneering International, Inc. 3,328 162
Oil States International, Inc. (Æ) 2,698 215
Plains Exploration & Production
Co. (Æ) 3,280 124
Rosetta Resources, Inc. (Æ) 3,716 178
SandRidge Energy, Inc. (Æ)(Ñ) 13,772 107
Superior Energy Services, Inc.
(Æ)(Ñ) 17,417 497
Tesoro Corp. (Æ) 6,407 160
Tetra Technologies, Inc. (Æ) 7,629 71
Walter Energy, Inc. Class A 5,598 387
Whiting Petroleum Corp. (Æ) 15,010 752
World Fuel Services Corp. 4,108 186
6,139
Financial Services - 17.5%Advent Software, Inc. (Æ)(Ñ) 32,400 851
Affiliated Managers Group, Inc.
(Æ) 3,150 317
American Campus Communities,
Inc. (ö) 15,939 682
American Equity Investment Life
Holding Co. (Ñ) 57,023 657
Apollo Investment Corp. 3,000 23
Ares Capital Corp. 10,550 167
Argo Group International
Holdings, Ltd. 17,878 515
Assured Guaranty, Ltd. 7,127 111
Principal
Amount ($)
or Shares
Market
Value
$
Fair Isaac Corp. 19,805 718
Federal Agricultural Mortgage
Corp. Class C 6,190 120
Federal Realty Investment Trust
(Ñ)(ö) 2,477 234
FelCor Lodging Trust, Inc.
(Æ)(Ñ)(ö) 96,978 370
Fidelity National Financial, Inc.
Class A 8,883 162
First Financial Bankshares, Inc.
(Ñ) 12,610 430
First Industrial Realty Trust, Inc.
(Æ)(ö) 45,427 522
FNB Corp. (Ñ) 40,950 480
Glacier Bancorp, Inc. (Ñ) 37,110 518
Hanover Insurance Group, Inc.
(The) 12,728 463
Health Care REIT, Inc. (ö) 2,607 149
Healthcare Realty Trust, Inc.
(Ñ)(ö) 21,925 462
Higher One Holdings, Inc. (Æ)(Ñ) 26,000 440
Home Properties, Inc. (Ñ)(ö) 7,602 453
Hudson City Bancorp, Inc. (Ñ) 16,855 113
Huntington Bancshares, Inc. 18,060 103
Iberiabank Corp. (Ñ) 2,759 144
Inland Real Estate Corp. (ö) 14,388 123
iStar Financial, Inc. (Æ)(Ñ)(ö) 15,472 108
Jefferies Group, Inc. (Ñ) 6,043 92
Kayne Anderson Energy
Development Co. 5,082 114
KeyCorp 15,208 118
Macerich Co. (The) (ö) 2,415 131
Manning & Napier, Inc.
Class A (Æ)(Ñ) 5,718 76
Markel Corp. (Æ) 428 173
MarketAxess Holdings, Inc. 11,160 347
MBIA, Inc. (Æ)(Ñ) 8,108 100
Copyright © 2012 www.secdatabase.com. All Rights Reserved.Please Consider the Environment Before Printing This Document

Russell Tax-Managed U.S. Mid & Small Cap Fund 77
Astoria Financial Corp. (Ñ) 16,210 135
Axis Capital Holdings, Ltd. 5,601 172
Banco Latinoamericano de
Comercio Exterior SA Class E 6,718 124
Bank of Hawaii Corp. (Ñ) 8,637 395
Bank of the Ozarks, Inc. (Ñ) 22,960 643
BioMed Realty Trust, Inc. (Ñ)(ö) 16,835 313
Broadridge Financial Solutions,
Inc. 5,818 139
Brookline Bancorp, Inc. 4,655 43
Camden Property Trust (ö) 3,363 217
Cash America International, Inc.
(Ñ) 2,112 93
CBL & Associates Properties,
Inc. (Ñ)(ö) 5,858 102
CBOE Holdings, Inc. (Ñ) 3,885 99
CBRE Group, Inc. Class A (Æ) 24,728 477
Cedar Realty Trust, Inc. (Ñ)(ö) 51,949 259
Cogdell Spencer, Inc. (Ñ)(ö) 23,820 101
Columbia Banking System, Inc.
(Ñ) 5,350 112
Community Bank System, Inc. (Ñ) 18,561 508
CreXus Investment Corp. (Ñ)(ö) 10,850 120
CVB Financial Corp. (Ñ) 10,947 115
Delphi Financial Group, Inc.
Class A 4,582 204
DuPont Fabros Technology, Inc.
(Ñ)(ö) 14,675 374
East West Bancorp, Inc. 14,440 317
Endurance Specialty Holdings,
Ltd. 7,021 263
Equifax, Inc. 9,439 368
Extra Space Storage, Inc. (ö) 6,553 172
Ezcorp, Inc. Class A (Æ) 30,770 825
MGIC Investment Corp. (Æ)(Ñ) 86,064 326
Mid-America Apartment
Communities, Inc. (ö) 17,332 1,108
MSCI, Inc. Class A (Æ) 2,915 95
National Health Investors, Inc.
(Ñ)(ö) 8,266 400
Navigators Group, Inc. (The)
(Æ)(Ñ) 2,383 114
Old National Bancorp 38,040 448
Oritani Financial Corp. (Ñ) 9,092 118
PacWest Bancorp (Ñ) 5,060 108
Post Properties, Inc. (ö) 3,920 175
Prosperity Bancshares, Inc. (Ñ) 11,119 462
PS Business Parks, Inc. (ö) 7,750 482
Raymond James Financial, Inc. 4,948 173
Reinsurance Group of America,
Inc. Class A 2,243 122
Resource Capital Corp. (ö) 18,643 109
Selective Insurance Group, Inc. (Ñ) 52,820 950
Signature Bank NY (Æ)(Ñ) 11,711 681
SL Green Realty Corp. (Ñ)(ö) 1,767 130
Sun Communities, Inc. (ö) 24,162 969
Tanger Factory Outlet Centers (ö) 6,269 185
Two Harbors Investment Corp. (ö) 6,804 68
UMB Financial Corp. 6,975 269
Umpqua Holdings Corp. (Ñ) 8,134 99
United Bankshares, Inc. (Ñ) 10,970 306
Valley National Bancorp (Ñ) 35,663 425
Ventas, Inc. (ö) 2,794 163
Waddell & Reed Financial, Inc.
Class A 5,063 139
Walter Investment Management
Corp. 1,722 32
Copyright © 2012 www.secdatabase.com. All Rights Reserved.Please Consider the Environment Before Printing This Document
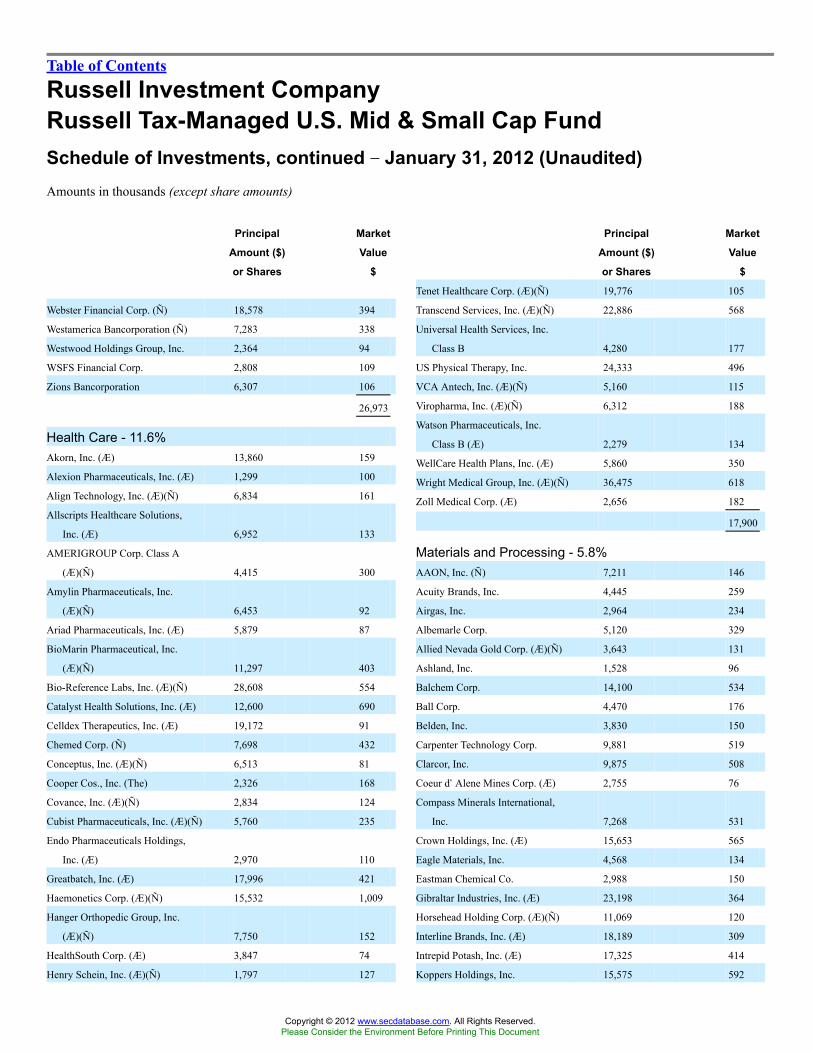
Table of Contents
Russell Investment CompanyRussell Tax-Managed U.S. Mid & Small Cap FundSchedule of Investments, continued �� January 31, 2012 (Unaudited)Amounts in thousands (except share amounts)
Principal
Amount ($)
or Shares
Market
Value
$
Webster Financial Corp. (Ñ) 18,578 394
Westamerica Bancorporation (Ñ) 7,283 338
Westwood Holdings Group, Inc. 2,364 94
WSFS Financial Corp. 2,808 109
Zions Bancorporation 6,307 106
26,973
Health Care - 11.6%Akorn, Inc. (Æ) 13,860 159
Alexion Pharmaceuticals, Inc. (Æ) 1,299 100
Align Technology, Inc. (Æ)(Ñ) 6,834 161
Allscripts Healthcare Solutions,
Inc. (Æ) 6,952 133
AMERIGROUP Corp. Class A
(Æ)(Ñ) 4,415 300
Amylin Pharmaceuticals, Inc.
(Æ)(Ñ) 6,453 92
Ariad Pharmaceuticals, Inc. (Æ) 5,879 87
BioMarin Pharmaceutical, Inc.
(Æ)(Ñ) 11,297 403
Bio-Reference Labs, Inc. (Æ)(Ñ) 28,608 554
Catalyst Health Solutions, Inc. (Æ) 12,600 690
Celldex Therapeutics, Inc. (Æ) 19,172 91
Chemed Corp. (Ñ) 7,698 432
Conceptus, Inc. (Æ)(Ñ) 6,513 81
Cooper Cos., Inc. (The) 2,326 168
Covance, Inc. (Æ)(Ñ) 2,834 124
Cubist Pharmaceuticals, Inc. (Æ)(Ñ) 5,760 235
Endo Pharmaceuticals Holdings,
Inc. (Æ) 2,970 110
Greatbatch, Inc. (Æ) 17,996 421
Haemonetics Corp. (Æ)(Ñ) 15,532 1,009
Hanger Orthopedic Group, Inc.
(Æ)(Ñ) 7,750 152
HealthSouth Corp. (Æ) 3,847 74
Henry Schein, Inc. (Æ)(Ñ) 1,797 127
Principal
Amount ($)
or Shares
Market
Value
$
Tenet Healthcare Corp. (Æ)(Ñ) 19,776 105
Transcend Services, Inc. (Æ)(Ñ) 22,886 568
Universal Health Services, Inc.
Class B 4,280 177
US Physical Therapy, Inc. 24,333 496
VCA Antech, Inc. (Æ)(Ñ) 5,160 115
Viropharma, Inc. (Æ)(Ñ) 6,312 188
Watson Pharmaceuticals, Inc.
Class B (Æ) 2,279 134
WellCare Health Plans, Inc. (Æ) 5,860 350
Wright Medical Group, Inc. (Æ)(Ñ) 36,475 618
Zoll Medical Corp. (Æ) 2,656 182
17,900
Materials and Processing - 5.8%AAON, Inc. (Ñ) 7,211 146
Acuity Brands, Inc. 4,445 259
Airgas, Inc. 2,964 234
Albemarle Corp. 5,120 329
Allied Nevada Gold Corp. (Æ)(Ñ) 3,643 131
Ashland, Inc. 1,528 96
Balchem Corp. 14,100 534
Ball Corp. 4,470 176
Belden, Inc. 3,830 150
Carpenter Technology Corp. 9,881 519
Clarcor, Inc. 9,875 508
Coeur d�Alene Mines Corp. (Æ) 2,755 76
Compass Minerals International,
Inc. 7,268 531
Crown Holdings, Inc. (Æ) 15,653 565
Eagle Materials, Inc. 4,568 134
Eastman Chemical Co. 2,988 150
Gibraltar Industries, Inc. (Æ) 23,198 364
Horsehead Holding Corp. (Æ)(Ñ) 11,069 120
Interline Brands, Inc. (Æ) 18,189 309
Intrepid Potash, Inc. (Æ) 17,325 414
Koppers Holdings, Inc. 15,575 592
Copyright © 2012 www.secdatabase.com. All Rights Reserved.Please Consider the Environment Before Printing This Document

78 Russell Tax-Managed U.S. Mid & Small Cap Fund
HMS Holdings Corp. (Æ) 37,200 1,228
Hologic, Inc. (Æ) 9,896 202
Human Genome Sciences, Inc.
(Æ)(Ñ) 6,757 66
IPC The Hospitalist Co., Inc. (Æ)(Ñ) 11,122 375
Isis Pharmaceuticals, Inc. (Æ)(Ñ) 9,116 74
Kindred Healthcare, Inc. (Æ)(Ñ) 12,780 157
LifePoint Hospitals, Inc. (Æ) 9,464 380
Magellan Health Services, Inc. (Æ) 7,596 371
MedAssets, Inc. (Æ) 6,646 70
Mednax, Inc. (Æ)(Ñ) 2,682 191
Meridian Bioscience, Inc. (Ñ) 4,609 80
Merit Medical Systems, Inc. (Æ) 35,553 502
MWI Veterinary Supply, Inc. (Æ)(Ñ) 17,687 1,389
Neogen Corp. (Æ) 8,200 267
Omnicell, Inc. (Æ) 8,346 129
Onyx Pharmaceuticals, Inc. (Æ)(Ñ) 7,580 310
Orexigen Therapeutics, Inc. (Æ)(Ñ) 26,292 72
Orthofix International NV (Æ) 3,868 155
PSS World Medical, Inc. (Æ)(Ñ) 14,728 357
Quality Systems, Inc. (Ñ) 2,976 121
Questcor Pharmaceuticals,
Inc. (Æ)(Ñ) 5,800 206
Regeneron Pharmaceuticals,
Inc. (Æ)(Ñ) 204 19
Salix Pharmaceuticals, Ltd. (Æ) 5,430 262
Seattle Genetics, Inc. (Æ)(Ñ) 4,553 86
Sunrise Senior Living, Inc. (Æ)(Ñ) 75,880 540
SXC Health Solutions Corp. (Æ) 19,680 1,241
Synovis Life Technologies, Inc. (Æ) 14,800 414
Lennox International, Inc. (Ñ) 3,585 130
Minerals Technologies, Inc. 4,361 277
Owens Corning (Æ) 15,717 530
Packaging Corp. of America 5,026 141
Rockwood Holdings, Inc. (Æ) 6,020 304
RPM International, Inc. 8,007 200
Solutia, Inc. (Ñ) 4,502 124
Sonoco Products Co. 3,910 122
Steel Dynamics, Inc. 7,619 122
Stillwater Mining Co. (Æ) 4,686 60
Temple-Inland, Inc. 3,056 98
Timken Co. 2,910 142
Universal Forest Products, Inc. (Ñ) 2,625 83
WR Grace & Co. (Æ) 3,939 211
8,881
Producer Durables - 15.7%Accuride Corp. (Æ)(Ñ) 94,497 708
Actuant Corp. Class A (Ñ) 20,095 509
Advisory Board Co. (The) (Æ) 20,627 1,573
AECOM Technology Corp. (Æ) 5,153 118
Allegiant Travel Co. Class A (Æ)(Ñ) 2,304 127
Ametek, Inc. 9,137 429
Copyright © 2012 www.secdatabase.com. All Rights Reserved.Please Consider the Environment Before Printing This Document

Table of Contents
Russell Investment CompanyRussell Tax-Managed U.S. Mid & Small Cap FundSchedule of Investments, continued �� January 31, 2012 (Unaudited)Amounts in thousands (except share amounts)
Principal
Amount ($)
or Shares
Market
Value
$
Applied Industrial Technologies,
Inc. (Ñ) 4,854 187
Arkansas Best Corp. 12,675 230
Babcock & Wilcox Co. (The) (Æ) 4,380 109
Barnes Group, Inc. 25,834 653
Bristow Group, Inc. 18,259 896
Carlisle Cos., Inc. 3,361 160
CDI Corp. 6,882 103
Celadon Group, Inc. 5,958 89
Chart Industries, Inc. (Æ) 7,380 412
Chicago Bridge & Iron Co. NV 2,329 99
Colfax Corp. (Æ) 6,780 206
Commercial Vehicle Group,
Inc. (Æ)(Ñ) 39,531 495
Con-way, Inc. 3,100 98
Corporate Executive Board Co.
(The) 10,775 424
Corrections Corp. of America (Æ) 6,957 164
CoStar Group, Inc. (Æ) 10,500 595
Echo Global Logistics, Inc. (Æ) 51,400 861
EnPro Industries, Inc. (Æ) 10,220 361
ExlService Holdings, Inc. (Æ) 49,428 1,193
Forward Air Corp. (Ñ) 3,059 107
Franklin Electric Co., Inc. (Ñ) 9,280 465
Gardner Denver, Inc. 7,347 548
GATX Corp. 15,325 658
Genesee & Wyoming, Inc. Class
A (Æ) 8,826 548
GrafTech International, Ltd.
(Æ)(Ñ) 8,620 142
HEICO Corp. (Ñ) 3,109 173
Heidrick & Struggles International,
Inc. 14,900 328
Herman Miller, Inc. 16,034 339
HNI Corp. (Ñ) 4,654 126
InnerWorkings, Inc. (Æ)(Ñ) 11,600 128
Principal
Amount ($)
or Shares
Market
Value
$
Titan International, Inc. (Ñ) 25,769 622
Toro Co. (The) 11,125 705
TransDigm Group, Inc. (Æ) 2,160 226
Trimas Corp. (Æ) 19,224 417
Trimble Navigation, Ltd. (Æ) 2,554 120
Trinity Industries, Inc. 3,212 101
United Rentals, Inc. (Æ)(Ñ) 22,293 853
United Stationers, Inc. (Ñ) 21,900 708
Wabtec Corp. 8,813 606
WESCO International, Inc. (Æ)(Ñ) 3,158 199
Woodward, Inc. 3,350 141
24,243
Technology - 17.8%AboveNet, Inc. (Æ)(Ñ) 8,475 563
Acme Packet, Inc. (Æ)(Ñ) 9,830 287
Active Network, Inc. (The) (Æ)(Ñ) 16,510 246
Amtech Systems, Inc. (Æ) 6,806 69
Anixter International, Inc. (Æ) 7,270 476
Ansys, Inc. (Æ) 20,858 1,262
AOL, Inc. (Æ)(Ñ) 5,211 84
Applied Micro Circuits Corp. (Æ) 13,404 105
Ariba, Inc. (Æ) 5,990 164
Aruba Networks, Inc. (Æ)(Ñ) 11,430 254
Atmel Corp. (Æ) 16,416 159
Avago Technologies, Ltd. 10,150 345
Avnet, Inc. (Æ) 5,180 181
Blue Coat Systems, Inc. (Æ) 3,003 77
Bottomline Technologies, Inc. (Æ) 25,588 700
Brocade Communications Systems,
Inc. (Æ) 11,965 67
Cavium, Inc. (Æ)(Ñ) 23,200 746
Ceva, Inc. (Æ)(Ñ) 11,060 299
CIBER, Inc. (Æ)(Ñ) 92,093 401
comScore, Inc. (Æ)(Ñ) 33,182 735
Cypress Semiconductor Corp. 17,060 293
DealerTrack Holdings, Inc. (Æ) 48,700 1,331
Copyright © 2012 www.secdatabase.com. All Rights Reserved.Please Consider the Environment Before Printing This Document

Russell Tax-Managed U.S. Mid & Small Cap Fund 79
Itron, Inc. (Æ) 2,554 99
Kansas City Southern (Æ) 2,952 203
KBR, Inc. 6,364 205
Knightsbridge Tankers, Ltd. (Æ) 2,589 39
Layne Christensen Co. (Æ) 2,855 66
Littelfuse, Inc. (Ñ) 2,943 149
Manitowoc Co., Inc. (The) (Ñ) 5,493 74
MAXIMUS, Inc. (Ñ) 4,115 185
Mettler-Toledo International,
Inc. (Æ)(Ñ) 678 119
Mistras Group, Inc. (Æ)(Ñ) 37,535 845
Monster Worldwide, Inc. (Æ)(Ñ) 8,522 61
Navigant Consulting, Inc. (Æ) 6,034 77
Navistar International Corp. (Æ) 1,985 86
Nordic American Tanker Shipping 4,640 64
Old Dominion Freight Line, Inc.
(Æ) 21,245 905
Orbital Sciences Corp. (Æ) 7,204 104
Oshkosh Corp. (Æ) 3,884 94
Pall Corp. 2,401 143
Pentair, Inc. (Ñ) 5,262 194
Quanta Services, Inc. (Æ) 4,294 93
Robbins & Myers, Inc. 13,854 673
Robert Half International, Inc. (Ñ) 4,436 123
SkyWest, Inc. 5,094 65
SunOpta, Inc. (Æ)(Ñ) 54,129 264
Taser International, Inc. (Æ)(Ñ) 14,055 67
Terex Corp. (Æ)(Ñ) 4,352 86
Tetra Tech, Inc. (Æ) 4,369 101
Digimarc Corp. (Æ) 13,040 345
Diodes, Inc. (Æ)(Ñ) 13,312 343
DynaVox, Inc. Class A (Æ)(Ñ) 1,753 7
Earthlink, Inc. (Ñ) 116,203 838
Ebix, Inc. (Ñ) 20,200 501
Ellie Mae, Inc. (Æ) 39,800 234
Emulex Corp. (Æ) 35,900 375
Entegris, Inc. (Æ)(Ñ) 53,922 517
Equinix, Inc. (Æ) 1,142 137
Fairchild Semiconductor
International, Inc. Class A (Æ) 31,841 445
FEI Co. (Æ)(Ñ) 5,700 251
Fortinet, Inc. (Æ) 9,260 211
Integrated Device Technology, Inc.
(Æ) 71,263 452
Interactive Intelligence Group,
Inc. (Æ)(Ñ) 22,290 575
Intermolecular, Inc. (Æ)(Ñ) 20,710 174
IPG Photonics Corp. (Æ)(Ñ) 1,991 105
J2 Global Inc. (Æ)(Ñ) 19,860 535
Jabil Circuit, Inc. 7,013 159
JDS Uniphase Corp. (Æ) 5,603 71
Keynote Systems, Inc. 16,510 323
Copyright © 2012 www.secdatabase.com. All Rights Reserved.Please Consider the Environment Before Printing This Document

Table of Contents
Russell Investment CompanyRussell Tax-Managed U.S. Mid & Small Cap FundSchedule of Investments, continued �� January 31, 2012 (Unaudited)Amounts in thousands (except share amounts)
Principal
Amount ($)
or Shares
Market
Value
$
Lam Research Corp. (Æ)(Ñ) 6,080 259
LinkedIn Corp. Class A (Æ) 1,680 121
LivePerson, Inc. (Æ)(Ñ) 35,335 424
LogMeIn, Inc. (Æ)(Ñ) 19,500 777
LSI Corp. (Æ) 15,169 115
Mentor Graphics Corp. (Æ)(Ñ) 9,771 136
Micrel, Inc. 5,717 66
MICROS Systems, Inc. (Æ) 4,213 209
Monolithic Power Systems, Inc. (Æ) 6,476 106
Monotype Imaging Holdings,
Inc. (Æ) 4,615 72
Netlogic Microsystems, Inc. (Æ) 1,457 73
Newport Corp. (Æ) 8,837 163
NIC, Inc. (Ñ) 28,537 357
Nuance Communications, Inc. (Æ) 4,520 129
NVE Corp. (Æ) 588 32
NXP Semiconductor NV (Æ)(Ñ) 10,740 228
ON Semiconductor Corp. (Æ) 46,838 408
Plexus Corp. (Æ)(Ñ) 26,950 977
Progress Software Corp. (Æ) 48,221 1,125
QLIK Technologies, Inc. (Æ)(Ñ) 5,680 160
Quest Software, Inc. (Æ) 26,800 545
Rackspace Hosting, Inc. (Æ)(Ñ) 4,040 175
RealPage, Inc. (Æ)(Ñ) 13,300 342
RF Micro Devices, Inc. (Æ)(Ñ) 19,603 98
Riverbed Technology, Inc. (Æ)(Ñ) 21,115 506
Rogers Corp. (Æ)(Ñ) 2,134 82
SBA Communications Corp.
Class A (Æ)(Ñ) 3,103 142
SciQuest, Inc. (Æ) 24,000 351
SolarWinds, Inc. (Æ)(Ñ) 3,610 114
Spansion, Inc. Class A (Æ) 3,091 31
SuccessFactors, Inc. (Æ) 2,094 83
Syntel, Inc. 21,537 1,011
Tangoe, Inc. (Æ)(Ñ) 34,300 497
Teradyne, Inc. (Æ)(Ñ) 15,320 250
Principal
Amount ($)
or Shares
Market
Value
$
Gran Tierra Energy, Inc. (Æ)(Ñ) 17,173 99
Lone Pine Resources, Inc. (Æ) 350 2
National Fuel Gas Co. 3,059 154
Neutral Tandem, Inc. (Æ) 4,480 55
New Jersey Resources Corp. (Ñ) 3,300 157
Northeast Utilities 6,648 231
Northwest Natural Gas Co. (Ñ) 2,526 120
NorthWestern Corp. 18,790 660
NSTAR 4,513 203
NTELOS Holdings Corp. 1,298 30
Southwest Gas Corp. 4,202 176
Time Warner Telecom, Inc. Class A
(Æ) 9,230 186
4,692
Total Common Stocks(cost $109,933) 147,435
Short-Term Investments - 4.5%Russell U.S. Cash Management
Fund 6,867,576 (¥) 6,868
Total Short-TermInvestments(cost $6,868) 6,868
Other Securities - 10.2%Russell Investment Company
Liquidating Trust (×) 896,017 (¥) 911
Russell U.S. Cash Collateral
Fund (×) 14,820,313 (¥) 14,820
Total Other Securities(cost $15,716) 15,731
Total Investments - 110.4%(identified cost $132,517) 170,034
Other Assets and Liabilities,Net - (10.4%) (15,979 )
Copyright © 2012 www.secdatabase.com. All Rights Reserved.Please Consider the Environment Before Printing This Document
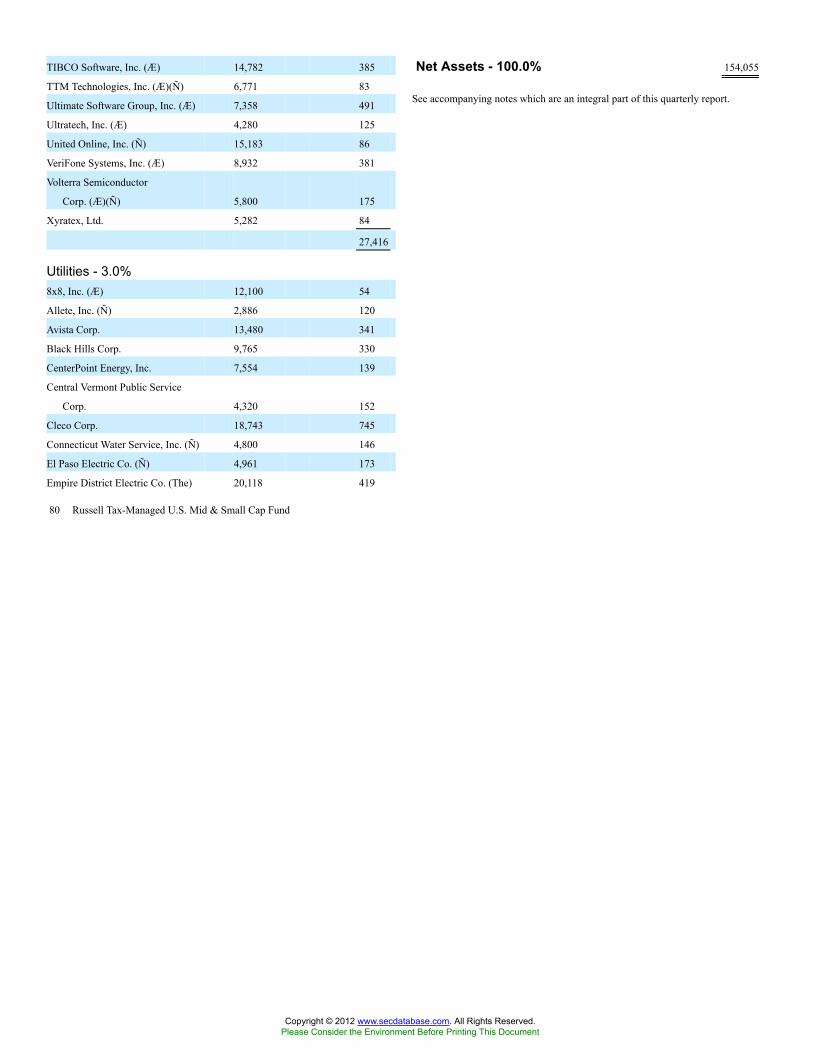
See accompanying notes which are an integral part of this quarterly report.
80 Russell Tax-Managed U.S. Mid & Small Cap Fund
TIBCO Software, Inc. (Æ) 14,782 385
TTM Technologies, Inc. (Æ)(Ñ) 6,771 83
Ultimate Software Group, Inc. (Æ) 7,358 491
Ultratech, Inc. (Æ) 4,280 125
United Online, Inc. (Ñ) 15,183 86
VeriFone Systems, Inc. (Æ) 8,932 381
Volterra Semiconductor
Corp. (Æ)(Ñ) 5,800 175
Xyratex, Ltd. 5,282 84
27,416
Utilities - 3.0%8x8, Inc. (Æ) 12,100 54
Allete, Inc. (Ñ) 2,886 120
Avista Corp. 13,480 341
Black Hills Corp. 9,765 330
CenterPoint Energy, Inc. 7,554 139
Central Vermont Public Service
Corp. 4,320 152
Cleco Corp. 18,743 745
Connecticut Water Service, Inc. (Ñ) 4,800 146
El Paso Electric Co. (Ñ) 4,961 173
Empire District Electric Co. (The) 20,118 419
Net Assets - 100.0% 154,055
Copyright © 2012 www.secdatabase.com. All Rights Reserved.Please Consider the Environment Before Printing This Document

Table of Contents
Russell Investment CompanyRussell Tax-Managed U.S. Mid & Small Cap FundSchedule of Investments, continued �� January 31, 2012 (Unaudited)Amounts in thousands (except contract amounts)
Futures ContractsNumber of
Contracts
Notional
AmountExpiration
Date
Unrealized
Appreciation
(Depreciation)
$
Long PositionsS&P Midcap 400 E-Mini Index Futures (CME) 74 USD 6,918 03/12 381
Total Unrealized Appreciation (Depreciation) on Open Futures Contracts (å) 381
Presentation of Portfolio Holdings �� January 31, 2012 (Unaudited)
Amounts in thousands
Market Value
Portfolio Summary Level 1 Level 2 Level 3 Total
Common Stocks
Consumer Discretionary $25,685 $� $ � $25,685
Consumer Staples 5,506 � � 5,506
Energy 6,139 � � 6,139
Financial Services 26,973 � � 26,973
Health Care 17,900 � � 17,900
Materials and Processing 8,881 � � 8,881
Producer Durables 24,243 � � 24,243
Technology 27,416 � � 27,416
Utilities 4,692 � � 4,692
Short-Term Investments � 6,868 � 6,868
Other Securities � 15,731 � 15,731
Total Investments 147,435 22,599 � 170,034
Other Financial Instruments
Futures Contracts 381 � � 381
Total Other Financial Instruments* $381 $� $ � $381
* Other financial instruments reflected, such as futures, forwards, interest rate swaps, and credit default swaps are valued at the unrealized appreciation/depreciation
on the instruments.
For a description of the levels see note 2 in the Notes to Quarterly Report.
See accompanying notes which are an integral part of this quarterly report.
Copyright © 2012 www.secdatabase.com. All Rights Reserved.Please Consider the Environment Before Printing This Document

Russell Tax-Managed U.S. Mid & Small Cap Fund 81
Copyright © 2012 www.secdatabase.com. All Rights Reserved.Please Consider the Environment Before Printing This Document

Table of Contents
Russell Investment CompanyRussell Global Opportunistic Credit Fund
Schedule of Investments �� January 31, 2012 (Unaudited)Amounts in thousands (except share amounts)
Principal
Amount ($)
or Shares
Market
Value
$
Long-Term Fixed Income Investments - 89.0%Argentina - 2.7%Argentine Government
International Bond
Series dis
5.830% due 12/31/33 ARS 5,828 1,829
Argentine Republic Government
International Bond
Series disEUR
7.820% due 12/31/33 EUR 5,042 4,436
Series dscEUR
7.820% due 12/31/33 EUR 7,532 6,626
Series EURGDP
6.500% due 12/15/35 (Ê) EUR 8,122 1,243
Series $DSC
8.280% due 12/31/33 5,066 3,951
Series NY
3.750% due 03/31/19 4,407 1,719
Capex SA
10.000% due 03/10/18 (Þ) 646 551
Empresa Distribuidora Y
Comercializadora Norte
9.750% due 10/25/22 (Þ) 329 273
Series REGS
9.750% due 10/25/22 250 208
IRSA Inversiones y
Representaciones SA
11.500% due 07/20/20 (Þ) 500 528
Tarjeta Naranja SA
9.000% due 01/28/17 (Þ) 160 157
21,521
Australia - 0.0%Mirabela Nickel, Ltd.
8.750% due 04/15/18 (Þ) 155 135
Principal
Amount ($)
or Shares
Market
Value
$
Digicel, Ltd.
Series REGS
8.250% due 09/01/17 410 430
Inkia Energy, Ltd.
8.375% due 04/04/21 (Þ) 351 351
Qtel International Finance, Ltd.
4.750% due 02/16/21 (Þ) 264 268
5.000% due 10/19/25 (Þ) 895 902
Series REGS
4.750% due 02/16/21 700 711
5.000% due 10/19/25 200 201
4,036
Brazil - 1.5%Banco Cruzeiro do Sul SA
8.875% due 09/22/20 (Þ) 691 532
Series REGS
8.875% due 09/22/20 341 263
BM&FBovespa SA
5.500% due 07/16/20 (Þ) 299 317
Series REGS
5.500% due 07/16/20 200 212
BR Malls International Finance,
Ltd.
8.500% due 01/29/49 (�)(Þ) 265 272
BR Properties SA
Series REGS
9.000% due 10/29/49 (�) 282 288
Brazilian Government International
Bond
5.875% due 01/15/19 1,395 1,665
4.875% due 01/22/21 1,338 1,505
8.875% due 04/15/24 1,063 1,592
8.750% due 02/04/25 558 837
7.125% due 01/20/37 480 653
Globo Comunicacao e
Participacoes SA 233 248
Copyright © 2012 www.secdatabase.com. All Rights Reserved.Please Consider the Environment Before Printing This Document

82 Russell Global Opportunistic Credit Fund
Barbados - 0.1%Columbus International, Inc.
11.500% due 11/20/14 (Þ) 250 265
Series REGS
11.500% due 11/20/14 347 367
632
Belgium - 0.3%Ontex IV SA
Series 144a
9.000% due 04/15/19 (Þ) EUR 1,050 1,009
Series REGS
7.500% due 04/15/18 EUR 600 730
9.000% due 04/15/19 EUR 450 433
2,172
Bermuda - 0.5%Digicel Group, Ltd.
9.125% due 01/15/15 (Þ) 640 647
Series REGS
10.500% due 04/15/18 500 526
Series REGS
9.375% due 07/20/15 (�)
Hypermarcas SA
6.500% due 04/20/21 (Þ) 1,155 1,080
NET Servicos de Comunicacao SA
7.500% due 01/27/20 432 502
OGX Petroleo e Gas Participacoes
SA
8.500% due 06/01/18 (Þ) 1,205 1,245
Telemar Norte Leste SA
5.500% due 10/23/20 (Þ) 806 805
12,016
Canada - 1.1%Cascades, Inc.
7.750% due 12/15/17 1,935 1,998
Harvest Operations Corp.
6.875% due 10/01/17 (Þ) 1,450 1,530
National Money Mart Co.
10.375% due 12/15/16 1,800 1,971
Novelis, Inc.
8.375% due 12/15/17 855 938
8.750% due 12/15/20 1,895 2,118
8,555
Copyright © 2012 www.secdatabase.com. All Rights Reserved.Please Consider the Environment Before Printing This Document

Table of Contents
Russell Investment CompanyRussell Global Opportunistic Credit FundSchedule of Investments, continued �� January 31, 2012 (Unaudited)Amounts in thousands (except share amounts)
Principal
Amount ($)
or Shares
Market
Value
$
Cayman Islands - 1.4%China Liansu Group Holdings,
Ltd.
7.875% due 05/13/16 (Þ) 456 412
Countrywide Holdings, Ltd.
Series REGS
10.000% due 05/08/18 GBP 1,515 2,340
DP World Sukuk Ltd.
6.250% due 07/02/17 750 774
Dubai Holding Commercial
Operations MTN, Ltd.
4.750% due 01/30/14 EUR 100 116
Series EMtN
6.000% due 02/01/17 GBP 550 676
Evergrande Real Estate Group,
Ltd.
Series REGS
13.000% due 01/27/15 195 179
General Shopping Finance, Ltd.
10.000% due 11/09/15 (�)(Þ) 663 670
Series REGS
10.000% due 12/29/49 (�) 100 98
Grupo Aval, Ltd.
5.250% due 02/01/17 (Å) 200 202
Gruposura Finance
5.700% due 05/18/21 (Þ) 761 780
Hutchison Whampoa
International 10, Ltd.
Series REGS
6.000% due 12/29/49 (�) 511 513
Hutchison Whampoa
International 11, Ltd.
4.625% due 01/13/22 (Å) 400 402
IPIC GMTN, Ltd.
3.750% due 03/01/17 (Þ) 650 648
6.875% due 11/01/41 (Å) 200 206
Principal
Amount ($)
or Shares
Market
Value
$
Corp. Nacional del Cobre de
Chile
Series REGS
6.150% due 10/24/36 1,234 1,549
2,076
Colombia - 1.5%Bogota Distrito Capital
Series REGS
9.750% due 07/26/28 COP 4,000,000 3,044
Colombia Government
International Bond
7.375% due 01/27/17 1,271 1,563
7.750% due 04/14/21 COP 1,391,000 920
4.375% due 07/12/21 980 1,053
7.375% due 09/18/37 3,144 4,323
6.125% due 01/18/41 533 640
Empresa de Energia de Bogota
SA
6.125% due 11/10/21 (Þ) 500 512
12,055
Croatia - 0.3%Croatia Government
International Bond
6.375% due 03/24/21 (Þ) 2,766 2,552
Cyprus - 0.1%Mriya Agro Holding PLC
10.950% due 03/30/16 (Þ) 610 537
Dominican Republic - 0.0%Capital Cana SA
10.000% due 04/30/16 (Þ) 250 50
El Salvador - 0.4%El Salvador Government
International Bond 2,157 2,329
Copyright © 2012 www.secdatabase.com. All Rights Reserved.Please Consider the Environment Before Printing This Document

Russell Global Opportunistic Credit Fund 83
Kaisa Group Holdings, Ltd.
Series REGS
13.500% due 04/28/15 406 380
MIE Holdings Corp.
9.750% due 05/12/16 (Þ) 706 650
Minerva Overseas II, Ltd.
10.875% due 11/15/19 (Þ) 500 464
Odebrecht Drilling Norbe VIII/
IX, Ltd.
6.350% due 06/30/21 (Þ) 671 697
Series REGS
6.350% due 06/30/21 470 489
Odebrecht Finance, Ltd.
Series REGS 7.000% due 04/
21/20 150 162
Petrobras International Finance
Co. - Pifco
5.375% due 01/27/21 130 136
Texhong Textile Group, Ltd.
7.625% due 01/19/16 (Þ) 202 168
Series REGS
7.625% due 01/19/16 208 172
11,334
Chile - 0.3%Cencosud SA
5.500% due 01/20/21 (Þ) 500 527
Series REGS
7.375% due 12/01/19
7.650% due 06/15/35 700 723
3,052
France - 1.1%Cie Generale de Geophysique -
Veritas
6.500% due 06/01/21 2,000 1,990
Lafarge SA
6.750% due 12/16/19 EUR 1,115 1,400
Nexans SA
5.750% due 05/02/17 EUR 1,500 1,947
Rexel SA
7.000% due 12/17/18 EUR 1,040 1,381
SPCM SA
Series REGS
8.250% due 06/15/17 EUR 1,420 1,923
8,641
Germany - 1.6%ALBA Group PLC & Co. KG
8.000% due 05/15/18 (Þ) EUR 1,790 2,342
Copyright © 2012 www.secdatabase.com. All Rights Reserved.Please Consider the Environment Before Printing This Document

Table of Contents
Russell Investment CompanyRussell Global Opportunistic Credit FundSchedule of Investments, continued �� January 31, 2012 (Unaudited)Amounts in thousands (except share amounts)
Principal
Amount ($)
or Shares
Market
Value
$
Deutsche Bank AG/London
9.375% due 02/13/18 (Þ) 1,604 1,620
Kabel BW Musketeer GmbH
9.500% due 03/15/21 (Þ) EUR 1,200 1,632
Series REGS
9.500% due 03/15/21 EUR 510 694
KUKA AG
Series REGS
8.750% due 11/15/17 EUR 1,680 2,318
Styrolution Group GmbH
7.625% due 05/15/16 (Þ) EUR 1,540 1,652
Series REGS
7.625% due 05/15/16 EUR 490 525
Unitymedia GmbH
Series ReGS
9.625% due 12/01/19 EUR 1,575 2,189
12,972
Ghana - 0.1%Republic of Ghana
Series REGS
8.500% due 10/04/17 787 870
Hungary - 0.3%Hungary Government
International Bond
4.500% due 01/29/14 EUR 434 526
5.500% due 05/06/14 GBP 61 88
4.750% due 02/03/15 230 215
5.000% due 03/30/16 GBP 209 270
3.500% due 07/18/16 EUR 289 310
4.375% due 07/04/17 EUR 624 673
7.625% due 03/29/41 150 139
2,221
India - 0.1%
Principal
Amount ($)
or Shares
Market
Value
$
Ireland - 0.9%Alfa Bank OJSC Via Alfa Bond
Issuance PLC
7.875% due 09/25/17 (Þ) 372 375
Ardagh Packaging Finance PLC
Series 144a
7.375% due 10/15/17 (Þ) EUR 1,175 1,568
Series REGS
9.250% due 10/15/20 EUR 500 637
Metalloinvest Finance, Ltd.
6.500% due 07/21/16 (Þ) 1,108 1,057
Novatek Finance, Ltd.
6.604% due 02/03/21 (Þ) 1,183 1,241
SCF Capital, Ltd.
5.375% due 10/27/17 (Þ) 861 762
Smurfit Kappa Acquisitions
Series REGS
7.750% due 11/15/19 EUR 500 687
Vimpel Communications Via VIP
Finance Ireland, Ltd. OJSC
7.748% due 02/02/21 (Þ) 528 510
Series REGS
6.493% due 02/02/16 200 198
7,035
Jersey - 0.1%West China Cement, Ltd.
7.500% due 01/25/16 (Þ) 411 346
Series REGS
7.500% due 01/25/16 468 395
741
Kazakhstan - 1.0%BTA Bank JSC
Zero coupon due 06/30/20 (Þ) 1,427 71
KazMunayGas National Co.
9.125% due 07/02/18 (Þ) 272 329
Copyright © 2012 www.secdatabase.com. All Rights Reserved.Please Consider the Environment Before Printing This Document

84 Russell Global Opportunistic Credit Fund
Axis Bank
7.125% due 06/28/22 126 113
Bank of India
6.994% due 03/29/49 (�) 137 123
ICICI Bank, Ltd.
5.750% due 11/16/20 (Þ) 375 367
603
Indonesia - 1.3%Adaro Indonesia PT
Series REGS
7.625% due 10/22/19 496 554
Republic of Indonesia
6.875% due 01/17/18 3,023 3,590
11.625% due 03/04/19 2,767 4,116
5.875% due 03/13/20 1,643 1,873
10,133
Iraq - 1.2%Republic of Iraq
Series REGS
5.800% due 01/15/28 12,487 9,677
6.375% due 04/09/21 (Þ) 1,355 1,426
Series REGS
8.375% due 07/02/13 2,109 2,252
11.750% due 01/23/15 369 447
7.000% due 05/05/20 2,364 2,595
Zhaikmunai LLP
10.500% due 10/19/15 (Þ) 363 363
Series REGS
10.500% due 10/19/15 580 580
8,063
Lithuania - 0.6%Lithuania Government
International Bond
Series REGS
7.375% due 02/11/20 166 179
6.125% due 03/09/21 4,466 4,410
4,589
Copyright © 2012 www.secdatabase.com. All Rights Reserved.Please Consider the Environment Before Printing This Document

Table of Contents
Russell Investment CompanyRussell Global Opportunistic Credit FundSchedule of Investments, continued �� January 31, 2012 (Unaudited)Amounts in thousands (except share amounts)
Principal
Amount ($)
or Shares
Market
Value
$
Luxembourg - 3.6%Aguila 3 SA
7.875% due 01/31/18 (Þ) 1,395 1,418
Series REGS
7.875% due 01/31/18 CHF 850 951
ALROSA Finance SA
Series REGS
7.750% due 11/03/20 200 207
APERAM
7.750% due 04/01/18 (Þ) 2,515 2,150
Capsugel FinanceCo SCA
9.875% due 08/01/19 (Þ) EUR 1,800 2,525
ConvaTec Healthcare E SA
7.375% due 12/15/17 (Þ) EUR 635 851
Series REGS
7.375% due 12/15/17 EUR 1,140 1,529
Evraz Group SA
6.750% due 04/27/18 (Þ) 1,237 1,166
Expro Finance Luxembourg SCA
8.500% due 12/15/16 (Þ) 2,650 2,405
FMC Finance VIII SA
6.500% due 09/15/18 (Þ) EUR 900 1,295
Greif Luxembourg Finance SCA
7.375% due 07/15/21 (Þ) EUR 700 904
Intelsat Jackson Holdings SA
7.250% due 04/01/19 (Þ) 65 68
7.250% due 10/15/20 2,500 2,609
KION Finance SA
Series REGS
7.875% due 04/15/18 EUR 2,000 2,302
MHP SA
10.250% due 04/29/15 (Þ) 150 141
Series REGS
10.250% due 04/29/15 200 188
Principal
Amount ($)
or Shares
Market
Value
$
Series 0409
3.741% due 02/27/15 MYR 1,195 401
Series 2/04
5.094% due 04/30/14 MYR 5,170 1,779
Penerbahgan Malaysia Berhad
5.625% due 03/15/16 3,500 3,898
Petronas Capital, Ltd.
Series REGS
5.250% due 08/12/19 647 730
7.875% due 05/22/22 3,898 5,300
Petronas Global Sukuk, Ltd.
4.250% due 08/12/14 (Þ) 616 648
15,509
Mexico - 3.3%America Movil SAB de CV
2.375% due 09/08/16 1,712 1,734
Axtel SAB de CV
7.625% due 02/01/17 (Þ) 240 183
Series REGS
9.000% due 09/22/19 365 288
Bank of New York Mellon SA
Institucion de Banca Multiple
9.625% due 05/02/21 (Þ) 1,007 892
BBVA Bancomer SA
Series REGS
4.500% due 03/10/16 208 209
Cemex SAB de CV
5.579% due 09/30/15 (Ê)(Þ) 865 718
9.000% due 01/11/18 (Þ) 487 424
Series REGS
9.000% due 01/11/18 300 261
Grupo Bimbo SAB de CV
4.875% due 06/30/20 (Þ) 131 139
Grupo Televisa SAB
6.000% due 05/15/18 100 114
Copyright © 2012 www.secdatabase.com. All Rights Reserved.Please Consider the Environment Before Printing This Document
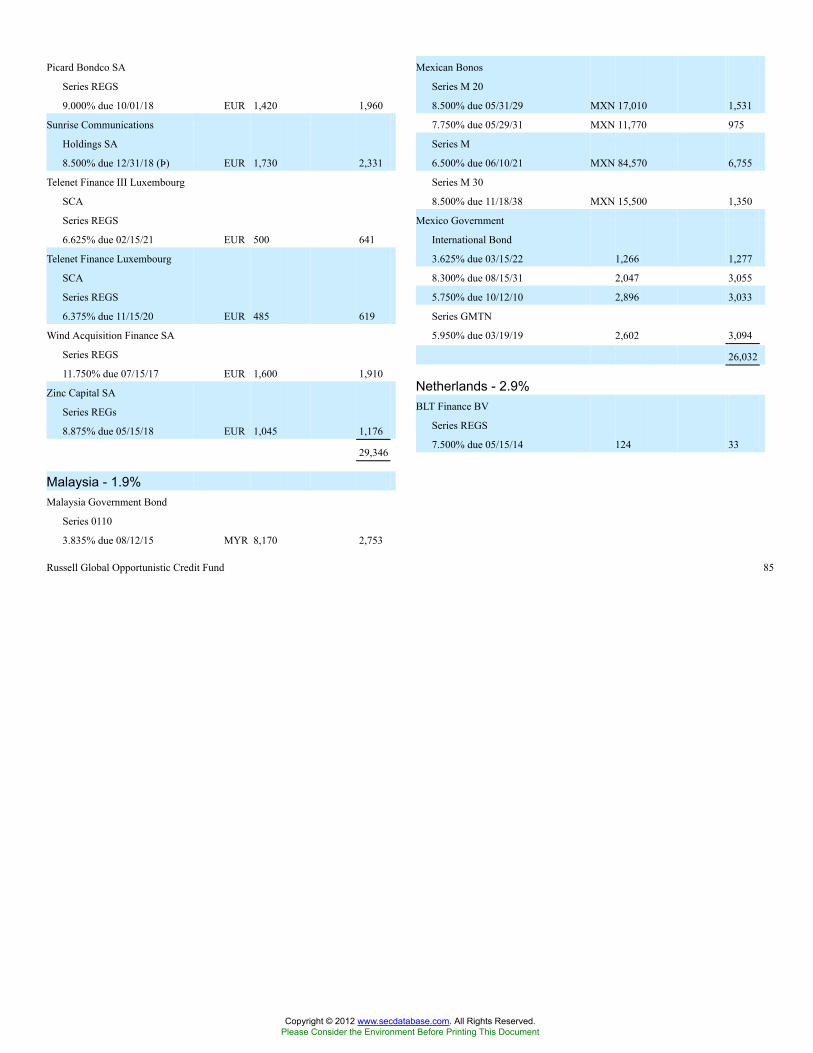
Russell Global Opportunistic Credit Fund 85
Picard Bondco SA
Series REGS
9.000% due 10/01/18 EUR 1,420 1,960
Sunrise Communications
Holdings SA
8.500% due 12/31/18 (Þ) EUR 1,730 2,331
Telenet Finance III Luxembourg
SCA
Series REGS
6.625% due 02/15/21 EUR 500 641
Telenet Finance Luxembourg
SCA
Series REGS
6.375% due 11/15/20 EUR 485 619
Wind Acquisition Finance SA
Series REGS
11.750% due 07/15/17 EUR 1,600 1,910
Zinc Capital SA
Series REGs
8.875% due 05/15/18 EUR 1,045 1,176
29,346
Malaysia - 1.9%Malaysia Government Bond
Series 0110
3.835% due 08/12/15 MYR 8,170 2,753
Mexican Bonos
Series M 20
8.500% due 05/31/29 MXN 17,010 1,531
7.750% due 05/29/31 MXN 11,770 975
Series M
6.500% due 06/10/21 MXN 84,570 6,755
Series M 30
8.500% due 11/18/38 MXN 15,500 1,350
Mexico Government
International Bond
3.625% due 03/15/22 1,266 1,277
8.300% due 08/15/31 2,047 3,055
5.750% due 10/12/10 2,896 3,033
Series GMTN
5.950% due 03/19/19 2,602 3,094
26,032
Netherlands - 2.9%BLT Finance BV
Series REGS
7.500% due 05/15/14 124 33
Copyright © 2012 www.secdatabase.com. All Rights Reserved.Please Consider the Environment Before Printing This Document

Table of Contents
Russell Investment CompanyRussell Global Opportunistic Credit FundSchedule of Investments, continued �� January 31, 2012 (Unaudited)Amounts in thousands (except share amounts)
Principal
Amount ($)
or Shares
Market
Value
$
Carlson Wagonlit BV
Series REGS
6.881% due 05/01/15 (Ê) EUR 1,800 2,166
Conti-Gummi Finance BV
Series REGS
7.500% due 09/15/17 EUR 1,545 2,102
Elster Finance BV
Series REGS
6.250% due 04/15/18 EUR 650 848
HeidelbergCement Finance BV
7.500% due 04/03/20 EUR 1,690 2,285
Indosat Palapa Co. BV
7.375% due 07/29/20 (Þ) 250 280
InterXion Holding NV
Series REGS
9.500% due 02/12/17 EUR 360 513
MDC-GMTN B.V.
Series REGS
3.750% due 04/20/16 200 206
Metinvest BV
8.750% due 02/14/18 (Þ) 805 700
Myriad International Holding BV
6.375% due 07/28/17 (Þ) 500 545
Series REGS
6.375% due 07/28/17 770 839
OI European Group BV
Series REGS
6.750% due 09/15/20 EUR 1,535 2,063
Phoenix PIB Finance BV
Series REGS
9.625% due 07/15/14 EUR 600 863
Refresco Group BV
Series 144a
7.375% due 05/15/18 (Þ) EUR 1,760 2,256
Sensata Technologies BV
6.500% due 05/15/19 (Þ) 2,575 2,626
Principal
Amount ($)
or Shares
Market
Value
$
Peru - 0.5%Banco de Credito del Peru
5.375% due 09/16/20 (Þ) 369 364
Peruvian Government
International Bond
8.375% due 05/03/16 672 834
8.750% due 11/21/33 1,505 2,295
Volcan Cia Minera SAA
5.375% due 02/02/22 (Å) 200 202
3,695
Philippines - 1.0%Philippine Government
International Bond
4.000% due 01/15/21 6,036 6,202
9.500% due 02/02/30 402 627
6.375% due 10/23/34 1,064 1,279
8,108
Poland - 1.7%Poland Government International
Bond
6.375% due 07/15/19 6,800 7,642
4.000% due 03/23/21 EUR 652 800
5.125% due 04/21/21 2,235 2,299
5.000% due 03/23/22 3,061 3,104
13,845
Puerto Rico - 0.2%Warner Chilcott Co. LLC /
Warner Chilcott Finance LLC
7.750% due 09/15/18 1,865 1,972
Qatar - 0.6%Qatar Government International
Bond
5.250% due 01/20/20 (Þ) 886 969
Copyright © 2012 www.secdatabase.com. All Rights Reserved.Please Consider the Environment Before Printing This Document

86 Russell Global Opportunistic Credit Fund
UPC Holding BV
Series REGS
8.375% due 08/15/20 EUR 1,675 2,158
VimpelCom Holdings BV
Series REGS
6.255% due 03/01/17 500 484
Ziggo Bond Co. BV
Series REGS
8.000% due 05/15/18 EUR 1,395 1,911
22,878
Panama - 1.5%Panama Government International
Bond
5.200% due 01/30/20 4,100 4,660
7.125% due 01/29/26 116 152
8.875% due 09/30/27 236 352
9.375% due 04/01/29 3,611 5,705
Series 2006-
6.700% due 01/26/36 850 1,084
11,953
Series REGS
6.550% due 04/09/19 1,397 1,648
5.250% due 01/20/20 2,023 2,213
4,830
Russia - 3.1%Russian Foreign Bond
Series REGS
7.500% due 03/31/30 4,490 5,321
Russian Foreign Bond -
Eurobond Series REGS
11.000% due 07/24/18 128 179
5.000% due 04/29/20 6,100 6,435
7.500% due 03/31/30 10,713 12,695
24,630
Singapore - 0.2%Bakrie Telecom Pte, Ltd.
Series REGS
11.500% due 05/07/15 519 337
Bumi Capital Pte, Ltd.
Series REGS
12.000% due 11/10/16 460 499
Copyright © 2012 www.secdatabase.com. All Rights Reserved.Please Consider the Environment Before Printing This Document

Table of Contents
Russell Investment CompanyRussell Global Opportunistic Credit FundSchedule of Investments, continued �� January 31, 2012 (Unaudited)Amounts in thousands (except share amounts)
Principal
Amount ($)
or Shares
Market
Value
$
Bumi Investment Pte, Ltd.
10.750% due 10/06/17 (Þ) 493 523
STATS ChipPAC, Ltd.
5.375% due 03/31/16 (Þ) 175 178
1,537
South Africa - 2.0%South Africa Government Bond
Series R204
8.000% due 12/21/18 ZAR 10,050 1,324
Series R208
6.750% due 03/31/21 ZAR 39,800 4,769
South Africa Government
International Bond
6.875% due 05/27/19 860 1,028
5.500% due 03/09/20 4,540 5,028
5.875% due 05/30/22 1,304 1,467
4.665% due 01/17/24 676 684
6.250% due 03/08/41 1,182 1,330
15,630
South Korea - 0.1%Export-Import Bank of Korea
4.375% due 09/15/21 675 666
Korea Gas Corp.
6.250% due 01/20/42 (Å) 249 262
928
Spain - 0.8%Abengoa Finance SAU
8.875% due 11/01/17 (Þ) 1,950 1,901
Abengoa SA
8.500% due 03/31/16 EUR 450 586
Cemex Espana Luxembourg
Series REGS
8.875% due 05/12/17 EUR 51 53
Principal
Amount ($)
or Shares
Market
Value
$
Yuksel Insaat AS
Series REGS
9.500% due 11/10/15 317 247
9,735
Ukraine - 0.4%Ukraine Government
International Bond
6.875% due 09/23/15 (Þ) 1,425 1,311
6.250% due 06/17/16 (Þ) 642 562
Series REGS
7.750% due 09/23/20 765 669
Series REGS
7.650% due 06/11/13 790 766
3,308
United Arab Emirates - 0.1%DP World, Ltd.
Series REGS
6.850% due 07/02/37 880 818
United Kingdom - 2.2%Anglian Water Osprey Financing
PLC
7.000% due 01/31/18 GBP 1,515 2,352
British Airways PLC
8.750% due 08/23/16 GBP 785 1,212
EC Finance PLC
9.750% due 08/01/17 (Þ) EUR 910 1,044
Series REGS
9.750% due 08/01/17 EUR 120 138
Ferrexpo Finance PLC
7.875% due 04/07/16 (Þ) 667 600
Ineos Group Holdings, Ltd.
Series REGS
7.875% due 02/15/16 EUR 950 1,069
Copyright © 2012 www.secdatabase.com. All Rights Reserved.Please Consider the Environment Before Printing This Document

Russell Global Opportunistic Credit Fund 87
Inaer Aviation Finance, Ltd.
Series REGS
9.500% due 08/01/17 EUR 1,785 2,055
Obrascon Huarte Lain SA
7.375% due 04/28/15 EUR 1,750 2,312
6,907
Sweden - 0.3%Stena AB Series REGS
6.125% due 02/01/17 EUR 1,850 2,251
Turkey - 1.2%Turkey Government International
Bond
7.250% due 03/15/15 1,000 1,090
7.500% due 11/07/19 2,282 2,590
7.000% due 06/05/20 3,297 3,639
5.625% due 03/30/21 319 321
5.125% due 03/25/22 1,305 1,243
6.875% due 03/17/36 583 605
ISS A/S
Series REGS
11.000% due 06/15/14 EUR 820 1,136
Kerling PLC
Series REGS
10.625% due 02/01/17 EUR 1,770 2,246
Ladbrokes Group Finance PLC
7.625% due 03/05/17 GBP 1,475 2,417
Phones4u Finance PLC
9.500% due 04/01/18 (Þ) GBP 1,100 1,499
Series REGS
9.500% due 04/01/18 GBP 520 709
Priory Group No. 3 PLC
8.875% due 02/15/19 (Þ) GBP 760 1,036
Series REGS
7.000% due 02/15/18 GBP 100 154
8.875% due 02/15/19 GBP 800 1,090
Ukreximbank Via Biz Finance
PLC
Series REGS
8.375% due 04/27/15 700 628
Vedanta Resources PLC
8.250% due 06/07/21 (Þ) 698 565
17,895
Copyright © 2012 www.secdatabase.com. All Rights Reserved.Please Consider the Environment Before Printing This Document
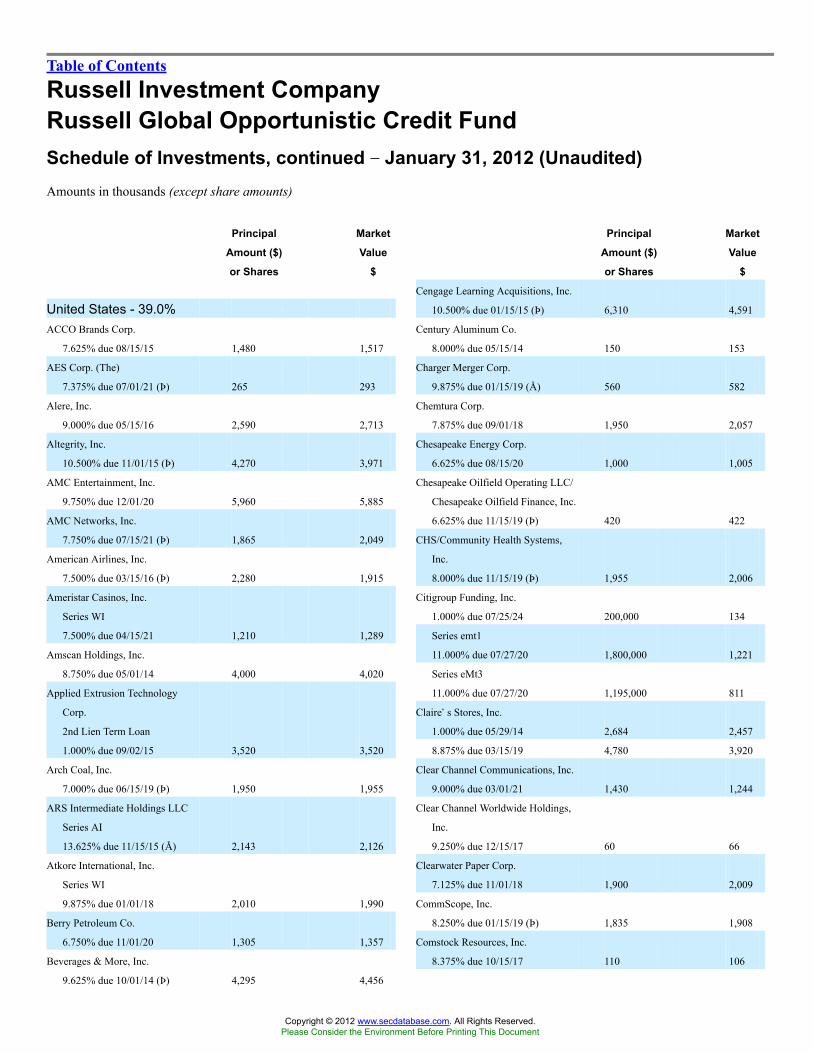
Table of Contents
Russell Investment CompanyRussell Global Opportunistic Credit FundSchedule of Investments, continued �� January 31, 2012 (Unaudited)Amounts in thousands (except share amounts)
Principal
Amount ($)
or Shares
Market
Value
$
United States - 39.0%ACCO Brands Corp.
7.625% due 08/15/15 1,480 1,517
AES Corp. (The)
7.375% due 07/01/21 (Þ) 265 293
Alere, Inc.
9.000% due 05/15/16 2,590 2,713
Altegrity, Inc.
10.500% due 11/01/15 (Þ) 4,270 3,971
AMC Entertainment, Inc.
9.750% due 12/01/20 5,960 5,885
AMC Networks, Inc.
7.750% due 07/15/21 (Þ) 1,865 2,049
American Airlines, Inc.
7.500% due 03/15/16 (Þ) 2,280 1,915
Ameristar Casinos, Inc.
Series WI
7.500% due 04/15/21 1,210 1,289
Amscan Holdings, Inc.
8.750% due 05/01/14 4,000 4,020
Applied Extrusion Technology
Corp.
2nd Lien Term Loan
1.000% due 09/02/15 3,520 3,520
Arch Coal, Inc.
7.000% due 06/15/19 (Þ) 1,950 1,955
ARS Intermediate Holdings LLC
Series AI
13.625% due 11/15/15 (Å) 2,143 2,126
Atkore International, Inc.
Series WI
9.875% due 01/01/18 2,010 1,990
Berry Petroleum Co.
6.750% due 11/01/20 1,305 1,357
Beverages & More, Inc.
9.625% due 10/01/14 (Þ) 4,295 4,456
Principal
Amount ($)
or Shares
Market
Value
$
Cengage Learning Acquisitions, Inc.
10.500% due 01/15/15 (Þ) 6,310 4,591
Century Aluminum Co.
8.000% due 05/15/14 150 153
Charger Merger Corp.
9.875% due 01/15/19 (Å) 560 582
Chemtura Corp.
7.875% due 09/01/18 1,950 2,057
Chesapeake Energy Corp.
6.625% due 08/15/20 1,000 1,005
Chesapeake Oilfield Operating LLC/
Chesapeake Oilfield Finance, Inc.
6.625% due 11/15/19 (Þ) 420 422
CHS/Community Health Systems,
Inc.
8.000% due 11/15/19 (Þ) 1,955 2,006
Citigroup Funding, Inc.
1.000% due 07/25/24 200,000 134
Series emt1
11.000% due 07/27/20 1,800,000 1,221
Series eMt3
11.000% due 07/27/20 1,195,000 811
Claire�s Stores, Inc.
1.000% due 05/29/14 2,684 2,457
8.875% due 03/15/19 4,780 3,920
Clear Channel Communications, Inc.
9.000% due 03/01/21 1,430 1,244
Clear Channel Worldwide Holdings,
Inc.
9.250% due 12/15/17 60 66
Clearwater Paper Corp.
7.125% due 11/01/18 1,900 2,009
CommScope, Inc.
8.250% due 01/15/19 (Þ) 1,835 1,908
Comstock Resources, Inc.
8.375% due 10/15/17 110 106
Copyright © 2012 www.secdatabase.com. All Rights Reserved.Please Consider the Environment Before Printing This Document

88 Russell Global Opportunistic Credit Fund
Brickman Group Holdings, Inc.
9.125% due 11/01/18 (Þ) 2,220 2,048
Building Materials Corp. of
America
7.500% due 03/15/20 (Þ) 1,875 2,032
Bumble Bee Acquisition Corp.
9.000% due 12/15/17 (Þ) 2,832 2,917
C&S Group Enterprises LLC
8.375% due 05/01/17 (Þ) 1,885 2,024
Caesars Entertainment Operating
Co., Inc.
3.294% due 01/28/15 (Ê) 2,480 2,243
10.000% due 12/15/15 980 828
11.250% due 06/01/17 5,545 6,009
Capella Healthcare, Inc.
9.250% due 07/01/17 1,720 1,750
CCH II LLC / CCH II Capital
Corp.
13.500% due 11/30/16 659 760
CCO Holdings LLC / CCO
Holdings Capital Corp.
7.375% due 06/01/20 650 702
6.500% due 04/30/21 1,370 1,425
CDW LLC / CDW Finance Corp.
8.000% due 12/15/18 3,250 3,494
Cott Beverages, Inc.
8.125% due 09/01/18 1,850 2,021
CSC Holdings LLC
6.750% due 11/15/21 (Þ) 895 962
Cumulus Media, Inc.
7.750% due 05/01/19 (Þ) 2,260 2,119
DISH DBS Corp.
6.750% due 06/01/21 1,900 2,071
Dynacast International LLC /
Dynacast Finance, Inc.
9.250% due 07/15/19 (Þ) 600 609
Education Management LLC /
Education Management Finance
Corp.
8.750% due 06/01/14 1,950 1,967
Emdeon, Inc.
11.000% due 12/31/19 (Þ) 1,415 1,528
Emergency Medical Services Corp.
Series WI
8.125% due 06/01/19 3,115 3,177
Entercom Radio LLC
10.500% due 12/01/19 1,840 1,923
Equinox Holdings, Inc.
9.500% due 02/01/16 (Å) 3,040 3,177
Copyright © 2012 www.secdatabase.com. All Rights Reserved.Please Consider the Environment Before Printing This Document

Table of Contents
Russell Investment CompanyRussell Global Opportunistic Credit FundSchedule of Investments, continued �� January 31, 2012 (Unaudited)Amounts in thousands (except share amounts)
Principal
Amount ($)
or Shares
Market
Value
$
FGI Holding Co., Inc.
11.250% due 10/01/15 1,545 1,545
First Data Corp.
7.375% due 06/15/19 (Þ) 1,835 1,830
Foresight Energy LLC / Foresight
Energy Corp.
9.625% due 08/15/17 (Þ) 3,695 3,880
Fresenius Medical Care US
Finance, Inc.
Series 144a
6.500% due 09/15/18 (Þ) 870 933
Graham Packaging Co., LP / GPC
Capital Corp. I
9.875% due 10/15/14 2,500 2,550
Grifols, Inc.
8.250% due 02/01/18 1,435 1,575
GXS Worldwide, Inc.
9.750% due 06/15/15 4,160 4,077
Harbinger Group, Inc.
10.625% due 11/15/15 2,490 2,543
Harrahs Operating Company
Zero coupon due 01/28/15 269 243
HCA Holdings, Inc.
7.750% due 05/15/21 2,495 2,614
Health Management Associates,
Inc.
7.375% due 01/15/20 (Þ) 2,540 2,616
HUB International Holdings, Inc.
9.000% due 12/15/14 (Þ) 2,600 2,649
10.250% due 06/15/15 (Þ) 510 515
Huntington Ingalls Industries, Inc.
6.875% due 03/15/18 (Þ) 590 611
7.125% due 03/15/21 (Þ) 555 580
Icon Health & Fitness
11.875% due 10/15/16 (Þ) 90 71
Principal
Amount ($)
or Shares
Market
Value
$
MedAssets, Inc.
8.000% due 11/15/18 4,080 4,162
Mercer International, Inc.
9.500% due 12/01/17 1,960 2,033
Merrill Communications, LLC
Term Loan B
1.000% due 11/22/12 6,243 5,716
Michaels Stores, Inc.
7.750% due 11/01/18 2,090 2,181
Midwest Gaming Borrower LLC /
Midwest Finance Corp.
11.625% due 04/15/16 (Þ) 1,660 1,838
Midwest Generation LLC
Series B
8.560% due 01/02/16 1,253 1,209
Milk Specialties, Co.
1.000% due 12/27/18 1,500 1,455
Mueller Water Products, Inc.
7.375% due 06/01/17 2,205 2,106
Murray Energy Corp.
10.250% due 10/15/15 (Þ) 1,750 1,767
National Mentor Holdings, Inc.
1.000% due 02/09/17 1,439 1,387
12.500% due 02/15/18 (Þ) 1,590 1,518
NBTY, Inc.
Series WI
9.000% due 10/01/18 2,685 2,967
NCO Group, Inc. Term Loan B
1.000% due 05/15/13 6,424 6,371
New Star Metals, Inc.
1.000% due 06/18/15 (Å) 6,750 6,750
Niska Gas Storage US LLC/Niska
Gas Storage Canada ULC
8.875% due 03/15/18 1,895 1,822
Nortek, Inc.
8.500% due 04/15/21 (Þ) 1,300 1,235
Copyright © 2012 www.secdatabase.com. All Rights Reserved.Please Consider the Environment Before Printing This Document

Russell Global Opportunistic Credit Fund 89
Immucor, Inc.
11.125% due 08/15/19 4,085 4,432
INC Research LLC
11.500% due 07/15/19 (Þ) 1,840 1,693
J Crew Group, Inc.
8.125% due 03/01/19 1,230 1,193
JBS USA LLC/JBS USA Finance,
Inc.
7.250% due 06/01/21 (Þ) 1,110 1,052
JMC Steel Group
8.250% due 03/15/18 (Þ) 1,240 1,271
Kraton Polymers LLC/Kraton
Polymers Capital Corp.
6.750% due 03/01/19 2,110 2,089
Level 3 Financing, Inc.
8.125% due 07/01/19 (Þ) 565 569
8.625% due 07/15/20 (Å) 450 461
Series WI
9.375% due 04/01/19 2,270 2,395
Levi Strauss & Co.
7.750% due 05/15/18 775 1,004
7.625% due 05/15/20 1,500 1,567
Linn Energy LLC/Linn Energy
Finance Corp.
6.500% due 05/15/19 (Þ) 1,960 1,980
North Atlantic Trading Co.
11.500% due 07/15/16 (Þ) 3,060 3,037
19.000% due 01/15/17 (Þ) 1,200 1,146
NRG Energy, Inc.
7.625% due 01/15/18 1,350 1,323
Oasis Petroleum, Inc.
6.500% due 11/01/21 1,190 1,202
Optima Specialty Steel, Inc.
12.500% due 12/15/16 (Þ) 2,030 2,081
Paperworks Industries, Inc. Term
Loan
1.000% due 07/12/16 1,410 1,409
1.000% due 07/20/16 4,478 4,478
Pemex Project Funding Master
Trust
Series REGS
5.500% due 02/24/25 2,100 2,667
Penske Automotive Group, Inc.
7.750% due 12/15/16 1,600 1,656
Pilgrim�s Pride Corp.
7.875% due 12/15/18 2,640 2,515
Pinnacle Entertainment, Inc.
8.750% due 05/15/20 1,898 1,931
Copyright © 2012 www.secdatabase.com. All Rights Reserved.Please Consider the Environment Before Printing This Document

Table of Contents
Russell Investment CompanyRussell Global Opportunistic Credit FundSchedule of Investments, continued �� January 31, 2012 (Unaudited)Amounts in thousands (except share amounts)
Principal
Amount ($)
or Shares
Market
Value
$
Pinnacle Foods Finance LLC /
Pinnacle Foods Finance Corp.
9.250% due 04/01/15 2,000 2,060
Plains Exploration & Production
Co.
6.750% due 02/01/22 1,100 1,196
Ply Gem Industries, Inc.
8.250% due 02/15/18 1,130 1,096
Polymer Group, Inc.
7.750% due 02/01/19 1,960 2,073
Prestige Brands, Inc.
8.125% due 02/01/20 (Å) 1,365 1,416
Production Resource Group, Inc.
8.875% due 05/01/19 (Þ) 1,195 1,075
Radiation Therapy Services, Inc.
9.875% due 04/15/17 3,500 2,441
Realogy Corp.
1.000% due 10/15/17 2,770 2,821
Revlon Consumer Products Corp.
9.750% due 11/15/15 2,000 2,140
Reynolds Group Issuer, Inc. /
Reynolds Group Issuer LLC /
Reynolds Group Issuer Lu
7.125% due 04/15/19 (Þ) 2,400 2,520
7.875% due 08/15/19 (Þ) 398 429
6.875% due 02/15/21 (Þ) 105 109
Roofing Supply Group LLC /
Roofing Supply Finance, Inc.
8.625% due 12/01/17 (Þ) 3,231 3,393
RSC Equipment Rental, Inc./RSC
Holdings III LLC
8.250% due 02/01/21 570 589
Sally Holdings LLC / Sally Capital,
Inc.
6.875% due 11/15/19 (Þ) 1,485 1,589
Principal
Amount ($)
or Shares
Market
Value
$
Stone Energy Corp.
8.625% due 02/01/17 1,220 1,254
Summit Materials LLC / Summit
Materials Finance Corp.
10.500% due 01/31/20 (Å) 1,285 1,307
SunGard Data Systems, Inc.
Series WI
7.625% due 11/15/20 1,450 1,541
Sunstate Equipment Co. LLC/
Sunstate Equipment Co, Inc.
12.000% due 06/15/16 (Þ) 1,460 1,467
Symbion, Inc.
8.000% due 06/15/16 750 705
Tekin Plex, Inc. Term Loan
9.250% due 11/19/15 3,177 2,970
Texas Competitive Electric
Holdings Co. LLC / TCEH
Finance, Inc.
11.500% due 10/01/20 (Þ) 2,475 1,869
Thermadyne Holdings Corp.
9.000% due 12/15/17 3,670 3,854
Tomkins LLC / Tomkins, Inc.
9.000% due 10/01/18 1,835 2,019
TransDigm, Inc.
7.750% due 12/15/18 170 186
TransUnion LLC/TransUnion
Financing Corp.
11.375% due 06/15/18 2,190 2,584
Trimas Corp.
9.750% due 12/15/17 1,750 1,916
UCI International, Inc.
8.625% due 02/15/19 1,605 1,623
United Surgical Partners
International, Inc.
8.875% due 05/01/17 1,700 1,781
9.250% due 05/01/17 70 71
Copyright © 2012 www.secdatabase.com. All Rights Reserved.Please Consider the Environment Before Printing This Document
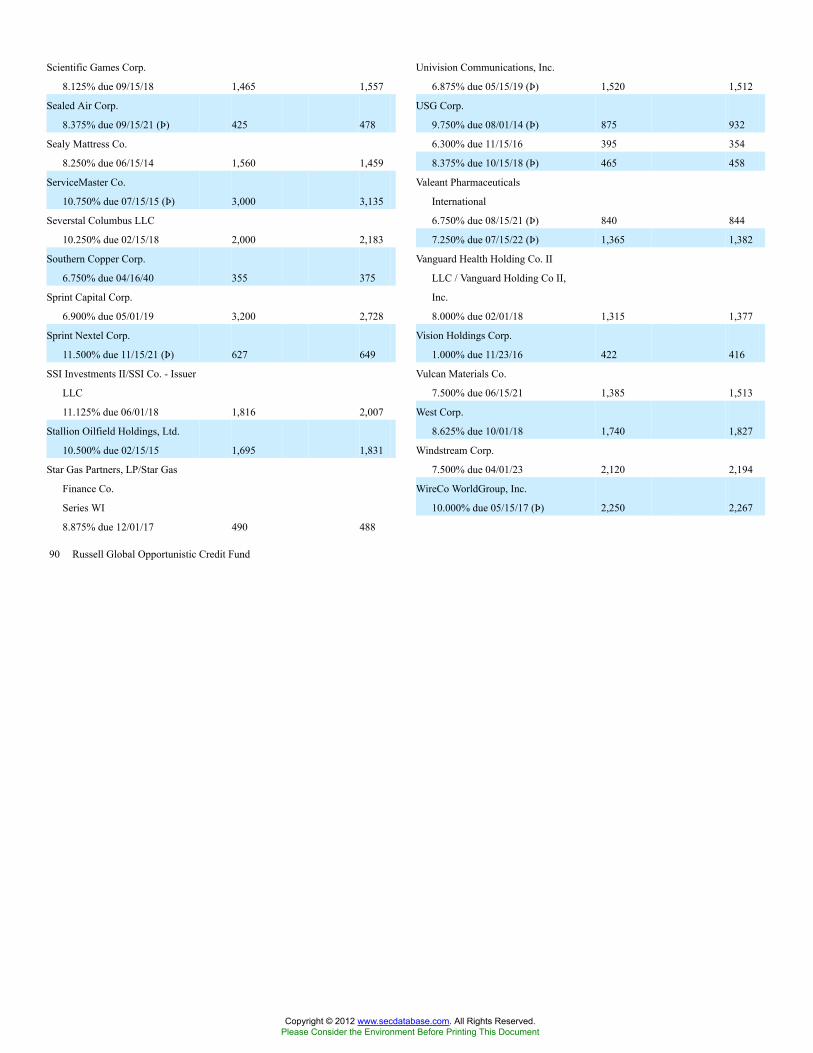
90 Russell Global Opportunistic Credit Fund
Scientific Games Corp.
8.125% due 09/15/18 1,465 1,557
Sealed Air Corp.
8.375% due 09/15/21 (Þ) 425 478
Sealy Mattress Co.
8.250% due 06/15/14 1,560 1,459
ServiceMaster Co.
10.750% due 07/15/15 (Þ) 3,000 3,135
Severstal Columbus LLC
10.250% due 02/15/18 2,000 2,183
Southern Copper Corp.
6.750% due 04/16/40 355 375
Sprint Capital Corp.
6.900% due 05/01/19 3,200 2,728
Sprint Nextel Corp.
11.500% due 11/15/21 (Þ) 627 649
SSI Investments II/SSI Co. - Issuer
LLC
11.125% due 06/01/18 1,816 2,007
Stallion Oilfield Holdings, Ltd.
10.500% due 02/15/15 1,695 1,831
Star Gas Partners, LP/Star Gas
Finance Co.
Series WI
8.875% due 12/01/17 490 488
Univision Communications, Inc.
6.875% due 05/15/19 (Þ) 1,520 1,512
USG Corp.
9.750% due 08/01/14 (Þ) 875 932
6.300% due 11/15/16 395 354
8.375% due 10/15/18 (Þ) 465 458
Valeant Pharmaceuticals
International
6.750% due 08/15/21 (Þ) 840 844
7.250% due 07/15/22 (Þ) 1,365 1,382
Vanguard Health Holding Co. II
LLC / Vanguard Holding Co II,
Inc.
8.000% due 02/01/18 1,315 1,377
Vision Holdings Corp.
1.000% due 11/23/16 422 416
Vulcan Materials Co.
7.500% due 06/15/21 1,385 1,513
West Corp.
8.625% due 10/01/18 1,740 1,827
Windstream Corp.
7.500% due 04/01/23 2,120 2,194
WireCo WorldGroup, Inc.
10.000% due 05/15/17 (Þ) 2,250 2,267
Copyright © 2012 www.secdatabase.com. All Rights Reserved.Please Consider the Environment Before Printing This Document

Table of Contents
Russell Investment CompanyRussell Global Opportunistic Credit FundSchedule of Investments, continued �� January 31, 2012 (Unaudited)Amounts in thousands (except share amounts)
Principal
Amount ($)
or Shares
Market
Value
$
WMG Acquisition Corp.
9.500% due 06/15/16 1,465 1,593
9.500% due 06/15/16 (Þ) 75 82
11.500% due 10/01/18 (Þ) 1,660 1,693
311,462
Uruguay - 0.8%Uruguay Government International
Bond
9.250% due 05/17/17 302 399
8.000% due 11/18/22 2,755 3,752
6.875% due 09/28/25 828 1,070
7.625% due 03/21/36 716 988
6,209
Venezuela, Bolivarian Republic of - 2.5%Bogota Distrito Capital
9.750% due 07/26/28 800,000 609
Petroleos de Venezuela SA
Series 2014
4.900% due 10/28/14 13,860 11,642
Series 2015
5.000% due 10/28/15 183 140
Series REGS
8.500% due 11/02/17 854 677
Venezuela Government International
Bond
Series REGS
12.750% due 08/23/22 6,771 6,483
19,551
Virgin Islands, British - 0.6%Gold Fields Orogen Holding BVI, Ltd.
Series REGS
4.875% due 10/07/20 869 824
Mega Advance Investments, Ltd.
5.000% due 05/12/21 (Þ) 405 419
Principal
Amount ($)
or Shares
Market
Value
$
Short-Term Investments - 9.6%Brazil - 0.1%JPMorgan Chase Bank NA
12.750% due 07/10/12 200 1,144
Germany - 0.1%Deutsche Bank AG/London
10.576% due 12/22/12 (Ê)(Þ) 500 500
Kazakhstan - 0.1%BTA Bank JSC
12.500% due 01/01/13 (Þ) 783 147
Series REGS
12.500% due 01/01/13 1,348 253
400
Ukraine - 0.5%Ukraine Government International
Bond
Series REGS
6.385% due 06/26/12 4,000 3,985
United States - 8.9%Citigroup Funding, Inc.
10.000% due 07/18/12 (Å) 200 1,143
1.000% due 07/20/12 510 2,693
Series EMTn
10.000% due 05/11/12 390 2,059
JPMorgan Chase Bank NA
Series gmtn
Zero coupon due 02/16/12 560 2,987
PT Bakrie & Brothers, TBK
Zero coupon due 01/18/13 444 444
Russell U.S. Cash Management Fund 61,639,757 (¥) 61,640
70,966
Total Short-Term Investments(cost $76,341) 76,995
Copyright © 2012 www.secdatabase.com. All Rights Reserved.Please Consider the Environment Before Printing This Document
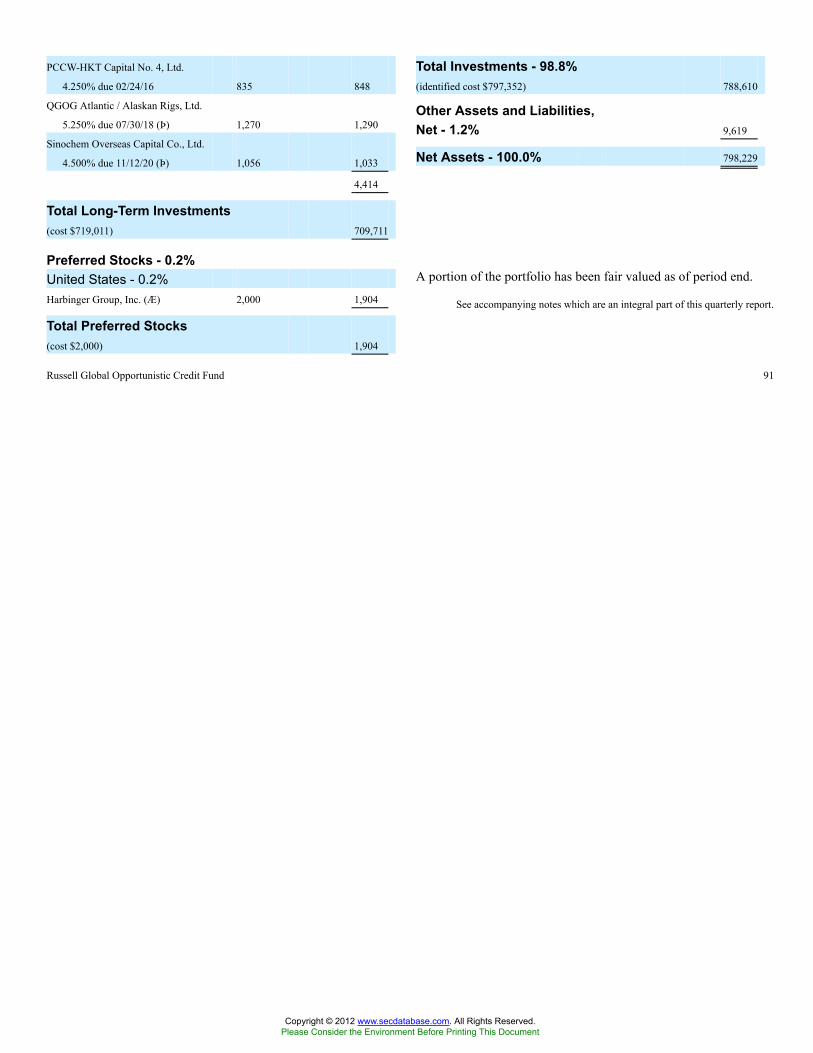
See accompanying notes which are an integral part of this quarterly report.
Russell Global Opportunistic Credit Fund 91
PCCW-HKT Capital No. 4, Ltd.
4.250% due 02/24/16 835 848
QGOG Atlantic / Alaskan Rigs, Ltd.
5.250% due 07/30/18 (Þ) 1,270 1,290
Sinochem Overseas Capital Co., Ltd.
4.500% due 11/12/20 (Þ) 1,056 1,033
4,414
Total Long-Term Investments(cost $719,011) 709,711
Preferred Stocks - 0.2%United States - 0.2%Harbinger Group, Inc. (Æ) 2,000 1,904
Total Preferred Stocks(cost $2,000) 1,904
Total Investments - 98.8%(identified cost $797,352) 788,610
Other Assets and Liabilities,Net - 1.2% 9,619
Net Assets - 100.0% 798,229
A portion of the portfolio has been fair valued as of period end.
Copyright © 2012 www.secdatabase.com. All Rights Reserved.Please Consider the Environment Before Printing This Document
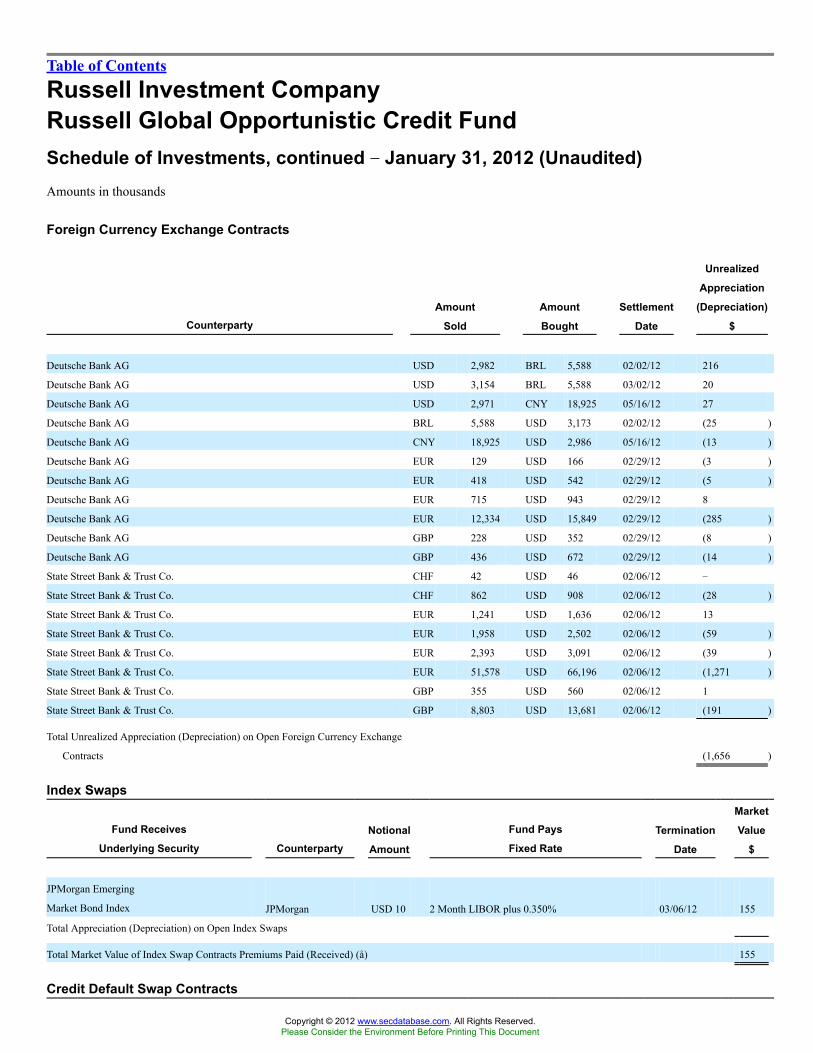
Table of Contents
Russell Investment CompanyRussell Global Opportunistic Credit FundSchedule of Investments, continued �� January 31, 2012 (Unaudited)Amounts in thousands
Foreign Currency Exchange Contracts
CounterpartyAmount
Sold
Amount
Bought
Settlement
Date
Unrealized
Appreciation
(Depreciation)
$
Deutsche Bank AG USD 2,982 BRL 5,588 02/02/12 216
Deutsche Bank AG USD 3,154 BRL 5,588 03/02/12 20
Deutsche Bank AG USD 2,971 CNY 18,925 05/16/12 27
Deutsche Bank AG BRL 5,588 USD 3,173 02/02/12 (25 )
Deutsche Bank AG CNY 18,925 USD 2,986 05/16/12 (13 )
Deutsche Bank AG EUR 129 USD 166 02/29/12 (3 )
Deutsche Bank AG EUR 418 USD 542 02/29/12 (5 )
Deutsche Bank AG EUR 715 USD 943 02/29/12 8
Deutsche Bank AG EUR 12,334 USD 15,849 02/29/12 (285 )
Deutsche Bank AG GBP 228 USD 352 02/29/12 (8 )
Deutsche Bank AG GBP 436 USD 672 02/29/12 (14 )
State Street Bank & Trust Co. CHF 42 USD 46 02/06/12 �
State Street Bank & Trust Co. CHF 862 USD 908 02/06/12 (28 )
State Street Bank & Trust Co. EUR 1,241 USD 1,636 02/06/12 13
State Street Bank & Trust Co. EUR 1,958 USD 2,502 02/06/12 (59 )
State Street Bank & Trust Co. EUR 2,393 USD 3,091 02/06/12 (39 )
State Street Bank & Trust Co. EUR 51,578 USD 66,196 02/06/12 (1,271 )
State Street Bank & Trust Co. GBP 355 USD 560 02/06/12 1
State Street Bank & Trust Co. GBP 8,803 USD 13,681 02/06/12 (191 )
Total Unrealized Appreciation (Depreciation) on Open Foreign Currency Exchange
Contracts (1,656 )
Index Swaps
Fund Receives
Underlying Security CounterpartyNotional
Amount
Fund Pays
Fixed RateTermination
Date
Market
Value
$
JPMorgan Emerging
Market Bond Index JPMorgan USD 10 2 Month LIBOR plus 0.350% 03/06/12 155
Total Appreciation (Depreciation) on Open Index Swaps
Total Market Value of Index Swap Contracts Premiums Paid (Received) (å) 155
Credit Default Swap Contracts
Copyright © 2012 www.secdatabase.com. All Rights Reserved.Please Consider the Environment Before Printing This Document

Credit Indices
Reference
Entity CounterpartyNotional
Amount
Fund (Pays)/
Receives
Fixed Rate
Termination
Date
Market
Value
$
Dow Jones CDX Index Morgan Stanley USD 1,960 5.000% 12/20/16 (53 )
Dow Jones CDX Index Morgan Stanley USD 3,000 5.000% 12/20/16 (81 )
Dow Jones CDX Index Morgan Stanley USD 6,860 5.000% 12/20/16 (185 )
Total Market Value on Open Credit Default Swap Contracts Premiums Paid (Received) - ($1,104) (å) (319 )
See accompanying notes which are an integral part of this quarterly report.
92 Russell Global Opportunistic Credit Fund
Copyright © 2012 www.secdatabase.com. All Rights Reserved.Please Consider the Environment Before Printing This Document
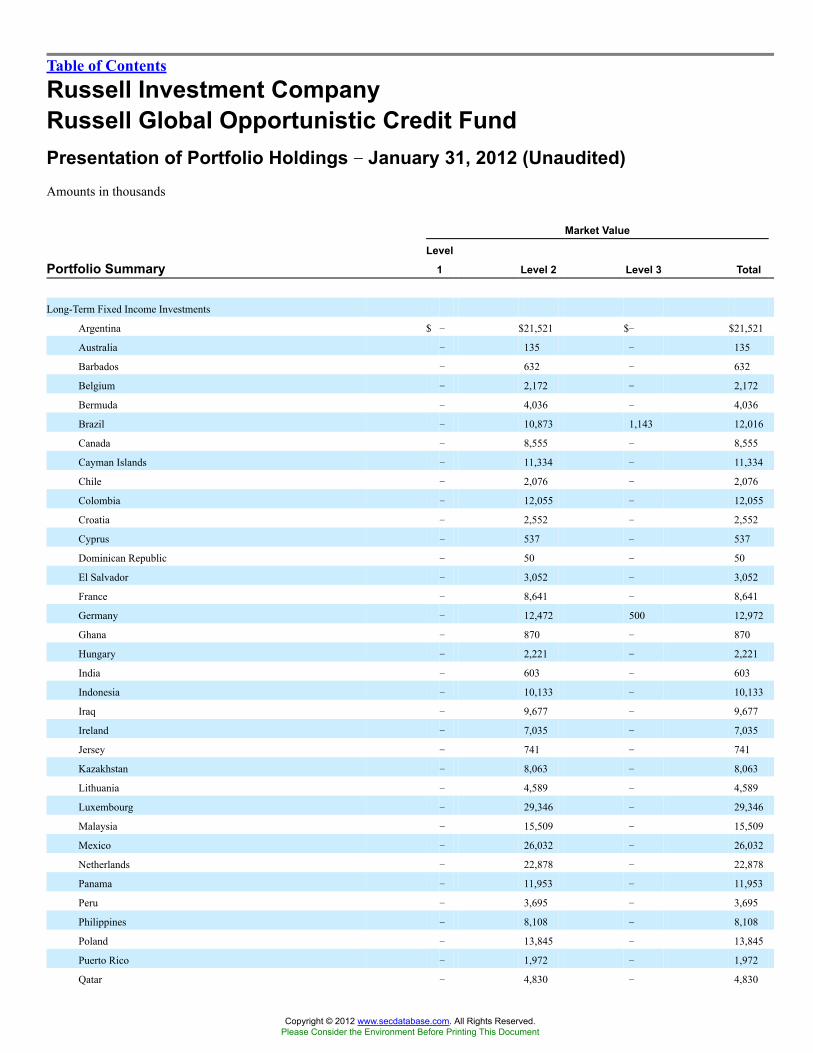
Table of Contents
Russell Investment CompanyRussell Global Opportunistic Credit FundPresentation of Portfolio Holdings �� January 31, 2012 (Unaudited)Amounts in thousands
Market Value
Portfolio SummaryLevel
1 Level 2 Level 3 Total
Long-Term Fixed Income Investments
Argentina $ � $21,521 $� $21,521
Australia � 135 � 135
Barbados � 632 � 632
Belgium � 2,172 � 2,172
Bermuda � 4,036 � 4,036
Brazil � 10,873 1,143 12,016
Canada � 8,555 � 8,555
Cayman Islands � 11,334 � 11,334
Chile � 2,076 � 2,076
Colombia � 12,055 � 12,055
Croatia � 2,552 � 2,552
Cyprus � 537 � 537
Dominican Republic � 50 � 50
El Salvador � 3,052 � 3,052
France � 8,641 � 8,641
Germany � 12,472 500 12,972
Ghana � 870 � 870
Hungary � 2,221 � 2,221
India � 603 � 603
Indonesia � 10,133 � 10,133
Iraq � 9,677 � 9,677
Ireland � 7,035 � 7,035
Jersey � 741 � 741
Kazakhstan � 8,063 � 8,063
Lithuania � 4,589 � 4,589
Luxembourg � 29,346 � 29,346
Malaysia � 15,509 � 15,509
Mexico � 26,032 � 26,032
Netherlands � 22,878 � 22,878
Panama � 11,953 � 11,953
Peru � 3,695 � 3,695
Philippines � 8,108 � 8,108
Poland � 13,845 � 13,845
Puerto Rico � 1,972 � 1,972
Qatar � 4,830 � 4,830
Copyright © 2012 www.secdatabase.com. All Rights Reserved.Please Consider the Environment Before Printing This Document

Russia � 24,630 � 24,630
Singapore � 1,537 � 1,537
South Africa � 15,630 � 15,630
South Korea � 928 � 928
Spain � 6,907 � 6,907
Sweden � 2,251 � 2,251
Turkey � 9,735 � 9,735
Ukraine � 3,308 � 3,308
United Arab Emirates � 818 � 818
United Kingdom � 17,895 � 17,895
United States � 283,465 27,997 311,462
Uruguay � 6,209 � 6,209
Venezuela, Bolivarian Republic of � 19,551 � 19,551
Virgin Islands, British � 4,414 � 4,414
Preferred Stocks � � 1,904 1,904
Short-Term Investments � 76,995 � 76,995
Total Investments $ $680,471 $108,139 $788,610
See accompanying notes which are an integral part of this quarterly report.
Russell Global Opportunistic Credit Fund 93
Copyright © 2012 www.secdatabase.com. All Rights Reserved.Please Consider the Environment Before Printing This Document

Table of Contents
Russell Investment CompanyRussell Global Opportunistic Credit FundPresentation of Portfolio Holdings �� January 31, 2012 (Unaudited)Amounts in thousands
Market Value
Portfolio Summary Level 1 Level 2 Level 3 Total
Other Financial Instruments
Foreign Currency Exchange Contracts $ � $(1,656 ) $ � $(1,656)
Credit Default Swap Contracts � (319 ) � (319 )
Index Swap Contracts � 155 � 155
Total Other Financial Instruments* $ � $(1,820 ) $ � $(1,820)
* Other financial instruments reflected, such as futures, forwards, interest rate swaps, and credit default swaps are valued at the unrealized appreciation/depreciation
on the instruments.
For a description of the levels see note 2 in the Notes to Quarterly Report.
A reconciliation of investments in which significant unobservable inputs (Level 3) were used in determining a value for the periodending January 31, 2012 were as follows:
Category and Subcategory
Beginning
Balance
11/1/2011
Gross
Purchases
Gross
Sales
Accrued
Discounts/
(Premiums)
Realized
Gain/
(Loss)
Long-Term Fixed Income Investments
Brazil $ 1,147 $ � $� $ � $ �
Germany � 500 � � �
United States 31,199 7,644 10,807 (1 ) (223 )
Preferred Stock 1,910 � � � �
Total Investments 34,256 8,144 10,807 (1 ) (223 )
Category and Subcategory
Net
Transfers
Level 3
Net
Transfers
Level 3
Net change
in Unrealized
(Depreciation)
Ending
1/31/
2012
Change in
Unrealized
Appreciation/
(Depreciation)
on Investments
still held as of
1/31/2012
Long-Term Fixed Income Investments
Brazil $ � $ � $ (4 ) $1,143 $ (4 )
Germany � � � 500 �
United States � � 185 27,997 174
Preferred Stock � � (6 ) 1,904 (6 )
Total Investments � � 175 31,544 164
Copyright © 2012 www.secdatabase.com. All Rights Reserved.Please Consider the Environment Before Printing This Document

See accompanying notes which are an integral part of this quarterly report.
94 Russell Global Opportunistic Credit Fund
Copyright © 2012 www.secdatabase.com. All Rights Reserved.Please Consider the Environment Before Printing This Document

Table of Contents
Russell Investment CompanyRussell Strategic Bond Fund
Schedule of Investments �� January 31, 2012 (Unaudited)Amounts in thousands (except share amounts)
Principal
Amount ($)
or Shares
Market
Value
$
Long-Term Investments - 94.8%Asset-Backed Securities - 7.5%Aames Mortgage Investment Trust
Series 2006-1 Class A3
0.436% due 04/25/36 (Ê) 4,721 3,306
Accredited Mortgage Loan Trust
Series 2005-4 Class A2D
0.596% due 12/25/35 (Ê) 1,388 858
ACE Securities Corp.
Series 2005-HE2 Class M3
0.756% due 04/25/35 (Ê) 2,365 1,925
Series 2005-HE5 Class M1
0.746% due 08/25/35 (Ê) 829 805
Series 2005-SD3 Class A
0.676% due 08/25/45 (Ê) 565 533
Series 2006-HE2 Class A2C
0.436% due 05/25/36 (Ê) 3,208 1,873
Series 2006-HE4 Class A2A
0.336% due 10/25/36 (Ê) 154 38
Series 2006-OP2 Class A2C
0.426% due 08/25/36 (Ê) 11,298 4,177
Ally Master Owner Trust
Series 2011-3 Class A2
1.810% due 05/15/16 9,515 9,637
AmeriCredit Automobile
Receivables Trust
Series 2010-4 Class A2
0.960% due 05/08/14 3,138 3,139
Series 2010-4 Class B
1.990% due 10/08/15 3,505 3,540
Series 2011-3 Class B
2.280% due 06/08/16 6,530 6,544
Series 2012-1
0.447% due 02/08/13 11,735 11,735
Ameriquest Mortgage Securities,
Inc. 3 4
Principal
Amount ($)
or Shares
Market
Value
$
Series 2004-HE7 Class M9
3.776% due 10/25/34 (Ê)(Þ) 1,081 201
Series 2005-HE6 Class M3
0.806% due 07/25/35 (Ê) 2,106 1,174
Series 2006-HE3 Class A4
0.446% due 03/25/36 (Ê) 3,429 2,516
Series 2006-HE5 Class A5
0.516% due 07/25/36 (Ê) 8,729 2,972
Bayview Financial Acquisition
Trust
Series 2004-C Class A1
0.901% due 05/28/44 (Ê) 194 179
Series 2006-A Class 1A3
5.865% due 02/28/41 1,880 1,414
Bear Stearns Asset Backed
Securities Trust
Series 2006-HE8 Class 2M1
0.606% due 10/25/36 (Ê) 1,829 152
Series 2007-HE5 Class 1A2
0.456% due 06/25/47 (Ê) 3,500 2,547
BNC Mortgage Loan Trust
Series 2007-2 Class A2
0.376% due 05/25/37 (Ê) 317 282
Brazos Higher Education Authority
Series 2005-3 Class A14
0.684% due 09/25/23 (Ê) 5,394 5,336
Series 2010-1 Class A1
1.406% due 05/25/29 (Ê) 1,744 1,732
Series 2010-1 Class A2
1.706% due 02/25/35 (Ê) 5,000 4,547
Series 2011-1 Class A2
1.306% due 02/25/30 (Ê) 9,000 8,757
Series 2011-2 Class A2
1.410% due 07/25/29 (Ê) 9,200 8,961
CarMax Auto Owner Trust
Series 2010-1 Class A3
1.560% due 07/15/14 2,803 2,818
Copyright © 2012 www.secdatabase.com. All Rights Reserved.Please Consider the Environment Before Printing This Document

Russell Strategic Bond Fund 95
Series 2004-R10 Class A5
0.666% due 11/25/34 (Ê)
Series 2005-R3 Class A1A
0.476% due 05/25/35 (Ê) 1,277 1,252
Series 2005-R6 Class A2
0.476% due 08/25/35 (Ê) 4,381 4,120
Series 2005-R10 Class A2B
0.496% due 12/25/35 (Ê) 511 478
Argent Securities, Inc.
Series 2005-W2 Class A2B1
0.476% due 10/25/35 (Ê) 3,655 3,312
Series 2005-W2 Class A2B2
0.536% due 10/25/35 (Ê) 654 590
Series 2005-W5 Class A2D
0.596% due 01/25/36 (Ê) 7,650 2,772
Asset Backed Funding Certificates
Series 2006-HE1 Class A2C
0.436% due 01/25/37 (Ê) 21,085 6,861
Asset Backed Securities Corp.
Home Equity
Series 2003-HE1 Class M2
3.810% due 01/15/33 (Ê) 1,986 1,797
Series 2004-HE6 Class A1
0.551% due 09/25/34 (Ê) 80 71
Carrington Mortgage Loan Trust
Series 2006-NC1 Class A4
0.586% due 01/25/36 (Ê) 18,100 6,113
Centex Home Equity
Series 2002-D Class AF4
5.210% due 11/25/28 111 109
Series 2006-A Class AV4
0.526% due 06/25/36 (Ê) 1,800 995
Chase Issuance Trust
Series 2007-A17 Class A
5.120% due 10/15/14 3,105 3,207
CIT Education Loan Trust
Series 2007-1 Class A
0.664% due 03/25/42 (Ê)(Þ) 5,332 4,812
CIT Mortgage Loan Trust
Series 2007-1 Class 2A1
1.276% due 10/25/37 (Å)(Ê) 591 586
Series 2007-1 Class 2A2
1.526% due 10/25/37 (Å)(Ê) 2,100 1,587
Series 2007-1 Class 2A3
1.726% due 10/25/37 (Å)(Ê) 3,900 1,663
Copyright © 2012 www.secdatabase.com. All Rights Reserved.Please Consider the Environment Before Printing This Document
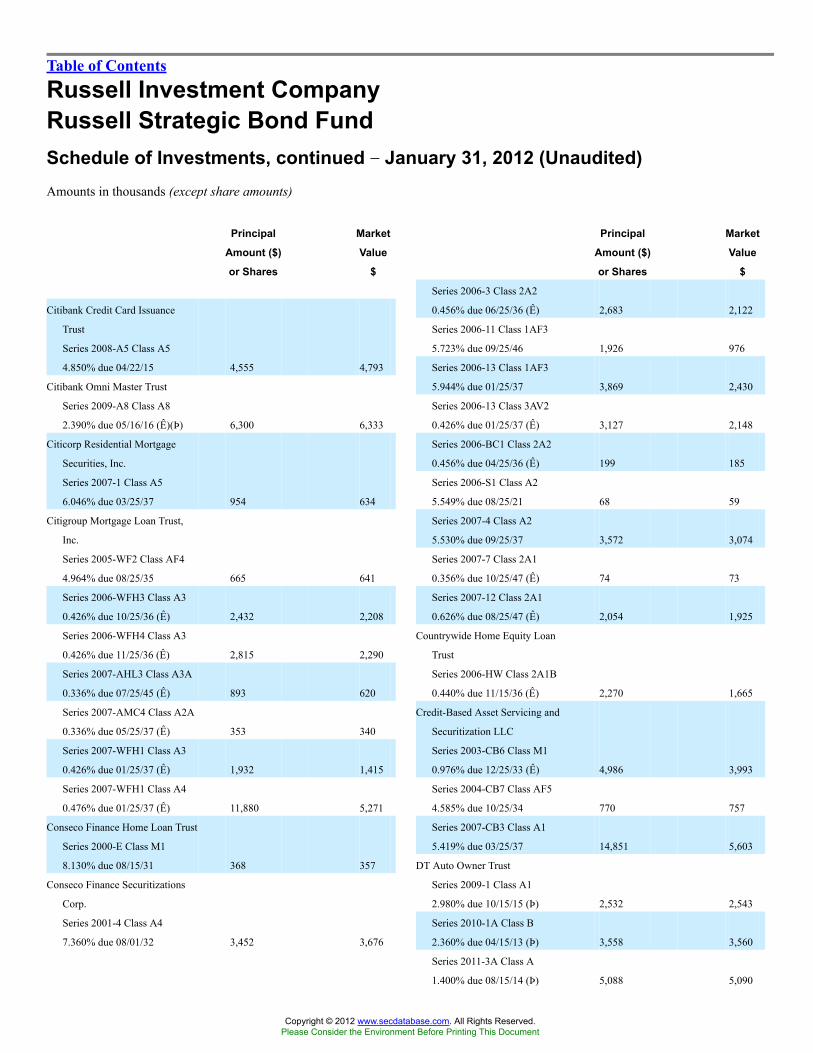
Table of Contents
Russell Investment CompanyRussell Strategic Bond FundSchedule of Investments, continued �� January 31, 2012 (Unaudited)Amounts in thousands (except share amounts)
Principal
Amount ($)
or Shares
Market
Value
$
Citibank Credit Card Issuance
Trust
Series 2008-A5 Class A5
4.850% due 04/22/15 4,555 4,793
Citibank Omni Master Trust
Series 2009-A8 Class A8
2.390% due 05/16/16 (Ê)(Þ) 6,300 6,333
Citicorp Residential Mortgage
Securities, Inc.
Series 2007-1 Class A5
6.046% due 03/25/37 954 634
Citigroup Mortgage Loan Trust,
Inc.
Series 2005-WF2 Class AF4
4.964% due 08/25/35 665 641
Series 2006-WFH3 Class A3
0.426% due 10/25/36 (Ê) 2,432 2,208
Series 2006-WFH4 Class A3
0.426% due 11/25/36 (Ê) 2,815 2,290
Series 2007-AHL3 Class A3A
0.336% due 07/25/45 (Ê) 893 620
Series 2007-AMC4 Class A2A
0.336% due 05/25/37 (Ê) 353 340
Series 2007-WFH1 Class A3
0.426% due 01/25/37 (Ê) 1,932 1,415
Series 2007-WFH1 Class A4
0.476% due 01/25/37 (Ê) 11,880 5,271
Conseco Finance Home Loan Trust
Series 2000-E Class M1
8.130% due 08/15/31 368 357
Conseco Finance Securitizations
Corp.
Series 2001-4 Class A4
7.360% due 08/01/32 3,452 3,676
Principal
Amount ($)
or Shares
Market
Value
$
Series 2006-3 Class 2A2
0.456% due 06/25/36 (Ê) 2,683 2,122
Series 2006-11 Class 1AF3
5.723% due 09/25/46 1,926 976
Series 2006-13 Class 1AF3
5.944% due 01/25/37 3,869 2,430
Series 2006-13 Class 3AV2
0.426% due 01/25/37 (Ê) 3,127 2,148
Series 2006-BC1 Class 2A2
0.456% due 04/25/36 (Ê) 199 185
Series 2006-S1 Class A2
5.549% due 08/25/21 68 59
Series 2007-4 Class A2
5.530% due 09/25/37 3,572 3,074
Series 2007-7 Class 2A1
0.356% due 10/25/47 (Ê) 74 73
Series 2007-12 Class 2A1
0.626% due 08/25/47 (Ê) 2,054 1,925
Countrywide Home Equity Loan
Trust
Series 2006-HW Class 2A1B
0.440% due 11/15/36 (Ê) 2,270 1,665
Credit-Based Asset Servicing and
Securitization LLC
Series 2003-CB6 Class M1
0.976% due 12/25/33 (Ê) 4,986 3,993
Series 2004-CB7 Class AF5
4.585% due 10/25/34 770 757
Series 2007-CB3 Class A1
5.419% due 03/25/37 14,851 5,603
DT Auto Owner Trust
Series 2009-1 Class A1
2.980% due 10/15/15 (Þ) 2,532 2,543
Series 2010-1A Class B
2.360% due 04/15/13 (Þ) 3,558 3,560
Series 2011-3A Class A
1.400% due 08/15/14 (Þ) 5,088 5,090
Copyright © 2012 www.secdatabase.com. All Rights Reserved.Please Consider the Environment Before Printing This Document

96 Russell Strategic Bond Fund
Conseco Financial Corp.
Series 1997-5 Class A6
6.820% due 05/15/29 213 224
Series 1997-7 Class A6
6.760% due 07/15/29 492 530
Countrywide Asset-Backed
Certificates
Series 2004-6 Class 2A5
0.666% due 11/25/34 (Ê) 407 352
Series 2005-4 Class AF3
4.456% due 10/25/35 277 267
Series 2005-6 Class M1
0.766% due 12/25/35 (Ê) 1,168 1,113
Series 2005-7 Class AF3
4.454% due 10/25/35 41 40
Series 2005-11 Class 3AV2
0.566% due 02/25/36 (Ê) 77 77
Series 2005-11 Class 3AV3
0.696% due 02/25/36 (Ê) 2,428 2,364
Series 2005-11 Class MV1
0.746% due 02/25/36 (Ê) 1,946 1,569
Series 2005-12 Class 2A3
5.069% due 02/25/36 592 533
Series 2005-17 Class 4A2A
0.536% due 05/25/36 (Ê) 2,132 1,819
Series 2005-AB1 Class A2
0.486% due 08/25/35 (Ê) 15 15
Education Funding Capital Trust I
Series 2004-1 Class A2
0.706% due 12/15/22 (Ê) 2,169 2,156
Educational Services of America,
Inc.
Series 2010-1 Class A1
1.410% due 07/25/23 (Å)(Ê) 2,951 2,897
Equifirst Mortgage Loan Trust
Series 2003-2 Class M2
1.976% due 09/25/33 (Ê) 2,582 2,192
Fannie Mae Grantor Trust
Series 2003-T4 Class 2A5
5.407% due 09/26/33 710 755
Federal Home Loan Mortgage
Corp. Structured Pass Through
Securities
Series 2000-30 Class A5
6.704% due 12/25/30 487 533
First Franklin Mortgage Loan
Asset Backed Certificates
Series 2005-FF3 Class M1
0.676% due 04/25/35 (Ê) 2,480 2,389
Copyright © 2012 www.secdatabase.com. All Rights Reserved.Please Consider the Environment Before Printing This Document

Table of Contents
Russell Investment CompanyRussell Strategic Bond FundSchedule of Investments, continued �� January 31, 2012 (Unaudited)Amounts in thousands (except share amounts)
Principal
Amount ($)
or Shares
Market
Value
$
Series 2005-FF4 Class M1
0.706% due 05/25/35 (Ê) 573 430
Series 2005-FF5 Class M1
0.726% due 03/25/35 (Ê) 2,782 2,602
Series 2005-FF10 Class A4
0.596% due 11/25/35 (Ê) 9,178 7,224
Series 2006-FF9 Class M1
0.526% due 06/25/36 (Ê) 8,330 258
Series 2006-FF10 Class A5
0.586% due 07/25/36 (Ê) 1,378 230
Series 2006-FF15 Class A5
0.436% due 11/25/36 (Ê) 5,321 2,141
Series 2007-FF1 Class A2B
0.366% due 01/25/38 (Ê) 15,588 7,647
Series 2007-FF1 Class A2C
0.416% due 01/25/38 (Ê) 15,010 5,617
First NLC Trust
Series 2005-2 Class AV2
0.576% due 09/25/35 (Ê) 45 45
Ford Credit Floorplan Master
Owner Trust
Series 2010-5 Class A1
1.500% due 09/15/15 4,380 4,424
Fremont Home Loan Trust
Series 2006-E Class 2A1
0.336% due 01/25/37 (Ê) 34 32
GCO Education Loan Funding
Trust
Series 2006-1 Class A10L
0.696% due 02/27/28 (Ê) 700 601
Series 2006-1 Class A11L
0.736% due 05/25/36 (Ê) 1,400 1,170
Series 2006-1 Class A8L
0.636% due 05/25/25 (Ê) 5,100 4,677
Principal
Amount ($)
or Shares
Market
Value
$
Series 2005-6 Class M1
0.746% due 12/25/35 (Ê) 525 391
Series 2005-7 Class M1
0.726% due 01/25/36 (Ê) 6,285 2,563
HSBC Home Equity Loan Trust
Series 2005-1 Class A
0.571% due 01/20/34 (Ê) 1,972 1,785
Series 2006-2 Class A1
0.431% due 03/20/36 (Ê) 3,549 3,278
Series 2007-1 Class AS
0.481% due 03/20/36 (Ê) 3,149 2,688
Series 2007-2 Class A3V
0.501% due 07/20/36 (Ê) 5,360 4,821
Series 2007-3 Class APT
1.481% due 11/20/36 (Ê) 3,715 3,283
HSI Asset Securitization Corp. Trust
Series 2007-WF1 Class 2A4
0.526% due 05/25/37 (Ê) 9,069 3,870
Indymac Residential Asset Backed
Trust
Series 2006-H2 Class A
0.421% due 06/28/36 (Ê) 1,243 542
JP Morgan Mortgage Acquisition
Corp.
Series 2007-CH1 Class AV4
0.406% due 11/25/36 (Ê) 2,777 2,200
Series 2007-CH1 Class MV1
0.506% due 11/25/36 (Ê) 2,374 1,447
Series 2007-CH2 Class AV4
0.426% due 01/25/37 (Ê) 22,370 10,216
Series 2007-HE1 Class AV1
0.336% due 03/25/47 (Ê) 134 111
Series 2007-HE1 Class AV3
0.466% due 03/25/47 (Ê) 9,263 2,972
KnowledgeWorks Foundation
Series 2010-1 Class A
1.456% due 02/25/42 (Ê) 1,989 1,923
Copyright © 2012 www.secdatabase.com. All Rights Reserved.Please Consider the Environment Before Printing This Document

Russell Strategic Bond Fund 97
GE Equipment Midticket LLC
Series 2009-1 Class A3
2.340% due 06/17/13 101 101
GMAC Mortgage Corp. Loan Trust
Series 2007-HE3 Class 1A1
7.000% due 09/25/37 735 538
Series 2007-HE3 Class 2A1
7.000% due 09/25/37 991 694
Goal Capital Funding Trust
Series 2010-1 Class A
1.206% due 08/25/48 (Ê)(Þ) 3,152 2,947
Green Tree Financial Corp.
Series 1994-1 Class A5
7.650% due 04/15/19 1,387 1,469
GSAA Trust
Series 2006-2 Class 2A3
0.546% due 12/25/35 (Ê) 3,270 2,957
GSAMP Trust
Series 2007-FM1 Class A2A
0.346% due 12/25/36 (Ê) 716 471
Series 2007-H1 Class M1
0.616% due 01/25/47 (Ê) 3,621 57
Home Equity Asset Trust
Series 2005-5 Class 2A2
0.526% due 11/25/35 (Ê) 127 127
Lehman XS Trust
Series 2006-9 Class A1B
0.436% due 05/25/46 (Ê) 1,772 1,093
Series 2006-13 Class 1A2
0.446% due 09/25/36 (Ê) 1,707 998
Series 2006-19 Class A2
0.446% due 12/25/36 (Ê) 2,593 1,574
Series 2006-4N Class A2A
0.496% due 04/25/46 (Ê) 2,928 1,444
Long Beach Mortgage Loan Trust
Series 2002-5 Class M1
1.521% due 11/25/32 (Ê) 2,457 1,739
Series 2004-4 Class 1A1
0.836% due 10/25/34 (Ê) 39 28
Series 2004-4 Class M1
1.176% due 10/25/34 (Ê) 10,600 7,429
Series 2004-6 Class A3
1.576% due 11/25/34 (Ê) 4,284 3,291
Massachusetts Educational
Financing Authority
Series 2008-1 Class A1
1.510% due 04/25/38 (Ê) 3,503 3,497
Copyright © 2012 www.secdatabase.com. All Rights Reserved.Please Consider the Environment Before Printing This Document

Table of Contents
Russell Investment CompanyRussell Strategic Bond FundSchedule of Investments, continued �� January 31, 2012 (Unaudited)Amounts in thousands (except share amounts)
Principal
Amount ($)
or Shares
Market
Value
$
Mastr Asset Backed Securities Trust
Series 2005-WMC1 Class M2
0.726% due 03/25/35 (Ê) 3,850 3,406
Series 2006-AB1 Class A2
0.506% due 02/25/36 (Ê) 6,521 5,572
Series 2007-HE1 Class A1
0.356% due 05/25/37 (Ê) 253 228
Mid-State Trust
Series 2010-1 Class M
5.250% due 12/15/45 (Þ) 4,170 4,393
Missouri Higher Education Loan
Authority
Series 2010-1 Class A1
1.456% due 11/26/32 (Ê) 5,454 5,255
MMCA Automobile Trust
Series 2012-A Class A1
0.601% due 02/04/13 (Å) 10,790 10,789
Morgan Stanley ABS Capital I
Series 2005-HE2 Class M1
0.676% due 01/25/35 (Ê) 2,243 1,648
Series 2006-HE1 Class A3
0.456% due 01/25/36 (Ê) 2,671 2,351
Series 2006-HE2 Class M1
0.606% due 03/25/36 (Ê) 10,623 162
Series 2006-HE2 Class M2
0.626% due 03/25/36 (Ê) 136 �
Series 2006-HE3 Class A2C
0.436% due 04/25/36 (Ê) 1,003 643
Series 2006-HE3 Class M2
0.576% due 04/25/36 (Ê) 1,156 1
Series 2006-HE5 Class A2D
0.526% due 08/25/36 (Ê) 3,650 1,145
Series 2006-NC2 Class A2D
0.566% due 02/25/36 (Ê) 11,837 4,263
Series 2006-WMC2 Class A2FP
0.326% due 07/25/36 (Ê) 55 16
Principal
Amount ($)
or Shares
Market
Value
$
Series 2007-1 Class A8
Zero coupon due 01/29/46 (Ê) 1,525 1,227
Option One Mortgage Loan Trust
Series 2005-4 Class A3
0.536% due 11/25/35 (Ê) 180 164
Series 2007-4 Class 2A2
0.456% due 04/25/37 (Ê) 9,970 4,748
Panhandle-Plains Higher Education
Authority, Inc.
Series 2010-2 Class A1
1.711% due 10/01/35 (Ê) 4,131 4,122
Series 2011-1 Class A3
1.531% due 10/01/37 (Ê) 2,500 2,317
Park Place Securities, Inc.
Series 2004-MHQ1 Class M1
0.976% due 12/25/34 (Ê) 503 487
Series 2004-WWF1 Class M2
0.956% due 12/25/34 (Ê) 6,366 6,039
Series 2005-WHQ2 Class A2D
0.606% due 05/25/35 (Ê) 5,597 5,357
Series 2005-WLL1 Class M1
0.696% due 03/25/35 (Ê) 1,915 1,788
People�s Choice Home Loan
Securities Trust
Series 2005-3 Class M1
0.776% due 08/25/35 (Ê) 1,388 1,305
Popular ABS Mortgage Pass-
Through Trust
Series 2005-6 Class A3
5.615% due 01/25/36 1,074 929
Series 2006-C Class A4
0.526% due 07/25/36 (Ê) 14,824 7,669
Series 2006-D Class A3
0.536% due 11/25/46 (Ê) 3,814 1,930
Renaissance Home Equity Loan
Trust 815 636
Copyright © 2012 www.secdatabase.com. All Rights Reserved.Please Consider the Environment Before Printing This Document

98 Russell Strategic Bond Fund
Series 2007-HE5 Class A2C
0.526% due 03/25/37 (Ê) 3,000 900
Morgan Stanley IXIS Real Estate
Capital Trust
Series 2006-2 Class A1
0.326% due 11/25/36 (Ê) 4 1
Nationstar Home Equity Loan Trust
Series 2007-A Class AV4
0.506% due 03/25/37 (Ê) 6,789 3,512
New Century Home Equity Loan
Trust
Series 2005-A Class A5
5.208% due 08/25/35 2,621 1,376
Nissan Auto Receivables Owner
Trust
Series 2009-1 Class A3
5.000% due 09/15/14 1,820 1,841
Northstar Education Finance, Inc.
Series 2005-1 Class A1
0.653% due 10/28/26 (Ê) 709 700
Series 2007-1 Class A3
0.613% due 01/29/46 (Ê) 4,850 4,332
Series 2007-1 Class A6
Zero coupon due 01/29/46 (Ê) 975 795
Series 2005-2 Class AF4
4.934% due 08/25/35
Series 2005-4 Class A3
5.565% due 02/25/36 198 172
Series 2006-1 Class AF3
5.608% due 05/25/36 78 34
Series 2006-1 Class AF6
5.746% due 05/25/36 1,673 763
Series 2006-2 Class AF2
5.762% due 08/25/36 268 182
Series 2007-1 Class AF2
5.512% due 04/25/37 6,125 2,147
Series 2007-2 Class AF2
5.675% due 06/25/37 1,855 752
Series 2007-2 Class AF4
5.906% due 06/25/37 5,423 2,274
Series 2007-2 Class AF6
5.879% due 06/25/37 2,266 981
Series 2007-3 Class AF2
6.998% due 09/25/37 4,352 1,677
Residential Asset Mortgage
Products, Inc.
Series 2003-RS11 Class AI6A
5.980% due 12/25/33 1,138 1,045
Copyright © 2012 www.secdatabase.com. All Rights Reserved.Please Consider the Environment Before Printing This Document

Table of Contents
Russell Investment CompanyRussell Strategic Bond FundSchedule of Investments, continued �� January 31, 2012 (Unaudited)Amounts in thousands (except share amounts)
Principal
Amount ($)
or Shares
Market
Value
$
Series 2007-RS2 Class A1
0.396% due 05/25/37 (Ê) 51 50
Residential Asset Securities Corp.
Series 2001-KS3 Class AII
0.736% due 09/25/31 (Ê) 148 110
Series 2003-KS4 Class AIIB
0.856% due 06/25/33 (Ê) 217 124
Series 2005-AHL1 Class A2
0.546% due 07/25/35 (Ê) 172 170
Series 2005-KS10 Class 1A2
0.526% due 11/25/35 (Ê) 173 165
Series 2005-KS12 Class A2
0.526% due 01/25/36 (Ê) 3,751 3,564
Series 2005-KS12 Class A3
0.596% due 01/25/36 (Ê) 894 641
Series 2006-KS3 Class AI3
0.446% due 04/25/36 (Ê) 299 271
Series 2007-KS1 Class A3
0.426% due 01/25/37 (Ê) 1,838 786
Santander Drive Auto Receivables
Trust
Series 2010-2 Class A2
0.950% due 08/15/13 2,696 2,697
Series 2010-A Class A2
1.370% due 08/15/13 (Þ) 6,433 6,440
Series 2010-B Class A2
1.010% due 07/15/13 (Þ) 4,277 4,277
Series 2011-2 Class B
2.660% due 01/15/16 2,900 2,917
Series 2011-3 Class B
2.500% due 12/15/15 7,225 7,227
Series 2012-1 Class B
2.720% due 05/16/16 5,375 5,386
Saxon Asset Securities Trust
Series 2003-3 Class M1
1.251% due 12/25/33 (Ê) 1,594 1,134
Principal
Amount ($)
or Shares
Market
Value
$
Series 2008-2 Class A1
0.860% due 01/25/15 (Ê) 8 8
Series 2008-7 Class A2
1.060% due 10/25/17 (Ê) 31,380 31,284
Series 2011-A Class A2
4.370% due 04/17/28 (Þ) 3,605 3,715
Series 2011-B Class A2
3.740% due 02/15/29 (Þ) 9,330 9,332
Small Business Administration
Participation Certificates
Series 1997-20D Class 1
7.500% due 04/01/17 585 643
Series 2004-20F Class 1
5.520% due 06/01/24 178 198
Series 2005-20G Class 1
4.750% due 07/01/25 2,380 2,624
Soundview Home Equity Loan Trust
Series 2005-CTX1 Class M1
0.696% due 11/25/35 (Ê) 4,121 3,096
Series 2005-DO1 Class M2
0.726% due 05/25/35 (Ê) 954 893
Series 2005-OPT4 Class 2A3
0.536% due 12/25/35 (Ê) 9,898 7,896
Series 2006-EQ2 Class A3
0.436% due 01/25/37 (Ê) 17,529 5,882
Series 2006-OPT5 Class 2A4
0.516% due 07/25/36 (Ê) 3,325 1,087
Series 2006-OPT5 Class M3
0.596% due 07/25/36 (Ê) 1,099 6
Series 2007-OPT1 Class 2A1
0.356% due 06/25/37 (Ê) 673 521
Specialty Underwriting &
Residential Finance
Series 2005-AB2 Class A1C
0.666% due 06/25/36 (Ê) 2,549 2,262
Series 2005-BC4 Class A2B
0.506% due 09/25/36 (Ê) 424 417
Copyright © 2012 www.secdatabase.com. All Rights Reserved.Please Consider the Environment Before Printing This Document
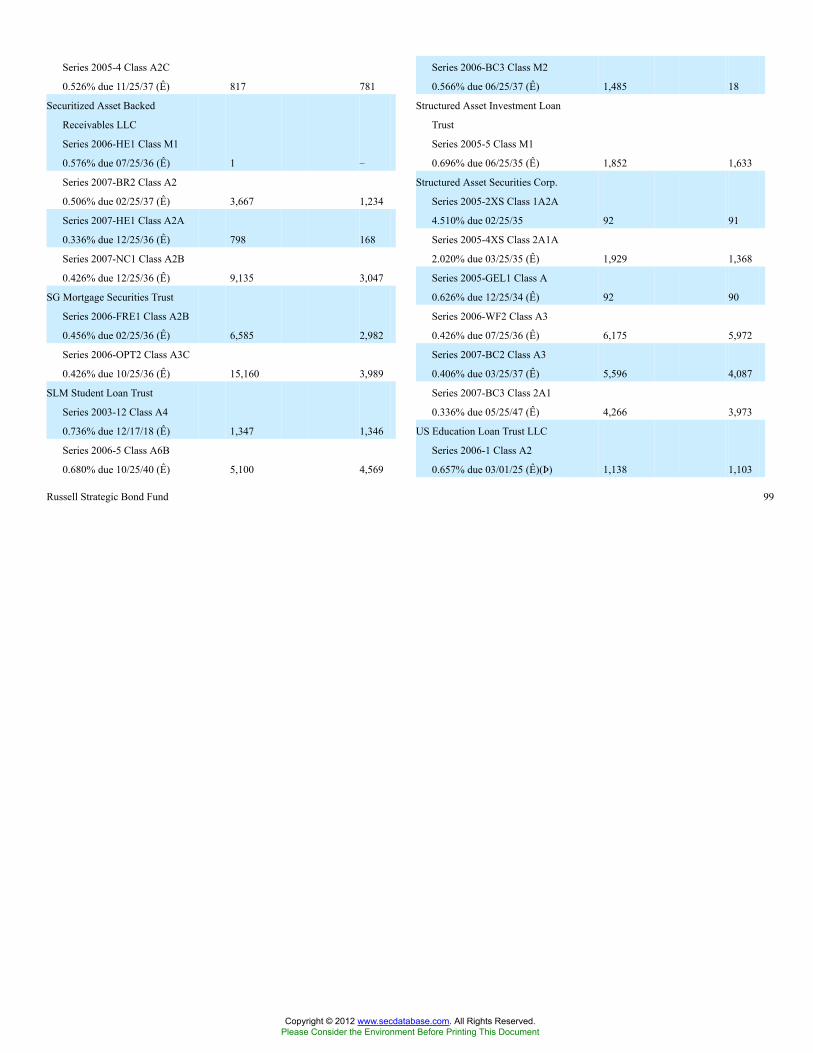
Russell Strategic Bond Fund 99
Series 2005-4 Class A2C
0.526% due 11/25/37 (Ê) 817 781
Securitized Asset Backed
Receivables LLC
Series 2006-HE1 Class M1
0.576% due 07/25/36 (Ê) 1 �
Series 2007-BR2 Class A2
0.506% due 02/25/37 (Ê) 3,667 1,234
Series 2007-HE1 Class A2A
0.336% due 12/25/36 (Ê) 798 168
Series 2007-NC1 Class A2B
0.426% due 12/25/36 (Ê) 9,135 3,047
SG Mortgage Securities Trust
Series 2006-FRE1 Class A2B
0.456% due 02/25/36 (Ê) 6,585 2,982
Series 2006-OPT2 Class A3C
0.426% due 10/25/36 (Ê) 15,160 3,989
SLM Student Loan Trust
Series 2003-12 Class A4
0.736% due 12/17/18 (Ê) 1,347 1,346
Series 2006-5 Class A6B
0.680% due 10/25/40 (Ê) 5,100 4,569
Series 2006-BC3 Class M2
0.566% due 06/25/37 (Ê) 1,485 18
Structured Asset Investment Loan
Trust
Series 2005-5 Class M1
0.696% due 06/25/35 (Ê) 1,852 1,633
Structured Asset Securities Corp.
Series 2005-2XS Class 1A2A
4.510% due 02/25/35 92 91
Series 2005-4XS Class 2A1A
2.020% due 03/25/35 (Ê) 1,929 1,368
Series 2005-GEL1 Class A
0.626% due 12/25/34 (Ê) 92 90
Series 2006-WF2 Class A3
0.426% due 07/25/36 (Ê) 6,175 5,972
Series 2007-BC2 Class A3
0.406% due 03/25/37 (Ê) 5,596 4,087
Series 2007-BC3 Class 2A1
0.336% due 05/25/47 (Ê) 4,266 3,973
US Education Loan Trust LLC
Series 2006-1 Class A2
0.657% due 03/01/25 (Ê)(Þ) 1,138 1,103
Copyright © 2012 www.secdatabase.com. All Rights Reserved.Please Consider the Environment Before Printing This Document
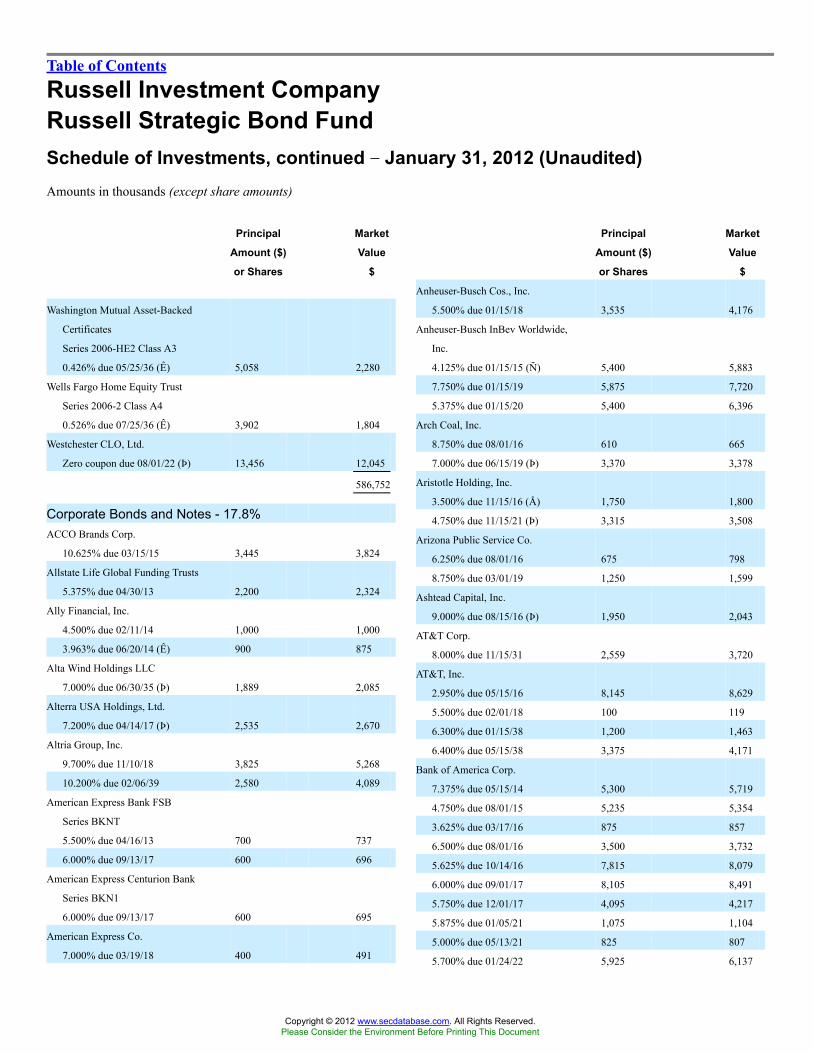
Table of Contents
Russell Investment CompanyRussell Strategic Bond FundSchedule of Investments, continued �� January 31, 2012 (Unaudited)Amounts in thousands (except share amounts)
Principal
Amount ($)
or Shares
Market
Value
$
Washington Mutual Asset-Backed
Certificates
Series 2006-HE2 Class A3
0.426% due 05/25/36 (Ê) 5,058 2,280
Wells Fargo Home Equity Trust
Series 2006-2 Class A4
0.526% due 07/25/36 (Ê) 3,902 1,804
Westchester CLO, Ltd.
Zero coupon due 08/01/22 (Þ) 13,456 12,045
586,752
Corporate Bonds and Notes - 17.8%ACCO Brands Corp.
10.625% due 03/15/15 3,445 3,824
Allstate Life Global Funding Trusts
5.375% due 04/30/13 2,200 2,324
Ally Financial, Inc.
4.500% due 02/11/14 1,000 1,000
3.963% due 06/20/14 (Ê) 900 875
Alta Wind Holdings LLC
7.000% due 06/30/35 (Þ) 1,889 2,085
Alterra USA Holdings, Ltd.
7.200% due 04/14/17 (Þ) 2,535 2,670
Altria Group, Inc.
9.700% due 11/10/18 3,825 5,268
10.200% due 02/06/39 2,580 4,089
American Express Bank FSB
Series BKNT
5.500% due 04/16/13 700 737
6.000% due 09/13/17 600 696
American Express Centurion Bank
Series BKN1
6.000% due 09/13/17 600 695
American Express Co.
7.000% due 03/19/18 400 491
Principal
Amount ($)
or Shares
Market
Value
$
Anheuser-Busch Cos., Inc.
5.500% due 01/15/18 3,535 4,176
Anheuser-Busch InBev Worldwide,
Inc.
4.125% due 01/15/15 (Ñ) 5,400 5,883
7.750% due 01/15/19 5,875 7,720
5.375% due 01/15/20 5,400 6,396
Arch Coal, Inc.
8.750% due 08/01/16 610 665
7.000% due 06/15/19 (Þ) 3,370 3,378
Aristotle Holding, Inc.
3.500% due 11/15/16 (Å) 1,750 1,800
4.750% due 11/15/21 (Þ) 3,315 3,508
Arizona Public Service Co.
6.250% due 08/01/16 675 798
8.750% due 03/01/19 1,250 1,599
Ashtead Capital, Inc.
9.000% due 08/15/16 (Þ) 1,950 2,043
AT&T Corp.
8.000% due 11/15/31 2,559 3,720
AT&T, Inc.
2.950% due 05/15/16 8,145 8,629
5.500% due 02/01/18 100 119
6.300% due 01/15/38 1,200 1,463
6.400% due 05/15/38 3,375 4,171
Bank of America Corp.
7.375% due 05/15/14 5,300 5,719
4.750% due 08/01/15 5,235 5,354
3.625% due 03/17/16 875 857
6.500% due 08/01/16 3,500 3,732
5.625% due 10/14/16 7,815 8,079
6.000% due 09/01/17 8,105 8,491
5.750% due 12/01/17 4,095 4,217
5.875% due 01/05/21 1,075 1,104
5.000% due 05/13/21 825 807
5.700% due 01/24/22 5,925 6,137
Copyright © 2012 www.secdatabase.com. All Rights Reserved.Please Consider the Environment Before Printing This Document

100 Russell Strategic Bond Fund
American Express Credit Corp.
5.875% due 05/02/13 2,000 2,115
American International Group, Inc.
4.250% due 05/15/13 10,300 10,441
5.050% due 10/01/15 400 410
4.875% due 09/15/16 7,160 7,267
5.850% due 01/16/18 8,500 8,863
8.250% due 08/15/18 9,100 10,479
Ameriprise Financial, Inc.
7.518% due 06/01/66 (Ñ) 3,835 3,940
AmerisourceBergen Corp.
5.875% due 09/15/15 2,495 2,864
Amgen, Inc.
6.150% due 06/01/18 5,600 6,695
3.875% due 11/15/21 9,245 9,628
Amsouth Bank
Series AI
4.850% due 04/01/13 1,360 1,353
Anadarko Petroleum Corp.
6.375% due 09/15/17 11,960 14,146
8.700% due 03/15/19 2,200 2,882
6.450% due 09/15/36 4,630 5,530
Bank of America NA
Series BKNT
0.826% due 06/15/16 (Ê) 3,100 2,531
0.846% due 06/15/17 (Ê)(Ñ) 4,175 3,115
6.100% due 06/15/17 3,845 3,901
6.000% due 10/15/36 500 470
Barnett Capital III
1.172% due 02/01/27 (Ê) 1,250 851
BB&T Corp.
3.200% due 03/15/16 4,050 4,304
Bear Stearns Cos. LLC (The)
5.550% due 01/22/17 8,901 9,604
7.250% due 02/01/18 1,150 1,375
Berkshire Hathaway, Inc.
1.900% due 01/31/17 3,565 3,621
Best Buy Co., Inc.
6.750% due 07/15/13 5,345 5,673
Boardwalk Pipelines, LP
5.875% due 11/15/16 3,250 3,669
Boston Scientific Corp.
4.500% due 01/15/15 4,813 5,135
Copyright © 2012 www.secdatabase.com. All Rights Reserved.Please Consider the Environment Before Printing This Document

Table of Contents
Russell Investment CompanyRussell Strategic Bond FundSchedule of Investments, continued �� January 31, 2012 (Unaudited)Amounts in thousands (except share amounts)
Principal
Amount ($)
or Shares
Market
Value
$
Braskem America Finance Co.
7.125% due 07/22/41 (Þ) 7,455 7,336
Burlington Northern and Santa Fe
Railway Co. 2005-4 Pass
Through Trust
4.967% due 04/01/23 168 190
Burlington Northern Santa Fe LLC
6.875% due 12/01/27 160 205
6.750% due 03/15/29 110 141
Calpine Construction Finance Co.,
LP and CCFC Finance Corp.
8.000% due 06/01/16 (Þ) 7,700 8,297
Cameron International Corp.
1.459% due 06/02/14 (Ê) 1,500 1,503
Capital One Bank USA NA
8.800% due 07/15/19 1,250 1,512
Capital One Capital III
7.686% due 08/15/36 2,675 2,702
Capital One Financial Corp.
7.375% due 05/23/14 1,964 2,184
Cargill, Inc.
3.250% due 11/15/21 (Þ) 2,995 3,032
Caterpillar, Inc.
0.649% due 05/21/13 (Ê) 5,500 5,517
5.200% due 05/27/41 1,445 1,748
CBA Capital Trust II
6.024% due 03/29/49 (�)(Þ) 3,700 3,434
CEDC Finance Corp. International,
Inc.
9.125% due 12/01/16 (Ñ)(Þ) 1,750 1,234
Series REGS
9.125% due 12/01/16 200 141
Cellco Partnership / Verizon
Wireless Capital LLC
8.500% due 11/15/18 2,750 3,834
Principal
Amount ($)
or Shares
Market
Value
$
5.000% due 09/15/14 6,525 6,710
4.750% due 05/19/15 1,400 1,474
4.700% due 05/29/15 350 368
5.300% due 01/07/16 1,325 1,411
5.850% due 08/02/16 1,630 1,762
4.450% due 01/10/17 15,575 16,239
6.000% due 08/15/17 6,000 6,571
6.125% due 11/21/17 6,395 7,036
6.125% due 05/15/18 200 220
8.500% due 05/22/19 500 611
4.500% due 01/14/22 4,850 4,828
1.056% due 08/25/36 (Ê) 2,250 1,262
6.125% due 08/25/36 900 868
8.125% due 07/15/39 1,914 2,502
5.875% due 01/30/42 2,500 2,588
Clearwire Communications
LLC/Clearwire Finance, Inc.
12.000% due 12/01/17 (Ñ)(Þ) 3,810 3,086
Columbus Southern Power Co.
Series C
5.500% due 03/01/13 435 454
Comcast Corp.
5.875% due 02/15/18 300 353
5.700% due 05/15/18 3,230 3,788
6.450% due 03/15/37 300 368
Commonwealth Edison Co.
5.800% due 03/15/18 4,735 5,613
Continental Airlines 2006-1 Class G
Pass Through Trust
Series 061G
0.879% due 06/02/13 (Ê) 2,931 2,785
Continental Airlines 2009-1
Pass Through Trust
Series 09-1
9.000% due 07/08/16 3,097 3,437
Copyright © 2012 www.secdatabase.com. All Rights Reserved.Please Consider the Environment Before Printing This Document

Russell Strategic Bond Fund 101
CenterPoint Energy Resources
Corp.
6.125% due 11/01/17 860 1,003
CF Industries, Inc.
6.875% due 05/01/18 4,580 5,313
Chase Capital III
Series C
1.077% due 03/01/27 (Ê) 2,740 2,056
CHS/Community Health Systems,
Inc.
8.875% due 07/15/15 (Ñ) 5,581 5,804
Chubb Corp. (The)
6.375% due 03/29/67 2,450 2,499
Cigna Corp.
2.750% due 11/15/16 2,000 2,025
5.375% due 02/15/42 3,265 3,469
CIT Group, Inc.
5.250% due 04/01/14 (Þ) 1,000 1,017
7.000% due 05/04/15 (Þ) 715 719
7.000% due 05/02/17 (Þ) 3,720 3,729
6.625% due 04/01/18 (Ñ)(Þ) 3,155 3,376
Citigroup Capital XXI
8.300% due 12/21/57 9,335 9,501
Citigroup, Inc.
5.500% due 04/11/13 7,900 8,199
5.850% due 07/02/13 700 729
2.027% due 01/13/14 (Ê)(Ñ) 2,700 2,648
Continental Airlines, Inc.
Series 2002-1 Class G2
6.563% due 08/15/13 1,130 1,131
Credit Suisse USA, Inc.
5.500% due 08/15/13 380 398
Crown Castle Towers LLC
3.214% due 08/15/15 (Þ) 1,215 1,230
CSC Holdings LLC
8.500% due 04/15/14 4,223 4,698
CVS Caremark Corp.
3.250% due 05/18/15 4,800 5,093
DCP Midstream Operating, LP
3.250% due 10/01/15 4,519 4,567
DDR Corp.
9.625% due 03/15/16 1,565 1,837
7.500% due 04/01/17 3,700 4,167
Delta Air Lines 2002-1 Class G-1
Pass Through Trust
Series 02G1
6.718% due 01/02/23 3,271 3,353
Delta Air Lines, Inc.
9.500% due 09/15/14 (Ñ)(Þ) 2,258 2,405
Copyright © 2012 www.secdatabase.com. All Rights Reserved.Please Consider the Environment Before Printing This Document
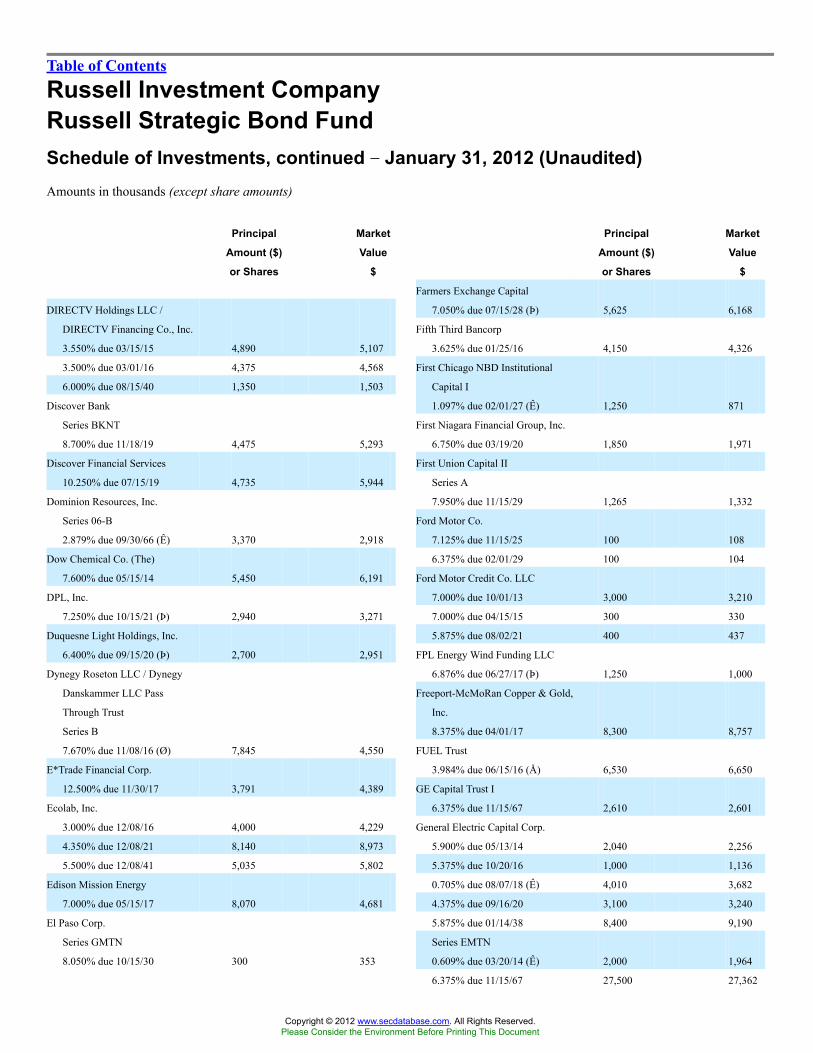
Table of Contents
Russell Investment CompanyRussell Strategic Bond FundSchedule of Investments, continued �� January 31, 2012 (Unaudited)Amounts in thousands (except share amounts)
Principal
Amount ($)
or Shares
Market
Value
$
DIRECTV Holdings LLC /
DIRECTV Financing Co., Inc.
3.550% due 03/15/15 4,890 5,107
3.500% due 03/01/16 4,375 4,568
6.000% due 08/15/40 1,350 1,503
Discover Bank
Series BKNT
8.700% due 11/18/19 4,475 5,293
Discover Financial Services
10.250% due 07/15/19 4,735 5,944
Dominion Resources, Inc.
Series 06-B
2.879% due 09/30/66 (Ê) 3,370 2,918
Dow Chemical Co. (The)
7.600% due 05/15/14 5,450 6,191
DPL, Inc.
7.250% due 10/15/21 (Þ) 2,940 3,271
Duquesne Light Holdings, Inc.
6.400% due 09/15/20 (Þ) 2,700 2,951
Dynegy Roseton LLC / Dynegy
Danskammer LLC Pass
Through Trust
Series B
7.670% due 11/08/16 (Ø) 7,845 4,550
E*Trade Financial Corp.
12.500% due 11/30/17 3,791 4,389
Ecolab, Inc.
3.000% due 12/08/16 4,000 4,229
4.350% due 12/08/21 8,140 8,973
5.500% due 12/08/41 5,035 5,802
Edison Mission Energy
7.000% due 05/15/17 8,070 4,681
El Paso Corp.
Series GMTN
8.050% due 10/15/30 300 353
Principal
Amount ($)
or Shares
Market
Value
$
Farmers Exchange Capital
7.050% due 07/15/28 (Þ) 5,625 6,168
Fifth Third Bancorp
3.625% due 01/25/16 4,150 4,326
First Chicago NBD Institutional
Capital I
1.097% due 02/01/27 (Ê) 1,250 871
First Niagara Financial Group, Inc.
6.750% due 03/19/20 1,850 1,971
First Union Capital II
Series A
7.950% due 11/15/29 1,265 1,332
Ford Motor Co.
7.125% due 11/15/25 100 108
6.375% due 02/01/29 100 104
Ford Motor Credit Co. LLC
7.000% due 10/01/13 3,000 3,210
7.000% due 04/15/15 300 330
5.875% due 08/02/21 400 437
FPL Energy Wind Funding LLC
6.876% due 06/27/17 (Þ) 1,250 1,000
Freeport-McMoRan Copper & Gold,
Inc.
8.375% due 04/01/17 8,300 8,757
FUEL Trust
3.984% due 06/15/16 (Å) 6,530 6,650
GE Capital Trust I
6.375% due 11/15/67 2,610 2,601
General Electric Capital Corp.
5.900% due 05/13/14 2,040 2,256
5.375% due 10/20/16 1,000 1,136
0.705% due 08/07/18 (Ê) 4,010 3,682
4.375% due 09/16/20 3,100 3,240
5.875% due 01/14/38 8,400 9,190
Series EMTN
0.609% due 03/20/14 (Ê) 2,000 1,964
6.375% due 11/15/67 27,500 27,362
Copyright © 2012 www.secdatabase.com. All Rights Reserved.Please Consider the Environment Before Printing This Document

102 Russell Strategic Bond Fund
El Paso Natural Gas Co.
7.500% due 11/15/26 1,425 1,686
El Paso Pipeline Partners Operating
Co. LLC
6.500% due 04/01/20 5,880 6,567
Energy Transfer Partners, LP
6.700% due 07/01/18 2,575 2,933
9.700% due 03/15/19 1,150 1,454
5.200% due 02/01/22 1,725 1,822
Enterprise Products Operating LLC
5.900% due 04/15/13 1,425 1,507
5.250% due 01/31/20 6,860 7,673
Series A
8.375% due 08/01/66 1,550 1,674
Series B
7.034% due 01/15/68 3,050 3,226
ERP Operating, LP
4.625% due 12/15/21 3,325 3,543
Exelis, Inc.
5.550% due 10/01/21 (Þ) 2,210 2,319
Express Scripts, Inc.
6.250% due 06/15/14 3,645 3,995
7.250% due 06/15/19 3,087 3,747
Series GMTN
6.150% due 08/07/37 3,035 3,440
6.875% due 01/10/39 750 931
Series MTNA
0.806% due 09/15/14 (Ê) 4,000 3,887
6.750% due 03/15/32 623 746
General Electric Co.
5.250% due 12/06/17 5,515 6,445
GenOn REMA LLC
Series B
9.237% due 07/02/17 3,011 2,891
Genworth Financial, Inc.
6.150% due 11/15/66 5,960 3,814
Georgia-Pacific LLC
8.875% due 05/15/31 5,555 7,716
Gilead Sciences, Inc.
3.050% due 12/01/16 2,705 2,835
4.400% due 12/01/21 6,815 7,377
GlaxoSmithKline Capital, Inc.
4.850% due 05/15/13 6,900 7,297
Goldman Sachs Group, Inc. (The)
1.553% due 07/29/13 (Ê) 1,700 1,657
Copyright © 2012 www.secdatabase.com. All Rights Reserved.Please Consider the Environment Before Printing This Document

Table of Contents
Russell Investment CompanyRussell Strategic Bond FundSchedule of Investments, continued �� January 31, 2012 (Unaudited)Amounts in thousands (except share amounts)
Principal
Amount ($)
or Shares
Market
Value
$
6.000% due 05/01/14 2,000 2,151
1.020% due 03/22/16 (Ê) 1,300 1,162
5.750% due 10/01/16 1,338 1,442
5.625% due 01/15/17 5,461 5,655
6.250% due 09/01/17 12,400 13,612
7.500% due 02/15/19 5,651 6,414
6.000% due 06/15/20 1,875 1,982
5.750% due 01/24/22 4,500 4,664
6.750% due 10/01/37 7,900 7,823
Great Plains Energy, Inc.
4.850% due 06/01/21 4,940 5,203
HCA, Inc.
8.500% due 04/15/19 3,480 3,863
7.875% due 02/15/20 2,375 2,598
7.250% due 09/15/20 2,920 3,142
HCP, Inc.
6.300% due 09/15/16 2,700 3,054
6.000% due 01/30/17 2,250 2,510
6.700% due 01/30/18 4,000 4,660
5.375% due 02/01/21 1,800 1,989
Health Care REIT, Inc.
4.700% due 09/15/17 5,480 5,738
5.250% due 01/15/22 2,500 2,640
6.500% due 03/15/41 2,000 2,181
Healthcare Realty Trust, Inc.
6.500% due 01/17/17 3,350 3,682
Hewlett-Packard Co.
0.786% due 05/24/13 (Ê) 6,400 6,363
4.750% due 06/02/14 5,195 5,553
2.650% due 06/01/16 4,230 4,289
3.000% due 09/15/16 2,850 2,936
4.650% due 12/09/21 4,495 4,835
Historic TW, Inc.
8.050% due 01/15/16 2,900 3,458
HRPT Properties Trust
5.750% due 02/15/14 2,710 2,793
Principal
Amount ($)
or Shares
Market
Value
$
JC Penney Corp., Inc.
6.375% due 10/15/36 3,355 2,885
JetBlue Airways 2004-2 G-2
Pass Through Trust
Series 04-2
0.907% due 11/15/16 (Ê) 4,039 3,231
JP Morgan Chase Capital XIII
Series M
1.529% due 09/30/34 (Ê) 6,050 4,330
JP Morgan Chase Capital XX
Series T
6.550% due 09/29/36 300 302
JP Morgan Chase Capital XXIII
1.457% due 05/15/47 (Ê) 8,880 6,224
JPMorgan Chase & Co.
5.375% due 01/15/14 2,565 2,743
5.150% due 10/01/15 3,950 4,235
6.000% due 01/15/18 8,300 9,410
6.300% due 04/23/19 3,050 3,524
4.625% due 05/10/21 1,105 1,145
4.350% due 08/15/21 2,900 2,958
4.500% due 01/24/22 1,565 1,613
5.400% due 01/06/42 2,555 2,628
Series 1
7.900% due 04/29/49 (Æ)(�) 3,580 3,878
JPMorgan Chase Bank NA
Series BKNT
5.875% due 06/13/16 240 262
6.000% due 10/01/17 6,400 7,107
JPMorgan Chase Capital XXI
Series U
1.497% due 02/02/37 (Ê) 455 319
Kraft Foods, Inc.
4.125% due 02/09/16 3,995 4,340
6.125% due 02/01/18 1,000 1,194
6.125% due 08/23/18 2,075 2,502
6.500% due 02/09/40 2,300 2,950
Copyright © 2012 www.secdatabase.com. All Rights Reserved.Please Consider the Environment Before Printing This Document

Russell Strategic Bond Fund 103
HSBC Bank USA NA
4.875% due 08/24/20 3,021 2,996
HSBC Finance Corp.
6.676% due 01/15/21 6,975 7,247
Humana, Inc.
6.450% due 06/01/16 1,875 2,119
8.150% due 06/15/38 2,756 3,761
IDEX Corp.
4.500% due 12/15/20 1,360 1,420
Indiantown Cogeneration, LP
Series A-10
9.770% due 12/15/20 2,607 2,718
Intel Corp.
1.950% due 10/01/16 3,300 3,421
International Lease Finance Corp.
6.500% due 09/01/14 (Þ) 15,545 16,381
5.750% due 05/15/16 400 394
6.750% due 09/01/16 (Þ) 1,000 1,076
International Paper Co.
4.750% due 02/15/22 2,315 2,502
Ipalco Enterprises, Inc.
5.000% due 05/01/18 1,725 1,701
Lehman Brothers Holdings, Inc.
6.200% due 09/26/14 (Ø) 1,000 274
6.875% due 05/02/18 (Ø) 1,365 375
7.000% due 09/27/27 (Ø) 1,260 342
Liberty Property, LP
4.750% due 10/01/20 3,975 4,102
Lorillard Tobacco Co.
6.875% due 05/01/20 (Ñ) 7,235 8,351
Manufacturers & Traders Trust Co.
5.585% due 12/28/20 745 730
MBNA Corp.
6.125% due 03/01/13 2,000 2,067
Medco Health Solutions, Inc.
7.250% due 08/15/13 4,357 4,755
Merrill Lynch & Co., Inc.
5.450% due 02/05/13 7,500 7,718
6.050% due 05/16/16 3,575 3,600
6.400% due 08/28/17 8,355 8,834
6.500% due 07/15/18 100 106
6.875% due 11/15/18 100 108
7.750% due 05/14/38 1,500 1,578
Copyright © 2012 www.secdatabase.com. All Rights Reserved.Please Consider the Environment Before Printing This Document

Table of Contents
Russell Investment CompanyRussell Strategic Bond FundSchedule of Investments, continued �� January 31, 2012 (Unaudited)Amounts in thousands (except share amounts)
Principal
Amount ($)
or Shares
Market
Value
$
MetLife Capital Trust X
9.250% due 04/08/38 (Þ) 1,500 1,774
MetLife Global Funding I
3.125% due 01/11/16 (Þ) 5,660 5,832
MetLife, Inc.
6.400% due 12/15/36 500 487
10.750% due 08/01/39 4,440 6,174
Metropolitan Life Global Funding I
5.125% due 04/10/13 (Þ) 3,000 3,144
Mirant Mid Atlantic Pass Through
Trust B
Series B
9.125% due 06/30/17 2,915 2,944
Monsanto Co.
5.125% due 04/15/18 5,000 5,856
Morgan Stanley
5.375% due 10/15/15 7,000 7,206
1.015% due 10/18/16 (Ê) 5,505 4,763
5.750% due 10/18/16 1,500 1,558
5.550% due 04/27/17 2,450 2,509
6.250% due 08/28/17 1,300 1,352
5.950% due 12/28/17 2,350 2,414
6.625% due 04/01/18 12,041 12,688
5.500% due 07/28/21 2,175 2,151
Series GMTN
2.953% due 05/14/13 (Ê) 1,100 1,099
0.883% due 01/09/14 (Ê) 9,885 9,295
5.450% due 01/09/17 2,425 2,482
Mosaic Co. (The)
3.750% due 11/15/21 4,275 4,477
National City Bank
Series BKNT
0.904% due 06/07/17 (Ê) 7,200 6,495
National Rural Utilities Cooperative
Finance Corp.
1.900% due 11/01/15 2,370 2,413
Principal
Amount ($)
or Shares
Market
Value
$
Nisource Finance Corp.
6.400% due 03/15/18 2,180 2,547
NRG Energy, Inc.
7.625% due 01/15/18 2,695 2,641
8.500% due 06/15/19 1,660 1,668
NuStar Logistics, LP
6.050% due 03/15/13 3,607 3,771
OMX Timber Finance Investments
I LLC
5.420% due 01/29/20 (Þ) 7,200 7,500
Oncor Electric Delivery Co. LLC
6.800% due 09/01/18 4,750 5,833
O�Reilly Automotive, Inc.
4.625% due 09/15/21 4,140 4,362
Panhandle Eastern Pipeline Co., LP
8.125% due 06/01/19 3,542 4,347
PC Financial Partnership
5.000% due 11/15/14 2,449 2,674
Peabody Energy Corp.
7.875% due 11/01/26 500 536
Petrohawk Energy Corp.
7.250% due 08/15/18 4,460 5,084
Philip Morris International, Inc.
2.500% due 05/16/16 6,120 6,373
5.650% due 05/16/18 1,400 1,697
Plains Exploration & Production
Co.
7.625% due 06/01/18 1,250 1,338
Plastipak Holdings, Inc.
8.500% due 12/15/15 (Þ) 1,150 1,185
Principal Life Income Funding
Trusts
5.300% due 04/24/13 400 421
Progress Energy, Inc.
7.050% due 03/15/19 2,550 3,188
ProLogis, LP
1.875% due 11/15/37 2,550 2,525
Copyright © 2012 www.secdatabase.com. All Rights Reserved.Please Consider the Environment Before Printing This Document

104 Russell Strategic Bond Fund
Nationwide Financial Services, Inc.
5.375% due 03/25/21 (Þ) 4,675 4,732
NB Capital Trust IV
8.250% due 04/15/27 3,511 3,467
NBCUniversal Media LLC
4.375% due 04/01/21 4,850 5,266
NCUA Guaranteed Notes
Series A4
3.000% due 06/12/19 3,500 3,786
Newfield Exploration Co.
5.750% due 01/30/22 1,400 1,488
News America, Inc.
8.250% due 10/17/96 240 283
Series WI
6.150% due 02/15/41 8,085 9,656
Nextel Communications, Inc.
Series C
5.950% due 03/15/14 5,235 5,183
Nielsen Finance LLC / Nielsen
Finance Co.
11.500% due 05/01/16 3,700 4,246
NII Capital Corp.
7.625% due 04/01/21 4,510 4,623
Prudential Financial, Inc.
3.875% due 01/14/15 5,675 5,953
Prudential Holdings LLC
8.695% due 12/18/23 (Þ) 5,600 6,831
Series FSA
1.434% due 12/18/17 (Ê)(Þ) 3,500 3,276
Public Service Co. of New Mexico
7.950% due 05/15/18 3,320 3,948
Puget Sound Energy, Inc.
Series A
6.974% due 06/01/67 1,500 1,503
Quebecor World Capital Corp.
6.125% due 11/15/13 (Ø) 1,955 �
4.875% due 01/02/49 (Ø) 625 �
Qwest Communications
International, Inc.
8.000% due 10/01/15 1,175 1,260
Qwest Corp.
7.625% due 06/15/15 1,000 1,138
8.375% due 05/01/16 2,150 2,504
Range Resources Corp.
7.500% due 10/01/17 550 580
7.250% due 05/01/18 800 852
Copyright © 2012 www.secdatabase.com. All Rights Reserved.Please Consider the Environment Before Printing This Document

Table of Contents
Russell Investment CompanyRussell Strategic Bond FundSchedule of Investments, continued �� January 31, 2012 (Unaudited)Amounts in thousands (except share amounts)
Principal
Amount ($)
or Shares
Market
Value
$
Rensselaer Polytechnic Institute
5.600% due 09/01/20 4,675 5,246
Rockies Express Pipeline LLC
6.850% due 07/15/18 (Þ) 7,095 6,811
Rock-Tenn Co.
5.625% due 03/15/13 373 384
Rohm & Haas Co.
6.000% due 09/15/17 100 115
RSC Equipment Rental, Inc./RSC
Holdings III LLC
10.000% due 07/15/17 (Þ) 3,450 4,002
Sabine Pass LNG, LP
7.250% due 11/30/13 8,590 8,891
7.500% due 11/30/16 500 521
7.500% due 11/30/16 (Þ) 2,900 2,907
SABMiller Holdings, Inc.
2.450% due 01/15/17 (Å) 3,400 3,473
3.750% due 01/15/22 (Å) 5,950 6,194
Santander Holdings USA, Inc.
4.625% due 04/19/16 1,460 1,426
Sempra Energy
2.000% due 03/15/14 4,180 4,252
Simon Property Group, LP
6.100% due 05/01/16 1,955 2,255
10.350% due 04/01/19 3,840 5,414
5.650% due 02/01/20 2,800 3,308
SLM Corp.
6.250% due 01/25/16 6,250 6,380
South Carolina Electric & Gas Co.
6.500% due 11/01/18 1,240 1,549
Southern Copper Corp.
6.375% due 07/27/15 1,780 1,977
Southern Natural Gas Co. /
Southern
Natural Issuing Corp.
4.400% due 06/15/21 6,295 6,484
Principal
Amount ($)
or Shares
Market
Value
$
Textron, Inc.
6.200% due 03/15/15 5,290 5,677
Time Warner Cable, Inc.
6.200% due 07/01/13 5,900 6,334
Time Warner Entertainment Co., LP
Series*
8.375% due 03/15/23 516 692
Timken Co.
6.000% due 09/15/14 2,440 2,639
Transatlantic Holdings, Inc.
8.000% due 11/30/39 2,350 2,664
UAL 2009-1 Pass Through Trust
Series 09-1
10.400% due 11/01/16 461 519
UBS Preferred Funding Trust V
Series 1
6.243% due 05/29/49 (�)(Ñ) 3,600 3,240
Union Electric Co.
6.400% due 06/15/17 3,145 3,808
UnitedHealth Group, Inc.
4.875% due 02/15/13 400 416
6.000% due 06/15/17 56 67
6.500% due 06/15/37 675 891
USB Capital IX
3.500% due 10/29/49 (�) 300 224
USB Realty Corp.
1.719% due 12/29/49 (Ê)(�)(Þ) 2,225 1,697
Verizon Communications, Inc.
5.250% due 04/15/13 300 317
3.000% due 04/01/16 4,180 4,444
3.500% due 11/01/21 2,650 2,771
VF Corp.
3.500% due 09/01/21 2,655 2,784
Wachovia Bank NA
Series BKNT
6.600% due 01/15/38 2,725 3,239
Copyright © 2012 www.secdatabase.com. All Rights Reserved.Please Consider the Environment Before Printing This Document

Russell Strategic Bond Fund 105
Southern Union Co.
3.564% due 11/01/66 (Ê) 8,940 8,515
Springleaf Finance Corp.
6.900% due 12/15/17 600 465
Steel Dynamics, Inc.
7.750% due 04/15/16 3,450 3,605
SunTrust Banks, Inc.
3.600% due 04/15/16 2,550 2,634
Symetra Financial Corp.
8.300% due 10/15/37 (Þ) 3,430 3,224
TD Ameritrade Holding Corp.
4.150% due 12/01/14 3,665 3,912
Tenet Healthcare Corp.
10.000% due 05/01/18 765 882
8.875% due 07/01/19 1,500 1,697
Tennessee Gas Pipeline Co.
8.000% due 02/01/16 3,305 3,873
8.375% due 06/15/32 1,250 1,552
Texas Competitive Electric
Holdings
Co. LLC / TCEH Finance, Inc.
10.500% due 11/01/16 (Ñ) 6,837 1,931
Wachovia Capital Trust III
5.570% due 03/29/49 (�) 3,897 3,444
Wachovia Corp.
5.625% due 10/15/16 100 111
5.750% due 02/01/18 500 576
Watson Pharmaceuticals, Inc.
5.000% due 08/15/14 4,441 4,763
WEA Finance LLC / WT Finance
Aust Pty, Ltd.
7.500% due 06/02/14 (Þ) 3,870 4,285
6.750% due 09/02/19 (Þ) 1,300 1,536
Wells Fargo & Co.
Series K
7.980% due 03/29/49 (�) 20,000 21,650
Weyerhaeuser Co.
7.375% due 10/01/19 1,480 1,688
Williams Cos., Inc. (The)
7.875% due 09/01/21 458 579
Williams Partners, LP / Williams
Partners Finance Corp.
7.250% due 02/01/17 4,245 5,128
Copyright © 2012 www.secdatabase.com. All Rights Reserved.Please Consider the Environment Before Printing This Document

Table of Contents
Russell Investment CompanyRussell Strategic Bond FundSchedule of Investments, continued �� January 31, 2012 (Unaudited)Amounts in thousands (except share amounts)
Principal
Amount ($)
or Shares
Market
Value
$
Xylem, Inc.
3.550% due 09/20/16 (Þ) 3,225 3,342
ZFS Finance USA Trust II
6.450% due 12/15/65 (Þ) 11,555 10,862
ZFS Finance USA Trust IV
5.875% due 05/09/32 (Þ) 263 256
1,395,839
International Debt - 8.6%Abbey National Treasury Services
PLC
4.000% due 04/27/16 8,205 7,962
Achmea Hypotheekbank NV
3.200% due 11/03/14 (Þ) 8,267 8,606
AK Transneft OJSC Via
TransCapitalInvest, Ltd.
8.700% due 08/07/18 (Þ) 1,000 1,215
American International Group, Inc.
6.765% due 11/15/17 (Þ) 2,094 3,297
ANZ National International, Ltd.
6.200% due 07/19/13 (Þ) 5,000 5,282
ArcelorMittal
9.000% due 02/15/15 (Ñ) 2,150 2,461
5.250% due 08/05/20 7,145 6,985
AstraZeneca PLC
5.900% due 09/15/17 1,100 1,341
Australia & New Zealand Banking
Group, Ltd.
2.125% due 01/10/14 (Ñ)(Þ) 2,700 2,698
AWAS Aviation Capital, Ltd.
7.000% due 10/17/16 (Þ) 3,435 3,538
Bakrie Telecom Pte, Ltd.
11.500% due 05/07/15 (Þ) 3,055 1,986
Banco do Estado do Rio Grande do
Sul
7.375% due 02/02/22 (Å) 230 236
Principal
Amount ($)
or Shares
Market
Value
$
Black Diamond CLO, Ltd.
Series 2007-1A Class AD
0.803% due 04/29/19 (Ê)(Þ) 23,250 21,195
BNP Paribas SA
5.186% due 06/29/49 (�)(Þ) 600 432
Bolivarian Republic of Venezuela
8.250% due 10/13/24 790 559
BP Capital Markets PLC
3.200% due 03/11/16 2,075 2,206
4.500% due 10/01/20 4,700 5,263
Braskem Finance, Ltd.
5.750% due 04/15/21 (Þ) 500 499
Brazilian Government International
Bond
5.625% due 01/07/41 1,000 1,150
BRFkredit A/S
2.050% due 04/15/13 (Þ) 16,500 16,752
Caisse Centrale Desjardins du
Quebec
2.650% due 09/16/15 (Þ) 6,040 6,229
Chatham Light CLO, Ltd.
Series 2005-2A Class A1
0.682% due 08/03/19 (Å)(Ê) 3,177 3,067
Colombia Government International
Bond
6.125% due 01/18/41 1,630 1,956
Cooperatieve Centrale Raiffeisen-
Boerenleenbank BA/Utrect
3.375% due 01/19/17 3,325 3,422
Corp. Andina de Fomento
8.125% due 06/04/19 970 1,186
Corp. Nacional del Cobre de Chile
7.500% due 01/15/19 (Þ) 1,900 2,453
6.150% due 10/24/36 (Þ) 100 125
Covidien International Finance SA
4.200% due 06/15/20 2,250 2,492
Copyright © 2012 www.secdatabase.com. All Rights Reserved.Please Consider the Environment Before Printing This Document

106 Russell Strategic Bond Fund
Banco Santander Brasil SA
4.500% due 04/06/15 (Þ) 300 297
Banco Santander Brazil SA/Cayman
Islands
2.659% due 03/18/14 (Ê)(Þ) 1,400 1,336
Bank of China Hong Kong, Ltd.
5.550% due 02/11/20 (Þ) 600 631
Bank of India
Series REGS
4.750% due 09/30/15 600 584
Bank of Montreal
2.850% due 06/09/15 (Ñ)(Þ) 1,100 1,163
2.500% due 01/11/17 5,505 5,592
1.950% due 01/30/17 (Å) 6,800 6,911
Bank of New York Mellon SA
Institucion de Banca Multiple
9.625% due 05/02/21 (Þ) 1,300 1,151
Bank of Scotland PLC
5.250% due 02/21/17 (Þ) 2,900 3,060
Barclays Bank PLC
2.375% due 01/13/14 1,000 996
6.050% due 12/04/17 (Þ) 2,700 2,722
BBVA Bancomer SA
4.500% due 03/10/16 (Þ) 600 604
6.500% due 03/10/21 (Þ) 1,200 1,193
Credit Suisse AG/Guernsey
Series 1
1.147% due 05/29/49 (Ê)(�) 3,595 2,299
Credit Suisse NY
2.200% due 01/14/14 900 902
5.500% due 05/01/14 3,000 3,200
6.000% due 02/15/18 1,380 1,447
CSN Islands XI Corp.
6.875% due 09/21/19 (Ñ)(Þ) 300 324
CSN Resources SA
6.500% due 07/21/20 (Þ) 400 423
Deutsche Bank AG
6.000% due 09/01/17 4,300 4,917
Dexia Credit Local SA
1.033% due 04/29/14 (Ê)(Þ) 5,300 4,822
Digicel Group, Ltd.
8.875% due 01/15/15 (Þ) 875 881
9.125% due 01/15/15 (Þ) 6,957 7,027
DNB Boligkreditt AS
2.100% due 10/14/15 (Þ) 9,500 9,496
Eastern and Southern African Trade
and Development Bank
6.875% due 01/09/16 2,435 2,230
Eksportfinans ASA
2.375% due 05/25/16 1,000 861
Copyright © 2012 www.secdatabase.com. All Rights Reserved.Please Consider the Environment Before Printing This Document

Table of Contents
Russell Investment CompanyRussell Strategic Bond FundSchedule of Investments, continued �� January 31, 2012 (Unaudited)Amounts in thousands (except share amounts)
Principal
Amount ($)
or Shares
Market
Value
$
Electricite De France
5.500% due 01/26/14 (Ñ)(Þ) 1,700 1,820
6.500% due 01/26/19 (Þ) 1,700 1,967
6.950% due 01/26/39 (Þ) 1,400 1,659
Endurance Specialty Holdings, Ltd.
6.150% due 10/15/15 525 554
Enel Finance International NV
6.250% due 09/15/17 (Ñ)(Þ) 1,500 1,502
6.000% due 10/07/39 (Þ) 2,850 2,424
ENN Energy Holdings, Ltd.
6.000% due 05/13/21 (Þ) 300 283
Escrow GM Corp
1.000% due 08/15/13 (Þ) 420 160
Export-Import Bank of China
4.875% due 07/21/15 (Þ) 300 323
Federal Home Loan Mortgage Corp.
4.375% due 01/15/14 3,500 4,794
Gazprom OAO Via Gaz Capital SA
7.343% due 04/11/13 (Þ) 600 631
8.146% due 04/11/18 (Þ) 2,600 3,029
Series REGS
9.250% due 04/23/19 2,380 2,922
8.625% due 04/28/34 17,900 22,017
Gazprom OAO Via Gazprom
International SA
Series REGS
7.201% due 02/01/20 1,818 1,973
Gazprom OAO Via RBS AG
Series REGS
9.625% due 03/01/13 1,200 1,287
Gazprom OAO Via White Nights
Finance BV
Series REGS
10.500% due 03/08/14 300 338
10.500% due 03/25/14 1,100 1,242
Principal
Amount ($)
or Shares
Market
Value
$
Hutchison Whampoa
International 09, Ltd.
Series REGS
7.625% due 04/09/19 2,800 3,427
Hutchison Whampoa
International 11, Ltd.
4.625% due 01/13/22 (Å) 7,645 7,688
ING Bank NV
1.596% due 03/15/13 (Ê)(Þ) 8,100 7,993
2.375% due 06/09/14 (Þ) 4,500 4,449
2.500% due 01/14/16 (Þ) 8,100 8,107
Intelsat Jackson Holdings SA
9.500% due 06/15/16 5,595 5,875
7.250% due 04/01/19 (Þ) 3,750 3,918
IPIC GMTN, Ltd.
5.500% due 03/01/22 (Þ) 6,660 6,743
6.875% due 11/01/41 (Þ) 2,365 2,436
Israel Government AID Bond
5.500% due 09/18/23 3,400 4,382
5.500% due 09/18/33 6,000 7,907
Jasper CLO, Ltd.
Series 2005-1A Class A
0.817% due 08/01/17 (Ê)(Þ) 10,757 9,966
JPMorgan Chase & Co.
1.654% due 09/26/13 (Ê) 300 389
Kansas City Southern de Mexico
SA de CV
6.625% due 12/15/20 1,425 1,553
Kinross Gold Corp.
6.875% due 09/01/41 (Þ) 1,415 1,502
Korea Electric Power Corp.
5.125% due 04/23/34 (Þ) 485 500
Korea Gas Corp.
6.250% due 01/20/42 (Å) 1,400 1,470
LBG Capital No. 1 PLC
8.500% due 12/29/49 (�)(Þ) 300 207
Copyright © 2012 www.secdatabase.com. All Rights Reserved.Please Consider the Environment Before Printing This Document

Russell Strategic Bond Fund 107
Gerdau Trade, Inc.
5.750% due 01/30/21 (Ñ)(Þ) 2,700 2,727
Government of the Cayman Islands
5.950% due 11/24/19 (Þ) 2,230 2,347
Granite Mortgages PLC
Series 2004-3 Class 2A1
0.843% due 09/20/44 (Ê) 384 372
Greywolf CLO, Ltd.
Series 2007-1A Class A
0.716% due 02/18/21 (Ê)(Þ) 4,418 4,050
Grupo Bimbo SAB de CV
4.500% due 01/25/22 (Å) 3,550 3,623
HBOS PLC
Series GMTN
6.750% due 05/21/18 (Þ) 9,920 8,728
HSBC Bank USA NA NY
Series CLN
Zero coupon due 08/15/40 8,130 10,812
HSBC Holdings PLC
6.500% due 05/02/36 700 748
6.500% due 09/15/37 1,200 1,277
6.800% due 06/01/38 1,375 1,543
Lloyds TSB Bank PLC
12.000% due 12/29/49 (�)(Þ) 8,700 8,004
Majapahit Holding BV
Series REGS
7.750% due 10/17/16 900 1,033
Mexico Government International
Bond
6.050% due 01/11/40 1,380 1,668
Montpelier Re Holdings, Ltd.
6.125% due 08/15/13 4,985 5,078
Monument Park CDO, Ltd.
Series 2004-1A Class A1
1.111% due 01/20/16 (Ê)(Þ) 1,033 1,013
Morgan Stanley
1.807% due 03/01/13 (Ê) 2,500 3,213
Series GMTN
1.651% due 01/16/17 (Ê) 300 329
5.750% due 02/14/17 200 323
MTS International Funding, Ltd.
Series REGS
8.625% due 06/22/20 200 226
MUFG Capital Finance 1, Ltd.
6.346% due 07/29/49 (�) 4,050 4,209
National Australia Bank, Ltd.
5.350% due 06/12/13 (Þ) 6,725 7,014
Copyright © 2012 www.secdatabase.com. All Rights Reserved.Please Consider the Environment Before Printing This Document

Table of Contents
Russell Investment CompanyRussell Strategic Bond FundSchedule of Investments, continued �� January 31, 2012 (Unaudited)Amounts in thousands (except share amounts)
Principal
Amount ($)
or Shares
Market
Value
$
Nationwide Building Society
6.250% due 02/25/20 (Þ) 2,600 2,659
Newcrest Finance Pty, Ltd.
4.450% due 11/15/21 (Þ) 3,600 3,641
Nexen, Inc.
6.400% due 05/15/37 290 327
7.500% due 07/30/39 3,700 4,693
Noble Group, Ltd.
6.750% due 01/29/20 (Þ) 700 634
Nokia OYJ
5.375% due 05/15/19 2,550 2,591
Nordea Bank AB
2.125% due 01/14/14 (Þ) 400 398
Nordea Eiendomskreditt AS
1.875% due 04/07/14 (Þ) 11,525 11,598
Norske Skogindustrier ASA
6.125% due 10/15/15 (Þ) 2,525 1,654
North American Development Bank
4.375% due 02/11/20 5,900 6,653
Novatek Finance, Ltd.
5.326% due 02/03/16 (Þ) 400 411
Odebrecht Drilling Norbe VIII/IX,
Ltd.
6.350% due 06/30/21 (Þ) 1,666 1,731
OGX Petroleo e Gas Participacoes
SA
8.500% due 06/01/18 (Þ) 3,905 4,034
Panama Government International
Bond
7.250% due 03/15/15 300 347
PE Paper Escrow GmbH
12.000% due 08/01/14 (Þ) 3,650 3,960
Pernod-Ricard SA
2.950% due 01/15/17 (Å) 13,050 13,285
5.500% due 01/15/42 (Å) 2,880 3,028
Principal
Amount ($)
or Shares
Market
Value
$
4.500% due 01/20/22 (Ñ)(Þ) 3,035 3,126
5.750% due 01/20/42 (Þ) 3,545 3,766
QBE Capital Funding III, Ltd.
7.250% due 05/24/41 (Þ) 3,000 2,653
Qtel International Finance, Ltd.
5.000% due 10/19/25 (Þ) 4,710 4,745
Rabobank Nederland NV
11.000% due 06/29/49 (�)(Þ) 4,042 5,002
Ralph Lauren Corp.
4.500% due 10/04/13 2,050 2,774
Ras Laffan Liquefied Natural Gas
Co., Ltd. II
5.298% due 09/30/20 (Þ) 661 709
Ras Laffan Liquefied Natural Gas
Co., Ltd. III
5.838% due 09/30/27 (Þ) 300 320
Reliance Industries, Ltd.
10.250% due 01/15/97 (Þ) 1,000 1,045
Republic of Venezuela
7.750% due 10/13/19 2,220 1,687
RESI Finance, LP
Series 2003-D Class B3
1.596% due 12/10/35 (Ê)(Þ) 1,248 944
Series 2003-D Class B4
1.796% due 12/10/35 (Ê)(Þ) 1,452 1,061
Resix Finance, Ltd. Credit-Linked
Notes
Series 2003-D Class B7
6.046% due 12/10/35 (Ê)(Þ) 1,452 1,021
Resona Bank, Ltd.
5.850% due 09/29/49 (�)(Þ) 600 613
Rio Tinto Finance USA, Ltd.
3.750% due 09/20/21 4,125 4,423
Romanian Government Internation
Bond
6.750% due 02/07/22 3,186 3,158
Copyright © 2012 www.secdatabase.com. All Rights Reserved.Please Consider the Environment Before Printing This Document

108 Russell Strategic Bond Fund
Perusahaan Penerbit SBSN
4.000% due 11/21/18 (Þ) 500 504
Petrobras International Finance Co.-
Pifco
3.875% due 01/27/16 4,000 4,095
5.875% due 03/01/18 700 768
8.375% due 12/10/18 400 491
5.750% due 01/20/20 320 343
5.375% due 01/27/21 4,270 4,475
Petroleos de Venezuela SA
Series REGS
8.500% due 11/02/17 1,960 1,553
Petroleos Mexicanos
8.000% due 05/03/19 4,400 5,500
4.875% due 01/24/22 (Å)(Ñ) 980 1,011
Series WI
6.500% due 06/02/41 1,015 1,122
PPL WEM Holdings PLC
5.375% due 05/01/21 (Þ) 2,720 2,940
Province of Ontario Canada
1.375% due 01/27/14 1,700 1,720
3.000% due 07/16/18 500 531
PTTEP Canada International
Finance, Ltd.
5.692% due 04/05/21 (Þ) 2,610 2,782
Qatar Government International
Bond
5.250% due 01/20/20 (Þ) 6,820 7,460
Royal Bank of Scotland Group
PLC
Series 1
9.118% due 03/31/49 (�) 2,300 1,978
Royal Bank of Scotland PLC (The)
3.250% due 01/11/14 5,500 5,452
4.875% due 08/25/14 (Þ) 4,075 4,115
1.316% due 09/29/15 (Ê) 100 80
1.352% due 10/14/16 (Ê) 100 77
Russian Foreign Bond - Eurobond
Series REGS
3.625% due 04/29/15 200 204
5.000% due 04/29/20 100 105
Sirius International Group, Ltd.
7.506% due 05/29/49 (�)(Þ) 5,830 5,434
SMART Trust
Series 2011-1USA Class A2A
1.180% due 04/14/13 (Þ) 3,465 3,465
Series 2011-2USA Class A4A
2.310% due 04/14/17 (Þ) 7,420 7,520
Smurfit Kappa Treasury Funding,
Ltd.
7.500% due 11/20/25 1,800 1,723
Societe Generale SA
1.631% due 04/11/14 (Ê)(Þ) 300 283
Copyright © 2012 www.secdatabase.com. All Rights Reserved.Please Consider the Environment Before Printing This Document
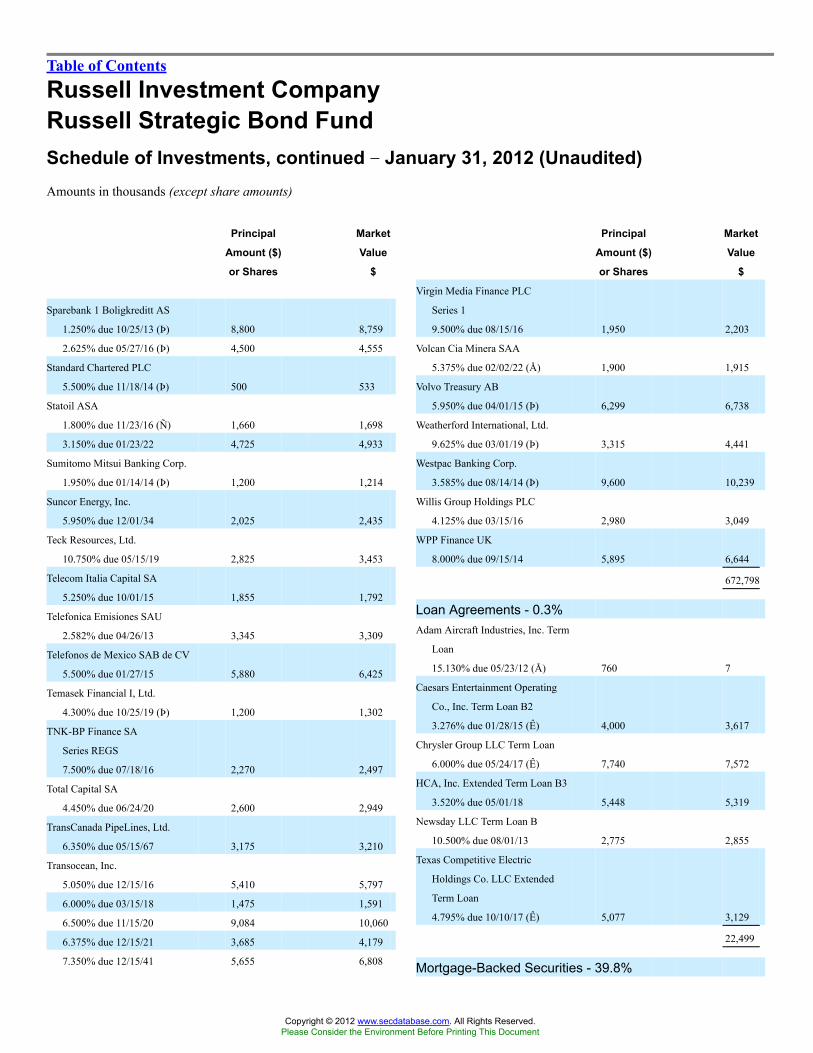
Table of Contents
Russell Investment CompanyRussell Strategic Bond FundSchedule of Investments, continued �� January 31, 2012 (Unaudited)Amounts in thousands (except share amounts)
Principal
Amount ($)
or Shares
Market
Value
$
Sparebank 1 Boligkreditt AS
1.250% due 10/25/13 (Þ) 8,800 8,759
2.625% due 05/27/16 (Þ) 4,500 4,555
Standard Chartered PLC
5.500% due 11/18/14 (Þ) 500 533
Statoil ASA
1.800% due 11/23/16 (Ñ) 1,660 1,698
3.150% due 01/23/22 4,725 4,933
Sumitomo Mitsui Banking Corp.
1.950% due 01/14/14 (Þ) 1,200 1,214
Suncor Energy, Inc.
5.950% due 12/01/34 2,025 2,435
Teck Resources, Ltd.
10.750% due 05/15/19 2,825 3,453
Telecom Italia Capital SA
5.250% due 10/01/15 1,855 1,792
Telefonica Emisiones SAU
2.582% due 04/26/13 3,345 3,309
Telefonos de Mexico SAB de CV
5.500% due 01/27/15 5,880 6,425
Temasek Financial I, Ltd.
4.300% due 10/25/19 (Þ) 1,200 1,302
TNK-BP Finance SA
Series REGS
7.500% due 07/18/16 2,270 2,497
Total Capital SA
4.450% due 06/24/20 2,600 2,949
TransCanada PipeLines, Ltd.
6.350% due 05/15/67 3,175 3,210
Transocean, Inc.
5.050% due 12/15/16 5,410 5,797
6.000% due 03/15/18 1,475 1,591
6.500% due 11/15/20 9,084 10,060
6.375% due 12/15/21 3,685 4,179
7.350% due 12/15/41 5,655 6,808
Principal
Amount ($)
or Shares
Market
Value
$
Virgin Media Finance PLC
Series 1
9.500% due 08/15/16 1,950 2,203
Volcan Cia Minera SAA
5.375% due 02/02/22 (Å) 1,900 1,915
Volvo Treasury AB
5.950% due 04/01/15 (Þ) 6,299 6,738
Weatherford International, Ltd.
9.625% due 03/01/19 (Þ) 3,315 4,441
Westpac Banking Corp.
3.585% due 08/14/14 (Þ) 9,600 10,239
Willis Group Holdings PLC
4.125% due 03/15/16 2,980 3,049
WPP Finance UK
8.000% due 09/15/14 5,895 6,644
672,798
Loan Agreements - 0.3%Adam Aircraft Industries, Inc. Term
Loan
15.130% due 05/23/12 (Å) 760 7
Caesars Entertainment Operating
Co., Inc. Term Loan B2
3.276% due 01/28/15 (Ê) 4,000 3,617
Chrysler Group LLC Term Loan
6.000% due 05/24/17 (Ê) 7,740 7,572
HCA, Inc. Extended Term Loan B3
3.520% due 05/01/18 5,448 5,319
Newsday LLC Term Loan B
10.500% due 08/01/13 2,775 2,855
Texas Competitive Electric
Holdings Co. LLC Extended
Term Loan
4.795% due 10/10/17 (Ê) 5,077 3,129
22,499
Mortgage-Backed Securities - 39.8%
Copyright © 2012 www.secdatabase.com. All Rights Reserved.Please Consider the Environment Before Printing This Document

Russell Strategic Bond Fund 109
Tyco Electronics Group SA
6.550% due 10/01/17 2,945 3,487
3.500% due 02/03/22 2,555 2,545
UBM PLC
5.750% due 11/03/20 (Þ) 4,715 4,713
UBS AG
5.850% due 12/31/17 (Þ) 4,690 1,292
Series BKNT
5.875% due 12/20/17 2,000 2,240
5.750% due 04/25/18 300 336
Series FRN
1.553% due 01/28/14 (Ê) 1,000 979
Vale Overseas, Ltd.
6.250% due 01/23/17 200 229
6.875% due 11/21/36 200 235
Venezuela Government
International Bond
9.000% due 05/07/23 570 428
9.250% due 05/07/28 210 155
Vimpel Communications Via VIP
Finance Ireland, Ltd. OJSC
6.493% due 02/02/16 (Þ) 1,860 1,846
7.748% due 02/02/21 (Þ) 1,790 1,727
Adjustable Rate Mortgage Trust
Series 2006-1 Class 2A1
3.188% due 03/25/36 1,090 562
Series 2007-1 Class 1A1
2.939% due 03/25/37 5,196 2,522
American Home Mortgage Assets
LLC
Series 2007-4 Class A2
0.466% due 08/25/37 (Ê) 8,357 5,783
American Home Mortgage
Investment Trust
Series 2004-4 Class 4A
2.746% due 02/25/45 (Ê) 621 472
Series 2005-2 Class 5A3
5.077% due 09/25/35 753 761
Banc of America Alternative Loan
Trust
Series 2005-5 Class 2CB1
6.000% due 06/25/35 626 450
Series 2006-6 Class CB6
6.000% due 06/25/46 1,174 192
Banc of America Funding Corp.
Series 2005-D Class A1
2.682% due 05/25/35 (Ê) 811 775
Copyright © 2012 www.secdatabase.com. All Rights Reserved.Please Consider the Environment Before Printing This Document

Table of Contents
Russell Investment CompanyRussell Strategic Bond FundSchedule of Investments, continued �� January 31, 2012 (Unaudited)Amounts in thousands (except share amounts)
Principal
Amount ($)
or Shares
Market
Value
$
Series 2005-F Class 1A2
0.631% due 09/20/35 (Ê) 261 65
Series 2006-3 Class 5A8
5.500% due 03/25/36 4,640 4,325
Series 2006-A Class 4A1
5.434% due 02/20/36 (Ê) 2,894 2,131
Series 2006-D Class 1A2
0.561% due 05/20/36 (Ê) 39,000 6,987
Series 2006-F Class 1A2
2.736% due 07/20/36 (Ê) 215 47
Series 2006-G Class 2A3
0.451% due 07/20/36 (Ê) 6,977 6,699
Series 2006-H Class 4A4
5.955% due 09/20/46 827 58
Series 2006-I Class 5A1
5.965% due 10/20/46 (Ê) 9,280 7,163
Series 2006-J Class 4A1
5.745% due 01/20/47 808 524
Series 2007-2 Class TA1B
5.806% due 03/25/37 295 199
Banc of America Merrill Lynch
Commercial Mortgage, Inc.
Series 2002-PB2 Class A4
6.186% due 06/11/35 421 421
Series 2002-PB2 Class C
6.349% due 06/11/35 100 100
Series 2003-1 Class D
4.903% due 09/11/36 (Þ) 440 445
Series 2003-1 Class SBB
5.860% due 03/11/32 (Þ) 1,626 1,697
Series 2003-1 Class SBC
5.790% due 03/11/32 (Þ) 1,336 1,394
Series 2003-1 Class SBE
6.770% due 03/11/32 (Þ) 433 458
Series 2005-1 Class A3
4.877% due 11/10/42 1,227 1,226
Principal
Amount ($)
or Shares
Market
Value
$
Series 2008-1 Class C
6.438% due 02/10/51 (Þ) 1,507 927
Banc of America Mortgage
Securities, Inc.
Series 2004-1 Class 5A1
6.500% due 09/25/33 27 28
Series 2004-11 Class 2A1
5.750% due 01/25/35 1,551 1,585
Series 2004-D Class 1A1
2.748% due 05/25/34 (Ê) 52 45
Series 2004-F Class 1A1
2.748% due 07/25/34 (Ê) 732 663
Series 2004-I Class 2A2
2.753% due 10/25/34 (Ê) 148 132
Series 2004-L Class 2A1
2.931% due 01/25/35 (Ê) 2,576 2,159
Series 2005-H Class 2A5
2.754% due 09/25/35 (Ê) 3,300 2,507
Series 2005-I Class 2A2
2.732% due 10/25/35 (Ê) 1,995 362
Series 2005-I Class 4A1
5.146% due 10/25/35 (Ê) 1,678 1,526
Series 2006-2 Class A12
6.000% due 07/25/46 92 77
Series 2006-B Class 1A1
2.299% due 10/20/46 (Ê) 907 395
Series 2007-1 Class 1A16
5.625% due 03/25/37 1,539 1,445
Series 2007-1 Class 1A26
6.000% due 03/25/37 1,115 1,001
Bcap LLC 2011 RR4 II
Series 2011-RR4 Class 7A2
11.236% due 04/26/37 (Þ) 5,371 1,423
Bear Stearns Adjustable Rate
Mortgage Trust
Series 2002-11 Class 1A2
2.888% due 02/25/33 8 6
Copyright © 2012 www.secdatabase.com. All Rights Reserved.Please Consider the Environment Before Printing This Document
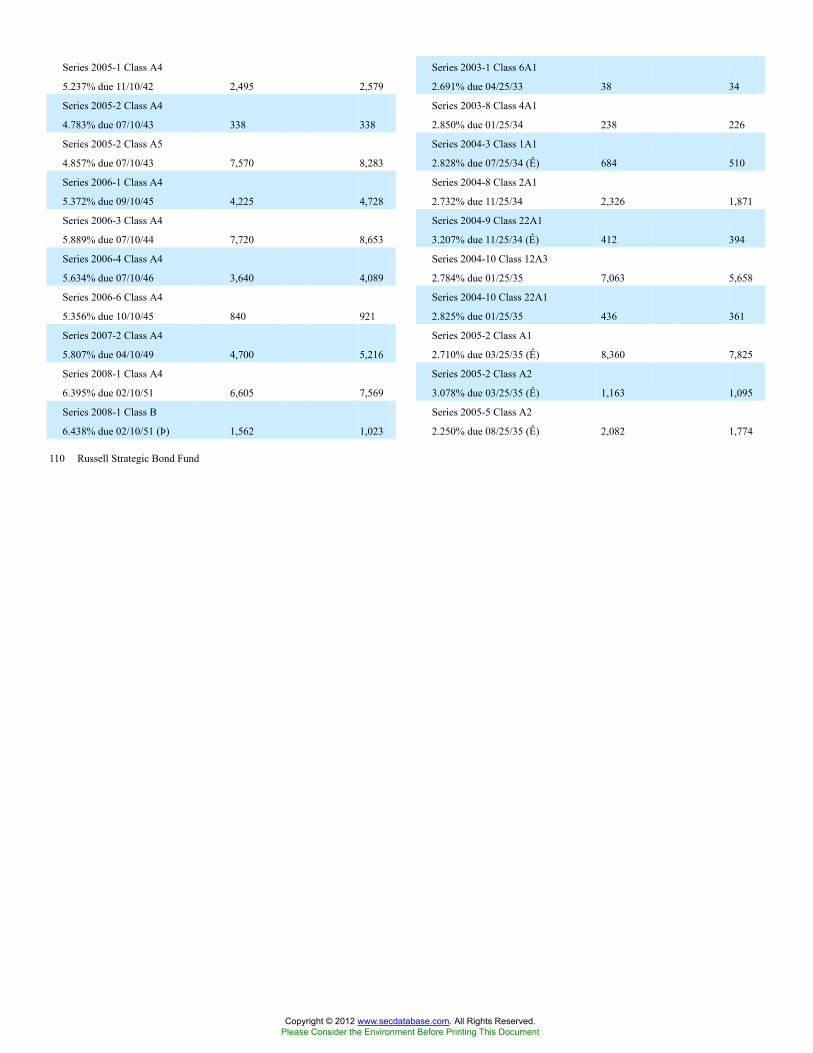
110 Russell Strategic Bond Fund
Series 2005-1 Class A4
5.237% due 11/10/42 2,495 2,579
Series 2005-2 Class A4
4.783% due 07/10/43 338 338
Series 2005-2 Class A5
4.857% due 07/10/43 7,570 8,283
Series 2006-1 Class A4
5.372% due 09/10/45 4,225 4,728
Series 2006-3 Class A4
5.889% due 07/10/44 7,720 8,653
Series 2006-4 Class A4
5.634% due 07/10/46 3,640 4,089
Series 2006-6 Class A4
5.356% due 10/10/45 840 921
Series 2007-2 Class A4
5.807% due 04/10/49 4,700 5,216
Series 2008-1 Class A4
6.395% due 02/10/51 6,605 7,569
Series 2008-1 Class B
6.438% due 02/10/51 (Þ) 1,562 1,023
Series 2003-1 Class 6A1
2.691% due 04/25/33 38 34
Series 2003-8 Class 4A1
2.850% due 01/25/34 238 226
Series 2004-3 Class 1A1
2.828% due 07/25/34 (Ê) 684 510
Series 2004-8 Class 2A1
2.732% due 11/25/34 2,326 1,871
Series 2004-9 Class 22A1
3.207% due 11/25/34 (Ê) 412 394
Series 2004-10 Class 12A3
2.784% due 01/25/35 7,063 5,658
Series 2004-10 Class 22A1
2.825% due 01/25/35 436 361
Series 2005-2 Class A1
2.710% due 03/25/35 (Ê) 8,360 7,825
Series 2005-2 Class A2
3.078% due 03/25/35 (Ê) 1,163 1,095
Series 2005-5 Class A2
2.250% due 08/25/35 (Ê) 2,082 1,774
Copyright © 2012 www.secdatabase.com. All Rights Reserved.Please Consider the Environment Before Printing This Document

Table of Contents
Russell Investment CompanyRussell Strategic Bond FundSchedule of Investments, continued �� January 31, 2012 (Unaudited)Amounts in thousands (except share amounts)
Principal
Amount ($)
or Shares
Market
Value
$
Series 2005-10 Class A3
2.704% due 10/25/35 (Ê) 8,583 6,871
Series 2005-12 Class 13A1
5.397% due 02/25/36 451 386
Series 2007-1 Class 3A2
5.319% due 02/25/47 1,530 161
Series 2007-3 Class 1A1
5.059% due 05/25/47 3,201 2,024
Bear Stearns Alt-A Trust
Series 2005-4 Class 23A1
2.605% due 05/25/35 1,409 1,039
Series 2005-5 Class 21A1
2.531% due 07/25/35 3,241 2,365
Series 2005-7 Class 22A1
2.807% due 09/25/35 952 599
Bear Stearns Asset Backed
Securities Trust
Series 2005-AC9 Class A3
0.626% due 12/25/35 (Ê) 7,092 3,545
Bear Stearns Commercial Mortgage
Securities
Series 2005-PWR9 Class A4B
4.943% due 09/11/42 495 510
Series 2005-T20 Class A4A
5.299% due 10/12/42 9,036 10,088
Series 2006-PW11 Class A1
5.266% due 03/11/39 685 684
Series 2006-PW11 Class A4
5.619% due 03/11/39 5,570 6,257
Series 2006-PW13 Class A4
5.540% due 09/11/41 10,863 12,318
Series 2006-PW14 Class A4
5.201% due 12/11/38 2,800 3,126
Series 2007-PW15 Class A4
5.331% due 02/11/44 100 107
Principal
Amount ($)
or Shares
Market
Value
$
Series 2007-A1 Class 4A1
2.746% due 02/25/37 217 201
Series 2007-A1 Class 5A1
2.757% due 02/25/37 860 743
Series 2007-A1 Class 7A1
2.748% due 02/25/37 252 242
Series 2007-A1 Class 8A1
2.739% due 02/25/37 2,332 2,351
Citicorp Mortgage Securities, Inc.
Series 2005-7 Class 1A1
5.500% due 10/25/35 1,100 1,107
Series 2006-3 Class 1A9
5.750% due 06/25/36 2,702 2,412
Citigroup Commercial Mortgage
Trust
Series 2006-C5 Class A4
5.431% due 10/15/49 2,146 2,429
Series 2007-C6 Class A4
5.885% due 12/10/49 3,155 3,602
Citigroup Mortgage Loan Trust,
Inc.
Series 2004-NCM2 Class 1CB2
6.750% due 08/25/34 211 224
Series 2005-11 Class A2A
2.580% due 10/25/35 (Ê) 212 179
Series 2006-AR6 Class 1A1
5.881% due 08/25/36 1,491 1,242
Series 2006-AR7 Class 1A4A
5.253% due 11/25/36 6,160 3,991
Series 2007-6 Class 1A4A
5.576% due 03/25/37 2,110 1,024
Series 2007-10 Class 2A3A
5.912% due 09/25/37 1,204 736
Series 2007-10 Class 2A4A
6.118% due 09/25/37 (Ê) 226 151
Series 2007-AR4 Class 1A1A
5.782% due 03/25/37 1,579 1,300
Copyright © 2012 www.secdatabase.com. All Rights Reserved.Please Consider the Environment Before Printing This Document

Russell Strategic Bond Fund 111
Series 2007-PW16 Class A4
5.904% due 06/11/40 5,198 5,873
Series 2007-PW17 Class A4
5.694% due 06/11/50 13,110 14,784
Series 2007-T26 Class A4
5.471% due 01/12/45 400 457
Bear Stearns Structured Products,
Inc.
Series 2007-R6 Class 1A1
2.580% due 01/26/36 2,026 1,190
Series 2007-R6 Class 2A1
3.230% due 12/26/46 1,791 1,057
Chase Commercial Mortgage
Securities Corp.
Series 1997-1 Class F
7.370% due 06/19/29 (Þ) 384 388
Chase Mortgage Finance Corp.
Series 2007-A1 Class 11M1
2.502% due 03/25/37 (Ê) 744 520
Series 2007-A1 Class 2A1
2.757% due 02/25/37 767 730
Series 2007-A1 Class 3A1
2.760% due 02/25/37 480 414
Series 2007-AR8 Class 2A1A
5.173% due 07/25/37 2,679 1,748
Series 2008-RR1 Class A1A1
0.346% due 01/25/37 (Ê)(Þ) 184 98
Citigroup/Deutsche Bank
Commercial Mortgage Trust
Series 2005-CD1 Class A4
5.399% due 07/15/44 5,180 5,767
Series 2007-CD4 Class A4
5.322% due 12/11/49 4,030 4,392
Commercial Mortgage Acceptance
Corp.
Series 1998-C2 Class F
5.440% due 09/15/30 (Þ) 425 442
Commercial Mortgage Asset Trust
Series 1999-C1 Class C
7.350% due 01/17/32 385 417
Series 1999-C1 Class D
7.350% due 01/17/32 1,675 1,816
Commercial Mortgage Pass
Through Certificates
Series 2003-LB1A Class A2
4.084% due 06/10/38 3,825 3,929
Copyright © 2012 www.secdatabase.com. All Rights Reserved.Please Consider the Environment Before Printing This Document

Table of Contents
Russell Investment CompanyRussell Strategic Bond FundSchedule of Investments, continued �� January 31, 2012 (Unaudited)Amounts in thousands (except share amounts)
Principal
Amount ($)
or Shares
Market
Value
$
Series 2006-C7 Class A2
5.690% due 06/10/46 19 19
Series 2006-C8 Class A4
5.306% due 12/10/46 1,400 1,555
Series 2007-C9 Class A4
6.007% due 12/10/49 6,771 7,755
Series 2010-RR1 Class GEA
5.543% due 12/11/49 (Þ) 7,300 8,139
Series 2011-THL Class A
3.376% due 06/09/28 (Þ) 4,680 4,809
Countrywide Alternative Loan
Trust
Series 2003-20CB Class 1A2
5.500% due 10/25/33 341 353
Series 2004-28CB Class 6A1
6.000% due 01/25/35 501 477
Series 2005-16 Class A1
1.842% due 06/25/35 (Ê) 2,528 1,499
Series 2005-38 Class A1
1.697% due 09/25/35 (Ê) 1,034 600
Series 2005-51 Class 4A1
0.601% due 11/20/35 (Ê) 480 256
Series 2005-58 Class A2
0.671% due 12/20/35 (Ê) 1,354 314
Series 2005-59 Class 1A1
0.611% due 11/20/35 (Ê) 2,259 1,213
Series 2005-1CB Class 2A2
5.500% due 03/25/35 1,121 965
Series 2005-32T1 Class A7
0.526% due 08/25/35 (Ê) 45 45
Series 2005-48T1 Class A6
5.500% due 11/25/35 9,685 6,151
Series 2005-85CB Class 2A2
5.500% due 02/25/36 26 18
Series 2006-6CB Class 1A10
5.500% due 05/25/36 247 166
Principal
Amount ($)
or Shares
Market
Value
$
Series 2007-J2 Class 2A1
6.000% due 07/25/37 18,443 14,195
Series 2007-OA4 Class A1
0.446% due 05/25/47 (Ê) 3,363 1,911
Series 2007-OA6 Class A1B
0.476% due 06/25/37 (Ê) 1,480 835
Series 2007-OA11 Class A1A
1.577% due 11/25/47 (Ê) 6,835 3,118
Countrywide Home Loan Mortgage
Pass Through Trust
Series 2003-52 Class A1
2.667% due 02/19/34 1,373 1,196
Series 2004-22 Class A3
2.751% due 11/25/34 1,637 1,215
Series 2004-HYB6 Class A2
2.715% due 11/20/34 1,222 938
Series 2004-HYB9 Class 1A1
2.774% due 02/20/35 2,755 2,179
Series 2004-J9 Class 2A1
5.250% due 01/25/35 349 348
Series 2005-11 Class 5A1
0.576% due 03/25/35 (Ê) 41 24
Series 2005-27 Class 2A1
5.500% due 12/25/35 4,762 3,714
Series 2005-HYB9 Class 3A2A
2.595% due 02/20/36 (Ê) 301 204
Series 2005-R2 Class 2A4
8.500% due 06/25/35 (Þ) 209 215
Series 2006-1 Class A2
6.000% due 03/25/36 1,102 853
Series 2006-1 Class A3
6.000% due 03/25/36 284 47
Series 2006-13 Class 1A23
6.250% due 09/25/36 97 34
Series 2006-21 Class A8
5.750% due 02/25/37 5,080 4,078
Copyright © 2012 www.secdatabase.com. All Rights Reserved.Please Consider the Environment Before Printing This Document
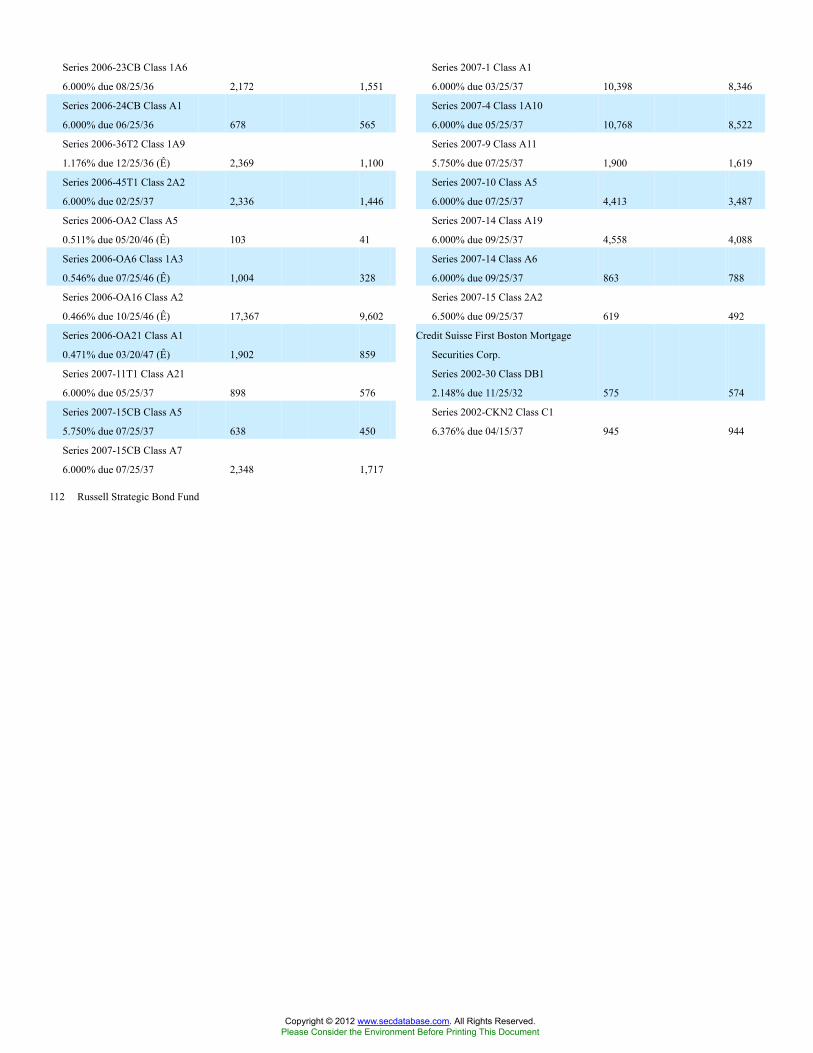
112 Russell Strategic Bond Fund
Series 2006-23CB Class 1A6
6.000% due 08/25/36 2,172 1,551
Series 2006-24CB Class A1
6.000% due 06/25/36 678 565
Series 2006-36T2 Class 1A9
1.176% due 12/25/36 (Ê) 2,369 1,100
Series 2006-45T1 Class 2A2
6.000% due 02/25/37 2,336 1,446
Series 2006-OA2 Class A5
0.511% due 05/20/46 (Ê) 103 41
Series 2006-OA6 Class 1A3
0.546% due 07/25/46 (Ê) 1,004 328
Series 2006-OA16 Class A2
0.466% due 10/25/46 (Ê) 17,367 9,602
Series 2006-OA21 Class A1
0.471% due 03/20/47 (Ê) 1,902 859
Series 2007-11T1 Class A21
6.000% due 05/25/37 898 576
Series 2007-15CB Class A5
5.750% due 07/25/37 638 450
Series 2007-15CB Class A7
6.000% due 07/25/37 2,348 1,717
Series 2007-1 Class A1
6.000% due 03/25/37 10,398 8,346
Series 2007-4 Class 1A10
6.000% due 05/25/37 10,768 8,522
Series 2007-9 Class A11
5.750% due 07/25/37 1,900 1,619
Series 2007-10 Class A5
6.000% due 07/25/37 4,413 3,487
Series 2007-14 Class A19
6.000% due 09/25/37 4,558 4,088
Series 2007-14 Class A6
6.000% due 09/25/37 863 788
Series 2007-15 Class 2A2
6.500% due 09/25/37 619 492
Credit Suisse First Boston Mortgage
Securities Corp.
Series 2002-30 Class DB1
2.148% due 11/25/32 575 574
Series 2002-CKN2 Class C1
6.376% due 04/15/37 945 944
Copyright © 2012 www.secdatabase.com. All Rights Reserved.Please Consider the Environment Before Printing This Document

Table of Contents
Russell Investment CompanyRussell Strategic Bond FundSchedule of Investments, continued �� January 31, 2012 (Unaudited)Amounts in thousands (except share amounts)
Principal
Amount ($)
or Shares
Market
Value
$
Series 2002-CKS4 Class B
5.333% due 11/15/36 2,525 2,530
Series 2002-CP3 Class A3
5.603% due 07/15/35 5,995 6,040
Series 2002-CP3 Class C
5.510% due 07/15/35 3,770 3,784
Series 2003-CPN1 Class A2
4.597% due 03/15/35 432 441
Series 2004-1 Class 3A1
7.000% due 02/25/34 36 37
Series 2005-9 Class 2A1
5.500% due 10/25/35 4,614 4,249
Series 2005-C2 Class A3
4.691% due 04/15/37 1,342 1,402
Series 2005-C4 Class A3
5.120% due 08/15/38 532 536
Credit Suisse Mortgage Capital
Certificates
Series 2006-8 Class 4A1
6.500% due 10/25/21 5,194 4,101
Series 2006-C3 Class AJ
6.009% due 06/15/38 1,372 1,129
Series 2006-C3 Class B
6.009% due 06/15/38 2,153 1,553
Series 2006-C5 Class A3
5.311% due 12/15/39 6,965 7,611
Series 2006-TF2A Class D
0.585% due 10/15/21 (Ê)(Þ) 724 646
Series 2007-2 Class 3A4
5.500% due 03/25/37 5,000 4,263
Series 2007-C1 Class A3
5.383% due 02/15/40 5,350 5,518
DBRR Trust
Series 2011-LC2 Class A4A
4.537% due 07/12/44 (Þ) 3,265 3,691
Principal
Amount ($)
or Shares
Market
Value
$
11.000% due 2016 30 34
5.000% due 2017 324 349
5.500% due 2017 158 172
6.000% due 2017 124 133
6.500% due 2017 114 125
7.000% due 2017 8 9
8.000% due 2017 19 20
2.800% due 2018 4,921 5,178
3.740% due 2018 2,974 3,260
3.840% due 2018 3,480 3,833
4.000% due 2018 7,458 7,963
4.500% due 2018 815 890
5.000% due 2018 124 135
5.500% due 2018 83 91
6.500% due 2018 81 91
7.000% due 2018 52 58
10.000% due 2018 11 12
4.506% due 2019 9,000 10,172
5.000% due 2019 604 658
6.500% due 2019 44 50
3.416% due 2020 (Ê) 2,370 2,551
3.632% due 2020 (Ê) 1,778 1,937
3.763% due 2020 17,987 19,733
4.000% due 2020 29 31
4.250% due 2020 7,543 8,447
6.500% due 2020 19 21
8.000% due 2020 3 3
5.500% due 2021 418 457
5.500% due 2022 2,559 2,785
6.500% due 2022 26 29
5.500% due 2023 3,578 3,914
4.000% due 2024 1,291 1,370
5.000% due 2024 444 480
5.500% due 2024 2,444 2,660
7.500% due 2024 2 2
8.000% due 2024 39 47
10.000% due 2024 7 8
Copyright © 2012 www.secdatabase.com. All Rights Reserved.Please Consider the Environment Before Printing This Document

Russell Strategic Bond Fund 113
DBUBS Mortgage Trust
Series 2011-LC3A Class A2
3.642% due 08/10/44 3,425 3,663
Deutsche ALT-A Securities, Inc.
Alternate Loan Trust
Series 2003-4XS Class A6A
4.820% due 10/25/33 331 324
Series 2007-AR3 Class 2A4
0.626% due 06/25/37 (Ê) 5,000 919
Series 2007-OA1 Class A1
0.426% due 02/25/47 (Ê) 6,031 2,926
Series 2007-OA2 Class A1
0.967% due 04/25/47 (Ê) 14,067 8,570
Downey Savings & Loan
Association Mortgage Loan
Trust
Series 2006-AR1 Class 2A1A
1.137% due 04/19/47 (Ê) 1,488 852
Fannie Mae
5.500% due 2014 26 28
6.500% due 2015 2 2
5.000% due 2016 83 90
6.000% due 2016 79 85
8.000% due 2016 4 4
2.342% due 2025 (Ê) 13 14
4.000% due 2025 8,636 9,158
4.500% due 2025 256 276
5.500% due 2025 14,659 15,968
7.000% due 2025 1 1
2.396% due 2026 (Ê) 207 219
3.500% due 2026 40,771 43,443
4.000% due 2026 1,279 1,359
6.000% due 2026 654 720
7.000% due 2026 75 87
9.000% due 2026 14 16
6.000% due 2027 2,060 2,269
7.000% due 2027 3 4
7.500% due 2027 15 16
6.500% due 2028 129 148
7.000% due 2028 176 204
4.500% due 2029 7,567 8,101
5.000% due 2029 20 21
5.500% due 2029 � �
6.500% due 2029 296 340
Copyright © 2012 www.secdatabase.com. All Rights Reserved.Please Consider the Environment Before Printing This Document

Table of Contents
Russell Investment CompanyRussell Strategic Bond FundSchedule of Investments, continued �� January 31, 2012 (Unaudited)Amounts in thousands (except share amounts)
Principal
Amount ($)
or Shares
Market
Value
$
7.000% due 2029 1,011 1,181
7.500% due 2029 48 58
8.000% due 2029 3 3
8.500% due 2029 2 2
6.500% due 2030 143 164
7.000% due 2030 380 436
7.500% due 2030 198 224
8.000% due 2030 205 248
8.500% due 2030 120 139
9.500% due 2030 58 70
6.500% due 2031 248 284
7.000% due 2031 874 1,023
7.500% due 2031 331 388
8.000% due 2031 380 443
8.500% due 2031 226 268
6.500% due 2032 653 748
7.000% due 2032 2,154 2,523
7.500% due 2032 200 235
8.000% due 2032 14 17
8.500% due 2032 25 31
2.282% due 2033 (Ê) 194 203
2.324% due 2033 (Ê) 4 4
2.418% due 2033 (Ê) 795 841
2.454% due 2033 (Ê) 45 47
2.465% due 2033 (Ê) 376 392
2.625% due 2033 (Ê) 10 10
4.500% due 2033 227 243
5.000% due 2033 142 155
5.500% due 2033 36 39
6.500% due 2033 551 628
7.000% due 2033 799 922
2.322% due 2034 (Ê) 1,000 1,054
2.452% due 2034 (Ê) 438 459
2.470% due 2034 (Ê) 181 192
2.475% due 2034 (Ê) 912 963
5.000% due 2034 796 861
Principal
Amount ($)
or Shares
Market
Value
$
5.500% due 2036 5,526 5,989
6.000% due 2036 4,594 5,061
6.305% due 2036 (Ê) 25 27
6.500% due 2036 190 215
7.000% due 2036 375 432
5.500% due 2037 27,631 30,077
6.000% due 2037 1,551 1,711
5.500% due 2038 1,646 1,797
6.000% due 2038 1,237 1,366
4.000% due 2039 2,520 2,681
4.500% due 2039 8,824 9,610
5.500% due 2039 27 30
6.000% due 2039 1,797 2,009
1.608% due 2040 (Ê) 204 207
4.000% due 2040 34,177 36,232
4.500% due 2040 11,758 12,580
3.500% due 2041 28,000 29,121
4.000% due 2041 163,285 173,315
4.500% due 2041 30,801 32,961
5.000% due 2041 50,937 55,121
4.000% due 2042 9,846 10,472
1.408% due 2043 (Ê) 126 127
15 Year TBA (Ï)
3.000% 182,500 189,922
3.500% 26,615 28,000
4.000% 2,000 2,120
5.500% 5,500 5,978
30 Year TBA (Ï)
3.500% 91,280 94,831
4.000% 38,800 40,984
4.500% 117,705 125,765
5.000% 72,435 78,218
5.500% 28,625 31,161
6.000% 30,375 33,397
6.500% 8,000 8,943
Copyright © 2012 www.secdatabase.com. All Rights Reserved.Please Consider the Environment Before Printing This Document

114 Russell Strategic Bond Fund
5.500% due 2034 6,434 7,029
6.000% due 2034 52 58
6.500% due 2034 680 772
7.000% due 2034 257 297
2.147% due 2035 (Ê) 367 384
2.183% due 2035 (Ê) 614 641
2.185% due 2035 (Ê) 1,000 1,045
2.284% due 2035 (Ê) 699 738
2.360% due 2035 (Ê) 900 953
2.375% due 2035 (Ê) 928 983
2.380% due 2035 (Ê) 1,514 1,593
2.590% due 2035 (Ê) 1,878 1,991
5.000% due 2035 58 63
5.030% due 2035 (Ê) 195 209
5.184% due 2035 (Ê) 136 143
5.500% due 2035 2,768 3,022
6.000% due 2035 2,436 2,715
6.500% due 2035 48 55
7.000% due 2035 210 242
7.500% due 2035 697 837
3.987% due 2036 (Ê) 201 214
4.000% due 2036 2,798 2,965
Series 1997-281 Class 2
Interest Only STRIP
9.000% due 11/01/26 36 9
Series 2000-306 Class IO
Interest Only STRIP
8.000% due 05/01/30 37 8
Series 2001-317 Class 2
Interest Only STRIP
8.000% due 12/01/31 57 12
Series 2002-320 Class 2
Interest Only STRIP
7.000% due 04/01/32 19 3
Series 2003-339 Class 23
Interest Only STRIP
5.000% due 07/01/18 1,214 104
Series 2003-345 Class 19
Interest Only STRIP
4.500% due 01/01/19 3,773 287
Series 2006-369 Class 8
Interest Only STRIP
5.500% due 04/01/36 1,074 152
Copyright © 2012 www.secdatabase.com. All Rights Reserved.Please Consider the Environment Before Printing This Document
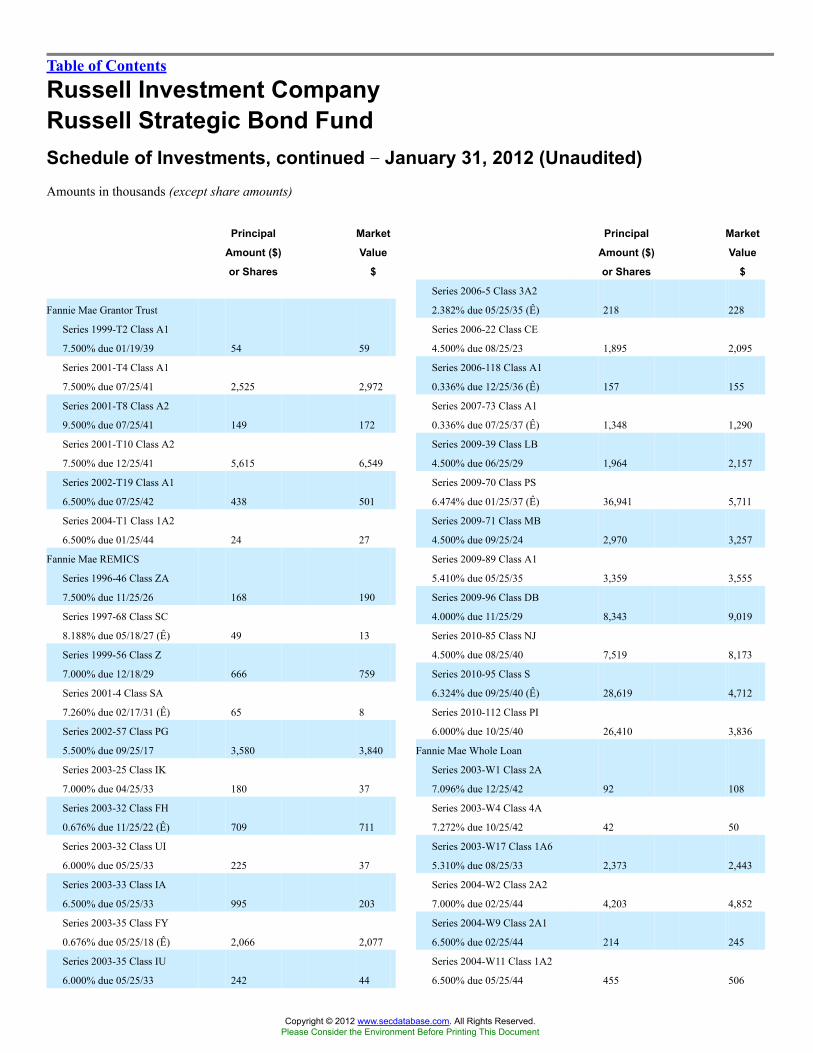
Table of Contents
Russell Investment CompanyRussell Strategic Bond FundSchedule of Investments, continued �� January 31, 2012 (Unaudited)Amounts in thousands (except share amounts)
Principal
Amount ($)
or Shares
Market
Value
$
Fannie Mae Grantor Trust
Series 1999-T2 Class A1
7.500% due 01/19/39 54 59
Series 2001-T4 Class A1
7.500% due 07/25/41 2,525 2,972
Series 2001-T8 Class A2
9.500% due 07/25/41 149 172
Series 2001-T10 Class A2
7.500% due 12/25/41 5,615 6,549
Series 2002-T19 Class A1
6.500% due 07/25/42 438 501
Series 2004-T1 Class 1A2
6.500% due 01/25/44 24 27
Fannie Mae REMICS
Series 1996-46 Class ZA
7.500% due 11/25/26 168 190
Series 1997-68 Class SC
8.188% due 05/18/27 (Ê) 49 13
Series 1999-56 Class Z
7.000% due 12/18/29 666 759
Series 2001-4 Class SA
7.260% due 02/17/31 (Ê) 65 8
Series 2002-57 Class PG
5.500% due 09/25/17 3,580 3,840
Series 2003-25 Class IK
7.000% due 04/25/33 180 37
Series 2003-32 Class FH
0.676% due 11/25/22 (Ê) 709 711
Series 2003-32 Class UI
6.000% due 05/25/33 225 37
Series 2003-33 Class IA
6.500% due 05/25/33 995 203
Series 2003-35 Class FY
0.676% due 05/25/18 (Ê) 2,066 2,077
Series 2003-35 Class IU
6.000% due 05/25/33 242 44
Principal
Amount ($)
or Shares
Market
Value
$
Series 2006-5 Class 3A2
2.382% due 05/25/35 (Ê) 218 228
Series 2006-22 Class CE
4.500% due 08/25/23 1,895 2,095
Series 2006-118 Class A1
0.336% due 12/25/36 (Ê) 157 155
Series 2007-73 Class A1
0.336% due 07/25/37 (Ê) 1,348 1,290
Series 2009-39 Class LB
4.500% due 06/25/29 1,964 2,157
Series 2009-70 Class PS
6.474% due 01/25/37 (Ê) 36,941 5,711
Series 2009-71 Class MB
4.500% due 09/25/24 2,970 3,257
Series 2009-89 Class A1
5.410% due 05/25/35 3,359 3,555
Series 2009-96 Class DB
4.000% due 11/25/29 8,343 9,019
Series 2010-85 Class NJ
4.500% due 08/25/40 7,519 8,173
Series 2010-95 Class S
6.324% due 09/25/40 (Ê) 28,619 4,712
Series 2010-112 Class PI
6.000% due 10/25/40 26,410 3,836
Fannie Mae Whole Loan
Series 2003-W1 Class 2A
7.096% due 12/25/42 92 108
Series 2003-W4 Class 4A
7.272% due 10/25/42 42 50
Series 2003-W17 Class 1A6
5.310% due 08/25/33 2,373 2,443
Series 2004-W2 Class 2A2
7.000% due 02/25/44 4,203 4,852
Series 2004-W9 Class 2A1
6.500% due 02/25/44 214 245
Series 2004-W11 Class 1A2
6.500% due 05/25/44 455 506
Copyright © 2012 www.secdatabase.com. All Rights Reserved.Please Consider the Environment Before Printing This Document

Russell Strategic Bond Fund 115
Series 2003-35 Class UI
6.500% due 05/25/33 222 40
Series 2003-64 Class JI
6.000% due 07/25/33 199 33
Series 2003-82 Class IA
6.000% due 08/25/32 38 �
Series 2003-343 Class 6
Interest Only STRIP
5.000% due 10/01/33 1,478 196
Series 2003-345 Class 18
Interest Only STRIP
4.500% due 12/01/18 3,437 263
Series 2004-70 Class EB
5.000% due 10/25/24 3,450 3,756
Series 2005-110 Class MB
5.500% due 09/25/35 1,167 1,310
Series 2005-117 Class LC
5.500% due 11/25/35 9,128 10,066
Series 2005-365 Class 12
Interest Only STRIP
5.500% due 12/01/35 6,599 900
Fannie Mae-Aces
Series 2006-M2 Class A2F
5.259% due 05/25/20 355 409
FDIC Structured Sale Guaranteed
Notes
Series 2010-L2A Class A
3.000% due 09/30/19 (Þ) 6,579 6,618
Series 2010-S1 Class 1A
0.845% due 02/25/48 (Ê)(Þ) 3,495 3,491
Series 2010-S2 Class 2A
2.570% due 07/29/47 (Þ) 3,482 3,413
FDIC Trust
Series 2010-R1 Class A
2.184% due 05/25/50 (Þ) 2,822 2,818
Series 2011-R1 Class A
2.672% due 07/25/26 (Þ) 11,772 12,051
Federal Home Loan Bank
4.000% due 07/01/39 227 242
4.000% due 08/01/39 185 198
4.000% due 08/01/40 78 83
4.000% due 09/01/40 25 26
4.000% due 09/01/41 101 108
Copyright © 2012 www.secdatabase.com. All Rights Reserved.Please Consider the Environment Before Printing This Document

Table of Contents
Russell Investment CompanyRussell Strategic Bond FundSchedule of Investments, continued �� January 31, 2012 (Unaudited)Amounts in thousands (except share amounts)
Principal
Amount ($)
or Shares
Market
Value
$
4.000% due 10/01/41 1,043 1,115
4.000% due 12/01/41 2,974 3,180
Federal Home Loan Mortgage
Corp. Multifamily Structured
Pass Through Certificates
Series 2011-K014 Class X1
Interest Only STRIP
1.453% due 04/25/21 21,973 1,867
Series 2011-K702 Class X1
Interest Only STRIP
1.731% due 02/25/18 77,815 5,788
Series 2011-K703 Class A2
2.699% due 05/25/18 7,000 7,336
Series 2011-KAIV Class A2
3.989% due 06/25/46 6,300 7,035
Series 2012-K705 Class A2
2.303% due 09/25/18 5,900 6,025
Federal Home Loan Mortgage
Corp. Structured Pass Through
Securities
Series 2002-42 Class A6
9.500% due 02/25/42 71 86
Series 2003-58 Class 2A
6.500% due 09/25/43 239 278
Series 2005-63 Class 1A1
1.408% due 02/25/45 (Ê) 101 97
First Horizon Alternative Mortgage
Securities
Series 2005-AA2 Class 1A1
2.260% due 03/25/35 (Ê) 169 130
Series 2005-AA5 Class 1A1
2.374% due 07/25/35 (Ê) 210 134
First Horizon Asset Securities, Inc.
Series 2003-5 Class 1A17
8.000% due 07/25/33 26 28
Principal
Amount ($)
or Shares
Market
Value
$
10.000% due 2016 31 32
5.500% due 2017 55 60
8.500% due 2017 16 18
10.500% due 2017 3 3
4.500% due 2018 42 46
5.000% due 2018 1,332 1,434
5.500% due 2018 22 24
5.000% due 2019 2,406 2,603
5.500% due 2019 64 70
5.500% due 2020 459 500
8.000% due 2020 54 62
10.000% due 2020 14 17
11.000% due 2020 15 18
5.000% due 2021 474 511
10.500% due 2021 10 12
3.500% due 2025 13,801 14,621
6.500% due 2025 2 3
8.500% due 2025 18 22
2.594% due 2027 (Ê) 13 14
7.000% due 2027 92 107
8.500% due 2027 116 141
2.364% due 2028 (Ê) 14 14
2.495% due 2028 (Ê) 12 12
7.500% due 2028 24 28
6.500% due 2029 56 64
7.500% due 2029 44 52
2.615% due 2030 (Ê) 23 23
6.500% due 2030 1 1
7.000% due 2030 20 23
7.500% due 2030 212 253
8.000% due 2030 29 34
8.500% due 2030 43 52
6.500% due 2031 368 421
7.000% due 2031 230 267
7.500% due 2031 70 80
8.000% due 2031 157 181
7.000% due 2032 101 117
Copyright © 2012 www.secdatabase.com. All Rights Reserved.Please Consider the Environment Before Printing This Document
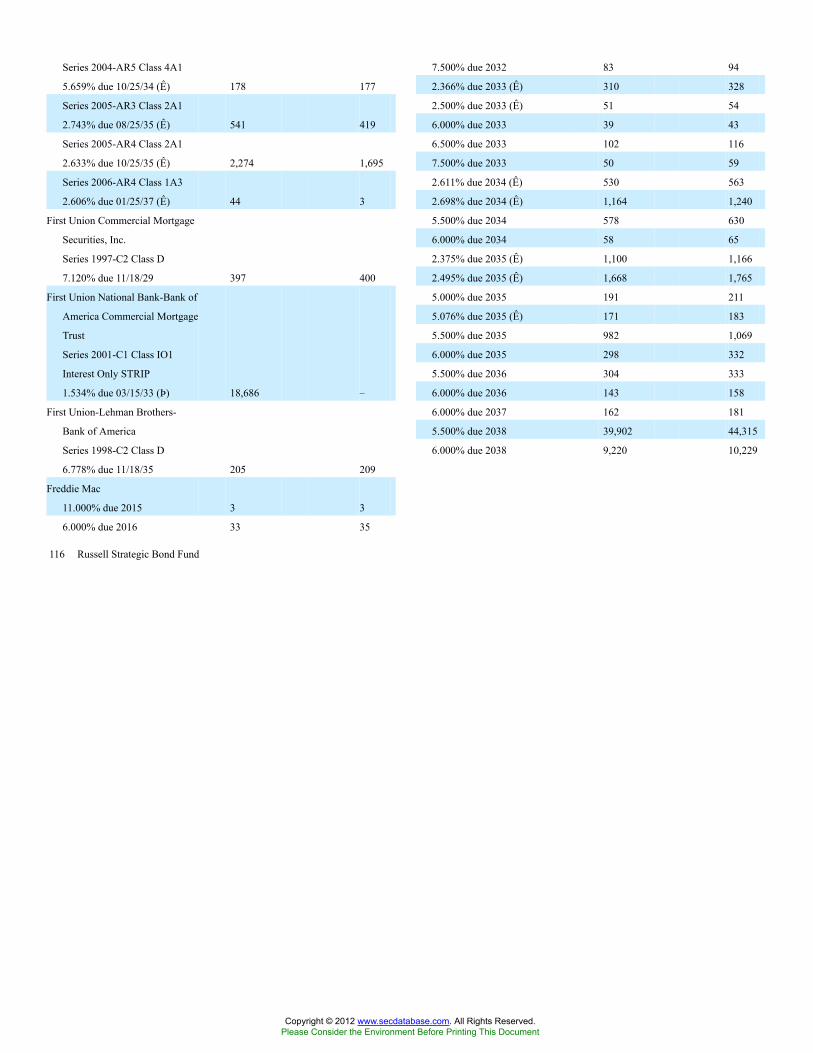
116 Russell Strategic Bond Fund
Series 2004-AR5 Class 4A1
5.659% due 10/25/34 (Ê) 178 177
Series 2005-AR3 Class 2A1
2.743% due 08/25/35 (Ê) 541 419
Series 2005-AR4 Class 2A1
2.633% due 10/25/35 (Ê) 2,274 1,695
Series 2006-AR4 Class 1A3
2.606% due 01/25/37 (Ê) 44 3
First Union Commercial Mortgage
Securities, Inc.
Series 1997-C2 Class D
7.120% due 11/18/29 397 400
First Union National Bank-Bank of
America Commercial Mortgage
Trust
Series 2001-C1 Class IO1
Interest Only STRIP
1.534% due 03/15/33 (Þ) 18,686 �
First Union-Lehman Brothers-
Bank of America
Series 1998-C2 Class D
6.778% due 11/18/35 205 209
Freddie Mac
11.000% due 2015 3 3
6.000% due 2016 33 35
7.500% due 2032 83 94
2.366% due 2033 (Ê) 310 328
2.500% due 2033 (Ê) 51 54
6.000% due 2033 39 43
6.500% due 2033 102 116
7.500% due 2033 50 59
2.611% due 2034 (Ê) 530 563
2.698% due 2034 (Ê) 1,164 1,240
5.500% due 2034 578 630
6.000% due 2034 58 65
2.375% due 2035 (Ê) 1,100 1,166
2.495% due 2035 (Ê) 1,668 1,765
5.000% due 2035 191 211
5.076% due 2035 (Ê) 171 183
5.500% due 2035 982 1,069
6.000% due 2035 298 332
5.500% due 2036 304 333
6.000% due 2036 143 158
6.000% due 2037 162 181
5.500% due 2038 39,902 44,315
6.000% due 2038 9,220 10,229
Copyright © 2012 www.secdatabase.com. All Rights Reserved.Please Consider the Environment Before Printing This Document

Table of Contents
Russell Investment CompanyRussell Strategic Bond FundSchedule of Investments, continued �� January 31, 2012 (Unaudited)Amounts in thousands (except share amounts)
Principal
Amount ($)
or Shares
Market
Value
$
6.500% due 2038 366 410
4.500% due 2039 29,655 32,146
5.500% due 2039 4,468 4,855
6.000% due 2039 77 86
4.000% due 2040 38,701 41,271
4.500% due 2040 42,126 45,935
5.500% due 2040 5,961 6,473
4.000% due 2041 77,032 82,040
4.500% due 2041 1,573 1,675
4.000% due 2042 701 750
30 Year TBA (Ï)
4.500% 2,725 2,899
5.000% 85 116
5.500% 1,000 1,084
Freddie Mac Mortgage Trust
Series 2010-K7 Class B
5.619% due 04/25/20 (Þ) 8,310 8,100
Freddie Mac REMICS
Series 1991-1037 Class Z
9.000% due 02/15/21 31 31
Series 1994-1730 Class Z
7.000% due 05/15/24 207 234
Series 1999-2129 Class SG
6.688% due 06/17/27 (Ê) 881 194
Series 2000-2247 Class SC
7.210% due 08/15/30 (Ê) 25 5
Series 2000-2266 Class F
0.740% due 11/15/30 (Ê) 43 42
Series 2002-2463 Class SJ
7.710% due 03/15/32 (Ê) 104 22
Series 2003-2610 Class UI
6.500% due 05/15/33 33 6
Series 2003-2621 Class QH
5.000% due 05/15/33 1,615 1,738
Series 2003-2624 Class QH
5.000% due 06/15/33 1,655 1,890
Principal
Amount ($)
or Shares
Market
Value
$
Series 2006-3150 Class EQ
5.000% due 05/15/26 1,920 2,176
Series 2007-3335 Class BF
0.440% due 07/15/19 (Ê) 1,119 1,116
Series 2007-3335 Class FT
0.440% due 08/15/19 (Ê) 2,770 2,761
Series 2007-3345 Class FP
0.490% due 11/15/36 (Ê) 5,239 5,216
Series 2007-3345 Class PF
0.470% due 05/15/36 (Ê) 5,042 5,021
Series 2009-3558 Class G
4.000% due 08/15/24 150 164
Series 2010-3640 Class JA
1.500% due 03/15/15 7,907 7,940
Series 2010-3653 Class B
4.500% due 04/15/30 5,760 6,378
Series 2010-3704 Class DC
4.000% due 11/15/36 2,518 2,689
Series 2011-3820 Class DA
4.000% due 11/15/35 14,735 15,570
Freddie Mac Strips
Series 1998-191 Class IO
Interest Only STRIP
8.000% due 01/01/28 32 7
Series 1998-194 Class IO
Interest Only STRIP
6.500% due 04/01/28 114 21
Series 2001-212 Class IO
Interest Only STRIP
6.000% due 05/01/31 129 26
Series 2001-215 Class IO
Interest Only STRIP
8.000% due 06/15/31 92 18
Series 2008-256 Class 56
Interest Only STRIP
4.500% due 05/15/23 (Å) 11,571 898
Copyright © 2012 www.secdatabase.com. All Rights Reserved.Please Consider the Environment Before Printing This Document

Russell Strategic Bond Fund 117
Series 2003-2649 Class IM
7.000% due 07/15/33 232 44
Series 2003-2662 Class MA
4.500% due 10/15/31 72 72
Series 2003-2697 Class LG
4.500% due 10/15/23 1,375 1,471
Series 2003-2725 Class TA
4.500% due 12/15/33 1,300 1,440
Series 2004-2752 Class FM
0.640% due 12/15/30 (Ê) 37 37
Series 2004-2778 Class UF
0.590% due 06/15/33 (Ê) 322 322
Series 2005-3019 Class IM
Interest Only STRIP
5.500% due 01/15/31 175 1
Series 2005-3038 Class XA
Zero coupon due 09/15/35
(Å)(Ê) 1 1
Series 2006-3123 Class HT
5.000% due 03/15/26 3,916 4,400
Series 2006-3149 Class LF
0.590% due 05/15/36 (Ê) 345 344
FREMF Mortgage Trust
Series 2011-K14 Class B
5.332% due 02/25/47 (Þ) 2,560 2,410
Series 2011-K702 Class B
4.936% due 04/25/44 (Þ) 5,570 5,372
GE Capital Commercial Mortgage
Corp.
Series 2002-1A Class A3
6.269% due 12/10/35 67 67
Series 2003-C2 Class F
5.705% due 07/10/37 (Þ) 600 609
Series 2005-C3 Class A4
5.046% due 07/10/45 440 439
Series 2005-C4 Class A4
5.486% due 11/10/45 2,320 2,603
Ginnie Mae I
11.000% due 2013 2 2
10.500% due 2015 23 24
11.000% due 2015 � �
7.000% due 2016 3 3
10.500% due 2016 27 28
8.000% due 2017 � �
11.000% due 2020 14 15
Copyright © 2012 www.secdatabase.com. All Rights Reserved.Please Consider the Environment Before Printing This Document

Table of Contents
Russell Investment CompanyRussell Strategic Bond FundSchedule of Investments, continued �� January 31, 2012 (Unaudited)Amounts in thousands (except share amounts)
Principal
Amount ($)
or Shares
Market
Value
$
10.500% due 2021 21 24
8.000% due 2022 10 11
10.000% due 2022 42 48
7.500% due 2024 12 14
3.950% due 2025 1,667 1,805
8.000% due 2025 8 9
10.000% due 2025 37 43
8.000% due 2030 180 218
7.500% due 2031 45 49
8.000% due 2031 2 2
7.500% due 2032 10 12
4.500% due 2039 43,072 47,199
5.000% due 2039 803 894
30 Year TBA (Ï)
3.500% 1,000 1,052
4.000% 25,000 26,957
Ginnie Mae II
1.625% due 2023 (Ê) 20 21
2.125% due 2023 (Ê) 193 199
2.375% due 2023 (Ê) 127 131
1.625% due 2024 (Ê) 141 145
2.125% due 2024 (Ê) 158 162
2.000% due 2025 (Ê) 7 8
2.125% due 2025 (Ê) 7 7
2.375% due 2025 (Ê) 81 83
2.500% due 2025 (Ê) 112 116
3.000% due 2025 (Ê) 38 40
2.125% due 2026 (Ê) 69 71
8.500% due 2026 24 29
1.625% due 2027 (Ê) 132 136
2.125% due 2027 (Ê) 4 5
2.375% due 2027 (Ê) 94 97
2.375% due 2028 (Ê) 2 2
2.125% due 2029 (Ê) 160 165
2.375% due 2030 (Ê) 60 62
4.502% due 2061 3,571 3,939
Principal
Amount ($)
or Shares
Market
Value
$
Series 2002-27 Class SA
7.710% due 05/16/32 (Ê) 26 7
Series 2010-14 Class A
4.500% due 06/16/39 2,529 2,759
Series 2010-116 Class MP
3.500% due 09/16/40 20,673 21,462
Series 2011-67 Class B
3.863% due 10/16/47 3,395 3,734
Series 2011-127 Class IO
Interest Only STRIP
1.563% due 03/16/47 39,345 3,140
Greenpoint Mortgage Funding Trust
Series 2005-AR5 Class 1A1
0.546% due 11/25/45 (Ê) 202 115
Series 2006-AR6 Class A1A
0.356% due 10/25/46 (Ê) 106 99
Series 2006-AR8 Class 1A1A
0.356% due 01/25/47 (Ê) 44 42
Greenpoint Mortgage Pass-Through
Certificates
Series 2003-1 Class A1
2.801% due 10/25/33 (Ê) 783 642
Greenwich Capital Commercial
Funding Corp.
Series 2004-GG1 Class A7
5.317% due 06/10/36 9,435 10,098
Series 2005-GG3 Class A4
4.799% due 08/10/42 100 108
Series 2006-GG7 Class A4
6.079% due 07/10/38 10,790 12,232
Series 2006-GG7 Class AJ
6.079% due 07/10/38 2,500 1,975
Series 2007-GG9 Class A4
5.444% due 03/10/39 13,205 14,486
Series 2007-GG11 Class AJ
6.199% due 12/10/49 2,492 1,546
Copyright © 2012 www.secdatabase.com. All Rights Reserved.Please Consider the Environment Before Printing This Document
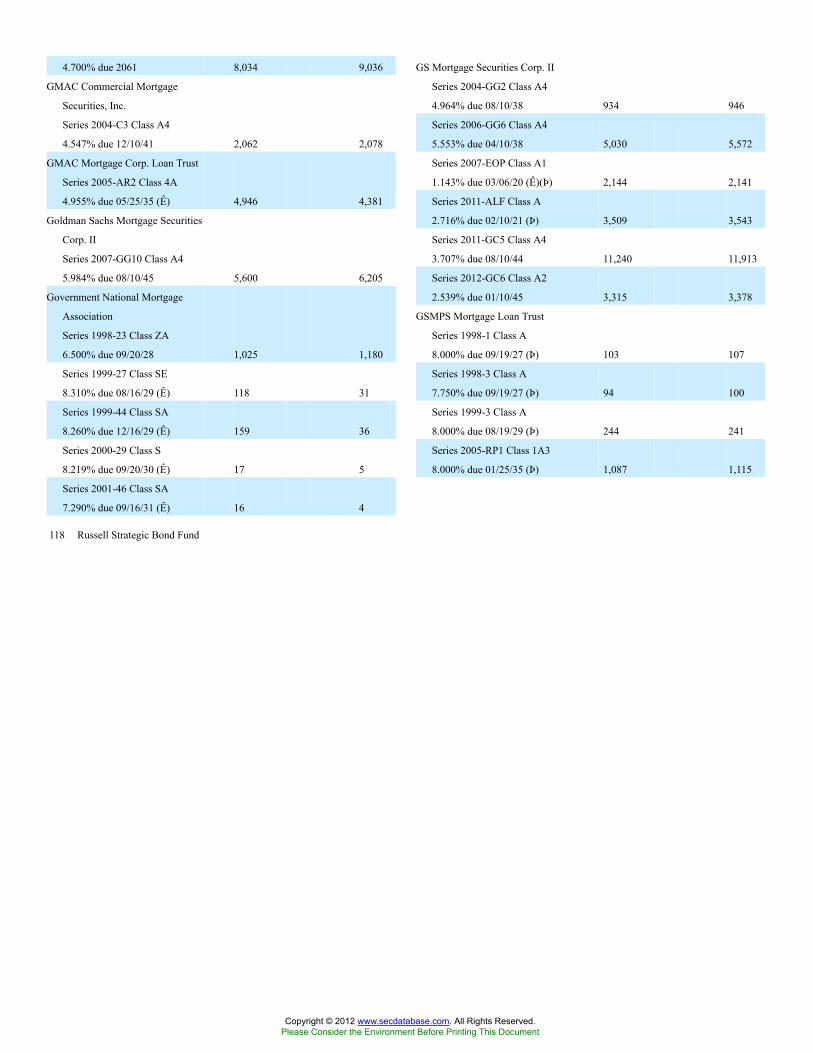
118 Russell Strategic Bond Fund
4.700% due 2061 8,034 9,036
GMAC Commercial Mortgage
Securities, Inc.
Series 2004-C3 Class A4
4.547% due 12/10/41 2,062 2,078
GMAC Mortgage Corp. Loan Trust
Series 2005-AR2 Class 4A
4.955% due 05/25/35 (Ê) 4,946 4,381
Goldman Sachs Mortgage Securities
Corp. II
Series 2007-GG10 Class A4
5.984% due 08/10/45 5,600 6,205
Government National Mortgage
Association
Series 1998-23 Class ZA
6.500% due 09/20/28 1,025 1,180
Series 1999-27 Class SE
8.310% due 08/16/29 (Ê) 118 31
Series 1999-44 Class SA
8.260% due 12/16/29 (Ê) 159 36
Series 2000-29 Class S
8.219% due 09/20/30 (Ê) 17 5
Series 2001-46 Class SA
7.290% due 09/16/31 (Ê) 16 4
GS Mortgage Securities Corp. II
Series 2004-GG2 Class A4
4.964% due 08/10/38 934 946
Series 2006-GG6 Class A4
5.553% due 04/10/38 5,030 5,572
Series 2007-EOP Class A1
1.143% due 03/06/20 (Ê)(Þ) 2,144 2,141
Series 2011-ALF Class A
2.716% due 02/10/21 (Þ) 3,509 3,543
Series 2011-GC5 Class A4
3.707% due 08/10/44 11,240 11,913
Series 2012-GC6 Class A2
2.539% due 01/10/45 3,315 3,378
GSMPS Mortgage Loan Trust
Series 1998-1 Class A
8.000% due 09/19/27 (Þ) 103 107
Series 1998-3 Class A
7.750% due 09/19/27 (Þ) 94 100
Series 1999-3 Class A
8.000% due 08/19/29 (Þ) 244 241
Series 2005-RP1 Class 1A3
8.000% due 01/25/35 (Þ) 1,087 1,115
Copyright © 2012 www.secdatabase.com. All Rights Reserved.Please Consider the Environment Before Printing This Document
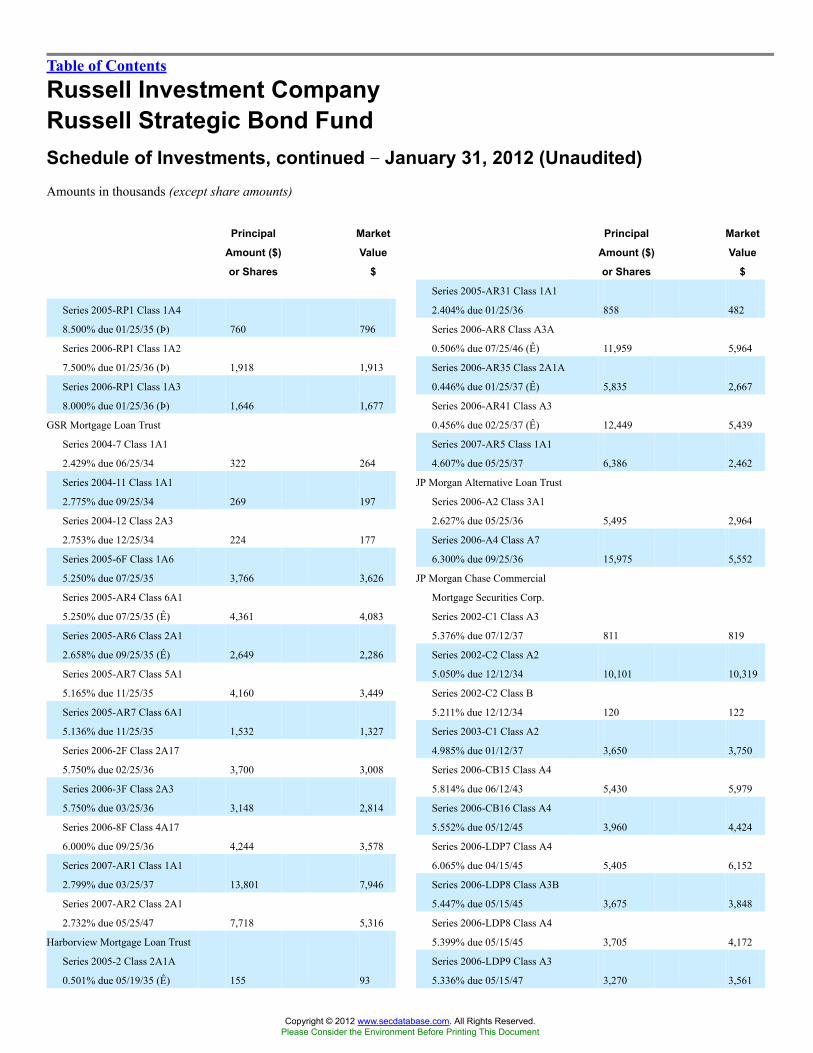
Table of Contents
Russell Investment CompanyRussell Strategic Bond FundSchedule of Investments, continued �� January 31, 2012 (Unaudited)Amounts in thousands (except share amounts)
Principal
Amount ($)
or Shares
Market
Value
$
Series 2005-RP1 Class 1A4
8.500% due 01/25/35 (Þ) 760 796
Series 2006-RP1 Class 1A2
7.500% due 01/25/36 (Þ) 1,918 1,913
Series 2006-RP1 Class 1A3
8.000% due 01/25/36 (Þ) 1,646 1,677
GSR Mortgage Loan Trust
Series 2004-7 Class 1A1
2.429% due 06/25/34 322 264
Series 2004-11 Class 1A1
2.775% due 09/25/34 269 197
Series 2004-12 Class 2A3
2.753% due 12/25/34 224 177
Series 2005-6F Class 1A6
5.250% due 07/25/35 3,766 3,626
Series 2005-AR4 Class 6A1
5.250% due 07/25/35 (Ê) 4,361 4,083
Series 2005-AR6 Class 2A1
2.658% due 09/25/35 (Ê) 2,649 2,286
Series 2005-AR7 Class 5A1
5.165% due 11/25/35 4,160 3,449
Series 2005-AR7 Class 6A1
5.136% due 11/25/35 1,532 1,327
Series 2006-2F Class 2A17
5.750% due 02/25/36 3,700 3,008
Series 2006-3F Class 2A3
5.750% due 03/25/36 3,148 2,814
Series 2006-8F Class 4A17
6.000% due 09/25/36 4,244 3,578
Series 2007-AR1 Class 1A1
2.799% due 03/25/37 13,801 7,946
Series 2007-AR2 Class 2A1
2.732% due 05/25/47 7,718 5,316
Harborview Mortgage Loan Trust
Series 2005-2 Class 2A1A
0.501% due 05/19/35 (Ê) 155 93
Principal
Amount ($)
or Shares
Market
Value
$
Series 2005-AR31 Class 1A1
2.404% due 01/25/36 858 482
Series 2006-AR8 Class A3A
0.506% due 07/25/46 (Ê) 11,959 5,964
Series 2006-AR35 Class 2A1A
0.446% due 01/25/37 (Ê) 5,835 2,667
Series 2006-AR41 Class A3
0.456% due 02/25/37 (Ê) 12,449 5,439
Series 2007-AR5 Class 1A1
4.607% due 05/25/37 6,386 2,462
JP Morgan Alternative Loan Trust
Series 2006-A2 Class 3A1
2.627% due 05/25/36 5,495 2,964
Series 2006-A4 Class A7
6.300% due 09/25/36 15,975 5,552
JP Morgan Chase Commercial
Mortgage Securities Corp.
Series 2002-C1 Class A3
5.376% due 07/12/37 811 819
Series 2002-C2 Class A2
5.050% due 12/12/34 10,101 10,319
Series 2002-C2 Class B
5.211% due 12/12/34 120 122
Series 2003-C1 Class A2
4.985% due 01/12/37 3,650 3,750
Series 2006-CB15 Class A4
5.814% due 06/12/43 5,430 5,979
Series 2006-CB16 Class A4
5.552% due 05/12/45 3,960 4,424
Series 2006-LDP7 Class A4
6.065% due 04/15/45 5,405 6,152
Series 2006-LDP8 Class A3B
5.447% due 05/15/45 3,675 3,848
Series 2006-LDP8 Class A4
5.399% due 05/15/45 3,705 4,172
Series 2006-LDP9 Class A3
5.336% due 05/15/47 3,270 3,561
Copyright © 2012 www.secdatabase.com. All Rights Reserved.Please Consider the Environment Before Printing This Document

Russell Strategic Bond Fund 119
Series 2005-4 Class 3A1
2.775% due 07/19/35 3,300 2,224
Series 2005-5 Class 2A1B
0.571% due 07/19/45 (Ê) 260 82
Series 2005-10 Class 2A1B
0.661% due 11/19/35 (Ê) 642 187
Series 2005-15 Class 2A11
0.551% due 10/20/45 (Ê) 932 592
Series 2005-16 Class 3A1B
0.621% due 01/19/36 (Ê) 778 161
Series 2006-10 Class 2A1B
0.521% due 11/19/36 (Ê) 1,737 407
Series 2006-14 Class 2A1B
0.481% due 01/25/47 (Ê) 1,293 226
Impac Secured Assets CMN
Owner Trust
Series 2005-2 Class A1
0.596% due 03/25/36 (Ê) 724 302
Indymac Index Mortgage Loan
Trust
Series 2004-AR11 Class 2A
2.578% due 12/25/34 90 64
Series 2005-AR25 Class 1A21
5.355% due 12/25/35 759 507
Series 2007-CB18 Class A4
5.440% due 06/12/47 7,000 7,757
Series 2007-CB20 Class A4
5.794% due 02/12/51 7,415 8,468
Series 2007-CB20 Class AJ
6.293% due 02/12/51 1,700 1,287
Series 2007-LD12 Class A4
5.882% due 02/15/51 400 448
Series 2007-LDPX Class A3
5.420% due 01/15/49 200 221
Series 2010-CNTR Class A2
4.311% due 08/05/32 (Þ) 5,904 6,279
Series 2011-C3 Class A4
4.717% due 02/15/46 (Þ) 7,870 8,808
JP Morgan Mortgage Trust
Series 2005-A1 Class 6T1
5.019% due 02/25/35 (Ê) 312 309
Series 2005-A4 Class 1A1
5.313% due 07/25/35 908 889
Series 2005-A4 Class 2A1
2.785% due 07/25/35 3,596 2,884
Copyright © 2012 www.secdatabase.com. All Rights Reserved.Please Consider the Environment Before Printing This Document

Table of Contents
Russell Investment CompanyRussell Strategic Bond FundSchedule of Investments, continued �� January 31, 2012 (Unaudited)Amounts in thousands (except share amounts)
Principal
Amount ($)
or Shares
Market
Value
$
Series 2005-A6 Class 1A2
5.080% due 09/25/35 2,650 2,150
Series 2005-A8 Class 1A1
5.397% due 11/25/35 3,472 3,099
Series 2005-S3 Class 1A2
5.750% due 01/25/36 214 198
Series 2006-A2 Class 2A1
5.527% due 04/25/36 197 157
Series 2006-A6 Class 1A2
2.768% due 10/25/36 1,356 1,023
Series 2006-A7 Class 3A2
5.683% due 01/25/37 5,778 4,474
Series 2006-S4 Class A5
6.000% due 01/25/37 2,564 2,102
Series 2007-A1 Class 1A1
2.810% due 07/25/35 (Ê) 389 357
Series 2007-A1 Class 5A2
2.813% due 07/25/35 (Ê) 668 586
Series 2007-A1 Class B1
3.232% due 07/25/35 150 12
Series 2007-A4 Class 3A1
5.681% due 06/25/37 16,722 13,625
Series 2007-A4 Class 3A3
5.681% due 06/25/37 2,667 2,341
Series 2007-S3 Class 1A74
6.000% due 08/25/37 2,364 1,971
Series 2007-S3 Class 1A8
6.000% due 08/25/37 9,688 7,748
JP Morgan Reremic
Series 2010-2 Class 2A1
2.641% due 03/21/37 (Þ) 2,183 2,132
JPMorgan Chase Commercial
Mortgage Securities Corp.
Series 2006-LDP7 Class AJ
6.065% due 04/15/45 2,224 1,946
Principal
Amount ($)
or Shares
Market
Value
$
Series 2006-8 Class 2A1
0.696% due 12/25/36 (Ê) 6,534 2,761
Series 2007-8 Class 3A1
7.250% due 09/25/37 13,119 5,439
Luminent Mortgage Trust
Series 2006-6 Class A1
0.476% due 10/25/46 (Ê) 1,006 647
Master Reperforming Loan Trust
Series 2005-1 Class 1A5
8.000% due 08/25/34 (Þ) 700 723
Series 2005-2 Class 1A4
8.000% due 05/25/35 (Þ) 1,142 1,142
Master Specialized Loan Trust
Series 2005-2 Class A2
5.006% due 07/25/35 (Þ) 272 274
Mastr Adjustable Rate Mortgages
Trust
Series 2004-10 Class 2A2
3.027% due 10/25/34 7 4
Series 2005-1 Class B1
3.282% due 03/25/35 1,100 86
Series 2005-6 Class 7A1
5.398% due 06/25/35 375 370
Series 2006-1 Class I2A3
0.937% due 01/25/47 (Ê) 3,033 1,433
Series 2006-2 Class 3A1
2.699% due 01/25/36 317 235
Series 2006-2 Class 4A1
4.873% due 02/25/36 2,214 1,995
Series 2006-OA2 Class 4A1B
1.397% due 12/25/46 (Ê) 11,048 3,261
Series 2007-HF2 Class A1
0.586% due 09/25/37 (Ê) 7,102 4,474
Mastr Alternative Loans Trust
Series 2003-4 Class B1
5.783% due 06/25/33 1,198 1,047
Copyright © 2012 www.secdatabase.com. All Rights Reserved.Please Consider the Environment Before Printing This Document
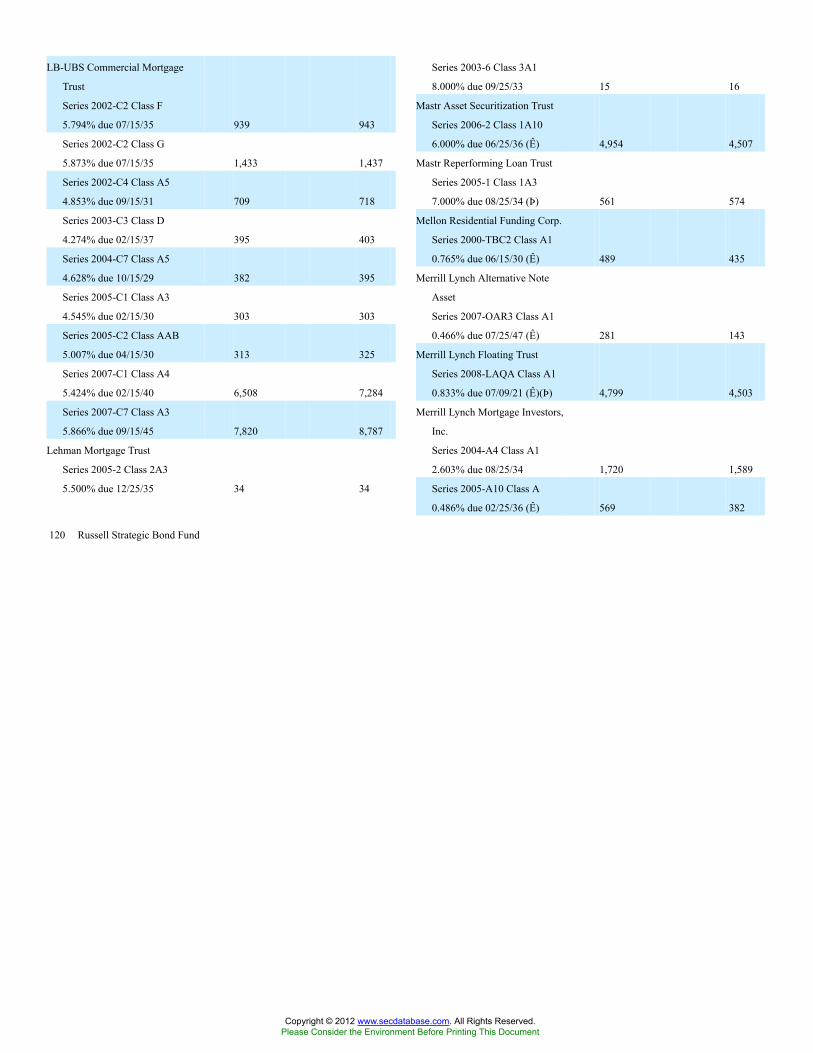
120 Russell Strategic Bond Fund
LB-UBS Commercial Mortgage
Trust
Series 2002-C2 Class F
5.794% due 07/15/35 939 943
Series 2002-C2 Class G
5.873% due 07/15/35 1,433 1,437
Series 2002-C4 Class A5
4.853% due 09/15/31 709 718
Series 2003-C3 Class D
4.274% due 02/15/37 395 403
Series 2004-C7 Class A5
4.628% due 10/15/29 382 395
Series 2005-C1 Class A3
4.545% due 02/15/30 303 303
Series 2005-C2 Class AAB
5.007% due 04/15/30 313 325
Series 2007-C1 Class A4
5.424% due 02/15/40 6,508 7,284
Series 2007-C7 Class A3
5.866% due 09/15/45 7,820 8,787
Lehman Mortgage Trust
Series 2005-2 Class 2A3
5.500% due 12/25/35 34 34
Series 2003-6 Class 3A1
8.000% due 09/25/33 15 16
Mastr Asset Securitization Trust
Series 2006-2 Class 1A10
6.000% due 06/25/36 (Ê) 4,954 4,507
Mastr Reperforming Loan Trust
Series 2005-1 Class 1A3
7.000% due 08/25/34 (Þ) 561 574
Mellon Residential Funding Corp.
Series 2000-TBC2 Class A1
0.765% due 06/15/30 (Ê) 489 435
Merrill Lynch Alternative Note
Asset
Series 2007-OAR3 Class A1
0.466% due 07/25/47 (Ê) 281 143
Merrill Lynch Floating Trust
Series 2008-LAQA Class A1
0.833% due 07/09/21 (Ê)(Þ) 4,799 4,503
Merrill Lynch Mortgage Investors,
Inc.
Series 2004-A4 Class A1
2.603% due 08/25/34 1,720 1,589
Series 2005-A10 Class A
0.486% due 02/25/36 (Ê) 569 382
Copyright © 2012 www.secdatabase.com. All Rights Reserved.Please Consider the Environment Before Printing This Document

Table of Contents
Russell Investment CompanyRussell Strategic Bond FundSchedule of Investments, continued �� January 31, 2012 (Unaudited)Amounts in thousands (except share amounts)
Principal
Amount ($)
or Shares
Market
Value
$
Series 2006-A1 Class 1A1
2.783% due 03/25/36 7,382 4,046
Merrill Lynch Mortgage Trust
Series 2002-MW1 Class J
5.695% due 07/12/34 (Þ) 740 603
Series 2003-KEY1 Class A4
5.236% due 11/12/35 1,235 1,308
Series 2005-CIP1 Class A2
4.960% due 07/12/38 32 33
Series 2005-CIP1 Class AM
5.107% due 07/12/38 4,345 4,645
Series 2008-C1 Class A4
5.690% due 02/12/51 7,963 8,826
Merrill Lynch/Countrywide
Commercial Mortgage Trust
Series 2007-6 Class A4
5.485% due 03/12/51 900 964
Series 2007-8 Class A3
6.164% due 08/12/49 1,100 1,216
MLCC Mortgage Investors, Inc.
Series 2005-2 Class 3A
1.295% due 10/25/35 (Ê) 210 172
Series 2005-3 Class 5A
0.526% due 11/25/35 (Ê) 1,043 781
Morgan Stanley Capital I
Series 1998-HF2 Class G
6.010% due 11/15/30 (Þ) 2,010 2,008
Series 2005-T19 Class A3
4.827% due 06/12/47 300 300
Series 2005-T19 Class A4A
4.890% due 06/12/47 7,915 8,732
Series 2006-HQ9 Class A4
5.731% due 07/12/44 4,089 4,669
Series 2006-T23 Class A4
5.989% due 08/12/41 5,093 5,907
Principal
Amount ($)
or Shares
Market
Value
$
NCUA Guaranteed Notes
Series 2010-C1 Class APT
2.650% due 10/29/20 6,267 6,589
Series 2010-R1 Class 1A
0.745% due 10/07/20 (Ê) 13,598 13,613
Series 2010-R1 Class 2A
1.840% due 10/07/20 14,241 14,393
Series 2010-R2 Class 1A
0.665% due 11/06/17 (Ê) 12,351 12,351
Series 2010-R2 Class 2A
0.765% due 11/05/20 (Ê) 7,781 7,781
Series 2010-R3 Class 1A
0.855% due 12/08/20 (Ê) 7,038 7,065
Series 2010-R3 Class 2A
0.855% due 12/08/20 (Ê) 5,873 5,899
Series 2010-R3 Class 3A
2.400% due 12/08/20 4,334 4,430
Series 2011-R2 Class 1A
0.695% due 02/06/20 (Ê) 9,568 9,563
Nomura Asset Acceptance Corp.
Series 2005-WF1 Class 2A2
4.786% due 03/25/35 621 571
OBP Depositor LLC Trust
Series 2010-OBP Class A
4.646% due 07/15/45 (Þ) 4,460 5,038
Prime Mortgage Trust
Series 2004-CL1 Class 1A2
0.676% due 02/25/34 (Ê) 67 59
Series 2004-CL1 Class 2A2
0.676% due 02/25/19 (Ê) 7 7
Prudential Commercial Mortgage
Trust
Series 2003-PWR1 Class C
4.706% due 02/11/36 860 846
Series 2003-PWR1 Class E
5.259% due 02/11/36 (Þ) 1,405 1,356
Copyright © 2012 www.secdatabase.com. All Rights Reserved.Please Consider the Environment Before Printing This Document

Russell Strategic Bond Fund 121
Series 2007-IQ13 Class A4
5.364% due 03/15/44 4,921 5,298
Series 2007-IQ16 Class A4
5.809% due 12/12/49 3,100 3,531
Series 2008-T29 Class A4
6.456% due 01/11/43 3,690 4,373
Series 2011-C3 Class A2
3.224% due 07/15/49 1,885 1,982
Series 2011-C3 Class A4
4.118% due 07/15/49 1,105 1,209
Morgan Stanley Dean Witter
Capital I
Series 2001-TOP1 Class E
7.741% due 02/15/33 (Þ) 380 374
Series 2001-TOP3 Class C
6.790% due 07/15/33 840 820
Series 2002-TOP7 Class B
6.080% due 01/15/39 500 502
Morgan Stanley Reremic Trust
Series 2009-GG10 Class A4A
5.984% due 08/12/45 (Þ) 400 455
Residential Accredit Loans, Inc.
Series 2004-QS5 Class A1
4.600% due 04/25/34 647 628
Series 2005-QS13 Class 2A3
5.750% due 09/25/35 5,540 3,896
Series 2005-QS14 Class 2A1
6.000% due 09/25/35 3,490 2,286
Series 2005-QS17 Class A10
6.000% due 12/25/35 987 682
Series 2006-QO1 Class 1A1
0.536% due 02/25/46 (Ê) 277 87
Series 2006-QO1 Class 2A1
0.546% due 02/25/46 (Ê) 400 135
Series 2006-QO10 Class A1
0.436% due 01/25/37 (Ê) 526 295
Series 2007-QO4 Class A1
0.476% due 05/25/47 (Ê) 13,788 7,778
Series 2007-QS6 Class A1
0.606% due 04/25/37 (Ê) 11,373 4,929
Residential Asset Mortgage
Products, Inc.
Series 2004-SL1 Class A3
7.000% due 11/25/31 8 8
Copyright © 2012 www.secdatabase.com. All Rights Reserved.Please Consider the Environment Before Printing This Document

Table of Contents
Russell Investment CompanyRussell Strategic Bond FundSchedule of Investments, continued �� January 31, 2012 (Unaudited)Amounts in thousands (except share amounts)
Principal
Amount ($)
or Shares
Market
Value
$
Residential Asset Securitization
Trust
Series 2005-A14 Class A5
5.500% due 12/25/35 3,449 2,748
Series 2006-A11 Class 1A4
6.250% due 10/25/36 390 251
Series 2006-A9CB Class A6
6.000% due 09/25/36 2,704 1,444
Residential Funding Mortgage
Securities I
Series 2005-S5 Class A6
5.250% due 07/25/35 3,818 3,617
Series 2005-SA4 Class 1A21
3.055% due 09/25/35 4,155 2,695
Series 2005-SA4 Class 2A1
2.957% due 09/25/35 2,434 1,833
Series 2006-S10 Class 1A7
6.000% due 10/25/36 2,811 2,299
Series 2006-SA4 Class 2A1
3.696% due 11/25/36 606 409
Sovereign Commercial Mortgage
Securities Trust
Series 2007-C1 Class A2
5.988% due 07/22/30 (Þ) 1,597 1,640
Structured Adjustable Rate
Mortgage Loan Trust
Series 2004-12 Class 3A2
2.489% due 09/25/34 3,716 3,233
Series 2004-18 Class 5A
5.500% due 12/25/34 250 229
Series 2004-20 Class 3A1
2.667% due 01/25/35 1,784 1,352
Series 2005-17 Class 3A1
2.602% due 08/25/35 38 28
Series 2005-22 Class 4A2
5.167% due 12/25/35 61 6
Principal
Amount ($)
or Shares
Market
Value
$
Series 2005-6 Class B2
5.252% due 05/25/35 314 11
Suntrust Adjustable Rate Mortgage
Loan Trust
Series 2007-2 Class 3A3
5.511% due 04/25/37 (Ê) 9,481 6,752
Suntrust Alternative Loan Trust
Series 2006-1F Class 3A
0.626% due 04/25/36 (Ê) 917 265
Vornado DP LLC
Series 2010-VNO Class A2FX
4.004% due 09/13/28 (Þ) 2,350 2,544
Wachovia Bank Commercial
Mortgage Trust
Series 2003-C4 Class D
5.040% due 04/15/35 844 851
Series 2006-C29 Class E
5.516% due 11/15/48 2,682 612
Series 2006-WL7A Class A1
0.375% due 09/15/21 (Ê)(Þ) 7,084 6,780
Series 2007-C30 Class A5
5.342% due 12/15/43 16,650 17,805
Series 2007-C31 Class A4
5.509% due 04/15/47 3,830 4,127
Series 2007-C32 Class A3
5.929% due 06/15/49 1,890 2,037
Series 2007-WHL8 Class A1
0.365% due 06/15/20 (Ê)(Þ) 2,658 2,411
Washington Mutual Alternative
Mortgage Pass-Through
Certificates
Series 2006-1 Class 4CB
6.500% due 02/25/36 12,043 5,993
Series 2006-5 Class 3A2
6.000% due 07/25/36 431 191
Series 2006-AR2 Class A1A
1.137% due 04/25/46 (Ê) 1,297 639
Copyright © 2012 www.secdatabase.com. All Rights Reserved.Please Consider the Environment Before Printing This Document

122 Russell Strategic Bond Fund
Series 2005-19XS Class 1A1
0.596% due 10/25/35 (Ê) 446 265
Series 2006-1 Class 2A3
5.422% due 02/25/36 174 5
Series 2006-5 Class 5A4
5.244% due 06/25/36 126 10
Structured Asset Mortgage
Investments, Inc.
Series 2005-AR5 Class A3
0.531% due 07/19/35 (Ê) 296 250
Series 2005-AR8 Class A1A
0.556% due 02/25/36 (Ê) 935 475
Series 2005-AR8 Class A2
1.677% due 02/25/36 (Ê) 2,459 1,523
Series 2006-AR5 Class 1A2
0.536% due 05/25/46 (Ê) 493 86
Series 2006-AR6 Class 1A3
0.466% due 07/25/46 (Ê) 1,198 530
Series 2007-AR6 Class A1
1.697% due 08/25/47 (Ê) 11,891 6,139
Structured Asset Securities Corp.
Series 2003-34A Class 5A4
2.443% due 11/25/33 (Ê) 7,101 6,744
Series 2006-AR6 Class 1A
0.466% due 07/25/46 (Ê) 592 319
Series 2006-AR7 Class A1A
1.128% due 09/25/46 (Ê) 15,988 6,015
Series 2006-AR8 Class 2A
1.047% due 10/25/46 (Ê) 2,140 895
Series 2006-AR9 Class 2A
1.048% due 11/25/46 (Ê) 15,370 6,362
Series 2007-HY2 Class 2A3
4.790% due 04/25/37 6,535 3,518
Series 2007-OA5 Class A1A
1.037% due 05/25/47 (Ê) 6,367 3,258
Washington Mutual Mortgage Pass
Through Certificates
Series 2002-AR9 Class 1A
1.597% due 08/25/42 (Ê) 140 106
Series 2004-AR1 Class A
2.562% due 03/25/34 130 123
Series 2005-AR6 Class B3
0.936% due 04/25/45 (Ê)(Þ) 1,627 55
Series 2005-AR11 Class A1A
0.596% due 08/25/45 (Ê) 855 647
Copyright © 2012 www.secdatabase.com. All Rights Reserved.Please Consider the Environment Before Printing This Document

Table of Contents
Russell Investment CompanyRussell Strategic Bond FundSchedule of Investments, continued �� January 31, 2012 (Unaudited)Amounts in thousands (except share amounts)
Principal
Amount ($)
or Shares
Market
Value
$
Series 2005-AR13 Class A1A1
0.566% due 10/25/45 (Ê) 223 167
Series 2005-AR14 Class 1A1
2.470% due 12/25/35 364 356
Series 2005-AR17 Class A1A2
0.566% due 12/25/45 (Ê) 437 324
Series 2006-AR8 Class 1A5
2.541% due 08/25/46 95 3
Series 2006-AR8 Class 2A3
5.701% due 08/25/36 (Ê) 120 19
Series 2006-AR11 Class 2A
2.701% due 09/25/46 (Ê) 419 298
Series 2007-HY3 Class 4A1
2.601% due 03/25/37 5,563 4,157
Series 2007-HY3 Class 4B1
2.601% due 03/25/37 1,189 24
Wells Fargo Alternative Loan Trust
Series 2007-PA2 Class 1A1
6.000% due 06/25/37 1,814 1,399
Wells Fargo Mortgage Backed
Securities Trust
Series 2003-N Class 1A1
4.552% due 12/25/33 (Ê) 894 895
Series 2004-AA Class A1
2.663% due 12/25/34 (Ê) 819 784
Series 2004-CC Class A1
2.594% due 01/25/35 (Ê) 1,346 1,266
Series 2004-E Class A2
4.500% due 05/25/34 (Ê) 126 125
Series 2004-EE Class 2A1
2.707% due 12/25/34 (Ê) 80 77
Series 2004-I Class 1A1
2.692% due 07/25/34 888 839
Series 2004-T Class A1
2.692% due 09/25/34 (Ê) 2,359 2,236
Principal
Amount ($)
or Shares
Market
Value
$
Series 2006-6 Class 1A22
6.000% due 05/25/36 (Ê) 13,106 11,935
Series 2006-6 Class 1A8
5.750% due 05/25/36 2,419 2,292
Series 2006-8 Class A15
6.000% due 07/25/36 5,467 4,817
Series 2006-11 Class A8
6.000% due 09/25/36 1,255 1,167
Series 2006-11 Class A9
6.500% due 09/25/36 2,396 2,218
Series 2006-13 Class A5
6.000% due 10/25/36 1,488 1,442
Series 2006-AR1 Class 2A5
5.375% due 03/25/36 (Ê) 1,787 1,580
Series 2006-AR2 Class 2A1
2.648% due 03/25/36 1,841 1,469
Series 2006-AR4 Class 1A1
5.770% due 04/25/36 (Ê) 6,580 5,400
Series 2006-AR6 Class 7A1
5.046% due 03/25/36 (Ê) 5,461 5,107
Series 2006-AR10 Class 4A1
2.698% due 07/25/36 (Ê) 3,403 2,334
Series 2006-AR12 Class 2A1
5.837% due 09/25/36 3,778 3,244
Series 2006-AR14 Class 1A7
5.666% due 10/25/36 16,900 14,587
Series 2006-AR15 Class A1
5.312% due 10/25/36 (Ê) 1,993 1,631
Series 2006-AR17 Class A1
2.609% due 10/25/36 (Ê) 10,095 7,117
Series 2006-AR18 Class 2A2
5.376% due 11/25/36 314 35
Series 2007-1 Class A6
5.500% due 02/25/37 772 653
Series 2007-2 Class 1A13
6.000% due 03/25/37 6,173 5,448
Copyright © 2012 www.secdatabase.com. All Rights Reserved.Please Consider the Environment Before Printing This Document

Russell Strategic Bond Fund 123
Series 2005-11 Class 1A3
5.500% due 11/25/35 70 54
Series 2005-17 Class 1A1
5.500% due 01/25/36 1,209 1,148
Series 2005-18 Class 2A10
21.720% due 01/25/36 (Ê) 1,258 1,465
Series 2005-AR2 Class 2A2
2.680% due 03/25/35 (Ê) 71 62
Series 2005-AR7 Class 2A1
5.085% due 05/25/35 (Ê) 5,222 5,080
Series 2005-AR8 Class 2A1
2.696% due 06/25/35 575 543
Series 2005-AR11 Class 1A1
2.701% due 06/25/35 (Ê) 633 625
Series 2005-AR16 Class 2A1
2.672% due 02/25/34 7,097 6,434
Series 2006-2 Class 2A3
5.500% due 03/25/36 1,740 1,723
Series 2006-3 Class A11
5.500% due 03/25/36 5,909 5,813
Series 2006-4 Class 2A3
5.750% due 04/25/36 487 207
Series 2007-4 Class A15
6.000% due 04/25/37 1,044 938
Series 2007-4 Class A21
5.500% due 04/25/37 682 581
Series 2007-6 Class A6
6.000% due 05/25/37 540 453
Series 2007-7 Class A38
6.000% due 06/25/37 1,098 1,017
Series 2007-7 Class A49
6.000% due 06/25/37 2,404 2,091
Series 2007-7 Class A6
6.000% due 06/25/37 1,033 1,007
Series 2007-8 Class 1A16
6.000% due 07/25/37 233 216
Series 2007-8 Class 2A2
6.000% due 07/25/37 4,253 4,083
Series 2007-10 Class 1A18
6.000% due 07/25/37 4,507 4,120
Series 2007-10 Class 1A5
6.000% due 07/25/37 5,904 5,326
Series 2007-11
6.000% due 08/25/37 5,142 4,832
Copyright © 2012 www.secdatabase.com. All Rights Reserved.Please Consider the Environment Before Printing This Document

Table of Contents
Russell Investment CompanyRussell Strategic Bond FundSchedule of Investments, continued �� January 31, 2012 (Unaudited)Amounts in thousands (except share amounts)
Principal
Amount ($)
or Shares
Market
Value
$
Series 2007-11 Class A14
6.000% due 08/25/37 714 664
Series 2007-11 Class A36
6.000% due 08/25/37 2,943 2,726
Series 2007-11 Class A85
6.000% due 08/25/37 235 221
Series 2007-11 Class A96
6.000% due 08/25/37 2,757 2,591
Series 2007-13 Class A7
6.000% due 09/25/37 1,120 1,000
Series 2007-14 Class 1A1
6.000% due 10/25/37 938 883
Series 2007-AR5 Class A1
6.072% due 10/25/37 2,402 2,023
WF-RBS Commercial Mortgage
Trust
Series 2011-C5 Class A4
3.667% due 11/15/44 14,695 15,497
3,117,598
Municipal Bonds - 2.0%American Municipal Power, Inc.
Revenue Bonds
6.270% due 02/15/50 1,750 1,969
Chicago Transit Authority Revenue
Bonds
6.300% due 12/01/21 500 557
6.899% due 12/01/40 5,200 6,408
City of Chicago Illinois General
Obligation Unlimited
5.000% due 12/01/24 (µ) 17,715 19,196
City of Colorado Springs Colorado
Utilities System Revenue Bonds
5.000% due 11/15/33 200 208
Principal
Amount ($)
or Shares
Market
Value
$
New York City Municipal Water
Finance Authority Revenue
Bonds
5.375% due 06/15/43 5,075 5,816
New York Liberty Development
Corp. Revenue Bonds
5.000% due 12/15/41 300 333
Northstar Education Finance, Inc.
Revenue Bonds
1.601% due 04/01/42 (Ê) 1,200 1,002
1.756% due 04/01/42 (Ê) 4,600 3,634
2.084% due 04/01/42 (Ê) 1,350 1,127
1.619% due 01/29/46 (Ê) 150 123
1.624% due 01/29/46 (Ê) 4,000 3,220
Public Power Generation Agency
Revenue Bonds
7.242% due 01/01/41 100 116
San Diego County Regional Airport
Authority Revenue Bonds
6.628% due 07/01/40 15,190 16,518
San Diego Redevelopment Agency
Tax Allocation
7.625% due 09/01/30 500 526
San Diego Tobacco Settlement
Revenue Funding Corp. Revenue
Bonds
7.125% due 06/01/32 1,045 845
South Carolina Student Loan Corp.
Revenue Bonds
0.647% due 12/01/20 (Ê) 4,500 4,299
State of California General
Obligation Unlimited
5.700% due 11/01/21 920 1,043
6.650% due 03/01/22 1,675 2,032
7.500% due 04/01/34 800 1,045
7.950% due 03/01/36 4,435 5,226
5.650% due 04/01/39 (Ê) 700 734
Copyright © 2012 www.secdatabase.com. All Rights Reserved.Please Consider the Environment Before Printing This Document
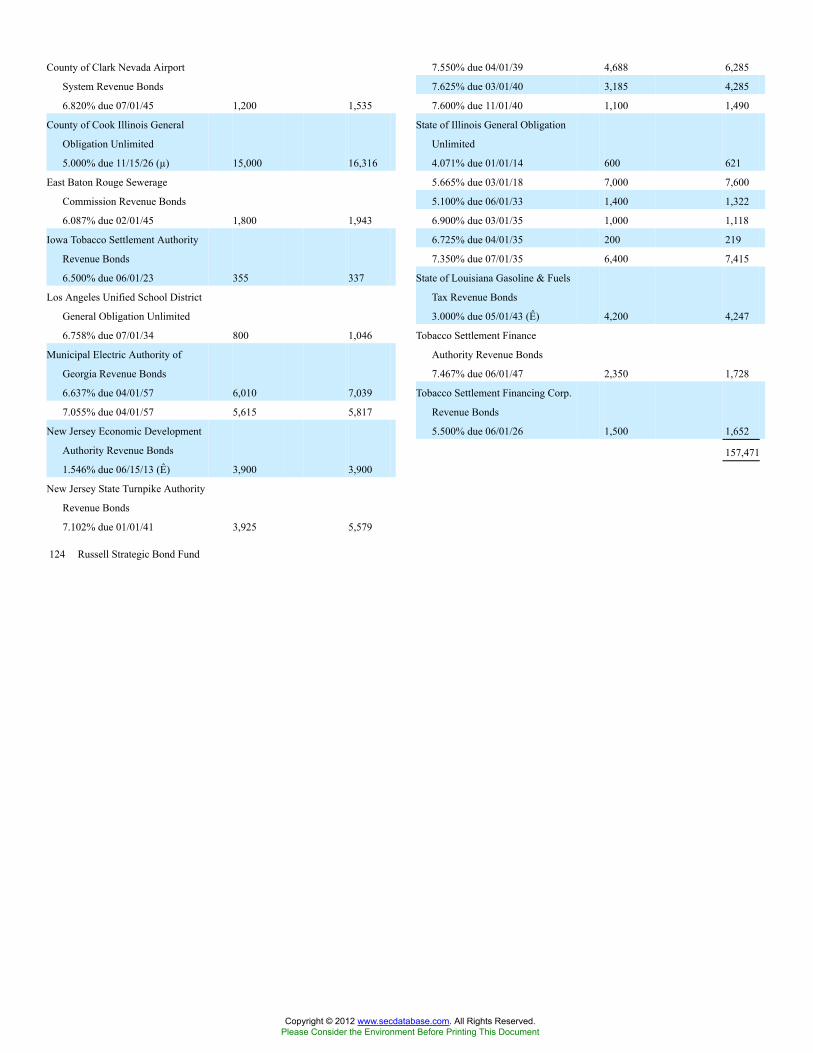
124 Russell Strategic Bond Fund
County of Clark Nevada Airport
System Revenue Bonds
6.820% due 07/01/45 1,200 1,535
County of Cook Illinois General
Obligation Unlimited
5.000% due 11/15/26 (µ) 15,000 16,316
East Baton Rouge Sewerage
Commission Revenue Bonds
6.087% due 02/01/45 1,800 1,943
Iowa Tobacco Settlement Authority
Revenue Bonds
6.500% due 06/01/23 355 337
Los Angeles Unified School District
General Obligation Unlimited
6.758% due 07/01/34 800 1,046
Municipal Electric Authority of
Georgia Revenue Bonds
6.637% due 04/01/57 6,010 7,039
7.055% due 04/01/57 5,615 5,817
New Jersey Economic Development
Authority Revenue Bonds
1.546% due 06/15/13 (Ê) 3,900 3,900
New Jersey State Turnpike Authority
Revenue Bonds
7.102% due 01/01/41 3,925 5,579
7.550% due 04/01/39 4,688 6,285
7.625% due 03/01/40 3,185 4,285
7.600% due 11/01/40 1,100 1,490
State of Illinois General Obligation
Unlimited
4.071% due 01/01/14 600 621
5.665% due 03/01/18 7,000 7,600
5.100% due 06/01/33 1,400 1,322
6.900% due 03/01/35 1,000 1,118
6.725% due 04/01/35 200 219
7.350% due 07/01/35 6,400 7,415
State of Louisiana Gasoline & Fuels
Tax Revenue Bonds
3.000% due 05/01/43 (Ê) 4,200 4,247
Tobacco Settlement Finance
Authority Revenue Bonds
7.467% due 06/01/47 2,350 1,728
Tobacco Settlement Financing Corp.
Revenue Bonds
5.500% due 06/01/26 1,500 1,652
157,471
Copyright © 2012 www.secdatabase.com. All Rights Reserved.Please Consider the Environment Before Printing This Document

Table of Contents
Russell Investment CompanyRussell Strategic Bond FundSchedule of Investments, continued �� January 31, 2012 (Unaudited)Amounts in thousands (except share amounts)
Principal
Amount ($)
or Shares
Market
Value
$
Non-US Bonds - 1.3%Brasil Telecom SA
Series 144a
9.750% due 09/15/16 (Þ) BRL 2,975 1,694
Brazil Notas do Tesouro
Nacional Serie B
Series NTNB
6.000% due 05/15/13 BRL 3,157 3,971
Brazil Notas do Tesouro
Nacional Serie F
Series NTNF
10.000% due 01/01/14 BRL 6,874 3,962
10.000% due 01/01/17 BRL 6,850 3,817
Canada Housing Trust No. 1
3.750% due 03/15/20 (Þ) CAD 2,300 2,566
3.350% due 12/15/20 (Þ) CAD 300 325
3.800% due 06/15/21 (Þ) CAD 1,600 1,795
Canadian Government Bond
4.250% due 06/01/18 CAD 200 233
3.750% due 06/01/19 CAD 1,000 1,142
3.250% due 06/01/21 CAD 1,000 1,111
Eksportfinans ASA
Series 2
0.720% due 07/28/16 JPY 300,000 2,929
European Investment Bank
3.625% due 01/15/21 EUR 100 139
Series INTL
4.625% due 04/15/20 EUR 200 297
European Loan Conduit
Series 2007-25X Class A
1.612% due 05/15/19 (Ê) EUR 163 176
Federative Republic of Brazil
12.500% due 01/05/22 BRL 2,500 1,782
10.250% due 01/10/28 BRL 2,600 1,670
Principal
Amount ($)
or Shares
Market
Value
$
Mexican Bonos
Series M 20
12.500% due 11/30/17 MXN 43,193 4,431
Series M 30
8.500% due 11/18/38 MXN 31,500 2,743
Series M
6.250% due 06/16/16 MXN 59,040 4,741
Province of British Columbia
Canada
4.300% due 06/18/42 CAD 200 233
Province of Ontario Canada
4.300% due 03/08/17 CAD 200 224
4.000% due 06/02/21 CAD 13,765 15,133
3.150% due 06/02/22 CAD 500 511
4.600% due 06/02/39 CAD 900 1,074
Province of Quebec Canada
4.500% due 12/01/17 CAD 600 680
4.500% due 12/01/18 CAD 200 228
4.500% due 12/01/20 CAD 700 795
4.250% due 12/01/21 CAD 2,200 2,452
3.500% due 12/01/22 CAD 300 313
Republic of Peru
6.950% due 08/12/31 PEN 7,840 3,060
South Africa Government Bond
Series R186
10.500% due 12/21/26 ZAR 86,290 13,245
Series R207
7.250% due 01/15/20 ZAR 6,280 784
Series R208
6.750% due 03/31/21 ZAR 43,630 5,228
100,710
United States Government Agencies - 1.4%Fannie Mae
4.125% due 04/15/14 1,800 1,945
5.000% due 02/13/17 200 239
Copyright © 2012 www.secdatabase.com. All Rights Reserved.Please Consider the Environment Before Printing This Document

Russell Strategic Bond Fund 125
Granite Master Issuer PLC
Series 2005-2 Class A5
1.080% due 12/20/54 (Ê) EUR 794 1,001
Granite Mortgages PLC
Series 2003-3 Class 2A
1.584% due 01/20/44 (Ê) EUR 1,182 1,501
Series 2004-2 Class 3A
1.390% due 06/20/44 (Ê) GBP 195 296
Series 2004-3 Class 2A2
1.697% due 09/20/44 (Ê) EUR 493 626
Series 2004-3 Class 3A1
1.430% due 09/20/44 (Ê) GBP 129 196
Holmes Master Issuer PLC
Series 2011-1A Class A3
2.581% due 10/15/54 (Ê)(Þ) EUR 1,200 1,566
Housing Financing Fund
Series 2
3.750% due 04/15/34 ISK 369,998 3,468
Series 3
3.750% due 06/15/44 ISK 743,293 7,017
Italy Buoni Poliennali Del
Tesoro
Series CPI
2.100% due 09/15/21 EUR 1,574 1,555
Federal Home Loan Mortgage
Corp.
0.700% due 11/04/13 23,040 23,052
1.375% due 02/25/14 4,355 4,427
2.500% due 05/27/16 100 107
2.000% due 08/25/16 11,075 11,587
1.000% due 03/08/17 19,300 19,222
2.375% due 01/13/22 18,500 18,706
Federal National Mortgage
Association 1.250% due 01/
30/17 13,700 13,867
Principal Only STRIP
Zero coupon due 10/09/19 11,005 8,502
Freddie Mac
4.875% due 06/13/18 4,200 5,081
Series 1
0.500% due 10/15/13 3,700 3,698
Tennessee Valley Authority
4.625% due 09/15/60 1,300 1,527
111,960
Copyright © 2012 www.secdatabase.com. All Rights Reserved.Please Consider the Environment Before Printing This Document
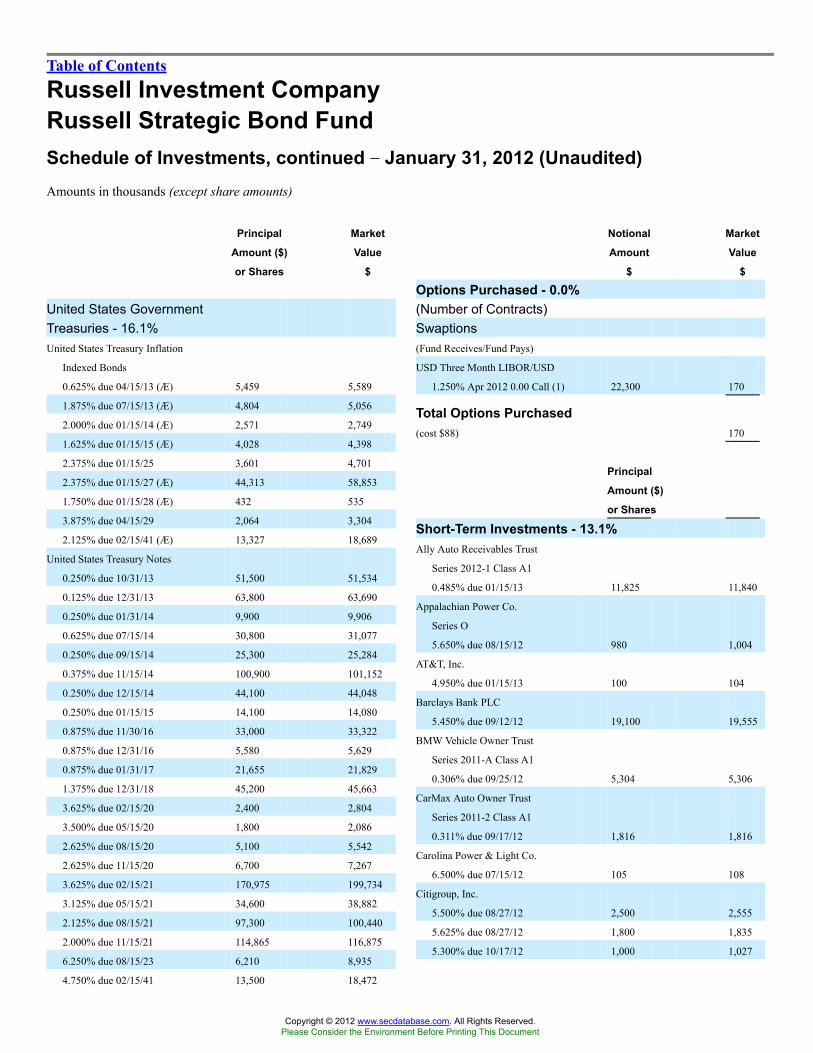
Table of Contents
Russell Investment CompanyRussell Strategic Bond FundSchedule of Investments, continued �� January 31, 2012 (Unaudited)Amounts in thousands (except share amounts)
Principal
Amount ($)
or Shares
Market
Value
$
United States GovernmentTreasuries - 16.1%United States Treasury Inflation
Indexed Bonds
0.625% due 04/15/13 (Æ) 5,459 5,589
1.875% due 07/15/13 (Æ) 4,804 5,056
2.000% due 01/15/14 (Æ) 2,571 2,749
1.625% due 01/15/15 (Æ) 4,028 4,398
2.375% due 01/15/25 3,601 4,701
2.375% due 01/15/27 (Æ) 44,313 58,853
1.750% due 01/15/28 (Æ) 432 535
3.875% due 04/15/29 2,064 3,304
2.125% due 02/15/41 (Æ) 13,327 18,689
United States Treasury Notes
0.250% due 10/31/13 51,500 51,534
0.125% due 12/31/13 63,800 63,690
0.250% due 01/31/14 9,900 9,906
0.625% due 07/15/14 30,800 31,077
0.250% due 09/15/14 25,300 25,284
0.375% due 11/15/14 100,900 101,152
0.250% due 12/15/14 44,100 44,048
0.250% due 01/15/15 14,100 14,080
0.875% due 11/30/16 33,000 33,322
0.875% due 12/31/16 5,580 5,629
0.875% due 01/31/17 21,655 21,829
1.375% due 12/31/18 45,200 45,663
3.625% due 02/15/20 2,400 2,804
3.500% due 05/15/20 1,800 2,086
2.625% due 08/15/20 5,100 5,542
2.625% due 11/15/20 6,700 7,267
3.625% due 02/15/21 170,975 199,734
3.125% due 05/15/21 34,600 38,882
2.125% due 08/15/21 97,300 100,440
2.000% due 11/15/21 114,865 116,875
6.250% due 08/15/23 6,210 8,935
4.750% due 02/15/41 13,500 18,472
Notional
Amount
$
Market
Value
$
Options Purchased - 0.0%(Number of Contracts)Swaptions(Fund Receives/Fund Pays)
USD Three Month LIBOR/USD
1.250% Apr 2012 0.00 Call (1) 22,300 170
Total Options Purchased(cost $88) 170
Principal
Amount ($)
or Shares
Short-Term Investments - 13.1%Ally Auto Receivables Trust
Series 2012-1 Class A1
0.485% due 01/15/13 11,825 11,840
Appalachian Power Co.
Series O
5.650% due 08/15/12 980 1,004
AT&T, Inc.
4.950% due 01/15/13 100 104
Barclays Bank PLC
5.450% due 09/12/12 19,100 19,555
BMW Vehicle Owner Trust
Series 2011-A Class A1
0.306% due 09/25/12 5,304 5,306
CarMax Auto Owner Trust
Series 2011-2 Class A1
0.311% due 09/17/12 1,816 1,816
Carolina Power & Light Co.
6.500% due 07/15/12 105 108
Citigroup, Inc.
5.500% due 08/27/12 2,500 2,555
5.625% due 08/27/12 1,800 1,835
5.300% due 10/17/12 1,000 1,027
Copyright © 2012 www.secdatabase.com. All Rights Reserved.Please Consider the Environment Before Printing This Document

126 Russell Strategic Bond Fund
4.375% due 05/15/41 58,915 76,138
3.750% due 08/15/41 82,790 96,515
3.125% due 11/15/41 38,490 39,897
1,264,675
Total Long-Term Investments(cost $7,373,196) 7,430,302
Preferred Stocks - 0.1%Financial Services - 0.1%Centaur Funding Corp. 2,868 3,276
DG Funding Trust (Å) 479 3,594
6,870
Total Preferred Stocks(cost $8,241) 6,870
Comcast Cable Holdings LLC
9.800% due 02/01/12 (ç) 1,660 1,660
Comcast Holdings Corp.
10.625% due 07/15/12 4,800 4,977
Countrywide Financial Corp.
Series MTN
5.800% due 06/07/12 (Ñ) 500 506
DDR Corp.
5.375% due 10/15/12 3,320 3,356
Delta Air Lines 2002-1 Class G-2 Pass
Through Trust
Series 02G2
6.417% due 07/02/12 2,785 2,820
Dow Chemical Co. (The)
4.850% due 08/15/12 2,600 2,655
Federal Home Loan Banks
0.180% due 12/19/12 400 400
0.210% due 01/04/13 20,800 20,806
0.125% due 01/17/13 18,100 18,089
0.200% due 01/11/13 4,000 4,000
0.170% due 01/17/13 21,100 21,097
Copyright © 2012 www.secdatabase.com. All Rights Reserved.Please Consider the Environment Before Printing This Document

Table of Contents
Russell Investment CompanyRussell Strategic Bond FundSchedule of Investments, continued �� January 31, 2012 (Unaudited)Amounts in thousands (except share amounts)
Notional
Amount
$
Market
Value
$
0.160% due 01/24/13 11,600 11,597
Federal National Mortgage
Association
0.312% due 10/18/12 (Ê) 15,490 15,508
FIH Erhvervsbank A/S
2.450% due 08/17/12 (Þ) 8,600 8,682
Ford Motor Credit Co. LLC
7.500% due 08/01/12 4,940 5,076
Freddie Mac MAC
4.500% due 01/15/13 14,700 15,307
Frontier Communications Corp.
6.250% due 01/15/13 3,600 3,690
Governor & Co. of the Bank of
Ireland (The)
Series REGS
2.750% due 03/02/12 3,110 3,097
Honda Auto Receivables Owner
Trust
Series 2011-3 Class A1
0.398% due 10/22/12 8,049 8,056
Itau Unibanco SA
Zero coupon due 02/09/12 (ç)(�) 1,400 1,400
KCP&L Greater Missouri Operations
Co.
11.875% due 07/01/12 7,475 7,794
Merrill Lynch & Co., Inc.
6.050% due 08/15/12 (Ñ) 6,600 6,731
Mexico Cetes
Series BI
Zero coupon due 03/08/12 (�) 65,000 4,965
Zero coupon due 05/03/12 3,750,000 28,454
Mirant Mid Atlantic Pass Through
Trust A
Series A
8.625% due 06/30/12 750 760
Notional
Amount
$
Market
Value
$
United States Treasury Bills
Zero coupon due 02/23/12 25 25
Zero coupon due 03/01/12 (ç)(�) 260 260
Zero coupon due 04/12/12 (�) 2,750 2,750
Zero coupon due 06/07/12 (�) 702 702
Zero coupon due 07/19/12 (�) 880 880
0.104% due 01/10/13 (�) 3,300 3,296
United States Treasury Inflation
Indexed Bonds
3.000% due 07/15/12 (Æ) 7,524 7,698
Volkswagen Auto Loan Enhanced
Trust
Series 2012-1 Class A1
0.439% due 01/22/13 5,310 5,310
WCI Finance LLC / WEA Finance
LLC
5.400% due 10/01/12 (Þ) 753 772
World Omni Auto Receivables Trust
Series 2011-B Class A1
0.411% due 11/15/12 5,831 5,829
Total Short-Term Investments(cost $1,025,379) 1,026,748
Repurchase Agreements - 0.0%Agreement with JP Morgan Securities,
Inc. and The Bank of New York
Mellon (Tri-Party) of $3,100 dated
January 31, 2012 at 3.125% to be
repurchased at $3,100 on
February 1, 2012 collateralized by:
$2,812 par various United States
Treasury Obligations, valued at
$3,121. 3,100 3,100
Total Repurchase Agreements(cost $3,100) 3,100
Other Securities - 0.7%
Copyright © 2012 www.secdatabase.com. All Rights Reserved.Please Consider the Environment Before Printing This Document

See accompanying notes which are an integral part of this quarterly report.
Russell Strategic Bond Fund 127
NGPL PipeCo LLC
6.514% due 12/15/12 (Þ) 5,000 4,816
Royal Bank of Scotland PLC (The)
2.625% due 05/11/12 (Þ) 4,400 4,424
Russell U.S. Cash Management Fund 696,621,492(¥) 696,621
Santander Drive Auto Receivables
Trust
Series 2011-4 Class A1
0.419% due 10/15/12 8,649 8,652
Santander US Debt SAU
1.379% due 03/30/12 (Ê)(Þ) 11,200 11,187
SBAB Bank AB
3.125% due 03/23/12 (Þ) 7,100 7,126
Societe Financement de l�Economie
Francaise
0.767% due 07/16/12 (Ê)(Þ) 2,000 2,002
Springleaf Finance Corp.
Series MTNI
4.875% due 07/15/12 200 196
Swedbank AB
2.900% due 01/14/13 (Þ) 15,300 15,666
TNK-BP Finance SA
6.125% due 03/20/12 (Þ) 500 502
UBS AG
1.595% due 02/23/12 (Ê) 1,400 1,401
Russell Investment Company
Liquidating Trust (×) 3,881,826 (¥) 3,946
Russell U.S. Cash Collateral Fund (×) 53,574,819(¥) 53,575
Total Other Securities(cost $57,457) 57,521
Total Investments - 108.7%(identified cost $8,467,461) 8,524,711
Other Assets and Liabilities,Net - (8.7%) (684,160 )
Net Assets - 100.0% 7,840,551
A portion of the portfolio has been fair valued as of period end.
Copyright © 2012 www.secdatabase.com. All Rights Reserved.Please Consider the Environment Before Printing This Document
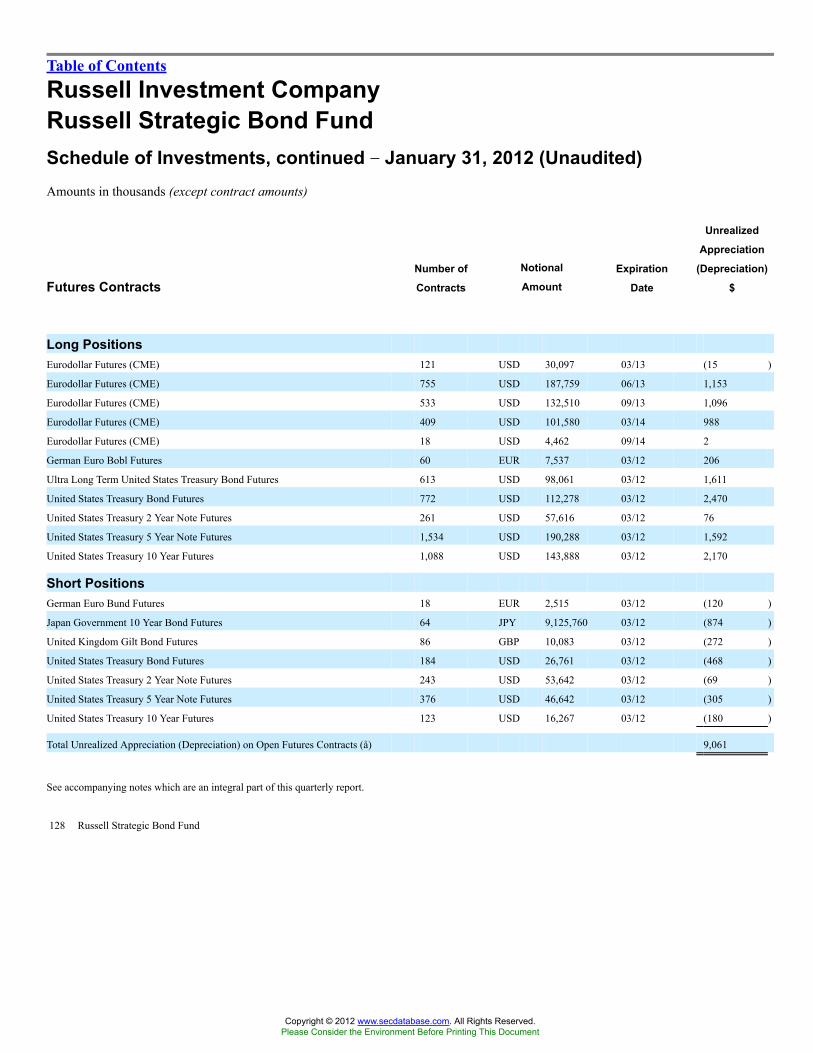
Table of Contents
Russell Investment CompanyRussell Strategic Bond FundSchedule of Investments, continued �� January 31, 2012 (Unaudited)Amounts in thousands (except contract amounts)
Futures ContractsNumber of
Contracts
Notional
AmountExpiration
Date
Unrealized
Appreciation
(Depreciation)
$
Long PositionsEurodollar Futures (CME) 121 USD 30,097 03/13 (15 )
Eurodollar Futures (CME) 755 USD 187,759 06/13 1,153
Eurodollar Futures (CME) 533 USD 132,510 09/13 1,096
Eurodollar Futures (CME) 409 USD 101,580 03/14 988
Eurodollar Futures (CME) 18 USD 4,462 09/14 2
German Euro Bobl Futures 60 EUR 7,537 03/12 206
Ultra Long Term United States Treasury Bond Futures 613 USD 98,061 03/12 1,611
United States Treasury Bond Futures 772 USD 112,278 03/12 2,470
United States Treasury 2 Year Note Futures 261 USD 57,616 03/12 76
United States Treasury 5 Year Note Futures 1,534 USD 190,288 03/12 1,592
United States Treasury 10 Year Futures 1,088 USD 143,888 03/12 2,170
Short PositionsGerman Euro Bund Futures 18 EUR 2,515 03/12 (120 )
Japan Government 10 Year Bond Futures 64 JPY 9,125,760 03/12 (874 )
United Kingdom Gilt Bond Futures 86 GBP 10,083 03/12 (272 )
United States Treasury Bond Futures 184 USD 26,761 03/12 (468 )
United States Treasury 2 Year Note Futures 243 USD 53,642 03/12 (69 )
United States Treasury 5 Year Note Futures 376 USD 46,642 03/12 (305 )
United States Treasury 10 Year Futures 123 USD 16,267 03/12 (180 )
Total Unrealized Appreciation (Depreciation) on Open Futures Contracts (å) 9,061
See accompanying notes which are an integral part of this quarterly report.
128 Russell Strategic Bond Fund
Copyright © 2012 www.secdatabase.com. All Rights Reserved.Please Consider the Environment Before Printing This Document

Table of Contents
Russell Investment CompanyRussell Strategic Bond FundSchedule of Investments, continued �� January 31, 2012 (Unaudited)Amounts in thousands (except contract amounts)
Options WrittenCall/
Put
Number of
Contracts
Strike
Price
Notional
AmountExpiration
Date
Market
Value
$
Eurodollar Futures Put 162 99.00 USD 405 03/19/12 (1 )
Inflationary Floor Options Call 1 0.00 USD 8,490 11/23/20 (24 )
Inflationary Floor Options Put 1 0.00 USD 1,300 03/10/20 (5 )
Inflationary Floor Options Put 1 0.00 USD 3,600 03/12/20 (9 )
Inflationary Floor Options Put 1 0.00 USD 8,800 04/07/20 (22 )
Inflationary Floor Options Put 1 0.00 USD 3,300 09/29/20 (9 )
Swaptions(Fund Receives/Fund Pays)
USD 0.9200%/USD Three Month LIBOR Put 2 0.00 69,000 11/14/12 (85 )
USD 1.000%/USD Three Month LIBOR Put 1 0.00 6,400 08/13/12 (10 )
USD 1.000%/USD Three Month LIBOR Put 1 0.00 23,800 11/19/12 (11 )
USD 1.200%/USD Three Month LIBOR Put 1 0.00 17,100 07/11/13 (42 )
USD 1.700%/USD Three Month LIBOR Put 4 0.00 136,600 08/13/12 (310 )
USD 1.750%/USD Three Month LIBOR Put 1 0.00 26,800 11/19/12 (5 )
USD 1.750%/USD Three Month LIBOR Put 1 0.00 116,400 07/11/13 (63 )
USD 2.000%/USD Three Month LIBOR Put 1 0.00 44,600 04/30/12 �
USD 2.250%/USD Three Month LIBOR Put 5 0.00 119,500 09/24/12 (13 )
USD 2.250%/USD Three Month LIBOR Put 1 0.00 24,700 05/28/13 (8 )
USD 2.750%/USD Three Month LIBOR Put 2 0.00 31,100 06/18/12 �
USD 3.000%/USD Three Month LIBOR Put 6 0.00 132,500 06/18/12 �
USD 3.250%/USD Three Month LIBOR Put 2 0.00 19,000 07/16/12 �
USD 10.000%/USD Three Month LIBOR Put 1 0.00 9,000 07/10/12 �
Total Liability for Options Written (premiums received $6,387) (617 )
See accompanying notes which are an integral part of this quarterly report.
Russell Strategic Bond Fund 129
Copyright © 2012 www.secdatabase.com. All Rights Reserved.Please Consider the Environment Before Printing This Document

Table of Contents
Russell Investment CompanyRussell Strategic Bond FundSchedule of Investments, continued �� January 31, 2012 (Unaudited)Amounts in thousands
Foreign Currency Exchange Contracts
CounterpartyAmount
Sold
Amount
Bought
Settlement
Date
Unrealized
Appreciation
(Depreciation)
$
Bank of America USD 1,643 AUD 1,550 02/02/12 3
Bank of America USD 2,940 AUD 2,820 02/13/12 50
Bank of America AUD 1,550 USD 1,650 02/02/12 4
Bank of America AUD 2,834 USD 3,018 02/13/12 13
Bank of America MXN 117,291 USD 8,570 02/13/12 (420 )
Barclays Bank PLC USD 3,111 AUD 2,934 02/13/12 (1 )
Barclays Bank PLC USD 5,033 GBP 3,280 02/13/12 135
Barclays Bank PLC USD 250 MXN 3,493 03/15/12 17
Barclays Bank PLC AUD 1,100 USD 1,123 02/23/12 (42 )
Barclays Bank PLC BRL 179 USD 100 03/02/12 (1 )
Barclays Bank PLC BRL 365 USD 200 03/02/12 (7 )
Barclays Bank PLC BRL 539 USD 300 03/02/12 (6 )
Barclays Bank PLC BRL 549 USD 300 03/02/12 (12 )
Barclays Bank PLC BRL 702 USD 400 03/02/12 1
Barclays Bank PLC BRL 713 USD 400 03/02/12 (5 )
Barclays Bank PLC BRL 886 USD 500 03/02/12 (3 )
Barclays Bank PLC BRL 1,759 USD 1,000 03/02/12 1
Barclays Bank PLC CAD 38 USD 37 02/09/12 (1 )
Barclays Bank PLC CAD 304 USD 301 02/09/12 (3 )
Barclays Bank PLC CAD 717 USD 703 02/09/12 (12 )
Barclays Bank PLC CHF 1,947 EUR 1,610 03/21/12 (10 )
Barclays Bank PLC EUR 15,493 USD 19,795 02/13/12 (471 )
Barclays Bank PLC EUR 1,740 USD 2,318 03/21/12 42
Barclays Bank PLC EUR 7,608 USD 9,752 04/16/12 (202 )
Barclays Bank PLC GBP 1,587 EUR 1,897 03/21/12 (18 )
Barclays Bank PLC GBP 533 USD 817 02/02/12 (23 )
Barclays Bank PLC GBP 3,280 USD 5,034 02/13/12 (134 )
Barclays Bank PLC GBP 100 USD 156 03/02/12 (1 )
Barclays Bank PLC NOK 13,522 SEK 15,917 03/21/12 34
Citibank USD 15,607 EUR 11,989 02/02/12 75
Citibank USD 11,028 GBP 7,090 02/02/12 144
Citibank USD 2,336 JPY 179,092 03/21/12 15
Citibank AUD 100 USD 101 02/23/12 (5 )
Copyright © 2012 www.secdatabase.com. All Rights Reserved.Please Consider the Environment Before Printing This Document

Citibank AUD 200 USD 202 02/23/12 (10 )
Citibank AUD 300 USD 296 02/23/12 (21 )
Citibank AUD 398 USD 408 02/23/12 (13 )
Citibank AUD 500 USD 513 02/23/12 (17 )
Citibank AUD 600 USD 600 02/23/12 (36 )
Citibank AUD 2,265 USD 2,319 03/21/12 (73 )
Citibank CAD 8 USD 8 02/09/12 �
Citibank CAD 400 USD 391 02/09/12 (7 )
Citibank CAD 412 USD 405 02/09/12 (6 )
Citibank CAD 900 USD 880 02/09/12 (17 )
Citibank CAD 938 USD 907 02/09/12 (28 )
Citibank CAD 1,100 USD 1,058 02/09/12 (39 )
Citibank CHF 971 AUD 1,007 03/21/12 7
Citibank CHF 2,220 EUR 1,839 03/21/12 (8 )
Citibank CHF 3,037 USD 3,245 03/21/12 (57 )
Citibank EUR 1,431 CHF 1,747 03/21/12 27
Citibank EUR 3,617 GBP 3,024 03/21/12 32
Citibank EUR 1,768 JPY 180,706 03/21/12 59
Citibank EUR 3,682 SEK 32,627 03/21/12 (31 )
Citibank EUR 11,989 USD 15,609 03/02/12 (74 )
See accompanying notes which are an integral part of this quarterly report.
130 Russell Strategic Bond Fund
Copyright © 2012 www.secdatabase.com. All Rights Reserved.Please Consider the Environment Before Printing This Document

Table of Contents
Russell Investment CompanyRussell Strategic Bond FundSchedule of Investments, continued �� January 31, 2012 (Unaudited)Amounts in thousands
Foreign Currency Exchange Contracts
CounterpartyAmount
Sold
Amount
Bought
Settlement
Date
Unrealized
Appreciation
(Depreciation)
$
Citibank EUR 1,836 USD 2,335 03/21/12 (66 )
Citibank EUR 5,620 USD 7,192 04/16/12 (161 )
Citibank GBP 294 USD 455 02/02/12 (8 )
Citibank GBP 700 USD 1,093 03/02/12 (10 )
Citibank GBP 7,090 USD 11,026 03/02/12 (144 )
Citibank JPY 179,434 EUR 1,768 03/21/12 (43 )
Citibank JPY 179,753 USD 2,354 03/21/12 (6 )
Citibank JPY 358,299 USD 4,669 03/21/12 (35 )
Citibank NOK 10,910 USD 1,816 03/21/12 (40 )
Credit Suisse First Boston USD 1,931 EUR 1,508 03/21/12 42
Credit Suisse First Boston USD 2,327 EUR 1,786 03/21/12 10
Credit Suisse First Boston CHF 1,633 EUR 1,353 03/21/12 (5 )
Credit Suisse First Boston CHF 2,181 EUR 1,784 03/21/12 (38 )
Credit Suisse First Boston CHF 5,057 EUR 4,154 03/21/12 (64 )
Credit Suisse First Boston EUR 1,806 USD 2,337 03/21/12 (25 )
Credit Suisse First Boston JPY 357,786 USD 4,669 03/21/12 (28 )
Deutsche Bank AG USD 2,327 AUD 2,265 03/21/12 65
Deutsche Bank AG USD 4,647 AUD 4,431 03/21/12 32
Deutsche Bank AG USD 22,246 CNY 141,107 02/13/12 118
Deutsche Bank AG USD 324 EUR 247 02/01/12 (1 )
Deutsche Bank AG USD 2,326 EUR 1,834 03/21/12 73
Deutsche Bank AG USD 2,327 EUR 1,793 03/21/12 19
Deutsche Bank AG USD 2,332 EUR 1,830 03/21/12 62
Deutsche Bank AG USD 3 MXN 40 03/15/12 �
Deutsche Bank AG USD 2,034 NZD 2,636 03/21/12 135
Deutsche Bank AG USD 4,671 NZD 5,714 03/21/12 32
Deutsche Bank AG USD 9,292 NZD 11,888 03/21/12 491
Deutsche Bank AG AUD 2,251 CAD 2,343 03/21/12 (43 )
Deutsche Bank AG CAD 381 USD 370 02/09/12 (9 )
Deutsche Bank AG CAD 717 USD 689 02/09/12 (26 )
Deutsche Bank AG CAD 819 USD 795 02/09/12 (22 )
Deutsche Bank AG CAD 1,560 USD 1,528 02/09/12 (27 )
Deutsche Bank AG CHF 1,748 EUR 1,431 03/21/12 (29 )
Copyright © 2012 www.secdatabase.com. All Rights Reserved.Please Consider the Environment Before Printing This Document
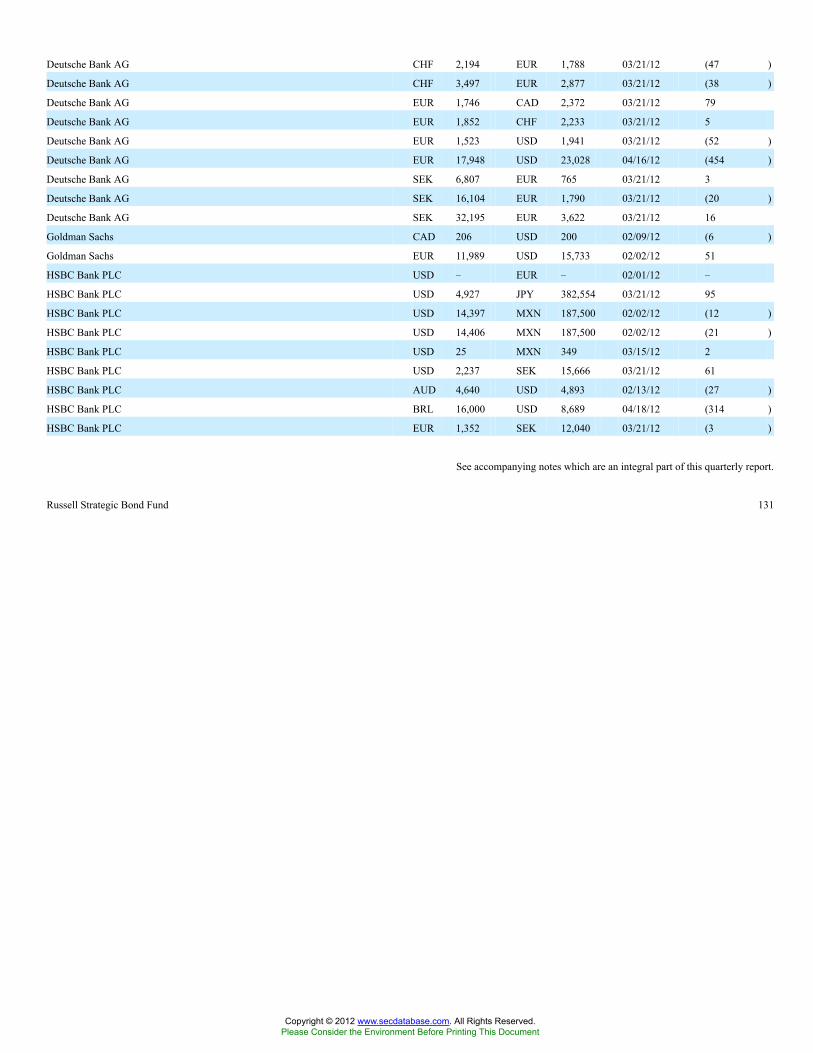
Deutsche Bank AG CHF 2,194 EUR 1,788 03/21/12 (47 )
Deutsche Bank AG CHF 3,497 EUR 2,877 03/21/12 (38 )
Deutsche Bank AG EUR 1,746 CAD 2,372 03/21/12 79
Deutsche Bank AG EUR 1,852 CHF 2,233 03/21/12 5
Deutsche Bank AG EUR 1,523 USD 1,941 03/21/12 (52 )
Deutsche Bank AG EUR 17,948 USD 23,028 04/16/12 (454 )
Deutsche Bank AG SEK 6,807 EUR 765 03/21/12 3
Deutsche Bank AG SEK 16,104 EUR 1,790 03/21/12 (20 )
Deutsche Bank AG SEK 32,195 EUR 3,622 03/21/12 16
Goldman Sachs CAD 206 USD 200 02/09/12 (6 )
Goldman Sachs EUR 11,989 USD 15,733 02/02/12 51
HSBC Bank PLC USD � EUR � 02/01/12 �
HSBC Bank PLC USD 4,927 JPY 382,554 03/21/12 95
HSBC Bank PLC USD 14,397 MXN 187,500 02/02/12 (12 )
HSBC Bank PLC USD 14,406 MXN 187,500 02/02/12 (21 )
HSBC Bank PLC USD 25 MXN 349 03/15/12 2
HSBC Bank PLC USD 2,237 SEK 15,666 03/21/12 61
HSBC Bank PLC AUD 4,640 USD 4,893 02/13/12 (27 )
HSBC Bank PLC BRL 16,000 USD 8,689 04/18/12 (314 )
HSBC Bank PLC EUR 1,352 SEK 12,040 03/21/12 (3 )
See accompanying notes which are an integral part of this quarterly report.
Russell Strategic Bond Fund 131
Copyright © 2012 www.secdatabase.com. All Rights Reserved.Please Consider the Environment Before Printing This Document

Table of Contents
Russell Investment CompanyRussell Strategic Bond FundSchedule of Investments, continued �� January 31, 2012 (Unaudited)Amounts in thousands
Foreign Currency Exchange Contracts
CounterpartyAmount
Sold
Amount
Bought
Settlement
Date
Unrealized
Appreciation
(Depreciation)
$
HSBC Bank PLC EUR 1,598 SEK 14,177 03/21/12 (11 )
HSBC Bank PLC EUR � USD � 02/01/12 �
HSBC Bank PLC EUR 1,783 USD 2,324 03/21/12 (8 )
HSBC Bank PLC JPY 475,831 USD 6,181 02/13/12 (62 )
HSBC Bank PLC MXN 187,500 USD 14,287 05/03/12 11
HSBC Bank PLC MXN 187,500 USD 14,296 05/03/12 20
HSBC Bank PLC SEK 14,046 USD 2,042 03/21/12 (18 )
HSBC Bank PLC SEK 45,331 USD 6,466 03/21/12 (183 )
HSBC Bank PLC SEK 55,658 USD 8,155 03/21/12 (9 )
JPMorgan Chase Bank USD 10,301 BRL 19,474 03/02/12 760
JPMorgan Chase Bank USD 2,331 CAD 2,379 03/21/12 39
JPMorgan Chase Bank USD 2,319 EUR 1,772 03/21/12 (1 )
JPMorgan Chase Bank USD 2,320 EUR 1,750 03/21/12 (31 )
JPMorgan Chase Bank USD 2,326 EUR 1,783 03/21/12 6
JPMorgan Chase Bank USD 2,333 EUR 1,769 03/21/12 (18 )
JPMorgan Chase Bank USD 2,333 EUR 1,811 03/21/12 37
JPMorgan Chase Bank USD 2,333 EUR 1,799 03/21/12 20
JPMorgan Chase Bank USD 7,148 EUR 5,635 03/21/12 224
JPMorgan Chase Bank USD 35 GBP 22 01/31/12 (2 )
JPMorgan Chase Bank USD 6,769 GBP 4,320 03/08/12 37
JPMorgan Chase Bank USD 2,329 JPY 179,470 03/21/12 27
JPMorgan Chase Bank USD 5,135 NOK 30,951 03/21/12 130
JPMorgan Chase Bank AUD 2,272 CAD 2,358 03/21/12 (50 )
JPMorgan Chase Bank AUD 2,820 USD 2,946 02/13/12 (45 )
JPMorgan Chase Bank CAD 14 USD 14 02/09/12 �
JPMorgan Chase Bank CAD 265 USD 261 02/09/12 (3 )
JPMorgan Chase Bank CAD 304 USD 297 02/09/12 (6 )
JPMorgan Chase Bank CAD 461 USD 454 02/09/12 (5 )
JPMorgan Chase Bank CAD 496 USD 479 02/09/12 (15 )
JPMorgan Chase Bank CAD 508 USD 498 02/09/12 (9 )
JPMorgan Chase Bank CAD 614 USD 597 02/09/12 (15 )
JPMorgan Chase Bank CAD 2,479 USD 2,401 02/09/12 (71 )
JPMorgan Chase Bank CHF 1,836 EUR 1,516 03/21/12 (12 )
Copyright © 2012 www.secdatabase.com. All Rights Reserved.Please Consider the Environment Before Printing This Document

JPMorgan Chase Bank CHF 2,194 EUR 1,788 03/21/12 (47 )
JPMorgan Chase Bank EUR 4,149 SEK 37,060 03/21/12 8
JPMorgan Chase Bank EUR 8 USD 10 01/31/12 �
JPMorgan Chase Bank EUR 6,425 USD 8,232 02/24/12 (172 )
JPMorgan Chase Bank EUR 1,783 USD 2,334 03/21/12 1
JPMorgan Chase Bank EUR 1,825 USD 2,344 03/21/12 (43 )
JPMorgan Chase Bank EUR 1,827 USD 2,335 03/21/12 (55 )
JPMorgan Chase Bank EUR 3,554 USD 4,652 03/21/12 2
JPMorgan Chase Bank EUR 4,772 USD 6,223 03/21/12 (20 )
JPMorgan Chase Bank EUR 4,780 USD 6,223 03/21/12 (31 )
JPMorgan Chase Bank JPY 414,749 CAD 5,470 03/21/12 5
JPMorgan Chase Bank JPY 5,120 USD 67 01/31/12 �
Morgan Stanley & Co., Inc. USD 2,324 EUR 1,757 03/21/12 (25 )
Morgan Stanley & Co., Inc. BRL 357 USD 200 03/02/12 (3 )
Morgan Stanley & Co., Inc. BRL 539 USD 300 03/02/12 (6 )
Morgan Stanley & Co., Inc. BRL 539 USD 300 03/02/12 (6 )
Morgan Stanley & Co., Inc. BRL 701 USD 400 03/02/12 2
Morgan Stanley & Co., Inc. BRL 703 USD 400 03/02/12 1
Morgan Stanley & Co., Inc. BRL 704 USD 400 03/02/12 �
Morgan Stanley & Co., Inc. BRL 876 USD 500 03/02/12 2
See accompanying notes which are an integral part of this quarterly report.
132 Russell Strategic Bond Fund
Copyright © 2012 www.secdatabase.com. All Rights Reserved.Please Consider the Environment Before Printing This Document

Table of Contents
Russell Investment CompanyRussell Strategic Bond FundSchedule of Investments, continued �� January 31, 2012 (Unaudited)Amounts in thousands
Foreign Currency Exchange Contracts
CounterpartyAmount
Sold
Amount
Bought
Settlement
Date
Unrealized
Appreciation
(Depreciation)
$
Morgan Stanley & Co., Inc. BRL 885 USD 500 03/02/12 (3 )
Morgan Stanley & Co., Inc. BRL 891 USD 500 03/02/12 (6 )
Morgan Stanley & Co., Inc. BRL 901 USD 500 03/02/12 (11 )
Morgan Stanley & Co., Inc. BRL 1,076 USD 600 03/02/12 (11 )
Morgan Stanley & Co., Inc. BRL 1,605 USD 900 03/02/12 (12 )
Morgan Stanley & Co., Inc. CAD 309 USD 300 02/09/12 (8 )
Morgan Stanley & Co., Inc. CAD 1,234 USD 1,202 02/09/12 (29 )
Morgan Stanley & Co., Inc. EUR 1,785 USD 2,328 03/21/12 (8 )
Morgan Stanley & Co., Inc. EUR 1,822 USD 2,331 03/21/12 (52 )
Morgan Stanley & Co., Inc. GBP 500 USD 785 03/02/12 (3 )
Morgan Stanley & Co., Inc. JPY 182,258 USD 2,337 03/21/12 (56 )
Royal Bank of Canada USD 2,710 CAD 2,706 02/09/12 (12 )
Royal Bank of Canada USD 2,323 CAD 2,370 03/21/12 38
Royal Bank of Canada USD 2,331 CAD 2,376 03/21/12 36
Royal Bank of Canada USD 2,331 CAD 2,364 03/21/12 25
Royal Bank of Canada USD 2,335 CAD 2,357 03/21/12 13
Royal Bank of Canada USD 4,662 CAD 4,782 03/21/12 102
Royal Bank of Canada USD 4,669 CAD 4,736 03/21/12 49
Royal Bank of Canada USD 4,671 CAD 4,679 03/21/12 (9 )
Royal Bank of Canada USD 2,360 EUR 1,813 04/16/12 12
Royal Bank of Canada CAD 2,369 EUR 1,786 03/21/12 (24 )
Royal Bank of Canada CAD 298 USD 292 02/09/12 (5 )
Royal Bank of Canada CAD 372 USD 362 02/09/12 (9 )
Royal Bank of Canada CAD 414 USD 401 02/09/12 (12 )
Royal Bank of Canada CAD 513 USD 499 02/09/12 (12 )
Royal Bank of Canada CAD 725 USD 700 02/09/12 (22 )
Royal Bank of Canada CAD 956 USD 930 02/09/12 (23 )
Royal Bank of Canada CAD 838 USD 814 03/21/12 (21 )
Royal Bank of Canada CAD 2,706 USD 2,707 03/22/12 12
Royal Bank of Canada EUR 1,784 CAD 2,414 03/21/12 71
Royal Bank of Canada EUR 939 USD 1,193 04/16/12 (36 )
Royal Bank of Canada GBP 5,763 USD 9,023 02/02/12 (59 )
Royal Bank of Canada GBP 2,387 USD 3,765 03/21/12 6
Copyright © 2012 www.secdatabase.com. All Rights Reserved.Please Consider the Environment Before Printing This Document

Royal Bank of Canada JPY 137,647 CAD 1,778 03/21/12 (36 )
Royal Bank of Canada JPY 157,726 CAD 2,116 03/21/12 37
Royal Bank of Scotland PLC USD 9,235 EUR 7,020 03/21/12 (51 )
Royal Bank of Scotland PLC AUD 2,260 CAD 2,358 03/21/12 (38 )
Royal Bank of Scotland PLC EUR 1,797 CAD 2,369 03/21/12 9
Royal Bank of Scotland PLC EUR 1,802 GBP 1,492 03/21/12 (7 )
Royal Bank of Scotland PLC EUR 3,554 USD 4,648 03/21/12 (2 )
Royal Bank of Scotland PLC SEK 31,291 EUR 3,451 03/21/12 (75 )
State Street Bank & Trust Co. USD 2,323 AUD 2,189 03/21/12 (12 )
State Street Bank & Trust Co. EUR 3,540 CAD 4,776 03/21/12 127
State Street Bank & Trust Co. EUR 7,087 USD 9,228 03/21/12 (44 )
State Street Bank & Trust Co. GBP 6,450 USD 10,048 03/21/12 (111 )
State Street Bank & Trust Co. NZD 11,901 USD 9,090 03/21/12 (705 )
State Street Bank & Trust Co. ZAR 148,436 USD 17,879 02/09/12 (1,080 )
UBS AG USD 2,320 EUR 1,757 03/21/12 (21 )
UBS AG USD 2,331 EUR 1,785 03/21/12 4
UBS AG AUD 2,286 EUR 1,796 03/21/12 (64 )
UBS AG BRL 365 USD 200 03/02/12 (8 )
UBS AG BRL 536 USD 300 03/02/12 (4 )
UBS AG BRL 540 USD 300 03/02/12 (7 )
See accompanying notes which are an integral part of this quarterly report.
Russell Strategic Bond Fund 133
Copyright © 2012 www.secdatabase.com. All Rights Reserved.Please Consider the Environment Before Printing This Document

Table of Contents
Russell Investment CompanyRussell Strategic Bond FundSchedule of Investments, continued �� January 31, 2012 (Unaudited)Amounts in thousands
Foreign Currency Exchange Contracts
CounterpartyAmount
Sold
Amount
Bought
Settlement
Date
Unrealized
Appreciation
(Depreciation)
$
UBS AG BRL 548 USD 300 03/02/12 (11 )
UBS AG BRL 548 USD 300 03/02/12 (11 )
UBS AG BRL 718 USD 400 03/02/12 (8 )
UBS AG BRL 721 USD 400 03/02/12 (10 )
UBS AG BRL 876 USD 500 03/02/12 3
UBS AG BRL 896 USD 500 03/02/12 (9 )
UBS AG CAD 2,354 EUR 1,730 03/21/12 (82 )
UBS AG CAD 102 USD 100 02/09/12 (2 )
UBS AG CAD 310 USD 299 02/09/12 (10 )
UBS AG CHF 944 USD 1,019 03/21/12 (7 )
UBS AG EUR 2,013 USD 2,589 03/21/12 (45 )
UBS AG EUR 5,950 USD 7,592 04/16/12 (193 )
UBS AG EUR 7,801 USD 9,920 04/16/12 (287 )
UBS AG GBP 500 USD 771 02/02/12 (17 )
Westpac Banking Corp. USD 9,267 AUD 9,069 03/21/12 310
Westpac Banking Corp. USD 1,751 NZD 2,351 03/21/12 184
Westpac Banking Corp. AUD 9,382 USD 9,220 03/21/12 (687 )
Total Unrealized Appreciation (Depreciation) on Open Foreign Currency Exchange Contracts (å) (4,141 )
See accompanying notes which are an integral part of this quarterly report.
134 Russell Strategic Bond Fund
Copyright © 2012 www.secdatabase.com. All Rights Reserved.Please Consider the Environment Before Printing This Document

Table of Contents
Russell Investment CompanyRussell Strategic Bond FundSchedule of Investments, continued �� January 31, 2012 (Unaudited)Amounts in thousands
Interest Rate Swap Contracts
CounterpartyNotional
Amount Fund Receives Fund PaysTermination
Date
Market
Value
$
Bank of America CAD 2,600 Canadian Dealer Offer Rate 3.325% 08/29/42 (336 )
Bank of America CAD 8,600 Canadian Dealer Offer Rate 2.173% 08/09/17 (243 )
Bank of America CAD 7,000 Canadian Dealer Offer Rate 2.115% 08/29/17 (173 )
Bank of America CAD 5,600 Canadian Dealer Offer Rate 2.180% 08/31/17 (156 )
Bank of America CAD 6,500 Canadian Dealer Offer Rate 1.898% 09/14/17 (90 )
Bank of America USD 24,600 Three Month LIBOR 2.000% 06/20/19 (694 )
Bank of America CAD 11,600 3.158% Canadian Dealer Offer Rate 08/09/22 859
Bank of America CAD 9,400 2.972% Canadian Dealer Offer Rate 08/29/22 526
Bank of America CAD 7,500 3.290% Canadian Dealer Offer Rate 08/31/22 458
Bank of America CAD 8,700 2.658% Canadian Dealer Offer Rate 09/14/22 233
Bank of America CAD 3,300 Canadian Dealer Offer Rate 3.586% 08/09/42 (605 )
Bank of America CAD 2,100 Canadian Dealer Offer Rate 3.377% 08/31/42 (293 )
Bank of America CAD 2,300 Canadian Dealer Offer Rate 2.888% 09/14/42 (90 )
Barclays Bank PLC BRL 3,100 12.455% Brazil Interbank Deposit Rate 01/02/13 47
Barclays Bank PLC BRL 1,500 10.830% Brazil Interbank Deposit Rate 01/02/14 11
Barclays Bank PLC EUR 9,690 Six Month EURIBOR 1.375% 12/20/14 (63 )
Barclays Bank PLC EUR 11,400 Six Month EURIBOR 1.448% 12/27/14 (94 )
Barclays Bank PLC EUR 23,000 Six Month EURIBOR 1.270% 01/28/15 (72 )
Barclays Bank PLC MXN 54,800 5.600% Mexico Interbank 28 Day Deposit Rate 09/06/16 54
Barclays Bank PLC EUR 3,890 2.650% Six Month EURIBOR 09/30/18 138
Barclays Bank PLC EUR 10,400 2.362% Six Month EURIBOR 12/20/19 225
Barclays Bank PLC EUR 12,200 2.430% Six Month EURIBOR 12/27/19 328
Barclays Bank PLC EUR 24,500 2.350% Six Month EURIBOR 01/28/20 437
Barclays Bank PLC EUR 2,020 Six Month EURIBOR 3.005% 09/30/23 (92 )
Barclays Bank PLC EUR 4,060 Six Month EURIBOR 2.780% 12/20/27 (79 )
Barclays Bank PLC EUR 4,760 Six Month EURIBOR 2.868% 12/27/27 (159 )
Barclays Bank PLC EUR 9,610 Six Month EURIBOR 2.876% 01/28/28 (312 )
Barclays Bank PLC USD 5,000 Three Month LIBOR 2.750% 06/20/42 (84 )
BNP Paribas BRL 1,500 11.880% Brazil Interbank Deposit Rate 01/02/13 29
BNP Paribas BRL 13,600 12.800% Brazil Interbank Deposit Rate 01/02/13 374
BNP Paribas BRL 1,700 12.110% Brazil Interbank Deposit Rate 01/02/14 48
BNP Paribas USD 9,000 1.000% Federal Fund Effective Rate - 1 Year 09/19/14 146
Citibank AUD 700 4.250% Six Month BBSW 06/15/17 1
Citibank AUD 1,000 5.000% Six Month BBSW 06/15/17 37
Citibank EUR 22,100 2.330% Six Month EURIBOR 01/31/19 169
Copyright © 2012 www.secdatabase.com. All Rights Reserved.Please Consider the Environment Before Printing This Document
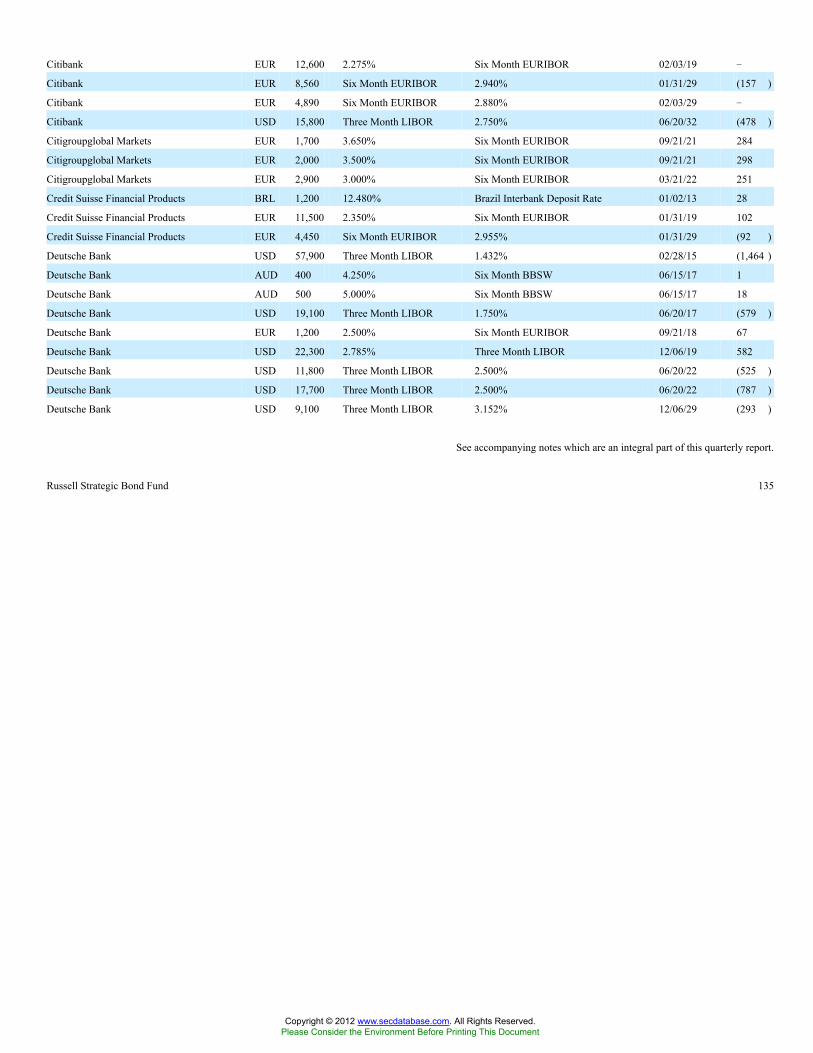
Citibank EUR 12,600 2.275% Six Month EURIBOR 02/03/19 �
Citibank EUR 8,560 Six Month EURIBOR 2.940% 01/31/29 (157 )
Citibank EUR 4,890 Six Month EURIBOR 2.880% 02/03/29 �
Citibank USD 15,800 Three Month LIBOR 2.750% 06/20/32 (478 )
Citigroupglobal Markets EUR 1,700 3.650% Six Month EURIBOR 09/21/21 284
Citigroupglobal Markets EUR 2,000 3.500% Six Month EURIBOR 09/21/21 298
Citigroupglobal Markets EUR 2,900 3.000% Six Month EURIBOR 03/21/22 251
Credit Suisse Financial Products BRL 1,200 12.480% Brazil Interbank Deposit Rate 01/02/13 28
Credit Suisse Financial Products EUR 11,500 2.350% Six Month EURIBOR 01/31/19 102
Credit Suisse Financial Products EUR 4,450 Six Month EURIBOR 2.955% 01/31/29 (92 )
Deutsche Bank USD 57,900 Three Month LIBOR 1.432% 02/28/15 (1,464 )
Deutsche Bank AUD 400 4.250% Six Month BBSW 06/15/17 1
Deutsche Bank AUD 500 5.000% Six Month BBSW 06/15/17 18
Deutsche Bank USD 19,100 Three Month LIBOR 1.750% 06/20/17 (579 )
Deutsche Bank EUR 1,200 2.500% Six Month EURIBOR 09/21/18 67
Deutsche Bank USD 22,300 2.785% Three Month LIBOR 12/06/19 582
Deutsche Bank USD 11,800 Three Month LIBOR 2.500% 06/20/22 (525 )
Deutsche Bank USD 17,700 Three Month LIBOR 2.500% 06/20/22 (787 )
Deutsche Bank USD 9,100 Three Month LIBOR 3.152% 12/06/29 (293 )
See accompanying notes which are an integral part of this quarterly report.
Russell Strategic Bond Fund 135
Copyright © 2012 www.secdatabase.com. All Rights Reserved.Please Consider the Environment Before Printing This Document
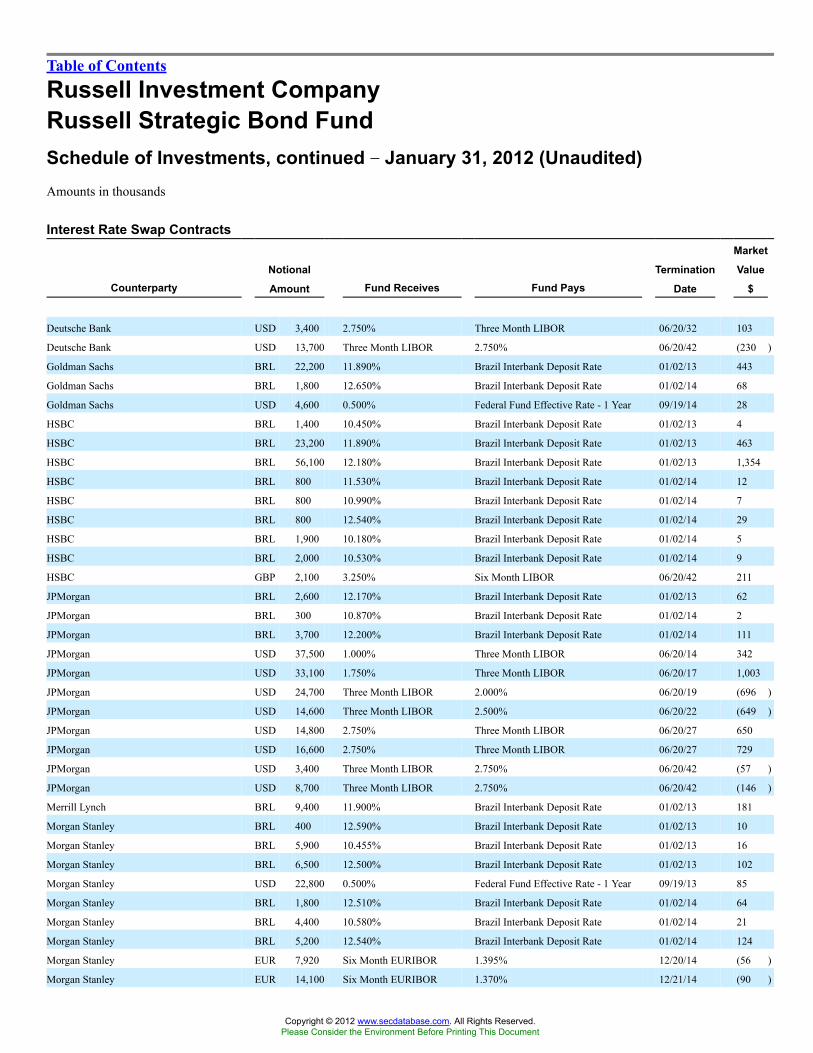
Table of Contents
Russell Investment CompanyRussell Strategic Bond FundSchedule of Investments, continued �� January 31, 2012 (Unaudited)Amounts in thousands
Interest Rate Swap Contracts
CounterpartyNotional
Amount Fund Receives Fund PaysTermination
Date
Market
Value
$
Deutsche Bank USD 3,400 2.750% Three Month LIBOR 06/20/32 103
Deutsche Bank USD 13,700 Three Month LIBOR 2.750% 06/20/42 (230 )
Goldman Sachs BRL 22,200 11.890% Brazil Interbank Deposit Rate 01/02/13 443
Goldman Sachs BRL 1,800 12.650% Brazil Interbank Deposit Rate 01/02/14 68
Goldman Sachs USD 4,600 0.500% Federal Fund Effective Rate - 1 Year 09/19/14 28
HSBC BRL 1,400 10.450% Brazil Interbank Deposit Rate 01/02/13 4
HSBC BRL 23,200 11.890% Brazil Interbank Deposit Rate 01/02/13 463
HSBC BRL 56,100 12.180% Brazil Interbank Deposit Rate 01/02/13 1,354
HSBC BRL 800 11.530% Brazil Interbank Deposit Rate 01/02/14 12
HSBC BRL 800 10.990% Brazil Interbank Deposit Rate 01/02/14 7
HSBC BRL 800 12.540% Brazil Interbank Deposit Rate 01/02/14 29
HSBC BRL 1,900 10.180% Brazil Interbank Deposit Rate 01/02/14 5
HSBC BRL 2,000 10.530% Brazil Interbank Deposit Rate 01/02/14 9
HSBC GBP 2,100 3.250% Six Month LIBOR 06/20/42 211
JPMorgan BRL 2,600 12.170% Brazil Interbank Deposit Rate 01/02/13 62
JPMorgan BRL 300 10.870% Brazil Interbank Deposit Rate 01/02/14 2
JPMorgan BRL 3,700 12.200% Brazil Interbank Deposit Rate 01/02/14 111
JPMorgan USD 37,500 1.000% Three Month LIBOR 06/20/14 342
JPMorgan USD 33,100 1.750% Three Month LIBOR 06/20/17 1,003
JPMorgan USD 24,700 Three Month LIBOR 2.000% 06/20/19 (696 )
JPMorgan USD 14,600 Three Month LIBOR 2.500% 06/20/22 (649 )
JPMorgan USD 14,800 2.750% Three Month LIBOR 06/20/27 650
JPMorgan USD 16,600 2.750% Three Month LIBOR 06/20/27 729
JPMorgan USD 3,400 Three Month LIBOR 2.750% 06/20/42 (57 )
JPMorgan USD 8,700 Three Month LIBOR 2.750% 06/20/42 (146 )
Merrill Lynch BRL 9,400 11.900% Brazil Interbank Deposit Rate 01/02/13 181
Morgan Stanley BRL 400 12.590% Brazil Interbank Deposit Rate 01/02/13 10
Morgan Stanley BRL 5,900 10.455% Brazil Interbank Deposit Rate 01/02/13 16
Morgan Stanley BRL 6,500 12.500% Brazil Interbank Deposit Rate 01/02/13 102
Morgan Stanley USD 22,800 0.500% Federal Fund Effective Rate - 1 Year 09/19/13 85
Morgan Stanley BRL 1,800 12.510% Brazil Interbank Deposit Rate 01/02/14 64
Morgan Stanley BRL 4,400 10.580% Brazil Interbank Deposit Rate 01/02/14 21
Morgan Stanley BRL 5,200 12.540% Brazil Interbank Deposit Rate 01/02/14 124
Morgan Stanley EUR 7,920 Six Month EURIBOR 1.395% 12/20/14 (56 )
Morgan Stanley EUR 14,100 Six Month EURIBOR 1.370% 12/21/14 (90 )
Copyright © 2012 www.secdatabase.com. All Rights Reserved.Please Consider the Environment Before Printing This Document

Morgan Stanley MXN 5,700 5.600% Mexico Interbank 28 Day Deposit Rate 09/06/16 6
Morgan Stanley EUR 8,500 2.380% Six Month EURIBOR 12/20/19 197
Morgan Stanley EUR 15,100 2.354% Six Month EURIBOR 12/21/19 314
Morgan Stanley MXN 5,100 6.350% Mexico Interbank 28 Day Deposit Rate 06/02/21 5
Morgan Stanley EUR 4,400 3.000% Six Month EURIBOR 09/21/21 407
Morgan Stanley EUR 400 Six Month EURIBOR 3.000% 03/21/22 (33 )
Morgan Stanley EUR 4,000 2.500% Six Month EURIBOR 03/21/22 104
Morgan Stanley EUR 9,200 2.750% Six Month EURIBOR 03/21/22 517
Morgan Stanley EUR 3,320 Six Month EURIBOR 2.790% 12/20/27 (70 )
Morgan Stanley EUR 5,870 Six Month EURIBOR 2.770% 12/21/27 (104 )
Morgan Stanley USD 7,945 Three Month LIBOR 3.925% 05/15/41 (2,170 )
Morgan Stanley USD 7,500 Three Month LIBOR 2.750% 06/20/42 (126 )
Royal Bank of Canada CAD 2,300 Canadian Dealer Offer Rate 2.882% 09/27/42 (87 )
Royal Bank of Canada CAD 6,500 Canadian Dealer Offer Rate 1.921% 09/27/17 (94 )
Royal Bank of Canada CAD 8,700 2.697% Canadian Dealer Offer Rate 09/27/22 256
Royal Bank of Scotland EUR 13,900 Six Month EURIBOR 1.375% 12/20/14 (91 )
Royal Bank of Scotland AUD 900 5.000% Six Month BBSW 06/15/17 33
Royal Bank of Scotland EUR 14,900 2.358% Six Month EURIBOR 12/20/19 315
Royal Bank of Scotland EUR 5,790 Six Month EURIBOR 2.775% 12/20/27 (108 )
See accompanying notes which are an integral part of this quarterly report.
136 Russell Strategic Bond Fund
Copyright © 2012 www.secdatabase.com. All Rights Reserved.Please Consider the Environment Before Printing This Document

Table of Contents
Russell Investment CompanyRussell Strategic Bond FundSchedule of Investments, continued �� January 31, 2012 (Unaudited)Amounts in thousands
Interest Rate Swap Contracts
CounterpartyNotional
Amount Fund Receives Fund PaysTermination
Date
Market
Value
$
UBS BRL 700 10.605% Brazil Interbank Deposit Rate 01/02/13 3
UBS BRL 1,600 12.070% Brazil Interbank Deposit Rate 01/02/13 36
UBS BRL 1,700 12.250% Brazil Interbank Deposit Rate 01/02/14 53
UBS BRL 2,400 10.380% Brazil Interbank Deposit Rate 01/02/14 9
UBS BRL 2,900 11.760% Brazil Interbank Deposit Rate 01/02/14 47
UBS BRL 4,500 10.770% Brazil Interbank Deposit Rate 01/02/14 30
Total Market Value on Open Interest Rate Swap Contracts Premiums Paid (Received) - $583 (å) 1,504
See accompanying notes which are an integral part of this quarterly report.
Russell Strategic Bond Fund 137
Copyright © 2012 www.secdatabase.com. All Rights Reserved.Please Consider the Environment Before Printing This Document

Table of Contents
Russell Investment CompanyRussell Strategic Bond FundSchedule of Investments, continued �� January 31, 2012 (Unaudited)Amounts in thousands
Credit Default Swap ContractsCorporate Issues
Reference
Entity Counterparty
Implied
Credit
Spread
Notional
Amount
Fund (Pays)/
Receives
Fixed Rate
Termination
Date
Market
Value
$
Berkshire Hathaway, Inc. Deutsche Bank 0.850% USD 17,100 1.000% 03/20/13 37
D.R. Horton, Inc. Deutsche Bank 1.796% USD 945 (1.000% ) 09/20/16 33
D.R. Horton, Inc. Goldman Sachs 1.796% USD 945 (1.000% ) 09/20/16 33
GE Capital Corp. Citibank 1.335% USD 600 4.800% 12/20/13 39
GE Capital Corp. Deutsche Bank 1.770% USD 300 1.000% 03/20/16 (9 )
GE Capital Corp. Morgan Stanley 1.809% USD 900 1.000% 06/20/16 (30 )
GE Capital Corp. JPMorgan 2.040% USD 1,625 1.000% 06/20/15 (55 )
MetLife, Inc. Deutsche Bank 1.539% USD 8,500 2.050% 03/20/13 54
MetLife, Inc. Deutsche Bank 2.330% USD 1,200 1.000% 03/20/15 (48 )
MetLife, Inc. Deutsche Bank 2.330% USD 1,300 1.000% 03/20/15 (52 )
MetLife, Inc. Deutsche Bank 2.330% USD 2,300 1.000% 03/20/15 (92 )
MetLife, Inc. UBS 1.539% USD 8,500 2.050% 03/20/13 54
Morgan Stanley Goldman Sachs 2.930% USD 7,900 1.000% 03/20/16 (581 )
Prudential Financial, Inc. Deutsche Bank 1.344% USD 8,500 2.300% 03/20/13 84
Prudential Financial, Inc. UBS 1.344% USD 8,500 2.300% 03/20/13 84
Total Market Value on Open Corporate Issues Premiums Paid (Received) - ($445) (449 )
Credit Indices
Reference
Entity CounterpartyNotional
Amount
Fund (Pays)/
Receives
Fixed Rate
Termination
Date
Market
Value
$
CMBX AJ Index Bank of America USD 2,645 (0.840% ) 10/12/52 403
CMBX AJ Index Barclays Bank PLC USD 6,500 (0.840% ) 10/12/52 990
CMBX AJ Index Credit Suisse First Boston USD 3,690 (0.840% ) 10/12/52 562
CMBX AJ Index Credit Suisse First Boston USD 1,410 (0.840% ) 10/12/52 215
Dow Jones CDX Index Bank of America USD 42,800 1.000% 06/20/16 50
Dow Jones CDX Index Bank of America USD 42,800 (1.000% ) 06/20/14 (312 )
Dow Jones CDX Index Barclays Bank PLC USD 3,100 5.000% 12/20/15 283
Dow Jones CDX Index Barclays Bank PLC USD 15,100 5.000% 06/20/15 1,234
Dow Jones CDX Index Citibank USD 4,836 0.355% 06/20/12 6
Dow Jones CDX Index Citibank USD 1,043 0.401% 06/20/12 1
Dow Jones CDX Index Citibank USD 4,742 0.360% 06/20/12 6
Copyright © 2012 www.secdatabase.com. All Rights Reserved.Please Consider the Environment Before Printing This Document
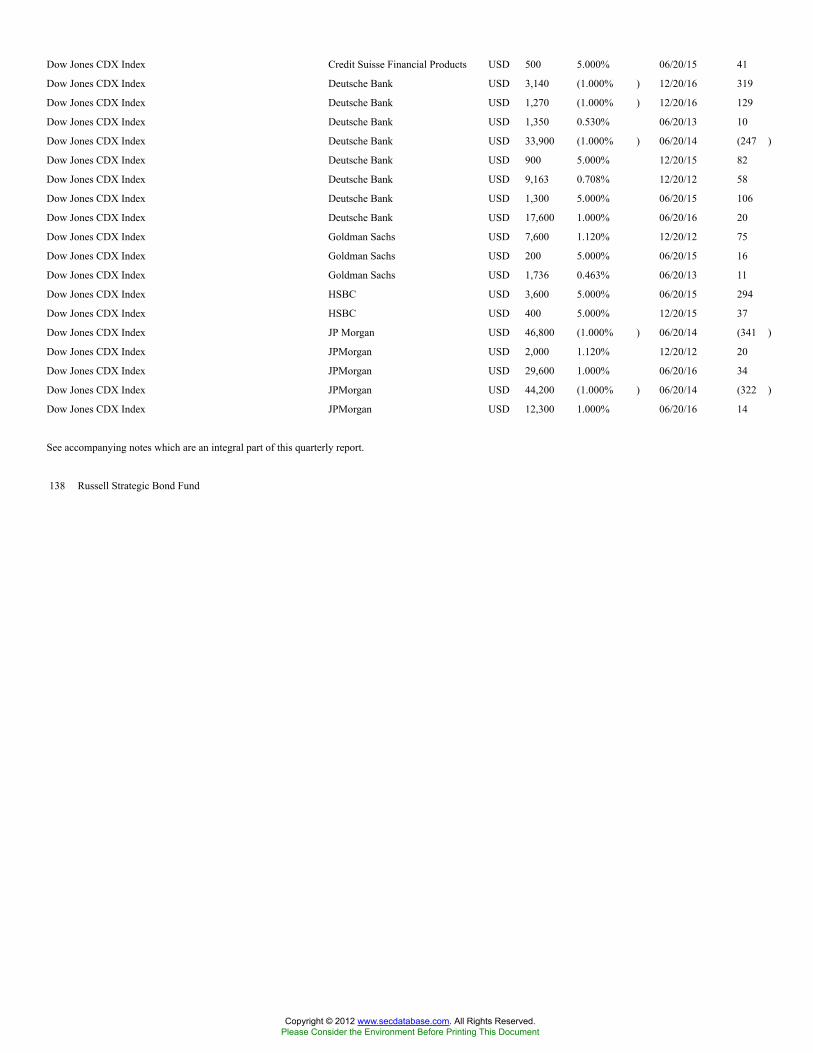
Dow Jones CDX Index Credit Suisse Financial Products USD 500 5.000% 06/20/15 41
Dow Jones CDX Index Deutsche Bank USD 3,140 (1.000% ) 12/20/16 319
Dow Jones CDX Index Deutsche Bank USD 1,270 (1.000% ) 12/20/16 129
Dow Jones CDX Index Deutsche Bank USD 1,350 0.530% 06/20/13 10
Dow Jones CDX Index Deutsche Bank USD 33,900 (1.000% ) 06/20/14 (247 )
Dow Jones CDX Index Deutsche Bank USD 900 5.000% 12/20/15 82
Dow Jones CDX Index Deutsche Bank USD 9,163 0.708% 12/20/12 58
Dow Jones CDX Index Deutsche Bank USD 1,300 5.000% 06/20/15 106
Dow Jones CDX Index Deutsche Bank USD 17,600 1.000% 06/20/16 20
Dow Jones CDX Index Goldman Sachs USD 7,600 1.120% 12/20/12 75
Dow Jones CDX Index Goldman Sachs USD 200 5.000% 06/20/15 16
Dow Jones CDX Index Goldman Sachs USD 1,736 0.463% 06/20/13 11
Dow Jones CDX Index HSBC USD 3,600 5.000% 06/20/15 294
Dow Jones CDX Index HSBC USD 400 5.000% 12/20/15 37
Dow Jones CDX Index JP Morgan USD 46,800 (1.000% ) 06/20/14 (341 )
Dow Jones CDX Index JPMorgan USD 2,000 1.120% 12/20/12 20
Dow Jones CDX Index JPMorgan USD 29,600 1.000% 06/20/16 34
Dow Jones CDX Index JPMorgan USD 44,200 (1.000% ) 06/20/14 (322 )
Dow Jones CDX Index JPMorgan USD 12,300 1.000% 06/20/16 14
See accompanying notes which are an integral part of this quarterly report.
138 Russell Strategic Bond Fund
Copyright © 2012 www.secdatabase.com. All Rights Reserved.Please Consider the Environment Before Printing This Document

Table of Contents
Russell Investment CompanyRussell Strategic Bond FundSchedule of Investments, continued �� January 31, 2012 (Unaudited)Amounts in thousands
Credit Default Swap ContractsCredit Indices
Reference
Entity CounterpartyNotional
Amount
Fund (Pays)/
Receives
Fixed Rate
Termination
Date
Market
Value
$
Dow Jones CDX Index JPMorgan USD 1,447 0.553% 12/20/17 27
Dow Jones CDX Index Merrill Lynch USD 19,000 1.580% 12/20/12 243
Dow Jones CDX Index Merrill Lynch USD 19,000 1.640% 12/20/12 253
Dow Jones CDX Index Morgan Stanley USD 6,200 5.000% 06/20/15 507
Dow Jones CDX Index Morgan Stanley USD 2,800 5.000% 12/20/15 256
Dow Jones CDX Index Morgan Stanley USD 4,214 (5.000% ) 12/20/16 111
Dow Jones CDX Index Morgan Stanley USD 484,000 (1.000% ) 12/20/16 (5 )
Dow Jones CDX Index Pershing LLC 1st Republic P.B. USD 579 0.548% 12/20/17 11
Dow Jones CDX Index UBS USD 1,640 (1.000% ) 12/20/16 167
Total Market Value on Open Credit Indices Premiums Paid (Received) - $13,754 5,364
Sovereign Issues
Reference Entity Counterparty
Implied
Credit
Spread
Notional
Amount
Fund (Pays)/
Receives
Fixed Rate
Termination
Date
Market
Value
$
Brazil Government International Bond Bank of America 1.213% USD 1,800 1.000% 09/20/15 (15 )
Brazil Government International Bond Barclays Bank PLC 1.170% USD 500 1.000% 06/20/15 (3 )
Brazil Government International Bond Barclays Bank PLC 1.281% USD 1,700 1.000% 03/20/16 (21 )
Brazil Government International Bond Citibank 1.213% USD 1,000 1.000% 09/20/15 (8 )
Brazil Government International Bond Citibank 1.336% USD 9,400 1.000% 06/20/16 (139 )
Brazil Government International Bond Credit Suisse Financial Products 1.336% USD 6,500 1.000% 06/20/16 (96 )
Brazil Government International Bond Deutsche Bank 1.170% USD 1,300 1.000% 06/20/15 (8 )
Brazil Government International Bond Deutsche Bank 1.170% USD 500 1.000% 06/20/15 (3 )
Brazil Government International Bond Deutsche Bank 1.336% USD 1,800 1.000% 06/20/16 (27 )
Brazil Government International Bond Goldman Sachs 1.170% USD 500 1.000% 06/20/15 (3 )
Brazil Government International Bond HSBC 1.213% USD 500 1.000% 09/20/15 (4 )
Brazil Government International Bond JPMorgan 1.213% USD 1,000 1.000% 09/20/15 (8 )
Brazil Government International Bond JPMorgan 1.384% USD 700 1.000% 09/20/16 (12 )
Brazil Government International Bond Morgan Stanley 1.170% USD 500 1.000% 06/20/15 (3 )
Brazil Government International Bond UBS 1.213% USD 500 1.000% 09/20/15 (4 )
Brazil Government International Bond UBS 0.863% USD 4,000 1.190% 08/20/13 18
China Government International Bond Bank of America 1.006% USD 1,100 1.000% 06/20/15 (2 )
China Government International Bond Bank of America 1.006% USD 400 1.000% 06/20/15 (1 )
Copyright © 2012 www.secdatabase.com. All Rights Reserved.Please Consider the Environment Before Printing This Document

China Government International Bond Barclays Bank PLC 1.161% USD 700 1.000% 03/20/16 (4 )
China Government International Bond BNP Paribas 1.161% USD 300 1.000% 03/20/16 (2 )
China Government International Bond Barclays Bank PLC 1.226% USD 12,400 1.000% 06/20/16 (109 )
China Government International Bond Citibank 1.006% USD 300 1.000% 06/20/15 (1 )
China Government International Bond Deutsche Bank 1.283% USD 400 1.000% 09/20/16 (5 )
China Government International Bond JPMorgan 1.283% USD 300 1.000% 09/20/16 (4 )
China Government International Bond Morgan Stanley 1.283% USD 300 1.000% 09/20/16 (4 )
China Government International Bond Royal Bank of Scotland 1.006% USD 800 1.000% 06/20/15 (1 )
France Government International Bond Bank of America 1.646% USD 800 0.250% 03/20/16 (44 )
France Government International Bond Barclays Bank PLC 1.646% USD 700 0.250% 03/20/16 (38 )
France Government International Bond Barclays Bank PLC 1.728% USD 15,000 0.250% 09/20/16 (971 )
France Government International Bond Barclays Bank PLC 1.747% USD 200 0.250% 09/20/16 (13 )
France Government International Bond Deutsche Bank 1.646% USD 300 0.250% 03/20/16 (16 )
France Government International Bond Goldman Sachs 1.789% USD 7,400 0.250% 12/20/16 (516 )
France Government International Bond HSBC 1.747% USD 300 0.250% 09/20/16 (19 )
France Government International Bond Morgan Stanley 1.646% USD 500 0.250% 03/20/16 (27 )
France Government International Bond Royal Bank of Scotland 1.646% USD 500 0.250% 03/20/16 (27 )
France Government International Bond UBS 1.646% USD 9,800 0.250% 03/20/16 (534 )
See accompanying notes which are an integral part of this quarterly report.
Russell Strategic Bond Fund 139
Copyright © 2012 www.secdatabase.com. All Rights Reserved.Please Consider the Environment Before Printing This Document

Table of Contents
Russell Investment CompanyRussell Strategic Bond FundSchedule of Investments, continued �� January 31, 2012 (Unaudited)Amounts in thousands
Credit Default Swap ContractsSovereign Issues
Reference Entity Counterparty
Implied
Credit
Spread
Notional
Amount
Fund (Pays)/
Receives
Fixed Rate
Termination
Date
Market
Value
$
France Government International Bond UBS 1.699% USD 10,000 0.250% 06/20/16 (596 )
France Government International Bond UBS 1.747% USD 200 0.250% 09/20/16 (13 )
Indonesia Government International Bond Bank of America 1.647% USD 1,200 1.000% 09/20/16 (38 )
Indonesia Government International Bond Barclays Bank PLC 1.570% USD 800 1.000% 06/20/16 (22 )
Indonesia Government International Bond Barclays Bank PLC 1.570% USD 800 1.000% 06/20/16 (22 )
Indonesia Government International Bond Morgan Stanley 1.647% USD 3,100 1.000% 09/20/16 (98 )
Indonesia Government International Bond UBS 1.647% USD 400 1.000% 09/20/16 (13 )
Italy Government International Bond Barclays Bank PLC 4.108% USD 800 1.000% 03/20/16 (90 )
Italy Government International Bond Goldman Sachs 4.108% USD 200 1.000% 03/20/16 (23 )
Italy Government International Bond Goldman Sachs 4.109% USD 1,000 1.000% 06/20/16 (119 )
Japan Government International Bond Bank of America 1.191% USD 100 1.000% 03/20/16 (1 )
Japan Government International Bond Bank of America 1.191% USD 200 1.000% 03/20/16 (2 )
Japan Government International Bond Goldman Sachs 1.244% USD 1,700 1.000% 06/20/16 (20 )
Japan Government International Bond JPMorgan 1.191% USD 700 1.000% 03/20/16 (7 )
Kazakhstan Government International Bond Citibank 2.433% USD 300 1.000% 03/20/16 (17 )
Kazakhstan Government International Bond Deutsche Bank 2.433% USD 300 1.000% 03/20/16 (17 )
Kazakhstan Government International Bond HSBC 2.433% USD 400 1.000% 03/20/16 (22 )
Korea Government International Bond Bank of America 1.421% USD 600 1.000% 09/20/16 (11 )
Korea Government International Bond Deutsche Bank 1.363% USD 500 1.000% 06/20/16 (8 )
Korea Government International Bond Deutsche Bank 1.363% USD 400 1.000% 06/20/16 (6 )
Korea Government International Bond HSBC 1.421% USD 400 1.000% 09/20/16 (7 )
Korea Government International Bond UBS 1.421% USD 700 1.000% 09/20/16 (13 )
Mexico Government International Bond Bank of America 1.171% USD 300 1.000% 09/20/15 (2 )
Mexico Government International Bond Barclays Bank PLC 1.244% USD 5,000 1.000% 03/20/16 (51 )
Mexico Government International Bond Citibank 1.171% USD 700 1.000% 09/20/15 (5 )
Mexico Government International Bond Citibank 1.301% USD 12,800 1.000% 06/20/16 (166 )
Mexico Government International Bond Deutsche Bank 1.301% USD 3,300 1.000% 06/20/16 (43 )
Mexico Government International Bond Deutsche Bank 1.244% USD 3,100 1.000% 03/20/16 (32 )
Mexico Government International Bond Goldman Sachs 1.301% USD 2,100 1.000% 06/20/16 (27 )
Mexico Government International Bond HSBC 1.244% USD 4,700 1.000% 03/20/16 (48 )
Mexico Government International Bond JPMorgan 1.246% USD 2,600 0.920% 03/20/16 (35 )
Spain Government International Bond Bank of America 3.685% USD 200 1.000% 03/20/16 (20 )
Spain Government International Bond Goldman Sachs 3.685% USD 200 1.000% 03/20/16 (20 )
Spain Government International Bond Goldman Sachs 3.699% USD 1,000 1.000% 06/20/16 (106 )
Copyright © 2012 www.secdatabase.com. All Rights Reserved.Please Consider the Environment Before Printing This Document

United Kingdom Gilt Citibank 0.683% USD 5,700 1.000% 06/20/16 80
United Kingdom Gilt Deutsche Bank 0.630% USD 600 1.000% 03/20/16 9
United Kingdom Gilt Morgan Stanley 0.683% USD 2,100 1.000% 06/20/16 29
United Kingdom Gilt Societe Generale 0.415% USD 4,000 1.000% 03/20/15 69
United Kingdom Gilt Societe Generale 0.415% USD 2,700 1.000% 03/20/15 46
United Kingdom Gilt UBS 0.415% USD 400 1.000% 03/20/15 7
United Kingdom Gilt UBS 0.415% USD 700 1.000% 03/20/15 12
United Kingdom Gilt UBS 0.683% USD 1,200 1.000% 06/20/16 17
Total Market Value on Open Sovereign Issues Premiums Paid (Received) - ($3,057) (4,125 )
Total Market Value on Open Credit Default Swap Contracts Premiums Paid (Received) - $10,252 (å) 790
See accompanying notes which are an integral part of this quarterly report.
140 Russell Strategic Bond Fund
Copyright © 2012 www.secdatabase.com. All Rights Reserved.Please Consider the Environment Before Printing This Document

Table of Contents
Russell Investment CompanyRussell Strategic Bond FundPresentation of Portfolio Holdings �� January 31, 2012 (Unaudited)Amounts in thousands
Market Value
Portfolio Summary Level 1 Level 2 Level 3 Total
Long-Term Investments
Asset-Backed Securities $� $584,730 $2,022 $586,752
Corporate Bonds and Notes � 1,359,712 36,127 1,395,839
International Debt � 660,781 12,017 672,798
Loan Agreements � 22,492 7 22,499
Mortgage-Backed Securities � 3,029,508 88,090 3,117,598
Municipal Bonds � 148,365 9,106 157,471
Non-US Bonds � 100,710 � 100,710
United States Government Agencies � 111,960 � 111,960
United States Government Treasuries � 1,264,675 � 1,264,675
Preferred Stocks 3,276 � 3,594 6,870
Options Purchased � 170 � 170
Short-Term Investments � 1,023,168 3,580 1,026,748
Repurchase Agreements � 3,100 � 3,100
Other Securities � 57,521 � 57,521
Total Investments 3,276 8,366,892 154,543 8,524,711
Other Financial Instruments
Futures Contracts 9,061 � � 9,061
Options Written (1 ) (547 ) (69 ) (617 )
Foreign Currency Exchange Contracts (28 ) (4,113 ) � (4,141 )
Interest Rate Swap Contracts � (200 ) 1,121 921
Credit Default Swap Contracts � (2,324 ) (7,138 ) (9,462 )
Total Other Financial Instruments* $9,032 $(7,184 ) $(6,086 ) $(4,238 )
* Other financial instruments reflected, such as futures, forwards, interest rate swaps, and credit default swaps are valued at the unrealized appreciation/depreciation
on the instruments.
For a description of the levels see note 2 in the Notes to Quarterly Report.
A reconciliation of investments in which significant unobservable inputs (Level 3) were used in determining a value for the periodending January 31, 2012 were as follows:
Category and Subcategory
Beginning
Balance
as of 11/
01/11
Gross
Purchases
Gross
Sales
Accrued
Discounts/
(Premium)
Realized
Gain/
(Loss)
Long-Term Investments
Copyright © 2012 www.secdatabase.com. All Rights Reserved.Please Consider the Environment Before Printing This Document

Asset-Backed Securities $ 4,524 $ � $� $ 2 $ �
Corporate Bonds and Notes 37,770 1,206 2,536 (91 ) 79
International Debt 11,670 � � (19 ) �
Loan Agreements 8 � � � �
Mortgage-Backed Securities 106,261 � 14,972 (2 ) (12 )
Municipal Bonds 5,813 � � 10 �
Preferred Stocks 3,604 � � � �
Short-Term Investments 3,559 � 2 (11 ) �
Total-Term Investments 173,209 1,206 17,510 (111 ) 67
Other Financial Instruments
Options Written (372 ) � � � 281
Interest Rate Swap Contracts � � � � �
Credit Default Swap Contracts � � � � �
Total Other Financial Instruments (372 ) � � � 281
See accompanying notes which are an integral part of this quarterly report.
Russell Strategic Bond Fund 141
Copyright © 2012 www.secdatabase.com. All Rights Reserved.Please Consider the Environment Before Printing This Document
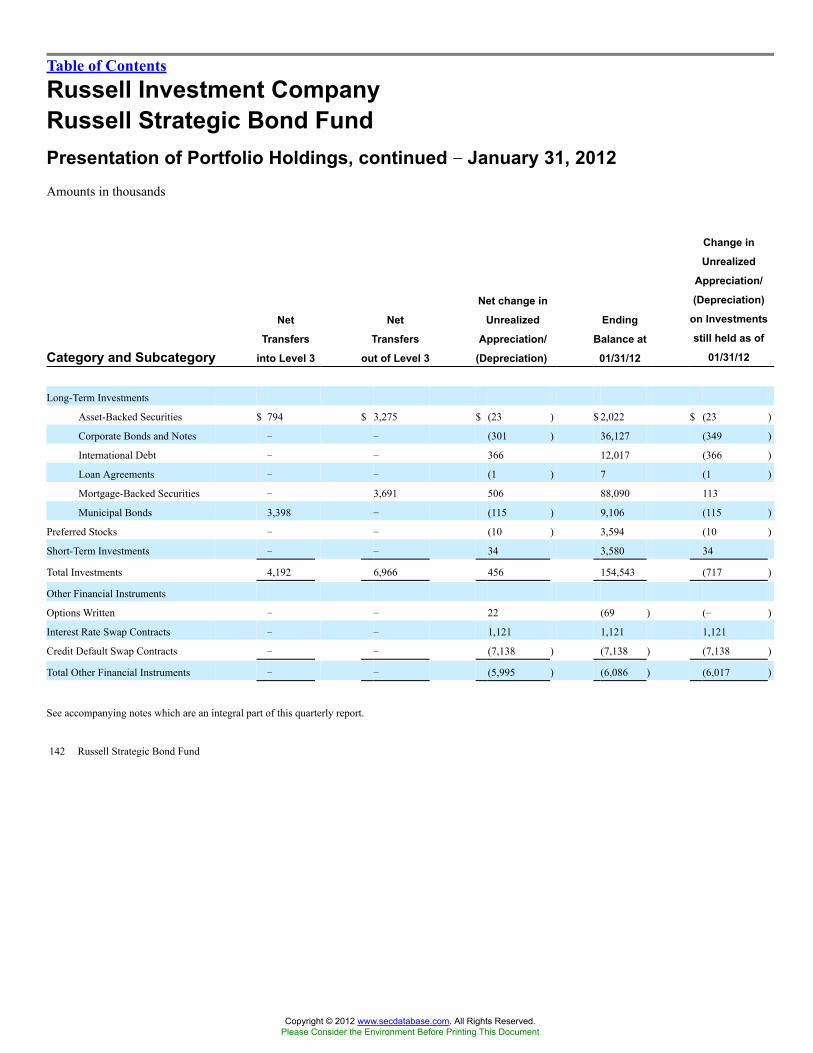
Table of Contents
Russell Investment CompanyRussell Strategic Bond FundPresentation of Portfolio Holdings, continued �� January 31, 2012Amounts in thousands
Category and Subcategory
Net
Transfers
into Level 3
Net
Transfers
out of Level 3
Net change in
Unrealized
Appreciation/
(Depreciation)
Ending
Balance at
01/31/12
Change in
Unrealized
Appreciation/
(Depreciation)
on Investments
still held as of
01/31/12
Long-Term Investments
Asset-Backed Securities $ 794 $ 3,275 $ (23 ) $ 2,022 $ (23 )
Corporate Bonds and Notes � � (301 ) 36,127 (349 )
International Debt � � 366 12,017 (366 )
Loan Agreements � � (1 ) 7 (1 )
Mortgage-Backed Securities � 3,691 506 88,090 113
Municipal Bonds 3,398 � (115 ) 9,106 (115 )
Preferred Stocks � � (10 ) 3,594 (10 )
Short-Term Investments � � 34 3,580 34
Total Investments 4,192 6,966 456 154,543 (717 )
Other Financial Instruments
Options Written � � 22 (69 ) (� )
Interest Rate Swap Contracts � � 1,121 1,121 1,121
Credit Default Swap Contracts � � (7,138 ) (7,138 ) (7,138 )
Total Other Financial Instruments � � (5,995 ) (6,086 ) (6,017 )
See accompanying notes which are an integral part of this quarterly report.
142 Russell Strategic Bond Fund
Copyright © 2012 www.secdatabase.com. All Rights Reserved.Please Consider the Environment Before Printing This Document

Table of Contents
Russell Investment CompanyRussell Investment Grade Bond Fund
Schedule of Investments �� January 31, 2012 (Unaudited)Amounts in thousands (except share amounts)
Principal
Amount ($)
or Shares
Market
Value
$
Long-Term Investments - 91.3%Asset-Backed Securities -3.7%Accredited Mortgage Loan Trust
Series 2007-1 Class A4
0.496% due 02/25/37 (Ê) 2,583 1,083
ACE Securities Corp.
Series 2005-SD3 Class A
0.676% due 08/25/45 (Ê) 98 93
Series 2006-HE4 Class A2A
0.336% due 10/25/36 (Ê) 49 12
Ally Master Owner Trust
Series 2011-3 Class A2
1.810% due 05/15/16 1,550 1,570
AmeriCredit Automobile
Receivables Trust
Series 2011-4 Class A3
1.170% due 05/09/16 1,560 1,560
Ameriquest Mortgage Securities,
Inc.
Series 2004-R2 Class A1A
0.621% due 04/25/34 (Ê) 301 244
Series 2004-R10 Class A5
0.666% due 11/25/34 (Ê) 2 2
Series 2005-R10 Class A2B
0.496% due 12/25/35 (Ê) 562 526
Argent Securities, Inc.
Series 2003-W9 Class M1
1.311% due 03/25/34 (Ê) 641 520
Asset Backed Funding Certificates
Zero coupon due 1,977 1,883
Asset Backed Securities Corp.
Home Equity
Series 2003-HE7 Class M1
1.260% due 12/15/33 (Ê) 264 199
Principal
Amount ($)
or Shares
Market
Value
$
BNC Mortgage Loan Trust
Series 2007-2 Class A2
0.376% due 05/25/37 (Ê) 95 84
Series 2008-4 Class A3A
0.526% due 11/25/37 (Ê) 885 864
Brazos Higher Education Authority
Series 2010-1 Class A2
1.706% due 02/25/35 (Ê) 1,500 1,364
Series 2011-2 Class A3
1.560% due 10/27/36 (Ê) 525 473
Business Loan Express
Series 2003-2A Class A
1.076% due 01/25/32 (Ê)(Þ) 167 123
Carrington Mortgage Loan Trust
Series 2005-NC3 Class M1
0.716% due 06/25/35 (Ê) 2,200 1,811
Series 2005-NC5 Class A2
0.596% due 10/25/35 (Ê) 69 64
Series 2006-NC3 Class A3
0.426% due 08/25/36 (Ê) 2,105 536
Centex Home Equity
Series 2003-B Class AF4
3.735% due 02/25/32 2,253 1,965
Series 2006-A Class AV4
0.526% due 06/25/36 (Ê) 1,700 940
CIT Education Loan Trust
Series 2007-1 Class A
0.664% due 03/25/42 (Ê)(Þ) 1,158 1,045
Citibank Omni Master Trust
Series 2009-A8 Class A8
2.390% due 05/16/16 (Ê)(Þ) 1,000 1,005
Citigroup Mortgage Loan Trust,
Inc.
Series 2006-HE1 Class A4
0.546% due 01/25/36 (Ê) 1,432 1,334
Series 2006-SHL1 Class A1
0.476% due 11/25/45 (Ê)(Þ) 472 325
Copyright © 2012 www.secdatabase.com. All Rights Reserved.Please Consider the Environment Before Printing This Document

Russell Investment Grade Bond Fund 143
Series 2006-HE2 Class A1A
0.526% due 03/25/36 (Ê) 1,346 37
Avis Budget Rental Car Funding
AESOP LLC
Series 2010-3A Class A
4.640% due 05/20/16 (Þ) 260 281
Series 2010-5A Class A
3.150% due 03/20/17 (Þ) 220 224
Bayview Financial Acquisition
Trust
Series 2006-A Class 1A3
5.865% due 02/28/41 410 308
Bear Stearns Asset Backed
Securities Trust
Series 2003-1 Class A1
1.276% due 11/25/42 (Ê) 75 63
Series 2003-SD1 Class A
0.726% due 12/25/33 (Ê) 61 51
Series 2004-SD3 Class A3
0.846% due 09/25/34 (Ê) 199 172
Series 2005-TC2 Class A3
0.646% due 08/25/35 (Ê) 1,945 1,674
Series 2006-SD2 Class A2
0.476% due 06/25/36 (Ê) 35 35
Series 2007-HE5 Class 1A1
0.366% due 06/25/47 (Ê) 16 15
Series 2007-HE6 Class 1A1
1.526% due 08/25/37 (Ê) 549 326
Series 2007-AHL3 Class A3A
0.336% due 07/25/45 (Ê) 137 95
Countrywide Asset-Backed
Certificates
Series 2001-BC3 Class A
0.756% due 12/25/31 (Ê) 62 33
Series 2005-4 Class MV1
0.736% due 10/25/35 (Ê) 611 592
Series 2006-6 Class 2A2
0.456% due 09/25/36 (Ê) 299 238
Series 2006-BC1 Class 1A
0.476% due 04/25/36 (Ê) 638 472
Series 2006-BC4 Class 2A2
0.436% due 11/25/36 (Ê) 1,820 1,166
Series 2007-7 Class 2A1
0.356% due 10/25/47 (Ê) 20 20
Countrywide Home Equity Loan
Trust
Series 2005-A Class 2A
0.525% due 04/15/35 (Ê) 130 74
Series 2005-G Class 2A
0.515% due 12/15/35 (Ê) 669 367
Copyright © 2012 www.secdatabase.com. All Rights Reserved.Please Consider the Environment Before Printing This Document

Table of Contents
Russell Investment CompanyRussell Investment Grade Bond FundSchedule of Investments, continued �� January 31, 2012 (Unaudited)Amounts in thousands (except share amounts)
Principal
Amount ($)
or Shares
Market
Value
$
Series 2006-E Class 2A
0.425% due 07/15/36 (Ê) 392 234
Series 2007-GW Class A
0.835% due 08/15/37 (Ê) 201 165
Credit-Based Asset Servicing and
Securitization LLC
Series 2004-CB7 Class AF5
4.585% due 10/25/34 550 541
Series 2005-CB5 Class AV2
0.536% due 08/25/35 (Ê) 54 50
Series 2007-RP1 Class A
0.586% due 05/25/46 (Ê)(Þ) 849 359
Educational Funding of the South,
Inc.
Series 2011-1 Class A2
1.210% due 04/25/35 (Ê) 500 461
Ellington Loan Acquisition Trust
Series 2007-1 Class A2A1
1.276% due 05/26/37 (Ê)(Þ) 255 231
Fannie Mae Grantor Trust
Series 2003-T4 Class 1A
0.495% due 09/26/33 (Ê) 129 127
Series 2003-T4 Class 2A5
5.407% due 09/26/33 736 783
Fannie Mae Whole Loan
Series 2003-W5 Class A
0.496% due 04/25/33 (Ê) 110 105
Series 2003-W9 Class A
0.516% due 06/25/33 (Ê) 163 155
Ford Credit Floorplan Master
Owner Trust
Series 2010-5 Class A1
1.500% due 09/15/15 1,000 1,010
GE-WMC Mortgage Securities
LLC
Principal
Amount ($)
or Shares
Market
Value
$
Series 2006-1 Class A1
0.441% due 01/20/36 (Ê) 1,377 1,251
Series 2006-2 Class A1
0.431% due 03/20/36 (Ê) 802 741
Series 2006-4 Class A3V
0.431% due 03/20/36 (Ê) 1,658 1,598
Series 2007-1 Class AS
0.481% due 03/20/36 (Ê) 1,375 1,174
Series 2007-2 Class A2V
0.441% due 07/20/36 (Ê) 847 843
JP Morgan Mortgage Acquisition
Corp.
Series 2007-CH1 Class AV4
0.406% due 11/25/36 (Ê) 2,575 2,040
Series 2007-CH3 Class A2
0.356% due 03/25/37 (Ê) 84 81
Lehman ABS Manufactured
Housing Contract Trust
Series 2001-B Class A4
5.270% due 04/15/40 853 894
Lehman XS Trust
Series 2005-1 Class 2A1
1.757% due 07/25/35 (Ê) 288 211
Series 2005-5N Class 1A1
0.576% due 11/25/35 (Ê) 318 230
Series 2005-7N Class 1A1B
0.576% due 12/25/35 (Ê) 273 73
Long Beach Mortgage Loan Trust
Series 2004-4 Class 1A1
0.836% due 10/25/34 (Ê) 34 25
Morgan Stanley ABS Capital I
Series 2003-NC6 Class M1
1.476% due 06/25/33 (Ê) 382 296
Series 2003-NC7 Class M1
1.326% due 06/25/33 (Ê) 324 262
Series 2005-WMC1 Class M1
0.981% due 01/25/35 (Ê) 131 130
Copyright © 2012 www.secdatabase.com. All Rights Reserved.Please Consider the Environment Before Printing This Document

144 Russell Investment Grade Bond Fund
Series 2006-1 Class A2A
0.316% due 08/25/36 (Ê) 11 3
Greenpoint Manufactured Housing
Series 2000-6 Class A3
2.292% due 11/22/31 (Ê) 325 270
Series 2001-2 Class IA2
3.776% due 02/20/32 (Ê) 300 227
Series 2001-2 Class IIA2
3.778% due 03/13/32 (Ê) 375 283
GSAA Trust
Series 2006-2 Class 2A3
0.546% due 12/25/35 (Ê) 570 515
GSAMP Trust
Series 2004-SEA2 Class A2B
0.826% due 03/25/34 (Ê) 691 674
Hertz Vehicle Financing LLC
Series 2009-2A Class A2
5.290% due 03/25/16 (Þ) 280 307
Home Equity Asset Trust
Series 2003-8 Class M1
1.356% due 04/25/34 (Ê) 510 375
HSBC Home Equity Loan Trust
Series 2005-1 Class A
0.571% due 01/20/34 (Ê) 341 309
Series 2007-HE2 Class A2B
0.366% due 01/25/37 (Ê) 2,800 920
Series 2007-HE6 Class A1
0.336% due 05/25/37 (Ê) 45 38
Nelnet Student Loan Trust
Series 2004-4 Class A5
0.720% due 01/25/37 (Ê) 200 189
Novastar Home Equity Loan
Series 2003-3 Class A2C
1.336% due 12/25/33 (Ê) 298 244
Option One Mortgage Loan Trust
Series 2007-6 Class 2A1
0.336% due 07/25/37 (Ê) 109 104
Ownit Mortgage Loan Asset
Backed Certificates
Series 2006-6 Class A2C
0.436% due 09/25/37 (Ê) 2,390 747
Park Place Securities, Inc.
Series 2004-MHQ1 Class M1
0.976% due 12/25/34 (Ê) 1,111 1,076
Copyright © 2012 www.secdatabase.com. All Rights Reserved.Please Consider the Environment Before Printing This Document

Table of Contents
Russell Investment CompanyRussell Investment Grade Bond FundSchedule of Investments, continued �� January 31, 2012 (Unaudited)Amounts in thousands (except share amounts)
Principal
Amount ($)
or Shares
Market
Value
$
Series 2004-WCW2 Class M1
0.896% due 10/25/34 (Ê) 2,099 2,050
Series 2005-WCW1 Class A3D
0.616% due 09/25/35 (Ê) 930 895
Popular ABS Mortgage Pass-
Through Trust
Series 2005-6 Class A3
5.615% due 01/25/36 185 160
Prestige Auto Receivables Trust
Series 2011-1A Class A3
1.900% due 08/17/15 (Þ) 1,555 1,564
RAAC Series
Series 2006-RP2 Class A
0.526% due 02/25/37 (Ê)(Þ) 300 216
Renaissance Home Equity Loan
Trust
Series 2003-3 Class A
0.776% due 12/25/33 (Ê) 256 205
Series 2005-2 Class AF4
4.934% due 08/25/35 585 457
Series 2006-1 Class AF6
5.746% due 05/25/36 289 132
Residential Asset Mortgage
Products, Inc.
Series 2003-RS2 Class AII
0.956% due 03/25/33 (Ê) 70 47
Series 2003-RS3 Class AII
0.996% due 04/25/33 (Ê) 43 30
Series 2003-RS11 Class AI6A
5.980% due 12/25/33 196 180
Series 2004-RZ1 Class AI7
4.030% due 01/25/33 1,001 998
Residential Asset Securities Corp.
Series 2001-KS1 Class AI6
6.349% due 03/25/32 350 318
Principal
Amount ($)
or Shares
Market
Value
$
Security National Mortgage Loan
Trust
Series 2006-3A Class A1
0.556% due 01/25/37 (Ê)(Þ) 161 145
Sierra Receivables Funding Co.
LLC
Series 2006-1A Class A2
0.431% due 05/20/18 (Ê)(Þ) 61 60
SLM Student Loan Trust
Series 2006-5 Class A6B
0.680% due 10/25/40 (Ê) 1,000 896
Series 2008-2 Class A1
0.860% due 01/25/15 (Ê) 8 8
Small Business Administration
Participation Certificates
Series 2003-20I Class 1
5.130% due 09/01/23 43 48
Soundview Home Equity Loan
Trust
Series 2006-WF2 Class A2C
0.416% due 12/25/36 (Ê) 2,505 2,050
Specialty Underwriting &
Residential Finance
Series 2003-BC1 Class A
0.956% due 01/25/34 (Ê) 25 19
Structured Asset Securities Corp.
Series 2002-AL1 Class A3
3.450% due 02/25/32 257 235
Series 2002-HF1 Class A
0.856% due 01/25/33 (Ê) 9 8
Series 2006-WF2 Class A3
0.426% due 07/25/36 (Ê) 2,098 2,029
Truman Capital Mortgage Loan
Trust
Series 2006-1 Class A
0.536% due 03/25/36 (Ê)(Þ) 685 471
Wells Fargo Home Equity Trust
Copyright © 2012 www.secdatabase.com. All Rights Reserved.Please Consider the Environment Before Printing This Document

Russell Investment Grade Bond Fund 145
Series 2001-KS1 Class AII
0.746% due 03/25/32 (Ê) 19 18
Series 2001-KS3 Class AII
0.736% due 09/25/31 (Ê) 38 28
Series 2003-KS4 Class AIIB
0.856% due 06/25/33 (Ê) 118 68
Series 2005-EMX3 Class M1
0.706% due 09/25/35 (Ê) 1,000 925
Series 2005-KS12 Class A2
0.526% due 01/25/36 (Ê) 1,053 1,001
SACO I, Inc.
Series 2005-WM3 Class A1
0.796% due 09/25/35 (Ê) 40 16
Santander Drive Auto Receivables
Trust
Series 2011-1 Class A3
1.280% due 01/15/15 1,560 1,562
Series 2011-2 Class B
2.660% due 01/15/16 970 976
Saxon Asset Securities Trust
Series 2004-1 Class A
0.816% due 03/25/35 (Ê) 57 39
Series 2005-1 Class M1
0.736% due 05/25/35 (Ê) 781 542
Series 2004-2 Class AI6
5.000% due 05/25/34 1,900 1,894
66,509
Corporate Bonds and Notes - 16.6%Air 2 US
8.027% due 10/01/19 (Þ) 373 343
Allstate Life Global Funding
Trusts
5.375% due 04/30/13 400 423
Altria Group, Inc.
8.500% due 11/10/13 220 248
9.700% due 11/10/18 1,285 1,770
10.200% due 02/06/39 325 515
American Express Co.
7.000% due 03/19/18 200 246
American Express Credit Corp.
5.875% due 05/02/13 2,400 2,538
American International Group, Inc.
3.750% due 11/30/13 (Þ) 200 198
5.050% due 10/01/15 200 205
4.875% due 09/15/16 1,190 1,208
8.250% due 08/15/18 1,500 1,727
6.250% due 03/15/37 2,100 1,659
Copyright © 2012 www.secdatabase.com. All Rights Reserved.Please Consider the Environment Before Printing This Document
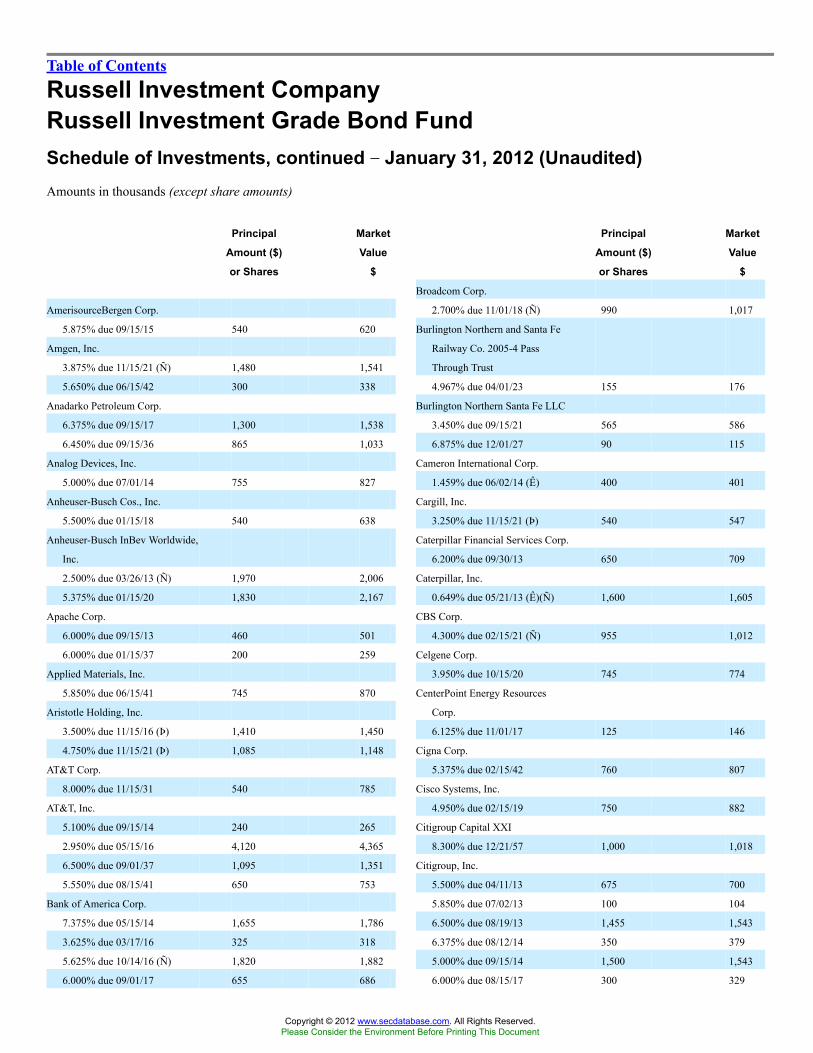
Table of Contents
Russell Investment CompanyRussell Investment Grade Bond FundSchedule of Investments, continued �� January 31, 2012 (Unaudited)Amounts in thousands (except share amounts)
Principal
Amount ($)
or Shares
Market
Value
$
AmerisourceBergen Corp.
5.875% due 09/15/15 540 620
Amgen, Inc.
3.875% due 11/15/21 (Ñ) 1,480 1,541
5.650% due 06/15/42 300 338
Anadarko Petroleum Corp.
6.375% due 09/15/17 1,300 1,538
6.450% due 09/15/36 865 1,033
Analog Devices, Inc.
5.000% due 07/01/14 755 827
Anheuser-Busch Cos., Inc.
5.500% due 01/15/18 540 638
Anheuser-Busch InBev Worldwide,
Inc.
2.500% due 03/26/13 (Ñ) 1,970 2,006
5.375% due 01/15/20 1,830 2,167
Apache Corp.
6.000% due 09/15/13 460 501
6.000% due 01/15/37 200 259
Applied Materials, Inc.
5.850% due 06/15/41 745 870
Aristotle Holding, Inc.
3.500% due 11/15/16 (Þ) 1,410 1,450
4.750% due 11/15/21 (Þ) 1,085 1,148
AT&T Corp.
8.000% due 11/15/31 540 785
AT&T, Inc.
5.100% due 09/15/14 240 265
2.950% due 05/15/16 4,120 4,365
6.500% due 09/01/37 1,095 1,351
5.550% due 08/15/41 650 753
Bank of America Corp.
7.375% due 05/15/14 1,655 1,786
3.625% due 03/17/16 325 318
5.625% due 10/14/16 (Ñ) 1,820 1,882
6.000% due 09/01/17 655 686
Principal
Amount ($)
or Shares
Market
Value
$
Broadcom Corp.
2.700% due 11/01/18 (Ñ) 990 1,017
Burlington Northern and Santa Fe
Railway Co. 2005-4 Pass
Through Trust
4.967% due 04/01/23 155 176
Burlington Northern Santa Fe LLC
3.450% due 09/15/21 565 586
6.875% due 12/01/27 90 115
Cameron International Corp.
1.459% due 06/02/14 (Ê) 400 401
Cargill, Inc.
3.250% due 11/15/21 (Þ) 540 547
Caterpillar Financial Services Corp.
6.200% due 09/30/13 650 709
Caterpillar, Inc.
0.649% due 05/21/13 (Ê)(Ñ) 1,600 1,605
CBS Corp.
4.300% due 02/15/21 (Ñ) 955 1,012
Celgene Corp.
3.950% due 10/15/20 745 774
CenterPoint Energy Resources
Corp.
6.125% due 11/01/17 125 146
Cigna Corp.
5.375% due 02/15/42 760 807
Cisco Systems, Inc.
4.950% due 02/15/19 750 882
Citigroup Capital XXI
8.300% due 12/21/57 1,000 1,018
Citigroup, Inc.
5.500% due 04/11/13 675 700
5.850% due 07/02/13 100 104
6.500% due 08/19/13 1,455 1,543
6.375% due 08/12/14 350 379
5.000% due 09/15/14 1,500 1,543
6.000% due 08/15/17 300 329
Copyright © 2012 www.secdatabase.com. All Rights Reserved.Please Consider the Environment Before Printing This Document
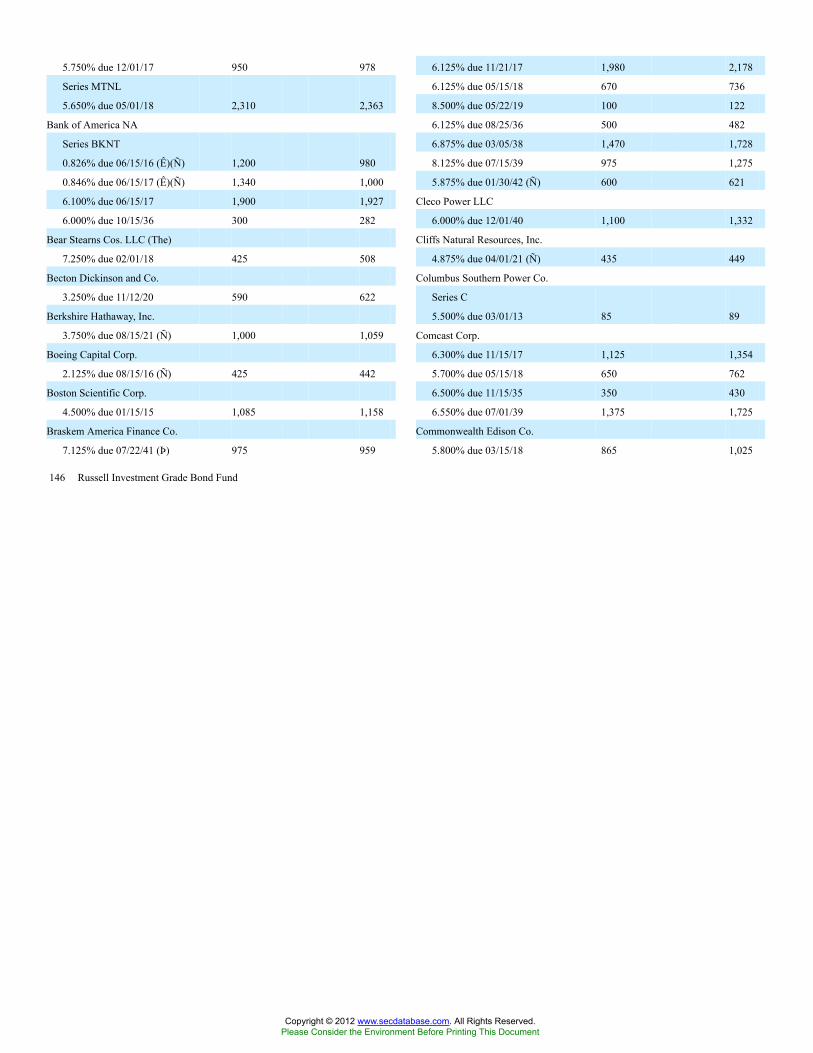
146 Russell Investment Grade Bond Fund
5.750% due 12/01/17 950 978
Series MTNL
5.650% due 05/01/18 2,310 2,363
Bank of America NA
Series BKNT
0.826% due 06/15/16 (Ê)(Ñ) 1,200 980
0.846% due 06/15/17 (Ê)(Ñ) 1,340 1,000
6.100% due 06/15/17 1,900 1,927
6.000% due 10/15/36 300 282
Bear Stearns Cos. LLC (The)
7.250% due 02/01/18 425 508
Becton Dickinson and Co.
3.250% due 11/12/20 590 622
Berkshire Hathaway, Inc.
3.750% due 08/15/21 (Ñ) 1,000 1,059
Boeing Capital Corp.
2.125% due 08/15/16 (Ñ) 425 442
Boston Scientific Corp.
4.500% due 01/15/15 1,085 1,158
Braskem America Finance Co.
7.125% due 07/22/41 (Þ) 975 959
6.125% due 11/21/17 1,980 2,178
6.125% due 05/15/18 670 736
8.500% due 05/22/19 100 122
6.125% due 08/25/36 500 482
6.875% due 03/05/38 1,470 1,728
8.125% due 07/15/39 975 1,275
5.875% due 01/30/42 (Ñ) 600 621
Cleco Power LLC
6.000% due 12/01/40 1,100 1,332
Cliffs Natural Resources, Inc.
4.875% due 04/01/21 (Ñ) 435 449
Columbus Southern Power Co.
Series C
5.500% due 03/01/13 85 89
Comcast Corp.
6.300% due 11/15/17 1,125 1,354
5.700% due 05/15/18 650 762
6.500% due 11/15/35 350 430
6.550% due 07/01/39 1,375 1,725
Commonwealth Edison Co.
5.800% due 03/15/18 865 1,025
Copyright © 2012 www.secdatabase.com. All Rights Reserved.Please Consider the Environment Before Printing This Document

Table of Contents
Russell Investment CompanyRussell Investment Grade Bond FundSchedule of Investments, continued �� January 31, 2012 (Unaudited)Amounts in thousands (except share amounts)
Principal
Amount ($)
or Shares
Market
Value
$
ConocoPhillips
6.500% due 02/01/39 275 386
Continental Airlines 2007-1
Class A Pass Through Trust
Series 071A
5.983% due 04/19/22 2,463 2,626
Continental Airlines 2009-1 Pass
Through Trust
Series 09-1
9.000% due 07/08/16 442 491
Corn Products International, Inc.
3.200% due 11/01/15 860 889
COX Communications, Inc.
5.450% due 12/15/14 210 234
Credit Suisse USA, Inc.
5.500% due 08/15/13 (Ñ) 115 120
Crown Castle Towers LLC
3.214% due 08/15/15 (Þ) 540 547
CSX Corp.
4.750% due 05/30/42 350 365
CVS Caremark Corp.
3.250% due 05/18/15 760 806
6.250% due 06/01/27 815 1,002
CVS Pass-Through Trust
5.789% due 01/10/26 (Þ) 229 242
5.880% due 01/10/28 11 11
Daimler Finance NA LLC
1.950% due 03/28/14 (Þ) 515 514
DCP Midstream Operating, LP
3.250% due 10/01/15 975 985
Dell, Inc.
5.650% due 04/15/18 (Ñ) 475 558
Delta Air Lines 2007-1 Class A
Pass Through Trust
Series 071A
6.821% due 08/10/22 (Ñ) 1,479 1,597
Principal
Amount ($)
or Shares
Market
Value
$
Ecolab, Inc.
4.350% due 12/08/21 865 954
5.500% due 12/08/41 1,085 1,250
Enterprise Products Operating LLC
5.250% due 01/31/20 1,190 1,331
Series O
9.750% due 01/31/14 830 956
ERAC USA Finance LLC
2.250% due 01/10/14 (Þ) 1,385 1,389
7.000% due 10/15/37 (Þ) 570 681
Exelon Corp.
4.900% due 06/15/15 1,965 2,146
Express Scripts, Inc.
3.125% due 05/15/16 (Ñ) 830 859
Farmers Exchange Capital
7.050% due 07/15/28 (Þ) 1,035 1,135
7.200% due 07/15/48 (Þ) 700 757
Farmers Insurance Exchange
8.625% due 05/01/24 (Þ) 610 772
Freeport-McMoRan Copper &
Gold, Inc.
8.375% due 04/01/17 1,410 1,488
General Electric Capital Corp.
5.900% due 05/13/14 370 409
5.625% due 05/01/18 1,270 1,456
4.375% due 09/16/20 700 732
4.650% due 10/17/21 760 803
5.875% due 01/14/38 3,775 4,130
Series EMTN
0.609% due 03/20/14 (Ê) 800 785
Series GMTN
6.150% due 08/07/37 670 759
6.875% due 01/10/39 1,100 1,366
Series MTNA
0.806% due 09/15/14 (Ê)(Ñ) 830 806
General Electric Co.
5.250% due 12/06/17 1,155 1,350
Copyright © 2012 www.secdatabase.com. All Rights Reserved.Please Consider the Environment Before Printing This Document

Russell Investment Grade Bond Fund 147
Delta Air Lines 2010-1 Class A
Pass Through Trust
Series 1A
6.200% due 07/02/18 (Ñ) 922 991
Devon Energy Corp.
4.000% due 07/15/21 485 532
DirectTV Holdings LLC/DirectTV
Financing Co., Inc.
3.550% due 03/15/15 975 1,019
3.125% due 02/15/16 1,210 1,245
5.000% due 03/01/21 2,345 2,579
Dominion Resources, Inc.
4.450% due 03/15/21 1,355 1,522
Dow Chemical Co. (The)
8.550% due 05/15/19 (Ñ) 420 557
Duke Energy Carolinas LLC
6.000% due 01/15/38 325 426
Duke Energy Corp.
6.300% due 02/01/14 225 248
3.950% due 09/15/14 410 440
Georgia-Pacific LLC
8.875% due 05/15/31 760 1,056
Gerdau Holdings, Inc.
7.000% due 01/20/20 (Þ) 600 654
Series REGS
7.000% due 01/20/20 1,200 1,308
Gilead Sciences, Inc.
4.400% due 12/01/21 (Ñ) 825 893
Goldman Sachs Group, Inc. (The)
4.750% due 07/15/13 320 332
5.250% due 10/15/13 150 157
3.625% due 02/07/16 (Ñ) 750 747
6.250% due 09/01/17 1,025 1,125
6.150% due 04/01/18 360 388
7.500% due 02/15/19 1,134 1,287
5.375% due 03/15/20 1,200 1,217
5.250% due 07/27/21 1,500 1,499
5.950% due 01/15/27 250 252
6.450% due 05/01/36 125 121
6.750% due 10/01/37 2,300 2,278
Copyright © 2012 www.secdatabase.com. All Rights Reserved.Please Consider the Environment Before Printing This Document

Table of Contents
Russell Investment CompanyRussell Investment Grade Bond FundSchedule of Investments, continued �� January 31, 2012 (Unaudited)Amounts in thousands (except share amounts)
Principal
Amount ($)
or Shares
Market
Value
$
GSPA Monetization Trust
6.422% due 10/09/29 (Þ) 683 639
Hartford Financial Services Group,
Inc.
5.375% due 03/15/17 460 476
HCP, Inc.
3.750% due 02/01/16 555 577
6.300% due 09/15/16 (Ñ) 500 566
6.700% due 01/30/18 (Ñ) 1,025 1,194
Series MTNE
6.000% due 06/15/14 1,000 1,059
Health Care REIT, Inc.
6.125% due 04/15/20 1,700 1,858
5.250% due 01/15/22 1,065 1,124
6.500% due 03/15/41 750 818
Hewlett-Packard Co.
0.786% due 05/24/13 (Ê) 1,900 1,889
4.750% due 06/02/14 865 925
2.650% due 06/01/16 760 770
3.300% due 12/09/16 (Ñ) 1,575 1,646
3.750% due 12/01/20 825 830
4.650% due 12/09/21 1,410 1,517
Historic TW, Inc.
8.050% due 01/15/16 (Ñ) 565 674
Home Depot, Inc.
5.875% due 12/16/36 450 561
HSBC Finance Corp.
6.676% due 01/15/21 975 1,013
Humana, Inc.
6.450% due 06/01/16 540 610
Hyundai Capital America
3.750% due 04/06/16 (Þ) 965 971
ILFC E-Capital Trust II
6.250% due 12/21/65 (Þ) 290 209
Intel Corp.
1.950% due 10/01/16 540 560
Principal
Amount ($)
or Shares
Market
Value
$
6.000% due 01/15/18 425 482
JPMorgan Chase Bank NA
Series BKNT
5.875% due 06/13/16 85 93
6.000% due 10/01/17 1,800 1,999
JPMorgan Chase Capital XXVII
Series AA
7.000% due 11/01/39 930 942
KCP&L Greater Missouri
Operations Co.
8.270% due 11/15/21 425 529
Kellogg Co.
4.450% due 05/30/16 800 893
Kentucky Utilities Co.
Series WI
5.125% due 11/01/40 555 660
Kinder Morgan Energy Partners,
LP
5.000% due 12/15/13 115 122
3.500% due 03/01/16 735 773
6.950% due 01/15/38 625 720
Kraft Foods, Inc.
2.625% due 05/08/13 4,900 4,995
4.125% due 02/09/16 760 826
6.125% due 02/01/18 900 1,075
5.375% due 02/10/20 525 613
6.500% due 02/09/40 1,450 1,860
Kroger Co. (The)
2.200% due 01/15/17 1,040 1,050
Lehman Brothers Holdings Capital
Trust VII
5.857% due 11/29/49 (�)(Ø) 1,450 �
Lehman Brothers Holdings, Inc.
6.500% due 07/19/17 (Ø) 390 �
6.750% due 12/28/17 (Ø) 990 �
6.875% due 05/02/18 (Ø) 200 55
Lockheed Martin Corp.
Copyright © 2012 www.secdatabase.com. All Rights Reserved.Please Consider the Environment Before Printing This Document

148 Russell Investment Grade Bond Fund
3.300% due 10/01/21 760 806
International Business Machines
Corp.
5.700% due 09/14/17 700 855
International Lease Finance Corp.
5.625% due 09/20/13 400 401
6.500% due 09/01/14 (Þ) 2,675 2,819
5.750% due 05/15/16 100 98
6.750% due 09/01/16 (Þ) 300 323
International Paper Co.
4.750% due 02/15/22 435 470
6.000% due 11/15/41 435 496
JP Morgan Chase Capital XIII
Series M
1.529% due 09/30/34 (Ê) 625 447
JP Morgan Chase Capital XX
Series T
6.550% due 09/29/36 200 201
JP Morgan Chase Capital XXIII
1.457% due 05/15/47 (Ê)(Ñ) 3,495 2,450
JPMorgan Chase & Co.
5.375% due 01/15/14 475 508
2.050% due 01/24/14 (Ñ) 860 871
3.350% due 09/15/21 810 823
Lorillard Tobacco Co.
8.125% due 06/23/19 1,245 1,517
6.875% due 05/01/20 1,300 1,500
Lowe�s Cos., Inc.
3.800% due 11/15/21 540 582
Macy�s Retail Holdings, Inc.
3.875% due 01/15/22 435 445
5.125% due 01/15/42 675 703
Manufacturers & Traders Trust Co.
5.585% due 12/28/20 180 176
Marathon Petroleum Corp.
Series WI
3.500% due 03/01/16 695 716
MBNA Corp.
6.125% due 03/01/13 (Ñ) 445 460
Mead Johnson Nutrition Co.
4.900% due 11/01/19 50 57
Merrill Lynch & Co., Inc.
6.400% due 08/28/17 800 846
MetLife Institutional Funding II
1.481% due 04/04/14 (Ê)(Þ) 1,900 1,900
Copyright © 2012 www.secdatabase.com. All Rights Reserved.Please Consider the Environment Before Printing This Document

Table of Contents
Russell Investment CompanyRussell Investment Grade Bond FundSchedule of Investments, continued �� January 31, 2012 (Unaudited)Amounts in thousands (except share amounts)
Principal
Amount ($)
or Shares
Market
Value
$
MetLife, Inc.
6.750% due 06/01/16 (Ñ) 650 767
4.750% due 02/08/21 770 853
10.750% due 08/01/39 540 751
Metropolitan Life Global Funding I
5.125% due 06/10/14 (Þ) 300 326
MidAmerican Energy Co.
5.800% due 10/15/36 300 362
Morgan Stanley
6.000% due 05/13/14 680 714
3.800% due 04/29/16 (Ñ) 655 636
1.015% due 10/18/16 (Ê) 2,195 1,899
5.550% due 04/27/17 410 420
6.250% due 08/28/17 300 312
6.625% due 04/01/18 2,505 2,639
5.625% due 09/23/19 1,015 1,010
5.500% due 07/24/20 1,025 1,012
Series GMTN
2.953% due 05/14/13 (Ê) 500 500
5.450% due 01/09/17 600 614
Mosaic Co. (The)
3.750% due 11/15/21 975 1,021
National City Bank
Series BKNT
0.904% due 06/07/17 (Ê) 1,400 1,263
National Rural Utilities
Cooperative Finance Corp.
1.900% due 11/01/15 435 443
NBCUniversal Media LLC
3.650% due 04/30/15 2,695 2,876
New Cingular Wireless Services,
Inc.
8.750% due 03/01/31 435 640
News America, Inc.
8.250% due 10/17/96 65 77
Series WI
Principal
Amount ($)
or Shares
Market
Value
$
Prudential Financial, Inc.
3.875% due 01/14/15 535 561
6.200% due 11/15/40 670 745
Prudential Holdings LLC
8.695% due 12/18/23 (Þ) 1,675 2,043
Public Service Co. of New Mexico
7.950% due 05/15/18 675 803
Public Service Electric & Gas Co.
5.300% due 05/01/18 800 961
Quest Diagnostics, Inc.
3.200% due 04/01/16 70 73
Qwest Corp.
6.750% due 12/01/21 770 854
Raytheon Co.
3.125% due 10/15/20 385 399
Republic Services, Inc.
5.250% due 11/15/21 820 941
6.200% due 03/01/40 340 413
Rockies Express Pipeline LLC
6.850% due 07/15/18 (Þ) 1,085 1,042
SABMiller Holdings, Inc.
2.450% due 01/15/17 (Þ) 1,950 1,992
4.950% due 01/15/42 (Å) 1,090 1,159
Simon Property Group, LP
6.100% due 05/01/16 (Ñ) 295 340
10.350% due 04/01/19 650 917
SLM Corp.
8.450% due 06/15/18 1,000 1,083
Southern Copper Corp.
6.375% due 07/27/15 435 483
5.375% due 04/16/20 (Ñ) 375 412
Southwestern Electric Power Co.
6.450% due 01/15/19 770 906
State Street Capital Trust IV
1.546% due 06/15/37 (Ê) 100 68
Stone Street Trust
5.902% due 12/15/15 (Þ) 900 887
Copyright © 2012 www.secdatabase.com. All Rights Reserved.Please Consider the Environment Before Printing This Document
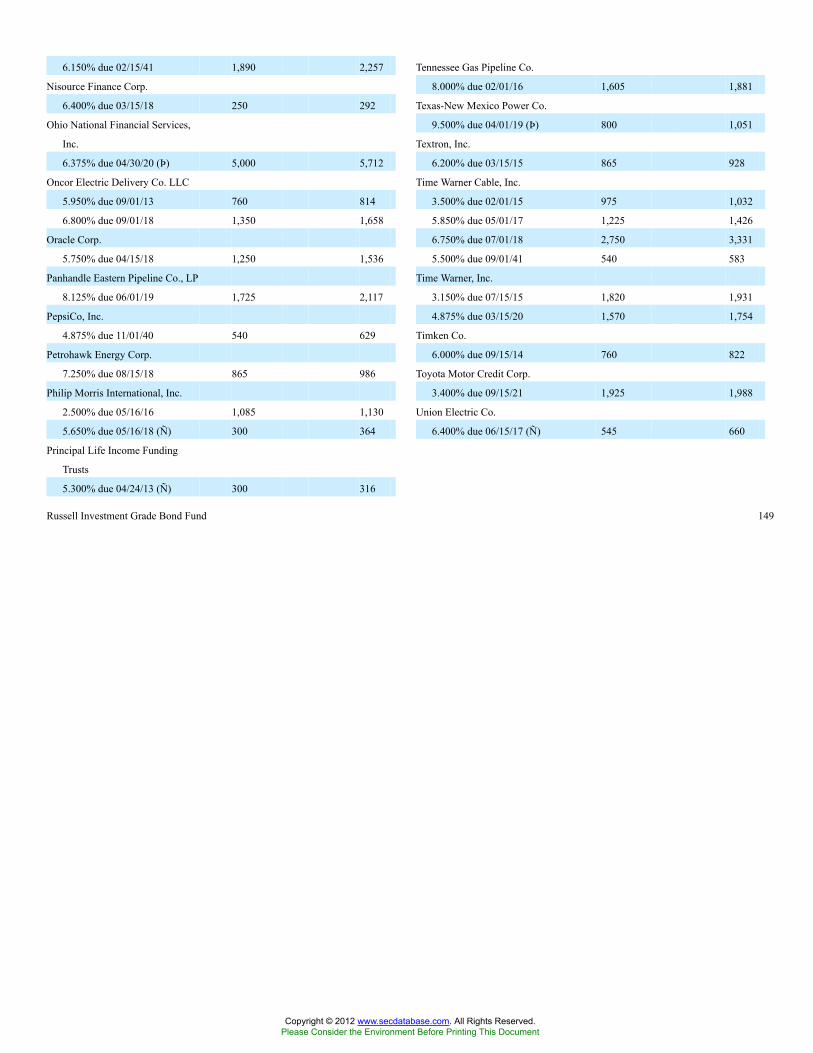
Russell Investment Grade Bond Fund 149
6.150% due 02/15/41 1,890 2,257
Nisource Finance Corp.
6.400% due 03/15/18 250 292
Ohio National Financial Services,
Inc.
6.375% due 04/30/20 (Þ) 5,000 5,712
Oncor Electric Delivery Co. LLC
5.950% due 09/01/13 760 814
6.800% due 09/01/18 1,350 1,658
Oracle Corp.
5.750% due 04/15/18 1,250 1,536
Panhandle Eastern Pipeline Co., LP
8.125% due 06/01/19 1,725 2,117
PepsiCo, Inc.
4.875% due 11/01/40 540 629
Petrohawk Energy Corp.
7.250% due 08/15/18 865 986
Philip Morris International, Inc.
2.500% due 05/16/16 1,085 1,130
5.650% due 05/16/18 (Ñ) 300 364
Principal Life Income Funding
Trusts
5.300% due 04/24/13 (Ñ) 300 316
Tennessee Gas Pipeline Co.
8.000% due 02/01/16 1,605 1,881
Texas-New Mexico Power Co.
9.500% due 04/01/19 (Þ) 800 1,051
Textron, Inc.
6.200% due 03/15/15 865 928
Time Warner Cable, Inc.
3.500% due 02/01/15 975 1,032
5.850% due 05/01/17 1,225 1,426
6.750% due 07/01/18 2,750 3,331
5.500% due 09/01/41 540 583
Time Warner, Inc.
3.150% due 07/15/15 1,820 1,931
4.875% due 03/15/20 1,570 1,754
Timken Co.
6.000% due 09/15/14 760 822
Toyota Motor Credit Corp.
3.400% due 09/15/21 1,925 1,988
Union Electric Co.
6.400% due 06/15/17 (Ñ) 545 660
Copyright © 2012 www.secdatabase.com. All Rights Reserved.Please Consider the Environment Before Printing This Document

Table of Contents
Russell Investment CompanyRussell Investment Grade Bond FundSchedule of Investments, continued �� January 31, 2012 (Unaudited)Amounts in thousands (except share amounts)
Principal
Amount ($)
or Shares
Market
Value
$
UnitedHealth Group, Inc.
6.000% due 06/15/17 4 5
6.500% due 06/15/37 120 158
US Bancorp
2.200% due 11/15/16 985 1,004
USB Capital IX
3.500% due 10/29/49 (�) 200 150
Valero Energy Corp.
9.375% due 03/15/19 385 491
Verizon Communications, Inc.
3.000% due 04/01/16 760 808
6.100% due 04/15/18 550 673
3.500% due 11/01/21 705 737
6.400% due 02/15/38 800 1,012
4.750% due 11/01/41 1,365 1,456
Viacom, Inc.
2.500% due 12/15/16 740 755
Wachovia Corp.
5.625% due 10/15/16 (Ñ) 400 446
Wal-Mart Stores, Inc.
5.000% due 10/25/40 1,038 1,203
Waste Management, Inc.
4.750% due 06/30/20 1,045 1,167
WEA Finance LLC
7.125% due 04/15/18 (Þ) 2,400 2,887
WEA Finance LLC / WT Finance
Aust Pty, Ltd.
7.500% due 06/02/14 (Þ) 1,070 1,184
6.750% due 09/02/19 (Þ) 120 142
Wells Fargo & Co.
3.625% due 04/15/15 2,740 2,915
Series K
7.980% due 03/29/49 (�)(Ñ) 900 974
Wells Fargo Capital X
5.950% due 12/15/36 200 200
Williams Cos., Inc. (The)
Principal
Amount ($)
or Shares
Market
Value
$
ANZ National International, Ltd.
6.200% due 07/19/13 (Þ) 1,600 1,690
ArcelorMittal
5.375% due 06/01/13 1,375 1,422
5.250% due 08/05/20 (Ñ) 3,230 3,158
AstraZeneca PLC
5.900% due 09/15/17 300 366
Australia & New Zealand Banking
Group, Ltd.
1.288% due 05/08/13 (Ê)(Þ) 700 700
Banco Santander Brasil SA
2.659% due 03/18/14 (Ê)(Þ) 900 859
4.500% due 04/06/15 (Þ) 100 99
4.250% due 01/14/16 (Ñ)(Þ) 500 488
Banco Santander Chile
2.162% due 01/19/16 (Ê)(Þ) 1,000 940
Bank of China Hong Kong, Ltd.
5.550% due 02/11/20 (Þ) 100 105
Bank of Montreal
2.850% due 06/09/15 (Þ) 300 317
Bank of Nova Scotia
0.589% due 10/18/12 (�) 1,600 1,602
Banque Centrale de Tunisie SA
8.250% due 09/19/27 550 652
Banque PSA Finance SA
Series 144a
2.481% due 04/04/14 (Ê)(Ñ)(Þ) 700 635
Barclays Bank PLC
5.200% due 07/10/14 (Ñ) 785 827
BBVA Bancomer SA
4.500% due 03/10/16 (Þ) 200 201
6.500% due 03/10/21 (Þ) 400 398
BHP Billiton Finance USA, Ltd.
3.250% due 11/21/21 (Ñ) 1,825 1,915
BNP Paribas SA
5.186% due 06/29/49 (�)(Þ) 1,900 1,368
Series BKNT
Copyright © 2012 www.secdatabase.com. All Rights Reserved.Please Consider the Environment Before Printing This Document

150 Russell Investment Grade Bond Fund
7.750% due 06/15/31 526 637
WM Wrigley Jr Co.
3.050% due 06/28/13 (Þ) 5,000 5,089
Xerox Corp.
4.250% due 02/15/15 2,070 2,186
Yum! Brands, Inc.
4.250% due 09/15/15 435 472
ZFS Finance USA Trust II
6.450% due 12/15/65 (Þ) 3,460 3,252
299,807
International Debt - 6.5%Abbey National Treasury Services
PLC
1.602% due 06/10/13 (�) 3,500 3,495
2.875% due 04/25/14 (Ñ) 775 761
3.875% due 11/10/14 (Þ) 1,010 990
AK Transneft OJSC Via
TransCapitalInvest, Ltd.
8.700% due 08/07/18 (Þ) 200 243
Series REGS
8.700% due 08/07/18 200 243
1.482% due 01/10/14 (Ê)(Ñ) 1,200 1,155
BP Capital Markets PLC
5.250% due 11/07/13 650 700
2.248% due 11/01/16 (Ñ) 895 916
Braskem Finance, Ltd.
5.750% due 04/15/21 (Ñ)(Þ) 300 299
Cenovus Energy, Inc.
4.500% due 09/15/14 435 471
Corp. Andina de Fomento
8.125% due 06/04/19 435 532
Corp. Nacional del Cobre de Chile
7.500% due 01/15/19 (Þ) 400 516
6.150% due 10/24/36 (Þ) 100 126
Credit Suisse AG/Guernsey
5.860% due 05/29/49 (�) 520 452
Series 1
1.147% due 05/29/49 (Ê)(�) 725 464
Credit Suisse NY
5.000% due 05/15/13 1,000 1,038
5.500% due 05/01/14 500 534
Copyright © 2012 www.secdatabase.com. All Rights Reserved.Please Consider the Environment Before Printing This Document

Table of Contents
Russell Investment CompanyRussell Investment Grade Bond FundSchedule of Investments, continued �� January 31, 2012 (Unaudited)Amounts in thousands (except share amounts)
Principal
Amount ($)
or Shares
Market
Value
$
6.000% due 02/15/18 (Ñ) 500 524
Deutsche Telekom International
Finance BV
4.875% due 07/08/14 540 577
Dexia Credit Local SA
1.033% due 04/29/14 (Ê)(Þ) 1,700 1,547
Dryden Leveraged Loan CDO
2002-II
Series 2003-5A Class A
1.110% due 12/22/15 (Ê)(Þ) 118 117
Electricite De France
5.500% due 01/26/14 (Þ) 400 428
6.500% due 01/26/19 (Ñ)(Þ) 400 463
6.950% due 01/26/39 (Þ) 400 474
Encana Corp.
3.900% due 11/15/21 (Ñ) 695 680
European Investment Bank
2.375% due 03/14/14 825 846
Export-Import Bank of China
4.875% due 07/21/15 (Þ) 200 216
Export-Import Bank of Korea
4.000% due 01/29/21 (Ñ) 500 480
FIH Erhvervsbank A/S
0.912% due 06/13/13 (Ê)(Þ) 5,900 5,895
France Telecom SA
5.375% due 01/13/42 (Ñ) 590 621
Gazprom OAO Via Gaz Capital SA
7.343% due 04/11/13 (Þ) 100 105
6.212% due 11/22/16 (Þ) 100 107
8.146% due 04/11/18 (Þ) 500 583
Series REGS
8.146% due 04/11/18 1,600 1,864
Gazprom OAO Via Gazprom
International SA
Series REGS
7.201% due 02/01/20 45 49
Principal
Amount ($)
or Shares
Market
Value
$
HBOS PLC
Series GMTN
6.750% due 05/21/18 (Þ) 2,425 2,134
Hillmark Funding
Series 2006-1A Class A1
0.729% due 05/21/21 (Ê)(Þ) 1,400 1,308
HSBC Bank PLC
3.100% due 05/24/16 (Þ) 1,500 1,533
HSBC Finance Corp.
1.583% due 04/05/13 (Ê) 500 641
HSBC Holdings PLC
5.100% due 04/05/21 1,205 1,309
6.500% due 05/02/36 500 534
6.500% due 09/15/37 500 532
Hutchison Whampoa International
11, Ltd.
3.500% due 01/13/17 (Þ) 1,190 1,211
Indian Oil Corp., Ltd.
4.750% due 01/22/15 200 204
ING Bank NV
1.596% due 03/15/13 (Ê)(Þ) 1,900 1,875
1.940% due 06/09/14 (Ê)(Þ) 400 385
Ingersoll-Rand Global Holding
Co., Ltd.
9.500% due 04/15/14 565 655
Intesa Sanpaolo SpA
2.906% due 02/24/14 (Ê)(Þ) 700 645
3.625% due 08/12/15 (Þ) 310 281
IPIC GMTN, Ltd.
5.000% due 11/15/20 (Þ) 300 304
5.500% due 03/01/22 (Þ) 1,190 1,205
Itau Unibanco Holding SA
6.200% due 04/15/20 (Ñ)(Þ) 1,800 1,865
Kaupthing Bank Hf
7.625% due 02/28/15 (Þ)(Ø) 1,210 300
7.125% due 05/19/16 (Þ)(Ø) 1,480 �
Korea Electric Power Corp.
Copyright © 2012 www.secdatabase.com. All Rights Reserved.Please Consider the Environment Before Printing This Document

Russell Investment Grade Bond Fund 151
Gazprom OAO Via RBS AG
Series REGS
9.625% due 03/01/13 100 107
Gazprom OAO Via White Nights
Finance BV
Series REGS
10.500% due 03/08/14 200 225
10.500% due 03/25/14 200 226
General Electric Capital Corp.
5.500% due 09/15/67 (Þ) 300 341
Gerdau Trade, Inc.
5.750% due 01/30/21 (Þ) 100 101
Glitnir Banki HF
6.693% due 06/15/16 (Þ)(Ø) 700 �
Goldman Sachs Group, Inc. (The)
6.125% due 02/14/17 100 166
Granite Master Issuer PLC
Series 2006-3 Class A7
0.381% due 12/20/54 (Ê) 244 235
HBOS Capital Funding No2, LP
6.071% due 06/29/49 (�)(Þ) 110 79
3.000% due 10/05/15 (Þ) 1,200 1,205
5.125% due 04/23/34 (Þ) 155 160
Korea Gas Corp.
6.250% due 01/20/42 (Þ) 540 567
Korea Hydro & Nuclear Power
Co., Ltd.
3.125% due 09/16/15 (Þ) 600 605
LBG Capital No..1 PLC
8.500% due 12/29/49 (�)(Þ) 200 138
Mexico Government International
Bond
6.050% due 01/11/40 334 404
Series MTNA
6.750% due 09/27/34 213 276
Morgan Stanley
Series GMTN
1.651% due 01/16/17 (Ê) 1,900 2,085
National Australia Bank, Ltd.
5.350% due 06/12/13 (Þ) 600 626
1.301% due 04/11/14 (Ê)(Þ) 2,500 2,464
Nexen, Inc.
7.500% due 07/30/39 435 552
Copyright © 2012 www.secdatabase.com. All Rights Reserved.Please Consider the Environment Before Printing This Document

Table of Contents
Russell Investment CompanyRussell Investment Grade Bond FundSchedule of Investments, continued �� January 31, 2012 (Unaudited)Amounts in thousands (except share amounts)
Principal
Amount ($)
or Shares
Market
Value
$
Noble Group, Ltd.
6.750% due 01/29/20 (Þ) 200 181
Series REGS
6.750% due 01/29/20 1,200 1,086
Nokia OYJ
5.375% due 05/15/19 435 442
Novatek Finance, Ltd.
5.326% due 02/03/16 (Þ) 200 205
Pernod-Ricard SA
2.950% due 01/15/17 (Þ) 1,515 1,542
4.450% due 01/15/22 (Þ) 675 705
5.500% due 01/15/42 (Þ) 435 458
Petrobras International Finance Co.
- Pifco
3.875% due 01/27/16 1,900 1,945
5.750% due 01/20/20 (Ñ) 1,200 1,286
Petroleos Mexicanos
6.000% due 03/05/20 (Ñ) 400 448
4.875% due 01/24/22 (Þ) 540 557
Province of Ontario Canada
1.375% due 01/27/14 500 506
3.000% due 07/16/18 100 106
Qtel International Finance, Ltd.
5.000% due 10/19/25 (Þ) 975 982
Ras Laffan Liquefied Natural Gas
Co.,
Ltd. II
Series REGS
5.298% due 09/30/20 264 284
Ras Laffan Liquefied Natural Gas
Co.,
Ltd. III
5.838% due 09/30/27 (Þ) 250 266
Series REGS
5.832% due 09/30/16 (Å) 1,009 1,089
Resona Bank, Ltd.
Principal
Amount ($)
or Shares
Market
Value
$
3.150% due 01/23/22 975 1,018
Suncor Energy, Inc.
5.950% due 12/01/34 435 523
Sydney Airport Finance Co. Pty,
Ltd.
5.125% due 02/22/21 (Þ) 100 103
Telecom Italia Capital SA
5.250% due 10/01/15 400 387
Telefonica Emisiones SAU
2.582% due 04/26/13 1,105 1,093
3.992% due 02/16/16 (Ñ) 1,350 1,349
Telefonos de Mexico SAB de CV
5.500% due 01/27/15 865 945
Temasek Financial I, Ltd.
4.300% due 10/25/19 (Þ) 300 326
TNK-BP Finance SA
Series 144a
7.500% due 07/18/16 (Þ) 100 110
Series REGS
6.625% due 03/20/17 400 424
7.875% due 03/13/18 1,600 1,788
Total Capital SA
4.450% due 06/24/20 635 720
Transocean, Inc.
5.250% due 03/15/13 280 287
5.050% due 12/15/16 975 1,045
6.375% due 12/15/21 540 612
7.350% due 12/15/41 865 1,041
Tyco Electronics Group SA
6.550% due 10/01/17 865 1,024
Vale Overseas, Ltd.
6.250% due 01/23/17 100 114
4.625% due 09/15/20 (Ñ) 785 828
6.875% due 11/21/36 100 118
6.875% due 11/10/39 (Ñ) 200 237
Virgin Media Secured Finance PLC
6.500% due 01/15/18 865 930
Copyright © 2012 www.secdatabase.com. All Rights Reserved.Please Consider the Environment Before Printing This Document

152 Russell Investment Grade Bond Fund
5.850% due 09/29/49 (�)(Ñ)(Þ) 100 102
Rio Tinto Finance USA, Ltd.
3.500% due 11/02/20 1,615 1,694
3.750% due 09/20/21 760 815
Royal Bank of Scotland Group
PLC
Series 1
9.118% due 03/31/49 (�) 200 172
Royal Bank of Scotland PLC (The)
3.250% due 01/11/14 1,255 1,244
Russian Foreign Bond - Eurobond
Series REGS
3.625% due 04/29/15 100 102
7.500% due 03/31/30 40 47
Sigma Alimentos SA de CV
5.625% due 04/14/18 (Þ) 435 444
SLM Corp.
1.756% due 06/17/13 (Ê) 650 800
SMART Trust
Series 2011-2USA Class A4A
2.310% due 04/14/17 (Þ) 1,545 1,566
Societe Generale SA
1.631% due 04/11/14 (Ê)(Þ) 2,700 2,545
Statoil ASA
1.800% due 11/23/16 435 445
Vodafone Group PLC
4.150% due 06/10/14 295 316
Volvo Treasury AB
5.950% due 04/01/15 (Þ) 1,085 1,161
Westpac Banking Corp.
3.585% due 08/14/14 (Þ) 2,000 2,133
Woolworths, Ltd.
2.550% due 09/22/15 (Ñ)(Þ) 1,655 1,693
WPP Finance UK
8.000% due 09/15/14 865 975
117,100
Mortgage-Backed Securities - 41.4%American Home Mortgage
Investment Trust
Series 2004-4 Class 4A
2.746% due 02/25/45 (Ê) 128 98
Series 2005-4 Class 1A1
0.566% due 11/25/45 (Ê) 517 308
Banc of America Alternative Loan
Trust
Series 2006-5 Class CB17
6.000% due 06/25/46 504 347
Copyright © 2012 www.secdatabase.com. All Rights Reserved.Please Consider the Environment Before Printing This Document

Table of Contents
Russell Investment CompanyRussell Investment Grade Bond FundSchedule of Investments, continued �� January 31, 2012 (Unaudited)Amounts in thousands (except share amounts)
Principal
Amount ($)
or Shares
Market
Value
$
Banc of America Funding Corp.
Series 2005-5 Class 1A11
5.500% due 09/25/35 419 416
Series 2005-D Class A1
2.682% due 05/25/35 (Ê) 211 202
Series 2006-G Class 2A3
0.451% due 07/20/36 (Ê) 1,498 1,438
Series 2007-E Class 4A1
5.493% due 07/20/47 (Ê) 590 377
Banc of America Merrill Lynch
Commercial Mortgage, Inc.
Series 2005-2 Class A4
4.783% due 07/10/43 97 96
Series 2005-2 Class A5
4.857% due 07/10/43 1,690 1,849
Series 2006-1 Class A4
5.372% due 09/10/45 910 1,018
Series 2006-2 Class A4
5.921% due 05/10/45 230 262
Series 2006-3 Class A4
5.889% due 07/10/44 1,330 1,491
Series 2006-4 Class A4
5.634% due 07/10/46 160 180
Series 2006-6 Class A4
5.356% due 10/10/45 2,575 2,825
Series 2007-2 Class AAB
5.757% due 04/10/49 990 1,073
Banc of America Mortgage
Securities, Inc.
Series 2004-1 Class 5A1
6.500% due 09/25/33 18 19
Series 2004-2 Class 5A1
6.500% due 10/25/31 20 20
Series 2004-11 Class 2A1
5.750% due 01/25/35 351 359
Principal
Amount ($)
or Shares
Market
Value
$
Bear Stearns Alt-A Trust
Series 2004-13 Class A1
1.016% due 11/25/34 (Ê) 1,849 1,640
Series 2005-4 Class 23A1
2.605% due 05/25/35 337 249
Series 2005-7 Class 22A1
2.807% due 09/25/35 220 138
Bear Stearns Commercial
Mortgage Securities
Series 2005-T20 Class A4A
5.299% due 10/12/42 1,965 2,194
Series 2006-PW14 Class A4
5.201% due 12/11/38 4,500 5,023
Series 2006-T22 Class A4
5.704% due 04/12/38 1,115 1,272
Series 2007-PW15 Class A4
5.331% due 02/11/44 1,250 1,342
Bear Stearns Structured Products,
Inc.
Series 2007-R6 Class 1A1
2.580% due 01/26/36 358 210
Series 2007-R6 Class 2A1
3.230% due 12/26/46 179 106
Chase Mortgage Finance Corp.
Series 2005-A1 Class 2A2
2.802% due 12/25/35 (Ê) 172 167
Series 2006-S4 Class A3
6.000% due 12/25/36 237 231
Citigroup Commercial Mortgage
Trust
Series 2006-C5 Class A4
5.431% due 10/15/49 1,225 1,387
Series 2007-C6 Class A4
5.885% due 12/10/49 665 759
Citigroup Mortgage Loan Trust,
Inc.
Copyright © 2012 www.secdatabase.com. All Rights Reserved.Please Consider the Environment Before Printing This Document

Russell Investment Grade Bond Fund 153
Series 2005-H Class 2A5
2.754% due 09/25/35 (Ê) 575 437
Series 2006-2 Class A15
6.000% due 07/25/46 103 103
Series 2006-B Class 1A1
2.299% due 10/20/46 (Ê) 139 61
Bear Stearns Adjustable Rate
Mortgage Trust
Series 2002-11 Class 1A1
5.703% due 02/25/33 6 6
Series 2004-1 Class 23A1
5.475% due 04/25/34 (Ê) 68 65
Series 2004-8 Class 2A1
2.732% due 11/25/34 402 323
Series 2004-9 Class 22A1
3.207% due 11/25/34 (Ê) 103 99
Series 2004-10 Class 22A1
2.825% due 01/25/35 97 80
Series 2005-2 Class A1
2.710% due 03/25/35 (Ê) 1,511 1,415
Series 2005-12 Class 13A1
5.397% due 02/25/36 90 77
Series 2004-HYB1 Class A2
2.843% due 02/25/34 (Ê) 20 16
Series 2005-3 Class 2A2B
2.687% due 08/25/35 372 179
Series 2005-11 Class A2A
2.580% due 10/25/35 (Ê) 212 179
Series 2007-AR8 Class 2A1A
5.173% due 07/25/37 337 219
Series 2010-3 Class 4A1
2.520% due 02/25/36 (Ê)(Þ) 581 566
Citigroup/Deutsche Bank
Commercial Mortgage Trust
Series 2005-CD1 Class A4
5.399% due 07/15/44 765 852
Commercial Mortgage Asset Trust
Series 1999-C1 Class A4
6.975% due 01/17/32 607 627
Commercial Mortgage Pass
Through Certificates
Series 2007-C9 Class A4
6.007% due 12/10/49 330 378
Countrywide Alternative Loan
Trust
Series 2005-J8 Class 1A3
5.500% due 07/25/35 490 441
Copyright © 2012 www.secdatabase.com. All Rights Reserved.Please Consider the Environment Before Printing This Document

Table of Contents
Russell Investment CompanyRussell Investment Grade Bond FundSchedule of Investments, continued �� January 31, 2012 (Unaudited)Amounts in thousands (except share amounts)
Principal
Amount ($)
or Shares
Market
Value
$
Series 2007-OA6 Class A1B
0.476% due 06/25/37 (Ê) 493 279
Series 2007-OA7 Class A1A
0.456% due 05/25/47 (Ê) 494 262
Countrywide Home Loan Mortgage
Pass Through Trust
Series 2004-22 Class A3
2.751% due 11/25/34 273 203
Series 2004-HYB9 Class 1A1
2.774% due 02/20/35 584 462
Series 2004-R2 Class 1AF1
0.696% due 11/25/34 (Ê)(Þ) 22 17
Series 2005-3 Class 1A2
0.566% due 04/25/35 (Ê) 843 488
Series 2005-9 Class 1A1
0.576% due 05/25/35 (Ê) 2,500 1,517
Series 2005-HYB9 Class 3A2A
2.595% due 02/20/36 (Ê) 86 58
Series 2005-R1 Class 1AF1
0.636% due 03/25/35 (Ê)(Þ) 30 23
Series 2005-R3 Class AF
0.676% due 09/25/35 (Ê)(Þ) 476 391
Series 2006-HYB3 Class 2A1A
2.741% due 05/20/36 454 282
Series 2006-OA4 Class A1
1.157% due 04/25/46 (Ê) 275 114
Credit Suisse First Boston
Mortgage Securities Corp.
Series 2005-9 Class 2A1
5.500% due 10/25/35 804 741
Series 2005-C4 Class A3
5.120% due 08/15/38 4,137 4,162
Credit Suisse Mortgage Capital
Certificates
Series 2006-C4 Class A3
5.467% due 09/15/39 1,350 1,464
Principal
Amount ($)
or Shares
Market
Value
$
Deutsche ALT-A Securities, Inc.
Alternate Loan Trust
Series 2005-AR1 Class 2A3
1.926% due 08/25/35 1,060 552
Deutsche Mortgage Securities, Inc.
Series 2005-WF1 Class 1A3
5.244% due 06/26/35 (Þ) 920 851
Downey Savings & Loan
Association Mortgage Loan
Trust
Series 2004-AR3 Class 1A1B
2.532% due 07/19/44 (Ê) 87 67
Series 2005-AR6 Class 2A1A
0.571% due 10/19/45 (Ê) 490 313
Fannie Mae
5.500% due 2013 6 6
6.500% due 2013 7 7
6.500% due 2015 3 4
7.000% due 2015 2 3
5.500% due 2016 202 220
6.000% due 2016 13 14
6.500% due 2016 38 42
5.500% due 2017 399 434
6.000% due 2017 476 512
6.500% due 2017 92 101
7.500% due 2017 � �
8.500% due 2017 1 2
5.000% due 2018 410 444
5.500% due 2018 394 430
6.500% due 2018 112 126
5.000% due 2019 712 770
5.500% due 2019 268 292
6.500% due 2019 58 64
3.975% due 2020 1,673 1,857
4.000% due 2020 323 345
4.399% due 2020 1,160 1,310
4.671% due 2020 1,597 1,829
Copyright © 2012 www.secdatabase.com. All Rights Reserved.Please Consider the Environment Before Printing This Document

154 Russell Investment Grade Bond Fund
Series 2006-C5 Class A3
5.311% due 12/15/39 750 820
Series 2007-C1 Class A3
5.383% due 02/15/40 2,500 2,579
Series 2007-C3 Class A4
5.902% due 06/15/39 2,400 2,590
Series 2007-C5 Class A3
5.694% due 09/15/40 545 580
Series 2007-C5 Class A4
5.695% due 09/15/40 1,200 1,295
Series 2008-C1 Class A3
6.413% due 02/15/41 1,570 1,744
CW Capital Cobalt, Ltd.
Series 2007-C3 Class A4
6.010% due 05/15/46 1,700 1,882
DBRR Trust
Series 2011-LC2 Class A4A
4.537% due 07/12/44 (Þ) 690 780
DBUBS Mortgage Trust
Series 2011-LC3A Class A2
3.642% due 08/10/44 1,290 1,380
4.761% due 2020 1,577 1,810
5.000% due 2020 347 375
5.500% due 2020 2,436 2,658
6.500% due 2020 24 27
4.000% due 2021 145 155
4.303% due 2021 1,153 1,303
5.500% due 2021 1,280 1,394
4.500% due 2022 224 240
5.000% due 2022 304 329
5.500% due 2022 123 134
4.500% due 2023 1,401 1,499
5.000% due 2023 807 871
4.000% due 2024 439 465
4.500% due 2024 1,876 2,008
5.000% due 2024 109 117
5.500% due 2024 460 502
8.000% due 2024 50 60
8.500% due 2024 7 7
9.000% due 2024 3 3
4.000% due 2025 2,080 2,206
4.500% due 2025 5,939 6,423
Copyright © 2012 www.secdatabase.com. All Rights Reserved.Please Consider the Environment Before Printing This Document

Table of Contents
Russell Investment CompanyRussell Investment Grade Bond FundSchedule of Investments, continued �� January 31, 2012 (Unaudited)Amounts in thousands (except share amounts)
Principal
Amount ($)
or Shares
Market
Value
$
7.000% due 2025 7 9
8.000% due 2025 1 1
8.500% due 2025 18 19
3.500% due 2026 5,438 5,786
4.000% due 2026 1,864 1,981
4.500% due 2026 149 160
6.000% due 2026 121 133
7.000% due 2026 16 19
9.000% due 2026 4 5
3.000% due 2027 73 76
7.000% due 2027 2 2
9.000% due 2027 1 1
6.500% due 2028 96 110
6.500% due 2029 548 629
8.000% due 2030 65 78
6.500% due 2031 21 25
8.000% due 2031 57 68
6.000% due 2032 72 80
6.500% due 2032 745 852
8.000% due 2032 3 4
4.500% due 2033 3,157 3,409
5.000% due 2033 1,004 1,085
5.500% due 2033 1,232 1,348
6.000% due 2033 110 123
6.500% due 2033 208 236
4.500% due 2034 88 94
5.000% due 2034 1,059 1,145
5.500% due 2034 2,719 2,970
6.000% due 2034 1,509 1,680
6.500% due 2034 434 494
2.103% due 2035 (Ê) 217 224
2.144% due 2035 (Ê) 150 155
2.149% due 2035 (Ê) 73 76
2.156% due 2035 (Ê) 84 87
2.158% due 2035 (Ê) 82 85
2.159% due 2035 (Ê) 101 105
Principal
Amount ($)
or Shares
Market
Value
$
4.500% due 2039 1,639 1,754
5.500% due 2039 2,489 2,710
6.500% due 2039 843 935
4.000% due 2040 11,059 11,728
4.500% due 2040 3,566 3,815
5.000% due 2040 1,757 1,899
6.500% due 2040 314 346
3.500% due 2041 1,918 2,000
4.000% due 2041 15,129 16,110
4.500% due 2041 3,991 4,270
1.408% due 2044 (Ê) 71 72
15 Year TBA (Ï)
3.000% 63,495 66,053
3.500% 16,345 17,196
4.000% 3,590 3,805
4.500% 155 166
5.000% 165 178
5.500% 395 429
30 Year TBA (Ï)
3.500% 109,270 113,521
4.500% 29,000 30,989
5.000% 17,475 18,871
5.500% 13,835 15,056
6.000% 7,145 7,859
6.500% 195 218
Zero coupon due 840 858
3.000% due 11/01/26 840 877
6.000% due 08/01/35 275 306
6.000% due 11/01/37 297 327
6.000% due 05/01/38 500 553
6.000% due 10/01/38 560 616
6.000% due 11/01/38 288 318
4.500% due 06/01/41 354 378
Series 2003-345 Class 19
Interest Only STRIP
4.500% due 01/01/19 845 64
Copyright © 2012 www.secdatabase.com. All Rights Reserved.Please Consider the Environment Before Printing This Document

Russell Investment Grade Bond Fund 155
2.170% due 2035 (Ê) 80 83
2.172% due 2035 (Ê) 581 602
2.183% due 2035 (Ê) 123 128
2.371% due 2035 (Ê) 256 271
4.500% due 2035 258 276
5.000% due 2035 4,747 5,131
5.500% due 2035 449 490
6.000% due 2035 1,772 1,967
5.000% due 2036 1,621 1,752
5.500% due 2036 4,983 5,433
6.000% due 2036 1,354 1,498
6.500% due 2036 740 835
5.500% due 2037 1,754 1,909
5.791% due 2037 (Ê) 30 32
6.000% due 2037 4,251 4,681
6.500% due 2037 807 908
5.000% due 2038 713 771
5.500% due 2038 2,604 2,840
6.000% due 2038 4,775 5,261
6.500% due 2038 710 797
4.000% due 2039 2,099 2,221
Series 2006-369 Class 8
Interest Only STRIP
5.500% due 04/01/36 266 38
Fannie Mae Grantor Trust
Series 2002-T5 Class A1
0.516% due 05/25/32 (Ê) 357 342
Fannie Mae REMICS
Series 1992-158 Class ZZ
7.750% due 08/25/22 101 113
Series 1999-56 Class Z
7.000% due 12/18/29 191 217
Series 2003-32 Class FH
0.676% due 11/25/22 (Ê) 54 54
Series 2003-35 Class FY
0.676% due 05/25/18 (Ê) 397 399
Series 2003-343 Class 6
Interest Only STRIP
5.000% due 10/01/33 421 56
Series 2003-345 Class 18
Interest Only STRIP
4.500% due 12/01/18 770 59
Copyright © 2012 www.secdatabase.com. All Rights Reserved.Please Consider the Environment Before Printing This Document

Table of Contents
Russell Investment CompanyRussell Investment Grade Bond FundSchedule of Investments, continued �� January 31, 2012 (Unaudited)Amounts in thousands (except share amounts)
Principal
Amount ($)
or Shares
Market
Value
$
Series 2004-38 Class FK
0.626% due 05/25/34 (Ê) 379 379
Series 2005-117 Class LC
5.500% due 11/25/35 2,073 2,286
Series 2005-365 Class 12
Interest Only STRIP
5.500% due 12/01/35 1,152 157
Series 2006-5 Class 3A2
2.382% due 05/25/35 (Ê) 36 38
Series 2007-30 Class AF
0.586% due 04/25/37 (Ê) 344 342
Series 2007-73 Class A1
0.336% due 07/25/37 (Ê) 238 228
Series 2009-70 Class PS
6.474% due 01/25/37 (Ê) 8,113 1,254
Series 2010-110 Class AE
9.750% due 11/25/18 1,644 1,906
Series 2010-112 Class PI
6.000% due 10/25/40 5,748 835
Series 2011-15 Class AB
9.750% due 08/25/19 579 667
Series 2011-63 Class SW
Interest Only STRIP
6.404% due 07/25/41 (Ê) 1,027 164
Series 2011-96 Class SA
Interest Only STRIP
6.274% due 10/25/41 (Ê) 1,037 197
Series 2011-127 Class FA
0.726% due 12/25/41 (Ê) 675 674
Fannie Mae Whole Loan
Series 2003-W1 Class 1A1
6.283% due 12/25/42 39 45
Series 2004-W2 Class 5AF
0.626% due 03/25/44 (Ê) 227 220
FDIC Structured Sale Guaranteed
Notes
Principal
Amount ($)
or Shares
Market
Value
$
Federal Home Loan Mortgage
Corp. Structured Pass Through
Securities
Series 2005-63 Class 1A1
1.408% due 02/25/45 (Ê) 40 39
FHA Project Citi 68 NP
7.430% due 06/27/21 33 33
First Horizon Alternative Mortgage
Securities
Series 2006-AA7 Class A1
2.324% due 01/25/37 (Ê) 1,294 613
Series 2006-FA1 Class 1A6
1.026% due 04/25/36 (Ê) 302 263
Freddie Mac
6.000% due 2013 1 1
7.000% due 2014 3 3
6.000% due 2016 83 89
9.000% due 2016 31 35
6.000% due 2017 160 172
8.000% due 2017 6 6
4.500% due 2018 376 403
5.000% due 2018 90 97
4.500% due 2019 130 139
5.000% due 2019 271 293
5.500% due 2019 274 298
6.000% due 2022 12 13
5.500% due 2024 678 736
9.000% due 2024 4 4
3.500% due 2025 3,144 3,331
6.500% due 2025 5 6
8.000% due 2025 7 9
9.000% due 2025 6 6
9.000% due 2026 1 1
2.594% due 2027 (Ê) 12 13
6.500% due 2027 � �
8.500% due 2027 28 34
6.000% due 2028 481 529
Copyright © 2012 www.secdatabase.com. All Rights Reserved.Please Consider the Environment Before Printing This Document

156 Russell Investment Grade Bond Fund
Series 2010-S1 Class 1A
0.845% due 02/25/48 (Ê)(Þ) 583 582
Federal Home Loan Bank
5.000% due 2038 184 199
5.000% due 2040 338 364
5.000% due 2041 750 809
3.500% due 08/01/25 100 105
5.500% due 06/01/33 5 5
4.000% due 11/01/39 100 106
4.500% due 07/01/41 281 300
3.500% due 10/01/41 80 83
3.500% due 01/01/42 114 118
Federal Home Loan Mortgage
Corp. Multifamily Structured
Pass Through Certificates
Series 2010-K009 Class A2
3.808% due 08/25/20 1,615 1,771
Series 2011-K014 Class X1
Interest Only STRIP
1.453% due 04/25/21 4,711 400
Series 2011-KAIV Class A2
3.989% due 06/25/46 1,585 1,770
6.500% due 2028 93 106
6.500% due 2029 126 145
2.615% due 2030 (Ê) 6 6
6.500% due 2031 163 187
5.500% due 2032 494 539
6.000% due 2032 32 36
6.500% due 2032 275 312
7.000% due 2032 181 208
7.500% due 2032 25 31
5.500% due 2033 258 281
6.000% due 2033 4 5
6.500% due 2033 32 36
4.500% due 2034 209 223
5.000% due 2034 1,367 1,474
5.500% due 2034 805 876
6.000% due 2034 93 104
6.500% due 2034 84 95
5.000% due 2035 1,497 1,615
5.500% due 2035 1,045 1,138
6.000% due 2035 209 233
1.977% due 2036 (Ê) 133 141
Copyright © 2012 www.secdatabase.com. All Rights Reserved.Please Consider the Environment Before Printing This Document

Table of Contents
Russell Investment CompanyRussell Investment Grade Bond FundSchedule of Investments, continued �� January 31, 2012 (Unaudited)Amounts in thousands (except share amounts)
Principal
Amount ($)
or Shares
Market
Value
$
5.000% due 2036 298 324
5.500% due 2036 1,169 1,270
6.000% due 2036 359 397
5.000% due 2037 197 213
5.088% due 2037 (Ê) 427 454
5.434% due 2037 (Ê) 91 95
5.500% due 2037 830 901
5.623% due 2037 (Ê) 158 169
5.684% due 2037 (Ê) 316 332
6.000% due 2037 1,012 1,113
5.000% due 2038 160 173
5.500% due 2038 4,187 4,559
6.000% due 2038 3,093 3,422
4.500% due 2039 4,975 5,407
5.500% due 2039 107 116
6.000% due 2039 348 383
6.500% due 2039 268 303
4.000% due 2040 10,570 11,271
4.500% due 2040 11,441 12,427
5.000% due 2040 270 290
5.500% due 2040 365 397
6.000% due 2040 258 283
4.000% due 2041 18,682 19,908
4.500% due 2041 6,521 6,945
5.000% due 2041 1,305 1,408
30 Year TBA (Ï)
3.500% 1,635 1,695
4.000% 4,310 4,544
4.500% 4,220 4,491
5.000% 6,205 6,678
Freddie Mac REMICS
Series 1991-1053 Class G
7.000% due 03/15/21 19 23
Series 1998-2104 Class ZM
6.000% due 12/15/28 223 238
Series 2000-2266 Class F
Principal
Amount ($)
or Shares
Market
Value
$
8.000% due 2025 14 14
9.000% due 2025 8 8
8.000% due 2026 34 40
7.000% due 2029 2 2
8.000% due 2029 11 13
8.500% due 2029 19 19
8.000% due 2030 17 18
7.000% due 2031 171 204
7.000% due 2032 48 58
7.000% due 2033 14 16
6.000% due 2036 103 116
6.000% due 2038 749 846
4.500% due 2040 287 313
5.000% due 2040 88 98
4.500% due 2041 200 219
30 Year TBA (Ï)
4.000% 920 992
Ginnie Mae II
2.125% due 2027 (Ê) 23 23
2.000% due 2030 (Ê) 59 61
2.375% due 2030 (Ê) 9 9
7.500% due 2032 5 6
6.500% due 2037 553 635
6.000% due 2038 1,100 1,240
5.500% due 2039 574 639
4.500% due 2040 362 396
5.000% due 2040 1,314 1,451
5.500% due 2040 600 669
6.000% due 2040 262 295
4.500% due 2041 2,912 3,183
5.000% due 2041 1,626 1,796
5.500% due 2041 57 63
6.000% due 2041 737 831
3.500% due 2042 300 316
1.981% due 2060 (Ê) 736 770
2.000% due 2060 (Ê) 483 499
30 Year TBA (Ï)
Copyright © 2012 www.secdatabase.com. All Rights Reserved.Please Consider the Environment Before Printing This Document

Russell Investment Grade Bond Fund 157
0.740% due 11/15/30 (Ê) 5 5
Series 2002-2533 Class Z
5.500% due 12/15/32 4,321 4,848
Series 2004-2778 Class UF
0.590% due 06/15/33 (Ê) 55 55
Series 2004-2808 Class FT
0.640% due 04/15/33 (Ê) 273 273
Series 2005-3019 Class IM
Interest Only STRIP
5.500% due 01/15/31 39 �
Series 2007-3335 Class BF
0.440% due 07/15/19 (Ê) 365 364
Series 2007-3335 Class FT
0.440% due 08/15/19 (Ê) 479 478
Ginnie Mae I
9.500% due 2016 � �
8.000% due 2017 3 3
10.500% due 2020 4 4
8.000% due 2022 8 10
8.500% due 2022 8 9
8.500% due 2024 6 6
4.000% 3,480 3,747
4.500% 8,460 9,216
Goldman Sachs Mortgage
Securities Corp. II
Series 2007-GG10 Class A4
5.984% due 08/10/45 2,000 2,216
Government National Mortgage
Association
Series 2004-93 Class PC
5.000% due 04/16/34 2,650 2,954
Series 2007-26 Class SD
6.510% due 05/16/37 (Ê) 5,633 911
Series 2010-42 Class PC
5.000% due 07/20/39 2,800 3,236
Series 2010-116 Class MP
3.500% due 09/16/40 4,495 4,667
Series 2010-H10 Class FB
1.294% due 05/20/60 (Ê) 2,774 2,822
Series 2010-H10 Class FC
1.294% due 05/20/60 (Ê) 1,135 1,152
Series 2010-H11 Class FA
1.294% due 06/20/60 (Ê) 1,143 1,161
Copyright © 2012 www.secdatabase.com. All Rights Reserved.Please Consider the Environment Before Printing This Document

Table of Contents
Russell Investment CompanyRussell Investment Grade Bond FundSchedule of Investments, continued �� January 31, 2012 (Unaudited)Amounts in thousands (except share amounts)
Principal
Amount ($)
or Shares
Market
Value
$
Series 2010-H20 Class AF
0.600% due 10/20/60 (Ê) 2,037 1,999
Series 2011-40 Class SA
Interest Only STRIP
5.840% due 02/16/36 (Ê) 1,161 170
Series 2011-H09 Class AF
0.770% due 03/20/61 (Ê) 388 383
Greenpoint Mortgage Pass-
Through Certificates
Series 2003-1 Class A1
2.801% due 10/25/33 (Ê) 163 133
Greenwich Capital Commercial
Funding Corp.
Series 2004-GG1 Class A7
5.317% due 06/10/36 1,940 2,076
Series 2006-GG7 Class A4
6.079% due 07/10/38 3,350 3,798
Series 2007-GG9 Class A4
5.444% due 03/10/39 1,660 1,821
GS Mortgage Securities Corp. II
Series 2006-GG6 Class A4
5.553% due 04/10/38 1,150 1,274
Series 2011-GC5 Class A4
3.707% due 08/10/44 2,370 2,512
GSMPS Mortgage Loan Trust
Series 2004-4 Class 1AF
0.676% due 06/25/34 (Ê)(Þ) 597 487
Series 2005-RP2 Class 1AF
0.626% due 03/25/35 (Ê)(Þ) 257 207
Series 2005-RP3 Class 1AF
0.626% due 09/25/35 (Ê)(Þ) 823 622
GSR Mortgage Loan Trust
Series 2004-5 Class 1A3
1.750% due 05/25/34 (Ê) 188 146
Series 2004-7 Class 4A1
4.877% due 06/25/34 21 21
Principal
Amount ($)
or Shares
Market
Value
$
Series 2007-FLX1 Class A1
0.376% due 02/25/37 (Ê) 627 597
JP Morgan Chase Commercial
Mortgage Securities Corp.
Series 2002-C2 Class A2
5.050% due 12/12/34 682 697
Series 2002-C3 Class A2
4.994% due 07/12/35 1,573 1,609
Series 2006-CB16 Class A4
5.552% due 05/12/45 785 877
Series 2006-LDP7 Class A4
6.065% due 04/15/45 690 785
Series 2006-LDP8 Class A3B
5.447% due 05/15/45 820 859
Series 2006-LDP8 Class A4
5.399% due 05/15/45 1,055 1,188
Series 2006-LDP9 Class A3
5.336% due 05/15/47 1,555 1,693
Series 2007-CB18 Class A4
5.440% due 06/12/47 1,300 1,441
Series 2007-CB20 Class ASB
5.688% due 02/12/51 1,165 1,256
Series 2007-LDPX Class A3
5.420% due 01/15/49 1,755 1,939
Series 2008-C2 Class ASB
6.125% due 02/12/51 1,055 1,157
Series 2011-C3 Class A4
4.717% due 02/15/46 (Þ) 1,240 1,388
JP Morgan Mortgage Trust
Series 2004-A3 Class SF3
2.178% due 06/25/34 275 263
Series 2005-A1 Class 6T1
5.019% due 02/25/35 (Ê) 137 135
Series 2006-A2 Class 1A1
2.855% due 04/25/36 363 258
Series 2007-A1 Class 3A2
2.791% due 07/25/35 (Ê) 1,023 877
Copyright © 2012 www.secdatabase.com. All Rights Reserved.Please Consider the Environment Before Printing This Document

158 Russell Investment Grade Bond Fund
Series 2005-AR7 Class 6A1
5.136% due 11/25/35 1,698 1,471
Harborview Mortgage Loan Trust
Series 2004-4 Class 3A
1.045% due 06/19/34 (Ê) 93 71
Series 2005-4 Class 3A1
2.775% due 07/19/35 257 173
Series 2006-3 Class 1A1A
2.664% due 06/19/36 (Ê) 3,669 1,842
Impac CMB Trust
Series 2004-5 Class 1A1
0.996% due 10/25/34 (Ê) 142 126
Indymac Index Mortgage Loan
Trust
Series 2004-AR6 Class 5A1
2.588% due 10/25/34 1,680 1,421
Series 2005-AR1 Class 1A1
2.662% due 03/25/35 554 365
Series 2005-AR15 Class A2
4.894% due 09/25/35 195 141
Series 2006-AR2 Class 1A1B
0.486% due 04/25/46 (Ê) 607 311
Series 2007-A4 Class 3A1
5.681% due 06/25/37 766 624
LB-UBS Commercial Mortgage
Trust
Series 2005-C3 Class A5
4.739% due 07/15/30 450 490
Series 2007-C1 Class A4
5.424% due 02/15/40 123 137
Series 2007-C6 Class A4
5.858% due 07/15/40 1,170 1,311
Mastr Adjustable Rate Mortgages
Trust
Series 2004-13 Class 2A1
2.662% due 04/21/34 (Ê) 1,010 982
Series 2006-2 Class 3A1
2.699% due 01/25/36 521 386
Series 2006-OA2 Class 1A1
0.997% due 12/25/46 (Ê) 375 105
Mastr Alternative Loans Trust
Series 2003-4 Class B1
5.783% due 06/25/33 276 241
Copyright © 2012 www.secdatabase.com. All Rights Reserved.Please Consider the Environment Before Printing This Document

Table of Contents
Russell Investment CompanyRussell Investment Grade Bond FundSchedule of Investments, continued �� January 31, 2012 (Unaudited)Amounts in thousands (except share amounts)
Principal
Amount ($)
or Shares
Market
Value
$
MASTR Alternative Loans Trust
Series 2004-10 Class 5A6
5.750% due 09/25/34 479 486
Mastr Reperforming Loan Trust
Series 2005-1 Class 1A1
6.000% due 08/25/34 (Þ) 349 340
Series 2005-2 Class 1A1F
0.626% due 05/25/35 (Ê)(Þ) 460 346
Merrill Lynch Mortgage Investors,
Inc.
Series 2005-A10 Class A
0.486% due 02/25/36 (Ê) 207 139
Merrill Lynch Mortgage Trust
Series 2005-CIP1 Class AM
5.107% due 07/12/38 885 946
Merrill Lynch/Countrywide
Commercial Mortgage Trust
Series 2006-4 Class A3
5.172% due 12/12/49 1,000 1,102
Series 2007-5 Class A4
5.378% due 08/12/48 2,000 2,126
Series 2007-7 Class A4
5.810% due 06/12/50 2,760 2,954
Series 2007-8 Class A3
6.164% due 08/12/49 900 995
Series 2007-8 Class ASB
6.097% due 08/12/49 810 876
MLCC Mortgage Investors, Inc.
Series 2005-2 Class 3A
1.295% due 10/25/35 (Ê) 105 86
Series 2005-3 Class 4A
0.526% due 11/25/35 (Ê) 48 39
Series 2007-1 Class 4A3
5.688% due 01/25/37 314 308
Morgan Stanley Capital I
Principal
Amount ($)
or Shares
Market
Value
$
NCUA Guaranteed Notes
Series 2010-R1 Class 1A
0.745% due 10/07/20 (Ê) 3,106 3,109
Series 2010-R2 Class 1A
0.665% due 11/06/17 (Ê) 2,821 2,821
Series 2010-R2 Class 2A
0.765% due 11/05/20 (Ê) 1,777 1,777
Series 2010-R3 Class 1A
0.855% due 12/08/20 (Ê) 1,613 1,619
Series 2010-R3 Class 2A
0.855% due 12/08/20 (Ê) 1,346 1,352
Series 2011-R2 Class 1A
0.695% due 02/06/20 (Ê) 2,168 2,167
Nomura Asset Acceptance Corp.
Series 2004-R3 Class A1
6.500% due 02/25/35 (Þ) 466 475
Nomura Asset Securities Corp.
Series 1998-D6 Class A1C
6.690% due 03/15/30 431 440
NovaStar Mortgage-Backed Notes
Series 2006-MTA1 Class 2A1A
0.466% due 09/25/46 (Ê) 524 359
Prime Mortgage Trust
Series 2004-CL1 Class 1A2
0.676% due 02/25/34 (Ê) 59 53
Series 2004-CL1 Class 2A2
0.676% due 02/25/19 (Ê) 5 5
RBSSP Resecuritization Trust
Series 2010-3 Class 4A1
3.162% due 12/26/35 (Ê)(Þ) 269 263
Residential Accredit Loans, Inc.
Series 2005-QA10 Class A41
5.676% due 09/25/35 584 379
Series 2005-QO3 Class A1
0.676% due 10/25/45 (Ê) 624 352
Series 2006-QO7 Class 3A2
0.481% due 09/25/46 (Ê) 1,010 467
Copyright © 2012 www.secdatabase.com. All Rights Reserved.Please Consider the Environment Before Printing This Document
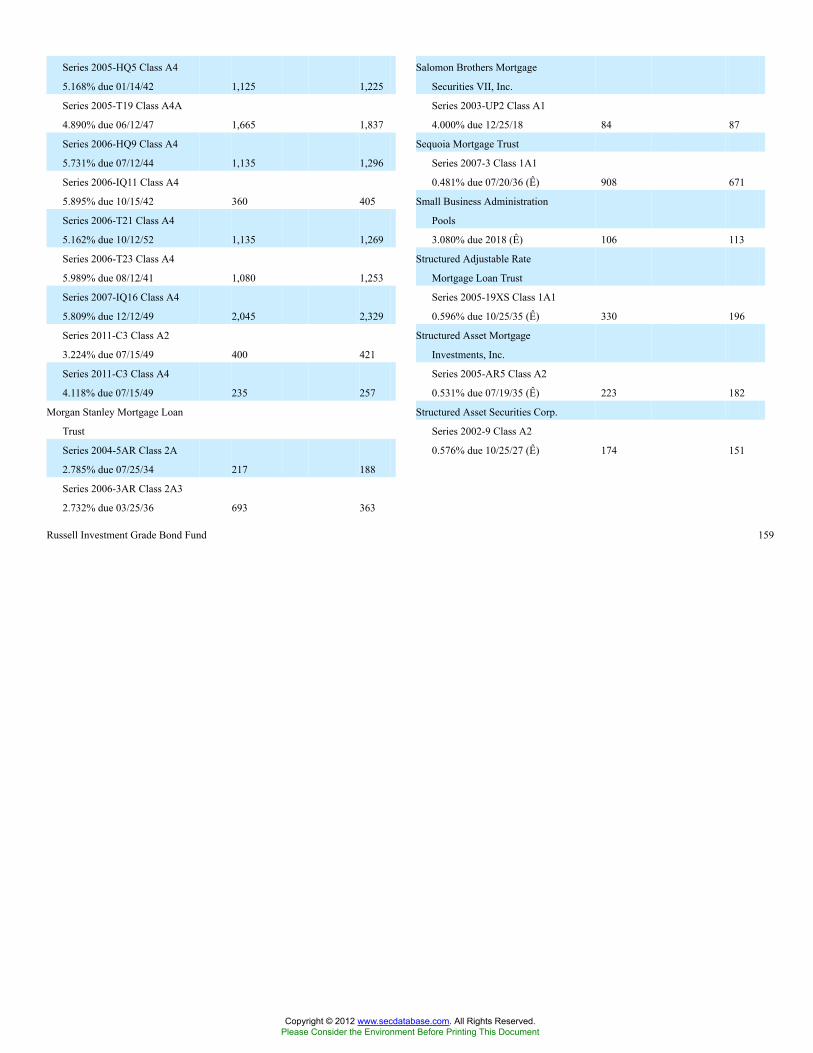
Russell Investment Grade Bond Fund 159
Series 2005-HQ5 Class A4
5.168% due 01/14/42 1,125 1,225
Series 2005-T19 Class A4A
4.890% due 06/12/47 1,665 1,837
Series 2006-HQ9 Class A4
5.731% due 07/12/44 1,135 1,296
Series 2006-IQ11 Class A4
5.895% due 10/15/42 360 405
Series 2006-T21 Class A4
5.162% due 10/12/52 1,135 1,269
Series 2006-T23 Class A4
5.989% due 08/12/41 1,080 1,253
Series 2007-IQ16 Class A4
5.809% due 12/12/49 2,045 2,329
Series 2011-C3 Class A2
3.224% due 07/15/49 400 421
Series 2011-C3 Class A4
4.118% due 07/15/49 235 257
Morgan Stanley Mortgage Loan
Trust
Series 2004-5AR Class 2A
2.785% due 07/25/34 217 188
Series 2006-3AR Class 2A3
2.732% due 03/25/36 693 363
Salomon Brothers Mortgage
Securities VII, Inc.
Series 2003-UP2 Class A1
4.000% due 12/25/18 84 87
Sequoia Mortgage Trust
Series 2007-3 Class 1A1
0.481% due 07/20/36 (Ê) 908 671
Small Business Administration
Pools
3.080% due 2018 (Ê) 106 113
Structured Adjustable Rate
Mortgage Loan Trust
Series 2005-19XS Class 1A1
0.596% due 10/25/35 (Ê) 330 196
Structured Asset Mortgage
Investments, Inc.
Series 2005-AR5 Class A2
0.531% due 07/19/35 (Ê) 223 182
Structured Asset Securities Corp.
Series 2002-9 Class A2
0.576% due 10/25/27 (Ê) 174 151
Copyright © 2012 www.secdatabase.com. All Rights Reserved.Please Consider the Environment Before Printing This Document

Table of Contents
Russell Investment CompanyRussell Investment Grade Bond FundSchedule of Investments, continued �� January 31, 2012 (Unaudited)Amounts in thousands (except share amounts)
Principal
Amount ($)
or Shares
Market
Value
$
Series 2003-26A Class 3A5
2.469% due 09/25/33 573 491
Series 2003-34A Class 5A4
2.443% due 11/25/33 (Ê) 1,617 1,536
Series 2005-RF3 Class 1A
0.626% due 06/25/35 (Ê)(Þ) 110 82
Series 2006-11 Class A1
2.668% due 10/25/35 (Þ) 113 90
Wachovia Bank Commercial
Mortgage Trust
Series 2006-C29 Class A4
5.308% due 11/15/48 119 133
Series 2006-WL7A Class A1
0.375% due 09/15/21 (Ê)(Þ) 103 98
Series 2007-WHL8 Class A1
0.365% due 06/15/20 (Ê)(Þ) 124 112
WaMu Mortgage Pass Through
Certificates
Series 2003-AR9 Class 1A7
2.461% due 09/25/33 (Ê) 86 83
Series 2003-AR11 Class A6
2.475% due 10/25/33 780 744
Series 2005-AR3 Class A2
2.567% due 03/25/35 342 298
Washington Mutual Alternative
Mortgage Pass-Through
Certificates
Series 2007-OA2 Class 2A
0.908% due 01/25/47 (Ê) 372 133
Washington Mutual Mortgage Pass
Through Certificates
Series 2002-AR19 Class A6
2.477% due 02/25/33 (Ê) 220 199
Series 2004-AR13 Class A1A
0.673% due 11/25/34 (Ê) 314 237
Principal
Amount ($)
or Shares
Market
Value
$
Series 2005-AR8 Class 2A1
2.696% due 06/25/35 312 295
Series 2006-2 Class 2A3
5.500% due 03/25/36 403 399
Series 2006-AR2 Class 2A1
2.648% due 03/25/36 354 283
Series 2006-AR8 Class 1A3
2.660% due 04/25/36 1,680 1,543
Series 2006-AR8 Class 2A3
2.698% due 04/25/36 52 40
Wells Fargo Mortgage Loan Trust
Series 2010-RR4 Class 2A1
2.766% due 08/27/35 (Þ) 707 650
WF-RBS Commercial Mortgage
Trust
Series 2011-C5 Class A4
3.667% due 11/15/44 1,105 1,165
746,243
Municipal Bonds - 2.0%Birmingham Commercial
Development Authority
Revenue Bonds
5.500% due 04/01/41 30 33
City of Chicago Illinois O�Hare
International Airport Revenue
Bonds
5.500% due 01/01/31 90 103
5.625% due 01/01/35 50 56
City of Los Angeles Department of
Airports Revenue Bonds
5.000% due 05/15/35 70 78
5.250% due 05/15/39 60 67
City of New York New York
General Obligation Unlimited
6.246% due 06/01/35 600 674
Copyright © 2012 www.secdatabase.com. All Rights Reserved.Please Consider the Environment Before Printing This Document

160 Russell Investment Grade Bond Fund
Series 2005-AR6 Class B3
0.936% due 04/25/45 (Å)(Ê) 423 14
Series 2005-AR11 Class A1A
0.596% due 08/25/45 (Ê) 934 706
Series 2005-AR12 Class 1A1
2.479% due 10/25/35 12 11
Series 2005-AR13 Class A1A1
0.566% due 10/25/45 (Ê) 496 372
Series 2005-AR15 Class A1A2
0.556% due 11/25/45 (Ê) 535 361
Series 2005-AR17 Class A1A2
0.566% due 12/25/45 (Ê) 262 194
Series 2007-HY3 Class 4B1
2.601% due 03/25/37 275 6
Series 2007-OA2 Class 1A
0.897% due 03/25/47 (Ê) 348 193
Wells Fargo Mortgage Backed
Securities Trust
Series 2003-17 Class 2A10
5.500% due 01/25/34 1,236 1,300
Series 2004-CC Class A1
2.594% due 01/25/35 (Ê) 236 222
Series 2004-Y Class 1A2
2.620% due 11/25/34 304 271
County of Clark Nevada Airport
System Revenue Bonds
6.820% due 07/01/45 200 256
County of Clark Nevada Revenue
Bonds
5.250% due 07/01/39 (µ) 60 64
Florida Educational Loan
Marketing Corp. Revenue
Bonds
0.345% due 12/01/38 (Ê) 1,000 750
Iowa Tobacco Settlement Authority
Revenue Bonds
6.500% due 06/01/23 70 66
Los Angeles Community College
District General Obligation
Unlimited
6.750% due 08/01/49 5,000 6,664
Los Angeles Department of
Water & Power Revenue Bonds
6.574% due 07/01/45 240 328
Los Angeles Unified School
District General Obligation
Unlimited
6.758% due 07/01/34 100 131
Massachusetts School Building
Authority Revenue Bonds
5.468% due 06/15/27 5,000 5,732
Copyright © 2012 www.secdatabase.com. All Rights Reserved.Please Consider the Environment Before Printing This Document

Table of Contents
Russell Investment CompanyRussell Investment Grade Bond FundSchedule of Investments, continued �� January 31, 2012 (Unaudited)Amounts in thousands (except share amounts)
Principal
Amount ($)
or Shares
Market
Value
$
Metropolitan Atlanta Rapid Transit
Authority Revenue Bonds
5.000% due 07/01/39 50 55
Municipal Electric Authority of
Georgia Revenue Bonds
6.637% due 04/01/57 180 211
6.655% due 04/01/57 150 172
New Jersey Economic
Development Authority
Revenue Bonds
1.546% due 06/15/13 (Ê) 1,100 1,100
New York City Municipal Water
Finance Authority Revenue
Bonds
6.491% due 06/15/42 1,700 1,976
New York Liberty Development
Corp. Revenue Bonds
5.250% due 10/01/35 110 121
Northern California Power Agency
Revenue Bonds
7.311% due 06/01/40 3,000 3,500
Northstar Education Finance, Inc.
Series 2007-1 Class A3
0.613% due 01/29/46 (Ê) 1,000 893
Pennsylvania Higher Education
Assistance Agency Revenue
Bonds
2.003% due 05/01/46 (Ê) 800 740
1.996% due 06/01/47 (Ê) 1,475 1,364
Public Power Generation Agency
Revenue Bonds
7.242% due 01/01/41 300 348
San Diego County Regional
Airport Authority Revenue
Bonds
6.628% due 07/01/40 500 544
Principal
Amount ($)
or Shares
Market
Value
$
5.877% due 03/01/19 685 753
5.100% due 06/01/33 875 826
Tobacco Settlement Finance
Authority Revenue Bonds
7.467% due 06/01/47 475 349
35,569
Non-US Bonds - 0.5%Canada Housing Trust No. 1
3.750% due 03/15/20 (Þ) CAD 200 223
3.350% due 12/15/20 (Þ) CAD 100 108
3.800% due 06/15/21 (Þ) CAD 400 449
Canadian Government Bond
3.750% due 06/01/19 CAD 300 343
3.250% due 06/01/21 CAD 200 222
European Investment Bank
Series INTL
4.625% due 04/15/20 EUR 100 149
European Loan Conduit
Series 2007-25X Class A
1.612% due 05/15/19 (Ê) EUR 54 59
Granite Master Issuer PLC
Series 2005-2 Class A7
0.927% due 12/20/54 (Ê) GBP 285 430
Instituto de Credito Oficial Series
REGS
3.154% due 03/25/14 (Ê) EUR 800 989
MUFG Capital Finance 5, Ltd.
6.299% due 12/31/49 (�) GBP 1,000 1,535
Province of British Columbia
Canada
4.300% due 06/18/42 CAD 100 116
Province of Ontario Canada
4.300% due 03/08/17 CAD 100 112
4.200% due 06/02/20 CAD 200 224
4.000% due 06/02/21 CAD 1,700 1,869
3.150% due 06/02/22 CAD 300 306
Copyright © 2012 www.secdatabase.com. All Rights Reserved.Please Consider the Environment Before Printing This Document

Russell Investment Grade Bond Fund 161
San Diego Tobacco Settlement
Revenue Funding Corp.
Revenue Bonds
7.125% due 06/01/32 265 214
San Mateo County Community
College District General
Obligation Unlimited
5.000% due 09/01/38 30 32
Santa Clara Valley Transportation
Authority Revenue Bonds
5.876% due 04/01/32 360 430
South Carolina Student Loan Corp.
Revenue Bonds
0.647% due 12/01/20 (Ê) 900 860
State of California General
Obligation Unlimited
6.650% due 03/01/22 825 1,001
7.500% due 04/01/34 100 131
5.650% due 04/01/39 (Ê) 100 105
7.550% due 04/01/39 875 1,173
7.300% due 10/01/39 220 284
7.600% due 11/01/40 475 643
State of Illinois General Obligation
Unlimited
4.071% due 01/01/14 300 311
5.665% due 03/01/18 1,240 1,346
4.350% due 06/01/18 1,070 1,085
4.700% due 06/02/37 CAD 400 480
4.600% due 06/02/39 CAD 300 358
Province of Quebec Canada
4.500% due 12/01/17 CAD 200 227
4.500% due 12/01/18 CAD 400 455
4.500% due 12/01/20 CAD 100 114
4.250% due 12/01/21 CAD 900 1,003
3.500% due 12/01/22 CAD 100 104
9,875
United States Government Agencies - 2.5%Fannie Mae
2.750% due 03/13/14 30 31
5.250% due 09/15/16 145 173
1.500% due 10/20/16 1,120 1,122
5.375% due 06/12/17 2,085 2,540
7.125% due 01/15/30 345 533
7.250% due 05/15/30 230 361
6.625% due 11/15/30 230 342
Federal Farm Credit Bank
5.125% due 08/25/16 310 368
Copyright © 2012 www.secdatabase.com. All Rights Reserved.Please Consider the Environment Before Printing This Document
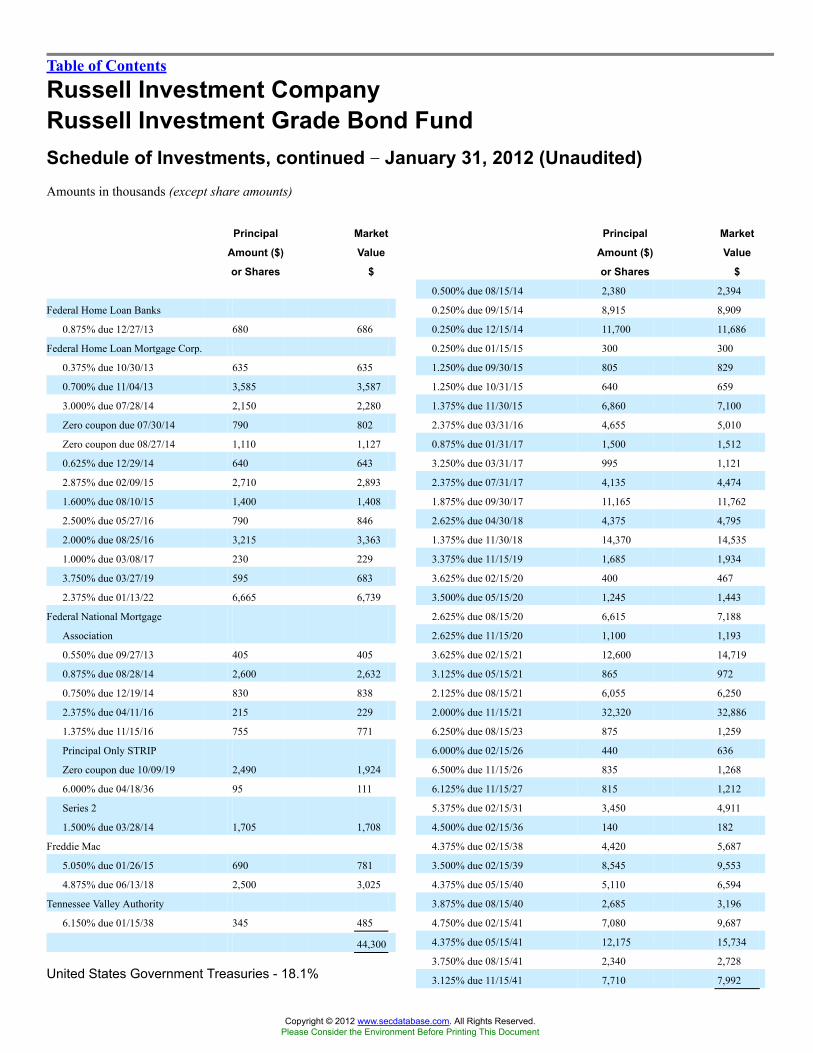
Table of Contents
Russell Investment CompanyRussell Investment Grade Bond FundSchedule of Investments, continued �� January 31, 2012 (Unaudited)Amounts in thousands (except share amounts)
Principal
Amount ($)
or Shares
Market
Value
$
Federal Home Loan Banks
0.875% due 12/27/13 680 686
Federal Home Loan Mortgage Corp.
0.375% due 10/30/13 635 635
0.700% due 11/04/13 3,585 3,587
3.000% due 07/28/14 2,150 2,280
Zero coupon due 07/30/14 790 802
Zero coupon due 08/27/14 1,110 1,127
0.625% due 12/29/14 640 643
2.875% due 02/09/15 2,710 2,893
1.600% due 08/10/15 1,400 1,408
2.500% due 05/27/16 790 846
2.000% due 08/25/16 3,215 3,363
1.000% due 03/08/17 230 229
3.750% due 03/27/19 595 683
2.375% due 01/13/22 6,665 6,739
Federal National Mortgage
Association
0.550% due 09/27/13 405 405
0.875% due 08/28/14 2,600 2,632
0.750% due 12/19/14 830 838
2.375% due 04/11/16 215 229
1.375% due 11/15/16 755 771
Principal Only STRIP
Zero coupon due 10/09/19 2,490 1,924
6.000% due 04/18/36 95 111
Series 2
1.500% due 03/28/14 1,705 1,708
Freddie Mac
5.050% due 01/26/15 690 781
4.875% due 06/13/18 2,500 3,025
Tennessee Valley Authority
6.150% due 01/15/38 345 485
44,300
United States Government Treasuries - 18.1%
Principal
Amount ($)
or Shares
Market
Value
$
0.500% due 08/15/14 2,380 2,394
0.250% due 09/15/14 8,915 8,909
0.250% due 12/15/14 11,700 11,686
0.250% due 01/15/15 300 300
1.250% due 09/30/15 805 829
1.250% due 10/31/15 640 659
1.375% due 11/30/15 6,860 7,100
2.375% due 03/31/16 4,655 5,010
0.875% due 01/31/17 1,500 1,512
3.250% due 03/31/17 995 1,121
2.375% due 07/31/17 4,135 4,474
1.875% due 09/30/17 11,165 11,762
2.625% due 04/30/18 4,375 4,795
1.375% due 11/30/18 14,370 14,535
3.375% due 11/15/19 1,685 1,934
3.625% due 02/15/20 400 467
3.500% due 05/15/20 1,245 1,443
2.625% due 08/15/20 6,615 7,188
2.625% due 11/15/20 1,100 1,193
3.625% due 02/15/21 12,600 14,719
3.125% due 05/15/21 865 972
2.125% due 08/15/21 6,055 6,250
2.000% due 11/15/21 32,320 32,886
6.250% due 08/15/23 875 1,259
6.000% due 02/15/26 440 636
6.500% due 11/15/26 835 1,268
6.125% due 11/15/27 815 1,212
5.375% due 02/15/31 3,450 4,911
4.500% due 02/15/36 140 182
4.375% due 02/15/38 4,420 5,687
3.500% due 02/15/39 8,545 9,553
4.375% due 05/15/40 5,110 6,594
3.875% due 08/15/40 2,685 3,196
4.750% due 02/15/41 7,080 9,687
4.375% due 05/15/41 12,175 15,734
3.750% due 08/15/41 2,340 2,728
3.125% due 11/15/41 7,710 7,992
Copyright © 2012 www.secdatabase.com. All Rights Reserved.Please Consider the Environment Before Printing This Document

162 Russell Investment Grade Bond Fund
United States Treasury Inflation
Indexed Bonds
2.375% due 01/15/25 3,061 3,996
2.000% due 01/15/26 (Æ) 570 720
2.375% due 01/15/27 (Æ) 9,760 12,962
1.750% due 01/15/28 (Æ) 1,262 1,564
3.875% due 04/15/29 413 661
2.125% due 02/15/41 (Æ) 2,815 3,948
United States Treasury Notes
1.375% due 03/15/13 3,035 3,076
0.625% due 04/30/13 2,910 2,926
1.375% due 05/15/13 2,445 2,482
1.125% due 06/15/13 2,565 2,598
Zero coupon due 07/15/13 7,180 7,263
3.125% due 08/31/13 2,610 2,730
0.500% due 10/15/13 5,735 5,763
0.500% due 11/15/13 1,835 1,844
0.750% due 12/15/13 3,695 3,731
0.125% due 12/31/13 39,300 39,232
4.000% due 02/15/14 2,205 2,374
1.875% due 04/30/14 5,365 5,561
Zero coupon due 05/15/14 10,170 10,345
326,553
Total Long-Term Investments(cost $1,611,089) 1,645,956
Preferred Stocks - 0.3%Financial Services - 0.3%CoBank ACB (Å) 70,000 3,611
DG Funding Trust (Å) 392 2,941
6,552
Total Preferred Stocks(cost $8,014) 6,552
Copyright © 2012 www.secdatabase.com. All Rights Reserved.Please Consider the Environment Before Printing This Document
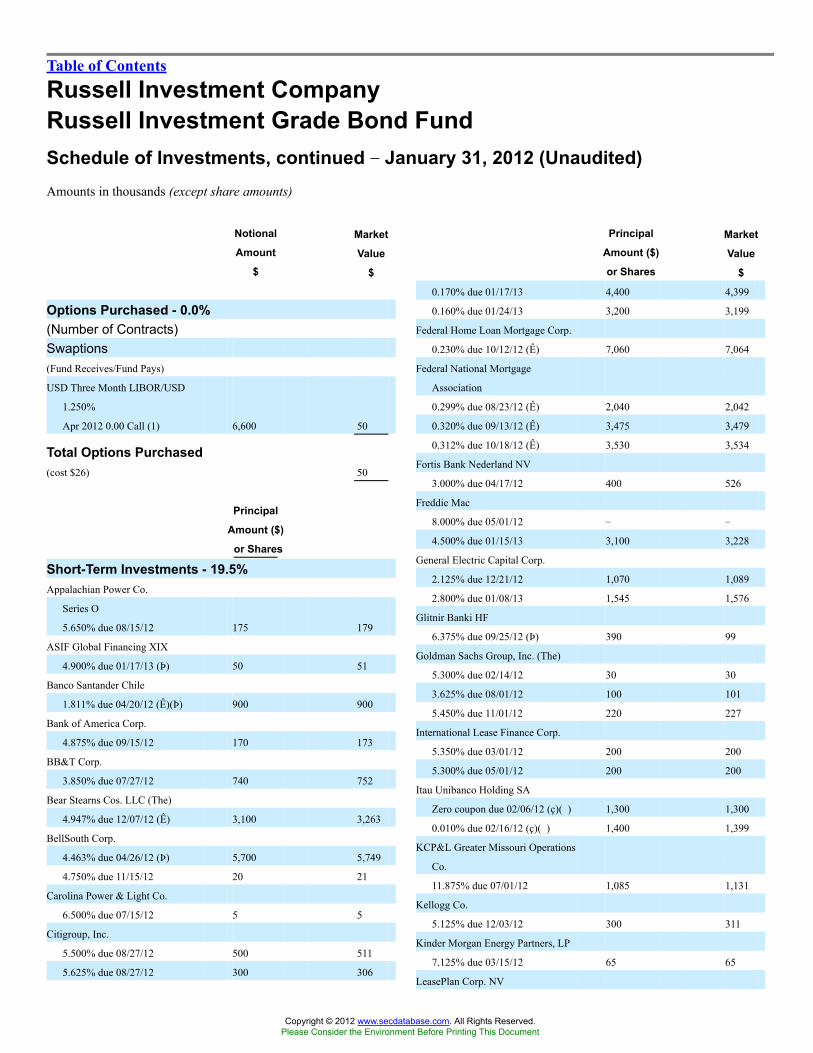
Table of Contents
Russell Investment CompanyRussell Investment Grade Bond FundSchedule of Investments, continued �� January 31, 2012 (Unaudited)Amounts in thousands (except share amounts)
Notional
Amount
$
Market
Value
$
Options Purchased - 0.0%(Number of Contracts)Swaptions(Fund Receives/Fund Pays)
USD Three Month LIBOR/USD
1.250%
Apr 2012 0.00 Call (1) 6,600 50
Total Options Purchased(cost $26) 50
Principal
Amount ($)
or Shares
Short-Term Investments - 19.5%Appalachian Power Co.
Series O
5.650% due 08/15/12 175 179
ASIF Global Financing XIX
4.900% due 01/17/13 (Þ) 50 51
Banco Santander Chile
1.811% due 04/20/12 (Ê)(Þ) 900 900
Bank of America Corp.
4.875% due 09/15/12 170 173
BB&T Corp.
3.850% due 07/27/12 740 752
Bear Stearns Cos. LLC (The)
4.947% due 12/07/12 (Ê) 3,100 3,263
BellSouth Corp.
4.463% due 04/26/12 (Þ) 5,700 5,749
4.750% due 11/15/12 20 21
Carolina Power & Light Co.
6.500% due 07/15/12 5 5
Citigroup, Inc.
5.500% due 08/27/12 500 511
5.625% due 08/27/12 300 306
Principal
Amount ($)
or Shares
Market
Value
$
0.170% due 01/17/13 4,400 4,399
0.160% due 01/24/13 3,200 3,199
Federal Home Loan Mortgage Corp.
0.230% due 10/12/12 (Ê) 7,060 7,064
Federal National Mortgage
Association
0.299% due 08/23/12 (Ê) 2,040 2,042
0.320% due 09/13/12 (Ê) 3,475 3,479
0.312% due 10/18/12 (Ê) 3,530 3,534
Fortis Bank Nederland NV
3.000% due 04/17/12 400 526
Freddie Mac
8.000% due 05/01/12 � �
4.500% due 01/15/13 3,100 3,228
General Electric Capital Corp.
2.125% due 12/21/12 1,070 1,089
2.800% due 01/08/13 1,545 1,576
Glitnir Banki HF
6.375% due 09/25/12 (Þ) 390 99
Goldman Sachs Group, Inc. (The)
5.300% due 02/14/12 30 30
3.625% due 08/01/12 100 101
5.450% due 11/01/12 220 227
International Lease Finance Corp.
5.350% due 03/01/12 200 200
5.300% due 05/01/12 200 200
Itau Unibanco Holding SA
Zero coupon due 02/06/12 (ç)(�) 1,300 1,300
0.010% due 02/16/12 (ç)(�) 1,400 1,399
KCP&L Greater Missouri Operations
Co.
11.875% due 07/01/12 1,085 1,131
Kellogg Co.
5.125% due 12/03/12 300 311
Kinder Morgan Energy Partners, LP
7.125% due 03/15/12 65 65
LeasePlan Corp. NV
Copyright © 2012 www.secdatabase.com. All Rights Reserved.Please Consider the Environment Before Printing This Document
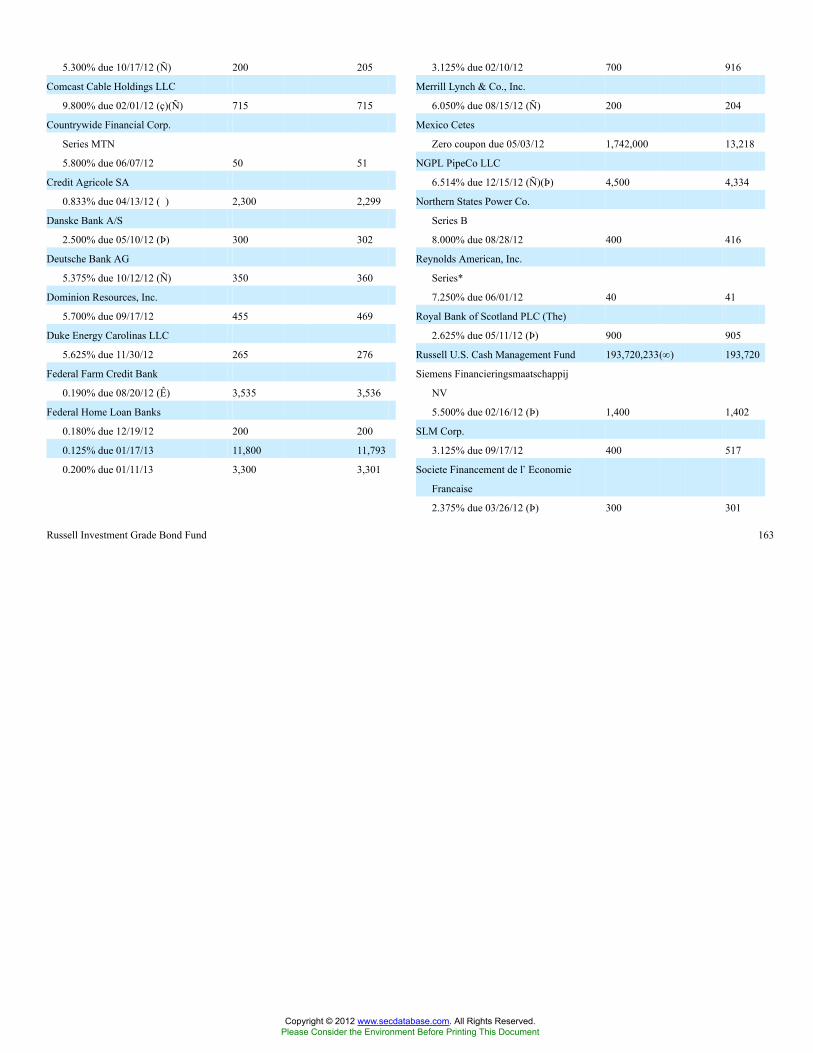
Russell Investment Grade Bond Fund 163
5.300% due 10/17/12 (Ñ) 200 205
Comcast Cable Holdings LLC
9.800% due 02/01/12 (ç)(Ñ) 715 715
Countrywide Financial Corp.
Series MTN
5.800% due 06/07/12 50 51
Credit Agricole SA
0.833% due 04/13/12 (�) 2,300 2,299
Danske Bank A/S
2.500% due 05/10/12 (Þ) 300 302
Deutsche Bank AG
5.375% due 10/12/12 (Ñ) 350 360
Dominion Resources, Inc.
5.700% due 09/17/12 455 469
Duke Energy Carolinas LLC
5.625% due 11/30/12 265 276
Federal Farm Credit Bank
0.190% due 08/20/12 (Ê) 3,535 3,536
Federal Home Loan Banks
0.180% due 12/19/12 200 200
0.125% due 01/17/13 11,800 11,793
0.200% due 01/11/13 3,300 3,301
3.125% due 02/10/12 700 916
Merrill Lynch & Co., Inc.
6.050% due 08/15/12 (Ñ) 200 204
Mexico Cetes
Zero coupon due 05/03/12 1,742,000 13,218
NGPL PipeCo LLC
6.514% due 12/15/12 (Ñ)(Þ) 4,500 4,334
Northern States Power Co.
Series B
8.000% due 08/28/12 400 416
Reynolds American, Inc.
Series*
7.250% due 06/01/12 40 41
Royal Bank of Scotland PLC (The)
2.625% due 05/11/12 (Þ) 900 905
Russell U.S. Cash Management Fund 193,720,233(¥) 193,720
Siemens Financieringsmaatschappij
NV
5.500% due 02/16/12 (Þ) 1,400 1,402
SLM Corp.
3.125% due 09/17/12 400 517
Societe Financement de l�Economie
Francaise
2.375% due 03/26/12 (Þ) 300 301
Copyright © 2012 www.secdatabase.com. All Rights Reserved.Please Consider the Environment Before Printing This Document

Table of Contents
Russell Investment CompanyRussell Investment Grade Bond FundSchedule of Investments, continued �� January 31, 2012 (Unaudited)Amounts in thousands (except share amounts)
Notional
Amount
$
Market
Value
$
2.125% due 05/20/12 400 525
0.767% due 07/16/12 (Ê)(Þ) 1,000 1,001
UBS AG
1.595% due 02/23/12 (Ê) 500 500
United Parcel Service, Inc.
4.500% due 01/15/13 100 104
United States Treasury Bills
Zero coupon due 03/15/12 (ç)(�) 260 260
Zero coupon due 04/05/12 (�) 620 620
Zero coupon due 12/13/12 45,000 44,961
0.102% due 01/10/13 300 300
0.104% due 01/10/13 (�) 329 329
United States Treasury Inflation
Indexed Bonds
3.000% due 07/15/12 (Æ) 8,386 8,580
United States Treasury Notes
Zero coupon due 11/15/12 3,495 3,529
Volkswagen International Finance NV
1.031% due 10/01/12 (Ê)(Þ) 1,500 1,499
Wachovia Corp.
4.810% due 05/25/12 (Ê) 1,700 1,799
Washington Mutual, Inc.
5.000% due 03/22/12 425 488
Total Short-Term Investments(cost $351,458) 351,085
Repurchase Agreements - 0.6%Agreement with Barclays Capital Inc.
and Bank of New York Mellon Corp.
(Tri-Party) of $5,000 dated
January 31, 2012 at 6.0% to be
repurchased at $5,000 on February 1,
2012 collateralized by: $5,000 par
various United States Treasury
Obligations, valued at $5,652. 5,000 5,000
Notional
Amount
$
Market
Value
$
Other Securities - 1.0%Russell Investment Company
Liquidating Trust (×) 654,646 (¥) 666
Russell U.S. Cash Collateral Fund (×) 17,183,371(¥) 17,183
Total Other Securities(cost $17,838) 17,849
Total Investments - 112.7%(identified cost $1,998,625) 2,031,692
Other Assets and Liabilities,Net - (12.7%) (229,018 )
Net Assets - 100.0% 1,802,674
Copyright © 2012 www.secdatabase.com. All Rights Reserved.Please Consider the Environment Before Printing This Document

See accompanying notes which are an integral part of this quarterly report.
164 Russell Investment Grade Bond Fund
Agreement with JP Morgan Securities
LLC and Bank of New York Mellon
Corp. (Tri-Party) of $5,200 dated
January 31, 2012 at 3.125% to be
repurchased at $5,200 on February 1,
2012 collateralized by: $4,717 par
various United States Treasury
Obligations, valued at $5,849
5,200 5,200
Total Repurchase Agreements(cost $10,200) 10,200
A portion of the portfolio has been fair valued as of period end.
Copyright © 2012 www.secdatabase.com. All Rights Reserved.Please Consider the Environment Before Printing This Document
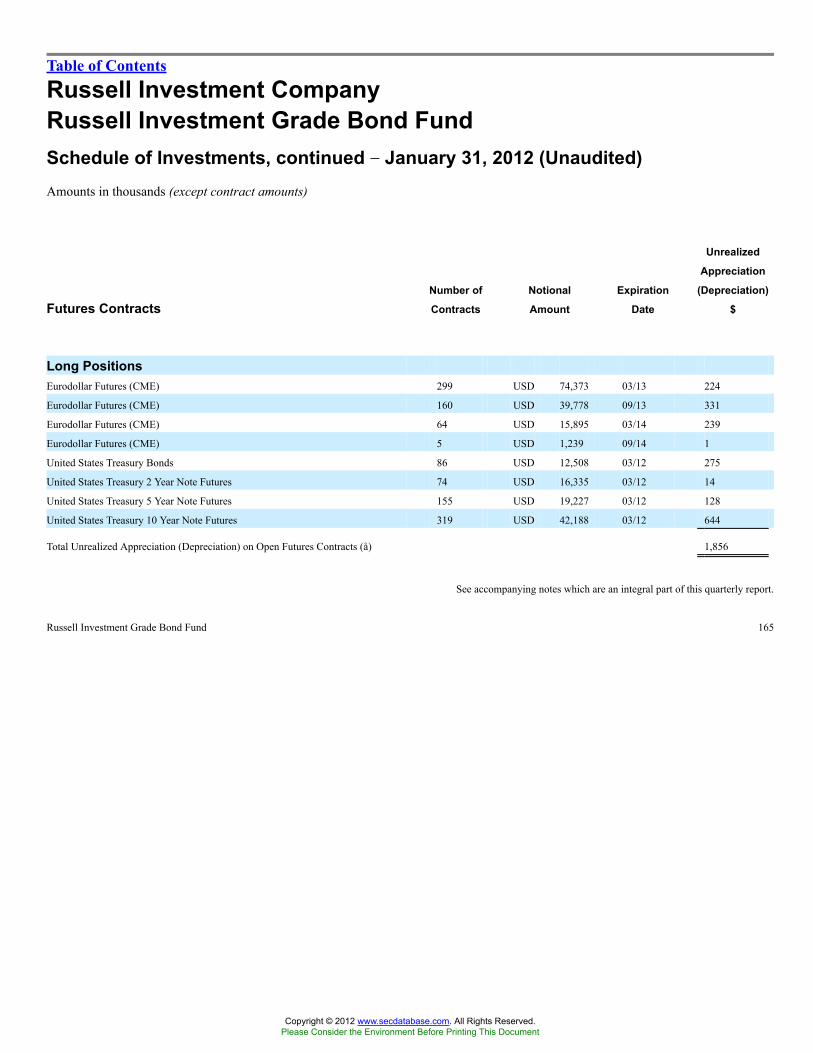
Table of Contents
Russell Investment CompanyRussell Investment Grade Bond FundSchedule of Investments, continued �� January 31, 2012 (Unaudited)Amounts in thousands (except contract amounts)
Futures ContractsNumber of
Contracts
Notional
Amount
Expiration
Date
Unrealized
Appreciation
(Depreciation)
$
Long PositionsEurodollar Futures (CME) 299 USD 74,373 03/13 224
Eurodollar Futures (CME) 160 USD 39,778 09/13 331
Eurodollar Futures (CME) 64 USD 15,895 03/14 239
Eurodollar Futures (CME) 5 USD 1,239 09/14 1
United States Treasury Bonds 86 USD 12,508 03/12 275
United States Treasury 2 Year Note Futures 74 USD 16,335 03/12 14
United States Treasury 5 Year Note Futures 155 USD 19,227 03/12 128
United States Treasury 10 Year Note Futures 319 USD 42,188 03/12 644
Total Unrealized Appreciation (Depreciation) on Open Futures Contracts (å) 1,856
See accompanying notes which are an integral part of this quarterly report.
Russell Investment Grade Bond Fund 165
Copyright © 2012 www.secdatabase.com. All Rights Reserved.Please Consider the Environment Before Printing This Document

Table of Contents
Russell Investment CompanyRussell Investment Grade Bond FundSchedule of Investments, continued �� January 31, 2012 (Unaudited)Amounts in thousands (except contract amounts)
Options WrittenCall/
Put
Number of
Contracts
Strike
Price
Notional
Amount
Expiration
Date
Market
Value
$
Eurodollar Futures Put 49 99.00 USD 123 03/19/12 �
Inflationary Floor Options Call 1 0.00 USD 1,930 11/23/20 (6 )
Inflationary Floor Options Put 1 0.00 USD 1,600 03/12/20 (4 )
Inflationary Floor Options Put 1 0.00 USD 1,000 04/07/20 (2 )
Inflationary Floor Options Put 1 0.00 USD 1,000 09/29/20 (3 )
Swaptions(Fund Receives/Fund Pays)
USD 0.9200%/USD Three Month LIBOR Put 2 0.00 12,600 11/14/12 (16 )
USD 1.000%/USD Three Month LIBOR Put 1 0.00 1,800 08/13/12 (3 )
USD 1.000%/USD Three Month LIBOR Put 1 0.00 7,700 11/19/12 (3 )
USD 1.200%/USD Three Month LIBOR Put 1 0.00 4,900 07/11/13 (12 )
USD 1.700%/USD Three Month LIBOR Put 4 0.00 31,200 08/13/12 (71 )
USD 1.700%/USD Three Month LIBOR Put 1 0.00 2,600 08/13/12 (6 )
USD 1.750%/USD Three Month LIBOR Put 1 0.00 8,100 11/19/12 (2 )
USD 1.750%/USD Three Month LIBOR Put 1 0.00 33,900 07/11/13 (18 )
USD 2.000%/USD Three Month LIBOR Put 1 0.00 13,200 04/30/12 �
USD 2.250%/USD Three Month LIBOR Put 5 0.00 36,800 09/24/12 (4 )
USD 2.250%/USD Three Month LIBOR Put 1 0.00 7,200 05/28/13 (2 )
USD 3.000%/USD Three Month LIBOR Put 5 0.00 51,700 06/18/12 �
USD 3.250%/USD Three Month LIBOR Put 2 0.00 5,800 07/16/12 �
USD 10.000%/USD Three Month LIBOR Put 1 0.00 1,600 07/10/12 �
Total Liability for Options Written (premiums received $1,823) (152 )
See accompanying notes which are an integral part of this quarterly report.
166 Russell Investment Grade Bond Fund
Copyright © 2012 www.secdatabase.com. All Rights Reserved.Please Consider the Environment Before Printing This Document

Table of Contents
Russell Investment CompanyRussell Investment Grade Bond FundSchedule of Investments, continued �� January 31, 2012 (Unaudited)Amounts in thousands
Foreign Currency Exchange Contracts
CounterpartyAmount
Sold
Amount
Bought
Settlement
Date
Unrealized
Appreciation
(Depreciation)
$
Barclays Bank PLC USD 315 CAD 324 02/09/12 8
Barclays Bank PLC USD 14 MXN 191 03/15/12 1
Barclays Bank PLC USD 136 MXN 1,907 03/15/12 10
Barclays Bank PLC AUD 300 USD 306 02/23/12 (11 )
Barclays Bank PLC BRL 176 USD 100 03/02/12 �
Barclays Bank PLC BRL 176 USD 100 03/02/12 �
Barclays Bank PLC BRL 177 USD 100 03/02/12 (1 )
Barclays Bank PLC BRL 178 USD 100 03/02/12 (1 )
Barclays Bank PLC BRL 179 USD 100 03/02/12 (1 )
Barclays Bank PLC BRL 180 USD 100 03/02/12 (2 )
Barclays Bank PLC BRL 352 USD 200 03/02/12 �
Barclays Bank PLC BRL 366 USD 200 03/02/12 (8 )
Barclays Bank PLC CAD 101 USD 100 02/09/12 (1 )
Barclays Bank PLC CAD 205 USD 201 02/09/12 (3 )
Barclays Bank PLC EUR 2,164 USD 2,774 04/16/12 (57 )
Barclays Bank PLC GBP 200 USD 307 02/02/12 (9 )
Barclays Bank PLC GBP 236 USD 368 03/02/12 (4 )
Citibank USD 3,504 CAD 3,570 02/16/12 55
Citibank USD 8,628 EUR 6,628 02/02/12 41
Citibank USD 646 EUR 467 02/16/12 (35 )
Citibank USD 5,951 EUR 4,582 02/16/12 43
Citibank USD 4,444 GBP 2,857 02/02/12 58
Citibank USD 772 PLN 2,556 02/16/12 19
Citibank AUD 99 USD 102 02/23/12 (3 )
Citibank AUD 100 USD 101 02/23/12 (5 )
Citibank AUD 100 USD 100 02/23/12 (6 )
Citibank AUD 200 USD 205 02/23/12 (7 )
Citibank AUD 338 USD 334 02/23/12 (24 )
Citibank CAD 100 USD 98 02/09/12 (2 )
Citibank CAD 200 USD 196 02/09/12 (4 )
Citibank CAD 312 USD 300 02/09/12 (11 )
Citibank CAD 313 USD 303 02/09/12 (9 )
Copyright © 2012 www.secdatabase.com. All Rights Reserved.Please Consider the Environment Before Printing This Document

Citibank CAD 3,570 USD 3,526 02/16/12 (33 )
Citibank EUR 467 USD 593 02/16/12 (18 )
Citibank EUR 4,582 USD 5,963 02/16/12 (30 )
Citibank EUR 6,628 USD 8,629 03/02/12 (41 )
Citibank EUR 1,590 USD 2,035 04/16/12 (46 )
Citibank GBP 99 USD 153 02/02/12 (3 )
Citibank GBP 2,857 USD 4,443 03/02/12 (58 )
Citibank PLN 2,556 USD 804 02/16/12 13
Deutsche Bank AG USD 7,753 CNY 49,177 02/13/12 41
Deutsche Bank AG CAD 7 USD 7 02/09/12 �
Deutsche Bank AG CAD 93 USD 90 02/09/12 (3 )
Deutsche Bank AG CAD 204 USD 196 02/09/12 (7 )
Deutsche Bank AG CAD 812 USD 795 02/09/12 (14 )
Deutsche Bank AG EUR 135 USD 171 04/16/12 (6 )
Deutsche Bank AG EUR 5,104 USD 6,549 04/16/12 (129 )
Goldman Sachs CAD 102 USD 99 02/09/12 (3 )
Goldman Sachs EUR 6,628 USD 8,698 02/02/12 28
HSBC Bank PLC USD 6,688 MXN 87,100 02/02/12 (5 )
HSBC Bank PLC USD 6,692 MXN 87,100 02/02/12 (10 )
HSBC Bank PLC CNY 1,279 USD 200 02/13/12 (3 )
HSBC Bank PLC CNY 8,904 USD 1,400 02/13/12 (11 )
See accompanying notes which are an integral part of this quarterly report.
Russell Investment Grade Bond Fund 167
Copyright © 2012 www.secdatabase.com. All Rights Reserved.Please Consider the Environment Before Printing This Document

Table of Contents
Russell Investment CompanyRussell Investment Grade Bond FundSchedule of Investments, continued �� January 31, 2012 (Unaudited)Amounts in thousands
Foreign Currency Exchange Contracts
CounterpartyAmount
Sold
Amount
Bought
Settlement
Date
Unrealized
Appreciation
(Depreciation)
$
HSBC Bank PLC MXN 87,100 USD 6,641 05/03/12 9
HSBC Bank PLC MXN 87,100 USD 6,637 05/03/12 5
JPMorgan Chase Bank USD 4,012 BRL 7,584 03/02/12 296
JPMorgan Chase Bank AUD 4,700 USD 4,618 02/23/12 (360 )
JPMorgan Chase Bank CAD 1 USD 1 02/09/12 �
JPMorgan Chase Bank CAD 5 USD 5 02/09/12 �
JPMorgan Chase Bank CAD 54 USD 53 02/09/12 (1 )
JPMorgan Chase Bank CAD 93 USD 92 02/09/12 (1 )
JPMorgan Chase Bank CAD 103 USD 101 02/09/12 (2 )
JPMorgan Chase Bank CAD 172 USD 168 02/09/12 (3 )
JPMorgan Chase Bank CAD 198 USD 191 02/09/12 (6 )
JPMorgan Chase Bank CAD 204 USD 198 02/09/12 (5 )
JPMorgan Chase Bank CAD 304 USD 297 02/09/12 (6 )
JPMorgan Chase Bank CAD 306 USD 300 02/09/12 (5 )
JPMorgan Chase Bank CAD 413 USD 400 02/09/12 (12 )
JPMorgan Chase Bank CNY 639 USD 100 02/13/12 (1 )
JPMorgan Chase Bank CNY 639 USD 100 02/13/12 (1 )
Morgan Stanley & Co., Inc. BRL 175 USD 100 03/02/12 �
Morgan Stanley & Co., Inc. BRL 176 USD 100 03/02/12 �
Morgan Stanley & Co., Inc. BRL 176 USD 100 03/02/12 �
Morgan Stanley & Co., Inc. BRL 180 USD 100 03/02/12 (2 )
Morgan Stanley & Co., Inc. BRL 180 USD 100 03/02/12 (2 )
Morgan Stanley & Co., Inc. BRL 350 USD 200 03/02/12 1
Morgan Stanley & Co., Inc. BRL 354 USD 200 03/02/12 (1 )
Morgan Stanley & Co., Inc. BRL 356 USD 200 03/02/12 (2 )
Morgan Stanley & Co., Inc. BRL 359 USD 200 03/02/12 (4 )
Morgan Stanley & Co., Inc. BRL 360 USD 200 03/02/12 (5 )
Morgan Stanley & Co., Inc. CAD 307 USD 299 02/09/12 (7 )
Morgan Stanley & Co., Inc. GBP 100 USD 157 03/02/12 �
Royal Bank of Canada USD 5,303 CAD 5,295 02/09/12 (23 )
Royal Bank of Canada CAD 103 USD 100 02/09/12 (3 )
Royal Bank of Canada CAD 104 USD 101 02/09/12 (3 )
Royal Bank of Canada CAD 204 USD 200 02/09/12 (3 )
Copyright © 2012 www.secdatabase.com. All Rights Reserved.Please Consider the Environment Before Printing This Document
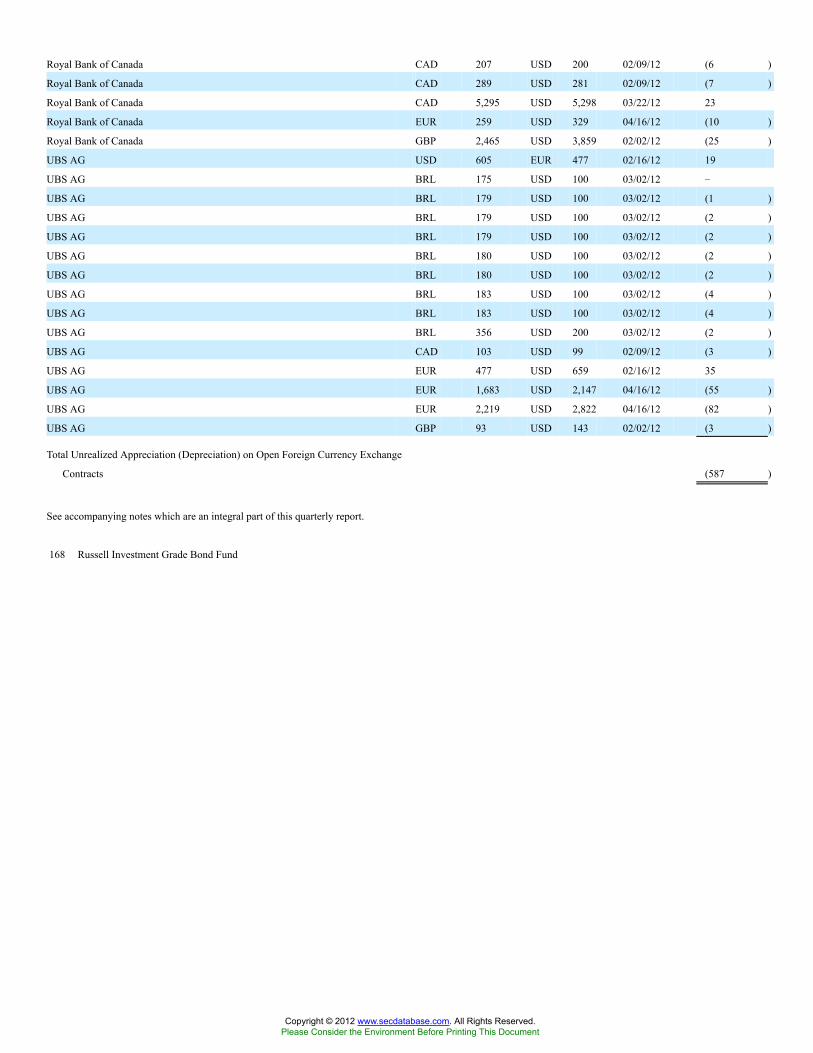
Royal Bank of Canada CAD 207 USD 200 02/09/12 (6 )
Royal Bank of Canada CAD 289 USD 281 02/09/12 (7 )
Royal Bank of Canada CAD 5,295 USD 5,298 03/22/12 23
Royal Bank of Canada EUR 259 USD 329 04/16/12 (10 )
Royal Bank of Canada GBP 2,465 USD 3,859 02/02/12 (25 )
UBS AG USD 605 EUR 477 02/16/12 19
UBS AG BRL 175 USD 100 03/02/12 �
UBS AG BRL 179 USD 100 03/02/12 (1 )
UBS AG BRL 179 USD 100 03/02/12 (2 )
UBS AG BRL 179 USD 100 03/02/12 (2 )
UBS AG BRL 180 USD 100 03/02/12 (2 )
UBS AG BRL 180 USD 100 03/02/12 (2 )
UBS AG BRL 183 USD 100 03/02/12 (4 )
UBS AG BRL 183 USD 100 03/02/12 (4 )
UBS AG BRL 356 USD 200 03/02/12 (2 )
UBS AG CAD 103 USD 99 02/09/12 (3 )
UBS AG EUR 477 USD 659 02/16/12 35
UBS AG EUR 1,683 USD 2,147 04/16/12 (55 )
UBS AG EUR 2,219 USD 2,822 04/16/12 (82 )
UBS AG GBP 93 USD 143 02/02/12 (3 )
Total Unrealized Appreciation (Depreciation) on Open Foreign Currency Exchange
Contracts (587 )
See accompanying notes which are an integral part of this quarterly report.
168 Russell Investment Grade Bond Fund
Copyright © 2012 www.secdatabase.com. All Rights Reserved.Please Consider the Environment Before Printing This Document

Table of Contents
Russell Investment CompanyRussell Investment Grade Bond FundSchedule of Investments, continued �� January 31, 2012 (Unaudited)Amounts in thousands
Interest Rate Swap Contracts
CounterpartyNotional
Amount Fund Receives Fund PaysTermination
Date
Market
Value
$
Barclays Bank PLC BRL 900 12.455% Brazil Interbank Deposit Rate 01/02/13 14
Barclays Bank PLC BRL 2,400 11.910% Brazil Interbank Deposit Rate 01/02/13 46
Barclays Bank PLC BRL 300 10.830% Brazil Interbank Deposit Rate 01/02/14 2
Barclays Bank PLC MXN 28,300 5.600% Mexico Interbank 28 Day Deposit Rate 09/06/16 28
Barclays Bank PLC USD 4,100 Three Month LIBOR 2.750% 06/20/42 (69 )
BNP Paribas BRL 1,100 11.880% Brazil Interbank Deposit Rate 01/02/13 21
BNP Paribas BRL 3,400 12.800% Brazil Interbank Deposit Rate 01/02/13 93
BNP Paribas BRL 300 12.110% Brazil Interbank Deposit Rate 01/02/14 8
BNP Paribas USD 2,600 1.000% Federal Fund Effective Rate - 1 Year 09/19/14 42
Citibank AUD 200 4.250% Six Month BBSW 06/15/17 �
Citibank AUD 300 5.000% Six Month BBSW 06/15/17 11
Citibank AUD 800 5.250% Six Month BBSW 06/15/22 45
Citigroupglobal Markets EUR 200 3.650% Six Month EURIBOR 09/21/21 33
Citigroupglobal Markets EUR 800 3.000% Six Month EURIBOR 03/21/22 69
Credit Suisse Financial Products BRL 100 12.480% Brazil Interbank Deposit Rate 01/02/13 2
Deutsche Bank AUD 100 4.250% Six Month BBSW 06/15/17 �
Deutsche Bank AUD 100 5.000% Six Month BBSW 06/15/17 4
Deutsche Bank EUR 300 2.500% Six Month EURIBOR 09/21/18 17
Goldman Sachs BRL 3,900 11.890% Brazil Interbank Deposit Rate 01/02/13 78
Goldman Sachs BRL 800 12.650% Brazil Interbank Deposit Rate 01/02/14 30
Goldman Sachs USD 1,300 0.500% Federal Fund Effective Rate - 1 Year 09/19/14 8
Goldman Sachs AUD 3,000 5.000% Six Month BBSW 06/15/17 111
HSBC BRL 200 10.450% Brazil Interbank Deposit Rate 01/02/13 1
HSBC BRL 2,900 11.890% Brazil Interbank Deposit Rate 01/02/13 58
HSBC BRL 3,600 12.830% Brazil Interbank Deposit Rate 01/02/13 100
HSBC BRL 600 11.530% Brazil Interbank Deposit Rate 01/02/14 9
HSBC BRL 1,500 10.990% Brazil Interbank Deposit Rate 01/02/14 13
HSBC BRL 1,700 10.530% Brazil Interbank Deposit Rate 01/02/14 7
HSBC BRL 2,500 10.180% Brazil Interbank Deposit Rate 01/02/14 6
HSBC BRL 2,500 12.540% Brazil Interbank Deposit Rate 01/02/14 90
HSBC MXN 1,700 5.600% Mexico Interbank 28 Day Deposit Rate 09/06/16 2
JPMorgan BRL 2,900 12.170% Brazil Interbank Deposit Rate 01/02/13 70
JPMorgan BRL 100 10.870% Brazil Interbank Deposit Rate 01/02/14 1
JPMorgan BRL 600 12.200% Brazil Interbank Deposit Rate 01/02/14 18
Copyright © 2012 www.secdatabase.com. All Rights Reserved.Please Consider the Environment Before Printing This Document
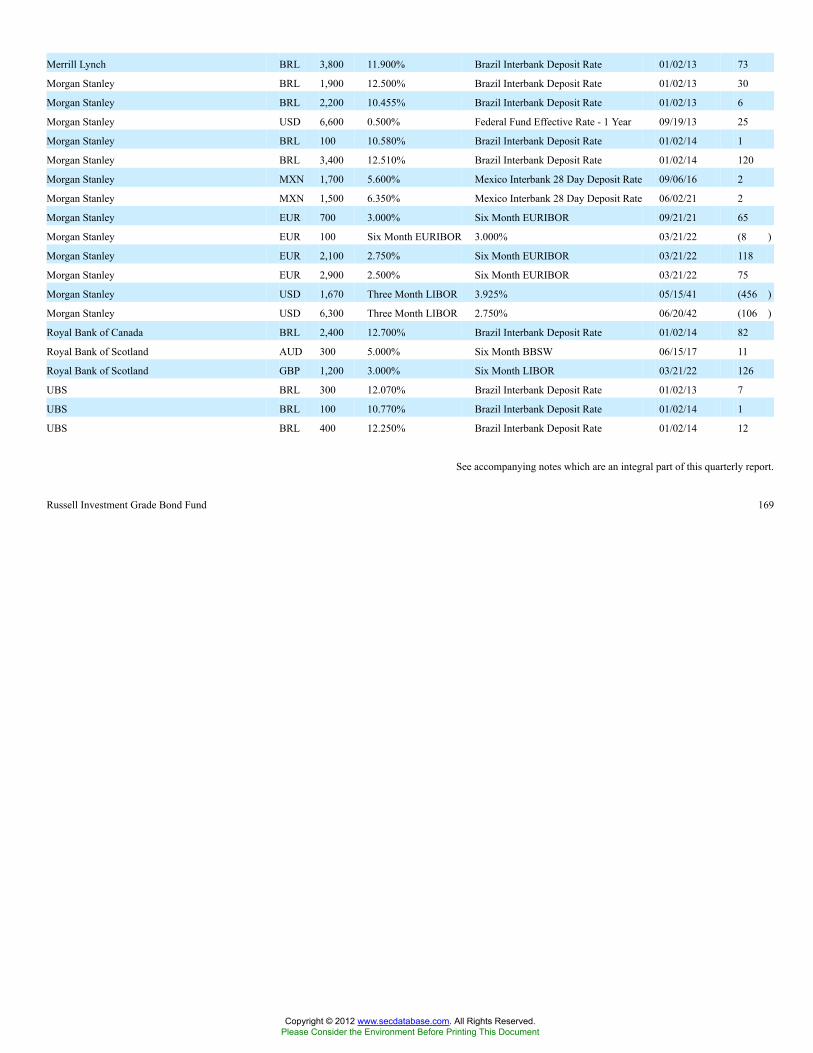
Merrill Lynch BRL 3,800 11.900% Brazil Interbank Deposit Rate 01/02/13 73
Morgan Stanley BRL 1,900 12.500% Brazil Interbank Deposit Rate 01/02/13 30
Morgan Stanley BRL 2,200 10.455% Brazil Interbank Deposit Rate 01/02/13 6
Morgan Stanley USD 6,600 0.500% Federal Fund Effective Rate - 1 Year 09/19/13 25
Morgan Stanley BRL 100 10.580% Brazil Interbank Deposit Rate 01/02/14 1
Morgan Stanley BRL 3,400 12.510% Brazil Interbank Deposit Rate 01/02/14 120
Morgan Stanley MXN 1,700 5.600% Mexico Interbank 28 Day Deposit Rate 09/06/16 2
Morgan Stanley MXN 1,500 6.350% Mexico Interbank 28 Day Deposit Rate 06/02/21 2
Morgan Stanley EUR 700 3.000% Six Month EURIBOR 09/21/21 65
Morgan Stanley EUR 100 Six Month EURIBOR 3.000% 03/21/22 (8 )
Morgan Stanley EUR 2,100 2.750% Six Month EURIBOR 03/21/22 118
Morgan Stanley EUR 2,900 2.500% Six Month EURIBOR 03/21/22 75
Morgan Stanley USD 1,670 Three Month LIBOR 3.925% 05/15/41 (456 )
Morgan Stanley USD 6,300 Three Month LIBOR 2.750% 06/20/42 (106 )
Royal Bank of Canada BRL 2,400 12.700% Brazil Interbank Deposit Rate 01/02/14 82
Royal Bank of Scotland AUD 300 5.000% Six Month BBSW 06/15/17 11
Royal Bank of Scotland GBP 1,200 3.000% Six Month LIBOR 03/21/22 126
UBS BRL 300 12.070% Brazil Interbank Deposit Rate 01/02/13 7
UBS BRL 100 10.770% Brazil Interbank Deposit Rate 01/02/14 1
UBS BRL 400 12.250% Brazil Interbank Deposit Rate 01/02/14 12
See accompanying notes which are an integral part of this quarterly report.
Russell Investment Grade Bond Fund 169
Copyright © 2012 www.secdatabase.com. All Rights Reserved.Please Consider the Environment Before Printing This Document

Table of Contents
Russell Investment CompanyRussell Investment Grade Bond FundSchedule of Investments, continued �� January 31, 2012 (Unaudited)Amounts in thousands
Interest Rate Swap Contracts
CounterpartyNotional
Amount Fund Receives Fund PaysTermination
Date
Market
Value
$
UBS BRL 600 10.380% Brazil Interbank Deposit Rate 01/02/14 2
UBS BRL 3,000 11.760% Brazil Interbank Deposit Rate 01/02/14 49
Total Market Value on Open Interest Rate Swap Contracts Premiums Paid (Received) - $136 (å) 1,205
See accompanying notes which are an integral part of this quarterly report.
170 Russell Investment Grade Bond Fund
Copyright © 2012 www.secdatabase.com. All Rights Reserved.Please Consider the Environment Before Printing This Document
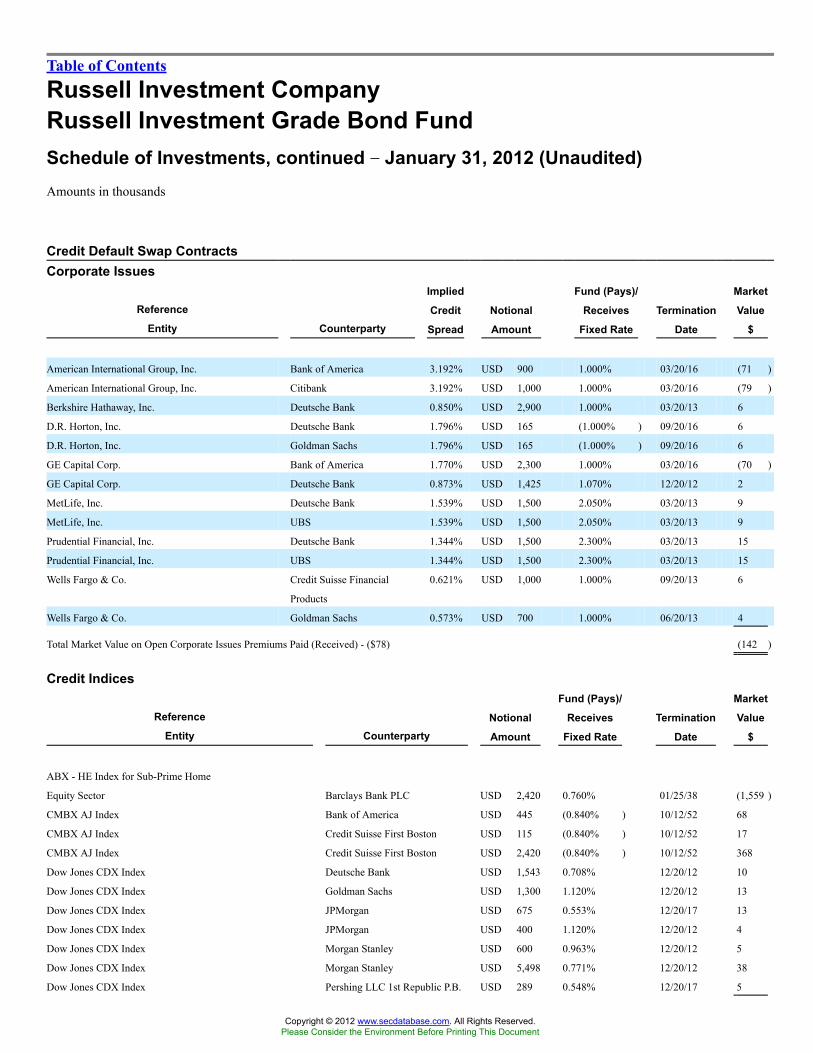
Table of Contents
Russell Investment CompanyRussell Investment Grade Bond FundSchedule of Investments, continued �� January 31, 2012 (Unaudited)Amounts in thousands
Credit Default Swap ContractsCorporate Issues
Reference
Entity Counterparty
Implied
Credit
Spread
Notional
Amount
Fund (Pays)/
Receives
Fixed Rate
Termination
Date
Market
Value
$
American International Group, Inc. Bank of America 3.192% USD 900 1.000% 03/20/16 (71 )
American International Group, Inc. Citibank 3.192% USD 1,000 1.000% 03/20/16 (79 )
Berkshire Hathaway, Inc. Deutsche Bank 0.850% USD 2,900 1.000% 03/20/13 6
D.R. Horton, Inc. Deutsche Bank 1.796% USD 165 (1.000% ) 09/20/16 6
D.R. Horton, Inc. Goldman Sachs 1.796% USD 165 (1.000% ) 09/20/16 6
GE Capital Corp. Bank of America 1.770% USD 2,300 1.000% 03/20/16 (70 )
GE Capital Corp. Deutsche Bank 0.873% USD 1,425 1.070% 12/20/12 2
MetLife, Inc. Deutsche Bank 1.539% USD 1,500 2.050% 03/20/13 9
MetLife, Inc. UBS 1.539% USD 1,500 2.050% 03/20/13 9
Prudential Financial, Inc. Deutsche Bank 1.344% USD 1,500 2.300% 03/20/13 15
Prudential Financial, Inc. UBS 1.344% USD 1,500 2.300% 03/20/13 15
Wells Fargo & Co. Credit Suisse Financial
Products
0.621% USD 1,000 1.000% 09/20/13 6
Wells Fargo & Co. Goldman Sachs 0.573% USD 700 1.000% 06/20/13 4
Total Market Value on Open Corporate Issues Premiums Paid (Received) - ($78) (142 )
Credit Indices
Reference
Entity CounterpartyNotional
Amount
Fund (Pays)/
Receives
Fixed Rate
Termination
Date
Market
Value
$
ABX - HE Index for Sub-Prime Home
Equity Sector Barclays Bank PLC USD 2,420 0.760% 01/25/38 (1,559 )
CMBX AJ Index Bank of America USD 445 (0.840% ) 10/12/52 68
CMBX AJ Index Credit Suisse First Boston USD 115 (0.840% ) 10/12/52 17
CMBX AJ Index Credit Suisse First Boston USD 2,420 (0.840% ) 10/12/52 368
Dow Jones CDX Index Deutsche Bank USD 1,543 0.708% 12/20/12 10
Dow Jones CDX Index Goldman Sachs USD 1,300 1.120% 12/20/12 13
Dow Jones CDX Index JPMorgan USD 675 0.553% 12/20/17 13
Dow Jones CDX Index JPMorgan USD 400 1.120% 12/20/12 4
Dow Jones CDX Index Morgan Stanley USD 600 0.963% 12/20/12 5
Dow Jones CDX Index Morgan Stanley USD 5,498 0.771% 12/20/12 38
Dow Jones CDX Index Pershing LLC 1st Republic P.B. USD 289 0.548% 12/20/17 5
Copyright © 2012 www.secdatabase.com. All Rights Reserved.Please Consider the Environment Before Printing This Document

Total Market Value on Open Credit Indices Premiums Paid (Received) - ($18) (1,018 )
Sovereign Issues
Reference
Entity Counterparty
Implied
Credit
Spread
Notional
Amount
Fund (Pays)/
Receives
Fixed Rate
Termination
Date
Market
Value
$
Brazil Government International Bond Bank of America 1.213% USD 1,000 1.000% 09/20/15 (8 )
Brazil Government International Bond Bank of America 1.281% USD 2,600 1.000% 03/20/16 (32 )
Brazil Government International Bond Barclays Bank PLC 1.170% USD 500 1.000% 06/20/15 (3 )
Brazil Government International Bond Citibank 1.213% USD 1,000 1.000% 09/20/15 (8 )
Brazil Government International Bond Citibank 1.336% USD 800 1.000% 06/20/16 (12 )
Brazil Government International Bond Credit Suisse Financial
Products
1.336% USD 1,900 1.000% 06/20/16 (28 )
Brazil Government International Bond Deutsche Bank 1.336% USD 1,000 1.000% 06/20/16 (15 )
Brazil Government International Bond Deutsche Bank 1.170% USD 1,000 1.000% 06/20/15 (6 )
Brazil Government International Bond Deutsche Bank 1.170% USD 500 1.000% 06/20/15 (3 )
Brazil Government International Bond Goldman Sachs 1.170% USD 500 1.000% 06/20/15 (3 )
Brazil Government International Bond HSBC 1.213% USD 700 1.000% 09/20/15 (6 )
Brazil Government International Bond HSBC 1.336% USD 7,400 1.000% 06/20/16 (110 )
Brazil Government International Bond JPMorgan 1.213% USD 200 1.000% 09/20/15 (2 )
See accompanying notes which are an integral part of this quarterly report.
Russell Investment Grade Bond Fund 171
Copyright © 2012 www.secdatabase.com. All Rights Reserved.Please Consider the Environment Before Printing This Document

Table of Contents
Russell Investment CompanyRussell Investment Grade Bond FundSchedule of Investments, continued �� January 31, 2012 (Unaudited)Amounts in thousands
Credit Default Swap ContractsSovereign Issues
Reference
Entity Counterparty
Implied
Credit
Spread
Notional
Amount
Fund (Pays)/
Receives
Fixed Rate
Termination
Date
Market
Value
$
Brazil Government International Bond JPMorgan 1.384% USD 200 1.000% 09/20/16 (4 )
Brazil Government International Bond Morgan Stanley 1.170% USD 500 1.000% 06/20/15 (3 )
Brazil Government International Bond UBS 1.213% USD 500 1.000% 09/20/15 (4 )
China Government International Bond Barclays Bank PLC 1.161% USD 2,400 1.000% 03/20/16 (13 )
China Government International Bond Deutsche Bank 1.283% USD 400 1.000% 09/20/16 (5 )
China Government International Bond Goldman Sachs 1.283% USD 100 1.000% 09/20/16 (1 )
China Government International Bond JPMorgan 1.283% USD 400 1.000% 09/20/16 (5 )
China Government International Bond Morgan Stanley 1.283% USD 300 1.000% 09/20/16 (4 )
China Government International Bond Morgan Stanley 1.226% USD 1,200 1.000% 06/20/16 (11 )
China Government International Bond Morgan Stanley 0.937% USD 2,000 1.000% 03/20/15 (1 )
France Government International Bond Barclays Bank PLC 1.728% USD 3,165 0.250% 09/20/16 (205 )
France Government International Bond Goldman Sachs 1.646% USD 3,800 0.250% 03/20/16 (207 )
France Government International Bond HSBC 1.747% USD 100 0.250% 09/20/16 (6 )
France Government International Bond Morgan Stanley 1.646% USD 500 0.250% 03/20/16 (27 )
France Government International Bond Royal Bank of Scotland 1.646% USD 500 0.250% 03/20/16 (27 )
Germany Government International Bond UBS 0.770% USD 1,200 0.250% 06/20/16 (27 )
Italy Government International Bond Barclays Bank PLC 4.108% USD 800 1.000% 03/20/16 (90 )
Italy Government International Bond Goldman Sachs 4.108% USD 2,800 1.000% 03/20/16 (316 )
Italy Government International Bond Goldman Sachs 4.108% USD 200 1.000% 03/20/16 (23 )
Italy Government International Bond Goldman Sachs 4.109% USD 1,000 1.000% 06/20/16 (119 )
Japan Government International Bond Bank of America 1.191% USD 200 1.000% 03/20/16 (2 )
Japan Government International Bond Bank of America 1.191% USD 100 1.000% 03/20/16 (1 )
Japan Government International Bond Goldman Sachs 1.244% USD 500 1.000% 06/20/16 (6 )
Japan Government International Bond JPMorgan 1.191% USD 700 1.000% 03/20/16 (7 )
Kazakhstan Government International Bond Citibank 2.433% USD 300 1.000% 03/20/16 (17 )
Kazakhstan Government International Bond Deutsche Bank 2.433% USD 300 1.000% 03/20/16 (17 )
Kazakhstan Government International Bond HSBC 2.433% USD 400 1.000% 03/20/16 (22 )
Korea Government International Bond Deutsche Bank 1.363% USD 600 1.000% 06/20/16 (9 )
Korea Government International Bond Deutsche Bank 1.363% USD 400 1.000% 06/20/16 (6 )
Mexico Government International Bond Bank of America 1.171% USD 300 1.000% 09/20/15 (2 )
Mexico Government International Bond Citibank 1.301% USD 1,000 1.000% 06/20/16 (13 )
Mexico Government International Bond Citibank 1.171% USD 700 1.000% 09/20/15 (5 )
Mexico Government International Bond Citibank 1.072% USD 400 1.000% 03/20/15 (1 )
Copyright © 2012 www.secdatabase.com. All Rights Reserved.Please Consider the Environment Before Printing This Document

Mexico Government International Bond Credit Suisse Financial
Products
1.072% USD 400 1.000% 03/20/15 (1 )
Mexico Government International Bond Deutsche Bank 1.301% USD 2,100 1.000% 06/20/16 (27 )
Mexico Government International Bond Deutsche Bank 1.072% USD 200 1.000% 03/20/15 (1 )
Mexico Government International Bond Deutsche Bank 1.244% USD 900 1.000% 03/20/16 (9 )
Mexico Government International Bond Goldman Sachs 1.244% USD 3,100 1.000% 03/20/16 (32 )
Mexico Government International Bond Morgan Stanley 1.351% USD 300 1.000% 09/20/16 (5 )
Spain Government International Bond Bank of America 3.685% USD 100 1.000% 03/20/16 (10 )
United Kingdom Gilt Credit Suisse Financial
Products
0.630% USD 200 1.000% 03/20/16 3
United Kingdom Gilt Goldman Sachs 0.587% USD 400 1.000% 12/20/15 6
United Kingdom Gilt UBS 0.415% USD 100 1.000% 03/20/15 2
United Kingdom Gilt UBS 0.415% USD 300 1.000% 03/20/15 5
United Kingdom Gilt UBS 0.683% USD 1,000 1.000% 06/20/16 14
United Kingdom Gilt UBS 0.683% USD 400 1.000% 06/20/16 6
United States Government Bond BNP Paribas 0.364% EUR 1,000 0.250% 03/20/16 (9 )
Total Market Value on Open Sovereign Issues Premiums Paid (Received) - ($1,453) (1,500 )
Total Market Value on Open Credit Default Swap Contracts Premiums Paid (Received) - ($1,549) (å) (2,660 )
See accompanying notes which are an integral part of this quarterly report.
172 Russell Investment Grade Bond Fund
Copyright © 2012 www.secdatabase.com. All Rights Reserved.Please Consider the Environment Before Printing This Document

Table of Contents
Russell Investment CompanyRussell Investment Grade Bond FundPresentation of Portfolio Holdings �� January 31, 2012 (Unaudited)Amounts in thousands
Market Value
Portfolio Summary Level 1 Level 2 Level 3 Total
Long-Term Investments
Asset-Backed Securities $� $66,509 $� $66,509
Corporate Bonds and Notes � 292,878 6,929 299,807
International Debt � 117,100 � 117,100
Mortgage-Backed Securities � 724,579 21,664 746,243
Municipal Bonds � 32,715 2,854 35,569
Non-US Bonds � 9,875 � 9,875
United States Government Agencies � 44,300 � 44,300
United States Government Treasuries � 326,553 � 326,553
Preferred Stocks 3,611 � 2,941 6,552
Options Purchased � 50 � 50
Short-Term Investments � 351,085 � 351,085
Repurchase Agreements � 10,200 � 10,200
Other Securities � 17,849 � 17,849
Total Investments 3,611 1,993,693 34,388 2,031,692
Other Financial Instruments
Futures Contracts 1,856 � � 1,856
Options Written � (137 ) (15 ) (152 )
Foreign Currency Exchange Contracts (15 ) (572 ) � (587 )
Interest Rate Swap Contracts � 687 382 1,069
Credit Default Swap Contracts � (1,111 ) � (1,111 )
Total Other Financial Instruments* $1,841 $(1,133 ) $367 $1,075
* Other financial instruments reflected, such as futures, forwards, interest rate swaps, and credit default swaps are valued at the unrealized appreciation/depreciation
on the instruments.
For a description of the levels see note 2 in the Notes to Quarterly Report.
A reconciliation of investments in which significant unobservable inputs (Level 3) were used in determining a value for the periodending January 31, 2012 were as follows:
Category and Subcategory
Beginning
Balance
11/1/2011
Gross
Purchases
Gross
Sales
Accrued
Discounts/
(Premiums)
Realized/
Gain/
(Loss)
Net Transfers
out of Level 3
Long-Term Investments
Asset-Backed Securities $ � $ � $� $ � $ � $ �
Corporate Bonds and Notes 7,305 982 1,603 (2 ) 33 �
Copyright © 2012 www.secdatabase.com. All Rights Reserved.Please Consider the Environment Before Printing This Document
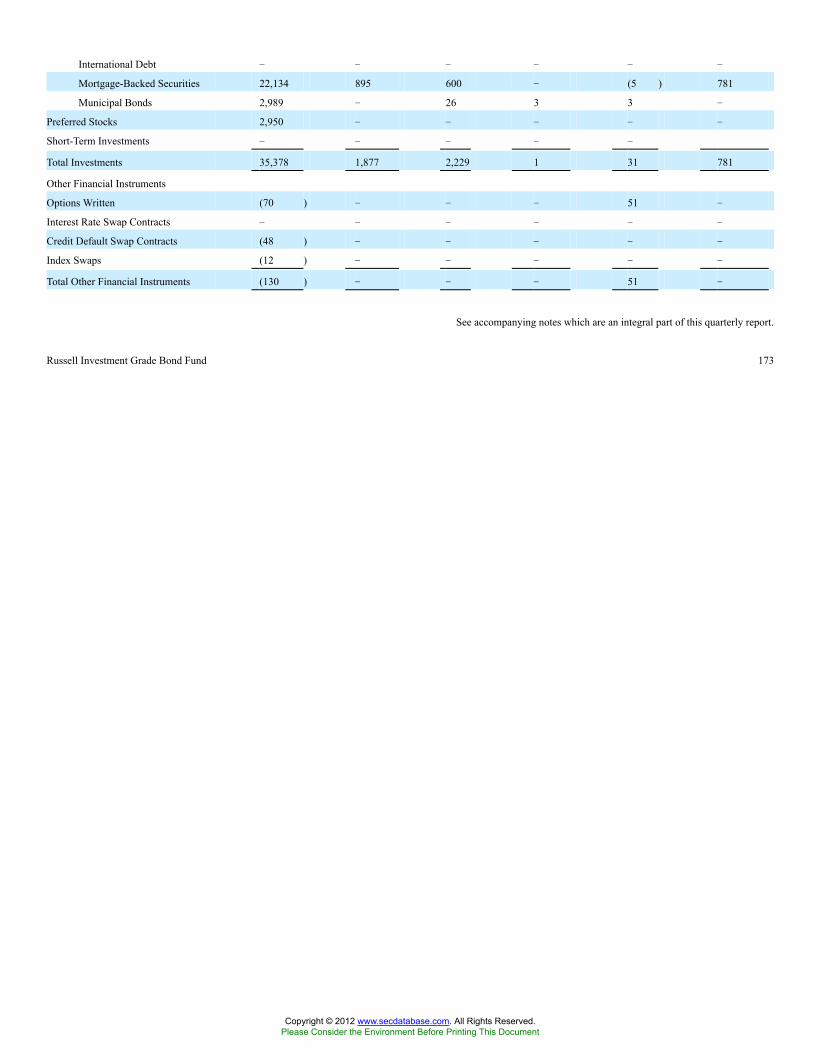
International Debt � � � � � �
Mortgage-Backed Securities 22,134 895 600 � (5 ) 781
Municipal Bonds 2,989 � 26 3 3 �
Preferred Stocks 2,950 � � � � �
Short-Term Investments � � � � �
Total Investments 35,378 1,877 2,229 1 31 781
Other Financial Instruments
Options Written (70 ) � � � 51 �
Interest Rate Swap Contracts � � � � � �
Credit Default Swap Contracts (48 ) � � � � �
Index Swaps (12 ) � � � � �
Total Other Financial Instruments (130 ) � � � 51 �
See accompanying notes which are an integral part of this quarterly report.
Russell Investment Grade Bond Fund 173
Copyright © 2012 www.secdatabase.com. All Rights Reserved.Please Consider the Environment Before Printing This Document

Table of Contents
Russell Investment CompanyRussell Investment Grade Bond FundPresentation of Portfolio Holdings, continued �� January 31, 2012Amounts in thousands
Category and Subcategory
Net change in
Unrealized
Appreciation/
(Depreciation)
Ending
Balance
At 1/31/
2012
Change in
Unrealized
Appreciation/
(Depreciation)
on Investments
still held as of
01/31/12
Long-Term Investments
Asset-Backed Securities $ � $� $ �
Corporate Bonds and Notes 214 6,929 214
International Debt � � �
Mortgage-Backed Securities 21 21,664 (38 )
Municipal Bonds (115 ) 2,854 (115 )
Preferred Stocks (9 ) 2,941 (9 )
Short-Term Investments � � �
Total Investments 111 34,388 52
Other Financial Instruments
Options Written 4 (15 ) (� )
Interest Rate Swap Contracts 382 382 382
Credit Default Swap Contracts 48 � �
Index Swaps 12 � �
Total Other Financial Instruments 446 367 382
See accompanying notes which are an integral part of this quarterly report.
174 Russell Investment Grade Bond Fund
Copyright © 2012 www.secdatabase.com. All Rights Reserved.Please Consider the Environment Before Printing This Document

Table of Contents
Russell Investment CompanyRussell Short Duration Bond Fund
Schedule of Investments �� January 31, 2012 (Unaudited)Amounts in thousands (except share amounts)
Principal
Amount ($)
or Shares
Market
Value
$
Long-Term Investments - 96.1%Asset-Backed Securities - 7.8%Ally Master Owner Trust
Series 2010-2 Class A
4.250% due 04/15/17 (Þ) 3,000 3,244
Series 2011-1 Class A2
2.150% due 01/15/16 5,250 5,340
Series 2011-3 Class A2
1.810% due 05/15/16 985 998
AmeriCredit Automobile
Receivables Trust
Series 2010-1 Class B
3.720% due 11/17/14 330 336
Series 2010-2 Class A2
1.220% due 10/08/13 305 305
Series 2010-4 Class A2
0.960% due 05/08/14 689 689
Series 2010-4 Class B
1.990% due 10/08/15 1,435 1,449
Series 2010-A Class A2
1.460% due 11/06/13 35 35
Series 2011-2 Class A3
1.610% due 10/08/15 2,525 2,551
Series 2011-3 Class B
2.280% due 06/08/16 1,290 1,293
Series 2011-4 Class A3
1.170% due 05/09/16 4,800 4,802
Ameriquest Mortgage Securities,
Inc.
Series 2005-R10 Class A2B
0.496% due 12/25/35 (Ê) 392 366
Asset Backed Securities Corp.
Home Equity
Series 2002-HE1 Class M1
1.935% due 03/15/32 (Ê) 427 308
Principal
Amount ($)
or Shares
Market
Value
$
Series 2007-A9 Class A9
0.315% due 06/16/14 (Ê) 3,700 3,699
CIT Marine Trust
Series 1999-A Class A4
6.250% due 11/15/19 71 72
Citibank Omni Master Trust
Series 2009-A8 Class A8
2.390% due 05/16/16 (Ê)(Þ) 3,700 3,720
Countrywide Asset-Backed
Certificates
Series 2001-BC3 Class A
0.756% due 12/25/31 (Ê) 62 32
Series 2005-1 Class AF4
5.147% due 07/25/35 295 273
Series 2005-4 Class AF3
4.456% due 10/25/35 36 35
Series 2005-17 Class 4A2A
0.536% due 05/25/36 (Ê) 432 369
Series 2006-3 Class 2A2
0.456% due 06/25/36 (Ê) 244 193
Series 2007-4 Class A2
5.530% due 09/25/37 360 310
Discover Card Master Trust I
Series 2007-3 Class B2
0.465% due 10/16/14 (Ê) 1,240 1,239
DT Auto Owner Trust
Series 2009-1 Class A1
2.980% due 10/15/15 (Þ) 558 561
Series 2010-1A Class B
2.360% due 04/15/13 (Þ) 767 768
Series 2011-2A Class A
0.960% due 01/15/14 (Þ) 691 691
Series 2011-2A Class B
2.120% due 02/16/16 (Þ) 2,295 2,297
Series 2011-3A Class A
1.400% due 08/15/14 (Þ) 1,244 1,245
Equity One ABS, Inc.
Copyright © 2012 www.secdatabase.com. All Rights Reserved.Please Consider the Environment Before Printing This Document
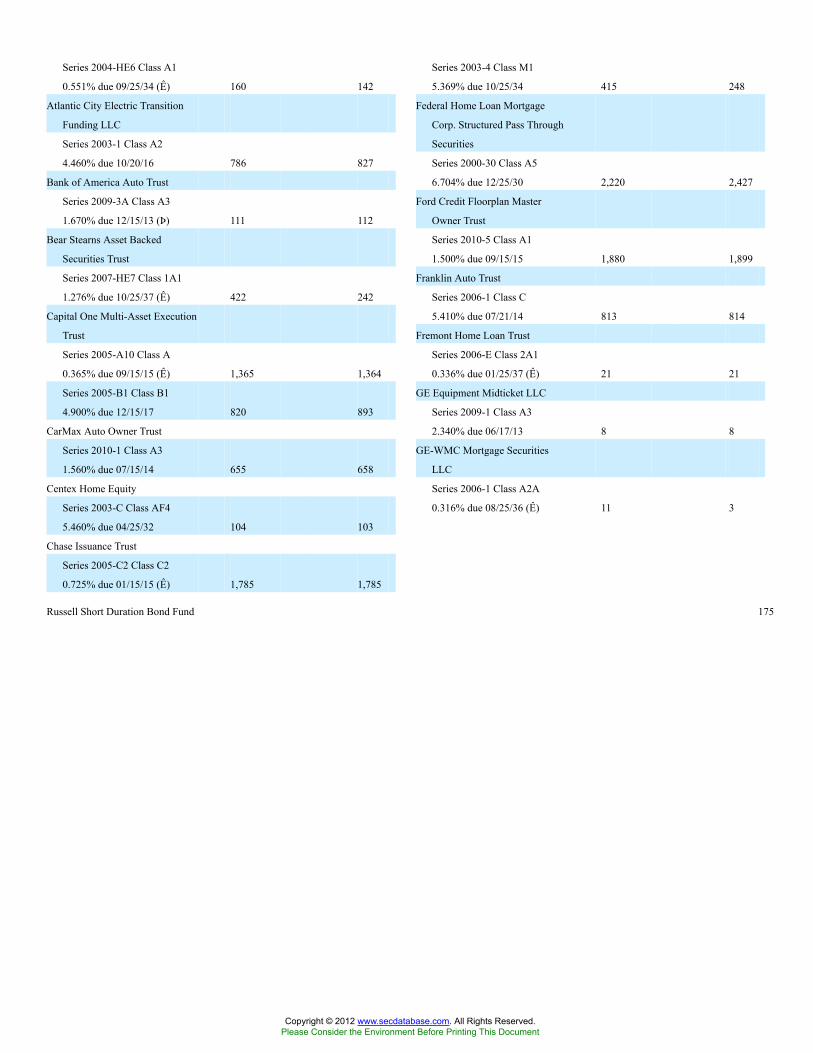
Russell Short Duration Bond Fund 175
Series 2004-HE6 Class A1
0.551% due 09/25/34 (Ê) 160 142
Atlantic City Electric Transition
Funding LLC
Series 2003-1 Class A2
4.460% due 10/20/16 786 827
Bank of America Auto Trust
Series 2009-3A Class A3
1.670% due 12/15/13 (Þ) 111 112
Bear Stearns Asset Backed
Securities Trust
Series 2007-HE7 Class 1A1
1.276% due 10/25/37 (Ê) 422 242
Capital One Multi-Asset Execution
Trust
Series 2005-A10 Class A
0.365% due 09/15/15 (Ê) 1,365 1,364
Series 2005-B1 Class B1
4.900% due 12/15/17 820 893
CarMax Auto Owner Trust
Series 2010-1 Class A3
1.560% due 07/15/14 655 658
Centex Home Equity
Series 2003-C Class AF4
5.460% due 04/25/32 104 103
Chase Issuance Trust
Series 2005-C2 Class C2
0.725% due 01/15/15 (Ê) 1,785 1,785
Series 2003-4 Class M1
5.369% due 10/25/34 415 248
Federal Home Loan Mortgage
Corp. Structured Pass Through
Securities
Series 2000-30 Class A5
6.704% due 12/25/30 2,220 2,427
Ford Credit Floorplan Master
Owner Trust
Series 2010-5 Class A1
1.500% due 09/15/15 1,880 1,899
Franklin Auto Trust
Series 2006-1 Class C
5.410% due 07/21/14 813 814
Fremont Home Loan Trust
Series 2006-E Class 2A1
0.336% due 01/25/37 (Ê) 21 21
GE Equipment Midticket LLC
Series 2009-1 Class A3
2.340% due 06/17/13 8 8
GE-WMC Mortgage Securities
LLC
Series 2006-1 Class A2A
0.316% due 08/25/36 (Ê) 11 3
Copyright © 2012 www.secdatabase.com. All Rights Reserved.Please Consider the Environment Before Printing This Document

Table of Contents
Russell Investment CompanyRussell Short Duration Bond FundSchedule of Investments, continued �� January 31, 2012 (Unaudited)Amounts in thousands (except share amounts)
Principal
Amount ($)
or Shares
Market
Value
$
GSAMP Trust
Series 2007-FM1 Class A2A
0.346% due 12/25/36 (Ê) 99 65
Harley-Davidson Motorcycle Trust
Series 2007-2 Class A4
5.120% due 08/15/13 84 84
Series 2007-3 Class A4
5.520% due 11/15/13 292 294
Home Equity Asset Trust
Series 2006-3 Class 2A3
0.456% due 07/25/36 (Ê) 883 847
HSBC Home Equity Loan Trust
Series 2005-1 Class A
0.571% due 01/20/34 (Ê) 195 176
Series 2005-3 Class A1
0.541% due 01/20/35 (Ê) 1,607 1,465
JPMorgan Auto Receivables Trust
Series 2008-A Class A4
5.220% due 07/15/15 (Þ) 2,455 2,479
Landmark CDO, Ltd.
Series 2003-3A Class A1LA
1.037% due 01/15/16 (Ê)(Þ) 48 47
Long Beach Mortgage Loan Trust
Series 2004-4 Class 1A1
0.836% due 10/25/34 (Ê) 20 15
Long Grove CLO, Ltd.
Series 2004-1A Class A
0.886% due 05/25/16 (Ê)(Þ) 1,297 1,270
Marriott Vacation Club Owner
Trust
Series 2006-1A Class D
6.502% due 04/20/28 (Þ) 133 135
Massachusetts Educational
Financing Authority
Series 2008-1 Class A1
1.510% due 04/25/38 (Ê) 1,210 1,208
Principal
Amount ($)
or Shares
Market
Value
$
Series 2010-A Class A2
1.370% due 08/15/13 (Þ) 345 345
Series 2010-B Class A2
1.010% due 07/15/13 (Þ) 1,056 1,056
Series 2011-1 Class A2
0.940% due 02/18/14 1,298 1,297
Series 2011-1 Class A3
1.280% due 01/15/15 1,240 1,242
Series 2011-1 Class B
2.350% due 11/16/15 1,525 1,532
Series 2011-2 Class B
2.660% due 01/15/16 755 759
Series 2011-3 Class B
2.500% due 12/15/15 2,180 2,181
Series 2012-1 Class B
2.720% due 05/16/16 1,680 1,683
SLM Student Loan Trust
Series 2003-12 Class A4
0.736% due 12/17/18 (Ê) 286 286
Series 2003-7A Class A5A
1.746% due 12/15/33 (Ê)(Þ) 600 595
Series 2008-2 Class A1
0.860% due 01/25/15 (Ê) 4 4
Series 2008-7 Class A2
1.060% due 10/25/17 (Ê) 2,472 2,465
Series 2011-A Class A1
1.285% due 10/15/24 (Ê)(Þ) 3,032 3,002
Series 2011-A Class A2
4.370% due 04/17/28 (Þ) 715 737
Series 2011-B Class A2
3.740% due 02/15/29 (Þ) 1,765 1,765
Small Business Administration
Participation Certificates
Series 2009-20D Class 1
4.310% due 04/01/29 471 514
SMART Trust
Copyright © 2012 www.secdatabase.com. All Rights Reserved.Please Consider the Environment Before Printing This Document

176 Russell Short Duration Bond Fund
Mercedes-Benz Auto Lease Trust
Series 2011-B Class A4
1.240% due 07/17/17 (Þ) 3,000 3,008
Porsche Innovative Lease Owner
Trust
Series 2011-1 Class A4
1.260% due 11/20/17 (Þ) 2,000 2,006
Prestige Auto Receivables Trust
Series 2011-1A Class A3
1.900% due 08/17/15 (Þ) 1,385 1,393
Renaissance Home Equity Loan
Trust
Series 2005-4 Class A3
5.565% due 02/25/36 117 101
Series 2007-2 Class AF2
5.675% due 06/25/37 355 144
Santander Drive Auto Receivables
Trust
Series 2010-1 Class A2
1.360% due 03/15/13 186 186
Series 2010-1 Class A3
1.840% due 11/17/14 2,085 2,101
Series 2010-2 Class A2
0.950% due 08/15/13 541 541
Series 2010-2 Class B
2.240% due 12/15/14 450 450
Series 2011-1USA Class A2A
1.180% due 04/14/13 (Þ) 601 601
South Carolina Student Loan Corp.
Series 2008-1 Class A4
1.527% due 09/03/24 (Ê) 400 394
South Carolina Student Loan Corp.
Revenue Bonds
Series 2008-1 Class A2
1.077% due 03/01/18 (Ê) 431 426
Series 2008-1 Class A3
1.277% due 03/02/20 (Ê) 700 690
88,355
Corporate Bonds and Notes - 12.7%Allstate Life Global Funding
Trusts
5.375% due 04/30/13 200 211
Ally Financial, Inc.
3.963% due 06/20/14 (Ê) 300 292
American Express Bank FSB
Series BKNT
5.500% due 04/16/13 300 316
Copyright © 2012 www.secdatabase.com. All Rights Reserved.Please Consider the Environment Before Printing This Document
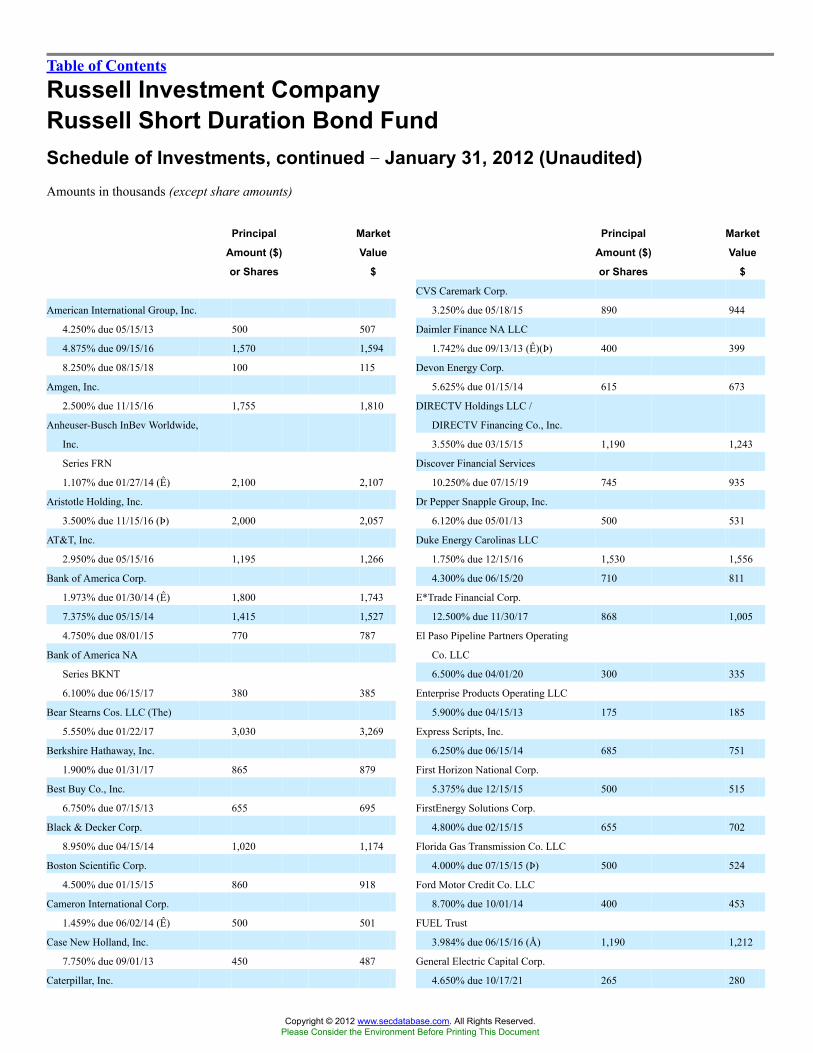
Table of Contents
Russell Investment CompanyRussell Short Duration Bond FundSchedule of Investments, continued �� January 31, 2012 (Unaudited)Amounts in thousands (except share amounts)
Principal
Amount ($)
or Shares
Market
Value
$
American International Group, Inc.
4.250% due 05/15/13 500 507
4.875% due 09/15/16 1,570 1,594
8.250% due 08/15/18 100 115
Amgen, Inc.
2.500% due 11/15/16 1,755 1,810
Anheuser-Busch InBev Worldwide,
Inc.
Series FRN
1.107% due 01/27/14 (Ê) 2,100 2,107
Aristotle Holding, Inc.
3.500% due 11/15/16 (Þ) 2,000 2,057
AT&T, Inc.
2.950% due 05/15/16 1,195 1,266
Bank of America Corp.
1.973% due 01/30/14 (Ê) 1,800 1,743
7.375% due 05/15/14 1,415 1,527
4.750% due 08/01/15 770 787
Bank of America NA
Series BKNT
6.100% due 06/15/17 380 385
Bear Stearns Cos. LLC (The)
5.550% due 01/22/17 3,030 3,269
Berkshire Hathaway, Inc.
1.900% due 01/31/17 865 879
Best Buy Co., Inc.
6.750% due 07/15/13 655 695
Black & Decker Corp.
8.950% due 04/15/14 1,020 1,174
Boston Scientific Corp.
4.500% due 01/15/15 860 918
Cameron International Corp.
1.459% due 06/02/14 (Ê) 500 501
Case New Holland, Inc.
7.750% due 09/01/13 450 487
Caterpillar, Inc.
Principal
Amount ($)
or Shares
Market
Value
$
CVS Caremark Corp.
3.250% due 05/18/15 890 944
Daimler Finance NA LLC
1.742% due 09/13/13 (Ê)(Þ) 400 399
Devon Energy Corp.
5.625% due 01/15/14 615 673
DIRECTV Holdings LLC /
DIRECTV Financing Co., Inc.
3.550% due 03/15/15 1,190 1,243
Discover Financial Services
10.250% due 07/15/19 745 935
Dr Pepper Snapple Group, Inc.
6.120% due 05/01/13 500 531
Duke Energy Carolinas LLC
1.750% due 12/15/16 1,530 1,556
4.300% due 06/15/20 710 811
E*Trade Financial Corp.
12.500% due 11/30/17 868 1,005
El Paso Pipeline Partners Operating
Co. LLC
6.500% due 04/01/20 300 335
Enterprise Products Operating LLC
5.900% due 04/15/13 175 185
Express Scripts, Inc.
6.250% due 06/15/14 685 751
First Horizon National Corp.
5.375% due 12/15/15 500 515
FirstEnergy Solutions Corp.
4.800% due 02/15/15 655 702
Florida Gas Transmission Co. LLC
4.000% due 07/15/15 (Þ) 500 524
Ford Motor Credit Co. LLC
8.700% due 10/01/14 400 453
FUEL Trust
3.984% due 06/15/16 (Å) 1,190 1,212
General Electric Capital Corp.
4.650% due 10/17/21 265 280
Copyright © 2012 www.secdatabase.com. All Rights Reserved.Please Consider the Environment Before Printing This Document

Russell Short Duration Bond Fund 177
0.649% due 05/21/13 (Ê) 1,800 1,806
CEDC Finance Corp. International,
Inc.
9.125% due 12/01/16 (Þ) 575 405
CenterPoint Energy Houston
Electric LLC
Series U
7.000% due 03/01/14 547 613
Cintas Corp. No. 2
2.850% due 06/01/16 1,105 1,148
CIT Group, Inc.
7.000% due 05/01/17 204 204
Series A
7.000% due 05/01/16 115 115
Citigroup, Inc.
1.307% due 02/15/13 (Ê) 5,800 5,744
5.500% due 04/11/13 700 726
4.450% due 01/10/17 2,555 2,664
Commonwealth Edison Co.
1.625% due 01/15/14 855 869
Continental Airlines 2006-1
Class G
Pass Through Trust
Series 061G
0.879% due 06/02/13 (Ê) 579 550
Series MTNA
0.806% due 09/15/14 (Ê) 2,525 2,453
Gilead Sciences, Inc.
3.050% due 12/01/16 1,385 1,452
Goldman Sachs Group, Inc. (The)
3.700% due 08/01/15 2,035 2,069
5.250% due 07/27/21 4,900 4,895
Goodrich Corp.
6.290% due 07/01/16 1,215 1,436
Hewlett-Packard Co.
0.786% due 05/24/13 (Ê) 2,100 2,088
4.750% due 06/02/14 1,285 1,374
2.650% due 06/01/16 1,040 1,054
Humana, Inc.
6.450% due 06/01/16 383 433
International Lease Finance Corp.
6.500% due 09/01/14 (Þ) 4,715 4,968
John Deere Capital Corp.
4.900% due 09/09/13 980 1,044
2.800% due 09/18/17 2,290 2,426
Copyright © 2012 www.secdatabase.com. All Rights Reserved.Please Consider the Environment Before Printing This Document
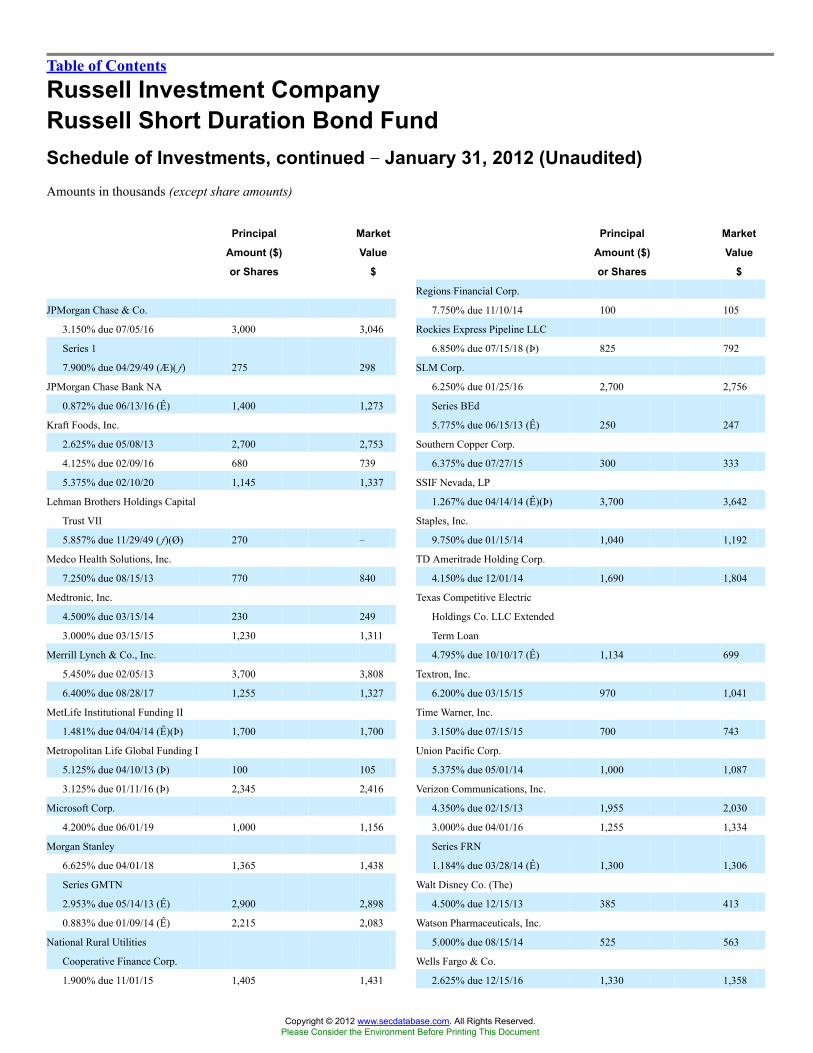
Table of Contents
Russell Investment CompanyRussell Short Duration Bond FundSchedule of Investments, continued �� January 31, 2012 (Unaudited)Amounts in thousands (except share amounts)
Principal
Amount ($)
or Shares
Market
Value
$
JPMorgan Chase & Co.
3.150% due 07/05/16 3,000 3,046
Series 1
7.900% due 04/29/49 (Æ)(�) 275 298
JPMorgan Chase Bank NA
0.872% due 06/13/16 (Ê) 1,400 1,273
Kraft Foods, Inc.
2.625% due 05/08/13 2,700 2,753
4.125% due 02/09/16 680 739
5.375% due 02/10/20 1,145 1,337
Lehman Brothers Holdings Capital
Trust VII
5.857% due 11/29/49 (�)(Ø) 270 �
Medco Health Solutions, Inc.
7.250% due 08/15/13 770 840
Medtronic, Inc.
4.500% due 03/15/14 230 249
3.000% due 03/15/15 1,230 1,311
Merrill Lynch & Co., Inc.
5.450% due 02/05/13 3,700 3,808
6.400% due 08/28/17 1,255 1,327
MetLife Institutional Funding II
1.481% due 04/04/14 (Ê)(Þ) 1,700 1,700
Metropolitan Life Global Funding I
5.125% due 04/10/13 (Þ) 100 105
3.125% due 01/11/16 (Þ) 2,345 2,416
Microsoft Corp.
4.200% due 06/01/19 1,000 1,156
Morgan Stanley
6.625% due 04/01/18 1,365 1,438
Series GMTN
2.953% due 05/14/13 (Ê) 2,900 2,898
0.883% due 01/09/14 (Ê) 2,215 2,083
National Rural Utilities
Cooperative Finance Corp.
1.900% due 11/01/15 1,405 1,431
Principal
Amount ($)
or Shares
Market
Value
$
Regions Financial Corp.
7.750% due 11/10/14 100 105
Rockies Express Pipeline LLC
6.850% due 07/15/18 (Þ) 825 792
SLM Corp.
6.250% due 01/25/16 2,700 2,756
Series BEd
5.775% due 06/15/13 (Ê) 250 247
Southern Copper Corp.
6.375% due 07/27/15 300 333
SSIF Nevada, LP
1.267% due 04/14/14 (Ê)(Þ) 3,700 3,642
Staples, Inc.
9.750% due 01/15/14 1,040 1,192
TD Ameritrade Holding Corp.
4.150% due 12/01/14 1,690 1,804
Texas Competitive Electric
Holdings Co. LLC Extended
Term Loan
4.795% due 10/10/17 (Ê) 1,134 699
Textron, Inc.
6.200% due 03/15/15 970 1,041
Time Warner, Inc.
3.150% due 07/15/15 700 743
Union Pacific Corp.
5.375% due 05/01/14 1,000 1,087
Verizon Communications, Inc.
4.350% due 02/15/13 1,955 2,030
3.000% due 04/01/16 1,255 1,334
Series FRN
1.184% due 03/28/14 (Ê) 1,300 1,306
Walt Disney Co. (The)
4.500% due 12/15/13 385 413
Watson Pharmaceuticals, Inc.
5.000% due 08/15/14 525 563
Wells Fargo & Co.
2.625% due 12/15/16 1,330 1,358
Copyright © 2012 www.secdatabase.com. All Rights Reserved.Please Consider the Environment Before Printing This Document
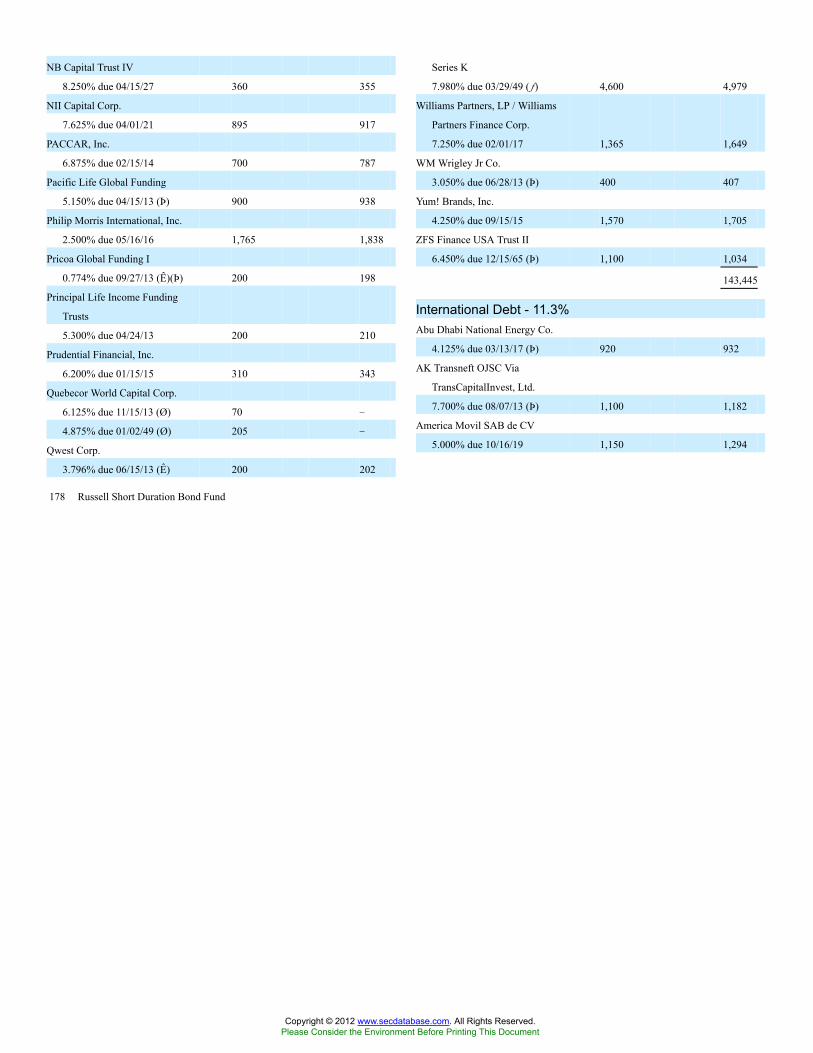
178 Russell Short Duration Bond Fund
NB Capital Trust IV
8.250% due 04/15/27 360 355
NII Capital Corp.
7.625% due 04/01/21 895 917
PACCAR, Inc.
6.875% due 02/15/14 700 787
Pacific Life Global Funding
5.150% due 04/15/13 (Þ) 900 938
Philip Morris International, Inc.
2.500% due 05/16/16 1,765 1,838
Pricoa Global Funding I
0.774% due 09/27/13 (Ê)(Þ) 200 198
Principal Life Income Funding
Trusts
5.300% due 04/24/13 200 210
Prudential Financial, Inc.
6.200% due 01/15/15 310 343
Quebecor World Capital Corp.
6.125% due 11/15/13 (Ø) 70 �
4.875% due 01/02/49 (Ø) 205 �
Qwest Corp.
3.796% due 06/15/13 (Ê) 200 202
Series K
7.980% due 03/29/49 (�) 4,600 4,979
Williams Partners, LP / Williams
Partners Finance Corp.
7.250% due 02/01/17 1,365 1,649
WM Wrigley Jr Co.
3.050% due 06/28/13 (Þ) 400 407
Yum! Brands, Inc.
4.250% due 09/15/15 1,570 1,705
ZFS Finance USA Trust II
6.450% due 12/15/65 (Þ) 1,100 1,034
143,445
International Debt - 11.3%Abu Dhabi National Energy Co.
4.125% due 03/13/17 (Þ) 920 932
AK Transneft OJSC Via
TransCapitalInvest, Ltd.
7.700% due 08/07/13 (Þ) 1,100 1,182
America Movil SAB de CV
5.000% due 10/16/19 1,150 1,294
Copyright © 2012 www.secdatabase.com. All Rights Reserved.Please Consider the Environment Before Printing This Document

Table of Contents
Russell Investment CompanyRussell Short Duration Bond FundSchedule of Investments, continued �� January 31, 2012 (Unaudited)Amounts in thousands (except share amounts)
Principal
Amount ($)
or Shares
Market
Value
$
American International Group, Inc.
1.388% due 07/19/13 (Ê) 2,900 3,567
Series MPLE
4.900% due 06/02/14 3,000 2,971
ANZ National International, Ltd.
6.200% due 07/19/13 (Þ) 200 211
ArcelorMittal
3.750% due 08/05/15 1,605 1,623
5.250% due 08/05/20 420 411
Babson CLO, Ltd.
Series 2004-2A Class A2A
0.777% due 11/15/16 (Ê)(Þ) 569 554
Banco Bradesco SA
2.561% due 05/16/14 (Ê)(Þ) 2,100 2,048
Banco do Brasil SA
4.500% due 01/22/15 (Þ) 300 310
Banco do Nordeste do Brasil SA
3.625% due 11/09/15 (Þ) 600 597
Banco Mercantil del Norte SA
4.375% due 07/19/15 (Þ) 500 508
Banco Santander Chile
3.750% due 09/22/15 (Þ) 1,000 1,008
Bank of Montreal
2.500% due 01/11/17 1,350 1,371
Bank of Nova Scotia
2.550% due 01/12/17 590 601
Bank of Tokyo-Mitsubishi UFJ,
Ltd.
3.850% due 01/22/15 (Þ) 600 637
Banque PSA Finance SA
Series 144a
2.481% due 04/04/14 (Ê)(Þ) 800 726
BHP Billiton Finance USA, Ltd.
5.500% due 04/01/14 200 221
BNP Paribas SA
Principal
Amount ($)
or Shares
Market
Value
$
Credit Agricole Home Loan SFH
1.311% due 07/21/14 (Ê)(Þ) 1,800 1,725
Credit Agricole SA
2.011% due 01/21/14 (Ê)(Þ) 1,600 1,512
DanFin Funding, Ltd.
1.267% due 07/16/13 (Ê)(Þ) 3,000 3,032
Deutsche Telekom International
Finance BV
5.250% due 07/22/13 2,000 2,104
Dexia Credit Local NY
0.927% due 03/05/13 (Ê)(Þ) 2,800 2,661
Dexia Credit Local SA
1.033% due 04/29/14 (Ê)(Þ) 1,400 1,274
Digicel Group, Ltd.
8.875% due 01/15/15 (Þ) 190 191
9.125% due 01/15/15 (Þ) 1,280 1,293
Dryden Leveraged Loan CDO
2002-II
Series 2005-8A Class A
0.738% due 05/22/17 (Ê)(Þ) 880 843
Eksportfinans ASA
2.375% due 05/25/16 1,740 1,498
FIH Erhvervsbank A/S
0.912% due 06/13/13 (Ê)(Þ) 4,900 4,896
Gazprom OAO Via Gaz Capital SA
7.510% due 07/31/13 (Þ) 600 641
Goldman Sachs Group, Inc. (The)
1.884% due 02/04/13 (Ê) 200 258
6.125% due 02/14/17 100 166
Series REGS
4.500% due 05/09/16 100 132
HSBC Finance Corp.
1.583% due 04/05/13 (Ê) 2,000 2,563
Hutchison Whampoa International
09/19, Ltd.
5.750% due 09/11/19 (Þ) 685 763
Copyright © 2012 www.secdatabase.com. All Rights Reserved.Please Consider the Environment Before Printing This Document
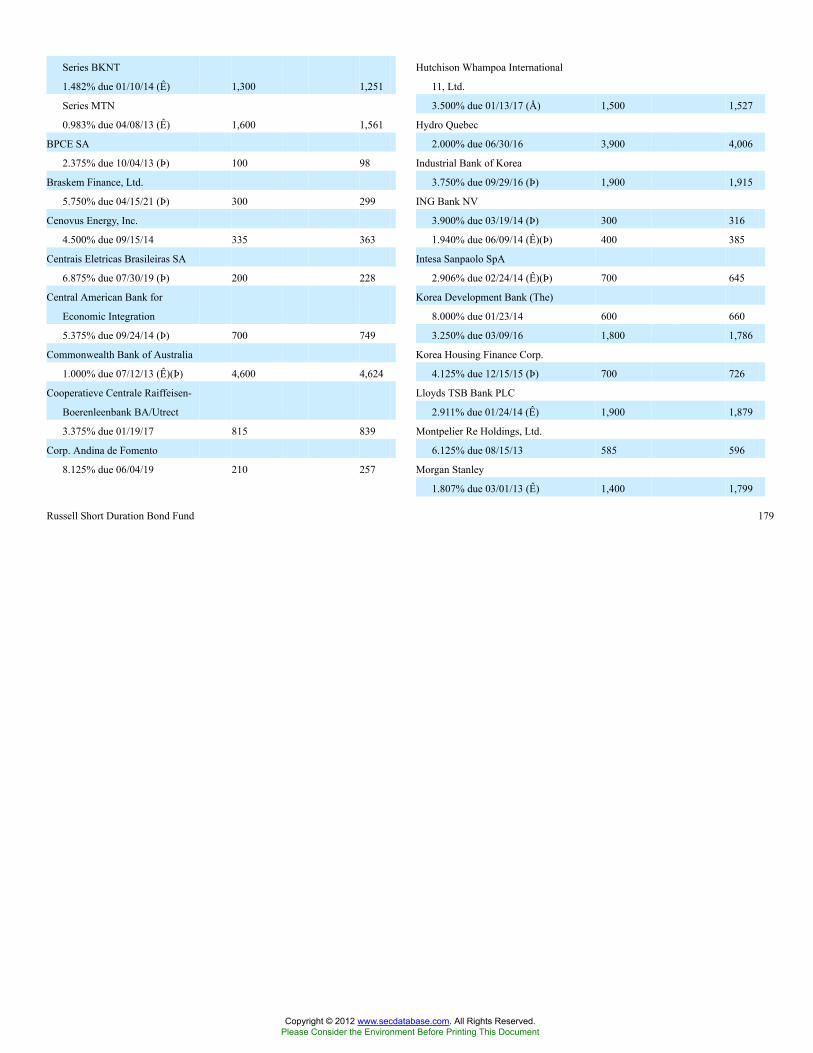
Russell Short Duration Bond Fund 179
Series BKNT
1.482% due 01/10/14 (Ê) 1,300 1,251
Series MTN
0.983% due 04/08/13 (Ê) 1,600 1,561
BPCE SA
2.375% due 10/04/13 (Þ) 100 98
Braskem Finance, Ltd.
5.750% due 04/15/21 (Þ) 300 299
Cenovus Energy, Inc.
4.500% due 09/15/14 335 363
Centrais Eletricas Brasileiras SA
6.875% due 07/30/19 (Þ) 200 228
Central American Bank for
Economic Integration
5.375% due 09/24/14 (Þ) 700 749
Commonwealth Bank of Australia
1.000% due 07/12/13 (Ê)(Þ) 4,600 4,624
Cooperatieve Centrale Raiffeisen-
Boerenleenbank BA/Utrect
3.375% due 01/19/17 815 839
Corp. Andina de Fomento
8.125% due 06/04/19 210 257
Hutchison Whampoa International
11, Ltd.
3.500% due 01/13/17 (Å) 1,500 1,527
Hydro Quebec
2.000% due 06/30/16 3,900 4,006
Industrial Bank of Korea
3.750% due 09/29/16 (Þ) 1,900 1,915
ING Bank NV
3.900% due 03/19/14 (Þ) 300 316
1.940% due 06/09/14 (Ê)(Þ) 400 385
Intesa Sanpaolo SpA
2.906% due 02/24/14 (Ê)(Þ) 700 645
Korea Development Bank (The)
8.000% due 01/23/14 600 660
3.250% due 03/09/16 1,800 1,786
Korea Housing Finance Corp.
4.125% due 12/15/15 (Þ) 700 726
Lloyds TSB Bank PLC
2.911% due 01/24/14 (Ê) 1,900 1,879
Montpelier Re Holdings, Ltd.
6.125% due 08/15/13 585 596
Morgan Stanley
1.807% due 03/01/13 (Ê) 1,400 1,799
Copyright © 2012 www.secdatabase.com. All Rights Reserved.Please Consider the Environment Before Printing This Document

Table of Contents
Russell Investment CompanyRussell Short Duration Bond FundSchedule of Investments, continued �� January 31, 2012 (Unaudited)Amounts in thousands (except share amounts)
Principal
Amount ($)
or Shares
Market
Value
$
Series GMTN
1.651% due 01/16/17 (Ê) 200 220
5.750% due 02/14/17 100 161
National Australia Bank, Ltd.
1.301% due 04/11/14 (Ê)(Þ) 2,800 2,760
Nordea Eiendomskreditt AS
1.003% due 04/07/14 (Ê)(Þ) 1,300 1,260
Norske Skogindustrier ASA
6.125% due 10/15/15 (Þ) 535 350
PE Paper Escrow GmbH
12.000% due 08/01/14 (Þ) 400 434
Pernod-Ricard SA
2.950% due 01/15/17 (Å) 2,070 2,107
Petroleum Co. of Trinidad &
Tobago, Ltd.
6.000% due 05/08/22 (Þ) 2,625 2,592
Province of Ontario Canada
1.600% due 09/21/16 14,500 14,622
Qatar Government International
Bond
3.125% due 01/20/17 (Þ) 2,375 2,411
Qatari Diar Finance QSC
3.500% due 07/21/15 (Þ) 1,400 1,453
Qtel International Finance, Ltd.
3.375% due 10/14/16 (Þ) 2,800 2,818
5.000% due 10/19/25 (Þ) 700 705
RCI Banque SA
Series 144a
2.451% due 04/11/14 (Ê)(Þ) 1,800 1,649
SABMiller PLC
5.500% due 08/15/13 (Þ) 1,145 1,213
Shell International Finance BV
3.100% due 06/28/15 1,700 1,833
SLM Corp.
1.756% due 06/17/13 (Ê) 100 123
SLM Student Loan Trust
Principal
Amount ($)
or Shares
Market
Value
$
VimpelCom Holdings BV
7.504% due 03/01/22 (Þ) 365 343
Volvo Treasury AB
5.950% due 04/01/15 (Þ) 1,135 1,214
Waha Aerospace BV
3.925% due 07/28/20 (Þ) 1,530 1,564
Westpac Banking Corp.
1.309% due 03/31/14 (Ê)(Þ) 1,400 1,379
Willis Group Holdings PLC
4.125% due 03/15/16 535 548
XL Group PLC
5.250% due 09/15/14 1,101 1,163
127,894
Loan Agreements - 0.0%Newsday LLC Term Loan B
10.500% due 08/01/13 275 283
Mortgage-Backed Securities - 46.0%American Home Mortgage
Investment Trust
Series 2004-3 Class 5A
2.566% due 10/25/34 (Ê) 647 560
Series 2004-4 Class 4A
2.746% due 02/25/45 (Ê) 236 179
Asset Securitization Corp.
Series 1997-D5 Class A3
7.133% due 02/14/43 295 301
Banc of America Funding Corp.
Series 2005-D Class A1
2.682% due 05/25/35 (Ê) 3,525 3,368
Series 2006-2 Class 2A18
5.750% due 03/25/36 1,076 1,036
Series 2006-A Class 1A1
2.655% due 02/20/36 (Ê) 866 718
Copyright © 2012 www.secdatabase.com. All Rights Reserved.Please Consider the Environment Before Printing This Document

180 Russell Short Duration Bond Fund
Series 2004-5X Class A5
1.418% due 10/25/23 (Ê) 1,800 2,118
SMART Trust
Series 2011-2USA Class A4A
2.310% due 04/14/17 (Þ) 1,825 1,850
SMART Trust/Australia
Series 2011-4USA Class A3A
1.810% due 11/14/15 (Þ) 3,000 3,012
Societe Financement de l�Economie
Francaise
3.375% due 05/05/14 (Þ) 1,300 1,352
Statoil ASA
1.800% due 11/23/16 405 414
Telefonica Emisiones SAU
2.582% due 04/26/13 390 386
Telefonos de Mexico SAB de CV
5.500% due 01/27/15 845 923
Transocean, Inc.
5.050% due 12/15/16 825 884
Tyco International Finance SA
4.125% due 10/15/14 680 728
Vedanta Resources PLC
6.750% due 06/07/16 (Þ) 535 472
Series 2006-F Class 1A2
2.736% due 07/20/36 (Ê) 77 17
Series 2006-I Class 5A1
5.965% due 10/20/46 (Ê) 444 343
Banc of America Merrill Lynch
Commercial Mortgage, Inc.
Series 2002-2 Class F
5.487% due 07/11/43 1,505 1,516
Series 2002-PB2 Class A4
6.186% due 06/11/35 91 91
Series 2002-PB2 Class C
6.349% due 06/11/35 155 155
Series 2003-1 Class D
4.903% due 09/11/36 (Þ) 460 465
Series 2003-1 Class SBB
5.860% due 03/11/32 (Þ) 885 924
Series 2003-1 Class SBC
5.790% due 03/11/32 (Þ) 980 1,022
Series 2003-1 Class SBE
6.770% due 03/11/32 (Þ) 1,112 1,175
Copyright © 2012 www.secdatabase.com. All Rights Reserved.Please Consider the Environment Before Printing This Document

Table of Contents
Russell Investment CompanyRussell Short Duration Bond FundSchedule of Investments, continued �� January 31, 2012 (Unaudited)Amounts in thousands (except share amounts)
Principal
Amount ($)
or Shares
Market
Value
$
Series 2005-1 Class A3
4.877% due 11/10/42 329 329
Series 2005-1 Class A4
5.237% due 11/10/42 1,815 1,876
Series 2005-3 Class A2
4.501% due 07/10/43 230 229
Series 2006-1 Class A2
5.334% due 09/10/45 2,016 2,033
Series 2007-1 Class A2
5.381% due 01/15/49 132 132
Series 2007-2 Class AAB
5.757% due 04/10/49 460 499
Banc of America Mortgage
Securities, Inc.
Series 2004-2 Class 5A1
6.500% due 10/25/31 43 45
Series 2004-I Class 2A2
2.753% due 10/25/34 (Ê) 1,698 1,514
Series 2004-L Class 1A1
2.958% due 01/25/35 (Ê) 31 24
Bear Stearns Adjustable Rate
Mortgage Trust
Series 2003-1 Class 5A1
5.579% due 04/25/33 134 128
Series 2003-8 Class 2A1
2.918% due 01/25/34 (Ê) 128 119
Series 2005-6 Class 1A1
2.732% due 08/25/35 163 94
Bear Stearns Alt-A Trust
Series 2005-4 Class 23A1
2.605% due 05/25/35 582 429
Series 2005-7 Class 22A1
2.807% due 09/25/35 37 23
Bear Stearns Asset Backed
Securities Trust
Principal
Amount ($)
or Shares
Market
Value
$
Series 2007-R6 Class 2A1
3.230% due 12/26/46 1,492 881
Chase Commercial Mortgage
Securities Corp.
Series 1997-1 Class F
7.370% due 06/19/29 (Þ) 78 79
Series 1998-1 Class F
6.560% due 05/18/30 (Þ) 3,457 3,584
Chase Mortgage Finance Corp.
Series 2007-A1 Class 8A1
2.739% due 02/25/37 299 301
Citicorp Mortgage Securities, Inc.
Series 2005-7 Class 1A1
5.500% due 10/25/35 341 343
Citigroup Mortgage Loan Trust,
Inc.
Series 2007-10 Class 2A3A
5.912% due 09/25/37 127 78
Commercial Mortgage Acceptance
Corp.
Series 1998-C2 Class F
5.440% due 09/15/30 (Þ) 695 724
Commercial Mortgage Asset Trust
Series 1999-C1 Class D
7.350% due 01/17/32 650 704
Series 1999-C2 Class E
7.640% due 11/17/32 50 54
Commercial Mortgage Pass
Through Certificates
Series 2003-LB1A Class A2
4.084% due 06/10/38 1,520 1,561
Series 2006-C7 Class A2
5.690% due 06/10/46 4 4
Series 2006-C8 Class A4
5.306% due 12/10/46 400 444
Series 2011-THL Class A
3.376% due 06/09/28 (Þ) 930 956
Copyright © 2012 www.secdatabase.com. All Rights Reserved.Please Consider the Environment Before Printing This Document

Russell Short Duration Bond Fund 181
Series 2003-AC3 Class A1
4.500% due 07/25/33 165 161
Bear Stearns Commercial
Mortgage Securities
Series 2003-T10 Class A1
4.000% due 03/13/40 92 92
Series 2003-T12 Class A3
4.240% due 08/13/39 6 6
Series 2003-T12 Class B
4.891% due 08/13/39 465 478
Series 2003-T12 Class C
5.011% due 08/13/39 945 937
Series 2005-PWR7 Class A3
5.116% due 02/11/41 330 361
Series 2005-PWR8 Class A3
4.550% due 06/11/41 167 167
Series 2005-T20 Class A2
5.127% due 10/12/42 425 425
Series 2006-PW11 Class A1
5.266% due 03/11/39 144 144
Series 2007-T26 Class A4
5.471% due 01/12/45 100 114
Bear Stearns Structured Products,
Inc.
Series 2007-R6 Class 1A1
2.580% due 01/26/36 179 105
Community Program Loan Trust
Series 1987-A Class A4
4.500% due 10/01/18 127 128
Countrywide Alternative Loan
Trust
Series 2003-J2 Class A1
6.000% due 10/25/33 100 97
Series 2005-48T1 Class A6
5.500% due 11/25/35 2,692 1,710
Series 2006-36T2 Class 1A9
1.176% due 12/25/36 (Ê) 677 314
Countrywide Home Loan Mortgage
Pass Through Trust
Series 2004-22 Class A3
2.751% due 11/25/34 159 118
Series 2004-HYB9 Class 1A1
2.774% due 02/20/35 278 220
Series 2005-HYB9 Class 5A1
2.610% due 02/20/36 (Ê) 628 368
Series 2005-R2 Class 2A4
8.500% due 06/25/35 (Þ) 158 162
Series 2006-1 Class A2
6.000% due 03/25/36 743 575
Copyright © 2012 www.secdatabase.com. All Rights Reserved.Please Consider the Environment Before Printing This Document
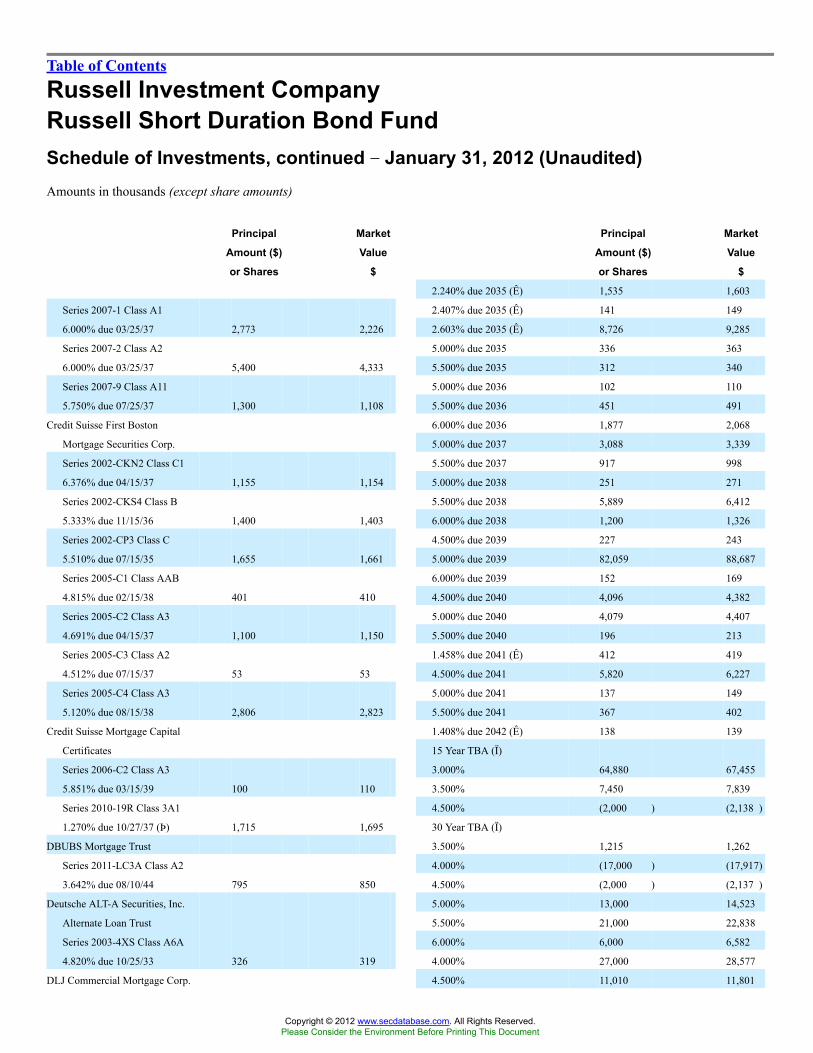
Table of Contents
Russell Investment CompanyRussell Short Duration Bond FundSchedule of Investments, continued �� January 31, 2012 (Unaudited)Amounts in thousands (except share amounts)
Principal
Amount ($)
or Shares
Market
Value
$
Series 2007-1 Class A1
6.000% due 03/25/37 2,773 2,226
Series 2007-2 Class A2
6.000% due 03/25/37 5,400 4,333
Series 2007-9 Class A11
5.750% due 07/25/37 1,300 1,108
Credit Suisse First Boston
Mortgage Securities Corp.
Series 2002-CKN2 Class C1
6.376% due 04/15/37 1,155 1,154
Series 2002-CKS4 Class B
5.333% due 11/15/36 1,400 1,403
Series 2002-CP3 Class C
5.510% due 07/15/35 1,655 1,661
Series 2005-C1 Class AAB
4.815% due 02/15/38 401 410
Series 2005-C2 Class A3
4.691% due 04/15/37 1,100 1,150
Series 2005-C3 Class A2
4.512% due 07/15/37 53 53
Series 2005-C4 Class A3
5.120% due 08/15/38 2,806 2,823
Credit Suisse Mortgage Capital
Certificates
Series 2006-C2 Class A3
5.851% due 03/15/39 100 110
Series 2010-19R Class 3A1
1.270% due 10/27/37 (Þ) 1,715 1,695
DBUBS Mortgage Trust
Series 2011-LC3A Class A2
3.642% due 08/10/44 795 850
Deutsche ALT-A Securities, Inc.
Alternate Loan Trust
Series 2003-4XS Class A6A
4.820% due 10/25/33 326 319
DLJ Commercial Mortgage Corp.
Principal
Amount ($)
or Shares
Market
Value
$
2.240% due 2035 (Ê) 1,535 1,603
2.407% due 2035 (Ê) 141 149
2.603% due 2035 (Ê) 8,726 9,285
5.000% due 2035 336 363
5.500% due 2035 312 340
5.000% due 2036 102 110
5.500% due 2036 451 491
6.000% due 2036 1,877 2,068
5.000% due 2037 3,088 3,339
5.500% due 2037 917 998
5.000% due 2038 251 271
5.500% due 2038 5,889 6,412
6.000% due 2038 1,200 1,326
4.500% due 2039 227 243
5.000% due 2039 82,059 88,687
6.000% due 2039 152 169
4.500% due 2040 4,096 4,382
5.000% due 2040 4,079 4,407
5.500% due 2040 196 213
1.458% due 2041 (Ê) 412 419
4.500% due 2041 5,820 6,227
5.000% due 2041 137 149
5.500% due 2041 367 402
1.408% due 2042 (Ê) 138 139
15 Year TBA (Ï)
3.000% 64,880 67,455
3.500% 7,450 7,839
4.500% (2,000 ) (2,138 )
30 Year TBA (Ï)
3.500% 1,215 1,262
4.000% (17,000 ) (17,917)
4.500% (2,000 ) (2,137 )
5.000% 13,000 14,523
5.500% 21,000 22,838
6.000% 6,000 6,582
4.000% 27,000 28,577
4.500% 11,010 11,801
Copyright © 2012 www.secdatabase.com. All Rights Reserved.Please Consider the Environment Before Printing This Document

182 Russell Short Duration Bond Fund
Series 2000-CKP1 Class B1
7.950% due 11/10/33 75 76
Fannie Mae
5.000% due 2013 49 52
6.000% due 2013 22 24
4.000% due 2014 317 336
6.000% due 2014 94 100
5.500% due 2016 253 275
5.500% due 2017 415 452
6.000% due 2017 48 51
7.000% due 2017 52 57
4.000% due 2018 1,321 1,410
7.000% due 2022 748 790
4.500% due 2023 2,545 2,724
4.000% due 2024 74 79
4.500% due 2024 2,787 2,982
4.000% due 2025 1,285 1,363
4.000% due 2026 1,777 1,887
5.000% due 2028 281 304
2.356% due 2033 (Ê) 47 50
5.000% due 2033 536 579
5.000% due 2034 796 861
5.000% 7,838 8,475
5.500% 1,248 1,361
Fannie Mae Grantor Trust
Series 2001-T3 Class A1
7.500% due 11/25/40 317 374
Series 2001-T4 Class A1
7.500% due 07/25/41 871 1,025
Series 2001-T8 Class A2
9.500% due 07/25/41 24 28
Series 2001-T10 Class A1
7.000% due 12/25/41 67 74
Series 2001-T10 Class A2
7.500% due 12/25/41 1,273 1,485
Series 2002-T4 Class A3
7.500% due 12/25/41 11 13
Series 2002-T19 Class A1
6.500% due 07/25/42 559 640
Series 2004-T1 Class 1A2
6.500% due 01/25/44 1,060 1,194
Series 2004-T2 Class 1A3
7.000% due 11/25/43 907 1,020
Copyright © 2012 www.secdatabase.com. All Rights Reserved.Please Consider the Environment Before Printing This Document
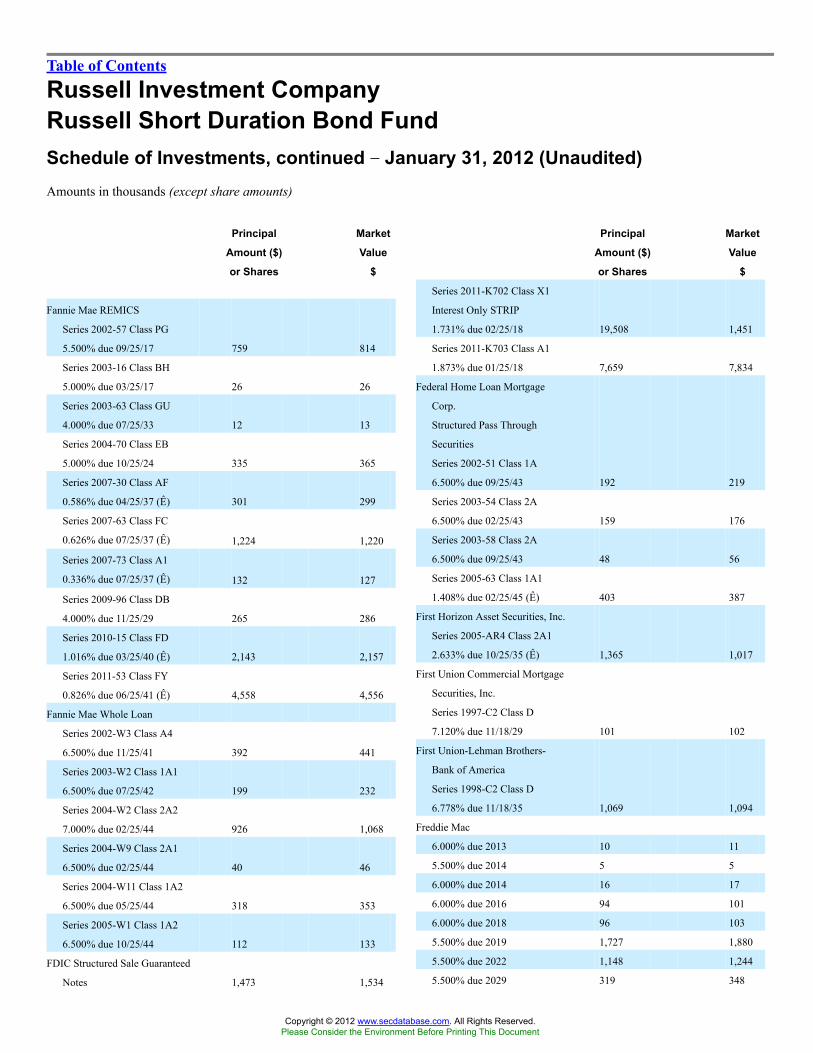
Table of Contents
Russell Investment CompanyRussell Short Duration Bond FundSchedule of Investments, continued �� January 31, 2012 (Unaudited)Amounts in thousands (except share amounts)
Principal
Amount ($)
or Shares
Market
Value
$
Fannie Mae REMICS
Series 2002-57 Class PG
5.500% due 09/25/17 759 814
Series 2003-16 Class BH
5.000% due 03/25/17 26 26
Series 2003-63 Class GU
4.000% due 07/25/33 12 13
Series 2004-70 Class EB
5.000% due 10/25/24 335 365
Series 2007-30 Class AF
0.586% due 04/25/37 (Ê) 301 299
Series 2007-63 Class FC
0.626% due 07/25/37 (Ê) 1,224 1,220
Series 2007-73 Class A1
0.336% due 07/25/37 (Ê) 132 127
Series 2009-96 Class DB
4.000% due 11/25/29 265 286
Series 2010-15 Class FD
1.016% due 03/25/40 (Ê) 2,143 2,157
Series 2011-53 Class FY
0.826% due 06/25/41 (Ê) 4,558 4,556
Fannie Mae Whole Loan
Series 2002-W3 Class A4
6.500% due 11/25/41 392 441
Series 2003-W2 Class 1A1
6.500% due 07/25/42 199 232
Series 2004-W2 Class 2A2
7.000% due 02/25/44 926 1,068
Series 2004-W9 Class 2A1
6.500% due 02/25/44 40 46
Series 2004-W11 Class 1A2
6.500% due 05/25/44 318 353
Series 2005-W1 Class 1A2
6.500% due 10/25/44 112 133
FDIC Structured Sale Guaranteed
Notes 1,473 1,534
Principal
Amount ($)
or Shares
Market
Value
$
Series 2011-K702 Class X1
Interest Only STRIP
1.731% due 02/25/18 19,508 1,451
Series 2011-K703 Class A1
1.873% due 01/25/18 7,659 7,834
Federal Home Loan Mortgage
Corp.
Structured Pass Through
Securities
Series 2002-51 Class 1A
6.500% due 09/25/43 192 219
Series 2003-54 Class 2A
6.500% due 02/25/43 159 176
Series 2003-58 Class 2A
6.500% due 09/25/43 48 56
Series 2005-63 Class 1A1
1.408% due 02/25/45 (Ê) 403 387
First Horizon Asset Securities, Inc.
Series 2005-AR4 Class 2A1
2.633% due 10/25/35 (Ê) 1,365 1,017
First Union Commercial Mortgage
Securities, Inc.
Series 1997-C2 Class D
7.120% due 11/18/29 101 102
First Union-Lehman Brothers-
Bank of America
Series 1998-C2 Class D
6.778% due 11/18/35 1,069 1,094
Freddie Mac
6.000% due 2013 10 11
5.500% due 2014 5 5
6.000% due 2014 16 17
6.000% due 2016 94 101
6.000% due 2018 96 103
5.500% due 2019 1,727 1,880
5.500% due 2022 1,148 1,244
5.500% due 2029 319 348
Copyright © 2012 www.secdatabase.com. All Rights Reserved.Please Consider the Environment Before Printing This Document

Russell Short Duration Bond Fund 183
Series 2010-C1 Class A
2.980% due 12/06/20 (Þ)
Series 2010-L2A Class A
3.000% due 09/30/19 (Þ) 1,222 1,229
Series 2010-S1 Class 1A
0.845% due 02/25/48 (Ê)(Þ) 583 582
FDIC Trust
Series 2010-R1 Class A
2.184% due 05/25/50 (Þ) 1,382 1,380
Series 2011-R1 Class A
2.672% due 07/25/26 (Þ) 2,018 2,065
Federal Home Loan Mortgage
Corp.
Multifamily Structured Pass
Through Certificates
Series 2009-K003 Class A3
4.324% due 12/25/15 875 965
Series 2011-K014 Class X1
Interest Only STRIP
1.453% due 04/25/21 5,334 453
Series 2011-K015 Class X1
Interest Only STRIP
1.848% due 07/25/21 2,985 336
6.000% due 2029 32 36
6.000% due 2031 81 90
6.000% due 2033 173 193
2.494% due 2035 (Ê) 265 281
5.500% due 2038 774 840
5.500% due 2039 616 668
30 Year TBA (Ï)
4.500% 2,000 2,128
Freddie Mac REMICS
Series 2003-2559 Class PB
5.500% due 08/15/30 2 2
Series 2003-2614 Class JA
3.760% due 03/15/29 86 86
Series 2003-2632 Class AB
4.500% due 06/15/18 1,205 1,339
Series 2003-2657 Class WT
4.500% due 08/15/18 810 864
Series 2003-2662 Class MA
4.500% due 10/15/31 8 8
Series 2006-3149 Class LF
0.590% due 05/15/36 (Ê) 345 344
Harborview Mortgage Loan Trust
Series 2005-4 Class 3A1
2.775% due 07/19/35 880 593
Copyright © 2012 www.secdatabase.com. All Rights Reserved.Please Consider the Environment Before Printing This Document

Table of Contents
Russell Investment CompanyRussell Short Duration Bond FundSchedule of Investments, continued �� January 31, 2012 (Unaudited)Amounts in thousands (except share amounts)
Principal
Amount ($)
or Shares
Market
Value
$
Series 2006-3173 Class PE
6.000% due 04/15/35 265 288
Series 2007-3335 Class BF
0.440% due 07/15/19 (Ê) 122 121
Series 2007-3335 Class FT
0.440% due 08/15/19 (Ê) 320 319
Series 2008-3414 Class JB
4.500% due 02/15/23 360 402
Series 2010-3640 Class JA
1.500% due 03/15/15 1,375 1,381
Series 2010-3704 Class DC
4.000% due 11/15/36 485 518
Series 2011-3898 Class AF
0.860% due 06/15/41 (Ê) 5,669 5,668
FREMF Mortgage Trust
Series 2011-K14 Class B
5.332% due 02/25/47 (Þ) 400 377
Series 2011-K702 Class B
4.936% due 04/25/44 (Þ) 500 482
GE Capital Commercial Mortgage
Corp.
Series 2002-1A Class A3
6.269% due 12/10/35 22 22
Series 2003-C1 Class A4
4.819% due 01/10/38 1,032 1,060
Series 2003-C2 Class F
5.705% due 07/10/37 (Þ) 135 137
Series 2005-C3 Class A4
5.046% due 07/10/45 2,163 2,163
Ginnie Mae I
9.500% due 2017 � �
Ginnie Mae II
1.625% due 2027 (Ê) 36 37
2.000% due 2032 (Ê) 52 54
4.502% due 2061 755 833
4.700% due 2061 1,880 2,115
Principal
Amount ($)
or Shares
Market
Value
$
Greenpoint Mortgage Funding
Trust
Series 2006-AR8 Class 1A1A
0.356% due 01/25/47 (Ê) 39 37
Greenpoint Mortgage Pass-
Through Certificates
Series 2003-1 Class A1
2.801% due 10/25/33 (Ê) 177 145
Greenwich Capital Commercial
Funding Corp.
Series 2005-GG3 Class A2
4.305% due 08/10/42 107 107
Series 2007-GG9 Class A2
5.381% due 03/10/39 518 520
Series 2007-GG9 Class A4
5.444% due 03/10/39 100 110
GS Mortgage Securities Corp. II
Series 2004-GG2 Class A4
4.964% due 08/10/38 2,787 2,822
Series 2005-GG4 Class A2
4.475% due 07/10/39 433 433
Series 2006-GG8 Class A2
5.479% due 11/10/39 227 228
Series 2011-ALF Class A
2.716% due 02/10/21 (Þ) 1,075 1,085
Series 2012-GC6 Class A2
2.539% due 01/10/45 805 821
GSMPS Mortgage Loan Trust
Series 1998-1 Class A
8.000% due 09/19/27 (Þ) 64 66
Series 1998-2 Class A
7.750% due 05/19/27 (Þ) 302 315
Series 1998-3 Class A
7.750% due 09/19/27 (Þ) 15 16
Series 1999-3 Class A
8.000% due 08/19/29 (Þ) 24 24
Copyright © 2012 www.secdatabase.com. All Rights Reserved.Please Consider the Environment Before Printing This Document

184 Russell Short Duration Bond Fund
GMAC Commercial Mortgage
Securities, Inc.
Series 2001-C1 Class D
7.034% due 04/15/34 83 83
Series 2001-C2 Class C
6.870% due 04/15/34 285 285
Series 2002-C3 Class B
5.101% due 07/10/39 1,485 1,511
Series 2004-C3 Class A4
4.547% due 12/10/41 744 750
Government National Mortgage
Association
Series 2006-67 Class A
3.947% due 11/16/30 338 343
Series 2007-4 Class A
4.206% due 06/16/29 294 299
Series 2010-14 Class A
4.500% due 06/16/39 444 485
Series 2011-127 Class IO
Interest Only STRIP
1.563% due 03/16/47 8,954 715
Series 2011-H21 Class HI
Interest Only STRIP
1.789% due 11/20/61 10,027 777
Series 2005-RP1 Class 1A3
8.000% due 01/25/35 (Þ) 426 437
Series 2005-RP1 Class 1A4
8.500% due 01/25/35 (Þ) 248 260
Series 2006-RP1 Class 1A2
7.500% due 01/25/36 (Þ) 467 466
Series 2006-RP1 Class 1A3
8.000% due 01/25/36 (Þ) 129 131
GSR Mortgage Loan Trust
Series 2004-7 Class 1A1
2.429% due 06/25/34 247 203
Series 2005-AR6 Class 2A1
2.658% due 09/25/35 (Ê) 366 316
Series 2006-2F Class 3A3
6.000% due 02/25/36 2,586 1,897
Series 2006-3F Class 2A3
5.750% due 03/25/36 650 581
Series 2006-8F Class 4A17
6.000% due 09/25/36 1,231 1,037
Series 2007-AR1 Class 1A1
2.799% due 03/25/37 3,615 2,081
Copyright © 2012 www.secdatabase.com. All Rights Reserved.Please Consider the Environment Before Printing This Document

Table of Contents
Russell Investment CompanyRussell Short Duration Bond FundSchedule of Investments, continued �� January 31, 2012 (Unaudited)Amounts in thousands (except share amounts)
Principal
Amount ($)
or Shares
Market
Value
$
JP Morgan Chase Commercial
Mortgage Securities Corp.
Series 2001-CIB2 Class D
6.847% due 04/15/35 103 103
Series 2001-CIBC Class E
7.167% due 03/15/33 19 19
Series 2002-C2 Class B
5.211% due 12/12/34 761 772
Series 2002-C3 Class B
5.146% due 07/12/35 465 471
Series 2002-CIB4 Class A3
6.162% due 05/12/34 123 124
Series 2003-C1 Class A2
4.985% due 01/12/37 480 493
Series 2003-C1 Class B
5.095% due 01/12/37 175 177
Series 2007-LD12 Class A4
5.882% due 02/15/51 100 112
JP Morgan Mortgage Trust
Series 2004-A2 Class 1A1
2.752% due 05/25/34 301 278
Series 2005-A1 Class 6T1
5.019% due 02/25/35 (Ê) 20 19
Series 2005-A3 Class 3A3
4.831% due 06/25/35 288 284
Series 2005-A4 Class 1A1
5.313% due 07/25/35 156 153
Series 2006-A6 Class 1A2
2.768% due 10/25/36 36 27
JP Morgan Reremic
Series 2009-7 Class 2A1
6.000% due 02/27/37 (Þ) 1,026 1,040
JPMorgan Chase Commercial
Mortgage Securities Corp.
Series 2010-CNTR Class A2
4.311% due 08/05/32 (Þ) 595 633
Principal
Amount ($)
or Shares
Market
Value
$
Mastr Adjustable Rate Mortgages
Trust
Series 2005-1 Class B1
3.282% due 03/25/35 319 25
Series 2005-6 Class 7A1
5.398% due 06/25/35 47 47
Mastr Reperforming Loan Trust
Series 2005-1 Class 1A3
7.000% due 08/25/34 (Þ) 603 616
Series 2005-1 Class 1A5
8.000% due 08/25/34 (Þ) 393 406
Series 2005-2 Class 1A4
8.000% due 05/25/35 (Þ) 416 416
Mastr Specialized Loan Trust
Series 2005-2 Class A2
5.006% due 07/25/35 (Þ) 96 96
Mellon Residential Funding Corp.
Series 2000-TBC2 Class A1
0.765% due 06/15/30 (Ê) 391 348
Merrill Lynch Mortgage Investors,
Inc.
Series 1998-C1 Class A3
6.720% due 11/15/26 2,298 2,564
Series 1998-C3 Class E
7.008% due 12/15/30 3,650 3,865
Series 2005-A10 Class A
0.486% due 02/25/36 (Ê) 52 35
Merrill Lynch Mortgage Trust
Series 2003-KEY1 Class A4
5.236% due 11/12/35 3,000 3,178
Series 2005-CIP1 Class A2
4.960% due 07/12/38 160 162
Merrill Lynch/Countrywide
Commercial Mortgage Trust
Series 2007-6 Class A4
5.485% due 03/12/51 200 214
Copyright © 2012 www.secdatabase.com. All Rights Reserved.Please Consider the Environment Before Printing This Document

Russell Short Duration Bond Fund 185
LB Commercial Conduit Mortgage
Trust
Series 1998-C1 Class E
7.000% due 02/18/30 655 681
LB-UBS Commercial Mortgage
Trust
Series 2003-C7 Class A2
4.064% due 09/15/27 226 226
Series 2003-C8 Class D
5.237% due 09/15/37 470 483
Series 2004-C2 Class A3
3.973% due 03/15/29 125 127
Series 2004-C7 Class A1A
4.475% due 10/15/29 1,331 1,388
Series 2004-C7 Class A5
4.628% due 10/15/29 232 240
Series 2005-C1 Class A3
4.545% due 02/15/30 67 67
Lehman Mortgage Trust
Series 2005-2 Class 2A3
5.500% due 12/25/35 � 1
Series 2006-1 Class 3A3
5.500% due 02/25/36 105 105
MLCC Mortgage Investors, Inc.
Series 2005-1 Class 2A1
2.116% due 04/25/35 1,137 990
Series 2005-1 Class 2A2
2.116% due 04/25/35 593 540
Series 2005-3 Class 5A
0.526% due 11/25/35 (Ê) 95 71
Morgan Stanley Capital I
Series 1998-HF2 Class G
6.010% due 11/15/30 (Þ) 85 85
Morgan Stanley Dean Witter
Capital I
Series 2001-TOP1 Class E
7.741% due 02/15/33 (Þ) 55 54
Series 2001-TOP3 Class C
6.790% due 07/15/33 745 728
Series 2002-HQ Class B
6.640% due 04/15/34 900 903
Series 2002-IQ2 Class B
5.930% due 12/15/35 75 75
Series 2002-TOP7 Class B
6.080% due 01/15/39 1,100 1,105
NCUA Guaranteed Notes
Series 2010-R1 Class 2A
1.840% due 10/07/20 2,909 2,940
Copyright © 2012 www.secdatabase.com. All Rights Reserved.Please Consider the Environment Before Printing This Document

Table of Contents
Russell Investment CompanyRussell Short Duration Bond FundSchedule of Investments, continued �� January 31, 2012 (Unaudited)Amounts in thousands (except share amounts)
Principal
Amount ($)
or Shares
Market
Value
$
Series 2010-R3 Class 3A
2.400% due 12/08/20 913 933
Nomura Asset Acceptance Corp.
Series 2004-AR4 Class 1A1
2.405% due 12/25/34 782 737
Series 2005-WF1 Class 2A2
4.786% due 03/25/35 258 237
PNC Mortgage Acceptance Corp.
Series 1999-CM1 Class B5
7.100% due 12/10/32 (Þ) 272 272
Prime Mortgage Trust
Series 2004-CL1 Class 1A2
0.676% due 02/25/34 (Ê) 59 53
Series 2004-CL1 Class 2A2
0.676% due 02/25/19 (Ê) 5 5
Prudential Commercial Mortgage
Trust
Series 2003-PWR1 Class C
4.706% due 02/11/36 500 492
Series 2003-PWR1 Class E
5.259% due 02/11/36 (Þ) 180 174
Residential Accredit Loans, Inc.
Series 2005-QS14 Class 2A1
6.000% due 09/25/35 279 183
Residential Asset Securitization
Trust
Series 2005-A10 Class A3
5.500% due 09/25/35 679 554
Series 2006-A9CB Class A6
6.000% due 09/25/36 684 365
Residential Funding Mortgage
Securities I
Series 2006-S10 Class 1A7
6.000% due 10/25/36 653 534
Salomon Brothers Mortgage
Securities VII, Inc. 150 149
Principal
Amount ($)
or Shares
Market
Value
$
Suntrust Adjustable Rate Mortgage
Loan Trust
Series 2007-2 Class 3A3
5.511% due 04/25/37 (Ê) 5,786 4,121
Series 2005-6 Class B2
5.252% due 05/25/35 153 6
Suntrust Adjustable Rate Mortgage
Loan Trust
Series 2007-2 Class 3A3
5.511% due 04/25/37 (Ê) 5,786 4,121
Wachovia Bank Commercial
Mortgage Trust
Series 2003-C4 Class D
5.040% due 04/15/35 555 560
Series 2003-C5 Class B
4.107% due 06/15/35 110 110
Series 2003-C9 Class B
5.109% due 12/15/35 240 245
Series 2005-C22 Class A3
5.464% due 12/15/44 475 484
Series 2006-WL7A Class A1
0.375% due 09/15/21 (Ê)(Þ) 890 852
Series 2007-C31 Class A4
5.509% due 04/15/47 100 108
Series 2007-C33 Class A2
6.051% due 02/15/51 1,000 1,008
Washington Mutual Mortgage Pass
Through Certificates
Series 2002-AR6 Class A
1.597% due 06/25/42 (Ê) 58 44
Series 2002-AR9 Class 1A
1.597% due 08/25/42 (Ê) 160 122
Series 2003-AR7 Class A7
2.443% due 08/25/33 (Ê) 167 161
Series 2004-AR13 Class A2A
0.683% due 11/25/34 (Ê) 484 366
Copyright © 2012 www.secdatabase.com. All Rights Reserved.Please Consider the Environment Before Printing This Document
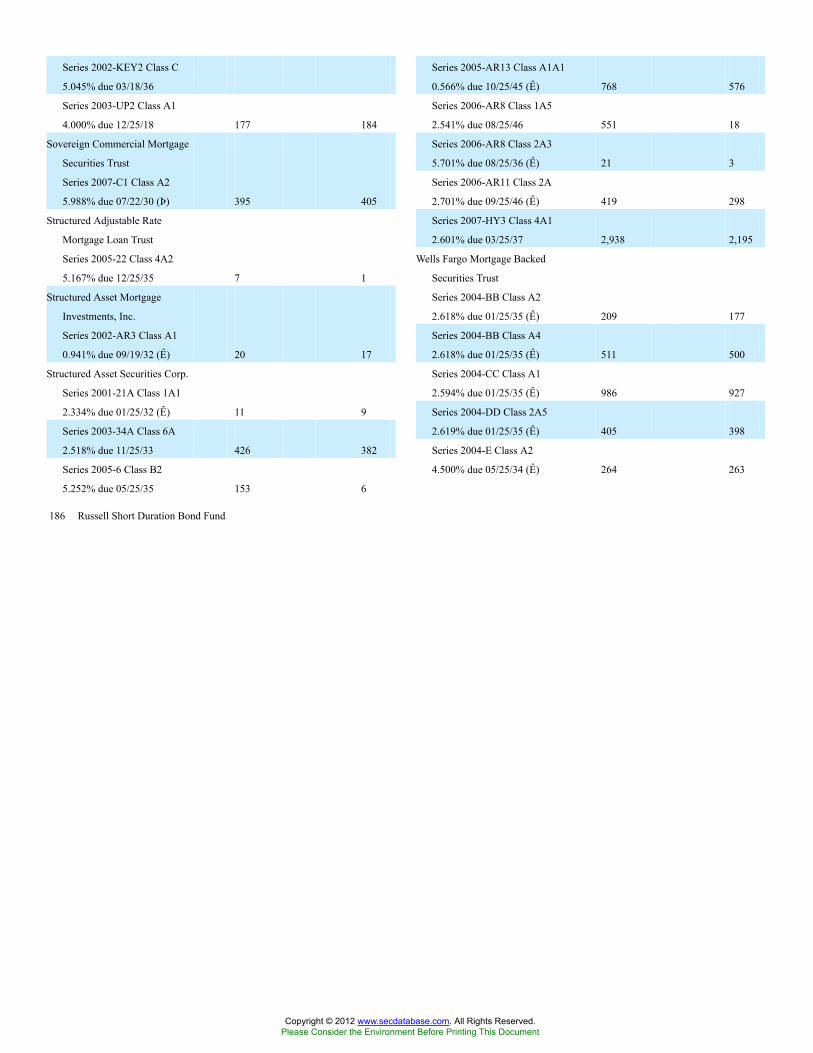
186 Russell Short Duration Bond Fund
Series 2002-KEY2 Class C
5.045% due 03/18/36
Series 2003-UP2 Class A1
4.000% due 12/25/18 177 184
Sovereign Commercial Mortgage
Securities Trust
Series 2007-C1 Class A2
5.988% due 07/22/30 (Þ) 395 405
Structured Adjustable Rate
Mortgage Loan Trust
Series 2005-22 Class 4A2
5.167% due 12/25/35 7 1
Structured Asset Mortgage
Investments, Inc.
Series 2002-AR3 Class A1
0.941% due 09/19/32 (Ê) 20 17
Structured Asset Securities Corp.
Series 2001-21A Class 1A1
2.334% due 01/25/32 (Ê) 11 9
Series 2003-34A Class 6A
2.518% due 11/25/33 426 382
Series 2005-6 Class B2
5.252% due 05/25/35 153 6
Series 2005-AR13 Class A1A1
0.566% due 10/25/45 (Ê) 768 576
Series 2006-AR8 Class 1A5
2.541% due 08/25/46 551 18
Series 2006-AR8 Class 2A3
5.701% due 08/25/36 (Ê) 21 3
Series 2006-AR11 Class 2A
2.701% due 09/25/46 (Ê) 419 298
Series 2007-HY3 Class 4A1
2.601% due 03/25/37 2,938 2,195
Wells Fargo Mortgage Backed
Securities Trust
Series 2004-BB Class A2
2.618% due 01/25/35 (Ê) 209 177
Series 2004-BB Class A4
2.618% due 01/25/35 (Ê) 511 500
Series 2004-CC Class A1
2.594% due 01/25/35 (Ê) 986 927
Series 2004-DD Class 2A5
2.619% due 01/25/35 (Ê) 405 398
Series 2004-E Class A2
4.500% due 05/25/34 (Ê) 264 263
Copyright © 2012 www.secdatabase.com. All Rights Reserved.Please Consider the Environment Before Printing This Document
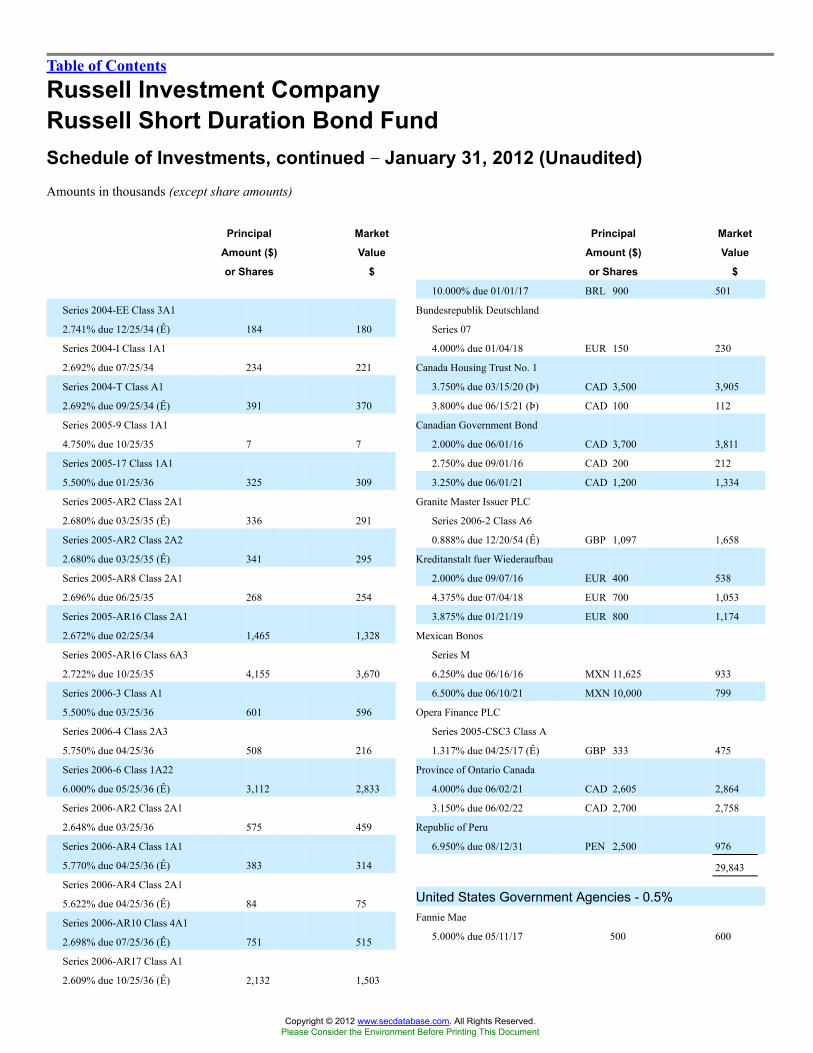
Table of Contents
Russell Investment CompanyRussell Short Duration Bond FundSchedule of Investments, continued �� January 31, 2012 (Unaudited)Amounts in thousands (except share amounts)
Principal
Amount ($)
or Shares
Market
Value
$
Series 2004-EE Class 3A1
2.741% due 12/25/34 (Ê) 184 180
Series 2004-I Class 1A1
2.692% due 07/25/34 234 221
Series 2004-T Class A1
2.692% due 09/25/34 (Ê) 391 370
Series 2005-9 Class 1A1
4.750% due 10/25/35 7 7
Series 2005-17 Class 1A1
5.500% due 01/25/36 325 309
Series 2005-AR2 Class 2A1
2.680% due 03/25/35 (Ê) 336 291
Series 2005-AR2 Class 2A2
2.680% due 03/25/35 (Ê) 341 295
Series 2005-AR8 Class 2A1
2.696% due 06/25/35 268 254
Series 2005-AR16 Class 2A1
2.672% due 02/25/34 1,465 1,328
Series 2005-AR16 Class 6A3
2.722% due 10/25/35 4,155 3,670
Series 2006-3 Class A1
5.500% due 03/25/36 601 596
Series 2006-4 Class 2A3
5.750% due 04/25/36 508 216
Series 2006-6 Class 1A22
6.000% due 05/25/36 (Ê) 3,112 2,833
Series 2006-AR2 Class 2A1
2.648% due 03/25/36 575 459
Series 2006-AR4 Class 1A1
5.770% due 04/25/36 (Ê) 383 314
Series 2006-AR4 Class 2A1
5.622% due 04/25/36 (Ê) 84 75
Series 2006-AR10 Class 4A1
2.698% due 07/25/36 (Ê) 751 515
Series 2006-AR17 Class A1
2.609% due 10/25/36 (Ê) 2,132 1,503
Principal
Amount ($)
or Shares
Market
Value
$
10.000% due 01/01/17 BRL 900 501
Bundesrepublik Deutschland
Series 07
4.000% due 01/04/18 EUR 150 230
Canada Housing Trust No. 1
3.750% due 03/15/20 (Þ) CAD 3,500 3,905
3.800% due 06/15/21 (Þ) CAD 100 112
Canadian Government Bond
2.000% due 06/01/16 CAD 3,700 3,811
2.750% due 09/01/16 CAD 200 212
3.250% due 06/01/21 CAD 1,200 1,334
Granite Master Issuer PLC
Series 2006-2 Class A6
0.888% due 12/20/54 (Ê) GBP 1,097 1,658
Kreditanstalt fuer Wiederaufbau
2.000% due 09/07/16 EUR 400 538
4.375% due 07/04/18 EUR 700 1,053
3.875% due 01/21/19 EUR 800 1,174
Mexican Bonos
Series M
6.250% due 06/16/16 MXN 11,625 933
6.500% due 06/10/21 MXN 10,000 799
Opera Finance PLC
Series 2005-CSC3 Class A
1.317% due 04/25/17 (Ê) GBP 333 475
Province of Ontario Canada
4.000% due 06/02/21 CAD 2,605 2,864
3.150% due 06/02/22 CAD 2,700 2,758
Republic of Peru
6.950% due 08/12/31 PEN 2,500 976
29,843
United States Government Agencies - 0.5%Fannie Mae
5.000% due 05/11/17 500 600
Copyright © 2012 www.secdatabase.com. All Rights Reserved.Please Consider the Environment Before Printing This Document

Russell Short Duration Bond Fund 187
Series 2006-AR18 Class 2A2
5.376% due 11/25/36 248 28
Series 2007-AR8 Class A1
6.034% due 11/25/37 1,122 834
518,816
Municipal Bonds - 0.1%New Jersey Economic
Development Authority
Revenue Bonds
1.546% due 06/15/13 (Ê) 1,000 1,000
Non-US Bonds - 2.6%Arran Residential Mortgages
Funding PLC
Series 2011-1A Class A1B
2.660% due 11/19/47 (Ê)(Þ) EUR 4,124 5,391
Brazil Notas do Tesouro Nacional
Serie B
Series NTNB
6.000% due 05/15/13 BRL 445 560
Brazil Notas do Tesouro Nacional
Serie F
Series NTNF
10.000% due 01/01/14 BRL 969 559
Federal Home Loan Mortgage
Corp.
1.375% due 02/25/14 925 940
2.000% due 08/25/16 2,175 2,276
Federal National Mortgage
Association Principal Only
STRIP
Zero coupon due 10/09/19 1,670 1,290
5,106
United States Government Treasuries - 15.1%United States Treasury Inflation
Indexed Bonds
1.625% due 01/15/15 (Æ) 2,328 2,542
2.000% due 01/15/16 849 963
0.125% due 04/15/16 22,036 23,383
United States Treasury Notes
0.250% due 01/31/14 78,160 78,209
0.250% due 01/15/15 26,870 26,832
0.875% due 12/31/16 13,555 13,675
1.375% due 12/31/18 24,000 24,246
2.000% due 11/15/21 1,000 1,017
170,867
Total Long-Term Investments(cost $1,080,142) 1,085,609
Copyright © 2012 www.secdatabase.com. All Rights Reserved.Please Consider the Environment Before Printing This Document
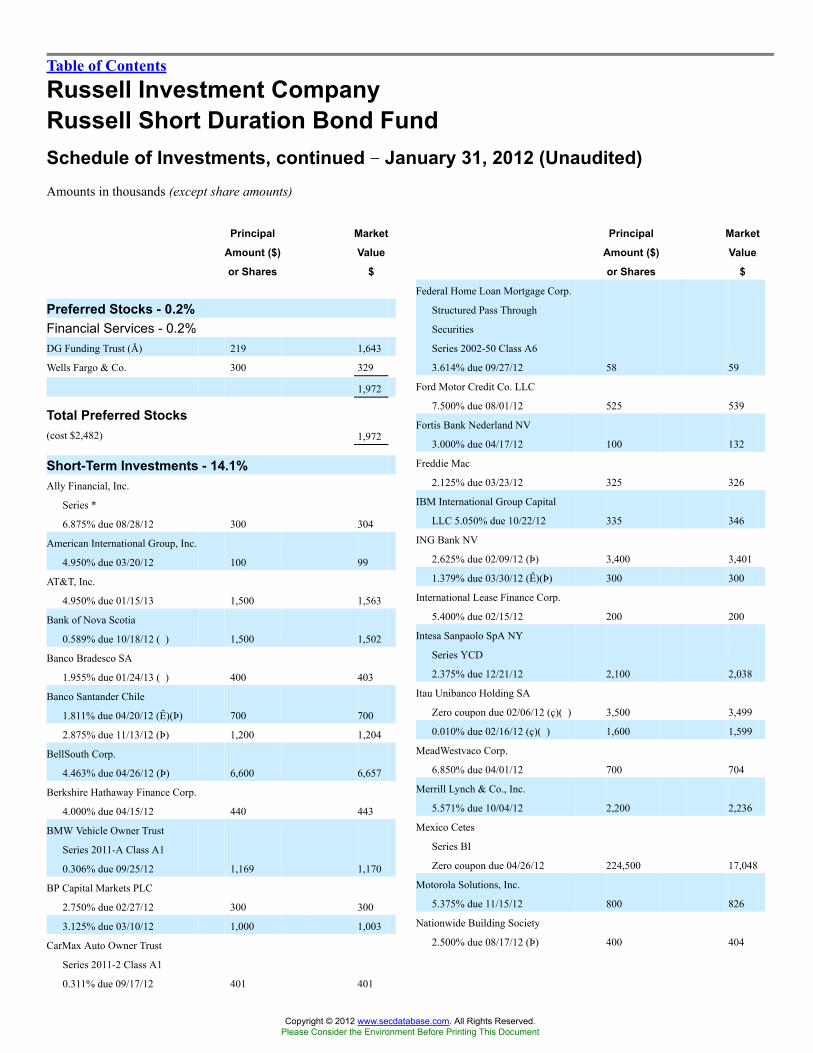
Table of Contents
Russell Investment CompanyRussell Short Duration Bond FundSchedule of Investments, continued �� January 31, 2012 (Unaudited)Amounts in thousands (except share amounts)
Principal
Amount ($)
or Shares
Market
Value
$
Preferred Stocks - 0.2%Financial Services - 0.2%DG Funding Trust (Å) 219 1,643
Wells Fargo & Co. 300 329
1,972
Total Preferred Stocks(cost $2,482) 1,972
Short-Term Investments - 14.1%Ally Financial, Inc.
Series *
6.875% due 08/28/12 300 304
American International Group, Inc.
4.950% due 03/20/12 100 99
AT&T, Inc.
4.950% due 01/15/13 1,500 1,563
Bank of Nova Scotia
0.589% due 10/18/12 (�) 1,500 1,502
Banco Bradesco SA
1.955% due 01/24/13 (�) 400 403
Banco Santander Chile
1.811% due 04/20/12 (Ê)(Þ) 700 700
2.875% due 11/13/12 (Þ) 1,200 1,204
BellSouth Corp.
4.463% due 04/26/12 (Þ) 6,600 6,657
Berkshire Hathaway Finance Corp.
4.000% due 04/15/12 440 443
BMW Vehicle Owner Trust
Series 2011-A Class A1
0.306% due 09/25/12 1,169 1,170
BP Capital Markets PLC
2.750% due 02/27/12 300 300
3.125% due 03/10/12 1,000 1,003
CarMax Auto Owner Trust
Series 2011-2 Class A1
0.311% due 09/17/12 401 401
Principal
Amount ($)
or Shares
Market
Value
$
Federal Home Loan Mortgage Corp.
Structured Pass Through
Securities
Series 2002-50 Class A6
3.614% due 09/27/12 58 59
Ford Motor Credit Co. LLC
7.500% due 08/01/12 525 539
Fortis Bank Nederland NV
3.000% due 04/17/12 100 132
Freddie Mac
2.125% due 03/23/12 325 326
IBM International Group Capital
LLC 5.050% due 10/22/12 335 346
ING Bank NV
2.625% due 02/09/12 (Þ) 3,400 3,401
1.379% due 03/30/12 (Ê)(Þ) 300 300
International Lease Finance Corp.
5.400% due 02/15/12 200 200
Intesa Sanpaolo SpA NY
Series YCD
2.375% due 12/21/12 2,100 2,038
Itau Unibanco Holding SA
Zero coupon due 02/06/12 (ç)(�) 3,500 3,499
0.010% due 02/16/12 (ç)(�) 1,600 1,599
MeadWestvaco Corp.
6.850% due 04/01/12 700 704
Merrill Lynch & Co., Inc.
5.571% due 10/04/12 2,200 2,236
Mexico Cetes
Series BI
Zero coupon due 04/26/12 224,500 17,048
Motorola Solutions, Inc.
5.375% due 11/15/12 800 826
Nationwide Building Society
2.500% due 08/17/12 (Þ) 400 404
Copyright © 2012 www.secdatabase.com. All Rights Reserved.Please Consider the Environment Before Printing This Document

188 Russell Short Duration Bond Fund
Citigroup, Inc.
5.625% due 08/27/12 200 204
Commonwealth Edison Co.
Series 98
6.150% due 03/15/12 250 252
COX Communications, Inc.
7.125% due 10/01/12 2,250 2,348
Danske Bank A/S
2.500% due 05/10/12 (Þ) 200 201
Dominion Resources, Inc.
Series B
6.250% due 06/30/12 350 358
Dow Chemical Co. (The)
4.850% due 08/15/12 5,455 5,570
Enterprise Products Operating LLC
4.600% due 08/01/12 1,000 1,019
Export-Import Bank of Korea
1.050% due 03/03/12 (Þ) 700 556
Fannie Mae
5.250% due 08/01/12 2,230 2,282
Railcar Leasing LLC
Series 1997-1 Class A2
7.125% due 01/15/13 (Þ) 470 484
Regions Financial Corp.
0.744% due 06/26/12 (Ê) 1,100 1,084
Russell U.S. Cash Management Fund 64,043,483 (¥) 64,043
Santander Drive Auto Receivables
Trust
Series 2011-4 Class A1
0.419% due 10/15/12 2,014 2,015
Santander US Debt SAU
1.379% due 03/30/12 (Ê)(Þ) 1,800 1,798
SBAB Bank AB
3.125% due 03/23/12 (Þ) 1,500 1,506
SLM Corp.
Series emtn
4.875% due 12/17/12 500 768
Societe Financement de l�Economie
Francaise
2.125% due 05/20/12 300 394
Springleaf Finance Corp.
Series MTNI
4.875% due 07/15/12 300 294
TIAA Global Markets, Inc.
5.125% due 10/10/12 (Þ) 1,000 1,030
Copyright © 2012 www.secdatabase.com. All Rights Reserved.Please Consider the Environment Before Printing This Document

Table of Contents
Russell Investment CompanyRussell Short Duration Bond FundSchedule of Investments, continued �� January 31, 2012 (Unaudited)Amounts in thousands (except share amounts)
See accompanying notes which are an integral part of this quarterly report.
Principal
Amount ($)
or Shares
Market
Value
$
UBS AG
1.595% due 02/23/12 (Ê) 700 700
United States Treasury Bills
0.009% due 03/01/12 (ç)(�) 80 80
0.073% due 05/24/12 (�) 10 10
0.096% due 12/13/12 (�) 15,579 15,566
Volkswagen International Finance
NV
1.031% due 10/01/12 (Ê)(Þ) 1,700 1,699
Wachovia Corp.
4.810% due 05/25/12 (Ê) 2,700 2,858
Westpac Banking Corp.
2.250% due 11/19/12 2,000 2,025
Total Short-TermInvestments(cost $158,344) 158,550
Total Investments -110.4%(identified cost $1,240,968) 1,246,131
Other Assets andLiabilities,Net - (10.4%) (117,705 )
Net Assets - 100.0% 1,128,426
Copyright © 2012 www.secdatabase.com. All Rights Reserved.Please Consider the Environment Before Printing This Document

Russell Short Duration Bond Fund 189
A portion of the portfolio has been fair valued as of period end.
Copyright © 2012 www.secdatabase.com. All Rights Reserved.Please Consider the Environment Before Printing This Document

Table of Contents
Russell Investment CompanyRussell Short Duration Bond FundSchedule of Investments, continued �� January 31, 2012 (Unaudited)Amounts in thousands (except contract amounts)
Futures ContractsNumber of
Contracts
Notional
Amount
Expiration
Date
Unrealized
Appreciation
(Depreciation)
$
Long PositionsEurodollar Futures (CME) 187 USD 46,514 03/13 (15 )
Eurodollar Futures (CME) 46 USD 11,436 09/13 95
Eurodollar Futures (CME) 18 USD 4,471 03/14 67
United States Treasury 2 Year Note Futures 292 USD 64,459 03/12 86
United States Treasury 5 Year Note Futures 46 USD 5,706 03/12 41
Short PositionsUnited States Treasury 5 Year Note Futures 198 USD 24,561 03/12 (250 )
United States Treasury 10 Year Futures 200 USD 26,450 03/12 (491 )
Total Unrealized Appreciation (Depreciation) on Open Futures Contracts (å) (467 )
See accompanying notes which are an integral part of this quarterly report.
190 Russell Short Duration Bond Fund
Copyright © 2012 www.secdatabase.com. All Rights Reserved.Please Consider the Environment Before Printing This Document

Table of Contents
Russell Investment CompanyRussell Short Duration Bond FundSchedule of Investments, continued �� January 31, 2012 (Unaudited)Amounts in thousands (except contract amounts)
Options WrittenCall/
Put
Number of
Contracts
Strike
Price
Notional
Amount
Expiration
Date
Market
Value
$
Eurodollar Futures Put 54 99.00 USD 135 03/19/12 �
Swaptions(Fund Receives/Fund Pays)
USD 0.9200%/USD Three Month LIBOR Put 2 0.00 7,800 11/14/12 (10 )
USD 1.750%/USD Three Month LIBOR Put 1 0.00 24,400 07/11/13 (13 )
USD 2.250%/USD Three Month LIBOR Put 3 0.00 26,600 09/24/12 (3 )
USD 2.750%/USD Three Month LIBOR Put 2 0.00 14,800 06/18/12 �
USD 3.000%/USD Three Month LIBOR Put 6 0.00 30,000 06/18/12 �
USD 3.250%/USD Three Month LIBOR Put 2 0.00 5,200 07/16/12 �
Total Liability for Options Written (premiums received $982) (26 )
See accompanying notes which are an integral part of this quarterly report.
Russell Short Duration Bond Fund 191
Copyright © 2012 www.secdatabase.com. All Rights Reserved.Please Consider the Environment Before Printing This Document

Table of Contents
Russell Investment CompanyRussell Short Duration Bond FundSchedule of Investments, continued �� January 31, 2012 (Unaudited)Amounts in thousands
Foreign Currency Exchange Contracts
CounterpartyAmount
Sold
Amount
Bought
Settlement
Date
Unrealized
Appreciation
(Depreciation)
$
Bank of America USD 424 AUD 400 02/02/12 1
Bank of America USD 667 AUD 640 02/13/12 11
Bank of America AUD 400 USD 426 02/02/12 1
Bank of America AUD 693 USD 738 02/13/12 3
Bank of America MXN 21,337 USD 1,559 02/13/12 (76 )
Barclays Bank PLC USD 735 AUD 693 02/13/12 �
Barclays Bank PLC USD 1,635 CAD 1,680 02/09/12 40
Barclays Bank PLC USD 10,790 EUR 8,326 02/02/12 100
Barclays Bank PLC USD 1,228 GBP 800 02/13/12 33
Barclays Bank PLC AUD 400 USD 408 02/23/12 (15 )
Barclays Bank PLC BRL 176 USD 100 03/02/12 �
Barclays Bank PLC BRL 176 USD 100 03/02/12 �
Barclays Bank PLC BRL 178 USD 100 03/02/12 (1 )
Barclays Bank PLC BRL 180 USD 100 03/02/12 (2 )
Barclays Bank PLC BRL 183 USD 100 03/02/12 (4 )
Barclays Bank PLC BRL 183 USD 100 03/02/12 (4 )
Barclays Bank PLC BRL 354 USD 200 03/02/12 (1 )
Barclays Bank PLC BRL 528 USD 300 03/02/12 �
Barclays Bank PLC CAD 203 USD 201 02/09/12 (2 )
Barclays Bank PLC CAD 307 USD 301 02/09/12 (5 )
Barclays Bank PLC CAD 2,543 USD 2,484 02/09/12 (52 )
Barclays Bank PLC EUR 2,742 USD 3,503 02/13/12 (83 )
Barclays Bank PLC EUR 8,326 USD 10,792 03/02/12 (100 )
Barclays Bank PLC EUR 2,928 USD 3,753 04/16/12 (77 )
Barclays Bank PLC GBP 300 USD 460 02/02/12 (13 )
Barclays Bank PLC GBP 800 USD 1,228 02/13/12 (33 )
Barclays Bank PLC MXN 224,500 USD 16,930 04/26/12 (172 )
Citibank USD 3,235 EUR 2,485 02/02/12 16
Citibank USD 5,850 GBP 3,761 02/02/12 76
Citibank AUD 100 USD 100 02/23/12 (6 )
Citibank AUD 100 USD 101 02/23/12 (5 )
Citibank AUD 166 USD 164 02/23/12 (12 )
Citibank CAD 100 USD 98 02/09/12 (2 )
Copyright © 2012 www.secdatabase.com. All Rights Reserved.Please Consider the Environment Before Printing This Document

Citibank CAD 300 USD 293 02/09/12 (5 )
Citibank CAD 325 USD 314 02/09/12 (10 )
Citibank CAD 416 USD 400 02/09/12 (15 )
Citibank EUR 2,485 USD 3,235 03/02/12 (15 )
Citibank EUR 2,363 USD 3,024 04/16/12 (68 )
Citibank GBP 373 USD 583 03/02/12 (5 )
Citibank GBP 3,761 USD 5,849 03/02/12 (76 )
Citibank SGD 706 USD 552 02/10/12 (9 )
Deutsche Bank AG USD 8,903 CNY 56,471 02/13/12 47
Deutsche Bank AG CAD 215 USD 209 02/09/12 (6 )
Deutsche Bank AG CAD 307 USD 295 02/09/12 (11 )
Deutsche Bank AG CAD 2,913 USD 2,853 02/09/12 (51 )
Deutsche Bank AG EUR 6,907 USD 8,862 04/16/12 (175 )
Goldman Sachs CAD 103 USD 100 02/09/12 (3 )
Goldman Sachs EUR 14,291 USD 18,754 02/02/12 61
HSBC Bank PLC USD � EUR � 02/01/12 �
HSBC Bank PLC AUD 1,205 USD 1,271 02/13/12 (7 )
HSBC Bank PLC CNY 10,176 USD 1,600 02/13/12 (12 )
HSBC Bank PLC EUR � USD � 02/01/12 �
HSBC Bank PLC JPY 44,577 USD 579 02/13/12 (6 )
See accompanying notes which are an integral part of this quarterly report.
192 Russell Short Duration Bond Fund
Copyright © 2012 www.secdatabase.com. All Rights Reserved.Please Consider the Environment Before Printing This Document
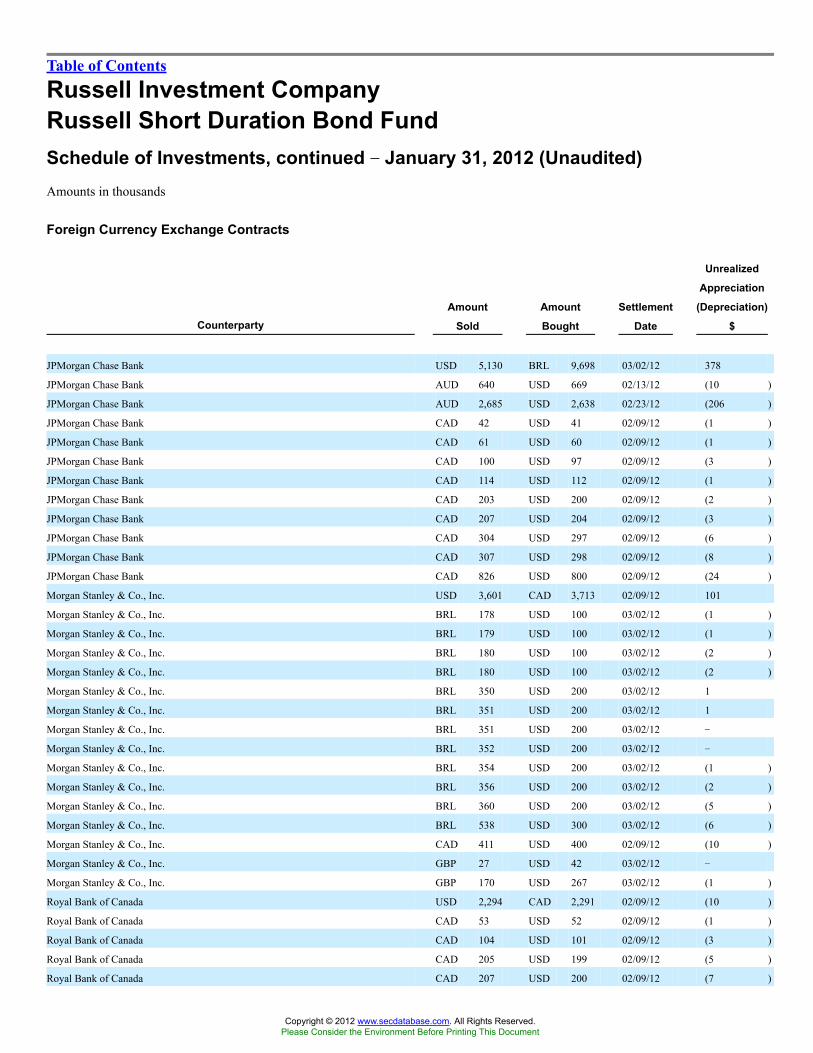
Table of Contents
Russell Investment CompanyRussell Short Duration Bond FundSchedule of Investments, continued �� January 31, 2012 (Unaudited)Amounts in thousands
Foreign Currency Exchange Contracts
CounterpartyAmount
Sold
Amount
Bought
Settlement
Date
Unrealized
Appreciation
(Depreciation)
$
JPMorgan Chase Bank USD 5,130 BRL 9,698 03/02/12 378
JPMorgan Chase Bank AUD 640 USD 669 02/13/12 (10 )
JPMorgan Chase Bank AUD 2,685 USD 2,638 02/23/12 (206 )
JPMorgan Chase Bank CAD 42 USD 41 02/09/12 (1 )
JPMorgan Chase Bank CAD 61 USD 60 02/09/12 (1 )
JPMorgan Chase Bank CAD 100 USD 97 02/09/12 (3 )
JPMorgan Chase Bank CAD 114 USD 112 02/09/12 (1 )
JPMorgan Chase Bank CAD 203 USD 200 02/09/12 (2 )
JPMorgan Chase Bank CAD 207 USD 204 02/09/12 (3 )
JPMorgan Chase Bank CAD 304 USD 297 02/09/12 (6 )
JPMorgan Chase Bank CAD 307 USD 298 02/09/12 (8 )
JPMorgan Chase Bank CAD 826 USD 800 02/09/12 (24 )
Morgan Stanley & Co., Inc. USD 3,601 CAD 3,713 02/09/12 101
Morgan Stanley & Co., Inc. BRL 178 USD 100 03/02/12 (1 )
Morgan Stanley & Co., Inc. BRL 179 USD 100 03/02/12 (1 )
Morgan Stanley & Co., Inc. BRL 180 USD 100 03/02/12 (2 )
Morgan Stanley & Co., Inc. BRL 180 USD 100 03/02/12 (2 )
Morgan Stanley & Co., Inc. BRL 350 USD 200 03/02/12 1
Morgan Stanley & Co., Inc. BRL 351 USD 200 03/02/12 1
Morgan Stanley & Co., Inc. BRL 351 USD 200 03/02/12 �
Morgan Stanley & Co., Inc. BRL 352 USD 200 03/02/12 �
Morgan Stanley & Co., Inc. BRL 354 USD 200 03/02/12 (1 )
Morgan Stanley & Co., Inc. BRL 356 USD 200 03/02/12 (2 )
Morgan Stanley & Co., Inc. BRL 360 USD 200 03/02/12 (5 )
Morgan Stanley & Co., Inc. BRL 538 USD 300 03/02/12 (6 )
Morgan Stanley & Co., Inc. CAD 411 USD 400 02/09/12 (10 )
Morgan Stanley & Co., Inc. GBP 27 USD 42 03/02/12 �
Morgan Stanley & Co., Inc. GBP 170 USD 267 03/02/12 (1 )
Royal Bank of Canada USD 2,294 CAD 2,291 02/09/12 (10 )
Royal Bank of Canada CAD 53 USD 52 02/09/12 (1 )
Royal Bank of Canada CAD 104 USD 101 02/09/12 (3 )
Royal Bank of Canada CAD 205 USD 199 02/09/12 (5 )
Royal Bank of Canada CAD 207 USD 200 02/09/12 (7 )
Copyright © 2012 www.secdatabase.com. All Rights Reserved.Please Consider the Environment Before Printing This Document

Royal Bank of Canada CAD 345 USD 336 02/09/12 (8 )
Royal Bank of Canada CAD 2,821 USD 2,769 02/09/12 (44 )
Royal Bank of Canada CAD 3,712 USD 3,617 02/09/12 (85 )
Royal Bank of Canada CAD 2,291 USD 2,292 03/22/12 10
Royal Bank of Canada GBP 3,416 USD 5,348 02/02/12 (35 )
UBS AG USD 4,525 EUR 3,480 02/02/12 27
UBS AG BRL 179 USD 100 03/02/12 (1 )
UBS AG BRL 179 USD 100 03/02/12 (2 )
UBS AG BRL 180 USD 100 03/02/12 (2 )
UBS AG BRL 183 USD 100 03/02/12 (4 )
UBS AG BRL 183 USD 100 03/02/12 (4 )
UBS AG BRL 183 USD 100 03/02/12 (4 )
UBS AG BRL 350 USD 200 03/02/12 1
UBS AG BRL 357 USD 200 03/02/12 (3 )
UBS AG BRL 359 USD 200 03/02/12 (4 )
UBS AG BRL 361 USD 200 03/02/12 (5 )
UBS AG CAD 206 USD 199 02/09/12 (7 )
UBS AG CAD 3,416 USD 3,330 02/09/12 (76 )
UBS AG EUR 3,480 USD 4,525 03/02/12 (27 )
UBS AG EUR 2,502 USD 3,192 04/16/12 (81 )
See accompanying notes which are an integral part of this quarterly report.
Russell Short Duration Bond Fund 193
Copyright © 2012 www.secdatabase.com. All Rights Reserved.Please Consider the Environment Before Printing This Document
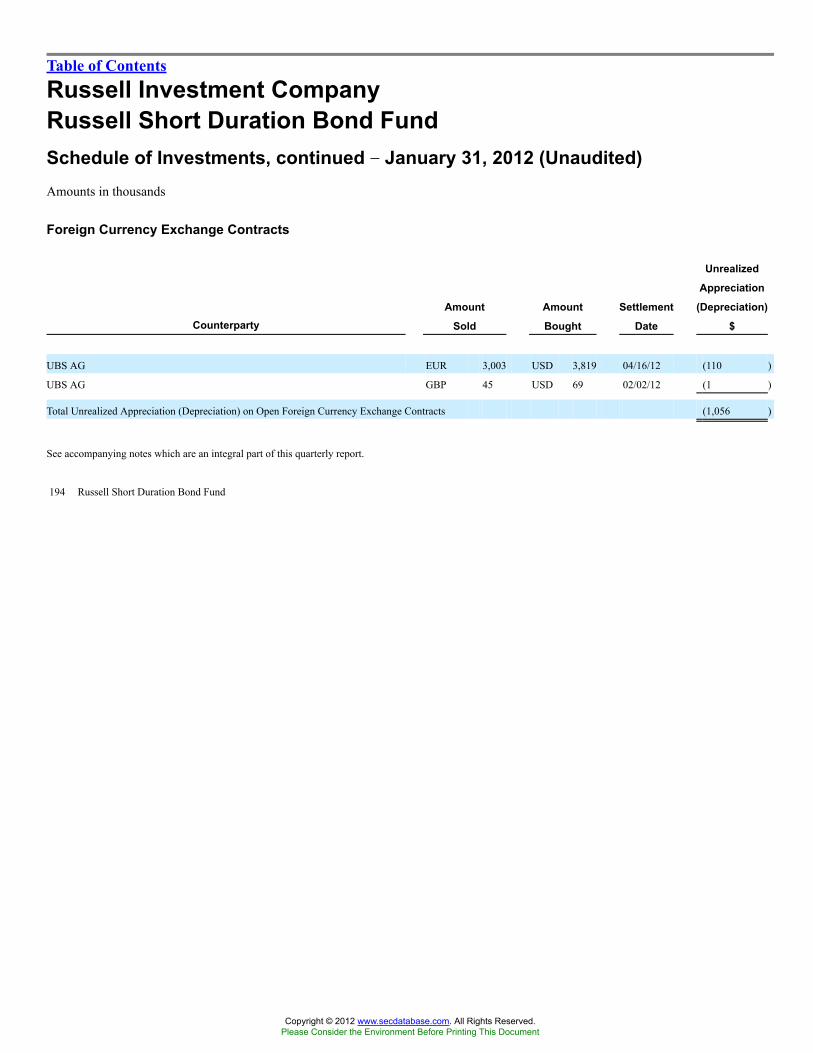
Table of Contents
Russell Investment CompanyRussell Short Duration Bond FundSchedule of Investments, continued �� January 31, 2012 (Unaudited)Amounts in thousands
Foreign Currency Exchange Contracts
CounterpartyAmount
Sold
Amount
Bought
Settlement
Date
Unrealized
Appreciation
(Depreciation)
$
UBS AG EUR 3,003 USD 3,819 04/16/12 (110 )
UBS AG GBP 45 USD 69 02/02/12 (1 )
Total Unrealized Appreciation (Depreciation) on Open Foreign Currency Exchange Contracts (1,056 )
See accompanying notes which are an integral part of this quarterly report.
194 Russell Short Duration Bond Fund
Copyright © 2012 www.secdatabase.com. All Rights Reserved.Please Consider the Environment Before Printing This Document

Table of Contents
Russell Investment CompanyRussell Short Duration Bond FundSchedule of Investments, continued �� January 31, 2012 (Unaudited)Amounts in thousands
Interest Rate Swap Contracts
CounterpartyNotional
Amount
Fund
Receives Fund PaysTermination
Date
Market
Value
$
Barclays Bank PLC BRL 2,000 11.910% Brazil Interbank Deposit Rate 01/02/13 39
Barclays Bank PLC BRL 400 11.990% Brazil Interbank Deposit Rate 01/02/14 10
Barclays Bank PLC BRL 7,200 10.830% Brazil Interbank Deposit Rate 01/02/14 53
BNP Paribas BRL 500 11.880% Brazil Interbank Deposit Rate 01/02/13 10
BNP Paribas BRL 2,800 12.800% Brazil Interbank Deposit Rate 01/02/13 77
BNP Paribas BRL 400 12.110% Brazil Interbank Deposit Rate 01/02/14 11
BNP Paribas BRL 3,700 12.560% Brazil Interbank Deposit Rate 01/02/14 118
BNP Paribas USD 19,100 1.000% Federal Fund Effective Rate - 1 Year 09/19/14 311
Credit Suisse Financial Products BRL 2,400 12.480% Brazil Interbank Deposit Rate 01/02/13 56
Goldman Sachs BRL 2,600 11.890% Brazil Interbank Deposit Rate 01/02/13 52
HSBC BRL 500 11.880% Brazil Interbank Deposit Rate 01/02/13 9
HSBC BRL 600 10.450% Brazil Interbank Deposit Rate 01/02/13 1
HSBC BRL 1,200 11.890% Brazil Interbank Deposit Rate 01/02/13 24
HSBC BRL 3,000 12.830% Brazil Interbank Deposit Rate 01/02/13 83
HSBC BRL 3,500 12.300% Brazil Interbank Deposit Rate 01/02/13 91
HSBC BRL 200 12.540% Brazil Interbank Deposit Rate 01/02/14 7
HSBC BRL 1,000 10.990% Brazil Interbank Deposit Rate 01/02/14 9
HSBC BRL 1,400 10.530% Brazil Interbank Deposit Rate 01/02/14 6
HSBC BRL 4,800 10.180% Brazil Interbank Deposit Rate 01/02/14 12
JPMorgan BRL 2,400 12.170% Brazil Interbank Deposit Rate 01/02/13 58
JPMorgan BRL 5,500 12.070% Brazil Interbank Deposit Rate 01/02/13 98
JPMorgan BRL 300 10.870% Brazil Interbank Deposit Rate 01/02/14 2
JPMorgan BRL 700 12.200% Brazil Interbank Deposit Rate 01/02/14 21
Merrill Lynch BRL 5,600 11.900% Brazil Interbank Deposit Rate 01/02/13 108
Morgan Stanley BRL 700 11.980% Brazil Interbank Deposit Rate 01/02/13 15
Morgan Stanley BRL 1,800 10.455% Brazil Interbank Deposit Rate 01/02/13 5
Morgan Stanley BRL 7,500 12.590% Brazil Interbank Deposit Rate 01/02/13 186
Morgan Stanley BRL 2,200 10.580% Brazil Interbank Deposit Rate 01/02/14 11
Morgan Stanley BRL 3,400 11.890% Brazil Interbank Deposit Rate 01/02/14 72
Royal Bank of Canada BRL 400 11.955% Brazil Interbank Deposit Rate 01/02/13 6
Royal Bank of Scotland BRL 400 11.950% Brazil Interbank Deposit Rate 01/02/13 6
UBS BRL 300 12.070% Brazil Interbank Deposit Rate 01/02/13 7
UBS BRL 600 10.605% Brazil Interbank Deposit Rate 01/02/13 2
UBS BRL 300 12.250% Brazil Interbank Deposit Rate 01/02/14 9
UBS BRL 500 10.380% Brazil Interbank Deposit Rate 01/02/14 2
Copyright © 2012 www.secdatabase.com. All Rights Reserved.Please Consider the Environment Before Printing This Document

UBS BRL 1,200 10.770% Brazil Interbank Deposit Rate 01/02/14 8
UBS BRL 5,300 11.760% Brazil Interbank Deposit Rate 01/02/14 86
Total Market Value on Open Interest Rate Swap Contracts Premiums Paid (Received) - $53 (å) 1,681
See accompanying notes which are an integral part of this quarterly report.
Russell Short Duration Bond Fund 195
Copyright © 2012 www.secdatabase.com. All Rights Reserved.Please Consider the Environment Before Printing This Document

Table of Contents
Russell Investment CompanyRussell Short Duration Bond FundSchedule of Investments, continued �� January 31, 2012 (Unaudited)Amounts in thousands
Credit Default Swap ContractsCorporate Issues
Reference
Entity Counterparty
Implied
Credit
Spread
Notional
Amount
Fund (Pays)/
Receives
Fixed Rate
Termination
Date
Market
Value
$
Ally Financial, Inc. JPMorgan 2.430% USD 500 5.000% 06/20/15 41
Berkshire Hathaway, Inc. Bank of America 1.412% USD 400 1.000% 03/20/16 (6 )
Gazprom Deutsche Bank 1.240% USD 1,200 1.000% 12/20/12 �
Gazprom UBS 1.240% USD 1,200 1.000% 12/20/12 �
GE Capital Corp. Barclays Bank PLC 0.954% USD 700 1.670% 03/20/13 6
GE Capital Corp. BNP Paribas 0.954% USD 1,200 1.300% 03/20/13 5
GE Capital Corp. BNP Paribas 0.954% USD 100 1.250% 03/20/13 �
GE Capital Corp. Citibank 1.335% USD 100 4.900% 12/20/13 6
GE Capital Corp. Citibank 1.335% USD 200 4.325% 12/20/13 11
GE Capital Corp. Citibank 1.335% USD 200 4.200% 12/20/13 10
GE Capital Corp. Deutsche Bank 1.335% USD 200 4.230% 12/20/13 11
MetLife, Inc. JPMorgan 1.832% USD 1,400 1.000% 09/20/13 (17 )
Petbra Deutsche Bank 0.710% USD 600 1.000% 09/20/12 �
Wells Fargo & Co. Goldman Sachs 0.573% USD 1,100 1.000% 06/20/13 6
Total Market Value on Open Corporate Issues Premiums Paid (Received) - ($81) 73
Credit Indices
Reference
Entity CounterpartyNotional
Amount
Fund (Pays)/
Receives
Fixed Rate
Termination
Date
Market
Value
$
Dow Jones CDX Index Barclays Bank PLC USD 6,200 5.000% 06/20/15 507
Dow Jones CDX Index Barclays Bank PLC USD 1,000 5.000% 06/20/15 82
Dow Jones CDX Index Deutsche Bank USD 200 5.000% 12/20/15 18
Dow Jones CDX Index Deutsche Bank USD 772 0.708% 12/20/12 5
Dow Jones CDX Index HSBC USD 200 5.000% 12/20/15 18
Dow Jones CDX Index HSBC USD 1,700 5.000% 06/20/15 139
Dow Jones CDX Index JPMorgan USD 96 0.553% 12/20/17 2
Dow Jones CDX Index Morgan Stanley USD 300 5.000% 06/20/15 25
Dow Jones CDX Index Morgan Stanley USD 200 5.000% 12/20/15 18
Dow Jones CDX Index Pershing LLC 1st Republic P.B. USD 96 0.548% 12/20/17 2
iTraxx SovX Western Europe Series 5 BNP Paribas EUR 8,900 1.000% 12/20/15 (183 )
Total Market Value on Open Credit Indices Premiums Paid (Received) - $662 633
Copyright © 2012 www.secdatabase.com. All Rights Reserved.Please Consider the Environment Before Printing This Document

Sovereign Issues
Reference
Entity Counterparty
Implied
Credit
Spread
Notional
Amount
Fund (Pays)/
Receives
Fixed Rate
Termination
Date
Market
Value
$
Abu Dhabi Morgan Stanley 1.214% USD 900 1.000% 12/20/15 (8 )
Brazil Government International Bond Barclays Bank PLC 1.213% USD 1,700 1.000% 09/20/15 (14 )
Brazil Government International Bond BNP Paribas 0.685% USD 1,700 1.000% 12/20/12 4
Brazil Government International Bond Citibank 0.685% USD 1,100 1.000% 12/20/12 2
Brazil Government International Bond Citibank 1.213% USD 1,000 1.000% 09/20/15 (8 )
Brazil Government International Bond Citibank 1.281% USD 3,300 1.000% 03/20/16 (40 )
Brazil Government International Bond Credit Suisse Financial
Products
1.336% USD 2,200 1.000% 06/20/16 (33 )
Brazil Government International Bond Goldman Sachs 0.685% USD 1,600 1.000% 12/20/12 3
Brazil Government International Bond HSBC 1.213% USD 700 1.000% 09/20/15 (6 )
Brazil Government International Bond HSBC 1.281% USD 300 1.000% 03/20/16 (4 )
Brazil Government International Bond UBS 1.213% USD 500 1.000% 09/20/15 (4 )
China Government International Bond Barclays Bank PLC 0.534% USD 700 1.000% 12/20/12 2
China Government International Bond Deutsche Bank 2.030% USD 700 1.000% 12/20/16 (33 )
See accompanying notes which are an integral part of this quarterly report.
196 Russell Short Duration Bond Fund
Copyright © 2012 www.secdatabase.com. All Rights Reserved.Please Consider the Environment Before Printing This Document

Table of Contents
Russell Investment CompanyRussell Short Duration Bond FundSchedule of Investments, continued �� January 31, 2012 (Unaudited)Amounts in thousands
Credit Default Swap ContractsSovereign Issues
Reference
Entity Counterparty
Implied
Credit
Spread
Notional
Amount
Fund (Pays)/
Receives
Fixed Rate
Termination
Date
Market
Value
$
Credit Agricole (London) Citibank 1.898% USD 300 (1.000% ) 03/20/14 8
Credit Agricole (London) Credit Suisse Financial Products 4.576% EUR 300 3.000% 06/20/16 (25 )
Credit Agricole (London) Deutsche Bank 4.576% EUR 300 3.000% 06/20/16 (25 )
France Government International Bond Citibank 1.607% USD 200 0.250% 12/20/15 (10 )
France Government International Bond Citibank 1.747% USD 700 0.250% 09/20/16 (45 )
France Government International Bond Deutsche Bank 1.747% USD 2,000 0.250% 09/20/16 (129 )
France Government International Bond HSBC 1.747% USD 1,700 0.250% 09/20/16 (110 )
France Government International Bond Morgan Stanley 1.747% USD 2,600 0.250% 09/20/16 (168 )
Germany Government International Bond Citibank 0.820% USD 2,000 0.250% 09/20/16 (51 )
Germany Government International Bond Morgan Stanley 0.820% USD 4,900 0.250% 09/20/16 (124 )
Italy Government International Bond BNP Paribas 4.109% USD 1,900 1.000% 06/20/16 (226 )
Japan Government International Bond Bank of America 1.156% USD 500 1.000% 12/20/15 (4 )
Japan Government International Bond Bank of America 1.191% USD 800 1.000% 03/20/16 (8 )
Japan Government International Bond Bank of America 1.191% USD 1,100 1.000% 03/20/16 (11 )
Japan Government International Bond Barclays Bank PLC 1.156% USD 500 1.000% 12/20/15 (4 )
Japan Government International Bond Barclays Bank PLC 1.191% USD 1,400 1.000% 03/20/16 (13 )
Japan Government International Bond JPMorgan 1.191% USD 700 1.000% 03/20/16 (7 )
Japan Government International Bond JPMorgan 1.191% USD 1,200 1.000% 03/20/16 (11 )
Japan Government International Bond Morgan Stanley 1.156% USD 500 1.000% 12/20/15 (4 )
Japan Government International Bond Pamure Gordon & Co. Ltd. 1.070% USD 800 1.000% 06/20/15 (3 )
Japan Government International Bond UBS 1.156% USD 500 1.000% 12/20/15 (4 )
Korea Government International Bond Deutsche Bank 0.647% USD 800 1.000% 12/20/12 2
Korea Government International Bond Deutsche Bank 0.647% USD 900 1.000% 12/20/12 2
Korea Government International Bond Deutsche Bank 1.653% USD 300 1.000% 12/20/16 (8 )
Mexico Government International Bond Barclays Bank PLC 1.171% USD 1,700 1.000% 09/20/15 (12 )
Mexico Government International Bond Citibank 0.469% USD 400 1.000% 12/20/12 2
Mexico Government International Bond Deutsche Bank 1.244% USD 1,100 1.000% 03/20/16 (11 )
Mexico Government International Bond Deutsche Bank 1.301% USD 2,500 1.000% 06/20/16 (32 )
Mexico Government International Bond Goldman Sachs 0.469% USD 1,900 1.000% 12/20/12 7
Mexico Government International Bond HSBC 1.711% USD 1,300 1.000% 03/20/21 (72 )
Mexico Government International Bond JPMorgan 0.469% USD 2,500 1.000% 12/20/12 10
Russian Government International Bond HSBC 0.935% USD 2,200 1.000% 12/20/12 �
Spain Government International Bond Bank of America 3.685% USD 100 1.000% 03/20/16 (10 )
Spain Government International Bond Citibank 3.699% USD 900 1.000% 06/20/16 (95 )
Copyright © 2012 www.secdatabase.com. All Rights Reserved.Please Consider the Environment Before Printing This Document

United Kingdom Gilt BNP Paribas 0.415% USD 400 1.000% 03/20/15 7
United Kingdom Gilt Citibank 0.630% USD 500 1.000% 03/20/16 8
United Kingdom Gilt Deutsche Bank 0.630% USD 400 1.000% 03/20/16 6
United Kingdom Gilt Goldman Sachs 0.415% USD 100 1.000% 03/20/15 2
United Kingdom Gilt Goldman Sachs 0.630% USD 500 1.000% 03/20/16 8
United Kingdom Gilt Goldman Sachs 0.630% USD 300 1.000% 03/20/16 5
United Kingdom Gilt Goldman Sachs 0.731% USD 1,300 1.000% 09/20/16 16
United Kingdom Gilt Morgan Stanley 0.731% USD 5,500 1.000% 09/20/16 69
United Kingdom Gilt Morgan Stanley 0.731% USD 1,100 1.000% 09/20/16 14
United Kingdom Gilt UBS 0.415% USD 300 1.000% 03/20/15 5
United Kingdom Gilt UBS 0.415% USD 100 1.000% 03/20/15 2
United Kingdom Gilt UBS 0.415% USD 100 1.000% 03/20/15 2
United Kingdom Gilt UBS 0.415% USD 200 1.000% 03/20/15 3
United Kingdom Gilt UBS 0.683% USD 800 1.000% 06/20/16 11
United States Government Bond BNP Paribas 0.402% EUR 2,000 0.250% 09/20/16 (22 )
Total Market Value on Open Sovereign Issues Premiums Paid (Received) - ($626) (1,194 )
Total Market Value on Open Credit Default Swap Contracts Premiums Paid (Received) - ($45) (å) (488 )
See accompanying notes which are an integral part of this quarterly report.
Russell Short Duration Bond Fund 197
Copyright © 2012 www.secdatabase.com. All Rights Reserved.Please Consider the Environment Before Printing This Document
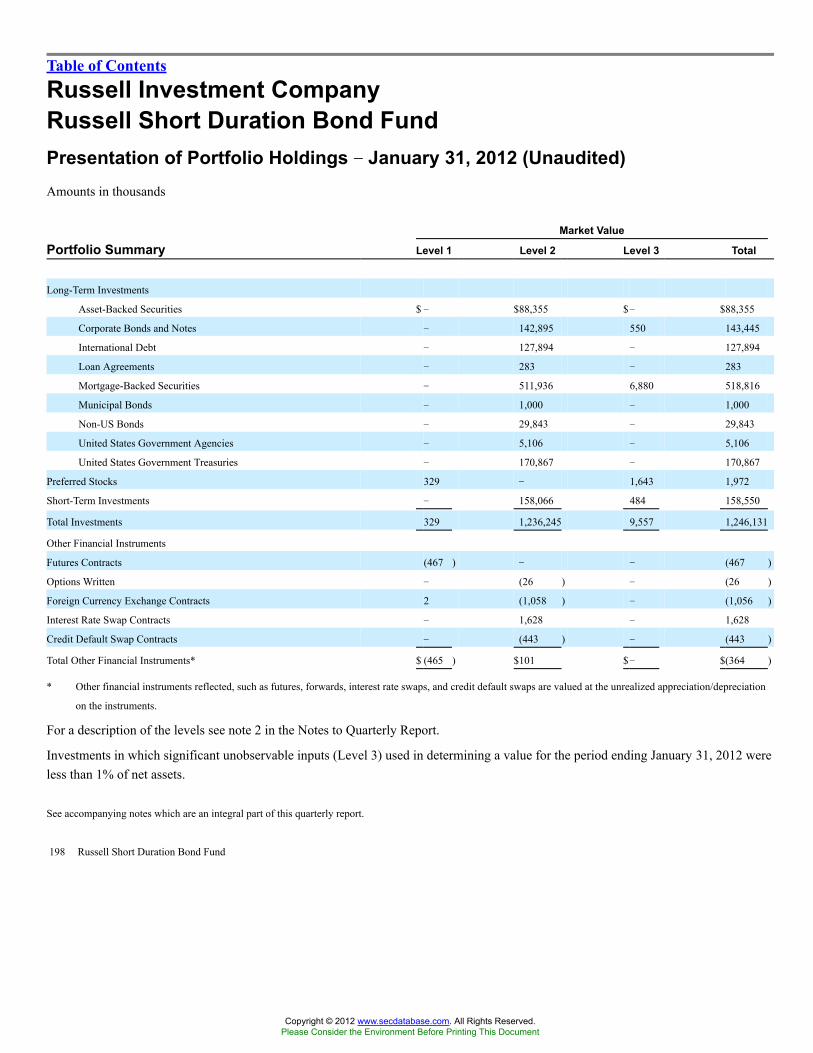
Table of Contents
Russell Investment CompanyRussell Short Duration Bond FundPresentation of Portfolio Holdings �� January 31, 2012 (Unaudited)Amounts in thousands
Market Value
Portfolio Summary Level 1 Level 2 Level 3 Total
Long-Term Investments
Asset-Backed Securities $ � $88,355 $� $88,355
Corporate Bonds and Notes � 142,895 550 143,445
International Debt � 127,894 � 127,894
Loan Agreements � 283 � 283
Mortgage-Backed Securities � 511,936 6,880 518,816
Municipal Bonds � 1,000 � 1,000
Non-US Bonds � 29,843 � 29,843
United States Government Agencies � 5,106 � 5,106
United States Government Treasuries � 170,867 � 170,867
Preferred Stocks 329 � 1,643 1,972
Short-Term Investments � 158,066 484 158,550
Total Investments 329 1,236,245 9,557 1,246,131
Other Financial Instruments
Futures Contracts (467 ) � � (467 )
Options Written � (26 ) � (26 )
Foreign Currency Exchange Contracts 2 (1,058 ) � (1,056 )
Interest Rate Swap Contracts � 1,628 � 1,628
Credit Default Swap Contracts � (443 ) � (443 )
Total Other Financial Instruments* $ (465 ) $101 $� $(364 )
* Other financial instruments reflected, such as futures, forwards, interest rate swaps, and credit default swaps are valued at the unrealized appreciation/depreciation
on the instruments.
For a description of the levels see note 2 in the Notes to Quarterly Report.
Investments in which significant unobservable inputs (Level 3) used in determining a value for the period ending January 31, 2012 wereless than 1% of net assets.
See accompanying notes which are an integral part of this quarterly report.
198 Russell Short Duration Bond Fund
Copyright © 2012 www.secdatabase.com. All Rights Reserved.Please Consider the Environment Before Printing This Document

Table of Contents
Russell Investment CompanyRussell Tax Exempt Bond Fund
Schedule of Investments �� January 31, 2012 (Unaudited)Amounts in thousands (except share amounts)
Principal
Amount ($)
or Shares
Rate
%
Date
of
Maturity
Value
$
Municipal Bonds - 94.6%Alabama - 0.8%Alabama Public School & College Authority Revenue Bonds 1,000 5.000 05/01/14 1,086
Alabama Public School & College Authority Revenue Bonds 1,000 5.000 05/01/15 1,133
Birmingham Water Works Board Revenue Bonds (µ) 1,275 5.000 01/01/17 1,482
Courtland Industrial Development Board Revenue Bonds 250 5.000 11/01/13 265
Mobile Industrial Development Board Revenue Bonds (Ê) 1,400 4.875 06/01/34 1,469
5,435
Alaska - 0.3%City of Valdez Alaska Revenue Bonds 1,470 5.000 01/01/21 1,732
Arizona - 2.9%Arizona Health Facilities Authority Revenue Bonds 2,000 5.250 01/01/18 2,385
Arizona Health Facilities Authority Revenue Bonds 2,000 5.250 01/01/22 2,278
Arizona School Facilities Board Revenue Bonds 1,500 5.000 07/01/16 1,708
Arizona Transportation Board Revenue Bonds 1,500 5.000 07/01/14 1,657
Arizona Water Infrastructure Finance Authority Revenue Bonds 1,455 5.000 10/01/18 1,821
City of Mesa Arizona Revenue Bonds (µ) 1,000 5.250 07/01/14 1,100
City of Phoenix Arizona General Obligation Unlimited 2,000 5.000 07/01/15 2,289
Maricopa County Pollution Control Corp. Revenue Bonds (Ê) 2,310 5.200 06/01/43 2,539
Salt River Project Agricultural Improvement & Power District Revenue Bonds 1,635 5.000 01/01/25 1,940
Salt Verde Financial Corp. Revenue Bonds 1,045 5.250 12/01/24 1,115
18,832
Arkansas - 0.3%State of Arkansas General Obligation Unlimited 1,750 5.000 08/01/13 1,871
California - 9.3%Abag Finance Authority for Nonprofit Corps. Certificate Of Participation 380 5.700 08/15/14 382
California Health Facilities Financing Authority Revenue Bonds 1,550 5.000 07/01/16 1,752
California Health Facilities Financing Authority Revenue Bonds 1,375 5.000 11/15/32 1,531
California Infrastructure & Economic Development Bank Revenue Bonds (µ)(Ê) 1,600 0.040 09/01/37 1,600
California State Department of Water Resources Revenue Bonds 1,000 5.000 05/01/14 1,103
California State Department of Water Resources Revenue Bonds 1,000 5.000 05/01/16 1,181
California State Department of Water Resources Revenue Bonds 1,000 5.000 05/01/17 1,205
California State Department of Water Resources Revenue Bonds 2,500 5.000 05/01/19 3,118
California State Department of Water Resources Revenue Bonds 2,500 5.000 12/01/20 3,164
Copyright © 2012 www.secdatabase.com. All Rights Reserved.Please Consider the Environment Before Printing This Document

California State Department of Water Resources Revenue Bonds 1,000 5.000 12/01/21 1,201
California State Public Works Board Revenue Bonds 1,000 5.000 12/01/16 1,144
California Statewide Communities Development Authority Revenue Bonds 2,250 5.000 06/15/13 2,386
California Statewide Communities Development Authority Revenue Bonds 1,000 5.000 04/01/14 1,090
California Statewide Communities Development Authority Revenue Bonds 2,260 5.000 04/01/19 2,715
California Statewide Communities Development Authority Revenue Bonds 1,405 6.000 05/15/23 1,588
California Statewide Communities Development Authority Revenue Bonds (µ)(Ê) 610 4.100 04/01/28 633
County of Sacramento California Airport System Revenue Bonds 2,000 5.000 07/01/22 2,253
County of Sacramento California Airport System Revenue Bonds 895 5.500 07/01/28 998
County of Sacramento California Airport System Revenue Bonds 750 5.625 07/01/29 837
Golden State Tobacco Securitization Corp. Revenue Bonds (µ) 500 5.000 06/01/20 500
Golden State Tobacco Securitization Corp. Revenue Bonds (µ) 750 4.600 06/01/23 777
Kings River Conservation District Certificate Of Participation 850 5.000 05/01/15 949
Los Angeles Harbor Department Revenue Bonds 2,000 5.250 08/01/22 2,409
Los Angeles Unified School District General Obligation Unlimited (µ)(æ) 1,150 5.000 07/01/13 1,226
Modesto Irrigation District Revenue Bonds 1,425 5.000 07/01/17 1,667
Northern California Power Agency Revenue Bonds 1,000 5.000 06/01/15 1,114
San Diego Public Facilities Financing Authority Sewer Revenue Bonds 240 5.000 05/15/21 290
San Francisco City & County Public Utilities Commission Water Revenue Bonds 2,685 5.000 11/01/27 3,249
Russell Tax Exempt Bond Fund 199
Copyright © 2012 www.secdatabase.com. All Rights Reserved.Please Consider the Environment Before Printing This Document

Table of Contents
Russell Investment CompanyRussell Tax Exempt Bond FundSchedule of Investments, continued �� January 31, 2012 (Unaudited)Amounts in thousands (except share amounts)
Principal
Amount ($)
or Shares
Rate
%
Date
of
Maturity
Value
$
Southern California Public Power Authority Revenue Bonds 1,000 5.000 07/01/23 1,192
State of California General Obligation Unlimited 1,000 5.000 02/01/12 1,000
State of California General Obligation Unlimited (µ) 1,000 6.000 02/01/17 1,230
State of California General Obligation Unlimited 1,000 5.000 10/01/17 1,200
State of California General Obligation Unlimited 1,250 5.000 07/01/20 1,533
State of California General Obligation Unlimited 2,500 5.500 04/01/21 3,042
State of California General Obligation Unlimited 1,000 5.250 07/01/21 1,242
State of California General Obligation Unlimited 1,000 5.250 03/01/22 1,218
State of California General Obligation Unlimited (µ)(Ê) 100 0.040 07/01/23 100
State of California General Obligation Unlimited 2,500 5.250 09/01/28 2,913
State of California General Obligation Unlimited (µ)(Ê) 300 0.040 05/01/34 300
Tuolumne Wind Project Authority Revenue Bonds 1,500 5.000 01/01/18 1,750
University of California Revenue Bonds 500 4.000 05/15/14 540
59,322
Colorado - 0.3%Colorado Health Facilities Authority Revenue Bonds 1,000 5.250 06/01/23 1,062
Colorado Housing & Finance Authority Revenue Bonds 5 6.300 08/01/12 5
Colorado Housing & Finance Authority Revenue Bonds 20 6.300 08/01/16 20
Colorado Housing & Finance Authority Revenue Bonds 5 6.700 10/01/16 5
E-470 Public Highway Authority Revenue Bonds (µ) 850 5.000 09/01/17 903
1,995
Connecticut - 0.9%Connecticut State Health & Educational Facility Authority Revenue Bonds 2,500 5.000 07/01/25 3,003
State of Connecticut General Obligation Unlimited 2,490 5.000 01/01/16 2,898
5,901
Delaware - 0.7%Delaware Transportation Authority Revenue Bonds 1,330 5.000 07/01/16 1,572
Delaware Transportation Authority Revenue Bonds 1,000 5.000 07/01/17 1,212
Delaware Transportation Authority Revenue Bonds (µ) 1,305 5.000 07/01/18 1,476
4,260
District of Columbia - 0.2%District of Columbia Revenue Bonds (µ) 1,000 5.000 02/01/12 1,000
Florida - 6.4%
Copyright © 2012 www.secdatabase.com. All Rights Reserved.Please Consider the Environment Before Printing This Document

Citizens Property Insurance Corp. Revenue Bonds (µ) 1,000 5.000 03/01/15 1,088
Citizens Property Insurance Corp. Revenue Bonds 2,600 5.000 06/01/15 2,847
Citizens Property Insurance Corp. Revenue Bonds 2,500 5.000 06/01/18 2,828
City of Gulf Breeze Florida Revenue Bonds (µ) 1,825 5.000 12/01/15 1,865
City of Lakeland Florida Energy System Revenue Bonds (µ) 2,000 5.000 10/01/17 2,348
City of Pembroke Pines Florida Revenue Bonds (µ) 1,000 5.000 10/01/16 1,122
City of Tampa Florida Revenue Bonds 500 5.000 11/15/15 572
County of Hillsborough Florida Revenue Bonds (µ) 1,000 5.500 08/01/12 1,026
County of Miami-Dade Florida Water & Sewer System Revenue Bonds (µ) 1,500 5.250 10/01/19 1,834
Escambia County Health Facilities Authority Revenue Bonds 1,000 5.250 11/15/13 1,082
Florida Department of Children & Family Services Certificate Of Participation (µ) 1,175 5.000 10/01/15 1,310
Florida Hurricane Catastrophe Fund Finance Corp. Revenue Bonds 1,000 5.000 07/01/15 1,110
Florida State Department of Transportation Revenue Bonds (µ) 2,000 5.000 07/01/13 2,128
Hillsborough County Aviation Authority Revenue Bonds 1,000 5.000 10/01/14 1,095
JEA Electric System Revenue Bonds 1,000 5.000 10/01/17 1,195
Kissimmee Utility Authority Revenue Bonds (µ) 1,000 5.000 10/01/17 1,179
Miami-Dade County Educational Facilities Authority Revenue Bonds (µ)(æ) 1,750 5.000 04/01/14 1,916
Orlando Utilities Commission Revenue Bonds 3,000 5.000 10/01/19 3,682
Russell Tax Exempt Bond Fund 200
Copyright © 2012 www.secdatabase.com. All Rights Reserved.Please Consider the Environment Before Printing This Document

Table of Contents
Russell Investment CompanyRussell Tax Exempt Bond FundSchedule of Investments, continued �� January 31, 2012 (Unaudited)Amounts in thousands (except share amounts)
Principal
Amount ($)
or Shares
Rate
%
Date
of
Maturity
Value
$
Palm Beach County School District Certificate Of Participation (µ) 1,000 5.000 08/01/14 1,081
South Miami Health Facilities Authority Revenue Bonds 750 5.000 08/15/18 876
State of Florida General Obligation Unlimited 1,000 5.000 06/01/16 1,176
State of Florida General Obligation Unlimited 3,515 5.000 06/01/17 4,037
State of Florida Revenue Bonds (µ) 1,000 5.250 01/01/13 1,045
State of Florida Revenue Bonds 1,300 5.000 07/01/16 1,508
Tampa-Hillsborough County Expressway Authority Revenue Bonds (µ) 1,000 5.000 07/01/14 1,096
41,046
Georgia - 4.3%Atlanta Independent School System Certificate Of Participation 2,000 5.000 03/01/17 2,352
City of Atlanta Georgia Airport Revenue Revenue Bonds 2,000 5.000 01/01/16 2,275
City of Atlanta Georgia Airport Revenue Revenue Bonds 2,500 5.000 01/01/20 2,994
City of Atlanta Georgia Revenue Bonds 1,000 6.000 11/01/20 1,272
City of Atlanta Georgia Revenue Bonds (µ) 2,000 5.500 11/01/23 2,371
City of Atlanta Georgia Revenue Bonds 1,300 6.000 11/01/25 1,588
Georgia State Road & Tollway Authority Revenue Bonds 1,150 5.000 03/01/19 1,453
Hall County School District General Obligation Unlimited 1,000 5.000 11/01/12 1,034
Marietta Development Authority Revenue Bonds 515 6.250 06/15/20 521
Municipal Electric Authority of Georgia Revenue Bonds (µ) 850 6.250 01/01/17 1,029
Private Colleges & Universities Authority Revenue Bonds 1,500 5.000 09/01/16 1,784
State of Georgia General Obligation Unlimited 2,000 5.000 07/01/12 2,040
State of Georgia General Obligation Unlimited 2,100 5.500 07/01/13 2,255
State of Georgia General Obligation Unlimited 1,000 5.000 11/01/16 1,201
State of Georgia General Obligation Unlimited 1,240 5.000 07/01/17 1,517
State of Georgia General Obligation Unlimited 1,500 5.000 07/01/22 1,831
27,517
Guam - 0.1%Territory of Guam Revenue Bonds 500 5.375 12/01/24 535
Hawaii - 0.8%City & County of Honolulu Hawaii Revenue Bonds (µ) 1,500 5.000 07/01/19 1,783
Hawaii Housing & Community Development Corp. Revenue Bonds 160 3.700 01/01/22 164
State of Hawaii General Obligation Unlimited 1,000 5.000 02/01/15 1,129
State of Hawaii General Obligation Unlimited 1,290 5.000 06/01/15 1,473
State of Hawaii General Obligation Unlimited 660 5.000 12/01/29 795
Copyright © 2012 www.secdatabase.com. All Rights Reserved.Please Consider the Environment Before Printing This Document

5,344
Idaho - 0.4%Boise State University Revenue Bonds (µ)(æ) 1,230 5.375 04/01/12 1,240
Boise State University Revenue Bonds (µ) 5 5.375 04/01/22 5
Idaho Housing & Finance Association Revenue Bonds (µ) 1,330 5.250 07/15/21 1,565
2,810
Illinois - 4.0%City of Chicago Illinois General Obligation Unlimited (µ)(æ) 1,000 5.000 01/01/14 1,088
City of Chicago Illinois General Obligation Unlimited (µ) 2,500 5.000 01/01/17 2,779
City of Chicago Illinois General Obligation Unlimited (µ) 2,135 5.000 12/01/23 2,339
City of Chicago Illinois O�Hare International Airport Revenue 1,320 3.840 01/31/20 1,522
City of Chicago Illinois O�Hare International Airport Revenue Revenue Bonds (µ) 1,000 5.000 01/01/19 1,106
Cook County Community Consolidated School District No. 15 Palatine General
Obligation Limited (µ) 2,235 Zero coupon 12/01/13 2,151
Illinois Finance Authority Revenue Bonds 670 5.500 10/01/12 691
Illinois Finance Authority Revenue Bonds 1,000 5.000 03/01/15 1,113
Lake County Community Unit School District No. 116 Round Lake General
Obligation Unlimited (µ) 400 7.600 02/01/14 457
Russell Tax Exempt Bond Fund 201
Copyright © 2012 www.secdatabase.com. All Rights Reserved.Please Consider the Environment Before Printing This Document
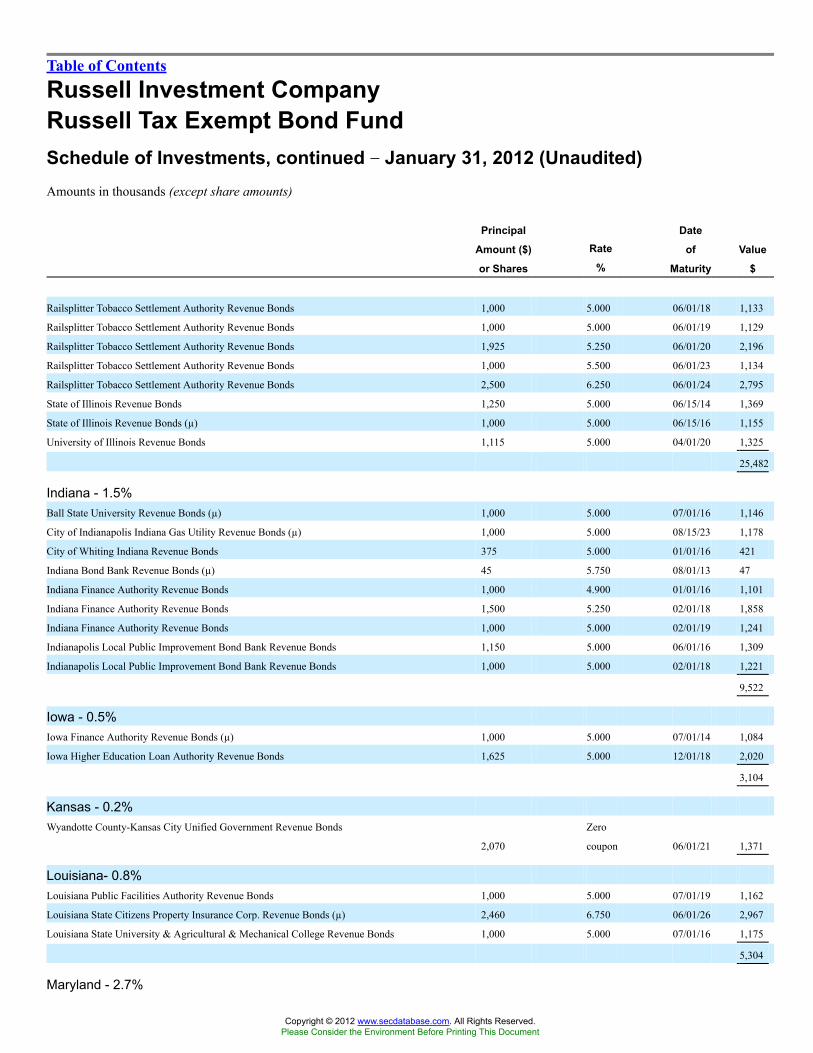
Table of Contents
Russell Investment CompanyRussell Tax Exempt Bond FundSchedule of Investments, continued �� January 31, 2012 (Unaudited)Amounts in thousands (except share amounts)
Principal
Amount ($)
or Shares
Rate
%
Date
of
Maturity
Value
$
Railsplitter Tobacco Settlement Authority Revenue Bonds 1,000 5.000 06/01/18 1,133
Railsplitter Tobacco Settlement Authority Revenue Bonds 1,000 5.000 06/01/19 1,129
Railsplitter Tobacco Settlement Authority Revenue Bonds 1,925 5.250 06/01/20 2,196
Railsplitter Tobacco Settlement Authority Revenue Bonds 1,000 5.500 06/01/23 1,134
Railsplitter Tobacco Settlement Authority Revenue Bonds 2,500 6.250 06/01/24 2,795
State of Illinois Revenue Bonds 1,250 5.000 06/15/14 1,369
State of Illinois Revenue Bonds (µ) 1,000 5.000 06/15/16 1,155
University of Illinois Revenue Bonds 1,115 5.000 04/01/20 1,325
25,482
Indiana - 1.5%Ball State University Revenue Bonds (µ) 1,000 5.000 07/01/16 1,146
City of Indianapolis Indiana Gas Utility Revenue Bonds (µ) 1,000 5.000 08/15/23 1,178
City of Whiting Indiana Revenue Bonds 375 5.000 01/01/16 421
Indiana Bond Bank Revenue Bonds (µ) 45 5.750 08/01/13 47
Indiana Finance Authority Revenue Bonds 1,000 4.900 01/01/16 1,101
Indiana Finance Authority Revenue Bonds 1,500 5.250 02/01/18 1,858
Indiana Finance Authority Revenue Bonds 1,000 5.000 02/01/19 1,241
Indianapolis Local Public Improvement Bond Bank Revenue Bonds 1,150 5.000 06/01/16 1,309
Indianapolis Local Public Improvement Bond Bank Revenue Bonds 1,000 5.000 02/01/18 1,221
9,522
Iowa - 0.5%Iowa Finance Authority Revenue Bonds (µ) 1,000 5.000 07/01/14 1,084
Iowa Higher Education Loan Authority Revenue Bonds 1,625 5.000 12/01/18 2,020
3,104
Kansas - 0.2%Wyandotte County-Kansas City Unified Government Revenue Bonds
2,070
Zero
coupon 06/01/21 1,371
Louisiana- 0.8%Louisiana Public Facilities Authority Revenue Bonds 1,000 5.000 07/01/19 1,162
Louisiana State Citizens Property Insurance Corp. Revenue Bonds (µ) 2,460 6.750 06/01/26 2,967
Louisiana State University & Agricultural & Mechanical College Revenue Bonds 1,000 5.000 07/01/16 1,175
5,304
Maryland - 2.7%
Copyright © 2012 www.secdatabase.com. All Rights Reserved.Please Consider the Environment Before Printing This Document

County of Montgomery Maryland General Obligation Unlimited 2,000 5.000 07/01/17 2,449
County of Montgomery Maryland General Obligation Unlimited 1,350 5.000 07/01/19 1,711
County of Prince George�s Maryland General Obligation Limited 1,000 5.000 07/15/16 1,192
Maryland Economic Development Corp. Revenue Bonds 1,250 5.125 06/01/20 1,312
Maryland Economic Development Corp. Revenue Bonds 885 6.200 09/01/22 1,086
Maryland Economic Development Corp. Revenue Bonds 1,120 5.375 06/01/25 1,160
Maryland Economic Development Corp. Revenue Bonds 1,350 5.750 09/01/25 1,417
Maryland Health & Higher Educational Facilities Authority Revenue Bonds (Ê) 465 5.000 05/15/48 523
Maryland State Department of Transportation Revenue Bonds (æ) 1,100 5.000 05/01/14 1,215
Maryland State Transportation Authority Revenue Bonds 1,000 5.000 03/01/16 1,172
State of Maryland General Obligation Unlimited 2,500 5.250 03/01/13 2,635
State of Maryland General Obligation Unlimited 1,500 5.000 08/01/14 1,671
17,543
Massachusetts - 1.7%Commonwealth of Massachusetts General Obligation Limited 930 5.500 11/01/15 1,095
Commonwealth of Massachusetts General Obligation Limited 1,000 5.500 10/01/16 1,215
Commonwealth of Massachusetts General Obligation Unlimited 1,500 5.250 08/01/13 1,610
202 Russell Tax Exempt Bond Fund
Copyright © 2012 www.secdatabase.com. All Rights Reserved.Please Consider the Environment Before Printing This Document

Table of Contents
Russell Investment CompanyRussell Tax Exempt Bond FundSchedule of Investments, continued �� January 31, 2012 (Unaudited)Amounts in thousands (except share amounts)
Principal
Amount ($)
or Shares
Rate
%
Date
of
Maturity
Value
$
Massachusetts Department of Transportation Revenue Bonds 1,380 5.000 01/01/15 1,517
Massachusetts School Building Authority Revenue Bonds 1,000 5.000 10/15/22 1,273
Massachusetts School Building Authority Revenue Bonds 780 5.000 10/15/27 954
Massachusetts State Water Pollution Abatement Revenue Bonds 1,090 5.000 08/01/16 1,297
Massachusetts Water Resources Authority Revenue Bonds 1,525 5.000 08/01/14 1,694
10,655
Michigan - 1.8%City of Detroit Michigan Sewage Disposal System Revenue Bonds (µ) 1,000 5.000 07/01/14 1,074
City of Detroit Michigan Water Supply System Revenue Bonds (µ) 1,015 5.000 07/01/18 1,105
Detroit City School District General Obligation Unlimited (µ) 1,000 6.000 05/01/19 1,185
Kent Hospital Finance Authority Revenue Bonds 1,505 5.000 11/15/19 1,774
Kent Hospital Finance Authority Revenue Bonds (Ê) 500 5.250 01/15/47 536
Michigan State Hospital Finance Authority Revenue Bonds 1,000 5.500 11/01/14 1,069
Michigan State Housing Development Authority Revenue Bonds (µ) 40 4.150 10/01/13 41
Michigan Strategic Fund Revenue Bonds 2,000 6.250 06/01/14 2,216
Wayne County Airport Authority Revenue Bonds 2,000 5.000 12/01/17 2,279
11,279
Minnesota - 3.2%City of Minneapolis Minnesota Revenue Bonds 1,250 5.000 08/01/17 1,366
City of Minneapolis Minnesota Revenue Bonds 1,855 6.375 11/15/23 2,199
City of Rochester Minnesota Revenue Bonds (Ê) 1,125 4.000 11/15/30 1,273
City of Saint Louis Park Minnesota Revenue Bonds 1,165 5.500 07/01/17 1,330
City of Saint Louis Park Minnesota Revenue Bonds 725 5.500 07/01/18 832
Minnesota Municipal Power Agency Revenue Bonds 2,220 5.250 10/01/21 2,447
State of Minnesota General Obligation Unlimited 545 5.000 06/01/14 603
State of Minnesota General Obligation Unlimited 1,000 5.000 08/01/15 1,151
State of Minnesota General Obligation Unlimited 2,990 5.000 06/01/17 3,642
State of Minnesota General Obligation Unlimited 1,925 4.000 08/01/18 2,279
Tobacco Securitization Authority Minnesota Revenue Bonds 1,175 5.000 03/01/21 1,344
Tobacco Securitization Authority Minnesota Revenue Bonds 1,010 5.000 03/01/22 1,152
Tobacco Securitization Authority Minnesota Revenue Bonds 780 5.250 03/01/31 843
20,461
Mississippi - 0.5%Mississippi Development Bank Revenue Bonds (µ) 1,000 5.000 07/01/15 1,105
Copyright © 2012 www.secdatabase.com. All Rights Reserved.Please Consider the Environment Before Printing This Document

Mississippi Hospital Equipment & Facilities Authority Revenue Bonds 1,555 5.000 10/01/17 1,822
2,927
Missouri - 0.8%City of State Louis Missouri Airport Revenue Bonds 1,680 6.125 07/01/24 1,913
Missouri Highway & Transportation Commission Revenue Bonds 2,500 5.250 05/01/23 2,923
4,836
Nevada - 1.0%County of Clark Nevada Airport System Revenue Bonds 1,000 5.000 07/01/12 1,019
County of Clark Nevada Airport System Revenue Bonds (µ) 2,500 5.000 07/01/22 2,860
County of Clark Nevada General Obligation Limited (µ) 1,000 5.000 11/01/13 1,082
County of Clark Nevada Revenue Bonds 1,000 5.000 07/01/16 1,141
6,102
New Jersey - 3.5%New Jersey Economic Development Authority Revenue Bonds 1,000 5.000 09/01/12 1,028
New Jersey Economic Development Authority Revenue Bonds 1,020 5.375 06/15/15 1,091
New Jersey Economic Development Authority Revenue Bonds (µ) 1,500 5.500 06/15/16 1,624
Russell Tax Exempt Bond Fund 203
Copyright © 2012 www.secdatabase.com. All Rights Reserved.Please Consider the Environment Before Printing This Document

Table of Contents
Russell Investment CompanyRussell Tax Exempt Bond FundSchedule of Investments, continued �� January 31, 2012 (Unaudited)Amounts in thousands (except share amounts)
Principal
Amount ($)
or Shares
Rate
%
Date
of
Maturity
Value
$
New Jersey Economic Development Authority Revenue Bonds 2,500 5.000 09/01/18 3,011
New Jersey Educational Facilities Authority Revenue Bonds 2,000 5.000 07/01/16 2,384
New Jersey Health Care Facilities Financing Authority Revenue Bonds 980 5.000 07/01/13 1,018
New Jersey Health Care Facilities Financing Authority Revenue Bonds (µ) 1,000 5.000 09/15/17 1,148
New Jersey Transportation Trust Fund Authority Revenue Bonds 1,000 5.000 12/15/16 1,173
New Jersey Transportation Trust Fund Authority Revenue Bonds (µ) 1,500 5.000 06/15/18 1,692
New Jersey Transportation Trust Fund Authority Revenue Bonds 1,000 5.000 12/15/18 1,218
New Jersey Transportation Trust Fund Authority Revenue Bonds 3,750 5.500 06/15/31 4,433
State of New Jersey General Obligation Unlimited (µ) 2,080 5.500 07/15/18 2,607
22,427
New Mexico - 0.6%State of New Mexico Revenue Bonds 3,500 5.000 07/01/15 4,012
New York - 11.3%Battery Park City Authority Revenue Bonds 1,500 5.250 11/01/22 1,628
Brooklyn Arena Local Development Corp. Revenue Bonds 2,250 6.500 07/15/30 2,466
Buffalo & Erie County Industrial Land Development Corp. Revenue Bonds 1,350 5.750 10/01/26 1,620
City of New York New York General Obligation Unlimited 850 5.000 03/01/12 853
City of New York New York General Obligation Unlimited 750 5.000 11/01/12 777
City of New York New York General Obligation Unlimited 1,500 5.000 08/01/15 1,717
City of New York New York General Obligation Unlimited 2,170 5.000 08/01/16 2,559
City of New York New York General Obligation Unlimited 1,500 5.000 08/01/19 1,860
City of New York New York General Obligation Unlimited 2,750 5.000 10/01/28 3,280
Hempstead Town Local Development Corp. Revenue Bonds 1,600 5.750 07/01/23 1,810
Metropolitan Transportation Authority Revenue Bonds 1,430 6.500 11/15/28 1,763
New York City Health & Hospital Corp. Revenue Bonds 1,500 5.000 02/15/17 1,749
New York City Municipal Water Finance Authority Revenue Bonds (µ) 865 5.000 06/15/21 974
New York City Transitional Finance Authority Future Tax Secured Revenue Bonds 890 5.000 11/01/20 1,122
New York City Trust for Cultural Resources Revenue Bonds 940 5.000 07/01/21 1,124
New York State Dormitory Authority Revenue Bonds 3,415 5.000 07/01/16 3,822
New York State Dormitory Authority Revenue Bonds 1,755 5.000 07/01/17 2,074
New York State Dormitory Authority Revenue Bonds 1,000 5.000 10/01/19 1,264
New York State Dormitory Authority Revenue Bonds 1,000 5.250 02/15/21 1,250
New York State Dormitory Authority Revenue Bonds 1,000 6.500 12/01/21 1,094
New York State Dormitory Authority Revenue Bonds 2,400 5.000 05/01/22 2,825
New York State Dormitory Authority Revenue Bonds 2,500 5.250 07/01/29 2,931
Copyright © 2012 www.secdatabase.com. All Rights Reserved.Please Consider the Environment Before Printing This Document

New York State Environmental Facilities Corp. Revenue Bonds 770 5.000 06/15/22 920
New York State Environmental Facilities Corp. Revenue Bonds 1,640 5.000 09/15/23 1,928
New York State Thruway Authority Revenue Bonds (µ) 1,575 5.250 04/01/13 1,665
New York State Thruway Authority Revenue Bonds 4,000 5.000 04/01/14 4,384
New York State Thruway Authority Revenue Bonds 2,300 5.000 03/15/19 2,853
New York State Urban Development Corp. Revenue Bonds 2,500 5.000 03/15/17 2,999
Port Authority of New York & New Jersey Revenue Bonds 2,500 6.500 12/01/28 2,686
Sales Tax Asset Receivable Corp. Revenue Bonds (µ) 1,700 5.000 10/15/25 1,881
State of New York General Obligation Unlimited 1,500 5.000 02/15/14 1,639
State of New York General Obligation Unlimited 2,000 5.000 12/15/21 2,568
Tobacco Settlement Financing Corp. Revenue Bonds 1,030 5.000 06/01/12 1,046
Triborough Bridge & Tunnel Authority Revenue Bonds 950 5.000 11/15/17 1,155
Triborough Bridge & Tunnel Authority Revenue Bonds (µ) 1,000 5.500 11/15/20 1,272
Triborough Bridge & Tunnel Authority Revenue Bonds (Ê) 2,250 5.000 11/15/25 2,434
Triborough Bridge & Tunnel Authority Revenue Bonds (Ê) 900 5.000 11/15/38 1,021
Troy Capital Resource Corp. Revenue Bonds 1,000 5.000 09/01/20 1,178
72,191
North Carolina - 1.8%City of Charlotte North Carolina General Obligation Unlimited 1,890 5.000 06/01/15 2,164
204 Russell Tax Exempt Bond Fund
Copyright © 2012 www.secdatabase.com. All Rights Reserved.Please Consider the Environment Before Printing This Document

Table of Contents
Russell Investment CompanyRussell Tax Exempt Bond FundSchedule of Investments, continued �� January 31, 2012 (Unaudited)Amounts in thousands (except share amounts)
Principal
Amount ($)
or Shares
Rate
%
Date
of
Maturity
Value
$
North Carolina Eastern Municipal Power Agency Revenue Bonds 650 5.000 01/01/16 746
North Carolina Medical Care Commission Revenue Bonds 410 5.400 10/01/27 412
North Carolina Municipal Power Agency No. 1 Revenue Bonds 200 5.500 01/01/13 209
State of North Carolina General Obligation Unlimited 1,000 5.000 03/01/12 1,004
State of North Carolina General Obligation Unlimited 1,000 5.000 03/01/14 1,052
State of North Carolina General Obligation Unlimited 2,500 5.000 05/01/20 3,194
State of North Carolina Revenue Bonds 1,000 5.000 05/01/19 1,250
University of North Carolina at Chapel Hill Revenue Bonds 1,205 5.000 12/01/31 1,366
11,397
Ohio - 1.2%County of Montgomery Ohio Revenue Bonds 1,100 5.750 11/15/22 1,342
Kent State University Revenue Bonds (µ) 2,000 5.000 05/01/16 2,300
Ohio Air Quality Development Authority Revenue Bonds 1,110 5.700 02/01/14 1,191
Ohio Air Quality Development Authority Revenue Bonds 1,050 5.625 06/01/18 1,188
Ohio Air Quality Development Authority Revenue Bonds 1,725 5.700 08/01/20 1,942
7,963
Oklahoma - 0.2%Oklahoma Development Finance Authority Revenue Bonds 275 5.000 10/01/13 293
Tulsa County Industrial Authority Revenue Bonds 1,000 4.000 09/01/14 1,070
1,363
Oregon - 1.6%City of Portland Oregon Sewer System Revenue Bonds 2,000 5.000 06/15/18 2,474
Morrow County School District No. 1 General Obligation Unlimited (µ) 1,955 5.500 06/15/21 2,529
Oregon Department of Transportation Revenue Bonds 2,000 5.250 11/15/14 2,262
State of Oregon General Obligation Unlimited 2,500 5.000 05/01/27 3,052
10,317
Pennsylvania - 5.5%Allegheny County Hospital Development Authority Revenue Bonds 2,000 5.000 09/01/16 2,324
Allegheny County Industrial Development Authority Revenue Bonds 920 6.500 05/01/17 967
Berks County Municipal Authority Revenue Bonds 1,960 5.250 11/01/24 2,244
Berks County Vocational Technical School Authority Revenue Bonds (µ) 1,260 5.000 06/01/15 1,375
Butler County Hospital Authority Revenue Bonds 1,000 7.125 07/01/29 1,163
Commonwealth of Pennsylvania General Obligation Unlimited 2,000 5.000 08/01/13 2,139
Copyright © 2012 www.secdatabase.com. All Rights Reserved.Please Consider the Environment Before Printing This Document
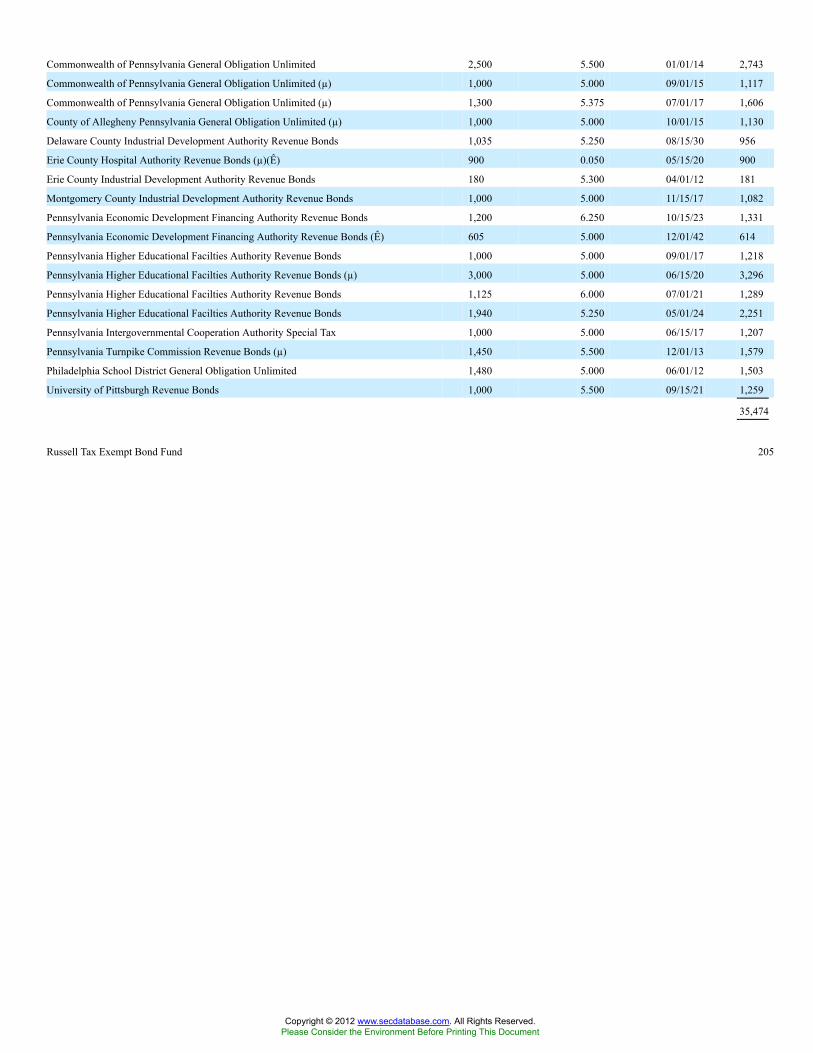
Commonwealth of Pennsylvania General Obligation Unlimited 2,500 5.500 01/01/14 2,743
Commonwealth of Pennsylvania General Obligation Unlimited (µ) 1,000 5.000 09/01/15 1,117
Commonwealth of Pennsylvania General Obligation Unlimited (µ) 1,300 5.375 07/01/17 1,606
County of Allegheny Pennsylvania General Obligation Unlimited (µ) 1,000 5.000 10/01/15 1,130
Delaware County Industrial Development Authority Revenue Bonds 1,035 5.250 08/15/30 956
Erie County Hospital Authority Revenue Bonds (µ)(Ê) 900 0.050 05/15/20 900
Erie County Industrial Development Authority Revenue Bonds 180 5.300 04/01/12 181
Montgomery County Industrial Development Authority Revenue Bonds 1,000 5.000 11/15/17 1,082
Pennsylvania Economic Development Financing Authority Revenue Bonds 1,200 6.250 10/15/23 1,331
Pennsylvania Economic Development Financing Authority Revenue Bonds (Ê) 605 5.000 12/01/42 614
Pennsylvania Higher Educational Facilties Authority Revenue Bonds 1,000 5.000 09/01/17 1,218
Pennsylvania Higher Educational Facilties Authority Revenue Bonds (µ) 3,000 5.000 06/15/20 3,296
Pennsylvania Higher Educational Facilties Authority Revenue Bonds 1,125 6.000 07/01/21 1,289
Pennsylvania Higher Educational Facilties Authority Revenue Bonds 1,940 5.250 05/01/24 2,251
Pennsylvania Intergovernmental Cooperation Authority Special Tax 1,000 5.000 06/15/17 1,207
Pennsylvania Turnpike Commission Revenue Bonds (µ) 1,450 5.500 12/01/13 1,579
Philadelphia School District General Obligation Unlimited 1,480 5.000 06/01/12 1,503
University of Pittsburgh Revenue Bonds 1,000 5.500 09/15/21 1,259
35,474
Russell Tax Exempt Bond Fund 205
Copyright © 2012 www.secdatabase.com. All Rights Reserved.Please Consider the Environment Before Printing This Document

Table of Contents
Russell Investment CompanyRussell Tax Exempt Bond FundSchedule of Investments, continued �� January 31, 2012 (Unaudited)Amounts in thousands (except share amounts)
Principal
Amount ($)
or Shares
Rate
%
Date
of
Maturity
Value
$
Puerto Rico - 4.1%Commonwealth of Puerto Rico General Obligation Unlimited 750 5.250 07/01/15 818
Commonwealth of Puerto Rico General Obligation Unlimited (æ) 620 5.250 07/01/16 745
Commonwealth of Puerto Rico General Obligation Unlimited 1,780 5.250 07/01/22 1,831
Government Development Bank for Puerto Rico Revenue Bonds (µ) 2,830 4.750 12/01/15 2,913
Puerto Rico Electric Power Authority Revenue Bonds (µ) 1,005 5.500 07/01/16 1,150
Puerto Rico Electric Power Authority Revenue Bonds 1,000 5.000 07/01/17 1,133
Puerto Rico Electric Power Authority Revenue Bonds (µ) 500 5.500 07/01/17 579
Puerto Rico Highway & Transportation Authority Revenue Bonds 2,000 5.000 07/01/13 2,107
Puerto Rico Housing Finance Authority Revenue Bonds 180 5.500 12/01/15 200
Puerto Rico Housing Finance Authority Revenue Bonds 1,830 5.500 12/01/16 2,076
Puerto Rico Public Buildings Authority Revenue Bonds (æ) 2,000 5.500 07/01/14 2,234
Puerto Rico Public Buildings Authority Revenue Bonds 500 5.750 07/01/16 560
Puerto Rico Public Finance Corp. Revenue Bonds (µ)(Ê) 2,250 5.750 08/01/27 2,250
Puerto Rico Sales Tax Financing Corp. Revenue Bonds (æ) 30 6.125 02/01/14 33
Puerto Rico Sales Tax Financing Corp. Revenue Bonds 650 5.000 08/01/22 786
Puerto Rico Sales Tax Financing Corp. Revenue Bonds 2,500 5.500 08/01/22 2,941
Puerto Rico Sales Tax Financing Corp. Revenue Bonds 970 6.125 08/01/29 1,041
Puerto Rico Sales Tax Financing Corp. Revenue Bonds 2,500 6.500 08/01/35 2,978
26,375
South Carolina - 0.8%Piedmont Municipal Power Agency Revenue Bonds 1,000 5.000 01/01/20 1,183
South Carolina State Public Service Authority Revenue Bonds 1,000 5.000 12/01/16 1,183
South Carolina Transportation Infrastructure Bank Revenue Bonds 2,500 5.000 10/01/17 2,963
5,329
South Dakota - 0.3%South Dakota Housing Development Authority Revenue Bonds 270 4.800 05/01/22 272
South Dakota State Building Authority Revenue Bonds (µ) 1,330 5.000 09/01/12 1,367
1,639
Tennessee - 1.1%City of Memphis Tennessee Revenue Bonds 2,500 5.000 12/01/14 2,792
City of Memphis Tennessee Revenue Bonds 1,135 5.000 12/01/15 1,306
Memphis-Shelby County Airport Authority Revenue Bonds 1,000 5.050 09/01/12 1,025
Metropolitan Government of Nashville & Davidson County Tennessee Revenue Bonds 1,500 5.000 07/01/21 1,881
Copyright © 2012 www.secdatabase.com. All Rights Reserved.Please Consider the Environment Before Printing This Document

7,004
Texas - 9.1%Canadian River Municipal Water Authority Corp. Revenue Bonds (µ) 800 5.000 02/15/17 927
Canadian River Municipal Water Authority Corp. Revenue Bonds (µ) 415 5.000 02/15/18 478
City of Austin Texas Water & Wastewater System Revenue Revenue Bonds (µ) 1,000 5.250 11/15/14 1,127
City of Bryan Texas Revenue Bonds 1,000 5.000 07/01/15 1,124
City of Dallas Texas Revenue Bonds (µ) 2,500 5.000 10/01/17 3,064
City of Dallas Texas Revenue Bonds 2,000 5.000 10/01/18 2,488
City of Fort Worth Texas Water & Sewer System Revenue Bonds 1,000 5.000 02/15/13 1,049
City of Fort Worth Texas Water & Sewer System Revenue Bonds 1,340 5.000 02/15/17 1,611
City of Houston Texas Airport System Revenue Bonds 1,500 5.000 07/01/17 1,774
City of Houston Texas General Obligation Limited 1,375 5.250 03/01/28 1,616
City of Houston Texas Revenue Bonds 1,890 5.000 09/01/20 2,182
City of New Braunfels Texas General Obligation Limited (µ)(æ) 665 5.250 10/01/14 750
City of San Antonio Texas Revenue Bonds 50 5.250 02/01/13 52
City of San Antonio Texas Revenue Bonds 1,000 5.000 02/01/14 1,091
City of San Antonio Texas Revenue Bonds 1,000 5.000 02/01/18 1,230
City of San Antonio Texas Revenue Bonds 2,250 5.000 05/15/24 2,721
206 Russell Tax Exempt Bond Fund
Copyright © 2012 www.secdatabase.com. All Rights Reserved.Please Consider the Environment Before Printing This Document

Table of Contents
Russell Investment CompanyRussell Tax Exempt Bond FundSchedule of Investments, continued �� January 31, 2012 (Unaudited)Amounts in thousands (except share amounts)
Principal
Amount ($)
or Shares
Rate
%
Date
of
Maturity
Value
$
Conroe Independent School District General Obligation Unlimited 1,445 5.000 02/15/13 1,516
Conroe Independent School District General Obligation Unlimited 1,085 5.000 02/15/25 1,316
County of Fort Bend Texas General Obligation Limited (µ) 1,000 5.000 03/01/16 1,165
County of Travis Texas General Obligation Limited 1,000 5.000 03/01/15 1,127
Dallas Convention Center Hotel Development Corp. Revenue Bonds 2,150 5.250 01/01/23 2,450
Dallas Independent School District General Obligation Unlimited 2,100 5.000 02/15/14 2,295
Dallas-Fort Worth International Airport Facilities Improvement Corp. Revenue Bonds 280 5.000 11/01/22 314
Dallas-Fort Worth International Airport Facilities Improvement Corp. Revenue Bonds 200 5.000 11/01/23 223
Dallas-Fort Worth International Airport Facilities Improvement Corp. Revenue Bonds 250 5.000 11/01/24 277
Dickinson Independent School District General Obligation Unlimited 1,000 5.000 02/15/23 1,121
Fort Worth Independent School District General Obligation Unlimited 2,000 5.000 02/15/18 2,458
Grand Prairie Independent School District General Obligation Unlimited 750 5.000 02/15/19 890
Lower Colorado River Authority Revenue Bonds (µ) 430 5.875 05/15/14 432
Lower Colorado River Authority Revenue Bonds 1,300 5.000 05/15/16 1,515
North East Independent School District General Obligation Unlimited (µ)(æ) 1,000 5.000 08/01/14 1,113
North Texas Municipal Water District Revenue Bonds (µ) 2,000 5.000 09/01/13 2,147
North Texas Tollway Authority Revenue Bonds 960 6.000 01/01/24 1,140
North Texas Tollway Authority Revenue Bonds (Ê) 1,235 5.750 01/01/38 1,433
Round Rock Independent School District General Obligation Unlimited 430 5.375 08/01/12 441
Round Rock Independent School District General Obligation Unlimited 1,350 5.250 08/01/14 1,510
Tarrant County Cultural Education Facilities Finance Corp. Revenue Bonds 1,500 5.000 11/15/16 1,760
Texas A&M University Revenue Bonds 2,000 5.000 05/15/15 2,285
Texas Private Activity Bond Surface Transportation Corp. Revenue Bonds 1,445 7.500 12/31/31 1,690
Texas Private Activity Bond Surface Transportation Corp. Revenue Bonds 1,250 7.500 06/30/33 1,460
Texas Transportation Commission Revenue Bonds 2,500 5.000 04/01/25 2,834
58,196
Utah - 0.4%State of Utah General Obligation Unlimited 2,000 5.000 07/01/16 2,377
Virgin Islands - 0.0%Virgin Islands Public Finance Authority Revenue Bonds 200 5.000 10/01/13 210
Virginia - 2.7%Chesapeake Economic Development Authority Revenue Bonds (Ê) 550 3.600 02/01/32 560
Chesterfield County Economic Development Authority Revenue Bonds 650 5.000 05/01/23 740
Commonwealth of Virginia General Obligation Unlimited 1,000 5.000 06/01/23 1,197
Copyright © 2012 www.secdatabase.com. All Rights Reserved.Please Consider the Environment Before Printing This Document

County of Fairfax Virginia General Obligation Unlimited 1,750 5.250 04/01/14 1,932
County of Fairfax Virginia General Obligation Unlimited 3,000 5.000 04/01/18 3,719
University of Virginia Revenue Bonds (æ) 2,345 5.000 06/01/13 2,493
University of Virginia Revenue Bonds 205 5.000 06/01/20 214
University of Virginia Revenue Bonds 240 5.000 06/01/21 250
Virginia College Building Authority Revenue Bonds (æ) 2,065 5.000 02/01/14 2,254
Virginia Commonwealth Transportation Board Revenue Bonds 360 5.375 05/15/12 362
Virginia Commonwealth Transportation Board Revenue Bonds 1,250 4.750 05/15/21 1,344
Virginia Public Building Authority Revenue Bonds 1,000 5.000 08/01/14 1,110
Virginia Public School Authority Revenue Bonds 1,000 5.000 08/01/17 1,215
17,390
Washington - 3.3%City of Seattle Washington Municipal Light & Power Revenue Bonds 1,500 5.000 02/01/14 1,637
Clark County Public Utility District No. 1 Revenue Bonds 1,375 5.000 01/01/14 1,477
County of King Washington Sewer Revenue Bonds (µ) 1,625 5.000 01/01/14 1,768
Energy Northwest Revenue Bonds 1,000 5.000 07/01/14 1,108
Energy Northwest Revenue Bonds 2,500 5.000 07/01/15 2,865
Energy Northwest Revenue Bonds 1,000 7.125 07/01/16 1,261
King County Public Hospital District No. 2 General Obligation Limited (µ) 1,000 5.000 12/01/19 1,132
Russell Tax Exempt Bond Fund 207
Copyright © 2012 www.secdatabase.com. All Rights Reserved.Please Consider the Environment Before Printing This Document

Table of Contents
Russell Investment CompanyRussell Tax Exempt Bond FundSchedule of Investments, continued �� January 31, 2012 (Unaudited)Amounts in thousands (except share amounts)
Principal
Amount ($)
or Shares
Rate
%
Date
of
Maturity
Value
$
King County School District No. 405 Bellevue General Obligation Unlimited (µ) 1,000 5.000 12/01/14 1,120
Mason County School District No. 309 Shelton General Obligation Unlimited (µ) 1,115 5.000 12/01/18 1,361
Pierce County School District No. 3 Puyallup General Obligation Unlimited (µ) 1,000 5.000 12/01/18 1,143
Port of Seattle Washington Revenue Bonds 1,000 5.000 06/01/22 1,204
Snohomish County School District No. 15 Edmonds General Obligation Unlimited (µ) 2,000 5.000 12/01/18 2,308
State of Washington General Obligation Unlimited 1,000 5.000 07/01/17 1,211
State of Washington General Obligation Unlimited 1,560 5.000 08/01/29 1,864
21,459
West Virginia - 0.3%West Virginia University Revenue Bonds 1,350 5.000 10/01/21 1,699
Wisconsin - 0.4%City of Madison Wisconsin Revenue Bonds (Ê) 280 4.875 10/01/27 282
Wisconsin Department of Transportation Revenue Bonds (µ) 1,500 5.000 07/01/19 1,867
Wisconsin Health & Educational Facilities Authority Revenue Bonds 210 5.250 05/01/12 211
Wisconsin Health & Educational Facilities Authority Revenue Bonds 220 5.250 05/01/13 226
2,586
Total Municipal Bonds (cost 564,146) 605,594
Short-Term Investments - 5.2%Russell U.S. Cash Management Fund 33,150,628 (¥) 33,151
Total Short-Term Investments (cost 33,151) 33,151
Total Investments - 99.8% (identified cost $597,297) 638,745
Other Assets and Liabilities, Net - 0.2% 1,476
Net Assets - 100.0% 640,221
See accompanying notes which are an integral part of this quarterly report.
208 Russell Tax Exempt Bond Fund
Copyright © 2012 www.secdatabase.com. All Rights Reserved.Please Consider the Environment Before Printing This Document
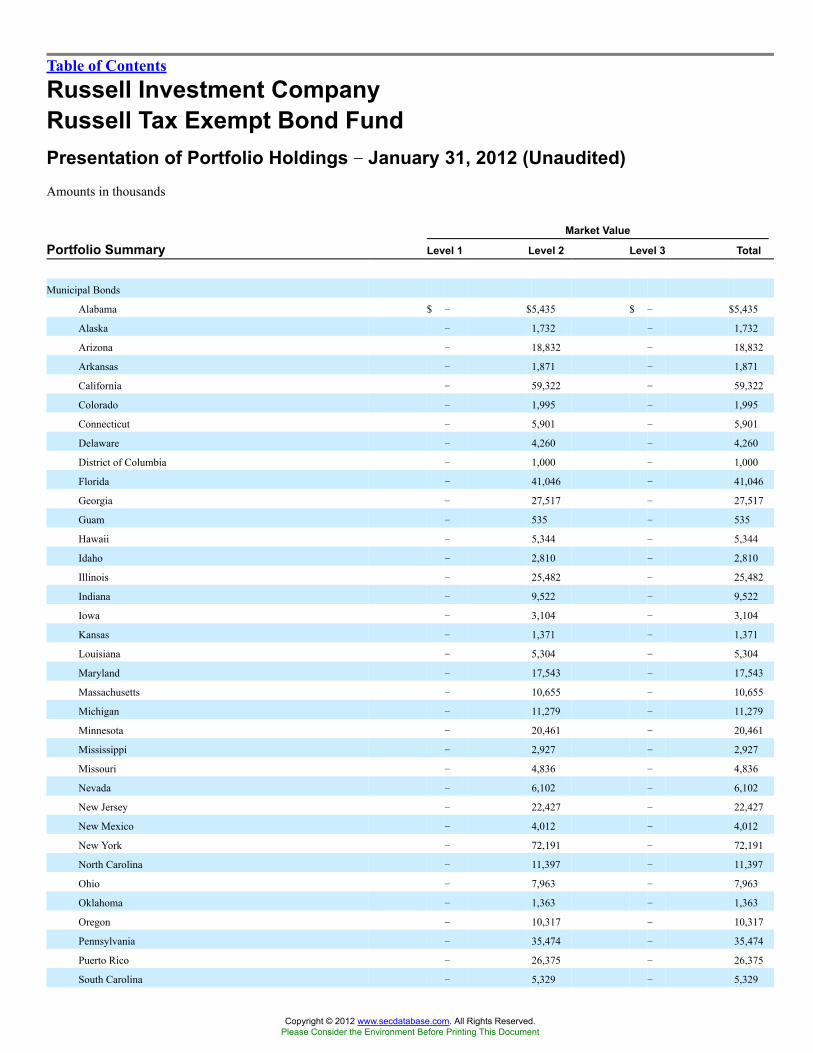
Table of Contents
Russell Investment CompanyRussell Tax Exempt Bond FundPresentation of Portfolio Holdings �� January 31, 2012 (Unaudited)Amounts in thousands
Market Value
Portfolio Summary Level 1 Level 2 Level 3 Total
Municipal Bonds
Alabama $ � $5,435 $ � $5,435
Alaska � 1,732 � 1,732
Arizona � 18,832 � 18,832
Arkansas � 1,871 � 1,871
California � 59,322 � 59,322
Colorado � 1,995 � 1,995
Connecticut � 5,901 � 5,901
Delaware � 4,260 � 4,260
District of Columbia � 1,000 � 1,000
Florida � 41,046 � 41,046
Georgia � 27,517 � 27,517
Guam � 535 � 535
Hawaii � 5,344 � 5,344
Idaho � 2,810 � 2,810
Illinois � 25,482 � 25,482
Indiana � 9,522 � 9,522
Iowa � 3,104 � 3,104
Kansas � 1,371 � 1,371
Louisiana � 5,304 � 5,304
Maryland � 17,543 � 17,543
Massachusetts � 10,655 � 10,655
Michigan � 11,279 � 11,279
Minnesota � 20,461 � 20,461
Mississippi � 2,927 � 2,927
Missouri � 4,836 � 4,836
Nevada � 6,102 � 6,102
New Jersey � 22,427 � 22,427
New Mexico � 4,012 � 4,012
New York � 72,191 � 72,191
North Carolina � 11,397 � 11,397
Ohio � 7,963 � 7,963
Oklahoma � 1,363 � 1,363
Oregon � 10,317 � 10,317
Pennsylvania � 35,474 � 35,474
Puerto Rico � 26,375 � 26,375
South Carolina � 5,329 � 5,329
Copyright © 2012 www.secdatabase.com. All Rights Reserved.Please Consider the Environment Before Printing This Document

South Dakota � 1,639 � 1,639
Tennessee � 7,004 � 7,004
Texas � 58,196 � 58,196
Utah � 2,377 � 2,377
Virgin Islands � 210 � 210
Virginia � 17,390 � 17,390
Washington � 21,459 � 21,459
West Virginia � 1,699 � 1,699
Wisconsin � 2,586 � 2,586
Short-Term Investments � 33,151 � 33,151
Total Investments $ � $638,745 $ � $638,745
For a description of the levels see note 2 in the Notes to Quarterly Report.
See accompanying notes which are an integral part of this quarterly report.
Russell Tax Exempt Bond Fund 209
Copyright © 2012 www.secdatabase.com. All Rights Reserved.Please Consider the Environment Before Printing This Document

Table of Contents
Russell Investment CompanyRussell Commodity Strategies Fund
Consolidated Schedule of Investments �� January 31, 2012 (Unaudited)Amounts in thousands (except share amounts)
Principal
Amount ($)
or Shares
Market
Value
$
Long-Term Investments - 11.4%United States Government Agencies - 11.4%Federal Farm Credit Bank
0.261% due 02/11/13 (Ê) 22,000 22,019
0.260% due 03/15/13 (Ê) 20,000 20,018
0.221% due 07/29/13 (Ê) 10,100 10,106
Federal Home Loan Banks
0.280% due 03/06/13 10,000 10,007
0.240% due 04/12/13 13,000 12,999
Series 1
0.320% due 03/15/13 (Ê) 15,000 15,022
Federal Home Loan Mortgage Corp.
0.239% due 03/21/13 (Ê) 18,000 18,021
0.245% due 05/06/13 (Ê) 10,000 10,019
Federal National Mortgage Association
0.550% due 08/23/13 7,000 7,006
0.265% due 11/08/13 (Ê) 15,000 15,012
140,229
Total Long-Term Investments(cost $140,080) 140,229
Short-Term Investments - 86.5%FC Discount Notes
Zero coupon due 11/20/12 10,000 9,993
Federal Farm Credit Bank
0.270% due 04/25/12 18,000 18,007
0.400% due 08/17/12 (Ê) 8,000 8,007
Series 1
0.331% due 07/02/12 (Ê) 4,000 4,004
Federal Farm Credit Discount Notes
Zero coupon due 05/15/12 11,000 10,999
Federal Home Loan Banks
0.130% due 02/24/12 (ç) 10,000 10,000
0.161% due 09/04/12 (Ê) 18,000 18,007
0.235% due 11/01/12 (Ê) 18,000 18,009
0.200% due 11/21/12 16,000 16,003
Principal
Amount ($)
or Shares
Market
Value
$
United States Treasury Notes
0.231% due 02/29/12 (ç)(�) 15,000 15,007
0.379% due 03/31/12 (ç) 18,000 18,027
0.173% due 03/31/12 (ç) 7,000 7,010
0.185% due 04/30/12 10,000 10,023
0.070% due 04/30/12 5,000 5,011
0.098% due 08/31/12 10,000 10,016
0.100% due 08/31/12 2,000 2,003
0.121% due 09/30/12 5,000 5,008
0.117% due 09/30/12 5,000 5,009
0.103% due 10/31/12 10,000 10,019
Total Short-Term Investments(cost $1,059,878) 1,060,002
Total Investments - 97.9%(identified cost $1,199,958) 1,200,231
Other Assets and Liabilities,Net - 2.1% 25,818
Net Assets - 100.0% 1,226,049
Copyright © 2012 www.secdatabase.com. All Rights Reserved.Please Consider the Environment Before Printing This Document

See accompanying notes which are an integral part of this quarterly report.
210 Russell Commodity Strategies Fund
Federal Home Loan Mortgage Corp.
1.000% due 08/28/12 12,000 12,058
0.750% due 12/28/12 15,000 15,079
Federal National Mortgage Association
0.299% due 08/23/12 (Ê) 17,500 17,515
0.315% due 09/17/12 (Ê) 15,000 15,015
0.290% due 12/03/12 (Ê) 15,000 15,017
0.375% due 12/28/12 12,500 12,529
Freddie Mac Discount Notes
Zero coupon due 02/21/12 18,000 18,000
Russell U.S. Cash Management Fund 358,979,588(¥) 358,980
United States Treasury Bills
0.103% due 02/23/12 (ç)(�) 100,000 99,998
Zero coupon due 03/29/12 (ç)(�) 6,700 6,700
0.033% due 04/19/12 (�) 84,000 83,991
Zero coupon due 04/26/12 (�) 5,000 4,999
0.061% due 05/24/12 (�) 100,000 99,981
0.064% due 05/31/12 (�) 100,000 99,978
Copyright © 2012 www.secdatabase.com. All Rights Reserved.Please Consider the Environment Before Printing This Document
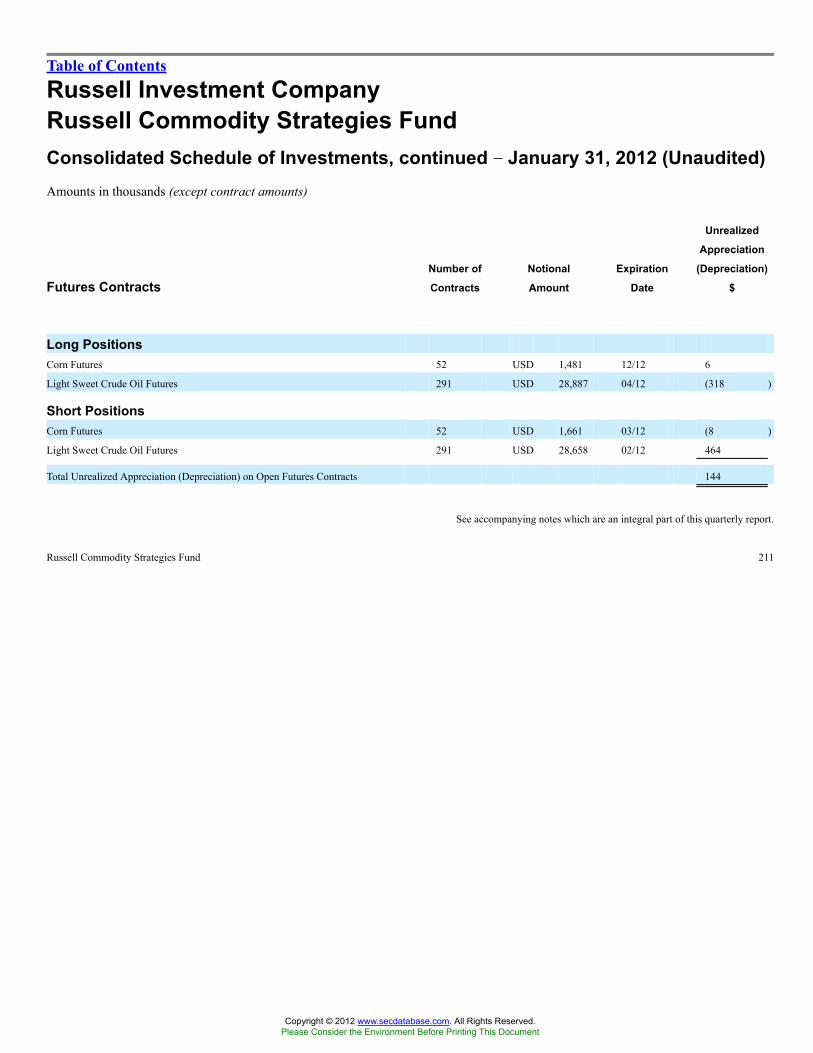
Table of Contents
Russell Investment CompanyRussell Commodity Strategies FundConsolidated Schedule of Investments, continued �� January 31, 2012 (Unaudited)Amounts in thousands (except contract amounts)
Futures ContractsNumber of
Contracts
Notional
Amount
Expiration
Date
Unrealized
Appreciation
(Depreciation)
$
Long PositionsCorn Futures 52 USD 1,481 12/12 6
Light Sweet Crude Oil Futures 291 USD 28,887 04/12 (318 )
Short PositionsCorn Futures 52 USD 1,661 03/12 (8 )
Light Sweet Crude Oil Futures 291 USD 28,658 02/12 464
Total Unrealized Appreciation (Depreciation) on Open Futures Contracts 144
See accompanying notes which are an integral part of this quarterly report.
Russell Commodity Strategies Fund 211
Copyright © 2012 www.secdatabase.com. All Rights Reserved.Please Consider the Environment Before Printing This Document

Table of Contents
Russell Investment CompanyRussell Commodity Strategies FundConsolidated Schedule of Investments, continued �� January 31, 2012 (Unaudited)Amounts in thousands
Index Swaps
Fund Receives
Underlying Security CounterpartyNotional
Amount
Fund Pays
Fixed Rate
Termination
Date
Market
Value
$
Dow Jones-UBS Commodity Index Merrill Lynch USD 121,000 0.140% 06/20/12 2,586
Dow Jones-UBS Commodity Index Merrill Lynch USD 100,951 0.140% 06/20/12 87
Dow Jones-UBS Commodity Index 3 Month Forward UBS AG USD 121,000 0.250% 01/28/13 541
Dow Jones-UBS Commodity Index 3 Month Forward UBS AG USD 147,933 0.250% 01/28/13 (1,193 )
Dow Jones-UBS Commodity Index Total Return BNP Paribas USD 43,188 0.250% 02/23/12 (619 )
Dow Jones-UBS Commodity Index Total Return Morgan Stanley USD 31,671 0.160% 12/23/13 823
Dow Jones-UBS Commodity Index Total Return Societe Generale USD 49,979 0.150% 02/23/12 (717 )
Dow Jones-UBS Commodity Index Total Return UBS AG USD 20,944 0.130% 02/23/12 (300 )
Dow Jones-UBS Commodity Index Total Return 2 Month Forward Morgan Stanley USD 244,895 0.250% 12/23/13 6,948
Dow Jones-UBS Commodity Index Total Return 2 Month Forward Societe Generale USD 48,707 0.300% 02/23/12 (613 )
Dow Jones-UBS Commodity Index Total Return 2 Month Forward UBS AG USD 29,732 0.300% 02/23/12 (374 )
Dow Jones-UBS Commodity Index Total Return 2 Month Forward UBS AG USD 3,000 0.300% 02/23/12 (44 )
Russell Jeffries Diversified I Index Newedge Group USD 246,953 0.350% 09/09/31 (1,115 )
Total Market Value of Open Index Swap Contracts Premiums Paid (Received) - $� (å) 6,010
See accompanying notes which are an integral part of this quarterly report.
212 Russell Commodity Strategies Fund
Copyright © 2012 www.secdatabase.com. All Rights Reserved.Please Consider the Environment Before Printing This Document

Table of Contents
Russell Investment CompanyRussell Commodity Strategies FundConsolidated Presentation of Portfolio Holdings �� January 31, 2012 (Unaudited)Amounts in thousands
Market Value
Portfolio Summary Level 1 Level 2 Level 3 Total
Long-Term Investments
United States Government Agencies $ � $140,229 $� $140,229
Short-Term Investments � 1,060,002 � 1,060,002
Total Investments � 1,200,231 � 1,200,231
Other Financial Instruments
Futures Contracts 144 � � 144
Index Swaps � 7,125 (1,115 ) 6,010
Total Other Financial Instruments* $ 144 $7,125 $(1,115 ) $6,154
* Other financial instruments reflected, such as futures, forwards, interest rate swaps, and credit default swaps are valued at the unrealized appreciation/depreciation
on the instruments.
For a description of the levels see note 2 in the Notes to Quarterly Report.
Investments in which significant unobservable inputs (Level 3) were used in determining a value for the period ending January 31, 2012were less than 1% of net assets.
See accompanying notes which are an integral part of this quarterly report.
Russell Commodity Strategies Fund 213
Copyright © 2012 www.secdatabase.com. All Rights Reserved.Please Consider the Environment Before Printing This Document
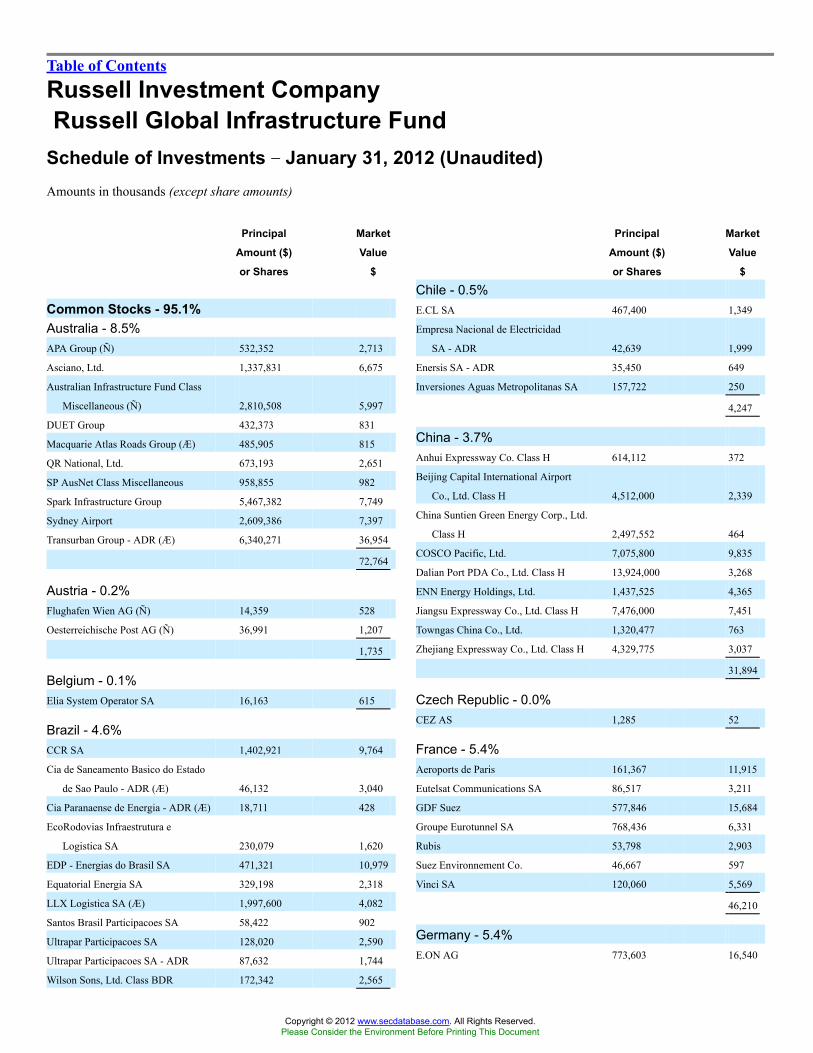
Table of Contents
Russell Investment CompanyRussell Global Infrastructure Fund
Schedule of Investments �� January 31, 2012 (Unaudited)Amounts in thousands (except share amounts)
Principal
Amount ($)
or Shares
Market
Value
$
Common Stocks - 95.1%Australia - 8.5%APA Group (Ñ) 532,352 2,713
Asciano, Ltd. 1,337,831 6,675
Australian Infrastructure Fund Class
Miscellaneous (Ñ) 2,810,508 5,997
DUET Group 432,373 831
Macquarie Atlas Roads Group (Æ) 485,905 815
QR National, Ltd. 673,193 2,651
SP AusNet Class Miscellaneous 958,855 982
Spark Infrastructure Group 5,467,382 7,749
Sydney Airport 2,609,386 7,397
Transurban Group - ADR (Æ) 6,340,271 36,954
72,764
Austria - 0.2%Flughafen Wien AG (Ñ) 14,359 528
Oesterreichische Post AG (Ñ) 36,991 1,207
1,735
Belgium - 0.1%Elia System Operator SA 16,163 615
Brazil - 4.6%CCR SA 1,402,921 9,764
Cia de Saneamento Basico do Estado
de Sao Paulo - ADR (Æ) 46,132 3,040
Cia Paranaense de Energia - ADR (Æ) 18,711 428
EcoRodovias Infraestrutura e
Logistica SA 230,079 1,620
EDP - Energias do Brasil SA 471,321 10,979
Equatorial Energia SA 329,198 2,318
LLX Logistica SA (Æ) 1,997,600 4,082
Santos Brasil Participacoes SA 58,422 902
Ultrapar Participacoes SA 128,020 2,590
Ultrapar Participacoes SA - ADR 87,632 1,744
Wilson Sons, Ltd. Class BDR 172,342 2,565
Principal
Amount ($)
or Shares
Market
Value
$
Chile - 0.5%E.CL SA 467,400 1,349
Empresa Nacional de Electricidad
SA - ADR 42,639 1,999
Enersis SA - ADR 35,450 649
Inversiones Aguas Metropolitanas SA 157,722 250
4,247
China - 3.7%Anhui Expressway Co. Class H 614,112 372
Beijing Capital International Airport
Co., Ltd. Class H 4,512,000 2,339
China Suntien Green Energy Corp., Ltd.
Class H 2,497,552 464
COSCO Pacific, Ltd. 7,075,800 9,835
Dalian Port PDA Co., Ltd. Class H 13,924,000 3,268
ENN Energy Holdings, Ltd. 1,437,525 4,365
Jiangsu Expressway Co., Ltd. Class H 7,476,000 7,451
Towngas China Co., Ltd. 1,320,477 763
Zhejiang Expressway Co., Ltd. Class H 4,329,775 3,037
31,894
Czech Republic - 0.0%CEZ AS 1,285 52
France - 5.4%Aeroports de Paris 161,367 11,915
Eutelsat Communications SA 86,517 3,211
GDF Suez 577,846 15,684
Groupe Eurotunnel SA 768,436 6,331
Rubis 53,798 2,903
Suez Environnement Co. 46,667 597
Vinci SA 120,060 5,569
46,210
Germany - 5.4%E.ON AG 773,603 16,540
Copyright © 2012 www.secdatabase.com. All Rights Reserved.Please Consider the Environment Before Printing This Document

214 Russell Global Infrastructure Fund
40,032
Canada - 10.5%AltaGas, Ltd. - ADR 29,000 876
Atco, Ltd. Class I (Ñ) 47,726 2,841
Brookfield Infrastructure Partners, LP 232,084 6,770
Brookfield Renewable Energy
Partners, LP 121,767 3,184
Canadian Utilities, Ltd. Class A 20,026 1,206
Emera, Inc. (Ñ) 77,804 2,516
Enbridge, Inc. 1,007,451 37,879
Fortis, Inc. 54,667 1,820
Keyera Corp. (Ñ) 87,109 4,080
Pembina Pipeline Corp. (Ñ) 82,124 2,197
TransCanada Corp. (Ñ) 520,874 21,425
Veresen, Inc. Class Common
Subscription Recei 40,331 607
Westshore Terminals Investment Corp. 213,828 5,274
90,675
Fraport AG Frankfurt Airport Services
Worldwide 396,238 23,728
Hamburger Hafen und Logistik AG (Ñ) 172,403 5,525
RWE AG 22,531 862
46,655
Hong Kong - 4.8%Beijing Enterprises Holdings, Ltd. 1,777,109 10,312
Cheung Kong Infrastructure
Holdings, Ltd. 1,463,202 8,330
China Everbright International, Ltd. 3,635,371 1,561
China Merchants Holdings International
Co., Ltd. 2,572,635 8,559
CLP Holdings, Ltd. 45,500 373
Guangdong Investment, Ltd. 3,912,932 2,265
Hong Kong & China Gas Co., Ltd. 1,118,037 2,653
MTR Corp. 897,715 2,992
Power Assets Holdings, Ltd. 603,265 4,352
41,397
Copyright © 2012 www.secdatabase.com. All Rights Reserved.Please Consider the Environment Before Printing This Document

Table of Contents
Russell Investment CompanyRussell Global Infrastructure FundSchedule of Investments, continued �� January 31, 2012 (Unaudited)Amounts in thousands (except share amounts)
Principal
Amount ($)
or Shares
Market
Value
$
India - 0.3%GAIL India, Ltd. - GDR 36,473 1,656
Power Grid Corp. of India, Ltd. 616,006 1,297
2,953
Italy - 4.0%Ansaldo STS SpA 75,374 731
Atlantia SpA 1,599,991 24,905
Autostrada Torino-Milano SpA 51,162 475
Enel SpA 792,249 3,239
Hera SpA 967,289 1,354
Iren SpA - ADR 194,079 180
Societa Iniziative Autostradali e
Servizi SpA 353,522 2,525
Terna Rete Elettrica Nazionale SpA 204,300 749
34,158
Japan - 2.1%East Japan Railway Co. 39,615 2,565
Japan Airport Terminal Co., Ltd. (Ñ) 256,954 3,560
Kamigumi Co., Ltd. 288,526 2,540
Kansai Electric Power Co., Inc.
(The) (Ñ) 40,700 655
Mitsubishi Logistics Corp. (Ñ) 245,000 2,829
Tokyo Gas Co., Ltd. 1,386,000 6,401
18,550
Luxembourg - 0.8%SES SA 295,138 6,969
Mexico - 1.1%Grupo Aeroportuario del Pacifico SAB
de CV - ADR 89,096 3,338
Grupo Aeroportuario del Sureste SA de
CV Class B 10,197 67
Grupo Aeroportuario del Sureste SAB
de CV - ADR 34,493 2,272
Principal
Amount ($)
or Shares
Market
Value
$
Portugal - 0.1%Brisa Auto-Estradas de Portugal SA (Ñ) 422,661 1,238
Singapore - 3.1%Cityspring Infrastructure Trust (Æ) 3,634,013 1,069
ComfortDelGro Corp., Ltd. (Ñ) 1,403,364 1,657
Hutchison Port Holdings Trust Class
U (Ñ) 15,184,214 11,388
Hyflux, Ltd. (Ñ) 209,546 229
Parkway Life Real Estate Investment
Trust (Æ)(ö) 1,085,500 1,532
SATS, Ltd. (Ñ) 1,201,735 2,188
SembCorp Industries, Ltd. 61,235 233
Singapore Post, Ltd. (Ñ) 4,232,267 3,281
Singapore Telecommunications, Ltd. 802,447 1,971
SMRT Corp., Ltd. (Ñ) 2,539,866 3,513
27,061
Spain - 3.7%Abertis Infraestructuras SA 1,178,788 19,860
Enagas SA 144,483 2,892
Ferrovial SA (Ñ) 761,915 8,920
Iberdrola SA 116,700 687
32,359
Switzerland - 0.9%Flughafen Zuerich AG 19,928 7,577
United Kingdom - 6.1%BBA Aviation PLC 597,898 1,756
Centrica PLC 1,379,869 6,380
National Grid PLC 1,405,456 13,997
National Grid PLC - ADR 239,645 11,956
Pennon Group PLC 100,293 1,099
Scottish & Southern Energy PLC 372,362 7,176
Severn Trent PLC Class H 252,551 6,069
United Utilities Group PLC 434,036 4,117
52,550
Copyright © 2012 www.secdatabase.com. All Rights Reserved.Please Consider the Environment Before Printing This Document

Russell Global Infrastructure Fund 215
OHL Mexico SAB de CV (Æ) 2,265,791 3,663
9,340
Netherlands - 1.3%Koninklijke Vopak NV 209,616 11,390
New Zealand - 0.8%Auckland International Airport, Ltd. 1,062,842 2,154
Infratil, Ltd. 873,269 1,352
Port of Tauranga, Ltd. 368,522 3,177
6,683
Norway - 0.1%Hafslund ASA Class B 72,456 716
Philippines - 0.5%International Container Terminal
Services, Inc. 3,034,543 3,966
United States - 26.5%American Electric Power Co., Inc. 188,438 7,455
American States Water Co. 9,019 326
American Tower Corp. Class A 242,444 15,398
American Water Works Co., Inc. 124,075 4,185
Aqua America, Inc. 65,016 1,434
Atmos Energy Corp. 45,924 1,488
Boardwalk Pipeline Partners, LP (Ñ) 20,601 568
CenterPoint Energy, Inc. 138,856 2,565
Chesapeake Utilities Corp. 19,310 831
Corrections Corp. of America (Æ) 281,718 6,629
Crown Castle International Corp. (Æ) 73,500 3,563
Digital Realty Trust, Inc. (ö) 9,912 702
Dominion Resources, Inc. 167,043 8,359
Edison International 34,700 1,424
El Paso Corp. 526,598 14,149
El Paso Pipeline Partners, LP 39,637 1,392
Enbridge Energy Partners, LP Class A 43,600 1,412
Copyright © 2012 www.secdatabase.com. All Rights Reserved.Please Consider the Environment Before Printing This Document

Table of Contents
Russell Investment CompanyRussell Global Infrastructure FundSchedule of Investments, continued �� January 31, 2012 (Unaudited)Amounts in thousands (except share amounts)
Principal
Amount ($)
or Shares
Market
Value
$
Enterprise Products Partners, LP 64,563 3,118
Exelon Corp. 149,099 5,931
FirstEnergy Corp. 48,700 2,056
Golar LNG Partners, LP 28,825 990
Holly Energy Partners, LP 1,067 59
ITC Holdings Corp. 40,920 3,016
Kinder Morgan, Inc. (Ñ) 39,448 1,281
Magellan Midstream Partners, LP 25,700 1,724
MarkWest Energy Partners, LP 14,550 843
Middlesex Water Co. 20,466 387
NextEra Energy, Inc. 184,126 11,020
NiSource, Inc. (Ñ) 224,897 5,112
OGE Energy Corp. 104,404 5,519
Oiltanking Partners, LP 29,576 859
ONEOK, Inc. 7,485 622
Pepco Holdings, Inc. 49,645 976
PG&E Corp. 326,899 13,292
Piedmont Natural Gas Co., Inc. 4,803 158
Pinnacle West Capital Corp. 18,781 888
PPL Corp. 372,472 10,351
Public Service Enterprise Group, Inc. 125,750 3,815
Questar Corp. 458,345 8,837
Rose Rock Midstream, LP (Æ) 22,350 469
Sempra Energy 16,315 928
Southern Co. 234,703 10,693
Spectra Energy Corp. 602,945 18,987
Standard Parking Corp. (Æ) 61,061 1,080
Targa Resources Corp. 20,200 837
Tesoro Logistics, LP 33,896 1,125
UIL Holdings Corp. 89,464 3,094
Unitil Corp. 31,927 882
Waste Connections, Inc. 262,930 8,495
Williams Cos., Inc. (The) 769,182 22,168
Williams Partners, LP (Æ) 37,473 2,338
Wisconsin Energy Corp. 12,200 415
WPX Energy Inc (Æ) 107,966 1,779
Principal
Amount ($)
or Shares
Market
Value
$
Other Securities - 2.8%Russell U.S. Cash Collateral
Fund (×) 24,458,490 (¥) 24,458
Total Other Securities(cost $24,458) 24,458
Total Investments - 102.5%(identified cost $853,757) 885,124
Other Assets and Liabilities,Net - (2.5%) (21,725 )
Net Assets - 100.0% 863,399
Copyright © 2012 www.secdatabase.com. All Rights Reserved.Please Consider the Environment Before Printing This Document

See accompanying notes which are an integral part of this quarterly report.
216 Russell Global Infrastructure Fund
Xcel Energy, Inc. 106,476 2,832
228,856
Total Common Stocks(cost $789,290) 820,642
Preferred Stocks - 0.1%Brazil - 0.1%Cia Energetica do Ceara 28,187 547
Total Preferred Stocks(cost $532) 547
Short-Term Investments - 4.5%United States - 4.5%Russell U.S. Cash Management Fund 39,476,663 (¥) 39,477
Total Short-Term Investments(cost $39,477) 39,477
Copyright © 2012 www.secdatabase.com. All Rights Reserved.Please Consider the Environment Before Printing This Document

Table of Contents
Russell Investment CompanyRussell Global Infrastructure FundSchedule of Investments, continued �� January 31, 2012 (Unaudited)Amounts in thousands (except contract amounts)
Futures ContractsNumber of
Contracts
Notional
AmountExpiration
Date
Unrealized
Appreciation
(Depreciation)
$
Long PositionsASX SPI 200 Index Futures 33 AUD 3,487 03/12 39
EURO STOXX 50 Index Futures 360 EUR 8,712 03/12 465
FTSE 100 Index Futures 30 GBP 1,693 03/12 61
Hang Seng Index Futures (Hong Kong) 18 HKD 18,321 02/12 3
S&P 500 E-Mini Index Futures (CME) 205 USD 13,409 03/12 384
S&P TSE 60 Index Futures 31 CAD 4,390 03/12 155
TOPIX Index Futures (Japan) 17 JPY 128,605 03/12 24
Total Unrealized Appreciation (Depreciation) on Open Futures Contracts (å) 1,131
See accompanying notes which are an integral part of this quarterly report.
Russell Global Infrastructure Fund 217
Copyright © 2012 www.secdatabase.com. All Rights Reserved.Please Consider the Environment Before Printing This Document

Table of Contents
Russell Investment CompanyRussell Global Infrastructure FundSchedule of Investments, continued �� January 31, 2012 (Unaudited)Amounts in thousands
Foreign Currency Exchange Contracts
CounterpartyAmount
Sold
Amount
Bought
Settlement
Date
Unrealized
Appreciation
(Depreciation)
$
Barclays Bank PLC USD 98 AUD 100 03/21/12 7
Barclays Bank PLC USD 508 AUD 501 03/21/12 21
Barclays Bank PLC USD 193 CAD 200 03/21/12 7
Barclays Bank PLC USD 634 CAD 641 03/21/12 5
Barclays Bank PLC USD 1,042 EUR 800 03/21/12 4
Barclays Bank PLC USD 1,789 EUR 1,335 03/21/12 (42 )
Barclays Bank PLC USD 155 GBP 100 03/21/12 3
Barclays Bank PLC USD 402 GBP 256 03/21/12 1
Barclays Bank PLC USD 64 HKD 500 03/21/12 �
Barclays Bank PLC USD 374 HKD 2,908 03/21/12 1
Barclays Bank PLC USD 260 JPY 20,171 03/21/12 4
Brown Brothers Harriman & Co. USD 512 EUR 400 03/21/12 11
Brown Brothers Harriman & Co. AUD 80 USD 82 03/21/12 (2 )
Brown Brothers Harriman & Co. CAD 130 USD 128 03/21/12 (1 )
Brown Brothers Harriman & Co. EUR 125 USD 163 03/21/12 �
Brown Brothers Harriman & Co. EUR 130 USD 168 03/21/12 (2 )
Brown Brothers Harriman & Co. EUR 500 USD 639 03/21/12 (15 )
Brown Brothers Harriman & Co. GBP 40 USD 62 03/21/12 (1 )
Brown Brothers Harriman & Co. HKD 250 USD 32 03/21/12 �
Brown Brothers Harriman & Co. HKD 1,000 USD 129 03/21/12 �
Citibank USD 591 AUD 557 02/01/12 �
Citibank USD 1,597 CAD 1,604 02/02/12 2
Citibank AUD 200 USD 206 03/21/12 (6 )
Citibank CAD 230 USD 227 03/21/12 (2 )
Citibank EUR 500 USD 648 03/21/12 (6 )
Citibank GBP 100 USD 156 03/21/12 (1 )
Citibank HKD 6,017 USD 776 02/01/12 �
Citibank HKD 15,545 USD 2,004 02/02/12 �
Citibank HKD 950 USD 122 03/21/12 �
Citibank JPY 6,500 USD 85 03/21/12 (1 )
Commonwealth Bank of Australia USD 508 AUD 501 03/21/12 21
Commonwealth Bank of Australia USD 1,789 EUR 1,335 03/21/12 (42 )
Commonwealth Bank of Australia USD 260 JPY 20,171 03/21/12 4
Copyright © 2012 www.secdatabase.com. All Rights Reserved.Please Consider the Environment Before Printing This Document
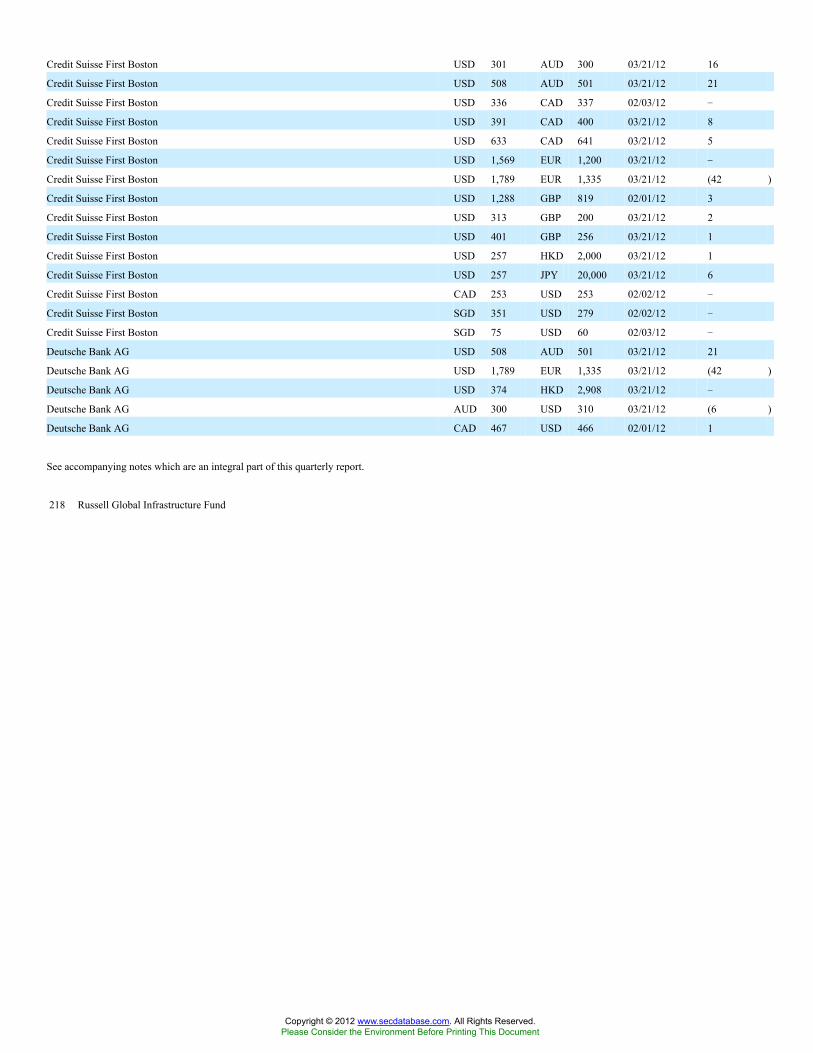
Credit Suisse First Boston USD 301 AUD 300 03/21/12 16
Credit Suisse First Boston USD 508 AUD 501 03/21/12 21
Credit Suisse First Boston USD 336 CAD 337 02/03/12 �
Credit Suisse First Boston USD 391 CAD 400 03/21/12 8
Credit Suisse First Boston USD 633 CAD 641 03/21/12 5
Credit Suisse First Boston USD 1,569 EUR 1,200 03/21/12 �
Credit Suisse First Boston USD 1,789 EUR 1,335 03/21/12 (42 )
Credit Suisse First Boston USD 1,288 GBP 819 02/01/12 3
Credit Suisse First Boston USD 313 GBP 200 03/21/12 2
Credit Suisse First Boston USD 401 GBP 256 03/21/12 1
Credit Suisse First Boston USD 257 HKD 2,000 03/21/12 1
Credit Suisse First Boston USD 257 JPY 20,000 03/21/12 6
Credit Suisse First Boston CAD 253 USD 253 02/02/12 �
Credit Suisse First Boston SGD 351 USD 279 02/02/12 �
Credit Suisse First Boston SGD 75 USD 60 02/03/12 �
Deutsche Bank AG USD 508 AUD 501 03/21/12 21
Deutsche Bank AG USD 1,789 EUR 1,335 03/21/12 (42 )
Deutsche Bank AG USD 374 HKD 2,908 03/21/12 �
Deutsche Bank AG AUD 300 USD 310 03/21/12 (6 )
Deutsche Bank AG CAD 467 USD 466 02/01/12 1
See accompanying notes which are an integral part of this quarterly report.
218 Russell Global Infrastructure Fund
Copyright © 2012 www.secdatabase.com. All Rights Reserved.Please Consider the Environment Before Printing This Document

Table of Contents
Russell Investment CompanyRussell Global Infrastructure FundSchedule of Investments, continued �� January 31, 2012 (Unaudited)Amounts in thousands
Foreign Currency Exchange Contracts
CounterpartyAmount
Sold
Amount
Bought
Settlement
Date
Unrealized
Appreciation
(Depreciation)
$
Deutsche Bank AG CAD 300 USD 297 03/21/12 (2 )
Deutsche Bank AG EUR 1,000 USD 1,289 03/21/12 (19 )
Deutsche Bank AG GBP 450 USD 709 02/03/12 �
Deutsche Bank AG GBP 150 USD 232 03/21/12 (4 )
Deutsche Bank AG MXN 55 USD 4 02/01/12 �
Deutsche Bank AG NZD 100 USD 82 02/02/12 (1 )
Deutsche Bank AG SGD 430 USD 342 02/01/12 1
HSBC Bank PLC USD 508 AUD 501 03/21/12 21
HSBC Bank PLC USD 633 CAD 641 03/21/12 5
HSBC Bank PLC USD 1,789 EUR 1,335 03/21/12 (42 )
HSBC Bank PLC USD 401 GBP 256 03/21/12 1
HSBC Bank PLC USD 374 HKD 2,908 03/21/12 1
HSBC Bank PLC USD 260 JPY 20,171 03/21/12 5
JPMorgan Chase Bank USD 508 AUD 501 03/21/12 21
JPMorgan Chase Bank USD 634 CAD 641 03/21/12 5
JPMorgan Chase Bank USD 1,789 EUR 1,335 03/21/12 (42 )
JPMorgan Chase Bank USD 402 GBP 256 03/21/12 1
JPMorgan Chase Bank USD 374 HKD 2,908 03/21/12 1
JPMorgan Chase Bank USD 260 JPY 20,171 03/21/12 4
Mellon Bank AUD 30 USD 31 03/21/12 (1 )
Mellon Bank CAD 135 USD 133 03/21/12 (1 )
Mellon Bank HKD 500 USD 64 03/21/12 �
Mellon Bank JPY 4,000 USD 52 03/21/12 �
Morgan Stanley & Co., Inc. USD 15 AUD 14 02/01/12 �
Morgan Stanley & Co., Inc. USD 3 CAD 3 02/01/12 �
Morgan Stanley & Co., Inc. USD 4 JPY 284 02/01/12 �
Morgan Stanley & Co., Inc. EUR 53 USD 65 02/01/12 (4 )
Morgan Stanley & Co., Inc. GBP 7 USD 11 02/01/12 1
Morgan Stanley & Co., Inc. HKD 74 USD 10 02/01/12 �
Royal Bank of Canada USD 634 CAD 641 03/21/12 5
Royal Bank of Canada USD 402 GBP 256 03/21/12 1
Royal Bank of Canada USD 374 HKD 2,908 03/21/12 1
Royal Bank of Canada USD 260 JPY 20,171 03/21/12 4
Copyright © 2012 www.secdatabase.com. All Rights Reserved.Please Consider the Environment Before Printing This Document

State Street Bank & Trust Co. USD 5 AUD 5 02/01/12 �
State Street Bank & Trust Co. USD 22 AUD 21 02/01/12 �
State Street Bank & Trust Co. USD 630 AUD 597 02/01/12 5
State Street Bank & Trust Co. USD 609 AUD 571 02/02/12 (3 )
State Street Bank & Trust Co. USD 100 AUD 100 03/21/12 6
State Street Bank & Trust Co. USD 102 AUD 100 03/21/12 4
State Street Bank & Trust Co. USD 102 AUD 100 03/21/12 4
State Street Bank & Trust Co. USD 106 AUD 100 03/21/12 �
State Street Bank & Trust Co. USD 201 AUD 200 03/21/12 10
State Street Bank & Trust Co. USD 208 AUD 200 03/21/12 3
State Street Bank & Trust Co. USD 312 AUD 300 03/21/12 5
State Street Bank & Trust Co. USD 349 AUD 350 03/21/12 20
State Street Bank & Trust Co. USD 632 AUD 600 03/21/12 1
State Street Bank & Trust Co. USD 97 CAD 100 03/21/12 3
State Street Bank & Trust Co. USD 97 CAD 100 03/21/12 2
State Street Bank & Trust Co. USD 98 CAD 100 03/21/12 2
State Street Bank & Trust Co. USD 150 CAD 150 03/21/12 �
State Street Bank & Trust Co. USD 196 CAD 200 03/21/12 4
State Street Bank & Trust Co. USD 247 CAD 250 03/21/12 2
State Street Bank & Trust Co. USD 295 CAD 300 03/21/12 3
See accompanying notes which are an integral part of this quarterly report.
Russell Global Infrastructure Fund 219
Copyright © 2012 www.secdatabase.com. All Rights Reserved.Please Consider the Environment Before Printing This Document

Table of Contents
Russell Investment CompanyRussell Global Infrastructure FundSchedule of Investments, continued �� January 31, 2012 (Unaudited)Amounts in thousands
Foreign Currency Exchange Contracts
CounterpartyAmount
Sold
Amount
Bought
Settlement
Date
Unrealized
Appreciation
(Depreciation)
$
State Street Bank & Trust Co. USD 340 CAD 350 03/21/12 9
State Street Bank & Trust Co. USD 633 CAD 641 03/21/12 5
State Street Bank & Trust Co. USD 797 CAD 800 03/21/12 �
State Street Bank & Trust Co. USD 1,294 EUR 981 02/01/12 (11 )
State Street Bank & Trust Co. USD 245 EUR 187 02/03/12 �
State Street Bank & Trust Co. USD 253 EUR 200 03/21/12 8
State Street Bank & Trust Co. USD 260 EUR 200 03/21/12 2
State Street Bank & Trust Co. USD 261 EUR 200 03/21/12 �
State Street Bank & Trust Co. USD 461 EUR 350 03/21/12 (3 )
State Street Bank & Trust Co. USD 522 EUR 400 03/21/12 1
State Street Bank & Trust Co. USD 525 EUR 400 03/21/12 (2 )
State Street Bank & Trust Co. USD 637 EUR 500 03/21/12 17
State Street Bank & Trust Co. USD 670 EUR 500 03/21/12 (16 )
State Street Bank & Trust Co. USD 775 EUR 600 03/21/12 10
State Street Bank & Trust Co. USD 779 EUR 600 03/21/12 6
State Street Bank & Trust Co. USD 1,970 EUR 1,500 03/21/12 (7 )
State Street Bank & Trust Co. USD 153 GBP 100 03/21/12 5
State Street Bank & Trust Co. USD 155 GBP 100 03/21/12 2
State Street Bank & Trust Co. USD 156 GBP 100 03/21/12 2
State Street Bank & Trust Co. USD 157 GBP 100 03/21/12 1
State Street Bank & Trust Co. USD 157 GBP 100 03/21/12 1
State Street Bank & Trust Co. USD 157 GBP 100 03/21/12 1
State Street Bank & Trust Co. USD 402 GBP 256 03/21/12 1
State Street Bank & Trust Co. USD 471 GBP 300 03/21/12 2
State Street Bank & Trust Co. USD 81 HKD 626 02/01/12 �
State Street Bank & Trust Co. USD 269 HKD 2,089 02/01/12 �
State Street Bank & Trust Co. USD 705 HKD 5,466 02/01/12 �
State Street Bank & Trust Co. USD 84 HKD 650 02/02/12 �
State Street Bank & Trust Co. USD 174 HKD 1,352 02/02/12 �
State Street Bank & Trust Co. USD 64 HKD 500 03/21/12 �
State Street Bank & Trust Co. USD 64 HKD 500 03/21/12 �
State Street Bank & Trust Co. USD 90 HKD 700 03/21/12 �
State Street Bank & Trust Co. USD 129 HKD 1,000 03/21/12 �
Copyright © 2012 www.secdatabase.com. All Rights Reserved.Please Consider the Environment Before Printing This Document
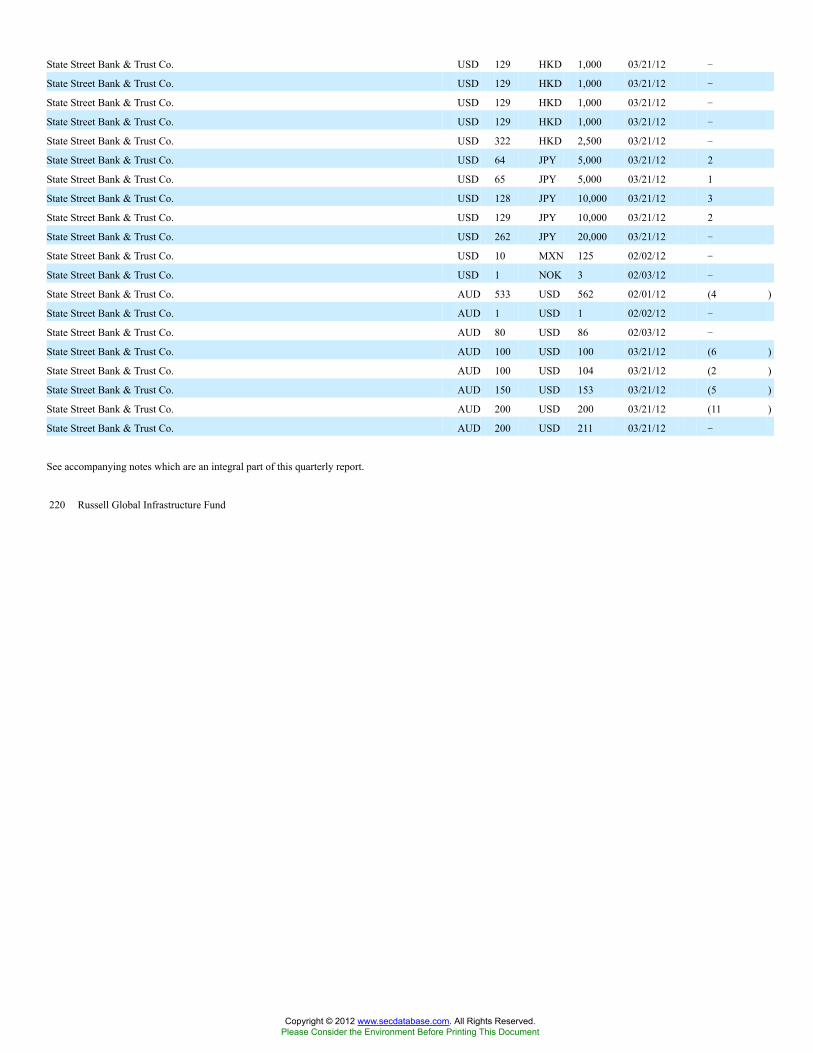
State Street Bank & Trust Co. USD 129 HKD 1,000 03/21/12 �
State Street Bank & Trust Co. USD 129 HKD 1,000 03/21/12 �
State Street Bank & Trust Co. USD 129 HKD 1,000 03/21/12 �
State Street Bank & Trust Co. USD 129 HKD 1,000 03/21/12 �
State Street Bank & Trust Co. USD 322 HKD 2,500 03/21/12 �
State Street Bank & Trust Co. USD 64 JPY 5,000 03/21/12 2
State Street Bank & Trust Co. USD 65 JPY 5,000 03/21/12 1
State Street Bank & Trust Co. USD 128 JPY 10,000 03/21/12 3
State Street Bank & Trust Co. USD 129 JPY 10,000 03/21/12 2
State Street Bank & Trust Co. USD 262 JPY 20,000 03/21/12 �
State Street Bank & Trust Co. USD 10 MXN 125 02/02/12 �
State Street Bank & Trust Co. USD 1 NOK 3 02/03/12 �
State Street Bank & Trust Co. AUD 533 USD 562 02/01/12 (4 )
State Street Bank & Trust Co. AUD 1 USD 1 02/02/12 �
State Street Bank & Trust Co. AUD 80 USD 86 02/03/12 �
State Street Bank & Trust Co. AUD 100 USD 100 03/21/12 (6 )
State Street Bank & Trust Co. AUD 100 USD 104 03/21/12 (2 )
State Street Bank & Trust Co. AUD 150 USD 153 03/21/12 (5 )
State Street Bank & Trust Co. AUD 200 USD 200 03/21/12 (11 )
State Street Bank & Trust Co. AUD 200 USD 211 03/21/12 �
See accompanying notes which are an integral part of this quarterly report.
220 Russell Global Infrastructure Fund
Copyright © 2012 www.secdatabase.com. All Rights Reserved.Please Consider the Environment Before Printing This Document
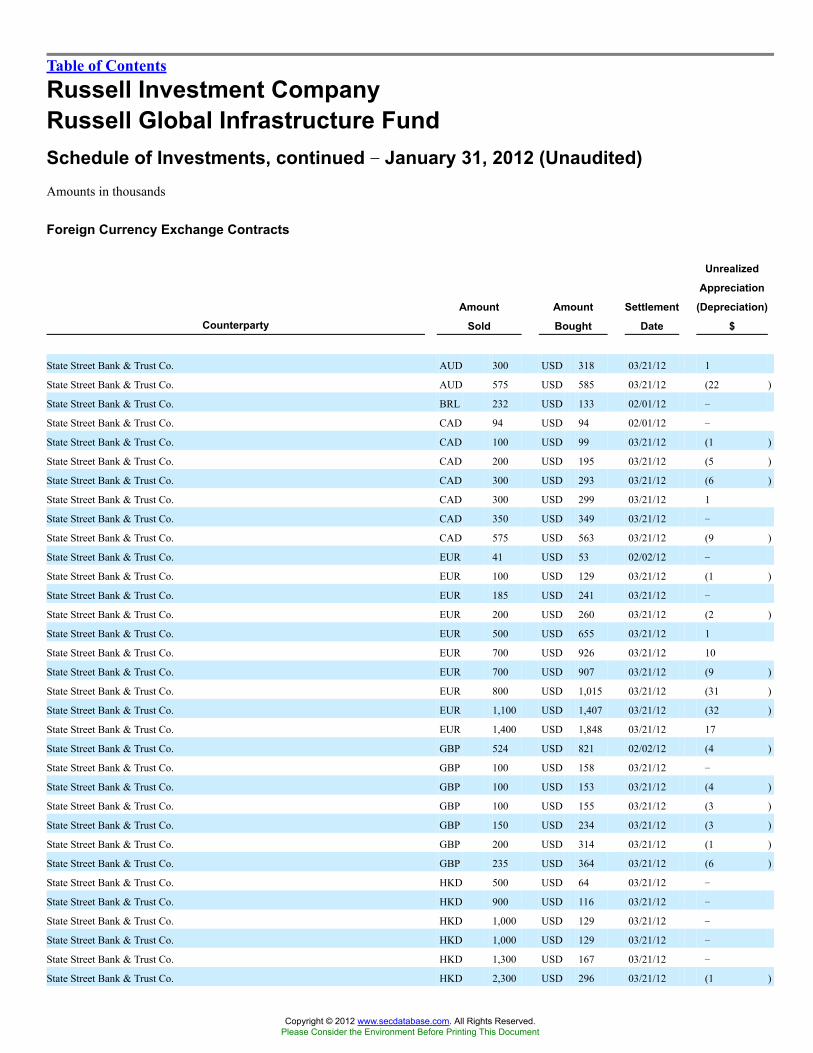
Table of Contents
Russell Investment CompanyRussell Global Infrastructure FundSchedule of Investments, continued �� January 31, 2012 (Unaudited)Amounts in thousands
Foreign Currency Exchange Contracts
CounterpartyAmount
Sold
Amount
Bought
Settlement
Date
Unrealized
Appreciation
(Depreciation)
$
State Street Bank & Trust Co. AUD 300 USD 318 03/21/12 1
State Street Bank & Trust Co. AUD 575 USD 585 03/21/12 (22 )
State Street Bank & Trust Co. BRL 232 USD 133 02/01/12 �
State Street Bank & Trust Co. CAD 94 USD 94 02/01/12 �
State Street Bank & Trust Co. CAD 100 USD 99 03/21/12 (1 )
State Street Bank & Trust Co. CAD 200 USD 195 03/21/12 (5 )
State Street Bank & Trust Co. CAD 300 USD 293 03/21/12 (6 )
State Street Bank & Trust Co. CAD 300 USD 299 03/21/12 1
State Street Bank & Trust Co. CAD 350 USD 349 03/21/12 �
State Street Bank & Trust Co. CAD 575 USD 563 03/21/12 (9 )
State Street Bank & Trust Co. EUR 41 USD 53 02/02/12 �
State Street Bank & Trust Co. EUR 100 USD 129 03/21/12 (1 )
State Street Bank & Trust Co. EUR 185 USD 241 03/21/12 �
State Street Bank & Trust Co. EUR 200 USD 260 03/21/12 (2 )
State Street Bank & Trust Co. EUR 500 USD 655 03/21/12 1
State Street Bank & Trust Co. EUR 700 USD 926 03/21/12 10
State Street Bank & Trust Co. EUR 700 USD 907 03/21/12 (9 )
State Street Bank & Trust Co. EUR 800 USD 1,015 03/21/12 (31 )
State Street Bank & Trust Co. EUR 1,100 USD 1,407 03/21/12 (32 )
State Street Bank & Trust Co. EUR 1,400 USD 1,848 03/21/12 17
State Street Bank & Trust Co. GBP 524 USD 821 02/02/12 (4 )
State Street Bank & Trust Co. GBP 100 USD 158 03/21/12 �
State Street Bank & Trust Co. GBP 100 USD 153 03/21/12 (4 )
State Street Bank & Trust Co. GBP 100 USD 155 03/21/12 (3 )
State Street Bank & Trust Co. GBP 150 USD 234 03/21/12 (3 )
State Street Bank & Trust Co. GBP 200 USD 314 03/21/12 (1 )
State Street Bank & Trust Co. GBP 235 USD 364 03/21/12 (6 )
State Street Bank & Trust Co. HKD 500 USD 64 03/21/12 �
State Street Bank & Trust Co. HKD 900 USD 116 03/21/12 �
State Street Bank & Trust Co. HKD 1,000 USD 129 03/21/12 �
State Street Bank & Trust Co. HKD 1,000 USD 129 03/21/12 �
State Street Bank & Trust Co. HKD 1,300 USD 167 03/21/12 �
State Street Bank & Trust Co. HKD 2,300 USD 296 03/21/12 (1 )
Copyright © 2012 www.secdatabase.com. All Rights Reserved.Please Consider the Environment Before Printing This Document

State Street Bank & Trust Co. HKD 2,500 USD 322 03/21/12 �
State Street Bank & Trust Co. JPY 69,873 USD 913 02/02/12 (4 )
State Street Bank & Trust Co. JPY 10,000 USD 129 03/21/12 (3 )
State Street Bank & Trust Co. JPY 10,000 USD 130 03/21/12 (1 )
State Street Bank & Trust Co. JPY 10,000 USD 131 03/21/12 �
State Street Bank & Trust Co. JPY 10,000 USD 128 03/21/12 (3 )
State Street Bank & Trust Co. JPY 20,000 USD 260 03/21/12 (3 )
Westpac Banking Corp. USD 374 HKD 2,908 03/21/12 1
Westpac Banking Corp. USD 260 JPY 20,171 03/21/12 4
Total Unrealized Appreciation (Depreciation) on Open Foreign Currency Exchange Contracts (107 )
See accompanying notes which are an integral part of this quarterly report.
Russell Global Infrastructure Fund 221
Copyright © 2012 www.secdatabase.com. All Rights Reserved.Please Consider the Environment Before Printing This Document

Table of Contents
Russell Investment CompanyRussell Global Infrastructure FundPresentation of Portfolio Holdings �� January 31, 2012 (Unaudited)Amounts in thousands
Market Value
Portfolio Summary Level 1 Level 2 Level 3 Total
Common Stocks
Australia $72,764 $� $ � $72,764
Austria 1,735 � � 1,735
Belgium 615 � � 615
Bermuda 3,184 � � 3,184
Brazil 40,032 � � 40,032
Canada 90,675 � � 90,675
Chile 4,247 � � 4,247
China 31,894 � � 31,894
Czech Republic 52 � � 52
France 46,210 � � 46,210
Germany 46,655 � � 46,655
Hong Kong 41,397 � � 41,397
India 2,953 � � 2,953
Italy 34,158 � � 34,158
Japan 18,550 � � 18,550
Luxembourg 6,969 � � 6,969
Marshall Islands 990 � � 990
Mexico 9,340 � � 9,340
Netherlands 11,390 � � 11,390
New Zealand 6,683 � � 6,683
Norway 716 � � 716
Philippines 3,966 � � 3,966
Portugal 1,238 � � 1,238
Singapore 27,061 � � 27,061
Spain 32,359 � � 32,359
Switzerland 7,577 � � 7,577
United Kingdom 52,550 � � 52,550
United States 228,856 � � 228,856
Preferred Stocks 547 � � 547
Short-Term Investments � 39,477 � 39,477
Other Securities � 24,458 � 24,458
Total Investments 821,189 63,935 � 885,124
Other Financial Instruments
Futures Contracts 1,131 � � 1,131
Foreign Currency Exchange Contracts (18 ) (89 ) � (107 )
Copyright © 2012 www.secdatabase.com. All Rights Reserved.Please Consider the Environment Before Printing This Document

Total Other Financial Instruments* $1,113 $(89 ) $ � $1,024
* Other financial instruments reflected, such as futures, forwards, interest rate swaps, and credit default swaps are valued at the unrealized appreciation/depreciation
on the instruments.
For a description of the levels see note 2 in the Notes to Quarterly Report.
See accompanying notes which are an integral part of this quarterly report.
222 Russell Global Infrastructure Fund
Copyright © 2012 www.secdatabase.com. All Rights Reserved.Please Consider the Environment Before Printing This Document

Table of Contents
Russell Investment CompanyRussell Global Real Estate Securities Fund
Schedule of Investments �� January 31, 2012 (Unaudited)Amounts in thousands (except share amounts)
Principal
Amount ($)
or Shares
Market
Value
$
Common Stocks - 97.7%Australia - 9.0%BGP Holdings PLC (Æ)(Þ)(ö) 4,619,419 �
CFS Retail Property Trust (Ñ)(ö) 5,453,076 9,929
Charter Hall Retail REIT (ö) 252,770 872
Commonwealth Property Office
Fund (Ñ)(ö) 3,773,206 3,886
Dexus Property Group (ö) 13,710,331 12,954
FKP Property Group (Ñ) 3,662,657 2,469
Goodman Group (ö) 5,481,314 3,724
GPT Group (ö) 4,026,666 13,209
Investa Office Fund (ö) 9,029,628 6,087
Mirvac Group (ö) 5,304,353 6,955
Stockland (ö) 6,589,391 23,505
Westfield Group (ö) 4,581,437 41,343
Westfield Retail Trust (ö) 6,671,071 17,918
142,851
Austria - 0.2%Conwert Immobilien Invest SE (Ñ) 247,098 2,671
Brazil - 0.9%Aliansce Shopping Centers SA 152,190 1,272
BR Malls Participacoes SA 368,297 4,020
BR Properties SA 556,583 6,068
Multiplan Empreendimentos
Imobiliarios SA 99,550 2,279
13,639
Canada - 4.4%Boardwalk Real Estate Investment
Trust (ö) 231,987 12,144
Brookfield Office Properties, Inc. 913,229 15,794
Canadian Real Estate Investment Trust
(ö) 46,457 1,726
Chartwell Seniors Housing Real Estate
Investment Trust Class Trust Unit (ö) 389,977 3,465
Principal
Amount ($)
or Shares
Market
Value
$
Societe Immobiliere de Location
pourl�Industrie et le Commerce
(Ñ)(ö) 26,148 2,653
Unibail-Rodamco SE (ö) 205,868 39,531
54,612
Germany - 1.0%Alstria Office REIT- AG (ö) 136,263 1,628
Deutsche Euroshop AG 18,123 618
Deutsche Wohnen AG 742,559 9,854
GSW Immobilien AG (Æ) 129,922 4,026
16,126
Hong Kong - 13.1%Agile Property Holdings, Ltd. (Ñ) 1,620,565 1,808
China Overseas Land & Investment,
Ltd. (Ñ) 10,948,985 20,415
China Resources Land, Ltd. (Ñ) 7,944,016 14,033
Country Garden Holdings Co., Ltd. (Ñ) 12,625,797 5,421
Hang Lung Properties, Ltd. - ADR 4,953,745 17,023
Henderson Land Development Co., Ltd.
(Ñ) 697,250 3,785
Hongkong Land Holdings, Ltd. (Ñ) 4,833,980 24,895
Hysan Development Co., Ltd. 1,668,693 6,563
Kerry Properties, Ltd. 1,916,373 7,351
Link REIT (The) (Ñ)(ö) 4,241,546 15,451
New World Development Co., Ltd. 1,829,128 2,005
Shimao Property Holdings, Ltd. (Ñ) 4,158,053 4,284
Sino Land Co., Ltd. (Ñ) 4,620,286 7,697
Soho China, Ltd. (Ñ) 1,549,500 1,017
Sun Hung Kai Properties, Ltd. (Ñ) 4,383,635 60,707
Wharf Holdings, Ltd. 1,983,424 11,279
Wheelock & Co., Ltd. 1,023,760 3,267
207,001
India - 0.1%Phoenix Mills, Ltd. 340,094 1,249
Copyright © 2012 www.secdatabase.com. All Rights Reserved.Please Consider the Environment Before Printing This Document

Russell Global Real Estate Securities Fund 223
Dundee Real Estate Investment Trust (ö) 208,066 6,945
First Capital Realty, Inc. Class A (Ñ) 78,700 1,406
H&R Real Estate Investment Trust (ö) 166,750 3,875
Primaris Retail Real Estate Investment
Trust Class Common Subscription
Receipt (ö) 433,169 9,318
RioCan Real Estate Investment Trust
Class Trust Unit (ö) 587,694 15,227
69,900
Finland - 0.2%Citycon OYJ 395,820 1,294
Sponda OYJ 560,691 2,398
3,692
France - 3.4%Fonciere Des Regions (ö) 9,520 629
Gecina SA (ö) 52,302 4,994
ICADE (ö) 7,079 576
Klepierre - GDR (ö) 151,459 4,548
Mercialys SA (ö) 48,416 1,681
Italy - 0.1%Beni Stabili SpA (ö) 2,605,251 1,290
Japan - 7.5%Advance Residence Investment Corp.
Class A (ö) 1,282 2,313
Aeon Mall Co., Ltd. 158,570 3,508
Japan Prime Realty Investment Corp.
Class A (Ñ)(ö) 778 1,857
Japan Real Estate Investment Corp.
Class A (Ñ)(ö) 278 2,433
Japan Retail Fund Investment Corp.
Class A (Ñ)(ö) 1,376 1,995
Mitsubishi Estate Co., Ltd. 2,003,743 31,994
Mitsui Fudosan Co., Ltd. 2,015,552 33,134
Mori Hills Reit Investment C Class A (ö) 175 579
Nippon Accommodations Fund, Inc.
Class A (ö) 412 2,713
Nippon Building Fund, Inc. Class A
(Ñ)(ö) 1,520 13,640
Nomura Real Estate Holdings, Inc. 240,900 3,739
Copyright © 2012 www.secdatabase.com. All Rights Reserved.Please Consider the Environment Before Printing This Document

Table of Contents
Russell Investment CompanyRussell Global Real Estate Securities FundSchedule of Investments, continued �� January 31, 2012 (Unaudited)Amounts in thousands (except share amounts)
Principal
Amount ($)
or Shares
Market
Value
$
Nomura Real Estate Office Fund, Inc.
Class A (ö) 355 1,898
Sumitomo Realty & Development Co.,
Ltd. 533,260 10,131
Tokyu Land Corp. 460,000 1,913
United Urban Investment Corp.
Class A (Ñ)(ö) 5,792 6,307
118,154
Netherlands - 0.6%Corio NV (ö) 158,373 7,368
Eurocommercial Properties NV (ö) 58,468 2,023
Vastned Retail NV (ö) 16,307 726
10,117
Norway - 0.1%Norwegian Property ASA 1,528,982 2,202
Philippines - 0.4%SM Prime Holdings, Inc. 16,452,518 6,292
Singapore - 3.7%Ascendas Real Estate Investment
Trust (Æ)(Ñ)(ö) 1,296,000 1,922
CapitaCommercial Trust (Æ)(Ñ)(ö) 5,961,000 5,094
CapitaLand, Ltd. 5,307,380 11,097
CapitaMall Trust Class A (Ñ)(ö) 8,503,425 11,560
CapitaMalls Asia, Ltd. (Ñ) 1,397,000 1,472
City Developments, Ltd. (Ñ) 276,000 2,164
Global Logistic Properties, Ltd. (Æ)(Ñ) 7,359,427 11,643
Keppel Land, Ltd. (Ñ) 944,654 2,140
Mapletree Industrial Trust (Ñ)(ö) 4,006,057 3,567
Overseas Union Enterprise, Ltd. (Ñ) 464,447 827
Perennial China Retail Trust (Æ)(Ñ) 7,197,370 2,918
Suntec Real Estate Investment Trust
(Ñ)(ö) 4,383,670 3,921
58,325
Principal
Amount ($)
or Shares
Market
Value
$
Hammerson PLC (ö) 2,750,048 16,342
Land Securities Group PLC (ö) 1,545,522 16,427
Metric Property Investments PLC (ö) 605,470 782
Segro PLC (ö) 779,542 2,700
Shaftesbury PLC (ö) 367,895 2,902
Unite Group PLC 858,138 2,407
79,906
United States - 46.2%Acadia Realty Trust (ö) 115,452 2,427
Alexandria Real Estate Equities, Inc.
(ö) 249,756 18,085
American Assets Trust, Inc. (ö) 216,881 4,802
American Campus Communities,
Inc. (ö) 119,050 5,095
Apartment Investment & Management
Co. Class A (ö) 233,875 5,744
AvalonBay Communities, Inc. (ö) 209,461 28,489
BioMed Realty Trust, Inc. (ö) 417,541 7,754
Boston Properties, Inc. (ö) 278,222 28,949
BRE Properties, Inc. Class A (ö) 173,885 9,011
Brookdale Senior Living, Inc.
Class A (Æ) 56,123 988
Camden Property Trust (ö) 122,237 7,884
Campus Crest Communities, Inc. (ö) 45,730 489
CBL & Associates Properties, Inc. (ö) 229,886 3,993
Colonial Properties Trust (ö) 123,894 2,649
Coresite Realty Corp. (ö) 52,100 1,045
CubeSmart (ö) 369,680 4,207
DCT Industrial Trust, Inc. (ö) 1,177,117 6,498
DDR Corp. (ö) 616,699 8,547
DiamondRock Hospitality Co. (ö) 292,319 3,081
Digital Realty Trust, Inc. (Ñ)(ö) 167,438 11,865
Douglas Emmett, Inc. (ö) 251,472 5,258
Duke Realty Corp. (ö) 423,546 5,671
DuPont Fabros Technology, Inc. (Ñ)(ö) 329,616 8,405
Copyright © 2012 www.secdatabase.com. All Rights Reserved.Please Consider the Environment Before Printing This Document

224 Russell Global Real Estate Securities Fund
Sweden - 1.1%Castellum AB 501,202 6,373
Fabege AB 692,343 6,046
Hufvudstaden AB Class A 247,266 2,601
Wihlborgs Fastigheter AB 194,473 2,659
17,679
Switzerland - 0.7%PSP Swiss Property AG (Æ) 88,532 7,391
Swiss Prime Site AG Class A (Æ) 50,318 3,821
11,212
United Kingdom - 5.0%Big Yellow Group PLC (ö) 352,331 1,553
British Land Co. PLC (ö) 2,610,221 20,097
Capital & Counties Properties PLC 397,521 1,190
Capital Shopping Centres Group PLC
Class H (ö) 320,631 1,633
Derwent London PLC (ö) 382,012 10,071
Great Portland Estates PLC (ö) 669,612 3,802
Education Realty Trust, Inc.
Classonvertible model bit (ö) 356,759 3,817
Entertainment Properties Trust (ö) 83,700 3,722
Equity Lifestyle Properties, Inc.
Classonvertible model bit (ö) 130,259 9,136
Equity Residential (ö) 681,215 40,566
Essex Property Trust, Inc. (ö) 73,358 10,564
Extra Space Storage, Inc. (ö) 404,635 10,650
Federal Realty Investment Trust (ö) 155,814 14,718
First Industrial Realty Trust, Inc.
(Æ)(ö) 265,996 3,054
First Potomac Realty Trust (ö) 218,500 3,251
Forest City Enterprises, Inc.
Class A (Æ) 148,900 1,955
General Growth Properties, Inc. (ö) 797,692 12,588
HCP, Inc. (ö) 847,191 35,608
Health Care REIT, Inc. (Ñ)(ö) 207,436 11,867
Healthcare Realty Trust, Inc. (ö) 128,100 2,699
Hersha Hospitality Trust Class A (ö) 625,051 3,394
Highwoods Properties, Inc. (ö) 98,097 3,246
Host Hotels & Resorts, Inc. (ö) 1,814,997 29,802
Hyatt Hotels Corp. Class A (Æ) 145,528 6,202
Kilroy Realty Corp. (ö) 415,772 17,309
Kimco Realty Corp. (ö) 357,433 6,523
Kite Realty Group Trust (ö) 120,200 601
Liberty Property Trust (Ñ)(ö) 268,556 8,940
Copyright © 2012 www.secdatabase.com. All Rights Reserved.Please Consider the Environment Before Printing This Document

Table of Contents
Russell Investment CompanyRussell Global Real Estate Securities FundSchedule of Investments, continued �� January 31, 2012 (Unaudited)Amounts in thousands (except share amounts)
Principal
Amount ($)
or Shares
Market
Value
$
Macerich Co. (The) (ö) 261,732 14,212
Mid-America Apartment
Communities, Inc. (ö) 57,554 3,679
National Retail Properties, Inc. (ö) 207,033 5,592
Omega Healthcare Investors, Inc.
(Ñ)(ö) 211,700 4,412
Orient-Express Hotels, Ltd. Class A
(Æ) 147,906 1,251
Pebblebrook Hotel Trust (ö) 173,301 3,844
Piedmont Office Realty Trust, Inc.
Class A (Ñ)(ö) 244,600 4,530
Post Properties, Inc. (ö) 214 10
ProLogis, Inc. (ö) 1,004,707 31,859
Public Storage (ö) 238,802 33,160
Regency Centers Corp. (ö) 275,022 11,364
Retail Opportunity Investments Corp.
(Ñ)(ö) 387,259 4,593
RLJ Lodging Trust (ö) 119,800 2,137
Rouse Properties, Inc. (Æ) 17,385 215
Simon Property Group, Inc. (ö) 621,899 84,491
SL Green Realty Corp. (ö) 140,277 10,314
Sovran Self Storage, Inc. (ö) 60,802 2,827
Starwood Hotels & Resorts
Worldwide, Inc. (ö) 145,687 7,902
Sunstone Hotel Investors, Inc. (Æ)(ö) 158,500 1,473
Taubman Centers, Inc. (ö) 99,669 6,681
UDR, Inc. (ö) 212,750 5,536
Ventas, Inc. (ö) 699,499 40,788
Vornado Realty Trust (ö) 311,500 25,194
Weingarten Realty Investors (ö) 177,952 4,319
731,531
Total Common Stocks(cost $1,310,350) 1,548,449
Short-Term Investments - 1.6%United States - 1.6%
Copyright © 2012 www.secdatabase.com. All Rights Reserved.Please Consider the Environment Before Printing This Document

See accompanying notes which are an integral part of this quarterly report.
Russell Global Real Estate Securities Fund 225
Russell U.S. Cash Management Fund 25,861,765 (¥) 25,862
Total Short-Term Investments(cost $25,862) 25,862
Other Securities - 6.9%Russell Investment Company
Liquidating Trust (×) 3,610,574 (¥) 3,671
Russell U.S. Cash Collateral Fund
(×) 105,141,633(¥) 105,142
Total Other Securities(cost $108,752) 108,813
Total Investments - 106.2%(identified cost $1,444,964) 1,683,124
Other Assets and Liabilities,Net - (6.2%) (98,287 )
Net Assets - 100.0% 1,584,837
A portion of the portfolio has been fair valued as of period end.
Copyright © 2012 www.secdatabase.com. All Rights Reserved.Please Consider the Environment Before Printing This Document

Table of Contents
Russell Investment CompanyRussell Global Real Estate Securities FundSchedule of Investments, continued �� January 31, 2012 (Unaudited)Amounts in thousands (except contracts)
Futures ContractsNumber of
Contracts
Notional
Amount
Expiration
Date
Unrealized
Appreciation
(Depreciation)
$
Long PositionsASX SPI 200 Index Futures (Australia) 23 AUD 2,430 03/12 49
FTSE EPRA Europe Index Futures (UK) 250 EUR 3,173 03/12 257
HANG SENG Index Futures (Hong Kong) 27 HKD 27,482 02/12 13
S&P Midcap 400 E-Mini Index Futures (CME) 30 USD 2,805 03/12 74
S&P TSE 60 Index Futures (Canada) 12 CAD 1,699 03/12 31
SGX MSCI Index Futures (Singapore) 22 SGD 1,466 02/12 5
TOPIX Index Futures (Japan) 26 JPY 196,690 03/12 61
Total Unrealized Appreciation (Depreciation) on Open Futures Contracts (å) 490
See accompanying notes which are an integral part of this quarterly report.
226 Russell Global Real Estate Securities Fund
Copyright © 2012 www.secdatabase.com. All Rights Reserved.Please Consider the Environment Before Printing This Document

Table of Contents
Russell Investment CompanyRussell Global Real Estate Securities FundSchedule of Investments, continued �� January 31, 2012 (Unaudited)Amounts in thousands
Foreign Currency Exchange Contracts
CounterpartyAmount
Sold
Amount
Bought
Settlement
Date
Unrealized
Appreciation
(Depreciation)
$
Barclays Bank PLC USD 718 AUD 708 03/21/12 29
Barclays Bank PLC USD 475 CAD 480 03/21/12 4
Barclays Bank PLC USD 1,401 EUR 1,046 03/21/12 (33 )
Barclays Bank PLC USD 1,109 HKD 8,613 03/21/12 2
Barclays Bank PLC USD 853 JPY 66,075 03/21/12 15
Barclays Bank PLC USD 2,345 SGD 3,015 03/21/12 52
Brown Brothers Harriman & Co. USD 185 CAD 185 02/01/12 �
Brown Brothers Harriman & Co. USD 669 EUR 500 03/21/12 (15 )
Brown Brothers Harriman & Co. AUD 400 USD 410 03/21/12 (12 )
Brown Brothers Harriman & Co. CAD 400 USD 392 03/21/12 (7 )
Brown Brothers Harriman & Co. EUR 600 USD 767 03/21/12 (18 )
Brown Brothers Harriman & Co. HKD 6,500 USD 837 03/21/12 (1 )
Brown Brothers Harriman & Co. JPY 45,000 USD 586 03/21/12 (4 )
Brown Brothers Harriman & Co. SGD 300 USD 233 03/21/12 (6 )
Commonwealth Bank of Australia USD 718 AUD 708 03/21/12 29
Commonwealth Bank of Australia USD 1,401 EUR 1,046 03/21/12 (33 )
Commonwealth Bank of Australia USD 853 JPY 66,075 03/21/12 15
Credit Suisse First Boston USD 718 AUD 708 03/21/12 29
Credit Suisse First Boston USD 474 CAD 480 03/21/12 4
Credit Suisse First Boston USD 1,401 EUR 1,046 03/21/12 (33 )
Deutsche Bank AG USD 718 AUD 708 03/21/12 29
Deutsche Bank AG USD 1,401 EUR 1,046 03/21/12 (33 )
Deutsche Bank AG USD 1,109 HKD 8,613 03/21/12 2
HSBC Bank PLC USD 718 AUD 708 03/21/12 29
HSBC Bank PLC USD 474 CAD 480 03/21/12 4
HSBC Bank PLC USD 1,401 EUR 1,046 03/21/12 (33 )
HSBC Bank PLC USD 1,109 HKD 8,613 03/21/12 2
HSBC Bank PLC USD 852 JPY 66,075 03/21/12 15
HSBC Bank PLC HKD 4,000 USD 515 03/21/12 (1 )
JPMorgan Chase Bank USD 718 AUD 708 03/21/12 29
JPMorgan Chase Bank USD 475 CAD 480 03/21/12 4
JPMorgan Chase Bank USD 1,401 EUR 1,046 03/21/12 (33 )
Copyright © 2012 www.secdatabase.com. All Rights Reserved.Please Consider the Environment Before Printing This Document

JPMorgan Chase Bank USD 1,109 HKD 8,613 03/21/12 2
JPMorgan Chase Bank USD 853 JPY 66,075 03/21/12 15
Mellon Bank AUD 1,600 USD 1,646 03/21/12 (44 )
Mellon Bank CAD 1,200 USD 1,185 03/21/12 (11 )
Mellon Bank HKD 24,000 USD 3,090 03/21/12 (4 )
Mellon Bank JPY 175,000 USD 2,285 03/21/12 (12 )
Mellon Bank SGD 1,300 USD 1,013 03/21/12 (21 )
Royal Bank of Canada USD 475 CAD 480 03/21/12 3
Royal Bank of Canada USD 1,109 HKD 8,613 03/21/12 2
Royal Bank of Canada USD 853 JPY 66,075 03/21/12 15
State Street Bank & Trust Co. USD 58 AUD 55 02/01/12 �
State Street Bank & Trust Co. USD 477 AUD 447 02/01/12 (1 )
State Street Bank & Trust Co. USD 78 AUD 74 02/02/12 �
State Street Bank & Trust Co. USD 124 AUD 117 02/02/12 1
State Street Bank & Trust Co. USD 307 AUD 300 03/21/12 10
State Street Bank & Trust Co. USD 865 AUD 850 03/21/12 33
State Street Bank & Trust Co. USD 25 BRL 43 02/01/12 �
State Street Bank & Trust Co. USD 195 CAD 200 03/21/12 4
State Street Bank & Trust Co. USD 474 CAD 480 03/21/12 4
State Street Bank & Trust Co. USD 784 CAD 800 03/21/12 13
State Street Bank & Trust Co. USD 3 EUR 2 02/01/12 �
State Street Bank & Trust Co. USD 7 EUR 5 02/01/12 �
State Street Bank & Trust Co. USD 21 EUR 16 02/01/12 �
See accompanying notes which are an integral part of this quarterly report.
Russell Global Real Estate Securities Fund 227
Copyright © 2012 www.secdatabase.com. All Rights Reserved.Please Consider the Environment Before Printing This Document
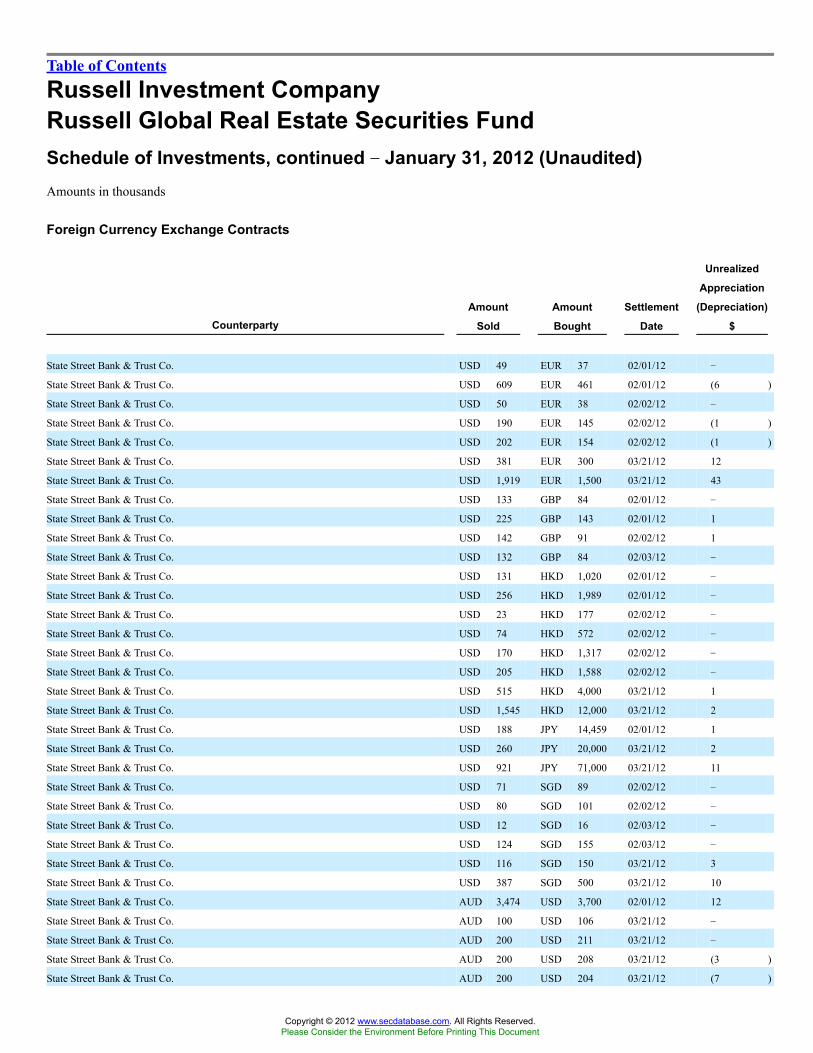
Table of Contents
Russell Investment CompanyRussell Global Real Estate Securities FundSchedule of Investments, continued �� January 31, 2012 (Unaudited)Amounts in thousands
Foreign Currency Exchange Contracts
CounterpartyAmount
Sold
Amount
Bought
Settlement
Date
Unrealized
Appreciation
(Depreciation)
$
State Street Bank & Trust Co. USD 49 EUR 37 02/01/12 �
State Street Bank & Trust Co. USD 609 EUR 461 02/01/12 (6 )
State Street Bank & Trust Co. USD 50 EUR 38 02/02/12 �
State Street Bank & Trust Co. USD 190 EUR 145 02/02/12 (1 )
State Street Bank & Trust Co. USD 202 EUR 154 02/02/12 (1 )
State Street Bank & Trust Co. USD 381 EUR 300 03/21/12 12
State Street Bank & Trust Co. USD 1,919 EUR 1,500 03/21/12 43
State Street Bank & Trust Co. USD 133 GBP 84 02/01/12 �
State Street Bank & Trust Co. USD 225 GBP 143 02/01/12 1
State Street Bank & Trust Co. USD 142 GBP 91 02/02/12 1
State Street Bank & Trust Co. USD 132 GBP 84 02/03/12 �
State Street Bank & Trust Co. USD 131 HKD 1,020 02/01/12 �
State Street Bank & Trust Co. USD 256 HKD 1,989 02/01/12 �
State Street Bank & Trust Co. USD 23 HKD 177 02/02/12 �
State Street Bank & Trust Co. USD 74 HKD 572 02/02/12 �
State Street Bank & Trust Co. USD 170 HKD 1,317 02/02/12 �
State Street Bank & Trust Co. USD 205 HKD 1,588 02/02/12 �
State Street Bank & Trust Co. USD 515 HKD 4,000 03/21/12 1
State Street Bank & Trust Co. USD 1,545 HKD 12,000 03/21/12 2
State Street Bank & Trust Co. USD 188 JPY 14,459 02/01/12 1
State Street Bank & Trust Co. USD 260 JPY 20,000 03/21/12 2
State Street Bank & Trust Co. USD 921 JPY 71,000 03/21/12 11
State Street Bank & Trust Co. USD 71 SGD 89 02/02/12 �
State Street Bank & Trust Co. USD 80 SGD 101 02/02/12 �
State Street Bank & Trust Co. USD 12 SGD 16 02/03/12 �
State Street Bank & Trust Co. USD 124 SGD 155 02/03/12 �
State Street Bank & Trust Co. USD 116 SGD 150 03/21/12 3
State Street Bank & Trust Co. USD 387 SGD 500 03/21/12 10
State Street Bank & Trust Co. AUD 3,474 USD 3,700 02/01/12 12
State Street Bank & Trust Co. AUD 100 USD 106 03/21/12 �
State Street Bank & Trust Co. AUD 200 USD 211 03/21/12 �
State Street Bank & Trust Co. AUD 200 USD 208 03/21/12 (3 )
State Street Bank & Trust Co. AUD 200 USD 204 03/21/12 (7 )
Copyright © 2012 www.secdatabase.com. All Rights Reserved.Please Consider the Environment Before Printing This Document
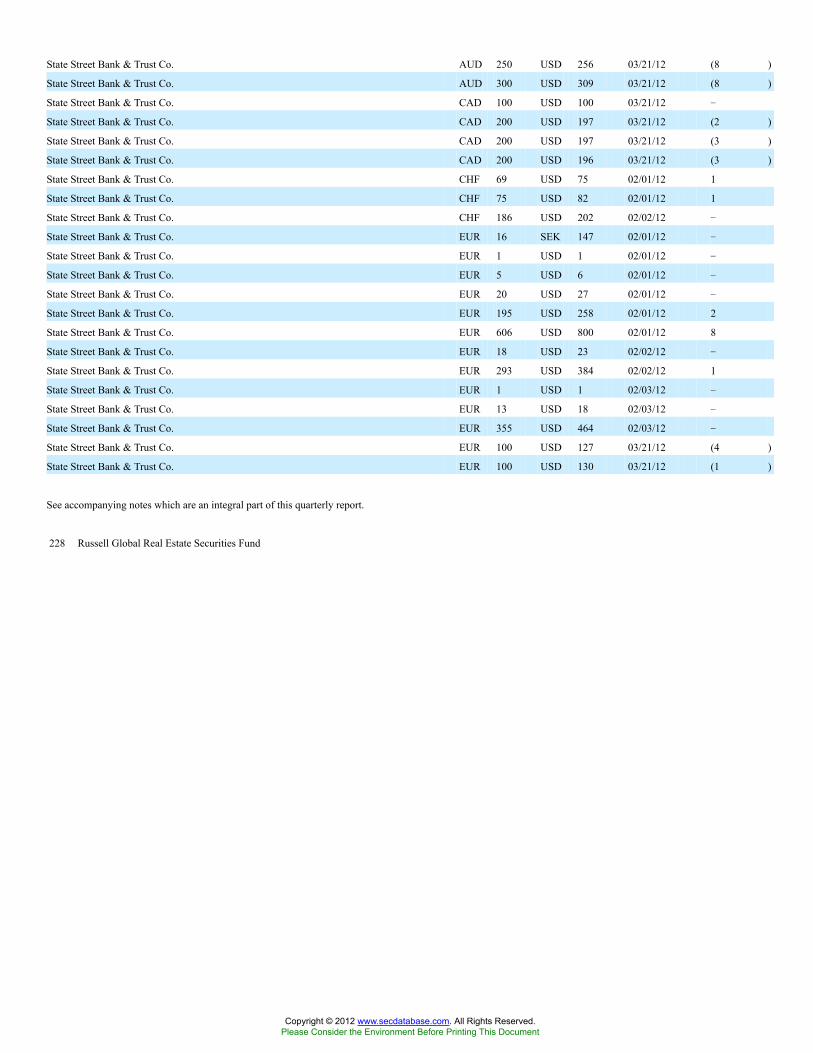
State Street Bank & Trust Co. AUD 250 USD 256 03/21/12 (8 )
State Street Bank & Trust Co. AUD 300 USD 309 03/21/12 (8 )
State Street Bank & Trust Co. CAD 100 USD 100 03/21/12 �
State Street Bank & Trust Co. CAD 200 USD 197 03/21/12 (2 )
State Street Bank & Trust Co. CAD 200 USD 197 03/21/12 (3 )
State Street Bank & Trust Co. CAD 200 USD 196 03/21/12 (3 )
State Street Bank & Trust Co. CHF 69 USD 75 02/01/12 1
State Street Bank & Trust Co. CHF 75 USD 82 02/01/12 1
State Street Bank & Trust Co. CHF 186 USD 202 02/02/12 �
State Street Bank & Trust Co. EUR 16 SEK 147 02/01/12 �
State Street Bank & Trust Co. EUR 1 USD 1 02/01/12 �
State Street Bank & Trust Co. EUR 5 USD 6 02/01/12 �
State Street Bank & Trust Co. EUR 20 USD 27 02/01/12 �
State Street Bank & Trust Co. EUR 195 USD 258 02/01/12 2
State Street Bank & Trust Co. EUR 606 USD 800 02/01/12 8
State Street Bank & Trust Co. EUR 18 USD 23 02/02/12 �
State Street Bank & Trust Co. EUR 293 USD 384 02/02/12 1
State Street Bank & Trust Co. EUR 1 USD 1 02/03/12 �
State Street Bank & Trust Co. EUR 13 USD 18 02/03/12 �
State Street Bank & Trust Co. EUR 355 USD 464 02/03/12 �
State Street Bank & Trust Co. EUR 100 USD 127 03/21/12 (4 )
State Street Bank & Trust Co. EUR 100 USD 130 03/21/12 (1 )
See accompanying notes which are an integral part of this quarterly report.
228 Russell Global Real Estate Securities Fund
Copyright © 2012 www.secdatabase.com. All Rights Reserved.Please Consider the Environment Before Printing This Document
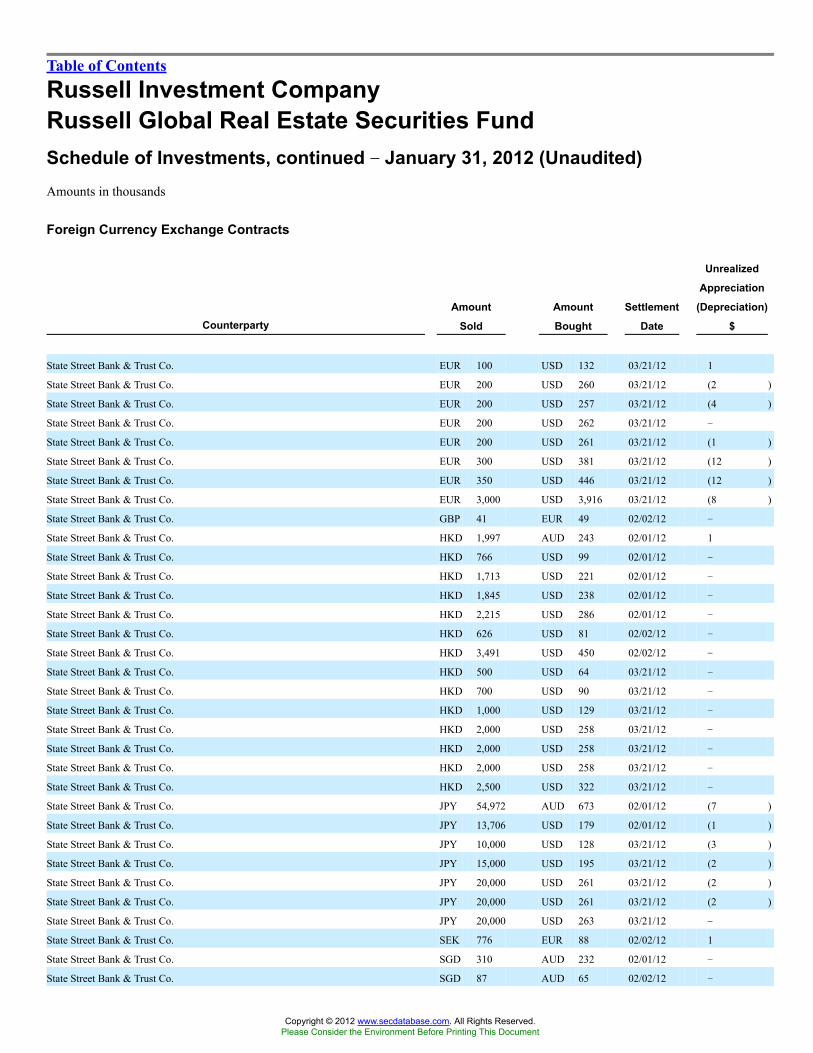
Table of Contents
Russell Investment CompanyRussell Global Real Estate Securities FundSchedule of Investments, continued �� January 31, 2012 (Unaudited)Amounts in thousands
Foreign Currency Exchange Contracts
CounterpartyAmount
Sold
Amount
Bought
Settlement
Date
Unrealized
Appreciation
(Depreciation)
$
State Street Bank & Trust Co. EUR 100 USD 132 03/21/12 1
State Street Bank & Trust Co. EUR 200 USD 260 03/21/12 (2 )
State Street Bank & Trust Co. EUR 200 USD 257 03/21/12 (4 )
State Street Bank & Trust Co. EUR 200 USD 262 03/21/12 �
State Street Bank & Trust Co. EUR 200 USD 261 03/21/12 (1 )
State Street Bank & Trust Co. EUR 300 USD 381 03/21/12 (12 )
State Street Bank & Trust Co. EUR 350 USD 446 03/21/12 (12 )
State Street Bank & Trust Co. EUR 3,000 USD 3,916 03/21/12 (8 )
State Street Bank & Trust Co. GBP 41 EUR 49 02/02/12 �
State Street Bank & Trust Co. HKD 1,997 AUD 243 02/01/12 1
State Street Bank & Trust Co. HKD 766 USD 99 02/01/12 �
State Street Bank & Trust Co. HKD 1,713 USD 221 02/01/12 �
State Street Bank & Trust Co. HKD 1,845 USD 238 02/01/12 �
State Street Bank & Trust Co. HKD 2,215 USD 286 02/01/12 �
State Street Bank & Trust Co. HKD 626 USD 81 02/02/12 �
State Street Bank & Trust Co. HKD 3,491 USD 450 02/02/12 �
State Street Bank & Trust Co. HKD 500 USD 64 03/21/12 �
State Street Bank & Trust Co. HKD 700 USD 90 03/21/12 �
State Street Bank & Trust Co. HKD 1,000 USD 129 03/21/12 �
State Street Bank & Trust Co. HKD 2,000 USD 258 03/21/12 �
State Street Bank & Trust Co. HKD 2,000 USD 258 03/21/12 �
State Street Bank & Trust Co. HKD 2,000 USD 258 03/21/12 �
State Street Bank & Trust Co. HKD 2,500 USD 322 03/21/12 �
State Street Bank & Trust Co. JPY 54,972 AUD 673 02/01/12 (7 )
State Street Bank & Trust Co. JPY 13,706 USD 179 02/01/12 (1 )
State Street Bank & Trust Co. JPY 10,000 USD 128 03/21/12 (3 )
State Street Bank & Trust Co. JPY 15,000 USD 195 03/21/12 (2 )
State Street Bank & Trust Co. JPY 20,000 USD 261 03/21/12 (2 )
State Street Bank & Trust Co. JPY 20,000 USD 261 03/21/12 (2 )
State Street Bank & Trust Co. JPY 20,000 USD 263 03/21/12 �
State Street Bank & Trust Co. SEK 776 EUR 88 02/02/12 1
State Street Bank & Trust Co. SGD 310 AUD 232 02/01/12 �
State Street Bank & Trust Co. SGD 87 AUD 65 02/02/12 �
Copyright © 2012 www.secdatabase.com. All Rights Reserved.Please Consider the Environment Before Printing This Document

State Street Bank & Trust Co. SGD 94 AUD 70 02/03/12 �
State Street Bank & Trust Co. SGD 80 USD 64 02/02/12 �
State Street Bank & Trust Co. SGD 88 USD 70 02/02/12 �
State Street Bank & Trust Co. SGD 13 USD 10 02/03/12 �
State Street Bank & Trust Co. SGD 156 USD 125 02/03/12 �
State Street Bank & Trust Co. SGD 100 USD 77 03/21/12 (2 )
State Street Bank & Trust Co. SGD 150 USD 117 03/21/12 (3 )
State Street Bank & Trust Co. SGD 150 USD 116 03/21/12 (3 )
State Street Bank & Trust Co. SGD 150 USD 119 03/21/12 �
State Street Bank & Trust Co. SGD 200 USD 157 03/21/12 (2 )
UBS AG USD 11 AUD 11 02/01/12 1
UBS AG USD 1 CAD 1 02/01/12 �
UBS AG USD 6 JPY 501 02/01/12 �
UBS AG EUR 10 USD 13 02/01/12 �
UBS AG HKD 131 USD 17 02/01/12 �
UBS AG SGD 10 USD 8 02/01/12 �
Westpac Banking Corp. USD 1,109 HKD 8,613 03/21/12 2
Westpac Banking Corp. USD 852 JPY 66,075 03/21/12 15
Total Unrealized Appreciation (Depreciation) Open Foreign Currency Exchange Contracts 60
See accompanying notes which are an integral part of this quarterly report.
Russell Global Real Estate Securities Fund 229
Copyright © 2012 www.secdatabase.com. All Rights Reserved.Please Consider the Environment Before Printing This Document

Table of Contents
Russell Investment CompanyRussell Global Real Estate Securities FundSchedule of Investments, continued �� January 31, 2012 (Unaudited)Amounts in thousands
Index Swap Contracts
Underlying Security CounterpartyNotional
Amount TermsTermination
Date
Market
Value
$
iShares Dow Jones US Real Estate Index Fund Bank of America USD 11,206 3 Month LIBOR minus 0.610% 09/04/12 663
Total Market Value of Open Index Swap Contracts Premiums Paid (Received) -$- (å) 663
See accompanying notes which are an integral part of this quarterly report.
230 Russell Global Real Estate Securities Fund
Copyright © 2012 www.secdatabase.com. All Rights Reserved.Please Consider the Environment Before Printing This Document

Table of Contents
Russell Investment CompanyRussell Global Real Estate Securities FundPresentation of Portfolio Holdings �� January 31, 2012 (Unaudited)Amounts in thousands
Market Value
Portfolio Summary Level 1 Level 2 Level 3 Total
Common Stocks
Australia $142,851 $� $� $142,851
Austria 2,671 � � 2,671
Brazil 13,639 � � 13,639
Canada 68,551 � 1,349 69,900
Finland 3,692 � � 3,692
France 54,612 � � 54,612
Germany 16,126 � � 16,126
Hong Kong 207,001 � � 207,001
India 1,249 � � 1,249
Italy 1,290 � � 1,290
Japan 118,154 � � 118,154
Netherlands 10,117 � � 10,117
Norway 2,202 � � 2,202
Philippines 6,292 � � 6,292
Singapore 58,325 � � 58,325
Sweden 17,679 � � 17,679
Switzerland 11,212 � � 11,212
United Kingdom 79,906 � � 79,906
United States 731,531 � � 731,531
Short-Term Investments � 25,862 � 25,862
Other Securities � 108,813 � 108,813
Total Investments 1,547,100 134,675 1,349 1,683,124
Other Financial Instruments
Futures Contracts 490 � � 490
Foreign Currency Exchange Contracts 13 47 � 60
Index Swap Contracts � 663 � 663
Total Other Financial Instruments* $503 $710 $� $1,213
* Other financial instruments reflected, such as futures, forwards, interest rate swaps, and credit default swaps are valued at the unrealized appreciation/depreciation
on the instruments.
For a description of the levels see note 2 in the Notes to Quarterly Report.
Investments in which significant observable inputs (Level 3) used in determining a value for the period ending January 31, 2012 wereless than 1% of net assets.
See accompanying notes which are an integral part of this quarterly report.
Copyright © 2012 www.secdatabase.com. All Rights Reserved.Please Consider the Environment Before Printing This Document

Russell Global Real Estate Securities Fund 231
Copyright © 2012 www.secdatabase.com. All Rights Reserved.Please Consider the Environment Before Printing This Document

Table of Contents
Russell Investment CompanyRussell Money Market Fund
Schedule of Investments �� January 31, 2012 (Unaudited)Amounts in thousands (except share amounts)
Principal
Amount ($)
or Shares
Rate
%
Date
of
Maturity
Value
$
Domestic Commercial Paper - 3.0%Straight-A Funding, LLC 4,000 Zero coupon 03/01/12 3,999
Straight-A Funding, LLC 1,500 Zero coupon 04/05/12 1,500
Total Domestic Commercial Paper (amortized cost $5,499) 5,499
United States Government Agencies - 56.1%AID to INH Portugal Guaranteed Notes, weekly demand (Å)(Ê) 3,750 0.894 12/01/17 3,769
Fannie Mae 2,880 5.000 02/16/12 2,886
Federal Farm Credit Bank 2,300 0.950 03/05/12 2,302
Federal Home Loan Bank Discount Notes 7,500 Zero coupon 02/01/12 7,500
Federal Home Loan Bank Discount Notes 7,442 Zero coupon 02/03/12 7,442
Federal Home Loan Bank Discount Notes 15,000 Zero coupon 02/10/12 15,000
Federal Home Loan Bank Discount Notes 18,837 Zero coupon 02/15/12 18,837
Federal Home Loan Bank Discount Notes 2,000 Zero coupon 02/16/12 2,000
Federal Home Loan Bank Discount Notes 14,000 Zero coupon 02/22/12 14,000
Federal Home Loan Bank Discount Notes 3,705 0.120 02/27/12 3,705
Federal National Mortgage Association Discount Notes 5,000 Zero coupon 04/27/12 4,999
Freddie Mac Discount Notes 2,747 Zero coupon 02/01/12 2,747
Freddie Mac Discount Notes 2,000 Zero coupon 02/07/12 2,000
Freddie Mac Discount Notes 10,000 Zero coupon 03/05/12 9,999
Freddie Mac Discount Notes 5,000 Zero coupon 03/06/12 5,000
Total United States Government Agencies (amortized cost $102,186) 102,186
United States Treasury - 46.4%United States Treasury Bills 22,860 Zero coupon 02/02/12 22,860
United States Treasury Bills 25,500 Zero coupon 02/09/12 25,500
United States Treasury Bills 22,000 Zero coupon 02/23/12 21,999
United States Treasury Notes 12,000 0.875 02/29/12 12,008
United States Treasury Notes 2,000 0.375 10/31/12 2,004
Total United States Treasury (amortized cost $84,371) 84,371
Total Investments - 105.5% (cost $192,056) (�) 192,056
Other Assets and Liabilities, Net - (5.5%) (10,093 )
Net Assets - 100.0% 181,963
See accompanying notes which are an integral part of this quarterly report.
Copyright © 2012 www.secdatabase.com. All Rights Reserved.Please Consider the Environment Before Printing This Document

232 Russell Money Market Fund
Copyright © 2012 www.secdatabase.com. All Rights Reserved.Please Consider the Environment Before Printing This Document

Table of Contents
Russell Investment CompanyRussell Money Market FundPresentation of Portfolio Holdings �� January 31, 2012 (Unaudited)Amounts in thousands
Market Value
Portfolio Summary Level 1 Level 2 Level 3 Total
Domestic Commercial Paper $ � $5,499 $ � $5,499
United States Government Agencies � 102,186 � 102,186
United States Treasury � 84,371 � 84,371
Total Investments $ � $192,056 $ � $192,056
For a description of the levels see note 2 in the Notes to Quarterly Report.
See accompanying notes which are an integral part of this quarterly report.
Russell Money Market Fund 233
Copyright © 2012 www.secdatabase.com. All Rights Reserved.Please Consider the Environment Before Printing This Document
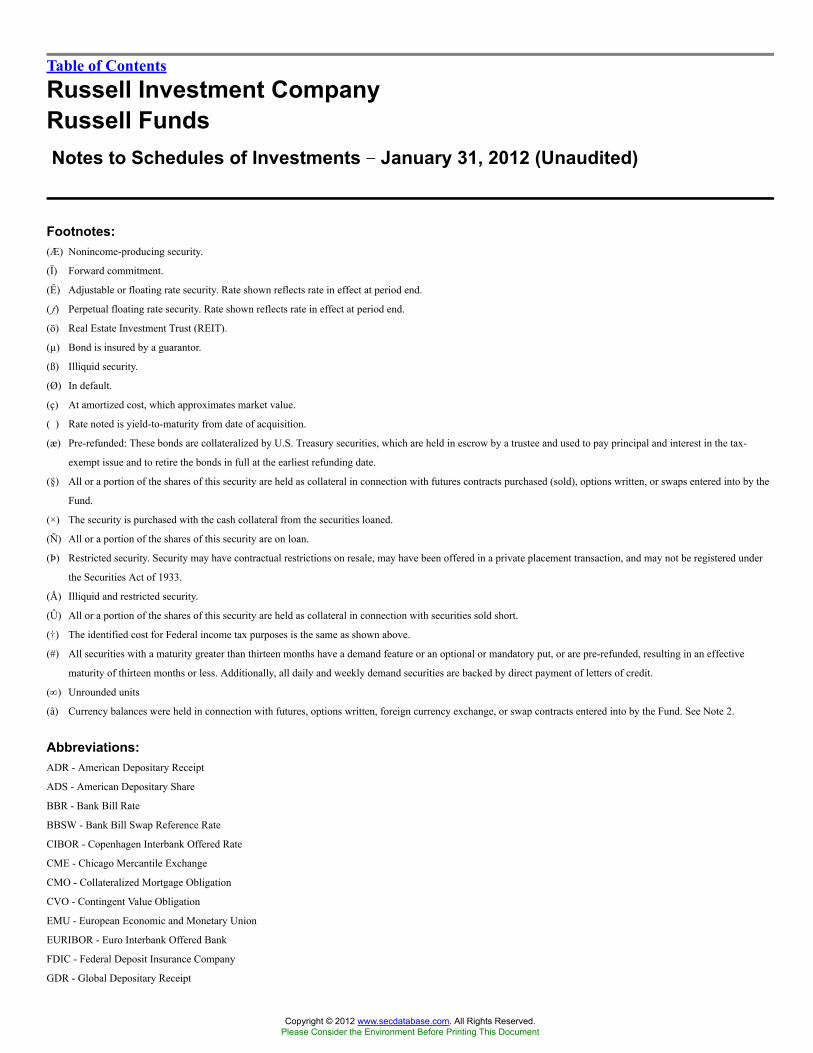
Table of Contents
Russell Investment CompanyRussell FundsNotes to Schedules of Investments �� January 31, 2012 (Unaudited)
Footnotes:(Æ) Nonincome-producing security.
(Ï) Forward commitment.
(Ê) Adjustable or floating rate security. Rate shown reflects rate in effect at period end.
(�) Perpetual floating rate security. Rate shown reflects rate in effect at period end.
(ö) Real Estate Investment Trust (REIT).
(µ) Bond is insured by a guarantor.
(ß) Illiquid security.
(Ø) In default.
(ç) At amortized cost, which approximates market value.
(�) Rate noted is yield-to-maturity from date of acquisition.
(æ) Pre-refunded: These bonds are collateralized by U.S. Treasury securities, which are held in escrow by a trustee and used to pay principal and interest in the tax-
exempt issue and to retire the bonds in full at the earliest refunding date.
(§) All or a portion of the shares of this security are held as collateral in connection with futures contracts purchased (sold), options written, or swaps entered into by the
Fund.
(×) The security is purchased with the cash collateral from the securities loaned.
(Ñ) All or a portion of the shares of this security are on loan.
(Þ) Restricted security. Security may have contractual restrictions on resale, may have been offered in a private placement transaction, and may not be registered under
the Securities Act of 1933.
(Å) Illiquid and restricted security.
(Û) All or a portion of the shares of this security are held as collateral in connection with securities sold short.
(�) The identified cost for Federal income tax purposes is the same as shown above.
(#) All securities with a maturity greater than thirteen months have a demand feature or an optional or mandatory put, or are pre-refunded, resulting in an effective
maturity of thirteen months or less. Additionally, all daily and weekly demand securities are backed by direct payment of letters of credit.
(¥) Unrounded units
(å) Currency balances were held in connection with futures, options written, foreign currency exchange, or swap contracts entered into by the Fund. See Note 2.
Abbreviations:ADR - American Depositary Receipt
ADS - American Depositary Share
BBR - Bank Bill Rate
BBSW - Bank Bill Swap Reference Rate
CIBOR - Copenhagen Interbank Offered Rate
CME - Chicago Mercantile Exchange
CMO - Collateralized Mortgage Obligation
CVO - Contingent Value Obligation
EMU - European Economic and Monetary Union
EURIBOR - Euro Interbank Offered Bank
FDIC - Federal Deposit Insurance Company
GDR - Global Depositary Receipt
Copyright © 2012 www.secdatabase.com. All Rights Reserved.Please Consider the Environment Before Printing This Document

GDS - Global Depositary Share
LIBOR - London Interbank Offered Rate
NIBOR - Norwegian Interbank Offered Rate
NZD - New Zealand Dollar
PIK - Payment in Kind
REMIC - Real Estate Mortgage Investment Conduit
STRIP - Separate Trading of Registered Interest and Principal of Securities
TBA - To Be Announced Security
UK - United Kingdom
234 Notes to Schedules of Investments
Copyright © 2012 www.secdatabase.com. All Rights Reserved.Please Consider the Environment Before Printing This Document
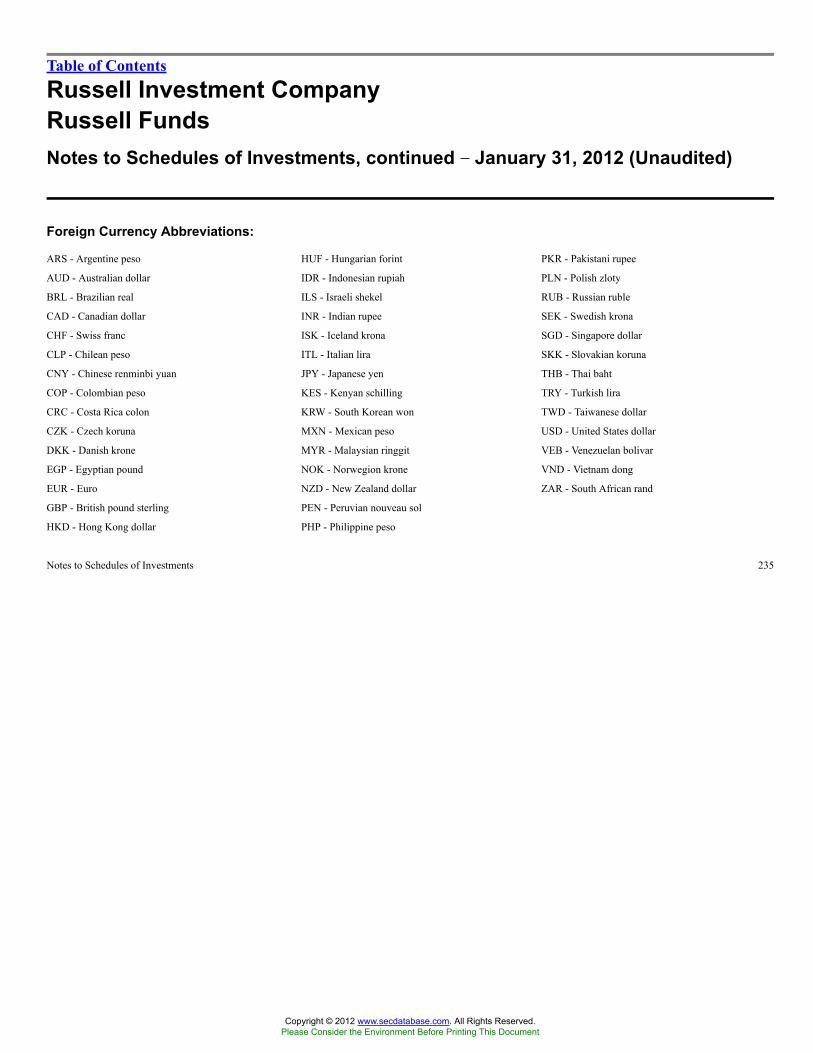
Table of Contents
Russell Investment CompanyRussell FundsNotes to Schedules of Investments, continued �� January 31, 2012 (Unaudited)
Foreign Currency Abbreviations:
ARS - Argentine peso HUF - Hungarian forint PKR - Pakistani rupee
AUD - Australian dollar IDR - Indonesian rupiah PLN - Polish zloty
BRL - Brazilian real ILS - Israeli shekel RUB - Russian ruble
CAD - Canadian dollar INR - Indian rupee SEK - Swedish krona
CHF - Swiss franc ISK - Iceland krona SGD - Singapore dollar
CLP - Chilean peso ITL - Italian lira SKK - Slovakian koruna
CNY - Chinese renminbi yuan JPY - Japanese yen THB - Thai baht
COP - Colombian peso KES - Kenyan schilling TRY - Turkish lira
CRC - Costa Rica colon KRW - South Korean won TWD - Taiwanese dollar
CZK - Czech koruna MXN - Mexican peso USD - United States dollar
DKK - Danish krone MYR - Malaysian ringgit VEB - Venezuelan bolivar
EGP - Egyptian pound NOK - Norwegion krone VND - Vietnam dong
EUR - Euro NZD - New Zealand dollar ZAR - South African rand
GBP - British pound sterling PEN - Peruvian nouveau sol
HKD - Hong Kong dollar PHP - Philippine peso
Notes to Schedules of Investments 235
Copyright © 2012 www.secdatabase.com. All Rights Reserved.Please Consider the Environment Before Printing This Document

Table of Contents
Russell Investment CompanyRussell FundsNotes to Quarterly Report �� January 31, 2012 (Unaudited)
1. OrganizationRussell Investment Company (the �Investment Company� or �RIC�) is a series investment company with 36 different investmentportfolios referred to as Funds. These financial statements report on 19 of these Funds (each a �Fund� and collectively the �Funds�).The Investment Company is registered under the Investment Company Act of 1940, as amended, as an open-end managementinvestment company. It is organized and operated as a Massachusetts business trust under a Second Amended and Restated MasterTrust Agreement dated October 1, 2008 (�Master Trust Agreement�), as amended. The Investment Company�s Master TrustAgreement permits the Board of Trustees (the �Board�) to issue an unlimited number of shares of beneficial interest.
2. Significant Accounting PoliciesThe following is a summary of the significant accounting policies consistently followed by the Funds in the preparation of thisQuarterly Report. These policies are in conformity with U.S. generally accepted accounting principles (�U.S. GAAP�) for investmentcompanies. The presentation of these schedules of investments in conformity with U.S. GAAP requires management to makeestimates and assumptions that affect the reported amounts of assets and liabilities at the date of the Quarterly Report. Actual resultscould differ from those estimates.
Security Valuation
The Funds value portfolio securities according to Board-approved securities valuation procedures which include market and fairvalue procedures. Russell Money Market Fund securities are priced using the amortized cost method of valuation, as are debtobligation securities maturing within 60 days at the time of purchase, unless the Board determines that amortized cost does notrepresent market value of such money market fund securities or short-term debt obligations. The Board has delegated theresponsibility for administration of the securities valuation procedures to Russell Fund Services Company (�RFSC�).
U.S. GAAP defines fair market value as the price that a Fund would receive to sell an asset or pay to transfer a liability in an orderlytransaction between market participants at the measurement date. It establishes a fair value hierarchy that prioritizes inputs tovaluation methods and requires a separate disclosure of the fair value hierarchy, separately for each major category of assets andliabilities, that segregates fair value measurements into levels (Level 1, 2, and 3). The inputs or methodology used for valuingsecurities are not necessarily an indication of the risk associated with investing in those securities. Levels 1, 2 and 3 of the fair valuehierarchy are defined as follows:
� Level 1 � Inputs using quoted prices in active markets or exchanges for identical assets and liabilities.
� Level 2 � Significant other observable inputs, which may include, but are not limited to, quoted prices for similar assets orliabilities in markets that are active, quoted prices for identical or similar assets or liabilities in markets that are non-active, inputsother than quoted prices that are observable for the assets or liabilities (such as interest rates, yield curves, volatilities, prepaymentspeeds, loss severities, credit risks and default rates) or other market corroborated inputs.
� Level 3 � Significant unobservable inputs based on the best information available in the circumstances, to the extent observableinputs are not available, which may include assumptions made by the Board or persons acting at their direction that are used indetermining the fair market value of investments.
The valuation techniques and significant inputs used in determining the fair market values of financial instruments classified as Level1 and Level 2 of the fair value hierarchy are as follows:
Copyright © 2012 www.secdatabase.com. All Rights Reserved.Please Consider the Environment Before Printing This Document

Common stocks, exchange traded funds and derivatives that are traded on a national securities exchange are stated at the last reportedsale or settlement price on the day of valuation. To the extent these securities are actively traded and valuation adjustments are notapplied, they are categorized as Level 1 of the fair value hierarchy.
Fixed income securities including corporate, convertible and municipal bonds and notes, U.S. government agencies, U.S. treasuryobligations, sovereign issues, bank loans, bank notes and non-U.S. bonds are normally valued by pricing service providers that usebroker dealer quotations or valuation estimates from their internal pricing models. The service providers� internal models use inputsthat are observable such as issuer details, interest rates, yield curves, prepayment speeds, credit risks/spreads and default rates.Securities that use similar valuation techniques and inputs as described above are categorized as Level 2 of the fair value hierarchy.
Fixed income securities purchased on a delayed-delivery basis and marked-to-market daily until settlement at the forward settlementdate are categorized as Level 2 of the fair value hierarchy.
Mortgage and asset-backed securities are usually issued as separate tranches, or classes, of securities within each deal. Thesesecurities are also normally valued by pricing service providers that use broker dealer quotations or valuation estimates from their
236 Notes to Quarterly Report
Copyright © 2012 www.secdatabase.com. All Rights Reserved.Please Consider the Environment Before Printing This Document
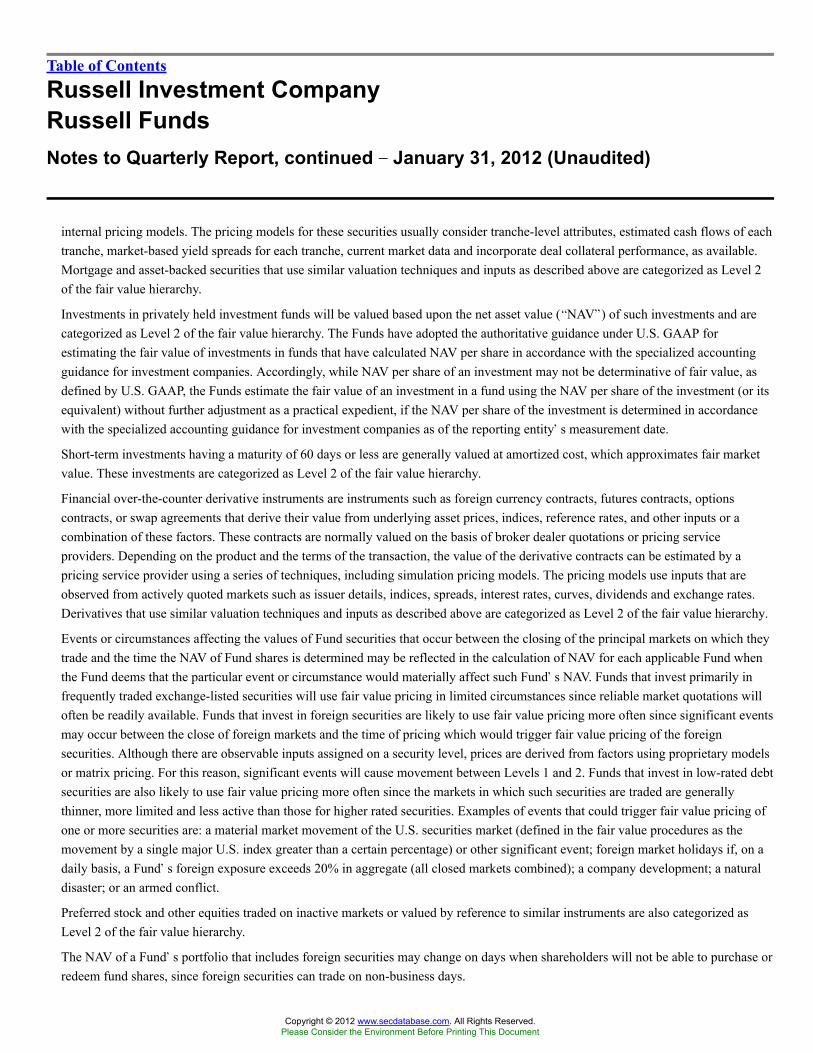
Table of Contents
Russell Investment CompanyRussell FundsNotes to Quarterly Report, continued �� January 31, 2012 (Unaudited)
internal pricing models. The pricing models for these securities usually consider tranche-level attributes, estimated cash flows of eachtranche, market-based yield spreads for each tranche, current market data and incorporate deal collateral performance, as available.Mortgage and asset-backed securities that use similar valuation techniques and inputs as described above are categorized as Level 2of the fair value hierarchy.
Investments in privately held investment funds will be valued based upon the net asset value (�NAV�) of such investments and arecategorized as Level 2 of the fair value hierarchy. The Funds have adopted the authoritative guidance under U.S. GAAP forestimating the fair value of investments in funds that have calculated NAV per share in accordance with the specialized accountingguidance for investment companies. Accordingly, while NAV per share of an investment may not be determinative of fair value, asdefined by U.S. GAAP, the Funds estimate the fair value of an investment in a fund using the NAV per share of the investment (or itsequivalent) without further adjustment as a practical expedient, if the NAV per share of the investment is determined in accordancewith the specialized accounting guidance for investment companies as of the reporting entity�s measurement date.
Short-term investments having a maturity of 60 days or less are generally valued at amortized cost, which approximates fair marketvalue. These investments are categorized as Level 2 of the fair value hierarchy.
Financial over-the-counter derivative instruments are instruments such as foreign currency contracts, futures contracts, optionscontracts, or swap agreements that derive their value from underlying asset prices, indices, reference rates, and other inputs or acombination of these factors. These contracts are normally valued on the basis of broker dealer quotations or pricing serviceproviders. Depending on the product and the terms of the transaction, the value of the derivative contracts can be estimated by apricing service provider using a series of techniques, including simulation pricing models. The pricing models use inputs that areobserved from actively quoted markets such as issuer details, indices, spreads, interest rates, curves, dividends and exchange rates.Derivatives that use similar valuation techniques and inputs as described above are categorized as Level 2 of the fair value hierarchy.
Events or circumstances affecting the values of Fund securities that occur between the closing of the principal markets on which theytrade and the time the NAV of Fund shares is determined may be reflected in the calculation of NAV for each applicable Fund whenthe Fund deems that the particular event or circumstance would materially affect such Fund�s NAV. Funds that invest primarily infrequently traded exchange-listed securities will use fair value pricing in limited circumstances since reliable market quotations willoften be readily available. Funds that invest in foreign securities are likely to use fair value pricing more often since significant eventsmay occur between the close of foreign markets and the time of pricing which would trigger fair value pricing of the foreignsecurities. Although there are observable inputs assigned on a security level, prices are derived from factors using proprietary modelsor matrix pricing. For this reason, significant events will cause movement between Levels 1 and 2. Funds that invest in low-rated debtsecurities are also likely to use fair value pricing more often since the markets in which such securities are traded are generallythinner, more limited and less active than those for higher rated securities. Examples of events that could trigger fair value pricing ofone or more securities are: a material market movement of the U.S. securities market (defined in the fair value procedures as themovement by a single major U.S. index greater than a certain percentage) or other significant event; foreign market holidays if, on adaily basis, a Fund�s foreign exposure exceeds 20% in aggregate (all closed markets combined); a company development; a naturaldisaster; or an armed conflict.
Preferred stock and other equities traded on inactive markets or valued by reference to similar instruments are also categorized asLevel 2 of the fair value hierarchy.
The NAV of a Fund�s portfolio that includes foreign securities may change on days when shareholders will not be able to purchase orredeem fund shares, since foreign securities can trade on non-business days.
Copyright © 2012 www.secdatabase.com. All Rights Reserved.Please Consider the Environment Before Printing This Document
Level 3 Trading Assets and Trading Liabilities, at Fair Value.
The valuation techniques and significant inputs used in determining the fair values of financial instruments classified as Level 3 ofthe fair value hierarchy are as follows:
Securities and other assets for which market quotes are not readily available are valued at fair value as determined in good faith bythe Board and are categorized as Level 3 of the fair value hierarchy. Market quotes are considered not readily available incircumstances where there is an absence of current or reliable market-based data (e.g., trade information or broker quotes). WhenRFSC applies fair valuation methods that use significant unobservable inputs to determine a Fund�s NAV, securities will not bepriced on the basis of quotes from the primary market in which they are traded, but rather may be priced by another method that theBoard or persons acting at their direction believe accurately reflects fair value and are categorized as Level 3 of the fair valuehierarchy. Fair value pricing may require subjective determinations about the value of a security. While the securities valuationprocedures are intended to result in a calculation of a Fund�s NAV that fairly reflects security values as of the time of pricing, theprocess cannot guarantee that fair values determined by the Board or persons acting at their direction would accurately reflect the
Notes to Quarterly Report 237
Copyright © 2012 www.secdatabase.com. All Rights Reserved.Please Consider the Environment Before Printing This Document

Table of Contents
Russell Investment CompanyRussell FundsNotes to Quarterly Report, continued �� January 31, 2012 (Unaudited)
price that a Fund could obtain for a security if it were to dispose of that security as of the time of pricing (for instance, in a forced ordistressed sale). The prices used by a Fund may differ from the value that would be realized if the securities were sold.
For fair valuations using significant unobservable inputs, U.S. GAAP requires a reconciliation of the beginning to ending balancesfor reported market values that presents changes attributable to total realized and unrealized gains or losses, purchases and sales, andtransfers in/out of the Level 3 category during the period. In accordance with the requirements of U.S. GAAP, a fair value hierarchyand Level 3 reconciliation, if any, have been included in the Notes to the Schedule of Investments for each respective Fund.
In 2011, the Financial Accounting Standards Board (�FASB�) issued an update to requirements relating to fair valuationmeasurements which represent amendments to achieve common fair value measurements and disclosure requirements in U.S. GAAPand International Financial Reporting Standards. The amendments are of two types: (i) those that clarify the FASB�s intent about theapplication of existing fair value measurements and disclosure requirements and (ii) those that change a particular principle orrequirement for measuring fair value or for disclosing information about fair value measurements.
The amendments that change a particular principle or requirement for measuring fair value or disclosing information about fair valuemeasurements relate to (i) measuring the fair value of the financial instruments that are managed within a portfolio; (ii) application ofpremium and discount in a fair value measurement; and (iii) additional disclosures about fair value measurements. The update iseffective for annual periods beginning after December 15, 2011. Management does not believe the adoption of this update will have amaterial impact on the Funds� financial statements.
Investment Transactions
Investment transactions are reflected as of the trade date for financial reporting purposes. This may cause the NAV stated in thefinancial statements to be different from the NAV at which shareholders may transact. Realized gains and losses from securitiestransactions, if any, are recorded on the basis of specific identified cost incurred by each money manager within a particular Fund.
Investment Income
Dividend income is recorded net of applicable withholding taxes on the ex-dividend date, except that certain dividends from foreignsecurities are recorded as soon thereafter as the Funds are informed of the ex-dividend date. Interest income is recorded daily on theaccrual basis. The fixed income funds classify gains and losses realized on prepayments received on mortgage-backed securities as anadjustment to interest income. All premiums and discounts, including original issue discounts, are amortized/accreted using theeffective interest method.
Foreign Currency Translations
The books and records of the Funds are maintained in U.S. dollars. Foreign currency amounts and transactions of the Funds aretranslated into U.S. dollars on the following basis:
(a) Market value of investment securities, other assets and liabilities at the closing rate of exchange on the valuation date.
(b) Purchases and sales of investment securities and income at the closing rate of exchange prevailing on the respective trade dates ofsuch transactions.
Net realized gains or losses from foreign currency-related transactions arise from: sales and maturities of short-term securities; salesof foreign currencies; currency gains or losses realized between the trade and settlement dates on securities transactions; thedifference between the amounts of dividends, interest, and foreign withholding taxes recorded on the Funds� books and the U.S.dollar equivalent of the amounts actually received or paid. Net unrealized gains or losses from foreign currency-related transactions
Copyright © 2012 www.secdatabase.com. All Rights Reserved.Please Consider the Environment Before Printing This Document

arise from changes in the value of assets and liabilities, other than investments in securities, as a result of changes in the exchangerates.
The Funds do not isolate that portion of the results of operations of the Funds that arises as a result of changes in exchange rates fromthat portion that arises from changes in market prices of investments during the year. Such fluctuations are included with the netrealized and unrealized gain or loss from investments. However, for federal income tax purposes, the Funds do isolate the effects ofchanges in foreign exchange rates from the fluctuations arising from changes in market prices for realized gain (or loss) on debtobligations.
Derivatives
To the extent permitted by the investment objectives, restrictions and policies set forth in the Funds� Prospectuses and Statement ofAdditional Information, the Funds may participate in various derivative-based transactions. Derivative securities are
238 Notes to Quarterly Report
Copyright © 2012 www.secdatabase.com. All Rights Reserved.Please Consider the Environment Before Printing This Document
Table of Contents
Russell Investment CompanyRussell FundsNotes to Quarterly Report, continued �� January 31, 2012 (Unaudited)
instruments or agreements whose value is derived from an underlying security or index. They include options, futures, swaps andforwards. These instruments offer unique characteristics and risks that facilitate Funds� investment strategies.
The Funds typically use derivatives in three ways: exposing cash reserves to markets, hedging and return enhancement. In addition,certain Funds may enter into foreign exchange contracts for trade settlement purposes. The Funds, other than the Russell Tax ExemptBond Fund, Russell Commodity Strategies Fund, and Russell Money Market Fund, may pursue their strategy of being fully investedby exposing cash reserves to the performance of appropriate markets by purchasing securities and/or derivatives. This is intended tocause the Funds to perform as though cash reserves were actually invested in those markets. Hedging may also be used by certainFunds to limit or control risks, such as adverse movements in exchange rates and interest rates. Return enhancement can beaccomplished through the use of derivatives in a Fund, including using derivatives as a substitute for holding physical bonds, andusing them to express various macro views (e.g., interest rate movements, currency movements, and macro credit strategies). Bypurchasing certain instruments, the Funds may more effectively achieve the desired portfolio characteristics that assist them inmeeting their investment objectives. Depending on how the derivatives are structured and utilized, the risks associated with them mayvary widely. These risks include, but are not limited to, market risk, liquidity risk, counterparty risk, basis risk, reinvestment risk,political risk, prepayment risk, extension risk and credit risk.
Foreign Currency Exchange Contracts
In connection with investment transactions consistent with the Funds� investment objectives and strategies, certain Funds may enterinto foreign currency exchange spot contracts and forward foreign currency exchange contracts (�FX contracts�). From time to time,certain Funds may enter into FX contracts to hedge certain foreign currency-denominated assets. FX contracts are recorded at marketvalue. Certain risks may arise upon entering into these FX contracts from the potential inability of counterparties to meet the terms oftheir FX contracts and are generally limited to the amount of unrealized gain on the FX contracts, if any, that are disclosed in theStatements of Assets and Liabilities. Realized gains or losses arising from such transactions are included in net realized gain (or loss)from foreign currency-related transactions.
For the period ended January 31, 2012, the following Funds entered into foreign currency exchange contracts primarily for thestrategies listed below:
Funds Strategies
Russell International Developed Markets Fund Return enhancement, exposing cash reserves to markets and trade settlementRussell Global Equity Fund Exposing cash reserves to markets and trade settlementRussell Emerging Markets Fund Exposing cash reserves to markets and trade settlementRussell Global Opportunistic Credit Fund Return enhancement and hedgingRussell Strategic Bond Fund Return enhancement and hedgingRussell Investment Grade Bond Fund Return enhancement and hedgingRussell Short Duration Bond Fund Return enhancement and hedgingRussell Global Infrastructure Fund Exposing cash reserves to markets and trade settlementRussell Global Real Estate Securities Fund Trade settlement
The Funds� period end foreign currency exchange contracts, as presented in the tables following the Schedule of Investments,generally are indicative of the volume of their derivative activity during the period ended January 31, 2012.
As of January 31, 2012, the Funds had cash collateral balances in connection with forward contracts purchased (sold) as follows:
Copyright © 2012 www.secdatabase.com. All Rights Reserved.Please Consider the Environment Before Printing This Document

Cash Collateral
for Forwards Due to Broker
Russell Strategic Bond Fund $ � $ 235,000
Options
The Funds may purchase and sell (write) call and put options on securities and securities indices, provided such options are traded ona national securities exchange or in an over-the-counter market. The Funds may also purchase and sell call and put options on foreigncurrencies. The domestic equity Funds may utilize options to expose cash reserves to markets.
When a Fund writes a covered call or a put option, an amount equal to the premium received by the Fund is included in the Fund�sStatement of Assets and Liabilities as an asset and as an equivalent liability. The amount of the liability is subsequently marked-to-market to reflect the current market value of the option written. The Fund receives a premium on the sale of a call option but gives upthe opportunity to profit from any increase in stock value above the exercise price of the option, and when the Fund writes a putoption it is exposed to a decline in the price of the underlying security.
Notes to Quarterly Report 239
Copyright © 2012 www.secdatabase.com. All Rights Reserved.Please Consider the Environment Before Printing This Document

Table of Contents
Russell Investment CompanyRussell FundsNotes to Quarterly Report, continued �� January 31, 2012 (Unaudited)
Whether an option which the Fund has written expires on its stipulated expiration date or the Fund enters into a closing purchasetransaction, the Fund realizes a gain (or loss, if the cost of a closing purchase transaction exceeds the premium received when theoption was sold) without regard to any unrealized gain or loss on the underlying security, and the liability related to such option isextinguished. If a call option which the Fund has written is exercised, the Fund realizes a capital gain or loss from the sale of theunderlying security, and the proceeds from such sale are increased by the premium originally received. When a put option which aFund has written is exercised, the amount of the premium originally received will reduce the cost of the security which a Fundpurchases upon exercise of the option. Realized gains (losses) on purchased options are included in net realized gain (loss) frominvestments on the Statements of Operations.
The Funds� use of written options involves, to varying degrees, elements of market risk in excess of the amount recognized in theStatements of Assets and Liabilities. The face or contract amounts of these instruments reflect the extent of the Funds� exposure tomarket risk. The risks may be caused by an imperfect correlation between movements in the price of the instrument and the price ofthe underlying securities and interest rates.
A Fund may enter into a swaption (swap option). In a swaption, the buyer gains the right but not the obligation to enter into aspecified swap agreement with the issuer on a specified future date. The writer of the contract receives the premium and bears therisk of unfavorable changes in the preset rate on the underlying interest rate swap. Unrealized gains/losses on swaptions are reflectedin investment assets and investment liabilities in a Fund�s Statement of Assets and Liabilities.
For the period ended January 31, 2012, the Funds purchased/sold options primarily for the strategies listed below:
Funds Strategies
Russell Global Opportunistic Credit Fund Return enhancement and hedgingRussell Strategic Bond Fund Return enhancement and hedgingRussell Investment Grade Bond Fund Return enhancement and hedgingRussell Short Duration Bond Fund Return enhancement and hedging
The Funds� period end options contracts, as presented in the Schedule of Investments or the tables following the Schedule ofInvestments, generally are indicative of the volume of their derivative activity during the period ended January 31, 2012.
Futures Contracts
The Funds may invest in futures contracts (i.e., interest rate, foreign currency and index futures contracts) to a limited extent. Theface or contract amounts of these instruments reflect the extent of the Funds� exposure to off balance sheet risk. The primary risksassociated with the use of futures contracts are an imperfect correlation between the change in market value of the securities held bythe Fund and the prices of futures contracts and the possibility of an illiquid market. Upon entering into a futures contract, the Fundsare required to deposit with a broker an amount, termed the initial margin, which typically represents 5% of the purchase priceindicated in the futures contract. Payments to and from the broker, known as variation margin, are typically required to be made on adaily basis as the price of the futures contract fluctuates. Changes in initial settlement value are accounted for as unrealizedappreciation (depreciation) until the contracts are terminated, at which time realized gains and losses are recognized.
For the period ended January 31, 2012, the following Funds entered into future contracts primarily for the strategies listed below:
Funds Strategies
Russell U.S. Core Equity Fund Exposing cash reserves to markets
Copyright © 2012 www.secdatabase.com. All Rights Reserved.Please Consider the Environment Before Printing This Document
Russell U.S. Quantitative Equity Fund Exposing cash reserves to marketsRussell U.S. Growth Fund Exposing cash reserves to marketsRussell U.S. Value Fund Exposing cash reserves to marketsRussell U.S. Small Cap Equity Fund Exposing cash reserves to marketsRussell International Developed Markets Fund Return enhancement and exposing cash reserves to marketsRussell Global Equity Fund Exposing cash reserves to marketsRussell Emerging Markets Exposing cash reserves to marketsRussell Tax-Managed U.S. Large Cap Fund Exposing cash reserves to marketsRussell Tax-Managed U.S. Mid & Small Cap Fund Exposing cash reserves to marketsRussell Global Opportunistic Credit Fund Return enhancement, hedging and exposing cash reserves to marketsRussell Strategic Bond Fund Return enhancement, hedging, and exposing cash reserves to marketsRussell Investment Grade Bond Fund Return enhancement, hedging, and exposing cash reserves to marketsRussell Short Duration Bond Fund Return enhancement, hedging, and exposing cash reserves to marketsRussell Commodity Strategies Fund Return enhancementRussell Global Infrastructure Fund Exposing cash reserves to markets and trade settlementRussell Global Real Estate Securities Fund Exposing cash reserves to markets and trade settlement
240 Notes to Quarterly Report
Copyright © 2012 www.secdatabase.com. All Rights Reserved.Please Consider the Environment Before Printing This Document

Table of Contents
Russell Investment CompanyRussell FundsNotes to Quarterly Report, continued �� January 31, 2012 (Unaudited)
The Funds� period end futures contracts, as presented in the tables following the Schedule of Investments, generally are indicative ofthe volume of their derivative activity during the period ended January 31, 2012.
As of January 31, 2012, the Funds had cash collateral balances in connection with futures contracts purchased (sold) as follows:
Cash Collateral
for Futures Due to Broker
Russell U.S. Core Equity Fund $19,000,000 $�Russell U.S. Quantitative Equity Fund 7,000,000 �
Russell U.S. Growth Fund 270,000 �
Russell U.S. Value Fund 385,000 �
Russell U.S. Small Cap Equity Fund 3,550,000 �
Russell International Developed Markets Fund 51,949,862 3,012,881Russell Global Equity Fund 11,100,000 �
Russell Emerging Markets Fund 4,300,000 �
Russell Tax-Managed U.S. Large Cap Fund 1,005,000 �
Russell Tax-Managed U.S. Mid & Small Cap Fund 1,005,000 �
Russell Strategic Bond Fund 1,990,000 �
Russell Investment Grade Bond Fund 1,047,800 �
Russell Short Duration Bond Fund 99,000 �
Russell Global Infrastructure Fund 3,700,000 �
Russell Global Real Estate Securities Fund 1,800,000
Swap Agreements
The Funds may enter into swap agreements, on either an asset-based or liability-based basis, depending on whether they are hedgingtheir assets or their liabilities, and will usually enter into swaps on a net basis, i.e., the two payment streams are netted out, with theFunds receiving or paying, as the case may be, only the net amount of the two payments. When a Fund engages in a swap, itexchanges its obligations to pay or rights to receive payments for the obligations or rights to receive payments of another party (i.e.,an exchange of floating rate payments for fixed rate payments).
Certain Funds may enter into several different types of agreements including interest rate, credit default, commodity-linked (RussellCommodity Strategies Fund only), index (total return) and currency swaps. The Funds may enter into index swap agreements toexpose cash reserves to markets or to effect investment transactions consistent with those Funds� investment objectives andstrategies. Interest rate swaps are a counterparty agreement, can be customized to meet each party�s needs, and involve the exchangeof a fixed payment per period for a payment that is not fixed. Currency swaps are an agreement where two parties exchange specifiedamounts of different currencies which are followed by each paying the other a series of interest payments that are based on theprincipal cash flow. At maturity the principal amounts are returned. Credit default swaps are a counterparty agreement which allowsthe transfer of third party credit risk (the possibility that an issuer will default on their obligation by failing to pay principal or interestin a timely manner) from one party to another. The lender faces the credit risk from a third party and the counterparty in the swapagrees to insure this risk in exchange for regular periodic payments.
Copyright © 2012 www.secdatabase.com. All Rights Reserved.Please Consider the Environment Before Printing This Document

The Funds expect to enter into these transactions primarily to preserve a return or spread on a particular investment or portion of theirportfolios or to protect against any increase in the price of securities they anticipate purchasing at a later date or for returnenhancement. The net amount of the excess, if any, of the Funds� obligations over their entitlements with respect to each swap willbe accrued on a daily basis and an amount of cash or liquid assets having an aggregate NAV at least equal to the accrued excess willbe segregated. To the extent that the Funds enter into swaps on other than a net basis, the amount earmarked on the Funds� recordswill be the full amount of the Funds� obligations, if any, with respect to such interest rate swaps, accrued on a daily basis. If there is adefault by the other party to such a transaction, the Funds will have contractual remedies pursuant to the agreement related to thetransaction.
A Fund may not receive the expected amount under a swap agreement if the other party to the agreement defaults or becomesbankrupt. The market for swap agreements is largely unregulated. The Funds may enter into swap agreements with counterpartiesthat meet RIMCo�s credit quality limitations. The Funds will not enter into any swap unless the counterparty has a minimum seniorunsecured credit rating or long term counterparty credit rating, including reassignments, of A- or better as defined by Standard &Poor�s or an equivalent rating from any nationally recognized statistical rating organization (using highest of split ratings) at the timeof entering into such transaction.
Notes to Quarterly Report 241
Copyright © 2012 www.secdatabase.com. All Rights Reserved.Please Consider the Environment Before Printing This Document

Table of Contents
Russell Investment CompanyRussell FundsNotes to Quarterly Report, continued �� January 31, 2012 (Unaudited)
Swap agreements generally are entered into by �eligible contract participants� and in compliance with certain other criteria necessaryto render them excluded from regulation under the Commodity Exchange Act (�CEA�) and, therefore not subject to regulation asfutures or commodity option transactions under the CEA.
As of January 31, 2012, the Funds had cash collateral balances in connection with swap contracts purchased (sold) as follows:
Cash Collateral
for Swaps Due to Broker
Russell Emerging Markets Fund $8,000,000 $�Russell Global Opportunistic Credit Fund 1,413,000 1,188,000Russell Strategic Bond Fund 4,966,779 11,386,364Russell Investment Grade Bond Fund 1,411,000 1,179,000Russell Short Duration Bond Fund � 1,445,000Russell Commodity Strategies Fund 22,635,290 �
Russell Global Real Estate Securities Fund 3,175,000 3,635,000
Credit Default Swaps
The fixed income funds may enter into credit default swaps. A credit default swap can refer to corporate issues, asset-backedsecurities or an index of assets, each known as the reference entity or underlying asset. The fixed income funds may act as either thebuyer or the seller of a credit default swap involving one party making a stream of payments to another party in exchange for theright to receive a specified return in the event of a default or other credit event. Depending upon the terms of the contract, the creditdefault swap may be closed via physical settlement. However, due to the possible or potential instability in the market, there is a riskthat the fixed income funds may be unable to deliver the underlying debt security to the other party to the agreement. Additionally,the fixed income funds may not receive the expected amount under the swap agreement if the other party to the agreement defaults orbecomes bankrupt. In an unhedged credit default swap, the fixed income funds enter into a credit default swap without owning theunderlying asset or debt issued by the reference entity. Credit default swaps allow the fixed income funds to acquire or reduce creditexposure to a particular issuer, asset or basket of assets.
As the seller of protection in a credit default swap, a fixed income fund would be required to pay the par or other agreed-upon value(or otherwise perform according to the swap contract) of a reference debt obligation to the counterparty in the event of a default (orother specified credit event); the counterparty would be required to surrender the reference debt obligation. In return, the fixedincome fund would receive from the counterparty a periodic stream of payments over the term of the contract provided that no creditevent has occurred. If no credit event occurs, the fixed income fund would keep the stream of payments and would have no paymentobligations. As a seller of protection, the fixed income fund would effectively add leverage to its portfolio because in addition to itstotal net assets, that Fund would be subject to investment exposure on the notional amount of the swap.
Each fixed income fund may also purchase protection via credit default swap contracts in order to offset the risk of default of debtsecurities held in its portfolio, in which case the fixed income fund would function as the counterparty referenced in the precedingparagraph.
If a credit event occurs on a corporate issue and cash settlement is not elected, a variety of other deliverable obligations may bedelivered in lieu of the specific referenced obligation. The ability to deliver other obligations may result in a cheapest-to-deliver
Copyright © 2012 www.secdatabase.com. All Rights Reserved.Please Consider the Environment Before Printing This Document

option (the buyer of protection�s right to choose the deliverable obligation with the lowest value following a credit event). The fixedincome funds may use credit default swaps on corporate issues to provide a measure of protection against defaults of the issuers (i.e.,to reduce risk where the fixed income funds own or have exposure to the referenced obligation) or to take an active long or shortposition with respect to the likelihood (as measured by the credit default swap�s spread) of a particular issuer�s default.
Unlike credit default swaps on corporate issues, deliverable obligations for credit default swaps on asset-backed securities in mostinstances are limited to the specific referenced obligation as performance for asset-backed securities can vary across deals.Prepayments, principal paydowns, and other write-down or loss events on the underlying mortgage loans will reduce the outstandingprincipal balance of the referenced obligation. These reductions may be temporary or permanent as defined under the terms of theswap agreement and the notional amount for the swap agreement generally will be adjusted by corresponding amounts. The fixedincome funds may use credit default swaps on asset-backed securities to provide a measure of protection against defaults (or otherdefined credit events) of the referenced obligation or to take an active long or short position with respect to the likelihood of aparticular referenced obligation�s default (or other defined credit events).
Credit default swap agreements on credit indices involve one party making a stream of payments to another party in exchange for theright to receive a specified return in the event of a write-down, principal shortfall, interest shortfall or default of all or part of
242 Notes to Quarterly Report
Copyright © 2012 www.secdatabase.com. All Rights Reserved.Please Consider the Environment Before Printing This Document

Table of Contents
Russell Investment CompanyRussell FundsNotes to Quarterly Report, continued �� January 31, 2012 (Unaudited)
the referenced entities comprising the credit index. A credit index is a basket of credit instruments or exposures designed to berepresentative of some part of the credit market as a whole. These indices are made up of reference credits that are judged by a poll ofdealers to be the most liquid entities in the credit default swap market based on the sector of the index. Components of the indicesmay include, but are not limited to, investment grade securities, high yield securities, asset-backed securities, emerging markets, and/or various credit ratings within each sector. Credit indices are traded using credit default swaps with standardized terms including afixed spread and standard maturity dates. An index credit default swap references all the names in the index, and if there is a default,the credit event is settled based on that name�s weight in the index. The composition of the indices changes periodically, usuallyevery six months, and for most indices, each name has an equal weight in the index. Traders may use credit default swaps on indicesto speculate on changes in credit quality.
Implied credit spreads, represented in absolute terms, utilized in determining the market value of credit default swap agreements oncorporate issues as of period end are disclosed in the Schedules of Investments and generally serve as an indicator of the currentstatus of the payment/performance risk and represent the likelihood or risk of default (or other defined credit event) for the creditderivative. The implied credit spread of a particular referenced entity reflects the cost of entering into a credit default swap and mayinclude upfront payments required to be made to enter into the agreement. For credit default swap agreements on asset-backedsecurities and credit indices, the quoted market prices and resulting values serve as the indicator of the current status of the payment/performance risk. Wider credit spreads and increasing market values, in absolute terms when compared to the notional amount of theswap, generally represent a deterioration of the referenced entity�s credit soundness and a greater likelihood or risk of default orother credit event occurring as defined under the terms of the agreement. The maximum potential amount of future payments(undiscounted) that a fixed income fund as a seller of protection could be required to make under a credit default swap agreementwould be an amount equal to the notional amount of the agreement. Notional amounts of all credit default swap agreementsoutstanding as of January 31, 2012 for which a fixed income fund is the seller of protection are disclosed in the Schedules ofInvestments. These potential amounts would be partially offset by any recovery values of the respective referenced obligations,upfront payments received upon entering into the agreement, or net amounts received from the settlement of buy protection creditdefault swap agreements entered into by a fixed income fund for the same referenced entity or entities.
Credit default swaps could result in losses if the fixed income funds do not correctly evaluate the creditworthiness of the company orcompanies on which the credit default swap is based. Credit default swap agreements may involve greater risks than if the fixedincome funds had invested in the reference obligation directly since, in addition to risks relating to the reference obligation, creditdefault swaps are subject to illiquidity and counterparty risk. A fixed income fund will generally incur a greater degree of risk when itsells a credit default swap than when it purchases a credit default swap. As a buyer of a credit default swap, a fixed income fund maylose its investment and recover nothing should a credit event fail to occur and the swap is held to its termination date. As seller of acredit default swap, if a credit event were to occur, the value of any deliverable obligation received by a fixed income fund, coupledwith the upfront or periodic payments previously received, may be less than what it pays to the buyer, resulting in a loss of value tothe fixed income fund.
If the creditworthiness of a fixed income fund�s swap counterparty declines, the risk that the counterparty may not perform couldincrease, potentially resulting in a loss to the fixed income fund. To limit the counterparty risk involved in swap agreements, the fixedincome funds will only enter into swap agreements with counterparties that meet certain standards of creditworthiness. Althoughthere can be no assurance that the fixed income funds will be able to do so, the fixed income funds may be able to reduce or eliminatetheir exposure under a swap agreement either by assignment or other disposition, or by entering into an offsetting swap agreement
Copyright © 2012 www.secdatabase.com. All Rights Reserved.Please Consider the Environment Before Printing This Document

with the same party or another creditworthy party. The fixed income funds may have limited ability to eliminate their exposure undera credit default swap if the credit of the reference entity or underlying asset has declined.
For the period ended January 31, 2012, the Funds entered into credit default swaps primarily for the strategies listed below:
Funds Strategies
Russell Global Opportunistic Credit Fund Return enhancement, hedging and exposing cash reserves to marketsRussell Strategic Bond Fund Return enhancement and hedgingRussell Investment Grade Bond Fund Return enhancement and hedgingRussell Short Duration Bond Fund Return enhancement and hedging
The Funds� period end credit default swap contracts, as presented in the tables following the Schedule of Investments, generally areindicative of the volume of their derivative activity during the period ended January 31, 2012.
Interest Rate Swaps
The use of interest rate swaps is a highly specialized activity which involves investment techniques and risks different from thoseassociated with ordinary portfolio securities transactions. If a money manager using this technique is incorrect in its forecast of
Notes to Quarterly Report 243
Copyright © 2012 www.secdatabase.com. All Rights Reserved.Please Consider the Environment Before Printing This Document

Table of Contents
Russell Investment CompanyRussell FundsNotes to Quarterly Report, continued �� January 31, 2012 (Unaudited)
market values, interest rates and other applicable factors, the investment performance of a Fund might diminish compared to what itwould have been if this investment technique were not used.
Interest rate swaps do not involve the delivery of securities or other underlying assets or principal. Accordingly, the risk of loss withrespect to interest rate swaps is limited to the net amount of interest payments that the Funds are contractually obligated to make. Ifthe other party to an interest rate swap defaults, the Funds� risk of loss consists of the net amount of interest payments that the Fundsare contractually entitled to receive. Since interest rate swaps are individually negotiated, the Funds expect to achieve an acceptabledegree of correlation between their rights to receive interest on their portfolio securities and their rights and obligations to receive andpay interest pursuant to interest rate swaps.
For the period ended January 31, 2012, the Funds entered into interest rate swaps primarily for the strategies listed below:
Funds Strategies
Russell Global Opportunistic Credit Fund Return enhancement and hedgingRussell Strategic Bond Fund Return enhancement and hedgingRussell Investment Grade Bond Fund Return enhancement and hedgingRussell Short Duration Bond Fund Return enhancement and hedging
The Funds� period end interest rate swap contracts, as presented in the tables following the Schedule of Investments, generally areindicative of the volume of their derivative activity during the period ended January 31, 2012.
Index Swaps
Certain Funds may enter into index swap agreements to expose cash reserves to markets or to effect investment transactionsconsistent with these Funds� investment objectives and strategies. Swap agreements are two party contracts entered into primarily byinstitutional investors for periods ranging from a few weeks to more than one year. In a standard swap transaction, the two partiesagree to exchange the returns (or differentials in rates of return) earned or realized on particular investments or instruments. Thereturns to be exchanged between the parties are calculated with respect to a �notional amount� (i.e., a specified dollar amount that ishypothetically invested in a �basket� of securities representing a particular index).
For the period ended January 31, 2012, the Funds entered into index swaps primarily for the strategies listed below:
Funds Strategies
Russell Emerging Markets Fund Exposing cash reserves to marketsRussell Global Opportunistic Credit Fund Exposing cash reserves to marketsRussell Investment Grade Bond Fund Return enhancementRussell Commodity Strategies Fund Return enhancement and gain exposure to the commodity futures markets
The Funds� period end index swap contracts, as presented in the tables following the Schedule of Investments, generally areindicative of the volume of their derivative activity during the period ended January 31, 2012.
Commodity-Linked Derivatives
The Russell Commodity Strategies Fund invests in commodity-linked derivative instruments, such as swap agreements and futures.At least part of their value is derived from the value of an underlying commodity index, commodity futures contract, index or otherreadily measurable economic variable. The prices of commodity-linked derivative instruments may move in different directions thaninvestments in traditional equity and debt securities when the value of those traditional securities is declining due to adverse
Copyright © 2012 www.secdatabase.com. All Rights Reserved.Please Consider the Environment Before Printing This Document
economic conditions. As an example, during periods of rising inflation, historically debt securities have tended to decline in valuedue to the general increase in prevailing interest rates. Conversely, during those same periods of rising inflation, historically theprices of certain commodities, such as oil and metals, have tended to increase. Of course, there cannot be any guarantee thatderivative instruments will perform in that manner in the future, and at certain times the price movements of commodity-linkedinvestments have been parallel to those of debt and equity securities. For the period ended January 31, 2012, the Russell CommodityStrategies Fund entered into commodity-linked swaps primarily for exposure to the commodities markets.
ISDA Master Agreements
The Funds are parties to International Swaps and Derivatives Association, Inc. Master Agreements (�ISDA Master Agreements�)with counterparties that govern transactions in over-the-counter derivative and foreign exchange contracts entered into by the Fundsand those counterparties. The ISDA Master Agreements contain provisions for general obligations, representations, agreements,collateral and events of default or termination. Events of termination include conditions that may entitle
244 Notes to Quarterly Report
Copyright © 2012 www.secdatabase.com. All Rights Reserved.Please Consider the Environment Before Printing This Document

Table of Contents
Russell Investment CompanyRussell FundsNotes to Quarterly Report, continued �� January 31, 2012 (Unaudited)
counterparties to elect to terminate early and cause settlement of all outstanding transactions under the applicable ISDA MasterAgreement. Any election to terminate early could be material to the financial statements.
Loan Agreements
The Russell Global Opportunistic Credit, Russell Strategic Bond, Russell Investment Grade Bond and Russell Short Duration BondFunds may invest in direct debt instruments, which are interests in amounts owed by corporate, governmental, or other borrowers tolenders or lending syndicates. The Funds� investments in loans may be in the form of participations in loans or assignments of all ora portion of loans from third parties. A loan is often administered by a bank or other financial institution (the �agent�) that acts asagent for all holders. The agent administers the terms of the loan, as specified in the loan agreement. When investing in a loanparticipation, the Funds have the right to receive payments of principal, interest and any fees to which it is entitled only from theagent selling the loan agreement and only upon receipt by the agent of payments from the borrower. The Funds generally have noright to enforce compliance with the terms of the loan agreement with the borrower. As a result, the Funds may be subject to thecredit risk of both the borrower and the agent that is selling the loan agreement. When the Funds purchase assignments from agentsthey acquire direct rights against the borrower on the loan. As of January 31, 2012, the Funds had no unfunded loan commitments.
Participation Notes
Certain Funds may purchase participation notes, also known as participation certificates or participation interest notes. Participationnotes are issued by banks or broker-dealers that are designed to replicate the performance of foreign companies or foreign securitiesmarkets and can be used by the Fund as an alternative means to access the securities market of a frontier emerging market country.The performance results of participation notes will not replicate exactly the performance of the foreign companies or foreignsecurities markets that they seek to replicate due to transaction and other expenses. Investments in participation notes involve certainrisks in addition to those associated with a direct investment in the underlying foreign companies or foreign securities markets whosereturn they seek to replicate. There can be no assurance that there will be a trading market or that the trading price of a participationnote will equal the underlying value of the foreign company or foreign securities market that it seeks to replicate. The Fund relies onthe creditworthiness of the counterparty issuing the participation note and has no rights against the issuer of the underlying security.The Fund minimizes this risk by entering into agreements only with counterparties that RIMCo deems creditworthy. Due to liquidityand transfer restrictions, the secondary markets on which the participation notes are traded may be less liquid than the markets forother securities, or may be completely illiquid.
Credit Linked Notes
The Russell Global Opportunistic Credit Fund may purchase credit linked notes. Credit linked notes are obligations between two ormore parties where the payment of principal and/or interest is based on the performance of some obligation, basket of obligations,index or economic indicator (a �reference instrument�). In addition to the credit risk associated with the reference instrument andinterest rate risk, the buyer and seller of a credit linked note or similar structured investment are subject to counterparty risk.
Short Sales
The Russell U.S. Quantitative Equity Fund may enter into short sale transactions. In a short sale, the seller sells a security that it doesnot own, typically a security borrowed from a broker or dealer. Because the seller remains liable to return the underlying security thatit borrowed from the broker or dealer, the seller must purchase the security prior to the date on which delivery to the broker or dealeris required. The Fund will incur a loss as a result of the short sale if the price of the security increases between the date of the shortsale and the date on which the Fund must return the borrowed security. The Fund will realize a gain if the security declines in price
Copyright © 2012 www.secdatabase.com. All Rights Reserved.Please Consider the Environment Before Printing This Document

between those dates. The making of short sales exposes the Fund to the risk of liability for the market value of the security that is sold(the amount of which increases as the market value of the underlying security increases), in addition to the costs associated withestablishing, maintaining and closing out the short position.
Although the Fund�s potential for gain as a result of a short sale is limited to the price at which it sold the security short less the costof borrowing the security, its potential for loss is theoretically unlimited because there is no limit to the cost of replacing theborrowed security. When the Fund makes a short sale, the Fund may use all or a portion of the cash proceeds of short sales topurchase other securities or for any other permissible Fund purpose. To the extent necessary to meet collateral requirements, the Fundis required to pledge assets in a segregated account maintained by the Fund�s custodian for the benefit of the broker. The Fund alsomay use securities it owns to meet any such collateral obligations. Until the Fund replaces a borrowed security in connection with ashort sale, the Fund will: (a) maintain daily a segregated account, containing cash, cash equivalents, or liquid marketable securities, atsuch a level that the amount deposited in the segregated account plus the amount deposited with the
Notes to Quarterly Report 245
Copyright © 2012 www.secdatabase.com. All Rights Reserved.Please Consider the Environment Before Printing This Document

Table of Contents
Russell Investment CompanyRussell FundsNotes to Quarterly Report, continued �� January 31, 2012 (Unaudited)
broker as collateral will equal the current requirement under Regulation T promulgated by the Board of Governors of the FederalReserve System under the authority of Sections 7 and 8 of the Securities Exchange Act of 1934, as amended; or (b) otherwise coverits short position in accordance with positions taken by the staff of the Securities and Exchange Commission (e.g., taking anoffsetting long position in the security sold short). As of January 31, 2012, $637,366,530 was held as collateral.
Investments in Emerging Markets
Emerging Markets SecuritiesInvesting in emerging markets securities can pose some risks different from and greater than, risks of investing in U.S. or developedmarkets securities. These risks include: a risk of loss due to political instability; exposure to economic structures that are generallyless diverse and mature, and to political systems which may have less stability, than those of more developed countries; smallermarket capitalization of securities markets, which may suffer periods of relative illiquidity; significant price volatility; restrictions onforeign investment; and possible repatriation of investment income and capital. In addition, foreign investors may be required toregister the proceeds of sales and future economic or political crises could lead to price controls, forced mergers, expropriation orconfiscatory taxation, seizure, nationalization, or creation of government monopolies. The currencies of emerging market countriesmay experience significant declines against the U.S. dollar, and devaluation may occur subsequent to investments in these currenciesby the Funds. Emerging market securities may be subject to currency transfer restrictions and may experience delays and disruptionsin securities settlement procedures for a Fund�s portfolio securities. Inflation and rapid fluctuations in inflation rates have had, andmay continue to have, negative effects on the economies and securities markets of certain emerging market countries.
Emerging Markets DebtA Fund�s emerging markets debt securities may include obligations of governments and corporations. As with any fixed incomesecurities, emerging markets debt securities are subject to the risk of being downgraded in credit rating and to the risk of default. Inthe event of a default on any investments in foreign debt obligations, it may be more difficult for a Fund to obtain or to enforce ajudgment against the issuers of such securities. With respect to debt issued by emerging market governments, such issuers may beunwilling to pay interest and repay principal when due, either due to an inability to pay or submission to political pressure not to pay,and as a result may default, declare temporary suspensions of interest payments or require that the conditions for payment berenegotiated.
Repurchase Agreements
The fixed income funds and the Russell Money Market Fund may enter into repurchase agreements. A repurchase agreement is anagreement under which a Fund acquires a fixed income security from a commercial bank, broker or dealer and simultaneously agreesto resell such security to the seller at an agreed upon price and date (normally within a few days or weeks). The resale price reflectsan agreed upon interest rate effective for the period the security is held by the Fund and is unrelated to the interest rate on thesecurity. The securities acquired by the Fund constitute collateral for the repurchase obligation. In these transactions, the securitiesacquired by the Fund (including accrued interest earned thereon) must have a total value in excess of the value of the repurchaseagreement and must be held by the custodian bank until repurchased. A Fund will not invest more than 15% (10% in the case of theRussell Money Market Fund) of its net assets (taken at current market value) in repurchase agreements maturing in more than sevendays. The Russell Money Market Fund will only enter into repurchase agreements collateralized by U.S. government or agencyobligations.
Mortgage-Related and Other Asset-Backed Securities
Copyright © 2012 www.secdatabase.com. All Rights Reserved.Please Consider the Environment Before Printing This Document

Certain Funds may invest in mortgage or other asset-backed securities (�ABS�). These securities may include mortgage instrumentsissued by U.S. government agencies (�agency mortgages�) or those issued by private entities (�non-agency mortgages�). Specifictypes of instruments may include mortgage pass-through securities, collateralized mortgage obligations (�CMOs�), commercialmortgage-backed securities, mortgage dollar rolls, CMO residuals, stripped mortgage-backed securities and other securities thatdirectly or indirectly represent a participation in, or are secured by a payable from, mortgage loans on real property. The value of aFund�s mortgage-backed securities (�MBS�) may be affected by, among other things, changes or perceived changes in interest rates,factors concerning the interests in and structure of the issuer or the originator of the mortgage, or the quality of the underlying assets.The quality and value of the underlying assets may decline, or default. This has become an increasing risk for collateral related tonon-agency mortgages (e.g., sub-prime, Alternative A-paper (�Alt-A loans�)) and non-conforming mortgage loans, especially in adeclining residential real estate market. In addition, regulatory or tax changes may adversely affect the mortgage securities markets asa whole.
246 Notes to Quarterly Report
Copyright © 2012 www.secdatabase.com. All Rights Reserved.Please Consider the Environment Before Printing This Document
Table of Contents
Russell Investment CompanyRussell FundsNotes to Quarterly Report, continued �� January 31, 2012 (Unaudited)
MBS often have stated maturities of up to thirty years when they are issued, depending upon the length of the mortgages underlyingthe securities. In practice however, unscheduled or early payments of principal and interest on the underlying mortgages may makethe securities� effective maturity shorter than this, and the prevailing interest rates may be higher or lower than the current yield of aFund�s portfolio at the time the Fund receives the payments for reinvestment.
Rising or high interest rates may result in slower than expected principal payments which may tend to extend the duration of MBS,making them more volatile and more sensitive to changes in interest rates. This is known as extension risk.
MBS may have less potential for capital appreciation than comparable fixed income securities due to the likelihood of increasedprepayments of mortgages resulting from foreclosures or declining interest rates. These foreclosed or refinanced mortgages are paidoff at face value (par) or less, causing a loss, particularly for any investor who may have purchased the security at a premium or aprice above par. In such an environment, this risk limits the potential price appreciation of these securities.
Through its investments in MBS, including those that are issued by private issuers, the Funds have exposure to agency mortgages,private non-agency mortgages (including those secured by subprime and Alt-A loans) and non-conforming loans as well as to themortgage and credit markets generally. Private issuers include commercial banks, savings associations, mortgage companies,investment banking firms, finance companies and special purpose finance entities (called special purpose vehicles or �SPVs�) andother entities that acquire and package mortgage loans for resale as MBS. These privately issued non-agency MBS may offer higheryields than those issued by government agencies, but also may be subject to greater price changes than governmental issues.Subprime loans refer to loans made to borrowers with weakened credit histories or with a lower capacity to make timely payments ontheir loans. Alt-A loans refer to loans extended to borrowers who have incomplete documentation of income, assets, or othervariables that are important to the credit underwriting processes. Non-conforming mortgages are loans that do not meet the standardsthat allow purchase by government-sponsored enterprises. MBS with exposure to subprime loans, Alt-A loans or non-conformingloans have had in many cases higher default rates than those loans that meet government underwriting requirements. The risk of non-payment is greater for MBS that are backed by mortgage pools that contain subprime, Alt-A and non-conforming loans, but a level ofrisk exists for all loans.
Unlike agency MBS issued or guaranteed by the U.S. government or a government-sponsored entity (e.g., Fannie Mae (the FederalNational Mortgage Association) and Freddie Mac (the Federal Home Loan Mortgage Corporation)), MBS issued by private issuersdo not have a government or government-sponsored entity guarantee, but may have credit enhancements provided by external entitiessuch as banks or financial institutions or achieved through the structuring of the transaction itself. Examples of such credit supportarising out of the structure of the transaction include the issue of senior and subordinated securities (e.g., the issuance of securities byan SPV in multiple classes or �tranches,� with one or more classes being senior to other subordinated classes as to the payment ofprincipal and interest, with the result that defaults on the underlying mortgage loans are borne first by the holders of the subordinatedclass); creation of �reserve funds� (in which case cash or investments, sometimes funded from a portion of the payments on theunderlying mortgage loans, are held in reserve against future losses); and �overcollateralization� (in which case the scheduledpayments on, or the principal amount of, the underlying mortgage loans exceeds that required to make payment on the securities andpay any servicing or other fees). However, there can be no guarantee that credit enhancements, if any, will be sufficient to preventlosses in the event of defaults on the underlying mortgage loans. In addition, MBS that are issued by private issuers are not subject tothe underwriting requirements for the underlying mortgages that are applicable to those MBS that have a government or government-sponsored entity guarantee. As a result, the mortgage loans underlying private MBS may, and frequently do, have less favorablecollateral, credit risk or other underwriting characteristics than government or government-sponsored MBS and have wider variancesin a number of terms including interest rate, term, size, purpose and borrower characteristics. Privately issued pools more frequently
Copyright © 2012 www.secdatabase.com. All Rights Reserved.Please Consider the Environment Before Printing This Document
include second mortgages, high loan-to-value mortgages and manufactured housing loans. The coupon rates and maturities of theunderlying mortgage loans in a private-label MBS pool may vary to a greater extent than those included in a government guaranteedpool, and the pool may include subprime mortgage loans.
Privately issued MBS are not traded on an exchange and there may be a limited market for the securities, especially when there is aperceived weakness in the mortgage and real estate market sectors. Without an active trading market, MBS held in a Fund�s portfoliomay be particularly difficult to value because of the complexities involved in assessing the value of the underlying mortgage loans.
ABS may include MBS, loans, receivables or other assets. The value of the Funds� ABS may be affected by, among other things,actual or perceived changes in interest rates, factors concerning the interests in and structure of the issuer or the originator of thereceivables, the market�s assessment of the quality of underlying assets or actual or perceived changes in the credit worthiness of theindividual borrowers, the originator, the servicing agent or the financial institution providing the credit support.
Payment of principal and interest may be largely dependent upon the cash flows generated by the assets backing the securities. Risingor high interest rates tend to extend the duration of ABS, making them more volatile and more sensitive to changes in
Notes to Quarterly Report 247
Copyright © 2012 www.secdatabase.com. All Rights Reserved.Please Consider the Environment Before Printing This Document

Table of Contents
Russell Investment CompanyRussell FundsNotes to Quarterly Report, continued �� January 31, 2012 (Unaudited)
interest rates. The underlying assets are sometimes subject to prepayments which can shorten the security�s weighted average lifeand may lower its return. Defaults on loans underlying ABS have become an increasing risk for ABS that are secured by home equityloans related to sub-prime, Alt-A or non-conforming mortgage loans, especially in a declining residential real estate market.
ABS (other than MBS) present certain risks that are not presented by MBS. Primarily, these securities may not have the benefit ofany security interest in the related assets. Credit card receivables are generally unsecured and the debtors are entitled to the protectionof a number of state and federal consumer credit laws, many of which give such debtors the right to set off certain amounts owed onthe credit cards, thereby reducing the balance due. There is the possibility that recoveries on repossessed collateral may not, in somecases, be available to support payments on these securities. ABS are often backed by a pool of assets representing the obligations of anumber of different parties. To lessen the effect of failures by obligors on underlying assets to make payments, the securities maycontain elements of credit support which fall into two categories: (i) liquidity protection, and (ii) protection against losses resultingfrom ultimate default by an obligor on the underlying assets. Liquidity protection refers to the provision of advances, generally by theentity administering the pool of assets, to ensure that the receipt of payments on the underlying pool occurs in a timely fashion.Protection against losses results from payment of the insurance obligations on at least a portion of the assets in the pool. Thisprotection may be provided through guarantees, policies or letters of credit obtained by the issuer or sponsor from third parties,through various means of structuring the transaction or through a combination of such approaches. The Funds will not pay anyadditional or separate fees for credit support. The degree of credit support provided for each issue is generally based on historicalinformation respecting the level of credit risk associated with the underlying assets. Delinquency or loss in excess of that anticipatedor failure of the credit support could adversely affect the return on an investment in such a security. The availability of ABS may beaffected by legislative or regulatory developments. It is possible that such developments may require the Funds to dispose of any thenexisting holdings of such securities.
Forward Commitments
The Funds may contract to purchase securities for a fixed price at a future date beyond customary settlement time consistent with aFund�s investment strategies. The price of the underlying securities and the date when the securities will be delivered and paid for arefixed at the time the transaction is negotiated. The Funds may dispose of a forward commitment transaction prior to settlement if it isappropriate to do so and may realize short-term gains (or losses) upon such sale. When effecting such transactions, cash or liquidhigh-grade debt obligations of the Funds in a dollar amount sufficient to make payment for the portfolio securities to be purchasedwill be earmarked on the Fund�s records at the trade date and until the transaction is settled. A forward commitment transactioninvolves a risk of loss if the value of the security to be purchased declines prior to the settlement date or the other party to thetransaction fails to complete the transaction.
A to be announced (�TBA�) security is a forward mortgage-backed securities trade. The securities are purchased and sold on aforward commitment basis with an approximate principal amount and maturity date. The actual principal amount and maturity datewill be determined upon settlement when the specific mortgage pools are assigned. As of January 31, 2012, the Funds had cashcollateral balances in connection with TBAs as follows:
Due to Broker
Russell Strategic Bond Fund $ 1,300,000Russell Short Duration Bond Fund 840,000
Inflation-Indexed Bonds
Copyright © 2012 www.secdatabase.com. All Rights Reserved.Please Consider the Environment Before Printing This Document

Fixed income funds may invest in inflation-indexed securities, which are typically bonds or notes designed to provide a return higherthan the rate of inflation (based on a designated index) if held to maturity. A common type of inflation-indexed security is a U.S.Treasury Inflation-Protected Security, or TIPS. The principal of a TIPS increases with inflation and decreases with deflation, asmeasured by the Consumer Price Index. When a TIPS matures, the adjusted principal or original principal is paid, whichever isgreater. TIPS pay interest twice a year, at a fixed rate. The rate is applied to the adjusted principal; so, like the principal, interestpayments rise with inflation and fall with deflation.
Guarantees
In the normal course of business, the Funds enter into contracts that contain a variety of representations which provide generalindemnifications. The Funds� maximum exposure under these arrangements is unknown as this would involve future claims that maybe made against the Funds that have not yet occurred. However, the Funds expect the risk of loss to be remote.
248 Notes to Quarterly Report
Copyright © 2012 www.secdatabase.com. All Rights Reserved.Please Consider the Environment Before Printing This Document

Table of Contents
Russell Investment CompanyRussell FundsNotes to Quarterly Report, continued �� January 31, 2012 (Unaudited)
Market, Credit and Counterparty Risk
In the normal course of business, the Funds trade financial instruments and enter into financial transactions where risk of potentialloss exists due to changes in the market (market risk) or failure of the other party to a transaction to perform (credit risk). Similar tocredit risk, the Funds may also be exposed to counterparty risk or risk that an institution or other entity with which the Funds haveunsettled or open transactions will default. The potential loss could exceed the value of the relevant assets recorded in the financialstatements (the �Assets�). The Assets, which potentially expose the Funds to credit risk, consist principally of cash due fromcounterparties and investments. The extent of the Funds� exposure to credit and counterparty risks with respect to the Assetsapproximates their carrying value as recorded in the Funds� Statements of Assets and Liabilities.
On September 15, 2008, Lehman Brothers Holdings Inc. filed for protection under Chapter 11 of the United States Bankruptcy Code.Certain Funds had direct holdings, swap agreements, and securities and derivatives transactions outstanding with Lehman Brothersentities as issuers, counterparties or guarantors at the time the relevant Lehman Brothers entities filed for protection or were placed inadministration. The direct holdings and other derivative transactions associated with Lehman Brothers entities have been writtendown to their estimated recoverable values and incorporated as components of other receivables and liabilities on the Statements ofAssets and Liabilities and net changes in the realized gain (loss) or unrealized appreciation (depreciation) on the Statements ofOperations. The Funds have also utilized certain netting arrangements to offset payables and receivables of Lehman Brothersentities� securities.
On November 4, 2011, creditors of Lehman Brothers Holdings Inc. and its affiliated chapter 11 debtors (collectively, �LehmanBrothers�) voted to accept the Third Amended Joint Chapter 11 Plan of Lehman Brothers dated August 31, 2011 (the �Plan�). TheBankruptcy Court confirmed the Plan on December 6, 2011. Creditors of Lehman Brothers expect to receive preliminary distributionsin the first quarter of 2012. Pursuant to the Plan, there will be an initial distribution of �Available Cash� with semiannualdistributions on each March 30th and September 30th thereafter. Reserved amounts that become available (through claims beingdisallowed or reduced, litigation being resolved, or distributions not being collected) will be included as Available Cash for thesubsequent semi-annual distributions. Distributions will be made only to claimants holding �Allowed Claims� as of the relevantdistribution date. The date for final distributions to creditors of Lehman Brothers is unknown.
3. Investment in Russell Cayman Commodity Strategies Fund Ltd.Russell Cayman Commodity Strategies Fund Ltd. (the �Subsidiary�), a Cayman Islands exempted company, was incorporated onMarch 5, 2010 and is currently a wholly-owned subsidiary of the Russell Commodity Strategy Fund (the �Fund�), both of which areadvised by RIMCo. The Subsidiary acts as an investment vehicle for the Fund in order to effect certain investments on behalf of theFund consistent with the Fund�s investment objectives and policies specified in the Fund�s prospectus and statement of additionalinformation. The Fund is the sole shareholder of the Subsidiary and it is intended that the Fund will remain the sole shareholder and,as a result, will continue to control the Subsidiary. As of January 31, 2012, net assets of the Fund were $1,226,049,327 of which$258,765,543, or approximately 21%, represented the Fund�s ownership of the shares of the Subsidiary.
The Russell Commodity Strategies Fund may invest up to 25% of its total assets in the Subsidiary, which may invest withoutlimitation in commodity-linked derivative instruments, such as swaps and futures that provide exposure to the performance ofcommodities markets. The Subsidiary may also invest in fixed income securities. The Russell Commodity Strategies Fund�sSchedule of Investments has been consolidated and includes the accounts of both the Russell Commodity Strategies Fund and theSubsidiary. All inter-company transactions and balances have been eliminated upon consolidation.
4. Investment Transactions
Copyright © 2012 www.secdatabase.com. All Rights Reserved.Please Consider the Environment Before Printing This Document

Written Options Contracts
Transactions in written options contracts for the period ended January 31, 2012 for the following Funds were as follows:
Russell Strategic
Bond Fund
Russell Investment Grade
Bond Fund
Russell Short Duration
Bond Fund
Number of
Contracts
Premiums
Received
Number of
Contracts
Premiums
Received
Number of
Contracts
Premiums
Received
Outstanding October 31, 2011 210 $5,837,130 413 $ 1,842,652 80 $1,118,943Opened 7 1,119,127 55 254,861 3 28,135Closed (1 ) (40,999 ) (161 ) (78,805 ) (1 ) (4,713 )Expired (20 ) (528,424 ) (227 ) (195,949 ) (12 ) (160,811 )Outstanding January 31, 2012 196 $6,386,834 80 $ 1,822,759 70 $981,554
Notes to Quarterly Report 249
Copyright © 2012 www.secdatabase.com. All Rights Reserved.Please Consider the Environment Before Printing This Document
Table of Contents
Russell Investment CompanyRussell FundsNotes to Quarterly Report, continued �� January 31, 2012 (Unaudited)
Securities Lending
The Investment Company has a securities lending program whereby each Fund can loan securities with a value up to 33 1/3% of eachFund�s total assets. The Fund receives cash (U.S. currency), U.S. Government or U.S. Government Agency obligations as collateralagainst the loaned securities. To the extent that a loan is collateralized by cash, such collateral is invested by the securities lendingagent, State Street Bank and Trust Company (�State Street�), in short-term instruments, pooled collateral vehicles that invest in shortterm instruments, money market mutual funds and other short-term investments that meet certain quality and diversificationrequirements. The collateral received is recorded on a lending Fund�s Statement of Assets and Liabilities along with the relatedobligation to return the collateral.
Income generated from the investment of cash collateral, less negotiated rebate fees paid to participating brokers and transactioncosts, is divided between the Fund and State Street and is recorded as income for the Fund. To the extent that a loan is secured bynon-cash collateral, brokers pay the Fund negotiated lenders� fees, which are divided between the Fund and State Street and arerecorded as securities lending income for the Fund. All collateral received will be in an amount at least equal to 102% (for loans ofU.S. securities) or 105% (for loans of non-U.S. securities) of the market value of the loaned securities at the inception of each loan.The market value of the loaned securities is determined at the close of business of the Fund and any additional required collateral isdelivered to the Fund the next day. Should the borrower of the securities fail financially, there is a risk of delay in recovery of thesecurities or loss of rights in the collateral. Consequently, loans are made only to borrowers which are deemed to be creditworthy byState Street.
Each Fund that participates in the securities lending program has most of the cash collateral invested in the Russell U.S. CashCollateral Fund, an unregistered fund advised by RIMCo. Prior to December 3, 2010, the Funds that participated in securities lendinghad a portion of their cash collateral invested in the State Street Securities Lending Quality Trust Fund (�SLQT�), a securitieslending cash collateral vehicle. On December 3, 2010, the Funds redeemed in-kind out of SLQT, realizing certain losses as a result ofsuch redemption, and proceeds of the redemption were invested in the RIC Liquidating Trust, an unregistered fund managed by StateStreet.
As of January 31, 2012, the non-cash collateral pledged for the securities on loan in the following funds was as follows:
Non-Cash
Collateral Value Non-Cash Collateral Holding
Russell U.S. Core Equity Fund $12,028 Pool of U.S. Government SecuritiesRussell U.S. Value Fund 87,926 Pool of U.S. Government SecuritiesRussell U.S. Small Cap Equity Fund 1,613,776 Pool of U.S. Government SecuritiesRussell International Developed Markets Fund 14,345,020 Pool of U.S. Government SecuritiesRussell Global Equity Fund 12,761,493 Pool of U.S. Government SecuritiesRussell Emerging Markets Fund 11,424,010 Pool of U.S. Government SecuritiesRussell Tax-Managed U.S. Large Cap Fund 13,349 Pool of U.S. Government SecuritiesRussell Tax-Managed U.S. Mid & Small Cap Fund 166,429 Pool of U.S. Government SecuritiesRussell Global Infrastructure Fund 5,886,292 Pool of U.S. Government SecuritiesRussell Global Real Estate Securities Fund 391,080 Pool of U.S. Government Securities
5. Related Party Transactions
Copyright © 2012 www.secdatabase.com. All Rights Reserved.Please Consider the Environment Before Printing This Document

Adviser and Administrator
RIMCo is the Funds� adviser and RFSC, a wholly-owned subsidiary of RIMCo, is the Funds� administrator and transfer agent.RIMCo is a wholly-owned subsidiary of Frank Russell Company (a subsidiary of The Northwestern Mutual Life InsuranceCompany). Frank Russell Company provides ongoing money manager research and trade placement services to RIC and RIMCo.
The Funds are permitted to invest their cash reserves (i.e., cash awaiting investment or cash held to meet redemption requests or topay expenses) in the Russell U.S. Cash Management Fund, an unregistered Fund advised by RIMCo. As of January 31, 2012, theFunds have invested $2,370,411,370 in the Russell U.S. Cash Management Fund. In addition, a portion of the collateral receivedfrom the Investment Company�s securities lending program in the amount of $864,546,423 is invested in the Russell U.S. CashCollateral Fund, an unregistered Fund advised by RIMCo.
250 Notes to Quarterly Report
Copyright © 2012 www.secdatabase.com. All Rights Reserved.Please Consider the Environment Before Printing This Document

Table of Contents
Russell Investment CompanyRussell FundsNotes to Quarterly Report, continued �� January 31, 2012 (Unaudited)
6. Federal Income TaxesAt January 31, 2012, the cost of investments and net unrealized appreciation (depreciation) for income tax purposes were as follows:
Russell U.S. Core
Equity Fund
Russell U.S.
Quantitative
Equity Fund
Russell U.S.
Growth Fund
Russell U.S.
Value Fund
Russell U.S.
Small Cap
Equity Fund
Cost of Investments $3,373,421,281 $2,794,966,132 $54,953,740 $84,466,951 $1,440,875,532
Unrealized Appreciation $454,186,877 $397,172,696 $10,985,791 $8,381,303 $170,627,109Unrealized Depreciation (61,125,049 ) (62,190,088 ) (872,239 ) (2,052,232 ) (36,631,013 )Net Unrealized Appreciation
(Depreciation) $393,061,828 $334,982,608 $10,113,552 $6,329,071 $133,996,096
Russell
International
Developed
Markets Fund
Russell Global
Equity Fund
Russell
Emerging
Markets Fund
Russell
Tax-Managed
U.S.
Large Cap Fund
Russell
Tax-Managed
U.S. Mid &
Small Cap Fund
Cost of Investments $4,787,617,529 $2,685,975,117 $1,808,046,188 $379,152,721 $132,930,352
Unrealized Appreciation $155,166,247 $264,483,686 $257,086,177 $99,915,495 $40,516,267Unrealized Depreciation (98,702,796 ) (122,139,127 ) (74,434,885 ) (8,847,631 ) (3,412,288 )Net Unrealized Appreciation
(Depreciation) $56,463,451 $142,344,559 $182,651,292 $91,067,864 $37,103,979
Russell Global
Opportunistic
Credit Fund
Russell
Strategic
Bond Fund
Russell
Investment
Grade Bond
Fund
Russell Short
Duration Bond
Fund
Russell Tax
Exempt Bond
Fund
Cost of Investments $797,831,777 $8,483,709,938 $2,004,221,104 $1,262,856,161 $597,297,416
Unrealized Appreciation $17,803,639 $218,055,431 $57,582,867 $39,960,471 $41,843,365Unrealized Depreciation (27,025,412 ) (177,054,722 ) (30,111,745 ) (56,685,938 ) (395,495 )Net Unrealized Appreciation
(Depreciation) $(9,221,773 ) $41,000,709 $27,471,122 $(16,725,467 ) $41,447,870
Russell
Commodity
Strategies Fund
Russell Global
Infrastructure
Fund
Russell Global
Real Estate
Securities Fund
Cost of Investments $1,231,394,368 $868,870,470 $1,524,413,437
Unrealized Appreciation $429,759 $35,689,334 $200,796,467Unrealized Depreciation (31,592,655 ) (19,435,580 ) (42,085,701 )
Copyright © 2012 www.secdatabase.com. All Rights Reserved.Please Consider the Environment Before Printing This Document

Net Unrealized Appreciation(Depreciation) $(31,162,896 ) $16,253,754 $158,710,766
7. Restricted SecuritiesRestricted securities are subject to contractual limitations on resale, are often issued in private placement transactions, and are notregistered under the Securities Act of 1933, as amended (the �Act�). The most common types of restricted securities are those soldunder Rule 144A of the Act and commercial paper sold under Section 4(2) of the Act.
A Fund may invest a portion of its net assets not to exceed 15% (other than Russell Money Market Fund) in securities that areilliquid. The Russell Money Market Fund may invest a portion of its net assets not to exceed 5% in securities that are illiquid. Thislimitation is applied at the time of purchase. Illiquid securities are securities that may not be readily marketable, and that cannot besold within seven days in the ordinary course of business at the approximate amount at which the Fund has valued the securities.Restricted securities are generally considered to be illiquid.
Notes to Quarterly Report 251
Copyright © 2012 www.secdatabase.com. All Rights Reserved.Please Consider the Environment Before Printing This Document

Table of Contents
Russell Investment CompanyRussell FundsNotes to Quarterly Report, continued �� January 31, 2012 (Unaudited)
The following table lists restricted securities held by a Fund that are illiquid. The following table does not include (1) securitiesdeemed liquid by RIMCo or a money manager pursuant to Board approved policies and procedures or (2) illiquid securities that arenot restricted securities as designated on a Fund�s Schedule of Investments.
Fund - % of Net Assets
Securities
Acquisition
Date
Principal
Amount ($)
or
Shares
Cost per
Unit
$
Cost
(000)
$
Market Value
(000)
$
Russell Global Equity Fund - 0.1%BrasilAgro - Companhia Brasileira de Propriedades Agricolas 05/28/10 373,800 4.66 1,743 2,182Russell Emerging Markets Fund - 0.2%Magnit OJSC 05/16/06 30,428 30.13 917 3,311Russell Global Opportunistic Credit Fund - 2.3%ARS Intermediate Holdings LLC 05/03/11 2,143,062 98.57 2,112 2,126Charger Merger Corp. 01/13/12 560,000 100.00 560 582Citigroup Funding, Inc. 01/09/12 200,000 543.56 1,087 1,143Equinox Holdings, Inc. 01/09/12 3,040,000 104.80 3,186 3,177Grupo Aval, Ltd. 01/25/12 200,000 99.46 199 202Hutchison Whampoa International 11, Ltd. 01/10/12 400,000 98.94 396 402IPIC GMTN, Ltd. 01/05/12 200,000 103.75 207 206Korea Gas Corp. 01/12/12 249,000 98.06 244 262Level 3 Financing, Inc. 01/10/12 450,000 100.04 450 461New Star Metals, Inc. 05/31/11 6,750,000 100.00 6,750 6,750Prestige Brands, Inc. 01/24/12 1,365,000 103.68 1,415 1,416Summit Materials LLC / Summit Materials Finance Corp. 01/23/12 1,285,000 100.00 1,285 1,307Volcan Cia Minera SAA 01/26/12 200,000 100.00 200 202
18,236
Russell Strategic Bond Fund - 1.1%Adam Aircraft Industries, Inc. Term Loan 05/22/07 760,489 96.83 736 7Aristotle Holding, Inc. 01/06/12 1,750,000 102.74 1,798 1,800Banco do Estado do Rio Grande do Sul 01/26/12 230,000 99.13 228 236Bank of Montreal 01/23/12 6,800,000 99.83 6,788 6,911Chatham Light CLO, Ltd. 11/25/09 3,177,195 92.05 2,925 3,067CIT Mortgage Loan Trust 10/05/07 590,945 100.00 591 586CIT Mortgage Loan Trust 10/05/07 2,100,000 100.00 2,100 1,587CIT Mortgage Loan Trust 10/05/07 3,900,000 100.00 3,900 1,663DG Funding Trust 11/05/03 479 10,585.30 5,070 3,594Educational Services of America, Inc. 02/23/10 2,951,342 100.00 2,951 2,897Freddie Mac REMICS 05/29/07 614 94.14 � 1
Copyright © 2012 www.secdatabase.com. All Rights Reserved.Please Consider the Environment Before Printing This Document

Freddie Mac Strips 12/02/09 11,570,854 7.92 917 898FUEL Trust 06/14/11 6,530,000 100.00 6,530 6,650Grupo Bimbo SAB de CV 01/18/12 3,550,000 99.19 3,521 3,623Hutchison Whampoa International 11, Ltd. 01/19/12 7,645,000 99.06 7,573 7,688Korea Gas Corp. 01/12/12 1,400,000 98.06 1,373 1,470MMCA Automobile Trust 01/11/12 10,790,000 100.00 10,790 10,789Pernod-Ricard SA 01/05/12 2,880,000 98.64 2,841 3,028Pernod-Ricard SA 01/05/12 13,050,000 99.83 13,028 13,285Petroleos Mexicanos 01/17/12 980,000 99.12 971 1,011SABMiller Holdings, Inc. 01/10/12 5,950,000 99.52 5,922 6,194SABMiller Holdings, Inc. 01/10/12 3,400,000 99.81 3,393 3,473Volcan Cia Minera SAA 01/26/12 1,900,000 100.00 1,900 1,915
82,373
Russell Investment Grade Bond Fund - 0.5%CoBank ACB 03/23/11 70,000 55.20 3,864 3,611DG Funding Trust 11/05/03 392 10,587.26 4,150 2,941Ras Laffan Liquefied Natural Gas Co., Ltd. III 03/09/10 1,008,540 104.75 1,056 1,089
252 Notes to Quarterly Report
Copyright © 2012 www.secdatabase.com. All Rights Reserved.Please Consider the Environment Before Printing This Document

Table of Contents
Russell Investment CompanyRussell FundsNotes to Quarterly Report, continued �� January 31, 2012 (Unaudited)
Fund - % of Net Assets
Securities
Acquisition
Date
Principal
Amount ($) or
Shares
Cost per
Unit
$
Cost
(000)
$
Market Value
(000)
$
SABMiller Holdings, Inc. 01/10/12 1,090,000 100.20 1,092 1,159Washington Mutual Mortgage Pass Through Certificates 04/01/05 422,808 100.00 423 14
8,814
Russell Short Duration Bond Fund - 0.6%DG Funding Trust 11/05/03 219 10,537.12 2,307 1,643FUEL Trust 06/14/11 1,190,000 100.00 1,190 1,212Hutchison Whampoa International 11, Ltd. 01/10/12 1,500,000 99.52 1,493 1,527Pernod-Ricard SA 01/05/12 2,070,000 99.83 2,067 2,107
6,489
Russell Money Market Fund - 2.1%AID to INH Portugal Guaranteed Notes, weekly demand 05/06/94 3,750,000 100.50 3,769 3,769
Illiquid securities and restricted securities may be priced by the Funds using fair valuation procedures approved by the Board.
8. Subsequent EventsManagement has evaluated events and/or transactions that have occurred through the date this Quarterly Report was issued and notedno items requiring adjustments of the Quarterly Report or additional disclosures.
Notes to Quarterly Report 253
Copyright © 2012 www.secdatabase.com. All Rights Reserved.Please Consider the Environment Before Printing This Document

Table of Contents
Russell Investment CompanyRussell FundsShareholder Requests for Additional Information �� January 31, 2012 (Unaudited)
A complete unaudited schedule of investments is made available generally no later than 60 days after the end of the first and thirdquarters of each fiscal year. These reports are available (i) free of charge, upon request, by calling the Funds at (800) 787-7354; (ii) atwww.russell.com; (iii) on the Securities and Exchange Commission�s website at www.sec.gov; and (iv) at the Securities and ExchangeCommission�s public reference room.
The Board has delegated to RIMCo, as RIC�s investment adviser, the primary responsibility for monitoring, evaluating and votingproxies solicited by or with respect to issuers of securities in which assets of the Funds may be invested. RIMCo has established a proxyvoting committee and has adopted written proxy voting policies and procedures (�P&P�) and proxy voting guidelines (�Guidelines�).The Funds maintain a Portfolio Holdings Disclosure Policy that governs the timing and circumstances of disclosure to shareholders andthird parties of information regarding the portfolio investments held by the Funds. A description of the P&P, Guidelines, PortfolioHoldings Disclosure Policy and additional information about Fund Trustees are contained in the Funds� Statement of AdditionalInformation (�SAI�). The SAI and information regarding how the Funds voted proxies relating to portfolio securities during the mostrecent 12-month period ended June 30, 2011 are available (i) free of charge, upon request, by calling the Funds at (800) 787-7354; (ii) atwww.russell.com; and (iii) on the Securities and Exchange Commission�s website at www.sec.gov.
To reduce expenses, we may mail only one copy of the Funds� prospectuses and each annual and semi-annual report to those addressesshared by two or more accounts. If you wish to receive individual copies of these documents, please contact your financial institution.
Some Financial Intermediaries may offer electronic delivery of the Funds� prospectuses and annual and semi-annual reports. Pleasecontact your Financial Intermediary for further details.
254 Shareholder Requests for Additional Information
Copyright © 2012 www.secdatabase.com. All Rights Reserved.Please Consider the Environment Before Printing This Document

Table of ContentsRussell Investment Company 1301 Second Avenue 800-787-7354
Seattle, Washington 98101 Fax: 206-505-3495
www.russell.com
Copyright © 2012 www.secdatabase.com. All Rights Reserved.Please Consider the Environment Before Printing This Document
Table of Contents
2012 QUARTERLY REPORT
LifePoints® Funds
JANUARY 31, 2012
FUND SHARE CLASS
Conservative Strategy Fund A, C, E, R1, R2, R3, S
Moderate Strategy Fund A, C, E, R1, R2, R3, S
Balanced Strategy Fund A, C, E, R1, R2, R3, S
Growth Strategy Fund A, C, E, R1, R2, R3, S
Equity Growth Strategy Fund A, C, E, R1, R2, R3, S
2015 Strategy Fund R1, R2, R3
2020 Strategy Fund A, E, R1, R2, R3, S
2025 Strategy Fund R1, R2, R3
2030 Strategy Fund A, E, R1, R2, R3, S
2035 Strategy Fund R1, R2, R3
2040 Strategy Fund A, E, R1, R2, R3, S
2045 Strategy Fund R1, R2, R3
2050 Strategy Fund R1, R2, R3
2055 Strategy Fund R1, R2, R3
In Retirement Fund A, R1, R2, R3
Copyright © 2012 www.secdatabase.com. All Rights Reserved.Please Consider the Environment Before Printing This Document

Table of Contents
Russell Investment CompanyRussell Investment Company is a series investment companywith 36 different investment portfolios referred to as Funds.This Quarterly Report reports on 15 of these Funds.
Copyright © 2012 www.secdatabase.com. All Rights Reserved.Please Consider the Environment Before Printing This Document

Table of Contents
Russell Investment Company
LifePoints® Funds
Quarterly Report
January 31, 2012 (Unaudited)
Table of Contents
PageConservative Strategy Fund 3Moderate Strategy Fund 4Balanced Strategy Fund 5Growth Strategy Fund 6Equity Growth Strategy Fund 72015 Strategy Fund 82020 Strategy Fund 92025 Strategy Fund 102030 Strategy Fund 112035 Strategy Fund 122040 Strategy Fund 132045 Strategy Fund 142050 Strategy Fund 152055 Strategy Fund 16In Retirement Fund 17Notes to Quarterly Report 18Shareholder Requests for Additional Information 22
Copyright © 2012 www.secdatabase.com. All Rights Reserved.Please Consider the Environment Before Printing This Document

Table of ContentsRussell Investment Company - LifePoints® Funds.
Copyright © Russell Investments 2012. All rights reserved.
Russell Investments is a Washington, USA corporation, which operates through subsidiaries worldwide and is a subsidiary of TheNorthwestern Mutual Life Insurance Company.
Fund objectives, risks, charges and expenses should be carefully considered before investing. A prospectuscontaining this and other important information must precede or accompany this material. Please read theprospectus carefully before investing.
Securities distributed through Russell Financial Services, Inc., member FINRA and part of Russell Investments.
Copyright © 2012 www.secdatabase.com. All Rights Reserved.Please Consider the Environment Before Printing This Document

Table of Contents
Russell Investment CompanyConservative Strategy Fund
Schedule of Investments �� January 31, 2012 (Unaudited)Amounts in thousands (except share amounts)
Shares
Market
Value
$
Investments - 99.8%Other Russell Investment Company Series Mutual Funds - Class YShares
Domestic Equities - 6.0%Russell U.S. Core Equity Fund 747,599 21,067
Russell U.S. Quantitative Equity Fund 680,652 21,155
42,222
Fixed Income - 77.8%Russell Global Opportunistic Credit Fund 1,418,645 14,172
Russell Investment Grade Bond Fund 6,291,221 141,049
Russell Short Duration Bond Fund 6,547,597 126,500
Russell Strategic Bond Fund 24,510,946 268,395
550,116
International Equities - 10.0%Russell Global Equity Fund 4,156,947 35,376
Russell International Developed Markets Fund 1,254,628 35,405
70,781
Real Assets - 6.0%Russell Commodity Strategies Fund 1,434,713 14,032
Russell Global Infrastructure Fund 1,364,260 14,188
Russell Global Real Estate Securities Fund 406,020 14,312
42,532
Total Investments - 99.8%(identified cost $656,023) 705,651
Other Assets and Liabilities,Net - 0.2% 1,408
Net Assets - 100.0% 707,059
See accompanying notes which are an integral part of this quarterly report.
Conservative Strategy Fund 3
Copyright © 2012 www.secdatabase.com. All Rights Reserved.Please Consider the Environment Before Printing This Document

Table of Contents
Russell Investment CompanyModerate Strategy Fund
Schedule of Investments �� January 31, 2012 (Unaudited)Amounts in thousands (except share amounts)
Shares
Market
Value
$
Investments - 100.0%Other Russell Investment Company Series Mutual Funds - Class YShares
Domestic Equities - 13.0%Russell U.S. Core Equity Fund 1,951,120 54,983
Russell U.S. Quantitative Equity Fund 2,130,086 66,203
Russell U.S. Small Cap Equity Fund 958,418 22,331
143,517
Fixed Income - 57.6%Russell Global Opportunistic Credit Fund 2,216,233 22,140
Russell Investment Grade Bond Fund 9,776,355 219,186
Russell Strategic Bond Fund 36,100,977 395,306
636,632
International Equities - 20.3%Russell Emerging Markets Fund 1,923,430 34,179
Russell Global Equity Fund 10,489,515 89,266
Russell International Developed Markets Fund 3,560,944 100,490
223,935
Real Assets - 9.1%Russell Commodity Strategies Fund 3,372,395 32,982
Russell Global Infrastructure Fund 3,197,165 33,250
Russell Global Real Estate Securities Fund 966,441 34,067
100,299
Total Investments - 100.0%(identified cost $1,031,362) 1,104,383
Other Assets and Liabilities,Net - 0.0% 144
Net Assets - 100.0% 1,104,527
See accompanying notes which are an integral part of this quarterly report.
Copyright © 2012 www.secdatabase.com. All Rights Reserved.Please Consider the Environment Before Printing This Document

4 Moderate Strategy Fund
Copyright © 2012 www.secdatabase.com. All Rights Reserved.Please Consider the Environment Before Printing This Document

Table of Contents
Russell Investment CompanyBalanced Strategy Fund
Schedule of Investments �� January 31, 2012 (Unaudited)Amounts in thousands (except share amounts)
Shares
Market
Value
$
Investments - 100.0%Other Russell Investment Company Series Mutual Funds - Class YShares
Domestic Equities - 23.3%Russell U.S. Core Equity Fund 14,974,343 421,977
Russell U.S. Quantitative Equity Fund 12,245,888 380,602
Russell U.S. Small Cap Equity Fund 7,329,010 170,766
973,345
Fixed Income - 37.7%Russell Global Opportunistic Credit Fund 12,620,770 126,082
Russell Strategic Bond Fund 132,478,765 1,450,642
1,576,724
International Equities - 29.1%Russell Emerging Markets Fund 9,615,483 170,867
Russell Global Equity Fund 49,722,043 423,135
Russell International Developed Markets Fund 22,091,756 623,429
1,217,431
Real Assets - 9.9%Russell Commodity Strategies Fund 16,431,254 160,698
Russell Global Infrastructure Fund 12,149,093 126,351
Russell Global Real Estate Securities Fund 3,669,008 129,332
416,381
Total Investments - 100.0%(identified cost $3,960,152) 4,183,881
Other Assets and Liabilities,Net - (0.0%) (763 )
Net Assets - 100.0% 4,183,118
See accompanying notes which are an integral part of this quarterly report.
Balanced Strategy Fund 5
Copyright © 2012 www.secdatabase.com. All Rights Reserved.Please Consider the Environment Before Printing This Document

Table of Contents
Russell Investment CompanyGrowth Strategy Fund
Schedule of Investments �� January 31, 2012 (Unaudited)Amounts in thousands (except share amounts)
Shares
Market
Value
$
Investments - 100.0%Other Russell Investment Company Series Mutual Funds - Class YShares
Domestic Equities - 29.1%Russell U.S. Core Equity Fund 11,306,009 318,603
Russell U.S. Quantitative Equity Fund 9,431,121 293,119
Russell U.S. Small Cap Equity Fund 6,918,918 161,211
772,933
Fixed Income - 18.6%Russell Global Opportunistic Credit Fund 10,614,480 106,039
Russell Strategic Bond Fund 35,623,249 390,074
496,113
International Equities - 38.4%Russell Emerging Markets Fund 7,681,640 136,503
Russell Global Equity Fund 44,122,788 375,485
Russell International Developed Markets Fund 17,976,931 507,309
1,019,297
Real Assets - 13.9%Russell Commodity Strategies Fund 15,667,309 153,226
Russell Global Infrastructure Fund 10,260,584 106,710
Russell Global Real Estate Securities Fund 3,092,419 109,008
368,944
Total Investments - 100.0%(identified cost $2,556,971) 2,657,287
Other Assets and Liabilities,Net - (0.0%) (1,216 )
Net Assets - 100.0% 2,656,071
See accompanying notes which are an integral part of this quarterly report.
6 Growth Strategy Fund
Copyright © 2012 www.secdatabase.com. All Rights Reserved.Please Consider the Environment Before Printing This Document

Table of Contents
Russell Investment CompanyEquity Growth Strategy Fund
Schedule of Investments �� January 31, 2012 (Unaudited)Amounts in thousands (except share amounts)
Shares
Market
Value
$
Investments - 100.1%Other Russell Investment Company Series Mutual Funds - Class YShares
Domestic Equities - 36.0%Russell U.S. Core Equity Fund 6,255,089 176,268
Russell U.S. Quantitative Equity Fund 5,310,904 165,063
Russell U.S. Small Cap Equity Fund 3,558,673 82,917
424,248
Fixed Income - 5.0%Russell Global Opportunistic Credit Fund 5,859,622 58,538
International Equities - 44.2%Russell Emerging Markets Fund 4,719,878 83,872
Russell Global Equity Fund 19,471,576 165,703
Russell International Developed Markets Fund 9,641,936 272,096
521,671
Real Assets - 14.9%Russell Commodity Strategies Fund 7,043,840 68,889
Russell Global Infrastructure Fund 4,554,297 47,365
Russell Global Real Estate Securities Fund 1,694,059 59,715
175,969
Total Investments - 100.1%(identified cost $1,149,978) 1,180,426
Other Assets and Liabilities,Net - (0.1%) (607 )
Net Assets - 100.0% 1,179,819
See accompanying notes which are an integral part of this quarterly report.
Equity Growth Strategy Fund 7
Copyright © 2012 www.secdatabase.com. All Rights Reserved.Please Consider the Environment Before Printing This Document

Table of Contents
Russell Investment Company2015 Strategy Fund
Schedule of Investments �� January 31, 2012 (Unaudited)Amounts in thousands (except share amounts)
Shares
Market
Value
$
Investments - 100.0%Other Russell Investment Company Series Mutual Funds - Class YShares
Domestic Equities - 15.9%Russell U.S. Core Equity Fund 135,971 3,832
Russell U.S. Quantitative Equity Fund 125,438 3,898
Russell U.S. Small Cap Equity Fund 67,881 1,582
9,312
Fixed Income - 62.0%Russell Investment Grade Bond Fund 520,130 11,661
Russell Short Duration Bond Fund 60,182 1,163
Russell Strategic Bond Fund 2,131,242 23,337
36,161
International Equities - 16.3%Russell Emerging Markets Fund 59,791 1,062
Russell Global Equity Fund 406,122 3,456
Russell International Developed Markets Fund 176,568 4,983
9,501
Real Assets - 5.8%Russell Commodity Strategies Fund 173,045 1,693
Russell Global Real Estate Securities Fund 48,597 1,713
3,406
Total Investments - 100.0%(identified cost $53,370) 58,380
Other Assets and Liabilities,Net - (0.0%) (20 )
Net Assets - 100.0% 58,360
See accompanying notes which are an integral part of this quarterly report.
8 2015 Strategy Fund
Copyright © 2012 www.secdatabase.com. All Rights Reserved.Please Consider the Environment Before Printing This Document

Table of Contents
Russell Investment Company2020 Strategy Fund
Schedule of Investments �� January 31, 2012 (Unaudited)Amounts in thousands (except share amounts)
Shares
Market
Value
$
Investments - 100.0%Other Russell Investment Company Series Mutual Funds - Class Y Shares
Domestic Equities - 21.4%Russell U.S. Core Equity Fund 818,263 23,059
Russell U.S. Quantitative Equity Fund 743,635 23,112
Russell U.S. Small Cap Equity Fund 375,903 8,758
54,929
Fixed Income - 51.9%Russell Investment Grade Bond Fund 1,373,908 30,803
Russell Strategic Bond Fund 9,389,409 102,814
133,617
International Equities - 20.3%Russell Emerging Markets Fund 351,696 6,250
Russell Global Equity Fund 2,060,856 17,538
Russell International Developed Markets Fund 1,006,719 28,409
52,197
Real Assets - 6.4%Russell Commodity Strategies Fund 891,341 8,718
Russell Global Real Estate Securities Fund 220,831 7,784
16,502
Total Investments - 100.0%(identified cost $228,626) 257,245
Other Assets and Liabilities,Net - (0.0%) (52 )
Net Assets - 100.0% 257,193
See accompanying notes which are an integral part of this quarterly report.
2020 Strategy Fund 9
Copyright © 2012 www.secdatabase.com. All Rights Reserved.Please Consider the Environment Before Printing This Document

Table of Contents
Russell Investment Company2025 Strategy Fund
Schedule of Investments �� January 31, 2012 (Unaudited)Amounts in thousands (except share amounts)
Shares
Market
Value
$
Investments - 100.1%Other Russell Investment Company Series Mutual Funds - Class YShares
Domestic Equities - 28.3%Russell U.S. Core Equity Fund 228,338 6,434
Russell U.S. Quantitative Equity Fund 206,825 6,428
Russell U.S. Small Cap Equity Fund 93,373 2,176
15,038
Fixed Income - 39.1%Russell Strategic Bond Fund 1,898,321 20,787
International Equities - 25.5%Russell Emerging Markets Fund 92,246 1,639
Russell Global Equity Fund 505,329 4,301
Russell International Developed Markets Fund 268,393 7,574
13,514
Real Assets - 7.2%Russell Commodity Strategies Fund 221,637 2,167
Russell Global Real Estate Securities Fund 46,410 1,636
3,803
Total Investments - 100.1%(identified cost $47,587) 53,142
Other Assets and Liabilities,Net - (0.1%) (27 )
Net Assets - 100.0% 53,115
See accompanying notes which are an integral part of this quarterly report.
10 2025 Strategy Fund
Copyright © 2012 www.secdatabase.com. All Rights Reserved.Please Consider the Environment Before Printing This Document

Table of Contents
Russell Investment Company2030 Strategy Fund
Schedule of Investments �� January 31, 2012 (Unaudited)Amounts in thousands (except share amounts)
Shares
Market
Value
$
Investments - 100.0%Other Russell Investment Company Series Mutual Funds - Class Y Shares
Domestic Equities - 36.0%Russell U.S. Core Equity Fund 1,089,608 30,705
Russell U.S. Quantitative Equity Fund 933,981 29,028
Russell U.S. Small Cap Equity Fund 492,889 11,485
71,218
Fixed Income - 21.9%Russell Strategic Bond Fund 3,960,235 43,364
International Equities - 32.4%Russell Emerging Markets Fund 439,445 7,809
Russell Global Equity Fund 2,282,472 19,424
Russell International Developed Markets Fund 1,300,870 36,710
63,943
Real Assets - 9.7%Russell Commodity Strategies Fund 1,164,724 11,391
Russell Global Real Estate Securities Fund 220,842 7,785
19,176
Total Investments - 100.0%(identified cost $174,164) 197,701
Other Assets and Liabilities,Net - (0.0%) (42 )
Net Assets - 100.0% 197,659
See accompanying notes which are an integral part of this quarterly report.
2030 Strategy Fund 11
Copyright © 2012 www.secdatabase.com. All Rights Reserved.Please Consider the Environment Before Printing This Document

Table of Contents
Russell Investment Company2035 Strategy Fund
Schedule of Investments �� January 31, 2012 (Unaudited)Amounts in thousands (except share amounts)
Shares
Market
Value
$
Investments - 100.1%Other Russell Investment Company Series Mutual Funds - Class Y Shares
Domestic Equities - 41.9%Russell U.S. Core Equity Fund 151,802 4,278
Russell U.S. Quantitative Equity Fund 134,353 4,176
Russell U.S. Small Cap Equity Fund 66,639 1,552
10,006
Fixed Income - 10.0%Russell Strategic Bond Fund 219,107 2,399
International Equities - 37.1%Russell Emerging Markets Fund 61,218 1,088
Russell Global Equity Fund 322,470 2,744
Russell International Developed Markets Fund 177,998 5,023
8,855
Real Assets - 11.1%Russell Commodity Strategies Fund 146,936 1,437
Russell Global Real Estate Securities Fund 34,266 1,208
2,645
Total Investments - 100.1%(identified cost $20,880) 23,905
Other Assets and Liabilities,Net - (0.1%) (23 )
Net Assets - 100.0% 23,882
See accompanying notes which are an integral part of this quarterly report.
12 2035 Strategy Fund
Copyright © 2012 www.secdatabase.com. All Rights Reserved.Please Consider the Environment Before Printing This Document

Table of Contents
Russell Investment Company2040 Strategy Fund
Schedule of Investments �� January 31, 2012 (Unaudited)Amounts in thousands (except share amounts)
Shares
Market
Value
$
Investments - 100.0%Other Russell Investment Company Series Mutual Funds - Class Y Shares
Domestic Equities - 41.9%Russell U.S. Core Equity Fund 904,233 25,481
Russell U.S. Quantitative Equity Fund 800,302 24,873
Russell U.S. Small Cap Equity Fund 396,593 9,241
59,595
Fixed Income - 10.0%Russell Strategic Bond Fund 1,300,362 14,239
International Equities - 37.1%Russell Emerging Markets Fund 363,607 6,461
Russell Global Equity Fund 1,923,002 16,365
Russell International Developed Markets Fund 1,060,766 29,935
52,761
Real Assets - 11.0%Russell Commodity Strategies Fund 869,030 8,499
Russell Global Real Estate Securities Fund 202,810 7,149
15,648
Total Investments - 100.0%(identified cost $121,625) 142,243
Other Assets and Liabilities,Net - (0.0%) (15 )
Net Assets - 100.0% 142,228
See accompanying notes which are an integral part of this quarterly report.
2040 Strategy Fund 13
Copyright © 2012 www.secdatabase.com. All Rights Reserved.Please Consider the Environment Before Printing This Document
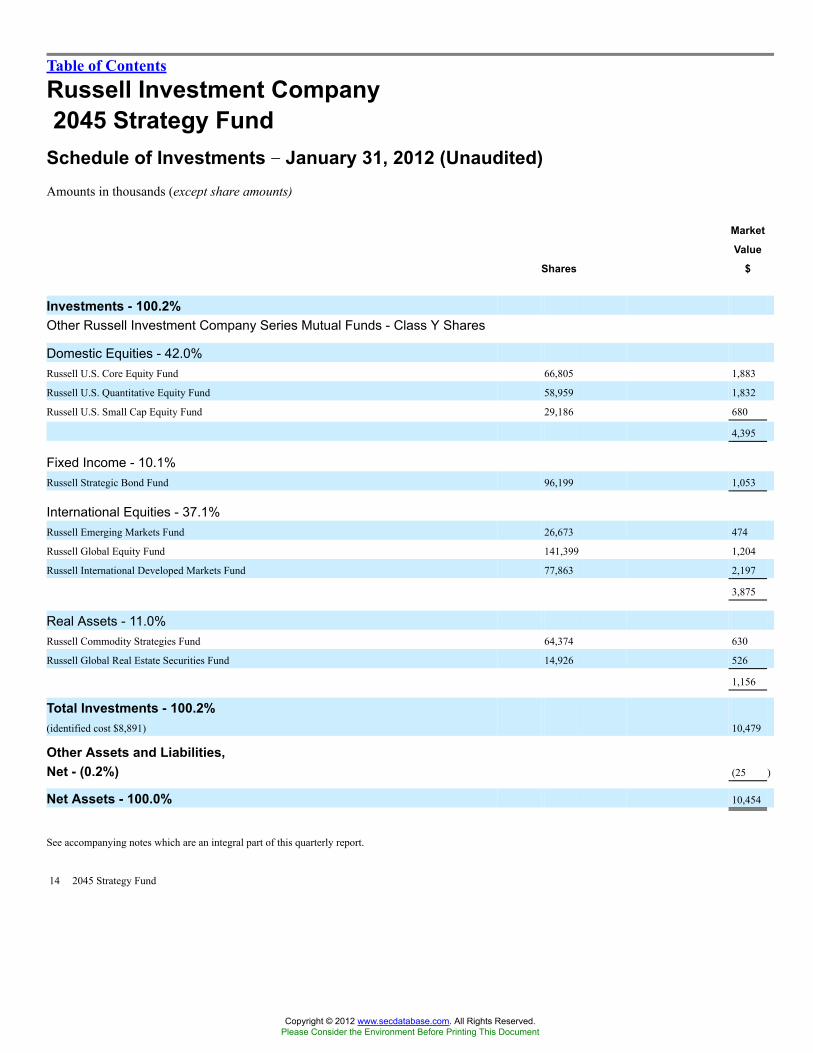
Table of Contents
Russell Investment Company2045 Strategy Fund
Schedule of Investments �� January 31, 2012 (Unaudited)Amounts in thousands (except share amounts)
Shares
Market
Value
$
Investments - 100.2%Other Russell Investment Company Series Mutual Funds - Class Y Shares
Domestic Equities - 42.0%Russell U.S. Core Equity Fund 66,805 1,883
Russell U.S. Quantitative Equity Fund 58,959 1,832
Russell U.S. Small Cap Equity Fund 29,186 680
4,395
Fixed Income - 10.1%Russell Strategic Bond Fund 96,199 1,053
International Equities - 37.1%Russell Emerging Markets Fund 26,673 474
Russell Global Equity Fund 141,399 1,204
Russell International Developed Markets Fund 77,863 2,197
3,875
Real Assets - 11.0%Russell Commodity Strategies Fund 64,374 630
Russell Global Real Estate Securities Fund 14,926 526
1,156
Total Investments - 100.2%(identified cost $8,891) 10,479
Other Assets and Liabilities,Net - (0.2%) (25 )
Net Assets - 100.0% 10,454
See accompanying notes which are an integral part of this quarterly report.
14 2045 Strategy Fund
Copyright © 2012 www.secdatabase.com. All Rights Reserved.Please Consider the Environment Before Printing This Document
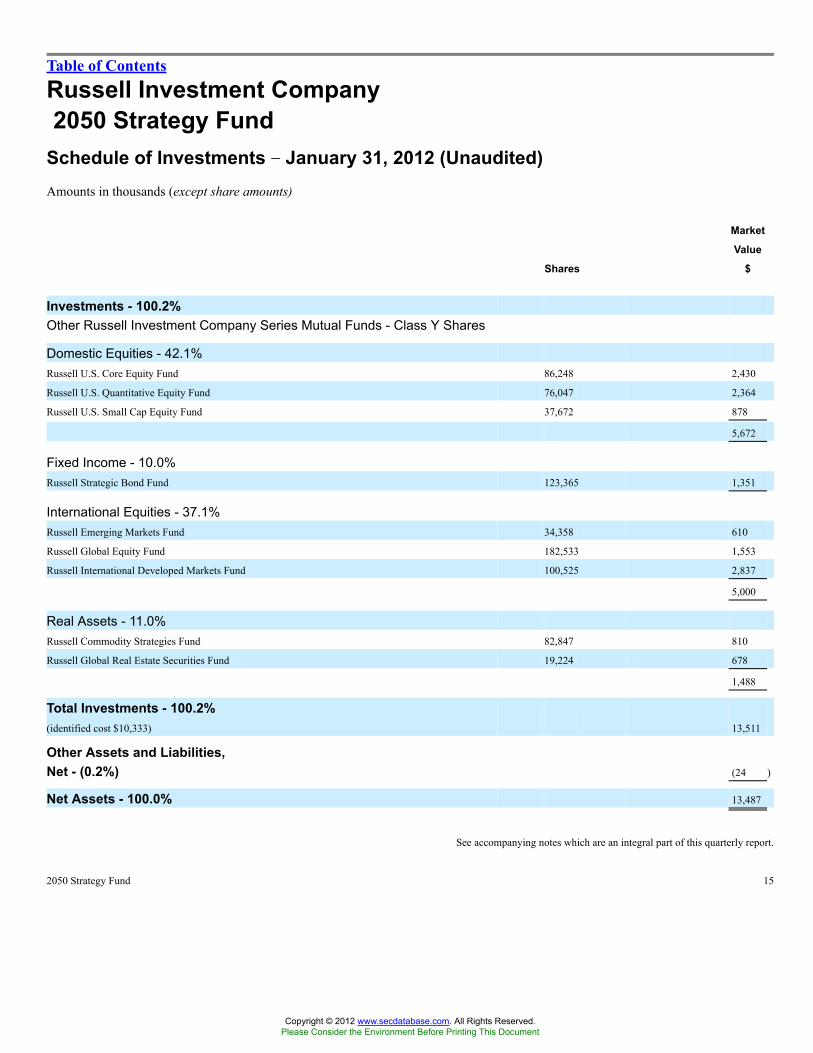
Table of Contents
Russell Investment Company2050 Strategy Fund
Schedule of Investments �� January 31, 2012 (Unaudited)Amounts in thousands (except share amounts)
Shares
Market
Value
$
Investments - 100.2%Other Russell Investment Company Series Mutual Funds - Class Y Shares
Domestic Equities - 42.1%Russell U.S. Core Equity Fund 86,248 2,430
Russell U.S. Quantitative Equity Fund 76,047 2,364
Russell U.S. Small Cap Equity Fund 37,672 878
5,672
Fixed Income - 10.0%Russell Strategic Bond Fund 123,365 1,351
International Equities - 37.1%Russell Emerging Markets Fund 34,358 610
Russell Global Equity Fund 182,533 1,553
Russell International Developed Markets Fund 100,525 2,837
5,000
Real Assets - 11.0%Russell Commodity Strategies Fund 82,847 810
Russell Global Real Estate Securities Fund 19,224 678
1,488
Total Investments - 100.2%(identified cost $10,333) 13,511
Other Assets and Liabilities,Net - (0.2%) (24 )
Net Assets - 100.0% 13,487
See accompanying notes which are an integral part of this quarterly report.
2050 Strategy Fund 15
Copyright © 2012 www.secdatabase.com. All Rights Reserved.Please Consider the Environment Before Printing This Document

Table of Contents
Russell Investment Company2055 Strategy Fund
Schedule of Investments �� January 31, 2012 (Unaudited)Amounts in thousands (except share amounts)
Shares
Market
Value
$
Investments - 100.0%Other Russell Investment Company Series Mutual Funds - Class YShares
Domestic Equities - 42.0%Russell U.S. Core Equity Fund 6,652 187
Russell U.S. Quantitative Equity Fund 5,884 183
Russell U.S. Small Cap Equity Fund 2,952 69
439
Fixed Income - 9.9%Russell Strategic Bond Fund 9,512 104
International Equities - 37.1%Russell Emerging Markets Fund 2,723 49
Russell Global Equity Fund 14,112 120
Russell International Developed Markets Fund 7,761 219
388
Real Assets - 11.0%Russell Commodity Strategies Fund 6,328 62
Russell Global Real Estate Securities Fund 1,517 53
115
Total Investments - 100.0%(identified cost $1,017) 1,046
Other Assets and Liabilities,Net - (0.0%) (� )
Net Assets - 100.0% 1,046
See accompanying notes which are an integral part of this quarterly report.
16 2055 Strategy Fund
Copyright © 2012 www.secdatabase.com. All Rights Reserved.Please Consider the Environment Before Printing This Document

Table of Contents
Russell Investment CompanyIn Retirement Fund
Schedule of Investments �� January 31, 2012 (Unaudited)Amounts in thousands (except share amounts)
Shares
Market
Value
$
Investments - 100.0%Other Russell Investment Company Series Mutual Funds - Class YShares
Domestic Equities - 13.0%Russell U.S. Core Equity Fund 158,129 4,456
Russell U.S. Quantitative Equity Fund 154,263 4,795
Russell U.S. Small Cap Equity Fund 64,005 1,491
10,742
Fixed Income - 67.9%Russell Investment Grade Bond Fund 735,544 16,491
Russell Short Duration Bond Fund 340,580 6,580
Russell Strategic Bond Fund 3,016,158 33,027
56,098
International Equities - 13.9%Russell Emerging Markets Fund 56,525 1,004
Russell Global Equity Fund 546,393 4,650
Russell International Developed Markets Fund 206,175 5,818
11,472
Real Assets - 5.2%Russell Commodity Strategies Fund 219,072 2,143
Russell Global Real Estate Securities Fund 61,511 2,168
4,311
Total Investments - 100.0%(identified cost $72,259) 82,623
Other Assets and Liabilities,Net - (0.0%) (32 )
Net Assets - 100.0% 82,591
See accompanying notes which are an integral part of this quarterly report.
In Retirement Fund 17
Copyright © 2012 www.secdatabase.com. All Rights Reserved.Please Consider the Environment Before Printing This Document

Table of Contents
Russell Investment CompanyLifePoints® FundsNotes to Quarterly Report �� January 31, 2012 (Unaudited)
1. OrganizationRussell Investment Company (the �Investment Company� or �RIC�) is a series investment company with 36 different investmentportfolios referred to as Funds. These financial statements report on 15 of these Funds (each a �Fund� and collectively the �Funds�).The Investment Company is registered under the Investment Company Act of 1940, as amended (�Investment Company Act�), as anopen-end management investment company. It is organized and operates as a Massachusetts business trust under a Second Amendedand Restated Master Trust Agreement dated October 1, 2008. (�Master Trust Agreement�), as amended. The Investment Company�sMaster Trust Agreement permits the Board of Trustees (the �Board�) to issue an unlimited number of shares of beneficial interest.
Target Portfolio Funds
Each of the Target Portfolio Funds listed in the table below is a �fund of funds� which seeks to achieve its objective by investing in acombination of several other RIC funds (the �Underlying Funds�) as set forth in the table below. The Funds intend their strategy ofinvesting in a combination of Underlying Funds to result in investment diversification that an investor could otherwise achieve onlyby holding numerous individual investments. Russell Investment Management Company (�RIMCo�), the Funds� investment adviser,may modify the target allocation for any Fund and/or the Underlying Funds in which a Fund invests from time to time based oncapital markets research or on factors such as RIMCo�s outlook for the economy, financial markets generally and/or relative marketvaluation of the asset classes represented by each Underlying Fund. Modifications in the allocations to the Underlying Funds aretypically based on strategic, long-term allocation decisions. A Fund�s actual allocation may vary from the target strategic assetallocation at any point in time (1) due to market movements, (2) by up to +/- 3% at the equities, fixed income or real asset categorylevel based on RIMCo�s assessment of relative market valuation of the asset classes represented by each Underlying Fund, (3) due tothe implementation over a period of time of a change to the target strategic asset allocation including the addition of a newUnderlying Fund. There may be no changes in the asset allocation or to the Underlying Funds in a given year or such changes may bemade one or more times in a year. In the future, the Funds may also invest in other RIC Underlying Funds that pursue investmentstrategies not pursued by the current Underlying Funds or represent asset classes which are not currently represented by theUnderlying Funds.
Asset Allocation Targets as of March 1, 2011*
Underlying FundsConservative
Strategy Fund
Moderate
Strategy Fund
Balanced
Strategy Fund
Growth
Strategy Fund
Equity Growth
Strategy Fund
Domestic Equity FundsRussell U.S. Core Equity
Fund 3 % 5 % 10 % 12 % 15 %Russell U.S. Quantitative
Equity Fund 3 6 9 11 14Russell U.S. Small Cap
Equity Fund � 2 4 6 7Fixed Income Funds
Russell GlobalOpportunistic CreditFund 2 2 3 4 5
Russell Investment GradeBond Fund 20 20 � � �
Copyright © 2012 www.secdatabase.com. All Rights Reserved.Please Consider the Environment Before Printing This Document
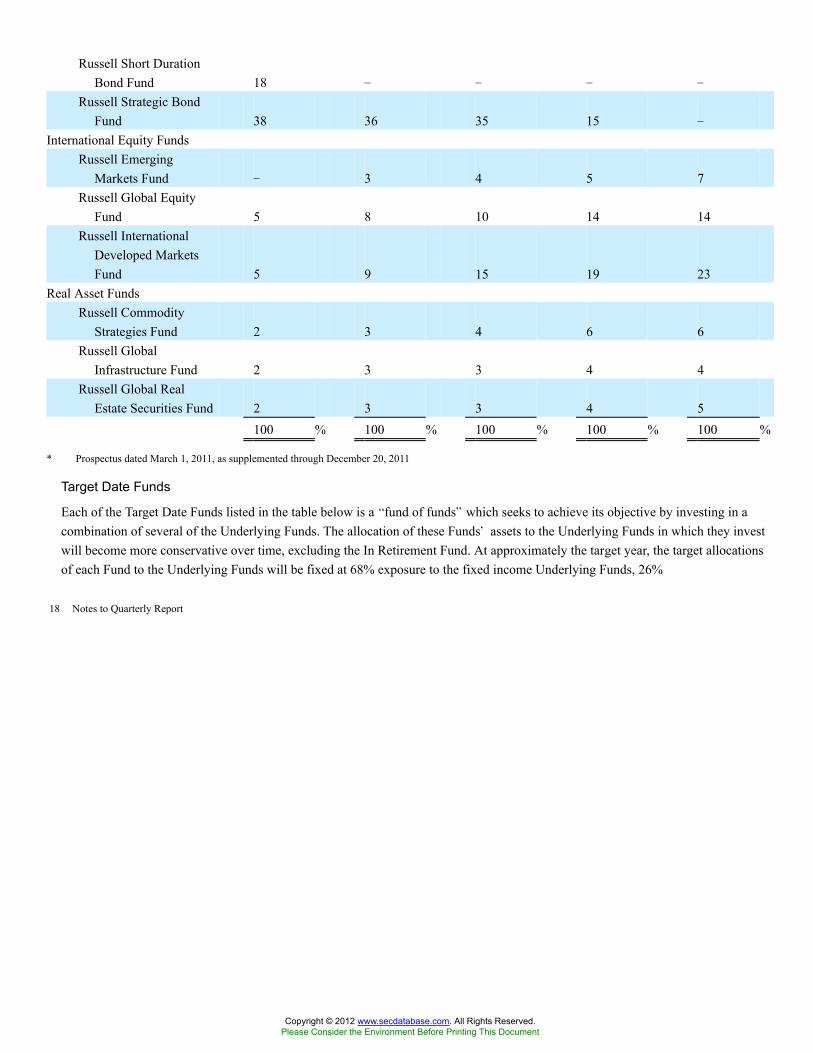
Russell Short DurationBond Fund 18 � � � �
Russell Strategic BondFund 38 36 35 15 �
International Equity FundsRussell Emerging
Markets Fund � 3 4 5 7Russell Global Equity
Fund 5 8 10 14 14Russell International
Developed MarketsFund 5 9 15 19 23
Real Asset FundsRussell Commodity
Strategies Fund 2 3 4 6 6Russell Global
Infrastructure Fund 2 3 3 4 4Russell Global Real
Estate Securities Fund 2 3 3 4 5100 % 100 % 100 % 100 % 100 %
* Prospectus dated March 1, 2011, as supplemented through December 20, 2011
Target Date Funds
Each of the Target Date Funds listed in the table below is a �fund of funds� which seeks to achieve its objective by investing in acombination of several of the Underlying Funds. The allocation of these Funds� assets to the Underlying Funds in which they investwill become more conservative over time, excluding the In Retirement Fund. At approximately the target year, the target allocationsof each Fund to the Underlying Funds will be fixed at 68% exposure to the fixed income Underlying Funds, 26%
18 Notes to Quarterly Report
Copyright © 2012 www.secdatabase.com. All Rights Reserved.Please Consider the Environment Before Printing This Document

Table of Contents
Russell Investment CompanyLifePoints® FundsNotes to Quarterly Report, continued �� January 31, 2012 (Unaudited)
exposure to domestic and international equity Underlying Funds and 6% to the real asset Underlying Funds. This means 32% of theinvestment will be exposed to the equity and real asset Underlying Funds, and the risks of such exposure, while in retirement. Once aFund (other than the In Retirement Fund) reaches its target year it may, depending on the facts and circumstances at the time andcontingent upon Board approval, continue to operate, be merged into the In Retirement Fund or another fund, or be liquidated.Currently, RIMCo will manage each Fund according to its target asset allocation strategy and will not trade actively amongUnderlying Funds or attempt to capture short-term market opportunities. However, RIMCo may modify the target asset allocation forthe Fund and/or the Underlying Funds in which the Fund invests from time to time based on strategic capital markets research or onfactors such as RIMCo�s outlook for the economy, financial markets generally and/or relative market valuation of the asset classesrepresented by each Underlying Fund. In the future, the Funds may also invest in other RIC Underlying Funds. Any modification inthe asset allocation or changes to the Underlying Funds will be based on strategic, long-term allocation decisions and not on tactical,short-term positioning and may be made one or more times per year. In addition, the Funds may in the future invest in other fundswhich are not currently Underlying Funds.
Asset Allocation Targets as of March 1, 2011*
Underlying Funds2015
Strategy Fund
2020
Strategy Fund
2025
Strategy Fund
2030
Strategy Fund
2035
Strategy Fund
Domestic Equity FundsRussell U.S. Core Equity
Fund 7 % 9 % 13 % 17 % 18 %Russell U.S. Quantitative
Equity Fund 7 9 13 16 17Russell U.S. Small Cap
Equity Fund 3 4 4 6 7Fixed Income Funds
Russell Investment GradeBond Fund 20 10 � � �
Russell Short DurationBond Fund � � � � �
Russell Strategic BondFund 40 40 36 17 10
International Equity FundsRussell Emerging
Markets Fund 2 3 3 4 5Russell Global Equity
Fund 6 7 9 10 11Russell International
Developed MarketsFund 9 11 15 20 21
Real Asset Funds
Copyright © 2012 www.secdatabase.com. All Rights Reserved.Please Consider the Environment Before Printing This Document

Russell CommodityStrategies Fund 3 4 4 6 6
Russell Global RealEstate Securities Fund 3 3 3 4 5
100 % 100 % 100 % 100 % 100 %
Asset Allocation Targets as of March 1, 2011*
Underlying Funds2040
Strategy Fund
2045
Strategy Fund
2050
Strategy Fund
2055
Strategy Fund
In
Retirement
Fund
Domestic Equity FundsRussell U.S. Core Equity
Fund 18 % 18 % 18 % 18 % 5 %Russell U.S. Quantitative
Equity Fund 17 17 17 17 6Russell U.S. Small Cap
Equity Fund 7 7 7 7 2Fixed Income Funds
Russell Investment GradeBond Fund � � � � 20
Russell Short DurationBond Fund � � � � 8
Russell Strategic BondFund 10 10 10 10 40
International Equity FundsRussell Emerging Markets
Fund 5 5 5 5 1Russell Global Equity Fund 11 11 11 11 5Russell International
Developed MarketsFund 21 21 21 21 7
Real Asset FundsRussell Commodity
Strategies Fund 6 6 6 6 3Russell Global Real Estate
Securities Fund 5 5 5 5 3100 % 100 % 100 % 100 % 100 %
* Prospectus dated March 1, 2011, as supplemented through December 20, 2011
Notes to Quarterly Report 19
Copyright © 2012 www.secdatabase.com. All Rights Reserved.Please Consider the Environment Before Printing This Document

Table of Contents
Russell Investment CompanyLifePoints® FundsNotes to Quarterly Report, continued �� January 31, 2012 (Unaudited)
2. Significant Accounting PoliciesThe following is a summary of the significant accounting policies consistently followed by the Funds in the preparation of thisQuarterly Report. These policies are in conformity with U.S. generally accepted accounting principles (�U.S. GAAP�) for investmentcompanies. The presentation of these schedules of investments in conformity with U.S. GAAP requires management to makeestimates and assumptions that affect the reported amounts of assets and liabilities at the date of the Quarterly Report. Actual resultscould differ from those estimates.
Security Valuation
The Funds value their portfolio securities, the shares of the Underlying Funds, at the current net asset value per share of eachUnderlying Fund.
Fair value of securities is defined as the price that the Funds would receive upon selling an investment in a timely transaction to anindependent buyer in the principal or most advantageous market of the investment. To increase consistency and comparability in fairvalue measurement, the fair value hierarchy was established to maximize the use of observable market data and minimize the use ofunobservable inputs and to establish classification of fair value measurements for disclosure purposes. Inputs refer broadly to theassumptions that market participants would use in pricing the asset or liability, including assumptions about risk, (e.g., the riskinherent in a particular valuation technique, such as a pricing model or the risks inherent in the inputs to a particular valuationtechnique). Inputs may be observable or unobservable. Observable inputs are inputs that reflect the assumptions market participantswould use in pricing the asset or liability developed based on market data obtained from sources independent of the reporting entity.Unobservable inputs are inputs that reflect the reporting entity�s own assumptions about the assumptions market participants woulduse in pricing the asset or liability developed based on the best information available in the circumstances.
The fair value hierarchy of inputs is summarized in the three broad levels listed below.
� Level 1 � quoted prices (unadjusted) in active markets for identical investments
� Level 2 � other significant observable inputs including quoted prices in non-active markets or prices derived from market data
� Level 3 � significant unobservable inputs including the Fund�s own assumptions in determining the fair value of investments
The levels associated with valuing the Funds� investments for the period ended January 31, 2012 were Level 1 for all Funds.
Investment Transactions
Investment transactions are reflected as of the trade date for financial reporting purposes. This may cause the net asset value stated inthe financial statements to be different from the net asset value at which shareholders may transact. Realized gains and losses fromsecurities transactions, if any, are recorded on the basis of specific identified cost.
Investment Income
Distributions of income and capital gains from the Underlying Funds are recorded on the ex-dividend date.
Guarantees
In the normal course of business, the Funds enter into contracts that contain a variety of representations which provide generalindemnifications. The Funds� maximum exposure under these arrangements is unknown as this would involve future claims that maybe made against the Funds that have not yet occurred. However, the Funds expect the risk of loss to be remote.
Copyright © 2012 www.secdatabase.com. All Rights Reserved.Please Consider the Environment Before Printing This Document
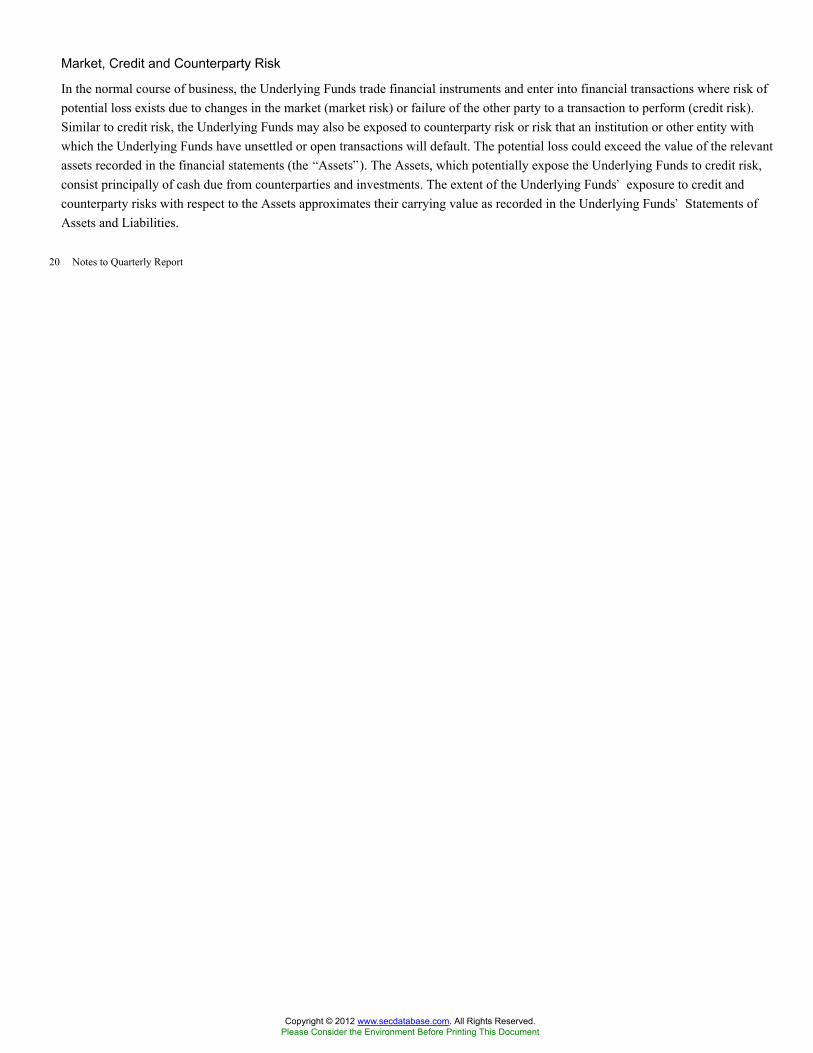
Market, Credit and Counterparty Risk
In the normal course of business, the Underlying Funds trade financial instruments and enter into financial transactions where risk ofpotential loss exists due to changes in the market (market risk) or failure of the other party to a transaction to perform (credit risk).Similar to credit risk, the Underlying Funds may also be exposed to counterparty risk or risk that an institution or other entity withwhich the Underlying Funds have unsettled or open transactions will default. The potential loss could exceed the value of the relevantassets recorded in the financial statements (the �Assets�). The Assets, which potentially expose the Underlying Funds to credit risk,consist principally of cash due from counterparties and investments. The extent of the Underlying Funds� exposure to credit andcounterparty risks with respect to the Assets approximates their carrying value as recorded in the Underlying Funds� Statements ofAssets and Liabilities.
20 Notes to Quarterly Report
Copyright © 2012 www.secdatabase.com. All Rights Reserved.Please Consider the Environment Before Printing This Document
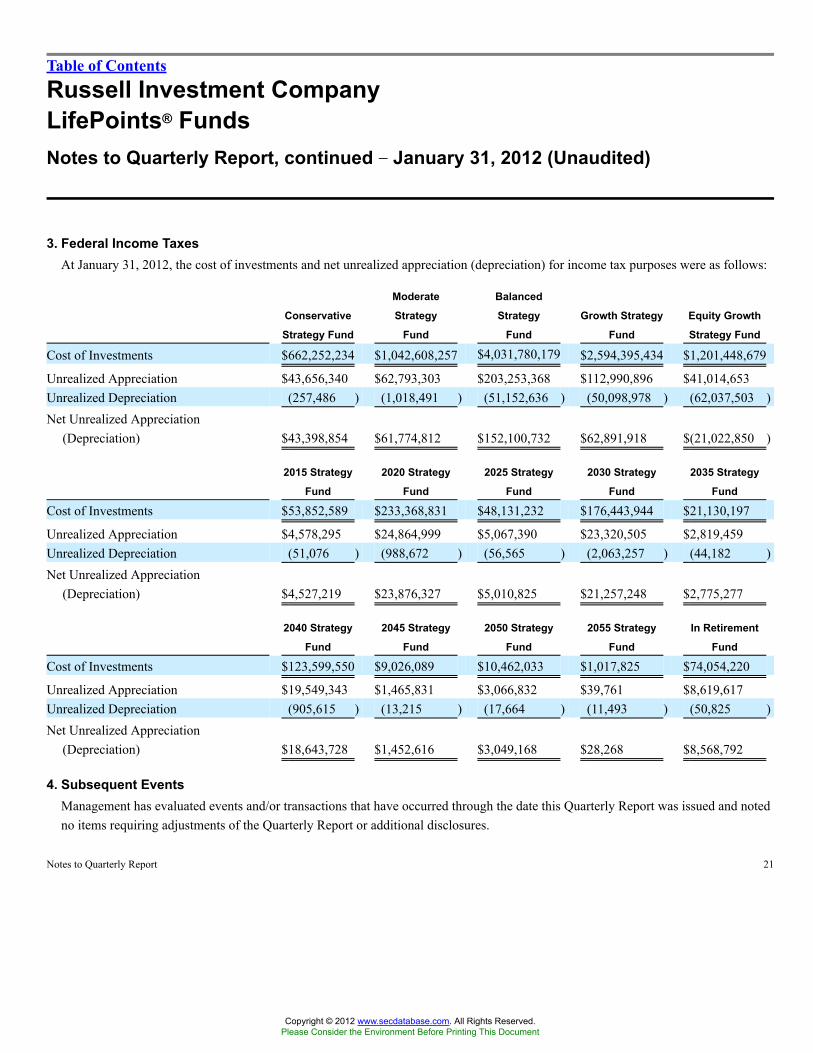
Table of Contents
Russell Investment CompanyLifePoints® FundsNotes to Quarterly Report, continued �� January 31, 2012 (Unaudited)
3. Federal Income TaxesAt January 31, 2012, the cost of investments and net unrealized appreciation (depreciation) for income tax purposes were as follows:
Conservative
Strategy Fund
Moderate
Strategy
Fund
Balanced
Strategy
Fund
Growth Strategy
Fund
Equity Growth
Strategy Fund
Cost of Investments $662,252,234 $1,042,608,257 $4,031,780,179 $2,594,395,434 $1,201,448,679
Unrealized Appreciation $43,656,340 $62,793,303 $203,253,368 $112,990,896 $41,014,653Unrealized Depreciation (257,486 ) (1,018,491 ) (51,152,636 ) (50,098,978 ) (62,037,503 )Net Unrealized Appreciation
(Depreciation) $43,398,854 $61,774,812 $152,100,732 $62,891,918 $(21,022,850 )
2015 Strategy
Fund
2020 Strategy
Fund
2025 Strategy
Fund
2030 Strategy
Fund
2035 Strategy
Fund
Cost of Investments $53,852,589 $233,368,831 $48,131,232 $176,443,944 $21,130,197
Unrealized Appreciation $4,578,295 $24,864,999 $5,067,390 $23,320,505 $2,819,459Unrealized Depreciation (51,076 ) (988,672 ) (56,565 ) (2,063,257 ) (44,182 )Net Unrealized Appreciation
(Depreciation) $4,527,219 $23,876,327 $5,010,825 $21,257,248 $2,775,277
2040 Strategy
Fund
2045 Strategy
Fund
2050 Strategy
Fund
2055 Strategy
Fund
In Retirement
Fund
Cost of Investments $123,599,550 $9,026,089 $10,462,033 $1,017,825 $74,054,220
Unrealized Appreciation $19,549,343 $1,465,831 $3,066,832 $39,761 $8,619,617Unrealized Depreciation (905,615 ) (13,215 ) (17,664 ) (11,493 ) (50,825 )Net Unrealized Appreciation
(Depreciation) $18,643,728 $1,452,616 $3,049,168 $28,268 $8,568,792
4. Subsequent EventsManagement has evaluated events and/or transactions that have occurred through the date this Quarterly Report was issued and notedno items requiring adjustments of the Quarterly Report or additional disclosures.
Notes to Quarterly Report 21
Copyright © 2012 www.secdatabase.com. All Rights Reserved.Please Consider the Environment Before Printing This Document

Table of Contents
Russell Investment CompanyLifePoints® FundsShareholder Requests for Additional Information �� January 31, 2012 (Unaudited)
A complete unaudited schedule of investments is made available generally no later than 60 days after the end of the first and thirdquarters of each fiscal year. These reports are available (i) free of charge, upon request, by calling the Funds at (800) 787-7354; (ii) atwww.russell.com; (iii) on the Securities and Exchange Commission�s website at www.sec.gov; and (iv) at the Securities and ExchangeCommission�s public reference room.
The Board has delegated to RIMCo, as RIC�s investment adviser, the primary responsibility for monitoring, evaluating and votingproxies solicited by or with respect to issuers of securities in which assets of the Underlying Funds may be invested. RIMCo hasestablished a proxy voting committee and has adopted written proxy voting policies and procedures (�P&P�) and proxy votingguidelines (�Guidelines�). The Funds maintain a Portfolio Holdings Disclosure Policy that governs the timing and circumstances ofdisclosure to shareholders and third parties of information regarding the portfolio investments held by the Funds. A description of theP&P, Guidelines, Portfolio Holdings Disclosure Policy and additional information about Fund Trustees are contained in the Funds�Statement of Additional Information (�SAI�). The SAI and information regarding how the Underlying Funds voted proxies relating toportfolio securities during the most recent 12-month period ended June 30, 2011 are available (i) free of charge, upon request, by callingthe Funds at (800) 787-7354; (ii) at www.russell.com; and (iii) on the Securities and Exchange Commission�s website at www.sec.gov.
To reduce expenses, we may mail only one copy of the Funds� prospectuses and each annual and semi-annual report to those addressesshared by two or more accounts. If you wish to receive individual copies of these documents, please contact your FinancialIntermediary.
Some Financial Intermediaries may offer electronic delivery of the Funds� prospectuses and annual and semi-annual reports. Pleasecontact your Financial Intermediary for further details.
22 Shareholder Requests for Additional Information
Copyright © 2012 www.secdatabase.com. All Rights Reserved.Please Consider the Environment Before Printing This Document
Table of ContentsRussell Investment Company 1301 Second Avenue 800-787-7354
Seattle, Washington 98101 Fax: 206-505-3495
www.russell.com
Copyright © 2012 www.secdatabase.com. All Rights Reserved.Please Consider the Environment Before Printing This Document

Table of ContentsItem 2. Controls and Procedures
(a) Registrant�s principal executive officer and principal financial officer have concluded that Registrant�s disclosure controls andprocedures (as defined in Rule 30a-3(c) under the Investment Company Act of 1940 (the �Act�)) are effective, based on theirevaluation of these controls and procedures required by Rule 30a-3(b) under the Act and Rule 13a-15(b) or 15d-15(b) under theExchange Act as of a date within 90 days of the date this report is filed with the Securities and Exchange Commission.
(b) There were no material changes in Registrant�s internal controls over financial reporting (as defined in Rule 30a-3(d) under theAct) that occurred during the Registrant�s last fiscal quarter that have materially affected, or are reasonably likely to materiallyaffect, the Registrant�s internal control over financial reporting.
Item 3. Exhibits
(a) Certification for principal executive officer of Registrant as required by Rule 30a-2(a) under the Act and certification forprincipal financial officer of Registrant as required by Rule 30a-2(a) under the Act.
Copyright © 2012 www.secdatabase.com. All Rights Reserved.Please Consider the Environment Before Printing This Document
Table of ContentsSIGNATURES
Pursuant to the requirements of the Securities Exchange Act of 1934 and the Investment Company Act of 1940, the Registrant has dulycaused this report to be signed on its behalf by the undersigned, thereunto duly authorized.
Russell Investment Company
By: /s/ Sandra CavanaughSandra CavanaughPrincipal Executive Officer and ChiefExecutive Officer
Date: March 30, 2012
Pursuant to the requirements of the Securities Exchange Act of 1934 and the Investment Company Act of 1940, this report has beensigned below by the following persons on behalf of the Registrant and in the capacities and on the dates indicated.
By: /s/ Sandra CavanaughSandra CavanaughPrincipal Executive Officer and ChiefExecutive Officer
Date : March 30, 2012
By: /s/ Mark E. SwansonMark E. SwansonPrincipal Financial Officer, PrincipalAccounting Officer and Treasurer
Date: March 30, 2012
Copyright © 2012 www.secdatabase.com. All Rights Reserved.Please Consider the Environment Before Printing This Document

Exhibit (a)
CERTIFICATION
I, Sandra Cavanaugh, certify that:
1. I have reviewed this report on Form N-Q of Russell Investment Company;
2. Based on my knowledge, this report does not contain any untrue statement of a material fact or omit to state a material fact necessaryto make the statements made, in light of the circumstances under which such statements were made, not misleading with respect to theperiod covered by this report;
3. Based on my knowledge, the schedule of investments included in this report fairly present in all material respects the investments ofthe Registrant as of the end of the fiscal quarter for which the report is filed;
4. The Registrant�s other certifying officer and I are responsible for establishing and maintaining disclosure controls and procedures (asdefined in Rule 30a-3(c) under the Investment Company Act of 1940) and internal control over financial reporting (as defined in Rule30a-3(d) under the Investment Company Act of 1940) for the Registrant and have:
(a) Designed such disclosure controls and procedures, or caused such disclosure controls and procedures to be designed underour supervision, to ensure that material information relating to the Registrant, including its consolidated subsidiaries, is madeknown to us by others within those entities, particularly during the period in which this report is being prepared;
(b) Designed such internal control over financial reporting, or caused such internal control over financial reporting to bedesigned under our supervision, to provide reasonable assurance regarding the reliability of financial reporting and thepreparation of financial statements for external purposes in accordance with generally accepted accounting principles;
(c) Evaluated the effectiveness of the Registrant�s disclosure controls and procedures and presented in this report ourconclusions about the effectiveness of the disclosure controls and procedures, as of a date within 90 days prior to the filingdate of this report based on such evaluation; and
(d) Disclosed in this report any change in the Registrant�s internal control over financial reporting that occurred during theRegistrant�s most recent fiscal quarter that has materially affected, or is reasonably likely to materially affect, theRegistrant�s internal control over financial reporting; and
Copyright © 2012 www.secdatabase.com. All Rights Reserved.Please Consider the Environment Before Printing This Document

5. The Registrant�s other certifying officer and I have disclosed to the Registrant�s auditors and the audit committee of the Registrant�sboard of directors (or persons performing the equivalent functions):
(a) All significant deficiencies and material weaknesses in the design or operation of internal control over financial reportingwhich are reasonably likely to adversely affect the Registrant�s ability to record, process, summarize, and report financialinformation; and
(b) Any fraud, whether or not material, that involves management or other employees who have a significant role in theRegistrant�s internal control over financial reporting.
Date: March 30, 2012 /s/ Sandra CavanaughSandra CavanaughPrincipal Executive Officer and Chief ExecutiveOfficer
Copyright © 2012 www.secdatabase.com. All Rights Reserved.Please Consider the Environment Before Printing This Document
CERTIFICATION
I, Mark E. Swanson, certify that:
1. I have reviewed this report on Form N-Q of Russell Investment Company;
2. Based on my knowledge, this report does not contain any untrue statement of a material fact or omit to state a material fact necessaryto make the statements made, in light of the circumstances under which such statements were made, not misleading with respect to theperiod covered by this report;
3. Based on my knowledge, the schedule of investments included in this report fairly present in all material respects the investments ofthe Registrant as of the end of the fiscal quarter for which the report is filed;
4. The Registrant�s other certifying officer and I are responsible for establishing and maintaining disclosure controls and procedures (asdefined in Rule 30a-3(c) under the Investment Company Act of 1940) and internal control over financial reporting (as defined in Rule30a-3(d) under the Investment Company Act of 1940) for the Registrant and have:
(a) Designed such disclosure controls and procedures, or caused such disclosure controls and procedures to be designed underour supervision, to ensure that material information relating to the Registrant, including its consolidated subsidiaries, is madeknown to us by others within those entities, particularly during the period in which this report is being prepared;
(b) Designed such internal control over financial reporting, or caused such internal control over financial reporting to bedesigned under our supervision, to provide reasonable assurance regarding the reliability of financial reporting and thepreparation of financial statements for external purposes in accordance with generally accepted accounting principles;
(c) Evaluated the effectiveness of the Registrant�s disclosure controls and procedures and presented in this report ourconclusions about the effectiveness of the disclosure controls and procedures, as of a date within 90 days prior to the filingdate of this report based on such evaluation; and
(d) Disclosed in this report any change in the Registrant�s internal control over financial reporting that occurred during theRegistrant�s most recent fiscal quarter that has materially affected, or is reasonably likely to materially affect, theRegistrant�s internal control over financial reporting; and
Copyright © 2012 www.secdatabase.com. All Rights Reserved.Please Consider the Environment Before Printing This Document

5. The Registrant�s other certifying officer and I have disclosed to the Registrant�s auditors and the audit committee of the Registrant�sboard of directors (or persons performing the equivalent functions):
(a) All significant deficiencies and material weaknesses in the design or operation of internal control over financial reportingwhich are reasonably likely to adversely affect the Registrant�s ability to record, process, summarize, and report financialinformation; and
(b) Any fraud, whether or not material, that involves management or other employees who have a significant role in theRegistrant�s internal control over financial reporting.
Date: March 30, 2012 /s/ Mark E. SwansonMark E. SwansonPrincipal Financial Officer, Principal AccountingOfficer and Treasurer
Copyright © 2012 www.secdatabase.com. All Rights Reserved.Please Consider the Environment Before Printing This Document