FORM NQ - SEC EDGAR Filings Search Alert | Annual Report
670
Business Address 601 CONGRESS STREET BOSTON MA 02210 617-663-2166 Mailing Address 601 CONGRESS STREET BOSTON MA 02210 SECURITIES AND EXCHANGE COMMISSION FORM N-Q Quarterly schedule of portfolio holdings of registered management investment company filed on Form N-Q Filing Date: 2013-01-29 | Period of Report: 2012-11-30 SEC Accession No. 0000928816-13-000138 (HTML Version on secdatabase.com) FILER John Hancock Funds II CIK:1331971| IRS No.: 000000000 | State of Incorp.:MA | Fiscal Year End: 1031 Type: N-Q | Act: 40 | File No.: 811-21779 | Film No.: 13554491 Copyright © 2013 www.secdatabase.com . All Rights Reserved. Please Consider the Environment Before Printing This Document
-
Upload
khangminh22 -
Category
Documents
-
view
1 -
download
0
Transcript of FORM NQ - SEC EDGAR Filings Search Alert | Annual Report
Business Address601 CONGRESS STREETBOSTON MA 02210617-663-2166
Mailing Address601 CONGRESS STREETBOSTON MA 02210
SECURITIES AND EXCHANGE COMMISSION
FORM N-QQuarterly schedule of portfolio holdings of registered management investment company filed
on Form N-Q
Filing Date: 2013-01-29 | Period of Report: 2012-11-30SEC Accession No. 0000928816-13-000138
(HTML Version on secdatabase.com)
FILERJohn Hancock Funds IICIK:1331971| IRS No.: 000000000 | State of Incorp.:MA | Fiscal Year End: 1031Type: N-Q | Act: 40 | File No.: 811-21779 | Film No.: 13554491
Copyright © 2013 www.secdatabase.com. All Rights Reserved.Please Consider the Environment Before Printing This Document
UNITED STATESSECURITIES AND EXCHANGE COMMISSION
Washington, DC 20549
FORM N-Q
QUARTERLY SCHEDULE OF PORTFOLIO HOLDINGS OF REGISTEREDMANAGEMENT INVESTMENT COMPANY
Investment Company Act file number: 811-21779
JOHN HANCOCK FUNDS II
(Exact name of registrant as specified in charter)
601 CONGRESS STREET, BOSTON, MA 02210
(Address of principal executive offices) (Zip code)
Salvatore Salvone, 601 CONGRESS STREET, BOSTON, MA 02210
(Name and address of agent for service)
Registrant’s telephone number, including area code: 617-663-4497
Date of fiscal year end: August 31Date of reporting period: November 30, 2012
Item 1. Schedule of Investments.
Copyright © 2013 www.secdatabase.com. All Rights Reserved.Please Consider the Environment Before Printing This Document
Floating Rate Income FundAs of 11-30-12 (Unaudited)
Maturity Par value
Rate (%) date Value
Term Loans (M) 84.6% $2,359,235,510(Cost $2,349,399,222)
Consumer Discretionary 24.7% 689,763,685
Auto Components - 1.5%
Allison Transmission, Inc. 2.710 08/07/14 $5,947,347 5,949,827Allison Transmission, Inc. 4.250 08/23/19 11,225,000 11,277,623August LuxUK Holding Company 6.250 04/27/18 5,030,394 5,080,698August US Holding Company, Inc. 6.250 04/27/18 6,869,606 6,938,302The Hertz Corp. 3.750 03/11/18 7,500,000 7,504,688UCI International, Inc. 5.500 07/26/17 3,912,500 3,941,844
Copyright © 2013 www.secdatabase.com. All Rights Reserved.Please Consider the Environment Before Printing This Document
Diversified Consumer Services - 0.6%
Monitronics International, Inc. 5.500 03/23/18 16,450,000 16,548,700
Hotels, Restaurants & Leisure - 8.6%
Caesars Entertainment Operating Company, Inc. 5.458 01/26/18 39,617,852 35,353,426Caesars Entertainment Operating Company, Inc. 9.500 10/31/16 16,644,760 16,942,285CCM Merger, Inc. 6.000 03/01/17 25,344,008 25,359,848DineEquity, Inc. 4.250 10/19/17 10,001,633 10,074,565Equinox Fitness Clubs (T) TBD 11/16/19 30,650,000 30,573,375Golden Nugget, Inc. 3.270 06/30/14 4,721,313 4,524,591Insignia Vessel Acquisition (T) TBD 04/27/15 1,128,892 1,089,380Landry's, Inc. 6.500 04/24/18 27,188,375 27,433,070Las Vegas Sands LLC 2.710 11/23/16 20,878,675 20,865,522Leslie's Poolmart 4.870 10/28/19 8,362,800 8,383,707Pinnacle Entertainment, Inc. 4.000 03/19/19 7,213,750 7,245,310QCE LLC 9.000 01/24/17 16,212,282 12,564,518Seven Seas Cruises S de RL LLC 6.250 12/21/18 16,530,750 16,696,058Stockbridge SBE Holdings LLC 13.000 05/02/17 10,000,000 9,875,000Wendy's International, Inc. 4.750 05/15/19 13,270,000 13,364,788
Media - 9.0%
Acosta, Inc. 5.000 03/02/18 21,566,419 21,674,251Advantage Sales & Marketing LLC 5.250 12/18/17 11,240,163 11,233,138AMC Entertainment, Inc. 4.250 12/15/16 12,723,889 12,777,571Bresnan Broadband Holdings LLC 4.500 12/14/17 6,855,797 6,875,083Cengage Learning Acquisitions, Inc. 5.710 07/05/17 40,665,852 30,121,766Charter Communications Operating LLC 3.460 09/06/16 10,074,928 10,117,747Charter Communications Operating LLC 4.000 05/15/19 9,950,000 10,018,406CSC Holdings LLC 1.959 03/29/16 1,728,635 1,731,722Getty Images, Inc. 4.750 10/18/19 24,650,000 24,748,600Kabel Deutschland GmbH 4.250 02/01/19 10,604,630 10,606,528Nielsen Finance LLC 2.459 02/02/17 4,331,250 4,307,272Nielsen Finance LLC 3.459 05/02/16 11,928,308 11,981,556Regal Cinemas Corp. 3.240 08/23/17 7,995,593 8,011,296Sinclair Television Group, Inc. 4.000 10/28/16 9,686,266 9,726,464TWCC Holding Corp. 4.250 02/13/17 19,663,551 19,843,807Univision Communications, Inc. 4.459 03/31/17 40,872,691 39,850,873Visant Corp. 5.250 12/22/16 20,179,694 18,250,011
1
Floating Rate Income FundAs of 11-30-12 (Unaudited)
Maturity Par value
Rate (%) date Value
Consumer Discretionary (continued)
Multiline Retail - 2.0%
Michaels Stores, Inc. 4.912 07/29/16 $28,817,172 $29,074,480The Neiman Marcus Group, Inc. 4.750 05/16/18 28,267,494 28,277,953
Specialty Retail - 3.0%
Freedom Group, Inc. 5.502 04/19/19 10,977,593 11,005,037Gymboree Corp. 5.000 02/23/18 23,564,771 22,674,541Party City Holdings, Inc. 5.750 07/26/19 30,250,000 30,509,273Petco Animal Supplies, Inc. 4.500 11/24/17 18,672,489 18,759,185
Consumer Staples 6.1% 170,183,169
Food & Staples Retailing - 2.1%
AdvancePierre Foods 5.750 07/10/17 14,400,000 14,544,000AdvancePierre Foods 9.500 10/10/17 4,840,000 4,921,675Dunkin' Brands, Inc. 4.000 11/23/17 34,120,705 34,239,172Michael Foods Group, Inc. 4.250 02/23/18 5,871,973 5,905,003
Food Products - 2.7%
Brickman Group Holdings, Inc. 5.500 10/14/16 4,299,445 4,342,440Candy Intermediate Holdings 7.509 06/18/18 20,847,750 21,021,474Del Monte Corp. 4.500 03/08/18 36,111,247 36,096,189Dole Food Company, Inc. 5.021 07/06/18 8,040,342 8,058,770Dole Food Company, Inc. 5.036 07/06/18 6,493,125 6,508,007
Copyright © 2013 www.secdatabase.com. All Rights Reserved.Please Consider the Environment Before Printing This Document
Household Products - 0.6%
Spectrum Brands, Inc. 5.018 06/17/16 4,966,335 4,966,335Yankee Candle Company, Inc. 5.250 04/02/19 11,200,608 11,291,613
Personal Products - 0.7%
NBTY, Inc. 4.250 10/02/17 18,147,341 18,288,491
Energy 5.5% 154,665,095
Energy Equipment & Services - 0.8%
Invenergy Wind LLC 9.000 11/21/17 9,473,329 9,520,696Vantage Drilling Company 6.250 10/26/17 14,590,000 14,371,150
Oil, Gas & Consumable Fuels - 4.7%
Arch Coal, Inc. 5.750 05/16/18 25,838,900 26,011,168Chesapeake Energy Corp. 5.750 12/01/17 26,020,000 25,559,992EP Energy LLC 5.000 05/24/18 6,500,000 6,550,785FTS International, Inc. 8.500 05/06/16 20,513,277 17,487,569Plains Exploration & Production Company (T) TBD 09/13/19 17,370,000 17,435,138Samson Investment Company 6.000 09/25/18 23,050,000 23,177,605SunCoke Energy, Inc. 4.000 07/26/18 14,587,461 14,550,992
Financials 2.8% 76,636,063
Capital Markets - 0.5%
Constellium Holdco BV 9.250 05/25/18 13,466,250 13,466,250
Diversified Financial Services - 1.3%
BLB Management Services, Inc. 8.500 11/05/15 10,003,779 10,049,627Star West Generation LLC 6.000 05/17/18 25,838,975 25,774,377
Real Estate Management & Development - 1.0%
Realogy Corp. 4.459 10/10/16 24,955,623 24,899,473
2
Floating Rate Income FundAs of 11-30-12 (Unaudited)
Maturity Par value
Rate (%) date Value
Financials (continued)Realogy Corp. 4.464 10/10/16 $2,451,852 $2,446,336
Health Care 13.0% 362,752,254
Biotechnology - 2.4%
Capsugel Holdings US, Inc. 4.750 08/01/18 33,690,362 33,921,983Medpace, Inc. 6.500 06/16/17 14,224,707 13,513,472Par Pharmaceutical Companies, Inc. 5.000 09/30/19 16,200,000 16,155,450Quintiles Transnational Corp. 4.500 06/08/18 4,000,000 4,005,000
Health Care Equipment & Supplies - 2.5%
Bausch & Lomb, Inc. 5.250 05/17/19 15,710,625 15,918,225BSN Medical 5.000 10/18/19 11,000,000 11,018,337ConvaTec, Inc. 5.000 12/22/16 18,569,692 18,708,965Immucor, Inc. 5.750 08/17/18 10,895,181 10,970,086Kinetic Concepts, Inc. 7.000 05/04/18 12,066,071 12,179,190
Health Care Providers & Services - 5.2%
Ardent Medical Services, Inc. (T) TBD 05/23/18 8,410,000 8,473,075Catalent Pharma Solutions, Inc. 5.250 09/15/17 9,925,125 10,024,376Community Health Systems, Inc. 3.812 01/25/17 411,849 414,080CRC Health Corp. 4.862 11/16/15 29,449,617 28,566,128Emergency Medical Services Corp. 5.250 05/25/18 26,870,976 27,131,302Hanger Orthopedic Group, Inc. 4.000 12/01/16 17,461,081 17,504,734MultiPlan, Inc. 4.750 08/26/17 17,525,861 17,575,161National Healing Corp. 8.250 11/30/17 9,820,775 9,833,051Radnet Management, Inc. 5.505 09/30/18 6,750,000 6,744,377Universal Health Services, Inc. 3.750 11/15/16 7,459,000 7,471,434Vanguard Health Holding Company II LLC 5.000 01/29/16 10,371,967 10,421,234
Health Care Technology - 0.2%
Copyright © 2013 www.secdatabase.com. All Rights Reserved.Please Consider the Environment Before Printing This Document
MedAssets, Inc. 5.000 11/16/16 7,274,562 7,274,562
Life Sciences Tools & Services - 0.8%
Pharmaceutical Product Development, Inc. 6.250 12/05/18 22,256,737 22,585,958
Pharmaceuticals - 1.9%
Quintiles Transnational Corp. 5.000 06/08/18 25,221,099 25,265,236Warner Chilcott Company LLC 4.250 03/15/18 27,009,314 27,076,838
Industrials 10.1% 281,531,529
Aerospace & Defense - 0.7%
Delos Aircraft, Inc. 4.750 04/12/16 18,000,000 18,202,500TransDigm, Inc. 4.000 02/14/17 1,922,822 1,929,071Airlines - 0.6%
Delta Air Lines, Inc. 5.500 04/20/17 15,991,043 16,055,007
Commercial Services & Supplies - 3.7%
ACCO Brands Corp. 4.250 04/30/19 1,870,731 1,887,100ADS Waste Holdings, Inc. 5.250 10/09/19 25,670,000 25,958,788ARAMARK Corp. 2.089 01/27/14 64,096 64,032ARAMARK Corp. 2.237 01/27/14 1,171,857 1,170,978ARAMARK Corp. 3.400 07/26/16 72,135 72,067
3
Floating Rate Income FundAs of 11-30-12 (Unaudited)
Maturity Par value
Rate (%) date Value
Industrials (continued)ARAMARK Corp. 3.459 07/26/16 $4,074,825 $4,075,844ARAMARK Corp. 3.464 07/26/16 267,979 268,046ARAMARK Corp. 3.566 07/26/16 927,865 926,996Flying Fortress, Inc. 5.000 06/30/17 22,000,000 22,247,500Language Line LLC 6.250 06/20/16 14,947,367 14,822,811US Investigations Services, Inc. 2.958 02/21/15 13,001,235 12,091,148US Investigations Services, Inc. 7.750 02/20/15 5,034,302 5,009,131Waste Industries USA, Inc. 4.750 03/17/17 15,689,268 15,728,491
Electrical Equipment - 0.9%
Generac Power Systems, Inc. 6.250 05/30/18 22,942,500 23,439,595
Machinery - 2.3%
CPM Holdings, Inc. 6.250 08/29/17 7,630,000 7,677,688Intelligrated, Inc. 6.750 07/30/18 16,000,000 16,140,000Intelligrated, Inc. 10.500 12/31/19 6,310,000 6,357,325Schaeffler AG 6.000 01/27/17 33,700,000 34,015,938
Professional Services - 0.8%
Fenwal, Inc. 2.459 02/28/14 21,348,768 21,308,739
Road & Rail - 0.6%
The Hertz Corp. 3.750 03/09/18 17,459,789 17,416,140
Trading Companies & Distributors - 0.5%
BakerCorp International, Inc. 5.000 06/01/18 14,611,799 14,666,594
Information Technology 5.1% 141,934,144
Communications Equipment - 1.1%
Compucom Systems 6.500 10/02/18 21,000,000 21,039,375Compucom Systems 10.250 10/02/19 9,730,000 9,584,050
Electronic Equipment, Instruments & Components - 1.0%
Sensus USA, Inc. 4.750 05/09/17 10,462,780 10,462,780Sensus USA, Inc. 8.500 05/09/18 4,000,000 3,995,000Sophia LP 6.250 07/19/18 13,489,390 13,658,007
IT Services - 0.2%
Global Cash Access, Inc. 7.000 03/01/16 5,672,917 5,683,553
Copyright © 2013 www.secdatabase.com. All Rights Reserved.Please Consider the Environment Before Printing This Document
Semiconductors & Semiconductor Equipment - 0.4%
NXP BV 5.250 03/19/19 1,492,500 1,505,559NXP Funding LLC 5.500 03/03/17 8,362,651 8,505,510
Software - 2.4%
First Data Corp. 4.208 03/23/18 27,695,507 26,325,576First Data Corp. 5.208 03/24/17 5,000,000 4,895,535First Data Corp. 5.208 09/24/18 5,000,000 4,885,940Infor US, Inc. 5.250 04/05/18 7,974,375 8,032,524SunGard Data Systems, Inc. 3.709 02/28/14 2,283,955 2,287,525SunGard Data Systems, Inc. 3.864 02/26/16 21,027,203 21,073,210
4
Floating Rate Income FundAs of 11-30-12 (Unaudited)
Maturity Par value
Rate (%) date Value
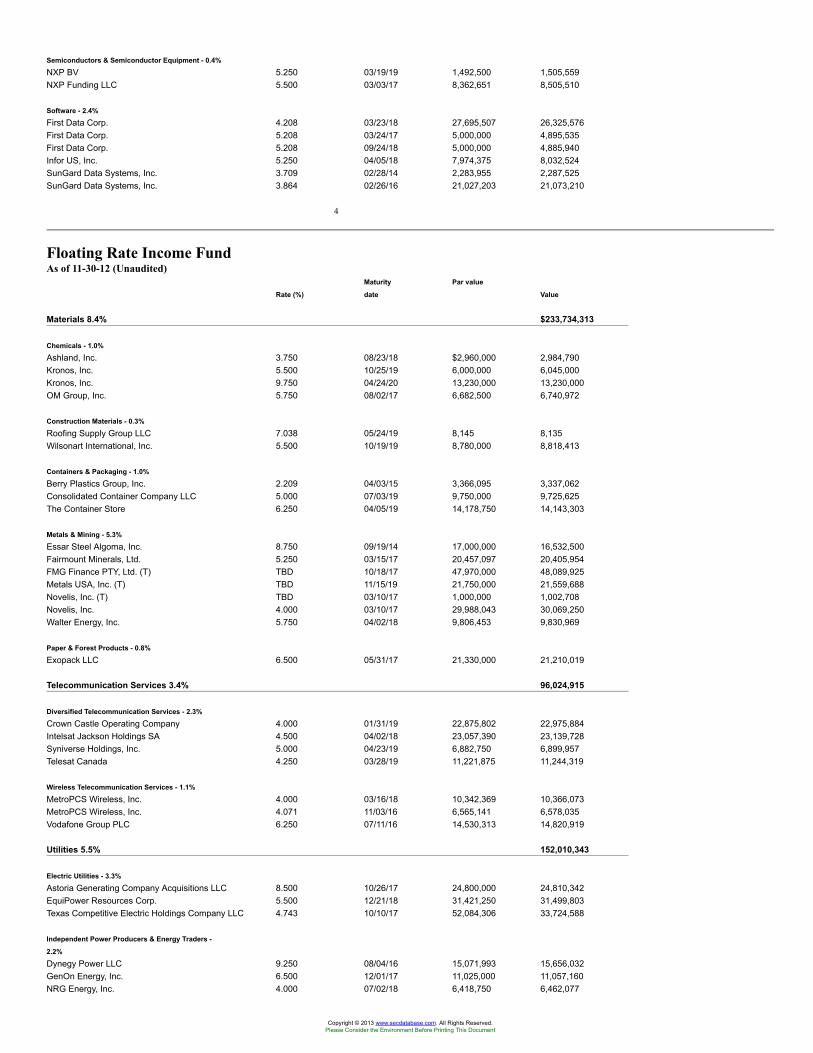
Materials 8.4% $233,734,313
Chemicals - 1.0%
Ashland, Inc. 3.750 08/23/18 $2,960,000 2,984,790Kronos, Inc. 5.500 10/25/19 6,000,000 6,045,000Kronos, Inc. 9.750 04/24/20 13,230,000 13,230,000OM Group, Inc. 5.750 08/02/17 6,682,500 6,740,972
Construction Materials - 0.3%
Roofing Supply Group LLC 7.038 05/24/19 8,145 8,135Wilsonart International, Inc. 5.500 10/19/19 8,780,000 8,818,413
Containers & Packaging - 1.0%
Berry Plastics Group, Inc. 2.209 04/03/15 3,366,095 3,337,062Consolidated Container Company LLC 5.000 07/03/19 9,750,000 9,725,625The Container Store 6.250 04/05/19 14,178,750 14,143,303
Metals & Mining - 5.3%
Essar Steel Algoma, Inc. 8.750 09/19/14 17,000,000 16,532,500Fairmount Minerals, Ltd. 5.250 03/15/17 20,457,097 20,405,954FMG Finance PTY, Ltd. (T) TBD 10/18/17 47,970,000 48,089,925Metals USA, Inc. (T) TBD 11/15/19 21,750,000 21,559,688Novelis, Inc. (T) TBD 03/10/17 1,000,000 1,002,708Novelis, Inc. 4.000 03/10/17 29,988,043 30,069,250Walter Energy, Inc. 5.750 04/02/18 9,806,453 9,830,969
Paper & Forest Products - 0.8%
Exopack LLC 6.500 05/31/17 21,330,000 21,210,019
Telecommunication Services 3.4% 96,024,915
Diversified Telecommunication Services - 2.3%
Crown Castle Operating Company 4.000 01/31/19 22,875,802 22,975,884Intelsat Jackson Holdings SA 4.500 04/02/18 23,057,390 23,139,728Syniverse Holdings, Inc. 5.000 04/23/19 6,882,750 6,899,957Telesat Canada 4.250 03/28/19 11,221,875 11,244,319
Wireless Telecommunication Services - 1.1%
MetroPCS Wireless, Inc. 4.000 03/16/18 10,342,369 10,366,073MetroPCS Wireless, Inc. 4.071 11/03/16 6,565,141 6,578,035Vodafone Group PLC 6.250 07/11/16 14,530,313 14,820,919
Utilities 5.5% 152,010,343
Electric Utilities - 3.3%
Astoria Generating Company Acquisitions LLC 8.500 10/26/17 24,800,000 24,810,342EquiPower Resources Corp. 5.500 12/21/18 31,421,250 31,499,803Texas Competitive Electric Holdings Company LLC 4.743 10/10/17 52,084,306 33,724,588
Independent Power Producers & Energy Traders -
2.2%
Dynegy Power LLC 9.250 08/04/16 15,071,993 15,656,032GenOn Energy, Inc. 6.500 12/01/17 11,025,000 11,057,160NRG Energy, Inc. 4.000 07/02/18 6,418,750 6,462,077
Copyright © 2013 www.secdatabase.com. All Rights Reserved.Please Consider the Environment Before Printing This Document
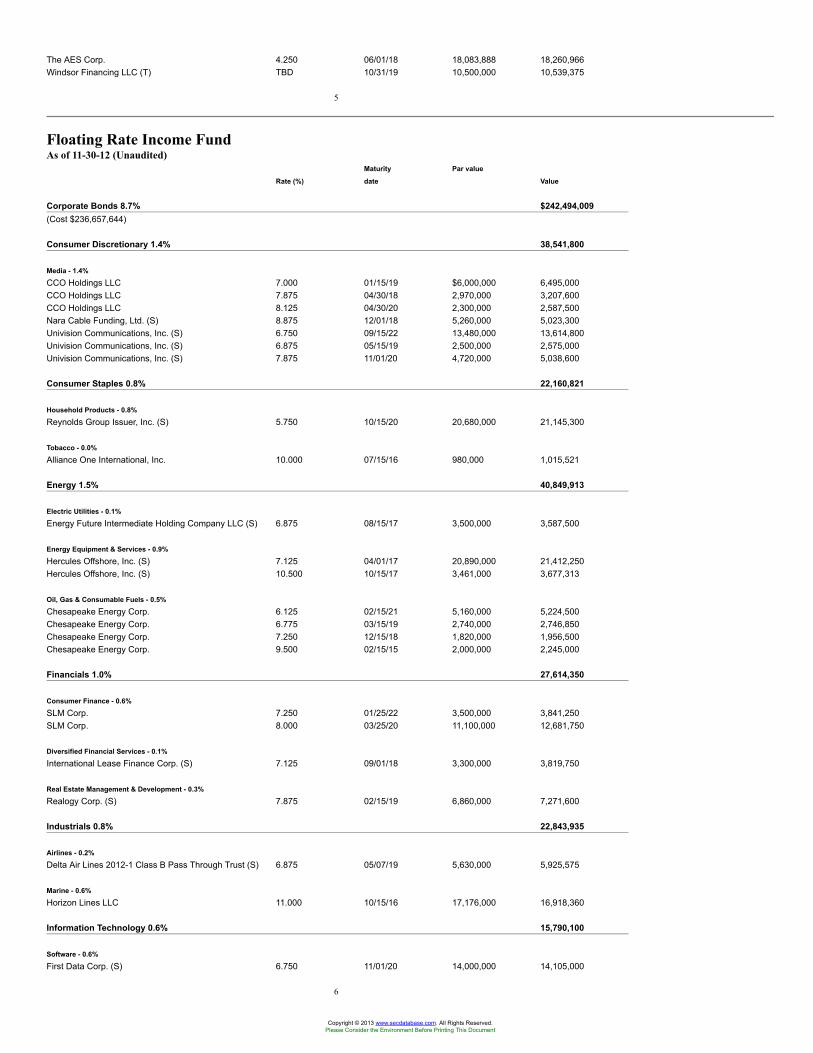
The AES Corp. 4.250 06/01/18 18,083,888 18,260,966Windsor Financing LLC (T) TBD 10/31/19 10,500,000 10,539,375
5
Floating Rate Income FundAs of 11-30-12 (Unaudited)
Maturity Par value
Rate (%) date Value
Corporate Bonds 8.7% $242,494,009(Cost $236,657,644)
Consumer Discretionary 1.4% 38,541,800
Media - 1.4%
CCO Holdings LLC 7.000 01/15/19 $6,000,000 6,495,000CCO Holdings LLC 7.875 04/30/18 2,970,000 3,207,600CCO Holdings LLC 8.125 04/30/20 2,300,000 2,587,500Nara Cable Funding, Ltd. (S) 8.875 12/01/18 5,260,000 5,023,300Univision Communications, Inc. (S) 6.750 09/15/22 13,480,000 13,614,800Univision Communications, Inc. (S) 6.875 05/15/19 2,500,000 2,575,000Univision Communications, Inc. (S) 7.875 11/01/20 4,720,000 5,038,600
Consumer Staples 0.8% 22,160,821
Household Products - 0.8%
Reynolds Group Issuer, Inc. (S) 5.750 10/15/20 20,680,000 21,145,300
Tobacco - 0.0%
Alliance One International, Inc. 10.000 07/15/16 980,000 1,015,521
Energy 1.5% 40,849,913
Electric Utilities - 0.1%
Energy Future Intermediate Holding Company LLC (S) 6.875 08/15/17 3,500,000 3,587,500
Energy Equipment & Services - 0.9%
Hercules Offshore, Inc. (S) 7.125 04/01/17 20,890,000 21,412,250Hercules Offshore, Inc. (S) 10.500 10/15/17 3,461,000 3,677,313
Oil, Gas & Consumable Fuels - 0.5%
Chesapeake Energy Corp. 6.125 02/15/21 5,160,000 5,224,500Chesapeake Energy Corp. 6.775 03/15/19 2,740,000 2,746,850Chesapeake Energy Corp. 7.250 12/15/18 1,820,000 1,956,500Chesapeake Energy Corp. 9.500 02/15/15 2,000,000 2,245,000
Financials 1.0% 27,614,350
Consumer Finance - 0.6%
SLM Corp. 7.250 01/25/22 3,500,000 3,841,250SLM Corp. 8.000 03/25/20 11,100,000 12,681,750
Diversified Financial Services - 0.1%
International Lease Finance Corp. (S) 7.125 09/01/18 3,300,000 3,819,750
Real Estate Management & Development - 0.3%
Realogy Corp. (S) 7.875 02/15/19 6,860,000 7,271,600
Industrials 0.8% 22,843,935
Airlines - 0.2%
Delta Air Lines 2012-1 Class B Pass Through Trust (S) 6.875 05/07/19 5,630,000 5,925,575
Marine - 0.6%
Horizon Lines LLC 11.000 10/15/16 17,176,000 16,918,360
Information Technology 0.6% 15,790,100
Software - 0.6%
First Data Corp. (S) 6.750 11/01/20 14,000,000 14,105,000
6
Copyright © 2013 www.secdatabase.com. All Rights Reserved.Please Consider the Environment Before Printing This Document
Floating Rate Income FundAs of 11-30-12 (Unaudited)
Maturity Par value
Rate (%) date Value
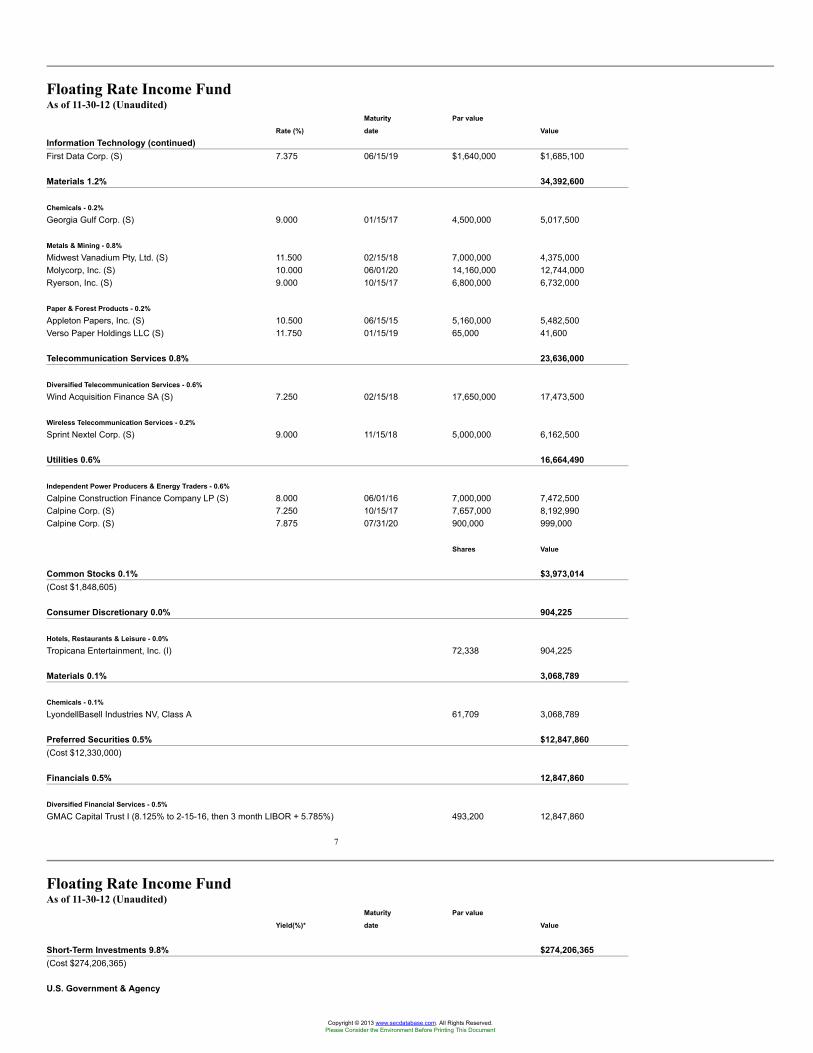
Information Technology (continued)First Data Corp. (S) 7.375 06/15/19 $1,640,000 $1,685,100
Materials 1.2% 34,392,600
Chemicals - 0.2%
Georgia Gulf Corp. (S) 9.000 01/15/17 4,500,000 5,017,500
Metals & Mining - 0.8%
Midwest Vanadium Pty, Ltd. (S) 11.500 02/15/18 7,000,000 4,375,000Molycorp, Inc. (S) 10.000 06/01/20 14,160,000 12,744,000Ryerson, Inc. (S) 9.000 10/15/17 6,800,000 6,732,000
Paper & Forest Products - 0.2%
Appleton Papers, Inc. (S) 10.500 06/15/15 5,160,000 5,482,500Verso Paper Holdings LLC (S) 11.750 01/15/19 65,000 41,600
Telecommunication Services 0.8% 23,636,000
Diversified Telecommunication Services - 0.6%
Wind Acquisition Finance SA (S) 7.250 02/15/18 17,650,000 17,473,500
Wireless Telecommunication Services - 0.2%
Sprint Nextel Corp. (S) 9.000 11/15/18 5,000,000 6,162,500
Utilities 0.6% 16,664,490
Independent Power Producers & Energy Traders - 0.6%
Calpine Construction Finance Company LP (S) 8.000 06/01/16 7,000,000 7,472,500Calpine Corp. (S) 7.250 10/15/17 7,657,000 8,192,990Calpine Corp. (S) 7.875 07/31/20 900,000 999,000
Shares Value
Common Stocks 0.1% $3,973,014(Cost $1,848,605)
Consumer Discretionary 0.0% 904,225
Hotels, Restaurants & Leisure - 0.0%
Tropicana Entertainment, Inc. (I) 72,338 904,225
Materials 0.1% 3,068,789
Chemicals - 0.1%
LyondellBasell Industries NV, Class A 61,709 3,068,789
Preferred Securities 0.5% $12,847,860(Cost $12,330,000)
Financials 0.5% 12,847,860
Diversified Financial Services - 0.5%
GMAC Capital Trust I (8.125% to 2-15-16, then 3 month LIBOR + 5.785%) 493,200 12,847,860
7
Floating Rate Income FundAs of 11-30-12 (Unaudited)
Maturity Par value
Yield(%)* date Value
Short-Term Investments 9.8% $274,206,365(Cost $274,206,365)
U.S. Government & Agency
Copyright © 2013 www.secdatabase.com. All Rights Reserved.Please Consider the Environment Before Printing This Document
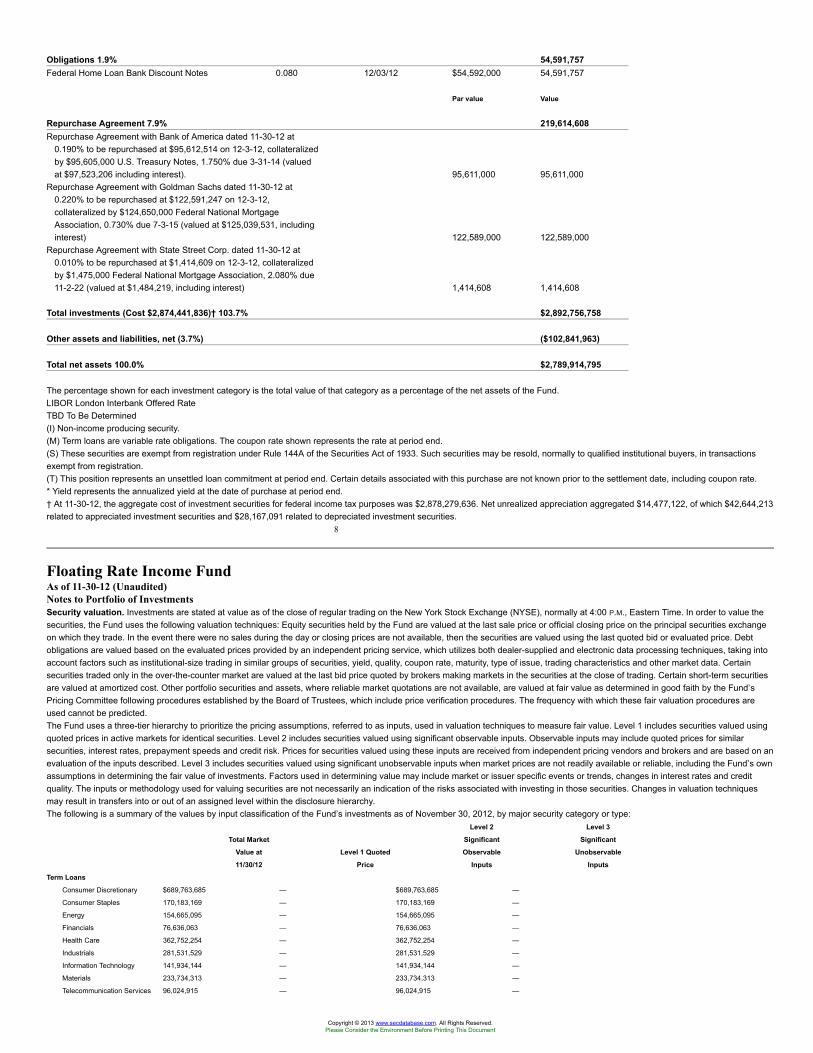
Obligations 1.9% 54,591,757Federal Home Loan Bank Discount Notes 0.080 12/03/12 $54,592,000 54,591,757
Par value Value
Repurchase Agreement 7.9% 219,614,608Repurchase Agreement with Bank of America dated 11-30-12 at
0.190% to be repurchased at $95,612,514 on 12-3-12, collateralizedby $95,605,000 U.S. Treasury Notes, 1.750% due 3-31-14 (valuedat $97,523,206 including interest). 95,611,000 95,611,000
Repurchase Agreement with Goldman Sachs dated 11-30-12 at0.220% to be repurchased at $122,591,247 on 12-3-12,collateralized by $124,650,000 Federal National MortgageAssociation, 0.730% due 7-3-15 (valued at $125,039,531, includinginterest) 122,589,000 122,589,000
Repurchase Agreement with State Street Corp. dated 11-30-12 at0.010% to be repurchased at $1,414,609 on 12-3-12, collateralizedby $1,475,000 Federal National Mortgage Association, 2.080% due11-2-22 (valued at $1,484,219, including interest) 1,414,608 1,414,608
Total investments (Cost $2,874,441,836)† 103.7% $2,892,756,758
Other assets and liabilities, net (3.7%) ($102,841,963)
Total net assets 100.0% $2,789,914,795
The percentage shown for each investment category is the total value of that category as a percentage of the net assets of the Fund.LIBOR London Interbank Offered RateTBD To Be Determined(I) Non-income producing security.(M) Term loans are variable rate obligations. The coupon rate shown represents the rate at period end.(S) These securities are exempt from registration under Rule 144A of the Securities Act of 1933. Such securities may be resold, normally to qualified institutional buyers, in transactionsexempt from registration.(T) This position represents an unsettled loan commitment at period end. Certain details associated with this purchase are not known prior to the settlement date, including coupon rate.* Yield represents the annualized yield at the date of purchase at period end.† At 11-30-12, the aggregate cost of investment securities for federal income tax purposes was $2,878,279,636. Net unrealized appreciation aggregated $14,477,122, of which $42,644,213related to appreciated investment securities and $28,167,091 related to depreciated investment securities.
8
Floating Rate Income FundAs of 11-30-12 (Unaudited)Notes to Portfolio of InvestmentsSecurity valuation. Investments are stated at value as of the close of regular trading on the New York Stock Exchange (NYSE), normally at 4:00 P.M., Eastern Time. In order to value thesecurities, the Fund uses the following valuation techniques: Equity securities held by the Fund are valued at the last sale price or official closing price on the principal securities exchangeon which they trade. In the event there were no sales during the day or closing prices are not available, then the securities are valued using the last quoted bid or evaluated price. Debtobligations are valued based on the evaluated prices provided by an independent pricing service, which utilizes both dealer-supplied and electronic data processing techniques, taking intoaccount factors such as institutional-size trading in similar groups of securities, yield, quality, coupon rate, maturity, type of issue, trading characteristics and other market data. Certainsecurities traded only in the over-the-counter market are valued at the last bid price quoted by brokers making markets in the securities at the close of trading. Certain short-term securitiesare valued at amortized cost. Other portfolio securities and assets, where reliable market quotations are not available, are valued at fair value as determined in good faith by the Fund’sPricing Committee following procedures established by the Board of Trustees, which include price verification procedures. The frequency with which these fair valuation procedures areused cannot be predicted.The Fund uses a three-tier hierarchy to prioritize the pricing assumptions, referred to as inputs, used in valuation techniques to measure fair value. Level 1 includes securities valued usingquoted prices in active markets for identical securities. Level 2 includes securities valued using significant observable inputs. Observable inputs may include quoted prices for similarsecurities, interest rates, prepayment speeds and credit risk. Prices for securities valued using these inputs are received from independent pricing vendors and brokers and are based on anevaluation of the inputs described. Level 3 includes securities valued using significant unobservable inputs when market prices are not readily available or reliable, including the Fund’s ownassumptions in determining the fair value of investments. Factors used in determining value may include market or issuer specific events or trends, changes in interest rates and creditquality. The inputs or methodology used for valuing securities are not necessarily an indication of the risks associated with investing in those securities. Changes in valuation techniquesmay result in transfers into or out of an assigned level within the disclosure hierarchy.The following is a summary of the values by input classification of the Fund’s investments as of November 30, 2012, by major security category or type:
Level 2 Level 3
Total Market Significant Significant
Value at Level 1 Quoted Observable Unobservable
11/30/12 Price Inputs Inputs
Term Loans
Consumer Discretionary $689,763,685 — $689,763,685 —
Consumer Staples 170,183,169 — 170,183,169 —
Energy 154,665,095 — 154,665,095 —
Financials 76,636,063 — 76,636,063 —
Health Care 362,752,254 — 362,752,254 —
Industrials 281,531,529 — 281,531,529 —
Information Technology 141,934,144 — 141,934,144 —
Materials 233,734,313 — 233,734,313 —
Telecommunication Services 96,024,915 — 96,024,915 —
Copyright © 2013 www.secdatabase.com. All Rights Reserved.Please Consider the Environment Before Printing This Document
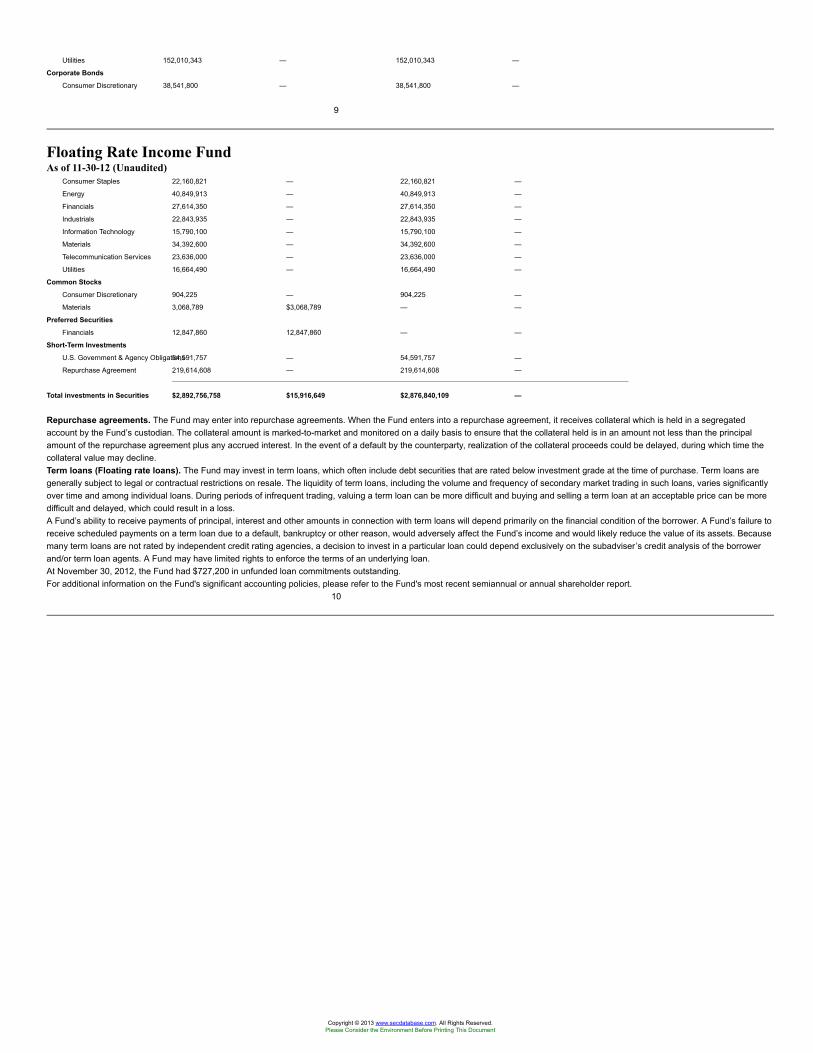
Utilities 152,010,343 — 152,010,343 —
Corporate Bonds
Consumer Discretionary 38,541,800 — 38,541,800 —
9
Floating Rate Income FundAs of 11-30-12 (Unaudited)
Consumer Staples 22,160,821 — 22,160,821 —
Energy 40,849,913 — 40,849,913 —
Financials 27,614,350 — 27,614,350 —
Industrials 22,843,935 — 22,843,935 —
Information Technology 15,790,100 — 15,790,100 —
Materials 34,392,600 — 34,392,600 —
Telecommunication Services 23,636,000 — 23,636,000 —
Utilities 16,664,490 — 16,664,490 —
Common Stocks
Consumer Discretionary 904,225 — 904,225 —
Materials 3,068,789 $3,068,789 — —
Preferred Securities
Financials 12,847,860 12,847,860 — —
Short-Term Investments
U.S. Government & Agency Obligations54,591,757 — 54,591,757 —
Repurchase Agreement 219,614,608 — 219,614,608 —
Total investments in Securities $2,892,756,758 $15,916,649 $2,876,840,109 —
Repurchase agreements. The Fund may enter into repurchase agreements. When the Fund enters into a repurchase agreement, it receives collateral which is held in a segregatedaccount by the Fund’s custodian. The collateral amount is marked-to-market and monitored on a daily basis to ensure that the collateral held is in an amount not less than the principalamount of the repurchase agreement plus any accrued interest. In the event of a default by the counterparty, realization of the collateral proceeds could be delayed, during which time thecollateral value may decline.Term loans (Floating rate loans). The Fund may invest in term loans, which often include debt securities that are rated below investment grade at the time of purchase. Term loans aregenerally subject to legal or contractual restrictions on resale. The liquidity of term loans, including the volume and frequency of secondary market trading in such loans, varies significantlyover time and among individual loans. During periods of infrequent trading, valuing a term loan can be more difficult and buying and selling a term loan at an acceptable price can be moredifficult and delayed, which could result in a loss.A Fund’s ability to receive payments of principal, interest and other amounts in connection with term loans will depend primarily on the financial condition of the borrower. A Fund’s failure toreceive scheduled payments on a term loan due to a default, bankruptcy or other reason, would adversely affect the Fund’s income and would likely reduce the value of its assets. Becausemany term loans are not rated by independent credit rating agencies, a decision to invest in a particular loan could depend exclusively on the subadviser’s credit analysis of the borrowerand/or term loan agents. A Fund may have limited rights to enforce the terms of an underlying loan.At November 30, 2012, the Fund had $727,200 in unfunded loan commitments outstanding.For additional information on the Fund's significant accounting policies, please refer to the Fund's most recent semiannual or annual shareholder report.
10
Copyright © 2013 www.secdatabase.com. All Rights Reserved.Please Consider the Environment Before Printing This Document
Copyright © 2013 www.secdatabase.com. All Rights Reserved.Please Consider the Environment Before Printing This Document
Alternative Asset Allocation FundAs of 11-30-12 (Unaudited)Investment CompaniesUnderlying Funds’ Subadvisers
Deutsche Investment Management Americas, Inc. (Deutsche)
Dimensional Fund Advisors LP (DFA)
First Quadrant, LP (First Quadrant)
John Hancock Asset Management1 (John Hancock)
Pacific Investment Management Company LLC (PIMCO)
RCM Capital Management LLC (RCM)
RS Investment Management Company LLC (RS Investments)
Standard Life Investments (Corporate Funds) Limited (Standard Life)
Stone Harbor Investment Partners LP (Stone Harbor)
Wellington Management Company, LLP (Wellington)
Shares Value
Copyright © 2013 www.secdatabase.com. All Rights Reserved.Please Consider the Environment Before Printing This Document
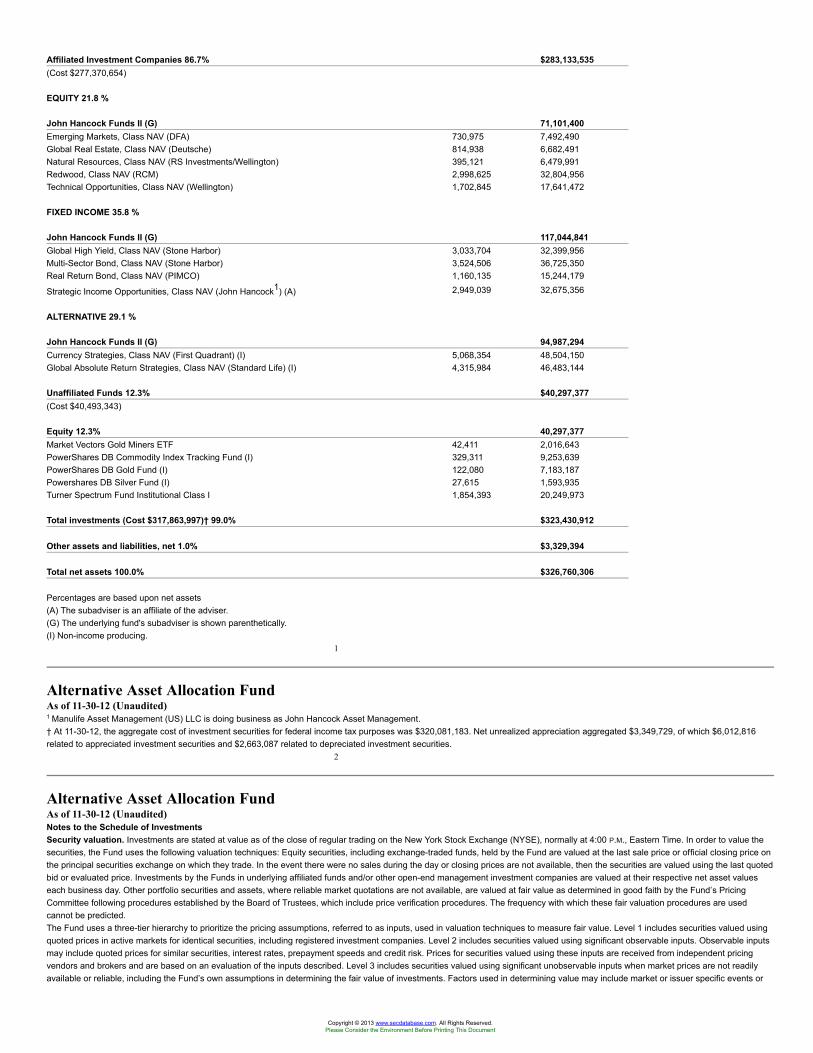
Affiliated Investment Companies 86.7% $283,133,535(Cost $277,370,654)
EQUITY 21.8 %
John Hancock Funds II (G) 71,101,400Emerging Markets, Class NAV (DFA) 730,975 7,492,490Global Real Estate, Class NAV (Deutsche) 814,938 6,682,491Natural Resources, Class NAV (RS Investments/Wellington) 395,121 6,479,991Redwood, Class NAV (RCM) 2,998,625 32,804,956Technical Opportunities, Class NAV (Wellington) 1,702,845 17,641,472
FIXED INCOME 35.8 %
John Hancock Funds II (G) 117,044,841Global High Yield, Class NAV (Stone Harbor) 3,033,704 32,399,956Multi-Sector Bond, Class NAV (Stone Harbor) 3,524,506 36,725,350Real Return Bond, Class NAV (PIMCO) 1,160,135 15,244,179
Strategic Income Opportunities, Class NAV (John Hancock1) (A) 2,949,039 32,675,356
ALTERNATIVE 29.1 %
John Hancock Funds II (G) 94,987,294Currency Strategies, Class NAV (First Quadrant) (I) 5,068,354 48,504,150Global Absolute Return Strategies, Class NAV (Standard Life) (I) 4,315,984 46,483,144
Unaffiliated Funds 12.3% $40,297,377(Cost $40,493,343)
Equity 12.3% 40,297,377Market Vectors Gold Miners ETF 42,411 2,016,643PowerShares DB Commodity Index Tracking Fund (I) 329,311 9,253,639PowerShares DB Gold Fund (I) 122,080 7,183,187Powershares DB Silver Fund (I) 27,615 1,593,935Turner Spectrum Fund Institutional Class I 1,854,393 20,249,973
Total investments (Cost $317,863,997)† 99.0% $323,430,912
Other assets and liabilities, net 1.0% $3,329,394
Total net assets 100.0% $326,760,306
Percentages are based upon net assets(A) The subadviser is an affiliate of the adviser.(G) The underlying fund's subadviser is shown parenthetically.(I) Non-income producing.
1
Alternative Asset Allocation FundAs of 11-30-12 (Unaudited)1 Manulife Asset Management (US) LLC is doing business as John Hancock Asset Management.† At 11-30-12, the aggregate cost of investment securities for federal income tax purposes was $320,081,183. Net unrealized appreciation aggregated $3,349,729, of which $6,012,816related to appreciated investment securities and $2,663,087 related to depreciated investment securities.
2
Alternative Asset Allocation FundAs of 11-30-12 (Unaudited)Notes to the Schedule of InvestmentsSecurity valuation. Investments are stated at value as of the close of regular trading on the New York Stock Exchange (NYSE), normally at 4:00 P.M., Eastern Time. In order to value thesecurities, the Fund uses the following valuation techniques: Equity securities, including exchange-traded funds, held by the Fund are valued at the last sale price or official closing price onthe principal securities exchange on which they trade. In the event there were no sales during the day or closing prices are not available, then the securities are valued using the last quotedbid or evaluated price. Investments by the Funds in underlying affiliated funds and/or other open-end management investment companies are valued at their respective net asset valueseach business day. Other portfolio securities and assets, where reliable market quotations are not available, are valued at fair value as determined in good faith by the Fund’s PricingCommittee following procedures established by the Board of Trustees, which include price verification procedures. The frequency with which these fair valuation procedures are usedcannot be predicted.The Fund uses a three-tier hierarchy to prioritize the pricing assumptions, referred to as inputs, used in valuation techniques to measure fair value. Level 1 includes securities valued usingquoted prices in active markets for identical securities, including registered investment companies. Level 2 includes securities valued using significant observable inputs. Observable inputsmay include quoted prices for similar securities, interest rates, prepayment speeds and credit risk. Prices for securities valued using these inputs are received from independent pricingvendors and brokers and are based on an evaluation of the inputs described. Level 3 includes securities valued using significant unobservable inputs when market prices are not readilyavailable or reliable, including the Fund’s own assumptions in determining the fair value of investments. Factors used in determining value may include market or issuer specific events or
Copyright © 2013 www.secdatabase.com. All Rights Reserved.Please Consider the Environment Before Printing This Document
trends, changes in interest rates and credit quality. The inputs or methodology used for valuing securities are not necessarily an indication of the risks associated with investing in thosesecurities. Changes in valuation techniques may result in transfers into or out of an assigned level within the disclosure hierarchy.As of November 30, 2012, all investments are categorized as Level 1 under the hierarchy described above.For additional information on the Fund's significant accounting policies, please refer to the Fund's most recent semiannual or annual shareholder report.
3
Copyright © 2013 www.secdatabase.com. All Rights Reserved.Please Consider the Environment Before Printing This Document
Natural Resources FundAs of 11-30-12 (Unaudited)
Shares Value
Common Stocks 95.9% $733,895,884(Cost $752,567,109)
Energy 58.8% 449,880,769
Energy Equipment & Services 5.9%
Baker Hughes, Inc. 104,952 4,528,679Cameron International Corp. (I) 90,856 4,901,681Dril-Quip, Inc. (I) 53,348 3,754,099National Oilwell Varco, Inc. 55,264 3,774,531Noble Corp. 113,372 3,910,200Patterson-UTI Energy, Inc. (L) 381,396 6,773,593Saipem SpA 102,085 4,544,014Schlumberger, Ltd. 134,832 9,656,668
Copyright © 2013 www.secdatabase.com. All Rights Reserved.Please Consider the Environment Before Printing This Document
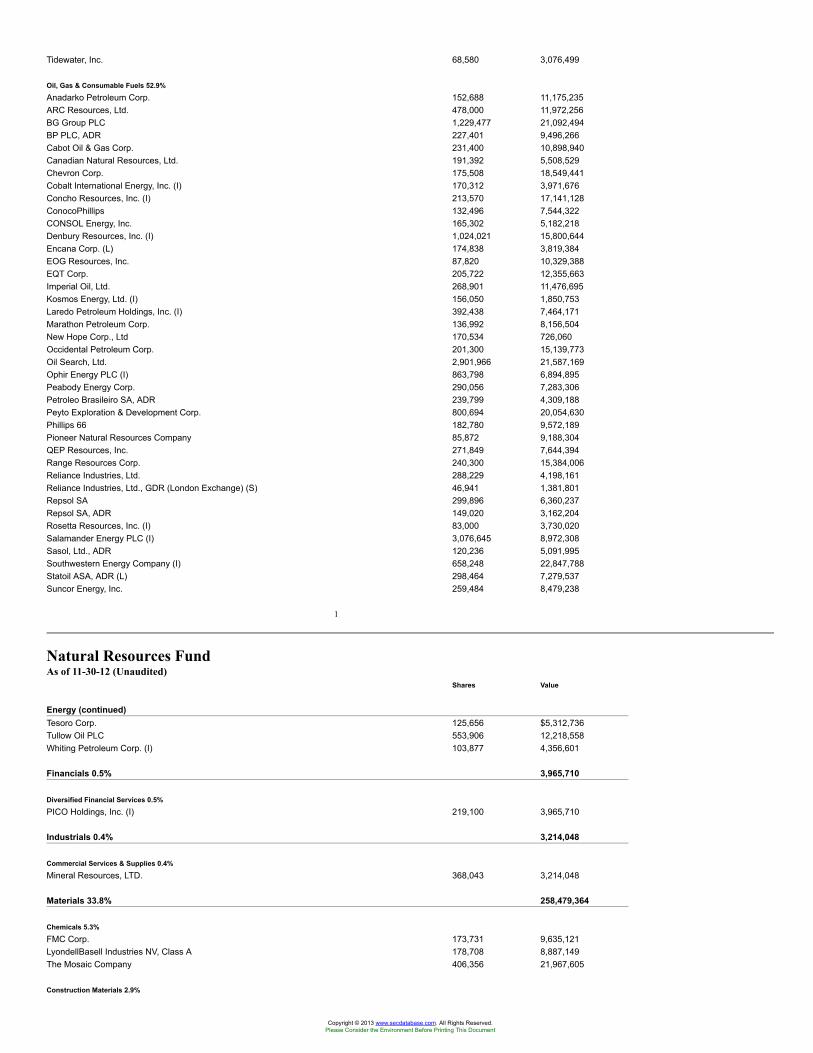
Tidewater, Inc. 68,580 3,076,499
Oil, Gas & Consumable Fuels 52.9%
Anadarko Petroleum Corp. 152,688 11,175,235ARC Resources, Ltd. 478,000 11,972,256BG Group PLC 1,229,477 21,092,494BP PLC, ADR 227,401 9,496,266Cabot Oil & Gas Corp. 231,400 10,898,940Canadian Natural Resources, Ltd. 191,392 5,508,529Chevron Corp. 175,508 18,549,441Cobalt International Energy, Inc. (I) 170,312 3,971,676Concho Resources, Inc. (I) 213,570 17,141,128ConocoPhillips 132,496 7,544,322CONSOL Energy, Inc. 165,302 5,182,218Denbury Resources, Inc. (I) 1,024,021 15,800,644Encana Corp. (L) 174,838 3,819,384EOG Resources, Inc. 87,820 10,329,388EQT Corp. 205,722 12,355,663Imperial Oil, Ltd. 268,901 11,476,695Kosmos Energy, Ltd. (I) 156,050 1,850,753Laredo Petroleum Holdings, Inc. (I) 392,438 7,464,171Marathon Petroleum Corp. 136,992 8,156,504New Hope Corp., Ltd 170,534 726,060Occidental Petroleum Corp. 201,300 15,139,773Oil Search, Ltd. 2,901,966 21,587,169Ophir Energy PLC (I) 863,798 6,894,895Peabody Energy Corp. 290,056 7,283,306Petroleo Brasileiro SA, ADR 239,799 4,309,188Peyto Exploration & Development Corp. 800,694 20,054,630Phillips 66 182,780 9,572,189Pioneer Natural Resources Company 85,872 9,188,304QEP Resources, Inc. 271,849 7,644,394Range Resources Corp. 240,300 15,384,006Reliance Industries, Ltd. 288,229 4,198,161Reliance Industries, Ltd., GDR (London Exchange) (S) 46,941 1,381,801Repsol SA 299,896 6,360,237Repsol SA, ADR 149,020 3,162,204Rosetta Resources, Inc. (I) 83,000 3,730,020Salamander Energy PLC (I) 3,076,645 8,972,308Sasol, Ltd., ADR 120,236 5,091,995Southwestern Energy Company (I) 658,248 22,847,788Statoil ASA, ADR (L) 298,464 7,279,537Suncor Energy, Inc. 259,484 8,479,238
1
Natural Resources FundAs of 11-30-12 (Unaudited)
Shares Value
Energy (continued)Tesoro Corp. 125,656 $5,312,736Tullow Oil PLC 553,906 12,218,558Whiting Petroleum Corp. (I) 103,877 4,356,601
Financials 0.5% 3,965,710
Diversified Financial Services 0.5%
PICO Holdings, Inc. (I) 219,100 3,965,710
Industrials 0.4% 3,214,048
Commercial Services & Supplies 0.4%
Mineral Resources, LTD. 368,043 3,214,048
Materials 33.8% 258,479,364
Chemicals 5.3%
FMC Corp. 173,731 9,635,121LyondellBasell Industries NV, Class A 178,708 8,887,149The Mosaic Company 406,356 21,967,605
Construction Materials 2.9%
Copyright © 2013 www.secdatabase.com. All Rights Reserved.Please Consider the Environment Before Printing This Document
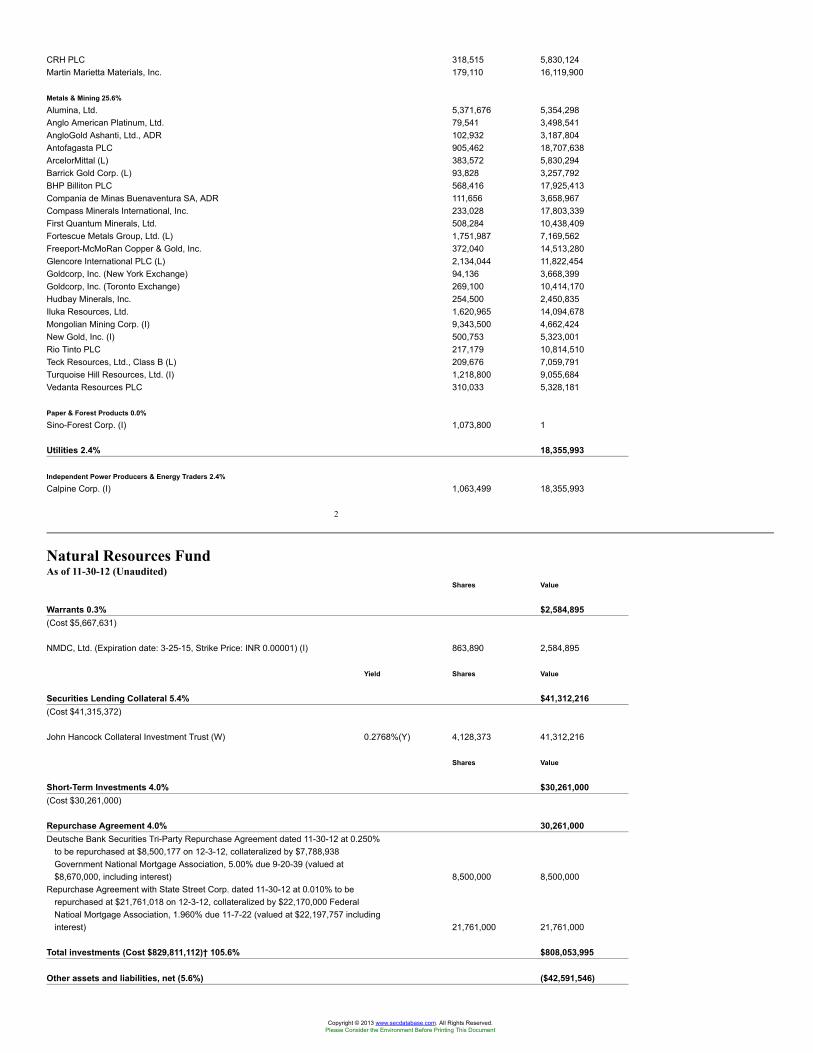
CRH PLC 318,515 5,830,124Martin Marietta Materials, Inc. 179,110 16,119,900
Metals & Mining 25.6%
Alumina, Ltd. 5,371,676 5,354,298Anglo American Platinum, Ltd. 79,541 3,498,541AngloGold Ashanti, Ltd., ADR 102,932 3,187,804Antofagasta PLC 905,462 18,707,638ArcelorMittal (L) 383,572 5,830,294Barrick Gold Corp. (L) 93,828 3,257,792BHP Billiton PLC 568,416 17,925,413Compania de Minas Buenaventura SA, ADR 111,656 3,658,967Compass Minerals International, Inc. 233,028 17,803,339First Quantum Minerals, Ltd. 508,284 10,438,409Fortescue Metals Group, Ltd. (L) 1,751,987 7,169,562Freeport-McMoRan Copper & Gold, Inc. 372,040 14,513,280Glencore International PLC (L) 2,134,044 11,822,454Goldcorp, Inc. (New York Exchange) 94,136 3,668,399Goldcorp, Inc. (Toronto Exchange) 269,100 10,414,170Hudbay Minerals, Inc. 254,500 2,450,835Iluka Resources, Ltd. 1,620,965 14,094,678Mongolian Mining Corp. (I) 9,343,500 4,662,424New Gold, Inc. (I) 500,753 5,323,001Rio Tinto PLC 217,179 10,814,510Teck Resources, Ltd., Class B (L) 209,676 7,059,791Turquoise Hill Resources, Ltd. (I) 1,218,800 9,055,684Vedanta Resources PLC 310,033 5,328,181
Paper & Forest Products 0.0%
Sino-Forest Corp. (I) 1,073,800 1
Utilities 2.4% 18,355,993
Independent Power Producers & Energy Traders 2.4%
Calpine Corp. (I) 1,063,499 18,355,993
2
Natural Resources FundAs of 11-30-12 (Unaudited)
Shares Value
Warrants 0.3% $2,584,895(Cost $5,667,631)
NMDC, Ltd. (Expiration date: 3-25-15, Strike Price: INR 0.00001) (I) 863,890 2,584,895
Yield Shares Value
Securities Lending Collateral 5.4% $41,312,216(Cost $41,315,372)
John Hancock Collateral Investment Trust (W) 0.2768%(Y) 4,128,373 41,312,216
Shares Value
Short-Term Investments 4.0% $30,261,000(Cost $30,261,000)
Repurchase Agreement 4.0% 30,261,000Deutsche Bank Securities Tri-Party Repurchase Agreement dated 11-30-12 at 0.250%
to be repurchased at $8,500,177 on 12-3-12, collateralized by $7,788,938Government National Mortgage Association, 5.00% due 9-20-39 (valued at$8,670,000, including interest) 8,500,000 8,500,000
Repurchase Agreement with State Street Corp. dated 11-30-12 at 0.010% to berepurchased at $21,761,018 on 12-3-12, collateralized by $22,170,000 FederalNatioal Mortgage Association, 1.960% due 11-7-22 (valued at $22,197,757 includinginterest) 21,761,000 21,761,000
Total investments (Cost $829,811,112)† 105.6% $808,053,995
Other assets and liabilities, net (5.6%) ($42,591,546)
Copyright © 2013 www.secdatabase.com. All Rights Reserved.Please Consider the Environment Before Printing This Document
Total net assets 100.0% $765,462,449
The percentage shown for each investment category is the total value of the category as a percentage of the net assets of the Fund.ADR American Depositary ReceiptsGDR Global Depositary ReceiptINR Indian Rupee(I) Non-income producing security.(L) A portion of this security is on loan as of 11-30-12.(S) These securities are exempt from registration under Rule 144A of the Securities Act of 1933. Such securities may be resold, normally to qualified institutional buyers, in transactionsexempt from registration.(W) Investment is an affiliate of the Fund, the adviser and/or subadviser. This investment represents securities lending collateral received.(Y) The rate shown is the annualized seven-day yield as of 11-30-12.
3
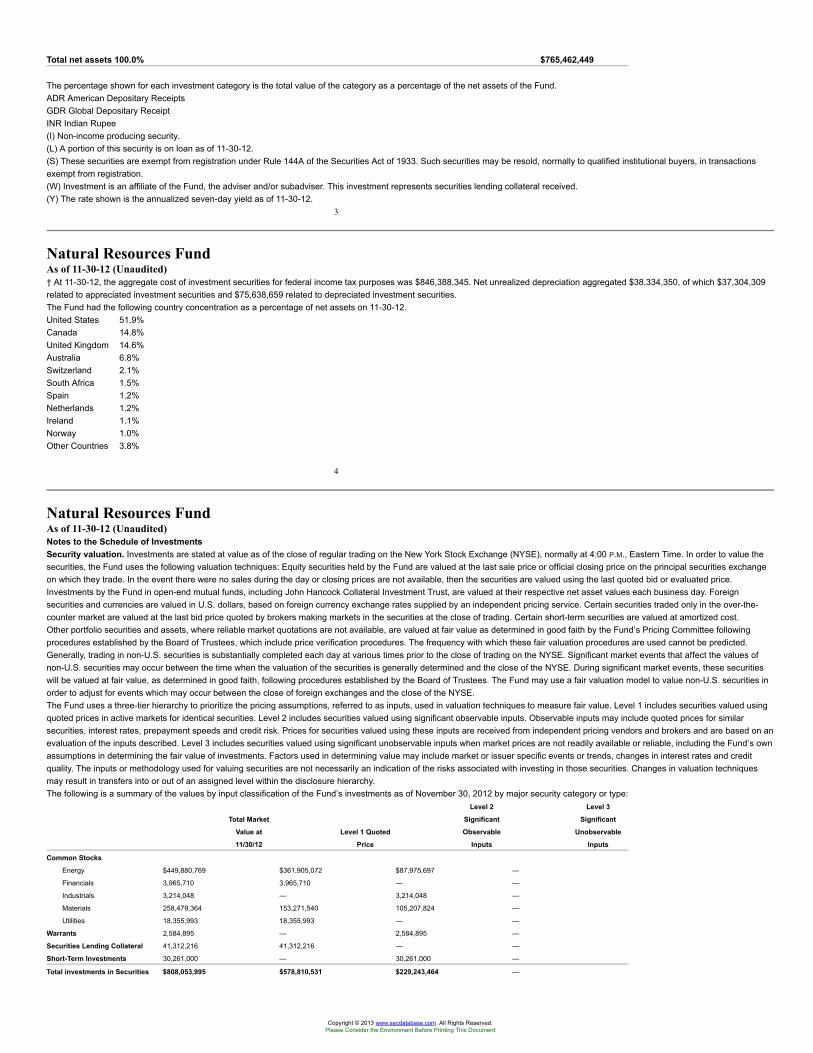
Natural Resources FundAs of 11-30-12 (Unaudited)† At 11-30-12, the aggregate cost of investment securities for federal income tax purposes was $846,388,345. Net unrealized depreciation aggregated $38,334,350, of which $37,304,309related to appreciated investment securities and $75,638,659 related to depreciated investment securities.The Fund had the following country concentration as a percentage of net assets on 11-30-12.United States 51.9%Canada 14.8%United Kingdom 14.6%Australia 6.8%Switzerland 2.1%South Africa 1.5%Spain 1.2%Netherlands 1.2%Ireland 1.1%Norway 1.0%Other Countries 3.8%
4
Natural Resources FundAs of 11-30-12 (Unaudited)Notes to the Schedule of InvestmentsSecurity valuation. Investments are stated at value as of the close of regular trading on the New York Stock Exchange (NYSE), normally at 4:00 P.M., Eastern Time. In order to value thesecurities, the Fund uses the following valuation techniques: Equity securities held by the Fund are valued at the last sale price or official closing price on the principal securities exchangeon which they trade. In the event there were no sales during the day or closing prices are not available, then the securities are valued using the last quoted bid or evaluated price.Investments by the Fund in open-end mutual funds, including John Hancock Collateral Investment Trust, are valued at their respective net asset values each business day. Foreignsecurities and currencies are valued in U.S. dollars, based on foreign currency exchange rates supplied by an independent pricing service. Certain securities traded only in the over-the-counter market are valued at the last bid price quoted by brokers making markets in the securities at the close of trading. Certain short-term securities are valued at amortized cost.Other portfolio securities and assets, where reliable market quotations are not available, are valued at fair value as determined in good faith by the Fund’s Pricing Committee followingprocedures established by the Board of Trustees, which include price verification procedures. The frequency with which these fair valuation procedures are used cannot be predicted.Generally, trading in non-U.S. securities is substantially completed each day at various times prior to the close of trading on the NYSE. Significant market events that affect the values ofnon-U.S. securities may occur between the time when the valuation of the securities is generally determined and the close of the NYSE. During significant market events, these securitieswill be valued at fair value, as determined in good faith, following procedures established by the Board of Trustees. The Fund may use a fair valuation model to value non-U.S. securities inorder to adjust for events which may occur between the close of foreign exchanges and the close of the NYSE.The Fund uses a three-tier hierarchy to prioritize the pricing assumptions, referred to as inputs, used in valuation techniques to measure fair value. Level 1 includes securities valued usingquoted prices in active markets for identical securities. Level 2 includes securities valued using significant observable inputs. Observable inputs may include quoted prices for similarsecurities, interest rates, prepayment speeds and credit risk. Prices for securities valued using these inputs are received from independent pricing vendors and brokers and are based on anevaluation of the inputs described. Level 3 includes securities valued using significant unobservable inputs when market prices are not readily available or reliable, including the Fund’s ownassumptions in determining the fair value of investments. Factors used in determining value may include market or issuer specific events or trends, changes in interest rates and creditquality. The inputs or methodology used for valuing securities are not necessarily an indication of the risks associated with investing in those securities. Changes in valuation techniquesmay result in transfers into or out of an assigned level within the disclosure hierarchy.The following is a summary of the values by input classification of the Fund’s investments as of November 30, 2012 by major security category or type:
Level 2 Level 3
Total Market Significant Significant
Value at Level 1 Quoted Observable Unobservable
11/30/12 Price Inputs Inputs
Common Stocks
Energy $449,880,769 $361,905,072 $87,975,697 —
Financials 3,965,710 3,965,710 — —
Industrials 3,214,048 — 3,214,048 —
Materials 258,479,364 153,271,540 105,207,824 —
Utilities 18,355,993 18,355,993 — —
Warrants 2,584,895 — 2,584,895 —
Securities Lending Collateral 41,312,216 41,312,216 — —
Short-Term Investments 30,261,000 — 30,261,000 —
Total investments in Securities $808,053,995 $578,810,531 $229,243,464 —
Copyright © 2013 www.secdatabase.com. All Rights Reserved.Please Consider the Environment Before Printing This Document
Repurchase agreements. The Fund may enter into repurchase agreements. When the Fund enters into a repurchase agreement, it receives collateral which is held in a segregatedaccount by the Fund’s custodian. The collateral amount is marked-to-market and monitored on a daily basis to ensure that the collateral held is in an amount not less than the principalamount of the repurchase agreement plus any accrued interest. In the event of a default by the counterparty, realization of the collateral proceeds could be delayed, during which
Natural Resources FundAs of 11-30-12 (Unaudited)time the collateral value may decline. Collateral for certain tri-party repurchase agreements is held at a third-party custodian bank in a segregated account for the benefit of the Fund.For additional information on the Fund's significant accounting policies, please refer to the Fund's most recent semiannual or annual shareholder report.
Copyright © 2013 www.secdatabase.com. All Rights Reserved.Please Consider the Environment Before Printing This Document
Strategic Income Opportunities FundAs of 11-30-12 (Unaudited)
Maturity Par value^
Rate (%) date Value
Corporate Bonds 44.2% $1,543,741,781(Cost $1,455,707,240)
Consumer Discretionary 7.9% 277,553,450
Auto Components 1.3%
Allison Transmission, Inc. (S) 7.125 05/15/19 8,000,000 8,520,000American Axle & Manufacturing, Inc. 6.625 10/15/22 10,415,000 10,571,225Hyva Global BV (S) 8.625 03/24/16 2,600,000 2,496,000Lear Corp. 8.125 03/15/20 3,186,000 3,560,355Tenneco, Inc. 6.875 12/15/20 2,545,000 2,739,056The Goodyear Tire & Rubber Company 7.000 05/15/22 15,480,000 16,524,900The Goodyear Tire & Rubber Company 8.750 08/15/20 1,905,000 2,152,650
Copyright © 2013 www.secdatabase.com. All Rights Reserved.Please Consider the Environment Before Printing This Document
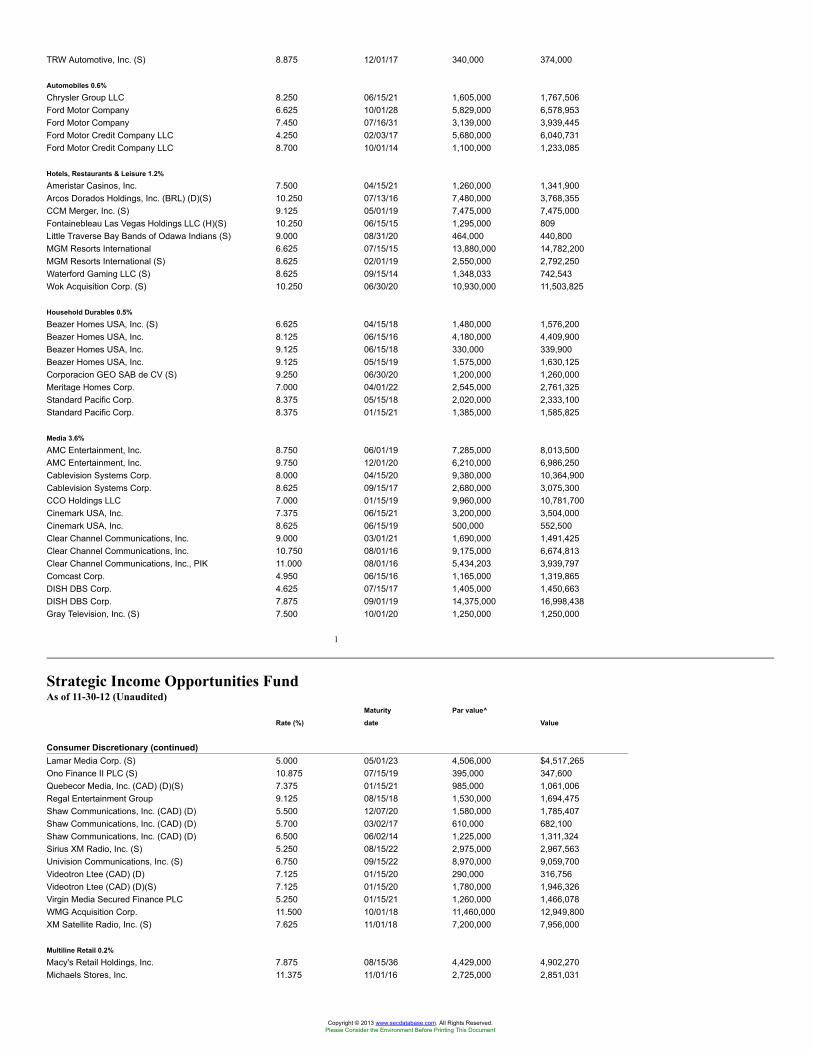
TRW Automotive, Inc. (S) 8.875 12/01/17 340,000 374,000
Automobiles 0.6%
Chrysler Group LLC 8.250 06/15/21 1,605,000 1,767,506Ford Motor Company 6.625 10/01/28 5,829,000 6,578,953Ford Motor Company 7.450 07/16/31 3,139,000 3,939,445Ford Motor Credit Company LLC 4.250 02/03/17 5,680,000 6,040,731Ford Motor Credit Company LLC 8.700 10/01/14 1,100,000 1,233,085
Hotels, Restaurants & Leisure 1.2%
Ameristar Casinos, Inc. 7.500 04/15/21 1,260,000 1,341,900Arcos Dorados Holdings, Inc. (BRL) (D)(S) 10.250 07/13/16 7,480,000 3,768,355CCM Merger, Inc. (S) 9.125 05/01/19 7,475,000 7,475,000Fontainebleau Las Vegas Holdings LLC (H)(S) 10.250 06/15/15 1,295,000 809Little Traverse Bay Bands of Odawa Indians (S) 9.000 08/31/20 464,000 440,800MGM Resorts International 6.625 07/15/15 13,880,000 14,782,200MGM Resorts International (S) 8.625 02/01/19 2,550,000 2,792,250Waterford Gaming LLC (S) 8.625 09/15/14 1,348,033 742,543Wok Acquisition Corp. (S) 10.250 06/30/20 10,930,000 11,503,825
Household Durables 0.5%
Beazer Homes USA, Inc. (S) 6.625 04/15/18 1,480,000 1,576,200Beazer Homes USA, Inc. 8.125 06/15/16 4,180,000 4,409,900Beazer Homes USA, Inc. 9.125 06/15/18 330,000 339,900Beazer Homes USA, Inc. 9.125 05/15/19 1,575,000 1,630,125Corporacion GEO SAB de CV (S) 9.250 06/30/20 1,200,000 1,260,000Meritage Homes Corp. 7.000 04/01/22 2,545,000 2,761,325Standard Pacific Corp. 8.375 05/15/18 2,020,000 2,333,100Standard Pacific Corp. 8.375 01/15/21 1,385,000 1,585,825
Media 3.6%
AMC Entertainment, Inc. 8.750 06/01/19 7,285,000 8,013,500AMC Entertainment, Inc. 9.750 12/01/20 6,210,000 6,986,250Cablevision Systems Corp. 8.000 04/15/20 9,380,000 10,364,900Cablevision Systems Corp. 8.625 09/15/17 2,680,000 3,075,300CCO Holdings LLC 7.000 01/15/19 9,960,000 10,781,700Cinemark USA, Inc. 7.375 06/15/21 3,200,000 3,504,000Cinemark USA, Inc. 8.625 06/15/19 500,000 552,500Clear Channel Communications, Inc. 9.000 03/01/21 1,690,000 1,491,425Clear Channel Communications, Inc. 10.750 08/01/16 9,175,000 6,674,813Clear Channel Communications, Inc., PIK 11.000 08/01/16 5,434,203 3,939,797Comcast Corp. 4.950 06/15/16 1,165,000 1,319,865DISH DBS Corp. 4.625 07/15/17 1,405,000 1,450,663DISH DBS Corp. 7.875 09/01/19 14,375,000 16,998,438Gray Television, Inc. (S) 7.500 10/01/20 1,250,000 1,250,000
1
Strategic Income Opportunities FundAs of 11-30-12 (Unaudited)
Maturity Par value^
Rate (%) date Value
Consumer Discretionary (continued)Lamar Media Corp. (S) 5.000 05/01/23 4,506,000 $4,517,265Ono Finance II PLC (S) 10.875 07/15/19 395,000 347,600Quebecor Media, Inc. (CAD) (D)(S) 7.375 01/15/21 985,000 1,061,006Regal Entertainment Group 9.125 08/15/18 1,530,000 1,694,475Shaw Communications, Inc. (CAD) (D) 5.500 12/07/20 1,580,000 1,785,407Shaw Communications, Inc. (CAD) (D) 5.700 03/02/17 610,000 682,100Shaw Communications, Inc. (CAD) (D) 6.500 06/02/14 1,225,000 1,311,324Sirius XM Radio, Inc. (S) 5.250 08/15/22 2,975,000 2,967,563Univision Communications, Inc. (S) 6.750 09/15/22 8,970,000 9,059,700Videotron Ltee (CAD) (D) 7.125 01/15/20 290,000 316,756Videotron Ltee (CAD) (D)(S) 7.125 01/15/20 1,780,000 1,946,326Virgin Media Secured Finance PLC 5.250 01/15/21 1,260,000 1,466,078WMG Acquisition Corp. 11.500 10/01/18 11,460,000 12,949,800XM Satellite Radio, Inc. (S) 7.625 11/01/18 7,200,000 7,956,000
Multiline Retail 0.2%
Macy's Retail Holdings, Inc. 7.875 08/15/36 4,429,000 4,902,270Michaels Stores, Inc. 11.375 11/01/16 2,725,000 2,851,031
Copyright © 2013 www.secdatabase.com. All Rights Reserved.Please Consider the Environment Before Printing This Document
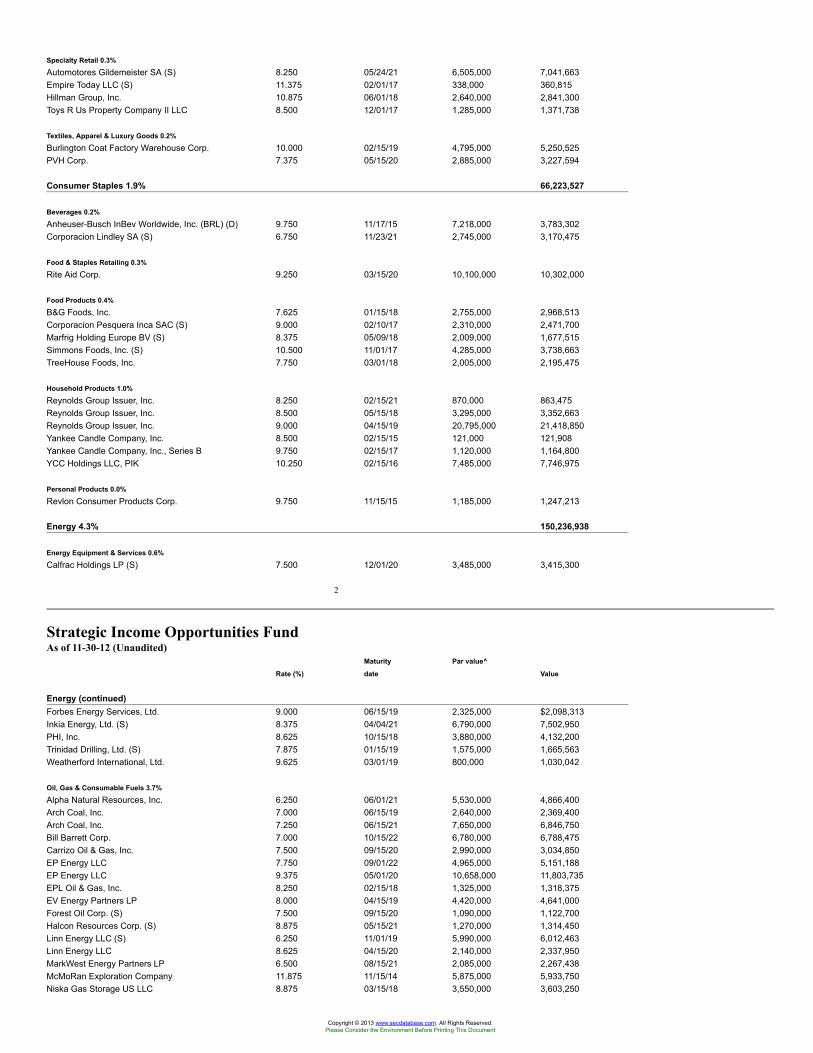
Specialty Retail 0.3%
Automotores Gildemeister SA (S) 8.250 05/24/21 6,505,000 7,041,663Empire Today LLC (S) 11.375 02/01/17 338,000 360,815Hillman Group, Inc. 10.875 06/01/18 2,640,000 2,841,300Toys R Us Property Company II LLC 8.500 12/01/17 1,285,000 1,371,738
Textiles, Apparel & Luxury Goods 0.2%
Burlington Coat Factory Warehouse Corp. 10.000 02/15/19 4,795,000 5,250,525PVH Corp. 7.375 05/15/20 2,885,000 3,227,594
Consumer Staples 1.9% 66,223,527
Beverages 0.2%
Anheuser-Busch InBev Worldwide, Inc. (BRL) (D) 9.750 11/17/15 7,218,000 3,783,302Corporacion Lindley SA (S) 6.750 11/23/21 2,745,000 3,170,475
Food & Staples Retailing 0.3%
Rite Aid Corp. 9.250 03/15/20 10,100,000 10,302,000
Food Products 0.4%
B&G Foods, Inc. 7.625 01/15/18 2,755,000 2,968,513Corporacion Pesquera Inca SAC (S) 9.000 02/10/17 2,310,000 2,471,700Marfrig Holding Europe BV (S) 8.375 05/09/18 2,009,000 1,677,515Simmons Foods, Inc. (S) 10.500 11/01/17 4,285,000 3,738,663TreeHouse Foods, Inc. 7.750 03/01/18 2,005,000 2,195,475
Household Products 1.0%
Reynolds Group Issuer, Inc. 8.250 02/15/21 870,000 863,475Reynolds Group Issuer, Inc. 8.500 05/15/18 3,295,000 3,352,663Reynolds Group Issuer, Inc. 9.000 04/15/19 20,795,000 21,418,850Yankee Candle Company, Inc. 8.500 02/15/15 121,000 121,908Yankee Candle Company, Inc., Series B 9.750 02/15/17 1,120,000 1,164,800YCC Holdings LLC, PIK 10.250 02/15/16 7,485,000 7,746,975
Personal Products 0.0%
Revlon Consumer Products Corp. 9.750 11/15/15 1,185,000 1,247,213
Energy 4.3% 150,236,938
Energy Equipment & Services 0.6%
Calfrac Holdings LP (S) 7.500 12/01/20 3,485,000 3,415,300
2
Strategic Income Opportunities FundAs of 11-30-12 (Unaudited)
Maturity Par value^
Rate (%) date Value
Energy (continued)Forbes Energy Services, Ltd. 9.000 06/15/19 2,325,000 $2,098,313Inkia Energy, Ltd. (S) 8.375 04/04/21 6,790,000 7,502,950PHI, Inc. 8.625 10/15/18 3,880,000 4,132,200Trinidad Drilling, Ltd. (S) 7.875 01/15/19 1,575,000 1,665,563Weatherford International, Ltd. 9.625 03/01/19 800,000 1,030,042
Oil, Gas & Consumable Fuels 3.7%
Alpha Natural Resources, Inc. 6.250 06/01/21 5,530,000 4,866,400Arch Coal, Inc. 7.000 06/15/19 2,640,000 2,369,400Arch Coal, Inc. 7.250 06/15/21 7,650,000 6,846,750Bill Barrett Corp. 7.000 10/15/22 6,780,000 6,788,475Carrizo Oil & Gas, Inc. 7.500 09/15/20 2,990,000 3,034,850EP Energy LLC 7.750 09/01/22 4,965,000 5,151,188EP Energy LLC 9.375 05/01/20 10,658,000 11,803,735EPL Oil & Gas, Inc. 8.250 02/15/18 1,325,000 1,318,375EV Energy Partners LP 8.000 04/15/19 4,420,000 4,641,000Forest Oil Corp. (S) 7.500 09/15/20 1,090,000 1,122,700Halcon Resources Corp. (S) 8.875 05/15/21 1,270,000 1,314,450Linn Energy LLC (S) 6.250 11/01/19 5,990,000 6,012,463Linn Energy LLC 8.625 04/15/20 2,140,000 2,337,950MarkWest Energy Partners LP 6.500 08/15/21 2,085,000 2,267,438McMoRan Exploration Company 11.875 11/15/14 5,875,000 5,933,750Niska Gas Storage US LLC 8.875 03/15/18 3,550,000 3,603,250
Copyright © 2013 www.secdatabase.com. All Rights Reserved.Please Consider the Environment Before Printing This Document
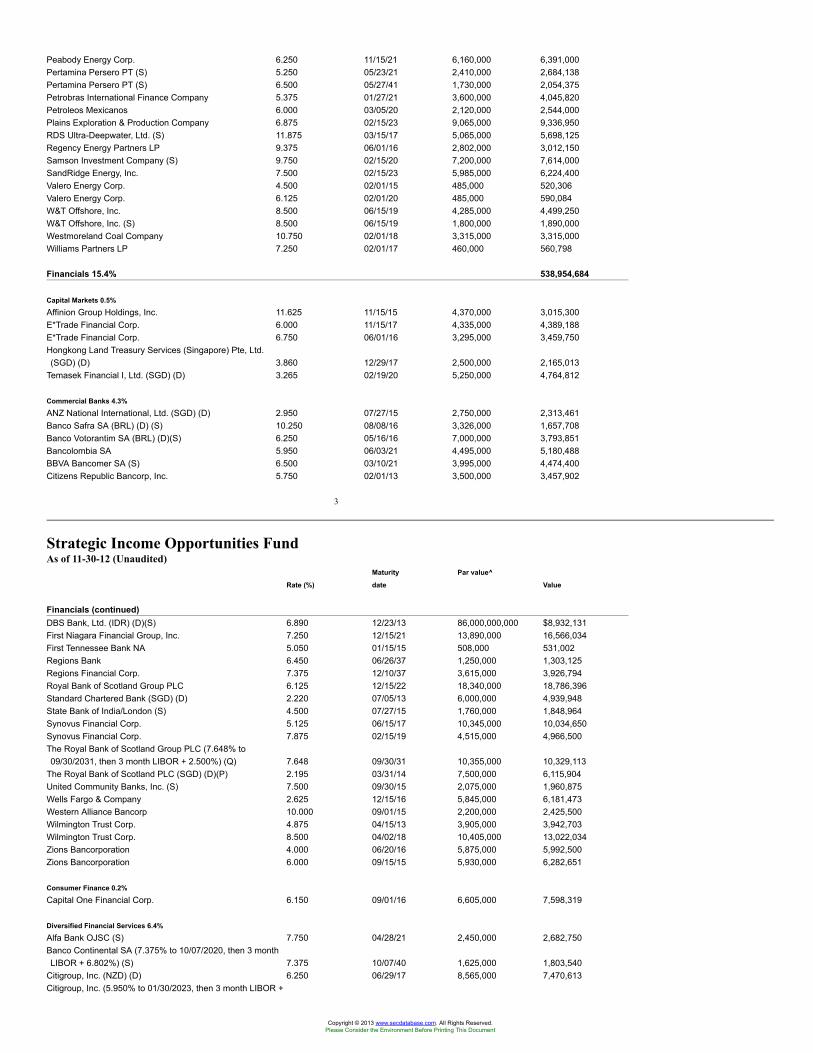
Peabody Energy Corp. 6.250 11/15/21 6,160,000 6,391,000Pertamina Persero PT (S) 5.250 05/23/21 2,410,000 2,684,138Pertamina Persero PT (S) 6.500 05/27/41 1,730,000 2,054,375Petrobras International Finance Company 5.375 01/27/21 3,600,000 4,045,820Petroleos Mexicanos 6.000 03/05/20 2,120,000 2,544,000Plains Exploration & Production Company 6.875 02/15/23 9,065,000 9,336,950RDS Ultra-Deepwater, Ltd. (S) 11.875 03/15/17 5,065,000 5,698,125Regency Energy Partners LP 9.375 06/01/16 2,802,000 3,012,150Samson Investment Company (S) 9.750 02/15/20 7,200,000 7,614,000SandRidge Energy, Inc. 7.500 02/15/23 5,985,000 6,224,400Valero Energy Corp. 4.500 02/01/15 485,000 520,306Valero Energy Corp. 6.125 02/01/20 485,000 590,084W&T Offshore, Inc. 8.500 06/15/19 4,285,000 4,499,250W&T Offshore, Inc. (S) 8.500 06/15/19 1,800,000 1,890,000Westmoreland Coal Company 10.750 02/01/18 3,315,000 3,315,000Williams Partners LP 7.250 02/01/17 460,000 560,798
Financials 15.4% 538,954,684
Capital Markets 0.5%
Affinion Group Holdings, Inc. 11.625 11/15/15 4,370,000 3,015,300E*Trade Financial Corp. 6.000 11/15/17 4,335,000 4,389,188E*Trade Financial Corp. 6.750 06/01/16 3,295,000 3,459,750Hongkong Land Treasury Services (Singapore) Pte, Ltd.(SGD) (D) 3.860 12/29/17 2,500,000 2,165,013
Temasek Financial I, Ltd. (SGD) (D) 3.265 02/19/20 5,250,000 4,764,812
Commercial Banks 4.3%
ANZ National International, Ltd. (SGD) (D) 2.950 07/27/15 2,750,000 2,313,461Banco Safra SA (BRL) (D) (S) 10.250 08/08/16 3,326,000 1,657,708Banco Votorantim SA (BRL) (D)(S) 6.250 05/16/16 7,000,000 3,793,851Bancolombia SA 5.950 06/03/21 4,495,000 5,180,488BBVA Bancomer SA (S) 6.500 03/10/21 3,995,000 4,474,400Citizens Republic Bancorp, Inc. 5.750 02/01/13 3,500,000 3,457,902
3
Strategic Income Opportunities FundAs of 11-30-12 (Unaudited)
Maturity Par value^
Rate (%) date Value
Financials (continued)DBS Bank, Ltd. (IDR) (D)(S) 6.890 12/23/13 86,000,000,000 $8,932,131First Niagara Financial Group, Inc. 7.250 12/15/21 13,890,000 16,566,034First Tennessee Bank NA 5.050 01/15/15 508,000 531,002Regions Bank 6.450 06/26/37 1,250,000 1,303,125Regions Financial Corp. 7.375 12/10/37 3,615,000 3,926,794Royal Bank of Scotland Group PLC 6.125 12/15/22 18,340,000 18,786,396Standard Chartered Bank (SGD) (D) 2.220 07/05/13 6,000,000 4,939,948State Bank of India/London (S) 4.500 07/27/15 1,760,000 1,848,964Synovus Financial Corp. 5.125 06/15/17 10,345,000 10,034,650Synovus Financial Corp. 7.875 02/15/19 4,515,000 4,966,500The Royal Bank of Scotland Group PLC (7.648% to09/30/2031, then 3 month LIBOR + 2.500%) (Q) 7.648 09/30/31 10,355,000 10,329,113
The Royal Bank of Scotland PLC (SGD) (D)(P) 2.195 03/31/14 7,500,000 6,115,904United Community Banks, Inc. (S) 7.500 09/30/15 2,075,000 1,960,875Wells Fargo & Company 2.625 12/15/16 5,845,000 6,181,473Western Alliance Bancorp 10.000 09/01/15 2,200,000 2,425,500Wilmington Trust Corp. 4.875 04/15/13 3,905,000 3,942,703Wilmington Trust Corp. 8.500 04/02/18 10,405,000 13,022,034Zions Bancorporation 4.000 06/20/16 5,875,000 5,992,500Zions Bancorporation 6.000 09/15/15 5,930,000 6,282,651
Consumer Finance 0.2%
Capital One Financial Corp. 6.150 09/01/16 6,605,000 7,598,319
Diversified Financial Services 6.4%
Alfa Bank OJSC (S) 7.750 04/28/21 2,450,000 2,682,750Banco Continental SA (7.375% to 10/07/2020, then 3 monthLIBOR + 6.802%) (S) 7.375 10/07/40 1,625,000 1,803,540
Citigroup, Inc. (NZD) (D) 6.250 06/29/17 8,565,000 7,470,613Citigroup, Inc. (5.950% to 01/30/2023, then 3 month LIBOR +
Copyright © 2013 www.secdatabase.com. All Rights Reserved.Please Consider the Environment Before Printing This Document
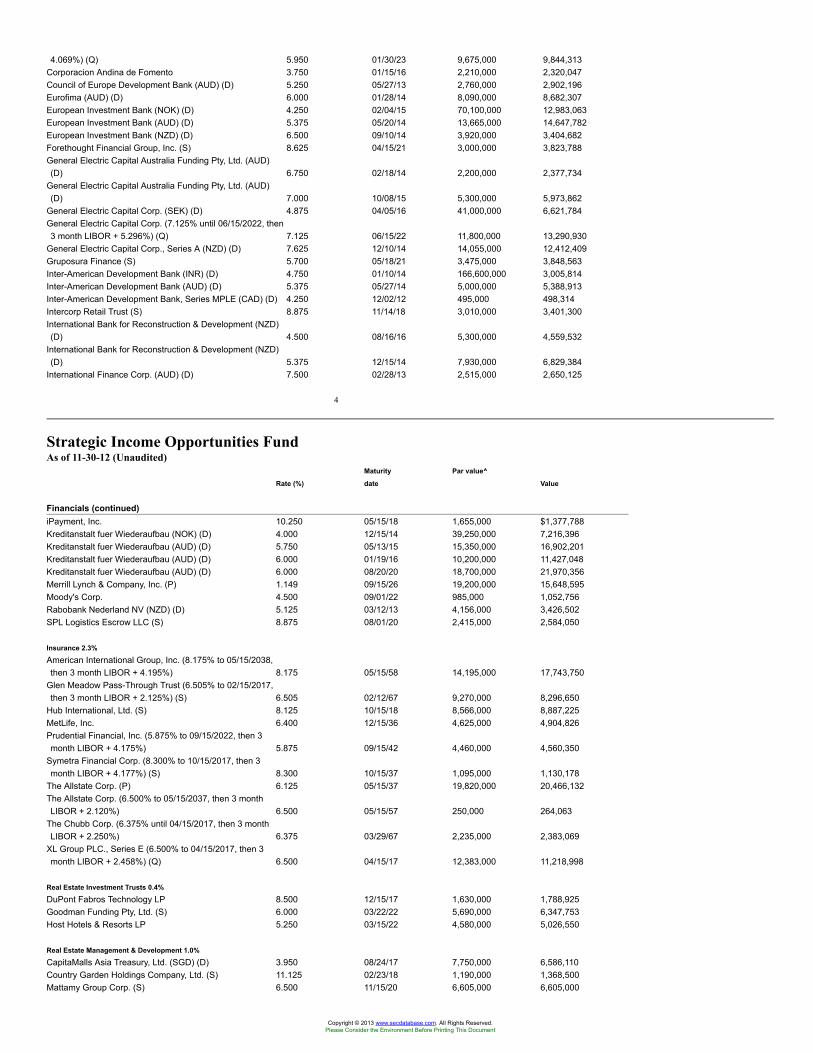
4.069%) (Q) 5.950 01/30/23 9,675,000 9,844,313Corporacion Andina de Fomento 3.750 01/15/16 2,210,000 2,320,047Council of Europe Development Bank (AUD) (D) 5.250 05/27/13 2,760,000 2,902,196Eurofima (AUD) (D) 6.000 01/28/14 8,090,000 8,682,307European Investment Bank (NOK) (D) 4.250 02/04/15 70,100,000 12,983,063European Investment Bank (AUD) (D) 5.375 05/20/14 13,665,000 14,647,782European Investment Bank (NZD) (D) 6.500 09/10/14 3,920,000 3,404,682Forethought Financial Group, Inc. (S) 8.625 04/15/21 3,000,000 3,823,788General Electric Capital Australia Funding Pty, Ltd. (AUD)(D) 6.750 02/18/14 2,200,000 2,377,734
General Electric Capital Australia Funding Pty, Ltd. (AUD)(D) 7.000 10/08/15 5,300,000 5,973,862
General Electric Capital Corp. (SEK) (D) 4.875 04/05/16 41,000,000 6,621,784General Electric Capital Corp. (7.125% until 06/15/2022, then3 month LIBOR + 5.296%) (Q) 7.125 06/15/22 11,800,000 13,290,930
General Electric Capital Corp., Series A (NZD) (D) 7.625 12/10/14 14,055,000 12,412,409Gruposura Finance (S) 5.700 05/18/21 3,475,000 3,848,563Inter-American Development Bank (INR) (D) 4.750 01/10/14 166,600,000 3,005,814Inter-American Development Bank (AUD) (D) 5.375 05/27/14 5,000,000 5,388,913Inter-American Development Bank, Series MPLE (CAD) (D) 4.250 12/02/12 495,000 498,314Intercorp Retail Trust (S) 8.875 11/14/18 3,010,000 3,401,300International Bank for Reconstruction & Development (NZD)(D) 4.500 08/16/16 5,300,000 4,559,532
International Bank for Reconstruction & Development (NZD)(D) 5.375 12/15/14 7,930,000 6,829,384
International Finance Corp. (AUD) (D) 7.500 02/28/13 2,515,000 2,650,125
4
Strategic Income Opportunities FundAs of 11-30-12 (Unaudited)
Maturity Par value^
Rate (%) date Value
Financials (continued)iPayment, Inc. 10.250 05/15/18 1,655,000 $1,377,788Kreditanstalt fuer Wiederaufbau (NOK) (D) 4.000 12/15/14 39,250,000 7,216,396Kreditanstalt fuer Wiederaufbau (AUD) (D) 5.750 05/13/15 15,350,000 16,902,201Kreditanstalt fuer Wiederaufbau (AUD) (D) 6.000 01/19/16 10,200,000 11,427,048Kreditanstalt fuer Wiederaufbau (AUD) (D) 6.000 08/20/20 18,700,000 21,970,356Merrill Lynch & Company, Inc. (P) 1.149 09/15/26 19,200,000 15,648,595Moody's Corp. 4.500 09/01/22 985,000 1,052,756Rabobank Nederland NV (NZD) (D) 5.125 03/12/13 4,156,000 3,426,502SPL Logistics Escrow LLC (S) 8.875 08/01/20 2,415,000 2,584,050
Insurance 2.3%
American International Group, Inc. (8.175% to 05/15/2038,then 3 month LIBOR + 4.195%) 8.175 05/15/58 14,195,000 17,743,750
Glen Meadow Pass-Through Trust (6.505% to 02/15/2017,then 3 month LIBOR + 2.125%) (S) 6.505 02/12/67 9,270,000 8,296,650
Hub International, Ltd. (S) 8.125 10/15/18 8,566,000 8,887,225MetLife, Inc. 6.400 12/15/36 4,625,000 4,904,826Prudential Financial, Inc. (5.875% to 09/15/2022, then 3month LIBOR + 4.175%) 5.875 09/15/42 4,460,000 4,560,350
Symetra Financial Corp. (8.300% to 10/15/2017, then 3month LIBOR + 4.177%) (S) 8.300 10/15/37 1,095,000 1,130,178
The Allstate Corp. (P) 6.125 05/15/37 19,820,000 20,466,132The Allstate Corp. (6.500% to 05/15/2037, then 3 monthLIBOR + 2.120%) 6.500 05/15/57 250,000 264,063
The Chubb Corp. (6.375% until 04/15/2017, then 3 monthLIBOR + 2.250%) 6.375 03/29/67 2,235,000 2,383,069
XL Group PLC., Series E (6.500% to 04/15/2017, then 3month LIBOR + 2.458%) (Q) 6.500 04/15/17 12,383,000 11,218,998
Real Estate Investment Trusts 0.4%
DuPont Fabros Technology LP 8.500 12/15/17 1,630,000 1,788,925Goodman Funding Pty, Ltd. (S) 6.000 03/22/22 5,690,000 6,347,753Host Hotels & Resorts LP 5.250 03/15/22 4,580,000 5,026,550
Real Estate Management & Development 1.0%
CapitaMalls Asia Treasury, Ltd. (SGD) (D) 3.950 08/24/17 7,750,000 6,586,110Country Garden Holdings Company, Ltd. (S) 11.125 02/23/18 1,190,000 1,368,500Mattamy Group Corp. (S) 6.500 11/15/20 6,605,000 6,605,000
Copyright © 2013 www.secdatabase.com. All Rights Reserved.Please Consider the Environment Before Printing This Document
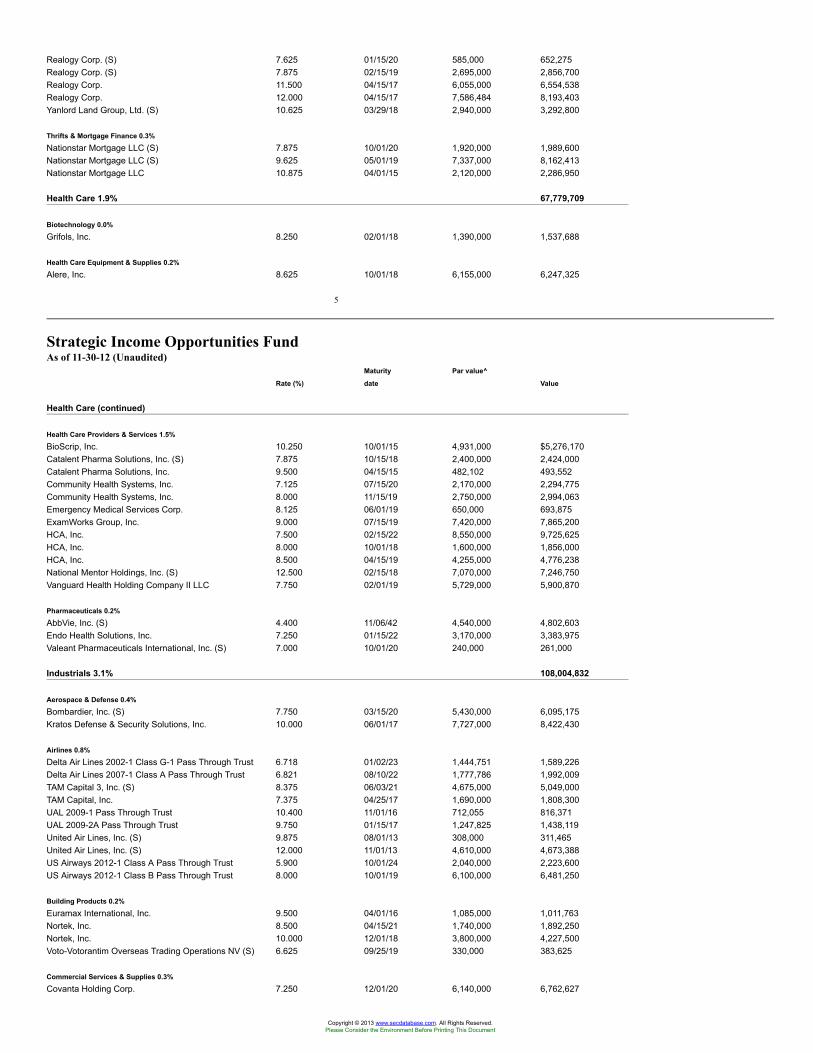
Realogy Corp. (S) 7.625 01/15/20 585,000 652,275Realogy Corp. (S) 7.875 02/15/19 2,695,000 2,856,700Realogy Corp. 11.500 04/15/17 6,055,000 6,554,538Realogy Corp. 12.000 04/15/17 7,586,484 8,193,403Yanlord Land Group, Ltd. (S) 10.625 03/29/18 2,940,000 3,292,800
Thrifts & Mortgage Finance 0.3%
Nationstar Mortgage LLC (S) 7.875 10/01/20 1,920,000 1,989,600Nationstar Mortgage LLC (S) 9.625 05/01/19 7,337,000 8,162,413Nationstar Mortgage LLC 10.875 04/01/15 2,120,000 2,286,950
Health Care 1.9% 67,779,709
Biotechnology 0.0%
Grifols, Inc. 8.250 02/01/18 1,390,000 1,537,688
Health Care Equipment & Supplies 0.2%
Alere, Inc. 8.625 10/01/18 6,155,000 6,247,325
5
Strategic Income Opportunities FundAs of 11-30-12 (Unaudited)
Maturity Par value^
Rate (%) date Value
Health Care (continued)
Health Care Providers & Services 1.5%
BioScrip, Inc. 10.250 10/01/15 4,931,000 $5,276,170Catalent Pharma Solutions, Inc. (S) 7.875 10/15/18 2,400,000 2,424,000Catalent Pharma Solutions, Inc. 9.500 04/15/15 482,102 493,552Community Health Systems, Inc. 7.125 07/15/20 2,170,000 2,294,775Community Health Systems, Inc. 8.000 11/15/19 2,750,000 2,994,063Emergency Medical Services Corp. 8.125 06/01/19 650,000 693,875ExamWorks Group, Inc. 9.000 07/15/19 7,420,000 7,865,200HCA, Inc. 7.500 02/15/22 8,550,000 9,725,625HCA, Inc. 8.000 10/01/18 1,600,000 1,856,000HCA, Inc. 8.500 04/15/19 4,255,000 4,776,238National Mentor Holdings, Inc. (S) 12.500 02/15/18 7,070,000 7,246,750Vanguard Health Holding Company II LLC 7.750 02/01/19 5,729,000 5,900,870
Pharmaceuticals 0.2%
AbbVie, Inc. (S) 4.400 11/06/42 4,540,000 4,802,603Endo Health Solutions, Inc. 7.250 01/15/22 3,170,000 3,383,975Valeant Pharmaceuticals International, Inc. (S) 7.000 10/01/20 240,000 261,000
Industrials 3.1% 108,004,832
Aerospace & Defense 0.4%
Bombardier, Inc. (S) 7.750 03/15/20 5,430,000 6,095,175Kratos Defense & Security Solutions, Inc. 10.000 06/01/17 7,727,000 8,422,430
Airlines 0.8%
Delta Air Lines 2002-1 Class G-1 Pass Through Trust 6.718 01/02/23 1,444,751 1,589,226Delta Air Lines 2007-1 Class A Pass Through Trust 6.821 08/10/22 1,777,786 1,992,009TAM Capital 3, Inc. (S) 8.375 06/03/21 4,675,000 5,049,000TAM Capital, Inc. 7.375 04/25/17 1,690,000 1,808,300UAL 2009-1 Pass Through Trust 10.400 11/01/16 712,055 816,371UAL 2009-2A Pass Through Trust 9.750 01/15/17 1,247,825 1,438,119United Air Lines, Inc. (S) 9.875 08/01/13 308,000 311,465United Air Lines, Inc. (S) 12.000 11/01/13 4,610,000 4,673,388US Airways 2012-1 Class A Pass Through Trust 5.900 10/01/24 2,040,000 2,223,600US Airways 2012-1 Class B Pass Through Trust 8.000 10/01/19 6,100,000 6,481,250
Building Products 0.2%
Euramax International, Inc. 9.500 04/01/16 1,085,000 1,011,763Nortek, Inc. 8.500 04/15/21 1,740,000 1,892,250Nortek, Inc. 10.000 12/01/18 3,800,000 4,227,500Voto-Votorantim Overseas Trading Operations NV (S) 6.625 09/25/19 330,000 383,625
Commercial Services & Supplies 0.3%
Covanta Holding Corp. 7.250 12/01/20 6,140,000 6,762,627
Copyright © 2013 www.secdatabase.com. All Rights Reserved.Please Consider the Environment Before Printing This Document
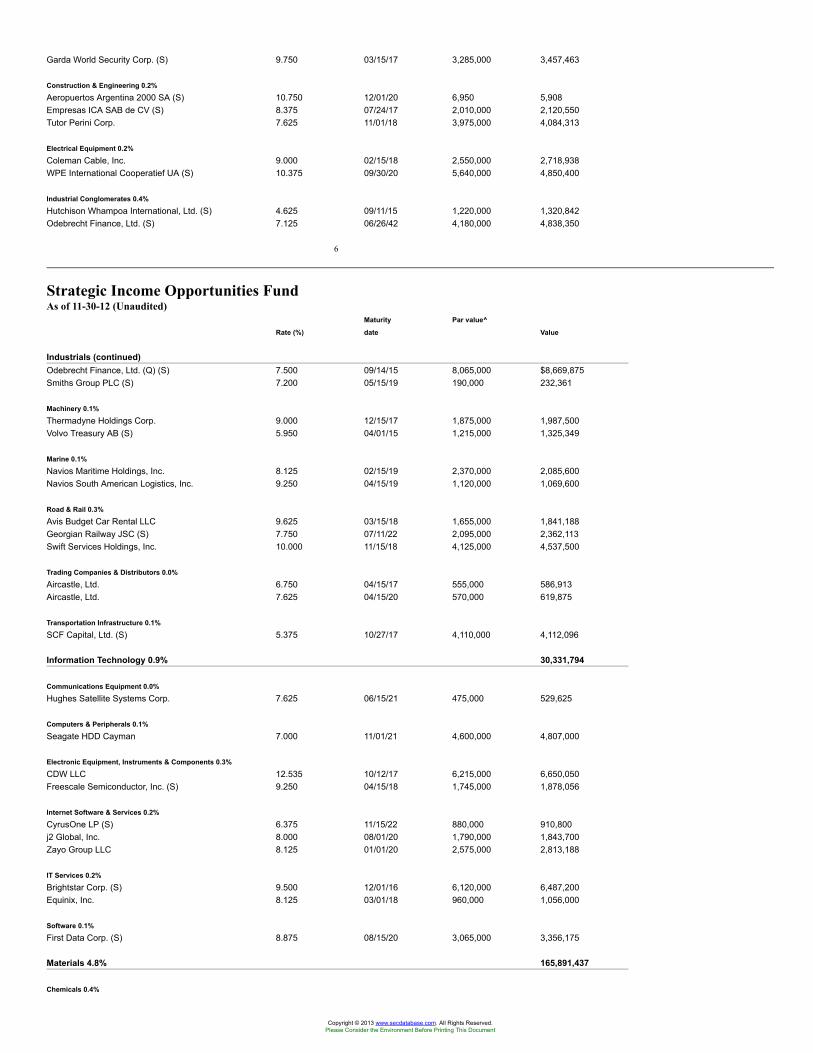
Garda World Security Corp. (S) 9.750 03/15/17 3,285,000 3,457,463
Construction & Engineering 0.2%
Aeropuertos Argentina 2000 SA (S) 10.750 12/01/20 6,950 5,908Empresas ICA SAB de CV (S) 8.375 07/24/17 2,010,000 2,120,550Tutor Perini Corp. 7.625 11/01/18 3,975,000 4,084,313
Electrical Equipment 0.2%
Coleman Cable, Inc. 9.000 02/15/18 2,550,000 2,718,938WPE International Cooperatief UA (S) 10.375 09/30/20 5,640,000 4,850,400
Industrial Conglomerates 0.4%
Hutchison Whampoa International, Ltd. (S) 4.625 09/11/15 1,220,000 1,320,842Odebrecht Finance, Ltd. (S) 7.125 06/26/42 4,180,000 4,838,350
6
Strategic Income Opportunities FundAs of 11-30-12 (Unaudited)
Maturity Par value^
Rate (%) date Value
Industrials (continued)Odebrecht Finance, Ltd. (Q) (S) 7.500 09/14/15 8,065,000 $8,669,875Smiths Group PLC (S) 7.200 05/15/19 190,000 232,361
Machinery 0.1%
Thermadyne Holdings Corp. 9.000 12/15/17 1,875,000 1,987,500Volvo Treasury AB (S) 5.950 04/01/15 1,215,000 1,325,349
Marine 0.1%
Navios Maritime Holdings, Inc. 8.125 02/15/19 2,370,000 2,085,600Navios South American Logistics, Inc. 9.250 04/15/19 1,120,000 1,069,600
Road & Rail 0.3%
Avis Budget Car Rental LLC 9.625 03/15/18 1,655,000 1,841,188Georgian Railway JSC (S) 7.750 07/11/22 2,095,000 2,362,113Swift Services Holdings, Inc. 10.000 11/15/18 4,125,000 4,537,500
Trading Companies & Distributors 0.0%
Aircastle, Ltd. 6.750 04/15/17 555,000 586,913Aircastle, Ltd. 7.625 04/15/20 570,000 619,875
Transportation Infrastructure 0.1%
SCF Capital, Ltd. (S) 5.375 10/27/17 4,110,000 4,112,096
Information Technology 0.9% 30,331,794
Communications Equipment 0.0%
Hughes Satellite Systems Corp. 7.625 06/15/21 475,000 529,625
Computers & Peripherals 0.1%
Seagate HDD Cayman 7.000 11/01/21 4,600,000 4,807,000
Electronic Equipment, Instruments & Components 0.3%
CDW LLC 12.535 10/12/17 6,215,000 6,650,050Freescale Semiconductor, Inc. (S) 9.250 04/15/18 1,745,000 1,878,056
Internet Software & Services 0.2%
CyrusOne LP (S) 6.375 11/15/22 880,000 910,800j2 Global, Inc. 8.000 08/01/20 1,790,000 1,843,700Zayo Group LLC 8.125 01/01/20 2,575,000 2,813,188
IT Services 0.2%
Brightstar Corp. (S) 9.500 12/01/16 6,120,000 6,487,200Equinix, Inc. 8.125 03/01/18 960,000 1,056,000
Software 0.1%
First Data Corp. (S) 8.875 08/15/20 3,065,000 3,356,175
Materials 4.8% 165,891,437
Chemicals 0.4%
Copyright © 2013 www.secdatabase.com. All Rights Reserved.Please Consider the Environment Before Printing This Document
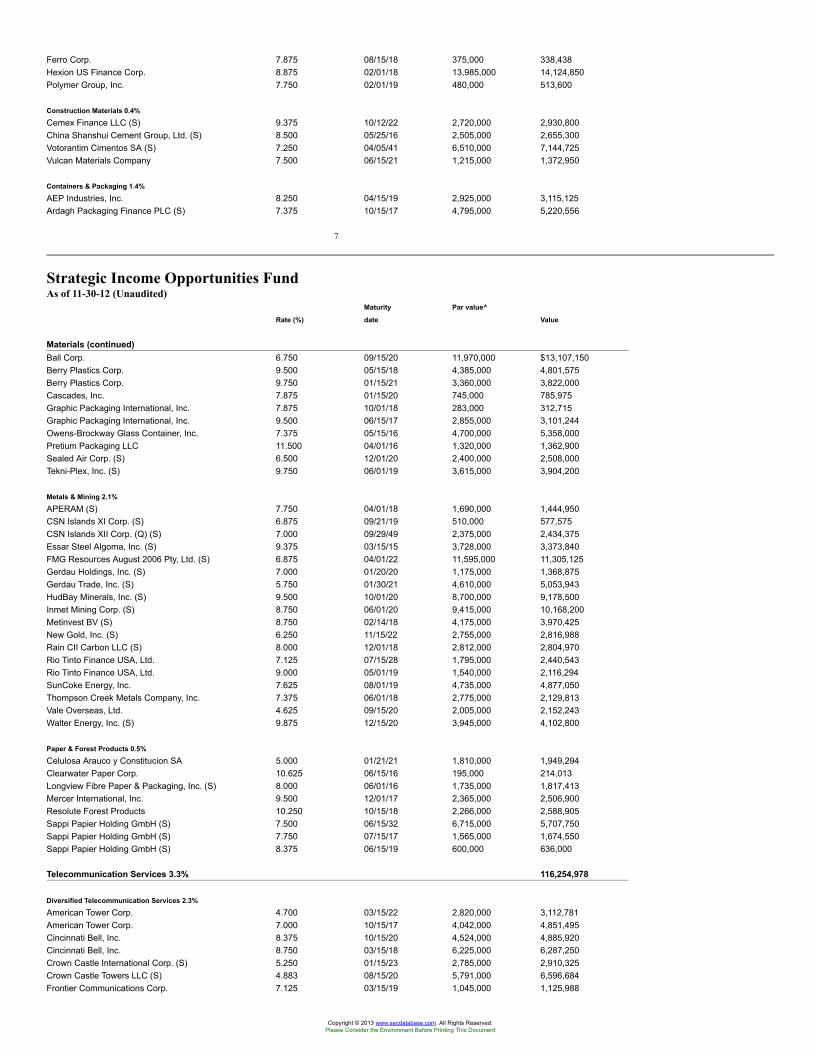
Ferro Corp. 7.875 08/15/18 375,000 338,438Hexion US Finance Corp. 8.875 02/01/18 13,985,000 14,124,850Polymer Group, Inc. 7.750 02/01/19 480,000 513,600
Construction Materials 0.4%
Cemex Finance LLC (S) 9.375 10/12/22 2,720,000 2,930,800China Shanshui Cement Group, Ltd. (S) 8.500 05/25/16 2,505,000 2,655,300Votorantim Cimentos SA (S) 7.250 04/05/41 6,510,000 7,144,725Vulcan Materials Company 7.500 06/15/21 1,215,000 1,372,950
Containers & Packaging 1.4%
AEP Industries, Inc. 8.250 04/15/19 2,925,000 3,115,125Ardagh Packaging Finance PLC (S) 7.375 10/15/17 4,795,000 5,220,556
7
Strategic Income Opportunities FundAs of 11-30-12 (Unaudited)
Maturity Par value^
Rate (%) date Value
Materials (continued)Ball Corp. 6.750 09/15/20 11,970,000 $13,107,150Berry Plastics Corp. 9.500 05/15/18 4,385,000 4,801,575Berry Plastics Corp. 9.750 01/15/21 3,360,000 3,822,000Cascades, Inc. 7.875 01/15/20 745,000 785,975Graphic Packaging International, Inc. 7.875 10/01/18 283,000 312,715Graphic Packaging International, Inc. 9.500 06/15/17 2,855,000 3,101,244Owens-Brockway Glass Container, Inc. 7.375 05/15/16 4,700,000 5,358,000Pretium Packaging LLC 11.500 04/01/16 1,320,000 1,362,900Sealed Air Corp. (S) 6.500 12/01/20 2,400,000 2,508,000Tekni-Plex, Inc. (S) 9.750 06/01/19 3,615,000 3,904,200
Metals & Mining 2.1%
APERAM (S) 7.750 04/01/18 1,690,000 1,444,950CSN Islands XI Corp. (S) 6.875 09/21/19 510,000 577,575CSN Islands XII Corp. (Q) (S) 7.000 09/29/49 2,375,000 2,434,375Essar Steel Algoma, Inc. (S) 9.375 03/15/15 3,728,000 3,373,840FMG Resources August 2006 Pty, Ltd. (S) 6.875 04/01/22 11,595,000 11,305,125Gerdau Holdings, Inc. (S) 7.000 01/20/20 1,175,000 1,368,875Gerdau Trade, Inc. (S) 5.750 01/30/21 4,610,000 5,053,943HudBay Minerals, Inc. (S) 9.500 10/01/20 8,700,000 9,178,500Inmet Mining Corp. (S) 8.750 06/01/20 9,415,000 10,168,200Metinvest BV (S) 8.750 02/14/18 4,175,000 3,970,425New Gold, Inc. (S) 6.250 11/15/22 2,755,000 2,816,988Rain CII Carbon LLC (S) 8.000 12/01/18 2,812,000 2,804,970Rio Tinto Finance USA, Ltd. 7.125 07/15/28 1,795,000 2,440,543Rio Tinto Finance USA, Ltd. 9.000 05/01/19 1,540,000 2,116,294SunCoke Energy, Inc. 7.625 08/01/19 4,735,000 4,877,050Thompson Creek Metals Company, Inc. 7.375 06/01/18 2,775,000 2,129,813Vale Overseas, Ltd. 4.625 09/15/20 2,005,000 2,152,243Walter Energy, Inc. (S) 9.875 12/15/20 3,945,000 4,102,800
Paper & Forest Products 0.5%
Celulosa Arauco y Constitucion SA 5.000 01/21/21 1,810,000 1,949,294Clearwater Paper Corp. 10.625 06/15/16 195,000 214,013Longview Fibre Paper & Packaging, Inc. (S) 8.000 06/01/16 1,735,000 1,817,413Mercer International, Inc. 9.500 12/01/17 2,365,000 2,506,900Resolute Forest Products 10.250 10/15/18 2,266,000 2,588,905Sappi Papier Holding GmbH (S) 7.500 06/15/32 6,715,000 5,707,750Sappi Papier Holding GmbH (S) 7.750 07/15/17 1,565,000 1,674,550Sappi Papier Holding GmbH (S) 8.375 06/15/19 600,000 636,000
Telecommunication Services 3.3% 116,254,978
Diversified Telecommunication Services 2.3%
American Tower Corp. 4.700 03/15/22 2,820,000 3,112,781American Tower Corp. 7.000 10/15/17 4,042,000 4,851,495Cincinnati Bell, Inc. 8.375 10/15/20 4,524,000 4,885,920Cincinnati Bell, Inc. 8.750 03/15/18 6,225,000 6,287,250Crown Castle International Corp. (S) 5.250 01/15/23 2,785,000 2,910,325Crown Castle Towers LLC (S) 4.883 08/15/20 5,791,000 6,596,684Frontier Communications Corp. 7.125 03/15/19 1,045,000 1,125,988
Copyright © 2013 www.secdatabase.com. All Rights Reserved.Please Consider the Environment Before Printing This Document
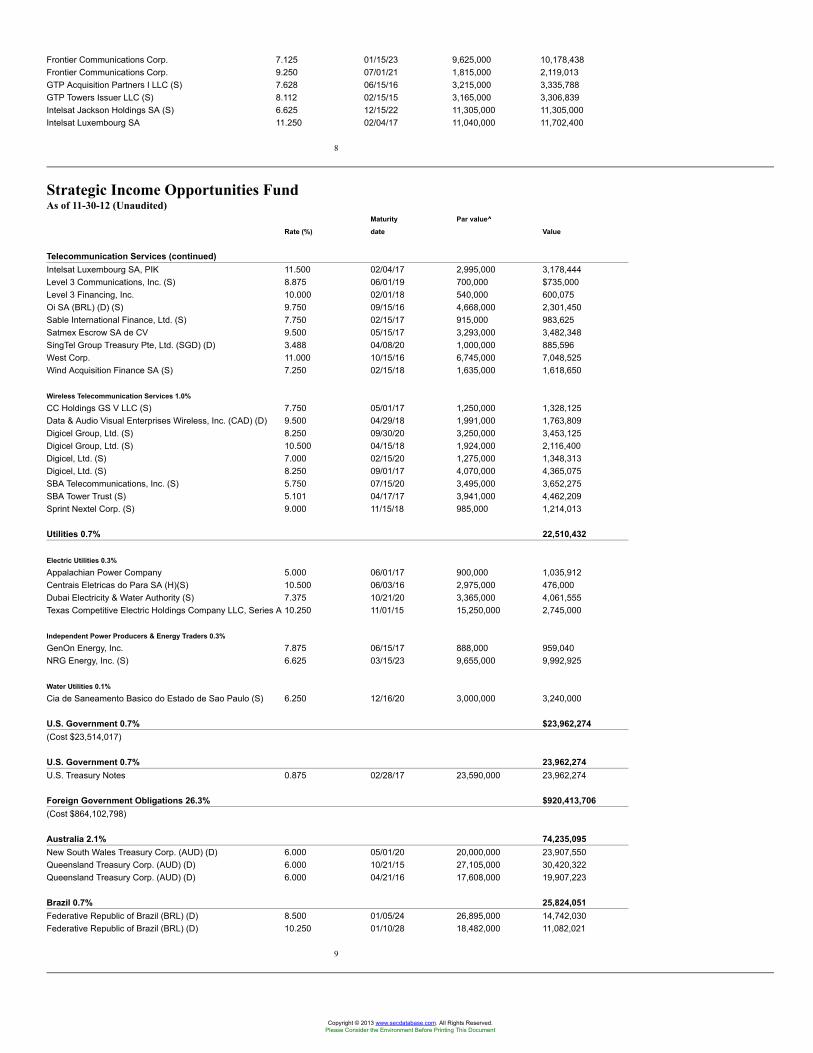
Frontier Communications Corp. 7.125 01/15/23 9,625,000 10,178,438Frontier Communications Corp. 9.250 07/01/21 1,815,000 2,119,013GTP Acquisition Partners I LLC (S) 7.628 06/15/16 3,215,000 3,335,788GTP Towers Issuer LLC (S) 8.112 02/15/15 3,165,000 3,306,839Intelsat Jackson Holdings SA (S) 6.625 12/15/22 11,305,000 11,305,000Intelsat Luxembourg SA 11.250 02/04/17 11,040,000 11,702,400
8
Strategic Income Opportunities FundAs of 11-30-12 (Unaudited)
Maturity Par value^
Rate (%) date Value
Telecommunication Services (continued)Intelsat Luxembourg SA, PIK 11.500 02/04/17 2,995,000 3,178,444Level 3 Communications, Inc. (S) 8.875 06/01/19 700,000 $735,000Level 3 Financing, Inc. 10.000 02/01/18 540,000 600,075Oi SA (BRL) (D) (S) 9.750 09/15/16 4,668,000 2,301,450Sable International Finance, Ltd. (S) 7.750 02/15/17 915,000 983,625Satmex Escrow SA de CV 9.500 05/15/17 3,293,000 3,482,348SingTel Group Treasury Pte, Ltd. (SGD) (D) 3.488 04/08/20 1,000,000 885,596West Corp. 11.000 10/15/16 6,745,000 7,048,525Wind Acquisition Finance SA (S) 7.250 02/15/18 1,635,000 1,618,650
Wireless Telecommunication Services 1.0%
CC Holdings GS V LLC (S) 7.750 05/01/17 1,250,000 1,328,125Data & Audio Visual Enterprises Wireless, Inc. (CAD) (D) 9.500 04/29/18 1,991,000 1,763,809Digicel Group, Ltd. (S) 8.250 09/30/20 3,250,000 3,453,125Digicel Group, Ltd. (S) 10.500 04/15/18 1,924,000 2,116,400Digicel, Ltd. (S) 7.000 02/15/20 1,275,000 1,348,313Digicel, Ltd. (S) 8.250 09/01/17 4,070,000 4,365,075SBA Telecommunications, Inc. (S) 5.750 07/15/20 3,495,000 3,652,275SBA Tower Trust (S) 5.101 04/17/17 3,941,000 4,462,209Sprint Nextel Corp. (S) 9.000 11/15/18 985,000 1,214,013
Utilities 0.7% 22,510,432
Electric Utilities 0.3%
Appalachian Power Company 5.000 06/01/17 900,000 1,035,912Centrais Eletricas do Para SA (H)(S) 10.500 06/03/16 2,975,000 476,000Dubai Electricity & Water Authority (S) 7.375 10/21/20 3,365,000 4,061,555Texas Competitive Electric Holdings Company LLC, Series A 10.250 11/01/15 15,250,000 2,745,000
Independent Power Producers & Energy Traders 0.3%
GenOn Energy, Inc. 7.875 06/15/17 888,000 959,040NRG Energy, Inc. (S) 6.625 03/15/23 9,655,000 9,992,925
Water Utilities 0.1%
Cia de Saneamento Basico do Estado de Sao Paulo (S) 6.250 12/16/20 3,000,000 3,240,000
U.S. Government 0.7% $23,962,274(Cost $23,514,017)
U.S. Government 0.7% 23,962,274U.S. Treasury Notes 0.875 02/28/17 23,590,000 23,962,274
Foreign Government Obligations 26.3% $920,413,706(Cost $864,102,798)
Australia 2.1% 74,235,095New South Wales Treasury Corp. (AUD) (D) 6.000 05/01/20 20,000,000 23,907,550Queensland Treasury Corp. (AUD) (D) 6.000 10/21/15 27,105,000 30,420,322Queensland Treasury Corp. (AUD) (D) 6.000 04/21/16 17,608,000 19,907,223
Brazil 0.7% 25,824,051Federative Republic of Brazil (BRL) (D) 8.500 01/05/24 26,895,000 14,742,030Federative Republic of Brazil (BRL) (D) 10.250 01/10/28 18,482,000 11,082,021
9
Copyright © 2013 www.secdatabase.com. All Rights Reserved.Please Consider the Environment Before Printing This Document
Strategic Income Opportunities FundAs of 11-30-12 (Unaudited)
Maturity Par value^
Rate (%) date Value
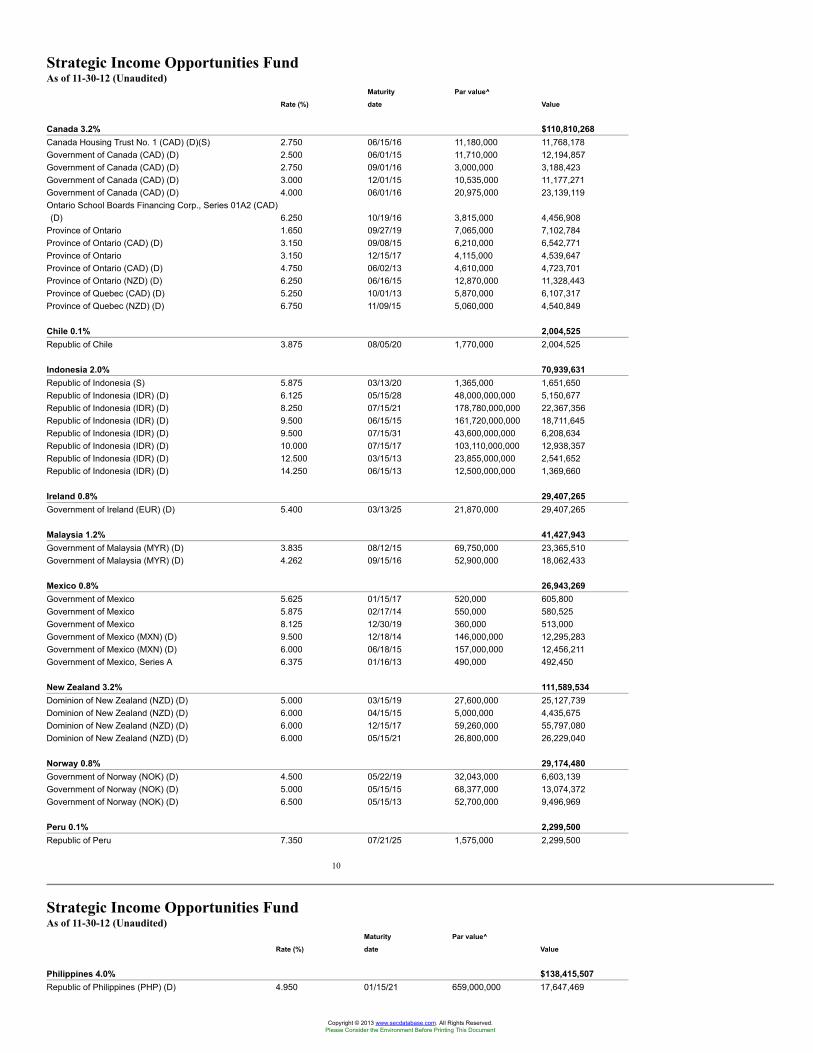
Canada 3.2% $110,810,268Canada Housing Trust No. 1 (CAD) (D)(S) 2.750 06/15/16 11,180,000 11,768,178Government of Canada (CAD) (D) 2.500 06/01/15 11,710,000 12,194,857Government of Canada (CAD) (D) 2.750 09/01/16 3,000,000 3,188,423Government of Canada (CAD) (D) 3.000 12/01/15 10,535,000 11,177,271Government of Canada (CAD) (D) 4.000 06/01/16 20,975,000 23,139,119Ontario School Boards Financing Corp., Series 01A2 (CAD)(D) 6.250 10/19/16 3,815,000 4,456,908
Province of Ontario 1.650 09/27/19 7,065,000 7,102,784Province of Ontario (CAD) (D) 3.150 09/08/15 6,210,000 6,542,771Province of Ontario 3.150 12/15/17 4,115,000 4,539,647Province of Ontario (CAD) (D) 4.750 06/02/13 4,610,000 4,723,701Province of Ontario (NZD) (D) 6.250 06/16/15 12,870,000 11,328,443Province of Quebec (CAD) (D) 5.250 10/01/13 5,870,000 6,107,317Province of Quebec (NZD) (D) 6.750 11/09/15 5,060,000 4,540,849
Chile 0.1% 2,004,525Republic of Chile 3.875 08/05/20 1,770,000 2,004,525
Indonesia 2.0% 70,939,631Republic of Indonesia (S) 5.875 03/13/20 1,365,000 1,651,650Republic of Indonesia (IDR) (D) 6.125 05/15/28 48,000,000,000 5,150,677Republic of Indonesia (IDR) (D) 8.250 07/15/21 178,780,000,000 22,367,356Republic of Indonesia (IDR) (D) 9.500 06/15/15 161,720,000,000 18,711,645Republic of Indonesia (IDR) (D) 9.500 07/15/31 43,600,000,000 6,208,634Republic of Indonesia (IDR) (D) 10.000 07/15/17 103,110,000,000 12,938,357Republic of Indonesia (IDR) (D) 12.500 03/15/13 23,855,000,000 2,541,652Republic of Indonesia (IDR) (D) 14.250 06/15/13 12,500,000,000 1,369,660
Ireland 0.8% 29,407,265Government of Ireland (EUR) (D) 5.400 03/13/25 21,870,000 29,407,265
Malaysia 1.2% 41,427,943Government of Malaysia (MYR) (D) 3.835 08/12/15 69,750,000 23,365,510Government of Malaysia (MYR) (D) 4.262 09/15/16 52,900,000 18,062,433
Mexico 0.8% 26,943,269Government of Mexico 5.625 01/15/17 520,000 605,800Government of Mexico 5.875 02/17/14 550,000 580,525Government of Mexico 8.125 12/30/19 360,000 513,000Government of Mexico (MXN) (D) 9.500 12/18/14 146,000,000 12,295,283Government of Mexico (MXN) (D) 6.000 06/18/15 157,000,000 12,456,211Government of Mexico, Series A 6.375 01/16/13 490,000 492,450
New Zealand 3.2% 111,589,534Dominion of New Zealand (NZD) (D) 5.000 03/15/19 27,600,000 25,127,739Dominion of New Zealand (NZD) (D) 6.000 04/15/15 5,000,000 4,435,675Dominion of New Zealand (NZD) (D) 6.000 12/15/17 59,260,000 55,797,080Dominion of New Zealand (NZD) (D) 6.000 05/15/21 26,800,000 26,229,040
Norway 0.8% 29,174,480Government of Norway (NOK) (D) 4.500 05/22/19 32,043,000 6,603,139Government of Norway (NOK) (D) 5.000 05/15/15 68,377,000 13,074,372Government of Norway (NOK) (D) 6.500 05/15/13 52,700,000 9,496,969
Peru 0.1% 2,299,500Republic of Peru 7.350 07/21/25 1,575,000 2,299,500
10
Strategic Income Opportunities FundAs of 11-30-12 (Unaudited)
Maturity Par value^
Rate (%) date Value
Philippines 4.0% $138,415,507Republic of Philippines (PHP) (D) 4.950 01/15/21 659,000,000 17,647,469
Copyright © 2013 www.secdatabase.com. All Rights Reserved.Please Consider the Environment Before Printing This Document
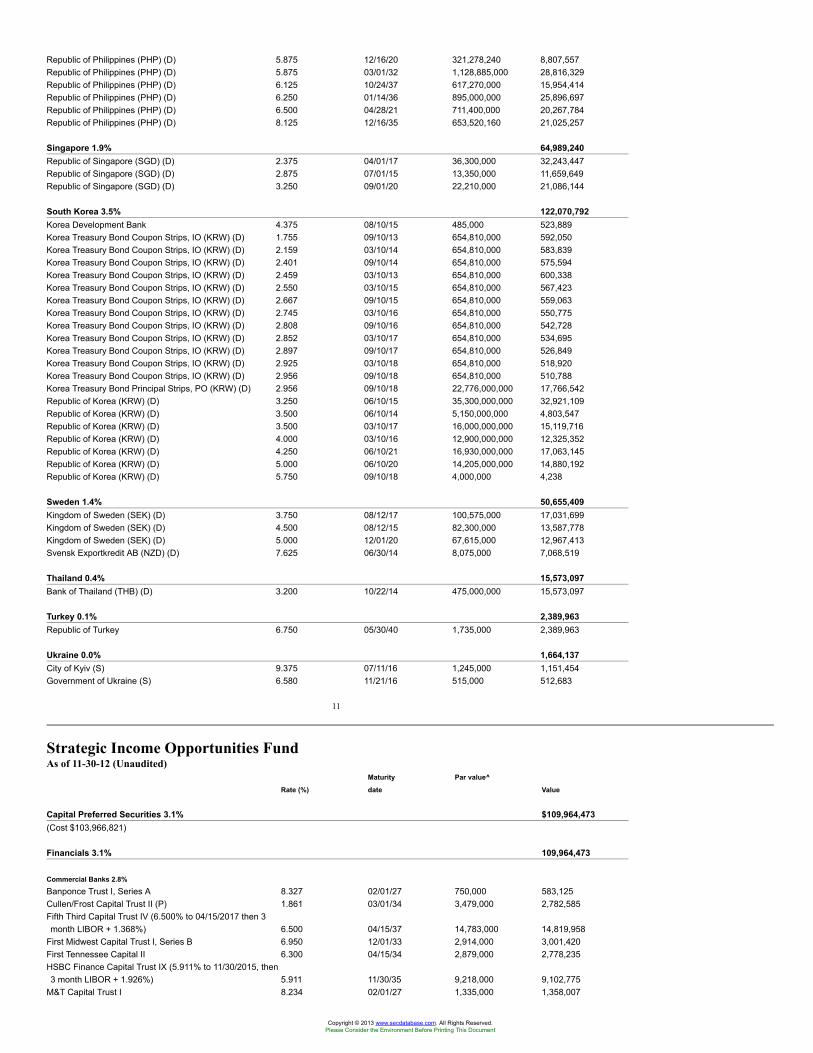
Republic of Philippines (PHP) (D) 5.875 12/16/20 321,278,240 8,807,557Republic of Philippines (PHP) (D) 5.875 03/01/32 1,128,885,000 28,816,329Republic of Philippines (PHP) (D) 6.125 10/24/37 617,270,000 15,954,414Republic of Philippines (PHP) (D) 6.250 01/14/36 895,000,000 25,896,697Republic of Philippines (PHP) (D) 6.500 04/28/21 711,400,000 20,267,784Republic of Philippines (PHP) (D) 8.125 12/16/35 653,520,160 21,025,257
Singapore 1.9% 64,989,240Republic of Singapore (SGD) (D) 2.375 04/01/17 36,300,000 32,243,447Republic of Singapore (SGD) (D) 2.875 07/01/15 13,350,000 11,659,649Republic of Singapore (SGD) (D) 3.250 09/01/20 22,210,000 21,086,144
South Korea 3.5% 122,070,792Korea Development Bank 4.375 08/10/15 485,000 523,889Korea Treasury Bond Coupon Strips, IO (KRW) (D) 1.755 09/10/13 654,810,000 592,050Korea Treasury Bond Coupon Strips, IO (KRW) (D) 2.159 03/10/14 654,810,000 583,839Korea Treasury Bond Coupon Strips, IO (KRW) (D) 2.401 09/10/14 654,810,000 575,594Korea Treasury Bond Coupon Strips, IO (KRW) (D) 2.459 03/10/13 654,810,000 600,338Korea Treasury Bond Coupon Strips, IO (KRW) (D) 2.550 03/10/15 654,810,000 567,423Korea Treasury Bond Coupon Strips, IO (KRW) (D) 2.667 09/10/15 654,810,000 559,063Korea Treasury Bond Coupon Strips, IO (KRW) (D) 2.745 03/10/16 654,810,000 550,775Korea Treasury Bond Coupon Strips, IO (KRW) (D) 2.808 09/10/16 654,810,000 542,728Korea Treasury Bond Coupon Strips, IO (KRW) (D) 2.852 03/10/17 654,810,000 534,695Korea Treasury Bond Coupon Strips, IO (KRW) (D) 2.897 09/10/17 654,810,000 526,849Korea Treasury Bond Coupon Strips, IO (KRW) (D) 2.925 03/10/18 654,810,000 518,920Korea Treasury Bond Coupon Strips, IO (KRW) (D) 2.956 09/10/18 654,810,000 510,788Korea Treasury Bond Principal Strips, PO (KRW) (D) 2.956 09/10/18 22,776,000,000 17,766,542Republic of Korea (KRW) (D) 3.250 06/10/15 35,300,000,000 32,921,109Republic of Korea (KRW) (D) 3.500 06/10/14 5,150,000,000 4,803,547Republic of Korea (KRW) (D) 3.500 03/10/17 16,000,000,000 15,119,716Republic of Korea (KRW) (D) 4.000 03/10/16 12,900,000,000 12,325,352Republic of Korea (KRW) (D) 4.250 06/10/21 16,930,000,000 17,063,145Republic of Korea (KRW) (D) 5.000 06/10/20 14,205,000,000 14,880,192Republic of Korea (KRW) (D) 5.750 09/10/18 4,000,000 4,238
Sweden 1.4% 50,655,409Kingdom of Sweden (SEK) (D) 3.750 08/12/17 100,575,000 17,031,699Kingdom of Sweden (SEK) (D) 4.500 08/12/15 82,300,000 13,587,778Kingdom of Sweden (SEK) (D) 5.000 12/01/20 67,615,000 12,967,413Svensk Exportkredit AB (NZD) (D) 7.625 06/30/14 8,075,000 7,068,519
Thailand 0.4% 15,573,097Bank of Thailand (THB) (D) 3.200 10/22/14 475,000,000 15,573,097
Turkey 0.1% 2,389,963Republic of Turkey 6.750 05/30/40 1,735,000 2,389,963
Ukraine 0.0% 1,664,137City of Kyiv (S) 9.375 07/11/16 1,245,000 1,151,454Government of Ukraine (S) 6.580 11/21/16 515,000 512,683
11
Strategic Income Opportunities FundAs of 11-30-12 (Unaudited)
Maturity Par value^
Rate (%) date Value
Capital Preferred Securities 3.1% $109,964,473(Cost $103,966,821)
Financials 3.1% 109,964,473
Commercial Banks 2.8%
Banponce Trust I, Series A 8.327 02/01/27 750,000 583,125Cullen/Frost Capital Trust II (P) 1.861 03/01/34 3,479,000 2,782,585Fifth Third Capital Trust IV (6.500% to 04/15/2017 then 3month LIBOR + 1.368%) 6.500 04/15/37 14,783,000 14,819,958
First Midwest Capital Trust I, Series B 6.950 12/01/33 2,914,000 3,001,420First Tennessee Capital II 6.300 04/15/34 2,879,000 2,778,235HSBC Finance Capital Trust IX (5.911% to 11/30/2015, then3 month LIBOR + 1.926%) 5.911 11/30/35 9,218,000 9,102,775
M&T Capital Trust I 8.234 02/01/27 1,335,000 1,358,007
Copyright © 2013 www.secdatabase.com. All Rights Reserved.Please Consider the Environment Before Printing This Document
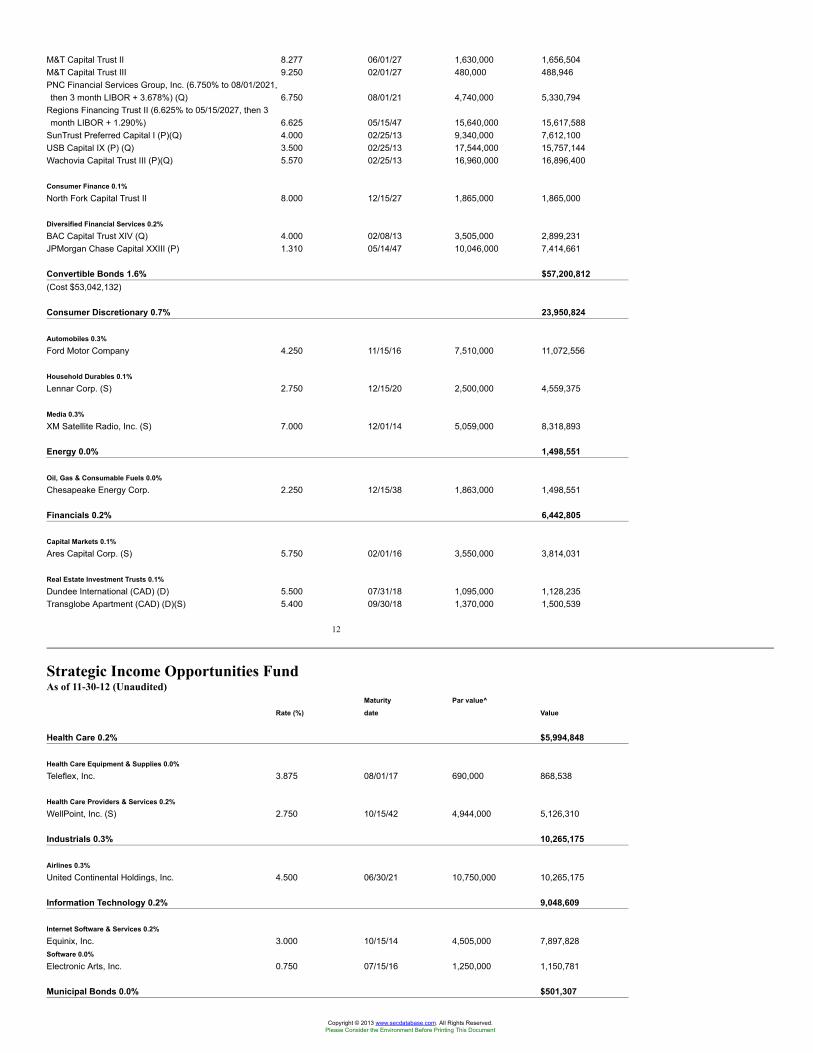
M&T Capital Trust II 8.277 06/01/27 1,630,000 1,656,504M&T Capital Trust III 9.250 02/01/27 480,000 488,946PNC Financial Services Group, Inc. (6.750% to 08/01/2021,then 3 month LIBOR + 3.678%) (Q) 6.750 08/01/21 4,740,000 5,330,794
Regions Financing Trust II (6.625% to 05/15/2027, then 3month LIBOR + 1.290%) 6.625 05/15/47 15,640,000 15,617,588
SunTrust Preferred Capital I (P)(Q) 4.000 02/25/13 9,340,000 7,612,100USB Capital IX (P) (Q) 3.500 02/25/13 17,544,000 15,757,144Wachovia Capital Trust III (P)(Q) 5.570 02/25/13 16,960,000 16,896,400
Consumer Finance 0.1%
North Fork Capital Trust II 8.000 12/15/27 1,865,000 1,865,000
Diversified Financial Services 0.2%
BAC Capital Trust XIV (Q) 4.000 02/08/13 3,505,000 2,899,231JPMorgan Chase Capital XXIII (P) 1.310 05/14/47 10,046,000 7,414,661
Convertible Bonds 1.6% $57,200,812(Cost $53,042,132)
Consumer Discretionary 0.7% 23,950,824
Automobiles 0.3%
Ford Motor Company 4.250 11/15/16 7,510,000 11,072,556
Household Durables 0.1%
Lennar Corp. (S) 2.750 12/15/20 2,500,000 4,559,375
Media 0.3%
XM Satellite Radio, Inc. (S) 7.000 12/01/14 5,059,000 8,318,893
Energy 0.0% 1,498,551
Oil, Gas & Consumable Fuels 0.0%
Chesapeake Energy Corp. 2.250 12/15/38 1,863,000 1,498,551
Financials 0.2% 6,442,805
Capital Markets 0.1%
Ares Capital Corp. (S) 5.750 02/01/16 3,550,000 3,814,031
Real Estate Investment Trusts 0.1%
Dundee International (CAD) (D) 5.500 07/31/18 1,095,000 1,128,235Transglobe Apartment (CAD) (D)(S) 5.400 09/30/18 1,370,000 1,500,539
12
Strategic Income Opportunities FundAs of 11-30-12 (Unaudited)
Maturity Par value^
Rate (%) date Value
Health Care 0.2% $5,994,848
Health Care Equipment & Supplies 0.0%
Teleflex, Inc. 3.875 08/01/17 690,000 868,538
Health Care Providers & Services 0.2%
WellPoint, Inc. (S) 2.750 10/15/42 4,944,000 5,126,310
Industrials 0.3% 10,265,175
Airlines 0.3%
United Continental Holdings, Inc. 4.500 06/30/21 10,750,000 10,265,175
Information Technology 0.2% 9,048,609
Internet Software & Services 0.2%
Equinix, Inc. 3.000 10/15/14 4,505,000 7,897,828Software 0.0%
Electronic Arts, Inc. 0.750 07/15/16 1,250,000 1,150,781
Municipal Bonds 0.0% $501,307
Copyright © 2013 www.secdatabase.com. All Rights Reserved.Please Consider the Environment Before Printing This Document
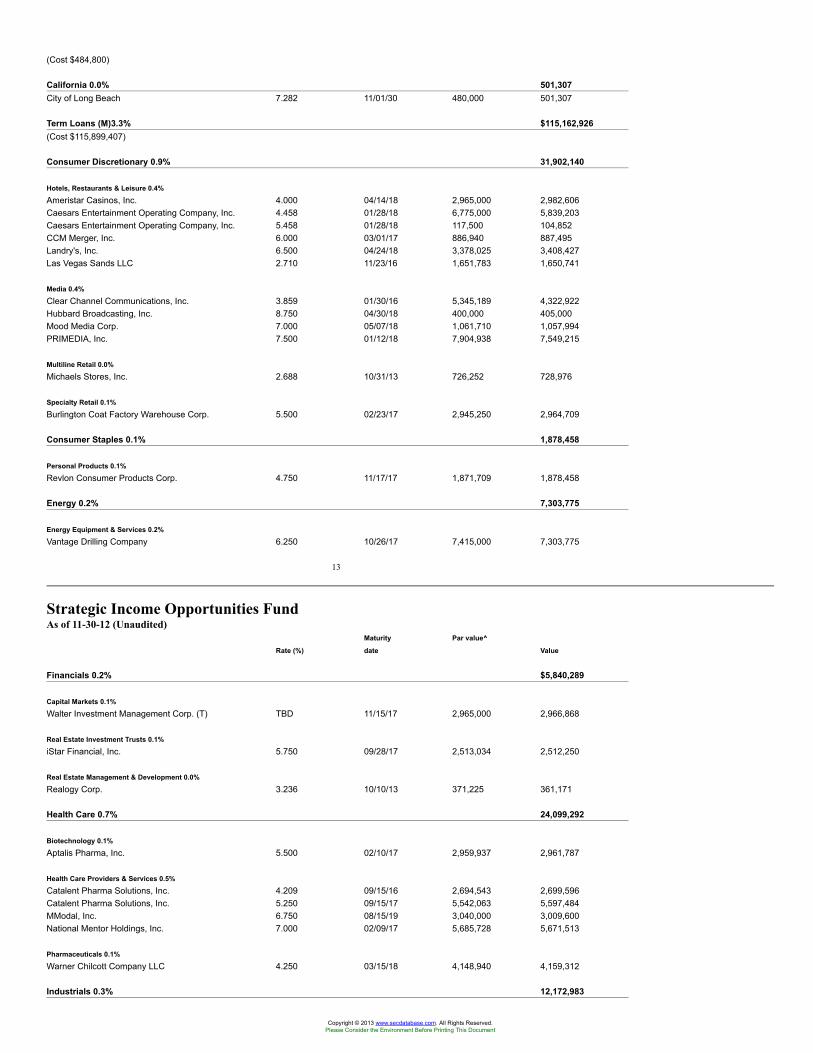
(Cost $484,800)
California 0.0% 501,307City of Long Beach 7.282 11/01/30 480,000 501,307
Term Loans (M)3.3% $115,162,926(Cost $115,899,407)
Consumer Discretionary 0.9% 31,902,140
Hotels, Restaurants & Leisure 0.4%
Ameristar Casinos, Inc. 4.000 04/14/18 2,965,000 2,982,606Caesars Entertainment Operating Company, Inc. 4.458 01/28/18 6,775,000 5,839,203Caesars Entertainment Operating Company, Inc. 5.458 01/28/18 117,500 104,852CCM Merger, Inc. 6.000 03/01/17 886,940 887,495Landry's, Inc. 6.500 04/24/18 3,378,025 3,408,427Las Vegas Sands LLC 2.710 11/23/16 1,651,783 1,650,741
Media 0.4%
Clear Channel Communications, Inc. 3.859 01/30/16 5,345,189 4,322,922Hubbard Broadcasting, Inc. 8.750 04/30/18 400,000 405,000Mood Media Corp. 7.000 05/07/18 1,061,710 1,057,994PRIMEDIA, Inc. 7.500 01/12/18 7,904,938 7,549,215
Multiline Retail 0.0%
Michaels Stores, Inc. 2.688 10/31/13 726,252 728,976
Specialty Retail 0.1%
Burlington Coat Factory Warehouse Corp. 5.500 02/23/17 2,945,250 2,964,709
Consumer Staples 0.1% 1,878,458
Personal Products 0.1%
Revlon Consumer Products Corp. 4.750 11/17/17 1,871,709 1,878,458
Energy 0.2% 7,303,775
Energy Equipment & Services 0.2%
Vantage Drilling Company 6.250 10/26/17 7,415,000 7,303,775
13
Strategic Income Opportunities FundAs of 11-30-12 (Unaudited)
Maturity Par value^
Rate (%) date Value
Financials 0.2% $5,840,289
Capital Markets 0.1%
Walter Investment Management Corp. (T) TBD 11/15/17 2,965,000 2,966,868
Real Estate Investment Trusts 0.1%
iStar Financial, Inc. 5.750 09/28/17 2,513,034 2,512,250
Real Estate Management & Development 0.0%
Realogy Corp. 3.236 10/10/13 371,225 361,171
Health Care 0.7% 24,099,292
Biotechnology 0.1%
Aptalis Pharma, Inc. 5.500 02/10/17 2,959,937 2,961,787
Health Care Providers & Services 0.5%
Catalent Pharma Solutions, Inc. 4.209 09/15/16 2,694,543 2,699,596Catalent Pharma Solutions, Inc. 5.250 09/15/17 5,542,063 5,597,484MModal, Inc. 6.750 08/15/19 3,040,000 3,009,600National Mentor Holdings, Inc. 7.000 02/09/17 5,685,728 5,671,513
Pharmaceuticals 0.1%
Warner Chilcott Company LLC 4.250 03/15/18 4,148,940 4,159,312
Industrials 0.3% 12,172,983
Copyright © 2013 www.secdatabase.com. All Rights Reserved.Please Consider the Environment Before Printing This Document
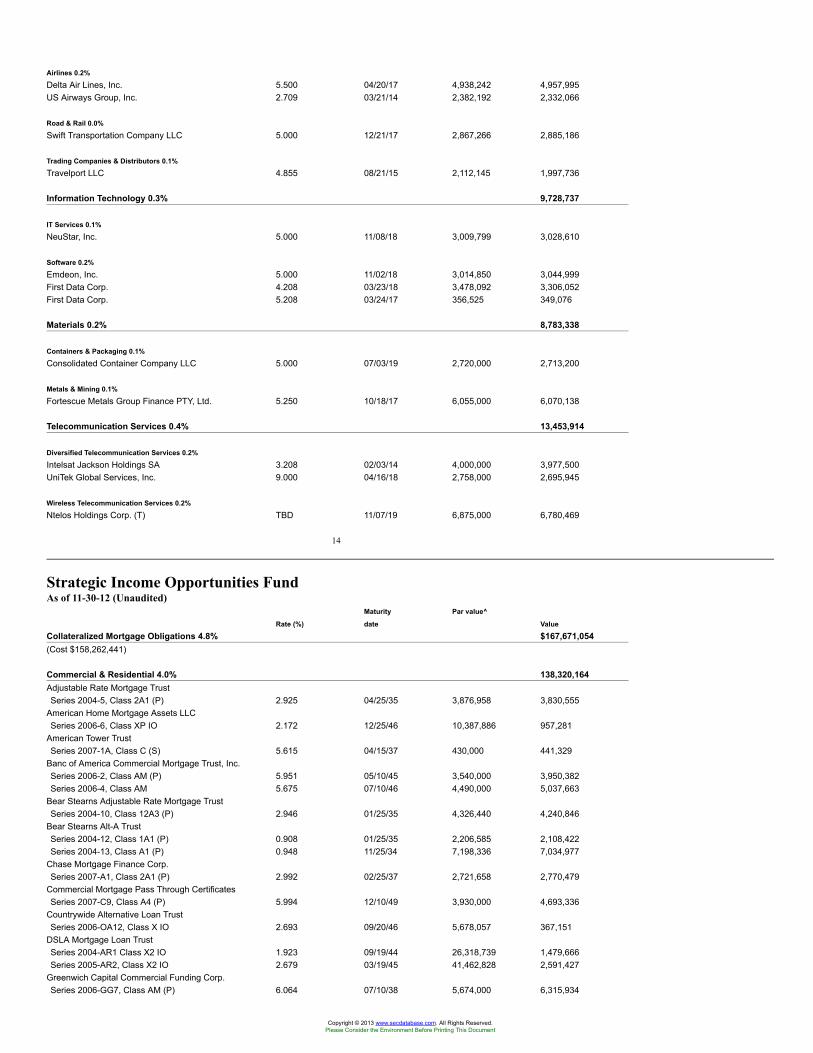
Airlines 0.2%
Delta Air Lines, Inc. 5.500 04/20/17 4,938,242 4,957,995US Airways Group, Inc. 2.709 03/21/14 2,382,192 2,332,066
Road & Rail 0.0%
Swift Transportation Company LLC 5.000 12/21/17 2,867,266 2,885,186
Trading Companies & Distributors 0.1%
Travelport LLC 4.855 08/21/15 2,112,145 1,997,736
Information Technology 0.3% 9,728,737
IT Services 0.1%
NeuStar, Inc. 5.000 11/08/18 3,009,799 3,028,610
Software 0.2%
Emdeon, Inc. 5.000 11/02/18 3,014,850 3,044,999First Data Corp. 4.208 03/23/18 3,478,092 3,306,052First Data Corp. 5.208 03/24/17 356,525 349,076
Materials 0.2% 8,783,338
Containers & Packaging 0.1%
Consolidated Container Company LLC 5.000 07/03/19 2,720,000 2,713,200
Metals & Mining 0.1%
Fortescue Metals Group Finance PTY, Ltd. 5.250 10/18/17 6,055,000 6,070,138
Telecommunication Services 0.4% 13,453,914
Diversified Telecommunication Services 0.2%
Intelsat Jackson Holdings SA 3.208 02/03/14 4,000,000 3,977,500UniTek Global Services, Inc. 9.000 04/16/18 2,758,000 2,695,945
Wireless Telecommunication Services 0.2%
Ntelos Holdings Corp. (T) TBD 11/07/19 6,875,000 6,780,469
14
Strategic Income Opportunities FundAs of 11-30-12 (Unaudited)
Maturity Par value^
Rate (%) date Value
Collateralized Mortgage Obligations 4.8% $167,671,054(Cost $158,262,441)
Commercial & Residential 4.0% 138,320,164Adjustable Rate Mortgage TrustSeries 2004-5, Class 2A1 (P) 2.925 04/25/35 3,876,958 3,830,555
American Home Mortgage Assets LLCSeries 2006-6, Class XP IO 2.172 12/25/46 10,387,886 957,281
American Tower TrustSeries 2007-1A, Class C (S) 5.615 04/15/37 430,000 441,329
Banc of America Commercial Mortgage Trust, Inc.Series 2006-2, Class AM (P) 5.951 05/10/45 3,540,000 3,950,382Series 2006-4, Class AM 5.675 07/10/46 4,490,000 5,037,663
Bear Stearns Adjustable Rate Mortgage TrustSeries 2004-10, Class 12A3 (P) 2.946 01/25/35 4,326,440 4,240,846
Bear Stearns Alt-A TrustSeries 2004-12, Class 1A1 (P) 0.908 01/25/35 2,206,585 2,108,422Series 2004-13, Class A1 (P) 0.948 11/25/34 7,198,336 7,034,977
Chase Mortgage Finance Corp.Series 2007-A1, Class 2A1 (P) 2.992 02/25/37 2,721,658 2,770,479
Commercial Mortgage Pass Through CertificatesSeries 2007-C9, Class A4 (P) 5.994 12/10/49 3,930,000 4,693,336
Countrywide Alternative Loan TrustSeries 2006-OA12, Class X IO 2.693 09/20/46 5,678,057 367,151
DSLA Mortgage Loan TrustSeries 2004-AR1 Class X2 IO 1.923 09/19/44 26,318,739 1,479,666Series 2005-AR2, Class X2 IO 2.679 03/19/45 41,462,828 2,591,427
Greenwich Capital Commercial Funding Corp.Series 2006-GG7, Class AM (P) 6.064 07/10/38 5,674,000 6,315,934
Copyright © 2013 www.secdatabase.com. All Rights Reserved.Please Consider the Environment Before Printing This Document
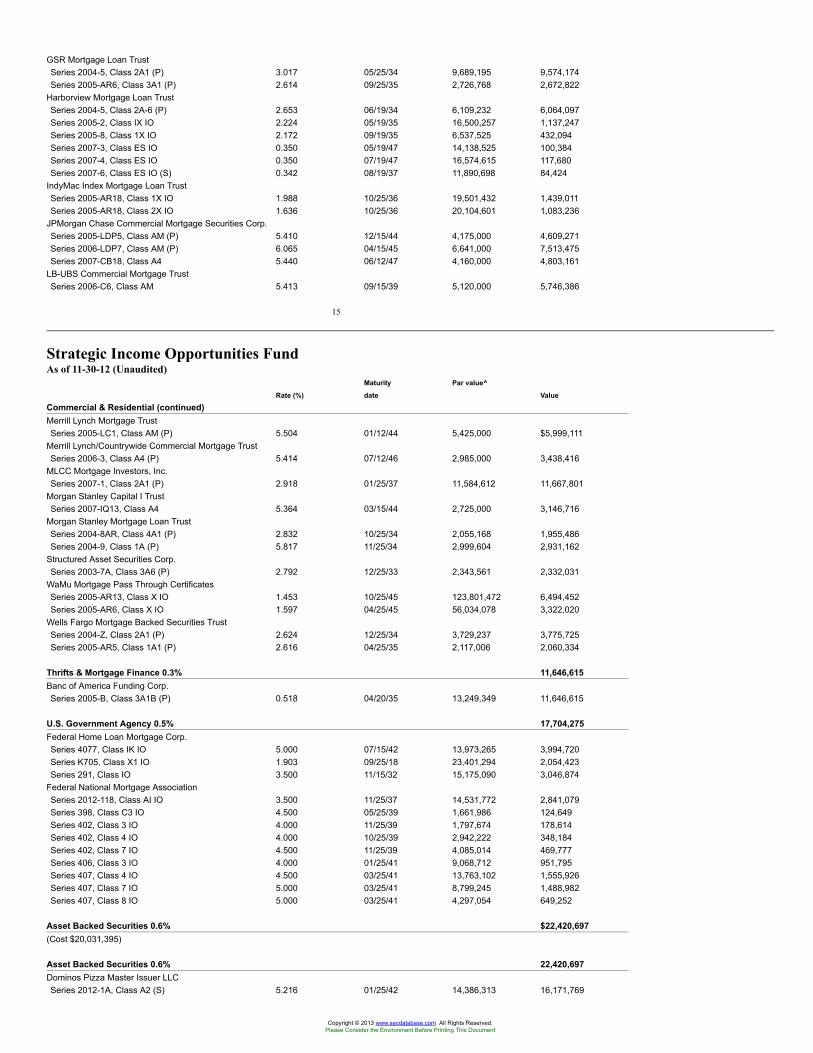
GSR Mortgage Loan TrustSeries 2004-5, Class 2A1 (P) 3.017 05/25/34 9,689,195 9,574,174Series 2005-AR6, Class 3A1 (P) 2.614 09/25/35 2,726,768 2,672,822
Harborview Mortgage Loan TrustSeries 2004-5, Class 2A-6 (P) 2.653 06/19/34 6,109,232 6,064,097Series 2005-2, Class IX IO 2.224 05/19/35 16,500,257 1,137,247Series 2005-8, Class 1X IO 2.172 09/19/35 6,537,525 432,094Series 2007-3, Class ES IO 0.350 05/19/47 14,138,525 100,384Series 2007-4, Class ES IO 0.350 07/19/47 16,574,615 117,680Series 2007-6, Class ES IO (S) 0.342 08/19/37 11,890,698 84,424
IndyMac Index Mortgage Loan TrustSeries 2005-AR18, Class 1X IO 1.988 10/25/36 19,501,432 1,439,011Series 2005-AR18, Class 2X IO 1.636 10/25/36 20,104,601 1,083,236
JPMorgan Chase Commercial Mortgage Securities Corp.Series 2005-LDP5, Class AM (P) 5.410 12/15/44 4,175,000 4,609,271Series 2006-LDP7, Class AM (P) 6.065 04/15/45 6,641,000 7,513,475Series 2007-CB18, Class A4 5.440 06/12/47 4,160,000 4,803,161
LB-UBS Commercial Mortgage TrustSeries 2006-C6, Class AM 5.413 09/15/39 5,120,000 5,746,386
15
Strategic Income Opportunities FundAs of 11-30-12 (Unaudited)
Maturity Par value^
Rate (%) date Value
Commercial & Residential (continued)Merrill Lynch Mortgage TrustSeries 2005-LC1, Class AM (P) 5.504 01/12/44 5,425,000 $5,999,111
Merrill Lynch/Countrywide Commercial Mortgage TrustSeries 2006-3, Class A4 (P) 5.414 07/12/46 2,985,000 3,438,416
MLCC Mortgage Investors, Inc.Series 2007-1, Class 2A1 (P) 2.918 01/25/37 11,584,612 11,667,801
Morgan Stanley Capital I TrustSeries 2007-IQ13, Class A4 5.364 03/15/44 2,725,000 3,146,716
Morgan Stanley Mortgage Loan TrustSeries 2004-8AR, Class 4A1 (P) 2.832 10/25/34 2,055,168 1,955,486Series 2004-9, Class 1A (P) 5.817 11/25/34 2,999,604 2,931,162
Structured Asset Securities Corp.Series 2003-7A, Class 3A6 (P) 2.792 12/25/33 2,343,561 2,332,031
WaMu Mortgage Pass Through CertificatesSeries 2005-AR13, Class X IO 1.453 10/25/45 123,801,472 6,494,452Series 2005-AR6, Class X IO 1.597 04/25/45 56,034,078 3,322,020
Wells Fargo Mortgage Backed Securities TrustSeries 2004-Z, Class 2A1 (P) 2.624 12/25/34 3,729,237 3,775,725Series 2005-AR5, Class 1A1 (P) 2.616 04/25/35 2,117,006 2,060,334
Thrifts & Mortgage Finance 0.3% 11,646,615Banc of America Funding Corp.Series 2005-B, Class 3A1B (P) 0.518 04/20/35 13,249,349 11,646,615
U.S. Government Agency 0.5% 17,704,275Federal Home Loan Mortgage Corp.Series 4077, Class IK IO 5.000 07/15/42 13,973,265 3,994,720Series K705, Class X1 IO 1.903 09/25/18 23,401,294 2,054,423Series 291, Class IO 3.500 11/15/32 15,175,090 3,046,874
Federal National Mortgage AssociationSeries 2012-118, Class AI IO 3.500 11/25/37 14,531,772 2,841,079Series 398, Class C3 IO 4.500 05/25/39 1,661,986 124,649Series 402, Class 3 IO 4.000 11/25/39 1,797,674 178,614Series 402, Class 4 IO 4.000 10/25/39 2,942,222 348,184Series 402, Class 7 IO 4.500 11/25/39 4,085,014 469,777Series 406, Class 3 IO 4.000 01/25/41 9,068,712 951,795Series 407, Class 4 IO 4.500 03/25/41 13,763,102 1,555,926Series 407, Class 7 IO 5.000 03/25/41 8,799,245 1,488,982Series 407, Class 8 IO 5.000 03/25/41 4,297,054 649,252
Asset Backed Securities 0.6% $22,420,697(Cost $20,031,395)
Asset Backed Securities 0.6% 22,420,697Dominos Pizza Master Issuer LLCSeries 2012-1A, Class A2 (S) 5.216 01/25/42 14,386,313 16,171,769
Copyright © 2013 www.secdatabase.com. All Rights Reserved.Please Consider the Environment Before Printing This Document
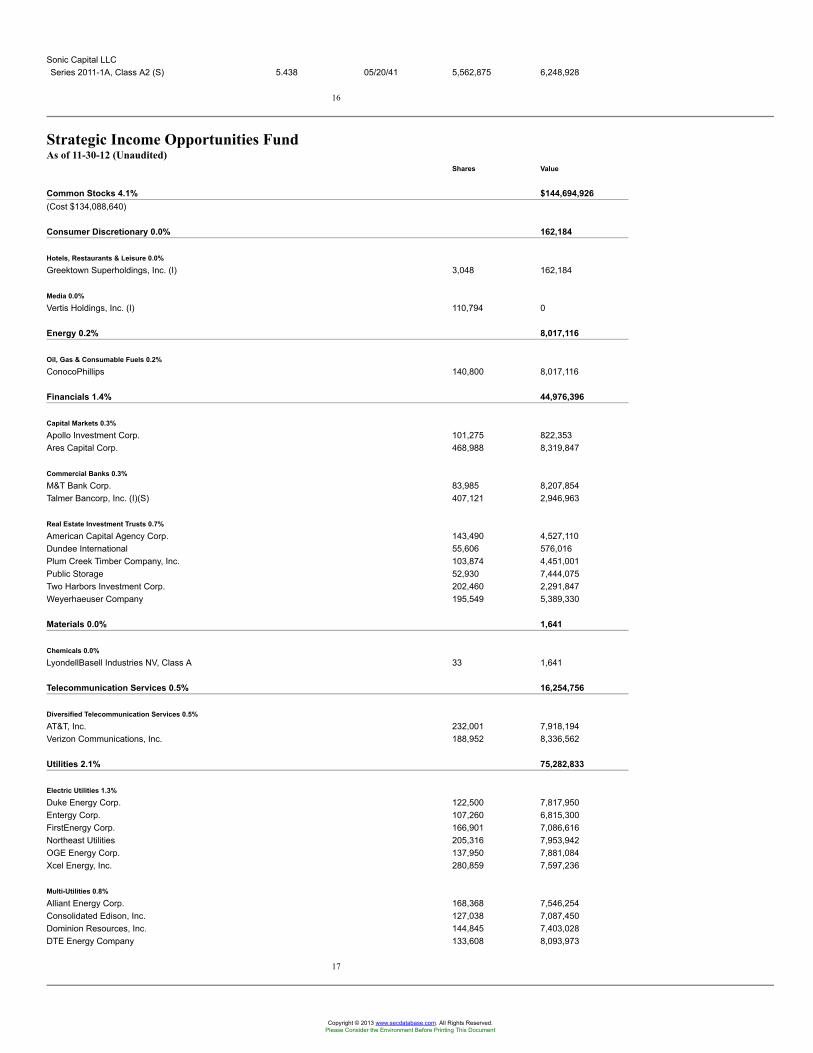
Sonic Capital LLCSeries 2011-1A, Class A2 (S) 5.438 05/20/41 5,562,875 6,248,928
16
Strategic Income Opportunities FundAs of 11-30-12 (Unaudited)
Shares Value
Common Stocks 4.1% $144,694,926(Cost $134,088,640)
Consumer Discretionary 0.0% 162,184
Hotels, Restaurants & Leisure 0.0%
Greektown Superholdings, Inc. (I) 3,048 162,184
Media 0.0%
Vertis Holdings, Inc. (I) 110,794 0
Energy 0.2% 8,017,116
Oil, Gas & Consumable Fuels 0.2%
ConocoPhillips 140,800 8,017,116
Financials 1.4% 44,976,396
Capital Markets 0.3%
Apollo Investment Corp. 101,275 822,353Ares Capital Corp. 468,988 8,319,847
Commercial Banks 0.3%
M&T Bank Corp. 83,985 8,207,854Talmer Bancorp, Inc. (I)(S) 407,121 2,946,963
Real Estate Investment Trusts 0.7%
American Capital Agency Corp. 143,490 4,527,110Dundee International 55,606 576,016Plum Creek Timber Company, Inc. 103,874 4,451,001Public Storage 52,930 7,444,075Two Harbors Investment Corp. 202,460 2,291,847Weyerhaeuser Company 195,549 5,389,330
Materials 0.0% 1,641
Chemicals 0.0%
LyondellBasell Industries NV, Class A 33 1,641
Telecommunication Services 0.5% 16,254,756
Diversified Telecommunication Services 0.5%
AT&T, Inc. 232,001 7,918,194Verizon Communications, Inc. 188,952 8,336,562
Utilities 2.1% 75,282,833
Electric Utilities 1.3%
Duke Energy Corp. 122,500 7,817,950Entergy Corp. 107,260 6,815,300FirstEnergy Corp. 166,901 7,086,616Northeast Utilities 205,316 7,953,942OGE Energy Corp. 137,950 7,881,084Xcel Energy, Inc. 280,859 7,597,236
Multi-Utilities 0.8%
Alliant Energy Corp. 168,368 7,546,254Consolidated Edison, Inc. 127,038 7,087,450Dominion Resources, Inc. 144,845 7,403,028DTE Energy Company 133,608 8,093,973
17
Copyright © 2013 www.secdatabase.com. All Rights Reserved.Please Consider the Environment Before Printing This Document
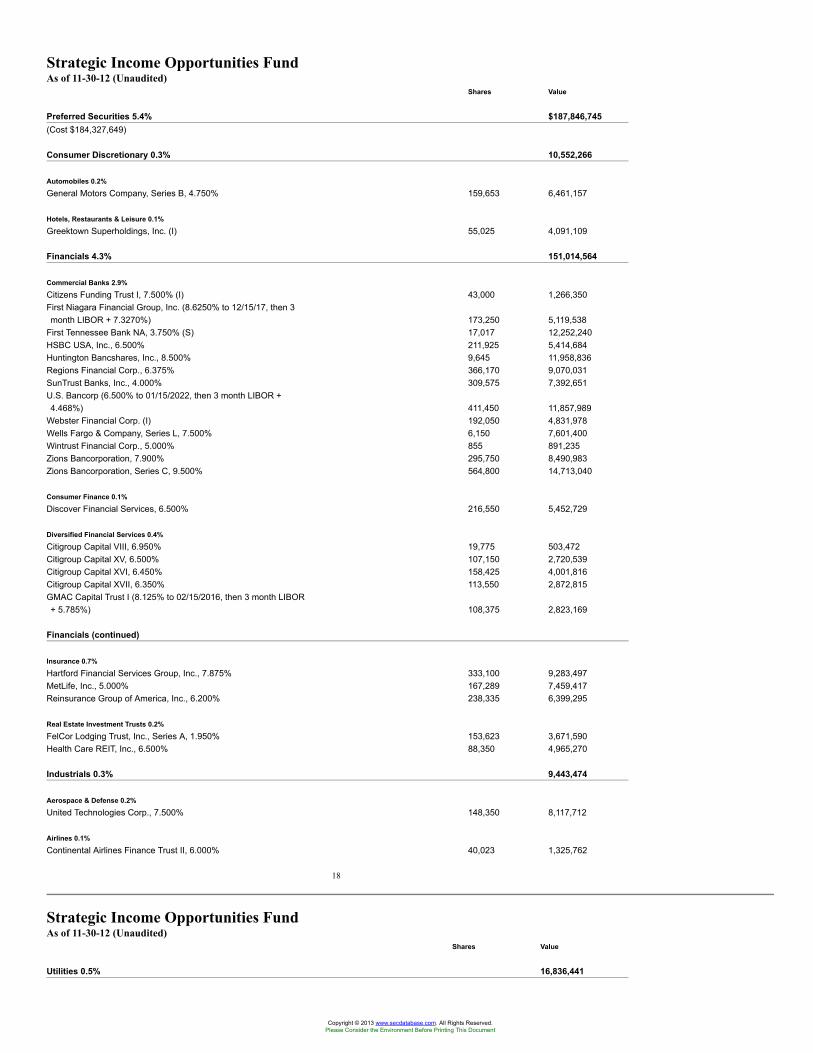
Strategic Income Opportunities FundAs of 11-30-12 (Unaudited)
Shares Value
Preferred Securities 5.4% $187,846,745(Cost $184,327,649)
Consumer Discretionary 0.3% 10,552,266
Automobiles 0.2%
General Motors Company, Series B, 4.750% 159,653 6,461,157
Hotels, Restaurants & Leisure 0.1%
Greektown Superholdings, Inc. (I) 55,025 4,091,109
Financials 4.3% 151,014,564
Commercial Banks 2.9%
Citizens Funding Trust I, 7.500% (I) 43,000 1,266,350First Niagara Financial Group, Inc. (8.6250% to 12/15/17, then 3month LIBOR + 7.3270%) 173,250 5,119,538
First Tennessee Bank NA, 3.750% (S) 17,017 12,252,240HSBC USA, Inc., 6.500% 211,925 5,414,684Huntington Bancshares, Inc., 8.500% 9,645 11,958,836Regions Financial Corp., 6.375% 366,170 9,070,031SunTrust Banks, Inc., 4.000% 309,575 7,392,651U.S. Bancorp (6.500% to 01/15/2022, then 3 month LIBOR +4.468%) 411,450 11,857,989
Webster Financial Corp. (I) 192,050 4,831,978Wells Fargo & Company, Series L, 7.500% 6,150 7,601,400Wintrust Financial Corp., 5.000% 855 891,235Zions Bancorporation, 7.900% 295,750 8,490,983Zions Bancorporation, Series C, 9.500% 564,800 14,713,040
Consumer Finance 0.1%
Discover Financial Services, 6.500% 216,550 5,452,729
Diversified Financial Services 0.4%
Citigroup Capital VIII, 6.950% 19,775 503,472Citigroup Capital XV, 6.500% 107,150 2,720,539Citigroup Capital XVI, 6.450% 158,425 4,001,816Citigroup Capital XVII, 6.350% 113,550 2,872,815GMAC Capital Trust I (8.125% to 02/15/2016, then 3 month LIBOR+ 5.785%) 108,375 2,823,169
Financials (continued)
Insurance 0.7%
Hartford Financial Services Group, Inc., 7.875% 333,100 9,283,497MetLife, Inc., 5.000% 167,289 7,459,417Reinsurance Group of America, Inc., 6.200% 238,335 6,399,295
Real Estate Investment Trusts 0.2%
FelCor Lodging Trust, Inc., Series A, 1.950% 153,623 3,671,590Health Care REIT, Inc., 6.500% 88,350 4,965,270
Industrials 0.3% 9,443,474
Aerospace & Defense 0.2%
United Technologies Corp., 7.500% 148,350 8,117,712
Airlines 0.1%
Continental Airlines Finance Trust II, 6.000% 40,023 1,325,762
18
Strategic Income Opportunities FundAs of 11-30-12 (Unaudited)
Shares Value
Utilities 0.5% 16,836,441
Copyright © 2013 www.secdatabase.com. All Rights Reserved.Please Consider the Environment Before Printing This Document
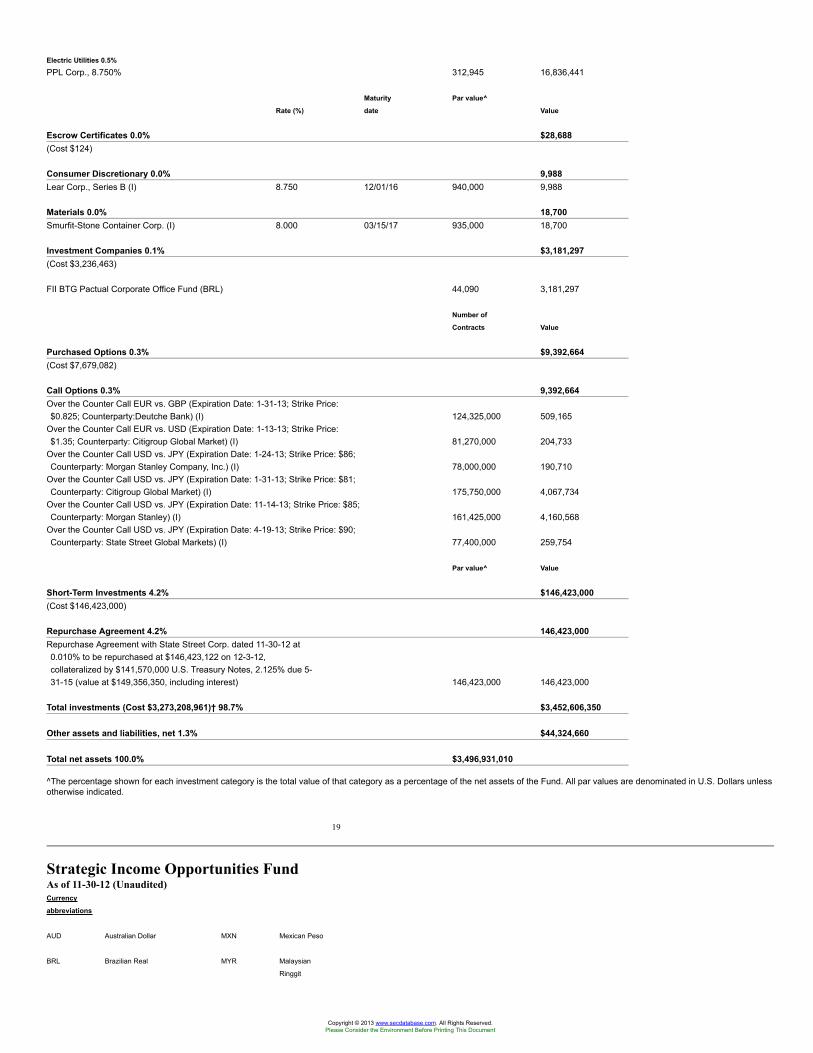
Electric Utilities 0.5%
PPL Corp., 8.750% 312,945 16,836,441
Maturity Par value^
Rate (%) date Value
Escrow Certificates 0.0% $28,688(Cost $124)
Consumer Discretionary 0.0% 9,988Lear Corp., Series B (I) 8.750 12/01/16 940,000 9,988
Materials 0.0% 18,700Smurfit-Stone Container Corp. (I) 8.000 03/15/17 935,000 18,700
Investment Companies 0.1% $3,181,297(Cost $3,236,463)
FII BTG Pactual Corporate Office Fund (BRL) 44,090 3,181,297
Number of
Contracts Value
Purchased Options 0.3% $9,392,664(Cost $7,679,082)
Call Options 0.3% 9,392,664Over the Counter Call EUR vs. GBP (Expiration Date: 1-31-13; Strike Price:$0.825; Counterparty:Deutche Bank) (I) 124,325,000 509,165
Over the Counter Call EUR vs. USD (Expiration Date: 1-13-13; Strike Price:$1.35; Counterparty: Citigroup Global Market) (I) 81,270,000 204,733
Over the Counter Call USD vs. JPY (Expiration Date: 1-24-13; Strike Price: $86;Counterparty: Morgan Stanley Company, Inc.) (I) 78,000,000 190,710
Over the Counter Call USD vs. JPY (Expiration Date: 1-31-13; Strike Price: $81;Counterparty: Citigroup Global Market) (I) 175,750,000 4,067,734
Over the Counter Call USD vs. JPY (Expiration Date: 11-14-13; Strike Price: $85;Counterparty: Morgan Stanley) (I) 161,425,000 4,160,568
Over the Counter Call USD vs. JPY (Expiration Date: 4-19-13; Strike Price: $90;Counterparty: State Street Global Markets) (I) 77,400,000 259,754
Par value^ Value
Short-Term Investments 4.2% $146,423,000(Cost $146,423,000)
Repurchase Agreement 4.2% 146,423,000Repurchase Agreement with State Street Corp. dated 11-30-12 at0.010% to be repurchased at $146,423,122 on 12-3-12,collateralized by $141,570,000 U.S. Treasury Notes, 2.125% due 5-31-15 (value at $149,356,350, including interest) 146,423,000 146,423,000
Total investments (Cost $3,273,208,961)† 98.7% $3,452,606,350
Other assets and liabilities, net 1.3% $44,324,660
Total net assets 100.0% $3,496,931,010
^The percentage shown for each investment category is the total value of that category as a percentage of the net assets of the Fund. All par values are denominated in U.S. Dollars unlessotherwise indicated.
19
Strategic Income Opportunities FundAs of 11-30-12 (Unaudited)Currency
abbreviations
AUD Australian Dollar MXN Mexican Peso
BRL Brazilian Real MYR Malaysian
Ringgit
Copyright © 2013 www.secdatabase.com. All Rights Reserved.Please Consider the Environment Before Printing This Document
CAD Canadian Dollar NOK Norwegian Krone
EUR Euro NZD New Zealand
Dollar
GBP British Pound PHP Philippines Peso
IDR Indonesian Rupiah SEK Swedish Krona
JPY Japanese Yen SGD Singapore Dollar
KRW Korean Won THB Thai Baht
USD United States
Dollar
IO Interest-Only Security - (Interest Tranche of Stripped Mortgage Pool). Rate shown is the annualized yield at the end of the period.PO Principal-Only Security – (Principal Tranche of Stripped Security). Rate shown is the annualized yield on date of purchase.LIBOR London Interbank Offered RatePIK Paid In KindTBD To be determined(D) Par value of foreign bonds is expressed in local currency as shown parenthetically in security description.(H) Non-income producing - Issuer is in default.(I) Non-income producing security.(M) Term loans are variable rate obligations. The coupon rate shown represents the rate at period end.(P) Variable rate obligation. The coupon rate shown represents the rate at period end.(Q) Perpetual bonds have no stated maturity date. Date shown as maturity date is next call date.(S) These securities are exempt from registration under Rule 144A of the Securities Act of 1933. Such securities may be resold, normally to qualified institutional buyers, in transactionsexempt from registration. Rule 144A securities amounted to $539,217,697 or 15.42% of the Fund's net assets as of 11-30-12.(T) This position represents an unsettled loan commitment at period end. Certain details associated with this purchase are not known prior to the settlement date, including coupon rate.† At 11-30-12, the aggregate cost of investment securities for federal income tax purposes was $3,286,488,560. Net unrealized appreciation aggregated $166,117,790, of which$215,352,592 related to appreciated investment securities and $49,234,802 related to depreciated investment securities.
20
Strategic Income Opportunities FundAs of 11-30-12 (Unaudited)The Fund had the following country concentration as a percentage of net assets on 11-30-12.United States 57.7%Canada 5.0%Philippines 4.0%South Korea 3.5%New Zealand 3.2%Australia 3.2%Singapore 2.6%Indonesia 2.2%Luxembourg 1.8%Germany 1.7%Other Countries 12.2%Short-Term Investments & Other 2.9%
21
John Hancock Strategic Income Opportunities FundAs of 11-30-12 (Unaudited)Notes to the Portfolio of InvestmentsSecurity valuation. Investments are stated at value as of the close of regular trading on the New York Stock Exchange (NYSE), normally at 4:00 P.M., Eastern Time. In order to value thesecurities, the Fund uses the following valuation techniques. Equity securities held by the Fund are valued at the last sale price or official closing price on the principal securities exchangeon which they trade. In the event there were no sales during the day or closing prices are not available, then the securities are valued using the last quoted bid or evaluated price. Debtobligations are valued based on the evaluated prices provided by an independent pricing service, which utilizes both dealer-supplied and electronic data processing techniques, taking intoaccount factors such as institutional-size trading in similar groups of securities, yield, quality, coupon rate, maturity, type of issue, trading characteristics and other market data. Optionslisted on an exchange are valued at the mean between the last bid and ask prices from the exchange on which they are principally traded. For options not listed on an exchange, anindependent pricing source is used to value the options at the mean between the last bid and ask prices. Futures contracts are valued at the quoted daily settlement prices established bythe exchange on which they trade. Foreign securities and currencies, including forward foreign currency contracts, are valued in U.S. dollars, based on foreign currency exchange ratessupplied by an independent pricing service. Certain securities and forward foreign currency contracts traded only in the over-the-counter market are valued at the last bid price quoted bybrokers making markets in the securities at the close of trading. Certain short-term securities are valued at amortized cost.Other portfolio securities and assets, where market quotations are not readily available, are valued at fair value, as determined in good faith by the Fund’s Pricing Committee, followingprocedures established by the Board of Trustees, which include price verification procedures. The frequency with which these fair valuation procedures are used cannot be predicted.Generally, trading in non-U.S. securities is substantially completed each day at various times prior to the close of trading on the NYSE. Significant market events that affect the values ofnon-U.S. securities may occur between the time when the valuation of the securities is generally determined and the close of the NYSE. During significant market events, these securitieswill be valued at fair value, as determined in good faith, following procedures established by the Board of Trustees. The Fund may use a fair valuation model to value non-U.S. securities inorder to adjust for events which may occur between the close of foreign exchanges and the close of the NYSE.
Copyright © 2013 www.secdatabase.com. All Rights Reserved.Please Consider the Environment Before Printing This Document
The Fund uses a three-tier hierarchy to prioritize the pricing assumptions, referred to as inputs, used in valuation techniques to measure fair value. Level 1 includes securities valued usingquoted prices in active markets for identical securities. Level 2 includes securities valued using significant observable inputs. Observable inputs may include quoted prices for similarsecurities, interest rates, prepayment speeds and credit risk. Prices for securities valued using these inputs are received from independent pricing vendors and brokers and are based on anevaluation of the inputs described. Level 3 includes securities valued using significant unobservable inputs when market prices are not readily available or reliable, including the Fund’s ownassumptions in determining the fair value of investments. Factors used in determining value may include market or issuer specific events, changes in interest rates and credit quality. Theinputs or methodology used for valuing securities are not necessarily an indication of the risks associated with investing in those securities. Changes in valuation techniques may result intransfers into or out of an assigned level within the disclosure hierarchy.The following is a summary of the values by input classification of the Fund’s investments as of November 30, 2012, by major security category or type:
22
Level 2 Level 3
Total Market Significant Significant
Value at Level 1 Quoted Observable Unobservable
11-30-12 Price Inputs Inputs
Corporate Bonds 1,543,741,781 — 1,531,862,498 11,879,283
U.S. Government 23,962,274 — 23,962,274 —
Foreign Government
Obligations 920,413,706 — 920,413,706 —
Capital Preferred Securities 109,964,473 — 109,964,473 —
Convertible Bonds 57,200,812 — 57,200,812 —
Municipal Bonds 501,307 — 501,307 —
Term Loans 115,162,926 — 115,162,926 —
Collateralized Mortgage
Obligations 167,671,054 — 167,368,566 302,488
Asset Backed Securities 22,420,697 — 22,420,697 —
Common Stocks 147,876,223 144,767,076 — 3,109,147
Preferred Securities 187,846,745 169,286,399 14,469,237 4,091,109
Escrow Certificates 28,688 — 18,700 9,988
Purchased Options 9,392,664 — 9,392,664 —
Short-Term Investments 146,423,000 — 146,423,000 —
Total investments in Securities 3,452,606,350 314,053,475 3,119,160,860 19,392,015
Other Financial Instruments:
Futures (906,211) (906,211) —- —-
Forward Currency Contracts 3,763,785 — 3,763,785 —
The following is a reconciliation of Level 3 assets for which significant unobservable inputs were used to determine fair value.Collateralized
Mortgage Common Preferred Escrow
Corporate Bonds Obligations Stock Securities Certificates Totals
Balance as of 8-31-12 $16,481,299 $285,275 $3,259,285 $3,894,119 $10,575 $23,930,553
Realized gain (loss) (89,022) - - - - (89,022)
Change in unrealized appreciation (depreciation) 619,088 33,126 (150,138) 196,990 (587) 698,479
Purchases - 105 - - - 105
Sales (5,132,082) (16,018) - - - (5,148,100)
Transfers into Level 3 - - - - - -
Transfers out of Level 3 - - - - - -
Balance as of 11-30-12 $11,879,283 $302,488 $3,109,147 $4,091,109 $9,988 $19,392,015
Change in unrealized at period end* $599,366 $33,126 ($150,138) $196,990 ($587) $678,757
* Change in unrealized appreciation (depreciation) attributable to Level 3 securities held at the period end.
Repurchase agreements. The Fund may enter into repurchase agreements. When the Fund enters into a repurchase agreement, it receives collateral which is held in a segregatedaccount by the Fund’s custodian. The collateral amount is marked-to-market and monitored on a daily basis to ensure that the collateral held is in an amount not less than the principalamount of the repurchase agreement plus any accrued interest. In the event of a default by the counterparty, realization of the collateral proceeds could be delayed, during which time thecollateral value may decline.Term loans (Floating rate loans). The Fund may invest in term loans, which often include debt securities that are rated below investment grade at the time of purchase. Term loans aregenerally subject to legal or contractual restrictions on resale. The liquidity of term loans, including the volume and frequency of secondary market trading in such loans, varies significantlyover time and among individual loans. During periods of infrequent trading, valuing a term loan can be more difficult and buying and selling a term loan at an acceptable price can be moredifficult and delayed, which could result in a loss.The Fund’s ability to receive payments of principal, interest and other amounts in connection with term loans will depend primarily on the financial condition of the borrower. The Fund’sfailure to receive scheduled payments on a term loan due to a default, bankruptcy or other reason, would adversely affect the Fund’s income and would likely reduce the value of its assets.Because many term loans are not rated by independent credit rating agencies, a decision to invest in a particular loan could depend exclusively on the subadviser’s credit analysis of theborrower
23
and/or term loan agents. The Fund may have limited rights to enforce the terms of an underlying loan. At November 30, 2012, the fund had $19,435,797 in unfunded term loancommitments outstanding.Stripped securities. Stripped mortgage-backed securities are financial instruments structured to separate principal and interest cash flows so that one class receives only principalpayments from the underlying mortgage assets (PO or principal only), while the other class receives the interest cash flows (IO or interest only). Both PO and IO investments represent aninterest in the cash flows of an underlying stripped mortgage-backed security. If the underlying mortgage assets experience greater than anticipated prepayments of principal, the Fund mayfail to fully recover its initial investment in an IO security. The market value of these securities can be extremely volatile in response to changes in interest rates. In addition, these securitiespresent additional credit risk such that the Fund may not receive all or part of its principal or interest payments because the borrower or issuer has defaulted on its obligation.
Copyright © 2013 www.secdatabase.com. All Rights Reserved.Please Consider the Environment Before Printing This Document
Futures. A futures contract is a contractual agreement to buy or sell a particular, currency or financial instrument at a pre-determined price in the future. Risks related to the use of futurescontracts include possible illiquidity of the futures markets and contract prices that can be highly volatile and imperfectly correlated to movements in hedged security values and/or interestrates.During the period ended November 30, 2012, the Fund used futures contracts to manage against anticipated interest rate changes and manage duration. The following table summarizesthe contracts held at November 30, 2012.
NUMBER OF EXPIRATION UNREALIZEDOPEN CONTRACTS CONTRACTS POSITION DATE VALUE DEPRECIATION
U.S. 10-Year Treasury Note Futures 2,135 Short March 2013 ($285,322,734) ($906,211)
Forward foreign currency contracts. A forward foreign currency contract is an agreement between two parties to buy and sell a specific currency at a price that is set on the date of thecontract. The forward contract calls for delivery of the currency on a future date that is specified in the contract. Risks related to the use of forwards include the possible failure ofcounterparties to meet the terms of the forward agreement and the risk that currency movements will not occur thereby reducing the Fund’s total return.The market value of a forward foreign currency contract fluctuates with changes in foreign currency exchange rates. Forward foreign currency contracts are marked-to-market daily and thechange in value is recorded by the Fund as an unrealized gain or loss. Realized gains or losses, equal to the difference between the value of the contract at the time it was opened and thevalue at the time it was closed, are recorded upon delivery or receipt of the currency or settlement with the counterparty.During the period ended November 30, 2012, the Fund used forward foreign currency contracts to manage against anticipated currency exchange rate changes and gain exposure toforeign currencies. The following table summarizes the contracts held at November 30, 2012.
PRINCIPAL AMOUNT PRINCIPAL AMOUNT
CURRENCY COVERED BY COVERED BY CONTRACT COUNTERPARTY SETTLEMENT UNREALIZED APPRECIATION/
CONTRACT (USD) DATE (DEPRECIATION)
BUYS
CANADIAN IMPERIAL BANK OF
AUD 31,950,000 $32,912,761 COMMERCE 2/5/2013 $266,313
AUD 10,695,000 11,079,271 HSBC BANK USA 2/5/2013 27,151
AUD 21,370,000 22,167,528 HSBC BANK USA 2/5/2013 24,546
STATE STREET BANK AND TRUST
AUD 42,490,000 43,936,742 COMPANY 2/5/2013 187,789
CAD 115,821,529 115,414,692 BANK OF MONTREAL 2/5/2013 1,027,306
24
EUR 152,318,745 193,841,924 BANK OF MONTREAL 2/5/2013 4,381,782
EUR 20,185,000 26,178,927 DEUTSCHE BANK AG 2/5/2013 89,314
EUR 40,370,000 52,357,854 ROYAL BANK OF CANADA 2/5/2013 178,628
GBP 32,518,059 51,719,981 BANK OF MONTREAL 2/5/2013 370,837
GBP 16,420,901 26,308,759 DEUTSCHE BANK AG 2/5/2013 (4,047)
JPY 4,412,666,665 54,835,573 TORONTO DOMINION BANK 2/5/2013 (1,271,749)
JPY 2,483,628,848 30,952,503 UBS AG 2/5/2013 (804,597)
JPY 1,344,954,760 16,761,650 ROYAL BANK OF CANADA 2/5/2013 (435,712)
JPY 4,745,646,720 58,710,000 BANK OF MONTREAL 2/5/2013 (1,104,247)
CANADIAN IMPERIAL BANK OF
JPY 2,368,537,530 29,355,000 COMMERCE 2/5/2013 (604,148)
MXN 533,744,385 40,006,925 BANK OF NOVA SCOTIA 2/5/2013 1,024,612
MXN 263,834,098 20,185,000 ROYAL BANK OF CANADA 2/5/2013 97,215
NZD 32,085,000 26,155,050 DEUTSCHE BANK AG LONDON 2/5/2013 76,920
NZD 21,360,000 17,520,326 ROYAL BANK OF CANADA 2/5/2013 (56,873)
NZD 63,875,000 52,073,008 UBS AG 2/5/2013 149,748
$922,473,474 $3,620,788
SELLS
AUD 14,950,000 15,539,030 BANK OF MONTREAL 2/5/2013 13,924
AUD 135,436,857 140,327,482 BANK OF NOVA SCOTIA 2/5/2013 (319,444)
CANADIAN IMPERIAL BANK OF
AUD 21,340,000 22,076,230 COMMERCE 2/5/2013 (84,690)
AUD 32,060,000 33,392,048 HSBC BANK USA 2/5/2013 98,744
STATE STREET BANK AND TRUST
AUD 21,305,000 22,027,879 COMPANY 2/5/2013 (96,695)
CAD 40,235,000 40,610,573 TORONTO DOMINION BANK 2/5/2013 160,030
CHF 105,530,249 111,500,546 BANK OF MONTREAL 2/5/2013 (2,486,878)
EUR 40,355,000 51,719,981 BANK OF MONTREAL 2/5/2013 (796,981)
EUR 20,185,000 26,308,759 DEUTSCHE BANK AG 2/5/2013 40,518
EUR 24,195,000 30,952,503 UBS AG 2/5/2013 (534,249)
STATE STREET BANK AND TRUST
EUR 21,340,000 27,558,796 COMPANY 2/5/2013 (212,533)
GBP 32,389,730 51,402,208 BANK OF MONTREAL 2/5/2013 (483,040)
GBP 16,347,226 26,178,927 DEUTSCHE BANK AG LONDON 2/5/2013 (7,764)
Copyright © 2013 www.secdatabase.com. All Rights Reserved.Please Consider the Environment Before Printing This Document
GBP 32,699,700 52,357,854 ROYAL BANK OF CANADA 2/5/2013 (23,936)
JPY 15,015,097,000 189,241,677 BANK OF MONTREAL 2/5/2013 6,978,642
JPY 340,337,522 4,197,656 TORONTO DOMINION BANK 2/5/2013 66,417
STATE STREET BANK AND TRUST
NOK 272,014,352 47,013,561 COMPANY 2/5/2013 (895,762)
NZD 20,555,000 16,761,650 ROYAL BANK OF CANADA 2/5/2013 (43,654)
NZD 87,490,585 71,269,831 BANK OF NOVA SCOTIA 2/5/2013 (260,494)
NZD 32,060,000 26,334,084 UBS AG 2/5/2013 122,553
25
STATE STREET BANK AND TRUST
SEK 318,136,613 46,820,255 COMPANY 2/5/2013 (915,344)
SGD 104,235,543 85,220,679 BANK OF MONTREAL 2/5/2013 (176,367)
$1,138,812,209 $142,997
Currency abbreviations
AUD Australian DollarCAD Canadian DollarCHF Swiss FrancEUR EuroGDP British PoundJPY Japanese YenMXN Mexican PesoNOK Norwegian KroneNZD New Zealand DollarSEK Swedish KronaSGD Singapore Dollar
Options. There are two types of options, a put option and a call option. A call option gives the purchaser of the option the right to buy (and the seller the obligation to sell) the underlyinginstrument at the exercise price. A put option gives the purchaser of the option the right to sell (and the writer the obligation to buy) the underlying instrument at the exercise price. Writingputs and buying calls may increase the Fund’s exposure to changes in the value of the underlying instrument. Buying puts and writing calls may decrease the Fund’s exposure to suchchanges. Risks related to the use of options include the loss of the premium, possible illiquidity of the options markets, trading restrictions imposed by an exchange and movements inunderlying security values.Options are traded either over-the-counter or on an exchange. When the Fund purchases an option, the premium paid by the Fund is included in the Portfolio of investments andsubsequently “marked-to-market” to reflect current market value.During the period ended November 30, 2012, the Fund used purchased options to manage against anticipated currency exchange rate changes.For additional information on the Fund's significant accounting policies, please refer to the Fund's most recent semiannual or annual shareholder report.
26
Copyright © 2013 www.secdatabase.com. All Rights Reserved.Please Consider the Environment Before Printing This Document

Copyright © 2013 www.secdatabase.com. All Rights Reserved.Please Consider the Environment Before Printing This Document
Emerging Markets FundAs of 11-30-12 (Unaudited)
Shares Value
Common Stocks 97.7% $2,256,791,962(Cost $2,054,698,905)
Brazil 10.5% 243,051,823AES Tiete SA 30,593 287,060Aliansce Shopping Centers SA 48,492 495,858All America Latina Logistica SA 208,991 770,708Amil Participacoes SA 73,447 1,059,702Anhanguera Educacional Participacoes SA 119,530 1,805,145Arezzo Industria E Comercio SA 28,591 495,071Autometal SA 4,062 34,218B2W Cia Global do Varejo (I) 22,600 161,821Banco Alfa de Investimento SA 10,300 26,704Banco Bradesco SA 187,744 2,851,129
Copyright © 2013 www.secdatabase.com. All Rights Reserved.Please Consider the Environment Before Printing This Document
Banco Bradesco SA, ADR (L) 550,552 9,271,296Banco do Brasil SA 352,619 3,615,632Banco Santander Brasil SA, ADR 773,908 5,177,445Bematech SA 66,175 188,912BHG SA - Brazil Hospitality Group (I) 1,580 14,752BM&F Bovespa SA 1,969,328 11,833,663BR Malls Participacoes SA 472,119 6,064,988Brasil Brokers Participacoes SA 155,943 469,259Braskem SA, ADR 50,629 659,190BRF - Brasil Foods SA, ADR (L) 603,892 11,081,418Brookfield Incorporacoes SA 379,400 585,932Brookfield Incorporacoes SA, ADR (I) 116,094 179,292CCR SA 384,456 3,303,357CCX Carvao da Colombia SA (I) 68,000 68,420Centrais Eletricas Brasileiras SA 29,500 105,614Centrais Eletricas Brasileiras SA, ADR, B Shares 35,300 168,028Centrais Eletricas Brasileiras SA, ADR, (U.S. Exchange) (L) 47,167 172,631CETIP SA - Mercados Organizados 105,534 1,084,084Cia Brasileira de Distribuicao Grupo Pao de Acucar, ADR (L) 66,560 2,880,717Cia de Saneamento Basico do Estado de Sao Paulo 5,400 218,598Cia de Saneamento de Minas Gerais 46,300 975,056Cia Energetica de Minas Gerais 23,663 255,257Cia Energetica de Minas Gerais, ADR 160,926 1,969,734Cia Hering 75,600 1,692,580Cia Paranaense de Energia 1,000 11,227Cia Paranaense de Energia, ADR (L) 55,947 752,487Cia Providencia Industria e Comercio SA 39,800 152,733Cia Siderurgica Nacional SA 136,900 672,071Cielo SA 126,882 3,304,466Companhia de Bebidas das Americas 153,400 6,353,379Companhia de Bebidas das Americas, ADR (L) 114,926 4,782,071Companhia de Saneamento Basico de Estado de Sao Paulo, ADR 19,370 1,576,137Companhia Siderurgica Nacional SA, ADR (L) 259,126 1,251,579Contax Participacoes SA 1,400 16,511Cosan SA Industria e Comercio 153,900 2,829,807CPFL Energia SA 10,100 108,005CPFL Energia SA, ADR (L) 28,796 628,905CR2 Empreendimentos Imobiliarios SA 28,800 61,999Cremer SA 650 4,046CSU Cardsystem SA 4,000 7,844Cyrela Brazil Realty SA Empreendimentos e Participacoes 221,028 1,843,279Cyrela Commercial Properties SA Empreendimentos e Participacoes 2,100 24,845
1
Emerging Markets FundAs of 11-30-12 (Unaudited)
Shares Value
Brazil (continued)Diagnosticos da America SA 269,326 $1,565,438Direcional Engenharia SA 5,225 31,910Duratex SA 242,485 1,673,836Ecorodovias Infraestrutura e Logistica SA 87,533 698,855EDP - Energias do Brasil SA 124,772 707,711Embraer SA 32,692 200,577Embraer SA, ADR (L) 175,929 4,385,910Equatorial Energia SA 36,426 294,061Estacio Participacoes SA 48,374 886,298Eternit SA 62,999 233,210Even Construtora e Incorporadora SA 241,500 973,098EZ Tec Empreendimentos e Participacoes SA 99,800 1,205,932Fertilizantes Heringer SA (I) 38,800 171,956Fibria Celulose SA, ADR (I)(L) 248,951 2,516,895Fleury SA 33,900 364,891Forjas Taurus SA 7,413 10,061Gafisa SA (I) 521,522 1,027,521Gafisa SA, ADR (I)(L) 74,154 292,167General Shopping Brasil SA (I) 60,020 286,224Gerdau SA 103,043 714,183Gerdau SA, ADR (L) 894,088 7,590,807Grendene SA 210,900 1,495,290Guararapes Confeccoes SA 2,700 149,708
Copyright © 2013 www.secdatabase.com. All Rights Reserved.Please Consider the Environment Before Printing This Document
Helbor Empreendimentos SA 145,200 781,449Hypermarcas SA (I) 250,217 1,803,324IdeiasNet SA (I) 28,300 23,575Iguatemi Empresa de Shopping Centers SA 124,300 1,511,867Industrias Romi SA (I) 93,000 213,263Inepar SA Industria e Construcoes (I) 9,800 6,971International Meal Company Holdings SA 10,000 115,547Iochpe-Maxion SA 124,676 1,500,103Itau Unibanco Holding SA 96,022 1,307,675Itau Unibanco Holding SA, ADR (L) 646,657 9,796,854JBS SA (I) 613,979 1,554,486JHSF Participacoes SA 205,000 826,984Joao Fortes Engenharia SA 675 1,990JSL SA 23,700 139,751Kroton Educacional SA (I) 10,403 24,294Kroton Educacional SA, Preference Shares (I) 115,459 2,239,152Light SA 37,603 417,068Localiza Rent a Car SA 113,448 1,887,437Log-in Logistica Intermodal SA (I) 65,400 238,731Lojas Americanas SA 72,620 599,842Lojas Renner SA (I) 72,550 2,653,399LPS Brasil Consultoria de Imoveis SA 23,300 425,044Lupatech SA (I) 3,800 3,272M Dias Branco SA 24,729 824,339Magnesita Refratarios SA 282,565 1,049,965Mahle-Metal Leve SA Industria e Comercio 42,500 527,670Marcopolo SA 8,000 40,996Marfrig Alimentos SA (I) 200,293 1,087,326Marisa Lojas SA 48,673 717,521Metalfrio Solutions SA (I) 16,800 30,663Mills Estruturas e Servicos de Engenharia SA 90,017 1,324,895Minerva SA 60,400 303,583
2
Emerging Markets FundAs of 11-30-12 (Unaudited)
Shares Value
Brazil (continued)MMX Mineracao e Metalicos SA (I) 286,400 $471,793MPX Energia SA (I) 183,300 956,475MRV Engenharia e Participacoes SA 333,700 1,766,261Multiplan Empreendimentos Imobiliarios SA 47,700 1,317,063Multiplus SA 32,097 743,542Natura Cosmeticos SA 92,600 2,451,075Obrascon Huarte Lain Brasil SA 118,226 1,051,242Odontoprev SA 270,770 1,368,549Oi SA 57,436 242,453Oi SA, ADR 175,443 664,929Oi SA, Series C, ADR (L) 12,205 54,312OSX Brasil SA (I) 25,250 106,232Paranapanema SA (I) 275,500 523,460PDG Realty SA Empreendimentos e Participacoes 243,884 343,547Petroleo Brasileiro SA 97,783 874,043Petroleo Brasileiro SA, ADR (L) 671,572 12,068,149Petroleo Brasileiro SA, ADR, Class A (L) 837,292 14,694,475Plascar Participacoes Industriais SA 13,400 2,947Porto Seguro SA 166,625 1,756,861Positivo Informatica SA (I) 26,000 59,987Profarma Distribuidora de Produtos Farmaceuticos SA 42,000 288,937QGEP Participacoes SA 36,700 228,259Raia Drogasil SA 124,576 1,224,306Refinaria de Petroleos de Manguinhos SA (I) 40,000 5,803Restoque Comercio e Confeccoes de Roupas SA 94,596 389,575Rodobens Negocios Imobiliarios SA 59,200 351,853Rossi Residencial SA 121,400 231,801Santos Brasil Participacoes SA 52,908 668,531Sao Carlos Empreendimentos e Participacoes SA 71,400 1,537,065Sao Martinho SA 66,300 746,837SLC Agricola SA 49,500 414,430Sonae Sierra Brasil SA 5,736 81,874Souza Cruz SA 161,600 2,349,734
Copyright © 2013 www.secdatabase.com. All Rights Reserved.Please Consider the Environment Before Printing This Document
Springs Global Participacoes SA (I) 137,067 172,553Sul America SA 274,382 1,990,322T4F Entretenimento SA 10,600 50,351Tecnisa SA 41,600 143,287Tegma Gestao Logistica 25,578 386,040Telefonica Brasil SA 4,502 84,908Telefonica Brasil SA, ADR (L) 88,100 1,932,914Tempo Participacoes SA (I) 16,496 28,101Tereos Internacional SA 9,500 12,004Tim Participacoes SA 47,400 166,814Tim Participacoes SA, ADR (L) 43,961 779,429Totvs SA 99,999 1,871,471TPI - Triunfo Participacoes e Investimentos SA 75,690 414,439Tractebel Energia SA 36,638 597,545Trisul SA (I) 30,607 35,809Ultrapar Participacoes SA, ADR 182,880 3,760,013Usinas Siderurgicas de Minas Gerais SA 135,144 863,308Vale SA 14,800 260,427Vale SA, ADR, Ordinary A Shares (L) 622,881 10,856,816Vale SA, ADR, Preference A Shares 530,973 9,074,329Valid Solucoes e Servicos de Seguranca em Meios de Pagamento e Identificacao SA 74,585 1,361,295Vanguarda Agro SA (I) 1,152,700 194,203
3
Emerging Markets FundAs of 11-30-12 (Unaudited)
Shares Value
Brazil (continued)Viver Incorporadora e Construtora SA (I) 246,617 $103,873Viver Incorporadora e Construtora SA (I) 43,219 16,585WEG SA 156,700 1,998,350
Chile 1.8% 42,398,438AES Gener SA (I) 789,916 512,431Aguas Andinas SA 1,103,018 754,534Almendral SA 205,170 30,288Banco de Chile 3,324,290 497,659Banco de Chile, ADR (L) 5,474 493,864Banco de Credito e Inversiones 17,962 1,187,632Banco Santander Chile 5,453,570 367,842Banco Santander Chile, ADR (L) 51,996 1,400,252Banmedica SA 300 649Besalco SA 274,576 456,723CAP SA 44,286 1,452,106Cementos Bio-Bio SA (I) 2,795 3,952Cencosud SA 493,536 2,574,658Cia Cervecerias Unidas SA 15,538 225,179Cia Cervecerias Unidas SA, ADR (L) 8,617 632,488Cia General de Electricidad 330,742 1,801,734Cia Sud Americana de Vapores SA (I) 8,532,311 748,651Cintac SA 78,352 32,908Colbun SA (I) 3,075,845 835,873Corpbanca SA 58,425,982 754,393Corpbanca SA, ADR 13,087 254,935Cristalerias de Chile SA 62,943 536,576E.CL SA 264,051 612,157Embotelladora Andina SA, ADR, Series A 300 9,075Embotelladora Andina SA, ADR, Series B (L) 1,594 60,524Empresa Nacional de Electricidad SA 1,112,975 1,659,223Empresa Nacional de Electricidad SA, ADR (L) 18,202 817,634Empresas CMPC SA 668,839 2,439,222Empresas COPEC SA 299,947 4,147,308Empresas Hites SA 12,912 10,739Empresas Iansa SA 4,708,478 348,033Empresas La Polar SA (I) 202,586 85,550Enersis SA, ADR (L) 169,382 2,871,025ENTEL Chile SA 67,071 1,380,607Forus SA 2,628 12,568Gasco SA 218,626 1,795,556Grupo Security SA 593,749 216,056Inversiones Aguas Metropolitanas SA 889,211 1,636,244
Copyright © 2013 www.secdatabase.com. All Rights Reserved.Please Consider the Environment Before Printing This Document
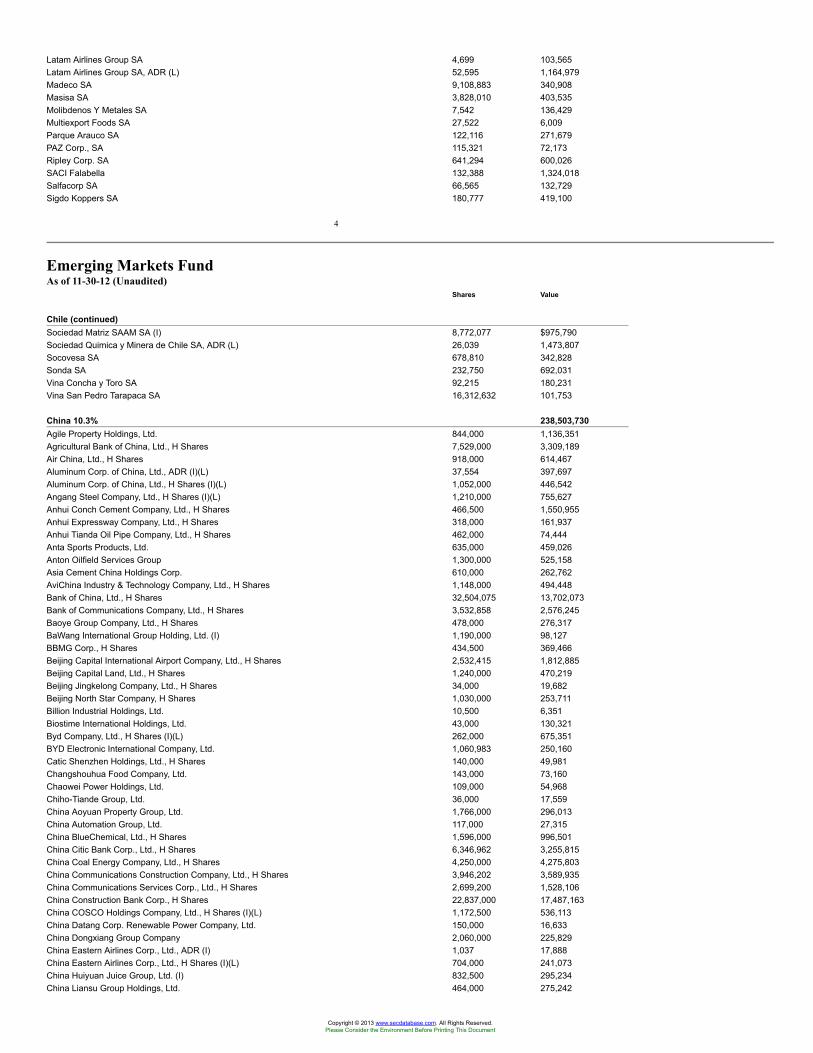
Latam Airlines Group SA 4,699 103,565Latam Airlines Group SA, ADR (L) 52,595 1,164,979Madeco SA 9,108,883 340,908Masisa SA 3,828,010 403,535Molibdenos Y Metales SA 7,542 136,429Multiexport Foods SA 27,522 6,009Parque Arauco SA 122,116 271,679PAZ Corp., SA 115,321 72,173Ripley Corp. SA 641,294 600,026SACI Falabella 132,388 1,324,018Salfacorp SA 66,565 132,729Sigdo Koppers SA 180,777 419,100
4
Emerging Markets FundAs of 11-30-12 (Unaudited)
Shares Value
Chile (continued)Sociedad Matriz SAAM SA (I) 8,772,077 $975,790Sociedad Quimica y Minera de Chile SA, ADR (L) 26,039 1,473,807Socovesa SA 678,810 342,828Sonda SA 232,750 692,031Vina Concha y Toro SA 92,215 180,231Vina San Pedro Tarapaca SA 16,312,632 101,753
China 10.3% 238,503,730Agile Property Holdings, Ltd. 844,000 1,136,351Agricultural Bank of China, Ltd., H Shares 7,529,000 3,309,189Air China, Ltd., H Shares 918,000 614,467Aluminum Corp. of China, Ltd., ADR (I)(L) 37,554 397,697Aluminum Corp. of China, Ltd., H Shares (I)(L) 1,052,000 446,542Angang Steel Company, Ltd., H Shares (I)(L) 1,210,000 755,627Anhui Conch Cement Company, Ltd., H Shares 466,500 1,550,955Anhui Expressway Company, Ltd., H Shares 318,000 161,937Anhui Tianda Oil Pipe Company, Ltd., H Shares 462,000 74,444Anta Sports Products, Ltd. 635,000 459,026Anton Oilfield Services Group 1,300,000 525,158Asia Cement China Holdings Corp. 610,000 262,762AviChina Industry & Technology Company, Ltd., H Shares 1,148,000 494,448Bank of China, Ltd., H Shares 32,504,075 13,702,073Bank of Communications Company, Ltd., H Shares 3,532,858 2,576,245Baoye Group Company, Ltd., H Shares 478,000 276,317BaWang International Group Holding, Ltd. (I) 1,190,000 98,127BBMG Corp., H Shares 434,500 369,466Beijing Capital International Airport Company, Ltd., H Shares 2,532,415 1,812,885Beijing Capital Land, Ltd., H Shares 1,240,000 470,219Beijing Jingkelong Company, Ltd., H Shares 34,000 19,682Beijing North Star Company, H Shares 1,030,000 253,711Billion Industrial Holdings, Ltd. 10,500 6,351Biostime International Holdings, Ltd. 43,000 130,321Byd Company, Ltd., H Shares (I)(L) 262,000 675,351BYD Electronic International Company, Ltd. 1,060,983 250,160Catic Shenzhen Holdings, Ltd., H Shares 140,000 49,981Changshouhua Food Company, Ltd. 143,000 73,160Chaowei Power Holdings, Ltd. 109,000 54,968Chiho-Tiande Group, Ltd. 36,000 17,559China Aoyuan Property Group, Ltd. 1,766,000 296,013China Automation Group, Ltd. 117,000 27,315China BlueChemical, Ltd., H Shares 1,596,000 996,501China Citic Bank Corp., Ltd., H Shares 6,346,962 3,255,815China Coal Energy Company, Ltd., H Shares 4,250,000 4,275,803China Communications Construction Company, Ltd., H Shares 3,946,202 3,589,935China Communications Services Corp., Ltd., H Shares 2,699,200 1,528,106China Construction Bank Corp., H Shares 22,837,000 17,487,163China COSCO Holdings Company, Ltd., H Shares (I)(L) 1,172,500 536,113China Datang Corp. Renewable Power Company, Ltd. 150,000 16,633China Dongxiang Group Company 2,060,000 225,829China Eastern Airlines Corp., Ltd., ADR (I) 1,037 17,888China Eastern Airlines Corp., Ltd., H Shares (I)(L) 704,000 241,073China Huiyuan Juice Group, Ltd. (I) 832,500 295,234China Liansu Group Holdings, Ltd. 464,000 275,242
Copyright © 2013 www.secdatabase.com. All Rights Reserved.Please Consider the Environment Before Printing This Document
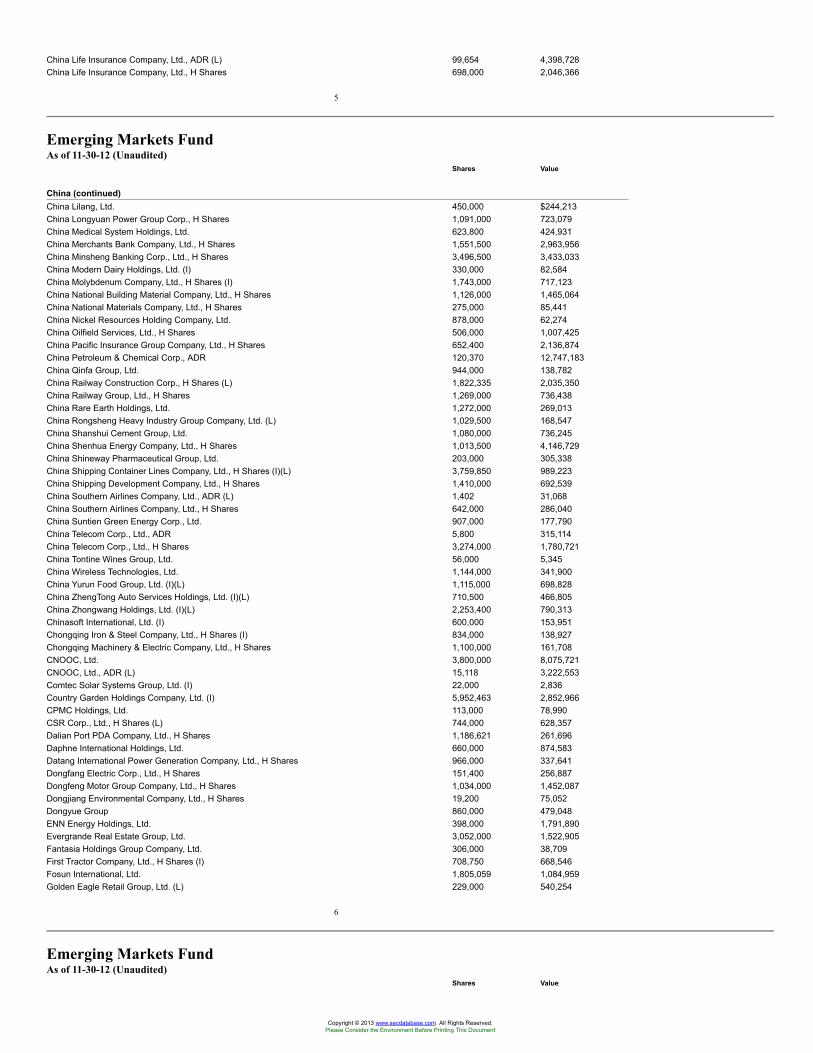
China Life Insurance Company, Ltd., ADR (L) 99,654 4,398,728China Life Insurance Company, Ltd., H Shares 698,000 2,046,366
5
Emerging Markets FundAs of 11-30-12 (Unaudited)
Shares Value
China (continued)China Lilang, Ltd. 450,000 $244,213China Longyuan Power Group Corp., H Shares 1,091,000 723,079China Medical System Holdings, Ltd. 623,800 424,931China Merchants Bank Company, Ltd., H Shares 1,551,500 2,963,956China Minsheng Banking Corp., Ltd., H Shares 3,496,500 3,433,033China Modern Dairy Holdings, Ltd. (I) 330,000 82,584China Molybdenum Company, Ltd., H Shares (I) 1,743,000 717,123China National Building Material Company, Ltd., H Shares 1,126,000 1,465,064China National Materials Company, Ltd., H Shares 275,000 85,441China Nickel Resources Holding Company, Ltd. 878,000 62,274China Oilfield Services, Ltd., H Shares 506,000 1,007,425China Pacific Insurance Group Company, Ltd., H Shares 652,400 2,136,874China Petroleum & Chemical Corp., ADR 120,370 12,747,183China Qinfa Group, Ltd. 944,000 138,782China Railway Construction Corp., H Shares (L) 1,822,335 2,035,350China Railway Group, Ltd., H Shares 1,269,000 736,438China Rare Earth Holdings, Ltd. 1,272,000 269,013China Rongsheng Heavy Industry Group Company, Ltd. (L) 1,029,500 168,547China Shanshui Cement Group, Ltd. 1,080,000 736,245China Shenhua Energy Company, Ltd., H Shares 1,013,500 4,146,729China Shineway Pharmaceutical Group, Ltd. 203,000 305,338China Shipping Container Lines Company, Ltd., H Shares (I)(L) 3,759,850 989,223China Shipping Development Company, Ltd., H Shares 1,410,000 692,539China Southern Airlines Company, Ltd., ADR (L) 1,402 31,068China Southern Airlines Company, Ltd., H Shares 642,000 286,040China Suntien Green Energy Corp., Ltd. 907,000 177,790China Telecom Corp., Ltd., ADR 5,800 315,114China Telecom Corp., Ltd., H Shares 3,274,000 1,780,721China Tontine Wines Group, Ltd. 56,000 5,345China Wireless Technologies, Ltd. 1,144,000 341,900China Yurun Food Group, Ltd. (I)(L) 1,115,000 698,828China ZhengTong Auto Services Holdings, Ltd. (I)(L) 710,500 466,805China Zhongwang Holdings, Ltd. (I)(L) 2,253,400 790,313Chinasoft International, Ltd. (I) 600,000 153,951Chongqing Iron & Steel Company, Ltd., H Shares (I) 834,000 138,927Chongqing Machinery & Electric Company, Ltd., H Shares 1,100,000 161,708CNOOC, Ltd. 3,800,000 8,075,721CNOOC, Ltd., ADR (L) 15,118 3,222,553Comtec Solar Systems Group, Ltd. (I) 22,000 2,836Country Garden Holdings Company, Ltd. (I) 5,952,463 2,852,966CPMC Holdings, Ltd. 113,000 78,990CSR Corp., Ltd., H Shares (L) 744,000 628,357Dalian Port PDA Company, Ltd., H Shares 1,186,621 261,696Daphne International Holdings, Ltd. 660,000 874,583Datang International Power Generation Company, Ltd., H Shares 966,000 337,641Dongfang Electric Corp., Ltd., H Shares 151,400 256,887Dongfeng Motor Group Company, Ltd., H Shares 1,034,000 1,452,087Dongjiang Environmental Company, Ltd., H Shares 19,200 75,052Dongyue Group 860,000 479,048ENN Energy Holdings, Ltd. 398,000 1,791,890Evergrande Real Estate Group, Ltd. 3,052,000 1,522,905Fantasia Holdings Group Company, Ltd. 306,000 38,709First Tractor Company, Ltd., H Shares (I) 708,750 668,546Fosun International, Ltd. 1,805,059 1,084,959Golden Eagle Retail Group, Ltd. (L) 229,000 540,254
6
Emerging Markets FundAs of 11-30-12 (Unaudited)
Shares Value
Copyright © 2013 www.secdatabase.com. All Rights Reserved.Please Consider the Environment Before Printing This Document
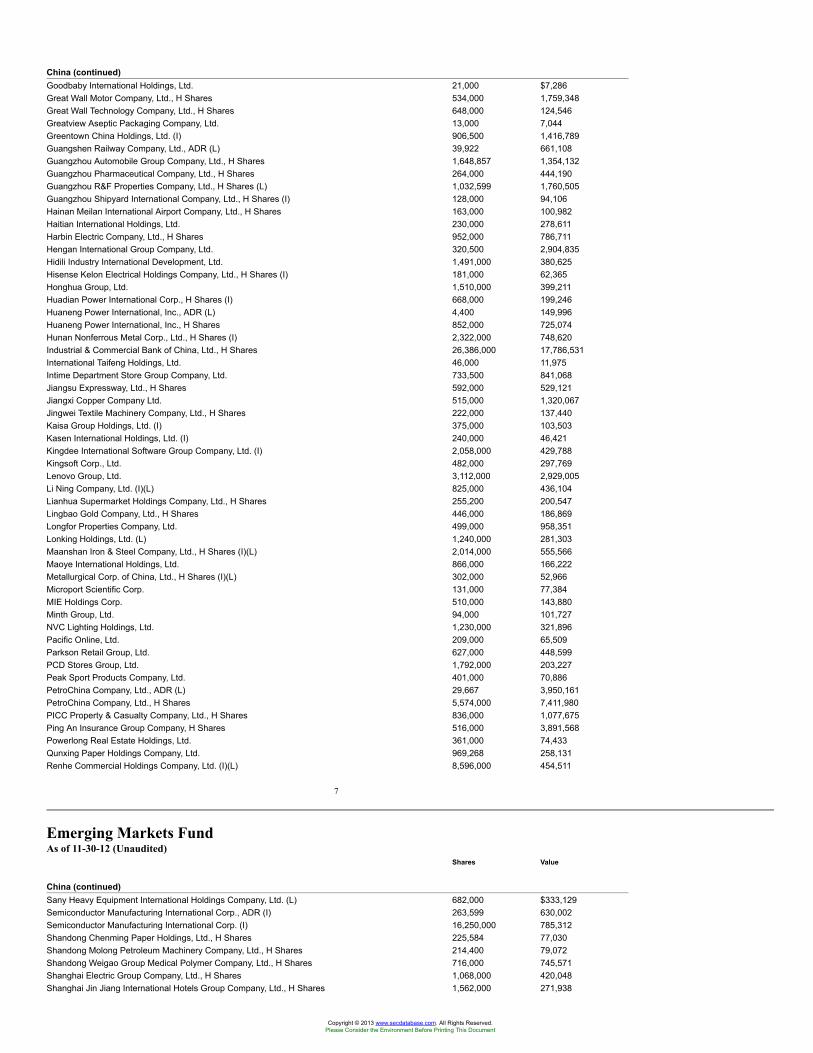
China (continued)Goodbaby International Holdings, Ltd. 21,000 $7,286Great Wall Motor Company, Ltd., H Shares 534,000 1,759,348Great Wall Technology Company, Ltd., H Shares 648,000 124,546Greatview Aseptic Packaging Company, Ltd. 13,000 7,044Greentown China Holdings, Ltd. (I) 906,500 1,416,789Guangshen Railway Company, Ltd., ADR (L) 39,922 661,108Guangzhou Automobile Group Company, Ltd., H Shares 1,648,857 1,354,132Guangzhou Pharmaceutical Company, Ltd., H Shares 264,000 444,190Guangzhou R&F Properties Company, Ltd., H Shares (L) 1,032,599 1,760,505Guangzhou Shipyard International Company, Ltd., H Shares (I) 128,000 94,106Hainan Meilan International Airport Company, Ltd., H Shares 163,000 100,982Haitian International Holdings, Ltd. 230,000 278,611Harbin Electric Company, Ltd., H Shares 952,000 786,711Hengan International Group Company, Ltd. 320,500 2,904,835Hidili Industry International Development, Ltd. 1,491,000 380,625Hisense Kelon Electrical Holdings Company, Ltd., H Shares (I) 181,000 62,365Honghua Group, Ltd. 1,510,000 399,211Huadian Power International Corp., H Shares (I) 668,000 199,246Huaneng Power International, Inc., ADR (L) 4,400 149,996Huaneng Power International, Inc., H Shares 852,000 725,074Hunan Nonferrous Metal Corp., Ltd., H Shares (I) 2,322,000 748,620Industrial & Commercial Bank of China, Ltd., H Shares 26,386,000 17,786,531International Taifeng Holdings, Ltd. 46,000 11,975Intime Department Store Group Company, Ltd. 733,500 841,068Jiangsu Expressway, Ltd., H Shares 592,000 529,121Jiangxi Copper Company Ltd. 515,000 1,320,067Jingwei Textile Machinery Company, Ltd., H Shares 222,000 137,440Kaisa Group Holdings, Ltd. (I) 375,000 103,503Kasen International Holdings, Ltd. (I) 240,000 46,421Kingdee International Software Group Company, Ltd. (I) 2,058,000 429,788Kingsoft Corp., Ltd. 482,000 297,769Lenovo Group, Ltd. 3,112,000 2,929,005Li Ning Company, Ltd. (I)(L) 825,000 436,104Lianhua Supermarket Holdings Company, Ltd., H Shares 255,200 200,547Lingbao Gold Company, Ltd., H Shares 446,000 186,869Longfor Properties Company, Ltd. 499,000 958,351Lonking Holdings, Ltd. (L) 1,240,000 281,303Maanshan Iron & Steel Company, Ltd., H Shares (I)(L) 2,014,000 555,566Maoye International Holdings, Ltd. 866,000 166,222Metallurgical Corp. of China, Ltd., H Shares (I)(L) 302,000 52,966Microport Scientific Corp. 131,000 77,384MIE Holdings Corp. 510,000 143,880Minth Group, Ltd. 94,000 101,727NVC Lighting Holdings, Ltd. 1,230,000 321,896Pacific Online, Ltd. 209,000 65,509Parkson Retail Group, Ltd. 627,000 448,599PCD Stores Group, Ltd. 1,792,000 203,227Peak Sport Products Company, Ltd. 401,000 70,886PetroChina Company, Ltd., ADR (L) 29,667 3,950,161PetroChina Company, Ltd., H Shares 5,574,000 7,411,980PICC Property & Casualty Company, Ltd., H Shares 836,000 1,077,675Ping An Insurance Group Company, H Shares 516,000 3,891,568Powerlong Real Estate Holdings, Ltd. 361,000 74,433Qunxing Paper Holdings Company, Ltd. 969,268 258,131Renhe Commercial Holdings Company, Ltd. (I)(L) 8,596,000 454,511
7
Emerging Markets FundAs of 11-30-12 (Unaudited)
Shares Value
China (continued)Sany Heavy Equipment International Holdings Company, Ltd. (L) 682,000 $333,129Semiconductor Manufacturing International Corp., ADR (I) 263,599 630,002Semiconductor Manufacturing International Corp. (I) 16,250,000 785,312Shandong Chenming Paper Holdings, Ltd., H Shares 225,584 77,030Shandong Molong Petroleum Machinery Company, Ltd., H Shares 214,400 79,072Shandong Weigao Group Medical Polymer Company, Ltd., H Shares 716,000 745,571Shanghai Electric Group Company, Ltd., H Shares 1,068,000 420,048Shanghai Jin Jiang International Hotels Group Company, Ltd., H Shares 1,562,000 271,938
Copyright © 2013 www.secdatabase.com. All Rights Reserved.Please Consider the Environment Before Printing This Document
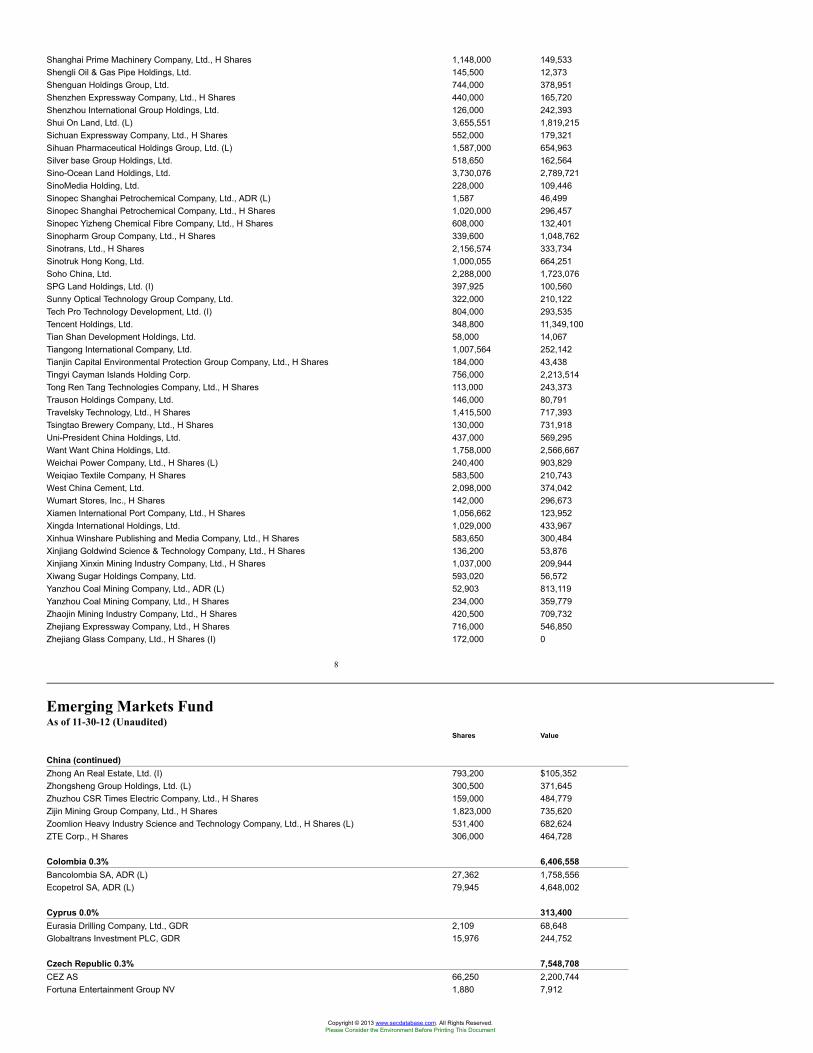
Shanghai Prime Machinery Company, Ltd., H Shares 1,148,000 149,533Shengli Oil & Gas Pipe Holdings, Ltd. 145,500 12,373Shenguan Holdings Group, Ltd. 744,000 378,951Shenzhen Expressway Company, Ltd., H Shares 440,000 165,720Shenzhou International Group Holdings, Ltd. 126,000 242,393Shui On Land, Ltd. (L) 3,655,551 1,819,215Sichuan Expressway Company, Ltd., H Shares 552,000 179,321Sihuan Pharmaceutical Holdings Group, Ltd. (L) 1,587,000 654,963Silver base Group Holdings, Ltd. 518,650 162,564Sino-Ocean Land Holdings, Ltd. 3,730,076 2,789,721SinoMedia Holding, Ltd. 228,000 109,446Sinopec Shanghai Petrochemical Company, Ltd., ADR (L) 1,587 46,499Sinopec Shanghai Petrochemical Company, Ltd., H Shares 1,020,000 296,457Sinopec Yizheng Chemical Fibre Company, Ltd., H Shares 608,000 132,401Sinopharm Group Company, Ltd., H Shares 339,600 1,048,762Sinotrans, Ltd., H Shares 2,156,574 333,734Sinotruk Hong Kong, Ltd. 1,000,055 664,251Soho China, Ltd. 2,288,000 1,723,076SPG Land Holdings, Ltd. (I) 397,925 100,560Sunny Optical Technology Group Company, Ltd. 322,000 210,122Tech Pro Technology Development, Ltd. (I) 804,000 293,535Tencent Holdings, Ltd. 348,800 11,349,100Tian Shan Development Holdings, Ltd. 58,000 14,067Tiangong International Company, Ltd. 1,007,564 252,142Tianjin Capital Environmental Protection Group Company, Ltd., H Shares 184,000 43,438Tingyi Cayman Islands Holding Corp. 756,000 2,213,514Tong Ren Tang Technologies Company, Ltd., H Shares 113,000 243,373Trauson Holdings Company, Ltd. 146,000 80,791Travelsky Technology, Ltd., H Shares 1,415,500 717,393Tsingtao Brewery Company, Ltd., H Shares 130,000 731,918Uni-President China Holdings, Ltd. 437,000 569,295Want Want China Holdings, Ltd. 1,758,000 2,566,667Weichai Power Company, Ltd., H Shares (L) 240,400 903,829Weiqiao Textile Company, H Shares 583,500 210,743West China Cement, Ltd. 2,098,000 374,042Wumart Stores, Inc., H Shares 142,000 296,673Xiamen International Port Company, Ltd., H Shares 1,056,662 123,952Xingda International Holdings, Ltd. 1,029,000 433,967Xinhua Winshare Publishing and Media Company, Ltd., H Shares 583,650 300,484Xinjiang Goldwind Science & Technology Company, Ltd., H Shares 136,200 53,876Xinjiang Xinxin Mining Industry Company, Ltd., H Shares 1,037,000 209,944Xiwang Sugar Holdings Company, Ltd. 593,020 56,572Yanzhou Coal Mining Company, Ltd., ADR (L) 52,903 813,119Yanzhou Coal Mining Company, Ltd., H Shares 234,000 359,779Zhaojin Mining Industry Company, Ltd., H Shares 420,500 709,732Zhejiang Expressway Company, Ltd., H Shares 716,000 546,850Zhejiang Glass Company, Ltd., H Shares (I) 172,000 0
8
Emerging Markets FundAs of 11-30-12 (Unaudited)
Shares Value
China (continued)Zhong An Real Estate, Ltd. (I) 793,200 $105,352Zhongsheng Group Holdings, Ltd. (L) 300,500 371,645Zhuzhou CSR Times Electric Company, Ltd., H Shares 159,000 484,779Zijin Mining Group Company, Ltd., H Shares 1,823,000 735,620Zoomlion Heavy Industry Science and Technology Company, Ltd., H Shares (L) 531,400 682,624ZTE Corp., H Shares 306,000 464,728
Colombia 0.3% 6,406,558Bancolombia SA, ADR (L) 27,362 1,758,556Ecopetrol SA, ADR (L) 79,945 4,648,002
Cyprus 0.0% 313,400Eurasia Drilling Company, Ltd., GDR 2,109 68,648Globaltrans Investment PLC, GDR 15,976 244,752
Czech Republic 0.3% 7,548,708CEZ AS 66,250 2,200,744Fortuna Entertainment Group NV 1,880 7,912
Copyright © 2013 www.secdatabase.com. All Rights Reserved.Please Consider the Environment Before Printing This Document
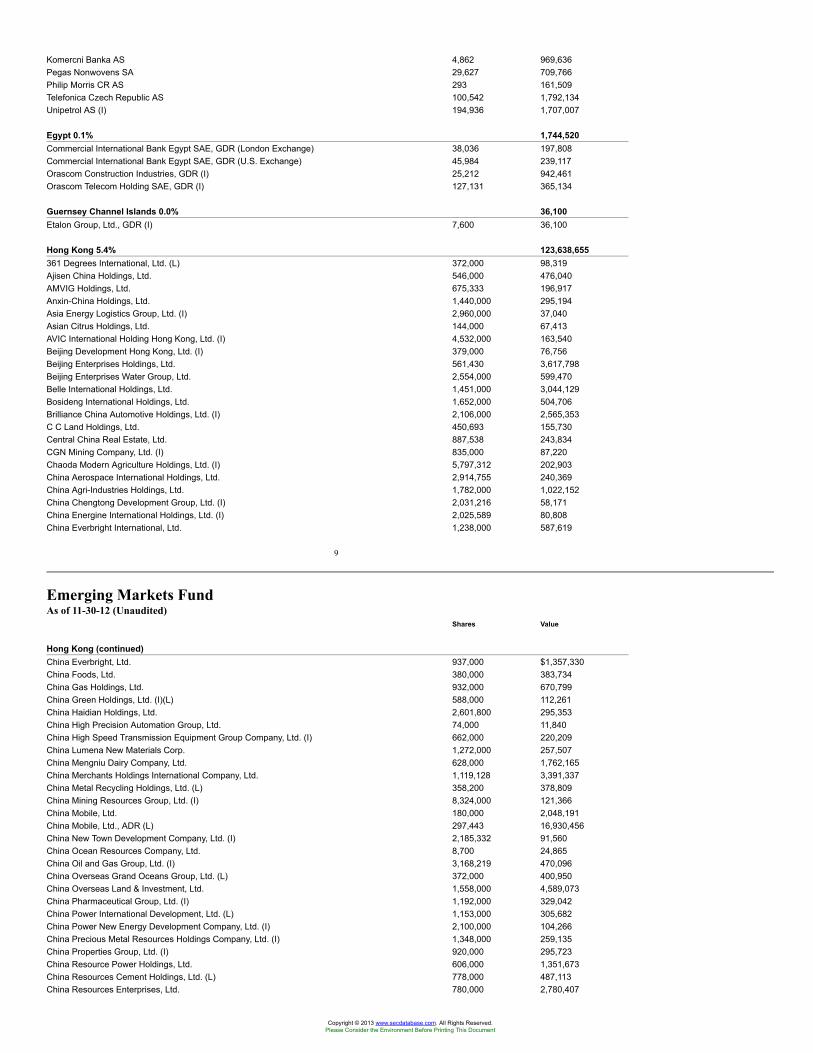
Komercni Banka AS 4,862 969,636Pegas Nonwovens SA 29,627 709,766Philip Morris CR AS 293 161,509Telefonica Czech Republic AS 100,542 1,792,134Unipetrol AS (I) 194,936 1,707,007
Egypt 0.1% 1,744,520Commercial International Bank Egypt SAE, GDR (London Exchange) 38,036 197,808Commercial International Bank Egypt SAE, GDR (U.S. Exchange) 45,984 239,117Orascom Construction Industries, GDR (I) 25,212 942,461Orascom Telecom Holding SAE, GDR (I) 127,131 365,134
Guernsey Channel Islands 0.0% 36,100Etalon Group, Ltd., GDR (I) 7,600 36,100
Hong Kong 5.4% 123,638,655361 Degrees International, Ltd. (L) 372,000 98,319Ajisen China Holdings, Ltd. 546,000 476,040AMVIG Holdings, Ltd. 675,333 196,917Anxin-China Holdings, Ltd. 1,440,000 295,194Asia Energy Logistics Group, Ltd. (I) 2,960,000 37,040Asian Citrus Holdings, Ltd. 144,000 67,413AVIC International Holding Hong Kong, Ltd. (I) 4,532,000 163,540Beijing Development Hong Kong, Ltd. (I) 379,000 76,756Beijing Enterprises Holdings, Ltd. 561,430 3,617,798Beijing Enterprises Water Group, Ltd. 2,554,000 599,470Belle International Holdings, Ltd. 1,451,000 3,044,129Bosideng International Holdings, Ltd. 1,652,000 504,706Brilliance China Automotive Holdings, Ltd. (I) 2,106,000 2,565,353C C Land Holdings, Ltd. 450,693 155,730Central China Real Estate, Ltd. 887,538 243,834CGN Mining Company, Ltd. (I) 835,000 87,220Chaoda Modern Agriculture Holdings, Ltd. (I) 5,797,312 202,903China Aerospace International Holdings, Ltd. 2,914,755 240,369China Agri-Industries Holdings, Ltd. 1,782,000 1,022,152China Chengtong Development Group, Ltd. (I) 2,031,216 58,171China Energine International Holdings, Ltd. (I) 2,025,589 80,808China Everbright International, Ltd. 1,238,000 587,619
9
Emerging Markets FundAs of 11-30-12 (Unaudited)
Shares Value
Hong Kong (continued)China Everbright, Ltd. 937,000 $1,357,330China Foods, Ltd. 380,000 383,734China Gas Holdings, Ltd. 932,000 670,799China Green Holdings, Ltd. (I)(L) 588,000 112,261China Haidian Holdings, Ltd. 2,601,800 295,353China High Precision Automation Group, Ltd. 74,000 11,840China High Speed Transmission Equipment Group Company, Ltd. (I) 662,000 220,209China Lumena New Materials Corp. 1,272,000 257,507China Mengniu Dairy Company, Ltd. 628,000 1,762,165China Merchants Holdings International Company, Ltd. 1,119,128 3,391,337China Metal Recycling Holdings, Ltd. (L) 358,200 378,809China Mining Resources Group, Ltd. (I) 8,324,000 121,366China Mobile, Ltd. 180,000 2,048,191China Mobile, Ltd., ADR (L) 297,443 16,930,456China New Town Development Company, Ltd. (I) 2,185,332 91,560China Ocean Resources Company, Ltd. 8,700 24,865China Oil and Gas Group, Ltd. (I) 3,168,219 470,096China Overseas Grand Oceans Group, Ltd. (L) 372,000 400,950China Overseas Land & Investment, Ltd. 1,558,000 4,589,073China Pharmaceutical Group, Ltd. (I) 1,192,000 329,042China Power International Development, Ltd. (L) 1,153,000 305,682China Power New Energy Development Company, Ltd. (I) 2,100,000 104,266China Precious Metal Resources Holdings Company, Ltd. (I) 1,348,000 259,135China Properties Group, Ltd. (I) 920,000 295,723China Resource Power Holdings, Ltd. 606,000 1,351,673China Resources Cement Holdings, Ltd. (L) 778,000 487,113China Resources Enterprises, Ltd. 780,000 2,780,407
Copyright © 2013 www.secdatabase.com. All Rights Reserved.Please Consider the Environment Before Printing This Document
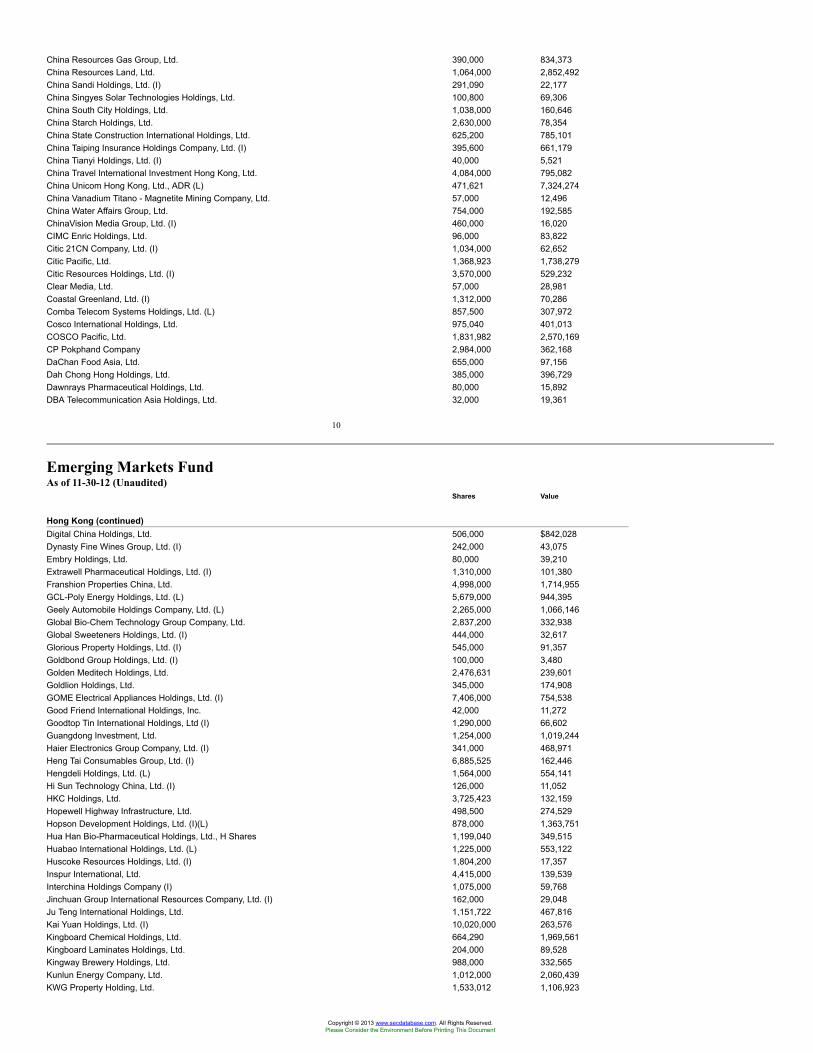
China Resources Gas Group, Ltd. 390,000 834,373China Resources Land, Ltd. 1,064,000 2,852,492China Sandi Holdings, Ltd. (I) 291,090 22,177China Singyes Solar Technologies Holdings, Ltd. 100,800 69,306China South City Holdings, Ltd. 1,038,000 160,646China Starch Holdings, Ltd. 2,630,000 78,354China State Construction International Holdings, Ltd. 625,200 785,101China Taiping Insurance Holdings Company, Ltd. (I) 395,600 661,179China Tianyi Holdings, Ltd. (I) 40,000 5,521China Travel International Investment Hong Kong, Ltd. 4,084,000 795,082China Unicom Hong Kong, Ltd., ADR (L) 471,621 7,324,274China Vanadium Titano - Magnetite Mining Company, Ltd. 57,000 12,496China Water Affairs Group, Ltd. 754,000 192,585ChinaVision Media Group, Ltd. (I) 460,000 16,020CIMC Enric Holdings, Ltd. 96,000 83,822Citic 21CN Company, Ltd. (I) 1,034,000 62,652Citic Pacific, Ltd. 1,368,923 1,738,279Citic Resources Holdings, Ltd. (I) 3,570,000 529,232Clear Media, Ltd. 57,000 28,981Coastal Greenland, Ltd. (I) 1,312,000 70,286Comba Telecom Systems Holdings, Ltd. (L) 857,500 307,972Cosco International Holdings, Ltd. 975,040 401,013COSCO Pacific, Ltd. 1,831,982 2,570,169CP Pokphand Company 2,984,000 362,168DaChan Food Asia, Ltd. 655,000 97,156Dah Chong Hong Holdings, Ltd. 385,000 396,729Dawnrays Pharmaceutical Holdings, Ltd. 80,000 15,892DBA Telecommunication Asia Holdings, Ltd. 32,000 19,361
10
Emerging Markets FundAs of 11-30-12 (Unaudited)
Shares Value
Hong Kong (continued)Digital China Holdings, Ltd. 506,000 $842,028Dynasty Fine Wines Group, Ltd. (I) 242,000 43,075Embry Holdings, Ltd. 80,000 39,210Extrawell Pharmaceutical Holdings, Ltd. (I) 1,310,000 101,380Franshion Properties China, Ltd. 4,998,000 1,714,955GCL-Poly Energy Holdings, Ltd. (L) 5,679,000 944,395Geely Automobile Holdings Company, Ltd. (L) 2,265,000 1,066,146Global Bio-Chem Technology Group Company, Ltd. 2,837,200 332,938Global Sweeteners Holdings, Ltd. (I) 444,000 32,617Glorious Property Holdings, Ltd. (I) 545,000 91,357Goldbond Group Holdings, Ltd. (I) 100,000 3,480Golden Meditech Holdings, Ltd. 2,476,631 239,601Goldlion Holdings, Ltd. 345,000 174,908GOME Electrical Appliances Holdings, Ltd. (I) 7,406,000 754,538Good Friend International Holdings, Inc. 42,000 11,272Goodtop Tin International Holdings, Ltd (I) 1,290,000 66,602Guangdong Investment, Ltd. 1,254,000 1,019,244Haier Electronics Group Company, Ltd. (I) 341,000 468,971Heng Tai Consumables Group, Ltd. (I) 6,885,525 162,446Hengdeli Holdings, Ltd. (L) 1,564,000 554,141Hi Sun Technology China, Ltd. (I) 126,000 11,052HKC Holdings, Ltd. 3,725,423 132,159Hopewell Highway Infrastructure, Ltd. 498,500 274,529Hopson Development Holdings, Ltd. (I)(L) 878,000 1,363,751Hua Han Bio-Pharmaceutical Holdings, Ltd., H Shares 1,199,040 349,515Huabao International Holdings, Ltd. (L) 1,225,000 553,122Huscoke Resources Holdings, Ltd. (I) 1,804,200 17,357Inspur International, Ltd. 4,415,000 139,539Interchina Holdings Company (I) 1,075,000 59,768Jinchuan Group International Resources Company, Ltd. (I) 162,000 29,048Ju Teng International Holdings, Ltd. 1,151,722 467,816Kai Yuan Holdings, Ltd. (I) 10,020,000 263,576Kingboard Chemical Holdings, Ltd. 664,290 1,969,561Kingboard Laminates Holdings, Ltd. 204,000 89,528Kingway Brewery Holdings, Ltd. 988,000 332,565Kunlun Energy Company, Ltd. 1,012,000 2,060,439KWG Property Holding, Ltd. 1,533,012 1,106,923
Copyright © 2013 www.secdatabase.com. All Rights Reserved.Please Consider the Environment Before Printing This Document
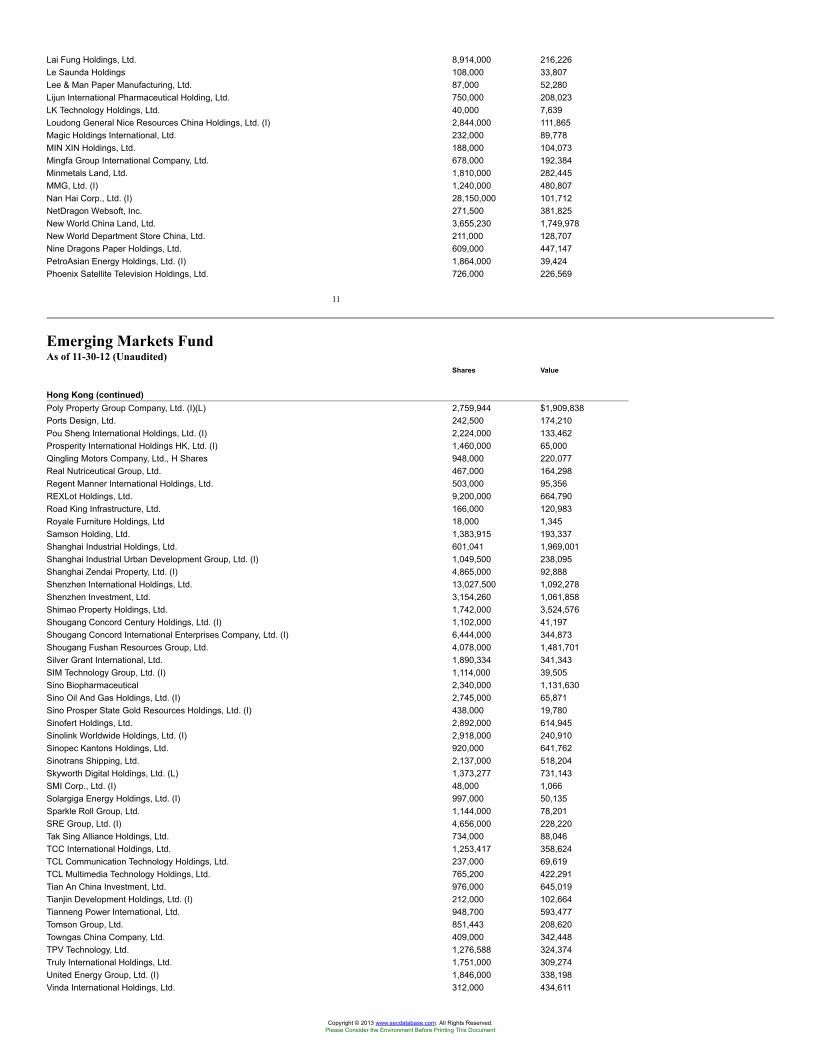
Lai Fung Holdings, Ltd. 8,914,000 216,226Le Saunda Holdings 108,000 33,807Lee & Man Paper Manufacturing, Ltd. 87,000 52,280Lijun International Pharmaceutical Holding, Ltd. 750,000 208,023LK Technology Holdings, Ltd. 40,000 7,639Loudong General Nice Resources China Holdings, Ltd. (I) 2,844,000 111,865Magic Holdings International, Ltd. 232,000 89,778MIN XIN Holdings, Ltd. 188,000 104,073Mingfa Group International Company, Ltd. 678,000 192,384Minmetals Land, Ltd. 1,810,000 282,445MMG, Ltd. (I) 1,240,000 480,807Nan Hai Corp., Ltd. (I) 28,150,000 101,712NetDragon Websoft, Inc. 271,500 381,825New World China Land, Ltd. 3,655,230 1,749,978New World Department Store China, Ltd. 211,000 128,707Nine Dragons Paper Holdings, Ltd. 609,000 447,147PetroAsian Energy Holdings, Ltd. (I) 1,864,000 39,424Phoenix Satellite Television Holdings, Ltd. 726,000 226,569
11
Emerging Markets FundAs of 11-30-12 (Unaudited)
Shares Value
Hong Kong (continued)Poly Property Group Company, Ltd. (I)(L) 2,759,944 $1,909,838Ports Design, Ltd. 242,500 174,210Pou Sheng International Holdings, Ltd. (I) 2,224,000 133,462Prosperity International Holdings HK, Ltd. (I) 1,460,000 65,000Qingling Motors Company, Ltd., H Shares 948,000 220,077Real Nutriceutical Group, Ltd. 467,000 164,298Regent Manner International Holdings, Ltd. 503,000 95,356REXLot Holdings, Ltd. 9,200,000 664,790Road King Infrastructure, Ltd. 166,000 120,983Royale Furniture Holdings, Ltd 18,000 1,345Samson Holding, Ltd. 1,383,915 193,337Shanghai Industrial Holdings, Ltd. 601,041 1,969,001Shanghai Industrial Urban Development Group, Ltd. (I) 1,049,500 238,095Shanghai Zendai Property, Ltd. (I) 4,865,000 92,888Shenzhen International Holdings, Ltd. 13,027,500 1,092,278Shenzhen Investment, Ltd. 3,154,260 1,061,858Shimao Property Holdings, Ltd. 1,742,000 3,524,576Shougang Concord Century Holdings, Ltd. (I) 1,102,000 41,197Shougang Concord International Enterprises Company, Ltd. (I) 6,444,000 344,873Shougang Fushan Resources Group, Ltd. 4,078,000 1,481,701Silver Grant International, Ltd. 1,890,334 341,343SIM Technology Group, Ltd. (I) 1,114,000 39,505Sino Biopharmaceutical 2,340,000 1,131,630Sino Oil And Gas Holdings, Ltd. (I) 2,745,000 65,871Sino Prosper State Gold Resources Holdings, Ltd. (I) 438,000 19,780Sinofert Holdings, Ltd. 2,892,000 614,945Sinolink Worldwide Holdings, Ltd. (I) 2,918,000 240,910Sinopec Kantons Holdings, Ltd. 920,000 641,762Sinotrans Shipping, Ltd. 2,137,000 518,204Skyworth Digital Holdings, Ltd. (L) 1,373,277 731,143SMI Corp., Ltd. (I) 48,000 1,066Solargiga Energy Holdings, Ltd. (I) 997,000 50,135Sparkle Roll Group, Ltd. 1,144,000 78,201SRE Group, Ltd. (I) 4,656,000 228,220Tak Sing Alliance Holdings, Ltd. 734,000 88,046TCC International Holdings, Ltd. 1,253,417 358,624TCL Communication Technology Holdings, Ltd. 237,000 69,619TCL Multimedia Technology Holdings, Ltd. 765,200 422,291Tian An China Investment, Ltd. 976,000 645,019Tianjin Development Holdings, Ltd. (I) 212,000 102,664Tianneng Power International, Ltd. 948,700 593,477Tomson Group, Ltd. 851,443 208,620Towngas China Company, Ltd. 409,000 342,448TPV Technology, Ltd. 1,276,588 324,374Truly International Holdings, Ltd. 1,751,000 309,274United Energy Group, Ltd. (I) 1,846,000 338,198Vinda International Holdings, Ltd. 312,000 434,611
Copyright © 2013 www.secdatabase.com. All Rights Reserved.Please Consider the Environment Before Printing This Document
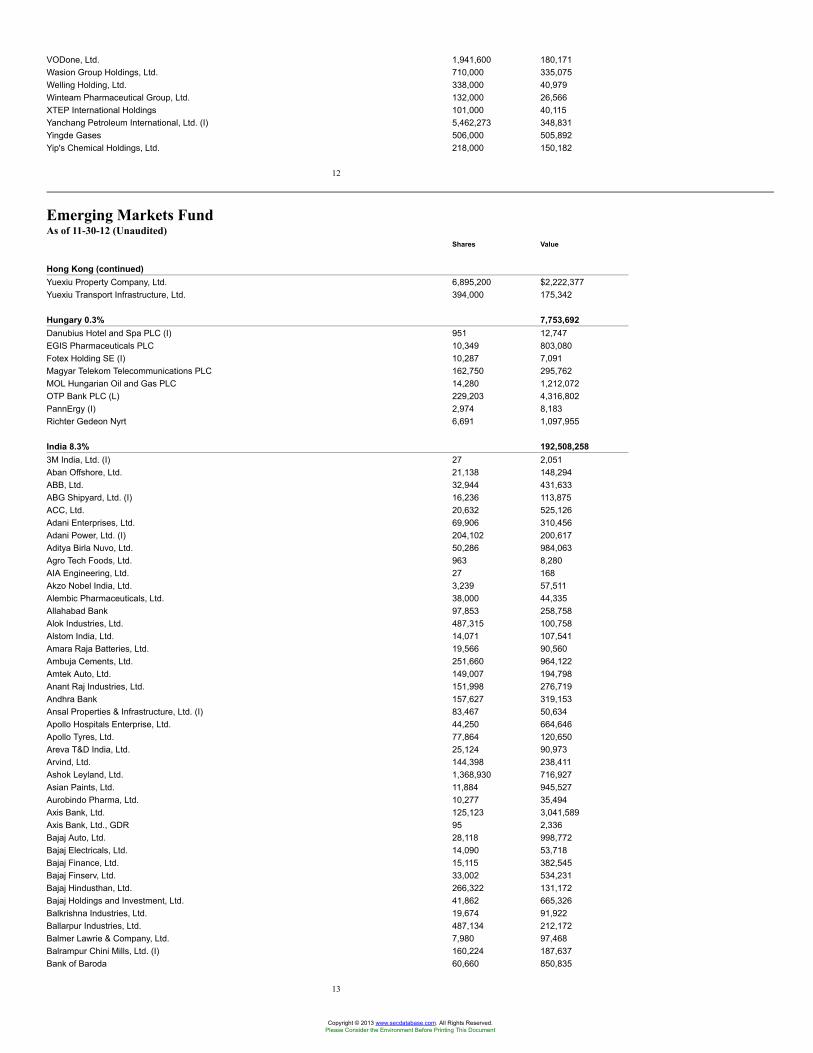
VODone, Ltd. 1,941,600 180,171Wasion Group Holdings, Ltd. 710,000 335,075Welling Holding, Ltd. 338,000 40,979Winteam Pharmaceutical Group, Ltd. 132,000 26,566XTEP International Holdings 101,000 40,115Yanchang Petroleum International, Ltd. (I) 5,462,273 348,831Yingde Gases 506,000 505,892Yip's Chemical Holdings, Ltd. 218,000 150,182
12
Emerging Markets FundAs of 11-30-12 (Unaudited)
Shares Value
Hong Kong (continued)Yuexiu Property Company, Ltd. 6,895,200 $2,222,377Yuexiu Transport Infrastructure, Ltd. 394,000 175,342
Hungary 0.3% 7,753,692Danubius Hotel and Spa PLC (I) 951 12,747EGIS Pharmaceuticals PLC 10,349 803,080Fotex Holding SE (I) 10,287 7,091Magyar Telekom Telecommunications PLC 162,750 295,762MOL Hungarian Oil and Gas PLC 14,280 1,212,072OTP Bank PLC (L) 229,203 4,316,802PannErgy (I) 2,974 8,183Richter Gedeon Nyrt 6,691 1,097,955
India 8.3% 192,508,2583M India, Ltd. (I) 27 2,051Aban Offshore, Ltd. 21,138 148,294ABB, Ltd. 32,944 431,633ABG Shipyard, Ltd. (I) 16,236 113,875ACC, Ltd. 20,632 525,126Adani Enterprises, Ltd. 69,906 310,456Adani Power, Ltd. (I) 204,102 200,617Aditya Birla Nuvo, Ltd. 50,286 984,063Agro Tech Foods, Ltd. 963 8,280AIA Engineering, Ltd. 27 168Akzo Nobel India, Ltd. 3,239 57,511Alembic Pharmaceuticals, Ltd. 38,000 44,335Allahabad Bank 97,853 258,758Alok Industries, Ltd. 487,315 100,758Alstom India, Ltd. 14,071 107,541Amara Raja Batteries, Ltd. 19,566 90,560Ambuja Cements, Ltd. 251,660 964,122Amtek Auto, Ltd. 149,007 194,798Anant Raj Industries, Ltd. 151,998 276,719Andhra Bank 157,627 319,153Ansal Properties & Infrastructure, Ltd. (I) 83,467 50,634Apollo Hospitals Enterprise, Ltd. 44,250 664,646Apollo Tyres, Ltd. 77,864 120,650Areva T&D India, Ltd. 25,124 90,973Arvind, Ltd. 144,398 238,411Ashok Leyland, Ltd. 1,368,930 716,927Asian Paints, Ltd. 11,884 945,527Aurobindo Pharma, Ltd. 10,277 35,494Axis Bank, Ltd. 125,123 3,041,589Axis Bank, Ltd., GDR 95 2,336Bajaj Auto, Ltd. 28,118 998,772Bajaj Electricals, Ltd. 14,090 53,718Bajaj Finance, Ltd. 15,115 382,545Bajaj Finserv, Ltd. 33,002 534,231Bajaj Hindusthan, Ltd. 266,322 131,172Bajaj Holdings and Investment, Ltd. 41,862 665,326Balkrishna Industries, Ltd. 19,674 91,922Ballarpur Industries, Ltd. 487,134 212,172Balmer Lawrie & Company, Ltd. 7,980 97,468Balrampur Chini Mills, Ltd. (I) 160,224 187,637Bank of Baroda 60,660 850,835
13
Copyright © 2013 www.secdatabase.com. All Rights Reserved.Please Consider the Environment Before Printing This Document
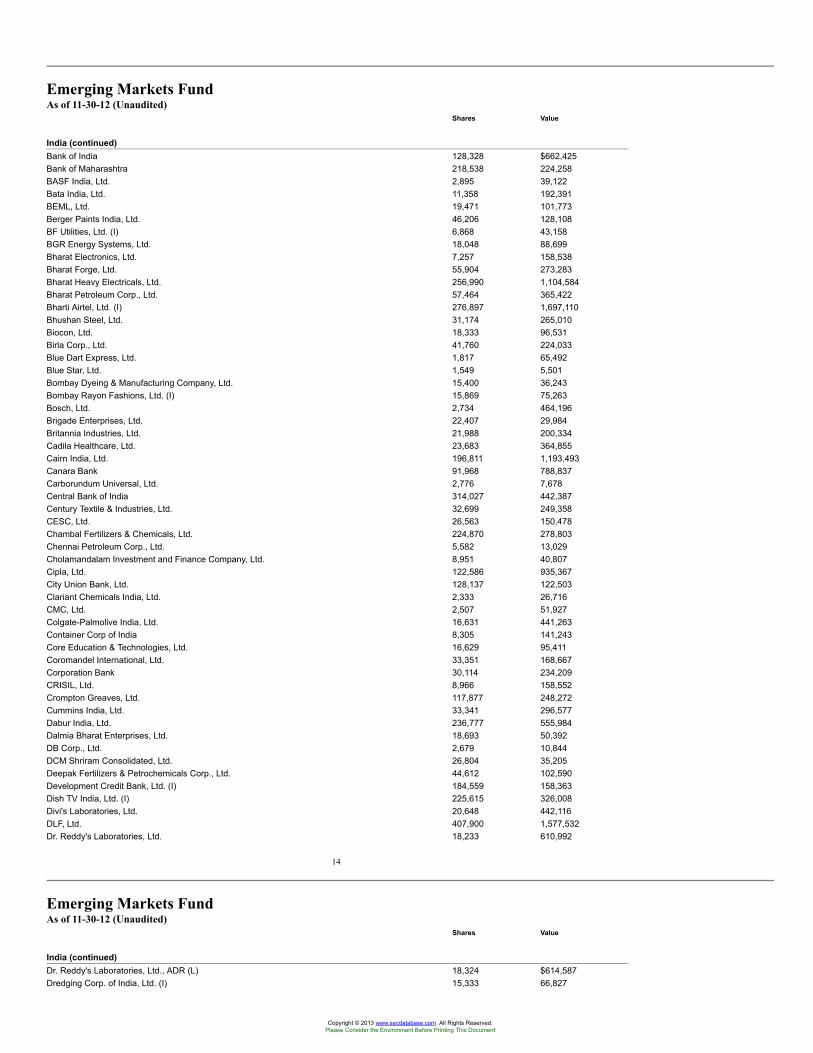
Emerging Markets FundAs of 11-30-12 (Unaudited)
Shares Value
India (continued)Bank of India 128,328 $662,425Bank of Maharashtra 218,538 224,258BASF India, Ltd. 2,895 39,122Bata India, Ltd. 11,358 192,391BEML, Ltd. 19,471 101,773Berger Paints India, Ltd. 46,206 128,108BF Utilities, Ltd. (I) 6,868 43,158BGR Energy Systems, Ltd. 18,048 88,699Bharat Electronics, Ltd. 7,257 158,538Bharat Forge, Ltd. 55,904 273,283Bharat Heavy Electricals, Ltd. 256,990 1,104,584Bharat Petroleum Corp., Ltd. 57,464 365,422Bharti Airtel, Ltd. (I) 276,897 1,697,110Bhushan Steel, Ltd. 31,174 265,010Biocon, Ltd. 18,333 96,531Birla Corp., Ltd. 41,760 224,033Blue Dart Express, Ltd. 1,817 65,492Blue Star, Ltd. 1,549 5,501Bombay Dyeing & Manufacturing Company, Ltd. 15,400 36,243Bombay Rayon Fashions, Ltd. (I) 15,869 75,263Bosch, Ltd. 2,734 464,196Brigade Enterprises, Ltd. 22,407 29,984Britannia Industries, Ltd. 21,988 200,334Cadila Healthcare, Ltd. 23,683 364,855Cairn India, Ltd. 196,811 1,193,493Canara Bank 91,968 788,837Carborundum Universal, Ltd. 2,776 7,678Central Bank of India 314,027 442,387Century Textile & Industries, Ltd. 32,699 249,358CESC, Ltd. 26,563 150,478Chambal Fertilizers & Chemicals, Ltd. 224,870 278,803Chennai Petroleum Corp., Ltd. 5,582 13,029Cholamandalam Investment and Finance Company, Ltd. 8,951 40,807Cipla, Ltd. 122,586 935,367City Union Bank, Ltd. 128,137 122,503Clariant Chemicals India, Ltd. 2,333 26,716CMC, Ltd. 2,507 51,927Colgate-Palmolive India, Ltd. 16,631 441,263Container Corp of India 8,305 141,243Core Education & Technologies, Ltd. 16,629 95,411Coromandel International, Ltd. 33,351 168,667Corporation Bank 30,114 234,209CRISIL, Ltd. 8,966 158,552Crompton Greaves, Ltd. 117,877 248,272Cummins India, Ltd. 33,341 296,577Dabur India, Ltd. 236,777 555,984Dalmia Bharat Enterprises, Ltd. 18,693 50,392DB Corp., Ltd. 2,679 10,844DCM Shriram Consolidated, Ltd. 26,804 35,205Deepak Fertilizers & Petrochemicals Corp., Ltd. 44,612 102,590Development Credit Bank, Ltd. (I) 184,559 158,363Dish TV India, Ltd. (I) 225,615 326,008Divi's Laboratories, Ltd. 20,648 442,116DLF, Ltd. 407,900 1,577,532Dr. Reddy's Laboratories, Ltd. 18,233 610,992
14
Emerging Markets FundAs of 11-30-12 (Unaudited)
Shares Value
India (continued)Dr. Reddy's Laboratories, Ltd., ADR (L) 18,324 $614,587Dredging Corp. of India, Ltd. (I) 15,333 66,827
Copyright © 2013 www.secdatabase.com. All Rights Reserved.Please Consider the Environment Before Printing This Document
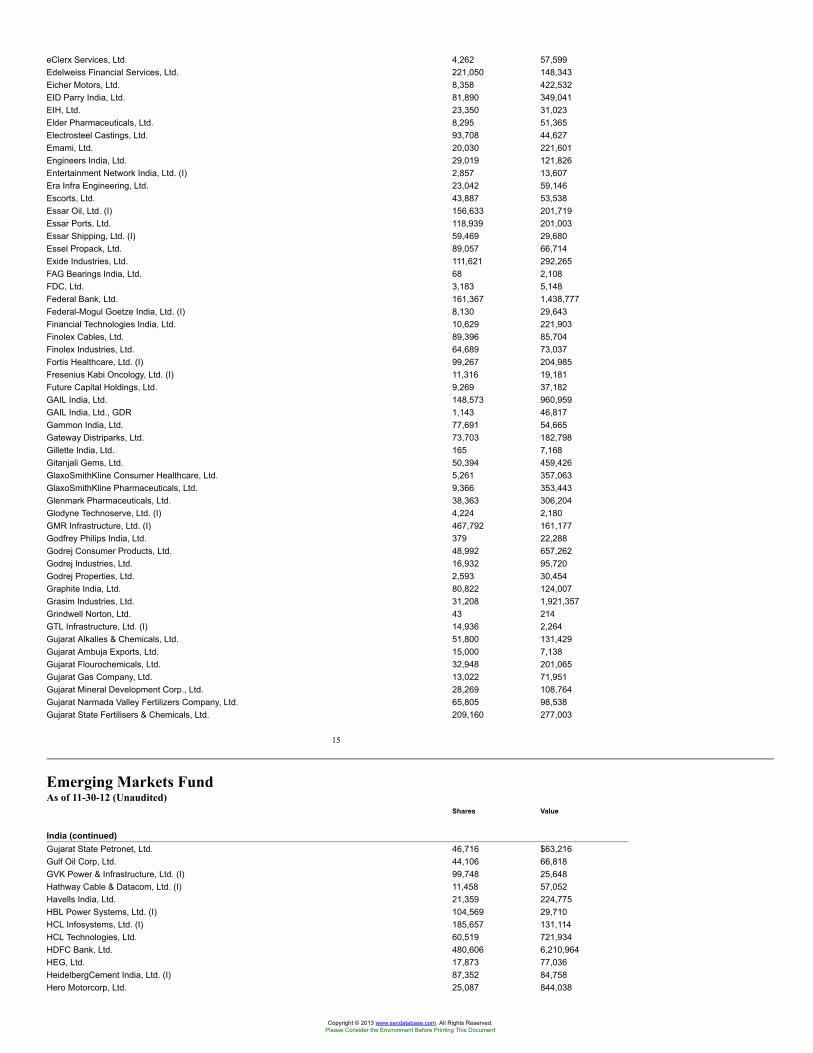
eClerx Services, Ltd. 4,262 57,599Edelweiss Financial Services, Ltd. 221,050 148,343Eicher Motors, Ltd. 8,358 422,532EID Parry India, Ltd. 81,890 349,041EIH, Ltd. 23,350 31,023Elder Pharmaceuticals, Ltd. 8,295 51,365Electrosteel Castings, Ltd. 93,708 44,627Emami, Ltd. 20,030 221,601Engineers India, Ltd. 29,019 121,826Entertainment Network India, Ltd. (I) 2,857 13,607Era Infra Engineering, Ltd. 23,042 59,146Escorts, Ltd. 43,887 53,538Essar Oil, Ltd. (I) 156,633 201,719Essar Ports, Ltd. 118,939 201,003Essar Shipping, Ltd. (I) 59,469 29,680Essel Propack, Ltd. 89,057 66,714Exide Industries, Ltd. 111,621 292,265FAG Bearings India, Ltd. 68 2,108FDC, Ltd. 3,183 5,148Federal Bank, Ltd. 161,367 1,438,777Federal-Mogul Goetze India, Ltd. (I) 8,130 29,643Financial Technologies India, Ltd. 10,629 221,903Finolex Cables, Ltd. 89,396 85,704Finolex Industries, Ltd. 64,689 73,037Fortis Healthcare, Ltd. (I) 99,267 204,985Fresenius Kabi Oncology, Ltd. (I) 11,316 19,181Future Capital Holdings, Ltd. 9,269 37,182GAIL India, Ltd. 148,573 960,959GAIL India, Ltd., GDR 1,143 46,817Gammon India, Ltd. 77,691 54,665Gateway Distriparks, Ltd. 73,703 182,798Gillette India, Ltd. 165 7,168Gitanjali Gems, Ltd. 50,394 459,426GlaxoSmithKline Consumer Healthcare, Ltd. 5,261 357,063GlaxoSmithKline Pharmaceuticals, Ltd. 9,366 353,443Glenmark Pharmaceuticals, Ltd. 38,363 306,204Glodyne Technoserve, Ltd. (I) 4,224 2,180GMR Infrastructure, Ltd. (I) 467,792 161,177Godfrey Philips India, Ltd. 379 22,288Godrej Consumer Products, Ltd. 48,992 657,262Godrej Industries, Ltd. 16,932 95,720Godrej Properties, Ltd. 2,593 30,454Graphite India, Ltd. 80,822 124,007Grasim Industries, Ltd. 31,208 1,921,357Grindwell Norton, Ltd. 43 214GTL Infrastructure, Ltd. (I) 14,936 2,264Gujarat Alkalies & Chemicals, Ltd. 51,800 131,429Gujarat Ambuja Exports, Ltd. 15,000 7,138Gujarat Flourochemicals, Ltd. 32,948 201,065Gujarat Gas Company, Ltd. 13,022 71,951Gujarat Mineral Development Corp., Ltd. 28,269 108,764Gujarat Narmada Valley Fertilizers Company, Ltd. 65,805 98,538Gujarat State Fertilisers & Chemicals, Ltd. 209,160 277,003
15
Emerging Markets FundAs of 11-30-12 (Unaudited)
Shares Value
India (continued)Gujarat State Petronet, Ltd. 46,716 $63,216Gulf Oil Corp, Ltd. 44,106 66,818GVK Power & Infrastructure, Ltd. (I) 99,748 25,648Hathway Cable & Datacom, Ltd. (I) 11,458 57,052Havells India, Ltd. 21,359 224,775HBL Power Systems, Ltd. (I) 104,569 29,710HCL Infosystems, Ltd. (I) 185,657 131,114HCL Technologies, Ltd. 60,519 721,934HDFC Bank, Ltd. 480,606 6,210,964HEG, Ltd. 17,873 77,036HeidelbergCement India, Ltd. (I) 87,352 84,758Hero Motorcorp, Ltd. 25,087 844,038
Copyright © 2013 www.secdatabase.com. All Rights Reserved.Please Consider the Environment Before Printing This Document
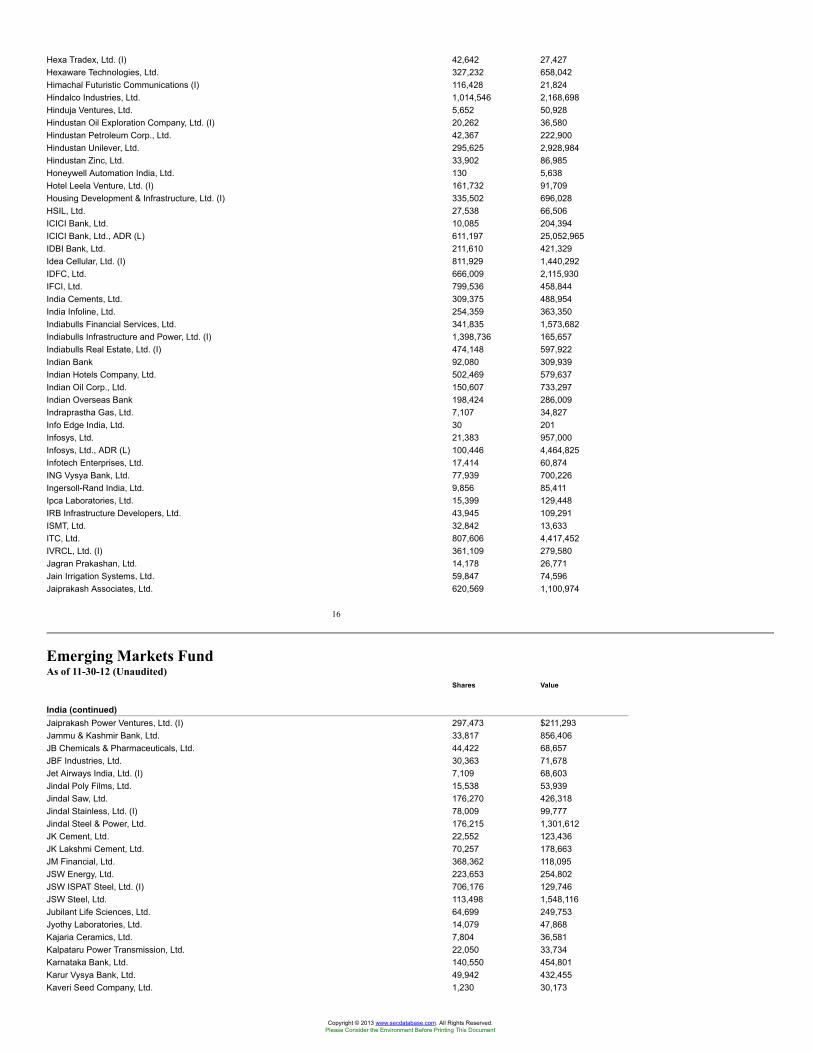
Hexa Tradex, Ltd. (I) 42,642 27,427Hexaware Technologies, Ltd. 327,232 658,042Himachal Futuristic Communications (I) 116,428 21,824Hindalco Industries, Ltd. 1,014,546 2,168,698Hinduja Ventures, Ltd. 5,652 50,928Hindustan Oil Exploration Company, Ltd. (I) 20,262 36,580Hindustan Petroleum Corp., Ltd. 42,367 222,900Hindustan Unilever, Ltd. 295,625 2,928,984Hindustan Zinc, Ltd. 33,902 86,985Honeywell Automation India, Ltd. 130 5,638Hotel Leela Venture, Ltd. (I) 161,732 91,709Housing Development & Infrastructure, Ltd. (I) 335,502 696,028HSIL, Ltd. 27,538 66,506ICICI Bank, Ltd. 10,085 204,394ICICI Bank, Ltd., ADR (L) 611,197 25,052,965IDBI Bank, Ltd. 211,610 421,329Idea Cellular, Ltd. (I) 811,929 1,440,292IDFC, Ltd. 666,009 2,115,930IFCI, Ltd. 799,536 458,844India Cements, Ltd. 309,375 488,954India Infoline, Ltd. 254,359 363,350Indiabulls Financial Services, Ltd. 341,835 1,573,682Indiabulls Infrastructure and Power, Ltd. (I) 1,398,736 165,657Indiabulls Real Estate, Ltd. (I) 474,148 597,922Indian Bank 92,080 309,939Indian Hotels Company, Ltd. 502,469 579,637Indian Oil Corp., Ltd. 150,607 733,297Indian Overseas Bank 198,424 286,009Indraprastha Gas, Ltd. 7,107 34,827Info Edge India, Ltd. 30 201Infosys, Ltd. 21,383 957,000Infosys, Ltd., ADR (L) 100,446 4,464,825Infotech Enterprises, Ltd. 17,414 60,874ING Vysya Bank, Ltd. 77,939 700,226Ingersoll-Rand India, Ltd. 9,856 85,411Ipca Laboratories, Ltd. 15,399 129,448IRB Infrastructure Developers, Ltd. 43,945 109,291ISMT, Ltd. 32,842 13,633ITC, Ltd. 807,606 4,417,452IVRCL, Ltd. (I) 361,109 279,580Jagran Prakashan, Ltd. 14,178 26,771Jain Irrigation Systems, Ltd. 59,847 74,596Jaiprakash Associates, Ltd. 620,569 1,100,974
16
Emerging Markets FundAs of 11-30-12 (Unaudited)
Shares Value
India (continued)Jaiprakash Power Ventures, Ltd. (I) 297,473 $211,293Jammu & Kashmir Bank, Ltd. 33,817 856,406JB Chemicals & Pharmaceuticals, Ltd. 44,422 68,657JBF Industries, Ltd. 30,363 71,678Jet Airways India, Ltd. (I) 7,109 68,603Jindal Poly Films, Ltd. 15,538 53,939Jindal Saw, Ltd. 176,270 426,318Jindal Stainless, Ltd. (I) 78,009 99,777Jindal Steel & Power, Ltd. 176,215 1,301,612JK Cement, Ltd. 22,552 123,436JK Lakshmi Cement, Ltd. 70,257 178,663JM Financial, Ltd. 368,362 118,095JSW Energy, Ltd. 223,653 254,802JSW ISPAT Steel, Ltd. (I) 706,176 129,746JSW Steel, Ltd. 113,498 1,548,116Jubilant Life Sciences, Ltd. 64,699 249,753Jyothy Laboratories, Ltd. 14,079 47,868Kajaria Ceramics, Ltd. 7,804 36,581Kalpataru Power Transmission, Ltd. 22,050 33,734Karnataka Bank, Ltd. 140,550 454,801Karur Vysya Bank, Ltd. 49,942 432,455Kaveri Seed Company, Ltd. 1,230 30,173
Copyright © 2013 www.secdatabase.com. All Rights Reserved.Please Consider the Environment Before Printing This Document
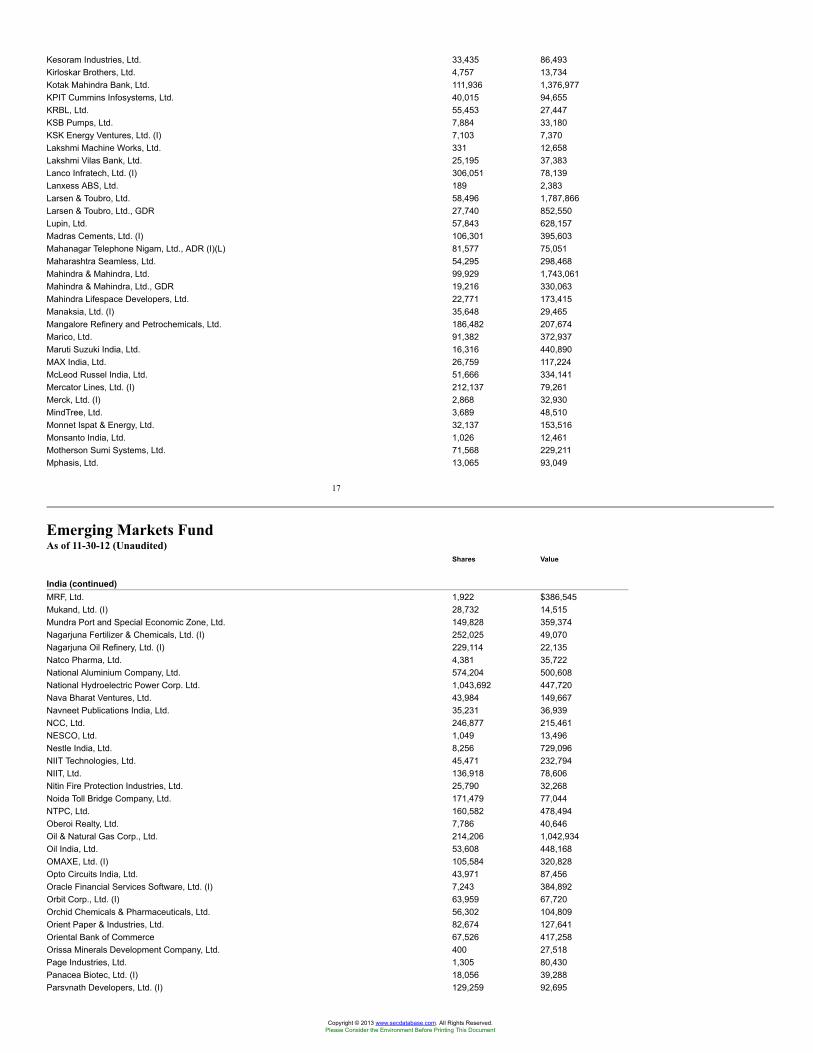
Kesoram Industries, Ltd. 33,435 86,493Kirloskar Brothers, Ltd. 4,757 13,734Kotak Mahindra Bank, Ltd. 111,936 1,376,977KPIT Cummins Infosystems, Ltd. 40,015 94,655KRBL, Ltd. 55,453 27,447KSB Pumps, Ltd. 7,884 33,180KSK Energy Ventures, Ltd. (I) 7,103 7,370Lakshmi Machine Works, Ltd. 331 12,658Lakshmi Vilas Bank, Ltd. 25,195 37,383Lanco Infratech, Ltd. (I) 306,051 78,139Lanxess ABS, Ltd. 189 2,383Larsen & Toubro, Ltd. 58,496 1,787,866Larsen & Toubro, Ltd., GDR 27,740 852,550Lupin, Ltd. 57,843 628,157Madras Cements, Ltd. (I) 106,301 395,603Mahanagar Telephone Nigam, Ltd., ADR (I)(L) 81,577 75,051Maharashtra Seamless, Ltd. 54,295 298,468Mahindra & Mahindra, Ltd. 99,929 1,743,061Mahindra & Mahindra, Ltd., GDR 19,216 330,063Mahindra Lifespace Developers, Ltd. 22,771 173,415Manaksia, Ltd. (I) 35,648 29,465Mangalore Refinery and Petrochemicals, Ltd. 186,482 207,674Marico, Ltd. 91,382 372,937Maruti Suzuki India, Ltd. 16,316 440,890MAX India, Ltd. 26,759 117,224McLeod Russel India, Ltd. 51,666 334,141Mercator Lines, Ltd. (I) 212,137 79,261Merck, Ltd. (I) 2,868 32,930MindTree, Ltd. 3,689 48,510Monnet Ispat & Energy, Ltd. 32,137 153,516Monsanto India, Ltd. 1,026 12,461Motherson Sumi Systems, Ltd. 71,568 229,211Mphasis, Ltd. 13,065 93,049
17
Emerging Markets FundAs of 11-30-12 (Unaudited)
Shares Value
India (continued)MRF, Ltd. 1,922 $386,545Mukand, Ltd. (I) 28,732 14,515Mundra Port and Special Economic Zone, Ltd. 149,828 359,374Nagarjuna Fertilizer & Chemicals, Ltd. (I) 252,025 49,070Nagarjuna Oil Refinery, Ltd. (I) 229,114 22,135Natco Pharma, Ltd. 4,381 35,722National Aluminium Company, Ltd. 574,204 500,608National Hydroelectric Power Corp. Ltd. 1,043,692 447,720Nava Bharat Ventures, Ltd. 43,984 149,667Navneet Publications India, Ltd. 35,231 36,939NCC, Ltd. 246,877 215,461NESCO, Ltd. 1,049 13,496Nestle India, Ltd. 8,256 729,096NIIT Technologies, Ltd. 45,471 232,794NIIT, Ltd. 136,918 78,606Nitin Fire Protection Industries, Ltd. 25,790 32,268Noida Toll Bridge Company, Ltd. 171,479 77,044NTPC, Ltd. 160,582 478,494Oberoi Realty, Ltd. 7,786 40,646Oil & Natural Gas Corp., Ltd. 214,206 1,042,934Oil India, Ltd. 53,608 448,168OMAXE, Ltd. (I) 105,584 320,828Opto Circuits India, Ltd. 43,971 87,456Oracle Financial Services Software, Ltd. (I) 7,243 384,892Orbit Corp., Ltd. (I) 63,959 67,720Orchid Chemicals & Pharmaceuticals, Ltd. 56,302 104,809Orient Paper & Industries, Ltd. 82,674 127,641Oriental Bank of Commerce 67,526 417,258Orissa Minerals Development Company, Ltd. 400 27,518Page Industries, Ltd. 1,305 80,430Panacea Biotec, Ltd. (I) 18,056 39,288Parsvnath Developers, Ltd. (I) 129,259 92,695
Copyright © 2013 www.secdatabase.com. All Rights Reserved.Please Consider the Environment Before Printing This Document
Patel Engineering, Ltd. 24,567 37,466Peninsula Land, Ltd. 89,370 112,672Persistent Systems, Ltd. 753 6,713Petronet LNG, Ltd. 88,738 265,768Pfizer, Ltd. 1,678 35,961Phoenix Mills, Ltd. 1,084 4,214Pidilite Industries, Ltd. 62,233 245,046Pipavav Defence & Offshore Engineering Company, Ltd. (I) 41,014 62,919Piramal Enterprises, Ltd. 87,007 791,982Plethico Pharmaceuticals, Ltd. (I) 5,976 29,877Polaris Financial Technology, Ltd. 39,735 91,327Polyplex Corp., Ltd. 18,044 67,518Power Grid Corp. of India Ltd. 304,915 662,838Praj Industries, Ltd. 57,344 50,047Prism Cement, Ltd. 71,827 73,865PTC India, Ltd. 222,817 291,501Punj Lloyd, Ltd. 224,909 224,184Punjab National Bank, Ltd. (I) 5,000 74,433Radico Khaitan, Ltd. 20,886 56,045Rain Commodities Ltd. 114,375 76,214Rajesh Exports, Ltd. 43,299 100,392Rallis India, Ltd. 32,506 95,466Ranbaxy Laboratories, Ltd. (I) 31,761 294,333
18
Emerging Markets FundAs of 11-30-12 (Unaudited)
Shares Value
India (continued)Ranbaxy Laboratories, Ltd., GDR (I) 2,335 $22,116Raymond, Ltd. 43,363 350,675Redington India, Ltd. 66,332 101,164REI Agro, Ltd. (I) 164,589 35,965REI Six Ten Retail, Ltd. (I) 7,790 558Reliance Capital, Ltd. 108,604 847,646Reliance Communications, Ltd. 617,273 812,565Reliance Industries, Ltd. 1,112,068 16,197,678Reliance Industries, Ltd., GDR (S) 31,730 934,035Reliance Infrastructure, Ltd. 72,487 646,681Reliance Power, Ltd. (I) 555,888 993,287Rolta India, Ltd. 153,518 176,029Ruchi Soya Industries, Ltd. 127,227 143,713Rural Electrification Corp. Ltd. 370,755 1,571,114S Kumars Nationwide, Ltd. 142,150 35,664Sadbhav Engineering, Ltd. 2,751 6,893Sanwaria Agro Oils, Ltd. (I) 559 361Satyam Computer Services, Ltd. (I) 270,166 504,231Schneider Electric Infrastructure, Ltd. 25,124 46,038SEAMEC, Ltd. (I) 7,435 10,927Sesa Goa, Ltd. 194,063 649,405Shipping Corp. of India, Ltd. (I) 7,493 7,325Shiv-Vani Oil & Gas Exploration Services, Ltd. 20,192 44,783Shoppers Stop, Ltd. 10,088 79,571Shree Cement, Ltd. 1,858 149,852Shree Renuka Sugars, Ltd. (I) 423,210 242,911Shriram Transport Finance Company, Ltd. 43,154 532,139Sintex Industries, Ltd. 88,110 102,852SJVN, Ltd. 43,447 15,142SKF India, Ltd. 4,232 49,632Sobha Developers, Ltd. 50,252 339,836Solar Industries India, Ltd. 480 8,548South Indian Bank, Ltd. 847,658 384,901SREI Infrastructure Finance, Ltd. 294,220 190,955SRF, Ltd. 19,638 75,213State Bank of Bikaner & Jaipur 18,445 137,576State Bank of India 49,639 1,981,820State Bank of India, GDR 4,501 369,147Steel Authority of India, Ltd. 369,419 549,002Sterling Biotech, Ltd. (I) 96,778 9,779Sterlite Industries India, Ltd., ADR (L) 349,435 2,757,042Strides Arcolab, Ltd. 8,868 184,870
Copyright © 2013 www.secdatabase.com. All Rights Reserved.Please Consider the Environment Before Printing This Document
Sun Pharma Advanced Research Company, Ltd. (I) 4,864 7,869Sun Pharma Advanced Research Company, Ltd. (I) 34,050 75,467Sun Pharmaceutical Industries, Ltd. 111,238 1,452,804Sun TV Network, Ltd. 28,201 210,874Sundaram Finance, Ltd. 8,650 159,015Supreme Industries, Ltd. 11,409 60,514Suzlon Energy, Ltd. (I) 534,875 192,144Syndicate Bank, Ltd. 165,888 388,557Tamilnadu Newsprint & Papers, Ltd. 37,939 78,243Tata Chemicals, Ltd. 74,739 449,455Tata Communications, Ltd. 33,200 144,856Tata Communications, Ltd., ADR (L) 63,885 536,634Tata Consultancy Services, Ltd. 140,278 3,400,609
19
Emerging Markets FundAs of 11-30-12 (Unaudited)
Shares Value
India (continued)Tata Elxsi, Ltd. 5,653 $25,201Tata Global Beverages, Ltd. 459,764 1,402,347Tata Investment Corp., Ltd. 15,423 123,847Tata Motors, Ltd. 366,104 1,840,160Tata Motors, Ltd., ADR (L) 53,090 1,330,966Tata Power Company, Ltd. 298,832 593,039Tata Steel, Ltd. 302,239 2,149,484Tata Teleservices Maharashtra, Ltd. (I) 179,695 40,950Tech Mahindra, Ltd. 10,490 169,312The Great Eastern Shipping Company, Ltd. 84,792 394,968Thermax, Ltd. 11,265 120,917Time Technoplast, Ltd. 105,115 90,861Titagarh Wagons, Ltd. 8,719 54,961Titan Industries, Ltd. 96,547 552,256Torrent Pharmaceuticals, Ltd. 14,751 182,547Torrent Power, Ltd. 9,093 26,903Trent, Ltd. 401 9,146Triveni Turbine, Ltd. 25,986 24,399TTK Prestige, Ltd. 1,939 126,515Tube Investments of India, Ltd. 7,883 24,558TVS Motor Company, Ltd. 47,690 34,236UCO Bank 198,438 276,370Uflex, Ltd. 34,032 62,327Ultratech Cement, Ltd. 27,084 1,006,091Union Bank of India, Ltd. 122,021 543,951Unitech, Ltd. (I) 747,580 432,635United Breweries, Ltd. 29,446 434,446United Phosphorus, Ltd. 59,880 132,073United Spirits, Ltd. (I) 52,796 1,940,768Usha Martin, Ltd. (I) 176,167 99,565Vardhman Special Steels, Ltd. (I) 1,653 929Vardhman Textiles, Ltd. 8,267 38,133Videocon Industries, Ltd. 86,553 340,151Vijaya Bank 167,219 181,085VIP Industries, Ltd. 21,685 32,763Voltas, Ltd. 39,110 78,004VST Industries, Ltd. 2,273 77,219Wipro, Ltd. 154,762 1,117,550Wockhardt, Ltd. (I) 20,900 629,350Wyeth, Ltd. 346 6,198Yes Bank, Ltd. 90,602 735,573Zee Entertainment Enterprises, Ltd. 220,526 791,140Zuari Agro Chemicals, Ltd. (I) 9,847 58,743Zuari Global, Ltd. 9,847 22,132Zydus Wellness, Ltd. 1,331 11,427Zylog Systems Ltd. 19,130 23,928
Indonesia 3.2% 73,954,005Ace Hardware Indonesia Tbk PT 410,000 32,026Adaro Energy Tbk PT 4,837,000 674,963Adhi Karya Persero Tbk PT 823,000 162,453Agung Podomoro Land Tbk PT (I) 278,500 10,586
Copyright © 2013 www.secdatabase.com. All Rights Reserved.Please Consider the Environment Before Printing This Document
AKR Corporindo Tbk PT 2,318,500 1,038,181Alam Sutera Realty Tbk PT 3,166,000 201,684Aneka Tambang Persero Tbk PT 5,330,000 687,840
20
Emerging Markets FundAs of 11-30-12 (Unaudited)
Shares Value
Indonesia (continued)Asahimas Flat Glass Tbk PT (I) 113,500 $97,576Astra Agro Lestari Tbk PT 228,500 428,346Astra Graphia Tbk PT 606,500 86,030Astra International Tbk PT 6,507,500 4,914,160Bakrie & Brothers Tbk PT (I) 129,839,261 676,704Bakrie Sumatera Plantations Tbk PT 17,913,000 179,700Bakrie Telecom Tbk PT (I) 34,369,000 178,961Bakrieland Development Tbk PT (I) 43,066,000 260,122Bank Bukopin Tbk PT 4,762,666 307,716Bank Central Asia Tbk PT 4,506,500 4,130,938Bank Danamon Indonesia Tbk PT 4,266,371 2,400,437Bank Mandiri Persero Tbk PT 5,420,646 4,657,408Bank Negara Indonesia Persero Tbk PT 5,152,103 1,989,293Bank Pan Indonesia Tbk PT (I) 9,167,000 610,770Bank Permata Tbk PT (I) 25,500 3,719Bank Rakyat Indonesia Persero Tbk PT 5,084,000 3,744,973Bank Tabungan Negara Persero Tbk PT 1,675,798 281,161Bank Tabungan Pensiunan Nasional Tbk PT (I) 167,000 90,502Barito Pacific Tbk PT (I) 3,118,500 121,808Bayan Resources Tbk PT 98,000 101,641Berau Coal Energy Tbk PT 150,000 3,360Berlian Laju Tanker Tbk PT (I) 11,916,666 243,463Bhakti Investama Tbk PT 22,152,800 1,269,033Bisi International PT 203,000 18,650Budi Acid Jaya Tbk PT (I) 2,039,000 28,269Bumi Resources Tbk PT 30,622,430 1,881,013Bumi Serpong Damai PT 3,504,000 441,467BW Plantation Tbk PT 1,116,000 161,551Central Proteinaprima Tbk PT (I) 30,464,500 101,617Chandra Asri Petrochemical Tbk PT (I) 8,000 2,332Charoen Pokphand Indonesia Tbk PT 3,630,920 1,294,821Ciputra Development Tbk PT 16,645,500 1,353,136Ciputra Surya Tbk PT 1,437,500 303,202Citra Marga Nusaphala Persada Tbk PT 860,500 188,224Darma Henwa Tbk PT (I) 20,860,500 108,685Davomas Abadi Tbk PT (I) 8,435,500 43,965Delta Dunia Makmur Tbk PT (I) 4,163,000 69,162Elnusa Tbk PT (I) 2,863,500 53,102Energi Mega Persada Tbk PT (I) 40,739,638 317,979Gajah Tunggal Tbk PT 2,601,000 596,030Global Mediacom Tbk PT 6,626,000 1,657,558Gozco Plantations Tbk PT 5,611,200 113,909Gudang Garam Tbk PT 416,243 2,291,367Hanson International Tbk PT (I) 70,000 1,933Harum Energy Tbk PT 481,000 250,472Hexindo Adiperkasa Tbk PT 117,000 89,574Holcim Indonesia Tbk PT 586,500 218,367Indah Kiat Pulp and Paper Corp. Tbk PT (I) 4,870,000 345,167Indika Energy Tbk PT 1,908,000 256,286Indo Tambangraya Megah Tbk PT 174,000 711,742Indocement Tunggal Prakarsa Tbk PT 645,500 1,561,074Indofood CBP Sukses Makmur Tbk PT 77,000 59,352Indofood Sukses Makmur Tbk PT 4,542,000 2,774,780Indosat Tbk PT 312,000 180,471Indosat Tbk PT, ADR 500 15,405
21
Emerging Markets FundAs of 11-30-12 (Unaudited)
Copyright © 2013 www.secdatabase.com. All Rights Reserved.Please Consider the Environment Before Printing This Document
Shares Value
Indonesia (continued)Inovisi Infracom Tbk PT (I) 41,500 $27,240Intiland Development Tbk PT 3,553,500 116,623Japfa Comfeed Indonesia Tbk PT 710,500 396,058Jasa Marga Tbk PT 765,500 454,529Kalbe Farma Tbk PT 13,072,500 1,405,589Kawasan Industri Jababeka Tbk PT (I) 15,626,500 324,070Lippo Karawaci Tbk PT 25,745,625 2,876,195Malindo Feedmill Tbk PT 555,500 124,399Matahari Putra Prima Tbk PT 3,619,500 501,791Mayora Indah Tbk PT 188,750 412,795Medco Energi Internasional Tbk PT 2,289,000 350,357Media Nusantara Citra Tbk PT 3,515,000 980,072Mitra Adiperkasa Tbk PT 1,032,000 763,418Mitra International Resources Tbk PT (I) 5,235,500 81,860Modern Internasional Tbk PT (I) 80,600 6,550Nippon Indosari Corpindo Tbk PT 39,500 26,374Nusantara Infrastructure Tbk PT (I) 138,000 2,720Pabrik Kertas Tjiwi Kimia Tbk PT 321,000 69,534Pakuwon Jati Tbk PT 6,302,000 150,978Panin Financial Tbk PT (I) 18,582,500 263,776Panin Insurance Tbk PT 1,443,000 74,331Pembangunan Perumahan Persero Tbk PT 585,000 56,864Perusahaan Gas Negara Persero Tbk PT 3,428,500 1,616,259Perusahaan Perkebunan London Sumatra Indonesia Tbk PT 3,882,500 758,015Polychem Indonesia Tbk PT (I) 1,930,000 69,389Ramayana Lestari Sentosa Tbk PT 4,070,000 543,360Resource Alam Indonesia Tbk PT 139,000 31,861Samindo Resources Tbk PT (I) 21,000 2,165Sampoerna Agro Tbk PT 1,086,500 255,184Samudera Indonesia Tbk PT 74,500 30,453Selamat Sempurna Tbk PT 1,188,000 319,352Semen Gresik Persero Tbk PT 1,264,500 1,949,200Sentul City Tbk PT (I) 14,266,000 282,345Sinar Mas Multiartha Tbk PT 37,000 17,542Summarecon Agung Tbk PT 9,612,500 1,922,240Surya Citra Media Tbk PT 167,500 37,949Surya Semesta Internusa Tbk PT 3,281,500 382,791Suryainti Permata Tbk PT (I) 1,802,000 16,717Tambang Batubara Bukit Asam Persero Tbk PT 479,500 698,317Telekomunikasi Indonesia Persero Tbk PT 398,500 377,227Telekomunikasi Indonesia Tbk PT, ADR 69,787 2,654,697Tiga Pilar Sejahtera Food Tbk 177,500 22,001Timah Persero Tbk PT 505,000 69,273Tower Bersama Infrastructure Tbk PT (I) 2,500 1,563Trada Maritime Tbk PT (I) 4,824,000 514,290Trias Sentosa Tbk PT 1,000,000 29,656Trimegah Securities Tbk PT (I) 1,540,500 18,627Truba Alam Manunggal Engineering Tbk PT (I) 19,436,000 101,298Tunas Baru Lampung Tbk PT 1,536,000 76,984Tunas Ridean Tbk PT 872,500 77,273Unilever Indonesia Tbk PT 553,000 1,517,896United Tractors Tbk PT 792,000 1,404,289Vale Indonesia Tbk PT 3,245,000 706,370Wijaya Karya Persero Tbk PT 2,967,500 504,537Xl Axiata Tbk PT 751,000 402,546
22
Emerging Markets FundAs of 11-30-12 (Unaudited)
Shares Value
Israel 0.0% $111,270Mivtach Shamir Holdings, Ltd. (I) 5,896 111,270
Luxembourg 0.1% 1,589,496Brait SE (I) 399,334 1,585,259O'Key Group SA, GDR 417 4,237
Malaysia 4.0% 92,635,043
Copyright © 2013 www.secdatabase.com. All Rights Reserved.Please Consider the Environment Before Printing This Document
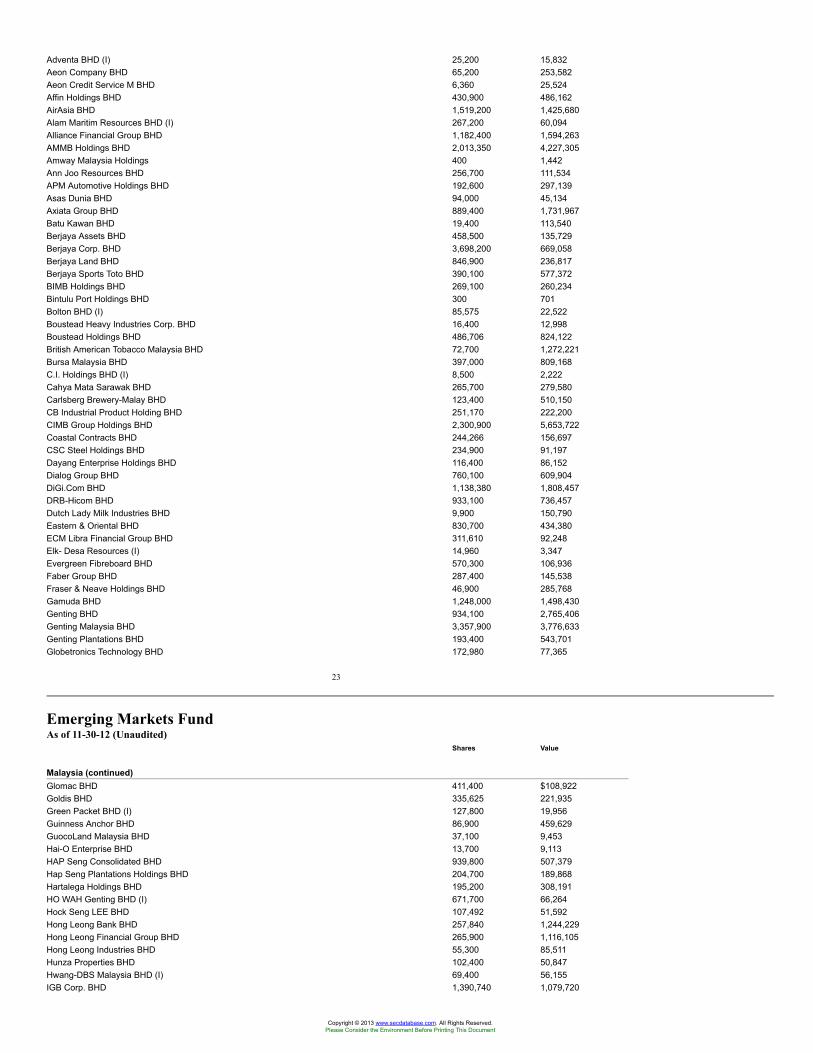
Adventa BHD (I) 25,200 15,832Aeon Company BHD 65,200 253,582Aeon Credit Service M BHD 6,360 25,524Affin Holdings BHD 430,900 486,162AirAsia BHD 1,519,200 1,425,680Alam Maritim Resources BHD (I) 267,200 60,094Alliance Financial Group BHD 1,182,400 1,594,263AMMB Holdings BHD 2,013,350 4,227,305Amway Malaysia Holdings 400 1,442Ann Joo Resources BHD 256,700 111,534APM Automotive Holdings BHD 192,600 297,139Asas Dunia BHD 94,000 45,134Axiata Group BHD 889,400 1,731,967Batu Kawan BHD 19,400 113,540Berjaya Assets BHD 458,500 135,729Berjaya Corp. BHD 3,698,200 669,058Berjaya Land BHD 846,900 236,817Berjaya Sports Toto BHD 390,100 577,372BIMB Holdings BHD 269,100 260,234Bintulu Port Holdings BHD 300 701Bolton BHD (I) 85,575 22,522Boustead Heavy Industries Corp. BHD 16,400 12,998Boustead Holdings BHD 486,706 824,122British American Tobacco Malaysia BHD 72,700 1,272,221Bursa Malaysia BHD 397,000 809,168C.I. Holdings BHD (I) 8,500 2,222Cahya Mata Sarawak BHD 265,700 279,580Carlsberg Brewery-Malay BHD 123,400 510,150CB Industrial Product Holding BHD 251,170 222,200CIMB Group Holdings BHD 2,300,900 5,653,722Coastal Contracts BHD 244,266 156,697CSC Steel Holdings BHD 234,900 91,197Dayang Enterprise Holdings BHD 116,400 86,152Dialog Group BHD 760,100 609,904DiGi.Com BHD 1,138,380 1,808,457DRB-Hicom BHD 933,100 736,457Dutch Lady Milk Industries BHD 9,900 150,790Eastern & Oriental BHD 830,700 434,380ECM Libra Financial Group BHD 311,610 92,248Elk- Desa Resources (I) 14,960 3,347Evergreen Fibreboard BHD 570,300 106,936Faber Group BHD 287,400 145,538Fraser & Neave Holdings BHD 46,900 285,768Gamuda BHD 1,248,000 1,498,430Genting BHD 934,100 2,765,406Genting Malaysia BHD 3,357,900 3,776,633Genting Plantations BHD 193,400 543,701Globetronics Technology BHD 172,980 77,365
23
Emerging Markets FundAs of 11-30-12 (Unaudited)
Shares Value
Malaysia (continued)Glomac BHD 411,400 $108,922Goldis BHD 335,625 221,935Green Packet BHD (I) 127,800 19,956Guinness Anchor BHD 86,900 459,629GuocoLand Malaysia BHD 37,100 9,453Hai-O Enterprise BHD 13,700 9,113HAP Seng Consolidated BHD 939,800 507,379Hap Seng Plantations Holdings BHD 204,700 189,868Hartalega Holdings BHD 195,200 308,191HO WAH Genting BHD (I) 671,700 66,264Hock Seng LEE BHD 107,492 51,592Hong Leong Bank BHD 257,840 1,244,229Hong Leong Financial Group BHD 265,900 1,116,105Hong Leong Industries BHD 55,300 85,511Hunza Properties BHD 102,400 50,847Hwang-DBS Malaysia BHD (I) 69,400 56,155IGB Corp. BHD 1,390,740 1,079,720
Copyright © 2013 www.secdatabase.com. All Rights Reserved.Please Consider the Environment Before Printing This Document
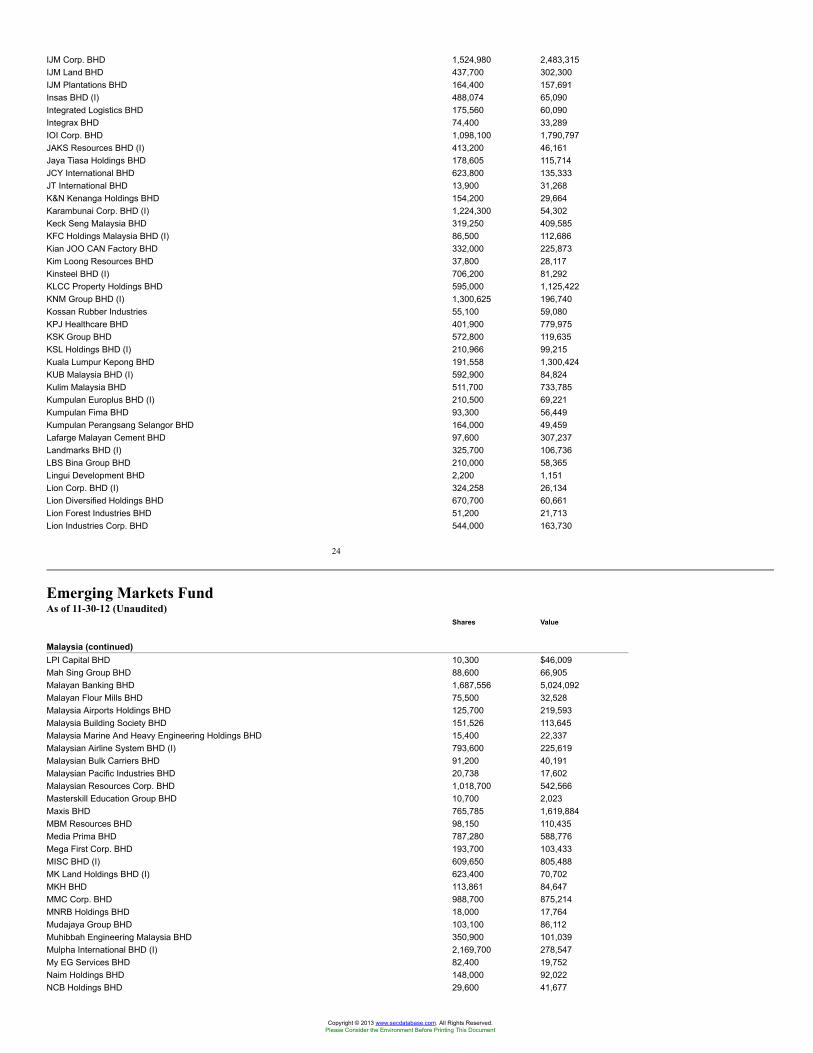
IJM Corp. BHD 1,524,980 2,483,315IJM Land BHD 437,700 302,300IJM Plantations BHD 164,400 157,691Insas BHD (I) 488,074 65,090Integrated Logistics BHD 175,560 60,090Integrax BHD 74,400 33,289IOI Corp. BHD 1,098,100 1,790,797JAKS Resources BHD (I) 413,200 46,161Jaya Tiasa Holdings BHD 178,605 115,714JCY International BHD 623,800 135,333JT International BHD 13,900 31,268K&N Kenanga Holdings BHD 154,200 29,664Karambunai Corp. BHD (I) 1,224,300 54,302Keck Seng Malaysia BHD 319,250 409,585KFC Holdings Malaysia BHD (I) 86,500 112,686Kian JOO CAN Factory BHD 332,000 225,873Kim Loong Resources BHD 37,800 28,117Kinsteel BHD (I) 706,200 81,292KLCC Property Holdings BHD 595,000 1,125,422KNM Group BHD (I) 1,300,625 196,740Kossan Rubber Industries 55,100 59,080KPJ Healthcare BHD 401,900 779,975KSK Group BHD 572,800 119,635KSL Holdings BHD (I) 210,966 99,215Kuala Lumpur Kepong BHD 191,558 1,300,424KUB Malaysia BHD (I) 592,900 84,824Kulim Malaysia BHD 511,700 733,785Kumpulan Europlus BHD (I) 210,500 69,221Kumpulan Fima BHD 93,300 56,449Kumpulan Perangsang Selangor BHD 164,000 49,459Lafarge Malayan Cement BHD 97,600 307,237Landmarks BHD (I) 325,700 106,736LBS Bina Group BHD 210,000 58,365Lingui Development BHD 2,200 1,151Lion Corp. BHD (I) 324,258 26,134Lion Diversified Holdings BHD 670,700 60,661Lion Forest Industries BHD 51,200 21,713Lion Industries Corp. BHD 544,000 163,730
24
Emerging Markets FundAs of 11-30-12 (Unaudited)
Shares Value
Malaysia (continued)LPI Capital BHD 10,300 $46,009Mah Sing Group BHD 88,600 66,905Malayan Banking BHD 1,687,556 5,024,092Malayan Flour Mills BHD 75,500 32,528Malaysia Airports Holdings BHD 125,700 219,593Malaysia Building Society BHD 151,526 113,645Malaysia Marine And Heavy Engineering Holdings BHD 15,400 22,337Malaysian Airline System BHD (I) 793,600 225,619Malaysian Bulk Carriers BHD 91,200 40,191Malaysian Pacific Industries BHD 20,738 17,602Malaysian Resources Corp. BHD 1,018,700 542,566Masterskill Education Group BHD 10,700 2,023Maxis BHD 765,785 1,619,884MBM Resources BHD 98,150 110,435Media Prima BHD 787,280 588,776Mega First Corp. BHD 193,700 103,433MISC BHD (I) 609,650 805,488MK Land Holdings BHD (I) 623,400 70,702MKH BHD 113,861 84,647MMC Corp. BHD 988,700 875,214MNRB Holdings BHD 18,000 17,764Mudajaya Group BHD 103,100 86,112Muhibbah Engineering Malaysia BHD 350,900 101,039Mulpha International BHD (I) 2,169,700 278,547My EG Services BHD 82,400 19,752Naim Holdings BHD 148,000 92,022NCB Holdings BHD 29,600 41,677
Copyright © 2013 www.secdatabase.com. All Rights Reserved.Please Consider the Environment Before Printing This Document
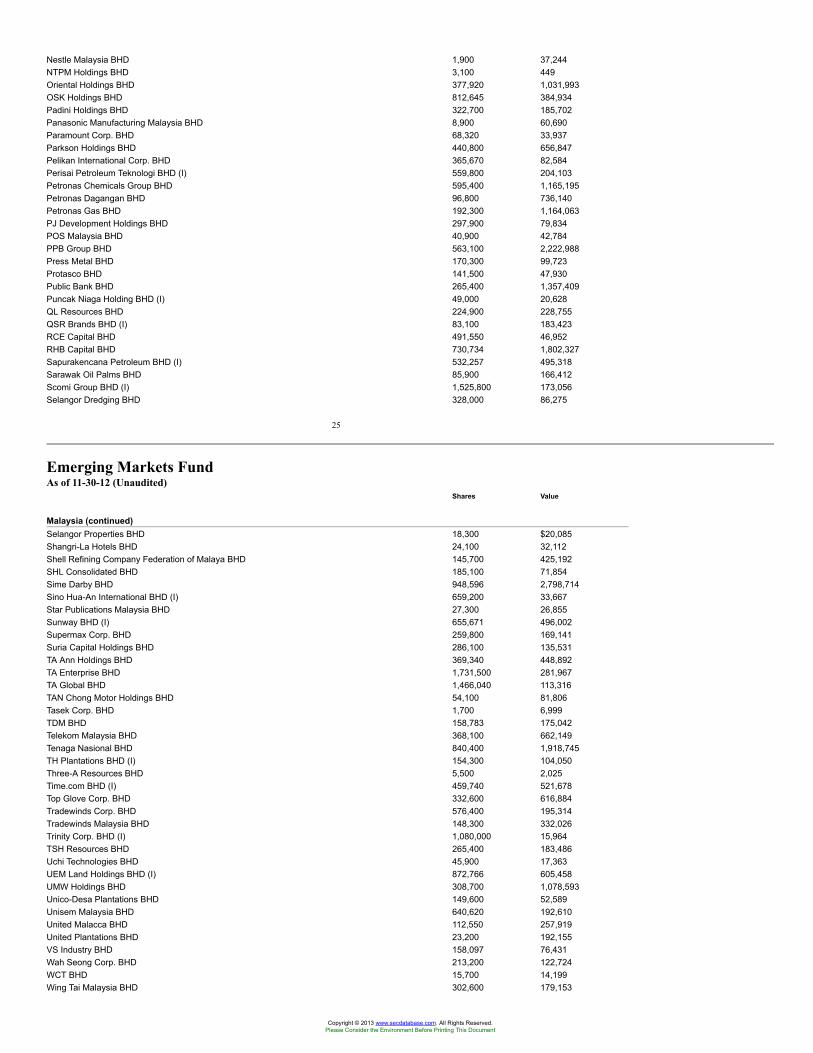
Nestle Malaysia BHD 1,900 37,244NTPM Holdings BHD 3,100 449Oriental Holdings BHD 377,920 1,031,993OSK Holdings BHD 812,645 384,934Padini Holdings BHD 322,700 185,702Panasonic Manufacturing Malaysia BHD 8,900 60,690Paramount Corp. BHD 68,320 33,937Parkson Holdings BHD 440,800 656,847Pelikan International Corp. BHD 365,670 82,584Perisai Petroleum Teknologi BHD (I) 559,800 204,103Petronas Chemicals Group BHD 595,400 1,165,195Petronas Dagangan BHD 96,800 736,140Petronas Gas BHD 192,300 1,164,063PJ Development Holdings BHD 297,900 79,834POS Malaysia BHD 40,900 42,784PPB Group BHD 563,100 2,222,988Press Metal BHD 170,300 99,723Protasco BHD 141,500 47,930Public Bank BHD 265,400 1,357,409Puncak Niaga Holding BHD (I) 49,000 20,628QL Resources BHD 224,900 228,755QSR Brands BHD (I) 83,100 183,423RCE Capital BHD 491,550 46,952RHB Capital BHD 730,734 1,802,327Sapurakencana Petroleum BHD (I) 532,257 495,318Sarawak Oil Palms BHD 85,900 166,412Scomi Group BHD (I) 1,525,800 173,056Selangor Dredging BHD 328,000 86,275
25
Emerging Markets FundAs of 11-30-12 (Unaudited)
Shares Value
Malaysia (continued)Selangor Properties BHD 18,300 $20,085Shangri-La Hotels BHD 24,100 32,112Shell Refining Company Federation of Malaya BHD 145,700 425,192SHL Consolidated BHD 185,100 71,854Sime Darby BHD 948,596 2,798,714Sino Hua-An International BHD (I) 659,200 33,667Star Publications Malaysia BHD 27,300 26,855Sunway BHD (I) 655,671 496,002Supermax Corp. BHD 259,800 169,141Suria Capital Holdings BHD 286,100 135,531TA Ann Holdings BHD 369,340 448,892TA Enterprise BHD 1,731,500 281,967TA Global BHD 1,466,040 113,316TAN Chong Motor Holdings BHD 54,100 81,806Tasek Corp. BHD 1,700 6,999TDM BHD 158,783 175,042Telekom Malaysia BHD 368,100 662,149Tenaga Nasional BHD 840,400 1,918,745TH Plantations BHD (I) 154,300 104,050Three-A Resources BHD 5,500 2,025Time.com BHD (I) 459,740 521,678Top Glove Corp. BHD 332,600 616,884Tradewinds Corp. BHD 576,400 195,314Tradewinds Malaysia BHD 148,300 332,026Trinity Corp. BHD (I) 1,080,000 15,964TSH Resources BHD 265,400 183,486Uchi Technologies BHD 45,900 17,363UEM Land Holdings BHD (I) 872,766 605,458UMW Holdings BHD 308,700 1,078,593Unico-Desa Plantations BHD 149,600 52,589Unisem Malaysia BHD 640,620 192,610United Malacca BHD 112,550 257,919United Plantations BHD 23,200 192,155VS Industry BHD 158,097 76,431Wah Seong Corp. BHD 213,200 122,724WCT BHD 15,700 14,199Wing Tai Malaysia BHD 302,600 179,153
Copyright © 2013 www.secdatabase.com. All Rights Reserved.Please Consider the Environment Before Printing This Document
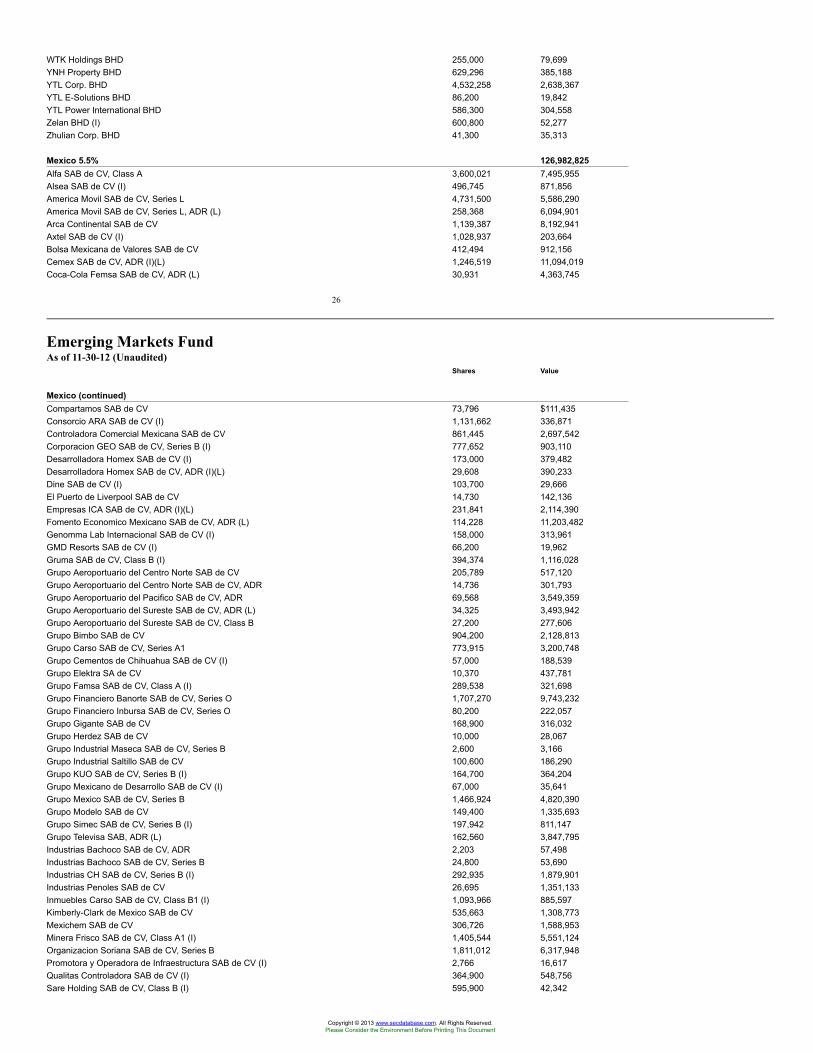
WTK Holdings BHD 255,000 79,699YNH Property BHD 629,296 385,188YTL Corp. BHD 4,532,258 2,638,367YTL E-Solutions BHD 86,200 19,842YTL Power International BHD 586,300 304,558Zelan BHD (I) 600,800 52,277Zhulian Corp. BHD 41,300 35,313
Mexico 5.5% 126,982,825Alfa SAB de CV, Class A 3,600,021 7,495,955Alsea SAB de CV (I) 496,745 871,856America Movil SAB de CV, Series L 4,731,500 5,586,290America Movil SAB de CV, Series L, ADR (L) 258,368 6,094,901Arca Continental SAB de CV 1,139,387 8,192,941Axtel SAB de CV (I) 1,028,937 203,664Bolsa Mexicana de Valores SAB de CV 412,494 912,156Cemex SAB de CV, ADR (I)(L) 1,246,519 11,094,019Coca-Cola Femsa SAB de CV, ADR (L) 30,931 4,363,745
26
Emerging Markets FundAs of 11-30-12 (Unaudited)
Shares Value
Mexico (continued)Compartamos SAB de CV 73,796 $111,435Consorcio ARA SAB de CV (I) 1,131,662 336,871Controladora Comercial Mexicana SAB de CV 861,445 2,697,542Corporacion GEO SAB de CV, Series B (I) 777,652 903,110Desarrolladora Homex SAB de CV (I) 173,000 379,482Desarrolladora Homex SAB de CV, ADR (I)(L) 29,608 390,233Dine SAB de CV (I) 103,700 29,666El Puerto de Liverpool SAB de CV 14,730 142,136Empresas ICA SAB de CV, ADR (I)(L) 231,841 2,114,390Fomento Economico Mexicano SAB de CV, ADR (L) 114,228 11,203,482Genomma Lab Internacional SAB de CV (I) 158,000 313,961GMD Resorts SAB de CV (I) 66,200 19,962Gruma SAB de CV, Class B (I) 394,374 1,116,028Grupo Aeroportuario del Centro Norte SAB de CV 205,789 517,120Grupo Aeroportuario del Centro Norte SAB de CV, ADR 14,736 301,793Grupo Aeroportuario del Pacifico SAB de CV, ADR 69,568 3,549,359Grupo Aeroportuario del Sureste SAB de CV, ADR (L) 34,325 3,493,942Grupo Aeroportuario del Sureste SAB de CV, Class B 27,200 277,606Grupo Bimbo SAB de CV 904,200 2,128,813Grupo Carso SAB de CV, Series A1 773,915 3,200,748Grupo Cementos de Chihuahua SAB de CV (I) 57,000 188,539Grupo Elektra SA de CV 10,370 437,781Grupo Famsa SAB de CV, Class A (I) 289,538 321,698Grupo Financiero Banorte SAB de CV, Series O 1,707,270 9,743,232Grupo Financiero Inbursa SAB de CV, Series O 80,200 222,057Grupo Gigante SAB de CV 168,900 316,032Grupo Herdez SAB de CV 10,000 28,067Grupo Industrial Maseca SAB de CV, Series B 2,600 3,166Grupo Industrial Saltillo SAB de CV 100,600 186,290Grupo KUO SAB de CV, Series B (I) 164,700 364,204Grupo Mexicano de Desarrollo SAB de CV (I) 67,000 35,641Grupo Mexico SAB de CV, Series B 1,466,924 4,820,390Grupo Modelo SAB de CV 149,400 1,335,693Grupo Simec SAB de CV, Series B (I) 197,942 811,147Grupo Televisa SAB, ADR (L) 162,560 3,847,795Industrias Bachoco SAB de CV, ADR 2,203 57,498Industrias Bachoco SAB de CV, Series B 24,800 53,690Industrias CH SAB de CV, Series B (I) 292,935 1,879,901Industrias Penoles SAB de CV 26,695 1,351,133Inmuebles Carso SAB de CV, Class B1 (I) 1,093,966 885,597Kimberly-Clark de Mexico SAB de CV 535,663 1,308,773Mexichem SAB de CV 306,726 1,588,953Minera Frisco SAB de CV, Class A1 (I) 1,405,544 5,551,124Organizacion Soriana SAB de CV, Series B 1,811,012 6,317,948Promotora y Operadora de Infraestructura SAB de CV (I) 2,766 16,617Qualitas Controladora SAB de CV (I) 364,900 548,756Sare Holding SAB de CV, Class B (I) 595,900 42,342
Copyright © 2013 www.secdatabase.com. All Rights Reserved.Please Consider the Environment Before Printing This Document
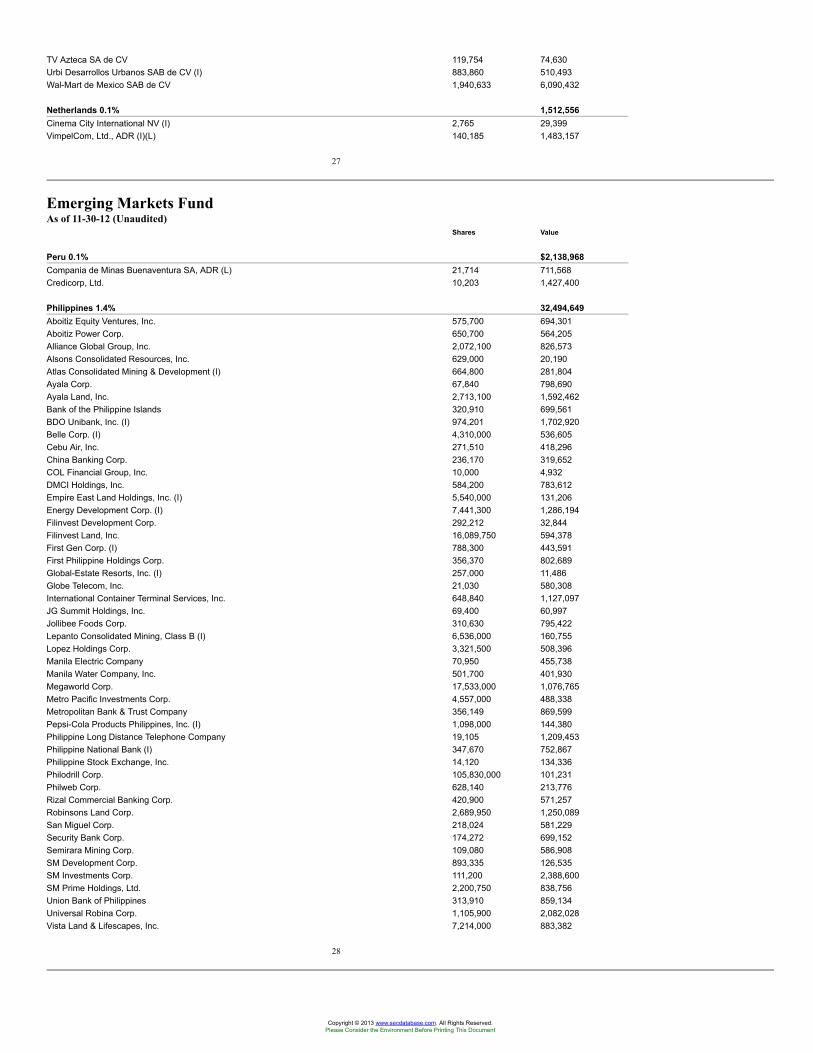
TV Azteca SA de CV 119,754 74,630Urbi Desarrollos Urbanos SAB de CV (I) 883,860 510,493Wal-Mart de Mexico SAB de CV 1,940,633 6,090,432
Netherlands 0.1% 1,512,556Cinema City International NV (I) 2,765 29,399VimpelCom, Ltd., ADR (I)(L) 140,185 1,483,157
27
Emerging Markets FundAs of 11-30-12 (Unaudited)
Shares Value
Peru 0.1% $2,138,968Compania de Minas Buenaventura SA, ADR (L) 21,714 711,568Credicorp, Ltd. 10,203 1,427,400
Philippines 1.4% 32,494,649Aboitiz Equity Ventures, Inc. 575,700 694,301Aboitiz Power Corp. 650,700 564,205Alliance Global Group, Inc. 2,072,100 826,573Alsons Consolidated Resources, Inc. 629,000 20,190Atlas Consolidated Mining & Development (I) 664,800 281,804Ayala Corp. 67,840 798,690Ayala Land, Inc. 2,713,100 1,592,462Bank of the Philippine Islands 320,910 699,561BDO Unibank, Inc. (I) 974,201 1,702,920Belle Corp. (I) 4,310,000 536,605Cebu Air, Inc. 271,510 418,296China Banking Corp. 236,170 319,652COL Financial Group, Inc. 10,000 4,932DMCI Holdings, Inc. 584,200 783,612Empire East Land Holdings, Inc. (I) 5,540,000 131,206Energy Development Corp. (I) 7,441,300 1,286,194Filinvest Development Corp. 292,212 32,844Filinvest Land, Inc. 16,089,750 594,378First Gen Corp. (I) 788,300 443,591First Philippine Holdings Corp. 356,370 802,689Global-Estate Resorts, Inc. (I) 257,000 11,486Globe Telecom, Inc. 21,030 580,308International Container Terminal Services, Inc. 648,840 1,127,097JG Summit Holdings, Inc. 69,400 60,997Jollibee Foods Corp. 310,630 795,422Lepanto Consolidated Mining, Class B (I) 6,536,000 160,755Lopez Holdings Corp. 3,321,500 508,396Manila Electric Company 70,950 455,738Manila Water Company, Inc. 501,700 401,930Megaworld Corp. 17,533,000 1,076,765Metro Pacific Investments Corp. 4,557,000 488,338Metropolitan Bank & Trust Company 356,149 869,599Pepsi-Cola Products Philippines, Inc. (I) 1,098,000 144,380Philippine Long Distance Telephone Company 19,105 1,209,453Philippine National Bank (I) 347,670 752,867Philippine Stock Exchange, Inc. 14,120 134,336Philodrill Corp. 105,830,000 101,231Philweb Corp. 628,140 213,776Rizal Commercial Banking Corp. 420,900 571,257Robinsons Land Corp. 2,689,950 1,250,089San Miguel Corp. 218,024 581,229Security Bank Corp. 174,272 699,152Semirara Mining Corp. 109,080 586,908SM Development Corp. 893,335 126,535SM Investments Corp. 111,200 2,388,600SM Prime Holdings, Ltd. 2,200,750 838,756Union Bank of Philippines 313,910 859,134Universal Robina Corp. 1,105,900 2,082,028Vista Land & Lifescapes, Inc. 7,214,000 883,382
28
Copyright © 2013 www.secdatabase.com. All Rights Reserved.Please Consider the Environment Before Printing This Document
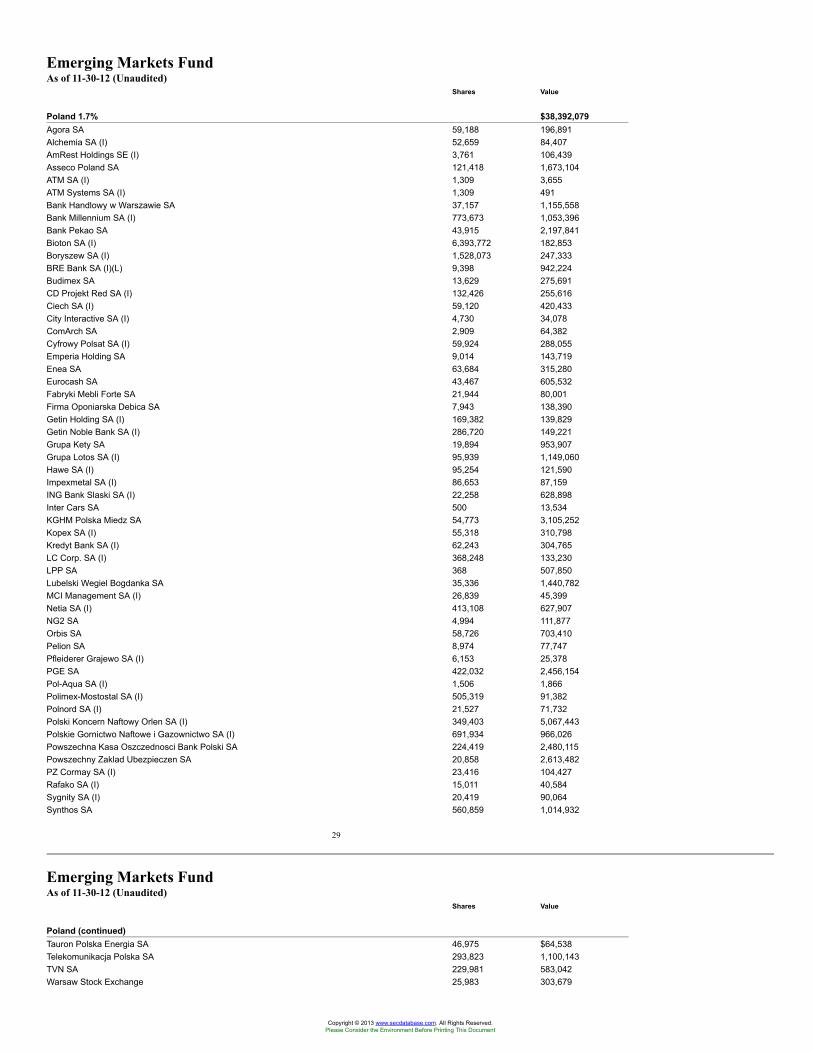
Emerging Markets FundAs of 11-30-12 (Unaudited)
Shares Value
Poland 1.7% $38,392,079Agora SA 59,188 196,891Alchemia SA (I) 52,659 84,407AmRest Holdings SE (I) 3,761 106,439Asseco Poland SA 121,418 1,673,104ATM SA (I) 1,309 3,655ATM Systems SA (I) 1,309 491Bank Handlowy w Warszawie SA 37,157 1,155,558Bank Millennium SA (I) 773,673 1,053,396Bank Pekao SA 43,915 2,197,841Bioton SA (I) 6,393,772 182,853Boryszew SA (I) 1,528,073 247,333BRE Bank SA (I)(L) 9,398 942,224Budimex SA 13,629 275,691CD Projekt Red SA (I) 132,426 255,616Ciech SA (I) 59,120 420,433City Interactive SA (I) 4,730 34,078ComArch SA 2,909 64,382Cyfrowy Polsat SA (I) 59,924 288,055Emperia Holding SA 9,014 143,719Enea SA 63,684 315,280Eurocash SA 43,467 605,532Fabryki Mebli Forte SA 21,944 80,001Firma Oponiarska Debica SA 7,943 138,390Getin Holding SA (I) 169,382 139,829Getin Noble Bank SA (I) 286,720 149,221Grupa Kety SA 19,894 953,907Grupa Lotos SA (I) 95,939 1,149,060Hawe SA (I) 95,254 121,590Impexmetal SA (I) 86,653 87,159ING Bank Slaski SA (I) 22,258 628,898Inter Cars SA 500 13,534KGHM Polska Miedz SA 54,773 3,105,252Kopex SA (I) 55,318 310,798Kredyt Bank SA (I) 62,243 304,765LC Corp. SA (I) 368,248 133,230LPP SA 368 507,850Lubelski Wegiel Bogdanka SA 35,336 1,440,782MCI Management SA (I) 26,839 45,399Netia SA (I) 413,108 627,907NG2 SA 4,994 111,877Orbis SA 58,726 703,410Pelion SA 8,974 77,747Pfleiderer Grajewo SA (I) 6,153 25,378PGE SA 422,032 2,456,154Pol-Aqua SA (I) 1,506 1,866Polimex-Mostostal SA (I) 505,319 91,382Polnord SA (I) 21,527 71,732Polski Koncern Naftowy Orlen SA (I) 349,403 5,067,443Polskie Gornictwo Naftowe i Gazownictwo SA (I) 691,934 966,026Powszechna Kasa Oszczednosci Bank Polski SA 224,419 2,480,115Powszechny Zaklad Ubezpieczen SA 20,858 2,613,482PZ Cormay SA (I) 23,416 104,427Rafako SA (I) 15,011 40,584Sygnity SA (I) 20,419 90,064Synthos SA 560,859 1,014,932
29
Emerging Markets FundAs of 11-30-12 (Unaudited)
Shares Value
Poland (continued)Tauron Polska Energia SA 46,975 $64,538Telekomunikacja Polska SA 293,823 1,100,143TVN SA 229,981 583,042Warsaw Stock Exchange 25,983 303,679
Copyright © 2013 www.secdatabase.com. All Rights Reserved.Please Consider the Environment Before Printing This Document
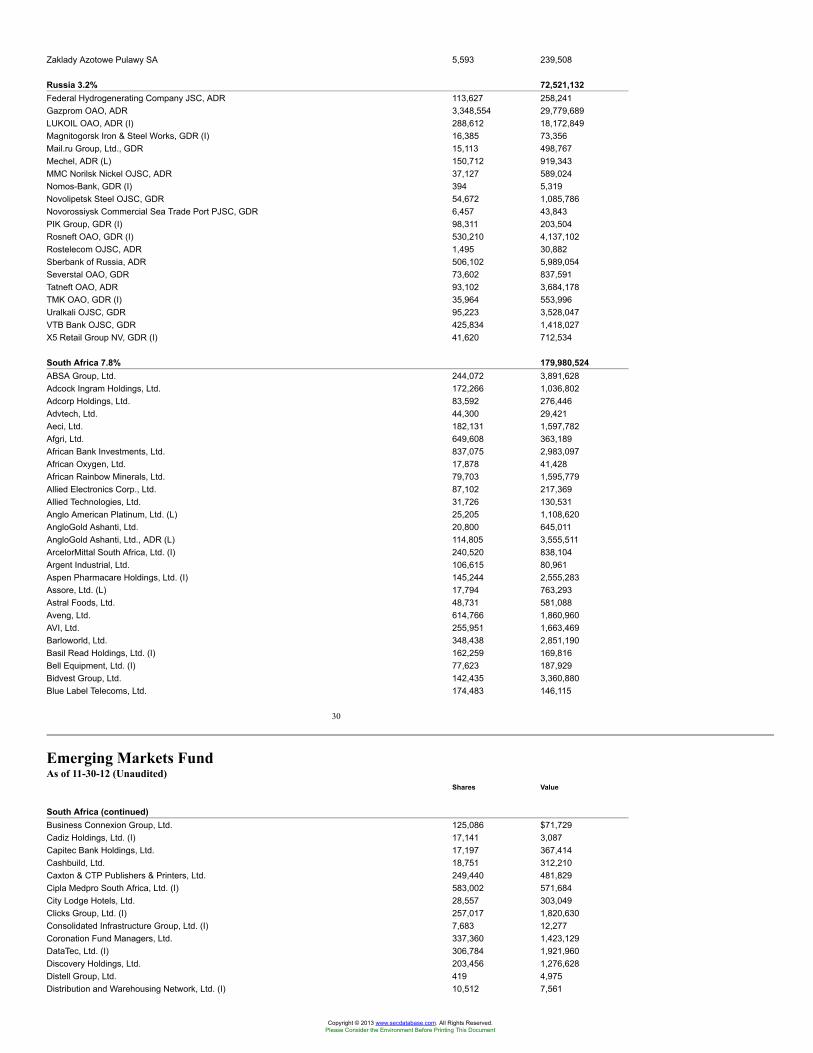
Zaklady Azotowe Pulawy SA 5,593 239,508
Russia 3.2% 72,521,132Federal Hydrogenerating Company JSC, ADR 113,627 258,241Gazprom OAO, ADR 3,348,554 29,779,689LUKOIL OAO, ADR (I) 288,612 18,172,849Magnitogorsk Iron & Steel Works, GDR (I) 16,385 73,356Mail.ru Group, Ltd., GDR 15,113 498,767Mechel, ADR (L) 150,712 919,343MMC Norilsk Nickel OJSC, ADR 37,127 589,024Nomos-Bank, GDR (I) 394 5,319Novolipetsk Steel OJSC, GDR 54,672 1,085,786Novorossiysk Commercial Sea Trade Port PJSC, GDR 6,457 43,843PIK Group, GDR (I) 98,311 203,504Rosneft OAO, GDR (I) 530,210 4,137,102Rostelecom OJSC, ADR 1,495 30,882Sberbank of Russia, ADR 506,102 5,989,054Severstal OAO, GDR 73,602 837,591Tatneft OAO, ADR 93,102 3,684,178TMK OAO, GDR (I) 35,964 553,996Uralkali OJSC, GDR 95,223 3,528,047VTB Bank OJSC, GDR 425,834 1,418,027X5 Retail Group NV, GDR (I) 41,620 712,534
South Africa 7.8% 179,980,524ABSA Group, Ltd. 244,072 3,891,628Adcock Ingram Holdings, Ltd. 172,266 1,036,802Adcorp Holdings, Ltd. 83,592 276,446Advtech, Ltd. 44,300 29,421Aeci, Ltd. 182,131 1,597,782Afgri, Ltd. 649,608 363,189African Bank Investments, Ltd. 837,075 2,983,097African Oxygen, Ltd. 17,878 41,428African Rainbow Minerals, Ltd. 79,703 1,595,779Allied Electronics Corp., Ltd. 87,102 217,369Allied Technologies, Ltd. 31,726 130,531Anglo American Platinum, Ltd. (L) 25,205 1,108,620AngloGold Ashanti, Ltd. 20,800 645,011AngloGold Ashanti, Ltd., ADR (L) 114,805 3,555,511ArcelorMittal South Africa, Ltd. (I) 240,520 838,104Argent Industrial, Ltd. 106,615 80,961Aspen Pharmacare Holdings, Ltd. (I) 145,244 2,555,283Assore, Ltd. (L) 17,794 763,293Astral Foods, Ltd. 48,731 581,088Aveng, Ltd. 614,766 1,860,960AVI, Ltd. 255,951 1,663,469Barloworld, Ltd. 348,438 2,851,190Basil Read Holdings, Ltd. (I) 162,259 169,816Bell Equipment, Ltd. (I) 77,623 187,929Bidvest Group, Ltd. 142,435 3,360,880Blue Label Telecoms, Ltd. 174,483 146,115
30
Emerging Markets FundAs of 11-30-12 (Unaudited)
Shares Value
South Africa (continued)Business Connexion Group, Ltd. 125,086 $71,729Cadiz Holdings, Ltd. (I) 17,141 3,087Capitec Bank Holdings, Ltd. 17,197 367,414Cashbuild, Ltd. 18,751 312,210Caxton & CTP Publishers & Printers, Ltd. 249,440 481,829Cipla Medpro South Africa, Ltd. (I) 583,002 571,684City Lodge Hotels, Ltd. 28,557 303,049Clicks Group, Ltd. (I) 257,017 1,820,630Consolidated Infrastructure Group, Ltd. (I) 7,683 12,277Coronation Fund Managers, Ltd. 337,360 1,423,129DataTec, Ltd. (I) 306,784 1,921,960Discovery Holdings, Ltd. 203,456 1,276,628Distell Group, Ltd. 419 4,975Distribution and Warehousing Network, Ltd. (I) 10,512 7,561
Copyright © 2013 www.secdatabase.com. All Rights Reserved.Please Consider the Environment Before Printing This Document
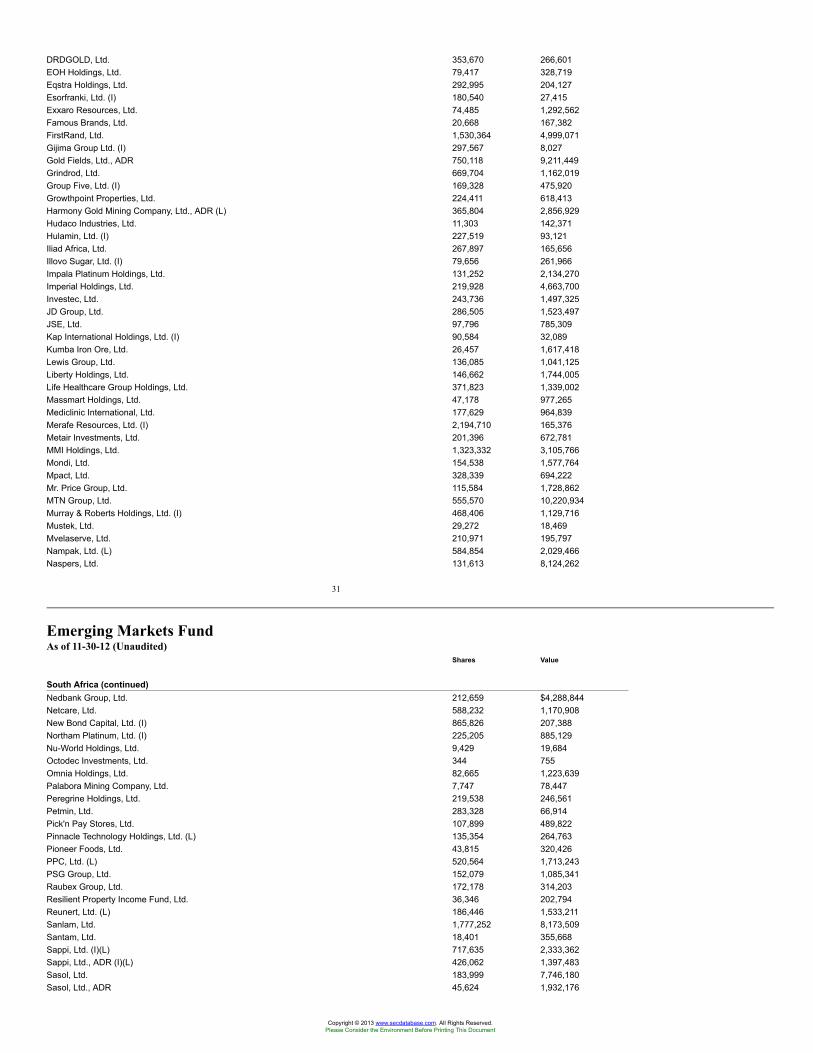
DRDGOLD, Ltd. 353,670 266,601EOH Holdings, Ltd. 79,417 328,719Eqstra Holdings, Ltd. 292,995 204,127Esorfranki, Ltd. (I) 180,540 27,415Exxaro Resources, Ltd. 74,485 1,292,562Famous Brands, Ltd. 20,668 167,382FirstRand, Ltd. 1,530,364 4,999,071Gijima Group Ltd. (I) 297,567 8,027Gold Fields, Ltd., ADR 750,118 9,211,449Grindrod, Ltd. 669,704 1,162,019Group Five, Ltd. (I) 169,328 475,920Growthpoint Properties, Ltd. 224,411 618,413Harmony Gold Mining Company, Ltd., ADR (L) 365,804 2,856,929Hudaco Industries, Ltd. 11,303 142,371Hulamin, Ltd. (I) 227,519 93,121Iliad Africa, Ltd. 267,897 165,656Illovo Sugar, Ltd. (I) 79,656 261,966Impala Platinum Holdings, Ltd. 131,252 2,134,270Imperial Holdings, Ltd. 219,928 4,663,700Investec, Ltd. 243,736 1,497,325JD Group, Ltd. 286,505 1,523,497JSE, Ltd. 97,796 785,309Kap International Holdings, Ltd. (I) 90,584 32,089Kumba Iron Ore, Ltd. 26,457 1,617,418Lewis Group, Ltd. 136,085 1,041,125Liberty Holdings, Ltd. 146,662 1,744,005Life Healthcare Group Holdings, Ltd. 371,823 1,339,002Massmart Holdings, Ltd. 47,178 977,265Mediclinic International, Ltd. 177,629 964,839Merafe Resources, Ltd. (I) 2,194,710 165,376Metair Investments, Ltd. 201,396 672,781MMI Holdings, Ltd. 1,323,332 3,105,766Mondi, Ltd. 154,538 1,577,764Mpact, Ltd. 328,339 694,222Mr. Price Group, Ltd. 115,584 1,728,862MTN Group, Ltd. 555,570 10,220,934Murray & Roberts Holdings, Ltd. (I) 468,406 1,129,716Mustek, Ltd. 29,272 18,469Mvelaserve, Ltd. 210,971 195,797Nampak, Ltd. (L) 584,854 2,029,466Naspers, Ltd. 131,613 8,124,262
31
Emerging Markets FundAs of 11-30-12 (Unaudited)
Shares Value
South Africa (continued)Nedbank Group, Ltd. 212,659 $4,288,844Netcare, Ltd. 588,232 1,170,908New Bond Capital, Ltd. (I) 865,826 207,388Northam Platinum, Ltd. (I) 225,205 885,129Nu-World Holdings, Ltd. 9,429 19,684Octodec Investments, Ltd. 344 755Omnia Holdings, Ltd. 82,665 1,223,639Palabora Mining Company, Ltd. 7,747 78,447Peregrine Holdings, Ltd. 219,538 246,561Petmin, Ltd. 283,328 66,914Pick'n Pay Stores, Ltd. 107,899 489,822Pinnacle Technology Holdings, Ltd. (L) 135,354 264,763Pioneer Foods, Ltd. 43,815 320,426PPC, Ltd. (L) 520,564 1,713,243PSG Group, Ltd. 152,079 1,085,341Raubex Group, Ltd. 172,178 314,203Resilient Property Income Fund, Ltd. 36,346 202,794Reunert, Ltd. (L) 186,446 1,533,211Sanlam, Ltd. 1,777,252 8,173,509Santam, Ltd. 18,401 355,668Sappi, Ltd. (I)(L) 717,635 2,333,362Sappi, Ltd., ADR (I)(L) 426,062 1,397,483Sasol, Ltd. 183,999 7,746,180Sasol, Ltd., ADR 45,624 1,932,176
Copyright © 2013 www.secdatabase.com. All Rights Reserved.Please Consider the Environment Before Printing This Document
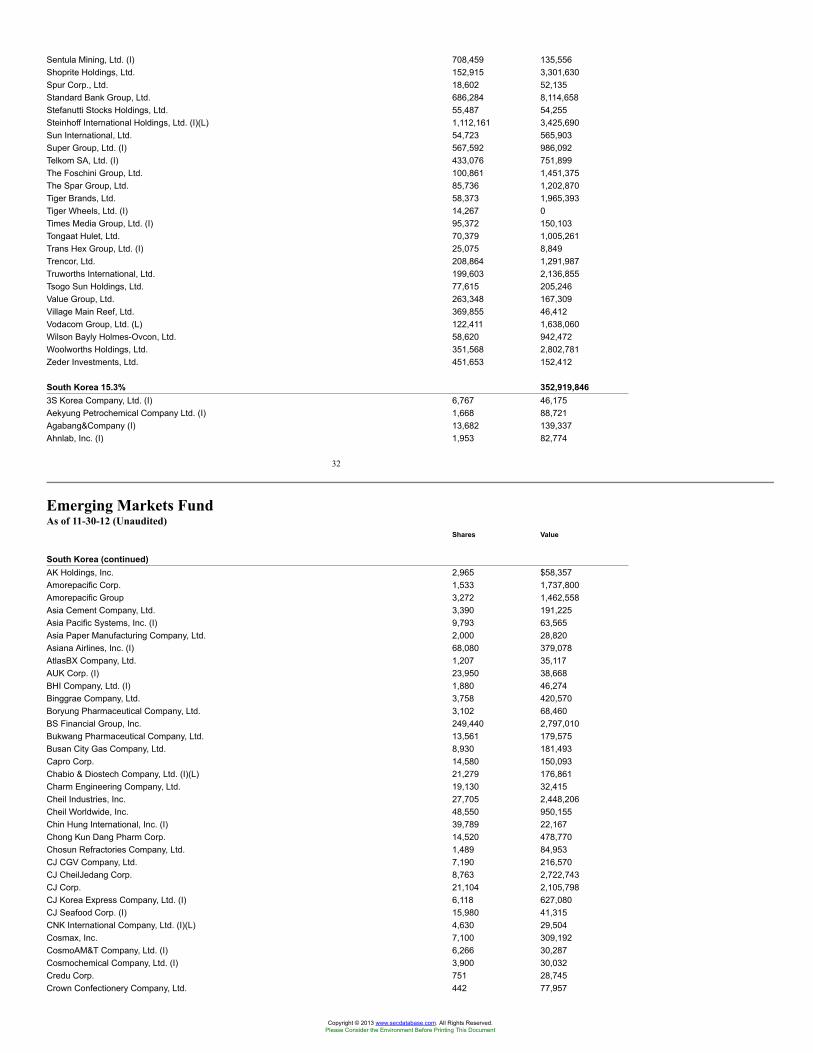
Sentula Mining, Ltd. (I) 708,459 135,556Shoprite Holdings, Ltd. 152,915 3,301,630Spur Corp., Ltd. 18,602 52,135Standard Bank Group, Ltd. 686,284 8,114,658Stefanutti Stocks Holdings, Ltd. 55,487 54,255Steinhoff International Holdings, Ltd. (I)(L) 1,112,161 3,425,690Sun International, Ltd. 54,723 565,903Super Group, Ltd. (I) 567,592 986,092Telkom SA, Ltd. (I) 433,076 751,899The Foschini Group, Ltd. 100,861 1,451,375The Spar Group, Ltd. 85,736 1,202,870Tiger Brands, Ltd. 58,373 1,965,393Tiger Wheels, Ltd. (I) 14,267 0Times Media Group, Ltd. (I) 95,372 150,103Tongaat Hulet, Ltd. 70,379 1,005,261Trans Hex Group, Ltd. (I) 25,075 8,849Trencor, Ltd. 208,864 1,291,987Truworths International, Ltd. 199,603 2,136,855Tsogo Sun Holdings, Ltd. 77,615 205,246Value Group, Ltd. 263,348 167,309Village Main Reef, Ltd. 369,855 46,412Vodacom Group, Ltd. (L) 122,411 1,638,060Wilson Bayly Holmes-Ovcon, Ltd. 58,620 942,472Woolworths Holdings, Ltd. 351,568 2,802,781Zeder Investments, Ltd. 451,653 152,412
South Korea 15.3% 352,919,8463S Korea Company, Ltd. (I) 6,767 46,175Aekyung Petrochemical Company Ltd. (I) 1,668 88,721Agabang&Company (I) 13,682 139,337Ahnlab, Inc. (I) 1,953 82,774
32
Emerging Markets FundAs of 11-30-12 (Unaudited)
Shares Value
South Korea (continued)AK Holdings, Inc. 2,965 $58,357Amorepacific Corp. 1,533 1,737,800Amorepacific Group 3,272 1,462,558Asia Cement Company, Ltd. 3,390 191,225Asia Pacific Systems, Inc. (I) 9,793 63,565Asia Paper Manufacturing Company, Ltd. 2,000 28,820Asiana Airlines, Inc. (I) 68,080 379,078AtlasBX Company, Ltd. 1,207 35,117AUK Corp. (I) 23,950 38,668BHI Company, Ltd. (I) 1,880 46,274Binggrae Company, Ltd. 3,758 420,570Boryung Pharmaceutical Company, Ltd. 3,102 68,460BS Financial Group, Inc. 249,440 2,797,010Bukwang Pharmaceutical Company, Ltd. 13,561 179,575Busan City Gas Company, Ltd. 8,930 181,493Capro Corp. 14,580 150,093Chabio & Diostech Company, Ltd. (I)(L) 21,279 176,861Charm Engineering Company, Ltd. 19,130 32,415Cheil Industries, Inc. 27,705 2,448,206Cheil Worldwide, Inc. 48,550 950,155Chin Hung International, Inc. (I) 39,789 22,167Chong Kun Dang Pharm Corp. 14,520 478,770Chosun Refractories Company, Ltd. 1,489 84,953CJ CGV Company, Ltd. 7,190 216,570CJ CheilJedang Corp. 8,763 2,722,743CJ Corp. 21,104 2,105,798CJ Korea Express Company, Ltd. (I) 6,118 627,080CJ Seafood Corp. (I) 15,980 41,315CNK International Company, Ltd. (I)(L) 4,630 29,504Cosmax, Inc. 7,100 309,192CosmoAM&T Company, Ltd. (I) 6,266 30,287Cosmochemical Company, Ltd. (I) 3,900 30,032Credu Corp. 751 28,745Crown Confectionery Company, Ltd. 442 77,957
Copyright © 2013 www.secdatabase.com. All Rights Reserved.Please Consider the Environment Before Printing This Document
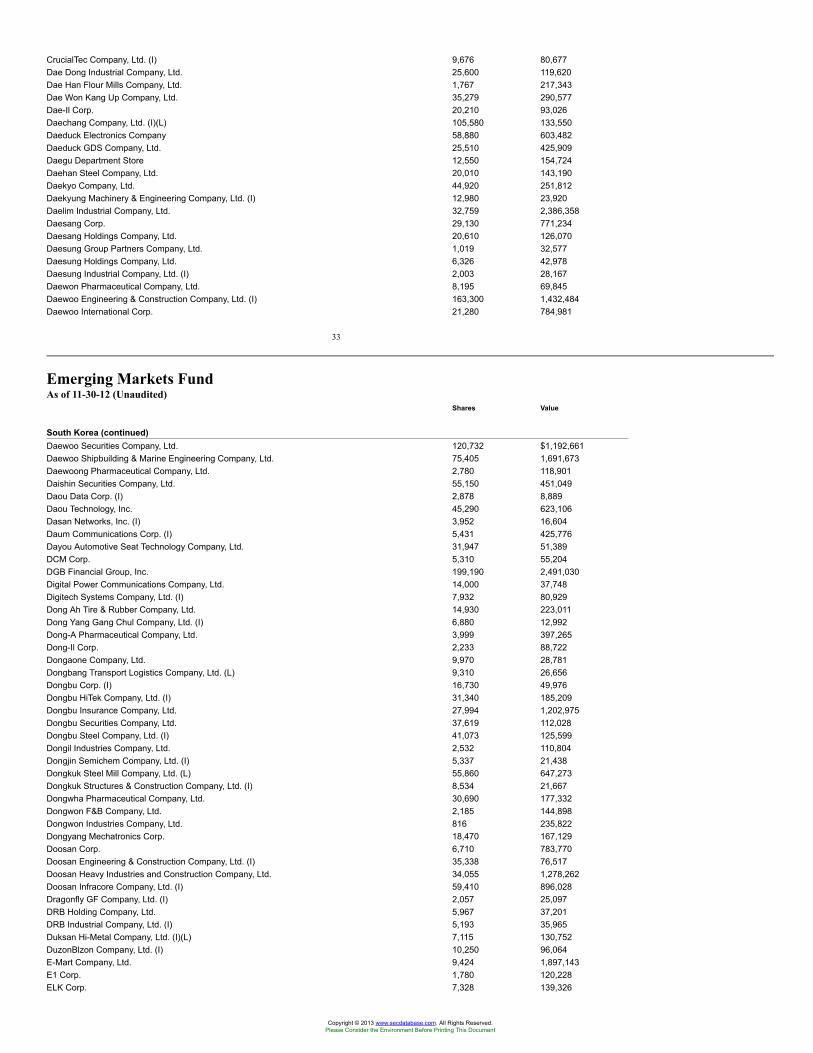
CrucialTec Company, Ltd. (I) 9,676 80,677Dae Dong Industrial Company, Ltd. 25,600 119,620Dae Han Flour Mills Company, Ltd. 1,767 217,343Dae Won Kang Up Company, Ltd. 35,279 290,577Dae-Il Corp. 20,210 93,026Daechang Company, Ltd. (I)(L) 105,580 133,550Daeduck Electronics Company 58,880 603,482Daeduck GDS Company, Ltd. 25,510 425,909Daegu Department Store 12,550 154,724Daehan Steel Company, Ltd. 20,010 143,190Daekyo Company, Ltd. 44,920 251,812Daekyung Machinery & Engineering Company, Ltd. (I) 12,980 23,920Daelim Industrial Company, Ltd. 32,759 2,386,358Daesang Corp. 29,130 771,234Daesang Holdings Company, Ltd. 20,610 126,070Daesung Group Partners Company, Ltd. 1,019 32,577Daesung Holdings Company, Ltd. 6,326 42,978Daesung Industrial Company, Ltd. (I) 2,003 28,167Daewon Pharmaceutical Company, Ltd. 8,195 69,845Daewoo Engineering & Construction Company, Ltd. (I) 163,300 1,432,484Daewoo International Corp. 21,280 784,981
33
Emerging Markets FundAs of 11-30-12 (Unaudited)
Shares Value
South Korea (continued)Daewoo Securities Company, Ltd. 120,732 $1,192,661Daewoo Shipbuilding & Marine Engineering Company, Ltd. 75,405 1,691,673Daewoong Pharmaceutical Company, Ltd. 2,780 118,901Daishin Securities Company, Ltd. 55,150 451,049Daou Data Corp. (I) 2,878 8,889Daou Technology, Inc. 45,290 623,106Dasan Networks, Inc. (I) 3,952 16,604Daum Communications Corp. (I) 5,431 425,776Dayou Automotive Seat Technology Company, Ltd. 31,947 51,389DCM Corp. 5,310 55,204DGB Financial Group, Inc. 199,190 2,491,030Digital Power Communications Company, Ltd. 14,000 37,748Digitech Systems Company, Ltd. (I) 7,932 80,929Dong Ah Tire & Rubber Company, Ltd. 14,930 223,011Dong Yang Gang Chul Company, Ltd. (I) 6,880 12,992Dong-A Pharmaceutical Company, Ltd. 3,999 397,265Dong-Il Corp. 2,233 88,722Dongaone Company, Ltd. 9,970 28,781Dongbang Transport Logistics Company, Ltd. (L) 9,310 26,656Dongbu Corp. (I) 16,730 49,976Dongbu HiTek Company, Ltd. (I) 31,340 185,209Dongbu Insurance Company, Ltd. 27,994 1,202,975Dongbu Securities Company, Ltd. 37,619 112,028Dongbu Steel Company, Ltd. (I) 41,073 125,599Dongil Industries Company, Ltd. 2,532 110,804Dongjin Semichem Company, Ltd. (I) 5,337 21,438Dongkuk Steel Mill Company, Ltd. (L) 55,860 647,273Dongkuk Structures & Construction Company, Ltd. (I) 8,534 21,667Dongwha Pharmaceutical Company, Ltd. 30,690 177,332Dongwon F&B Company, Ltd. 2,185 144,898Dongwon Industries Company, Ltd. 816 235,822Dongyang Mechatronics Corp. 18,470 167,129Doosan Corp. 6,710 783,770Doosan Engineering & Construction Company, Ltd. (I) 35,338 76,517Doosan Heavy Industries and Construction Company, Ltd. 34,055 1,278,262Doosan Infracore Company, Ltd. (I) 59,410 896,028Dragonfly GF Company, Ltd. (I) 2,057 25,097DRB Holding Company, Ltd. 5,967 37,201DRB Industrial Company, Ltd. (I) 5,193 35,965Duksan Hi-Metal Company, Ltd. (I)(L) 7,115 130,752DuzonBlzon Company, Ltd. (I) 10,250 96,064E-Mart Company, Ltd. 9,424 1,897,143E1 Corp. 1,780 120,228ELK Corp. 7,328 139,326
Copyright © 2013 www.secdatabase.com. All Rights Reserved.Please Consider the Environment Before Printing This Document
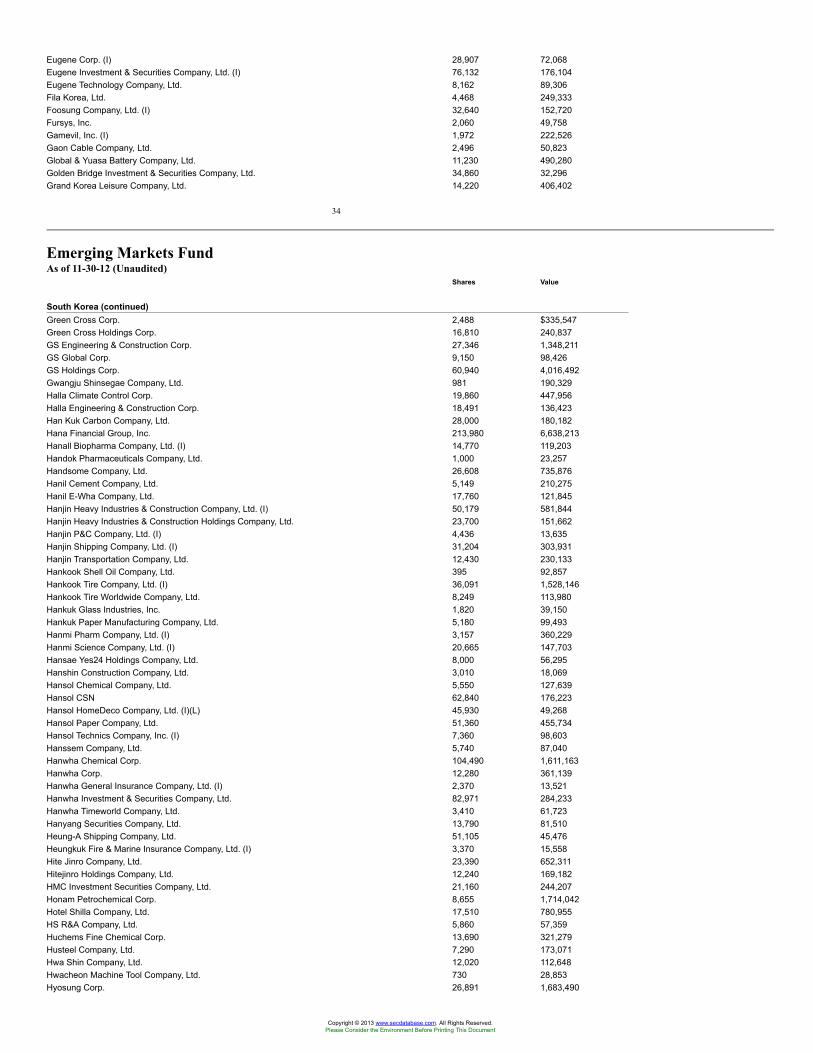
Eugene Corp. (I) 28,907 72,068Eugene Investment & Securities Company, Ltd. (I) 76,132 176,104Eugene Technology Company, Ltd. 8,162 89,306Fila Korea, Ltd. 4,468 249,333Foosung Company, Ltd. (I) 32,640 152,720Fursys, Inc. 2,060 49,758Gamevil, Inc. (I) 1,972 222,526Gaon Cable Company, Ltd. 2,496 50,823Global & Yuasa Battery Company, Ltd. 11,230 490,280Golden Bridge Investment & Securities Company, Ltd. 34,860 32,296Grand Korea Leisure Company, Ltd. 14,220 406,402
34
Emerging Markets FundAs of 11-30-12 (Unaudited)
Shares Value
South Korea (continued)Green Cross Corp. 2,488 $335,547Green Cross Holdings Corp. 16,810 240,837GS Engineering & Construction Corp. 27,346 1,348,211GS Global Corp. 9,150 98,426GS Holdings Corp. 60,940 4,016,492Gwangju Shinsegae Company, Ltd. 981 190,329Halla Climate Control Corp. 19,860 447,956Halla Engineering & Construction Corp. 18,491 136,423Han Kuk Carbon Company, Ltd. 28,000 180,182Hana Financial Group, Inc. 213,980 6,638,213Hanall Biopharma Company, Ltd. (I) 14,770 119,203Handok Pharmaceuticals Company, Ltd. 1,000 23,257Handsome Company, Ltd. 26,608 735,876Hanil Cement Company, Ltd. 5,149 210,275Hanil E-Wha Company, Ltd. 17,760 121,845Hanjin Heavy Industries & Construction Company, Ltd. (I) 50,179 581,844Hanjin Heavy Industries & Construction Holdings Company, Ltd. 23,700 151,662Hanjin P&C Company, Ltd. (I) 4,436 13,635Hanjin Shipping Company, Ltd. (I) 31,204 303,931Hanjin Transportation Company, Ltd. 12,430 230,133Hankook Shell Oil Company, Ltd. 395 92,857Hankook Tire Company, Ltd. (I) 36,091 1,528,146Hankook Tire Worldwide Company, Ltd. 8,249 113,980Hankuk Glass Industries, Inc. 1,820 39,150Hankuk Paper Manufacturing Company, Ltd. 5,180 99,493Hanmi Pharm Company, Ltd. (I) 3,157 360,229Hanmi Science Company, Ltd. (I) 20,665 147,703Hansae Yes24 Holdings Company, Ltd. 8,000 56,295Hanshin Construction Company, Ltd. 3,010 18,069Hansol Chemical Company, Ltd. 5,550 127,639Hansol CSN 62,840 176,223Hansol HomeDeco Company, Ltd. (I)(L) 45,930 49,268Hansol Paper Company, Ltd. 51,360 455,734Hansol Technics Company, Inc. (I) 7,360 98,603Hanssem Company, Ltd. 5,740 87,040Hanwha Chemical Corp. 104,490 1,611,163Hanwha Corp. 12,280 361,139Hanwha General Insurance Company, Ltd. (I) 2,370 13,521Hanwha Investment & Securities Company, Ltd. 82,971 284,233Hanwha Timeworld Company, Ltd. 3,410 61,723Hanyang Securities Company, Ltd. 13,790 81,510Heung-A Shipping Company, Ltd. 51,105 45,476Heungkuk Fire & Marine Insurance Company, Ltd. (I) 3,370 15,558Hite Jinro Company, Ltd. 23,390 652,311Hitejinro Holdings Company, Ltd. 12,240 169,182HMC Investment Securities Company, Ltd. 21,160 244,207Honam Petrochemical Corp. 8,655 1,714,042Hotel Shilla Company, Ltd. 17,510 780,955HS R&A Company, Ltd. 5,860 57,359Huchems Fine Chemical Corp. 13,690 321,279Husteel Company, Ltd. 7,290 173,071Hwa Shin Company, Ltd. 12,020 112,648Hwacheon Machine Tool Company, Ltd. 730 28,853Hyosung Corp. 26,891 1,683,490
Copyright © 2013 www.secdatabase.com. All Rights Reserved.Please Consider the Environment Before Printing This Document
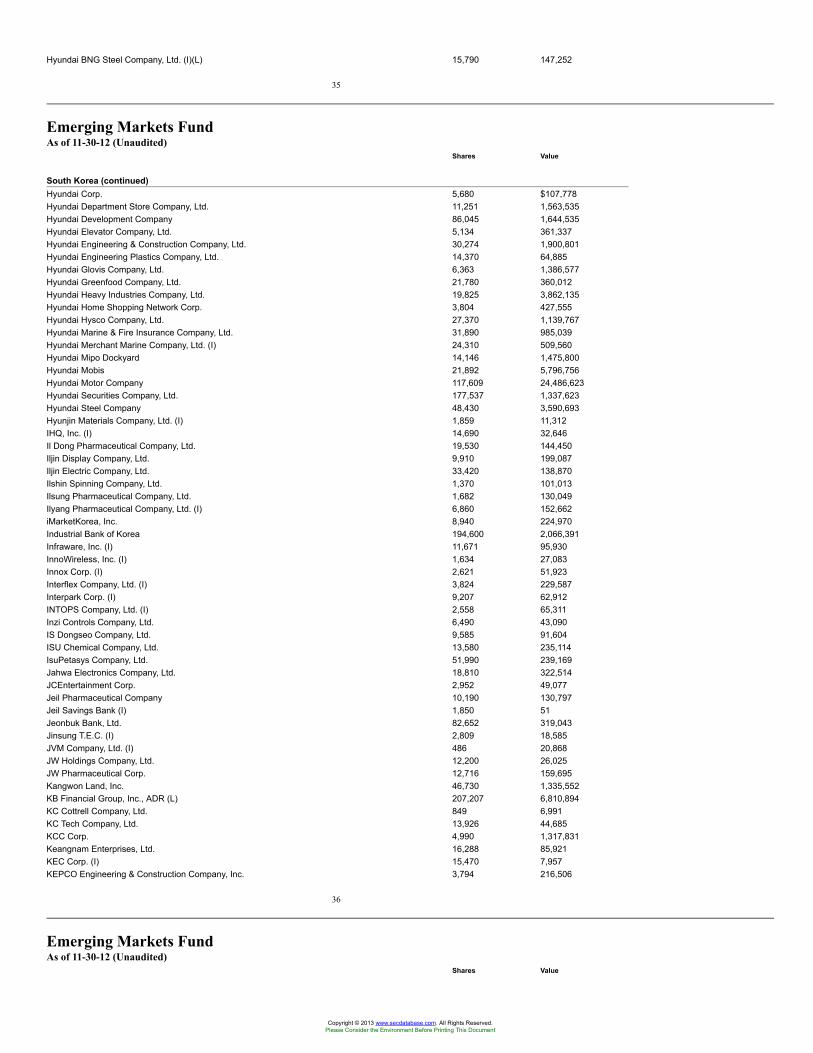
Hyundai BNG Steel Company, Ltd. (I)(L) 15,790 147,252
35
Emerging Markets FundAs of 11-30-12 (Unaudited)
Shares Value
South Korea (continued)Hyundai Corp. 5,680 $107,778Hyundai Department Store Company, Ltd. 11,251 1,563,535Hyundai Development Company 86,045 1,644,535Hyundai Elevator Company, Ltd. 5,134 361,337Hyundai Engineering & Construction Company, Ltd. 30,274 1,900,801Hyundai Engineering Plastics Company, Ltd. 14,370 64,885Hyundai Glovis Company, Ltd. 6,363 1,386,577Hyundai Greenfood Company, Ltd. 21,780 360,012Hyundai Heavy Industries Company, Ltd. 19,825 3,862,135Hyundai Home Shopping Network Corp. 3,804 427,555Hyundai Hysco Company, Ltd. 27,370 1,139,767Hyundai Marine & Fire Insurance Company, Ltd. 31,890 985,039Hyundai Merchant Marine Company, Ltd. (I) 24,310 509,560Hyundai Mipo Dockyard 14,146 1,475,800Hyundai Mobis 21,892 5,796,756Hyundai Motor Company 117,609 24,486,623Hyundai Securities Company, Ltd. 177,537 1,337,623Hyundai Steel Company 48,430 3,590,693Hyunjin Materials Company, Ltd. (I) 1,859 11,312IHQ, Inc. (I) 14,690 32,646Il Dong Pharmaceutical Company, Ltd. 19,530 144,450Iljin Display Company, Ltd. 9,910 199,087Iljin Electric Company, Ltd. 33,420 138,870Ilshin Spinning Company, Ltd. 1,370 101,013Ilsung Pharmaceutical Company, Ltd. 1,682 130,049Ilyang Pharmaceutical Company, Ltd. (I) 6,860 152,662iMarketKorea, Inc. 8,940 224,970Industrial Bank of Korea 194,600 2,066,391Infraware, Inc. (I) 11,671 95,930InnoWireless, Inc. (I) 1,634 27,083Innox Corp. (I) 2,621 51,923Interflex Company, Ltd. (I) 3,824 229,587Interpark Corp. (I) 9,207 62,912INTOPS Company, Ltd. (I) 2,558 65,311Inzi Controls Company, Ltd. 6,490 43,090IS Dongseo Company, Ltd. 9,585 91,604ISU Chemical Company, Ltd. 13,580 235,114IsuPetasys Company, Ltd. 51,990 239,169Jahwa Electronics Company, Ltd. 18,810 322,514JCEntertainment Corp. 2,952 49,077Jeil Pharmaceutical Company 10,190 130,797Jeil Savings Bank (I) 1,850 51Jeonbuk Bank, Ltd. 82,652 319,043Jinsung T.E.C. (I) 2,809 18,585JVM Company, Ltd. (I) 486 20,868JW Holdings Company, Ltd. 12,200 26,025JW Pharmaceutical Corp. 12,716 159,695Kangwon Land, Inc. 46,730 1,335,552KB Financial Group, Inc., ADR (L) 207,207 6,810,894KC Cottrell Company, Ltd. 849 6,991KC Tech Company, Ltd. 13,926 44,685KCC Corp. 4,990 1,317,831Keangnam Enterprises, Ltd. 16,288 85,921KEC Corp. (I) 15,470 7,957KEPCO Engineering & Construction Company, Inc. 3,794 216,506
36
Emerging Markets FundAs of 11-30-12 (Unaudited)
Shares Value
Copyright © 2013 www.secdatabase.com. All Rights Reserved.Please Consider the Environment Before Printing This Document
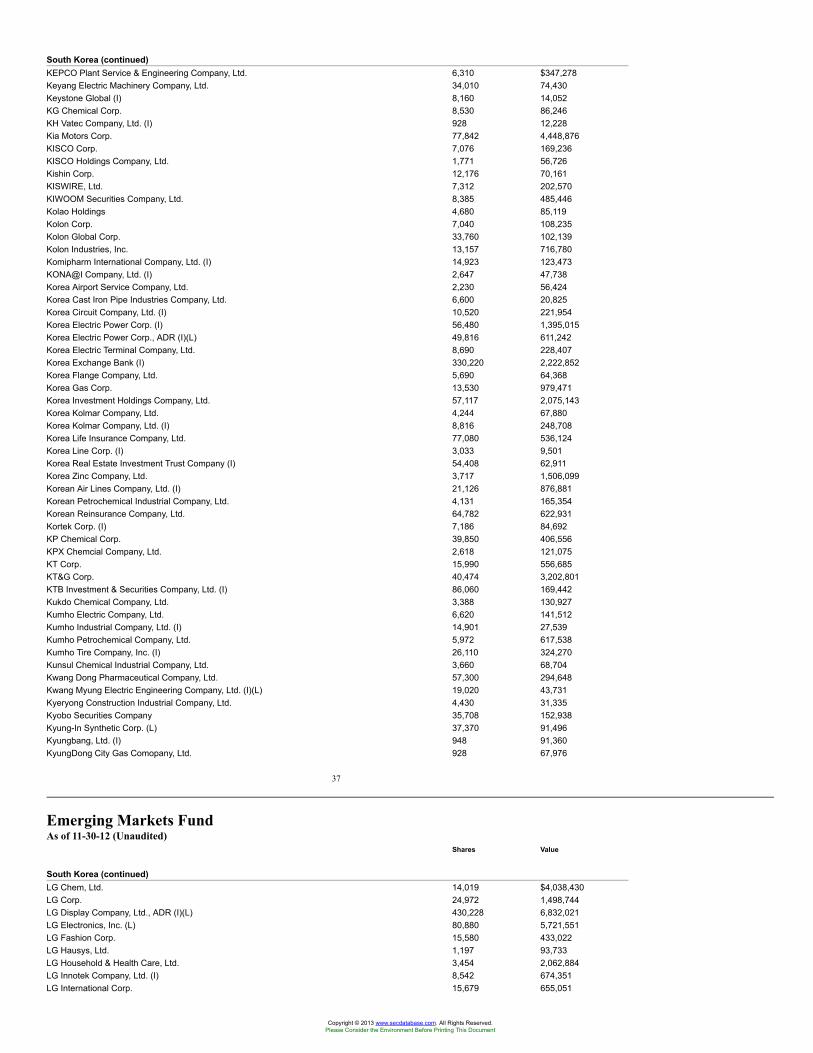
South Korea (continued)KEPCO Plant Service & Engineering Company, Ltd. 6,310 $347,278Keyang Electric Machinery Company, Ltd. 34,010 74,430Keystone Global (I) 8,160 14,052KG Chemical Corp. 8,530 86,246KH Vatec Company, Ltd. (I) 928 12,228Kia Motors Corp. 77,842 4,448,876KISCO Corp. 7,076 169,236KISCO Holdings Company, Ltd. 1,771 56,726Kishin Corp. 12,176 70,161KISWIRE, Ltd. 7,312 202,570KIWOOM Securities Company, Ltd. 8,385 485,446Kolao Holdings 4,680 85,119Kolon Corp. 7,040 108,235Kolon Global Corp. 33,760 102,139Kolon Industries, Inc. 13,157 716,780Komipharm International Company, Ltd. (I) 14,923 123,473KONA@I Company, Ltd. (I) 2,647 47,738Korea Airport Service Company, Ltd. 2,230 56,424Korea Cast Iron Pipe Industries Company, Ltd. 6,600 20,825Korea Circuit Company, Ltd. (I) 10,520 221,954Korea Electric Power Corp. (I) 56,480 1,395,015Korea Electric Power Corp., ADR (I)(L) 49,816 611,242Korea Electric Terminal Company, Ltd. 8,690 228,407Korea Exchange Bank (I) 330,220 2,222,852Korea Flange Company, Ltd. 5,690 64,368Korea Gas Corp. 13,530 979,471Korea Investment Holdings Company, Ltd. 57,117 2,075,143Korea Kolmar Company, Ltd. 4,244 67,880Korea Kolmar Company, Ltd. (I) 8,816 248,708Korea Life Insurance Company, Ltd. 77,080 536,124Korea Line Corp. (I) 3,033 9,501Korea Real Estate Investment Trust Company (I) 54,408 62,911Korea Zinc Company, Ltd. 3,717 1,506,099Korean Air Lines Company, Ltd. (I) 21,126 876,881Korean Petrochemical Industrial Company, Ltd. 4,131 165,354Korean Reinsurance Company, Ltd. 64,782 622,931Kortek Corp. (I) 7,186 84,692KP Chemical Corp. 39,850 406,556KPX Chemcial Company, Ltd. 2,618 121,075KT Corp. 15,990 556,685KT&G Corp. 40,474 3,202,801KTB Investment & Securities Company, Ltd. (I) 86,060 169,442Kukdo Chemical Company, Ltd. 3,388 130,927Kumho Electric Company, Ltd. 6,620 141,512Kumho Industrial Company, Ltd. (I) 14,901 27,539Kumho Petrochemical Company, Ltd. 5,972 617,538Kumho Tire Company, Inc. (I) 26,110 324,270Kunsul Chemical Industrial Company, Ltd. 3,660 68,704Kwang Dong Pharmaceutical Company, Ltd. 57,300 294,648Kwang Myung Electric Engineering Company, Ltd. (I)(L) 19,020 43,731Kyeryong Construction Industrial Company, Ltd. 4,430 31,335Kyobo Securities Company 35,708 152,938Kyung-In Synthetic Corp. (L) 37,370 91,496Kyungbang, Ltd. (I) 948 91,360KyungDong City Gas Comopany, Ltd. 928 67,976
37
Emerging Markets FundAs of 11-30-12 (Unaudited)
Shares Value
South Korea (continued)LG Chem, Ltd. 14,019 $4,038,430LG Corp. 24,972 1,498,744LG Display Company, Ltd., ADR (I)(L) 430,228 6,832,021LG Electronics, Inc. (L) 80,880 5,721,551LG Fashion Corp. 15,580 433,022LG Hausys, Ltd. 1,197 93,733LG Household & Health Care, Ltd. 3,454 2,062,884LG Innotek Company, Ltd. (I) 8,542 674,351LG International Corp. 15,679 655,051
Copyright © 2013 www.secdatabase.com. All Rights Reserved.Please Consider the Environment Before Printing This Document
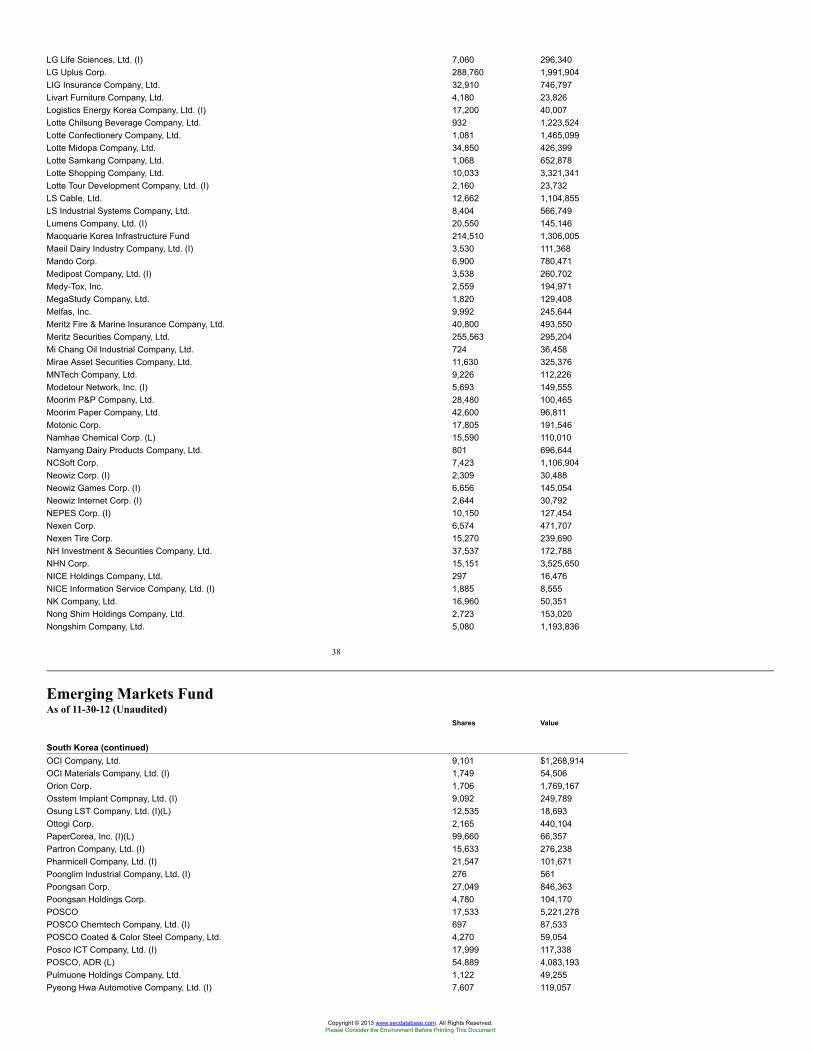
LG Life Sciences, Ltd. (I) 7,060 296,340LG Uplus Corp. 288,760 1,991,904LIG Insurance Company, Ltd. 32,910 746,797Livart Furniture Company, Ltd. 4,180 23,826Logistics Energy Korea Company, Ltd. (I) 17,200 40,007Lotte Chilsung Beverage Company, Ltd. 932 1,223,524Lotte Confectionery Company, Ltd. 1,081 1,465,099Lotte Midopa Company, Ltd. 34,850 426,399Lotte Samkang Company, Ltd. 1,068 652,878Lotte Shopping Company, Ltd. 10,033 3,321,341Lotte Tour Development Company, Ltd. (I) 2,160 23,732LS Cable, Ltd. 12,662 1,104,855LS Industrial Systems Company, Ltd. 8,404 566,749Lumens Company, Ltd. (I) 20,550 145,146Macquarie Korea Infrastructure Fund 214,510 1,306,005Maeil Dairy Industry Company, Ltd. (I) 3,530 111,368Mando Corp. 6,900 780,471Medipost Company, Ltd. (I) 3,538 260,702Medy-Tox, Inc. 2,559 194,971MegaStudy Company, Ltd. 1,820 129,408Melfas, Inc. 9,992 245,644Meritz Fire & Marine Insurance Company, Ltd. 40,800 493,550Meritz Securities Company, Ltd. 255,563 295,204Mi Chang Oil Industrial Company, Ltd. 724 36,458Mirae Asset Securities Company, Ltd. 11,630 325,376MNTech Company, Ltd. 9,226 112,226Modetour Network, Inc. (I) 5,693 149,555Moorim P&P Company, Ltd. 28,480 100,465Moorim Paper Company, Ltd. 42,600 96,811Motonic Corp. 17,805 191,546Namhae Chemical Corp. (L) 15,590 110,010Namyang Dairy Products Company, Ltd. 801 696,644NCSoft Corp. 7,423 1,106,904Neowiz Corp. (I) 2,309 30,488Neowiz Games Corp. (I) 6,656 145,054Neowiz Internet Corp. (I) 2,644 30,792NEPES Corp. (I) 10,150 127,454Nexen Corp. 6,574 471,707Nexen Tire Corp. 15,270 239,690NH Investment & Securities Company, Ltd. 37,537 172,788NHN Corp. 15,151 3,525,650NICE Holdings Company, Ltd. 297 16,476NICE Information Service Company, Ltd. (I) 1,885 8,555NK Company, Ltd. 16,960 50,351Nong Shim Holdings Company, Ltd. 2,723 153,020Nongshim Company, Ltd. 5,080 1,193,836
38
Emerging Markets FundAs of 11-30-12 (Unaudited)
Shares Value
South Korea (continued)OCI Company, Ltd. 9,101 $1,268,914OCI Materials Company, Ltd. (I) 1,749 54,506Orion Corp. 1,706 1,769,167Osstem Implant Compnay, Ltd. (I) 9,092 249,789Osung LST Company, Ltd. (I)(L) 12,535 18,693Ottogi Corp. 2,165 440,104PaperCorea, Inc. (I)(L) 99,660 66,357Partron Company, Ltd. (I) 15,633 276,238Pharmicell Company, Ltd. (I) 21,547 101,671Poonglim Industrial Company, Ltd. (I) 276 561Poongsan Corp. 27,049 846,363Poongsan Holdings Corp. 4,780 104,170POSCO 17,533 5,221,278POSCO Chemtech Company, Ltd. (I) 697 87,533POSCO Coated & Color Steel Company, Ltd. 4,270 59,054Posco ICT Company, Ltd. (I) 17,999 117,338POSCO, ADR (L) 54,889 4,083,193Pulmuone Holdings Company, Ltd. 1,122 49,255Pyeong Hwa Automotive Company, Ltd. (I) 7,607 119,057
Copyright © 2013 www.secdatabase.com. All Rights Reserved.Please Consider the Environment Before Printing This Document
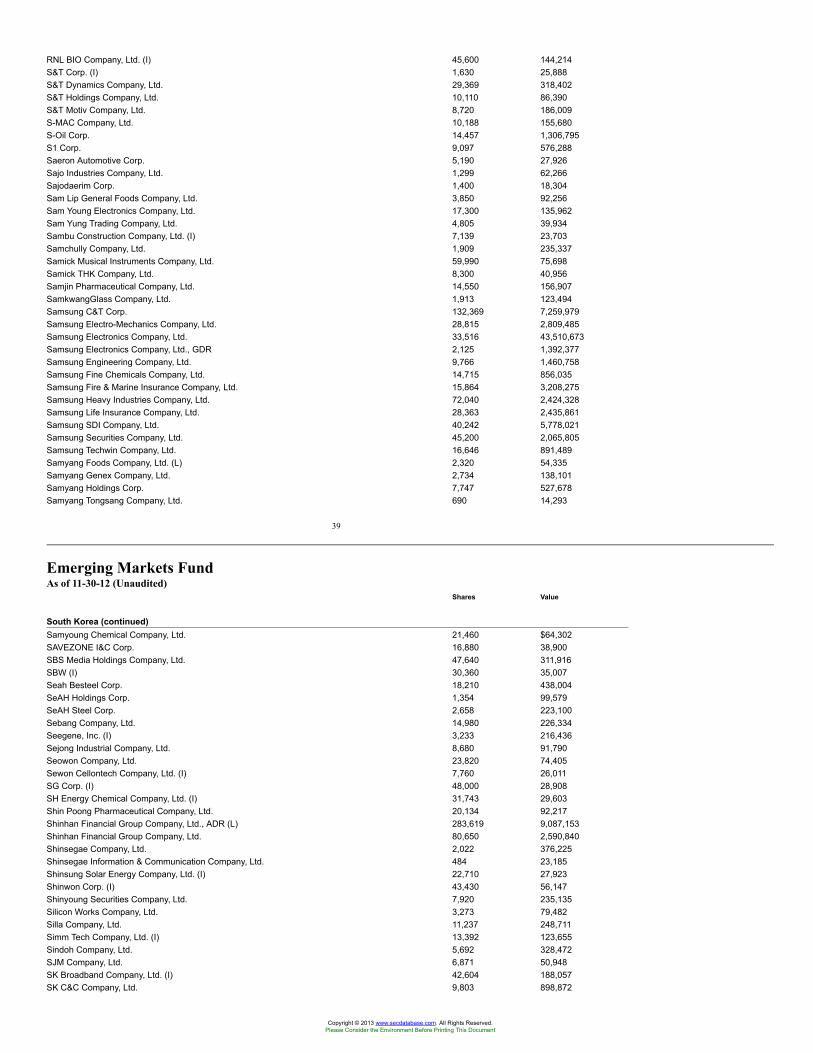
RNL BIO Company, Ltd. (I) 45,600 144,214S&T Corp. (I) 1,630 25,888S&T Dynamics Company, Ltd. 29,369 318,402S&T Holdings Company, Ltd. 10,110 86,390S&T Motiv Company, Ltd. 8,720 186,009S-MAC Company, Ltd. 10,188 155,680S-Oil Corp. 14,457 1,306,795S1 Corp. 9,097 576,288Saeron Automotive Corp. 5,190 27,926Sajo Industries Company, Ltd. 1,299 62,266Sajodaerim Corp. 1,400 18,304Sam Lip General Foods Company, Ltd. 3,850 92,256Sam Young Electronics Company, Ltd. 17,300 135,962Sam Yung Trading Company, Ltd. 4,805 39,934Sambu Construction Company, Ltd. (I) 7,139 23,703Samchully Company, Ltd. 1,909 235,337Samick Musical Instruments Company, Ltd. 59,990 75,698Samick THK Company, Ltd. 8,300 40,956Samjin Pharmaceutical Company, Ltd. 14,550 156,907SamkwangGlass Company, Ltd. 1,913 123,494Samsung C&T Corp. 132,369 7,259,979Samsung Electro-Mechanics Company, Ltd. 28,815 2,809,485Samsung Electronics Company, Ltd. 33,516 43,510,673Samsung Electronics Company, Ltd., GDR 2,125 1,392,377Samsung Engineering Company, Ltd. 9,766 1,460,758Samsung Fine Chemicals Company, Ltd. 14,715 856,035Samsung Fire & Marine Insurance Company, Ltd. 15,864 3,208,275Samsung Heavy Industries Company, Ltd. 72,040 2,424,328Samsung Life Insurance Company, Ltd. 28,363 2,435,861Samsung SDI Company, Ltd. 40,242 5,778,021Samsung Securities Company, Ltd. 45,200 2,065,805Samsung Techwin Company, Ltd. 16,646 891,489Samyang Foods Company, Ltd. (L) 2,320 54,335Samyang Genex Company, Ltd. 2,734 138,101Samyang Holdings Corp. 7,747 527,678Samyang Tongsang Company, Ltd. 690 14,293
39
Emerging Markets FundAs of 11-30-12 (Unaudited)
Shares Value
South Korea (continued)Samyoung Chemical Company, Ltd. 21,460 $64,302SAVEZONE I&C Corp. 16,880 38,900SBS Media Holdings Company, Ltd. 47,640 311,916SBW (I) 30,360 35,007Seah Besteel Corp. 18,210 438,004SeAH Holdings Corp. 1,354 99,579SeAH Steel Corp. 2,658 223,100Sebang Company, Ltd. 14,980 226,334Seegene, Inc. (I) 3,233 216,436Sejong Industrial Company, Ltd. 8,680 91,790Seowon Company, Ltd. 23,820 74,405Sewon Cellontech Company, Ltd. (I) 7,760 26,011SG Corp. (I) 48,000 28,908SH Energy Chemical Company, Ltd. (I) 31,743 29,603Shin Poong Pharmaceutical Company, Ltd. 20,134 92,217Shinhan Financial Group Company, Ltd., ADR (L) 283,619 9,087,153Shinhan Financial Group Company, Ltd. 80,650 2,590,840Shinsegae Company, Ltd. 2,022 376,225Shinsegae Information & Communication Company, Ltd. 484 23,185Shinsung Solar Energy Company, Ltd. (I) 22,710 27,923Shinwon Corp. (I) 43,430 56,147Shinyoung Securities Company, Ltd. 7,920 235,135Silicon Works Company, Ltd. 3,273 79,482Silla Company, Ltd. 11,237 248,711Simm Tech Company, Ltd. (I) 13,392 123,655Sindoh Company, Ltd. 5,692 328,472SJM Company, Ltd. 6,871 50,948SK Broadband Company, Ltd. (I) 42,604 188,057SK C&C Company, Ltd. 9,803 898,872
Copyright © 2013 www.secdatabase.com. All Rights Reserved.Please Consider the Environment Before Printing This Document
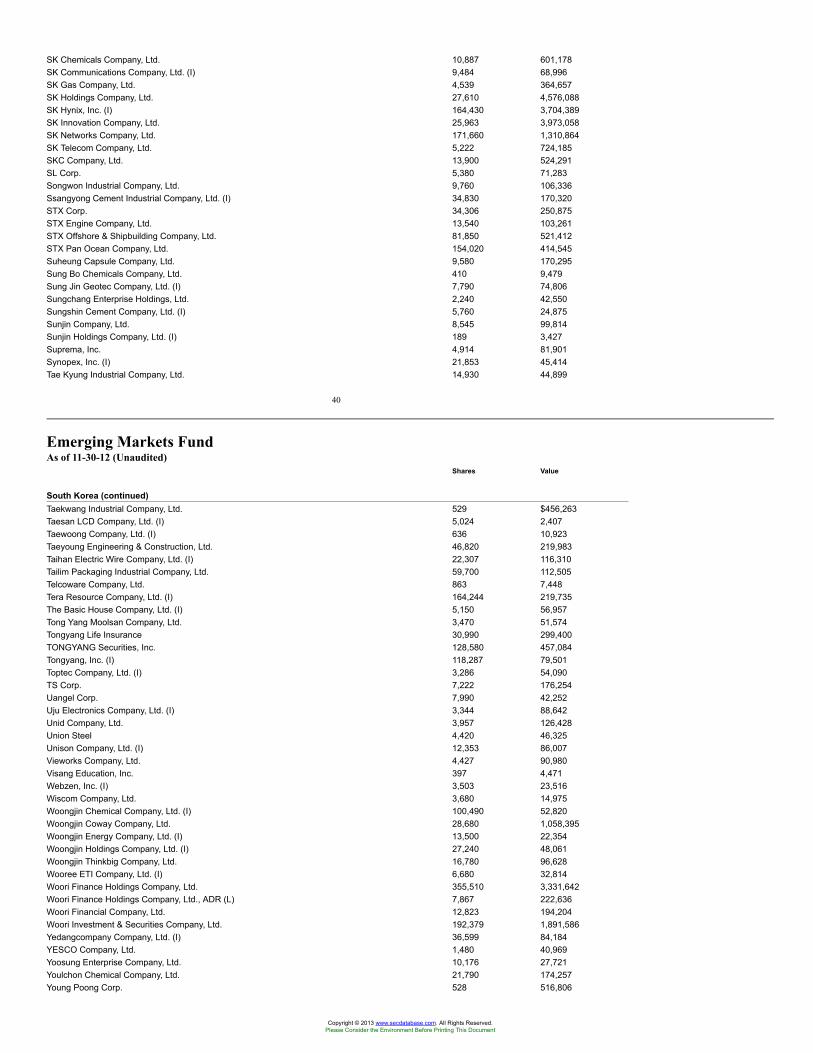
SK Chemicals Company, Ltd. 10,887 601,178SK Communications Company, Ltd. (I) 9,484 68,996SK Gas Company, Ltd. 4,539 364,657SK Holdings Company, Ltd. 27,610 4,576,088SK Hynix, Inc. (I) 164,430 3,704,389SK Innovation Company, Ltd. 25,963 3,973,058SK Networks Company, Ltd. 171,660 1,310,864SK Telecom Company, Ltd. 5,222 724,185SKC Company, Ltd. 13,900 524,291SL Corp. 5,380 71,283Songwon Industrial Company, Ltd. 9,760 106,336Ssangyong Cement Industrial Company, Ltd. (I) 34,830 170,320STX Corp. 34,306 250,875STX Engine Company, Ltd. 13,540 103,261STX Offshore & Shipbuilding Company, Ltd. 81,850 521,412STX Pan Ocean Company, Ltd. 154,020 414,545Suheung Capsule Company, Ltd. 9,580 170,295Sung Bo Chemicals Company, Ltd. 410 9,479Sung Jin Geotec Company, Ltd. (I) 7,790 74,806Sungchang Enterprise Holdings, Ltd. 2,240 42,550Sungshin Cement Company, Ltd. (I) 5,760 24,875Sunjin Company, Ltd. 8,545 99,814Sunjin Holdings Company, Ltd. (I) 189 3,427Suprema, Inc. 4,914 81,901Synopex, Inc. (I) 21,853 45,414Tae Kyung Industrial Company, Ltd. 14,930 44,899
40
Emerging Markets FundAs of 11-30-12 (Unaudited)
Shares Value
South Korea (continued)Taekwang Industrial Company, Ltd. 529 $456,263Taesan LCD Company, Ltd. (I) 5,024 2,407Taewoong Company, Ltd. (I) 636 10,923Taeyoung Engineering & Construction, Ltd. 46,820 219,983Taihan Electric Wire Company, Ltd. (I) 22,307 116,310Tailim Packaging Industrial Company, Ltd. 59,700 112,505Telcoware Company, Ltd. 863 7,448Tera Resource Company, Ltd. (I) 164,244 219,735The Basic House Company, Ltd. (I) 5,150 56,957Tong Yang Moolsan Company, Ltd. 3,470 51,574Tongyang Life Insurance 30,990 299,400TONGYANG Securities, Inc. 128,580 457,084Tongyang, Inc. (I) 118,287 79,501Toptec Company, Ltd. (I) 3,286 54,090TS Corp. 7,222 176,254Uangel Corp. 7,990 42,252Uju Electronics Company, Ltd. (I) 3,344 88,642Unid Company, Ltd. 3,957 126,428Union Steel 4,420 46,325Unison Company, Ltd. (I) 12,353 86,007Vieworks Company, Ltd. 4,427 90,980Visang Education, Inc. 397 4,471Webzen, Inc. (I) 3,503 23,516Wiscom Company, Ltd. 3,680 14,975Woongjin Chemical Company, Ltd. (I) 100,490 52,820Woongjin Coway Company, Ltd. 28,680 1,058,395Woongjin Energy Company, Ltd. (I) 13,500 22,354Woongjin Holdings Company, Ltd. (I) 27,240 48,061Woongjin Thinkbig Company, Ltd. 16,780 96,628Wooree ETI Company, Ltd. (I) 6,680 32,814Woori Finance Holdings Company, Ltd. 355,510 3,331,642Woori Finance Holdings Company, Ltd., ADR (L) 7,867 222,636Woori Financial Company, Ltd. 12,823 194,204Woori Investment & Securities Company, Ltd. 192,379 1,891,586Yedangcompany Company, Ltd. (I) 36,599 84,184YESCO Company, Ltd. 1,480 40,969Yoosung Enterprise Company, Ltd. 10,176 27,721Youlchon Chemical Company, Ltd. 21,790 174,257Young Poong Corp. 528 516,806
Copyright © 2013 www.secdatabase.com. All Rights Reserved.Please Consider the Environment Before Printing This Document
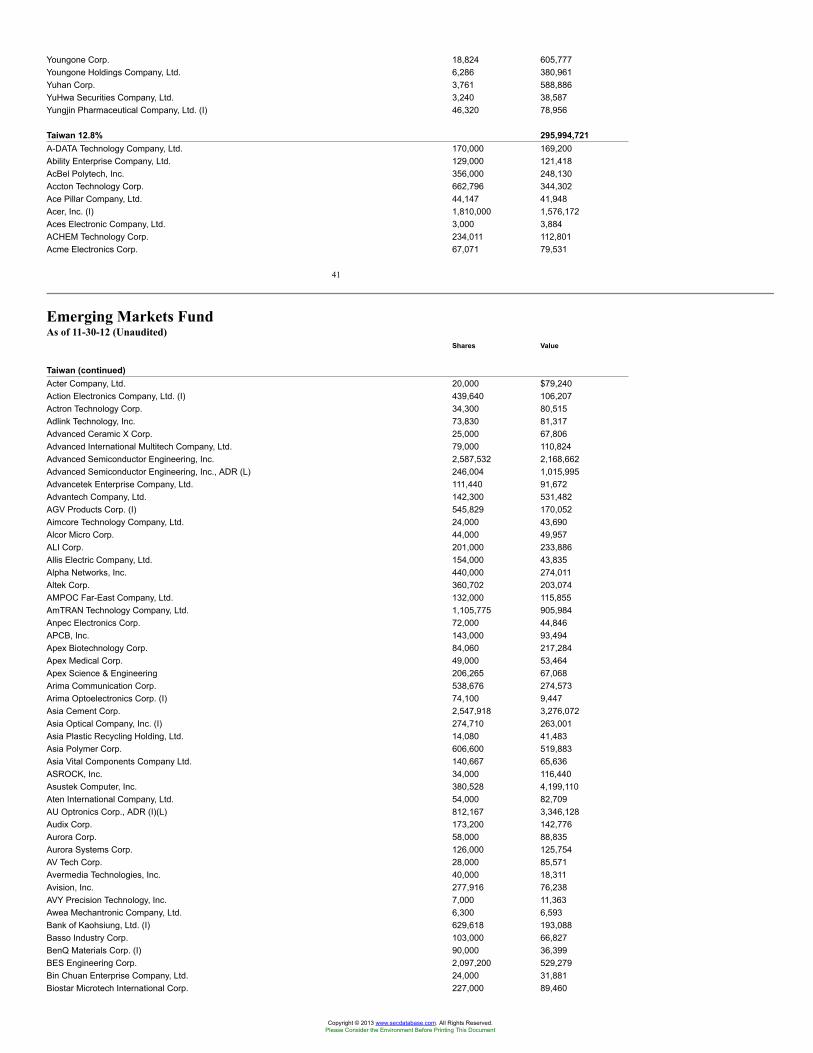
Youngone Corp. 18,824 605,777Youngone Holdings Company, Ltd. 6,286 380,961Yuhan Corp. 3,761 588,886YuHwa Securities Company, Ltd. 3,240 38,587Yungjin Pharmaceutical Company, Ltd. (I) 46,320 78,956
Taiwan 12.8% 295,994,721A-DATA Technology Company, Ltd. 170,000 169,200Ability Enterprise Company, Ltd. 129,000 121,418AcBel Polytech, Inc. 356,000 248,130Accton Technology Corp. 662,796 344,302Ace Pillar Company, Ltd. 44,147 41,948Acer, Inc. (I) 1,810,000 1,576,172Aces Electronic Company, Ltd. 3,000 3,884ACHEM Technology Corp. 234,011 112,801Acme Electronics Corp. 67,071 79,531
41
Emerging Markets FundAs of 11-30-12 (Unaudited)
Shares Value
Taiwan (continued)Acter Company, Ltd. 20,000 $79,240Action Electronics Company, Ltd. (I) 439,640 106,207Actron Technology Corp. 34,300 80,515Adlink Technology, Inc. 73,830 81,317Advanced Ceramic X Corp. 25,000 67,806Advanced International Multitech Company, Ltd. 79,000 110,824Advanced Semiconductor Engineering, Inc. 2,587,532 2,168,662Advanced Semiconductor Engineering, Inc., ADR (L) 246,004 1,015,995Advancetek Enterprise Company, Ltd. 111,440 91,672Advantech Company, Ltd. 142,300 531,482AGV Products Corp. (I) 545,829 170,052Aimcore Technology Company, Ltd. 24,000 43,690Alcor Micro Corp. 44,000 49,957ALI Corp. 201,000 233,886Allis Electric Company, Ltd. 154,000 43,835Alpha Networks, Inc. 440,000 274,011Altek Corp. 360,702 203,074AMPOC Far-East Company, Ltd. 132,000 115,855AmTRAN Technology Company, Ltd. 1,105,775 905,984Anpec Electronics Corp. 72,000 44,846APCB, Inc. 143,000 93,494Apex Biotechnology Corp. 84,060 217,284Apex Medical Corp. 49,000 53,464Apex Science & Engineering 206,265 67,068Arima Communication Corp. 538,676 274,573Arima Optoelectronics Corp. (I) 74,100 9,447Asia Cement Corp. 2,547,918 3,276,072Asia Optical Company, Inc. (I) 274,710 263,001Asia Plastic Recycling Holding, Ltd. 14,080 41,483Asia Polymer Corp. 606,600 519,883Asia Vital Components Company Ltd. 140,667 65,636ASROCK, Inc. 34,000 116,440Asustek Computer, Inc. 380,528 4,199,110Aten International Company, Ltd. 54,000 82,709AU Optronics Corp., ADR (I)(L) 812,167 3,346,128Audix Corp. 173,200 142,776Aurora Corp. 58,000 88,835Aurora Systems Corp. 126,000 125,754AV Tech Corp. 28,000 85,571Avermedia Technologies, Inc. 40,000 18,311Avision, Inc. 277,916 76,238AVY Precision Technology, Inc. 7,000 11,363Awea Mechantronic Company, Ltd. 6,300 6,593Bank of Kaohsiung, Ltd. (I) 629,618 193,088Basso Industry Corp. 103,000 66,827BenQ Materials Corp. (I) 90,000 36,399BES Engineering Corp. 2,097,200 529,279Bin Chuan Enterprise Company, Ltd. 24,000 31,881Biostar Microtech International Corp. 227,000 89,460
Copyright © 2013 www.secdatabase.com. All Rights Reserved.Please Consider the Environment Before Printing This Document
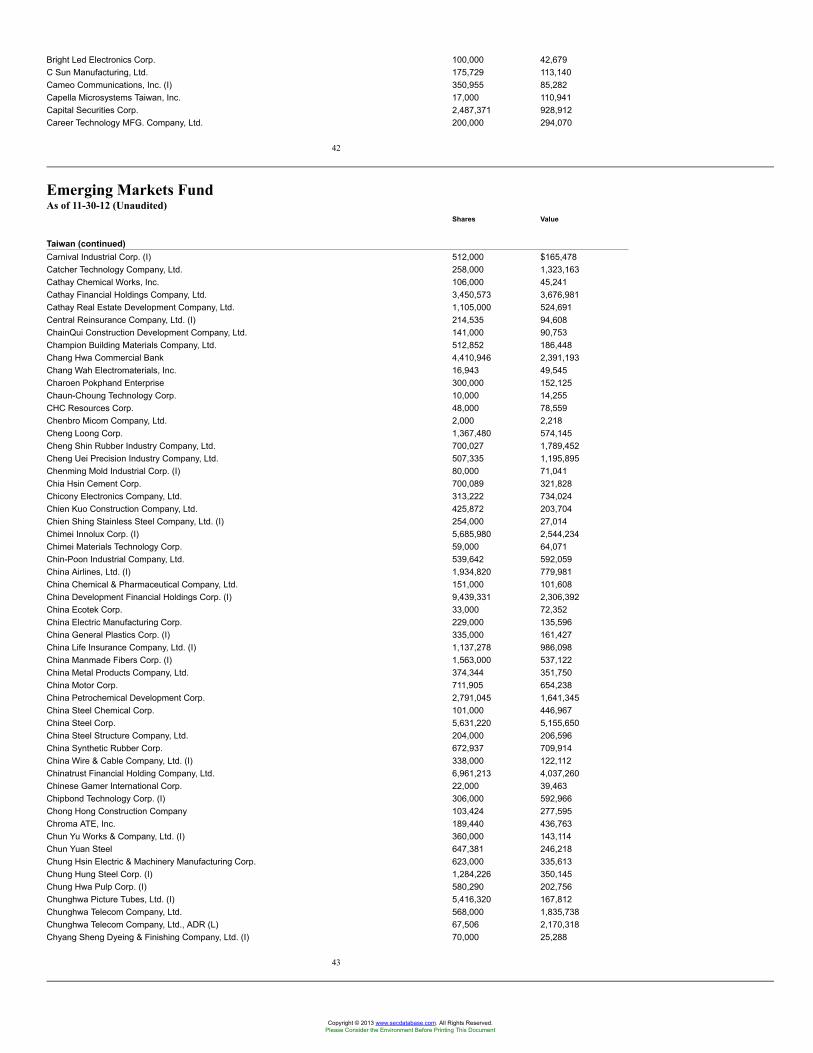
Bright Led Electronics Corp. 100,000 42,679C Sun Manufacturing, Ltd. 175,729 113,140Cameo Communications, Inc. (I) 350,955 85,282Capella Microsystems Taiwan, Inc. 17,000 110,941Capital Securities Corp. 2,487,371 928,912Career Technology MFG. Company, Ltd. 200,000 294,070
42
Emerging Markets FundAs of 11-30-12 (Unaudited)
Shares Value
Taiwan (continued)Carnival Industrial Corp. (I) 512,000 $165,478Catcher Technology Company, Ltd. 258,000 1,323,163Cathay Chemical Works, Inc. 106,000 45,241Cathay Financial Holdings Company, Ltd. 3,450,573 3,676,981Cathay Real Estate Development Company, Ltd. 1,105,000 524,691Central Reinsurance Company, Ltd. (I) 214,535 94,608ChainQui Construction Development Company, Ltd. 141,000 90,753Champion Building Materials Company, Ltd. 512,852 186,448Chang Hwa Commercial Bank 4,410,946 2,391,193Chang Wah Electromaterials, Inc. 16,943 49,545Charoen Pokphand Enterprise 300,000 152,125Chaun-Choung Technology Corp. 10,000 14,255CHC Resources Corp. 48,000 78,559Chenbro Micom Company, Ltd. 2,000 2,218Cheng Loong Corp. 1,367,480 574,145Cheng Shin Rubber Industry Company, Ltd. 700,027 1,789,452Cheng Uei Precision Industry Company, Ltd. 507,335 1,195,895Chenming Mold Industrial Corp. (I) 80,000 71,041Chia Hsin Cement Corp. 700,089 321,828Chicony Electronics Company, Ltd. 313,222 734,024Chien Kuo Construction Company, Ltd. 425,872 203,704Chien Shing Stainless Steel Company, Ltd. (I) 254,000 27,014Chimei Innolux Corp. (I) 5,685,980 2,544,234Chimei Materials Technology Corp. 59,000 64,071Chin-Poon Industrial Company, Ltd. 539,642 592,059China Airlines, Ltd. (I) 1,934,820 779,981China Chemical & Pharmaceutical Company, Ltd. 151,000 101,608China Development Financial Holdings Corp. (I) 9,439,331 2,306,392China Ecotek Corp. 33,000 72,352China Electric Manufacturing Corp. 229,000 135,596China General Plastics Corp. (I) 335,000 161,427China Life Insurance Company, Ltd. (I) 1,137,278 986,098China Manmade Fibers Corp. (I) 1,563,000 537,122China Metal Products Company, Ltd. 374,344 351,750China Motor Corp. 711,905 654,238China Petrochemical Development Corp. 2,791,045 1,641,345China Steel Chemical Corp. 101,000 446,967China Steel Corp. 5,631,220 5,155,650China Steel Structure Company, Ltd. 204,000 206,596China Synthetic Rubber Corp. 672,937 709,914China Wire & Cable Company, Ltd. (I) 338,000 122,112Chinatrust Financial Holding Company, Ltd. 6,961,213 4,037,260Chinese Gamer International Corp. 22,000 39,463Chipbond Technology Corp. (I) 306,000 592,966Chong Hong Construction Company 103,424 277,595Chroma ATE, Inc. 189,440 436,763Chun Yu Works & Company, Ltd. (I) 360,000 143,114Chun Yuan Steel 647,381 246,218Chung Hsin Electric & Machinery Manufacturing Corp. 623,000 335,613Chung Hung Steel Corp. (I) 1,284,226 350,145Chung Hwa Pulp Corp. (I) 580,290 202,756Chunghwa Picture Tubes, Ltd. (I) 5,416,320 167,812Chunghwa Telecom Company, Ltd. 568,000 1,835,738Chunghwa Telecom Company, Ltd., ADR (L) 67,506 2,170,318Chyang Sheng Dyeing & Finishing Company, Ltd. (I) 70,000 25,288
43
Copyright © 2013 www.secdatabase.com. All Rights Reserved.Please Consider the Environment Before Printing This Document
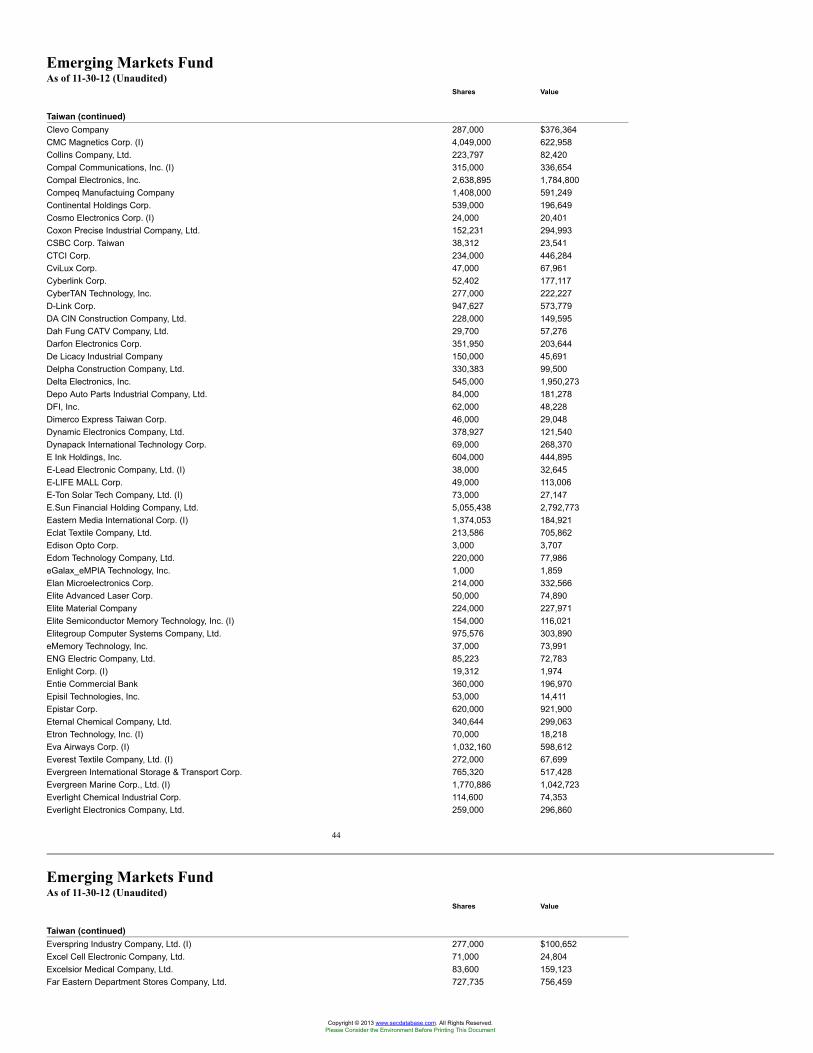
Emerging Markets FundAs of 11-30-12 (Unaudited)
Shares Value
Taiwan (continued)Clevo Company 287,000 $376,364CMC Magnetics Corp. (I) 4,049,000 622,958Collins Company, Ltd. 223,797 82,420Compal Communications, Inc. (I) 315,000 336,654Compal Electronics, Inc. 2,638,895 1,784,800Compeq Manufactuing Company 1,408,000 591,249Continental Holdings Corp. 539,000 196,649Cosmo Electronics Corp. (I) 24,000 20,401Coxon Precise Industrial Company, Ltd. 152,231 294,993CSBC Corp. Taiwan 38,312 23,541CTCI Corp. 234,000 446,284CviLux Corp. 47,000 67,961Cyberlink Corp. 52,402 177,117CyberTAN Technology, Inc. 277,000 222,227D-Link Corp. 947,627 573,779DA CIN Construction Company, Ltd. 228,000 149,595Dah Fung CATV Company, Ltd. 29,700 57,276Darfon Electronics Corp. 351,950 203,644De Licacy Industrial Company 150,000 45,691Delpha Construction Company, Ltd. 330,383 99,500Delta Electronics, Inc. 545,000 1,950,273Depo Auto Parts Industrial Company, Ltd. 84,000 181,278DFI, Inc. 62,000 48,228Dimerco Express Taiwan Corp. 46,000 29,048Dynamic Electronics Company, Ltd. 378,927 121,540Dynapack International Technology Corp. 69,000 268,370E Ink Holdings, Inc. 604,000 444,895E-Lead Electronic Company, Ltd. (I) 38,000 32,645E-LIFE MALL Corp. 49,000 113,006E-Ton Solar Tech Company, Ltd. (I) 73,000 27,147E.Sun Financial Holding Company, Ltd. 5,055,438 2,792,773Eastern Media International Corp. (I) 1,374,053 184,921Eclat Textile Company, Ltd. 213,586 705,862Edison Opto Corp. 3,000 3,707Edom Technology Company, Ltd. 220,000 77,986eGalax_eMPIA Technology, Inc. 1,000 1,859Elan Microelectronics Corp. 214,000 332,566Elite Advanced Laser Corp. 50,000 74,890Elite Material Company 224,000 227,971Elite Semiconductor Memory Technology, Inc. (I) 154,000 116,021Elitegroup Computer Systems Company, Ltd. 975,576 303,890eMemory Technology, Inc. 37,000 73,991ENG Electric Company, Ltd. 85,223 72,783Enlight Corp. (I) 19,312 1,974Entie Commercial Bank 360,000 196,970Episil Technologies, Inc. 53,000 14,411Epistar Corp. 620,000 921,900Eternal Chemical Company, Ltd. 340,644 299,063Etron Technology, Inc. (I) 70,000 18,218Eva Airways Corp. (I) 1,032,160 598,612Everest Textile Company, Ltd. (I) 272,000 67,699Evergreen International Storage & Transport Corp. 765,320 517,428Evergreen Marine Corp., Ltd. (I) 1,770,886 1,042,723Everlight Chemical Industrial Corp. 114,600 74,353Everlight Electronics Company, Ltd. 259,000 296,860
44
Emerging Markets FundAs of 11-30-12 (Unaudited)
Shares Value
Taiwan (continued)Everspring Industry Company, Ltd. (I) 277,000 $100,652Excel Cell Electronic Company, Ltd. 71,000 24,804Excelsior Medical Company, Ltd. 83,600 159,123Far Eastern Department Stores Company, Ltd. 727,735 756,459
Copyright © 2013 www.secdatabase.com. All Rights Reserved.Please Consider the Environment Before Printing This Document
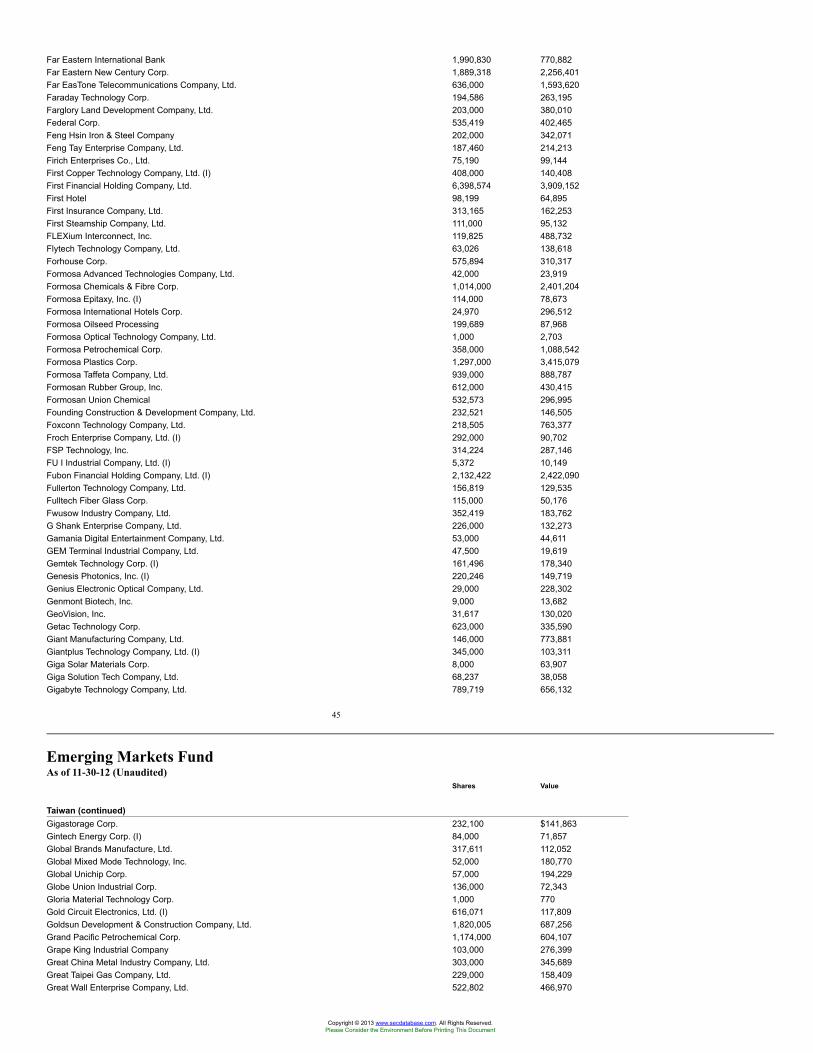
Far Eastern International Bank 1,990,830 770,882Far Eastern New Century Corp. 1,889,318 2,256,401Far EasTone Telecommunications Company, Ltd. 636,000 1,593,620Faraday Technology Corp. 194,586 263,195Farglory Land Development Company, Ltd. 203,000 380,010Federal Corp. 535,419 402,465Feng Hsin Iron & Steel Company 202,000 342,071Feng Tay Enterprise Company, Ltd. 187,460 214,213Firich Enterprises Co., Ltd. 75,190 99,144First Copper Technology Company, Ltd. (I) 408,000 140,408First Financial Holding Company, Ltd. 6,398,574 3,909,152First Hotel 98,199 64,895First Insurance Company, Ltd. 313,165 162,253First Steamship Company, Ltd. 111,000 95,132FLEXium Interconnect, Inc. 119,825 488,732Flytech Technology Company, Ltd. 63,026 138,618Forhouse Corp. 575,894 310,317Formosa Advanced Technologies Company, Ltd. 42,000 23,919Formosa Chemicals & Fibre Corp. 1,014,000 2,401,204Formosa Epitaxy, Inc. (I) 114,000 78,673Formosa International Hotels Corp. 24,970 296,512Formosa Oilseed Processing 199,689 87,968Formosa Optical Technology Company, Ltd. 1,000 2,703Formosa Petrochemical Corp. 358,000 1,088,542Formosa Plastics Corp. 1,297,000 3,415,079Formosa Taffeta Company, Ltd. 939,000 888,787Formosan Rubber Group, Inc. 612,000 430,415Formosan Union Chemical 532,573 296,995Founding Construction & Development Company, Ltd. 232,521 146,505Foxconn Technology Company, Ltd. 218,505 763,377Froch Enterprise Company, Ltd. (I) 292,000 90,702FSP Technology, Inc. 314,224 287,146FU I Industrial Company, Ltd. (I) 5,372 10,149Fubon Financial Holding Company, Ltd. (I) 2,132,422 2,422,090Fullerton Technology Company, Ltd. 156,819 129,535Fulltech Fiber Glass Corp. 115,000 50,176Fwusow Industry Company, Ltd. 352,419 183,762G Shank Enterprise Company, Ltd. 226,000 132,273Gamania Digital Entertainment Company, Ltd. 53,000 44,611GEM Terminal Industrial Company, Ltd. 47,500 19,619Gemtek Technology Corp. (I) 161,496 178,340Genesis Photonics, Inc. (I) 220,246 149,719Genius Electronic Optical Company, Ltd. 29,000 228,302Genmont Biotech, Inc. 9,000 13,682GeoVision, Inc. 31,617 130,020Getac Technology Corp. 623,000 335,590Giant Manufacturing Company, Ltd. 146,000 773,881Giantplus Technology Company, Ltd. (I) 345,000 103,311Giga Solar Materials Corp. 8,000 63,907Giga Solution Tech Company, Ltd. 68,237 38,058Gigabyte Technology Company, Ltd. 789,719 656,132
45
Emerging Markets FundAs of 11-30-12 (Unaudited)
Shares Value
Taiwan (continued)Gigastorage Corp. 232,100 $141,863Gintech Energy Corp. (I) 84,000 71,857Global Brands Manufacture, Ltd. 317,611 112,052Global Mixed Mode Technology, Inc. 52,000 180,770Global Unichip Corp. 57,000 194,229Globe Union Industrial Corp. 136,000 72,343Gloria Material Technology Corp. 1,000 770Gold Circuit Electronics, Ltd. (I) 616,071 117,809Goldsun Development & Construction Company, Ltd. 1,820,005 687,256Grand Pacific Petrochemical Corp. 1,174,000 604,107Grape King Industrial Company 103,000 276,399Great China Metal Industry Company, Ltd. 303,000 345,689Great Taipei Gas Company, Ltd. 229,000 158,409Great Wall Enterprise Company, Ltd. 522,802 466,970
Copyright © 2013 www.secdatabase.com. All Rights Reserved.Please Consider the Environment Before Printing This Document
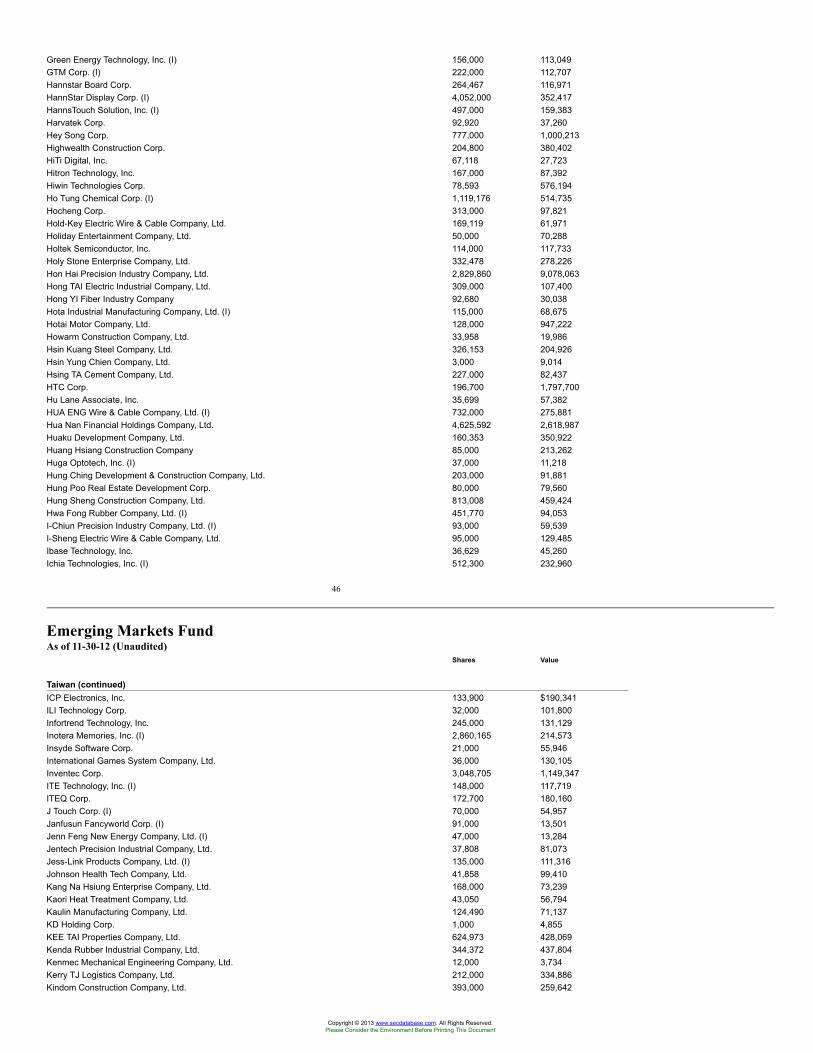
Green Energy Technology, Inc. (I) 156,000 113,049GTM Corp. (I) 222,000 112,707Hannstar Board Corp. 264,467 116,971HannStar Display Corp. (I) 4,052,000 352,417HannsTouch Solution, Inc. (I) 497,000 159,383Harvatek Corp. 92,920 37,260Hey Song Corp. 777,000 1,000,213Highwealth Construction Corp. 204,800 380,402HiTi Digital, Inc. 67,118 27,723Hitron Technology, Inc. 167,000 87,392Hiwin Technologies Corp. 78,593 576,194Ho Tung Chemical Corp. (I) 1,119,176 514,735Hocheng Corp. 313,000 97,821Hold-Key Electric Wire & Cable Company, Ltd. 169,119 61,971Holiday Entertainment Company, Ltd. 50,000 70,288Holtek Semiconductor, Inc. 114,000 117,733Holy Stone Enterprise Company, Ltd. 332,478 278,226Hon Hai Precision Industry Company, Ltd. 2,829,860 9,078,063Hong TAI Electric Industrial Company, Ltd. 309,000 107,400Hong YI Fiber Industry Company 92,680 30,038Hota Industrial Manufacturing Company, Ltd. (I) 115,000 68,675Hotai Motor Company, Ltd. 128,000 947,222Howarm Construction Company, Ltd. 33,958 19,986Hsin Kuang Steel Company, Ltd. 326,153 204,926Hsin Yung Chien Company, Ltd. 3,000 9,014Hsing TA Cement Company, Ltd. 227,000 82,437HTC Corp. 196,700 1,797,700Hu Lane Associate, Inc. 35,699 57,382HUA ENG Wire & Cable Company, Ltd. (I) 732,000 275,881Hua Nan Financial Holdings Company, Ltd. 4,625,592 2,618,987Huaku Development Company, Ltd. 160,353 350,922Huang Hsiang Construction Company 85,000 213,262Huga Optotech, Inc. (I) 37,000 11,218Hung Ching Development & Construction Company, Ltd. 203,000 91,881Hung Poo Real Estate Development Corp. 80,000 79,560Hung Sheng Construction Company, Ltd. 813,008 459,424Hwa Fong Rubber Company, Ltd. (I) 451,770 94,053I-Chiun Precision Industry Company, Ltd. (I) 93,000 59,539I-Sheng Electric Wire & Cable Company, Ltd. 95,000 129,485Ibase Technology, Inc. 36,629 45,260Ichia Technologies, Inc. (I) 512,300 232,960
46
Emerging Markets FundAs of 11-30-12 (Unaudited)
Shares Value
Taiwan (continued)ICP Electronics, Inc. 133,900 $190,341ILI Technology Corp. 32,000 101,800Infortrend Technology, Inc. 245,000 131,129Inotera Memories, Inc. (I) 2,860,165 214,573Insyde Software Corp. 21,000 55,946International Games System Company, Ltd. 36,000 130,105Inventec Corp. 3,048,705 1,149,347ITE Technology, Inc. (I) 148,000 117,719ITEQ Corp. 172,700 180,160J Touch Corp. (I) 70,000 54,957Janfusun Fancyworld Corp. (I) 91,000 13,501Jenn Feng New Energy Company, Ltd. (I) 47,000 13,284Jentech Precision Industrial Company, Ltd. 37,808 81,073Jess-Link Products Company, Ltd. (I) 135,000 111,316Johnson Health Tech Company, Ltd. 41,858 99,410Kang Na Hsiung Enterprise Company, Ltd. 168,000 73,239Kaori Heat Treatment Company, Ltd. 43,050 56,794Kaulin Manufacturing Company, Ltd. 124,490 71,137KD Holding Corp. 1,000 4,855KEE TAI Properties Company, Ltd. 624,973 428,069Kenda Rubber Industrial Company, Ltd. 344,372 437,804Kenmec Mechanical Engineering Company, Ltd. 12,000 3,734Kerry TJ Logistics Company, Ltd. 212,000 334,886Kindom Construction Company, Ltd. 393,000 259,642
Copyright © 2013 www.secdatabase.com. All Rights Reserved.Please Consider the Environment Before Printing This Document
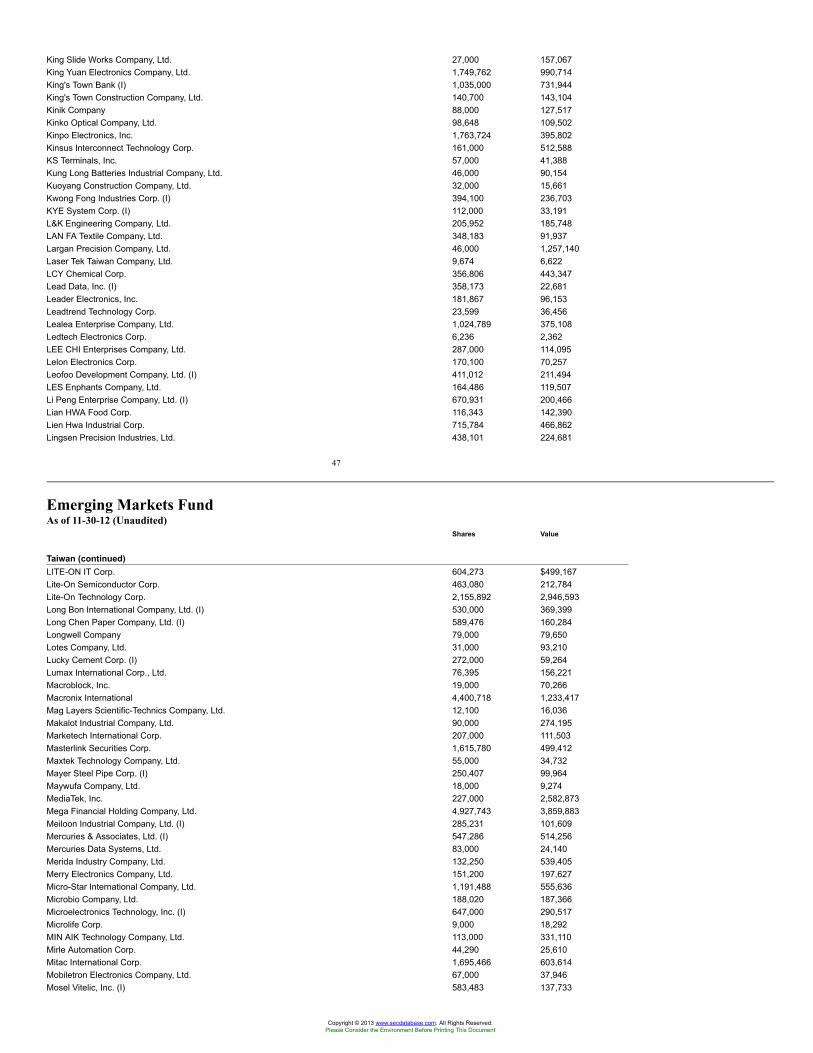
King Slide Works Company, Ltd. 27,000 157,067King Yuan Electronics Company, Ltd. 1,749,762 990,714King's Town Bank (I) 1,035,000 731,944King's Town Construction Company, Ltd. 140,700 143,104Kinik Company 88,000 127,517Kinko Optical Company, Ltd. 98,648 109,502Kinpo Electronics, Inc. 1,763,724 395,802Kinsus Interconnect Technology Corp. 161,000 512,588KS Terminals, Inc. 57,000 41,388Kung Long Batteries Industrial Company, Ltd. 46,000 90,154Kuoyang Construction Company, Ltd. 32,000 15,661Kwong Fong Industries Corp. (I) 394,100 236,703KYE System Corp. (I) 112,000 33,191L&K Engineering Company, Ltd. 205,952 185,748LAN FA Textile Company, Ltd. 348,183 91,937Largan Precision Company, Ltd. 46,000 1,257,140Laser Tek Taiwan Company, Ltd. 9,674 6,622LCY Chemical Corp. 356,806 443,347Lead Data, Inc. (I) 358,173 22,681Leader Electronics, Inc. 181,867 96,153Leadtrend Technology Corp. 23,599 36,456Lealea Enterprise Company, Ltd. 1,024,789 375,108Ledtech Electronics Corp. 6,236 2,362LEE CHI Enterprises Company, Ltd. 287,000 114,095Lelon Electronics Corp. 170,100 70,257Leofoo Development Company, Ltd. (I) 411,012 211,494LES Enphants Company, Ltd. 164,486 119,507Li Peng Enterprise Company, Ltd. (I) 670,931 200,466Lian HWA Food Corp. 116,343 142,390Lien Hwa Industrial Corp. 715,784 466,862Lingsen Precision Industries, Ltd. 438,101 224,681
47
Emerging Markets FundAs of 11-30-12 (Unaudited)
Shares Value
Taiwan (continued)LITE-ON IT Corp. 604,273 $499,167Lite-On Semiconductor Corp. 463,080 212,784Lite-On Technology Corp. 2,155,892 2,946,593Long Bon International Company, Ltd. (I) 530,000 369,399Long Chen Paper Company, Ltd. (I) 589,476 160,284Longwell Company 79,000 79,650Lotes Company, Ltd. 31,000 93,210Lucky Cement Corp. (I) 272,000 59,264Lumax International Corp., Ltd. 76,395 156,221Macroblock, Inc. 19,000 70,266Macronix International 4,400,718 1,233,417Mag Layers Scientific-Technics Company, Ltd. 12,100 16,036Makalot Industrial Company, Ltd. 90,000 274,195Marketech International Corp. 207,000 111,503Masterlink Securities Corp. 1,615,780 499,412Maxtek Technology Company, Ltd. 55,000 34,732Mayer Steel Pipe Corp. (I) 250,407 99,964Maywufa Company, Ltd. 18,000 9,274MediaTek, Inc. 227,000 2,582,873Mega Financial Holding Company, Ltd. 4,927,743 3,859,883Meiloon Industrial Company, Ltd. (I) 285,231 101,609Mercuries & Associates, Ltd. (I) 547,286 514,256Mercuries Data Systems, Ltd. 83,000 24,140Merida Industry Company, Ltd. 132,250 539,405Merry Electronics Company, Ltd. 151,200 197,627Micro-Star International Company, Ltd. 1,191,488 555,636Microbio Company, Ltd. 188,020 187,366Microelectronics Technology, Inc. (I) 647,000 290,517Microlife Corp. 9,000 18,292MIN AIK Technology Company, Ltd. 113,000 331,110Mirle Automation Corp. 44,290 25,610Mitac International Corp. 1,695,466 603,614Mobiletron Electronics Company, Ltd. 67,000 37,946Mosel Vitelic, Inc. (I) 583,483 137,733
Copyright © 2013 www.secdatabase.com. All Rights Reserved.Please Consider the Environment Before Printing This Document
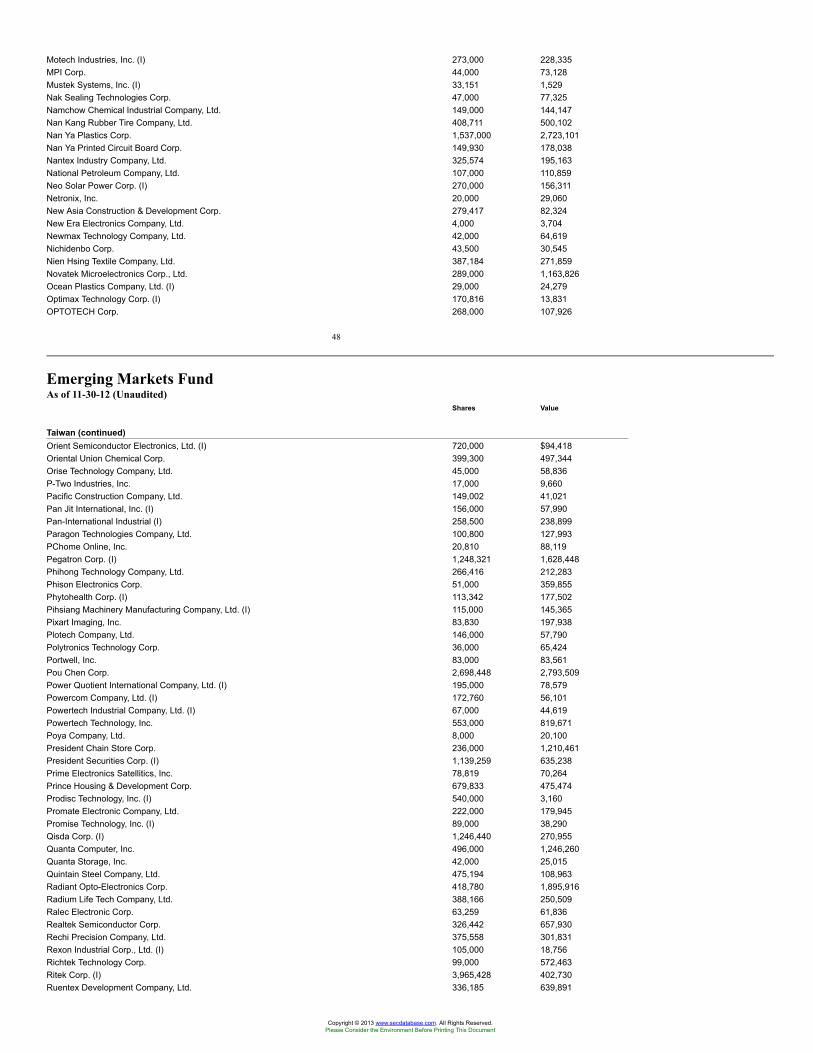
Motech Industries, Inc. (I) 273,000 228,335MPI Corp. 44,000 73,128Mustek Systems, Inc. (I) 33,151 1,529Nak Sealing Technologies Corp. 47,000 77,325Namchow Chemical Industrial Company, Ltd. 149,000 144,147Nan Kang Rubber Tire Company, Ltd. 408,711 500,102Nan Ya Plastics Corp. 1,537,000 2,723,101Nan Ya Printed Circuit Board Corp. 149,930 178,038Nantex Industry Company, Ltd. 325,574 195,163National Petroleum Company, Ltd. 107,000 110,859Neo Solar Power Corp. (I) 270,000 156,311Netronix, Inc. 20,000 29,060New Asia Construction & Development Corp. 279,417 82,324New Era Electronics Company, Ltd. 4,000 3,704Newmax Technology Company, Ltd. 42,000 64,619Nichidenbo Corp. 43,500 30,545Nien Hsing Textile Company, Ltd. 387,184 271,859Novatek Microelectronics Corp., Ltd. 289,000 1,163,826Ocean Plastics Company, Ltd. (I) 29,000 24,279Optimax Technology Corp. (I) 170,816 13,831OPTOTECH Corp. 268,000 107,926
48
Emerging Markets FundAs of 11-30-12 (Unaudited)
Shares Value
Taiwan (continued)Orient Semiconductor Electronics, Ltd. (I) 720,000 $94,418Oriental Union Chemical Corp. 399,300 497,344Orise Technology Company, Ltd. 45,000 58,836P-Two Industries, Inc. 17,000 9,660Pacific Construction Company, Ltd. 149,002 41,021Pan Jit International, Inc. (I) 156,000 57,990Pan-International Industrial (I) 258,500 238,899Paragon Technologies Company, Ltd. 100,800 127,993PChome Online, Inc. 20,810 88,119Pegatron Corp. (I) 1,248,321 1,628,448Phihong Technology Company, Ltd. 266,416 212,283Phison Electronics Corp. 51,000 359,855Phytohealth Corp. (I) 113,342 177,502Pihsiang Machinery Manufacturing Company, Ltd. (I) 115,000 145,365Pixart Imaging, Inc. 83,830 197,938Plotech Company, Ltd. 146,000 57,790Polytronics Technology Corp. 36,000 65,424Portwell, Inc. 83,000 83,561Pou Chen Corp. 2,698,448 2,793,509Power Quotient International Company, Ltd. (I) 195,000 78,579Powercom Company, Ltd. (I) 172,760 56,101Powertech Industrial Company, Ltd. (I) 67,000 44,619Powertech Technology, Inc. 553,000 819,671Poya Company, Ltd. 8,000 20,100President Chain Store Corp. 236,000 1,210,461President Securities Corp. (I) 1,139,259 635,238Prime Electronics Satellitics, Inc. 78,819 70,264Prince Housing & Development Corp. 679,833 475,474Prodisc Technology, Inc. (I) 540,000 3,160Promate Electronic Company, Ltd. 222,000 179,945Promise Technology, Inc. (I) 89,000 38,290Qisda Corp. (I) 1,246,440 270,955Quanta Computer, Inc. 496,000 1,246,260Quanta Storage, Inc. 42,000 25,015Quintain Steel Company, Ltd. 475,194 108,963Radiant Opto-Electronics Corp. 418,780 1,895,916Radium Life Tech Company, Ltd. 388,166 250,509Ralec Electronic Corp. 63,259 61,836Realtek Semiconductor Corp. 326,442 657,930Rechi Precision Company, Ltd. 375,558 301,831Rexon Industrial Corp., Ltd. (I) 105,000 18,756Richtek Technology Corp. 99,000 572,463Ritek Corp. (I) 3,965,428 402,730Ruentex Development Company, Ltd. 336,185 639,891
Copyright © 2013 www.secdatabase.com. All Rights Reserved.Please Consider the Environment Before Printing This Document
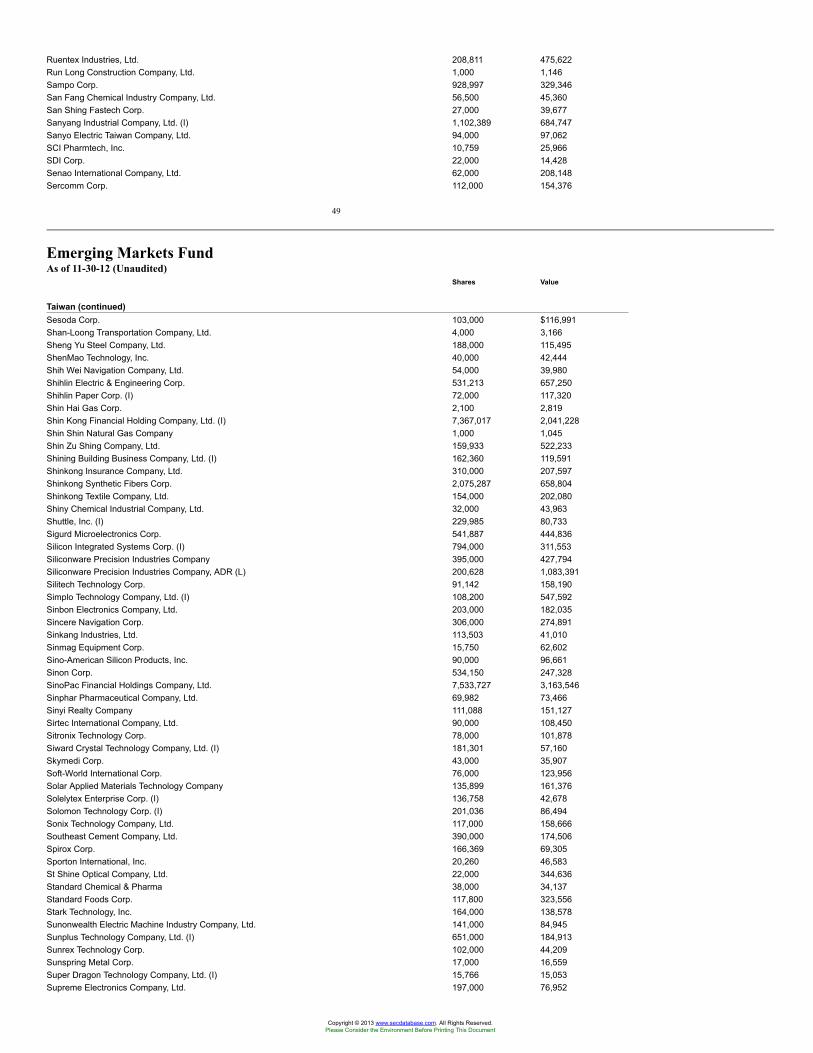
Ruentex Industries, Ltd. 208,811 475,622Run Long Construction Company, Ltd. 1,000 1,146Sampo Corp. 928,997 329,346San Fang Chemical Industry Company, Ltd. 56,500 45,360San Shing Fastech Corp. 27,000 39,677Sanyang Industrial Company, Ltd. (I) 1,102,389 684,747Sanyo Electric Taiwan Company, Ltd. 94,000 97,062SCI Pharmtech, Inc. 10,759 25,966SDI Corp. 22,000 14,428Senao International Company, Ltd. 62,000 208,148Sercomm Corp. 112,000 154,376
49
Emerging Markets FundAs of 11-30-12 (Unaudited)
Shares Value
Taiwan (continued)Sesoda Corp. 103,000 $116,991Shan-Loong Transportation Company, Ltd. 4,000 3,166Sheng Yu Steel Company, Ltd. 188,000 115,495ShenMao Technology, Inc. 40,000 42,444Shih Wei Navigation Company, Ltd. 54,000 39,980Shihlin Electric & Engineering Corp. 531,213 657,250Shihlin Paper Corp. (I) 72,000 117,320Shin Hai Gas Corp. 2,100 2,819Shin Kong Financial Holding Company, Ltd. (I) 7,367,017 2,041,228Shin Shin Natural Gas Company 1,000 1,045Shin Zu Shing Company, Ltd. 159,933 522,233Shining Building Business Company, Ltd. (I) 162,360 119,591Shinkong Insurance Company, Ltd. 310,000 207,597Shinkong Synthetic Fibers Corp. 2,075,287 658,804Shinkong Textile Company, Ltd. 154,000 202,080Shiny Chemical Industrial Company, Ltd. 32,000 43,963Shuttle, Inc. (I) 229,985 80,733Sigurd Microelectronics Corp. 541,887 444,836Silicon Integrated Systems Corp. (I) 794,000 311,553Siliconware Precision Industries Company 395,000 427,794Siliconware Precision Industries Company, ADR (L) 200,628 1,083,391Silitech Technology Corp. 91,142 158,190Simplo Technology Company, Ltd. (I) 108,200 547,592Sinbon Electronics Company, Ltd. 203,000 182,035Sincere Navigation Corp. 306,000 274,891Sinkang Industries, Ltd. 113,503 41,010Sinmag Equipment Corp. 15,750 62,602Sino-American Silicon Products, Inc. 90,000 96,661Sinon Corp. 534,150 247,328SinoPac Financial Holdings Company, Ltd. 7,533,727 3,163,546Sinphar Pharmaceutical Company, Ltd. 69,982 73,466Sinyi Realty Company 111,088 151,127Sirtec International Company, Ltd. 90,000 108,450Sitronix Technology Corp. 78,000 101,878Siward Crystal Technology Company, Ltd. (I) 181,301 57,160Skymedi Corp. 43,000 35,907Soft-World International Corp. 76,000 123,956Solar Applied Materials Technology Company 135,899 161,376Solelytex Enterprise Corp. (I) 136,758 42,678Solomon Technology Corp. (I) 201,036 86,494Sonix Technology Company, Ltd. 117,000 158,666Southeast Cement Company, Ltd. 390,000 174,506Spirox Corp. 166,369 69,305Sporton International, Inc. 20,260 46,583St Shine Optical Company, Ltd. 22,000 344,636Standard Chemical & Pharma 38,000 34,137Standard Foods Corp. 117,800 323,556Stark Technology, Inc. 164,000 138,578Sunonwealth Electric Machine Industry Company, Ltd. 141,000 84,945Sunplus Technology Company, Ltd. (I) 651,000 184,913Sunrex Technology Corp. 102,000 44,209Sunspring Metal Corp. 17,000 16,559Super Dragon Technology Company, Ltd. (I) 15,766 15,053Supreme Electronics Company, Ltd. 197,000 76,952
Copyright © 2013 www.secdatabase.com. All Rights Reserved.Please Consider the Environment Before Printing This Document
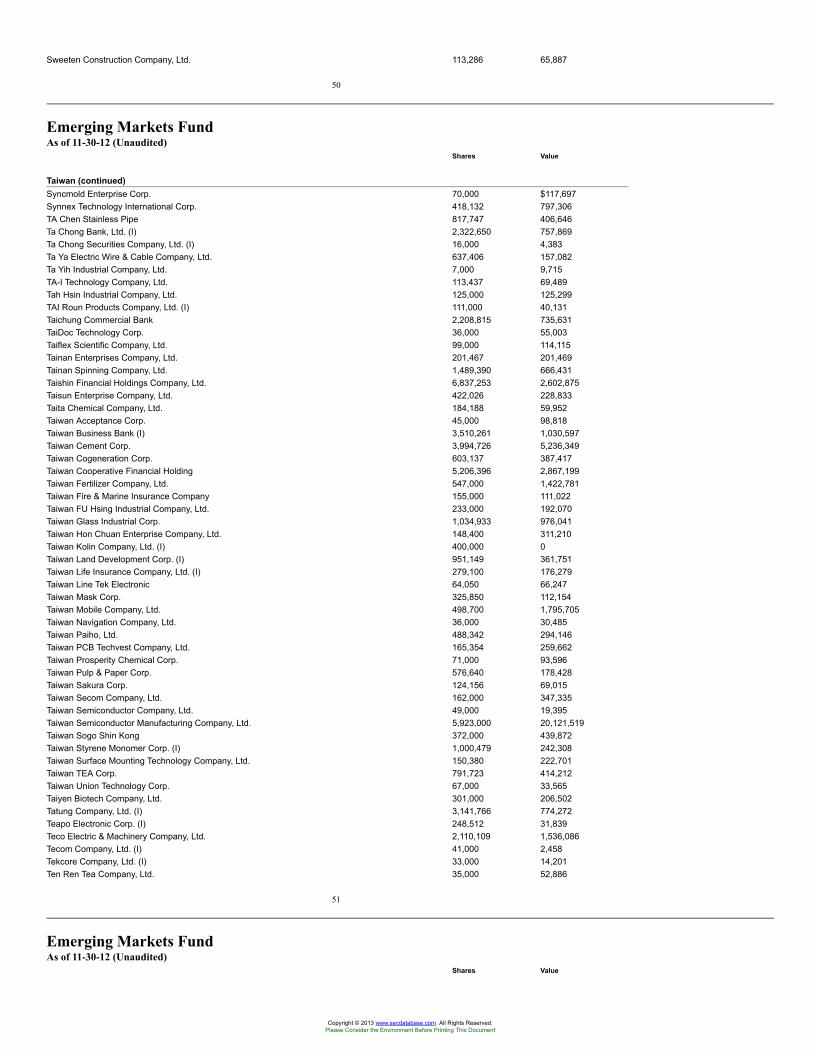
Sweeten Construction Company, Ltd. 113,286 65,887
50
Emerging Markets FundAs of 11-30-12 (Unaudited)
Shares Value
Taiwan (continued)Syncmold Enterprise Corp. 70,000 $117,697Synnex Technology International Corp. 418,132 797,306TA Chen Stainless Pipe 817,747 406,646Ta Chong Bank, Ltd. (I) 2,322,650 757,869Ta Chong Securities Company, Ltd. (I) 16,000 4,383Ta Ya Electric Wire & Cable Company, Ltd. 637,406 157,082Ta Yih Industrial Company, Ltd. 7,000 9,715TA-I Technology Company, Ltd. 113,437 69,489Tah Hsin Industrial Company, Ltd. 125,000 125,299TAI Roun Products Company, Ltd. (I) 111,000 40,131Taichung Commercial Bank 2,208,815 735,631TaiDoc Technology Corp. 36,000 55,003Taiflex Scientific Company, Ltd. 99,000 114,115Tainan Enterprises Company, Ltd. 201,467 201,469Tainan Spinning Company, Ltd. 1,489,390 666,431Taishin Financial Holdings Company, Ltd. 6,837,253 2,602,875Taisun Enterprise Company, Ltd. 422,026 228,833Taita Chemical Company, Ltd. 184,188 59,952Taiwan Acceptance Corp. 45,000 98,818Taiwan Business Bank (I) 3,510,261 1,030,597Taiwan Cement Corp. 3,994,726 5,236,349Taiwan Cogeneration Corp. 603,137 387,417Taiwan Cooperative Financial Holding 5,206,396 2,867,199Taiwan Fertilizer Company, Ltd. 547,000 1,422,781Taiwan Fire & Marine Insurance Company 155,000 111,022Taiwan FU Hsing Industrial Company, Ltd. 233,000 192,070Taiwan Glass Industrial Corp. 1,034,933 976,041Taiwan Hon Chuan Enterprise Company, Ltd. 148,400 311,210Taiwan Kolin Company, Ltd. (I) 400,000 0Taiwan Land Development Corp. (I) 951,149 361,751Taiwan Life Insurance Company, Ltd. (I) 279,100 176,279Taiwan Line Tek Electronic 64,050 66,247Taiwan Mask Corp. 325,850 112,154Taiwan Mobile Company, Ltd. 498,700 1,795,705Taiwan Navigation Company, Ltd. 36,000 30,485Taiwan Paiho, Ltd. 488,342 294,146Taiwan PCB Techvest Company, Ltd. 165,354 259,662Taiwan Prosperity Chemical Corp. 71,000 93,596Taiwan Pulp & Paper Corp. 576,640 178,428Taiwan Sakura Corp. 124,156 69,015Taiwan Secom Company, Ltd. 162,000 347,335Taiwan Semiconductor Company, Ltd. 49,000 19,395Taiwan Semiconductor Manufacturing Company, Ltd. 5,923,000 20,121,519Taiwan Sogo Shin Kong 372,000 439,872Taiwan Styrene Monomer Corp. (I) 1,000,479 242,308Taiwan Surface Mounting Technology Company, Ltd. 150,380 222,701Taiwan TEA Corp. 791,723 414,212Taiwan Union Technology Corp. 67,000 33,565Taiyen Biotech Company, Ltd. 301,000 206,502Tatung Company, Ltd. (I) 3,141,766 774,272Teapo Electronic Corp. (I) 248,512 31,839Teco Electric & Machinery Company, Ltd. 2,110,109 1,536,086Tecom Company, Ltd. (I) 41,000 2,458Tekcore Company, Ltd. (I) 33,000 14,201Ten Ren Tea Company, Ltd. 35,000 52,886
51
Emerging Markets FundAs of 11-30-12 (Unaudited)
Shares Value
Copyright © 2013 www.secdatabase.com. All Rights Reserved.Please Consider the Environment Before Printing This Document
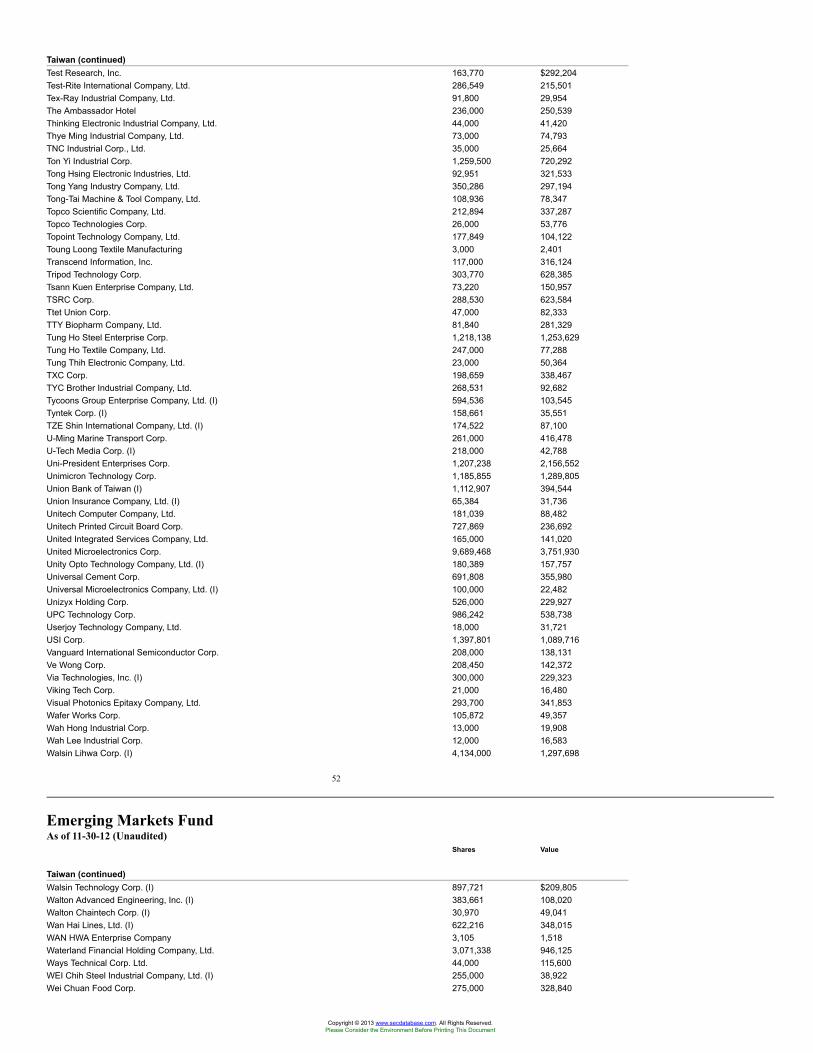
Taiwan (continued)Test Research, Inc. 163,770 $292,204Test-Rite International Company, Ltd. 286,549 215,501Tex-Ray Industrial Company, Ltd. 91,800 29,954The Ambassador Hotel 236,000 250,539Thinking Electronic Industrial Company, Ltd. 44,000 41,420Thye Ming Industrial Company, Ltd. 73,000 74,793TNC Industrial Corp., Ltd. 35,000 25,664Ton Yi Industrial Corp. 1,259,500 720,292Tong Hsing Electronic Industries, Ltd. 92,951 321,533Tong Yang Industry Company, Ltd. 350,286 297,194Tong-Tai Machine & Tool Company, Ltd. 108,936 78,347Topco Scientific Company, Ltd. 212,894 337,287Topco Technologies Corp. 26,000 53,776Topoint Technology Company, Ltd. 177,849 104,122Toung Loong Textile Manufacturing 3,000 2,401Transcend Information, Inc. 117,000 316,124Tripod Technology Corp. 303,770 628,385Tsann Kuen Enterprise Company, Ltd. 73,220 150,957TSRC Corp. 288,530 623,584Ttet Union Corp. 47,000 82,333TTY Biopharm Company, Ltd. 81,840 281,329Tung Ho Steel Enterprise Corp. 1,218,138 1,253,629Tung Ho Textile Company, Ltd. 247,000 77,288Tung Thih Electronic Company, Ltd. 23,000 50,364TXC Corp. 198,659 338,467TYC Brother Industrial Company, Ltd. 268,531 92,682Tycoons Group Enterprise Company, Ltd. (I) 594,536 103,545Tyntek Corp. (I) 158,661 35,551TZE Shin International Company, Ltd. (I) 174,522 87,100U-Ming Marine Transport Corp. 261,000 416,478U-Tech Media Corp. (I) 218,000 42,788Uni-President Enterprises Corp. 1,207,238 2,156,552Unimicron Technology Corp. 1,185,855 1,289,805Union Bank of Taiwan (I) 1,112,907 394,544Union Insurance Company, Ltd. (I) 65,384 31,736Unitech Computer Company, Ltd. 181,039 88,482Unitech Printed Circuit Board Corp. 727,869 236,692United Integrated Services Company, Ltd. 165,000 141,020United Microelectronics Corp. 9,689,468 3,751,930Unity Opto Technology Company, Ltd. (I) 180,389 157,757Universal Cement Corp. 691,808 355,980Universal Microelectronics Company, Ltd. (I) 100,000 22,482Unizyx Holding Corp. 526,000 229,927UPC Technology Corp. 986,242 538,738Userjoy Technology Company, Ltd. 18,000 31,721USI Corp. 1,397,801 1,089,716Vanguard International Semiconductor Corp. 208,000 138,131Ve Wong Corp. 208,450 142,372Via Technologies, Inc. (I) 300,000 229,323Viking Tech Corp. 21,000 16,480Visual Photonics Epitaxy Company, Ltd. 293,700 341,853Wafer Works Corp. 105,872 49,357Wah Hong Industrial Corp. 13,000 19,908Wah Lee Industrial Corp. 12,000 16,583Walsin Lihwa Corp. (I) 4,134,000 1,297,698
52
Emerging Markets FundAs of 11-30-12 (Unaudited)
Shares Value
Taiwan (continued)Walsin Technology Corp. (I) 897,721 $209,805Walton Advanced Engineering, Inc. (I) 383,661 108,020Walton Chaintech Corp. (I) 30,970 49,041Wan Hai Lines, Ltd. (I) 622,216 348,015WAN HWA Enterprise Company 3,105 1,518Waterland Financial Holding Company, Ltd. 3,071,338 946,125Ways Technical Corp. Ltd. 44,000 115,600WEI Chih Steel Industrial Company, Ltd. (I) 255,000 38,922Wei Chuan Food Corp. 275,000 328,840
Copyright © 2013 www.secdatabase.com. All Rights Reserved.Please Consider the Environment Before Printing This Document
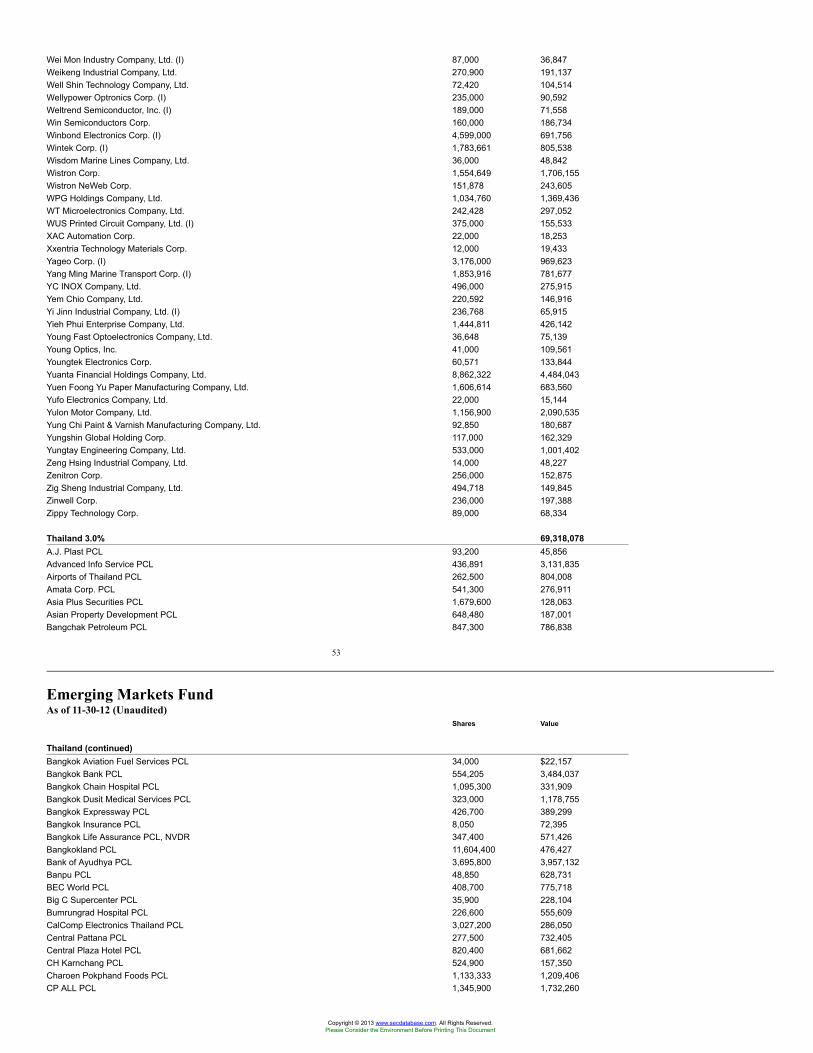
Wei Mon Industry Company, Ltd. (I) 87,000 36,847Weikeng Industrial Company, Ltd. 270,900 191,137Well Shin Technology Company, Ltd. 72,420 104,514Wellypower Optronics Corp. (I) 235,000 90,592Weltrend Semiconductor, Inc. (I) 189,000 71,558Win Semiconductors Corp. 160,000 186,734Winbond Electronics Corp. (I) 4,599,000 691,756Wintek Corp. (I) 1,783,661 805,538Wisdom Marine Lines Company, Ltd. 36,000 48,842Wistron Corp. 1,554,649 1,706,155Wistron NeWeb Corp. 151,878 243,605WPG Holdings Company, Ltd. 1,034,760 1,369,436WT Microelectronics Company, Ltd. 242,428 297,052WUS Printed Circuit Company, Ltd. (I) 375,000 155,533XAC Automation Corp. 22,000 18,253Xxentria Technology Materials Corp. 12,000 19,433Yageo Corp. (I) 3,176,000 969,623Yang Ming Marine Transport Corp. (I) 1,853,916 781,677YC INOX Company, Ltd. 496,000 275,915Yem Chio Company, Ltd. 220,592 146,916Yi Jinn Industrial Company, Ltd. (I) 236,768 65,915Yieh Phui Enterprise Company, Ltd. 1,444,811 426,142Young Fast Optoelectronics Company, Ltd. 36,648 75,139Young Optics, Inc. 41,000 109,561Youngtek Electronics Corp. 60,571 133,844Yuanta Financial Holdings Company, Ltd. 8,862,322 4,484,043Yuen Foong Yu Paper Manufacturing Company, Ltd. 1,606,614 683,560Yufo Electronics Company, Ltd. 22,000 15,144Yulon Motor Company, Ltd. 1,156,900 2,090,535Yung Chi Paint & Varnish Manufacturing Company, Ltd. 92,850 180,687Yungshin Global Holding Corp. 117,000 162,329Yungtay Engineering Company, Ltd. 533,000 1,001,402Zeng Hsing Industrial Company, Ltd. 14,000 48,227Zenitron Corp. 256,000 152,875Zig Sheng Industrial Company, Ltd. 494,718 149,845Zinwell Corp. 236,000 197,388Zippy Technology Corp. 89,000 68,334
Thailand 3.0% 69,318,078A.J. Plast PCL 93,200 45,856Advanced Info Service PCL 436,891 3,131,835Airports of Thailand PCL 262,500 804,008Amata Corp. PCL 541,300 276,911Asia Plus Securities PCL 1,679,600 128,063Asian Property Development PCL 648,480 187,001Bangchak Petroleum PCL 847,300 786,838
53
Emerging Markets FundAs of 11-30-12 (Unaudited)
Shares Value
Thailand (continued)Bangkok Aviation Fuel Services PCL 34,000 $22,157Bangkok Bank PCL 554,205 3,484,037Bangkok Chain Hospital PCL 1,095,300 331,909Bangkok Dusit Medical Services PCL 323,000 1,178,755Bangkok Expressway PCL 426,700 389,299Bangkok Insurance PCL 8,050 72,395Bangkok Life Assurance PCL, NVDR 347,400 571,426Bangkokland PCL 11,604,400 476,427Bank of Ayudhya PCL 3,695,800 3,957,132Banpu PCL 48,850 628,731BEC World PCL 408,700 775,718Big C Supercenter PCL 35,900 228,104Bumrungrad Hospital PCL 226,600 555,609CalComp Electronics Thailand PCL 3,027,200 286,050Central Pattana PCL 277,500 732,405Central Plaza Hotel PCL 820,400 681,662CH Karnchang PCL 524,900 157,350Charoen Pokphand Foods PCL 1,133,333 1,209,406CP ALL PCL 1,345,900 1,732,260
Copyright © 2013 www.secdatabase.com. All Rights Reserved.Please Consider the Environment Before Printing This Document
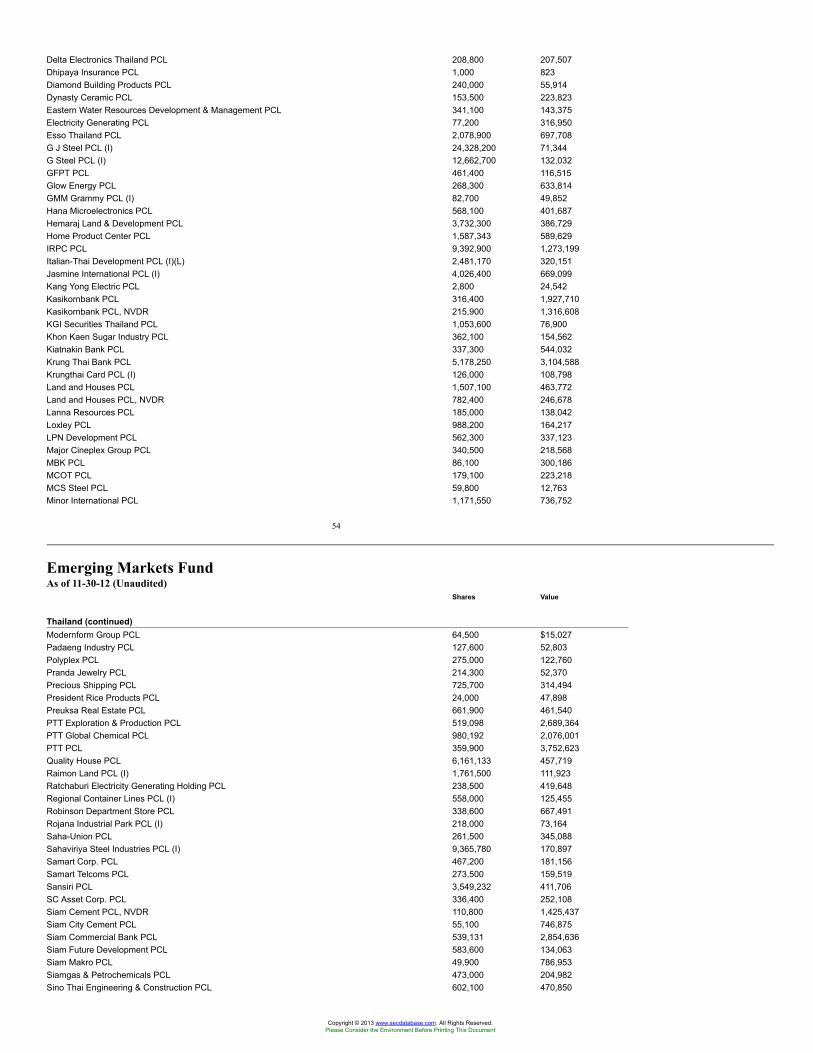
Delta Electronics Thailand PCL 208,800 207,507Dhipaya Insurance PCL 1,000 823Diamond Building Products PCL 240,000 55,914Dynasty Ceramic PCL 153,500 223,823Eastern Water Resources Development & Management PCL 341,100 143,375Electricity Generating PCL 77,200 316,950Esso Thailand PCL 2,078,900 697,708G J Steel PCL (I) 24,328,200 71,344G Steel PCL (I) 12,662,700 132,032GFPT PCL 461,400 116,515Glow Energy PCL 268,300 633,814GMM Grammy PCL (I) 82,700 49,852Hana Microelectronics PCL 568,100 401,687Hemaraj Land & Development PCL 3,732,300 386,729Home Product Center PCL 1,587,343 589,629IRPC PCL 9,392,900 1,273,199Italian-Thai Development PCL (I)(L) 2,481,170 320,151Jasmine International PCL (I) 4,026,400 669,099Kang Yong Electric PCL 2,800 24,542Kasikornbank PCL 316,400 1,927,710Kasikornbank PCL, NVDR 215,900 1,316,608KGI Securities Thailand PCL 1,053,600 76,900Khon Kaen Sugar Industry PCL 362,100 154,562Kiatnakin Bank PCL 337,300 544,032Krung Thai Bank PCL 5,178,250 3,104,588Krungthai Card PCL (I) 126,000 108,798Land and Houses PCL 1,507,100 463,772Land and Houses PCL, NVDR 782,400 246,678Lanna Resources PCL 185,000 138,042Loxley PCL 988,200 164,217LPN Development PCL 562,300 337,123Major Cineplex Group PCL 340,500 218,568MBK PCL 86,100 300,186MCOT PCL 179,100 223,218MCS Steel PCL 59,800 12,763Minor International PCL 1,171,550 736,752
54
Emerging Markets FundAs of 11-30-12 (Unaudited)
Shares Value
Thailand (continued)Modernform Group PCL 64,500 $15,027Padaeng Industry PCL 127,600 52,803Polyplex PCL 275,000 122,760Pranda Jewelry PCL 214,300 52,370Precious Shipping PCL 725,700 314,494President Rice Products PCL 24,000 47,898Preuksa Real Estate PCL 661,900 461,540PTT Exploration & Production PCL 519,098 2,689,364PTT Global Chemical PCL 980,192 2,076,001PTT PCL 359,900 3,752,623Quality House PCL 6,161,133 457,719Raimon Land PCL (I) 1,761,500 111,923Ratchaburi Electricity Generating Holding PCL 238,500 419,648Regional Container Lines PCL (I) 558,000 125,455Robinson Department Store PCL 338,600 667,491Rojana Industrial Park PCL (I) 218,000 73,164Saha-Union PCL 261,500 345,088Sahaviriya Steel Industries PCL (I) 9,365,780 170,897Samart Corp. PCL 467,200 181,156Samart Telcoms PCL 273,500 159,519Sansiri PCL 3,549,232 411,706SC Asset Corp. PCL 336,400 252,108Siam Cement PCL, NVDR 110,800 1,425,437Siam City Cement PCL 55,100 746,875Siam Commercial Bank PCL 539,131 2,854,636Siam Future Development PCL 583,600 134,063Siam Makro PCL 49,900 786,953Siamgas & Petrochemicals PCL 473,000 204,982Sino Thai Engineering & Construction PCL 602,100 470,850
Copyright © 2013 www.secdatabase.com. All Rights Reserved.Please Consider the Environment Before Printing This Document
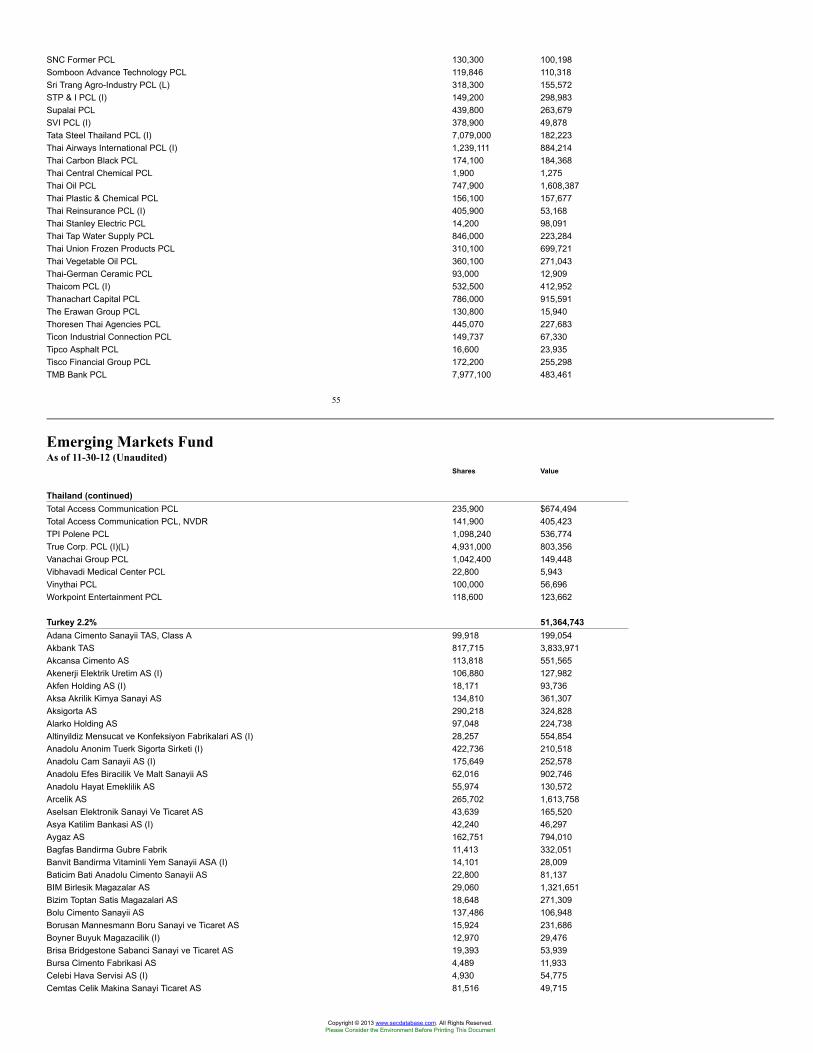
SNC Former PCL 130,300 100,198Somboon Advance Technology PCL 119,846 110,318Sri Trang Agro-Industry PCL (L) 318,300 155,572STP & I PCL (I) 149,200 298,983Supalai PCL 439,800 263,679SVI PCL (I) 378,900 49,878Tata Steel Thailand PCL (I) 7,079,000 182,223Thai Airways International PCL (I) 1,239,111 884,214Thai Carbon Black PCL 174,100 184,368Thai Central Chemical PCL 1,900 1,275Thai Oil PCL 747,900 1,608,387Thai Plastic & Chemical PCL 156,100 157,677Thai Reinsurance PCL (I) 405,900 53,168Thai Stanley Electric PCL 14,200 98,091Thai Tap Water Supply PCL 846,000 223,284Thai Union Frozen Products PCL 310,100 699,721Thai Vegetable Oil PCL 360,100 271,043Thai-German Ceramic PCL 93,000 12,909Thaicom PCL (I) 532,500 412,952Thanachart Capital PCL 786,000 915,591The Erawan Group PCL 130,800 15,940Thoresen Thai Agencies PCL 445,070 227,683Ticon Industrial Connection PCL 149,737 67,330Tipco Asphalt PCL 16,600 23,935Tisco Financial Group PCL 172,200 255,298TMB Bank PCL 7,977,100 483,461
55
Emerging Markets FundAs of 11-30-12 (Unaudited)
Shares Value
Thailand (continued)Total Access Communication PCL 235,900 $674,494Total Access Communication PCL, NVDR 141,900 405,423TPI Polene PCL 1,098,240 536,774True Corp. PCL (I)(L) 4,931,000 803,356Vanachai Group PCL 1,042,400 149,448Vibhavadi Medical Center PCL 22,800 5,943Vinythai PCL 100,000 56,696Workpoint Entertainment PCL 118,600 123,662
Turkey 2.2% 51,364,743Adana Cimento Sanayii TAS, Class A 99,918 199,054Akbank TAS 817,715 3,833,971Akcansa Cimento AS 113,818 551,565Akenerji Elektrik Uretim AS (I) 106,880 127,982Akfen Holding AS (I) 18,171 93,736Aksa Akrilik Kimya Sanayi AS 134,810 361,307Aksigorta AS 290,218 324,828Alarko Holding AS 97,048 224,738Altinyildiz Mensucat ve Konfeksiyon Fabrikalari AS (I) 28,257 554,854Anadolu Anonim Tuerk Sigorta Sirketi (I) 422,736 210,518Anadolu Cam Sanayii AS (I) 175,649 252,578Anadolu Efes Biracilik Ve Malt Sanayii AS 62,016 902,746Anadolu Hayat Emeklilik AS 55,974 130,572Arcelik AS 265,702 1,613,758Aselsan Elektronik Sanayi Ve Ticaret AS 43,639 165,520Asya Katilim Bankasi AS (I) 42,240 46,297Aygaz AS 162,751 794,010Bagfas Bandirma Gubre Fabrik 11,413 332,051Banvit Bandirma Vitaminli Yem Sanayii ASA (I) 14,101 28,009Baticim Bati Anadolu Cimento Sanayii AS 22,800 81,137BIM Birlesik Magazalar AS 29,060 1,321,651Bizim Toptan Satis Magazalari AS 18,648 271,309Bolu Cimento Sanayii AS 137,486 106,948Borusan Mannesmann Boru Sanayi ve Ticaret AS 15,924 231,686Boyner Buyuk Magazacilik (I) 12,970 29,476Brisa Bridgestone Sabanci Sanayi ve Ticaret AS 19,393 53,939Bursa Cimento Fabrikasi AS 4,489 11,933Celebi Hava Servisi AS (I) 4,930 54,775Cemtas Celik Makina Sanayi Ticaret AS 81,516 49,715
Copyright © 2013 www.secdatabase.com. All Rights Reserved.Please Consider the Environment Before Printing This Document
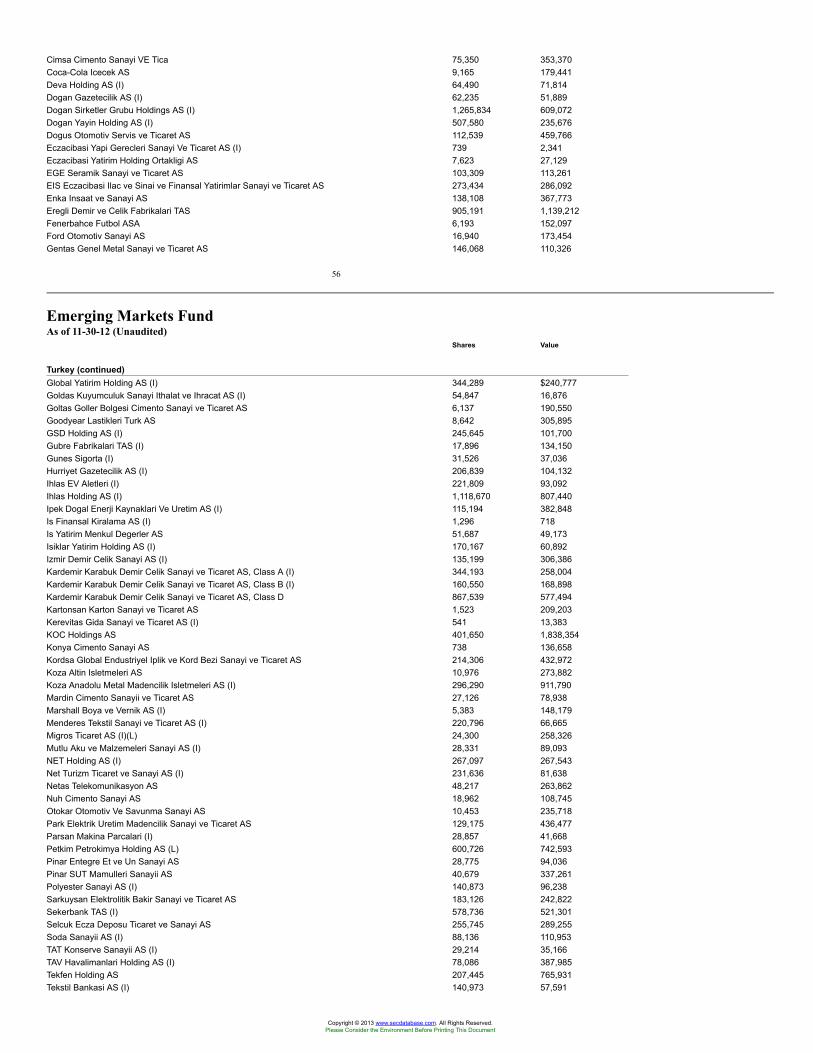
Cimsa Cimento Sanayi VE Tica 75,350 353,370Coca-Cola Icecek AS 9,165 179,441Deva Holding AS (I) 64,490 71,814Dogan Gazetecilik AS (I) 62,235 51,889Dogan Sirketler Grubu Holdings AS (I) 1,265,834 609,072Dogan Yayin Holding AS (I) 507,580 235,676Dogus Otomotiv Servis ve Ticaret AS 112,539 459,766Eczacibasi Yapi Gerecleri Sanayi Ve Ticaret AS (I) 739 2,341Eczacibasi Yatirim Holding Ortakligi AS 7,623 27,129EGE Seramik Sanayi ve Ticaret AS 103,309 113,261EIS Eczacibasi Ilac ve Sinai ve Finansal Yatirimlar Sanayi ve Ticaret AS 273,434 286,092Enka Insaat ve Sanayi AS 138,108 367,773Eregli Demir ve Celik Fabrikalari TAS 905,191 1,139,212Fenerbahce Futbol ASA 6,193 152,097Ford Otomotiv Sanayi AS 16,940 173,454Gentas Genel Metal Sanayi ve Ticaret AS 146,068 110,326
56
Emerging Markets FundAs of 11-30-12 (Unaudited)
Shares Value
Turkey (continued)Global Yatirim Holding AS (I) 344,289 $240,777Goldas Kuyumculuk Sanayi Ithalat ve Ihracat AS (I) 54,847 16,876Goltas Goller Bolgesi Cimento Sanayi ve Ticaret AS 6,137 190,550Goodyear Lastikleri Turk AS 8,642 305,895GSD Holding AS (I) 245,645 101,700Gubre Fabrikalari TAS (I) 17,896 134,150Gunes Sigorta (I) 31,526 37,036Hurriyet Gazetecilik AS (I) 206,839 104,132Ihlas EV Aletleri (I) 221,809 93,092Ihlas Holding AS (I) 1,118,670 807,440Ipek Dogal Enerji Kaynaklari Ve Uretim AS (I) 115,194 382,848Is Finansal Kiralama AS (I) 1,296 718Is Yatirim Menkul Degerler AS 51,687 49,173Isiklar Yatirim Holding AS (I) 170,167 60,892Izmir Demir Celik Sanayi AS (I) 135,199 306,386Kardemir Karabuk Demir Celik Sanayi ve Ticaret AS, Class A (I) 344,193 258,004Kardemir Karabuk Demir Celik Sanayi ve Ticaret AS, Class B (I) 160,550 168,898Kardemir Karabuk Demir Celik Sanayi ve Ticaret AS, Class D 867,539 577,494Kartonsan Karton Sanayi ve Ticaret AS 1,523 209,203Kerevitas Gida Sanayi ve Ticaret AS (I) 541 13,383KOC Holdings AS 401,650 1,838,354Konya Cimento Sanayi AS 738 136,658Kordsa Global Endustriyel Iplik ve Kord Bezi Sanayi ve Ticaret AS 214,306 432,972Koza Altin Isletmeleri AS 10,976 273,882Koza Anadolu Metal Madencilik Isletmeleri AS (I) 296,290 911,790Mardin Cimento Sanayii ve Ticaret AS 27,126 78,938Marshall Boya ve Vernik AS (I) 5,383 148,179Menderes Tekstil Sanayi ve Ticaret AS (I) 220,796 66,665Migros Ticaret AS (I)(L) 24,300 258,326Mutlu Aku ve Malzemeleri Sanayi AS (I) 28,331 89,093NET Holding AS (I) 267,097 267,543Net Turizm Ticaret ve Sanayi AS (I) 231,636 81,638Netas Telekomunikasyon AS 48,217 263,862Nuh Cimento Sanayi AS 18,962 108,745Otokar Otomotiv Ve Savunma Sanayi AS 10,453 235,718Park Elektrik Uretim Madencilik Sanayi ve Ticaret AS 129,175 436,477Parsan Makina Parcalari (I) 28,857 41,668Petkim Petrokimya Holding AS (L) 600,726 742,593Pinar Entegre Et ve Un Sanayi AS 28,775 94,036Pinar SUT Mamulleri Sanayii AS 40,679 337,261Polyester Sanayi AS (I) 140,873 96,238Sarkuysan Elektrolitik Bakir Sanayi ve Ticaret AS 183,126 242,822Sekerbank TAS (I) 578,736 521,301Selcuk Ecza Deposu Ticaret ve Sanayi AS 255,745 289,255Soda Sanayii AS (I) 88,136 110,953TAT Konserve Sanayii AS (I) 29,214 35,166TAV Havalimanlari Holding AS (I) 78,086 387,985Tekfen Holding AS 207,445 765,931Tekstil Bankasi AS (I) 140,973 57,591
Copyright © 2013 www.secdatabase.com. All Rights Reserved.Please Consider the Environment Before Printing This Document
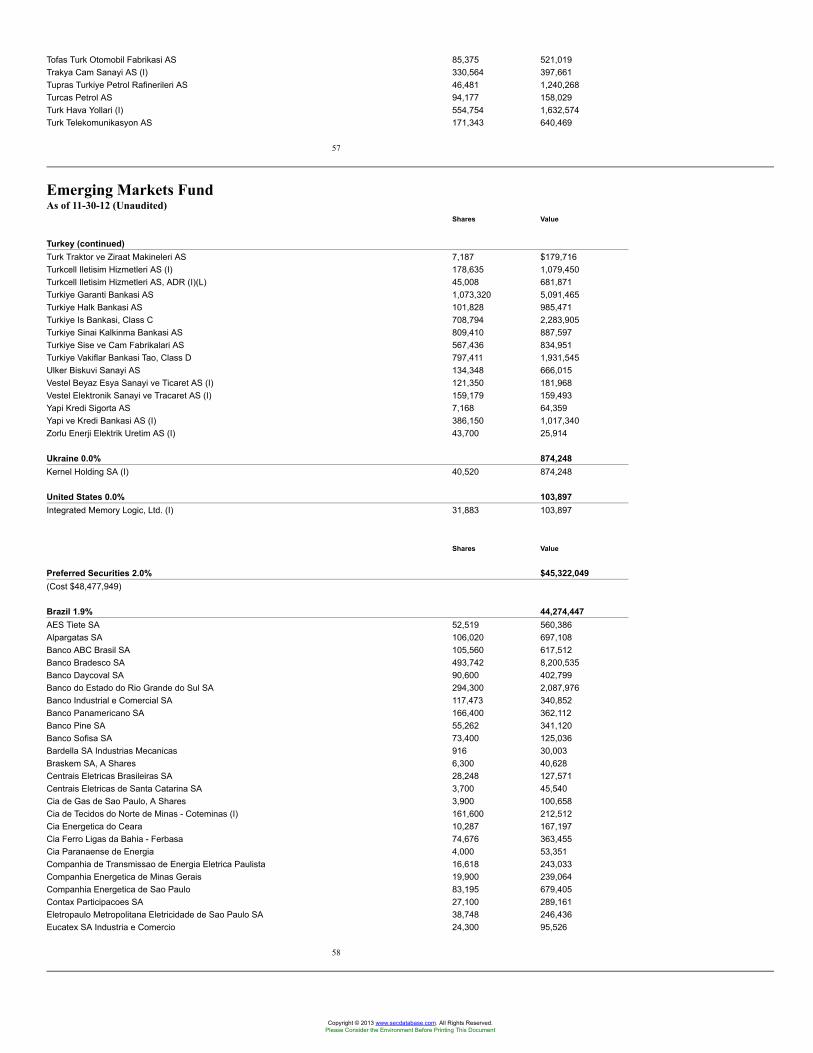
Tofas Turk Otomobil Fabrikasi AS 85,375 521,019Trakya Cam Sanayi AS (I) 330,564 397,661Tupras Turkiye Petrol Rafinerileri AS 46,481 1,240,268Turcas Petrol AS 94,177 158,029Turk Hava Yollari (I) 554,754 1,632,574Turk Telekomunikasyon AS 171,343 640,469
57
Emerging Markets FundAs of 11-30-12 (Unaudited)
Shares Value
Turkey (continued)Turk Traktor ve Ziraat Makineleri AS 7,187 $179,716Turkcell Iletisim Hizmetleri AS (I) 178,635 1,079,450Turkcell Iletisim Hizmetleri AS, ADR (I)(L) 45,008 681,871Turkiye Garanti Bankasi AS 1,073,320 5,091,465Turkiye Halk Bankasi AS 101,828 985,471Turkiye Is Bankasi, Class C 708,794 2,283,905Turkiye Sinai Kalkinma Bankasi AS 809,410 887,597Turkiye Sise ve Cam Fabrikalari AS 567,436 834,951Turkiye Vakiflar Bankasi Tao, Class D 797,411 1,931,545Ulker Biskuvi Sanayi AS 134,348 666,015Vestel Beyaz Esya Sanayi ve Ticaret AS (I) 121,350 181,968Vestel Elektronik Sanayi ve Tracaret AS (I) 159,179 159,493Yapi Kredi Sigorta AS 7,168 64,359Yapi ve Kredi Bankasi AS (I) 386,150 1,017,340Zorlu Enerji Elektrik Uretim AS (I) 43,700 25,914
Ukraine 0.0% 874,248Kernel Holding SA (I) 40,520 874,248
United States 0.0% 103,897Integrated Memory Logic, Ltd. (I) 31,883 103,897
Shares Value
Preferred Securities 2.0% $45,322,049(Cost $48,477,949)
Brazil 1.9% 44,274,447AES Tiete SA 52,519 560,386Alpargatas SA 106,020 697,108Banco ABC Brasil SA 105,560 617,512Banco Bradesco SA 493,742 8,200,535Banco Daycoval SA 90,600 402,799Banco do Estado do Rio Grande do Sul SA 294,300 2,087,976Banco Industrial e Comercial SA 117,473 340,852Banco Panamericano SA 166,400 362,112Banco Pine SA 55,262 341,120Banco Sofisa SA 73,400 125,036Bardella SA Industrias Mecanicas 916 30,003Braskem SA, A Shares 6,300 40,628Centrais Eletricas Brasileiras SA 28,248 127,571Centrais Eletricas de Santa Catarina SA 3,700 45,540Cia de Gas de Sao Paulo, A Shares 3,900 100,658Cia de Tecidos do Norte de Minas - Coteminas (I) 161,600 212,512Cia Energetica do Ceara 10,287 167,197Cia Ferro Ligas da Bahia - Ferbasa 74,676 363,455Cia Paranaense de Energia 4,000 53,351Companhia de Transmissao de Energia Eletrica Paulista 16,618 243,033Companhia Energetica de Minas Gerais 19,900 239,064Companhia Energetica de Sao Paulo 83,195 679,405Contax Participacoes SA 27,100 289,161Eletropaulo Metropolitana Eletricidade de Sao Paulo SA 38,748 246,436Eucatex SA Industria e Comercio 24,300 95,526
58
Copyright © 2013 www.secdatabase.com. All Rights Reserved.Please Consider the Environment Before Printing This Document
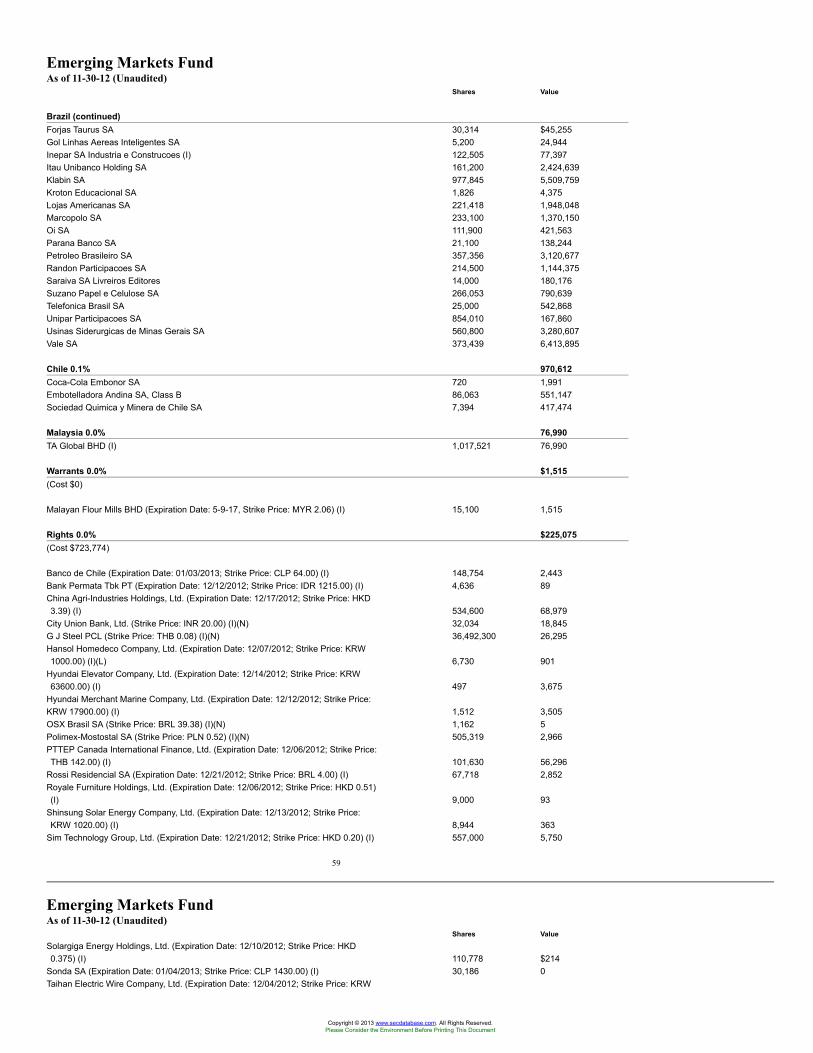
Emerging Markets FundAs of 11-30-12 (Unaudited)
Shares Value
Brazil (continued)Forjas Taurus SA 30,314 $45,255Gol Linhas Aereas Inteligentes SA 5,200 24,944Inepar SA Industria e Construcoes (I) 122,505 77,397Itau Unibanco Holding SA 161,200 2,424,639Klabin SA 977,845 5,509,759Kroton Educacional SA 1,826 4,375Lojas Americanas SA 221,418 1,948,048Marcopolo SA 233,100 1,370,150Oi SA 111,900 421,563Parana Banco SA 21,100 138,244Petroleo Brasileiro SA 357,356 3,120,677Randon Participacoes SA 214,500 1,144,375Saraiva SA Livreiros Editores 14,000 180,176Suzano Papel e Celulose SA 266,053 790,639Telefonica Brasil SA 25,000 542,868Unipar Participacoes SA 854,010 167,860Usinas Siderurgicas de Minas Gerais SA 560,800 3,280,607Vale SA 373,439 6,413,895
Chile 0.1% 970,612Coca-Cola Embonor SA 720 1,991Embotelladora Andina SA, Class B 86,063 551,147Sociedad Quimica y Minera de Chile SA 7,394 417,474
Malaysia 0.0% 76,990TA Global BHD (I) 1,017,521 76,990
Warrants 0.0% $1,515(Cost $0)
Malayan Flour Mills BHD (Expiration Date: 5-9-17, Strike Price: MYR 2.06) (I) 15,100 1,515
Rights 0.0% $225,075(Cost $723,774)
Banco de Chile (Expiration Date: 01/03/2013; Strike Price: CLP 64.00) (I) 148,754 2,443Bank Permata Tbk PT (Expiration Date: 12/12/2012; Strike Price: IDR 1215.00) (I) 4,636 89China Agri-Industries Holdings, Ltd. (Expiration Date: 12/17/2012; Strike Price: HKD3.39) (I) 534,600 68,979
City Union Bank, Ltd. (Strike Price: INR 20.00) (I)(N) 32,034 18,845G J Steel PCL (Strike Price: THB 0.08) (I)(N) 36,492,300 26,295Hansol Homedeco Company, Ltd. (Expiration Date: 12/07/2012; Strike Price: KRW1000.00) (I)(L) 6,730 901
Hyundai Elevator Company, Ltd. (Expiration Date: 12/14/2012; Strike Price: KRW63600.00) (I) 497 3,675
Hyundai Merchant Marine Company, Ltd. (Expiration Date: 12/12/2012; Strike Price:KRW 17900.00) (I) 1,512 3,505OSX Brasil SA (Strike Price: BRL 39.38) (I)(N) 1,162 5Polimex-Mostostal SA (Strike Price: PLN 0.52) (I)(N) 505,319 2,966PTTEP Canada International Finance, Ltd. (Expiration Date: 12/06/2012; Strike Price:THB 142.00) (I) 101,630 56,296
Rossi Residencial SA (Expiration Date: 12/21/2012; Strike Price: BRL 4.00) (I) 67,718 2,852Royale Furniture Holdings, Ltd. (Expiration Date: 12/06/2012; Strike Price: HKD 0.51)(I) 9,000 93
Shinsung Solar Energy Company, Ltd. (Expiration Date: 12/13/2012; Strike Price:KRW 1020.00) (I) 8,944 363
Sim Technology Group, Ltd. (Expiration Date: 12/21/2012; Strike Price: HKD 0.20) (I) 557,000 5,750
59
Emerging Markets FundAs of 11-30-12 (Unaudited)
Shares Value
Solargiga Energy Holdings, Ltd. (Expiration Date: 12/10/2012; Strike Price: HKD0.375) (I) 110,778 $214
Sonda SA (Expiration Date: 01/04/2013; Strike Price: CLP 1430.00) (I) 30,186 0Taihan Electric Wire Company, Ltd. (Expiration Date: 12/04/2012; Strike Price: KRW
Copyright © 2013 www.secdatabase.com. All Rights Reserved.Please Consider the Environment Before Printing This Document
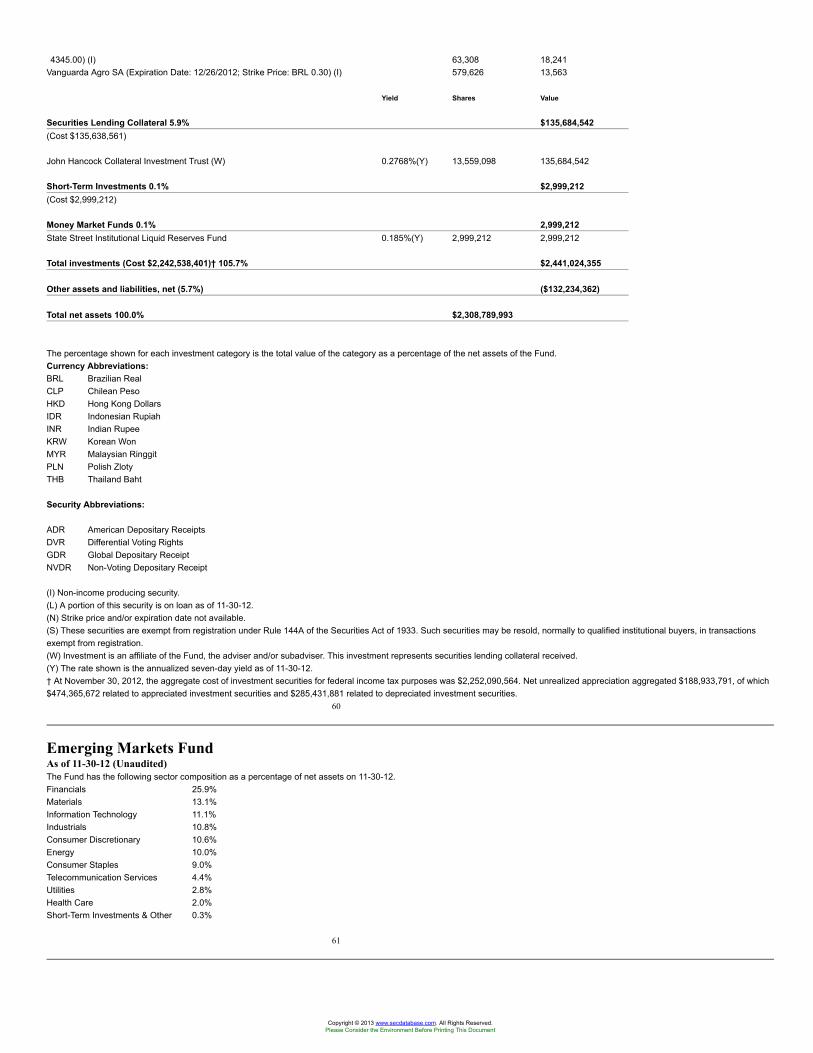
4345.00) (I) 63,308 18,241Vanguarda Agro SA (Expiration Date: 12/26/2012; Strike Price: BRL 0.30) (I) 579,626 13,563
Yield Shares Value
Securities Lending Collateral 5.9% $135,684,542(Cost $135,638,561)
John Hancock Collateral Investment Trust (W) 0.2768%(Y) 13,559,098 135,684,542
Short-Term Investments 0.1% $2,999,212(Cost $2,999,212)
Money Market Funds 0.1% 2,999,212State Street Institutional Liquid Reserves Fund 0.185%(Y) 2,999,212 2,999,212
Total investments (Cost $2,242,538,401)† 105.7% $2,441,024,355
Other assets and liabilities, net (5.7%) ($132,234,362)
Total net assets 100.0% $2,308,789,993
The percentage shown for each investment category is the total value of the category as a percentage of the net assets of the Fund.Currency Abbreviations:BRL Brazilian RealCLP Chilean PesoHKD Hong Kong DollarsIDR Indonesian RupiahINR Indian RupeeKRW Korean WonMYR Malaysian RinggitPLN Polish ZlotyTHB Thailand Baht
Security Abbreviations:
ADR American Depositary ReceiptsDVR Differential Voting RightsGDR Global Depositary ReceiptNVDR Non-Voting Depositary Receipt
(I) Non-income producing security.(L) A portion of this security is on loan as of 11-30-12.(N) Strike price and/or expiration date not available.(S) These securities are exempt from registration under Rule 144A of the Securities Act of 1933. Such securities may be resold, normally to qualified institutional buyers, in transactionsexempt from registration.(W) Investment is an affiliate of the Fund, the adviser and/or subadviser. This investment represents securities lending collateral received.(Y) The rate shown is the annualized seven-day yield as of 11-30-12.† At November 30, 2012, the aggregate cost of investment securities for federal income tax purposes was $2,252,090,564. Net unrealized appreciation aggregated $188,933,791, of which$474,365,672 related to appreciated investment securities and $285,431,881 related to depreciated investment securities.
60
Emerging Markets FundAs of 11-30-12 (Unaudited)The Fund has the following sector composition as a percentage of net assets on 11-30-12.Financials 25.9%Materials 13.1%Information Technology 11.1%Industrials 10.8%Consumer Discretionary 10.6%Energy 10.0%Consumer Staples 9.0%Telecommunication Services 4.4%Utilities 2.8%Health Care 2.0%Short-Term Investments & Other 0.3%
61
Copyright © 2013 www.secdatabase.com. All Rights Reserved.Please Consider the Environment Before Printing This Document
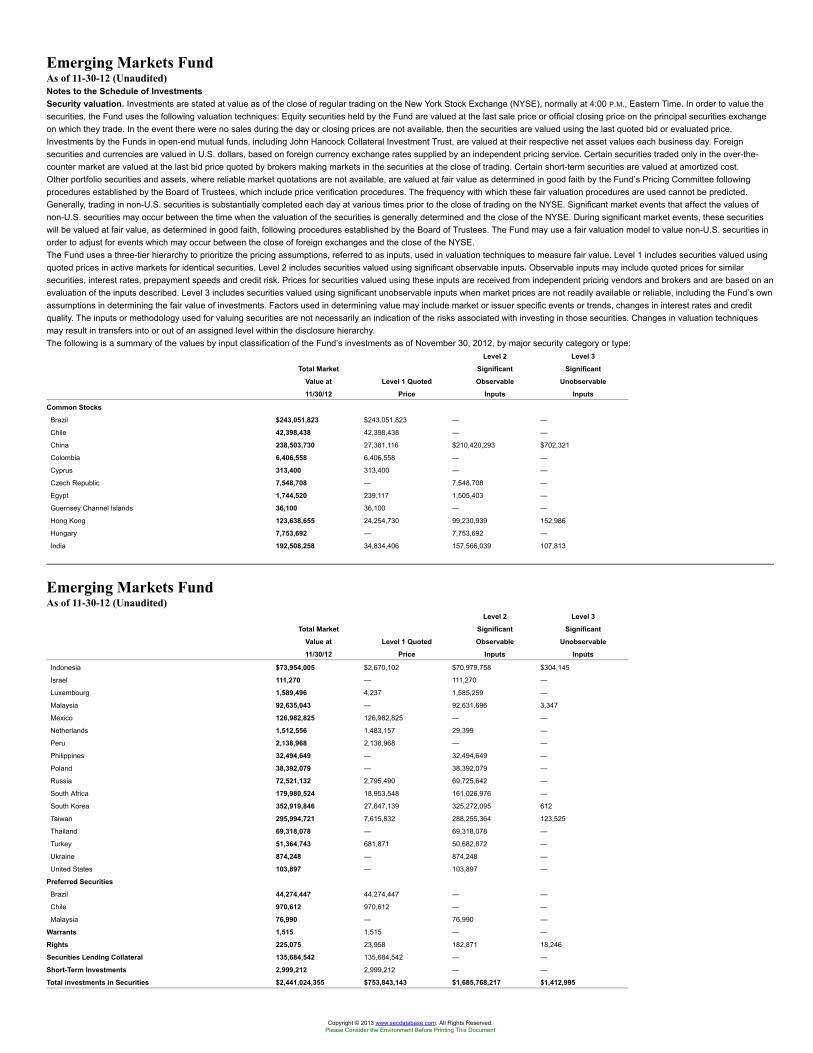
Emerging Markets FundAs of 11-30-12 (Unaudited)Notes to the Schedule of InvestmentsSecurity valuation. Investments are stated at value as of the close of regular trading on the New York Stock Exchange (NYSE), normally at 4:00 P.M., Eastern Time. In order to value thesecurities, the Fund uses the following valuation techniques: Equity securities held by the Fund are valued at the last sale price or official closing price on the principal securities exchangeon which they trade. In the event there were no sales during the day or closing prices are not available, then the securities are valued using the last quoted bid or evaluated price.Investments by the Funds in open-end mutual funds, including John Hancock Collateral Investment Trust, are valued at their respective net asset values each business day. Foreignsecurities and currencies are valued in U.S. dollars, based on foreign currency exchange rates supplied by an independent pricing service. Certain securities traded only in the over-the-counter market are valued at the last bid price quoted by brokers making markets in the securities at the close of trading. Certain short-term securities are valued at amortized cost.Other portfolio securities and assets, where reliable market quotations are not available, are valued at fair value as determined in good faith by the Fund’s Pricing Committee followingprocedures established by the Board of Trustees, which include price verification procedures. The frequency with which these fair valuation procedures are used cannot be predicted.Generally, trading in non-U.S. securities is substantially completed each day at various times prior to the close of trading on the NYSE. Significant market events that affect the values ofnon-U.S. securities may occur between the time when the valuation of the securities is generally determined and the close of the NYSE. During significant market events, these securitieswill be valued at fair value, as determined in good faith, following procedures established by the Board of Trustees. The Fund may use a fair valuation model to value non-U.S. securities inorder to adjust for events which may occur between the close of foreign exchanges and the close of the NYSE.The Fund uses a three-tier hierarchy to prioritize the pricing assumptions, referred to as inputs, used in valuation techniques to measure fair value. Level 1 includes securities valued usingquoted prices in active markets for identical securities. Level 2 includes securities valued using significant observable inputs. Observable inputs may include quoted prices for similarsecurities, interest rates, prepayment speeds and credit risk. Prices for securities valued using these inputs are received from independent pricing vendors and brokers and are based on anevaluation of the inputs described. Level 3 includes securities valued using significant unobservable inputs when market prices are not readily available or reliable, including the Fund’s ownassumptions in determining the fair value of investments. Factors used in determining value may include market or issuer specific events or trends, changes in interest rates and creditquality. The inputs or methodology used for valuing securities are not necessarily an indication of the risks associated with investing in those securities. Changes in valuation techniquesmay result in transfers into or out of an assigned level within the disclosure hierarchy.The following is a summary of the values by input classification of the Fund’s investments as of November 30, 2012, by major security category or type:
Level 2 Level 3
Total Market Significant Significant
Value at Level 1 Quoted Observable Unobservable
11/30/12 Price Inputs Inputs
Common Stocks
Brazil $243,051,823 $243,051,823 — —
Chile 42,398,438 42,398,438 — —
China 238,503,730 27,381,116 $210,420,293 $702,321
Colombia 6,406,558 6,406,558 — —
Cyprus 313,400 313,400 — —
Czech Republic 7,548,708 — 7,548,708 —
Egypt 1,744,520 239,117 1,505,403 —
Guernsey Channel Islands 36,100 36,100 — —
Hong Kong 123,638,655 24,254,730 99,230,939 152,986
Hungary 7,753,692 — 7,753,692 —
India 192,508,258 34,834,406 157,566,039 107,813
Emerging Markets FundAs of 11-30-12 (Unaudited)
Level 2 Level 3
Total Market Significant Significant
Value at Level 1 Quoted Observable Unobservable
11/30/12 Price Inputs Inputs
Indonesia $73,954,005 $2,670,102 $70,979,758 $304,145
Israel 111,270 — 111,270 —
Luxembourg 1,589,496 4,237 1,585,259 —
Malaysia 92,635,043 — 92,631,696 3,347
Mexico 126,982,825 126,982,825 — —
Netherlands 1,512,556 1,483,157 29,399 —
Peru 2,138,968 2,138,968 — —
Philippines 32,494,649 — 32,494,649 —
Poland 38,392,079 — 38,392,079 —
Russia 72,521,132 2,795,490 69,725,642 —
South Africa 179,980,524 18,953,548 161,026,976 —
South Korea 352,919,846 27,647,139 325,272,095 612
Taiwan 295,994,721 7,615,832 288,255,364 123,525
Thailand 69,318,078 — 69,318,078 —
Turkey 51,364,743 681,871 50,682,872 —
Ukraine 874,248 — 874,248 —
United States 103,897 — 103,897 —
Preferred Securities
Brazil 44,274,447 44,274,447 — —
Chile 970,612 970,612 — —
Malaysia 76,990 — 76,990 —
Warrants 1,515 1,515 — —
Rights 225,075 23,958 182,871 18,246
Securities Lending Collateral 135,684,542 135,684,542 — —
Short-Term Investments 2,999,212 2,999,212 — —
Total investments in Securities $2,441,024,355 $753,843,143 $1,685,768,217 $1,412,995
Copyright © 2013 www.secdatabase.com. All Rights Reserved.Please Consider the Environment Before Printing This Document
For additional information on the Fund's significant accounting policies, please refer to the Fund's most recent semiannual or annual shareholder report.
Copyright © 2013 www.secdatabase.com. All Rights Reserved.Please Consider the Environment Before Printing This Document
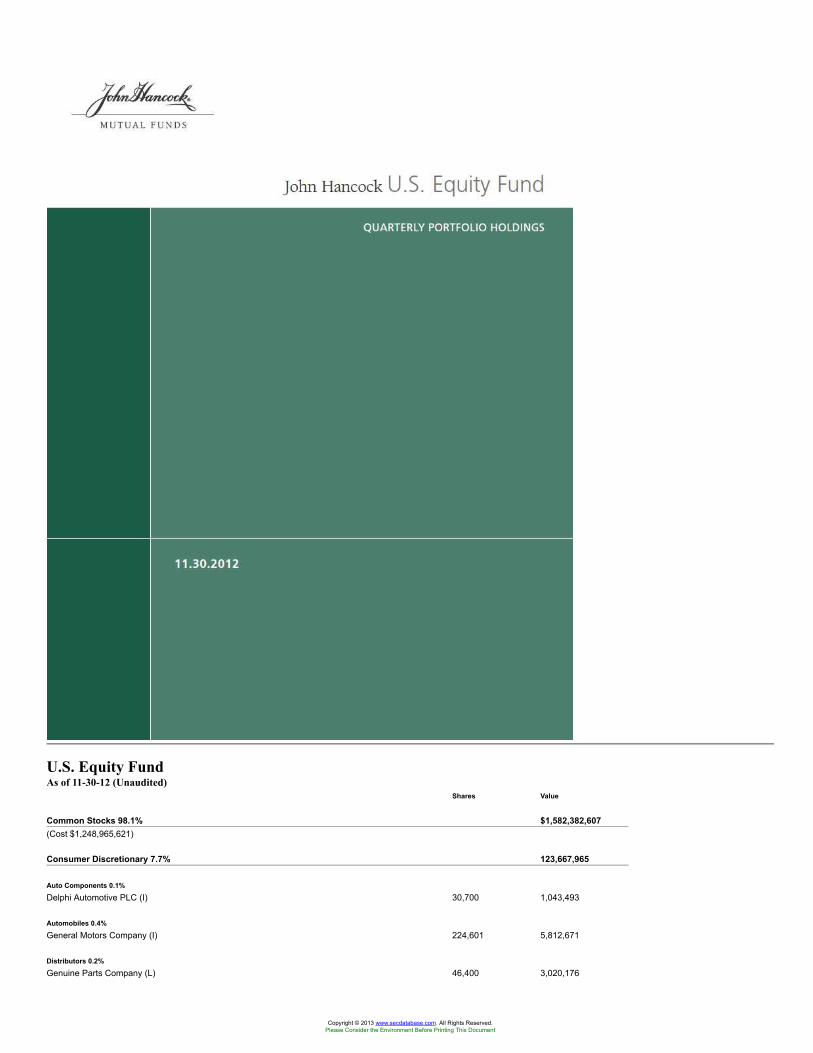
U.S. Equity FundAs of 11-30-12 (Unaudited)
Shares Value
Common Stocks 98.1% $1,582,382,607(Cost $1,248,965,621)
Consumer Discretionary 7.7% 123,667,965
Auto Components 0.1%
Delphi Automotive PLC (I) 30,700 1,043,493
Automobiles 0.4%
General Motors Company (I) 224,601 5,812,671
Distributors 0.2%
Genuine Parts Company (L) 46,400 3,020,176
Copyright © 2013 www.secdatabase.com. All Rights Reserved.Please Consider the Environment Before Printing This Document
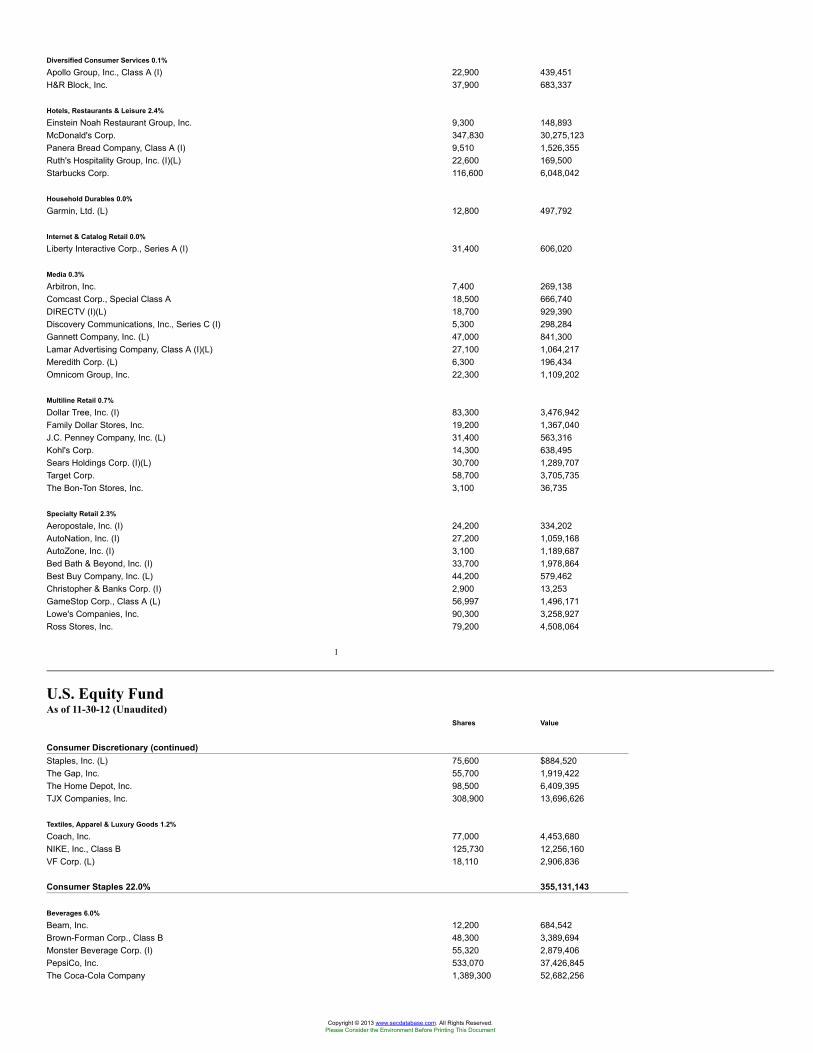
Diversified Consumer Services 0.1%
Apollo Group, Inc., Class A (I) 22,900 439,451H&R Block, Inc. 37,900 683,337
Hotels, Restaurants & Leisure 2.4%
Einstein Noah Restaurant Group, Inc. 9,300 148,893McDonald's Corp. 347,830 30,275,123Panera Bread Company, Class A (I) 9,510 1,526,355Ruth's Hospitality Group, Inc. (I)(L) 22,600 169,500Starbucks Corp. 116,600 6,048,042
Household Durables 0.0%
Garmin, Ltd. (L) 12,800 497,792
Internet & Catalog Retail 0.0%
Liberty Interactive Corp., Series A (I) 31,400 606,020
Media 0.3%
Arbitron, Inc. 7,400 269,138Comcast Corp., Special Class A 18,500 666,740DIRECTV (I)(L) 18,700 929,390Discovery Communications, Inc., Series C (I) 5,300 298,284Gannett Company, Inc. (L) 47,000 841,300Lamar Advertising Company, Class A (I)(L) 27,100 1,064,217Meredith Corp. (L) 6,300 196,434Omnicom Group, Inc. 22,300 1,109,202
Multiline Retail 0.7%
Dollar Tree, Inc. (I) 83,300 3,476,942Family Dollar Stores, Inc. 19,200 1,367,040J.C. Penney Company, Inc. (L) 31,400 563,316Kohl's Corp. 14,300 638,495Sears Holdings Corp. (I)(L) 30,700 1,289,707Target Corp. 58,700 3,705,735The Bon-Ton Stores, Inc. 3,100 36,735
Specialty Retail 2.3%
Aeropostale, Inc. (I) 24,200 334,202AutoNation, Inc. (I) 27,200 1,059,168AutoZone, Inc. (I) 3,100 1,189,687Bed Bath & Beyond, Inc. (I) 33,700 1,978,864Best Buy Company, Inc. (L) 44,200 579,462Christopher & Banks Corp. (I) 2,900 13,253GameStop Corp., Class A (L) 56,997 1,496,171Lowe's Companies, Inc. 90,300 3,258,927Ross Stores, Inc. 79,200 4,508,064
1
U.S. Equity FundAs of 11-30-12 (Unaudited)
Shares Value
Consumer Discretionary (continued)Staples, Inc. (L) 75,600 $884,520The Gap, Inc. 55,700 1,919,422The Home Depot, Inc. 98,500 6,409,395TJX Companies, Inc. 308,900 13,696,626
Textiles, Apparel & Luxury Goods 1.2%
Coach, Inc. 77,000 4,453,680NIKE, Inc., Class B 125,730 12,256,160VF Corp. (L) 18,110 2,906,836
Consumer Staples 22.0% 355,131,143
Beverages 6.0%
Beam, Inc. 12,200 684,542Brown-Forman Corp., Class B 48,300 3,389,694Monster Beverage Corp. (I) 55,320 2,879,406PepsiCo, Inc. 533,070 37,426,845The Coca-Cola Company 1,389,300 52,682,256
Copyright © 2013 www.secdatabase.com. All Rights Reserved.Please Consider the Environment Before Printing This Document
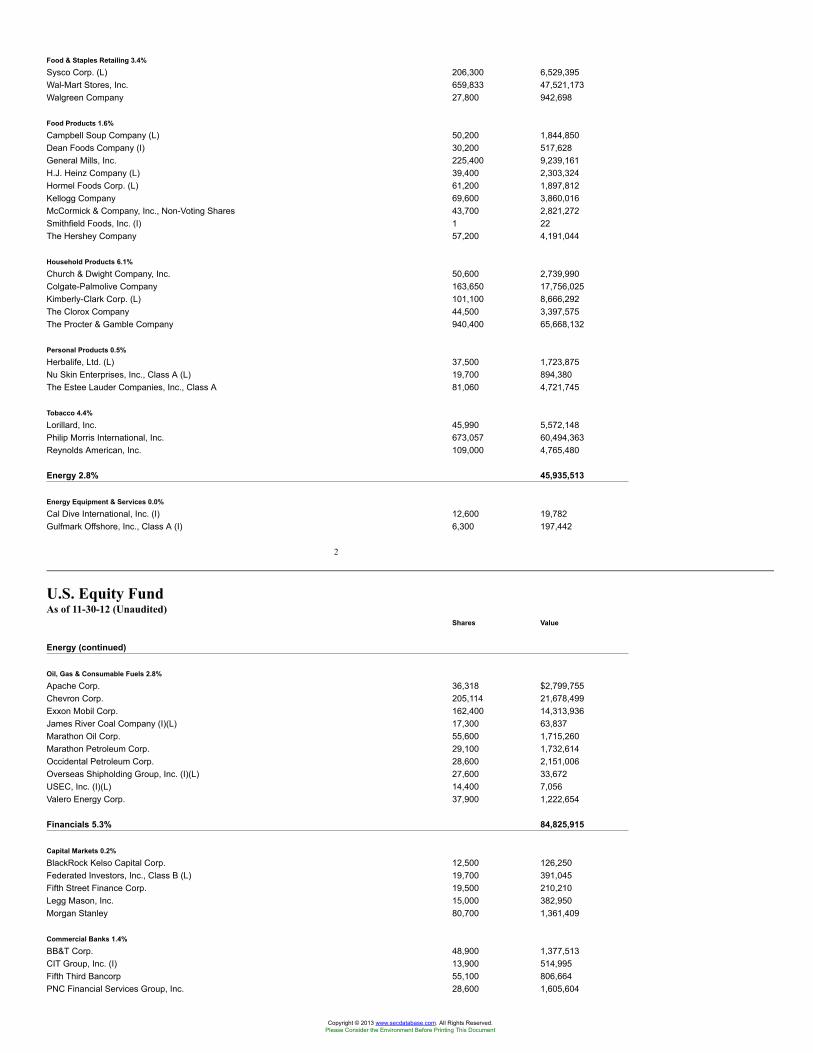
Food & Staples Retailing 3.4%
Sysco Corp. (L) 206,300 6,529,395Wal-Mart Stores, Inc. 659,833 47,521,173Walgreen Company 27,800 942,698
Food Products 1.6%
Campbell Soup Company (L) 50,200 1,844,850Dean Foods Company (I) 30,200 517,628General Mills, Inc. 225,400 9,239,161H.J. Heinz Company (L) 39,400 2,303,324Hormel Foods Corp. (L) 61,200 1,897,812Kellogg Company 69,600 3,860,016McCormick & Company, Inc., Non-Voting Shares 43,700 2,821,272Smithfield Foods, Inc. (I) 1 22The Hershey Company 57,200 4,191,044
Household Products 6.1%
Church & Dwight Company, Inc. 50,600 2,739,990Colgate-Palmolive Company 163,650 17,756,025Kimberly-Clark Corp. (L) 101,100 8,666,292The Clorox Company 44,500 3,397,575The Procter & Gamble Company 940,400 65,668,132
Personal Products 0.5%
Herbalife, Ltd. (L) 37,500 1,723,875Nu Skin Enterprises, Inc., Class A (L) 19,700 894,380The Estee Lauder Companies, Inc., Class A 81,060 4,721,745
Tobacco 4.4%
Lorillard, Inc. 45,990 5,572,148Philip Morris International, Inc. 673,057 60,494,363Reynolds American, Inc. 109,000 4,765,480
Energy 2.8% 45,935,513
Energy Equipment & Services 0.0%
Cal Dive International, Inc. (I) 12,600 19,782Gulfmark Offshore, Inc., Class A (I) 6,300 197,442
2
U.S. Equity FundAs of 11-30-12 (Unaudited)
Shares Value
Energy (continued)
Oil, Gas & Consumable Fuels 2.8%
Apache Corp. 36,318 $2,799,755Chevron Corp. 205,114 21,678,499Exxon Mobil Corp. 162,400 14,313,936James River Coal Company (I)(L) 17,300 63,837Marathon Oil Corp. 55,600 1,715,260Marathon Petroleum Corp. 29,100 1,732,614Occidental Petroleum Corp. 28,600 2,151,006Overseas Shipholding Group, Inc. (I)(L) 27,600 33,672USEC, Inc. (I)(L) 14,400 7,056Valero Energy Corp. 37,900 1,222,654
Financials 5.3% 84,825,915
Capital Markets 0.2%
BlackRock Kelso Capital Corp. 12,500 126,250Federated Investors, Inc., Class B (L) 19,700 391,045Fifth Street Finance Corp. 19,500 210,210Legg Mason, Inc. 15,000 382,950Morgan Stanley 80,700 1,361,409
Commercial Banks 1.4%
BB&T Corp. 48,900 1,377,513CIT Group, Inc. (I) 13,900 514,995Fifth Third Bancorp 55,100 806,664PNC Financial Services Group, Inc. 28,600 1,605,604
Copyright © 2013 www.secdatabase.com. All Rights Reserved.Please Consider the Environment Before Printing This Document
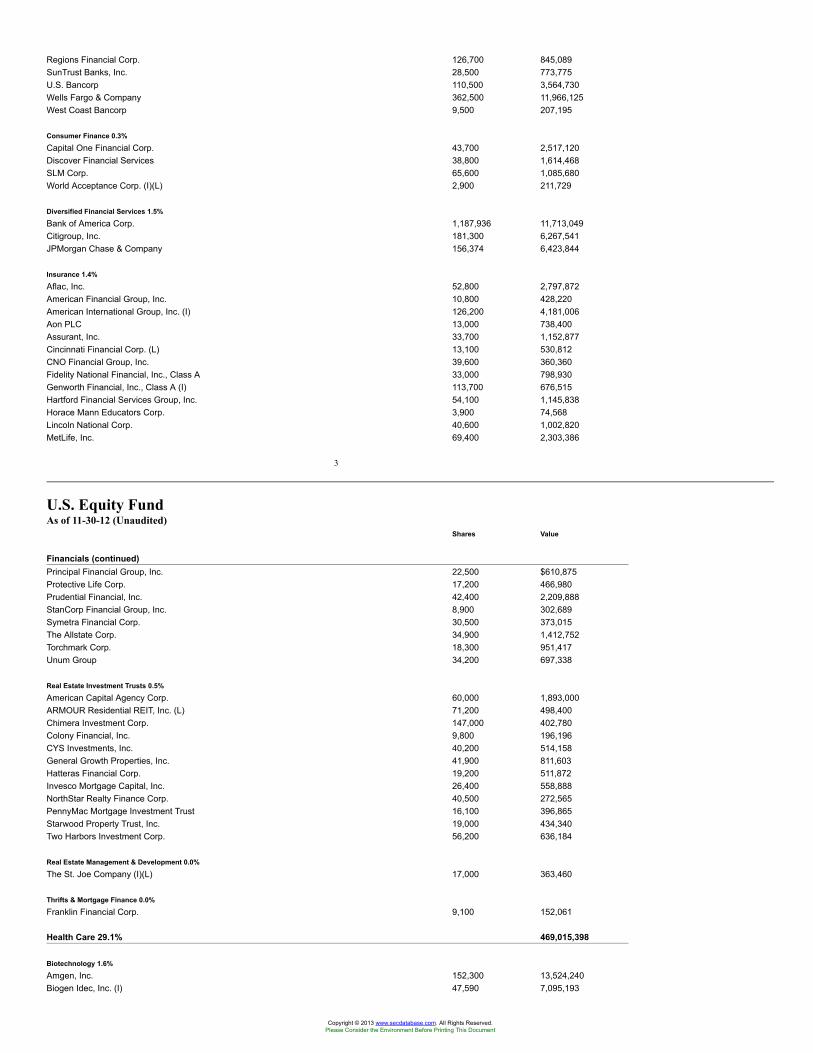
Regions Financial Corp. 126,700 845,089SunTrust Banks, Inc. 28,500 773,775U.S. Bancorp 110,500 3,564,730Wells Fargo & Company 362,500 11,966,125West Coast Bancorp 9,500 207,195
Consumer Finance 0.3%
Capital One Financial Corp. 43,700 2,517,120Discover Financial Services 38,800 1,614,468SLM Corp. 65,600 1,085,680World Acceptance Corp. (I)(L) 2,900 211,729
Diversified Financial Services 1.5%
Bank of America Corp. 1,187,936 11,713,049Citigroup, Inc. 181,300 6,267,541JPMorgan Chase & Company 156,374 6,423,844
Insurance 1.4%
Aflac, Inc. 52,800 2,797,872American Financial Group, Inc. 10,800 428,220American International Group, Inc. (I) 126,200 4,181,006Aon PLC 13,000 738,400Assurant, Inc. 33,700 1,152,877Cincinnati Financial Corp. (L) 13,100 530,812CNO Financial Group, Inc. 39,600 360,360Fidelity National Financial, Inc., Class A 33,000 798,930Genworth Financial, Inc., Class A (I) 113,700 676,515Hartford Financial Services Group, Inc. 54,100 1,145,838Horace Mann Educators Corp. 3,900 74,568Lincoln National Corp. 40,600 1,002,820MetLife, Inc. 69,400 2,303,386
3
U.S. Equity FundAs of 11-30-12 (Unaudited)
Shares Value
Financials (continued)Principal Financial Group, Inc. 22,500 $610,875Protective Life Corp. 17,200 466,980Prudential Financial, Inc. 42,400 2,209,888StanCorp Financial Group, Inc. 8,900 302,689Symetra Financial Corp. 30,500 373,015The Allstate Corp. 34,900 1,412,752Torchmark Corp. 18,300 951,417Unum Group 34,200 697,338
Real Estate Investment Trusts 0.5%
American Capital Agency Corp. 60,000 1,893,000ARMOUR Residential REIT, Inc. (L) 71,200 498,400Chimera Investment Corp. 147,000 402,780Colony Financial, Inc. 9,800 196,196CYS Investments, Inc. 40,200 514,158General Growth Properties, Inc. 41,900 811,603Hatteras Financial Corp. 19,200 511,872Invesco Mortgage Capital, Inc. 26,400 558,888NorthStar Realty Finance Corp. 40,500 272,565PennyMac Mortgage Investment Trust 16,100 396,865Starwood Property Trust, Inc. 19,000 434,340Two Harbors Investment Corp. 56,200 636,184
Real Estate Management & Development 0.0%
The St. Joe Company (I)(L) 17,000 363,460
Thrifts & Mortgage Finance 0.0%
Franklin Financial Corp. 9,100 152,061
Health Care 29.1% 469,015,398
Biotechnology 1.6%
Amgen, Inc. 152,300 13,524,240Biogen Idec, Inc. (I) 47,590 7,095,193
Copyright © 2013 www.secdatabase.com. All Rights Reserved.Please Consider the Environment Before Printing This Document
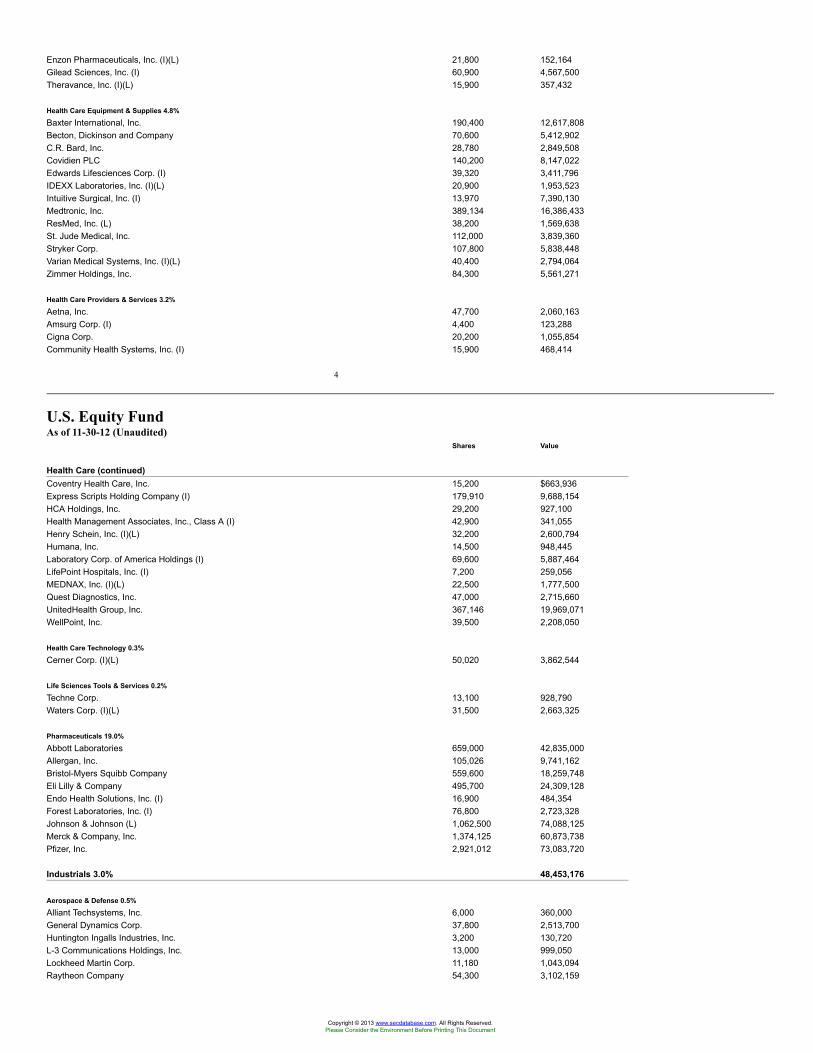
Enzon Pharmaceuticals, Inc. (I)(L) 21,800 152,164Gilead Sciences, Inc. (I) 60,900 4,567,500Theravance, Inc. (I)(L) 15,900 357,432
Health Care Equipment & Supplies 4.8%
Baxter International, Inc. 190,400 12,617,808Becton, Dickinson and Company 70,600 5,412,902C.R. Bard, Inc. 28,780 2,849,508Covidien PLC 140,200 8,147,022Edwards Lifesciences Corp. (I) 39,320 3,411,796IDEXX Laboratories, Inc. (I)(L) 20,900 1,953,523Intuitive Surgical, Inc. (I) 13,970 7,390,130Medtronic, Inc. 389,134 16,386,433ResMed, Inc. (L) 38,200 1,569,638St. Jude Medical, Inc. 112,000 3,839,360Stryker Corp. 107,800 5,838,448Varian Medical Systems, Inc. (I)(L) 40,400 2,794,064Zimmer Holdings, Inc. 84,300 5,561,271
Health Care Providers & Services 3.2%
Aetna, Inc. 47,700 2,060,163Amsurg Corp. (I) 4,400 123,288Cigna Corp. 20,200 1,055,854Community Health Systems, Inc. (I) 15,900 468,414
4
U.S. Equity FundAs of 11-30-12 (Unaudited)
Shares Value
Health Care (continued)Coventry Health Care, Inc. 15,200 $663,936Express Scripts Holding Company (I) 179,910 9,688,154HCA Holdings, Inc. 29,200 927,100Health Management Associates, Inc., Class A (I) 42,900 341,055Henry Schein, Inc. (I)(L) 32,200 2,600,794Humana, Inc. 14,500 948,445Laboratory Corp. of America Holdings (I) 69,600 5,887,464LifePoint Hospitals, Inc. (I) 7,200 259,056MEDNAX, Inc. (I)(L) 22,500 1,777,500Quest Diagnostics, Inc. 47,000 2,715,660UnitedHealth Group, Inc. 367,146 19,969,071WellPoint, Inc. 39,500 2,208,050
Health Care Technology 0.3%
Cerner Corp. (I)(L) 50,020 3,862,544
Life Sciences Tools & Services 0.2%
Techne Corp. 13,100 928,790Waters Corp. (I)(L) 31,500 2,663,325
Pharmaceuticals 19.0%
Abbott Laboratories 659,000 42,835,000Allergan, Inc. 105,026 9,741,162Bristol-Myers Squibb Company 559,600 18,259,748Eli Lilly & Company 495,700 24,309,128Endo Health Solutions, Inc. (I) 16,900 484,354Forest Laboratories, Inc. (I) 76,800 2,723,328Johnson & Johnson (L) 1,062,500 74,088,125Merck & Company, Inc. 1,374,125 60,873,738Pfizer, Inc. 2,921,012 73,083,720
Industrials 3.0% 48,453,176
Aerospace & Defense 0.5%
Alliant Techsystems, Inc. 6,000 360,000General Dynamics Corp. 37,800 2,513,700Huntington Ingalls Industries, Inc. 3,200 130,720L-3 Communications Holdings, Inc. 13,000 999,050Lockheed Martin Corp. 11,180 1,043,094Raytheon Company 54,300 3,102,159
Copyright © 2013 www.secdatabase.com. All Rights Reserved.Please Consider the Environment Before Printing This Document
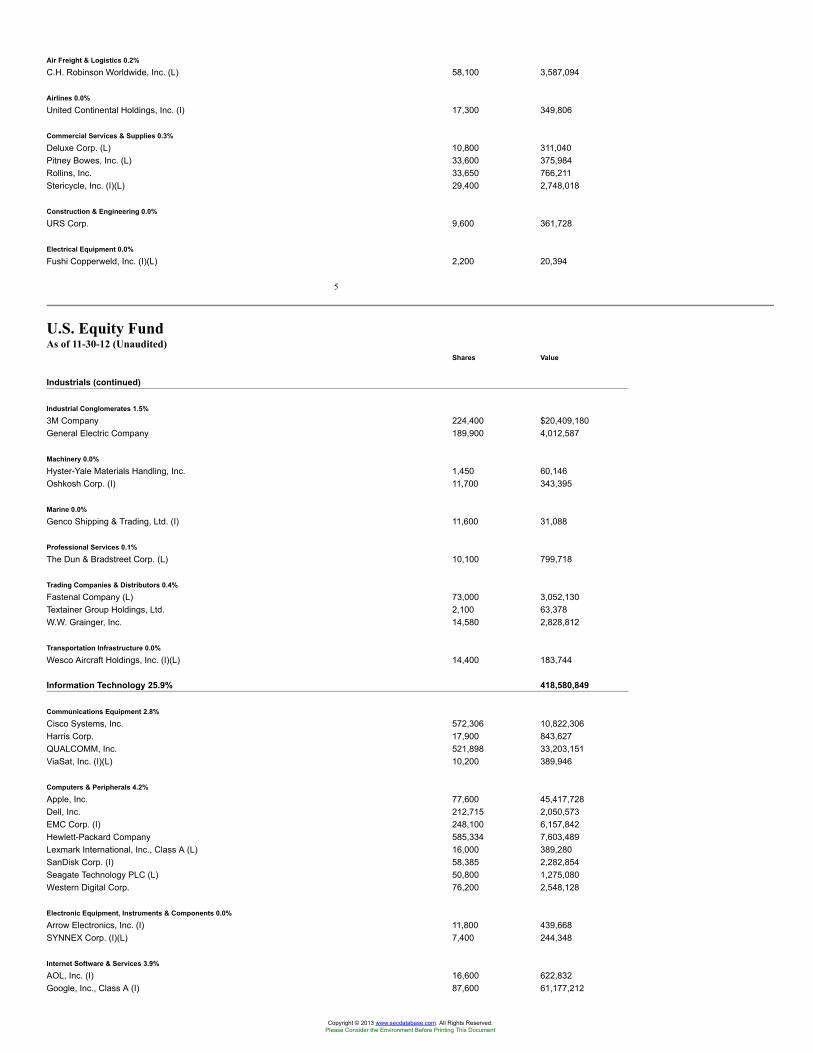
Air Freight & Logistics 0.2%
C.H. Robinson Worldwide, Inc. (L) 58,100 3,587,094
Airlines 0.0%
United Continental Holdings, Inc. (I) 17,300 349,806
Commercial Services & Supplies 0.3%
Deluxe Corp. (L) 10,800 311,040Pitney Bowes, Inc. (L) 33,600 375,984Rollins, Inc. 33,650 766,211Stericycle, Inc. (I)(L) 29,400 2,748,018
Construction & Engineering 0.0%
URS Corp. 9,600 361,728
Electrical Equipment 0.0%
Fushi Copperweld, Inc. (I)(L) 2,200 20,394
5
U.S. Equity FundAs of 11-30-12 (Unaudited)
Shares Value
Industrials (continued)
Industrial Conglomerates 1.5%
3M Company 224,400 $20,409,180General Electric Company 189,900 4,012,587
Machinery 0.0%
Hyster-Yale Materials Handling, Inc. 1,450 60,146Oshkosh Corp. (I) 11,700 343,395
Marine 0.0%
Genco Shipping & Trading, Ltd. (I) 11,600 31,088
Professional Services 0.1%
The Dun & Bradstreet Corp. (L) 10,100 799,718
Trading Companies & Distributors 0.4%
Fastenal Company (L) 73,000 3,052,130Textainer Group Holdings, Ltd. 2,100 63,378W.W. Grainger, Inc. 14,580 2,828,812
Transportation Infrastructure 0.0%
Wesco Aircraft Holdings, Inc. (I)(L) 14,400 183,744
Information Technology 25.9% 418,580,849
Communications Equipment 2.8%
Cisco Systems, Inc. 572,306 10,822,306Harris Corp. 17,900 843,627QUALCOMM, Inc. 521,898 33,203,151ViaSat, Inc. (I)(L) 10,200 389,946
Computers & Peripherals 4.2%
Apple, Inc. 77,600 45,417,728Dell, Inc. 212,715 2,050,573EMC Corp. (I) 248,100 6,157,842Hewlett-Packard Company 585,334 7,603,489Lexmark International, Inc., Class A (L) 16,000 389,280SanDisk Corp. (I) 58,385 2,282,854Seagate Technology PLC (L) 50,800 1,275,080Western Digital Corp. 76,200 2,548,128
Electronic Equipment, Instruments & Components 0.0%
Arrow Electronics, Inc. (I) 11,800 439,668SYNNEX Corp. (I)(L) 7,400 244,348
Internet Software & Services 3.9%
AOL, Inc. (I) 16,600 622,832Google, Inc., Class A (I) 87,600 61,177,212
Copyright © 2013 www.secdatabase.com. All Rights Reserved.Please Consider the Environment Before Printing This Document
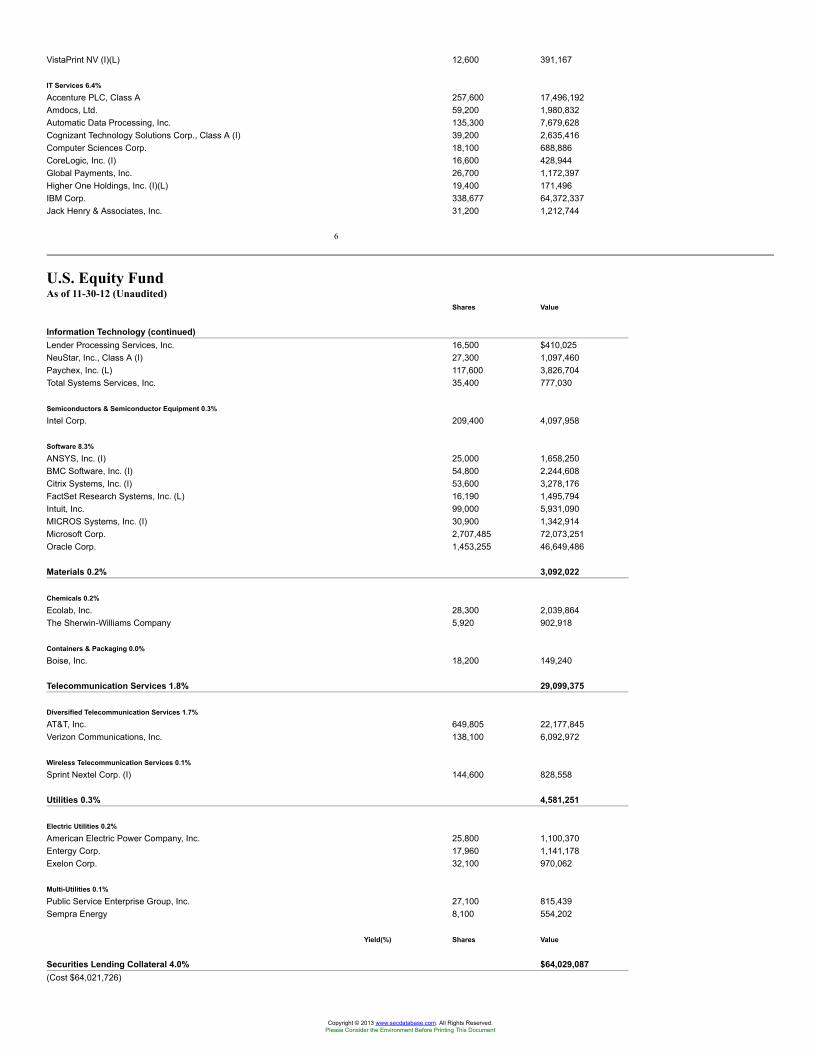
VistaPrint NV (I)(L) 12,600 391,167
IT Services 6.4%
Accenture PLC, Class A 257,600 17,496,192Amdocs, Ltd. 59,200 1,980,832Automatic Data Processing, Inc. 135,300 7,679,628Cognizant Technology Solutions Corp., Class A (I) 39,200 2,635,416Computer Sciences Corp. 18,100 688,886CoreLogic, Inc. (I) 16,600 428,944Global Payments, Inc. 26,700 1,172,397Higher One Holdings, Inc. (I)(L) 19,400 171,496IBM Corp. 338,677 64,372,337Jack Henry & Associates, Inc. 31,200 1,212,744
6
U.S. Equity FundAs of 11-30-12 (Unaudited)
Shares Value
Information Technology (continued)Lender Processing Services, Inc. 16,500 $410,025NeuStar, Inc., Class A (I) 27,300 1,097,460Paychex, Inc. (L) 117,600 3,826,704Total Systems Services, Inc. 35,400 777,030
Semiconductors & Semiconductor Equipment 0.3%
Intel Corp. 209,400 4,097,958
Software 8.3%
ANSYS, Inc. (I) 25,000 1,658,250BMC Software, Inc. (I) 54,800 2,244,608Citrix Systems, Inc. (I) 53,600 3,278,176FactSet Research Systems, Inc. (L) 16,190 1,495,794Intuit, Inc. 99,000 5,931,090MICROS Systems, Inc. (I) 30,900 1,342,914Microsoft Corp. 2,707,485 72,073,251Oracle Corp. 1,453,255 46,649,486
Materials 0.2% 3,092,022
Chemicals 0.2%
Ecolab, Inc. 28,300 2,039,864The Sherwin-Williams Company 5,920 902,918
Containers & Packaging 0.0%
Boise, Inc. 18,200 149,240
Telecommunication Services 1.8% 29,099,375
Diversified Telecommunication Services 1.7%
AT&T, Inc. 649,805 22,177,845Verizon Communications, Inc. 138,100 6,092,972
Wireless Telecommunication Services 0.1%
Sprint Nextel Corp. (I) 144,600 828,558
Utilities 0.3% 4,581,251
Electric Utilities 0.2%
American Electric Power Company, Inc. 25,800 1,100,370Entergy Corp. 17,960 1,141,178Exelon Corp. 32,100 970,062
Multi-Utilities 0.1%
Public Service Enterprise Group, Inc. 27,100 815,439Sempra Energy 8,100 554,202
Yield(%) Shares Value
Securities Lending Collateral 4.0% $64,029,087(Cost $64,021,726)
Copyright © 2013 www.secdatabase.com. All Rights Reserved.Please Consider the Environment Before Printing This Document
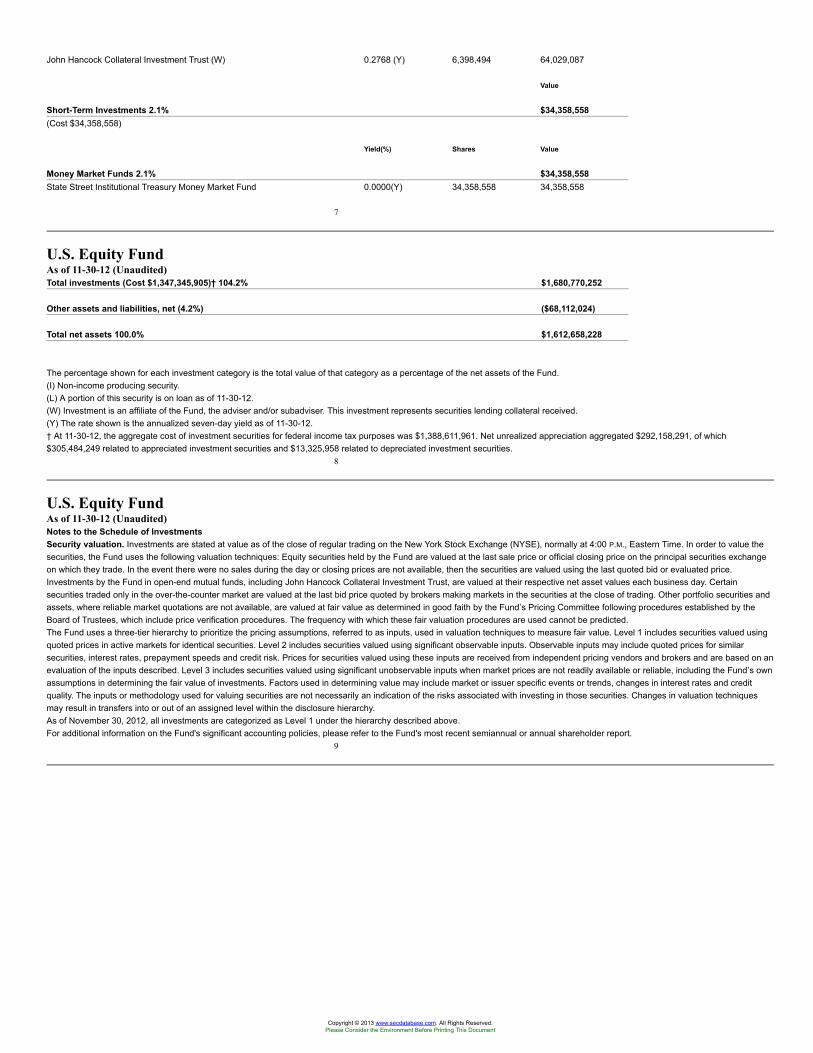
John Hancock Collateral Investment Trust (W) 0.2768 (Y) 6,398,494 64,029,087
Value
Short-Term Investments 2.1% $34,358,558(Cost $34,358,558)
Yield(%) Shares Value
Money Market Funds 2.1% $34,358,558State Street Institutional Treasury Money Market Fund 0.0000(Y) 34,358,558 34,358,558
7
U.S. Equity FundAs of 11-30-12 (Unaudited)Total investments (Cost $1,347,345,905)† 104.2% $1,680,770,252
Other assets and liabilities, net (4.2%) ($68,112,024)
Total net assets 100.0% $1,612,658,228
The percentage shown for each investment category is the total value of that category as a percentage of the net assets of the Fund.(I) Non-income producing security.(L) A portion of this security is on loan as of 11-30-12.(W) Investment is an affiliate of the Fund, the adviser and/or subadviser. This investment represents securities lending collateral received.(Y) The rate shown is the annualized seven-day yield as of 11-30-12.† At 11-30-12, the aggregate cost of investment securities for federal income tax purposes was $1,388,611,961. Net unrealized appreciation aggregated $292,158,291, of which$305,484,249 related to appreciated investment securities and $13,325,958 related to depreciated investment securities.
8
U.S. Equity FundAs of 11-30-12 (Unaudited)Notes to the Schedule of InvestmentsSecurity valuation. Investments are stated at value as of the close of regular trading on the New York Stock Exchange (NYSE), normally at 4:00 P.M., Eastern Time. In order to value thesecurities, the Fund uses the following valuation techniques: Equity securities held by the Fund are valued at the last sale price or official closing price on the principal securities exchangeon which they trade. In the event there were no sales during the day or closing prices are not available, then the securities are valued using the last quoted bid or evaluated price.Investments by the Fund in open-end mutual funds, including John Hancock Collateral Investment Trust, are valued at their respective net asset values each business day. Certainsecurities traded only in the over-the-counter market are valued at the last bid price quoted by brokers making markets in the securities at the close of trading. Other portfolio securities andassets, where reliable market quotations are not available, are valued at fair value as determined in good faith by the Fund’s Pricing Committee following procedures established by theBoard of Trustees, which include price verification procedures. The frequency with which these fair valuation procedures are used cannot be predicted.The Fund uses a three-tier hierarchy to prioritize the pricing assumptions, referred to as inputs, used in valuation techniques to measure fair value. Level 1 includes securities valued usingquoted prices in active markets for identical securities. Level 2 includes securities valued using significant observable inputs. Observable inputs may include quoted prices for similarsecurities, interest rates, prepayment speeds and credit risk. Prices for securities valued using these inputs are received from independent pricing vendors and brokers and are based on anevaluation of the inputs described. Level 3 includes securities valued using significant unobservable inputs when market prices are not readily available or reliable, including the Fund’s ownassumptions in determining the fair value of investments. Factors used in determining value may include market or issuer specific events or trends, changes in interest rates and creditquality. The inputs or methodology used for valuing securities are not necessarily an indication of the risks associated with investing in those securities. Changes in valuation techniquesmay result in transfers into or out of an assigned level within the disclosure hierarchy.As of November 30, 2012, all investments are categorized as Level 1 under the hierarchy described above.For additional information on the Fund's significant accounting policies, please refer to the Fund's most recent semiannual or annual shareholder report.
9
Copyright © 2013 www.secdatabase.com. All Rights Reserved.Please Consider the Environment Before Printing This Document
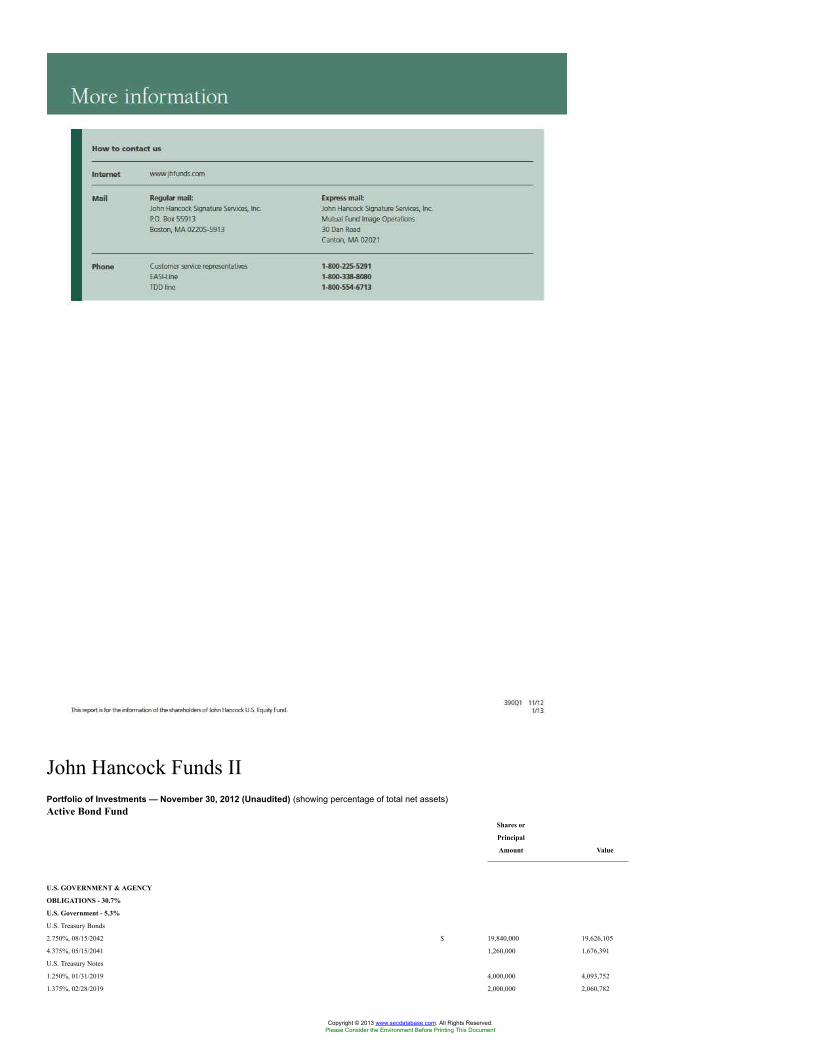
John Hancock Funds IIPortfolio of Investments — November 30, 2012 (Unaudited) (showing percentage of total net assets)Active Bond Fund
Shares or
Principal
Amount Value
U.S. GOVERNMENT & AGENCY
OBLIGATIONS - 30.7%
U.S. Government - 5.3%
U.S. Treasury Bonds
2.750%, 08/15/2042 $ 19,840,000 19,626,105
4.375%, 05/15/2041 1,260,000 1,676,391
U.S. Treasury Notes
1.250%, 01/31/2019 4,000,000 4,093,752
1.375%, 02/28/2019 2,000,000 2,060,782
Copyright © 2013 www.secdatabase.com. All Rights Reserved.Please Consider the Environment Before Printing This Document
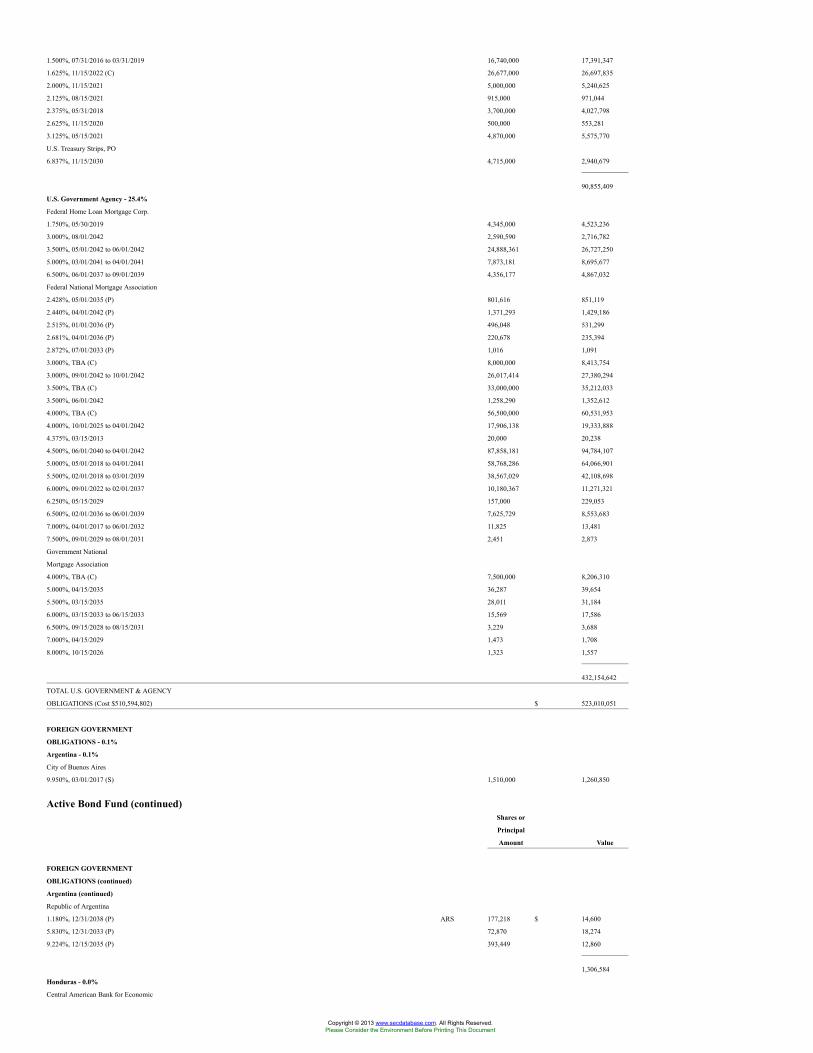
1.500%, 07/31/2016 to 03/31/2019 16,740,000 17,391,347
1.625%, 11/15/2022 (C) 26,677,000 26,697,835
2.000%, 11/15/2021 5,000,000 5,240,625
2.125%, 08/15/2021 915,000 971,044
2.375%, 05/31/2018 3,700,000 4,027,798
2.625%, 11/15/2020 500,000 553,281
3.125%, 05/15/2021 4,870,000 5,575,770
U.S. Treasury Strips, PO
6.837%, 11/15/2030 4,715,000 2,940,679
90,855,409
U.S. Government Agency - 25.4%
Federal Home Loan Mortgage Corp.
1.750%, 05/30/2019 4,345,000 4,523,236
3.000%, 08/01/2042 2,590,590 2,716,782
3.500%, 05/01/2042 to 06/01/2042 24,888,361 26,727,250
5.000%, 03/01/2041 to 04/01/2041 7,873,181 8,695,677
6.500%, 06/01/2037 to 09/01/2039 4,356,177 4,867,032
Federal National Mortgage Association
2.428%, 05/01/2035 (P) 801,616 851,119
2.440%, 04/01/2042 (P) 1,371,293 1,429,186
2.515%, 01/01/2036 (P) 496,048 531,299
2.681%, 04/01/2036 (P) 220,678 235,394
2.872%, 07/01/2033 (P) 1,016 1,091
3.000%, TBA (C) 8,000,000 8,413,754
3.000%, 09/01/2042 to 10/01/2042 26,017,414 27,380,294
3.500%, TBA (C) 33,000,000 35,212,033
3.500%, 06/01/2042 1,258,290 1,352,612
4.000%, TBA (C) 56,500,000 60,531,953
4.000%, 10/01/2025 to 04/01/2042 17,906,138 19,333,888
4.375%, 03/15/2013 20,000 20,238
4.500%, 06/01/2040 to 04/01/2042 87,858,181 94,784,107
5.000%, 05/01/2018 to 04/01/2041 58,768,286 64,066,901
5.500%, 02/01/2018 to 03/01/2039 38,567,029 42,108,698
6.000%, 09/01/2022 to 02/01/2037 10,180,367 11,271,321
6.250%, 05/15/2029 157,000 229,053
6.500%, 02/01/2036 to 06/01/2039 7,625,729 8,553,683
7.000%, 04/01/2017 to 06/01/2032 11,825 13,481
7.500%, 09/01/2029 to 08/01/2031 2,451 2,873
Government National
Mortgage Association
4.000%, TBA (C) 7,500,000 8,206,310
5.000%, 04/15/2035 36,287 39,654
5.500%, 03/15/2035 28,011 31,184
6.000%, 03/15/2033 to 06/15/2033 15,569 17,586
6.500%, 09/15/2028 to 08/15/2031 3,229 3,688
7.000%, 04/15/2029 1,473 1,708
8.000%, 10/15/2026 1,323 1,557
432,154,642
TOTAL U.S. GOVERNMENT & AGENCY
OBLIGATIONS (Cost $510,594,802) $ 523,010,051
FOREIGN GOVERNMENT
OBLIGATIONS - 0.1%
Argentina - 0.1%
City of Buenos Aires
9.950%, 03/01/2017 (S) 1,510,000 1,260,850
Active Bond Fund (continued)Shares or
Principal
Amount Value
FOREIGN GOVERNMENT
OBLIGATIONS (continued)
Argentina (continued)
Republic of Argentina
1.180%, 12/31/2038 (P) ARS 177,218 $ 14,600
5.830%, 12/31/2033 (P) 72,870 18,274
9.224%, 12/15/2035 (P) 393,449 12,860
1,306,584
Honduras - 0.0%
Central American Bank for Economic
Copyright © 2013 www.secdatabase.com. All Rights Reserved.Please Consider the Environment Before Printing This Document
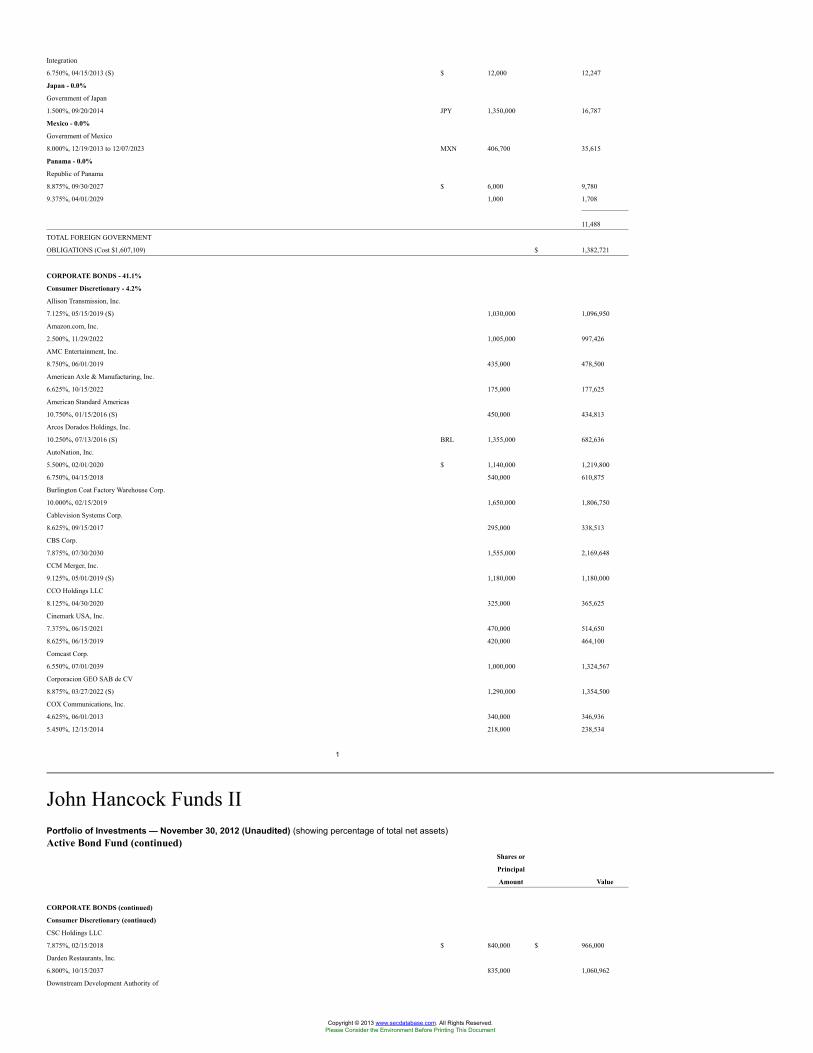
Integration
6.750%, 04/15/2013 (S) $ 12,000 12,247
Japan - 0.0%
Government of Japan
1.500%, 09/20/2014 JPY 1,350,000 16,787
Mexico - 0.0%
Government of Mexico
8.000%, 12/19/2013 to 12/07/2023 MXN 406,700 35,615
Panama - 0.0%
Republic of Panama
8.875%, 09/30/2027 $ 6,000 9,780
9.375%, 04/01/2029 1,000 1,708
11,488
TOTAL FOREIGN GOVERNMENT
OBLIGATIONS (Cost $1,607,109) $ 1,382,721
CORPORATE BONDS - 41.1%
Consumer Discretionary - 4.2%
Allison Transmission, Inc.
7.125%, 05/15/2019 (S) 1,030,000 1,096,950
Amazon.com, Inc.
2.500%, 11/29/2022 1,005,000 997,426
AMC Entertainment, Inc.
8.750%, 06/01/2019 435,000 478,500
American Axle & Manufacturing, Inc.
6.625%, 10/15/2022 175,000 177,625
American Standard Americas
10.750%, 01/15/2016 (S) 450,000 434,813
Arcos Dorados Holdings, Inc.
10.250%, 07/13/2016 (S) BRL 1,355,000 682,636
AutoNation, Inc.
5.500%, 02/01/2020 $ 1,140,000 1,219,800
6.750%, 04/15/2018 540,000 610,875
Burlington Coat Factory Warehouse Corp.
10.000%, 02/15/2019 1,650,000 1,806,750
Cablevision Systems Corp.
8.625%, 09/15/2017 295,000 338,513
CBS Corp.
7.875%, 07/30/2030 1,555,000 2,169,648
CCM Merger, Inc.
9.125%, 05/01/2019 (S) 1,180,000 1,180,000
CCO Holdings LLC
8.125%, 04/30/2020 325,000 365,625
Cinemark USA, Inc.
7.375%, 06/15/2021 470,000 514,650
8.625%, 06/15/2019 420,000 464,100
Comcast Corp.
6.550%, 07/01/2039 1,000,000 1,324,567
Corporacion GEO SAB de CV
8.875%, 03/27/2022 (S) 1,290,000 1,354,500
COX Communications, Inc.
4.625%, 06/01/2013 340,000 346,936
5.450%, 12/15/2014 218,000 238,534
1
John Hancock Funds IIPortfolio of Investments — November 30, 2012 (Unaudited) (showing percentage of total net assets)Active Bond Fund (continued)
Shares or
Principal
Amount Value
CORPORATE BONDS (continued)
Consumer Discretionary (continued)
CSC Holdings LLC
7.875%, 02/15/2018 $ 840,000 $ 966,000
Darden Restaurants, Inc.
6.800%, 10/15/2037 835,000 1,060,962
Downstream Development Authority of
Copyright © 2013 www.secdatabase.com. All Rights Reserved.Please Consider the Environment Before Printing This Document
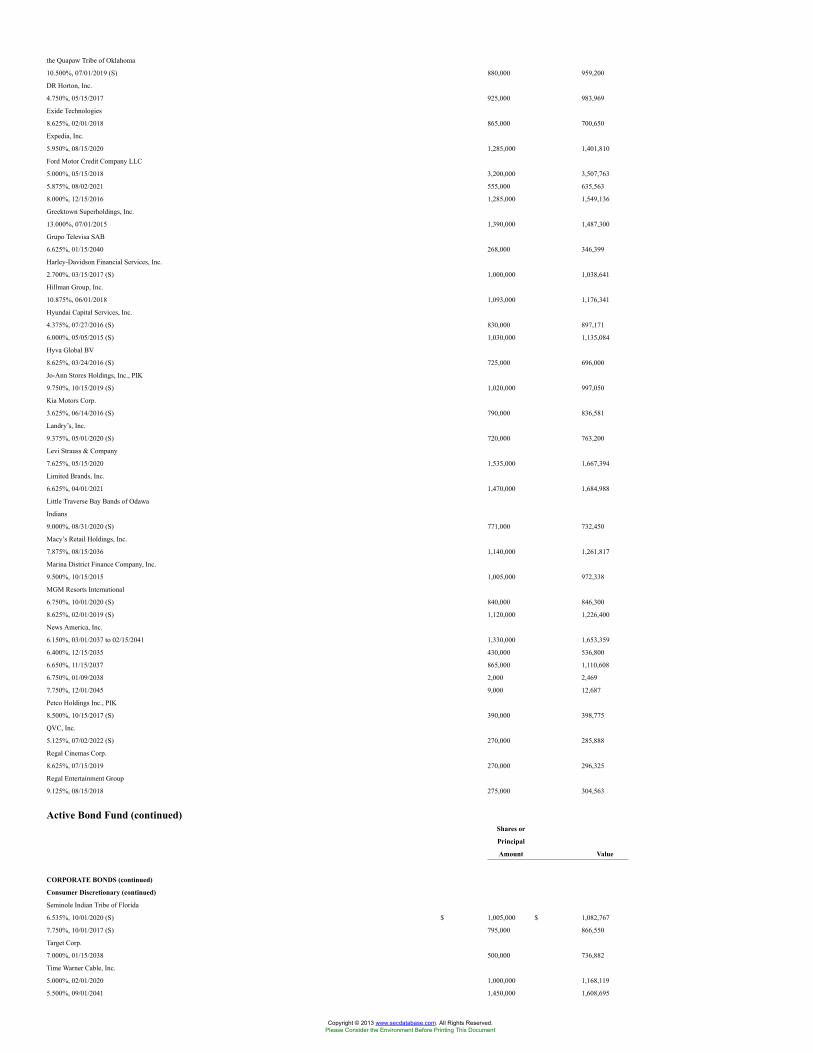
the Quapaw Tribe of Oklahoma
10.500%, 07/01/2019 (S) 880,000 959,200
DR Horton, Inc.
4.750%, 05/15/2017 925,000 983,969
Exide Technologies
8.625%, 02/01/2018 865,000 700,650
Expedia, Inc.
5.950%, 08/15/2020 1,285,000 1,401,810
Ford Motor Credit Company LLC
5.000%, 05/15/2018 3,200,000 3,507,763
5.875%, 08/02/2021 555,000 635,563
8.000%, 12/15/2016 1,285,000 1,549,136
Greektown Superholdings, Inc.
13.000%, 07/01/2015 1,390,000 1,487,300
Grupo Televisa SAB
6.625%, 01/15/2040 268,000 346,399
Harley-Davidson Financial Services, Inc.
2.700%, 03/15/2017 (S) 1,000,000 1,038,641
Hillman Group, Inc.
10.875%, 06/01/2018 1,093,000 1,176,341
Hyundai Capital Services, Inc.
4.375%, 07/27/2016 (S) 830,000 897,171
6.000%, 05/05/2015 (S) 1,030,000 1,135,084
Hyva Global BV
8.625%, 03/24/2016 (S) 725,000 696,000
Jo-Ann Stores Holdings, Inc., PIK
9.750%, 10/15/2019 (S) 1,020,000 997,050
Kia Motors Corp.
3.625%, 06/14/2016 (S) 790,000 836,581
Landry’s, Inc.
9.375%, 05/01/2020 (S) 720,000 763,200
Levi Strauss & Company
7.625%, 05/15/2020 1,535,000 1,667,394
Limited Brands, Inc.
6.625%, 04/01/2021 1,470,000 1,684,988
Little Traverse Bay Bands of Odawa
Indians
9.000%, 08/31/2020 (S) 771,000 732,450
Macy’s Retail Holdings, Inc.
7.875%, 08/15/2036 1,140,000 1,261,817
Marina District Finance Company, Inc.
9.500%, 10/15/2015 1,005,000 972,338
MGM Resorts International
6.750%, 10/01/2020 (S) 840,000 846,300
8.625%, 02/01/2019 (S) 1,120,000 1,226,400
News America, Inc.
6.150%, 03/01/2037 to 02/15/2041 1,330,000 1,653,359
6.400%, 12/15/2035 430,000 536,800
6.650%, 11/15/2037 865,000 1,110,608
6.750%, 01/09/2038 2,000 2,469
7.750%, 12/01/2045 9,000 12,687
Petco Holdings Inc., PIK
8.500%, 10/15/2017 (S) 390,000 398,775
QVC, Inc.
5.125%, 07/02/2022 (S) 270,000 285,888
Regal Cinemas Corp.
8.625%, 07/15/2019 270,000 296,325
Regal Entertainment Group
9.125%, 08/15/2018 275,000 304,563
Active Bond Fund (continued)Shares or
Principal
Amount Value
CORPORATE BONDS (continued)
Consumer Discretionary (continued)
Seminole Indian Tribe of Florida
6.535%, 10/01/2020 (S) $ 1,005,000 $ 1,082,767
7.750%, 10/01/2017 (S) 795,000 866,550
Target Corp.
7.000%, 01/15/2038 500,000 736,882
Time Warner Cable, Inc.
5.000%, 02/01/2020 1,000,000 1,168,119
5.500%, 09/01/2041 1,450,000 1,608,695
Copyright © 2013 www.secdatabase.com. All Rights Reserved.Please Consider the Environment Before Printing This Document
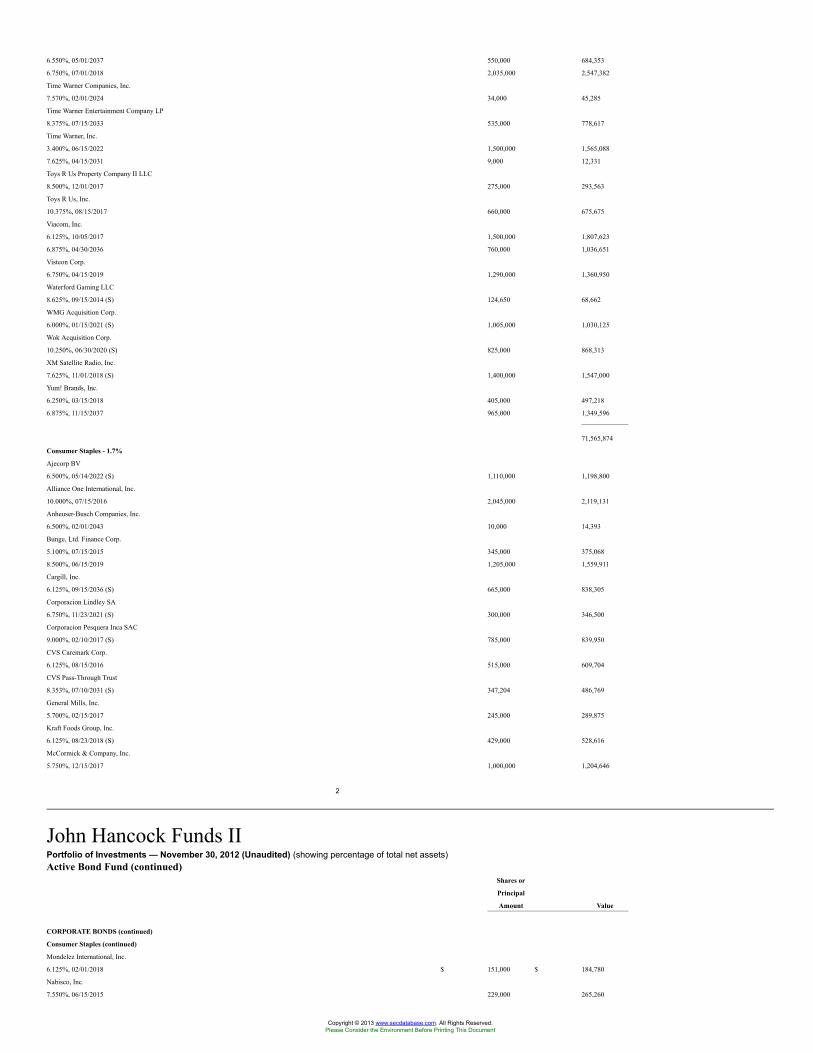
6.550%, 05/01/2037 550,000 684,353
6.750%, 07/01/2018 2,035,000 2,547,382
Time Warner Companies, Inc.
7.570%, 02/01/2024 34,000 45,285
Time Warner Entertainment Company LP
8.375%, 07/15/2033 535,000 778,617
Time Warner, Inc.
3.400%, 06/15/2022 1,500,000 1,565,088
7.625%, 04/15/2031 9,000 12,331
Toys R Us Property Company II LLC
8.500%, 12/01/2017 275,000 293,563
Toys R Us, Inc.
10.375%, 08/15/2017 660,000 675,675
Viacom, Inc.
6.125%, 10/05/2017 1,500,000 1,807,623
6.875%, 04/30/2036 760,000 1,036,651
Visteon Corp.
6.750%, 04/15/2019 1,290,000 1,360,950
Waterford Gaming LLC
8.625%, 09/15/2014 (S) 124,650 68,662
WMG Acquisition Corp.
6.000%, 01/15/2021 (S) 1,005,000 1,030,125
Wok Acquisition Corp.
10.250%, 06/30/2020 (S) 825,000 868,313
XM Satellite Radio, Inc.
7.625%, 11/01/2018 (S) 1,400,000 1,547,000
Yum! Brands, Inc.
6.250%, 03/15/2018 405,000 497,218
6.875%, 11/15/2037 965,000 1,349,596
71,565,874
Consumer Staples - 1.7%
Ajecorp BV
6.500%, 05/14/2022 (S) 1,110,000 1,198,800
Alliance One International, Inc.
10.000%, 07/15/2016 2,045,000 2,119,131
Anheuser-Busch Companies, Inc.
6.500%, 02/01/2043 10,000 14,393
Bunge, Ltd. Finance Corp.
5.100%, 07/15/2015 345,000 375,068
8.500%, 06/15/2019 1,205,000 1,559,911
Cargill, Inc.
6.125%, 09/15/2036 (S) 665,000 838,305
Corporacion Lindley SA
6.750%, 11/23/2021 (S) 300,000 346,500
Corporacion Pesquera Inca SAC
9.000%, 02/10/2017 (S) 785,000 839,950
CVS Caremark Corp.
6.125%, 08/15/2016 515,000 609,704
CVS Pass-Through Trust
8.353%, 07/10/2031 (S) 347,204 486,769
General Mills, Inc.
5.700%, 02/15/2017 245,000 289,875
Kraft Foods Group, Inc.
6.125%, 08/23/2018 (S) 429,000 528,616
McCormick & Company, Inc.
5.750%, 12/15/2017 1,000,000 1,204,646
2
John Hancock Funds IIPortfolio of Investments — November 30, 2012 (Unaudited) (showing percentage of total net assets)Active Bond Fund (continued)
Shares or
Principal
Amount Value
CORPORATE BONDS (continued)
Consumer Staples (continued)
Mondelez International, Inc.
6.125%, 02/01/2018 $ 151,000 $ 184,780
Nabisco, Inc.
7.550%, 06/15/2015 229,000 265,260
Copyright © 2013 www.secdatabase.com. All Rights Reserved.Please Consider the Environment Before Printing This Document
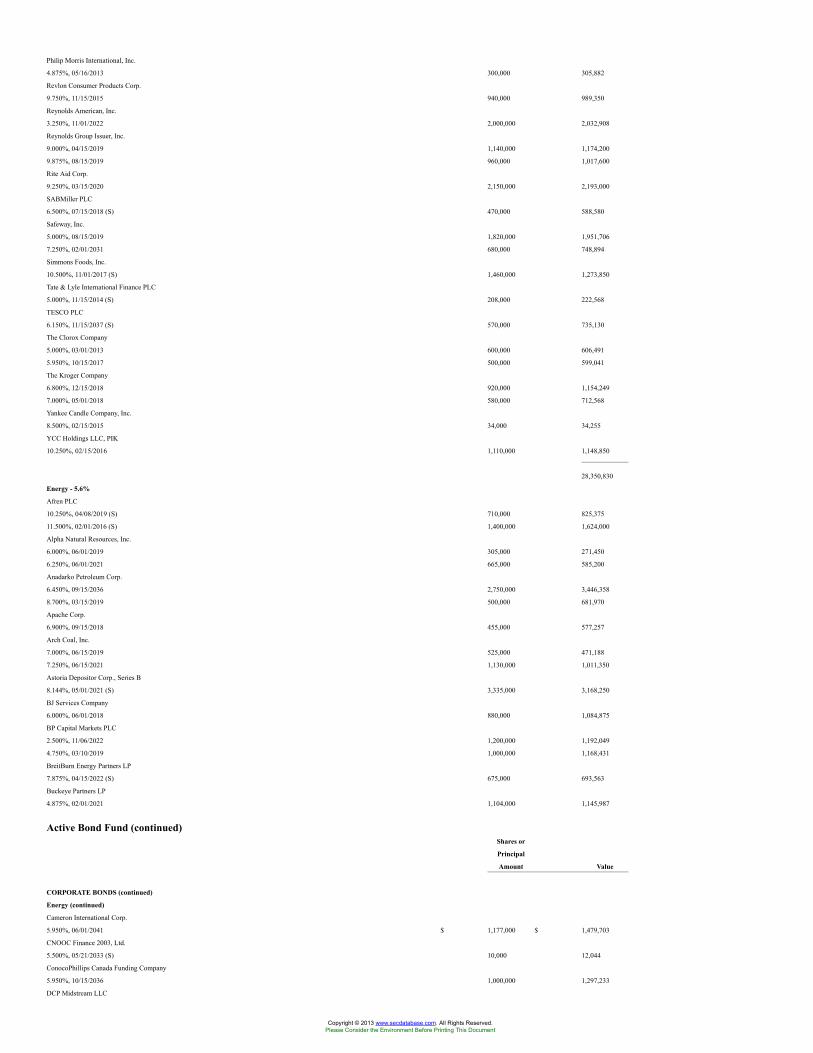
Philip Morris International, Inc.
4.875%, 05/16/2013 300,000 305,882
Revlon Consumer Products Corp.
9.750%, 11/15/2015 940,000 989,350
Reynolds American, Inc.
3.250%, 11/01/2022 2,000,000 2,032,908
Reynolds Group Issuer, Inc.
9.000%, 04/15/2019 1,140,000 1,174,200
9.875%, 08/15/2019 960,000 1,017,600
Rite Aid Corp.
9.250%, 03/15/2020 2,150,000 2,193,000
SABMiller PLC
6.500%, 07/15/2018 (S) 470,000 588,580
Safeway, Inc.
5.000%, 08/15/2019 1,820,000 1,951,706
7.250%, 02/01/2031 680,000 748,894
Simmons Foods, Inc.
10.500%, 11/01/2017 (S) 1,460,000 1,273,850
Tate & Lyle International Finance PLC
5.000%, 11/15/2014 (S) 208,000 222,568
TESCO PLC
6.150%, 11/15/2037 (S) 570,000 735,130
The Clorox Company
5.000%, 03/01/2013 600,000 606,491
5.950%, 10/15/2017 500,000 599,041
The Kroger Company
6.800%, 12/15/2018 920,000 1,154,249
7.000%, 05/01/2018 580,000 712,568
Yankee Candle Company, Inc.
8.500%, 02/15/2015 34,000 34,255
YCC Holdings LLC, PIK
10.250%, 02/15/2016 1,110,000 1,148,850
28,350,830
Energy - 5.6%
Afren PLC
10.250%, 04/08/2019 (S) 710,000 825,375
11.500%, 02/01/2016 (S) 1,400,000 1,624,000
Alpha Natural Resources, Inc.
6.000%, 06/01/2019 305,000 271,450
6.250%, 06/01/2021 665,000 585,200
Anadarko Petroleum Corp.
6.450%, 09/15/2036 2,750,000 3,446,358
8.700%, 03/15/2019 500,000 681,970
Apache Corp.
6.900%, 09/15/2018 455,000 577,257
Arch Coal, Inc.
7.000%, 06/15/2019 525,000 471,188
7.250%, 06/15/2021 1,130,000 1,011,350
Astoria Depositor Corp., Series B
8.144%, 05/01/2021 (S) 3,335,000 3,168,250
BJ Services Company
6.000%, 06/01/2018 880,000 1,084,875
BP Capital Markets PLC
2.500%, 11/06/2022 1,200,000 1,192,049
4.750%, 03/10/2019 1,000,000 1,168,431
BreitBurn Energy Partners LP
7.875%, 04/15/2022 (S) 675,000 693,563
Buckeye Partners LP
4.875%, 02/01/2021 1,104,000 1,145,987
Active Bond Fund (continued)Shares or
Principal
Amount Value
CORPORATE BONDS (continued)
Energy (continued)
Cameron International Corp.
5.950%, 06/01/2041 $ 1,177,000 $ 1,479,703
CNOOC Finance 2003, Ltd.
5.500%, 05/21/2033 (S) 10,000 12,044
ConocoPhillips Canada Funding Company
5.950%, 10/15/2036 1,000,000 1,297,233
DCP Midstream LLC
Copyright © 2013 www.secdatabase.com. All Rights Reserved.Please Consider the Environment Before Printing This Document
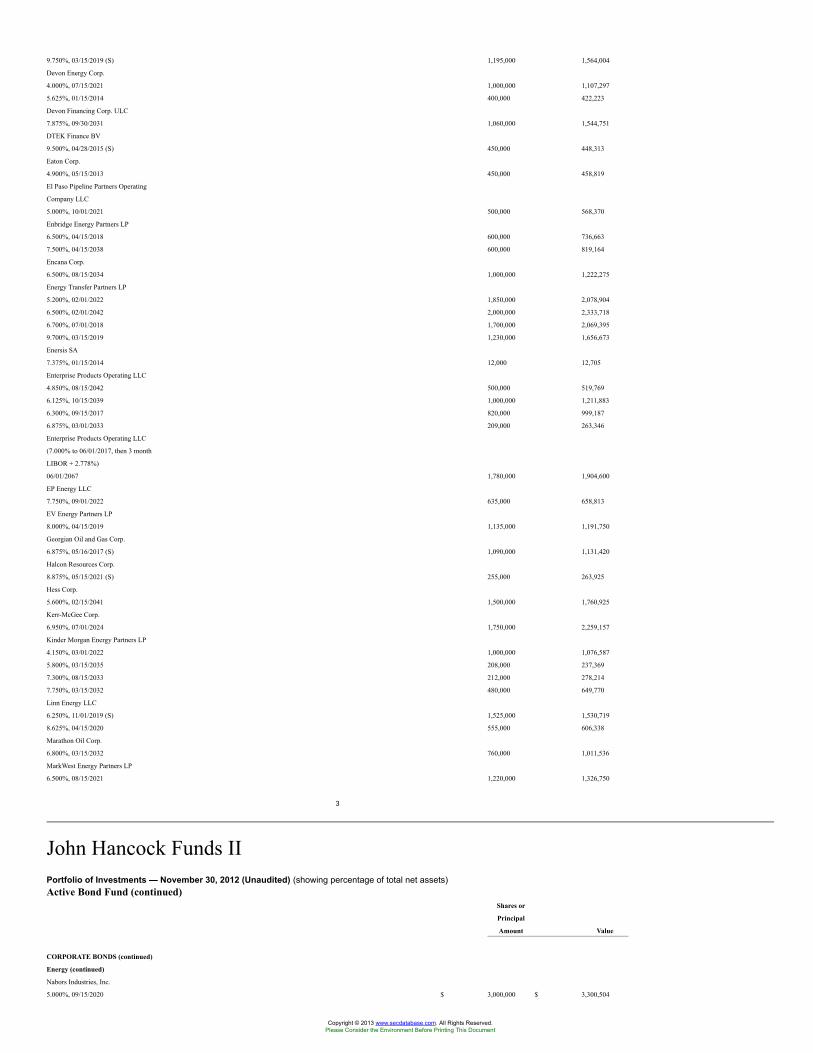
9.750%, 03/15/2019 (S) 1,195,000 1,564,004
Devon Energy Corp.
4.000%, 07/15/2021 1,000,000 1,107,297
5.625%, 01/15/2014 400,000 422,223
Devon Financing Corp. ULC
7.875%, 09/30/2031 1,060,000 1,544,751
DTEK Finance BV
9.500%, 04/28/2015 (S) 450,000 448,313
Eaton Corp.
4.900%, 05/15/2013 450,000 458,819
El Paso Pipeline Partners Operating
Company LLC
5.000%, 10/01/2021 500,000 568,370
Enbridge Energy Partners LP
6.500%, 04/15/2018 600,000 736,663
7.500%, 04/15/2038 600,000 819,164
Encana Corp.
6.500%, 08/15/2034 1,000,000 1,222,275
Energy Transfer Partners LP
5.200%, 02/01/2022 1,850,000 2,078,904
6.500%, 02/01/2042 2,000,000 2,333,718
6.700%, 07/01/2018 1,700,000 2,069,395
9.700%, 03/15/2019 1,230,000 1,656,673
Enersis SA
7.375%, 01/15/2014 12,000 12,705
Enterprise Products Operating LLC
4.850%, 08/15/2042 500,000 519,769
6.125%, 10/15/2039 1,000,000 1,211,883
6.300%, 09/15/2017 820,000 999,187
6.875%, 03/01/2033 209,000 263,346
Enterprise Products Operating LLC
(7.000% to 06/01/2017, then 3 month
LIBOR + 2.778%)
06/01/2067 1,780,000 1,904,600
EP Energy LLC
7.750%, 09/01/2022 635,000 658,813
EV Energy Partners LP
8.000%, 04/15/2019 1,135,000 1,191,750
Georgian Oil and Gas Corp.
6.875%, 05/16/2017 (S) 1,090,000 1,131,420
Halcon Resources Corp.
8.875%, 05/15/2021 (S) 255,000 263,925
Hess Corp.
5.600%, 02/15/2041 1,500,000 1,760,925
Kerr-McGee Corp.
6.950%, 07/01/2024 1,750,000 2,259,157
Kinder Morgan Energy Partners LP
4.150%, 03/01/2022 1,000,000 1,076,587
5.800%, 03/15/2035 208,000 237,369
7.300%, 08/15/2033 212,000 278,214
7.750%, 03/15/2032 480,000 649,770
Linn Energy LLC
6.250%, 11/01/2019 (S) 1,525,000 1,530,719
8.625%, 04/15/2020 555,000 606,338
Marathon Oil Corp.
6.800%, 03/15/2032 760,000 1,011,536
MarkWest Energy Partners LP
6.500%, 08/15/2021 1,220,000 1,326,750
3
John Hancock Funds IIPortfolio of Investments — November 30, 2012 (Unaudited) (showing percentage of total net assets)Active Bond Fund (continued)
Shares or
Principal
Amount Value
CORPORATE BONDS (continued)
Energy (continued)
Nabors Industries, Inc.
5.000%, 09/15/2020 $ 3,000,000 $ 3,300,504
Copyright © 2013 www.secdatabase.com. All Rights Reserved.Please Consider the Environment Before Printing This Document
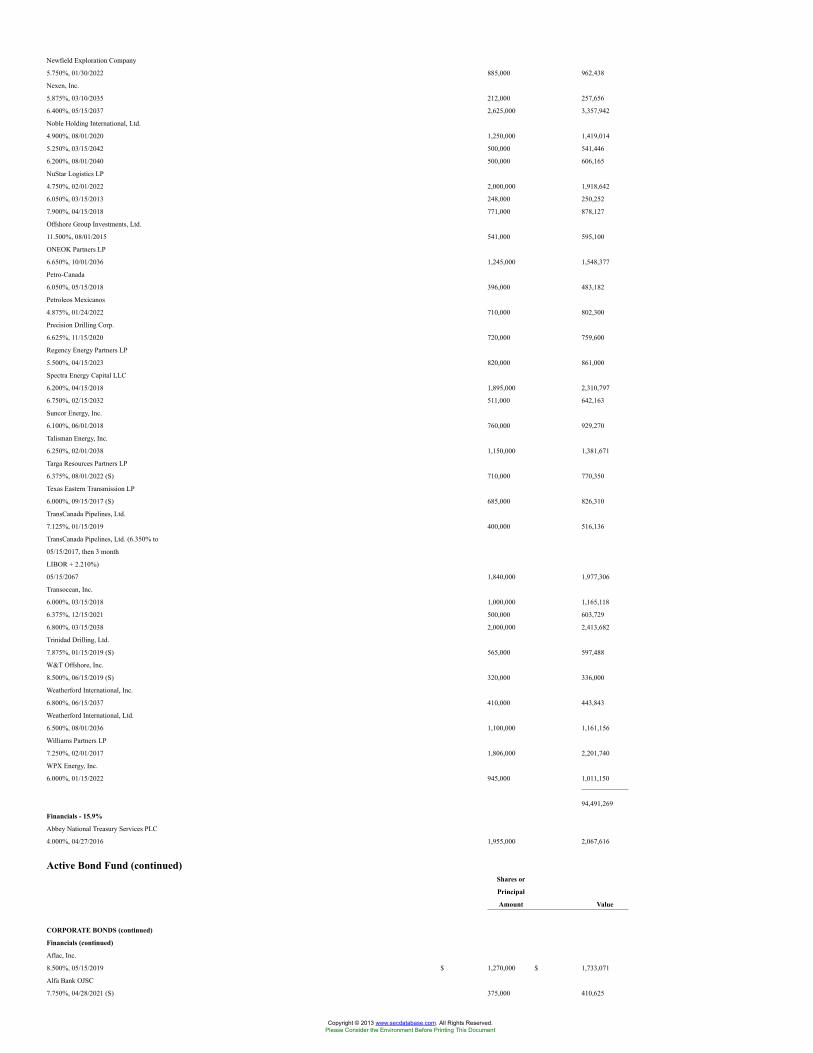
Newfield Exploration Company
5.750%, 01/30/2022 885,000 962,438
Nexen, Inc.
5.875%, 03/10/2035 212,000 257,656
6.400%, 05/15/2037 2,625,000 3,357,942
Noble Holding International, Ltd.
4.900%, 08/01/2020 1,250,000 1,419,014
5.250%, 03/15/2042 500,000 541,446
6.200%, 08/01/2040 500,000 606,165
NuStar Logistics LP
4.750%, 02/01/2022 2,000,000 1,918,642
6.050%, 03/15/2013 248,000 250,252
7.900%, 04/15/2018 771,000 878,127
Offshore Group Investments, Ltd.
11.500%, 08/01/2015 541,000 595,100
ONEOK Partners LP
6.650%, 10/01/2036 1,245,000 1,548,377
Petro-Canada
6.050%, 05/15/2018 396,000 483,182
Petroleos Mexicanos
4.875%, 01/24/2022 710,000 802,300
Precision Drilling Corp.
6.625%, 11/15/2020 720,000 759,600
Regency Energy Partners LP
5.500%, 04/15/2023 820,000 861,000
Spectra Energy Capital LLC
6.200%, 04/15/2018 1,895,000 2,310,797
6.750%, 02/15/2032 511,000 642,163
Suncor Energy, Inc.
6.100%, 06/01/2018 760,000 929,270
Talisman Energy, Inc.
6.250%, 02/01/2038 1,150,000 1,381,671
Targa Resources Partners LP
6.375%, 08/01/2022 (S) 710,000 770,350
Texas Eastern Transmission LP
6.000%, 09/15/2017 (S) 685,000 826,310
TransCanada Pipelines, Ltd.
7.125%, 01/15/2019 400,000 516,136
TransCanada Pipelines, Ltd. (6.350% to
05/15/2017, then 3 month
LIBOR + 2.210%)
05/15/2067 1,840,000 1,977,306
Transocean, Inc.
6.000%, 03/15/2018 1,000,000 1,165,118
6.375%, 12/15/2021 500,000 603,729
6.800%, 03/15/2038 2,000,000 2,413,682
Trinidad Drilling, Ltd.
7.875%, 01/15/2019 (S) 565,000 597,488
W&T Offshore, Inc.
8.500%, 06/15/2019 (S) 320,000 336,000
Weatherford International, Inc.
6.800%, 06/15/2037 410,000 443,843
Weatherford International, Ltd.
6.500%, 08/01/2036 1,100,000 1,161,156
Williams Partners LP
7.250%, 02/01/2017 1,806,000 2,201,740
WPX Energy, Inc.
6.000%, 01/15/2022 945,000 1,011,150
94,491,269
Financials - 15.9%
Abbey National Treasury Services PLC
4.000%, 04/27/2016 1,955,000 2,067,616
Active Bond Fund (continued)Shares or
Principal
Amount Value
CORPORATE BONDS (continued)
Financials (continued)
Aflac, Inc.
8.500%, 05/15/2019 $ 1,270,000 $ 1,733,071
Alfa Bank OJSC
7.750%, 04/28/2021 (S) 375,000 410,625
Copyright © 2013 www.secdatabase.com. All Rights Reserved.Please Consider the Environment Before Printing This Document
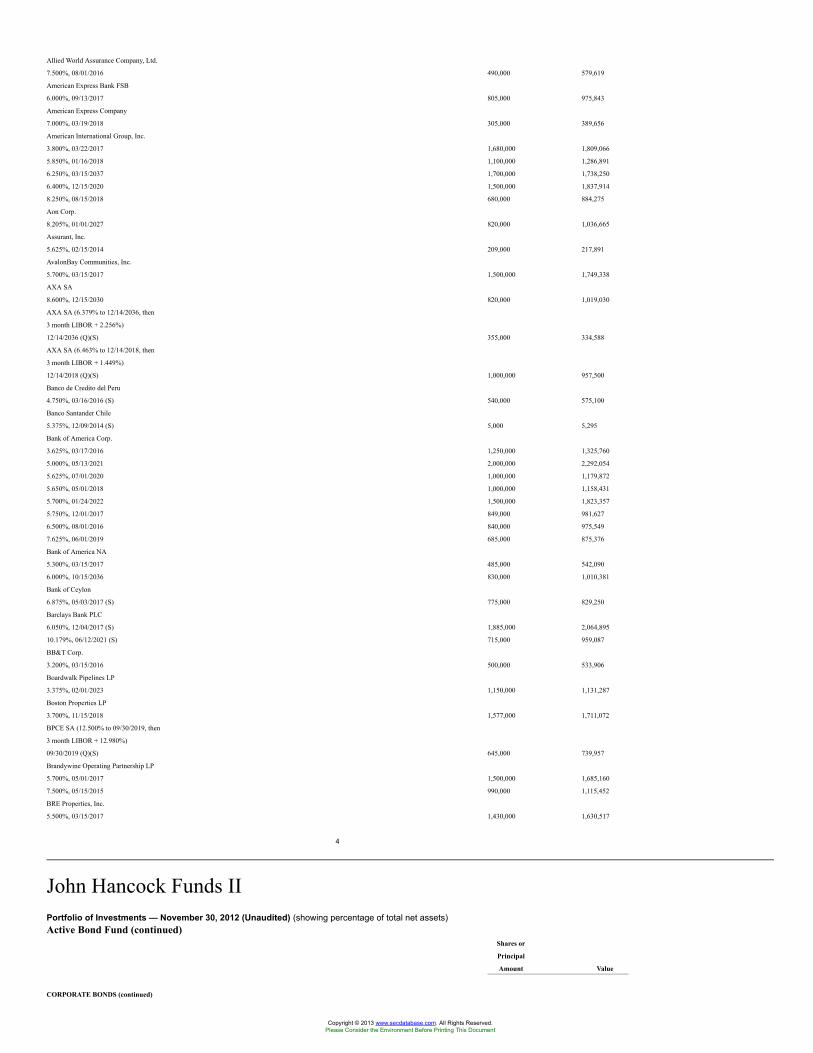
Allied World Assurance Company, Ltd.
7.500%, 08/01/2016 490,000 579,619
American Express Bank FSB
6.000%, 09/13/2017 805,000 975,843
American Express Company
7.000%, 03/19/2018 305,000 389,656
American International Group, Inc.
3.800%, 03/22/2017 1,680,000 1,809,066
5.850%, 01/16/2018 1,100,000 1,286,891
6.250%, 03/15/2037 1,700,000 1,738,250
6.400%, 12/15/2020 1,500,000 1,837,914
8.250%, 08/15/2018 680,000 884,275
Aon Corp.
8.205%, 01/01/2027 820,000 1,036,665
Assurant, Inc.
5.625%, 02/15/2014 209,000 217,891
AvalonBay Communities, Inc.
5.700%, 03/15/2017 1,500,000 1,749,338
AXA SA
8.600%, 12/15/2030 820,000 1,019,030
AXA SA (6.379% to 12/14/2036, then
3 month LIBOR + 2.256%)
12/14/2036 (Q)(S) 355,000 334,588
AXA SA (6.463% to 12/14/2018, then
3 month LIBOR + 1.449%)
12/14/2018 (Q)(S) 1,000,000 957,500
Banco de Credito del Peru
4.750%, 03/16/2016 (S) 540,000 575,100
Banco Santander Chile
5.375%, 12/09/2014 (S) 5,000 5,295
Bank of America Corp.
3.625%, 03/17/2016 1,250,000 1,325,760
5.000%, 05/13/2021 2,000,000 2,292,054
5.625%, 07/01/2020 1,000,000 1,179,872
5.650%, 05/01/2018 1,000,000 1,158,431
5.700%, 01/24/2022 1,500,000 1,823,357
5.750%, 12/01/2017 849,000 981,627
6.500%, 08/01/2016 840,000 975,549
7.625%, 06/01/2019 685,000 875,376
Bank of America NA
5.300%, 03/15/2017 485,000 542,090
6.000%, 10/15/2036 830,000 1,010,381
Bank of Ceylon
6.875%, 05/03/2017 (S) 775,000 829,250
Barclays Bank PLC
6.050%, 12/04/2017 (S) 1,885,000 2,064,895
10.179%, 06/12/2021 (S) 715,000 959,087
BB&T Corp.
3.200%, 03/15/2016 500,000 533,906
Boardwalk Pipelines LP
3.375%, 02/01/2023 1,150,000 1,131,287
Boston Properties LP
3.700%, 11/15/2018 1,577,000 1,711,072
BPCE SA (12.500% to 09/30/2019, then
3 month LIBOR + 12.980%)
09/30/2019 (Q)(S) 645,000 739,957
Brandywine Operating Partnership LP
5.700%, 05/01/2017 1,500,000 1,685,160
7.500%, 05/15/2015 990,000 1,115,452
BRE Properties, Inc.
5.500%, 03/15/2017 1,430,000 1,630,517
4
John Hancock Funds IIPortfolio of Investments — November 30, 2012 (Unaudited) (showing percentage of total net assets)Active Bond Fund (continued)
Shares or
Principal
Amount Value
CORPORATE BONDS (continued)
Copyright © 2013 www.secdatabase.com. All Rights Reserved.Please Consider the Environment Before Printing This Document
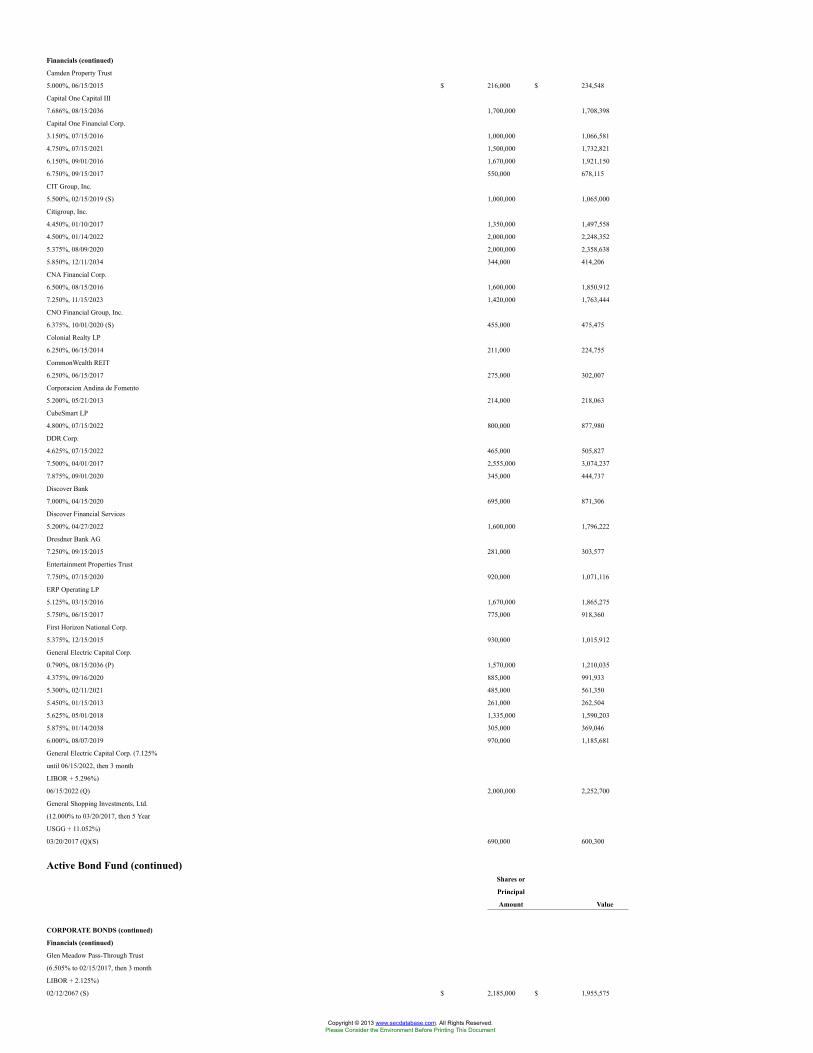
Financials (continued)
Camden Property Trust
5.000%, 06/15/2015 $ 216,000 $ 234,548
Capital One Capital III
7.686%, 08/15/2036 1,700,000 1,708,398
Capital One Financial Corp.
3.150%, 07/15/2016 1,000,000 1,066,581
4.750%, 07/15/2021 1,500,000 1,732,821
6.150%, 09/01/2016 1,670,000 1,921,150
6.750%, 09/15/2017 550,000 678,115
CIT Group, Inc.
5.500%, 02/15/2019 (S) 1,000,000 1,065,000
Citigroup, Inc.
4.450%, 01/10/2017 1,350,000 1,497,558
4.500%, 01/14/2022 2,000,000 2,248,352
5.375%, 08/09/2020 2,000,000 2,358,638
5.850%, 12/11/2034 344,000 414,206
CNA Financial Corp.
6.500%, 08/15/2016 1,600,000 1,850,912
7.250%, 11/15/2023 1,420,000 1,763,444
CNO Financial Group, Inc.
6.375%, 10/01/2020 (S) 455,000 475,475
Colonial Realty LP
6.250%, 06/15/2014 211,000 224,755
CommonWealth REIT
6.250%, 06/15/2017 275,000 302,007
Corporacion Andina de Fomento
5.200%, 05/21/2013 214,000 218,063
CubeSmart LP
4.800%, 07/15/2022 800,000 877,980
DDR Corp.
4.625%, 07/15/2022 465,000 505,827
7.500%, 04/01/2017 2,555,000 3,074,237
7.875%, 09/01/2020 345,000 444,737
Discover Bank
7.000%, 04/15/2020 695,000 871,306
Discover Financial Services
5.200%, 04/27/2022 1,600,000 1,796,222
Dresdner Bank AG
7.250%, 09/15/2015 281,000 303,577
Entertainment Properties Trust
7.750%, 07/15/2020 920,000 1,071,116
ERP Operating LP
5.125%, 03/15/2016 1,670,000 1,865,275
5.750%, 06/15/2017 775,000 918,360
First Horizon National Corp.
5.375%, 12/15/2015 930,000 1,015,912
General Electric Capital Corp.
0.790%, 08/15/2036 (P) 1,570,000 1,210,035
4.375%, 09/16/2020 885,000 991,933
5.300%, 02/11/2021 485,000 561,350
5.450%, 01/15/2013 261,000 262,504
5.625%, 05/01/2018 1,335,000 1,590,203
5.875%, 01/14/2038 305,000 369,046
6.000%, 08/07/2019 970,000 1,185,681
General Electric Capital Corp. (7.125%
until 06/15/2022, then 3 month
LIBOR + 5.296%)
06/15/2022 (Q) 2,000,000 2,252,700
General Shopping Investments, Ltd.
(12.000% to 03/20/2017, then 5 Year
USGG + 11.052%)
03/20/2017 (Q)(S) 690,000 600,300
Active Bond Fund (continued)Shares or
Principal
Amount Value
CORPORATE BONDS (continued)
Financials (continued)
Glen Meadow Pass-Through Trust
(6.505% to 02/15/2017, then 3 month
LIBOR + 2.125%)
02/12/2067 (S) $ 2,185,000 $ 1,955,575
Copyright © 2013 www.secdatabase.com. All Rights Reserved.Please Consider the Environment Before Printing This Document
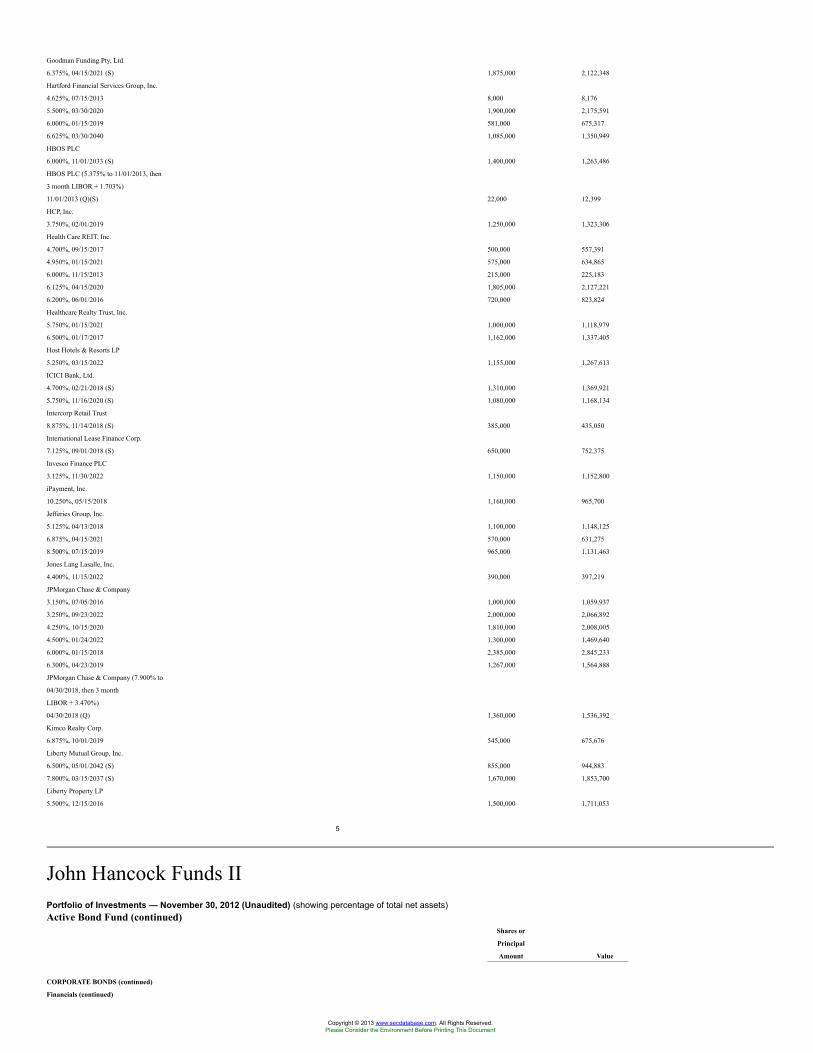
Goodman Funding Pty, Ltd.
6.375%, 04/15/2021 (S) 1,875,000 2,122,348
Hartford Financial Services Group, Inc.
4.625%, 07/15/2013 8,000 8,176
5.500%, 03/30/2020 1,900,000 2,175,591
6.000%, 01/15/2019 581,000 675,317
6.625%, 03/30/2040 1,085,000 1,350,949
HBOS PLC
6.000%, 11/01/2033 (S) 1,400,000 1,263,486
HBOS PLC (5.375% to 11/01/2013, then
3 month LIBOR + 1.703%)
11/01/2013 (Q)(S) 22,000 12,399
HCP, Inc.
3.750%, 02/01/2019 1,250,000 1,323,306
Health Care REIT, Inc.
4.700%, 09/15/2017 500,000 557,391
4.950%, 01/15/2021 575,000 634,865
6.000%, 11/15/2013 215,000 225,183
6.125%, 04/15/2020 1,805,000 2,127,221
6.200%, 06/01/2016 720,000 823,824
Healthcare Realty Trust, Inc.
5.750%, 01/15/2021 1,000,000 1,118,979
6.500%, 01/17/2017 1,162,000 1,337,405
Host Hotels & Resorts LP
5.250%, 03/15/2022 1,155,000 1,267,613
ICICI Bank, Ltd.
4.700%, 02/21/2018 (S) 1,310,000 1,369,921
5.750%, 11/16/2020 (S) 1,080,000 1,168,134
Intercorp Retail Trust
8.875%, 11/14/2018 (S) 385,000 435,050
International Lease Finance Corp.
7.125%, 09/01/2018 (S) 650,000 752,375
Invesco Finance PLC
3.125%, 11/30/2022 1,150,000 1,152,800
iPayment, Inc.
10.250%, 05/15/2018 1,160,000 965,700
Jefferies Group, Inc.
5.125%, 04/13/2018 1,100,000 1,148,125
6.875%, 04/15/2021 570,000 631,275
8.500%, 07/15/2019 965,000 1,131,463
Jones Lang Lasalle, Inc.
4.400%, 11/15/2022 390,000 397,219
JPMorgan Chase & Company
3.150%, 07/05/2016 1,000,000 1,059,937
3.250%, 09/23/2022 2,000,000 2,066,892
4.250%, 10/15/2020 1,810,000 2,008,005
4.500%, 01/24/2022 1,300,000 1,469,640
6.000%, 01/15/2018 2,385,000 2,845,233
6.300%, 04/23/2019 1,267,000 1,564,888
JPMorgan Chase & Company (7.900% to
04/30/2018, then 3 month
LIBOR + 3.470%)
04/30/2018 (Q) 1,360,000 1,536,392
Kimco Realty Corp.
6.875%, 10/01/2019 545,000 675,676
Liberty Mutual Group, Inc.
6.500%, 05/01/2042 (S) 855,000 944,883
7.800%, 03/15/2037 (S) 1,670,000 1,853,700
Liberty Property LP
5.500%, 12/15/2016 1,500,000 1,711,053
5
John Hancock Funds IIPortfolio of Investments — November 30, 2012 (Unaudited) (showing percentage of total net assets)Active Bond Fund (continued)
Shares or
Principal
Amount Value
CORPORATE BONDS (continued)
Financials (continued)
Copyright © 2013 www.secdatabase.com. All Rights Reserved.Please Consider the Environment Before Printing This Document
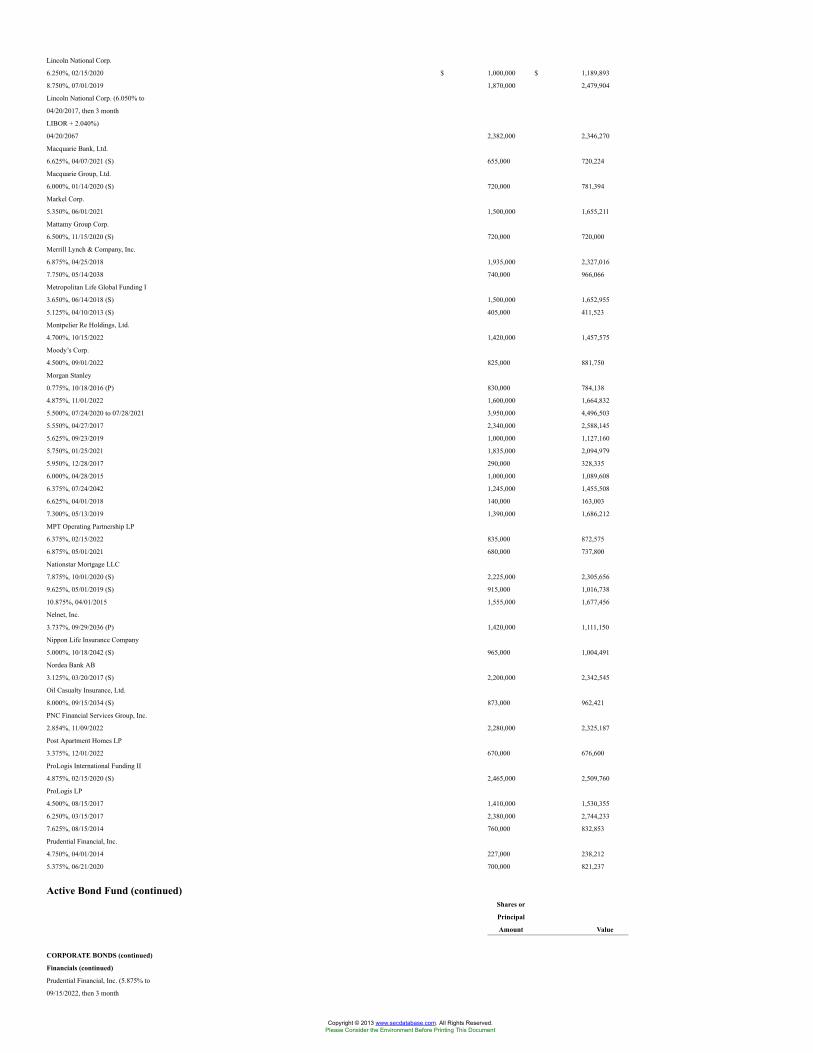
Lincoln National Corp.
6.250%, 02/15/2020 $ 1,000,000 $ 1,189,893
8.750%, 07/01/2019 1,870,000 2,479,904
Lincoln National Corp. (6.050% to
04/20/2017, then 3 month
LIBOR + 2.040%)
04/20/2067 2,382,000 2,346,270
Macquarie Bank, Ltd.
6.625%, 04/07/2021 (S) 655,000 720,224
Macquarie Group, Ltd.
6.000%, 01/14/2020 (S) 720,000 781,394
Markel Corp.
5.350%, 06/01/2021 1,500,000 1,655,211
Mattamy Group Corp.
6.500%, 11/15/2020 (S) 720,000 720,000
Merrill Lynch & Company, Inc.
6.875%, 04/25/2018 1,935,000 2,327,016
7.750%, 05/14/2038 740,000 966,066
Metropolitan Life Global Funding I
3.650%, 06/14/2018 (S) 1,500,000 1,652,955
5.125%, 04/10/2013 (S) 405,000 411,523
Montpelier Re Holdings, Ltd.
4.700%, 10/15/2022 1,420,000 1,457,575
Moody’s Corp.
4.500%, 09/01/2022 825,000 881,750
Morgan Stanley
0.775%, 10/18/2016 (P) 830,000 784,138
4.875%, 11/01/2022 1,600,000 1,664,832
5.500%, 07/24/2020 to 07/28/2021 3,950,000 4,496,503
5.550%, 04/27/2017 2,340,000 2,588,145
5.625%, 09/23/2019 1,000,000 1,127,160
5.750%, 01/25/2021 1,835,000 2,094,979
5.950%, 12/28/2017 290,000 328,335
6.000%, 04/28/2015 1,000,000 1,089,608
6.375%, 07/24/2042 1,245,000 1,455,508
6.625%, 04/01/2018 140,000 163,003
7.300%, 05/13/2019 1,390,000 1,686,212
MPT Operating Partnership LP
6.375%, 02/15/2022 835,000 872,575
6.875%, 05/01/2021 680,000 737,800
Nationstar Mortgage LLC
7.875%, 10/01/2020 (S) 2,225,000 2,305,656
9.625%, 05/01/2019 (S) 915,000 1,016,738
10.875%, 04/01/2015 1,555,000 1,677,456
Nelnet, Inc.
3.737%, 09/29/2036 (P) 1,420,000 1,111,150
Nippon Life Insurance Company
5.000%, 10/18/2042 (S) 965,000 1,004,491
Nordea Bank AB
3.125%, 03/20/2017 (S) 2,200,000 2,342,545
Oil Casualty Insurance, Ltd.
8.000%, 09/15/2034 (S) 873,000 962,421
PNC Financial Services Group, Inc.
2.854%, 11/09/2022 2,280,000 2,325,187
Post Apartment Homes LP
3.375%, 12/01/2022 670,000 676,600
ProLogis International Funding II
4.875%, 02/15/2020 (S) 2,465,000 2,509,760
ProLogis LP
4.500%, 08/15/2017 1,410,000 1,530,355
6.250%, 03/15/2017 2,380,000 2,744,233
7.625%, 08/15/2014 760,000 832,853
Prudential Financial, Inc.
4.750%, 04/01/2014 227,000 238,212
5.375%, 06/21/2020 700,000 821,237
Active Bond Fund (continued)Shares or
Principal
Amount Value
CORPORATE BONDS (continued)
Financials (continued)
Prudential Financial, Inc. (5.875% to
09/15/2022, then 3 month
Copyright © 2013 www.secdatabase.com. All Rights Reserved.Please Consider the Environment Before Printing This Document
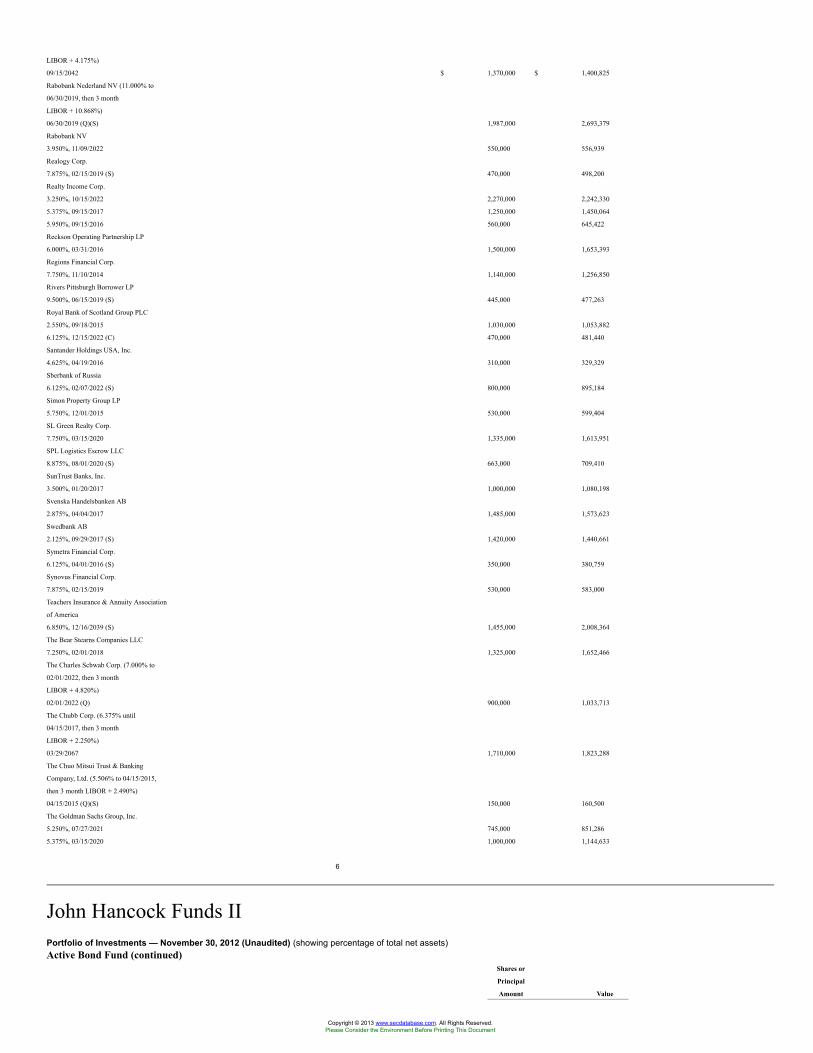
LIBOR + 4.175%)
09/15/2042 $ 1,370,000 $ 1,400,825
Rabobank Nederland NV (11.000% to
06/30/2019, then 3 month
LIBOR + 10.868%)
06/30/2019 (Q)(S) 1,987,000 2,693,379
Rabobank NV
3.950%, 11/09/2022 550,000 556,939
Realogy Corp.
7.875%, 02/15/2019 (S) 470,000 498,200
Realty Income Corp.
3.250%, 10/15/2022 2,270,000 2,242,330
5.375%, 09/15/2017 1,250,000 1,450,064
5.950%, 09/15/2016 560,000 645,422
Reckson Operating Partnership LP
6.000%, 03/31/2016 1,500,000 1,653,393
Regions Financial Corp.
7.750%, 11/10/2014 1,140,000 1,256,850
Rivers Pittsburgh Borrower LP
9.500%, 06/15/2019 (S) 445,000 477,263
Royal Bank of Scotland Group PLC
2.550%, 09/18/2015 1,030,000 1,053,882
6.125%, 12/15/2022 (C) 470,000 481,440
Santander Holdings USA, Inc.
4.625%, 04/19/2016 310,000 329,329
Sberbank of Russia
6.125%, 02/07/2022 (S) 800,000 895,184
Simon Property Group LP
5.750%, 12/01/2015 530,000 599,404
SL Green Realty Corp.
7.750%, 03/15/2020 1,335,000 1,613,951
SPL Logistics Escrow LLC
8.875%, 08/01/2020 (S) 663,000 709,410
SunTrust Banks, Inc.
3.500%, 01/20/2017 1,000,000 1,080,198
Svenska Handelsbanken AB
2.875%, 04/04/2017 1,485,000 1,573,623
Swedbank AB
2.125%, 09/29/2017 (S) 1,420,000 1,440,661
Symetra Financial Corp.
6.125%, 04/01/2016 (S) 350,000 380,759
Synovus Financial Corp.
7.875%, 02/15/2019 530,000 583,000
Teachers Insurance & Annuity Association
of America
6.850%, 12/16/2039 (S) 1,455,000 2,008,364
The Bear Stearns Companies LLC
7.250%, 02/01/2018 1,325,000 1,652,466
The Charles Schwab Corp. (7.000% to
02/01/2022, then 3 month
LIBOR + 4.820%)
02/01/2022 (Q) 900,000 1,033,713
The Chubb Corp. (6.375% until
04/15/2017, then 3 month
LIBOR + 2.250%)
03/29/2067 1,710,000 1,823,288
The Chuo Mitsui Trust & Banking
Company, Ltd. (5.506% to 04/15/2015,
then 3 month LIBOR + 2.490%)
04/15/2015 (Q)(S) 150,000 160,500
The Goldman Sachs Group, Inc.
5.250%, 07/27/2021 745,000 851,286
5.375%, 03/15/2020 1,000,000 1,144,633
6
John Hancock Funds IIPortfolio of Investments — November 30, 2012 (Unaudited) (showing percentage of total net assets)Active Bond Fund (continued)
Shares or
Principal
Amount Value
Copyright © 2013 www.secdatabase.com. All Rights Reserved.Please Consider the Environment Before Printing This Document
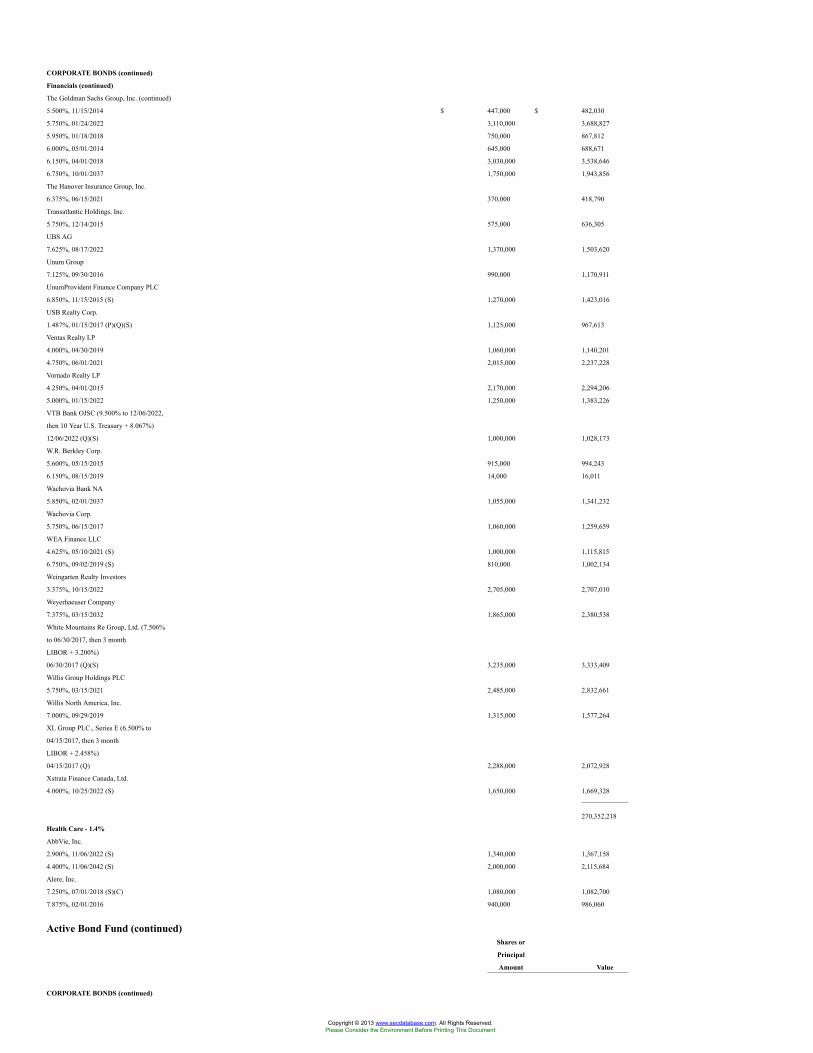
CORPORATE BONDS (continued)
Financials (continued)
The Goldman Sachs Group, Inc. (continued)
5.500%, 11/15/2014 $ 447,000 $ 482,030
5.750%, 01/24/2022 3,110,000 3,688,827
5.950%, 01/18/2018 750,000 867,812
6.000%, 05/01/2014 645,000 688,671
6.150%, 04/01/2018 3,030,000 3,538,646
6.750%, 10/01/2037 1,750,000 1,943,856
The Hanover Insurance Group, Inc.
6.375%, 06/15/2021 370,000 418,790
Transatlantic Holdings, Inc.
5.750%, 12/14/2015 575,000 636,305
UBS AG
7.625%, 08/17/2022 1,370,000 1,503,620
Unum Group
7.125%, 09/30/2016 990,000 1,170,911
UnumProvident Finance Company PLC
6.850%, 11/15/2015 (S) 1,270,000 1,423,016
USB Realty Corp.
1.487%, 01/15/2017 (P)(Q)(S) 1,125,000 967,613
Ventas Realty LP
4.000%, 04/30/2019 1,060,000 1,140,201
4.750%, 06/01/2021 2,015,000 2,237,228
Vornado Realty LP
4.250%, 04/01/2015 2,170,000 2,294,206
5.000%, 01/15/2022 1,250,000 1,383,226
VTB Bank OJSC (9.500% to 12/06/2022,
then 10 Year U.S. Treasury + 8.067%)
12/06/2022 (Q)(S) 1,000,000 1,028,173
W.R. Berkley Corp.
5.600%, 05/15/2015 915,000 994,243
6.150%, 08/15/2019 14,000 16,011
Wachovia Bank NA
5.850%, 02/01/2037 1,055,000 1,341,232
Wachovia Corp.
5.750%, 06/15/2017 1,060,000 1,259,659
WEA Finance LLC
4.625%, 05/10/2021 (S) 1,000,000 1,115,815
6.750%, 09/02/2019 (S) 810,000 1,002,134
Weingarten Realty Investors
3.375%, 10/15/2022 2,705,000 2,707,010
Weyerhaeuser Company
7.375%, 03/15/2032 1,865,000 2,380,538
White Mountains Re Group, Ltd. (7.506%
to 06/30/2017, then 3 month
LIBOR + 3.200%)
06/30/2017 (Q)(S) 3,235,000 3,333,409
Willis Group Holdings PLC
5.750%, 03/15/2021 2,485,000 2,832,661
Willis North America, Inc.
7.000%, 09/29/2019 1,315,000 1,577,264
XL Group PLC., Series E (6.500% to
04/15/2017, then 3 month
LIBOR + 2.458%)
04/15/2017 (Q) 2,288,000 2,072,928
Xstrata Finance Canada, Ltd.
4.000%, 10/25/2022 (S) 1,650,000 1,669,328
270,352,218
Health Care - 1.4%
AbbVie, Inc.
2.900%, 11/06/2022 (S) 1,340,000 1,367,158
4.400%, 11/06/2042 (S) 2,000,000 2,115,684
Alere, Inc.
7.250%, 07/01/2018 (S)(C) 1,080,000 1,082,700
7.875%, 02/01/2016 940,000 986,060
Active Bond Fund (continued)Shares or
Principal
Amount Value
CORPORATE BONDS (continued)
Copyright © 2013 www.secdatabase.com. All Rights Reserved.Please Consider the Environment Before Printing This Document
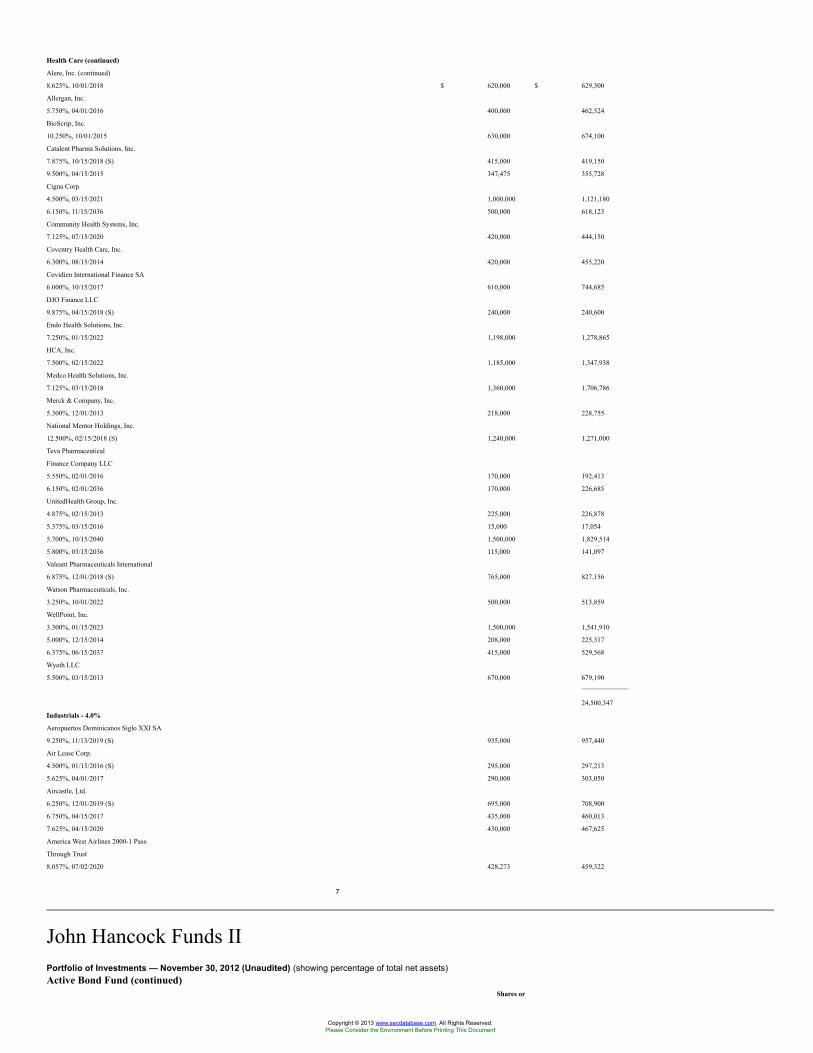
Health Care (continued)
Alere, Inc. (continued)
8.625%, 10/01/2018 $ 620,000 $ 629,300
Allergan, Inc.
5.750%, 04/01/2016 400,000 462,524
BioScrip, Inc.
10.250%, 10/01/2015 630,000 674,100
Catalent Pharma Solutions, Inc.
7.875%, 10/15/2018 (S) 415,000 419,150
9.500%, 04/15/2015 347,475 355,728
Cigna Corp.
4.500%, 03/15/2021 1,000,000 1,121,180
6.150%, 11/15/2036 500,000 618,123
Community Health Systems, Inc.
7.125%, 07/15/2020 420,000 444,150
Coventry Health Care, Inc.
6.300%, 08/15/2014 420,000 455,220
Covidien International Finance SA
6.000%, 10/15/2017 610,000 744,685
DJO Finance LLC
9.875%, 04/15/2018 (S) 240,000 240,600
Endo Health Solutions, Inc.
7.250%, 01/15/2022 1,198,000 1,278,865
HCA, Inc.
7.500%, 02/15/2022 1,185,000 1,347,938
Medco Health Solutions, Inc.
7.125%, 03/15/2018 1,360,000 1,706,786
Merck & Company, Inc.
5.300%, 12/01/2013 218,000 228,755
National Mentor Holdings, Inc.
12.500%, 02/15/2018 (S) 1,240,000 1,271,000
Teva Pharmaceutical
Finance Company LLC
5.550%, 02/01/2016 170,000 192,413
6.150%, 02/01/2036 170,000 226,685
UnitedHealth Group, Inc.
4.875%, 02/15/2013 225,000 226,878
5.375%, 03/15/2016 15,000 17,054
5.700%, 10/15/2040 1,500,000 1,829,514
5.800%, 03/15/2036 115,000 141,097
Valeant Pharmaceuticals International
6.875%, 12/01/2018 (S) 765,000 827,156
Watson Pharmaceuticals, Inc.
3.250%, 10/01/2022 500,000 513,859
WellPoint, Inc.
3.300%, 01/15/2023 1,500,000 1,541,910
5.000%, 12/15/2014 208,000 225,317
6.375%, 06/15/2037 415,000 529,568
Wyeth LLC
5.500%, 03/15/2013 670,000 679,190
24,500,347
Industrials - 4.0%
Aeropuertos Dominicanos Siglo XXI SA
9.250%, 11/13/2019 (S) 935,000 957,440
Air Lease Corp.
4.500%, 01/15/2016 (S) 295,000 297,213
5.625%, 04/01/2017 290,000 303,050
Aircastle, Ltd.
6.250%, 12/01/2019 (S) 695,000 708,900
6.750%, 04/15/2017 435,000 460,013
7.625%, 04/15/2020 430,000 467,625
America West Airlines 2000-1 Pass
Through Trust
8.057%, 07/02/2020 428,273 459,322
7
John Hancock Funds IIPortfolio of Investments — November 30, 2012 (Unaudited) (showing percentage of total net assets)Active Bond Fund (continued)
Shares or
Copyright © 2013 www.secdatabase.com. All Rights Reserved.Please Consider the Environment Before Printing This Document
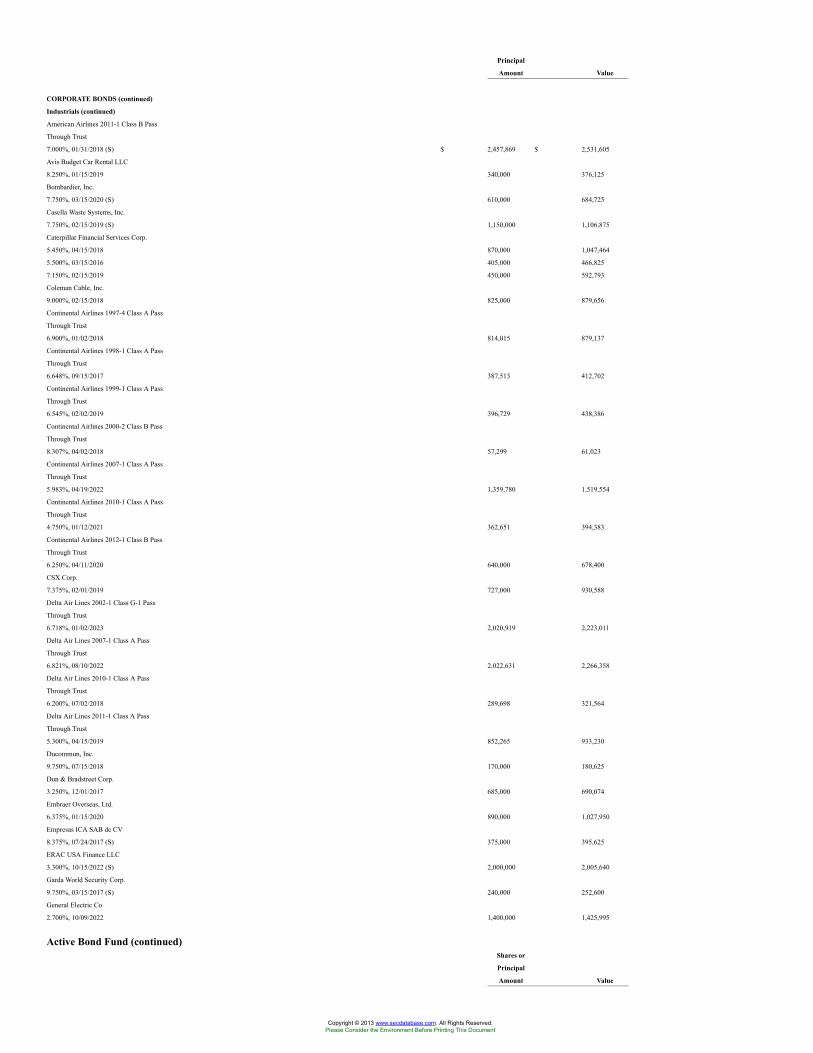
Principal
Amount Value
CORPORATE BONDS (continued)
Industrials (continued)
American Airlines 2011-1 Class B Pass
Through Trust
7.000%, 01/31/2018 (S) $ 2,457,869 $ 2,531,605
Avis Budget Car Rental LLC
8.250%, 01/15/2019 340,000 376,125
Bombardier, Inc.
7.750%, 03/15/2020 (S) 610,000 684,725
Casella Waste Systems, Inc.
7.750%, 02/15/2019 (S) 1,150,000 1,106,875
Caterpillar Financial Services Corp.
5.450%, 04/15/2018 870,000 1,047,464
5.500%, 03/15/2016 405,000 466,825
7.150%, 02/15/2019 450,000 592,793
Coleman Cable, Inc.
9.000%, 02/15/2018 825,000 879,656
Continental Airlines 1997-4 Class A Pass
Through Trust
6.900%, 01/02/2018 814,015 879,137
Continental Airlines 1998-1 Class A Pass
Through Trust
6.648%, 09/15/2017 387,513 412,702
Continental Airlines 1999-1 Class A Pass
Through Trust
6.545%, 02/02/2019 396,729 438,386
Continental Airlines 2000-2 Class B Pass
Through Trust
8.307%, 04/02/2018 57,299 61,023
Continental Airlines 2007-1 Class A Pass
Through Trust
5.983%, 04/19/2022 1,359,780 1,519,554
Continental Airlines 2010-1 Class A Pass
Through Trust
4.750%, 01/12/2021 362,651 394,383
Continental Airlines 2012-1 Class B Pass
Through Trust
6.250%, 04/11/2020 640,000 678,400
CSX Corp.
7.375%, 02/01/2019 727,000 930,588
Delta Air Lines 2002-1 Class G-1 Pass
Through Trust
6.718%, 01/02/2023 2,020,919 2,223,011
Delta Air Lines 2007-1 Class A Pass
Through Trust
6.821%, 08/10/2022 2,022,631 2,266,358
Delta Air Lines 2010-1 Class A Pass
Through Trust
6.200%, 07/02/2018 289,698 321,564
Delta Air Lines 2011-1 Class A Pass
Through Trust
5.300%, 04/15/2019 852,265 933,230
Ducommun, Inc.
9.750%, 07/15/2018 170,000 180,625
Dun & Bradstreet Corp.
3.250%, 12/01/2017 685,000 690,074
Embraer Overseas, Ltd.
6.375%, 01/15/2020 890,000 1,027,950
Empresas ICA SAB de CV
8.375%, 07/24/2017 (S) 375,000 395,625
ERAC USA Finance LLC
3.300%, 10/15/2022 (S) 2,000,000 2,005,640
Garda World Security Corp.
9.750%, 03/15/2017 (S) 240,000 252,600
General Electric Co
2.700%, 10/09/2022 1,400,000 1,425,995
Active Bond Fund (continued)Shares or
Principal
Amount Value
Copyright © 2013 www.secdatabase.com. All Rights Reserved.Please Consider the Environment Before Printing This Document
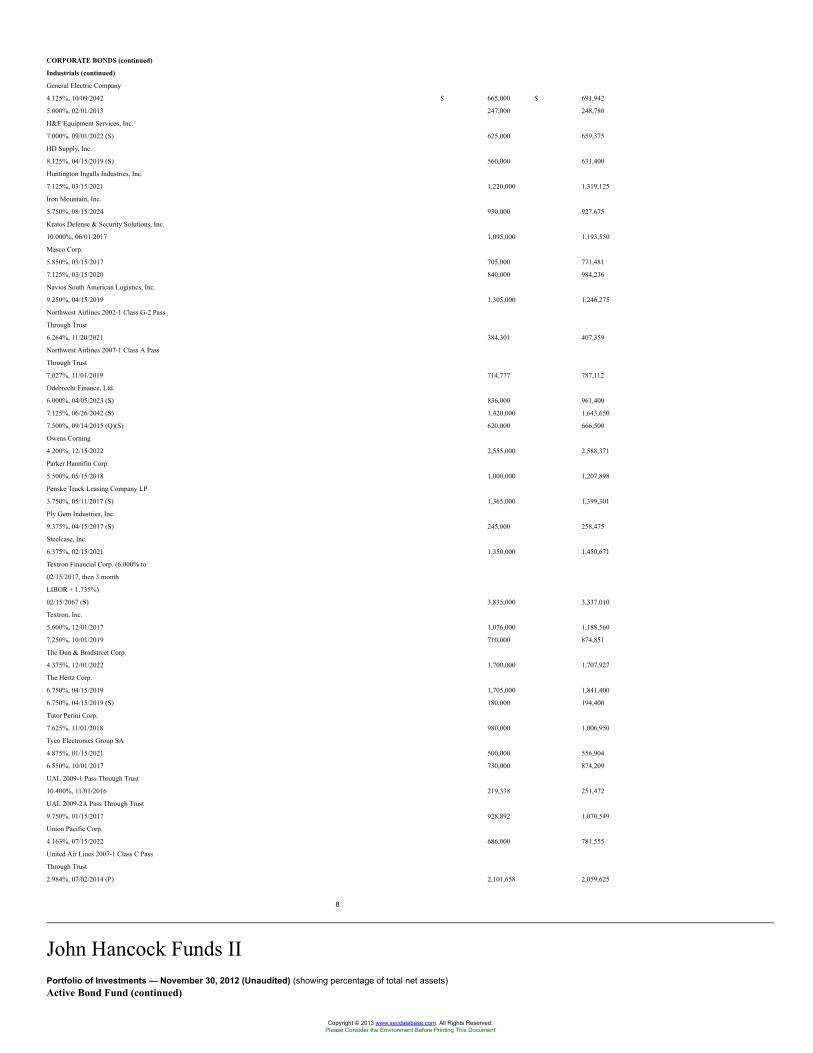
CORPORATE BONDS (continued)
Industrials (continued)
General Electric Company
4.125%, 10/09/2042 $ 665,000 $ 691,942
5.000%, 02/01/2013 247,000 248,780
H&E Equipment Services, Inc.
7.000%, 09/01/2022 (S) 625,000 659,375
HD Supply, Inc.
8.125%, 04/15/2019 (S) 560,000 631,400
Huntington Ingalls Industries, Inc.
7.125%, 03/15/2021 1,220,000 1,319,125
Iron Mountain, Inc.
5.750%, 08/15/2024 930,000 927,675
Kratos Defense & Security Solutions, Inc.
10.000%, 06/01/2017 1,095,000 1,193,550
Masco Corp.
5.850%, 03/15/2017 705,000 771,481
7.125%, 03/15/2020 840,000 984,236
Navios South American Logistics, Inc.
9.250%, 04/15/2019 1,305,000 1,246,275
Northwest Airlines 2002-1 Class G-2 Pass
Through Trust
6.264%, 11/20/2021 384,301 407,359
Northwest Airlines 2007-1 Class A Pass
Through Trust
7.027%, 11/01/2019 714,777 787,112
Odebrecht Finance, Ltd.
6.000%, 04/05/2023 (S) 836,000 961,400
7.125%, 06/26/2042 (S) 1,420,000 1,643,650
7.500%, 09/14/2015 (Q)(S) 620,000 666,500
Owens Corning
4.200%, 12/15/2022 2,555,000 2,588,371
Parker Hannifin Corp.
5.500%, 05/15/2018 1,000,000 1,207,898
Penske Truck Leasing Company LP
3.750%, 05/11/2017 (S) 1,365,000 1,399,301
Ply Gem Industries, Inc.
9.375%, 04/15/2017 (S) 245,000 258,475
Steelcase, Inc.
6.375%, 02/15/2021 1,350,000 1,450,671
Textron Financial Corp. (6.000% to
02/15/2017, then 3 month
LIBOR + 1.735%)
02/15/2067 (S) 3,835,000 3,337,010
Textron, Inc.
5.600%, 12/01/2017 1,076,000 1,188,560
7.250%, 10/01/2019 710,000 874,851
The Dun & Bradstreet Corp.
4.375%, 12/01/2022 1,700,000 1,707,927
The Hertz Corp.
6.750%, 04/15/2019 1,705,000 1,841,400
6.750%, 04/15/2019 (S) 180,000 194,400
Tutor Perini Corp.
7.625%, 11/01/2018 980,000 1,006,950
Tyco Electronics Group SA
4.875%, 01/15/2021 500,000 556,904
6.550%, 10/01/2017 730,000 874,209
UAL 2009-1 Pass Through Trust
10.400%, 11/01/2016 219,338 251,472
UAL 2009-2A Pass Through Trust
9.750%, 01/15/2017 928,892 1,070,549
Union Pacific Corp.
4.163%, 07/15/2022 686,000 781,555
United Air Lines 2007-1 Class C Pass
Through Trust
2.984%, 07/02/2014 (P) 2,101,658 2,059,625
8
John Hancock Funds IIPortfolio of Investments — November 30, 2012 (Unaudited) (showing percentage of total net assets)Active Bond Fund (continued)
Copyright © 2013 www.secdatabase.com. All Rights Reserved.Please Consider the Environment Before Printing This Document
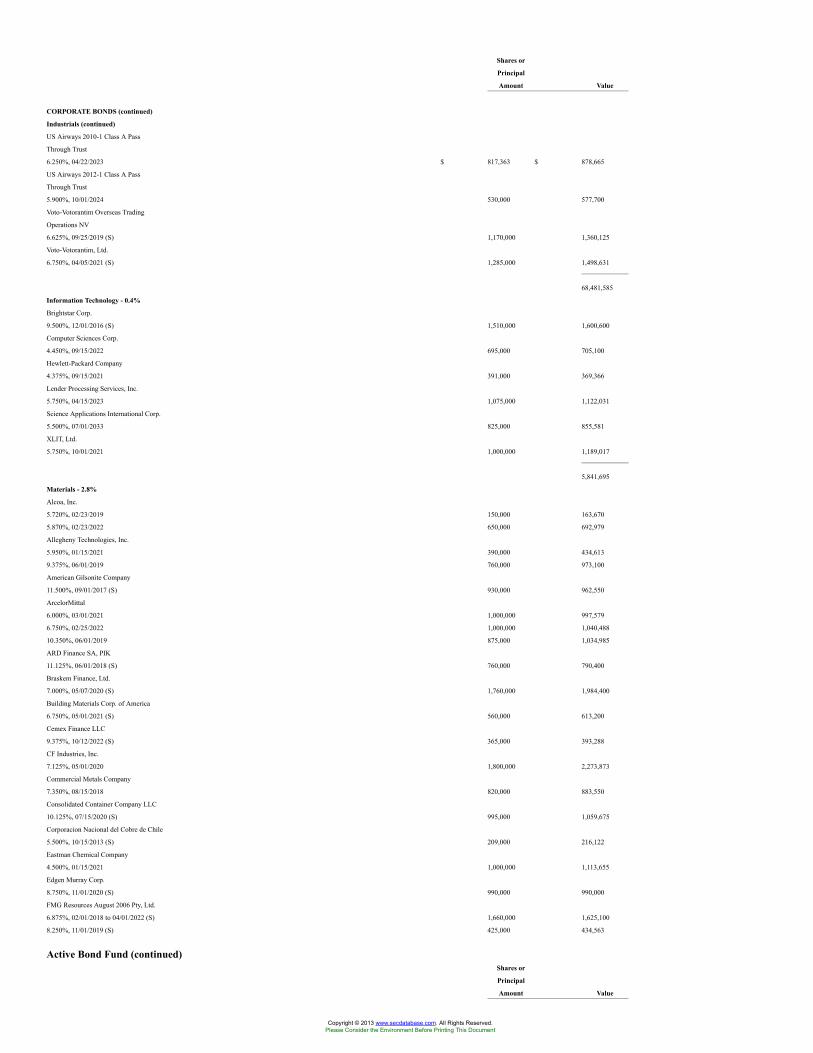
Shares or
Principal
Amount Value
CORPORATE BONDS (continued)
Industrials (continued)
US Airways 2010-1 Class A Pass
Through Trust
6.250%, 04/22/2023 $ 817,363 $ 878,665
US Airways 2012-1 Class A Pass
Through Trust
5.900%, 10/01/2024 530,000 577,700
Voto-Votorantim Overseas Trading
Operations NV
6.625%, 09/25/2019 (S) 1,170,000 1,360,125
Voto-Votorantim, Ltd.
6.750%, 04/05/2021 (S) 1,285,000 1,498,631
68,481,585
Information Technology - 0.4%
Brightstar Corp.
9.500%, 12/01/2016 (S) 1,510,000 1,600,600
Computer Sciences Corp.
4.450%, 09/15/2022 695,000 705,100
Hewlett-Packard Company
4.375%, 09/15/2021 391,000 369,366
Lender Processing Services, Inc.
5.750%, 04/15/2023 1,075,000 1,122,031
Science Applications International Corp.
5.500%, 07/01/2033 825,000 855,581
XLIT, Ltd.
5.750%, 10/01/2021 1,000,000 1,189,017
5,841,695
Materials - 2.8%
Alcoa, Inc.
5.720%, 02/23/2019 150,000 163,670
5.870%, 02/23/2022 650,000 692,979
Allegheny Technologies, Inc.
5.950%, 01/15/2021 390,000 434,613
9.375%, 06/01/2019 760,000 973,100
American Gilsonite Company
11.500%, 09/01/2017 (S) 930,000 962,550
ArcelorMittal
6.000%, 03/01/2021 1,000,000 997,579
6.750%, 02/25/2022 1,000,000 1,040,488
10.350%, 06/01/2019 875,000 1,034,985
ARD Finance SA, PIK
11.125%, 06/01/2018 (S) 760,000 790,400
Braskem Finance, Ltd.
7.000%, 05/07/2020 (S) 1,760,000 1,984,400
Building Materials Corp. of America
6.750%, 05/01/2021 (S) 560,000 613,200
Cemex Finance LLC
9.375%, 10/12/2022 (S) 365,000 393,288
CF Industries, Inc.
7.125%, 05/01/2020 1,800,000 2,273,873
Commercial Metals Company
7.350%, 08/15/2018 820,000 883,550
Consolidated Container Company LLC
10.125%, 07/15/2020 (S) 995,000 1,059,675
Corporacion Nacional del Cobre de Chile
5.500%, 10/15/2013 (S) 209,000 216,122
Eastman Chemical Company
4.500%, 01/15/2021 1,000,000 1,113,655
Edgen Murray Corp.
8.750%, 11/01/2020 (S) 990,000 990,000
FMG Resources August 2006 Pty, Ltd.
6.875%, 02/01/2018 to 04/01/2022 (S) 1,660,000 1,625,100
8.250%, 11/01/2019 (S) 425,000 434,563
Active Bond Fund (continued)Shares or
Principal
Amount Value
Copyright © 2013 www.secdatabase.com. All Rights Reserved.Please Consider the Environment Before Printing This Document
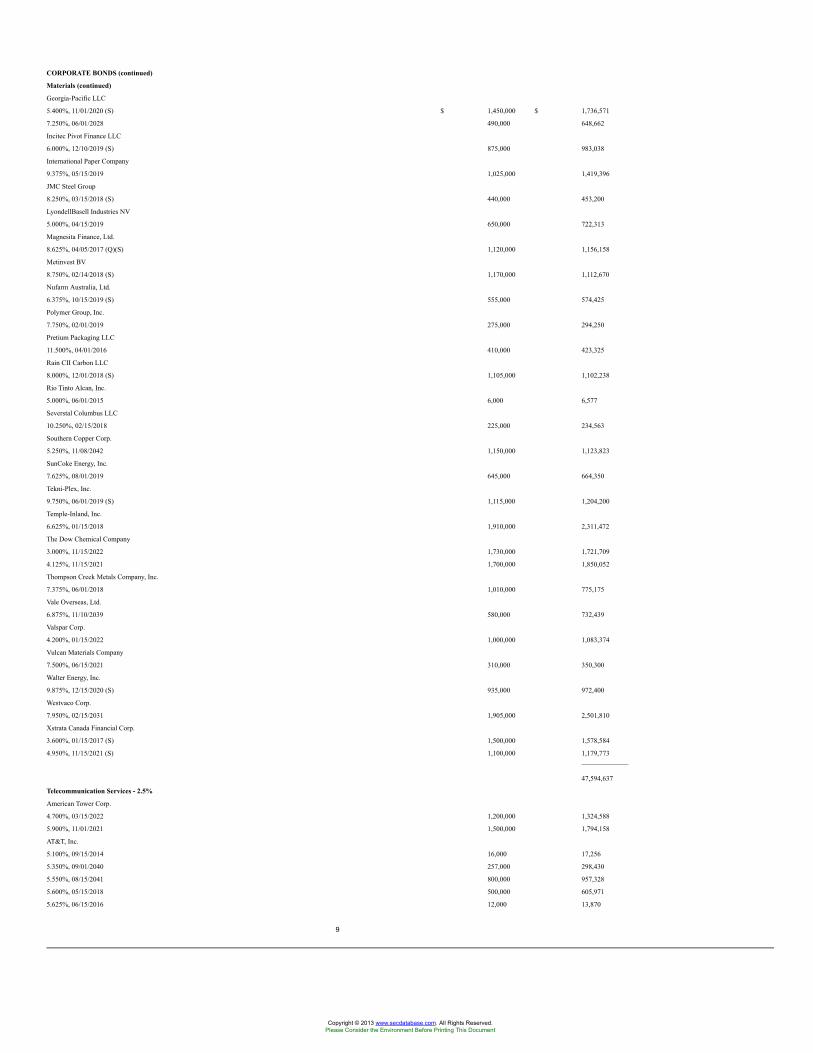
CORPORATE BONDS (continued)
Materials (continued)
Georgia-Pacific LLC
5.400%, 11/01/2020 (S) $ 1,450,000 $ 1,736,571
7.250%, 06/01/2028 490,000 648,662
Incitec Pivot Finance LLC
6.000%, 12/10/2019 (S) 875,000 983,038
International Paper Company
9.375%, 05/15/2019 1,025,000 1,419,396
JMC Steel Group
8.250%, 03/15/2018 (S) 440,000 453,200
LyondellBasell Industries NV
5.000%, 04/15/2019 650,000 722,313
Magnesita Finance, Ltd.
8.625%, 04/05/2017 (Q)(S) 1,120,000 1,156,158
Metinvest BV
8.750%, 02/14/2018 (S) 1,170,000 1,112,670
Nufarm Australia, Ltd.
6.375%, 10/15/2019 (S) 555,000 574,425
Polymer Group, Inc.
7.750%, 02/01/2019 275,000 294,250
Pretium Packaging LLC
11.500%, 04/01/2016 410,000 423,325
Rain CII Carbon LLC
8.000%, 12/01/2018 (S) 1,105,000 1,102,238
Rio Tinto Alcan, Inc.
5.000%, 06/01/2015 6,000 6,577
Severstal Columbus LLC
10.250%, 02/15/2018 225,000 234,563
Southern Copper Corp.
5.250%, 11/08/2042 1,150,000 1,123,823
SunCoke Energy, Inc.
7.625%, 08/01/2019 645,000 664,350
Tekni-Plex, Inc.
9.750%, 06/01/2019 (S) 1,115,000 1,204,200
Temple-Inland, Inc.
6.625%, 01/15/2018 1,910,000 2,311,472
The Dow Chemical Company
3.000%, 11/15/2022 1,730,000 1,721,709
4.125%, 11/15/2021 1,700,000 1,850,052
Thompson Creek Metals Company, Inc.
7.375%, 06/01/2018 1,010,000 775,175
Vale Overseas, Ltd.
6.875%, 11/10/2039 580,000 732,439
Valspar Corp.
4.200%, 01/15/2022 1,000,000 1,083,374
Vulcan Materials Company
7.500%, 06/15/2021 310,000 350,300
Walter Energy, Inc.
9.875%, 12/15/2020 (S) 935,000 972,400
Westvaco Corp.
7.950%, 02/15/2031 1,905,000 2,501,810
Xstrata Canada Financial Corp.
3.600%, 01/15/2017 (S) 1,500,000 1,578,584
4.950%, 11/15/2021 (S) 1,100,000 1,179,773
47,594,637
Telecommunication Services - 2.5%
American Tower Corp.
4.700%, 03/15/2022 1,200,000 1,324,588
5.900%, 11/01/2021 1,500,000 1,794,158
AT&T, Inc.
5.100%, 09/15/2014 16,000 17,256
5.350%, 09/01/2040 257,000 298,430
5.550%, 08/15/2041 800,000 957,328
5.600%, 05/15/2018 500,000 605,971
5.625%, 06/15/2016 12,000 13,870
9
Copyright © 2013 www.secdatabase.com. All Rights Reserved.Please Consider the Environment Before Printing This Document
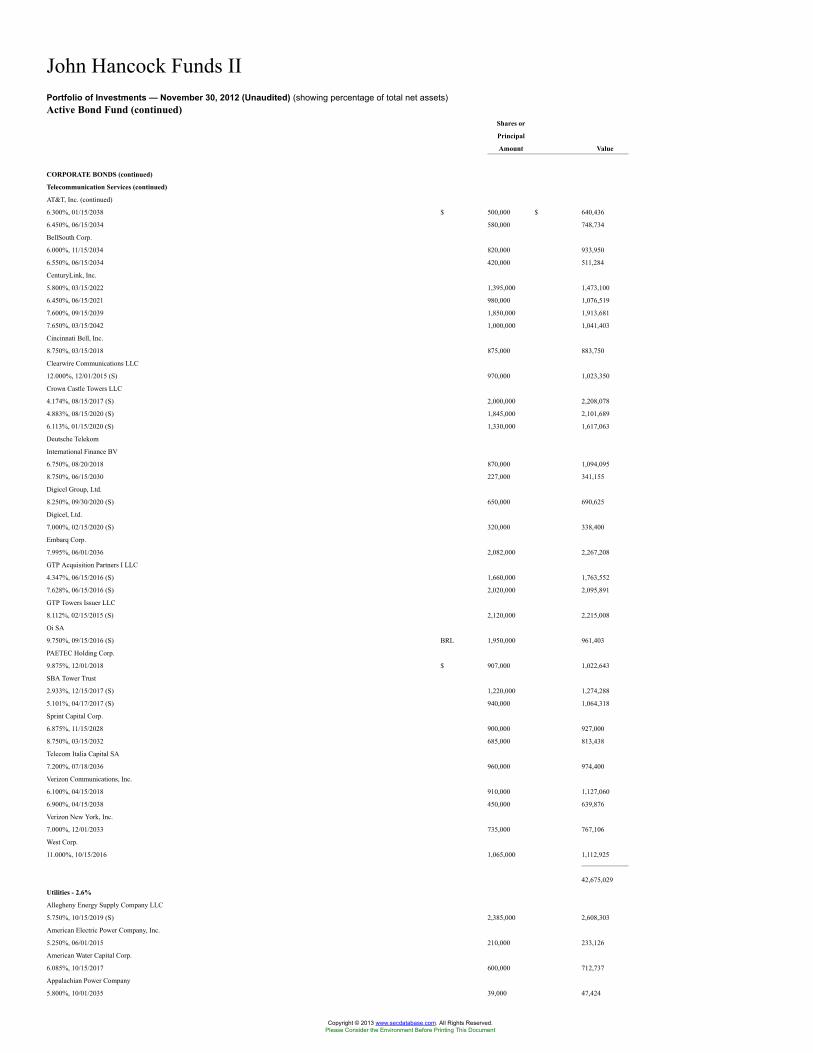
John Hancock Funds IIPortfolio of Investments — November 30, 2012 (Unaudited) (showing percentage of total net assets)Active Bond Fund (continued)
Shares or
Principal
Amount Value
CORPORATE BONDS (continued)
Telecommunication Services (continued)
AT&T, Inc. (continued)
6.300%, 01/15/2038 $ 500,000 $ 640,436
6.450%, 06/15/2034 580,000 748,734
BellSouth Corp.
6.000%, 11/15/2034 820,000 933,950
6.550%, 06/15/2034 420,000 511,284
CenturyLink, Inc.
5.800%, 03/15/2022 1,395,000 1,473,100
6.450%, 06/15/2021 980,000 1,076,519
7.600%, 09/15/2039 1,850,000 1,913,681
7.650%, 03/15/2042 1,000,000 1,041,403
Cincinnati Bell, Inc.
8.750%, 03/15/2018 875,000 883,750
Clearwire Communications LLC
12.000%, 12/01/2015 (S) 970,000 1,023,350
Crown Castle Towers LLC
4.174%, 08/15/2017 (S) 2,000,000 2,208,078
4.883%, 08/15/2020 (S) 1,845,000 2,101,689
6.113%, 01/15/2020 (S) 1,330,000 1,617,063
Deutsche Telekom
International Finance BV
6.750%, 08/20/2018 870,000 1,094,095
8.750%, 06/15/2030 227,000 341,155
Digicel Group, Ltd.
8.250%, 09/30/2020 (S) 650,000 690,625
Digicel, Ltd.
7.000%, 02/15/2020 (S) 320,000 338,400
Embarq Corp.
7.995%, 06/01/2036 2,082,000 2,267,208
GTP Acquisition Partners I LLC
4.347%, 06/15/2016 (S) 1,660,000 1,763,552
7.628%, 06/15/2016 (S) 2,020,000 2,095,891
GTP Towers Issuer LLC
8.112%, 02/15/2015 (S) 2,120,000 2,215,008
Oi SA
9.750%, 09/15/2016 (S) BRL 1,950,000 961,403
PAETEC Holding Corp.
9.875%, 12/01/2018 $ 907,000 1,022,643
SBA Tower Trust
2.933%, 12/15/2017 (S) 1,220,000 1,274,288
5.101%, 04/17/2017 (S) 940,000 1,064,318
Sprint Capital Corp.
6.875%, 11/15/2028 900,000 927,000
8.750%, 03/15/2032 685,000 813,438
Telecom Italia Capital SA
7.200%, 07/18/2036 960,000 974,400
Verizon Communications, Inc.
6.100%, 04/15/2018 910,000 1,127,060
6.900%, 04/15/2038 450,000 639,876
Verizon New York, Inc.
7.000%, 12/01/2033 735,000 767,106
West Corp.
11.000%, 10/15/2016 1,065,000 1,112,925
42,675,029
Utilities - 2.6%
Allegheny Energy Supply Company LLC
5.750%, 10/15/2019 (S) 2,385,000 2,608,303
American Electric Power Company, Inc.
5.250%, 06/01/2015 210,000 233,126
American Water Capital Corp.
6.085%, 10/15/2017 600,000 712,737
Appalachian Power Company
5.800%, 10/01/2035 39,000 47,424
Copyright © 2013 www.secdatabase.com. All Rights Reserved.Please Consider the Environment Before Printing This Document
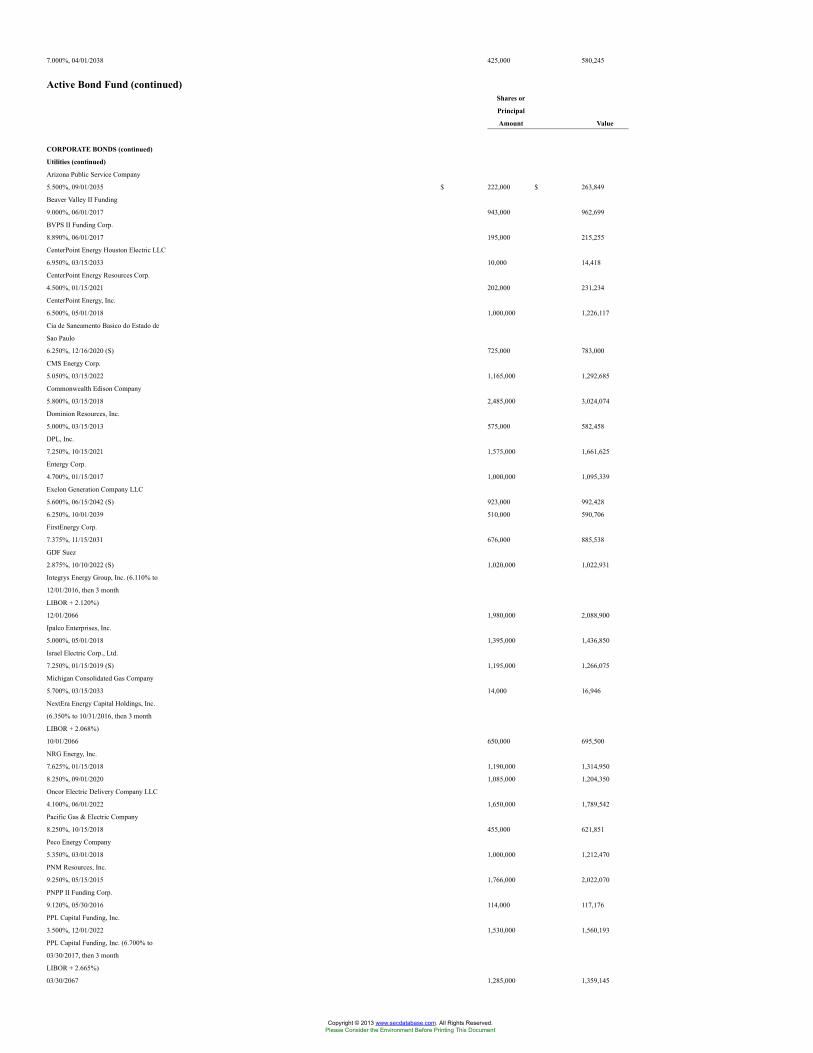
7.000%, 04/01/2038 425,000 580,245
Active Bond Fund (continued)Shares or
Principal
Amount Value
CORPORATE BONDS (continued)
Utilities (continued)
Arizona Public Service Company
5.500%, 09/01/2035 $ 222,000 $ 263,849
Beaver Valley II Funding
9.000%, 06/01/2017 943,000 962,699
BVPS II Funding Corp.
8.890%, 06/01/2017 195,000 215,255
CenterPoint Energy Houston Electric LLC
6.950%, 03/15/2033 10,000 14,418
CenterPoint Energy Resources Corp.
4.500%, 01/15/2021 202,000 231,234
CenterPoint Energy, Inc.
6.500%, 05/01/2018 1,000,000 1,226,117
Cia de Saneamento Basico do Estado de
Sao Paulo
6.250%, 12/16/2020 (S) 725,000 783,000
CMS Energy Corp.
5.050%, 03/15/2022 1,165,000 1,292,685
Commonwealth Edison Company
5.800%, 03/15/2018 2,485,000 3,024,074
Dominion Resources, Inc.
5.000%, 03/15/2013 575,000 582,458
DPL, Inc.
7.250%, 10/15/2021 1,575,000 1,661,625
Entergy Corp.
4.700%, 01/15/2017 1,000,000 1,095,339
Exelon Generation Company LLC
5.600%, 06/15/2042 (S) 923,000 992,428
6.250%, 10/01/2039 510,000 590,706
FirstEnergy Corp.
7.375%, 11/15/2031 676,000 885,538
GDF Suez
2.875%, 10/10/2022 (S) 1,020,000 1,022,931
Integrys Energy Group, Inc. (6.110% to
12/01/2016, then 3 month
LIBOR + 2.120%)
12/01/2066 1,980,000 2,088,900
Ipalco Enterprises, Inc.
5.000%, 05/01/2018 1,395,000 1,436,850
Israel Electric Corp., Ltd.
7.250%, 01/15/2019 (S) 1,195,000 1,266,075
Michigan Consolidated Gas Company
5.700%, 03/15/2033 14,000 16,946
NextEra Energy Capital Holdings, Inc.
(6.350% to 10/31/2016, then 3 month
LIBOR + 2.068%)
10/01/2066 650,000 695,500
NRG Energy, Inc.
7.625%, 01/15/2018 1,190,000 1,314,950
8.250%, 09/01/2020 1,085,000 1,204,350
Oncor Electric Delivery Company LLC
4.100%, 06/01/2022 1,650,000 1,789,542
Pacific Gas & Electric Company
8.250%, 10/15/2018 455,000 621,851
Peco Energy Company
5.350%, 03/01/2018 1,000,000 1,212,470
PNM Resources, Inc.
9.250%, 05/15/2015 1,766,000 2,022,070
PNPP II Funding Corp.
9.120%, 05/30/2016 114,000 117,176
PPL Capital Funding, Inc.
3.500%, 12/01/2022 1,530,000 1,560,193
PPL Capital Funding, Inc. (6.700% to
03/30/2017, then 3 month
LIBOR + 2.665%)
03/30/2067 1,285,000 1,359,145
Copyright © 2013 www.secdatabase.com. All Rights Reserved.Please Consider the Environment Before Printing This Document
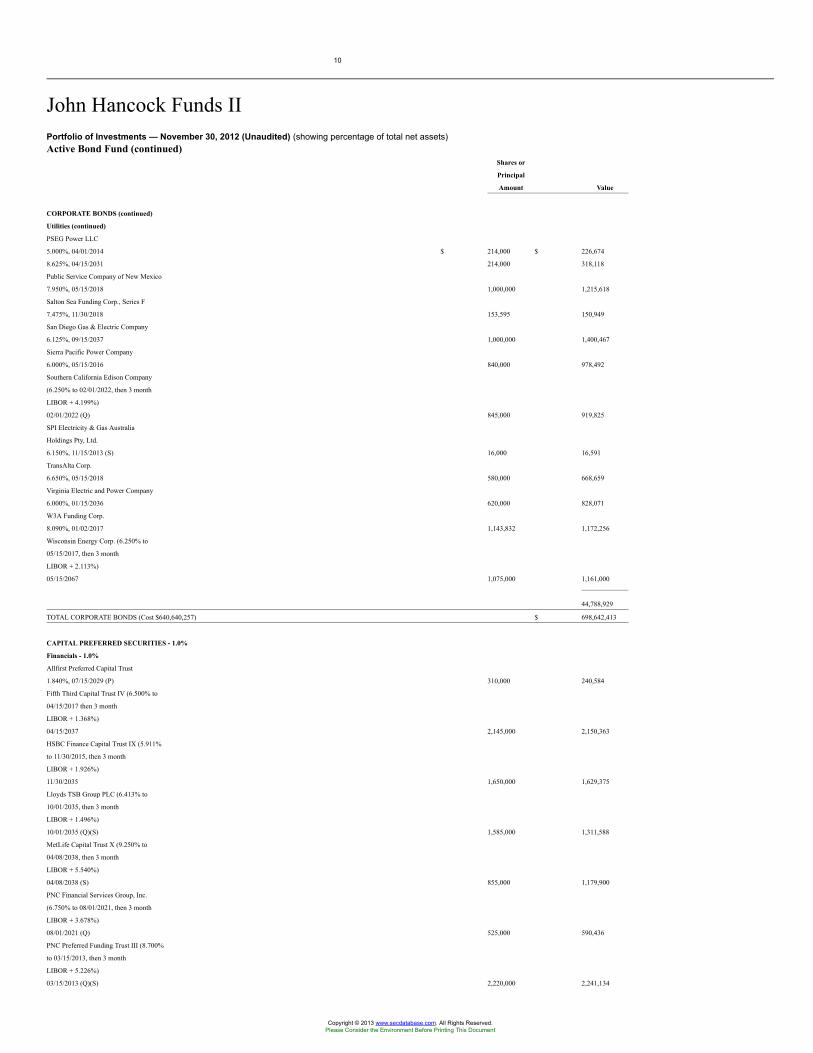
10
John Hancock Funds IIPortfolio of Investments — November 30, 2012 (Unaudited) (showing percentage of total net assets)Active Bond Fund (continued)
Shares or
Principal
Amount Value
CORPORATE BONDS (continued)
Utilities (continued)
PSEG Power LLC
5.000%, 04/01/2014 $ 214,000 $ 226,674
8.625%, 04/15/2031 214,000 318,118
Public Service Company of New Mexico
7.950%, 05/15/2018 1,000,000 1,215,618
Salton Sea Funding Corp., Series F
7.475%, 11/30/2018 153,595 150,949
San Diego Gas & Electric Company
6.125%, 09/15/2037 1,000,000 1,400,467
Sierra Pacific Power Company
6.000%, 05/15/2016 840,000 978,492
Southern California Edison Company
(6.250% to 02/01/2022, then 3 month
LIBOR + 4.199%)
02/01/2022 (Q) 845,000 919,825
SPI Electricity & Gas Australia
Holdings Pty, Ltd.
6.150%, 11/15/2013 (S) 16,000 16,591
TransAlta Corp.
6.650%, 05/15/2018 580,000 668,659
Virginia Electric and Power Company
6.000%, 01/15/2036 620,000 828,071
W3A Funding Corp.
8.090%, 01/02/2017 1,143,832 1,172,256
Wisconsin Energy Corp. (6.250% to
05/15/2017, then 3 month
LIBOR + 2.113%)
05/15/2067 1,075,000 1,161,000
44,788,929
TOTAL CORPORATE BONDS (Cost $640,640,257) $ 698,642,413
CAPITAL PREFERRED SECURITIES - 1.0%
Financials - 1.0%
Allfirst Preferred Capital Trust
1.840%, 07/15/2029 (P) 310,000 240,584
Fifth Third Capital Trust IV (6.500% to
04/15/2017 then 3 month
LIBOR + 1.368%)
04/15/2037 2,145,000 2,150,363
HSBC Finance Capital Trust IX (5.911%
to 11/30/2015, then 3 month
LIBOR + 1.926%)
11/30/2035 1,650,000 1,629,375
Lloyds TSB Group PLC (6.413% to
10/01/2035, then 3 month
LIBOR + 1.496%)
10/01/2035 (Q)(S) 1,585,000 1,311,588
MetLife Capital Trust X (9.250% to
04/08/2038, then 3 month
LIBOR + 5.540%)
04/08/2038 (S) 855,000 1,179,900
PNC Financial Services Group, Inc.
(6.750% to 08/01/2021, then 3 month
LIBOR + 3.678%)
08/01/2021 (Q) 525,000 590,436
PNC Preferred Funding Trust III (8.700%
to 03/15/2013, then 3 month
LIBOR + 5.226%)
03/15/2013 (Q)(S) 2,220,000 2,241,134
Copyright © 2013 www.secdatabase.com. All Rights Reserved.Please Consider the Environment Before Printing This Document
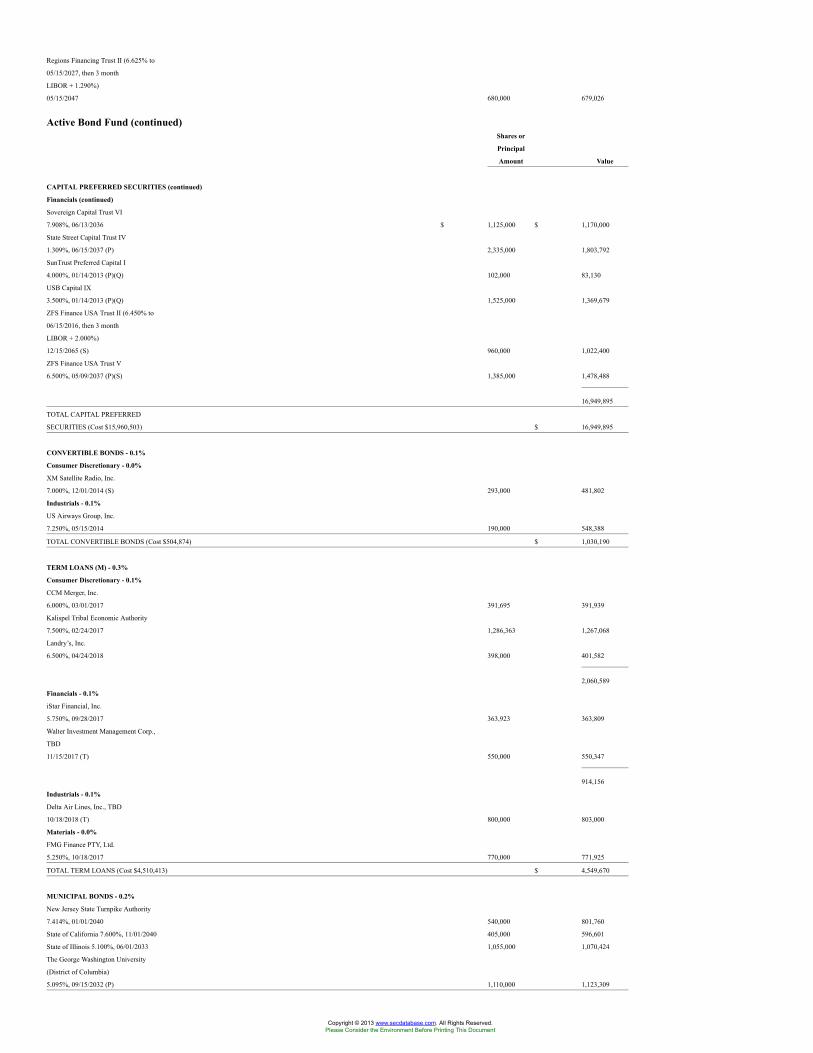
Regions Financing Trust II (6.625% to
05/15/2027, then 3 month
LIBOR + 1.290%)
05/15/2047 680,000 679,026
Active Bond Fund (continued)Shares or
Principal
Amount Value
CAPITAL PREFERRED SECURITIES (continued)
Financials (continued)
Sovereign Capital Trust VI
7.908%, 06/13/2036 $ 1,125,000 $ 1,170,000
State Street Capital Trust IV
1.309%, 06/15/2037 (P) 2,335,000 1,803,792
SunTrust Preferred Capital I
4.000%, 01/14/2013 (P)(Q) 102,000 83,130
USB Capital IX
3.500%, 01/14/2013 (P)(Q) 1,525,000 1,369,679
ZFS Finance USA Trust II (6.450% to
06/15/2016, then 3 month
LIBOR + 2.000%)
12/15/2065 (S) 960,000 1,022,400
ZFS Finance USA Trust V
6.500%, 05/09/2037 (P)(S) 1,385,000 1,478,488
16,949,895
TOTAL CAPITAL PREFERRED
SECURITIES (Cost $15,960,503) $ 16,949,895
CONVERTIBLE BONDS - 0.1%
Consumer Discretionary - 0.0%
XM Satellite Radio, Inc.
7.000%, 12/01/2014 (S) 293,000 481,802
Industrials - 0.1%
US Airways Group, Inc.
7.250%, 05/15/2014 190,000 548,388
TOTAL CONVERTIBLE BONDS (Cost $504,874) $ 1,030,190
TERM LOANS (M) - 0.3%
Consumer Discretionary - 0.1%
CCM Merger, Inc.
6.000%, 03/01/2017 391,695 391,939
Kalispel Tribal Economic Authority
7.500%, 02/24/2017 1,286,363 1,267,068
Landry’s, Inc.
6.500%, 04/24/2018 398,000 401,582
2,060,589
Financials - 0.1%
iStar Financial, Inc.
5.750%, 09/28/2017 363,923 363,809
Walter Investment Management Corp.,
TBD
11/15/2017 (T) 550,000 550,347
914,156
Industrials - 0.1%
Delta Air Lines, Inc., TBD
10/18/2018 (T) 800,000 803,000
Materials - 0.0%
FMG Finance PTY, Ltd.
5.250%, 10/18/2017 770,000 771,925
TOTAL TERM LOANS (Cost $4,510,413) $ 4,549,670
MUNICIPAL BONDS - 0.2%
New Jersey State Turnpike Authority
7.414%, 01/01/2040 540,000 801,760
State of California 7.600%, 11/01/2040 405,000 596,601
State of Illinois 5.100%, 06/01/2033 1,055,000 1,070,424
The George Washington University
(District of Columbia)
5.095%, 09/15/2032 (P) 1,110,000 1,123,309
Copyright © 2013 www.secdatabase.com. All Rights Reserved.Please Consider the Environment Before Printing This Document
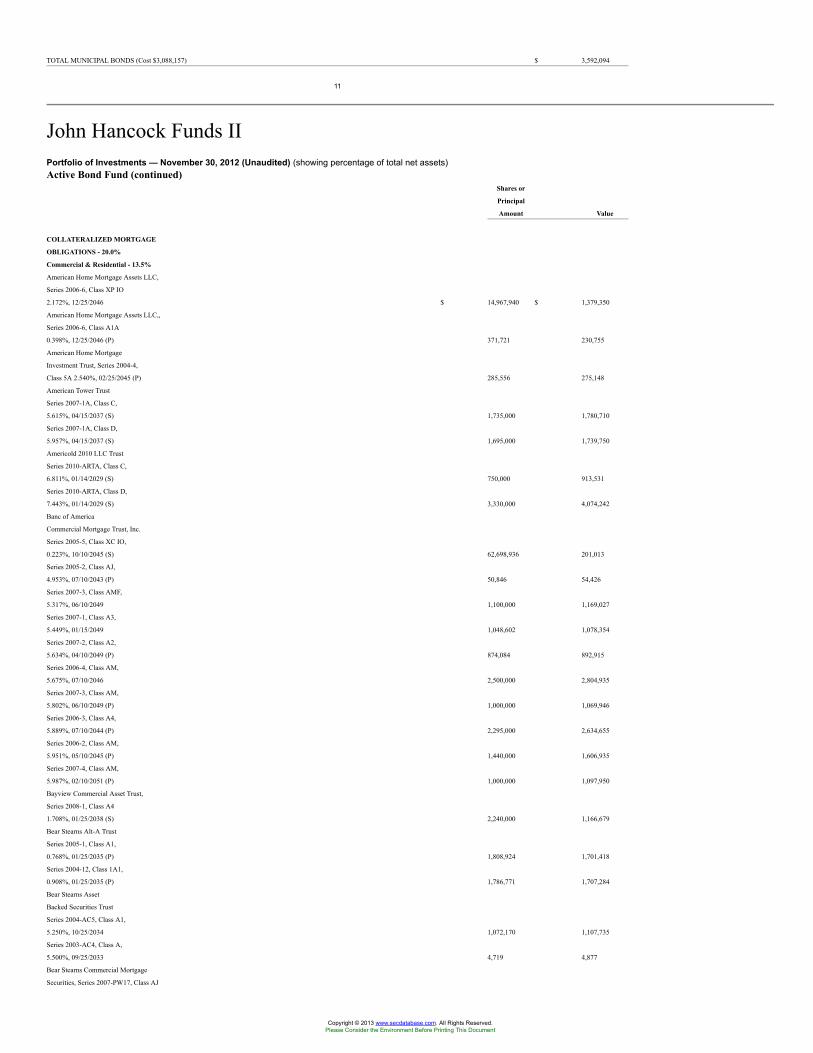
TOTAL MUNICIPAL BONDS (Cost $3,088,157) $ 3,592,094
11
John Hancock Funds IIPortfolio of Investments — November 30, 2012 (Unaudited) (showing percentage of total net assets)Active Bond Fund (continued)
Shares or
Principal
Amount Value
COLLATERALIZED MORTGAGE
OBLIGATIONS - 20.0%
Commercial & Residential - 13.5%
American Home Mortgage Assets LLC,
Series 2006-6, Class XP IO
2.172%, 12/25/2046 $ 14,967,940 $ 1,379,350
American Home Mortgage Assets LLC,,
Series 2006-6, Class A1A
0.398%, 12/25/2046 (P) 371,721 230,755
American Home Mortgage
Investment Trust, Series 2004-4,
Class 5A 2.540%, 02/25/2045 (P) 285,556 275,148
American Tower Trust
Series 2007-1A, Class C,
5.615%, 04/15/2037 (S) 1,735,000 1,780,710
Series 2007-1A, Class D,
5.957%, 04/15/2037 (S) 1,695,000 1,739,750
Americold 2010 LLC Trust
Series 2010-ARTA, Class C,
6.811%, 01/14/2029 (S) 750,000 913,531
Series 2010-ARTA, Class D,
7.443%, 01/14/2029 (S) 3,330,000 4,074,242
Banc of America
Commercial Mortgage Trust, Inc.
Series 2005-5, Class XC IO,
0.223%, 10/10/2045 (S) 62,698,936 201,013
Series 2005-2, Class AJ,
4.953%, 07/10/2043 (P) 50,846 54,426
Series 2007-3, Class AMF,
5.317%, 06/10/2049 1,100,000 1,169,027
Series 2007-1, Class A3,
5.449%, 01/15/2049 1,048,602 1,078,354
Series 2007-2, Class A2,
5.634%, 04/10/2049 (P) 874,084 892,915
Series 2006-4, Class AM,
5.675%, 07/10/2046 2,500,000 2,804,935
Series 2007-3, Class AM,
5.802%, 06/10/2049 (P) 1,000,000 1,069,946
Series 2006-3, Class A4,
5.889%, 07/10/2044 (P) 2,295,000 2,634,655
Series 2006-2, Class AM,
5.951%, 05/10/2045 (P) 1,440,000 1,606,935
Series 2007-4, Class AM,
5.987%, 02/10/2051 (P) 1,000,000 1,097,950
Bayview Commercial Asset Trust,
Series 2008-1, Class A4
1.708%, 01/25/2038 (S) 2,240,000 1,166,679
Bear Stearns Alt-A Trust
Series 2005-1, Class A1,
0.768%, 01/25/2035 (P) 1,808,924 1,701,418
Series 2004-12, Class 1A1,
0.908%, 01/25/2035 (P) 1,786,771 1,707,284
Bear Stearns Asset
Backed Securities Trust
Series 2004-AC5, Class A1,
5.250%, 10/25/2034 1,072,170 1,107,735
Series 2003-AC4, Class A,
5.500%, 09/25/2033 4,719 4,877
Bear Stearns Commercial Mortgage
Securities, Series 2007-PW17, Class AJ
Copyright © 2013 www.secdatabase.com. All Rights Reserved.Please Consider the Environment Before Printing This Document
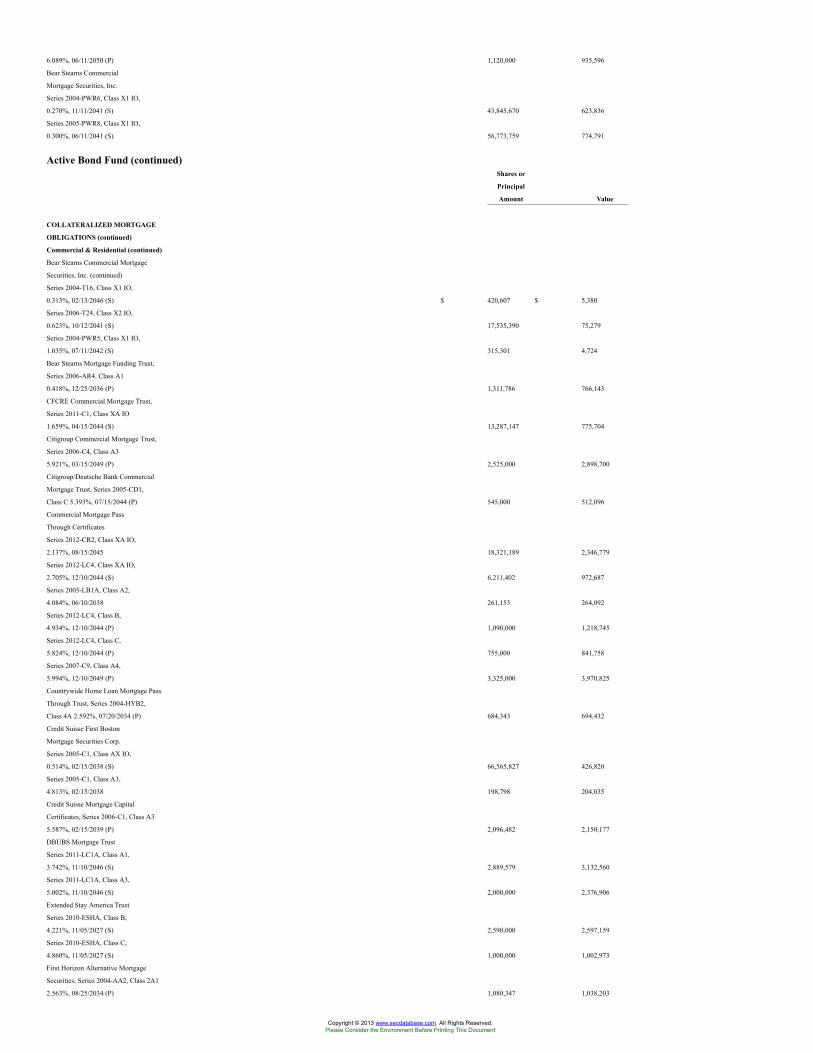
6.089%, 06/11/2050 (P) 1,120,000 935,596
Bear Stearns Commercial
Mortgage Securities, Inc.
Series 2004-PWR6, Class X1 IO,
0.270%, 11/11/2041 (S) 43,845,670 623,836
Series 2005-PWR8, Class X1 IO,
0.300%, 06/11/2041 (S) 56,773,759 774,791
Active Bond Fund (continued)Shares or
Principal
Amount Value
COLLATERALIZED MORTGAGE
OBLIGATIONS (continued)
Commercial & Residential (continued)
Bear Stearns Commercial Mortgage
Securities, Inc. (continued)
Series 2004-T16, Class X1 IO,
0.313%, 02/13/2046 (S) $ 420,607 $ 5,380
Series 2006-T24, Class X2 IO,
0.623%, 10/12/2041 (S) 17,535,390 75,279
Series 2004-PWR5, Class X1 IO,
1.035%, 07/11/2042 (S) 315,301 4,724
Bear Stearns Mortgage Funding Trust,
Series 2006-AR4, Class A1
0.418%, 12/25/2036 (P) 1,311,786 766,143
CFCRE Commercial Mortgage Trust,
Series 2011-C1, Class XA IO
1.659%, 04/15/2044 (S) 13,287,147 775,704
Citigroup Commercial Mortgage Trust,
Series 2006-C4, Class A3
5.921%, 03/15/2049 (P) 2,525,000 2,898,700
Citigroup/Deutsche Bank Commercial
Mortgage Trust, Series 2005-CD1,
Class C 5.393%, 07/15/2044 (P) 545,000 512,096
Commercial Mortgage Pass
Through Certificates
Series 2012-CR2, Class XA IO,
2.137%, 08/15/2045 18,321,189 2,346,779
Series 2012-LC4, Class XA IO,
2.705%, 12/10/2044 (S) 6,211,402 972,687
Series 2003-LB1A, Class A2,
4.084%, 06/10/2038 261,153 264,092
Series 2012-LC4, Class B,
4.934%, 12/10/2044 (P) 1,090,000 1,218,745
Series 2012-LC4, Class C,
5.824%, 12/10/2044 (P) 755,000 841,758
Series 2007-C9, Class A4,
5.994%, 12/10/2049 (P) 3,325,000 3,970,825
Countrywide Home Loan Mortgage Pass
Through Trust, Series 2004-HYB2,
Class 4A 2.592%, 07/20/2034 (P) 684,343 694,432
Credit Suisse First Boston
Mortgage Securities Corp.
Series 2005-C1, Class AX IO,
0.514%, 02/15/2038 (S) 66,565,827 426,820
Series 2005-C1, Class A3,
4.813%, 02/15/2038 198,798 204,035
Credit Suisse Mortgage Capital
Certificates, Series 2006-C1, Class A3
5.587%, 02/15/2039 (P) 2,096,482 2,150,177
DBUBS Mortgage Trust
Series 2011-LC1A, Class A1,
3.742%, 11/10/2046 (S) 2,889,579 3,132,560
Series 2011-LC1A, Class A3,
5.002%, 11/10/2046 (S) 2,000,000 2,376,906
Extended Stay America Trust
Series 2010-ESHA, Class B,
4.221%, 11/05/2027 (S) 2,590,000 2,597,159
Series 2010-ESHA, Class C,
4.860%, 11/05/2027 (S) 1,000,000 1,002,973
First Horizon Alternative Mortgage
Securities, Series 2004-AA2, Class 2A1
2.563%, 08/25/2034 (P) 1,080,347 1,038,203
Copyright © 2013 www.secdatabase.com. All Rights Reserved.Please Consider the Environment Before Printing This Document
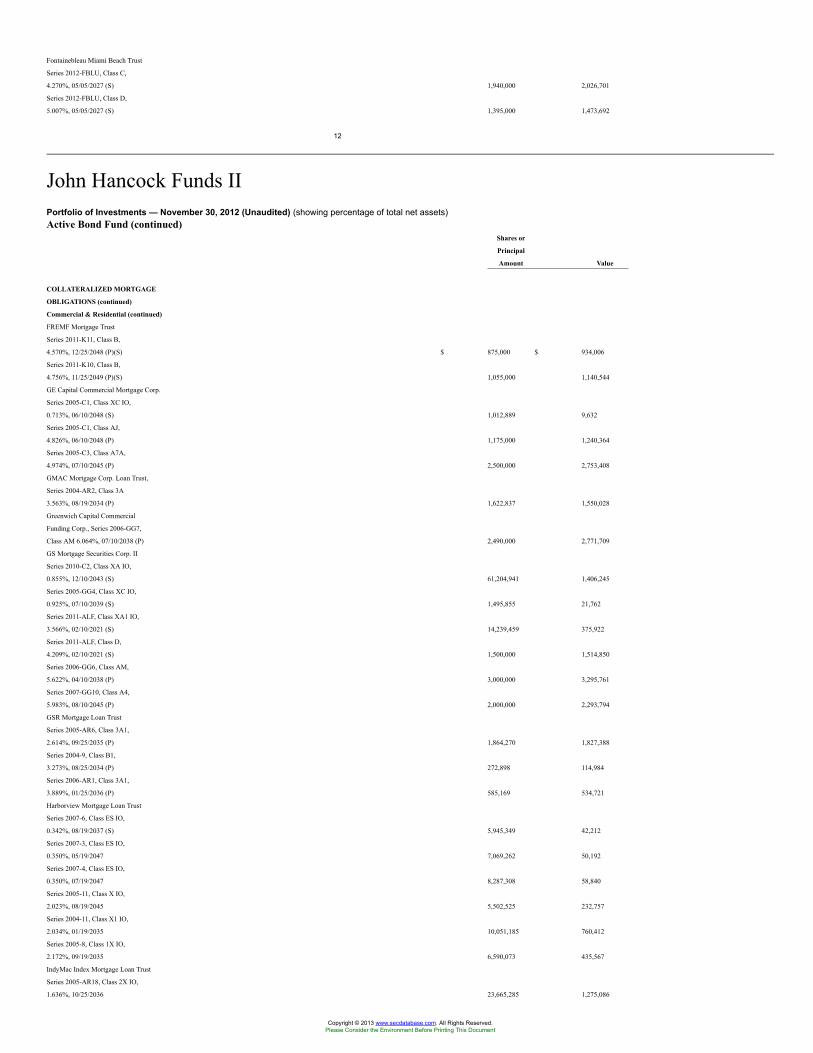
Fontainebleau Miami Beach Trust
Series 2012-FBLU, Class C,
4.270%, 05/05/2027 (S) 1,940,000 2,026,701
Series 2012-FBLU, Class D,
5.007%, 05/05/2027 (S) 1,395,000 1,473,692
12
John Hancock Funds IIPortfolio of Investments — November 30, 2012 (Unaudited) (showing percentage of total net assets)Active Bond Fund (continued)
Shares or
Principal
Amount Value
COLLATERALIZED MORTGAGE
OBLIGATIONS (continued)
Commercial & Residential (continued)
FREMF Mortgage Trust
Series 2011-K11, Class B,
4.570%, 12/25/2048 (P)(S) $ 875,000 $ 934,006
Series 2011-K10, Class B,
4.756%, 11/25/2049 (P)(S) 1,055,000 1,140,544
GE Capital Commercial Mortgage Corp.
Series 2005-C1, Class XC IO,
0.713%, 06/10/2048 (S) 1,012,889 9,632
Series 2005-C1, Class AJ,
4.826%, 06/10/2048 (P) 1,175,000 1,240,364
Series 2005-C3, Class A7A,
4.974%, 07/10/2045 (P) 2,500,000 2,753,408
GMAC Mortgage Corp. Loan Trust,
Series 2004-AR2, Class 3A
3.563%, 08/19/2034 (P) 1,622,837 1,550,028
Greenwich Capital Commercial
Funding Corp., Series 2006-GG7,
Class AM 6.064%, 07/10/2038 (P) 2,490,000 2,771,709
GS Mortgage Securities Corp. II
Series 2010-C2, Class XA IO,
0.855%, 12/10/2043 (S) 61,204,941 1,406,245
Series 2005-GG4, Class XC IO,
0.925%, 07/10/2039 (S) 1,495,855 21,762
Series 2011-ALF, Class XA1 IO,
3.566%, 02/10/2021 (S) 14,239,459 375,922
Series 2011-ALF, Class D,
4.209%, 02/10/2021 (S) 1,500,000 1,514,850
Series 2006-GG6, Class AM,
5.622%, 04/10/2038 (P) 3,000,000 3,295,761
Series 2007-GG10, Class A4,
5.983%, 08/10/2045 (P) 2,000,000 2,293,794
GSR Mortgage Loan Trust
Series 2005-AR6, Class 3A1,
2.614%, 09/25/2035 (P) 1,864,270 1,827,388
Series 2004-9, Class B1,
3.273%, 08/25/2034 (P) 272,898 114,984
Series 2006-AR1, Class 3A1,
3.889%, 01/25/2036 (P) 585,169 534,721
Harborview Mortgage Loan Trust
Series 2007-6, Class ES IO,
0.342%, 08/19/2037 (S) 5,945,349 42,212
Series 2007-3, Class ES IO,
0.350%, 05/19/2047 7,069,262 50,192
Series 2007-4, Class ES IO,
0.350%, 07/19/2047 8,287,308 58,840
Series 2005-11, Class X IO,
2.023%, 08/19/2045 5,502,525 232,757
Series 2004-11, Class X1 IO,
2.034%, 01/19/2035 10,051,185 760,412
Series 2005-8, Class 1X IO,
2.172%, 09/19/2035 6,590,073 435,567
IndyMac Index Mortgage Loan Trust
Series 2005-AR18, Class 2X IO,
1.636%, 10/25/2036 23,665,285 1,275,086
Copyright © 2013 www.secdatabase.com. All Rights Reserved.Please Consider the Environment Before Printing This Document
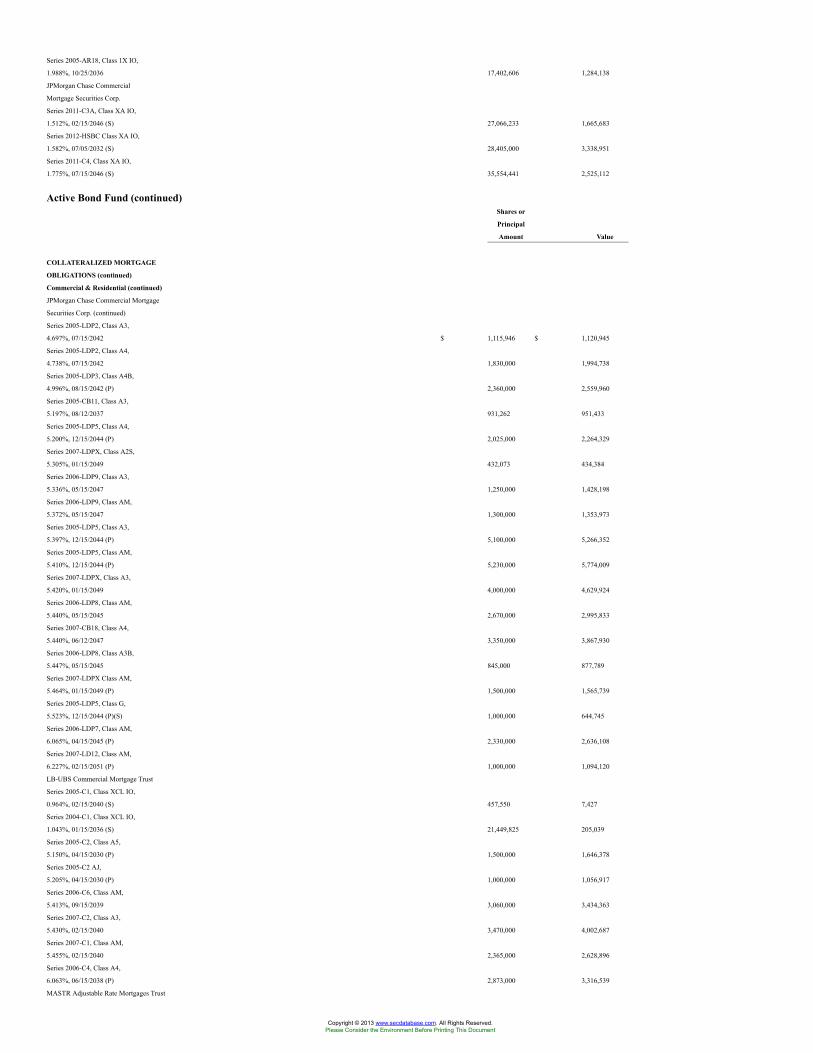
Series 2005-AR18, Class 1X IO,
1.988%, 10/25/2036 17,402,606 1,284,138
JPMorgan Chase Commercial
Mortgage Securities Corp.
Series 2011-C3A, Class XA IO,
1.512%, 02/15/2046 (S) 27,066,233 1,665,683
Series 2012-HSBC Class XA IO,
1.582%, 07/05/2032 (S) 28,405,000 3,338,951
Series 2011-C4, Class XA IO,
1.775%, 07/15/2046 (S) 35,554,441 2,525,112
Active Bond Fund (continued)Shares or
Principal
Amount Value
COLLATERALIZED MORTGAGE
OBLIGATIONS (continued)
Commercial & Residential (continued)
JPMorgan Chase Commercial Mortgage
Securities Corp. (continued)
Series 2005-LDP2, Class A3,
4.697%, 07/15/2042 $ 1,115,946 $ 1,120,945
Series 2005-LDP2, Class A4,
4.738%, 07/15/2042 1,830,000 1,994,738
Series 2005-LDP3, Class A4B,
4.996%, 08/15/2042 (P) 2,360,000 2,559,960
Series 2005-CB11, Class A3,
5.197%, 08/12/2037 931,262 951,433
Series 2005-LDP5, Class A4,
5.200%, 12/15/2044 (P) 2,025,000 2,264,329
Series 2007-LDPX, Class A2S,
5.305%, 01/15/2049 432,073 434,384
Series 2006-LDP9, Class A3,
5.336%, 05/15/2047 1,250,000 1,428,198
Series 2006-LDP9, Class AM,
5.372%, 05/15/2047 1,300,000 1,353,973
Series 2005-LDP5, Class A3,
5.397%, 12/15/2044 (P) 5,100,000 5,266,352
Series 2005-LDP5, Class AM,
5.410%, 12/15/2044 (P) 5,230,000 5,774,009
Series 2007-LDPX, Class A3,
5.420%, 01/15/2049 4,000,000 4,629,924
Series 2006-LDP8, Class AM,
5.440%, 05/15/2045 2,670,000 2,995,833
Series 2007-CB18, Class A4,
5.440%, 06/12/2047 3,350,000 3,867,930
Series 2006-LDP8, Class A3B,
5.447%, 05/15/2045 845,000 877,789
Series 2007-LDPX Class AM,
5.464%, 01/15/2049 (P) 1,500,000 1,565,739
Series 2005-LDP5, Class G,
5.523%, 12/15/2044 (P)(S) 1,000,000 644,745
Series 2006-LDP7, Class AM,
6.065%, 04/15/2045 (P) 2,330,000 2,636,108
Series 2007-LD12, Class AM,
6.227%, 02/15/2051 (P) 1,000,000 1,094,120
LB-UBS Commercial Mortgage Trust
Series 2005-C1, Class XCL IO,
0.964%, 02/15/2040 (S) 457,550 7,427
Series 2004-C1, Class XCL IO,
1.043%, 01/15/2036 (S) 21,449,825 205,039
Series 2005-C2, Class A5,
5.150%, 04/15/2030 (P) 1,500,000 1,646,378
Series 2005-C2 AJ,
5.205%, 04/15/2030 (P) 1,000,000 1,056,917
Series 2006-C6, Class AM,
5.413%, 09/15/2039 3,060,000 3,434,363
Series 2007-C2, Class A3,
5.430%, 02/15/2040 3,470,000 4,002,687
Series 2007-C1, Class AM,
5.455%, 02/15/2040 2,365,000 2,628,896
Series 2006-C4, Class A4,
6.063%, 06/15/2038 (P) 2,873,000 3,316,539
MASTR Adjustable Rate Mortgages Trust
Copyright © 2013 www.secdatabase.com. All Rights Reserved.Please Consider the Environment Before Printing This Document
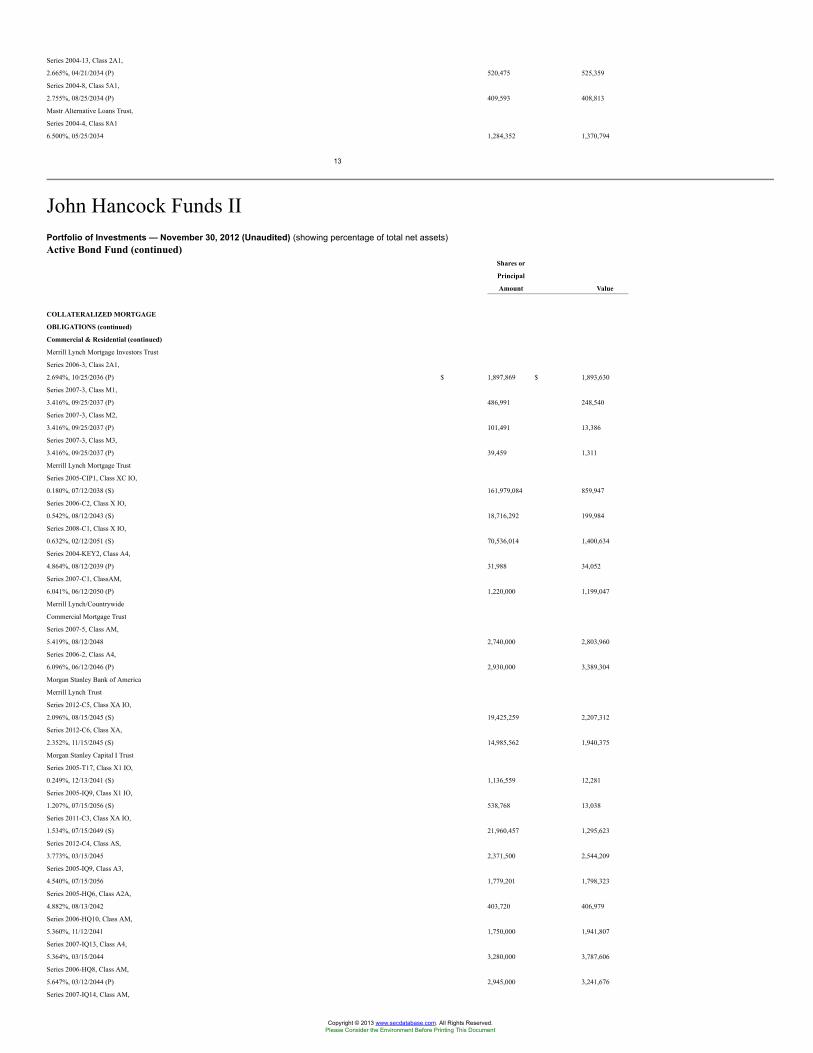
Series 2004-13, Class 2A1,
2.665%, 04/21/2034 (P) 520,475 525,359
Series 2004-8, Class 5A1,
2.755%, 08/25/2034 (P) 409,593 408,813
Mastr Alternative Loans Trust,
Series 2004-4, Class 8A1
6.500%, 05/25/2034 1,284,352 1,370,794
13
John Hancock Funds IIPortfolio of Investments — November 30, 2012 (Unaudited) (showing percentage of total net assets)Active Bond Fund (continued)
Shares or
Principal
Amount Value
COLLATERALIZED MORTGAGE
OBLIGATIONS (continued)
Commercial & Residential (continued)
Merrill Lynch Mortgage Investors Trust
Series 2006-3, Class 2A1,
2.694%, 10/25/2036 (P) $ 1,897,869 $ 1,893,630
Series 2007-3, Class M1,
3.416%, 09/25/2037 (P) 486,991 248,540
Series 2007-3, Class M2,
3.416%, 09/25/2037 (P) 101,491 13,386
Series 2007-3, Class M3,
3.416%, 09/25/2037 (P) 39,459 1,311
Merrill Lynch Mortgage Trust
Series 2005-CIP1, Class XC IO,
0.180%, 07/12/2038 (S) 161,979,084 859,947
Series 2006-C2, Class X IO,
0.542%, 08/12/2043 (S) 18,716,292 199,984
Series 2008-C1, Class X IO,
0.632%, 02/12/2051 (S) 70,536,014 1,400,634
Series 2004-KEY2, Class A4,
4.864%, 08/12/2039 (P) 31,988 34,052
Series 2007-C1, ClassAM,
6.041%, 06/12/2050 (P) 1,220,000 1,199,047
Merrill Lynch/Countrywide
Commercial Mortgage Trust
Series 2007-5, Class AM,
5.419%, 08/12/2048 2,740,000 2,803,960
Series 2006-2, Class A4,
6.096%, 06/12/2046 (P) 2,930,000 3,389,304
Morgan Stanley Bank of America
Merrill Lynch Trust
Series 2012-C5, Class XA IO,
2.096%, 08/15/2045 (S) 19,425,259 2,207,312
Series 2012-C6, Class XA,
2.352%, 11/15/2045 (S) 14,985,562 1,940,375
Morgan Stanley Capital I Trust
Series 2005-T17, Class X1 IO,
0.249%, 12/13/2041 (S) 1,136,559 12,281
Series 2005-IQ9, Class X1 IO,
1.207%, 07/15/2056 (S) 538,768 13,038
Series 2011-C3, Class XA IO,
1.534%, 07/15/2049 (S) 21,960,457 1,295,623
Series 2012-C4, Class AS,
3.773%, 03/15/2045 2,371,500 2,544,209
Series 2005-IQ9, Class A3,
4.540%, 07/15/2056 1,779,201 1,798,323
Series 2005-HQ6, Class A2A,
4.882%, 08/13/2042 403,720 406,979
Series 2006-HQ10, Class AM,
5.360%, 11/12/2041 1,750,000 1,941,807
Series 2007-IQ13, Class A4,
5.364%, 03/15/2044 3,280,000 3,787,606
Series 2006-HQ8, Class AM,
5.647%, 03/12/2044 (P) 2,945,000 3,241,676
Series 2007-IQ14, Class AM,
Copyright © 2013 www.secdatabase.com. All Rights Reserved.Please Consider the Environment Before Printing This Document
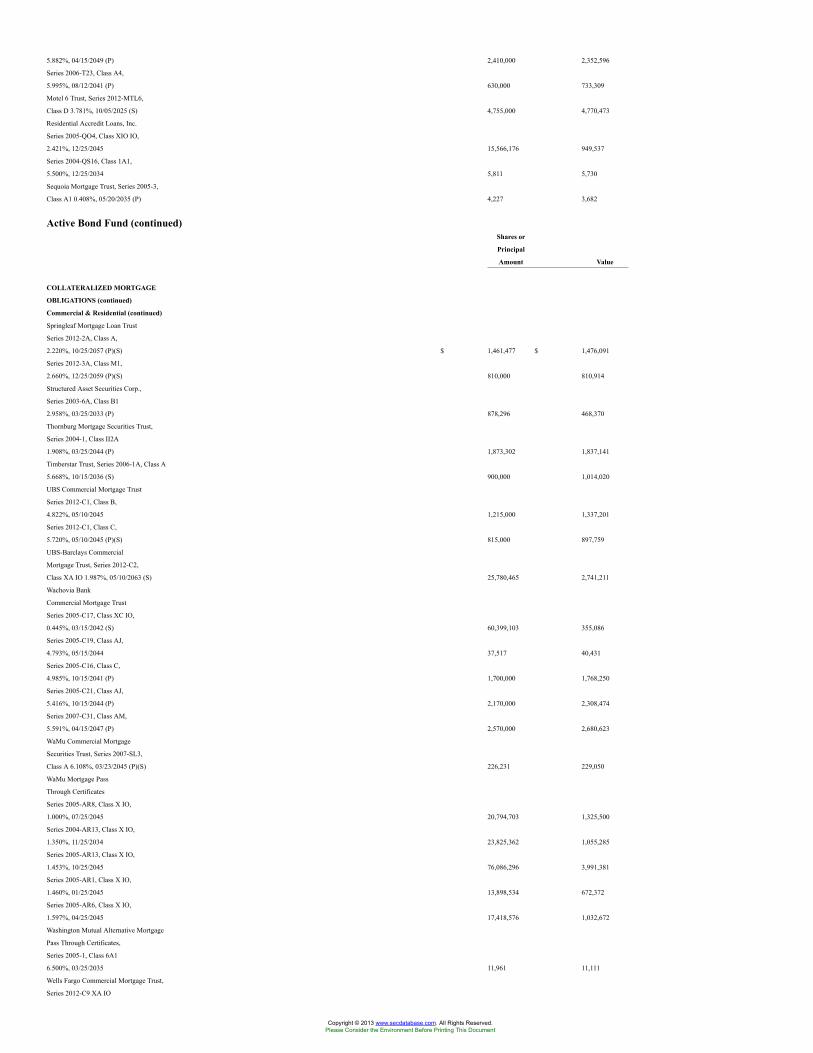
5.882%, 04/15/2049 (P) 2,410,000 2,352,596
Series 2006-T23, Class A4,
5.995%, 08/12/2041 (P) 630,000 733,309
Motel 6 Trust, Series 2012-MTL6,
Class D 3.781%, 10/05/2025 (S) 4,755,000 4,770,473
Residential Accredit Loans, Inc.
Series 2005-QO4, Class XIO IO,
2.421%, 12/25/2045 15,566,176 949,537
Series 2004-QS16, Class 1A1,
5.500%, 12/25/2034 5,811 5,730
Sequoia Mortgage Trust, Series 2005-3,
Class A1 0.408%, 05/20/2035 (P) 4,227 3,682
Active Bond Fund (continued)Shares or
Principal
Amount Value
COLLATERALIZED MORTGAGE
OBLIGATIONS (continued)
Commercial & Residential (continued)
Springleaf Mortgage Loan Trust
Series 2012-2A, Class A,
2.220%, 10/25/2057 (P)(S) $ 1,461,477 $ 1,476,091
Series 2012-3A, Class M1,
2.660%, 12/25/2059 (P)(S) 810,000 810,914
Structured Asset Securities Corp.,
Series 2003-6A, Class B1
2.958%, 03/25/2033 (P) 878,296 468,370
Thornburg Mortgage Securities Trust,
Series 2004-1, Class II2A
1.908%, 03/25/2044 (P) 1,873,302 1,837,141
Timberstar Trust, Series 2006-1A, Class A
5.668%, 10/15/2036 (S) 900,000 1,014,020
UBS Commercial Mortgage Trust
Series 2012-C1, Class B,
4.822%, 05/10/2045 1,215,000 1,337,201
Series 2012-C1, Class C,
5.720%, 05/10/2045 (P)(S) 815,000 897,759
UBS-Barclays Commercial
Mortgage Trust, Series 2012-C2,
Class XA IO 1.987%, 05/10/2063 (S) 25,780,465 2,741,211
Wachovia Bank
Commercial Mortgage Trust
Series 2005-C17, Class XC IO,
0.445%, 03/15/2042 (S) 60,399,103 355,086
Series 2005-C19, Class AJ,
4.793%, 05/15/2044 37,517 40,431
Series 2005-C16, Class C,
4.985%, 10/15/2041 (P) 1,700,000 1,768,250
Series 2005-C21, Class AJ,
5.416%, 10/15/2044 (P) 2,170,000 2,308,474
Series 2007-C31, Class AM,
5.591%, 04/15/2047 (P) 2,570,000 2,680,623
WaMu Commercial Mortgage
Securities Trust, Series 2007-SL3,
Class A 6.108%, 03/23/2045 (P)(S) 226,231 229,050
WaMu Mortgage Pass
Through Certificates
Series 2005-AR8, Class X IO,
1.000%, 07/25/2045 20,794,703 1,325,500
Series 2004-AR13, Class X IO,
1.350%, 11/25/2034 23,825,362 1,055,285
Series 2005-AR13, Class X IO,
1.453%, 10/25/2045 76,086,296 3,991,381
Series 2005-AR1, Class X IO,
1.460%, 01/25/2045 13,898,534 672,372
Series 2005-AR6, Class X IO,
1.597%, 04/25/2045 17,418,576 1,032,672
Washington Mutual Alternative Mortgage
Pass Through Certificates,
Series 2005-1, Class 6A1
6.500%, 03/25/2035 11,961 11,111
Wells Fargo Commercial Mortgage Trust,
Series 2012-C9 XA IO
Copyright © 2013 www.secdatabase.com. All Rights Reserved.Please Consider the Environment Before Printing This Document
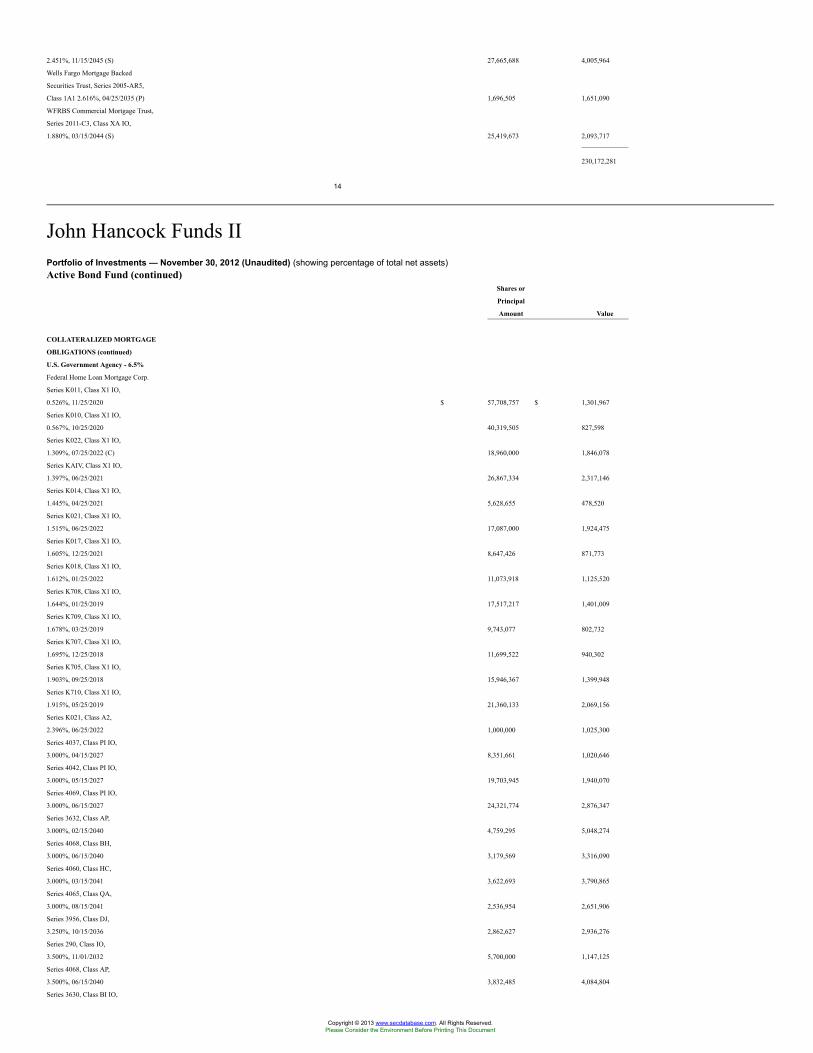
2.451%, 11/15/2045 (S) 27,665,688 4,005,964
Wells Fargo Mortgage Backed
Securities Trust, Series 2005-AR5,
Class 1A1 2.616%, 04/25/2035 (P) 1,696,505 1,651,090
WFRBS Commercial Mortgage Trust,
Series 2011-C3, Class XA IO,
1.880%, 03/15/2044 (S) 25,419,673 2,093,717
230,172,281
14
John Hancock Funds IIPortfolio of Investments — November 30, 2012 (Unaudited) (showing percentage of total net assets)Active Bond Fund (continued)
Shares or
Principal
Amount Value
COLLATERALIZED MORTGAGE
OBLIGATIONS (continued)
U.S. Government Agency - 6.5%
Federal Home Loan Mortgage Corp.
Series K011, Class X1 IO,
0.526%, 11/25/2020 $ 57,708,757 $ 1,301,967
Series K010, Class X1 IO,
0.567%, 10/25/2020 40,319,505 827,598
Series K022, Class X1 IO,
1.309%, 07/25/2022 (C) 18,960,000 1,846,078
Series KAIV, Class X1 IO,
1.397%, 06/25/2021 26,867,334 2,317,146
Series K014, Class X1 IO,
1.445%, 04/25/2021 5,628,655 478,520
Series K021, Class X1 IO,
1.515%, 06/25/2022 17,087,000 1,924,475
Series K017, Class X1 IO,
1.605%, 12/25/2021 8,647,426 871,773
Series K018, Class X1 IO,
1.612%, 01/25/2022 11,073,918 1,125,520
Series K708, Class X1 IO,
1.644%, 01/25/2019 17,517,217 1,401,009
Series K709, Class X1 IO,
1.678%, 03/25/2019 9,743,077 802,732
Series K707, Class X1 IO,
1.695%, 12/25/2018 11,699,522 940,302
Series K705, Class X1 IO,
1.903%, 09/25/2018 15,946,367 1,399,948
Series K710, Class X1 IO,
1.915%, 05/25/2019 21,360,133 2,069,156
Series K021, Class A2,
2.396%, 06/25/2022 1,000,000 1,025,300
Series 4037, Class PI IO,
3.000%, 04/15/2027 8,351,661 1,020,646
Series 4042, Class PI IO,
3.000%, 05/15/2027 19,703,945 1,940,070
Series 4069, Class PI IO,
3.000%, 06/15/2027 24,321,774 2,876,347
Series 3632, Class AP,
3.000%, 02/15/2040 4,759,295 5,048,274
Series 4068, Class BH,
3.000%, 06/15/2040 3,179,569 3,316,090
Series 4060, Class HC,
3.000%, 03/15/2041 3,622,693 3,790,865
Series 4065, Class QA,
3.000%, 08/15/2041 2,536,954 2,651,906
Series 3956, Class DJ,
3.250%, 10/15/2036 2,862,627 2,936,276
Series 290, Class IO,
3.500%, 11/01/2032 5,700,000 1,147,125
Series 4068, Class AP,
3.500%, 06/15/2040 3,832,485 4,084,804
Series 3630, Class BI IO,
Copyright © 2013 www.secdatabase.com. All Rights Reserved.Please Consider the Environment Before Printing This Document
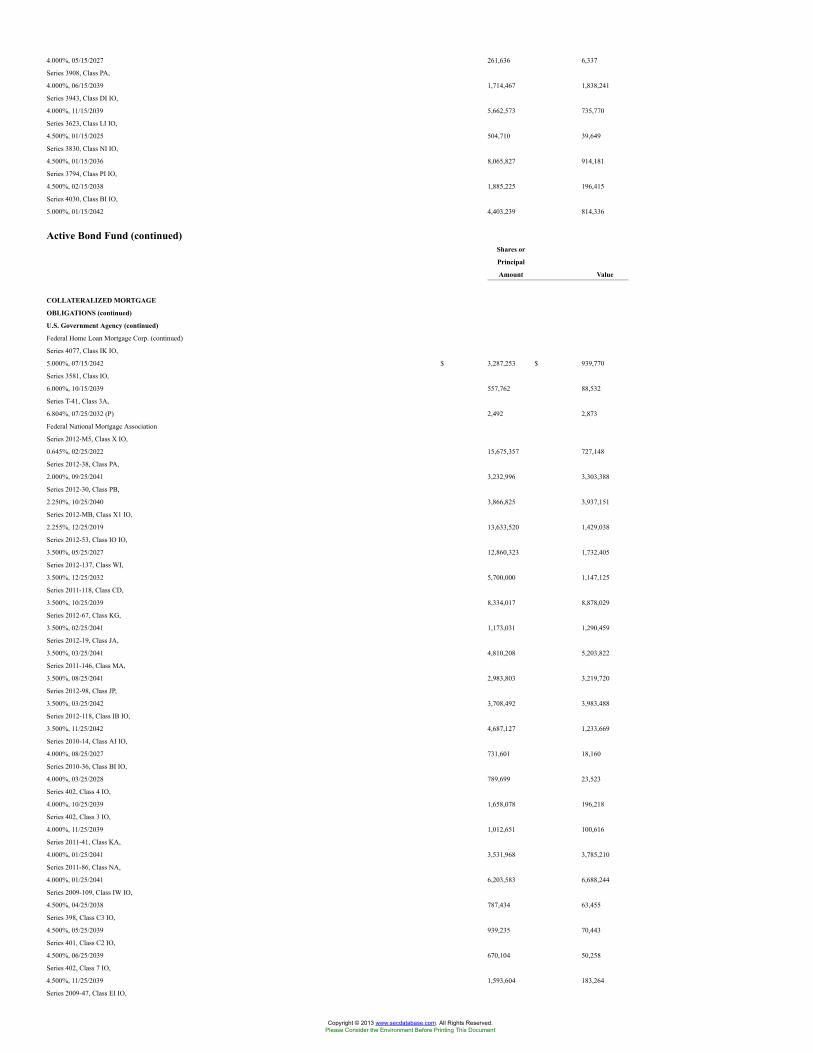
4.000%, 05/15/2027 261,636 6,337
Series 3908, Class PA,
4.000%, 06/15/2039 1,714,467 1,838,241
Series 3943, Class DI IO,
4.000%, 11/15/2039 5,662,573 735,770
Series 3623, Class LI IO,
4.500%, 01/15/2025 504,710 39,649
Series 3830, Class NI IO,
4.500%, 01/15/2036 8,065,827 914,181
Series 3794, Class PI IO,
4.500%, 02/15/2038 1,885,225 196,415
Series 4030, Class BI IO,
5.000%, 01/15/2042 4,403,239 814,336
Active Bond Fund (continued)Shares or
Principal
Amount Value
COLLATERALIZED MORTGAGE
OBLIGATIONS (continued)
U.S. Government Agency (continued)
Federal Home Loan Mortgage Corp. (continued)
Series 4077, Class IK IO,
5.000%, 07/15/2042 $ 3,287,253 $ 939,770
Series 3581, Class IO,
6.000%, 10/15/2039 557,762 88,532
Series T-41, Class 3A,
6.804%, 07/25/2032 (P) 2,492 2,873
Federal National Mortgage Association
Series 2012-M5, Class X IO,
0.645%, 02/25/2022 15,675,357 727,148
Series 2012-38, Class PA,
2.000%, 09/25/2041 3,232,996 3,303,388
Series 2012-30, Class PB,
2.250%, 10/25/2040 3,866,825 3,937,151
Series 2012-MB, Class X1 IO,
2.255%, 12/25/2019 13,633,520 1,429,038
Series 2012-53, Class IO IO,
3.500%, 05/25/2027 12,860,323 1,732,405
Series 2012-137, Class WI,
3.500%, 12/25/2032 5,700,000 1,147,125
Series 2011-118, Class CD,
3.500%, 10/25/2039 8,334,017 8,878,029
Series 2012-67, Class KG,
3.500%, 02/25/2041 1,173,031 1,290,459
Series 2012-19, Class JA,
3.500%, 03/25/2041 4,810,208 5,203,822
Series 2011-146, Class MA,
3.500%, 08/25/2041 2,983,803 3,219,720
Series 2012-98, Class JP,
3.500%, 03/25/2042 3,708,492 3,983,488
Series 2012-118, Class IB IO,
3.500%, 11/25/2042 4,687,127 1,233,669
Series 2010-14, Class AI IO,
4.000%, 08/25/2027 731,601 18,160
Series 2010-36, Class BI IO,
4.000%, 03/25/2028 789,699 23,523
Series 402, Class 4 IO,
4.000%, 10/25/2039 1,658,078 196,218
Series 402, Class 3 IO,
4.000%, 11/25/2039 1,012,651 100,616
Series 2011-41, Class KA,
4.000%, 01/25/2041 3,531,968 3,785,210
Series 2011-86, Class NA,
4.000%, 01/25/2041 6,203,583 6,688,244
Series 2009-109, Class IW IO,
4.500%, 04/25/2038 787,434 63,455
Series 398, Class C3 IO,
4.500%, 05/25/2039 939,235 70,443
Series 401, Class C2 IO,
4.500%, 06/25/2039 670,104 50,258
Series 402, Class 7 IO,
4.500%, 11/25/2039 1,593,604 183,264
Series 2009-47, Class EI IO,
Copyright © 2013 www.secdatabase.com. All Rights Reserved.Please Consider the Environment Before Printing This Document
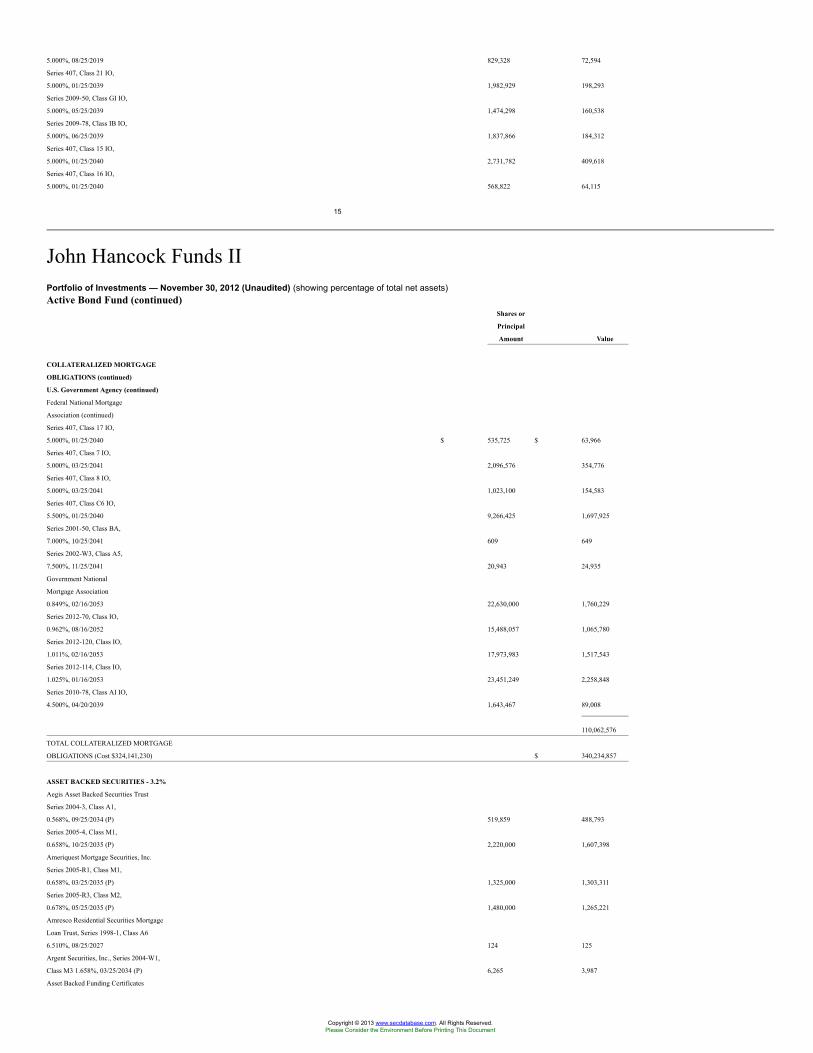
5.000%, 08/25/2019 829,328 72,594
Series 407, Class 21 IO,
5.000%, 01/25/2039 1,982,929 198,293
Series 2009-50, Class GI IO,
5.000%, 05/25/2039 1,474,298 160,538
Series 2009-78, Class IB IO,
5.000%, 06/25/2039 1,837,866 184,312
Series 407, Class 15 IO,
5.000%, 01/25/2040 2,731,782 409,618
Series 407, Class 16 IO,
5.000%, 01/25/2040 568,822 64,115
15
John Hancock Funds IIPortfolio of Investments — November 30, 2012 (Unaudited) (showing percentage of total net assets)Active Bond Fund (continued)
Shares or
Principal
Amount Value
COLLATERALIZED MORTGAGE
OBLIGATIONS (continued)
U.S. Government Agency (continued)
Federal National Mortgage
Association (continued)
Series 407, Class 17 IO,
5.000%, 01/25/2040 $ 535,725 $ 63,966
Series 407, Class 7 IO,
5.000%, 03/25/2041 2,096,576 354,776
Series 407, Class 8 IO,
5.000%, 03/25/2041 1,023,100 154,583
Series 407, Class C6 IO,
5.500%, 01/25/2040 9,266,425 1,697,925
Series 2001-50, Class BA,
7.000%, 10/25/2041 609 649
Series 2002-W3, Class A5,
7.500%, 11/25/2041 20,943 24,935
Government National
Mortgage Association
0.849%, 02/16/2053 22,630,000 1,760,229
Series 2012-70, Class IO,
0.962%, 08/16/2052 15,488,057 1,065,780
Series 2012-120, Class IO,
1.011%, 02/16/2053 17,973,983 1,517,543
Series 2012-114, Class IO,
1.025%, 01/16/2053 23,451,249 2,258,848
Series 2010-78, Class AI IO,
4.500%, 04/20/2039 1,643,467 89,008
110,062,576
TOTAL COLLATERALIZED MORTGAGE
OBLIGATIONS (Cost $324,141,230) $ 340,234,857
ASSET BACKED SECURITIES - 3.2%
Aegis Asset Backed Securities Trust
Series 2004-3, Class A1,
0.568%, 09/25/2034 (P) 519,859 488,793
Series 2005-4, Class M1,
0.658%, 10/25/2035 (P) 2,220,000 1,607,398
Ameriquest Mortgage Securities, Inc.
Series 2005-R1, Class M1,
0.658%, 03/25/2035 (P) 1,325,000 1,303,311
Series 2005-R3, Class M2,
0.678%, 05/25/2035 (P) 1,480,000 1,265,221
Amresco Residential Securities Mortgage
Loan Trust, Series 1998-1, Class A6
6.510%, 08/25/2027 124 125
Argent Securities, Inc., Series 2004-W1,
Class M3 1.658%, 03/25/2034 (P) 6,265 3,987
Asset Backed Funding Certificates
Copyright © 2013 www.secdatabase.com. All Rights Reserved.Please Consider the Environment Before Printing This Document
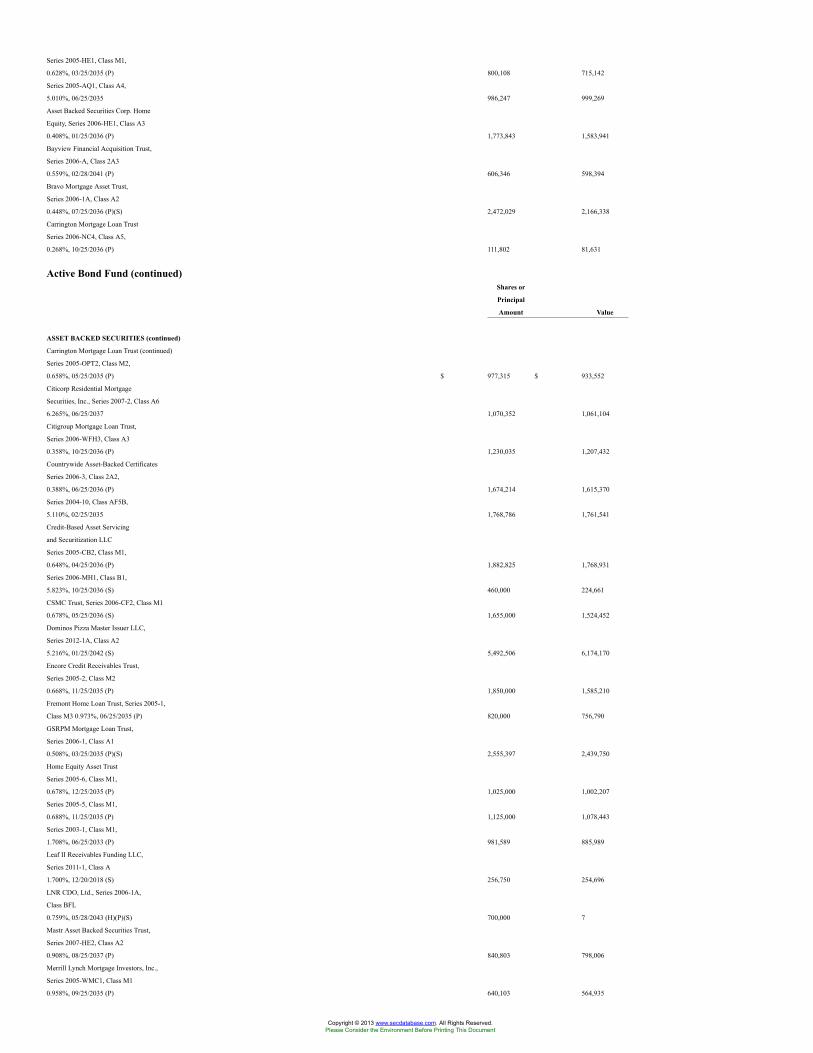
Series 2005-HE1, Class M1,
0.628%, 03/25/2035 (P) 800,108 715,142
Series 2005-AQ1, Class A4,
5.010%, 06/25/2035 986,247 999,269
Asset Backed Securities Corp. Home
Equity, Series 2006-HE1, Class A3
0.408%, 01/25/2036 (P) 1,773,843 1,583,941
Bayview Financial Acquisition Trust,
Series 2006-A, Class 2A3
0.559%, 02/28/2041 (P) 606,346 598,394
Bravo Mortgage Asset Trust,
Series 2006-1A, Class A2
0.448%, 07/25/2036 (P)(S) 2,472,029 2,166,338
Carrington Mortgage Loan Trust
Series 2006-NC4, Class A5,
0.268%, 10/25/2036 (P) 111,802 81,631
Active Bond Fund (continued)Shares or
Principal
Amount Value
ASSET BACKED SECURITIES (continued)
Carrington Mortgage Loan Trust (continued)
Series 2005-OPT2, Class M2,
0.658%, 05/25/2035 (P) $ 977,315 $ 933,552
Citicorp Residential Mortgage
Securities, Inc., Series 2007-2, Class A6
6.265%, 06/25/2037 1,070,352 1,061,104
Citigroup Mortgage Loan Trust,
Series 2006-WFH3, Class A3
0.358%, 10/25/2036 (P) 1,230,035 1,207,432
Countrywide Asset-Backed Certificates
Series 2006-3, Class 2A2,
0.388%, 06/25/2036 (P) 1,674,214 1,615,370
Series 2004-10, Class AF5B,
5.110%, 02/25/2035 1,768,786 1,761,541
Credit-Based Asset Servicing
and Securitization LLC
Series 2005-CB2, Class M1,
0.648%, 04/25/2036 (P) 1,882,825 1,768,931
Series 2006-MH1, Class B1,
5.823%, 10/25/2036 (S) 460,000 224,661
CSMC Trust, Series 2006-CF2, Class M1
0.678%, 05/25/2036 (S) 1,655,000 1,524,452
Dominos Pizza Master Issuer LLC,
Series 2012-1A, Class A2
5.216%, 01/25/2042 (S) 5,492,506 6,174,170
Encore Credit Receivables Trust,
Series 2005-2, Class M2
0.668%, 11/25/2035 (P) 1,850,000 1,585,210
Fremont Home Loan Trust, Series 2005-1,
Class M3 0.973%, 06/25/2035 (P) 820,000 756,790
GSRPM Mortgage Loan Trust,
Series 2006-1, Class A1
0.508%, 03/25/2035 (P)(S) 2,555,397 2,439,750
Home Equity Asset Trust
Series 2005-6, Class M1,
0.678%, 12/25/2035 (P) 1,025,000 1,002,207
Series 2005-5, Class M1,
0.688%, 11/25/2035 (P) 1,125,000 1,078,443
Series 2003-1, Class M1,
1.708%, 06/25/2033 (P) 981,589 885,989
Leaf II Receivables Funding LLC,
Series 2011-1, Class A
1.700%, 12/20/2018 (S) 256,750 254,696
LNR CDO, Ltd., Series 2006-1A,
Class BFL
0.759%, 05/28/2043 (H)(P)(S) 700,000 7
Mastr Asset Backed Securities Trust,
Series 2007-HE2, Class A2
0.908%, 08/25/2037 (P) 840,803 798,006
Merrill Lynch Mortgage Investors, Inc.,
Series 2005-WMC1, Class M1
0.958%, 09/25/2035 (P) 640,103 564,935
Copyright © 2013 www.secdatabase.com. All Rights Reserved.Please Consider the Environment Before Printing This Document
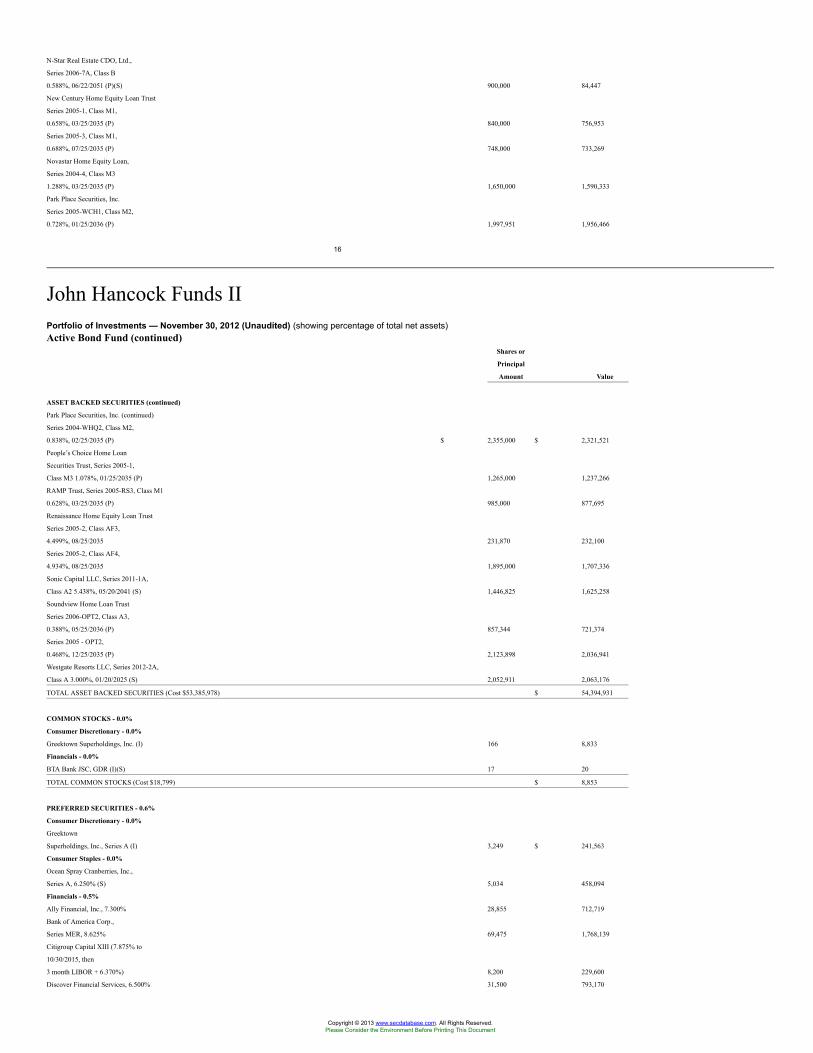
N-Star Real Estate CDO, Ltd.,
Series 2006-7A, Class B
0.588%, 06/22/2051 (P)(S) 900,000 84,447
New Century Home Equity Loan Trust
Series 2005-1, Class M1,
0.658%, 03/25/2035 (P) 840,000 756,953
Series 2005-3, Class M1,
0.688%, 07/25/2035 (P) 748,000 733,269
Novastar Home Equity Loan,
Series 2004-4, Class M3
1.288%, 03/25/2035 (P) 1,650,000 1,590,333
Park Place Securities, Inc.
Series 2005-WCH1, Class M2,
0.728%, 01/25/2036 (P) 1,997,951 1,956,466
16
John Hancock Funds IIPortfolio of Investments — November 30, 2012 (Unaudited) (showing percentage of total net assets)Active Bond Fund (continued)
Shares or
Principal
Amount Value
ASSET BACKED SECURITIES (continued)
Park Place Securities, Inc. (continued)
Series 2004-WHQ2, Class M2,
0.838%, 02/25/2035 (P) $ 2,355,000 $ 2,321,521
People’s Choice Home Loan
Securities Trust, Series 2005-1,
Class M3 1.078%, 01/25/2035 (P) 1,265,000 1,237,266
RAMP Trust, Series 2005-RS3, Class M1
0.628%, 03/25/2035 (P) 985,000 877,695
Renaissance Home Equity Loan Trust
Series 2005-2, Class AF3,
4.499%, 08/25/2035 231,870 232,100
Series 2005-2, Class AF4,
4.934%, 08/25/2035 1,895,000 1,707,336
Sonic Capital LLC, Series 2011-1A,
Class A2 5.438%, 05/20/2041 (S) 1,446,825 1,625,258
Soundview Home Loan Trust
Series 2006-OPT2, Class A3,
0.388%, 05/25/2036 (P) 857,344 721,374
Series 2005 - OPT2,
0.468%, 12/25/2035 (P) 2,123,898 2,036,941
Westgate Resorts LLC, Series 2012-2A,
Class A 3.000%, 01/20/2025 (S) 2,052,911 2,063,176
TOTAL ASSET BACKED SECURITIES (Cost $53,385,978) $ 54,394,931
COMMON STOCKS - 0.0%
Consumer Discretionary - 0.0%
Greektown Superholdings, Inc. (I) 166 8,833
Financials - 0.0%
BTA Bank JSC, GDR (I)(S) 17 20
TOTAL COMMON STOCKS (Cost $18,799) $ 8,853
PREFERRED SECURITIES - 0.6%
Consumer Discretionary - 0.0%
Greektown
Superholdings, Inc., Series A (I) 3,249 $ 241,563
Consumer Staples - 0.0%
Ocean Spray Cranberries, Inc.,
Series A, 6.250% (S) 5,034 458,094
Financials - 0.5%
Ally Financial, Inc., 7.300% 28,855 712,719
Bank of America Corp.,
Series MER, 8.625% 69,475 1,768,139
Citigroup Capital XIII (7.875% to
10/30/2015, then
3 month LIBOR + 6.370%) 8,200 229,600
Discover Financial Services, 6.500% 31,500 793,170
Copyright © 2013 www.secdatabase.com. All Rights Reserved.Please Consider the Environment Before Printing This Document
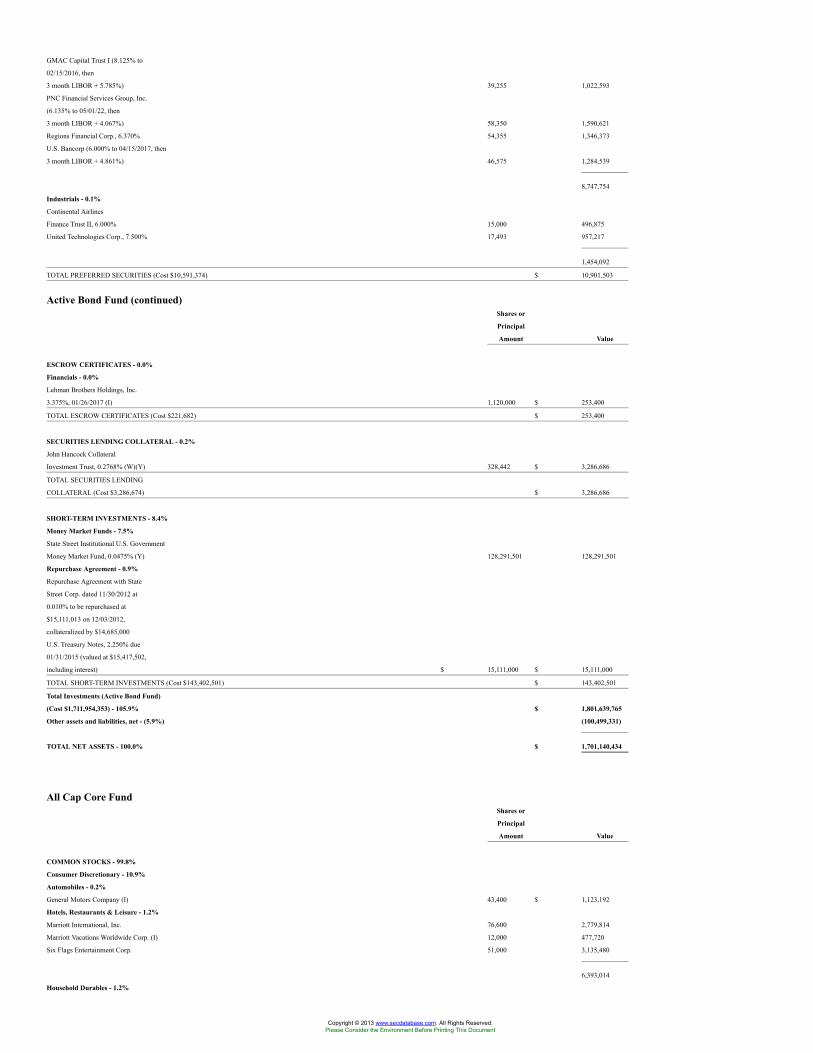
GMAC Capital Trust I (8.125% to
02/15/2016, then
3 month LIBOR + 5.785%) 39,255 1,022,593
PNC Financial Services Group, Inc.
(6.135% to 05/01/22, then
3 month LIBOR + 4.067%) 58,350 1,590,621
Regions Financial Corp., 6.370% 54,355 1,346,373
U.S. Bancorp (6.000% to 04/15/2017, then
3 month LIBOR + 4.861%) 46,575 1,284,539
8,747,754
Industrials - 0.1%
Continental Airlines
Finance Trust II, 6.000% 15,000 496,875
United Technologies Corp., 7.500% 17,493 957,217
1,454,092
TOTAL PREFERRED SECURITIES (Cost $10,591,374) $ 10,901,503
Active Bond Fund (continued)Shares or
Principal
Amount Value
ESCROW CERTIFICATES - 0.0%
Financials - 0.0%
Lehman Brothers Holdings, Inc.
3.375%, 01/26/2017 (I) 1,120,000 $ 253,400
TOTAL ESCROW CERTIFICATES (Cost $221,682) $ 253,400
SECURITIES LENDING COLLATERAL - 0.2%
John Hancock Collateral
Investment Trust, 0.2768% (W)(Y) 328,442 $ 3,286,686
TOTAL SECURITIES LENDING
COLLATERAL (Cost $3,286,674) $ 3,286,686
SHORT-TERM INVESTMENTS - 8.4%
Money Market Funds - 7.5%
State Street Institutional U.S. Government
Money Market Fund, 0.0475% (Y) 128,291,501 128,291,501
Repurchase Agreement - 0.9%
Repurchase Agreement with State
Street Corp. dated 11/30/2012 at
0.010% to be repurchased at
$15,111,013 on 12/03/2012,
collateralized by $14,685,000
U.S. Treasury Notes, 2.250% due
01/31/2015 (valued at $15,417,502,
including interest) $ 15,111,000 $ 15,111,000
TOTAL SHORT-TERM INVESTMENTS (Cost $143,402,501) $ 143,402,501
Total Investments (Active Bond Fund)
(Cost $1,711,954,353) - 105.9% $ 1,801,639,765
Other assets and liabilities, net - (5.9%) (100,499,331)
TOTAL NET ASSETS - 100.0% $ 1,701,140,434
All Cap Core FundShares or
Principal
Amount Value
COMMON STOCKS - 99.8%
Consumer Discretionary - 10.9%
Automobiles - 0.2%
General Motors Company (I) 43,400 $ 1,123,192
Hotels, Restaurants & Leisure - 1.2%
Marriott International, Inc. 76,600 2,779,814
Marriott Vacations Worldwide Corp. (I) 12,000 477,720
Six Flags Entertainment Corp. 51,000 3,135,480
6,393,014
Household Durables - 1.2%
Copyright © 2013 www.secdatabase.com. All Rights Reserved.Please Consider the Environment Before Printing This Document
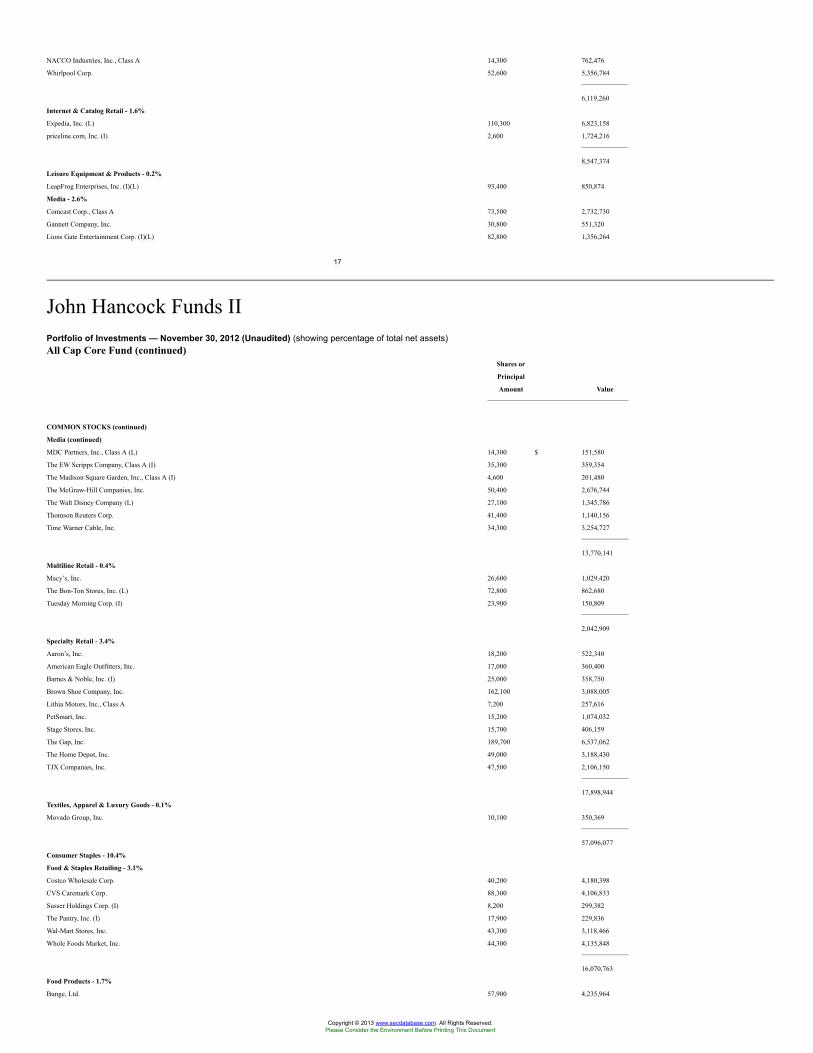
NACCO Industries, Inc., Class A 14,300 762,476
Whirlpool Corp. 52,600 5,356,784
6,119,260
Internet & Catalog Retail - 1.6%
Expedia, Inc. (L) 110,300 6,823,158
priceline.com, Inc. (I) 2,600 1,724,216
8,547,374
Leisure Equipment & Products - 0.2%
LeapFrog Enterprises, Inc. (I)(L) 93,400 850,874
Media - 2.6%
Comcast Corp., Class A 73,500 2,732,730
Gannett Company, Inc. 30,800 551,320
Lions Gate Entertainment Corp. (I)(L) 82,800 1,356,264
17
John Hancock Funds IIPortfolio of Investments — November 30, 2012 (Unaudited) (showing percentage of total net assets)All Cap Core Fund (continued)
Shares or
Principal
Amount Value
COMMON STOCKS (continued)
Media (continued)
MDC Partners, Inc., Class A (L) 14,300 $ 151,580
The EW Scripps Company, Class A (I) 35,300 359,354
The Madison Square Garden, Inc., Class A (I) 4,600 201,480
The McGraw-Hill Companies, Inc. 50,400 2,676,744
The Walt Disney Company (L) 27,100 1,345,786
Thomson Reuters Corp. 41,400 1,140,156
Time Warner Cable, Inc. 34,300 3,254,727
13,770,141
Multiline Retail - 0.4%
Macy’s, Inc. 26,600 1,029,420
The Bon-Ton Stores, Inc. (L) 72,800 862,680
Tuesday Morning Corp. (I) 23,900 150,809
2,042,909
Specialty Retail - 3.4%
Aaron’s, Inc. 18,200 522,340
American Eagle Outfitters, Inc. 17,000 360,400
Barnes & Noble, Inc. (I) 25,000 358,750
Brown Shoe Company, Inc. 162,100 3,088,005
Lithia Motors, Inc., Class A 7,200 257,616
PetSmart, Inc. 15,200 1,074,032
Stage Stores, Inc. 15,700 406,159
The Gap, Inc. 189,700 6,537,062
The Home Depot, Inc. 49,000 3,188,430
TJX Companies, Inc. 47,500 2,106,150
17,898,944
Textiles, Apparel & Luxury Goods - 0.1%
Movado Group, Inc. 10,100 350,369
57,096,077
Consumer Staples - 10.4%
Food & Staples Retailing - 3.1%
Costco Wholesale Corp. 40,200 4,180,398
CVS Caremark Corp. 88,300 4,106,833
Susser Holdings Corp. (I) 8,200 299,382
The Pantry, Inc. (I) 17,900 229,836
Wal-Mart Stores, Inc. 43,300 3,118,466
Whole Foods Market, Inc. 44,300 4,135,848
16,070,763
Food Products - 1.7%
Bunge, Ltd. 57,900 4,235,964
Copyright © 2013 www.secdatabase.com. All Rights Reserved.Please Consider the Environment Before Printing This Document
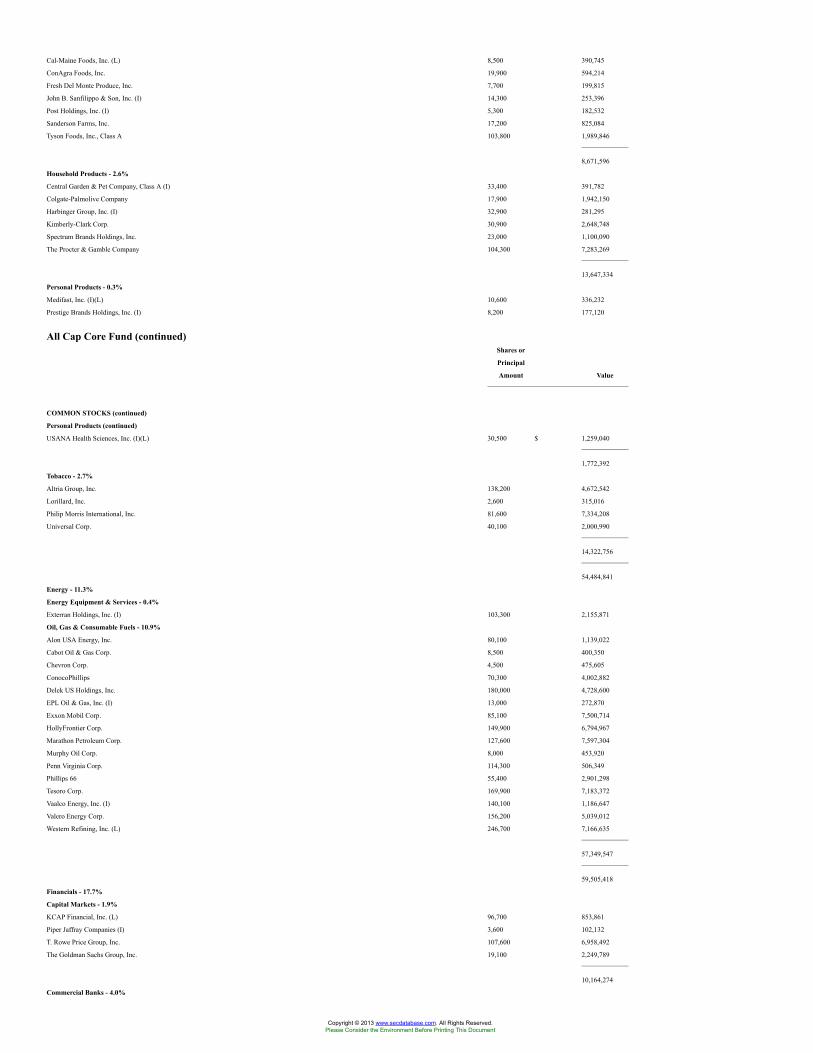
Cal-Maine Foods, Inc. (L) 8,500 390,745
ConAgra Foods, Inc. 19,900 594,214
Fresh Del Monte Produce, Inc. 7,700 199,815
John B. Sanfilippo & Son, Inc. (I) 14,300 253,396
Post Holdings, Inc. (I) 5,300 182,532
Sanderson Farms, Inc. 17,200 825,084
Tyson Foods, Inc., Class A 103,800 1,989,846
8,671,596
Household Products - 2.6%
Central Garden & Pet Company, Class A (I) 33,400 391,782
Colgate-Palmolive Company 17,900 1,942,150
Harbinger Group, Inc. (I) 32,900 281,295
Kimberly-Clark Corp. 30,900 2,648,748
Spectrum Brands Holdings, Inc. 23,000 1,100,090
The Procter & Gamble Company 104,300 7,283,269
13,647,334
Personal Products - 0.3%
Medifast, Inc. (I)(L) 10,600 336,232
Prestige Brands Holdings, Inc. (I) 8,200 177,120
All Cap Core Fund (continued)Shares or
Principal
Amount Value
COMMON STOCKS (continued)
Personal Products (continued)
USANA Health Sciences, Inc. (I)(L) 30,500 $ 1,259,040
1,772,392
Tobacco - 2.7%
Altria Group, Inc. 138,200 4,672,542
Lorillard, Inc. 2,600 315,016
Philip Morris International, Inc. 81,600 7,334,208
Universal Corp. 40,100 2,000,990
14,322,756
54,484,841
Energy - 11.3%
Energy Equipment & Services - 0.4%
Exterran Holdings, Inc. (I) 103,300 2,155,871
Oil, Gas & Consumable Fuels - 10.9%
Alon USA Energy, Inc. 80,100 1,139,022
Cabot Oil & Gas Corp. 8,500 400,350
Chevron Corp. 4,500 475,605
ConocoPhillips 70,300 4,002,882
Delek US Holdings, Inc. 180,000 4,728,600
EPL Oil & Gas, Inc. (I) 13,000 272,870
Exxon Mobil Corp. 85,100 7,500,714
HollyFrontier Corp. 149,900 6,794,967
Marathon Petroleum Corp. 127,600 7,597,304
Murphy Oil Corp. 8,000 453,920
Penn Virginia Corp. 114,300 506,349
Phillips 66 55,400 2,901,298
Tesoro Corp. 169,900 7,183,372
Vaalco Energy, Inc. (I) 140,100 1,186,647
Valero Energy Corp. 156,200 5,039,012
Western Refining, Inc. (L) 246,700 7,166,635
57,349,547
59,505,418
Financials - 17.7%
Capital Markets - 1.9%
KCAP Financial, Inc. (L) 96,700 853,861
Piper Jaffray Companies (I) 3,600 102,132
T. Rowe Price Group, Inc. 107,600 6,958,492
The Goldman Sachs Group, Inc. 19,100 2,249,789
10,164,274
Commercial Banks - 4.0%
Copyright © 2013 www.secdatabase.com. All Rights Reserved.Please Consider the Environment Before Printing This Document
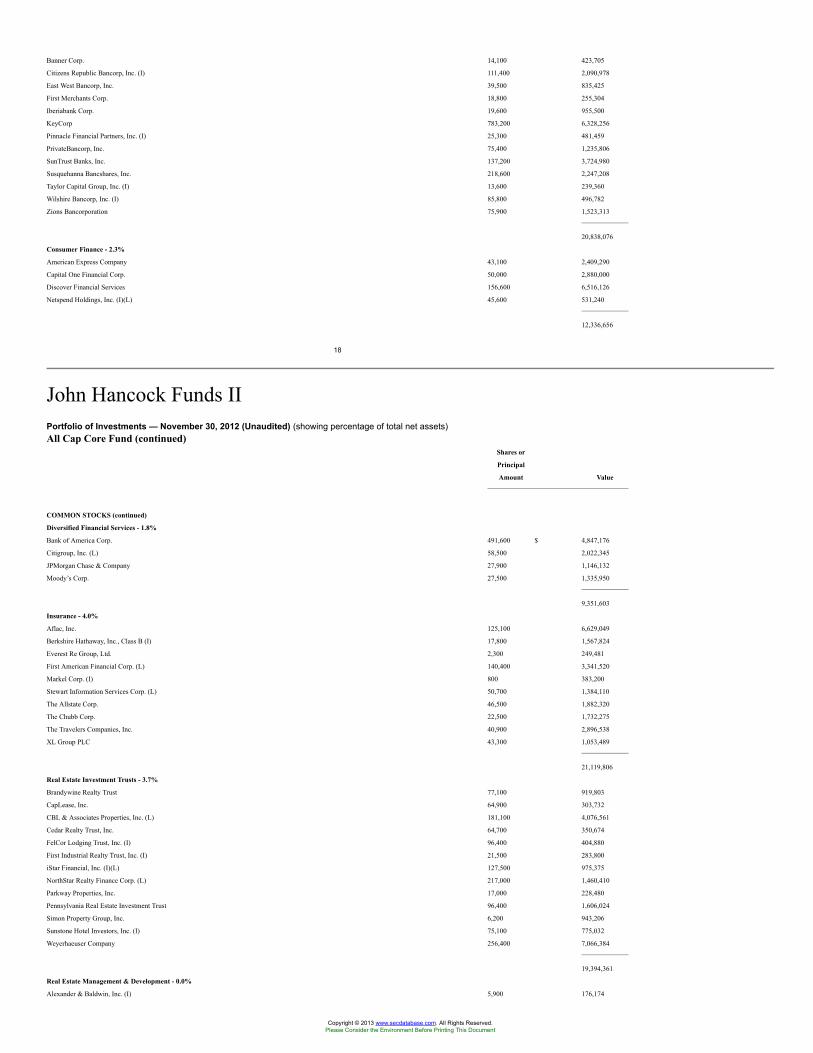
Banner Corp. 14,100 423,705
Citizens Republic Bancorp, Inc. (I) 111,400 2,090,978
East West Bancorp, Inc. 39,500 835,425
First Merchants Corp. 18,800 255,304
Iberiabank Corp. 19,600 955,500
KeyCorp 783,200 6,328,256
Pinnacle Financial Partners, Inc. (I) 25,300 481,459
PrivateBancorp, Inc. 75,400 1,235,806
SunTrust Banks, Inc. 137,200 3,724,980
Susquehanna Bancshares, Inc. 218,600 2,247,208
Taylor Capital Group, Inc. (I) 13,600 239,360
Wilshire Bancorp, Inc. (I) 85,800 496,782
Zions Bancorporation 75,900 1,523,313
20,838,076
Consumer Finance - 2.3%
American Express Company 43,100 2,409,290
Capital One Financial Corp. 50,000 2,880,000
Discover Financial Services 156,600 6,516,126
Netspend Holdings, Inc. (I)(L) 45,600 531,240
12,336,656
18
John Hancock Funds IIPortfolio of Investments — November 30, 2012 (Unaudited) (showing percentage of total net assets)All Cap Core Fund (continued)
Shares or
Principal
Amount Value
COMMON STOCKS (continued)
Diversified Financial Services - 1.8%
Bank of America Corp. 491,600 $ 4,847,176
Citigroup, Inc. (L) 58,500 2,022,345
JPMorgan Chase & Company 27,900 1,146,132
Moody’s Corp. 27,500 1,335,950
9,351,603
Insurance - 4.0%
Aflac, Inc. 125,100 6,629,049
Berkshire Hathaway, Inc., Class B (I) 17,800 1,567,824
Everest Re Group, Ltd. 2,300 249,481
First American Financial Corp. (L) 140,400 3,341,520
Markel Corp. (I) 800 383,200
Stewart Information Services Corp. (L) 50,700 1,384,110
The Allstate Corp. 46,500 1,882,320
The Chubb Corp. 22,500 1,732,275
The Travelers Companies, Inc. 40,900 2,896,538
XL Group PLC 43,300 1,053,489
21,119,806
Real Estate Investment Trusts - 3.7%
Brandywine Realty Trust 77,100 919,803
CapLease, Inc. 64,900 303,732
CBL & Associates Properties, Inc. (L) 181,100 4,076,561
Cedar Realty Trust, Inc. 64,700 350,674
FelCor Lodging Trust, Inc. (I) 96,400 404,880
First Industrial Realty Trust, Inc. (I) 21,500 283,800
iStar Financial, Inc. (I)(L) 127,500 975,375
NorthStar Realty Finance Corp. (L) 217,000 1,460,410
Parkway Properties, Inc. 17,000 228,480
Pennsylvania Real Estate Investment Trust 96,400 1,606,024
Simon Property Group, Inc. 6,200 943,206
Sunstone Hotel Investors, Inc. (I) 75,100 775,032
Weyerhaeuser Company 256,400 7,066,384
19,394,361
Real Estate Management & Development - 0.0%
Alexander & Baldwin, Inc. (I) 5,900 176,174
Copyright © 2013 www.secdatabase.com. All Rights Reserved.Please Consider the Environment Before Printing This Document
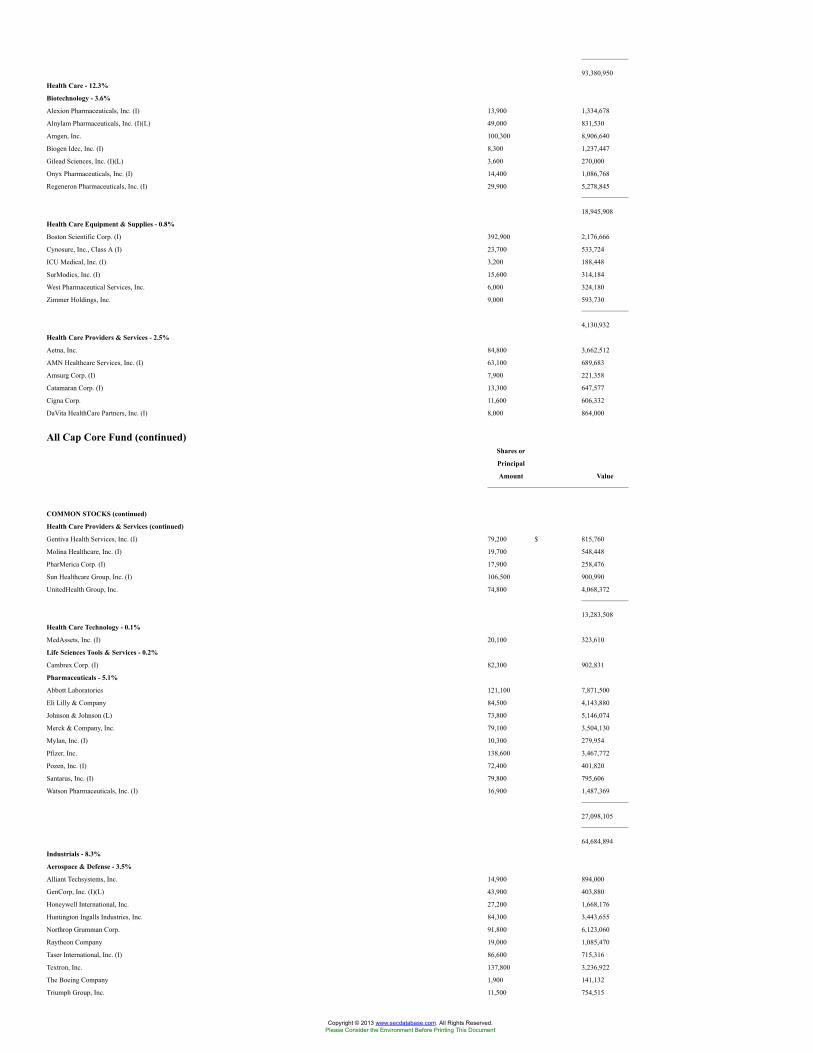
93,380,950
Health Care - 12.3%
Biotechnology - 3.6%
Alexion Pharmaceuticals, Inc. (I) 13,900 1,334,678
Alnylam Pharmaceuticals, Inc. (I)(L) 49,000 831,530
Amgen, Inc. 100,300 8,906,640
Biogen Idec, Inc. (I) 8,300 1,237,447
Gilead Sciences, Inc. (I)(L) 3,600 270,000
Onyx Pharmaceuticals, Inc. (I) 14,400 1,086,768
Regeneron Pharmaceuticals, Inc. (I) 29,900 5,278,845
18,945,908
Health Care Equipment & Supplies - 0.8%
Boston Scientific Corp. (I) 392,900 2,176,666
Cynosure, Inc., Class A (I) 23,700 533,724
ICU Medical, Inc. (I) 3,200 188,448
SurModics, Inc. (I) 15,600 314,184
West Pharmaceutical Services, Inc. 6,000 324,180
Zimmer Holdings, Inc. 9,000 593,730
4,130,932
Health Care Providers & Services - 2.5%
Aetna, Inc. 84,800 3,662,512
AMN Healthcare Services, Inc. (I) 63,100 689,683
Amsurg Corp. (I) 7,900 221,358
Catamaran Corp. (I) 13,300 647,577
Cigna Corp. 11,600 606,332
DaVita HealthCare Partners, Inc. (I) 8,000 864,000
All Cap Core Fund (continued)Shares or
Principal
Amount Value
COMMON STOCKS (continued)
Health Care Providers & Services (continued)
Gentiva Health Services, Inc. (I) 79,200 $ 815,760
Molina Healthcare, Inc. (I) 19,700 548,448
PharMerica Corp. (I) 17,900 258,476
Sun Healthcare Group, Inc. (I) 106,500 900,990
UnitedHealth Group, Inc. 74,800 4,068,372
13,283,508
Health Care Technology - 0.1%
MedAssets, Inc. (I) 20,100 323,610
Life Sciences Tools & Services - 0.2%
Cambrex Corp. (I) 82,300 902,831
Pharmaceuticals - 5.1%
Abbott Laboratories 121,100 7,871,500
Eli Lilly & Company 84,500 4,143,880
Johnson & Johnson (L) 73,800 5,146,074
Merck & Company, Inc. 79,100 3,504,130
Mylan, Inc. (I) 10,300 279,954
Pfizer, Inc. 138,600 3,467,772
Pozen, Inc. (I) 72,400 401,820
Santarus, Inc. (I) 79,800 795,606
Watson Pharmaceuticals, Inc. (I) 16,900 1,487,369
27,098,105
64,684,894
Industrials - 8.3%
Aerospace & Defense - 3.5%
Alliant Techsystems, Inc. 14,900 894,000
GenCorp, Inc. (I)(L) 43,900 403,880
Honeywell International, Inc. 27,200 1,668,176
Huntington Ingalls Industries, Inc. 84,300 3,443,655
Northrop Grumman Corp. 91,800 6,123,060
Raytheon Company 19,000 1,085,470
Taser International, Inc. (I) 86,600 715,316
Textron, Inc. 137,800 3,236,922
The Boeing Company 1,900 141,132
Triumph Group, Inc. 11,500 754,515
Copyright © 2013 www.secdatabase.com. All Rights Reserved.Please Consider the Environment Before Printing This Document
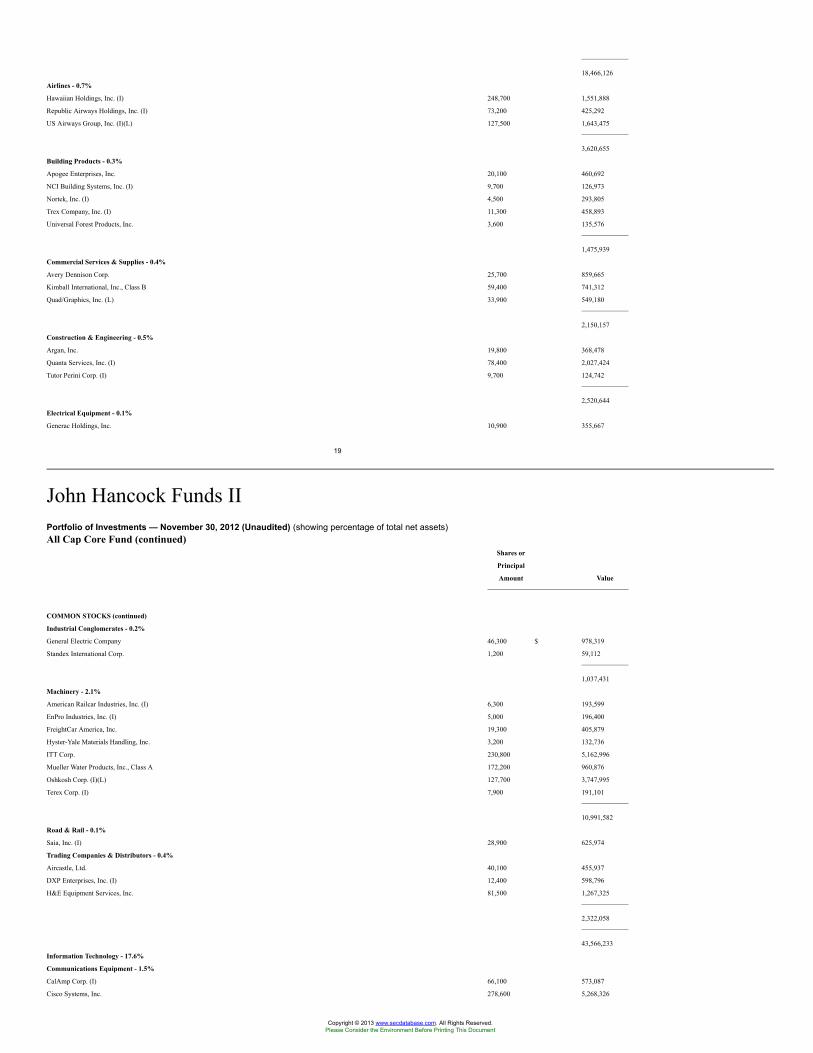
18,466,126
Airlines - 0.7%
Hawaiian Holdings, Inc. (I) 248,700 1,551,888
Republic Airways Holdings, Inc. (I) 73,200 425,292
US Airways Group, Inc. (I)(L) 127,500 1,643,475
3,620,655
Building Products - 0.3%
Apogee Enterprises, Inc. 20,100 460,692
NCI Building Systems, Inc. (I) 9,700 126,973
Nortek, Inc. (I) 4,500 293,805
Trex Company, Inc. (I) 11,300 458,893
Universal Forest Products, Inc. 3,600 135,576
1,475,939
Commercial Services & Supplies - 0.4%
Avery Dennison Corp. 25,700 859,665
Kimball International, Inc., Class B 59,400 741,312
Quad/Graphics, Inc. (L) 33,900 549,180
2,150,157
Construction & Engineering - 0.5%
Argan, Inc. 19,800 368,478
Quanta Services, Inc. (I) 78,400 2,027,424
Tutor Perini Corp. (I) 9,700 124,742
2,520,644
Electrical Equipment - 0.1%
Generac Holdings, Inc. 10,900 355,667
19
John Hancock Funds IIPortfolio of Investments — November 30, 2012 (Unaudited) (showing percentage of total net assets)All Cap Core Fund (continued)
Shares or
Principal
Amount Value
COMMON STOCKS (continued)
Industrial Conglomerates - 0.2%
General Electric Company 46,300 $ 978,319
Standex International Corp. 1,200 59,112
1,037,431
Machinery - 2.1%
American Railcar Industries, Inc. (I) 6,300 193,599
EnPro Industries, Inc. (I) 5,000 196,400
FreightCar America, Inc. 19,300 405,879
Hyster-Yale Materials Handling, Inc. 3,200 132,736
ITT Corp. 230,800 5,162,996
Mueller Water Products, Inc., Class A 172,200 960,876
Oshkosh Corp. (I)(L) 127,700 3,747,995
Terex Corp. (I) 7,900 191,101
10,991,582
Road & Rail - 0.1%
Saia, Inc. (I) 28,900 625,974
Trading Companies & Distributors - 0.4%
Aircastle, Ltd. 40,100 455,937
DXP Enterprises, Inc. (I) 12,400 598,796
H&E Equipment Services, Inc. 81,500 1,267,325
2,322,058
43,566,233
Information Technology - 17.6%
Communications Equipment - 1.5%
CalAmp Corp. (I) 66,100 573,087
Cisco Systems, Inc. 278,600 5,268,326
Copyright © 2013 www.secdatabase.com. All Rights Reserved.Please Consider the Environment Before Printing This Document
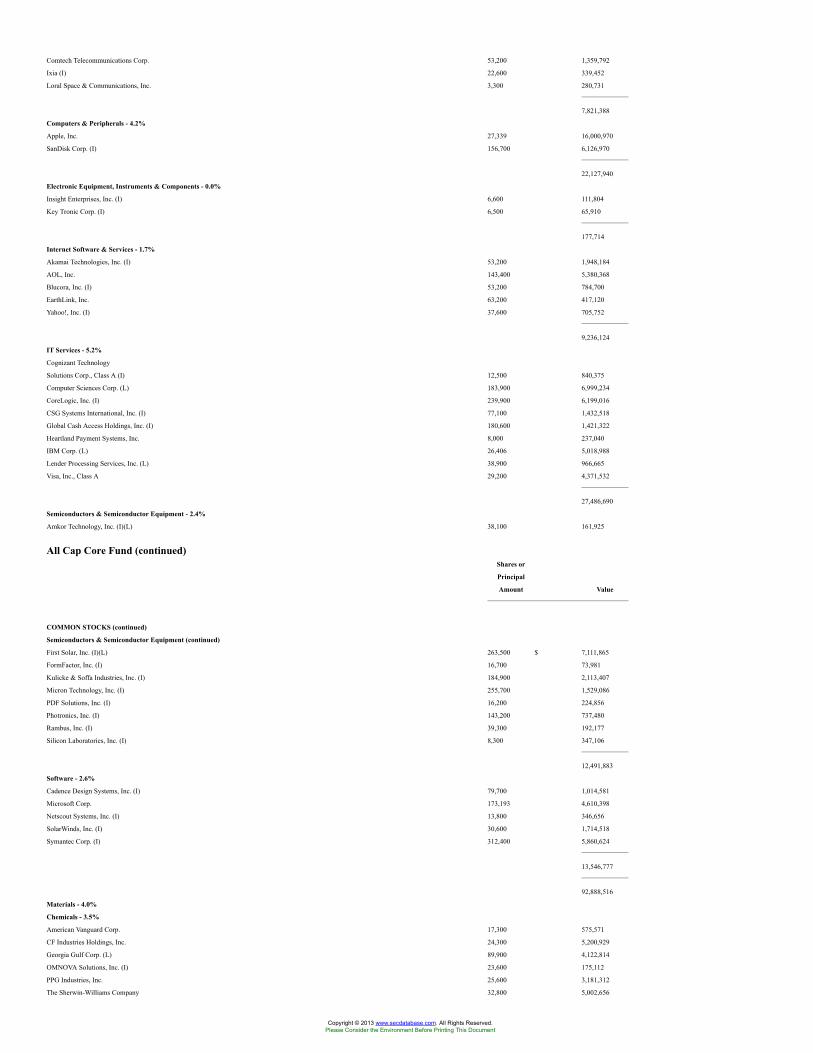
Comtech Telecommunications Corp. 53,200 1,359,792
Ixia (I) 22,600 339,452
Loral Space & Communications, Inc. 3,300 280,731
7,821,388
Computers & Peripherals - 4.2%
Apple, Inc. 27,339 16,000,970
SanDisk Corp. (I) 156,700 6,126,970
22,127,940
Electronic Equipment, Instruments & Components - 0.0%
Insight Enterprises, Inc. (I) 6,600 111,804
Key Tronic Corp. (I) 6,500 65,910
177,714
Internet Software & Services - 1.7%
Akamai Technologies, Inc. (I) 53,200 1,948,184
AOL, Inc. 143,400 5,380,368
Blucora, Inc. (I) 53,200 784,700
EarthLink, Inc. 63,200 417,120
Yahoo!, Inc. (I) 37,600 705,752
9,236,124
IT Services - 5.2%
Cognizant Technology
Solutions Corp., Class A (I) 12,500 840,375
Computer Sciences Corp. (L) 183,900 6,999,234
CoreLogic, Inc. (I) 239,900 6,199,016
CSG Systems International, Inc. (I) 77,100 1,432,518
Global Cash Access Holdings, Inc. (I) 180,600 1,421,322
Heartland Payment Systems, Inc. 8,000 237,040
IBM Corp. (L) 26,406 5,018,988
Lender Processing Services, Inc. (L) 38,900 966,665
Visa, Inc., Class A 29,200 4,371,532
27,486,690
Semiconductors & Semiconductor Equipment - 2.4%
Amkor Technology, Inc. (I)(L) 38,100 161,925
All Cap Core Fund (continued)Shares or
Principal
Amount Value
COMMON STOCKS (continued)
Semiconductors & Semiconductor Equipment (continued)
First Solar, Inc. (I)(L) 263,500 $ 7,111,865
FormFactor, Inc. (I) 16,700 73,981
Kulicke & Soffa Industries, Inc. (I) 184,900 2,113,407
Micron Technology, Inc. (I) 255,700 1,529,086
PDF Solutions, Inc. (I) 16,200 224,856
Photronics, Inc. (I) 143,200 737,480
Rambus, Inc. (I) 39,300 192,177
Silicon Laboratories, Inc. (I) 8,300 347,106
12,491,883
Software - 2.6%
Cadence Design Systems, Inc. (I) 79,700 1,014,581
Microsoft Corp. 173,193 4,610,398
Netscout Systems, Inc. (I) 13,800 346,656
SolarWinds, Inc. (I) 30,600 1,714,518
Symantec Corp. (I) 312,400 5,860,624
13,546,777
92,888,516
Materials - 4.0%
Chemicals - 3.5%
American Vanguard Corp. 17,300 575,571
CF Industries Holdings, Inc. 24,300 5,200,929
Georgia Gulf Corp. (L) 89,900 4,122,814
OMNOVA Solutions, Inc. (I) 23,600 175,112
PPG Industries, Inc. 25,600 3,181,312
The Sherwin-Williams Company 32,800 5,002,656
Copyright © 2013 www.secdatabase.com. All Rights Reserved.Please Consider the Environment Before Printing This Document
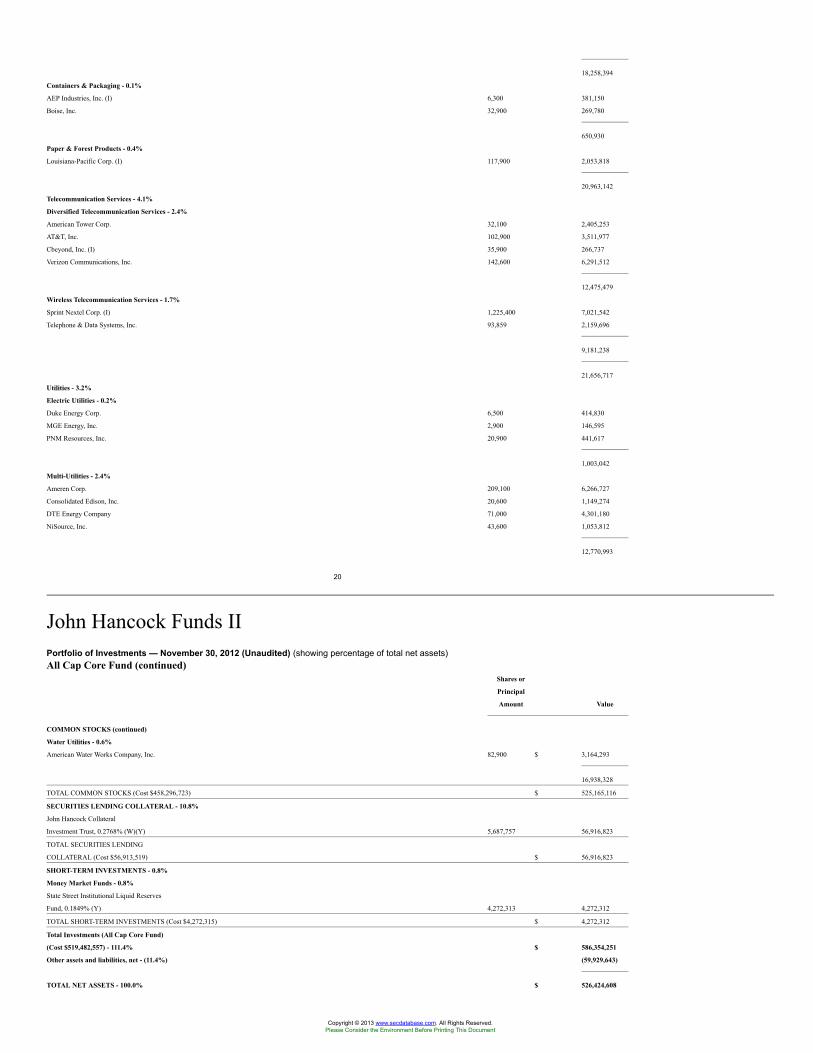
18,258,394
Containers & Packaging - 0.1%
AEP Industries, Inc. (I) 6,300 381,150
Boise, Inc. 32,900 269,780
650,930
Paper & Forest Products - 0.4%
Louisiana-Pacific Corp. (I) 117,900 2,053,818
20,963,142
Telecommunication Services - 4.1%
Diversified Telecommunication Services - 2.4%
American Tower Corp. 32,100 2,405,253
AT&T, Inc. 102,900 3,511,977
Cbeyond, Inc. (I) 35,900 266,737
Verizon Communications, Inc. 142,600 6,291,512
12,475,479
Wireless Telecommunication Services - 1.7%
Sprint Nextel Corp. (I) 1,225,400 7,021,542
Telephone & Data Systems, Inc. 93,859 2,159,696
9,181,238
21,656,717
Utilities - 3.2%
Electric Utilities - 0.2%
Duke Energy Corp. 6,500 414,830
MGE Energy, Inc. 2,900 146,595
PNM Resources, Inc. 20,900 441,617
1,003,042
Multi-Utilities - 2.4%
Ameren Corp. 209,100 6,266,727
Consolidated Edison, Inc. 20,600 1,149,274
DTE Energy Company 71,000 4,301,180
NiSource, Inc. 43,600 1,053,812
12,770,993
20
John Hancock Funds IIPortfolio of Investments — November 30, 2012 (Unaudited) (showing percentage of total net assets)All Cap Core Fund (continued)
Shares or
Principal
Amount Value
COMMON STOCKS (continued)
Water Utilities - 0.6%
American Water Works Company, Inc. 82,900 $ 3,164,293
16,938,328
TOTAL COMMON STOCKS (Cost $458,296,723) $ 525,165,116
SECURITIES LENDING COLLATERAL - 10.8%
John Hancock Collateral
Investment Trust, 0.2768% (W)(Y) 5,687,757 56,916,823
TOTAL SECURITIES LENDING
COLLATERAL (Cost $56,913,519) $ 56,916,823
SHORT-TERM INVESTMENTS - 0.8%
Money Market Funds - 0.8%
State Street Institutional Liquid Reserves
Fund, 0.1849% (Y) 4,272,313 4,272,312
TOTAL SHORT-TERM INVESTMENTS (Cost $4,272,315) $ 4,272,312
Total Investments (All Cap Core Fund)
(Cost $519,482,557) - 111.4% $ 586,354,251
Other assets and liabilities, net - (11.4%) (59,929,643)
TOTAL NET ASSETS - 100.0% $ 526,424,608
Copyright © 2013 www.secdatabase.com. All Rights Reserved.Please Consider the Environment Before Printing This Document
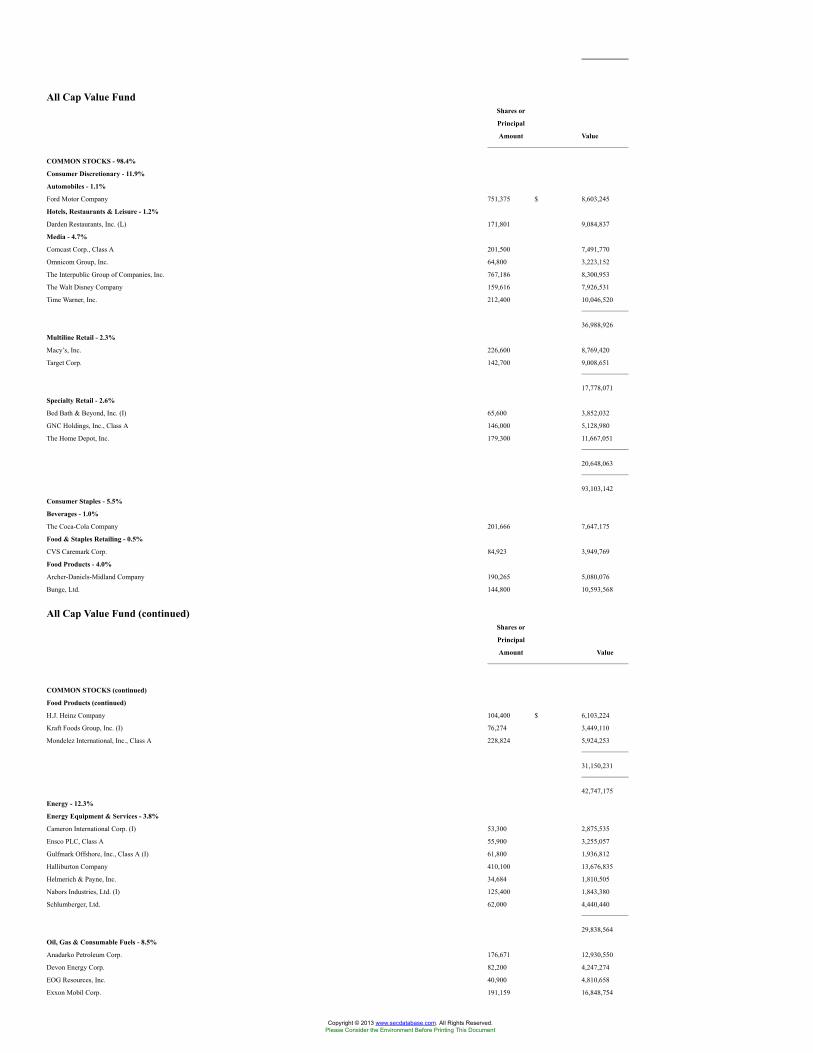
All Cap Value FundShares or
Principal
Amount Value
COMMON STOCKS - 98.4%
Consumer Discretionary - 11.9%
Automobiles - 1.1%
Ford Motor Company 751,375 $ 8,603,245
Hotels, Restaurants & Leisure - 1.2%
Darden Restaurants, Inc. (L) 171,801 9,084,837
Media - 4.7%
Comcast Corp., Class A 201,500 7,491,770
Omnicom Group, Inc. 64,800 3,223,152
The Interpublic Group of Companies, Inc. 767,186 8,300,953
The Walt Disney Company 159,616 7,926,531
Time Warner, Inc. 212,400 10,046,520
36,988,926
Multiline Retail - 2.3%
Macy’s, Inc. 226,600 8,769,420
Target Corp. 142,700 9,008,651
17,778,071
Specialty Retail - 2.6%
Bed Bath & Beyond, Inc. (I) 65,600 3,852,032
GNC Holdings, Inc., Class A 146,000 5,128,980
The Home Depot, Inc. 179,300 11,667,051
20,648,063
93,103,142
Consumer Staples - 5.5%
Beverages - 1.0%
The Coca-Cola Company 201,666 7,647,175
Food & Staples Retailing - 0.5%
CVS Caremark Corp. 84,923 3,949,769
Food Products - 4.0%
Archer-Daniels-Midland Company 190,265 5,080,076
Bunge, Ltd. 144,800 10,593,568
All Cap Value Fund (continued)Shares or
Principal
Amount Value
COMMON STOCKS (continued)
Food Products (continued)
H.J. Heinz Company 104,400 $ 6,103,224
Kraft Foods Group, Inc. (I) 76,274 3,449,110
Mondelez International, Inc., Class A 228,824 5,924,253
31,150,231
42,747,175
Energy - 12.3%
Energy Equipment & Services - 3.8%
Cameron International Corp. (I) 53,300 2,875,535
Ensco PLC, Class A 55,900 3,255,057
Gulfmark Offshore, Inc., Class A (I) 61,800 1,936,812
Halliburton Company 410,100 13,676,835
Helmerich & Payne, Inc. 34,684 1,810,505
Nabors Industries, Ltd. (I) 125,400 1,843,380
Schlumberger, Ltd. 62,000 4,440,440
29,838,564
Oil, Gas & Consumable Fuels - 8.5%
Anadarko Petroleum Corp. 176,671 12,930,550
Devon Energy Corp. 82,200 4,247,274
EOG Resources, Inc. 40,900 4,810,658
Exxon Mobil Corp. 191,159 16,848,754
Copyright © 2013 www.secdatabase.com. All Rights Reserved.Please Consider the Environment Before Printing This Document
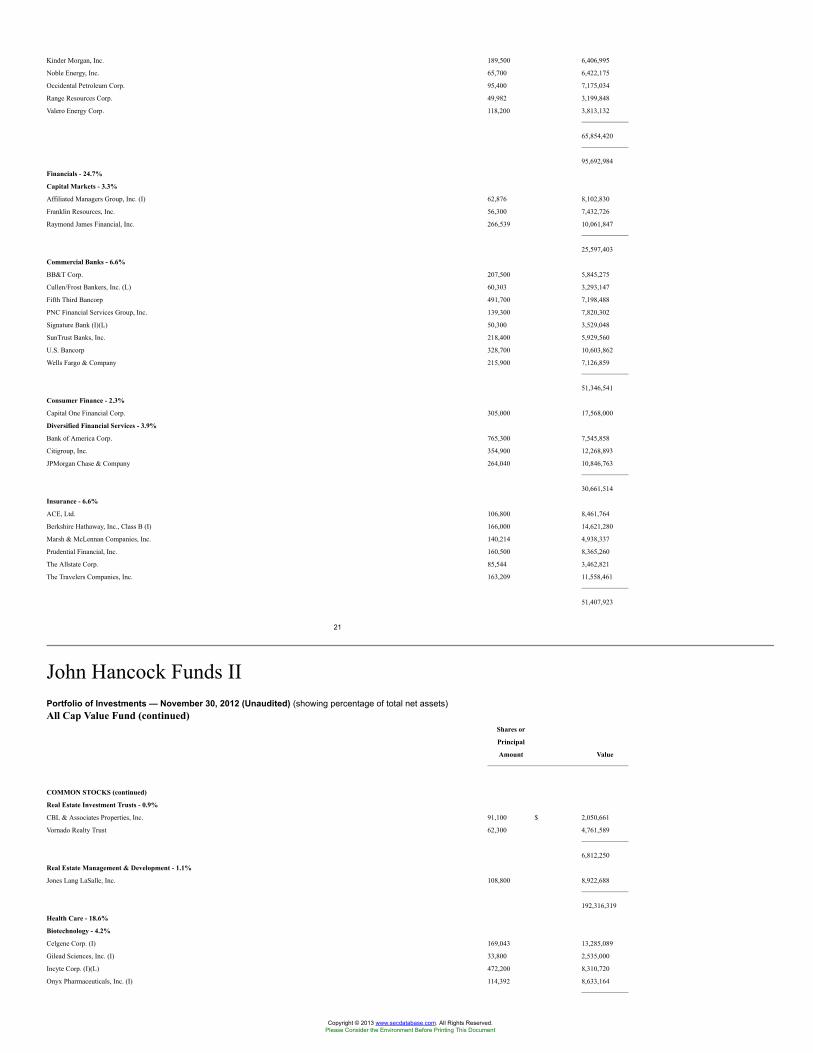
Kinder Morgan, Inc. 189,500 6,406,995
Noble Energy, Inc. 65,700 6,422,175
Occidental Petroleum Corp. 95,400 7,175,034
Range Resources Corp. 49,982 3,199,848
Valero Energy Corp. 118,200 3,813,132
65,854,420
95,692,984
Financials - 24.7%
Capital Markets - 3.3%
Affiliated Managers Group, Inc. (I) 62,876 8,102,830
Franklin Resources, Inc. 56,300 7,432,726
Raymond James Financial, Inc. 266,539 10,061,847
25,597,403
Commercial Banks - 6.6%
BB&T Corp. 207,500 5,845,275
Cullen/Frost Bankers, Inc. (L) 60,303 3,293,147
Fifth Third Bancorp 491,700 7,198,488
PNC Financial Services Group, Inc. 139,300 7,820,302
Signature Bank (I)(L) 50,300 3,529,048
SunTrust Banks, Inc. 218,400 5,929,560
U.S. Bancorp 328,700 10,603,862
Wells Fargo & Company 215,900 7,126,859
51,346,541
Consumer Finance - 2.3%
Capital One Financial Corp. 305,000 17,568,000
Diversified Financial Services - 3.9%
Bank of America Corp. 765,300 7,545,858
Citigroup, Inc. 354,900 12,268,893
JPMorgan Chase & Company 264,040 10,846,763
30,661,514
Insurance - 6.6%
ACE, Ltd. 106,800 8,461,764
Berkshire Hathaway, Inc., Class B (I) 166,000 14,621,280
Marsh & McLennan Companies, Inc. 140,214 4,938,337
Prudential Financial, Inc. 160,500 8,365,260
The Allstate Corp. 85,544 3,462,821
The Travelers Companies, Inc. 163,209 11,558,461
51,407,923
21
John Hancock Funds IIPortfolio of Investments — November 30, 2012 (Unaudited) (showing percentage of total net assets)All Cap Value Fund (continued)
Shares or
Principal
Amount Value
COMMON STOCKS (continued)
Real Estate Investment Trusts - 0.9%
CBL & Associates Properties, Inc. 91,100 $ 2,050,661
Vornado Realty Trust 62,300 4,761,589
6,812,250
Real Estate Management & Development - 1.1%
Jones Lang LaSalle, Inc. 108,800 8,922,688
192,316,319
Health Care - 18.6%
Biotechnology - 4.2%
Celgene Corp. (I) 169,043 13,285,089
Gilead Sciences, Inc. (I) 33,800 2,535,000
Incyte Corp. (I)(L) 472,200 8,310,720
Onyx Pharmaceuticals, Inc. (I) 114,392 8,633,164
Copyright © 2013 www.secdatabase.com. All Rights Reserved.Please Consider the Environment Before Printing This Document
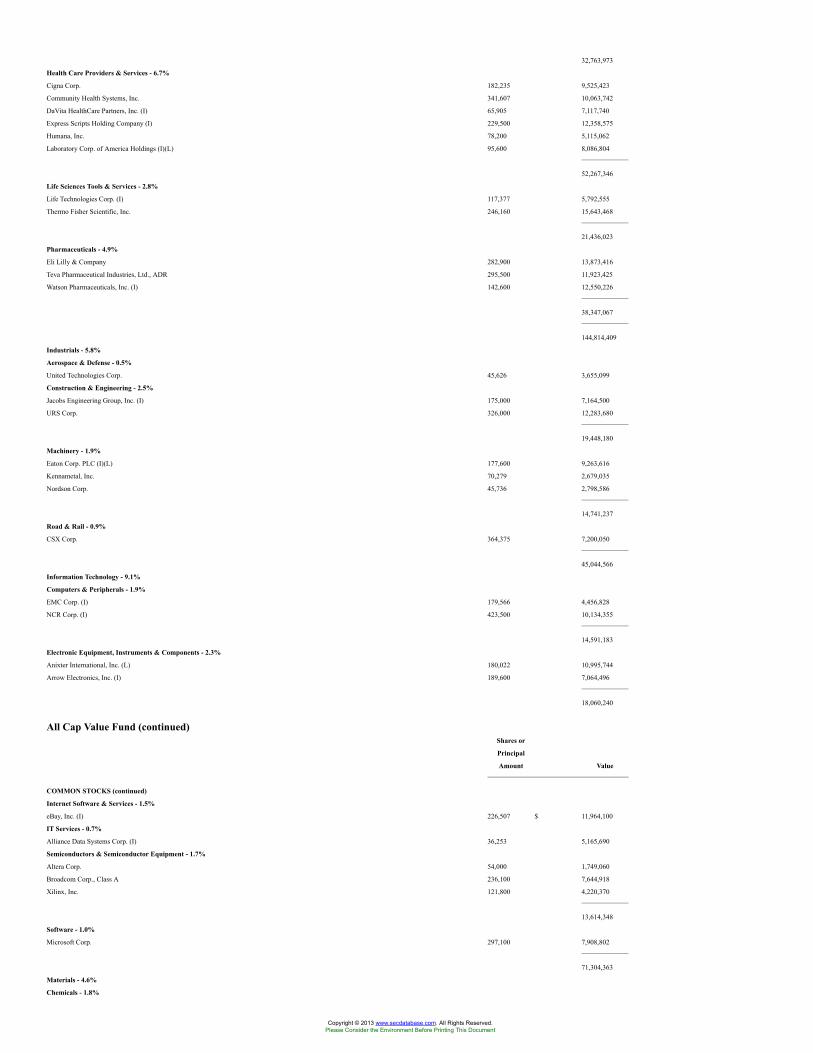
32,763,973
Health Care Providers & Services - 6.7%
Cigna Corp. 182,235 9,525,423
Community Health Systems, Inc. 341,607 10,063,742
DaVita HealthCare Partners, Inc. (I) 65,905 7,117,740
Express Scripts Holding Company (I) 229,500 12,358,575
Humana, Inc. 78,200 5,115,062
Laboratory Corp. of America Holdings (I)(L) 95,600 8,086,804
52,267,346
Life Sciences Tools & Services - 2.8%
Life Technologies Corp. (I) 117,377 5,792,555
Thermo Fisher Scientific, Inc. 246,160 15,643,468
21,436,023
Pharmaceuticals - 4.9%
Eli Lilly & Company 282,900 13,873,416
Teva Pharmaceutical Industries, Ltd., ADR 295,500 11,923,425
Watson Pharmaceuticals, Inc. (I) 142,600 12,550,226
38,347,067
144,814,409
Industrials - 5.8%
Aerospace & Defense - 0.5%
United Technologies Corp. 45,626 3,655,099
Construction & Engineering - 2.5%
Jacobs Engineering Group, Inc. (I) 175,000 7,164,500
URS Corp. 326,000 12,283,680
19,448,180
Machinery - 1.9%
Eaton Corp. PLC (I)(L) 177,600 9,263,616
Kennametal, Inc. 70,279 2,679,035
Nordson Corp. 45,736 2,798,586
14,741,237
Road & Rail - 0.9%
CSX Corp. 364,375 7,200,050
45,044,566
Information Technology - 9.1%
Computers & Peripherals - 1.9%
EMC Corp. (I) 179,566 4,456,828
NCR Corp. (I) 423,500 10,134,355
14,591,183
Electronic Equipment, Instruments & Components - 2.3%
Anixter International, Inc. (L) 180,022 10,995,744
Arrow Electronics, Inc. (I) 189,600 7,064,496
18,060,240
All Cap Value Fund (continued)Shares or
Principal
Amount Value
COMMON STOCKS (continued)
Internet Software & Services - 1.5%
eBay, Inc. (I) 226,507 $ 11,964,100
IT Services - 0.7%
Alliance Data Systems Corp. (I) 36,253 5,165,690
Semiconductors & Semiconductor Equipment - 1.7%
Altera Corp. 54,000 1,749,060
Broadcom Corp., Class A 236,100 7,644,918
Xilinx, Inc. 121,800 4,220,370
13,614,348
Software - 1.0%
Microsoft Corp. 297,100 7,908,802
71,304,363
Materials - 4.6%
Chemicals - 1.8%
Copyright © 2013 www.secdatabase.com. All Rights Reserved.Please Consider the Environment Before Printing This Document
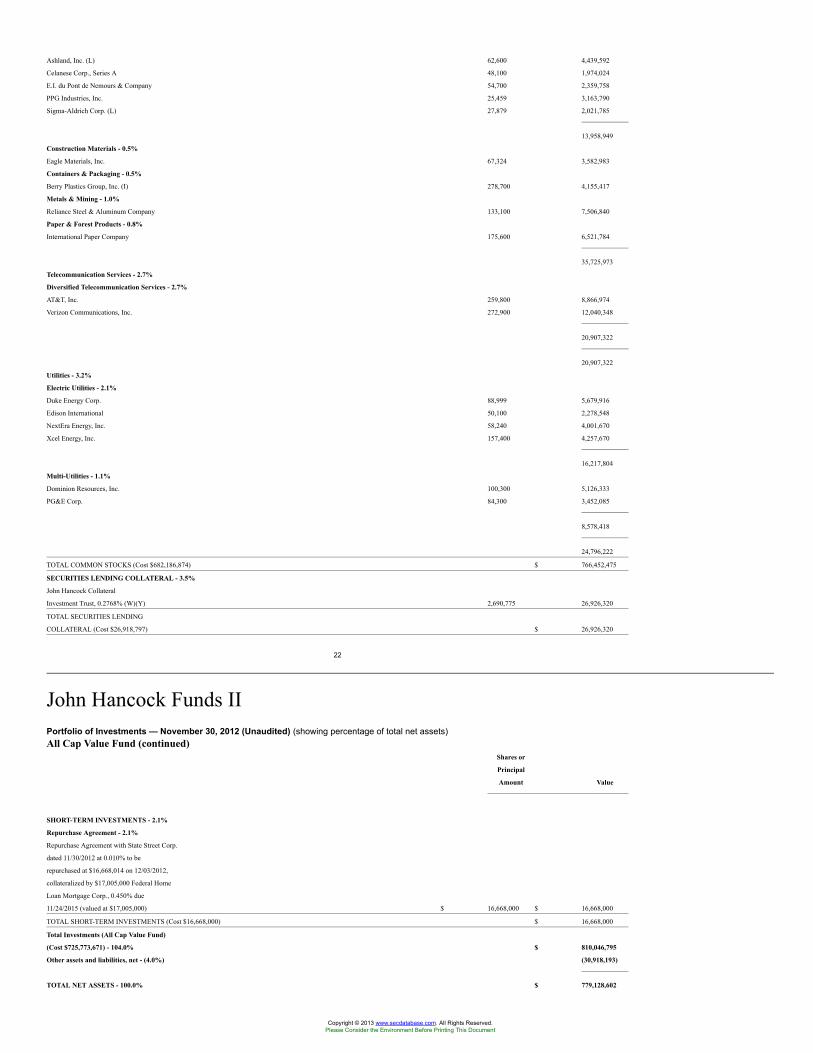
Ashland, Inc. (L) 62,600 4,439,592
Celanese Corp., Series A 48,100 1,974,024
E.I. du Pont de Nemours & Company 54,700 2,359,758
PPG Industries, Inc. 25,459 3,163,790
Sigma-Aldrich Corp. (L) 27,879 2,021,785
13,958,949
Construction Materials - 0.5%
Eagle Materials, Inc. 67,324 3,582,983
Containers & Packaging - 0.5%
Berry Plastics Group, Inc. (I) 278,700 4,155,417
Metals & Mining - 1.0%
Reliance Steel & Aluminum Company 133,100 7,506,840
Paper & Forest Products - 0.8%
International Paper Company 175,600 6,521,784
35,725,973
Telecommunication Services - 2.7%
Diversified Telecommunication Services - 2.7%
AT&T, Inc. 259,800 8,866,974
Verizon Communications, Inc. 272,900 12,040,348
20,907,322
20,907,322
Utilities - 3.2%
Electric Utilities - 2.1%
Duke Energy Corp. 88,999 5,679,916
Edison International 50,100 2,278,548
NextEra Energy, Inc. 58,240 4,001,670
Xcel Energy, Inc. 157,400 4,257,670
16,217,804
Multi-Utilities - 1.1%
Dominion Resources, Inc. 100,300 5,126,333
PG&E Corp. 84,300 3,452,085
8,578,418
24,796,222
TOTAL COMMON STOCKS (Cost $682,186,874) $ 766,452,475
SECURITIES LENDING COLLATERAL - 3.5%
John Hancock Collateral
Investment Trust, 0.2768% (W)(Y) 2,690,775 26,926,320
TOTAL SECURITIES LENDING
COLLATERAL (Cost $26,918,797) $ 26,926,320
22
John Hancock Funds IIPortfolio of Investments — November 30, 2012 (Unaudited) (showing percentage of total net assets)All Cap Value Fund (continued)
Shares or
Principal
Amount Value
SHORT-TERM INVESTMENTS - 2.1%
Repurchase Agreement - 2.1%
Repurchase Agreement with State Street Corp.
dated 11/30/2012 at 0.010% to be
repurchased at $16,668,014 on 12/03/2012,
collateralized by $17,005,000 Federal Home
Loan Mortgage Corp., 0.450% due
11/24/2015 (valued at $17,005,000) $ 16,668,000 $ 16,668,000
TOTAL SHORT-TERM INVESTMENTS (Cost $16,668,000) $ 16,668,000
Total Investments (All Cap Value Fund)
(Cost $725,773,671) - 104.0% $ 810,046,795
Other assets and liabilities, net - (4.0%) (30,918,193)
TOTAL NET ASSETS - 100.0% $ 779,128,602
Copyright © 2013 www.secdatabase.com. All Rights Reserved.Please Consider the Environment Before Printing This Document
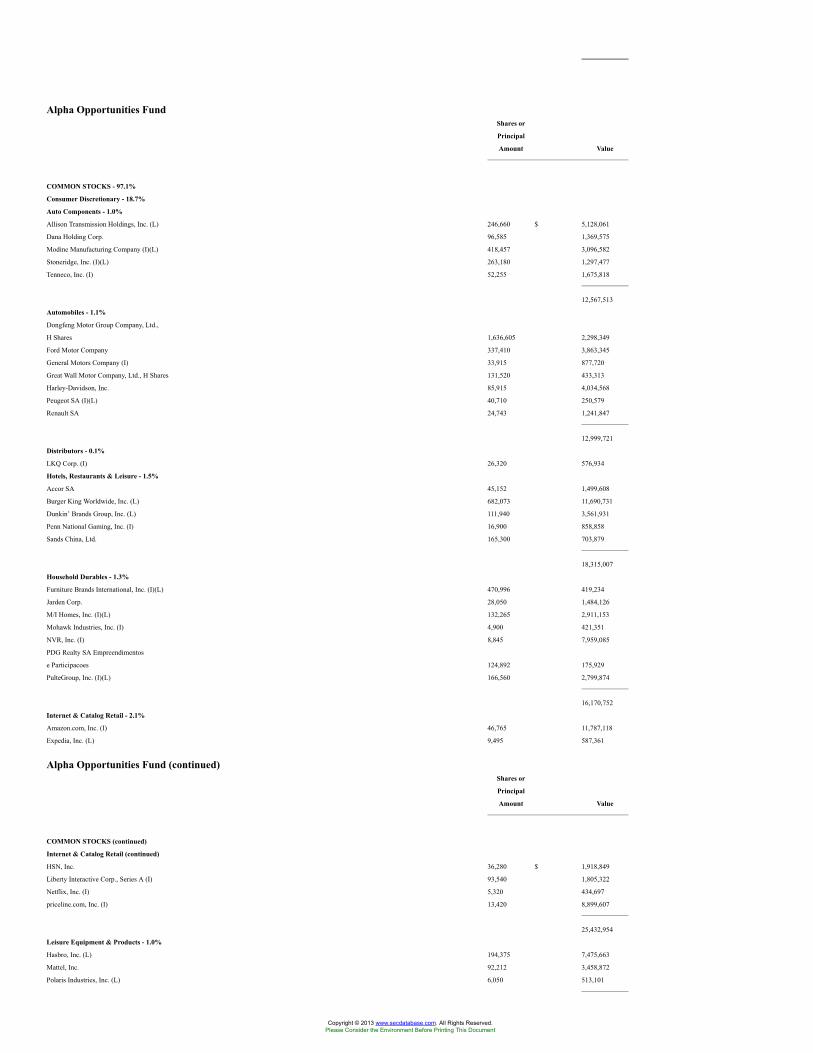
Alpha Opportunities FundShares or
Principal
Amount Value
COMMON STOCKS - 97.1%
Consumer Discretionary - 18.7%
Auto Components - 1.0%
Allison Transmission Holdings, Inc. (L) 246,660 $ 5,128,061
Dana Holding Corp. 96,585 1,369,575
Modine Manufacturing Company (I)(L) 418,457 3,096,582
Stoneridge, Inc. (I)(L) 263,180 1,297,477
Tenneco, Inc. (I) 52,255 1,675,818
12,567,513
Automobiles - 1.1%
Dongfeng Motor Group Company, Ltd.,
H Shares 1,636,605 2,298,349
Ford Motor Company 337,410 3,863,345
General Motors Company (I) 33,915 877,720
Great Wall Motor Company, Ltd., H Shares 131,520 433,313
Harley-Davidson, Inc. 85,915 4,034,568
Peugeot SA (I)(L) 40,710 250,579
Renault SA 24,743 1,241,847
12,999,721
Distributors - 0.1%
LKQ Corp. (I) 26,320 576,934
Hotels, Restaurants & Leisure - 1.5%
Accor SA 45,152 1,499,608
Burger King Worldwide, Inc. (L) 682,073 11,690,731
Dunkin’ Brands Group, Inc. (L) 111,940 3,561,931
Penn National Gaming, Inc. (I) 16,900 858,858
Sands China, Ltd. 165,300 703,879
18,315,007
Household Durables - 1.3%
Furniture Brands International, Inc. (I)(L) 470,996 419,234
Jarden Corp. 28,050 1,484,126
M/I Homes, Inc. (I)(L) 132,265 2,911,153
Mohawk Industries, Inc. (I) 4,900 421,351
NVR, Inc. (I) 8,845 7,959,085
PDG Realty SA Empreendimentos
e Participacoes 124,892 175,929
PulteGroup, Inc. (I)(L) 166,560 2,799,874
16,170,752
Internet & Catalog Retail - 2.1%
Amazon.com, Inc. (I) 46,765 11,787,118
Expedia, Inc. (L) 9,495 587,361
Alpha Opportunities Fund (continued)Shares or
Principal
Amount Value
COMMON STOCKS (continued)
Internet & Catalog Retail (continued)
HSN, Inc. 36,280 $ 1,918,849
Liberty Interactive Corp., Series A (I) 93,540 1,805,322
Netflix, Inc. (I) 5,320 434,697
priceline.com, Inc. (I) 13,420 8,899,607
25,432,954
Leisure Equipment & Products - 1.0%
Hasbro, Inc. (L) 194,375 7,475,663
Mattel, Inc. 92,212 3,458,872
Polaris Industries, Inc. (L) 6,050 513,101
Copyright © 2013 www.secdatabase.com. All Rights Reserved.Please Consider the Environment Before Printing This Document
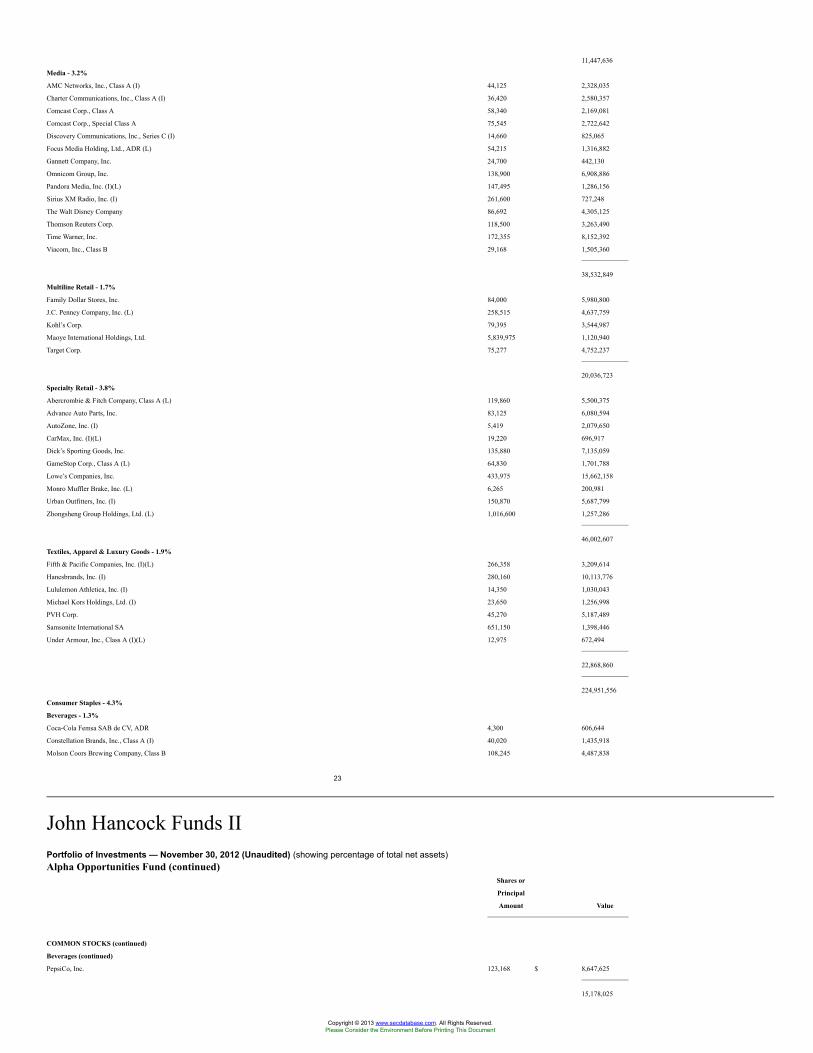
11,447,636
Media - 3.2%
AMC Networks, Inc., Class A (I) 44,125 2,328,035
Charter Communications, Inc., Class A (I) 36,420 2,580,357
Comcast Corp., Class A 58,340 2,169,081
Comcast Corp., Special Class A 75,545 2,722,642
Discovery Communications, Inc., Series C (I) 14,660 825,065
Focus Media Holding, Ltd., ADR (L) 54,215 1,316,882
Gannett Company, Inc. 24,700 442,130
Omnicom Group, Inc. 138,900 6,908,886
Pandora Media, Inc. (I)(L) 147,495 1,286,156
Sirius XM Radio, Inc. (I) 261,600 727,248
The Walt Disney Company 86,692 4,305,125
Thomson Reuters Corp. 118,500 3,263,490
Time Warner, Inc. 172,355 8,152,392
Viacom, Inc., Class B 29,168 1,505,360
38,532,849
Multiline Retail - 1.7%
Family Dollar Stores, Inc. 84,000 5,980,800
J.C. Penney Company, Inc. (L) 258,515 4,637,759
Kohl’s Corp. 79,395 3,544,987
Maoye International Holdings, Ltd. 5,839,975 1,120,940
Target Corp. 75,277 4,752,237
20,036,723
Specialty Retail - 3.8%
Abercrombie & Fitch Company, Class A (L) 119,860 5,500,375
Advance Auto Parts, Inc. 83,125 6,080,594
AutoZone, Inc. (I) 5,419 2,079,650
CarMax, Inc. (I)(L) 19,220 696,917
Dick’s Sporting Goods, Inc. 135,880 7,135,059
GameStop Corp., Class A (L) 64,830 1,701,788
Lowe’s Companies, Inc. 433,975 15,662,158
Monro Muffler Brake, Inc. (L) 6,265 200,981
Urban Outfitters, Inc. (I) 150,870 5,687,799
Zhongsheng Group Holdings, Ltd. (L) 1,016,600 1,257,286
46,002,607
Textiles, Apparel & Luxury Goods - 1.9%
Fifth & Pacific Companies, Inc. (I)(L) 266,358 3,209,614
Hanesbrands, Inc. (I) 280,160 10,113,776
Lululemon Athletica, Inc. (I) 14,350 1,030,043
Michael Kors Holdings, Ltd. (I) 23,650 1,256,998
PVH Corp. 45,270 5,187,489
Samsonite International SA 651,150 1,398,446
Under Armour, Inc., Class A (I)(L) 12,975 672,494
22,868,860
224,951,556
Consumer Staples - 4.3%
Beverages - 1.3%
Coca-Cola Femsa SAB de CV, ADR 4,300 606,644
Constellation Brands, Inc., Class A (I) 40,020 1,435,918
Molson Coors Brewing Company, Class B 108,245 4,487,838
23
John Hancock Funds IIPortfolio of Investments — November 30, 2012 (Unaudited) (showing percentage of total net assets)Alpha Opportunities Fund (continued)
Shares or
Principal
Amount Value
COMMON STOCKS (continued)
Beverages (continued)
PepsiCo, Inc. 123,168 $ 8,647,625
15,178,025
Copyright © 2013 www.secdatabase.com. All Rights Reserved.Please Consider the Environment Before Printing This Document
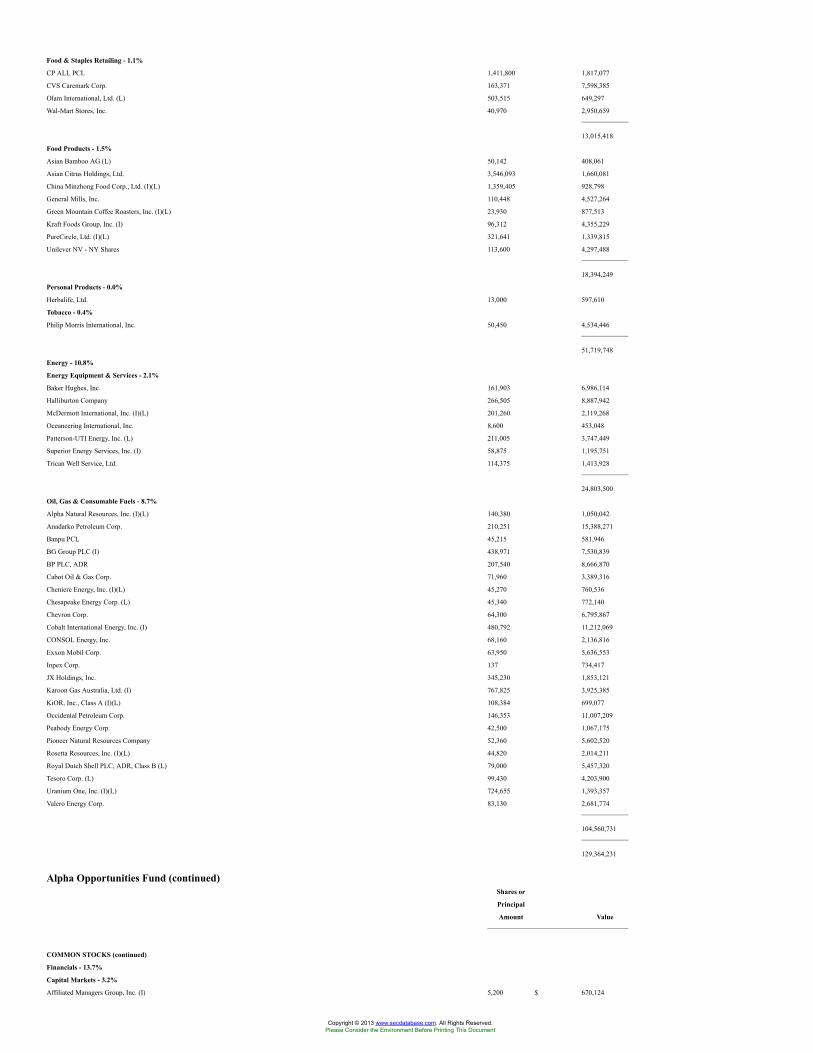
Food & Staples Retailing - 1.1%
CP ALL PCL 1,411,800 1,817,077
CVS Caremark Corp. 163,371 7,598,385
Olam International, Ltd. (L) 503,515 649,297
Wal-Mart Stores, Inc. 40,970 2,950,659
13,015,418
Food Products - 1.5%
Asian Bamboo AG (L) 50,142 408,061
Asian Citrus Holdings, Ltd. 3,546,093 1,660,081
China Minzhong Food Corp., Ltd. (I)(L) 1,359,405 928,798
General Mills, Inc. 110,448 4,527,264
Green Mountain Coffee Roasters, Inc. (I)(L) 23,930 877,513
Kraft Foods Group, Inc. (I) 96,312 4,355,229
PureCircle, Ltd. (I)(L) 321,641 1,339,815
Unilever NV - NY Shares 113,600 4,297,488
18,394,249
Personal Products - 0.0%
Herbalife, Ltd. 13,000 597,610
Tobacco - 0.4%
Philip Morris International, Inc. 50,450 4,534,446
51,719,748
Energy - 10.8%
Energy Equipment & Services - 2.1%
Baker Hughes, Inc. 161,903 6,986,114
Halliburton Company 266,505 8,887,942
McDermott International, Inc. (I)(L) 201,260 2,119,268
Oceaneering International, Inc. 8,600 453,048
Patterson-UTI Energy, Inc. (L) 211,005 3,747,449
Superior Energy Services, Inc. (I) 58,875 1,195,751
Trican Well Service, Ltd. 114,375 1,413,928
24,803,500
Oil, Gas & Consumable Fuels - 8.7%
Alpha Natural Resources, Inc. (I)(L) 140,380 1,050,042
Anadarko Petroleum Corp. 210,251 15,388,271
Banpu PCL 45,215 581,946
BG Group PLC (I) 438,971 7,530,839
BP PLC, ADR 207,540 8,666,870
Cabot Oil & Gas Corp. 71,960 3,389,316
Cheniere Energy, Inc. (I)(L) 45,270 760,536
Chesapeake Energy Corp. (L) 45,340 772,140
Chevron Corp. 64,300 6,795,867
Cobalt International Energy, Inc. (I) 480,792 11,212,069
CONSOL Energy, Inc. 68,160 2,136,816
Exxon Mobil Corp. 63,950 5,636,553
Inpex Corp. 137 734,417
JX Holdings, Inc. 345,230 1,853,121
Karoon Gas Australia, Ltd. (I) 767,825 3,925,385
KiOR, Inc., Class A (I)(L) 108,384 699,077
Occidental Petroleum Corp. 146,353 11,007,209
Peabody Energy Corp. 42,500 1,067,175
Pioneer Natural Resources Company 52,360 5,602,520
Rosetta Resources, Inc. (I)(L) 44,820 2,014,211
Royal Dutch Shell PLC, ADR, Class B (L) 79,000 5,457,320
Tesoro Corp. (L) 99,430 4,203,900
Uranium One, Inc. (I)(L) 724,655 1,393,357
Valero Energy Corp. 83,130 2,681,774
104,560,731
129,364,231
Alpha Opportunities Fund (continued)Shares or
Principal
Amount Value
COMMON STOCKS (continued)
Financials - 13.7%
Capital Markets - 3.2%
Affiliated Managers Group, Inc. (I) 5,200 $ 670,124
Copyright © 2013 www.secdatabase.com. All Rights Reserved.Please Consider the Environment Before Printing This Document
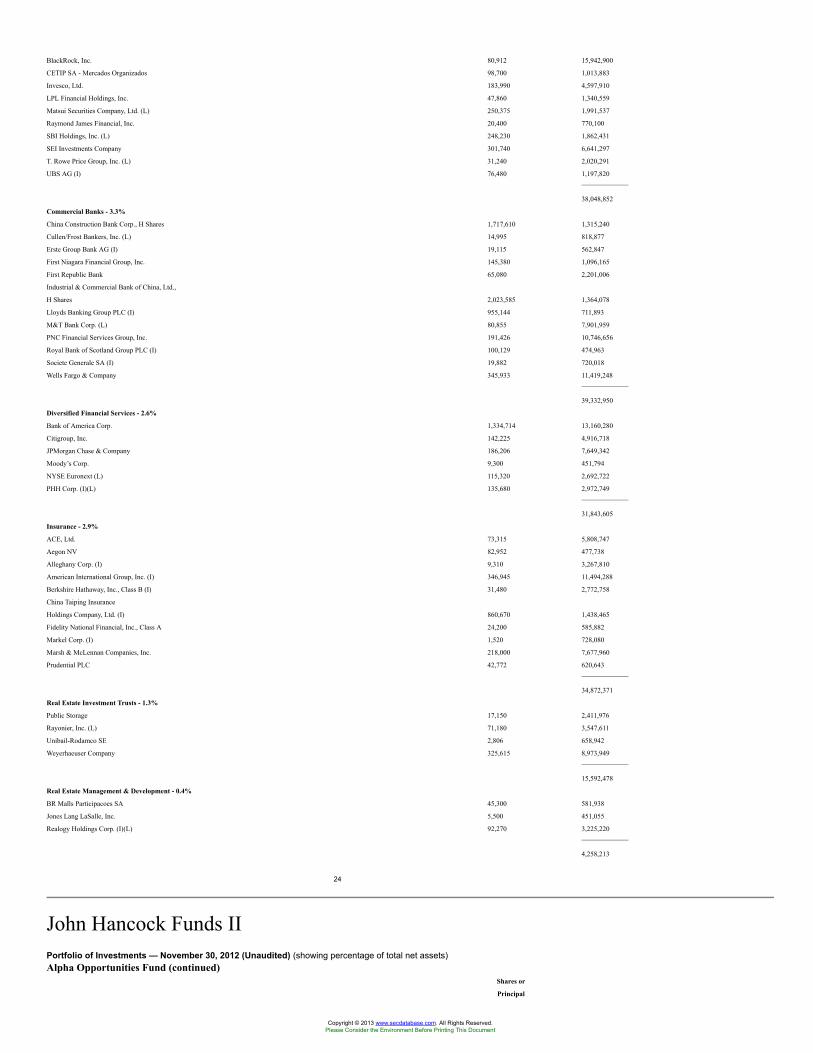
BlackRock, Inc. 80,912 15,942,900
CETIP SA - Mercados Organizados 98,700 1,013,883
Invesco, Ltd. 183,990 4,597,910
LPL Financial Holdings, Inc. 47,860 1,340,559
Matsui Securities Company, Ltd. (L) 250,375 1,991,537
Raymond James Financial, Inc. 20,400 770,100
SBI Holdings, Inc. (L) 248,230 1,862,431
SEI Investments Company 301,740 6,641,297
T. Rowe Price Group, Inc. (L) 31,240 2,020,291
UBS AG (I) 76,480 1,197,820
38,048,852
Commercial Banks - 3.3%
China Construction Bank Corp., H Shares 1,717,610 1,315,240
Cullen/Frost Bankers, Inc. (L) 14,995 818,877
Erste Group Bank AG (I) 19,115 562,847
First Niagara Financial Group, Inc. 145,380 1,096,165
First Republic Bank 65,080 2,201,006
Industrial & Commercial Bank of China, Ltd.,
H Shares 2,023,585 1,364,078
Lloyds Banking Group PLC (I) 955,144 711,893
M&T Bank Corp. (L) 80,855 7,901,959
PNC Financial Services Group, Inc. 191,426 10,746,656
Royal Bank of Scotland Group PLC (I) 100,129 474,963
Societe Generale SA (I) 19,882 720,018
Wells Fargo & Company 345,933 11,419,248
39,332,950
Diversified Financial Services - 2.6%
Bank of America Corp. 1,334,714 13,160,280
Citigroup, Inc. 142,225 4,916,718
JPMorgan Chase & Company 186,206 7,649,342
Moody’s Corp. 9,300 451,794
NYSE Euronext (L) 115,320 2,692,722
PHH Corp. (I)(L) 135,680 2,972,749
31,843,605
Insurance - 2.9%
ACE, Ltd. 73,315 5,808,747
Aegon NV 82,952 477,738
Alleghany Corp. (I) 9,310 3,267,810
American International Group, Inc. (I) 346,945 11,494,288
Berkshire Hathaway, Inc., Class B (I) 31,480 2,772,758
China Taiping Insurance
Holdings Company, Ltd. (I) 860,670 1,438,465
Fidelity National Financial, Inc., Class A 24,200 585,882
Markel Corp. (I) 1,520 728,080
Marsh & McLennan Companies, Inc. 218,000 7,677,960
Prudential PLC 42,772 620,643
34,872,371
Real Estate Investment Trusts - 1.3%
Public Storage 17,150 2,411,976
Rayonier, Inc. (L) 71,180 3,547,611
Unibail-Rodamco SE 2,806 658,942
Weyerhaeuser Company 325,615 8,973,949
15,592,478
Real Estate Management & Development - 0.4%
BR Malls Participacoes SA 45,300 581,938
Jones Lang LaSalle, Inc. 5,500 451,055
Realogy Holdings Corp. (I)(L) 92,270 3,225,220
4,258,213
24
John Hancock Funds IIPortfolio of Investments — November 30, 2012 (Unaudited) (showing percentage of total net assets)Alpha Opportunities Fund (continued)
Shares or
Principal
Copyright © 2013 www.secdatabase.com. All Rights Reserved.Please Consider the Environment Before Printing This Document
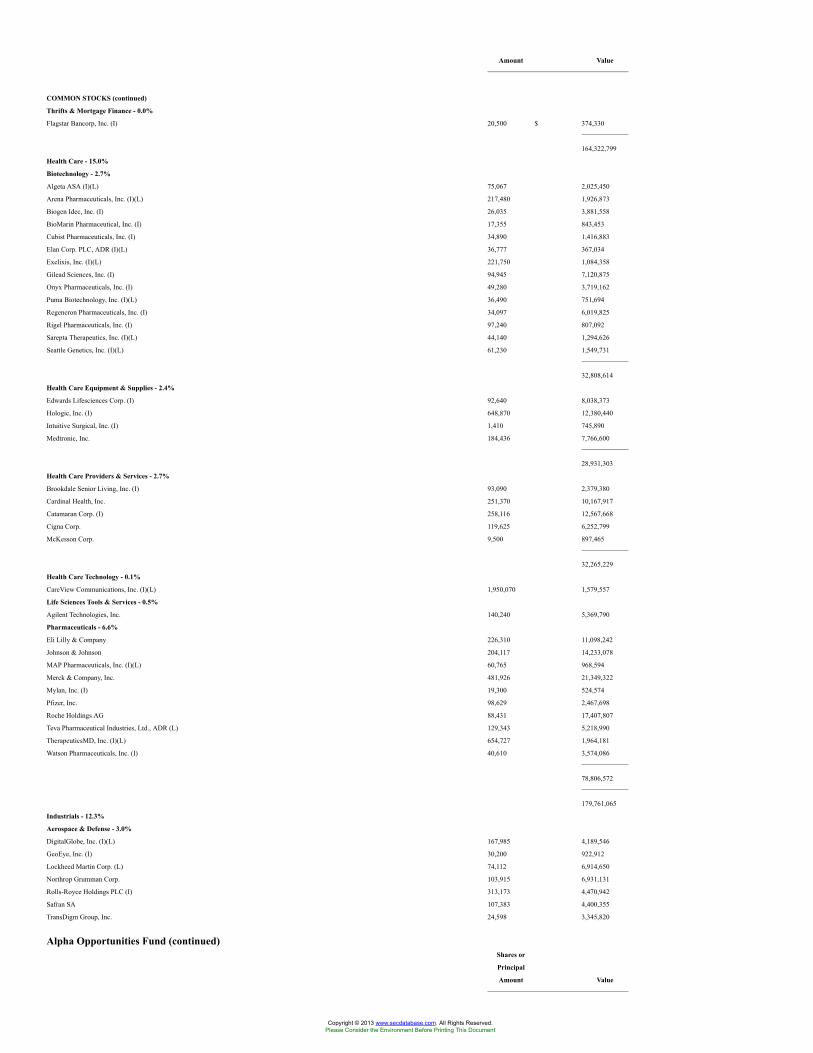
Amount Value
COMMON STOCKS (continued)
Thrifts & Mortgage Finance - 0.0%
Flagstar Bancorp, Inc. (I) 20,500 $ 374,330
164,322,799
Health Care - 15.0%
Biotechnology - 2.7%
Algeta ASA (I)(L) 75,067 2,025,450
Arena Pharmaceuticals, Inc. (I)(L) 217,480 1,926,873
Biogen Idec, Inc. (I) 26,035 3,881,558
BioMarin Pharmaceutical, Inc. (I) 17,355 843,453
Cubist Pharmaceuticals, Inc. (I) 34,890 1,416,883
Elan Corp. PLC, ADR (I)(L) 36,777 367,034
Exelixis, Inc. (I)(L) 221,750 1,084,358
Gilead Sciences, Inc. (I) 94,945 7,120,875
Onyx Pharmaceuticals, Inc. (I) 49,280 3,719,162
Puma Biotechnology, Inc. (I)(L) 36,490 751,694
Regeneron Pharmaceuticals, Inc. (I) 34,097 6,019,825
Rigel Pharmaceuticals, Inc. (I) 97,240 807,092
Sarepta Therapeutics, Inc. (I)(L) 44,140 1,294,626
Seattle Genetics, Inc. (I)(L) 61,230 1,549,731
32,808,614
Health Care Equipment & Supplies - 2.4%
Edwards Lifesciences Corp. (I) 92,640 8,038,373
Hologic, Inc. (I) 648,870 12,380,440
Intuitive Surgical, Inc. (I) 1,410 745,890
Medtronic, Inc. 184,436 7,766,600
28,931,303
Health Care Providers & Services - 2.7%
Brookdale Senior Living, Inc. (I) 93,090 2,379,380
Cardinal Health, Inc. 251,370 10,167,917
Catamaran Corp. (I) 258,116 12,567,668
Cigna Corp. 119,625 6,252,799
McKesson Corp. 9,500 897,465
32,265,229
Health Care Technology - 0.1%
CareView Communications, Inc. (I)(L) 1,950,070 1,579,557
Life Sciences Tools & Services - 0.5%
Agilent Technologies, Inc. 140,240 5,369,790
Pharmaceuticals - 6.6%
Eli Lilly & Company 226,310 11,098,242
Johnson & Johnson 204,117 14,233,078
MAP Pharmaceuticals, Inc. (I)(L) 60,765 968,594
Merck & Company, Inc. 481,926 21,349,322
Mylan, Inc. (I) 19,300 524,574
Pfizer, Inc. 98,629 2,467,698
Roche Holdings AG 88,431 17,407,807
Teva Pharmaceutical Industries, Ltd., ADR (L) 129,343 5,218,990
TherapeuticsMD, Inc. (I)(L) 654,727 1,964,181
Watson Pharmaceuticals, Inc. (I) 40,610 3,574,086
78,806,572
179,761,065
Industrials - 12.3%
Aerospace & Defense - 3.0%
DigitalGlobe, Inc. (I)(L) 167,985 4,189,546
GeoEye, Inc. (I) 30,200 922,912
Lockheed Martin Corp. (L) 74,112 6,914,650
Northrop Grumman Corp. 103,915 6,931,131
Rolls-Royce Holdings PLC (I) 313,173 4,470,942
Safran SA 107,383 4,400,355
TransDigm Group, Inc. 24,598 3,345,820
Alpha Opportunities Fund (continued)Shares or
Principal
Amount Value
Copyright © 2013 www.secdatabase.com. All Rights Reserved.Please Consider the Environment Before Printing This Document
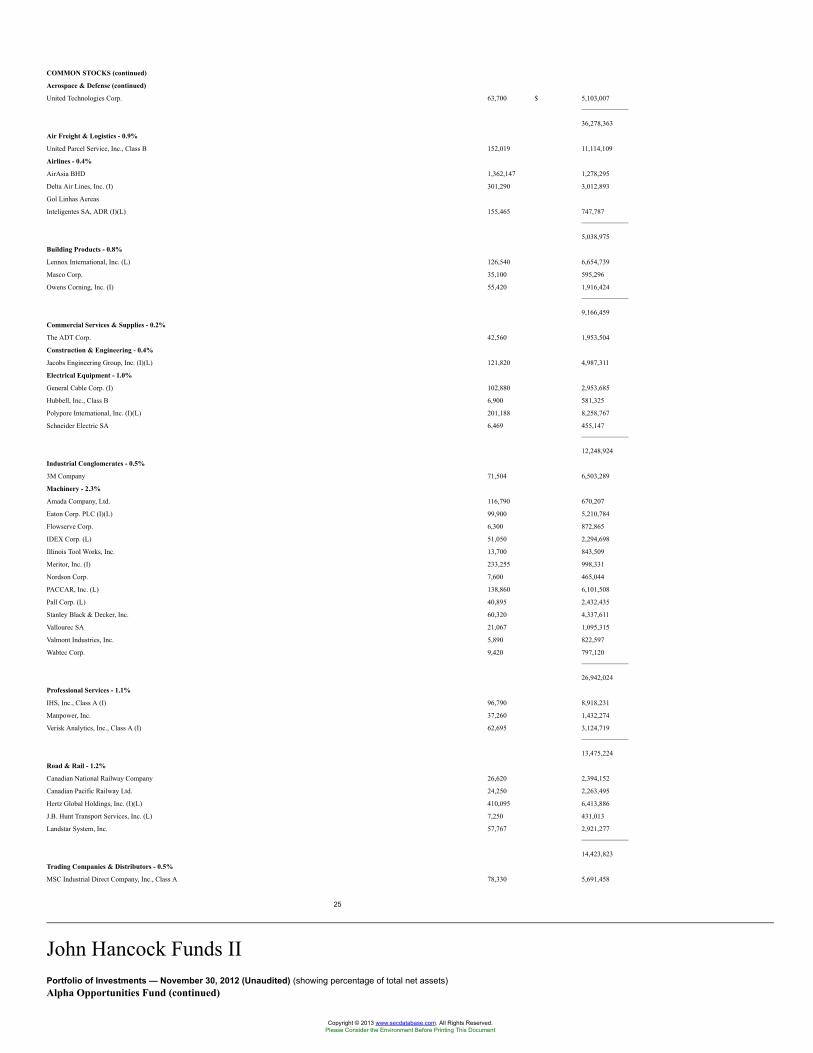
COMMON STOCKS (continued)
Aerospace & Defense (continued)
United Technologies Corp. 63,700 $ 5,103,007
36,278,363
Air Freight & Logistics - 0.9%
United Parcel Service, Inc., Class B 152,019 11,114,109
Airlines - 0.4%
AirAsia BHD 1,362,147 1,278,295
Delta Air Lines, Inc. (I) 301,290 3,012,893
Gol Linhas Aereas
Inteligentes SA, ADR (I)(L) 155,465 747,787
5,038,975
Building Products - 0.8%
Lennox International, Inc. (L) 126,540 6,654,739
Masco Corp. 35,100 595,296
Owens Corning, Inc. (I) 55,420 1,916,424
9,166,459
Commercial Services & Supplies - 0.2%
The ADT Corp. 42,560 1,953,504
Construction & Engineering - 0.4%
Jacobs Engineering Group, Inc. (I)(L) 121,820 4,987,311
Electrical Equipment - 1.0%
General Cable Corp. (I) 102,880 2,953,685
Hubbell, Inc., Class B 6,900 581,325
Polypore International, Inc. (I)(L) 201,188 8,258,767
Schneider Electric SA 6,469 455,147
12,248,924
Industrial Conglomerates - 0.5%
3M Company 71,504 6,503,289
Machinery - 2.3%
Amada Company, Ltd. 116,790 670,207
Eaton Corp. PLC (I)(L) 99,900 5,210,784
Flowserve Corp. 6,300 872,865
IDEX Corp. (L) 51,050 2,294,698
Illinois Tool Works, Inc. 13,700 843,509
Meritor, Inc. (I) 233,255 998,331
Nordson Corp. 7,600 465,044
PACCAR, Inc. (L) 138,860 6,101,508
Pall Corp. (L) 40,895 2,432,435
Stanley Black & Decker, Inc. 60,320 4,337,611
Vallourec SA 21,067 1,095,315
Valmont Industries, Inc. 5,890 822,597
Wabtec Corp. 9,420 797,120
26,942,024
Professional Services - 1.1%
IHS, Inc., Class A (I) 96,790 8,918,231
Manpower, Inc. 37,260 1,432,274
Verisk Analytics, Inc., Class A (I) 62,695 3,124,719
13,475,224
Road & Rail - 1.2%
Canadian National Railway Company 26,620 2,394,152
Canadian Pacific Railway Ltd. 24,250 2,263,495
Hertz Global Holdings, Inc. (I)(L) 410,095 6,413,886
J.B. Hunt Transport Services, Inc. (L) 7,250 431,013
Landstar System, Inc. 57,767 2,921,277
14,423,823
Trading Companies & Distributors - 0.5%
MSC Industrial Direct Company, Inc., Class A 78,330 5,691,458
25
John Hancock Funds IIPortfolio of Investments — November 30, 2012 (Unaudited) (showing percentage of total net assets)Alpha Opportunities Fund (continued)
Copyright © 2013 www.secdatabase.com. All Rights Reserved.Please Consider the Environment Before Printing This Document
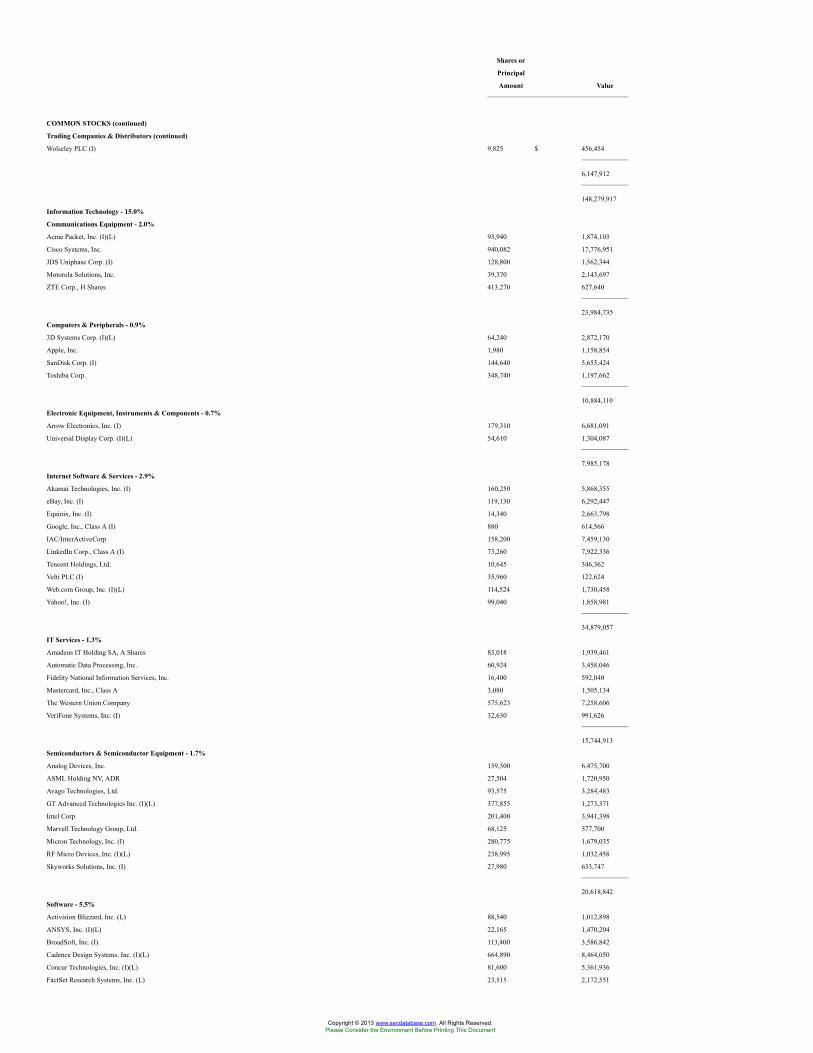
Shares or
Principal
Amount Value
COMMON STOCKS (continued)
Trading Companies & Distributors (continued)
Wolseley PLC (I) 9,825 $ 456,454
6,147,912
148,279,917
Information Technology - 15.0%
Communications Equipment - 2.0%
Acme Packet, Inc. (I)(L) 93,940 1,874,103
Cisco Systems, Inc. 940,082 17,776,951
JDS Uniphase Corp. (I) 128,800 1,562,344
Motorola Solutions, Inc. 39,370 2,143,697
ZTE Corp., H Shares 413,270 627,640
23,984,735
Computers & Peripherals - 0.9%
3D Systems Corp. (I)(L) 64,240 2,872,170
Apple, Inc. 1,980 1,158,854
SanDisk Corp. (I) 144,640 5,655,424
Toshiba Corp. 348,740 1,197,662
10,884,110
Electronic Equipment, Instruments & Components - 0.7%
Arrow Electronics, Inc. (I) 179,310 6,681,091
Universal Display Corp. (I)(L) 54,610 1,304,087
7,985,178
Internet Software & Services - 2.9%
Akamai Technologies, Inc. (I) 160,250 5,868,355
eBay, Inc. (I) 119,130 6,292,447
Equinix, Inc. (I) 14,340 2,663,798
Google, Inc., Class A (I) 880 614,566
IAC/InterActiveCorp 158,200 7,459,130
LinkedIn Corp., Class A (I) 73,260 7,922,336
Tencent Holdings, Ltd. 10,645 346,362
Velti PLC (I) 35,960 122,624
Web.com Group, Inc. (I)(L) 114,524 1,730,458
Yahoo!, Inc. (I) 99,040 1,858,981
34,879,057
IT Services - 1.3%
Amadeus IT Holding SA, A Shares 83,018 1,939,461
Automatic Data Processing, Inc. 60,924 3,458,046
Fidelity National Information Services, Inc. 16,400 592,040
Mastercard, Inc., Class A 3,080 1,505,134
The Western Union Company 575,623 7,258,606
VeriFone Systems, Inc. (I) 32,630 991,626
15,744,913
Semiconductors & Semiconductor Equipment - 1.7%
Analog Devices, Inc. 159,500 6,475,700
ASML Holding NV, ADR 27,504 1,720,950
Avago Technologies, Ltd. 93,575 3,284,483
GT Advanced Technologies Inc. (I)(L) 377,855 1,273,371
Intel Corp. 201,400 3,941,398
Marvell Technology Group, Ltd. 68,125 577,700
Micron Technology, Inc. (I) 280,775 1,679,035
RF Micro Devices, Inc. (I)(L) 238,995 1,032,458
Skyworks Solutions, Inc. (I) 27,980 633,747
20,618,842
Software - 5.5%
Activision Blizzard, Inc. (L) 88,540 1,012,898
ANSYS, Inc. (I)(L) 22,165 1,470,204
BroadSoft, Inc. (I) 113,400 3,586,842
Cadence Design Systems, Inc. (I)(L) 664,890 8,464,050
Concur Technologies, Inc. (I)(L) 81,600 5,361,936
FactSet Research Systems, Inc. (L) 23,515 2,172,551
Copyright © 2013 www.secdatabase.com. All Rights Reserved.Please Consider the Environment Before Printing This Document
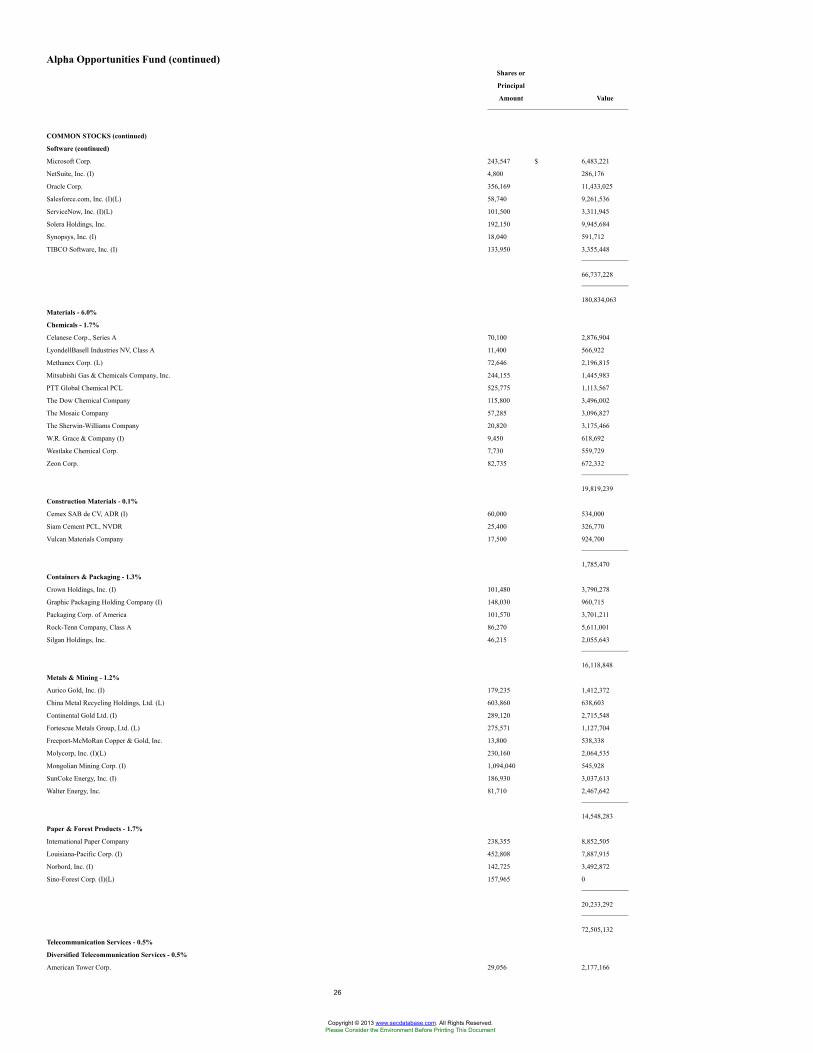
Alpha Opportunities Fund (continued)Shares or
Principal
Amount Value
COMMON STOCKS (continued)
Software (continued)
Microsoft Corp. 243,547 $ 6,483,221
NetSuite, Inc. (I) 4,800 286,176
Oracle Corp. 356,169 11,433,025
Salesforce.com, Inc. (I)(L) 58,740 9,261,536
ServiceNow, Inc. (I)(L) 101,500 3,311,945
Solera Holdings, Inc. 192,150 9,945,684
Synopsys, Inc. (I) 18,040 591,712
TIBCO Software, Inc. (I) 133,950 3,355,448
66,737,228
180,834,063
Materials - 6.0%
Chemicals - 1.7%
Celanese Corp., Series A 70,100 2,876,904
LyondellBasell Industries NV, Class A 11,400 566,922
Methanex Corp. (L) 72,646 2,196,815
Mitsubishi Gas & Chemicals Company, Inc. 244,155 1,445,983
PTT Global Chemical PCL 525,775 1,113,567
The Dow Chemical Company 115,800 3,496,002
The Mosaic Company 57,285 3,096,827
The Sherwin-Williams Company 20,820 3,175,466
W.R. Grace & Company (I) 9,450 618,692
Westlake Chemical Corp. 7,730 559,729
Zeon Corp. 82,735 672,332
19,819,239
Construction Materials - 0.1%
Cemex SAB de CV, ADR (I) 60,000 534,000
Siam Cement PCL, NVDR 25,400 326,770
Vulcan Materials Company 17,500 924,700
1,785,470
Containers & Packaging - 1.3%
Crown Holdings, Inc. (I) 101,480 3,790,278
Graphic Packaging Holding Company (I) 148,030 960,715
Packaging Corp. of America 101,570 3,701,211
Rock-Tenn Company, Class A 86,270 5,611,001
Silgan Holdings, Inc. 46,215 2,055,643
16,118,848
Metals & Mining - 1.2%
Aurico Gold, Inc. (I) 179,235 1,412,372
China Metal Recycling Holdings, Ltd. (L) 603,860 638,603
Continental Gold Ltd. (I) 289,120 2,715,548
Fortescue Metals Group, Ltd. (L) 275,571 1,127,704
Freeport-McMoRan Copper & Gold, Inc. 13,800 538,338
Molycorp, Inc. (I)(L) 230,160 2,064,535
Mongolian Mining Corp. (I) 1,094,040 545,928
SunCoke Energy, Inc. (I) 186,930 3,037,613
Walter Energy, Inc. 81,710 2,467,642
14,548,283
Paper & Forest Products - 1.7%
International Paper Company 238,355 8,852,505
Louisiana-Pacific Corp. (I) 452,808 7,887,915
Norbord, Inc. (I) 142,725 3,492,872
Sino-Forest Corp. (I)(L) 157,965 0
20,233,292
72,505,132
Telecommunication Services - 0.5%
Diversified Telecommunication Services - 0.5%
American Tower Corp. 29,056 2,177,166
26
Copyright © 2013 www.secdatabase.com. All Rights Reserved.Please Consider the Environment Before Printing This Document
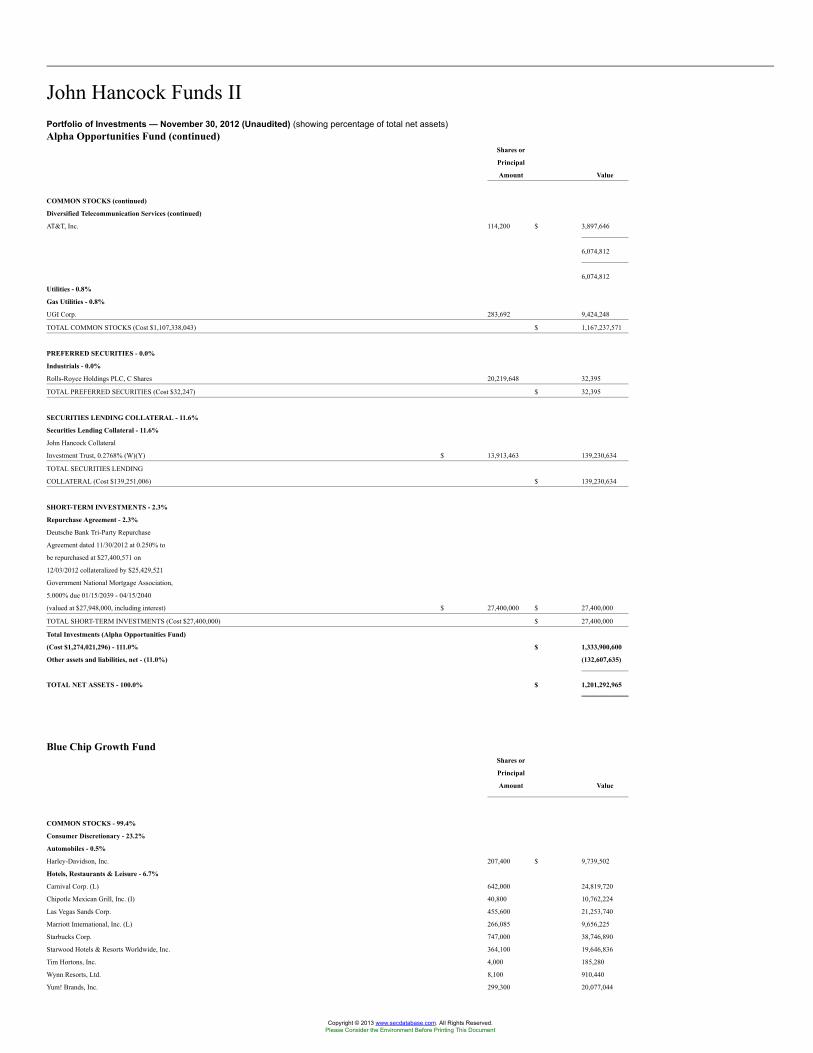
John Hancock Funds IIPortfolio of Investments — November 30, 2012 (Unaudited) (showing percentage of total net assets)Alpha Opportunities Fund (continued)
Shares or
Principal
Amount Value
COMMON STOCKS (continued)
Diversified Telecommunication Services (continued)
AT&T, Inc. 114,200 $ 3,897,646
6,074,812
6,074,812
Utilities - 0.8%
Gas Utilities - 0.8%
UGI Corp. 283,692 9,424,248
TOTAL COMMON STOCKS (Cost $1,107,338,043) $ 1,167,237,571
PREFERRED SECURITIES - 0.0%
Industrials - 0.0%
Rolls-Royce Holdings PLC, C Shares 20,219,648 32,395
TOTAL PREFERRED SECURITIES (Cost $32,247) $ 32,395
SECURITIES LENDING COLLATERAL - 11.6%
Securities Lending Collateral - 11.6%
John Hancock Collateral
Investment Trust, 0.2768% (W)(Y) $ 13,913,463 139,230,634
TOTAL SECURITIES LENDING
COLLATERAL (Cost $139,251,006) $ 139,230,634
SHORT-TERM INVESTMENTS - 2.3%
Repurchase Agreement - 2.3%
Deutsche Bank Tri-Party Repurchase
Agreement dated 11/30/2012 at 0.250% to
be repurchased at $27,400,571 on
12/03/2012 collateralized by $25,429,521
Government National Mortgage Association,
5.000% due 01/15/2039 - 04/15/2040
(valued at $27,948,000, including interest) $ 27,400,000 $ 27,400,000
TOTAL SHORT-TERM INVESTMENTS (Cost $27,400,000) $ 27,400,000
Total Investments (Alpha Opportunities Fund)
(Cost $1,274,021,296) - 111.0% $ 1,333,900,600
Other assets and liabilities, net - (11.0%) (132,607,635)
TOTAL NET ASSETS - 100.0% $ 1,201,292,965
Blue Chip Growth FundShares or
Principal
Amount Value
COMMON STOCKS - 99.4%
Consumer Discretionary - 23.2%
Automobiles - 0.5%
Harley-Davidson, Inc. 207,400 $ 9,739,502
Hotels, Restaurants & Leisure - 6.7%
Carnival Corp. (L) 642,000 24,819,720
Chipotle Mexican Grill, Inc. (I) 40,800 10,762,224
Las Vegas Sands Corp. 455,600 21,253,740
Marriott International, Inc. (L) 266,085 9,656,225
Starbucks Corp. 747,000 38,746,890
Starwood Hotels & Resorts Worldwide, Inc. 364,100 19,646,836
Tim Hortons, Inc. 4,000 185,280
Wynn Resorts, Ltd. 8,100 910,440
Yum! Brands, Inc. 299,300 20,077,044
Copyright © 2013 www.secdatabase.com. All Rights Reserved.Please Consider the Environment Before Printing This Document
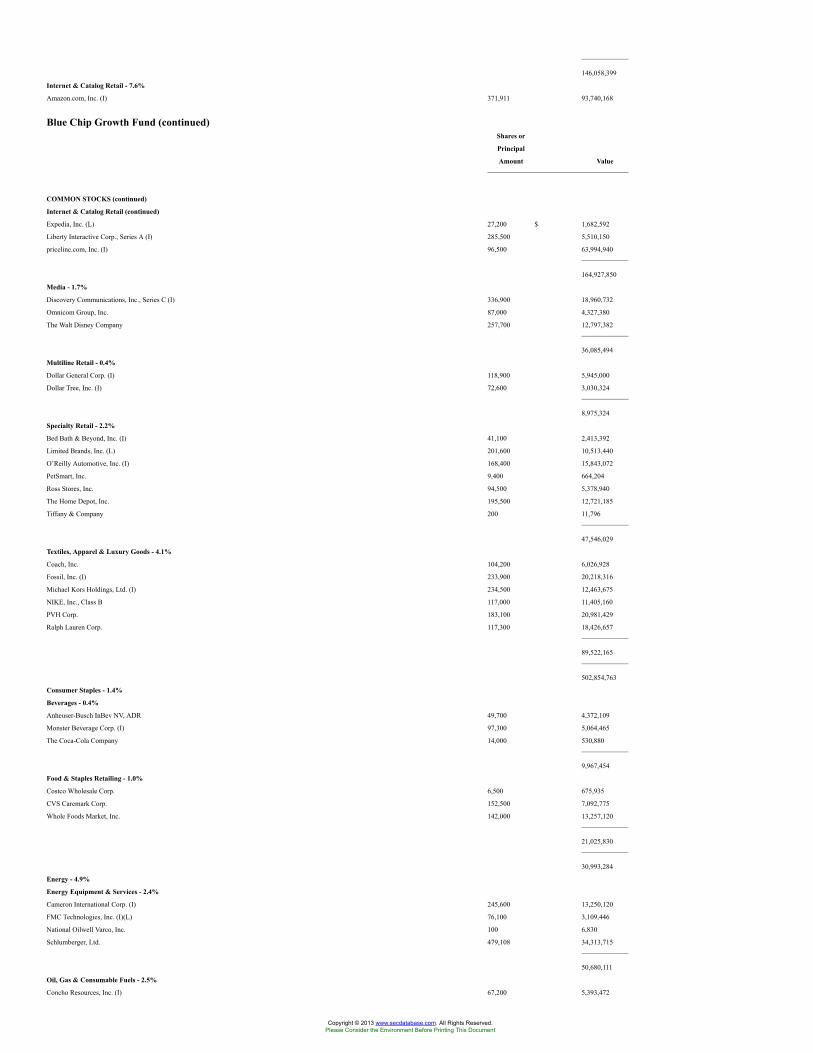
146,058,399
Internet & Catalog Retail - 7.6%
Amazon.com, Inc. (I) 371,911 93,740,168
Blue Chip Growth Fund (continued)Shares or
Principal
Amount Value
COMMON STOCKS (continued)
Internet & Catalog Retail (continued)
Expedia, Inc. (L) 27,200 $ 1,682,592
Liberty Interactive Corp., Series A (I) 285,500 5,510,150
priceline.com, Inc. (I) 96,500 63,994,940
164,927,850
Media - 1.7%
Discovery Communications, Inc., Series C (I) 336,900 18,960,732
Omnicom Group, Inc. 87,000 4,327,380
The Walt Disney Company 257,700 12,797,382
36,085,494
Multiline Retail - 0.4%
Dollar General Corp. (I) 118,900 5,945,000
Dollar Tree, Inc. (I) 72,600 3,030,324
8,975,324
Specialty Retail - 2.2%
Bed Bath & Beyond, Inc. (I) 41,100 2,413,392
Limited Brands, Inc. (L) 201,600 10,513,440
O’Reilly Automotive, Inc. (I) 168,400 15,843,072
PetSmart, Inc. 9,400 664,204
Ross Stores, Inc. 94,500 5,378,940
The Home Depot, Inc. 195,500 12,721,185
Tiffany & Company 200 11,796
47,546,029
Textiles, Apparel & Luxury Goods - 4.1%
Coach, Inc. 104,200 6,026,928
Fossil, Inc. (I) 233,900 20,218,316
Michael Kors Holdings, Ltd. (I) 234,500 12,463,675
NIKE, Inc., Class B 117,000 11,405,160
PVH Corp. 183,100 20,981,429
Ralph Lauren Corp. 117,300 18,426,657
89,522,165
502,854,763
Consumer Staples - 1.4%
Beverages - 0.4%
Anheuser-Busch InBev NV, ADR 49,700 4,372,109
Monster Beverage Corp. (I) 97,300 5,064,465
The Coca-Cola Company 14,000 530,880
9,967,454
Food & Staples Retailing - 1.0%
Costco Wholesale Corp. 6,500 675,935
CVS Caremark Corp. 152,500 7,092,775
Whole Foods Market, Inc. 142,000 13,257,120
21,025,830
30,993,284
Energy - 4.9%
Energy Equipment & Services - 2.4%
Cameron International Corp. (I) 245,600 13,250,120
FMC Technologies, Inc. (I)(L) 76,100 3,109,446
National Oilwell Varco, Inc. 100 6,830
Schlumberger, Ltd. 479,108 34,313,715
50,680,111
Oil, Gas & Consumable Fuels - 2.5%
Concho Resources, Inc. (I) 67,200 5,393,472
Copyright © 2013 www.secdatabase.com. All Rights Reserved.Please Consider the Environment Before Printing This Document
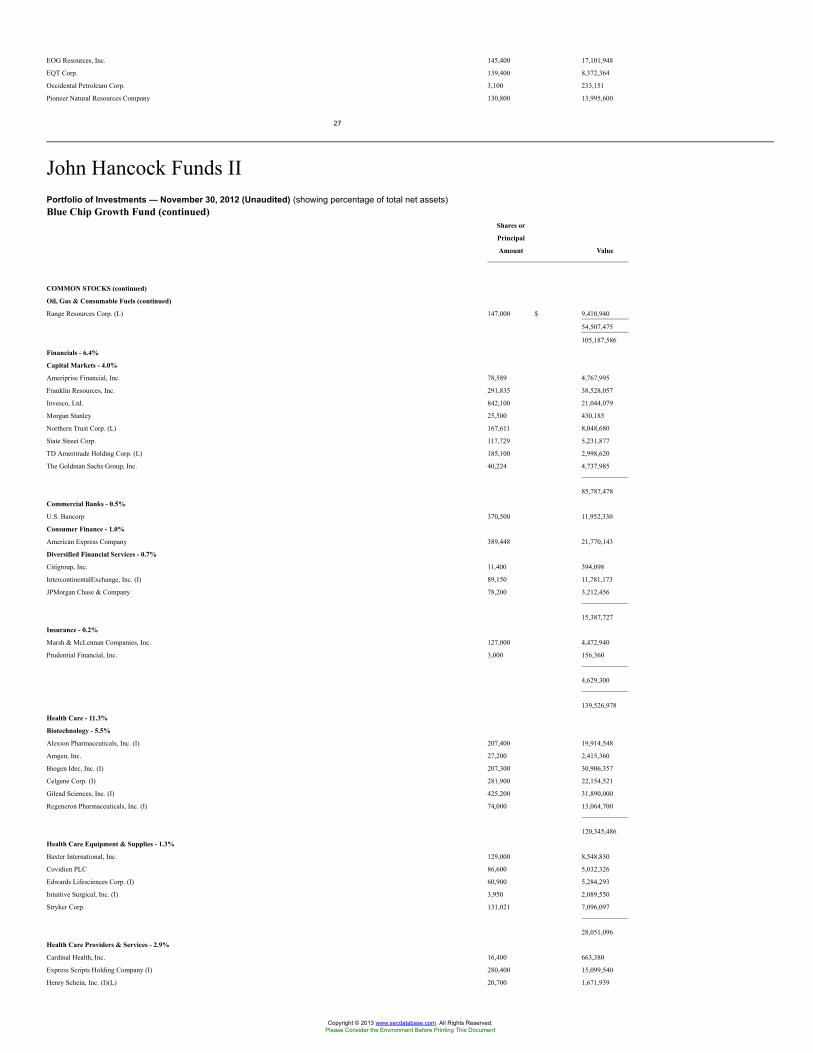
EOG Resources, Inc. 145,400 17,101,948
EQT Corp. 139,400 8,372,364
Occidental Petroleum Corp. 3,100 233,151
Pioneer Natural Resources Company 130,800 13,995,600
27
John Hancock Funds IIPortfolio of Investments — November 30, 2012 (Unaudited) (showing percentage of total net assets)Blue Chip Growth Fund (continued)
Shares or
Principal
Amount Value
COMMON STOCKS (continued)
Oil, Gas & Consumable Fuels (continued)
Range Resources Corp. (L) 147,000 $ 9,410,940
54,507,475
105,187,586
Financials - 6.4%
Capital Markets - 4.0%
Ameriprise Financial, Inc. 78,589 4,767,995
Franklin Resources, Inc. 291,835 38,528,057
Invesco, Ltd. 842,100 21,044,079
Morgan Stanley 25,500 430,185
Northern Trust Corp. (L) 167,611 8,048,680
State Street Corp. 117,729 5,231,877
TD Ameritrade Holding Corp. (L) 185,100 2,998,620
The Goldman Sachs Group, Inc. 40,224 4,737,985
85,787,478
Commercial Banks - 0.5%
U.S. Bancorp 370,500 11,952,330
Consumer Finance - 1.0%
American Express Company 389,448 21,770,143
Diversified Financial Services - 0.7%
Citigroup, Inc. 11,400 394,098
IntercontinentalExchange, Inc. (I) 89,150 11,781,173
JPMorgan Chase & Company 78,200 3,212,456
15,387,727
Insurance - 0.2%
Marsh & McLennan Companies, Inc. 127,000 4,472,940
Prudential Financial, Inc. 3,000 156,360
4,629,300
139,526,978
Health Care - 11.3%
Biotechnology - 5.5%
Alexion Pharmaceuticals, Inc. (I) 207,400 19,914,548
Amgen, Inc. 27,200 2,415,360
Biogen Idec, Inc. (I) 207,300 30,906,357
Celgene Corp. (I) 281,900 22,154,521
Gilead Sciences, Inc. (I) 425,200 31,890,000
Regeneron Pharmaceuticals, Inc. (I) 74,000 13,064,700
120,345,486
Health Care Equipment & Supplies - 1.3%
Baxter International, Inc. 129,000 8,548,830
Covidien PLC 86,600 5,032,326
Edwards Lifesciences Corp. (I) 60,900 5,284,293
Intuitive Surgical, Inc. (I) 3,950 2,089,550
Stryker Corp. 131,021 7,096,097
28,051,096
Health Care Providers & Services - 2.9%
Cardinal Health, Inc. 16,400 663,380
Express Scripts Holding Company (I) 280,400 15,099,540
Henry Schein, Inc. (I)(L) 20,700 1,671,939
Copyright © 2013 www.secdatabase.com. All Rights Reserved.Please Consider the Environment Before Printing This Document
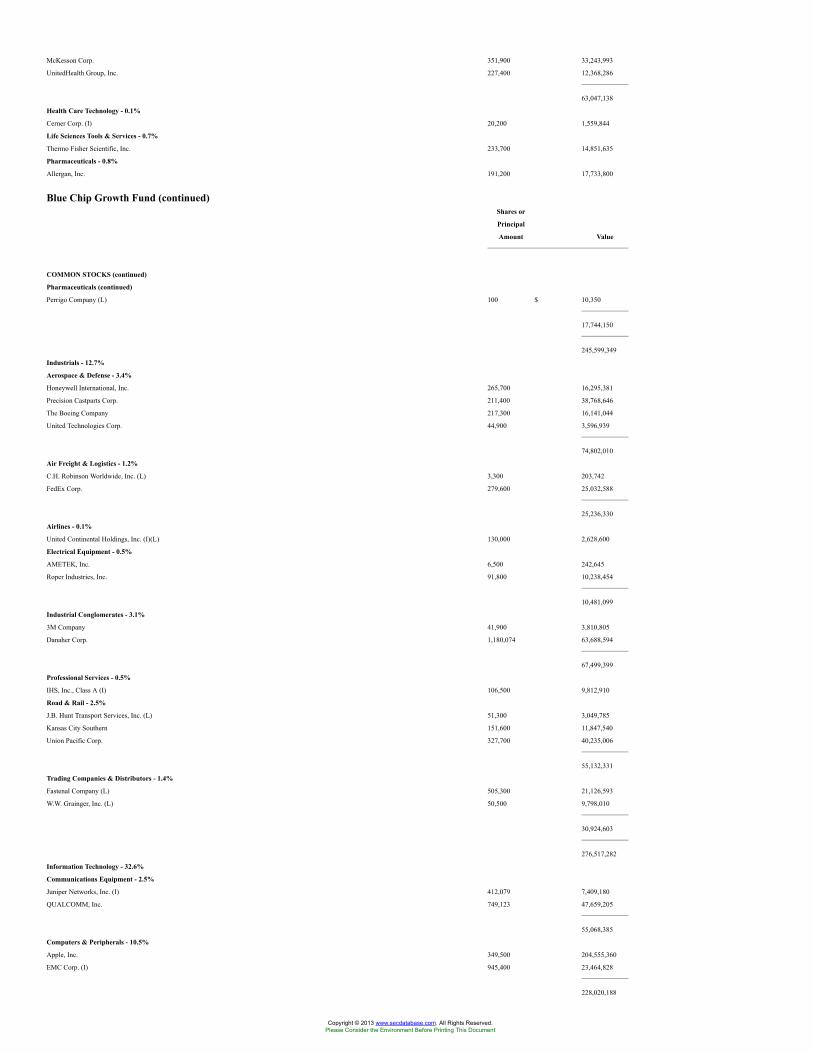
McKesson Corp. 351,900 33,243,993
UnitedHealth Group, Inc. 227,400 12,368,286
63,047,138
Health Care Technology - 0.1%
Cerner Corp. (I) 20,200 1,559,844
Life Sciences Tools & Services - 0.7%
Thermo Fisher Scientific, Inc. 233,700 14,851,635
Pharmaceuticals - 0.8%
Allergan, Inc. 191,200 17,733,800
Blue Chip Growth Fund (continued)Shares or
Principal
Amount Value
COMMON STOCKS (continued)
Pharmaceuticals (continued)
Perrigo Company (L) 100 $ 10,350
17,744,150
245,599,349
Industrials - 12.7%
Aerospace & Defense - 3.4%
Honeywell International, Inc. 265,700 16,295,381
Precision Castparts Corp. 211,400 38,768,646
The Boeing Company 217,300 16,141,044
United Technologies Corp. 44,900 3,596,939
74,802,010
Air Freight & Logistics - 1.2%
C.H. Robinson Worldwide, Inc. (L) 3,300 203,742
FedEx Corp. 279,600 25,032,588
25,236,330
Airlines - 0.1%
United Continental Holdings, Inc. (I)(L) 130,000 2,628,600
Electrical Equipment - 0.5%
AMETEK, Inc. 6,500 242,645
Roper Industries, Inc. 91,800 10,238,454
10,481,099
Industrial Conglomerates - 3.1%
3M Company 41,900 3,810,805
Danaher Corp. 1,180,074 63,688,594
67,499,399
Professional Services - 0.5%
IHS, Inc., Class A (I) 106,500 9,812,910
Road & Rail - 2.5%
J.B. Hunt Transport Services, Inc. (L) 51,300 3,049,785
Kansas City Southern 151,600 11,847,540
Union Pacific Corp. 327,700 40,235,006
55,132,331
Trading Companies & Distributors - 1.4%
Fastenal Company (L) 505,300 21,126,593
W.W. Grainger, Inc. (L) 50,500 9,798,010
30,924,603
276,517,282
Information Technology - 32.6%
Communications Equipment - 2.5%
Juniper Networks, Inc. (I) 412,079 7,409,180
QUALCOMM, Inc. 749,123 47,659,205
55,068,385
Computers & Peripherals - 10.5%
Apple, Inc. 349,500 204,555,360
EMC Corp. (I) 945,400 23,464,828
228,020,188
Copyright © 2013 www.secdatabase.com. All Rights Reserved.Please Consider the Environment Before Printing This Document
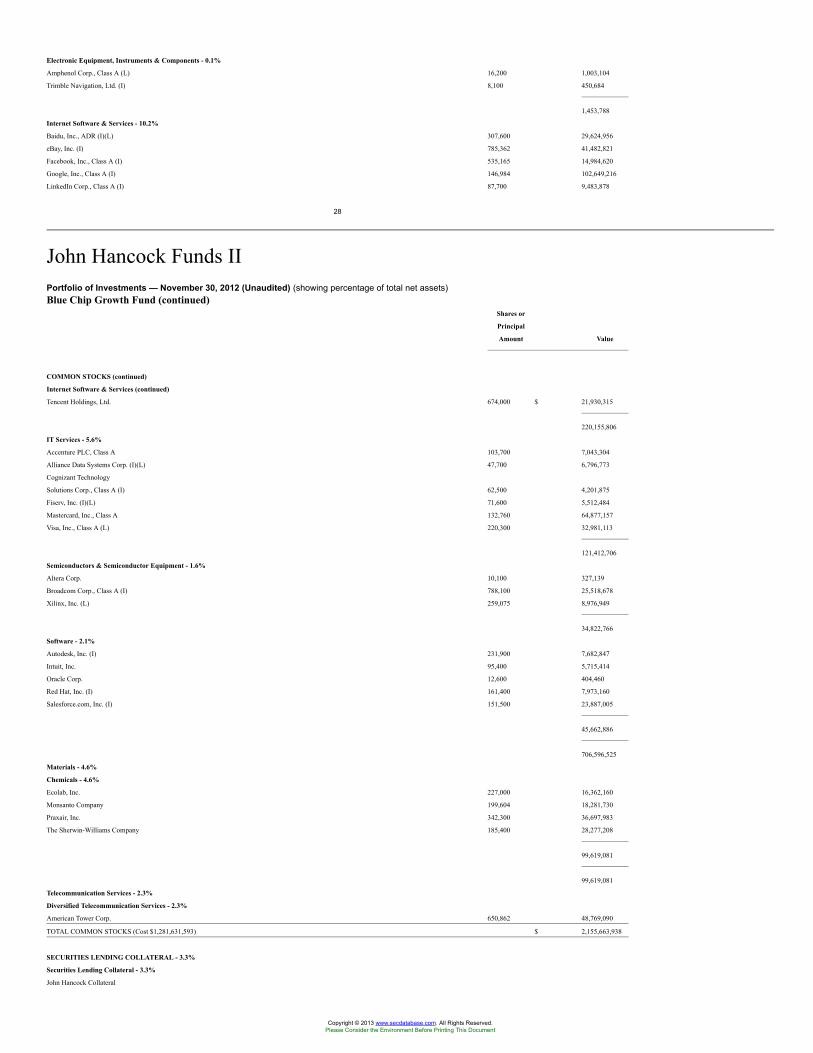
Electronic Equipment, Instruments & Components - 0.1%
Amphenol Corp., Class A (L) 16,200 1,003,104
Trimble Navigation, Ltd. (I) 8,100 450,684
1,453,788
Internet Software & Services - 10.2%
Baidu, Inc., ADR (I)(L) 307,600 29,624,956
eBay, Inc. (I) 785,362 41,482,821
Facebook, Inc., Class A (I) 535,165 14,984,620
Google, Inc., Class A (I) 146,984 102,649,216
LinkedIn Corp., Class A (I) 87,700 9,483,878
28
John Hancock Funds IIPortfolio of Investments — November 30, 2012 (Unaudited) (showing percentage of total net assets)Blue Chip Growth Fund (continued)
Shares or
Principal
Amount Value
COMMON STOCKS (continued)
Internet Software & Services (continued)
Tencent Holdings, Ltd. 674,000 $ 21,930,315
220,155,806
IT Services - 5.6%
Accenture PLC, Class A 103,700 7,043,304
Alliance Data Systems Corp. (I)(L) 47,700 6,796,773
Cognizant Technology
Solutions Corp., Class A (I) 62,500 4,201,875
Fiserv, Inc. (I)(L) 71,600 5,512,484
Mastercard, Inc., Class A 132,760 64,877,157
Visa, Inc., Class A (L) 220,300 32,981,113
121,412,706
Semiconductors & Semiconductor Equipment - 1.6%
Altera Corp. 10,100 327,139
Broadcom Corp., Class A (I) 788,100 25,518,678
Xilinx, Inc. (L) 259,075 8,976,949
34,822,766
Software - 2.1%
Autodesk, Inc. (I) 231,900 7,682,847
Intuit, Inc. 95,400 5,715,414
Oracle Corp. 12,600 404,460
Red Hat, Inc. (I) 161,400 7,973,160
Salesforce.com, Inc. (I) 151,500 23,887,005
45,662,886
706,596,525
Materials - 4.6%
Chemicals - 4.6%
Ecolab, Inc. 227,000 16,362,160
Monsanto Company 199,604 18,281,730
Praxair, Inc. 342,300 36,697,983
The Sherwin-Williams Company 185,400 28,277,208
99,619,081
99,619,081
Telecommunication Services - 2.3%
Diversified Telecommunication Services - 2.3%
American Tower Corp. 650,862 48,769,090
TOTAL COMMON STOCKS (Cost $1,281,631,593) $ 2,155,663,938
SECURITIES LENDING COLLATERAL - 3.3%
Securities Lending Collateral - 3.3%
John Hancock Collateral
Copyright © 2013 www.secdatabase.com. All Rights Reserved.Please Consider the Environment Before Printing This Document
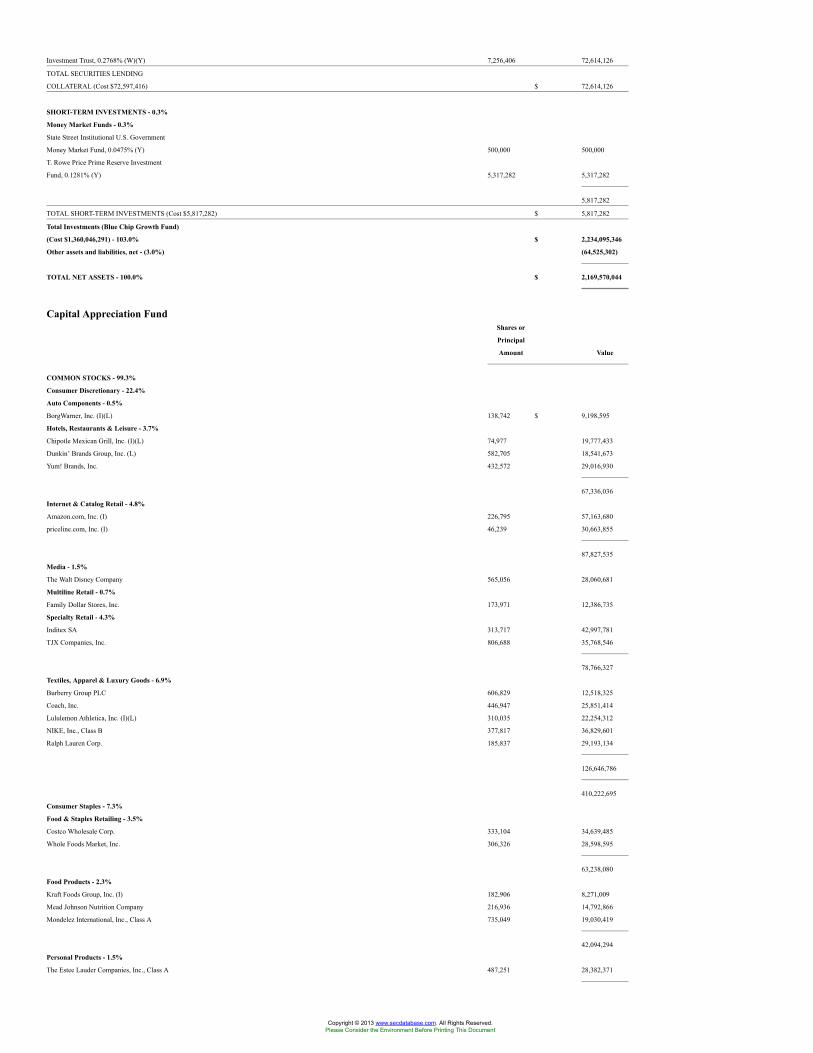
Investment Trust, 0.2768% (W)(Y) 7,256,406 72,614,126
TOTAL SECURITIES LENDING
COLLATERAL (Cost $72,597,416) $ 72,614,126
SHORT-TERM INVESTMENTS - 0.3%
Money Market Funds - 0.3%
State Street Institutional U.S. Government
Money Market Fund, 0.0475% (Y) 500,000 500,000
T. Rowe Price Prime Reserve Investment
Fund, 0.1281% (Y) 5,317,282 5,317,282
5,817,282
TOTAL SHORT-TERM INVESTMENTS (Cost $5,817,282) $ 5,817,282
Total Investments (Blue Chip Growth Fund)
(Cost $1,360,046,291) - 103.0% $ 2,234,095,346
Other assets and liabilities, net - (3.0%) (64,525,302)
TOTAL NET ASSETS - 100.0% $ 2,169,570,044
Capital Appreciation FundShares or
Principal
Amount Value
COMMON STOCKS - 99.3%
Consumer Discretionary - 22.4%
Auto Components - 0.5%
BorgWarner, Inc. (I)(L) 138,742 $ 9,198,595
Hotels, Restaurants & Leisure - 3.7%
Chipotle Mexican Grill, Inc. (I)(L) 74,977 19,777,433
Dunkin’ Brands Group, Inc. (L) 582,705 18,541,673
Yum! Brands, Inc. 432,572 29,016,930
67,336,036
Internet & Catalog Retail - 4.8%
Amazon.com, Inc. (I) 226,795 57,163,680
priceline.com, Inc. (I) 46,239 30,663,855
87,827,535
Media - 1.5%
The Walt Disney Company 565,056 28,060,681
Multiline Retail - 0.7%
Family Dollar Stores, Inc. 173,971 12,386,735
Specialty Retail - 4.3%
Inditex SA 313,717 42,997,781
TJX Companies, Inc. 806,688 35,768,546
78,766,327
Textiles, Apparel & Luxury Goods - 6.9%
Burberry Group PLC 606,829 12,518,325
Coach, Inc. 446,947 25,851,414
Lululemon Athletica, Inc. (I)(L) 310,035 22,254,312
NIKE, Inc., Class B 377,817 36,829,601
Ralph Lauren Corp. 185,837 29,193,134
126,646,786
410,222,695
Consumer Staples - 7.3%
Food & Staples Retailing - 3.5%
Costco Wholesale Corp. 333,104 34,639,485
Whole Foods Market, Inc. 306,326 28,598,595
63,238,080
Food Products - 2.3%
Kraft Foods Group, Inc. (I) 182,906 8,271,009
Mead Johnson Nutrition Company 216,936 14,792,866
Mondelez International, Inc., Class A 735,049 19,030,419
42,094,294
Personal Products - 1.5%
The Estee Lauder Companies, Inc., Class A 487,251 28,382,371
Copyright © 2013 www.secdatabase.com. All Rights Reserved.Please Consider the Environment Before Printing This Document
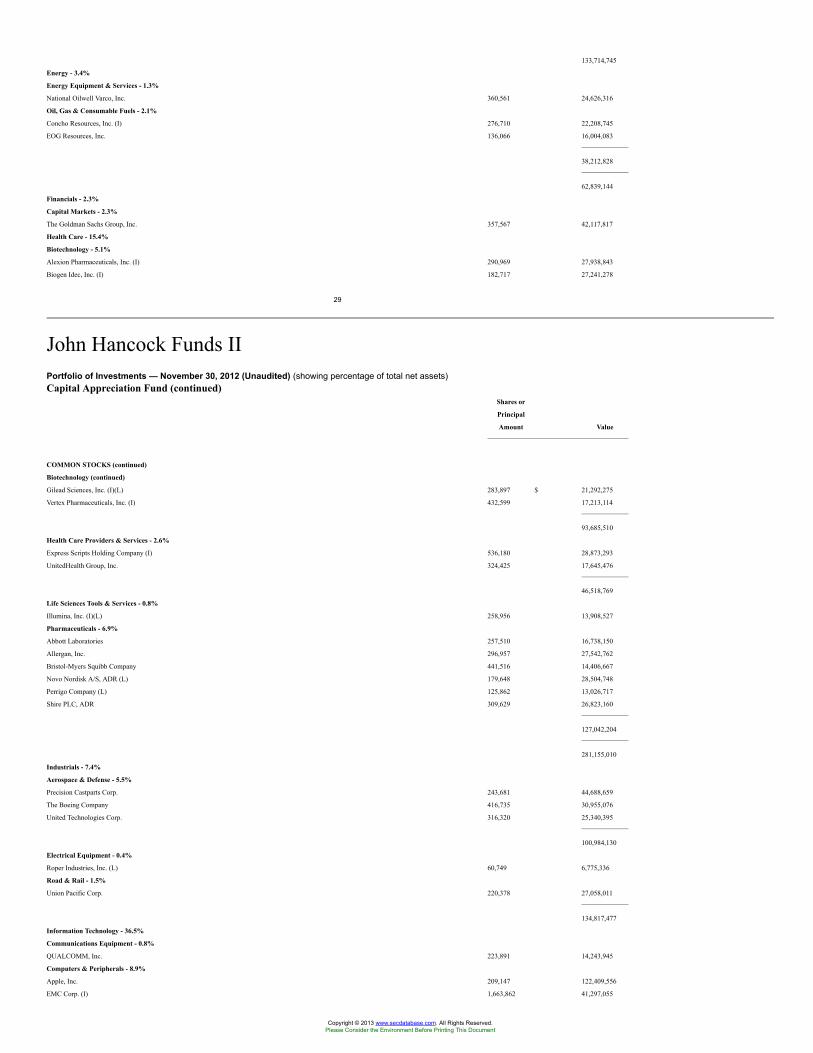
133,714,745
Energy - 3.4%
Energy Equipment & Services - 1.3%
National Oilwell Varco, Inc. 360,561 24,626,316
Oil, Gas & Consumable Fuels - 2.1%
Concho Resources, Inc. (I) 276,710 22,208,745
EOG Resources, Inc. 136,066 16,004,083
38,212,828
62,839,144
Financials - 2.3%
Capital Markets - 2.3%
The Goldman Sachs Group, Inc. 357,567 42,117,817
Health Care - 15.4%
Biotechnology - 5.1%
Alexion Pharmaceuticals, Inc. (I) 290,969 27,938,843
Biogen Idec, Inc. (I) 182,717 27,241,278
29
John Hancock Funds IIPortfolio of Investments — November 30, 2012 (Unaudited) (showing percentage of total net assets)Capital Appreciation Fund (continued)
Shares or
Principal
Amount Value
COMMON STOCKS (continued)
Biotechnology (continued)
Gilead Sciences, Inc. (I)(L) 283,897 $ 21,292,275
Vertex Pharmaceuticals, Inc. (I) 432,599 17,213,114
93,685,510
Health Care Providers & Services - 2.6%
Express Scripts Holding Company (I) 536,180 28,873,293
UnitedHealth Group, Inc. 324,425 17,645,476
46,518,769
Life Sciences Tools & Services - 0.8%
Illumina, Inc. (I)(L) 258,956 13,908,527
Pharmaceuticals - 6.9%
Abbott Laboratories 257,510 16,738,150
Allergan, Inc. 296,957 27,542,762
Bristol-Myers Squibb Company 441,516 14,406,667
Novo Nordisk A/S, ADR (L) 179,648 28,504,748
Perrigo Company (L) 125,862 13,026,717
Shire PLC, ADR 309,629 26,823,160
127,042,204
281,155,010
Industrials - 7.4%
Aerospace & Defense - 5.5%
Precision Castparts Corp. 243,681 44,688,659
The Boeing Company 416,735 30,955,076
United Technologies Corp. 316,320 25,340,395
100,984,130
Electrical Equipment - 0.4%
Roper Industries, Inc. (L) 60,749 6,775,336
Road & Rail - 1.5%
Union Pacific Corp. 220,378 27,058,011
134,817,477
Information Technology - 36.5%
Communications Equipment - 0.8%
QUALCOMM, Inc. 223,891 14,243,945
Computers & Peripherals - 8.9%
Apple, Inc. 209,147 122,409,556
EMC Corp. (I) 1,663,862 41,297,055
Copyright © 2013 www.secdatabase.com. All Rights Reserved.Please Consider the Environment Before Printing This Document
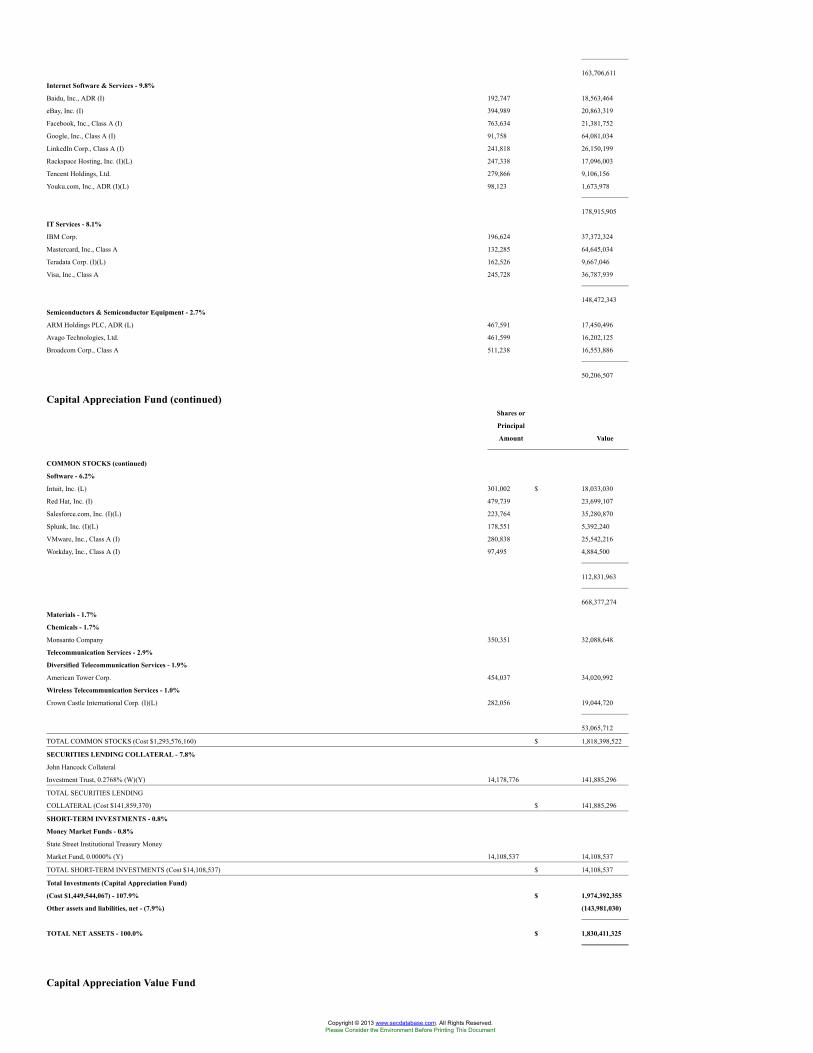
163,706,611
Internet Software & Services - 9.8%
Baidu, Inc., ADR (I) 192,747 18,563,464
eBay, Inc. (I) 394,989 20,863,319
Facebook, Inc., Class A (I) 763,634 21,381,752
Google, Inc., Class A (I) 91,758 64,081,034
LinkedIn Corp., Class A (I) 241,818 26,150,199
Rackspace Hosting, Inc. (I)(L) 247,338 17,096,003
Tencent Holdings, Ltd. 279,866 9,106,156
Youku.com, Inc., ADR (I)(L) 98,123 1,673,978
178,915,905
IT Services - 8.1%
IBM Corp. 196,624 37,372,324
Mastercard, Inc., Class A 132,285 64,645,034
Teradata Corp. (I)(L) 162,526 9,667,046
Visa, Inc., Class A 245,728 36,787,939
148,472,343
Semiconductors & Semiconductor Equipment - 2.7%
ARM Holdings PLC, ADR (L) 467,591 17,450,496
Avago Technologies, Ltd. 461,599 16,202,125
Broadcom Corp., Class A 511,238 16,553,886
50,206,507
Capital Appreciation Fund (continued)Shares or
Principal
Amount Value
COMMON STOCKS (continued)
Software - 6.2%
Intuit, Inc. (L) 301,002 $ 18,033,030
Red Hat, Inc. (I) 479,739 23,699,107
Salesforce.com, Inc. (I)(L) 223,764 35,280,870
Splunk, Inc. (I)(L) 178,551 5,392,240
VMware, Inc., Class A (I) 280,838 25,542,216
Workday, Inc., Class A (I) 97,495 4,884,500
112,831,963
668,377,274
Materials - 1.7%
Chemicals - 1.7%
Monsanto Company 350,351 32,088,648
Telecommunication Services - 2.9%
Diversified Telecommunication Services - 1.9%
American Tower Corp. 454,037 34,020,992
Wireless Telecommunication Services - 1.0%
Crown Castle International Corp. (I)(L) 282,056 19,044,720
53,065,712
TOTAL COMMON STOCKS (Cost $1,293,576,160) $ 1,818,398,522
SECURITIES LENDING COLLATERAL - 7.8%
John Hancock Collateral
Investment Trust, 0.2768% (W)(Y) 14,178,776 141,885,296
TOTAL SECURITIES LENDING
COLLATERAL (Cost $141,859,370) $ 141,885,296
SHORT-TERM INVESTMENTS - 0.8%
Money Market Funds - 0.8%
State Street Institutional Treasury Money
Market Fund, 0.0000% (Y) 14,108,537 14,108,537
TOTAL SHORT-TERM INVESTMENTS (Cost $14,108,537) $ 14,108,537
Total Investments (Capital Appreciation Fund)
(Cost $1,449,544,067) - 107.9% $ 1,974,392,355
Other assets and liabilities, net - (7.9%) (143,981,030)
TOTAL NET ASSETS - 100.0% $ 1,830,411,325
Capital Appreciation Value Fund
Copyright © 2013 www.secdatabase.com. All Rights Reserved.Please Consider the Environment Before Printing This Document
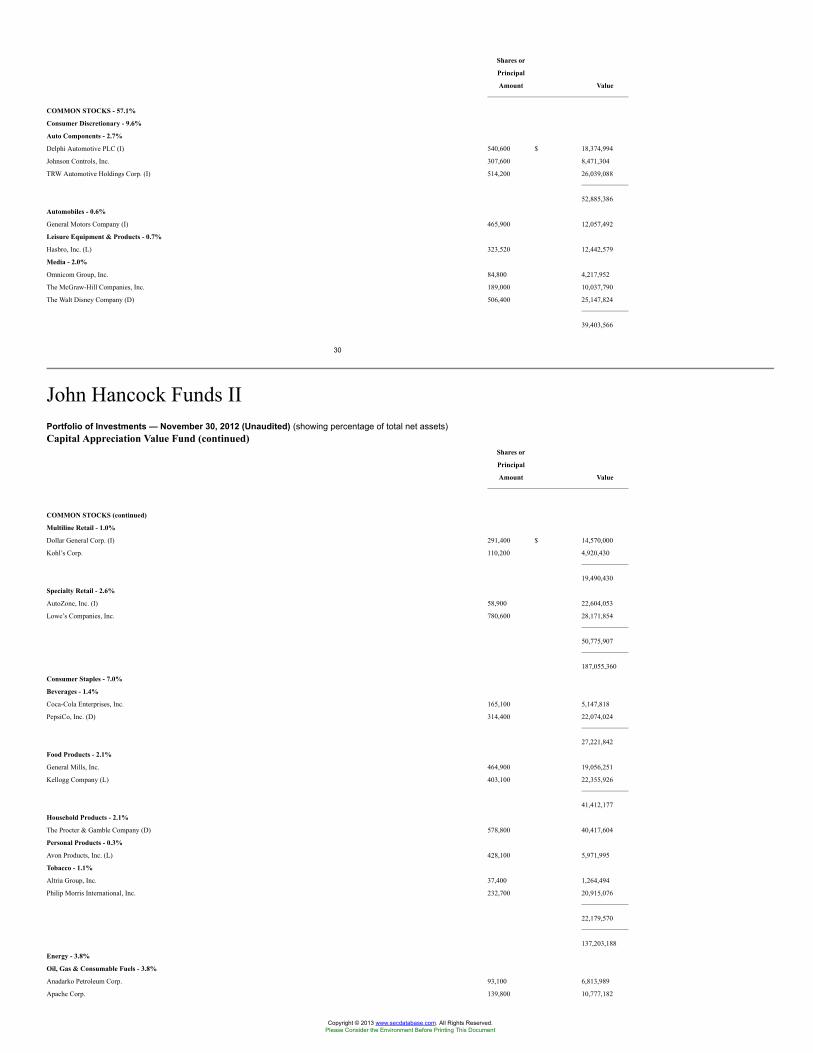
Shares or
Principal
Amount Value
COMMON STOCKS - 57.1%
Consumer Discretionary - 9.6%
Auto Components - 2.7%
Delphi Automotive PLC (I) 540,600 $ 18,374,994
Johnson Controls, Inc. 307,600 8,471,304
TRW Automotive Holdings Corp. (I) 514,200 26,039,088
52,885,386
Automobiles - 0.6%
General Motors Company (I) 465,900 12,057,492
Leisure Equipment & Products - 0.7%
Hasbro, Inc. (L) 323,520 12,442,579
Media - 2.0%
Omnicom Group, Inc. 84,800 4,217,952
The McGraw-Hill Companies, Inc. 189,000 10,037,790
The Walt Disney Company (D) 506,400 25,147,824
39,403,566
30
John Hancock Funds IIPortfolio of Investments — November 30, 2012 (Unaudited) (showing percentage of total net assets)Capital Appreciation Value Fund (continued)
Shares or
Principal
Amount Value
COMMON STOCKS (continued)
Multiline Retail - 1.0%
Dollar General Corp. (I) 291,400 $ 14,570,000
Kohl’s Corp. 110,200 4,920,430
19,490,430
Specialty Retail - 2.6%
AutoZone, Inc. (I) 58,900 22,604,053
Lowe’s Companies, Inc. 780,600 28,171,854
50,775,907
187,055,360
Consumer Staples - 7.0%
Beverages - 1.4%
Coca-Cola Enterprises, Inc. 165,100 5,147,818
PepsiCo, Inc. (D) 314,400 22,074,024
27,221,842
Food Products - 2.1%
General Mills, Inc. 464,900 19,056,251
Kellogg Company (L) 403,100 22,355,926
41,412,177
Household Products - 2.1%
The Procter & Gamble Company (D) 578,800 40,417,604
Personal Products - 0.3%
Avon Products, Inc. (L) 428,100 5,971,995
Tobacco - 1.1%
Altria Group, Inc. 37,400 1,264,494
Philip Morris International, Inc. 232,700 20,915,076
22,179,570
137,203,188
Energy - 3.8%
Oil, Gas & Consumable Fuels - 3.8%
Anadarko Petroleum Corp. 93,100 6,813,989
Apache Corp. 139,800 10,777,182
Copyright © 2013 www.secdatabase.com. All Rights Reserved.Please Consider the Environment Before Printing This Document
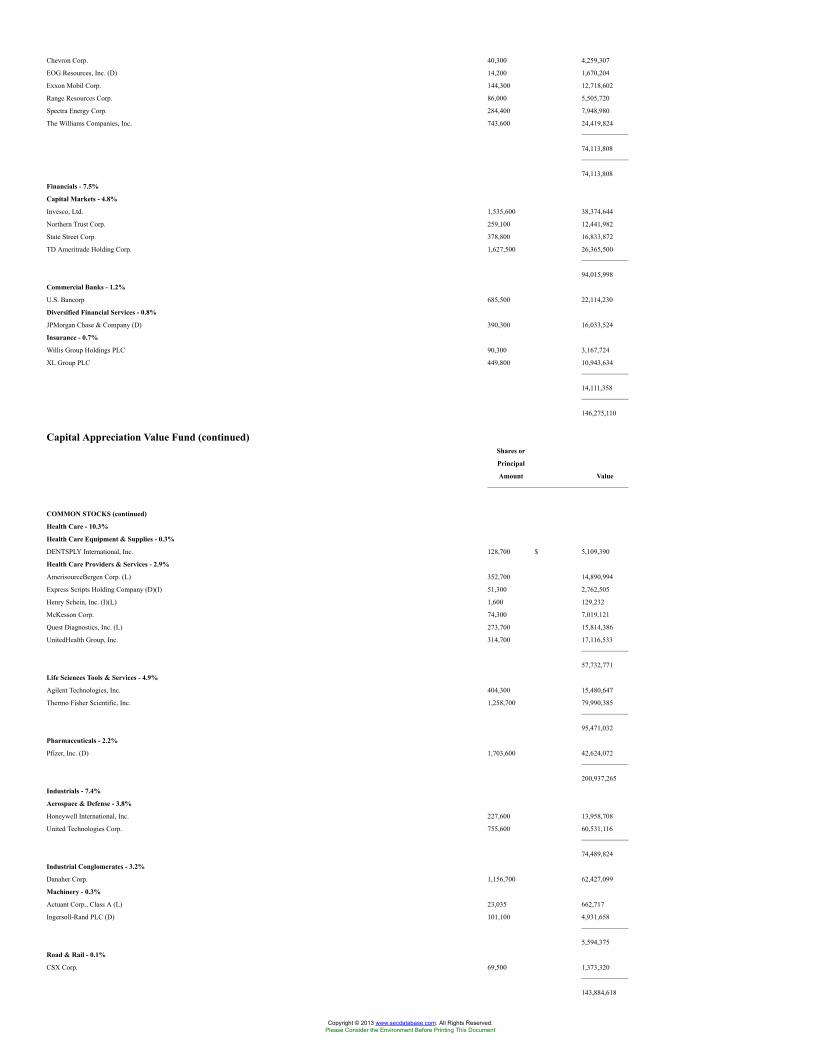
Chevron Corp. 40,300 4,259,307
EOG Resources, Inc. (D) 14,200 1,670,204
Exxon Mobil Corp. 144,300 12,718,602
Range Resources Corp. 86,000 5,505,720
Spectra Energy Corp. 284,400 7,948,980
The Williams Companies, Inc. 743,600 24,419,824
74,113,808
74,113,808
Financials - 7.5%
Capital Markets - 4.8%
Invesco, Ltd. 1,535,600 38,374,644
Northern Trust Corp. 259,100 12,441,982
State Street Corp. 378,800 16,833,872
TD Ameritrade Holding Corp. 1,627,500 26,365,500
94,015,998
Commercial Banks - 1.2%
U.S. Bancorp 685,500 22,114,230
Diversified Financial Services - 0.8%
JPMorgan Chase & Company (D) 390,300 16,033,524
Insurance - 0.7%
Willis Group Holdings PLC 90,300 3,167,724
XL Group PLC 449,800 10,943,634
14,111,358
146,275,110
Capital Appreciation Value Fund (continued)Shares or
Principal
Amount Value
COMMON STOCKS (continued)
Health Care - 10.3%
Health Care Equipment & Supplies - 0.3%
DENTSPLY International, Inc. 128,700 $ 5,109,390
Health Care Providers & Services - 2.9%
AmerisourceBergen Corp. (L) 352,700 14,890,994
Express Scripts Holding Company (D)(I) 51,300 2,762,505
Henry Schein, Inc. (I)(L) 1,600 129,232
McKesson Corp. 74,300 7,019,121
Quest Diagnostics, Inc. (L) 273,700 15,814,386
UnitedHealth Group, Inc. 314,700 17,116,533
57,732,771
Life Sciences Tools & Services - 4.9%
Agilent Technologies, Inc. 404,300 15,480,647
Thermo Fisher Scientific, Inc. 1,258,700 79,990,385
95,471,032
Pharmaceuticals - 2.2%
Pfizer, Inc. (D) 1,703,600 42,624,072
200,937,265
Industrials - 7.4%
Aerospace & Defense - 3.8%
Honeywell International, Inc. 227,600 13,958,708
United Technologies Corp. 755,600 60,531,116
74,489,824
Industrial Conglomerates - 3.2%
Danaher Corp. 1,156,700 62,427,099
Machinery - 0.3%
Actuant Corp., Class A (L) 23,035 662,717
Ingersoll-Rand PLC (D) 101,100 4,931,658
5,594,375
Road & Rail - 0.1%
CSX Corp. 69,500 1,373,320
143,884,618
Copyright © 2013 www.secdatabase.com. All Rights Reserved.Please Consider the Environment Before Printing This Document
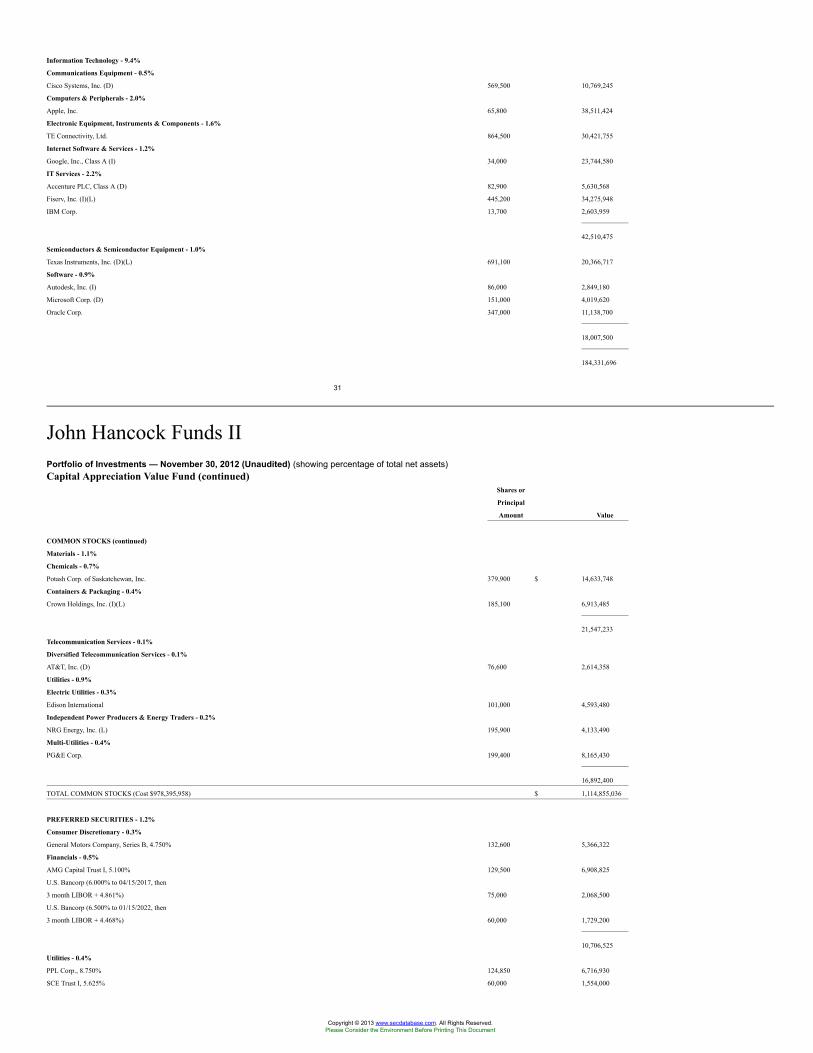
Information Technology - 9.4%
Communications Equipment - 0.5%
Cisco Systems, Inc. (D) 569,500 10,769,245
Computers & Peripherals - 2.0%
Apple, Inc. 65,800 38,511,424
Electronic Equipment, Instruments & Components - 1.6%
TE Connectivity, Ltd. 864,500 30,421,755
Internet Software & Services - 1.2%
Google, Inc., Class A (I) 34,000 23,744,580
IT Services - 2.2%
Accenture PLC, Class A (D) 82,900 5,630,568
Fiserv, Inc. (I)(L) 445,200 34,275,948
IBM Corp. 13,700 2,603,959
42,510,475
Semiconductors & Semiconductor Equipment - 1.0%
Texas Instruments, Inc. (D)(L) 691,100 20,366,717
Software - 0.9%
Autodesk, Inc. (I) 86,000 2,849,180
Microsoft Corp. (D) 151,000 4,019,620
Oracle Corp. 347,000 11,138,700
18,007,500
184,331,696
31
John Hancock Funds IIPortfolio of Investments — November 30, 2012 (Unaudited) (showing percentage of total net assets)Capital Appreciation Value Fund (continued)
Shares or
Principal
Amount Value
COMMON STOCKS (continued)
Materials - 1.1%
Chemicals - 0.7%
Potash Corp. of Saskatchewan, Inc. 379,900 $ 14,633,748
Containers & Packaging - 0.4%
Crown Holdings, Inc. (I)(L) 185,100 6,913,485
21,547,233
Telecommunication Services - 0.1%
Diversified Telecommunication Services - 0.1%
AT&T, Inc. (D) 76,600 2,614,358
Utilities - 0.9%
Electric Utilities - 0.3%
Edison International 101,000 4,593,480
Independent Power Producers & Energy Traders - 0.2%
NRG Energy, Inc. (L) 195,900 4,133,490
Multi-Utilities - 0.4%
PG&E Corp. 199,400 8,165,430
16,892,400
TOTAL COMMON STOCKS (Cost $978,395,958) $ 1,114,855,036
PREFERRED SECURITIES - 1.2%
Consumer Discretionary - 0.3%
General Motors Company, Series B, 4.750% 132,600 5,366,322
Financials - 0.5%
AMG Capital Trust I, 5.100% 129,500 6,908,825
U.S. Bancorp (6.000% to 04/15/2017, then
3 month LIBOR + 4.861%) 75,000 2,068,500
U.S. Bancorp (6.500% to 01/15/2022, then
3 month LIBOR + 4.468%) 60,000 1,729,200
10,706,525
Utilities - 0.4%
PPL Corp., 8.750% 124,850 6,716,930
SCE Trust I, 5.625% 60,000 1,554,000
Copyright © 2013 www.secdatabase.com. All Rights Reserved.Please Consider the Environment Before Printing This Document
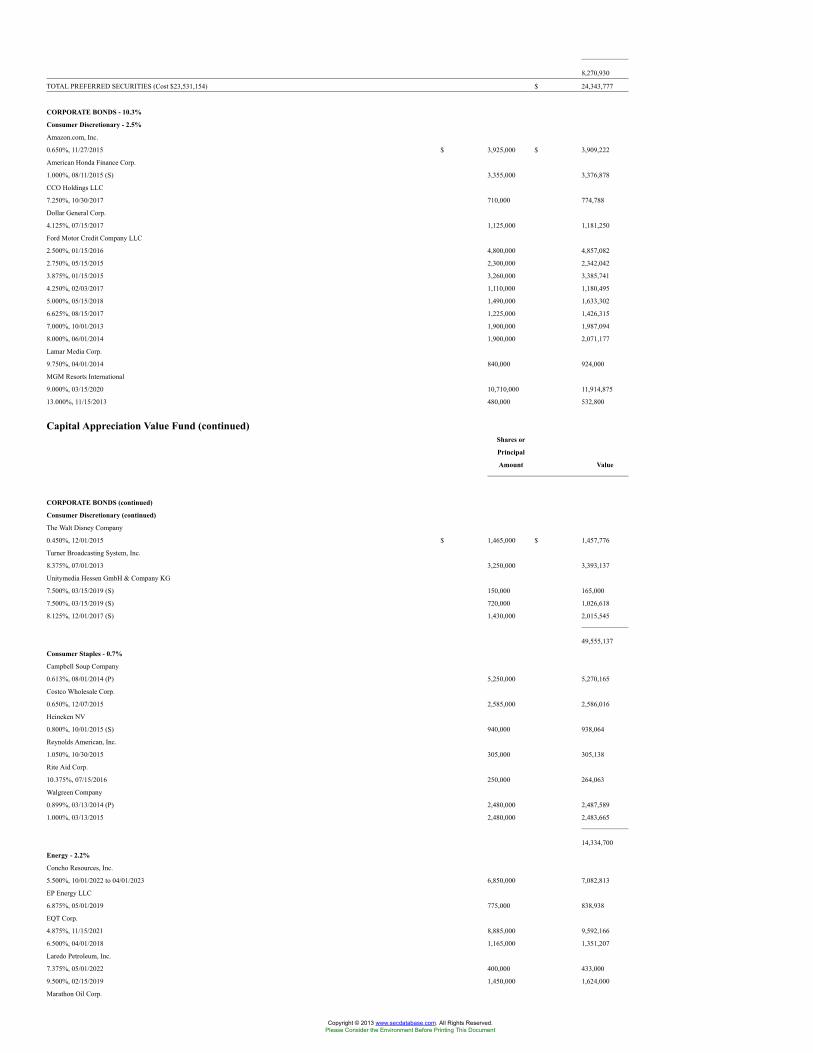
8,270,930
TOTAL PREFERRED SECURITIES (Cost $23,531,154) $ 24,343,777
CORPORATE BONDS - 10.3%
Consumer Discretionary - 2.5%
Amazon.com, Inc.
0.650%, 11/27/2015 $ 3,925,000 $ 3,909,222
American Honda Finance Corp.
1.000%, 08/11/2015 (S) 3,355,000 3,376,878
CCO Holdings LLC
7.250%, 10/30/2017 710,000 774,788
Dollar General Corp.
4.125%, 07/15/2017 1,125,000 1,181,250
Ford Motor Credit Company LLC
2.500%, 01/15/2016 4,800,000 4,857,082
2.750%, 05/15/2015 2,300,000 2,342,042
3.875%, 01/15/2015 3,260,000 3,385,741
4.250%, 02/03/2017 1,110,000 1,180,495
5.000%, 05/15/2018 1,490,000 1,633,302
6.625%, 08/15/2017 1,225,000 1,426,315
7.000%, 10/01/2013 1,900,000 1,987,094
8.000%, 06/01/2014 1,900,000 2,071,177
Lamar Media Corp.
9.750%, 04/01/2014 840,000 924,000
MGM Resorts International
9.000%, 03/15/2020 10,710,000 11,914,875
13.000%, 11/15/2013 480,000 532,800
Capital Appreciation Value Fund (continued)Shares or
Principal
Amount Value
CORPORATE BONDS (continued)
Consumer Discretionary (continued)
The Walt Disney Company
0.450%, 12/01/2015 $ 1,465,000 $ 1,457,776
Turner Broadcasting System, Inc.
8.375%, 07/01/2013 3,250,000 3,393,137
Unitymedia Hessen GmbH & Company KG
7.500%, 03/15/2019 (S) 150,000 165,000
7.500%, 03/15/2019 (S) 720,000 1,026,618
8.125%, 12/01/2017 (S) 1,430,000 2,015,545
49,555,137
Consumer Staples - 0.7%
Campbell Soup Company
0.613%, 08/01/2014 (P) 5,250,000 5,270,165
Costco Wholesale Corp.
0.650%, 12/07/2015 2,585,000 2,586,016
Heineken NV
0.800%, 10/01/2015 (S) 940,000 938,064
Reynolds American, Inc.
1.050%, 10/30/2015 305,000 305,138
Rite Aid Corp.
10.375%, 07/15/2016 250,000 264,063
Walgreen Company
0.899%, 03/13/2014 (P) 2,480,000 2,487,589
1.000%, 03/13/2015 2,480,000 2,483,665
14,334,700
Energy - 2.2%
Concho Resources, Inc.
5.500%, 10/01/2022 to 04/01/2023 6,850,000 7,082,813
EP Energy LLC
6.875%, 05/01/2019 775,000 838,938
EQT Corp.
4.875%, 11/15/2021 8,885,000 9,592,166
6.500%, 04/01/2018 1,165,000 1,351,207
Laredo Petroleum, Inc.
7.375%, 05/01/2022 400,000 433,000
9.500%, 02/15/2019 1,450,000 1,624,000
Marathon Oil Corp.
Copyright © 2013 www.secdatabase.com. All Rights Reserved.Please Consider the Environment Before Printing This Document
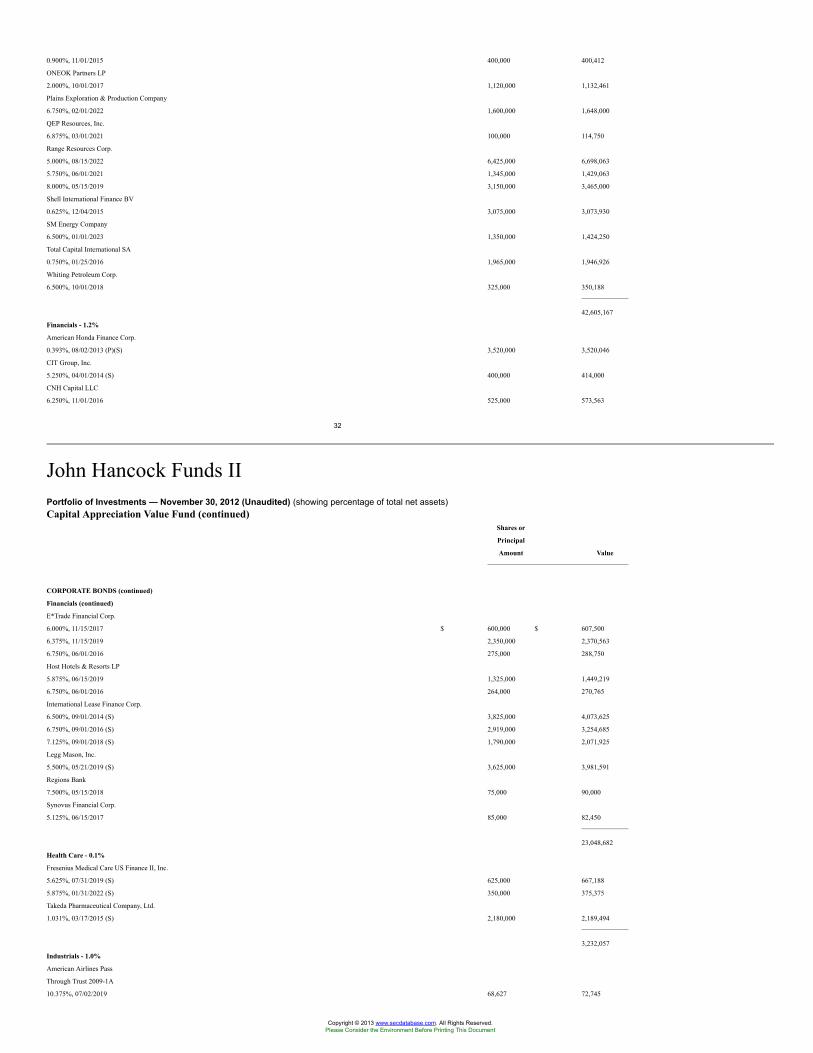
0.900%, 11/01/2015 400,000 400,412
ONEOK Partners LP
2.000%, 10/01/2017 1,120,000 1,132,461
Plains Exploration & Production Company
6.750%, 02/01/2022 1,600,000 1,648,000
QEP Resources, Inc.
6.875%, 03/01/2021 100,000 114,750
Range Resources Corp.
5.000%, 08/15/2022 6,425,000 6,698,063
5.750%, 06/01/2021 1,345,000 1,429,063
8.000%, 05/15/2019 3,150,000 3,465,000
Shell International Finance BV
0.625%, 12/04/2015 3,075,000 3,073,930
SM Energy Company
6.500%, 01/01/2023 1,350,000 1,424,250
Total Capital International SA
0.750%, 01/25/2016 1,965,000 1,946,926
Whiting Petroleum Corp.
6.500%, 10/01/2018 325,000 350,188
42,605,167
Financials - 1.2%
American Honda Finance Corp.
0.393%, 08/02/2013 (P)(S) 3,520,000 3,520,046
CIT Group, Inc.
5.250%, 04/01/2014 (S) 400,000 414,000
CNH Capital LLC
6.250%, 11/01/2016 525,000 573,563
32
John Hancock Funds IIPortfolio of Investments — November 30, 2012 (Unaudited) (showing percentage of total net assets)Capital Appreciation Value Fund (continued)
Shares or
Principal
Amount Value
CORPORATE BONDS (continued)
Financials (continued)
E*Trade Financial Corp.
6.000%, 11/15/2017 $ 600,000 $ 607,500
6.375%, 11/15/2019 2,350,000 2,370,563
6.750%, 06/01/2016 275,000 288,750
Host Hotels & Resorts LP
5.875%, 06/15/2019 1,325,000 1,449,219
6.750%, 06/01/2016 264,000 270,765
International Lease Finance Corp.
6.500%, 09/01/2014 (S) 3,825,000 4,073,625
6.750%, 09/01/2016 (S) 2,919,000 3,254,685
7.125%, 09/01/2018 (S) 1,790,000 2,071,925
Legg Mason, Inc.
5.500%, 05/21/2019 (S) 3,625,000 3,981,591
Regions Bank
7.500%, 05/15/2018 75,000 90,000
Synovus Financial Corp.
5.125%, 06/15/2017 85,000 82,450
23,048,682
Health Care - 0.1%
Fresenius Medical Care US Finance II, Inc.
5.625%, 07/31/2019 (S) 625,000 667,188
5.875%, 01/31/2022 (S) 350,000 375,375
Takeda Pharmaceutical Company, Ltd.
1.031%, 03/17/2015 (S) 2,180,000 2,189,494
3,232,057
Industrials - 1.0%
American Airlines Pass
Through Trust 2009-1A
10.375%, 07/02/2019 68,627 72,745
Copyright © 2013 www.secdatabase.com. All Rights Reserved.Please Consider the Environment Before Printing This Document
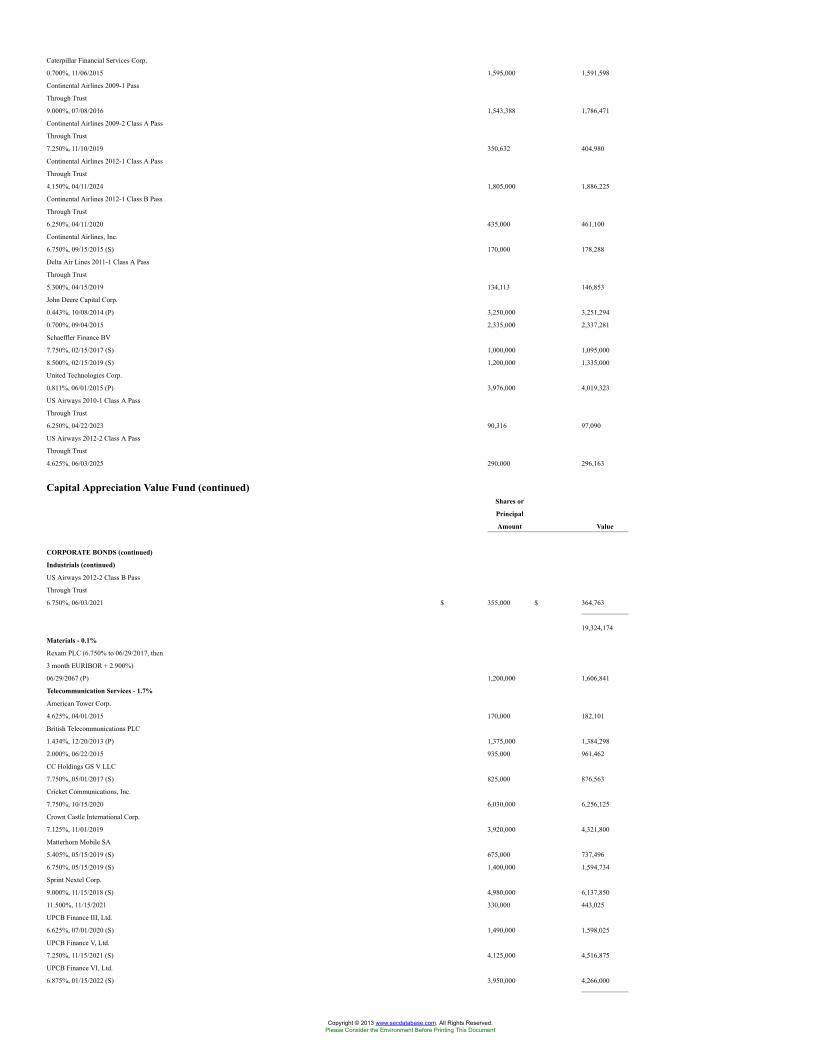
Caterpillar Financial Services Corp.
0.700%, 11/06/2015 1,595,000 1,591,598
Continental Airlines 2009-1 Pass
Through Trust
9.000%, 07/08/2016 1,543,388 1,786,471
Continental Airlines 2009-2 Class A Pass
Through Trust
7.250%, 11/10/2019 350,632 404,980
Continental Airlines 2012-1 Class A Pass
Through Trust
4.150%, 04/11/2024 1,805,000 1,886,225
Continental Airlines 2012-1 Class B Pass
Through Trust
6.250%, 04/11/2020 435,000 461,100
Continental Airlines, Inc.
6.750%, 09/15/2015 (S) 170,000 178,288
Delta Air Lines 2011-1 Class A Pass
Through Trust
5.300%, 04/15/2019 134,113 146,853
John Deere Capital Corp.
0.443%, 10/08/2014 (P) 3,250,000 3,251,294
0.700%, 09/04/2015 2,335,000 2,337,281
Schaeffler Finance BV
7.750%, 02/15/2017 (S) 1,000,000 1,095,000
8.500%, 02/15/2019 (S) 1,200,000 1,335,000
United Technologies Corp.
0.811%, 06/01/2015 (P) 3,976,000 4,019,323
US Airways 2010-1 Class A Pass
Through Trust
6.250%, 04/22/2023 90,316 97,090
US Airways 2012-2 Class A Pass
Through Trust
4.625%, 06/03/2025 290,000 296,163
Capital Appreciation Value Fund (continued)Shares or
Principal
Amount Value
CORPORATE BONDS (continued)
Industrials (continued)
US Airways 2012-2 Class B Pass
Through Trust
6.750%, 06/03/2021 $ 355,000 $ 364,763
19,324,174
Materials - 0.1%
Rexam PLC (6.750% to 06/29/2017, then
3 month EURIBOR + 2.900%)
06/29/2067 (P) 1,200,000 1,606,841
Telecommunication Services - 1.7%
American Tower Corp.
4.625%, 04/01/2015 170,000 182,101
British Telecommunications PLC
1.434%, 12/20/2013 (P) 1,375,000 1,384,298
2.000%, 06/22/2015 935,000 961,462
CC Holdings GS V LLC
7.750%, 05/01/2017 (S) 825,000 876,563
Cricket Communications, Inc.
7.750%, 10/15/2020 6,030,000 6,256,125
Crown Castle International Corp.
7.125%, 11/01/2019 3,920,000 4,321,800
Matterhorn Mobile SA
5.405%, 05/15/2019 (S) 675,000 737,496
6.750%, 05/15/2019 (S) 1,400,000 1,594,734
Sprint Nextel Corp.
9.000%, 11/15/2018 (S) 4,980,000 6,137,850
11.500%, 11/15/2021 330,000 443,025
UPCB Finance III, Ltd.
6.625%, 07/01/2020 (S) 1,490,000 1,598,025
UPCB Finance V, Ltd.
7.250%, 11/15/2021 (S) 4,125,000 4,516,875
UPCB Finance VI, Ltd.
6.875%, 01/15/2022 (S) 3,950,000 4,266,000
Copyright © 2013 www.secdatabase.com. All Rights Reserved.Please Consider the Environment Before Printing This Document
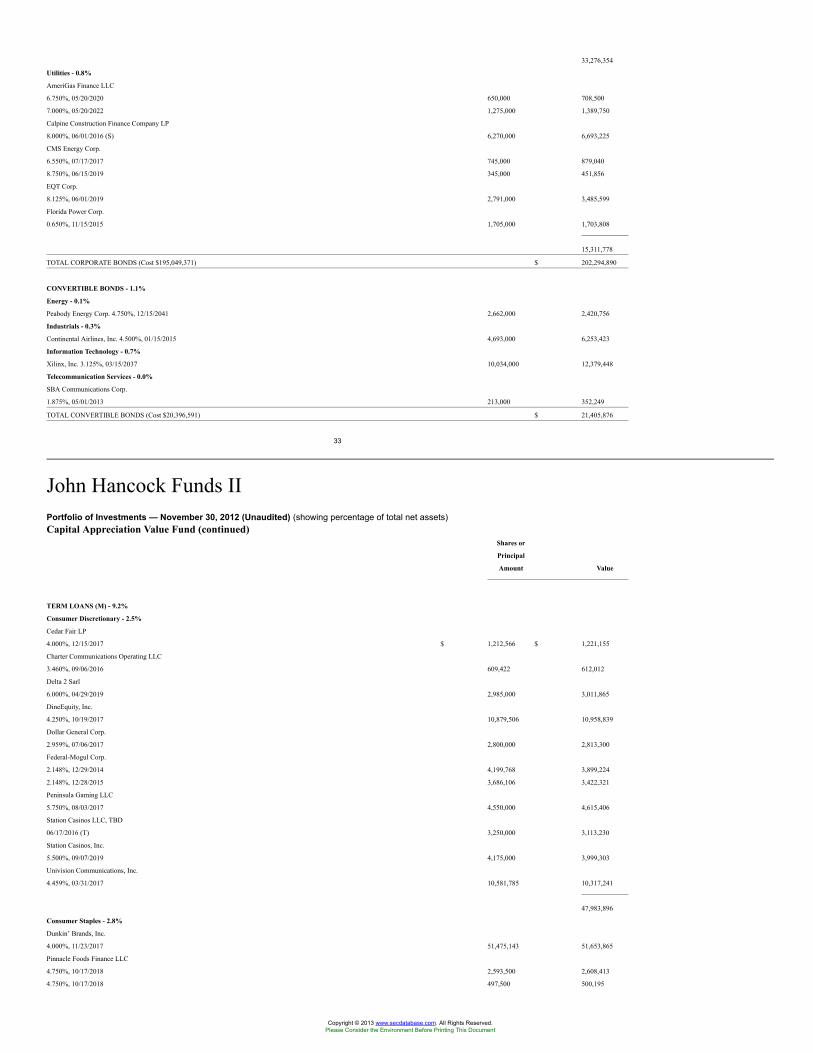
33,276,354
Utilities - 0.8%
AmeriGas Finance LLC
6.750%, 05/20/2020 650,000 708,500
7.000%, 05/20/2022 1,275,000 1,389,750
Calpine Construction Finance Company LP
8.000%, 06/01/2016 (S) 6,270,000 6,693,225
CMS Energy Corp.
6.550%, 07/17/2017 745,000 879,040
8.750%, 06/15/2019 345,000 451,856
EQT Corp.
8.125%, 06/01/2019 2,791,000 3,485,599
Florida Power Corp.
0.650%, 11/15/2015 1,705,000 1,703,808
15,311,778
TOTAL CORPORATE BONDS (Cost $195,049,371) $ 202,294,890
CONVERTIBLE BONDS - 1.1%
Energy - 0.1%
Peabody Energy Corp. 4.750%, 12/15/2041 2,662,000 2,420,756
Industrials - 0.3%
Continental Airlines, Inc. 4.500%, 01/15/2015 4,693,000 6,253,423
Information Technology - 0.7%
Xilinx, Inc. 3.125%, 03/15/2037 10,034,000 12,379,448
Telecommunication Services - 0.0%
SBA Communications Corp.
1.875%, 05/01/2013 213,000 352,249
TOTAL CONVERTIBLE BONDS (Cost $20,396,591) $ 21,405,876
33
John Hancock Funds IIPortfolio of Investments — November 30, 2012 (Unaudited) (showing percentage of total net assets)Capital Appreciation Value Fund (continued)
Shares or
Principal
Amount Value
TERM LOANS (M) - 9.2%
Consumer Discretionary - 2.5%
Cedar Fair LP
4.000%, 12/15/2017 $ 1,212,566 $ 1,221,155
Charter Communications Operating LLC
3.460%, 09/06/2016 609,422 612,012
Delta 2 Sarl
6.000%, 04/29/2019 2,985,000 3,011,865
DineEquity, Inc.
4.250%, 10/19/2017 10,879,506 10,958,839
Dollar General Corp.
2.959%, 07/06/2017 2,800,000 2,813,300
Federal-Mogul Corp.
2.148%, 12/29/2014 4,199,768 3,899,224
2.148%, 12/28/2015 3,686,106 3,422,321
Peninsula Gaming LLC
5.750%, 08/03/2017 4,550,000 4,615,406
Station Casinos LLC, TBD
06/17/2016 (T) 3,250,000 3,113,230
Station Casinos, Inc.
5.500%, 09/07/2019 4,175,000 3,999,303
Univision Communications, Inc.
4.459%, 03/31/2017 10,581,785 10,317,241
47,983,896
Consumer Staples - 2.8%
Dunkin’ Brands, Inc.
4.000%, 11/23/2017 51,475,143 51,653,865
Pinnacle Foods Finance LLC
4.750%, 10/17/2018 2,593,500 2,608,413
4.750%, 10/17/2018 497,500 500,195
Copyright © 2013 www.secdatabase.com. All Rights Reserved.Please Consider the Environment Before Printing This Document
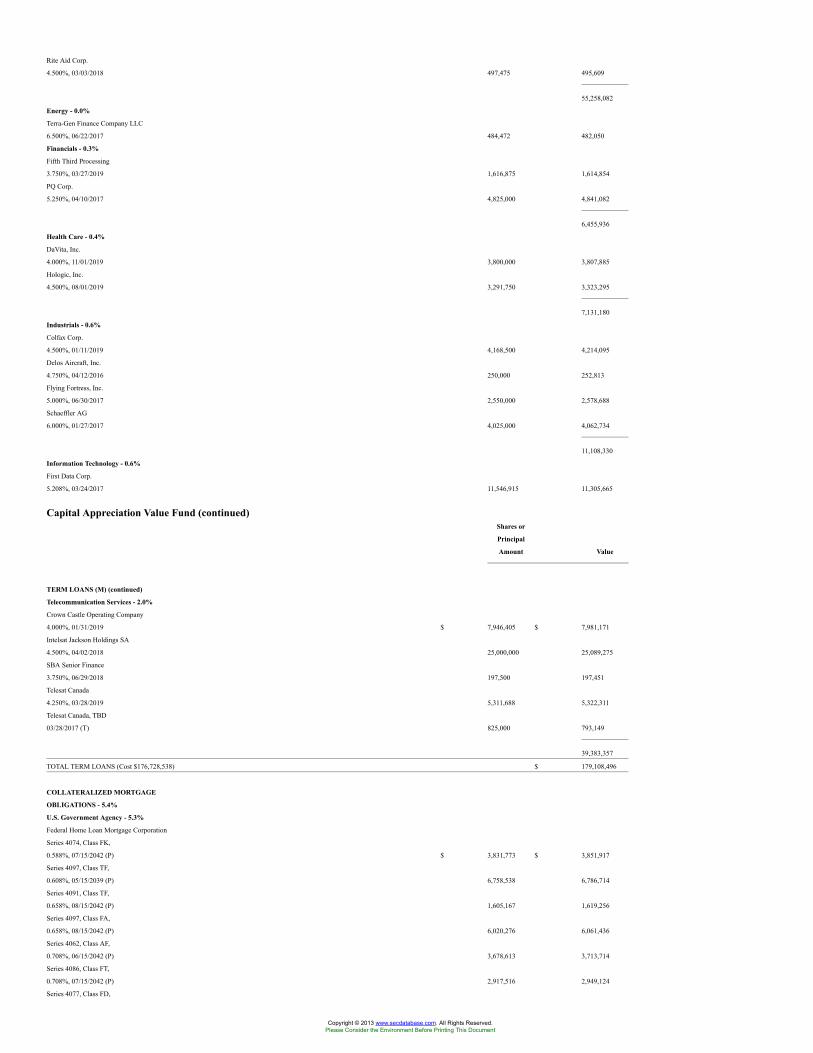
Rite Aid Corp.
4.500%, 03/03/2018 497,475 495,609
55,258,082
Energy - 0.0%
Terra-Gen Finance Company LLC
6.500%, 06/22/2017 484,472 482,050
Financials - 0.3%
Fifth Third Processing
3.750%, 03/27/2019 1,616,875 1,614,854
PQ Corp.
5.250%, 04/10/2017 4,825,000 4,841,082
6,455,936
Health Care - 0.4%
DaVita, Inc.
4.000%, 11/01/2019 3,800,000 3,807,885
Hologic, Inc.
4.500%, 08/01/2019 3,291,750 3,323,295
7,131,180
Industrials - 0.6%
Colfax Corp.
4.500%, 01/11/2019 4,168,500 4,214,095
Delos Aircraft, Inc.
4.750%, 04/12/2016 250,000 252,813
Flying Fortress, Inc.
5.000%, 06/30/2017 2,550,000 2,578,688
Schaeffler AG
6.000%, 01/27/2017 4,025,000 4,062,734
11,108,330
Information Technology - 0.6%
First Data Corp.
5.208%, 03/24/2017 11,546,915 11,305,665
Capital Appreciation Value Fund (continued)Shares or
Principal
Amount Value
TERM LOANS (M) (continued)
Telecommunication Services - 2.0%
Crown Castle Operating Company
4.000%, 01/31/2019 $ 7,946,405 $ 7,981,171
Intelsat Jackson Holdings SA
4.500%, 04/02/2018 25,000,000 25,089,275
SBA Senior Finance
3.750%, 06/29/2018 197,500 197,451
Telesat Canada
4.250%, 03/28/2019 5,311,688 5,322,311
Telesat Canada, TBD
03/28/2017 (T) 825,000 793,149
39,383,357
TOTAL TERM LOANS (Cost $176,728,538) $ 179,108,496
COLLATERALIZED MORTGAGE
OBLIGATIONS - 5.4%
U.S. Government Agency - 5.3%
Federal Home Loan Mortgage Corporation
Series 4074, Class FK,
0.588%, 07/15/2042 (P) $ 3,831,773 $ 3,851,917
Series 4097, Class TF,
0.608%, 05/15/2039 (P) 6,758,538 6,786,714
Series 4091, Class TF,
0.658%, 08/15/2042 (P) 1,605,167 1,619,256
Series 4097, Class FA,
0.658%, 08/15/2042 (P) 6,020,276 6,061,436
Series 4062, Class AF,
0.708%, 06/15/2042 (P) 3,678,613 3,713,714
Series 4086, Class FT,
0.708%, 07/15/2042 (P) 2,917,516 2,949,124
Series 4077, Class FD,
Copyright © 2013 www.secdatabase.com. All Rights Reserved.Please Consider the Environment Before Printing This Document
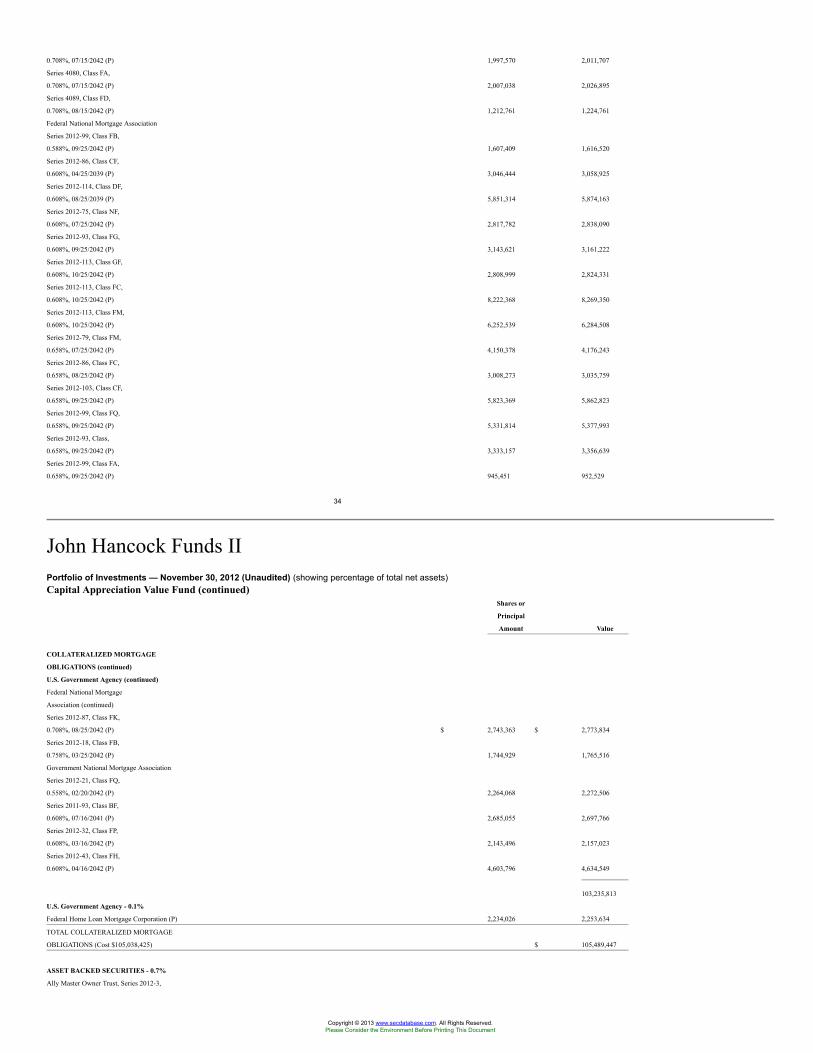
0.708%, 07/15/2042 (P) 1,997,570 2,011,707
Series 4080, Class FA,
0.708%, 07/15/2042 (P) 2,007,038 2,026,895
Series 4089, Class FD,
0.708%, 08/15/2042 (P) 1,212,761 1,224,761
Federal National Mortgage Association
Series 2012-99, Class FB,
0.588%, 09/25/2042 (P) 1,607,409 1,616,520
Series 2012-86, Class CF,
0.608%, 04/25/2039 (P) 3,046,444 3,058,925
Series 2012-114, Class DF,
0.608%, 08/25/2039 (P) 5,851,314 5,874,163
Series 2012-75, Class NF,
0.608%, 07/25/2042 (P) 2,817,782 2,838,090
Series 2012-93, Class FG,
0.608%, 09/25/2042 (P) 3,143,621 3,161,222
Series 2012-113, Class GF,
0.608%, 10/25/2042 (P) 2,808,999 2,824,331
Series 2012-113, Class FC,
0.608%, 10/25/2042 (P) 8,222,368 8,269,350
Series 2012-113, Class FM,
0.608%, 10/25/2042 (P) 6,252,539 6,284,508
Series 2012-79, Class FM,
0.658%, 07/25/2042 (P) 4,150,378 4,176,243
Series 2012-86, Class FC,
0.658%, 08/25/2042 (P) 3,008,273 3,035,759
Series 2012-103, Class CF,
0.658%, 09/25/2042 (P) 5,823,369 5,862,823
Series 2012-99, Class FQ,
0.658%, 09/25/2042 (P) 5,331,814 5,377,993
Series 2012-93, Class,
0.658%, 09/25/2042 (P) 3,333,157 3,356,639
Series 2012-99, Class FA,
0.658%, 09/25/2042 (P) 945,451 952,529
34
John Hancock Funds IIPortfolio of Investments — November 30, 2012 (Unaudited) (showing percentage of total net assets)Capital Appreciation Value Fund (continued)
Shares or
Principal
Amount Value
COLLATERALIZED MORTGAGE
OBLIGATIONS (continued)
U.S. Government Agency (continued)
Federal National Mortgage
Association (continued)
Series 2012-87, Class FK,
0.708%, 08/25/2042 (P) $ 2,743,363 $ 2,773,834
Series 2012-18, Class FB,
0.758%, 03/25/2042 (P) 1,744,929 1,765,516
Government National Mortgage Association
Series 2012-21, Class FQ,
0.558%, 02/20/2042 (P) 2,264,068 2,272,506
Series 2011-93, Class BF,
0.608%, 07/16/2041 (P) 2,685,055 2,697,766
Series 2012-32, Class FP,
0.608%, 03/16/2042 (P) 2,143,496 2,157,023
Series 2012-43, Class FH,
0.608%, 04/16/2042 (P) 4,603,796 4,634,549
103,235,813
U.S. Government Agency - 0.1%
Federal Home Loan Mortgage Corporation (P) 2,234,026 2,253,634
TOTAL COLLATERALIZED MORTGAGE
OBLIGATIONS (Cost $105,038,425) $ 105,489,447
ASSET BACKED SECURITIES - 0.7%
Ally Master Owner Trust, Series 2012-3,
Copyright © 2013 www.secdatabase.com. All Rights Reserved.Please Consider the Environment Before Printing This Document
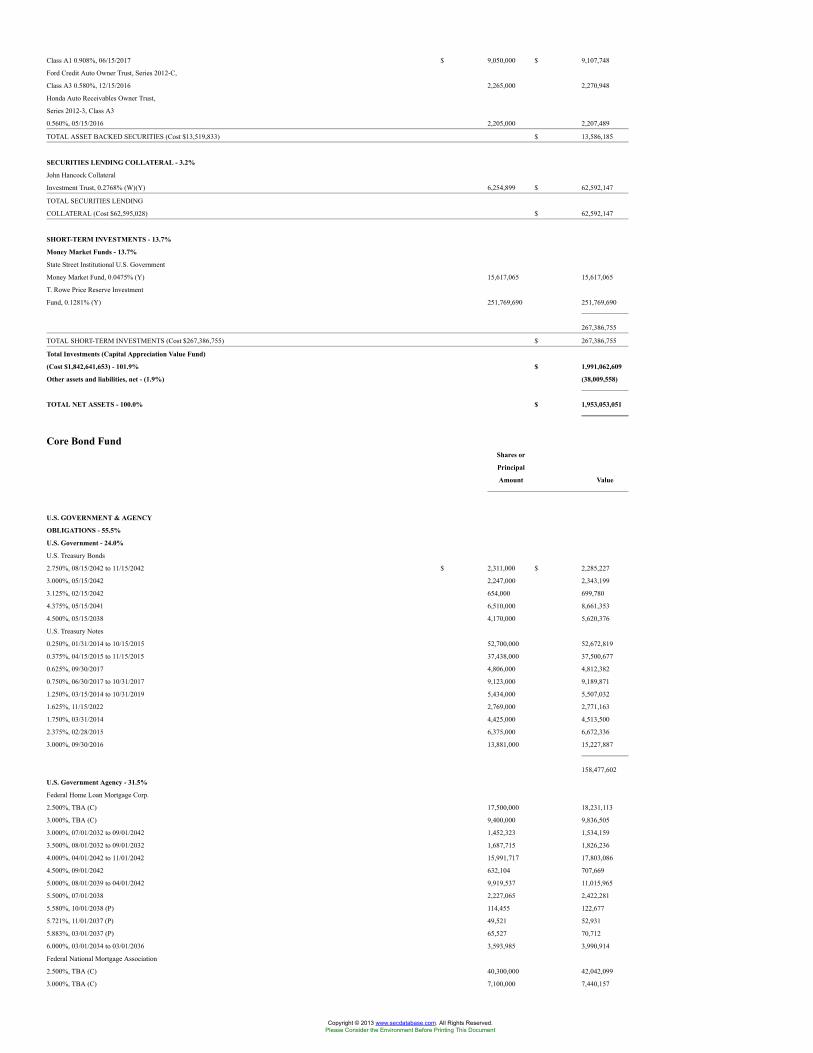
Class A1 0.908%, 06/15/2017 $ 9,050,000 $ 9,107,748
Ford Credit Auto Owner Trust, Series 2012-C,
Class A3 0.580%, 12/15/2016 2,265,000 2,270,948
Honda Auto Receivables Owner Trust,
Series 2012-3, Class A3
0.560%, 05/15/2016 2,205,000 2,207,489
TOTAL ASSET BACKED SECURITIES (Cost $13,519,833) $ 13,586,185
SECURITIES LENDING COLLATERAL - 3.2%
John Hancock Collateral
Investment Trust, 0.2768% (W)(Y) 6,254,899 $ 62,592,147
TOTAL SECURITIES LENDING
COLLATERAL (Cost $62,595,028) $ 62,592,147
SHORT-TERM INVESTMENTS - 13.7%
Money Market Funds - 13.7%
State Street Institutional U.S. Government
Money Market Fund, 0.0475% (Y) 15,617,065 15,617,065
T. Rowe Price Reserve Investment
Fund, 0.1281% (Y) 251,769,690 251,769,690
267,386,755
TOTAL SHORT-TERM INVESTMENTS (Cost $267,386,755) $ 267,386,755
Total Investments (Capital Appreciation Value Fund)
(Cost $1,842,641,653) - 101.9% $ 1,991,062,609
Other assets and liabilities, net - (1.9%) (38,009,558)
TOTAL NET ASSETS - 100.0% $ 1,953,053,051
Core Bond FundShares or
Principal
Amount Value
U.S. GOVERNMENT & AGENCY
OBLIGATIONS - 55.5%
U.S. Government - 24.0%
U.S. Treasury Bonds
2.750%, 08/15/2042 to 11/15/2042 $ 2,311,000 $ 2,285,227
3.000%, 05/15/2042 2,247,000 2,343,199
3.125%, 02/15/2042 654,000 699,780
4.375%, 05/15/2041 6,510,000 8,661,353
4.500%, 05/15/2038 4,170,000 5,620,376
U.S. Treasury Notes
0.250%, 01/31/2014 to 10/15/2015 52,700,000 52,672,819
0.375%, 04/15/2015 to 11/15/2015 37,438,000 37,500,677
0.625%, 09/30/2017 4,806,000 4,812,382
0.750%, 06/30/2017 to 10/31/2017 9,123,000 9,189,871
1.250%, 03/15/2014 to 10/31/2019 5,434,000 5,507,032
1.625%, 11/15/2022 2,769,000 2,771,163
1.750%, 03/31/2014 4,425,000 4,513,500
2.375%, 02/28/2015 6,375,000 6,672,336
3.000%, 09/30/2016 13,881,000 15,227,887
158,477,602
U.S. Government Agency - 31.5%
Federal Home Loan Mortgage Corp.
2.500%, TBA (C) 17,500,000 18,231,113
3.000%, TBA (C) 9,400,000 9,836,505
3.000%, 07/01/2032 to 09/01/2042 1,452,323 1,534,159
3.500%, 08/01/2032 to 09/01/2032 1,687,715 1,826,236
4.000%, 04/01/2042 to 11/01/2042 15,991,717 17,803,086
4.500%, 09/01/2042 632,104 707,669
5.000%, 08/01/2039 to 04/01/2042 9,919,537 11,015,965
5.500%, 07/01/2038 2,227,065 2,422,281
5.580%, 10/01/2038 (P) 114,455 122,677
5.721%, 11/01/2037 (P) 49,521 52,931
5.883%, 03/01/2037 (P) 65,527 70,712
6.000%, 03/01/2034 to 03/01/2036 3,593,985 3,990,914
Federal National Mortgage Association
2.500%, TBA (C) 40,300,000 42,042,099
3.000%, TBA (C) 7,100,000 7,440,157
Copyright © 2013 www.secdatabase.com. All Rights Reserved.Please Consider the Environment Before Printing This Document
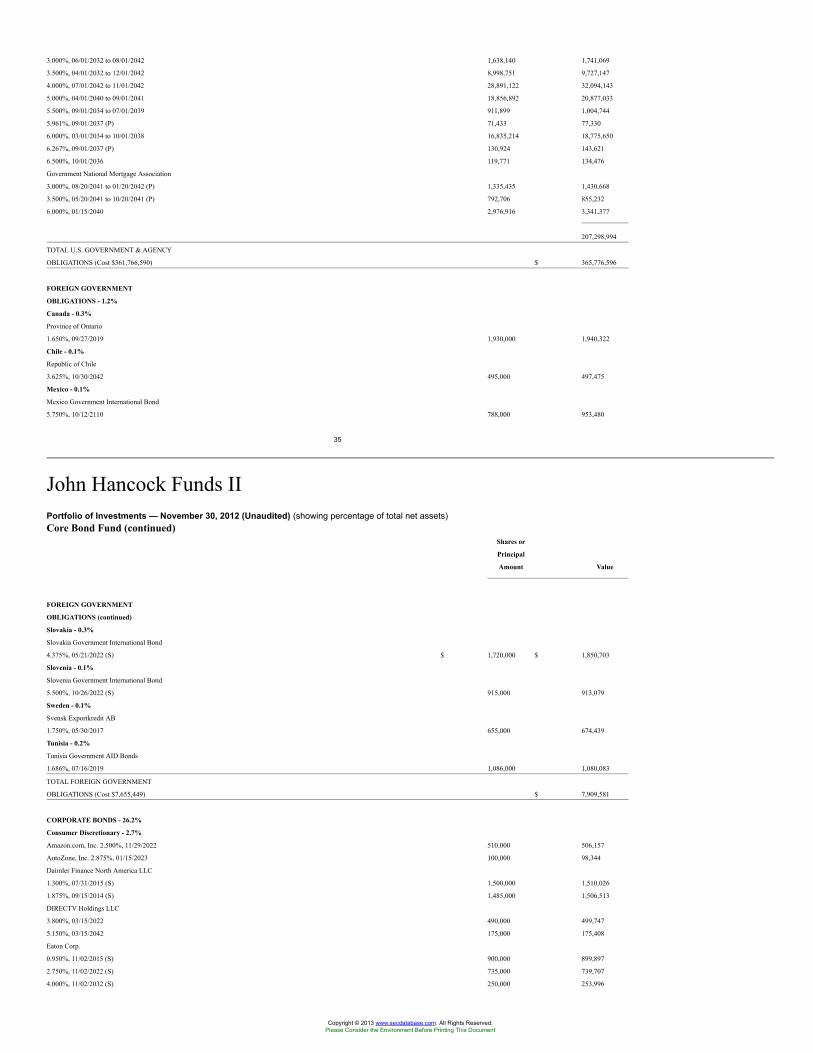
3.000%, 06/01/2032 to 08/01/2042 1,638,140 1,741,069
3.500%, 04/01/2032 to 12/01/2042 8,998,751 9,727,147
4.000%, 07/01/2042 to 11/01/2042 28,891,122 32,094,143
5.000%, 04/01/2040 to 09/01/2041 18,856,892 20,877,033
5.500%, 09/01/2034 to 07/01/2039 911,899 1,004,744
5.961%, 09/01/2037 (P) 71,433 77,330
6.000%, 03/01/2034 to 10/01/2038 16,835,214 18,775,650
6.267%, 09/01/2037 (P) 130,924 143,621
6.500%, 10/01/2036 119,771 134,476
Government National Mortgage Association
3.000%, 08/20/2041 to 01/20/2042 (P) 1,335,435 1,430,668
3.500%, 05/20/2041 to 10/20/2041 (P) 792,706 855,232
6.000%, 01/15/2040 2,976,916 3,341,377
207,298,994
TOTAL U.S. GOVERNMENT & AGENCY
OBLIGATIONS (Cost $361,766,590) $ 365,776,596
FOREIGN GOVERNMENT
OBLIGATIONS - 1.2%
Canada - 0.3%
Province of Ontario
1.650%, 09/27/2019 1,930,000 1,940,322
Chile - 0.1%
Republic of Chile
3.625%, 10/30/2042 495,000 497,475
Mexico - 0.1%
Mexico Government International Bond
5.750%, 10/12/2110 788,000 953,480
35
John Hancock Funds IIPortfolio of Investments — November 30, 2012 (Unaudited) (showing percentage of total net assets)Core Bond Fund (continued)
Shares or
Principal
Amount Value
FOREIGN GOVERNMENT
OBLIGATIONS (continued)
Slovakia - 0.3%
Slovakia Government International Bond
4.375%, 05/21/2022 (S) $ 1,720,000 $ 1,850,703
Slovenia - 0.1%
Slovenia Government International Bond
5.500%, 10/26/2022 (S) 915,000 913,079
Sweden - 0.1%
Svensk Exportkredit AB
1.750%, 05/30/2017 655,000 674,439
Tunisia - 0.2%
Tunisia Government AID Bonds
1.686%, 07/16/2019 1,086,000 1,080,083
TOTAL FOREIGN GOVERNMENT
OBLIGATIONS (Cost $7,655,449) $ 7,909,581
CORPORATE BONDS - 26.2%
Consumer Discretionary - 2.7%
Amazon.com, Inc. 2.500%, 11/29/2022 510,000 506,157
AutoZone, Inc. 2.875%, 01/15/2023 100,000 98,344
Daimler Finance North America LLC
1.300%, 07/31/2015 (S) 1,500,000 1,510,026
1.875%, 09/15/2014 (S) 1,485,000 1,506,513
DIRECTV Holdings LLC
3.800%, 03/15/2022 490,000 499,747
5.150%, 03/15/2042 175,000 175,408
Eaton Corp.
0.950%, 11/02/2015 (S) 900,000 899,897
2.750%, 11/02/2022 (S) 735,000 739,707
4.000%, 11/02/2032 (S) 250,000 253,996
Copyright © 2013 www.secdatabase.com. All Rights Reserved.Please Consider the Environment Before Printing This Document
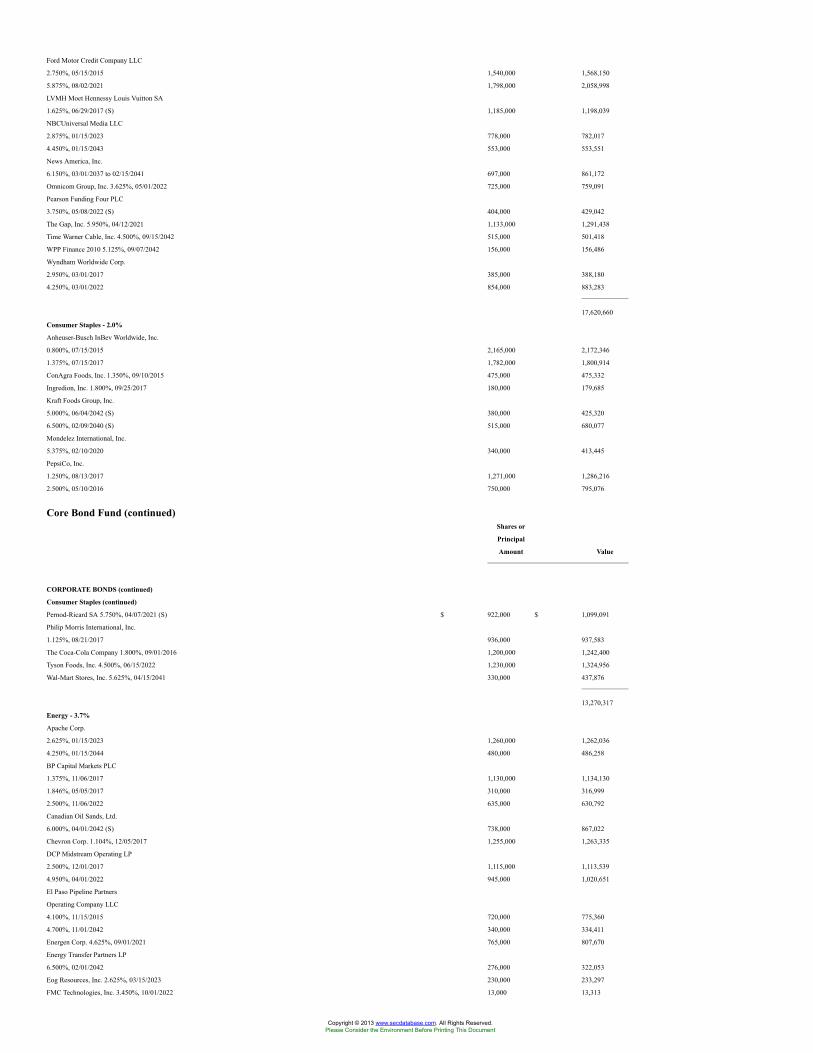
Ford Motor Credit Company LLC
2.750%, 05/15/2015 1,540,000 1,568,150
5.875%, 08/02/2021 1,798,000 2,058,998
LVMH Moet Hennessy Louis Vuitton SA
1.625%, 06/29/2017 (S) 1,185,000 1,198,039
NBCUniversal Media LLC
2.875%, 01/15/2023 778,000 782,017
4.450%, 01/15/2043 553,000 553,551
News America, Inc.
6.150%, 03/01/2037 to 02/15/2041 697,000 861,172
Omnicom Group, Inc. 3.625%, 05/01/2022 725,000 759,091
Pearson Funding Four PLC
3.750%, 05/08/2022 (S) 404,000 429,042
The Gap, Inc. 5.950%, 04/12/2021 1,133,000 1,291,438
Time Warner Cable, Inc. 4.500%, 09/15/2042 515,000 501,418
WPP Finance 2010 5.125%, 09/07/2042 156,000 156,486
Wyndham Worldwide Corp.
2.950%, 03/01/2017 385,000 388,180
4.250%, 03/01/2022 854,000 883,283
17,620,660
Consumer Staples - 2.0%
Anheuser-Busch InBev Worldwide, Inc.
0.800%, 07/15/2015 2,165,000 2,172,346
1.375%, 07/15/2017 1,782,000 1,800,914
ConAgra Foods, Inc. 1.350%, 09/10/2015 475,000 475,332
Ingredion, Inc. 1.800%, 09/25/2017 180,000 179,685
Kraft Foods Group, Inc.
5.000%, 06/04/2042 (S) 380,000 425,320
6.500%, 02/09/2040 (S) 515,000 680,077
Mondelez International, Inc.
5.375%, 02/10/2020 340,000 413,445
PepsiCo, Inc.
1.250%, 08/13/2017 1,271,000 1,286,216
2.500%, 05/10/2016 750,000 795,076
Core Bond Fund (continued)Shares or
Principal
Amount Value
CORPORATE BONDS (continued)
Consumer Staples (continued)
Pernod-Ricard SA 5.750%, 04/07/2021 (S) $ 922,000 $ 1,099,091
Philip Morris International, Inc.
1.125%, 08/21/2017 936,000 937,583
The Coca-Cola Company 1.800%, 09/01/2016 1,200,000 1,242,400
Tyson Foods, Inc. 4.500%, 06/15/2022 1,230,000 1,324,956
Wal-Mart Stores, Inc. 5.625%, 04/15/2041 330,000 437,876
13,270,317
Energy - 3.7%
Apache Corp.
2.625%, 01/15/2023 1,260,000 1,262,036
4.250%, 01/15/2044 480,000 486,258
BP Capital Markets PLC
1.375%, 11/06/2017 1,130,000 1,134,130
1.846%, 05/05/2017 310,000 316,999
2.500%, 11/06/2022 635,000 630,792
Canadian Oil Sands, Ltd.
6.000%, 04/01/2042 (S) 738,000 867,022
Chevron Corp. 1.104%, 12/05/2017 1,255,000 1,263,335
DCP Midstream Operating LP
2.500%, 12/01/2017 1,115,000 1,113,539
4.950%, 04/01/2022 945,000 1,020,651
El Paso Pipeline Partners
Operating Company LLC
4.100%, 11/15/2015 720,000 775,360
4.700%, 11/01/2042 340,000 334,411
Energen Corp. 4.625%, 09/01/2021 765,000 807,670
Energy Transfer Partners LP
6.500%, 02/01/2042 276,000 322,053
Eog Resources, Inc. 2.625%, 03/15/2023 230,000 233,297
FMC Technologies, Inc. 3.450%, 10/01/2022 13,000 13,313
Copyright © 2013 www.secdatabase.com. All Rights Reserved.Please Consider the Environment Before Printing This Document
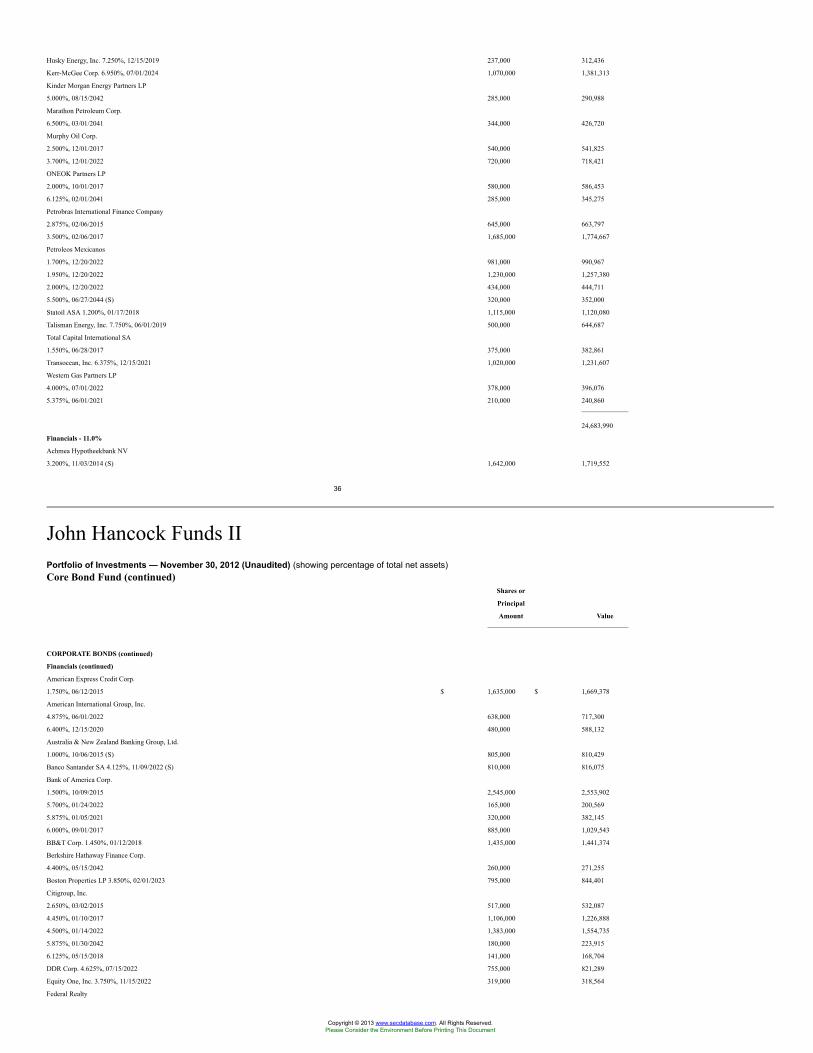
Husky Energy, Inc. 7.250%, 12/15/2019 237,000 312,436
Kerr-McGee Corp. 6.950%, 07/01/2024 1,070,000 1,381,313
Kinder Morgan Energy Partners LP
5.000%, 08/15/2042 285,000 290,988
Marathon Petroleum Corp.
6.500%, 03/01/2041 344,000 426,720
Murphy Oil Corp.
2.500%, 12/01/2017 540,000 541,825
3.700%, 12/01/2022 720,000 718,421
ONEOK Partners LP
2.000%, 10/01/2017 580,000 586,453
6.125%, 02/01/2041 285,000 345,275
Petrobras International Finance Company
2.875%, 02/06/2015 645,000 663,797
3.500%, 02/06/2017 1,685,000 1,774,667
Petroleos Mexicanos
1.700%, 12/20/2022 981,000 990,967
1.950%, 12/20/2022 1,230,000 1,257,380
2.000%, 12/20/2022 434,000 444,711
5.500%, 06/27/2044 (S) 320,000 352,000
Statoil ASA 1.200%, 01/17/2018 1,115,000 1,120,080
Talisman Energy, Inc. 7.750%, 06/01/2019 500,000 644,687
Total Capital International SA
1.550%, 06/28/2017 375,000 382,861
Transocean, Inc. 6.375%, 12/15/2021 1,020,000 1,231,607
Western Gas Partners LP
4.000%, 07/01/2022 378,000 396,076
5.375%, 06/01/2021 210,000 240,860
24,683,990
Financials - 11.0%
Achmea Hypotheekbank NV
3.200%, 11/03/2014 (S) 1,642,000 1,719,552
36
John Hancock Funds IIPortfolio of Investments — November 30, 2012 (Unaudited) (showing percentage of total net assets)Core Bond Fund (continued)
Shares or
Principal
Amount Value
CORPORATE BONDS (continued)
Financials (continued)
American Express Credit Corp.
1.750%, 06/12/2015 $ 1,635,000 $ 1,669,378
American International Group, Inc.
4.875%, 06/01/2022 638,000 717,300
6.400%, 12/15/2020 480,000 588,132
Australia & New Zealand Banking Group, Ltd.
1.000%, 10/06/2015 (S) 805,000 810,429
Banco Santander SA 4.125%, 11/09/2022 (S) 810,000 816,075
Bank of America Corp.
1.500%, 10/09/2015 2,545,000 2,553,902
5.700%, 01/24/2022 165,000 200,569
5.875%, 01/05/2021 320,000 382,145
6.000%, 09/01/2017 885,000 1,029,543
BB&T Corp. 1.450%, 01/12/2018 1,435,000 1,441,374
Berkshire Hathaway Finance Corp.
4.400%, 05/15/2042 260,000 271,255
Boston Properties LP 3.850%, 02/01/2023 795,000 844,401
Citigroup, Inc.
2.650%, 03/02/2015 517,000 532,087
4.450%, 01/10/2017 1,106,000 1,226,888
4.500%, 01/14/2022 1,383,000 1,554,735
5.875%, 01/30/2042 180,000 223,915
6.125%, 05/15/2018 141,000 168,704
DDR Corp. 4.625%, 07/15/2022 755,000 821,289
Equity One, Inc. 3.750%, 11/15/2022 319,000 318,564
Federal Realty
Copyright © 2013 www.secdatabase.com. All Rights Reserved.Please Consider the Environment Before Printing This Document
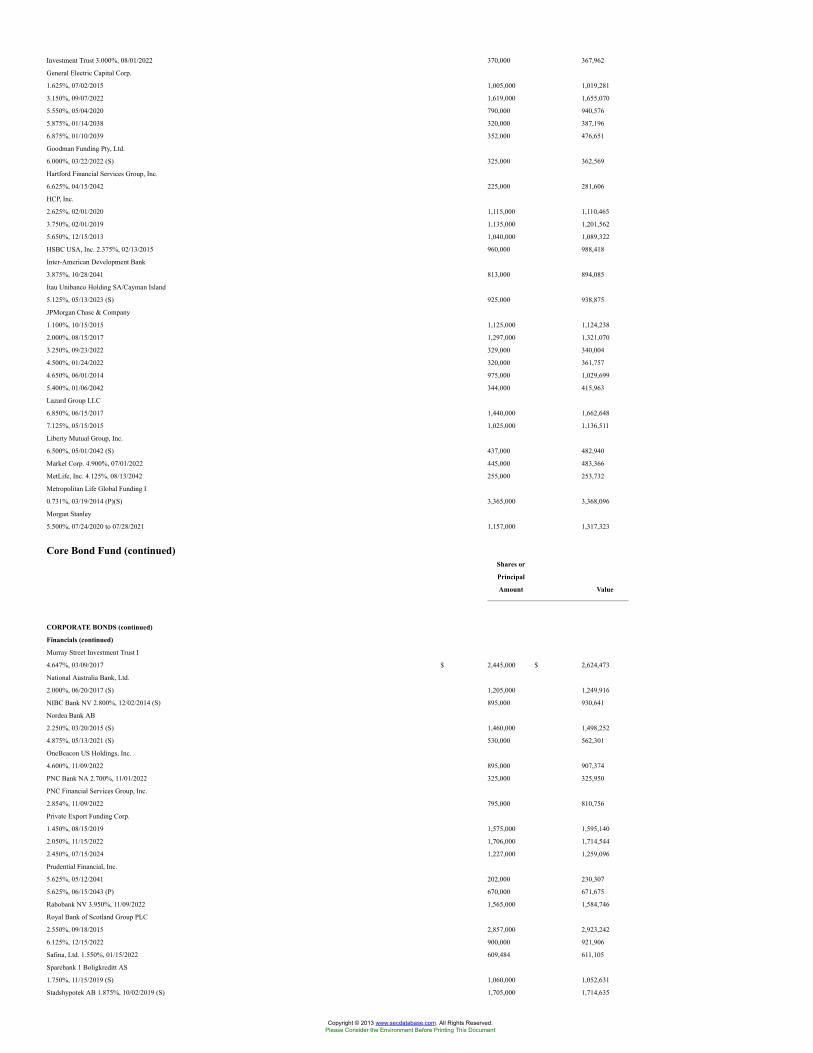
Investment Trust 3.000%, 08/01/2022 370,000 367,962
General Electric Capital Corp.
1.625%, 07/02/2015 1,005,000 1,019,281
3.150%, 09/07/2022 1,619,000 1,655,070
5.550%, 05/04/2020 790,000 940,576
5.875%, 01/14/2038 320,000 387,196
6.875%, 01/10/2039 352,000 476,651
Goodman Funding Pty, Ltd.
6.000%, 03/22/2022 (S) 325,000 362,569
Hartford Financial Services Group, Inc.
6.625%, 04/15/2042 225,000 281,606
HCP, Inc.
2.625%, 02/01/2020 1,115,000 1,110,465
3.750%, 02/01/2019 1,135,000 1,201,562
5.650%, 12/15/2013 1,040,000 1,089,322
HSBC USA, Inc. 2.375%, 02/13/2015 960,000 988,418
Inter-American Development Bank
3.875%, 10/28/2041 813,000 894,085
Itau Unibanco Holding SA/Cayman Island
5.125%, 05/13/2023 (S) 925,000 938,875
JPMorgan Chase & Company
1.100%, 10/15/2015 1,125,000 1,124,238
2.000%, 08/15/2017 1,297,000 1,321,070
3.250%, 09/23/2022 329,000 340,004
4.500%, 01/24/2022 320,000 361,757
4.650%, 06/01/2014 975,000 1,029,699
5.400%, 01/06/2042 344,000 415,963
Lazard Group LLC
6.850%, 06/15/2017 1,440,000 1,662,648
7.125%, 05/15/2015 1,025,000 1,136,511
Liberty Mutual Group, Inc.
6.500%, 05/01/2042 (S) 437,000 482,940
Markel Corp. 4.900%, 07/01/2022 445,000 483,366
MetLife, Inc. 4.125%, 08/13/2042 255,000 253,732
Metropolitan Life Global Funding I
0.731%, 03/19/2014 (P)(S) 3,365,000 3,368,096
Morgan Stanley
5.500%, 07/24/2020 to 07/28/2021 1,157,000 1,317,323
Core Bond Fund (continued)Shares or
Principal
Amount Value
CORPORATE BONDS (continued)
Financials (continued)
Murray Street Investment Trust I
4.647%, 03/09/2017 $ 2,445,000 $ 2,624,473
National Australia Bank, Ltd.
2.000%, 06/20/2017 (S) 1,205,000 1,249,916
NIBC Bank NV 2.800%, 12/02/2014 (S) 895,000 930,641
Nordea Bank AB
2.250%, 03/20/2015 (S) 1,460,000 1,498,252
4.875%, 05/13/2021 (S) 530,000 562,301
OneBeacon US Holdings, Inc.
4.600%, 11/09/2022 895,000 907,374
PNC Bank NA 2.700%, 11/01/2022 325,000 325,950
PNC Financial Services Group, Inc.
2.854%, 11/09/2022 795,000 810,756
Private Export Funding Corp.
1.450%, 08/15/2019 1,575,000 1,595,140
2.050%, 11/15/2022 1,706,000 1,714,544
2.450%, 07/15/2024 1,227,000 1,259,096
Prudential Financial, Inc.
5.625%, 05/12/2041 202,000 230,307
5.625%, 06/15/2043 (P) 670,000 671,675
Rabobank NV 3.950%, 11/09/2022 1,565,000 1,584,746
Royal Bank of Scotland Group PLC
2.550%, 09/18/2015 2,857,000 2,923,242
6.125%, 12/15/2022 900,000 921,906
Safina, Ltd. 1.550%, 01/15/2022 609,484 611,105
Sparebank 1 Boligkreditt AS
1.750%, 11/15/2019 (S) 1,060,000 1,052,631
Stadshypotek AB 1.875%, 10/02/2019 (S) 1,705,000 1,714,635
Copyright © 2013 www.secdatabase.com. All Rights Reserved.Please Consider the Environment Before Printing This Document
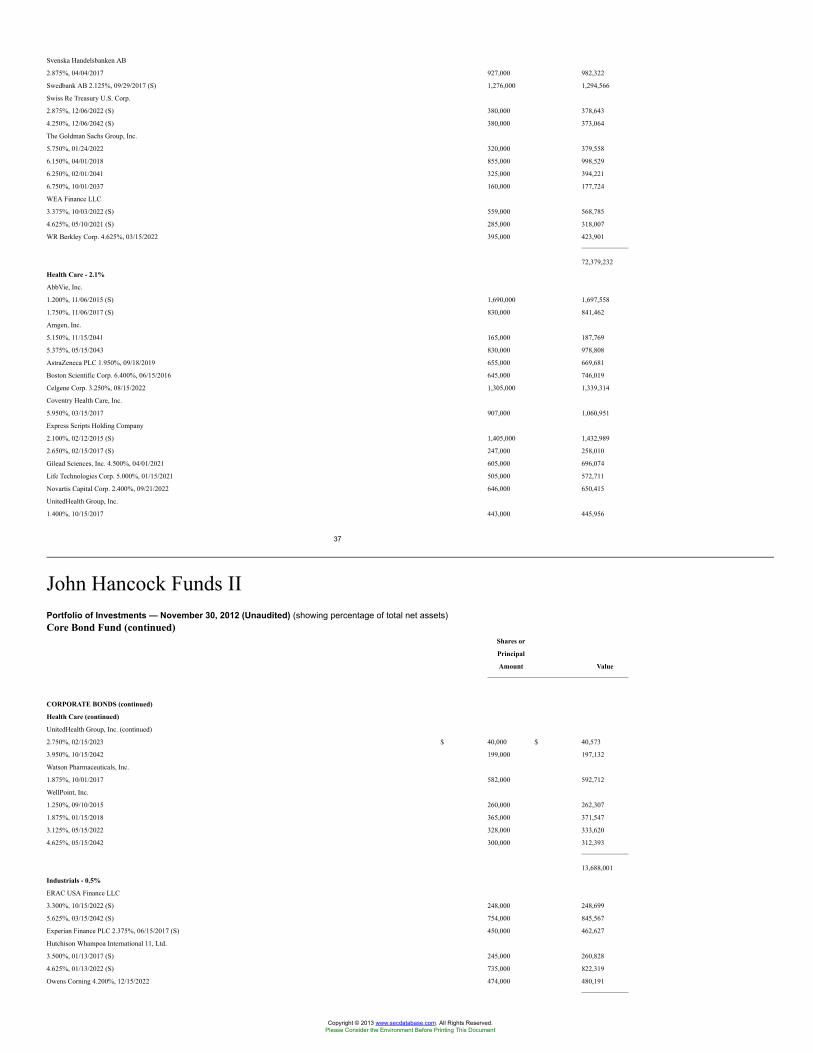
Svenska Handelsbanken AB
2.875%, 04/04/2017 927,000 982,322
Swedbank AB 2.125%, 09/29/2017 (S) 1,276,000 1,294,566
Swiss Re Treasury U.S. Corp.
2.875%, 12/06/2022 (S) 380,000 378,643
4.250%, 12/06/2042 (S) 380,000 373,064
The Goldman Sachs Group, Inc.
5.750%, 01/24/2022 320,000 379,558
6.150%, 04/01/2018 855,000 998,529
6.250%, 02/01/2041 325,000 394,221
6.750%, 10/01/2037 160,000 177,724
WEA Finance LLC
3.375%, 10/03/2022 (S) 559,000 568,785
4.625%, 05/10/2021 (S) 285,000 318,007
WR Berkley Corp. 4.625%, 03/15/2022 395,000 423,901
72,379,232
Health Care - 2.1%
AbbVie, Inc.
1.200%, 11/06/2015 (S) 1,690,000 1,697,558
1.750%, 11/06/2017 (S) 830,000 841,462
Amgen, Inc.
5.150%, 11/15/2041 165,000 187,769
5.375%, 05/15/2043 830,000 978,808
AstraZeneca PLC 1.950%, 09/18/2019 655,000 669,681
Boston Scientific Corp. 6.400%, 06/15/2016 645,000 746,019
Celgene Corp. 3.250%, 08/15/2022 1,305,000 1,339,314
Coventry Health Care, Inc.
5.950%, 03/15/2017 907,000 1,060,951
Express Scripts Holding Company
2.100%, 02/12/2015 (S) 1,405,000 1,432,989
2.650%, 02/15/2017 (S) 247,000 258,010
Gilead Sciences, Inc. 4.500%, 04/01/2021 605,000 696,074
Life Technologies Corp. 5.000%, 01/15/2021 505,000 572,711
Novartis Capital Corp. 2.400%, 09/21/2022 646,000 650,415
UnitedHealth Group, Inc.
1.400%, 10/15/2017 443,000 445,956
37
John Hancock Funds IIPortfolio of Investments — November 30, 2012 (Unaudited) (showing percentage of total net assets)Core Bond Fund (continued)
Shares or
Principal
Amount Value
CORPORATE BONDS (continued)
Health Care (continued)
UnitedHealth Group, Inc. (continued)
2.750%, 02/15/2023 $ 40,000 $ 40,573
3.950%, 10/15/2042 199,000 197,132
Watson Pharmaceuticals, Inc.
1.875%, 10/01/2017 582,000 592,712
WellPoint, Inc.
1.250%, 09/10/2015 260,000 262,307
1.875%, 01/15/2018 365,000 371,547
3.125%, 05/15/2022 328,000 333,620
4.625%, 05/15/2042 300,000 312,393
13,688,001
Industrials - 0.5%
ERAC USA Finance LLC
3.300%, 10/15/2022 (S) 248,000 248,699
5.625%, 03/15/2042 (S) 754,000 845,567
Experian Finance PLC 2.375%, 06/15/2017 (S) 450,000 462,627
Hutchison Whampoa International 11, Ltd.
3.500%, 01/13/2017 (S) 245,000 260,828
4.625%, 01/13/2022 (S) 735,000 822,319
Owens Corning 4.200%, 12/15/2022 474,000 480,191
Copyright © 2013 www.secdatabase.com. All Rights Reserved.Please Consider the Environment Before Printing This Document
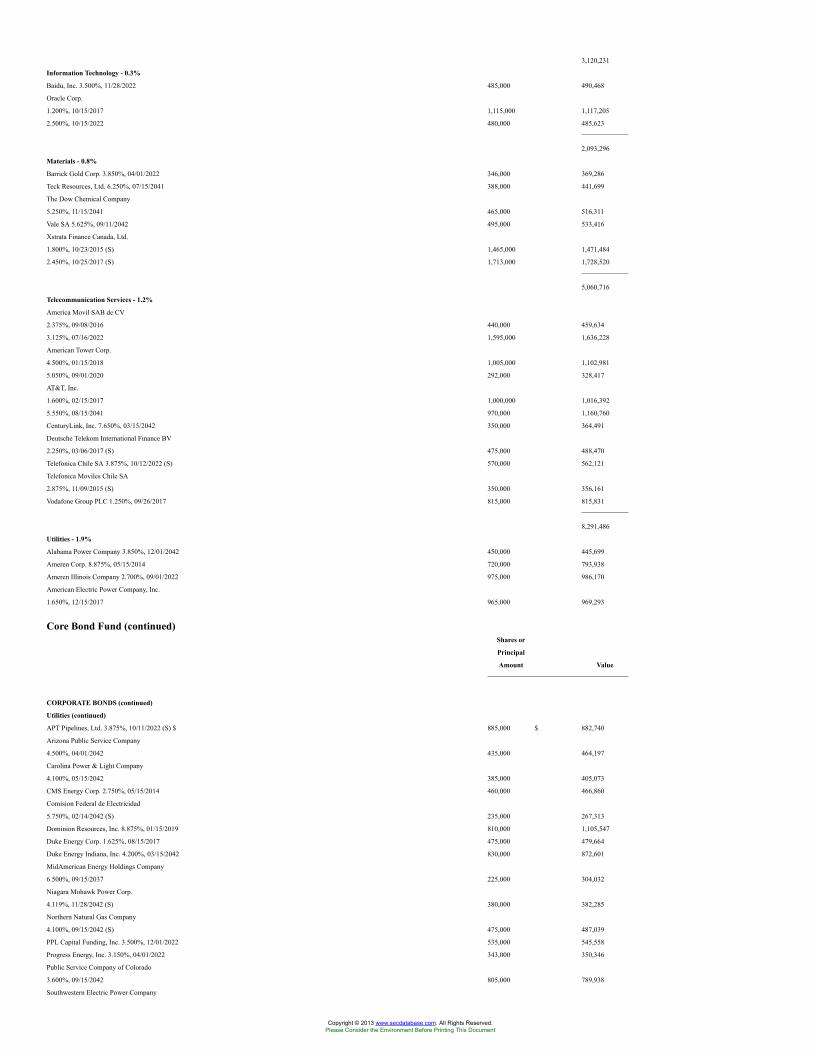
3,120,231
Information Technology - 0.3%
Baidu, Inc. 3.500%, 11/28/2022 485,000 490,468
Oracle Corp.
1.200%, 10/15/2017 1,115,000 1,117,205
2.500%, 10/15/2022 480,000 485,623
2,093,296
Materials - 0.8%
Barrick Gold Corp. 3.850%, 04/01/2022 346,000 369,286
Teck Resources, Ltd. 6.250%, 07/15/2041 388,000 441,699
The Dow Chemical Company
5.250%, 11/15/2041 465,000 516,311
Vale SA 5.625%, 09/11/2042 495,000 533,416
Xstrata Finance Canada, Ltd.
1.800%, 10/23/2015 (S) 1,465,000 1,471,484
2.450%, 10/25/2017 (S) 1,713,000 1,728,520
5,060,716
Telecommunication Services - 1.2%
America Movil SAB de CV
2.375%, 09/08/2016 440,000 459,634
3.125%, 07/16/2022 1,595,000 1,636,228
American Tower Corp.
4.500%, 01/15/2018 1,005,000 1,102,981
5.050%, 09/01/2020 292,000 328,417
AT&T, Inc.
1.600%, 02/15/2017 1,000,000 1,016,392
5.550%, 08/15/2041 970,000 1,160,760
CenturyLink, Inc. 7.650%, 03/15/2042 350,000 364,491
Deutsche Telekom International Finance BV
2.250%, 03/06/2017 (S) 475,000 488,470
Telefonica Chile SA 3.875%, 10/12/2022 (S) 570,000 562,121
Telefonica Moviles Chile SA
2.875%, 11/09/2015 (S) 350,000 356,161
Vodafone Group PLC 1.250%, 09/26/2017 815,000 815,831
8,291,486
Utilities - 1.9%
Alabama Power Company 3.850%, 12/01/2042 450,000 445,699
Ameren Corp. 8.875%, 05/15/2014 720,000 793,938
Ameren Illinois Company 2.700%, 09/01/2022 975,000 986,170
American Electric Power Company, Inc.
1.650%, 12/15/2017 965,000 969,293
Core Bond Fund (continued)Shares or
Principal
Amount Value
CORPORATE BONDS (continued)
Utilities (continued)
APT Pipelines, Ltd. 3.875%, 10/11/2022 (S) $ 885,000 $ 882,740
Arizona Public Service Company
4.500%, 04/01/2042 435,000 464,197
Carolina Power & Light Company
4.100%, 05/15/2042 385,000 405,073
CMS Energy Corp. 2.750%, 05/15/2014 460,000 466,860
Comision Federal de Electricidad
5.750%, 02/14/2042 (S) 235,000 267,313
Dominion Resources, Inc. 8.875%, 01/15/2019 810,000 1,105,547
Duke Energy Corp. 1.625%, 08/15/2017 475,000 479,664
Duke Energy Indiana, Inc. 4.200%, 03/15/2042 830,000 872,601
MidAmerican Energy Holdings Company
6.500%, 09/15/2037 225,000 304,032
Niagara Mohawk Power Corp.
4.119%, 11/28/2042 (S) 380,000 382,285
Northern Natural Gas Company
4.100%, 09/15/2042 (S) 475,000 487,039
PPL Capital Funding, Inc. 3.500%, 12/01/2022 535,000 545,558
Progress Energy, Inc. 3.150%, 04/01/2022 343,000 350,346
Public Service Company of Colorado
3.600%, 09/15/2042 805,000 789,938
Southwestern Electric Power Company
Copyright © 2013 www.secdatabase.com. All Rights Reserved.Please Consider the Environment Before Printing This Document
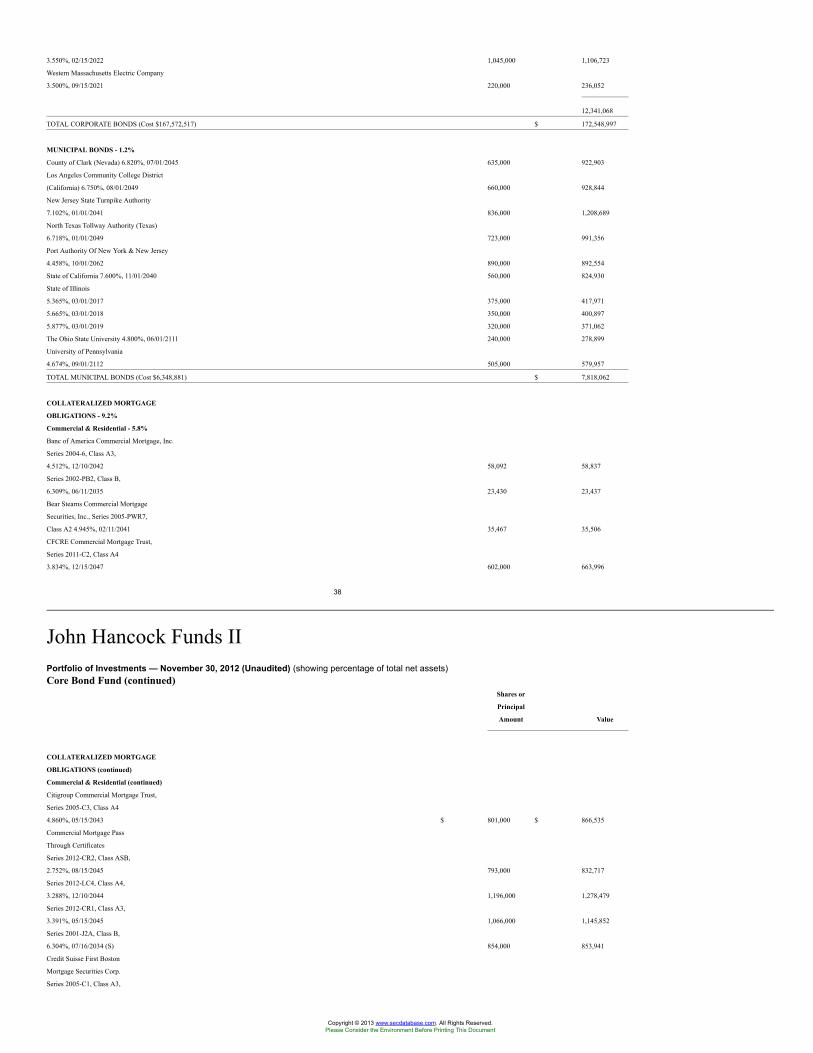
3.550%, 02/15/2022 1,045,000 1,106,723
Western Massachusetts Electric Company
3.500%, 09/15/2021 220,000 236,052
12,341,068
TOTAL CORPORATE BONDS (Cost $167,572,517) $ 172,548,997
MUNICIPAL BONDS - 1.2%
County of Clark (Nevada) 6.820%, 07/01/2045 635,000 922,903
Los Angeles Community College District
(California) 6.750%, 08/01/2049 660,000 928,844
New Jersey State Turnpike Authority
7.102%, 01/01/2041 836,000 1,208,689
North Texas Tollway Authority (Texas)
6.718%, 01/01/2049 723,000 991,356
Port Authority Of New York & New Jersey
4.458%, 10/01/2062 890,000 892,554
State of California 7.600%, 11/01/2040 560,000 824,930
State of Illinois
5.365%, 03/01/2017 375,000 417,971
5.665%, 03/01/2018 350,000 400,897
5.877%, 03/01/2019 320,000 371,062
The Ohio State University 4.800%, 06/01/2111 240,000 278,899
University of Pennsylvania
4.674%, 09/01/2112 505,000 579,957
TOTAL MUNICIPAL BONDS (Cost $6,348,881) $ 7,818,062
COLLATERALIZED MORTGAGE
OBLIGATIONS - 9.2%
Commercial & Residential - 5.8%
Banc of America Commercial Mortgage, Inc.
Series 2004-6, Class A3,
4.512%, 12/10/2042 58,092 58,837
Series 2002-PB2, Class B,
6.309%, 06/11/2035 23,430 23,437
Bear Stearns Commercial Mortgage
Securities, Inc., Series 2005-PWR7,
Class A2 4.945%, 02/11/2041 35,467 35,506
CFCRE Commercial Mortgage Trust,
Series 2011-C2, Class A4
3.834%, 12/15/2047 602,000 663,996
38
John Hancock Funds IIPortfolio of Investments — November 30, 2012 (Unaudited) (showing percentage of total net assets)Core Bond Fund (continued)
Shares or
Principal
Amount Value
COLLATERALIZED MORTGAGE
OBLIGATIONS (continued)
Commercial & Residential (continued)
Citigroup Commercial Mortgage Trust,
Series 2005-C3, Class A4
4.860%, 05/15/2043 $ 801,000 $ 866,535
Commercial Mortgage Pass
Through Certificates
Series 2012-CR2, Class ASB,
2.752%, 08/15/2045 793,000 832,717
Series 2012-LC4, Class A4,
3.288%, 12/10/2044 1,196,000 1,278,479
Series 2012-CR1, Class A3,
3.391%, 05/15/2045 1,066,000 1,145,852
Series 2001-J2A, Class B,
6.304%, 07/16/2034 (S) 854,000 853,941
Credit Suisse First Boston
Mortgage Securities Corp.
Series 2005-C1, Class A3,
Copyright © 2013 www.secdatabase.com. All Rights Reserved.Please Consider the Environment Before Printing This Document
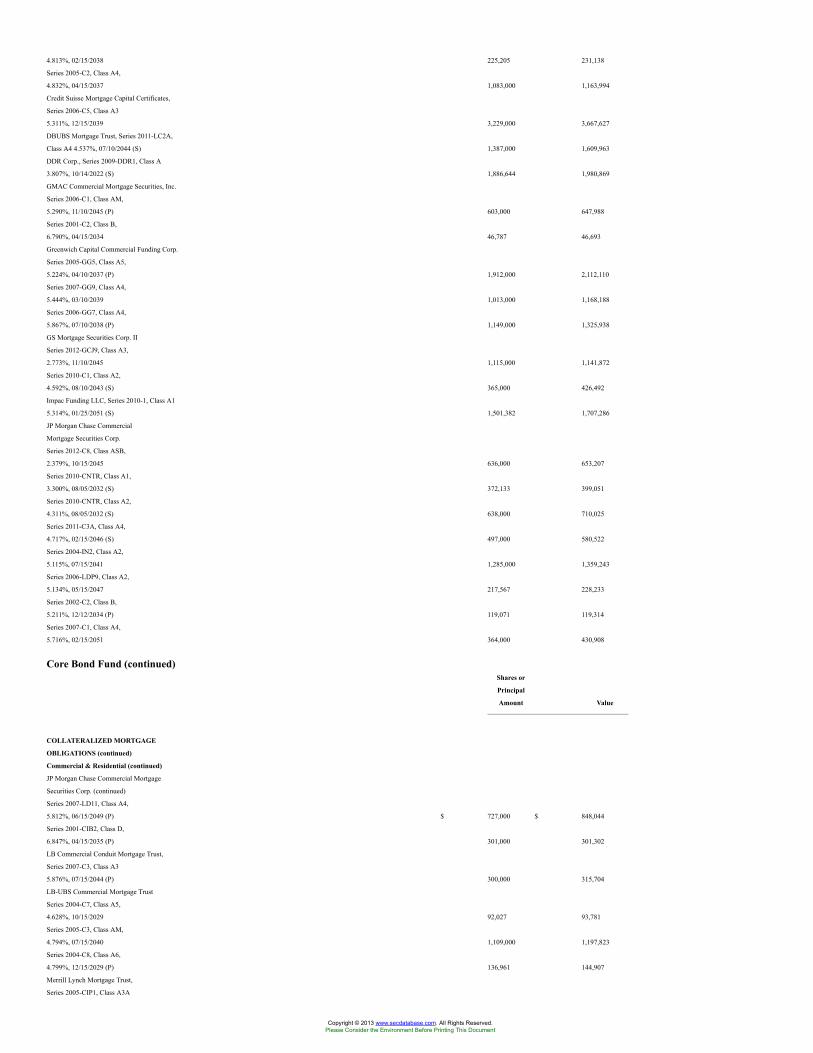
4.813%, 02/15/2038 225,205 231,138
Series 2005-C2, Class A4,
4.832%, 04/15/2037 1,083,000 1,163,994
Credit Suisse Mortgage Capital Certificates,
Series 2006-C5, Class A3
5.311%, 12/15/2039 3,229,000 3,667,627
DBUBS Mortgage Trust, Series 2011-LC2A,
Class A4 4.537%, 07/10/2044 (S) 1,387,000 1,609,963
DDR Corp., Series 2009-DDR1, Class A
3.807%, 10/14/2022 (S) 1,886,644 1,980,869
GMAC Commercial Mortgage Securities, Inc.
Series 2006-C1, Class AM,
5.290%, 11/10/2045 (P) 603,000 647,988
Series 2001-C2, Class B,
6.790%, 04/15/2034 46,787 46,693
Greenwich Capital Commercial Funding Corp.
Series 2005-GG5, Class A5,
5.224%, 04/10/2037 (P) 1,912,000 2,112,110
Series 2007-GG9, Class A4,
5.444%, 03/10/2039 1,013,000 1,168,188
Series 2006-GG7, Class A4,
5.867%, 07/10/2038 (P) 1,149,000 1,325,938
GS Mortgage Securities Corp. II
Series 2012-GCJ9, Class A3,
2.773%, 11/10/2045 1,115,000 1,141,872
Series 2010-C1, Class A2,
4.592%, 08/10/2043 (S) 365,000 426,492
Impac Funding LLC, Series 2010-1, Class A1
5.314%, 01/25/2051 (S) 1,501,382 1,707,286
JP Morgan Chase Commercial
Mortgage Securities Corp.
Series 2012-C8, Class ASB,
2.379%, 10/15/2045 636,000 653,207
Series 2010-CNTR, Class A1,
3.300%, 08/05/2032 (S) 372,133 399,051
Series 2010-CNTR, Class A2,
4.311%, 08/05/2032 (S) 638,000 710,025
Series 2011-C3A, Class A4,
4.717%, 02/15/2046 (S) 497,000 580,522
Series 2004-IN2, Class A2,
5.115%, 07/15/2041 1,285,000 1,359,243
Series 2006-LDP9, Class A2,
5.134%, 05/15/2047 217,567 228,233
Series 2002-C2, Class B,
5.211%, 12/12/2034 (P) 119,071 119,314
Series 2007-C1, Class A4,
5.716%, 02/15/2051 364,000 430,908
Core Bond Fund (continued)Shares or
Principal
Amount Value
COLLATERALIZED MORTGAGE
OBLIGATIONS (continued)
Commercial & Residential (continued)
JP Morgan Chase Commercial Mortgage
Securities Corp. (continued)
Series 2007-LD11, Class A4,
5.812%, 06/15/2049 (P) $ 727,000 $ 848,044
Series 2001-CIB2, Class D,
6.847%, 04/15/2035 (P) 301,000 301,302
LB Commercial Conduit Mortgage Trust,
Series 2007-C3, Class A3
5.876%, 07/15/2044 (P) 300,000 315,704
LB-UBS Commercial Mortgage Trust
Series 2004-C7, Class A5,
4.628%, 10/15/2029 92,027 93,781
Series 2005-C3, Class AM,
4.794%, 07/15/2040 1,109,000 1,197,823
Series 2004-C8, Class A6,
4.799%, 12/15/2029 (P) 136,961 144,907
Merrill Lynch Mortgage Trust,
Series 2005-CIP1, Class A3A
Copyright © 2013 www.secdatabase.com. All Rights Reserved.Please Consider the Environment Before Printing This Document
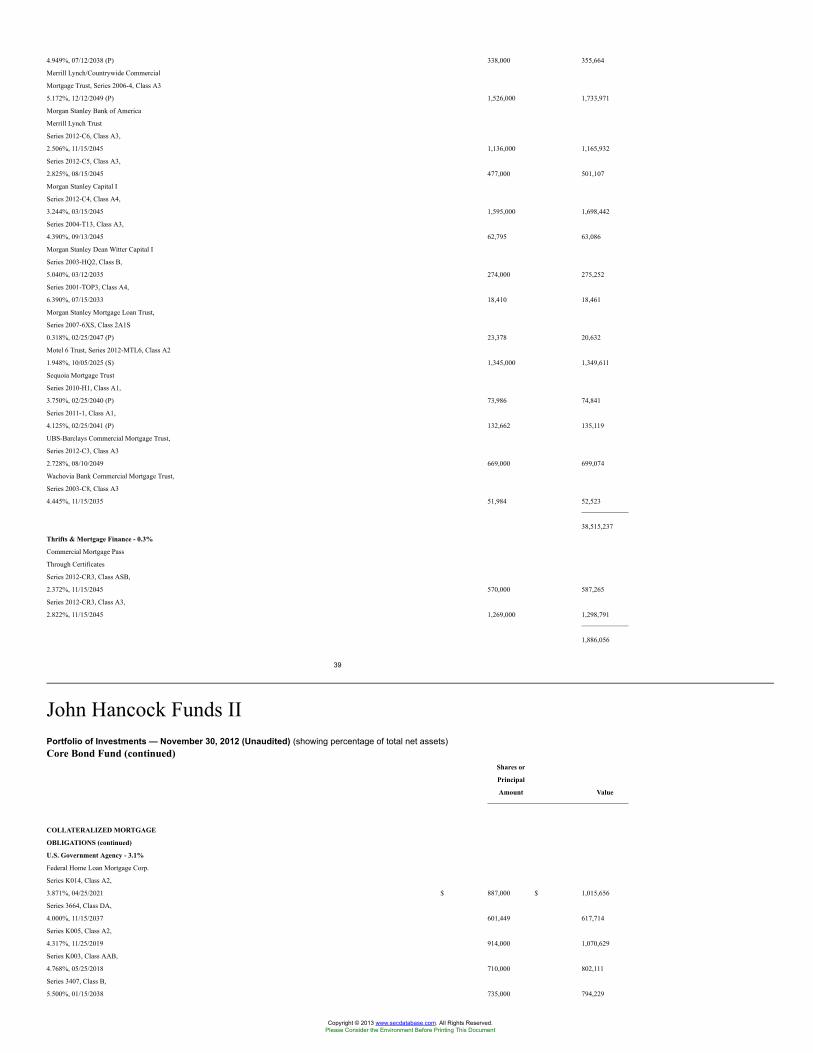
4.949%, 07/12/2038 (P) 338,000 355,664
Merrill Lynch/Countrywide Commercial
Mortgage Trust, Series 2006-4, Class A3
5.172%, 12/12/2049 (P) 1,526,000 1,733,971
Morgan Stanley Bank of America
Merrill Lynch Trust
Series 2012-C6, Class A3,
2.506%, 11/15/2045 1,136,000 1,165,932
Series 2012-C5, Class A3,
2.825%, 08/15/2045 477,000 501,107
Morgan Stanley Capital I
Series 2012-C4, Class A4,
3.244%, 03/15/2045 1,595,000 1,698,442
Series 2004-T13, Class A3,
4.390%, 09/13/2045 62,795 63,086
Morgan Stanley Dean Witter Capital I
Series 2003-HQ2, Class B,
5.040%, 03/12/2035 274,000 275,252
Series 2001-TOP3, Class A4,
6.390%, 07/15/2033 18,410 18,461
Morgan Stanley Mortgage Loan Trust,
Series 2007-6XS, Class 2A1S
0.318%, 02/25/2047 (P) 23,378 20,632
Motel 6 Trust, Series 2012-MTL6, Class A2
1.948%, 10/05/2025 (S) 1,345,000 1,349,611
Sequoia Mortgage Trust
Series 2010-H1, Class A1,
3.750%, 02/25/2040 (P) 73,986 74,841
Series 2011-1, Class A1,
4.125%, 02/25/2041 (P) 132,662 135,119
UBS-Barclays Commercial Mortgage Trust,
Series 2012-C3, Class A3
2.728%, 08/10/2049 669,000 699,074
Wachovia Bank Commercial Mortgage Trust,
Series 2003-C8, Class A3
4.445%, 11/15/2035 51,984 52,523
38,515,237
Thrifts & Mortgage Finance - 0.3%
Commercial Mortgage Pass
Through Certificates
Series 2012-CR3, Class ASB,
2.372%, 11/15/2045 570,000 587,265
Series 2012-CR3, Class A3,
2.822%, 11/15/2045 1,269,000 1,298,791
1,886,056
39
John Hancock Funds IIPortfolio of Investments — November 30, 2012 (Unaudited) (showing percentage of total net assets)Core Bond Fund (continued)
Shares or
Principal
Amount Value
COLLATERALIZED MORTGAGE
OBLIGATIONS (continued)
U.S. Government Agency - 3.1%
Federal Home Loan Mortgage Corp.
Series K014, Class A2,
3.871%, 04/25/2021 $ 887,000 $ 1,015,656
Series 3664, Class DA,
4.000%, 11/15/2037 601,449 617,714
Series K005, Class A2,
4.317%, 11/25/2019 914,000 1,070,629
Series K003, Class AAB,
4.768%, 05/25/2018 710,000 802,111
Series 3407, Class B,
5.500%, 01/15/2038 735,000 794,229
Copyright © 2013 www.secdatabase.com. All Rights Reserved.Please Consider the Environment Before Printing This Document
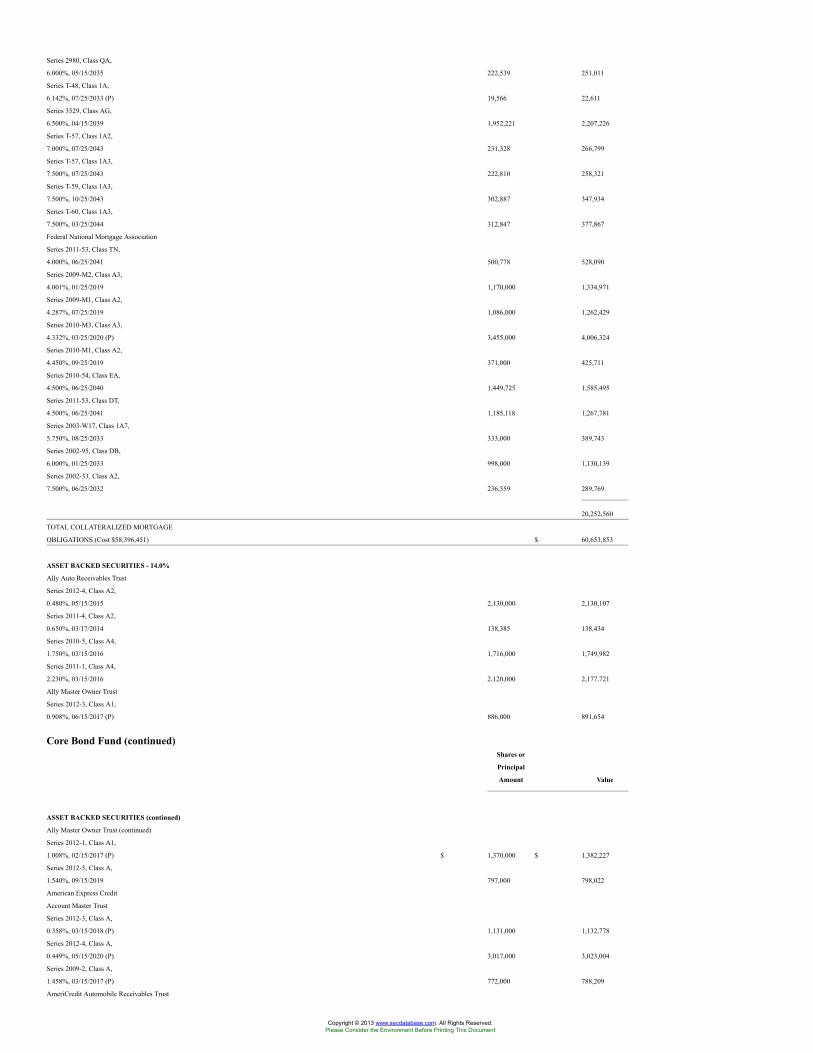
Series 2980, Class QA,
6.000%, 05/15/2035 222,539 251,011
Series T-48, Class 1A,
6.142%, 07/25/2033 (P) 19,566 22,611
Series 3529, Class AG,
6.500%, 04/15/2039 1,952,221 2,207,226
Series T-57, Class 1A2,
7.000%, 07/25/2043 231,328 266,799
Series T-57, Class 1A3,
7.500%, 07/25/2043 222,810 258,321
Series T-59, Class 1A3,
7.500%, 10/25/2043 302,887 347,934
Series T-60, Class 1A3,
7.500%, 03/25/2044 312,847 377,867
Federal National Mortgage Association
Series 2011-53, Class TN,
4.000%, 06/25/2041 500,778 528,090
Series 2009-M2, Class A3,
4.001%, 01/25/2019 1,170,000 1,334,971
Series 2009-M1, Class A2,
4.287%, 07/25/2019 1,086,000 1,262,429
Series 2010-M3, Class A3,
4.332%, 03/25/2020 (P) 3,455,000 4,006,324
Series 2010-M1, Class A2,
4.450%, 09/25/2019 371,000 425,711
Series 2010-54, Class EA,
4.500%, 06/25/2040 1,449,725 1,585,495
Series 2011-53, Class DT,
4.500%, 06/25/2041 1,185,118 1,267,781
Series 2003-W17, Class 1A7,
5.750%, 08/25/2033 333,000 389,743
Series 2002-95, Class DB,
6.000%, 01/25/2033 998,000 1,130,139
Series 2002-33, Class A2,
7.500%, 06/25/2032 236,559 289,769
20,252,560
TOTAL COLLATERALIZED MORTGAGE
OBLIGATIONS (Cost $58,396,451) $ 60,653,853
ASSET BACKED SECURITIES - 14.0%
Ally Auto Receivables Trust
Series 2012-4, Class A2,
0.480%, 05/15/2015 2,130,000 2,130,107
Series 2011-4, Class A2,
0.650%, 03/17/2014 138,385 138,434
Series 2010-5, Class A4,
1.750%, 03/15/2016 1,716,000 1,749,982
Series 2011-1, Class A4,
2.230%, 03/15/2016 2,120,000 2,177,721
Ally Master Owner Trust
Series 2012-3, Class A1,
0.908%, 06/15/2017 (P) 886,000 891,654
Core Bond Fund (continued)Shares or
Principal
Amount Value
ASSET BACKED SECURITIES (continued)
Ally Master Owner Trust (continued)
Series 2012-1, Class A1,
1.008%, 02/15/2017 (P) $ 1,370,000 $ 1,382,227
Series 2012-5, Class A,
1.540%, 09/15/2019 797,000 798,022
American Express Credit
Account Master Trust
Series 2012-3, Class A,
0.358%, 03/15/2018 (P) 1,131,000 1,132,778
Series 2012-4, Class A,
0.449%, 05/15/2020 (P) 3,017,000 3,023,004
Series 2009-2, Class A,
1.458%, 03/15/2017 (P) 772,000 788,209
AmeriCredit Automobile Receivables Trust
Copyright © 2013 www.secdatabase.com. All Rights Reserved.Please Consider the Environment Before Printing This Document
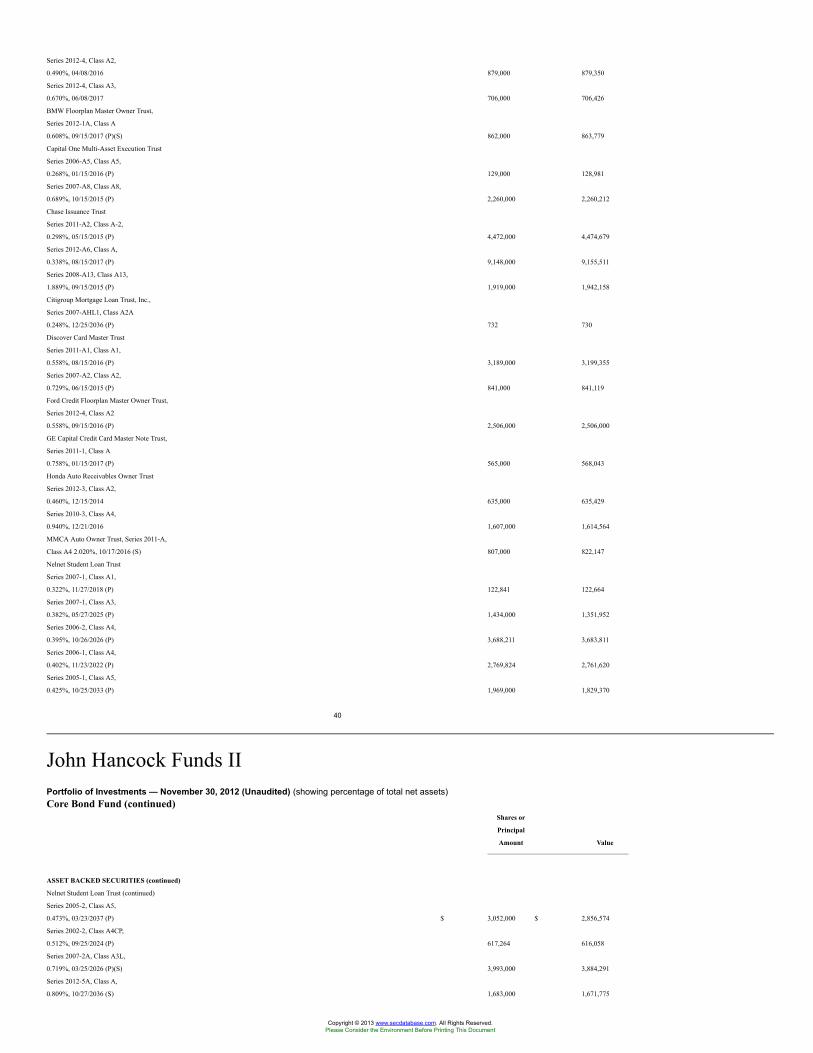
Series 2012-4, Class A2,
0.490%, 04/08/2016 879,000 879,350
Series 2012-4, Class A3,
0.670%, 06/08/2017 706,000 706,426
BMW Floorplan Master Owner Trust,
Series 2012-1A, Class A
0.608%, 09/15/2017 (P)(S) 862,000 863,779
Capital One Multi-Asset Execution Trust
Series 2006-A5, Class A5,
0.268%, 01/15/2016 (P) 129,000 128,981
Series 2007-A8, Class A8,
0.689%, 10/15/2015 (P) 2,260,000 2,260,212
Chase Issuance Trust
Series 2011-A2, Class A-2,
0.298%, 05/15/2015 (P) 4,472,000 4,474,679
Series 2012-A6, Class A,
0.338%, 08/15/2017 (P) 9,148,000 9,155,511
Series 2008-A13, Class A13,
1.889%, 09/15/2015 (P) 1,919,000 1,942,158
Citigroup Mortgage Loan Trust, Inc.,
Series 2007-AHL1, Class A2A
0.248%, 12/25/2036 (P) 732 730
Discover Card Master Trust
Series 2011-A1, Class A1,
0.558%, 08/15/2016 (P) 3,189,000 3,199,355
Series 2007-A2, Class A2,
0.729%, 06/15/2015 (P) 841,000 841,119
Ford Credit Floorplan Master Owner Trust,
Series 2012-4, Class A2
0.558%, 09/15/2016 (P) 2,506,000 2,506,000
GE Capital Credit Card Master Note Trust,
Series 2011-1, Class A
0.758%, 01/15/2017 (P) 565,000 568,043
Honda Auto Receivables Owner Trust
Series 2012-3, Class A2,
0.460%, 12/15/2014 635,000 635,429
Series 2010-3, Class A4,
0.940%, 12/21/2016 1,607,000 1,614,564
MMCA Auto Owner Trust, Series 2011-A,
Class A4 2.020%, 10/17/2016 (S) 807,000 822,147
Nelnet Student Loan Trust
Series 2007-1, Class A1,
0.322%, 11/27/2018 (P) 122,841 122,664
Series 2007-1, Class A3,
0.382%, 05/27/2025 (P) 1,434,000 1,351,952
Series 2006-2, Class A4,
0.395%, 10/26/2026 (P) 3,688,211 3,683,811
Series 2006-1, Class A4,
0.402%, 11/23/2022 (P) 2,769,824 2,761,620
Series 2005-1, Class A5,
0.425%, 10/25/2033 (P) 1,969,000 1,829,370
40
John Hancock Funds IIPortfolio of Investments — November 30, 2012 (Unaudited) (showing percentage of total net assets)Core Bond Fund (continued)
Shares or
Principal
Amount Value
ASSET BACKED SECURITIES (continued)
Nelnet Student Loan Trust (continued)
Series 2005-2, Class A5,
0.473%, 03/23/2037 (P) $ 3,052,000 $ 2,856,574
Series 2002-2, Class A4CP,
0.512%, 09/25/2024 (P) 617,264 616,058
Series 2007-2A, Class A3L,
0.719%, 03/25/2026 (P)(S) 3,993,000 3,884,291
Series 2012-5A, Class A,
0.809%, 10/27/2036 (S) 1,683,000 1,671,775
Copyright © 2013 www.secdatabase.com. All Rights Reserved.Please Consider the Environment Before Printing This Document
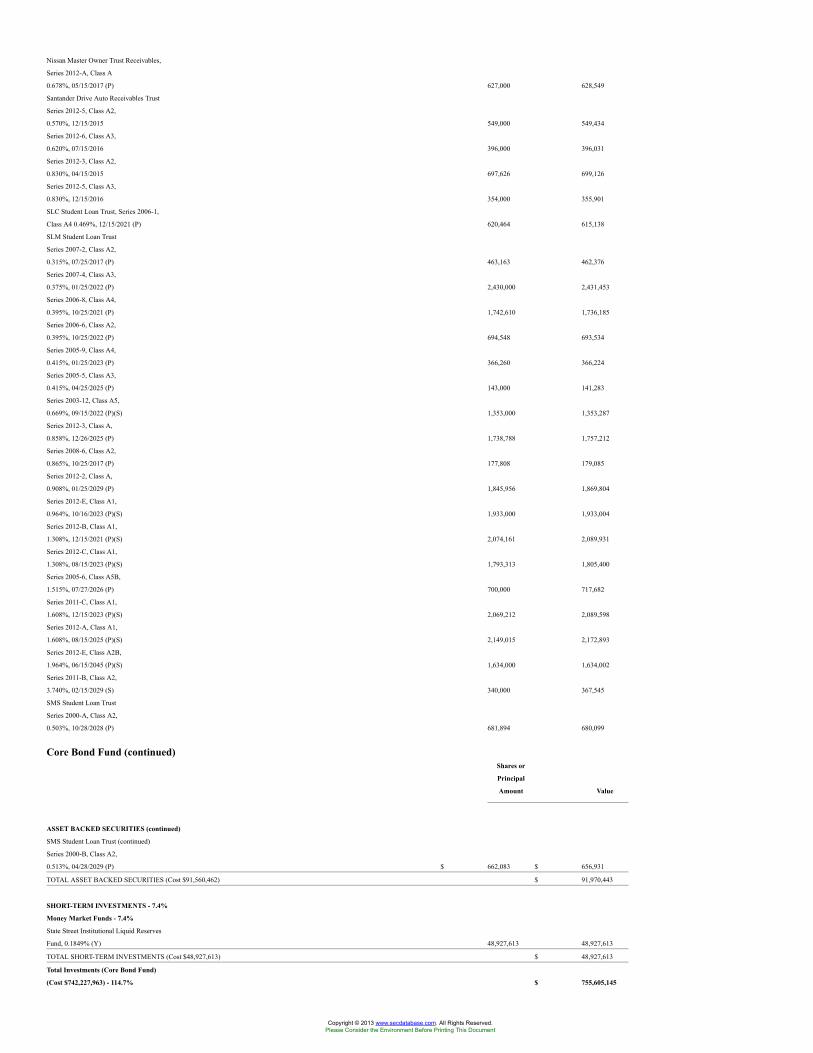
Nissan Master Owner Trust Receivables,
Series 2012-A, Class A
0.678%, 05/15/2017 (P) 627,000 628,549
Santander Drive Auto Receivables Trust
Series 2012-5, Class A2,
0.570%, 12/15/2015 549,000 549,434
Series 2012-6, Class A3,
0.620%, 07/15/2016 396,000 396,031
Series 2012-3, Class A2,
0.830%, 04/15/2015 697,626 699,126
Series 2012-5, Class A3,
0.830%, 12/15/2016 354,000 355,901
SLC Student Loan Trust, Series 2006-1,
Class A4 0.469%, 12/15/2021 (P) 620,464 615,138
SLM Student Loan Trust
Series 2007-2, Class A2,
0.315%, 07/25/2017 (P) 463,163 462,376
Series 2007-4, Class A3,
0.375%, 01/25/2022 (P) 2,430,000 2,431,453
Series 2006-8, Class A4,
0.395%, 10/25/2021 (P) 1,742,610 1,736,185
Series 2006-6, Class A2,
0.395%, 10/25/2022 (P) 694,548 693,534
Series 2005-9, Class A4,
0.415%, 01/25/2023 (P) 366,260 366,224
Series 2005-5, Class A3,
0.415%, 04/25/2025 (P) 143,000 141,283
Series 2003-12, Class A5,
0.669%, 09/15/2022 (P)(S) 1,353,000 1,353,287
Series 2012-3, Class A,
0.858%, 12/26/2025 (P) 1,738,788 1,757,212
Series 2008-6, Class A2,
0.865%, 10/25/2017 (P) 177,808 179,085
Series 2012-2, Class A,
0.908%, 01/25/2029 (P) 1,845,956 1,869,804
Series 2012-E, Class A1,
0.964%, 10/16/2023 (P)(S) 1,933,000 1,933,004
Series 2012-B, Class A1,
1.308%, 12/15/2021 (P)(S) 2,074,161 2,089,931
Series 2012-C, Class A1,
1.308%, 08/15/2023 (P)(S) 1,793,313 1,805,400
Series 2005-6, Class A5B,
1.515%, 07/27/2026 (P) 700,000 717,682
Series 2011-C, Class A1,
1.608%, 12/15/2023 (P)(S) 2,069,212 2,089,598
Series 2012-A, Class A1,
1.608%, 08/15/2025 (P)(S) 2,149,015 2,172,893
Series 2012-E, Class A2B,
1.964%, 06/15/2045 (P)(S) 1,634,000 1,634,002
Series 2011-B, Class A2,
3.740%, 02/15/2029 (S) 340,000 367,545
SMS Student Loan Trust
Series 2000-A, Class A2,
0.503%, 10/28/2028 (P) 681,894 680,099
Core Bond Fund (continued)Shares or
Principal
Amount Value
ASSET BACKED SECURITIES (continued)
SMS Student Loan Trust (continued)
Series 2000-B, Class A2,
0.513%, 04/28/2029 (P) $ 662,083 $ 656,931
TOTAL ASSET BACKED SECURITIES (Cost $91,560,462) $ 91,970,443
SHORT-TERM INVESTMENTS - 7.4%
Money Market Funds - 7.4%
State Street Institutional Liquid Reserves
Fund, 0.1849% (Y) 48,927,613 48,927,613
TOTAL SHORT-TERM INVESTMENTS (Cost $48,927,613) $ 48,927,613
Total Investments (Core Bond Fund)
(Cost $742,227,963) - 114.7% $ 755,605,145
Copyright © 2013 www.secdatabase.com. All Rights Reserved.Please Consider the Environment Before Printing This Document
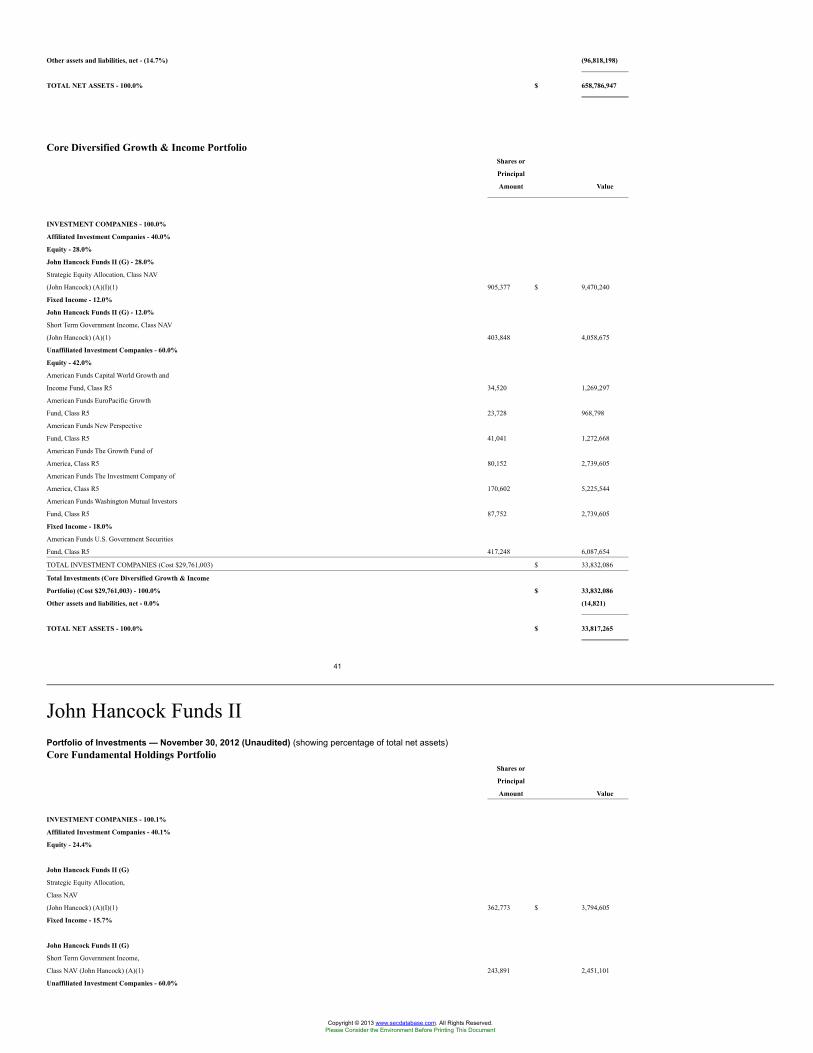
Other assets and liabilities, net - (14.7%) (96,818,198)
TOTAL NET ASSETS - 100.0% $ 658,786,947
Core Diversified Growth & Income PortfolioShares or
Principal
Amount Value
INVESTMENT COMPANIES - 100.0%
Affiliated Investment Companies - 40.0%
Equity - 28.0%
John Hancock Funds II (G) - 28.0%
Strategic Equity Allocation, Class NAV
(John Hancock) (A)(I)(1) 905,377 $ 9,470,240
Fixed Income - 12.0%
John Hancock Funds II (G) - 12.0%
Short Term Government Income, Class NAV
(John Hancock) (A)(1) 403,848 4,058,675
Unaffiliated Investment Companies - 60.0%
Equity - 42.0%
American Funds Capital World Growth and
Income Fund, Class R5 34,520 1,269,297
American Funds EuroPacific Growth
Fund, Class R5 23,728 968,798
American Funds New Perspective
Fund, Class R5 41,041 1,272,668
American Funds The Growth Fund of
America, Class R5 80,152 2,739,605
American Funds The Investment Company of
America, Class R5 170,602 5,225,544
American Funds Washington Mutual Investors
Fund, Class R5 87,752 2,739,605
Fixed Income - 18.0%
American Funds U.S. Government Securities
Fund, Class R5 417,248 6,087,654
TOTAL INVESTMENT COMPANIES (Cost $29,761,003) $ 33,832,086
Total Investments (Core Diversified Growth & Income
Portfolio) (Cost $29,761,003) - 100.0% $ 33,832,086
Other assets and liabilities, net - 0.0% (14,821)
TOTAL NET ASSETS - 100.0% $ 33,817,265
41
John Hancock Funds IIPortfolio of Investments — November 30, 2012 (Unaudited) (showing percentage of total net assets)Core Fundamental Holdings Portfolio
Shares or
Principal
Amount Value
INVESTMENT COMPANIES - 100.1%
Affiliated Investment Companies - 40.1%
Equity - 24.4%
John Hancock Funds II (G)
Strategic Equity Allocation,
Class NAV
(John Hancock) (A)(I)(1) 362,773 $ 3,794,605
Fixed Income - 15.7%
John Hancock Funds II (G)
Short Term Government Income,
Class NAV (John Hancock) (A)(1) 243,891 2,451,101
Unaffiliated Investment Companies - 60.0%
Copyright © 2013 www.secdatabase.com. All Rights Reserved.Please Consider the Environment Before Printing This Document
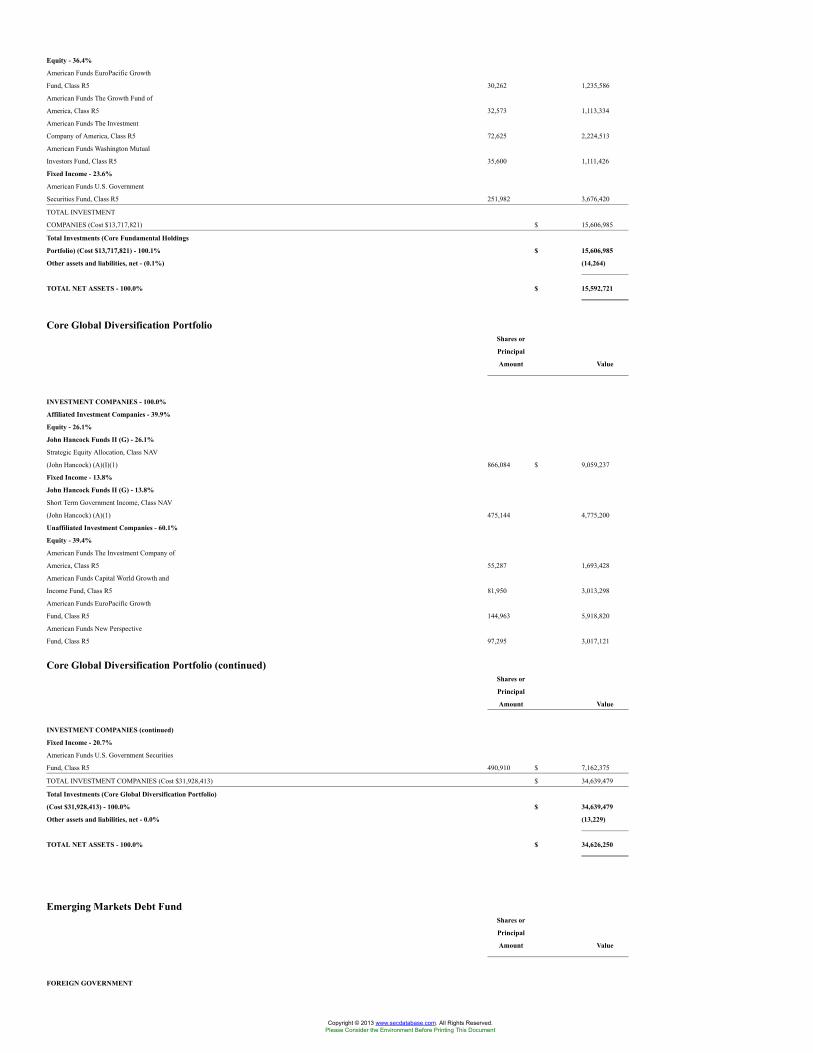
Equity - 36.4%
American Funds EuroPacific Growth
Fund, Class R5 30,262 1,235,586
American Funds The Growth Fund of
America, Class R5 32,573 1,113,334
American Funds The Investment
Company of America, Class R5 72,625 2,224,513
American Funds Washington Mutual
Investors Fund, Class R5 35,600 1,111,426
Fixed Income - 23.6%
American Funds U.S. Government
Securities Fund, Class R5 251,982 3,676,420
TOTAL INVESTMENT
COMPANIES (Cost $13,717,821) $ 15,606,985
Total Investments (Core Fundamental Holdings
Portfolio) (Cost $13,717,821) - 100.1% $ 15,606,985
Other assets and liabilities, net - (0.1%) (14,264)
TOTAL NET ASSETS - 100.0% $ 15,592,721
Core Global Diversification PortfolioShares or
Principal
Amount Value
INVESTMENT COMPANIES - 100.0%
Affiliated Investment Companies - 39.9%
Equity - 26.1%
John Hancock Funds II (G) - 26.1%
Strategic Equity Allocation, Class NAV
(John Hancock) (A)(I)(1) 866,084 $ 9,059,237
Fixed Income - 13.8%
John Hancock Funds II (G) - 13.8%
Short Term Government Income, Class NAV
(John Hancock) (A)(1) 475,144 4,775,200
Unaffiliated Investment Companies - 60.1%
Equity - 39.4%
American Funds The Investment Company of
America, Class R5 55,287 1,693,428
American Funds Capital World Growth and
Income Fund, Class R5 81,950 3,013,298
American Funds EuroPacific Growth
Fund, Class R5 144,963 5,918,820
American Funds New Perspective
Fund, Class R5 97,295 3,017,121
Core Global Diversification Portfolio (continued)Shares or
Principal
Amount Value
INVESTMENT COMPANIES (continued)
Fixed Income - 20.7%
American Funds U.S. Government Securities
Fund, Class R5 490,910 $ 7,162,375
TOTAL INVESTMENT COMPANIES (Cost $31,928,413) $ 34,639,479
Total Investments (Core Global Diversification Portfolio)
(Cost $31,928,413) - 100.0% $ 34,639,479
Other assets and liabilities, net - 0.0% (13,229)
TOTAL NET ASSETS - 100.0% $ 34,626,250
Emerging Markets Debt FundShares or
Principal
Amount Value
FOREIGN GOVERNMENT
Copyright © 2013 www.secdatabase.com. All Rights Reserved.Please Consider the Environment Before Printing This Document
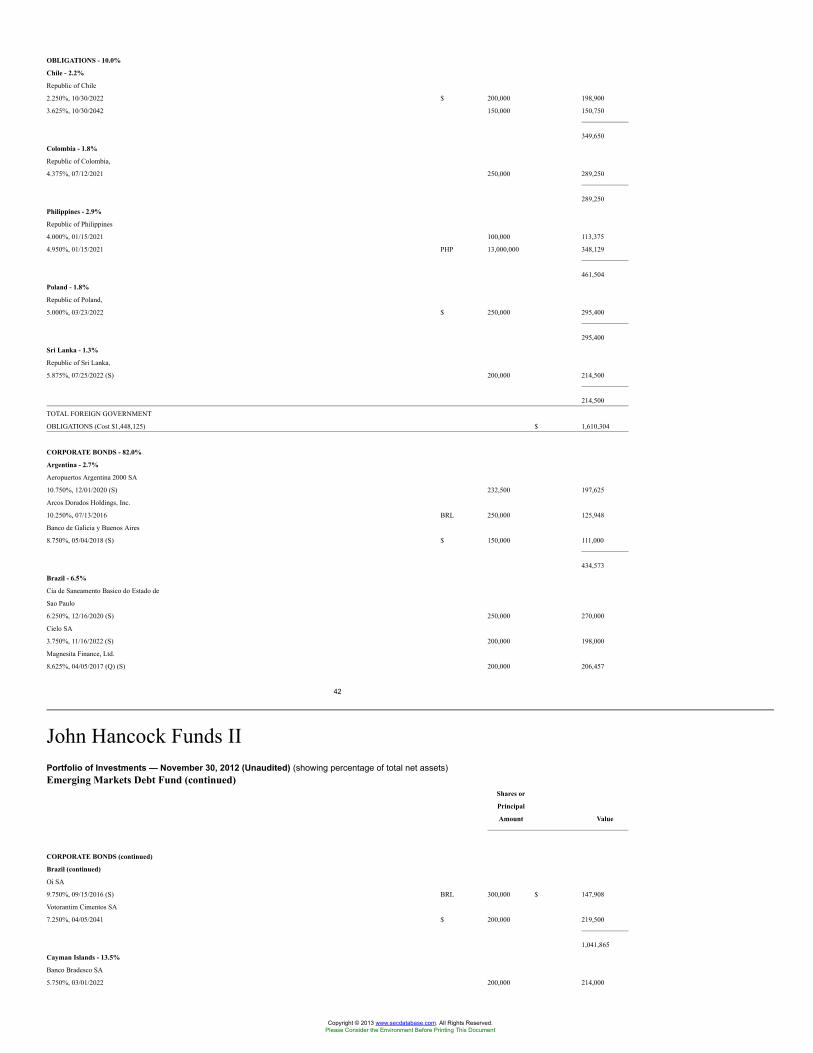
OBLIGATIONS - 10.0%
Chile - 2.2%
Republic of Chile
2.250%, 10/30/2022 $ 200,000 198,900
3.625%, 10/30/2042 150,000 150,750
349,650
Colombia - 1.8%
Republic of Colombia,
4.375%, 07/12/2021 250,000 289,250
289,250
Philippines - 2.9%
Republic of Philippines
4.000%, 01/15/2021 100,000 113,375
4.950%, 01/15/2021 PHP 13,000,000 348,129
461,504
Poland - 1.8%
Republic of Poland,
5.000%, 03/23/2022 $ 250,000 295,400
295,400
Sri Lanka - 1.3%
Republic of Sri Lanka,
5.875%, 07/25/2022 (S) 200,000 214,500
214,500
TOTAL FOREIGN GOVERNMENT
OBLIGATIONS (Cost $1,448,125) $ 1,610,304
CORPORATE BONDS - 82.0%
Argentina - 2.7%
Aeropuertos Argentina 2000 SA
10.750%, 12/01/2020 (S) 232,500 197,625
Arcos Dorados Holdings, Inc.
10.250%, 07/13/2016 BRL 250,000 125,948
Banco de Galicia y Buenos Aires
8.750%, 05/04/2018 (S) $ 150,000 111,000
434,573
Brazil - 6.5%
Cia de Saneamento Basico do Estado de
Sao Paulo
6.250%, 12/16/2020 (S) 250,000 270,000
Cielo SA
3.750%, 11/16/2022 (S) 200,000 198,000
Magnesita Finance, Ltd.
8.625%, 04/05/2017 (Q) (S) 200,000 206,457
42
John Hancock Funds IIPortfolio of Investments — November 30, 2012 (Unaudited) (showing percentage of total net assets)Emerging Markets Debt Fund (continued)
Shares or
Principal
Amount Value
CORPORATE BONDS (continued)
Brazil (continued)
Oi SA
9.750%, 09/15/2016 (S) BRL 300,000 $ 147,908
Votorantim Cimentos SA
7.250%, 04/05/2041 $ 200,000 219,500
1,041,865
Cayman Islands - 13.5%
Banco Bradesco SA
5.750%, 03/01/2022 200,000 214,000
Copyright © 2013 www.secdatabase.com. All Rights Reserved.Please Consider the Environment Before Printing This Document
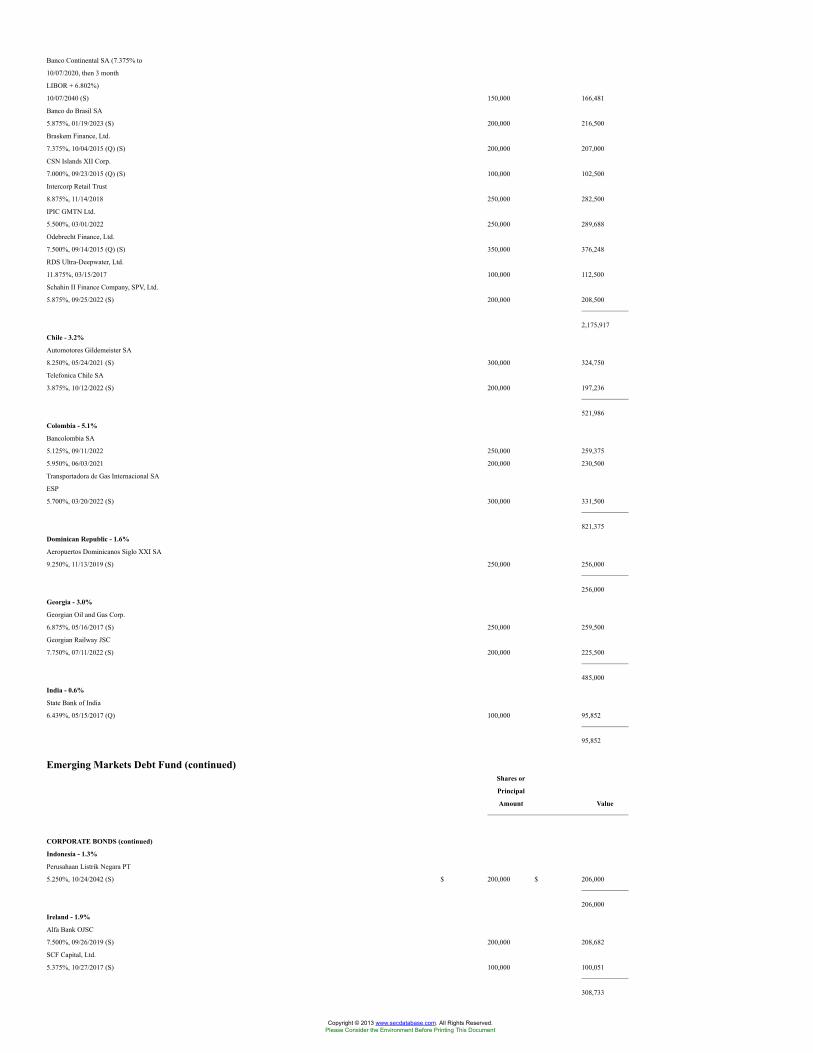
Banco Continental SA (7.375% to
10/07/2020, then 3 month
LIBOR + 6.802%)
10/07/2040 (S) 150,000 166,481
Banco do Brasil SA
5.875%, 01/19/2023 (S) 200,000 216,500
Braskem Finance, Ltd.
7.375%, 10/04/2015 (Q) (S) 200,000 207,000
CSN Islands XII Corp.
7.000%, 09/23/2015 (Q) (S) 100,000 102,500
Intercorp Retail Trust
8.875%, 11/14/2018 250,000 282,500
IPIC GMTN Ltd.
5.500%, 03/01/2022 250,000 289,688
Odebrecht Finance, Ltd.
7.500%, 09/14/2015 (Q) (S) 350,000 376,248
RDS Ultra-Deepwater, Ltd.
11.875%, 03/15/2017 100,000 112,500
Schahin II Finance Company, SPV, Ltd.
5.875%, 09/25/2022 (S) 200,000 208,500
2,175,917
Chile - 3.2%
Automotores Gildemeister SA
8.250%, 05/24/2021 (S) 300,000 324,750
Telefonica Chile SA
3.875%, 10/12/2022 (S) 200,000 197,236
521,986
Colombia - 5.1%
Bancolombia SA
5.125%, 09/11/2022 250,000 259,375
5.950%, 06/03/2021 200,000 230,500
Transportadora de Gas Internacional SA
ESP
5.700%, 03/20/2022 (S) 300,000 331,500
821,375
Dominican Republic - 1.6%
Aeropuertos Dominicanos Siglo XXI SA
9.250%, 11/13/2019 (S) 250,000 256,000
256,000
Georgia - 3.0%
Georgian Oil and Gas Corp.
6.875%, 05/16/2017 (S) 250,000 259,500
Georgian Railway JSC
7.750%, 07/11/2022 (S) 200,000 225,500
485,000
India - 0.6%
State Bank of India
6.439%, 05/15/2017 (Q) 100,000 95,852
95,852
Emerging Markets Debt Fund (continued)Shares or
Principal
Amount Value
CORPORATE BONDS (continued)
Indonesia - 1.3%
Perusahaan Listrik Negara PT
5.250%, 10/24/2042 (S) $ 200,000 $ 206,000
206,000
Ireland - 1.9%
Alfa Bank OJSC
7.500%, 09/26/2019 (S) 200,000 208,682
SCF Capital, Ltd.
5.375%, 10/27/2017 (S) 100,000 100,051
308,733
Copyright © 2013 www.secdatabase.com. All Rights Reserved.Please Consider the Environment Before Printing This Document
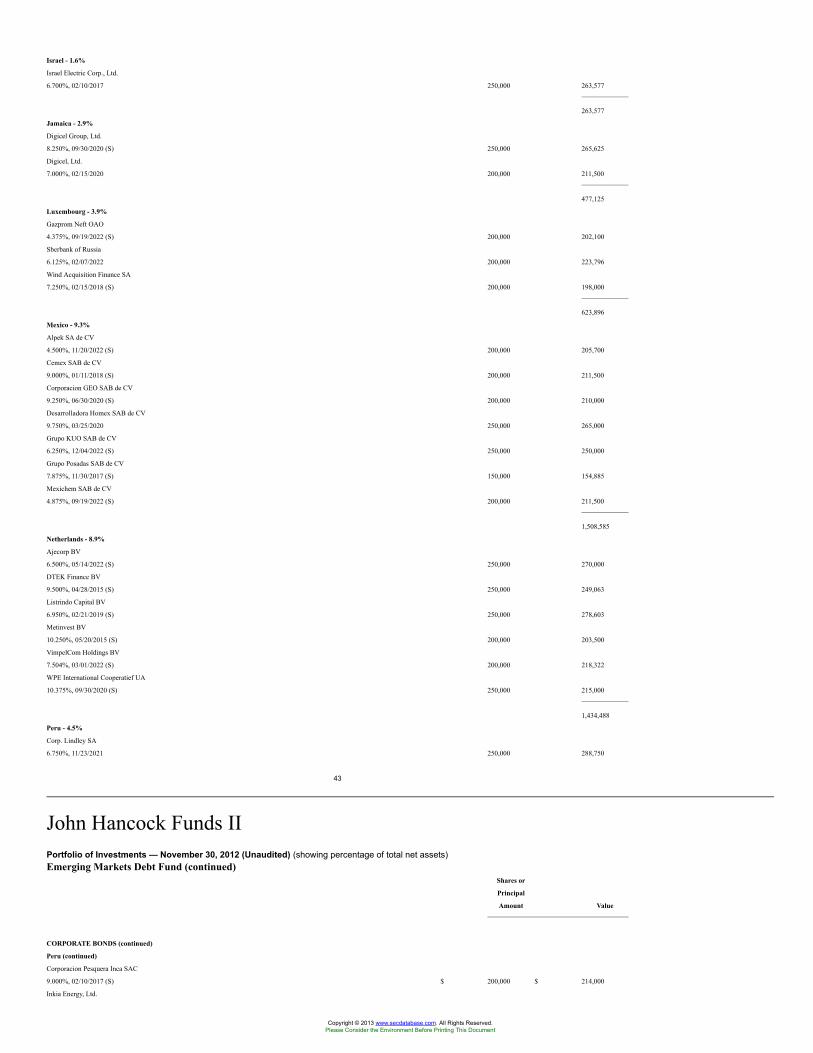
Israel - 1.6%
Israel Electric Corp., Ltd.
6.700%, 02/10/2017 250,000 263,577
263,577
Jamaica - 2.9%
Digicel Group, Ltd.
8.250%, 09/30/2020 (S) 250,000 265,625
Digicel, Ltd.
7.000%, 02/15/2020 200,000 211,500
477,125
Luxembourg - 3.9%
Gazprom Neft OAO
4.375%, 09/19/2022 (S) 200,000 202,100
Sberbank of Russia
6.125%, 02/07/2022 200,000 223,796
Wind Acquisition Finance SA
7.250%, 02/15/2018 (S) 200,000 198,000
623,896
Mexico - 9.3%
Alpek SA de CV
4.500%, 11/20/2022 (S) 200,000 205,700
Cemex SAB de CV
9.000%, 01/11/2018 (S) 200,000 211,500
Corporacion GEO SAB de CV
9.250%, 06/30/2020 (S) 200,000 210,000
Desarrolladora Homex SAB de CV
9.750%, 03/25/2020 250,000 265,000
Grupo KUO SAB de CV
6.250%, 12/04/2022 (S) 250,000 250,000
Grupo Posadas SAB de CV
7.875%, 11/30/2017 (S) 150,000 154,885
Mexichem SAB de CV
4.875%, 09/19/2022 (S) 200,000 211,500
1,508,585
Netherlands - 8.9%
Ajecorp BV
6.500%, 05/14/2022 (S) 250,000 270,000
DTEK Finance BV
9.500%, 04/28/2015 (S) 250,000 249,063
Listrindo Capital BV
6.950%, 02/21/2019 (S) 250,000 278,603
Metinvest BV
10.250%, 05/20/2015 (S) 200,000 203,500
VimpelCom Holdings BV
7.504%, 03/01/2022 (S) 200,000 218,322
WPE International Cooperatief UA
10.375%, 09/30/2020 (S) 250,000 215,000
1,434,488
Peru - 4.5%
Corp. Lindley SA
6.750%, 11/23/2021 250,000 288,750
43
John Hancock Funds IIPortfolio of Investments — November 30, 2012 (Unaudited) (showing percentage of total net assets)Emerging Markets Debt Fund (continued)
Shares or
Principal
Amount Value
CORPORATE BONDS (continued)
Peru (continued)
Corporacion Pesquera Inca SAC
9.000%, 02/10/2017 (S) $ 200,000 $ 214,000
Inkia Energy, Ltd.
Copyright © 2013 www.secdatabase.com. All Rights Reserved.Please Consider the Environment Before Printing This Document
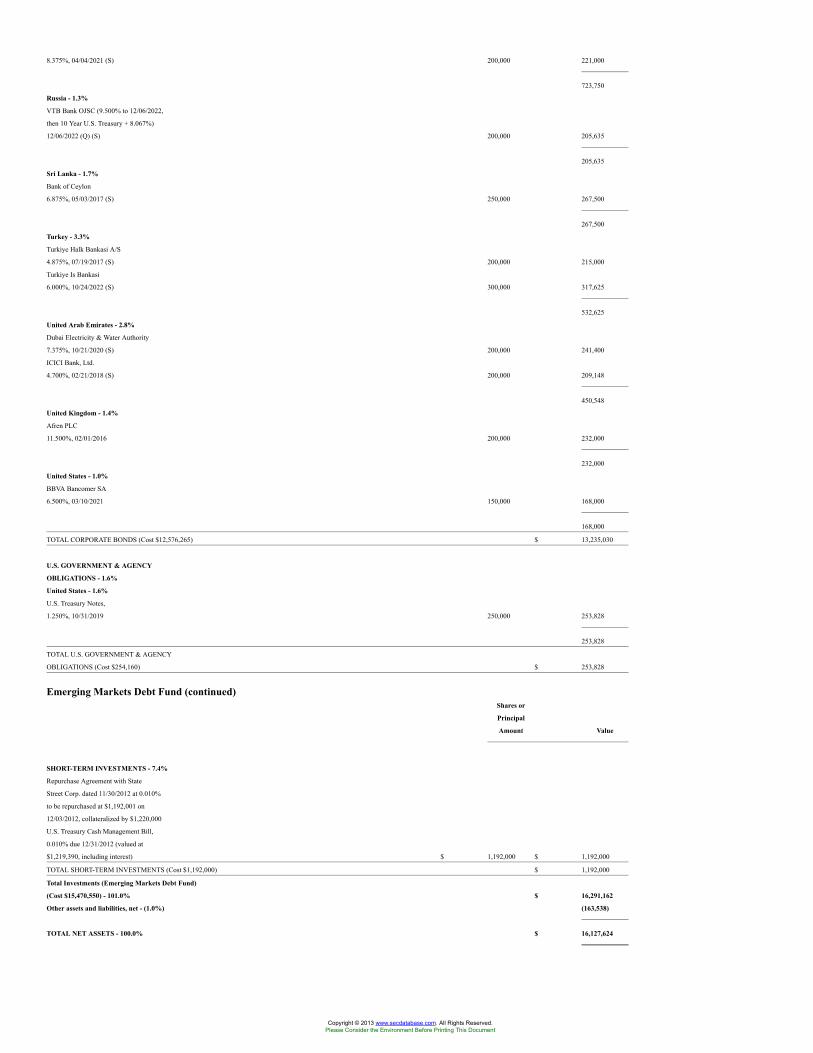
8.375%, 04/04/2021 (S) 200,000 221,000
723,750
Russia - 1.3%
VTB Bank OJSC (9.500% to 12/06/2022,
then 10 Year U.S. Treasury + 8.067%)
12/06/2022 (Q) (S) 200,000 205,635
205,635
Sri Lanka - 1.7%
Bank of Ceylon
6.875%, 05/03/2017 (S) 250,000 267,500
267,500
Turkey - 3.3%
Turkiye Halk Bankasi A/S
4.875%, 07/19/2017 (S) 200,000 215,000
Turkiye Is Bankasi
6.000%, 10/24/2022 (S) 300,000 317,625
532,625
United Arab Emirates - 2.8%
Dubai Electricity & Water Authority
7.375%, 10/21/2020 (S) 200,000 241,400
ICICI Bank, Ltd.
4.700%, 02/21/2018 (S) 200,000 209,148
450,548
United Kingdom - 1.4%
Afren PLC
11.500%, 02/01/2016 200,000 232,000
232,000
United States - 1.0%
BBVA Bancomer SA
6.500%, 03/10/2021 150,000 168,000
168,000
TOTAL CORPORATE BONDS (Cost $12,576,265) $ 13,235,030
U.S. GOVERNMENT & AGENCY
OBLIGATIONS - 1.6%
United States - 1.6%
U.S. Treasury Notes,
1.250%, 10/31/2019 250,000 253,828
253,828
TOTAL U.S. GOVERNMENT & AGENCY
OBLIGATIONS (Cost $254,160) $ 253,828
Emerging Markets Debt Fund (continued)Shares or
Principal
Amount Value
SHORT-TERM INVESTMENTS - 7.4%
Repurchase Agreement with State
Street Corp. dated 11/30/2012 at 0.010%
to be repurchased at $1,192,001 on
12/03/2012, collateralized by $1,220,000
U.S. Treasury Cash Management Bill,
0.010% due 12/31/2012 (valued at
$1,219,390, including interest) $ 1,192,000 $ 1,192,000
TOTAL SHORT-TERM INVESTMENTS (Cost $1,192,000) $ 1,192,000
Total Investments (Emerging Markets Debt Fund)
(Cost $15,470,550) - 101.0% $ 16,291,162
Other assets and liabilities, net - (1.0%) (163,538)
TOTAL NET ASSETS - 100.0% $ 16,127,624
Copyright © 2013 www.secdatabase.com. All Rights Reserved.Please Consider the Environment Before Printing This Document
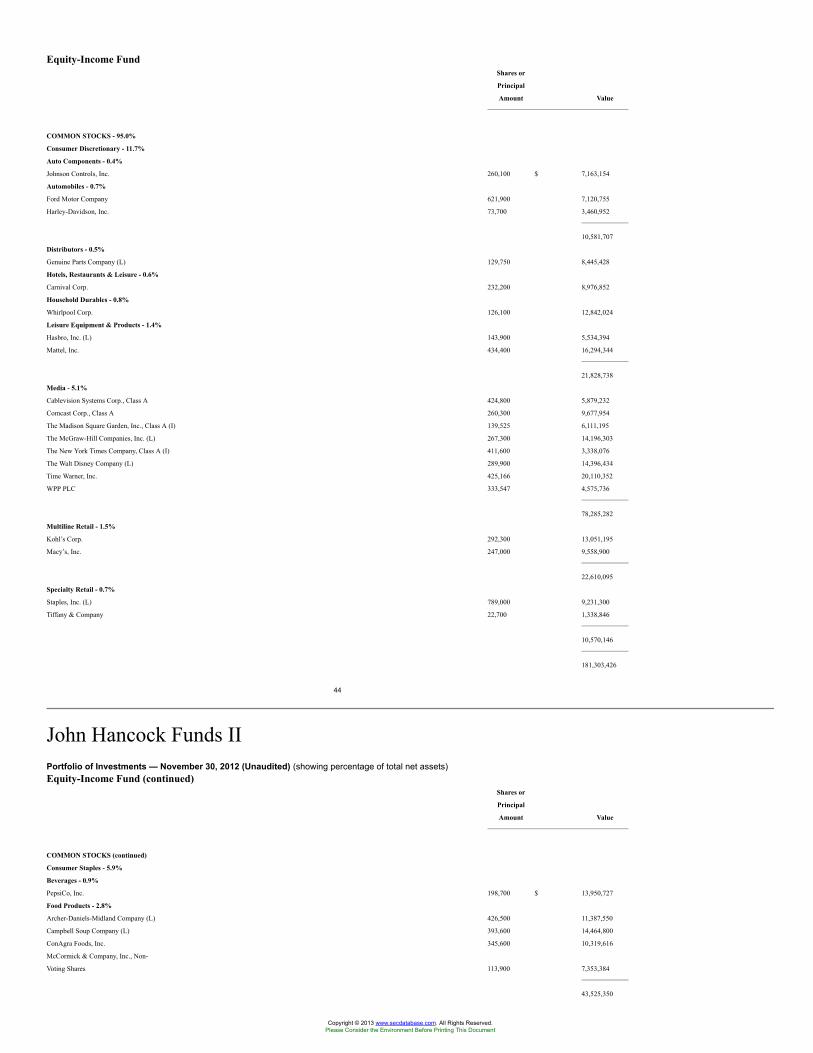
Equity-Income FundShares or
Principal
Amount Value
COMMON STOCKS - 95.0%
Consumer Discretionary - 11.7%
Auto Components - 0.4%
Johnson Controls, Inc. 260,100 $ 7,163,154
Automobiles - 0.7%
Ford Motor Company 621,900 7,120,755
Harley-Davidson, Inc. 73,700 3,460,952
10,581,707
Distributors - 0.5%
Genuine Parts Company (L) 129,750 8,445,428
Hotels, Restaurants & Leisure - 0.6%
Carnival Corp. 232,200 8,976,852
Household Durables - 0.8%
Whirlpool Corp. 126,100 12,842,024
Leisure Equipment & Products - 1.4%
Hasbro, Inc. (L) 143,900 5,534,394
Mattel, Inc. 434,400 16,294,344
21,828,738
Media - 5.1%
Cablevision Systems Corp., Class A 424,800 5,879,232
Comcast Corp., Class A 260,300 9,677,954
The Madison Square Garden, Inc., Class A (I) 139,525 6,111,195
The McGraw-Hill Companies, Inc. (L) 267,300 14,196,303
The New York Times Company, Class A (I) 411,600 3,338,076
The Walt Disney Company (L) 289,900 14,396,434
Time Warner, Inc. 425,166 20,110,352
WPP PLC 333,547 4,575,736
78,285,282
Multiline Retail - 1.5%
Kohl’s Corp. 292,300 13,051,195
Macy’s, Inc. 247,000 9,558,900
22,610,095
Specialty Retail - 0.7%
Staples, Inc. (L) 789,000 9,231,300
Tiffany & Company 22,700 1,338,846
10,570,146
181,303,426
44
John Hancock Funds IIPortfolio of Investments — November 30, 2012 (Unaudited) (showing percentage of total net assets)Equity-Income Fund (continued)
Shares or
Principal
Amount Value
COMMON STOCKS (continued)
Consumer Staples - 5.9%
Beverages - 0.9%
PepsiCo, Inc. 198,700 $ 13,950,727
Food Products - 2.8%
Archer-Daniels-Midland Company (L) 426,500 11,387,550
Campbell Soup Company (L) 393,600 14,464,800
ConAgra Foods, Inc. 345,600 10,319,616
McCormick & Company, Inc., Non-
Voting Shares 113,900 7,353,384
43,525,350
Copyright © 2013 www.secdatabase.com. All Rights Reserved.Please Consider the Environment Before Printing This Document
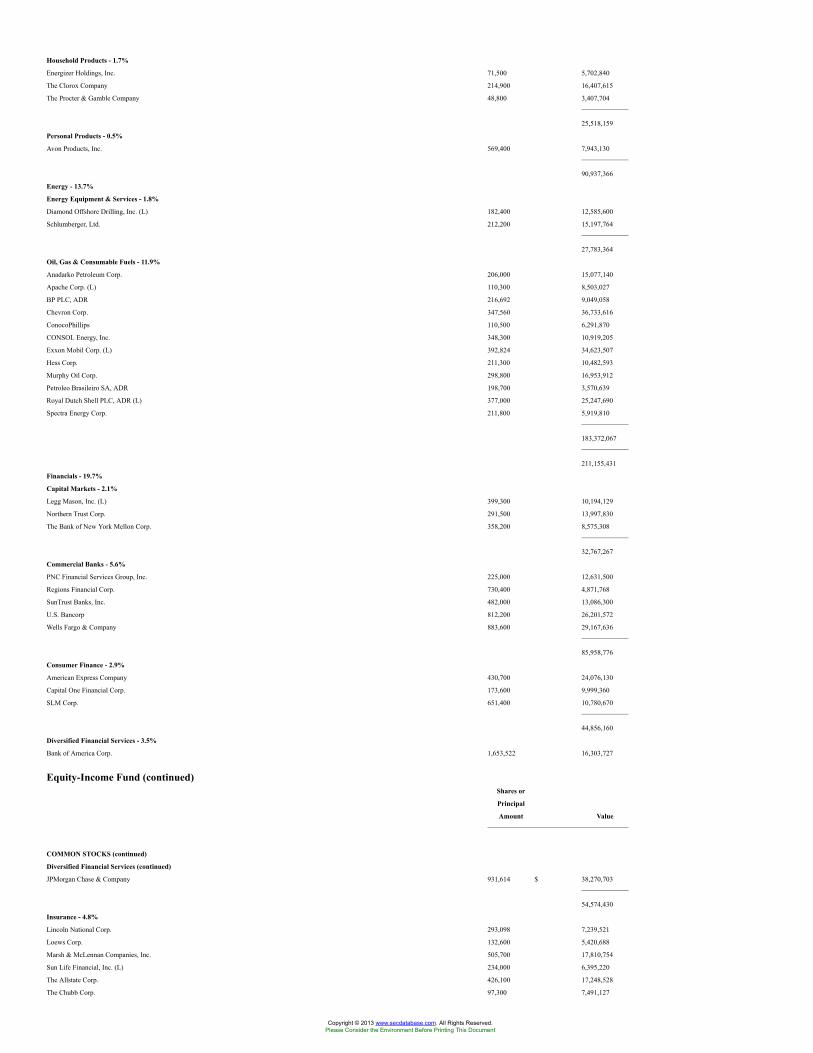
Household Products - 1.7%
Energizer Holdings, Inc. 71,500 5,702,840
The Clorox Company 214,900 16,407,615
The Procter & Gamble Company 48,800 3,407,704
25,518,159
Personal Products - 0.5%
Avon Products, Inc. 569,400 7,943,130
90,937,366
Energy - 13.7%
Energy Equipment & Services - 1.8%
Diamond Offshore Drilling, Inc. (L) 182,400 12,585,600
Schlumberger, Ltd. 212,200 15,197,764
27,783,364
Oil, Gas & Consumable Fuels - 11.9%
Anadarko Petroleum Corp. 206,000 15,077,140
Apache Corp. (L) 110,300 8,503,027
BP PLC, ADR 216,692 9,049,058
Chevron Corp. 347,560 36,733,616
ConocoPhillips 110,500 6,291,870
CONSOL Energy, Inc. 348,300 10,919,205
Exxon Mobil Corp. (L) 392,824 34,623,507
Hess Corp. 211,300 10,482,593
Murphy Oil Corp. 298,800 16,953,912
Petroleo Brasileiro SA, ADR 198,700 3,570,639
Royal Dutch Shell PLC, ADR (L) 377,000 25,247,690
Spectra Energy Corp. 211,800 5,919,810
183,372,067
211,155,431
Financials - 19.7%
Capital Markets - 2.1%
Legg Mason, Inc. (L) 399,300 10,194,129
Northern Trust Corp. 291,500 13,997,830
The Bank of New York Mellon Corp. 358,200 8,575,308
32,767,267
Commercial Banks - 5.6%
PNC Financial Services Group, Inc. 225,000 12,631,500
Regions Financial Corp. 730,400 4,871,768
SunTrust Banks, Inc. 482,000 13,086,300
U.S. Bancorp 812,200 26,201,572
Wells Fargo & Company 883,600 29,167,636
85,958,776
Consumer Finance - 2.9%
American Express Company 430,700 24,076,130
Capital One Financial Corp. 173,600 9,999,360
SLM Corp. 651,400 10,780,670
44,856,160
Diversified Financial Services - 3.5%
Bank of America Corp. 1,653,522 16,303,727
Equity-Income Fund (continued)Shares or
Principal
Amount Value
COMMON STOCKS (continued)
Diversified Financial Services (continued)
JPMorgan Chase & Company 931,614 $ 38,270,703
54,574,430
Insurance - 4.8%
Lincoln National Corp. 293,098 7,239,521
Loews Corp. 132,600 5,420,688
Marsh & McLennan Companies, Inc. 505,700 17,810,754
Sun Life Financial, Inc. (L) 234,000 6,395,220
The Allstate Corp. 426,100 17,248,528
The Chubb Corp. 97,300 7,491,127
Copyright © 2013 www.secdatabase.com. All Rights Reserved.Please Consider the Environment Before Printing This Document
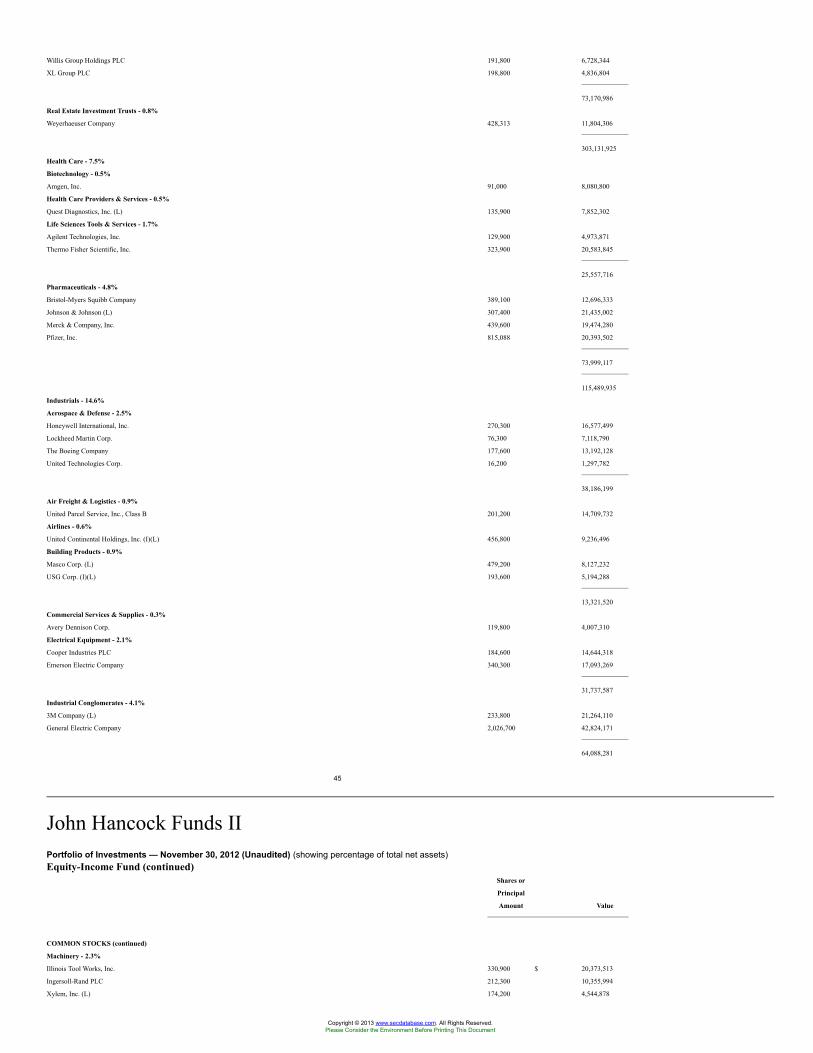
Willis Group Holdings PLC 191,800 6,728,344
XL Group PLC 198,800 4,836,804
73,170,986
Real Estate Investment Trusts - 0.8%
Weyerhaeuser Company 428,313 11,804,306
303,131,925
Health Care - 7.5%
Biotechnology - 0.5%
Amgen, Inc. 91,000 8,080,800
Health Care Providers & Services - 0.5%
Quest Diagnostics, Inc. (L) 135,900 7,852,302
Life Sciences Tools & Services - 1.7%
Agilent Technologies, Inc. 129,900 4,973,871
Thermo Fisher Scientific, Inc. 323,900 20,583,845
25,557,716
Pharmaceuticals - 4.8%
Bristol-Myers Squibb Company 389,100 12,696,333
Johnson & Johnson (L) 307,400 21,435,002
Merck & Company, Inc. 439,600 19,474,280
Pfizer, Inc. 815,088 20,393,502
73,999,117
115,489,935
Industrials - 14.6%
Aerospace & Defense - 2.5%
Honeywell International, Inc. 270,300 16,577,499
Lockheed Martin Corp. 76,300 7,118,790
The Boeing Company 177,600 13,192,128
United Technologies Corp. 16,200 1,297,782
38,186,199
Air Freight & Logistics - 0.9%
United Parcel Service, Inc., Class B 201,200 14,709,732
Airlines - 0.6%
United Continental Holdings, Inc. (I)(L) 456,800 9,236,496
Building Products - 0.9%
Masco Corp. (L) 479,200 8,127,232
USG Corp. (I)(L) 193,600 5,194,288
13,321,520
Commercial Services & Supplies - 0.3%
Avery Dennison Corp. 119,800 4,007,310
Electrical Equipment - 2.1%
Cooper Industries PLC 184,600 14,644,318
Emerson Electric Company 340,300 17,093,269
31,737,587
Industrial Conglomerates - 4.1%
3M Company (L) 233,800 21,264,110
General Electric Company 2,026,700 42,824,171
64,088,281
45
John Hancock Funds IIPortfolio of Investments — November 30, 2012 (Unaudited) (showing percentage of total net assets)Equity-Income Fund (continued)
Shares or
Principal
Amount Value
COMMON STOCKS (continued)
Machinery - 2.3%
Illinois Tool Works, Inc. 330,900 $ 20,373,513
Ingersoll-Rand PLC 212,300 10,355,994
Xylem, Inc. (L) 174,200 4,544,878
Copyright © 2013 www.secdatabase.com. All Rights Reserved.Please Consider the Environment Before Printing This Document
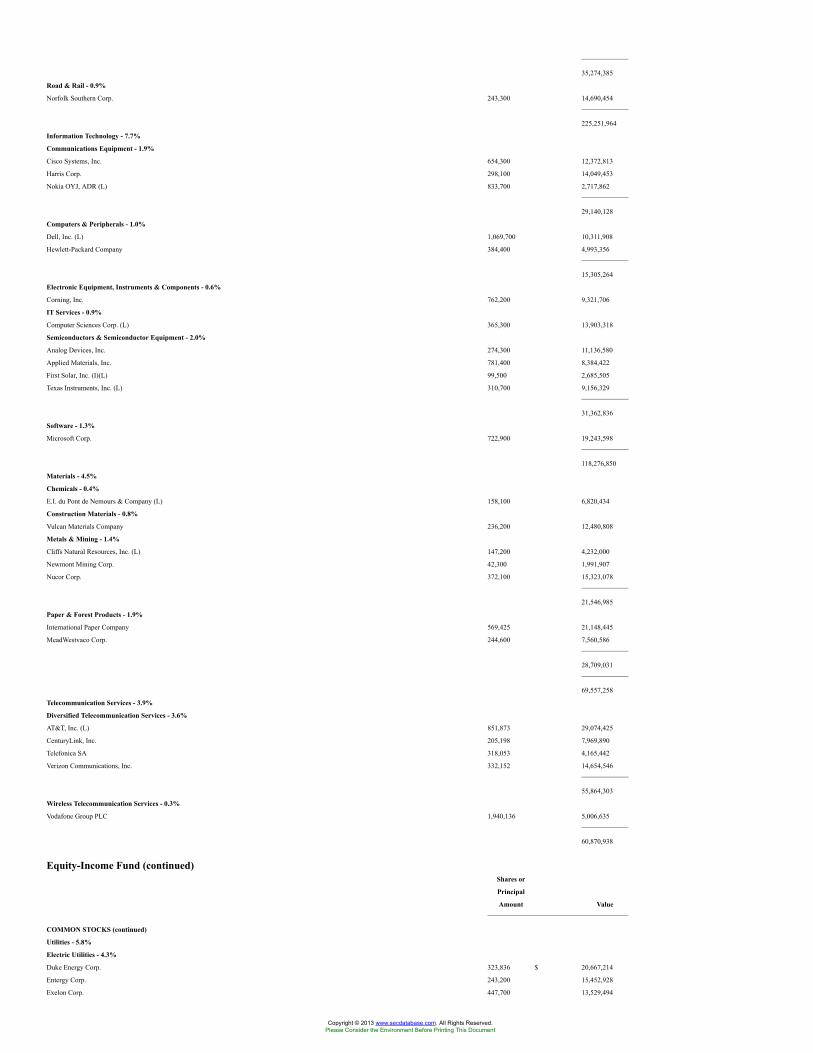
35,274,385
Road & Rail - 0.9%
Norfolk Southern Corp. 243,300 14,690,454
225,251,964
Information Technology - 7.7%
Communications Equipment - 1.9%
Cisco Systems, Inc. 654,300 12,372,813
Harris Corp. 298,100 14,049,453
Nokia OYJ, ADR (L) 833,700 2,717,862
29,140,128
Computers & Peripherals - 1.0%
Dell, Inc. (L) 1,069,700 10,311,908
Hewlett-Packard Company 384,400 4,993,356
15,305,264
Electronic Equipment, Instruments & Components - 0.6%
Corning, Inc. 762,200 9,321,706
IT Services - 0.9%
Computer Sciences Corp. (L) 365,300 13,903,318
Semiconductors & Semiconductor Equipment - 2.0%
Analog Devices, Inc. 274,300 11,136,580
Applied Materials, Inc. 781,400 8,384,422
First Solar, Inc. (I)(L) 99,500 2,685,505
Texas Instruments, Inc. (L) 310,700 9,156,329
31,362,836
Software - 1.3%
Microsoft Corp. 722,900 19,243,598
118,276,850
Materials - 4.5%
Chemicals - 0.4%
E.I. du Pont de Nemours & Company (L) 158,100 6,820,434
Construction Materials - 0.8%
Vulcan Materials Company 236,200 12,480,808
Metals & Mining - 1.4%
Cliffs Natural Resources, Inc. (L) 147,200 4,232,000
Newmont Mining Corp. 42,300 1,991,907
Nucor Corp. 372,100 15,323,078
21,546,985
Paper & Forest Products - 1.9%
International Paper Company 569,425 21,148,445
MeadWestvaco Corp. 244,600 7,560,586
28,709,031
69,557,258
Telecommunication Services - 3.9%
Diversified Telecommunication Services - 3.6%
AT&T, Inc. (L) 851,873 29,074,425
CenturyLink, Inc. 205,198 7,969,890
Telefonica SA 318,053 4,165,442
Verizon Communications, Inc. 332,152 14,654,546
55,864,303
Wireless Telecommunication Services - 0.3%
Vodafone Group PLC 1,940,136 5,006,635
60,870,938
Equity-Income Fund (continued)Shares or
Principal
Amount Value
COMMON STOCKS (continued)
Utilities - 5.8%
Electric Utilities - 4.3%
Duke Energy Corp. 323,836 $ 20,667,214
Entergy Corp. 243,200 15,452,928
Exelon Corp. 447,700 13,529,494
Copyright © 2013 www.secdatabase.com. All Rights Reserved.Please Consider the Environment Before Printing This Document
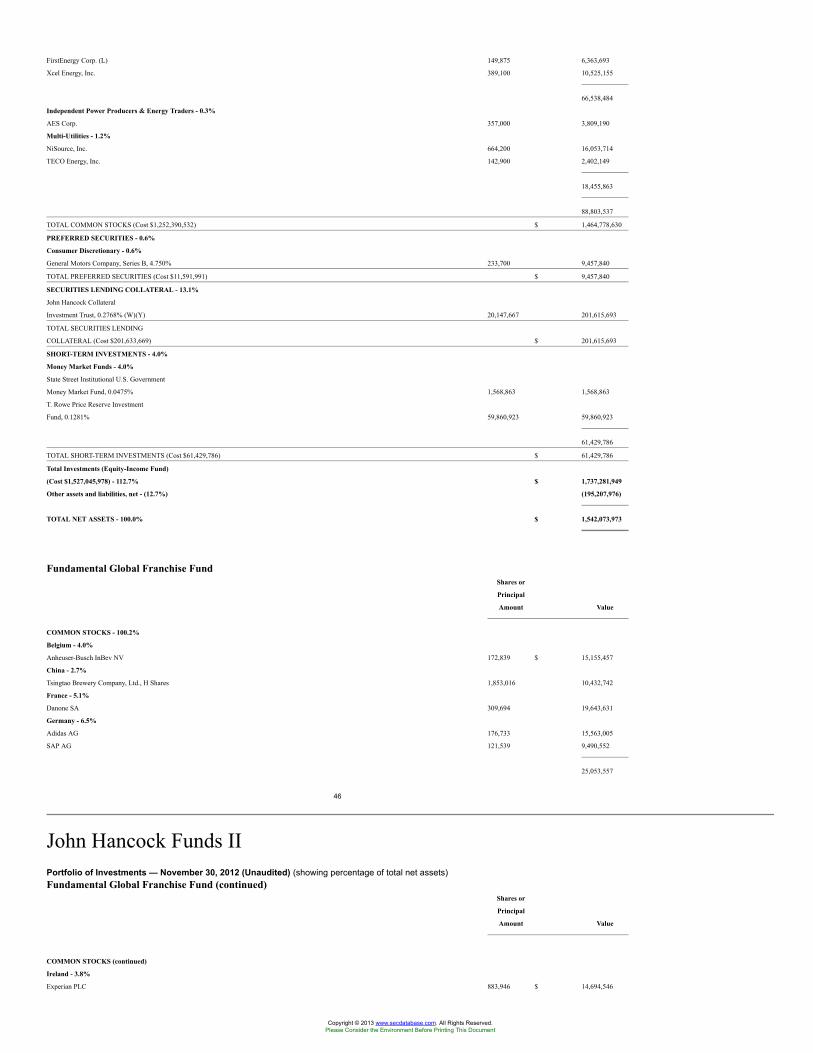
FirstEnergy Corp. (L) 149,875 6,363,693
Xcel Energy, Inc. 389,100 10,525,155
66,538,484
Independent Power Producers & Energy Traders - 0.3%
AES Corp. 357,000 3,809,190
Multi-Utilities - 1.2%
NiSource, Inc. 664,200 16,053,714
TECO Energy, Inc. 142,900 2,402,149
18,455,863
88,803,537
TOTAL COMMON STOCKS (Cost $1,252,390,532) $ 1,464,778,630
PREFERRED SECURITIES - 0.6%
Consumer Discretionary - 0.6%
General Motors Company, Series B, 4.750% 233,700 9,457,840
TOTAL PREFERRED SECURITIES (Cost $11,591,991) $ 9,457,840
SECURITIES LENDING COLLATERAL - 13.1%
John Hancock Collateral
Investment Trust, 0.2768% (W)(Y) 20,147,667 201,615,693
TOTAL SECURITIES LENDING
COLLATERAL (Cost $201,633,669) $ 201,615,693
SHORT-TERM INVESTMENTS - 4.0%
Money Market Funds - 4.0%
State Street Institutional U.S. Government
Money Market Fund, 0.0475% 1,568,863 1,568,863
T. Rowe Price Reserve Investment
Fund, 0.1281% 59,860,923 59,860,923
61,429,786
TOTAL SHORT-TERM INVESTMENTS (Cost $61,429,786) $ 61,429,786
Total Investments (Equity-Income Fund)
(Cost $1,527,045,978) - 112.7% $ 1,737,281,949
Other assets and liabilities, net - (12.7%) (195,207,976)
TOTAL NET ASSETS - 100.0% $ 1,542,073,973
Fundamental Global Franchise FundShares or
Principal
Amount Value
COMMON STOCKS - 100.2%
Belgium - 4.0%
Anheuser-Busch InBev NV 172,839 $ 15,155,457
China - 2.7%
Tsingtao Brewery Company, Ltd., H Shares 1,853,016 10,432,742
France - 5.1%
Danone SA 309,694 19,643,631
Germany - 6.5%
Adidas AG 176,733 15,563,005
SAP AG 121,539 9,490,552
25,053,557
46
John Hancock Funds IIPortfolio of Investments — November 30, 2012 (Unaudited) (showing percentage of total net assets)Fundamental Global Franchise Fund (continued)
Shares or
Principal
Amount Value
COMMON STOCKS (continued)
Ireland - 3.8%
Experian PLC 883,946 $ 14,694,546
Copyright © 2013 www.secdatabase.com. All Rights Reserved.Please Consider the Environment Before Printing This Document
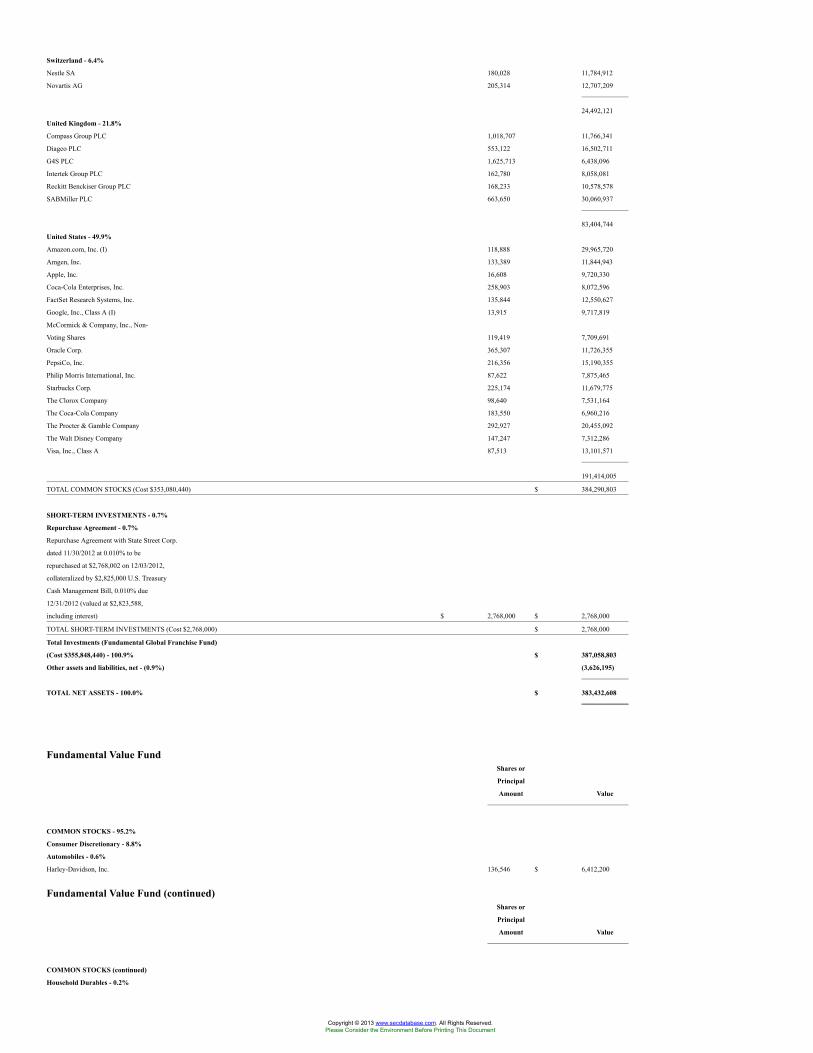
Switzerland - 6.4%
Nestle SA 180,028 11,784,912
Novartis AG 205,314 12,707,209
24,492,121
United Kingdom - 21.8%
Compass Group PLC 1,018,707 11,766,341
Diageo PLC 553,122 16,502,711
G4S PLC 1,625,713 6,438,096
Intertek Group PLC 162,780 8,058,081
Reckitt Benckiser Group PLC 168,233 10,578,578
SABMiller PLC 663,650 30,060,937
83,404,744
United States - 49.9%
Amazon.com, Inc. (I) 118,888 29,965,720
Amgen, Inc. 133,389 11,844,943
Apple, Inc. 16,608 9,720,330
Coca-Cola Enterprises, Inc. 258,903 8,072,596
FactSet Research Systems, Inc. 135,844 12,550,627
Google, Inc., Class A (I) 13,915 9,717,819
McCormick & Company, Inc., Non-
Voting Shares 119,419 7,709,691
Oracle Corp. 365,307 11,726,355
PepsiCo, Inc. 216,356 15,190,355
Philip Morris International, Inc. 87,622 7,875,465
Starbucks Corp. 225,174 11,679,775
The Clorox Company 98,640 7,531,164
The Coca-Cola Company 183,550 6,960,216
The Procter & Gamble Company 292,927 20,455,092
The Walt Disney Company 147,247 7,312,286
Visa, Inc., Class A 87,513 13,101,571
191,414,005
TOTAL COMMON STOCKS (Cost $353,080,440) $ 384,290,803
SHORT-TERM INVESTMENTS - 0.7%
Repurchase Agreement - 0.7%
Repurchase Agreement with State Street Corp.
dated 11/30/2012 at 0.010% to be
repurchased at $2,768,002 on 12/03/2012,
collateralized by $2,825,000 U.S. Treasury
Cash Management Bill, 0.010% due
12/31/2012 (valued at $2,823,588,
including interest) $ 2,768,000 $ 2,768,000
TOTAL SHORT-TERM INVESTMENTS (Cost $2,768,000) $ 2,768,000
Total Investments (Fundamental Global Franchise Fund)
(Cost $355,848,440) - 100.9% $ 387,058,803
Other assets and liabilities, net - (0.9%) (3,626,195)
TOTAL NET ASSETS - 100.0% $ 383,432,608
Fundamental Value FundShares or
Principal
Amount Value
COMMON STOCKS - 95.2%
Consumer Discretionary - 8.8%
Automobiles - 0.6%
Harley-Davidson, Inc. 136,546 $ 6,412,200
Fundamental Value Fund (continued)Shares or
Principal
Amount Value
COMMON STOCKS (continued)
Household Durables - 0.2%
Copyright © 2013 www.secdatabase.com. All Rights Reserved.Please Consider the Environment Before Printing This Document
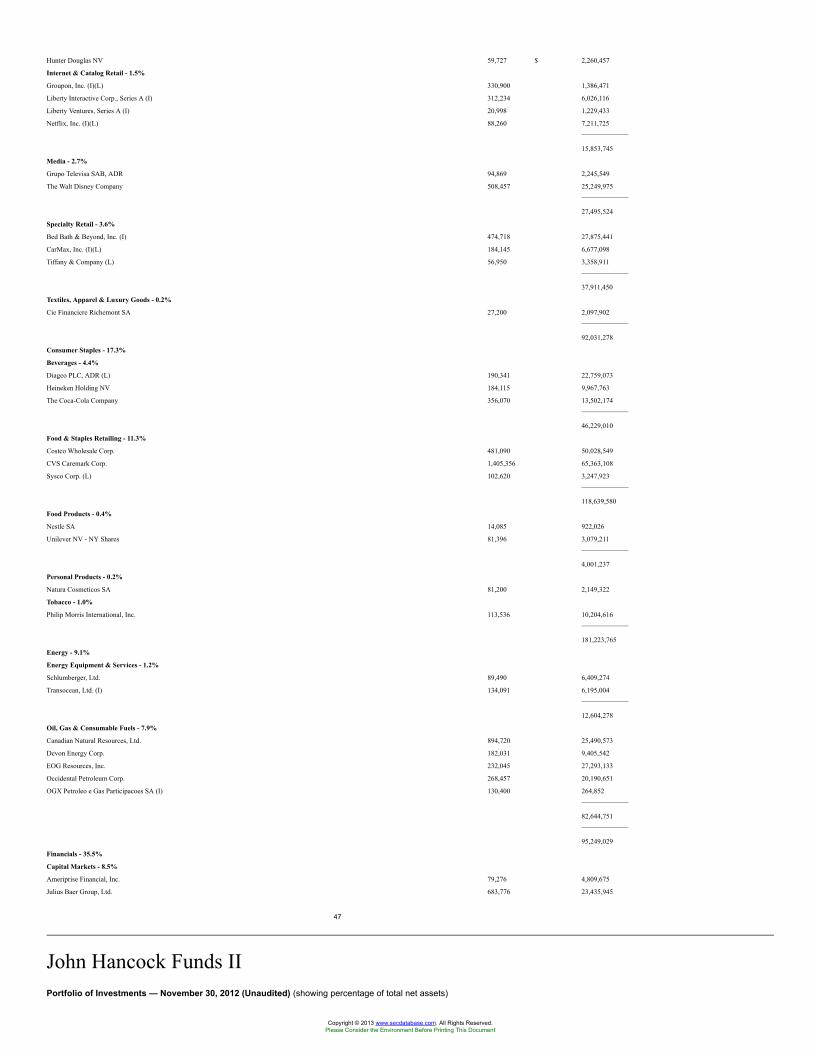
Hunter Douglas NV 59,727 $ 2,260,457
Internet & Catalog Retail - 1.5%
Groupon, Inc. (I)(L) 330,900 1,386,471
Liberty Interactive Corp., Series A (I) 312,234 6,026,116
Liberty Ventures, Series A (I) 20,998 1,229,433
Netflix, Inc. (I)(L) 88,260 7,211,725
15,853,745
Media - 2.7%
Grupo Televisa SAB, ADR 94,869 2,245,549
The Walt Disney Company 508,457 25,249,975
27,495,524
Specialty Retail - 3.6%
Bed Bath & Beyond, Inc. (I) 474,718 27,875,441
CarMax, Inc. (I)(L) 184,145 6,677,098
Tiffany & Company (L) 56,950 3,358,911
37,911,450
Textiles, Apparel & Luxury Goods - 0.2%
Cie Financiere Richemont SA 27,200 2,097,902
92,031,278
Consumer Staples - 17.3%
Beverages - 4.4%
Diageo PLC, ADR (L) 190,341 22,759,073
Heineken Holding NV 184,115 9,967,763
The Coca-Cola Company 356,070 13,502,174
46,229,010
Food & Staples Retailing - 11.3%
Costco Wholesale Corp. 481,090 50,028,549
CVS Caremark Corp. 1,405,356 65,363,108
Sysco Corp. (L) 102,620 3,247,923
118,639,580
Food Products - 0.4%
Nestle SA 14,085 922,026
Unilever NV - NY Shares 81,396 3,079,211
4,001,237
Personal Products - 0.2%
Natura Cosmeticos SA 81,200 2,149,322
Tobacco - 1.0%
Philip Morris International, Inc. 113,536 10,204,616
181,223,765
Energy - 9.1%
Energy Equipment & Services - 1.2%
Schlumberger, Ltd. 89,490 6,409,274
Transocean, Ltd. (I) 134,091 6,195,004
12,604,278
Oil, Gas & Consumable Fuels - 7.9%
Canadian Natural Resources, Ltd. 894,720 25,490,573
Devon Energy Corp. 182,031 9,405,542
EOG Resources, Inc. 232,045 27,293,133
Occidental Petroleum Corp. 268,457 20,190,651
OGX Petroleo e Gas Participacoes SA (I) 130,400 264,852
82,644,751
95,249,029
Financials - 35.5%
Capital Markets - 8.5%
Ameriprise Financial, Inc. 79,276 4,809,675
Julius Baer Group, Ltd. 683,776 23,435,945
47
John Hancock Funds IIPortfolio of Investments — November 30, 2012 (Unaudited) (showing percentage of total net assets)
Copyright © 2013 www.secdatabase.com. All Rights Reserved.Please Consider the Environment Before Printing This Document
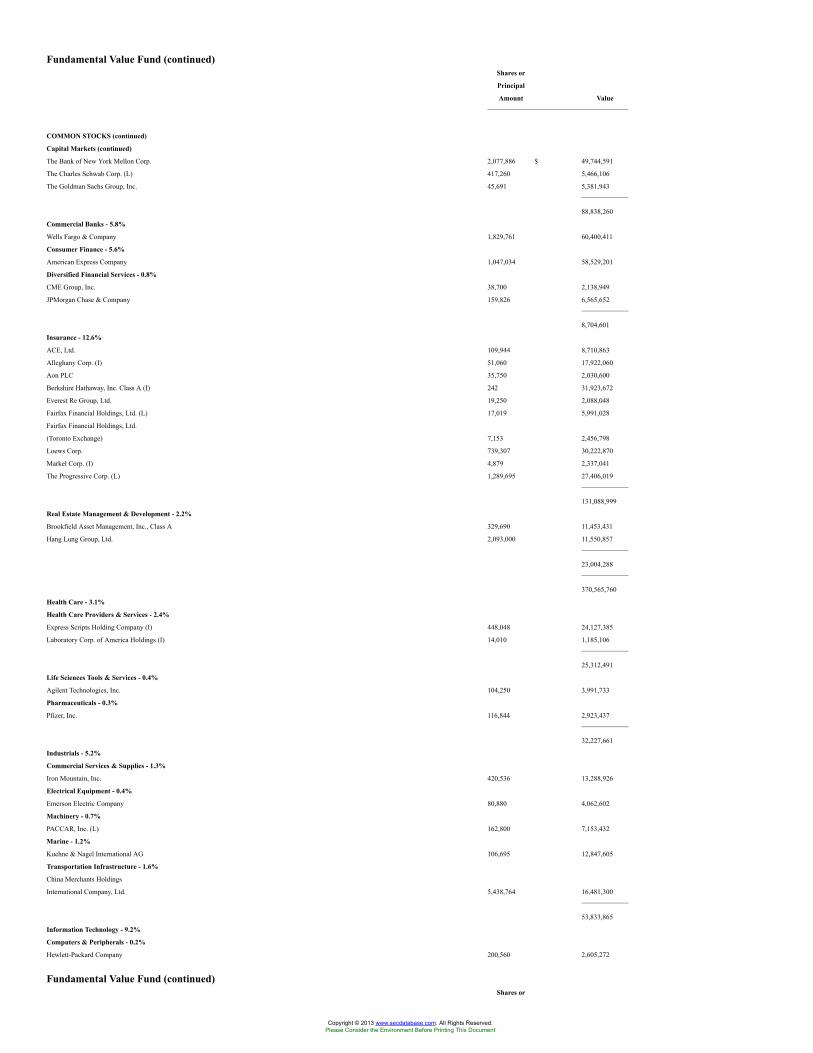
Fundamental Value Fund (continued)Shares or
Principal
Amount Value
COMMON STOCKS (continued)
Capital Markets (continued)
The Bank of New York Mellon Corp. 2,077,886 $ 49,744,591
The Charles Schwab Corp. (L) 417,260 5,466,106
The Goldman Sachs Group, Inc. 45,691 5,381,943
88,838,260
Commercial Banks - 5.8%
Wells Fargo & Company 1,829,761 60,400,411
Consumer Finance - 5.6%
American Express Company 1,047,034 58,529,201
Diversified Financial Services - 0.8%
CME Group, Inc. 38,700 2,138,949
JPMorgan Chase & Company 159,826 6,565,652
8,704,601
Insurance - 12.6%
ACE, Ltd. 109,944 8,710,863
Alleghany Corp. (I) 51,060 17,922,060
Aon PLC 35,750 2,030,600
Berkshire Hathaway, Inc. Class A (I) 242 31,923,672
Everest Re Group, Ltd. 19,250 2,088,048
Fairfax Financial Holdings, Ltd. (L) 17,019 5,991,028
Fairfax Financial Holdings, Ltd.
(Toronto Exchange) 7,153 2,456,798
Loews Corp. 739,307 30,222,870
Markel Corp. (I) 4,879 2,337,041
The Progressive Corp. (L) 1,289,695 27,406,019
131,088,999
Real Estate Management & Development - 2.2%
Brookfield Asset Management, Inc., Class A 329,690 11,453,431
Hang Lung Group, Ltd. 2,093,000 11,550,857
23,004,288
370,565,760
Health Care - 3.1%
Health Care Providers & Services - 2.4%
Express Scripts Holding Company (I) 448,048 24,127,385
Laboratory Corp. of America Holdings (I) 14,010 1,185,106
25,312,491
Life Sciences Tools & Services - 0.4%
Agilent Technologies, Inc. 104,250 3,991,733
Pharmaceuticals - 0.3%
Pfizer, Inc. 116,844 2,923,437
32,227,661
Industrials - 5.2%
Commercial Services & Supplies - 1.3%
Iron Mountain, Inc. 420,536 13,288,926
Electrical Equipment - 0.4%
Emerson Electric Company 80,880 4,062,602
Machinery - 0.7%
PACCAR, Inc. (L) 162,800 7,153,432
Marine - 1.2%
Kuehne & Nagel International AG 106,695 12,847,605
Transportation Infrastructure - 1.6%
China Merchants Holdings
International Company, Ltd. 5,438,764 16,481,300
53,833,865
Information Technology - 9.2%
Computers & Peripherals - 0.2%
Hewlett-Packard Company 200,560 2,605,272
Fundamental Value Fund (continued)Shares or
Copyright © 2013 www.secdatabase.com. All Rights Reserved.Please Consider the Environment Before Printing This Document
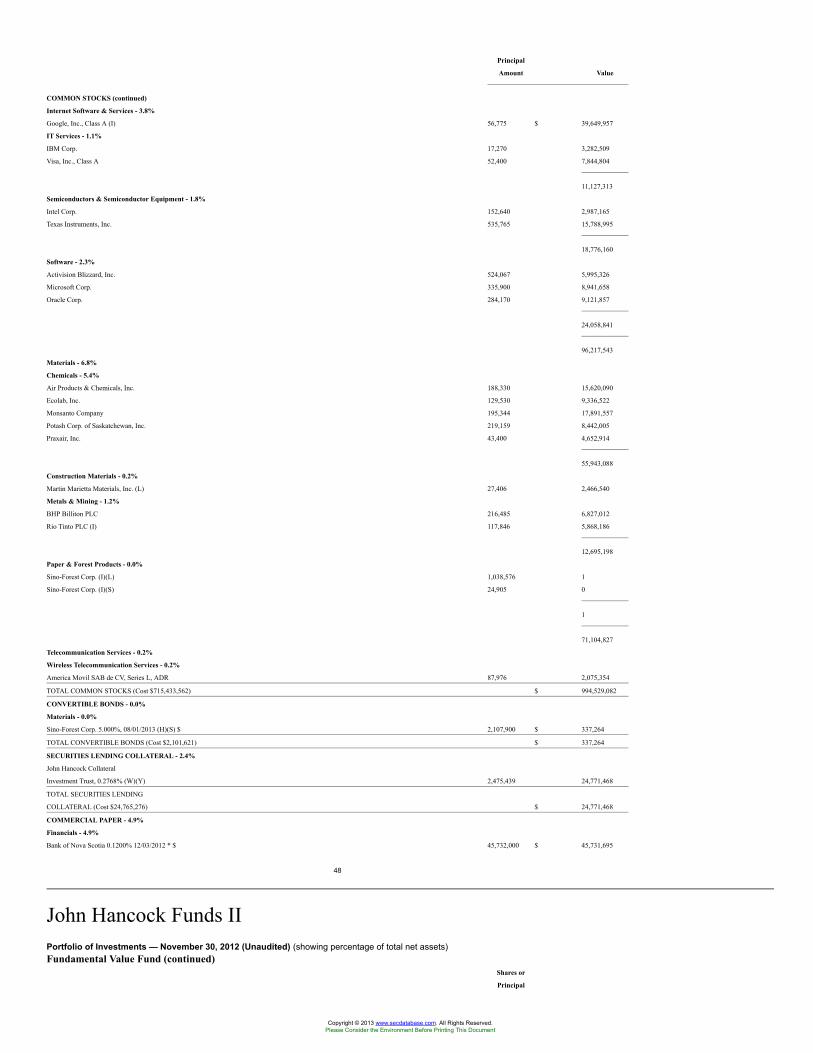
Principal
Amount Value
COMMON STOCKS (continued)
Internet Software & Services - 3.8%
Google, Inc., Class A (I) 56,775 $ 39,649,957
IT Services - 1.1%
IBM Corp. 17,270 3,282,509
Visa, Inc., Class A 52,400 7,844,804
11,127,313
Semiconductors & Semiconductor Equipment - 1.8%
Intel Corp. 152,640 2,987,165
Texas Instruments, Inc. 535,765 15,788,995
18,776,160
Software - 2.3%
Activision Blizzard, Inc. 524,067 5,995,326
Microsoft Corp. 335,900 8,941,658
Oracle Corp. 284,170 9,121,857
24,058,841
96,217,543
Materials - 6.8%
Chemicals - 5.4%
Air Products & Chemicals, Inc. 188,330 15,620,090
Ecolab, Inc. 129,530 9,336,522
Monsanto Company 195,344 17,891,557
Potash Corp. of Saskatchewan, Inc. 219,159 8,442,005
Praxair, Inc. 43,400 4,652,914
55,943,088
Construction Materials - 0.2%
Martin Marietta Materials, Inc. (L) 27,406 2,466,540
Metals & Mining - 1.2%
BHP Billiton PLC 216,485 6,827,012
Rio Tinto PLC (I) 117,846 5,868,186
12,695,198
Paper & Forest Products - 0.0%
Sino-Forest Corp. (I)(L) 1,038,576 1
Sino-Forest Corp. (I)(S) 24,905 0
1
71,104,827
Telecommunication Services - 0.2%
Wireless Telecommunication Services - 0.2%
America Movil SAB de CV, Series L, ADR 87,976 2,075,354
TOTAL COMMON STOCKS (Cost $715,433,562) $ 994,529,082
CONVERTIBLE BONDS - 0.0%
Materials - 0.0%
Sino-Forest Corp. 5.000%, 08/01/2013 (H)(S) $ 2,107,900 $ 337,264
TOTAL CONVERTIBLE BONDS (Cost $2,101,621) $ 337,264
SECURITIES LENDING COLLATERAL - 2.4%
John Hancock Collateral
Investment Trust, 0.2768% (W)(Y) 2,475,439 24,771,468
TOTAL SECURITIES LENDING
COLLATERAL (Cost $24,765,276) $ 24,771,468
COMMERCIAL PAPER - 4.9%
Financials - 4.9%
Bank of Nova Scotia 0.1200% 12/03/2012 * $ 45,732,000 $ 45,731,695
48
John Hancock Funds IIPortfolio of Investments — November 30, 2012 (Unaudited) (showing percentage of total net assets)Fundamental Value Fund (continued)
Shares or
Principal
Copyright © 2013 www.secdatabase.com. All Rights Reserved.Please Consider the Environment Before Printing This Document
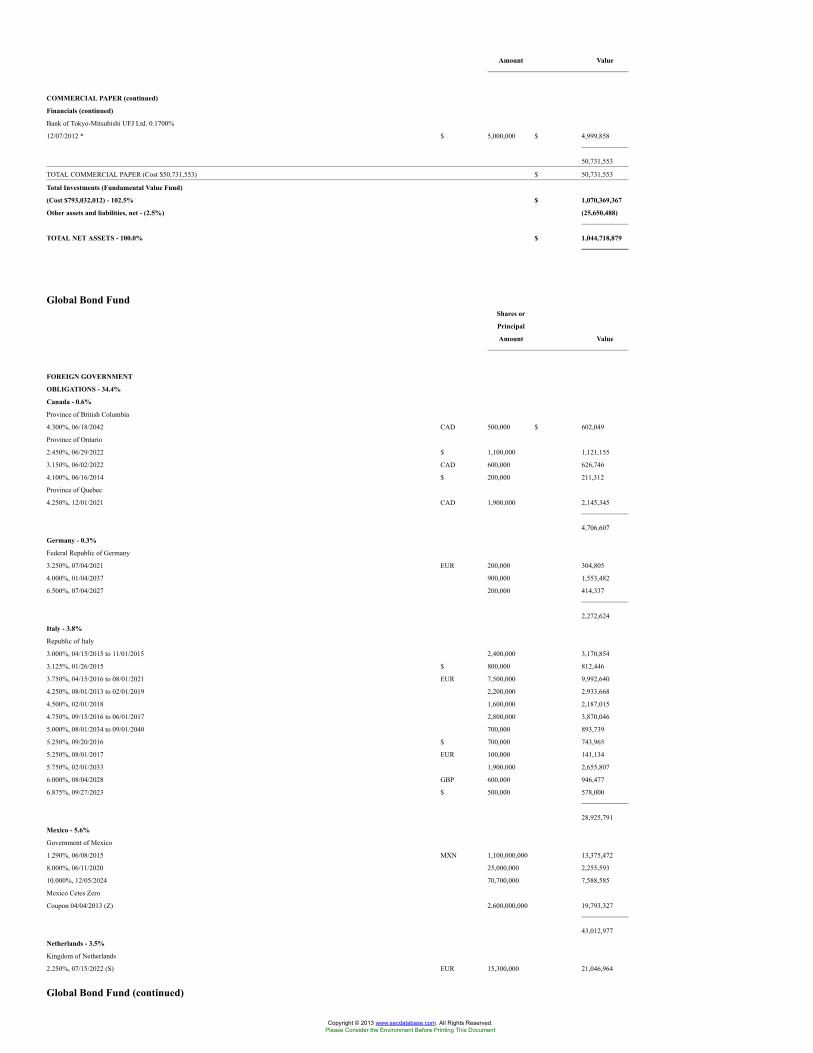
Amount Value
COMMERCIAL PAPER (continued)
Financials (continued)
Bank of Tokyo-Mitsubishi UFJ Ltd. 0.1700%
12/07/2012 * $ 5,000,000 $ 4,999,858
50,731,553
TOTAL COMMERCIAL PAPER (Cost $50,731,553) $ 50,731,553
Total Investments (Fundamental Value Fund)
(Cost $793,032,012) - 102.5% $ 1,070,369,367
Other assets and liabilities, net - (2.5%) (25,650,488)
TOTAL NET ASSETS - 100.0% $ 1,044,718,879
Global Bond FundShares or
Principal
Amount Value
FOREIGN GOVERNMENT
OBLIGATIONS - 34.4%
Canada - 0.6%
Province of British Columbia
4.300%, 06/18/2042 CAD 500,000 $ 602,049
Province of Ontario
2.450%, 06/29/2022 $ 1,100,000 1,121,155
3.150%, 06/02/2022 CAD 600,000 626,746
4.100%, 06/16/2014 $ 200,000 211,312
Province of Quebec
4.250%, 12/01/2021 CAD 1,900,000 2,145,345
4,706,607
Germany - 0.3%
Federal Republic of Germany
3.250%, 07/04/2021 EUR 200,000 304,805
4.000%, 01/04/2037 900,000 1,553,482
6.500%, 07/04/2027 200,000 414,337
2,272,624
Italy - 3.8%
Republic of Italy
3.000%, 04/15/2015 to 11/01/2015 2,400,000 3,170,854
3.125%, 01/26/2015 $ 800,000 812,446
3.750%, 04/15/2016 to 08/01/2021 EUR 7,500,000 9,992,640
4.250%, 08/01/2013 to 02/01/2019 2,200,000 2,933,668
4.500%, 02/01/2018 1,600,000 2,187,015
4.750%, 09/15/2016 to 06/01/2017 2,800,000 3,870,046
5.000%, 08/01/2034 to 09/01/2040 700,000 893,739
5.250%, 09/20/2016 $ 700,000 743,965
5.250%, 08/01/2017 EUR 100,000 141,134
5.750%, 02/01/2033 1,900,000 2,655,807
6.000%, 08/04/2028 GBP 600,000 946,477
6.875%, 09/27/2023 $ 500,000 578,000
28,925,791
Mexico - 5.6%
Government of Mexico
1.290%, 06/08/2015 MXN 1,100,000,000 13,375,472
8.000%, 06/11/2020 25,000,000 2,255,593
10.000%, 12/05/2024 70,700,000 7,588,585
Mexico Cetes Zero
Coupon 04/04/2013 (Z) 2,600,000,000 19,793,327
43,012,977
Netherlands - 3.5%
Kingdom of Netherlands
2.250%, 07/15/2022 (S) EUR 15,300,000 21,046,964
Global Bond Fund (continued)
Copyright © 2013 www.secdatabase.com. All Rights Reserved.Please Consider the Environment Before Printing This Document
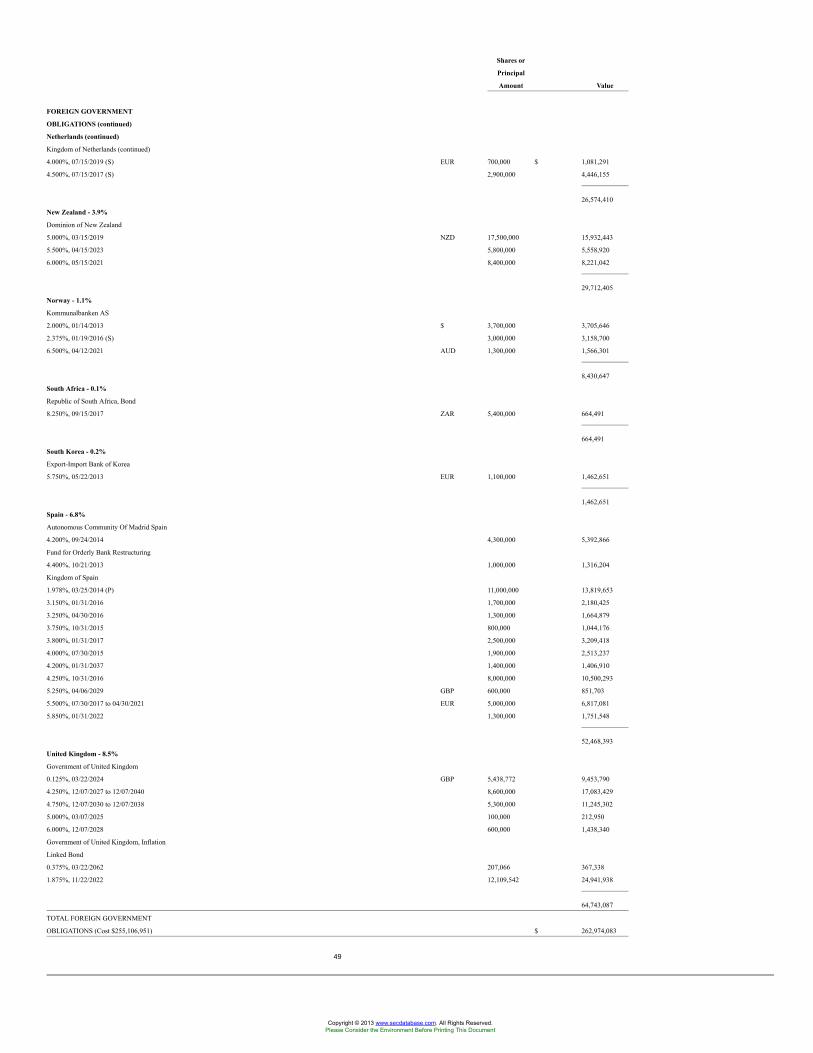
Shares or
Principal
Amount Value
FOREIGN GOVERNMENT
OBLIGATIONS (continued)
Netherlands (continued)
Kingdom of Netherlands (continued)
4.000%, 07/15/2019 (S) EUR 700,000 $ 1,081,291
4.500%, 07/15/2017 (S) 2,900,000 4,446,155
26,574,410
New Zealand - 3.9%
Dominion of New Zealand
5.000%, 03/15/2019 NZD 17,500,000 15,932,443
5.500%, 04/15/2023 5,800,000 5,558,920
6.000%, 05/15/2021 8,400,000 8,221,042
29,712,405
Norway - 1.1%
Kommunalbanken AS
2.000%, 01/14/2013 $ 3,700,000 3,705,646
2.375%, 01/19/2016 (S) 3,000,000 3,158,700
6.500%, 04/12/2021 AUD 1,300,000 1,566,301
8,430,647
South Africa - 0.1%
Republic of South Africa, Bond
8.250%, 09/15/2017 ZAR 5,400,000 664,491
664,491
South Korea - 0.2%
Export-Import Bank of Korea
5.750%, 05/22/2013 EUR 1,100,000 1,462,651
1,462,651
Spain - 6.8%
Autonomous Community Of Madrid Spain
4.200%, 09/24/2014 4,300,000 5,392,866
Fund for Orderly Bank Restructuring
4.400%, 10/21/2013 1,000,000 1,316,204
Kingdom of Spain
1.978%, 03/25/2014 (P) 11,000,000 13,819,653
3.150%, 01/31/2016 1,700,000 2,180,425
3.250%, 04/30/2016 1,300,000 1,664,879
3.750%, 10/31/2015 800,000 1,044,176
3.800%, 01/31/2017 2,500,000 3,209,418
4.000%, 07/30/2015 1,900,000 2,513,237
4.200%, 01/31/2037 1,400,000 1,406,910
4.250%, 10/31/2016 8,000,000 10,500,293
5.250%, 04/06/2029 GBP 600,000 851,703
5.500%, 07/30/2017 to 04/30/2021 EUR 5,000,000 6,817,081
5.850%, 01/31/2022 1,300,000 1,751,548
52,468,393
United Kingdom - 8.5%
Government of United Kingdom
0.125%, 03/22/2024 GBP 5,438,772 9,453,790
4.250%, 12/07/2027 to 12/07/2040 8,600,000 17,083,429
4.750%, 12/07/2030 to 12/07/2038 5,300,000 11,245,302
5.000%, 03/07/2025 100,000 212,950
6.000%, 12/07/2028 600,000 1,438,340
Government of United Kingdom, Inflation
Linked Bond
0.375%, 03/22/2062 207,066 367,338
1.875%, 11/22/2022 12,109,542 24,941,938
64,743,087
TOTAL FOREIGN GOVERNMENT
OBLIGATIONS (Cost $255,106,951) $ 262,974,083
49
Copyright © 2013 www.secdatabase.com. All Rights Reserved.Please Consider the Environment Before Printing This Document
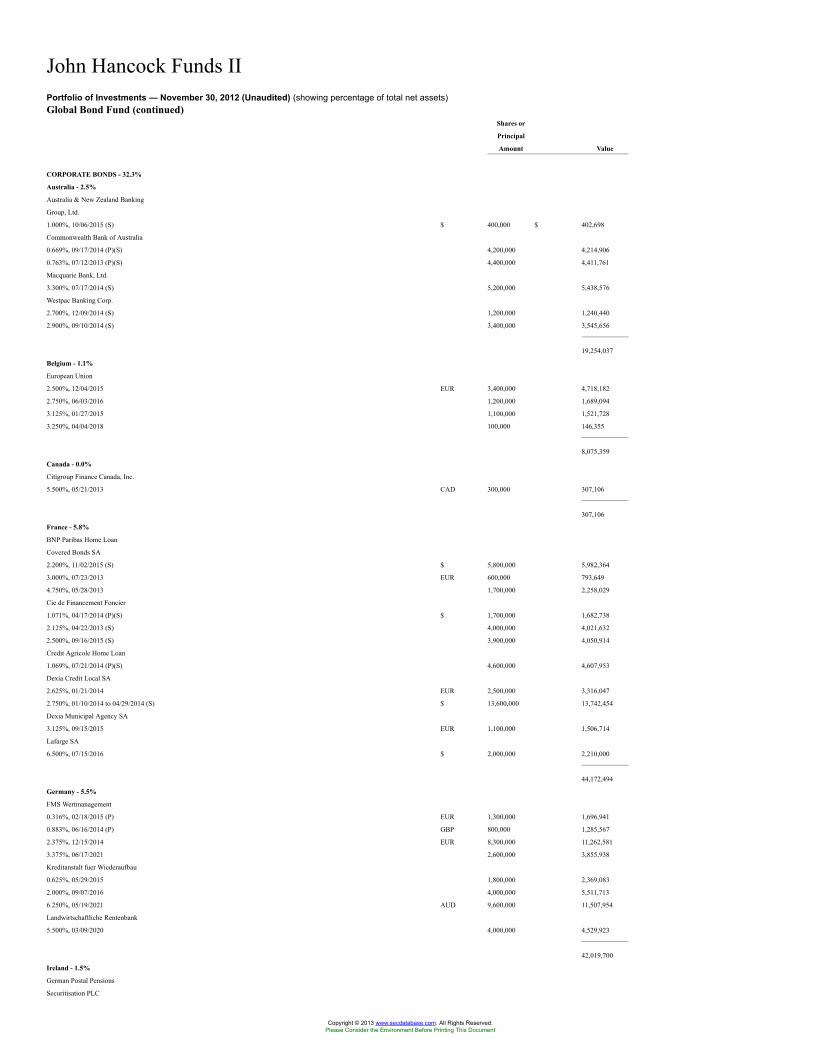
John Hancock Funds IIPortfolio of Investments — November 30, 2012 (Unaudited) (showing percentage of total net assets)Global Bond Fund (continued)
Shares or
Principal
Amount Value
CORPORATE BONDS - 32.3%
Australia - 2.5%
Australia & New Zealand Banking
Group, Ltd.
1.000%, 10/06/2015 (S) $ 400,000 $ 402,698
Commonwealth Bank of Australia
0.669%, 09/17/2014 (P)(S) 4,200,000 4,214,906
0.763%, 07/12/2013 (P)(S) 4,400,000 4,411,761
Macquarie Bank, Ltd.
3.300%, 07/17/2014 (S) 5,200,000 5,438,576
Westpac Banking Corp.
2.700%, 12/09/2014 (S) 1,200,000 1,240,440
2.900%, 09/10/2014 (S) 3,400,000 3,545,656
19,254,037
Belgium - 1.1%
European Union
2.500%, 12/04/2015 EUR 3,400,000 4,718,182
2.750%, 06/03/2016 1,200,000 1,689,094
3.125%, 01/27/2015 1,100,000 1,521,728
3.250%, 04/04/2018 100,000 146,355
8,075,359
Canada - 0.0%
Citigroup Finance Canada, Inc.
5.500%, 05/21/2013 CAD 300,000 307,106
307,106
France - 5.8%
BNP Paribas Home Loan
Covered Bonds SA
2.200%, 11/02/2015 (S) $ 5,800,000 5,982,364
3.000%, 07/23/2013 EUR 600,000 793,649
4.750%, 05/28/2013 1,700,000 2,258,029
Cie de Financement Foncier
1.071%, 04/17/2014 (P)(S) $ 1,700,000 1,682,738
2.125%, 04/22/2013 (S) 4,000,000 4,021,632
2.500%, 09/16/2015 (S) 3,900,000 4,050,914
Credit Agricole Home Loan
1.069%, 07/21/2014 (P)(S) 4,600,000 4,607,953
Dexia Credit Local SA
2.625%, 01/21/2014 EUR 2,500,000 3,316,047
2.750%, 01/10/2014 to 04/29/2014 (S) $ 13,600,000 13,742,454
Dexia Municipal Agency SA
3.125%, 09/15/2015 EUR 1,100,000 1,506,714
Lafarge SA
6.500%, 07/15/2016 $ 2,000,000 2,210,000
44,172,494
Germany - 5.5%
FMS Wertmanagement
0.316%, 02/18/2015 (P) EUR 1,300,000 1,696,941
0.883%, 06/16/2014 (P) GBP 800,000 1,285,567
2.375%, 12/15/2014 EUR 8,300,000 11,262,581
3.375%, 06/17/2021 2,600,000 3,855,938
Kreditanstalt fuer Wiederaufbau
0.625%, 05/29/2015 1,800,000 2,369,083
2.000%, 09/07/2016 4,000,000 5,511,713
6.250%, 05/19/2021 AUD 9,600,000 11,507,954
Landwirtschaftliche Rentenbank
5.500%, 03/09/2020 4,000,000 4,529,923
42,019,700
Ireland - 1.5%
German Postal Pensions
Securitisation PLC
Copyright © 2013 www.secdatabase.com. All Rights Reserved.Please Consider the Environment Before Printing This Document
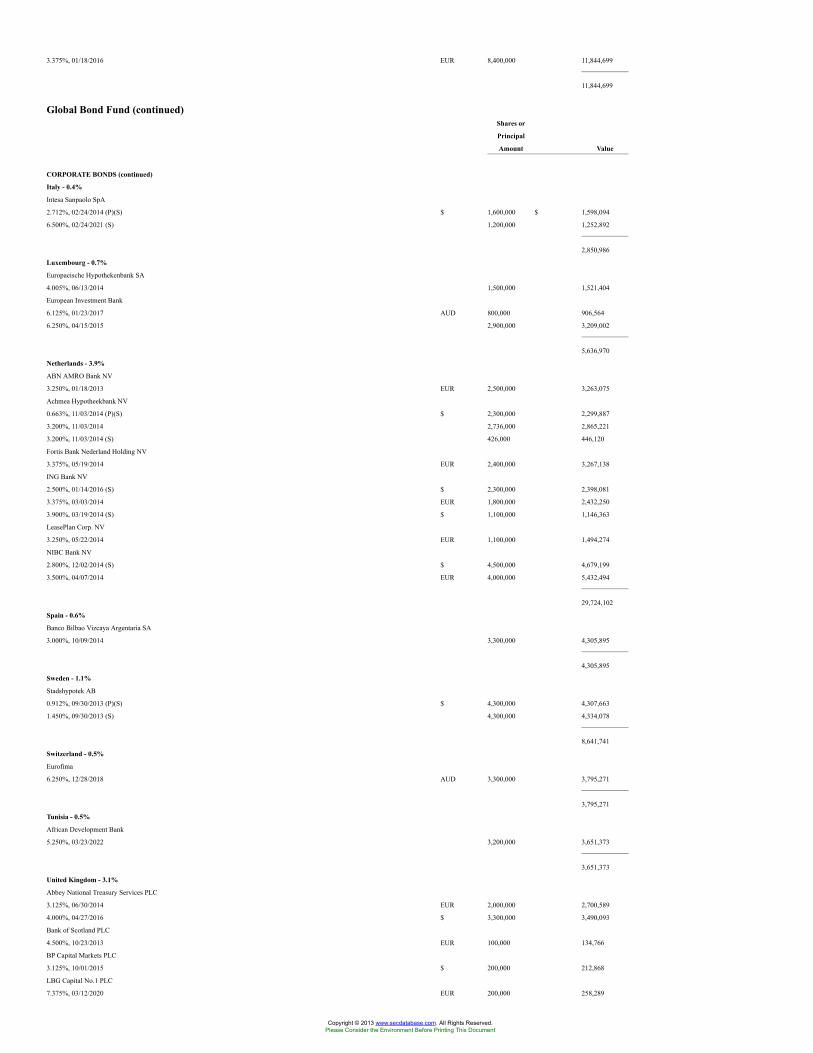
3.375%, 01/18/2016 EUR 8,400,000 11,844,699
11,844,699
Global Bond Fund (continued)Shares or
Principal
Amount Value
CORPORATE BONDS (continued)
Italy - 0.4%
Intesa Sanpaolo SpA
2.712%, 02/24/2014 (P)(S) $ 1,600,000 $ 1,598,094
6.500%, 02/24/2021 (S) 1,200,000 1,252,892
2,850,986
Luxembourg - 0.7%
Europaeische Hypothekenbank SA
4.005%, 06/13/2014 1,500,000 1,521,404
European Investment Bank
6.125%, 01/23/2017 AUD 800,000 906,564
6.250%, 04/15/2015 2,900,000 3,209,002
5,636,970
Netherlands - 3.9%
ABN AMRO Bank NV
3.250%, 01/18/2013 EUR 2,500,000 3,263,075
Achmea Hypotheekbank NV
0.663%, 11/03/2014 (P)(S) $ 2,300,000 2,299,887
3.200%, 11/03/2014 2,736,000 2,865,221
3.200%, 11/03/2014 (S) 426,000 446,120
Fortis Bank Nederland Holding NV
3.375%, 05/19/2014 EUR 2,400,000 3,267,138
ING Bank NV
2.500%, 01/14/2016 (S) $ 2,300,000 2,398,081
3.375%, 03/03/2014 EUR 1,800,000 2,432,250
3.900%, 03/19/2014 (S) $ 1,100,000 1,146,363
LeasePlan Corp. NV
3.250%, 05/22/2014 EUR 1,100,000 1,494,274
NIBC Bank NV
2.800%, 12/02/2014 (S) $ 4,500,000 4,679,199
3.500%, 04/07/2014 EUR 4,000,000 5,432,494
29,724,102
Spain - 0.6%
Banco Bilbao Vizcaya Argentaria SA
3.000%, 10/09/2014 3,300,000 4,305,895
4,305,895
Sweden - 1.1%
Stadshypotek AB
0.912%, 09/30/2013 (P)(S) $ 4,300,000 4,307,663
1.450%, 09/30/2013 (S) 4,300,000 4,334,078
8,641,741
Switzerland - 0.5%
Eurofima
6.250%, 12/28/2018 AUD 3,300,000 3,795,271
3,795,271
Tunisia - 0.5%
African Development Bank
5.250%, 03/23/2022 3,200,000 3,651,373
3,651,373
United Kingdom - 3.1%
Abbey National Treasury Services PLC
3.125%, 06/30/2014 EUR 2,000,000 2,700,589
4.000%, 04/27/2016 $ 3,300,000 3,490,093
Bank of Scotland PLC
4.500%, 10/23/2013 EUR 100,000 134,766
BP Capital Markets PLC
3.125%, 10/01/2015 $ 200,000 212,868
LBG Capital No.1 PLC
7.375%, 03/12/2020 EUR 200,000 258,289
Copyright © 2013 www.secdatabase.com. All Rights Reserved.Please Consider the Environment Before Printing This Document
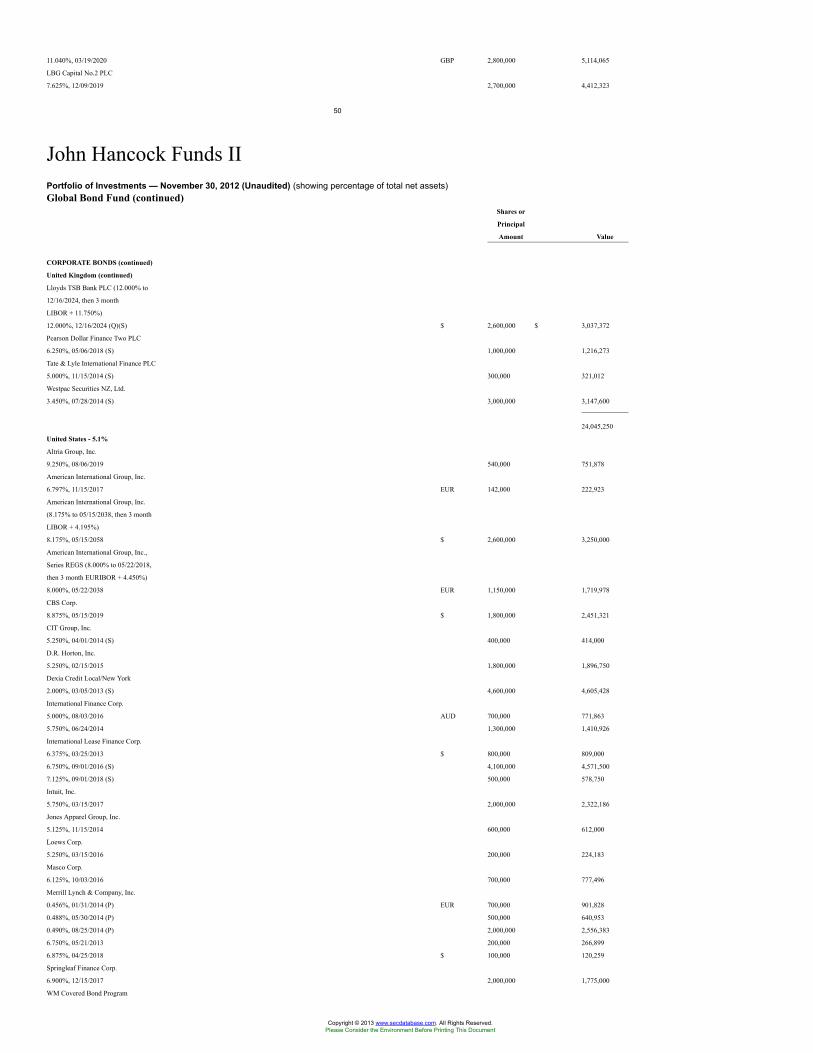
11.040%, 03/19/2020 GBP 2,800,000 5,114,065
LBG Capital No.2 PLC
7.625%, 12/09/2019 2,700,000 4,412,323
50
John Hancock Funds IIPortfolio of Investments — November 30, 2012 (Unaudited) (showing percentage of total net assets)Global Bond Fund (continued)
Shares or
Principal
Amount Value
CORPORATE BONDS (continued)
United Kingdom (continued)
Lloyds TSB Bank PLC (12.000% to
12/16/2024, then 3 month
LIBOR + 11.750%)
12.000%, 12/16/2024 (Q)(S) $ 2,600,000 $ 3,037,372
Pearson Dollar Finance Two PLC
6.250%, 05/06/2018 (S) 1,000,000 1,216,273
Tate & Lyle International Finance PLC
5.000%, 11/15/2014 (S) 300,000 321,012
Westpac Securities NZ, Ltd.
3.450%, 07/28/2014 (S) 3,000,000 3,147,600
24,045,250
United States - 5.1%
Altria Group, Inc.
9.250%, 08/06/2019 540,000 751,878
American International Group, Inc.
6.797%, 11/15/2017 EUR 142,000 222,923
American International Group, Inc.
(8.175% to 05/15/2038, then 3 month
LIBOR + 4.195%)
8.175%, 05/15/2058 $ 2,600,000 3,250,000
American International Group, Inc.,
Series REGS (8.000% to 05/22/2018,
then 3 month EURIBOR + 4.450%)
8.000%, 05/22/2038 EUR 1,150,000 1,719,978
CBS Corp.
8.875%, 05/15/2019 $ 1,800,000 2,451,321
CIT Group, Inc.
5.250%, 04/01/2014 (S) 400,000 414,000
D.R. Horton, Inc.
5.250%, 02/15/2015 1,800,000 1,896,750
Dexia Credit Local/New York
2.000%, 03/05/2013 (S) 4,600,000 4,605,428
International Finance Corp.
5.000%, 08/03/2016 AUD 700,000 771,863
5.750%, 06/24/2014 1,300,000 1,410,926
International Lease Finance Corp.
6.375%, 03/25/2013 $ 800,000 809,000
6.750%, 09/01/2016 (S) 4,100,000 4,571,500
7.125%, 09/01/2018 (S) 500,000 578,750
Intuit, Inc.
5.750%, 03/15/2017 2,000,000 2,322,186
Jones Apparel Group, Inc.
5.125%, 11/15/2014 600,000 612,000
Loews Corp.
5.250%, 03/15/2016 200,000 224,183
Masco Corp.
6.125%, 10/03/2016 700,000 777,496
Merrill Lynch & Company, Inc.
0.456%, 01/31/2014 (P) EUR 700,000 901,828
0.488%, 05/30/2014 (P) 500,000 640,953
0.490%, 08/25/2014 (P) 2,000,000 2,556,383
6.750%, 05/21/2013 200,000 266,899
6.875%, 04/25/2018 $ 100,000 120,259
Springleaf Finance Corp.
6.900%, 12/15/2017 2,000,000 1,775,000
WM Covered Bond Program
Copyright © 2013 www.secdatabase.com. All Rights Reserved.Please Consider the Environment Before Printing This Document
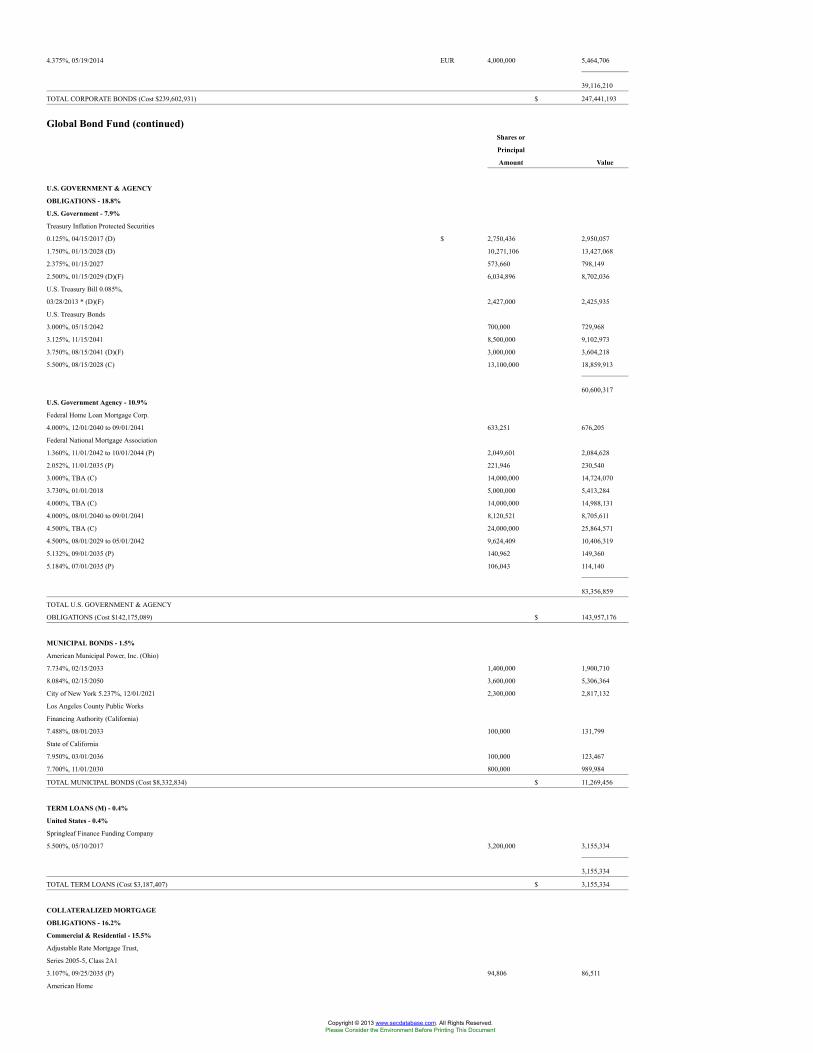
4.375%, 05/19/2014 EUR 4,000,000 5,464,706
39,116,210
TOTAL CORPORATE BONDS (Cost $239,602,931) $ 247,441,193
Global Bond Fund (continued)Shares or
Principal
Amount Value
U.S. GOVERNMENT & AGENCY
OBLIGATIONS - 18.8%
U.S. Government - 7.9%
Treasury Inflation Protected Securities
0.125%, 04/15/2017 (D) $ 2,750,436 2,950,057
1.750%, 01/15/2028 (D) 10,271,106 13,427,068
2.375%, 01/15/2027 573,660 798,149
2.500%, 01/15/2029 (D)(F) 6,034,896 8,702,036
U.S. Treasury Bill 0.085%,
03/28/2013 * (D)(F) 2,427,000 2,425,935
U.S. Treasury Bonds
3.000%, 05/15/2042 700,000 729,968
3.125%, 11/15/2041 8,500,000 9,102,973
3.750%, 08/15/2041 (D)(F) 3,000,000 3,604,218
5.500%, 08/15/2028 (C) 13,100,000 18,859,913
60,600,317
U.S. Government Agency - 10.9%
Federal Home Loan Mortgage Corp.
4.000%, 12/01/2040 to 09/01/2041 633,251 676,205
Federal National Mortgage Association
1.360%, 11/01/2042 to 10/01/2044 (P) 2,049,601 2,084,628
2.052%, 11/01/2035 (P) 221,946 230,540
3.000%, TBA (C) 14,000,000 14,724,070
3.730%, 01/01/2018 5,000,000 5,413,284
4.000%, TBA (C) 14,000,000 14,988,131
4.000%, 08/01/2040 to 09/01/2041 8,120,521 8,705,611
4.500%, TBA (C) 24,000,000 25,864,571
4.500%, 08/01/2029 to 05/01/2042 9,624,409 10,406,319
5.132%, 09/01/2035 (P) 140,962 149,360
5.184%, 07/01/2035 (P) 106,043 114,140
83,356,859
TOTAL U.S. GOVERNMENT & AGENCY
OBLIGATIONS (Cost $142,175,089) $ 143,957,176
MUNICIPAL BONDS - 1.5%
American Municipal Power, Inc. (Ohio)
7.734%, 02/15/2033 1,400,000 1,900,710
8.084%, 02/15/2050 3,600,000 5,306,364
City of New York 5.237%, 12/01/2021 2,300,000 2,817,132
Los Angeles County Public Works
Financing Authority (California)
7.488%, 08/01/2033 100,000 131,799
State of California
7.950%, 03/01/2036 100,000 123,467
7.700%, 11/01/2030 800,000 989,984
TOTAL MUNICIPAL BONDS (Cost $8,332,834) $ 11,269,456
TERM LOANS (M) - 0.4%
United States - 0.4%
Springleaf Finance Funding Company
5.500%, 05/10/2017 3,200,000 3,155,334
3,155,334
TOTAL TERM LOANS (Cost $3,187,407) $ 3,155,334
COLLATERALIZED MORTGAGE
OBLIGATIONS - 16.2%
Commercial & Residential - 15.5%
Adjustable Rate Mortgage Trust,
Series 2005-5, Class 2A1
3.107%, 09/25/2035 (P) 94,806 86,511
American Home
Copyright © 2013 www.secdatabase.com. All Rights Reserved.Please Consider the Environment Before Printing This Document
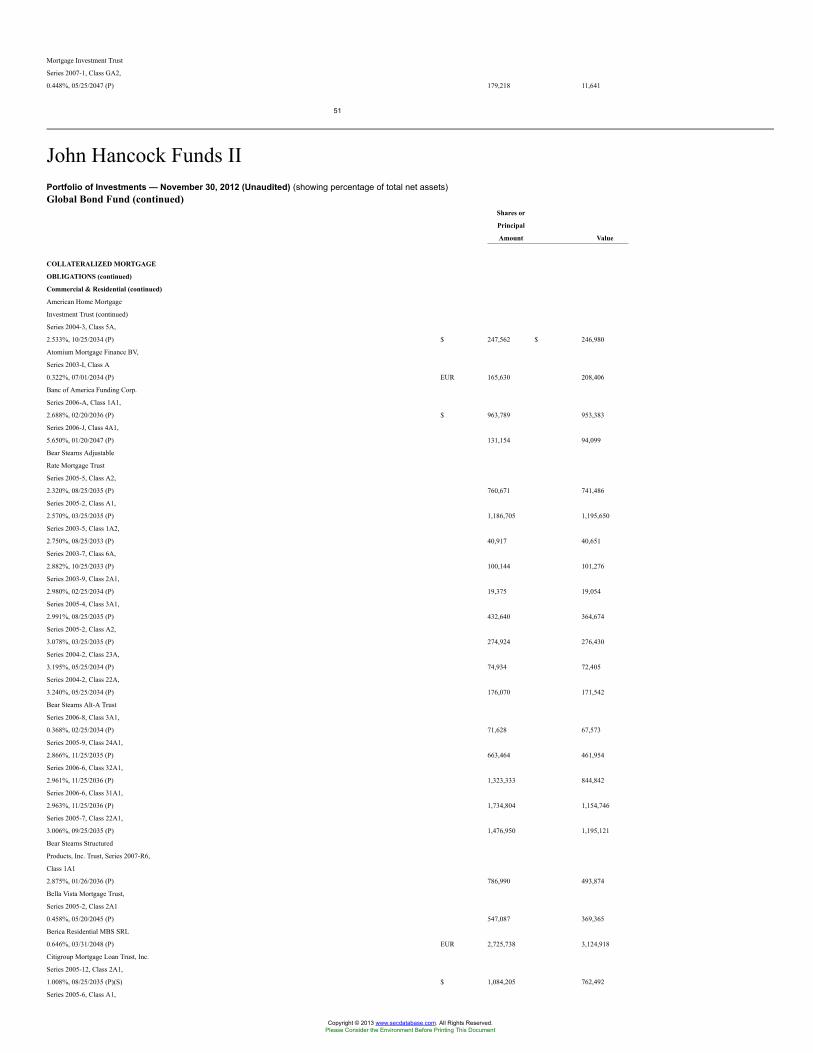
Mortgage Investment Trust
Series 2007-1, Class GA2,
0.448%, 05/25/2047 (P) 179,218 11,641
51
John Hancock Funds IIPortfolio of Investments — November 30, 2012 (Unaudited) (showing percentage of total net assets)Global Bond Fund (continued)
Shares or
Principal
Amount Value
COLLATERALIZED MORTGAGE
OBLIGATIONS (continued)
Commercial & Residential (continued)
American Home Mortgage
Investment Trust (continued)
Series 2004-3, Class 5A,
2.533%, 10/25/2034 (P) $ 247,562 $ 246,980
Atomium Mortgage Finance BV,
Series 2003-I, Class A
0.322%, 07/01/2034 (P) EUR 165,630 208,406
Banc of America Funding Corp.
Series 2006-A, Class 1A1,
2.688%, 02/20/2036 (P) $ 963,789 953,383
Series 2006-J, Class 4A1,
5.650%, 01/20/2047 (P) 131,154 94,099
Bear Stearns Adjustable
Rate Mortgage Trust
Series 2005-5, Class A2,
2.320%, 08/25/2035 (P) 760,671 741,486
Series 2005-2, Class A1,
2.570%, 03/25/2035 (P) 1,186,705 1,195,650
Series 2003-5, Class 1A2,
2.750%, 08/25/2033 (P) 40,917 40,651
Series 2003-7, Class 6A,
2.882%, 10/25/2033 (P) 100,144 101,276
Series 2003-9, Class 2A1,
2.980%, 02/25/2034 (P) 19,375 19,054
Series 2005-4, Class 3A1,
2.991%, 08/25/2035 (P) 432,640 364,674
Series 2005-2, Class A2,
3.078%, 03/25/2035 (P) 274,924 276,430
Series 2004-2, Class 23A,
3.195%, 05/25/2034 (P) 74,934 72,405
Series 2004-2, Class 22A,
3.240%, 05/25/2034 (P) 176,070 171,542
Bear Stearns Alt-A Trust
Series 2006-8, Class 3A1,
0.368%, 02/25/2034 (P) 71,628 67,573
Series 2005-9, Class 24A1,
2.866%, 11/25/2035 (P) 663,464 461,954
Series 2006-6, Class 32A1,
2.961%, 11/25/2036 (P) 1,323,333 844,842
Series 2006-6, Class 31A1,
2.963%, 11/25/2036 (P) 1,734,804 1,154,746
Series 2005-7, Class 22A1,
3.006%, 09/25/2035 (P) 1,476,950 1,195,121
Bear Stearns Structured
Products, Inc. Trust, Series 2007-R6,
Class 1A1
2.875%, 01/26/2036 (P) 786,990 493,874
Bella Vista Mortgage Trust,
Series 2005-2, Class 2A1
0.458%, 05/20/2045 (P) 547,087 369,365
Berica Residential MBS SRL
0.646%, 03/31/2048 (P) EUR 2,725,738 3,124,918
Citigroup Mortgage Loan Trust, Inc.
Series 2005-12, Class 2A1,
1.008%, 08/25/2035 (P)(S) $ 1,084,205 762,492
Series 2005-6, Class A1,
Copyright © 2013 www.secdatabase.com. All Rights Reserved.Please Consider the Environment Before Printing This Document
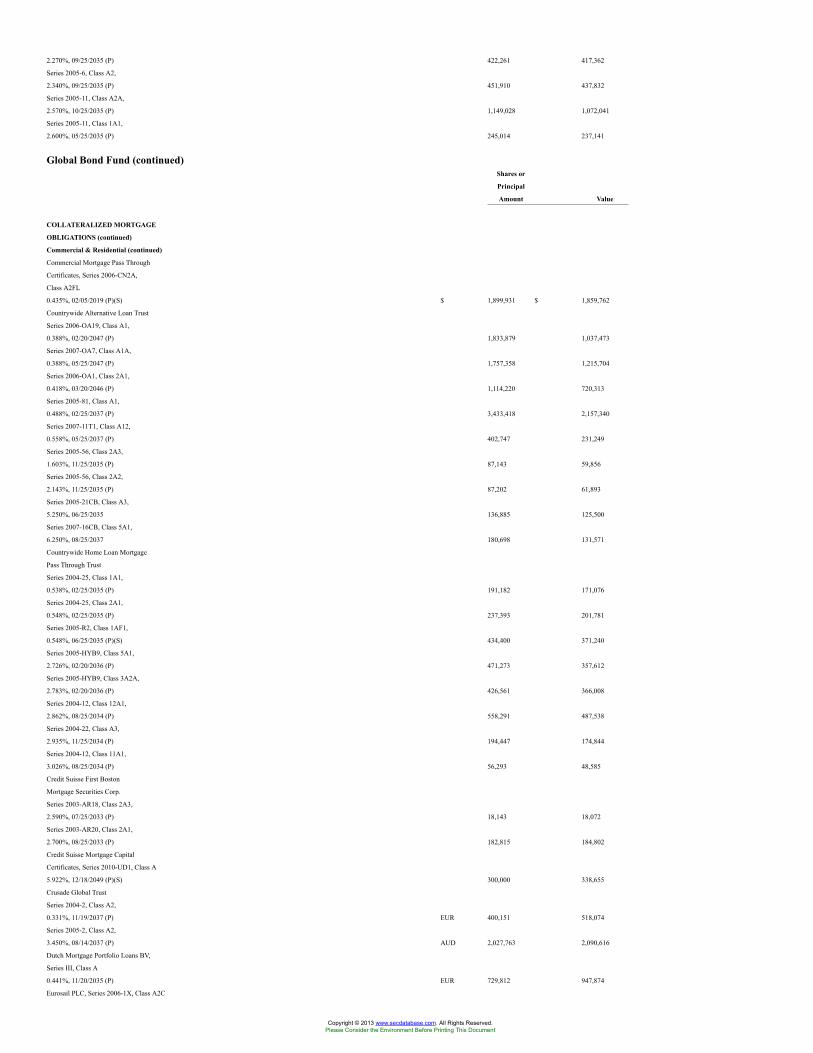
2.270%, 09/25/2035 (P) 422,261 417,362
Series 2005-6, Class A2,
2.340%, 09/25/2035 (P) 451,910 437,832
Series 2005-11, Class A2A,
2.570%, 10/25/2035 (P) 1,149,028 1,072,041
Series 2005-11, Class 1A1,
2.600%, 05/25/2035 (P) 245,014 237,141
Global Bond Fund (continued)Shares or
Principal
Amount Value
COLLATERALIZED MORTGAGE
OBLIGATIONS (continued)
Commercial & Residential (continued)
Commercial Mortgage Pass Through
Certificates, Series 2006-CN2A,
Class A2FL
0.435%, 02/05/2019 (P)(S) $ 1,899,931 $ 1,859,762
Countrywide Alternative Loan Trust
Series 2006-OA19, Class A1,
0.388%, 02/20/2047 (P) 1,833,879 1,037,473
Series 2007-OA7, Class A1A,
0.388%, 05/25/2047 (P) 1,757,358 1,215,704
Series 2006-OA1, Class 2A1,
0.418%, 03/20/2046 (P) 1,114,220 720,313
Series 2005-81, Class A1,
0.488%, 02/25/2037 (P) 3,433,418 2,157,340
Series 2007-11T1, Class A12,
0.558%, 05/25/2037 (P) 402,747 231,249
Series 2005-56, Class 2A3,
1.603%, 11/25/2035 (P) 87,143 59,856
Series 2005-56, Class 2A2,
2.143%, 11/25/2035 (P) 87,202 61,893
Series 2005-21CB, Class A3,
5.250%, 06/25/2035 136,885 125,500
Series 2007-16CB, Class 5A1,
6.250%, 08/25/2037 180,698 131,571
Countrywide Home Loan Mortgage
Pass Through Trust
Series 2004-25, Class 1A1,
0.538%, 02/25/2035 (P) 191,182 171,076
Series 2004-25, Class 2A1,
0.548%, 02/25/2035 (P) 237,393 201,781
Series 2005-R2, Class 1AF1,
0.548%, 06/25/2035 (P)(S) 434,400 371,240
Series 2005-HYB9, Class 5A1,
2.726%, 02/20/2036 (P) 471,273 357,612
Series 2005-HYB9, Class 3A2A,
2.783%, 02/20/2036 (P) 426,561 366,008
Series 2004-12, Class 12A1,
2.862%, 08/25/2034 (P) 558,291 487,538
Series 2004-22, Class A3,
2.935%, 11/25/2034 (P) 194,447 174,844
Series 2004-12, Class 11A1,
3.026%, 08/25/2034 (P) 56,293 48,585
Credit Suisse First Boston
Mortgage Securities Corp.
Series 2003-AR18, Class 2A3,
2.590%, 07/25/2033 (P) 18,143 18,072
Series 2003-AR20, Class 2A1,
2.700%, 08/25/2033 (P) 182,815 184,802
Credit Suisse Mortgage Capital
Certificates, Series 2010-UD1, Class A
5.922%, 12/18/2049 (P)(S) 300,000 338,655
Crusade Global Trust
Series 2004-2, Class A2,
0.331%, 11/19/2037 (P) EUR 400,151 518,074
Series 2005-2, Class A2,
3.450%, 08/14/2037 (P) AUD 2,027,763 2,090,616
Dutch Mortgage Portfolio Loans BV,
Series III, Class A
0.441%, 11/20/2035 (P) EUR 729,812 947,874
Eurosail PLC, Series 2006-1X, Class A2C
Copyright © 2013 www.secdatabase.com. All Rights Reserved.Please Consider the Environment Before Printing This Document

0.836%, 06/10/2044 (P) GBP 2,394,310 3,548,956
First Flexible PLC, Series 7, Class A
0.893%, 09/15/2033 (P) 401,785 618,836
52
John Hancock Funds IIPortfolio of Investments — November 30, 2012 (Unaudited) (showing percentage of total net assets)Global Bond Fund (continued)
Shares or
Principal
Amount Value
COLLATERALIZED MORTGAGE
OBLIGATIONS (continued)
Commercial & Residential (continued)
First Horizon Mortgage
Pass Through Trust
Series 2003-AR4, Class 2A1,
2.611%, 12/25/2033 (P) $ 99,884 $ 99,114
Series 2005-AR3, Class 2A1,
2.614%, 08/25/2035 (P) 101,025 96,660
First Republic Mortgage Loan Trust,
Series 2001-FRB1, Class A
0.558%, 11/15/2031 (P) 284,915 281,718
Fosse Master Issuer PLC, Series 2012-1A,
Class 2B2
2.633%, 10/18/2054 (P)(S) GBP 2,900,000 4,775,370
German Residential Asset
Note Distributor PLC, Series 2006-1,
Class A
0.445%, 07/20/2016 (P) EUR 1,041,348 1,330,625
GMAC Mortgage Corp. Loan Trust,
Series 2004-AR1, Class 22A
3.629%, 06/25/2034 (P) $ 16,026 15,671
Gosforth Funding PLC, Series 2011-1,
Class A2
1.979%, 04/24/2047 (P) GBP 1,800,000 2,957,107
Great Hall Mortgages PLC
Series 2007-1, Class A2B,
0.380%, 03/18/2039 (P) EUR 1,720,916 1,993,114
Series 2006-1, Class A2B,
0.400%, 06/18/2038 (P) 1,589,995 1,867,666
Series 2007-1, Class A2A,
0.776%, 03/18/2039 (P) GBP 1,479,988 2,112,510
Greenpoint Mortgage Funding Trust,
Series 2006-AR6, Class A1A
0.288%, 10/25/2046 (P) $ 14 14
Greenpoint Mortgage Pass-Through
Certificates, Series 2003-1, Class A1
3.168%, 10/25/2033 (P) 13,550 13,271
GS Mortgage Securities Corp. II,
Series 2012-GCJ9, Class XA
2.413%, 11/10/2022 (P) 3,500,000 540,050
GSR Mortgage Loan Trust, Series 2003-1,
Class A2
1.870%, 03/25/2033 (P) 94,526 94,912
Harborview Mortgage Loan Trust
Series 2006-1, Class 2A1A,
0.448%, 03/19/2036 (P) 1,054,390 660,462
Series 2003-1, Class A,
2.760%, 05/19/2033 (P) 186,606 186,816
Series 2005-4, Class 3A1,
3.080%, 07/19/2035 (P) 33,736 27,298
Holmes Master Issuer PLC,
Series 2010-1A, Class A3
1.610%, 10/15/2054 (P)(S) EUR 3,284,545 4,311,330
Indymac Index Mortgage Loan Trust,
Series 2004-AR11, Class 2A
2.670%, 12/25/2034 (P) $ 62,663 54,744
Intesa Securities SpA
0.339%, 10/30/2033 (P) EUR 1,477,733 1,857,461
Copyright © 2013 www.secdatabase.com. All Rights Reserved.Please Consider the Environment Before Printing This Document
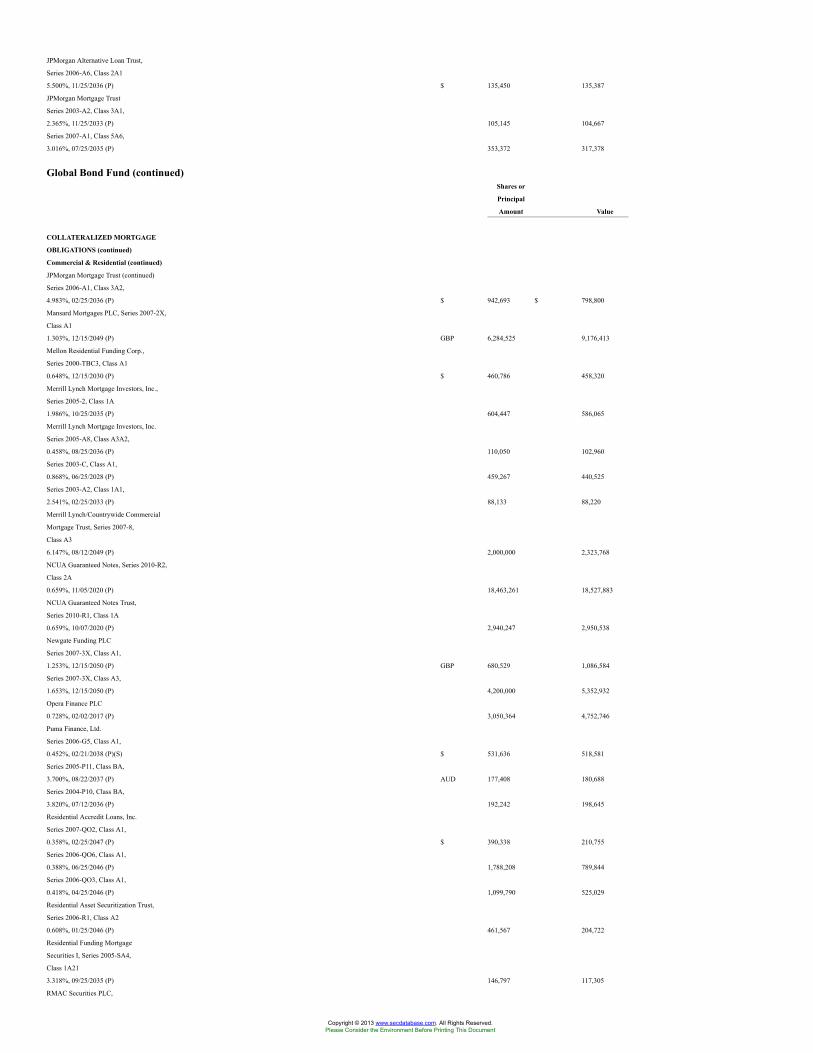
JPMorgan Alternative Loan Trust,
Series 2006-A6, Class 2A1
5.500%, 11/25/2036 (P) $ 135,450 135,387
JPMorgan Mortgage Trust
Series 2003-A2, Class 3A1,
2.365%, 11/25/2033 (P) 105,145 104,667
Series 2007-A1, Class 5A6,
3.016%, 07/25/2035 (P) 353,372 317,378
Global Bond Fund (continued)Shares or
Principal
Amount Value
COLLATERALIZED MORTGAGE
OBLIGATIONS (continued)
Commercial & Residential (continued)
JPMorgan Mortgage Trust (continued)
Series 2006-A1, Class 3A2,
4.983%, 02/25/2036 (P) $ 942,693 $ 798,800
Mansard Mortgages PLC, Series 2007-2X,
Class A1
1.303%, 12/15/2049 (P) GBP 6,284,525 9,176,413
Mellon Residential Funding Corp.,
Series 2000-TBC3, Class A1
0.648%, 12/15/2030 (P) $ 460,786 458,320
Merrill Lynch Mortgage Investors, Inc.,
Series 2005-2, Class 1A
1.986%, 10/25/2035 (P) 604,447 586,065
Merrill Lynch Mortgage Investors, Inc.
Series 2005-A8, Class A3A2,
0.458%, 08/25/2036 (P) 110,050 102,960
Series 2003-C, Class A1,
0.868%, 06/25/2028 (P) 459,267 440,525
Series 2003-A2, Class 1A1,
2.541%, 02/25/2033 (P) 88,133 88,220
Merrill Lynch/Countrywide Commercial
Mortgage Trust, Series 2007-8,
Class A3
6.147%, 08/12/2049 (P) 2,000,000 2,323,768
NCUA Guaranteed Notes, Series 2010-R2,
Class 2A
0.659%, 11/05/2020 (P) 18,463,261 18,527,883
NCUA Guaranteed Notes Trust,
Series 2010-R1, Class 1A
0.659%, 10/07/2020 (P) 2,940,247 2,950,538
Newgate Funding PLC
Series 2007-3X, Class A1,
1.253%, 12/15/2050 (P) GBP 680,529 1,086,584
Series 2007-3X, Class A3,
1.653%, 12/15/2050 (P) 4,200,000 5,352,932
Opera Finance PLC
0.728%, 02/02/2017 (P) 3,050,364 4,752,746
Puma Finance, Ltd.
Series 2006-G5, Class A1,
0.452%, 02/21/2038 (P)(S) $ 531,636 518,581
Series 2005-P11, Class BA,
3.700%, 08/22/2037 (P) AUD 177,408 180,688
Series 2004-P10, Class BA,
3.820%, 07/12/2036 (P) 192,242 198,645
Residential Accredit Loans, Inc.
Series 2007-QO2, Class A1,
0.358%, 02/25/2047 (P) $ 390,338 210,755
Series 2006-QO6, Class A1,
0.388%, 06/25/2046 (P) 1,788,208 789,844
Series 2006-QO3, Class A1,
0.418%, 04/25/2046 (P) 1,099,790 525,029
Residential Asset Securitization Trust,
Series 2006-R1, Class A2
0.608%, 01/25/2046 (P) 461,567 204,722
Residential Funding Mortgage
Securities I, Series 2005-SA4,
Class 1A21
3.318%, 09/25/2035 (P) 146,797 117,305
RMAC Securities PLC,
Copyright © 2013 www.secdatabase.com. All Rights Reserved.Please Consider the Environment Before Printing This Document
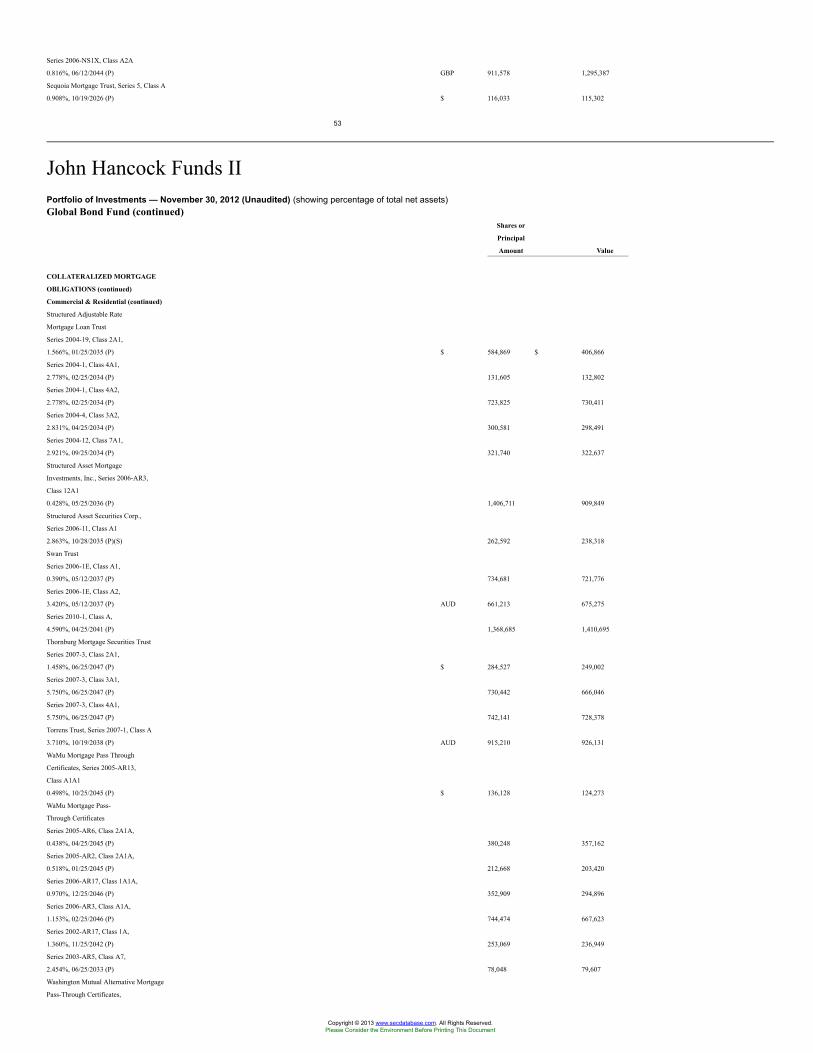
Series 2006-NS1X, Class A2A
0.816%, 06/12/2044 (P) GBP 911,578 1,295,387
Sequoia Mortgage Trust, Series 5, Class A
0.908%, 10/19/2026 (P) $ 116,033 115,302
53
John Hancock Funds IIPortfolio of Investments — November 30, 2012 (Unaudited) (showing percentage of total net assets)Global Bond Fund (continued)
Shares or
Principal
Amount Value
COLLATERALIZED MORTGAGE
OBLIGATIONS (continued)
Commercial & Residential (continued)
Structured Adjustable Rate
Mortgage Loan Trust
Series 2004-19, Class 2A1,
1.566%, 01/25/2035 (P) $ 584,869 $ 406,866
Series 2004-1, Class 4A1,
2.778%, 02/25/2034 (P) 131,605 132,802
Series 2004-1, Class 4A2,
2.778%, 02/25/2034 (P) 723,825 730,411
Series 2004-4, Class 3A2,
2.831%, 04/25/2034 (P) 300,581 298,491
Series 2004-12, Class 7A1,
2.921%, 09/25/2034 (P) 321,740 322,637
Structured Asset Mortgage
Investments, Inc., Series 2006-AR3,
Class 12A1
0.428%, 05/25/2036 (P) 1,406,711 909,849
Structured Asset Securities Corp.,
Series 2006-11, Class A1
2.863%, 10/28/2035 (P)(S) 262,592 238,318
Swan Trust
Series 2006-1E, Class A1,
0.390%, 05/12/2037 (P) 734,681 721,776
Series 2006-1E, Class A2,
3.420%, 05/12/2037 (P) AUD 661,213 675,275
Series 2010-1, Class A,
4.590%, 04/25/2041 (P) 1,368,685 1,410,695
Thornburg Mortgage Securities Trust
Series 2007-3, Class 2A1,
1.458%, 06/25/2047 (P) $ 284,527 249,002
Series 2007-3, Class 3A1,
5.750%, 06/25/2047 (P) 730,442 666,046
Series 2007-3, Class 4A1,
5.750%, 06/25/2047 (P) 742,141 728,378
Torrens Trust, Series 2007-1, Class A
3.710%, 10/19/2038 (P) AUD 915,210 926,131
WaMu Mortgage Pass Through
Certificates, Series 2005-AR13,
Class A1A1
0.498%, 10/25/2045 (P) $ 136,128 124,273
WaMu Mortgage Pass-
Through Certificates
Series 2005-AR6, Class 2A1A,
0.438%, 04/25/2045 (P) 380,248 357,162
Series 2005-AR2, Class 2A1A,
0.518%, 01/25/2045 (P) 212,668 203,420
Series 2006-AR17, Class 1A1A,
0.970%, 12/25/2046 (P) 352,909 294,896
Series 2006-AR3, Class A1A,
1.153%, 02/25/2046 (P) 744,474 667,623
Series 2002-AR17, Class 1A,
1.360%, 11/25/2042 (P) 253,069 236,949
Series 2003-AR5, Class A7,
2.454%, 06/25/2033 (P) 78,048 79,607
Washington Mutual Alternative Mortgage
Pass-Through Certificates,
Copyright © 2013 www.secdatabase.com. All Rights Reserved.Please Consider the Environment Before Printing This Document
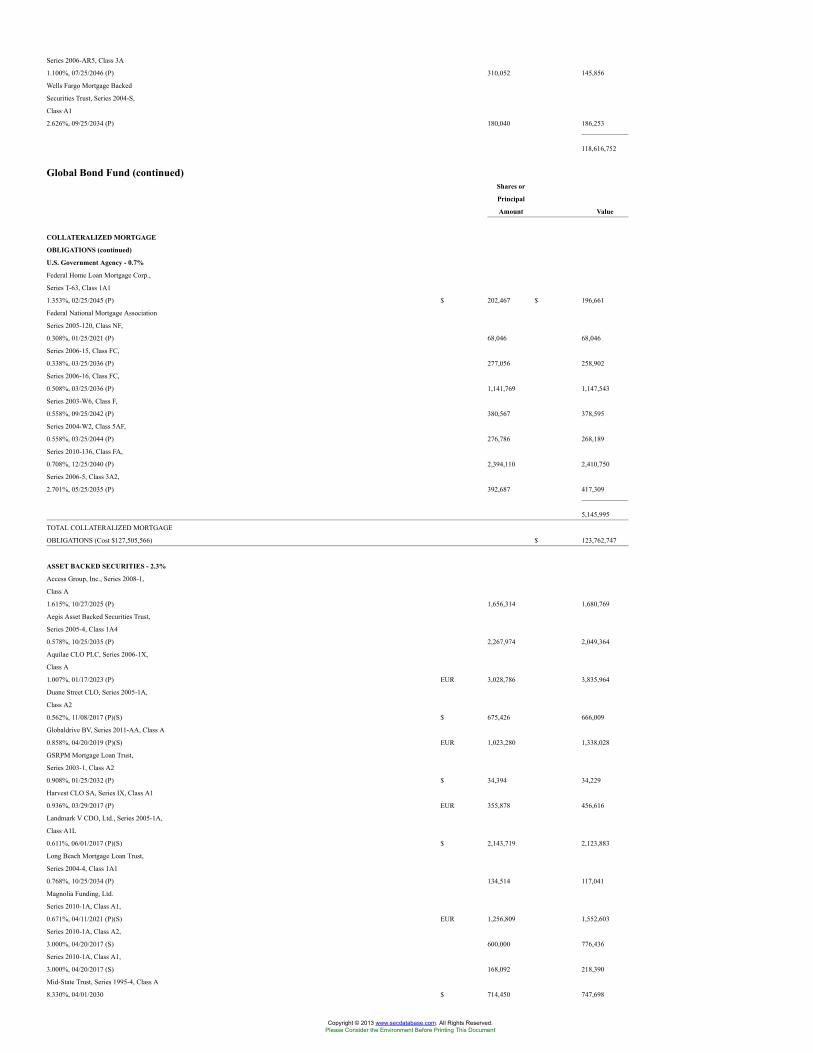
Series 2006-AR5, Class 3A
1.100%, 07/25/2046 (P) 310,052 145,856
Wells Fargo Mortgage Backed
Securities Trust, Series 2004-S,
Class A1
2.626%, 09/25/2034 (P) 180,040 186,253
118,616,752
Global Bond Fund (continued)Shares or
Principal
Amount Value
COLLATERALIZED MORTGAGE
OBLIGATIONS (continued)
U.S. Government Agency - 0.7%
Federal Home Loan Mortgage Corp.,
Series T-63, Class 1A1
1.353%, 02/25/2045 (P) $ 202,467 $ 196,661
Federal National Mortgage Association
Series 2005-120, Class NF,
0.308%, 01/25/2021 (P) 68,046 68,046
Series 2006-15, Class FC,
0.338%, 03/25/2036 (P) 277,056 258,902
Series 2006-16, Class FC,
0.508%, 03/25/2036 (P) 1,141,769 1,147,543
Series 2003-W6, Class F,
0.558%, 09/25/2042 (P) 380,567 378,595
Series 2004-W2, Class 5AF,
0.558%, 03/25/2044 (P) 276,786 268,189
Series 2010-136, Class FA,
0.708%, 12/25/2040 (P) 2,394,110 2,410,750
Series 2006-5, Class 3A2,
2.701%, 05/25/2035 (P) 392,687 417,309
5,145,995
TOTAL COLLATERALIZED MORTGAGE
OBLIGATIONS (Cost $127,505,566) $ 123,762,747
ASSET BACKED SECURITIES - 2.3%
Access Group, Inc., Series 2008-1,
Class A
1.615%, 10/27/2025 (P) 1,656,314 1,680,769
Aegis Asset Backed Securities Trust,
Series 2005-4, Class 1A4
0.578%, 10/25/2035 (P) 2,267,974 2,049,364
Aquilae CLO PLC, Series 2006-1X,
Class A
1.007%, 01/17/2023 (P) EUR 3,028,786 3,835,964
Duane Street CLO, Series 2005-1A,
Class A2
0.562%, 11/08/2017 (P)(S) $ 675,426 666,009
Globaldrive BV, Series 2011-AA, Class A
0.858%, 04/20/2019 (P)(S) EUR 1,023,280 1,338,028
GSRPM Mortgage Loan Trust,
Series 2003-1, Class A2
0.908%, 01/25/2032 (P) $ 34,394 34,229
Harvest CLO SA, Series IX, Class A1
0.936%, 03/29/2017 (P) EUR 355,878 456,616
Landmark V CDO, Ltd., Series 2005-1A,
Class A1L
0.611%, 06/01/2017 (P)(S) $ 2,143,719 2,123,883
Long Beach Mortgage Loan Trust,
Series 2004-4, Class 1A1
0.768%, 10/25/2034 (P) 134,514 117,041
Magnolia Funding, Ltd.
Series 2010-1A, Class A1,
0.671%, 04/11/2021 (P)(S) EUR 1,256,809 1,552,603
Series 2010-1A, Class A2,
3.000%, 04/20/2017 (S) 600,000 776,436
Series 2010-1A, Class A1,
3.000%, 04/20/2017 (S) 168,092 218,390
Mid-State Trust, Series 1995-4, Class A
8.330%, 04/01/2030 $ 714,450 747,698
Copyright © 2013 www.secdatabase.com. All Rights Reserved.Please Consider the Environment Before Printing This Document
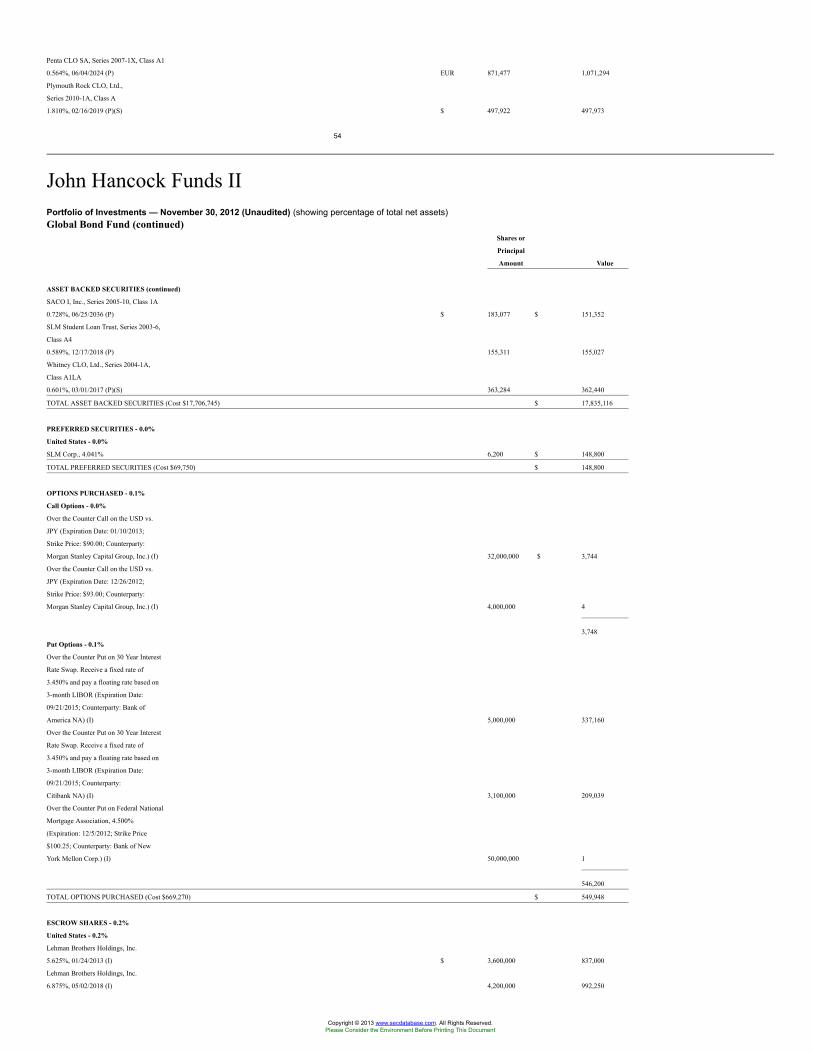
Penta CLO SA, Series 2007-1X, Class A1
0.564%, 06/04/2024 (P) EUR 871,477 1,071,294
Plymouth Rock CLO, Ltd.,
Series 2010-1A, Class A
1.810%, 02/16/2019 (P)(S) $ 497,922 497,973
54
John Hancock Funds IIPortfolio of Investments — November 30, 2012 (Unaudited) (showing percentage of total net assets)Global Bond Fund (continued)
Shares or
Principal
Amount Value
ASSET BACKED SECURITIES (continued)
SACO I, Inc., Series 2005-10, Class 1A
0.728%, 06/25/2036 (P) $ 183,077 $ 151,352
SLM Student Loan Trust, Series 2003-6,
Class A4
0.589%, 12/17/2018 (P) 155,311 155,027
Whitney CLO, Ltd., Series 2004-1A,
Class A1LA
0.601%, 03/01/2017 (P)(S) 363,284 362,440
TOTAL ASSET BACKED SECURITIES (Cost $17,706,745) $ 17,835,116
PREFERRED SECURITIES - 0.0%
United States - 0.0%
SLM Corp., 4.041% 6,200 $ 148,800
TOTAL PREFERRED SECURITIES (Cost $69,750) $ 148,800
OPTIONS PURCHASED - 0.1%
Call Options - 0.0%
Over the Counter Call on the USD vs.
JPY (Expiration Date: 01/10/2013;
Strike Price: $90.00; Counterparty:
Morgan Stanley Capital Group, Inc.) (I) 32,000,000 $ 3,744
Over the Counter Call on the USD vs.
JPY (Expiration Date: 12/26/2012;
Strike Price: $93.00; Counterparty:
Morgan Stanley Capital Group, Inc.) (I) 4,000,000 4
3,748
Put Options - 0.1%
Over the Counter Put on 30 Year Interest
Rate Swap. Receive a fixed rate of
3.450% and pay a floating rate based on
3-month LIBOR (Expiration Date:
09/21/2015; Counterparty: Bank of
America NA) (I) 5,000,000 337,160
Over the Counter Put on 30 Year Interest
Rate Swap. Receive a fixed rate of
3.450% and pay a floating rate based on
3-month LIBOR (Expiration Date:
09/21/2015; Counterparty:
Citibank NA) (I) 3,100,000 209,039
Over the Counter Put on Federal National
Mortgage Association, 4.500%
(Expiration: 12/5/2012; Strike Price
$100.25; Counterparty: Bank of New
York Mellon Corp.) (I) 50,000,000 1
546,200
TOTAL OPTIONS PURCHASED (Cost $669,270) $ 549,948
ESCROW SHARES - 0.2%
United States - 0.2%
Lehman Brothers Holdings, Inc.
5.625%, 01/24/2013 (I) $ 3,600,000 837,000
Lehman Brothers Holdings, Inc.
6.875%, 05/02/2018 (I) 4,200,000 992,250
Copyright © 2013 www.secdatabase.com. All Rights Reserved.Please Consider the Environment Before Printing This Document
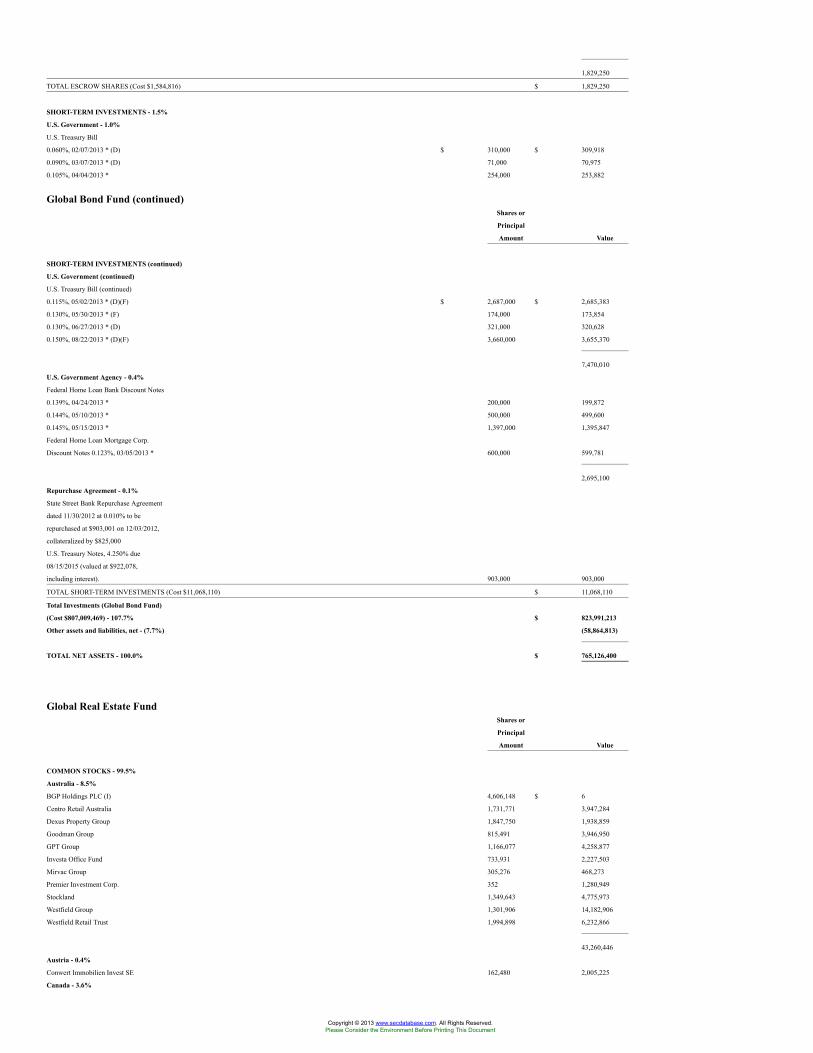
1,829,250
TOTAL ESCROW SHARES (Cost $1,584,816) $ 1,829,250
SHORT-TERM INVESTMENTS - 1.5%
U.S. Government - 1.0%
U.S. Treasury Bill
0.060%, 02/07/2013 * (D) $ 310,000 $ 309,918
0.090%, 03/07/2013 * (D) 71,000 70,975
0.105%, 04/04/2013 * 254,000 253,882
Global Bond Fund (continued)Shares or
Principal
Amount Value
SHORT-TERM INVESTMENTS (continued)
U.S. Government (continued)
U.S. Treasury Bill (continued)
0.115%, 05/02/2013 * (D)(F) $ 2,687,000 $ 2,685,383
0.130%, 05/30/2013 * (F) 174,000 173,854
0.130%, 06/27/2013 * (D) 321,000 320,628
0.150%, 08/22/2013 * (D)(F) 3,660,000 3,655,370
7,470,010
U.S. Government Agency - 0.4%
Federal Home Loan Bank Discount Notes
0.139%, 04/24/2013 * 200,000 199,872
0.144%, 05/10/2013 * 500,000 499,600
0.145%, 05/15/2013 * 1,397,000 1,395,847
Federal Home Loan Mortgage Corp.
Discount Notes 0.123%, 03/05/2013 * 600,000 599,781
2,695,100
Repurchase Agreement - 0.1%
State Street Bank Repurchase Agreement
dated 11/30/2012 at 0.010% to be
repurchased at $903,001 on 12/03/2012,
collateralized by $825,000
U.S. Treasury Notes, 4.250% due
08/15/2015 (valued at $922,078,
including interest). 903,000 903,000
TOTAL SHORT-TERM INVESTMENTS (Cost $11,068,110) $ 11,068,110
Total Investments (Global Bond Fund)
(Cost $807,009,469) - 107.7% $ 823,991,213
Other assets and liabilities, net - (7.7%) (58,864,813)
TOTAL NET ASSETS - 100.0% $ 765,126,400
Global Real Estate FundShares or
Principal
Amount Value
COMMON STOCKS - 99.5%
Australia - 8.5%
BGP Holdings PLC (I) 4,606,148 $ 6
Centro Retail Australia 1,731,771 3,947,284
Dexus Property Group 1,847,750 1,938,859
Goodman Group 815,491 3,946,950
GPT Group 1,166,077 4,258,877
Investa Office Fund 733,931 2,227,503
Mirvac Group 305,276 468,273
Premier Investment Corp. 352 1,280,949
Stockland 1,349,643 4,775,973
Westfield Group 1,301,906 14,182,906
Westfield Retail Trust 1,994,898 6,232,866
43,260,446
Austria - 0.4%
Conwert Immobilien Invest SE 162,480 2,005,225
Canada - 3.6%
Copyright © 2013 www.secdatabase.com. All Rights Reserved.Please Consider the Environment Before Printing This Document
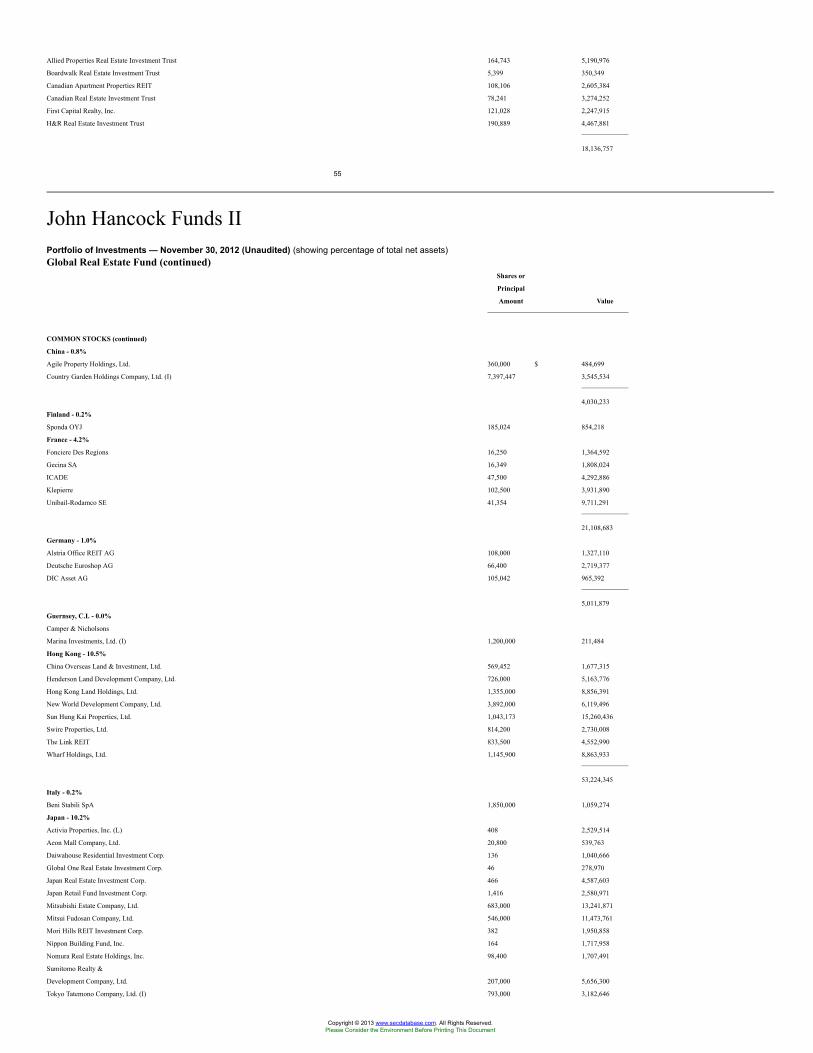
Allied Properties Real Estate Investment Trust 164,743 5,190,976
Boardwalk Real Estate Investment Trust 5,399 350,349
Canadian Apartment Properties REIT 108,106 2,605,384
Canadian Real Estate Investment Trust 78,241 3,274,252
First Capital Realty, Inc. 121,028 2,247,915
H&R Real Estate Investment Trust 190,889 4,467,881
18,136,757
55
John Hancock Funds IIPortfolio of Investments — November 30, 2012 (Unaudited) (showing percentage of total net assets)Global Real Estate Fund (continued)
Shares or
Principal
Amount Value
COMMON STOCKS (continued)
China - 0.8%
Agile Property Holdings, Ltd. 360,000 $ 484,699
Country Garden Holdings Company, Ltd. (I) 7,397,447 3,545,534
4,030,233
Finland - 0.2%
Sponda OYJ 185,024 854,218
France - 4.2%
Fonciere Des Regions 16,250 1,364,592
Gecina SA 16,349 1,808,024
ICADE 47,500 4,292,886
Klepierre 102,500 3,931,890
Unibail-Rodamco SE 41,354 9,711,291
21,108,683
Germany - 1.0%
Alstria Office REIT AG 108,000 1,327,110
Deutsche Euroshop AG 66,400 2,719,377
DIC Asset AG 105,042 965,392
5,011,879
Guernsey, C.I. - 0.0%
Camper & Nicholsons
Marina Investments, Ltd. (I) 1,200,000 211,484
Hong Kong - 10.5%
China Overseas Land & Investment, Ltd. 569,452 1,677,315
Henderson Land Development Company, Ltd. 726,000 5,163,776
Hong Kong Land Holdings, Ltd. 1,355,000 8,856,391
New World Development Company, Ltd. 3,892,000 6,119,496
Sun Hung Kai Properties, Ltd. 1,043,173 15,260,436
Swire Properties, Ltd. 814,200 2,730,008
The Link REIT 833,500 4,552,990
Wharf Holdings, Ltd. 1,145,900 8,863,933
53,224,345
Italy - 0.2%
Beni Stabili SpA 1,850,000 1,059,274
Japan - 10.2%
Activia Properties, Inc. (L) 408 2,529,514
Aeon Mall Company, Ltd. 20,800 539,763
Daiwahouse Residential Investment Corp. 136 1,040,666
Global One Real Estate Investment Corp. 46 278,970
Japan Real Estate Investment Corp. 466 4,587,603
Japan Retail Fund Investment Corp. 1,416 2,580,971
Mitsubishi Estate Company, Ltd. 683,000 13,241,871
Mitsui Fudosan Company, Ltd. 546,000 11,473,761
Mori Hills REIT Investment Corp. 382 1,950,858
Nippon Building Fund, Inc. 164 1,717,958
Nomura Real Estate Holdings, Inc. 98,400 1,707,491
Sumitomo Realty &
Development Company, Ltd. 207,000 5,656,300
Tokyo Tatemono Company, Ltd. (I) 793,000 3,182,646
Copyright © 2013 www.secdatabase.com. All Rights Reserved.Please Consider the Environment Before Printing This Document
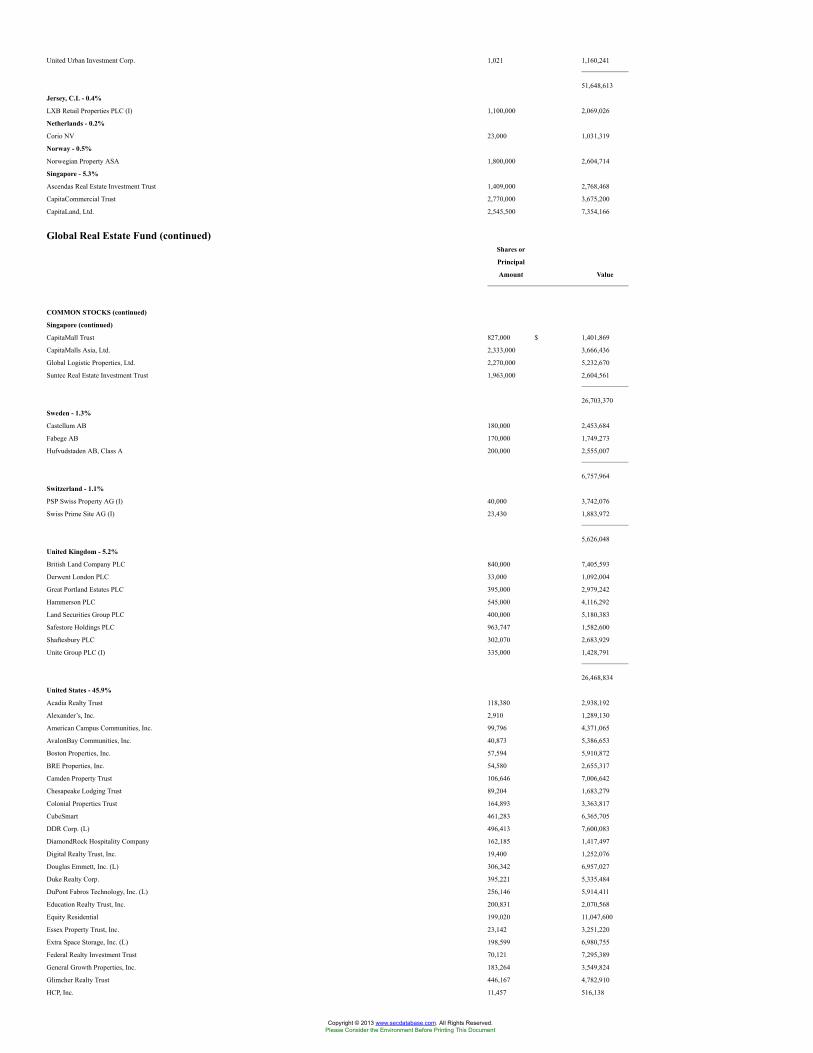
United Urban Investment Corp. 1,021 1,160,241
51,648,613
Jersey, C.I. - 0.4%
LXB Retail Properties PLC (I) 1,100,000 2,069,026
Netherlands - 0.2%
Corio NV 23,000 1,031,319
Norway - 0.5%
Norwegian Property ASA 1,800,000 2,604,714
Singapore - 5.3%
Ascendas Real Estate Investment Trust 1,409,000 2,768,468
CapitaCommercial Trust 2,770,000 3,675,200
CapitaLand, Ltd. 2,545,500 7,354,166
Global Real Estate Fund (continued)Shares or
Principal
Amount Value
COMMON STOCKS (continued)
Singapore (continued)
CapitaMall Trust 827,000 $ 1,401,869
CapitaMalls Asia, Ltd. 2,333,000 3,666,436
Global Logistic Properties, Ltd. 2,270,000 5,232,670
Suntec Real Estate Investment Trust 1,963,000 2,604,561
26,703,370
Sweden - 1.3%
Castellum AB 180,000 2,453,684
Fabege AB 170,000 1,749,273
Hufvudstaden AB, Class A 200,000 2,555,007
6,757,964
Switzerland - 1.1%
PSP Swiss Property AG (I) 40,000 3,742,076
Swiss Prime Site AG (I) 23,430 1,883,972
5,626,048
United Kingdom - 5.2%
British Land Company PLC 840,000 7,405,593
Derwent London PLC 33,000 1,092,004
Great Portland Estates PLC 395,000 2,979,242
Hammerson PLC 545,000 4,116,292
Land Securities Group PLC 400,000 5,180,383
Safestore Holdings PLC 963,747 1,582,600
Shaftesbury PLC 302,070 2,683,929
Unite Group PLC (I) 335,000 1,428,791
26,468,834
United States - 45.9%
Acadia Realty Trust 118,380 2,938,192
Alexander’s, Inc. 2,910 1,289,130
American Campus Communities, Inc. 99,796 4,371,065
AvalonBay Communities, Inc. 40,873 5,386,653
Boston Properties, Inc. 57,594 5,910,872
BRE Properties, Inc. 54,580 2,655,317
Camden Property Trust 106,646 7,006,642
Chesapeake Lodging Trust 89,204 1,683,279
Colonial Properties Trust 164,893 3,363,817
CubeSmart 461,283 6,365,705
DDR Corp. (L) 496,413 7,600,083
DiamondRock Hospitality Company 162,185 1,417,497
Digital Realty Trust, Inc. 19,400 1,252,076
Douglas Emmett, Inc. (L) 306,342 6,957,027
Duke Realty Corp. 395,221 5,335,484
DuPont Fabros Technology, Inc. (L) 256,146 5,914,411
Education Realty Trust, Inc. 200,831 2,070,568
Equity Residential 199,020 11,047,600
Essex Property Trust, Inc. 23,142 3,251,220
Extra Space Storage, Inc. (L) 198,599 6,980,755
Federal Realty Investment Trust 70,121 7,295,389
General Growth Properties, Inc. 183,264 3,549,824
Glimcher Realty Trust 446,167 4,782,910
HCP, Inc. 11,457 516,138
Copyright © 2013 www.secdatabase.com. All Rights Reserved.Please Consider the Environment Before Printing This Document
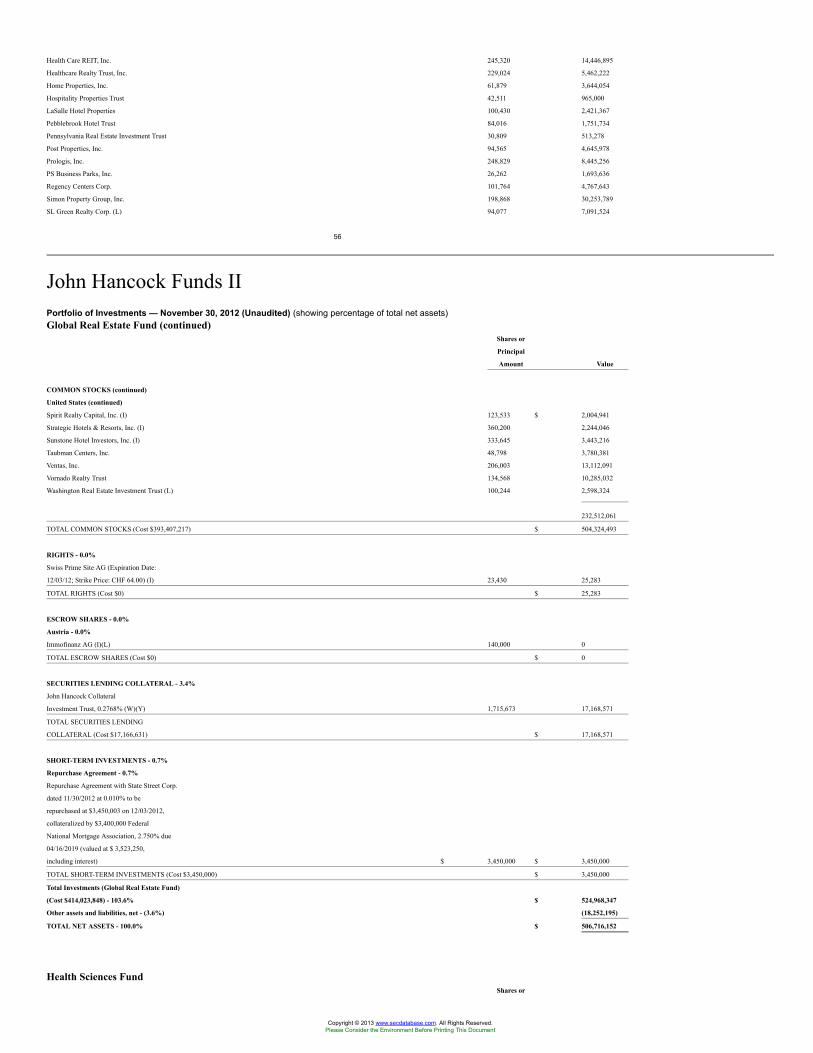
Health Care REIT, Inc. 245,320 14,446,895
Healthcare Realty Trust, Inc. 229,024 5,462,222
Home Properties, Inc. 61,879 3,644,054
Hospitality Properties Trust 42,511 965,000
LaSalle Hotel Properties 100,430 2,421,367
Pebblebrook Hotel Trust 84,016 1,751,734
Pennsylvania Real Estate Investment Trust 30,809 513,278
Post Properties, Inc. 94,565 4,645,978
Prologis, Inc. 248,829 8,445,256
PS Business Parks, Inc. 26,262 1,693,636
Regency Centers Corp. 101,764 4,767,643
Simon Property Group, Inc. 198,868 30,253,789
SL Green Realty Corp. (L) 94,077 7,091,524
56
John Hancock Funds IIPortfolio of Investments — November 30, 2012 (Unaudited) (showing percentage of total net assets)Global Real Estate Fund (continued)
Shares or
Principal
Amount Value
COMMON STOCKS (continued)
United States (continued)
Spirit Realty Capital, Inc. (I) 123,533 $ 2,004,941
Strategic Hotels & Resorts, Inc. (I) 360,200 2,244,046
Sunstone Hotel Investors, Inc. (I) 333,645 3,443,216
Taubman Centers, Inc. 48,798 3,780,381
Ventas, Inc. 206,003 13,112,091
Vornado Realty Trust 134,568 10,285,032
Washington Real Estate Investment Trust (L) 100,244 2,598,324
232,512,061
TOTAL COMMON STOCKS (Cost $393,407,217) $ 504,324,493
RIGHTS - 0.0%
Swiss Prime Site AG (Expiration Date:
12/03/12; Strike Price: CHF 64.00) (I) 23,430 25,283
TOTAL RIGHTS (Cost $0) $ 25,283
ESCROW SHARES - 0.0%
Austria - 0.0%
Immofinanz AG (I)(L) 140,000 0
TOTAL ESCROW SHARES (Cost $0) $ 0
SECURITIES LENDING COLLATERAL - 3.4%
John Hancock Collateral
Investment Trust, 0.2768% (W)(Y) 1,715,673 17,168,571
TOTAL SECURITIES LENDING
COLLATERAL (Cost $17,166,631) $ 17,168,571
SHORT-TERM INVESTMENTS - 0.7%
Repurchase Agreement - 0.7%
Repurchase Agreement with State Street Corp.
dated 11/30/2012 at 0.010% to be
repurchased at $3,450,003 on 12/03/2012,
collateralized by $3,400,000 Federal
National Mortgage Association, 2.750% due
04/16/2019 (valued at $ 3,523,250,
including interest) $ 3,450,000 $ 3,450,000
TOTAL SHORT-TERM INVESTMENTS (Cost $3,450,000) $ 3,450,000
Total Investments (Global Real Estate Fund)
(Cost $414,023,848) - 103.6% $ 524,968,347
Other assets and liabilities, net - (3.6%) (18,252,195)
TOTAL NET ASSETS - 100.0% $ 506,716,152
Health Sciences FundShares or
Copyright © 2013 www.secdatabase.com. All Rights Reserved.Please Consider the Environment Before Printing This Document
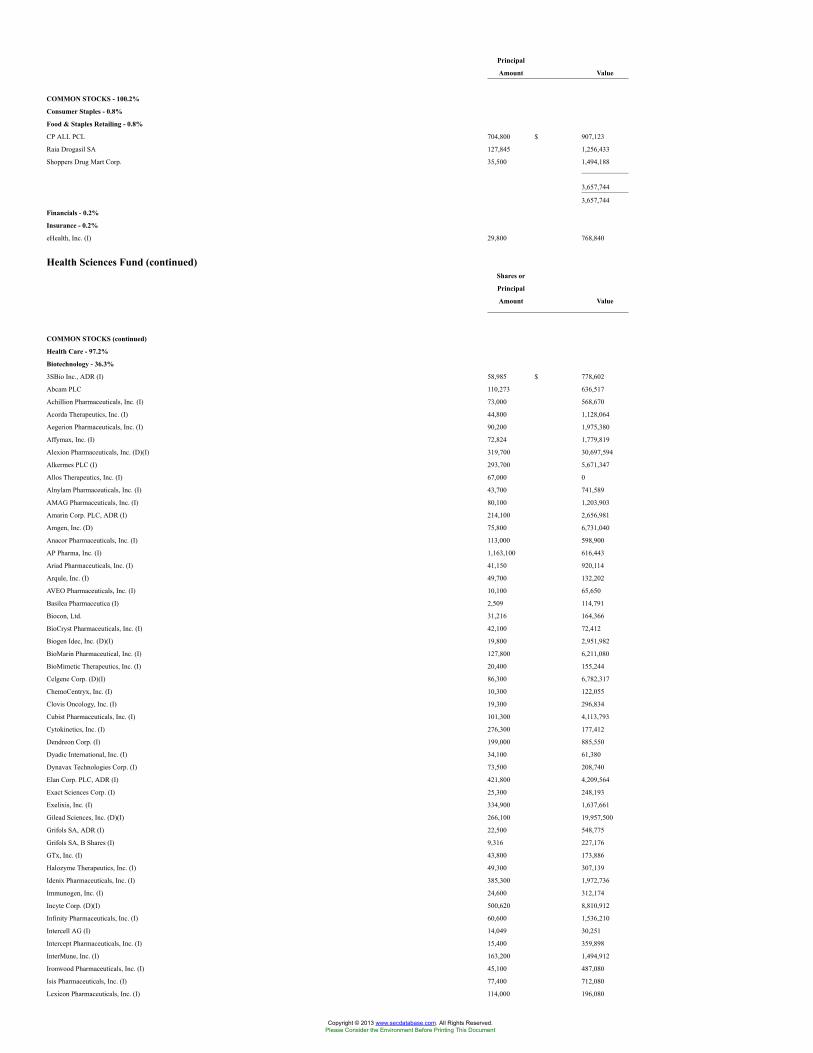
Principal
Amount Value
COMMON STOCKS - 100.2%
Consumer Staples - 0.8%
Food & Staples Retailing - 0.8%
CP ALL PCL 704,800 $ 907,123
Raia Drogasil SA 127,845 1,256,433
Shoppers Drug Mart Corp. 35,500 1,494,188
3,657,744
3,657,744
Financials - 0.2%
Insurance - 0.2%
eHealth, Inc. (I) 29,800 768,840
Health Sciences Fund (continued)Shares or
Principal
Amount Value
COMMON STOCKS (continued)
Health Care - 97.2%
Biotechnology - 36.3%
3SBio Inc., ADR (I) 58,985 $ 778,602
Abcam PLC 110,273 636,517
Achillion Pharmaceuticals, Inc. (I) 73,000 568,670
Acorda Therapeutics, Inc. (I) 44,800 1,128,064
Aegerion Pharmaceuticals, Inc. (I) 90,200 1,975,380
Affymax, Inc. (I) 72,824 1,779,819
Alexion Pharmaceuticals, Inc. (D)(I) 319,700 30,697,594
Alkermes PLC (I) 293,700 5,671,347
Allos Therapeutics, Inc. (I) 67,000 0
Alnylam Pharmaceuticals, Inc. (I) 43,700 741,589
AMAG Pharmaceuticals, Inc. (I) 80,100 1,203,903
Amarin Corp. PLC, ADR (I) 214,100 2,656,981
Amgen, Inc. (D) 75,800 6,731,040
Anacor Pharmaceuticals, Inc. (I) 113,000 598,900
AP Pharma, Inc. (I) 1,163,100 616,443
Ariad Pharmaceuticals, Inc. (I) 41,150 920,114
Arqule, Inc. (I) 49,700 132,202
AVEO Pharmaceuticals, Inc. (I) 10,100 65,650
Basilea Pharmaceutica (I) 2,509 114,791
Biocon, Ltd. 31,216 164,366
BioCryst Pharmaceuticals, Inc. (I) 42,100 72,412
Biogen Idec, Inc. (D)(I) 19,800 2,951,982
BioMarin Pharmaceutical, Inc. (I) 127,800 6,211,080
BioMimetic Therapeutics, Inc. (I) 20,400 155,244
Celgene Corp. (D)(I) 86,300 6,782,317
ChemoCentryx, Inc. (I) 10,300 122,055
Clovis Oncology, Inc. (I) 19,300 296,834
Cubist Pharmaceuticals, Inc. (I) 101,300 4,113,793
Cytokinetics, Inc. (I) 276,300 177,412
Dendreon Corp. (I) 199,000 885,550
Dyadic International, Inc. (I) 34,100 61,380
Dynavax Technologies Corp. (I) 73,500 208,740
Elan Corp. PLC, ADR (I) 421,800 4,209,564
Exact Sciences Corp. (I) 25,300 248,193
Exelixis, Inc. (I) 334,900 1,637,661
Gilead Sciences, Inc. (D)(I) 266,100 19,957,500
Grifols SA, ADR (I) 22,500 548,775
Grifols SA, B Shares (I) 9,316 227,176
GTx, Inc. (I) 43,800 173,886
Halozyme Therapeutics, Inc. (I) 49,300 307,139
Idenix Pharmaceuticals, Inc. (I) 385,300 1,972,736
Immunogen, Inc. (I) 24,600 312,174
Incyte Corp. (D)(I) 500,620 8,810,912
Infinity Pharmaceuticals, Inc. (I) 60,600 1,536,210
Intercell AG (I) 14,049 30,251
Intercept Pharmaceuticals, Inc. (I) 15,400 359,898
InterMune, Inc. (I) 163,200 1,494,912
Ironwood Pharmaceuticals, Inc. (I) 45,100 487,080
Isis Pharmaceuticals, Inc. (I) 77,400 712,080
Lexicon Pharmaceuticals, Inc. (I) 114,000 196,080
Copyright © 2013 www.secdatabase.com. All Rights Reserved.Please Consider the Environment Before Printing This Document
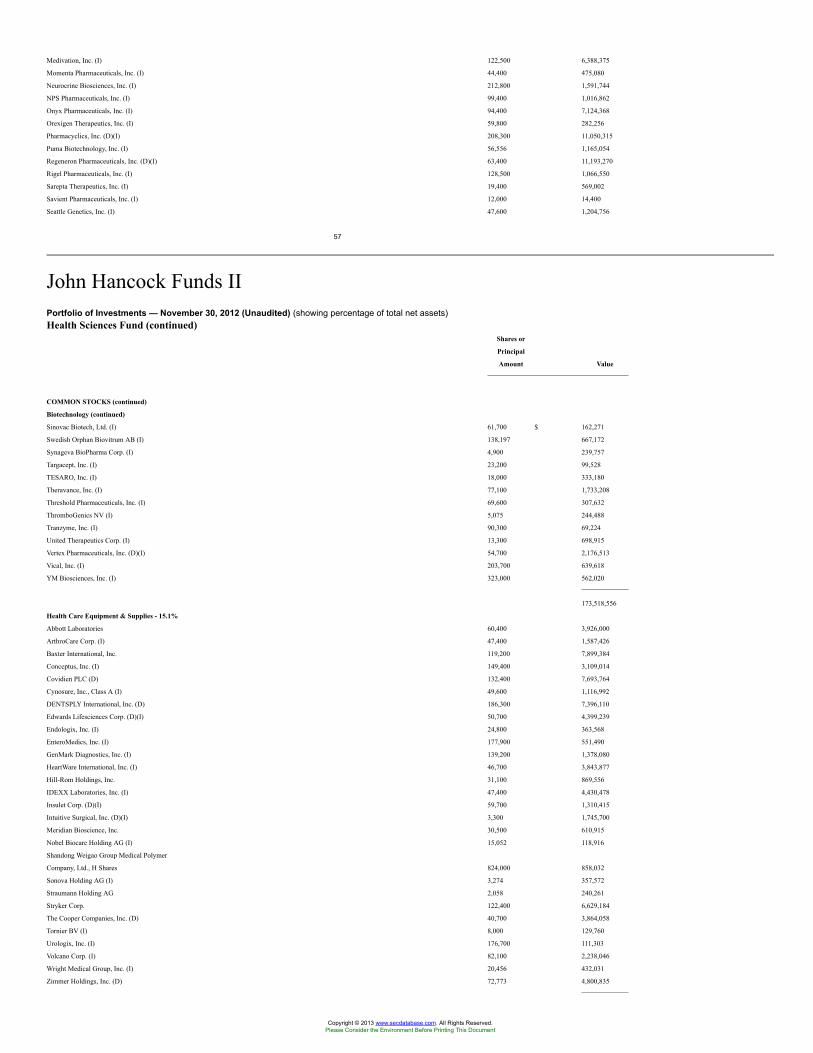
Medivation, Inc. (I) 122,500 6,388,375
Momenta Pharmaceuticals, Inc. (I) 44,400 475,080
Neurocrine Biosciences, Inc. (I) 212,800 1,591,744
NPS Pharmaceuticals, Inc. (I) 99,400 1,016,862
Onyx Pharmaceuticals, Inc. (I) 94,400 7,124,368
Orexigen Therapeutics, Inc. (I) 59,800 282,256
Pharmacyclics, Inc. (D)(I) 208,300 11,050,315
Puma Biotechnology, Inc. (I) 56,556 1,165,054
Regeneron Pharmaceuticals, Inc. (D)(I) 63,400 11,193,270
Rigel Pharmaceuticals, Inc. (I) 128,500 1,066,550
Sarepta Therapeutics, Inc. (I) 19,400 569,002
Savient Pharmaceuticals, Inc. (I) 12,000 14,400
Seattle Genetics, Inc. (I) 47,600 1,204,756
57
John Hancock Funds IIPortfolio of Investments — November 30, 2012 (Unaudited) (showing percentage of total net assets)Health Sciences Fund (continued)
Shares or
Principal
Amount Value
COMMON STOCKS (continued)
Biotechnology (continued)
Sinovac Biotech, Ltd. (I) 61,700 $ 162,271
Swedish Orphan Biovitrum AB (I) 138,197 667,172
Synageva BioPharma Corp. (I) 4,900 239,757
Targacept, Inc. (I) 23,200 99,528
TESARO, Inc. (I) 18,000 333,180
Theravance, Inc. (I) 77,100 1,733,208
Threshold Pharmaceuticals, Inc. (I) 69,600 307,632
ThromboGenics NV (I) 5,075 244,488
Tranzyme, Inc. (I) 90,300 69,224
United Therapeutics Corp. (I) 13,300 698,915
Vertex Pharmaceuticals, Inc. (D)(I) 54,700 2,176,513
Vical, Inc. (I) 203,700 639,618
YM Biosciences, Inc. (I) 323,000 562,020
173,518,556
Health Care Equipment & Supplies - 15.1%
Abbott Laboratories 60,400 3,926,000
ArthroCare Corp. (I) 47,400 1,587,426
Baxter International, Inc. 119,200 7,899,384
Conceptus, Inc. (I) 149,400 3,109,014
Covidien PLC (D) 132,400 7,693,764
Cynosure, Inc., Class A (I) 49,600 1,116,992
DENTSPLY International, Inc. (D) 186,300 7,396,110
Edwards Lifesciences Corp. (D)(I) 50,700 4,399,239
Endologix, Inc. (I) 24,800 363,568
EnteroMedics, Inc. (I) 177,900 551,490
GenMark Diagnostics, Inc. (I) 139,200 1,378,080
HeartWare International, Inc. (I) 46,700 3,843,877
Hill-Rom Holdings, Inc. 31,100 869,556
IDEXX Laboratories, Inc. (I) 47,400 4,430,478
Insulet Corp. (D)(I) 59,700 1,310,415
Intuitive Surgical, Inc. (D)(I) 3,300 1,745,700
Meridian Bioscience, Inc. 30,500 610,915
Nobel Biocare Holding AG (I) 15,052 118,916
Shandong Weigao Group Medical Polymer
Company, Ltd., H Shares 824,000 858,032
Sonova Holding AG (I) 3,274 357,572
Straumann Holding AG 2,058 240,261
Stryker Corp. 122,400 6,629,184
The Cooper Companies, Inc. (D) 40,700 3,864,058
Tornier BV (I) 8,000 129,760
Urologix, Inc. (I) 176,700 111,303
Volcano Corp. (I) 82,100 2,238,046
Wright Medical Group, Inc. (I) 20,456 432,031
Zimmer Holdings, Inc. (D) 72,773 4,800,835
Copyright © 2013 www.secdatabase.com. All Rights Reserved.Please Consider the Environment Before Printing This Document
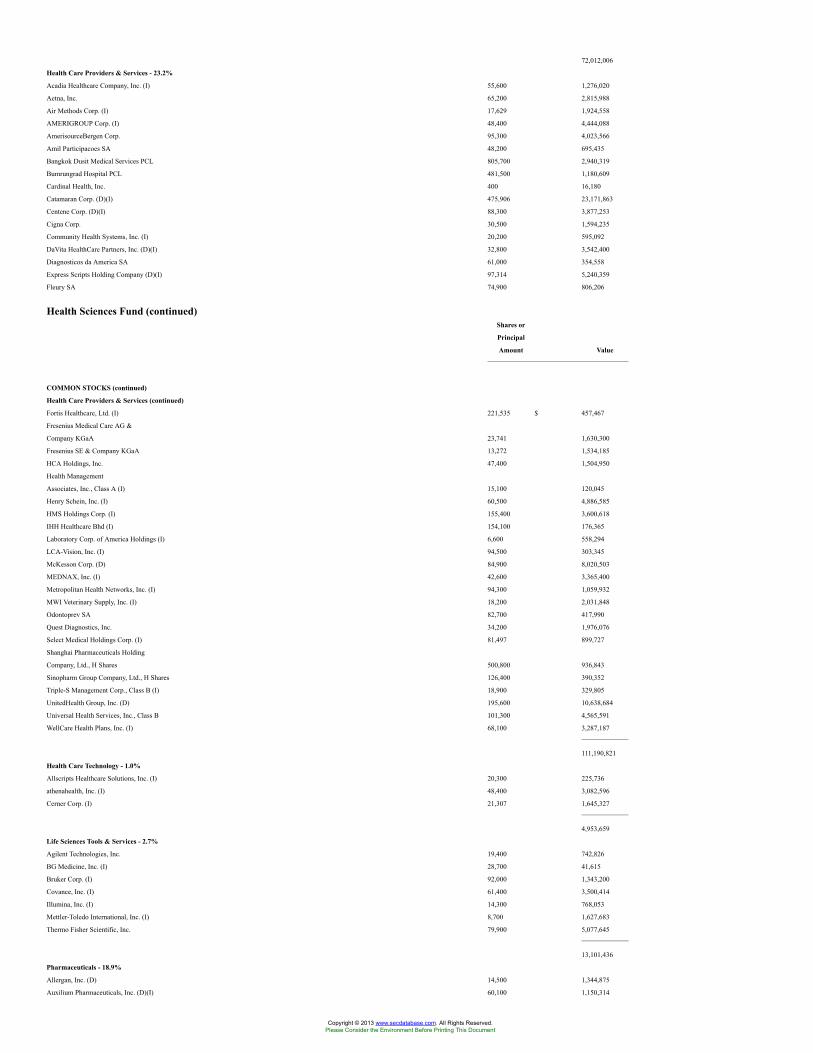
72,012,006
Health Care Providers & Services - 23.2%
Acadia Healthcare Company, Inc. (I) 55,600 1,276,020
Aetna, Inc. 65,200 2,815,988
Air Methods Corp. (I) 17,629 1,924,558
AMERIGROUP Corp. (I) 48,400 4,444,088
AmerisourceBergen Corp. 95,300 4,023,566
Amil Participacoes SA 48,200 695,435
Bangkok Dusit Medical Services PCL 805,700 2,940,319
Bumrungrad Hospital PCL 481,500 1,180,609
Cardinal Health, Inc. 400 16,180
Catamaran Corp. (D)(I) 475,906 23,171,863
Centene Corp. (D)(I) 88,300 3,877,253
Cigna Corp. 30,500 1,594,235
Community Health Systems, Inc. (I) 20,200 595,092
DaVita HealthCare Partners, Inc. (D)(I) 32,800 3,542,400
Diagnosticos da America SA 61,000 354,558
Express Scripts Holding Company (D)(I) 97,314 5,240,359
Fleury SA 74,900 806,206
Health Sciences Fund (continued)Shares or
Principal
Amount Value
COMMON STOCKS (continued)
Health Care Providers & Services (continued)
Fortis Healthcare, Ltd. (I) 221,535 $ 457,467
Fresenius Medical Care AG &
Company KGaA 23,741 1,630,300
Fresenius SE & Company KGaA 13,272 1,534,185
HCA Holdings, Inc. 47,400 1,504,950
Health Management
Associates, Inc., Class A (I) 15,100 120,045
Henry Schein, Inc. (I) 60,500 4,886,585
HMS Holdings Corp. (I) 155,400 3,600,618
IHH Healthcare Bhd (I) 154,100 176,365
Laboratory Corp. of America Holdings (I) 6,600 558,294
LCA-Vision, Inc. (I) 94,500 303,345
McKesson Corp. (D) 84,900 8,020,503
MEDNAX, Inc. (I) 42,600 3,365,400
Metropolitan Health Networks, Inc. (I) 94,300 1,059,932
MWI Veterinary Supply, Inc. (I) 18,200 2,031,848
Odontoprev SA 82,700 417,990
Quest Diagnostics, Inc. 34,200 1,976,076
Select Medical Holdings Corp. (I) 81,497 899,727
Shanghai Pharmaceuticals Holding
Company, Ltd., H Shares 500,800 936,843
Sinopharm Group Company, Ltd., H Shares 126,400 390,352
Triple-S Management Corp., Class B (I) 18,900 329,805
UnitedHealth Group, Inc. (D) 195,600 10,638,684
Universal Health Services, Inc., Class B 101,300 4,565,591
WellCare Health Plans, Inc. (I) 68,100 3,287,187
111,190,821
Health Care Technology - 1.0%
Allscripts Healthcare Solutions, Inc. (I) 20,300 225,736
athenahealth, Inc. (I) 48,400 3,082,596
Cerner Corp. (I) 21,307 1,645,327
4,953,659
Life Sciences Tools & Services - 2.7%
Agilent Technologies, Inc. 19,400 742,826
BG Medicine, Inc. (I) 28,700 41,615
Bruker Corp. (I) 92,000 1,343,200
Covance, Inc. (I) 61,400 3,500,414
Illumina, Inc. (I) 14,300 768,053
Mettler-Toledo International, Inc. (I) 8,700 1,627,683
Thermo Fisher Scientific, Inc. 79,900 5,077,645
13,101,436
Pharmaceuticals - 18.9%
Allergan, Inc. (D) 14,500 1,344,875
Auxilium Pharmaceuticals, Inc. (D)(I) 60,100 1,150,314
Copyright © 2013 www.secdatabase.com. All Rights Reserved.Please Consider the Environment Before Printing This Document
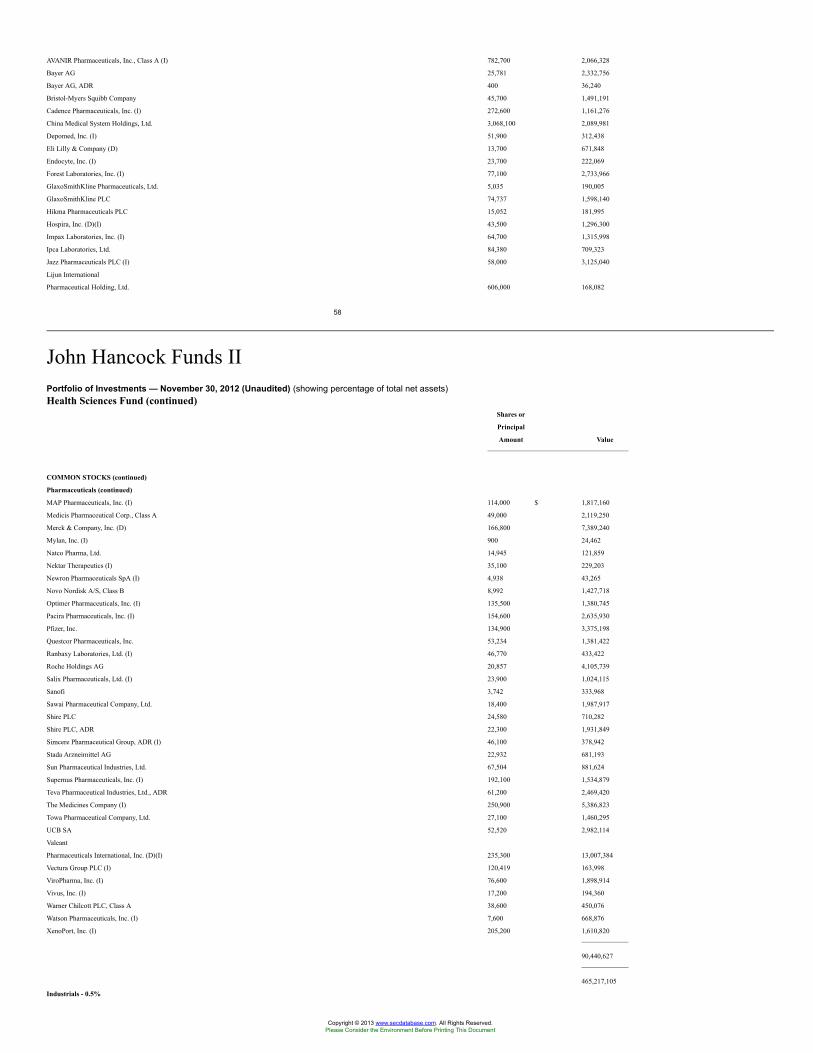
AVANIR Pharmaceuticals, Inc., Class A (I) 782,700 2,066,328
Bayer AG 25,781 2,332,756
Bayer AG, ADR 400 36,240
Bristol-Myers Squibb Company 45,700 1,491,191
Cadence Pharmaceuticals, Inc. (I) 272,600 1,161,276
China Medical System Holdings, Ltd. 3,068,100 2,089,981
Depomed, Inc. (I) 51,900 312,438
Eli Lilly & Company (D) 13,700 671,848
Endocyte, Inc. (I) 23,700 222,069
Forest Laboratories, Inc. (I) 77,100 2,733,966
GlaxoSmithKline Pharmaceuticals, Ltd. 5,035 190,005
GlaxoSmithKline PLC 74,737 1,598,140
Hikma Pharmaceuticals PLC 15,052 181,995
Hospira, Inc. (D)(I) 43,500 1,296,300
Impax Laboratories, Inc. (I) 64,700 1,315,998
Ipca Laboratories, Ltd. 84,380 709,323
Jazz Pharmaceuticals PLC (I) 58,000 3,125,040
Lijun International
Pharmaceutical Holding, Ltd. 606,000 168,082
58
John Hancock Funds IIPortfolio of Investments — November 30, 2012 (Unaudited) (showing percentage of total net assets)Health Sciences Fund (continued)
Shares or
Principal
Amount Value
COMMON STOCKS (continued)
Pharmaceuticals (continued)
MAP Pharmaceuticals, Inc. (I) 114,000 $ 1,817,160
Medicis Pharmaceutical Corp., Class A 49,000 2,119,250
Merck & Company, Inc. (D) 166,800 7,389,240
Mylan, Inc. (I) 900 24,462
Natco Pharma, Ltd. 14,945 121,859
Nektar Therapeutics (I) 35,100 229,203
Newron Pharmaceuticals SpA (I) 4,938 43,265
Novo Nordisk A/S, Class B 8,992 1,427,718
Optimer Pharmaceuticals, Inc. (I) 135,500 1,380,745
Pacira Pharmaceuticals, Inc. (I) 154,600 2,635,930
Pfizer, Inc. 134,900 3,375,198
Questcor Pharmaceuticals, Inc. 53,234 1,381,422
Ranbaxy Laboratories, Ltd. (I) 46,770 433,422
Roche Holdings AG 20,857 4,105,739
Salix Pharmaceuticals, Ltd. (I) 23,900 1,024,115
Sanofi 3,742 333,968
Sawai Pharmaceutical Company, Ltd. 18,400 1,987,917
Shire PLC 24,580 710,282
Shire PLC, ADR 22,300 1,931,849
Simcere Pharmaceutical Group, ADR (I) 46,100 378,942
Stada Arzneimittel AG 22,932 681,193
Sun Pharmaceutical Industries, Ltd. 67,504 881,624
Supernus Pharmaceuticals, Inc. (I) 192,100 1,534,879
Teva Pharmaceutical Industries, Ltd., ADR 61,200 2,469,420
The Medicines Company (I) 250,900 5,386,823
Towa Pharmaceutical Company, Ltd. 27,100 1,460,295
UCB SA 52,520 2,982,114
Valeant
Pharmaceuticals International, Inc. (D)(I) 235,300 13,007,384
Vectura Group PLC (I) 120,419 163,998
ViroPharma, Inc. (I) 76,600 1,898,914
Vivus, Inc. (I) 17,200 194,360
Warner Chilcott PLC, Class A 38,600 450,076
Watson Pharmaceuticals, Inc. (I) 7,600 668,876
XenoPort, Inc. (I) 205,200 1,610,820
90,440,627
465,217,105
Industrials - 0.5%
Copyright © 2013 www.secdatabase.com. All Rights Reserved.Please Consider the Environment Before Printing This Document
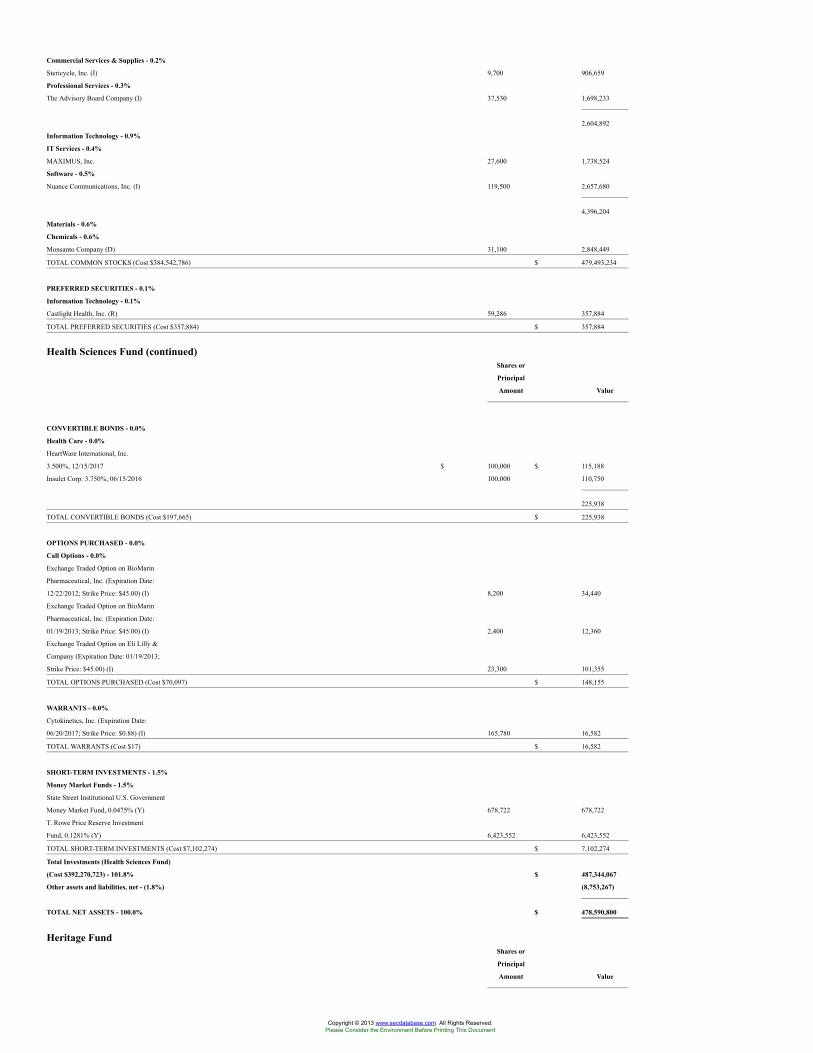
Commercial Services & Supplies - 0.2%
Stericycle, Inc. (I) 9,700 906,659
Professional Services - 0.3%
The Advisory Board Company (I) 37,530 1,698,233
2,604,892
Information Technology - 0.9%
IT Services - 0.4%
MAXIMUS, Inc. 27,600 1,738,524
Software - 0.5%
Nuance Communications, Inc. (I) 119,500 2,657,680
4,396,204
Materials - 0.6%
Chemicals - 0.6%
Monsanto Company (D) 31,100 2,848,449
TOTAL COMMON STOCKS (Cost $384,542,786) $ 479,493,234
PREFERRED SECURITIES - 0.1%
Information Technology - 0.1%
Castlight Health, Inc. (R) 59,286 357,884
TOTAL PREFERRED SECURITIES (Cost $357,884) $ 357,884
Health Sciences Fund (continued)Shares or
Principal
Amount Value
CONVERTIBLE BONDS - 0.0%
Health Care - 0.0%
HeartWare International, Inc.
3.500%, 12/15/2017 $ 100,000 $ 115,188
Insulet Corp. 3.750%, 06/15/2016 100,000 110,750
225,938
TOTAL CONVERTIBLE BONDS (Cost $197,665) $ 225,938
OPTIONS PURCHASED - 0.0%
Call Options - 0.0%
Exchange Traded Option on BioMarin
Pharmaceutical, Inc. (Expiration Date:
12/22/2012; Strike Price: $45.00) (I) 8,200 34,440
Exchange Traded Option on BioMarin
Pharmaceutical, Inc. (Expiration Date:
01/19/2013; Strike Price: $45.00) (I) 2,400 12,360
Exchange Traded Option on Eli Lilly &
Company (Expiration Date: 01/19/2013;
Strike Price: $45.00) (I) 23,300 101,355
TOTAL OPTIONS PURCHASED (Cost $70,097) $ 148,155
WARRANTS - 0.0%
Cytokinetics, Inc. (Expiration Date:
06/20/2017; Strike Price: $0.88) (I) 165,780 16,582
TOTAL WARRANTS (Cost $17) $ 16,582
SHORT-TERM INVESTMENTS - 1.5%
Money Market Funds - 1.5%
State Street Institutional U.S. Government
Money Market Fund, 0.0475% (Y) 678,722 678,722
T. Rowe Price Reserve Investment
Fund, 0.1281% (Y) 6,423,552 6,423,552
TOTAL SHORT-TERM INVESTMENTS (Cost $7,102,274) $ 7,102,274
Total Investments (Health Sciences Fund)
(Cost $392,270,723) - 101.8% $ 487,344,067
Other assets and liabilities, net - (1.8%) (8,753,267)
TOTAL NET ASSETS - 100.0% $ 478,590,800
Heritage FundShares or
Principal
Amount Value
Copyright © 2013 www.secdatabase.com. All Rights Reserved.Please Consider the Environment Before Printing This Document
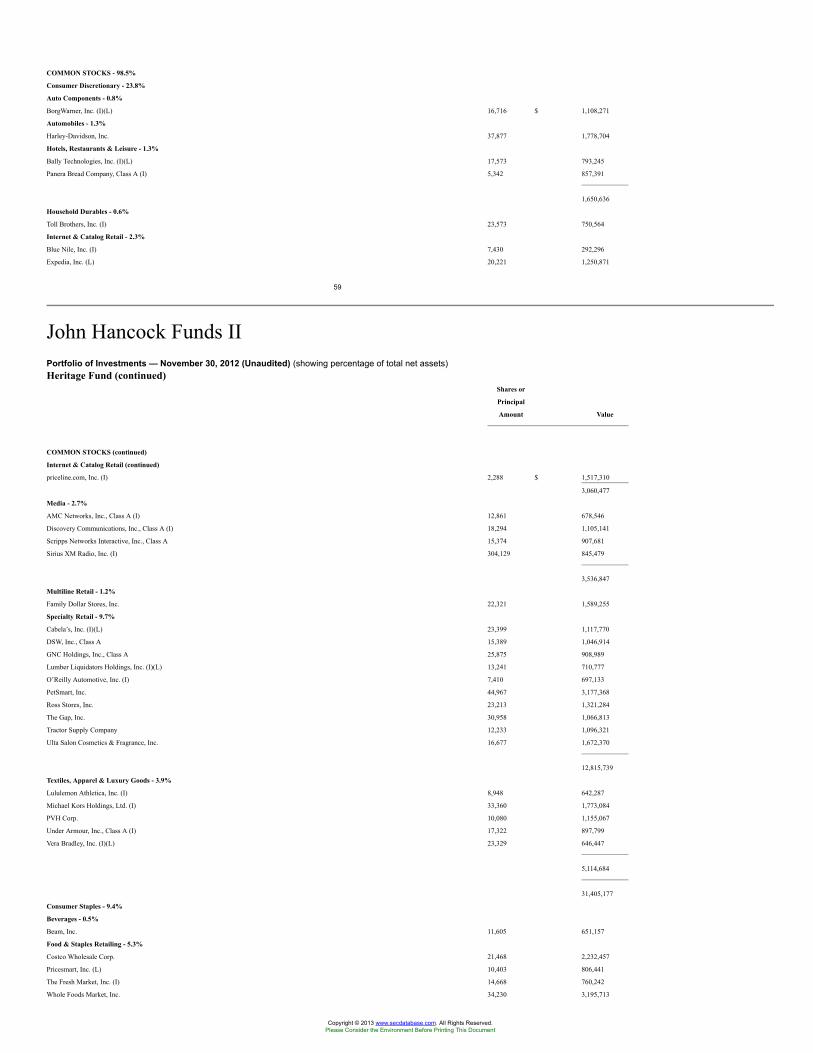
COMMON STOCKS - 98.5%
Consumer Discretionary - 23.8%
Auto Components - 0.8%
BorgWarner, Inc. (I)(L) 16,716 $ 1,108,271
Automobiles - 1.3%
Harley-Davidson, Inc. 37,877 1,778,704
Hotels, Restaurants & Leisure - 1.3%
Bally Technologies, Inc. (I)(L) 17,573 793,245
Panera Bread Company, Class A (I) 5,342 857,391
1,650,636
Household Durables - 0.6%
Toll Brothers, Inc. (I) 23,573 750,564
Internet & Catalog Retail - 2.3%
Blue Nile, Inc. (I) 7,430 292,296
Expedia, Inc. (L) 20,221 1,250,871
59
John Hancock Funds IIPortfolio of Investments — November 30, 2012 (Unaudited) (showing percentage of total net assets)Heritage Fund (continued)
Shares or
Principal
Amount Value
COMMON STOCKS (continued)
Internet & Catalog Retail (continued)
priceline.com, Inc. (I) 2,288 $ 1,517,310
3,060,477
Media - 2.7%
AMC Networks, Inc., Class A (I) 12,861 678,546
Discovery Communications, Inc., Class A (I) 18,294 1,105,141
Scripps Networks Interactive, Inc., Class A 15,374 907,681
Sirius XM Radio, Inc. (I) 304,129 845,479
3,536,847
Multiline Retail - 1.2%
Family Dollar Stores, Inc. 22,321 1,589,255
Specialty Retail - 9.7%
Cabela’s, Inc. (I)(L) 23,399 1,117,770
DSW, Inc., Class A 15,389 1,046,914
GNC Holdings, Inc., Class A 25,875 908,989
Lumber Liquidators Holdings, Inc. (I)(L) 13,241 710,777
O’Reilly Automotive, Inc. (I) 7,410 697,133
PetSmart, Inc. 44,967 3,177,368
Ross Stores, Inc. 23,213 1,321,284
The Gap, Inc. 30,958 1,066,813
Tractor Supply Company 12,233 1,096,321
Ulta Salon Cosmetics & Fragrance, Inc. 16,677 1,672,370
12,815,739
Textiles, Apparel & Luxury Goods - 3.9%
Lululemon Athletica, Inc. (I) 8,948 642,287
Michael Kors Holdings, Ltd. (I) 33,360 1,773,084
PVH Corp. 10,080 1,155,067
Under Armour, Inc., Class A (I) 17,322 897,799
Vera Bradley, Inc. (I)(L) 23,329 646,447
5,114,684
31,405,177
Consumer Staples - 9.4%
Beverages - 0.5%
Beam, Inc. 11,605 651,157
Food & Staples Retailing - 5.3%
Costco Wholesale Corp. 21,468 2,232,457
Pricesmart, Inc. (L) 10,403 806,441
The Fresh Market, Inc. (I) 14,668 760,242
Whole Foods Market, Inc. 34,230 3,195,713
Copyright © 2013 www.secdatabase.com. All Rights Reserved.Please Consider the Environment Before Printing This Document
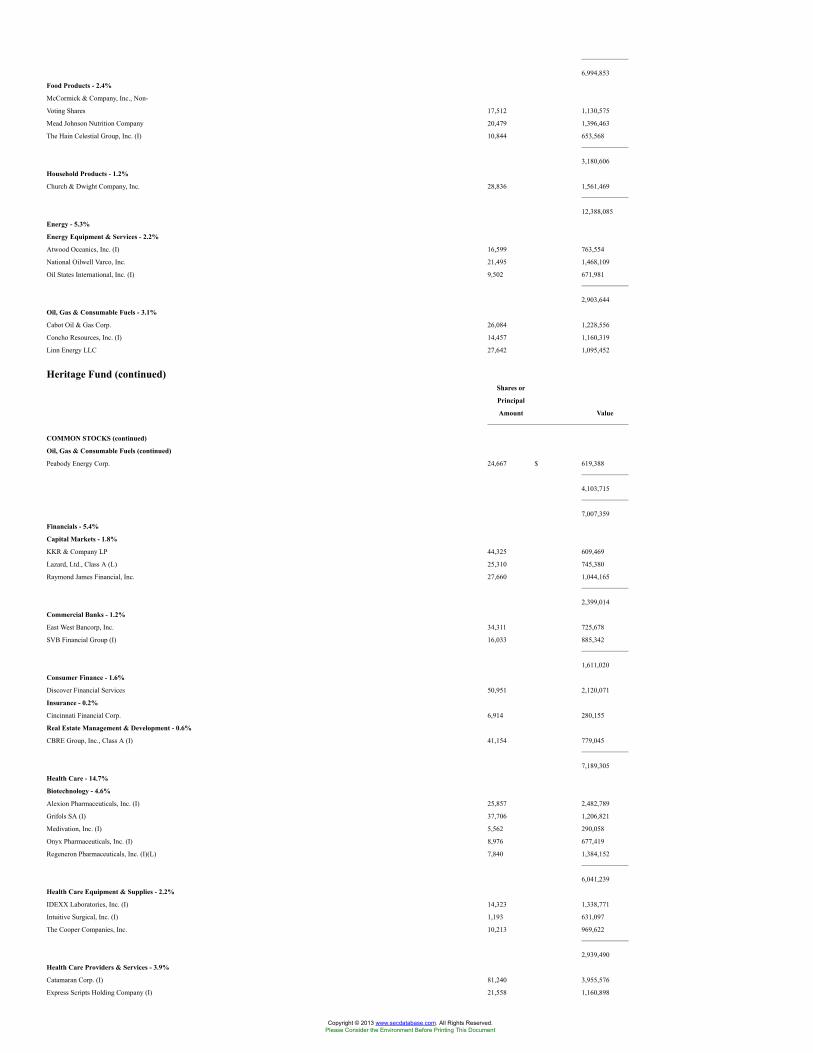
6,994,853
Food Products - 2.4%
McCormick & Company, Inc., Non-
Voting Shares 17,512 1,130,575
Mead Johnson Nutrition Company 20,479 1,396,463
The Hain Celestial Group, Inc. (I) 10,844 653,568
3,180,606
Household Products - 1.2%
Church & Dwight Company, Inc. 28,836 1,561,469
12,388,085
Energy - 5.3%
Energy Equipment & Services - 2.2%
Atwood Oceanics, Inc. (I) 16,599 763,554
National Oilwell Varco, Inc. 21,495 1,468,109
Oil States International, Inc. (I) 9,502 671,981
2,903,644
Oil, Gas & Consumable Fuels - 3.1%
Cabot Oil & Gas Corp. 26,084 1,228,556
Concho Resources, Inc. (I) 14,457 1,160,319
Linn Energy LLC 27,642 1,095,452
Heritage Fund (continued)Shares or
Principal
Amount Value
COMMON STOCKS (continued)
Oil, Gas & Consumable Fuels (continued)
Peabody Energy Corp. 24,667 $ 619,388
4,103,715
7,007,359
Financials - 5.4%
Capital Markets - 1.8%
KKR & Company LP 44,325 609,469
Lazard, Ltd., Class A (L) 25,310 745,380
Raymond James Financial, Inc. 27,660 1,044,165
2,399,014
Commercial Banks - 1.2%
East West Bancorp, Inc. 34,311 725,678
SVB Financial Group (I) 16,033 885,342
1,611,020
Consumer Finance - 1.6%
Discover Financial Services 50,951 2,120,071
Insurance - 0.2%
Cincinnati Financial Corp. 6,914 280,155
Real Estate Management & Development - 0.6%
CBRE Group, Inc., Class A (I) 41,154 779,045
7,189,305
Health Care - 14.7%
Biotechnology - 4.6%
Alexion Pharmaceuticals, Inc. (I) 25,857 2,482,789
Grifols SA (I) 37,706 1,206,821
Medivation, Inc. (I) 5,562 290,058
Onyx Pharmaceuticals, Inc. (I) 8,976 677,419
Regeneron Pharmaceuticals, Inc. (I)(L) 7,840 1,384,152
6,041,239
Health Care Equipment & Supplies - 2.2%
IDEXX Laboratories, Inc. (I) 14,323 1,338,771
Intuitive Surgical, Inc. (I) 1,193 631,097
The Cooper Companies, Inc. 10,213 969,622
2,939,490
Health Care Providers & Services - 3.9%
Catamaran Corp. (I) 81,240 3,955,576
Express Scripts Holding Company (I) 21,558 1,160,898
Copyright © 2013 www.secdatabase.com. All Rights Reserved.Please Consider the Environment Before Printing This Document
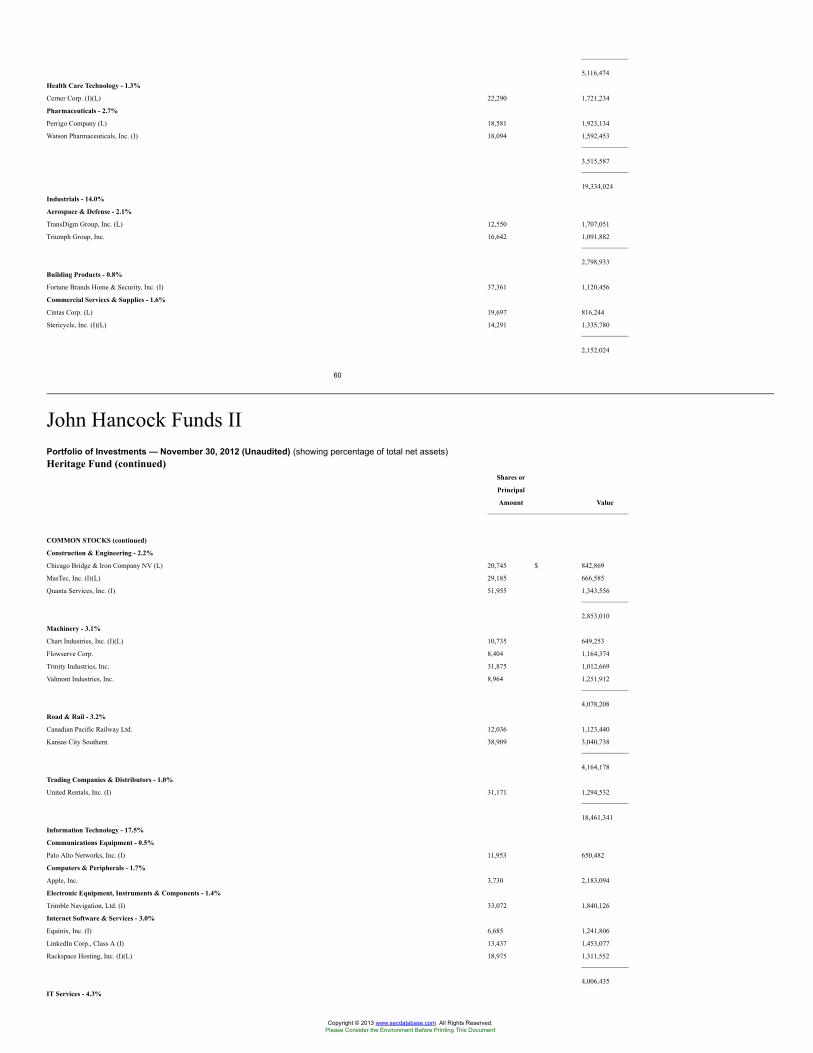
5,116,474
Health Care Technology - 1.3%
Cerner Corp. (I)(L) 22,290 1,721,234
Pharmaceuticals - 2.7%
Perrigo Company (L) 18,581 1,923,134
Watson Pharmaceuticals, Inc. (I) 18,094 1,592,453
3,515,587
19,334,024
Industrials - 14.0%
Aerospace & Defense - 2.1%
TransDigm Group, Inc. (L) 12,550 1,707,051
Triumph Group, Inc. 16,642 1,091,882
2,798,933
Building Products - 0.8%
Fortune Brands Home & Security, Inc. (I) 37,361 1,120,456
Commercial Services & Supplies - 1.6%
Cintas Corp. (L) 19,697 816,244
Stericycle, Inc. (I)(L) 14,291 1,335,780
2,152,024
60
John Hancock Funds IIPortfolio of Investments — November 30, 2012 (Unaudited) (showing percentage of total net assets)Heritage Fund (continued)
Shares or
Principal
Amount Value
COMMON STOCKS (continued)
Construction & Engineering - 2.2%
Chicago Bridge & Iron Company NV (L) 20,745 $ 842,869
MasTec, Inc. (I)(L) 29,185 666,585
Quanta Services, Inc. (I) 51,955 1,343,556
2,853,010
Machinery - 3.1%
Chart Industries, Inc. (I)(L) 10,735 649,253
Flowserve Corp. 8,404 1,164,374
Trinity Industries, Inc. 31,875 1,012,669
Valmont Industries, Inc. 8,964 1,251,912
4,078,208
Road & Rail - 3.2%
Canadian Pacific Railway Ltd. 12,036 1,123,440
Kansas City Southern 38,909 3,040,738
4,164,178
Trading Companies & Distributors - 1.0%
United Rentals, Inc. (I) 31,171 1,294,532
18,461,341
Information Technology - 17.5%
Communications Equipment - 0.5%
Palo Alto Networks, Inc. (I) 11,953 650,482
Computers & Peripherals - 1.7%
Apple, Inc. 3,730 2,183,094
Electronic Equipment, Instruments & Components - 1.4%
Trimble Navigation, Ltd. (I) 33,072 1,840,126
Internet Software & Services - 3.0%
Equinix, Inc. (I) 6,685 1,241,806
LinkedIn Corp., Class A (I) 13,437 1,453,077
Rackspace Hosting, Inc. (I)(L) 18,975 1,311,552
4,006,435
IT Services - 4.3%
Copyright © 2013 www.secdatabase.com. All Rights Reserved.Please Consider the Environment Before Printing This Document
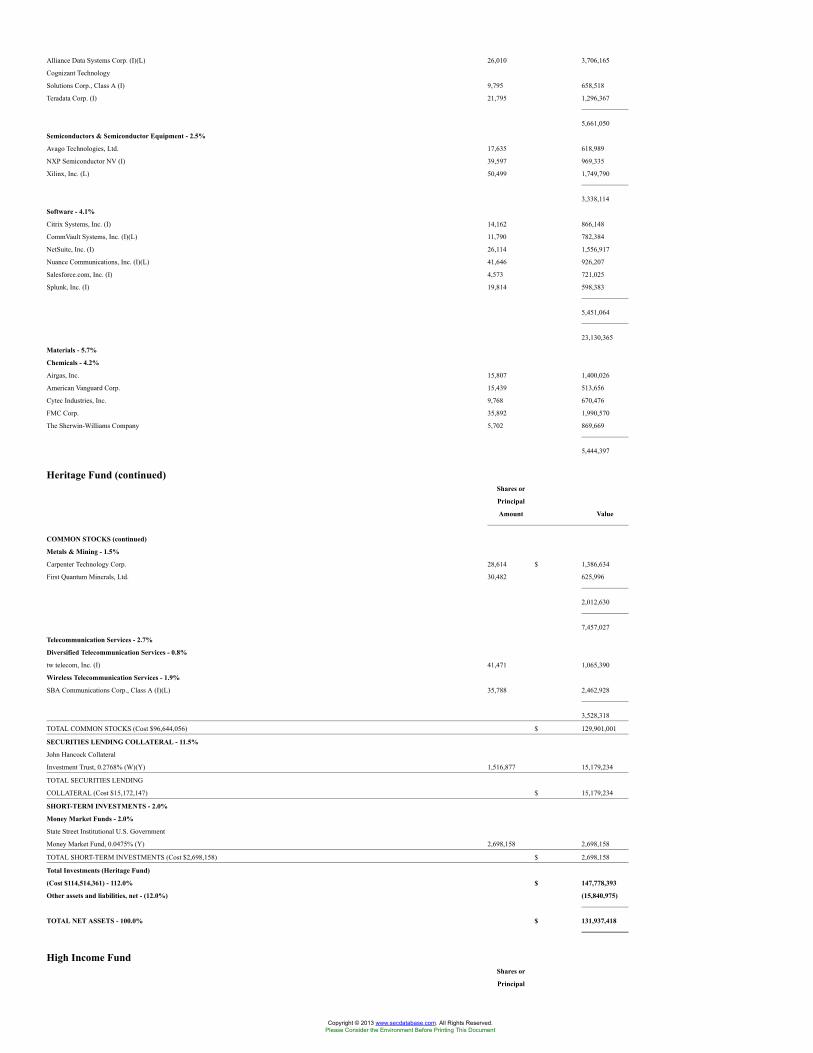
Alliance Data Systems Corp. (I)(L) 26,010 3,706,165
Cognizant Technology
Solutions Corp., Class A (I) 9,795 658,518
Teradata Corp. (I) 21,795 1,296,367
5,661,050
Semiconductors & Semiconductor Equipment - 2.5%
Avago Technologies, Ltd. 17,635 618,989
NXP Semiconductor NV (I) 39,597 969,335
Xilinx, Inc. (L) 50,499 1,749,790
3,338,114
Software - 4.1%
Citrix Systems, Inc. (I) 14,162 866,148
CommVault Systems, Inc. (I)(L) 11,790 782,384
NetSuite, Inc. (I) 26,114 1,556,917
Nuance Communications, Inc. (I)(L) 41,646 926,207
Salesforce.com, Inc. (I) 4,573 721,025
Splunk, Inc. (I) 19,814 598,383
5,451,064
23,130,365
Materials - 5.7%
Chemicals - 4.2%
Airgas, Inc. 15,807 1,400,026
American Vanguard Corp. 15,439 513,656
Cytec Industries, Inc. 9,768 670,476
FMC Corp. 35,892 1,990,570
The Sherwin-Williams Company 5,702 869,669
5,444,397
Heritage Fund (continued)Shares or
Principal
Amount Value
COMMON STOCKS (continued)
Metals & Mining - 1.5%
Carpenter Technology Corp. 28,614 $ 1,386,634
First Quantum Minerals, Ltd. 30,482 625,996
2,012,630
7,457,027
Telecommunication Services - 2.7%
Diversified Telecommunication Services - 0.8%
tw telecom, Inc. (I) 41,471 1,065,390
Wireless Telecommunication Services - 1.9%
SBA Communications Corp., Class A (I)(L) 35,788 2,462,928
3,528,318
TOTAL COMMON STOCKS (Cost $96,644,056) $ 129,901,001
SECURITIES LENDING COLLATERAL - 11.5%
John Hancock Collateral
Investment Trust, 0.2768% (W)(Y) 1,516,877 15,179,234
TOTAL SECURITIES LENDING
COLLATERAL (Cost $15,172,147) $ 15,179,234
SHORT-TERM INVESTMENTS - 2.0%
Money Market Funds - 2.0%
State Street Institutional U.S. Government
Money Market Fund, 0.0475% (Y) 2,698,158 2,698,158
TOTAL SHORT-TERM INVESTMENTS (Cost $2,698,158) $ 2,698,158
Total Investments (Heritage Fund)
(Cost $114,514,361) - 112.0% $ 147,778,393
Other assets and liabilities, net - (12.0%) (15,840,975)
TOTAL NET ASSETS - 100.0% $ 131,937,418
High Income FundShares or
Principal
Copyright © 2013 www.secdatabase.com. All Rights Reserved.Please Consider the Environment Before Printing This Document
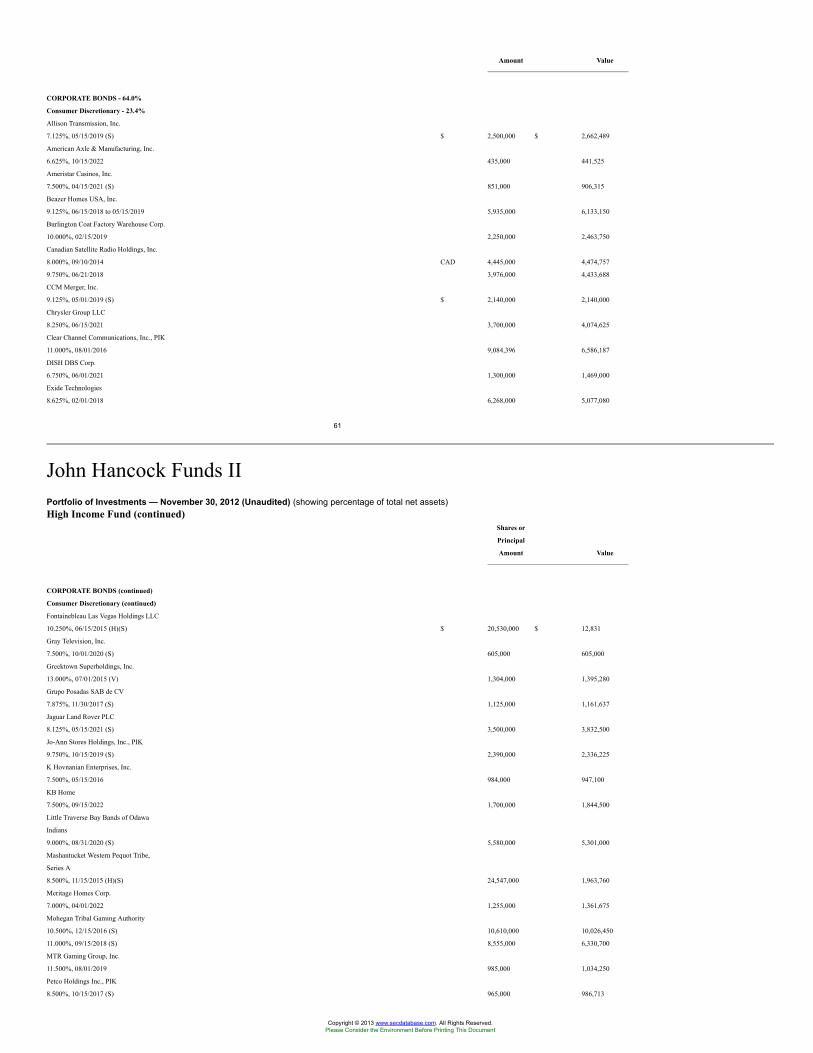
Amount Value
CORPORATE BONDS - 64.0%
Consumer Discretionary - 23.4%
Allison Transmission, Inc.
7.125%, 05/15/2019 (S) $ 2,500,000 $ 2,662,489
American Axle & Manufacturing, Inc.
6.625%, 10/15/2022 435,000 441,525
Ameristar Casinos, Inc.
7.500%, 04/15/2021 (S) 851,000 906,315
Beazer Homes USA, Inc.
9.125%, 06/15/2018 to 05/15/2019 5,935,000 6,133,150
Burlington Coat Factory Warehouse Corp.
10.000%, 02/15/2019 2,250,000 2,463,750
Canadian Satellite Radio Holdings, Inc.
8.000%, 09/10/2014 CAD 4,445,000 4,474,757
9.750%, 06/21/2018 3,976,000 4,433,688
CCM Merger, Inc.
9.125%, 05/01/2019 (S) $ 2,140,000 2,140,000
Chrysler Group LLC
8.250%, 06/15/2021 3,700,000 4,074,625
Clear Channel Communications, Inc., PIK
11.000%, 08/01/2016 9,084,396 6,586,187
DISH DBS Corp.
6.750%, 06/01/2021 1,300,000 1,469,000
Exide Technologies
8.625%, 02/01/2018 6,268,000 5,077,080
61
John Hancock Funds IIPortfolio of Investments — November 30, 2012 (Unaudited) (showing percentage of total net assets)High Income Fund (continued)
Shares or
Principal
Amount Value
CORPORATE BONDS (continued)
Consumer Discretionary (continued)
Fontainebleau Las Vegas Holdings LLC
10.250%, 06/15/2015 (H)(S) $ 20,530,000 $ 12,831
Gray Television, Inc.
7.500%, 10/01/2020 (S) 605,000 605,000
Greektown Superholdings, Inc.
13.000%, 07/01/2015 (V) 1,304,000 1,395,280
Grupo Posadas SAB de CV
7.875%, 11/30/2017 (S) 1,125,000 1,161,637
Jaguar Land Rover PLC
8.125%, 05/15/2021 (S) 3,500,000 3,832,500
Jo-Ann Stores Holdings, Inc., PIK
9.750%, 10/15/2019 (S) 2,390,000 2,336,225
K Hovnanian Enterprises, Inc.
7.500%, 05/15/2016 984,000 947,100
KB Home
7.500%, 09/15/2022 1,700,000 1,844,500
Little Traverse Bay Bands of Odawa
Indians
9.000%, 08/31/2020 (S) 5,580,000 5,301,000
Mashantucket Western Pequot Tribe,
Series A
8.500%, 11/15/2015 (H)(S) 24,547,000 1,963,760
Meritage Homes Corp.
7.000%, 04/01/2022 1,255,000 1,361,675
Mohegan Tribal Gaming Authority
10.500%, 12/15/2016 (S) 10,610,000 10,026,450
11.000%, 09/15/2018 (S) 8,555,000 6,330,700
MTR Gaming Group, Inc.
11.500%, 08/01/2019 985,000 1,034,250
Petco Holdings Inc., PIK
8.500%, 10/15/2017 (S) 965,000 986,713
Copyright © 2013 www.secdatabase.com. All Rights Reserved.Please Consider the Environment Before Printing This Document
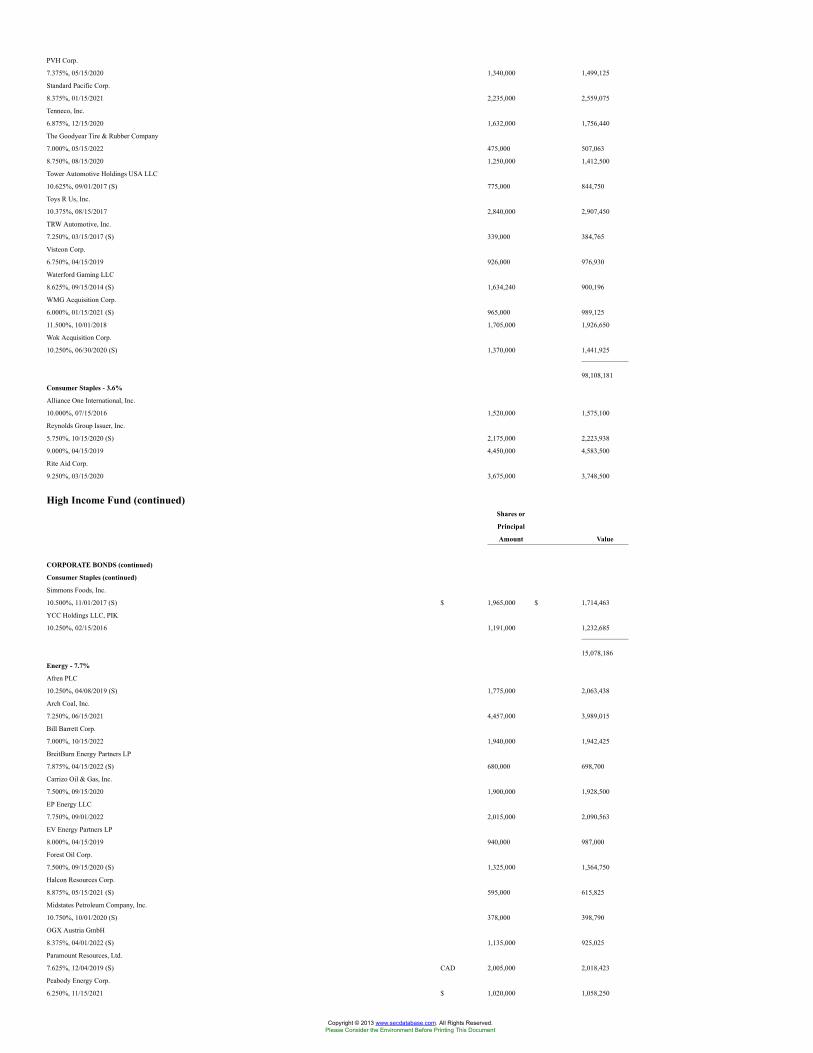
PVH Corp.
7.375%, 05/15/2020 1,340,000 1,499,125
Standard Pacific Corp.
8.375%, 01/15/2021 2,235,000 2,559,075
Tenneco, Inc.
6.875%, 12/15/2020 1,632,000 1,756,440
The Goodyear Tire & Rubber Company
7.000%, 05/15/2022 475,000 507,063
8.750%, 08/15/2020 1,250,000 1,412,500
Tower Automotive Holdings USA LLC
10.625%, 09/01/2017 (S) 775,000 844,750
Toys R Us, Inc.
10.375%, 08/15/2017 2,840,000 2,907,450
TRW Automotive, Inc.
7.250%, 03/15/2017 (S) 339,000 384,765
Visteon Corp.
6.750%, 04/15/2019 926,000 976,930
Waterford Gaming LLC
8.625%, 09/15/2014 (S) 1,634,240 900,196
WMG Acquisition Corp.
6.000%, 01/15/2021 (S) 965,000 989,125
11.500%, 10/01/2018 1,705,000 1,926,650
Wok Acquisition Corp.
10.250%, 06/30/2020 (S) 1,370,000 1,441,925
98,108,181
Consumer Staples - 3.6%
Alliance One International, Inc.
10.000%, 07/15/2016 1,520,000 1,575,100
Reynolds Group Issuer, Inc.
5.750%, 10/15/2020 (S) 2,175,000 2,223,938
9.000%, 04/15/2019 4,450,000 4,583,500
Rite Aid Corp.
9.250%, 03/15/2020 3,675,000 3,748,500
High Income Fund (continued)Shares or
Principal
Amount Value
CORPORATE BONDS (continued)
Consumer Staples (continued)
Simmons Foods, Inc.
10.500%, 11/01/2017 (S) $ 1,965,000 $ 1,714,463
YCC Holdings LLC, PIK
10.250%, 02/15/2016 1,191,000 1,232,685
15,078,186
Energy - 7.7%
Afren PLC
10.250%, 04/08/2019 (S) 1,775,000 2,063,438
Arch Coal, Inc.
7.250%, 06/15/2021 4,457,000 3,989,015
Bill Barrett Corp.
7.000%, 10/15/2022 1,940,000 1,942,425
BreitBurn Energy Partners LP
7.875%, 04/15/2022 (S) 680,000 698,700
Carrizo Oil & Gas, Inc.
7.500%, 09/15/2020 1,900,000 1,928,500
EP Energy LLC
7.750%, 09/01/2022 2,015,000 2,090,563
EV Energy Partners LP
8.000%, 04/15/2019 940,000 987,000
Forest Oil Corp.
7.500%, 09/15/2020 (S) 1,325,000 1,364,750
Halcon Resources Corp.
8.875%, 05/15/2021 (S) 595,000 615,825
Midstates Petroleum Company, Inc.
10.750%, 10/01/2020 (S) 378,000 398,790
OGX Austria GmbH
8.375%, 04/01/2022 (S) 1,135,000 925,025
Paramount Resources, Ltd.
7.625%, 12/04/2019 (S) CAD 2,005,000 2,018,423
Peabody Energy Corp.
6.250%, 11/15/2021 $ 1,020,000 1,058,250
Copyright © 2013 www.secdatabase.com. All Rights Reserved.Please Consider the Environment Before Printing This Document
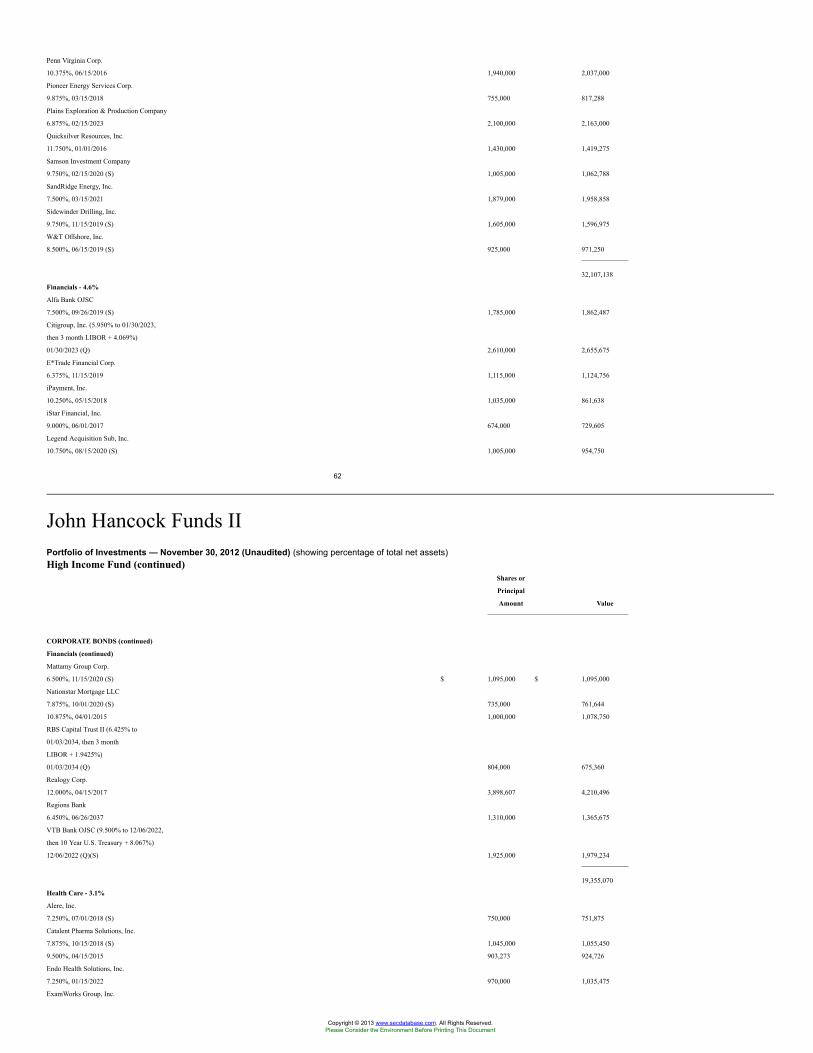
Penn Virginia Corp.
10.375%, 06/15/2016 1,940,000 2,037,000
Pioneer Energy Services Corp.
9.875%, 03/15/2018 755,000 817,288
Plains Exploration & Production Company
6.875%, 02/15/2023 2,100,000 2,163,000
Quicksilver Resources, Inc.
11.750%, 01/01/2016 1,430,000 1,419,275
Samson Investment Company
9.750%, 02/15/2020 (S) 1,005,000 1,062,788
SandRidge Energy, Inc.
7.500%, 03/15/2021 1,879,000 1,958,858
Sidewinder Drilling, Inc.
9.750%, 11/15/2019 (S) 1,605,000 1,596,975
W&T Offshore, Inc.
8.500%, 06/15/2019 (S) 925,000 971,250
32,107,138
Financials - 4.6%
Alfa Bank OJSC
7.500%, 09/26/2019 (S) 1,785,000 1,862,487
Citigroup, Inc. (5.950% to 01/30/2023,
then 3 month LIBOR + 4.069%)
01/30/2023 (Q) 2,610,000 2,655,675
E*Trade Financial Corp.
6.375%, 11/15/2019 1,115,000 1,124,756
iPayment, Inc.
10.250%, 05/15/2018 1,035,000 861,638
iStar Financial, Inc.
9.000%, 06/01/2017 674,000 729,605
Legend Acquisition Sub, Inc.
10.750%, 08/15/2020 (S) 1,005,000 954,750
62
John Hancock Funds IIPortfolio of Investments — November 30, 2012 (Unaudited) (showing percentage of total net assets)High Income Fund (continued)
Shares or
Principal
Amount Value
CORPORATE BONDS (continued)
Financials (continued)
Mattamy Group Corp.
6.500%, 11/15/2020 (S) $ 1,095,000 $ 1,095,000
Nationstar Mortgage LLC
7.875%, 10/01/2020 (S) 735,000 761,644
10.875%, 04/01/2015 1,000,000 1,078,750
RBS Capital Trust II (6.425% to
01/03/2034, then 3 month
LIBOR + 1.9425%)
01/03/2034 (Q) 804,000 675,360
Realogy Corp.
12.000%, 04/15/2017 3,898,607 4,210,496
Regions Bank
6.450%, 06/26/2037 1,310,000 1,365,675
VTB Bank OJSC (9.500% to 12/06/2022,
then 10 Year U.S. Treasury + 8.067%)
12/06/2022 (Q)(S) 1,925,000 1,979,234
19,355,070
Health Care - 3.1%
Alere, Inc.
7.250%, 07/01/2018 (S) 750,000 751,875
Catalent Pharma Solutions, Inc.
7.875%, 10/15/2018 (S) 1,045,000 1,055,450
9.500%, 04/15/2015 903,273 924,726
Endo Health Solutions, Inc.
7.250%, 01/15/2022 970,000 1,035,475
ExamWorks Group, Inc.
Copyright © 2013 www.secdatabase.com. All Rights Reserved.Please Consider the Environment Before Printing This Document
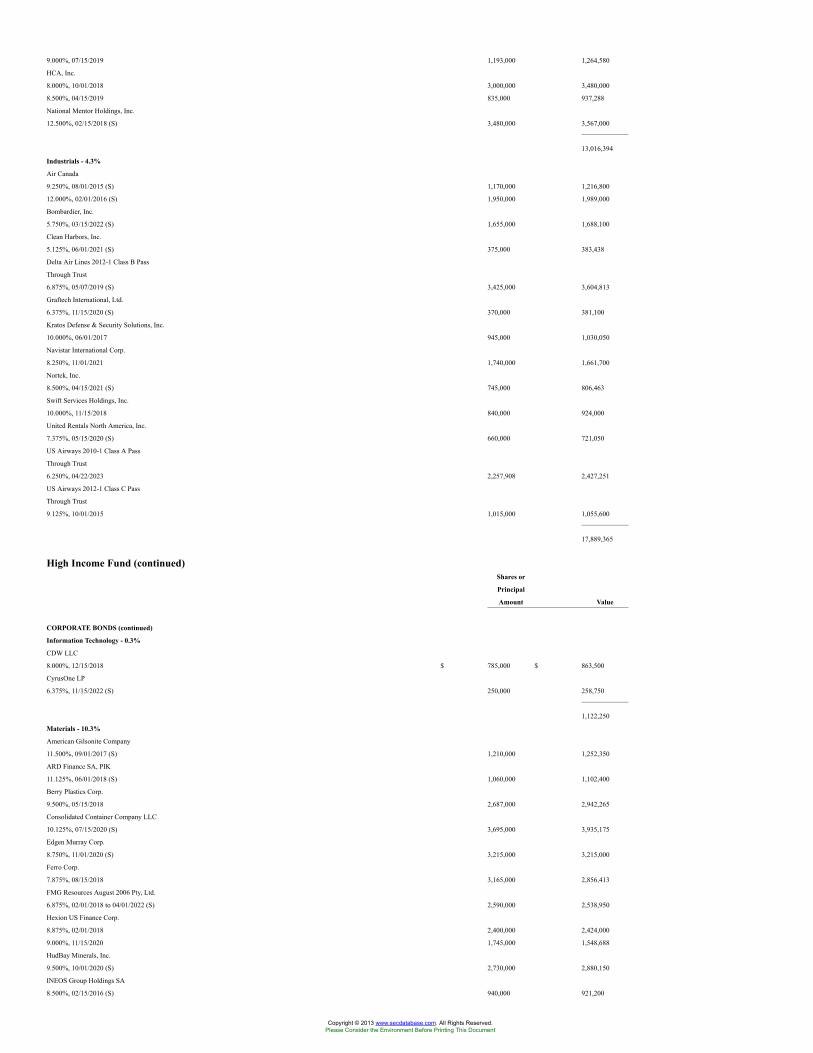
9.000%, 07/15/2019 1,193,000 1,264,580
HCA, Inc.
8.000%, 10/01/2018 3,000,000 3,480,000
8.500%, 04/15/2019 835,000 937,288
National Mentor Holdings, Inc.
12.500%, 02/15/2018 (S) 3,480,000 3,567,000
13,016,394
Industrials - 4.3%
Air Canada
9.250%, 08/01/2015 (S) 1,170,000 1,216,800
12.000%, 02/01/2016 (S) 1,950,000 1,989,000
Bombardier, Inc.
5.750%, 03/15/2022 (S) 1,655,000 1,688,100
Clean Harbors, Inc.
5.125%, 06/01/2021 (S) 375,000 383,438
Delta Air Lines 2012-1 Class B Pass
Through Trust
6.875%, 05/07/2019 (S) 3,425,000 3,604,813
Graftech International, Ltd.
6.375%, 11/15/2020 (S) 370,000 381,100
Kratos Defense & Security Solutions, Inc.
10.000%, 06/01/2017 945,000 1,030,050
Navistar International Corp.
8.250%, 11/01/2021 1,740,000 1,661,700
Nortek, Inc.
8.500%, 04/15/2021 (S) 745,000 806,463
Swift Services Holdings, Inc.
10.000%, 11/15/2018 840,000 924,000
United Rentals North America, Inc.
7.375%, 05/15/2020 (S) 660,000 721,050
US Airways 2010-1 Class A Pass
Through Trust
6.250%, 04/22/2023 2,257,908 2,427,251
US Airways 2012-1 Class C Pass
Through Trust
9.125%, 10/01/2015 1,015,000 1,055,600
17,889,365
High Income Fund (continued)Shares or
Principal
Amount Value
CORPORATE BONDS (continued)
Information Technology - 0.3%
CDW LLC
8.000%, 12/15/2018 $ 785,000 $ 863,500
CyrusOne LP
6.375%, 11/15/2022 (S) 250,000 258,750
1,122,250
Materials - 10.3%
American Gilsonite Company
11.500%, 09/01/2017 (S) 1,210,000 1,252,350
ARD Finance SA, PIK
11.125%, 06/01/2018 (S) 1,060,000 1,102,400
Berry Plastics Corp.
9.500%, 05/15/2018 2,687,000 2,942,265
Consolidated Container Company LLC
10.125%, 07/15/2020 (S) 3,695,000 3,935,175
Edgen Murray Corp.
8.750%, 11/01/2020 (S) 3,215,000 3,215,000
Ferro Corp.
7.875%, 08/15/2018 3,165,000 2,856,413
FMG Resources August 2006 Pty, Ltd.
6.875%, 02/01/2018 to 04/01/2022 (S) 2,590,000 2,538,950
Hexion US Finance Corp.
8.875%, 02/01/2018 2,400,000 2,424,000
9.000%, 11/15/2020 1,745,000 1,548,688
HudBay Minerals, Inc.
9.500%, 10/01/2020 (S) 2,730,000 2,880,150
INEOS Group Holdings SA
8.500%, 02/15/2016 (S) 940,000 921,200
Copyright © 2013 www.secdatabase.com. All Rights Reserved.Please Consider the Environment Before Printing This Document
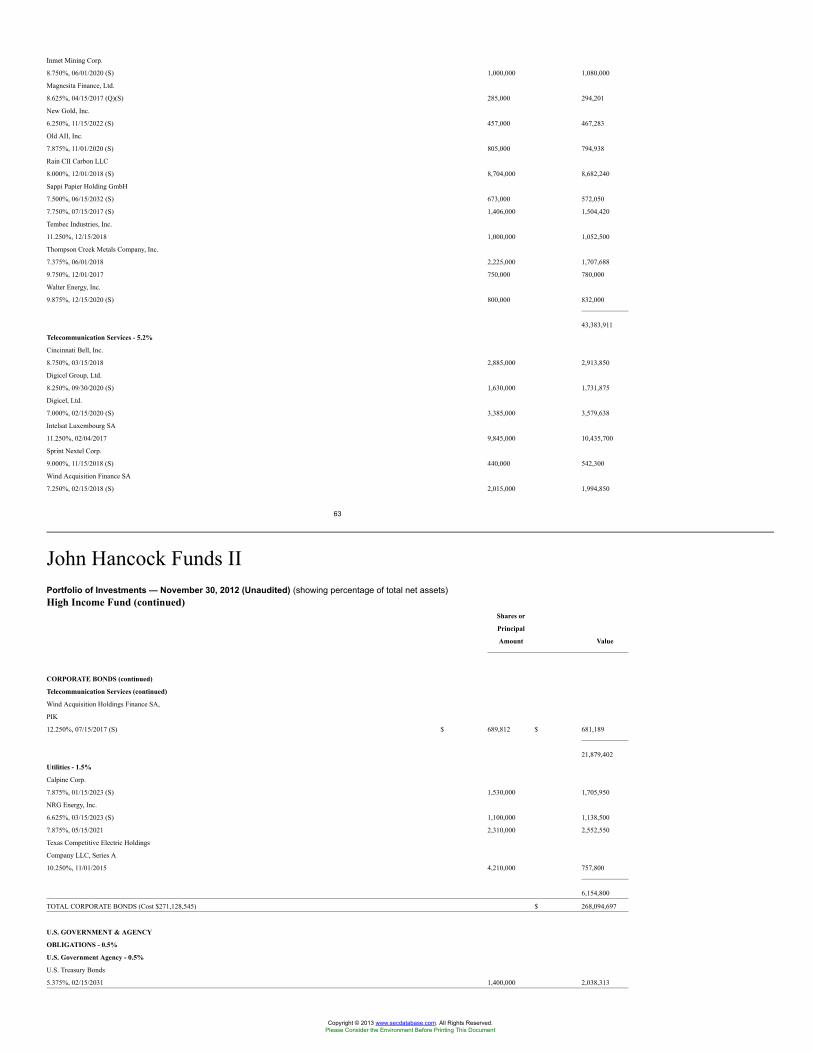
Inmet Mining Corp.
8.750%, 06/01/2020 (S) 1,000,000 1,080,000
Magnesita Finance, Ltd.
8.625%, 04/15/2017 (Q)(S) 285,000 294,201
New Gold, Inc.
6.250%, 11/15/2022 (S) 457,000 467,283
Old AII, Inc.
7.875%, 11/01/2020 (S) 805,000 794,938
Rain CII Carbon LLC
8.000%, 12/01/2018 (S) 8,704,000 8,682,240
Sappi Papier Holding GmbH
7.500%, 06/15/2032 (S) 673,000 572,050
7.750%, 07/15/2017 (S) 1,406,000 1,504,420
Tembec Industries, Inc.
11.250%, 12/15/2018 1,000,000 1,052,500
Thompson Creek Metals Company, Inc.
7.375%, 06/01/2018 2,225,000 1,707,688
9.750%, 12/01/2017 750,000 780,000
Walter Energy, Inc.
9.875%, 12/15/2020 (S) 800,000 832,000
43,383,911
Telecommunication Services - 5.2%
Cincinnati Bell, Inc.
8.750%, 03/15/2018 2,885,000 2,913,850
Digicel Group, Ltd.
8.250%, 09/30/2020 (S) 1,630,000 1,731,875
Digicel, Ltd.
7.000%, 02/15/2020 (S) 3,385,000 3,579,638
Intelsat Luxembourg SA
11.250%, 02/04/2017 9,845,000 10,435,700
Sprint Nextel Corp.
9.000%, 11/15/2018 (S) 440,000 542,300
Wind Acquisition Finance SA
7.250%, 02/15/2018 (S) 2,015,000 1,994,850
63
John Hancock Funds IIPortfolio of Investments — November 30, 2012 (Unaudited) (showing percentage of total net assets)High Income Fund (continued)
Shares or
Principal
Amount Value
CORPORATE BONDS (continued)
Telecommunication Services (continued)
Wind Acquisition Holdings Finance SA,
PIK
12.250%, 07/15/2017 (S) $ 689,812 $ 681,189
21,879,402
Utilities - 1.5%
Calpine Corp.
7.875%, 01/15/2023 (S) 1,530,000 1,705,950
NRG Energy, Inc.
6.625%, 03/15/2023 (S) 1,100,000 1,138,500
7.875%, 05/15/2021 2,310,000 2,552,550
Texas Competitive Electric Holdings
Company LLC, Series A
10.250%, 11/01/2015 4,210,000 757,800
6,154,800
TOTAL CORPORATE BONDS (Cost $271,128,545) $ 268,094,697
U.S. GOVERNMENT & AGENCY
OBLIGATIONS - 0.5%
U.S. Government Agency - 0.5%
U.S. Treasury Bonds
5.375%, 02/15/2031 1,400,000 2,038,313
Copyright © 2013 www.secdatabase.com. All Rights Reserved.Please Consider the Environment Before Printing This Document
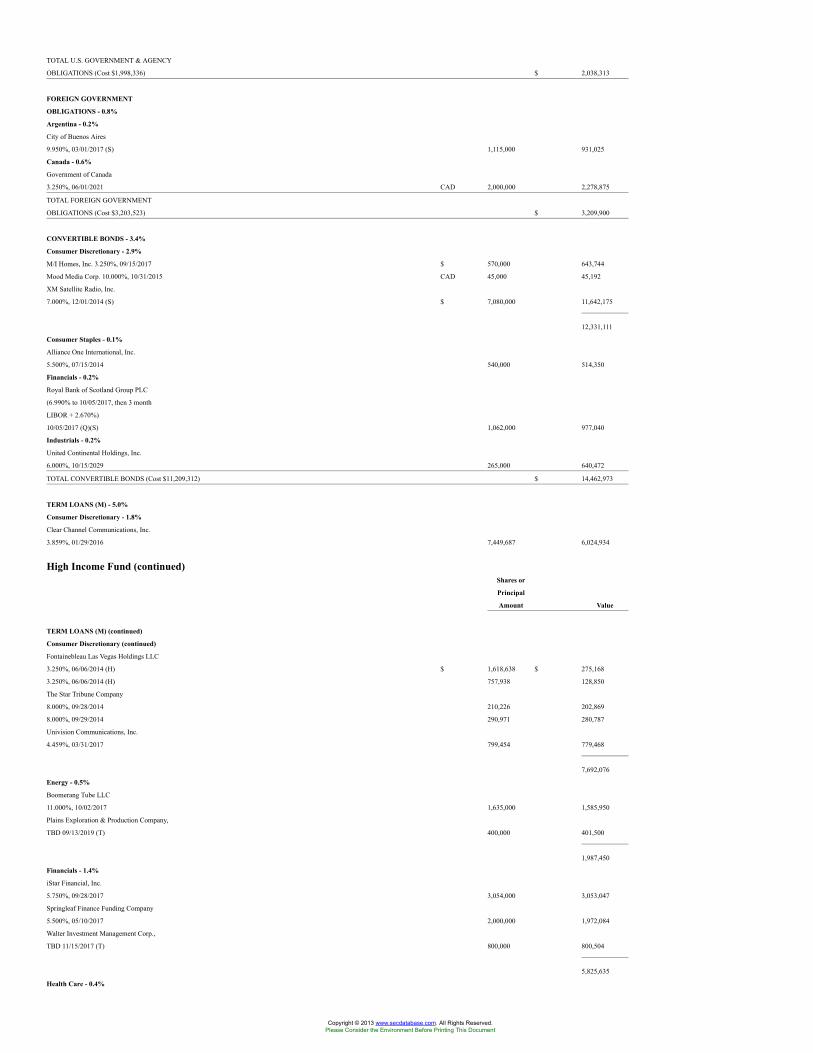
TOTAL U.S. GOVERNMENT & AGENCY
OBLIGATIONS (Cost $1,998,336) $ 2,038,313
FOREIGN GOVERNMENT
OBLIGATIONS - 0.8%
Argentina - 0.2%
City of Buenos Aires
9.950%, 03/01/2017 (S) 1,115,000 931,025
Canada - 0.6%
Government of Canada
3.250%, 06/01/2021 CAD 2,000,000 2,278,875
TOTAL FOREIGN GOVERNMENT
OBLIGATIONS (Cost $3,203,523) $ 3,209,900
CONVERTIBLE BONDS - 3.4%
Consumer Discretionary - 2.9%
M/I Homes, Inc. 3.250%, 09/15/2017 $ 570,000 643,744
Mood Media Corp. 10.000%, 10/31/2015 CAD 45,000 45,192
XM Satellite Radio, Inc.
7.000%, 12/01/2014 (S) $ 7,080,000 11,642,175
12,331,111
Consumer Staples - 0.1%
Alliance One International, Inc.
5.500%, 07/15/2014 540,000 514,350
Financials - 0.2%
Royal Bank of Scotland Group PLC
(6.990% to 10/05/2017, then 3 month
LIBOR + 2.670%)
10/05/2017 (Q)(S) 1,062,000 977,040
Industrials - 0.2%
United Continental Holdings, Inc.
6.000%, 10/15/2029 265,000 640,472
TOTAL CONVERTIBLE BONDS (Cost $11,209,312) $ 14,462,973
TERM LOANS (M) - 5.0%
Consumer Discretionary - 1.8%
Clear Channel Communications, Inc.
3.859%, 01/29/2016 7,449,687 6,024,934
High Income Fund (continued)Shares or
Principal
Amount Value
TERM LOANS (M) (continued)
Consumer Discretionary (continued)
Fontainebleau Las Vegas Holdings LLC
3.250%, 06/06/2014 (H) $ 1,618,638 $ 275,168
3.250%, 06/06/2014 (H) 757,938 128,850
The Star Tribune Company
8.000%, 09/28/2014 210,226 202,869
8.000%, 09/29/2014 290,971 280,787
Univision Communications, Inc.
4.459%, 03/31/2017 799,454 779,468
7,692,076
Energy - 0.5%
Boomerang Tube LLC
11.000%, 10/02/2017 1,635,000 1,585,950
Plains Exploration & Production Company,
TBD 09/13/2019 (T) 400,000 401,500
1,987,450
Financials - 1.4%
iStar Financial, Inc.
5.750%, 09/28/2017 3,054,000 3,053,047
Springleaf Finance Funding Company
5.500%, 05/10/2017 2,000,000 1,972,084
Walter Investment Management Corp.,
TBD 11/15/2017 (T) 800,000 800,504
5,825,635
Health Care - 0.4%
Copyright © 2013 www.secdatabase.com. All Rights Reserved.Please Consider the Environment Before Printing This Document
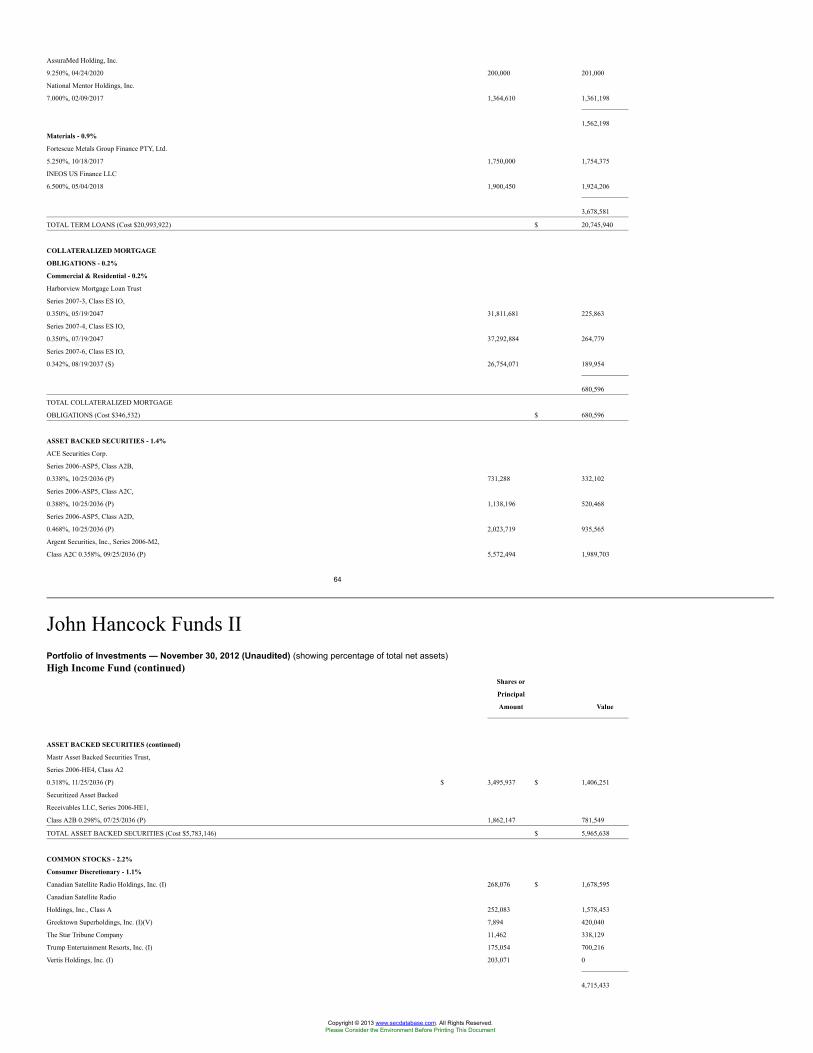
AssuraMed Holding, Inc.
9.250%, 04/24/2020 200,000 201,000
National Mentor Holdings, Inc.
7.000%, 02/09/2017 1,364,610 1,361,198
1,562,198
Materials - 0.9%
Fortescue Metals Group Finance PTY, Ltd.
5.250%, 10/18/2017 1,750,000 1,754,375
INEOS US Finance LLC
6.500%, 05/04/2018 1,900,450 1,924,206
3,678,581
TOTAL TERM LOANS (Cost $20,993,922) $ 20,745,940
COLLATERALIZED MORTGAGE
OBLIGATIONS - 0.2%
Commercial & Residential - 0.2%
Harborview Mortgage Loan Trust
Series 2007-3, Class ES IO,
0.350%, 05/19/2047 31,811,681 225,863
Series 2007-4, Class ES IO,
0.350%, 07/19/2047 37,292,884 264,779
Series 2007-6, Class ES IO,
0.342%, 08/19/2037 (S) 26,754,071 189,954
680,596
TOTAL COLLATERALIZED MORTGAGE
OBLIGATIONS (Cost $346,532) $ 680,596
ASSET BACKED SECURITIES - 1.4%
ACE Securities Corp.
Series 2006-ASP5, Class A2B,
0.338%, 10/25/2036 (P) 731,288 332,102
Series 2006-ASP5, Class A2C,
0.388%, 10/25/2036 (P) 1,138,196 520,468
Series 2006-ASP5, Class A2D,
0.468%, 10/25/2036 (P) 2,023,719 935,565
Argent Securities, Inc., Series 2006-M2,
Class A2C 0.358%, 09/25/2036 (P) 5,572,494 1,989,703
64
John Hancock Funds IIPortfolio of Investments — November 30, 2012 (Unaudited) (showing percentage of total net assets)High Income Fund (continued)
Shares or
Principal
Amount Value
ASSET BACKED SECURITIES (continued)
Mastr Asset Backed Securities Trust,
Series 2006-HE4, Class A2
0.318%, 11/25/2036 (P) $ 3,495,937 $ 1,406,251
Securitized Asset Backed
Receivables LLC, Series 2006-HE1,
Class A2B 0.298%, 07/25/2036 (P) 1,862,147 781,549
TOTAL ASSET BACKED SECURITIES (Cost $5,783,146) $ 5,965,638
COMMON STOCKS - 2.2%
Consumer Discretionary - 1.1%
Canadian Satellite Radio Holdings, Inc. (I) 268,076 $ 1,678,595
Canadian Satellite Radio
Holdings, Inc., Class A 252,083 1,578,453
Greektown Superholdings, Inc. (I)(V) 7,894 420,040
The Star Tribune Company 11,462 338,129
Trump Entertainment Resorts, Inc. (I) 175,054 700,216
Vertis Holdings, Inc. (I) 203,071 0
4,715,433
Copyright © 2013 www.secdatabase.com. All Rights Reserved.Please Consider the Environment Before Printing This Document
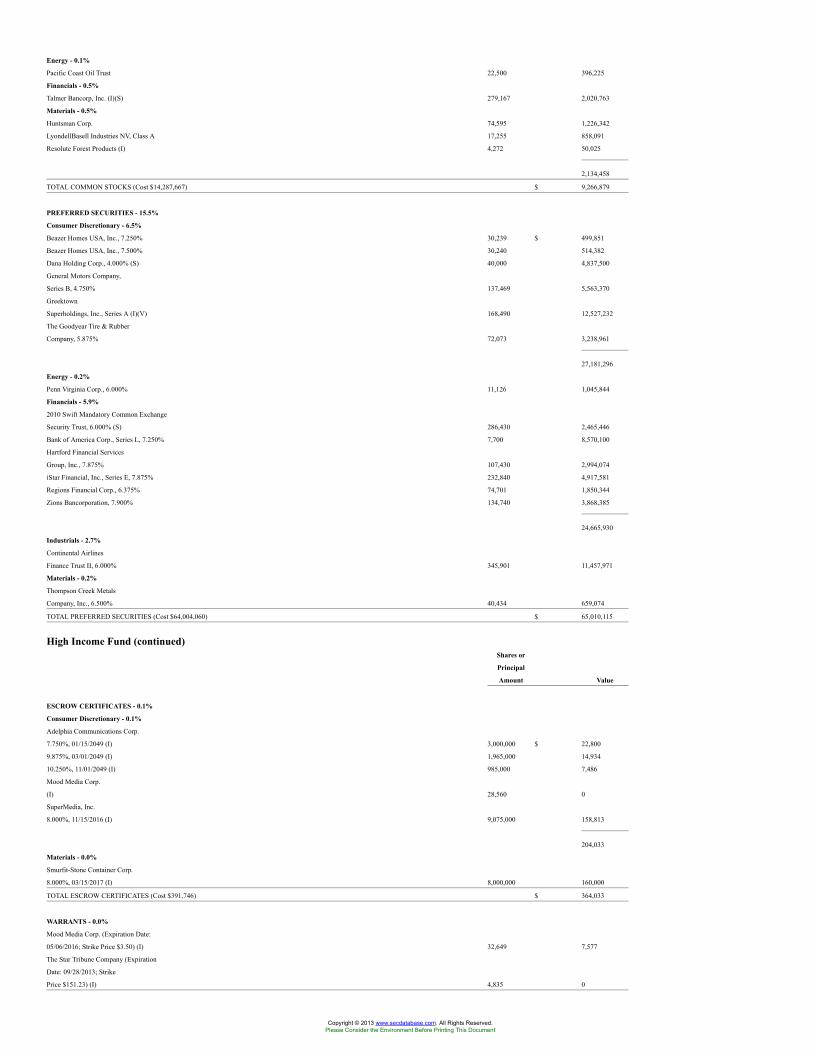
Energy - 0.1%
Pacific Coast Oil Trust 22,500 396,225
Financials - 0.5%
Talmer Bancorp, Inc. (I)(S) 279,167 2,020,763
Materials - 0.5%
Huntsman Corp. 74,595 1,226,342
LyondellBasell Industries NV, Class A 17,255 858,091
Resolute Forest Products (I) 4,272 50,025
2,134,458
TOTAL COMMON STOCKS (Cost $14,287,667) $ 9,266,879
PREFERRED SECURITIES - 15.5%
Consumer Discretionary - 6.5%
Beazer Homes USA, Inc., 7.250% 30,239 $ 499,851
Beazer Homes USA, Inc., 7.500% 30,240 514,382
Dana Holding Corp., 4.000% (S) 40,000 4,837,500
General Motors Company,
Series B, 4.750% 137,469 5,563,370
Greektown
Superholdings, Inc., Series A (I)(V) 168,490 12,527,232
The Goodyear Tire & Rubber
Company, 5.875% 72,073 3,238,961
27,181,296
Energy - 0.2%
Penn Virginia Corp., 6.000% 11,126 1,045,844
Financials - 5.9%
2010 Swift Mandatory Common Exchange
Security Trust, 6.000% (S) 286,430 2,465,446
Bank of America Corp., Series L, 7.250% 7,700 8,570,100
Hartford Financial Services
Group, Inc., 7.875% 107,430 2,994,074
iStar Financial, Inc., Series E, 7.875% 232,840 4,917,581
Regions Financial Corp., 6.375% 74,701 1,850,344
Zions Bancorporation, 7.900% 134,740 3,868,385
24,665,930
Industrials - 2.7%
Continental Airlines
Finance Trust II, 6.000% 345,901 11,457,971
Materials - 0.2%
Thompson Creek Metals
Company, Inc., 6.500% 40,434 659,074
TOTAL PREFERRED SECURITIES (Cost $64,004,060) $ 65,010,115
High Income Fund (continued)Shares or
Principal
Amount Value
ESCROW CERTIFICATES - 0.1%
Consumer Discretionary - 0.1%
Adelphia Communications Corp.
7.750%, 01/15/2049 (I) 3,000,000 $ 22,800
9.875%, 03/01/2049 (I) 1,965,000 14,934
10.250%, 11/01/2049 (I) 985,000 7,486
Mood Media Corp.
(I) 28,560 0
SuperMedia, Inc.
8.000%, 11/15/2016 (I) 9,075,000 158,813
204,033
Materials - 0.0%
Smurfit-Stone Container Corp.
8.000%, 03/15/2017 (I) 8,000,000 160,000
TOTAL ESCROW CERTIFICATES (Cost $391,746) $ 364,033
WARRANTS - 0.0%
Mood Media Corp. (Expiration Date:
05/06/2016; Strike Price $3.50) (I) 32,649 7,577
The Star Tribune Company (Expiration
Date: 09/28/2013; Strike
Price $151.23) (I) 4,835 0
Copyright © 2013 www.secdatabase.com. All Rights Reserved.Please Consider the Environment Before Printing This Document
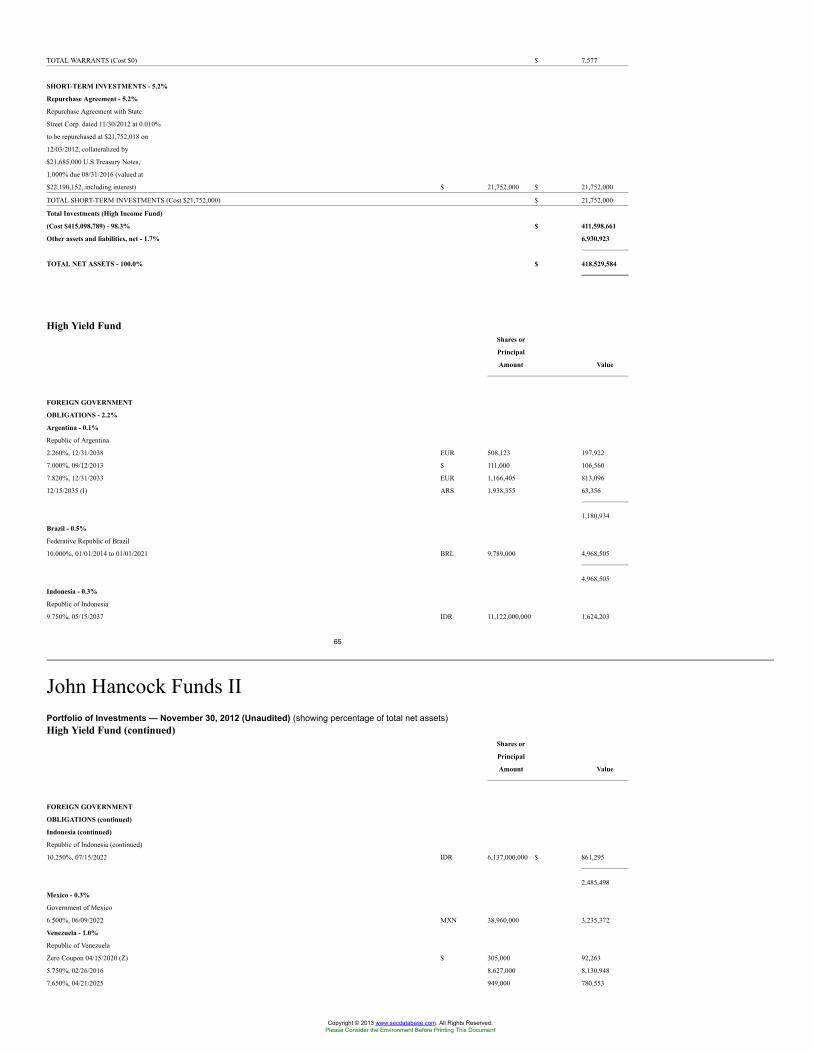
TOTAL WARRANTS (Cost $0) $ 7,577
SHORT-TERM INVESTMENTS - 5.2%
Repurchase Agreement - 5.2%
Repurchase Agreement with State
Street Corp. dated 11/30/2012 at 0.010%
to be repurchased at $21,752,018 on
12/03/2012, collateralized by
$21,685,000 U.S Treasury Notes,
1.000% due 08/31/2016 (valued at
$22,190,152, including interest) $ 21,752,000 $ 21,752,000
TOTAL SHORT-TERM INVESTMENTS (Cost $21,752,000) $ 21,752,000
Total Investments (High Income Fund)
(Cost $415,098,789) - 98.3% $ 411,598,661
Other assets and liabilities, net - 1.7% 6,930,923
TOTAL NET ASSETS - 100.0% $ 418,529,584
High Yield FundShares or
Principal
Amount Value
FOREIGN GOVERNMENT
OBLIGATIONS - 2.2%
Argentina - 0.1%
Republic of Argentina
2.260%, 12/31/2038 EUR 508,123 197,922
7.000%, 09/12/2013 $ 111,000 106,560
7.820%, 12/31/2033 EUR 1,166,405 813,096
12/15/2035 (I) ARS 1,938,355 63,356
1,180,934
Brazil - 0.5%
Federative Republic of Brazil
10.000%, 01/01/2014 to 01/01/2021 BRL 9,789,000 4,968,505
4,968,505
Indonesia - 0.3%
Republic of Indonesia
9.750%, 05/15/2037 IDR 11,122,000,000 1,624,203
65
John Hancock Funds IIPortfolio of Investments — November 30, 2012 (Unaudited) (showing percentage of total net assets)High Yield Fund (continued)
Shares or
Principal
Amount Value
FOREIGN GOVERNMENT
OBLIGATIONS (continued)
Indonesia (continued)
Republic of Indonesia (continued)
10.250%, 07/15/2022 IDR 6,137,000,000 $ 861,295
2,485,498
Mexico - 0.3%
Government of Mexico
6.500%, 06/09/2022 MXN 38,960,000 3,235,372
Venezuela - 1.0%
Republic of Venezuela
Zero Coupon 04/15/2020 (Z) $ 305,000 92,263
5.750%, 02/26/2016 8,627,000 8,130,948
7.650%, 04/21/2025 949,000 780,553
Copyright © 2013 www.secdatabase.com. All Rights Reserved.Please Consider the Environment Before Printing This Document
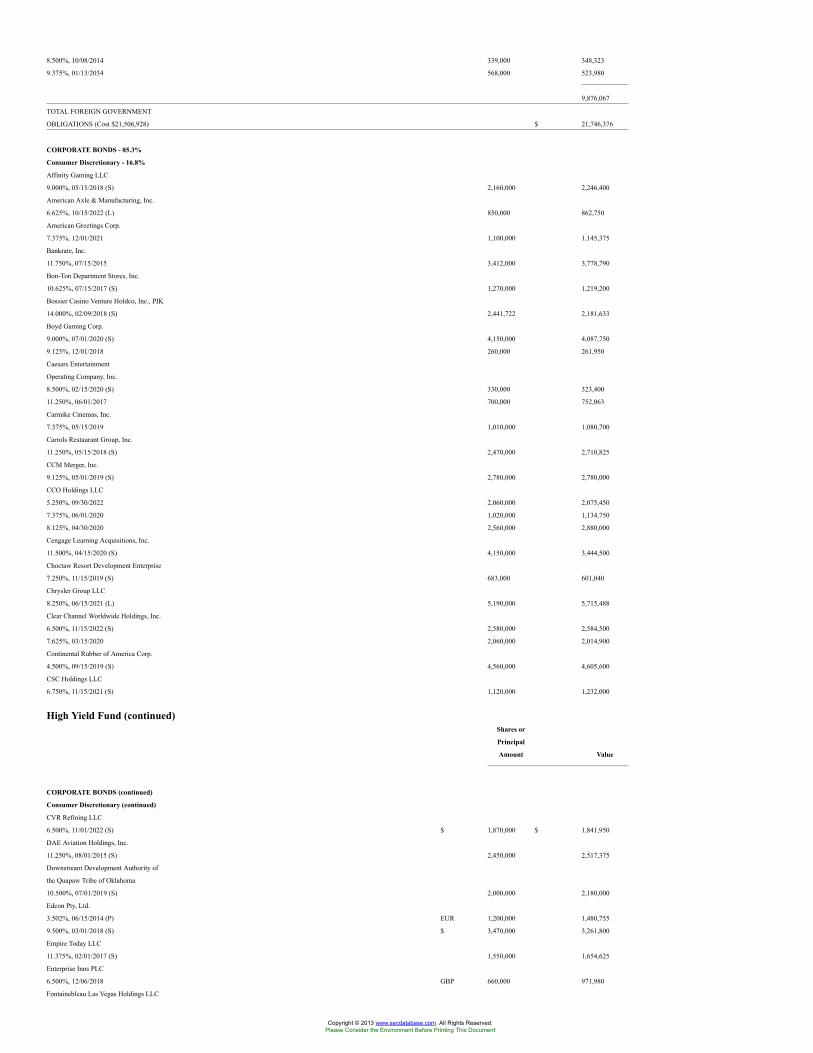
8.500%, 10/08/2014 339,000 348,323
9.375%, 01/13/2034 568,000 523,980
9,876,067
TOTAL FOREIGN GOVERNMENT
OBLIGATIONS (Cost $21,506,928) $ 21,746,376
CORPORATE BONDS - 85.3%
Consumer Discretionary - 16.8%
Affinity Gaming LLC
9.000%, 05/15/2018 (S) 2,160,000 2,246,400
American Axle & Manufacturing, Inc.
6.625%, 10/15/2022 (L) 850,000 862,750
American Greetings Corp.
7.375%, 12/01/2021 1,100,000 1,145,375
Bankrate, Inc.
11.750%, 07/15/2015 3,412,000 3,778,790
Bon-Ton Department Stores, Inc.
10.625%, 07/15/2017 (S) 1,270,000 1,219,200
Bossier Casino Venture Holdco, Inc., PIK
14.000%, 02/09/2018 (S) 2,441,722 2,181,633
Boyd Gaming Corp.
9.000%, 07/01/2020 (S) 4,150,000 4,087,750
9.125%, 12/01/2018 260,000 261,950
Caesars Entertainment
Operating Company, Inc.
8.500%, 02/15/2020 (S) 330,000 323,400
11.250%, 06/01/2017 700,000 752,063
Carmike Cinemas, Inc.
7.375%, 05/15/2019 1,010,000 1,080,700
Carrols Restaurant Group, Inc.
11.250%, 05/15/2018 (S) 2,470,000 2,710,825
CCM Merger, Inc.
9.125%, 05/01/2019 (S) 2,780,000 2,780,000
CCO Holdings LLC
5.250%, 09/30/2022 2,060,000 2,075,450
7.375%, 06/01/2020 1,020,000 1,134,750
8.125%, 04/30/2020 2,560,000 2,880,000
Cengage Learning Acquisitions, Inc.
11.500%, 04/15/2020 (S) 4,150,000 3,444,500
Choctaw Resort Development Enterprise
7.250%, 11/15/2019 (S) 683,000 601,040
Chrysler Group LLC
8.250%, 06/15/2021 (L) 5,190,000 5,715,488
Clear Channel Worldwide Holdings, Inc.
6.500%, 11/15/2022 (S) 2,580,000 2,584,500
7.625%, 03/15/2020 2,060,000 2,014,900
Continental Rubber of America Corp.
4.500%, 09/15/2019 (S) 4,560,000 4,605,600
CSC Holdings LLC
6.750%, 11/15/2021 (S) 1,120,000 1,232,000
High Yield Fund (continued)Shares or
Principal
Amount Value
CORPORATE BONDS (continued)
Consumer Discretionary (continued)
CVR Refining LLC
6.500%, 11/01/2022 (S) $ 1,870,000 $ 1,841,950
DAE Aviation Holdings, Inc.
11.250%, 08/01/2015 (S) 2,450,000 2,517,375
Downstream Development Authority of
the Quapaw Tribe of Oklahoma
10.500%, 07/01/2019 (S) 2,000,000 2,180,000
Edcon Pty, Ltd.
3.502%, 06/15/2014 (P) EUR 1,200,000 1,480,755
9.500%, 03/01/2018 (S) $ 3,470,000 3,261,800
Empire Today LLC
11.375%, 02/01/2017 (S) 1,550,000 1,654,625
Enterprise Inns PLC
6.500%, 12/06/2018 GBP 660,000 971,980
Fontainebleau Las Vegas Holdings LLC
Copyright © 2013 www.secdatabase.com. All Rights Reserved.Please Consider the Environment Before Printing This Document
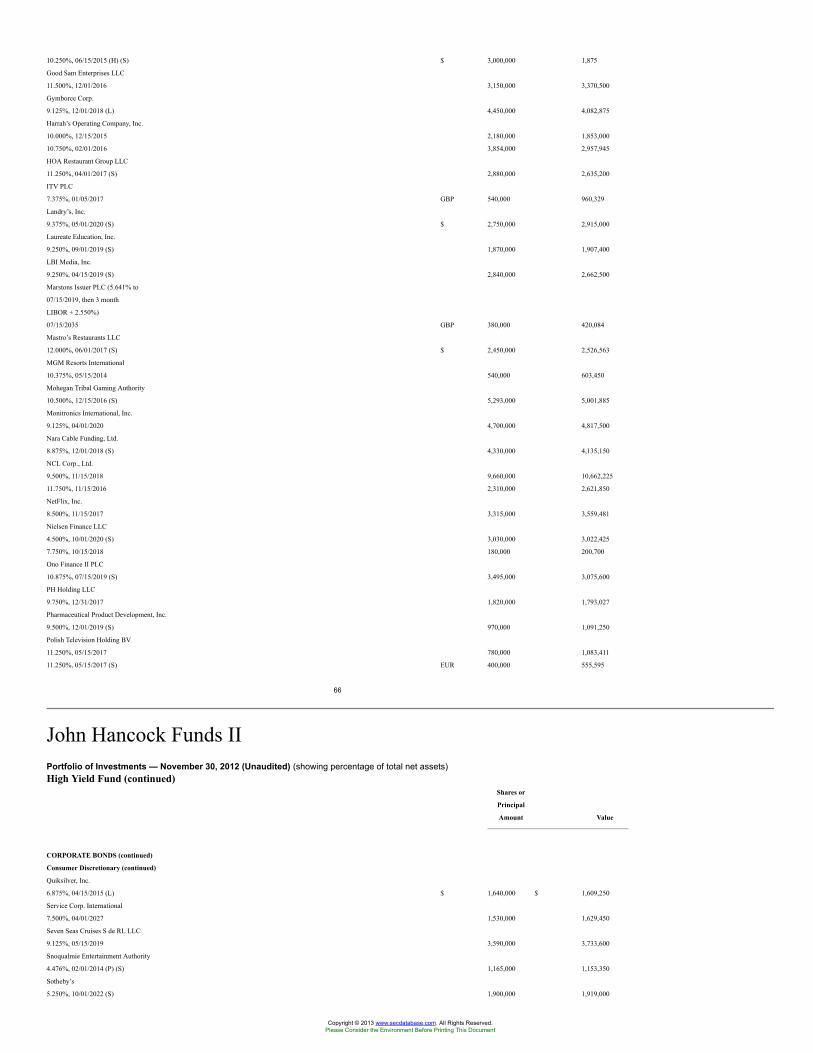
10.250%, 06/15/2015 (H) (S) $ 3,000,000 1,875
Good Sam Enterprises LLC
11.500%, 12/01/2016 3,150,000 3,370,500
Gymboree Corp.
9.125%, 12/01/2018 (L) 4,450,000 4,082,875
Harrah’s Operating Company, Inc.
10.000%, 12/15/2015 2,180,000 1,853,000
10.750%, 02/01/2016 3,854,000 2,957,945
HOA Restaurant Group LLC
11.250%, 04/01/2017 (S) 2,880,000 2,635,200
ITV PLC
7.375%, 01/05/2017 GBP 540,000 960,329
Landry’s, Inc.
9.375%, 05/01/2020 (S) $ 2,750,000 2,915,000
Laureate Education, Inc.
9.250%, 09/01/2019 (S) 1,870,000 1,907,400
LBI Media, Inc.
9.250%, 04/15/2019 (S) 2,840,000 2,662,500
Marstons Issuer PLC (5.641% to
07/15/2019, then 3 month
LIBOR + 2.550%)
07/15/2035 GBP 380,000 420,084
Mastro’s Restaurants LLC
12.000%, 06/01/2017 (S) $ 2,450,000 2,526,563
MGM Resorts International
10.375%, 05/15/2014 540,000 603,450
Mohegan Tribal Gaming Authority
10.500%, 12/15/2016 (S) 5,293,000 5,001,885
Monitronics International, Inc.
9.125%, 04/01/2020 4,700,000 4,817,500
Nara Cable Funding, Ltd.
8.875%, 12/01/2018 (S) 4,330,000 4,135,150
NCL Corp., Ltd.
9.500%, 11/15/2018 9,660,000 10,662,225
11.750%, 11/15/2016 2,310,000 2,621,850
NetFlix, Inc.
8.500%, 11/15/2017 3,315,000 3,559,481
Nielsen Finance LLC
4.500%, 10/01/2020 (S) 3,030,000 3,022,425
7.750%, 10/15/2018 180,000 200,700
Ono Finance II PLC
10.875%, 07/15/2019 (S) 3,495,000 3,075,600
PH Holding LLC
9.750%, 12/31/2017 1,820,000 1,793,027
Pharmaceutical Product Development, Inc.
9.500%, 12/01/2019 (S) 970,000 1,091,250
Polish Television Holding BV
11.250%, 05/15/2017 780,000 1,083,411
11.250%, 05/15/2017 (S) EUR 400,000 555,595
66
John Hancock Funds IIPortfolio of Investments — November 30, 2012 (Unaudited) (showing percentage of total net assets)High Yield Fund (continued)
Shares or
Principal
Amount Value
CORPORATE BONDS (continued)
Consumer Discretionary (continued)
Quiksilver, Inc.
6.875%, 04/15/2015 (L) $ 1,640,000 $ 1,609,250
Service Corp. International
7.500%, 04/01/2027 1,530,000 1,629,450
Seven Seas Cruises S de RL LLC
9.125%, 05/15/2019 3,590,000 3,733,600
Snoqualmie Entertainment Authority
4.476%, 02/01/2014 (P) (S) 1,165,000 1,153,350
Sotheby’s
5.250%, 10/01/2022 (S) 1,900,000 1,919,000
Copyright © 2013 www.secdatabase.com. All Rights Reserved.Please Consider the Environment Before Printing This Document
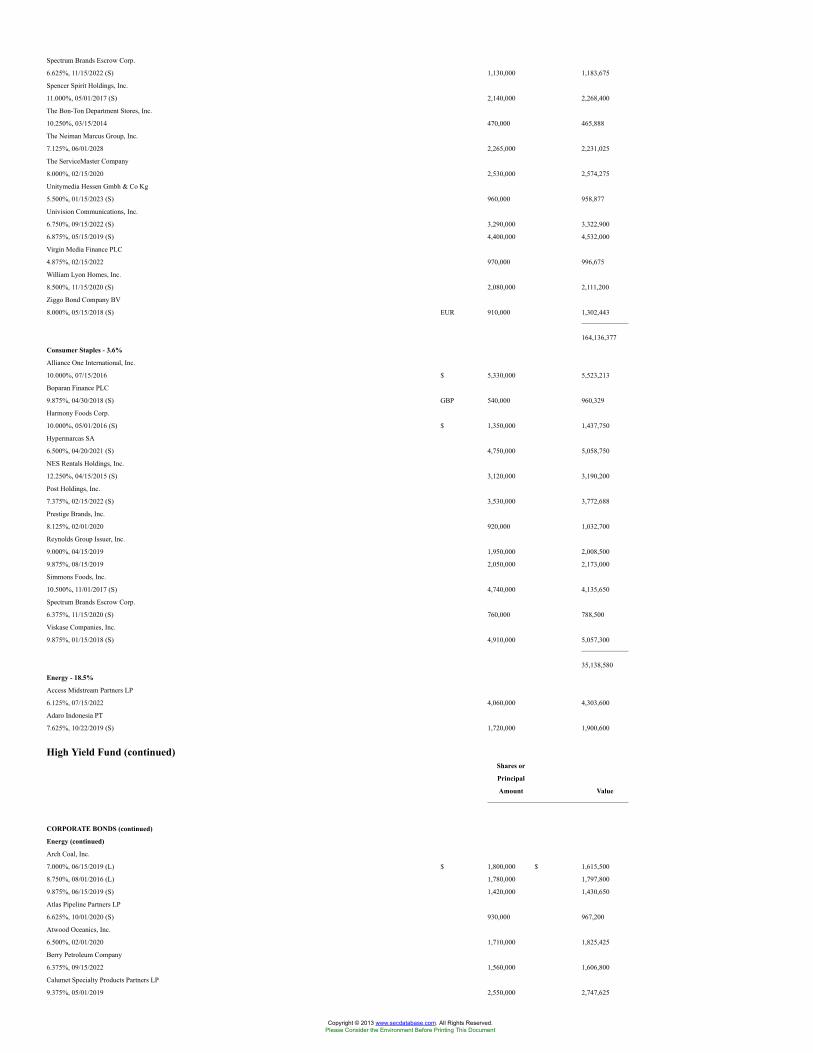
Spectrum Brands Escrow Corp.
6.625%, 11/15/2022 (S) 1,130,000 1,183,675
Spencer Spirit Holdings, Inc.
11.000%, 05/01/2017 (S) 2,140,000 2,268,400
The Bon-Ton Department Stores, Inc.
10.250%, 03/15/2014 470,000 465,888
The Neiman Marcus Group, Inc.
7.125%, 06/01/2028 2,265,000 2,231,025
The ServiceMaster Company
8.000%, 02/15/2020 2,530,000 2,574,275
Unitymedia Hessen Gmbh & Co Kg
5.500%, 01/15/2023 (S) 960,000 958,877
Univision Communications, Inc.
6.750%, 09/15/2022 (S) 3,290,000 3,322,900
6.875%, 05/15/2019 (S) 4,400,000 4,532,000
Virgin Media Finance PLC
4.875%, 02/15/2022 970,000 996,675
William Lyon Homes, Inc.
8.500%, 11/15/2020 (S) 2,080,000 2,111,200
Ziggo Bond Company BV
8.000%, 05/15/2018 (S) EUR 910,000 1,302,443
164,136,377
Consumer Staples - 3.6%
Alliance One International, Inc.
10.000%, 07/15/2016 $ 5,330,000 5,523,213
Boparan Finance PLC
9.875%, 04/30/2018 (S) GBP 540,000 960,329
Harmony Foods Corp.
10.000%, 05/01/2016 (S) $ 1,350,000 1,437,750
Hypermarcas SA
6.500%, 04/20/2021 (S) 4,750,000 5,058,750
NES Rentals Holdings, Inc.
12.250%, 04/15/2015 (S) 3,120,000 3,190,200
Post Holdings, Inc.
7.375%, 02/15/2022 (S) 3,530,000 3,772,688
Prestige Brands, Inc.
8.125%, 02/01/2020 920,000 1,032,700
Reynolds Group Issuer, Inc.
9.000%, 04/15/2019 1,950,000 2,008,500
9.875%, 08/15/2019 2,050,000 2,173,000
Simmons Foods, Inc.
10.500%, 11/01/2017 (S) 4,740,000 4,135,650
Spectrum Brands Escrow Corp.
6.375%, 11/15/2020 (S) 760,000 788,500
Viskase Companies, Inc.
9.875%, 01/15/2018 (S) 4,910,000 5,057,300
35,138,580
Energy - 18.5%
Access Midstream Partners LP
6.125%, 07/15/2022 4,060,000 4,303,600
Adaro Indonesia PT
7.625%, 10/22/2019 (S) 1,720,000 1,900,600
High Yield Fund (continued)Shares or
Principal
Amount Value
CORPORATE BONDS (continued)
Energy (continued)
Arch Coal, Inc.
7.000%, 06/15/2019 (L) $ 1,800,000 $ 1,615,500
8.750%, 08/01/2016 (L) 1,780,000 1,797,800
9.875%, 06/15/2019 (S) 1,420,000 1,430,650
Atlas Pipeline Partners LP
6.625%, 10/01/2020 (S) 930,000 967,200
Atwood Oceanics, Inc.
6.500%, 02/01/2020 1,710,000 1,825,425
Berry Petroleum Company
6.375%, 09/15/2022 1,560,000 1,606,800
Calumet Specialty Products Partners LP
9.375%, 05/01/2019 2,550,000 2,747,625
Copyright © 2013 www.secdatabase.com. All Rights Reserved.Please Consider the Environment Before Printing This Document
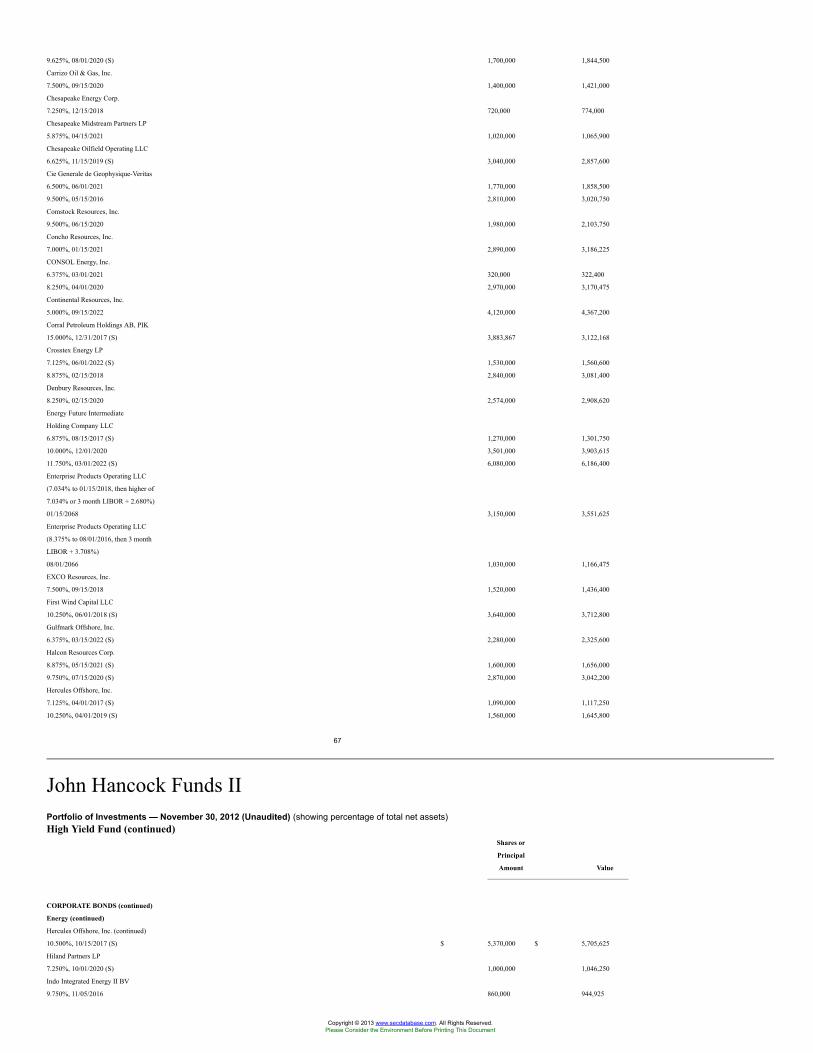
9.625%, 08/01/2020 (S) 1,700,000 1,844,500
Carrizo Oil & Gas, Inc.
7.500%, 09/15/2020 1,400,000 1,421,000
Chesapeake Energy Corp.
7.250%, 12/15/2018 720,000 774,000
Chesapeake Midstream Partners LP
5.875%, 04/15/2021 1,020,000 1,065,900
Chesapeake Oilfield Operating LLC
6.625%, 11/15/2019 (S) 3,040,000 2,857,600
Cie Generale de Geophysique-Veritas
6.500%, 06/01/2021 1,770,000 1,858,500
9.500%, 05/15/2016 2,810,000 3,020,750
Comstock Resources, Inc.
9.500%, 06/15/2020 1,980,000 2,103,750
Concho Resources, Inc.
7.000%, 01/15/2021 2,890,000 3,186,225
CONSOL Energy, Inc.
6.375%, 03/01/2021 320,000 322,400
8.250%, 04/01/2020 2,970,000 3,170,475
Continental Resources, Inc.
5.000%, 09/15/2022 4,120,000 4,367,200
Corral Petroleum Holdings AB, PIK
15.000%, 12/31/2017 (S) 3,883,867 3,122,168
Crosstex Energy LP
7.125%, 06/01/2022 (S) 1,530,000 1,560,600
8.875%, 02/15/2018 2,840,000 3,081,400
Denbury Resources, Inc.
8.250%, 02/15/2020 2,574,000 2,908,620
Energy Future Intermediate
Holding Company LLC
6.875%, 08/15/2017 (S) 1,270,000 1,301,750
10.000%, 12/01/2020 3,501,000 3,903,615
11.750%, 03/01/2022 (S) 6,080,000 6,186,400
Enterprise Products Operating LLC
(7.034% to 01/15/2018, then higher of
7.034% or 3 month LIBOR + 2.680%)
01/15/2068 3,150,000 3,551,625
Enterprise Products Operating LLC
(8.375% to 08/01/2016, then 3 month
LIBOR + 3.708%)
08/01/2066 1,030,000 1,166,475
EXCO Resources, Inc.
7.500%, 09/15/2018 1,520,000 1,436,400
First Wind Capital LLC
10.250%, 06/01/2018 (S) 3,640,000 3,712,800
Gulfmark Offshore, Inc.
6.375%, 03/15/2022 (S) 2,280,000 2,325,600
Halcon Resources Corp.
8.875%, 05/15/2021 (S) 1,600,000 1,656,000
9.750%, 07/15/2020 (S) 2,870,000 3,042,200
Hercules Offshore, Inc.
7.125%, 04/01/2017 (S) 1,090,000 1,117,250
10.250%, 04/01/2019 (S) 1,560,000 1,645,800
67
John Hancock Funds IIPortfolio of Investments — November 30, 2012 (Unaudited) (showing percentage of total net assets)High Yield Fund (continued)
Shares or
Principal
Amount Value
CORPORATE BONDS (continued)
Energy (continued)
Hercules Offshore, Inc. (continued)
10.500%, 10/15/2017 (S) $ 5,370,000 $ 5,705,625
Hiland Partners LP
7.250%, 10/01/2020 (S) 1,000,000 1,046,250
Indo Integrated Energy II BV
9.750%, 11/05/2016 860,000 944,925
Copyright © 2013 www.secdatabase.com. All Rights Reserved.Please Consider the Environment Before Printing This Document
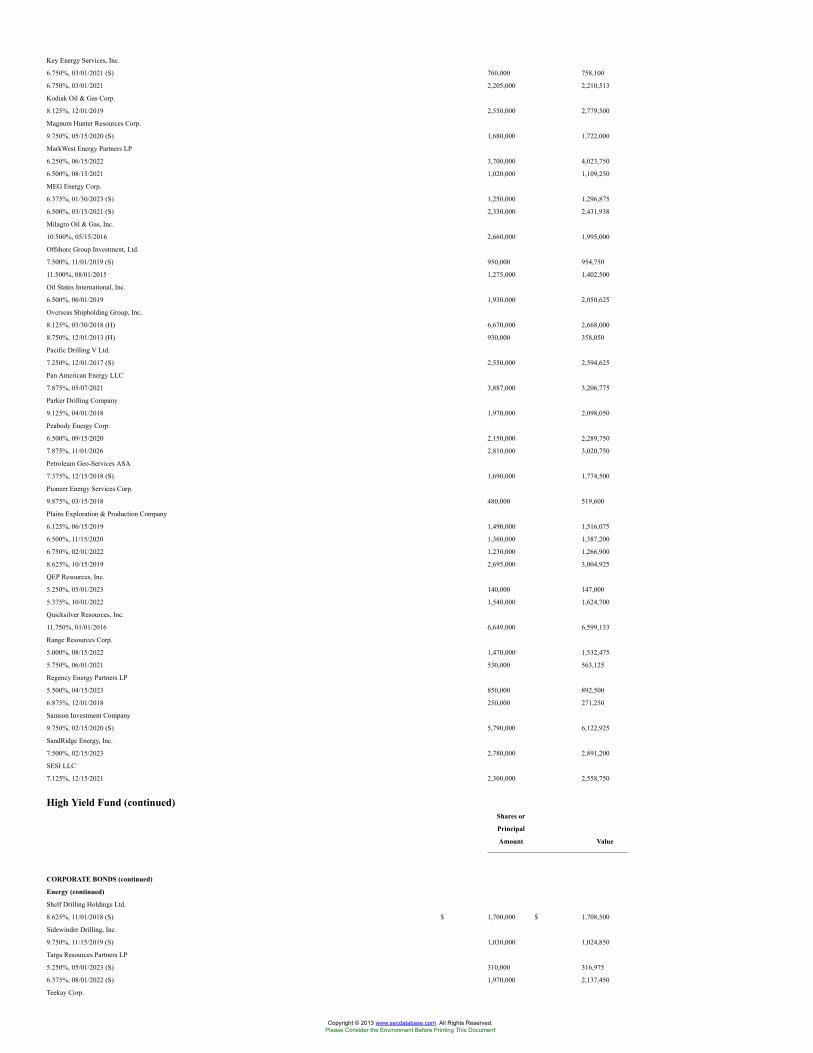
Key Energy Services, Inc.
6.750%, 03/01/2021 (S) 760,000 758,100
6.750%, 03/01/2021 2,205,000 2,210,513
Kodiak Oil & Gas Corp.
8.125%, 12/01/2019 2,550,000 2,779,500
Magnum Hunter Resources Corp.
9.750%, 05/15/2020 (S) 1,680,000 1,722,000
MarkWest Energy Partners LP
6.250%, 06/15/2022 3,700,000 4,023,750
6.500%, 08/15/2021 1,020,000 1,109,250
MEG Energy Corp.
6.375%, 01/30/2023 (S) 1,250,000 1,296,875
6.500%, 03/15/2021 (S) 2,330,000 2,431,938
Milagro Oil & Gas, Inc.
10.500%, 05/15/2016 2,660,000 1,995,000
Offshore Group Investment, Ltd.
7.500%, 11/01/2019 (S) 950,000 954,750
11.500%, 08/01/2015 1,275,000 1,402,500
Oil States International, Inc.
6.500%, 06/01/2019 1,930,000 2,050,625
Overseas Shipholding Group, Inc.
8.125%, 03/30/2018 (H) 6,670,000 2,668,000
8.750%, 12/01/2013 (H) 930,000 358,050
Pacific Drilling V Ltd.
7.250%, 12/01/2017 (S) 2,550,000 2,594,625
Pan American Energy LLC
7.875%, 05/07/2021 3,887,000 3,206,775
Parker Drilling Company
9.125%, 04/01/2018 1,970,000 2,098,050
Peabody Energy Corp.
6.500%, 09/15/2020 2,150,000 2,289,750
7.875%, 11/01/2026 2,810,000 3,020,750
Petroleum Geo-Services ASA
7.375%, 12/15/2018 (S) 1,690,000 1,774,500
Pioneer Energy Services Corp.
9.875%, 03/15/2018 480,000 519,600
Plains Exploration & Production Company
6.125%, 06/15/2019 1,490,000 1,516,075
6.500%, 11/15/2020 1,360,000 1,387,200
6.750%, 02/01/2022 1,230,000 1,266,900
8.625%, 10/15/2019 2,695,000 3,004,925
QEP Resources, Inc.
5.250%, 05/01/2023 140,000 147,000
5.375%, 10/01/2022 1,540,000 1,624,700
Quicksilver Resources, Inc.
11.750%, 01/01/2016 6,649,000 6,599,133
Range Resources Corp.
5.000%, 08/15/2022 1,470,000 1,532,475
5.750%, 06/01/2021 530,000 563,125
Regency Energy Partners LP
5.500%, 04/15/2023 850,000 892,500
6.875%, 12/01/2018 250,000 271,250
Samson Investment Company
9.750%, 02/15/2020 (S) 5,790,000 6,122,925
SandRidge Energy, Inc.
7.500%, 02/15/2023 2,780,000 2,891,200
SESI LLC
7.125%, 12/15/2021 2,300,000 2,558,750
High Yield Fund (continued)Shares or
Principal
Amount Value
CORPORATE BONDS (continued)
Energy (continued)
Shelf Drilling Holdings Ltd.
8.625%, 11/01/2018 (S) $ 1,700,000 $ 1,708,500
Sidewinder Drilling, Inc.
9.750%, 11/15/2019 (S) 1,030,000 1,024,850
Targa Resources Partners LP
5.250%, 05/01/2023 (S) 310,000 316,975
6.375%, 08/01/2022 (S) 1,970,000 2,137,450
Teekay Corp.
Copyright © 2013 www.secdatabase.com. All Rights Reserved.Please Consider the Environment Before Printing This Document
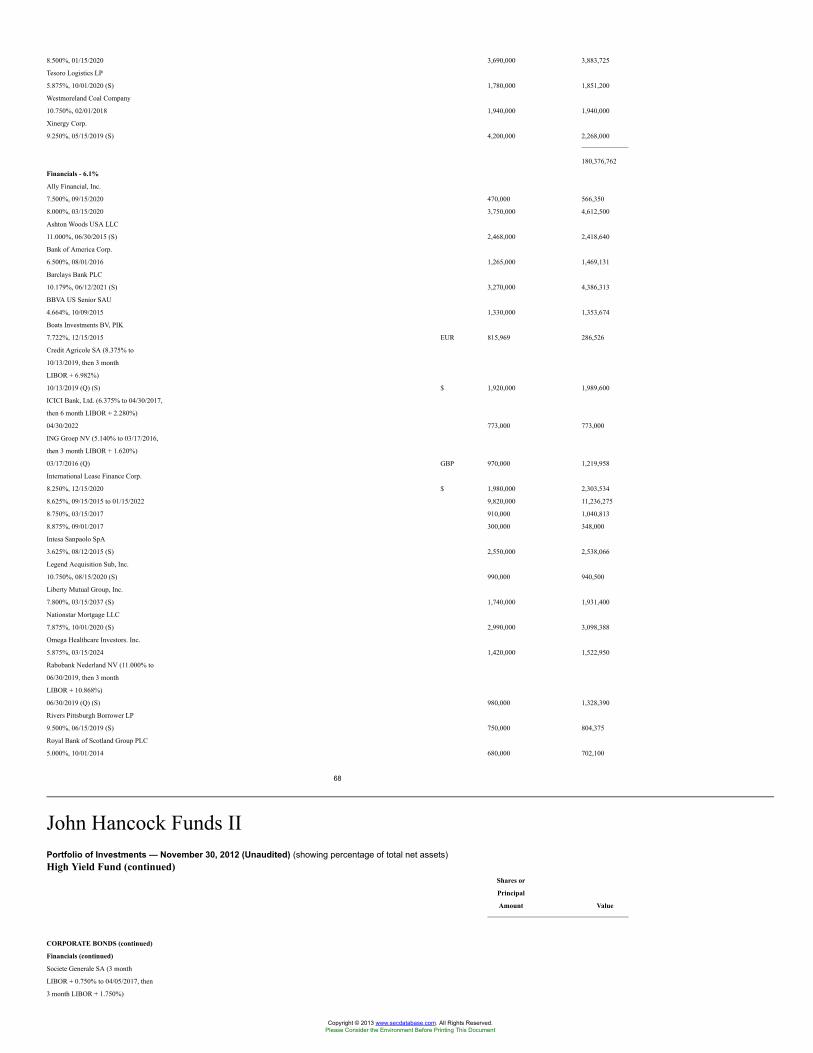
8.500%, 01/15/2020 3,690,000 3,883,725
Tesoro Logistics LP
5.875%, 10/01/2020 (S) 1,780,000 1,851,200
Westmoreland Coal Company
10.750%, 02/01/2018 1,940,000 1,940,000
Xinergy Corp.
9.250%, 05/15/2019 (S) 4,200,000 2,268,000
180,376,762
Financials - 6.1%
Ally Financial, Inc.
7.500%, 09/15/2020 470,000 566,350
8.000%, 03/15/2020 3,750,000 4,612,500
Ashton Woods USA LLC
11.000%, 06/30/2015 (S) 2,468,000 2,418,640
Bank of America Corp.
6.500%, 08/01/2016 1,265,000 1,469,131
Barclays Bank PLC
10.179%, 06/12/2021 (S) 3,270,000 4,386,313
BBVA US Senior SAU
4.664%, 10/09/2015 1,330,000 1,353,674
Boats Investments BV, PIK
7.722%, 12/15/2015 EUR 815,969 286,526
Credit Agricole SA (8.375% to
10/13/2019, then 3 month
LIBOR + 6.982%)
10/13/2019 (Q) (S) $ 1,920,000 1,989,600
ICICI Bank, Ltd. (6.375% to 04/30/2017,
then 6 month LIBOR + 2.280%)
04/30/2022 773,000 773,000
ING Groep NV (5.140% to 03/17/2016,
then 3 month LIBOR + 1.620%)
03/17/2016 (Q) GBP 970,000 1,219,958
International Lease Finance Corp.
8.250%, 12/15/2020 $ 1,980,000 2,303,534
8.625%, 09/15/2015 to 01/15/2022 9,820,000 11,236,275
8.750%, 03/15/2017 910,000 1,040,813
8.875%, 09/01/2017 300,000 348,000
Intesa Sanpaolo SpA
3.625%, 08/12/2015 (S) 2,550,000 2,538,066
Legend Acquisition Sub, Inc.
10.750%, 08/15/2020 (S) 990,000 940,500
Liberty Mutual Group, Inc.
7.800%, 03/15/2037 (S) 1,740,000 1,931,400
Nationstar Mortgage LLC
7.875%, 10/01/2020 (S) 2,990,000 3,098,388
Omega Healthcare Investors. Inc.
5.875%, 03/15/2024 1,420,000 1,522,950
Rabobank Nederland NV (11.000% to
06/30/2019, then 3 month
LIBOR + 10.868%)
06/30/2019 (Q) (S) 980,000 1,328,390
Rivers Pittsburgh Borrower LP
9.500%, 06/15/2019 (S) 750,000 804,375
Royal Bank of Scotland Group PLC
5.000%, 10/01/2014 680,000 702,100
68
John Hancock Funds IIPortfolio of Investments — November 30, 2012 (Unaudited) (showing percentage of total net assets)High Yield Fund (continued)
Shares or
Principal
Amount Value
CORPORATE BONDS (continued)
Financials (continued)
Societe Generale SA (3 month
LIBOR + 0.750% to 04/05/2017, then
3 month LIBOR + 1.750%)
Copyright © 2013 www.secdatabase.com. All Rights Reserved.Please Consider the Environment Before Printing This Document
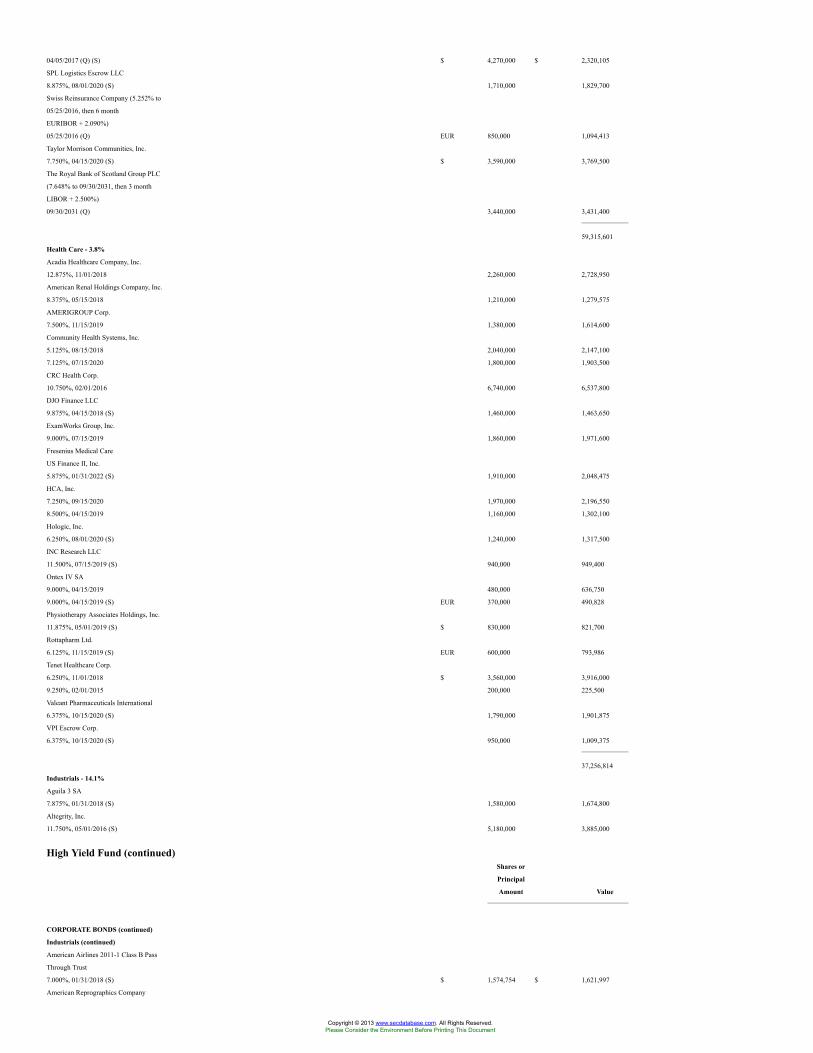
04/05/2017 (Q) (S) $ 4,270,000 $ 2,320,105
SPL Logistics Escrow LLC
8.875%, 08/01/2020 (S) 1,710,000 1,829,700
Swiss Reinsurance Company (5.252% to
05/25/2016, then 6 month
EURIBOR + 2.090%)
05/25/2016 (Q) EUR 850,000 1,094,413
Taylor Morrison Communities, Inc.
7.750%, 04/15/2020 (S) $ 3,590,000 3,769,500
The Royal Bank of Scotland Group PLC
(7.648% to 09/30/2031, then 3 month
LIBOR + 2.500%)
09/30/2031 (Q) 3,440,000 3,431,400
59,315,601
Health Care - 3.8%
Acadia Healthcare Company, Inc.
12.875%, 11/01/2018 2,260,000 2,728,950
American Renal Holdings Company, Inc.
8.375%, 05/15/2018 1,210,000 1,279,575
AMERIGROUP Corp.
7.500%, 11/15/2019 1,380,000 1,614,600
Community Health Systems, Inc.
5.125%, 08/15/2018 2,040,000 2,147,100
7.125%, 07/15/2020 1,800,000 1,903,500
CRC Health Corp.
10.750%, 02/01/2016 6,740,000 6,537,800
DJO Finance LLC
9.875%, 04/15/2018 (S) 1,460,000 1,463,650
ExamWorks Group, Inc.
9.000%, 07/15/2019 1,860,000 1,971,600
Fresenius Medical Care
US Finance II, Inc.
5.875%, 01/31/2022 (S) 1,910,000 2,048,475
HCA, Inc.
7.250%, 09/15/2020 1,970,000 2,196,550
8.500%, 04/15/2019 1,160,000 1,302,100
Hologic, Inc.
6.250%, 08/01/2020 (S) 1,240,000 1,317,500
INC Research LLC
11.500%, 07/15/2019 (S) 940,000 949,400
Ontex IV SA
9.000%, 04/15/2019 480,000 636,750
9.000%, 04/15/2019 (S) EUR 370,000 490,828
Physiotherapy Associates Holdings, Inc.
11.875%, 05/01/2019 (S) $ 830,000 821,700
Rottapharm Ltd.
6.125%, 11/15/2019 (S) EUR 600,000 793,986
Tenet Healthcare Corp.
6.250%, 11/01/2018 $ 3,560,000 3,916,000
9.250%, 02/01/2015 200,000 225,500
Valeant Pharmaceuticals International
6.375%, 10/15/2020 (S) 1,790,000 1,901,875
VPI Escrow Corp.
6.375%, 10/15/2020 (S) 950,000 1,009,375
37,256,814
Industrials - 14.1%
Aguila 3 SA
7.875%, 01/31/2018 (S) 1,580,000 1,674,800
Altegrity, Inc.
11.750%, 05/01/2016 (S) 5,180,000 3,885,000
High Yield Fund (continued)Shares or
Principal
Amount Value
CORPORATE BONDS (continued)
Industrials (continued)
American Airlines 2011-1 Class B Pass
Through Trust
7.000%, 01/31/2018 (S) $ 1,574,754 $ 1,621,997
American Reprographics Company
Copyright © 2013 www.secdatabase.com. All Rights Reserved.Please Consider the Environment Before Printing This Document
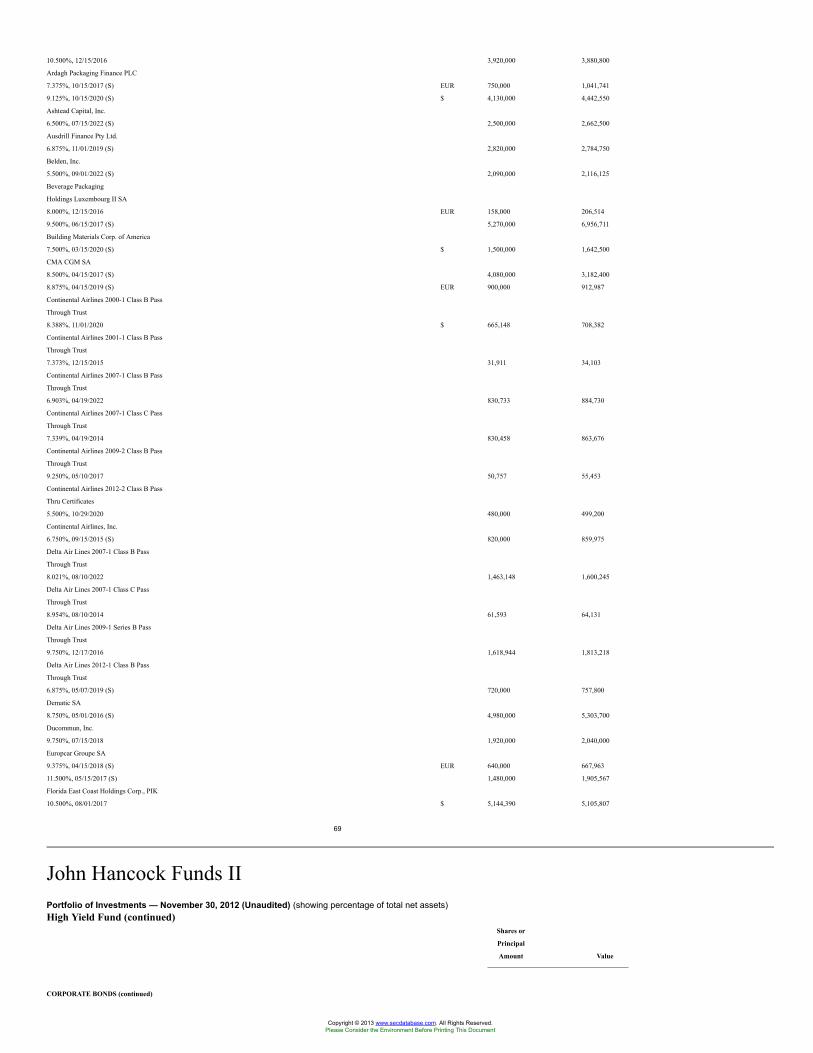
10.500%, 12/15/2016 3,920,000 3,880,800
Ardagh Packaging Finance PLC
7.375%, 10/15/2017 (S) EUR 750,000 1,041,741
9.125%, 10/15/2020 (S) $ 4,130,000 4,442,550
Ashtead Capital, Inc.
6.500%, 07/15/2022 (S) 2,500,000 2,662,500
Ausdrill Finance Pty Ltd.
6.875%, 11/01/2019 (S) 2,820,000 2,784,750
Belden, Inc.
5.500%, 09/01/2022 (S) 2,090,000 2,116,125
Beverage Packaging
Holdings Luxembourg II SA
8.000%, 12/15/2016 EUR 158,000 206,514
9.500%, 06/15/2017 (S) 5,270,000 6,956,711
Building Materials Corp. of America
7.500%, 03/15/2020 (S) $ 1,500,000 1,642,500
CMA CGM SA
8.500%, 04/15/2017 (S) 4,080,000 3,182,400
8.875%, 04/15/2019 (S) EUR 900,000 912,987
Continental Airlines 2000-1 Class B Pass
Through Trust
8.388%, 11/01/2020 $ 665,148 708,382
Continental Airlines 2001-1 Class B Pass
Through Trust
7.373%, 12/15/2015 31,911 34,103
Continental Airlines 2007-1 Class B Pass
Through Trust
6.903%, 04/19/2022 830,733 884,730
Continental Airlines 2007-1 Class C Pass
Through Trust
7.339%, 04/19/2014 830,458 863,676
Continental Airlines 2009-2 Class B Pass
Through Trust
9.250%, 05/10/2017 50,757 55,453
Continental Airlines 2012-2 Class B Pass
Thru Certificates
5.500%, 10/29/2020 480,000 499,200
Continental Airlines, Inc.
6.750%, 09/15/2015 (S) 820,000 859,975
Delta Air Lines 2007-1 Class B Pass
Through Trust
8.021%, 08/10/2022 1,463,148 1,600,245
Delta Air Lines 2007-1 Class C Pass
Through Trust
8.954%, 08/10/2014 61,593 64,131
Delta Air Lines 2009-1 Series B Pass
Through Trust
9.750%, 12/17/2016 1,618,944 1,813,218
Delta Air Lines 2012-1 Class B Pass
Through Trust
6.875%, 05/07/2019 (S) 720,000 757,800
Dematic SA
8.750%, 05/01/2016 (S) 4,980,000 5,303,700
Ducommun, Inc.
9.750%, 07/15/2018 1,920,000 2,040,000
Europcar Groupe SA
9.375%, 04/15/2018 (S) EUR 640,000 667,963
11.500%, 05/15/2017 (S) 1,480,000 1,905,567
Florida East Coast Holdings Corp., PIK
10.500%, 08/01/2017 $ 5,144,390 5,105,807
69
John Hancock Funds IIPortfolio of Investments — November 30, 2012 (Unaudited) (showing percentage of total net assets)High Yield Fund (continued)
Shares or
Principal
Amount Value
CORPORATE BONDS (continued)
Copyright © 2013 www.secdatabase.com. All Rights Reserved.Please Consider the Environment Before Printing This Document
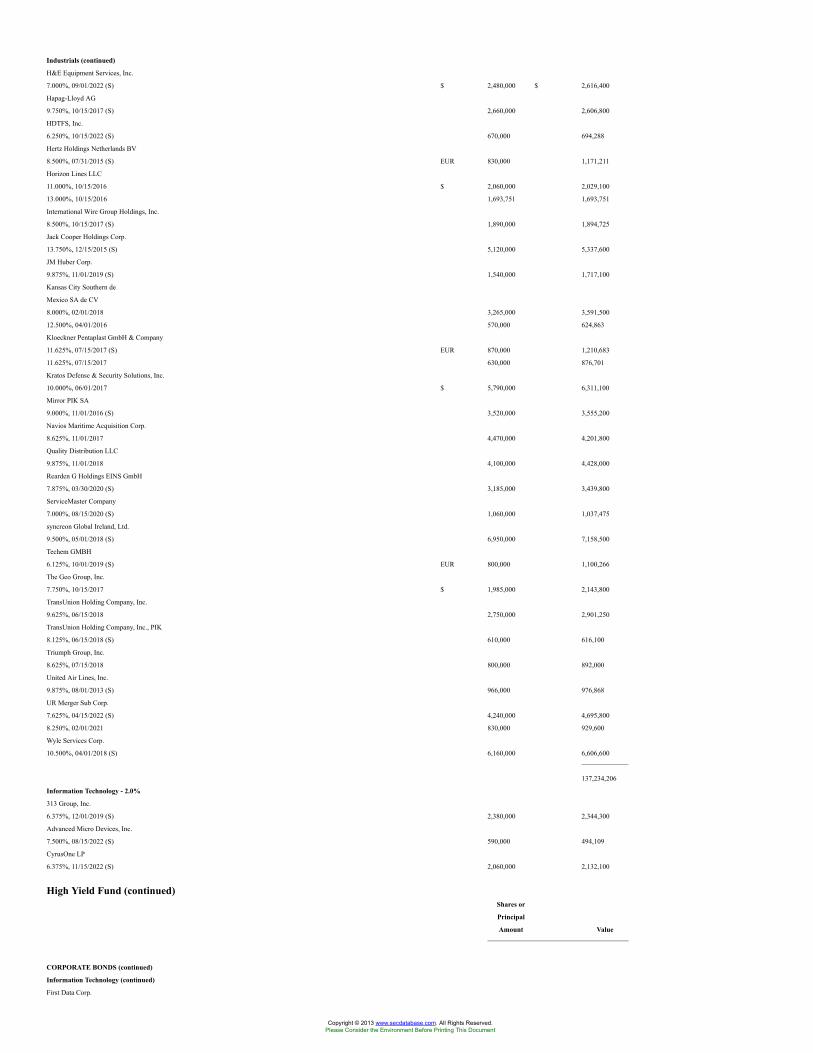
Industrials (continued)
H&E Equipment Services, Inc.
7.000%, 09/01/2022 (S) $ 2,480,000 $ 2,616,400
Hapag-Lloyd AG
9.750%, 10/15/2017 (S) 2,660,000 2,606,800
HDTFS, Inc.
6.250%, 10/15/2022 (S) 670,000 694,288
Hertz Holdings Netherlands BV
8.500%, 07/31/2015 (S) EUR 830,000 1,171,211
Horizon Lines LLC
11.000%, 10/15/2016 $ 2,060,000 2,029,100
13.000%, 10/15/2016 1,693,751 1,693,751
International Wire Group Holdings, Inc.
8.500%, 10/15/2017 (S) 1,890,000 1,894,725
Jack Cooper Holdings Corp.
13.750%, 12/15/2015 (S) 5,120,000 5,337,600
JM Huber Corp.
9.875%, 11/01/2019 (S) 1,540,000 1,717,100
Kansas City Southern de
Mexico SA de CV
8.000%, 02/01/2018 3,265,000 3,591,500
12.500%, 04/01/2016 570,000 624,863
Kloeckner Pentaplast GmbH & Company
11.625%, 07/15/2017 (S) EUR 870,000 1,210,683
11.625%, 07/15/2017 630,000 876,701
Kratos Defense & Security Solutions, Inc.
10.000%, 06/01/2017 $ 5,790,000 6,311,100
Mirror PIK SA
9.000%, 11/01/2016 (S) 3,520,000 3,555,200
Navios Maritime Acquisition Corp.
8.625%, 11/01/2017 4,470,000 4,201,800
Quality Distribution LLC
9.875%, 11/01/2018 4,100,000 4,428,000
Rearden G Holdings EINS GmbH
7.875%, 03/30/2020 (S) 3,185,000 3,439,800
ServiceMaster Company
7.000%, 08/15/2020 (S) 1,060,000 1,037,475
syncreon Global Ireland, Ltd.
9.500%, 05/01/2018 (S) 6,950,000 7,158,500
Techem GMBH
6.125%, 10/01/2019 (S) EUR 800,000 1,100,266
The Geo Group, Inc.
7.750%, 10/15/2017 $ 1,985,000 2,143,800
TransUnion Holding Company, Inc.
9.625%, 06/15/2018 2,750,000 2,901,250
TransUnion Holding Company, Inc., PIK
8.125%, 06/15/2018 (S) 610,000 616,100
Triumph Group, Inc.
8.625%, 07/15/2018 800,000 892,000
United Air Lines, Inc.
9.875%, 08/01/2013 (S) 966,000 976,868
UR Merger Sub Corp.
7.625%, 04/15/2022 (S) 4,240,000 4,695,800
8.250%, 02/01/2021 830,000 929,600
Wyle Services Corp.
10.500%, 04/01/2018 (S) 6,160,000 6,606,600
137,234,206
Information Technology - 2.0%
313 Group, Inc.
6.375%, 12/01/2019 (S) 2,380,000 2,344,300
Advanced Micro Devices, Inc.
7.500%, 08/15/2022 (S) 590,000 494,109
CyrusOne LP
6.375%, 11/15/2022 (S) 2,060,000 2,132,100
High Yield Fund (continued)Shares or
Principal
Amount Value
CORPORATE BONDS (continued)
Information Technology (continued)
First Data Corp.
Copyright © 2013 www.secdatabase.com. All Rights Reserved.Please Consider the Environment Before Printing This Document
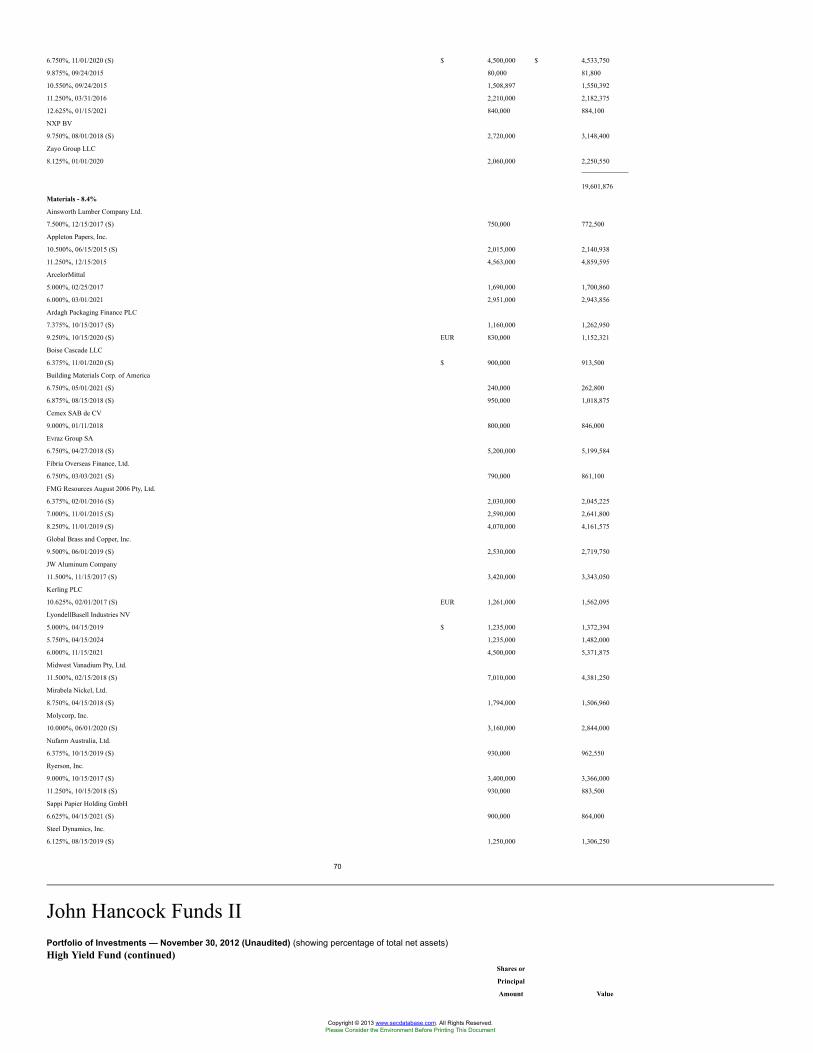
6.750%, 11/01/2020 (S) $ 4,500,000 $ 4,533,750
9.875%, 09/24/2015 80,000 81,800
10.550%, 09/24/2015 1,508,897 1,550,392
11.250%, 03/31/2016 2,210,000 2,182,375
12.625%, 01/15/2021 840,000 884,100
NXP BV
9.750%, 08/01/2018 (S) 2,720,000 3,148,400
Zayo Group LLC
8.125%, 01/01/2020 2,060,000 2,250,550
19,601,876
Materials - 8.4%
Ainsworth Lumber Company Ltd.
7.500%, 12/15/2017 (S) 750,000 772,500
Appleton Papers, Inc.
10.500%, 06/15/2015 (S) 2,015,000 2,140,938
11.250%, 12/15/2015 4,563,000 4,859,595
ArcelorMittal
5.000%, 02/25/2017 1,690,000 1,700,860
6.000%, 03/01/2021 2,951,000 2,943,856
Ardagh Packaging Finance PLC
7.375%, 10/15/2017 (S) 1,160,000 1,262,950
9.250%, 10/15/2020 (S) EUR 830,000 1,152,321
Boise Cascade LLC
6.375%, 11/01/2020 (S) $ 900,000 913,500
Building Materials Corp. of America
6.750%, 05/01/2021 (S) 240,000 262,800
6.875%, 08/15/2018 (S) 950,000 1,018,875
Cemex SAB de CV
9.000%, 01/11/2018 800,000 846,000
Evraz Group SA
6.750%, 04/27/2018 (S) 5,200,000 5,199,584
Fibria Overseas Finance, Ltd.
6.750%, 03/03/2021 (S) 790,000 861,100
FMG Resources August 2006 Pty, Ltd.
6.375%, 02/01/2016 (S) 2,030,000 2,045,225
7.000%, 11/01/2015 (S) 2,590,000 2,641,800
8.250%, 11/01/2019 (S) 4,070,000 4,161,575
Global Brass and Copper, Inc.
9.500%, 06/01/2019 (S) 2,530,000 2,719,750
JW Aluminum Company
11.500%, 11/15/2017 (S) 3,420,000 3,343,050
Kerling PLC
10.625%, 02/01/2017 (S) EUR 1,261,000 1,562,095
LyondellBasell Industries NV
5.000%, 04/15/2019 $ 1,235,000 1,372,394
5.750%, 04/15/2024 1,235,000 1,482,000
6.000%, 11/15/2021 4,500,000 5,371,875
Midwest Vanadium Pty, Ltd.
11.500%, 02/15/2018 (S) 7,010,000 4,381,250
Mirabela Nickel, Ltd.
8.750%, 04/15/2018 (S) 1,794,000 1,506,960
Molycorp, Inc.
10.000%, 06/01/2020 (S) 3,160,000 2,844,000
Nufarm Australia, Ltd.
6.375%, 10/15/2019 (S) 930,000 962,550
Ryerson, Inc.
9.000%, 10/15/2017 (S) 3,400,000 3,366,000
11.250%, 10/15/2018 (S) 930,000 883,500
Sappi Papier Holding GmbH
6.625%, 04/15/2021 (S) 900,000 864,000
Steel Dynamics, Inc.
6.125%, 08/15/2019 (S) 1,250,000 1,306,250
70
John Hancock Funds IIPortfolio of Investments — November 30, 2012 (Unaudited) (showing percentage of total net assets)High Yield Fund (continued)
Shares or
Principal
Amount Value
Copyright © 2013 www.secdatabase.com. All Rights Reserved.Please Consider the Environment Before Printing This Document
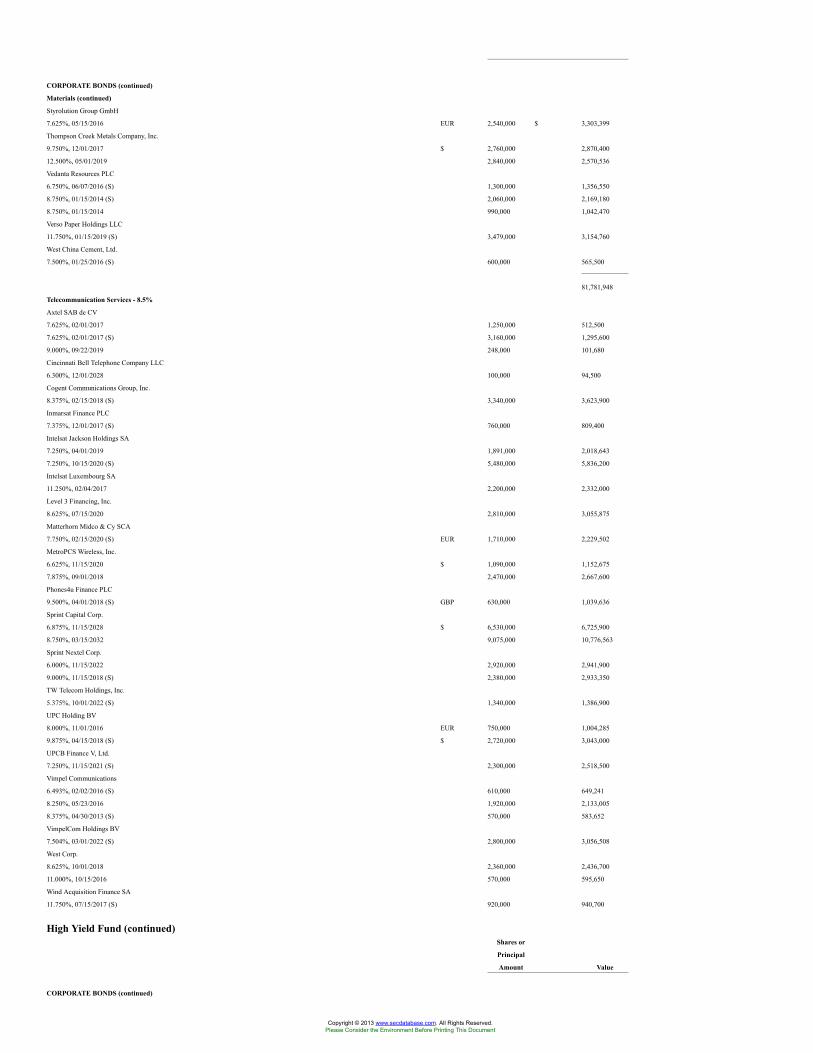
CORPORATE BONDS (continued)
Materials (continued)
Styrolution Group GmbH
7.625%, 05/15/2016 EUR 2,540,000 $ 3,303,399
Thompson Creek Metals Company, Inc.
9.750%, 12/01/2017 $ 2,760,000 2,870,400
12.500%, 05/01/2019 2,840,000 2,570,536
Vedanta Resources PLC
6.750%, 06/07/2016 (S) 1,300,000 1,356,550
8.750%, 01/15/2014 (S) 2,060,000 2,169,180
8.750%, 01/15/2014 990,000 1,042,470
Verso Paper Holdings LLC
11.750%, 01/15/2019 (S) 3,479,000 3,154,760
West China Cement, Ltd.
7.500%, 01/25/2016 (S) 600,000 565,500
81,781,948
Telecommunication Services - 8.5%
Axtel SAB de CV
7.625%, 02/01/2017 1,250,000 512,500
7.625%, 02/01/2017 (S) 3,160,000 1,295,600
9.000%, 09/22/2019 248,000 101,680
Cincinnati Bell Telephone Company LLC
6.300%, 12/01/2028 100,000 94,500
Cogent Communications Group, Inc.
8.375%, 02/15/2018 (S) 3,340,000 3,623,900
Inmarsat Finance PLC
7.375%, 12/01/2017 (S) 760,000 809,400
Intelsat Jackson Holdings SA
7.250%, 04/01/2019 1,891,000 2,018,643
7.250%, 10/15/2020 (S) 5,480,000 5,836,200
Intelsat Luxembourg SA
11.250%, 02/04/2017 2,200,000 2,332,000
Level 3 Financing, Inc.
8.625%, 07/15/2020 2,810,000 3,055,875
Matterhorn Midco & Cy SCA
7.750%, 02/15/2020 (S) EUR 1,710,000 2,229,502
MetroPCS Wireless, Inc.
6.625%, 11/15/2020 $ 1,090,000 1,152,675
7.875%, 09/01/2018 2,470,000 2,667,600
Phones4u Finance PLC
9.500%, 04/01/2018 (S) GBP 630,000 1,039,636
Sprint Capital Corp.
6.875%, 11/15/2028 $ 6,530,000 6,725,900
8.750%, 03/15/2032 9,075,000 10,776,563
Sprint Nextel Corp.
6.000%, 11/15/2022 2,920,000 2,941,900
9.000%, 11/15/2018 (S) 2,380,000 2,933,350
TW Telecom Holdings, Inc.
5.375%, 10/01/2022 (S) 1,340,000 1,386,900
UPC Holding BV
8.000%, 11/01/2016 EUR 750,000 1,004,285
9.875%, 04/15/2018 (S) $ 2,720,000 3,043,000
UPCB Finance V, Ltd.
7.250%, 11/15/2021 (S) 2,300,000 2,518,500
Vimpel Communications
6.493%, 02/02/2016 (S) 610,000 649,241
8.250%, 05/23/2016 1,920,000 2,133,005
8.375%, 04/30/2013 (S) 570,000 583,652
VimpelCom Holdings BV
7.504%, 03/01/2022 (S) 2,800,000 3,056,508
West Corp.
8.625%, 10/01/2018 2,360,000 2,436,700
11.000%, 10/15/2016 570,000 595,650
Wind Acquisition Finance SA
11.750%, 07/15/2017 (S) 920,000 940,700
High Yield Fund (continued)Shares or
Principal
Amount Value
CORPORATE BONDS (continued)
Copyright © 2013 www.secdatabase.com. All Rights Reserved.Please Consider the Environment Before Printing This Document
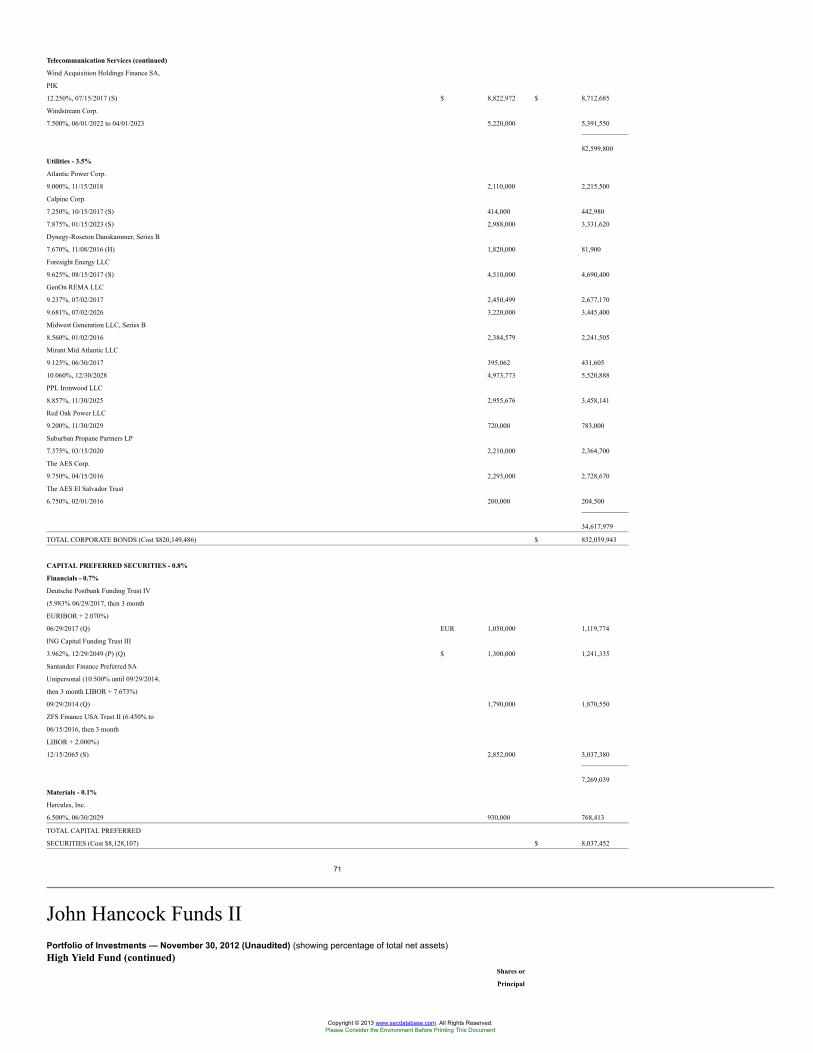
Telecommunication Services (continued)
Wind Acquisition Holdings Finance SA,
PIK
12.250%, 07/15/2017 (S) $ 8,822,972 $ 8,712,685
Windstream Corp.
7.500%, 06/01/2022 to 04/01/2023 5,220,000 5,391,550
82,599,800
Utilities - 3.5%
Atlantic Power Corp.
9.000%, 11/15/2018 2,110,000 2,215,500
Calpine Corp.
7.250%, 10/15/2017 (S) 414,000 442,980
7.875%, 01/15/2023 (S) 2,988,000 3,331,620
Dynegy-Roseton Danskammer, Series B
7.670%, 11/08/2016 (H) 1,820,000 81,900
Foresight Energy LLC
9.625%, 08/15/2017 (S) 4,510,000 4,690,400
GenOn REMA LLC
9.237%, 07/02/2017 2,450,499 2,677,170
9.681%, 07/02/2026 3,220,000 3,445,400
Midwest Generation LLC, Series B
8.560%, 01/02/2016 2,384,579 2,241,505
Mirant Mid Atlantic LLC
9.125%, 06/30/2017 395,062 431,605
10.060%, 12/30/2028 4,973,773 5,520,888
PPL Ironwood LLC
8.857%, 11/30/2025 2,955,676 3,458,141
Red Oak Power LLC
9.200%, 11/30/2029 720,000 783,000
Suburban Propane Partners LP
7.375%, 03/15/2020 2,210,000 2,364,700
The AES Corp.
9.750%, 04/15/2016 2,293,000 2,728,670
The AES El Salvador Trust
6.750%, 02/01/2016 200,000 204,500
34,617,979
TOTAL CORPORATE BONDS (Cost $820,149,486) $ 832,059,943
CAPITAL PREFERRED SECURITIES - 0.8%
Financials - 0.7%
Deutsche Postbank Funding Trust IV
(5.983% 06/29/2017, then 3 month
EURIBOR + 2.070%)
06/29/2017 (Q) EUR 1,050,000 1,119,774
ING Capital Funding Trust III
3.962%, 12/29/2049 (P) (Q) $ 1,300,000 1,241,335
Santander Finance Preferred SA
Unipersonal (10.500% until 09/29/2014,
then 3 month LIBOR + 7.673%)
09/29/2014 (Q) 1,790,000 1,870,550
ZFS Finance USA Trust II (6.450% to
06/15/2016, then 3 month
LIBOR + 2.000%)
12/15/2065 (S) 2,852,000 3,037,380
7,269,039
Materials - 0.1%
Hercules, Inc.
6.500%, 06/30/2029 930,000 768,413
TOTAL CAPITAL PREFERRED
SECURITIES (Cost $8,128,107) $ 8,037,452
71
John Hancock Funds IIPortfolio of Investments — November 30, 2012 (Unaudited) (showing percentage of total net assets)High Yield Fund (continued)
Shares or
Principal
Copyright © 2013 www.secdatabase.com. All Rights Reserved.Please Consider the Environment Before Printing This Document
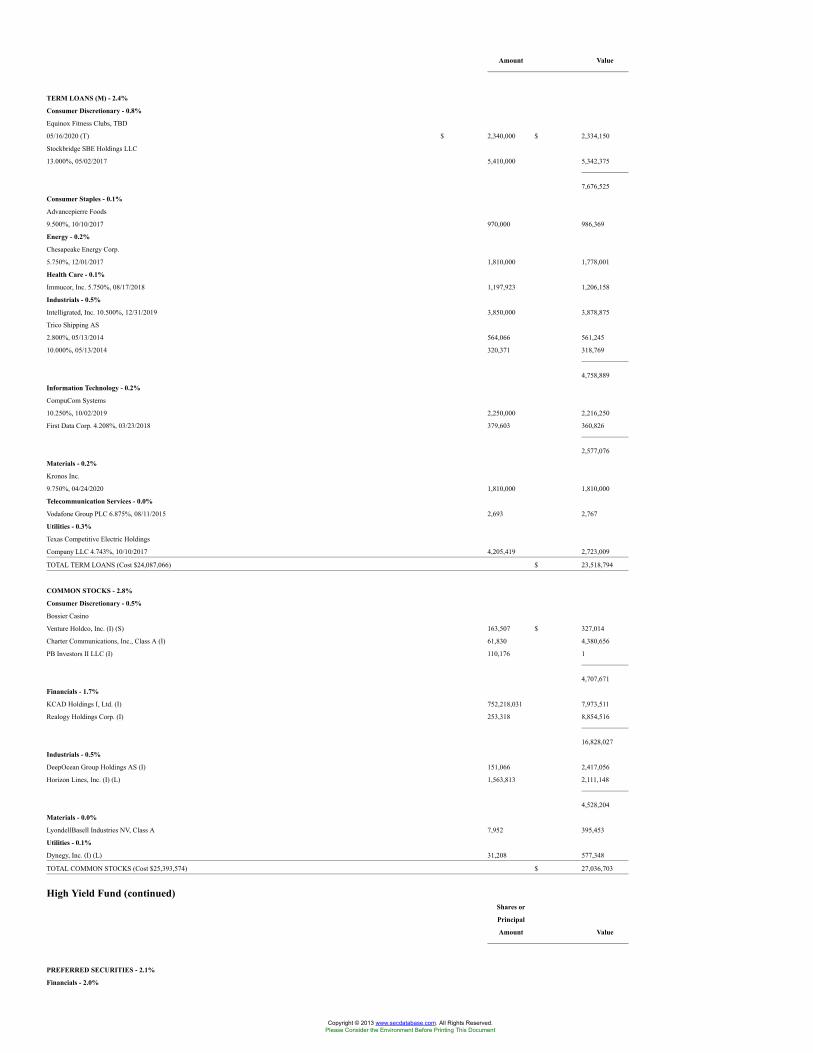
Amount Value
TERM LOANS (M) - 2.4%
Consumer Discretionary - 0.8%
Equinox Fitness Clubs, TBD
05/16/2020 (T) $ 2,340,000 $ 2,334,150
Stockbridge SBE Holdings LLC
13.000%, 05/02/2017 5,410,000 5,342,375
7,676,525
Consumer Staples - 0.1%
Advancepierre Foods
9.500%, 10/10/2017 970,000 986,369
Energy - 0.2%
Chesapeake Energy Corp.
5.750%, 12/01/2017 1,810,000 1,778,001
Health Care - 0.1%
Immucor, Inc. 5.750%, 08/17/2018 1,197,923 1,206,158
Industrials - 0.5%
Intelligrated, Inc. 10.500%, 12/31/2019 3,850,000 3,878,875
Trico Shipping AS
2.800%, 05/13/2014 564,066 561,245
10.000%, 05/13/2014 320,371 318,769
4,758,889
Information Technology - 0.2%
CompuCom Systems
10.250%, 10/02/2019 2,250,000 2,216,250
First Data Corp. 4.208%, 03/23/2018 379,603 360,826
2,577,076
Materials - 0.2%
Kronos Inc.
9.750%, 04/24/2020 1,810,000 1,810,000
Telecommunication Services - 0.0%
Vodafone Group PLC 6.875%, 08/11/2015 2,693 2,767
Utilities - 0.3%
Texas Competitive Electric Holdings
Company LLC 4.743%, 10/10/2017 4,205,419 2,723,009
TOTAL TERM LOANS (Cost $24,087,066) $ 23,518,794
COMMON STOCKS - 2.8%
Consumer Discretionary - 0.5%
Bossier Casino
Venture Holdco, Inc. (I) (S) 163,507 $ 327,014
Charter Communications, Inc., Class A (I) 61,830 4,380,656
PB Investors II LLC (I) 110,176 1
4,707,671
Financials - 1.7%
KCAD Holdings I, Ltd. (I) 752,218,031 7,973,511
Realogy Holdings Corp. (I) 253,318 8,854,516
16,828,027
Industrials - 0.5%
DeepOcean Group Holdings AS (I) 151,066 2,417,056
Horizon Lines, Inc. (I) (L) 1,563,813 2,111,148
4,528,204
Materials - 0.0%
LyondellBasell Industries NV, Class A 7,952 395,453
Utilities - 0.1%
Dynegy, Inc. (I) (L) 31,208 577,348
TOTAL COMMON STOCKS (Cost $25,393,574) $ 27,036,703
High Yield Fund (continued)Shares or
Principal
Amount Value
PREFERRED SECURITIES - 2.1%
Financials - 2.0%
Copyright © 2013 www.secdatabase.com. All Rights Reserved.Please Consider the Environment Before Printing This Document
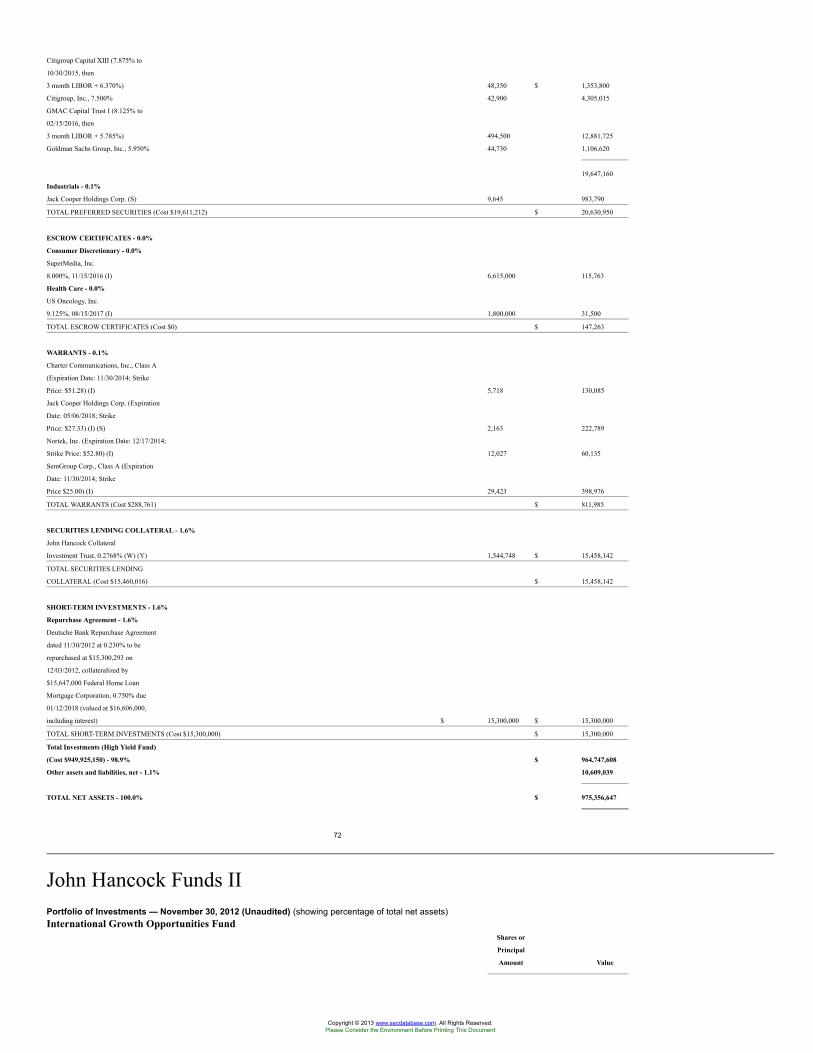
Citigroup Capital XIII (7.875% to
10/30/2015, then
3 month LIBOR + 6.370%) 48,350 $ 1,353,800
Citigroup, Inc., 7.500% 42,900 4,305,015
GMAC Capital Trust I (8.125% to
02/15/2016, then
3 month LIBOR + 5.785%) 494,500 12,881,725
Goldman Sachs Group, Inc., 5.950% 44,730 1,106,620
19,647,160
Industrials - 0.1%
Jack Cooper Holdings Corp. (S) 9,645 983,790
TOTAL PREFERRED SECURITIES (Cost $19,611,212) $ 20,630,950
ESCROW CERTIFICATES - 0.0%
Consumer Discretionary - 0.0%
SuperMedia, Inc.
8.000%, 11/15/2016 (I) 6,615,000 115,763
Health Care - 0.0%
US Oncology, Inc.
9.125%, 08/15/2017 (I) 1,800,000 31,500
TOTAL ESCROW CERTIFICATES (Cost $0) $ 147,263
WARRANTS - 0.1%
Charter Communications, Inc., Class A
(Expiration Date: 11/30/2014; Strike
Price: $51.28) (I) 5,718 130,085
Jack Cooper Holdings Corp. (Expiration
Date: 05/06/2018; Strike
Price: $27.33) (I) (S) 2,163 222,789
Nortek, Inc. (Expiration Date: 12/17/2014;
Strike Price: $52.80) (I) 12,027 60,135
SemGroup Corp., Class A (Expiration
Date: 11/30/2014; Strike
Price $25.00) (I) 29,423 398,976
TOTAL WARRANTS (Cost $288,761) $ 811,985
SECURITIES LENDING COLLATERAL - 1.6%
John Hancock Collateral
Investment Trust, 0.2768% (W) (Y) 1,544,748 $ 15,458,142
TOTAL SECURITIES LENDING
COLLATERAL (Cost $15,460,016) $ 15,458,142
SHORT-TERM INVESTMENTS - 1.6%
Repurchase Agreement - 1.6%
Deutsche Bank Repurchase Agreement
dated 11/30/2012 at 0.230% to be
repurchased at $15,300,293 on
12/03/2012, collateralized by
$15,647,000 Federal Home Loan
Mortgage Corporation, 0.750% due
01/12/2018 (valued at $16,606,000,
including interest) $ 15,300,000 $ 15,300,000
TOTAL SHORT-TERM INVESTMENTS (Cost $15,300,000) $ 15,300,000
Total Investments (High Yield Fund)
(Cost $949,925,150) - 98.9% $ 964,747,608
Other assets and liabilities, net - 1.1% 10,609,039
TOTAL NET ASSETS - 100.0% $ 975,356,647
72
John Hancock Funds IIPortfolio of Investments — November 30, 2012 (Unaudited) (showing percentage of total net assets)International Growth Opportunities Fund
Shares or
Principal
Amount Value
Copyright © 2013 www.secdatabase.com. All Rights Reserved.Please Consider the Environment Before Printing This Document
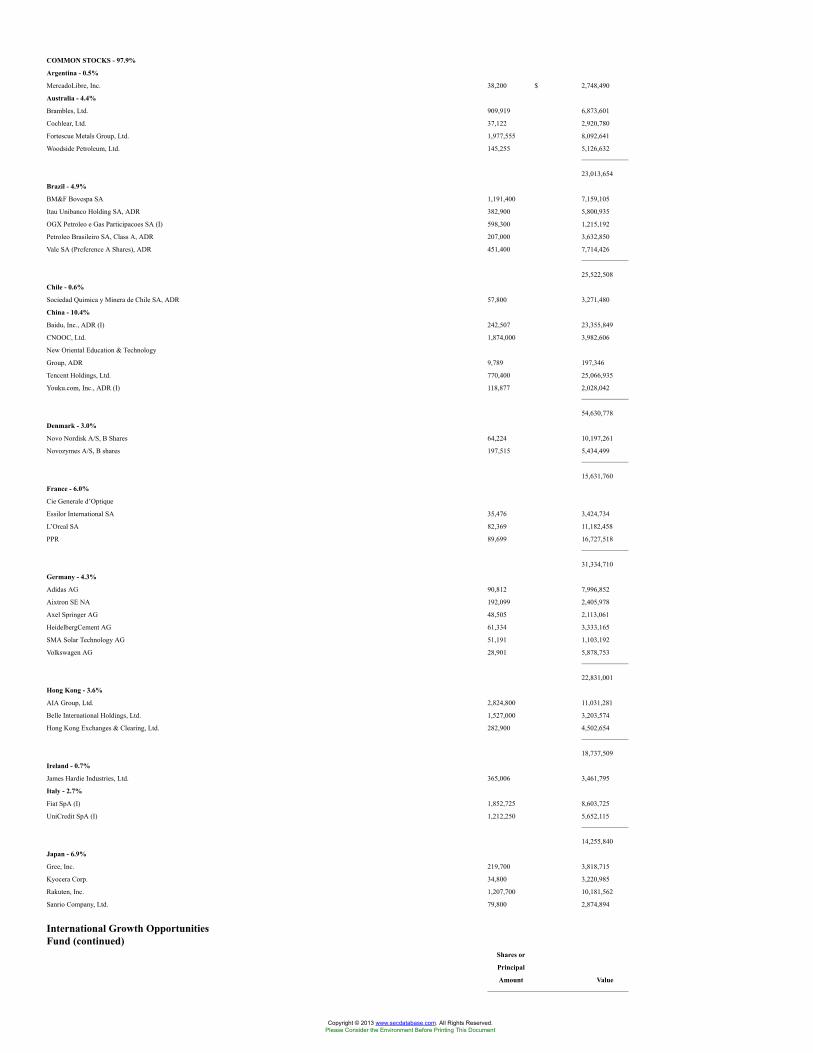
COMMON STOCKS - 97.9%
Argentina - 0.5%
MercadoLibre, Inc. 38,200 $ 2,748,490
Australia - 4.4%
Brambles, Ltd. 909,919 6,873,601
Cochlear, Ltd. 37,122 2,920,780
Fortescue Metals Group, Ltd. 1,977,555 8,092,641
Woodside Petroleum, Ltd. 145,255 5,126,632
23,013,654
Brazil - 4.9%
BM&F Bovespa SA 1,191,400 7,159,105
Itau Unibanco Holding SA, ADR 382,900 5,800,935
OGX Petroleo e Gas Participacoes SA (I) 598,300 1,215,192
Petroleo Brasileiro SA, Class A, ADR 207,000 3,632,850
Vale SA (Preference A Shares), ADR 451,400 7,714,426
25,522,508
Chile - 0.6%
Sociedad Quimica y Minera de Chile SA, ADR 57,800 3,271,480
China - 10.4%
Baidu, Inc., ADR (I) 242,507 23,355,849
CNOOC, Ltd. 1,874,000 3,982,606
New Oriental Education & Technology
Group, ADR 9,789 197,346
Tencent Holdings, Ltd. 770,400 25,066,935
Youku.com, Inc., ADR (I) 118,877 2,028,042
54,630,778
Denmark - 3.0%
Novo Nordisk A/S, B Shares 64,224 10,197,261
Novozymes A/S, B shares 197,515 5,434,499
15,631,760
France - 6.0%
Cie Generale d’Optique
Essilor International SA 35,476 3,424,734
L’Oreal SA 82,369 11,182,458
PPR 89,699 16,727,518
31,334,710
Germany - 4.3%
Adidas AG 90,812 7,996,852
Aixtron SE NA 192,099 2,405,978
Axel Springer AG 48,505 2,113,061
HeidelbergCement AG 61,334 3,333,165
SMA Solar Technology AG 51,191 1,103,192
Volkswagen AG 28,901 5,878,753
22,831,001
Hong Kong - 3.6%
AIA Group, Ltd. 2,824,800 11,031,281
Belle International Holdings, Ltd. 1,527,000 3,203,574
Hong Kong Exchanges & Clearing, Ltd. 282,900 4,502,654
18,737,509
Ireland - 0.7%
James Hardie Industries, Ltd. 365,006 3,461,795
Italy - 2.7%
Fiat SpA (I) 1,852,725 8,603,725
UniCredit SpA (I) 1,212,250 5,652,115
14,255,840
Japan - 6.9%
Gree, Inc. 219,700 3,818,715
Kyocera Corp. 34,800 3,220,985
Rakuten, Inc. 1,207,700 10,181,562
Sanrio Company, Ltd. 79,800 2,874,894
International Growth OpportunitiesFund (continued)
Shares or
Principal
Amount Value
Copyright © 2013 www.secdatabase.com. All Rights Reserved.Please Consider the Environment Before Printing This Document
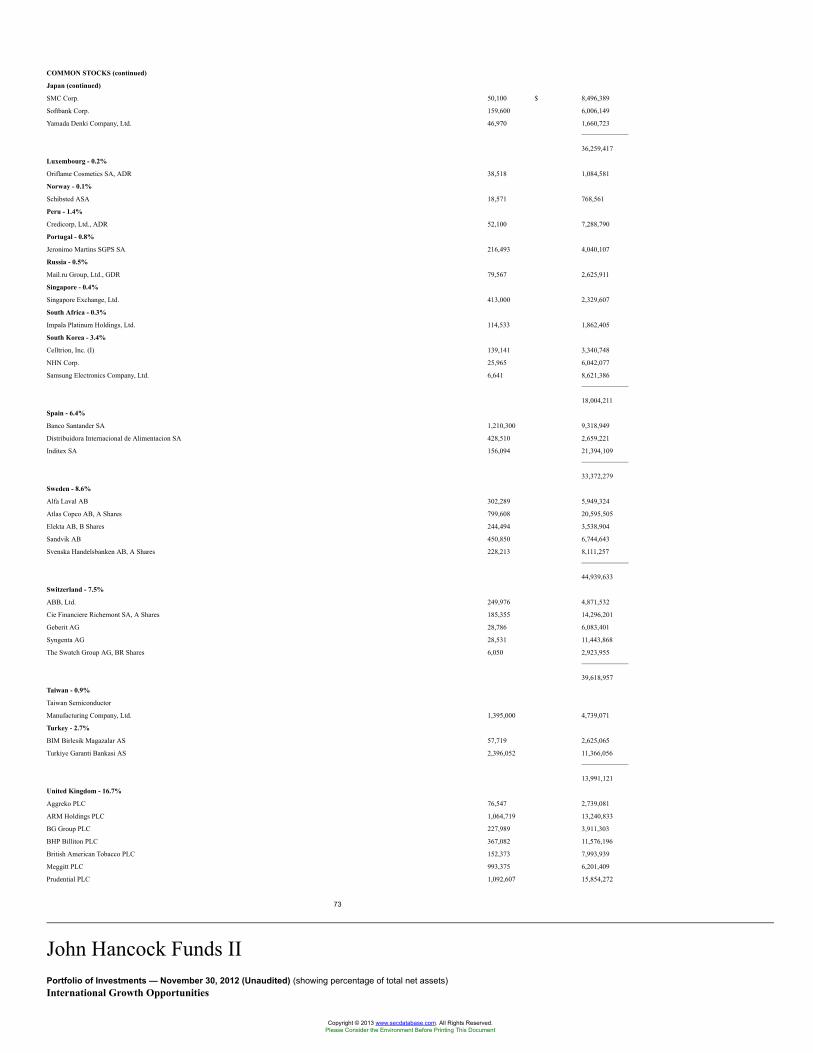
COMMON STOCKS (continued)
Japan (continued)
SMC Corp. 50,100 $ 8,496,389
Softbank Corp. 159,600 6,006,149
Yamada Denki Company, Ltd. 46,970 1,660,723
36,259,417
Luxembourg - 0.2%
Oriflame Cosmetics SA, ADR 38,518 1,084,581
Norway - 0.1%
Schibsted ASA 18,571 768,561
Peru - 1.4%
Credicorp, Ltd., ADR 52,100 7,288,790
Portugal - 0.8%
Jeronimo Martins SGPS SA 216,493 4,040,107
Russia - 0.5%
Mail.ru Group, Ltd., GDR 79,567 2,625,911
Singapore - 0.4%
Singapore Exchange, Ltd. 413,000 2,329,607
South Africa - 0.3%
Impala Platinum Holdings, Ltd. 114,533 1,862,405
South Korea - 3.4%
Celltrion, Inc. (I) 139,141 3,340,748
NHN Corp. 25,965 6,042,077
Samsung Electronics Company, Ltd. 6,641 8,621,386
18,004,211
Spain - 6.4%
Banco Santander SA 1,210,300 9,318,949
Distribuidora Internacional de Alimentacion SA 428,510 2,659,221
Inditex SA 156,094 21,394,109
33,372,279
Sweden - 8.6%
Alfa Laval AB 302,289 5,949,324
Atlas Copco AB, A Shares 799,608 20,595,505
Elekta AB, B Shares 244,494 3,538,904
Sandvik AB 450,850 6,744,643
Svenska Handelsbanken AB, A Shares 228,213 8,111,257
44,939,633
Switzerland - 7.5%
ABB, Ltd. 249,976 4,871,532
Cie Financiere Richemont SA, A Shares 185,355 14,296,201
Geberit AG 28,786 6,083,401
Syngenta AG 28,531 11,443,868
The Swatch Group AG, BR Shares 6,050 2,923,955
39,618,957
Taiwan - 0.9%
Taiwan Semiconductor
Manufacturing Company, Ltd. 1,395,000 4,739,071
Turkey - 2.7%
BIM Birlesik Magazalar AS 57,719 2,625,065
Turkiye Garanti Bankasi AS 2,396,052 11,366,056
13,991,121
United Kingdom - 16.7%
Aggreko PLC 76,547 2,739,081
ARM Holdings PLC 1,064,719 13,240,833
BG Group PLC 227,989 3,911,303
BHP Billiton PLC 367,082 11,576,196
British American Tobacco PLC 152,373 7,993,939
Meggitt PLC 993,375 6,201,409
Prudential PLC 1,092,607 15,854,272
73
John Hancock Funds IIPortfolio of Investments — November 30, 2012 (Unaudited) (showing percentage of total net assets)International Growth Opportunities
Copyright © 2013 www.secdatabase.com. All Rights Reserved.Please Consider the Environment Before Printing This Document
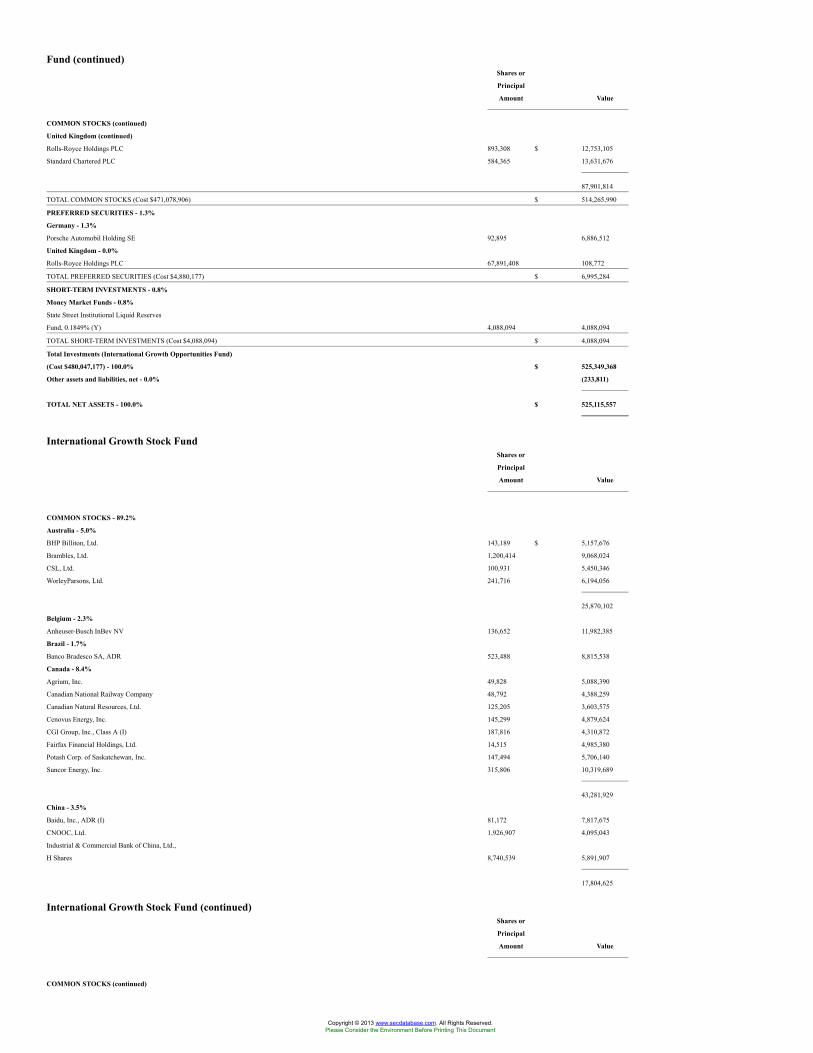
Fund (continued)Shares or
Principal
Amount Value
COMMON STOCKS (continued)
United Kingdom (continued)
Rolls-Royce Holdings PLC 893,308 $ 12,753,105
Standard Chartered PLC 584,365 13,631,676
87,901,814
TOTAL COMMON STOCKS (Cost $471,078,906) $ 514,265,990
PREFERRED SECURITIES - 1.3%
Germany - 1.3%
Porsche Automobil Holding SE 92,895 6,886,512
United Kingdom - 0.0%
Rolls-Royce Holdings PLC 67,891,408 108,772
TOTAL PREFERRED SECURITIES (Cost $4,880,177) $ 6,995,284
SHORT-TERM INVESTMENTS - 0.8%
Money Market Funds - 0.8%
State Street Institutional Liquid Reserves
Fund, 0.1849% (Y) 4,088,094 4,088,094
TOTAL SHORT-TERM INVESTMENTS (Cost $4,088,094) $ 4,088,094
Total Investments (International Growth Opportunities Fund)
(Cost $480,047,177) - 100.0% $ 525,349,368
Other assets and liabilities, net - 0.0% (233,811)
TOTAL NET ASSETS - 100.0% $ 525,115,557
International Growth Stock FundShares or
Principal
Amount Value
COMMON STOCKS - 89.2%
Australia - 5.0%
BHP Billiton, Ltd. 143,189 $ 5,157,676
Brambles, Ltd. 1,200,414 9,068,024
CSL, Ltd. 100,931 5,450,346
WorleyParsons, Ltd. 241,716 6,194,056
25,870,102
Belgium - 2.3%
Anheuser-Busch InBev NV 136,652 11,982,385
Brazil - 1.7%
Banco Bradesco SA, ADR 523,488 8,815,538
Canada - 8.4%
Agrium, Inc. 49,828 5,088,390
Canadian National Railway Company 48,792 4,388,259
Canadian Natural Resources, Ltd. 125,205 3,603,575
Cenovus Energy, Inc. 145,299 4,879,624
CGI Group, Inc., Class A (I) 187,816 4,310,872
Fairfax Financial Holdings, Ltd. 14,515 4,985,380
Potash Corp. of Saskatchewan, Inc. 147,494 5,706,140
Suncor Energy, Inc. 315,806 10,319,689
43,281,929
China - 3.5%
Baidu, Inc., ADR (I) 81,172 7,817,675
CNOOC, Ltd. 1,926,907 4,095,043
Industrial & Commercial Bank of China, Ltd.,
H Shares 8,740,539 5,891,907
17,804,625
International Growth Stock Fund (continued)Shares or
Principal
Amount Value
COMMON STOCKS (continued)
Copyright © 2013 www.secdatabase.com. All Rights Reserved.Please Consider the Environment Before Printing This Document
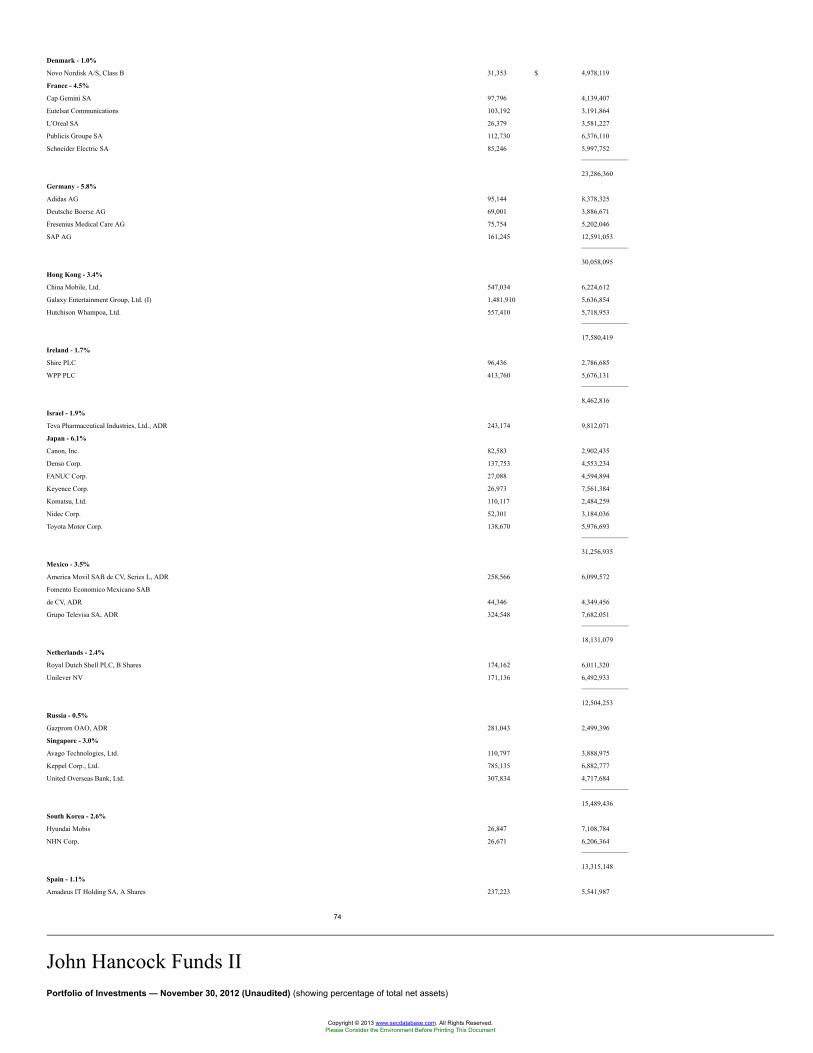
Denmark - 1.0%
Novo Nordisk A/S, Class B 31,353 $ 4,978,119
France - 4.5%
Cap Gemini SA 97,796 4,139,407
Eutelsat Communications 103,192 3,191,864
L’Oreal SA 26,379 3,581,227
Publicis Groupe SA 112,730 6,376,110
Schneider Electric SA 85,246 5,997,752
23,286,360
Germany - 5.8%
Adidas AG 95,144 8,378,325
Deutsche Boerse AG 69,001 3,886,671
Fresenius Medical Care AG 75,754 5,202,046
SAP AG 161,245 12,591,053
30,058,095
Hong Kong - 3.4%
China Mobile, Ltd. 547,034 6,224,612
Galaxy Entertainment Group, Ltd. (I) 1,481,910 5,636,854
Hutchison Whampoa, Ltd. 557,410 5,718,953
17,580,419
Ireland - 1.7%
Shire PLC 96,436 2,786,685
WPP PLC 413,760 5,676,131
8,462,816
Israel - 1.9%
Teva Pharmaceutical Industries, Ltd., ADR 243,174 9,812,071
Japan - 6.1%
Canon, Inc. 82,583 2,902,435
Denso Corp. 137,753 4,553,234
FANUC Corp. 27,088 4,594,894
Keyence Corp. 26,973 7,561,384
Komatsu, Ltd. 110,117 2,484,259
Nidec Corp. 52,301 3,184,036
Toyota Motor Corp. 138,670 5,976,693
31,256,935
Mexico - 3.5%
America Movil SAB de CV, Series L, ADR 258,566 6,099,572
Fomento Economico Mexicano SAB
de CV, ADR 44,346 4,349,456
Grupo Televisa SA, ADR 324,548 7,682,051
18,131,079
Netherlands - 2.4%
Royal Dutch Shell PLC, B Shares 174,162 6,011,320
Unilever NV 171,136 6,492,933
12,504,253
Russia - 0.5%
Gazprom OAO, ADR 281,043 2,499,396
Singapore - 3.0%
Avago Technologies, Ltd. 110,797 3,888,975
Keppel Corp., Ltd. 785,135 6,882,777
United Overseas Bank, Ltd. 307,834 4,717,684
15,489,436
South Korea - 2.6%
Hyundai Mobis 26,847 7,108,784
NHN Corp. 26,671 6,206,364
13,315,148
Spain - 1.1%
Amadeus IT Holding SA, A Shares 237,223 5,541,987
74
John Hancock Funds IIPortfolio of Investments — November 30, 2012 (Unaudited) (showing percentage of total net assets)
Copyright © 2013 www.secdatabase.com. All Rights Reserved.Please Consider the Environment Before Printing This Document
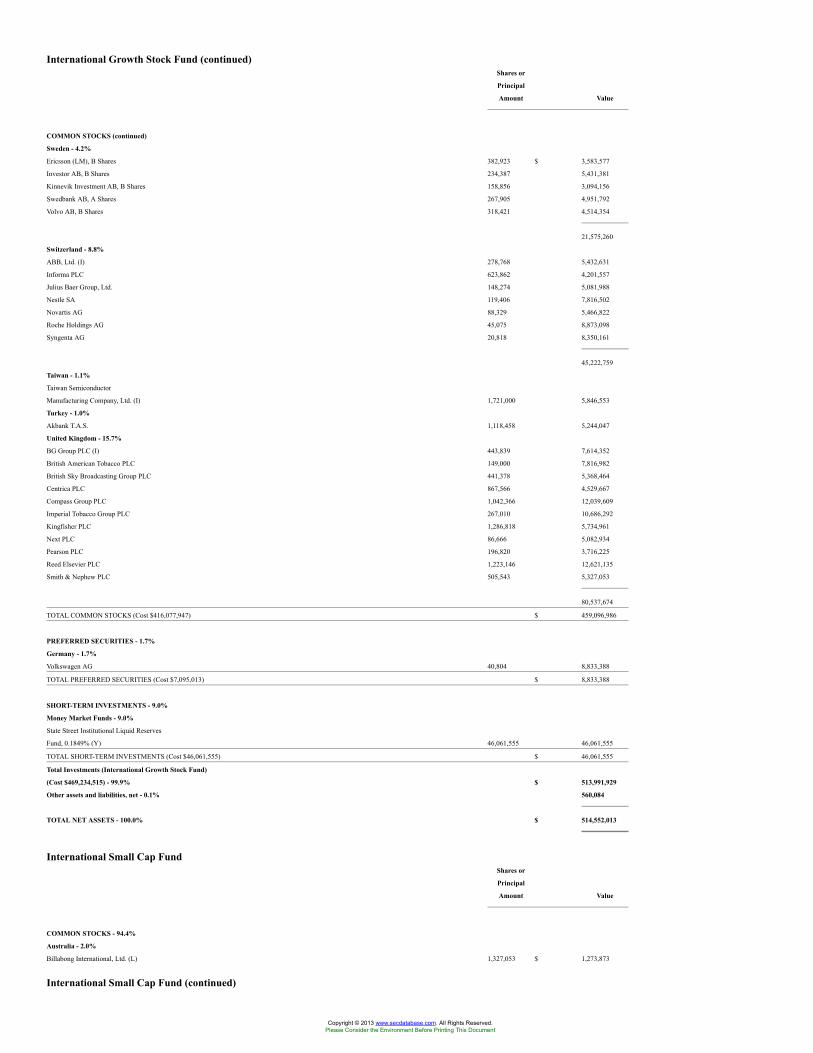
International Growth Stock Fund (continued)Shares or
Principal
Amount Value
COMMON STOCKS (continued)
Sweden - 4.2%
Ericsson (LM), B Shares 382,923 $ 3,583,577
Investor AB, B Shares 234,387 5,431,381
Kinnevik Investment AB, B Shares 158,856 3,094,156
Swedbank AB, A Shares 267,905 4,951,792
Volvo AB, B Shares 318,421 4,514,354
21,575,260
Switzerland - 8.8%
ABB, Ltd. (I) 278,768 5,432,631
Informa PLC 623,862 4,201,557
Julius Baer Group, Ltd. 148,274 5,081,988
Nestle SA 119,406 7,816,502
Novartis AG 88,329 5,466,822
Roche Holdings AG 45,075 8,873,098
Syngenta AG 20,818 8,350,161
45,222,759
Taiwan - 1.1%
Taiwan Semiconductor
Manufacturing Company, Ltd. (I) 1,721,000 5,846,553
Turkey - 1.0%
Akbank T.A.S. 1,118,458 5,244,047
United Kingdom - 15.7%
BG Group PLC (I) 443,839 7,614,352
British American Tobacco PLC 149,000 7,816,982
British Sky Broadcasting Group PLC 441,378 5,368,464
Centrica PLC 867,566 4,529,667
Compass Group PLC 1,042,366 12,039,609
Imperial Tobacco Group PLC 267,010 10,686,292
Kingfisher PLC 1,286,818 5,734,961
Next PLC 86,666 5,082,934
Pearson PLC 196,820 3,716,225
Reed Elsevier PLC 1,223,146 12,621,135
Smith & Nephew PLC 505,543 5,327,053
80,537,674
TOTAL COMMON STOCKS (Cost $416,077,947) $ 459,096,986
PREFERRED SECURITIES - 1.7%
Germany - 1.7%
Volkswagen AG 40,804 8,833,388
TOTAL PREFERRED SECURITIES (Cost $7,095,013) $ 8,833,388
SHORT-TERM INVESTMENTS - 9.0%
Money Market Funds - 9.0%
State Street Institutional Liquid Reserves
Fund, 0.1849% (Y) 46,061,555 46,061,555
TOTAL SHORT-TERM INVESTMENTS (Cost $46,061,555) $ 46,061,555
Total Investments (International Growth Stock Fund)
(Cost $469,234,515) - 99.9% $ 513,991,929
Other assets and liabilities, net - 0.1% 560,084
TOTAL NET ASSETS - 100.0% $ 514,552,013
International Small Cap FundShares or
Principal
Amount Value
COMMON STOCKS - 94.4%
Australia - 2.0%
Billabong International, Ltd. (L) 1,327,053 $ 1,273,873
International Small Cap Fund (continued)
Copyright © 2013 www.secdatabase.com. All Rights Reserved.Please Consider the Environment Before Printing This Document
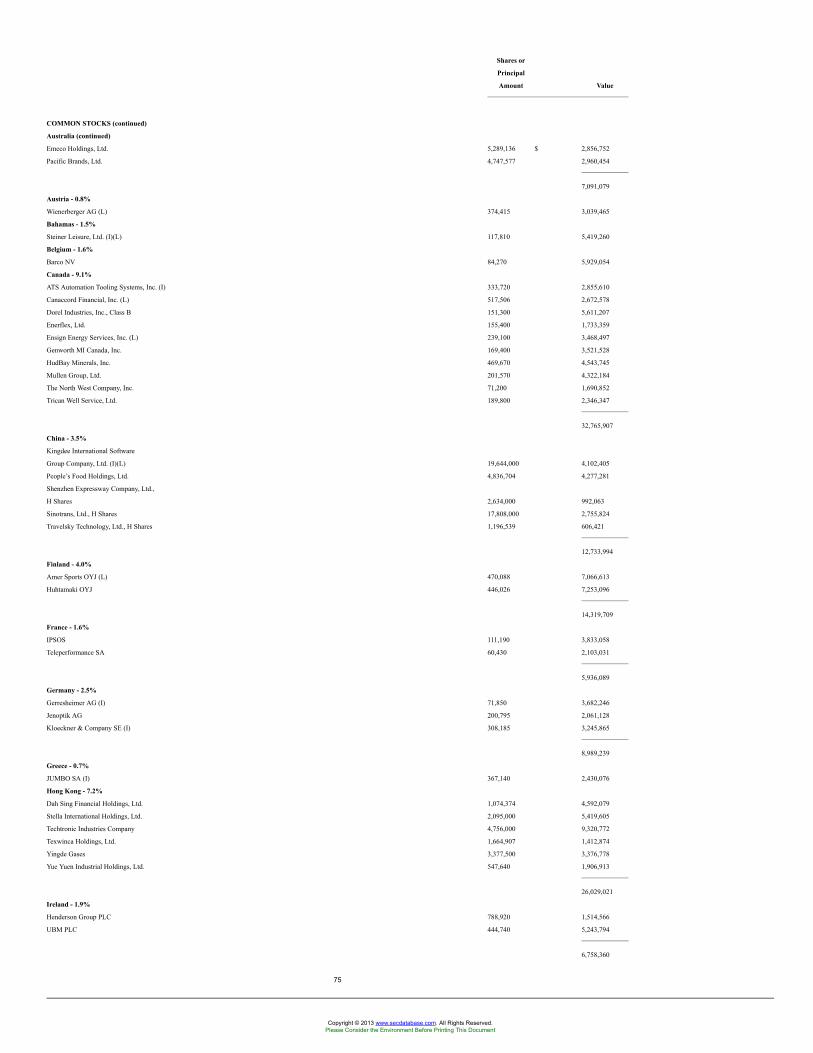
Shares or
Principal
Amount Value
COMMON STOCKS (continued)
Australia (continued)
Emeco Holdings, Ltd. 5,289,136 $ 2,856,752
Pacific Brands, Ltd. 4,747,577 2,960,454
7,091,079
Austria - 0.8%
Wienerberger AG (L) 374,415 3,039,465
Bahamas - 1.5%
Steiner Leisure, Ltd. (I)(L) 117,810 5,419,260
Belgium - 1.6%
Barco NV 84,270 5,929,054
Canada - 9.1%
ATS Automation Tooling Systems, Inc. (I) 333,720 2,855,610
Canaccord Financial, Inc. (L) 517,506 2,672,578
Dorel Industries, Inc., Class B 151,300 5,611,207
Enerflex, Ltd. 155,400 1,733,359
Ensign Energy Services, Inc. (L) 239,100 3,468,497
Genworth MI Canada, Inc. 169,400 3,521,528
HudBay Minerals, Inc. 469,670 4,543,745
Mullen Group, Ltd. 201,570 4,322,184
The North West Company, Inc. 71,200 1,690,852
Trican Well Service, Ltd. 189,800 2,346,347
32,765,907
China - 3.5%
Kingdee International Software
Group Company, Ltd. (I)(L) 19,644,000 4,102,405
People’s Food Holdings, Ltd. 4,836,704 4,277,281
Shenzhen Expressway Company, Ltd.,
H Shares 2,634,000 992,063
Sinotrans, Ltd., H Shares 17,808,000 2,755,824
Travelsky Technology, Ltd., H Shares 1,196,539 606,421
12,733,994
Finland - 4.0%
Amer Sports OYJ (L) 470,088 7,066,613
Huhtamaki OYJ 446,026 7,253,096
14,319,709
France - 1.6%
IPSOS 111,190 3,833,058
Teleperformance SA 60,430 2,103,031
5,936,089
Germany - 2.5%
Gerresheimer AG (I) 71,850 3,682,246
Jenoptik AG 200,795 2,061,128
Kloeckner & Company SE (I) 308,185 3,245,865
8,989,239
Greece - 0.7%
JUMBO SA (I) 367,140 2,430,076
Hong Kong - 7.2%
Dah Sing Financial Holdings, Ltd. 1,074,374 4,592,079
Stella International Holdings, Ltd. 2,095,000 5,419,605
Techtronic Industries Company 4,756,000 9,320,772
Texwinca Holdings, Ltd. 1,664,907 1,412,874
Yingde Gases 3,377,500 3,376,778
Yue Yuen Industrial Holdings, Ltd. 547,640 1,906,913
26,029,021
Ireland - 1.9%
Henderson Group PLC 788,920 1,514,566
UBM PLC 444,740 5,243,794
6,758,360
75
Copyright © 2013 www.secdatabase.com. All Rights Reserved.Please Consider the Environment Before Printing This Document
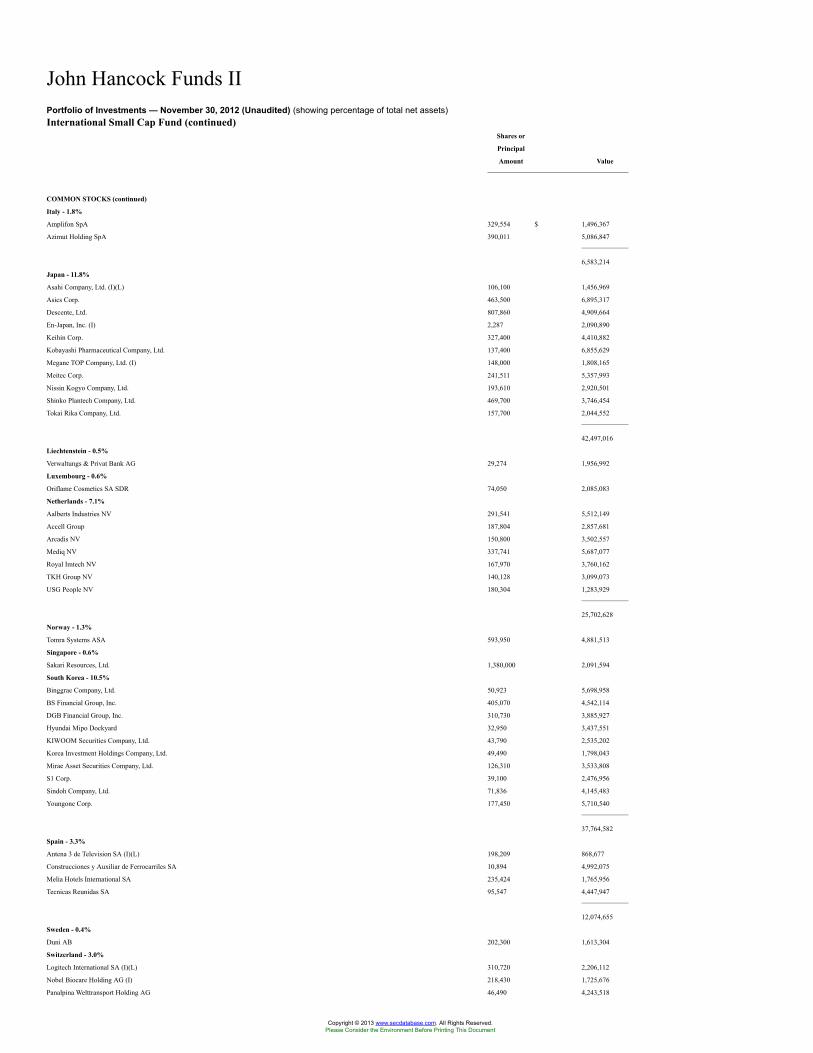
John Hancock Funds IIPortfolio of Investments — November 30, 2012 (Unaudited) (showing percentage of total net assets)International Small Cap Fund (continued)
Shares or
Principal
Amount Value
COMMON STOCKS (continued)
Italy - 1.8%
Amplifon SpA 329,554 $ 1,496,367
Azimut Holding SpA 390,011 5,086,847
6,583,214
Japan - 11.8%
Asahi Company, Ltd. (I)(L) 106,100 1,456,969
Asics Corp. 463,500 6,895,317
Descente, Ltd. 807,860 4,909,664
En-Japan, Inc. (I) 2,287 2,090,890
Keihin Corp. 327,400 4,410,882
Kobayashi Pharmaceutical Company, Ltd. 137,400 6,855,629
Megane TOP Company, Ltd. (I) 148,000 1,808,165
Meitec Corp. 241,511 5,357,993
Nissin Kogyo Company, Ltd. 193,610 2,920,501
Shinko Plantech Company, Ltd. 469,700 3,746,454
Tokai Rika Company, Ltd. 157,700 2,044,552
42,497,016
Liechtenstein - 0.5%
Verwaltungs & Privat Bank AG 29,274 1,956,992
Luxembourg - 0.6%
Oriflame Cosmetics SA SDR 74,050 2,085,083
Netherlands - 7.1%
Aalberts Industries NV 291,541 5,512,149
Accell Group 187,804 2,857,681
Arcadis NV 150,800 3,502,557
Mediq NV 337,741 5,687,077
Royal Imtech NV 167,970 3,760,162
TKH Group NV 140,128 3,099,073
USG People NV 180,304 1,283,929
25,702,628
Norway - 1.3%
Tomra Systems ASA 593,950 4,881,513
Singapore - 0.6%
Sakari Resources, Ltd. 1,380,000 2,091,594
South Korea - 10.5%
Binggrae Company, Ltd. 50,923 5,698,958
BS Financial Group, Inc. 405,070 4,542,114
DGB Financial Group, Inc. 310,730 3,885,927
Hyundai Mipo Dockyard 32,950 3,437,551
KIWOOM Securities Company, Ltd. 43,790 2,535,202
Korea Investment Holdings Company, Ltd. 49,490 1,798,043
Mirae Asset Securities Company, Ltd. 126,310 3,533,808
S1 Corp. 39,100 2,476,956
Sindoh Company, Ltd. 71,836 4,145,483
Youngone Corp. 177,450 5,710,540
37,764,582
Spain - 3.3%
Antena 3 de Television SA (I)(L) 198,209 868,677
Construcciones y Auxiliar de Ferrocarriles SA 10,894 4,992,075
Melia Hotels International SA 235,424 1,765,956
Tecnicas Reunidas SA 95,547 4,447,947
12,074,655
Sweden - 0.4%
Duni AB 202,300 1,613,304
Switzerland - 3.0%
Logitech International SA (I)(L) 310,720 2,206,112
Nobel Biocare Holding AG (I) 218,430 1,725,676
Panalpina Welttransport Holding AG 46,490 4,243,518
Copyright © 2013 www.secdatabase.com. All Rights Reserved.Please Consider the Environment Before Printing This Document
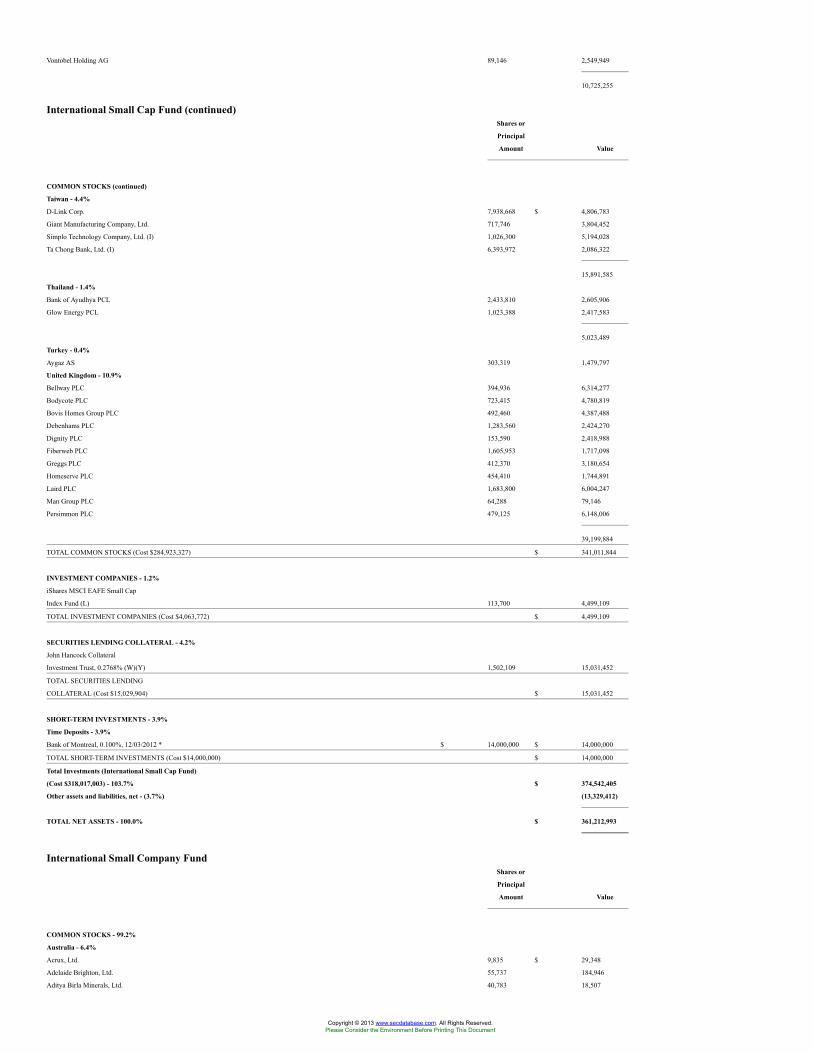
Vontobel Holding AG 89,146 2,549,949
10,725,255
International Small Cap Fund (continued)Shares or
Principal
Amount Value
COMMON STOCKS (continued)
Taiwan - 4.4%
D-Link Corp. 7,938,668 $ 4,806,783
Giant Manufacturing Company, Ltd. 717,746 3,804,452
Simplo Technology Company, Ltd. (I) 1,026,300 5,194,028
Ta Chong Bank, Ltd. (I) 6,393,972 2,086,322
15,891,585
Thailand - 1.4%
Bank of Ayudhya PCL 2,433,810 2,605,906
Glow Energy PCL 1,023,388 2,417,583
5,023,489
Turkey - 0.4%
Aygaz AS 303,319 1,479,797
United Kingdom - 10.9%
Bellway PLC 394,936 6,314,277
Bodycote PLC 723,415 4,780,819
Bovis Homes Group PLC 492,460 4,387,488
Debenhams PLC 1,283,560 2,424,270
Dignity PLC 153,590 2,418,988
Fiberweb PLC 1,605,953 1,717,098
Greggs PLC 412,370 3,180,654
Homeserve PLC 454,410 1,744,891
Laird PLC 1,683,800 6,004,247
Man Group PLC 64,288 79,146
Persimmon PLC 479,125 6,148,006
39,199,884
TOTAL COMMON STOCKS (Cost $284,923,327) $ 341,011,844
INVESTMENT COMPANIES - 1.2%
iShares MSCI EAFE Small Cap
Index Fund (L) 113,700 4,499,109
TOTAL INVESTMENT COMPANIES (Cost $4,063,772) $ 4,499,109
SECURITIES LENDING COLLATERAL - 4.2%
John Hancock Collateral
Investment Trust, 0.2768% (W)(Y) 1,502,109 15,031,452
TOTAL SECURITIES LENDING
COLLATERAL (Cost $15,029,904) $ 15,031,452
SHORT-TERM INVESTMENTS - 3.9%
Time Deposits - 3.9%
Bank of Montreal, 0.100%, 12/03/2012 * $ 14,000,000 $ 14,000,000
TOTAL SHORT-TERM INVESTMENTS (Cost $14,000,000) $ 14,000,000
Total Investments (International Small Cap Fund)
(Cost $318,017,003) - 103.7% $ 374,542,405
Other assets and liabilities, net - (3.7%) (13,329,412)
TOTAL NET ASSETS - 100.0% $ 361,212,993
International Small Company FundShares or
Principal
Amount Value
COMMON STOCKS - 99.2%
Australia - 6.4%
Acrux, Ltd. 9,835 $ 29,348
Adelaide Brighton, Ltd. 55,737 184,946
Aditya Birla Minerals, Ltd. 40,783 18,507
Copyright © 2013 www.secdatabase.com. All Rights Reserved.Please Consider the Environment Before Printing This Document
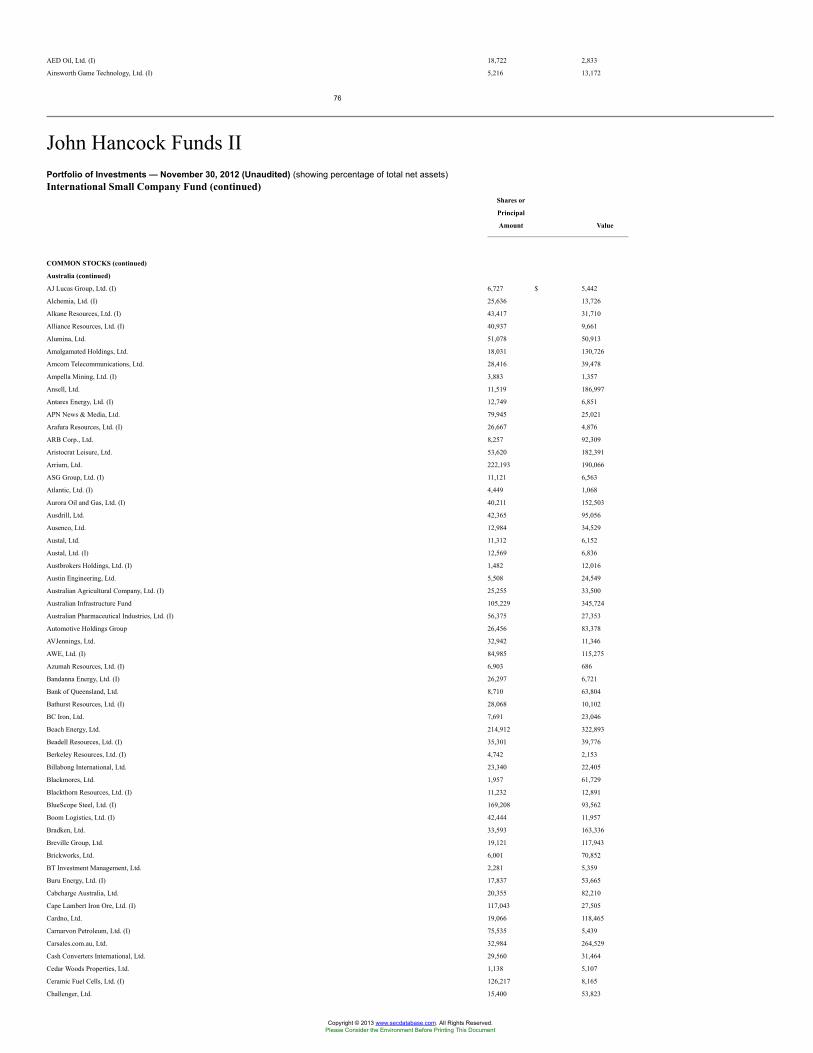
AED Oil, Ltd. (I) 18,722 2,833
Ainsworth Game Technology, Ltd. (I) 5,216 13,172
76
John Hancock Funds IIPortfolio of Investments — November 30, 2012 (Unaudited) (showing percentage of total net assets)International Small Company Fund (continued)
Shares or
Principal
Amount Value
COMMON STOCKS (continued)
Australia (continued)
AJ Lucas Group, Ltd. (I) 6,727 $ 5,442
Alchemia, Ltd. (I) 25,636 13,726
Alkane Resources, Ltd. (I) 43,417 31,710
Alliance Resources, Ltd. (I) 40,937 9,661
Alumina, Ltd. 51,078 50,913
Amalgamated Holdings, Ltd. 18,031 130,726
Amcom Telecommunications, Ltd. 28,416 39,478
Ampella Mining, Ltd. (I) 3,883 1,357
Ansell, Ltd. 11,519 186,997
Antares Energy, Ltd. (I) 12,749 6,851
APN News & Media, Ltd. 79,945 25,021
Arafura Resources, Ltd. (I) 26,667 4,876
ARB Corp., Ltd. 8,257 92,309
Aristocrat Leisure, Ltd. 53,620 182,391
Arrium, Ltd. 222,193 190,066
ASG Group, Ltd. (I) 11,121 6,563
Atlantic, Ltd. (I) 4,449 1,068
Aurora Oil and Gas, Ltd. (I) 40,211 152,503
Ausdrill, Ltd. 42,365 95,056
Ausenco, Ltd. 12,984 34,529
Austal, Ltd. 11,312 6,152
Austal, Ltd. (I) 12,569 6,836
Austbrokers Holdings, Ltd. (I) 1,482 12,016
Austin Engineering, Ltd. 5,508 24,549
Australian Agricultural Company, Ltd. (I) 25,255 33,500
Australian Infrastructure Fund 105,229 345,724
Australian Pharmaceutical Industries, Ltd. (I) 56,375 27,353
Automotive Holdings Group 26,456 83,378
AVJennings, Ltd. 32,942 11,346
AWE, Ltd. (I) 84,985 115,275
Azumah Resources, Ltd. (I) 6,903 686
Bandanna Energy, Ltd. (I) 26,297 6,721
Bank of Queensland, Ltd. 8,710 63,804
Bathurst Resources, Ltd. (I) 28,068 10,102
BC Iron, Ltd. 7,691 23,046
Beach Energy, Ltd. 214,912 322,893
Beadell Resources, Ltd. (I) 35,301 39,776
Berkeley Resources, Ltd. (I) 4,742 2,153
Billabong International, Ltd. 23,340 22,405
Blackmores, Ltd. 1,957 61,729
Blackthorn Resources, Ltd. (I) 11,232 12,891
BlueScope Steel, Ltd. (I) 169,208 93,562
Boom Logistics, Ltd. (I) 42,444 11,957
Bradken, Ltd. 33,593 163,336
Breville Group, Ltd. 19,121 117,943
Brickworks, Ltd. 6,001 70,852
BT Investment Management, Ltd. 2,281 5,359
Buru Energy, Ltd. (I) 17,837 53,665
Cabcharge Australia, Ltd. 20,355 82,210
Cape Lambert Iron Ore, Ltd. (I) 117,043 27,505
Cardno, Ltd. 19,066 118,465
Carnarvon Petroleum, Ltd. (I) 75,535 5,439
Carsales.com.au, Ltd. 32,984 264,529
Cash Converters International, Ltd. 29,560 31,464
Cedar Woods Properties, Ltd. 1,138 5,107
Ceramic Fuel Cells, Ltd. (I) 126,217 8,165
Challenger, Ltd. 15,400 53,823
Copyright © 2013 www.secdatabase.com. All Rights Reserved.Please Consider the Environment Before Printing This Document
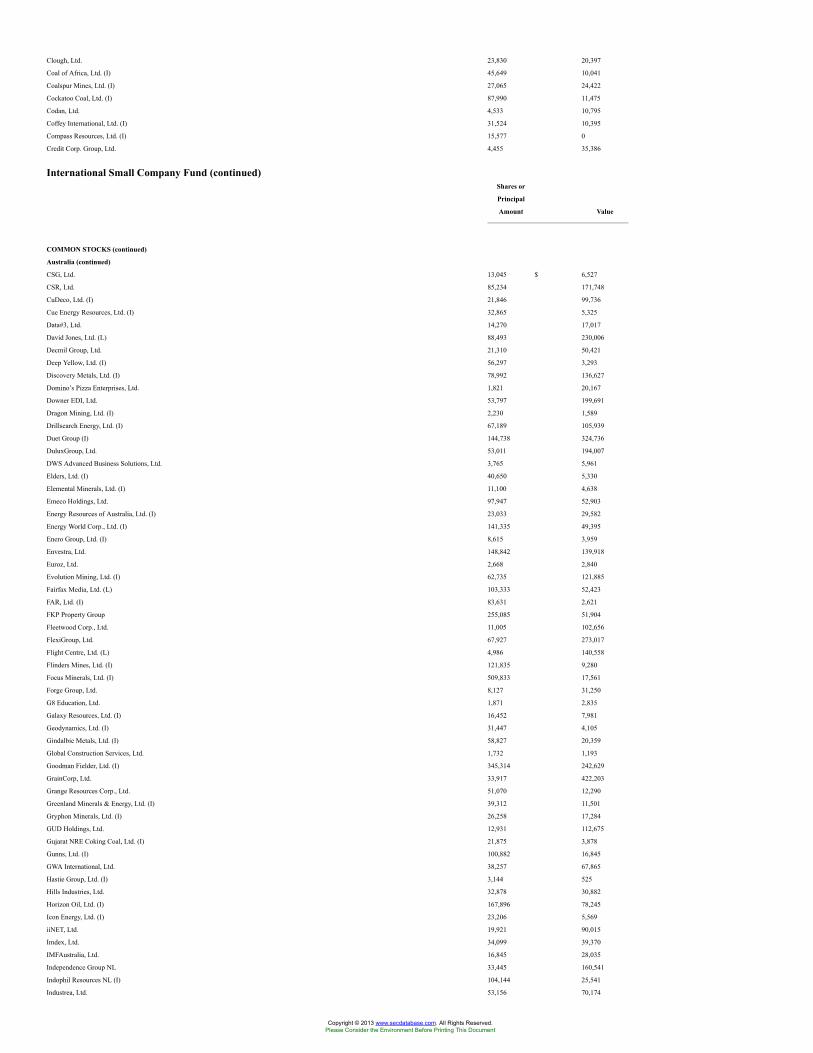
Clough, Ltd. 23,830 20,397
Coal of Africa, Ltd. (I) 45,649 10,041
Coalspur Mines, Ltd. (I) 27,065 24,422
Cockatoo Coal, Ltd. (I) 87,990 11,475
Codan, Ltd. 4,533 10,795
Coffey International, Ltd. (I) 31,524 10,395
Compass Resources, Ltd. (I) 15,577 0
Credit Corp. Group, Ltd. 4,455 35,386
International Small Company Fund (continued)Shares or
Principal
Amount Value
COMMON STOCKS (continued)
Australia (continued)
CSG, Ltd. 13,045 $ 6,527
CSR, Ltd. 85,234 171,748
CuDeco, Ltd. (I) 21,846 99,736
Cue Energy Resources, Ltd. (I) 32,865 5,325
Data#3, Ltd. 14,270 17,017
David Jones, Ltd. (L) 88,493 230,006
Decmil Group, Ltd. 21,310 50,421
Deep Yellow, Ltd. (I) 56,297 3,293
Discovery Metals, Ltd. (I) 78,992 136,627
Domino’s Pizza Enterprises, Ltd. 1,821 20,167
Downer EDI, Ltd. 53,797 199,691
Dragon Mining, Ltd. (I) 2,230 1,589
Drillsearch Energy, Ltd. (I) 67,189 105,939
Duet Group (I) 144,738 324,736
DuluxGroup, Ltd. 53,011 194,007
DWS Advanced Business Solutions, Ltd. 3,765 5,961
Elders, Ltd. (I) 40,650 5,330
Elemental Minerals, Ltd. (I) 11,100 4,638
Emeco Holdings, Ltd. 97,947 52,903
Energy Resources of Australia, Ltd. (I) 23,033 29,582
Energy World Corp., Ltd. (I) 141,335 49,395
Enero Group, Ltd. (I) 8,615 3,959
Envestra, Ltd. 148,842 139,918
Euroz, Ltd. 2,668 2,840
Evolution Mining, Ltd. (I) 62,735 121,885
Fairfax Media, Ltd. (L) 103,333 52,423
FAR, Ltd. (I) 83,631 2,621
FKP Property Group 255,085 51,904
Fleetwood Corp., Ltd. 11,005 102,656
FlexiGroup, Ltd. 67,927 273,017
Flight Centre, Ltd. (L) 4,986 140,558
Flinders Mines, Ltd. (I) 121,835 9,280
Focus Minerals, Ltd. (I) 509,833 17,561
Forge Group, Ltd. 8,127 31,250
G8 Education, Ltd. 1,871 2,835
Galaxy Resources, Ltd. (I) 16,452 7,981
Geodynamics, Ltd. (I) 31,447 4,105
Gindalbie Metals, Ltd. (I) 58,827 20,359
Global Construction Services, Ltd. 1,732 1,193
Goodman Fielder, Ltd. (I) 345,314 242,629
GrainCorp, Ltd. 33,917 422,203
Grange Resources Corp., Ltd. 51,070 12,290
Greenland Minerals & Energy, Ltd. (I) 39,312 11,501
Gryphon Minerals, Ltd. (I) 26,258 17,284
GUD Holdings, Ltd. 12,931 112,675
Gujarat NRE Coking Coal, Ltd. (I) 21,875 3,878
Gunns, Ltd. (I) 100,882 16,845
GWA International, Ltd. 38,257 67,865
Hastie Group, Ltd. (I) 3,144 525
Hills Industries, Ltd. 32,878 30,882
Horizon Oil, Ltd. (I) 167,896 78,245
Icon Energy, Ltd. (I) 23,206 5,569
iiNET, Ltd. 19,921 90,015
Imdex, Ltd. 34,099 39,370
IMFAustralia, Ltd. 16,845 28,035
Independence Group NL 33,445 160,541
Indophil Resources NL (I) 104,144 25,541
Industrea, Ltd. 53,156 70,174
Copyright © 2013 www.secdatabase.com. All Rights Reserved.Please Consider the Environment Before Printing This Document
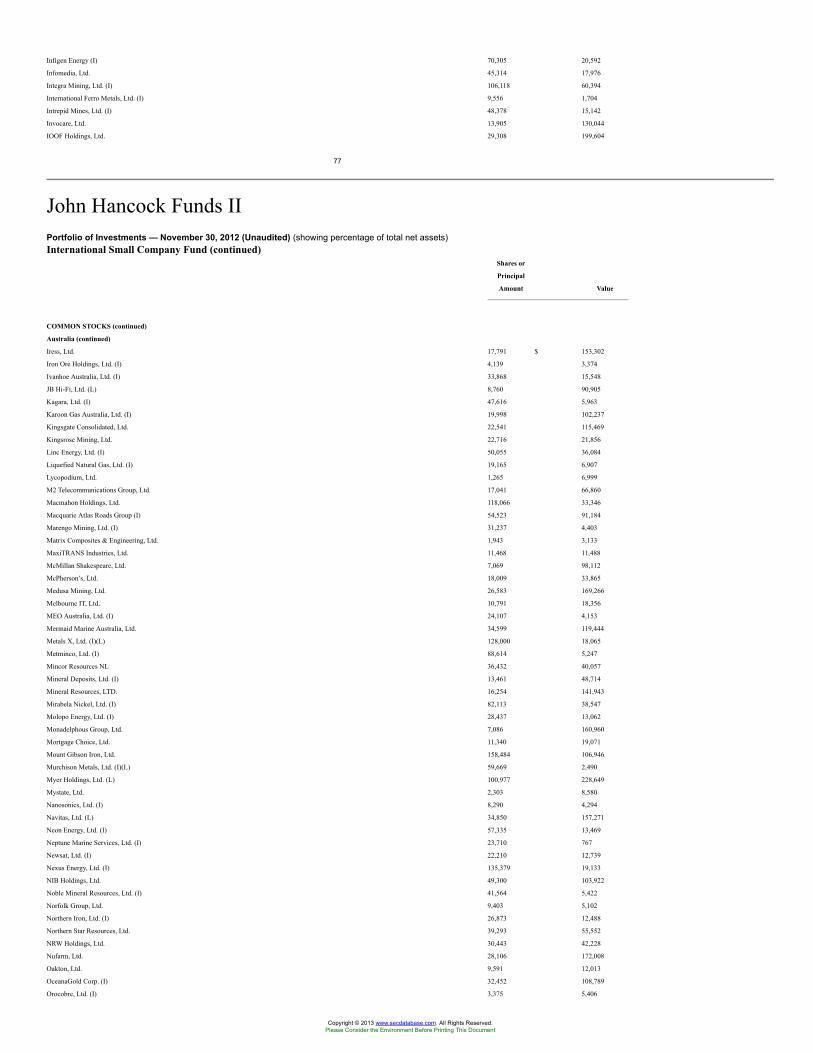
Infigen Energy (I) 70,305 20,592
Infomedia, Ltd. 45,314 17,976
Integra Mining, Ltd. (I) 106,118 60,394
International Ferro Metals, Ltd. (I) 9,556 1,704
Intrepid Mines, Ltd. (I) 48,378 15,142
Invocare, Ltd. 13,905 130,044
IOOF Holdings, Ltd. 29,308 199,604
77
John Hancock Funds IIPortfolio of Investments — November 30, 2012 (Unaudited) (showing percentage of total net assets)International Small Company Fund (continued)
Shares or
Principal
Amount Value
COMMON STOCKS (continued)
Australia (continued)
Iress, Ltd. 17,791 $ 153,302
Iron Ore Holdings, Ltd. (I) 4,139 3,374
Ivanhoe Australia, Ltd. (I) 33,868 15,548
JB Hi-Fi, Ltd. (L) 8,760 90,905
Kagara, Ltd. (I) 47,616 5,963
Karoon Gas Australia, Ltd. (I) 19,998 102,237
Kingsgate Consolidated, Ltd. 22,541 115,469
Kingsrose Mining, Ltd. 22,716 21,856
Linc Energy, Ltd. (I) 50,055 36,084
Liquefied Natural Gas, Ltd. (I) 19,165 6,907
Lycopodium, Ltd. 1,265 6,999
M2 Telecommunications Group, Ltd. 17,041 66,860
Macmahon Holdings, Ltd. 118,066 33,346
Macquarie Atlas Roads Group (I) 54,523 91,184
Marengo Mining, Ltd. (I) 31,237 4,403
Matrix Composites & Engineering, Ltd. 1,943 3,133
MaxiTRANS Industries, Ltd. 11,468 11,488
McMillan Shakespeare, Ltd. 7,069 98,112
McPherson’s, Ltd. 18,009 33,865
Medusa Mining, Ltd. 26,583 169,266
Melbourne IT, Ltd. 10,791 18,356
MEO Australia, Ltd. (I) 24,107 4,153
Mermaid Marine Australia, Ltd. 34,599 119,444
Metals X, Ltd. (I)(L) 128,000 18,065
Metminco, Ltd. (I) 88,614 5,247
Mincor Resources NL 36,432 40,057
Mineral Deposits, Ltd. (I) 13,461 48,714
Mineral Resources, LTD. 16,254 141,943
Mirabela Nickel, Ltd. (I) 82,113 38,547
Molopo Energy, Ltd. (I) 28,437 13,062
Monadelphous Group, Ltd. 7,086 160,960
Mortgage Choice, Ltd. 11,340 19,071
Mount Gibson Iron, Ltd. 158,484 106,946
Murchison Metals, Ltd. (I)(L) 59,669 2,490
Myer Holdings, Ltd. (L) 100,977 228,649
Mystate, Ltd. 2,303 8,580
Nanosonics, Ltd. (I) 8,290 4,294
Navitas, Ltd. (L) 34,850 157,271
Neon Energy, Ltd. (I) 57,335 13,469
Neptune Marine Services, Ltd. (I) 23,710 767
Newsat, Ltd. (I) 22,210 12,739
Nexus Energy, Ltd. (I) 135,379 19,133
NIB Holdings, Ltd. 49,300 103,922
Noble Mineral Resources, Ltd. (I) 41,564 5,422
Norfolk Group, Ltd. 9,403 5,102
Northern Iron, Ltd. (I) 26,873 12,488
Northern Star Resources, Ltd. 39,293 55,552
NRW Holdings, Ltd. 30,443 42,228
Nufarm, Ltd. 28,106 172,008
Oakton, Ltd. 9,591 12,013
OceanaGold Corp. (I) 32,452 108,789
Orocobre, Ltd. (I) 3,375 5,406
Copyright © 2013 www.secdatabase.com. All Rights Reserved.Please Consider the Environment Before Printing This Document
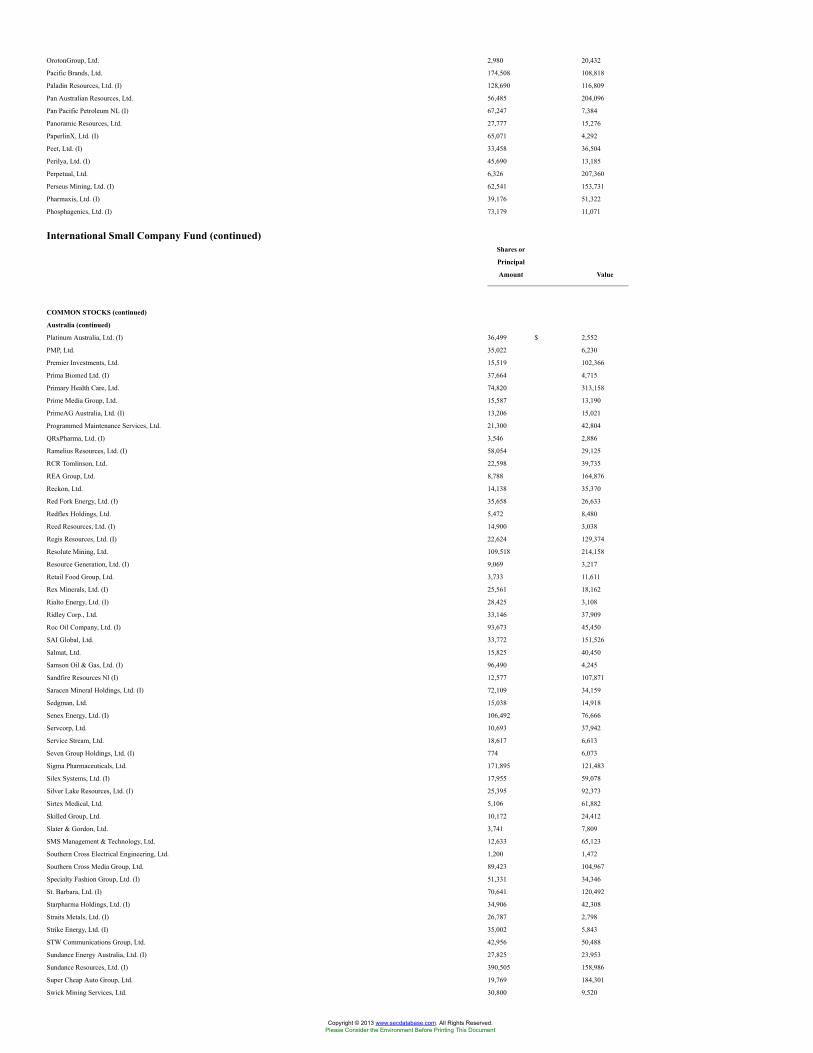
OrotonGroup, Ltd. 2,980 20,432
Pacific Brands, Ltd. 174,508 108,818
Paladin Resources, Ltd. (I) 128,690 116,809
Pan Australian Resources, Ltd. 56,485 204,096
Pan Pacific Petroleum NL (I) 67,247 7,384
Panoramic Resources, Ltd. 27,777 15,276
PaperlinX, Ltd. (I) 65,071 4,292
Peet, Ltd. (I) 33,458 36,504
Perilya, Ltd. (I) 45,690 13,185
Perpetual, Ltd. 6,326 207,360
Perseus Mining, Ltd. (I) 62,541 153,731
Pharmaxis, Ltd. (I) 39,176 51,322
Phosphagenics, Ltd. (I) 73,179 11,071
International Small Company Fund (continued)Shares or
Principal
Amount Value
COMMON STOCKS (continued)
Australia (continued)
Platinum Australia, Ltd. (I) 36,499 $ 2,552
PMP, Ltd. 35,022 6,230
Premier Investments, Ltd. 15,519 102,366
Prima Biomed Ltd. (I) 37,664 4,715
Primary Health Care, Ltd. 74,820 313,158
Prime Media Group, Ltd. 15,587 13,190
PrimeAG Australia, Ltd. (I) 13,206 15,021
Programmed Maintenance Services, Ltd. 21,300 42,804
QRxPharma, Ltd. (I) 3,546 2,886
Ramelius Resources, Ltd. (I) 58,054 29,125
RCR Tomlinson, Ltd. 22,598 39,735
REA Group, Ltd. 8,788 164,876
Reckon, Ltd. 14,138 35,370
Red Fork Energy, Ltd. (I) 35,658 26,633
Redflex Holdings, Ltd. 5,472 8,480
Reed Resources, Ltd. (I) 14,900 3,038
Regis Resources, Ltd. (I) 22,624 129,374
Resolute Mining, Ltd. 109,518 214,158
Resource Generation, Ltd. (I) 9,069 3,217
Retail Food Group, Ltd. 3,733 11,611
Rex Minerals, Ltd. (I) 25,561 18,162
Rialto Energy, Ltd. (I) 28,425 3,108
Ridley Corp., Ltd. 33,146 37,909
Roc Oil Company, Ltd. (I) 93,673 45,450
SAI Global, Ltd. 33,772 151,526
Salmat, Ltd. 15,825 40,450
Samson Oil & Gas, Ltd. (I) 96,490 4,245
Sandfire Resources Nl (I) 12,577 107,871
Saracen Mineral Holdings, Ltd. (I) 72,109 34,159
Sedgman, Ltd. 15,038 14,918
Senex Energy, Ltd. (I) 106,492 76,666
Servcorp, Ltd. 10,693 37,942
Service Stream, Ltd. 18,617 6,613
Seven Group Holdings, Ltd. (I) 774 6,073
Sigma Pharmaceuticals, Ltd. 171,895 121,483
Silex Systems, Ltd. (I) 17,955 59,078
Silver Lake Resources, Ltd. (I) 25,395 92,373
Sirtex Medical, Ltd. 5,106 61,882
Skilled Group, Ltd. 10,172 24,412
Slater & Gordon, Ltd. 3,741 7,809
SMS Management & Technology, Ltd. 12,633 65,123
Southern Cross Electrical Engineering, Ltd. 1,200 1,472
Southern Cross Media Group, Ltd. 89,423 104,967
Specialty Fashion Group, Ltd. (I) 51,331 34,346
St. Barbara, Ltd. (I) 70,641 120,492
Starpharma Holdings, Ltd. (I) 34,906 42,308
Straits Metals, Ltd. (I) 26,787 2,798
Strike Energy, Ltd. (I) 35,002 5,843
STW Communications Group, Ltd. 42,956 50,488
Sundance Energy Australia, Ltd. (I) 27,825 23,953
Sundance Resources, Ltd. (I) 390,505 158,986
Super Cheap Auto Group, Ltd. 19,769 184,301
Swick Mining Services, Ltd. 30,800 9,520
Copyright © 2013 www.secdatabase.com. All Rights Reserved.Please Consider the Environment Before Printing This Document
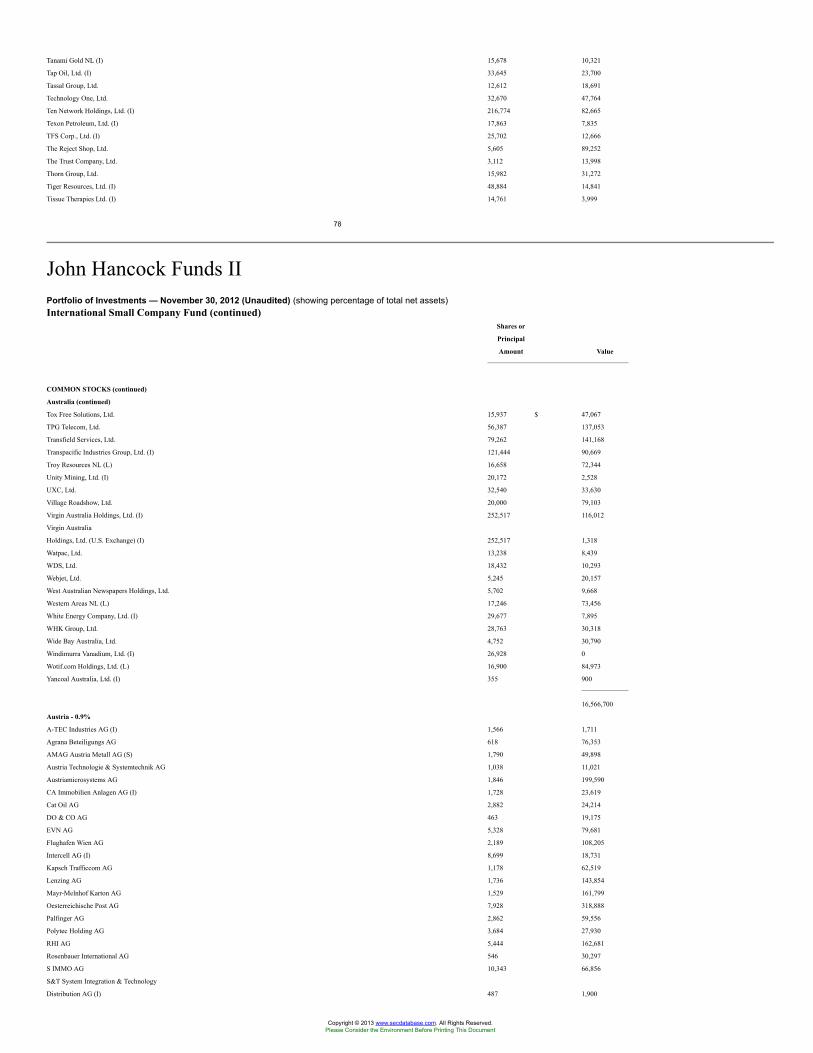
Tanami Gold NL (I) 15,678 10,321
Tap Oil, Ltd. (I) 33,645 23,700
Tassal Group, Ltd. 12,612 18,691
Technology One, Ltd. 32,670 47,764
Ten Network Holdings, Ltd. (I) 216,774 82,665
Texon Petroleum, Ltd. (I) 17,863 7,835
TFS Corp., Ltd. (I) 25,702 12,666
The Reject Shop, Ltd. 5,605 89,252
The Trust Company, Ltd. 3,112 13,998
Thorn Group, Ltd. 15,982 31,272
Tiger Resources, Ltd. (I) 48,884 14,841
Tissue Therapies Ltd. (I) 14,761 3,999
78
John Hancock Funds IIPortfolio of Investments — November 30, 2012 (Unaudited) (showing percentage of total net assets)International Small Company Fund (continued)
Shares or
Principal
Amount Value
COMMON STOCKS (continued)
Australia (continued)
Tox Free Solutions, Ltd. 15,937 $ 47,067
TPG Telecom, Ltd. 56,387 137,053
Transfield Services, Ltd. 79,262 141,168
Transpacific Industries Group, Ltd. (I) 121,444 90,669
Troy Resources NL (L) 16,658 72,344
Unity Mining, Ltd. (I) 20,172 2,528
UXC, Ltd. 32,540 33,630
Village Roadshow, Ltd. 20,000 79,103
Virgin Australia Holdings, Ltd. (I) 252,517 116,012
Virgin Australia
Holdings, Ltd. (U.S. Exchange) (I) 252,517 1,318
Watpac, Ltd. 13,238 8,439
WDS, Ltd. 18,432 10,293
Webjet, Ltd. 5,245 20,157
West Australian Newspapers Holdings, Ltd. 5,702 9,668
Western Areas NL (L) 17,246 73,456
White Energy Company, Ltd. (I) 29,677 7,895
WHK Group, Ltd. 28,763 30,318
Wide Bay Australia, Ltd. 4,752 30,790
Windimurra Vanadium, Ltd. (I) 26,928 0
Wotif.com Holdings, Ltd. (L) 16,900 84,973
Yancoal Australia, Ltd. (I) 355 900
16,566,700
Austria - 0.9%
A-TEC Industries AG (I) 1,566 1,711
Agrana Beteiligungs AG 618 76,353
AMAG Austria Metall AG (S) 1,790 49,898
Austria Technologie & Systemtechnik AG 1,038 11,021
Austriamicrosystems AG 1,846 199,590
CA Immobilien Anlagen AG (I) 1,728 23,619
Cat Oil AG 2,882 24,214
DO & CO AG 463 19,175
EVN AG 5,328 79,681
Flughafen Wien AG 2,189 108,205
Intercell AG (I) 8,699 18,731
Kapsch Trafficcom AG 1,178 62,519
Lenzing AG 1,736 143,854
Mayr-Melnhof Karton AG 1,529 161,799
Oesterreichische Post AG 7,928 318,888
Palfinger AG 2,862 59,556
Polytec Holding AG 3,684 27,930
RHI AG 5,444 162,681
Rosenbauer International AG 546 30,297
S IMMO AG 10,343 66,856
S&T System Integration & Technology
Distribution AG (I) 487 1,900
Copyright © 2013 www.secdatabase.com. All Rights Reserved.Please Consider the Environment Before Printing This Document
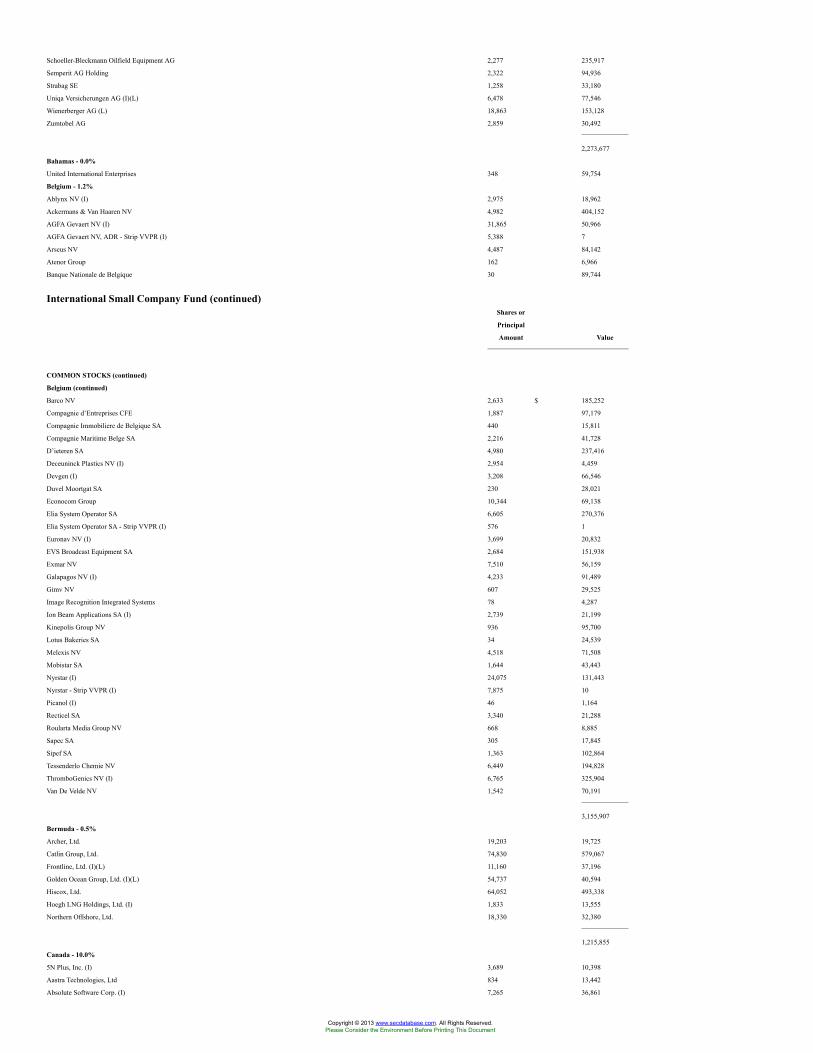
Schoeller-Bleckmann Oilfield Equipment AG 2,277 235,917
Semperit AG Holding 2,322 94,936
Strabag SE 1,258 33,180
Uniqa Versicherungen AG (I)(L) 6,478 77,546
Wienerberger AG (L) 18,863 153,128
Zumtobel AG 2,859 30,492
2,273,677
Bahamas - 0.0%
United International Enterprises 348 59,754
Belgium - 1.2%
Ablynx NV (I) 2,975 18,962
Ackermans & Van Haaren NV 4,982 404,152
AGFA Gevaert NV (I) 31,865 50,966
AGFA Gevaert NV, ADR - Strip VVPR (I) 5,388 7
Arseus NV 4,487 84,142
Atenor Group 162 6,966
Banque Nationale de Belgique 30 89,744
International Small Company Fund (continued)Shares or
Principal
Amount Value
COMMON STOCKS (continued)
Belgium (continued)
Barco NV 2,633 $ 185,252
Compagnie d’Entreprises CFE 1,887 97,179
Compagnie Immobiliere de Belgique SA 440 15,811
Compagnie Maritime Belge SA 2,216 41,728
D’ieteren SA 4,980 237,416
Deceuninck Plastics NV (I) 2,954 4,459
Devgen (I) 3,208 66,546
Duvel Moortgat SA 230 28,021
Econocom Group 10,344 69,138
Elia System Operator SA 6,605 270,376
Elia System Operator SA - Strip VVPR (I) 576 1
Euronav NV (I) 3,699 20,832
EVS Broadcast Equipment SA 2,684 151,938
Exmar NV 7,510 56,159
Galapagos NV (I) 4,233 91,489
Gimv NV 607 29,525
Image Recognition Integrated Systems 78 4,287
Ion Beam Applications SA (I) 2,739 21,199
Kinepolis Group NV 936 95,700
Lotus Bakeries SA 34 24,539
Melexis NV 4,518 71,508
Mobistar SA 1,644 43,443
Nyrstar (I) 24,075 131,443
Nyrstar - Strip VVPR (I) 7,875 10
Picanol (I) 46 1,164
Recticel SA 3,340 21,288
Roularta Media Group NV 668 8,885
Sapec SA 305 17,845
Sipef SA 1,363 102,864
Tessenderlo Chemie NV 6,449 194,828
ThromboGenics NV (I) 6,765 325,904
Van De Velde NV 1,542 70,191
3,155,907
Bermuda - 0.5%
Archer, Ltd. 19,203 19,725
Catlin Group, Ltd. 74,830 579,067
Frontline, Ltd. (I)(L) 11,160 37,196
Golden Ocean Group, Ltd. (I)(L) 54,737 40,594
Hiscox, Ltd. 64,052 493,338
Hoegh LNG Holdings, Ltd. (I) 1,833 13,555
Northern Offshore, Ltd. 18,330 32,380
1,215,855
Canada - 10.0%
5N Plus, Inc. (I) 3,689 10,398
Aastra Technologies, Ltd 834 13,442
Absolute Software Corp. (I) 7,265 36,861
Copyright © 2013 www.secdatabase.com. All Rights Reserved.Please Consider the Environment Before Printing This Document
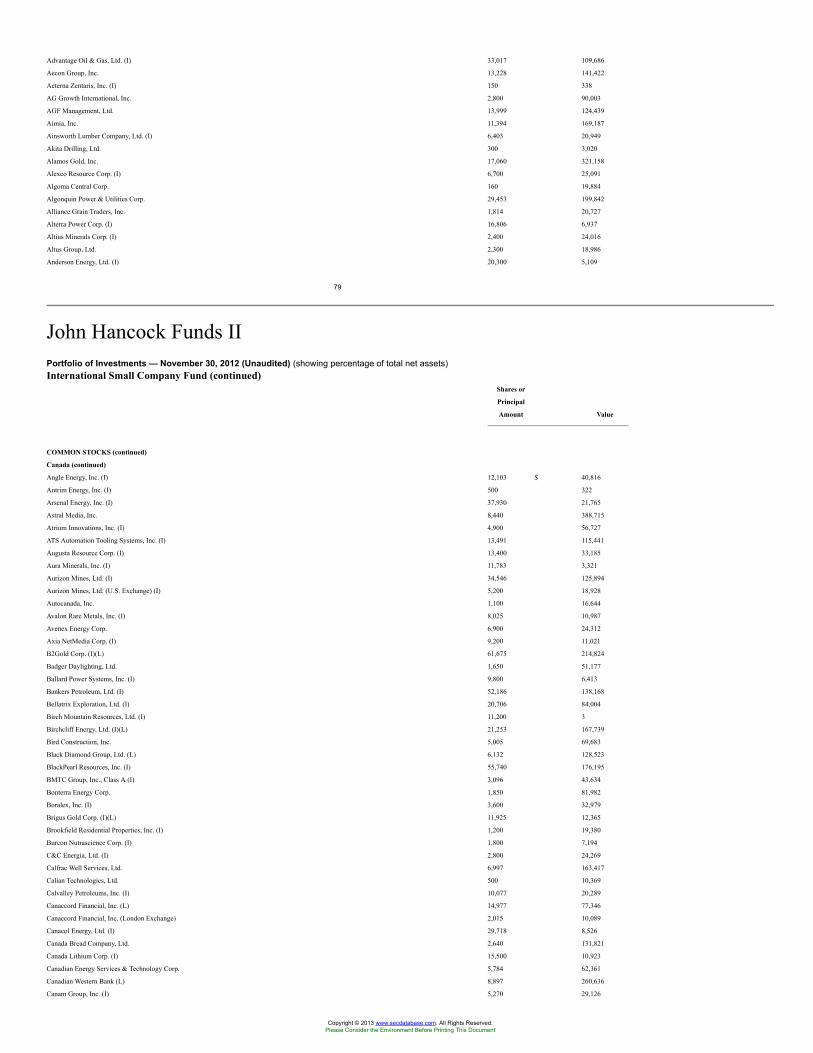
Advantage Oil & Gas, Ltd. (I) 33,017 109,686
Aecon Group, Inc. 13,228 141,422
Aeterna Zentaris, Inc. (I) 150 338
AG Growth International, Inc. 2,800 90,003
AGF Management, Ltd. 13,999 124,439
Aimia, Inc. 11,394 169,187
Ainsworth Lumber Company, Ltd. (I) 6,403 20,949
Akita Drilling, Ltd. 300 3,020
Alamos Gold, Inc. 17,060 321,158
Alexco Resource Corp. (I) 6,700 25,091
Algoma Central Corp. 160 19,884
Algonquin Power & Utilities Corp. 29,453 199,842
Alliance Grain Traders, Inc. 1,814 20,727
Alterra Power Corp. (I) 16,806 6,937
Altius Minerals Corp. (I) 2,400 24,016
Altus Group, Ltd. 2,300 18,986
Anderson Energy, Ltd. (I) 20,300 5,109
79
John Hancock Funds IIPortfolio of Investments — November 30, 2012 (Unaudited) (showing percentage of total net assets)International Small Company Fund (continued)
Shares or
Principal
Amount Value
COMMON STOCKS (continued)
Canada (continued)
Angle Energy, Inc. (I) 12,103 $ 40,816
Antrim Energy, Inc. (I) 500 322
Arsenal Energy, Inc. (I) 37,930 21,765
Astral Media, Inc. 8,440 388,715
Atrium Innovations, Inc. (I) 4,900 56,727
ATS Automation Tooling Systems, Inc. (I) 13,491 115,441
Augusta Resource Corp. (I) 13,400 33,185
Aura Minerals, Inc. (I) 11,783 3,321
Aurizon Mines, Ltd. (I) 34,546 125,894
Aurizon Mines, Ltd. (U.S. Exchange) (I) 5,200 18,928
Autocanada, Inc. 1,100 16,644
Avalon Rare Metals, Inc. (I) 8,025 10,987
Avenex Energy Corp. 6,900 24,312
Axia NetMedia Corp. (I) 9,200 11,021
B2Gold Corp. (I)(L) 61,675 214,824
Badger Daylighting, Ltd. 1,650 51,177
Ballard Power Systems, Inc. (I) 9,800 6,413
Bankers Petroleum, Ltd. (I) 52,186 138,168
Bellatrix Exploration, Ltd. (I) 20,706 84,004
Birch Mountain Resources, Ltd. (I) 11,200 3
Birchcliff Energy, Ltd. (I)(L) 21,253 167,739
Bird Construction, Inc. 5,005 69,683
Black Diamond Group, Ltd. (L) 6,132 128,523
BlackPearl Resources, Inc. (I) 55,740 176,195
BMTC Group, Inc., Class A (I) 3,096 43,634
Bonterra Energy Corp. 1,850 81,982
Boralex, Inc. (I) 3,600 32,979
Brigus Gold Corp. (I)(L) 11,925 12,365
Brookfield Residential Properties, Inc. (I) 1,200 19,380
Burcon Nutrascience Corp. (I) 1,800 7,194
C&C Energia, Ltd. (I) 2,800 24,269
Calfrac Well Services, Ltd. 6,997 163,417
Calian Technologies, Ltd. 500 10,369
Calvalley Petroleums, Inc. (I) 10,077 20,289
Canaccord Financial, Inc. (L) 14,977 77,346
Canaccord Financial, Inc. (London Exchange) 2,015 10,089
Canacol Energy, Ltd. (I) 29,718 8,526
Canada Bread Company, Ltd. 2,640 131,821
Canada Lithium Corp. (I) 15,500 10,923
Canadian Energy Services & Technology Corp. 5,784 62,361
Canadian Western Bank (L) 8,897 260,636
Canam Group, Inc. (I) 5,270 29,126
Copyright © 2013 www.secdatabase.com. All Rights Reserved.Please Consider the Environment Before Printing This Document
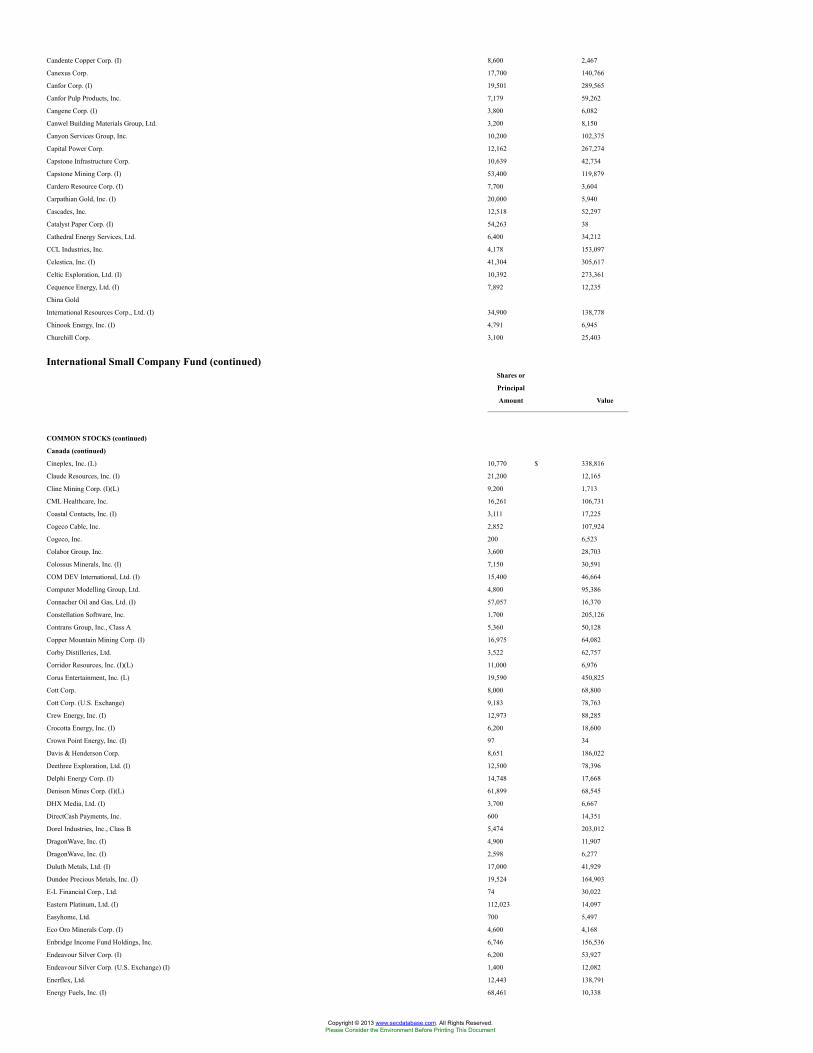
Candente Copper Corp. (I) 8,600 2,467
Canexus Corp. 17,700 140,766
Canfor Corp. (I) 19,501 289,565
Canfor Pulp Products, Inc. 7,179 59,262
Cangene Corp. (I) 3,800 6,082
Canwel Building Materials Group, Ltd. 3,200 8,150
Canyon Services Group, Inc. 10,200 102,375
Capital Power Corp. 12,162 267,274
Capstone Infrastructure Corp. 10,639 42,734
Capstone Mining Corp. (I) 53,400 119,879
Cardero Resource Corp. (I) 7,700 3,604
Carpathian Gold, Inc. (I) 20,000 5,940
Cascades, Inc. 12,518 52,297
Catalyst Paper Corp. (I) 54,263 38
Cathedral Energy Services, Ltd. 6,400 34,212
CCL Industries, Inc. 4,178 153,097
Celestica, Inc. (I) 41,304 305,617
Celtic Exploration, Ltd. (I) 10,392 273,361
Cequence Energy, Ltd. (I) 7,892 12,235
China Gold
International Resources Corp., Ltd. (I) 34,900 138,778
Chinook Energy, Inc. (I) 4,791 6,945
Churchill Corp. 3,100 25,403
International Small Company Fund (continued)Shares or
Principal
Amount Value
COMMON STOCKS (continued)
Canada (continued)
Cineplex, Inc. (L) 10,770 $ 338,816
Claude Resources, Inc. (I) 21,200 12,165
Cline Mining Corp. (I)(L) 9,200 1,713
CML Healthcare, Inc. 16,261 106,731
Coastal Contacts, Inc. (I) 3,111 17,225
Cogeco Cable, Inc. 2,852 107,924
Cogeco, Inc. 200 6,523
Colabor Group, Inc. 3,600 28,703
Colossus Minerals, Inc. (I) 7,150 30,591
COM DEV International, Ltd. (I) 15,400 46,664
Computer Modelling Group, Ltd. 4,800 95,386
Connacher Oil and Gas, Ltd. (I) 57,057 16,370
Constellation Software, Inc. 1,700 205,126
Contrans Group, Inc., Class A 5,360 50,128
Copper Mountain Mining Corp. (I) 16,975 64,082
Corby Distilleries, Ltd. 3,522 62,757
Corridor Resources, Inc. (I)(L) 11,000 6,976
Corus Entertainment, Inc. (L) 19,590 450,825
Cott Corp. 8,000 68,800
Cott Corp. (U.S. Exchange) 9,183 78,763
Crew Energy, Inc. (I) 12,973 88,285
Crocotta Energy, Inc. (I) 6,200 18,600
Crown Point Energy, Inc. (I) 97 34
Davis & Henderson Corp. 8,651 186,022
Deethree Exploration, Ltd. (I) 12,500 78,396
Delphi Energy Corp. (I) 14,748 17,668
Denison Mines Corp. (I)(L) 61,899 68,545
DHX Media, Ltd. (I) 3,700 6,667
DirectCash Payments, Inc. 600 14,351
Dorel Industries, Inc., Class B 5,474 203,012
DragonWave, Inc. (I) 4,900 11,907
DragonWave, Inc. (I) 2,598 6,277
Duluth Metals, Ltd. (I) 17,000 41,929
Dundee Precious Metals, Inc. (I) 19,524 164,903
E-L Financial Corp., Ltd. 74 30,022
Eastern Platinum, Ltd. (I) 112,023 14,097
Easyhome, Ltd. 700 5,497
Eco Oro Minerals Corp. (I) 4,600 4,168
Enbridge Income Fund Holdings, Inc. 6,746 156,536
Endeavour Silver Corp. (I) 6,200 53,927
Endeavour Silver Corp. (U.S. Exchange) (I) 1,400 12,082
Enerflex, Ltd. 12,443 138,791
Energy Fuels, Inc. (I) 68,461 10,338
Copyright © 2013 www.secdatabase.com. All Rights Reserved.Please Consider the Environment Before Printing This Document
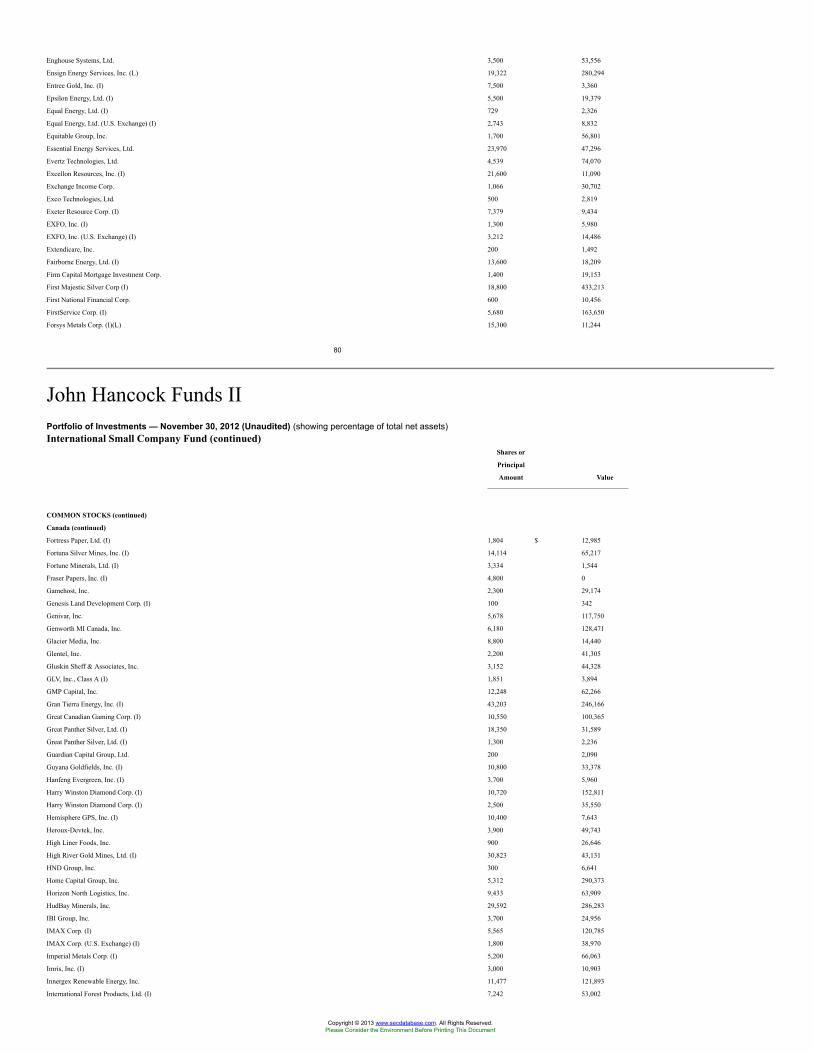
Enghouse Systems, Ltd. 3,500 53,556
Ensign Energy Services, Inc. (L) 19,322 280,294
Entree Gold, Inc. (I) 7,500 3,360
Epsilon Energy, Ltd. (I) 5,500 19,379
Equal Energy, Ltd. (I) 729 2,326
Equal Energy, Ltd. (U.S. Exchange) (I) 2,743 8,832
Equitable Group, Inc. 1,700 56,801
Essential Energy Services, Ltd. 23,970 47,296
Evertz Technologies, Ltd. 4,539 74,070
Excellon Resources, Inc. (I) 21,600 11,090
Exchange Income Corp. 1,066 30,702
Exco Technologies, Ltd. 500 2,819
Exeter Resource Corp. (I) 7,379 9,434
EXFO, Inc. (I) 1,300 5,980
EXFO, Inc. (U.S. Exchange) (I) 3,212 14,486
Extendicare, Inc. 200 1,492
Fairborne Energy, Ltd. (I) 13,600 18,209
Firm Capital Mortgage Investment Corp. 1,400 19,153
First Majestic Silver Corp (I) 18,800 433,213
First National Financial Corp. 600 10,456
FirstService Corp. (I) 5,680 163,650
Forsys Metals Corp. (I)(L) 15,300 11,244
80
John Hancock Funds IIPortfolio of Investments — November 30, 2012 (Unaudited) (showing percentage of total net assets)International Small Company Fund (continued)
Shares or
Principal
Amount Value
COMMON STOCKS (continued)
Canada (continued)
Fortress Paper, Ltd. (I) 1,804 $ 12,985
Fortuna Silver Mines, Inc. (I) 14,114 65,217
Fortune Minerals, Ltd. (I) 3,334 1,544
Fraser Papers, Inc. (I) 4,800 0
Gamehost, Inc. 2,300 29,174
Genesis Land Development Corp. (I) 100 342
Genivar, Inc. 5,678 117,750
Genworth MI Canada, Inc. 6,180 128,471
Glacier Media, Inc. 8,800 14,440
Glentel, Inc. 2,200 41,305
Gluskin Sheff & Associates, Inc. 3,152 44,328
GLV, Inc., Class A (I) 1,851 3,894
GMP Capital, Inc. 12,248 62,266
Gran Tierra Energy, Inc. (I) 43,203 246,166
Great Canadian Gaming Corp. (I) 10,550 100,365
Great Panther Silver, Ltd. (I) 18,350 31,589
Great Panther Silver, Ltd. (I) 1,300 2,236
Guardian Capital Group, Ltd. 200 2,090
Guyana Goldfields, Inc. (I) 10,800 33,378
Hanfeng Evergreen, Inc. (I) 3,700 5,960
Harry Winston Diamond Corp. (I) 10,720 152,811
Harry Winston Diamond Corp. (I) 2,500 35,550
Hemisphere GPS, Inc. (I) 10,400 7,643
Heroux-Devtek, Inc. 3,900 49,743
High Liner Foods, Inc. 900 26,646
High River Gold Mines, Ltd. (I) 30,823 43,131
HND Group, Inc. 300 6,641
Home Capital Group, Inc. 5,312 290,373
Horizon North Logistics, Inc. 9,433 63,909
HudBay Minerals, Inc. 29,592 286,283
IBI Group, Inc. 3,700 24,956
IMAX Corp. (I) 5,565 120,785
IMAX Corp. (U.S. Exchange) (I) 1,800 38,970
Imperial Metals Corp. (I) 5,200 66,063
Imris, Inc. (I) 3,000 10,903
Innergex Renewable Energy, Inc. 11,477 121,893
International Forest Products, Ltd. (I) 7,242 53,002
Copyright © 2013 www.secdatabase.com. All Rights Reserved.Please Consider the Environment Before Printing This Document
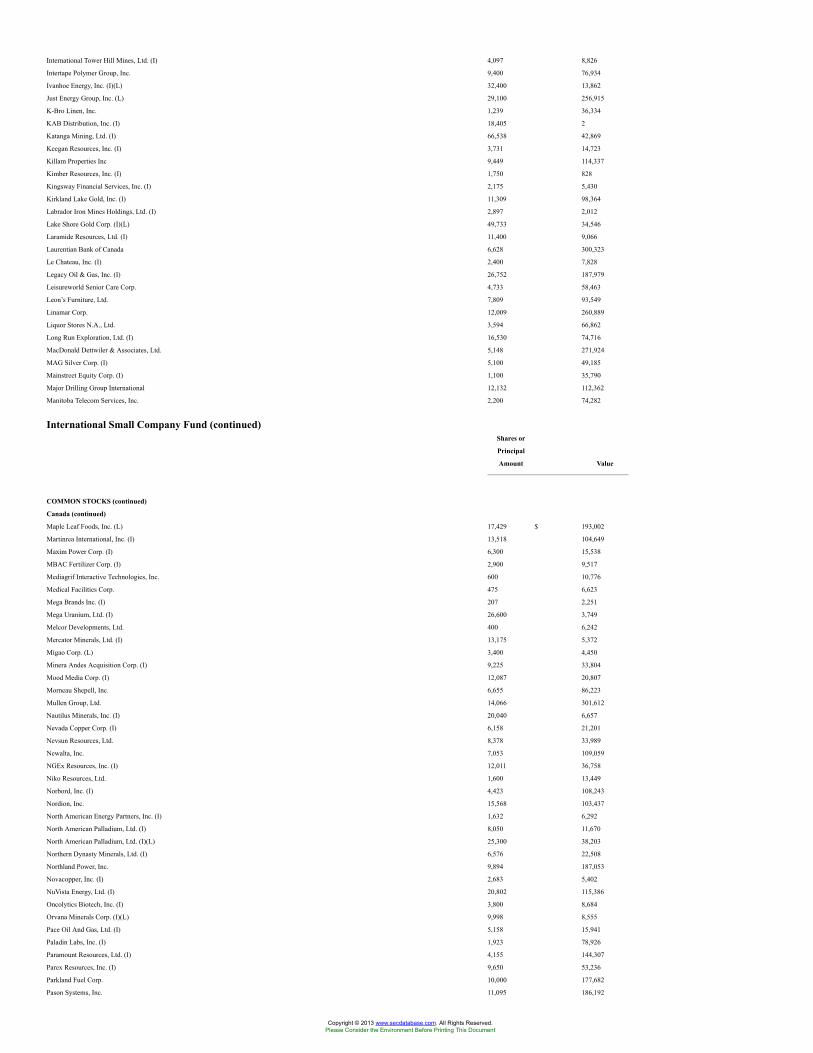
International Tower Hill Mines, Ltd. (I) 4,097 8,826
Intertape Polymer Group, Inc. 9,400 76,934
Ivanhoe Energy, Inc. (I)(L) 32,400 13,862
Just Energy Group, Inc. (L) 29,100 256,915
K-Bro Linen, Inc. 1,239 36,334
KAB Distribution, Inc. (I) 18,405 2
Katanga Mining, Ltd. (I) 66,538 42,869
Keegan Resources, Inc. (I) 3,731 14,723
Killam Properties Inc 9,449 114,337
Kimber Resources, Inc. (I) 1,750 828
Kingsway Financial Services, Inc. (I) 2,175 5,430
Kirkland Lake Gold, Inc. (I) 11,309 98,364
Labrador Iron Mines Holdings, Ltd. (I) 2,897 2,012
Lake Shore Gold Corp. (I)(L) 49,733 34,546
Laramide Resources, Ltd. (I) 11,400 9,066
Laurentian Bank of Canada 6,628 300,323
Le Chateau, Inc. (I) 2,400 7,828
Legacy Oil & Gas, Inc. (I) 26,752 187,979
Leisureworld Senior Care Corp. 4,733 58,463
Leon’s Furniture, Ltd. 7,809 93,549
Linamar Corp. 12,009 260,889
Liquor Stores N.A., Ltd. 3,594 66,862
Long Run Exploration, Ltd. (I) 16,530 74,716
MacDonald Dettwiler & Associates, Ltd. 5,148 271,924
MAG Silver Corp. (I) 5,100 49,185
Mainstreet Equity Corp. (I) 1,100 35,790
Major Drilling Group International 12,132 112,362
Manitoba Telecom Services, Inc. 2,200 74,282
International Small Company Fund (continued)Shares or
Principal
Amount Value
COMMON STOCKS (continued)
Canada (continued)
Maple Leaf Foods, Inc. (L) 17,429 $ 193,002
Martinrea International, Inc. (I) 13,518 104,649
Maxim Power Corp. (I) 6,300 15,538
MBAC Fertilizer Corp. (I) 2,900 9,517
Mediagrif Interactive Technologies, Inc. 600 10,776
Medical Facilities Corp. 475 6,623
Mega Brands Inc. (I) 207 2,251
Mega Uranium, Ltd. (I) 26,600 3,749
Melcor Developments, Ltd. 400 6,242
Mercator Minerals, Ltd. (I) 13,175 5,372
Migao Corp. (L) 3,400 4,450
Minera Andes Acquisition Corp. (I) 9,225 33,804
Mood Media Corp. (I) 12,087 20,807
Morneau Shepell, Inc. 6,655 86,223
Mullen Group, Ltd. 14,066 301,612
Nautilus Minerals, Inc. (I) 20,040 6,657
Nevada Copper Corp. (I) 6,158 21,201
Nevsun Resources, Ltd. 8,378 33,989
Newalta, Inc. 7,053 109,059
NGEx Resources, Inc. (I) 12,011 36,758
Niko Resources, Ltd. 1,600 13,449
Norbord, Inc. (I) 4,423 108,243
Nordion, Inc. 15,568 103,437
North American Energy Partners, Inc. (I) 1,632 6,292
North American Palladium, Ltd. (I) 8,050 11,670
North American Palladium, Ltd. (I)(L) 25,300 38,203
Northern Dynasty Minerals, Ltd. (I) 6,576 22,508
Northland Power, Inc. 9,894 187,053
Novacopper, Inc. (I) 2,683 5,402
NuVista Energy, Ltd. (I) 20,802 115,386
Oncolytics Biotech, Inc. (I) 3,800 8,684
Orvana Minerals Corp. (I)(L) 9,998 8,555
Pace Oil And Gas, Ltd. (I) 5,158 15,941
Paladin Labs, Inc. (I) 1,923 78,926
Paramount Resources, Ltd. (I) 4,155 144,307
Parex Resources, Inc. (I) 9,650 53,236
Parkland Fuel Corp. 10,000 177,682
Pason Systems, Inc. 11,095 186,192
Copyright © 2013 www.secdatabase.com. All Rights Reserved.Please Consider the Environment Before Printing This Document
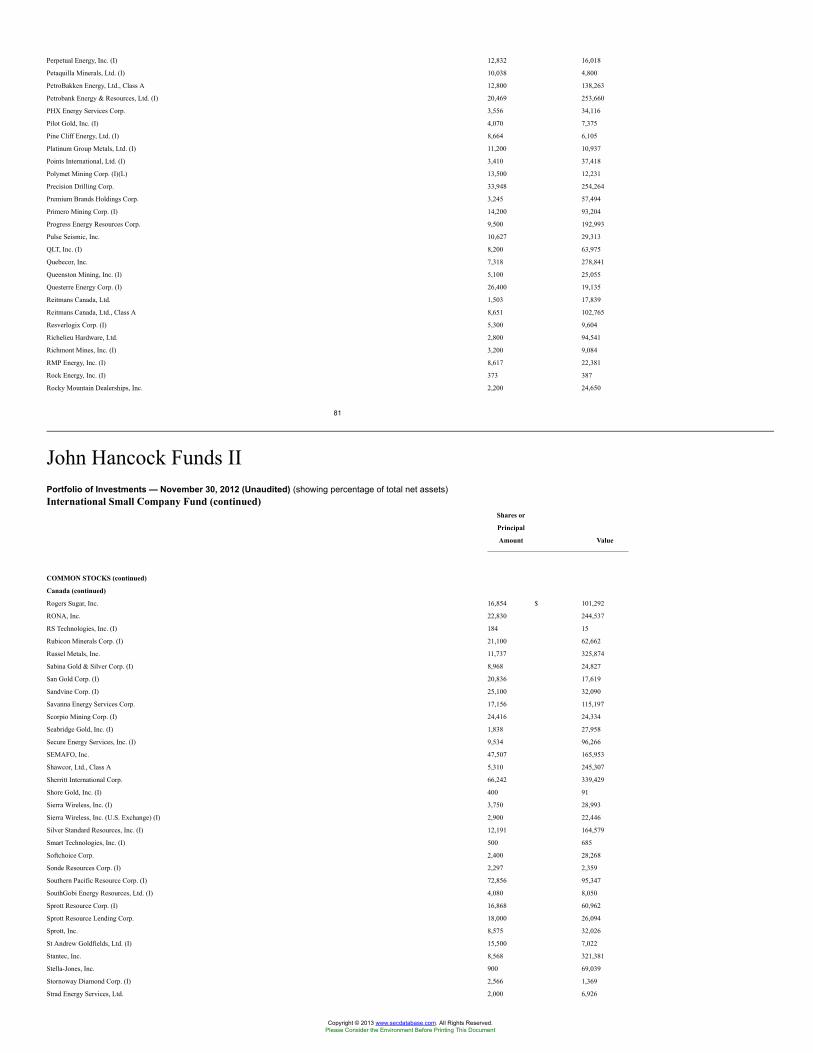
Perpetual Energy, Inc. (I) 12,832 16,018
Petaquilla Minerals, Ltd. (I) 10,038 4,800
PetroBakken Energy, Ltd., Class A 12,800 138,263
Petrobank Energy & Resources, Ltd. (I) 20,469 253,660
PHX Energy Services Corp. 3,556 34,116
Pilot Gold, Inc. (I) 4,070 7,375
Pine Cliff Energy, Ltd. (I) 8,664 6,105
Platinum Group Metals, Ltd. (I) 11,200 10,937
Points International, Ltd. (I) 3,410 37,418
Polymet Mining Corp. (I)(L) 13,500 12,231
Precision Drilling Corp. 33,948 254,264
Premium Brands Holdings Corp. 3,245 57,494
Primero Mining Corp. (I) 14,200 93,204
Progress Energy Resources Corp. 9,500 192,993
Pulse Seismic, Inc. 10,627 29,313
QLT, Inc. (I) 8,200 63,975
Quebecor, Inc. 7,318 278,841
Queenston Mining, Inc. (I) 5,100 25,055
Questerre Energy Corp. (I) 26,400 19,135
Reitmans Canada, Ltd. 1,503 17,839
Reitmans Canada, Ltd., Class A 8,651 102,765
Resverlogix Corp. (I) 5,300 9,604
Richelieu Hardware, Ltd. 2,800 94,541
Richmont Mines, Inc. (I) 3,200 9,084
RMP Energy, Inc. (I) 8,617 22,381
Rock Energy, Inc. (I) 373 387
Rocky Mountain Dealerships, Inc. 2,200 24,650
81
John Hancock Funds IIPortfolio of Investments — November 30, 2012 (Unaudited) (showing percentage of total net assets)International Small Company Fund (continued)
Shares or
Principal
Amount Value
COMMON STOCKS (continued)
Canada (continued)
Rogers Sugar, Inc. 16,854 $ 101,292
RONA, Inc. 22,830 244,537
RS Technologies, Inc. (I) 184 15
Rubicon Minerals Corp. (I) 21,100 62,662
Russel Metals, Inc. 11,737 325,874
Sabina Gold & Silver Corp. (I) 8,968 24,827
San Gold Corp. (I) 20,836 17,619
Sandvine Corp. (I) 25,100 32,090
Savanna Energy Services Corp. 17,156 115,197
Scorpio Mining Corp. (I) 24,416 24,334
Seabridge Gold, Inc. (I) 1,838 27,958
Secure Energy Services, Inc. (I) 9,534 96,266
SEMAFO, Inc. 47,507 165,953
Shawcor, Ltd., Class A 5,310 245,307
Sherritt International Corp. 66,242 339,429
Shore Gold, Inc. (I) 400 91
Sierra Wireless, Inc. (I) 3,750 28,993
Sierra Wireless, Inc. (U.S. Exchange) (I) 2,900 22,446
Silver Standard Resources, Inc. (I) 12,191 164,579
Smart Technologies, Inc. (I) 500 685
Softchoice Corp. 2,400 28,268
Sonde Resources Corp. (I) 2,297 2,359
Southern Pacific Resource Corp. (I) 72,856 95,347
SouthGobi Energy Resources, Ltd. (I) 4,080 8,050
Sprott Resource Corp. (I) 16,868 60,962
Sprott Resource Lending Corp. 18,000 26,094
Sprott, Inc. 8,575 32,026
St Andrew Goldfields, Ltd. (I) 15,500 7,022
Stantec, Inc. 8,568 321,381
Stella-Jones, Inc. 900 69,039
Stornoway Diamond Corp. (I) 2,566 1,369
Strad Energy Services, Ltd. 2,000 6,926
Copyright © 2013 www.secdatabase.com. All Rights Reserved.Please Consider the Environment Before Printing This Document
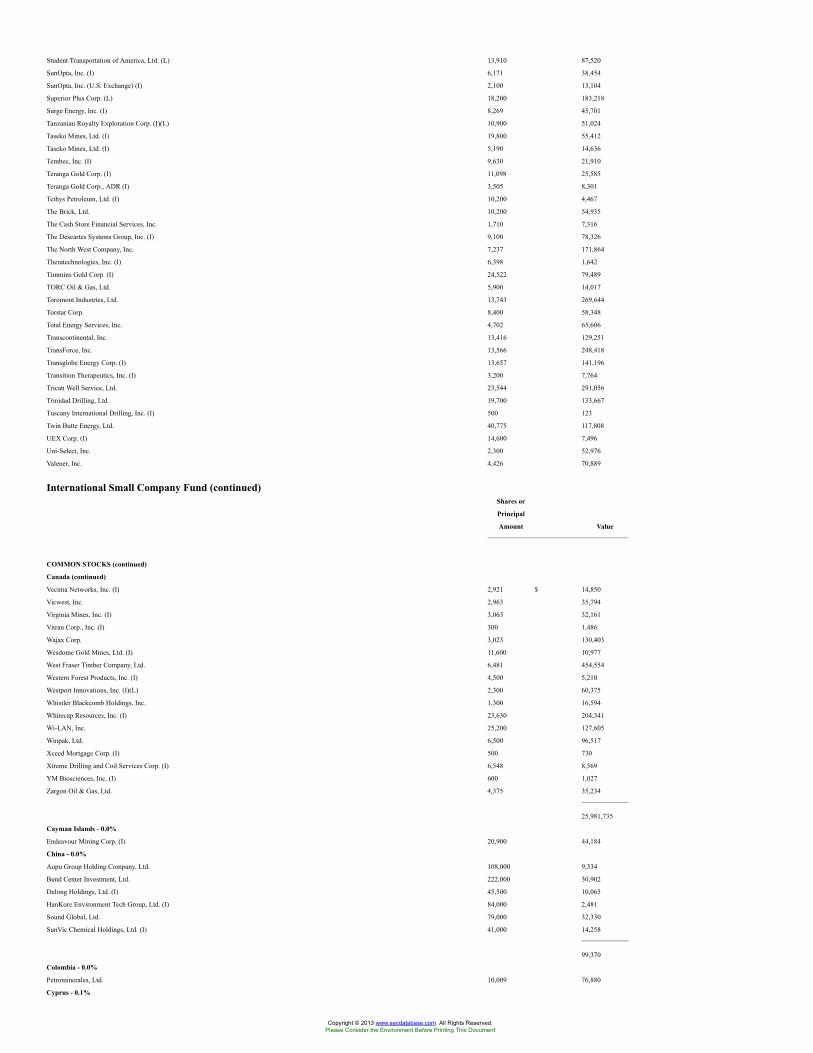
Student Transportation of America, Ltd. (L) 13,910 87,520
SunOpta, Inc. (I) 6,171 38,454
SunOpta, Inc. (U.S. Exchange) (I) 2,100 13,104
Superior Plus Corp. (L) 18,200 183,218
Surge Energy, Inc. (I) 8,269 45,701
Tanzanian Royalty Exploration Corp. (I)(L) 10,900 51,024
Taseko Mines, Ltd. (I) 19,800 55,412
Taseko Mines, Ltd. (I) 5,190 14,636
Tembec, Inc. (I) 9,630 21,910
Teranga Gold Corp. (I) 11,098 25,585
Teranga Gold Corp., ADR (I) 3,505 8,301
Tethys Petroleum, Ltd. (I) 10,200 4,467
The Brick, Ltd. 10,200 54,935
The Cash Store Financial Services, Inc. 1,710 7,316
The Descartes Systems Group, Inc. (I) 9,100 78,326
The North West Company, Inc. 7,237 171,864
Theratechnologies, Inc. (I) 6,398 1,642
Timmins Gold Corp. (I) 24,522 79,489
TORC Oil & Gas, Ltd. 5,900 14,017
Toromont Industries, Ltd. 13,743 269,644
Torstar Corp. 8,400 58,348
Total Energy Services, Inc. 4,702 65,606
Transcontinental, Inc. 13,416 129,251
TransForce, Inc. 13,566 248,418
Transglobe Energy Corp. (I) 13,657 141,196
Transition Therapeutics, Inc. (I) 3,200 7,764
Trican Well Service, Ltd. 23,544 291,056
Trinidad Drilling, Ltd. 19,700 133,667
Tuscany International Drilling, Inc. (I) 500 123
Twin Butte Energy, Ltd. 40,775 117,808
UEX Corp. (I) 14,600 7,496
Uni-Select, Inc. 2,300 52,976
Valener, Inc. 4,426 70,889
International Small Company Fund (continued)Shares or
Principal
Amount Value
COMMON STOCKS (continued)
Canada (continued)
Vecima Networks, Inc. (I) 2,921 $ 14,850
Vicwest, Inc. 2,963 35,794
Virginia Mines, Inc. (I) 3,063 32,161
Vitran Corp., Inc. (I) 300 1,486
Wajax Corp. 3,023 130,403
Wesdome Gold Mines, Ltd. (I) 11,600 10,977
West Fraser Timber Company, Ltd. 6,481 454,554
Western Forest Products, Inc. (I) 4,500 5,210
Westport Innovations, Inc. (I)(L) 2,300 60,375
Whistler Blackcomb Holdings, Inc. 1,300 16,594
Whitecap Resources, Inc. (I) 23,630 204,341
Wi-LAN, Inc. 25,200 127,605
Winpak, Ltd. 6,500 96,517
Xceed Mortgage Corp. (I) 500 730
Xtreme Drilling and Coil Services Corp. (I) 6,548 8,569
YM Biosciences, Inc. (I) 600 1,027
Zargon Oil & Gas, Ltd. 4,375 35,234
25,981,735
Cayman Islands - 0.0%
Endeavour Mining Corp. (I) 20,900 44,184
China - 0.0%
Aupu Group Holding Company, Ltd. 108,000 9,334
Bund Center Investment, Ltd. 222,000 30,902
Delong Holdings, Ltd. (I) 45,500 10,065
HanKore Environment Tech Group, Ltd. (I) 84,000 2,481
Sound Global, Ltd. 79,000 32,330
SunVic Chemical Holdings, Ltd. (I) 41,000 14,258
99,370
Colombia - 0.0%
Petrominerales, Ltd. 10,009 76,880
Cyprus - 0.1%
Copyright © 2013 www.secdatabase.com. All Rights Reserved.Please Consider the Environment Before Printing This Document
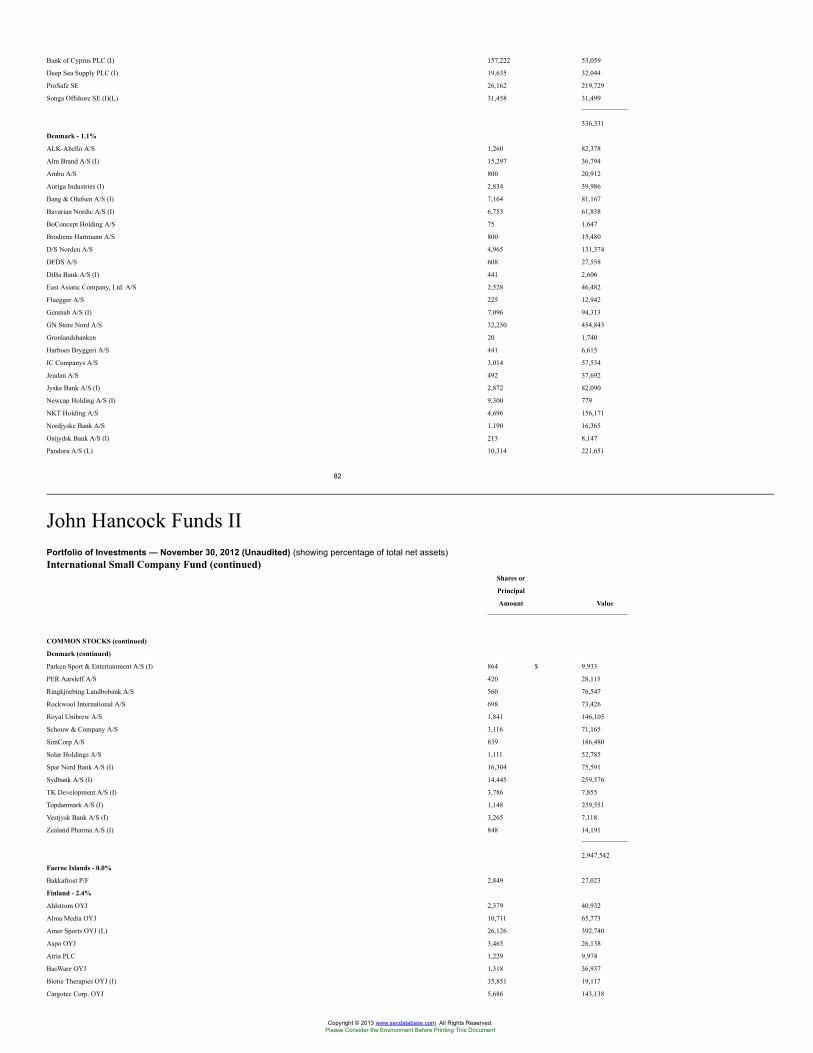
Bank of Cyprus PLC (I) 157,222 53,059
Deep Sea Supply PLC (I) 19,635 32,044
ProSafe SE 26,162 219,729
Songa Offshore SE (I)(L) 31,458 31,499
336,331
Denmark - 1.1%
ALK-Abello A/S 1,260 82,378
Alm Brand A/S (I) 15,297 36,794
Ambu A/S 800 20,912
Auriga Industries (I) 2,834 39,986
Bang & Olufsen A/S (I) 7,164 81,167
Bavarian Nordic A/S (I) 6,753 61,838
BoConcept Holding A/S 75 1,647
Brodrene Hartmann A/S 800 15,480
D/S Norden A/S 4,965 131,374
DFDS A/S 608 27,558
DiBa Bank A/S (I) 441 2,606
East Asiatic Company, Ltd. A/S 2,528 46,482
Fluegger A/S 225 12,942
Genmab A/S (I) 7,096 94,313
GN Store Nord A/S 32,250 454,843
Gronlandsbanken 20 1,740
Harboes Bryggeri A/S 441 6,615
IC Companys A/S 3,014 57,534
Jeudan A/S 492 37,692
Jyske Bank A/S (I) 2,872 82,090
Newcap Holding A/S (I) 9,300 779
NKT Holding A/S 4,696 156,171
Nordjyske Bank A/S 1,190 16,365
Ostjydsk Bank A/S (I) 213 8,147
Pandora A/S (L) 10,314 221,651
82
John Hancock Funds IIPortfolio of Investments — November 30, 2012 (Unaudited) (showing percentage of total net assets)International Small Company Fund (continued)
Shares or
Principal
Amount Value
COMMON STOCKS (continued)
Denmark (continued)
Parken Sport & Entertainment A/S (I) 864 $ 9,933
PER Aarsleff A/S 420 28,115
Ringkjoebing Landbobank A/S 560 76,547
Rockwool International A/S 698 73,426
Royal Unibrew A/S 1,841 146,105
Schouw & Company A/S 3,116 71,165
SimCorp A/S 839 186,480
Solar Holdings A/S 1,111 52,785
Spar Nord Bank A/S (I) 16,304 75,591
Sydbank A/S (I) 14,445 259,576
TK Development A/S (I) 3,786 7,855
Topdanmark A/S (I) 1,148 239,551
Vestjysk Bank A/S (I) 3,265 7,118
Zealand Pharma A/S (I) 848 14,191
2,947,542
Faeroe Islands - 0.0%
Bakkafrost P/F 2,849 27,023
Finland - 2.4%
Ahlstrom OYJ 2,379 40,932
Alma Media OYJ 10,711 65,773
Amer Sports OYJ (L) 26,126 392,740
Aspo OYJ 3,465 26,138
Atria PLC 1,229 9,974
BasWare OYJ 1,318 36,937
Biotie Therapies OYJ (I) 35,851 19,117
Cargotec Corp. OYJ 5,686 143,138
Copyright © 2013 www.secdatabase.com. All Rights Reserved.Please Consider the Environment Before Printing This Document
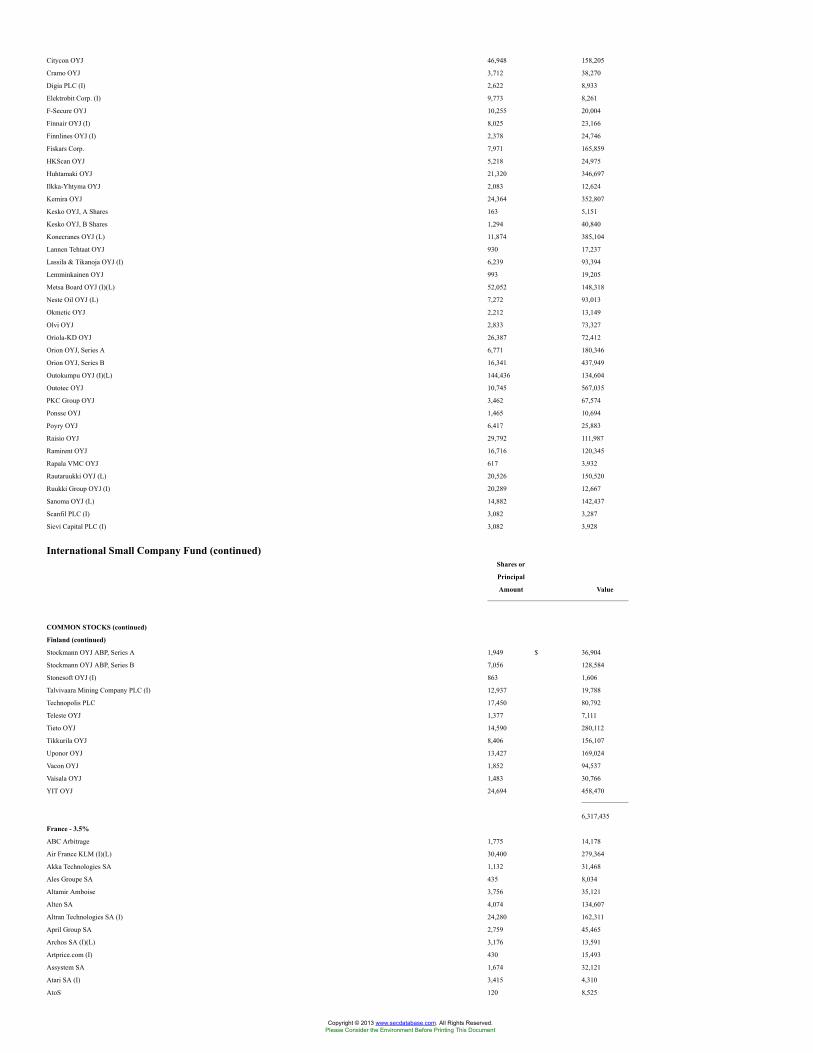
Citycon OYJ 46,948 158,205
Cramo OYJ 3,712 38,270
Digia PLC (I) 2,622 8,933
Elektrobit Corp. (I) 9,773 8,261
F-Secure OYJ 10,255 20,004
Finnair OYJ (I) 8,025 23,166
Finnlines OYJ (I) 2,378 24,746
Fiskars Corp. 7,971 165,859
HKScan OYJ 5,218 24,975
Huhtamaki OYJ 21,320 346,697
Ilkka-Yhtyma OYJ 2,083 12,624
Kemira OYJ 24,364 352,807
Kesko OYJ, A Shares 163 5,151
Kesko OYJ, B Shares 1,294 40,840
Konecranes OYJ (L) 11,874 385,104
Lannen Tehtaat OYJ 930 17,237
Lassila & Tikanoja OYJ (I) 6,239 93,394
Lemminkainen OYJ 993 19,205
Metsa Board OYJ (I)(L) 52,052 148,318
Neste Oil OYJ (L) 7,272 93,013
Okmetic OYJ 2,212 13,149
Olvi OYJ 2,833 73,327
Oriola-KD OYJ 26,387 72,412
Orion OYJ, Series A 6,771 180,346
Orion OYJ, Series B 16,341 437,949
Outokumpu OYJ (I)(L) 144,436 134,604
Outotec OYJ 10,745 567,035
PKC Group OYJ 3,462 67,574
Ponsse OYJ 1,465 10,694
Poyry OYJ 6,417 25,883
Raisio OYJ 29,792 111,987
Ramirent OYJ 16,716 120,345
Rapala VMC OYJ 617 3,932
Rautaruukki OYJ (L) 20,526 150,520
Ruukki Group OYJ (I) 20,289 12,667
Sanoma OYJ (L) 14,882 142,437
Scanfil PLC (I) 3,082 3,287
Sievi Capital PLC (I) 3,082 3,928
International Small Company Fund (continued)Shares or
Principal
Amount Value
COMMON STOCKS (continued)
Finland (continued)
Stockmann OYJ ABP, Series A 1,949 $ 36,904
Stockmann OYJ ABP, Series B 7,056 128,584
Stonesoft OYJ (I) 863 1,606
Talvivaara Mining Company PLC (I) 12,937 19,788
Technopolis PLC 17,450 80,792
Teleste OYJ 1,377 7,111
Tieto OYJ 14,590 280,112
Tikkurila OYJ 8,406 156,107
Uponor OYJ 13,427 169,024
Vacon OYJ 1,852 94,537
Vaisala OYJ 1,483 30,766
YIT OYJ 24,694 458,470
6,317,435
France - 3.5%
ABC Arbitrage 1,775 14,178
Air France KLM (I)(L) 30,400 279,364
Akka Technologies SA 1,132 31,468
Ales Groupe SA 435 8,034
Altamir Amboise 3,756 35,121
Alten SA 4,074 134,607
Altran Technologies SA (I) 24,280 162,311
April Group SA 2,759 45,465
Archos SA (I)(L) 3,176 13,591
Artprice.com (I) 430 15,493
Assystem SA 1,674 32,121
Atari SA (I) 3,415 4,310
AtoS 120 8,525
Copyright © 2013 www.secdatabase.com. All Rights Reserved.Please Consider the Environment Before Printing This Document
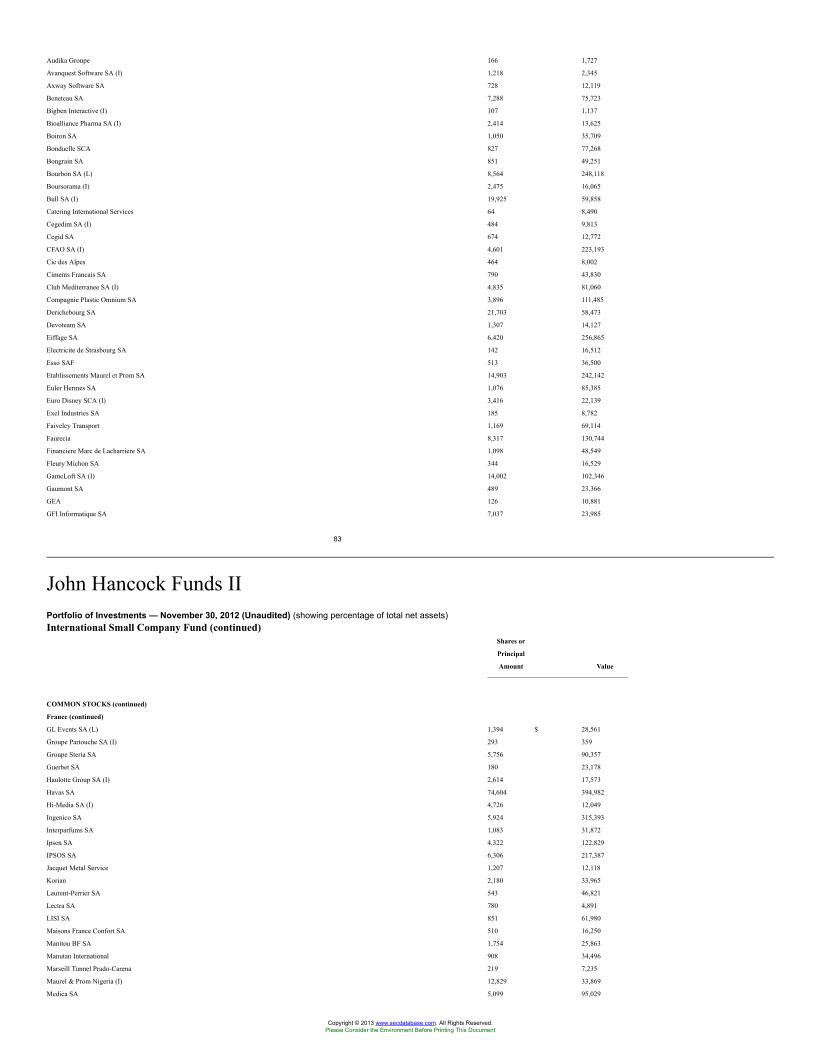
Audika Groupe 166 1,727
Avanquest Software SA (I) 1,218 2,345
Axway Software SA 728 12,119
Beneteau SA 7,288 75,723
Bigben Interactive (I) 107 1,137
Bioalliance Pharma SA (I) 2,414 13,625
Boiron SA 1,050 35,709
Bonduelle SCA 827 77,268
Bongrain SA 851 49,251
Bourbon SA (L) 8,564 248,118
Boursorama (I) 2,475 16,065
Bull SA (I) 19,925 59,858
Catering International Services 64 8,490
Cegedim SA (I) 484 9,813
Cegid SA 674 12,772
CFAO SA (I) 4,601 223,193
Cie des Alpes 464 8,002
Ciments Francais SA 790 43,830
Club Mediterranee SA (I) 4,835 81,060
Compagnie Plastic Omnium SA 3,896 111,485
Derichebourg SA 21,703 58,473
Devoteam SA 1,307 14,127
Eiffage SA 6,420 256,865
Electricite de Strasbourg SA 142 16,512
Esso SAF 513 36,500
Etablissements Maurel et Prom SA 14,903 242,142
Euler Hermes SA 1,076 85,385
Euro Disney SCA (I) 3,416 22,139
Exel Industries SA 185 8,782
Faiveley Transport 1,169 69,114
Faurecia 8,317 130,744
Financiere Marc de Lacharriere SA 1,098 48,549
Fleury Michon SA 344 16,529
GameLoft SA (I) 14,002 102,346
Gaumont SA 489 23,366
GEA 126 10,881
GFI Informatique SA 7,037 23,985
83
John Hancock Funds IIPortfolio of Investments — November 30, 2012 (Unaudited) (showing percentage of total net assets)International Small Company Fund (continued)
Shares or
Principal
Amount Value
COMMON STOCKS (continued)
France (continued)
GL Events SA (L) 1,394 $ 28,561
Groupe Partouche SA (I) 293 359
Groupe Steria SA 5,756 90,357
Guerbet SA 180 23,178
Haulotte Group SA (I) 2,614 17,573
Havas SA 74,604 394,982
Hi-Media SA (I) 4,726 12,049
Ingenico SA 5,924 315,393
Interparfums SA 1,083 31,872
Ipsen SA 4,322 122,829
IPSOS SA 6,306 217,387
Jacquet Metal Service 1,207 12,118
Korian 2,180 33,965
Laurent-Perrier SA 543 46,821
Lectra SA 780 4,891
LISI SA 851 61,980
Maisons France Confort SA 510 16,250
Manitou BF SA 1,754 25,863
Manutan International 908 34,496
Marseill Tunnel Prado-Carena 219 7,235
Maurel & Prom Nigeria (I) 12,829 33,869
Medica SA 5,099 95,029
Copyright © 2013 www.secdatabase.com. All Rights Reserved.Please Consider the Environment Before Printing This Document
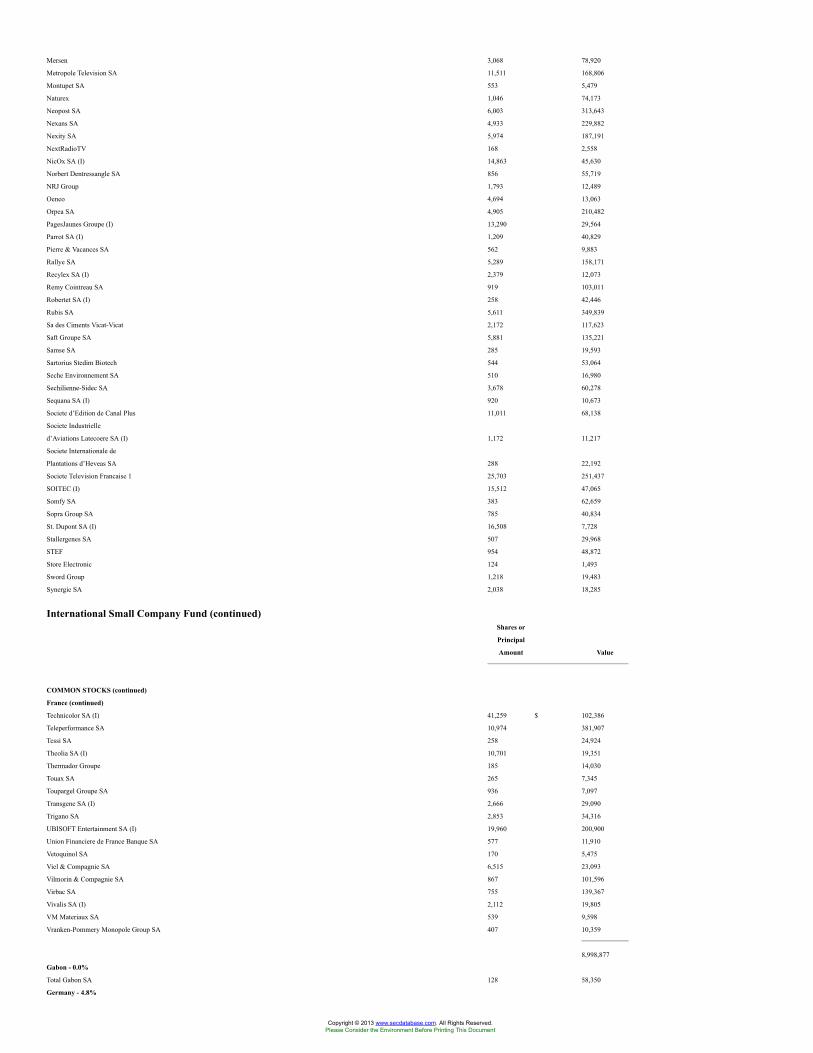
Mersen 3,068 78,920
Metropole Television SA 11,511 168,806
Montupet SA 553 5,479
Naturex 1,046 74,173
Neopost SA 6,003 313,643
Nexans SA 4,933 229,882
Nexity SA 5,974 187,191
NextRadioTV 168 2,558
NicOx SA (I) 14,863 45,630
Norbert Dentressangle SA 856 55,719
NRJ Group 1,793 12,489
Oeneo 4,694 13,063
Orpea SA 4,905 210,482
PagesJaunes Groupe (I) 13,290 29,564
Parrot SA (I) 1,209 40,829
Pierre & Vacances SA 562 9,883
Rallye SA 5,289 158,171
Recylex SA (I) 2,379 12,073
Remy Cointreau SA 919 103,011
Robertet SA (I) 258 42,446
Rubis SA 5,611 349,839
Sa des Ciments Vicat-Vicat 2,172 117,623
Saft Groupe SA 5,881 135,221
Samse SA 285 19,593
Sartorius Stedim Biotech 544 53,064
Seche Environnement SA 510 16,980
Sechilienne-Sidec SA 3,678 60,278
Sequana SA (I) 920 10,673
Societe d’Edition de Canal Plus 11,011 68,138
Societe Industrielle
d’Aviations Latecoere SA (I) 1,172 11,217
Societe Internationale de
Plantations d’Heveas SA 288 22,192
Societe Television Francaise 1 25,703 251,437
SOITEC (I) 15,512 47,065
Somfy SA 383 62,659
Sopra Group SA 785 40,834
St. Dupont SA (I) 16,508 7,728
Stallergenes SA 507 29,968
STEF 954 48,872
Store Electronic 124 1,493
Sword Group 1,218 19,483
Synergie SA 2,038 18,285
International Small Company Fund (continued)Shares or
Principal
Amount Value
COMMON STOCKS (continued)
France (continued)
Technicolor SA (I) 41,259 $ 102,386
Teleperformance SA 10,974 381,907
Tessi SA 258 24,924
Theolia SA (I) 10,701 19,351
Thermador Groupe 185 14,030
Touax SA 265 7,345
Toupargel Groupe SA 936 7,097
Transgene SA (I) 2,666 29,090
Trigano SA 2,853 34,316
UBISOFT Entertainment SA (I) 19,960 200,900
Union Financiere de France Banque SA 577 11,910
Vetoquinol SA 170 5,475
Viel & Compagnie SA 6,515 23,093
Vilmorin & Compagnie SA 867 101,596
Virbac SA 755 139,367
Vivalis SA (I) 2,112 19,805
VM Materiaux SA 539 9,598
Vranken-Pommery Monopole Group SA 407 10,359
8,998,877
Gabon - 0.0%
Total Gabon SA 128 58,350
Germany - 4.8%
Copyright © 2013 www.secdatabase.com. All Rights Reserved.Please Consider the Environment Before Printing This Document
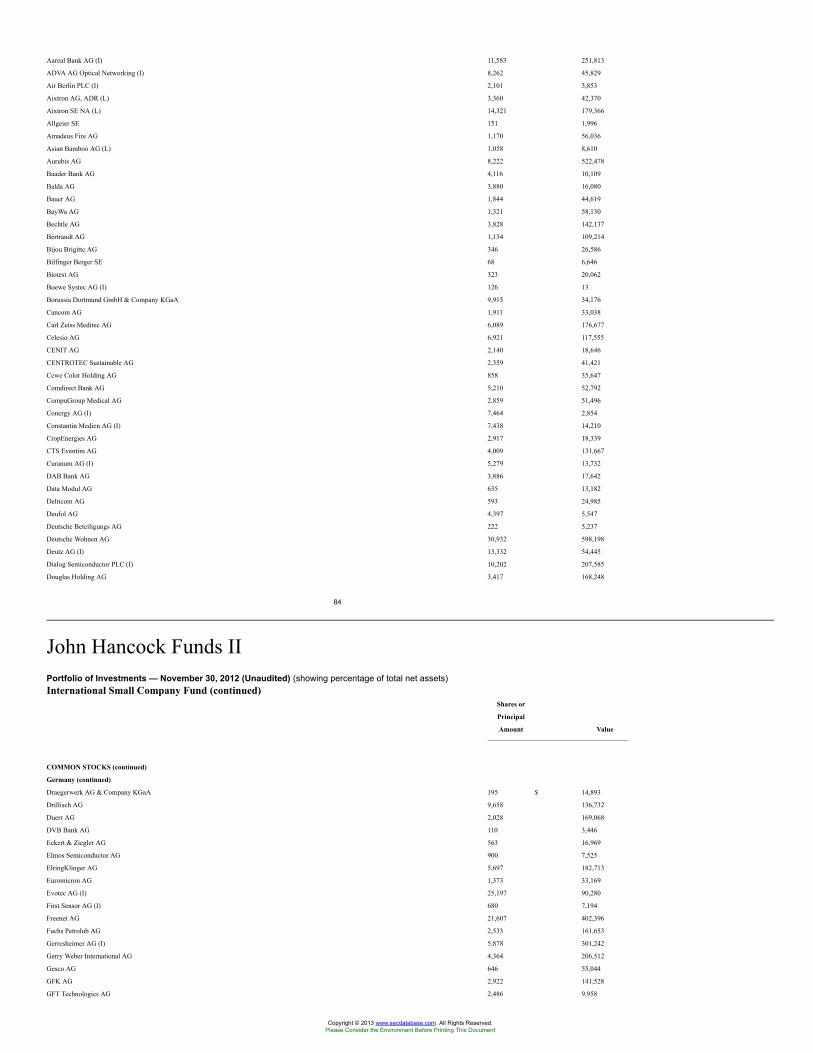
Aareal Bank AG (I) 11,583 251,813
ADVA AG Optical Networking (I) 8,262 45,829
Air Berlin PLC (I) 2,101 3,853
Aixtron AG, ADR (L) 3,360 42,370
Aixtron SE NA (L) 14,321 179,366
Allgeier SE 151 1,996
Amadeus Fire AG 1,170 56,036
Asian Bamboo AG (L) 1,058 8,610
Aurubis AG 8,222 522,478
Baader Bank AG 4,116 10,109
Balda AG 3,880 16,080
Bauer AG 1,844 44,619
BayWa AG 1,321 58,130
Bechtle AG 3,828 142,137
Bertrandt AG 1,134 109,214
Bijou Brigitte AG 346 26,586
Bilfinger Berger SE 68 6,646
Biotest AG 323 20,062
Boewe Systec AG (I) 126 13
Borussia Dortmund GmbH & Company KGaA 9,915 34,176
Cancom AG 1,911 33,038
Carl Zeiss Meditec AG 6,089 176,677
Celesio AG 6,921 117,555
CENIT AG 2,140 18,646
CENTROTEC Sustainable AG 2,359 41,421
Cewe Color Holding AG 858 35,647
Comdirect Bank AG 5,210 52,792
CompuGroup Medical AG 2,859 51,496
Conergy AG (I) 7,464 2,854
Constantin Medien AG (I) 7,438 14,210
CropEnergies AG 2,917 18,339
CTS Eventim AG 4,009 131,667
Curanum AG (I) 5,279 13,732
DAB Bank AG 3,886 17,642
Data Modul AG 635 13,182
Delticom AG 593 24,985
Deufol AG 4,397 5,547
Deutsche Beteiligungs AG 222 5,237
Deutsche Wohnen AG 30,932 598,198
Deutz AG (I) 13,332 54,445
Dialog Semiconductor PLC (I) 10,202 207,585
Douglas Holding AG 3,417 168,248
84
John Hancock Funds IIPortfolio of Investments — November 30, 2012 (Unaudited) (showing percentage of total net assets)International Small Company Fund (continued)
Shares or
Principal
Amount Value
COMMON STOCKS (continued)
Germany (continued)
Draegerwerk AG & Company KGaA 195 $ 14,893
Drillisch AG 9,658 136,732
Duerr AG 2,028 169,068
DVB Bank AG 110 3,446
Eckert & Ziegler AG 563 16,969
Elmos Semiconductor AG 900 7,525
ElringKlinger AG 5,697 182,713
Euromicron AG 1,373 33,169
Evotec AG (I) 25,197 90,280
First Sensor AG (I) 680 7,194
Freenet AG 21,607 402,396
Fuchs Petrolub AG 2,533 161,653
Gerresheimer AG (I) 5,878 301,242
Gerry Weber International AG 4,364 206,512
Gesco AG 646 55,044
GFK AG 2,922 141,528
GFT Technologies AG 2,486 9,958
Copyright © 2013 www.secdatabase.com. All Rights Reserved.Please Consider the Environment Before Printing This Document
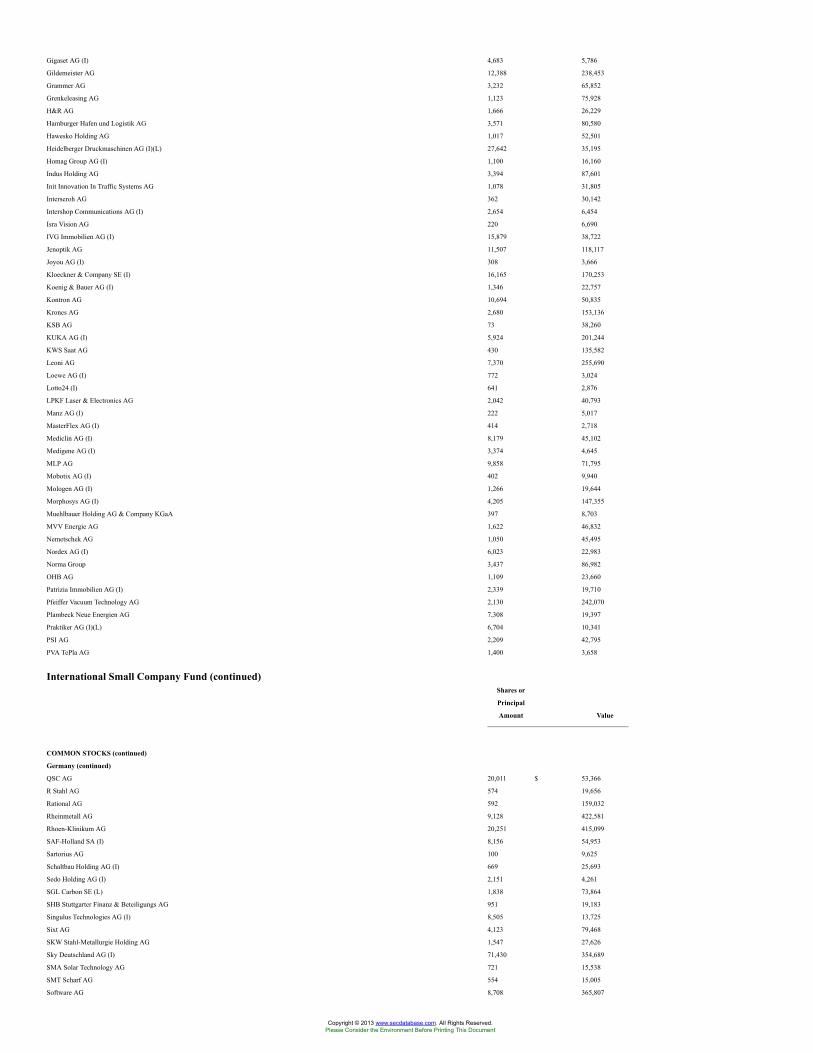
Gigaset AG (I) 4,683 5,786
Gildemeister AG 12,388 238,453
Grammer AG 3,232 65,852
Grenkeleasing AG 1,123 75,928
H&R AG 1,666 26,229
Hamburger Hafen und Logistik AG 3,571 80,580
Hawesko Holding AG 1,017 52,501
Heidelberger Druckmaschinen AG (I)(L) 27,642 35,195
Homag Group AG (I) 1,100 16,160
Indus Holding AG 3,394 87,601
Init Innovation In Traffic Systems AG 1,078 31,805
Interseroh AG 362 30,142
Intershop Communications AG (I) 2,654 6,454
Isra Vision AG 220 6,690
IVG Immobilien AG (I) 15,879 38,722
Jenoptik AG 11,507 118,117
Joyou AG (I) 308 3,666
Kloeckner & Company SE (I) 16,165 170,253
Koenig & Bauer AG (I) 1,346 22,757
Kontron AG 10,694 50,835
Krones AG 2,680 153,136
KSB AG 73 38,260
KUKA AG (I) 5,924 201,244
KWS Saat AG 430 135,582
Leoni AG 7,370 255,690
Loewe AG (I) 772 3,024
Lotto24 (I) 641 2,876
LPKF Laser & Electronics AG 2,042 40,793
Manz AG (I) 222 5,017
MasterFlex AG (I) 414 2,718
Mediclin AG (I) 8,179 45,102
Medigene AG (I) 3,374 4,645
MLP AG 9,858 71,795
Mobotix AG (I) 402 9,940
Mologen AG (I) 1,266 19,644
Morphosys AG (I) 4,205 147,355
Muehlbauer Holding AG & Company KGaA 397 8,703
MVV Energie AG 1,622 46,832
Nemetschek AG 1,050 45,495
Nordex AG (I) 6,023 22,983
Norma Group 3,437 86,982
OHB AG 1,109 23,660
Patrizia Immobilien AG (I) 2,339 19,710
Pfeiffer Vacuum Technology AG 2,130 242,070
Plambeck Neue Energien AG 7,308 19,397
Praktiker AG (I)(L) 6,704 10,341
PSI AG 2,209 42,795
PVA TePla AG 1,400 3,658
International Small Company Fund (continued)Shares or
Principal
Amount Value
COMMON STOCKS (continued)
Germany (continued)
QSC AG 20,011 $ 53,366
R Stahl AG 574 19,656
Rational AG 592 159,032
Rheinmetall AG 9,128 422,581
Rhoen-Klinikum AG 20,251 415,099
SAF-Holland SA (I) 8,156 54,953
Sartorius AG 100 9,625
Schaltbau Holding AG (I) 669 25,693
Sedo Holding AG (I) 2,151 4,261
SGL Carbon SE (L) 1,838 73,864
SHB Stuttgarter Finanz & Beteiligungs AG 951 19,183
Singulus Technologies AG (I) 8,505 13,725
Sixt AG 4,123 79,468
SKW Stahl-Metallurgie Holding AG 1,547 27,626
Sky Deutschland AG (I) 71,430 354,689
SMA Solar Technology AG 721 15,538
SMT Scharf AG 554 15,005
Software AG 8,708 365,807
Copyright © 2013 www.secdatabase.com. All Rights Reserved.Please Consider the Environment Before Printing This Document
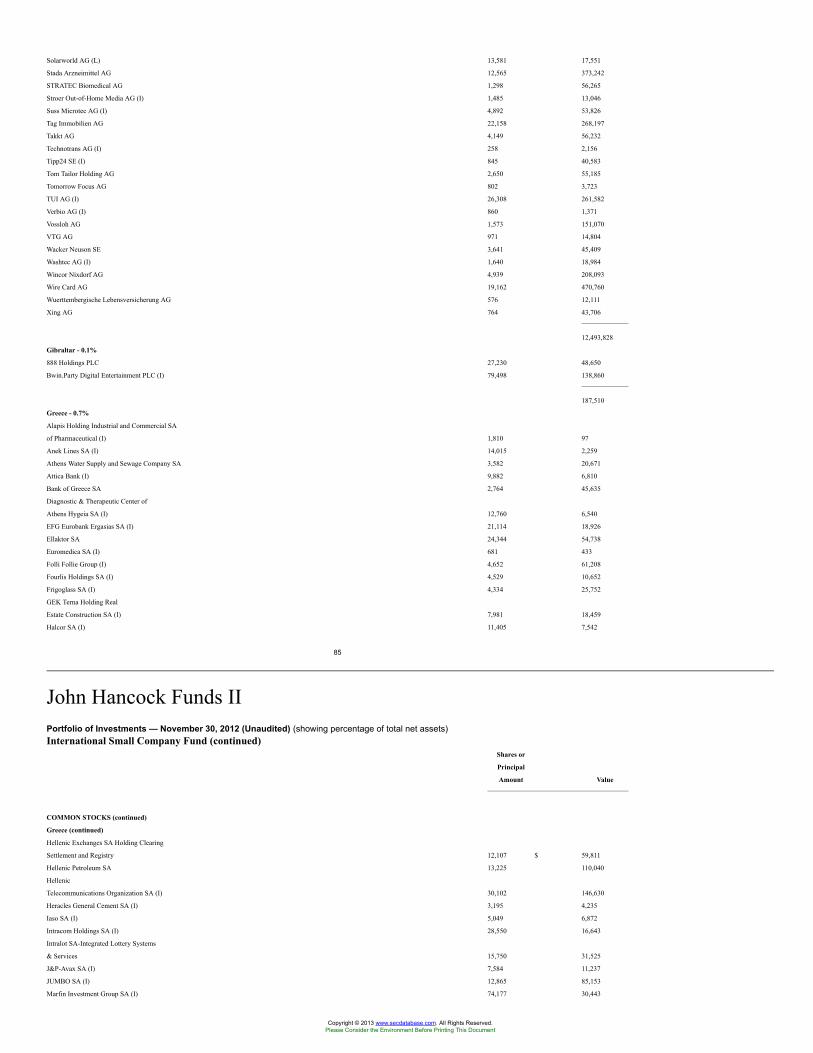
Solarworld AG (L) 13,581 17,551
Stada Arzneimittel AG 12,565 373,242
STRATEC Biomedical AG 1,298 56,265
Stroer Out-of-Home Media AG (I) 1,485 13,046
Suss Microtec AG (I) 4,892 53,826
Tag Immobilien AG 22,158 268,197
Takkt AG 4,149 56,232
Technotrans AG (I) 258 2,156
Tipp24 SE (I) 845 40,583
Tom Tailor Holding AG 2,650 55,185
Tomorrow Focus AG 802 3,723
TUI AG (I) 26,308 261,582
Verbio AG (I) 860 1,371
Vossloh AG 1,573 151,070
VTG AG 971 14,804
Wacker Neuson SE 3,641 45,409
Washtec AG (I) 1,640 18,984
Wincor Nixdorf AG 4,939 208,093
Wire Card AG 19,162 470,760
Wuerttembergische Lebensversicherung AG 576 12,111
Xing AG 764 43,706
12,493,828
Gibraltar - 0.1%
888 Holdings PLC 27,230 48,650
Bwin.Party Digital Entertainment PLC (I) 79,498 138,860
187,510
Greece - 0.7%
Alapis Holding Industrial and Commercial SA
of Pharmaceutical (I) 1,810 97
Anek Lines SA (I) 14,015 2,259
Athens Water Supply and Sewage Company SA 3,582 20,671
Attica Bank (I) 9,882 6,810
Bank of Greece SA 2,764 45,635
Diagnostic & Therapeutic Center of
Athens Hygeia SA (I) 12,760 6,540
EFG Eurobank Ergasias SA (I) 21,114 18,926
Ellaktor SA 24,344 54,738
Euromedica SA (I) 681 433
Folli Follie Group (I) 4,652 61,208
Fourlis Holdings SA (I) 4,529 10,652
Frigoglass SA (I) 4,334 25,752
GEK Terna Holding Real
Estate Construction SA (I) 7,981 18,459
Halcor SA (I) 11,405 7,542
85
John Hancock Funds IIPortfolio of Investments — November 30, 2012 (Unaudited) (showing percentage of total net assets)International Small Company Fund (continued)
Shares or
Principal
Amount Value
COMMON STOCKS (continued)
Greece (continued)
Hellenic Exchanges SA Holding Clearing
Settlement and Registry 12,107 $ 59,811
Hellenic Petroleum SA 13,225 110,040
Hellenic
Telecommunications Organization SA (I) 30,102 146,630
Heracles General Cement SA (I) 3,195 4,235
Iaso SA (I) 5,049 6,872
Intracom Holdings SA (I) 28,550 16,643
Intralot SA-Integrated Lottery Systems
& Services 15,750 31,525
J&P-Avax SA (I) 7,584 11,237
JUMBO SA (I) 12,865 85,153
Marfin Investment Group SA (I) 74,177 30,443
Copyright © 2013 www.secdatabase.com. All Rights Reserved.Please Consider the Environment Before Printing This Document
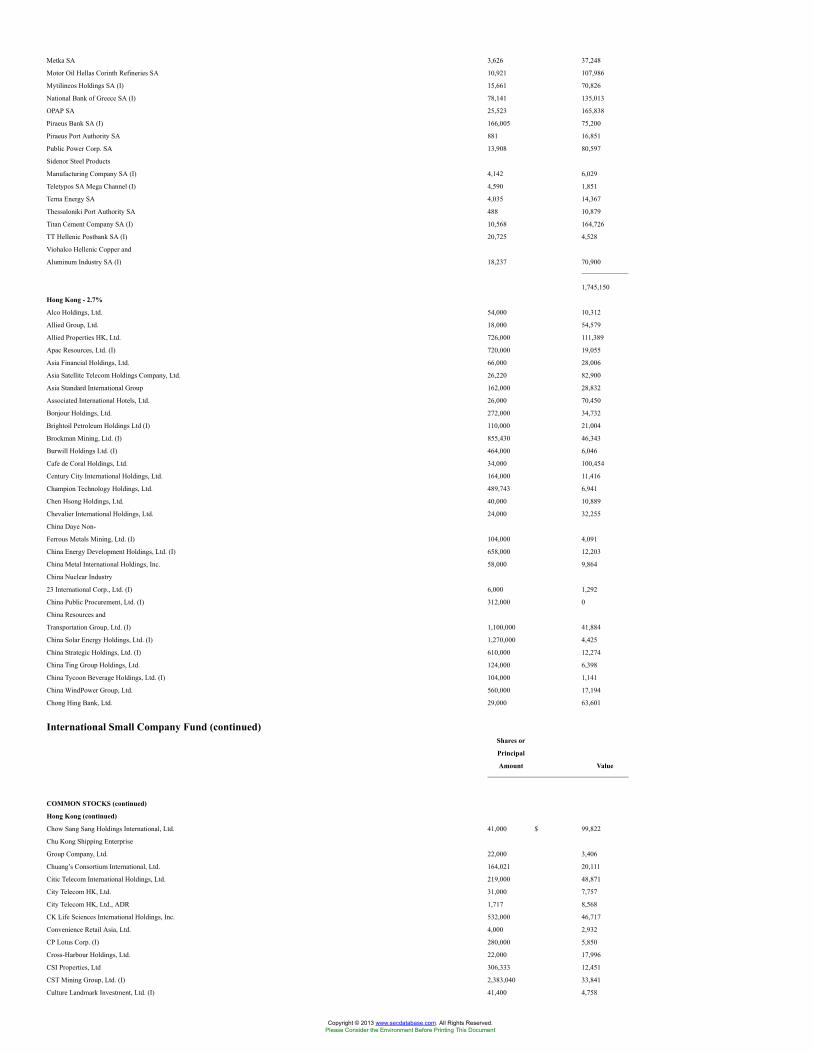
Metka SA 3,626 37,248
Motor Oil Hellas Corinth Refineries SA 10,921 107,986
Mytilineos Holdings SA (I) 15,661 70,826
National Bank of Greece SA (I) 78,141 135,013
OPAP SA 25,523 165,838
Piraeus Bank SA (I) 166,005 75,200
Piraeus Port Authority SA 881 16,851
Public Power Corp. SA 13,908 80,597
Sidenor Steel Products
Manufacturing Company SA (I) 4,142 6,029
Teletypos SA Mega Channel (I) 4,590 1,851
Terna Energy SA 4,035 14,367
Thessaloniki Port Authority SA 488 10,879
Titan Cement Company SA (I) 10,568 164,726
TT Hellenic Postbank SA (I) 20,725 4,528
Viohalco Hellenic Copper and
Aluminum Industry SA (I) 18,237 70,900
1,745,150
Hong Kong - 2.7%
Alco Holdings, Ltd. 54,000 10,312
Allied Group, Ltd. 18,000 54,579
Allied Properties HK, Ltd. 726,000 111,389
Apac Resources, Ltd. (I) 720,000 19,055
Asia Financial Holdings, Ltd. 66,000 28,006
Asia Satellite Telecom Holdings Company, Ltd. 26,220 82,900
Asia Standard International Group 162,000 28,832
Associated International Hotels, Ltd. 26,000 70,450
Bonjour Holdings, Ltd. 272,000 34,732
Brightoil Petroleum Holdings Ltd (I) 110,000 21,004
Brockman Mining, Ltd. (I) 855,430 46,343
Burwill Holdings Ltd. (I) 464,000 6,046
Cafe de Coral Holdings, Ltd. 34,000 100,454
Century City International Holdings, Ltd. 164,000 11,416
Champion Technology Holdings, Ltd. 489,743 6,941
Chen Hsong Holdings, Ltd. 40,000 10,889
Chevalier International Holdings, Ltd. 24,000 32,255
China Daye Non-
Ferrous Metals Mining, Ltd. (I) 104,000 4,091
China Energy Development Holdings, Ltd. (I) 658,000 12,203
China Metal International Holdings, Inc. 58,000 9,864
China Nuclear Industry
23 International Corp., Ltd. (I) 6,000 1,292
China Public Procurement, Ltd. (I) 312,000 0
China Resources and
Transportation Group, Ltd. (I) 1,100,000 41,884
China Solar Energy Holdings, Ltd. (I) 1,270,000 4,425
China Strategic Holdings, Ltd. (I) 610,000 12,274
China Ting Group Holdings, Ltd. 124,000 6,398
China Tycoon Beverage Holdings, Ltd. (I) 104,000 1,141
China WindPower Group, Ltd. 560,000 17,194
Chong Hing Bank, Ltd. 29,000 63,601
International Small Company Fund (continued)Shares or
Principal
Amount Value
COMMON STOCKS (continued)
Hong Kong (continued)
Chow Sang Sang Holdings International, Ltd. 41,000 $ 99,822
Chu Kong Shipping Enterprise
Group Company, Ltd. 22,000 3,406
Chuang’s Consortium International, Ltd. 164,021 20,111
Citic Telecom International Holdings, Ltd. 219,000 48,871
City Telecom HK, Ltd. 31,000 7,757
City Telecom HK, Ltd., ADR 1,717 8,568
CK Life Sciences International Holdings, Inc. 532,000 46,717
Convenience Retail Asia, Ltd. 4,000 2,932
CP Lotus Corp. (I) 280,000 5,850
Cross-Harbour Holdings, Ltd. 22,000 17,996
CSI Properties, Ltd 306,333 12,451
CST Mining Group, Ltd. (I) 2,383,040 33,841
Culture Landmark Investment, Ltd. (I) 41,400 4,758
Copyright © 2013 www.secdatabase.com. All Rights Reserved.Please Consider the Environment Before Printing This Document
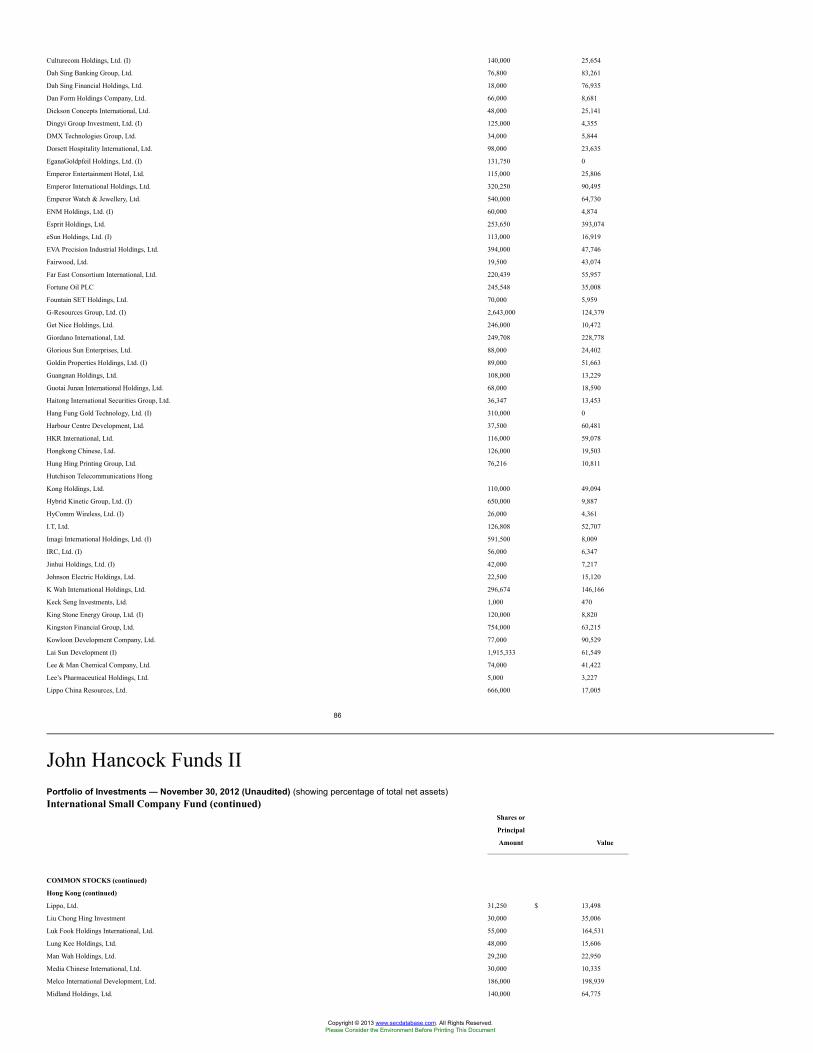
Culturecom Holdings, Ltd. (I) 140,000 25,654
Dah Sing Banking Group, Ltd. 76,800 83,261
Dah Sing Financial Holdings, Ltd. 18,000 76,935
Dan Form Holdings Company, Ltd. 66,000 8,681
Dickson Concepts International, Ltd. 48,000 25,141
Dingyi Group Investment, Ltd. (I) 125,000 4,355
DMX Technologies Group, Ltd. 34,000 5,844
Dorsett Hospitality International, Ltd. 98,000 23,635
EganaGoldpfeil Holdings, Ltd. (I) 131,750 0
Emperor Entertainment Hotel, Ltd. 115,000 25,806
Emperor International Holdings, Ltd. 320,250 90,495
Emperor Watch & Jewellery, Ltd. 540,000 64,730
ENM Holdings, Ltd. (I) 60,000 4,874
Esprit Holdings, Ltd. 253,650 393,074
eSun Holdings, Ltd. (I) 113,000 16,919
EVA Precision Industrial Holdings, Ltd. 394,000 47,746
Fairwood, Ltd. 19,500 43,074
Far East Consortium International, Ltd. 220,439 55,957
Fortune Oil PLC 245,548 35,008
Fountain SET Holdings, Ltd. 70,000 5,959
G-Resources Group, Ltd. (I) 2,643,000 124,379
Get Nice Holdings, Ltd. 246,000 10,472
Giordano International, Ltd. 249,708 228,778
Glorious Sun Enterprises, Ltd. 88,000 24,402
Goldin Properties Holdings, Ltd. (I) 89,000 51,663
Guangnan Holdings, Ltd. 108,000 13,229
Guotai Junan International Holdings, Ltd. 68,000 18,590
Haitong International Securities Group, Ltd. 36,347 13,453
Hang Fung Gold Technology, Ltd. (I) 310,000 0
Harbour Centre Development, Ltd. 37,500 60,481
HKR International, Ltd. 116,000 59,078
Hongkong Chinese, Ltd. 126,000 19,503
Hung Hing Printing Group, Ltd. 76,216 10,811
Hutchison Telecommunications Hong
Kong Holdings, Ltd. 110,000 49,094
Hybrid Kinetic Group, Ltd. (I) 650,000 9,887
HyComm Wireless, Ltd. (I) 26,000 4,361
I.T, Ltd. 126,808 52,707
Imagi International Holdings, Ltd. (I) 591,500 8,009
IRC, Ltd. (I) 56,000 6,347
Jinhui Holdings, Ltd. (I) 42,000 7,217
Johnson Electric Holdings, Ltd. 22,500 15,120
K Wah International Holdings, Ltd. 296,674 146,166
Keck Seng Investments, Ltd. 1,000 470
King Stone Energy Group, Ltd. (I) 120,000 8,820
Kingston Financial Group, Ltd. 754,000 63,215
Kowloon Development Company, Ltd. 77,000 90,529
Lai Sun Development (I) 1,915,333 61,549
Lee & Man Chemical Company, Ltd. 74,000 41,422
Lee’s Pharmaceutical Holdings, Ltd. 5,000 3,227
Lippo China Resources, Ltd. 666,000 17,005
86
John Hancock Funds IIPortfolio of Investments — November 30, 2012 (Unaudited) (showing percentage of total net assets)International Small Company Fund (continued)
Shares or
Principal
Amount Value
COMMON STOCKS (continued)
Hong Kong (continued)
Lippo, Ltd. 31,250 $ 13,498
Liu Chong Hing Investment 30,000 35,006
Luk Fook Holdings International, Ltd. 55,000 164,531
Lung Kee Holdings, Ltd. 48,000 15,606
Man Wah Holdings, Ltd. 29,200 22,950
Media Chinese International, Ltd. 30,000 10,335
Melco International Development, Ltd. 186,000 198,939
Midland Holdings, Ltd. 140,000 64,775
Copyright © 2013 www.secdatabase.com. All Rights Reserved.Please Consider the Environment Before Printing This Document
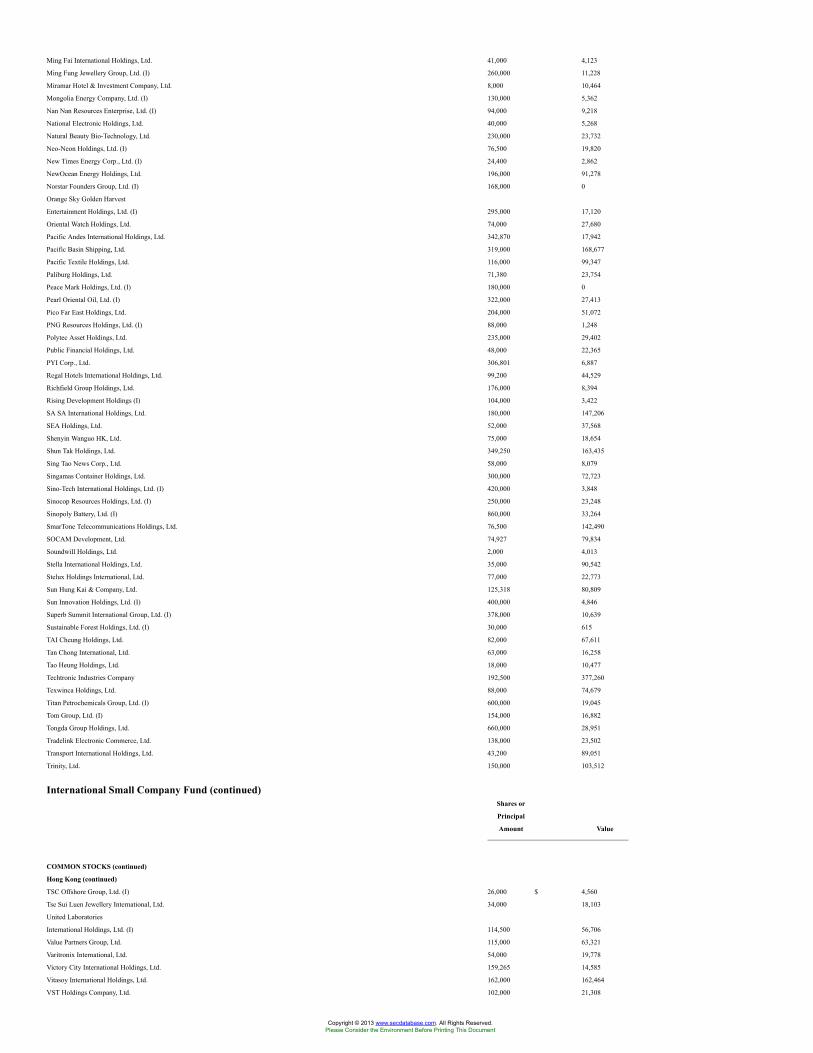
Ming Fai International Holdings, Ltd. 41,000 4,123
Ming Fung Jewellery Group, Ltd. (I) 260,000 11,228
Miramar Hotel & Investment Company, Ltd. 8,000 10,464
Mongolia Energy Company, Ltd. (I) 130,000 5,362
Nan Nan Resources Enterprise, Ltd. (I) 94,000 9,218
National Electronic Holdings, Ltd. 40,000 5,268
Natural Beauty Bio-Technology, Ltd. 230,000 23,732
Neo-Neon Holdings, Ltd. (I) 76,500 19,820
New Times Energy Corp., Ltd. (I) 24,400 2,862
NewOcean Energy Holdings, Ltd. 196,000 91,278
Norstar Founders Group, Ltd. (I) 168,000 0
Orange Sky Golden Harvest
Entertainment Holdings, Ltd. (I) 295,000 17,120
Oriental Watch Holdings, Ltd. 74,000 27,680
Pacific Andes International Holdings, Ltd. 342,870 17,942
Pacific Basin Shipping, Ltd. 319,000 168,677
Pacific Textile Holdings, Ltd. 116,000 99,347
Paliburg Holdings, Ltd. 71,380 23,754
Peace Mark Holdings, Ltd. (I) 180,000 0
Pearl Oriental Oil, Ltd. (I) 322,000 27,413
Pico Far East Holdings, Ltd. 204,000 51,072
PNG Resources Holdings, Ltd. (I) 88,000 1,248
Polytec Asset Holdings, Ltd. 235,000 29,402
Public Financial Holdings, Ltd. 48,000 22,365
PYI Corp., Ltd. 306,801 6,887
Regal Hotels International Holdings, Ltd. 99,200 44,529
Richfield Group Holdings, Ltd. 176,000 8,394
Rising Development Holdings (I) 104,000 3,422
SA SA International Holdings, Ltd. 180,000 147,206
SEA Holdings, Ltd. 52,000 37,568
Shenyin Wanguo HK, Ltd. 75,000 18,654
Shun Tak Holdings, Ltd. 349,250 163,435
Sing Tao News Corp., Ltd. 58,000 8,079
Singamas Container Holdings, Ltd. 300,000 72,723
Sino-Tech International Holdings, Ltd. (I) 420,000 3,848
Sinocop Resources Holdings, Ltd. (I) 250,000 23,248
Sinopoly Battery, Ltd. (I) 860,000 33,264
SmarTone Telecommunications Holdings, Ltd. 76,500 142,490
SOCAM Development, Ltd. 74,927 79,834
Soundwill Holdings, Ltd. 2,000 4,013
Stella International Holdings, Ltd. 35,000 90,542
Stelux Holdings International, Ltd. 77,000 22,773
Sun Hung Kai & Company, Ltd. 125,318 80,809
Sun Innovation Holdings, Ltd. (I) 400,000 4,846
Superb Summit International Group, Ltd. (I) 378,000 10,639
Sustainable Forest Holdings, Ltd. (I) 30,000 615
TAI Cheung Holdings, Ltd. 82,000 67,611
Tan Chong International, Ltd. 63,000 16,258
Tao Heung Holdings, Ltd. 18,000 10,477
Techtronic Industries Company 192,500 377,260
Texwinca Holdings, Ltd. 88,000 74,679
Titan Petrochemicals Group, Ltd. (I) 600,000 19,045
Tom Group, Ltd. (I) 154,000 16,882
Tongda Group Holdings, Ltd. 660,000 28,951
Tradelink Electronic Commerce, Ltd. 138,000 23,502
Transport International Holdings, Ltd. 43,200 89,051
Trinity, Ltd. 150,000 103,512
International Small Company Fund (continued)Shares or
Principal
Amount Value
COMMON STOCKS (continued)
Hong Kong (continued)
TSC Offshore Group, Ltd. (I) 26,000 $ 4,560
Tse Sui Luen Jewellery International, Ltd. 34,000 18,103
United Laboratories
International Holdings, Ltd. (I) 114,500 56,706
Value Partners Group, Ltd. 115,000 63,321
Varitronix International, Ltd. 54,000 19,778
Victory City International Holdings, Ltd. 159,265 14,585
Vitasoy International Holdings, Ltd. 162,000 162,464
VST Holdings Company, Ltd. 102,000 21,308
Copyright © 2013 www.secdatabase.com. All Rights Reserved.Please Consider the Environment Before Printing This Document
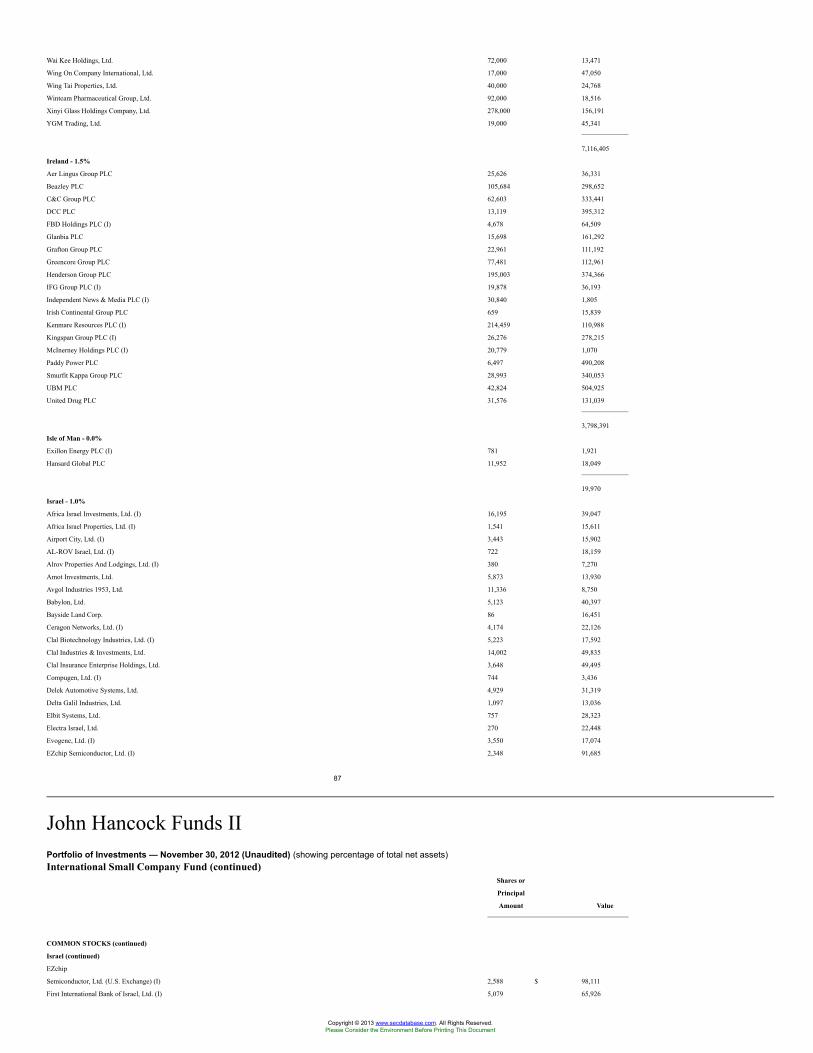
Wai Kee Holdings, Ltd. 72,000 13,471
Wing On Company International, Ltd. 17,000 47,050
Wing Tai Properties, Ltd. 40,000 24,768
Winteam Pharmaceutical Group, Ltd. 92,000 18,516
Xinyi Glass Holdings Company, Ltd. 278,000 156,191
YGM Trading, Ltd. 19,000 45,341
7,116,405
Ireland - 1.5%
Aer Lingus Group PLC 25,626 36,331
Beazley PLC 105,684 298,652
C&C Group PLC 62,603 333,441
DCC PLC 13,119 395,312
FBD Holdings PLC (I) 4,678 64,509
Glanbia PLC 15,698 161,292
Grafton Group PLC 22,961 111,192
Greencore Group PLC 77,481 112,961
Henderson Group PLC 195,003 374,366
IFG Group PLC (I) 19,878 36,193
Independent News & Media PLC (I) 30,840 1,805
Irish Continental Group PLC 659 15,839
Kenmare Resources PLC (I) 214,459 110,988
Kingspan Group PLC (I) 26,276 278,215
McInerney Holdings PLC (I) 20,779 1,070
Paddy Power PLC 6,497 490,208
Smurfit Kappa Group PLC 28,993 340,053
UBM PLC 42,824 504,925
United Drug PLC 31,576 131,039
3,798,391
Isle of Man - 0.0%
Exillon Energy PLC (I) 781 1,921
Hansard Global PLC 11,952 18,049
19,970
Israel - 1.0%
Africa Israel Investments, Ltd. (I) 16,195 39,047
Africa Israel Properties, Ltd. (I) 1,541 15,611
Airport City, Ltd. (I) 3,443 15,902
AL-ROV Israel, Ltd. (I) 722 18,159
Alrov Properties And Lodgings, Ltd. (I) 380 7,270
Amot Investments, Ltd. 5,873 13,930
Avgol Industries 1953, Ltd. 11,336 8,750
Babylon, Ltd. 5,123 40,397
Bayside Land Corp. 86 16,451
Ceragon Networks, Ltd. (I) 4,174 22,126
Clal Biotechnology Industries, Ltd. (I) 5,223 17,592
Clal Industries & Investments, Ltd. 14,002 49,835
Clal Insurance Enterprise Holdings, Ltd. 3,648 49,495
Compugen, Ltd. (I) 744 3,436
Delek Automotive Systems, Ltd. 4,929 31,319
Delta Galil Industries, Ltd. 1,097 13,036
Elbit Systems, Ltd. 757 28,323
Electra Israel, Ltd. 270 22,448
Evogene, Ltd. (I) 3,550 17,074
EZchip Semiconductor, Ltd. (I) 2,348 91,685
87
John Hancock Funds IIPortfolio of Investments — November 30, 2012 (Unaudited) (showing percentage of total net assets)International Small Company Fund (continued)
Shares or
Principal
Amount Value
COMMON STOCKS (continued)
Israel (continued)
EZchip
Semiconductor, Ltd. (U.S. Exchange) (I) 2,588 $ 98,111
First International Bank of Israel, Ltd. (I) 5,079 65,926
Copyright © 2013 www.secdatabase.com. All Rights Reserved.Please Consider the Environment Before Printing This Document
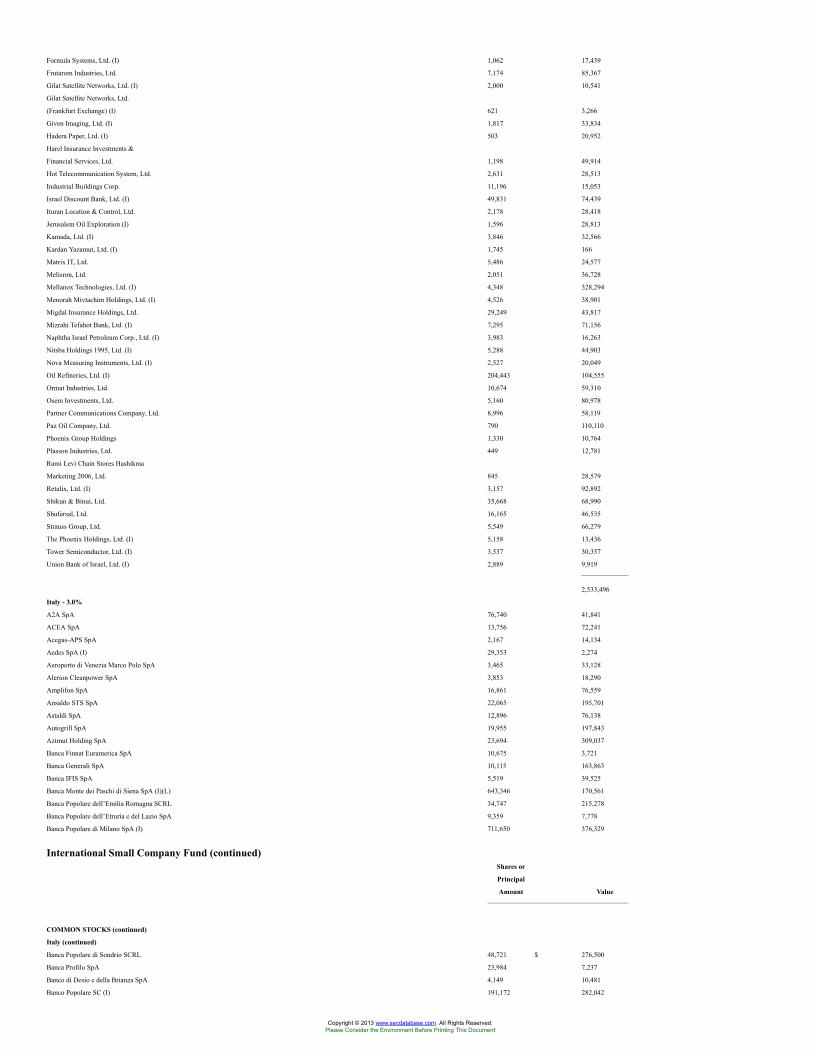
Formula Systems, Ltd. (I) 1,062 17,439
Frutarom Industries, Ltd. 7,174 85,367
Gilat Satellite Networks, Ltd. (I) 2,000 10,541
Gilat Satellite Networks, Ltd.
(Frankfurt Exchange) (I) 621 3,266
Given Imaging, Ltd. (I) 1,817 33,834
Hadera Paper, Ltd. (I) 503 20,952
Harel Insurance Investments &
Financial Services, Ltd. 1,198 49,914
Hot Telecommunication System, Ltd. 2,631 28,513
Industrial Buildings Corp. 11,196 15,053
Israel Discount Bank, Ltd. (I) 49,831 74,439
Ituran Location & Control, Ltd. 2,178 28,418
Jerusalem Oil Exploration (I) 1,596 28,813
Kamada, Ltd. (I) 3,846 32,566
Kardan Yazamut, Ltd. (I) 1,745 166
Matrix IT, Ltd. 5,486 24,577
Melisron, Ltd. 2,051 36,728
Mellanox Technologies, Ltd. (I) 4,348 328,294
Menorah Mivtachim Holdings, Ltd. (I) 4,526 38,901
Migdal Insurance Holdings, Ltd. 29,249 43,817
Mizrahi Tefahot Bank, Ltd. (I) 7,295 71,156
Naphtha Israel Petroleum Corp., Ltd. (I) 3,983 16,263
Nitsba Holdings 1995, Ltd. (I) 5,288 44,903
Nova Measuring Instruments, Ltd. (I) 2,527 20,049
Oil Refineries, Ltd. (I) 204,443 104,555
Ormat Industries, Ltd. 10,674 59,310
Osem Investments, Ltd. 5,160 80,978
Partner Communications Company, Ltd. 8,996 58,119
Paz Oil Company, Ltd. 790 110,110
Phoenix Group Holdings 1,330 10,764
Plasson Industries, Ltd. 449 12,781
Rami Levi Chain Stores Hashikma
Marketing 2006, Ltd. 845 28,579
Retalix, Ltd. (I) 3,157 92,892
Shikun & Binui, Ltd. 35,668 68,990
Shufersal, Ltd. 16,165 46,535
Strauss Group, Ltd. 5,549 66,279
The Phoenix Holdings, Ltd. (I) 5,158 13,436
Tower Semiconductor, Ltd. (I) 3,537 30,357
Union Bank of Israel, Ltd. (I) 2,889 9,919
2,533,496
Italy - 3.0%
A2A SpA 76,740 41,841
ACEA SpA 13,756 72,241
Acegas-APS SpA 2,167 14,134
Aedes SpA (I) 29,353 2,274
Aeroporto di Venezia Marco Polo SpA 3,465 33,128
Alerion Cleanpower SpA 3,853 18,290
Amplifon SpA 16,861 76,559
Ansaldo STS SpA 22,065 195,701
Astaldi SpA 12,896 76,138
Autogrill SpA 19,955 197,843
Azimut Holding SpA 23,694 309,037
Banca Finnat Euramerica SpA 10,675 3,721
Banca Generali SpA 10,115 163,863
Banca IFIS SpA 5,519 39,525
Banca Monte dei Paschi di Siena SpA (I)(L) 643,346 170,561
Banca Popolare dell’Emilia Romagna SCRL 34,747 215,278
Banca Popolare dell’Etruria e del Lazio SpA 9,359 7,778
Banca Popolare di Milano SpA (I) 711,650 376,329
International Small Company Fund (continued)Shares or
Principal
Amount Value
COMMON STOCKS (continued)
Italy (continued)
Banca Popolare di Sondrio SCRL 48,721 $ 276,500
Banca Profilo SpA 23,984 7,237
Banco di Desio e della Brianza SpA 4,149 10,481
Banco Popolare SC (I) 191,172 282,042
Copyright © 2013 www.secdatabase.com. All Rights Reserved.Please Consider the Environment Before Printing This Document
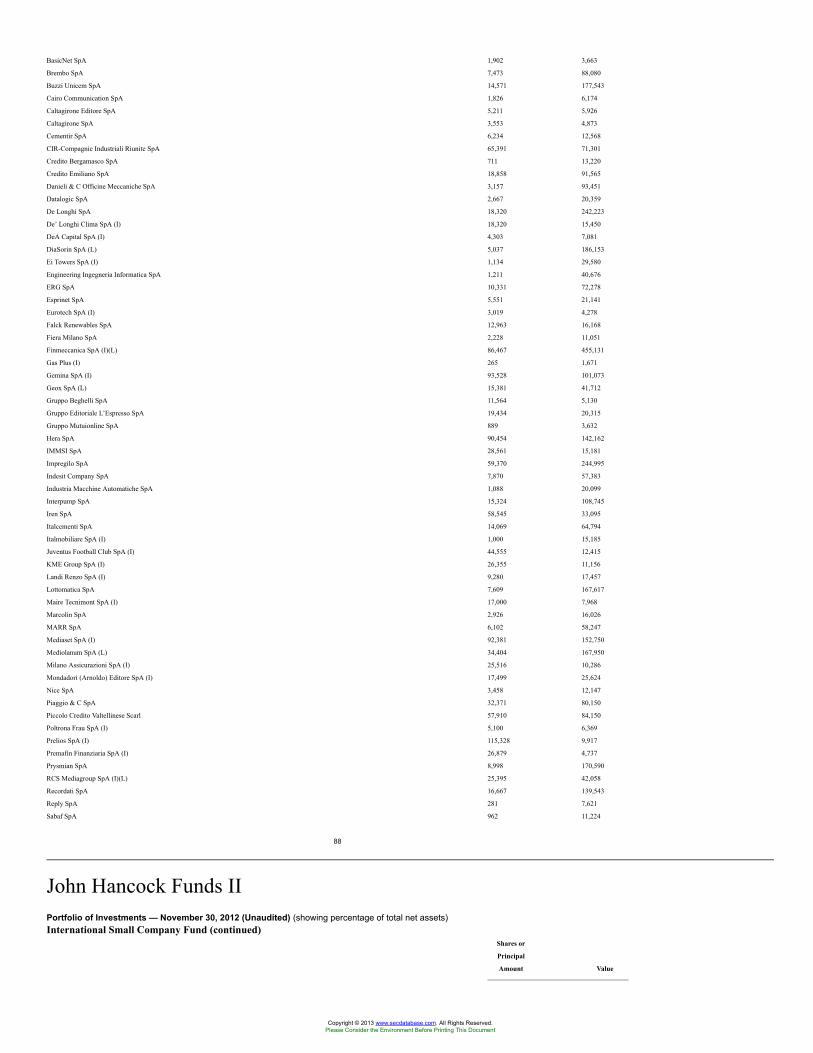
BasicNet SpA 1,902 3,663
Brembo SpA 7,473 88,080
Buzzi Unicem SpA 14,571 177,543
Cairo Communication SpA 1,826 6,174
Caltagirone Editore SpA 5,211 5,926
Caltagirone SpA 3,553 4,873
Cementir SpA 6,234 12,568
CIR-Compagnie Industriali Riunite SpA 65,391 71,301
Credito Bergamasco SpA 711 13,220
Credito Emiliano SpA 18,858 91,565
Danieli & C Officine Meccaniche SpA 3,157 93,451
Datalogic SpA 2,667 20,359
De Longhi SpA 18,320 242,223
De’ Longhi Clima SpA (I) 18,320 15,450
DeA Capital SpA (I) 4,303 7,081
DiaSorin SpA (L) 5,037 186,153
Ei Towers SpA (I) 1,134 29,580
Engineering Ingegneria Informatica SpA 1,211 40,676
ERG SpA 10,331 72,278
Esprinet SpA 5,551 21,141
Eurotech SpA (I) 3,019 4,278
Falck Renewables SpA 12,963 16,168
Fiera Milano SpA 2,228 11,051
Finmeccanica SpA (I)(L) 86,467 455,131
Gas Plus (I) 265 1,671
Gemina SpA (I) 93,528 101,073
Geox SpA (L) 15,381 41,712
Gruppo Beghelli SpA 11,564 5,130
Gruppo Editoriale L’Espresso SpA 19,434 20,315
Gruppo Mutuionline SpA 889 3,632
Hera SpA 90,454 142,162
IMMSI SpA 28,561 15,181
Impregilo SpA 59,370 244,995
Indesit Company SpA 7,870 57,383
Industria Macchine Automatiche SpA 1,088 20,099
Interpump SpA 15,324 108,745
Iren SpA 58,545 33,095
Italcementi SpA 14,069 64,794
Italmobiliare SpA (I) 1,000 15,185
Juventus Football Club SpA (I) 44,555 12,415
KME Group SpA (I) 26,355 11,156
Landi Renzo SpA (I) 9,280 17,457
Lottomatica SpA 7,609 167,617
Maire Tecnimont SpA (I) 17,000 7,968
Marcolin SpA 2,926 16,026
MARR SpA 6,102 58,247
Mediaset SpA (I) 92,381 152,750
Mediolanum SpA (L) 34,404 167,950
Milano Assicurazioni SpA (I) 25,516 10,286
Mondadori (Arnoldo) Editore SpA (I) 17,499 25,624
Nice SpA 3,458 12,147
Piaggio & C SpA 32,371 80,150
Piccolo Credito Valtellinese Scarl 57,910 84,150
Poltrona Frau SpA (I) 5,100 6,369
Prelios SpA (I) 115,328 9,917
Premafin Finanziaria SpA (I) 26,879 4,737
Prysmian SpA 8,998 170,590
RCS Mediagroup SpA (I)(L) 25,395 42,058
Recordati SpA 16,667 139,543
Reply SpA 281 7,621
Sabaf SpA 962 11,224
88
John Hancock Funds IIPortfolio of Investments — November 30, 2012 (Unaudited) (showing percentage of total net assets)International Small Company Fund (continued)
Shares or
Principal
Amount Value
Copyright © 2013 www.secdatabase.com. All Rights Reserved.Please Consider the Environment Before Printing This Document
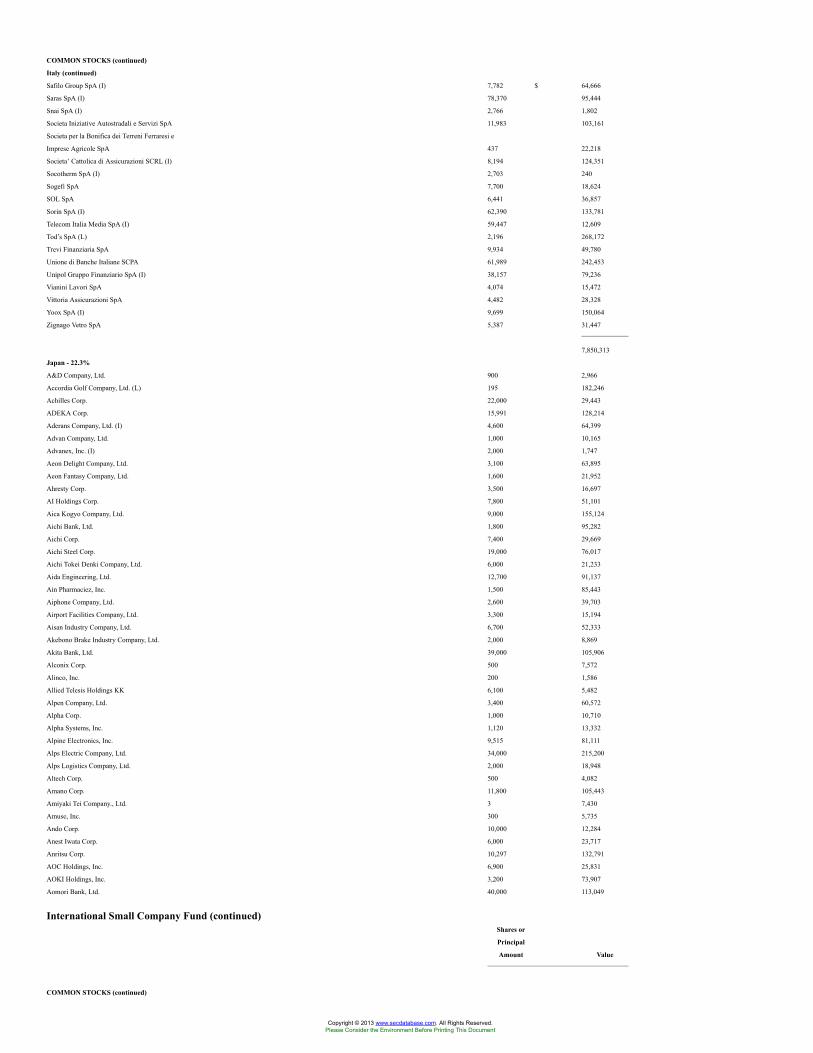
COMMON STOCKS (continued)
Italy (continued)
Safilo Group SpA (I) 7,782 $ 64,666
Saras SpA (I) 78,370 95,444
Snai SpA (I) 2,766 1,802
Societa Iniziative Autostradali e Servizi SpA 11,983 103,161
Societa per la Bonifica dei Terreni Ferraresi e
Imprese Agricole SpA 437 22,218
Societa’ Cattolica di Assicurazioni SCRL (I) 8,194 124,351
Socotherm SpA (I) 2,703 240
Sogefi SpA 7,700 18,624
SOL SpA 6,441 36,857
Sorin SpA (I) 62,390 133,781
Telecom Italia Media SpA (I) 59,447 12,609
Tod’s SpA (L) 2,196 268,172
Trevi Finanziaria SpA 9,934 49,780
Unione di Banche Italiane SCPA 61,989 242,453
Unipol Gruppo Finanziario SpA (I) 38,157 79,236
Vianini Lavori SpA 4,074 15,472
Vittoria Assicurazioni SpA 4,482 28,328
Yoox SpA (I) 9,699 150,064
Zignago Vetro SpA 5,387 31,447
7,850,313
Japan - 22.3%
A&D Company, Ltd. 900 2,966
Accordia Golf Company, Ltd. (L) 195 182,246
Achilles Corp. 22,000 29,443
ADEKA Corp. 15,991 128,214
Aderans Company, Ltd. (I) 4,600 64,399
Advan Company, Ltd. 1,000 10,165
Advanex, Inc. (I) 2,000 1,747
Aeon Delight Company, Ltd. 3,100 63,895
Aeon Fantasy Company, Ltd. 1,600 21,952
Ahresty Corp. 3,500 16,697
AI Holdings Corp. 7,800 51,101
Aica Kogyo Company, Ltd. 9,000 155,124
Aichi Bank, Ltd. 1,800 95,282
Aichi Corp. 7,400 29,669
Aichi Steel Corp. 19,000 76,017
Aichi Tokei Denki Company, Ltd. 6,000 21,233
Aida Engineering, Ltd. 12,700 91,137
Ain Pharmaciez, Inc. 1,500 85,443
Aiphone Company, Ltd. 2,600 39,703
Airport Facilities Company, Ltd. 3,300 15,194
Aisan Industry Company, Ltd. 6,700 52,333
Akebono Brake Industry Company, Ltd. 2,000 8,869
Akita Bank, Ltd. 39,000 105,906
Alconix Corp. 500 7,572
Alinco, Inc. 200 1,586
Allied Telesis Holdings KK 6,100 5,482
Alpen Company, Ltd. 3,400 60,572
Alpha Corp. 1,000 10,710
Alpha Systems, Inc. 1,120 13,332
Alpine Electronics, Inc. 9,515 81,111
Alps Electric Company, Ltd. 34,000 215,200
Alps Logistics Company, Ltd. 2,000 18,948
Altech Corp. 500 4,082
Amano Corp. 11,800 105,443
Amiyaki Tei Company., Ltd. 3 7,430
Amuse, Inc. 300 5,735
Ando Corp. 10,000 12,284
Anest Iwata Corp. 6,000 23,717
Anritsu Corp. 10,297 132,791
AOC Holdings, Inc. 6,900 25,831
AOKI Holdings, Inc. 3,200 73,907
Aomori Bank, Ltd. 40,000 113,049
International Small Company Fund (continued)Shares or
Principal
Amount Value
COMMON STOCKS (continued)
Copyright © 2013 www.secdatabase.com. All Rights Reserved.Please Consider the Environment Before Printing This Document
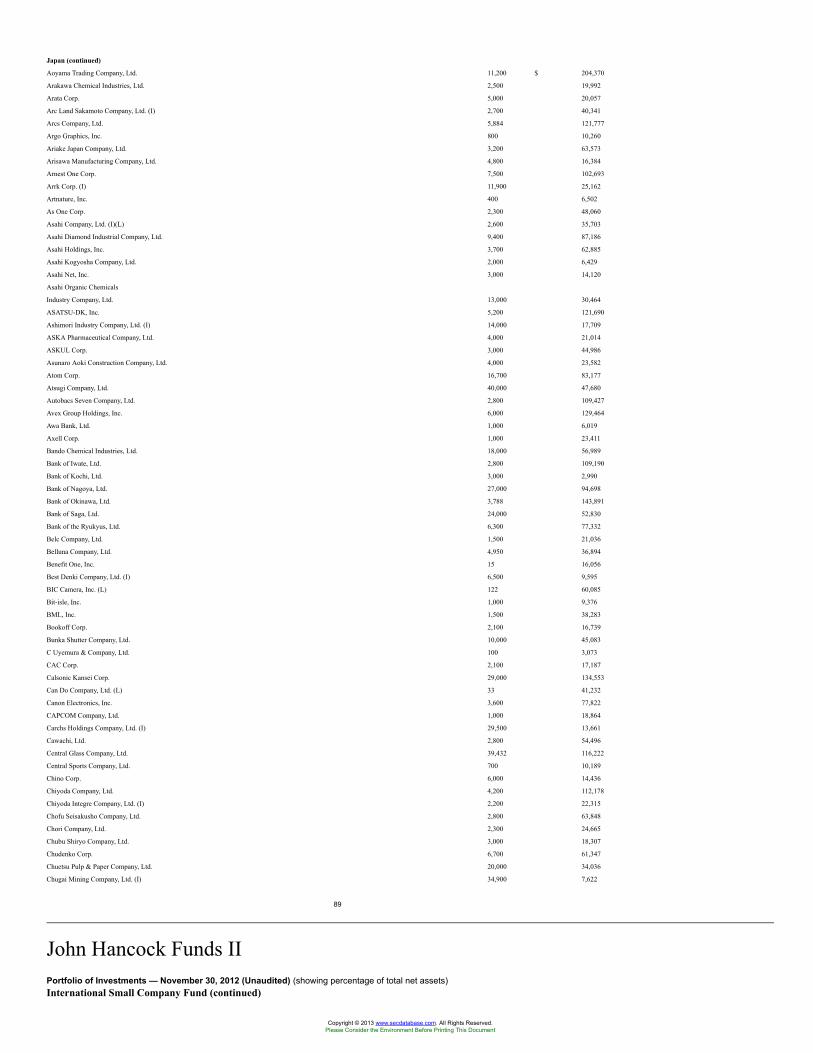
Japan (continued)
Aoyama Trading Company, Ltd. 11,200 $ 204,370
Arakawa Chemical Industries, Ltd. 2,500 19,992
Arata Corp. 5,000 20,057
Arc Land Sakamoto Company, Ltd. (I) 2,700 40,341
Arcs Company, Ltd. 5,884 121,777
Argo Graphics, Inc. 800 10,260
Ariake Japan Company, Ltd. 3,200 63,573
Arisawa Manufacturing Company, Ltd. 4,800 16,384
Arnest One Corp. 7,500 102,693
Arrk Corp. (I) 11,900 25,162
Artnature, Inc. 400 6,502
As One Corp. 2,300 48,060
Asahi Company, Ltd. (I)(L) 2,600 35,703
Asahi Diamond Industrial Company, Ltd. 9,400 87,186
Asahi Holdings, Inc. 3,700 62,885
Asahi Kogyosha Company, Ltd. 2,000 6,429
Asahi Net, Inc. 3,000 14,120
Asahi Organic Chemicals
Industry Company, Ltd. 13,000 30,464
ASATSU-DK, Inc. 5,200 121,690
Ashimori Industry Company, Ltd. (I) 14,000 17,709
ASKA Pharmaceutical Company, Ltd. 4,000 21,014
ASKUL Corp. 3,000 44,986
Asunaro Aoki Construction Company, Ltd. 4,000 23,582
Atom Corp. 16,700 83,177
Atsugi Company, Ltd. 40,000 47,680
Autobacs Seven Company, Ltd. 2,800 109,427
Avex Group Holdings, Inc. 6,000 129,464
Awa Bank, Ltd. 1,000 6,019
Axell Corp. 1,000 23,411
Bando Chemical Industries, Ltd. 18,000 56,989
Bank of Iwate, Ltd. 2,800 109,190
Bank of Kochi, Ltd. 3,000 2,990
Bank of Nagoya, Ltd. 27,000 94,698
Bank of Okinawa, Ltd. 3,788 143,891
Bank of Saga, Ltd. 24,000 52,830
Bank of the Ryukyus, Ltd. 6,300 77,332
Belc Company, Ltd. 1,500 21,036
Belluna Company, Ltd. 4,950 36,894
Benefit One, Inc. 15 16,056
Best Denki Company, Ltd. (I) 6,500 9,595
BIC Camera, Inc. (L) 122 60,085
Bit-isle, Inc. 1,000 9,376
BML, Inc. 1,500 38,283
Bookoff Corp. 2,100 16,739
Bunka Shutter Company, Ltd. 10,000 45,083
C Uyemura & Company, Ltd. 100 3,073
CAC Corp. 2,100 17,187
Calsonic Kansei Corp. 29,000 134,553
Can Do Company, Ltd. (L) 33 41,232
Canon Electronics, Inc. 3,600 77,822
CAPCOM Company, Ltd. 1,000 18,864
Carchs Holdings Company, Ltd. (I) 29,500 13,661
Cawachi, Ltd. 2,800 54,496
Central Glass Company, Ltd. 39,432 116,222
Central Sports Company, Ltd. 700 10,189
Chino Corp. 6,000 14,436
Chiyoda Company, Ltd. 4,200 112,178
Chiyoda Integre Company, Ltd. (I) 2,200 22,315
Chofu Seisakusho Company, Ltd. 2,800 63,848
Chori Company, Ltd. 2,300 24,665
Chubu Shiryo Company, Ltd. 3,000 18,307
Chudenko Corp. 6,700 61,347
Chuetsu Pulp & Paper Company, Ltd. 20,000 34,036
Chugai Mining Company, Ltd. (I) 34,900 7,622
89
John Hancock Funds IIPortfolio of Investments — November 30, 2012 (Unaudited) (showing percentage of total net assets)International Small Company Fund (continued)
Copyright © 2013 www.secdatabase.com. All Rights Reserved.Please Consider the Environment Before Printing This Document
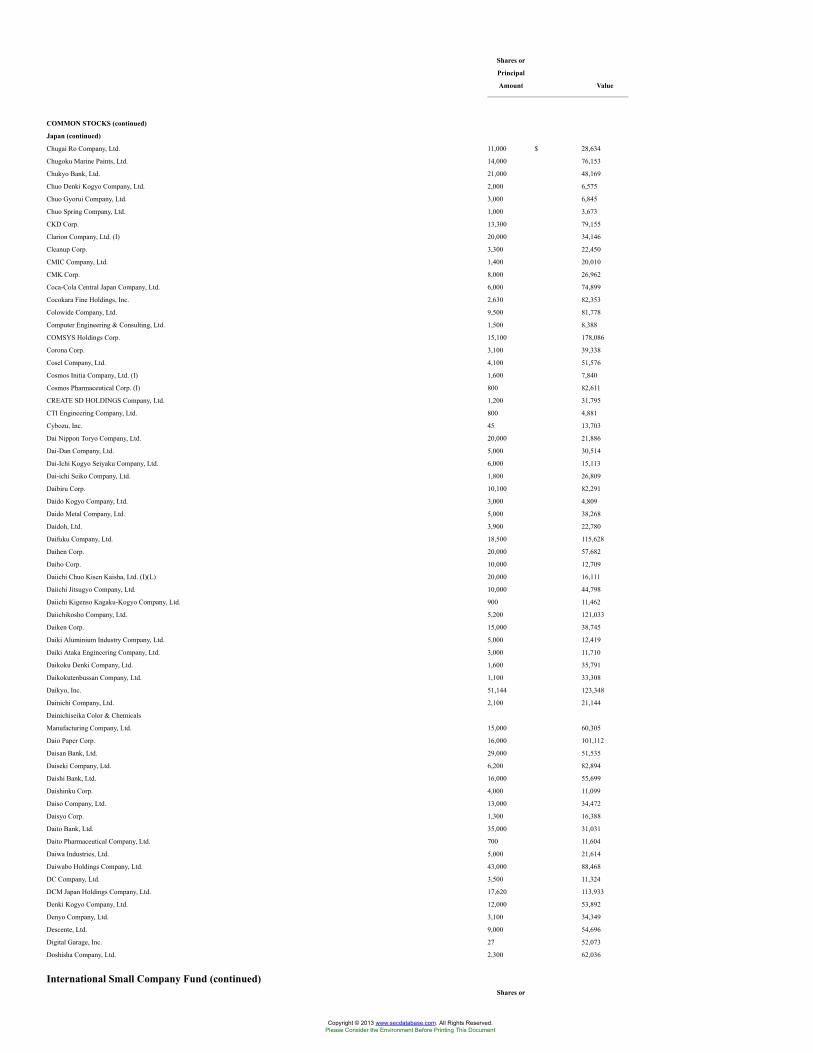
Shares or
Principal
Amount Value
COMMON STOCKS (continued)
Japan (continued)
Chugai Ro Company, Ltd. 11,000 $ 28,634
Chugoku Marine Paints, Ltd. 14,000 76,153
Chukyo Bank, Ltd. 21,000 48,169
Chuo Denki Kogyo Company, Ltd. 2,000 6,575
Chuo Gyorui Company, Ltd. 3,000 6,845
Chuo Spring Company, Ltd. 1,000 3,673
CKD Corp. 13,300 79,155
Clarion Company, Ltd. (I) 20,000 34,146
Cleanup Corp. 3,300 22,450
CMIC Company, Ltd. 1,400 20,010
CMK Corp. 8,000 26,962
Coca-Cola Central Japan Company, Ltd. 6,000 74,899
Cocokara Fine Holdings, Inc. 2,630 82,353
Colowide Company, Ltd. 9,500 81,778
Computer Engineering & Consulting, Ltd. 1,500 8,388
COMSYS Holdings Corp. 15,100 178,086
Corona Corp. 3,100 39,338
Cosel Company, Ltd. 4,100 51,576
Cosmos Initia Company, Ltd. (I) 1,600 7,840
Cosmos Pharmaceutical Corp. (I) 800 82,611
CREATE SD HOLDINGS Company, Ltd. 1,200 31,795
CTI Engineering Company, Ltd. 800 4,881
Cybozu, Inc. 45 13,703
Dai Nippon Toryo Company, Ltd. 20,000 21,886
Dai-Dan Company, Ltd. 5,000 30,514
Dai-Ichi Kogyo Seiyaku Company, Ltd. 6,000 15,113
Dai-ichi Seiko Company, Ltd. 1,800 26,809
Daibiru Corp. 10,100 82,291
Daido Kogyo Company, Ltd. 3,000 4,809
Daido Metal Company, Ltd. 5,000 38,268
Daidoh, Ltd. 3,900 22,780
Daifuku Company, Ltd. 18,500 115,628
Daihen Corp. 20,000 57,682
Daiho Corp. 10,000 12,709
Daiichi Chuo Kisen Kaisha, Ltd. (I)(L) 20,000 16,111
Daiichi Jitsugyo Company, Ltd. 10,000 44,798
Daiichi Kigenso Kagaku-Kogyo Company, Ltd. 900 11,462
Daiichikosho Company, Ltd. 5,200 121,033
Daiken Corp. 15,000 38,745
Daiki Aluminium Industry Company, Ltd. 5,000 12,419
Daiki Ataka Engineering Company, Ltd. 3,000 11,710
Daikoku Denki Company, Ltd. 1,600 35,791
Daikokutenbussan Company, Ltd. 1,100 33,308
Daikyo, Inc. 51,144 123,348
Dainichi Company, Ltd. 2,100 21,144
Dainichiseika Color & Chemicals
Manufacturing Company, Ltd. 15,000 60,305
Daio Paper Corp. 16,000 101,112
Daisan Bank, Ltd. 29,000 51,535
Daiseki Company, Ltd. 6,200 82,894
Daishi Bank, Ltd. 16,000 55,699
Daishinku Corp. 4,000 11,099
Daiso Company, Ltd. 13,000 34,472
Daisyo Corp. 1,300 16,388
Daito Bank, Ltd. 35,000 31,031
Daito Pharmaceutical Company, Ltd. 700 11,604
Daiwa Industries, Ltd. 5,000 21,614
Daiwabo Holdings Company, Ltd. 43,000 88,468
DC Company, Ltd. 3,500 11,324
DCM Japan Holdings Company, Ltd. 17,620 113,933
Denki Kogyo Company, Ltd. 12,000 53,892
Denyo Company, Ltd. 3,100 34,349
Descente, Ltd. 9,000 54,696
Digital Garage, Inc. 27 52,073
Doshisha Company, Ltd. 2,300 62,036
International Small Company Fund (continued)Shares or
Copyright © 2013 www.secdatabase.com. All Rights Reserved.Please Consider the Environment Before Printing This Document
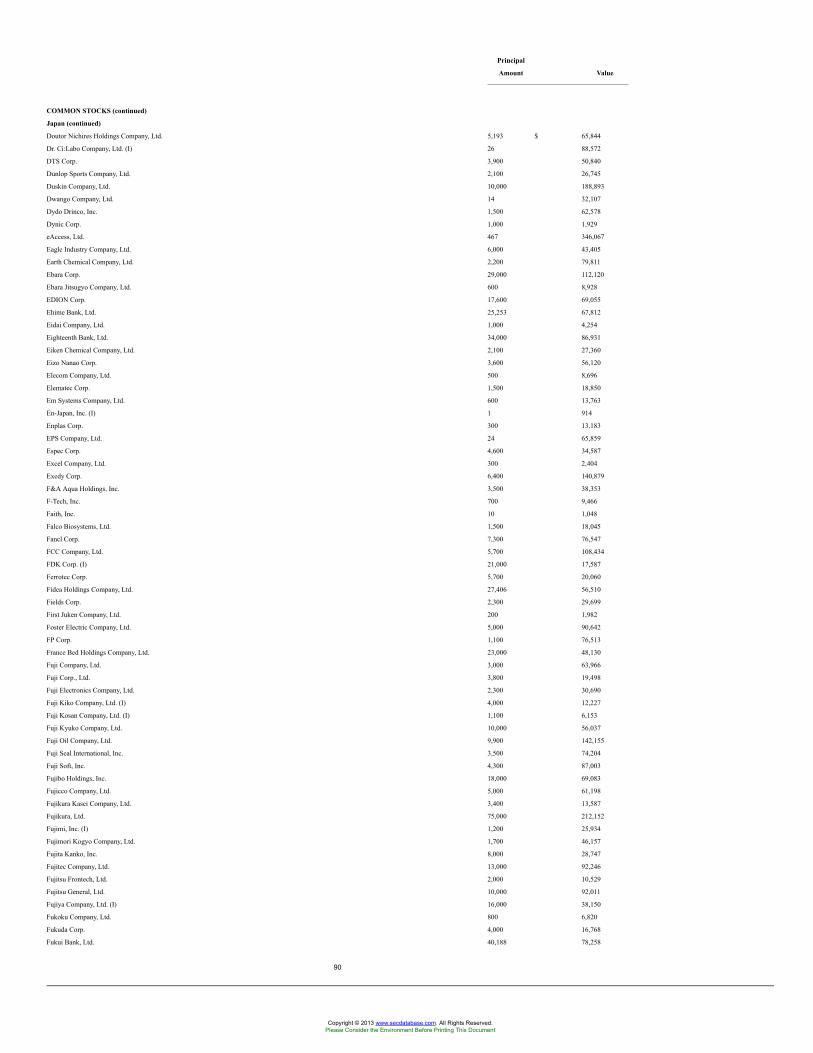
Principal
Amount Value
COMMON STOCKS (continued)
Japan (continued)
Doutor Nichires Holdings Company, Ltd. 5,193 $ 65,844
Dr. Ci:Labo Company, Ltd. (I) 26 88,572
DTS Corp. 3,900 50,840
Dunlop Sports Company, Ltd. 2,100 26,745
Duskin Company, Ltd. 10,000 188,893
Dwango Company, Ltd. 14 32,107
Dydo Drinco, Inc. 1,500 62,578
Dynic Corp. 1,000 1,929
eAccess, Ltd. 467 346,067
Eagle Industry Company, Ltd. 6,000 43,405
Earth Chemical Company, Ltd. 2,200 79,811
Ebara Corp. 29,000 112,120
Ebara Jitsugyo Company, Ltd. 600 8,928
EDION Corp. 17,600 69,055
Ehime Bank, Ltd. 25,253 67,812
Eidai Company, Ltd. 1,000 4,254
Eighteenth Bank, Ltd. 34,000 86,931
Eiken Chemical Company, Ltd. 2,100 27,360
Eizo Nanao Corp. 3,600 56,120
Elecom Company, Ltd. 500 8,696
Elematec Corp. 1,500 18,850
Em Systems Company, Ltd. 600 13,763
En-Japan, Inc. (I) 1 914
Enplas Corp. 300 13,183
EPS Company, Ltd. 24 65,859
Espec Corp. 4,600 34,587
Excel Company, Ltd. 300 2,404
Exedy Corp. 6,400 140,879
F&A Aqua Holdings, Inc. 3,500 38,353
F-Tech, Inc. 700 9,466
Faith, Inc. 10 1,048
Falco Biosystems, Ltd. 1,500 18,045
Fancl Corp. 7,300 76,547
FCC Company, Ltd. 5,700 108,434
FDK Corp. (I) 21,000 17,587
Ferrotec Corp. 5,700 20,060
Fidea Holdings Company, Ltd. 27,406 56,510
Fields Corp. 2,300 29,699
First Juken Company, Ltd. 200 1,982
Foster Electric Company, Ltd. 5,000 90,642
FP Corp. 1,100 76,513
France Bed Holdings Company, Ltd. 23,000 48,130
Fuji Company, Ltd. 3,000 63,966
Fuji Corp., Ltd. 3,800 19,498
Fuji Electronics Company, Ltd. 2,300 30,690
Fuji Kiko Company, Ltd. (I) 4,000 12,227
Fuji Kosan Company, Ltd. (I) 1,100 6,153
Fuji Kyuko Company, Ltd. 10,000 56,037
Fuji Oil Company, Ltd. 9,900 142,155
Fuji Seal International, Inc. 3,500 74,204
Fuji Soft, Inc. 4,300 87,003
Fujibo Holdings, Inc. 18,000 69,083
Fujicco Company, Ltd. 5,000 61,198
Fujikura Kasei Company, Ltd. 3,400 13,587
Fujikura, Ltd. 75,000 212,152
Fujimi, Inc. (I) 1,200 25,934
Fujimori Kogyo Company, Ltd. 1,700 46,157
Fujita Kanko, Inc. 8,000 28,747
Fujitec Company, Ltd. 13,000 92,246
Fujitsu Frontech, Ltd. 2,000 10,529
Fujitsu General, Ltd. 10,000 92,011
Fujiya Company, Ltd. (I) 16,000 38,150
Fukoku Company, Ltd. 800 6,820
Fukuda Corp. 4,000 16,768
Fukui Bank, Ltd. 40,188 78,258
90
Copyright © 2013 www.secdatabase.com. All Rights Reserved.Please Consider the Environment Before Printing This Document
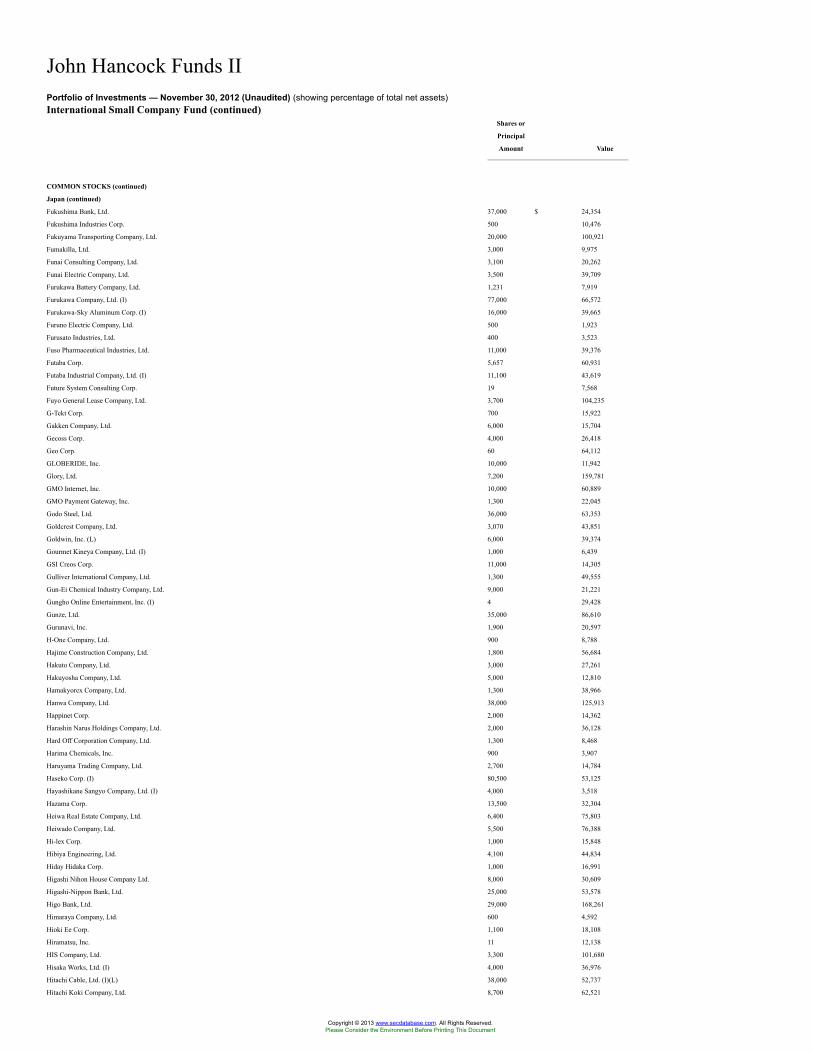
John Hancock Funds IIPortfolio of Investments — November 30, 2012 (Unaudited) (showing percentage of total net assets)International Small Company Fund (continued)
Shares or
Principal
Amount Value
COMMON STOCKS (continued)
Japan (continued)
Fukushima Bank, Ltd. 37,000 $ 24,354
Fukushima Industries Corp. 500 10,476
Fukuyama Transporting Company, Ltd. 20,000 100,921
Fumakilla, Ltd. 3,000 9,975
Funai Consulting Company, Ltd. 3,100 20,262
Funai Electric Company, Ltd. 3,500 39,709
Furukawa Battery Company, Ltd. 1,231 7,919
Furukawa Company, Ltd. (I) 77,000 66,572
Furukawa-Sky Aluminum Corp. (I) 16,000 39,665
Furuno Electric Company, Ltd. 500 1,923
Furusato Industries, Ltd. 400 3,523
Fuso Pharmaceutical Industries, Ltd. 11,000 39,376
Futaba Corp. 5,657 60,931
Futaba Industrial Company, Ltd. (I) 11,100 43,619
Future System Consulting Corp. 19 7,568
Fuyo General Lease Company, Ltd. 3,700 104,235
G-Tekt Corp. 700 15,922
Gakken Company, Ltd. 6,000 15,704
Gecoss Corp. 4,000 26,418
Geo Corp. 60 64,112
GLOBERIDE, Inc. 10,000 11,942
Glory, Ltd. 7,200 159,781
GMO Internet, Inc. 10,000 60,889
GMO Payment Gateway, Inc. 1,300 22,045
Godo Steel, Ltd. 36,000 63,353
Goldcrest Company, Ltd. 3,070 43,851
Goldwin, Inc. (L) 6,000 39,374
Gourmet Kineya Company, Ltd. (I) 1,000 6,439
GSI Creos Corp. 11,000 14,305
Gulliver International Company, Ltd. 1,300 49,555
Gun-Ei Chemical Industry Company, Ltd. 9,000 21,221
Gungho Online Entertainment, Inc. (I) 4 29,428
Gunze, Ltd. 35,000 86,610
Gurunavi, Inc. 1,900 20,597
H-One Company, Ltd. 900 8,788
Hajime Construction Company, Ltd. 1,800 56,684
Hakuto Company, Ltd. 3,000 27,261
Hakuyosha Company, Ltd. 5,000 12,810
Hamakyorex Company, Ltd. 1,300 38,966
Hanwa Company, Ltd. 38,000 125,913
Happinet Corp. 2,000 14,362
Harashin Narus Holdings Company, Ltd. 2,000 36,128
Hard Off Corporation Company, Ltd. 1,300 8,468
Harima Chemicals, Inc. 900 3,907
Haruyama Trading Company, Ltd. 2,700 14,784
Haseko Corp. (I) 80,500 53,125
Hayashikane Sangyo Company, Ltd. (I) 4,000 3,518
Hazama Corp. 13,500 32,304
Heiwa Real Estate Company, Ltd. 6,400 75,803
Heiwado Company, Ltd. 5,500 76,388
Hi-lex Corp. 1,000 15,848
Hibiya Engineering, Ltd. 4,100 44,834
Hiday Hidaka Corp. 1,000 16,991
Higashi Nihon House Company Ltd. 8,000 30,609
Higashi-Nippon Bank, Ltd. 25,000 53,578
Higo Bank, Ltd. 29,000 168,261
Himaraya Company, Ltd. 600 4,592
Hioki Ee Corp. 1,100 18,108
Hiramatsu, Inc. 11 12,138
HIS Company, Ltd. 3,300 101,680
Hisaka Works, Ltd. (I) 4,000 36,976
Hitachi Cable, Ltd. (I)(L) 38,000 52,737
Hitachi Koki Company, Ltd. 8,700 62,521
Copyright © 2013 www.secdatabase.com. All Rights Reserved.Please Consider the Environment Before Printing This Document
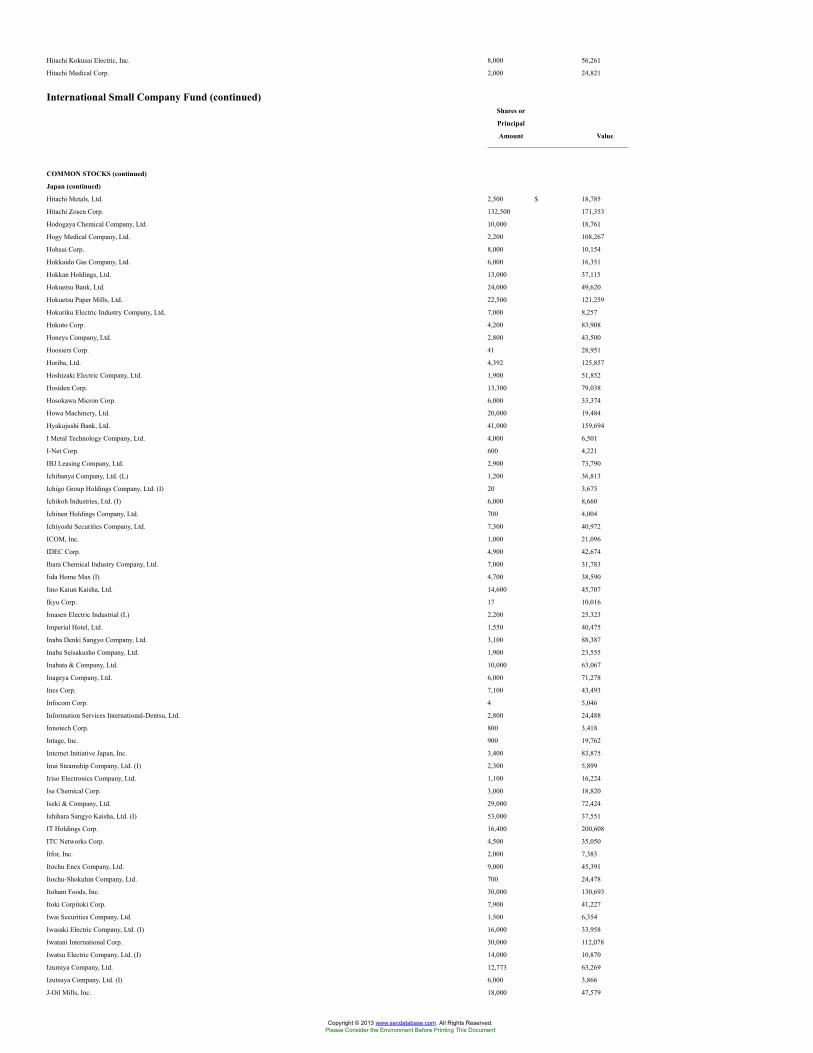
Hitachi Kokusai Electric, Inc. 8,000 56,261
Hitachi Medical Corp. 2,000 24,821
International Small Company Fund (continued)Shares or
Principal
Amount Value
COMMON STOCKS (continued)
Japan (continued)
Hitachi Metals, Ltd. 2,500 $ 18,785
Hitachi Zosen Corp. 132,500 171,353
Hodogaya Chemical Company, Ltd. 10,000 18,761
Hogy Medical Company, Ltd. 2,200 108,267
Hohsui Corp. 8,000 10,154
Hokkaido Gas Company, Ltd. 6,000 16,351
Hokkan Holdings, Ltd. 13,000 37,115
Hokuetsu Bank, Ltd. 24,000 49,620
Hokuetsu Paper Mills, Ltd. 22,500 121,259
Hokuriku Electric Industry Company, Ltd. 7,000 8,257
Hokuto Corp. 4,200 83,908
Honeys Company, Ltd. 2,800 43,500
Hoosiers Corp. 41 28,951
Horiba, Ltd. 4,392 125,857
Hoshizaki Electric Company, Ltd. 1,900 51,852
Hosiden Corp. 13,300 79,038
Hosokawa Micron Corp. 6,000 33,374
Howa Machinery, Ltd. 20,000 19,484
Hyakujushi Bank, Ltd. 41,000 159,694
I Metal Technology Company, Ltd. 4,000 6,501
I-Net Corp. 600 4,221
IBJ Leasing Company, Ltd. 2,900 73,790
Ichibanya Company, Ltd. (L) 1,200 36,813
Ichigo Group Holdings Company, Ltd. (I) 20 3,675
Ichikoh Industries, Ltd. (I) 6,000 8,660
Ichinen Holdings Company, Ltd. 700 4,004
Ichiyoshi Securities Company, Ltd. 7,300 40,972
ICOM, Inc. 1,000 21,096
IDEC Corp. 4,900 42,674
Ihara Chemical Industry Company, Ltd. 7,000 31,783
Iida Home Max (I) 4,700 38,590
Iino Kaiun Kaisha, Ltd. 14,600 45,707
Ikyu Corp. 17 10,016
Imasen Electric Industrial (L) 2,200 25,323
Imperial Hotel, Ltd. 1,550 40,475
Inaba Denki Sangyo Company, Ltd. 3,100 88,387
Inaba Seisakusho Company, Ltd. 1,900 23,555
Inabata & Company, Ltd. 10,000 63,067
Inageya Company, Ltd. 6,000 71,278
Ines Corp. 7,100 43,493
Infocom Corp. 4 5,046
Information Services International-Dentsu, Ltd. 2,800 24,488
Innotech Corp. 800 3,418
Intage, Inc. 900 19,762
Internet Initiative Japan, Inc. 3,400 83,875
Inui Steamship Company, Ltd. (I) 2,300 5,899
Iriso Electronics Company, Ltd. 1,100 16,224
Ise Chemical Corp. 3,000 18,820
Iseki & Company, Ltd. 29,000 72,424
Ishihara Sangyo Kaisha, Ltd. (I) 53,000 37,551
IT Holdings Corp. 16,400 200,608
ITC Networks Corp. 4,500 35,050
Itfor, Inc. 2,000 7,383
Itochu Enex Company, Ltd. 9,000 45,391
Itochu-Shokuhin Company, Ltd. 700 24,478
Itoham Foods, Inc. 30,000 130,693
Itoki Corpitoki Corp. 7,900 41,227
Iwai Securities Company, Ltd. 1,500 6,354
Iwasaki Electric Company, Ltd. (I) 16,000 33,958
Iwatani International Corp. 30,000 112,078
Iwatsu Electric Company, Ltd. (I) 14,000 10,870
Izumiya Company, Ltd. 12,773 63,269
Izutsuya Company, Ltd. (I) 6,000 3,866
J-Oil Mills, Inc. 18,000 47,579
Copyright © 2013 www.secdatabase.com. All Rights Reserved.Please Consider the Environment Before Printing This Document
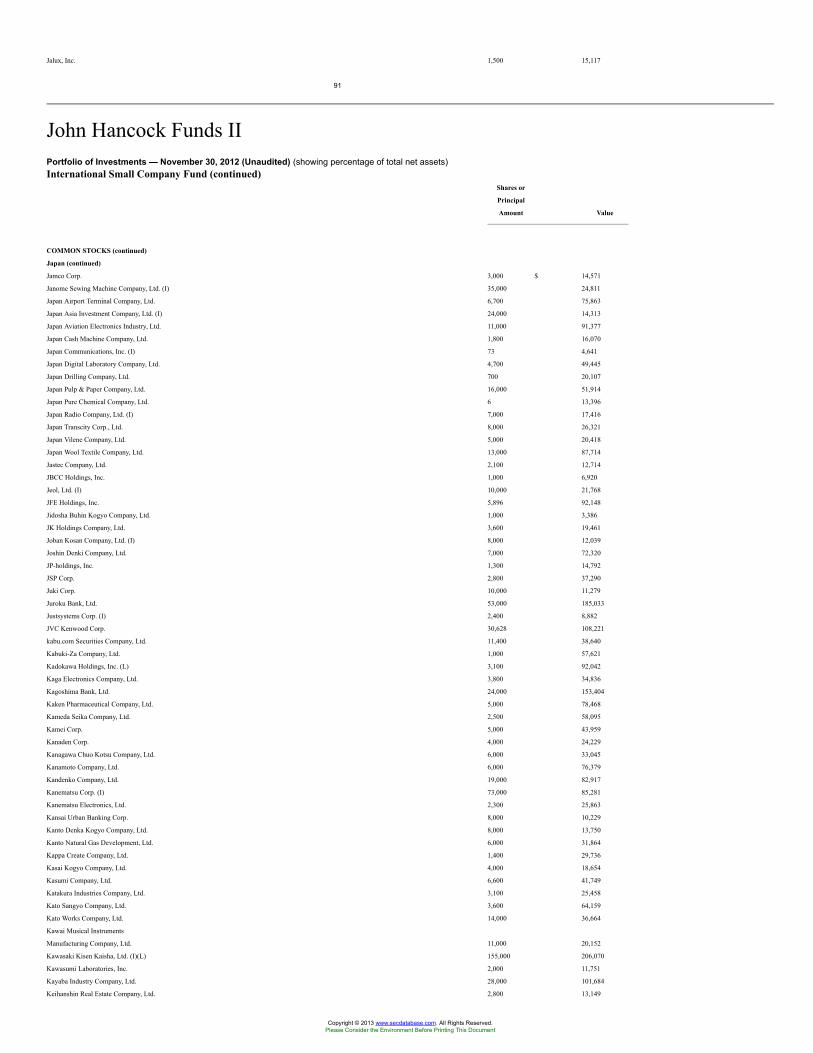
Jalux, Inc. 1,500 15,117
91
John Hancock Funds IIPortfolio of Investments — November 30, 2012 (Unaudited) (showing percentage of total net assets)International Small Company Fund (continued)
Shares or
Principal
Amount Value
COMMON STOCKS (continued)
Japan (continued)
Jamco Corp. 3,000 $ 14,571
Janome Sewing Machine Company, Ltd. (I) 35,000 24,811
Japan Airport Terminal Company, Ltd. 6,700 75,863
Japan Asia Investment Company, Ltd. (I) 24,000 14,313
Japan Aviation Electronics Industry, Ltd. 11,000 91,377
Japan Cash Machine Company, Ltd. 1,800 16,070
Japan Communications, Inc. (I) 73 4,641
Japan Digital Laboratory Company, Ltd. 4,700 49,445
Japan Drilling Company, Ltd. 700 20,107
Japan Pulp & Paper Company, Ltd. 16,000 51,914
Japan Pure Chemical Company, Ltd. 6 13,396
Japan Radio Company, Ltd. (I) 7,000 17,416
Japan Transcity Corp., Ltd. 8,000 26,321
Japan Vilene Company, Ltd. 5,000 20,418
Japan Wool Textile Company, Ltd. 13,000 87,714
Jastec Company, Ltd. 2,100 12,714
JBCC Holdings, Inc. 1,000 6,920
Jeol, Ltd. (I) 10,000 21,768
JFE Holdings, Inc. 5,896 92,148
Jidosha Buhin Kogyo Company, Ltd. 1,000 3,386
JK Holdings Company, Ltd. 3,600 19,461
Joban Kosan Company, Ltd. (I) 8,000 12,039
Joshin Denki Company, Ltd. 7,000 72,320
JP-holdings, Inc. 1,300 14,792
JSP Corp. 2,800 37,290
Juki Corp. 10,000 11,279
Juroku Bank, Ltd. 53,000 185,033
Justsystems Corp. (I) 2,400 8,882
JVC Kenwood Corp. 30,628 108,221
kabu.com Securities Company, Ltd. 11,400 38,640
Kabuki-Za Company, Ltd. 1,000 57,621
Kadokawa Holdings, Inc. (L) 3,100 92,042
Kaga Electronics Company, Ltd. 3,800 34,836
Kagoshima Bank, Ltd. 24,000 153,404
Kaken Pharmaceutical Company, Ltd. 5,000 78,468
Kameda Seika Company, Ltd. 2,500 58,095
Kamei Corp. 5,000 43,959
Kanaden Corp. 4,000 24,229
Kanagawa Chuo Kotsu Company, Ltd. 6,000 33,045
Kanamoto Company, Ltd. 6,000 76,379
Kandenko Company, Ltd. 19,000 82,917
Kanematsu Corp. (I) 73,000 85,281
Kanematsu Electronics, Ltd. 2,300 25,863
Kansai Urban Banking Corp. 8,000 10,229
Kanto Denka Kogyo Company, Ltd. 8,000 13,750
Kanto Natural Gas Development, Ltd. 6,000 31,864
Kappa Create Company, Ltd. 1,400 29,736
Kasai Kogyo Company, Ltd. 4,000 18,654
Kasumi Company, Ltd. 6,600 41,749
Katakura Industries Company, Ltd. 3,100 25,458
Kato Sangyo Company, Ltd. 3,600 64,159
Kato Works Company, Ltd. 14,000 36,664
Kawai Musical Instruments
Manufacturing Company, Ltd. 11,000 20,152
Kawasaki Kisen Kaisha, Ltd. (I)(L) 155,000 206,070
Kawasumi Laboratories, Inc. 2,000 11,751
Kayaba Industry Company, Ltd. 28,000 101,684
Keihanshin Real Estate Company, Ltd. 2,800 13,149
Copyright © 2013 www.secdatabase.com. All Rights Reserved.Please Consider the Environment Before Printing This Document
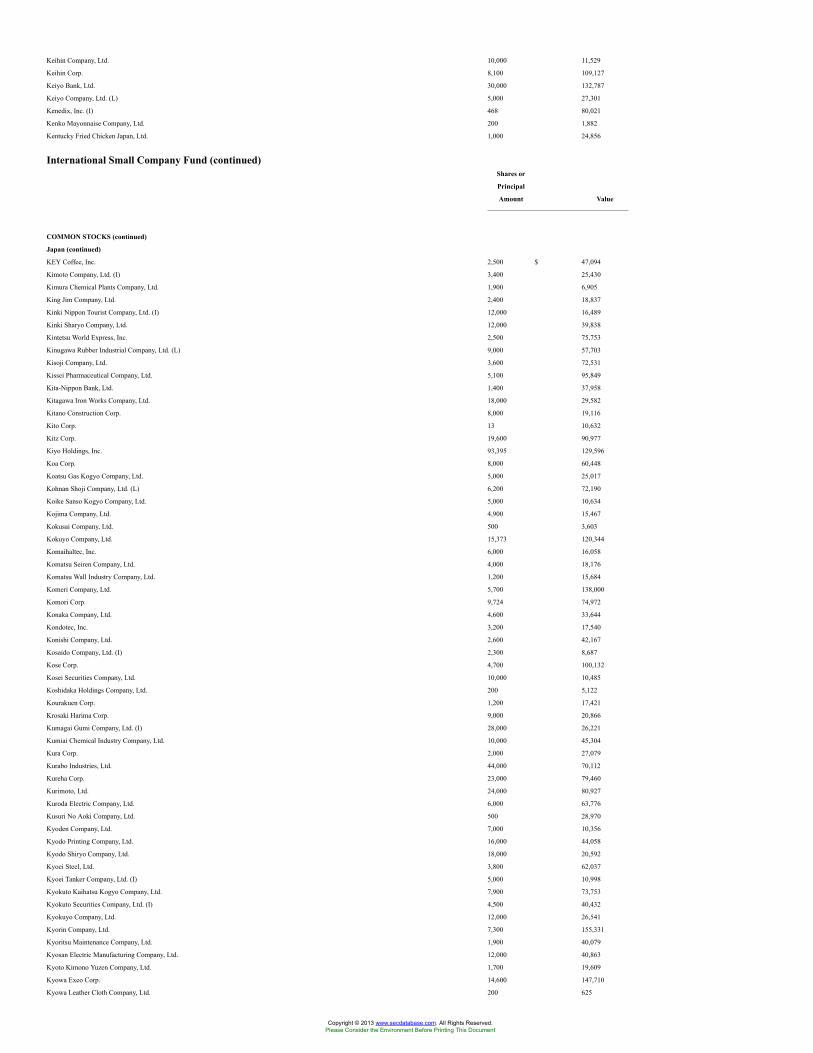
Keihin Company, Ltd. 10,000 11,529
Keihin Corp. 8,100 109,127
Keiyo Bank, Ltd. 30,000 132,787
Keiyo Company, Ltd. (L) 5,000 27,301
Kenedix, Inc. (I) 468 80,021
Kenko Mayonnaise Company, Ltd. 200 1,882
Kentucky Fried Chicken Japan, Ltd. 1,000 24,856
International Small Company Fund (continued)Shares or
Principal
Amount Value
COMMON STOCKS (continued)
Japan (continued)
KEY Coffee, Inc. 2,500 $ 47,094
Kimoto Company, Ltd. (I) 3,400 25,430
Kimura Chemical Plants Company, Ltd. 1,900 6,905
King Jim Company, Ltd. 2,400 18,837
Kinki Nippon Tourist Company, Ltd. (I) 12,000 16,489
Kinki Sharyo Company, Ltd. 12,000 39,838
Kintetsu World Express, Inc. 2,500 75,753
Kinugawa Rubber Industrial Company, Ltd. (L) 9,000 57,703
Kisoji Company, Ltd. 3,600 72,531
Kissei Pharmaceutical Company, Ltd. 5,100 95,849
Kita-Nippon Bank, Ltd. 1,400 37,958
Kitagawa Iron Works Company, Ltd. 18,000 29,582
Kitano Construction Corp. 8,000 19,116
Kito Corp. 13 10,632
Kitz Corp. 19,600 90,977
Kiyo Holdings, Inc. 93,395 129,596
Koa Corp. 8,000 60,448
Koatsu Gas Kogyo Company, Ltd. 5,000 25,017
Kohnan Shoji Company, Ltd. (L) 6,200 72,190
Koike Sanso Kogyo Company, Ltd. 5,000 10,634
Kojima Company, Ltd. 4,900 15,467
Kokusai Company, Ltd. 500 3,603
Kokuyo Company, Ltd. 15,373 120,344
Komaihaltec, Inc. 6,000 16,058
Komatsu Seiren Company, Ltd. 4,000 18,176
Komatsu Wall Industry Company, Ltd. 1,200 15,684
Komeri Company, Ltd. 5,700 138,000
Komori Corp. 9,724 74,972
Konaka Company, Ltd. 4,600 33,644
Kondotec, Inc. 3,200 17,540
Konishi Company, Ltd. 2,600 42,167
Kosaido Company, Ltd. (I) 2,300 8,687
Kose Corp. 4,700 100,132
Kosei Securities Company, Ltd. 10,000 10,485
Koshidaka Holdings Company, Ltd. 200 5,122
Kourakuen Corp. 1,200 17,421
Krosaki Harima Corp. 9,000 20,866
Kumagai Gumi Company, Ltd. (I) 28,000 26,221
Kumiai Chemical Industry Company, Ltd. 10,000 45,304
Kura Corp. 2,000 27,079
Kurabo Industries, Ltd. 44,000 70,112
Kureha Corp. 23,000 79,460
Kurimoto, Ltd. 24,000 80,927
Kuroda Electric Company, Ltd. 6,000 63,776
Kusuri No Aoki Company, Ltd. 500 28,970
Kyoden Company, Ltd. 7,000 10,356
Kyodo Printing Company, Ltd. 16,000 44,058
Kyodo Shiryo Company, Ltd. 18,000 20,592
Kyoei Steel, Ltd. 3,800 62,037
Kyoei Tanker Company, Ltd. (I) 5,000 10,998
Kyokuto Kaihatsu Kogyo Company, Ltd. 7,900 73,753
Kyokuto Securities Company, Ltd. (I) 4,500 40,432
Kyokuyo Company, Ltd. 12,000 26,541
Kyorin Company, Ltd. 7,300 155,331
Kyoritsu Maintenance Company, Ltd. 1,900 40,079
Kyosan Electric Manufacturing Company, Ltd. 12,000 40,863
Kyoto Kimono Yuzen Company, Ltd. 1,700 19,609
Kyowa Exeo Corp. 14,600 147,710
Kyowa Leather Cloth Company, Ltd. 200 625
Copyright © 2013 www.secdatabase.com. All Rights Reserved.Please Consider the Environment Before Printing This Document
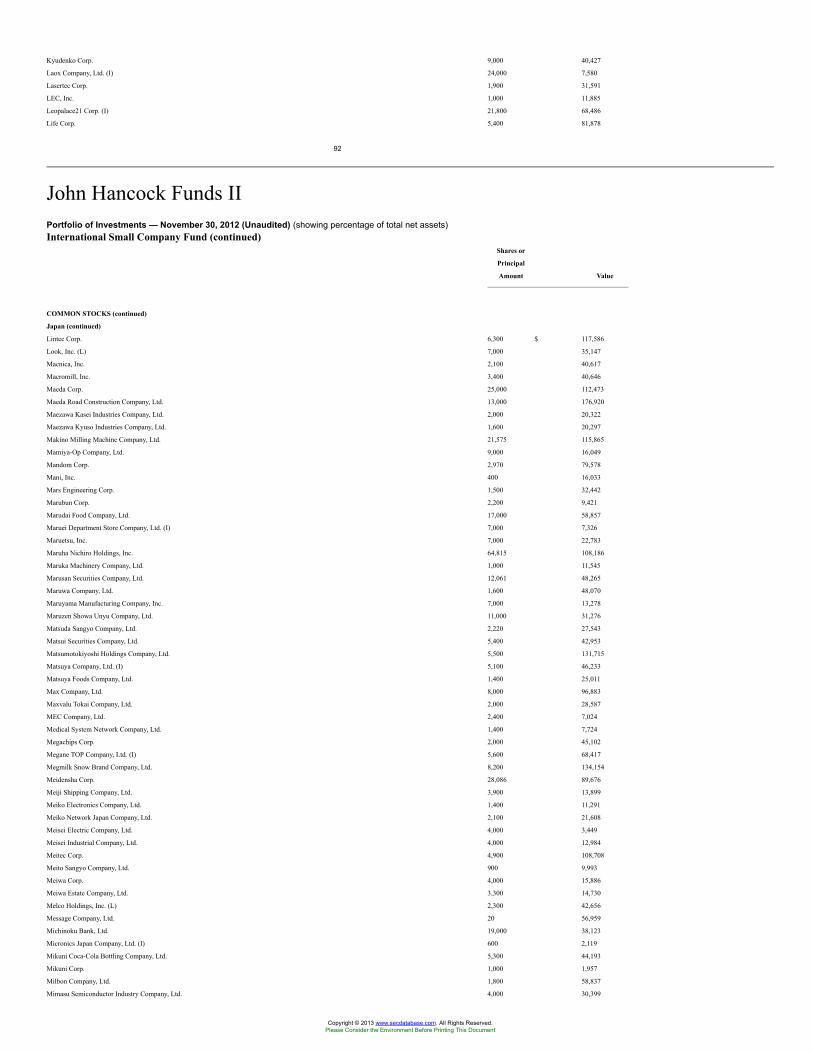
Kyudenko Corp. 9,000 40,427
Laox Company, Ltd. (I) 24,000 7,580
Lasertec Corp. 1,900 31,591
LEC, Inc. 1,000 11,885
Leopalace21 Corp. (I) 21,800 68,486
Life Corp. 5,400 81,878
92
John Hancock Funds IIPortfolio of Investments — November 30, 2012 (Unaudited) (showing percentage of total net assets)International Small Company Fund (continued)
Shares or
Principal
Amount Value
COMMON STOCKS (continued)
Japan (continued)
Lintec Corp. 6,300 $ 117,586
Look, Inc. (L) 7,000 35,147
Macnica, Inc. 2,100 40,617
Macromill, Inc. 3,400 40,646
Maeda Corp. 25,000 112,473
Maeda Road Construction Company, Ltd. 13,000 176,920
Maezawa Kasei Industries Company, Ltd. 2,000 20,322
Maezawa Kyuso Industries Company, Ltd. 1,600 20,297
Makino Milling Machine Company, Ltd. 21,575 115,865
Mamiya-Op Company, Ltd. 9,000 16,049
Mandom Corp. 2,970 79,578
Mani, Inc. 400 16,033
Mars Engineering Corp. 1,500 32,442
Marubun Corp. 2,200 9,421
Marudai Food Company, Ltd. 17,000 58,857
Maruei Department Store Company, Ltd. (I) 7,000 7,326
Maruetsu, Inc. 7,000 22,783
Maruha Nichiro Holdings, Inc. 64,815 108,186
Maruka Machinery Company, Ltd. 1,000 11,545
Marusan Securities Company, Ltd. 12,061 48,265
Maruwa Company, Ltd. 1,600 48,070
Maruyama Manufacturing Company, Inc. 7,000 13,278
Maruzen Showa Unyu Company, Ltd. 11,000 31,276
Matsuda Sangyo Company, Ltd. 2,220 27,543
Matsui Securities Company, Ltd. 5,400 42,953
Matsumotokiyoshi Holdings Company, Ltd. 5,500 131,715
Matsuya Company, Ltd. (I) 5,100 46,233
Matsuya Foods Company, Ltd. 1,400 25,011
Max Company, Ltd. 8,000 96,883
Maxvalu Tokai Company, Ltd. 2,000 28,587
MEC Company, Ltd. 2,400 7,024
Medical System Network Company, Ltd. 1,400 7,724
Megachips Corp. 2,000 45,102
Megane TOP Company, Ltd. (I) 5,600 68,417
Megmilk Snow Brand Company, Ltd. 8,200 134,154
Meidensha Corp. 28,086 89,676
Meiji Shipping Company, Ltd. 3,900 13,899
Meiko Electronics Company, Ltd. 1,400 11,291
Meiko Network Japan Company, Ltd. 2,100 21,608
Meisei Electric Company, Ltd. 4,000 3,449
Meisei Industrial Company, Ltd. 4,000 12,984
Meitec Corp. 4,900 108,708
Meito Sangyo Company, Ltd. 900 9,993
Meiwa Corp. 4,000 15,886
Meiwa Estate Company, Ltd. 3,300 14,730
Melco Holdings, Inc. (L) 2,300 42,656
Message Company, Ltd. 20 56,959
Michinoku Bank, Ltd. 19,000 38,123
Micronics Japan Company, Ltd. (I) 600 2,119
Mikuni Coca-Cola Bottling Company, Ltd. 5,300 44,193
Mikuni Corp. 1,000 1,957
Milbon Company, Ltd. 1,800 58,837
Mimasu Semiconductor Industry Company, Ltd. 4,000 30,399
Copyright © 2013 www.secdatabase.com. All Rights Reserved.Please Consider the Environment Before Printing This Document
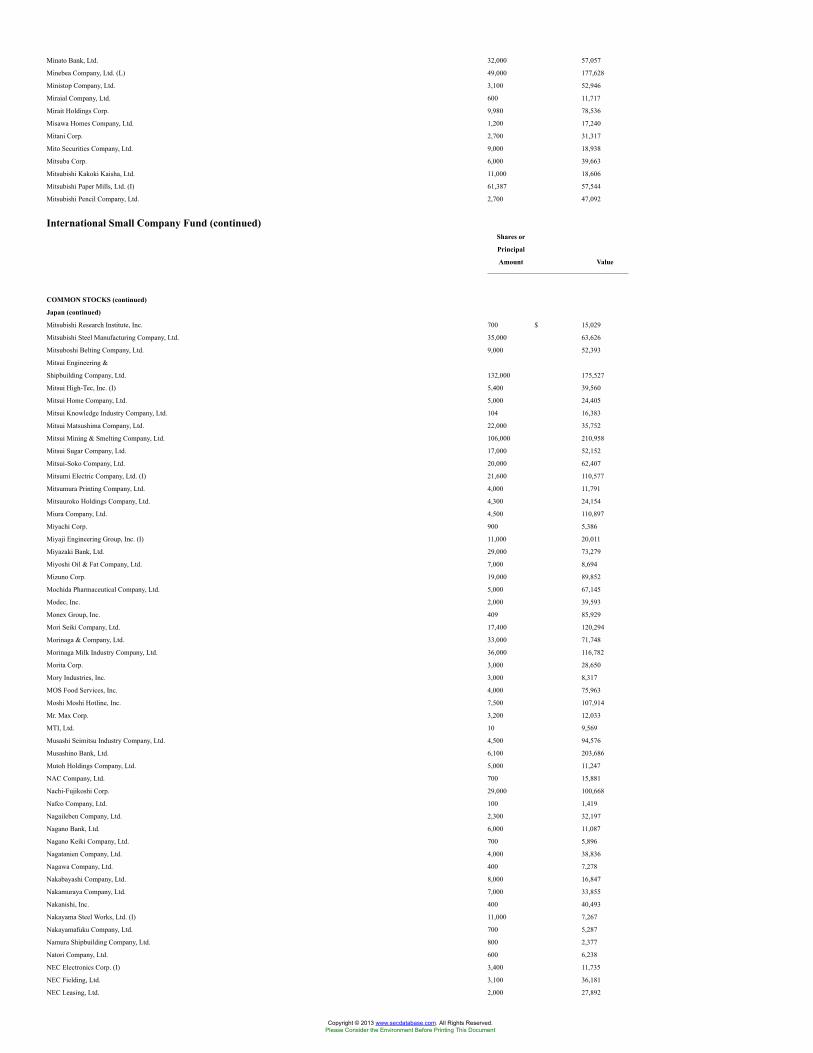
Minato Bank, Ltd. 32,000 57,057
Minebea Company, Ltd. (L) 49,000 177,628
Ministop Company, Ltd. 3,100 52,946
Miraial Company, Ltd. 600 11,717
Mirait Holdings Corp. 9,980 78,536
Misawa Homes Company, Ltd. 1,200 17,240
Mitani Corp. 2,700 31,317
Mito Securities Company, Ltd. 9,000 18,938
Mitsuba Corp. 6,000 39,663
Mitsubishi Kakoki Kaisha, Ltd. 11,000 18,606
Mitsubishi Paper Mills, Ltd. (I) 61,387 57,544
Mitsubishi Pencil Company, Ltd. 2,700 47,092
International Small Company Fund (continued)Shares or
Principal
Amount Value
COMMON STOCKS (continued)
Japan (continued)
Mitsubishi Research Institute, Inc. 700 $ 15,029
Mitsubishi Steel Manufacturing Company, Ltd. 35,000 63,626
Mitsuboshi Belting Company, Ltd. 9,000 52,393
Mitsui Engineering &
Shipbuilding Company, Ltd. 132,000 175,527
Mitsui High-Tec, Inc. (I) 5,400 39,560
Mitsui Home Company, Ltd. 5,000 24,405
Mitsui Knowledge Industry Company, Ltd. 104 16,383
Mitsui Matsushima Company, Ltd. 22,000 35,752
Mitsui Mining & Smelting Company, Ltd. 106,000 210,958
Mitsui Sugar Company, Ltd. 17,000 52,152
Mitsui-Soko Company, Ltd. 20,000 62,407
Mitsumi Electric Company, Ltd. (I) 21,600 110,577
Mitsumura Printing Company, Ltd. 4,000 11,791
Mitsuuroko Holdings Company, Ltd. 4,300 24,154
Miura Company, Ltd. 4,500 110,897
Miyachi Corp. 900 5,386
Miyaji Engineering Group, Inc. (I) 11,000 20,011
Miyazaki Bank, Ltd. 29,000 73,279
Miyoshi Oil & Fat Company, Ltd. 7,000 8,694
Mizuno Corp. 19,000 89,852
Mochida Pharmaceutical Company, Ltd. 5,000 67,145
Modec, Inc. 2,000 39,593
Monex Group, Inc. 409 85,929
Mori Seiki Company, Ltd. 17,400 120,294
Morinaga & Company, Ltd. 33,000 71,748
Morinaga Milk Industry Company, Ltd. 36,000 116,782
Morita Corp. 3,000 28,650
Mory Industries, Inc. 3,000 8,317
MOS Food Services, Inc. 4,000 75,963
Moshi Moshi Hotline, Inc. 7,500 107,914
Mr. Max Corp. 3,200 12,033
MTI, Ltd. 10 9,569
Musashi Seimitsu Industry Company, Ltd. 4,500 94,576
Musashino Bank, Ltd. 6,100 203,686
Mutoh Holdings Company, Ltd. 5,000 11,247
NAC Company, Ltd. 700 15,881
Nachi-Fujikoshi Corp. 29,000 100,668
Nafco Company, Ltd. 100 1,419
Nagaileben Company, Ltd. 2,300 32,197
Nagano Bank, Ltd. 6,000 11,087
Nagano Keiki Company, Ltd. 700 5,896
Nagatanien Company, Ltd. 4,000 38,836
Nagawa Company, Ltd. 400 7,278
Nakabayashi Company, Ltd. 8,000 16,847
Nakamuraya Company, Ltd. 7,000 33,855
Nakanishi, Inc. 400 40,493
Nakayama Steel Works, Ltd. (I) 11,000 7,267
Nakayamafuku Company, Ltd. 700 5,287
Namura Shipbuilding Company, Ltd. 800 2,377
Natori Company, Ltd. 600 6,238
NEC Electronics Corp. (I) 3,400 11,735
NEC Fielding, Ltd. 3,100 36,181
NEC Leasing, Ltd. 2,000 27,892
Copyright © 2013 www.secdatabase.com. All Rights Reserved.Please Consider the Environment Before Printing This Document
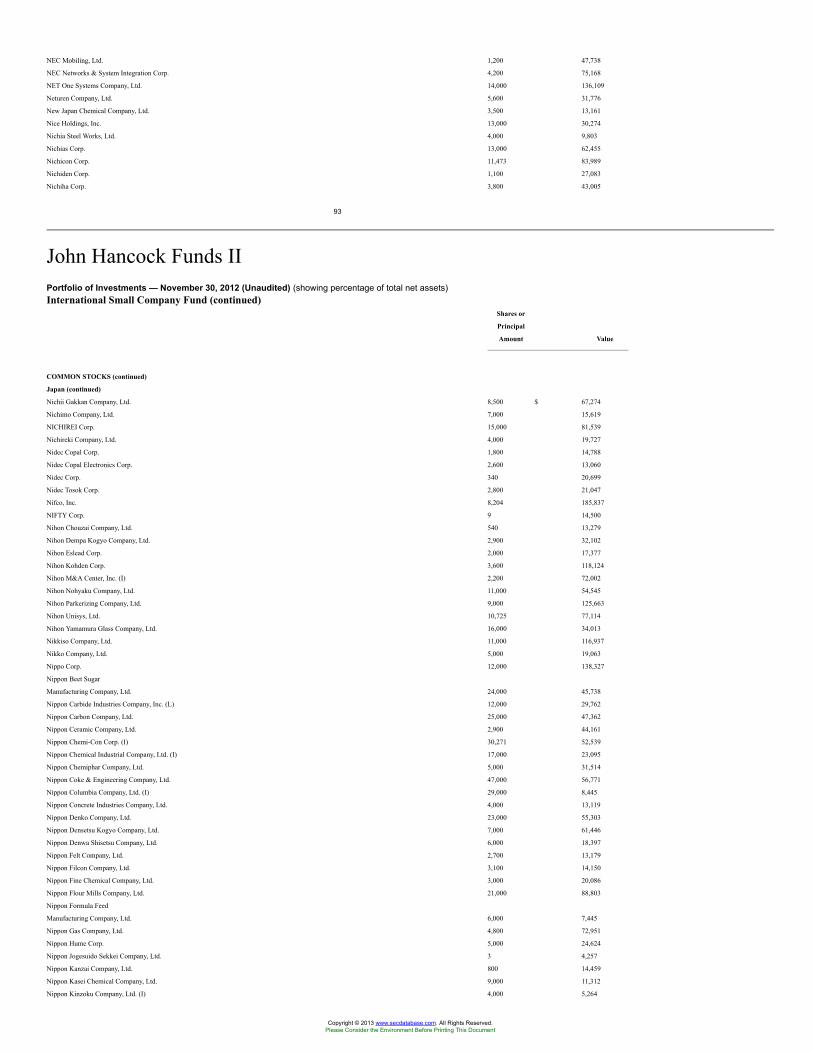
NEC Mobiling, Ltd. 1,200 47,738
NEC Networks & System Integration Corp. 4,200 75,168
NET One Systems Company, Ltd. 14,000 136,109
Neturen Company, Ltd. 5,600 31,776
New Japan Chemical Company, Ltd. 3,500 13,161
Nice Holdings, Inc. 13,000 30,274
Nichia Steel Works, Ltd. 4,000 9,803
Nichias Corp. 13,000 62,455
Nichicon Corp. 11,473 83,989
Nichiden Corp. 1,100 27,083
Nichiha Corp. 3,800 43,005
93
John Hancock Funds IIPortfolio of Investments — November 30, 2012 (Unaudited) (showing percentage of total net assets)International Small Company Fund (continued)
Shares or
Principal
Amount Value
COMMON STOCKS (continued)
Japan (continued)
Nichii Gakkan Company, Ltd. 8,500 $ 67,274
Nichimo Company, Ltd. 7,000 15,619
NICHIREI Corp. 15,000 81,539
Nichireki Company, Ltd. 4,000 19,727
Nidec Copal Corp. 1,800 14,788
Nidec Copal Electronics Corp. 2,600 13,060
Nidec Corp. 340 20,699
Nidec Tosok Corp. 2,800 21,047
Nifco, Inc. 8,204 185,837
NIFTY Corp. 9 14,500
Nihon Chouzai Company, Ltd. 540 13,279
Nihon Dempa Kogyo Company, Ltd. 2,900 32,102
Nihon Eslead Corp. 2,000 17,377
Nihon Kohden Corp. 3,600 118,124
Nihon M&A Center, Inc. (I) 2,200 72,002
Nihon Nohyaku Company, Ltd. 11,000 54,545
Nihon Parkerizing Company, Ltd. 9,000 125,663
Nihon Unisys, Ltd. 10,725 77,114
Nihon Yamamura Glass Company, Ltd. 16,000 34,013
Nikkiso Company, Ltd. 11,000 116,937
Nikko Company, Ltd. 5,000 19,063
Nippo Corp. 12,000 138,327
Nippon Beet Sugar
Manufacturing Company, Ltd. 24,000 45,738
Nippon Carbide Industries Company, Inc. (L) 12,000 29,762
Nippon Carbon Company, Ltd. 25,000 47,362
Nippon Ceramic Company, Ltd. 2,900 44,161
Nippon Chemi-Con Corp. (I) 30,271 52,539
Nippon Chemical Industrial Company, Ltd. (I) 17,000 23,095
Nippon Chemiphar Company, Ltd. 5,000 31,514
Nippon Coke & Engineering Company, Ltd. 47,000 56,771
Nippon Columbia Company, Ltd. (I) 29,000 8,445
Nippon Concrete Industries Company, Ltd. 4,000 13,119
Nippon Denko Company, Ltd. 23,000 55,303
Nippon Densetsu Kogyo Company, Ltd. 7,000 61,446
Nippon Denwa Shisetsu Company, Ltd. 6,000 18,397
Nippon Felt Company, Ltd. 2,700 13,179
Nippon Filcon Company, Ltd. 3,100 14,150
Nippon Fine Chemical Company, Ltd. 3,000 20,086
Nippon Flour Mills Company, Ltd. 21,000 88,803
Nippon Formula Feed
Manufacturing Company, Ltd. 6,000 7,445
Nippon Gas Company, Ltd. 4,800 72,951
Nippon Hume Corp. 5,000 24,624
Nippon Jogesuido Sekkei Company, Ltd. 3 4,257
Nippon Kanzai Company, Ltd. 800 14,459
Nippon Kasei Chemical Company, Ltd. 9,000 11,312
Nippon Kinzoku Company, Ltd. (I) 4,000 5,264
Copyright © 2013 www.secdatabase.com. All Rights Reserved.Please Consider the Environment Before Printing This Document
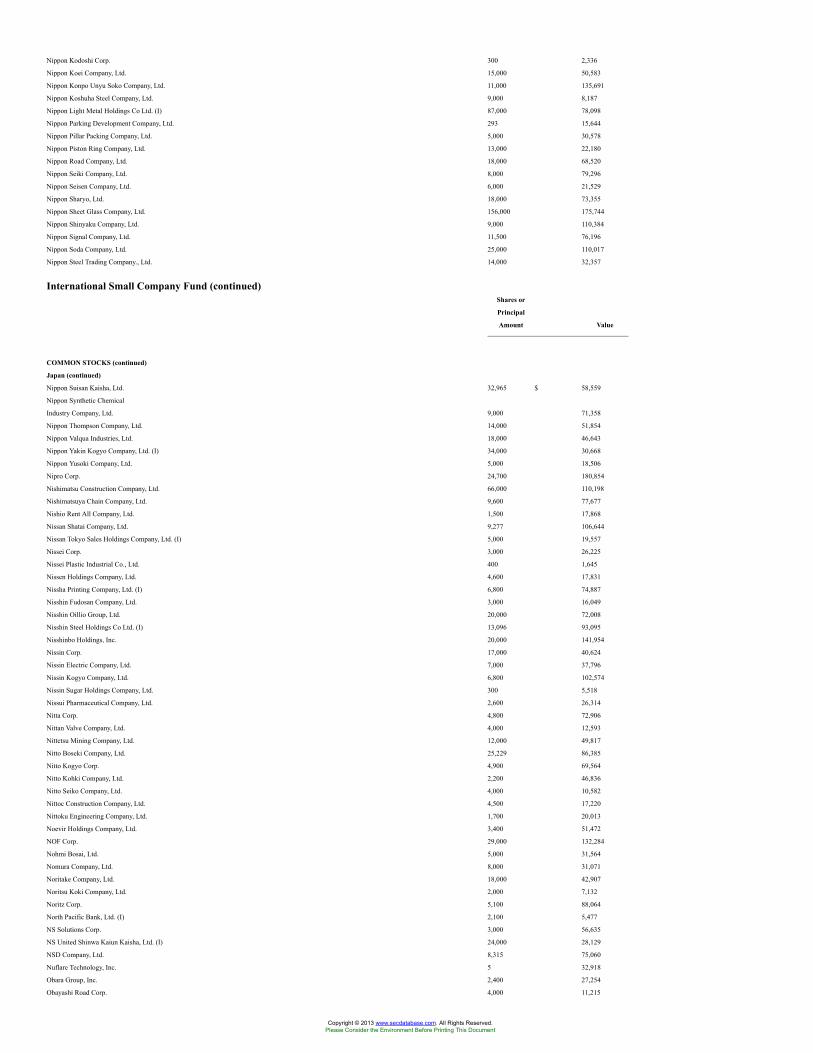
Nippon Kodoshi Corp. 300 2,336
Nippon Koei Company, Ltd. 15,000 50,583
Nippon Konpo Unyu Soko Company, Ltd. 11,000 135,691
Nippon Koshuha Steel Company, Ltd. 9,000 8,187
Nippon Light Metal Holdings Co Ltd. (I) 87,000 78,098
Nippon Parking Development Company, Ltd. 293 15,644
Nippon Pillar Packing Company, Ltd. 5,000 30,578
Nippon Piston Ring Company, Ltd. 13,000 22,180
Nippon Road Company, Ltd. 18,000 68,520
Nippon Seiki Company, Ltd. 8,000 79,296
Nippon Seisen Company, Ltd. 6,000 21,529
Nippon Sharyo, Ltd. 18,000 73,355
Nippon Sheet Glass Company, Ltd. 156,000 175,744
Nippon Shinyaku Company, Ltd. 9,000 110,384
Nippon Signal Company, Ltd. 11,500 76,196
Nippon Soda Company, Ltd. 25,000 110,017
Nippon Steel Trading Company., Ltd. 14,000 32,357
International Small Company Fund (continued)Shares or
Principal
Amount Value
COMMON STOCKS (continued)
Japan (continued)
Nippon Suisan Kaisha, Ltd. 32,965 $ 58,559
Nippon Synthetic Chemical
Industry Company, Ltd. 9,000 71,358
Nippon Thompson Company, Ltd. 14,000 51,854
Nippon Valqua Industries, Ltd. 18,000 46,643
Nippon Yakin Kogyo Company, Ltd. (I) 34,000 30,668
Nippon Yusoki Company, Ltd. 5,000 18,506
Nipro Corp. 24,700 180,854
Nishimatsu Construction Company, Ltd. 66,000 110,198
Nishimatsuya Chain Company, Ltd. 9,600 77,677
Nishio Rent All Company, Ltd. 1,500 17,868
Nissan Shatai Company, Ltd. 9,277 106,644
Nissan Tokyo Sales Holdings Company, Ltd. (I) 5,000 19,557
Nissei Corp. 3,000 26,225
Nissei Plastic Industrial Co., Ltd. 400 1,645
Nissen Holdings Company, Ltd. 4,600 17,831
Nissha Printing Company, Ltd. (I) 6,800 74,887
Nisshin Fudosan Company, Ltd. 3,000 16,049
Nisshin Oillio Group, Ltd. 20,000 72,008
Nisshin Steel Holdings Co Ltd. (I) 13,096 93,095
Nisshinbo Holdings, Inc. 20,000 141,954
Nissin Corp. 17,000 40,624
Nissin Electric Company, Ltd. 7,000 37,796
Nissin Kogyo Company, Ltd. 6,800 102,574
Nissin Sugar Holdings Company, Ltd. 300 5,518
Nissui Pharmaceutical Company, Ltd. 2,600 26,314
Nitta Corp. 4,800 72,906
Nittan Valve Company, Ltd. 4,000 12,593
Nittetsu Mining Company, Ltd. 12,000 49,817
Nitto Boseki Company, Ltd. 25,229 86,385
Nitto Kogyo Corp. 4,900 69,564
Nitto Kohki Company, Ltd. 2,200 46,836
Nitto Seiko Company, Ltd. 4,000 10,582
Nittoc Construction Company, Ltd. 4,500 17,220
Nittoku Engineering Company, Ltd. 1,700 20,013
Noevir Holdings Company, Ltd. 3,400 51,472
NOF Corp. 29,000 132,284
Nohmi Bosai, Ltd. 5,000 31,564
Nomura Company, Ltd. 8,000 31,071
Noritake Company, Ltd. 18,000 42,907
Noritsu Koki Company, Ltd. 2,000 7,132
Noritz Corp. 5,100 88,064
North Pacific Bank, Ltd. (I) 2,100 5,477
NS Solutions Corp. 3,000 56,635
NS United Shinwa Kaiun Kaisha, Ltd. (I) 24,000 28,129
NSD Company, Ltd. 8,315 75,060
Nuflare Technology, Inc. 5 32,918
Obara Group, Inc. 2,400 27,254
Obayashi Road Corp. 4,000 11,215
Copyright © 2013 www.secdatabase.com. All Rights Reserved.Please Consider the Environment Before Printing This Document
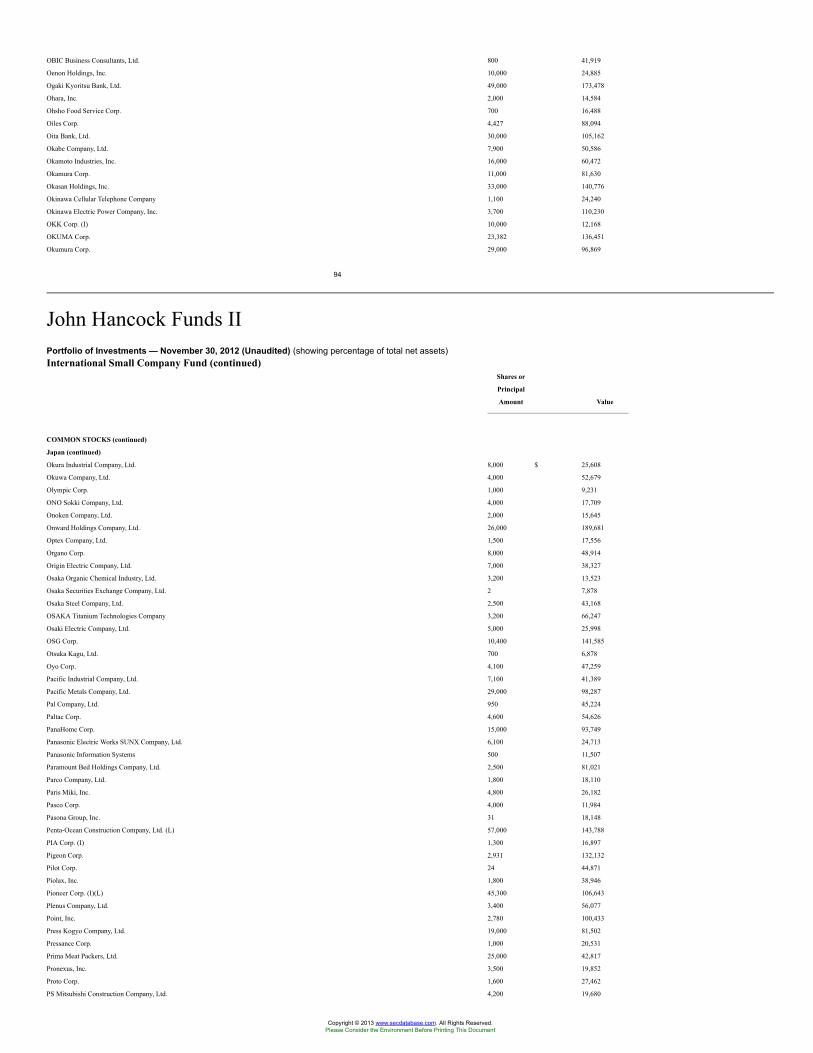
OBIC Business Consultants, Ltd. 800 41,919
Oenon Holdings, Inc. 10,000 24,885
Ogaki Kyoritsu Bank, Ltd. 49,000 173,478
Ohara, Inc. 2,000 14,584
Ohsho Food Service Corp. 700 16,488
Oiles Corp. 4,427 88,094
Oita Bank, Ltd. 30,000 105,162
Okabe Company, Ltd. 7,900 50,586
Okamoto Industries, Inc. 16,000 60,472
Okamura Corp. 11,000 81,630
Okasan Holdings, Inc. 33,000 140,776
Okinawa Cellular Telephone Company 1,100 24,240
Okinawa Electric Power Company, Inc. 3,700 110,230
OKK Corp. (I) 10,000 12,168
OKUMA Corp. 23,382 136,451
Okumura Corp. 29,000 96,869
94
John Hancock Funds IIPortfolio of Investments — November 30, 2012 (Unaudited) (showing percentage of total net assets)International Small Company Fund (continued)
Shares or
Principal
Amount Value
COMMON STOCKS (continued)
Japan (continued)
Okura Industrial Company, Ltd. 8,000 $ 25,608
Okuwa Company, Ltd. 4,000 52,679
Olympic Corp. 1,000 9,231
ONO Sokki Company, Ltd. 4,000 17,709
Onoken Company, Ltd. 2,000 15,645
Onward Holdings Company, Ltd. 26,000 189,681
Optex Company, Ltd. 1,500 17,556
Organo Corp. 8,000 48,914
Origin Electric Company, Ltd. 7,000 38,327
Osaka Organic Chemical Industry, Ltd. 3,200 13,523
Osaka Securities Exchange Company, Ltd. 2 7,878
Osaka Steel Company, Ltd. 2,500 43,168
OSAKA Titanium Technologies Company 3,200 66,247
Osaki Electric Company, Ltd. 5,000 25,998
OSG Corp. 10,400 141,585
Otsuka Kagu, Ltd. 700 6,878
Oyo Corp. 4,100 47,259
Pacific Industrial Company, Ltd. 7,100 41,389
Pacific Metals Company, Ltd. 29,000 98,287
Pal Company, Ltd. 950 45,224
Paltac Corp. 4,600 54,626
PanaHome Corp. 15,000 93,749
Panasonic Electric Works SUNX Company, Ltd. 6,100 24,713
Panasonic Information Systems 500 11,507
Paramount Bed Holdings Company, Ltd. 2,500 81,021
Parco Company, Ltd. 1,800 18,110
Paris Miki, Inc. 4,800 26,182
Pasco Corp. 4,000 11,984
Pasona Group, Inc. 31 18,148
Penta-Ocean Construction Company, Ltd. (L) 57,000 143,788
PIA Corp. (I) 1,300 16,897
Pigeon Corp. 2,931 132,132
Pilot Corp. 24 44,871
Piolax, Inc. 1,800 38,946
Pioneer Corp. (I)(L) 45,300 106,643
Plenus Company, Ltd. 3,400 56,077
Point, Inc. 2,780 100,433
Press Kogyo Company, Ltd. 19,000 81,502
Pressance Corp. 1,000 20,531
Prima Meat Packers, Ltd. 25,000 42,817
Pronexus, Inc. 3,500 19,852
Proto Corp. 1,600 27,462
PS Mitsubishi Construction Company, Ltd. 4,200 19,680
Copyright © 2013 www.secdatabase.com. All Rights Reserved.Please Consider the Environment Before Printing This Document
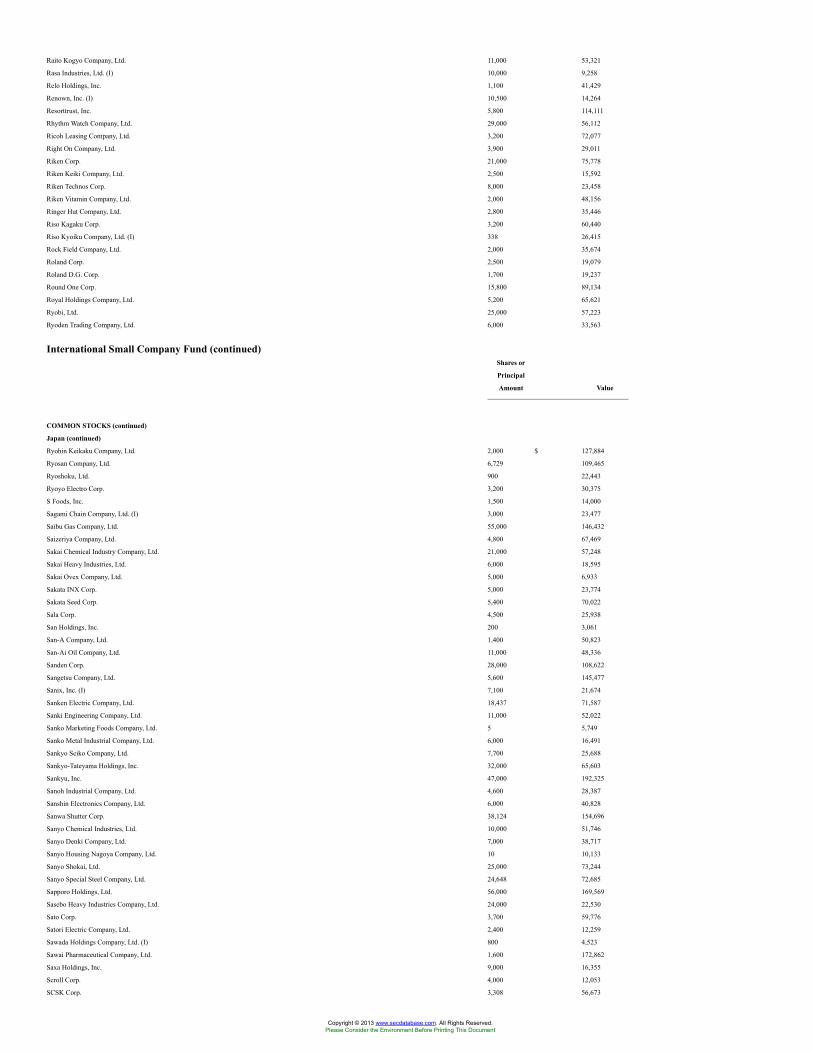
Raito Kogyo Company, Ltd. 11,000 53,321
Rasa Industries, Ltd. (I) 10,000 9,258
Relo Holdings, Inc. 1,100 41,429
Renown, Inc. (I) 10,500 14,264
Resorttrust, Inc. 5,800 114,111
Rhythm Watch Company, Ltd. 29,000 56,112
Ricoh Leasing Company, Ltd. 3,200 72,077
Right On Company, Ltd. 3,900 29,011
Riken Corp. 21,000 75,778
Riken Keiki Company, Ltd. 2,500 15,592
Riken Technos Corp. 8,000 23,458
Riken Vitamin Company, Ltd. 2,000 48,156
Ringer Hut Company, Ltd. 2,800 35,446
Riso Kagaku Corp. 3,200 60,440
Riso Kyoiku Company, Ltd. (I) 338 26,415
Rock Field Company, Ltd. 2,000 35,674
Roland Corp. 2,500 19,079
Roland D.G. Corp. 1,700 19,237
Round One Corp. 15,800 89,134
Royal Holdings Company, Ltd. 5,200 65,621
Ryobi, Ltd. 25,000 57,223
Ryoden Trading Company, Ltd. 6,000 33,563
International Small Company Fund (continued)Shares or
Principal
Amount Value
COMMON STOCKS (continued)
Japan (continued)
Ryohin Keikaku Company, Ltd. 2,000 $ 127,884
Ryosan Company, Ltd. 6,729 109,465
Ryoshoku, Ltd. 900 22,443
Ryoyo Electro Corp. 3,200 30,375
S Foods, Inc. 1,500 14,000
Sagami Chain Company, Ltd. (I) 3,000 23,477
Saibu Gas Company, Ltd. 55,000 146,432
Saizeriya Company, Ltd. 4,800 67,469
Sakai Chemical Industry Company, Ltd. 21,000 57,248
Sakai Heavy Industries, Ltd. 6,000 18,595
Sakai Ovex Company, Ltd. 5,000 6,933
Sakata INX Corp. 5,000 23,774
Sakata Seed Corp. 5,400 70,022
Sala Corp. 4,500 25,938
San Holdings, Inc. 200 3,061
San-A Company, Ltd. 1,400 50,823
San-Ai Oil Company, Ltd. 11,000 48,336
Sanden Corp. 28,000 108,622
Sangetsu Company, Ltd. 5,600 145,477
Sanix, Inc. (I) 7,100 21,674
Sanken Electric Company, Ltd. 18,437 71,587
Sanki Engineering Company, Ltd. 11,000 52,022
Sanko Marketing Foods Company, Ltd. 5 5,749
Sanko Metal Industrial Company, Ltd. 6,000 16,491
Sankyo Seiko Company, Ltd. 7,700 25,688
Sankyo-Tateyama Holdings, Inc. 32,000 65,603
Sankyu, Inc. 47,000 192,325
Sanoh Industrial Company, Ltd. 4,600 28,387
Sanshin Electronics Company, Ltd. 6,000 40,828
Sanwa Shutter Corp. 38,124 154,696
Sanyo Chemical Industries, Ltd. 10,000 51,746
Sanyo Denki Company, Ltd. 7,000 38,717
Sanyo Housing Nagoya Company, Ltd. 10 10,133
Sanyo Shokai, Ltd. 25,000 73,244
Sanyo Special Steel Company, Ltd. 24,648 72,685
Sapporo Holdings, Ltd. 56,000 169,569
Sasebo Heavy Industries Company, Ltd. 24,000 22,530
Sato Corp. 3,700 59,776
Satori Electric Company, Ltd. 2,400 12,259
Sawada Holdings Company, Ltd. (I) 800 4,523
Sawai Pharmaceutical Company, Ltd. 1,600 172,862
Saxa Holdings, Inc. 9,000 16,355
Scroll Corp. 4,000 12,053
SCSK Corp. 3,308 56,673
Copyright © 2013 www.secdatabase.com. All Rights Reserved.Please Consider the Environment Before Printing This Document
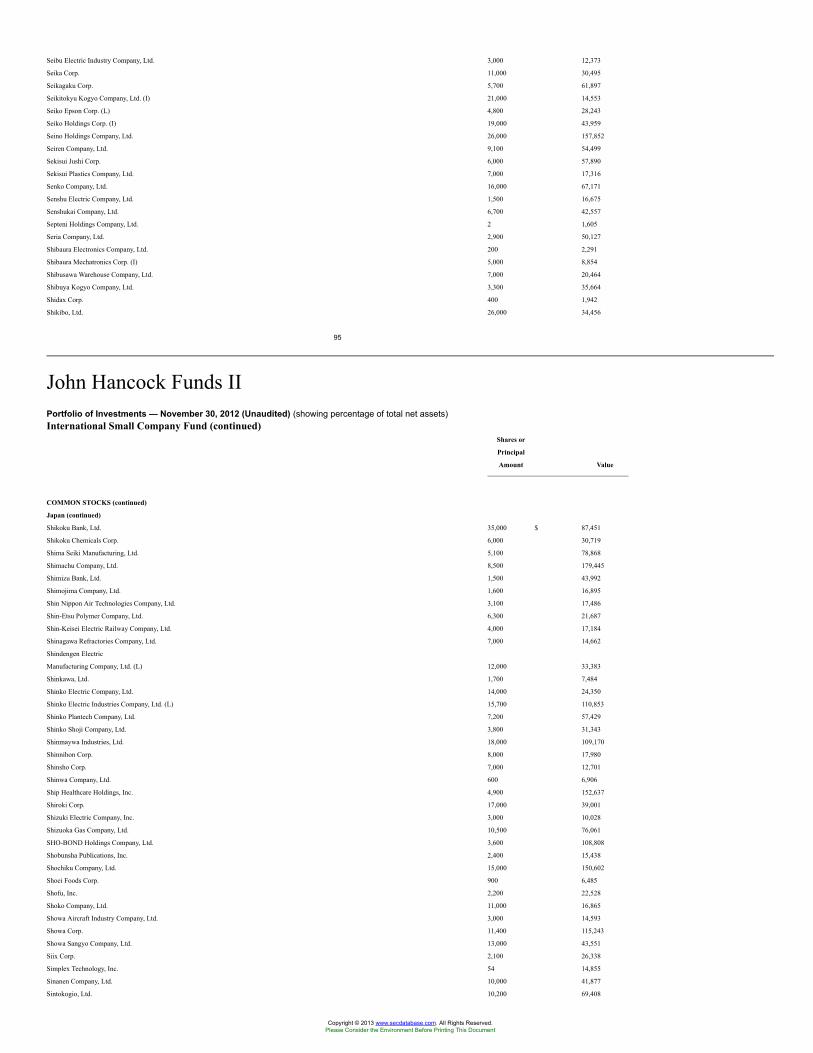
Seibu Electric Industry Company, Ltd. 3,000 12,373
Seika Corp. 11,000 30,495
Seikagaku Corp. 5,700 61,897
Seikitokyu Kogyo Company, Ltd. (I) 21,000 14,553
Seiko Epson Corp. (L) 4,800 28,243
Seiko Holdings Corp. (I) 19,000 43,959
Seino Holdings Company, Ltd. 26,000 157,852
Seiren Company, Ltd. 9,100 54,499
Sekisui Jushi Corp. 6,000 57,890
Sekisui Plastics Company, Ltd. 7,000 17,316
Senko Company, Ltd. 16,000 67,171
Senshu Electric Company, Ltd. 1,500 16,675
Senshukai Company, Ltd. 6,700 42,557
Septeni Holdings Company, Ltd. 2 1,605
Seria Company, Ltd. 2,900 50,127
Shibaura Electronics Company, Ltd. 200 2,291
Shibaura Mechatronics Corp. (I) 5,000 8,854
Shibusawa Warehouse Company, Ltd. 7,000 20,464
Shibuya Kogyo Company, Ltd. 3,300 35,664
Shidax Corp. 400 1,942
Shikibo, Ltd. 26,000 34,456
95
John Hancock Funds IIPortfolio of Investments — November 30, 2012 (Unaudited) (showing percentage of total net assets)International Small Company Fund (continued)
Shares or
Principal
Amount Value
COMMON STOCKS (continued)
Japan (continued)
Shikoku Bank, Ltd. 35,000 $ 87,451
Shikoku Chemicals Corp. 6,000 30,719
Shima Seiki Manufacturing, Ltd. 5,100 78,868
Shimachu Company, Ltd. 8,500 179,445
Shimizu Bank, Ltd. 1,500 43,992
Shimojima Company, Ltd. 1,600 16,895
Shin Nippon Air Technologies Company, Ltd. 3,100 17,486
Shin-Etsu Polymer Company, Ltd. 6,300 21,687
Shin-Keisei Electric Railway Company, Ltd. 4,000 17,184
Shinagawa Refractories Company, Ltd. 7,000 14,662
Shindengen Electric
Manufacturing Company, Ltd. (L) 12,000 33,383
Shinkawa, Ltd. 1,700 7,484
Shinko Electric Company, Ltd. 14,000 24,350
Shinko Electric Industries Company, Ltd. (L) 15,700 110,853
Shinko Plantech Company, Ltd. 7,200 57,429
Shinko Shoji Company, Ltd. 3,800 31,343
Shinmaywa Industries, Ltd. 18,000 109,170
Shinnihon Corp. 8,000 17,980
Shinsho Corp. 7,000 12,701
Shinwa Company, Ltd. 600 6,906
Ship Healthcare Holdings, Inc. 4,900 152,637
Shiroki Corp. 17,000 39,001
Shizuki Electric Company, Inc. 3,000 10,028
Shizuoka Gas Company, Ltd. 10,500 76,061
SHO-BOND Holdings Company, Ltd. 3,600 108,808
Shobunsha Publications, Inc. 2,400 15,438
Shochiku Company, Ltd. 15,000 150,602
Shoei Foods Corp. 900 6,485
Shofu, Inc. 2,200 22,528
Shoko Company, Ltd. 11,000 16,865
Showa Aircraft Industry Company, Ltd. 3,000 14,593
Showa Corp. 11,400 115,243
Showa Sangyo Company, Ltd. 13,000 43,551
Siix Corp. 2,100 26,338
Simplex Technology, Inc. 54 14,855
Sinanen Company, Ltd. 10,000 41,877
Sintokogio, Ltd. 10,200 69,408
Copyright © 2013 www.secdatabase.com. All Rights Reserved.Please Consider the Environment Before Printing This Document
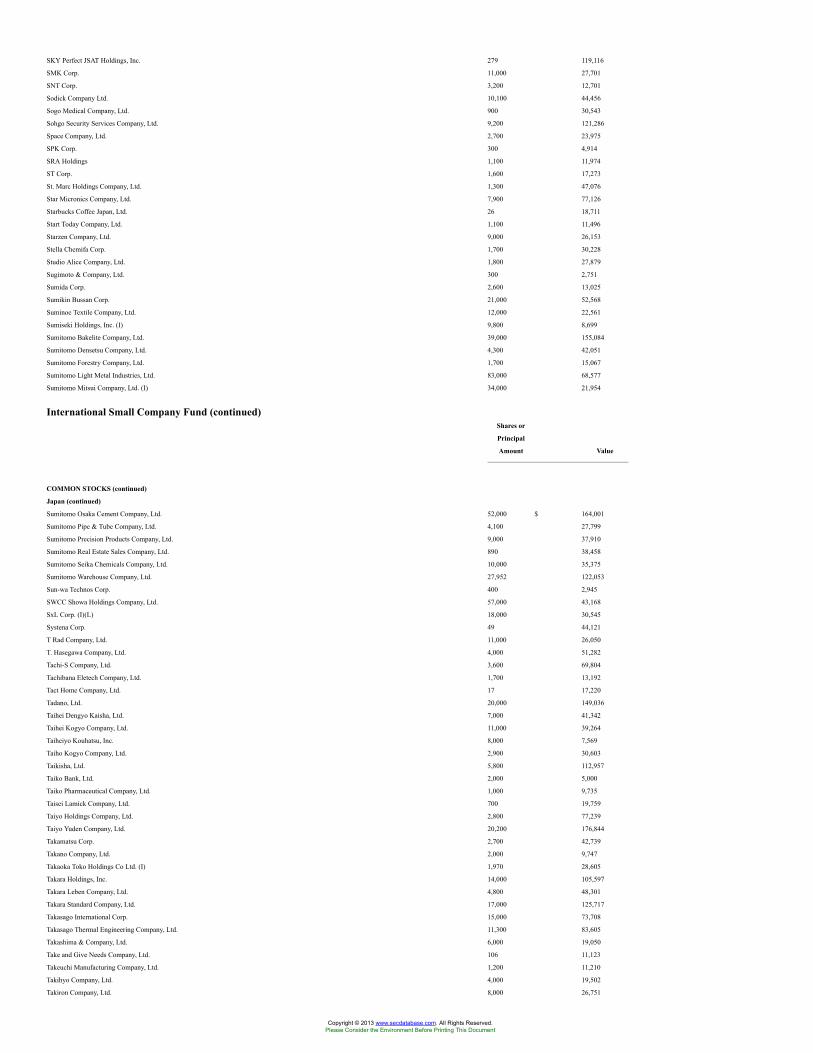
SKY Perfect JSAT Holdings, Inc. 279 119,116
SMK Corp. 11,000 27,701
SNT Corp. 3,200 12,701
Sodick Company Ltd. 10,100 44,456
Sogo Medical Company, Ltd. 900 30,543
Sohgo Security Services Company, Ltd. 9,200 121,286
Space Company, Ltd. 2,700 23,975
SPK Corp. 300 4,914
SRA Holdings 1,100 11,974
ST Corp. 1,600 17,273
St. Marc Holdings Company, Ltd. 1,300 47,076
Star Micronics Company, Ltd. 7,900 77,126
Starbucks Coffee Japan, Ltd. 26 18,711
Start Today Company, Ltd. 1,100 11,496
Starzen Company, Ltd. 9,000 26,153
Stella Chemifa Corp. 1,700 30,228
Studio Alice Company, Ltd. 1,800 27,879
Sugimoto & Company, Ltd. 300 2,751
Sumida Corp. 2,600 13,025
Sumikin Bussan Corp. 21,000 52,568
Suminoe Textile Company, Ltd. 12,000 22,561
Sumiseki Holdings, Inc. (I) 9,800 8,699
Sumitomo Bakelite Company, Ltd. 39,000 155,084
Sumitomo Densetsu Company, Ltd. 4,300 42,051
Sumitomo Forestry Company, Ltd. 1,700 15,067
Sumitomo Light Metal Industries, Ltd. 83,000 68,577
Sumitomo Mitsui Company, Ltd. (I) 34,000 21,954
International Small Company Fund (continued)Shares or
Principal
Amount Value
COMMON STOCKS (continued)
Japan (continued)
Sumitomo Osaka Cement Company, Ltd. 52,000 $ 164,001
Sumitomo Pipe & Tube Company, Ltd. 4,100 27,799
Sumitomo Precision Products Company, Ltd. 9,000 37,910
Sumitomo Real Estate Sales Company, Ltd. 890 38,458
Sumitomo Seika Chemicals Company, Ltd. 10,000 35,375
Sumitomo Warehouse Company, Ltd. 27,952 122,053
Sun-wa Technos Corp. 400 2,945
SWCC Showa Holdings Company, Ltd. 57,000 43,168
SxL Corp. (I)(L) 18,000 30,545
Systena Corp. 49 44,121
T Rad Company, Ltd. 11,000 26,050
T. Hasegawa Company, Ltd. 4,000 51,282
Tachi-S Company, Ltd. 3,600 69,804
Tachibana Eletech Company, Ltd. 1,700 13,192
Tact Home Company, Ltd. 17 17,220
Tadano, Ltd. 20,000 149,036
Taihei Dengyo Kaisha, Ltd. 7,000 41,342
Taihei Kogyo Company, Ltd. 11,000 39,264
Taiheiyo Kouhatsu, Inc. 8,000 7,569
Taiho Kogyo Company, Ltd. 2,900 30,603
Taikisha, Ltd. 5,800 112,957
Taiko Bank, Ltd. 2,000 5,000
Taiko Pharmaceutical Company, Ltd. 1,000 9,735
Taisei Lamick Company, Ltd. 700 19,759
Taiyo Holdings Company, Ltd. 2,800 77,239
Taiyo Yuden Company, Ltd. 20,200 176,844
Takamatsu Corp. 2,700 42,739
Takano Company, Ltd. 2,000 9,747
Takaoka Toko Holdings Co Ltd. (I) 1,970 28,605
Takara Holdings, Inc. 14,000 105,597
Takara Leben Company, Ltd. 4,800 48,301
Takara Standard Company, Ltd. 17,000 125,717
Takasago International Corp. 15,000 73,708
Takasago Thermal Engineering Company, Ltd. 11,300 83,605
Takashima & Company, Ltd. 6,000 19,050
Take and Give Needs Company, Ltd. 106 11,123
Takeuchi Manufacturing Company, Ltd. 1,200 11,210
Takihyo Company, Ltd. 4,000 19,502
Takiron Company, Ltd. 8,000 26,751
Copyright © 2013 www.secdatabase.com. All Rights Reserved.Please Consider the Environment Before Printing This Document
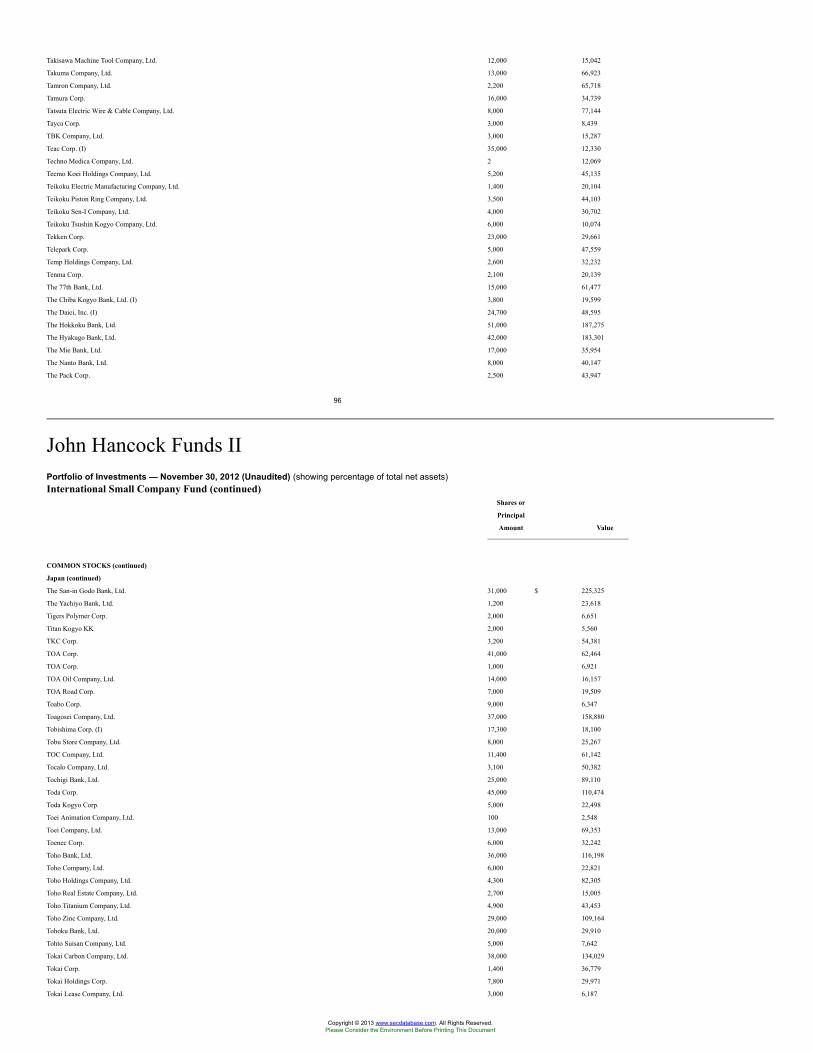
Takisawa Machine Tool Company, Ltd. 12,000 15,042
Takuma Company, Ltd. 13,000 66,923
Tamron Company, Ltd. 2,200 65,718
Tamura Corp. 16,000 34,739
Tatsuta Electric Wire & Cable Company, Ltd. 8,000 77,144
Tayca Corp. 3,000 8,439
TBK Company, Ltd. 3,000 15,287
Teac Corp. (I) 35,000 12,330
Techno Medica Company, Ltd. 2 12,069
Tecmo Koei Holdings Company, Ltd. 5,200 45,135
Teikoku Electric Manufacturing Company, Ltd. 1,400 20,104
Teikoku Piston Ring Company, Ltd. 3,500 44,103
Teikoku Sen-I Company, Ltd. 4,000 30,702
Teikoku Tsushin Kogyo Company, Ltd. 6,000 10,074
Tekken Corp. 23,000 29,661
Telepark Corp. 5,000 47,559
Temp Holdings Company, Ltd. 2,600 32,232
Tenma Corp. 2,100 20,139
The 77th Bank, Ltd. 15,000 61,477
The Chiba Kogyo Bank, Ltd. (I) 3,800 19,599
The Daiei, Inc. (I) 24,700 48,595
The Hokkoku Bank, Ltd. 51,000 187,275
The Hyakugo Bank, Ltd. 42,000 183,301
The Mie Bank, Ltd. 17,000 35,954
The Nanto Bank, Ltd. 8,000 40,147
The Pack Corp. 2,500 43,947
96
John Hancock Funds IIPortfolio of Investments — November 30, 2012 (Unaudited) (showing percentage of total net assets)International Small Company Fund (continued)
Shares or
Principal
Amount Value
COMMON STOCKS (continued)
Japan (continued)
The San-in Godo Bank, Ltd. 31,000 $ 225,325
The Yachiyo Bank, Ltd. 1,200 23,618
Tigers Polymer Corp. 2,000 6,651
Titan Kogyo KK 2,000 5,560
TKC Corp. 3,200 54,381
TOA Corp. 41,000 62,464
TOA Corp. 1,000 6,921
TOA Oil Company, Ltd. 14,000 16,157
TOA Road Corp. 7,000 19,509
Toabo Corp. 9,000 6,347
Toagosei Company, Ltd. 37,000 158,880
Tobishima Corp. (I) 17,300 18,100
Tobu Store Company, Ltd. 8,000 25,267
TOC Company, Ltd. 11,400 61,142
Tocalo Company, Ltd. 3,100 50,382
Tochigi Bank, Ltd. 25,000 89,110
Toda Corp. 45,000 110,474
Toda Kogyo Corp. 5,000 22,498
Toei Animation Company, Ltd. 100 2,548
Toei Company, Ltd. 13,000 69,353
Toenec Corp. 6,000 32,242
Toho Bank, Ltd. 36,000 116,198
Toho Company, Ltd. 6,000 22,821
Toho Holdings Company, Ltd. 4,300 82,305
Toho Real Estate Company, Ltd. 2,700 15,005
Toho Titanium Company, Ltd. 4,900 43,453
Toho Zinc Company, Ltd. 29,000 109,164
Tohoku Bank, Ltd. 20,000 29,910
Tohto Suisan Company, Ltd. 5,000 7,642
Tokai Carbon Company, Ltd. 38,000 134,029
Tokai Corp. 1,400 36,779
Tokai Holdings Corp. 7,800 29,971
Tokai Lease Company, Ltd. 3,000 6,187
Copyright © 2013 www.secdatabase.com. All Rights Reserved.Please Consider the Environment Before Printing This Document
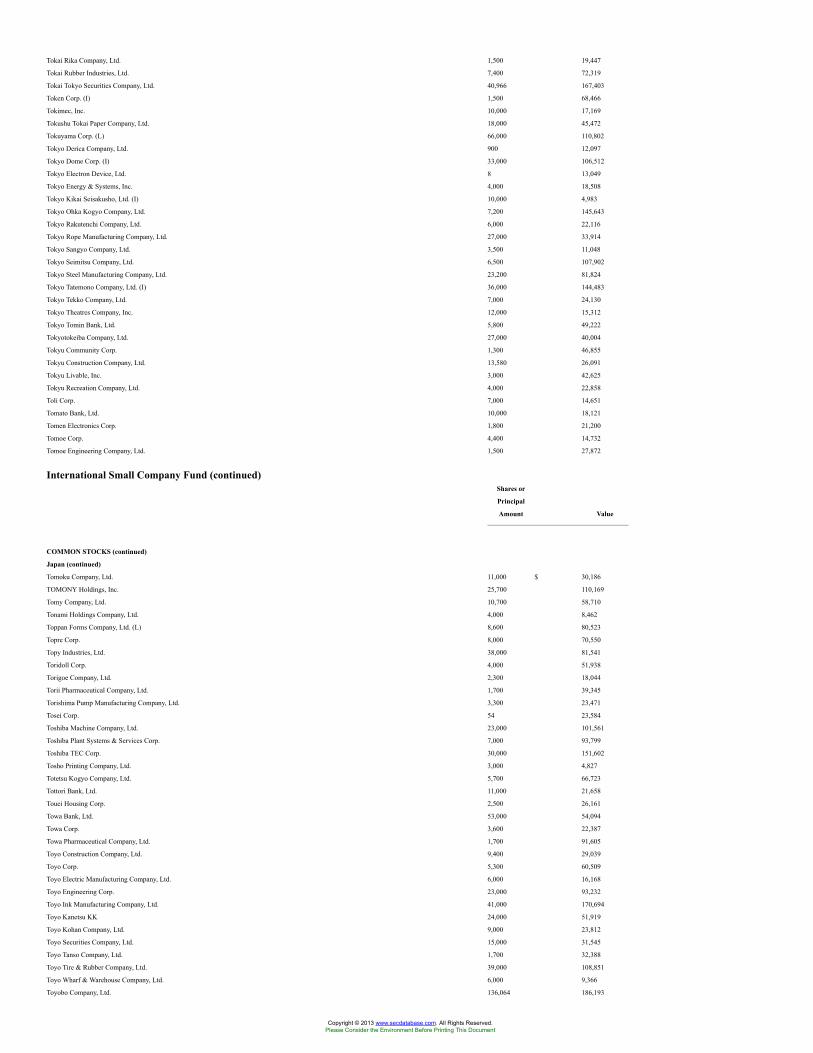
Tokai Rika Company, Ltd. 1,500 19,447
Tokai Rubber Industries, Ltd. 7,400 72,319
Tokai Tokyo Securities Company, Ltd. 40,966 167,403
Token Corp. (I) 1,500 68,466
Tokimec, Inc. 10,000 17,169
Tokushu Tokai Paper Company, Ltd. 18,000 45,472
Tokuyama Corp. (L) 66,000 110,802
Tokyo Derica Company, Ltd. 900 12,097
Tokyo Dome Corp. (I) 33,000 106,512
Tokyo Electron Device, Ltd. 8 13,049
Tokyo Energy & Systems, Inc. 4,000 18,508
Tokyo Kikai Seisakusho, Ltd. (I) 10,000 4,983
Tokyo Ohka Kogyo Company, Ltd. 7,200 145,643
Tokyo Rakutenchi Company, Ltd. 6,000 22,116
Tokyo Rope Manufacturing Company, Ltd. 27,000 33,914
Tokyo Sangyo Company, Ltd. 3,500 11,048
Tokyo Seimitsu Company, Ltd. 6,500 107,902
Tokyo Steel Manufacturing Company, Ltd. 23,200 81,824
Tokyo Tatemono Company, Ltd. (I) 36,000 144,483
Tokyo Tekko Company, Ltd. 7,000 24,130
Tokyo Theatres Company, Inc. 12,000 15,312
Tokyo Tomin Bank, Ltd. 5,800 49,222
Tokyotokeiba Company, Ltd. 27,000 40,004
Tokyu Community Corp. 1,300 46,855
Tokyu Construction Company, Ltd. 13,580 26,091
Tokyu Livable, Inc. 3,000 42,625
Tokyu Recreation Company, Ltd. 4,000 22,858
Toli Corp. 7,000 14,651
Tomato Bank, Ltd. 10,000 18,121
Tomen Electronics Corp. 1,800 21,200
Tomoe Corp. 4,400 14,732
Tomoe Engineering Company, Ltd. 1,500 27,872
International Small Company Fund (continued)Shares or
Principal
Amount Value
COMMON STOCKS (continued)
Japan (continued)
Tomoku Company, Ltd. 11,000 $ 30,186
TOMONY Holdings, Inc. 25,700 110,169
Tomy Company, Ltd. 10,700 58,710
Tonami Holdings Company, Ltd. 4,000 8,462
Toppan Forms Company, Ltd. (L) 8,600 80,523
Topre Corp. 8,000 70,550
Topy Industries, Ltd. 38,000 81,541
Toridoll Corp. 4,000 51,938
Torigoe Company, Ltd. 2,300 18,044
Torii Pharmaceutical Company, Ltd. 1,700 39,345
Torishima Pump Manufacturing Company, Ltd. 3,300 23,471
Tosei Corp. 54 23,584
Toshiba Machine Company, Ltd. 23,000 101,561
Toshiba Plant Systems & Services Corp. 7,000 93,799
Toshiba TEC Corp. 30,000 151,602
Tosho Printing Company, Ltd. 3,000 4,827
Totetsu Kogyo Company, Ltd. 5,700 66,723
Tottori Bank, Ltd. 11,000 21,658
Touei Housing Corp. 2,500 26,161
Towa Bank, Ltd. 53,000 54,094
Towa Corp. 3,600 22,387
Towa Pharmaceutical Company, Ltd. 1,700 91,605
Toyo Construction Company, Ltd. 9,400 29,039
Toyo Corp. 5,300 60,509
Toyo Electric Manufacturing Company, Ltd. 6,000 16,168
Toyo Engineering Corp. 23,000 93,232
Toyo Ink Manufacturing Company, Ltd. 41,000 170,694
Toyo Kanetsu KK 24,000 51,919
Toyo Kohan Company, Ltd. 9,000 23,812
Toyo Securities Company, Ltd. 15,000 31,545
Toyo Tanso Company, Ltd. 1,700 32,388
Toyo Tire & Rubber Company, Ltd. 39,000 108,851
Toyo Wharf & Warehouse Company, Ltd. 6,000 9,366
Toyobo Company, Ltd. 136,064 186,193
Copyright © 2013 www.secdatabase.com. All Rights Reserved.Please Consider the Environment Before Printing This Document
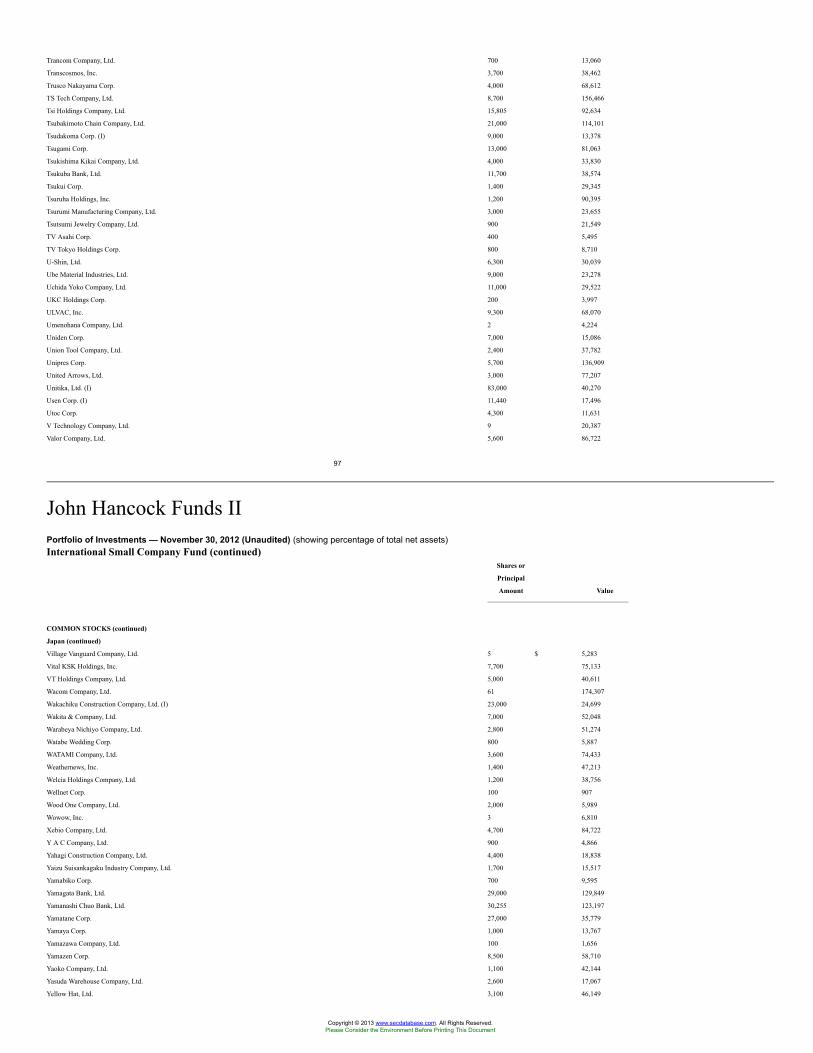
Trancom Company, Ltd. 700 13,060
Transcosmos, Inc. 3,700 38,462
Trusco Nakayama Corp. 4,000 68,612
TS Tech Company, Ltd. 8,700 156,466
Tsi Holdings Company, Ltd. 15,805 92,634
Tsubakimoto Chain Company, Ltd. 21,000 114,101
Tsudakoma Corp. (I) 9,000 13,378
Tsugami Corp. 13,000 81,063
Tsukishima Kikai Company, Ltd. 4,000 33,830
Tsukuba Bank, Ltd. 11,700 38,574
Tsukui Corp. 1,400 29,345
Tsuruha Holdings, Inc. 1,200 90,395
Tsurumi Manufacturing Company, Ltd. 3,000 23,655
Tsutsumi Jewelry Company, Ltd. 900 21,549
TV Asahi Corp. 400 5,495
TV Tokyo Holdings Corp. 800 8,710
U-Shin, Ltd. 6,300 30,039
Ube Material Industries, Ltd. 9,000 23,278
Uchida Yoko Company, Ltd. 11,000 29,522
UKC Holdings Corp. 200 3,997
ULVAC, Inc. 9,300 68,070
Umenohana Company, Ltd. 2 4,224
Uniden Corp. 7,000 15,086
Union Tool Company, Ltd. 2,400 37,782
Unipres Corp. 5,700 136,909
United Arrows, Ltd. 3,000 77,207
Unitika, Ltd. (I) 83,000 40,270
Usen Corp. (I) 11,440 17,496
Utoc Corp. 4,300 11,631
V Technology Company, Ltd. 9 20,387
Valor Company, Ltd. 5,600 86,722
97
John Hancock Funds IIPortfolio of Investments — November 30, 2012 (Unaudited) (showing percentage of total net assets)International Small Company Fund (continued)
Shares or
Principal
Amount Value
COMMON STOCKS (continued)
Japan (continued)
Village Vanguard Company, Ltd. 5 $ 5,283
Vital KSK Holdings, Inc. 7,700 75,133
VT Holdings Company, Ltd. 5,000 40,611
Wacom Company, Ltd. 61 174,307
Wakachiku Construction Company, Ltd. (I) 23,000 24,699
Wakita & Company, Ltd. 7,000 52,048
Warabeya Nichiyo Company, Ltd. 2,800 51,274
Watabe Wedding Corp. 800 5,887
WATAMI Company, Ltd. 3,600 74,433
Weathernews, Inc. 1,400 47,213
Welcia Holdings Company, Ltd. 1,200 38,756
Wellnet Corp. 100 907
Wood One Company, Ltd. 2,000 5,989
Wowow, Inc. 3 6,810
Xebio Company, Ltd. 4,700 84,722
Y A C Company, Ltd. 900 4,866
Yahagi Construction Company, Ltd. 4,400 18,838
Yaizu Suisankagaku Industry Company, Ltd. 1,700 15,517
Yamabiko Corp. 700 9,595
Yamagata Bank, Ltd. 29,000 129,849
Yamanashi Chuo Bank, Ltd. 30,255 123,197
Yamatane Corp. 27,000 35,779
Yamaya Corp. 1,000 13,767
Yamazawa Company, Ltd. 100 1,656
Yamazen Corp. 8,500 58,710
Yaoko Company, Ltd. 1,100 42,144
Yasuda Warehouse Company, Ltd. 2,600 17,067
Yellow Hat, Ltd. 3,100 46,149
Copyright © 2013 www.secdatabase.com. All Rights Reserved.Please Consider the Environment Before Printing This Document
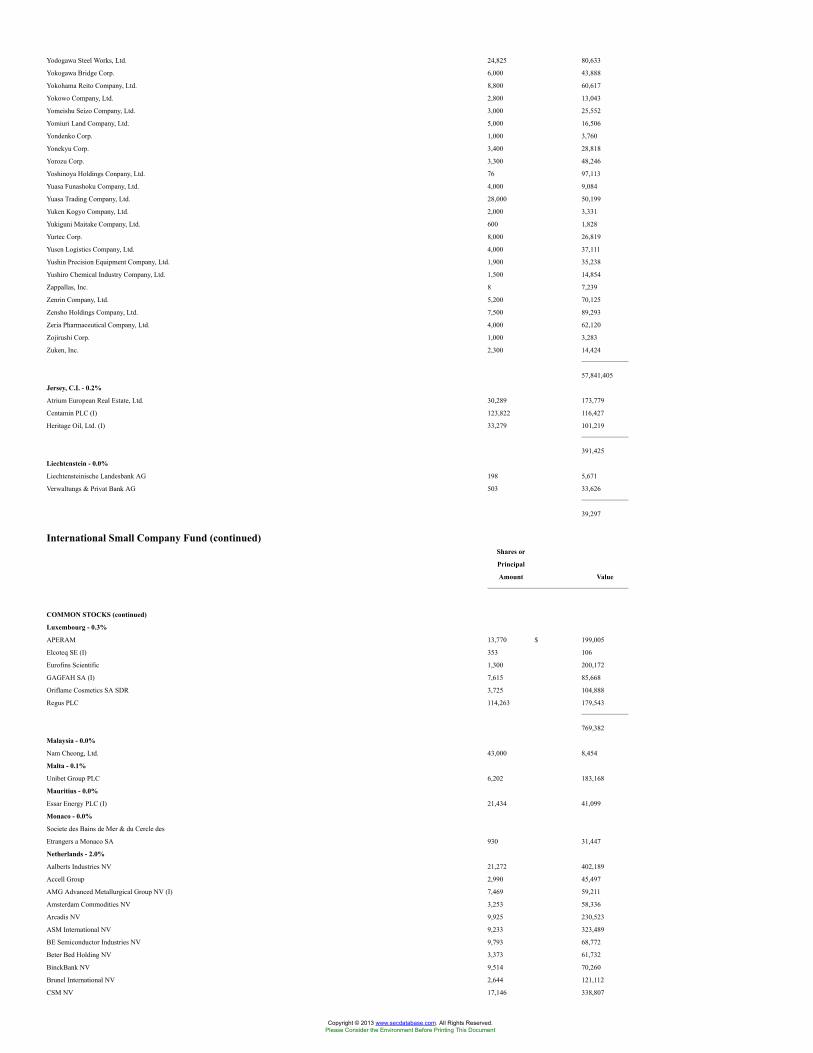
Yodogawa Steel Works, Ltd. 24,825 80,633
Yokogawa Bridge Corp. 6,000 43,888
Yokohama Reito Company, Ltd. 8,800 60,617
Yokowo Company, Ltd. 2,800 13,043
Yomeishu Seizo Company, Ltd. 3,000 25,552
Yomiuri Land Company, Ltd. 5,000 16,506
Yondenko Corp. 1,000 3,760
Yonekyu Corp. 3,400 28,818
Yorozu Corp. 3,300 48,246
Yoshinoya Holdings Conpany, Ltd. 76 97,113
Yuasa Funashoku Company, Ltd. 4,000 9,084
Yuasa Trading Company, Ltd. 28,000 50,199
Yuken Kogyo Company, Ltd. 2,000 3,331
Yukiguni Maitake Company, Ltd. 600 1,828
Yurtec Corp. 8,000 26,819
Yusen Logistics Company, Ltd. 4,000 37,111
Yushin Precision Equipment Company, Ltd. 1,900 35,238
Yushiro Chemical Industry Company, Ltd. 1,500 14,854
Zappallas, Inc. 8 7,239
Zenrin Company, Ltd. 5,200 70,125
Zensho Holdings Company, Ltd. 7,500 89,293
Zeria Pharmaceutical Company, Ltd. 4,000 62,120
Zojirushi Corp. 1,000 3,283
Zuken, Inc. 2,300 14,424
57,841,405
Jersey, C.I. - 0.2%
Atrium European Real Estate, Ltd. 30,289 173,779
Centamin PLC (I) 123,822 116,427
Heritage Oil, Ltd. (I) 33,279 101,219
391,425
Liechtenstein - 0.0%
Liechtensteinische Landesbank AG 198 5,671
Verwaltungs & Privat Bank AG 503 33,626
39,297
International Small Company Fund (continued)Shares or
Principal
Amount Value
COMMON STOCKS (continued)
Luxembourg - 0.3%
APERAM 13,770 $ 199,005
Elcoteq SE (I) 353 106
Eurofins Scientific 1,300 200,172
GAGFAH SA (I) 7,615 85,668
Oriflame Cosmetics SA SDR 3,725 104,888
Regus PLC 114,263 179,543
769,382
Malaysia - 0.0%
Nam Cheong, Ltd. 43,000 8,454
Malta - 0.1%
Unibet Group PLC 6,202 183,168
Mauritius - 0.0%
Essar Energy PLC (I) 21,434 41,099
Monaco - 0.0%
Societe des Bains de Mer & du Cercle des
Etrangers a Monaco SA 930 31,447
Netherlands - 2.0%
Aalberts Industries NV 21,272 402,189
Accell Group 2,990 45,497
AMG Advanced Metallurgical Group NV (I) 7,469 59,211
Amsterdam Commodities NV 3,253 58,336
Arcadis NV 9,925 230,523
ASM International NV 9,233 323,489
BE Semiconductor Industries NV 9,793 68,772
Beter Bed Holding NV 3,373 61,732
BinckBank NV 9,514 70,260
Brunel International NV 2,644 121,112
CSM NV 17,146 338,807
Copyright © 2013 www.secdatabase.com. All Rights Reserved.Please Consider the Environment Before Printing This Document
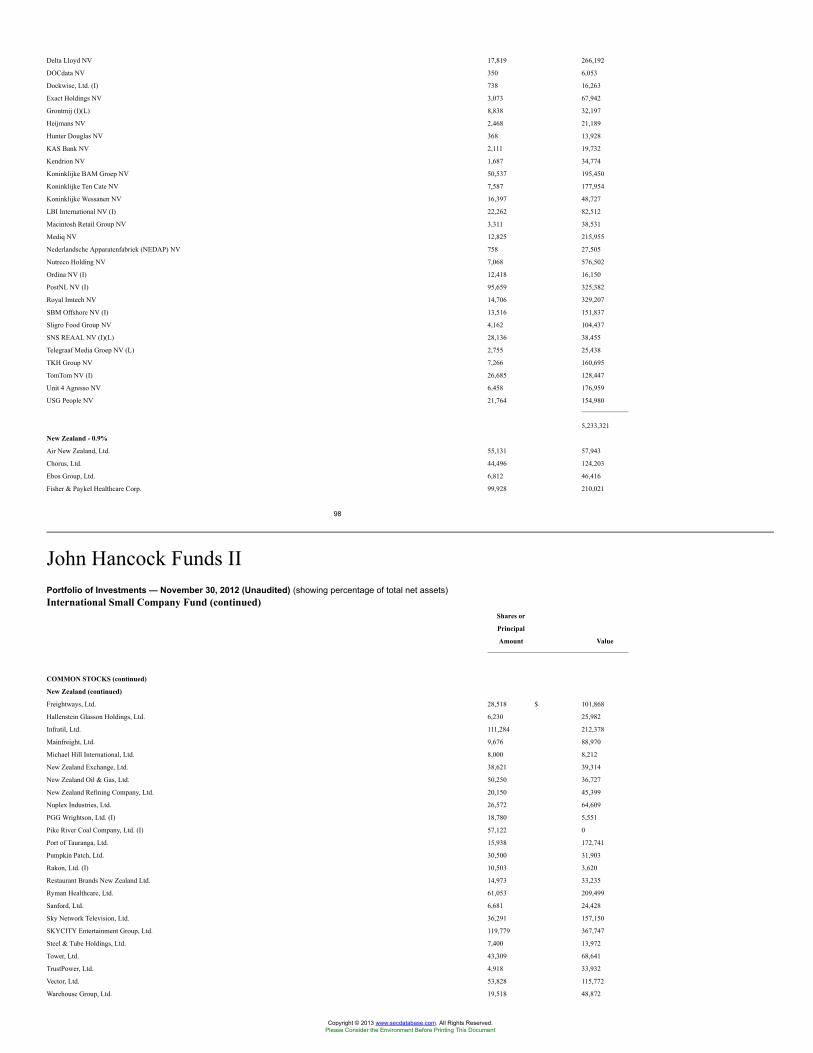
Delta Lloyd NV 17,819 266,192
DOCdata NV 350 6,053
Dockwise, Ltd. (I) 738 16,263
Exact Holdings NV 3,073 67,942
Grontmij (I)(L) 8,838 32,197
Heijmans NV 2,468 21,189
Hunter Douglas NV 368 13,928
KAS Bank NV 2,111 19,732
Kendrion NV 1,687 34,774
Koninklijke BAM Groep NV 50,537 195,450
Koninklijke Ten Cate NV 7,587 177,954
Koninklijke Wessanen NV 16,397 48,727
LBI International NV (I) 22,262 82,512
Macintosh Retail Group NV 3,311 38,531
Mediq NV 12,825 215,955
Nederlandsche Apparatenfabriek (NEDAP) NV 758 27,505
Nutreco Holding NV 7,068 576,502
Ordina NV (I) 12,418 16,150
PostNL NV (I) 95,659 325,382
Royal Imtech NV 14,706 329,207
SBM Offshore NV (I) 13,516 151,837
Sligro Food Group NV 4,162 104,437
SNS REAAL NV (I)(L) 28,136 38,455
Telegraaf Media Groep NV (L) 2,755 25,438
TKH Group NV 7,266 160,695
TomTom NV (I) 26,685 128,447
Unit 4 Agresso NV 6,458 176,959
USG People NV 21,764 154,980
5,233,321
New Zealand - 0.9%
Air New Zealand, Ltd. 55,131 57,943
Chorus, Ltd. 44,496 124,203
Ebos Group, Ltd. 6,812 46,416
Fisher & Paykel Healthcare Corp. 99,928 210,021
98
John Hancock Funds IIPortfolio of Investments — November 30, 2012 (Unaudited) (showing percentage of total net assets)International Small Company Fund (continued)
Shares or
Principal
Amount Value
COMMON STOCKS (continued)
New Zealand (continued)
Freightways, Ltd. 28,518 $ 101,868
Hallenstein Glasson Holdings, Ltd. 6,230 25,982
Infratil, Ltd. 111,284 212,378
Mainfreight, Ltd. 9,676 88,970
Michael Hill International, Ltd. 8,000 8,212
New Zealand Exchange, Ltd. 38,621 39,314
New Zealand Oil & Gas, Ltd. 50,250 36,727
New Zealand Refining Company, Ltd. 20,150 45,399
Nuplex Industries, Ltd. 26,572 64,609
PGG Wrightson, Ltd. (I) 18,780 5,551
Pike River Coal Company, Ltd. (I) 57,122 0
Port of Tauranga, Ltd. 15,938 172,741
Pumpkin Patch, Ltd. 30,500 31,903
Rakon, Ltd. (I) 10,503 3,620
Restaurant Brands New Zealand Ltd. 14,973 33,235
Ryman Healthcare, Ltd. 61,053 209,499
Sanford, Ltd. 6,681 24,428
Sky Network Television, Ltd. 36,291 157,150
SKYCITY Entertainment Group, Ltd. 119,779 367,747
Steel & Tube Holdings, Ltd. 7,400 13,972
Tower, Ltd. 43,309 68,641
TrustPower, Ltd. 4,918 33,932
Vector, Ltd. 53,828 115,772
Warehouse Group, Ltd. 19,518 48,872
Copyright © 2013 www.secdatabase.com. All Rights Reserved.Please Consider the Environment Before Printing This Document
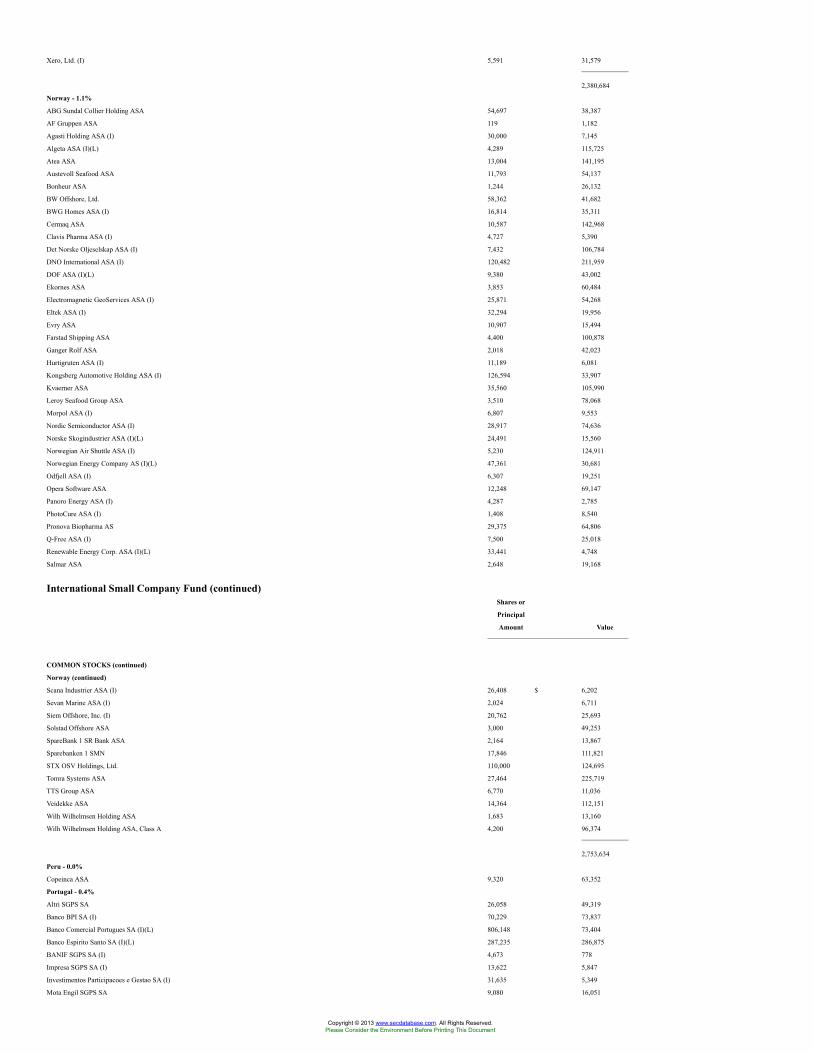
Xero, Ltd. (I) 5,591 31,579
2,380,684
Norway - 1.1%
ABG Sundal Collier Holding ASA 54,697 38,387
AF Gruppen ASA 119 1,182
Agasti Holding ASA (I) 30,000 7,145
Algeta ASA (I)(L) 4,289 115,725
Atea ASA 13,004 141,195
Austevoll Seafood ASA 11,793 54,137
Bonheur ASA 1,244 26,132
BW Offshore, Ltd. 58,362 41,682
BWG Homes ASA (I) 16,814 35,311
Cermaq ASA 10,587 142,968
Clavis Pharma ASA (I) 4,727 5,390
Det Norske Oljeselskap ASA (I) 7,432 106,784
DNO International ASA (I) 120,482 211,959
DOF ASA (I)(L) 9,380 43,002
Ekornes ASA 3,853 60,484
Electromagnetic GeoServices ASA (I) 25,871 54,268
Eltek ASA (I) 32,294 19,956
Evry ASA 10,907 15,494
Farstad Shipping ASA 4,400 100,878
Ganger Rolf ASA 2,018 42,023
Hurtigruten ASA (I) 11,189 6,081
Kongsberg Automotive Holding ASA (I) 126,594 33,907
Kvaerner ASA 35,560 105,990
Leroy Seafood Group ASA 3,510 78,068
Morpol ASA (I) 6,807 9,553
Nordic Semiconductor ASA (I) 28,917 74,636
Norske Skogindustrier ASA (I)(L) 24,491 15,560
Norwegian Air Shuttle ASA (I) 5,230 124,911
Norwegian Energy Company AS (I)(L) 47,361 30,681
Odfjell ASA (I) 6,307 19,251
Opera Software ASA 12,248 69,147
Panoro Energy ASA (I) 4,287 2,785
PhotoCure ASA (I) 1,408 8,540
Pronova Biopharma AS 29,375 64,806
Q-Free ASA (I) 7,500 25,018
Renewable Energy Corp. ASA (I)(L) 33,441 4,748
Salmar ASA 2,648 19,168
International Small Company Fund (continued)Shares or
Principal
Amount Value
COMMON STOCKS (continued)
Norway (continued)
Scana Industrier ASA (I) 26,408 $ 6,202
Sevan Marine ASA (I) 2,024 6,711
Siem Offshore, Inc. (I) 20,762 25,693
Solstad Offshore ASA 3,000 49,253
SpareBank 1 SR Bank ASA 2,164 13,867
Sparebanken 1 SMN 17,846 111,821
STX OSV Holdings, Ltd. 110,000 124,695
Tomra Systems ASA 27,464 225,719
TTS Group ASA 6,770 11,036
Veidekke ASA 14,364 112,151
Wilh Wilhelmsen Holding ASA 1,683 13,160
Wilh Wilhelmsen Holding ASA, Class A 4,200 96,374
2,753,634
Peru - 0.0%
Copeinca ASA 9,320 63,352
Portugal - 0.4%
Altri SGPS SA 26,058 49,319
Banco BPI SA (I) 70,229 73,837
Banco Comercial Portugues SA (I)(L) 806,148 73,404
Banco Espirito Santo SA (I)(L) 287,235 286,875
BANIF SGPS SA (I) 4,673 778
Impresa SGPS SA (I) 13,622 5,847
Investimentos Participacoes e Gestao SA (I) 31,635 5,349
Mota Engil SGPS SA 9,080 16,051
Copyright © 2013 www.secdatabase.com. All Rights Reserved.Please Consider the Environment Before Printing This Document
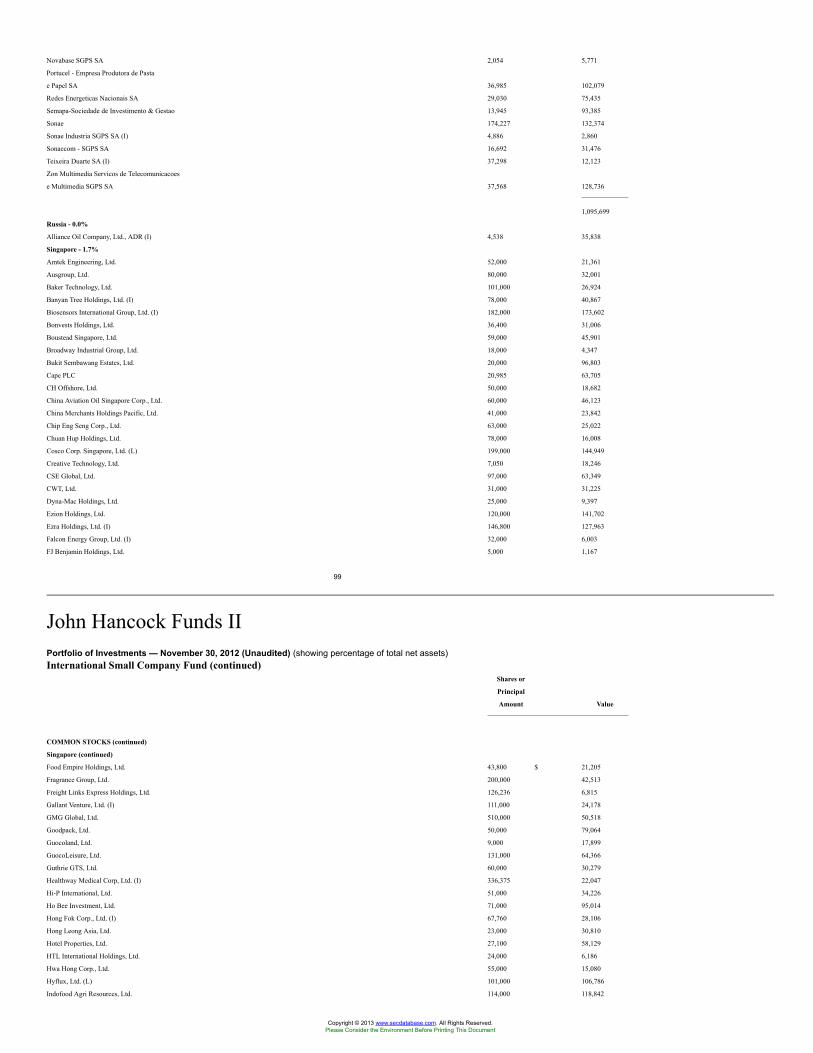
Novabase SGPS SA 2,054 5,771
Portucel - Empresa Produtora de Pasta
e Papel SA 36,985 102,079
Redes Energeticas Nacionais SA 29,030 75,435
Semapa-Sociedade de Investimento & Gestao 13,945 93,385
Sonae 174,227 132,374
Sonae Industria SGPS SA (I) 4,886 2,860
Sonaecom - SGPS SA 16,692 31,476
Teixeira Duarte SA (I) 37,298 12,123
Zon Multimedia Servicos de Telecomunicacoes
e Multimedia SGPS SA 37,568 128,736
1,095,699
Russia - 0.0%
Alliance Oil Company, Ltd., ADR (I) 4,538 35,838
Singapore - 1.7%
Amtek Engineering, Ltd. 52,000 21,361
Ausgroup, Ltd. 80,000 32,001
Baker Technology, Ltd. 101,000 26,924
Banyan Tree Holdings, Ltd. (I) 78,000 40,867
Biosensors International Group, Ltd. (I) 182,000 173,602
Bonvests Holdings, Ltd. 36,400 31,006
Boustead Singapore, Ltd. 59,000 45,901
Broadway Industrial Group, Ltd. 18,000 4,347
Bukit Sembawang Estates, Ltd. 20,000 96,803
Cape PLC 20,985 63,705
CH Offshore, Ltd. 50,000 18,682
China Aviation Oil Singapore Corp., Ltd. 60,000 46,123
China Merchants Holdings Pacific, Ltd. 41,000 23,842
Chip Eng Seng Corp., Ltd. 63,000 25,022
Chuan Hup Holdings, Ltd. 78,000 16,008
Cosco Corp. Singapore, Ltd. (L) 199,000 144,949
Creative Technology, Ltd. 7,050 18,246
CSE Global, Ltd. 97,000 63,349
CWT, Ltd. 31,000 31,225
Dyna-Mac Holdings, Ltd. 25,000 9,397
Ezion Holdings, Ltd. 120,000 141,702
Ezra Holdings, Ltd. (I) 146,800 127,963
Falcon Energy Group, Ltd. (I) 32,000 6,003
FJ Benjamin Holdings, Ltd. 5,000 1,167
99
John Hancock Funds IIPortfolio of Investments — November 30, 2012 (Unaudited) (showing percentage of total net assets)International Small Company Fund (continued)
Shares or
Principal
Amount Value
COMMON STOCKS (continued)
Singapore (continued)
Food Empire Holdings, Ltd. 43,800 $ 21,205
Fragrance Group, Ltd. 200,000 42,513
Freight Links Express Holdings, Ltd. 126,236 6,815
Gallant Venture, Ltd. (I) 111,000 24,178
GMG Global, Ltd. 510,000 50,518
Goodpack, Ltd. 50,000 79,064
Guocoland, Ltd. 9,000 17,899
GuocoLeisure, Ltd. 131,000 64,366
Guthrie GTS, Ltd. 60,000 30,279
Healthway Medical Corp, Ltd. (I) 336,375 22,047
Hi-P International, Ltd. 51,000 34,226
Ho Bee Investment, Ltd. 71,000 95,014
Hong Fok Corp., Ltd. (I) 67,760 28,106
Hong Leong Asia, Ltd. 23,000 30,810
Hotel Properties, Ltd. 27,100 58,129
HTL International Holdings, Ltd. 24,000 6,186
Hwa Hong Corp., Ltd. 55,000 15,080
Hyflux, Ltd. (L) 101,000 106,786
Indofood Agri Resources, Ltd. 114,000 118,842
Copyright © 2013 www.secdatabase.com. All Rights Reserved.Please Consider the Environment Before Printing This Document
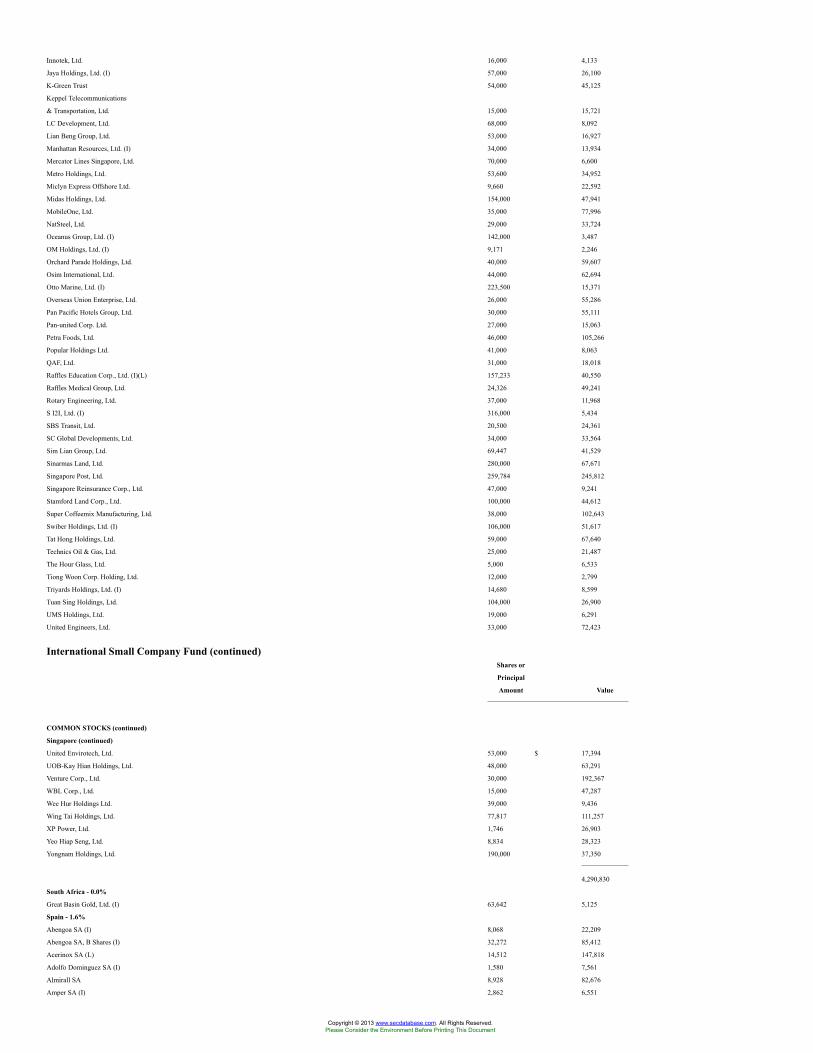
Innotek, Ltd. 16,000 4,133
Jaya Holdings, Ltd. (I) 57,000 26,100
K-Green Trust 54,000 45,125
Keppel Telecommunications
& Transportation, Ltd. 15,000 15,721
LC Development, Ltd. 68,000 8,092
Lian Beng Group, Ltd. 53,000 16,927
Manhattan Resources, Ltd. (I) 34,000 13,934
Mercator Lines Singapore, Ltd. 70,000 6,600
Metro Holdings, Ltd. 53,600 34,952
Miclyn Express Offshore Ltd. 9,660 22,592
Midas Holdings, Ltd. 154,000 47,941
MobileOne, Ltd. 35,000 77,996
NatSteel, Ltd. 29,000 33,724
Oceanus Group, Ltd. (I) 142,000 3,487
OM Holdings, Ltd. (I) 9,171 2,246
Orchard Parade Holdings, Ltd. 40,000 59,607
Osim International, Ltd. 44,000 62,694
Otto Marine, Ltd. (I) 223,500 15,371
Overseas Union Enterprise, Ltd. 26,000 55,286
Pan Pacific Hotels Group, Ltd. 30,000 55,111
Pan-united Corp. Ltd. 27,000 15,063
Petra Foods, Ltd. 46,000 105,266
Popular Holdings Ltd. 41,000 8,063
QAF, Ltd. 31,000 18,018
Raffles Education Corp., Ltd. (I)(L) 157,233 40,550
Raffles Medical Group, Ltd. 24,326 49,241
Rotary Engineering, Ltd. 37,000 11,968
S I2I, Ltd. (I) 316,000 5,434
SBS Transit, Ltd. 20,500 24,361
SC Global Developments, Ltd. 34,000 33,564
Sim Lian Group, Ltd. 69,447 41,529
Sinarmas Land, Ltd. 280,000 67,671
Singapore Post, Ltd. 259,784 245,812
Singapore Reinsurance Corp., Ltd. 47,000 9,241
Stamford Land Corp., Ltd. 100,000 44,612
Super Coffeemix Manufacturing, Ltd. 38,000 102,643
Swiber Holdings, Ltd. (I) 106,000 51,617
Tat Hong Holdings, Ltd. 59,000 67,640
Technics Oil & Gas, Ltd. 25,000 21,487
The Hour Glass, Ltd. 5,000 6,533
Tiong Woon Corp. Holding, Ltd. 12,000 2,799
Triyards Holdings, Ltd. (I) 14,680 8,599
Tuan Sing Holdings, Ltd. 104,000 26,900
UMS Holdings, Ltd. 19,000 6,291
United Engineers, Ltd. 33,000 72,423
International Small Company Fund (continued)Shares or
Principal
Amount Value
COMMON STOCKS (continued)
Singapore (continued)
United Envirotech, Ltd. 53,000 $ 17,394
UOB-Kay Hian Holdings, Ltd. 48,000 63,291
Venture Corp., Ltd. 30,000 192,367
WBL Corp., Ltd. 15,000 47,287
Wee Hur Holdings Ltd. 39,000 9,436
Wing Tai Holdings, Ltd. 77,817 111,257
XP Power, Ltd. 1,746 26,903
Yeo Hiap Seng, Ltd. 8,834 28,323
Yongnam Holdings, Ltd. 190,000 37,350
4,290,830
South Africa - 0.0%
Great Basin Gold, Ltd. (I) 63,642 5,125
Spain - 1.6%
Abengoa SA (I) 8,068 22,209
Abengoa SA, B Shares (I) 32,272 85,412
Acerinox SA (L) 14,512 147,818
Adolfo Dominguez SA (I) 1,580 7,561
Almirall SA 8,928 82,676
Amper SA (I) 2,862 6,551
Copyright © 2013 www.secdatabase.com. All Rights Reserved.Please Consider the Environment Before Printing This Document
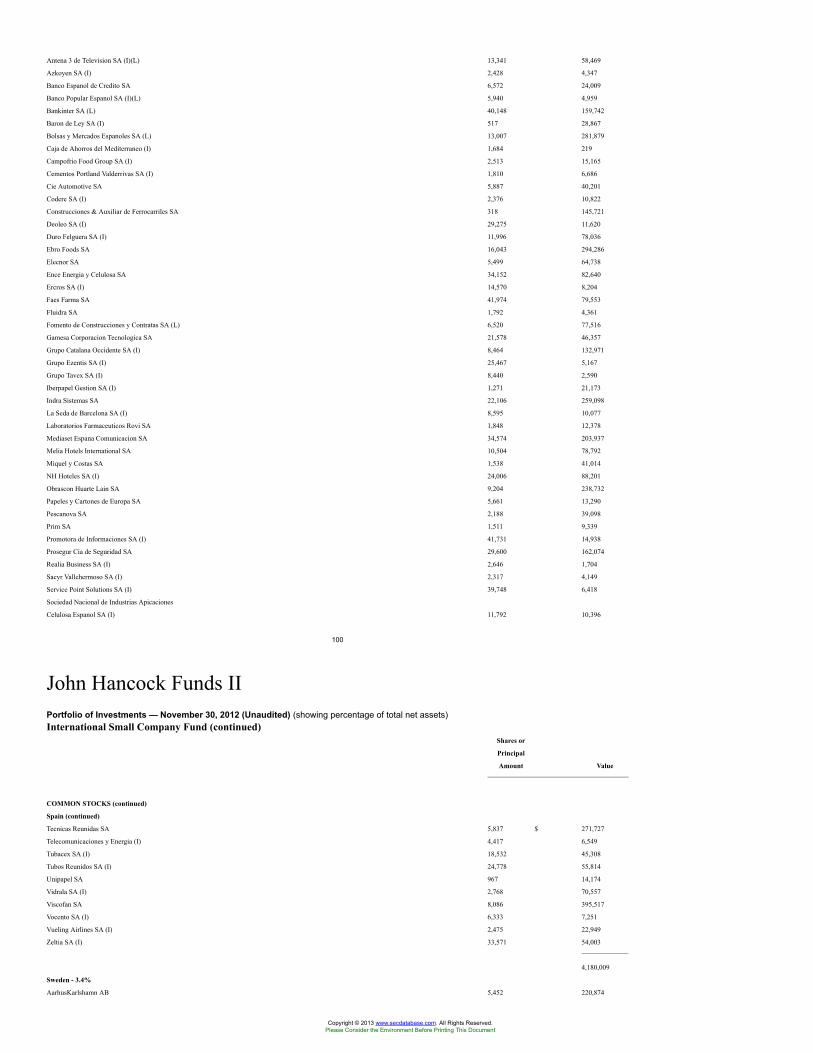
Antena 3 de Television SA (I)(L) 13,341 58,469
Azkoyen SA (I) 2,428 4,347
Banco Espanol de Credito SA 6,572 24,009
Banco Popular Espanol SA (I)(L) 5,940 4,959
Bankinter SA (L) 40,148 159,742
Baron de Ley SA (I) 517 28,867
Bolsas y Mercados Espanoles SA (L) 13,007 281,879
Caja de Ahorros del Mediterraneo (I) 1,684 219
Campofrio Food Group SA (I) 2,513 15,165
Cementos Portland Valderrivas SA (I) 1,810 6,686
Cie Automotive SA 5,887 40,201
Codere SA (I) 2,376 10,822
Construcciones & Auxiliar de Ferrocarriles SA 318 145,721
Deoleo SA (I) 29,275 11,620
Duro Felguera SA (I) 11,996 78,036
Ebro Foods SA 16,043 294,286
Elecnor SA 5,499 64,738
Ence Energia y Celulosa SA 34,152 82,640
Ercros SA (I) 14,570 8,204
Faes Farma SA 41,974 79,553
Fluidra SA 1,792 4,361
Fomento de Construcciones y Contratas SA (L) 6,520 77,516
Gamesa Corporacion Tecnologica SA 21,578 46,357
Grupo Catalana Occidente SA (I) 8,464 132,971
Grupo Ezentis SA (I) 25,467 5,167
Grupo Tavex SA (I) 8,440 2,590
Iberpapel Gestion SA (I) 1,271 21,173
Indra Sistemas SA 22,106 259,098
La Seda de Barcelona SA (I) 8,595 10,077
Laboratorios Farmaceuticos Rovi SA 1,848 12,378
Mediaset Espana Comunicacion SA 34,574 203,937
Melia Hotels International SA 10,504 78,792
Miquel y Costas SA 1,538 41,014
NH Hoteles SA (I) 24,006 88,201
Obrascon Huarte Lain SA 9,204 238,732
Papeles y Cartones de Europa SA 5,661 13,290
Pescanova SA 2,188 39,098
Prim SA 1,511 9,339
Promotora de Informaciones SA (I) 41,731 14,938
Prosegur Cia de Seguridad SA 29,600 162,074
Realia Business SA (I) 2,646 1,704
Sacyr Vallehermoso SA (I) 2,317 4,149
Service Point Solutions SA (I) 39,748 6,418
Sociedad Nacional de Industrias Apicaciones
Celulosa Espanol SA (I) 11,792 10,396
100
John Hancock Funds IIPortfolio of Investments — November 30, 2012 (Unaudited) (showing percentage of total net assets)International Small Company Fund (continued)
Shares or
Principal
Amount Value
COMMON STOCKS (continued)
Spain (continued)
Tecnicas Reunidas SA 5,837 $ 271,727
Telecomunicaciones y Energia (I) 4,417 6,549
Tubacex SA (I) 18,532 45,308
Tubos Reunidos SA (I) 24,778 55,814
Unipapel SA 967 14,174
Vidrala SA (I) 2,768 70,557
Viscofan SA 8,086 395,517
Vocento SA (I) 6,333 7,251
Vueling Airlines SA (I) 2,475 22,949
Zeltia SA (I) 33,571 54,003
4,180,009
Sweden - 3.4%
AarhusKarlshamn AB 5,452 220,874
Copyright © 2013 www.secdatabase.com. All Rights Reserved.Please Consider the Environment Before Printing This Document
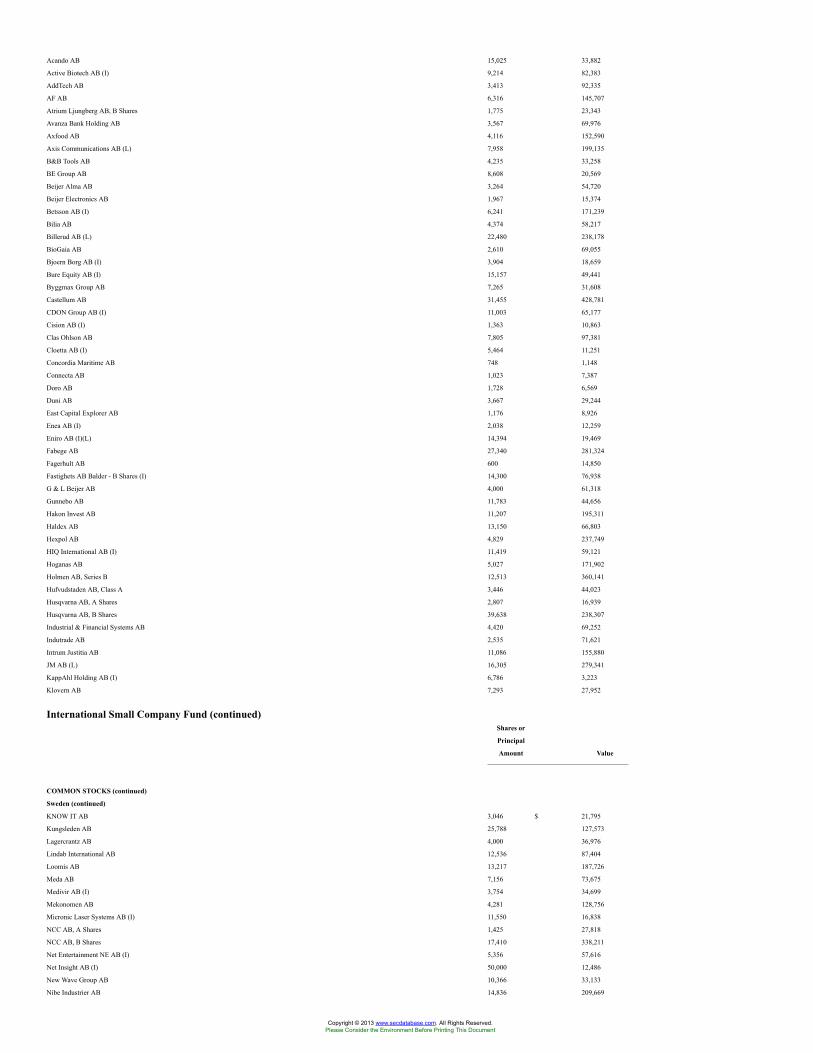
Acando AB 15,025 33,882
Active Biotech AB (I) 9,214 82,383
AddTech AB 3,413 92,335
AF AB 6,316 145,707
Atrium Ljungberg AB, B Shares 1,775 23,343
Avanza Bank Holding AB 3,567 69,976
Axfood AB 4,116 152,590
Axis Communications AB (L) 7,958 199,135
B&B Tools AB 4,235 33,258
BE Group AB 8,608 20,569
Beijer Alma AB 3,264 54,720
Beijer Electronics AB 1,967 15,374
Betsson AB (I) 6,241 171,239
Bilia AB 4,374 58,217
Billerud AB (L) 22,480 238,178
BioGaia AB 2,610 69,055
Bjoern Borg AB (I) 3,904 18,659
Bure Equity AB (I) 15,157 49,441
Byggmax Group AB 7,265 31,608
Castellum AB 31,455 428,781
CDON Group AB (I) 11,003 65,177
Cision AB (I) 1,363 10,863
Clas Ohlson AB 7,805 97,381
Cloetta AB (I) 5,464 11,251
Concordia Maritime AB 748 1,148
Connecta AB 1,023 7,387
Doro AB 1,728 6,569
Duni AB 3,667 29,244
East Capital Explorer AB 1,176 8,926
Enea AB (I) 2,038 12,259
Eniro AB (I)(L) 14,394 19,469
Fabege AB 27,340 281,324
Fagerhult AB 600 14,850
Fastighets AB Balder - B Shares (I) 14,300 76,938
G & L Beijer AB 4,000 61,318
Gunnebo AB 11,783 44,656
Hakon Invest AB 11,207 195,311
Haldex AB 13,150 66,803
Hexpol AB 4,829 237,749
HIQ International AB (I) 11,419 59,121
Hoganas AB 5,027 171,902
Holmen AB, Series B 12,513 360,141
Hufvudstaden AB, Class A 3,446 44,023
Husqvarna AB, A Shares 2,807 16,939
Husqvarna AB, B Shares 39,638 238,307
Industrial & Financial Systems AB 4,420 69,252
Indutrade AB 2,535 71,621
Intrum Justitia AB 11,086 155,880
JM AB (L) 16,305 279,341
KappAhl Holding AB (I) 6,786 3,223
Klovern AB 7,293 27,952
International Small Company Fund (continued)Shares or
Principal
Amount Value
COMMON STOCKS (continued)
Sweden (continued)
KNOW IT AB 3,046 $ 21,795
Kungsleden AB 25,788 127,573
Lagercrantz AB 4,000 36,976
Lindab International AB 12,536 87,404
Loomis AB 13,217 187,726
Meda AB 7,156 73,675
Medivir AB (I) 3,754 34,699
Mekonomen AB 4,281 128,756
Micronic Laser Systems AB (I) 11,550 16,838
NCC AB, A Shares 1,425 27,818
NCC AB, B Shares 17,410 338,211
Net Entertainment NE AB (I) 5,356 57,616
Net Insight AB (I) 50,000 12,486
New Wave Group AB 10,366 33,133
Nibe Industrier AB 14,836 209,669
Copyright © 2013 www.secdatabase.com. All Rights Reserved.Please Consider the Environment Before Printing This Document
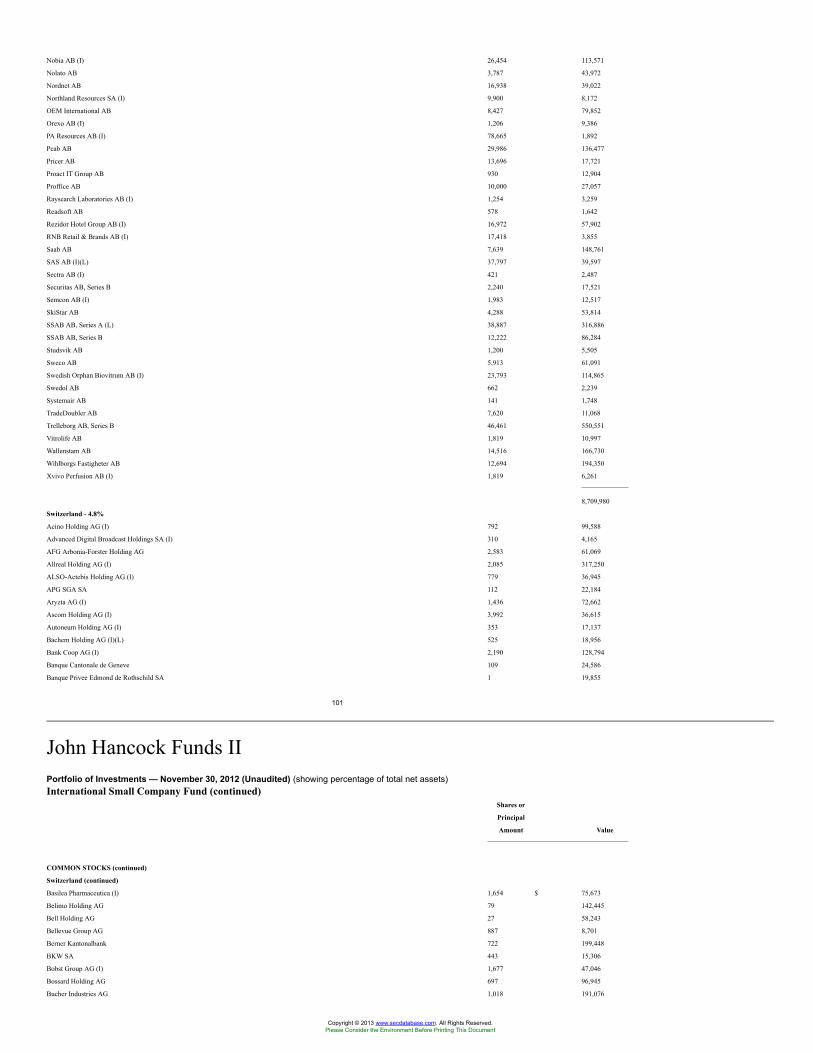
Nobia AB (I) 26,454 113,571
Nolato AB 3,787 43,972
Nordnet AB 16,938 39,022
Northland Resources SA (I) 9,900 8,172
OEM International AB 8,427 79,852
Orexo AB (I) 1,206 9,386
PA Resources AB (I) 78,665 1,892
Peab AB 29,986 136,477
Pricer AB 13,696 17,721
Proact IT Group AB 930 12,904
Proffice AB 10,000 27,057
Raysearch Laboratories AB (I) 1,254 3,259
Readsoft AB 578 1,642
Rezidor Hotel Group AB (I) 16,972 57,902
RNB Retail & Brands AB (I) 17,418 3,855
Saab AB 7,639 148,761
SAS AB (I)(L) 37,797 39,597
Sectra AB (I) 421 2,487
Securitas AB, Series B 2,240 17,521
Semcon AB (I) 1,983 12,517
SkiStar AB 4,288 53,814
SSAB AB, Series A (L) 38,887 316,886
SSAB AB, Series B 12,222 86,284
Studsvik AB 1,200 5,505
Sweco AB 5,913 61,091
Swedish Orphan Biovitrum AB (I) 23,793 114,865
Swedol AB 662 2,239
Systemair AB 141 1,748
TradeDoubler AB 7,620 11,068
Trelleborg AB, Series B 46,461 550,551
Vitrolife AB 1,819 10,997
Wallenstam AB 14,516 166,730
Wihlborgs Fastigheter AB 12,694 194,350
Xvivo Perfusion AB (I) 1,819 6,261
8,709,980
Switzerland - 4.8%
Acino Holding AG (I) 792 99,588
Advanced Digital Broadcast Holdings SA (I) 310 4,165
AFG Arbonia-Forster Holding AG 2,583 61,069
Allreal Holding AG (I) 2,085 317,250
ALSO-Actebis Holding AG (I) 779 36,945
APG SGA SA 112 22,184
Aryzta AG (I) 1,436 72,662
Ascom Holding AG (I) 3,992 36,615
Autoneum Holding AG (I) 353 17,137
Bachem Holding AG (I)(L) 525 18,956
Bank Coop AG (I) 2,190 128,794
Banque Cantonale de Geneve 109 24,586
Banque Privee Edmond de Rothschild SA 1 19,855
101
John Hancock Funds IIPortfolio of Investments — November 30, 2012 (Unaudited) (showing percentage of total net assets)International Small Company Fund (continued)
Shares or
Principal
Amount Value
COMMON STOCKS (continued)
Switzerland (continued)
Basilea Pharmaceutica (I) 1,654 $ 75,673
Belimo Holding AG 79 142,445
Bell Holding AG 27 58,243
Bellevue Group AG 887 8,701
Berner Kantonalbank 722 199,448
BKW SA 443 15,306
Bobst Group AG (I) 1,677 47,046
Bossard Holding AG 697 96,945
Bucher Industries AG 1,018 191,076
Copyright © 2013 www.secdatabase.com. All Rights Reserved.Please Consider the Environment Before Printing This Document
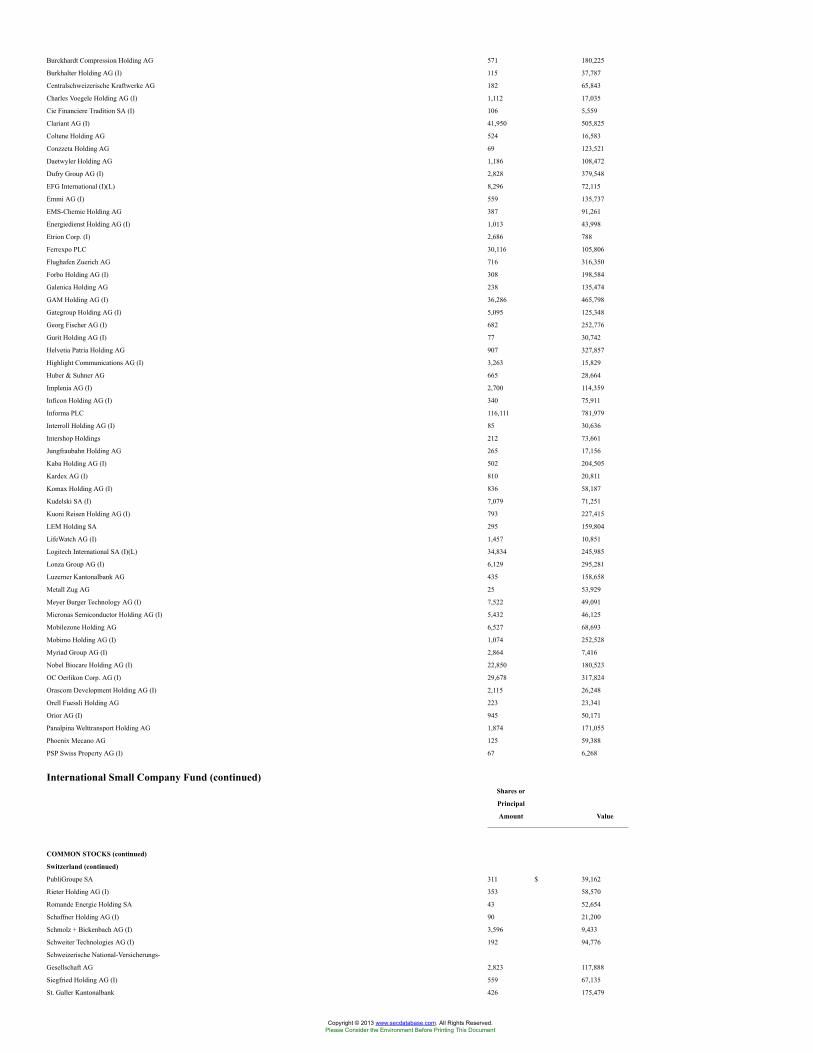
Burckhardt Compression Holding AG 571 180,225
Burkhalter Holding AG (I) 115 37,787
Centralschweizerische Kraftwerke AG 182 65,843
Charles Voegele Holding AG (I) 1,112 17,035
Cie Financiere Tradition SA (I) 106 5,559
Clariant AG (I) 41,950 505,825
Coltene Holding AG 524 16,583
Conzzeta Holding AG 69 123,521
Daetwyler Holding AG 1,186 108,472
Dufry Group AG (I) 2,828 379,548
EFG International (I)(L) 8,296 72,115
Emmi AG (I) 559 135,737
EMS-Chemie Holding AG 387 91,261
Energiedienst Holding AG (I) 1,013 43,998
Etrion Corp. (I) 2,686 788
Ferrexpo PLC 30,116 105,806
Flughafen Zuerich AG 716 316,350
Forbo Holding AG (I) 308 198,584
Galenica Holding AG 238 135,474
GAM Holding AG (I) 36,286 465,798
Gategroup Holding AG (I) 5,095 125,348
Georg Fischer AG (I) 682 252,776
Gurit Holding AG (I) 77 30,742
Helvetia Patria Holding AG 907 327,857
Highlight Communications AG (I) 3,263 15,829
Huber & Suhner AG 665 28,664
Implenia AG (I) 2,700 114,359
Inficon Holding AG (I) 340 75,911
Informa PLC 116,111 781,979
Interroll Holding AG (I) 85 30,636
Intershop Holdings 212 73,661
Jungfraubahn Holding AG 265 17,156
Kaba Holding AG (I) 502 204,505
Kardex AG (I) 810 20,811
Komax Holding AG (I) 836 58,187
Kudelski SA (I) 7,079 71,251
Kuoni Reisen Holding AG (I) 793 227,415
LEM Holding SA 295 159,804
LifeWatch AG (I) 1,457 10,851
Logitech International SA (I)(L) 34,834 245,985
Lonza Group AG (I) 6,129 295,281
Luzerner Kantonalbank AG 435 158,658
Metall Zug AG 25 53,929
Meyer Burger Technology AG (I) 7,522 49,091
Micronas Semiconductor Holding AG (I) 5,432 46,125
Mobilezone Holding AG 6,527 68,693
Mobimo Holding AG (I) 1,074 252,528
Myriad Group AG (I) 2,864 7,416
Nobel Biocare Holding AG (I) 22,850 180,523
OC Oerlikon Corp. AG (I) 29,678 317,824
Orascom Development Holding AG (I) 2,115 26,248
Orell Fuessli Holding AG 223 23,341
Orior AG (I) 945 50,171
Panalpina Welttransport Holding AG 1,874 171,055
Phoenix Mecano AG 125 59,388
PSP Swiss Property AG (I) 67 6,268
International Small Company Fund (continued)Shares or
Principal
Amount Value
COMMON STOCKS (continued)
Switzerland (continued)
PubliGroupe SA 311 $ 39,162
Rieter Holding AG (I) 353 58,570
Romande Energie Holding SA 43 52,654
Schaffner Holding AG (I) 90 21,200
Schmolz + Bickenbach AG (I) 3,596 9,433
Schweiter Technologies AG (I) 192 94,776
Schweizerische National-Versicherungs-
Gesellschaft AG 2,823 117,888
Siegfried Holding AG (I) 559 67,135
St. Galler Kantonalbank 426 175,479
Copyright © 2013 www.secdatabase.com. All Rights Reserved.Please Consider the Environment Before Printing This Document
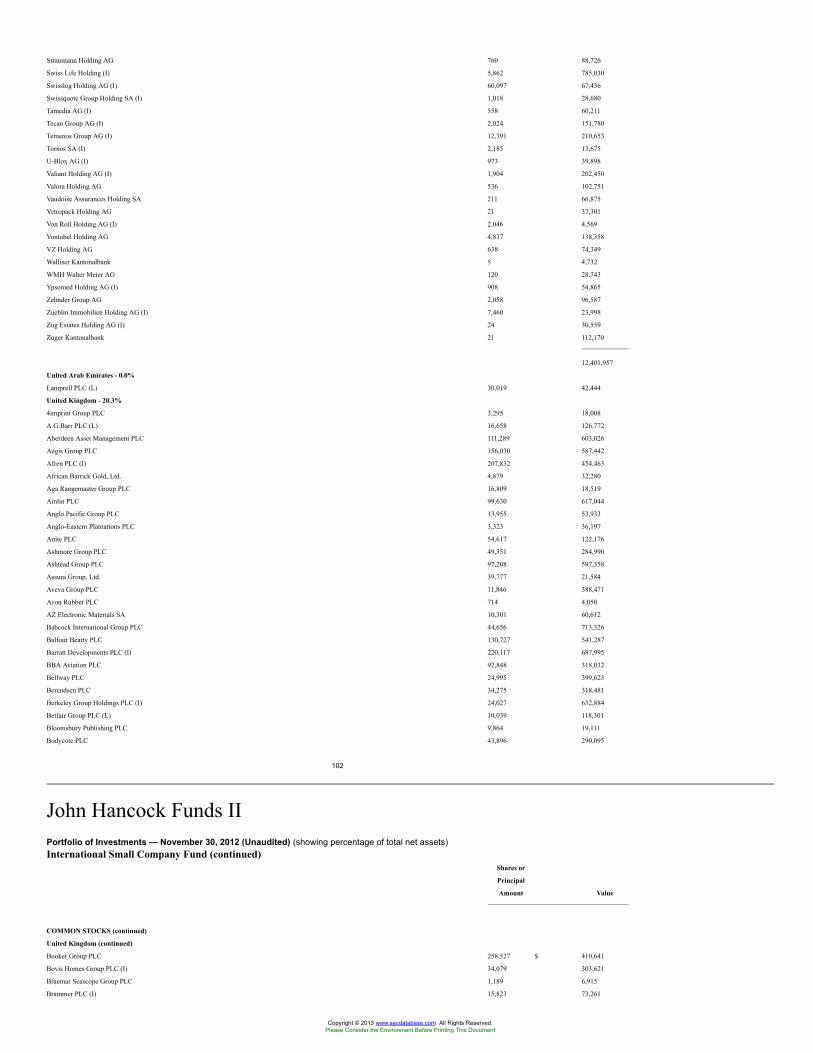
Straumann Holding AG 760 88,726
Swiss Life Holding (I) 5,862 785,030
Swisslog Holding AG (I) 60,097 67,436
Swissquote Group Holding SA (I) 1,018 28,680
Tamedia AG (I) 558 60,211
Tecan Group AG (I) 2,024 151,780
Temenos Group AG (I) 12,391 210,653
Tornos SA (I) 2,185 13,675
U-Blox AG (I) 973 39,898
Valiant Holding AG (I) 1,904 202,450
Valora Holding AG 536 102,751
Vaudoise Assurances Holding SA 211 66,875
Vetropack Holding AG 21 37,301
Von Roll Holding AG (I) 2,046 4,569
Vontobel Holding AG 4,837 138,358
VZ Holding AG 638 74,349
Walliser Kantonalbank 5 4,732
WMH Walter Meier AG 120 28,743
Ypsomed Holding AG (I) 908 54,865
Zehnder Group AG 2,058 96,587
Zueblin Immobilien Holding AG (I) 7,460 23,998
Zug Estates Holding AG (I) 24 30,559
Zuger Kantonalbank 21 112,170
12,401,957
United Arab Emirates - 0.0%
Lamprell PLC (L) 30,019 42,444
United Kingdom - 20.3%
4imprint Group PLC 3,295 18,008
A.G.Barr PLC (L) 16,658 126,772
Aberdeen Asset Management PLC 111,289 603,026
Aegis Group PLC 156,030 587,442
Afren PLC (I) 207,832 454,463
African Barrick Gold, Ltd. 4,879 32,280
Aga Rangemaster Group PLC 16,809 18,519
Amlin PLC 99,630 617,044
Anglo Pacific Group PLC 13,955 53,933
Anglo-Eastern Plantations PLC 3,323 36,197
Anite PLC 54,617 122,176
Ashmore Group PLC 49,351 284,990
Ashtead Group PLC 97,208 597,358
Assura Group, Ltd. 39,777 21,584
Aveva Group PLC 11,846 388,471
Avon Rubber PLC 714 4,050
AZ Electronic Materials SA 10,301 60,612
Babcock International Group PLC 44,656 713,326
Balfour Beatty PLC 130,727 541,287
Barratt Developments PLC (I) 220,117 687,995
BBA Aviation PLC 92,848 318,032
Bellway PLC 24,995 399,623
Berendsen PLC 34,275 318,481
Berkeley Group Holdings PLC (I) 24,027 632,884
Betfair Group PLC (L) 10,039 118,301
Bloomsbury Publishing PLC 9,864 19,111
Bodycote PLC 43,896 290,095
102
John Hancock Funds IIPortfolio of Investments — November 30, 2012 (Unaudited) (showing percentage of total net assets)International Small Company Fund (continued)
Shares or
Principal
Amount Value
COMMON STOCKS (continued)
United Kingdom (continued)
Booker Group PLC 258,527 $ 410,641
Bovis Homes Group PLC (I) 34,079 303,621
Braemar Seascope Group PLC 1,189 6,915
Brammer PLC (I) 15,823 73,261
Copyright © 2013 www.secdatabase.com. All Rights Reserved.Please Consider the Environment Before Printing This Document
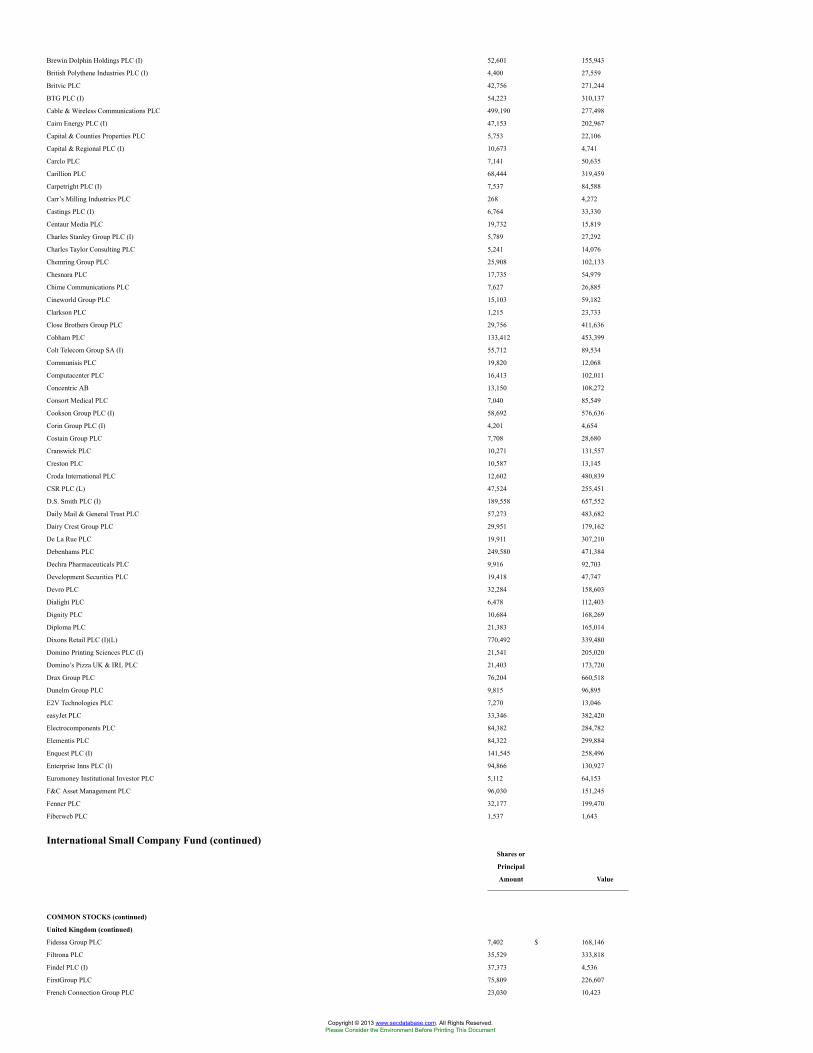
Brewin Dolphin Holdings PLC (I) 52,601 155,943
British Polythene Industries PLC (I) 4,400 27,559
Britvic PLC 42,756 271,244
BTG PLC (I) 54,223 310,137
Cable & Wireless Communications PLC 499,190 277,498
Cairn Energy PLC (I) 47,153 202,967
Capital & Counties Properties PLC 5,753 22,106
Capital & Regional PLC (I) 10,673 4,741
Carclo PLC 7,141 50,635
Carillion PLC 68,444 319,459
Carpetright PLC (I) 7,537 84,588
Carr’s Milling Industries PLC 268 4,272
Castings PLC (I) 6,764 33,330
Centaur Media PLC 19,732 15,819
Charles Stanley Group PLC (I) 5,789 27,292
Charles Taylor Consulting PLC 5,241 14,076
Chemring Group PLC 25,908 102,133
Chesnara PLC 17,735 54,979
Chime Communications PLC 7,627 26,885
Cineworld Group PLC 15,103 59,182
Clarkson PLC 1,215 23,733
Close Brothers Group PLC 29,756 411,636
Cobham PLC 133,412 453,399
Colt Telecom Group SA (I) 55,712 89,534
Communisis PLC 19,820 12,068
Computacenter PLC 16,413 102,011
Concentric AB 13,150 108,272
Consort Medical PLC 7,040 85,549
Cookson Group PLC (I) 58,692 576,636
Corin Group PLC (I) 4,201 4,654
Costain Group PLC 7,708 28,680
Cranswick PLC 10,271 131,557
Creston PLC 10,587 13,145
Croda International PLC 12,602 480,839
CSR PLC (L) 47,524 255,451
D.S. Smith PLC (I) 189,558 657,552
Daily Mail & General Trust PLC 57,273 483,682
Dairy Crest Group PLC 29,951 179,162
De La Rue PLC 19,911 307,210
Debenhams PLC 249,580 471,384
Dechra Pharmaceuticals PLC 9,916 92,703
Development Securities PLC 19,418 47,747
Devro PLC 32,284 158,603
Dialight PLC 6,478 112,403
Dignity PLC 10,684 168,269
Diploma PLC 21,383 165,014
Dixons Retail PLC (I)(L) 770,492 339,480
Domino Printing Sciences PLC (I) 21,541 205,020
Domino’s Pizza UK & IRL PLC 21,403 173,720
Drax Group PLC 76,204 660,518
Dunelm Group PLC 9,815 96,895
E2V Technologies PLC 7,270 13,046
easyJet PLC 33,346 382,420
Electrocomponents PLC 84,382 284,782
Elementis PLC 84,322 299,884
Enquest PLC (I) 141,545 258,496
Enterprise Inns PLC (I) 94,866 130,927
Euromoney Institutional Investor PLC 5,112 64,153
F&C Asset Management PLC 96,030 151,245
Fenner PLC 32,177 199,470
Fiberweb PLC 1,537 1,643
International Small Company Fund (continued)Shares or
Principal
Amount Value
COMMON STOCKS (continued)
United Kingdom (continued)
Fidessa Group PLC 7,402 $ 168,146
Filtrona PLC 35,529 333,818
Findel PLC (I) 37,373 4,536
FirstGroup PLC 75,809 226,607
French Connection Group PLC 23,030 10,423
Copyright © 2013 www.secdatabase.com. All Rights Reserved.Please Consider the Environment Before Printing This Document
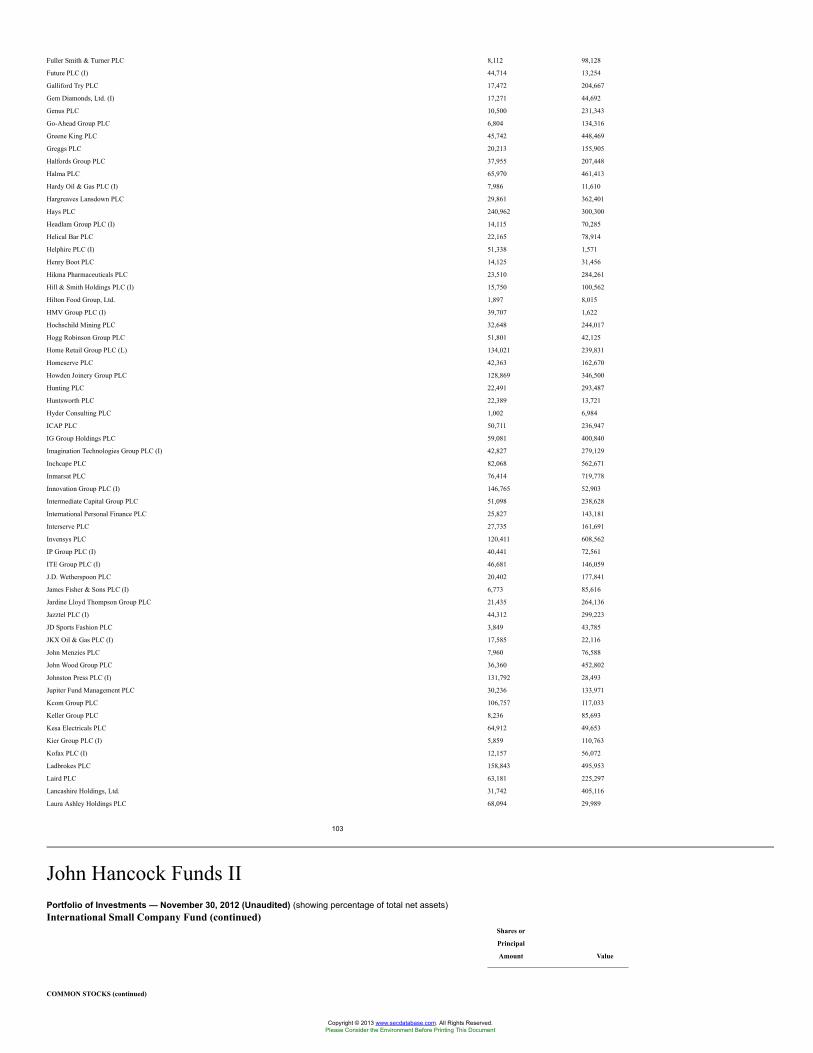
Fuller Smith & Turner PLC 8,112 98,128
Future PLC (I) 44,714 13,254
Galliford Try PLC 17,472 204,667
Gem Diamonds, Ltd. (I) 17,271 44,692
Genus PLC 10,500 231,343
Go-Ahead Group PLC 6,804 134,316
Greene King PLC 45,742 448,469
Greggs PLC 20,213 155,905
Halfords Group PLC 37,955 207,448
Halma PLC 65,970 461,413
Hardy Oil & Gas PLC (I) 7,986 11,610
Hargreaves Lansdown PLC 29,861 362,401
Hays PLC 240,962 300,300
Headlam Group PLC (I) 14,115 70,285
Helical Bar PLC 22,165 78,914
Helphire PLC (I) 51,338 1,571
Henry Boot PLC 14,125 31,456
Hikma Pharmaceuticals PLC 23,510 284,261
Hill & Smith Holdings PLC (I) 15,750 100,562
Hilton Food Group, Ltd. 1,897 8,015
HMV Group PLC (I) 39,707 1,622
Hochschild Mining PLC 32,648 244,017
Hogg Robinson Group PLC 51,801 42,125
Home Retail Group PLC (L) 134,021 239,831
Homeserve PLC 42,363 162,670
Howden Joinery Group PLC 128,869 346,500
Hunting PLC 22,491 293,487
Huntsworth PLC 22,389 13,721
Hyder Consulting PLC 1,002 6,984
ICAP PLC 50,711 236,947
IG Group Holdings PLC 59,081 400,840
Imagination Technologies Group PLC (I) 42,827 279,129
Inchcape PLC 82,068 562,671
Inmarsat PLC 76,414 719,778
Innovation Group PLC (I) 146,765 52,903
Intermediate Capital Group PLC 51,098 238,628
International Personal Finance PLC 25,827 143,181
Interserve PLC 27,735 161,691
Invensys PLC 120,411 608,562
IP Group PLC (I) 40,441 72,561
ITE Group PLC (I) 46,681 146,059
J.D. Wetherspoon PLC 20,402 177,841
James Fisher & Sons PLC (I) 6,773 85,616
Jardine Lloyd Thompson Group PLC 21,435 264,136
Jazztel PLC (I) 44,312 299,223
JD Sports Fashion PLC 3,849 43,785
JKX Oil & Gas PLC (I) 17,585 22,116
John Menzies PLC 7,960 76,588
John Wood Group PLC 36,360 452,802
Johnston Press PLC (I) 131,792 28,493
Jupiter Fund Management PLC 30,236 133,971
Kcom Group PLC 106,757 117,033
Keller Group PLC 8,236 85,693
Kesa Electricals PLC 64,912 49,653
Kier Group PLC (I) 5,859 110,763
Kofax PLC (I) 12,157 56,072
Ladbrokes PLC 158,843 495,953
Laird PLC 63,181 225,297
Lancashire Holdings, Ltd. 31,742 405,116
Laura Ashley Holdings PLC 68,094 29,989
103
John Hancock Funds IIPortfolio of Investments — November 30, 2012 (Unaudited) (showing percentage of total net assets)International Small Company Fund (continued)
Shares or
Principal
Amount Value
COMMON STOCKS (continued)
Copyright © 2013 www.secdatabase.com. All Rights Reserved.Please Consider the Environment Before Printing This Document
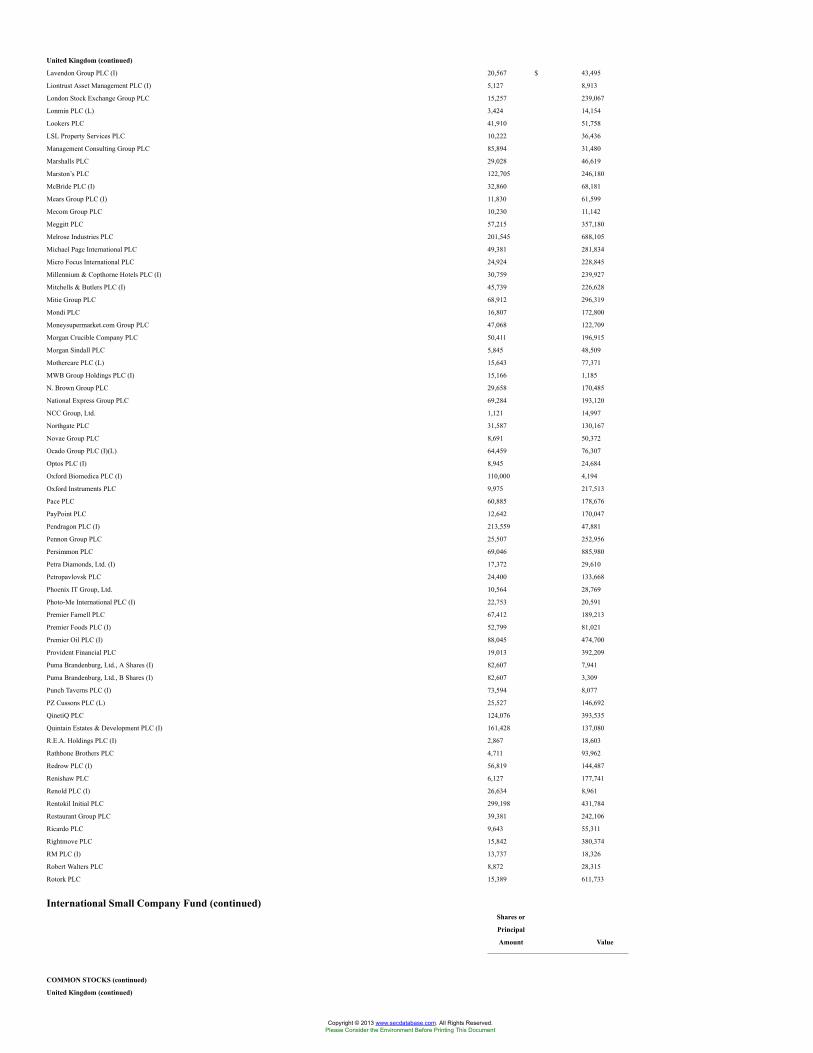
United Kingdom (continued)
Lavendon Group PLC (I) 20,567 $ 43,495
Liontrust Asset Management PLC (I) 5,127 8,913
London Stock Exchange Group PLC 15,257 239,067
Lonmin PLC (L) 3,424 14,154
Lookers PLC 41,910 51,758
LSL Property Services PLC 10,222 36,436
Management Consulting Group PLC 85,894 31,480
Marshalls PLC 29,028 46,619
Marston’s PLC 122,705 246,180
McBride PLC (I) 32,860 68,181
Mears Group PLC (I) 11,830 61,599
Mecom Group PLC 10,230 11,142
Meggitt PLC 57,215 357,180
Melrose Industries PLC 201,545 688,105
Michael Page International PLC 49,381 281,834
Micro Focus International PLC 24,924 228,845
Millennium & Copthorne Hotels PLC (I) 30,759 239,927
Mitchells & Butlers PLC (I) 45,739 226,628
Mitie Group PLC 68,912 296,319
Mondi PLC 16,807 172,800
Moneysupermarket.com Group PLC 47,068 122,709
Morgan Crucible Company PLC 50,411 196,915
Morgan Sindall PLC 5,845 48,509
Mothercare PLC (L) 15,643 77,371
MWB Group Holdings PLC (I) 15,166 1,185
N. Brown Group PLC 29,658 170,485
National Express Group PLC 69,284 193,120
NCC Group, Ltd. 1,121 14,997
Northgate PLC 31,587 130,167
Novae Group PLC 8,691 50,372
Ocado Group PLC (I)(L) 64,459 76,307
Optos PLC (I) 8,945 24,684
Oxford Biomedica PLC (I) 110,000 4,194
Oxford Instruments PLC 9,975 217,513
Pace PLC 60,885 178,676
PayPoint PLC 12,642 170,047
Pendragon PLC (I) 213,559 47,881
Pennon Group PLC 25,507 252,956
Persimmon PLC 69,046 885,980
Petra Diamonds, Ltd. (I) 17,372 29,610
Petropavlovsk PLC 24,400 133,668
Phoenix IT Group, Ltd. 10,564 28,769
Photo-Me International PLC (I) 22,753 20,591
Premier Farnell PLC 67,412 189,213
Premier Foods PLC (I) 52,799 81,021
Premier Oil PLC (I) 88,045 474,700
Provident Financial PLC 19,013 392,209
Puma Brandenburg, Ltd., A Shares (I) 82,607 7,941
Puma Brandenburg, Ltd., B Shares (I) 82,607 3,309
Punch Taverns PLC (I) 73,594 8,077
PZ Cussons PLC (L) 25,527 146,692
QinetiQ PLC 124,076 393,535
Quintain Estates & Development PLC (I) 161,428 137,080
R.E.A. Holdings PLC (I) 2,867 18,603
Rathbone Brothers PLC 4,711 93,962
Redrow PLC (I) 56,819 144,487
Renishaw PLC 6,127 177,741
Renold PLC (I) 26,634 8,961
Rentokil Initial PLC 299,198 431,784
Restaurant Group PLC 39,381 242,106
Ricardo PLC 9,643 55,311
Rightmove PLC 15,842 380,374
RM PLC (I) 13,737 18,326
Robert Walters PLC 8,872 28,315
Rotork PLC 15,389 611,733
International Small Company Fund (continued)Shares or
Principal
Amount Value
COMMON STOCKS (continued)
United Kingdom (continued)
Copyright © 2013 www.secdatabase.com. All Rights Reserved.Please Consider the Environment Before Printing This Document
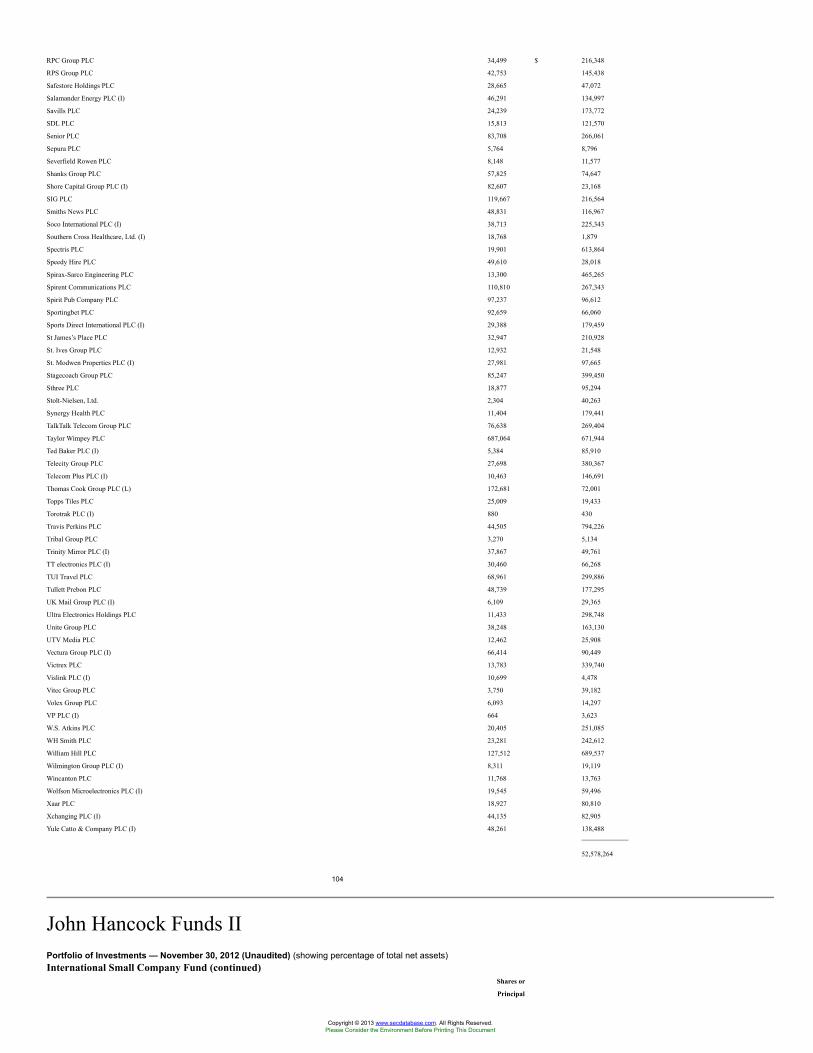
RPC Group PLC 34,499 $ 216,348
RPS Group PLC 42,753 145,438
Safestore Holdings PLC 28,665 47,072
Salamander Energy PLC (I) 46,291 134,997
Savills PLC 24,239 173,772
SDL PLC 15,813 121,570
Senior PLC 83,708 266,061
Sepura PLC 5,764 8,796
Severfield Rowen PLC 8,148 11,577
Shanks Group PLC 57,825 74,647
Shore Capital Group PLC (I) 82,607 23,168
SIG PLC 119,667 216,564
Smiths News PLC 48,831 116,967
Soco International PLC (I) 38,713 225,343
Southern Cross Healthcare, Ltd. (I) 18,768 1,879
Spectris PLC 19,901 613,864
Speedy Hire PLC 49,610 28,018
Spirax-Sarco Engineering PLC 13,300 465,265
Spirent Communications PLC 110,810 267,343
Spirit Pub Company PLC 97,237 96,612
Sportingbet PLC 92,659 66,060
Sports Direct International PLC (I) 29,388 179,459
St James’s Place PLC 32,947 210,928
St. Ives Group PLC 12,932 21,548
St. Modwen Properties PLC (I) 27,981 97,665
Stagecoach Group PLC 85,247 399,450
Sthree PLC 18,877 95,294
Stolt-Nielsen, Ltd. 2,304 40,263
Synergy Health PLC 11,404 179,441
TalkTalk Telecom Group PLC 76,638 269,404
Taylor Wimpey PLC 687,064 671,944
Ted Baker PLC (I) 5,384 85,910
Telecity Group PLC 27,698 380,367
Telecom Plus PLC (I) 10,463 146,691
Thomas Cook Group PLC (L) 172,681 72,001
Topps Tiles PLC 25,009 19,433
Torotrak PLC (I) 880 430
Travis Perkins PLC 44,505 794,226
Tribal Group PLC 3,270 5,134
Trinity Mirror PLC (I) 37,867 49,761
TT electronics PLC (I) 30,460 66,268
TUI Travel PLC 68,961 299,886
Tullett Prebon PLC 48,739 177,295
UK Mail Group PLC (I) 6,109 29,365
Ultra Electronics Holdings PLC 11,433 298,748
Unite Group PLC 38,248 163,130
UTV Media PLC 12,462 25,908
Vectura Group PLC (I) 66,414 90,449
Victrex PLC 13,783 339,740
Vislink PLC (I) 10,699 4,478
Vitec Group PLC 3,750 39,182
Volex Group PLC 6,093 14,297
VP PLC (I) 664 3,623
W.S. Atkins PLC 20,405 251,085
WH Smith PLC 23,281 242,612
William Hill PLC 127,512 689,537
Wilmington Group PLC (I) 8,311 19,119
Wincanton PLC 11,768 13,763
Wolfson Microelectronics PLC (I) 19,545 59,496
Xaar PLC 18,927 80,810
Xchanging PLC (I) 44,135 82,905
Yule Catto & Company PLC (I) 48,261 138,488
52,578,264
104
John Hancock Funds IIPortfolio of Investments — November 30, 2012 (Unaudited) (showing percentage of total net assets)International Small Company Fund (continued)
Shares or
Principal
Copyright © 2013 www.secdatabase.com. All Rights Reserved.Please Consider the Environment Before Printing This Document
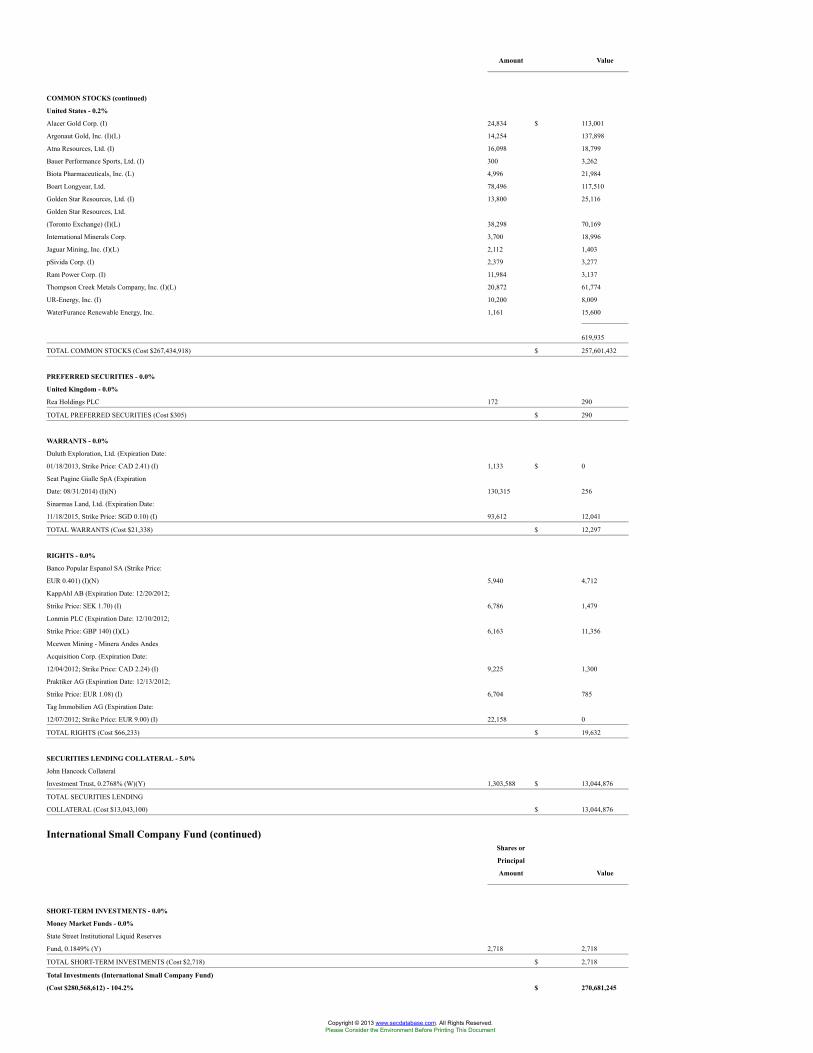
Amount Value
COMMON STOCKS (continued)
United States - 0.2%
Alacer Gold Corp. (I) 24,834 $ 113,001
Argonaut Gold, Inc. (I)(L) 14,254 137,898
Atna Resources, Ltd. (I) 16,098 18,799
Bauer Performance Sports, Ltd. (I) 300 3,262
Biota Pharmaceuticals, Inc. (L) 4,996 21,984
Boart Longyear, Ltd. 78,496 117,510
Golden Star Resources, Ltd. (I) 13,800 25,116
Golden Star Resources, Ltd.
(Toronto Exchange) (I)(L) 38,298 70,169
International Minerals Corp. 3,700 18,996
Jaguar Mining, Inc. (I)(L) 2,112 1,403
pSivida Corp. (I) 2,379 3,277
Ram Power Corp. (I) 11,984 3,137
Thompson Creek Metals Company, Inc. (I)(L) 20,872 61,774
UR-Energy, Inc. (I) 10,200 8,009
WaterFurance Renewable Energy, Inc. 1,161 15,600
619,935
TOTAL COMMON STOCKS (Cost $267,434,918) $ 257,601,432
PREFERRED SECURITIES - 0.0%
United Kingdom - 0.0%
Rea Holdings PLC 172 290
TOTAL PREFERRED SECURITIES (Cost $305) $ 290
WARRANTS - 0.0%
Duluth Exploration, Ltd. (Expiration Date:
01/18/2013, Strike Price: CAD 2.41) (I) 1,133 $ 0
Seat Pagine Gialle SpA (Expiration
Date: 08/31/2014) (I)(N) 130,315 256
Sinarmas Land, Ltd. (Expiration Date:
11/18/2015, Strike Price: SGD 0.10) (I) 93,612 12,041
TOTAL WARRANTS (Cost $21,338) $ 12,297
RIGHTS - 0.0%
Banco Popular Espanol SA (Strike Price:
EUR 0.401) (I)(N) 5,940 4,712
KappAhl AB (Expiration Date: 12/20/2012;
Strike Price: SEK 1.70) (I) 6,786 1,479
Lonmin PLC (Expiration Date: 12/10/2012;
Strike Price: GBP 140) (I)(L) 6,163 11,356
Mcewen Mining - Minera Andes Andes
Acquisition Corp. (Expiration Date:
12/04/2012; Strike Price: CAD 2.24) (I) 9,225 1,300
Praktiker AG (Expiration Date: 12/13/2012;
Strike Price: EUR 1.08) (I) 6,704 785
Tag Immobilien AG (Expiration Date:
12/07/2012; Strike Price: EUR 9.00) (I) 22,158 0
TOTAL RIGHTS (Cost $66,233) $ 19,632
SECURITIES LENDING COLLATERAL - 5.0%
John Hancock Collateral
Investment Trust, 0.2768% (W)(Y) 1,303,588 $ 13,044,876
TOTAL SECURITIES LENDING
COLLATERAL (Cost $13,043,100) $ 13,044,876
International Small Company Fund (continued)Shares or
Principal
Amount Value
SHORT-TERM INVESTMENTS - 0.0%
Money Market Funds - 0.0%
State Street Institutional Liquid Reserves
Fund, 0.1849% (Y) 2,718 2,718
TOTAL SHORT-TERM INVESTMENTS (Cost $2,718) $ 2,718
Total Investments (International Small Company Fund)
(Cost $280,568,612) - 104.2% $ 270,681,245
Copyright © 2013 www.secdatabase.com. All Rights Reserved.Please Consider the Environment Before Printing This Document
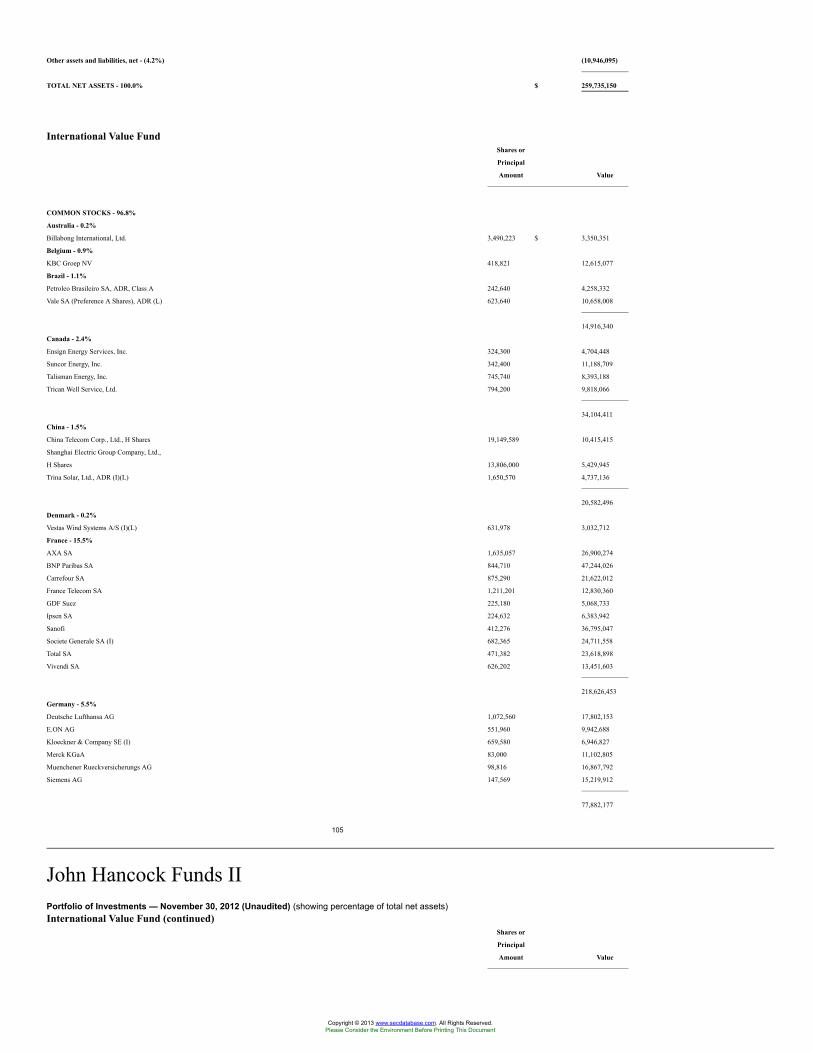
Other assets and liabilities, net - (4.2%) (10,946,095)
TOTAL NET ASSETS - 100.0% $ 259,735,150
International Value FundShares or
Principal
Amount Value
COMMON STOCKS - 96.8%
Australia - 0.2%
Billabong International, Ltd. 3,490,223 $ 3,350,351
Belgium - 0.9%
KBC Groep NV 418,821 12,615,077
Brazil - 1.1%
Petroleo Brasileiro SA, ADR, Class A 242,640 4,258,332
Vale SA (Preference A Shares), ADR (L) 623,640 10,658,008
14,916,340
Canada - 2.4%
Ensign Energy Services, Inc. 324,300 4,704,448
Suncor Energy, Inc. 342,400 11,188,709
Talisman Energy, Inc. 745,740 8,393,188
Trican Well Service, Ltd. 794,200 9,818,066
34,104,411
China - 1.5%
China Telecom Corp., Ltd., H Shares 19,149,589 10,415,415
Shanghai Electric Group Company, Ltd.,
H Shares 13,806,000 5,429,945
Trina Solar, Ltd., ADR (I)(L) 1,650,570 4,737,136
20,582,496
Denmark - 0.2%
Vestas Wind Systems A/S (I)(L) 631,978 3,032,712
France - 15.5%
AXA SA 1,635,057 26,900,274
BNP Paribas SA 844,710 47,244,026
Carrefour SA 875,290 21,622,012
France Telecom SA 1,211,201 12,830,360
GDF Suez 225,180 5,068,733
Ipsen SA 224,632 6,383,942
Sanofi 412,276 36,795,047
Societe Generale SA (I) 682,365 24,711,558
Total SA 471,382 23,618,898
Vivendi SA 626,202 13,451,603
218,626,453
Germany - 5.5%
Deutsche Lufthansa AG 1,072,560 17,802,153
E.ON AG 551,960 9,942,688
Kloeckner & Company SE (I) 659,580 6,946,827
Merck KGaA 83,000 11,102,805
Muenchener Rueckversicherungs AG 98,816 16,867,792
Siemens AG 147,569 15,219,912
77,882,177
105
John Hancock Funds IIPortfolio of Investments — November 30, 2012 (Unaudited) (showing percentage of total net assets)International Value Fund (continued)
Shares or
Principal
Amount Value
Copyright © 2013 www.secdatabase.com. All Rights Reserved.Please Consider the Environment Before Printing This Document
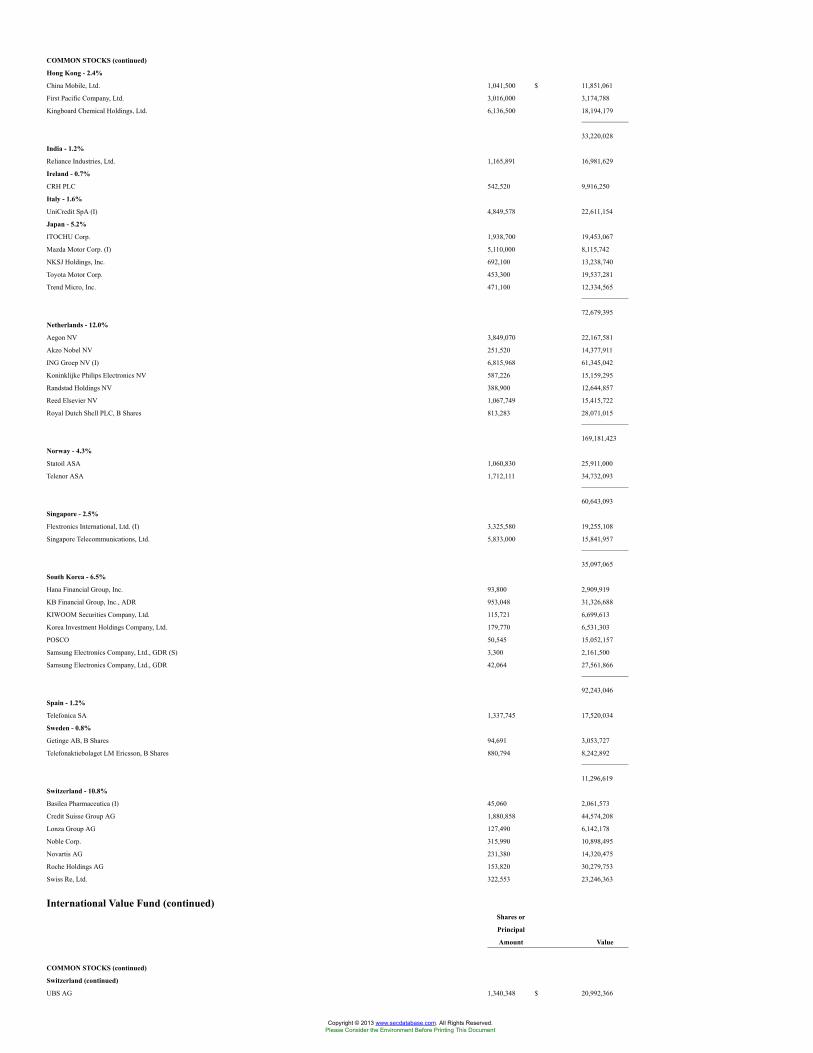
COMMON STOCKS (continued)
Hong Kong - 2.4%
China Mobile, Ltd. 1,041,500 $ 11,851,061
First Pacific Company, Ltd. 3,016,000 3,174,788
Kingboard Chemical Holdings, Ltd. 6,136,500 18,194,179
33,220,028
India - 1.2%
Reliance Industries, Ltd. 1,165,891 16,981,629
Ireland - 0.7%
CRH PLC 542,520 9,916,250
Italy - 1.6%
UniCredit SpA (I) 4,849,578 22,611,154
Japan - 5.2%
ITOCHU Corp. 1,938,700 19,453,067
Mazda Motor Corp. (I) 5,110,000 8,115,742
NKSJ Holdings, Inc. 692,100 13,238,740
Toyota Motor Corp. 453,300 19,537,281
Trend Micro, Inc. 471,100 12,334,565
72,679,395
Netherlands - 12.0%
Aegon NV 3,849,070 22,167,581
Akzo Nobel NV 251,520 14,377,911
ING Groep NV (I) 6,815,968 61,345,042
Koninklijke Philips Electronics NV 587,226 15,159,295
Randstad Holdings NV 388,900 12,644,857
Reed Elsevier NV 1,067,749 15,415,722
Royal Dutch Shell PLC, B Shares 813,283 28,071,015
169,181,423
Norway - 4.3%
Statoil ASA 1,060,830 25,911,000
Telenor ASA 1,712,111 34,732,093
60,643,093
Singapore - 2.5%
Flextronics International, Ltd. (I) 3,325,580 19,255,108
Singapore Telecommunications, Ltd. 5,833,000 15,841,957
35,097,065
South Korea - 6.5%
Hana Financial Group, Inc. 93,800 2,909,919
KB Financial Group, Inc., ADR 953,048 31,326,688
KIWOOM Securities Company, Ltd. 115,721 6,699,613
Korea Investment Holdings Company, Ltd. 179,770 6,531,303
POSCO 50,545 15,052,157
Samsung Electronics Company, Ltd., GDR (S) 3,300 2,161,500
Samsung Electronics Company, Ltd., GDR 42,064 27,561,866
92,243,046
Spain - 1.2%
Telefonica SA 1,337,745 17,520,034
Sweden - 0.8%
Getinge AB, B Shares 94,691 3,053,727
Telefonaktiebolaget LM Ericsson, B Shares 880,794 8,242,892
11,296,619
Switzerland - 10.8%
Basilea Pharmaceutica (I) 45,060 2,061,573
Credit Suisse Group AG 1,880,858 44,574,208
Lonza Group AG 127,490 6,142,178
Noble Corp. 315,990 10,898,495
Novartis AG 231,380 14,320,475
Roche Holdings AG 153,820 30,279,753
Swiss Re, Ltd. 322,553 23,246,363
International Value Fund (continued)Shares or
Principal
Amount Value
COMMON STOCKS (continued)
Switzerland (continued)
UBS AG 1,340,348 $ 20,992,366
Copyright © 2013 www.secdatabase.com. All Rights Reserved.Please Consider the Environment Before Printing This Document
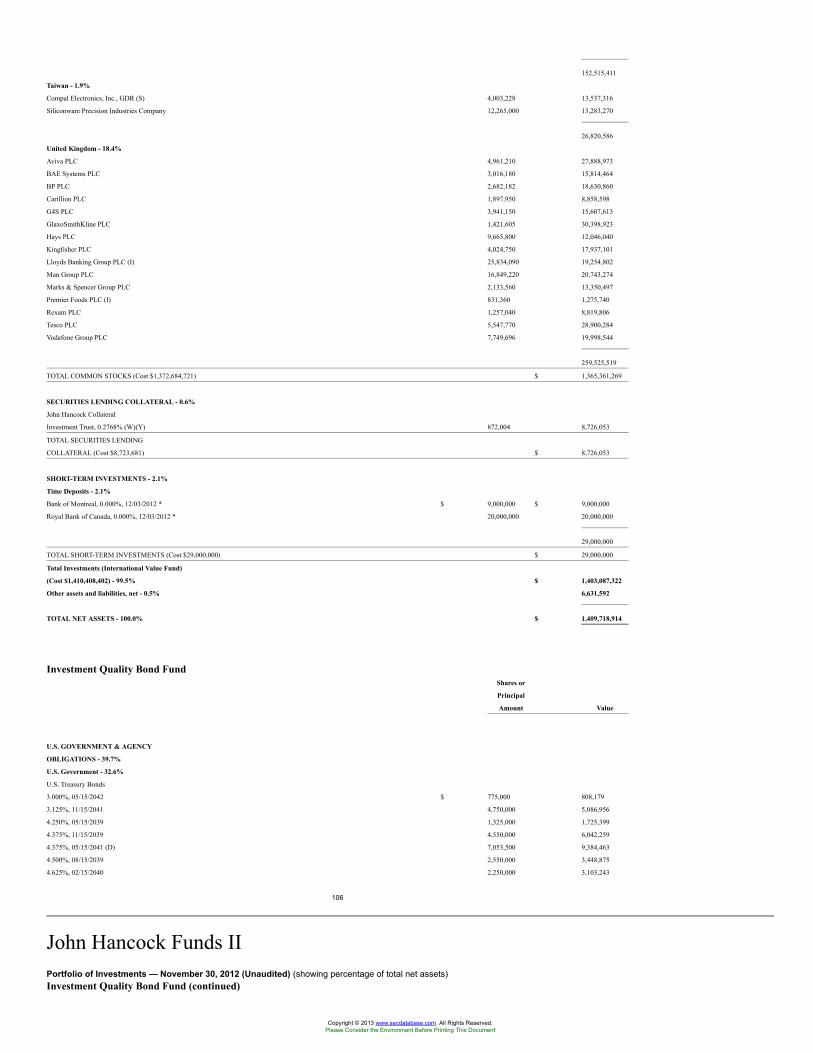
152,515,411
Taiwan - 1.9%
Compal Electronics, Inc., GDR (S) 4,003,228 13,537,316
Siliconware Precision Industries Company 12,265,000 13,283,270
26,820,586
United Kingdom - 18.4%
Aviva PLC 4,961,210 27,888,973
BAE Systems PLC 3,016,180 15,814,464
BP PLC 2,682,182 18,630,860
Carillion PLC 1,897,950 8,858,598
G4S PLC 3,941,150 15,607,613
GlaxoSmithKline PLC 1,421,605 30,398,923
Hays PLC 9,665,800 12,046,040
Kingfisher PLC 4,024,750 17,937,101
Lloyds Banking Group PLC (I) 25,834,090 19,254,802
Man Group PLC 16,849,220 20,743,274
Marks & Spencer Group PLC 2,133,560 13,350,497
Premier Foods PLC (I) 831,360 1,275,740
Rexam PLC 1,257,040 8,819,806
Tesco PLC 5,547,770 28,900,284
Vodafone Group PLC 7,749,696 19,998,544
259,525,519
TOTAL COMMON STOCKS (Cost $1,372,684,721) $ 1,365,361,269
SECURITIES LENDING COLLATERAL - 0.6%
John Hancock Collateral
Investment Trust, 0.2768% (W)(Y) 872,004 8,726,053
TOTAL SECURITIES LENDING
COLLATERAL (Cost $8,723,681) $ 8,726,053
SHORT-TERM INVESTMENTS - 2.1%
Time Deposits - 2.1%
Bank of Montreal, 0.000%, 12/03/2012 * $ 9,000,000 $ 9,000,000
Royal Bank of Canada, 0.000%, 12/03/2012 * 20,000,000 20,000,000
29,000,000
TOTAL SHORT-TERM INVESTMENTS (Cost $29,000,000) $ 29,000,000
Total Investments (International Value Fund)
(Cost $1,410,408,402) - 99.5% $ 1,403,087,322
Other assets and liabilities, net - 0.5% 6,631,592
TOTAL NET ASSETS - 100.0% $ 1,409,718,914
Investment Quality Bond FundShares or
Principal
Amount Value
U.S. GOVERNMENT & AGENCY
OBLIGATIONS - 39.7%
U.S. Government - 32.6%
U.S. Treasury Bonds
3.000%, 05/15/2042 $ 775,000 808,179
3.125%, 11/15/2041 4,750,000 5,086,956
4.250%, 05/15/2039 1,325,000 1,725,399
4.375%, 11/15/2039 4,550,000 6,042,259
4.375%, 05/15/2041 (D) 7,053,500 9,384,463
4.500%, 08/15/2039 2,550,000 3,448,875
4.625%, 02/15/2040 2,250,000 3,103,243
106
John Hancock Funds IIPortfolio of Investments — November 30, 2012 (Unaudited) (showing percentage of total net assets)Investment Quality Bond Fund (continued)
Copyright © 2013 www.secdatabase.com. All Rights Reserved.Please Consider the Environment Before Printing This Document
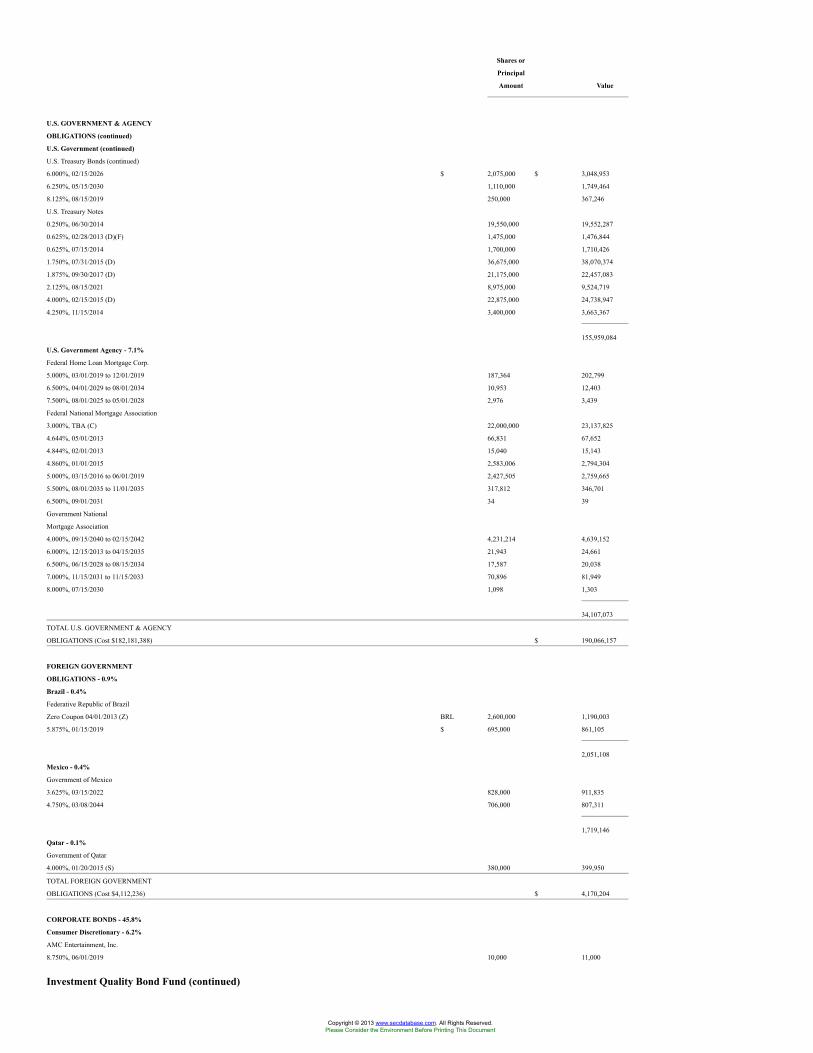
Shares or
Principal
Amount Value
U.S. GOVERNMENT & AGENCY
OBLIGATIONS (continued)
U.S. Government (continued)
U.S. Treasury Bonds (continued)
6.000%, 02/15/2026 $ 2,075,000 $ 3,048,953
6.250%, 05/15/2030 1,110,000 1,749,464
8.125%, 08/15/2019 250,000 367,246
U.S. Treasury Notes
0.250%, 06/30/2014 19,550,000 19,552,287
0.625%, 02/28/2013 (D)(F) 1,475,000 1,476,844
0.625%, 07/15/2014 1,700,000 1,710,426
1.750%, 07/31/2015 (D) 36,675,000 38,070,374
1.875%, 09/30/2017 (D) 21,175,000 22,457,083
2.125%, 08/15/2021 8,975,000 9,524,719
4.000%, 02/15/2015 (D) 22,875,000 24,738,947
4.250%, 11/15/2014 3,400,000 3,663,367
155,959,084
U.S. Government Agency - 7.1%
Federal Home Loan Mortgage Corp.
5.000%, 03/01/2019 to 12/01/2019 187,364 202,799
6.500%, 04/01/2029 to 08/01/2034 10,953 12,403
7.500%, 08/01/2025 to 05/01/2028 2,976 3,439
Federal National Mortgage Association
3.000%, TBA (C) 22,000,000 23,137,825
4.644%, 05/01/2013 66,831 67,652
4.844%, 02/01/2013 15,040 15,143
4.860%, 01/01/2015 2,583,006 2,794,304
5.000%, 03/15/2016 to 06/01/2019 2,427,505 2,759,665
5.500%, 08/01/2035 to 11/01/2035 317,812 346,701
6.500%, 09/01/2031 34 39
Government National
Mortgage Association
4.000%, 09/15/2040 to 02/15/2042 4,231,214 4,639,152
6.000%, 12/15/2013 to 04/15/2035 21,943 24,661
6.500%, 06/15/2028 to 08/15/2034 17,587 20,038
7.000%, 11/15/2031 to 11/15/2033 70,896 81,949
8.000%, 07/15/2030 1,098 1,303
34,107,073
TOTAL U.S. GOVERNMENT & AGENCY
OBLIGATIONS (Cost $182,181,388) $ 190,066,157
FOREIGN GOVERNMENT
OBLIGATIONS - 0.9%
Brazil - 0.4%
Federative Republic of Brazil
Zero Coupon 04/01/2013 (Z) BRL 2,600,000 1,190,003
5.875%, 01/15/2019 $ 695,000 861,105
2,051,108
Mexico - 0.4%
Government of Mexico
3.625%, 03/15/2022 828,000 911,835
4.750%, 03/08/2044 706,000 807,311
1,719,146
Qatar - 0.1%
Government of Qatar
4.000%, 01/20/2015 (S) 380,000 399,950
TOTAL FOREIGN GOVERNMENT
OBLIGATIONS (Cost $4,112,236) $ 4,170,204
CORPORATE BONDS - 45.8%
Consumer Discretionary - 6.2%
AMC Entertainment, Inc.
8.750%, 06/01/2019 10,000 11,000
Investment Quality Bond Fund (continued)
Copyright © 2013 www.secdatabase.com. All Rights Reserved.Please Consider the Environment Before Printing This Document
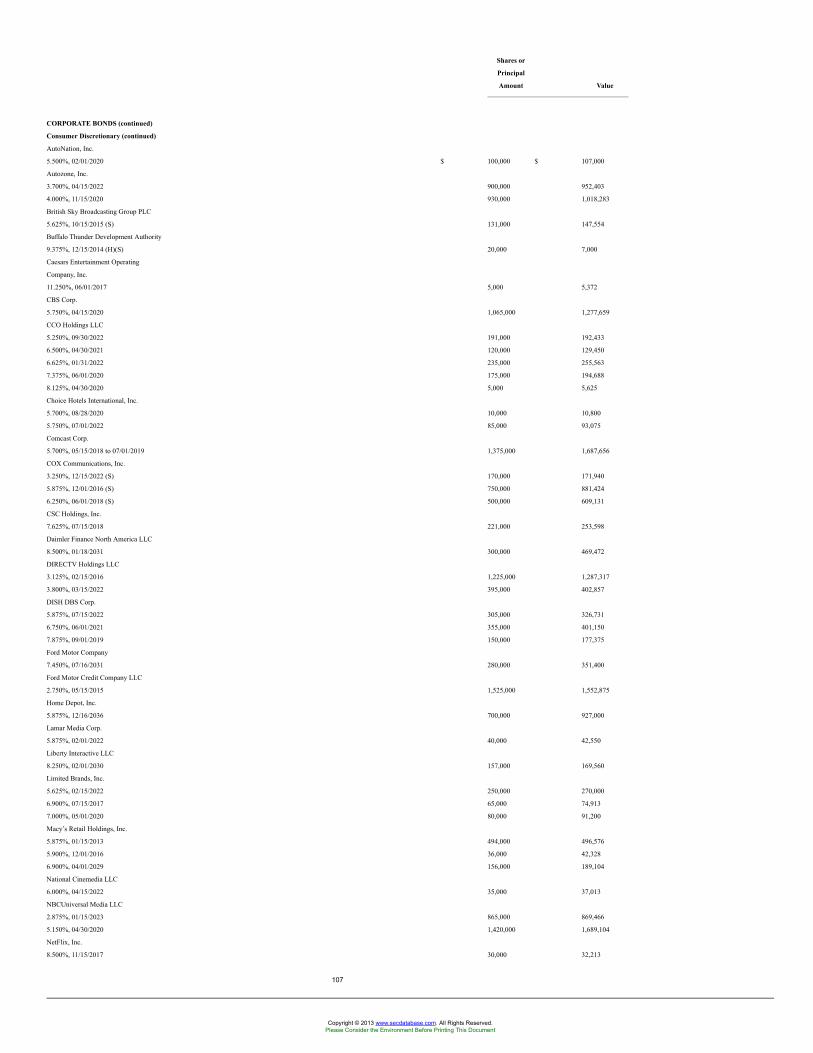
Shares or
Principal
Amount Value
CORPORATE BONDS (continued)
Consumer Discretionary (continued)
AutoNation, Inc.
5.500%, 02/01/2020 $ 100,000 $ 107,000
Autozone, Inc.
3.700%, 04/15/2022 900,000 952,403
4.000%, 11/15/2020 930,000 1,018,283
British Sky Broadcasting Group PLC
5.625%, 10/15/2015 (S) 131,000 147,554
Buffalo Thunder Development Authority
9.375%, 12/15/2014 (H)(S) 20,000 7,000
Caesars Entertainment Operating
Company, Inc.
11.250%, 06/01/2017 5,000 5,372
CBS Corp.
5.750%, 04/15/2020 1,065,000 1,277,659
CCO Holdings LLC
5.250%, 09/30/2022 191,000 192,433
6.500%, 04/30/2021 120,000 129,450
6.625%, 01/31/2022 235,000 255,563
7.375%, 06/01/2020 175,000 194,688
8.125%, 04/30/2020 5,000 5,625
Choice Hotels International, Inc.
5.700%, 08/28/2020 10,000 10,800
5.750%, 07/01/2022 85,000 93,075
Comcast Corp.
5.700%, 05/15/2018 to 07/01/2019 1,375,000 1,687,656
COX Communications, Inc.
3.250%, 12/15/2022 (S) 170,000 171,940
5.875%, 12/01/2016 (S) 750,000 881,424
6.250%, 06/01/2018 (S) 500,000 609,131
CSC Holdings, Inc.
7.625%, 07/15/2018 221,000 253,598
Daimler Finance North America LLC
8.500%, 01/18/2031 300,000 469,472
DIRECTV Holdings LLC
3.125%, 02/15/2016 1,225,000 1,287,317
3.800%, 03/15/2022 395,000 402,857
DISH DBS Corp.
5.875%, 07/15/2022 305,000 326,731
6.750%, 06/01/2021 355,000 401,150
7.875%, 09/01/2019 150,000 177,375
Ford Motor Company
7.450%, 07/16/2031 280,000 351,400
Ford Motor Credit Company LLC
2.750%, 05/15/2015 1,525,000 1,552,875
Home Depot, Inc.
5.875%, 12/16/2036 700,000 927,000
Lamar Media Corp.
5.875%, 02/01/2022 40,000 42,550
Liberty Interactive LLC
8.250%, 02/01/2030 157,000 169,560
Limited Brands, Inc.
5.625%, 02/15/2022 250,000 270,000
6.900%, 07/15/2017 65,000 74,913
7.000%, 05/01/2020 80,000 91,200
Macy’s Retail Holdings, Inc.
5.875%, 01/15/2013 494,000 496,576
5.900%, 12/01/2016 36,000 42,328
6.900%, 04/01/2029 156,000 189,104
National Cinemedia LLC
6.000%, 04/15/2022 35,000 37,013
NBCUniversal Media LLC
2.875%, 01/15/2023 865,000 869,466
5.150%, 04/30/2020 1,420,000 1,689,104
NetFlix, Inc.
8.500%, 11/15/2017 30,000 32,213
107
Copyright © 2013 www.secdatabase.com. All Rights Reserved.Please Consider the Environment Before Printing This Document
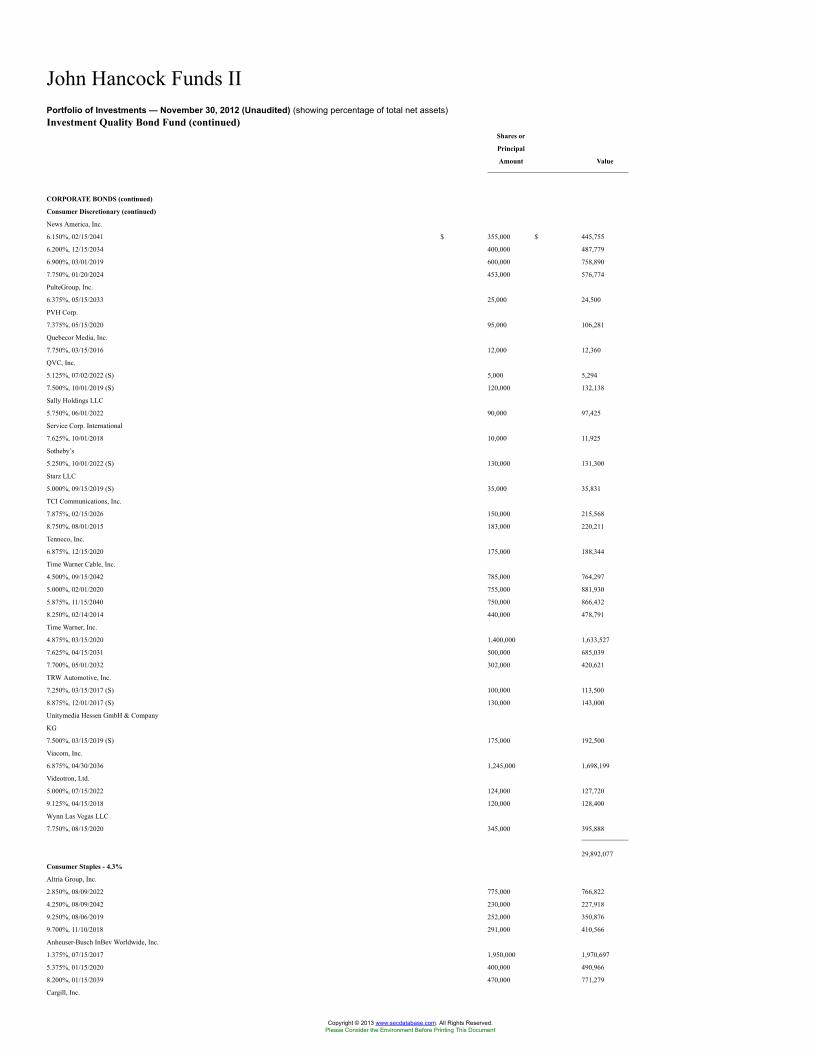
John Hancock Funds IIPortfolio of Investments — November 30, 2012 (Unaudited) (showing percentage of total net assets)Investment Quality Bond Fund (continued)
Shares or
Principal
Amount Value
CORPORATE BONDS (continued)
Consumer Discretionary (continued)
News America, Inc.
6.150%, 02/15/2041 $ 355,000 $ 445,755
6.200%, 12/15/2034 400,000 487,779
6.900%, 03/01/2019 600,000 758,890
7.750%, 01/20/2024 453,000 576,774
PulteGroup, Inc.
6.375%, 05/15/2033 25,000 24,500
PVH Corp.
7.375%, 05/15/2020 95,000 106,281
Quebecor Media, Inc.
7.750%, 03/15/2016 12,000 12,360
QVC, Inc.
5.125%, 07/02/2022 (S) 5,000 5,294
7.500%, 10/01/2019 (S) 120,000 132,138
Sally Holdings LLC
5.750%, 06/01/2022 90,000 97,425
Service Corp. International
7.625%, 10/01/2018 10,000 11,925
Sotheby’s
5.250%, 10/01/2022 (S) 130,000 131,300
Starz LLC
5.000%, 09/15/2019 (S) 35,000 35,831
TCI Communications, Inc.
7.875%, 02/15/2026 150,000 215,568
8.750%, 08/01/2015 183,000 220,211
Tenneco, Inc.
6.875%, 12/15/2020 175,000 188,344
Time Warner Cable, Inc.
4.500%, 09/15/2042 785,000 764,297
5.000%, 02/01/2020 755,000 881,930
5.875%, 11/15/2040 750,000 866,432
8.250%, 02/14/2014 440,000 478,791
Time Warner, Inc.
4.875%, 03/15/2020 1,400,000 1,633,527
7.625%, 04/15/2031 500,000 685,039
7.700%, 05/01/2032 302,000 420,621
TRW Automotive, Inc.
7.250%, 03/15/2017 (S) 100,000 113,500
8.875%, 12/01/2017 (S) 130,000 143,000
Unitymedia Hessen GmbH & Company
KG
7.500%, 03/15/2019 (S) 175,000 192,500
Viacom, Inc.
6.875%, 04/30/2036 1,245,000 1,698,199
Videotron, Ltd.
5.000%, 07/15/2022 124,000 127,720
9.125%, 04/15/2018 120,000 128,400
Wynn Las Vegas LLC
7.750%, 08/15/2020 345,000 395,888
29,892,077
Consumer Staples - 4.3%
Altria Group, Inc.
2.850%, 08/09/2022 775,000 766,822
4.250%, 08/09/2042 230,000 227,918
9.250%, 08/06/2019 252,000 350,876
9.700%, 11/10/2018 291,000 410,566
Anheuser-Busch InBev Worldwide, Inc.
1.375%, 07/15/2017 1,950,000 1,970,697
5.375%, 01/15/2020 400,000 490,966
8.200%, 01/15/2039 470,000 771,279
Cargill, Inc.
Copyright © 2013 www.secdatabase.com. All Rights Reserved.Please Consider the Environment Before Printing This Document
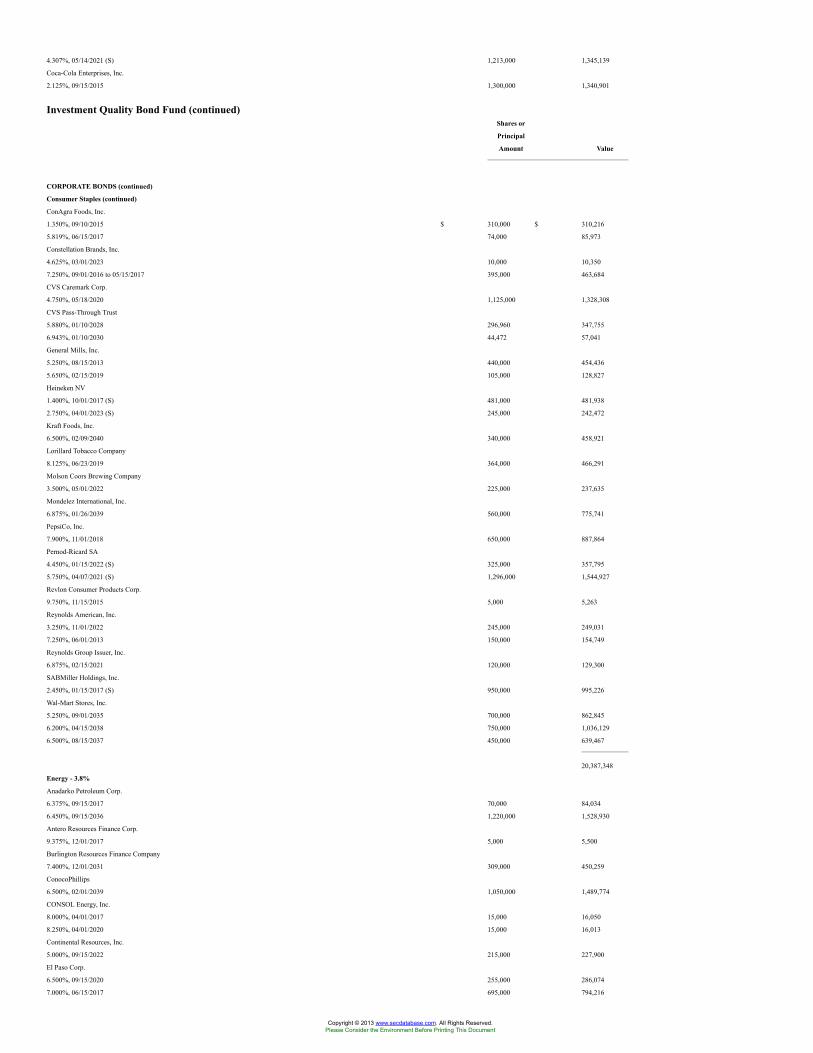
4.307%, 05/14/2021 (S) 1,213,000 1,345,139
Coca-Cola Enterprises, Inc.
2.125%, 09/15/2015 1,300,000 1,340,901
Investment Quality Bond Fund (continued)Shares or
Principal
Amount Value
CORPORATE BONDS (continued)
Consumer Staples (continued)
ConAgra Foods, Inc.
1.350%, 09/10/2015 $ 310,000 $ 310,216
5.819%, 06/15/2017 74,000 85,973
Constellation Brands, Inc.
4.625%, 03/01/2023 10,000 10,350
7.250%, 09/01/2016 to 05/15/2017 395,000 463,684
CVS Caremark Corp.
4.750%, 05/18/2020 1,125,000 1,328,308
CVS Pass-Through Trust
5.880%, 01/10/2028 296,960 347,755
6.943%, 01/10/2030 44,472 57,041
General Mills, Inc.
5.250%, 08/15/2013 440,000 454,436
5.650%, 02/15/2019 105,000 128,827
Heineken NV
1.400%, 10/01/2017 (S) 481,000 481,938
2.750%, 04/01/2023 (S) 245,000 242,472
Kraft Foods, Inc.
6.500%, 02/09/2040 340,000 458,921
Lorillard Tobacco Company
8.125%, 06/23/2019 364,000 466,291
Molson Coors Brewing Company
3.500%, 05/01/2022 225,000 237,635
Mondelez International, Inc.
6.875%, 01/26/2039 560,000 775,741
PepsiCo, Inc.
7.900%, 11/01/2018 650,000 887,864
Pernod-Ricard SA
4.450%, 01/15/2022 (S) 325,000 357,795
5.750%, 04/07/2021 (S) 1,296,000 1,544,927
Revlon Consumer Products Corp.
9.750%, 11/15/2015 5,000 5,263
Reynolds American, Inc.
3.250%, 11/01/2022 245,000 249,031
7.250%, 06/01/2013 150,000 154,749
Reynolds Group Issuer, Inc.
6.875%, 02/15/2021 120,000 129,300
SABMiller Holdings, Inc.
2.450%, 01/15/2017 (S) 950,000 995,226
Wal-Mart Stores, Inc.
5.250%, 09/01/2035 700,000 862,845
6.200%, 04/15/2038 750,000 1,036,129
6.500%, 08/15/2037 450,000 639,467
20,387,348
Energy - 3.8%
Anadarko Petroleum Corp.
6.375%, 09/15/2017 70,000 84,034
6.450%, 09/15/2036 1,220,000 1,528,930
Antero Resources Finance Corp.
9.375%, 12/01/2017 5,000 5,500
Burlington Resources Finance Company
7.400%, 12/01/2031 309,000 450,259
ConocoPhillips
6.500%, 02/01/2039 1,050,000 1,489,774
CONSOL Energy, Inc.
8.000%, 04/01/2017 15,000 16,050
8.250%, 04/01/2020 15,000 16,013
Continental Resources, Inc.
5.000%, 09/15/2022 215,000 227,900
El Paso Corp.
6.500%, 09/15/2020 255,000 286,074
7.000%, 06/15/2017 695,000 794,216
Copyright © 2013 www.secdatabase.com. All Rights Reserved.Please Consider the Environment Before Printing This Document
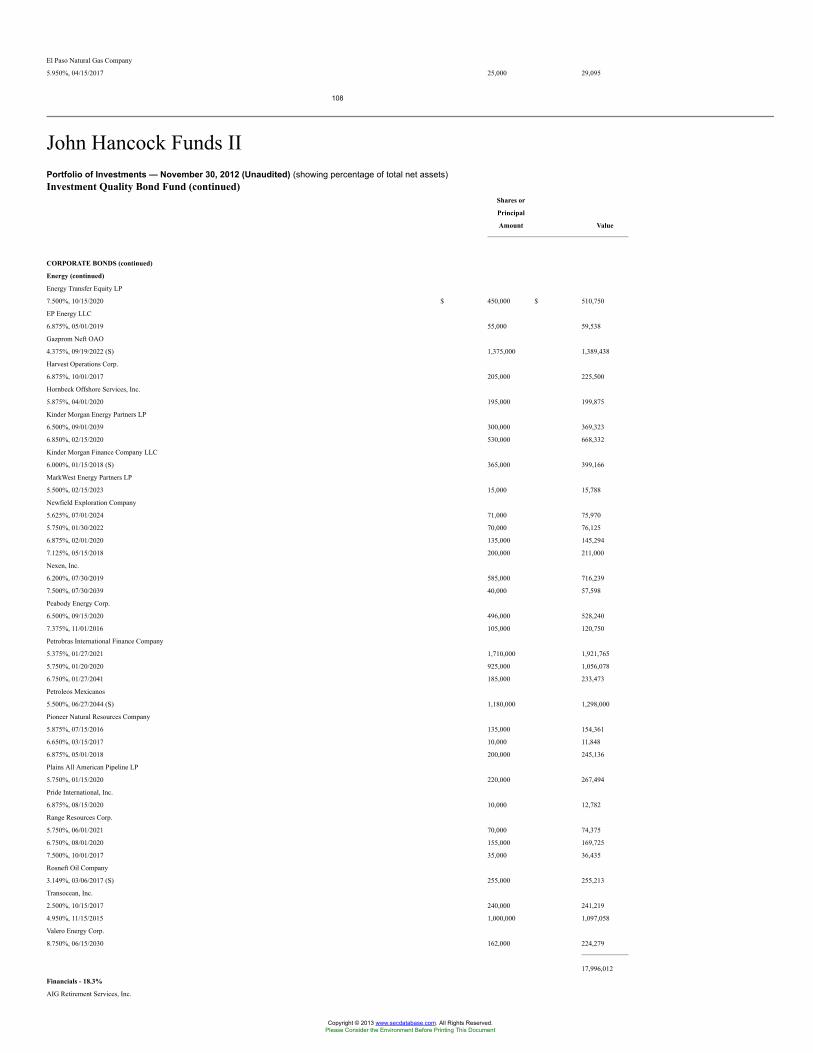
El Paso Natural Gas Company
5.950%, 04/15/2017 25,000 29,095
108
John Hancock Funds IIPortfolio of Investments — November 30, 2012 (Unaudited) (showing percentage of total net assets)Investment Quality Bond Fund (continued)
Shares or
Principal
Amount Value
CORPORATE BONDS (continued)
Energy (continued)
Energy Transfer Equity LP
7.500%, 10/15/2020 $ 450,000 $ 510,750
EP Energy LLC
6.875%, 05/01/2019 55,000 59,538
Gazprom Neft OAO
4.375%, 09/19/2022 (S) 1,375,000 1,389,438
Harvest Operations Corp.
6.875%, 10/01/2017 205,000 225,500
Hornbeck Offshore Services, Inc.
5.875%, 04/01/2020 195,000 199,875
Kinder Morgan Energy Partners LP
6.500%, 09/01/2039 300,000 369,323
6.850%, 02/15/2020 530,000 668,332
Kinder Morgan Finance Company LLC
6.000%, 01/15/2018 (S) 365,000 399,166
MarkWest Energy Partners LP
5.500%, 02/15/2023 15,000 15,788
Newfield Exploration Company
5.625%, 07/01/2024 71,000 75,970
5.750%, 01/30/2022 70,000 76,125
6.875%, 02/01/2020 135,000 145,294
7.125%, 05/15/2018 200,000 211,000
Nexen, Inc.
6.200%, 07/30/2019 585,000 716,239
7.500%, 07/30/2039 40,000 57,598
Peabody Energy Corp.
6.500%, 09/15/2020 496,000 528,240
7.375%, 11/01/2016 105,000 120,750
Petrobras International Finance Company
5.375%, 01/27/2021 1,710,000 1,921,765
5.750%, 01/20/2020 925,000 1,056,078
6.750%, 01/27/2041 185,000 233,473
Petroleos Mexicanos
5.500%, 06/27/2044 (S) 1,180,000 1,298,000
Pioneer Natural Resources Company
5.875%, 07/15/2016 135,000 154,361
6.650%, 03/15/2017 10,000 11,848
6.875%, 05/01/2018 200,000 245,136
Plains All American Pipeline LP
5.750%, 01/15/2020 220,000 267,494
Pride International, Inc.
6.875%, 08/15/2020 10,000 12,782
Range Resources Corp.
5.750%, 06/01/2021 70,000 74,375
6.750%, 08/01/2020 155,000 169,725
7.500%, 10/01/2017 35,000 36,435
Rosneft Oil Company
3.149%, 03/06/2017 (S) 255,000 255,213
Transocean, Inc.
2.500%, 10/15/2017 240,000 241,219
4.950%, 11/15/2015 1,000,000 1,097,058
Valero Energy Corp.
8.750%, 06/15/2030 162,000 224,279
17,996,012
Financials - 18.3%
AIG Retirement Services, Inc.
Copyright © 2013 www.secdatabase.com. All Rights Reserved.Please Consider the Environment Before Printing This Document
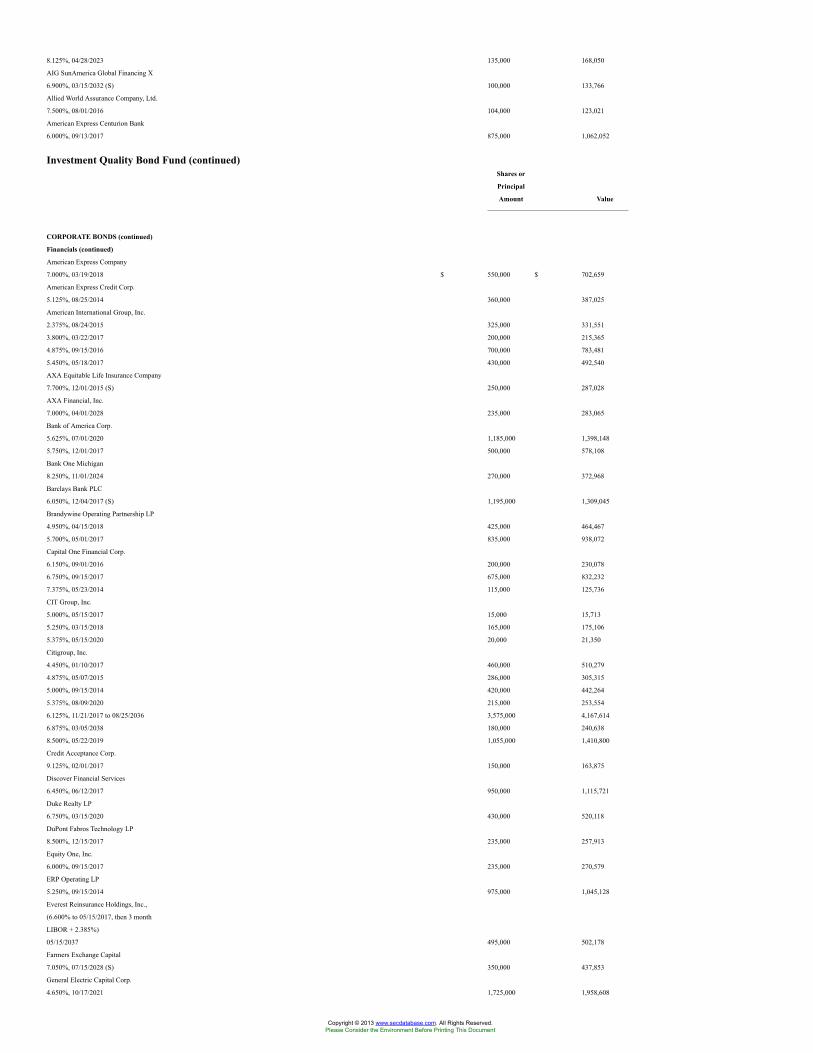
8.125%, 04/28/2023 135,000 168,050
AIG SunAmerica Global Financing X
6.900%, 03/15/2032 (S) 100,000 133,766
Allied World Assurance Company, Ltd.
7.500%, 08/01/2016 104,000 123,021
American Express Centurion Bank
6.000%, 09/13/2017 875,000 1,062,052
Investment Quality Bond Fund (continued)Shares or
Principal
Amount Value
CORPORATE BONDS (continued)
Financials (continued)
American Express Company
7.000%, 03/19/2018 $ 550,000 $ 702,659
American Express Credit Corp.
5.125%, 08/25/2014 360,000 387,025
American International Group, Inc.
2.375%, 08/24/2015 325,000 331,551
3.800%, 03/22/2017 200,000 215,365
4.875%, 09/15/2016 700,000 783,481
5.450%, 05/18/2017 430,000 492,540
AXA Equitable Life Insurance Company
7.700%, 12/01/2015 (S) 250,000 287,028
AXA Financial, Inc.
7.000%, 04/01/2028 235,000 283,065
Bank of America Corp.
5.625%, 07/01/2020 1,185,000 1,398,148
5.750%, 12/01/2017 500,000 578,108
Bank One Michigan
8.250%, 11/01/2024 270,000 372,968
Barclays Bank PLC
6.050%, 12/04/2017 (S) 1,195,000 1,309,045
Brandywine Operating Partnership LP
4.950%, 04/15/2018 425,000 464,467
5.700%, 05/01/2017 835,000 938,072
Capital One Financial Corp.
6.150%, 09/01/2016 200,000 230,078
6.750%, 09/15/2017 675,000 832,232
7.375%, 05/23/2014 115,000 125,736
CIT Group, Inc.
5.000%, 05/15/2017 15,000 15,713
5.250%, 03/15/2018 165,000 175,106
5.375%, 05/15/2020 20,000 21,350
Citigroup, Inc.
4.450%, 01/10/2017 460,000 510,279
4.875%, 05/07/2015 286,000 305,315
5.000%, 09/15/2014 420,000 442,264
5.375%, 08/09/2020 215,000 253,554
6.125%, 11/21/2017 to 08/25/2036 3,575,000 4,167,614
6.875%, 03/05/2038 180,000 240,638
8.500%, 05/22/2019 1,055,000 1,410,800
Credit Acceptance Corp.
9.125%, 02/01/2017 150,000 163,875
Discover Financial Services
6.450%, 06/12/2017 950,000 1,115,721
Duke Realty LP
6.750%, 03/15/2020 430,000 520,118
DuPont Fabros Technology LP
8.500%, 12/15/2017 235,000 257,913
Equity One, Inc.
6.000%, 09/15/2017 235,000 270,579
ERP Operating LP
5.250%, 09/15/2014 975,000 1,045,128
Everest Reinsurance Holdings, Inc.,
(6.600% to 05/15/2017, then 3 month
LIBOR + 2.385%)
05/15/2037 495,000 502,178
Farmers Exchange Capital
7.050%, 07/15/2028 (S) 350,000 437,853
General Electric Capital Corp.
4.650%, 10/17/2021 1,725,000 1,958,608
Copyright © 2013 www.secdatabase.com. All Rights Reserved.Please Consider the Environment Before Printing This Document
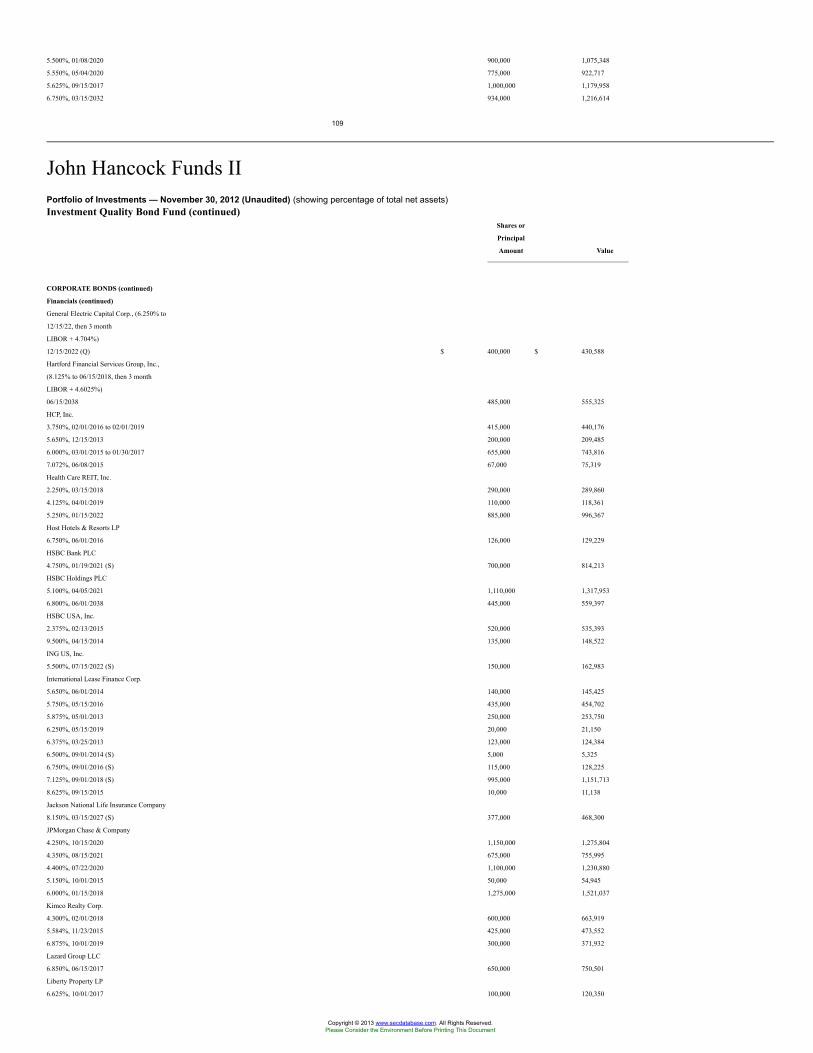
5.500%, 01/08/2020 900,000 1,075,348
5.550%, 05/04/2020 775,000 922,717
5.625%, 09/15/2017 1,000,000 1,179,958
6.750%, 03/15/2032 934,000 1,216,614
109
John Hancock Funds IIPortfolio of Investments — November 30, 2012 (Unaudited) (showing percentage of total net assets)Investment Quality Bond Fund (continued)
Shares or
Principal
Amount Value
CORPORATE BONDS (continued)
Financials (continued)
General Electric Capital Corp., (6.250% to
12/15/22, then 3 month
LIBOR + 4.704%)
12/15/2022 (Q) $ 400,000 $ 430,588
Hartford Financial Services Group, Inc.,
(8.125% to 06/15/2018, then 3 month
LIBOR + 4.6025%)
06/15/2038 485,000 555,325
HCP, Inc.
3.750%, 02/01/2016 to 02/01/2019 415,000 440,176
5.650%, 12/15/2013 200,000 209,485
6.000%, 03/01/2015 to 01/30/2017 655,000 743,816
7.072%, 06/08/2015 67,000 75,319
Health Care REIT, Inc.
2.250%, 03/15/2018 290,000 289,860
4.125%, 04/01/2019 110,000 118,361
5.250%, 01/15/2022 885,000 996,367
Host Hotels & Resorts LP
6.750%, 06/01/2016 126,000 129,229
HSBC Bank PLC
4.750%, 01/19/2021 (S) 700,000 814,213
HSBC Holdings PLC
5.100%, 04/05/2021 1,110,000 1,317,953
6.800%, 06/01/2038 445,000 559,397
HSBC USA, Inc.
2.375%, 02/13/2015 520,000 535,393
9.500%, 04/15/2014 135,000 148,522
ING US, Inc.
5.500%, 07/15/2022 (S) 150,000 162,983
International Lease Finance Corp.
5.650%, 06/01/2014 140,000 145,425
5.750%, 05/15/2016 435,000 454,702
5.875%, 05/01/2013 250,000 253,750
6.250%, 05/15/2019 20,000 21,150
6.375%, 03/25/2013 123,000 124,384
6.500%, 09/01/2014 (S) 5,000 5,325
6.750%, 09/01/2016 (S) 115,000 128,225
7.125%, 09/01/2018 (S) 995,000 1,151,713
8.625%, 09/15/2015 10,000 11,138
Jackson National Life Insurance Company
8.150%, 03/15/2027 (S) 377,000 468,300
JPMorgan Chase & Company
4.250%, 10/15/2020 1,150,000 1,275,804
4.350%, 08/15/2021 675,000 755,995
4.400%, 07/22/2020 1,100,000 1,230,880
5.150%, 10/01/2015 50,000 54,945
6.000%, 01/15/2018 1,275,000 1,521,037
Kimco Realty Corp.
4.300%, 02/01/2018 600,000 663,919
5.584%, 11/23/2015 425,000 473,552
6.875%, 10/01/2019 300,000 371,932
Lazard Group LLC
6.850%, 06/15/2017 650,000 750,501
Liberty Property LP
6.625%, 10/01/2017 100,000 120,350
Copyright © 2013 www.secdatabase.com. All Rights Reserved.Please Consider the Environment Before Printing This Document
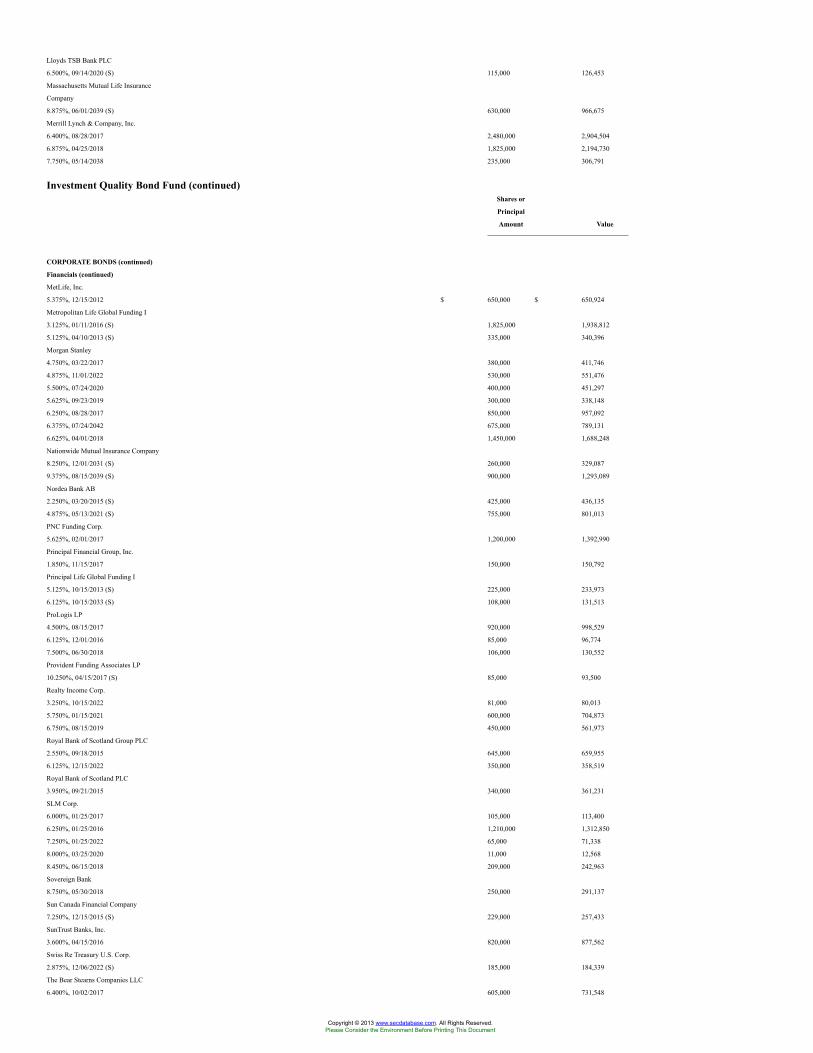
Lloyds TSB Bank PLC
6.500%, 09/14/2020 (S) 115,000 126,453
Massachusetts Mutual Life Insurance
Company
8.875%, 06/01/2039 (S) 630,000 966,675
Merrill Lynch & Company, Inc.
6.400%, 08/28/2017 2,480,000 2,904,504
6.875%, 04/25/2018 1,825,000 2,194,730
7.750%, 05/14/2038 235,000 306,791
Investment Quality Bond Fund (continued)Shares or
Principal
Amount Value
CORPORATE BONDS (continued)
Financials (continued)
MetLife, Inc.
5.375%, 12/15/2012 $ 650,000 $ 650,924
Metropolitan Life Global Funding I
3.125%, 01/11/2016 (S) 1,825,000 1,938,812
5.125%, 04/10/2013 (S) 335,000 340,396
Morgan Stanley
4.750%, 03/22/2017 380,000 411,746
4.875%, 11/01/2022 530,000 551,476
5.500%, 07/24/2020 400,000 451,297
5.625%, 09/23/2019 300,000 338,148
6.250%, 08/28/2017 850,000 957,092
6.375%, 07/24/2042 675,000 789,131
6.625%, 04/01/2018 1,450,000 1,688,248
Nationwide Mutual Insurance Company
8.250%, 12/01/2031 (S) 260,000 329,087
9.375%, 08/15/2039 (S) 900,000 1,293,089
Nordea Bank AB
2.250%, 03/20/2015 (S) 425,000 436,135
4.875%, 05/13/2021 (S) 755,000 801,013
PNC Funding Corp.
5.625%, 02/01/2017 1,200,000 1,392,990
Principal Financial Group, Inc.
1.850%, 11/15/2017 150,000 150,792
Principal Life Global Funding I
5.125%, 10/15/2013 (S) 225,000 233,973
6.125%, 10/15/2033 (S) 108,000 131,513
ProLogis LP
4.500%, 08/15/2017 920,000 998,529
6.125%, 12/01/2016 85,000 96,774
7.500%, 06/30/2018 106,000 130,552
Provident Funding Associates LP
10.250%, 04/15/2017 (S) 85,000 93,500
Realty Income Corp.
3.250%, 10/15/2022 81,000 80,013
5.750%, 01/15/2021 600,000 704,873
6.750%, 08/15/2019 450,000 561,973
Royal Bank of Scotland Group PLC
2.550%, 09/18/2015 645,000 659,955
6.125%, 12/15/2022 350,000 358,519
Royal Bank of Scotland PLC
3.950%, 09/21/2015 340,000 361,231
SLM Corp.
6.000%, 01/25/2017 105,000 113,400
6.250%, 01/25/2016 1,210,000 1,312,850
7.250%, 01/25/2022 65,000 71,338
8.000%, 03/25/2020 11,000 12,568
8.450%, 06/15/2018 209,000 242,963
Sovereign Bank
8.750%, 05/30/2018 250,000 291,137
Sun Canada Financial Company
7.250%, 12/15/2015 (S) 229,000 257,433
SunTrust Banks, Inc.
3.600%, 04/15/2016 820,000 877,562
Swiss Re Treasury U.S. Corp.
2.875%, 12/06/2022 (S) 185,000 184,339
The Bear Stearns Companies LLC
6.400%, 10/02/2017 605,000 731,548
Copyright © 2013 www.secdatabase.com. All Rights Reserved.Please Consider the Environment Before Printing This Document
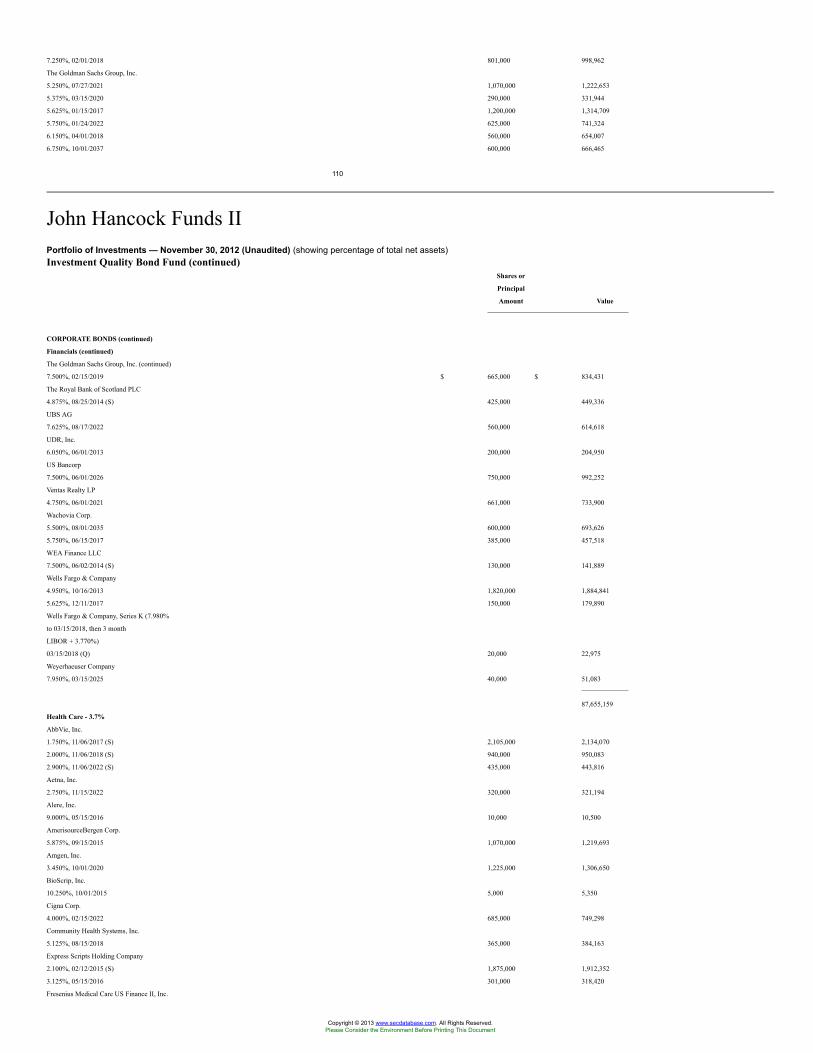
7.250%, 02/01/2018 801,000 998,962
The Goldman Sachs Group, Inc.
5.250%, 07/27/2021 1,070,000 1,222,653
5.375%, 03/15/2020 290,000 331,944
5.625%, 01/15/2017 1,200,000 1,314,709
5.750%, 01/24/2022 625,000 741,324
6.150%, 04/01/2018 560,000 654,007
6.750%, 10/01/2037 600,000 666,465
110
John Hancock Funds IIPortfolio of Investments — November 30, 2012 (Unaudited) (showing percentage of total net assets)Investment Quality Bond Fund (continued)
Shares or
Principal
Amount Value
CORPORATE BONDS (continued)
Financials (continued)
The Goldman Sachs Group, Inc. (continued)
7.500%, 02/15/2019 $ 665,000 $ 834,431
The Royal Bank of Scotland PLC
4.875%, 08/25/2014 (S) 425,000 449,336
UBS AG
7.625%, 08/17/2022 560,000 614,618
UDR, Inc.
6.050%, 06/01/2013 200,000 204,950
US Bancorp
7.500%, 06/01/2026 750,000 992,252
Ventas Realty LP
4.750%, 06/01/2021 661,000 733,900
Wachovia Corp.
5.500%, 08/01/2035 600,000 693,626
5.750%, 06/15/2017 385,000 457,518
WEA Finance LLC
7.500%, 06/02/2014 (S) 130,000 141,889
Wells Fargo & Company
4.950%, 10/16/2013 1,820,000 1,884,841
5.625%, 12/11/2017 150,000 179,890
Wells Fargo & Company, Series K (7.980%
to 03/15/2018, then 3 month
LIBOR + 3.770%)
03/15/2018 (Q) 20,000 22,975
Weyerhaeuser Company
7.950%, 03/15/2025 40,000 51,083
87,655,159
Health Care - 3.7%
AbbVie, Inc.
1.750%, 11/06/2017 (S) 2,105,000 2,134,070
2.000%, 11/06/2018 (S) 940,000 950,083
2.900%, 11/06/2022 (S) 435,000 443,816
Aetna, Inc.
2.750%, 11/15/2022 320,000 321,194
Alere, Inc.
9.000%, 05/15/2016 10,000 10,500
AmerisourceBergen Corp.
5.875%, 09/15/2015 1,070,000 1,219,693
Amgen, Inc.
3.450%, 10/01/2020 1,225,000 1,306,650
BioScrip, Inc.
10.250%, 10/01/2015 5,000 5,350
Cigna Corp.
4.000%, 02/15/2022 685,000 749,298
Community Health Systems, Inc.
5.125%, 08/15/2018 365,000 384,163
Express Scripts Holding Company
2.100%, 02/12/2015 (S) 1,875,000 1,912,352
3.125%, 05/15/2016 301,000 318,420
Fresenius Medical Care US Finance II, Inc.
Copyright © 2013 www.secdatabase.com. All Rights Reserved.Please Consider the Environment Before Printing This Document
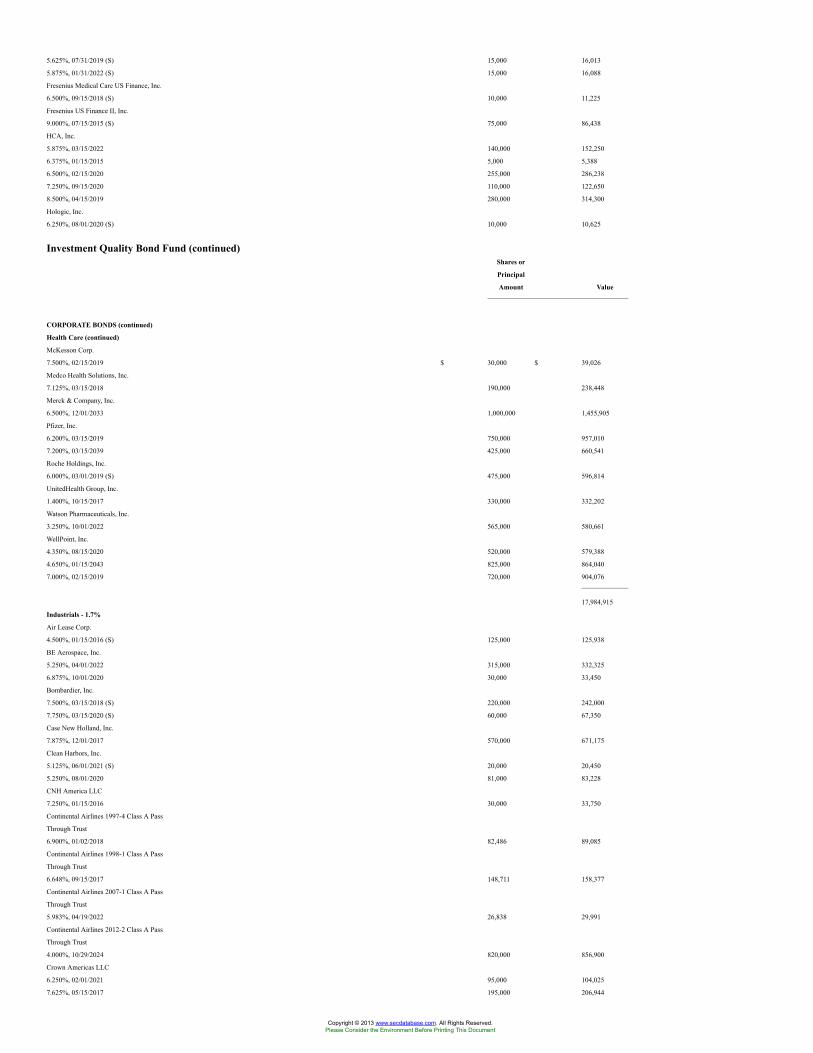
5.625%, 07/31/2019 (S) 15,000 16,013
5.875%, 01/31/2022 (S) 15,000 16,088
Fresenius Medical Care US Finance, Inc.
6.500%, 09/15/2018 (S) 10,000 11,225
Fresenius US Finance II, Inc.
9.000%, 07/15/2015 (S) 75,000 86,438
HCA, Inc.
5.875%, 03/15/2022 140,000 152,250
6.375%, 01/15/2015 5,000 5,388
6.500%, 02/15/2020 255,000 286,238
7.250%, 09/15/2020 110,000 122,650
8.500%, 04/15/2019 280,000 314,300
Hologic, Inc.
6.250%, 08/01/2020 (S) 10,000 10,625
Investment Quality Bond Fund (continued)Shares or
Principal
Amount Value
CORPORATE BONDS (continued)
Health Care (continued)
McKesson Corp.
7.500%, 02/15/2019 $ 30,000 $ 39,026
Medco Health Solutions, Inc.
7.125%, 03/15/2018 190,000 238,448
Merck & Company, Inc.
6.500%, 12/01/2033 1,000,000 1,455,905
Pfizer, Inc.
6.200%, 03/15/2019 750,000 957,010
7.200%, 03/15/2039 425,000 660,541
Roche Holdings, Inc.
6.000%, 03/01/2019 (S) 475,000 596,814
UnitedHealth Group, Inc.
1.400%, 10/15/2017 330,000 332,202
Watson Pharmaceuticals, Inc.
3.250%, 10/01/2022 565,000 580,661
WellPoint, Inc.
4.350%, 08/15/2020 520,000 579,388
4.650%, 01/15/2043 825,000 864,040
7.000%, 02/15/2019 720,000 904,076
17,984,915
Industrials - 1.7%
Air Lease Corp.
4.500%, 01/15/2016 (S) 125,000 125,938
BE Aerospace, Inc.
5.250%, 04/01/2022 315,000 332,325
6.875%, 10/01/2020 30,000 33,450
Bombardier, Inc.
7.500%, 03/15/2018 (S) 220,000 242,000
7.750%, 03/15/2020 (S) 60,000 67,350
Case New Holland, Inc.
7.875%, 12/01/2017 570,000 671,175
Clean Harbors, Inc.
5.125%, 06/01/2021 (S) 20,000 20,450
5.250%, 08/01/2020 81,000 83,228
CNH America LLC
7.250%, 01/15/2016 30,000 33,750
Continental Airlines 1997-4 Class A Pass
Through Trust
6.900%, 01/02/2018 82,486 89,085
Continental Airlines 1998-1 Class A Pass
Through Trust
6.648%, 09/15/2017 148,711 158,377
Continental Airlines 2007-1 Class A Pass
Through Trust
5.983%, 04/19/2022 26,838 29,991
Continental Airlines 2012-2 Class A Pass
Through Trust
4.000%, 10/29/2024 820,000 856,900
Crown Americas LLC
6.250%, 02/01/2021 95,000 104,025
7.625%, 05/15/2017 195,000 206,944
Copyright © 2013 www.secdatabase.com. All Rights Reserved.Please Consider the Environment Before Printing This Document
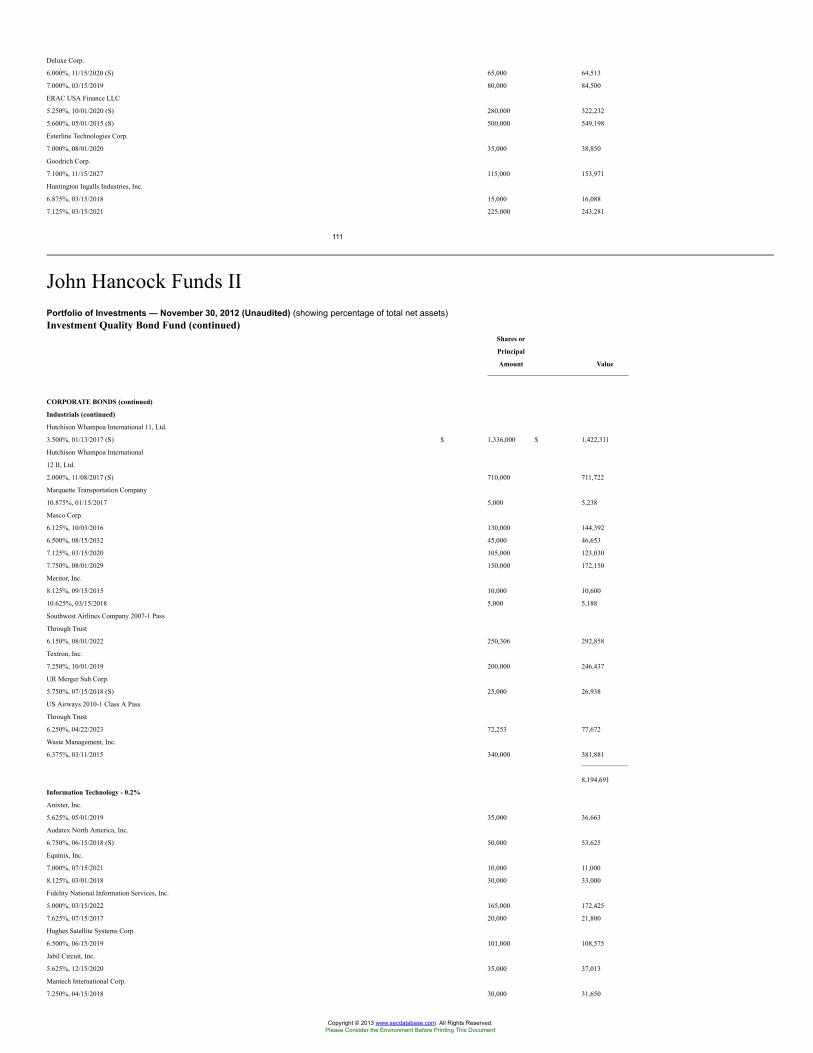
Deluxe Corp.
6.000%, 11/15/2020 (S) 65,000 64,513
7.000%, 03/15/2019 80,000 84,500
ERAC USA Finance LLC
5.250%, 10/01/2020 (S) 280,000 322,232
5.600%, 05/01/2015 (S) 500,000 549,198
Esterline Technologies Corp.
7.000%, 08/01/2020 35,000 38,850
Goodrich Corp.
7.100%, 11/15/2027 115,000 153,971
Huntington Ingalls Industries, Inc.
6.875%, 03/15/2018 15,000 16,088
7.125%, 03/15/2021 225,000 243,281
111
John Hancock Funds IIPortfolio of Investments — November 30, 2012 (Unaudited) (showing percentage of total net assets)Investment Quality Bond Fund (continued)
Shares or
Principal
Amount Value
CORPORATE BONDS (continued)
Industrials (continued)
Hutchison Whampoa International 11, Ltd.
3.500%, 01/13/2017 (S) $ 1,336,000 $ 1,422,311
Hutchison Whampoa International
12 II, Ltd.
2.000%, 11/08/2017 (S) 710,000 711,722
Marquette Transportation Company
10.875%, 01/15/2017 5,000 5,238
Masco Corp.
6.125%, 10/03/2016 130,000 144,392
6.500%, 08/15/2032 45,000 46,653
7.125%, 03/15/2020 105,000 123,030
7.750%, 08/01/2029 150,000 172,150
Meritor, Inc.
8.125%, 09/15/2015 10,000 10,600
10.625%, 03/15/2018 5,000 5,188
Southwest Airlines Company 2007-1 Pass
Through Trust
6.150%, 08/01/2022 250,306 292,858
Textron, Inc.
7.250%, 10/01/2019 200,000 246,437
UR Merger Sub Corp.
5.750%, 07/15/2018 (S) 25,000 26,938
US Airways 2010-1 Class A Pass
Through Trust
6.250%, 04/22/2023 72,253 77,672
Waste Management, Inc.
6.375%, 03/11/2015 340,000 381,881
8,194,691
Information Technology - 0.2%
Anixter, Inc.
5.625%, 05/01/2019 35,000 36,663
Audatex North America, Inc.
6.750%, 06/15/2018 (S) 50,000 53,625
Equinix, Inc.
7.000%, 07/15/2021 10,000 11,000
8.125%, 03/01/2018 30,000 33,000
Fidelity National Information Services, Inc.
5.000%, 03/15/2022 165,000 172,425
7.625%, 07/15/2017 20,000 21,800
Hughes Satellite Systems Corp.
6.500%, 06/15/2019 101,000 108,575
Jabil Circuit, Inc.
5.625%, 12/15/2020 35,000 37,013
Mantech International Corp.
7.250%, 04/15/2018 30,000 31,650
Copyright © 2013 www.secdatabase.com. All Rights Reserved.Please Consider the Environment Before Printing This Document
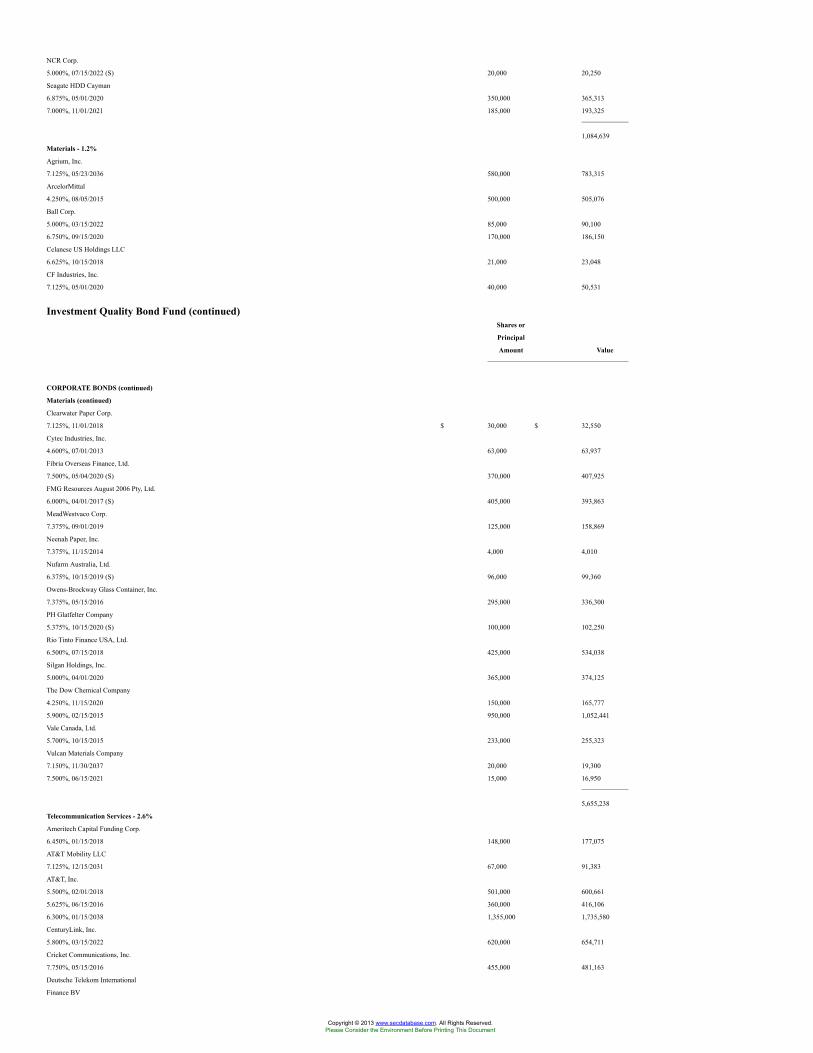
NCR Corp.
5.000%, 07/15/2022 (S) 20,000 20,250
Seagate HDD Cayman
6.875%, 05/01/2020 350,000 365,313
7.000%, 11/01/2021 185,000 193,325
1,084,639
Materials - 1.2%
Agrium, Inc.
7.125%, 05/23/2036 580,000 783,315
ArcelorMittal
4.250%, 08/05/2015 500,000 505,076
Ball Corp.
5.000%, 03/15/2022 85,000 90,100
6.750%, 09/15/2020 170,000 186,150
Celanese US Holdings LLC
6.625%, 10/15/2018 21,000 23,048
CF Industries, Inc.
7.125%, 05/01/2020 40,000 50,531
Investment Quality Bond Fund (continued)Shares or
Principal
Amount Value
CORPORATE BONDS (continued)
Materials (continued)
Clearwater Paper Corp.
7.125%, 11/01/2018 $ 30,000 $ 32,550
Cytec Industries, Inc.
4.600%, 07/01/2013 63,000 63,937
Fibria Overseas Finance, Ltd.
7.500%, 05/04/2020 (S) 370,000 407,925
FMG Resources August 2006 Pty, Ltd.
6.000%, 04/01/2017 (S) 405,000 393,863
MeadWestvaco Corp.
7.375%, 09/01/2019 125,000 158,869
Neenah Paper, Inc.
7.375%, 11/15/2014 4,000 4,010
Nufarm Australia, Ltd.
6.375%, 10/15/2019 (S) 96,000 99,360
Owens-Brockway Glass Container, Inc.
7.375%, 05/15/2016 295,000 336,300
PH Glatfelter Company
5.375%, 10/15/2020 (S) 100,000 102,250
Rio Tinto Finance USA, Ltd.
6.500%, 07/15/2018 425,000 534,038
Silgan Holdings, Inc.
5.000%, 04/01/2020 365,000 374,125
The Dow Chemical Company
4.250%, 11/15/2020 150,000 165,777
5.900%, 02/15/2015 950,000 1,052,441
Vale Canada, Ltd.
5.700%, 10/15/2015 233,000 255,323
Vulcan Materials Company
7.150%, 11/30/2037 20,000 19,300
7.500%, 06/15/2021 15,000 16,950
5,655,238
Telecommunication Services - 2.6%
Ameritech Capital Funding Corp.
6.450%, 01/15/2018 148,000 177,075
AT&T Mobility LLC
7.125%, 12/15/2031 67,000 91,383
AT&T, Inc.
5.500%, 02/01/2018 501,000 600,661
5.625%, 06/15/2016 360,000 416,106
6.300%, 01/15/2038 1,355,000 1,735,580
CenturyLink, Inc.
5.800%, 03/15/2022 620,000 654,711
Cricket Communications, Inc.
7.750%, 05/15/2016 455,000 481,163
Deutsche Telekom International
Finance BV
Copyright © 2013 www.secdatabase.com. All Rights Reserved.Please Consider the Environment Before Printing This Document
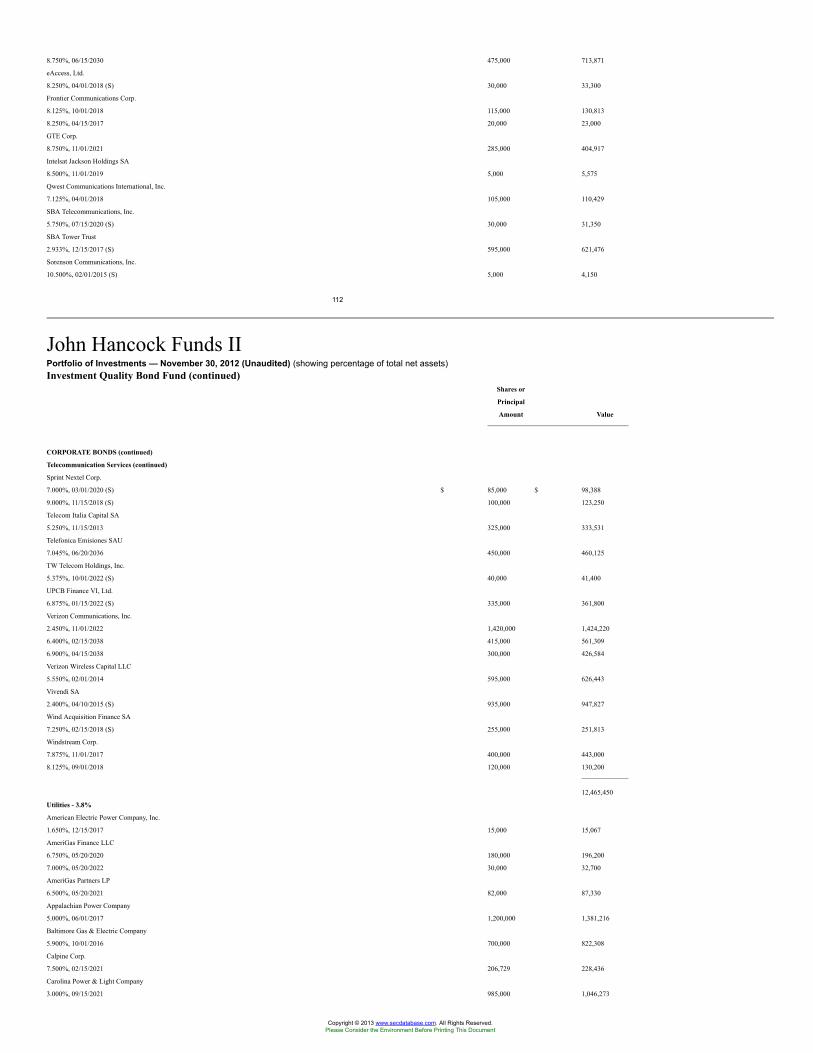
8.750%, 06/15/2030 475,000 713,871
eAccess, Ltd.
8.250%, 04/01/2018 (S) 30,000 33,300
Frontier Communications Corp.
8.125%, 10/01/2018 115,000 130,813
8.250%, 04/15/2017 20,000 23,000
GTE Corp.
8.750%, 11/01/2021 285,000 404,917
Intelsat Jackson Holdings SA
8.500%, 11/01/2019 5,000 5,575
Qwest Communications International, Inc.
7.125%, 04/01/2018 105,000 110,429
SBA Telecommunications, Inc.
5.750%, 07/15/2020 (S) 30,000 31,350
SBA Tower Trust
2.933%, 12/15/2017 (S) 595,000 621,476
Sorenson Communications, Inc.
10.500%, 02/01/2015 (S) 5,000 4,150
112
John Hancock Funds IIPortfolio of Investments — November 30, 2012 (Unaudited) (showing percentage of total net assets)Investment Quality Bond Fund (continued)
Shares or
Principal
Amount Value
CORPORATE BONDS (continued)
Telecommunication Services (continued)
Sprint Nextel Corp.
7.000%, 03/01/2020 (S) $ 85,000 $ 98,388
9.000%, 11/15/2018 (S) 100,000 123,250
Telecom Italia Capital SA
5.250%, 11/15/2013 325,000 333,531
Telefonica Emisiones SAU
7.045%, 06/20/2036 450,000 460,125
TW Telecom Holdings, Inc.
5.375%, 10/01/2022 (S) 40,000 41,400
UPCB Finance VI, Ltd.
6.875%, 01/15/2022 (S) 335,000 361,800
Verizon Communications, Inc.
2.450%, 11/01/2022 1,420,000 1,424,220
6.400%, 02/15/2038 415,000 561,309
6.900%, 04/15/2038 300,000 426,584
Verizon Wireless Capital LLC
5.550%, 02/01/2014 595,000 626,443
Vivendi SA
2.400%, 04/10/2015 (S) 935,000 947,827
Wind Acquisition Finance SA
7.250%, 02/15/2018 (S) 255,000 251,813
Windstream Corp.
7.875%, 11/01/2017 400,000 443,000
8.125%, 09/01/2018 120,000 130,200
12,465,450
Utilities - 3.8%
American Electric Power Company, Inc.
1.650%, 12/15/2017 15,000 15,067
AmeriGas Finance LLC
6.750%, 05/20/2020 180,000 196,200
7.000%, 05/20/2022 30,000 32,700
AmeriGas Partners LP
6.500%, 05/20/2021 82,000 87,330
Appalachian Power Company
5.000%, 06/01/2017 1,200,000 1,381,216
Baltimore Gas & Electric Company
5.900%, 10/01/2016 700,000 822,308
Calpine Corp.
7.500%, 02/15/2021 206,729 228,436
Carolina Power & Light Company
3.000%, 09/15/2021 985,000 1,046,273
Copyright © 2013 www.secdatabase.com. All Rights Reserved.Please Consider the Environment Before Printing This Document
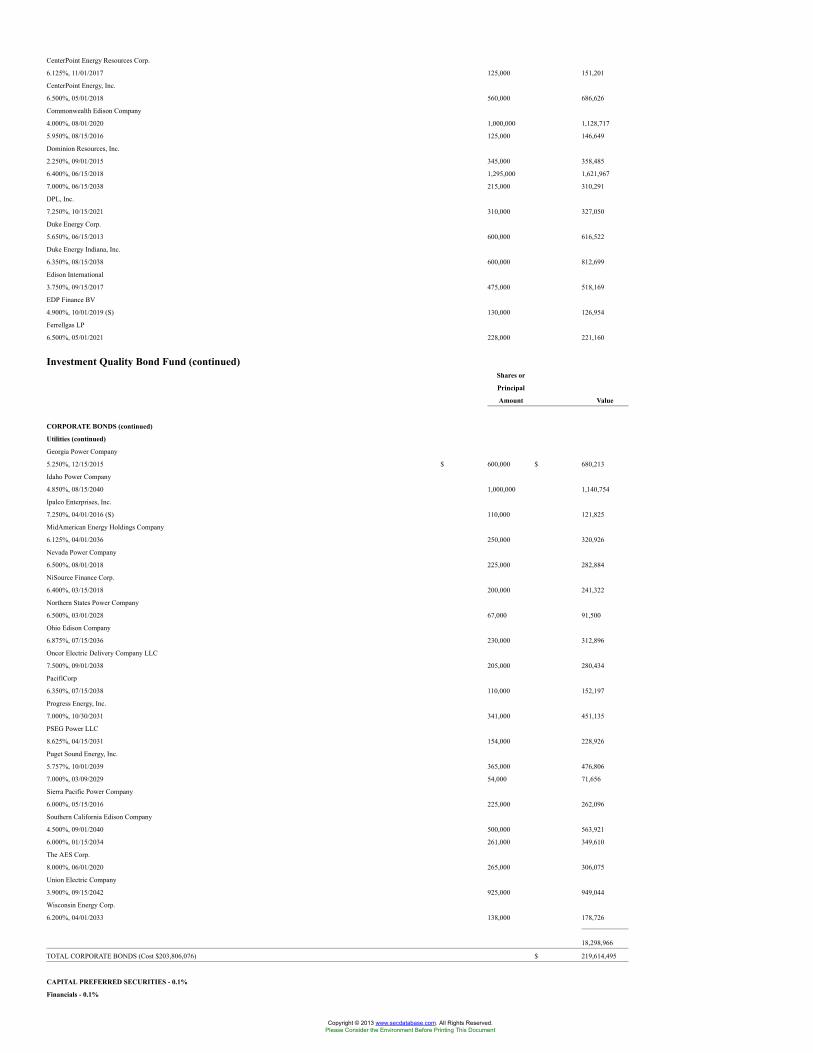
CenterPoint Energy Resources Corp.
6.125%, 11/01/2017 125,000 151,201
CenterPoint Energy, Inc.
6.500%, 05/01/2018 560,000 686,626
Commonwealth Edison Company
4.000%, 08/01/2020 1,000,000 1,128,717
5.950%, 08/15/2016 125,000 146,649
Dominion Resources, Inc.
2.250%, 09/01/2015 345,000 358,485
6.400%, 06/15/2018 1,295,000 1,621,967
7.000%, 06/15/2038 215,000 310,291
DPL, Inc.
7.250%, 10/15/2021 310,000 327,050
Duke Energy Corp.
5.650%, 06/15/2013 600,000 616,522
Duke Energy Indiana, Inc.
6.350%, 08/15/2038 600,000 812,699
Edison International
3.750%, 09/15/2017 475,000 518,169
EDP Finance BV
4.900%, 10/01/2019 (S) 130,000 126,954
Ferrellgas LP
6.500%, 05/01/2021 228,000 221,160
Investment Quality Bond Fund (continued)Shares or
Principal
Amount Value
CORPORATE BONDS (continued)
Utilities (continued)
Georgia Power Company
5.250%, 12/15/2015 $ 600,000 $ 680,213
Idaho Power Company
4.850%, 08/15/2040 1,000,000 1,140,754
Ipalco Enterprises, Inc.
7.250%, 04/01/2016 (S) 110,000 121,825
MidAmerican Energy Holdings Company
6.125%, 04/01/2036 250,000 320,926
Nevada Power Company
6.500%, 08/01/2018 225,000 282,884
NiSource Finance Corp.
6.400%, 03/15/2018 200,000 241,322
Northern States Power Company
6.500%, 03/01/2028 67,000 91,500
Ohio Edison Company
6.875%, 07/15/2036 230,000 312,896
Oncor Electric Delivery Company LLC
7.500%, 09/01/2038 205,000 280,434
PacifiCorp
6.350%, 07/15/2038 110,000 152,197
Progress Energy, Inc.
7.000%, 10/30/2031 341,000 451,135
PSEG Power LLC
8.625%, 04/15/2031 154,000 228,926
Puget Sound Energy, Inc.
5.757%, 10/01/2039 365,000 476,806
7.000%, 03/09/2029 54,000 71,656
Sierra Pacific Power Company
6.000%, 05/15/2016 225,000 262,096
Southern California Edison Company
4.500%, 09/01/2040 500,000 563,921
6.000%, 01/15/2034 261,000 349,610
The AES Corp.
8.000%, 06/01/2020 265,000 306,075
Union Electric Company
3.900%, 09/15/2042 925,000 949,044
Wisconsin Energy Corp.
6.200%, 04/01/2033 138,000 178,726
18,298,966
TOTAL CORPORATE BONDS (Cost $203,806,076) $ 219,614,495
CAPITAL PREFERRED SECURITIES - 0.1%
Financials - 0.1%
Copyright © 2013 www.secdatabase.com. All Rights Reserved.Please Consider the Environment Before Printing This Document
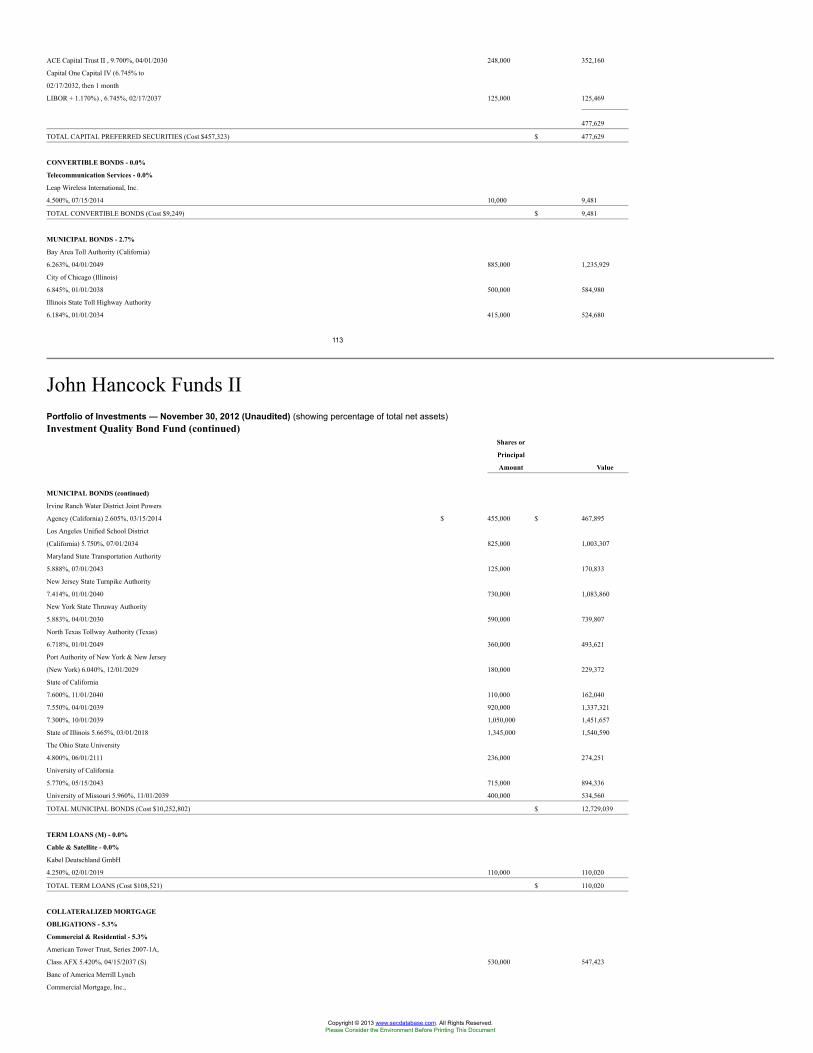
ACE Capital Trust II , 9.700%, 04/01/2030 248,000 352,160
Capital One Capital IV (6.745% to
02/17/2032, then 1 month
LIBOR + 1.170%) , 6.745%, 02/17/2037 125,000 125,469
477,629
TOTAL CAPITAL PREFERRED SECURITIES (Cost $457,323) $ 477,629
CONVERTIBLE BONDS - 0.0%
Telecommunication Services - 0.0%
Leap Wireless International, Inc.
4.500%, 07/15/2014 10,000 9,481
TOTAL CONVERTIBLE BONDS (Cost $9,249) $ 9,481
MUNICIPAL BONDS - 2.7%
Bay Area Toll Authority (California)
6.263%, 04/01/2049 885,000 1,235,929
City of Chicago (Illinois)
6.845%, 01/01/2038 500,000 584,980
Illinois State Toll Highway Authority
6.184%, 01/01/2034 415,000 524,680
113
John Hancock Funds IIPortfolio of Investments — November 30, 2012 (Unaudited) (showing percentage of total net assets)Investment Quality Bond Fund (continued)
Shares or
Principal
Amount Value
MUNICIPAL BONDS (continued)
Irvine Ranch Water District Joint Powers
Agency (California) 2.605%, 03/15/2014 $ 455,000 $ 467,895
Los Angeles Unified School District
(California) 5.750%, 07/01/2034 825,000 1,003,307
Maryland State Transportation Authority
5.888%, 07/01/2043 125,000 170,833
New Jersey State Turnpike Authority
7.414%, 01/01/2040 730,000 1,083,860
New York State Thruway Authority
5.883%, 04/01/2030 590,000 739,807
North Texas Tollway Authority (Texas)
6.718%, 01/01/2049 360,000 493,621
Port Authority of New York & New Jersey
(New York) 6.040%, 12/01/2029 180,000 229,372
State of California
7.600%, 11/01/2040 110,000 162,040
7.550%, 04/01/2039 920,000 1,337,321
7.300%, 10/01/2039 1,050,000 1,451,657
State of Illinois 5.665%, 03/01/2018 1,345,000 1,540,590
The Ohio State University
4.800%, 06/01/2111 236,000 274,251
University of California
5.770%, 05/15/2043 715,000 894,336
University of Missouri 5.960%, 11/01/2039 400,000 534,560
TOTAL MUNICIPAL BONDS (Cost $10,252,802) $ 12,729,039
TERM LOANS (M) - 0.0%
Cable & Satellite - 0.0%
Kabel Deutschland GmbH
4.250%, 02/01/2019 110,000 110,020
TOTAL TERM LOANS (Cost $108,521) $ 110,020
COLLATERALIZED MORTGAGE
OBLIGATIONS - 5.3%
Commercial & Residential - 5.3%
American Tower Trust, Series 2007-1A,
Class AFX 5.420%, 04/15/2037 (S) 530,000 547,423
Banc of America Merrill Lynch
Commercial Mortgage, Inc.,
Copyright © 2013 www.secdatabase.com. All Rights Reserved.Please Consider the Environment Before Printing This Document
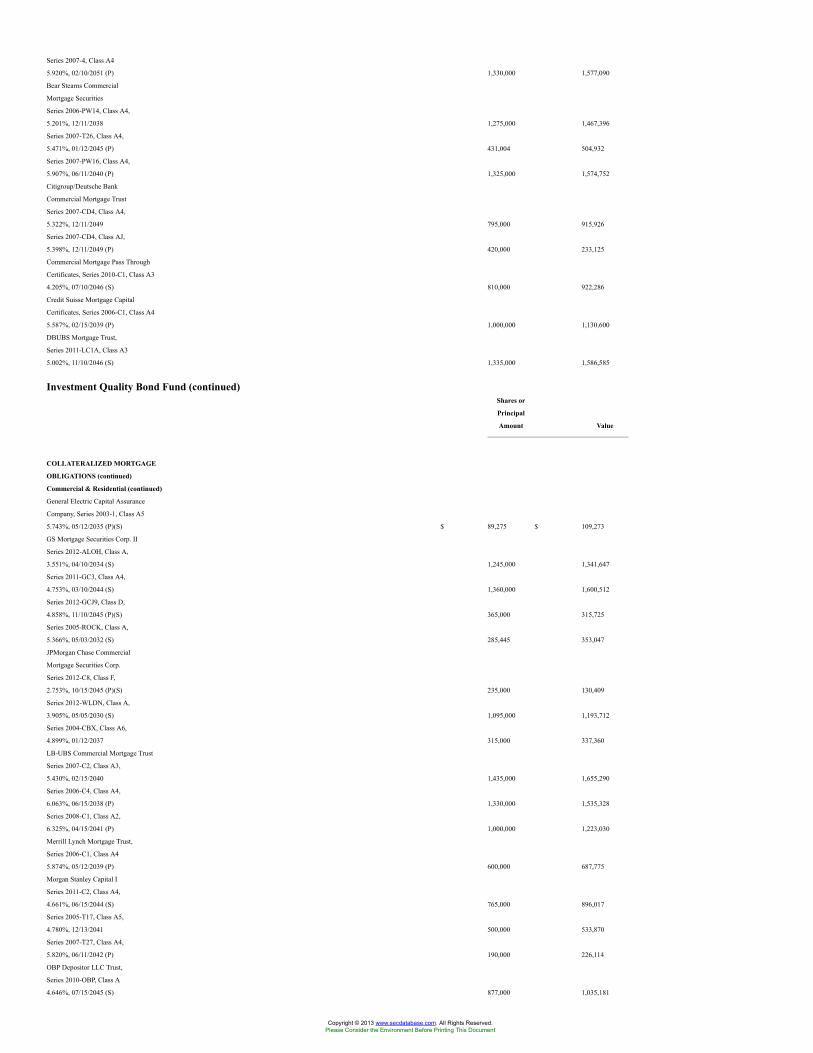
Series 2007-4, Class A4
5.920%, 02/10/2051 (P) 1,330,000 1,577,090
Bear Stearns Commercial
Mortgage Securities
Series 2006-PW14, Class A4,
5.201%, 12/11/2038 1,275,000 1,467,396
Series 2007-T26, Class A4,
5.471%, 01/12/2045 (P) 431,004 504,932
Series 2007-PW16, Class A4,
5.907%, 06/11/2040 (P) 1,325,000 1,574,752
Citigroup/Deutsche Bank
Commercial Mortgage Trust
Series 2007-CD4, Class A4,
5.322%, 12/11/2049 795,000 915,926
Series 2007-CD4, Class AJ,
5.398%, 12/11/2049 (P) 420,000 233,125
Commercial Mortgage Pass Through
Certificates, Series 2010-C1, Class A3
4.205%, 07/10/2046 (S) 810,000 922,286
Credit Suisse Mortgage Capital
Certificates, Series 2006-C1, Class A4
5.587%, 02/15/2039 (P) 1,000,000 1,130,600
DBUBS Mortgage Trust,
Series 2011-LC1A, Class A3
5.002%, 11/10/2046 (S) 1,335,000 1,586,585
Investment Quality Bond Fund (continued)Shares or
Principal
Amount Value
COLLATERALIZED MORTGAGE
OBLIGATIONS (continued)
Commercial & Residential (continued)
General Electric Capital Assurance
Company, Series 2003-1, Class A5
5.743%, 05/12/2035 (P)(S) $ 89,275 $ 109,273
GS Mortgage Securities Corp. II
Series 2012-ALOH, Class A,
3.551%, 04/10/2034 (S) 1,245,000 1,341,647
Series 2011-GC3, Class A4,
4.753%, 03/10/2044 (S) 1,360,000 1,600,512
Series 2012-GCJ9, Class D,
4.858%, 11/10/2045 (P)(S) 365,000 315,725
Series 2005-ROCK, Class A,
5.366%, 05/03/2032 (S) 285,445 353,047
JPMorgan Chase Commercial
Mortgage Securities Corp.
Series 2012-C8, Class F,
2.753%, 10/15/2045 (P)(S) 235,000 130,409
Series 2012-WLDN, Class A,
3.905%, 05/05/2030 (S) 1,095,000 1,193,712
Series 2004-CBX, Class A6,
4.899%, 01/12/2037 315,000 337,360
LB-UBS Commercial Mortgage Trust
Series 2007-C2, Class A3,
5.430%, 02/15/2040 1,435,000 1,655,290
Series 2006-C4, Class A4,
6.063%, 06/15/2038 (P) 1,330,000 1,535,328
Series 2008-C1, Class A2,
6.325%, 04/15/2041 (P) 1,000,000 1,223,030
Merrill Lynch Mortgage Trust,
Series 2006-C1, Class A4
5.874%, 05/12/2039 (P) 600,000 687,775
Morgan Stanley Capital I
Series 2011-C2, Class A4,
4.661%, 06/15/2044 (S) 765,000 896,017
Series 2005-T17, Class A5,
4.780%, 12/13/2041 500,000 533,870
Series 2007-T27, Class A4,
5.820%, 06/11/2042 (P) 190,000 226,114
OBP Depositor LLC Trust,
Series 2010-OBP, Class A
4.646%, 07/15/2045 (S) 877,000 1,035,181
Copyright © 2013 www.secdatabase.com. All Rights Reserved.Please Consider the Environment Before Printing This Document
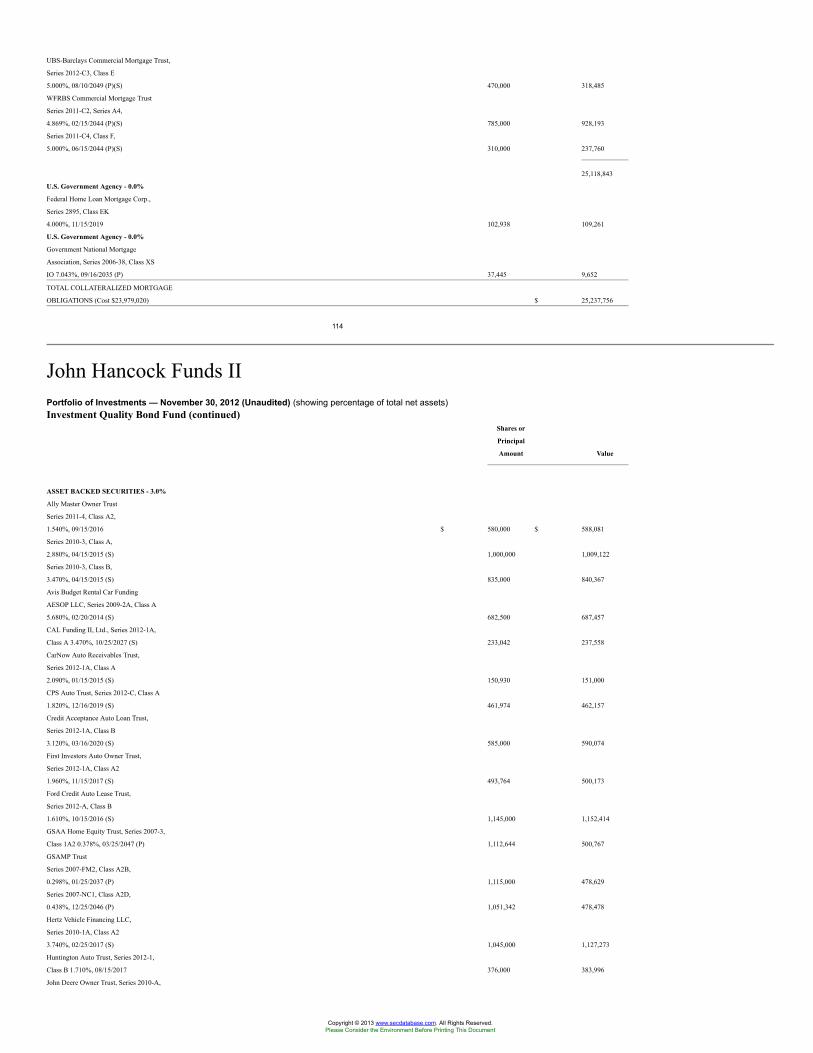
UBS-Barclays Commercial Mortgage Trust,
Series 2012-C3, Class E
5.000%, 08/10/2049 (P)(S) 470,000 318,485
WFRBS Commercial Mortgage Trust
Series 2011-C2, Series A4,
4.869%, 02/15/2044 (P)(S) 785,000 928,193
Series 2011-C4, Class F,
5.000%, 06/15/2044 (P)(S) 310,000 237,760
25,118,843
U.S. Government Agency - 0.0%
Federal Home Loan Mortgage Corp.,
Series 2895, Class EK
4.000%, 11/15/2019 102,938 109,261
U.S. Government Agency - 0.0%
Government National Mortgage
Association, Series 2006-38, Class XS
IO 7.043%, 09/16/2035 (P) 37,445 9,652
TOTAL COLLATERALIZED MORTGAGE
OBLIGATIONS (Cost $23,979,020) $ 25,237,756
114
John Hancock Funds IIPortfolio of Investments — November 30, 2012 (Unaudited) (showing percentage of total net assets)Investment Quality Bond Fund (continued)
Shares or
Principal
Amount Value
ASSET BACKED SECURITIES - 3.0%
Ally Master Owner Trust
Series 2011-4, Class A2,
1.540%, 09/15/2016 $ 580,000 $ 588,081
Series 2010-3, Class A,
2.880%, 04/15/2015 (S) 1,000,000 1,009,122
Series 2010-3, Class B,
3.470%, 04/15/2015 (S) 835,000 840,367
Avis Budget Rental Car Funding
AESOP LLC, Series 2009-2A, Class A
5.680%, 02/20/2014 (S) 682,500 687,457
CAL Funding II, Ltd., Series 2012-1A,
Class A 3.470%, 10/25/2027 (S) 233,042 237,558
CarNow Auto Receivables Trust,
Series 2012-1A, Class A
2.090%, 01/15/2015 (S) 150,930 151,000
CPS Auto Trust, Series 2012-C, Class A
1.820%, 12/16/2019 (S) 461,974 462,157
Credit Acceptance Auto Loan Trust,
Series 2012-1A, Class B
3.120%, 03/16/2020 (S) 585,000 590,074
First Investors Auto Owner Trust,
Series 2012-1A, Class A2
1.960%, 11/15/2017 (S) 493,764 500,173
Ford Credit Auto Lease Trust,
Series 2012-A, Class B
1.610%, 10/15/2016 (S) 1,145,000 1,152,414
GSAA Home Equity Trust, Series 2007-3,
Class 1A2 0.378%, 03/25/2047 (P) 1,112,644 500,767
GSAMP Trust
Series 2007-FM2, Class A2B,
0.298%, 01/25/2037 (P) 1,115,000 478,629
Series 2007-NC1, Class A2D,
0.438%, 12/25/2046 (P) 1,051,342 478,478
Hertz Vehicle Financing LLC,
Series 2010-1A, Class A2
3.740%, 02/25/2017 (S) 1,045,000 1,127,273
Huntington Auto Trust, Series 2012-1,
Class B 1.710%, 08/15/2017 376,000 383,996
John Deere Owner Trust, Series 2010-A,
Copyright © 2013 www.secdatabase.com. All Rights Reserved.Please Consider the Environment Before Printing This Document
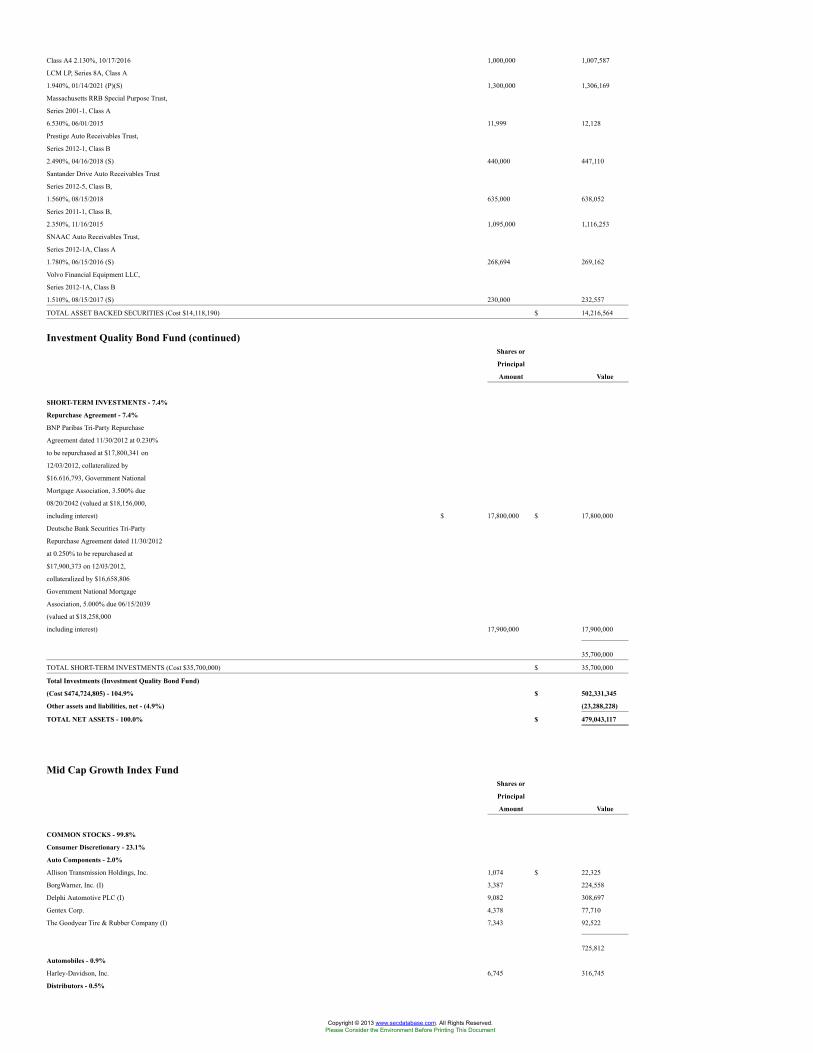
Class A4 2.130%, 10/17/2016 1,000,000 1,007,587
LCM LP, Series 8A, Class A
1.940%, 01/14/2021 (P)(S) 1,300,000 1,306,169
Massachusetts RRB Special Purpose Trust,
Series 2001-1, Class A
6.530%, 06/01/2015 11,999 12,128
Prestige Auto Receivables Trust,
Series 2012-1, Class B
2.490%, 04/16/2018 (S) 440,000 447,110
Santander Drive Auto Receivables Trust
Series 2012-5, Class B,
1.560%, 08/15/2018 635,000 638,052
Series 2011-1, Class B,
2.350%, 11/16/2015 1,095,000 1,116,253
SNAAC Auto Receivables Trust,
Series 2012-1A, Class A
1.780%, 06/15/2016 (S) 268,694 269,162
Volvo Financial Equipment LLC,
Series 2012-1A, Class B
1.510%, 08/15/2017 (S) 230,000 232,557
TOTAL ASSET BACKED SECURITIES (Cost $14,118,190) $ 14,216,564
Investment Quality Bond Fund (continued)Shares or
Principal
Amount Value
SHORT-TERM INVESTMENTS - 7.4%
Repurchase Agreement - 7.4%
BNP Paribas Tri-Party Repurchase
Agreement dated 11/30/2012 at 0.230%
to be repurchased at $17,800,341 on
12/03/2012, collateralized by
$16.616,793, Government National
Mortgage Association, 3.500% due
08/20/2042 (valued at $18,156,000,
including interest) $ 17,800,000 $ 17,800,000
Deutsche Bank Securities Tri-Party
Repurchase Agreement dated 11/30/2012
at 0.250% to be repurchased at
$17,900,373 on 12/03/2012,
collateralized by $16,658,806
Government National Mortgage
Association, 5.000% due 06/15/2039
(valued at $18,258,000
including interest) 17,900,000 17,900,000
35,700,000
TOTAL SHORT-TERM INVESTMENTS (Cost $35,700,000) $ 35,700,000
Total Investments (Investment Quality Bond Fund)
(Cost $474,724,805) - 104.9% $ 502,331,345
Other assets and liabilities, net - (4.9%) (23,288,228)
TOTAL NET ASSETS - 100.0% $ 479,043,117
Mid Cap Growth Index FundShares or
Principal
Amount Value
COMMON STOCKS - 99.8%
Consumer Discretionary - 23.1%
Auto Components - 2.0%
Allison Transmission Holdings, Inc. 1,074 $ 22,325
BorgWarner, Inc. (I) 3,387 224,558
Delphi Automotive PLC (I) 9,082 308,697
Gentex Corp. 4,378 77,710
The Goodyear Tire & Rubber Company (I) 7,343 92,522
725,812
Automobiles - 0.9%
Harley-Davidson, Inc. 6,745 316,745
Distributors - 0.5%
Copyright © 2013 www.secdatabase.com. All Rights Reserved.Please Consider the Environment Before Printing This Document
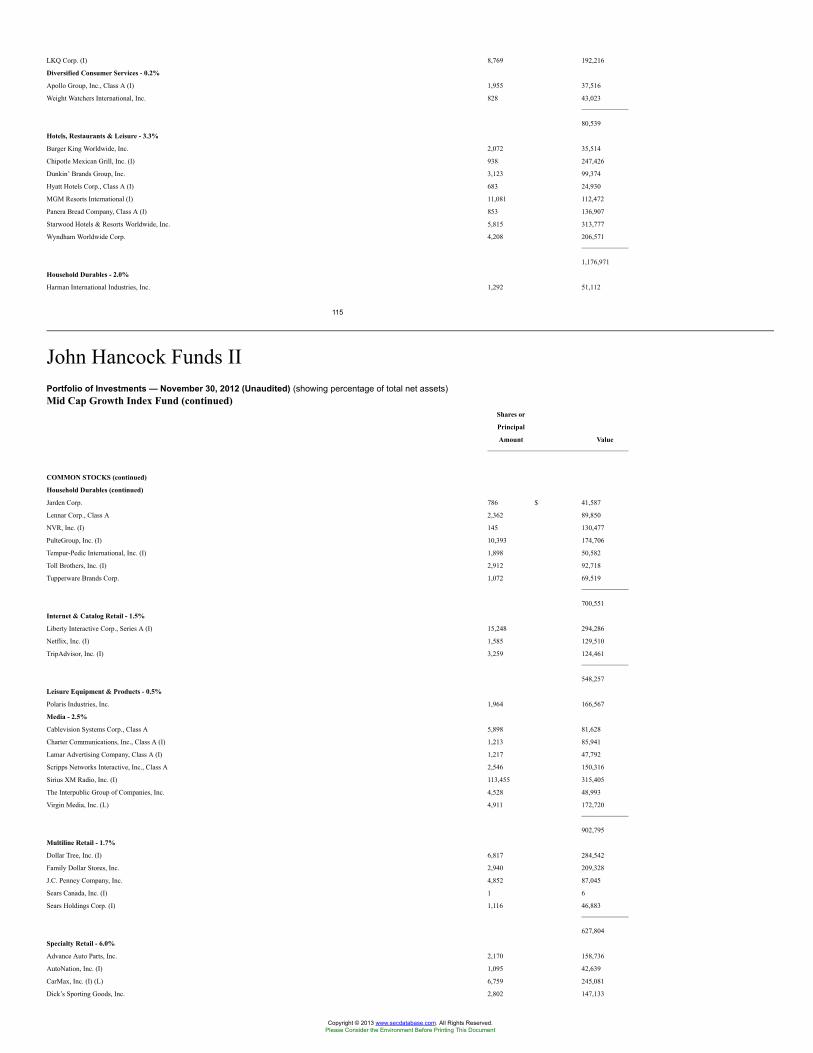
LKQ Corp. (I) 8,769 192,216
Diversified Consumer Services - 0.2%
Apollo Group, Inc., Class A (I) 1,955 37,516
Weight Watchers International, Inc. 828 43,023
80,539
Hotels, Restaurants & Leisure - 3.3%
Burger King Worldwide, Inc. 2,072 35,514
Chipotle Mexican Grill, Inc. (I) 938 247,426
Dunkin’ Brands Group, Inc. 3,123 99,374
Hyatt Hotels Corp., Class A (I) 683 24,930
MGM Resorts International (I) 11,081 112,472
Panera Bread Company, Class A (I) 853 136,907
Starwood Hotels & Resorts Worldwide, Inc. 5,815 313,777
Wyndham Worldwide Corp. 4,208 206,571
1,176,971
Household Durables - 2.0%
Harman International Industries, Inc. 1,292 51,112
115
John Hancock Funds IIPortfolio of Investments — November 30, 2012 (Unaudited) (showing percentage of total net assets)Mid Cap Growth Index Fund (continued)
Shares or
Principal
Amount Value
COMMON STOCKS (continued)
Household Durables (continued)
Jarden Corp. 786 $ 41,587
Lennar Corp., Class A 2,362 89,850
NVR, Inc. (I) 145 130,477
PulteGroup, Inc. (I) 10,393 174,706
Tempur-Pedic International, Inc. (I) 1,898 50,582
Toll Brothers, Inc. (I) 2,912 92,718
Tupperware Brands Corp. 1,072 69,519
700,551
Internet & Catalog Retail - 1.5%
Liberty Interactive Corp., Series A (I) 15,248 294,286
Netflix, Inc. (I) 1,585 129,510
TripAdvisor, Inc. (I) 3,259 124,461
548,257
Leisure Equipment & Products - 0.5%
Polaris Industries, Inc. 1,964 166,567
Media - 2.5%
Cablevision Systems Corp., Class A 5,898 81,628
Charter Communications, Inc., Class A (I) 1,213 85,941
Lamar Advertising Company, Class A (I) 1,217 47,792
Scripps Networks Interactive, Inc., Class A 2,546 150,316
Sirius XM Radio, Inc. (I) 113,455 315,405
The Interpublic Group of Companies, Inc. 4,528 48,993
Virgin Media, Inc. (L) 4,911 172,720
902,795
Multiline Retail - 1.7%
Dollar Tree, Inc. (I) 6,817 284,542
Family Dollar Stores, Inc. 2,940 209,328
J.C. Penney Company, Inc. 4,852 87,045
Sears Canada, Inc. (I) 1 6
Sears Holdings Corp. (I) 1,116 46,883
627,804
Specialty Retail - 6.0%
Advance Auto Parts, Inc. 2,170 158,736
AutoNation, Inc. (I) 1,095 42,639
CarMax, Inc. (I) (L) 6,759 245,081
Dick’s Sporting Goods, Inc. 2,802 147,133
Copyright © 2013 www.secdatabase.com. All Rights Reserved.Please Consider the Environment Before Printing This Document
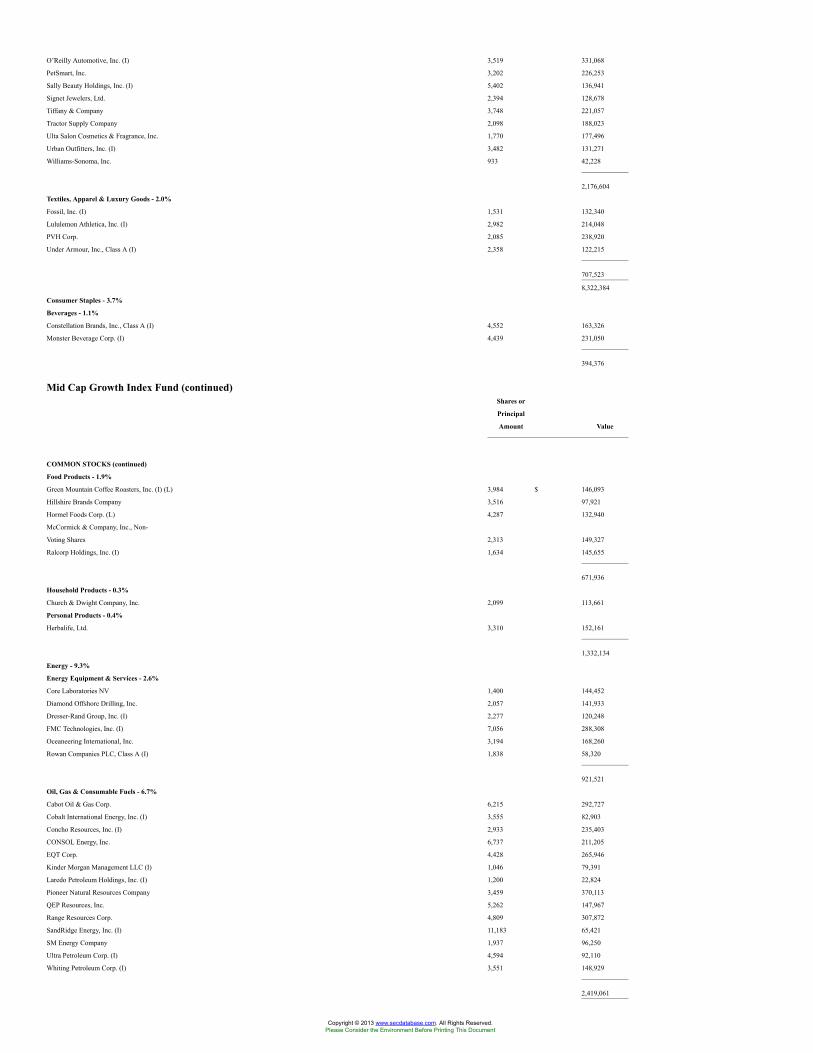
O’Reilly Automotive, Inc. (I) 3,519 331,068
PetSmart, Inc. 3,202 226,253
Sally Beauty Holdings, Inc. (I) 5,402 136,941
Signet Jewelers, Ltd. 2,394 128,678
Tiffany & Company 3,748 221,057
Tractor Supply Company 2,098 188,023
Ulta Salon Cosmetics & Fragrance, Inc. 1,770 177,496
Urban Outfitters, Inc. (I) 3,482 131,271
Williams-Sonoma, Inc. 933 42,228
2,176,604
Textiles, Apparel & Luxury Goods - 2.0%
Fossil, Inc. (I) 1,531 132,340
Lululemon Athletica, Inc. (I) 2,982 214,048
PVH Corp. 2,085 238,920
Under Armour, Inc., Class A (I) 2,358 122,215
707,523
8,322,384
Consumer Staples - 3.7%
Beverages - 1.1%
Constellation Brands, Inc., Class A (I) 4,552 163,326
Monster Beverage Corp. (I) 4,439 231,050
394,376
Mid Cap Growth Index Fund (continued)Shares or
Principal
Amount Value
COMMON STOCKS (continued)
Food Products - 1.9%
Green Mountain Coffee Roasters, Inc. (I) (L) 3,984 $ 146,093
Hillshire Brands Company 3,516 97,921
Hormel Foods Corp. (L) 4,287 132,940
McCormick & Company, Inc., Non-
Voting Shares 2,313 149,327
Ralcorp Holdings, Inc. (I) 1,634 145,655
671,936
Household Products - 0.3%
Church & Dwight Company, Inc. 2,099 113,661
Personal Products - 0.4%
Herbalife, Ltd. 3,310 152,161
1,332,134
Energy - 9.3%
Energy Equipment & Services - 2.6%
Core Laboratories NV 1,400 144,452
Diamond Offshore Drilling, Inc. 2,057 141,933
Dresser-Rand Group, Inc. (I) 2,277 120,248
FMC Technologies, Inc. (I) 7,056 288,308
Oceaneering International, Inc. 3,194 168,260
Rowan Companies PLC, Class A (I) 1,838 58,320
921,521
Oil, Gas & Consumable Fuels - 6.7%
Cabot Oil & Gas Corp. 6,215 292,727
Cobalt International Energy, Inc. (I) 3,555 82,903
Concho Resources, Inc. (I) 2,933 235,403
CONSOL Energy, Inc. 6,737 211,205
EQT Corp. 4,428 265,946
Kinder Morgan Management LLC (I) 1,046 79,391
Laredo Petroleum Holdings, Inc. (I) 1,200 22,824
Pioneer Natural Resources Company 3,459 370,113
QEP Resources, Inc. 5,262 147,967
Range Resources Corp. 4,809 307,872
SandRidge Energy, Inc. (I) 11,183 65,421
SM Energy Company 1,937 96,250
Ultra Petroleum Corp. (I) 4,594 92,110
Whiting Petroleum Corp. (I) 3,551 148,929
2,419,061
Copyright © 2013 www.secdatabase.com. All Rights Reserved.Please Consider the Environment Before Printing This Document
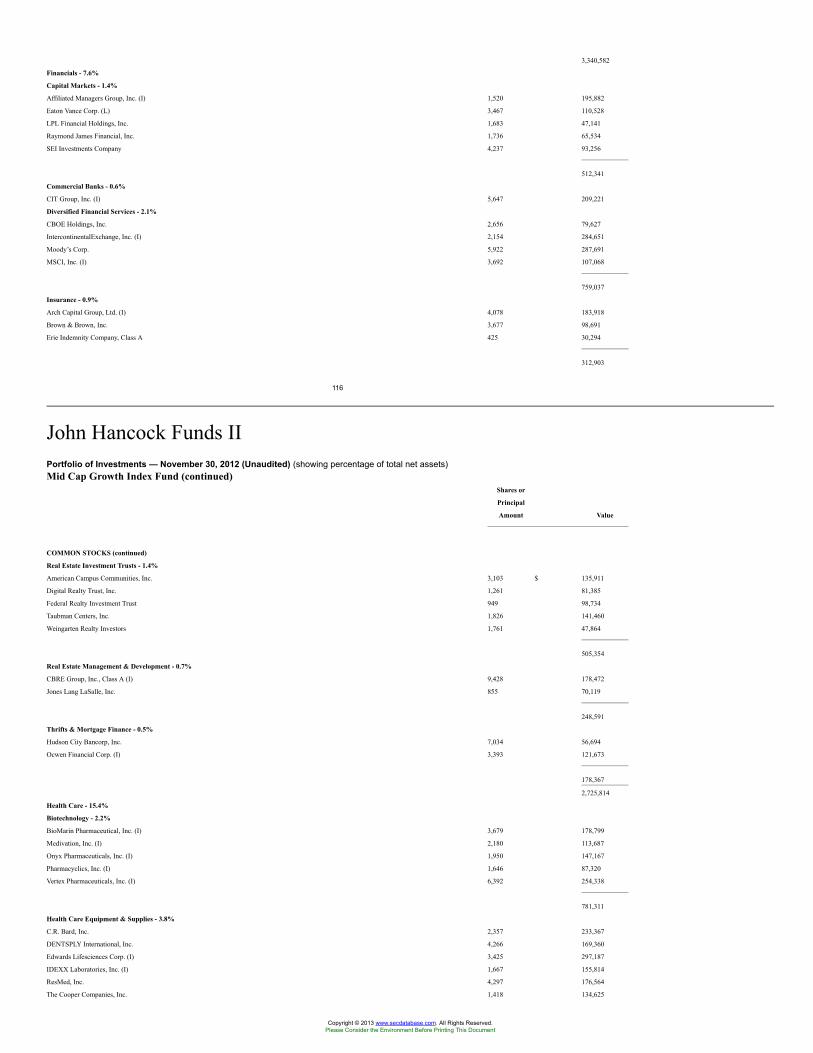
3,340,582
Financials - 7.6%
Capital Markets - 1.4%
Affiliated Managers Group, Inc. (I) 1,520 195,882
Eaton Vance Corp. (L) 3,467 110,528
LPL Financial Holdings, Inc. 1,683 47,141
Raymond James Financial, Inc. 1,736 65,534
SEI Investments Company 4,237 93,256
512,341
Commercial Banks - 0.6%
CIT Group, Inc. (I) 5,647 209,221
Diversified Financial Services - 2.1%
CBOE Holdings, Inc. 2,656 79,627
IntercontinentalExchange, Inc. (I) 2,154 284,651
Moody’s Corp. 5,922 287,691
MSCI, Inc. (I) 3,692 107,068
759,037
Insurance - 0.9%
Arch Capital Group, Ltd. (I) 4,078 183,918
Brown & Brown, Inc. 3,677 98,691
Erie Indemnity Company, Class A 425 30,294
312,903
116
John Hancock Funds IIPortfolio of Investments — November 30, 2012 (Unaudited) (showing percentage of total net assets)Mid Cap Growth Index Fund (continued)
Shares or
Principal
Amount Value
COMMON STOCKS (continued)
Real Estate Investment Trusts - 1.4%
American Campus Communities, Inc. 3,103 $ 135,911
Digital Realty Trust, Inc. 1,261 81,385
Federal Realty Investment Trust 949 98,734
Taubman Centers, Inc. 1,826 141,460
Weingarten Realty Investors 1,761 47,864
505,354
Real Estate Management & Development - 0.7%
CBRE Group, Inc., Class A (I) 9,428 178,472
Jones Lang LaSalle, Inc. 855 70,119
248,591
Thrifts & Mortgage Finance - 0.5%
Hudson City Bancorp, Inc. 7,034 56,694
Ocwen Financial Corp. (I) 3,393 121,673
178,367
2,725,814
Health Care - 15.4%
Biotechnology - 2.2%
BioMarin Pharmaceutical, Inc. (I) 3,679 178,799
Medivation, Inc. (I) 2,180 113,687
Onyx Pharmaceuticals, Inc. (I) 1,950 147,167
Pharmacyclics, Inc. (I) 1,646 87,320
Vertex Pharmaceuticals, Inc. (I) 6,392 254,338
781,311
Health Care Equipment & Supplies - 3.8%
C.R. Bard, Inc. 2,357 233,367
DENTSPLY International, Inc. 4,266 169,360
Edwards Lifesciences Corp. (I) 3,425 297,187
IDEXX Laboratories, Inc. (I) 1,667 155,814
ResMed, Inc. 4,297 176,564
The Cooper Companies, Inc. 1,418 134,625
Copyright © 2013 www.secdatabase.com. All Rights Reserved.Please Consider the Environment Before Printing This Document
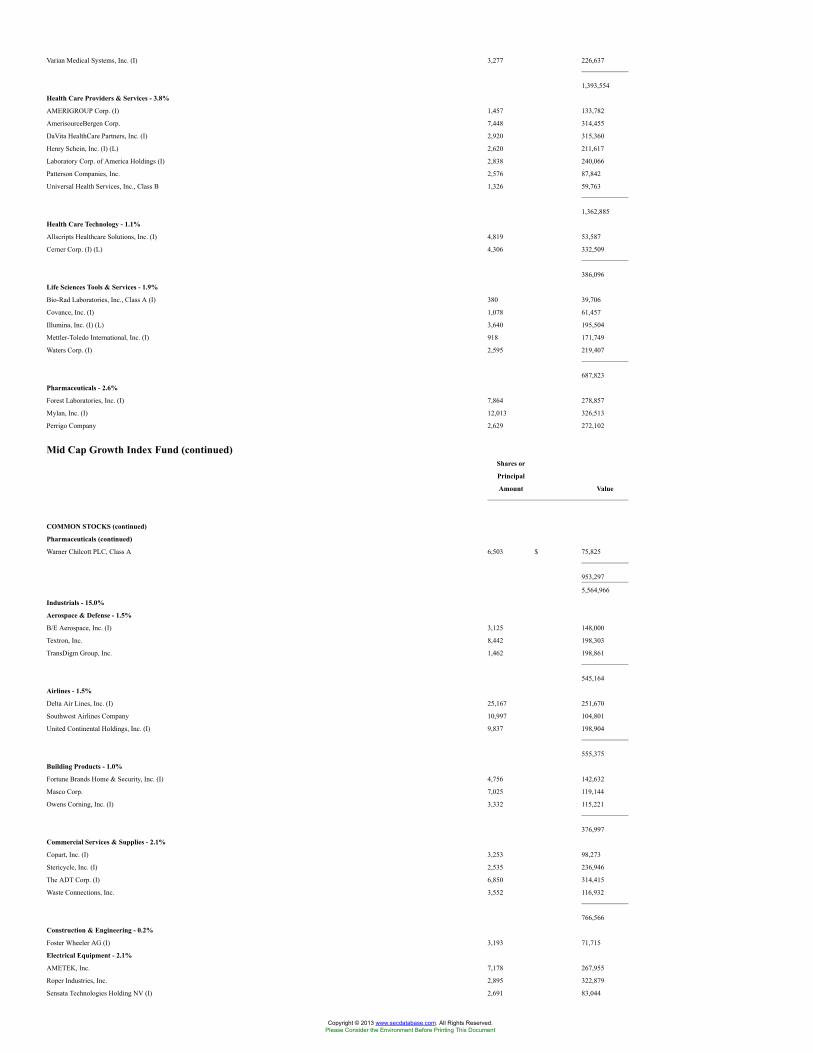
Varian Medical Systems, Inc. (I) 3,277 226,637
1,393,554
Health Care Providers & Services - 3.8%
AMERIGROUP Corp. (I) 1,457 133,782
AmerisourceBergen Corp. 7,448 314,455
DaVita HealthCare Partners, Inc. (I) 2,920 315,360
Henry Schein, Inc. (I) (L) 2,620 211,617
Laboratory Corp. of America Holdings (I) 2,838 240,066
Patterson Companies, Inc. 2,576 87,842
Universal Health Services, Inc., Class B 1,326 59,763
1,362,885
Health Care Technology - 1.1%
Allscripts Healthcare Solutions, Inc. (I) 4,819 53,587
Cerner Corp. (I) (L) 4,306 332,509
386,096
Life Sciences Tools & Services - 1.9%
Bio-Rad Laboratories, Inc., Class A (I) 380 39,706
Covance, Inc. (I) 1,078 61,457
Illumina, Inc. (I) (L) 3,640 195,504
Mettler-Toledo International, Inc. (I) 918 171,749
Waters Corp. (I) 2,595 219,407
687,823
Pharmaceuticals - 2.6%
Forest Laboratories, Inc. (I) 7,864 278,857
Mylan, Inc. (I) 12,013 326,513
Perrigo Company 2,629 272,102
Mid Cap Growth Index Fund (continued)Shares or
Principal
Amount Value
COMMON STOCKS (continued)
Pharmaceuticals (continued)
Warner Chilcott PLC, Class A 6,503 $ 75,825
953,297
5,564,966
Industrials - 15.0%
Aerospace & Defense - 1.5%
B/E Aerospace, Inc. (I) 3,125 148,000
Textron, Inc. 8,442 198,303
TransDigm Group, Inc. 1,462 198,861
545,164
Airlines - 1.5%
Delta Air Lines, Inc. (I) 25,167 251,670
Southwest Airlines Company 10,997 104,801
United Continental Holdings, Inc. (I) 9,837 198,904
555,375
Building Products - 1.0%
Fortune Brands Home & Security, Inc. (I) 4,756 142,632
Masco Corp. 7,025 119,144
Owens Corning, Inc. (I) 3,332 115,221
376,997
Commercial Services & Supplies - 2.1%
Copart, Inc. (I) 3,253 98,273
Stericycle, Inc. (I) 2,535 236,946
The ADT Corp. (I) 6,850 314,415
Waste Connections, Inc. 3,552 116,932
766,566
Construction & Engineering - 0.2%
Foster Wheeler AG (I) 3,193 71,715
Electrical Equipment - 2.1%
AMETEK, Inc. 7,178 267,955
Roper Industries, Inc. 2,895 322,879
Sensata Technologies Holding NV (I) 2,691 83,044
Copyright © 2013 www.secdatabase.com. All Rights Reserved.Please Consider the Environment Before Printing This Document
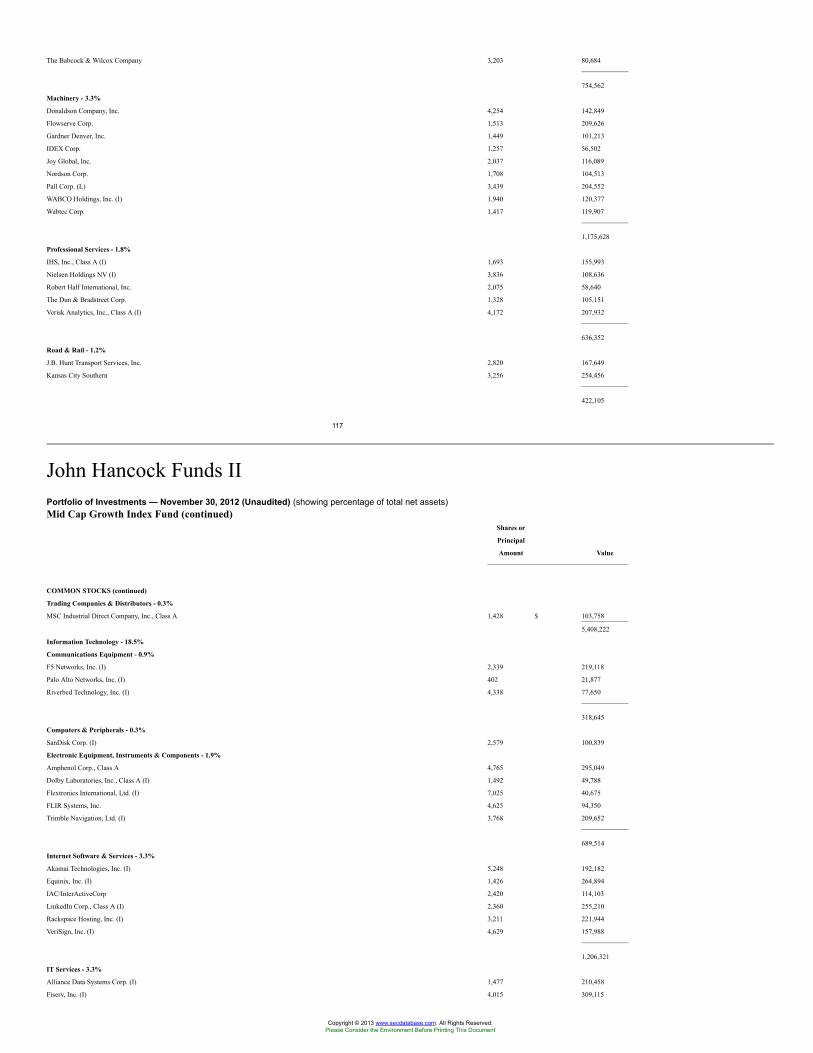
The Babcock & Wilcox Company 3,203 80,684
754,562
Machinery - 3.3%
Donaldson Company, Inc. 4,254 142,849
Flowserve Corp. 1,513 209,626
Gardner Denver, Inc. 1,449 101,213
IDEX Corp. 1,257 56,502
Joy Global, Inc. 2,037 116,089
Nordson Corp. 1,708 104,513
Pall Corp. (L) 3,439 204,552
WABCO Holdings, Inc. (I) 1,940 120,377
Wabtec Corp. 1,417 119,907
1,175,628
Professional Services - 1.8%
IHS, Inc., Class A (I) 1,693 155,993
Nielsen Holdings NV (I) 3,836 108,636
Robert Half International, Inc. 2,075 58,640
The Dun & Bradstreet Corp. 1,328 105,151
Verisk Analytics, Inc., Class A (I) 4,172 207,932
636,352
Road & Rail - 1.2%
J.B. Hunt Transport Services, Inc. 2,820 167,649
Kansas City Southern 3,256 254,456
422,105
117
John Hancock Funds IIPortfolio of Investments — November 30, 2012 (Unaudited) (showing percentage of total net assets)Mid Cap Growth Index Fund (continued)
Shares or
Principal
Amount Value
COMMON STOCKS (continued)
Trading Companies & Distributors - 0.3%
MSC Industrial Direct Company, Inc., Class A 1,428 $ 103,758
5,408,222
Information Technology - 18.5%
Communications Equipment - 0.9%
F5 Networks, Inc. (I) 2,339 219,118
Palo Alto Networks, Inc. (I) 402 21,877
Riverbed Technology, Inc. (I) 4,338 77,650
318,645
Computers & Peripherals - 0.3%
SanDisk Corp. (I) 2,579 100,839
Electronic Equipment, Instruments & Components - 1.9%
Amphenol Corp., Class A 4,765 295,049
Dolby Laboratories, Inc., Class A (I) 1,492 49,788
Flextronics International, Ltd. (I) 7,025 40,675
FLIR Systems, Inc. 4,625 94,350
Trimble Navigation, Ltd. (I) 3,768 209,652
689,514
Internet Software & Services - 3.3%
Akamai Technologies, Inc. (I) 5,248 192,182
Equinix, Inc. (I) 1,426 264,894
IAC/InterActiveCorp 2,420 114,103
LinkedIn Corp., Class A (I) 2,360 255,210
Rackspace Hosting, Inc. (I) 3,211 221,944
VeriSign, Inc. (I) 4,629 157,988
1,206,321
IT Services - 3.3%
Alliance Data Systems Corp. (I) 1,477 210,458
Fiserv, Inc. (I) 4,015 309,115
Copyright © 2013 www.secdatabase.com. All Rights Reserved.Please Consider the Environment Before Printing This Document
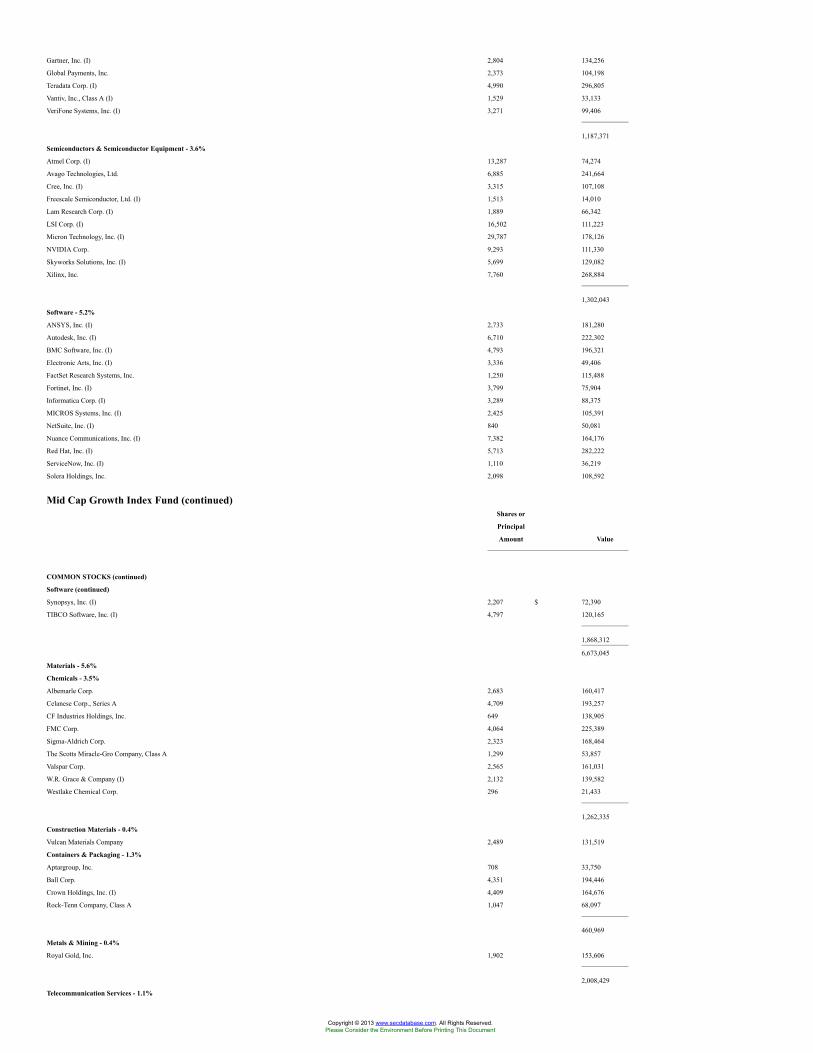
Gartner, Inc. (I) 2,804 134,256
Global Payments, Inc. 2,373 104,198
Teradata Corp. (I) 4,990 296,805
Vantiv, Inc., Class A (I) 1,529 33,133
VeriFone Systems, Inc. (I) 3,271 99,406
1,187,371
Semiconductors & Semiconductor Equipment - 3.6%
Atmel Corp. (I) 13,287 74,274
Avago Technologies, Ltd. 6,885 241,664
Cree, Inc. (I) 3,315 107,108
Freescale Semiconductor, Ltd. (I) 1,513 14,010
Lam Research Corp. (I) 1,889 66,342
LSI Corp. (I) 16,502 111,223
Micron Technology, Inc. (I) 29,787 178,126
NVIDIA Corp. 9,293 111,330
Skyworks Solutions, Inc. (I) 5,699 129,082
Xilinx, Inc. 7,760 268,884
1,302,043
Software - 5.2%
ANSYS, Inc. (I) 2,733 181,280
Autodesk, Inc. (I) 6,710 222,302
BMC Software, Inc. (I) 4,793 196,321
Electronic Arts, Inc. (I) 3,336 49,406
FactSet Research Systems, Inc. 1,250 115,488
Fortinet, Inc. (I) 3,799 75,904
Informatica Corp. (I) 3,289 88,375
MICROS Systems, Inc. (I) 2,425 105,391
NetSuite, Inc. (I) 840 50,081
Nuance Communications, Inc. (I) 7,382 164,176
Red Hat, Inc. (I) 5,713 282,222
ServiceNow, Inc. (I) 1,110 36,219
Solera Holdings, Inc. 2,098 108,592
Mid Cap Growth Index Fund (continued)Shares or
Principal
Amount Value
COMMON STOCKS (continued)
Software (continued)
Synopsys, Inc. (I) 2,207 $ 72,390
TIBCO Software, Inc. (I) 4,797 120,165
1,868,312
6,673,045
Materials - 5.6%
Chemicals - 3.5%
Albemarle Corp. 2,683 160,417
Celanese Corp., Series A 4,709 193,257
CF Industries Holdings, Inc. 649 138,905
FMC Corp. 4,064 225,389
Sigma-Aldrich Corp. 2,323 168,464
The Scotts Miracle-Gro Company, Class A 1,299 53,857
Valspar Corp. 2,565 161,031
W.R. Grace & Company (I) 2,132 139,582
Westlake Chemical Corp. 296 21,433
1,262,335
Construction Materials - 0.4%
Vulcan Materials Company 2,489 131,519
Containers & Packaging - 1.3%
Aptargroup, Inc. 708 33,750
Ball Corp. 4,351 194,446
Crown Holdings, Inc. (I) 4,409 164,676
Rock-Tenn Company, Class A 1,047 68,097
460,969
Metals & Mining - 0.4%
Royal Gold, Inc. 1,902 153,606
2,008,429
Telecommunication Services - 1.1%
Copyright © 2013 www.secdatabase.com. All Rights Reserved.Please Consider the Environment Before Printing This Document
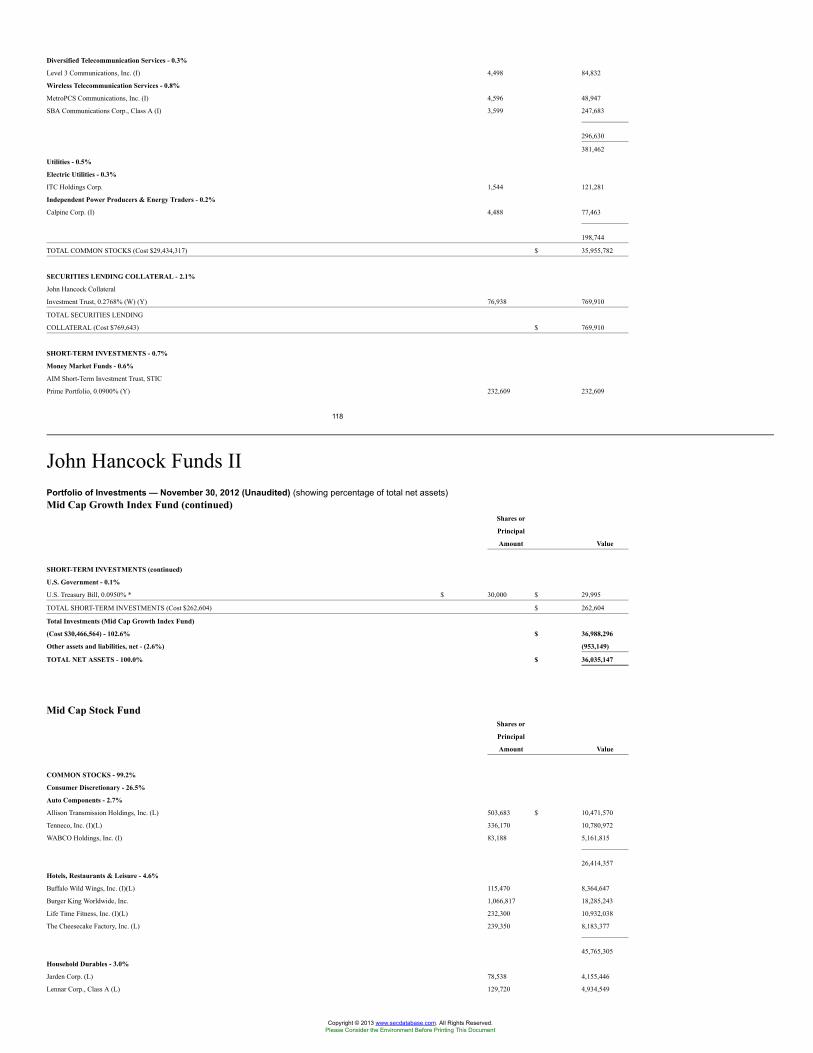
Diversified Telecommunication Services - 0.3%
Level 3 Communications, Inc. (I) 4,498 84,832
Wireless Telecommunication Services - 0.8%
MetroPCS Communications, Inc. (I) 4,596 48,947
SBA Communications Corp., Class A (I) 3,599 247,683
296,630
381,462
Utilities - 0.5%
Electric Utilities - 0.3%
ITC Holdings Corp. 1,544 121,281
Independent Power Producers & Energy Traders - 0.2%
Calpine Corp. (I) 4,488 77,463
198,744
TOTAL COMMON STOCKS (Cost $29,434,317) $ 35,955,782
SECURITIES LENDING COLLATERAL - 2.1%
John Hancock Collateral
Investment Trust, 0.2768% (W) (Y) 76,938 769,910
TOTAL SECURITIES LENDING
COLLATERAL (Cost $769,643) $ 769,910
SHORT-TERM INVESTMENTS - 0.7%
Money Market Funds - 0.6%
AIM Short-Term Investment Trust, STIC
Prime Portfolio, 0.0900% (Y) 232,609 232,609
118
John Hancock Funds IIPortfolio of Investments — November 30, 2012 (Unaudited) (showing percentage of total net assets)Mid Cap Growth Index Fund (continued)
Shares or
Principal
Amount Value
SHORT-TERM INVESTMENTS (continued)
U.S. Government - 0.1%
U.S. Treasury Bill, 0.0950% * $ 30,000 $ 29,995
TOTAL SHORT-TERM INVESTMENTS (Cost $262,604) $ 262,604
Total Investments (Mid Cap Growth Index Fund)
(Cost $30,466,564) - 102.6% $ 36,988,296
Other assets and liabilities, net - (2.6%) (953,149)
TOTAL NET ASSETS - 100.0% $ 36,035,147
Mid Cap Stock FundShares or
Principal
Amount Value
COMMON STOCKS - 99.2%
Consumer Discretionary - 26.5%
Auto Components - 2.7%
Allison Transmission Holdings, Inc. (L) 503,683 $ 10,471,570
Tenneco, Inc. (I)(L) 336,170 10,780,972
WABCO Holdings, Inc. (I) 83,188 5,161,815
26,414,357
Hotels, Restaurants & Leisure - 4.6%
Buffalo Wild Wings, Inc. (I)(L) 115,470 8,364,647
Burger King Worldwide, Inc. 1,066,817 18,285,243
Life Time Fitness, Inc. (I)(L) 232,300 10,932,038
The Cheesecake Factory, Inc. (L) 239,350 8,183,377
45,765,305
Household Durables - 3.0%
Jarden Corp. (L) 78,538 4,155,446
Lennar Corp., Class A (L) 129,720 4,934,549
Copyright © 2013 www.secdatabase.com. All Rights Reserved.Please Consider the Environment Before Printing This Document
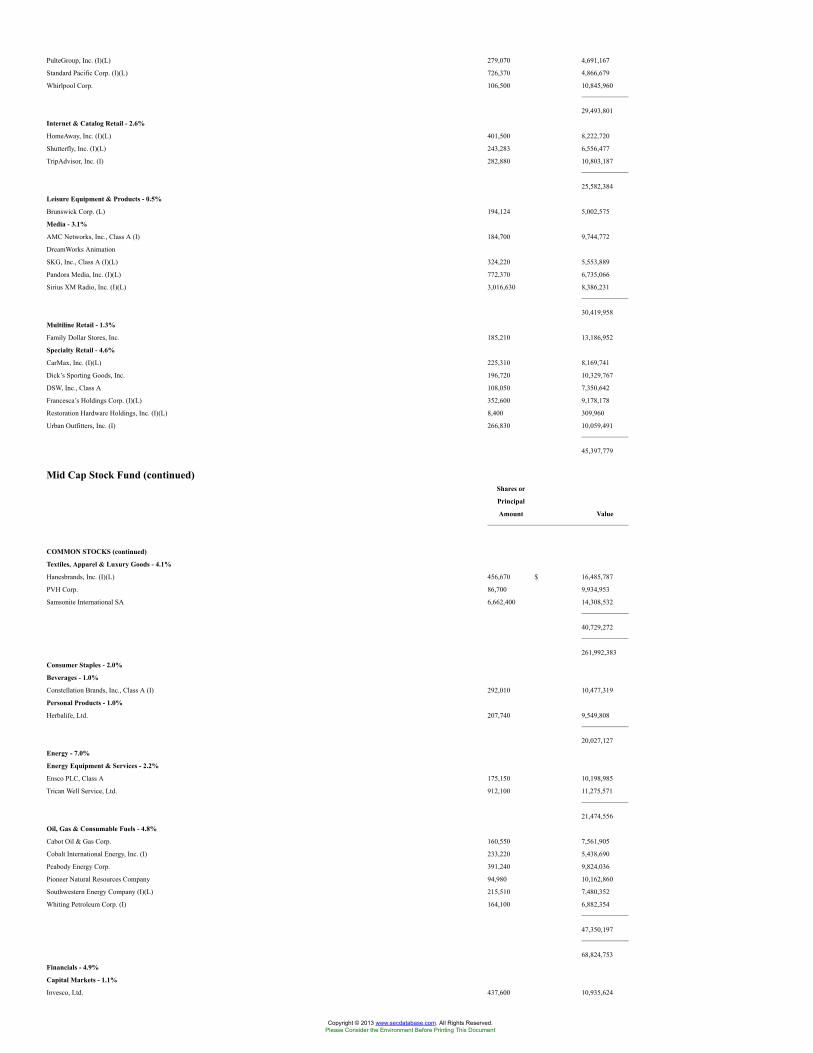
PulteGroup, Inc. (I)(L) 279,070 4,691,167
Standard Pacific Corp. (I)(L) 726,370 4,866,679
Whirlpool Corp. 106,500 10,845,960
29,493,801
Internet & Catalog Retail - 2.6%
HomeAway, Inc. (I)(L) 401,500 8,222,720
Shutterfly, Inc. (I)(L) 243,283 6,556,477
TripAdvisor, Inc. (I) 282,880 10,803,187
25,582,384
Leisure Equipment & Products - 0.5%
Brunswick Corp. (L) 194,124 5,002,575
Media - 3.1%
AMC Networks, Inc., Class A (I) 184,700 9,744,772
DreamWorks Animation
SKG, Inc., Class A (I)(L) 324,220 5,553,889
Pandora Media, Inc. (I)(L) 772,370 6,735,066
Sirius XM Radio, Inc. (I)(L) 3,016,630 8,386,231
30,419,958
Multiline Retail - 1.3%
Family Dollar Stores, Inc. 185,210 13,186,952
Specialty Retail - 4.6%
CarMax, Inc. (I)(L) 225,310 8,169,741
Dick’s Sporting Goods, Inc. 196,720 10,329,767
DSW, Inc., Class A 108,050 7,350,642
Francesca’s Holdings Corp. (I)(L) 352,600 9,178,178
Restoration Hardware Holdings, Inc. (I)(L) 8,400 309,960
Urban Outfitters, Inc. (I) 266,830 10,059,491
45,397,779
Mid Cap Stock Fund (continued)Shares or
Principal
Amount Value
COMMON STOCKS (continued)
Textiles, Apparel & Luxury Goods - 4.1%
Hanesbrands, Inc. (I)(L) 456,670 $ 16,485,787
PVH Corp. 86,700 9,934,953
Samsonite International SA 6,662,400 14,308,532
40,729,272
261,992,383
Consumer Staples - 2.0%
Beverages - 1.0%
Constellation Brands, Inc., Class A (I) 292,010 10,477,319
Personal Products - 1.0%
Herbalife, Ltd. 207,740 9,549,808
20,027,127
Energy - 7.0%
Energy Equipment & Services - 2.2%
Ensco PLC, Class A 175,150 10,198,985
Trican Well Service, Ltd. 912,100 11,275,571
21,474,556
Oil, Gas & Consumable Fuels - 4.8%
Cabot Oil & Gas Corp. 160,550 7,561,905
Cobalt International Energy, Inc. (I) 233,220 5,438,690
Peabody Energy Corp. 391,240 9,824,036
Pioneer Natural Resources Company 94,980 10,162,860
Southwestern Energy Company (I)(L) 215,510 7,480,352
Whiting Petroleum Corp. (I) 164,100 6,882,354
47,350,197
68,824,753
Financials - 4.9%
Capital Markets - 1.1%
Invesco, Ltd. 437,600 10,935,624
Copyright © 2013 www.secdatabase.com. All Rights Reserved.Please Consider the Environment Before Printing This Document
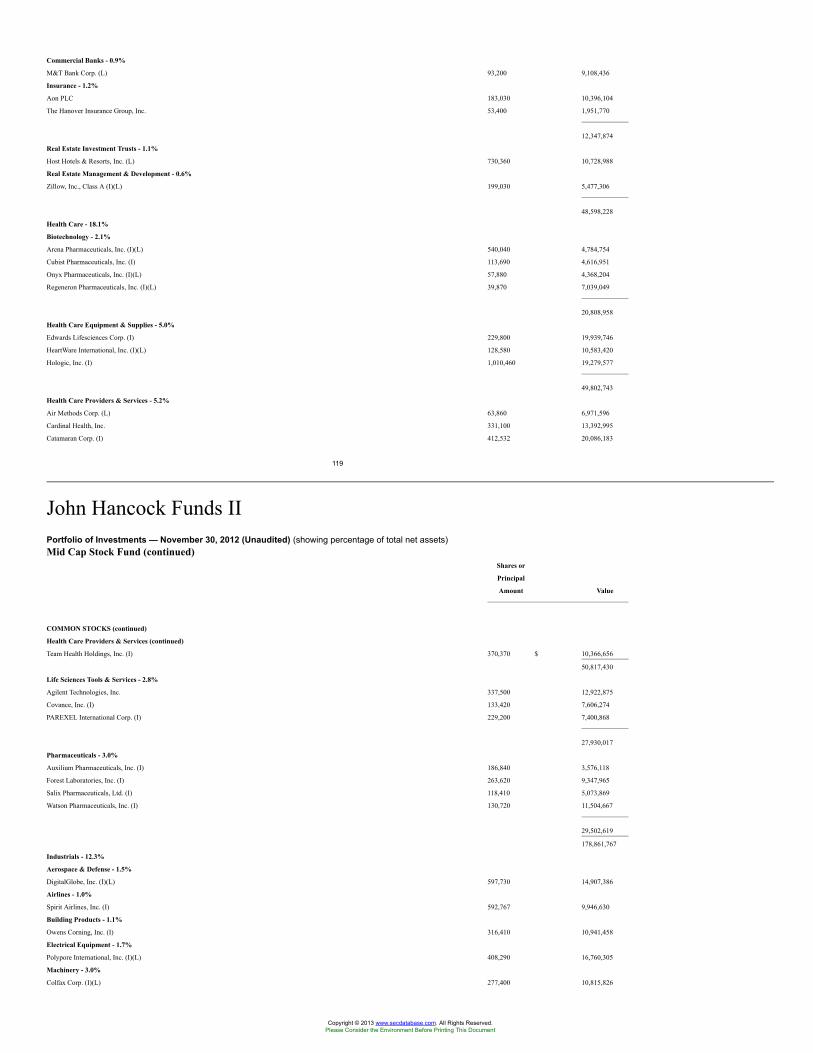
Commercial Banks - 0.9%
M&T Bank Corp. (L) 93,200 9,108,436
Insurance - 1.2%
Aon PLC 183,030 10,396,104
The Hanover Insurance Group, Inc. 53,400 1,951,770
12,347,874
Real Estate Investment Trusts - 1.1%
Host Hotels & Resorts, Inc. (L) 730,360 10,728,988
Real Estate Management & Development - 0.6%
Zillow, Inc., Class A (I)(L) 199,030 5,477,306
48,598,228
Health Care - 18.1%
Biotechnology - 2.1%
Arena Pharmaceuticals, Inc. (I)(L) 540,040 4,784,754
Cubist Pharmaceuticals, Inc. (I) 113,690 4,616,951
Onyx Pharmaceuticals, Inc. (I)(L) 57,880 4,368,204
Regeneron Pharmaceuticals, Inc. (I)(L) 39,870 7,039,049
20,808,958
Health Care Equipment & Supplies - 5.0%
Edwards Lifesciences Corp. (I) 229,800 19,939,746
HeartWare International, Inc. (I)(L) 128,580 10,583,420
Hologic, Inc. (I) 1,010,460 19,279,577
49,802,743
Health Care Providers & Services - 5.2%
Air Methods Corp. (L) 63,860 6,971,596
Cardinal Health, Inc. 331,100 13,392,995
Catamaran Corp. (I) 412,532 20,086,183
119
John Hancock Funds IIPortfolio of Investments — November 30, 2012 (Unaudited) (showing percentage of total net assets)Mid Cap Stock Fund (continued)
Shares or
Principal
Amount Value
COMMON STOCKS (continued)
Health Care Providers & Services (continued)
Team Health Holdings, Inc. (I) 370,370 $ 10,366,656
50,817,430
Life Sciences Tools & Services - 2.8%
Agilent Technologies, Inc. 337,500 12,922,875
Covance, Inc. (I) 133,420 7,606,274
PAREXEL International Corp. (I) 229,200 7,400,868
27,930,017
Pharmaceuticals - 3.0%
Auxilium Pharmaceuticals, Inc. (I) 186,840 3,576,118
Forest Laboratories, Inc. (I) 263,620 9,347,965
Salix Pharmaceuticals, Ltd. (I) 118,410 5,073,869
Watson Pharmaceuticals, Inc. (I) 130,720 11,504,667
29,502,619
178,861,767
Industrials - 12.3%
Aerospace & Defense - 1.5%
DigitalGlobe, Inc. (I)(L) 597,730 14,907,386
Airlines - 1.0%
Spirit Airlines, Inc. (I) 592,767 9,946,630
Building Products - 1.1%
Owens Corning, Inc. (I) 316,410 10,941,458
Electrical Equipment - 1.7%
Polypore International, Inc. (I)(L) 408,290 16,760,305
Machinery - 3.0%
Colfax Corp. (I)(L) 277,400 10,815,826
Copyright © 2013 www.secdatabase.com. All Rights Reserved.Please Consider the Environment Before Printing This Document
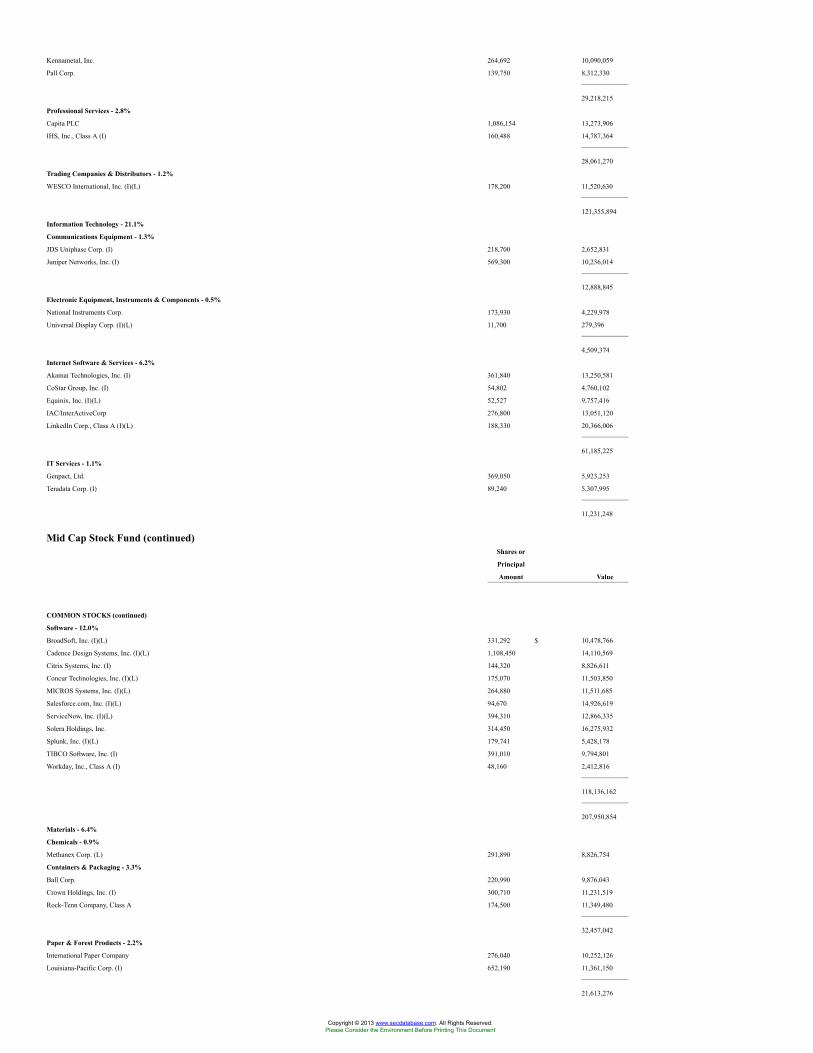
Kennametal, Inc. 264,692 10,090,059
Pall Corp. 139,750 8,312,330
29,218,215
Professional Services - 2.8%
Capita PLC 1,086,154 13,273,906
IHS, Inc., Class A (I) 160,488 14,787,364
28,061,270
Trading Companies & Distributors - 1.2%
WESCO International, Inc. (I)(L) 178,200 11,520,630
121,355,894
Information Technology - 21.1%
Communications Equipment - 1.3%
JDS Uniphase Corp. (I) 218,700 2,652,831
Juniper Networks, Inc. (I) 569,300 10,236,014
12,888,845
Electronic Equipment, Instruments & Components - 0.5%
National Instruments Corp. 173,930 4,229,978
Universal Display Corp. (I)(L) 11,700 279,396
4,509,374
Internet Software & Services - 6.2%
Akamai Technologies, Inc. (I) 361,840 13,250,581
CoStar Group, Inc. (I) 54,802 4,760,102
Equinix, Inc. (I)(L) 52,527 9,757,416
IAC/InterActiveCorp 276,800 13,051,120
LinkedIn Corp., Class A (I)(L) 188,330 20,366,006
61,185,225
IT Services - 1.1%
Genpact, Ltd. 369,050 5,923,253
Teradata Corp. (I) 89,240 5,307,995
11,231,248
Mid Cap Stock Fund (continued)Shares or
Principal
Amount Value
COMMON STOCKS (continued)
Software - 12.0%
BroadSoft, Inc. (I)(L) 331,292 $ 10,478,766
Cadence Design Systems, Inc. (I)(L) 1,108,450 14,110,569
Citrix Systems, Inc. (I) 144,320 8,826,611
Concur Technologies, Inc. (I)(L) 175,070 11,503,850
MICROS Systems, Inc. (I)(L) 264,880 11,511,685
Salesforce.com, Inc. (I)(L) 94,670 14,926,619
ServiceNow, Inc. (I)(L) 394,310 12,866,335
Solera Holdings, Inc. 314,450 16,275,932
Splunk, Inc. (I)(L) 179,741 5,428,178
TIBCO Software, Inc. (I) 391,010 9,794,801
Workday, Inc., Class A (I) 48,160 2,412,816
118,136,162
207,950,854
Materials - 6.4%
Chemicals - 0.9%
Methanex Corp. (L) 291,890 8,826,754
Containers & Packaging - 3.3%
Ball Corp. 220,990 9,876,043
Crown Holdings, Inc. (I) 300,710 11,231,519
Rock-Tenn Company, Class A 174,500 11,349,480
32,457,042
Paper & Forest Products - 2.2%
International Paper Company 276,040 10,252,126
Louisiana-Pacific Corp. (I) 652,190 11,361,150
21,613,276
Copyright © 2013 www.secdatabase.com. All Rights Reserved.Please Consider the Environment Before Printing This Document
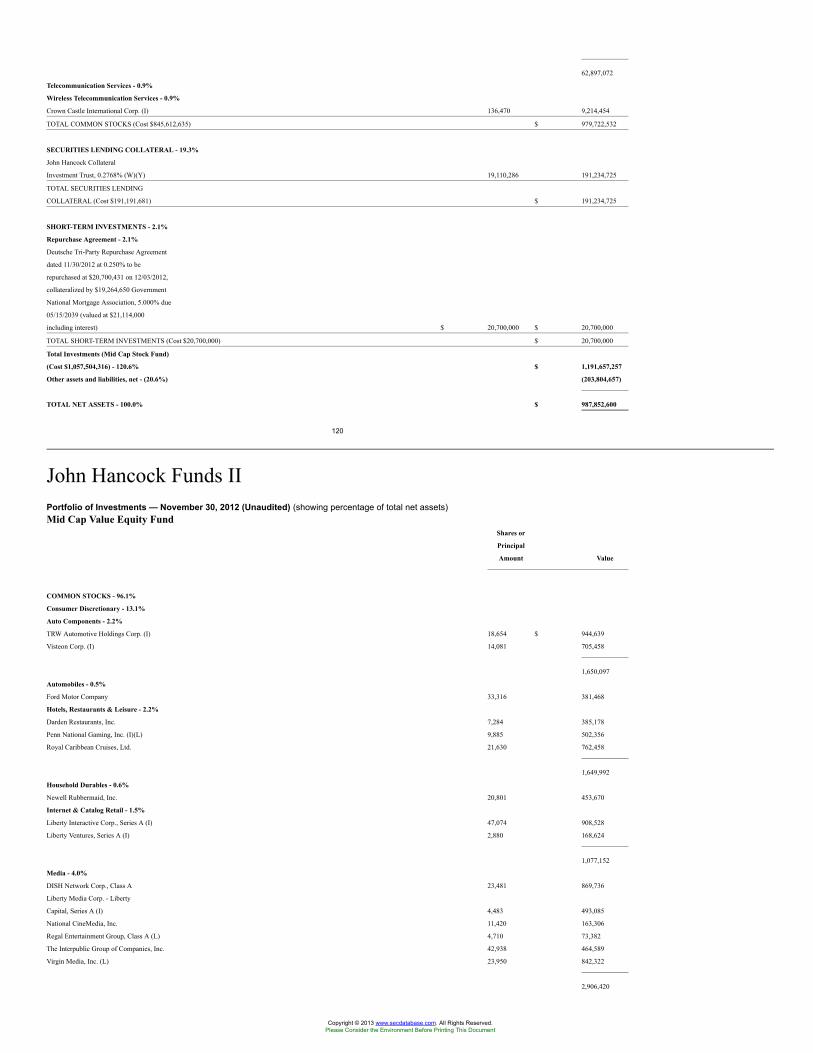
62,897,072
Telecommunication Services - 0.9%
Wireless Telecommunication Services - 0.9%
Crown Castle International Corp. (I) 136,470 9,214,454
TOTAL COMMON STOCKS (Cost $845,612,635) $ 979,722,532
SECURITIES LENDING COLLATERAL - 19.3%
John Hancock Collateral
Investment Trust, 0.2768% (W)(Y) 19,110,286 191,234,725
TOTAL SECURITIES LENDING
COLLATERAL (Cost $191,191,681) $ 191,234,725
SHORT-TERM INVESTMENTS - 2.1%
Repurchase Agreement - 2.1%
Deutsche Tri-Party Repurchase Agreement
dated 11/30/2012 at 0.250% to be
repurchased at $20,700,431 on 12/03/2012,
collateralized by $19,264,650 Government
National Mortgage Association, 5.000% due
05/15/2039 (valued at $21,114,000
including interest) $ 20,700,000 $ 20,700,000
TOTAL SHORT-TERM INVESTMENTS (Cost $20,700,000) $ 20,700,000
Total Investments (Mid Cap Stock Fund)
(Cost $1,057,504,316) - 120.6% $ 1,191,657,257
Other assets and liabilities, net - (20.6%) (203,804,657)
TOTAL NET ASSETS - 100.0% $ 987,852,600
120
John Hancock Funds IIPortfolio of Investments — November 30, 2012 (Unaudited) (showing percentage of total net assets)Mid Cap Value Equity Fund
Shares or
Principal
Amount Value
COMMON STOCKS - 96.1%
Consumer Discretionary - 13.1%
Auto Components - 2.2%
TRW Automotive Holdings Corp. (I) 18,654 $ 944,639
Visteon Corp. (I) 14,081 705,458
1,650,097
Automobiles - 0.5%
Ford Motor Company 33,316 381,468
Hotels, Restaurants & Leisure - 2.2%
Darden Restaurants, Inc. 7,284 385,178
Penn National Gaming, Inc. (I)(L) 9,885 502,356
Royal Caribbean Cruises, Ltd. 21,630 762,458
1,649,992
Household Durables - 0.6%
Newell Rubbermaid, Inc. 20,801 453,670
Internet & Catalog Retail - 1.5%
Liberty Interactive Corp., Series A (I) 47,074 908,528
Liberty Ventures, Series A (I) 2,880 168,624
1,077,152
Media - 4.0%
DISH Network Corp., Class A 23,481 869,736
Liberty Media Corp. - Liberty
Capital, Series A (I) 4,483 493,085
National CineMedia, Inc. 11,420 163,306
Regal Entertainment Group, Class A (L) 4,710 73,382
The Interpublic Group of Companies, Inc. 42,938 464,589
Virgin Media, Inc. (L) 23,950 842,322
2,906,420
Copyright © 2013 www.secdatabase.com. All Rights Reserved.Please Consider the Environment Before Printing This Document
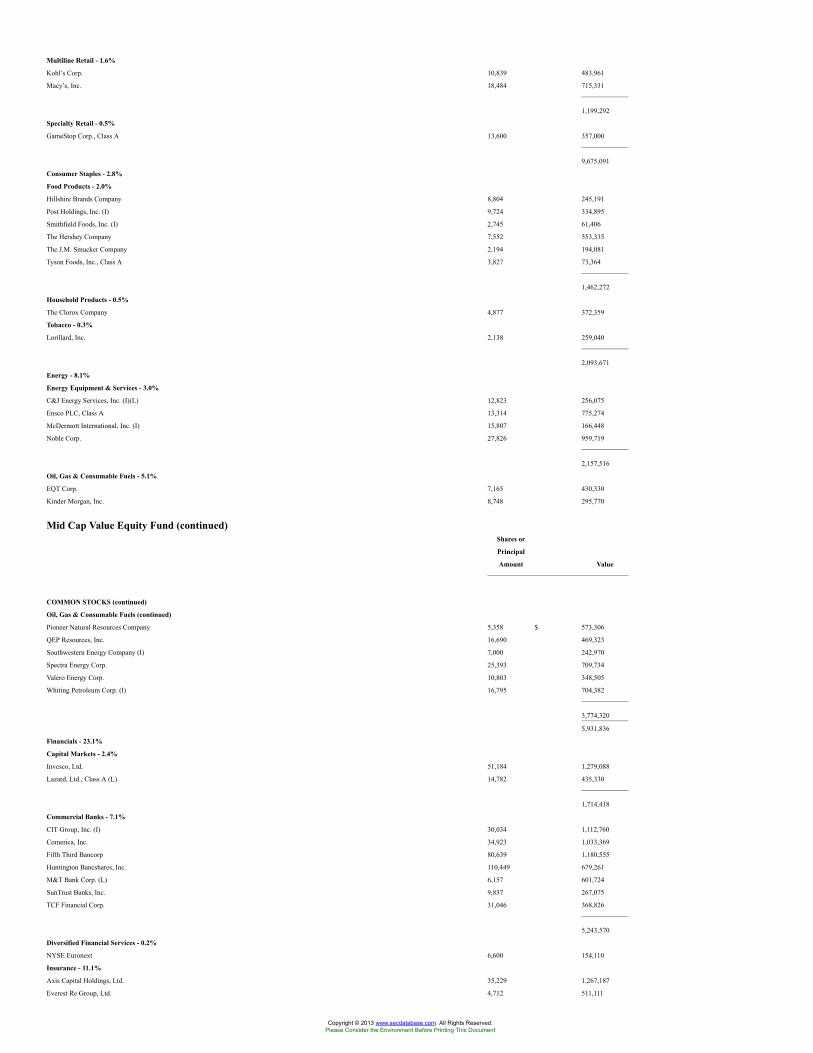
Multiline Retail - 1.6%
Kohl’s Corp. 10,839 483,961
Macy’s, Inc. 18,484 715,331
1,199,292
Specialty Retail - 0.5%
GameStop Corp., Class A 13,600 357,000
9,675,091
Consumer Staples - 2.8%
Food Products - 2.0%
Hillshire Brands Company 8,804 245,191
Post Holdings, Inc. (I) 9,724 334,895
Smithfield Foods, Inc. (I) 2,745 61,406
The Hershey Company 7,552 553,335
The J.M. Smucker Company 2,194 194,081
Tyson Foods, Inc., Class A 3,827 73,364
1,462,272
Household Products - 0.5%
The Clorox Company 4,877 372,359
Tobacco - 0.3%
Lorillard, Inc. 2,138 259,040
2,093,671
Energy - 8.1%
Energy Equipment & Services - 3.0%
C&J Energy Services, Inc. (I)(L) 12,823 256,075
Ensco PLC, Class A 13,314 775,274
McDermott International, Inc. (I) 15,807 166,448
Noble Corp. 27,826 959,719
2,157,516
Oil, Gas & Consumable Fuels - 5.1%
EQT Corp. 7,165 430,330
Kinder Morgan, Inc. 8,748 295,770
Mid Cap Value Equity Fund (continued)Shares or
Principal
Amount Value
COMMON STOCKS (continued)
Oil, Gas & Consumable Fuels (continued)
Pioneer Natural Resources Company 5,358 $ 573,306
QEP Resources, Inc. 16,690 469,323
Southwestern Energy Company (I) 7,000 242,970
Spectra Energy Corp. 25,393 709,734
Valero Energy Corp. 10,803 348,505
Whiting Petroleum Corp. (I) 16,795 704,382
3,774,320
5,931,836
Financials - 23.1%
Capital Markets - 2.4%
Invesco, Ltd. 51,184 1,279,088
Lazard, Ltd., Class A (L) 14,782 435,330
1,714,418
Commercial Banks - 7.1%
CIT Group, Inc. (I) 30,034 1,112,760
Comerica, Inc. 34,923 1,033,369
Fifth Third Bancorp 80,639 1,180,555
Huntington Bancshares, Inc. 110,449 679,261
M&T Bank Corp. (L) 6,157 601,724
SunTrust Banks, Inc. 9,837 267,075
TCF Financial Corp. 31,046 368,826
5,243,570
Diversified Financial Services - 0.2%
NYSE Euronext 6,600 154,110
Insurance - 11.1%
Axis Capital Holdings, Ltd. 35,229 1,267,187
Everest Re Group, Ltd. 4,712 511,111
Copyright © 2013 www.secdatabase.com. All Rights Reserved.Please Consider the Environment Before Printing This Document
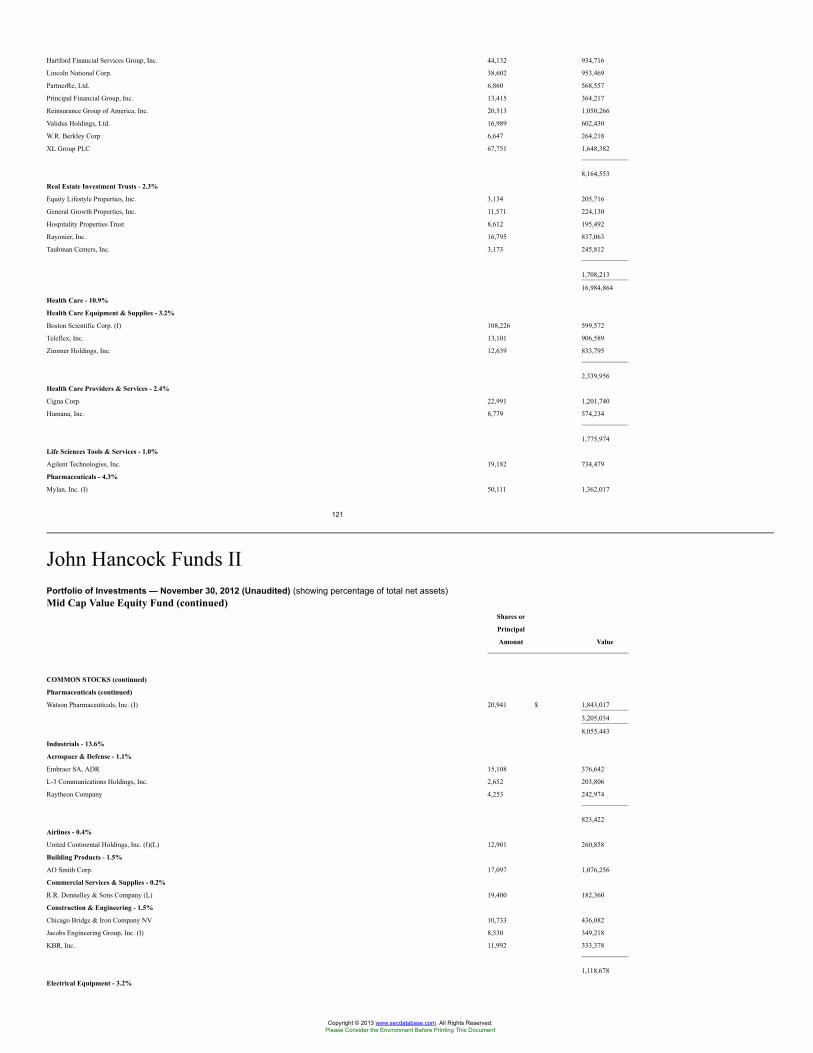
Hartford Financial Services Group, Inc. 44,132 934,716
Lincoln National Corp. 38,602 953,469
PartnerRe, Ltd. 6,860 568,557
Principal Financial Group, Inc. 13,415 364,217
Reinsurance Group of America, Inc. 20,513 1,050,266
Validus Holdings, Ltd. 16,989 602,430
W.R. Berkley Corp. 6,647 264,218
XL Group PLC 67,751 1,648,382
8,164,553
Real Estate Investment Trusts - 2.3%
Equity Lifestyle Properties, Inc. 3,134 205,716
General Growth Properties, Inc. 11,571 224,130
Hospitality Properties Trust 8,612 195,492
Rayonier, Inc. 16,795 837,063
Taubman Centers, Inc. 3,173 245,812
1,708,213
16,984,864
Health Care - 10.9%
Health Care Equipment & Supplies - 3.2%
Boston Scientific Corp. (I) 108,226 599,572
Teleflex, Inc. 13,101 906,589
Zimmer Holdings, Inc. 12,639 833,795
2,339,956
Health Care Providers & Services - 2.4%
Cigna Corp. 22,991 1,201,740
Humana, Inc. 8,779 574,234
1,775,974
Life Sciences Tools & Services - 1.0%
Agilent Technologies, Inc. 19,182 734,479
Pharmaceuticals - 4.3%
Mylan, Inc. (I) 50,111 1,362,017
121
John Hancock Funds IIPortfolio of Investments — November 30, 2012 (Unaudited) (showing percentage of total net assets)Mid Cap Value Equity Fund (continued)
Shares or
Principal
Amount Value
COMMON STOCKS (continued)
Pharmaceuticals (continued)
Watson Pharmaceuticals, Inc. (I) 20,941 $ 1,843,017
3,205,034
8,055,443
Industrials - 13.6%
Aerospace & Defense - 1.1%
Embraer SA, ADR 15,108 376,642
L-3 Communications Holdings, Inc. 2,652 203,806
Raytheon Company 4,253 242,974
823,422
Airlines - 0.4%
United Continental Holdings, Inc. (I)(L) 12,901 260,858
Building Products - 1.5%
AO Smith Corp. 17,097 1,076,256
Commercial Services & Supplies - 0.2%
R.R. Donnelley & Sons Company (L) 19,400 182,360
Construction & Engineering - 1.5%
Chicago Bridge & Iron Company NV 10,733 436,082
Jacobs Engineering Group, Inc. (I) 8,530 349,218
KBR, Inc. 11,992 333,378
1,118,678
Electrical Equipment - 3.2%
Copyright © 2013 www.secdatabase.com. All Rights Reserved.Please Consider the Environment Before Printing This Document
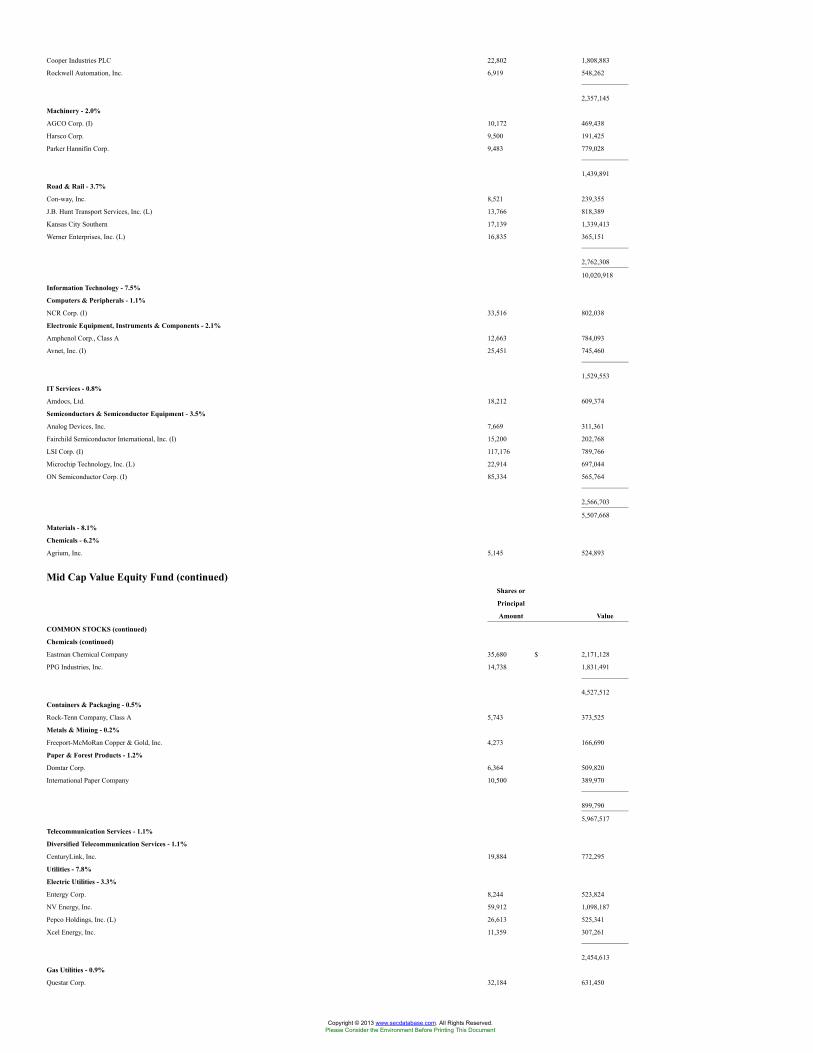
Cooper Industries PLC 22,802 1,808,883
Rockwell Automation, Inc. 6,919 548,262
2,357,145
Machinery - 2.0%
AGCO Corp. (I) 10,172 469,438
Harsco Corp. 9,500 191,425
Parker Hannifin Corp. 9,483 779,028
1,439,891
Road & Rail - 3.7%
Con-way, Inc. 8,521 239,355
J.B. Hunt Transport Services, Inc. (L) 13,766 818,389
Kansas City Southern 17,139 1,339,413
Werner Enterprises, Inc. (L) 16,835 365,151
2,762,308
10,020,918
Information Technology - 7.5%
Computers & Peripherals - 1.1%
NCR Corp. (I) 33,516 802,038
Electronic Equipment, Instruments & Components - 2.1%
Amphenol Corp., Class A 12,663 784,093
Avnet, Inc. (I) 25,451 745,460
1,529,553
IT Services - 0.8%
Amdocs, Ltd. 18,212 609,374
Semiconductors & Semiconductor Equipment - 3.5%
Analog Devices, Inc. 7,669 311,361
Fairchild Semiconductor International, Inc. (I) 15,200 202,768
LSI Corp. (I) 117,176 789,766
Microchip Technology, Inc. (L) 22,914 697,044
ON Semiconductor Corp. (I) 85,334 565,764
2,566,703
5,507,668
Materials - 8.1%
Chemicals - 6.2%
Agrium, Inc. 5,145 524,893
Mid Cap Value Equity Fund (continued)Shares or
Principal
Amount Value
COMMON STOCKS (continued)
Chemicals (continued)
Eastman Chemical Company 35,680 $ 2,171,128
PPG Industries, Inc. 14,738 1,831,491
4,527,512
Containers & Packaging - 0.5%
Rock-Tenn Company, Class A 5,743 373,525
Metals & Mining - 0.2%
Freeport-McMoRan Copper & Gold, Inc. 4,273 166,690
Paper & Forest Products - 1.2%
Domtar Corp. 6,364 509,820
International Paper Company 10,500 389,970
899,790
5,967,517
Telecommunication Services - 1.1%
Diversified Telecommunication Services - 1.1%
CenturyLink, Inc. 19,884 772,295
Utilities - 7.8%
Electric Utilities - 3.3%
Entergy Corp. 8,244 523,824
NV Energy, Inc. 59,912 1,098,187
Pepco Holdings, Inc. (L) 26,613 525,341
Xcel Energy, Inc. 11,359 307,261
2,454,613
Gas Utilities - 0.9%
Questar Corp. 32,184 631,450
Copyright © 2013 www.secdatabase.com. All Rights Reserved.Please Consider the Environment Before Printing This Document
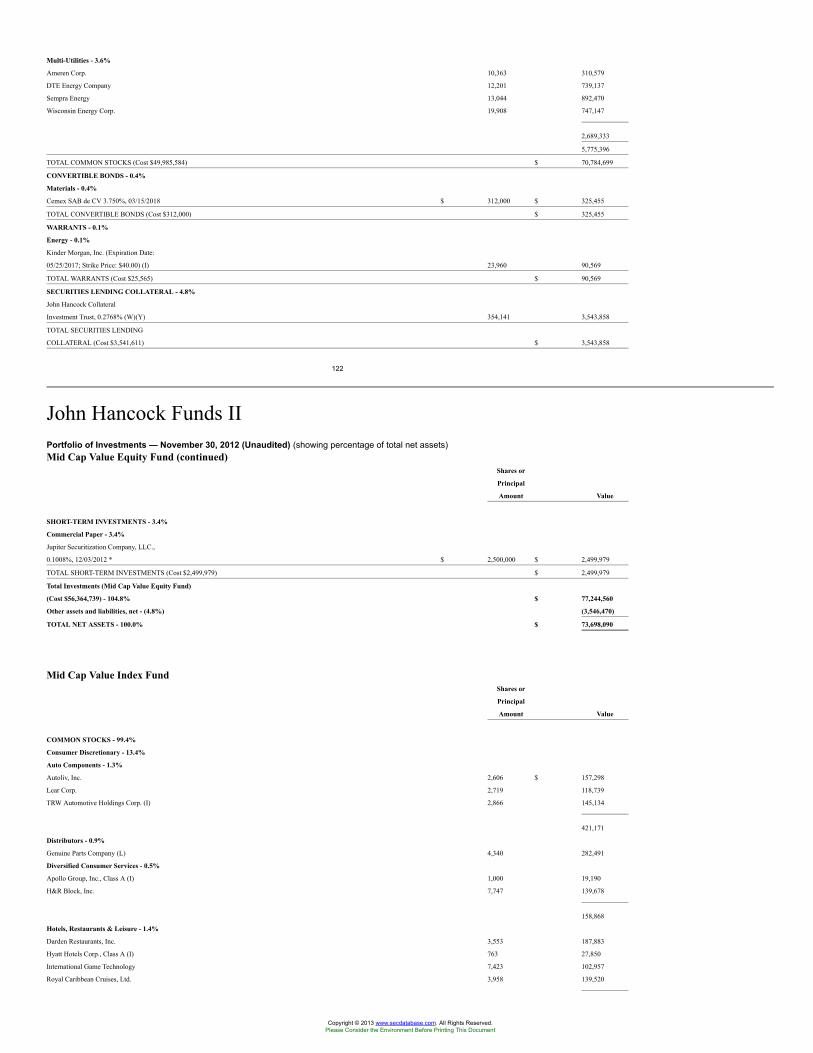
Multi-Utilities - 3.6%
Ameren Corp. 10,363 310,579
DTE Energy Company 12,201 739,137
Sempra Energy 13,044 892,470
Wisconsin Energy Corp. 19,908 747,147
2,689,333
5,775,396
TOTAL COMMON STOCKS (Cost $49,985,584) $ 70,784,699
CONVERTIBLE BONDS - 0.4%
Materials - 0.4%
Cemex SAB de CV 3.750%, 03/15/2018 $ 312,000 $ 325,455
TOTAL CONVERTIBLE BONDS (Cost $312,000) $ 325,455
WARRANTS - 0.1%
Energy - 0.1%
Kinder Morgan, Inc. (Expiration Date:
05/25/2017; Strike Price: $40.00) (I) 23,960 90,569
TOTAL WARRANTS (Cost $25,565) $ 90,569
SECURITIES LENDING COLLATERAL - 4.8%
John Hancock Collateral
Investment Trust, 0.2768% (W)(Y) 354,141 3,543,858
TOTAL SECURITIES LENDING
COLLATERAL (Cost $3,541,611) $ 3,543,858
122
John Hancock Funds IIPortfolio of Investments — November 30, 2012 (Unaudited) (showing percentage of total net assets)Mid Cap Value Equity Fund (continued)
Shares or
Principal
Amount Value
SHORT-TERM INVESTMENTS - 3.4%
Commercial Paper - 3.4%
Jupiter Securitization Company, LLC.,
0.1008%, 12/03/2012 * $ 2,500,000 $ 2,499,979
TOTAL SHORT-TERM INVESTMENTS (Cost $2,499,979) $ 2,499,979
Total Investments (Mid Cap Value Equity Fund)
(Cost $56,364,739) - 104.8% $ 77,244,560
Other assets and liabilities, net - (4.8%) (3,546,470)
TOTAL NET ASSETS - 100.0% $ 73,698,090
Mid Cap Value Index FundShares or
Principal
Amount Value
COMMON STOCKS - 99.4%
Consumer Discretionary - 13.4%
Auto Components - 1.3%
Autoliv, Inc. 2,606 $ 157,298
Lear Corp. 2,719 118,739
TRW Automotive Holdings Corp. (I) 2,866 145,134
421,171
Distributors - 0.9%
Genuine Parts Company (L) 4,340 282,491
Diversified Consumer Services - 0.5%
Apollo Group, Inc., Class A (I) 1,000 19,190
H&R Block, Inc. 7,747 139,678
158,868
Hotels, Restaurants & Leisure - 1.4%
Darden Restaurants, Inc. 3,553 187,883
Hyatt Hotels Corp., Class A (I) 763 27,850
International Game Technology 7,423 102,957
Royal Caribbean Cruises, Ltd. 3,958 139,520
Copyright © 2013 www.secdatabase.com. All Rights Reserved.Please Consider the Environment Before Printing This Document
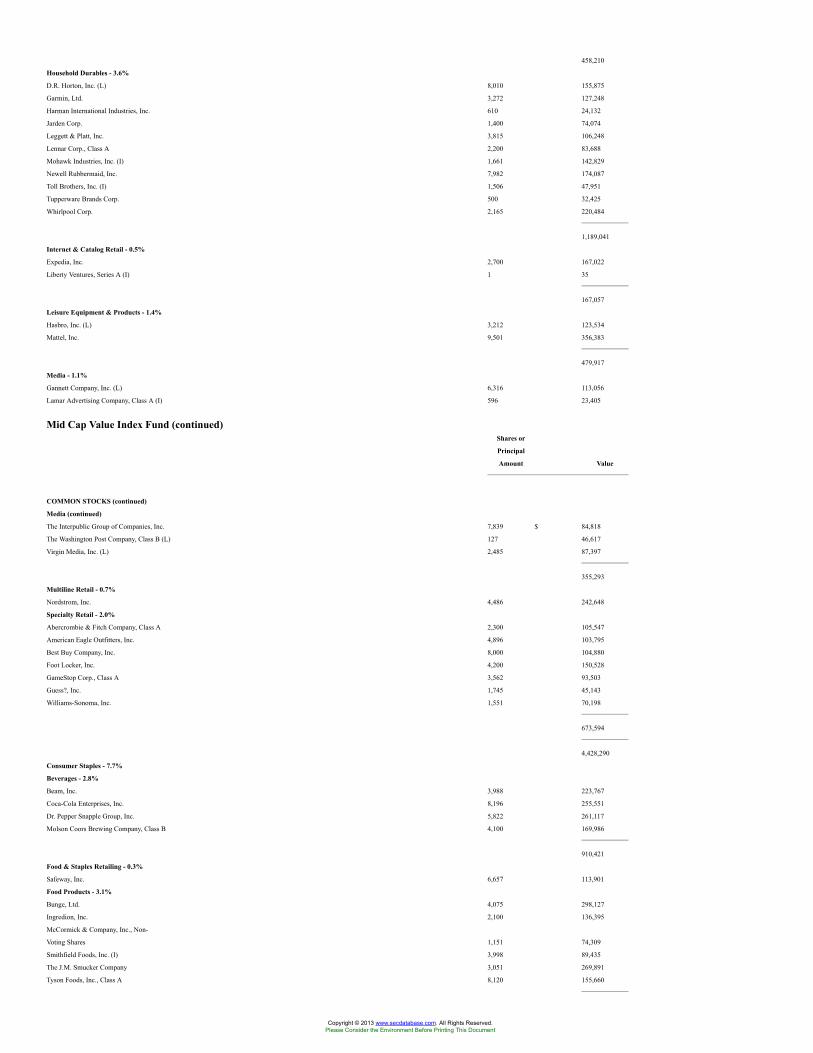
458,210
Household Durables - 3.6%
D.R. Horton, Inc. (L) 8,010 155,875
Garmin, Ltd. 3,272 127,248
Harman International Industries, Inc. 610 24,132
Jarden Corp. 1,400 74,074
Leggett & Platt, Inc. 3,815 106,248
Lennar Corp., Class A 2,200 83,688
Mohawk Industries, Inc. (I) 1,661 142,829
Newell Rubbermaid, Inc. 7,982 174,087
Toll Brothers, Inc. (I) 1,506 47,951
Tupperware Brands Corp. 500 32,425
Whirlpool Corp. 2,165 220,484
1,189,041
Internet & Catalog Retail - 0.5%
Expedia, Inc. 2,700 167,022
Liberty Ventures, Series A (I) 1 35
167,057
Leisure Equipment & Products - 1.4%
Hasbro, Inc. (L) 3,212 123,534
Mattel, Inc. 9,501 356,383
479,917
Media - 1.1%
Gannett Company, Inc. (L) 6,316 113,056
Lamar Advertising Company, Class A (I) 596 23,405
Mid Cap Value Index Fund (continued)Shares or
Principal
Amount Value
COMMON STOCKS (continued)
Media (continued)
The Interpublic Group of Companies, Inc. 7,839 $ 84,818
The Washington Post Company, Class B (L) 127 46,617
Virgin Media, Inc. (L) 2,485 87,397
355,293
Multiline Retail - 0.7%
Nordstrom, Inc. 4,486 242,648
Specialty Retail - 2.0%
Abercrombie & Fitch Company, Class A 2,300 105,547
American Eagle Outfitters, Inc. 4,896 103,795
Best Buy Company, Inc. 8,000 104,880
Foot Locker, Inc. 4,200 150,528
GameStop Corp., Class A 3,562 93,503
Guess?, Inc. 1,745 45,143
Williams-Sonoma, Inc. 1,551 70,198
673,594
4,428,290
Consumer Staples - 7.7%
Beverages - 2.8%
Beam, Inc. 3,988 223,767
Coca-Cola Enterprises, Inc. 8,196 255,551
Dr. Pepper Snapple Group, Inc. 5,822 261,117
Molson Coors Brewing Company, Class B 4,100 169,986
910,421
Food & Staples Retailing - 0.3%
Safeway, Inc. 6,657 113,901
Food Products - 3.1%
Bunge, Ltd. 4,075 298,127
Ingredion, Inc. 2,100 136,395
McCormick & Company, Inc., Non-
Voting Shares 1,151 74,309
Smithfield Foods, Inc. (I) 3,998 89,435
The J.M. Smucker Company 3,051 269,891
Tyson Foods, Inc., Class A 8,120 155,660
Copyright © 2013 www.secdatabase.com. All Rights Reserved.Please Consider the Environment Before Printing This Document
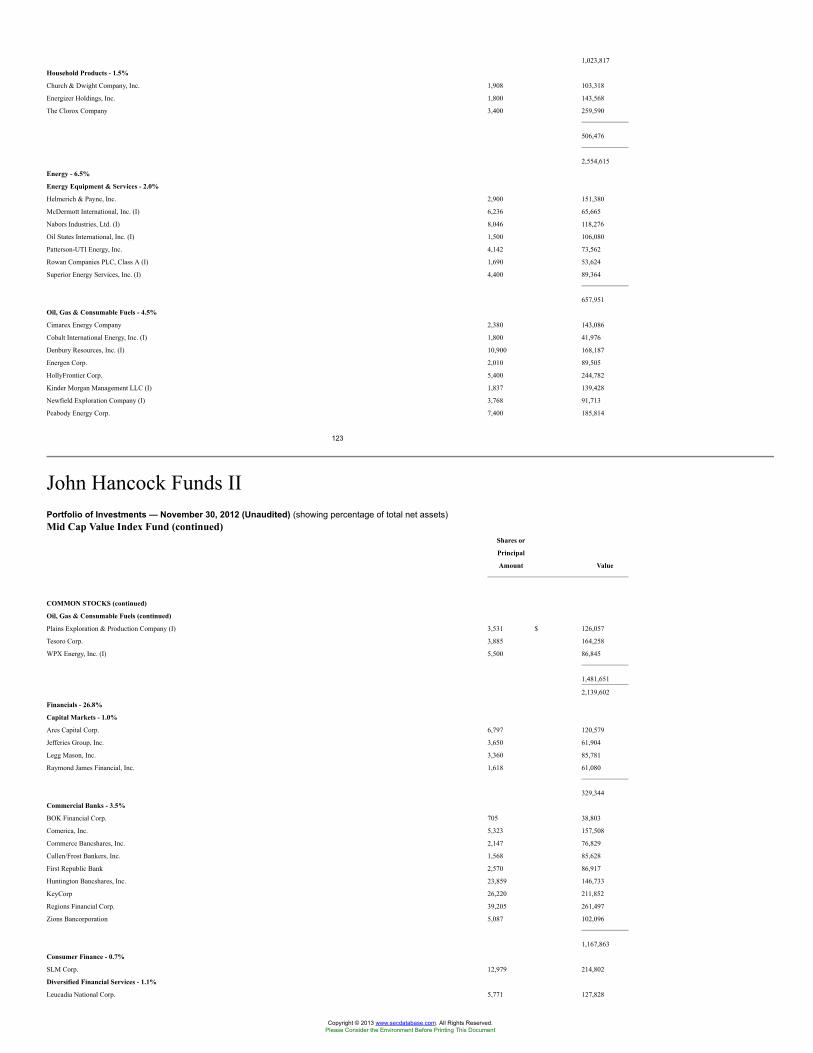
1,023,817
Household Products - 1.5%
Church & Dwight Company, Inc. 1,908 103,318
Energizer Holdings, Inc. 1,800 143,568
The Clorox Company 3,400 259,590
506,476
2,554,615
Energy - 6.5%
Energy Equipment & Services - 2.0%
Helmerich & Payne, Inc. 2,900 151,380
McDermott International, Inc. (I) 6,236 65,665
Nabors Industries, Ltd. (I) 8,046 118,276
Oil States International, Inc. (I) 1,500 106,080
Patterson-UTI Energy, Inc. 4,142 73,562
Rowan Companies PLC, Class A (I) 1,690 53,624
Superior Energy Services, Inc. (I) 4,400 89,364
657,951
Oil, Gas & Consumable Fuels - 4.5%
Cimarex Energy Company 2,380 143,086
Cobalt International Energy, Inc. (I) 1,800 41,976
Denbury Resources, Inc. (I) 10,900 168,187
Energen Corp. 2,010 89,505
HollyFrontier Corp. 5,400 244,782
Kinder Morgan Management LLC (I) 1,837 139,428
Newfield Exploration Company (I) 3,768 91,713
Peabody Energy Corp. 7,400 185,814
123
John Hancock Funds IIPortfolio of Investments — November 30, 2012 (Unaudited) (showing percentage of total net assets)Mid Cap Value Index Fund (continued)
Shares or
Principal
Amount Value
COMMON STOCKS (continued)
Oil, Gas & Consumable Fuels (continued)
Plains Exploration & Production Company (I) 3,531 $ 126,057
Tesoro Corp. 3,885 164,258
WPX Energy, Inc. (I) 5,500 86,845
1,481,651
2,139,602
Financials - 26.8%
Capital Markets - 1.0%
Ares Capital Corp. 6,797 120,579
Jefferies Group, Inc. 3,650 61,904
Legg Mason, Inc. 3,360 85,781
Raymond James Financial, Inc. 1,618 61,080
329,344
Commercial Banks - 3.5%
BOK Financial Corp. 705 38,803
Comerica, Inc. 5,323 157,508
Commerce Bancshares, Inc. 2,147 76,829
Cullen/Frost Bankers, Inc. 1,568 85,628
First Republic Bank 2,570 86,917
Huntington Bancshares, Inc. 23,859 146,733
KeyCorp 26,220 211,852
Regions Financial Corp. 39,205 261,497
Zions Bancorporation 5,087 102,096
1,167,863
Consumer Finance - 0.7%
SLM Corp. 12,979 214,802
Diversified Financial Services - 1.1%
Leucadia National Corp. 5,771 127,828
Copyright © 2013 www.secdatabase.com. All Rights Reserved.Please Consider the Environment Before Printing This Document
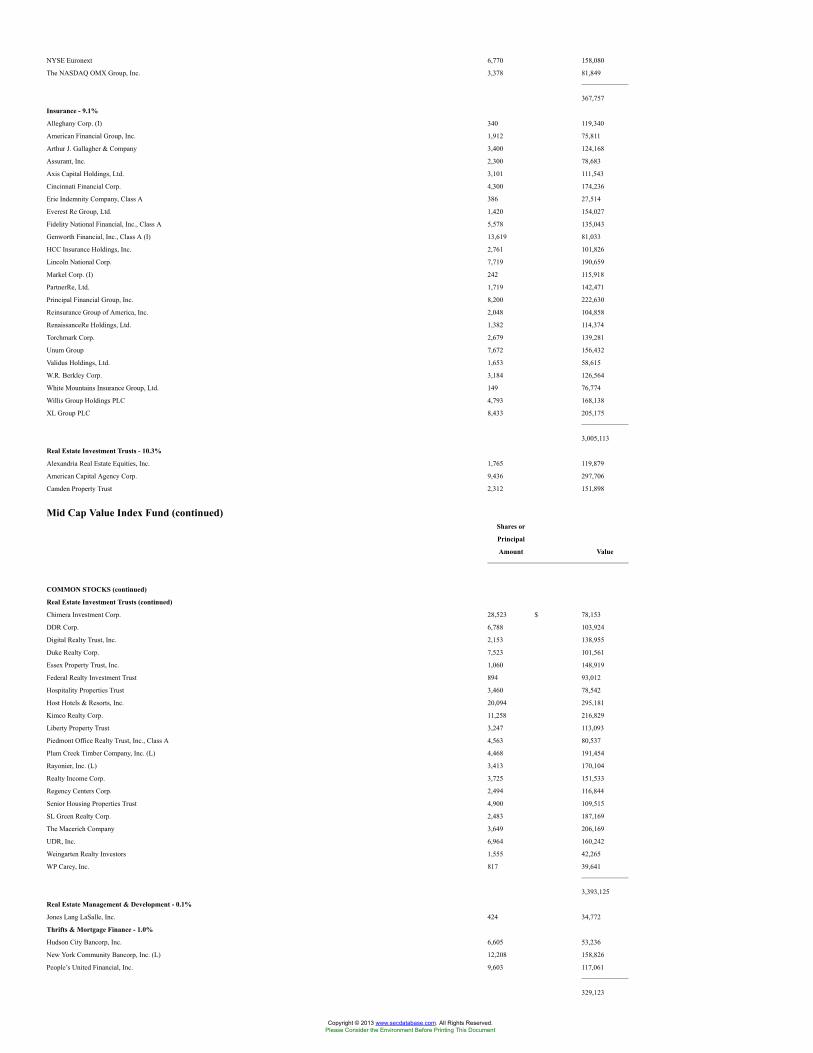
NYSE Euronext 6,770 158,080
The NASDAQ OMX Group, Inc. 3,378 81,849
367,757
Insurance - 9.1%
Alleghany Corp. (I) 340 119,340
American Financial Group, Inc. 1,912 75,811
Arthur J. Gallagher & Company 3,400 124,168
Assurant, Inc. 2,300 78,683
Axis Capital Holdings, Ltd. 3,101 111,543
Cincinnati Financial Corp. 4,300 174,236
Erie Indemnity Company, Class A 386 27,514
Everest Re Group, Ltd. 1,420 154,027
Fidelity National Financial, Inc., Class A 5,578 135,043
Genworth Financial, Inc., Class A (I) 13,619 81,033
HCC Insurance Holdings, Inc. 2,761 101,826
Lincoln National Corp. 7,719 190,659
Markel Corp. (I) 242 115,918
PartnerRe, Ltd. 1,719 142,471
Principal Financial Group, Inc. 8,200 222,630
Reinsurance Group of America, Inc. 2,048 104,858
RenaissanceRe Holdings, Ltd. 1,382 114,374
Torchmark Corp. 2,679 139,281
Unum Group 7,672 156,432
Validus Holdings, Ltd. 1,653 58,615
W.R. Berkley Corp. 3,184 126,564
White Mountains Insurance Group, Ltd. 149 76,774
Willis Group Holdings PLC 4,793 168,138
XL Group PLC 8,433 205,175
3,005,113
Real Estate Investment Trusts - 10.3%
Alexandria Real Estate Equities, Inc. 1,765 119,879
American Capital Agency Corp. 9,436 297,706
Camden Property Trust 2,312 151,898
Mid Cap Value Index Fund (continued)Shares or
Principal
Amount Value
COMMON STOCKS (continued)
Real Estate Investment Trusts (continued)
Chimera Investment Corp. 28,523 $ 78,153
DDR Corp. 6,788 103,924
Digital Realty Trust, Inc. 2,153 138,955
Duke Realty Corp. 7,523 101,561
Essex Property Trust, Inc. 1,060 148,919
Federal Realty Investment Trust 894 93,012
Hospitality Properties Trust 3,460 78,542
Host Hotels & Resorts, Inc. 20,094 295,181
Kimco Realty Corp. 11,258 216,829
Liberty Property Trust 3,247 113,093
Piedmont Office Realty Trust, Inc., Class A 4,563 80,537
Plum Creek Timber Company, Inc. (L) 4,468 191,454
Rayonier, Inc. (L) 3,413 170,104
Realty Income Corp. 3,725 151,533
Regency Centers Corp. 2,494 116,844
Senior Housing Properties Trust 4,900 109,515
SL Green Realty Corp. 2,483 187,169
The Macerich Company 3,649 206,169
UDR, Inc. 6,964 160,242
Weingarten Realty Investors 1,555 42,265
WP Carey, Inc. 817 39,641
3,393,125
Real Estate Management & Development - 0.1%
Jones Lang LaSalle, Inc. 424 34,772
Thrifts & Mortgage Finance - 1.0%
Hudson City Bancorp, Inc. 6,605 53,236
New York Community Bancorp, Inc. (L) 12,208 158,826
People’s United Financial, Inc. 9,603 117,061
329,123
Copyright © 2013 www.secdatabase.com. All Rights Reserved.Please Consider the Environment Before Printing This Document
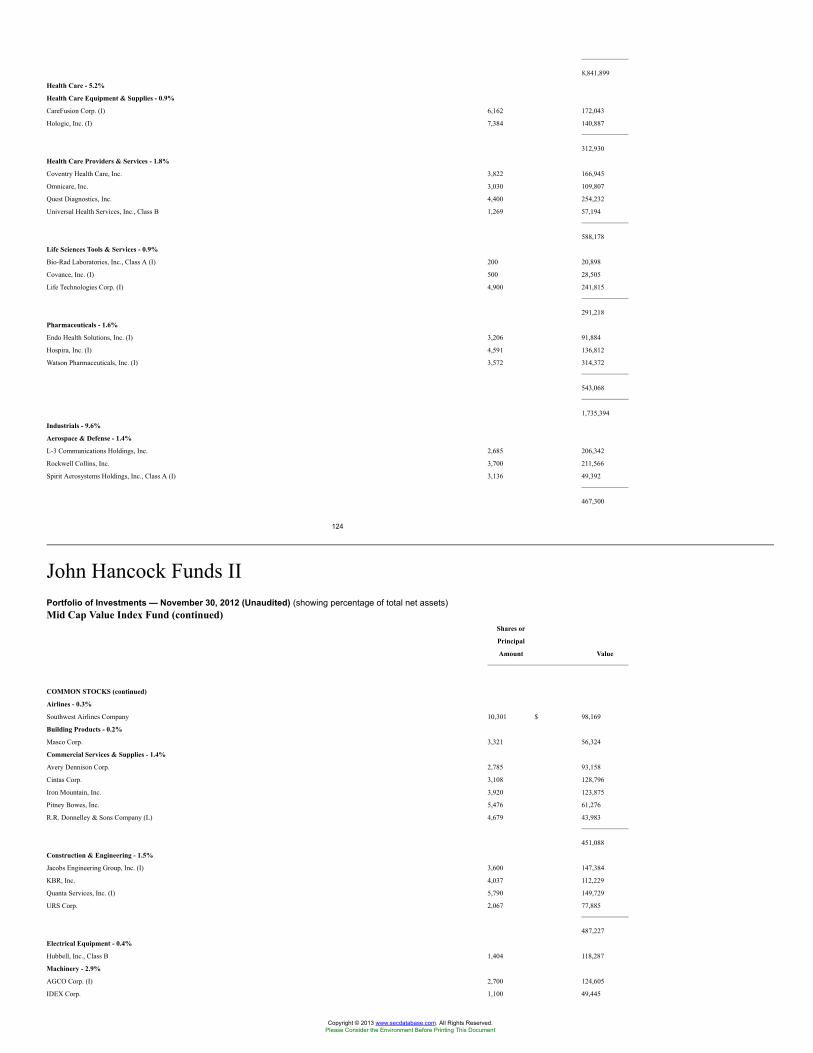
8,841,899
Health Care - 5.2%
Health Care Equipment & Supplies - 0.9%
CareFusion Corp. (I) 6,162 172,043
Hologic, Inc. (I) 7,384 140,887
312,930
Health Care Providers & Services - 1.8%
Coventry Health Care, Inc. 3,822 166,945
Omnicare, Inc. 3,030 109,807
Quest Diagnostics, Inc. 4,400 254,232
Universal Health Services, Inc., Class B 1,269 57,194
588,178
Life Sciences Tools & Services - 0.9%
Bio-Rad Laboratories, Inc., Class A (I) 200 20,898
Covance, Inc. (I) 500 28,505
Life Technologies Corp. (I) 4,900 241,815
291,218
Pharmaceuticals - 1.6%
Endo Health Solutions, Inc. (I) 3,206 91,884
Hospira, Inc. (I) 4,591 136,812
Watson Pharmaceuticals, Inc. (I) 3,572 314,372
543,068
1,735,394
Industrials - 9.6%
Aerospace & Defense - 1.4%
L-3 Communications Holdings, Inc. 2,685 206,342
Rockwell Collins, Inc. 3,700 211,566
Spirit Aerosystems Holdings, Inc., Class A (I) 3,136 49,392
467,300
124
John Hancock Funds IIPortfolio of Investments — November 30, 2012 (Unaudited) (showing percentage of total net assets)Mid Cap Value Index Fund (continued)
Shares or
Principal
Amount Value
COMMON STOCKS (continued)
Airlines - 0.3%
Southwest Airlines Company 10,301 $ 98,169
Building Products - 0.2%
Masco Corp. 3,321 56,324
Commercial Services & Supplies - 1.4%
Avery Dennison Corp. 2,785 93,158
Cintas Corp. 3,108 128,796
Iron Mountain, Inc. 3,920 123,875
Pitney Bowes, Inc. 5,476 61,276
R.R. Donnelley & Sons Company (L) 4,679 43,983
451,088
Construction & Engineering - 1.5%
Jacobs Engineering Group, Inc. (I) 3,600 147,384
KBR, Inc. 4,037 112,229
Quanta Services, Inc. (I) 5,790 149,729
URS Corp. 2,067 77,885
487,227
Electrical Equipment - 0.4%
Hubbell, Inc., Class B 1,404 118,287
Machinery - 2.9%
AGCO Corp. (I) 2,700 124,605
IDEX Corp. 1,100 49,445
Copyright © 2013 www.secdatabase.com. All Rights Reserved.Please Consider the Environment Before Printing This Document
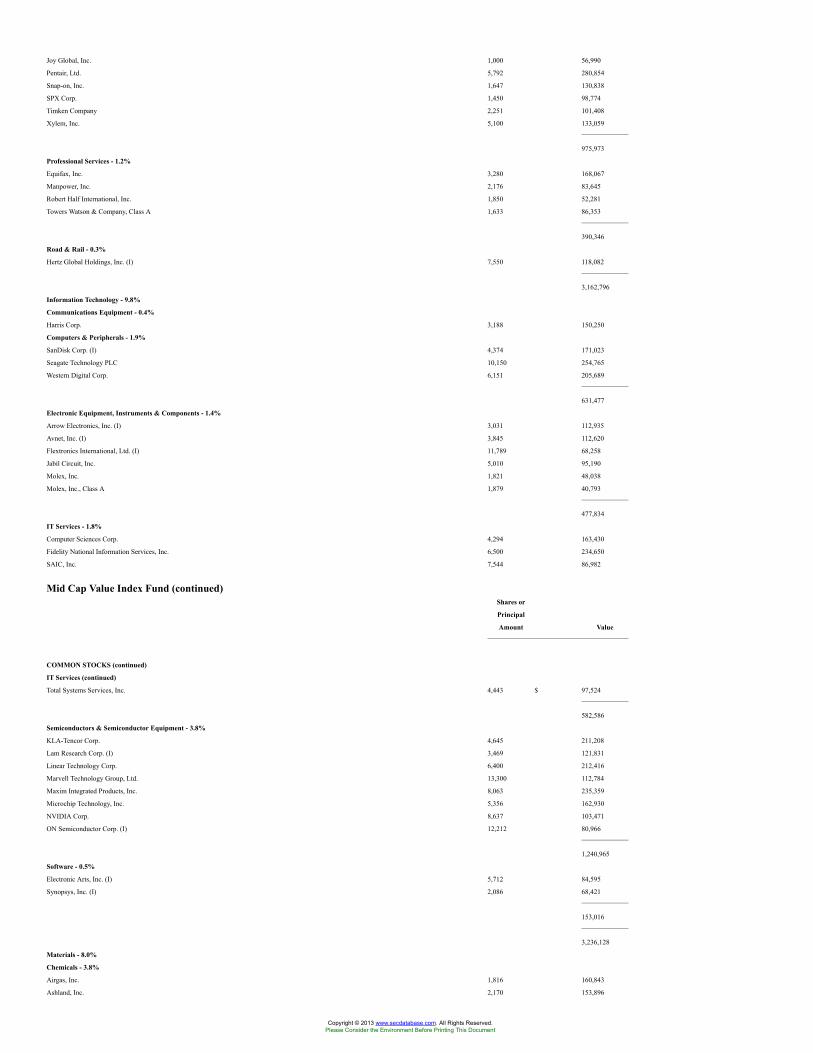
Joy Global, Inc. 1,000 56,990
Pentair, Ltd. 5,792 280,854
Snap-on, Inc. 1,647 130,838
SPX Corp. 1,450 98,774
Timken Company 2,251 101,408
Xylem, Inc. 5,100 133,059
975,973
Professional Services - 1.2%
Equifax, Inc. 3,280 168,067
Manpower, Inc. 2,176 83,645
Robert Half International, Inc. 1,850 52,281
Towers Watson & Company, Class A 1,633 86,353
390,346
Road & Rail - 0.3%
Hertz Global Holdings, Inc. (I) 7,550 118,082
3,162,796
Information Technology - 9.8%
Communications Equipment - 0.4%
Harris Corp. 3,188 150,250
Computers & Peripherals - 1.9%
SanDisk Corp. (I) 4,374 171,023
Seagate Technology PLC 10,150 254,765
Western Digital Corp. 6,151 205,689
631,477
Electronic Equipment, Instruments & Components - 1.4%
Arrow Electronics, Inc. (I) 3,031 112,935
Avnet, Inc. (I) 3,845 112,620
Flextronics International, Ltd. (I) 11,789 68,258
Jabil Circuit, Inc. 5,010 95,190
Molex, Inc. 1,821 48,038
Molex, Inc., Class A 1,879 40,793
477,834
IT Services - 1.8%
Computer Sciences Corp. 4,294 163,430
Fidelity National Information Services, Inc. 6,500 234,650
SAIC, Inc. 7,544 86,982
Mid Cap Value Index Fund (continued)Shares or
Principal
Amount Value
COMMON STOCKS (continued)
IT Services (continued)
Total Systems Services, Inc. 4,443 $ 97,524
582,586
Semiconductors & Semiconductor Equipment - 3.8%
KLA-Tencor Corp. 4,645 211,208
Lam Research Corp. (I) 3,469 121,831
Linear Technology Corp. 6,400 212,416
Marvell Technology Group, Ltd. 13,300 112,784
Maxim Integrated Products, Inc. 8,063 235,359
Microchip Technology, Inc. 5,356 162,930
NVIDIA Corp. 8,637 103,471
ON Semiconductor Corp. (I) 12,212 80,966
1,240,965
Software - 0.5%
Electronic Arts, Inc. (I) 5,712 84,595
Synopsys, Inc. (I) 2,086 68,421
153,016
3,236,128
Materials - 8.0%
Chemicals - 3.8%
Airgas, Inc. 1,816 160,843
Ashland, Inc. 2,170 153,896
Copyright © 2013 www.secdatabase.com. All Rights Reserved.Please Consider the Environment Before Printing This Document
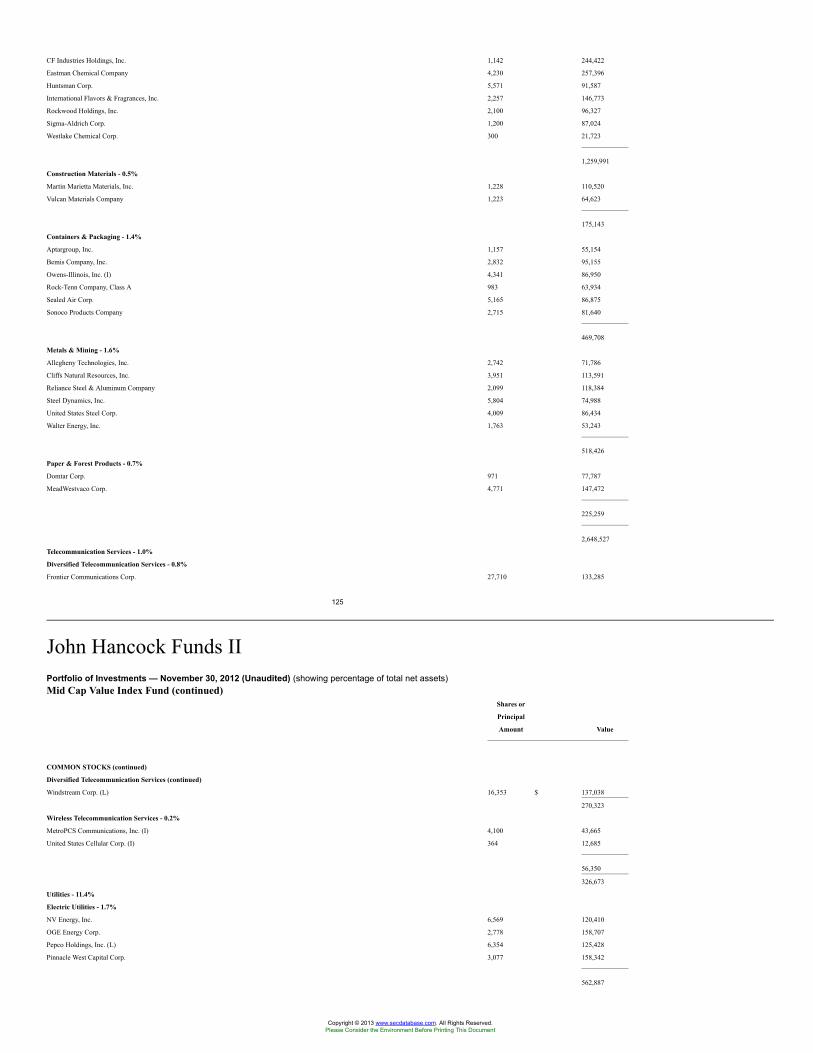
CF Industries Holdings, Inc. 1,142 244,422
Eastman Chemical Company 4,230 257,396
Huntsman Corp. 5,571 91,587
International Flavors & Fragrances, Inc. 2,257 146,773
Rockwood Holdings, Inc. 2,100 96,327
Sigma-Aldrich Corp. 1,200 87,024
Westlake Chemical Corp. 300 21,723
1,259,991
Construction Materials - 0.5%
Martin Marietta Materials, Inc. 1,228 110,520
Vulcan Materials Company 1,223 64,623
175,143
Containers & Packaging - 1.4%
Aptargroup, Inc. 1,157 55,154
Bemis Company, Inc. 2,832 95,155
Owens-Illinois, Inc. (I) 4,341 86,950
Rock-Tenn Company, Class A 983 63,934
Sealed Air Corp. 5,165 86,875
Sonoco Products Company 2,715 81,640
469,708
Metals & Mining - 1.6%
Allegheny Technologies, Inc. 2,742 71,786
Cliffs Natural Resources, Inc. 3,951 113,591
Reliance Steel & Aluminum Company 2,099 118,384
Steel Dynamics, Inc. 5,804 74,988
United States Steel Corp. 4,009 86,434
Walter Energy, Inc. 1,763 53,243
518,426
Paper & Forest Products - 0.7%
Domtar Corp. 971 77,787
MeadWestvaco Corp. 4,771 147,472
225,259
2,648,527
Telecommunication Services - 1.0%
Diversified Telecommunication Services - 0.8%
Frontier Communications Corp. 27,710 133,285
125
John Hancock Funds IIPortfolio of Investments — November 30, 2012 (Unaudited) (showing percentage of total net assets)Mid Cap Value Index Fund (continued)
Shares or
Principal
Amount Value
COMMON STOCKS (continued)
Diversified Telecommunication Services (continued)
Windstream Corp. (L) 16,353 $ 137,038
270,323
Wireless Telecommunication Services - 0.2%
MetroPCS Communications, Inc. (I) 4,100 43,665
United States Cellular Corp. (I) 364 12,685
56,350
326,673
Utilities - 11.4%
Electric Utilities - 1.7%
NV Energy, Inc. 6,569 120,410
OGE Energy Corp. 2,778 158,707
Pepco Holdings, Inc. (L) 6,354 125,428
Pinnacle West Capital Corp. 3,077 158,342
562,887
Copyright © 2013 www.secdatabase.com. All Rights Reserved.Please Consider the Environment Before Printing This Document
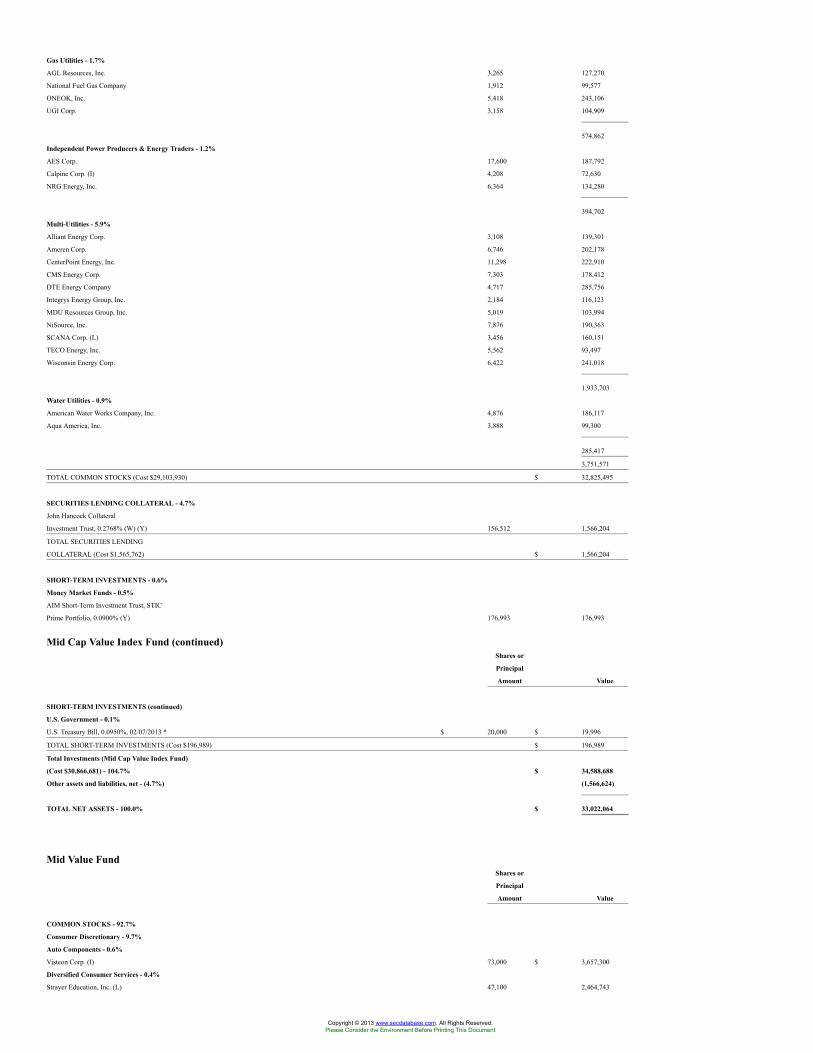
Gas Utilities - 1.7%
AGL Resources, Inc. 3,265 127,270
National Fuel Gas Company 1,912 99,577
ONEOK, Inc. 5,418 243,106
UGI Corp. 3,158 104,909
574,862
Independent Power Producers & Energy Traders - 1.2%
AES Corp. 17,600 187,792
Calpine Corp. (I) 4,208 72,630
NRG Energy, Inc. 6,364 134,280
394,702
Multi-Utilities - 5.9%
Alliant Energy Corp. 3,108 139,301
Ameren Corp. 6,746 202,178
CenterPoint Energy, Inc. 11,298 222,910
CMS Energy Corp. 7,303 178,412
DTE Energy Company 4,717 285,756
Integrys Energy Group, Inc. 2,184 116,123
MDU Resources Group, Inc. 5,019 103,994
NiSource, Inc. 7,876 190,363
SCANA Corp. (L) 3,456 160,151
TECO Energy, Inc. 5,562 93,497
Wisconsin Energy Corp. 6,422 241,018
1,933,703
Water Utilities - 0.9%
American Water Works Company, Inc. 4,876 186,117
Aqua America, Inc. 3,888 99,300
285,417
3,751,571
TOTAL COMMON STOCKS (Cost $29,103,930) $ 32,825,495
SECURITIES LENDING COLLATERAL - 4.7%
John Hancock Collateral
Investment Trust, 0.2768% (W) (Y) 156,512 1,566,204
TOTAL SECURITIES LENDING
COLLATERAL (Cost $1,565,762) $ 1,566,204
SHORT-TERM INVESTMENTS - 0.6%
Money Market Funds - 0.5%
AIM Short-Term Investment Trust, STIC
Prime Portfolio, 0.0900% (Y) 176,993 176,993
Mid Cap Value Index Fund (continued)Shares or
Principal
Amount Value
SHORT-TERM INVESTMENTS (continued)
U.S. Government - 0.1%
U.S. Treasury Bill, 0.0950%, 02/07/2013 * $ 20,000 $ 19,996
TOTAL SHORT-TERM INVESTMENTS (Cost $196,989) $ 196,989
Total Investments (Mid Cap Value Index Fund)
(Cost $30,866,681) - 104.7% $ 34,588,688
Other assets and liabilities, net - (4.7%) (1,566,624)
TOTAL NET ASSETS - 100.0% $ 33,022,064
Mid Value FundShares or
Principal
Amount Value
COMMON STOCKS - 92.7%
Consumer Discretionary - 9.7%
Auto Components - 0.6%
Visteon Corp. (I) 73,000 $ 3,657,300
Diversified Consumer Services - 0.4%
Strayer Education, Inc. (L) 47,100 2,464,743
Copyright © 2013 www.secdatabase.com. All Rights Reserved.Please Consider the Environment Before Printing This Document
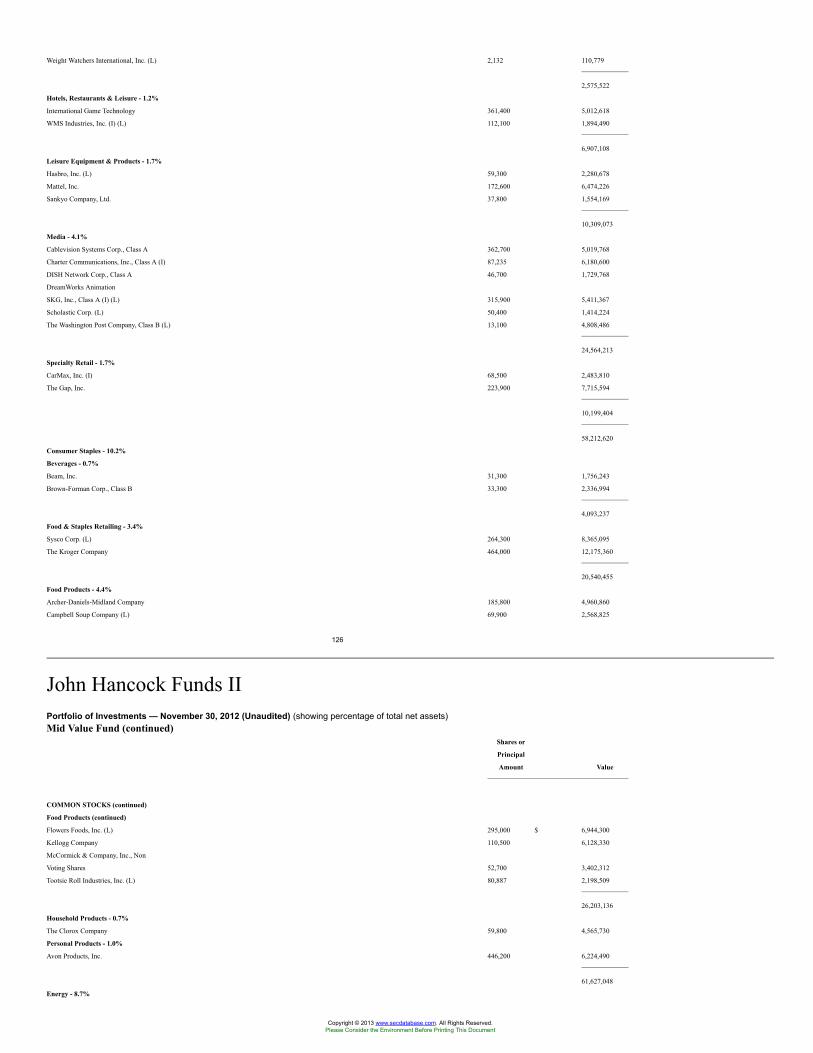
Weight Watchers International, Inc. (L) 2,132 110,779
2,575,522
Hotels, Restaurants & Leisure - 1.2%
International Game Technology 361,400 5,012,618
WMS Industries, Inc. (I) (L) 112,100 1,894,490
6,907,108
Leisure Equipment & Products - 1.7%
Hasbro, Inc. (L) 59,300 2,280,678
Mattel, Inc. 172,600 6,474,226
Sankyo Company, Ltd. 37,800 1,554,169
10,309,073
Media - 4.1%
Cablevision Systems Corp., Class A 362,700 5,019,768
Charter Communications, Inc., Class A (I) 87,235 6,180,600
DISH Network Corp., Class A 46,700 1,729,768
DreamWorks Animation
SKG, Inc., Class A (I) (L) 315,900 5,411,367
Scholastic Corp. (L) 50,400 1,414,224
The Washington Post Company, Class B (L) 13,100 4,808,486
24,564,213
Specialty Retail - 1.7%
CarMax, Inc. (I) 68,500 2,483,810
The Gap, Inc. 223,900 7,715,594
10,199,404
58,212,620
Consumer Staples - 10.2%
Beverages - 0.7%
Beam, Inc. 31,300 1,756,243
Brown-Forman Corp., Class B 33,300 2,336,994
4,093,237
Food & Staples Retailing - 3.4%
Sysco Corp. (L) 264,300 8,365,095
The Kroger Company 464,000 12,175,360
20,540,455
Food Products - 4.4%
Archer-Daniels-Midland Company 185,800 4,960,860
Campbell Soup Company (L) 69,900 2,568,825
126
John Hancock Funds IIPortfolio of Investments — November 30, 2012 (Unaudited) (showing percentage of total net assets)Mid Value Fund (continued)
Shares or
Principal
Amount Value
COMMON STOCKS (continued)
Food Products (continued)
Flowers Foods, Inc. (L) 295,000 $ 6,944,300
Kellogg Company 110,500 6,128,330
McCormick & Company, Inc., Non
Voting Shares 52,700 3,402,312
Tootsie Roll Industries, Inc. (L) 80,887 2,198,509
26,203,136
Household Products - 0.7%
The Clorox Company 59,800 4,565,730
Personal Products - 1.0%
Avon Products, Inc. 446,200 6,224,490
61,627,048
Energy - 8.7%
Copyright © 2013 www.secdatabase.com. All Rights Reserved.Please Consider the Environment Before Printing This Document
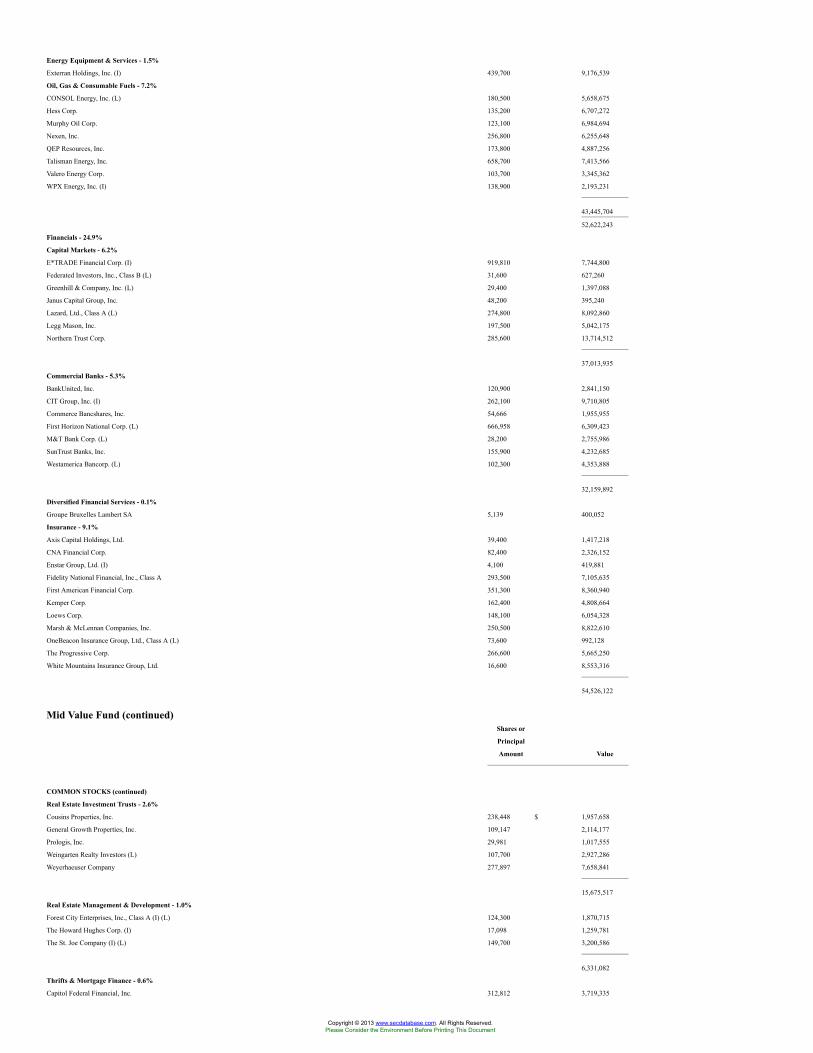
Energy Equipment & Services - 1.5%
Exterran Holdings, Inc. (I) 439,700 9,176,539
Oil, Gas & Consumable Fuels - 7.2%
CONSOL Energy, Inc. (L) 180,500 5,658,675
Hess Corp. 135,200 6,707,272
Murphy Oil Corp. 123,100 6,984,694
Nexen, Inc. 256,800 6,255,648
QEP Resources, Inc. 173,800 4,887,256
Talisman Energy, Inc. 658,700 7,413,566
Valero Energy Corp. 103,700 3,345,362
WPX Energy, Inc. (I) 138,900 2,193,231
43,445,704
52,622,243
Financials - 24.9%
Capital Markets - 6.2%
E*TRADE Financial Corp. (I) 919,810 7,744,800
Federated Investors, Inc., Class B (L) 31,600 627,260
Greenhill & Company, Inc. (L) 29,400 1,397,088
Janus Capital Group, Inc. 48,200 395,240
Lazard, Ltd., Class A (L) 274,800 8,092,860
Legg Mason, Inc. 197,500 5,042,175
Northern Trust Corp. 285,600 13,714,512
37,013,935
Commercial Banks - 5.3%
BankUnited, Inc. 120,900 2,841,150
CIT Group, Inc. (I) 262,100 9,710,805
Commerce Bancshares, Inc. 54,666 1,955,955
First Horizon National Corp. (L) 666,958 6,309,423
M&T Bank Corp. (L) 28,200 2,755,986
SunTrust Banks, Inc. 155,900 4,232,685
Westamerica Bancorp. (L) 102,300 4,353,888
32,159,892
Diversified Financial Services - 0.1%
Groupe Bruxelles Lambert SA 5,139 400,052
Insurance - 9.1%
Axis Capital Holdings, Ltd. 39,400 1,417,218
CNA Financial Corp. 82,400 2,326,152
Enstar Group, Ltd. (I) 4,100 419,881
Fidelity National Financial, Inc., Class A 293,500 7,105,635
First American Financial Corp. 351,300 8,360,940
Kemper Corp. 162,400 4,808,664
Loews Corp. 148,100 6,054,328
Marsh & McLennan Companies, Inc. 250,500 8,822,610
OneBeacon Insurance Group, Ltd., Class A (L) 73,600 992,128
The Progressive Corp. 266,600 5,665,250
White Mountains Insurance Group, Ltd. 16,600 8,553,316
54,526,122
Mid Value Fund (continued)Shares or
Principal
Amount Value
COMMON STOCKS (continued)
Real Estate Investment Trusts - 2.6%
Cousins Properties, Inc. 238,448 $ 1,957,658
General Growth Properties, Inc. 109,147 2,114,177
Prologis, Inc. 29,981 1,017,555
Weingarten Realty Investors (L) 107,700 2,927,286
Weyerhaeuser Company 277,897 7,658,841
15,675,517
Real Estate Management & Development - 1.0%
Forest City Enterprises, Inc., Class A (I) (L) 124,300 1,870,715
The Howard Hughes Corp. (I) 17,098 1,259,781
The St. Joe Company (I) (L) 149,700 3,200,586
6,331,082
Thrifts & Mortgage Finance - 0.6%
Capitol Federal Financial, Inc. 312,812 3,719,335
Copyright © 2013 www.secdatabase.com. All Rights Reserved.Please Consider the Environment Before Printing This Document
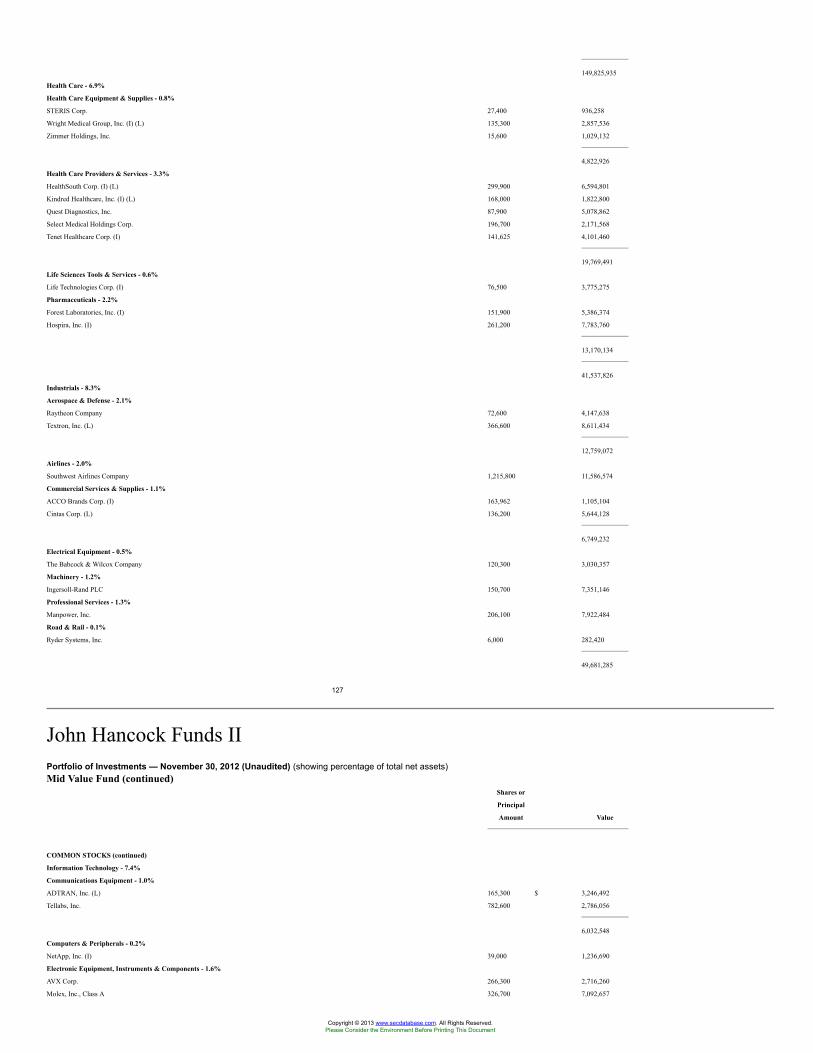
149,825,935
Health Care - 6.9%
Health Care Equipment & Supplies - 0.8%
STERIS Corp. 27,400 936,258
Wright Medical Group, Inc. (I) (L) 135,300 2,857,536
Zimmer Holdings, Inc. 15,600 1,029,132
4,822,926
Health Care Providers & Services - 3.3%
HealthSouth Corp. (I) (L) 299,900 6,594,801
Kindred Healthcare, Inc. (I) (L) 168,000 1,822,800
Quest Diagnostics, Inc. 87,900 5,078,862
Select Medical Holdings Corp. 196,700 2,171,568
Tenet Healthcare Corp. (I) 141,625 4,101,460
19,769,491
Life Sciences Tools & Services - 0.6%
Life Technologies Corp. (I) 76,500 3,775,275
Pharmaceuticals - 2.2%
Forest Laboratories, Inc. (I) 151,900 5,386,374
Hospira, Inc. (I) 261,200 7,783,760
13,170,134
41,537,826
Industrials - 8.3%
Aerospace & Defense - 2.1%
Raytheon Company 72,600 4,147,638
Textron, Inc. (L) 366,600 8,611,434
12,759,072
Airlines - 2.0%
Southwest Airlines Company 1,215,800 11,586,574
Commercial Services & Supplies - 1.1%
ACCO Brands Corp. (I) 163,962 1,105,104
Cintas Corp. (L) 136,200 5,644,128
6,749,232
Electrical Equipment - 0.5%
The Babcock & Wilcox Company 120,300 3,030,357
Machinery - 1.2%
Ingersoll-Rand PLC 150,700 7,351,146
Professional Services - 1.3%
Manpower, Inc. 206,100 7,922,484
Road & Rail - 0.1%
Ryder Systems, Inc. 6,000 282,420
49,681,285
127
John Hancock Funds IIPortfolio of Investments — November 30, 2012 (Unaudited) (showing percentage of total net assets)Mid Value Fund (continued)
Shares or
Principal
Amount Value
COMMON STOCKS (continued)
Information Technology - 7.4%
Communications Equipment - 1.0%
ADTRAN, Inc. (L) 165,300 $ 3,246,492
Tellabs, Inc. 782,600 2,786,056
6,032,548
Computers & Peripherals - 0.2%
NetApp, Inc. (I) 39,000 1,236,690
Electronic Equipment, Instruments & Components - 1.6%
AVX Corp. 266,300 2,716,260
Molex, Inc., Class A 326,700 7,092,657
Copyright © 2013 www.secdatabase.com. All Rights Reserved.Please Consider the Environment Before Printing This Document
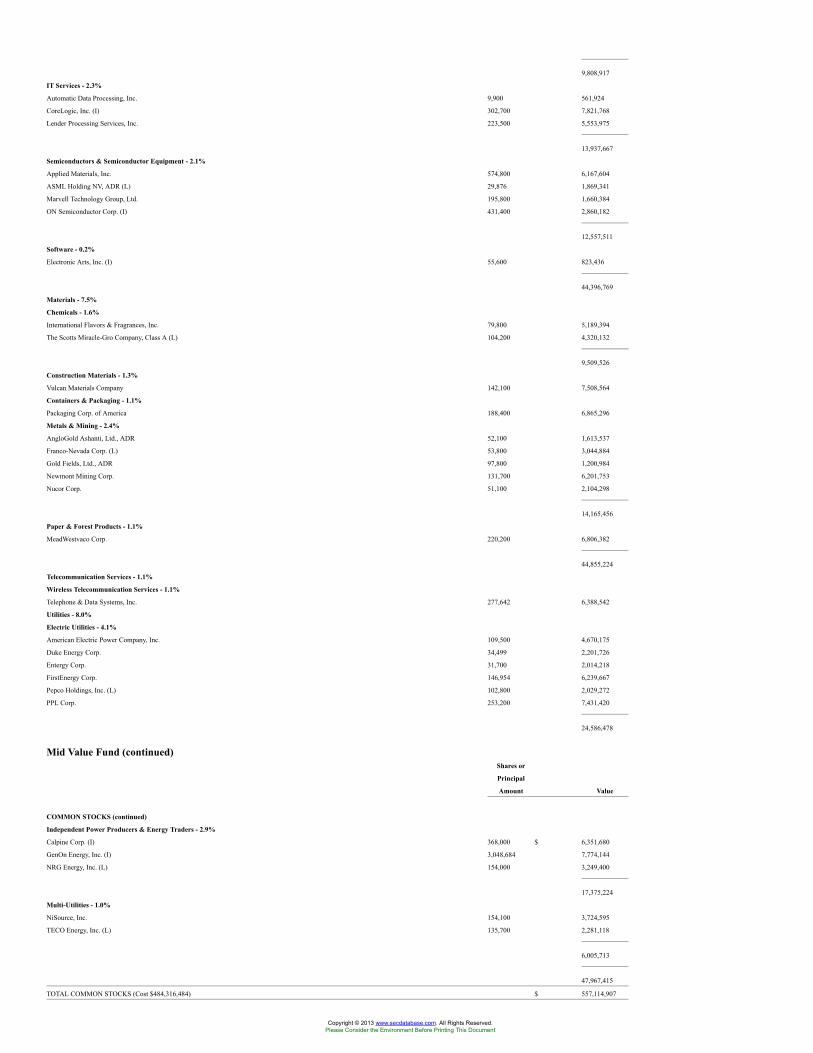
9,808,917
IT Services - 2.3%
Automatic Data Processing, Inc. 9,900 561,924
CoreLogic, Inc. (I) 302,700 7,821,768
Lender Processing Services, Inc. 223,500 5,553,975
13,937,667
Semiconductors & Semiconductor Equipment - 2.1%
Applied Materials, Inc. 574,800 6,167,604
ASML Holding NV, ADR (L) 29,876 1,869,341
Marvell Technology Group, Ltd. 195,800 1,660,384
ON Semiconductor Corp. (I) 431,400 2,860,182
12,557,511
Software - 0.2%
Electronic Arts, Inc. (I) 55,600 823,436
44,396,769
Materials - 7.5%
Chemicals - 1.6%
International Flavors & Fragrances, Inc. 79,800 5,189,394
The Scotts Miracle-Gro Company, Class A (L) 104,200 4,320,132
9,509,526
Construction Materials - 1.3%
Vulcan Materials Company 142,100 7,508,564
Containers & Packaging - 1.1%
Packaging Corp. of America 188,400 6,865,296
Metals & Mining - 2.4%
AngloGold Ashanti, Ltd., ADR 52,100 1,613,537
Franco-Nevada Corp. (L) 53,800 3,044,884
Gold Fields, Ltd., ADR 97,800 1,200,984
Newmont Mining Corp. 131,700 6,201,753
Nucor Corp. 51,100 2,104,298
14,165,456
Paper & Forest Products - 1.1%
MeadWestvaco Corp. 220,200 6,806,382
44,855,224
Telecommunication Services - 1.1%
Wireless Telecommunication Services - 1.1%
Telephone & Data Systems, Inc. 277,642 6,388,542
Utilities - 8.0%
Electric Utilities - 4.1%
American Electric Power Company, Inc. 109,500 4,670,175
Duke Energy Corp. 34,499 2,201,726
Entergy Corp. 31,700 2,014,218
FirstEnergy Corp. 146,954 6,239,667
Pepco Holdings, Inc. (L) 102,800 2,029,272
PPL Corp. 253,200 7,431,420
24,586,478
Mid Value Fund (continued)Shares or
Principal
Amount Value
COMMON STOCKS (continued)
Independent Power Producers & Energy Traders - 2.9%
Calpine Corp. (I) 368,000 $ 6,351,680
GenOn Energy, Inc. (I) 3,048,684 7,774,144
NRG Energy, Inc. (L) 154,000 3,249,400
17,375,224
Multi-Utilities - 1.0%
NiSource, Inc. 154,100 3,724,595
TECO Energy, Inc. (L) 135,700 2,281,118
6,005,713
47,967,415
TOTAL COMMON STOCKS (Cost $484,316,484) $ 557,114,907
Copyright © 2013 www.secdatabase.com. All Rights Reserved.Please Consider the Environment Before Printing This Document
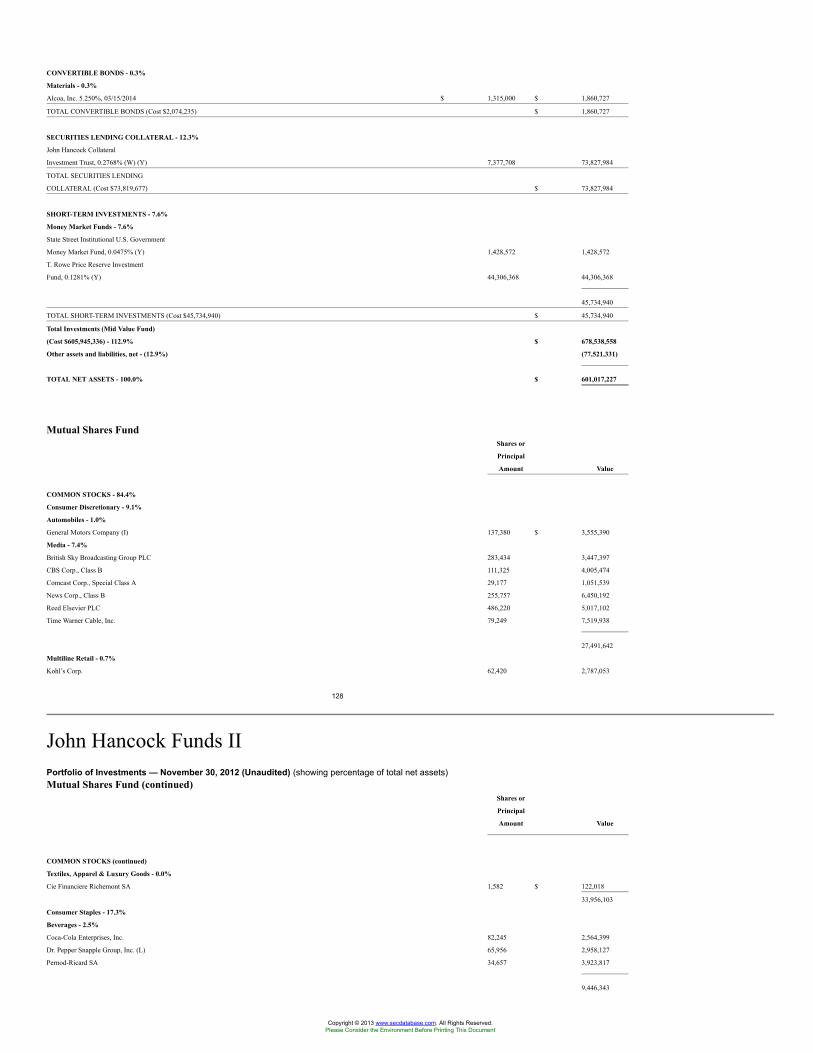
CONVERTIBLE BONDS - 0.3%
Materials - 0.3%
Alcoa, Inc. 5.250%, 03/15/2014 $ 1,315,000 $ 1,860,727
TOTAL CONVERTIBLE BONDS (Cost $2,074,235) $ 1,860,727
SECURITIES LENDING COLLATERAL - 12.3%
John Hancock Collateral
Investment Trust, 0.2768% (W) (Y) 7,377,708 73,827,984
TOTAL SECURITIES LENDING
COLLATERAL (Cost $73,819,677) $ 73,827,984
SHORT-TERM INVESTMENTS - 7.6%
Money Market Funds - 7.6%
State Street Institutional U.S. Government
Money Market Fund, 0.0475% (Y) 1,428,572 1,428,572
T. Rowe Price Reserve Investment
Fund, 0.1281% (Y) 44,306,368 44,306,368
45,734,940
TOTAL SHORT-TERM INVESTMENTS (Cost $45,734,940) $ 45,734,940
Total Investments (Mid Value Fund)
(Cost $605,945,336) - 112.9% $ 678,538,558
Other assets and liabilities, net - (12.9%) (77,521,331)
TOTAL NET ASSETS - 100.0% $ 601,017,227
Mutual Shares FundShares or
Principal
Amount Value
COMMON STOCKS - 84.4%
Consumer Discretionary - 9.1%
Automobiles - 1.0%
General Motors Company (I) 137,380 $ 3,555,390
Media - 7.4%
British Sky Broadcasting Group PLC 283,434 3,447,397
CBS Corp., Class B 111,325 4,005,474
Comcast Corp., Special Class A 29,177 1,051,539
News Corp., Class B 255,757 6,450,192
Reed Elsevier PLC 486,220 5,017,102
Time Warner Cable, Inc. 79,249 7,519,938
27,491,642
Multiline Retail - 0.7%
Kohl’s Corp. 62,420 2,787,053
128
John Hancock Funds IIPortfolio of Investments — November 30, 2012 (Unaudited) (showing percentage of total net assets)Mutual Shares Fund (continued)
Shares or
Principal
Amount Value
COMMON STOCKS (continued)
Textiles, Apparel & Luxury Goods - 0.0%
Cie Financiere Richemont SA 1,582 $ 122,018
33,956,103
Consumer Staples - 17.3%
Beverages - 2.5%
Coca-Cola Enterprises, Inc. 82,245 2,564,399
Dr. Pepper Snapple Group, Inc. (L) 65,956 2,958,127
Pernod-Ricard SA 34,657 3,923,817
9,446,343
Copyright © 2013 www.secdatabase.com. All Rights Reserved.Please Consider the Environment Before Printing This Document
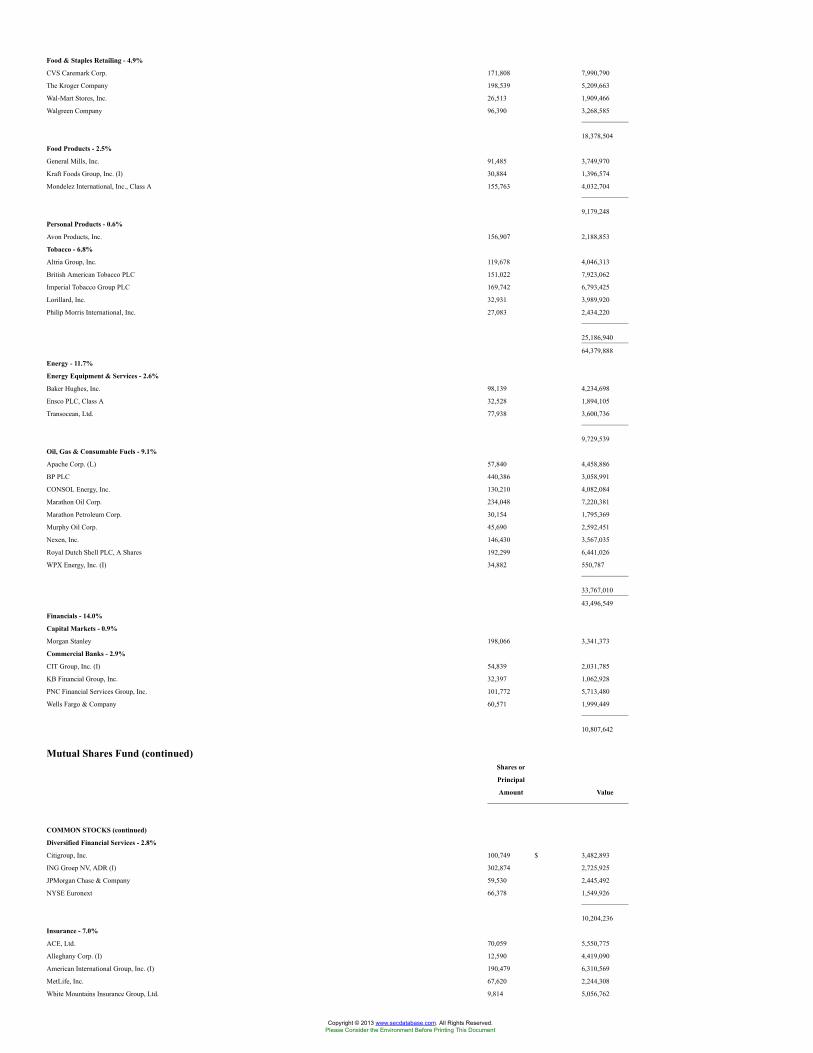
Food & Staples Retailing - 4.9%
CVS Caremark Corp. 171,808 7,990,790
The Kroger Company 198,539 5,209,663
Wal-Mart Stores, Inc. 26,513 1,909,466
Walgreen Company 96,390 3,268,585
18,378,504
Food Products - 2.5%
General Mills, Inc. 91,485 3,749,970
Kraft Foods Group, Inc. (I) 30,884 1,396,574
Mondelez International, Inc., Class A 155,763 4,032,704
9,179,248
Personal Products - 0.6%
Avon Products, Inc. 156,907 2,188,853
Tobacco - 6.8%
Altria Group, Inc. 119,678 4,046,313
British American Tobacco PLC 151,022 7,923,062
Imperial Tobacco Group PLC 169,742 6,793,425
Lorillard, Inc. 32,931 3,989,920
Philip Morris International, Inc. 27,083 2,434,220
25,186,940
64,379,888
Energy - 11.7%
Energy Equipment & Services - 2.6%
Baker Hughes, Inc. 98,139 4,234,698
Ensco PLC, Class A 32,528 1,894,105
Transocean, Ltd. 77,938 3,600,736
9,729,539
Oil, Gas & Consumable Fuels - 9.1%
Apache Corp. (L) 57,840 4,458,886
BP PLC 440,386 3,058,991
CONSOL Energy, Inc. 130,210 4,082,084
Marathon Oil Corp. 234,048 7,220,381
Marathon Petroleum Corp. 30,154 1,795,369
Murphy Oil Corp. 45,690 2,592,451
Nexen, Inc. 146,430 3,567,035
Royal Dutch Shell PLC, A Shares 192,299 6,441,026
WPX Energy, Inc. (I) 34,882 550,787
33,767,010
43,496,549
Financials - 14.0%
Capital Markets - 0.9%
Morgan Stanley 198,066 3,341,373
Commercial Banks - 2.9%
CIT Group, Inc. (I) 54,839 2,031,785
KB Financial Group, Inc. 32,397 1,062,928
PNC Financial Services Group, Inc. 101,772 5,713,480
Wells Fargo & Company 60,571 1,999,449
10,807,642
Mutual Shares Fund (continued)Shares or
Principal
Amount Value
COMMON STOCKS (continued)
Diversified Financial Services - 2.8%
Citigroup, Inc. 100,749 $ 3,482,893
ING Groep NV, ADR (I) 302,874 2,725,925
JPMorgan Chase & Company 59,530 2,445,492
NYSE Euronext 66,378 1,549,926
10,204,236
Insurance - 7.0%
ACE, Ltd. 70,059 5,550,775
Alleghany Corp. (I) 12,590 4,419,090
American International Group, Inc. (I) 190,479 6,310,569
MetLife, Inc. 67,620 2,244,308
White Mountains Insurance Group, Ltd. 9,814 5,056,762
Copyright © 2013 www.secdatabase.com. All Rights Reserved.Please Consider the Environment Before Printing This Document
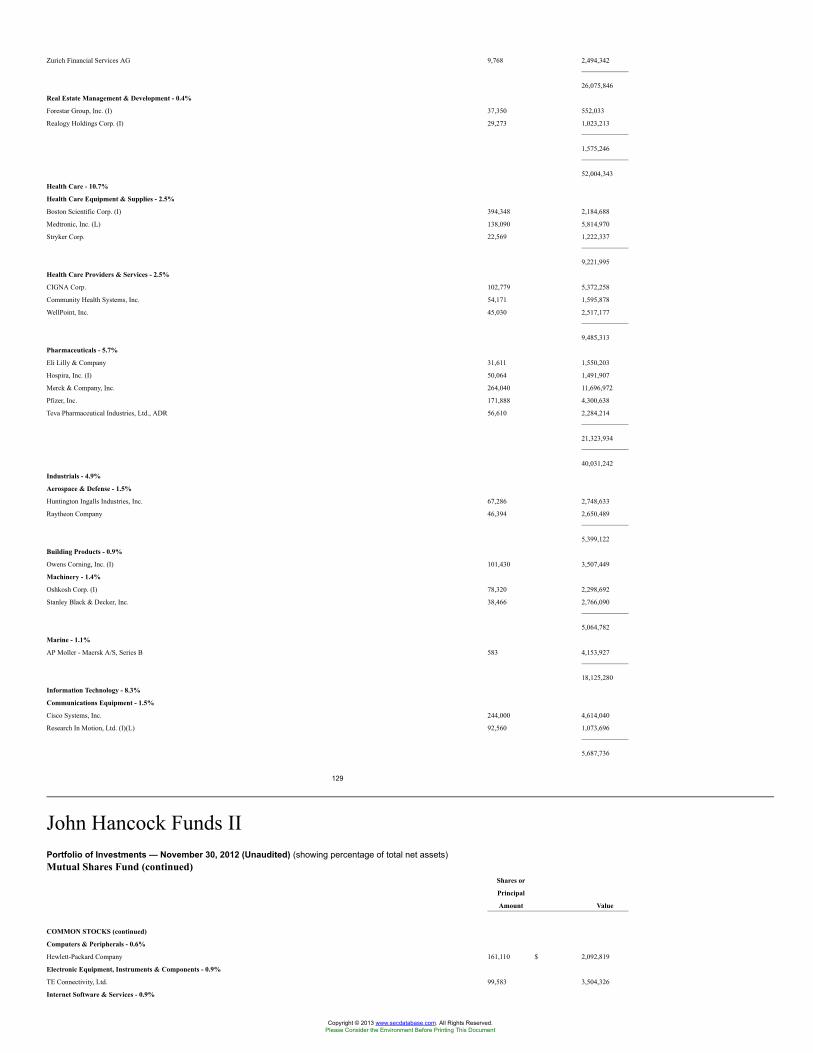
Zurich Financial Services AG 9,768 2,494,342
26,075,846
Real Estate Management & Development - 0.4%
Forestar Group, Inc. (I) 37,350 552,033
Realogy Holdings Corp. (I) 29,273 1,023,213
1,575,246
52,004,343
Health Care - 10.7%
Health Care Equipment & Supplies - 2.5%
Boston Scientific Corp. (I) 394,348 2,184,688
Medtronic, Inc. (L) 138,090 5,814,970
Stryker Corp. 22,569 1,222,337
9,221,995
Health Care Providers & Services - 2.5%
CIGNA Corp. 102,779 5,372,258
Community Health Systems, Inc. 54,171 1,595,878
WellPoint, Inc. 45,030 2,517,177
9,485,313
Pharmaceuticals - 5.7%
Eli Lilly & Company 31,611 1,550,203
Hospira, Inc. (I) 50,064 1,491,907
Merck & Company, Inc. 264,040 11,696,972
Pfizer, Inc. 171,888 4,300,638
Teva Pharmaceutical Industries, Ltd., ADR 56,610 2,284,214
21,323,934
40,031,242
Industrials - 4.9%
Aerospace & Defense - 1.5%
Huntington Ingalls Industries, Inc. 67,286 2,748,633
Raytheon Company 46,394 2,650,489
5,399,122
Building Products - 0.9%
Owens Corning, Inc. (I) 101,430 3,507,449
Machinery - 1.4%
Oshkosh Corp. (I) 78,320 2,298,692
Stanley Black & Decker, Inc. 38,466 2,766,090
5,064,782
Marine - 1.1%
AP Moller - Maersk A/S, Series B 583 4,153,927
18,125,280
Information Technology - 8.3%
Communications Equipment - 1.5%
Cisco Systems, Inc. 244,000 4,614,040
Research In Motion, Ltd. (I)(L) 92,560 1,073,696
5,687,736
129
John Hancock Funds IIPortfolio of Investments — November 30, 2012 (Unaudited) (showing percentage of total net assets)Mutual Shares Fund (continued)
Shares or
Principal
Amount Value
COMMON STOCKS (continued)
Computers & Peripherals - 0.6%
Hewlett-Packard Company 161,110 $ 2,092,819
Electronic Equipment, Instruments & Components - 0.9%
TE Connectivity, Ltd. 99,583 3,504,326
Internet Software & Services - 0.9%
Copyright © 2013 www.secdatabase.com. All Rights Reserved.Please Consider the Environment Before Printing This Document
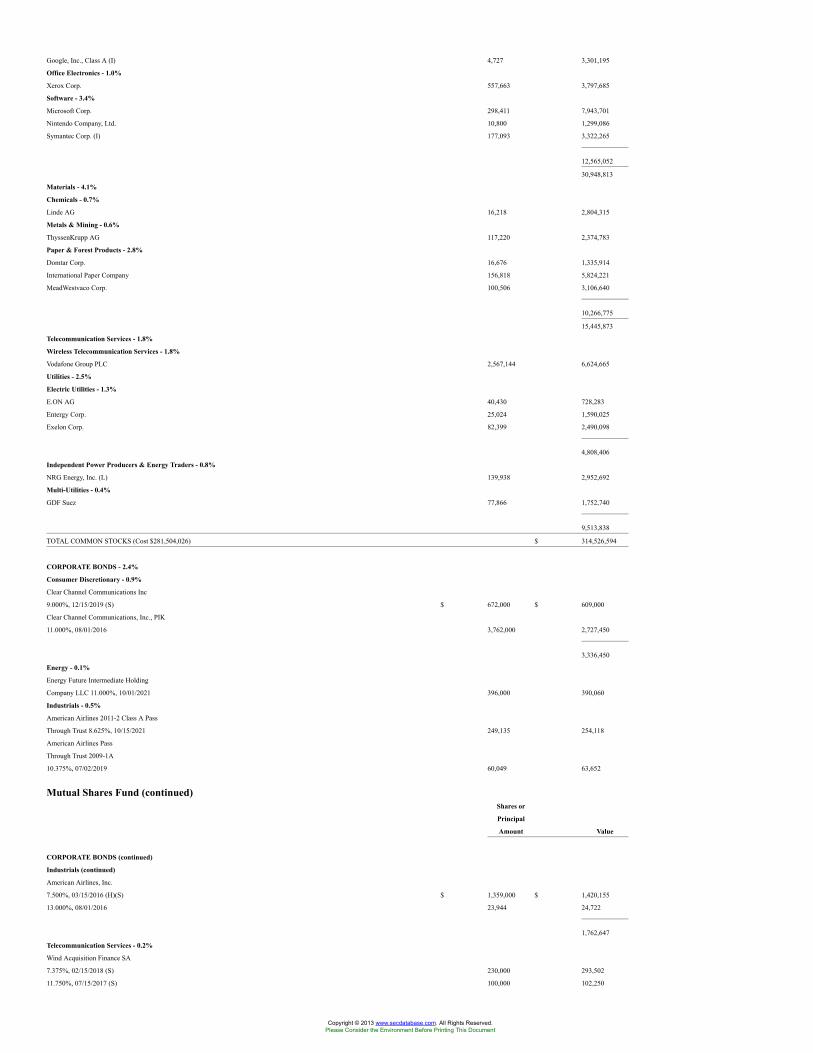
Google, Inc., Class A (I) 4,727 3,301,195
Office Electronics - 1.0%
Xerox Corp. 557,663 3,797,685
Software - 3.4%
Microsoft Corp. 298,411 7,943,701
Nintendo Company, Ltd. 10,800 1,299,086
Symantec Corp. (I) 177,093 3,322,265
12,565,052
30,948,813
Materials - 4.1%
Chemicals - 0.7%
Linde AG 16,218 2,804,315
Metals & Mining - 0.6%
ThyssenKrupp AG 117,220 2,374,783
Paper & Forest Products - 2.8%
Domtar Corp. 16,676 1,335,914
International Paper Company 156,818 5,824,221
MeadWestvaco Corp. 100,506 3,106,640
10,266,775
15,445,873
Telecommunication Services - 1.8%
Wireless Telecommunication Services - 1.8%
Vodafone Group PLC 2,567,144 6,624,665
Utilities - 2.5%
Electric Utilities - 1.3%
E.ON AG 40,430 728,283
Entergy Corp. 25,024 1,590,025
Exelon Corp. 82,399 2,490,098
4,808,406
Independent Power Producers & Energy Traders - 0.8%
NRG Energy, Inc. (L) 139,938 2,952,692
Multi-Utilities - 0.4%
GDF Suez 77,866 1,752,740
9,513,838
TOTAL COMMON STOCKS (Cost $281,504,026) $ 314,526,594
CORPORATE BONDS - 2.4%
Consumer Discretionary - 0.9%
Clear Channel Communications Inc
9.000%, 12/15/2019 (S) $ 672,000 $ 609,000
Clear Channel Communications, Inc., PIK
11.000%, 08/01/2016 3,762,000 2,727,450
3,336,450
Energy - 0.1%
Energy Future Intermediate Holding
Company LLC 11.000%, 10/01/2021 396,000 390,060
Industrials - 0.5%
American Airlines 2011-2 Class A Pass
Through Trust 8.625%, 10/15/2021 249,135 254,118
American Airlines Pass
Through Trust 2009-1A
10.375%, 07/02/2019 60,049 63,652
Mutual Shares Fund (continued)Shares or
Principal
Amount Value
CORPORATE BONDS (continued)
Industrials (continued)
American Airlines, Inc.
7.500%, 03/15/2016 (H)(S) $ 1,359,000 $ 1,420,155
13.000%, 08/01/2016 23,944 24,722
1,762,647
Telecommunication Services - 0.2%
Wind Acquisition Finance SA
7.375%, 02/15/2018 (S) 230,000 293,502
11.750%, 07/15/2017 (S) 100,000 102,250
Copyright © 2013 www.secdatabase.com. All Rights Reserved.Please Consider the Environment Before Printing This Document
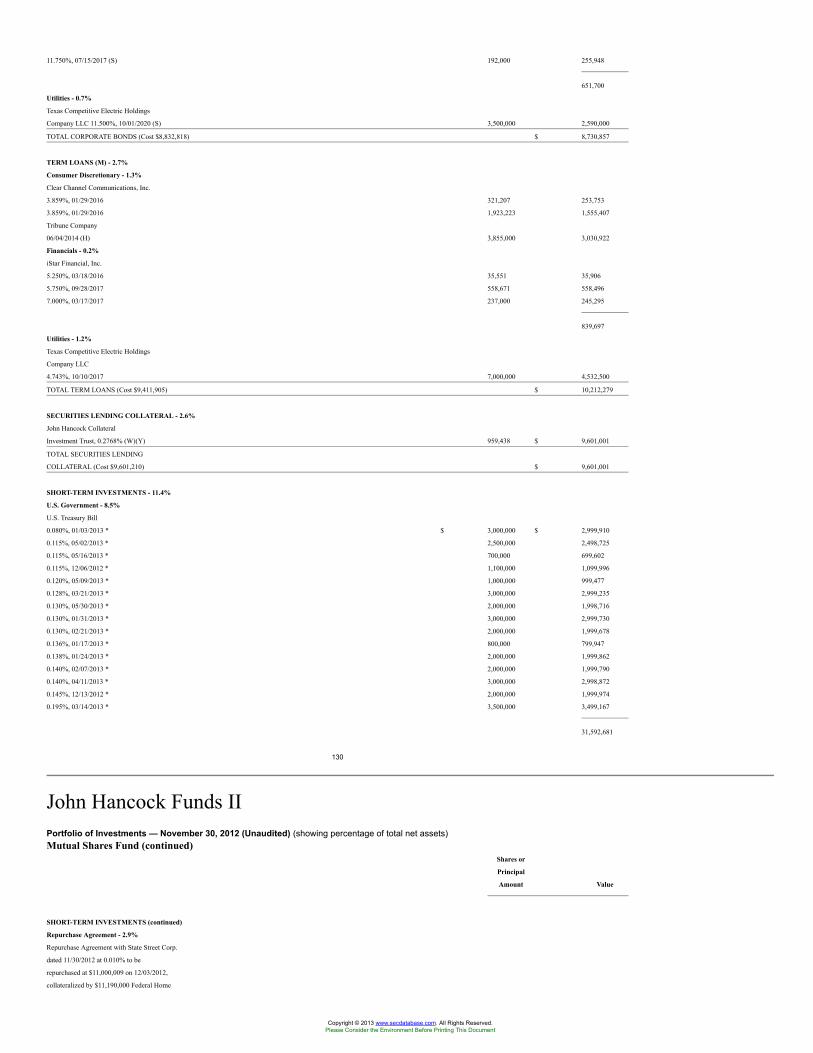
11.750%, 07/15/2017 (S) 192,000 255,948
651,700
Utilities - 0.7%
Texas Competitive Electric Holdings
Company LLC 11.500%, 10/01/2020 (S) 3,500,000 2,590,000
TOTAL CORPORATE BONDS (Cost $8,832,818) $ 8,730,857
TERM LOANS (M) - 2.7%
Consumer Discretionary - 1.3%
Clear Channel Communications, Inc.
3.859%, 01/29/2016 321,207 253,753
3.859%, 01/29/2016 1,923,223 1,555,407
Tribune Company
06/04/2014 (H) 3,855,000 3,030,922
Financials - 0.2%
iStar Financial, Inc.
5.250%, 03/18/2016 35,551 35,906
5.750%, 09/28/2017 558,671 558,496
7.000%, 03/17/2017 237,000 245,295
839,697
Utilities - 1.2%
Texas Competitive Electric Holdings
Company LLC
4.743%, 10/10/2017 7,000,000 4,532,500
TOTAL TERM LOANS (Cost $9,411,905) $ 10,212,279
SECURITIES LENDING COLLATERAL - 2.6%
John Hancock Collateral
Investment Trust, 0.2768% (W)(Y) 959,438 $ 9,601,001
TOTAL SECURITIES LENDING
COLLATERAL (Cost $9,601,210) $ 9,601,001
SHORT-TERM INVESTMENTS - 11.4%
U.S. Government - 8.5%
U.S. Treasury Bill
0.080%, 01/03/2013 * $ 3,000,000 $ 2,999,910
0.115%, 05/02/2013 * 2,500,000 2,498,725
0.115%, 05/16/2013 * 700,000 699,602
0.115%, 12/06/2012 * 1,100,000 1,099,996
0.120%, 05/09/2013 * 1,000,000 999,477
0.128%, 03/21/2013 * 3,000,000 2,999,235
0.130%, 05/30/2013 * 2,000,000 1,998,716
0.130%, 01/31/2013 * 3,000,000 2,999,730
0.130%, 02/21/2013 * 2,000,000 1,999,678
0.136%, 01/17/2013 * 800,000 799,947
0.138%, 01/24/2013 * 2,000,000 1,999,862
0.140%, 02/07/2013 * 2,000,000 1,999,790
0.140%, 04/11/2013 * 3,000,000 2,998,872
0.145%, 12/13/2012 * 2,000,000 1,999,974
0.195%, 03/14/2013 * 3,500,000 3,499,167
31,592,681
130
John Hancock Funds IIPortfolio of Investments — November 30, 2012 (Unaudited) (showing percentage of total net assets)Mutual Shares Fund (continued)
Shares or
Principal
Amount Value
SHORT-TERM INVESTMENTS (continued)
Repurchase Agreement - 2.9%
Repurchase Agreement with State Street Corp.
dated 11/30/2012 at 0.010% to be
repurchased at $11,000,009 on 12/03/2012,
collateralized by $11,190,000 Federal Home
Copyright © 2013 www.secdatabase.com. All Rights Reserved.Please Consider the Environment Before Printing This Document
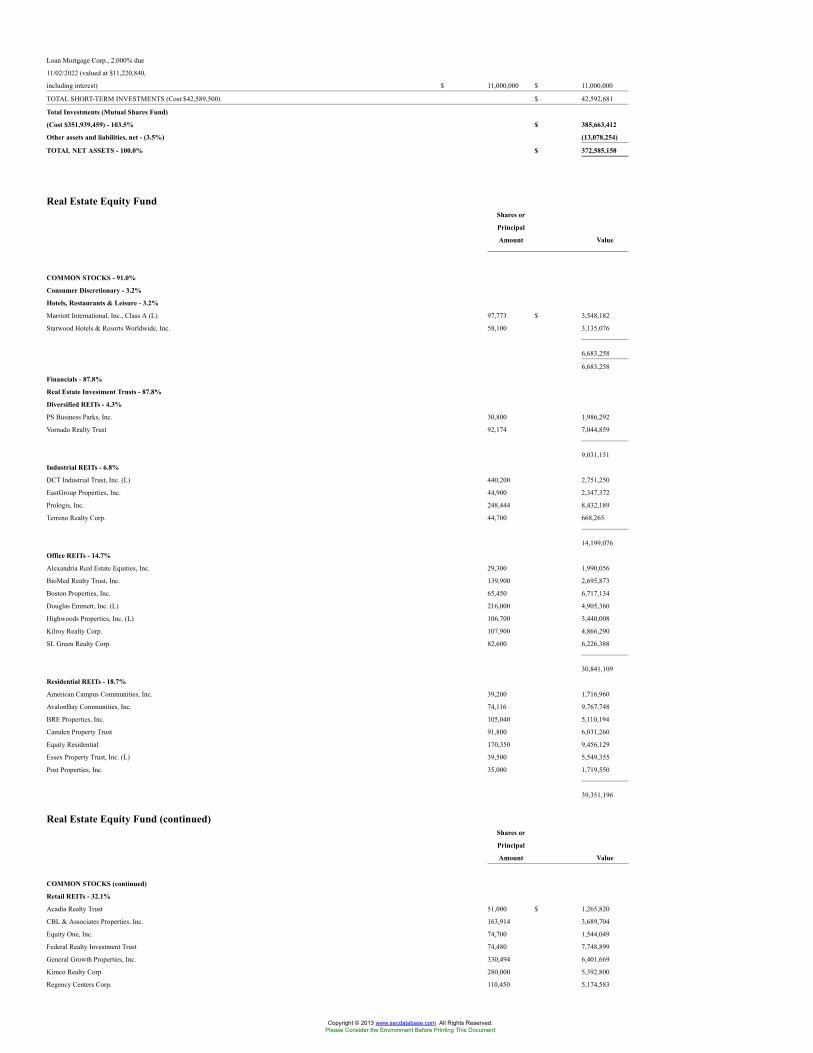
Loan Mortgage Corp., 2.000% due
11/02/2022 (valued at $11,220,840,
including interest) $ 11,000,000 $ 11,000,000
TOTAL SHORT-TERM INVESTMENTS (Cost $42,589,500) $ 42,592,681
Total Investments (Mutual Shares Fund)
(Cost $351,939,459) - 103.5% $ 385,663,412
Other assets and liabilities, net - (3.5%) (13,078,254)
TOTAL NET ASSETS - 100.0% $ 372,585,158
Real Estate Equity FundShares or
Principal
Amount Value
COMMON STOCKS - 91.0%
Consumer Discretionary - 3.2%
Hotels, Restaurants & Leisure - 3.2%
Marriott International, Inc., Class A (L) 97,773 $ 3,548,182
Starwood Hotels & Resorts Worldwide, Inc. 58,100 3,135,076
6,683,258
6,683,258
Financials - 87.8%
Real Estate Investment Trusts - 87.8%
Diversified REITs - 4.3%
PS Business Parks, Inc. 30,800 1,986,292
Vornado Realty Trust 92,174 7,044,859
9,031,151
Industrial REITs - 6.8%
DCT Industrial Trust, Inc. (L) 440,200 2,751,250
EastGroup Properties, Inc. 44,900 2,347,372
Prologis, Inc. 248,444 8,432,189
Terreno Realty Corp. 44,700 668,265
14,199,076
Office REITs - 14.7%
Alexandria Real Estate Equities, Inc. 29,300 1,990,056
BioMed Realty Trust, Inc. 139,900 2,695,873
Boston Properties, Inc. 65,450 6,717,134
Douglas Emmett, Inc. (L) 216,000 4,905,360
Highwoods Properties, Inc. (L) 106,700 3,440,008
Kilroy Realty Corp. 107,900 4,866,290
SL Green Realty Corp. 82,600 6,226,388
30,841,109
Residential REITs - 18.7%
American Campus Communities, Inc. 39,200 1,716,960
AvalonBay Communities, Inc. 74,116 9,767,748
BRE Properties, Inc. 105,040 5,110,194
Camden Property Trust 91,800 6,031,260
Equity Residential 170,350 9,456,129
Essex Property Trust, Inc. (L) 39,500 5,549,355
Post Properties, Inc. 35,000 1,719,550
39,351,196
Real Estate Equity Fund (continued)Shares or
Principal
Amount Value
COMMON STOCKS (continued)
Retail REITs - 32.1%
Acadia Realty Trust 51,000 $ 1,265,820
CBL & Associates Properties, Inc. 163,914 3,689,704
Equity One, Inc. 74,700 1,544,049
Federal Realty Investment Trust 74,480 7,748,899
General Growth Properties, Inc. 330,494 6,401,669
Kimco Realty Corp. 280,000 5,392,800
Regency Centers Corp. 110,450 5,174,583
Copyright © 2013 www.secdatabase.com. All Rights Reserved.Please Consider the Environment Before Printing This Document
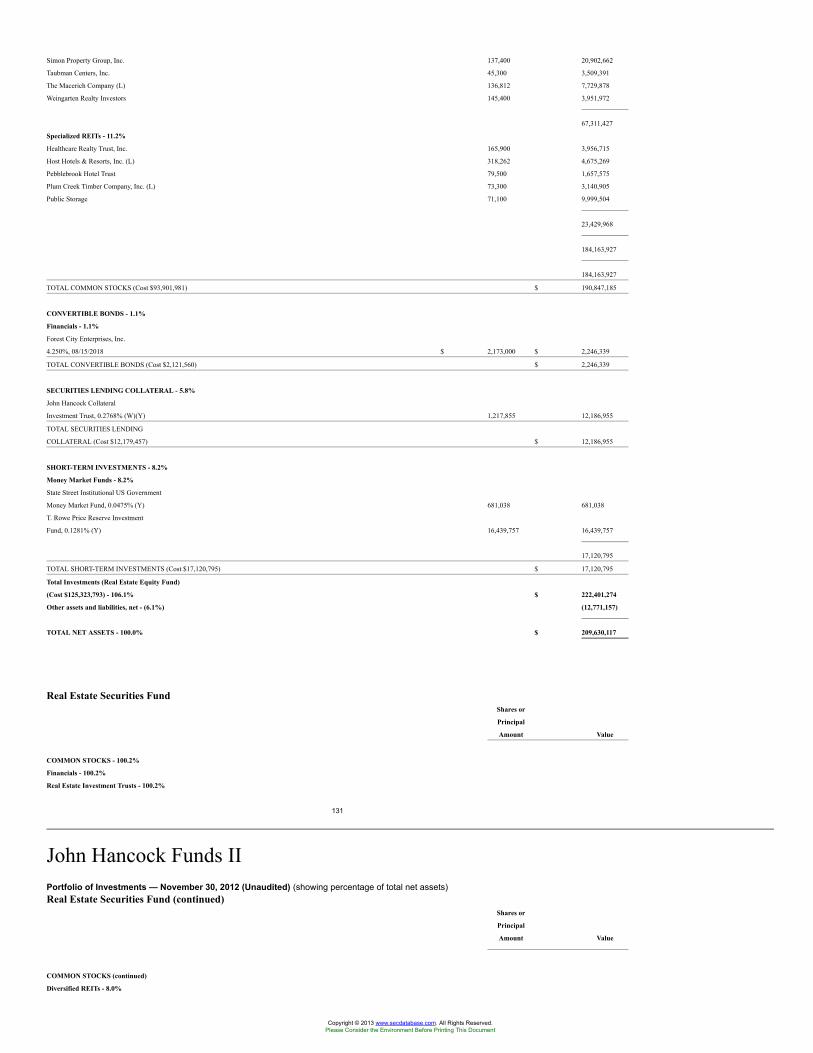
Simon Property Group, Inc. 137,400 20,902,662
Taubman Centers, Inc. 45,300 3,509,391
The Macerich Company (L) 136,812 7,729,878
Weingarten Realty Investors 145,400 3,951,972
67,311,427
Specialized REITs - 11.2%
Healthcare Realty Trust, Inc. 165,900 3,956,715
Host Hotels & Resorts, Inc. (L) 318,262 4,675,269
Pebblebrook Hotel Trust 79,500 1,657,575
Plum Creek Timber Company, Inc. (L) 73,300 3,140,905
Public Storage 71,100 9,999,504
23,429,968
184,163,927
184,163,927
TOTAL COMMON STOCKS (Cost $93,901,981) $ 190,847,185
CONVERTIBLE BONDS - 1.1%
Financials - 1.1%
Forest City Enterprises, Inc.
4.250%, 08/15/2018 $ 2,173,000 $ 2,246,339
TOTAL CONVERTIBLE BONDS (Cost $2,121,560) $ 2,246,339
SECURITIES LENDING COLLATERAL - 5.8%
John Hancock Collateral
Investment Trust, 0.2768% (W)(Y) 1,217,855 12,186,955
TOTAL SECURITIES LENDING
COLLATERAL (Cost $12,179,457) $ 12,186,955
SHORT-TERM INVESTMENTS - 8.2%
Money Market Funds - 8.2%
State Street Institutional US Government
Money Market Fund, 0.0475% (Y) 681,038 681,038
T. Rowe Price Reserve Investment
Fund, 0.1281% (Y) 16,439,757 16,439,757
17,120,795
TOTAL SHORT-TERM INVESTMENTS (Cost $17,120,795) $ 17,120,795
Total Investments (Real Estate Equity Fund)
(Cost $125,323,793) - 106.1% $ 222,401,274
Other assets and liabilities, net - (6.1%) (12,771,157)
TOTAL NET ASSETS - 100.0% $ 209,630,117
Real Estate Securities FundShares or
Principal
Amount Value
COMMON STOCKS - 100.2%
Financials - 100.2%
Real Estate Investment Trusts - 100.2%
131
John Hancock Funds IIPortfolio of Investments — November 30, 2012 (Unaudited) (showing percentage of total net assets)Real Estate Securities Fund (continued)
Shares or
Principal
Amount Value
COMMON STOCKS (continued)
Diversified REITs - 8.0%
Copyright © 2013 www.secdatabase.com. All Rights Reserved.Please Consider the Environment Before Printing This Document
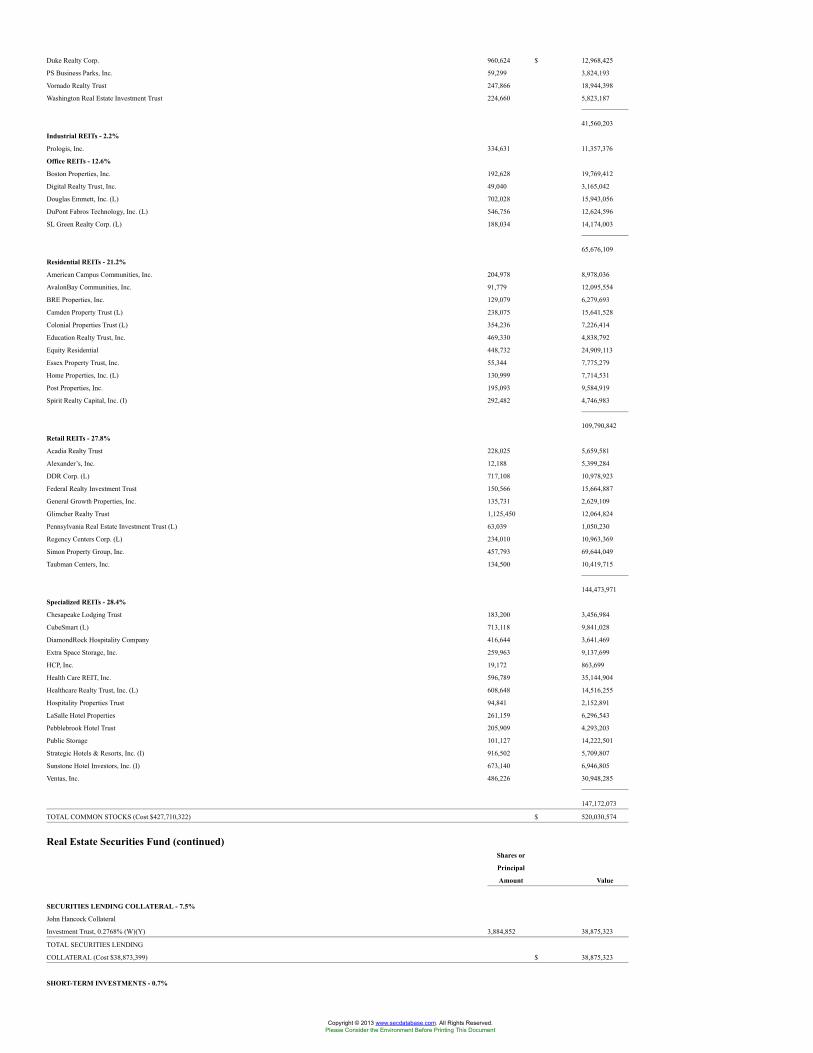
Duke Realty Corp. 960,624 $ 12,968,425
PS Business Parks, Inc. 59,299 3,824,193
Vornado Realty Trust 247,866 18,944,398
Washington Real Estate Investment Trust 224,660 5,823,187
41,560,203
Industrial REITs - 2.2%
Prologis, Inc. 334,631 11,357,376
Office REITs - 12.6%
Boston Properties, Inc. 192,628 19,769,412
Digital Realty Trust, Inc. 49,040 3,165,042
Douglas Emmett, Inc. (L) 702,028 15,943,056
DuPont Fabros Technology, Inc. (L) 546,756 12,624,596
SL Green Realty Corp. (L) 188,034 14,174,003
65,676,109
Residential REITs - 21.2%
American Campus Communities, Inc. 204,978 8,978,036
AvalonBay Communities, Inc. 91,779 12,095,554
BRE Properties, Inc. 129,079 6,279,693
Camden Property Trust (L) 238,075 15,641,528
Colonial Properties Trust (L) 354,236 7,226,414
Education Realty Trust, Inc. 469,330 4,838,792
Equity Residential 448,732 24,909,113
Essex Property Trust, Inc. 55,344 7,775,279
Home Properties, Inc. (L) 130,999 7,714,531
Post Properties, Inc. 195,093 9,584,919
Spirit Realty Capital, Inc. (I) 292,482 4,746,983
109,790,842
Retail REITs - 27.8%
Acadia Realty Trust 228,025 5,659,581
Alexander’s, Inc. 12,188 5,399,284
DDR Corp. (L) 717,108 10,978,923
Federal Realty Investment Trust 150,566 15,664,887
General Growth Properties, Inc. 135,731 2,629,109
Glimcher Realty Trust 1,125,450 12,064,824
Pennsylvania Real Estate Investment Trust (L) 63,039 1,050,230
Regency Centers Corp. (L) 234,010 10,963,369
Simon Property Group, Inc. 457,793 69,644,049
Taubman Centers, Inc. 134,500 10,419,715
144,473,971
Specialized REITs - 28.4%
Chesapeake Lodging Trust 183,200 3,456,984
CubeSmart (L) 713,118 9,841,028
DiamondRock Hospitality Company 416,644 3,641,469
Extra Space Storage, Inc. 259,963 9,137,699
HCP, Inc. 19,172 863,699
Health Care REIT, Inc. 596,789 35,144,904
Healthcare Realty Trust, Inc. (L) 608,648 14,516,255
Hospitality Properties Trust 94,841 2,152,891
LaSalle Hotel Properties 261,159 6,296,543
Pebblebrook Hotel Trust 205,909 4,293,203
Public Storage 101,127 14,222,501
Strategic Hotels & Resorts, Inc. (I) 916,502 5,709,807
Sunstone Hotel Investors, Inc. (I) 673,140 6,946,805
Ventas, Inc. 486,226 30,948,285
147,172,073
TOTAL COMMON STOCKS (Cost $427,710,322) $ 520,030,574
Real Estate Securities Fund (continued)Shares or
Principal
Amount Value
SECURITIES LENDING COLLATERAL - 7.5%
John Hancock Collateral
Investment Trust, 0.2768% (W)(Y) 3,884,852 38,875,323
TOTAL SECURITIES LENDING
COLLATERAL (Cost $38,873,399) $ 38,875,323
SHORT-TERM INVESTMENTS - 0.7%
Copyright © 2013 www.secdatabase.com. All Rights Reserved.Please Consider the Environment Before Printing This Document
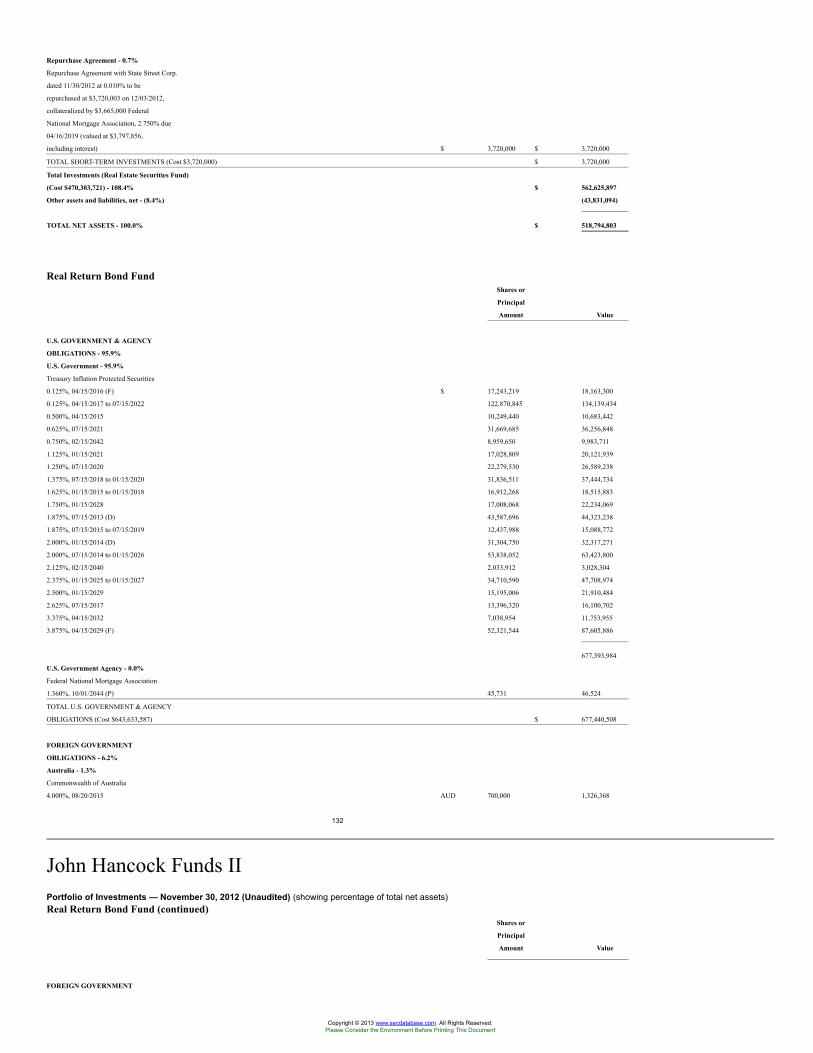
Repurchase Agreement - 0.7%
Repurchase Agreement with State Street Corp.
dated 11/30/2012 at 0.010% to be
repurchased at $3,720,003 on 12/03/2012,
collateralized by $3,665,000 Federal
National Mortgage Association, 2.750% due
04/16/2019 (valued at $3,797,856,
including interest) $ 3,720,000 $ 3,720,000
TOTAL SHORT-TERM INVESTMENTS (Cost $3,720,000) $ 3,720,000
Total Investments (Real Estate Securities Fund)
(Cost $470,303,721) - 108.4% $ 562,625,897
Other assets and liabilities, net - (8.4%) (43,831,094)
TOTAL NET ASSETS - 100.0% $ 518,794,803
Real Return Bond FundShares or
Principal
Amount Value
U.S. GOVERNMENT & AGENCY
OBLIGATIONS - 95.9%
U.S. Government - 95.9%
Treasury Inflation Protected Securities
0.125%, 04/15/2016 (F) $ 17,243,219 18,163,300
0.125%, 04/15/2017 to 07/15/2022 122,870,845 134,139,434
0.500%, 04/15/2015 10,249,440 10,683,442
0.625%, 07/15/2021 31,669,685 36,256,848
0.750%, 02/15/2042 8,959,650 9,983,711
1.125%, 01/15/2021 17,028,809 20,121,939
1.250%, 07/15/2020 22,279,530 26,589,238
1.375%, 07/15/2018 to 01/15/2020 31,836,511 37,444,734
1.625%, 01/15/2015 to 01/15/2018 16,912,268 18,515,883
1.750%, 01/15/2028 17,008,068 22,234,069
1.875%, 07/15/2013 (D) 43,587,696 44,323,238
1.875%, 07/15/2015 to 07/15/2019 12,437,988 15,088,772
2.000%, 01/15/2014 (D) 31,304,750 32,317,271
2.000%, 07/15/2014 to 01/15/2026 53,838,052 63,423,800
2.125%, 02/15/2040 2,033,912 3,028,304
2.375%, 01/15/2025 to 01/15/2027 34,710,590 47,708,974
2.500%, 01/15/2029 15,195,006 21,910,484
2.625%, 07/15/2017 13,396,320 16,100,702
3.375%, 04/15/2032 7,038,954 11,753,955
3.875%, 04/15/2029 (F) 52,321,544 87,605,886
677,393,984
U.S. Government Agency - 0.0%
Federal National Mortgage Association
1.360%, 10/01/2044 (P) 45,731 46,524
TOTAL U.S. GOVERNMENT & AGENCY
OBLIGATIONS (Cost $643,633,587) $ 677,440,508
FOREIGN GOVERNMENT
OBLIGATIONS - 6.2%
Australia - 1.3%
Commonwealth of Australia
4.000%, 08/20/2015 AUD 700,000 1,326,368
132
John Hancock Funds IIPortfolio of Investments — November 30, 2012 (Unaudited) (showing percentage of total net assets)Real Return Bond Fund (continued)
Shares or
Principal
Amount Value
FOREIGN GOVERNMENT
Copyright © 2013 www.secdatabase.com. All Rights Reserved.Please Consider the Environment Before Printing This Document
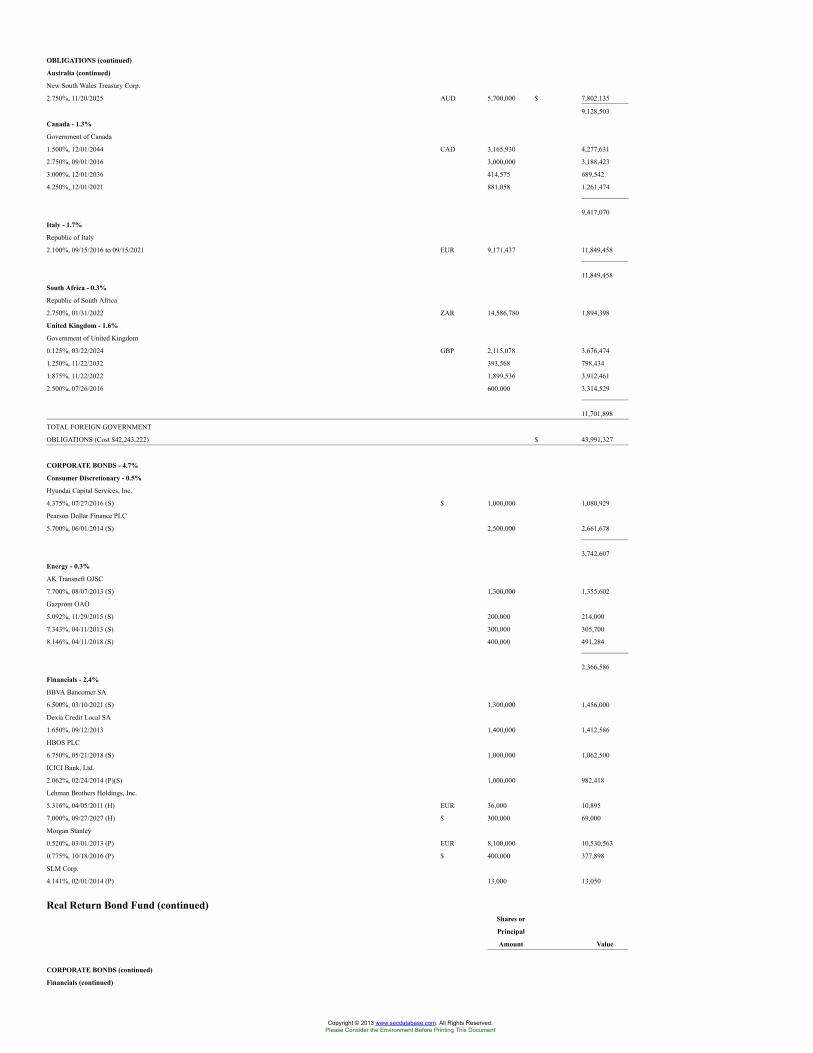
OBLIGATIONS (continued)
Australia (continued)
New South Wales Treasury Corp.
2.750%, 11/20/2025 AUD 5,700,000 $ 7,802,135
9,128,503
Canada - 1.3%
Government of Canada
1.500%, 12/01/2044 CAD 3,165,930 4,277,631
2.750%, 09/01/2016 3,000,000 3,188,423
3.000%, 12/01/2036 414,575 689,542
4.250%, 12/01/2021 881,058 1,261,474
9,417,070
Italy - 1.7%
Republic of Italy
2.100%, 09/15/2016 to 09/15/2021 EUR 9,171,437 11,849,458
11,849,458
South Africa - 0.3%
Republic of South Africa
2.750%, 01/31/2022 ZAR 14,586,780 1,894,398
United Kingdom - 1.6%
Government of United Kingdom
0.125%, 03/22/2024 GBP 2,115,078 3,676,474
1.250%, 11/22/2032 393,568 798,434
1.875%, 11/22/2022 1,899,536 3,912,461
2.500%, 07/26/2016 600,000 3,314,529
11,701,898
TOTAL FOREIGN GOVERNMENT
OBLIGATIONS (Cost $42,243,222) $ 43,991,327
CORPORATE BONDS - 4.7%
Consumer Discretionary - 0.5%
Hyundai Capital Services, Inc.
4.375%, 07/27/2016 (S) $ 1,000,000 1,080,929
Pearson Dollar Finance PLC
5.700%, 06/01/2014 (S) 2,500,000 2,661,678
3,742,607
Energy - 0.3%
AK Transneft OJSC
7.700%, 08/07/2013 (S) 1,300,000 1,355,602
Gazprom OAO
5.092%, 11/29/2015 (S) 200,000 214,000
7.343%, 04/11/2013 (S) 300,000 305,700
8.146%, 04/11/2018 (S) 400,000 491,284
2,366,586
Financials - 2.4%
BBVA Bancomer SA
6.500%, 03/10/2021 (S) 1,300,000 1,456,000
Dexia Credit Local SA
1.650%, 09/12/2013 1,400,000 1,412,586
HBOS PLC
6.750%, 05/21/2018 (S) 1,000,000 1,062,500
ICICI Bank, Ltd.
2.062%, 02/24/2014 (P)(S) 1,000,000 982,418
Lehman Brothers Holdings, Inc.
5.316%, 04/05/2011 (H) EUR 36,000 10,895
7.000%, 09/27/2027 (H) $ 300,000 69,000
Morgan Stanley
0.520%, 03/01/2013 (P) EUR 8,100,000 10,530,563
0.775%, 10/18/2016 (P) $ 400,000 377,898
SLM Corp.
4.141%, 02/01/2014 (P) 13,000 13,050
Real Return Bond Fund (continued)Shares or
Principal
Amount Value
CORPORATE BONDS (continued)
Financials (continued)
Copyright © 2013 www.secdatabase.com. All Rights Reserved.Please Consider the Environment Before Printing This Document
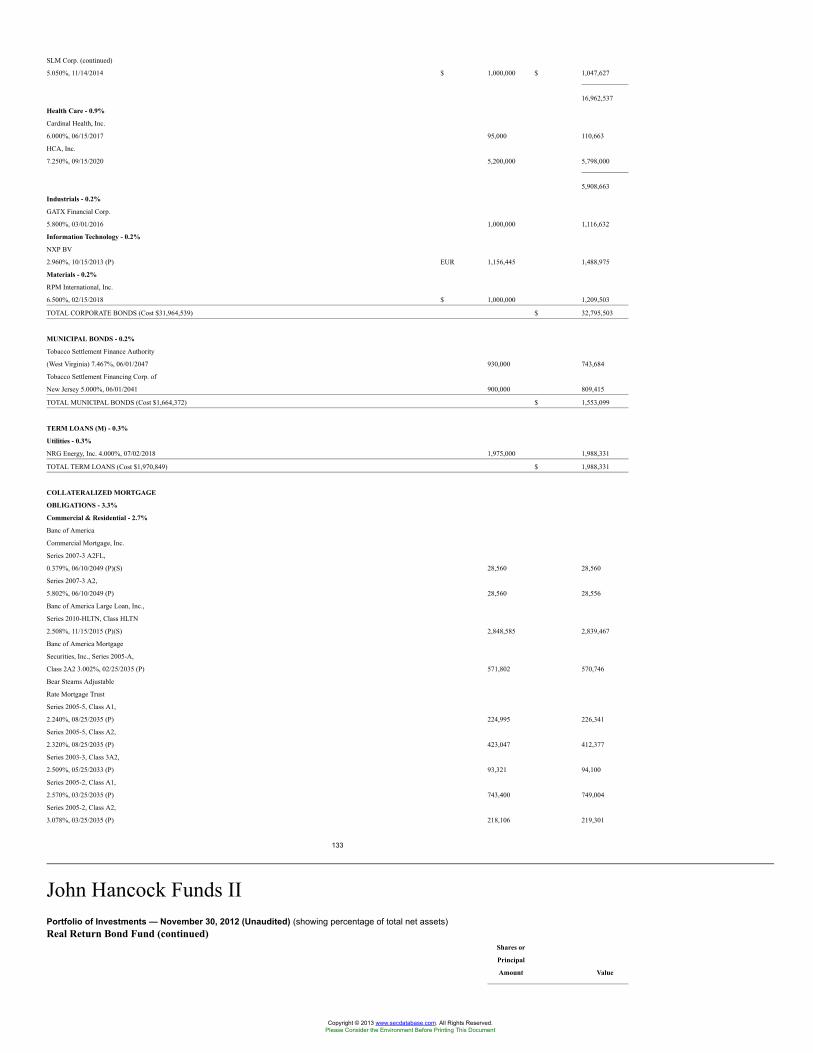
SLM Corp. (continued)
5.050%, 11/14/2014 $ 1,000,000 $ 1,047,627
16,962,537
Health Care - 0.9%
Cardinal Health, Inc.
6.000%, 06/15/2017 95,000 110,663
HCA, Inc.
7.250%, 09/15/2020 5,200,000 5,798,000
5,908,663
Industrials - 0.2%
GATX Financial Corp.
5.800%, 03/01/2016 1,000,000 1,116,632
Information Technology - 0.2%
NXP BV
2.960%, 10/15/2013 (P) EUR 1,156,445 1,488,975
Materials - 0.2%
RPM International, Inc.
6.500%, 02/15/2018 $ 1,000,000 1,209,503
TOTAL CORPORATE BONDS (Cost $31,964,539) $ 32,795,503
MUNICIPAL BONDS - 0.2%
Tobacco Settlement Finance Authority
(West Virginia) 7.467%, 06/01/2047 930,000 743,684
Tobacco Settlement Financing Corp. of
New Jersey 5.000%, 06/01/2041 900,000 809,415
TOTAL MUNICIPAL BONDS (Cost $1,664,372) $ 1,553,099
TERM LOANS (M) - 0.3%
Utilities - 0.3%
NRG Energy, Inc. 4.000%, 07/02/2018 1,975,000 1,988,331
TOTAL TERM LOANS (Cost $1,970,849) $ 1,988,331
COLLATERALIZED MORTGAGE
OBLIGATIONS - 3.3%
Commercial & Residential - 2.7%
Banc of America
Commercial Mortgage, Inc.
Series 2007-3 A2FL,
0.379%, 06/10/2049 (P)(S) 28,560 28,560
Series 2007-3 A2,
5.802%, 06/10/2049 (P) 28,560 28,556
Banc of America Large Loan, Inc.,
Series 2010-HLTN, Class HLTN
2.508%, 11/15/2015 (P)(S) 2,848,585 2,839,467
Banc of America Mortgage
Securities, Inc., Series 2005-A,
Class 2A2 3.002%, 02/25/2035 (P) 571,802 570,746
Bear Stearns Adjustable
Rate Mortgage Trust
Series 2005-5, Class A1,
2.240%, 08/25/2035 (P) 224,995 226,341
Series 2005-5, Class A2,
2.320%, 08/25/2035 (P) 423,047 412,377
Series 2003-3, Class 3A2,
2.509%, 05/25/2033 (P) 93,321 94,100
Series 2005-2, Class A1,
2.570%, 03/25/2035 (P) 743,400 749,004
Series 2005-2, Class A2,
3.078%, 03/25/2035 (P) 218,106 219,301
133
John Hancock Funds IIPortfolio of Investments — November 30, 2012 (Unaudited) (showing percentage of total net assets)Real Return Bond Fund (continued)
Shares or
Principal
Amount Value
Copyright © 2013 www.secdatabase.com. All Rights Reserved.Please Consider the Environment Before Printing This Document
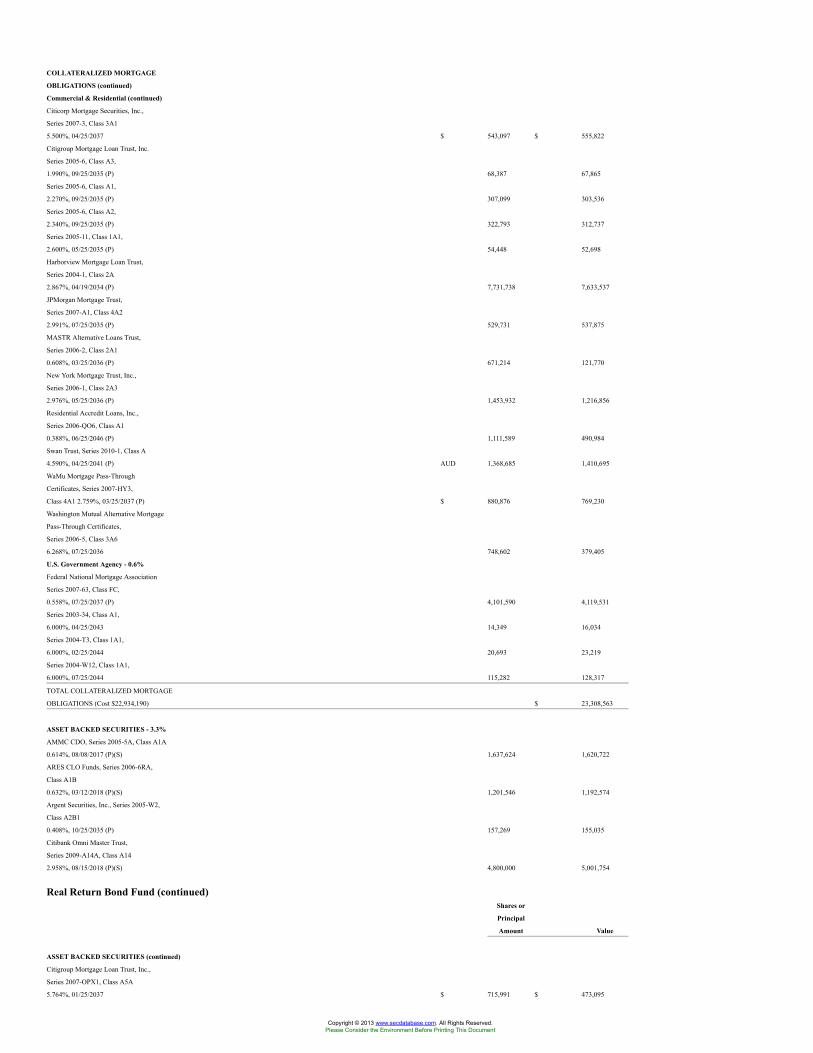
COLLATERALIZED MORTGAGE
OBLIGATIONS (continued)
Commercial & Residential (continued)
Citicorp Mortgage Securities, Inc.,
Series 2007-3, Class 3A1
5.500%, 04/25/2037 $ 543,097 $ 555,822
Citigroup Mortgage Loan Trust, Inc.
Series 2005-6, Class A3,
1.990%, 09/25/2035 (P) 68,387 67,865
Series 2005-6, Class A1,
2.270%, 09/25/2035 (P) 307,099 303,536
Series 2005-6, Class A2,
2.340%, 09/25/2035 (P) 322,793 312,737
Series 2005-11, Class 1A1,
2.600%, 05/25/2035 (P) 54,448 52,698
Harborview Mortgage Loan Trust,
Series 2004-1, Class 2A
2.867%, 04/19/2034 (P) 7,731,738 7,633,537
JPMorgan Mortgage Trust,
Series 2007-A1, Class 4A2
2.991%, 07/25/2035 (P) 529,731 537,875
MASTR Alternative Loans Trust,
Series 2006-2, Class 2A1
0.608%, 03/25/2036 (P) 671,214 121,770
New York Mortgage Trust, Inc.,
Series 2006-1, Class 2A3
2.976%, 05/25/2036 (P) 1,453,932 1,216,856
Residential Accredit Loans, Inc.,
Series 2006-QO6, Class A1
0.388%, 06/25/2046 (P) 1,111,589 490,984
Swan Trust, Series 2010-1, Class A
4.590%, 04/25/2041 (P) AUD 1,368,685 1,410,695
WaMu Mortgage Pass-Through
Certificates, Series 2007-HY3,
Class 4A1 2.759%, 03/25/2037 (P) $ 880,876 769,230
Washington Mutual Alternative Mortgage
Pass-Through Certificates,
Series 2006-5, Class 3A6
6.268%, 07/25/2036 748,602 379,405
U.S. Government Agency - 0.6%
Federal National Mortgage Association
Series 2007-63, Class FC,
0.558%, 07/25/2037 (P) 4,101,590 4,119,531
Series 2003-34, Class A1,
6.000%, 04/25/2043 14,349 16,034
Series 2004-T3, Class 1A1,
6.000%, 02/25/2044 20,693 23,219
Series 2004-W12, Class 1A1,
6.000%, 07/25/2044 115,282 128,317
TOTAL COLLATERALIZED MORTGAGE
OBLIGATIONS (Cost $22,934,190) $ 23,308,563
ASSET BACKED SECURITIES - 3.3%
AMMC CDO, Series 2005-5A, Class A1A
0.614%, 08/08/2017 (P)(S) 1,637,624 1,620,722
ARES CLO Funds, Series 2006-6RA,
Class A1B
0.632%, 03/12/2018 (P)(S) 1,201,546 1,192,574
Argent Securities, Inc., Series 2005-W2,
Class A2B1
0.408%, 10/25/2035 (P) 157,269 155,035
Citibank Omni Master Trust,
Series 2009-A14A, Class A14
2.958%, 08/15/2018 (P)(S) 4,800,000 5,001,754
Real Return Bond Fund (continued)Shares or
Principal
Amount Value
ASSET BACKED SECURITIES (continued)
Citigroup Mortgage Loan Trust, Inc.,
Series 2007-OPX1, Class A5A
5.764%, 01/25/2037 $ 715,991 $ 473,095
Copyright © 2013 www.secdatabase.com. All Rights Reserved.Please Consider the Environment Before Printing This Document
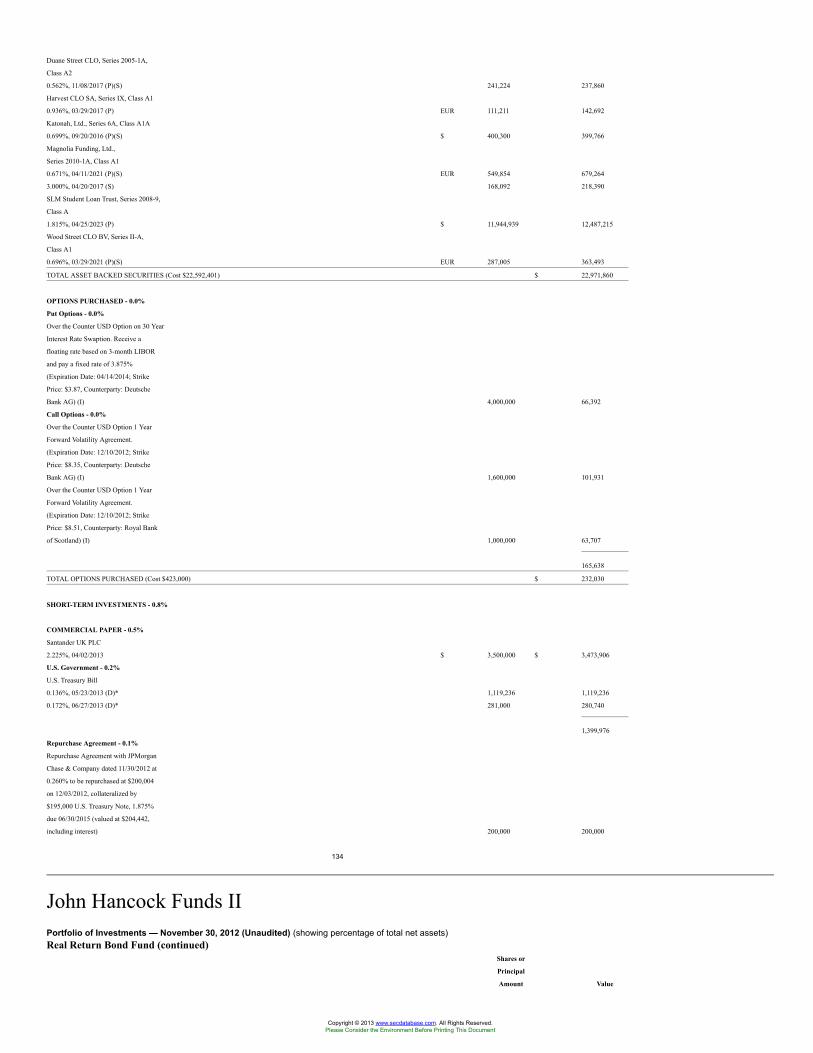
Duane Street CLO, Series 2005-1A,
Class A2
0.562%, 11/08/2017 (P)(S) 241,224 237,860
Harvest CLO SA, Series IX, Class A1
0.936%, 03/29/2017 (P) EUR 111,211 142,692
Katonah, Ltd., Series 6A, Class A1A
0.699%, 09/20/2016 (P)(S) $ 400,300 399,766
Magnolia Funding, Ltd.,
Series 2010-1A, Class A1
0.671%, 04/11/2021 (P)(S) EUR 549,854 679,264
3.000%, 04/20/2017 (S) 168,092 218,390
SLM Student Loan Trust, Series 2008-9,
Class A
1.815%, 04/25/2023 (P) $ 11,944,939 12,487,215
Wood Street CLO BV, Series II-A,
Class A1
0.696%, 03/29/2021 (P)(S) EUR 287,005 363,493
TOTAL ASSET BACKED SECURITIES (Cost $22,592,401) $ 22,971,860
OPTIONS PURCHASED - 0.0%
Put Options - 0.0%
Over the Counter USD Option on 30 Year
Interest Rate Swaption. Receive a
floating rate based on 3-month LIBOR
and pay a fixed rate of 3.875%
(Expiration Date: 04/14/2014; Strike
Price: $3.87, Counterparty: Deutsche
Bank AG) (I) 4,000,000 66,392
Call Options - 0.0%
Over the Counter USD Option 1 Year
Forward Volatility Agreement.
(Expiration Date: 12/10/2012; Strike
Price: $8.35, Counterparty: Deutsche
Bank AG) (I) 1,600,000 101,931
Over the Counter USD Option 1 Year
Forward Volatility Agreement.
(Expiration Date: 12/10/2012; Strike
Price: $8.51, Counterparty: Royal Bank
of Scotland) (I) 1,000,000 63,707
165,638
TOTAL OPTIONS PURCHASED (Cost $423,000) $ 232,030
SHORT-TERM INVESTMENTS - 0.8%
COMMERCIAL PAPER - 0.5%
Santander UK PLC
2.225%, 04/02/2013 $ 3,500,000 $ 3,473,906
U.S. Government - 0.2%
U.S. Treasury Bill
0.136%, 05/23/2013 (D)* 1,119,236 1,119,236
0.172%, 06/27/2013 (D)* 281,000 280,740
1,399,976
Repurchase Agreement - 0.1%
Repurchase Agreement with JPMorgan
Chase & Company dated 11/30/2012 at
0.260% to be repurchased at $200,004
on 12/03/2012, collateralized by
$195,000 U.S. Treasury Note, 1.875%
due 06/30/2015 (valued at $204,442,
including interest) 200,000 200,000
134
John Hancock Funds IIPortfolio of Investments — November 30, 2012 (Unaudited) (showing percentage of total net assets)Real Return Bond Fund (continued)
Shares or
Principal
Amount Value
Copyright © 2013 www.secdatabase.com. All Rights Reserved.Please Consider the Environment Before Printing This Document
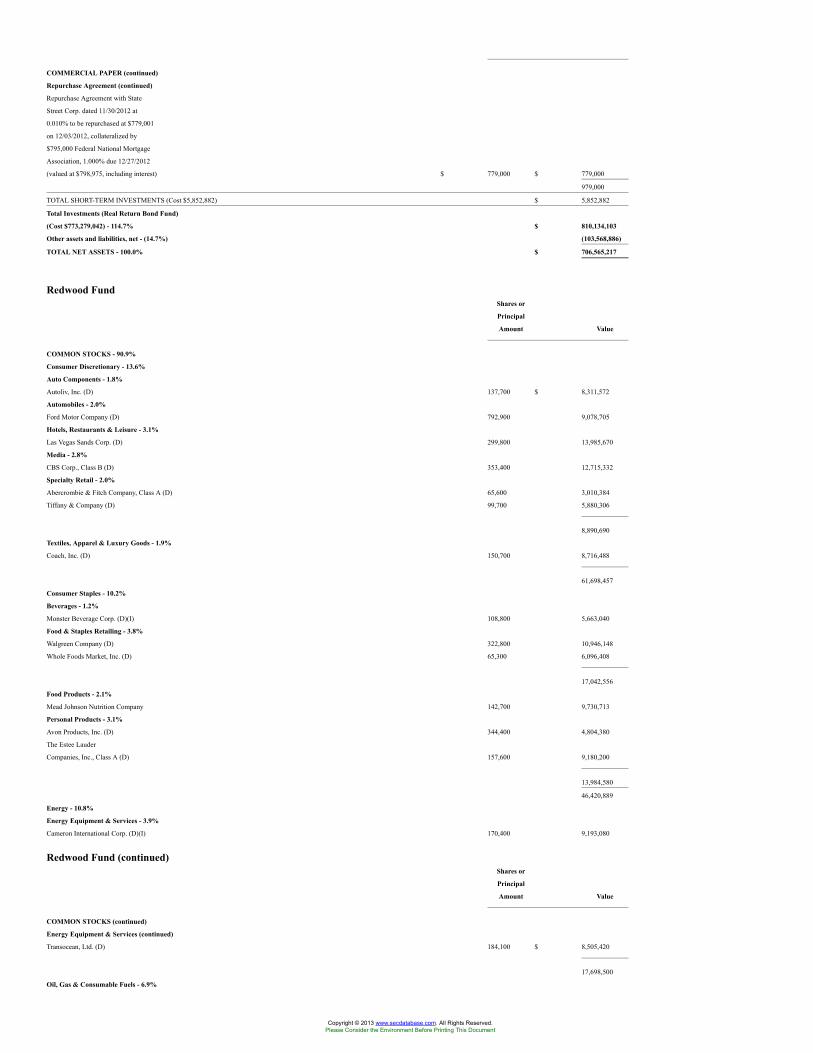
COMMERCIAL PAPER (continued)
Repurchase Agreement (continued)
Repurchase Agreement with State
Street Corp. dated 11/30/2012 at
0.010% to be repurchased at $779,001
on 12/03/2012, collateralized by
$795,000 Federal National Mortgage
Association, 1.000% due 12/27/2012
(valued at $798,975, including interest) $ 779,000 $ 779,000
979,000
TOTAL SHORT-TERM INVESTMENTS (Cost $5,852,882) $ 5,852,882
Total Investments (Real Return Bond Fund)
(Cost $773,279,042) - 114.7% $ 810,134,103
Other assets and liabilities, net - (14.7%) (103,568,886)
TOTAL NET ASSETS - 100.0% $ 706,565,217
Redwood FundShares or
Principal
Amount Value
COMMON STOCKS - 90.9%
Consumer Discretionary - 13.6%
Auto Components - 1.8%
Autoliv, Inc. (D) 137,700 $ 8,311,572
Automobiles - 2.0%
Ford Motor Company (D) 792,900 9,078,705
Hotels, Restaurants & Leisure - 3.1%
Las Vegas Sands Corp. (D) 299,800 13,985,670
Media - 2.8%
CBS Corp., Class B (D) 353,400 12,715,332
Specialty Retail - 2.0%
Abercrombie & Fitch Company, Class A (D) 65,600 3,010,384
Tiffany & Company (D) 99,700 5,880,306
8,890,690
Textiles, Apparel & Luxury Goods - 1.9%
Coach, Inc. (D) 150,700 8,716,488
61,698,457
Consumer Staples - 10.2%
Beverages - 1.2%
Monster Beverage Corp. (D)(I) 108,800 5,663,040
Food & Staples Retailing - 3.8%
Walgreen Company (D) 322,800 10,946,148
Whole Foods Market, Inc. (D) 65,300 6,096,408
17,042,556
Food Products - 2.1%
Mead Johnson Nutrition Company 142,700 9,730,713
Personal Products - 3.1%
Avon Products, Inc. (D) 344,400 4,804,380
The Estee Lauder
Companies, Inc., Class A (D) 157,600 9,180,200
13,984,580
46,420,889
Energy - 10.8%
Energy Equipment & Services - 3.9%
Cameron International Corp. (D)(I) 170,400 9,193,080
Redwood Fund (continued)Shares or
Principal
Amount Value
COMMON STOCKS (continued)
Energy Equipment & Services (continued)
Transocean, Ltd. (D) 184,100 $ 8,505,420
17,698,500
Oil, Gas & Consumable Fuels - 6.9%
Copyright © 2013 www.secdatabase.com. All Rights Reserved.Please Consider the Environment Before Printing This Document
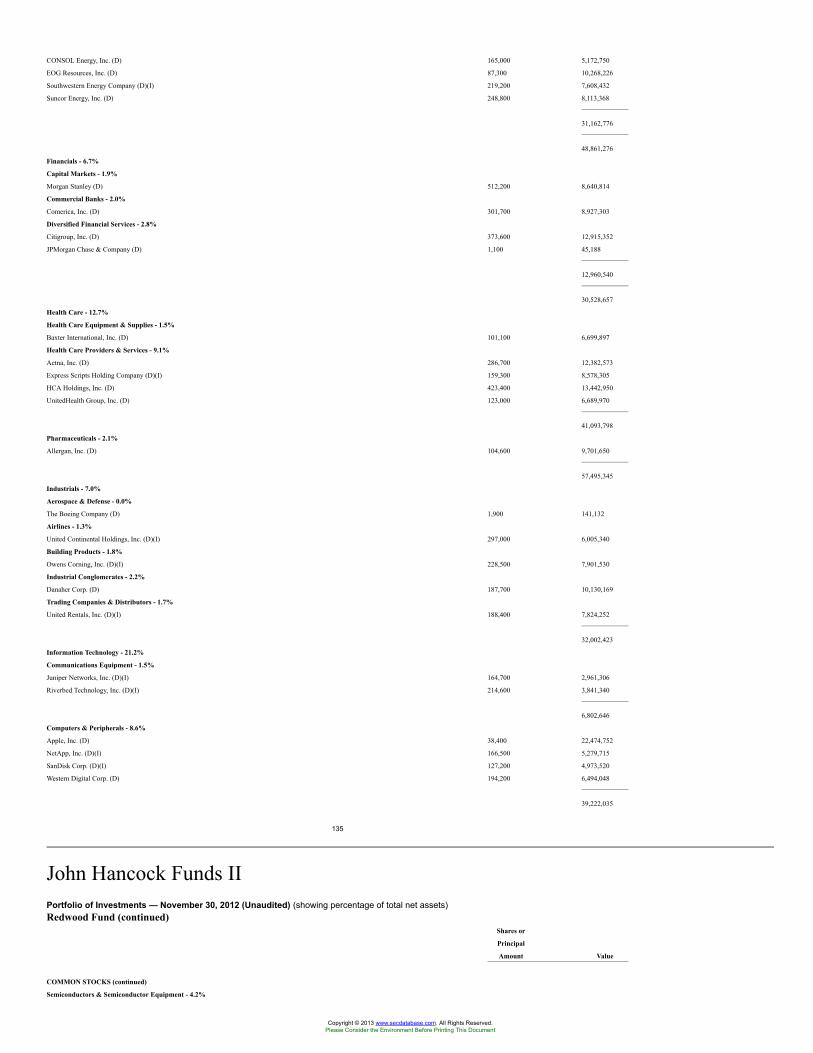
CONSOL Energy, Inc. (D) 165,000 5,172,750
EOG Resources, Inc. (D) 87,300 10,268,226
Southwestern Energy Company (D)(I) 219,200 7,608,432
Suncor Energy, Inc. (D) 248,800 8,113,368
31,162,776
48,861,276
Financials - 6.7%
Capital Markets - 1.9%
Morgan Stanley (D) 512,200 8,640,814
Commercial Banks - 2.0%
Comerica, Inc. (D) 301,700 8,927,303
Diversified Financial Services - 2.8%
Citigroup, Inc. (D) 373,600 12,915,352
JPMorgan Chase & Company (D) 1,100 45,188
12,960,540
30,528,657
Health Care - 12.7%
Health Care Equipment & Supplies - 1.5%
Baxter International, Inc. (D) 101,100 6,699,897
Health Care Providers & Services - 9.1%
Aetna, Inc. (D) 286,700 12,382,573
Express Scripts Holding Company (D)(I) 159,300 8,578,305
HCA Holdings, Inc. (D) 423,400 13,442,950
UnitedHealth Group, Inc. (D) 123,000 6,689,970
41,093,798
Pharmaceuticals - 2.1%
Allergan, Inc. (D) 104,600 9,701,650
57,495,345
Industrials - 7.0%
Aerospace & Defense - 0.0%
The Boeing Company (D) 1,900 141,132
Airlines - 1.3%
United Continental Holdings, Inc. (D)(I) 297,000 6,005,340
Building Products - 1.8%
Owens Corning, Inc. (D)(I) 228,500 7,901,530
Industrial Conglomerates - 2.2%
Danaher Corp. (D) 187,700 10,130,169
Trading Companies & Distributors - 1.7%
United Rentals, Inc. (D)(I) 188,400 7,824,252
32,002,423
Information Technology - 21.2%
Communications Equipment - 1.5%
Juniper Networks, Inc. (D)(I) 164,700 2,961,306
Riverbed Technology, Inc. (D)(I) 214,600 3,841,340
6,802,646
Computers & Peripherals - 8.6%
Apple, Inc. (D) 38,400 22,474,752
NetApp, Inc. (D)(I) 166,500 5,279,715
SanDisk Corp. (D)(I) 127,200 4,973,520
Western Digital Corp. (D) 194,200 6,494,048
39,222,035
135
John Hancock Funds IIPortfolio of Investments — November 30, 2012 (Unaudited) (showing percentage of total net assets)Redwood Fund (continued)
Shares or
Principal
Amount Value
COMMON STOCKS (continued)
Semiconductors & Semiconductor Equipment - 4.2%
Copyright © 2013 www.secdatabase.com. All Rights Reserved.Please Consider the Environment Before Printing This Document
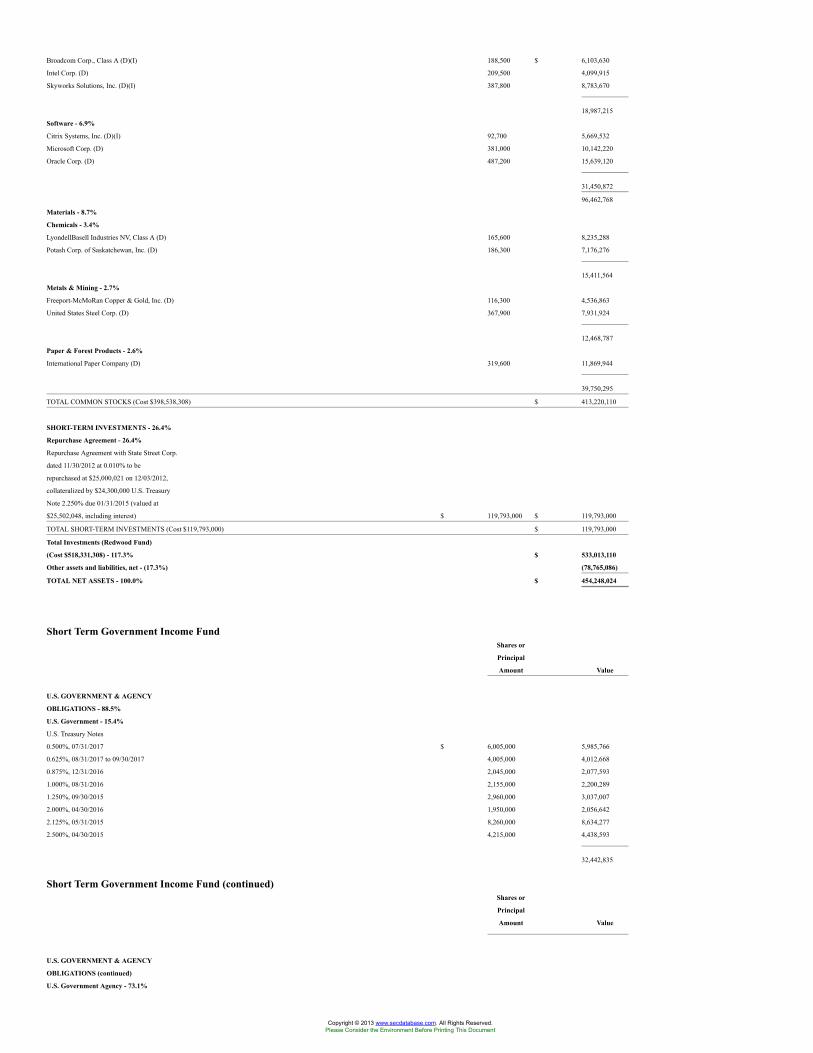
Broadcom Corp., Class A (D)(I) 188,500 $ 6,103,630
Intel Corp. (D) 209,500 4,099,915
Skyworks Solutions, Inc. (D)(I) 387,800 8,783,670
18,987,215
Software - 6.9%
Citrix Systems, Inc. (D)(I) 92,700 5,669,532
Microsoft Corp. (D) 381,000 10,142,220
Oracle Corp. (D) 487,200 15,639,120
31,450,872
96,462,768
Materials - 8.7%
Chemicals - 3.4%
LyondellBasell Industries NV, Class A (D) 165,600 8,235,288
Potash Corp. of Saskatchewan, Inc. (D) 186,300 7,176,276
15,411,564
Metals & Mining - 2.7%
Freeport-McMoRan Copper & Gold, Inc. (D) 116,300 4,536,863
United States Steel Corp. (D) 367,900 7,931,924
12,468,787
Paper & Forest Products - 2.6%
International Paper Company (D) 319,600 11,869,944
39,750,295
TOTAL COMMON STOCKS (Cost $398,538,308) $ 413,220,110
SHORT-TERM INVESTMENTS - 26.4%
Repurchase Agreement - 26.4%
Repurchase Agreement with State Street Corp.
dated 11/30/2012 at 0.010% to be
repurchased at $25,000,021 on 12/03/2012,
collateralized by $24,300,000 U.S. Treasury
Note 2.250% due 01/31/2015 (valued at
$25,502,048, including interest) $ 119,793,000 $ 119,793,000
TOTAL SHORT-TERM INVESTMENTS (Cost $119,793,000) $ 119,793,000
Total Investments (Redwood Fund)
(Cost $518,331,308) - 117.3% $ 533,013,110
Other assets and liabilities, net - (17.3%) (78,765,086)
TOTAL NET ASSETS - 100.0% $ 454,248,024
Short Term Government Income FundShares or
Principal
Amount Value
U.S. GOVERNMENT & AGENCY
OBLIGATIONS - 88.5%
U.S. Government - 15.4%
U.S. Treasury Notes
0.500%, 07/31/2017 $ 6,005,000 5,985,766
0.625%, 08/31/2017 to 09/30/2017 4,005,000 4,012,668
0.875%, 12/31/2016 2,045,000 2,077,593
1.000%, 08/31/2016 2,155,000 2,200,289
1.250%, 09/30/2015 2,960,000 3,037,007
2.000%, 04/30/2016 1,950,000 2,056,642
2.125%, 05/31/2015 8,260,000 8,634,277
2.500%, 04/30/2015 4,215,000 4,438,593
32,442,835
Short Term Government Income Fund (continued)Shares or
Principal
Amount Value
U.S. GOVERNMENT & AGENCY
OBLIGATIONS (continued)
U.S. Government Agency - 73.1%
Copyright © 2013 www.secdatabase.com. All Rights Reserved.Please Consider the Environment Before Printing This Document
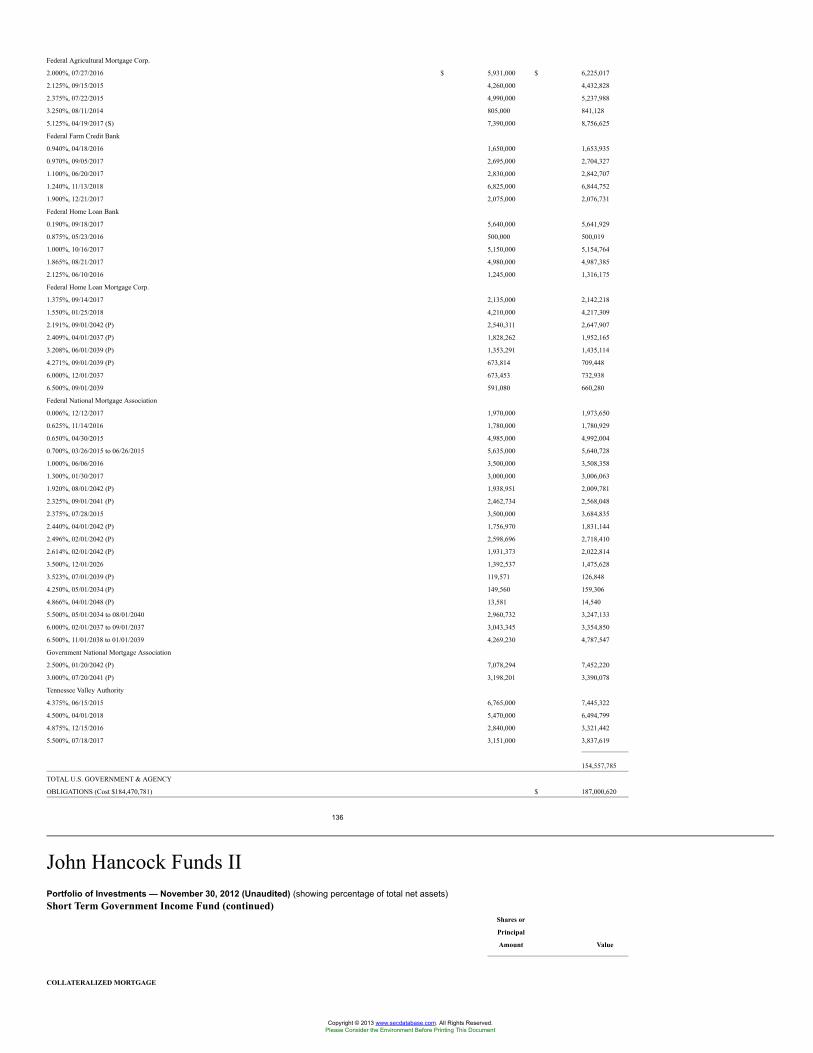
Federal Agricultural Mortgage Corp.
2.000%, 07/27/2016 $ 5,931,000 $ 6,225,017
2.125%, 09/15/2015 4,260,000 4,432,828
2.375%, 07/22/2015 4,990,000 5,237,988
3.250%, 08/11/2014 805,000 841,128
5.125%, 04/19/2017 (S) 7,390,000 8,756,625
Federal Farm Credit Bank
0.940%, 04/18/2016 1,650,000 1,653,935
0.970%, 09/05/2017 2,695,000 2,704,327
1.100%, 06/20/2017 2,830,000 2,842,707
1.240%, 11/13/2018 6,825,000 6,844,752
1.900%, 12/21/2017 2,075,000 2,076,731
Federal Home Loan Bank
0.190%, 09/18/2017 5,640,000 5,641,929
0.875%, 05/23/2016 500,000 500,019
1.000%, 10/16/2017 5,150,000 5,154,764
1.865%, 08/21/2017 4,980,000 4,987,385
2.125%, 06/10/2016 1,245,000 1,316,175
Federal Home Loan Mortgage Corp.
1.375%, 09/14/2017 2,135,000 2,142,218
1.550%, 01/25/2018 4,210,000 4,217,309
2.191%, 09/01/2042 (P) 2,540,311 2,647,907
2.409%, 04/01/2037 (P) 1,828,262 1,952,165
3.208%, 06/01/2039 (P) 1,353,291 1,435,114
4.271%, 09/01/2039 (P) 673,814 709,448
6.000%, 12/01/2037 673,453 732,938
6.500%, 09/01/2039 591,080 660,280
Federal National Mortgage Association
0.006%, 12/12/2017 1,970,000 1,973,650
0.625%, 11/14/2016 1,780,000 1,780,929
0.650%, 04/30/2015 4,985,000 4,992,004
0.700%, 03/26/2015 to 06/26/2015 5,635,000 5,640,728
1.000%, 06/06/2016 3,500,000 3,508,358
1.300%, 01/30/2017 3,000,000 3,006,063
1.920%, 08/01/2042 (P) 1,938,951 2,009,781
2.325%, 09/01/2041 (P) 2,462,734 2,568,048
2.375%, 07/28/2015 3,500,000 3,684,835
2.440%, 04/01/2042 (P) 1,756,970 1,831,144
2.496%, 02/01/2042 (P) 2,598,696 2,718,410
2.614%, 02/01/2042 (P) 1,931,373 2,022,814
3.500%, 12/01/2026 1,392,537 1,475,628
3.523%, 07/01/2039 (P) 119,571 126,848
4.250%, 05/01/2034 (P) 149,560 159,306
4.866%, 04/01/2048 (P) 13,581 14,540
5.500%, 05/01/2034 to 08/01/2040 2,960,732 3,247,133
6.000%, 02/01/2037 to 09/01/2037 3,043,345 3,354,850
6.500%, 11/01/2038 to 01/01/2039 4,269,230 4,787,547
Government National Mortgage Association
2.500%, 01/20/2042 (P) 7,078,294 7,452,220
3.000%, 07/20/2041 (P) 3,198,201 3,390,078
Tennessee Valley Authority
4.375%, 06/15/2015 6,765,000 7,445,322
4.500%, 04/01/2018 5,470,000 6,494,799
4.875%, 12/15/2016 2,840,000 3,321,442
5.500%, 07/18/2017 3,151,000 3,837,619
154,557,785
TOTAL U.S. GOVERNMENT & AGENCY
OBLIGATIONS (Cost $184,470,781) $ 187,000,620
136
John Hancock Funds IIPortfolio of Investments — November 30, 2012 (Unaudited) (showing percentage of total net assets)Short Term Government Income Fund (continued)
Shares or
Principal
Amount Value
COLLATERALIZED MORTGAGE
Copyright © 2013 www.secdatabase.com. All Rights Reserved.Please Consider the Environment Before Printing This Document
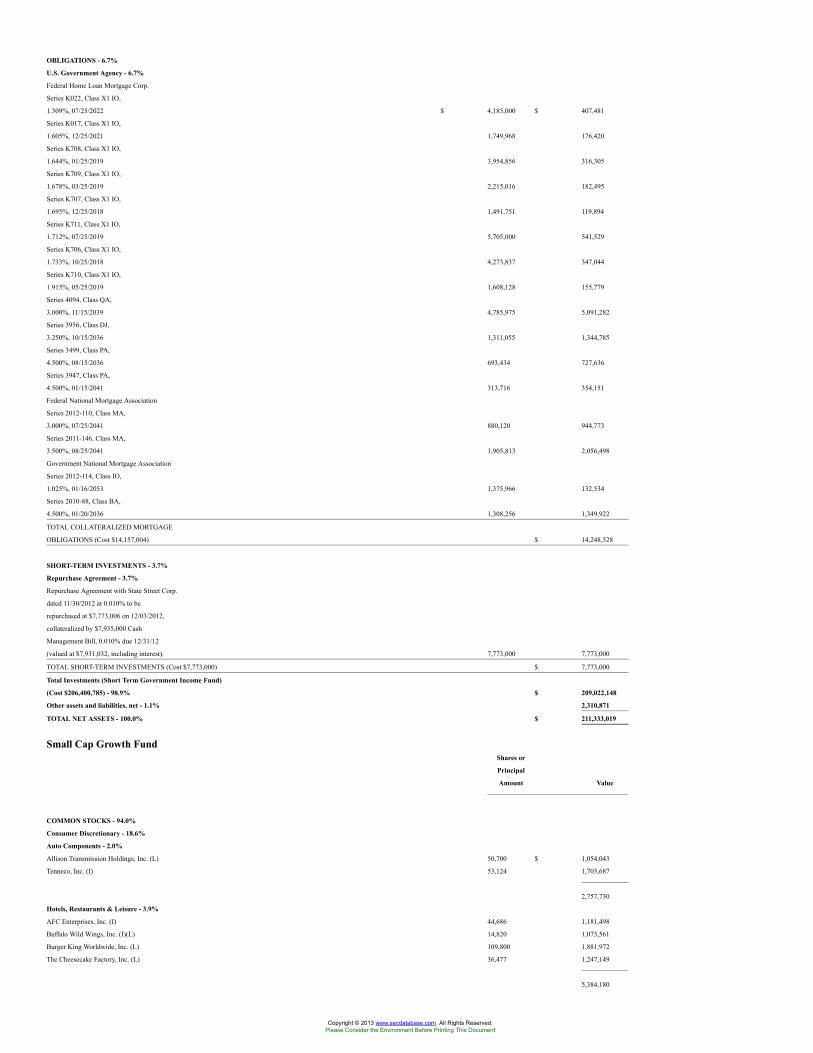
OBLIGATIONS - 6.7%
U.S. Government Agency - 6.7%
Federal Home Loan Mortgage Corp.
Series K022, Class X1 IO,
1.309%, 07/25/2022 $ 4,185,000 $ 407,481
Series K017, Class X1 IO,
1.605%, 12/25/2021 1,749,968 176,420
Series K708, Class X1 IO,
1.644%, 01/25/2019 3,954,856 316,305
Series K709, Class X1 IO,
1.678%, 03/25/2019 2,215,016 182,495
Series K707, Class X1 IO,
1.695%, 12/25/2018 1,491,751 119,894
Series K711, Class X1 IO,
1.712%, 07/25/2019 5,705,000 541,529
Series K706, Class X1 IO,
1.733%, 10/25/2018 4,273,837 347,044
Series K710, Class X1 IO,
1.915%, 05/25/2019 1,608,128 155,779
Series 4094, Class QA,
3.000%, 11/15/2039 4,785,975 5,091,282
Series 3956, Class DJ,
3.250%, 10/15/2036 1,311,055 1,344,785
Series 3499, Class PA,
4.500%, 08/15/2036 693,434 727,636
Series 3947, Class PA,
4.500%, 01/15/2041 313,716 354,151
Federal National Mortgage Association
Series 2012-110, Class MA,
3.000%, 07/25/2041 880,120 944,773
Series 2011-146, Class MA,
3.500%, 08/25/2041 1,905,813 2,056,498
Government National Mortgage Association
Series 2012-114, Class IO,
1.025%, 01/16/2053 1,375,966 132,534
Series 2010-88, Class BA,
4.500%, 01/20/2036 1,308,256 1,349,922
TOTAL COLLATERALIZED MORTGAGE
OBLIGATIONS (Cost $14,157,004) $ 14,248,528
SHORT-TERM INVESTMENTS - 3.7%
Repurchase Agreement - 3.7%
Repurchase Agreement with State Street Corp.
dated 11/30/2012 at 0.010% to be
repurchased at $7,773,006 on 12/03/2012,
collateralized by $7,935,000 Cash
Management Bill, 0.010% due 12/31/12
(valued at $7,931,032, including interest). 7,773,000 7,773,000
TOTAL SHORT-TERM INVESTMENTS (Cost $7,773,000) $ 7,773,000
Total Investments (Short Term Government Income Fund)
(Cost $206,400,785) - 98.9% $ 209,022,148
Other assets and liabilities, net - 1.1% 2,310,871
TOTAL NET ASSETS - 100.0% $ 211,333,019
Small Cap Growth FundShares or
Principal
Amount Value
COMMON STOCKS - 94.0%
Consumer Discretionary - 18.6%
Auto Components - 2.0%
Allison Transmission Holdings, Inc. (L) 50,700 $ 1,054,043
Tenneco, Inc. (I) 53,124 1,703,687
2,757,730
Hotels, Restaurants & Leisure - 3.9%
AFC Enterprises, Inc. (I) 44,686 1,181,498
Buffalo Wild Wings, Inc. (I)(L) 14,820 1,073,561
Burger King Worldwide, Inc. (L) 109,800 1,881,972
The Cheesecake Factory, Inc. (L) 36,477 1,247,149
5,384,180
Copyright © 2013 www.secdatabase.com. All Rights Reserved.Please Consider the Environment Before Printing This Document
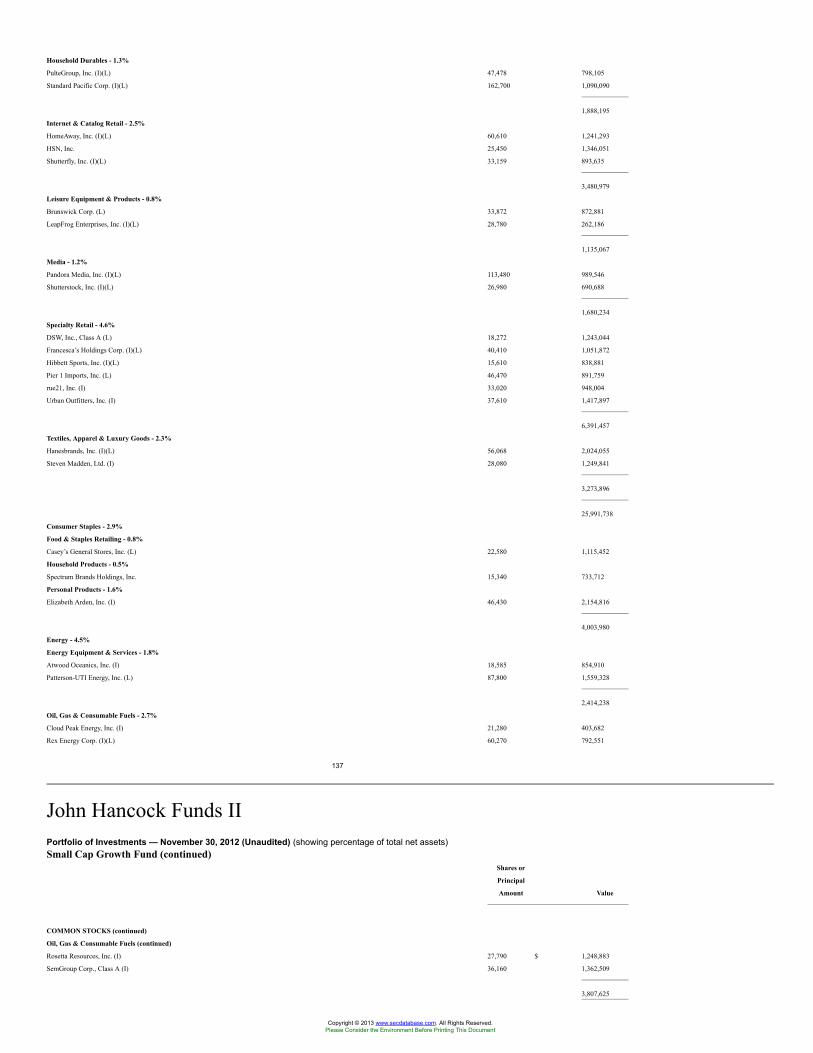
Household Durables - 1.3%
PulteGroup, Inc. (I)(L) 47,478 798,105
Standard Pacific Corp. (I)(L) 162,700 1,090,090
1,888,195
Internet & Catalog Retail - 2.5%
HomeAway, Inc. (I)(L) 60,610 1,241,293
HSN, Inc. 25,450 1,346,051
Shutterfly, Inc. (I)(L) 33,159 893,635
3,480,979
Leisure Equipment & Products - 0.8%
Brunswick Corp. (L) 33,872 872,881
LeapFrog Enterprises, Inc. (I)(L) 28,780 262,186
1,135,067
Media - 1.2%
Pandora Media, Inc. (I)(L) 113,480 989,546
Shutterstock, Inc. (I)(L) 26,980 690,688
1,680,234
Specialty Retail - 4.6%
DSW, Inc., Class A (L) 18,272 1,243,044
Francesca’s Holdings Corp. (I)(L) 40,410 1,051,872
Hibbett Sports, Inc. (I)(L) 15,610 838,881
Pier 1 Imports, Inc. (L) 46,470 891,759
rue21, Inc. (I) 33,020 948,004
Urban Outfitters, Inc. (I) 37,610 1,417,897
6,391,457
Textiles, Apparel & Luxury Goods - 2.3%
Hanesbrands, Inc. (I)(L) 56,068 2,024,055
Steven Madden, Ltd. (I) 28,080 1,249,841
3,273,896
25,991,738
Consumer Staples - 2.9%
Food & Staples Retailing - 0.8%
Casey’s General Stores, Inc. (L) 22,580 1,115,452
Household Products - 0.5%
Spectrum Brands Holdings, Inc. 15,340 733,712
Personal Products - 1.6%
Elizabeth Arden, Inc. (I) 46,430 2,154,816
4,003,980
Energy - 4.5%
Energy Equipment & Services - 1.8%
Atwood Oceanics, Inc. (I) 18,585 854,910
Patterson-UTI Energy, Inc. (L) 87,800 1,559,328
2,414,238
Oil, Gas & Consumable Fuels - 2.7%
Cloud Peak Energy, Inc. (I) 21,280 403,682
Rex Energy Corp. (I)(L) 60,270 792,551
137
John Hancock Funds IIPortfolio of Investments — November 30, 2012 (Unaudited) (showing percentage of total net assets)Small Cap Growth Fund (continued)
Shares or
Principal
Amount Value
COMMON STOCKS (continued)
Oil, Gas & Consumable Fuels (continued)
Rosetta Resources, Inc. (I) 27,790 $ 1,248,883
SemGroup Corp., Class A (I) 36,160 1,362,509
3,807,625
Copyright © 2013 www.secdatabase.com. All Rights Reserved.Please Consider the Environment Before Printing This Document
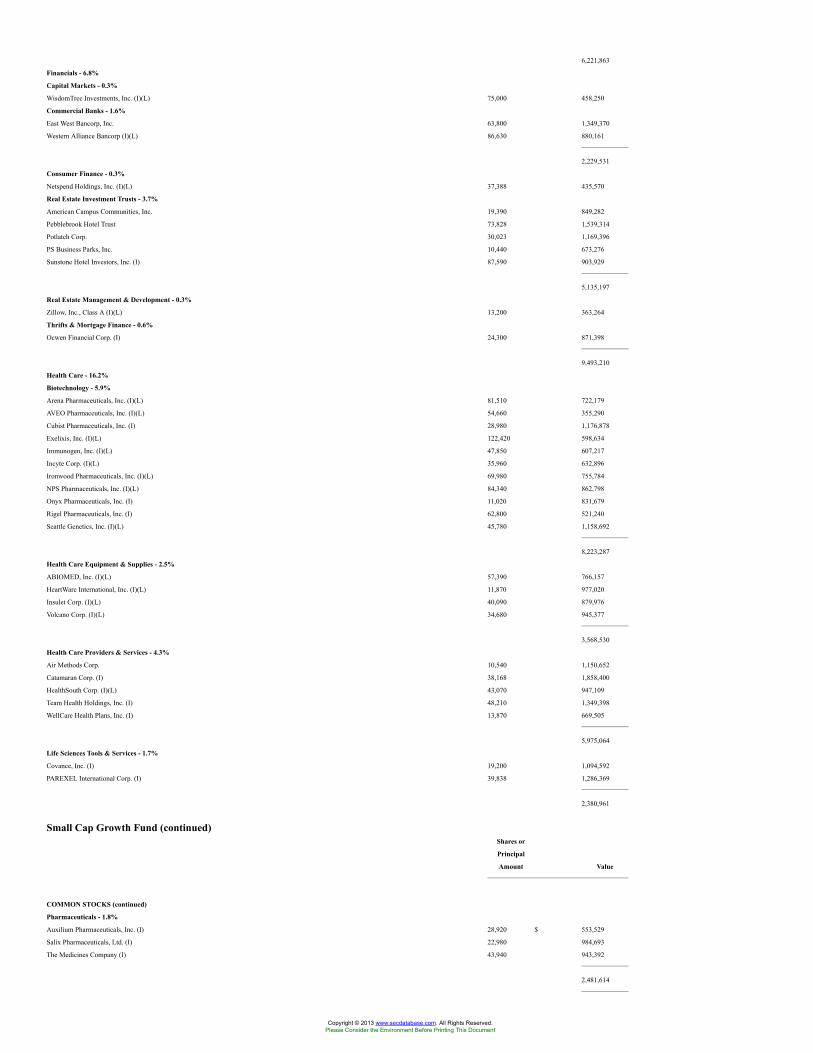
6,221,863
Financials - 6.8%
Capital Markets - 0.3%
WisdomTree Investments, Inc. (I)(L) 75,000 458,250
Commercial Banks - 1.6%
East West Bancorp, Inc. 63,800 1,349,370
Western Alliance Bancorp (I)(L) 86,630 880,161
2,229,531
Consumer Finance - 0.3%
Netspend Holdings, Inc. (I)(L) 37,388 435,570
Real Estate Investment Trusts - 3.7%
American Campus Communities, Inc. 19,390 849,282
Pebblebrook Hotel Trust 73,828 1,539,314
Potlatch Corp. 30,023 1,169,396
PS Business Parks, Inc. 10,440 673,276
Sunstone Hotel Investors, Inc. (I) 87,590 903,929
5,135,197
Real Estate Management & Development - 0.3%
Zillow, Inc., Class A (I)(L) 13,200 363,264
Thrifts & Mortgage Finance - 0.6%
Ocwen Financial Corp. (I) 24,300 871,398
9,493,210
Health Care - 16.2%
Biotechnology - 5.9%
Arena Pharmaceuticals, Inc. (I)(L) 81,510 722,179
AVEO Pharmaceuticals, Inc. (I)(L) 54,660 355,290
Cubist Pharmaceuticals, Inc. (I) 28,980 1,176,878
Exelixis, Inc. (I)(L) 122,420 598,634
Immunogen, Inc. (I)(L) 47,850 607,217
Incyte Corp. (I)(L) 35,960 632,896
Ironwood Pharmaceuticals, Inc. (I)(L) 69,980 755,784
NPS Pharmaceuticals, Inc. (I)(L) 84,340 862,798
Onyx Pharmaceuticals, Inc. (I) 11,020 831,679
Rigel Pharmaceuticals, Inc. (I) 62,800 521,240
Seattle Genetics, Inc. (I)(L) 45,780 1,158,692
8,223,287
Health Care Equipment & Supplies - 2.5%
ABIOMED, Inc. (I)(L) 57,390 766,157
HeartWare International, Inc. (I)(L) 11,870 977,020
Insulet Corp. (I)(L) 40,090 879,976
Volcano Corp. (I)(L) 34,680 945,377
3,568,530
Health Care Providers & Services - 4.3%
Air Methods Corp. 10,540 1,150,652
Catamaran Corp. (I) 38,168 1,858,400
HealthSouth Corp. (I)(L) 43,070 947,109
Team Health Holdings, Inc. (I) 48,210 1,349,398
WellCare Health Plans, Inc. (I) 13,870 669,505
5,975,064
Life Sciences Tools & Services - 1.7%
Covance, Inc. (I) 19,200 1,094,592
PAREXEL International Corp. (I) 39,838 1,286,369
2,380,961
Small Cap Growth Fund (continued)Shares or
Principal
Amount Value
COMMON STOCKS (continued)
Pharmaceuticals - 1.8%
Auxilium Pharmaceuticals, Inc. (I) 28,920 $ 553,529
Salix Pharmaceuticals, Ltd. (I) 22,980 984,693
The Medicines Company (I) 43,940 943,392
2,481,614
Copyright © 2013 www.secdatabase.com. All Rights Reserved.Please Consider the Environment Before Printing This Document
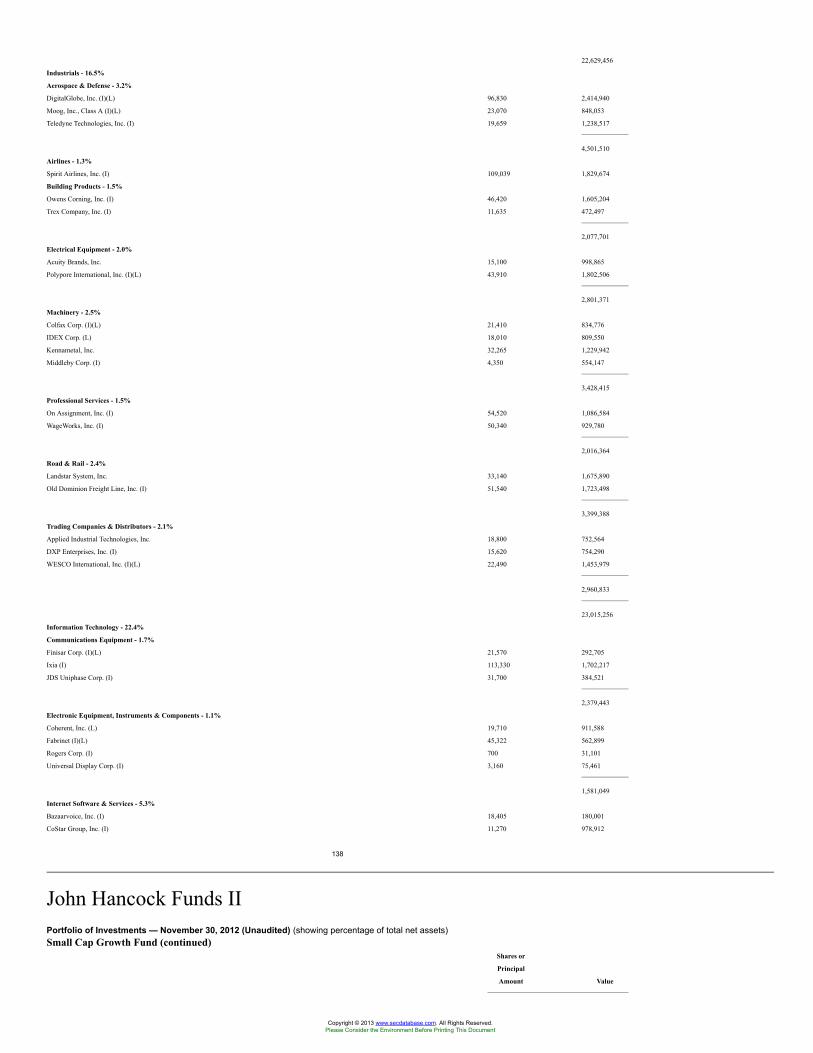
22,629,456
Industrials - 16.5%
Aerospace & Defense - 3.2%
DigitalGlobe, Inc. (I)(L) 96,830 2,414,940
Moog, Inc., Class A (I)(L) 23,070 848,053
Teledyne Technologies, Inc. (I) 19,659 1,238,517
4,501,510
Airlines - 1.3%
Spirit Airlines, Inc. (I) 109,039 1,829,674
Building Products - 1.5%
Owens Corning, Inc. (I) 46,420 1,605,204
Trex Company, Inc. (I) 11,635 472,497
2,077,701
Electrical Equipment - 2.0%
Acuity Brands, Inc. 15,100 998,865
Polypore International, Inc. (I)(L) 43,910 1,802,506
2,801,371
Machinery - 2.5%
Colfax Corp. (I)(L) 21,410 834,776
IDEX Corp. (L) 18,010 809,550
Kennametal, Inc. 32,265 1,229,942
Middleby Corp. (I) 4,350 554,147
3,428,415
Professional Services - 1.5%
On Assignment, Inc. (I) 54,520 1,086,584
WageWorks, Inc. (I) 50,340 929,780
2,016,364
Road & Rail - 2.4%
Landstar System, Inc. 33,140 1,675,890
Old Dominion Freight Line, Inc. (I) 51,540 1,723,498
3,399,388
Trading Companies & Distributors - 2.1%
Applied Industrial Technologies, Inc. 18,800 752,564
DXP Enterprises, Inc. (I) 15,620 754,290
WESCO International, Inc. (I)(L) 22,490 1,453,979
2,960,833
23,015,256
Information Technology - 22.4%
Communications Equipment - 1.7%
Finisar Corp. (I)(L) 21,570 292,705
Ixia (I) 113,330 1,702,217
JDS Uniphase Corp. (I) 31,700 384,521
2,379,443
Electronic Equipment, Instruments & Components - 1.1%
Coherent, Inc. (L) 19,710 911,588
Fabrinet (I)(L) 45,322 562,899
Rogers Corp. (I) 700 31,101
Universal Display Corp. (I) 3,160 75,461
1,581,049
Internet Software & Services - 5.3%
Bazaarvoice, Inc. (I) 18,405 180,001
CoStar Group, Inc. (I) 11,270 978,912
138
John Hancock Funds IIPortfolio of Investments — November 30, 2012 (Unaudited) (showing percentage of total net assets)Small Cap Growth Fund (continued)
Shares or
Principal
Amount Value
Copyright © 2013 www.secdatabase.com. All Rights Reserved.Please Consider the Environment Before Printing This Document
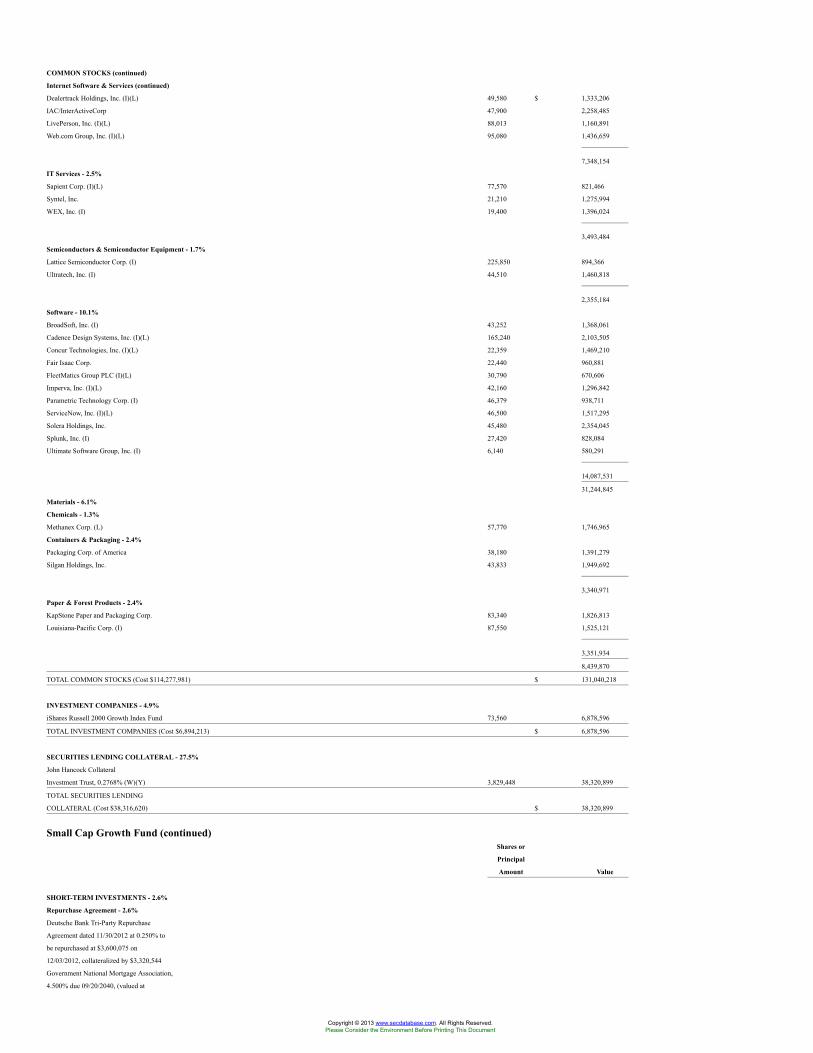
COMMON STOCKS (continued)
Internet Software & Services (continued)
Dealertrack Holdings, Inc. (I)(L) 49,580 $ 1,333,206
IAC/InterActiveCorp 47,900 2,258,485
LivePerson, Inc. (I)(L) 88,013 1,160,891
Web.com Group, Inc. (I)(L) 95,080 1,436,659
7,348,154
IT Services - 2.5%
Sapient Corp. (I)(L) 77,570 821,466
Syntel, Inc. 21,210 1,275,994
WEX, Inc. (I) 19,400 1,396,024
3,493,484
Semiconductors & Semiconductor Equipment - 1.7%
Lattice Semiconductor Corp. (I) 225,850 894,366
Ultratech, Inc. (I) 44,510 1,460,818
2,355,184
Software - 10.1%
BroadSoft, Inc. (I) 43,252 1,368,061
Cadence Design Systems, Inc. (I)(L) 165,240 2,103,505
Concur Technologies, Inc. (I)(L) 22,359 1,469,210
Fair Isaac Corp. 22,440 960,881
FleetMatics Group PLC (I)(L) 30,790 670,606
Imperva, Inc. (I)(L) 42,160 1,296,842
Parametric Technology Corp. (I) 46,379 938,711
ServiceNow, Inc. (I)(L) 46,500 1,517,295
Solera Holdings, Inc. 45,480 2,354,045
Splunk, Inc. (I) 27,420 828,084
Ultimate Software Group, Inc. (I) 6,140 580,291
14,087,531
31,244,845
Materials - 6.1%
Chemicals - 1.3%
Methanex Corp. (L) 57,770 1,746,965
Containers & Packaging - 2.4%
Packaging Corp. of America 38,180 1,391,279
Silgan Holdings, Inc. 43,833 1,949,692
3,340,971
Paper & Forest Products - 2.4%
KapStone Paper and Packaging Corp. 83,340 1,826,813
Louisiana-Pacific Corp. (I) 87,550 1,525,121
3,351,934
8,439,870
TOTAL COMMON STOCKS (Cost $114,277,981) $ 131,040,218
INVESTMENT COMPANIES - 4.9%
iShares Russell 2000 Growth Index Fund 73,560 6,878,596
TOTAL INVESTMENT COMPANIES (Cost $6,894,213) $ 6,878,596
SECURITIES LENDING COLLATERAL - 27.5%
John Hancock Collateral
Investment Trust, 0.2768% (W)(Y) 3,829,448 38,320,899
TOTAL SECURITIES LENDING
COLLATERAL (Cost $38,316,620) $ 38,320,899
Small Cap Growth Fund (continued)Shares or
Principal
Amount Value
SHORT-TERM INVESTMENTS - 2.6%
Repurchase Agreement - 2.6%
Deutsche Bank Tri-Party Repurchase
Agreement dated 11/30/2012 at 0.250% to
be repurchased at $3,600,075 on
12/03/2012, collateralized by $3,320,544
Government National Mortgage Association,
4.500% due 09/20/2040, (valued at
Copyright © 2013 www.secdatabase.com. All Rights Reserved.Please Consider the Environment Before Printing This Document
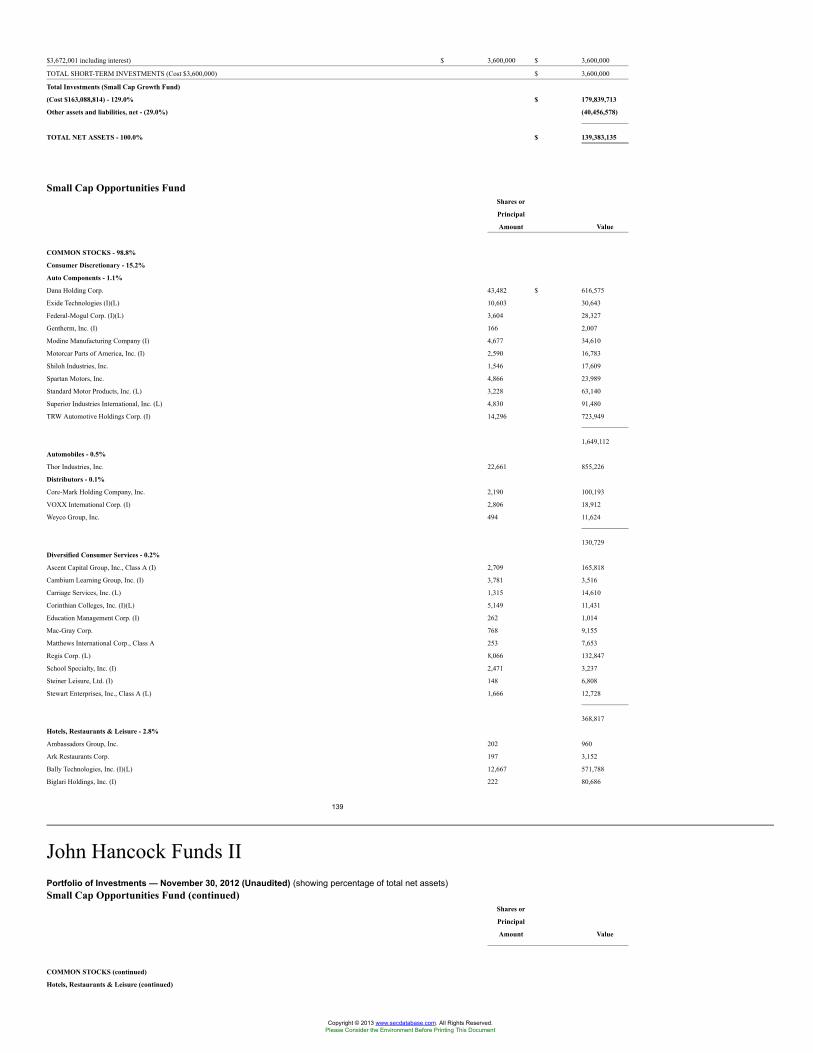
$3,672,001 including interest) $ 3,600,000 $ 3,600,000
TOTAL SHORT-TERM INVESTMENTS (Cost $3,600,000) $ 3,600,000
Total Investments (Small Cap Growth Fund)
(Cost $163,088,814) - 129.0% $ 179,839,713
Other assets and liabilities, net - (29.0%) (40,456,578)
TOTAL NET ASSETS - 100.0% $ 139,383,135
Small Cap Opportunities FundShares or
Principal
Amount Value
COMMON STOCKS - 98.8%
Consumer Discretionary - 15.2%
Auto Components - 1.1%
Dana Holding Corp. 43,482 $ 616,575
Exide Technologies (I)(L) 10,603 30,643
Federal-Mogul Corp. (I)(L) 3,604 28,327
Gentherm, Inc. (I) 166 2,007
Modine Manufacturing Company (I) 4,677 34,610
Motorcar Parts of America, Inc. (I) 2,590 16,783
Shiloh Industries, Inc. 1,546 17,609
Spartan Motors, Inc. 4,866 23,989
Standard Motor Products, Inc. (L) 3,228 63,140
Superior Industries International, Inc. (L) 4,830 91,480
TRW Automotive Holdings Corp. (I) 14,296 723,949
1,649,112
Automobiles - 0.5%
Thor Industries, Inc. 22,661 855,226
Distributors - 0.1%
Core-Mark Holding Company, Inc. 2,190 100,193
VOXX International Corp. (I) 2,806 18,912
Weyco Group, Inc. 494 11,624
130,729
Diversified Consumer Services - 0.2%
Ascent Capital Group, Inc., Class A (I) 2,709 165,818
Cambium Learning Group, Inc. (I) 3,781 3,516
Carriage Services, Inc. (L) 1,315 14,610
Corinthian Colleges, Inc. (I)(L) 5,149 11,431
Education Management Corp. (I) 262 1,014
Mac-Gray Corp. 768 9,155
Matthews International Corp., Class A 253 7,653
Regis Corp. (L) 8,066 132,847
School Specialty, Inc. (I) 2,471 3,237
Steiner Leisure, Ltd. (I) 148 6,808
Stewart Enterprises, Inc., Class A (L) 1,666 12,728
368,817
Hotels, Restaurants & Leisure - 2.8%
Ambassadors Group, Inc. 202 960
Ark Restaurants Corp. 197 3,152
Bally Technologies, Inc. (I)(L) 12,667 571,788
Biglari Holdings, Inc. (I) 222 80,686
139
John Hancock Funds IIPortfolio of Investments — November 30, 2012 (Unaudited) (showing percentage of total net assets)Small Cap Opportunities Fund (continued)
Shares or
Principal
Amount Value
COMMON STOCKS (continued)
Hotels, Restaurants & Leisure (continued)
Copyright © 2013 www.secdatabase.com. All Rights Reserved.Please Consider the Environment Before Printing This Document
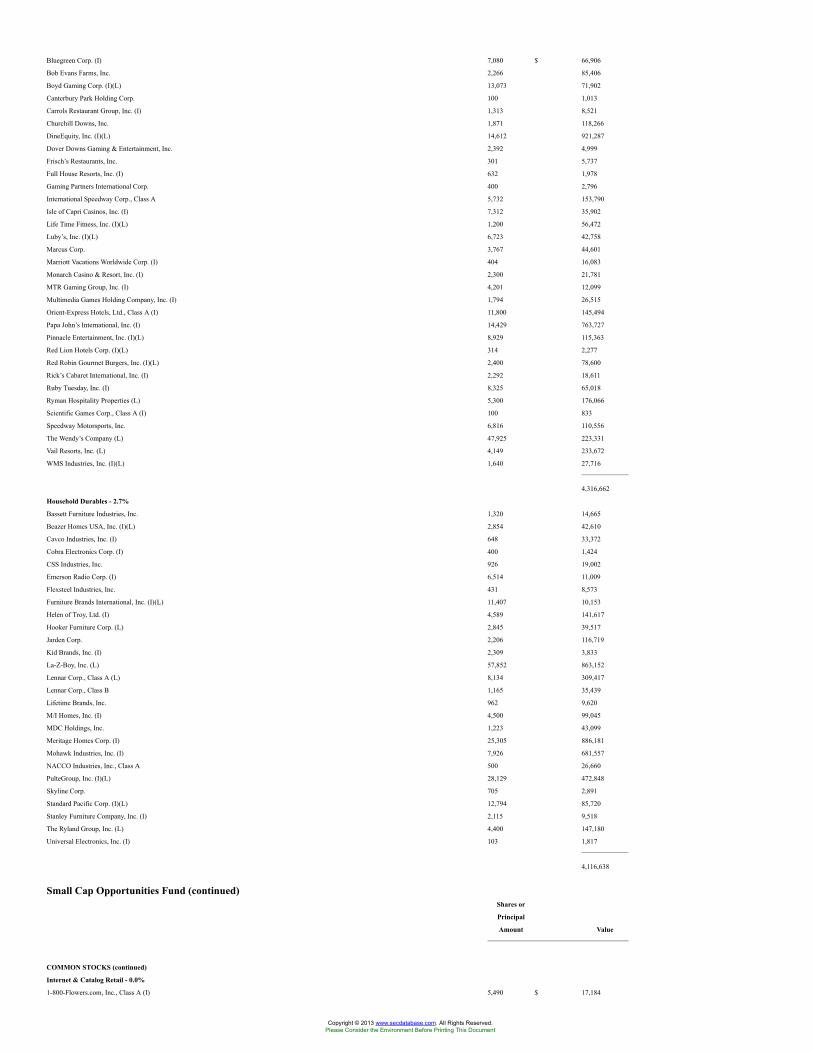
Bluegreen Corp. (I) 7,080 $ 66,906
Bob Evans Farms, Inc. 2,266 85,406
Boyd Gaming Corp. (I)(L) 13,073 71,902
Canterbury Park Holding Corp. 100 1,013
Carrols Restaurant Group, Inc. (I) 1,313 8,521
Churchill Downs, Inc. 1,871 118,266
DineEquity, Inc. (I)(L) 14,612 921,287
Dover Downs Gaming & Entertainment, Inc. 2,392 4,999
Frisch’s Restaurants, Inc. 301 5,737
Full House Resorts, Inc. (I) 632 1,978
Gaming Partners International Corp. 400 2,796
International Speedway Corp., Class A 5,732 153,790
Isle of Capri Casinos, Inc. (I) 7,312 35,902
Life Time Fitness, Inc. (I)(L) 1,200 56,472
Luby’s, Inc. (I)(L) 6,723 42,758
Marcus Corp. 3,767 44,601
Marriott Vacations Worldwide Corp. (I) 404 16,083
Monarch Casino & Resort, Inc. (I) 2,300 21,781
MTR Gaming Group, Inc. (I) 4,201 12,099
Multimedia Games Holding Company, Inc. (I) 1,794 26,515
Orient-Express Hotels, Ltd., Class A (I) 11,800 145,494
Papa John’s International, Inc. (I) 14,429 763,727
Pinnacle Entertainment, Inc. (I)(L) 8,929 115,363
Red Lion Hotels Corp. (I)(L) 314 2,277
Red Robin Gourmet Burgers, Inc. (I)(L) 2,400 78,600
Rick’s Cabaret International, Inc. (I) 2,292 18,611
Ruby Tuesday, Inc. (I) 8,325 65,018
Ryman Hospitality Properties (L) 5,300 176,066
Scientific Games Corp., Class A (I) 100 833
Speedway Motorsports, Inc. 6,816 110,556
The Wendy’s Company (L) 47,925 223,331
Vail Resorts, Inc. (L) 4,149 233,672
WMS Industries, Inc. (I)(L) 1,640 27,716
4,316,662
Household Durables - 2.7%
Bassett Furniture Industries, Inc. 1,320 14,665
Beazer Homes USA, Inc. (I)(L) 2,854 42,610
Cavco Industries, Inc. (I) 648 33,372
Cobra Electronics Corp. (I) 400 1,424
CSS Industries, Inc. 926 19,002
Emerson Radio Corp. (I) 6,514 11,009
Flexsteel Industries, Inc. 431 8,573
Furniture Brands International, Inc. (I)(L) 11,407 10,153
Helen of Troy, Ltd. (I) 4,589 141,617
Hooker Furniture Corp. (L) 2,845 39,517
Jarden Corp. 2,206 116,719
Kid Brands, Inc. (I) 2,309 3,833
La-Z-Boy, Inc. (L) 57,852 863,152
Lennar Corp., Class A (L) 8,134 309,417
Lennar Corp., Class B 1,165 35,439
Lifetime Brands, Inc. 962 9,620
M/I Homes, Inc. (I) 4,500 99,045
MDC Holdings, Inc. 1,223 43,099
Meritage Homes Corp. (I) 25,305 886,181
Mohawk Industries, Inc. (I) 7,926 681,557
NACCO Industries, Inc., Class A 500 26,660
PulteGroup, Inc. (I)(L) 28,129 472,848
Skyline Corp. 705 2,891
Standard Pacific Corp. (I)(L) 12,794 85,720
Stanley Furniture Company, Inc. (I) 2,115 9,518
The Ryland Group, Inc. (L) 4,400 147,180
Universal Electronics, Inc. (I) 103 1,817
4,116,638
Small Cap Opportunities Fund (continued)Shares or
Principal
Amount Value
COMMON STOCKS (continued)
Internet & Catalog Retail - 0.0%
1-800-Flowers.com, Inc., Class A (I) 5,490 $ 17,184
Copyright © 2013 www.secdatabase.com. All Rights Reserved.Please Consider the Environment Before Printing This Document
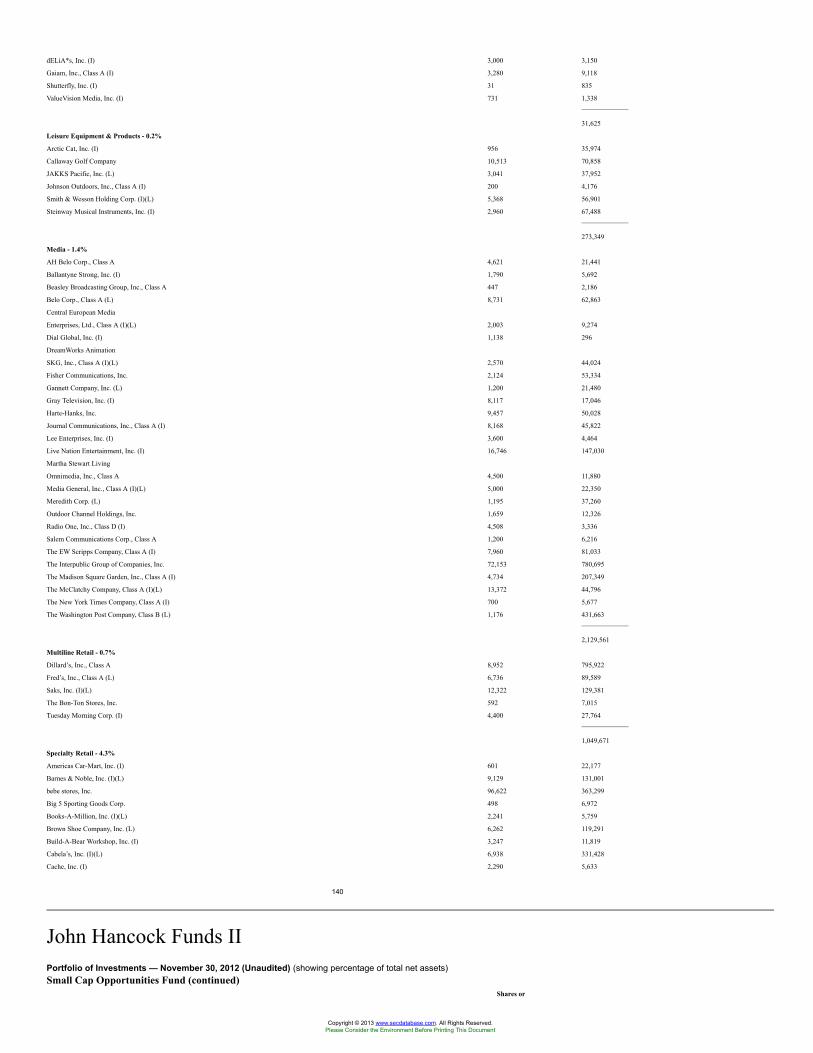
dELiA*s, Inc. (I) 3,000 3,150
Gaiam, Inc., Class A (I) 3,280 9,118
Shutterfly, Inc. (I) 31 835
ValueVision Media, Inc. (I) 731 1,338
31,625
Leisure Equipment & Products - 0.2%
Arctic Cat, Inc. (I) 956 35,974
Callaway Golf Company 10,513 70,858
JAKKS Pacific, Inc. (L) 3,041 37,952
Johnson Outdoors, Inc., Class A (I) 200 4,176
Smith & Wesson Holding Corp. (I)(L) 5,368 56,901
Steinway Musical Instruments, Inc. (I) 2,960 67,488
273,349
Media - 1.4%
AH Belo Corp., Class A 4,621 21,441
Ballantyne Strong, Inc. (I) 1,790 5,692
Beasley Broadcasting Group, Inc., Class A 447 2,186
Belo Corp., Class A (L) 8,731 62,863
Central European Media
Enterprises, Ltd., Class A (I)(L) 2,003 9,274
Dial Global, Inc. (I) 1,138 296
DreamWorks Animation
SKG, Inc., Class A (I)(L) 2,570 44,024
Fisher Communications, Inc. 2,124 53,334
Gannett Company, Inc. (L) 1,200 21,480
Gray Television, Inc. (I) 8,117 17,046
Harte-Hanks, Inc. 9,457 50,028
Journal Communications, Inc., Class A (I) 8,168 45,822
Lee Enterprises, Inc. (I) 3,600 4,464
Live Nation Entertainment, Inc. (I) 16,746 147,030
Martha Stewart Living
Omnimedia, Inc., Class A 4,500 11,880
Media General, Inc., Class A (I)(L) 5,000 22,350
Meredith Corp. (L) 1,195 37,260
Outdoor Channel Holdings, Inc. 1,659 12,326
Radio One, Inc., Class D (I) 4,508 3,336
Salem Communications Corp., Class A 1,200 6,216
The EW Scripps Company, Class A (I) 7,960 81,033
The Interpublic Group of Companies, Inc. 72,153 780,695
The Madison Square Garden, Inc., Class A (I) 4,734 207,349
The McClatchy Company, Class A (I)(L) 13,372 44,796
The New York Times Company, Class A (I) 700 5,677
The Washington Post Company, Class B (L) 1,176 431,663
2,129,561
Multiline Retail - 0.7%
Dillard’s, Inc., Class A 8,952 795,922
Fred’s, Inc., Class A (L) 6,736 89,589
Saks, Inc. (I)(L) 12,322 129,381
The Bon-Ton Stores, Inc. 592 7,015
Tuesday Morning Corp. (I) 4,400 27,764
1,049,671
Specialty Retail - 4.3%
Americas Car-Mart, Inc. (I) 601 22,177
Barnes & Noble, Inc. (I)(L) 9,129 131,001
bebe stores, Inc. 96,622 363,299
Big 5 Sporting Goods Corp. 498 6,972
Books-A-Million, Inc. (I)(L) 2,241 5,759
Brown Shoe Company, Inc. (L) 6,262 119,291
Build-A-Bear Workshop, Inc. (I) 3,247 11,819
Cabela’s, Inc. (I)(L) 6,938 331,428
Cache, Inc. (I) 2,290 5,633
140
John Hancock Funds IIPortfolio of Investments — November 30, 2012 (Unaudited) (showing percentage of total net assets)Small Cap Opportunities Fund (continued)
Shares or
Copyright © 2013 www.secdatabase.com. All Rights Reserved.Please Consider the Environment Before Printing This Document
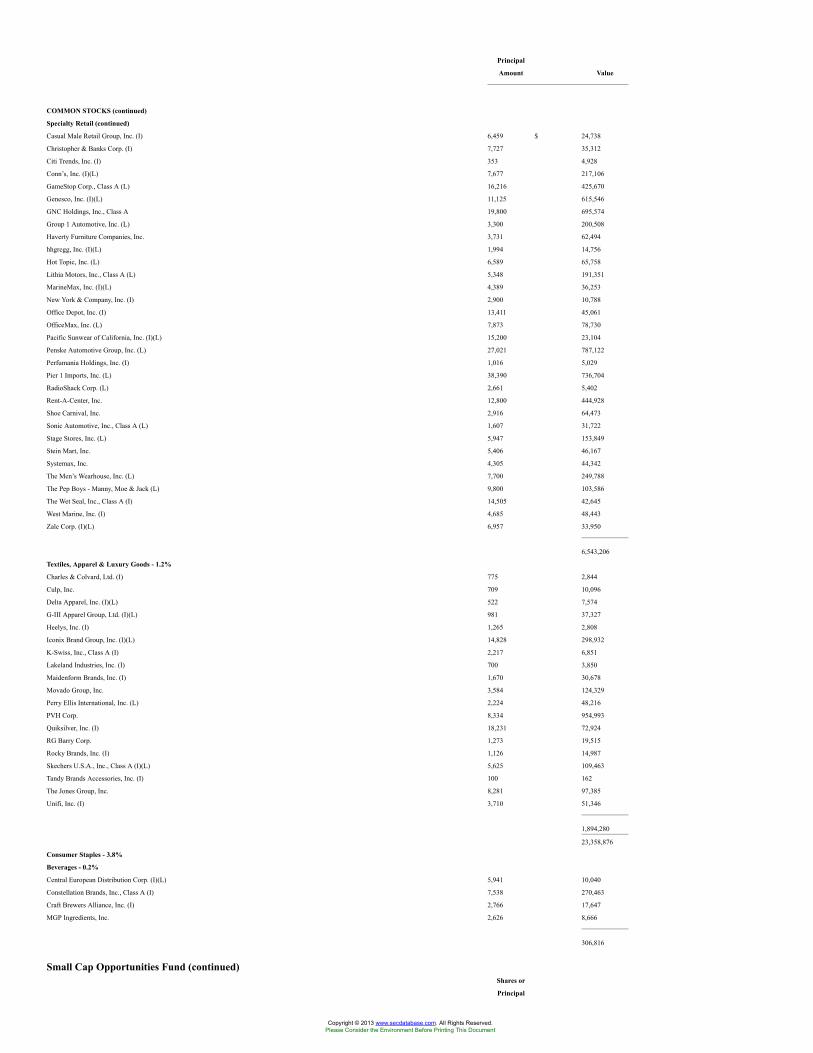
Principal
Amount Value
COMMON STOCKS (continued)
Specialty Retail (continued)
Casual Male Retail Group, Inc. (I) 6,459 $ 24,738
Christopher & Banks Corp. (I) 7,727 35,312
Citi Trends, Inc. (I) 353 4,928
Conn’s, Inc. (I)(L) 7,677 217,106
GameStop Corp., Class A (L) 16,216 425,670
Genesco, Inc. (I)(L) 11,125 615,546
GNC Holdings, Inc., Class A 19,800 695,574
Group 1 Automotive, Inc. (L) 3,300 200,508
Haverty Furniture Companies, Inc. 3,731 62,494
hhgregg, Inc. (I)(L) 1,994 14,756
Hot Topic, Inc. (L) 6,589 65,758
Lithia Motors, Inc., Class A (L) 5,348 191,351
MarineMax, Inc. (I)(L) 4,389 36,253
New York & Company, Inc. (I) 2,900 10,788
Office Depot, Inc. (I) 13,411 45,061
OfficeMax, Inc. (L) 7,873 78,730
Pacific Sunwear of California, Inc. (I)(L) 15,200 23,104
Penske Automotive Group, Inc. (L) 27,021 787,122
Perfumania Holdings, Inc. (I) 1,016 5,029
Pier 1 Imports, Inc. (L) 38,390 736,704
RadioShack Corp. (L) 2,661 5,402
Rent-A-Center, Inc. 12,800 444,928
Shoe Carnival, Inc. 2,916 64,473
Sonic Automotive, Inc., Class A (L) 1,607 31,722
Stage Stores, Inc. (L) 5,947 153,849
Stein Mart, Inc. 5,406 46,167
Systemax, Inc. 4,305 44,342
The Men’s Wearhouse, Inc. (L) 7,700 249,788
The Pep Boys - Manny, Moe & Jack (L) 9,800 103,586
The Wet Seal, Inc., Class A (I) 14,505 42,645
West Marine, Inc. (I) 4,685 48,443
Zale Corp. (I)(L) 6,957 33,950
6,543,206
Textiles, Apparel & Luxury Goods - 1.2%
Charles & Colvard, Ltd. (I) 775 2,844
Culp, Inc. 709 10,096
Delta Apparel, Inc. (I)(L) 522 7,574
G-III Apparel Group, Ltd. (I)(L) 981 37,327
Heelys, Inc. (I) 1,265 2,808
Iconix Brand Group, Inc. (I)(L) 14,828 298,932
K-Swiss, Inc., Class A (I) 2,217 6,851
Lakeland Industries, Inc. (I) 700 3,850
Maidenform Brands, Inc. (I) 1,670 30,678
Movado Group, Inc. 3,584 124,329
Perry Ellis International, Inc. (L) 2,224 48,216
PVH Corp. 8,334 954,993
Quiksilver, Inc. (I) 18,231 72,924
RG Barry Corp. 1,273 19,515
Rocky Brands, Inc. (I) 1,126 14,987
Skechers U.S.A., Inc., Class A (I)(L) 5,625 109,463
Tandy Brands Accessories, Inc. (I) 100 162
The Jones Group, Inc. 8,281 97,385
Unifi, Inc. (I) 3,710 51,346
1,894,280
23,358,876
Consumer Staples - 3.8%
Beverages - 0.2%
Central European Distribution Corp. (I)(L) 5,941 10,040
Constellation Brands, Inc., Class A (I) 7,538 270,463
Craft Brewers Alliance, Inc. (I) 2,766 17,647
MGP Ingredients, Inc. 2,626 8,666
306,816
Small Cap Opportunities Fund (continued)Shares or
Principal
Copyright © 2013 www.secdatabase.com. All Rights Reserved.Please Consider the Environment Before Printing This Document
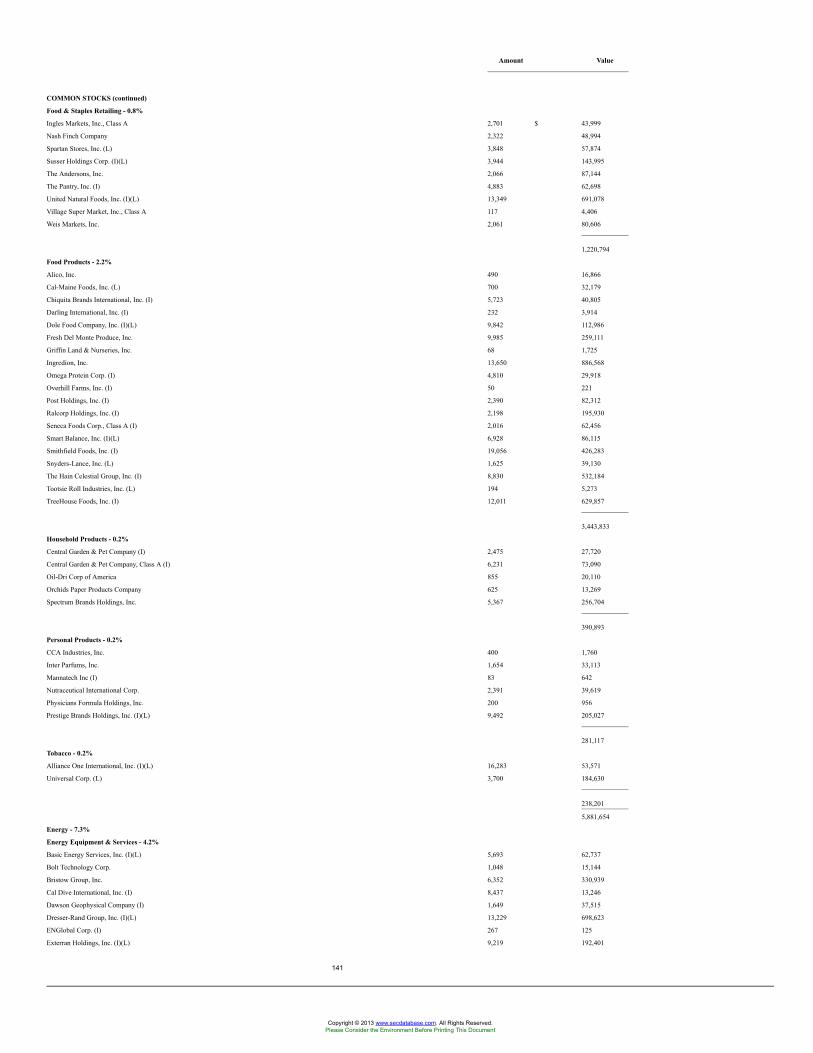
Amount Value
COMMON STOCKS (continued)
Food & Staples Retailing - 0.8%
Ingles Markets, Inc., Class A 2,701 $ 43,999
Nash Finch Company 2,322 48,994
Spartan Stores, Inc. (L) 3,848 57,874
Susser Holdings Corp. (I)(L) 3,944 143,995
The Andersons, Inc. 2,066 87,144
The Pantry, Inc. (I) 4,883 62,698
United Natural Foods, Inc. (I)(L) 13,349 691,078
Village Super Market, Inc., Class A 117 4,406
Weis Markets, Inc. 2,061 80,606
1,220,794
Food Products - 2.2%
Alico, Inc. 490 16,866
Cal-Maine Foods, Inc. (L) 700 32,179
Chiquita Brands International, Inc. (I) 5,723 40,805
Darling International, Inc. (I) 232 3,914
Dole Food Company, Inc. (I)(L) 9,842 112,986
Fresh Del Monte Produce, Inc. 9,985 259,111
Griffin Land & Nurseries, Inc. 68 1,725
Ingredion, Inc. 13,650 886,568
Omega Protein Corp. (I) 4,810 29,918
Overhill Farms, Inc. (I) 50 221
Post Holdings, Inc. (I) 2,390 82,312
Ralcorp Holdings, Inc. (I) 2,198 195,930
Seneca Foods Corp., Class A (I) 2,016 62,456
Smart Balance, Inc. (I)(L) 6,928 86,115
Smithfield Foods, Inc. (I) 19,056 426,283
Snyders-Lance, Inc. (L) 1,625 39,130
The Hain Celestial Group, Inc. (I) 8,830 532,184
Tootsie Roll Industries, Inc. (L) 194 5,273
TreeHouse Foods, Inc. (I) 12,011 629,857
3,443,833
Household Products - 0.2%
Central Garden & Pet Company (I) 2,475 27,720
Central Garden & Pet Company, Class A (I) 6,231 73,090
Oil-Dri Corp of America 855 20,110
Orchids Paper Products Company 625 13,269
Spectrum Brands Holdings, Inc. 5,367 256,704
390,893
Personal Products - 0.2%
CCA Industries, Inc. 400 1,760
Inter Parfums, Inc. 1,654 33,113
Mannatech Inc (I) 83 642
Nutraceutical International Corp. 2,391 39,619
Physicians Formula Holdings, Inc. 200 956
Prestige Brands Holdings, Inc. (I)(L) 9,492 205,027
281,117
Tobacco - 0.2%
Alliance One International, Inc. (I)(L) 16,283 53,571
Universal Corp. (L) 3,700 184,630
238,201
5,881,654
Energy - 7.3%
Energy Equipment & Services - 4.2%
Basic Energy Services, Inc. (I)(L) 5,693 62,737
Bolt Technology Corp. 1,048 15,144
Bristow Group, Inc. 6,352 330,939
Cal Dive International, Inc. (I) 8,437 13,246
Dawson Geophysical Company (I) 1,649 37,515
Dresser-Rand Group, Inc. (I)(L) 13,229 698,623
ENGlobal Corp. (I) 267 125
Exterran Holdings, Inc. (I)(L) 9,219 192,401
141
Copyright © 2013 www.secdatabase.com. All Rights Reserved.Please Consider the Environment Before Printing This Document
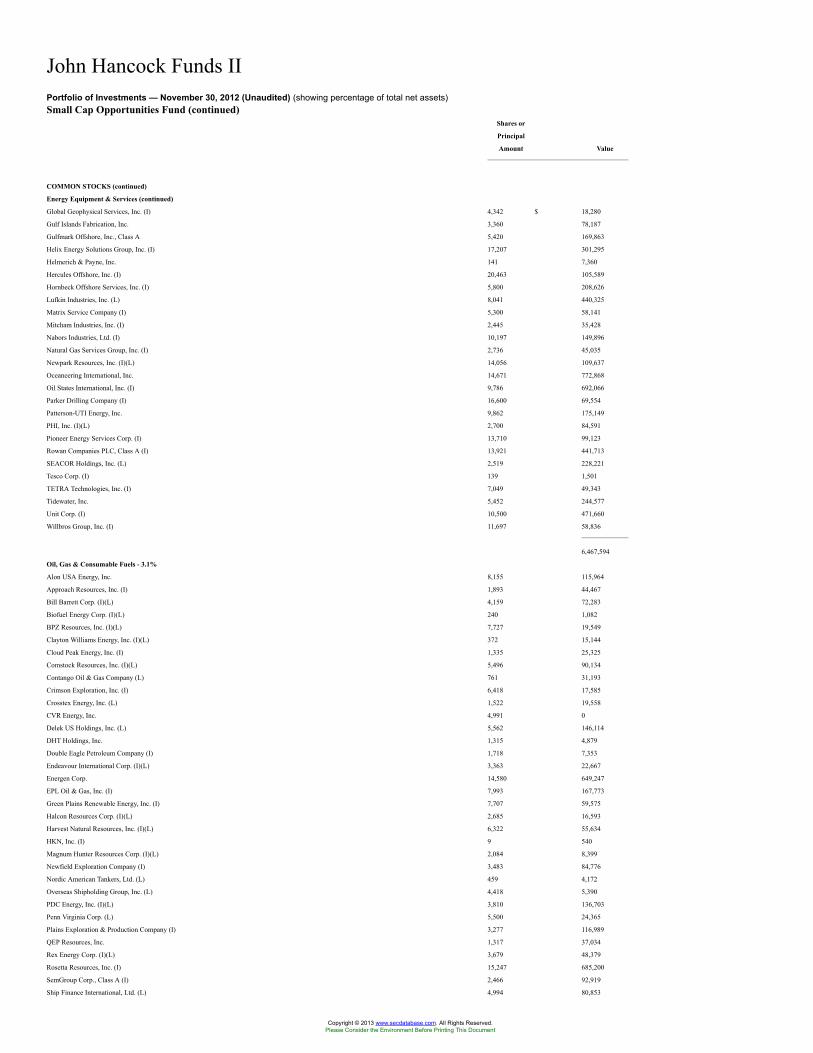
John Hancock Funds IIPortfolio of Investments — November 30, 2012 (Unaudited) (showing percentage of total net assets)Small Cap Opportunities Fund (continued)
Shares or
Principal
Amount Value
COMMON STOCKS (continued)
Energy Equipment & Services (continued)
Global Geophysical Services, Inc. (I) 4,342 $ 18,280
Gulf Islands Fabrication, Inc. 3,360 78,187
Gulfmark Offshore, Inc., Class A 5,420 169,863
Helix Energy Solutions Group, Inc. (I) 17,207 301,295
Helmerich & Payne, Inc. 141 7,360
Hercules Offshore, Inc. (I) 20,463 105,589
Hornbeck Offshore Services, Inc. (I) 5,800 208,626
Lufkin Industries, Inc. (L) 8,041 440,325
Matrix Service Company (I) 5,300 58,141
Mitcham Industries, Inc. (I) 2,445 35,428
Nabors Industries, Ltd. (I) 10,197 149,896
Natural Gas Services Group, Inc. (I) 2,736 45,035
Newpark Resources, Inc. (I)(L) 14,056 109,637
Oceaneering International, Inc. 14,671 772,868
Oil States International, Inc. (I) 9,786 692,066
Parker Drilling Company (I) 16,600 69,554
Patterson-UTI Energy, Inc. 9,862 175,149
PHI, Inc. (I)(L) 2,700 84,591
Pioneer Energy Services Corp. (I) 13,710 99,123
Rowan Companies PLC, Class A (I) 13,921 441,713
SEACOR Holdings, Inc. (L) 2,519 228,221
Tesco Corp. (I) 139 1,501
TETRA Technologies, Inc. (I) 7,049 49,343
Tidewater, Inc. 5,452 244,577
Unit Corp. (I) 10,500 471,660
Willbros Group, Inc. (I) 11,697 58,836
6,467,594
Oil, Gas & Consumable Fuels - 3.1%
Alon USA Energy, Inc. 8,155 115,964
Approach Resources, Inc. (I) 1,893 44,467
Bill Barrett Corp. (I)(L) 4,159 72,283
Biofuel Energy Corp. (I)(L) 240 1,082
BPZ Resources, Inc. (I)(L) 7,727 19,549
Clayton Williams Energy, Inc. (I)(L) 372 15,144
Cloud Peak Energy, Inc. (I) 1,335 25,325
Comstock Resources, Inc. (I)(L) 5,496 90,134
Contango Oil & Gas Company (L) 761 31,193
Crimson Exploration, Inc. (I) 6,418 17,585
Crosstex Energy, Inc. (L) 1,522 19,558
CVR Energy, Inc. 4,991 0
Delek US Holdings, Inc. (L) 5,562 146,114
DHT Holdings, Inc. 1,315 4,879
Double Eagle Petroleum Company (I) 1,718 7,353
Endeavour International Corp. (I)(L) 3,363 22,667
Energen Corp. 14,580 649,247
EPL Oil & Gas, Inc. (I) 7,993 167,773
Green Plains Renewable Energy, Inc. (I) 7,707 59,575
Halcon Resources Corp. (I)(L) 2,685 16,593
Harvest Natural Resources, Inc. (I)(L) 6,322 55,634
HKN, Inc. (I) 9 540
Magnum Hunter Resources Corp. (I)(L) 2,084 8,399
Newfield Exploration Company (I) 3,483 84,776
Nordic American Tankers, Ltd. (L) 459 4,172
Overseas Shipholding Group, Inc. (L) 4,418 5,390
PDC Energy, Inc. (I)(L) 3,810 136,703
Penn Virginia Corp. (L) 5,500 24,365
Plains Exploration & Production Company (I) 3,277 116,989
QEP Resources, Inc. 1,317 37,034
Rex Energy Corp. (I)(L) 3,679 48,379
Rosetta Resources, Inc. (I) 15,247 685,200
SemGroup Corp., Class A (I) 2,466 92,919
Ship Finance International, Ltd. (L) 4,994 80,853
Copyright © 2013 www.secdatabase.com. All Rights Reserved.Please Consider the Environment Before Printing This Document
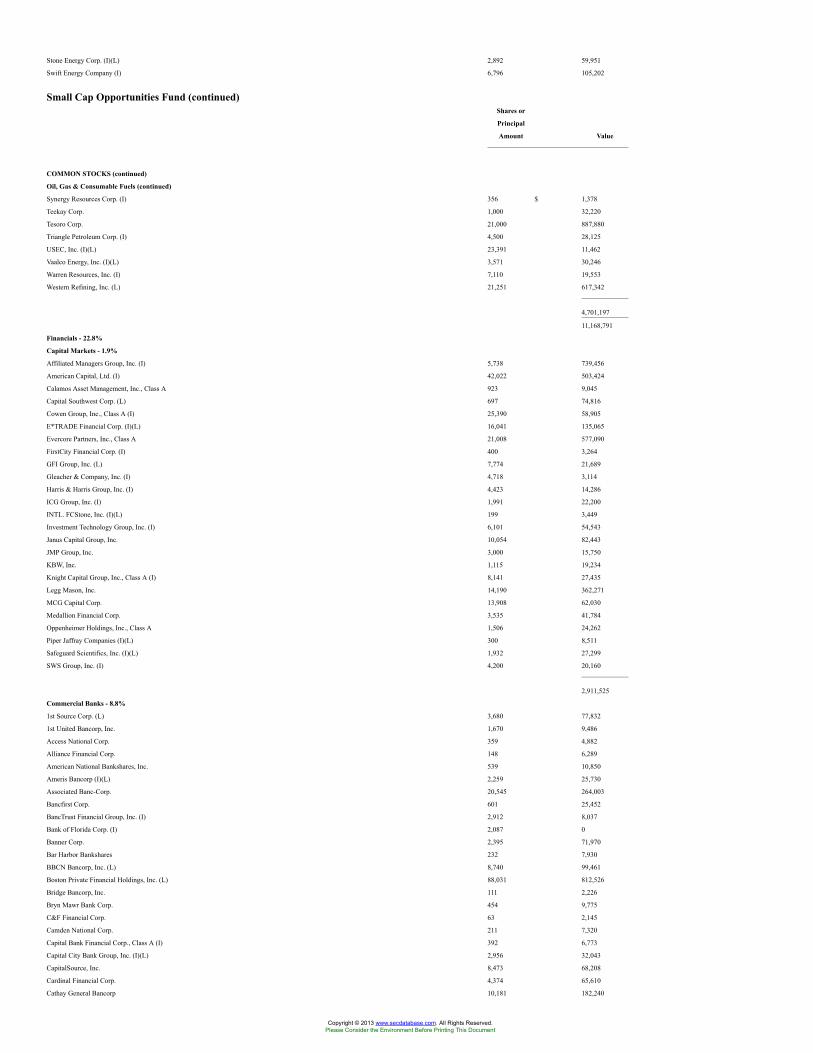
Stone Energy Corp. (I)(L) 2,892 59,951
Swift Energy Company (I) 6,796 105,202
Small Cap Opportunities Fund (continued)Shares or
Principal
Amount Value
COMMON STOCKS (continued)
Oil, Gas & Consumable Fuels (continued)
Synergy Resources Corp. (I) 356 $ 1,378
Teekay Corp. 1,000 32,220
Tesoro Corp. 21,000 887,880
Triangle Petroleum Corp. (I) 4,500 28,125
USEC, Inc. (I)(L) 23,391 11,462
Vaalco Energy, Inc. (I)(L) 3,571 30,246
Warren Resources, Inc. (I) 7,110 19,553
Western Refining, Inc. (L) 21,251 617,342
4,701,197
11,168,791
Financials - 22.8%
Capital Markets - 1.9%
Affiliated Managers Group, Inc. (I) 5,738 739,456
American Capital, Ltd. (I) 42,022 503,424
Calamos Asset Management, Inc., Class A 923 9,045
Capital Southwest Corp. (L) 697 74,816
Cowen Group, Inc., Class A (I) 25,390 58,905
E*TRADE Financial Corp. (I)(L) 16,041 135,065
Evercore Partners, Inc., Class A 21,008 577,090
FirstCity Financial Corp. (I) 400 3,264
GFI Group, Inc. (L) 7,774 21,689
Gleacher & Company, Inc. (I) 4,718 3,114
Harris & Harris Group, Inc. (I) 4,423 14,286
ICG Group, Inc. (I) 1,991 22,200
INTL. FCStone, Inc. (I)(L) 199 3,449
Investment Technology Group, Inc. (I) 6,101 54,543
Janus Capital Group, Inc. 10,054 82,443
JMP Group, Inc. 3,000 15,750
KBW, Inc. 1,115 19,234
Knight Capital Group, Inc., Class A (I) 8,141 27,435
Legg Mason, Inc. 14,190 362,271
MCG Capital Corp. 13,908 62,030
Medallion Financial Corp. 3,535 41,784
Oppenheimer Holdings, Inc., Class A 1,506 24,262
Piper Jaffray Companies (I)(L) 300 8,511
Safeguard Scientifics, Inc. (I)(L) 1,932 27,299
SWS Group, Inc. (I) 4,200 20,160
2,911,525
Commercial Banks - 8.8%
1st Source Corp. (L) 3,680 77,832
1st United Bancorp, Inc. 1,670 9,486
Access National Corp. 359 4,882
Alliance Financial Corp. 148 6,289
American National Bankshares, Inc. 539 10,850
Ameris Bancorp (I)(L) 2,259 25,730
Associated Banc-Corp. 20,545 264,003
Bancfirst Corp. 601 25,452
BancTrust Financial Group, Inc. (I) 2,912 8,037
Bank of Florida Corp. (I) 2,087 0
Banner Corp. 2,395 71,970
Bar Harbor Bankshares 232 7,930
BBCN Bancorp, Inc. (L) 8,740 99,461
Boston Private Financial Holdings, Inc. (L) 88,031 812,526
Bridge Bancorp, Inc. 111 2,226
Bryn Mawr Bank Corp. 454 9,775
C&F Financial Corp. 63 2,145
Camden National Corp. 211 7,320
Capital Bank Financial Corp., Class A (I) 392 6,773
Capital City Bank Group, Inc. (I)(L) 2,956 32,043
CapitalSource, Inc. 8,473 68,208
Cardinal Financial Corp. 4,374 65,610
Cathay General Bancorp 10,181 182,240
Copyright © 2013 www.secdatabase.com. All Rights Reserved.Please Consider the Environment Before Printing This Document
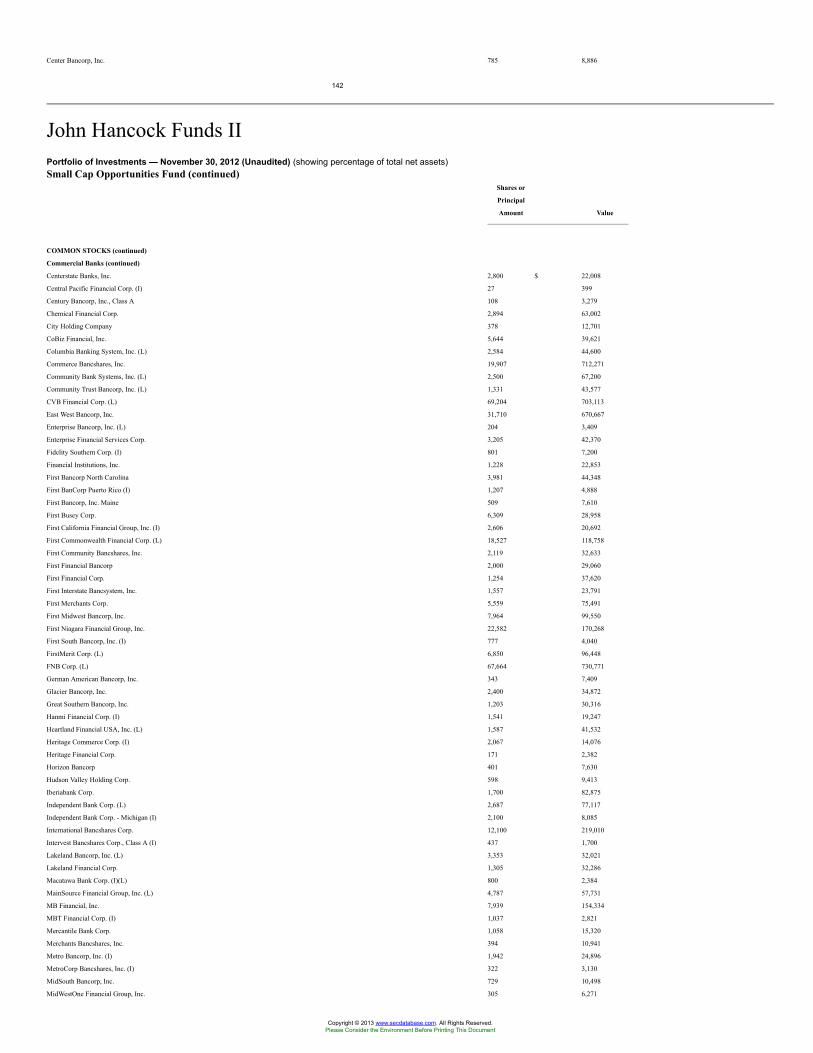
Center Bancorp, Inc. 785 8,886
142
John Hancock Funds IIPortfolio of Investments — November 30, 2012 (Unaudited) (showing percentage of total net assets)Small Cap Opportunities Fund (continued)
Shares or
Principal
Amount Value
COMMON STOCKS (continued)
Commercial Banks (continued)
Centerstate Banks, Inc. 2,800 $ 22,008
Central Pacific Financial Corp. (I) 27 399
Century Bancorp, Inc., Class A 108 3,279
Chemical Financial Corp. 2,894 63,002
City Holding Company 378 12,701
CoBiz Financial, Inc. 5,644 39,621
Columbia Banking System, Inc. (L) 2,584 44,600
Commerce Bancshares, Inc. 19,907 712,271
Community Bank Systems, Inc. (L) 2,500 67,200
Community Trust Bancorp, Inc. (L) 1,331 43,577
CVB Financial Corp. (L) 69,204 703,113
East West Bancorp, Inc. 31,710 670,667
Enterprise Bancorp, Inc. (L) 204 3,409
Enterprise Financial Services Corp. 3,205 42,370
Fidelity Southern Corp. (I) 801 7,200
Financial Institutions, Inc. 1,228 22,853
First Bancorp North Carolina 3,981 44,348
First BanCorp Puerto Rico (I) 1,207 4,888
First Bancorp, Inc. Maine 509 7,610
First Busey Corp. 6,309 28,958
First California Financial Group, Inc. (I) 2,606 20,692
First Commonwealth Financial Corp. (L) 18,527 118,758
First Community Bancshares, Inc. 2,119 32,633
First Financial Bancorp 2,000 29,060
First Financial Corp. 1,254 37,620
First Interstate Bancsystem, Inc. 1,557 23,791
First Merchants Corp. 5,559 75,491
First Midwest Bancorp, Inc. 7,964 99,550
First Niagara Financial Group, Inc. 22,582 170,268
First South Bancorp, Inc. (I) 777 4,040
FirstMerit Corp. (L) 6,850 96,448
FNB Corp. (L) 67,664 730,771
German American Bancorp, Inc. 343 7,409
Glacier Bancorp, Inc. 2,400 34,872
Great Southern Bancorp, Inc. 1,203 30,316
Hanmi Financial Corp. (I) 1,541 19,247
Heartland Financial USA, Inc. (L) 1,587 41,532
Heritage Commerce Corp. (I) 2,067 14,076
Heritage Financial Corp. 171 2,382
Horizon Bancorp 401 7,630
Hudson Valley Holding Corp. 598 9,413
Iberiabank Corp. 1,700 82,875
Independent Bank Corp. (L) 2,687 77,117
Independent Bank Corp. - Michigan (I) 2,100 8,085
International Bancshares Corp. 12,100 219,010
Intervest Bancshares Corp., Class A (I) 437 1,700
Lakeland Bancorp, Inc. (L) 3,353 32,021
Lakeland Financial Corp. 1,305 32,286
Macatawa Bank Corp. (I)(L) 800 2,384
MainSource Financial Group, Inc. (L) 4,787 57,731
MB Financial, Inc. 7,939 154,334
MBT Financial Corp. (I) 1,037 2,821
Mercantile Bank Corp. 1,058 15,320
Merchants Bancshares, Inc. 394 10,941
Metro Bancorp, Inc. (I) 1,942 24,896
MetroCorp Bancshares, Inc. (I) 322 3,130
MidSouth Bancorp, Inc. 729 10,498
MidWestOne Financial Group, Inc. 305 6,271
Copyright © 2013 www.secdatabase.com. All Rights Reserved.Please Consider the Environment Before Printing This Document
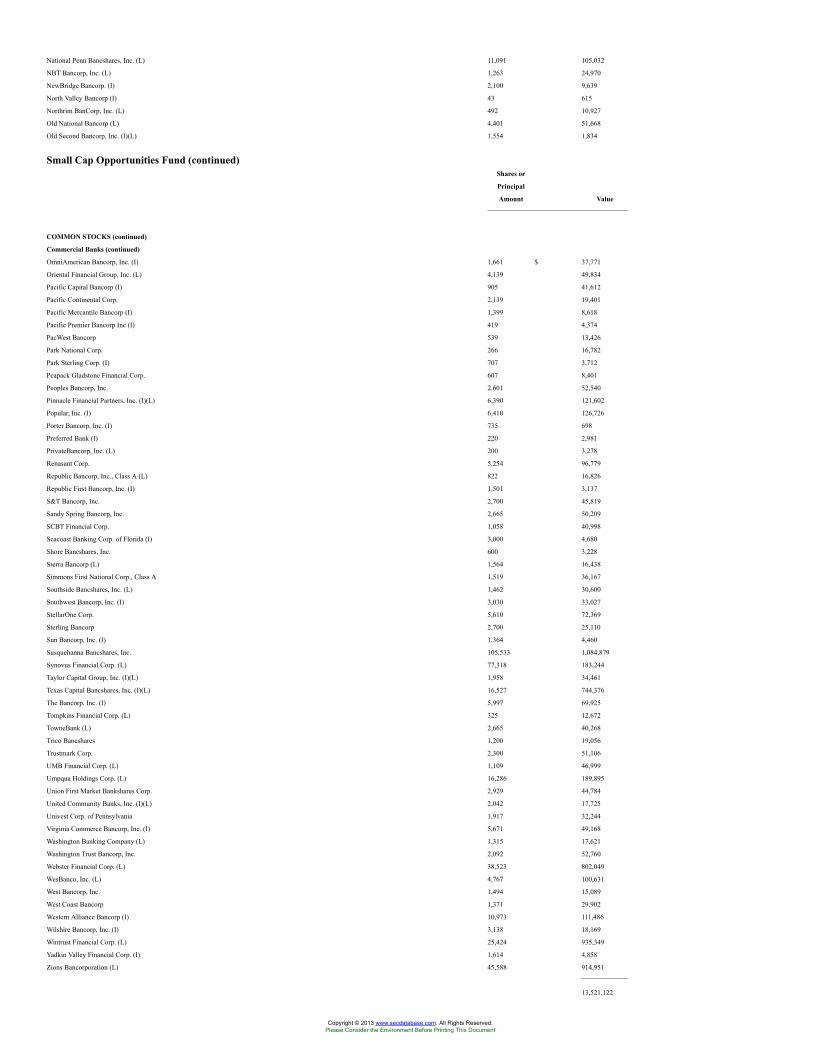
National Penn Bancshares, Inc. (L) 11,091 105,032
NBT Bancorp, Inc. (L) 1,263 24,970
NewBridge Bancorp. (I) 2,100 9,639
North Valley Bancorp (I) 43 615
Northrim BanCorp, Inc. (L) 492 10,927
Old National Bancorp (L) 4,401 51,668
Old Second Bancorp, Inc. (I)(L) 1,554 1,834
Small Cap Opportunities Fund (continued)Shares or
Principal
Amount Value
COMMON STOCKS (continued)
Commercial Banks (continued)
OmniAmerican Bancorp, Inc. (I) 1,661 $ 37,771
Oriental Financial Group, Inc. (L) 4,139 49,834
Pacific Capital Bancorp (I) 905 41,612
Pacific Continental Corp. 2,139 19,401
Pacific Mercantile Bancorp (I) 1,399 8,618
Pacific Premier Bancorp Inc (I) 419 4,374
PacWest Bancorp 539 13,426
Park National Corp. 266 16,782
Park Sterling Corp. (I) 707 3,712
Peapack Gladstone Financial Corp. 607 8,401
Peoples Bancorp, Inc. 2,601 52,540
Pinnacle Financial Partners, Inc. (I)(L) 6,390 121,602
Popular, Inc. (I) 6,410 126,726
Porter Bancorp, Inc. (I) 735 698
Preferred Bank (I) 220 2,981
PrivateBancorp, Inc. (L) 200 3,278
Renasant Corp. 5,254 96,779
Republic Bancorp, Inc., Class A (L) 822 16,826
Republic First Bancorp, Inc. (I) 1,501 3,137
S&T Bancorp, Inc. 2,700 45,819
Sandy Spring Bancorp, Inc. 2,665 50,209
SCBT Financial Corp. 1,058 40,998
Seacoast Banking Corp. of Florida (I) 3,000 4,680
Shore Bancshares, Inc. 600 3,228
Sierra Bancorp (L) 1,564 16,438
Simmons First National Corp., Class A 1,519 36,167
Southside Bancshares, Inc. (L) 1,462 30,600
Southwest Bancorp, Inc. (I) 3,030 33,027
StellarOne Corp. 5,610 72,369
Sterling Bancorp 2,700 25,110
Sun Bancorp, Inc. (I) 1,364 4,460
Susquehanna Bancshares, Inc. 105,533 1,084,879
Synovus Financial Corp. (L) 77,318 183,244
Taylor Capital Group, Inc. (I)(L) 1,958 34,461
Texas Capital Bancshares, Inc. (I)(L) 16,527 744,376
The Bancorp, Inc. (I) 5,997 69,925
Tompkins Financial Corp. (L) 325 12,672
TowneBank (L) 2,665 40,268
Trico Bancshares 1,200 19,056
Trustmark Corp. 2,300 51,106
UMB Financial Corp. (L) 1,109 46,999
Umpqua Holdings Corp. (L) 16,286 189,895
Union First Market Bankshares Corp. 2,929 44,784
United Community Banks, Inc. (I)(L) 2,042 17,725
Univest Corp. of Pennsylvania 1,917 32,244
Virginia Commerce Bancorp, Inc. (I) 5,671 49,168
Washington Banking Company (L) 1,315 17,621
Washington Trust Bancorp, Inc. 2,092 52,760
Webster Financial Corp. (L) 38,523 802,049
WesBanco, Inc. (L) 4,767 100,631
West Bancorp, Inc. 1,494 15,089
West Coast Bancorp 1,371 29,902
Western Alliance Bancorp (I) 10,973 111,486
Wilshire Bancorp, Inc. (I) 3,138 18,169
Wintrust Financial Corp. (L) 25,424 935,349
Yadkin Valley Financial Corp. (I) 1,614 4,858
Zions Bancorporation (L) 45,588 914,951
13,521,122
Copyright © 2013 www.secdatabase.com. All Rights Reserved.Please Consider the Environment Before Printing This Document
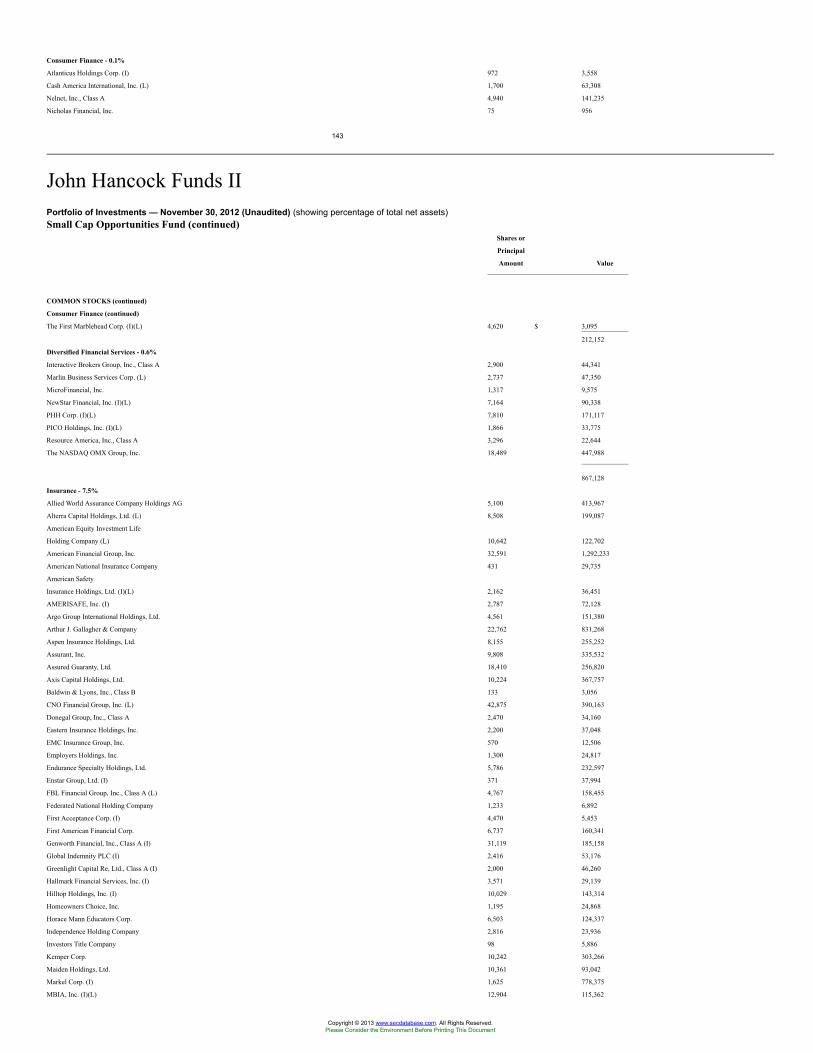
Consumer Finance - 0.1%
Atlanticus Holdings Corp. (I) 972 3,558
Cash America International, Inc. (L) 1,700 63,308
Nelnet, Inc., Class A 4,940 141,235
Nicholas Financial, Inc. 75 956
143
John Hancock Funds IIPortfolio of Investments — November 30, 2012 (Unaudited) (showing percentage of total net assets)Small Cap Opportunities Fund (continued)
Shares or
Principal
Amount Value
COMMON STOCKS (continued)
Consumer Finance (continued)
The First Marblehead Corp. (I)(L) 4,620 $ 3,095
212,152
Diversified Financial Services - 0.6%
Interactive Brokers Group, Inc., Class A 2,900 44,341
Marlin Business Services Corp. (L) 2,737 47,350
MicroFinancial, Inc. 1,317 9,575
NewStar Financial, Inc. (I)(L) 7,164 90,338
PHH Corp. (I)(L) 7,810 171,117
PICO Holdings, Inc. (I)(L) 1,866 33,775
Resource America, Inc., Class A 3,296 22,644
The NASDAQ OMX Group, Inc. 18,489 447,988
867,128
Insurance - 7.5%
Allied World Assurance Company Holdings AG 5,100 413,967
Alterra Capital Holdings, Ltd. (L) 8,508 199,087
American Equity Investment Life
Holding Company (L) 10,642 122,702
American Financial Group, Inc. 32,591 1,292,233
American National Insurance Company 431 29,735
American Safety
Insurance Holdings, Ltd. (I)(L) 2,162 36,451
AMERISAFE, Inc. (I) 2,787 72,128
Argo Group International Holdings, Ltd. 4,561 151,380
Arthur J. Gallagher & Company 22,762 831,268
Aspen Insurance Holdings, Ltd. 8,155 255,252
Assurant, Inc. 9,808 335,532
Assured Guaranty, Ltd. 18,410 256,820
Axis Capital Holdings, Ltd. 10,224 367,757
Baldwin & Lyons, Inc., Class B 133 3,056
CNO Financial Group, Inc. (L) 42,875 390,163
Donegal Group, Inc., Class A 2,470 34,160
Eastern Insurance Holdings, Inc. 2,200 37,048
EMC Insurance Group, Inc. 570 12,506
Employers Holdings, Inc. 1,300 24,817
Endurance Specialty Holdings, Ltd. 5,786 232,597
Enstar Group, Ltd. (I) 371 37,994
FBL Financial Group, Inc., Class A (L) 4,767 158,455
Federated National Holding Company 1,233 6,892
First Acceptance Corp. (I) 4,470 5,453
First American Financial Corp. 6,737 160,341
Genworth Financial, Inc., Class A (I) 31,119 185,158
Global Indemnity PLC (I) 2,416 53,176
Greenlight Capital Re, Ltd., Class A (I) 2,000 46,260
Hallmark Financial Services, Inc. (I) 3,571 29,139
Hilltop Holdings, Inc. (I) 10,029 143,314
Homeowners Choice, Inc. 1,195 24,868
Horace Mann Educators Corp. 6,503 124,337
Independence Holding Company 2,816 23,936
Investors Title Company 98 5,886
Kemper Corp. 10,242 303,266
Maiden Holdings, Ltd. 10,361 93,042
Markel Corp. (I) 1,625 778,375
MBIA, Inc. (I)(L) 12,904 115,362
Copyright © 2013 www.secdatabase.com. All Rights Reserved.Please Consider the Environment Before Printing This Document
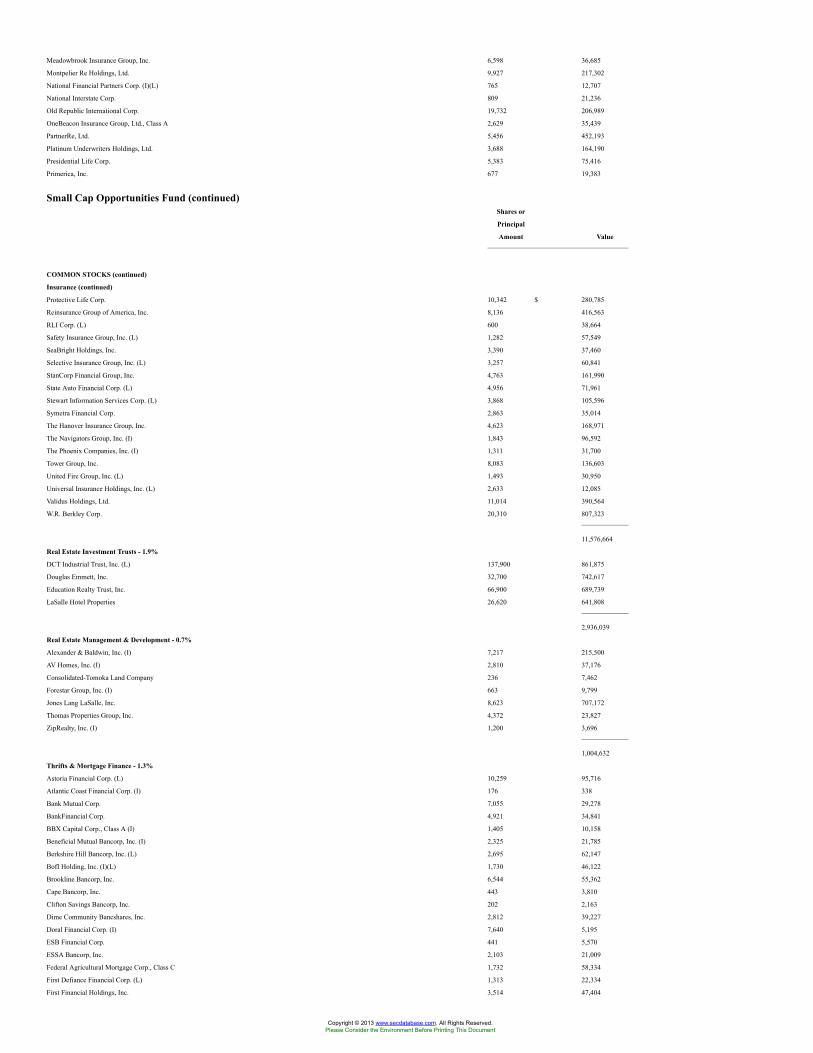
Meadowbrook Insurance Group, Inc. 6,598 36,685
Montpelier Re Holdings, Ltd. 9,927 217,302
National Financial Partners Corp. (I)(L) 765 12,707
National Interstate Corp. 809 21,236
Old Republic International Corp. 19,732 206,989
OneBeacon Insurance Group, Ltd., Class A 2,629 35,439
PartnerRe, Ltd. 5,456 452,193
Platinum Underwriters Holdings, Ltd. 3,688 164,190
Presidential Life Corp. 5,383 75,416
Primerica, Inc. 677 19,383
Small Cap Opportunities Fund (continued)Shares or
Principal
Amount Value
COMMON STOCKS (continued)
Insurance (continued)
Protective Life Corp. 10,342 $ 280,785
Reinsurance Group of America, Inc. 8,136 416,563
RLI Corp. (L) 600 38,664
Safety Insurance Group, Inc. (L) 1,282 57,549
SeaBright Holdings, Inc. 3,390 37,460
Selective Insurance Group, Inc. (L) 3,257 60,841
StanCorp Financial Group, Inc. 4,763 161,990
State Auto Financial Corp. (L) 4,956 71,961
Stewart Information Services Corp. (L) 3,868 105,596
Symetra Financial Corp. 2,863 35,014
The Hanover Insurance Group, Inc. 4,623 168,971
The Navigators Group, Inc. (I) 1,843 96,592
The Phoenix Companies, Inc. (I) 1,311 31,700
Tower Group, Inc. 8,083 136,603
United Fire Group, Inc. (L) 1,493 30,950
Universal Insurance Holdings, Inc. (L) 2,633 12,085
Validus Holdings, Ltd. 11,014 390,564
W.R. Berkley Corp. 20,310 807,323
11,576,664
Real Estate Investment Trusts - 1.9%
DCT Industrial Trust, Inc. (L) 137,900 861,875
Douglas Emmett, Inc. 32,700 742,617
Education Realty Trust, Inc. 66,900 689,739
LaSalle Hotel Properties 26,620 641,808
2,936,039
Real Estate Management & Development - 0.7%
Alexander & Baldwin, Inc. (I) 7,217 215,500
AV Homes, Inc. (I) 2,810 37,176
Consolidated-Tomoka Land Company 236 7,462
Forestar Group, Inc. (I) 663 9,799
Jones Lang LaSalle, Inc. 8,623 707,172
Thomas Properties Group, Inc. 4,372 23,827
ZipRealty, Inc. (I) 1,200 3,696
1,004,632
Thrifts & Mortgage Finance - 1.3%
Astoria Financial Corp. (L) 10,259 95,716
Atlantic Coast Financial Corp. (I) 176 338
Bank Mutual Corp. 7,055 29,278
BankFinancial Corp. 4,921 34,841
BBX Capital Corp., Class A (I) 1,405 10,158
Beneficial Mutual Bancorp, Inc. (I) 2,325 21,785
Berkshire Hill Bancorp, Inc. (L) 2,695 62,147
BofI Holding, Inc. (I)(L) 1,730 46,122
Brookline Bancorp, Inc. 6,544 55,362
Cape Bancorp, Inc. 443 3,810
Clifton Savings Bancorp, Inc. 202 2,163
Dime Community Bancshares, Inc. 2,812 39,227
Doral Financial Corp. (I) 7,640 5,195
ESB Financial Corp. 441 5,570
ESSA Bancorp, Inc. 2,103 21,009
Federal Agricultural Mortgage Corp., Class C 1,732 58,334
First Defiance Financial Corp. (L) 1,313 22,334
First Financial Holdings, Inc. 3,514 47,404
Copyright © 2013 www.secdatabase.com. All Rights Reserved.Please Consider the Environment Before Printing This Document
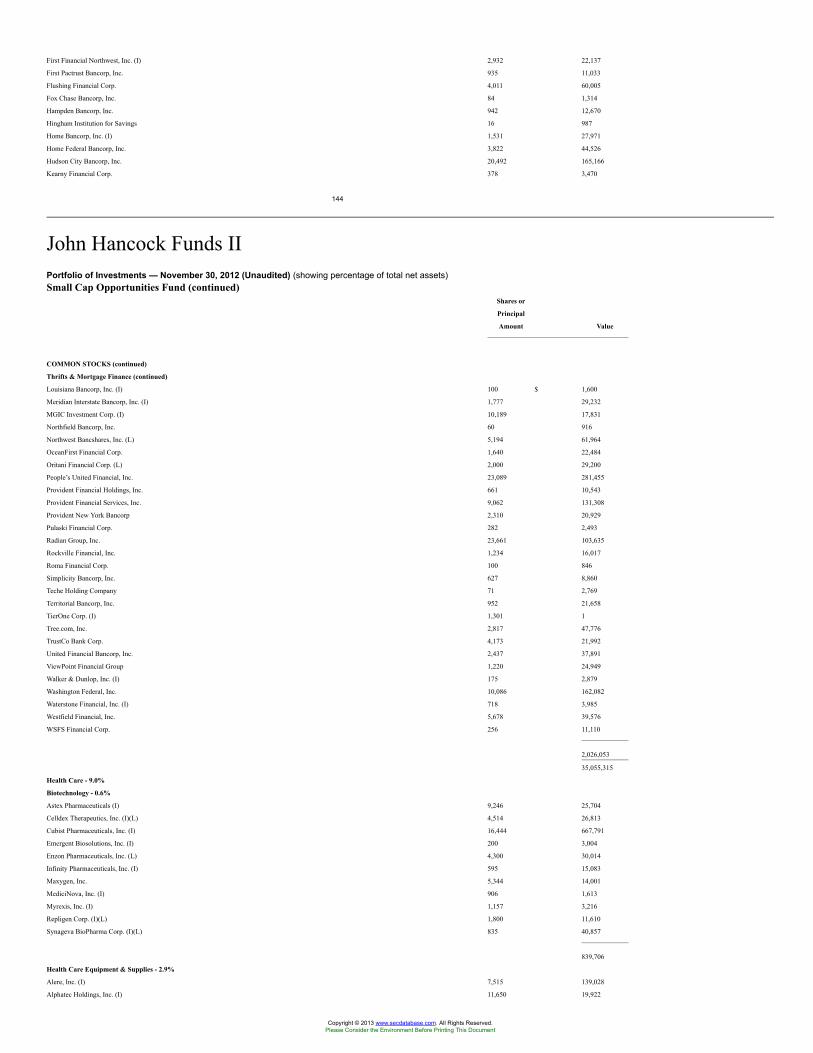
First Financial Northwest, Inc. (I) 2,932 22,137
First Pactrust Bancorp, Inc. 935 11,033
Flushing Financial Corp. 4,011 60,005
Fox Chase Bancorp, Inc. 84 1,314
Hampden Bancorp, Inc. 942 12,670
Hingham Institution for Savings 16 987
Home Bancorp, Inc. (I) 1,531 27,971
Home Federal Bancorp, Inc. 3,822 44,526
Hudson City Bancorp, Inc. 20,492 165,166
Kearny Financial Corp. 378 3,470
144
John Hancock Funds IIPortfolio of Investments — November 30, 2012 (Unaudited) (showing percentage of total net assets)Small Cap Opportunities Fund (continued)
Shares or
Principal
Amount Value
COMMON STOCKS (continued)
Thrifts & Mortgage Finance (continued)
Louisiana Bancorp, Inc. (I) 100 $ 1,600
Meridian Interstate Bancorp, Inc. (I) 1,777 29,232
MGIC Investment Corp. (I) 10,189 17,831
Northfield Bancorp, Inc. 60 916
Northwest Bancshares, Inc. (L) 5,194 61,964
OceanFirst Financial Corp. 1,640 22,484
Oritani Financial Corp. (L) 2,000 29,200
People’s United Financial, Inc. 23,089 281,455
Provident Financial Holdings, Inc. 661 10,543
Provident Financial Services, Inc. 9,062 131,308
Provident New York Bancorp 2,310 20,929
Pulaski Financial Corp. 282 2,493
Radian Group, Inc. 23,661 103,635
Rockville Financial, Inc. 1,234 16,017
Roma Financial Corp. 100 846
Simplicity Bancorp, Inc. 627 8,860
Teche Holding Company 71 2,769
Territorial Bancorp, Inc. 952 21,658
TierOne Corp. (I) 1,301 1
Tree.com, Inc. 2,817 47,776
TrustCo Bank Corp. 4,173 21,992
United Financial Bancorp, Inc. 2,437 37,891
ViewPoint Financial Group 1,220 24,949
Walker & Dunlop, Inc. (I) 175 2,879
Washington Federal, Inc. 10,086 162,082
Waterstone Financial, Inc. (I) 718 3,985
Westfield Financial, Inc. 5,678 39,576
WSFS Financial Corp. 256 11,110
2,026,053
35,055,315
Health Care - 9.0%
Biotechnology - 0.6%
Astex Pharmaceuticals (I) 9,246 25,704
Celldex Therapeutics, Inc. (I)(L) 4,514 26,813
Cubist Pharmaceuticals, Inc. (I) 16,444 667,791
Emergent Biosolutions, Inc. (I) 200 3,004
Enzon Pharmaceuticals, Inc. (L) 4,300 30,014
Infinity Pharmaceuticals, Inc. (I) 595 15,083
Maxygen, Inc. 5,344 14,001
MediciNova, Inc. (I) 906 1,613
Myrexis, Inc. (I) 1,157 3,216
Repligen Corp. (I)(L) 1,800 11,610
Synageva BioPharma Corp. (I)(L) 835 40,857
839,706
Health Care Equipment & Supplies - 2.9%
Alere, Inc. (I) 7,515 139,028
Alphatec Holdings, Inc. (I) 11,650 19,922
Copyright © 2013 www.secdatabase.com. All Rights Reserved.Please Consider the Environment Before Printing This Document
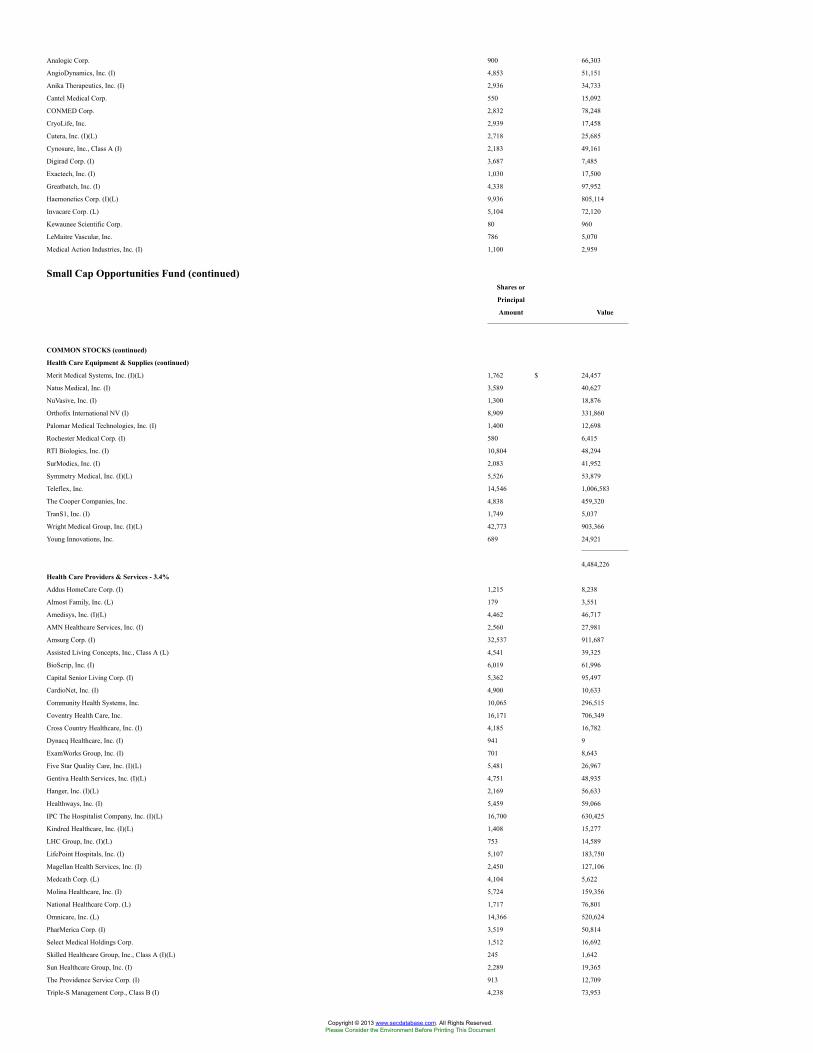
Analogic Corp. 900 66,303
AngioDynamics, Inc. (I) 4,853 51,151
Anika Therapeutics, Inc. (I) 2,936 34,733
Cantel Medical Corp. 550 15,092
CONMED Corp. 2,832 78,248
CryoLife, Inc. 2,939 17,458
Cutera, Inc. (I)(L) 2,718 25,685
Cynosure, Inc., Class A (I) 2,183 49,161
Digirad Corp. (I) 3,687 7,485
Exactech, Inc. (I) 1,030 17,500
Greatbatch, Inc. (I) 4,338 97,952
Haemonetics Corp. (I)(L) 9,936 805,114
Invacare Corp. (L) 5,104 72,120
Kewaunee Scientific Corp. 80 960
LeMaitre Vascular, Inc. 786 5,070
Medical Action Industries, Inc. (I) 1,100 2,959
Small Cap Opportunities Fund (continued)Shares or
Principal
Amount Value
COMMON STOCKS (continued)
Health Care Equipment & Supplies (continued)
Merit Medical Systems, Inc. (I)(L) 1,762 $ 24,457
Natus Medical, Inc. (I) 3,589 40,627
NuVasive, Inc. (I) 1,300 18,876
Orthofix International NV (I) 8,909 331,860
Palomar Medical Technologies, Inc. (I) 1,400 12,698
Rochester Medical Corp. (I) 580 6,415
RTI Biologics, Inc. (I) 10,804 48,294
SurModics, Inc. (I) 2,083 41,952
Symmetry Medical, Inc. (I)(L) 5,526 53,879
Teleflex, Inc. 14,546 1,006,583
The Cooper Companies, Inc. 4,838 459,320
TranS1, Inc. (I) 1,749 5,037
Wright Medical Group, Inc. (I)(L) 42,773 903,366
Young Innovations, Inc. 689 24,921
4,484,226
Health Care Providers & Services - 3.4%
Addus HomeCare Corp. (I) 1,215 8,238
Almost Family, Inc. (L) 179 3,551
Amedisys, Inc. (I)(L) 4,462 46,717
AMN Healthcare Services, Inc. (I) 2,560 27,981
Amsurg Corp. (I) 32,537 911,687
Assisted Living Concepts, Inc., Class A (L) 4,541 39,325
BioScrip, Inc. (I) 6,019 61,996
Capital Senior Living Corp. (I) 5,362 95,497
CardioNet, Inc. (I) 4,900 10,633
Community Health Systems, Inc. 10,065 296,515
Coventry Health Care, Inc. 16,171 706,349
Cross Country Healthcare, Inc. (I) 4,185 16,782
Dynacq Healthcare, Inc. (I) 941 9
ExamWorks Group, Inc. (I) 701 8,643
Five Star Quality Care, Inc. (I)(L) 5,481 26,967
Gentiva Health Services, Inc. (I)(L) 4,751 48,935
Hanger, Inc. (I)(L) 2,169 56,633
Healthways, Inc. (I) 5,459 59,066
IPC The Hospitalist Company, Inc. (I)(L) 16,700 630,425
Kindred Healthcare, Inc. (I)(L) 1,408 15,277
LHC Group, Inc. (I)(L) 753 14,589
LifePoint Hospitals, Inc. (I) 5,107 183,750
Magellan Health Services, Inc. (I) 2,450 127,106
Medcath Corp. (L) 4,104 5,622
Molina Healthcare, Inc. (I) 5,724 159,356
National Healthcare Corp. (L) 1,717 76,801
Omnicare, Inc. (L) 14,366 520,624
PharMerica Corp. (I) 3,519 50,814
Select Medical Holdings Corp. 1,512 16,692
Skilled Healthcare Group, Inc., Class A (I)(L) 245 1,642
Sun Healthcare Group, Inc. (I) 2,289 19,365
The Providence Service Corp. (I) 913 12,709
Triple-S Management Corp., Class B (I) 4,238 73,953
Copyright © 2013 www.secdatabase.com. All Rights Reserved.Please Consider the Environment Before Printing This Document
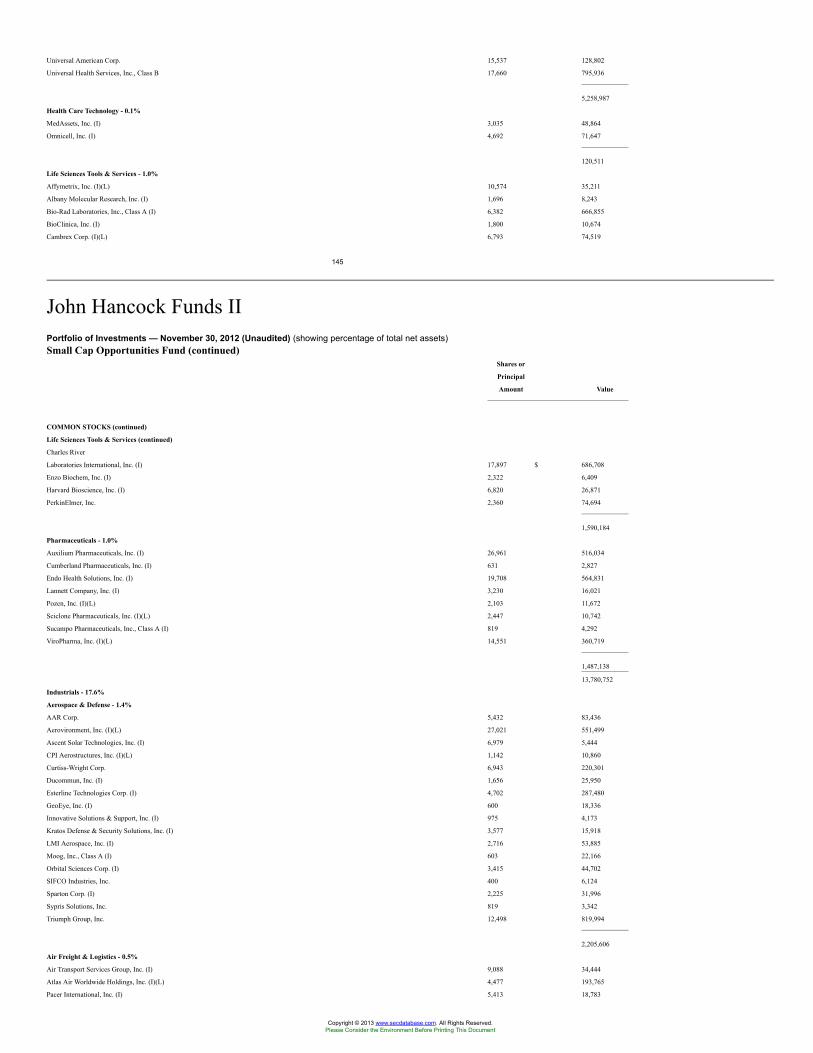
Universal American Corp. 15,537 128,802
Universal Health Services, Inc., Class B 17,660 795,936
5,258,987
Health Care Technology - 0.1%
MedAssets, Inc. (I) 3,035 48,864
Omnicell, Inc. (I) 4,692 71,647
120,511
Life Sciences Tools & Services - 1.0%
Affymetrix, Inc. (I)(L) 10,574 35,211
Albany Molecular Research, Inc. (I) 1,696 8,243
Bio-Rad Laboratories, Inc., Class A (I) 6,382 666,855
BioClinica, Inc. (I) 1,800 10,674
Cambrex Corp. (I)(L) 6,793 74,519
145
John Hancock Funds IIPortfolio of Investments — November 30, 2012 (Unaudited) (showing percentage of total net assets)Small Cap Opportunities Fund (continued)
Shares or
Principal
Amount Value
COMMON STOCKS (continued)
Life Sciences Tools & Services (continued)
Charles River
Laboratories International, Inc. (I) 17,897 $ 686,708
Enzo Biochem, Inc. (I) 2,322 6,409
Harvard Bioscience, Inc. (I) 6,820 26,871
PerkinElmer, Inc. 2,360 74,694
1,590,184
Pharmaceuticals - 1.0%
Auxilium Pharmaceuticals, Inc. (I) 26,961 516,034
Cumberland Pharmaceuticals, Inc. (I) 631 2,827
Endo Health Solutions, Inc. (I) 19,708 564,831
Lannett Company, Inc. (I) 3,230 16,021
Pozen, Inc. (I)(L) 2,103 11,672
Sciclone Pharmaceuticals, Inc. (I)(L) 2,447 10,742
Sucampo Pharmaceuticals, Inc., Class A (I) 819 4,292
ViroPharma, Inc. (I)(L) 14,551 360,719
1,487,138
13,780,752
Industrials - 17.6%
Aerospace & Defense - 1.4%
AAR Corp. 5,432 83,436
Aerovironment, Inc. (I)(L) 27,021 551,499
Ascent Solar Technologies, Inc. (I) 6,979 5,444
CPI Aerostructures, Inc. (I)(L) 1,142 10,860
Curtiss-Wright Corp. 6,943 220,301
Ducommun, Inc. (I) 1,656 25,950
Esterline Technologies Corp. (I) 4,702 287,480
GeoEye, Inc. (I) 600 18,336
Innovative Solutions & Support, Inc. (I) 975 4,173
Kratos Defense & Security Solutions, Inc. (I) 3,577 15,918
LMI Aerospace, Inc. (I) 2,716 53,885
Moog, Inc., Class A (I) 603 22,166
Orbital Sciences Corp. (I) 3,415 44,702
SIFCO Industries, Inc. 400 6,124
Sparton Corp. (I) 2,225 31,996
Sypris Solutions, Inc. 819 3,342
Triumph Group, Inc. 12,498 819,994
2,205,606
Air Freight & Logistics - 0.5%
Air Transport Services Group, Inc. (I) 9,088 34,444
Atlas Air Worldwide Holdings, Inc. (I)(L) 4,477 193,765
Pacer International, Inc. (I) 5,413 18,783
Copyright © 2013 www.secdatabase.com. All Rights Reserved.Please Consider the Environment Before Printing This Document
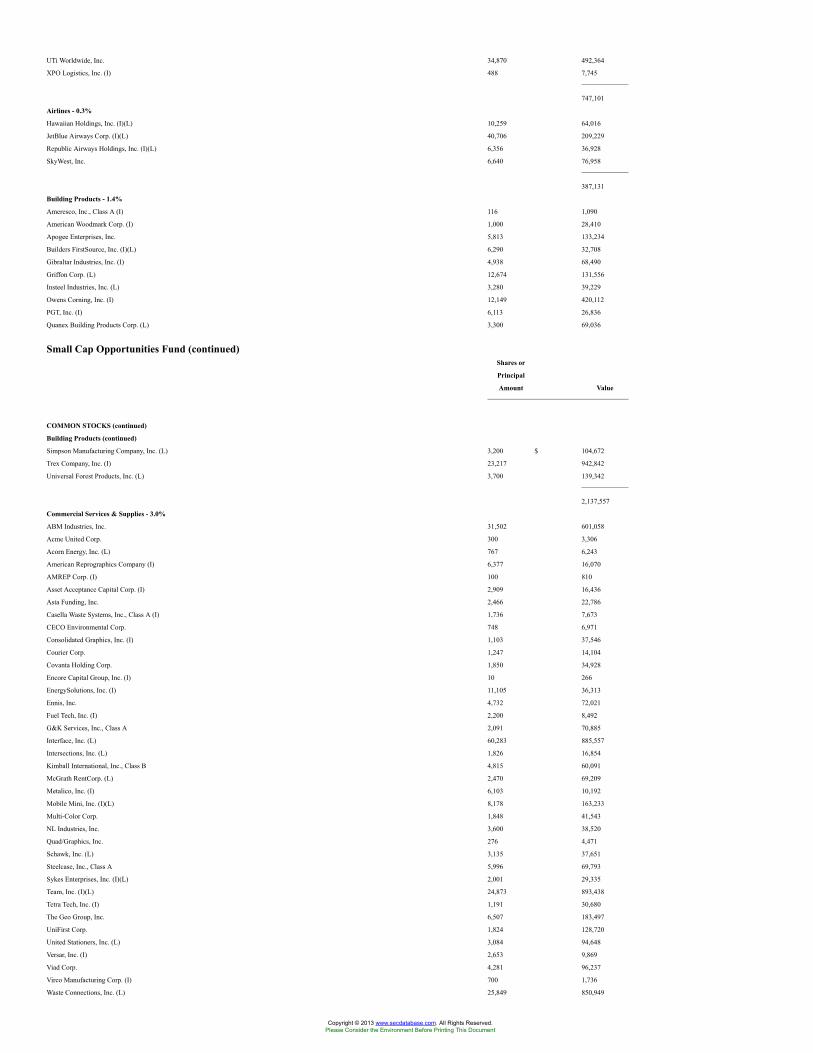
UTi Worldwide, Inc. 34,870 492,364
XPO Logistics, Inc. (I) 488 7,745
747,101
Airlines - 0.3%
Hawaiian Holdings, Inc. (I)(L) 10,259 64,016
JetBlue Airways Corp. (I)(L) 40,706 209,229
Republic Airways Holdings, Inc. (I)(L) 6,356 36,928
SkyWest, Inc. 6,640 76,958
387,131
Building Products - 1.4%
Ameresco, Inc., Class A (I) 116 1,090
American Woodmark Corp. (I) 1,000 28,410
Apogee Enterprises, Inc. 5,813 133,234
Builders FirstSource, Inc. (I)(L) 6,290 32,708
Gibraltar Industries, Inc. (I) 4,938 68,490
Griffon Corp. (L) 12,674 131,556
Insteel Industries, Inc. (L) 3,280 39,229
Owens Corning, Inc. (I) 12,149 420,112
PGT, Inc. (I) 6,113 26,836
Quanex Building Products Corp. (L) 3,300 69,036
Small Cap Opportunities Fund (continued)Shares or
Principal
Amount Value
COMMON STOCKS (continued)
Building Products (continued)
Simpson Manufacturing Company, Inc. (L) 3,200 $ 104,672
Trex Company, Inc. (I) 23,217 942,842
Universal Forest Products, Inc. (L) 3,700 139,342
2,137,557
Commercial Services & Supplies - 3.0%
ABM Industries, Inc. 31,502 601,058
Acme United Corp. 300 3,306
Acorn Energy, Inc. (L) 767 6,243
American Reprographics Company (I) 6,377 16,070
AMREP Corp. (I) 100 810
Asset Acceptance Capital Corp. (I) 2,909 16,436
Asta Funding, Inc. 2,466 22,786
Casella Waste Systems, Inc., Class A (I) 1,736 7,673
CECO Environmental Corp. 748 6,971
Consolidated Graphics, Inc. (I) 1,103 37,546
Courier Corp. 1,247 14,104
Covanta Holding Corp. 1,850 34,928
Encore Capital Group, Inc. (I) 10 266
EnergySolutions, Inc. (I) 11,105 36,313
Ennis, Inc. 4,732 72,021
Fuel Tech, Inc. (I) 2,200 8,492
G&K Services, Inc., Class A 2,091 70,885
Interface, Inc. (L) 60,283 885,557
Intersections, Inc. (L) 1,826 16,854
Kimball International, Inc., Class B 4,815 60,091
McGrath RentCorp. (L) 2,470 69,209
Metalico, Inc. (I) 6,103 10,192
Mobile Mini, Inc. (I)(L) 8,178 163,233
Multi-Color Corp. 1,848 41,543
NL Industries, Inc. 3,600 38,520
Quad/Graphics, Inc. 276 4,471
Schawk, Inc. (L) 3,135 37,651
Steelcase, Inc., Class A 5,996 69,793
Sykes Enterprises, Inc. (I)(L) 2,001 29,335
Team, Inc. (I)(L) 24,873 893,438
Tetra Tech, Inc. (I) 1,191 30,680
The Geo Group, Inc. 6,507 183,497
UniFirst Corp. 1,824 128,720
United Stationers, Inc. (L) 3,084 94,648
Versar, Inc. (I) 2,653 9,869
Viad Corp. 4,281 96,237
Virco Manufacturing Corp. (I) 700 1,736
Waste Connections, Inc. (L) 25,849 850,949
Copyright © 2013 www.secdatabase.com. All Rights Reserved.Please Consider the Environment Before Printing This Document
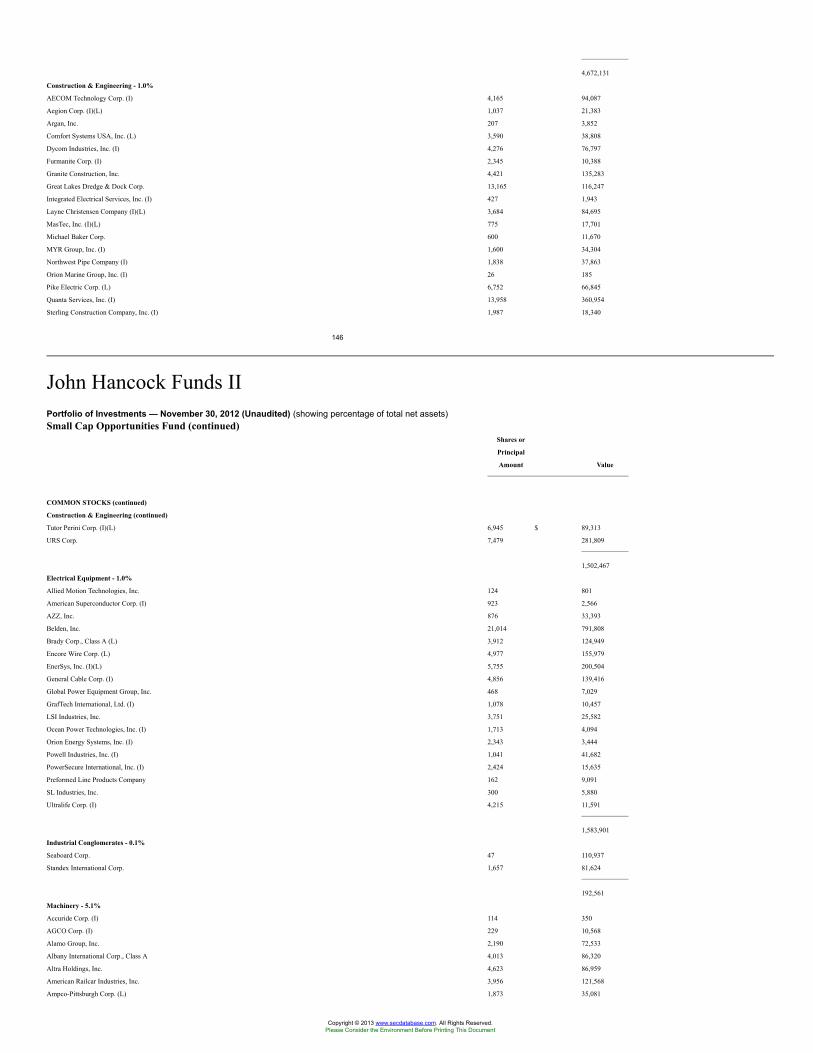
4,672,131
Construction & Engineering - 1.0%
AECOM Technology Corp. (I) 4,165 94,087
Aegion Corp. (I)(L) 1,037 21,383
Argan, Inc. 207 3,852
Comfort Systems USA, Inc. (L) 3,590 38,808
Dycom Industries, Inc. (I) 4,276 76,797
Furmanite Corp. (I) 2,345 10,388
Granite Construction, Inc. 4,421 135,283
Great Lakes Dredge & Dock Corp. 13,165 116,247
Integrated Electrical Services, Inc. (I) 427 1,943
Layne Christensen Company (I)(L) 3,684 84,695
MasTec, Inc. (I)(L) 775 17,701
Michael Baker Corp. 600 11,670
MYR Group, Inc. (I) 1,600 34,304
Northwest Pipe Company (I) 1,838 37,863
Orion Marine Group, Inc. (I) 26 185
Pike Electric Corp. (L) 6,752 66,845
Quanta Services, Inc. (I) 13,958 360,954
Sterling Construction Company, Inc. (I) 1,987 18,340
146
John Hancock Funds IIPortfolio of Investments — November 30, 2012 (Unaudited) (showing percentage of total net assets)Small Cap Opportunities Fund (continued)
Shares or
Principal
Amount Value
COMMON STOCKS (continued)
Construction & Engineering (continued)
Tutor Perini Corp. (I)(L) 6,945 $ 89,313
URS Corp. 7,479 281,809
1,502,467
Electrical Equipment - 1.0%
Allied Motion Technologies, Inc. 124 801
American Superconductor Corp. (I) 923 2,566
AZZ, Inc. 876 33,393
Belden, Inc. 21,014 791,808
Brady Corp., Class A (L) 3,912 124,949
Encore Wire Corp. (L) 4,977 155,979
EnerSys, Inc. (I)(L) 5,755 200,504
General Cable Corp. (I) 4,856 139,416
Global Power Equipment Group, Inc. 468 7,029
GrafTech International, Ltd. (I) 1,078 10,457
LSI Industries, Inc. 3,751 25,582
Ocean Power Technologies, Inc. (I) 1,713 4,094
Orion Energy Systems, Inc. (I) 2,343 3,444
Powell Industries, Inc. (I) 1,041 41,682
PowerSecure International, Inc. (I) 2,424 15,635
Preformed Line Products Company 162 9,091
SL Industries, Inc. 300 5,880
Ultralife Corp. (I) 4,215 11,591
1,583,901
Industrial Conglomerates - 0.1%
Seaboard Corp. 47 110,937
Standex International Corp. 1,657 81,624
192,561
Machinery - 5.1%
Accuride Corp. (I) 114 350
AGCO Corp. (I) 229 10,568
Alamo Group, Inc. 2,190 72,533
Albany International Corp., Class A 4,013 86,320
Altra Holdings, Inc. 4,623 86,959
American Railcar Industries, Inc. 3,956 121,568
Ampco-Pittsburgh Corp. (L) 1,873 35,081
Copyright © 2013 www.secdatabase.com. All Rights Reserved.Please Consider the Environment Before Printing This Document
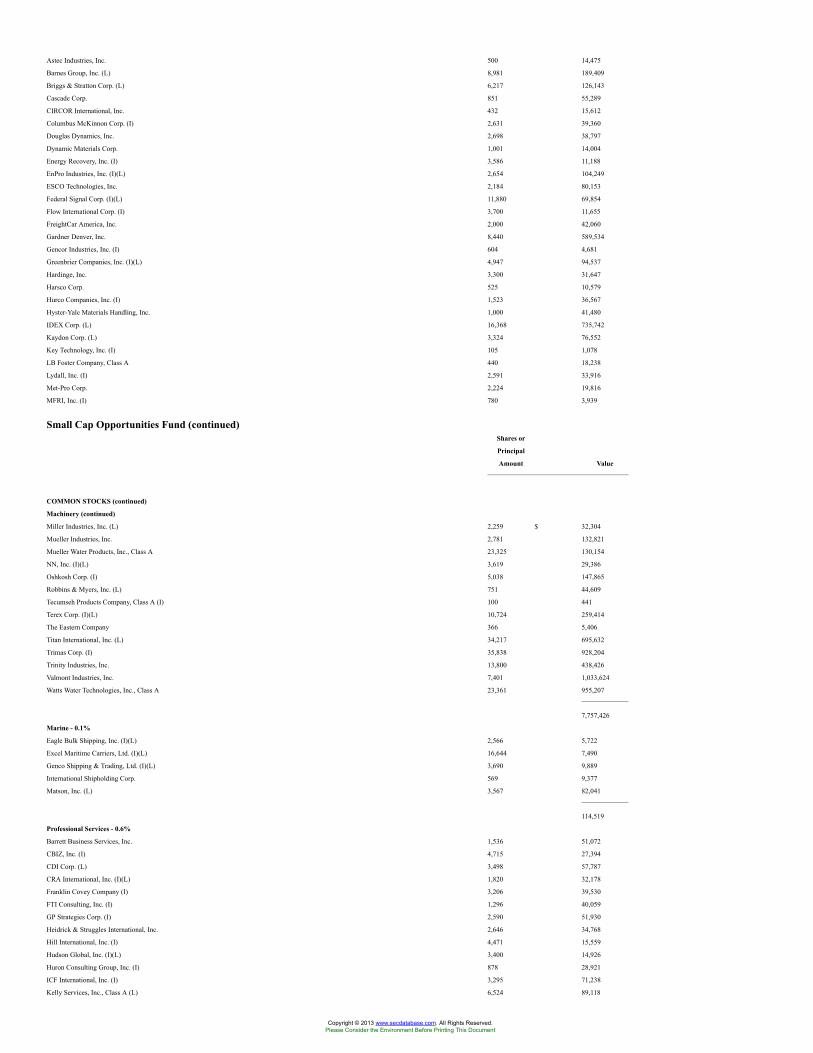
Astec Industries, Inc. 500 14,475
Barnes Group, Inc. (L) 8,981 189,409
Briggs & Stratton Corp. (L) 6,217 126,143
Cascade Corp. 851 55,289
CIRCOR International, Inc. 432 15,612
Columbus McKinnon Corp. (I) 2,631 39,360
Douglas Dynamics, Inc. 2,698 38,797
Dynamic Materials Corp. 1,001 14,004
Energy Recovery, Inc. (I) 3,586 11,188
EnPro Industries, Inc. (I)(L) 2,654 104,249
ESCO Technologies, Inc. 2,184 80,153
Federal Signal Corp. (I)(L) 11,880 69,854
Flow International Corp. (I) 3,700 11,655
FreightCar America, Inc. 2,000 42,060
Gardner Denver, Inc. 8,440 589,534
Gencor Industries, Inc. (I) 604 4,681
Greenbrier Companies, Inc. (I)(L) 4,947 94,537
Hardinge, Inc. 3,300 31,647
Harsco Corp. 525 10,579
Hurco Companies, Inc. (I) 1,523 36,567
Hyster-Yale Materials Handling, Inc. 1,000 41,480
IDEX Corp. (L) 16,368 735,742
Kaydon Corp. (L) 3,324 76,552
Key Technology, Inc. (I) 105 1,078
LB Foster Company, Class A 440 18,238
Lydall, Inc. (I) 2,591 33,916
Met-Pro Corp. 2,224 19,816
MFRI, Inc. (I) 780 3,939
Small Cap Opportunities Fund (continued)Shares or
Principal
Amount Value
COMMON STOCKS (continued)
Machinery (continued)
Miller Industries, Inc. (L) 2,259 $ 32,304
Mueller Industries, Inc. 2,781 132,821
Mueller Water Products, Inc., Class A 23,325 130,154
NN, Inc. (I)(L) 3,619 29,386
Oshkosh Corp. (I) 5,038 147,865
Robbins & Myers, Inc. (L) 751 44,609
Tecumseh Products Company, Class A (I) 100 441
Terex Corp. (I)(L) 10,724 259,414
The Eastern Company 366 5,406
Titan International, Inc. (L) 34,217 695,632
Trimas Corp. (I) 35,838 928,204
Trinity Industries, Inc. 13,800 438,426
Valmont Industries, Inc. 7,401 1,033,624
Watts Water Technologies, Inc., Class A 23,361 955,207
7,757,426
Marine - 0.1%
Eagle Bulk Shipping, Inc. (I)(L) 2,566 5,722
Excel Maritime Carriers, Ltd. (I)(L) 16,644 7,490
Genco Shipping & Trading, Ltd. (I)(L) 3,690 9,889
International Shipholding Corp. 569 9,377
Matson, Inc. (L) 3,567 82,041
114,519
Professional Services - 0.6%
Barrett Business Services, Inc. 1,536 51,072
CBIZ, Inc. (I) 4,715 27,394
CDI Corp. (L) 3,498 57,787
CRA International, Inc. (I)(L) 1,820 32,178
Franklin Covey Company (I) 3,206 39,530
FTI Consulting, Inc. (I) 1,296 40,059
GP Strategies Corp. (I) 2,590 51,930
Heidrick & Struggles International, Inc. 2,646 34,768
Hill International, Inc. (I) 4,471 15,559
Hudson Global, Inc. (I)(L) 3,400 14,926
Huron Consulting Group, Inc. (I) 878 28,921
ICF International, Inc. (I) 3,295 71,238
Kelly Services, Inc., Class A (L) 6,524 89,118
Copyright © 2013 www.secdatabase.com. All Rights Reserved.Please Consider the Environment Before Printing This Document
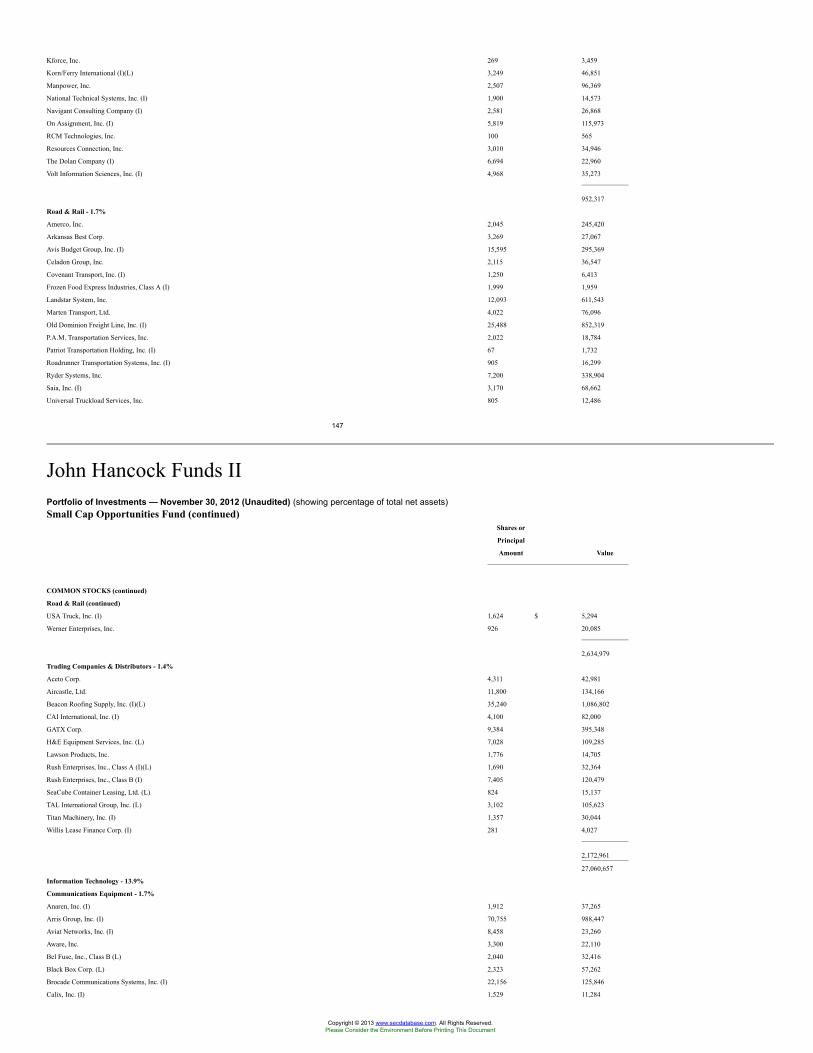
Kforce, Inc. 269 3,459
Korn/Ferry International (I)(L) 3,249 46,851
Manpower, Inc. 2,507 96,369
National Technical Systems, Inc. (I) 1,900 14,573
Navigant Consulting Company (I) 2,581 26,868
On Assignment, Inc. (I) 5,819 115,973
RCM Technologies, Inc. 100 565
Resources Connection, Inc. 3,010 34,946
The Dolan Company (I) 6,694 22,960
Volt Information Sciences, Inc. (I) 4,968 35,273
952,317
Road & Rail - 1.7%
Amerco, Inc. 2,045 245,420
Arkansas Best Corp. 3,269 27,067
Avis Budget Group, Inc. (I) 15,595 295,369
Celadon Group, Inc. 2,115 36,547
Covenant Transport, Inc. (I) 1,250 6,413
Frozen Food Express Industries, Class A (I) 1,999 1,959
Landstar System, Inc. 12,093 611,543
Marten Transport, Ltd. 4,022 76,096
Old Dominion Freight Line, Inc. (I) 25,488 852,319
P.A.M. Transportation Services, Inc. 2,022 18,784
Patriot Transportation Holding, Inc. (I) 67 1,732
Roadrunner Transportation Systems, Inc. (I) 905 16,299
Ryder Systems, Inc. 7,200 338,904
Saia, Inc. (I) 3,170 68,662
Universal Truckload Services, Inc. 805 12,486
147
John Hancock Funds IIPortfolio of Investments — November 30, 2012 (Unaudited) (showing percentage of total net assets)Small Cap Opportunities Fund (continued)
Shares or
Principal
Amount Value
COMMON STOCKS (continued)
Road & Rail (continued)
USA Truck, Inc. (I) 1,624 $ 5,294
Werner Enterprises, Inc. 926 20,085
2,634,979
Trading Companies & Distributors - 1.4%
Aceto Corp. 4,311 42,981
Aircastle, Ltd. 11,800 134,166
Beacon Roofing Supply, Inc. (I)(L) 35,240 1,086,802
CAI International, Inc. (I) 4,100 82,000
GATX Corp. 9,384 395,348
H&E Equipment Services, Inc. (L) 7,028 109,285
Lawson Products, Inc. 1,776 14,705
Rush Enterprises, Inc., Class A (I)(L) 1,690 32,364
Rush Enterprises, Inc., Class B (I) 7,405 120,479
SeaCube Container Leasing, Ltd. (L) 824 15,137
TAL International Group, Inc. (L) 3,102 105,623
Titan Machinery, Inc. (I) 1,357 30,044
Willis Lease Finance Corp. (I) 281 4,027
2,172,961
27,060,657
Information Technology - 13.9%
Communications Equipment - 1.7%
Anaren, Inc. (I) 1,912 37,265
Arris Group, Inc. (I) 70,755 988,447
Aviat Networks, Inc. (I) 8,458 23,260
Aware, Inc. 3,300 22,110
Bel Fuse, Inc., Class B (L) 2,040 32,416
Black Box Corp. (L) 2,323 57,262
Brocade Communications Systems, Inc. (I) 22,156 125,846
Calix, Inc. (I) 1,529 11,284
Copyright © 2013 www.secdatabase.com. All Rights Reserved.Please Consider the Environment Before Printing This Document
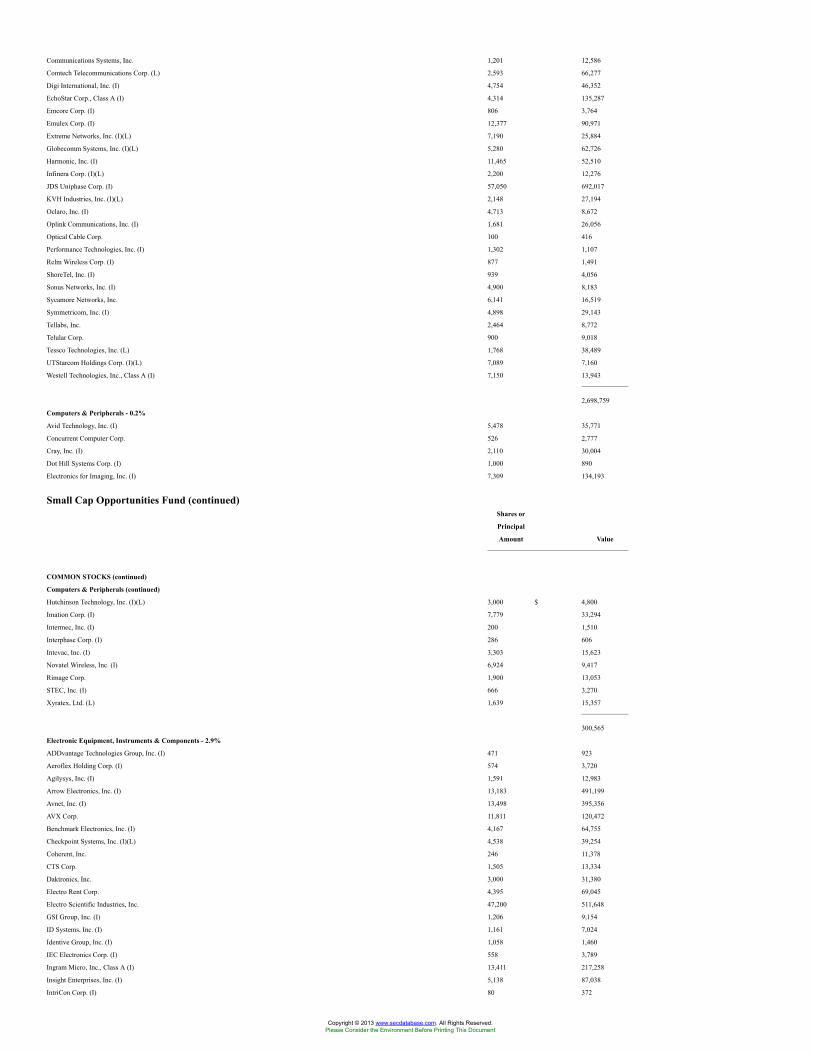
Communications Systems, Inc. 1,201 12,586
Comtech Telecommunications Corp. (L) 2,593 66,277
Digi International, Inc. (I) 4,754 46,352
EchoStar Corp., Class A (I) 4,314 135,287
Emcore Corp. (I) 806 3,764
Emulex Corp. (I) 12,377 90,971
Extreme Networks, Inc. (I)(L) 7,190 25,884
Globecomm Systems, Inc. (I)(L) 5,280 62,726
Harmonic, Inc. (I) 11,465 52,510
Infinera Corp. (I)(L) 2,200 12,276
JDS Uniphase Corp. (I) 57,050 692,017
KVH Industries, Inc. (I)(L) 2,148 27,194
Oclaro, Inc. (I) 4,713 8,672
Oplink Communications, Inc. (I) 1,681 26,056
Optical Cable Corp. 100 416
Performance Technologies, Inc. (I) 1,302 1,107
Relm Wireless Corp. (I) 877 1,491
ShoreTel, Inc. (I) 939 4,056
Sonus Networks, Inc. (I) 4,900 8,183
Sycamore Networks, Inc. 6,141 16,519
Symmetricom, Inc. (I) 4,898 29,143
Tellabs, Inc. 2,464 8,772
Telular Corp. 900 9,018
Tessco Technologies, Inc. (L) 1,768 38,489
UTStarcom Holdings Corp. (I)(L) 7,089 7,160
Westell Technologies, Inc., Class A (I) 7,150 13,943
2,698,759
Computers & Peripherals - 0.2%
Avid Technology, Inc. (I) 5,478 35,771
Concurrent Computer Corp. 526 2,777
Cray, Inc. (I) 2,110 30,004
Dot Hill Systems Corp. (I) 1,000 890
Electronics for Imaging, Inc. (I) 7,309 134,193
Small Cap Opportunities Fund (continued)Shares or
Principal
Amount Value
COMMON STOCKS (continued)
Computers & Peripherals (continued)
Hutchinson Technology, Inc. (I)(L) 3,000 $ 4,800
Imation Corp. (I) 7,779 33,294
Intermec, Inc. (I) 200 1,510
Interphase Corp. (I) 286 606
Intevac, Inc. (I) 3,303 15,623
Novatel Wireless, Inc. (I) 6,924 9,417
Rimage Corp. 1,900 13,053
STEC, Inc. (I) 666 3,270
Xyratex, Ltd. (L) 1,639 15,357
300,565
Electronic Equipment, Instruments & Components - 2.9%
ADDvantage Technologies Group, Inc. (I) 471 923
Aeroflex Holding Corp. (I) 574 3,720
Agilysys, Inc. (I) 1,591 12,983
Arrow Electronics, Inc. (I) 13,183 491,199
Avnet, Inc. (I) 13,498 395,356
AVX Corp. 11,811 120,472
Benchmark Electronics, Inc. (I) 4,167 64,755
Checkpoint Systems, Inc. (I)(L) 4,538 39,254
Coherent, Inc. 246 11,378
CTS Corp. 1,505 13,334
Daktronics, Inc. 3,000 31,380
Electro Rent Corp. 4,395 69,045
Electro Scientific Industries, Inc. 47,200 511,648
GSI Group, Inc. (I) 1,206 9,154
ID Systems, Inc. (I) 1,161 7,024
Identive Group, Inc. (I) 1,058 1,460
IEC Electronics Corp. (I) 558 3,789
Ingram Micro, Inc., Class A (I) 13,411 217,258
Insight Enterprises, Inc. (I) 5,138 87,038
IntriCon Corp. (I) 80 372
Copyright © 2013 www.secdatabase.com. All Rights Reserved.Please Consider the Environment Before Printing This Document
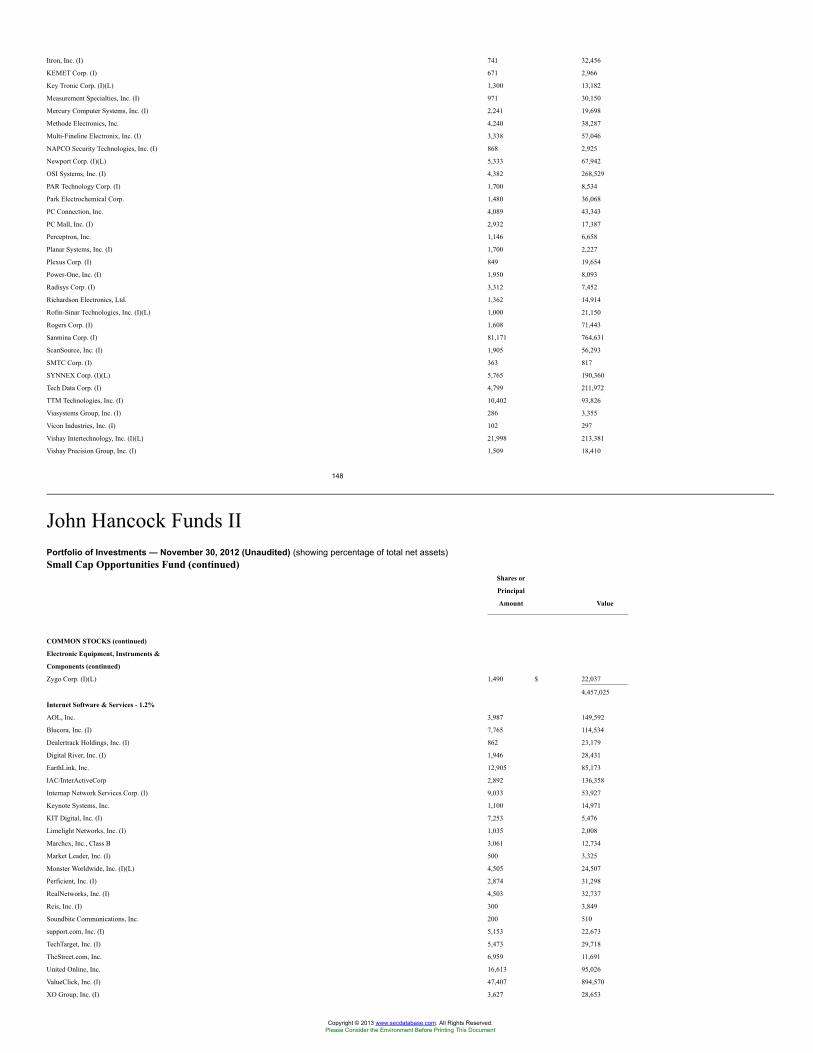
Itron, Inc. (I) 741 32,456
KEMET Corp. (I) 671 2,966
Key Tronic Corp. (I)(L) 1,300 13,182
Measurement Specialties, Inc. (I) 971 30,150
Mercury Computer Systems, Inc. (I) 2,241 19,698
Methode Electronics, Inc. 4,240 38,287
Multi-Fineline Electronix, Inc. (I) 3,338 57,046
NAPCO Security Technologies, Inc. (I) 868 2,925
Newport Corp. (I)(L) 5,333 67,942
OSI Systems, Inc. (I) 4,382 268,529
PAR Technology Corp. (I) 1,700 8,534
Park Electrochemical Corp. 1,480 36,068
PC Connection, Inc. 4,089 43,343
PC Mall, Inc. (I) 2,932 17,387
Perceptron, Inc. 1,146 6,658
Planar Systems, Inc. (I) 1,700 2,227
Plexus Corp. (I) 849 19,654
Power-One, Inc. (I) 1,950 8,093
Radisys Corp. (I) 3,312 7,452
Richardson Electronics, Ltd. 1,362 14,914
Rofin-Sinar Technologies, Inc. (I)(L) 1,000 21,150
Rogers Corp. (I) 1,608 71,443
Sanmina Corp. (I) 81,171 764,631
ScanSource, Inc. (I) 1,905 56,293
SMTC Corp. (I) 363 817
SYNNEX Corp. (I)(L) 5,765 190,360
Tech Data Corp. (I) 4,799 211,972
TTM Technologies, Inc. (I) 10,402 93,826
Viasystems Group, Inc. (I) 286 3,355
Vicon Industries, Inc. (I) 102 297
Vishay Intertechnology, Inc. (I)(L) 21,998 213,381
Vishay Precision Group, Inc. (I) 1,509 18,410
148
John Hancock Funds IIPortfolio of Investments — November 30, 2012 (Unaudited) (showing percentage of total net assets)Small Cap Opportunities Fund (continued)
Shares or
Principal
Amount Value
COMMON STOCKS (continued)
Electronic Equipment, Instruments &
Components (continued)
Zygo Corp. (I)(L) 1,490 $ 22,037
4,457,025
Internet Software & Services - 1.2%
AOL, Inc. 3,987 149,592
Blucora, Inc. (I) 7,765 114,534
Dealertrack Holdings, Inc. (I) 862 23,179
Digital River, Inc. (I) 1,946 28,431
EarthLink, Inc. 12,905 85,173
IAC/InterActiveCorp 2,892 136,358
Internap Network Services Corp. (I) 9,033 53,927
Keynote Systems, Inc. 1,100 14,971
KIT Digital, Inc. (I) 7,253 5,476
Limelight Networks, Inc. (I) 1,035 2,008
Marchex, Inc., Class B 3,061 12,734
Market Leader, Inc. (I) 500 3,325
Monster Worldwide, Inc. (I)(L) 4,505 24,507
Perficient, Inc. (I) 2,874 31,298
RealNetworks, Inc. (I) 4,503 32,737
Reis, Inc. (I) 300 3,849
Soundbite Communications, Inc. 200 510
support.com, Inc. (I) 5,153 22,673
TechTarget, Inc. (I) 5,473 29,718
TheStreet.com, Inc. 6,959 11,691
United Online, Inc. 16,613 95,026
ValueClick, Inc. (I) 47,407 894,570
XO Group, Inc. (I) 3,627 28,653
Copyright © 2013 www.secdatabase.com. All Rights Reserved.Please Consider the Environment Before Printing This Document
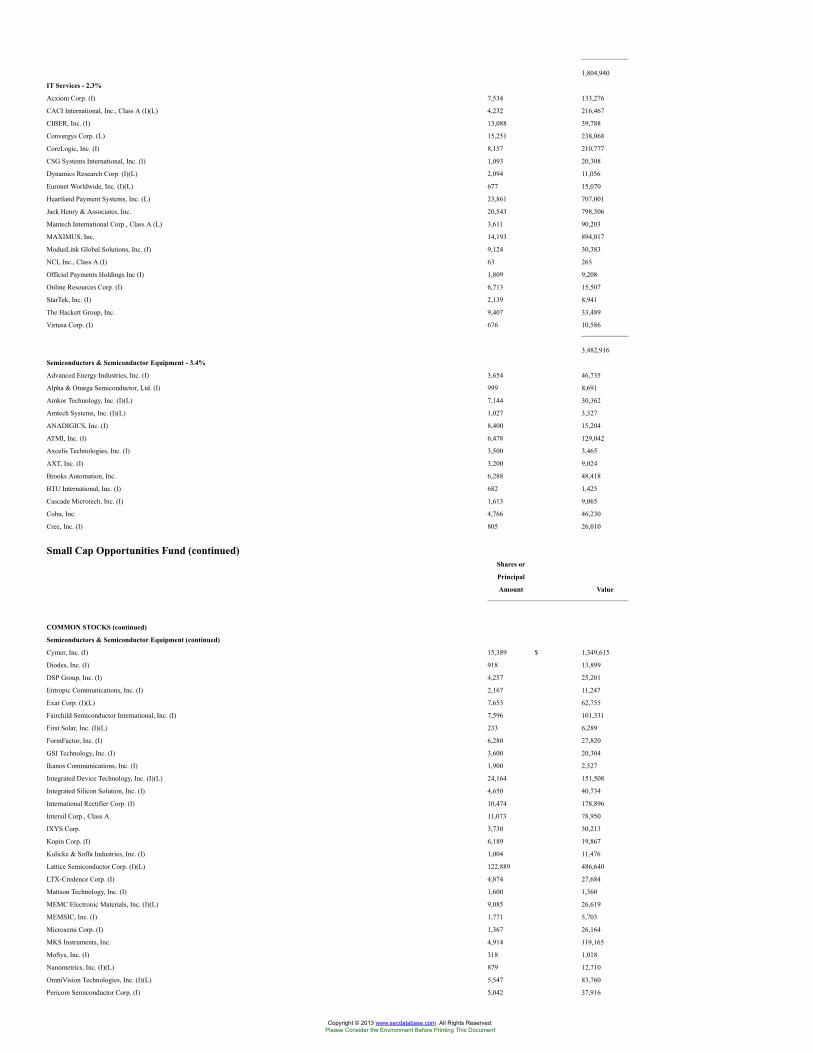
1,804,940
IT Services - 2.3%
Acxiom Corp. (I) 7,534 133,276
CACI International, Inc., Class A (I)(L) 4,232 216,467
CIBER, Inc. (I) 13,088 39,788
Convergys Corp. (L) 15,251 238,068
CoreLogic, Inc. (I) 8,157 210,777
CSG Systems International, Inc. (I) 1,093 20,308
Dynamics Research Corp. (I)(L) 2,094 11,056
Euronet Worldwide, Inc. (I)(L) 677 15,070
Heartland Payment Systems, Inc. (L) 23,861 707,001
Jack Henry & Associates, Inc. 20,543 798,506
Mantech International Corp., Class A (L) 3,611 90,203
MAXIMUS, Inc. 14,193 894,017
ModusLink Global Solutions, Inc. (I) 9,124 30,383
NCI, Inc., Class A (I) 63 265
Official Payments Holdings Inc (I) 1,809 9,208
Online Resources Corp. (I) 6,713 15,507
StarTek, Inc. (I) 2,139 8,941
The Hackett Group, Inc. 9,407 33,489
Virtusa Corp. (I) 676 10,586
3,482,916
Semiconductors & Semiconductor Equipment - 3.4%
Advanced Energy Industries, Inc. (I) 3,654 46,735
Alpha & Omega Semiconductor, Ltd. (I) 999 8,691
Amkor Technology, Inc. (I)(L) 7,144 30,362
Amtech Systems, Inc. (I)(L) 1,027 3,327
ANADIGICS, Inc. (I) 8,400 15,204
ATMI, Inc. (I) 6,478 129,042
Axcelis Technologies, Inc. (I) 3,500 3,465
AXT, Inc. (I) 3,200 9,024
Brooks Automation, Inc. 6,288 48,418
BTU International, Inc. (I) 682 1,425
Cascade Microtech, Inc. (I) 1,613 9,065
Cohu, Inc. 4,766 46,230
Cree, Inc. (I) 805 26,010
Small Cap Opportunities Fund (continued)Shares or
Principal
Amount Value
COMMON STOCKS (continued)
Semiconductors & Semiconductor Equipment (continued)
Cymer, Inc. (I) 15,389 $ 1,349,615
Diodes, Inc. (I) 918 13,899
DSP Group, Inc. (I) 4,257 25,201
Entropic Communications, Inc. (I) 2,167 11,247
Exar Corp. (I)(L) 7,653 62,755
Fairchild Semiconductor International, Inc. (I) 7,596 101,331
First Solar, Inc. (I)(L) 233 6,289
FormFactor, Inc. (I) 6,280 27,820
GSI Technology, Inc. (I) 3,600 20,304
Ikanos Communications, Inc. (I) 1,900 2,527
Integrated Device Technology, Inc. (I)(L) 24,164 151,508
Integrated Silicon Solution, Inc. (I) 4,650 40,734
International Rectifier Corp. (I) 10,474 178,896
Intersil Corp., Class A 11,073 78,950
IXYS Corp. 3,730 30,213
Kopin Corp. (I) 6,189 19,867
Kulicke & Soffa Industries, Inc. (I) 1,004 11,476
Lattice Semiconductor Corp. (I)(L) 122,889 486,640
LTX-Credence Corp. (I) 4,874 27,684
Mattson Technology, Inc. (I) 1,600 1,360
MEMC Electronic Materials, Inc. (I)(L) 9,085 26,619
MEMSIC, Inc. (I) 1,771 5,703
Microsemi Corp. (I) 1,367 26,164
MKS Instruments, Inc. 4,914 119,165
MoSys, Inc. (I) 318 1,018
Nanometrics, Inc. (I)(L) 879 12,710
OmniVision Technologies, Inc. (I)(L) 5,547 83,760
Pericom Semiconductor Corp. (I) 5,042 37,916
Copyright © 2013 www.secdatabase.com. All Rights Reserved.Please Consider the Environment Before Printing This Document
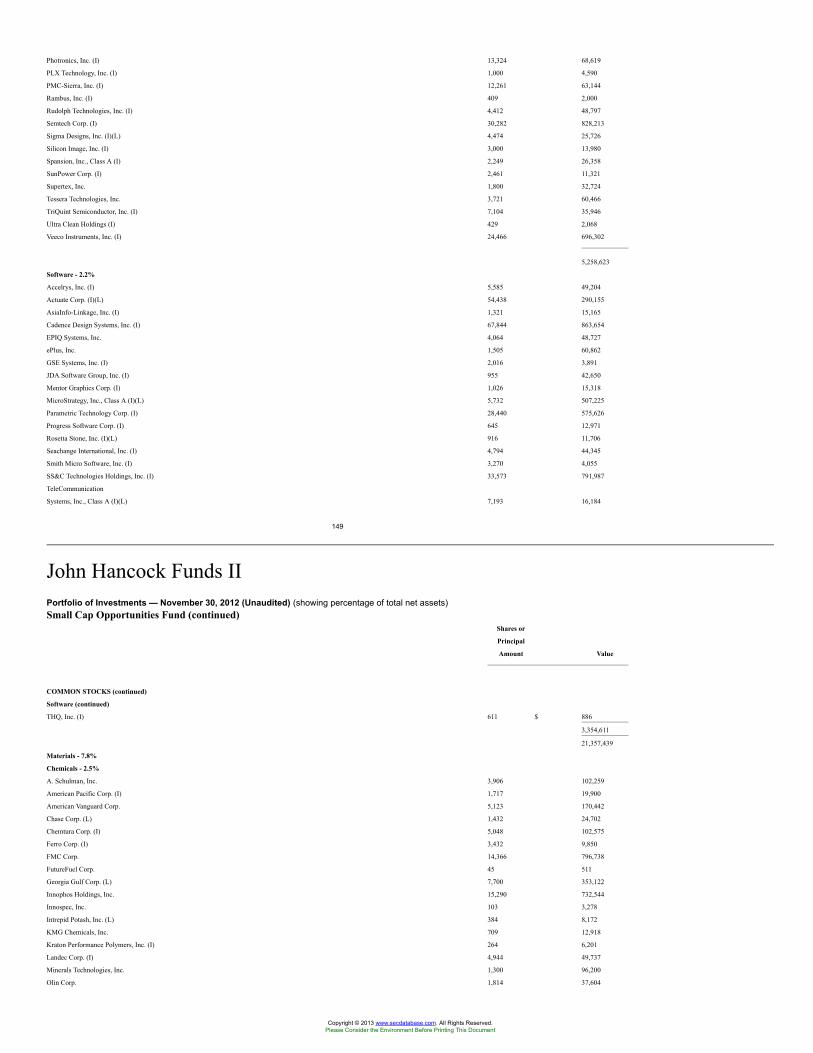
Photronics, Inc. (I) 13,324 68,619
PLX Technology, Inc. (I) 1,000 4,590
PMC-Sierra, Inc. (I) 12,261 63,144
Rambus, Inc. (I) 409 2,000
Rudolph Technologies, Inc. (I) 4,412 48,797
Semtech Corp. (I) 30,282 828,213
Sigma Designs, Inc. (I)(L) 4,474 25,726
Silicon Image, Inc. (I) 3,000 13,980
Spansion, Inc., Class A (I) 2,249 26,358
SunPower Corp. (I) 2,461 11,321
Supertex, Inc. 1,800 32,724
Tessera Technologies, Inc. 3,721 60,466
TriQuint Semiconductor, Inc. (I) 7,104 35,946
Ultra Clean Holdings (I) 429 2,068
Veeco Instruments, Inc. (I) 24,466 696,302
5,258,623
Software - 2.2%
Accelrys, Inc. (I) 5,585 49,204
Actuate Corp. (I)(L) 54,438 290,155
AsiaInfo-Linkage, Inc. (I) 1,321 15,165
Cadence Design Systems, Inc. (I) 67,844 863,654
EPIQ Systems, Inc. 4,064 48,727
ePlus, Inc. 1,505 60,862
GSE Systems, Inc. (I) 2,016 3,891
JDA Software Group, Inc. (I) 955 42,650
Mentor Graphics Corp. (I) 1,026 15,318
MicroStrategy, Inc., Class A (I)(L) 5,732 507,225
Parametric Technology Corp. (I) 28,440 575,626
Progress Software Corp. (I) 645 12,971
Rosetta Stone, Inc. (I)(L) 916 11,706
Seachange International, Inc. (I) 4,794 44,345
Smith Micro Software, Inc. (I) 3,270 4,055
SS&C Technologies Holdings, Inc. (I) 33,573 791,987
TeleCommunication
Systems, Inc., Class A (I)(L) 7,193 16,184
149
John Hancock Funds IIPortfolio of Investments — November 30, 2012 (Unaudited) (showing percentage of total net assets)Small Cap Opportunities Fund (continued)
Shares or
Principal
Amount Value
COMMON STOCKS (continued)
Software (continued)
THQ, Inc. (I) 611 $ 886
3,354,611
21,357,439
Materials - 7.8%
Chemicals - 2.5%
A. Schulman, Inc. 3,906 102,259
American Pacific Corp. (I) 1,717 19,900
American Vanguard Corp. 5,123 170,442
Chase Corp. (L) 1,432 24,702
Chemtura Corp. (I) 5,048 102,575
Ferro Corp. (I) 3,432 9,850
FMC Corp. 14,366 796,738
FutureFuel Corp. 45 511
Georgia Gulf Corp. (L) 7,700 353,122
Innophos Holdings, Inc. 15,290 732,544
Innospec, Inc. 103 3,278
Intrepid Potash, Inc. (L) 384 8,172
KMG Chemicals, Inc. 709 12,918
Kraton Performance Polymers, Inc. (I) 264 6,201
Landec Corp. (I) 4,944 49,737
Minerals Technologies, Inc. 1,300 96,200
Olin Corp. 1,814 37,604
Copyright © 2013 www.secdatabase.com. All Rights Reserved.Please Consider the Environment Before Printing This Document
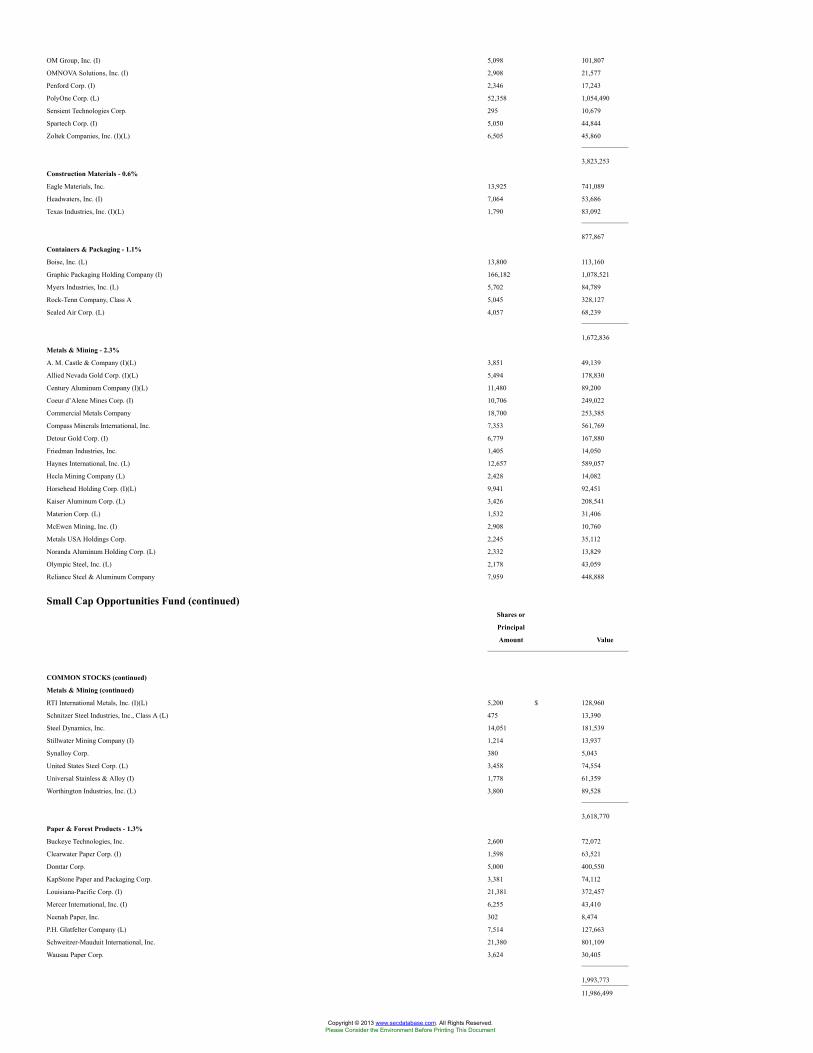
OM Group, Inc. (I) 5,098 101,807
OMNOVA Solutions, Inc. (I) 2,908 21,577
Penford Corp. (I) 2,346 17,243
PolyOne Corp. (L) 52,358 1,054,490
Sensient Technologies Corp. 295 10,679
Spartech Corp. (I) 5,050 44,844
Zoltek Companies, Inc. (I)(L) 6,505 45,860
3,823,253
Construction Materials - 0.6%
Eagle Materials, Inc. 13,925 741,089
Headwaters, Inc. (I) 7,064 53,686
Texas Industries, Inc. (I)(L) 1,790 83,092
877,867
Containers & Packaging - 1.1%
Boise, Inc. (L) 13,800 113,160
Graphic Packaging Holding Company (I) 166,182 1,078,521
Myers Industries, Inc. (L) 5,702 84,789
Rock-Tenn Company, Class A 5,045 328,127
Sealed Air Corp. (L) 4,057 68,239
1,672,836
Metals & Mining - 2.3%
A. M. Castle & Company (I)(L) 3,851 49,139
Allied Nevada Gold Corp. (I)(L) 5,494 178,830
Century Aluminum Company (I)(L) 11,480 89,200
Coeur d’Alene Mines Corp. (I) 10,706 249,022
Commercial Metals Company 18,700 253,385
Compass Minerals International, Inc. 7,353 561,769
Detour Gold Corp. (I) 6,779 167,880
Friedman Industries, Inc. 1,405 14,050
Haynes International, Inc. (L) 12,657 589,057
Hecla Mining Company (L) 2,428 14,082
Horsehead Holding Corp. (I)(L) 9,941 92,451
Kaiser Aluminum Corp. (L) 3,426 208,541
Materion Corp. (L) 1,532 31,406
McEwen Mining, Inc. (I) 2,908 10,760
Metals USA Holdings Corp. 2,245 35,112
Noranda Aluminum Holding Corp. (L) 2,332 13,829
Olympic Steel, Inc. (L) 2,178 43,059
Reliance Steel & Aluminum Company 7,959 448,888
Small Cap Opportunities Fund (continued)Shares or
Principal
Amount Value
COMMON STOCKS (continued)
Metals & Mining (continued)
RTI International Metals, Inc. (I)(L) 5,200 $ 128,960
Schnitzer Steel Industries, Inc., Class A (L) 475 13,390
Steel Dynamics, Inc. 14,051 181,539
Stillwater Mining Company (I) 1,214 13,937
Synalloy Corp. 380 5,043
United States Steel Corp. (L) 3,458 74,554
Universal Stainless & Alloy (I) 1,778 61,359
Worthington Industries, Inc. (L) 3,800 89,528
3,618,770
Paper & Forest Products - 1.3%
Buckeye Technologies, Inc. 2,600 72,072
Clearwater Paper Corp. (I) 1,598 63,521
Domtar Corp. 5,000 400,550
KapStone Paper and Packaging Corp. 3,381 74,112
Louisiana-Pacific Corp. (I) 21,381 372,457
Mercer International, Inc. (I) 6,255 43,410
Neenah Paper, Inc. 302 8,474
P.H. Glatfelter Company (L) 7,514 127,663
Schweitzer-Mauduit International, Inc. 21,380 801,109
Wausau Paper Corp. 3,624 30,405
1,993,773
11,986,499
Copyright © 2013 www.secdatabase.com. All Rights Reserved.Please Consider the Environment Before Printing This Document
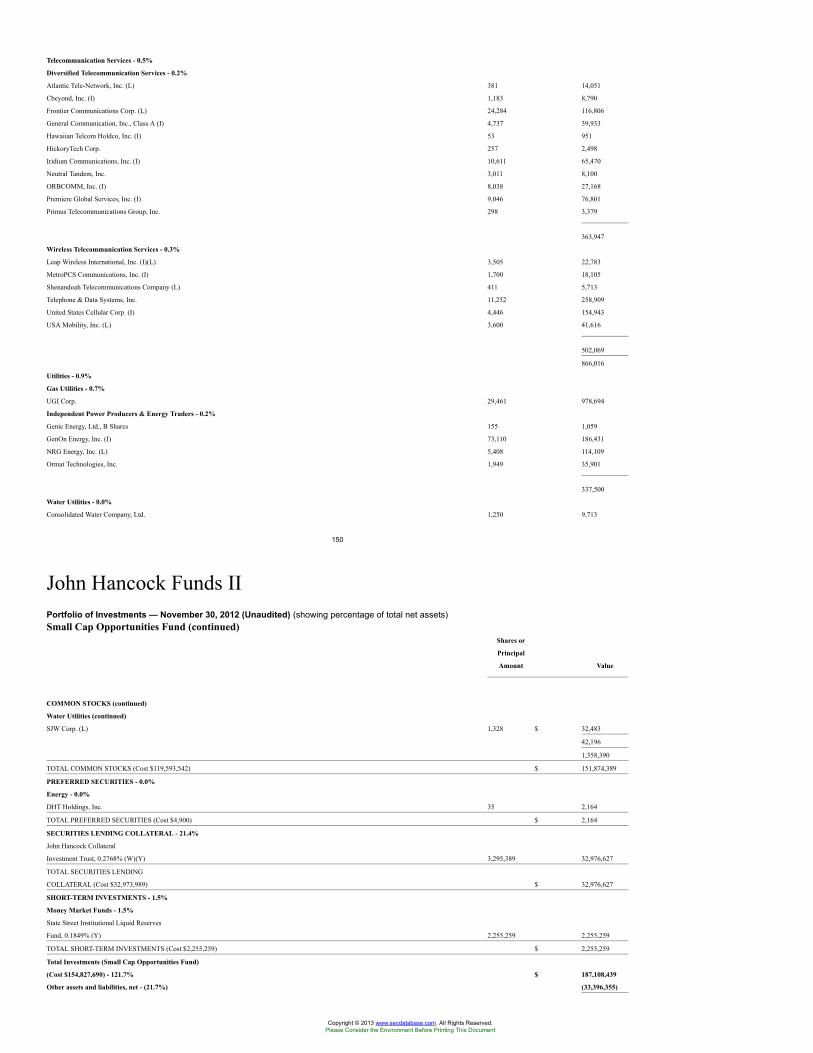
Telecommunication Services - 0.5%
Diversified Telecommunication Services - 0.2%
Atlantic Tele-Network, Inc. (L) 381 14,051
Cbeyond, Inc. (I) 1,183 8,790
Frontier Communications Corp. (L) 24,284 116,806
General Communication, Inc., Class A (I) 4,737 39,933
Hawaiian Telcom Holdco, Inc. (I) 53 951
HickoryTech Corp. 257 2,498
Iridium Communications, Inc. (I) 10,611 65,470
Neutral Tandem, Inc. 3,011 8,100
ORBCOMM, Inc. (I) 8,038 27,168
Premiere Global Services, Inc. (I) 9,046 76,801
Primus Telecommunications Group, Inc. 298 3,379
363,947
Wireless Telecommunication Services - 0.3%
Leap Wireless International, Inc. (I)(L) 3,505 22,783
MetroPCS Communications, Inc. (I) 1,700 18,105
Shenandoah Telecommunications Company (L) 411 5,713
Telephone & Data Systems, Inc. 11,252 258,909
United States Cellular Corp. (I) 4,446 154,943
USA Mobility, Inc. (L) 3,600 41,616
502,069
866,016
Utilities - 0.9%
Gas Utilities - 0.7%
UGI Corp. 29,461 978,694
Independent Power Producers & Energy Traders - 0.2%
Genie Energy, Ltd., B Shares 155 1,059
GenOn Energy, Inc. (I) 73,110 186,431
NRG Energy, Inc. (L) 5,408 114,109
Ormat Technologies, Inc. 1,949 35,901
337,500
Water Utilities - 0.0%
Consolidated Water Company, Ltd. 1,250 9,713
150
John Hancock Funds IIPortfolio of Investments — November 30, 2012 (Unaudited) (showing percentage of total net assets)Small Cap Opportunities Fund (continued)
Shares or
Principal
Amount Value
COMMON STOCKS (continued)
Water Utilities (continued)
SJW Corp. (L) 1,328 $ 32,483
42,196
1,358,390
TOTAL COMMON STOCKS (Cost $119,593,542) $ 151,874,389
PREFERRED SECURITIES - 0.0%
Energy - 0.0%
DHT Holdings, Inc. 35 2,164
TOTAL PREFERRED SECURITIES (Cost $4,900) $ 2,164
SECURITIES LENDING COLLATERAL - 21.4%
John Hancock Collateral
Investment Trust, 0.2768% (W)(Y) 3,295,389 32,976,627
TOTAL SECURITIES LENDING
COLLATERAL (Cost $32,973,989) $ 32,976,627
SHORT-TERM INVESTMENTS - 1.5%
Money Market Funds - 1.5%
State Street Institutional Liquid Reserves
Fund, 0.1849% (Y) 2,255,259 2,255,259
TOTAL SHORT-TERM INVESTMENTS (Cost $2,255,259) $ 2,255,259
Total Investments (Small Cap Opportunities Fund)
(Cost $154,827,690) - 121.7% $ 187,108,439
Other assets and liabilities, net - (21.7%) (33,396,355)
Copyright © 2013 www.secdatabase.com. All Rights Reserved.Please Consider the Environment Before Printing This Document
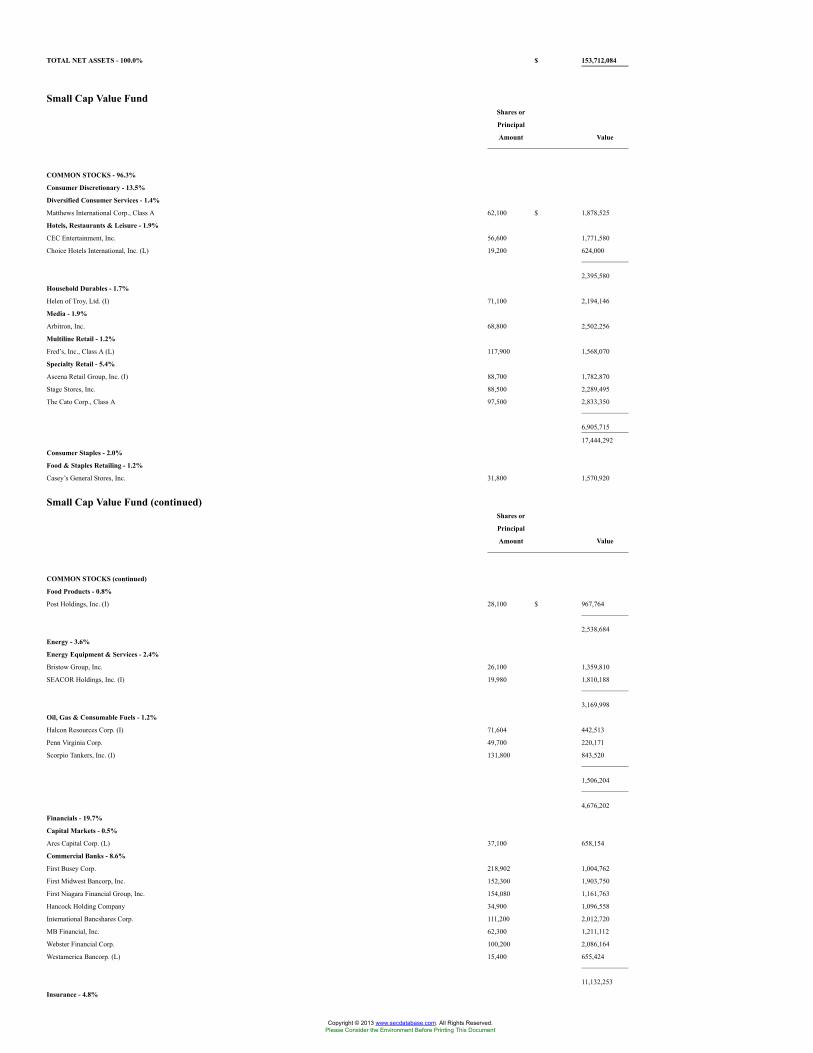
TOTAL NET ASSETS - 100.0% $ 153,712,084
Small Cap Value FundShares or
Principal
Amount Value
COMMON STOCKS - 96.3%
Consumer Discretionary - 13.5%
Diversified Consumer Services - 1.4%
Matthews International Corp., Class A 62,100 $ 1,878,525
Hotels, Restaurants & Leisure - 1.9%
CEC Entertainment, Inc. 56,600 1,771,580
Choice Hotels International, Inc. (L) 19,200 624,000
2,395,580
Household Durables - 1.7%
Helen of Troy, Ltd. (I) 71,100 2,194,146
Media - 1.9%
Arbitron, Inc. 68,800 2,502,256
Multiline Retail - 1.2%
Fred’s, Inc., Class A (L) 117,900 1,568,070
Specialty Retail - 5.4%
Ascena Retail Group, Inc. (I) 88,700 1,782,870
Stage Stores, Inc. 88,500 2,289,495
The Cato Corp., Class A 97,500 2,833,350
6,905,715
17,444,292
Consumer Staples - 2.0%
Food & Staples Retailing - 1.2%
Casey’s General Stores, Inc. 31,800 1,570,920
Small Cap Value Fund (continued)Shares or
Principal
Amount Value
COMMON STOCKS (continued)
Food Products - 0.8%
Post Holdings, Inc. (I) 28,100 $ 967,764
2,538,684
Energy - 3.6%
Energy Equipment & Services - 2.4%
Bristow Group, Inc. 26,100 1,359,810
SEACOR Holdings, Inc. (I) 19,980 1,810,188
3,169,998
Oil, Gas & Consumable Fuels - 1.2%
Halcon Resources Corp. (I) 71,604 442,513
Penn Virginia Corp. 49,700 220,171
Scorpio Tankers, Inc. (I) 131,800 843,520
1,506,204
4,676,202
Financials - 19.7%
Capital Markets - 0.5%
Ares Capital Corp. (L) 37,100 658,154
Commercial Banks - 8.6%
First Busey Corp. 218,902 1,004,762
First Midwest Bancorp, Inc. 152,300 1,903,750
First Niagara Financial Group, Inc. 154,080 1,161,763
Hancock Holding Company 34,900 1,096,558
International Bancshares Corp. 111,200 2,012,720
MB Financial, Inc. 62,300 1,211,112
Webster Financial Corp. 100,200 2,086,164
Westamerica Bancorp. (L) 15,400 655,424
11,132,253
Insurance - 4.8%
Copyright © 2013 www.secdatabase.com. All Rights Reserved.Please Consider the Environment Before Printing This Document
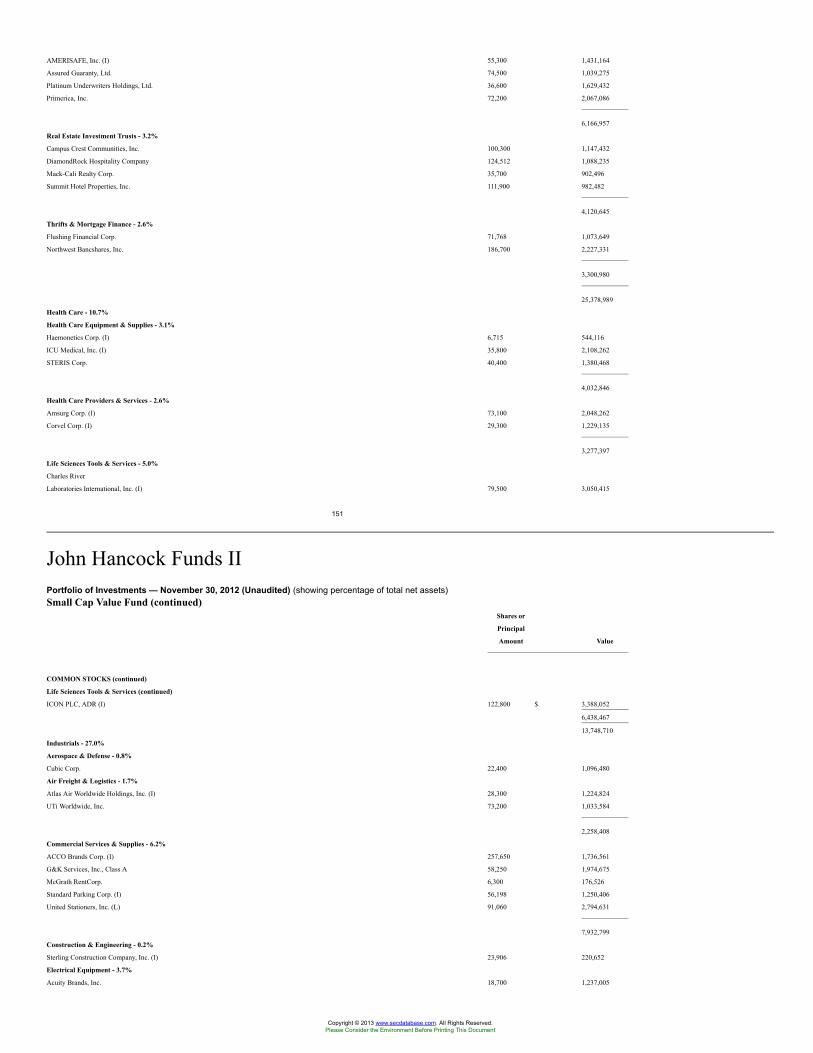
AMERISAFE, Inc. (I) 55,300 1,431,164
Assured Guaranty, Ltd. 74,500 1,039,275
Platinum Underwriters Holdings, Ltd. 36,600 1,629,432
Primerica, Inc. 72,200 2,067,086
6,166,957
Real Estate Investment Trusts - 3.2%
Campus Crest Communities, Inc. 100,300 1,147,432
DiamondRock Hospitality Company 124,512 1,088,235
Mack-Cali Realty Corp. 35,700 902,496
Summit Hotel Properties, Inc. 111,900 982,482
4,120,645
Thrifts & Mortgage Finance - 2.6%
Flushing Financial Corp. 71,768 1,073,649
Northwest Bancshares, Inc. 186,700 2,227,331
3,300,980
25,378,989
Health Care - 10.7%
Health Care Equipment & Supplies - 3.1%
Haemonetics Corp. (I) 6,715 544,116
ICU Medical, Inc. (I) 35,800 2,108,262
STERIS Corp. 40,400 1,380,468
4,032,846
Health Care Providers & Services - 2.6%
Amsurg Corp. (I) 73,100 2,048,262
Corvel Corp. (I) 29,300 1,229,135
3,277,397
Life Sciences Tools & Services - 5.0%
Charles River
Laboratories International, Inc. (I) 79,500 3,050,415
151
John Hancock Funds IIPortfolio of Investments — November 30, 2012 (Unaudited) (showing percentage of total net assets)Small Cap Value Fund (continued)
Shares or
Principal
Amount Value
COMMON STOCKS (continued)
Life Sciences Tools & Services (continued)
ICON PLC, ADR (I) 122,800 $ 3,388,052
6,438,467
13,748,710
Industrials - 27.0%
Aerospace & Defense - 0.8%
Cubic Corp. 22,400 1,096,480
Air Freight & Logistics - 1.7%
Atlas Air Worldwide Holdings, Inc. (I) 28,300 1,224,824
UTi Worldwide, Inc. 73,200 1,033,584
2,258,408
Commercial Services & Supplies - 6.2%
ACCO Brands Corp. (I) 257,650 1,736,561
G&K Services, Inc., Class A 58,250 1,974,675
McGrath RentCorp. 6,300 176,526
Standard Parking Corp. (I) 56,198 1,250,406
United Stationers, Inc. (L) 91,060 2,794,631
7,932,799
Construction & Engineering - 0.2%
Sterling Construction Company, Inc. (I) 23,906 220,652
Electrical Equipment - 3.7%
Acuity Brands, Inc. 18,700 1,237,005
Copyright © 2013 www.secdatabase.com. All Rights Reserved.Please Consider the Environment Before Printing This Document
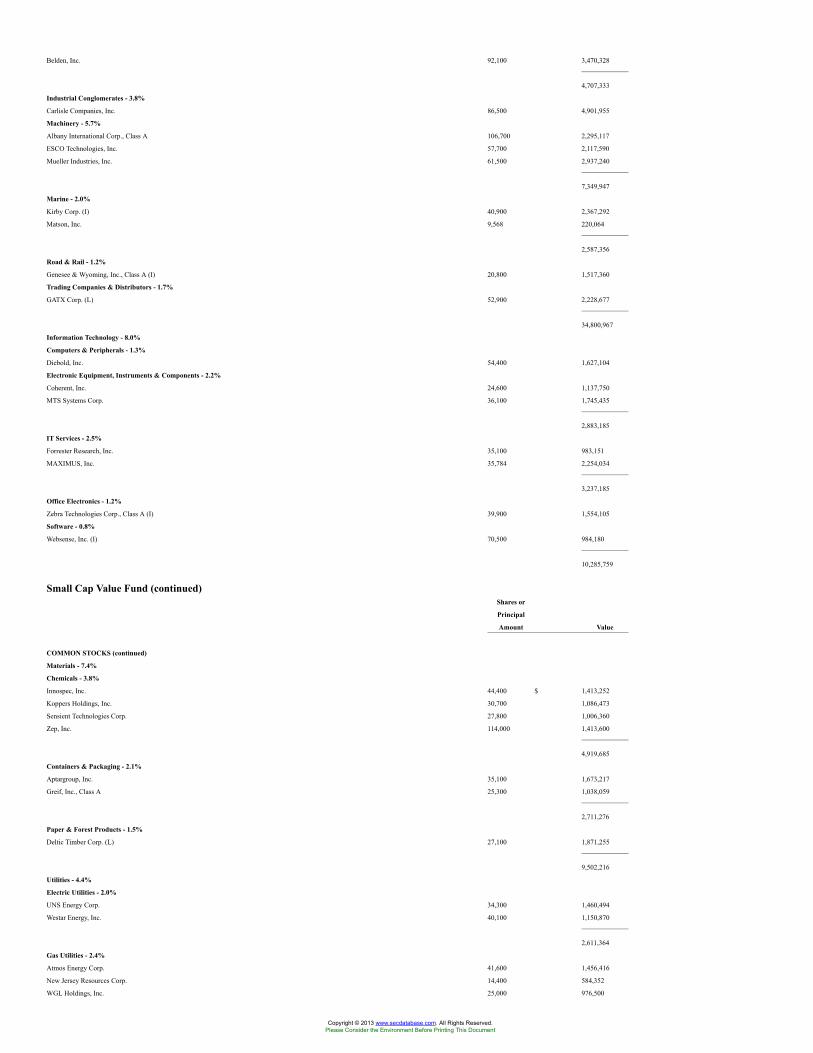
Belden, Inc. 92,100 3,470,328
4,707,333
Industrial Conglomerates - 3.8%
Carlisle Companies, Inc. 86,500 4,901,955
Machinery - 5.7%
Albany International Corp., Class A 106,700 2,295,117
ESCO Technologies, Inc. 57,700 2,117,590
Mueller Industries, Inc. 61,500 2,937,240
7,349,947
Marine - 2.0%
Kirby Corp. (I) 40,900 2,367,292
Matson, Inc. 9,568 220,064
2,587,356
Road & Rail - 1.2%
Genesee & Wyoming, Inc., Class A (I) 20,800 1,517,360
Trading Companies & Distributors - 1.7%
GATX Corp. (L) 52,900 2,228,677
34,800,967
Information Technology - 8.0%
Computers & Peripherals - 1.3%
Diebold, Inc. 54,400 1,627,104
Electronic Equipment, Instruments & Components - 2.2%
Coherent, Inc. 24,600 1,137,750
MTS Systems Corp. 36,100 1,745,435
2,883,185
IT Services - 2.5%
Forrester Research, Inc. 35,100 983,151
MAXIMUS, Inc. 35,784 2,254,034
3,237,185
Office Electronics - 1.2%
Zebra Technologies Corp., Class A (I) 39,900 1,554,105
Software - 0.8%
Websense, Inc. (I) 70,500 984,180
10,285,759
Small Cap Value Fund (continued)Shares or
Principal
Amount Value
COMMON STOCKS (continued)
Materials - 7.4%
Chemicals - 3.8%
Innospec, Inc. 44,400 $ 1,413,252
Koppers Holdings, Inc. 30,700 1,086,473
Sensient Technologies Corp. 27,800 1,006,360
Zep, Inc. 114,000 1,413,600
4,919,685
Containers & Packaging - 2.1%
Aptargroup, Inc. 35,100 1,673,217
Greif, Inc., Class A 25,300 1,038,059
2,711,276
Paper & Forest Products - 1.5%
Deltic Timber Corp. (L) 27,100 1,871,255
9,502,216
Utilities - 4.4%
Electric Utilities - 2.0%
UNS Energy Corp. 34,300 1,460,494
Westar Energy, Inc. 40,100 1,150,870
2,611,364
Gas Utilities - 2.4%
Atmos Energy Corp. 41,600 1,456,416
New Jersey Resources Corp. 14,400 584,352
WGL Holdings, Inc. 25,000 976,500
Copyright © 2013 www.secdatabase.com. All Rights Reserved.Please Consider the Environment Before Printing This Document
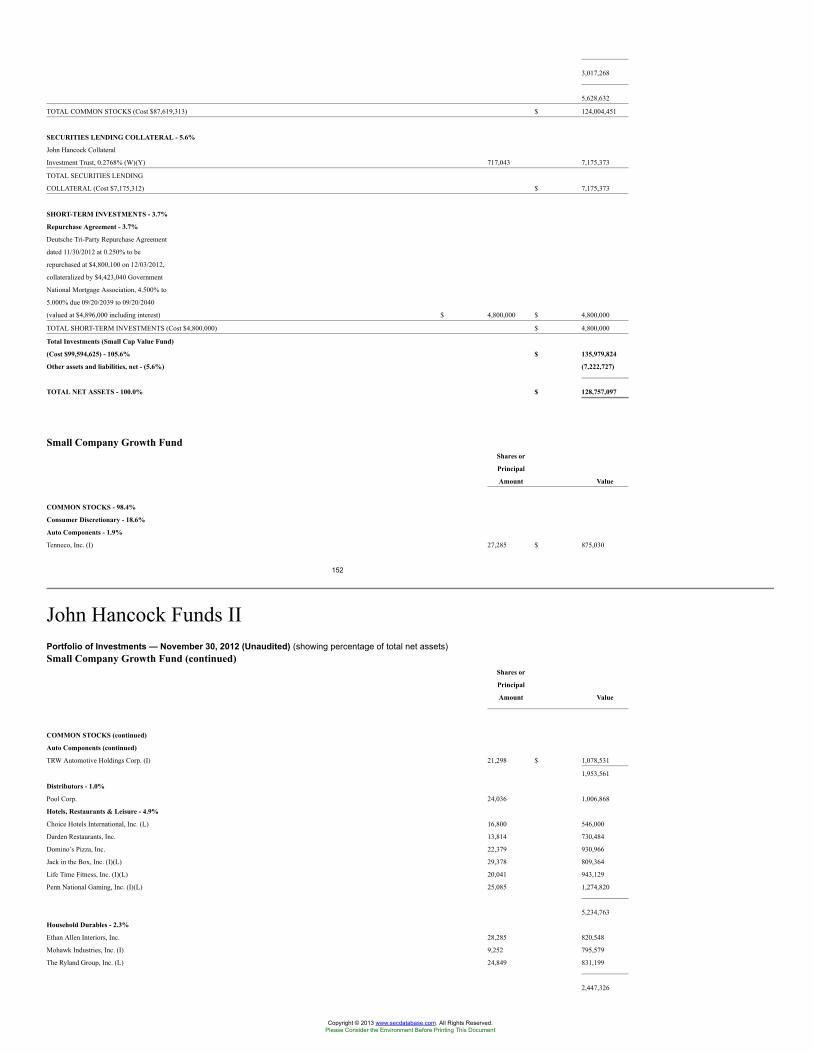
3,017,268
5,628,632
TOTAL COMMON STOCKS (Cost $87,619,313) $ 124,004,451
SECURITIES LENDING COLLATERAL - 5.6%
John Hancock Collateral
Investment Trust, 0.2768% (W)(Y) 717,043 7,175,373
TOTAL SECURITIES LENDING
COLLATERAL (Cost $7,175,312) $ 7,175,373
SHORT-TERM INVESTMENTS - 3.7%
Repurchase Agreement - 3.7%
Deutsche Tri-Party Repurchase Agreement
dated 11/30/2012 at 0.250% to be
repurchased at $4,800,100 on 12/03/2012,
collateralized by $4,423,040 Government
National Mortgage Association, 4.500% to
5.000% due 09/20/2039 to 09/20/2040
(valued at $4,896,000 including interest) $ 4,800,000 $ 4,800,000
TOTAL SHORT-TERM INVESTMENTS (Cost $4,800,000) $ 4,800,000
Total Investments (Small Cap Value Fund)
(Cost $99,594,625) - 105.6% $ 135,979,824
Other assets and liabilities, net - (5.6%) (7,222,727)
TOTAL NET ASSETS - 100.0% $ 128,757,097
Small Company Growth FundShares or
Principal
Amount Value
COMMON STOCKS - 98.4%
Consumer Discretionary - 18.6%
Auto Components - 1.9%
Tenneco, Inc. (I) 27,285 $ 875,030
152
John Hancock Funds IIPortfolio of Investments — November 30, 2012 (Unaudited) (showing percentage of total net assets)Small Company Growth Fund (continued)
Shares or
Principal
Amount Value
COMMON STOCKS (continued)
Auto Components (continued)
TRW Automotive Holdings Corp. (I) 21,298 $ 1,078,531
1,953,561
Distributors - 1.0%
Pool Corp. 24,036 1,006,868
Hotels, Restaurants & Leisure - 4.9%
Choice Hotels International, Inc. (L) 16,800 546,000
Darden Restaurants, Inc. 13,814 730,484
Domino’s Pizza, Inc. 22,379 930,966
Jack in the Box, Inc. (I)(L) 29,378 809,364
Life Time Fitness, Inc. (I)(L) 20,041 943,129
Penn National Gaming, Inc. (I)(L) 25,085 1,274,820
5,234,763
Household Durables - 2.3%
Ethan Allen Interiors, Inc. 28,285 820,548
Mohawk Industries, Inc. (I) 9,252 795,579
The Ryland Group, Inc. (L) 24,849 831,199
2,447,326
Copyright © 2013 www.secdatabase.com. All Rights Reserved.Please Consider the Environment Before Printing This Document
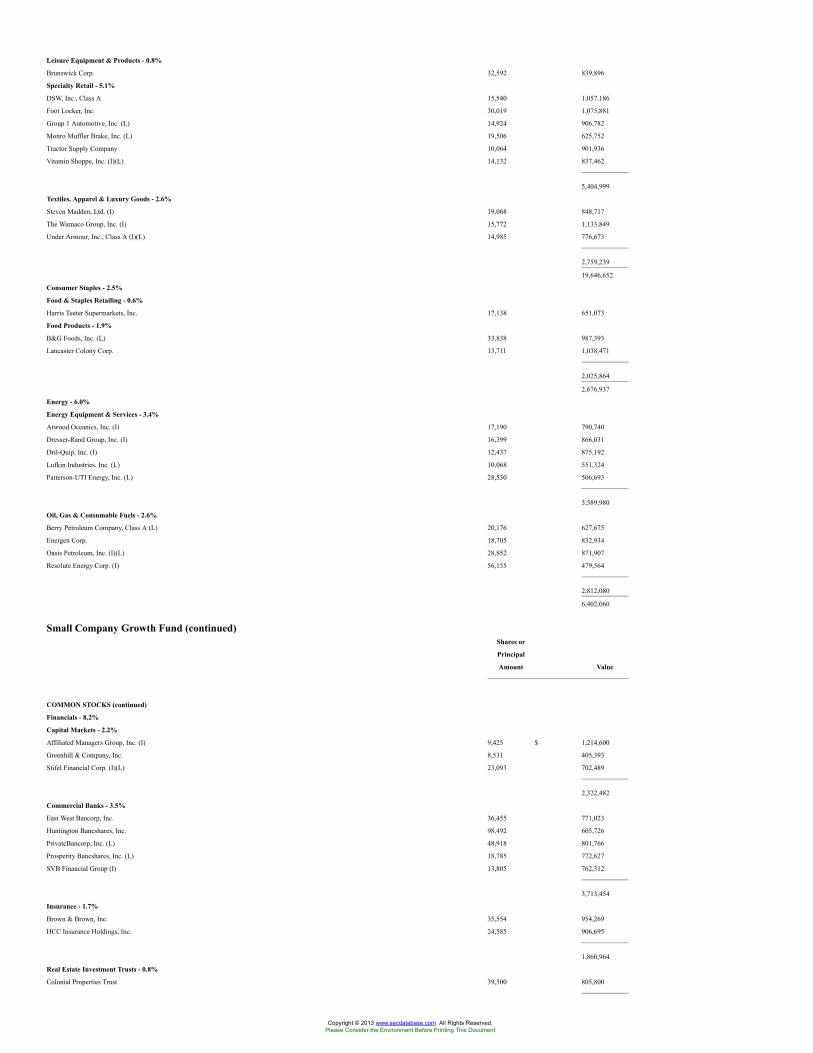
Leisure Equipment & Products - 0.8%
Brunswick Corp. 32,592 839,896
Specialty Retail - 5.1%
DSW, Inc., Class A 15,540 1,057,186
Foot Locker, Inc. 30,019 1,075,881
Group 1 Automotive, Inc. (L) 14,924 906,782
Monro Muffler Brake, Inc. (L) 19,506 625,752
Tractor Supply Company 10,064 901,936
Vitamin Shoppe, Inc. (I)(L) 14,132 837,462
5,404,999
Textiles, Apparel & Luxury Goods - 2.6%
Steven Madden, Ltd. (I) 19,068 848,717
The Warnaco Group, Inc. (I) 15,772 1,133,849
Under Armour, Inc., Class A (I)(L) 14,985 776,673
2,759,239
19,646,652
Consumer Staples - 2.5%
Food & Staples Retailing - 0.6%
Harris Teeter Supermarkets, Inc. 17,138 651,073
Food Products - 1.9%
B&G Foods, Inc. (L) 33,838 987,393
Lancaster Colony Corp. 13,711 1,038,471
2,025,864
2,676,937
Energy - 6.0%
Energy Equipment & Services - 3.4%
Atwood Oceanics, Inc. (I) 17,190 790,740
Dresser-Rand Group, Inc. (I) 16,399 866,031
Dril-Quip, Inc. (I) 12,437 875,192
Lufkin Industries, Inc. (L) 10,068 551,324
Patterson-UTI Energy, Inc. (L) 28,530 506,693
3,589,980
Oil, Gas & Consumable Fuels - 2.6%
Berry Petroleum Company, Class A (L) 20,176 627,675
Energen Corp. 18,705 832,934
Oasis Petroleum, Inc. (I)(L) 28,852 871,907
Resolute Energy Corp. (I) 56,155 479,564
2,812,080
6,402,060
Small Company Growth Fund (continued)Shares or
Principal
Amount Value
COMMON STOCKS (continued)
Financials - 8.2%
Capital Markets - 2.2%
Affiliated Managers Group, Inc. (I) 9,425 $ 1,214,600
Greenhill & Company, Inc. 8,531 405,393
Stifel Financial Corp. (I)(L) 23,093 702,489
2,322,482
Commercial Banks - 3.5%
East West Bancorp, Inc. 36,455 771,023
Huntington Bancshares, Inc. 98,492 605,726
PrivateBancorp, Inc. (L) 48,918 801,766
Prosperity Bancshares, Inc. (L) 18,785 772,627
SVB Financial Group (I) 13,805 762,312
3,713,454
Insurance - 1.7%
Brown & Brown, Inc. 35,554 954,269
HCC Insurance Holdings, Inc. 24,585 906,695
1,860,964
Real Estate Investment Trusts - 0.8%
Colonial Properties Trust 39,500 805,800
Copyright © 2013 www.secdatabase.com. All Rights Reserved.Please Consider the Environment Before Printing This Document
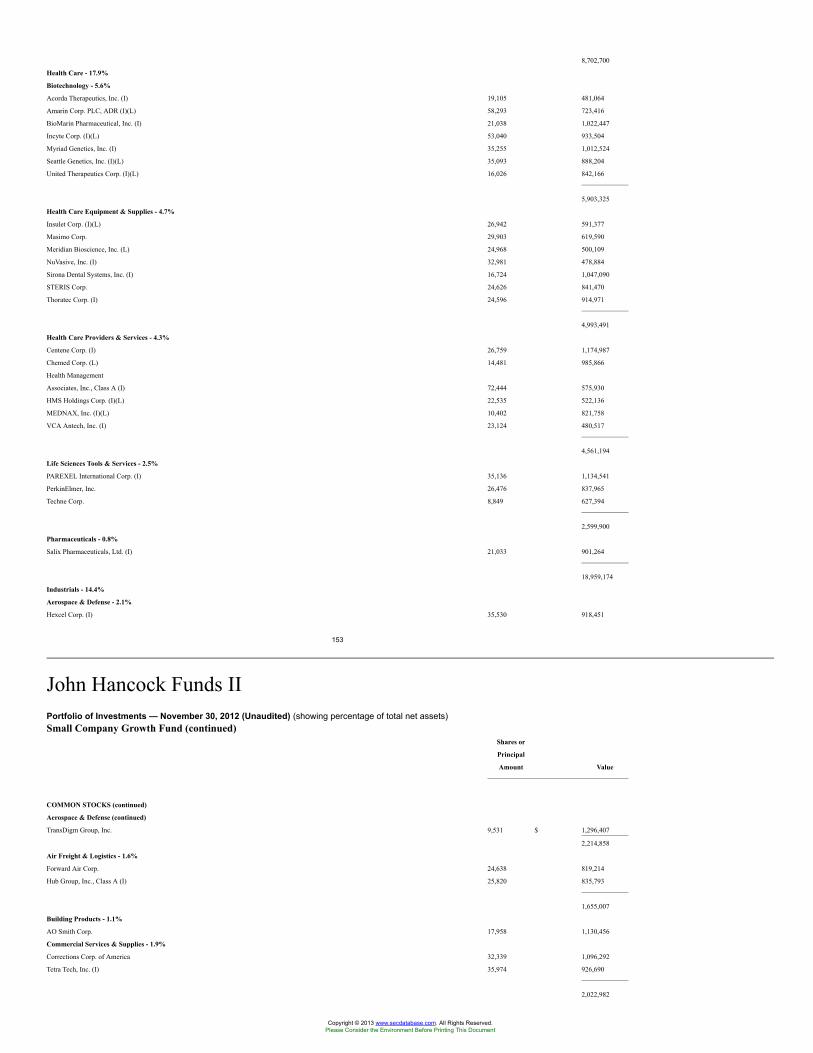
8,702,700
Health Care - 17.9%
Biotechnology - 5.6%
Acorda Therapeutics, Inc. (I) 19,105 481,064
Amarin Corp. PLC, ADR (I)(L) 58,293 723,416
BioMarin Pharmaceutical, Inc. (I) 21,038 1,022,447
Incyte Corp. (I)(L) 53,040 933,504
Myriad Genetics, Inc. (I) 35,255 1,012,524
Seattle Genetics, Inc. (I)(L) 35,093 888,204
United Therapeutics Corp. (I)(L) 16,026 842,166
5,903,325
Health Care Equipment & Supplies - 4.7%
Insulet Corp. (I)(L) 26,942 591,377
Masimo Corp. 29,903 619,590
Meridian Bioscience, Inc. (L) 24,968 500,109
NuVasive, Inc. (I) 32,981 478,884
Sirona Dental Systems, Inc. (I) 16,724 1,047,090
STERIS Corp. 24,626 841,470
Thoratec Corp. (I) 24,596 914,971
4,993,491
Health Care Providers & Services - 4.3%
Centene Corp. (I) 26,759 1,174,987
Chemed Corp. (L) 14,481 985,866
Health Management
Associates, Inc., Class A (I) 72,444 575,930
HMS Holdings Corp. (I)(L) 22,535 522,136
MEDNAX, Inc. (I)(L) 10,402 821,758
VCA Antech, Inc. (I) 23,124 480,517
4,561,194
Life Sciences Tools & Services - 2.5%
PAREXEL International Corp. (I) 35,136 1,134,541
PerkinElmer, Inc. 26,476 837,965
Techne Corp. 8,849 627,394
2,599,900
Pharmaceuticals - 0.8%
Salix Pharmaceuticals, Ltd. (I) 21,033 901,264
18,959,174
Industrials - 14.4%
Aerospace & Defense - 2.1%
Hexcel Corp. (I) 35,530 918,451
153
John Hancock Funds IIPortfolio of Investments — November 30, 2012 (Unaudited) (showing percentage of total net assets)Small Company Growth Fund (continued)
Shares or
Principal
Amount Value
COMMON STOCKS (continued)
Aerospace & Defense (continued)
TransDigm Group, Inc. 9,531 $ 1,296,407
2,214,858
Air Freight & Logistics - 1.6%
Forward Air Corp. 24,638 819,214
Hub Group, Inc., Class A (I) 25,820 835,793
1,655,007
Building Products - 1.1%
AO Smith Corp. 17,958 1,130,456
Commercial Services & Supplies - 1.9%
Corrections Corp. of America 32,339 1,096,292
Tetra Tech, Inc. (I) 35,974 926,690
2,022,982
Copyright © 2013 www.secdatabase.com. All Rights Reserved.Please Consider the Environment Before Printing This Document
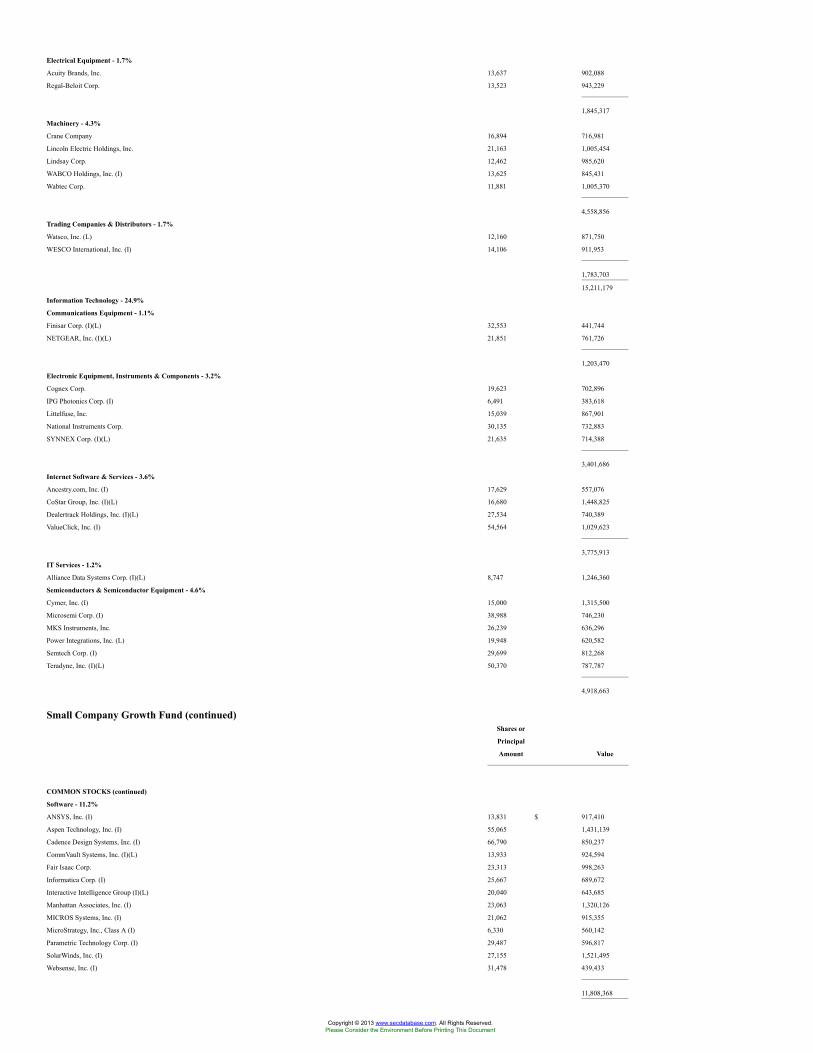
Electrical Equipment - 1.7%
Acuity Brands, Inc. 13,637 902,088
Regal-Beloit Corp. 13,523 943,229
1,845,317
Machinery - 4.3%
Crane Company 16,894 716,981
Lincoln Electric Holdings, Inc. 21,163 1,005,454
Lindsay Corp. 12,462 985,620
WABCO Holdings, Inc. (I) 13,625 845,431
Wabtec Corp. 11,881 1,005,370
4,558,856
Trading Companies & Distributors - 1.7%
Watsco, Inc. (L) 12,160 871,750
WESCO International, Inc. (I) 14,106 911,953
1,783,703
15,211,179
Information Technology - 24.9%
Communications Equipment - 1.1%
Finisar Corp. (I)(L) 32,553 441,744
NETGEAR, Inc. (I)(L) 21,851 761,726
1,203,470
Electronic Equipment, Instruments & Components - 3.2%
Cognex Corp. 19,623 702,896
IPG Photonics Corp. (I) 6,491 383,618
Littelfuse, Inc. 15,039 867,901
National Instruments Corp. 30,135 732,883
SYNNEX Corp. (I)(L) 21,635 714,388
3,401,686
Internet Software & Services - 3.6%
Ancestry.com, Inc. (I) 17,629 557,076
CoStar Group, Inc. (I)(L) 16,680 1,448,825
Dealertrack Holdings, Inc. (I)(L) 27,534 740,389
ValueClick, Inc. (I) 54,564 1,029,623
3,775,913
IT Services - 1.2%
Alliance Data Systems Corp. (I)(L) 8,747 1,246,360
Semiconductors & Semiconductor Equipment - 4.6%
Cymer, Inc. (I) 15,000 1,315,500
Microsemi Corp. (I) 38,988 746,230
MKS Instruments, Inc. 26,239 636,296
Power Integrations, Inc. (L) 19,948 620,582
Semtech Corp. (I) 29,699 812,268
Teradyne, Inc. (I)(L) 50,370 787,787
4,918,663
Small Company Growth Fund (continued)Shares or
Principal
Amount Value
COMMON STOCKS (continued)
Software - 11.2%
ANSYS, Inc. (I) 13,831 $ 917,410
Aspen Technology, Inc. (I) 55,065 1,431,139
Cadence Design Systems, Inc. (I) 66,790 850,237
CommVault Systems, Inc. (I)(L) 13,933 924,594
Fair Isaac Corp. 23,313 998,263
Informatica Corp. (I) 25,667 689,672
Interactive Intelligence Group (I)(L) 20,040 643,685
Manhattan Associates, Inc. (I) 23,063 1,320,126
MICROS Systems, Inc. (I) 21,062 915,355
MicroStrategy, Inc., Class A (I) 6,330 560,142
Parametric Technology Corp. (I) 29,487 596,817
SolarWinds, Inc. (I) 27,155 1,521,495
Websense, Inc. (I) 31,478 439,433
11,808,368
Copyright © 2013 www.secdatabase.com. All Rights Reserved.Please Consider the Environment Before Printing This Document
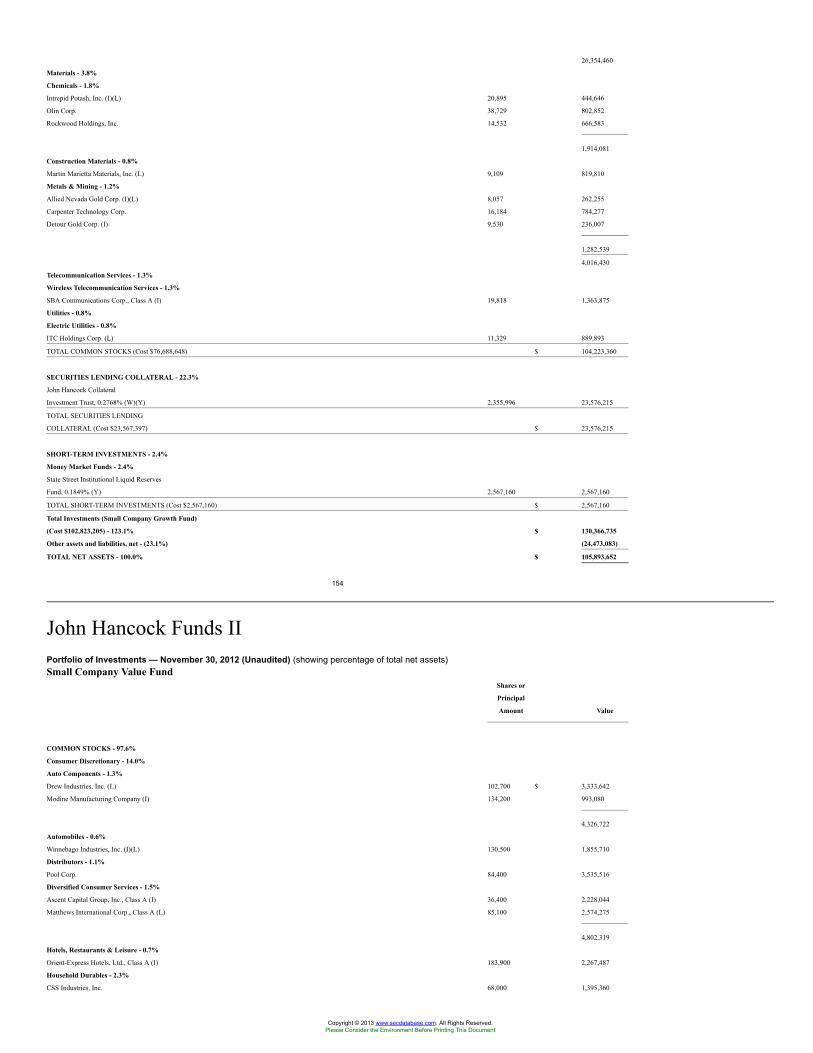
26,354,460
Materials - 3.8%
Chemicals - 1.8%
Intrepid Potash, Inc. (I)(L) 20,895 444,646
Olin Corp. 38,729 802,852
Rockwood Holdings, Inc. 14,532 666,583
1,914,081
Construction Materials - 0.8%
Martin Marietta Materials, Inc. (L) 9,109 819,810
Metals & Mining - 1.2%
Allied Nevada Gold Corp. (I)(L) 8,057 262,255
Carpenter Technology Corp. 16,184 784,277
Detour Gold Corp. (I) 9,530 236,007
1,282,539
4,016,430
Telecommunication Services - 1.3%
Wireless Telecommunication Services - 1.3%
SBA Communications Corp., Class A (I) 19,818 1,363,875
Utilities - 0.8%
Electric Utilities - 0.8%
ITC Holdings Corp. (L) 11,329 889,893
TOTAL COMMON STOCKS (Cost $76,688,648) $ 104,223,360
SECURITIES LENDING COLLATERAL - 22.3%
John Hancock Collateral
Investment Trust, 0.2768% (W)(Y) 2,355,996 23,576,215
TOTAL SECURITIES LENDING
COLLATERAL (Cost $23,567,397) $ 23,576,215
SHORT-TERM INVESTMENTS - 2.4%
Money Market Funds - 2.4%
State Street Institutional Liquid Reserves
Fund, 0.1849% (Y) 2,567,160 2,567,160
TOTAL SHORT-TERM INVESTMENTS (Cost $2,567,160) $ 2,567,160
Total Investments (Small Company Growth Fund)
(Cost $102,823,205) - 123.1% $ 130,366,735
Other assets and liabilities, net - (23.1%) (24,473,083)
TOTAL NET ASSETS - 100.0% $ 105,893,652
154
John Hancock Funds IIPortfolio of Investments — November 30, 2012 (Unaudited) (showing percentage of total net assets)Small Company Value Fund
Shares or
Principal
Amount Value
COMMON STOCKS - 97.6%
Consumer Discretionary - 14.0%
Auto Components - 1.3%
Drew Industries, Inc. (L) 102,700 $ 3,333,642
Modine Manufacturing Company (I) 134,200 993,080
4,326,722
Automobiles - 0.6%
Winnebago Industries, Inc. (I)(L) 130,500 1,855,710
Distributors - 1.1%
Pool Corp. 84,400 3,535,516
Diversified Consumer Services - 1.5%
Ascent Capital Group, Inc., Class A (I) 36,400 2,228,044
Matthews International Corp., Class A (L) 85,100 2,574,275
4,802,319
Hotels, Restaurants & Leisure - 0.7%
Orient-Express Hotels, Ltd., Class A (I) 183,900 2,267,487
Household Durables - 2.3%
CSS Industries, Inc. 68,000 1,395,360
Copyright © 2013 www.secdatabase.com. All Rights Reserved.Please Consider the Environment Before Printing This Document
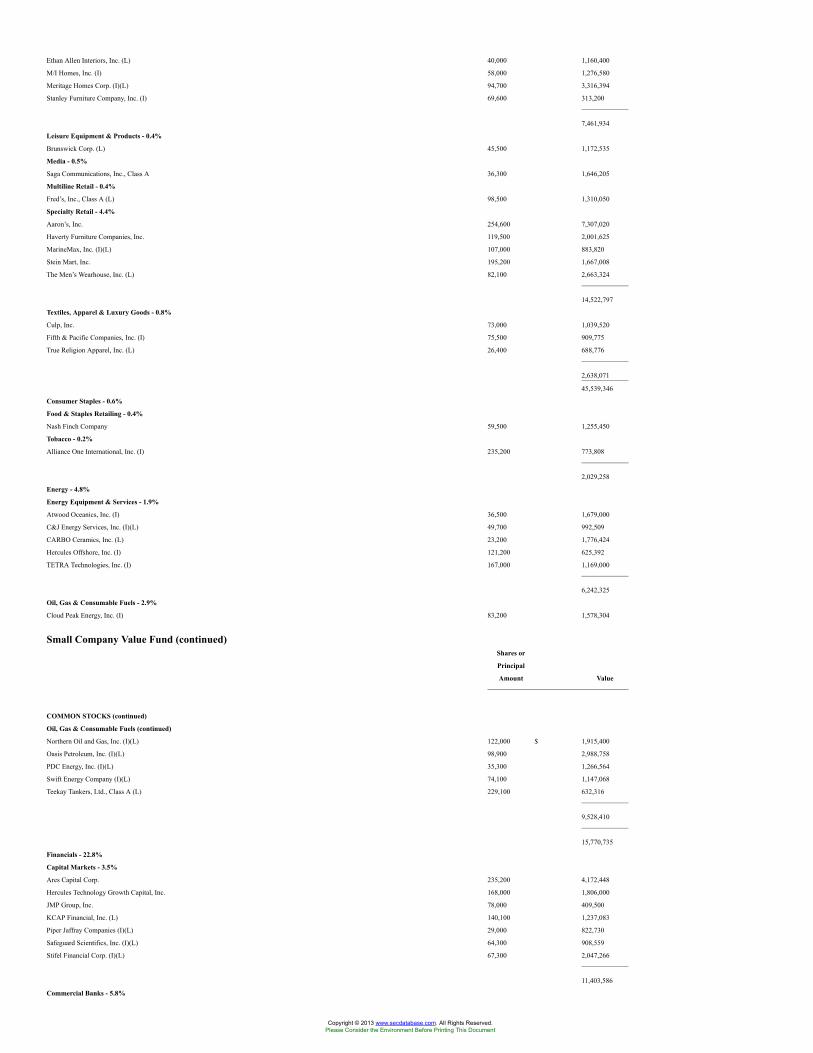
Ethan Allen Interiors, Inc. (L) 40,000 1,160,400
M/I Homes, Inc. (I) 58,000 1,276,580
Meritage Homes Corp. (I)(L) 94,700 3,316,394
Stanley Furniture Company, Inc. (I) 69,600 313,200
7,461,934
Leisure Equipment & Products - 0.4%
Brunswick Corp. (L) 45,500 1,172,535
Media - 0.5%
Saga Communications, Inc., Class A 36,300 1,646,205
Multiline Retail - 0.4%
Fred’s, Inc., Class A (L) 98,500 1,310,050
Specialty Retail - 4.4%
Aaron’s, Inc. 254,600 7,307,020
Haverty Furniture Companies, Inc. 119,500 2,001,625
MarineMax, Inc. (I)(L) 107,000 883,820
Stein Mart, Inc. 195,200 1,667,008
The Men’s Wearhouse, Inc. (L) 82,100 2,663,324
14,522,797
Textiles, Apparel & Luxury Goods - 0.8%
Culp, Inc. 73,000 1,039,520
Fifth & Pacific Companies, Inc. (I) 75,500 909,775
True Religion Apparel, Inc. (L) 26,400 688,776
2,638,071
45,539,346
Consumer Staples - 0.6%
Food & Staples Retailing - 0.4%
Nash Finch Company 59,500 1,255,450
Tobacco - 0.2%
Alliance One International, Inc. (I) 235,200 773,808
2,029,258
Energy - 4.8%
Energy Equipment & Services - 1.9%
Atwood Oceanics, Inc. (I) 36,500 1,679,000
C&J Energy Services, Inc. (I)(L) 49,700 992,509
CARBO Ceramics, Inc. (L) 23,200 1,776,424
Hercules Offshore, Inc. (I) 121,200 625,392
TETRA Technologies, Inc. (I) 167,000 1,169,000
6,242,325
Oil, Gas & Consumable Fuels - 2.9%
Cloud Peak Energy, Inc. (I) 83,200 1,578,304
Small Company Value Fund (continued)Shares or
Principal
Amount Value
COMMON STOCKS (continued)
Oil, Gas & Consumable Fuels (continued)
Northern Oil and Gas, Inc. (I)(L) 122,000 $ 1,915,400
Oasis Petroleum, Inc. (I)(L) 98,900 2,988,758
PDC Energy, Inc. (I)(L) 35,300 1,266,564
Swift Energy Company (I)(L) 74,100 1,147,068
Teekay Tankers, Ltd., Class A (L) 229,100 632,316
9,528,410
15,770,735
Financials - 22.8%
Capital Markets - 3.5%
Ares Capital Corp. 235,200 4,172,448
Hercules Technology Growth Capital, Inc. 168,000 1,806,000
JMP Group, Inc. 78,000 409,500
KCAP Financial, Inc. (L) 140,100 1,237,083
Piper Jaffray Companies (I)(L) 29,000 822,730
Safeguard Scientifics, Inc. (I)(L) 64,300 908,559
Stifel Financial Corp. (I)(L) 67,300 2,047,266
11,403,586
Commercial Banks - 5.8%
Copyright © 2013 www.secdatabase.com. All Rights Reserved.Please Consider the Environment Before Printing This Document
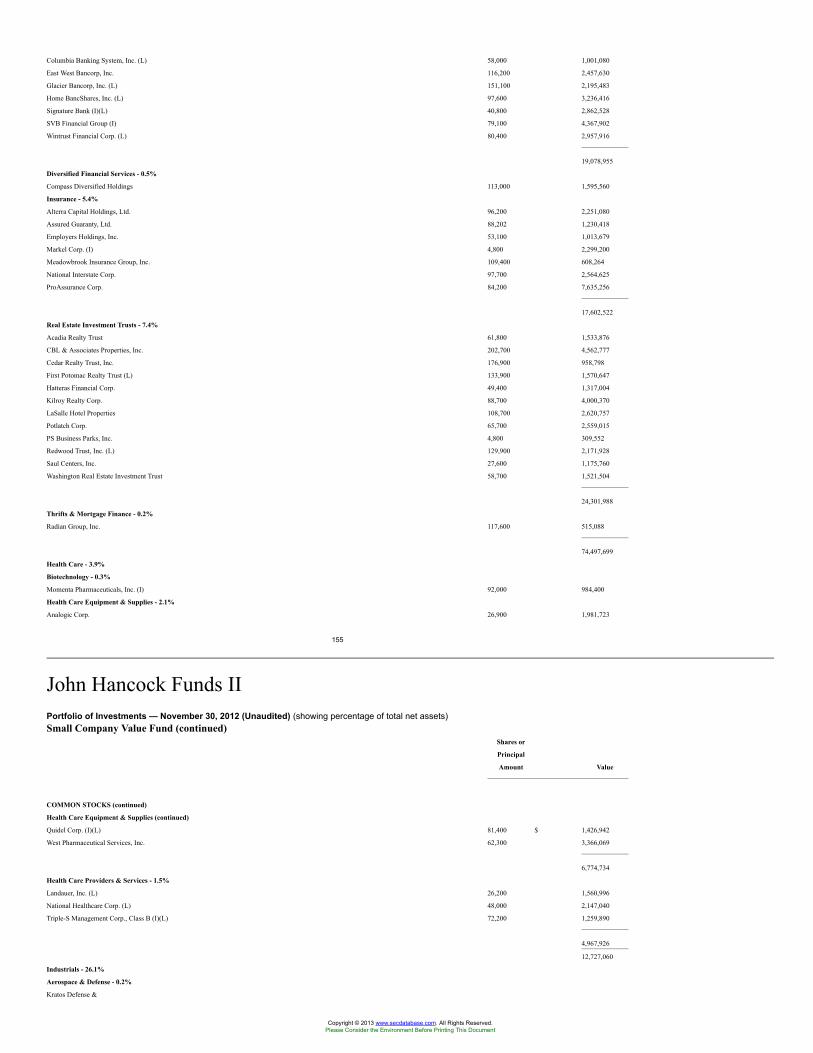
Columbia Banking System, Inc. (L) 58,000 1,001,080
East West Bancorp, Inc. 116,200 2,457,630
Glacier Bancorp, Inc. (L) 151,100 2,195,483
Home BancShares, Inc. (L) 97,600 3,236,416
Signature Bank (I)(L) 40,800 2,862,528
SVB Financial Group (I) 79,100 4,367,902
Wintrust Financial Corp. (L) 80,400 2,957,916
19,078,955
Diversified Financial Services - 0.5%
Compass Diversified Holdings 113,000 1,595,560
Insurance - 5.4%
Alterra Capital Holdings, Ltd. 96,200 2,251,080
Assured Guaranty, Ltd. 88,202 1,230,418
Employers Holdings, Inc. 53,100 1,013,679
Markel Corp. (I) 4,800 2,299,200
Meadowbrook Insurance Group, Inc. 109,400 608,264
National Interstate Corp. 97,700 2,564,625
ProAssurance Corp. 84,200 7,635,256
17,602,522
Real Estate Investment Trusts - 7.4%
Acadia Realty Trust 61,800 1,533,876
CBL & Associates Properties, Inc. 202,700 4,562,777
Cedar Realty Trust, Inc. 176,900 958,798
First Potomac Realty Trust (L) 133,900 1,570,647
Hatteras Financial Corp. 49,400 1,317,004
Kilroy Realty Corp. 88,700 4,000,370
LaSalle Hotel Properties 108,700 2,620,757
Potlatch Corp. 65,700 2,559,015
PS Business Parks, Inc. 4,800 309,552
Redwood Trust, Inc. (L) 129,900 2,171,928
Saul Centers, Inc. 27,600 1,175,760
Washington Real Estate Investment Trust 58,700 1,521,504
24,301,988
Thrifts & Mortgage Finance - 0.2%
Radian Group, Inc. 117,600 515,088
74,497,699
Health Care - 3.9%
Biotechnology - 0.3%
Momenta Pharmaceuticals, Inc. (I) 92,000 984,400
Health Care Equipment & Supplies - 2.1%
Analogic Corp. 26,900 1,981,723
155
John Hancock Funds IIPortfolio of Investments — November 30, 2012 (Unaudited) (showing percentage of total net assets)Small Company Value Fund (continued)
Shares or
Principal
Amount Value
COMMON STOCKS (continued)
Health Care Equipment & Supplies (continued)
Quidel Corp. (I)(L) 81,400 $ 1,426,942
West Pharmaceutical Services, Inc. 62,300 3,366,069
6,774,734
Health Care Providers & Services - 1.5%
Landauer, Inc. (L) 26,200 1,560,996
National Healthcare Corp. (L) 48,000 2,147,040
Triple-S Management Corp., Class B (I)(L) 72,200 1,259,890
4,967,926
12,727,060
Industrials - 26.1%
Aerospace & Defense - 0.2%
Kratos Defense &
Copyright © 2013 www.secdatabase.com. All Rights Reserved.Please Consider the Environment Before Printing This Document
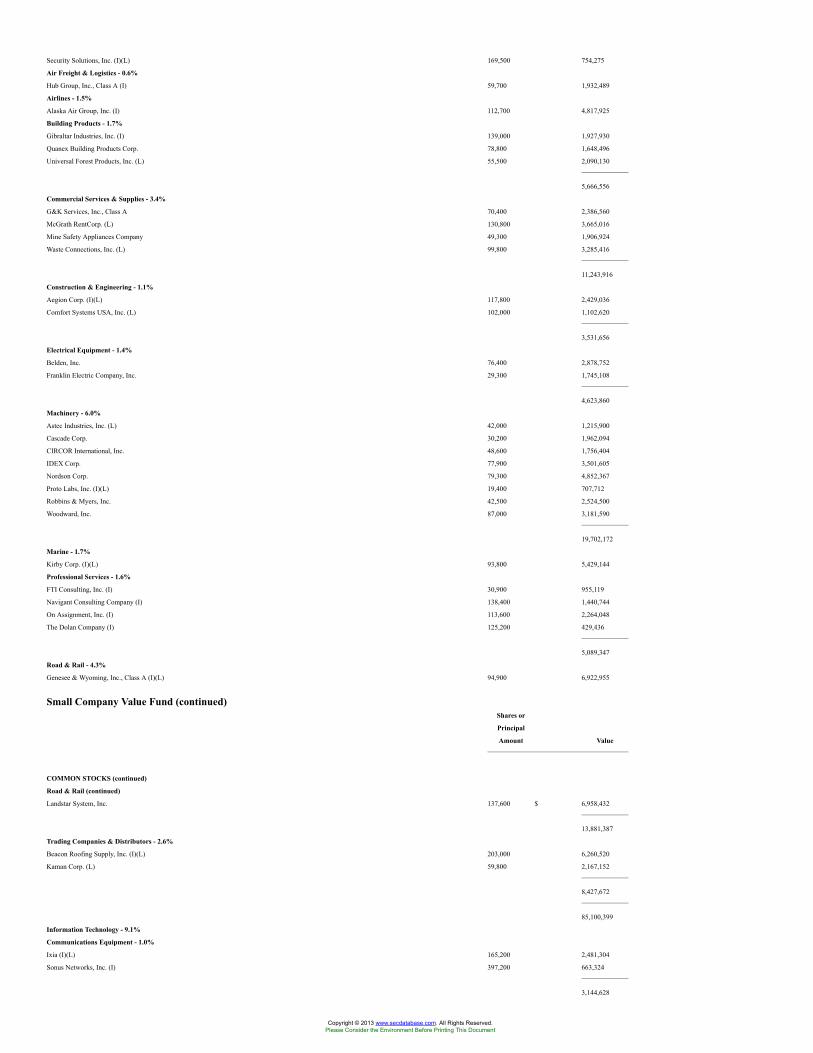
Security Solutions, Inc. (I)(L) 169,500 754,275
Air Freight & Logistics - 0.6%
Hub Group, Inc., Class A (I) 59,700 1,932,489
Airlines - 1.5%
Alaska Air Group, Inc. (I) 112,700 4,817,925
Building Products - 1.7%
Gibraltar Industries, Inc. (I) 139,000 1,927,930
Quanex Building Products Corp. 78,800 1,648,496
Universal Forest Products, Inc. (L) 55,500 2,090,130
5,666,556
Commercial Services & Supplies - 3.4%
G&K Services, Inc., Class A 70,400 2,386,560
McGrath RentCorp. (L) 130,800 3,665,016
Mine Safety Appliances Company 49,300 1,906,924
Waste Connections, Inc. (L) 99,800 3,285,416
11,243,916
Construction & Engineering - 1.1%
Aegion Corp. (I)(L) 117,800 2,429,036
Comfort Systems USA, Inc. (L) 102,000 1,102,620
3,531,656
Electrical Equipment - 1.4%
Belden, Inc. 76,400 2,878,752
Franklin Electric Company, Inc. 29,300 1,745,108
4,623,860
Machinery - 6.0%
Astec Industries, Inc. (L) 42,000 1,215,900
Cascade Corp. 30,200 1,962,094
CIRCOR International, Inc. 48,600 1,756,404
IDEX Corp. 77,900 3,501,605
Nordson Corp. 79,300 4,852,367
Proto Labs, Inc. (I)(L) 19,400 707,712
Robbins & Myers, Inc. 42,500 2,524,500
Woodward, Inc. 87,000 3,181,590
19,702,172
Marine - 1.7%
Kirby Corp. (I)(L) 93,800 5,429,144
Professional Services - 1.6%
FTI Consulting, Inc. (I) 30,900 955,119
Navigant Consulting Company (I) 138,400 1,440,744
On Assignment, Inc. (I) 113,600 2,264,048
The Dolan Company (I) 125,200 429,436
5,089,347
Road & Rail - 4.3%
Genesee & Wyoming, Inc., Class A (I)(L) 94,900 6,922,955
Small Company Value Fund (continued)Shares or
Principal
Amount Value
COMMON STOCKS (continued)
Road & Rail (continued)
Landstar System, Inc. 137,600 $ 6,958,432
13,881,387
Trading Companies & Distributors - 2.6%
Beacon Roofing Supply, Inc. (I)(L) 203,000 6,260,520
Kaman Corp. (L) 59,800 2,167,152
8,427,672
85,100,399
Information Technology - 9.1%
Communications Equipment - 1.0%
Ixia (I)(L) 165,200 2,481,304
Sonus Networks, Inc. (I) 397,200 663,324
3,144,628
Copyright © 2013 www.secdatabase.com. All Rights Reserved.Please Consider the Environment Before Printing This Document
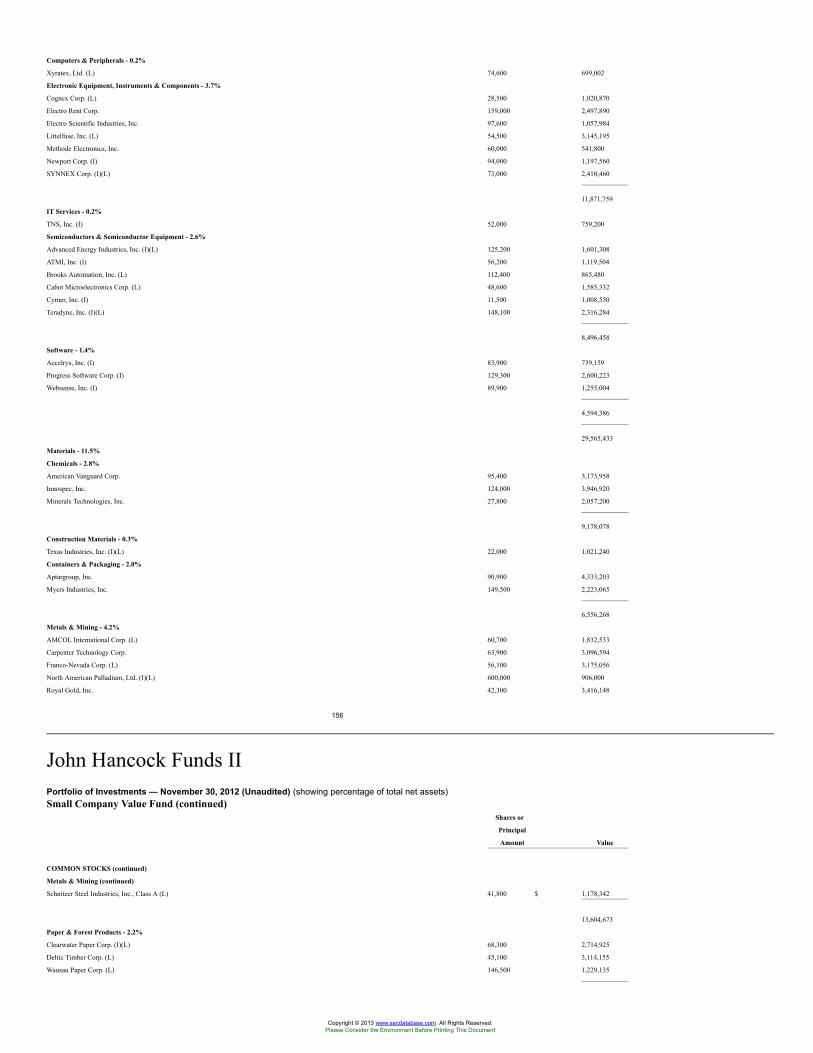
Computers & Peripherals - 0.2%
Xyratex, Ltd. (L) 74,600 699,002
Electronic Equipment, Instruments & Components - 3.7%
Cognex Corp. (L) 28,500 1,020,870
Electro Rent Corp. 159,000 2,497,890
Electro Scientific Industries, Inc. 97,600 1,057,984
Littelfuse, Inc. (L) 54,500 3,145,195
Methode Electronics, Inc. 60,000 541,800
Newport Corp. (I) 94,000 1,197,560
SYNNEX Corp. (I)(L) 73,000 2,410,460
11,871,759
IT Services - 0.2%
TNS, Inc. (I) 52,000 759,200
Semiconductors & Semiconductor Equipment - 2.6%
Advanced Energy Industries, Inc. (I)(L) 125,200 1,601,308
ATMI, Inc. (I) 56,200 1,119,504
Brooks Automation, Inc. (L) 112,400 865,480
Cabot Microelectronics Corp. (L) 48,600 1,585,332
Cymer, Inc. (I) 11,500 1,008,550
Teradyne, Inc. (I)(L) 148,100 2,316,284
8,496,458
Software - 1.4%
Accelrys, Inc. (I) 83,900 739,159
Progress Software Corp. (I) 129,300 2,600,223
Websense, Inc. (I) 89,900 1,255,004
4,594,386
29,565,433
Materials - 11.5%
Chemicals - 2.8%
American Vanguard Corp. 95,400 3,173,958
Innospec, Inc. 124,000 3,946,920
Minerals Technologies, Inc. 27,800 2,057,200
9,178,078
Construction Materials - 0.3%
Texas Industries, Inc. (I)(L) 22,000 1,021,240
Containers & Packaging - 2.0%
Aptargroup, Inc. 90,900 4,333,203
Myers Industries, Inc. 149,500 2,223,065
6,556,268
Metals & Mining - 4.2%
AMCOL International Corp. (L) 60,700 1,832,533
Carpenter Technology Corp. 63,900 3,096,594
Franco-Nevada Corp. (L) 56,100 3,175,056
North American Palladium, Ltd. (I)(L) 600,000 906,000
Royal Gold, Inc. 42,300 3,416,148
156
John Hancock Funds IIPortfolio of Investments — November 30, 2012 (Unaudited) (showing percentage of total net assets)Small Company Value Fund (continued)
Shares or
Principal
Amount Value
COMMON STOCKS (continued)
Metals & Mining (continued)
Schnitzer Steel Industries, Inc., Class A (L) 41,800 $ 1,178,342
13,604,673
Paper & Forest Products - 2.2%
Clearwater Paper Corp. (I)(L) 68,300 2,714,925
Deltic Timber Corp. (L) 45,100 3,114,155
Wausau Paper Corp. (L) 146,500 1,229,135
Copyright © 2013 www.secdatabase.com. All Rights Reserved.Please Consider the Environment Before Printing This Document
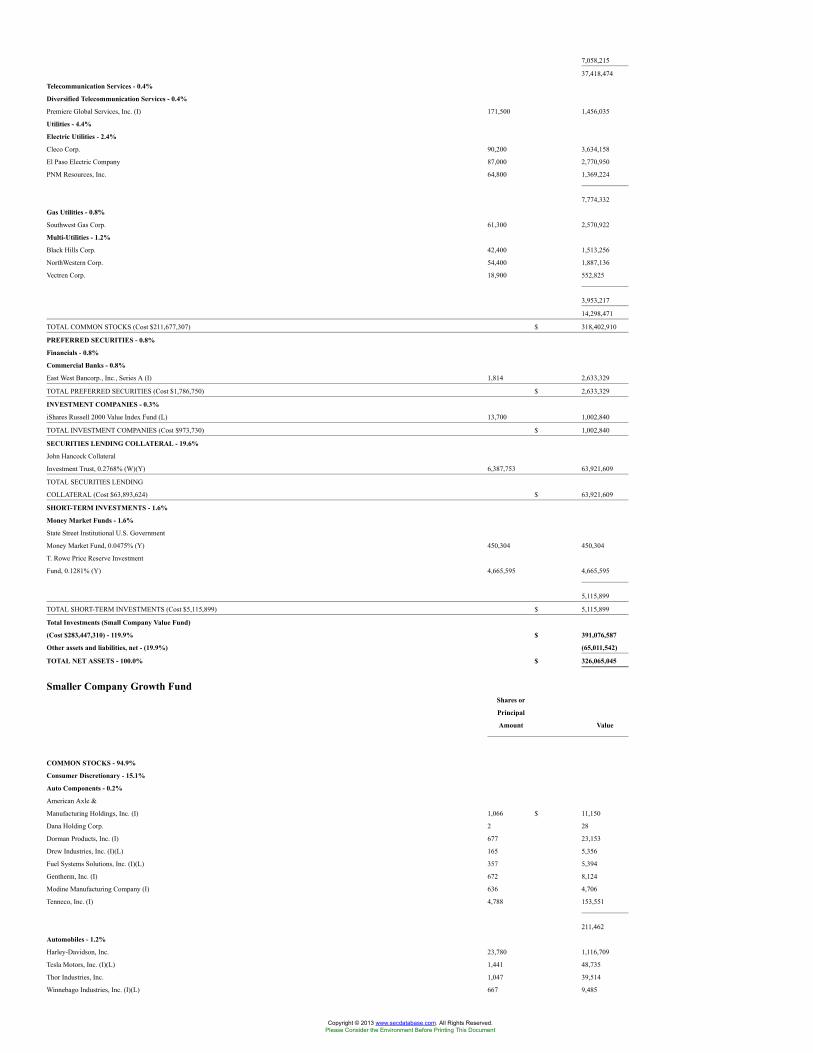
7,058,215
37,418,474
Telecommunication Services - 0.4%
Diversified Telecommunication Services - 0.4%
Premiere Global Services, Inc. (I) 171,500 1,456,035
Utilities - 4.4%
Electric Utilities - 2.4%
Cleco Corp. 90,200 3,634,158
El Paso Electric Company 87,000 2,770,950
PNM Resources, Inc. 64,800 1,369,224
7,774,332
Gas Utilities - 0.8%
Southwest Gas Corp. 61,300 2,570,922
Multi-Utilities - 1.2%
Black Hills Corp. 42,400 1,513,256
NorthWestern Corp. 54,400 1,887,136
Vectren Corp. 18,900 552,825
3,953,217
14,298,471
TOTAL COMMON STOCKS (Cost $211,677,307) $ 318,402,910
PREFERRED SECURITIES - 0.8%
Financials - 0.8%
Commercial Banks - 0.8%
East West Bancorp., Inc., Series A (I) 1,814 2,633,329
TOTAL PREFERRED SECURITIES (Cost $1,786,750) $ 2,633,329
INVESTMENT COMPANIES - 0.3%
iShares Russell 2000 Value Index Fund (L) 13,700 1,002,840
TOTAL INVESTMENT COMPANIES (Cost $973,730) $ 1,002,840
SECURITIES LENDING COLLATERAL - 19.6%
John Hancock Collateral
Investment Trust, 0.2768% (W)(Y) 6,387,753 63,921,609
TOTAL SECURITIES LENDING
COLLATERAL (Cost $63,893,624) $ 63,921,609
SHORT-TERM INVESTMENTS - 1.6%
Money Market Funds - 1.6%
State Street Institutional U.S. Government
Money Market Fund, 0.0475% (Y) 450,304 450,304
T. Rowe Price Reserve Investment
Fund, 0.1281% (Y) 4,665,595 4,665,595
5,115,899
TOTAL SHORT-TERM INVESTMENTS (Cost $5,115,899) $ 5,115,899
Total Investments (Small Company Value Fund)
(Cost $283,447,310) - 119.9% $ 391,076,587
Other assets and liabilities, net - (19.9%) (65,011,542)
TOTAL NET ASSETS - 100.0% $ 326,065,045
Smaller Company Growth FundShares or
Principal
Amount Value
COMMON STOCKS - 94.9%
Consumer Discretionary - 15.1%
Auto Components - 0.2%
American Axle &
Manufacturing Holdings, Inc. (I) 1,066 $ 11,150
Dana Holding Corp. 2 28
Dorman Products, Inc. (I) 677 23,153
Drew Industries, Inc. (I)(L) 165 5,356
Fuel Systems Solutions, Inc. (I)(L) 357 5,394
Gentherm, Inc. (I) 672 8,124
Modine Manufacturing Company (I) 636 4,706
Tenneco, Inc. (I) 4,788 153,551
211,462
Automobiles - 1.2%
Harley-Davidson, Inc. 23,780 1,116,709
Tesla Motors, Inc. (I)(L) 1,441 48,735
Thor Industries, Inc. 1,047 39,514
Winnebago Industries, Inc. (I)(L) 667 9,485
Copyright © 2013 www.secdatabase.com. All Rights Reserved.Please Consider the Environment Before Printing This Document
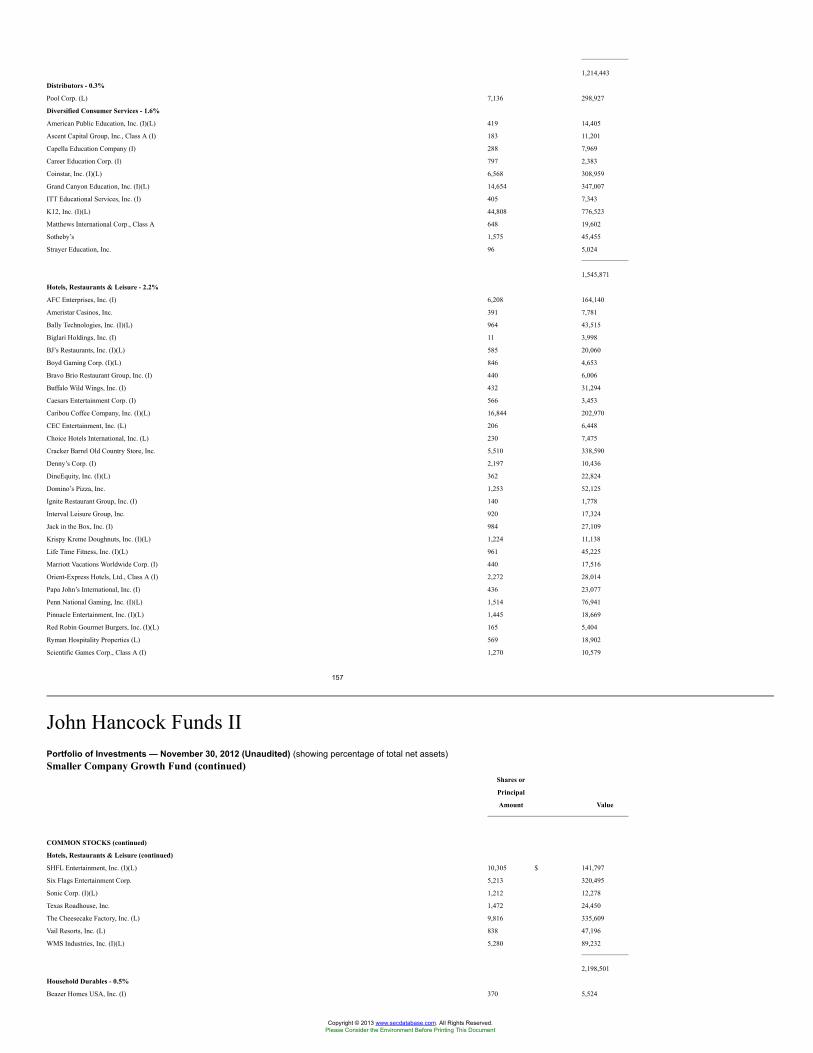
1,214,443
Distributors - 0.3%
Pool Corp. (L) 7,136 298,927
Diversified Consumer Services - 1.6%
American Public Education, Inc. (I)(L) 419 14,405
Ascent Capital Group, Inc., Class A (I) 183 11,201
Capella Education Company (I) 288 7,969
Career Education Corp. (I) 797 2,383
Coinstar, Inc. (I)(L) 6,568 308,959
Grand Canyon Education, Inc. (I)(L) 14,654 347,007
ITT Educational Services, Inc. (I) 405 7,343
K12, Inc. (I)(L) 44,808 776,523
Matthews International Corp., Class A 648 19,602
Sotheby’s 1,575 45,455
Strayer Education, Inc. 96 5,024
1,545,871
Hotels, Restaurants & Leisure - 2.2%
AFC Enterprises, Inc. (I) 6,208 164,140
Ameristar Casinos, Inc. 391 7,781
Bally Technologies, Inc. (I)(L) 964 43,515
Biglari Holdings, Inc. (I) 11 3,998
BJ’s Restaurants, Inc. (I)(L) 585 20,060
Boyd Gaming Corp. (I)(L) 846 4,653
Bravo Brio Restaurant Group, Inc. (I) 440 6,006
Buffalo Wild Wings, Inc. (I) 432 31,294
Caesars Entertainment Corp. (I) 566 3,453
Caribou Coffee Company, Inc. (I)(L) 16,844 202,970
CEC Entertainment, Inc. (L) 206 6,448
Choice Hotels International, Inc. (L) 230 7,475
Cracker Barrel Old Country Store, Inc. 5,510 338,590
Denny’s Corp. (I) 2,197 10,436
DineEquity, Inc. (I)(L) 362 22,824
Domino’s Pizza, Inc. 1,253 52,125
Ignite Restaurant Group, Inc. (I) 140 1,778
Interval Leisure Group, Inc. 920 17,324
Jack in the Box, Inc. (I) 984 27,109
Krispy Kreme Doughnuts, Inc. (I)(L) 1,224 11,138
Life Time Fitness, Inc. (I)(L) 961 45,225
Marriott Vacations Worldwide Corp. (I) 440 17,516
Orient-Express Hotels, Ltd., Class A (I) 2,272 28,014
Papa John’s International, Inc. (I) 436 23,077
Penn National Gaming, Inc. (I)(L) 1,514 76,941
Pinnacle Entertainment, Inc. (I)(L) 1,445 18,669
Red Robin Gourmet Burgers, Inc. (I)(L) 165 5,404
Ryman Hospitality Properties (L) 569 18,902
Scientific Games Corp., Class A (I) 1,270 10,579
157
John Hancock Funds IIPortfolio of Investments — November 30, 2012 (Unaudited) (showing percentage of total net assets)Smaller Company Growth Fund (continued)
Shares or
Principal
Amount Value
COMMON STOCKS (continued)
Hotels, Restaurants & Leisure (continued)
SHFL Entertainment, Inc. (I)(L) 10,305 $ 141,797
Six Flags Entertainment Corp. 5,213 320,495
Sonic Corp. (I)(L) 1,212 12,278
Texas Roadhouse, Inc. 1,472 24,450
The Cheesecake Factory, Inc. (L) 9,816 335,609
Vail Resorts, Inc. (L) 838 47,196
WMS Industries, Inc. (I)(L) 5,280 89,232
2,198,501
Household Durables - 0.5%
Beazer Homes USA, Inc. (I) 370 5,524
Copyright © 2013 www.secdatabase.com. All Rights Reserved.Please Consider the Environment Before Printing This Document
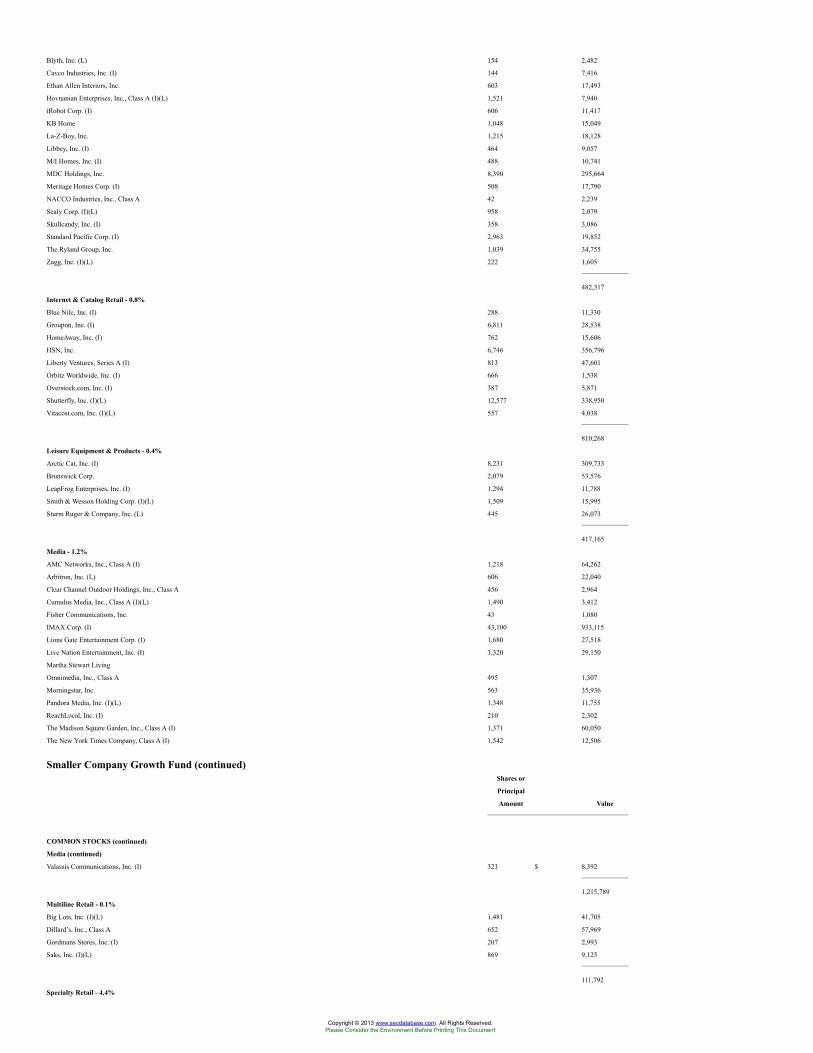
Blyth, Inc. (L) 154 2,482
Cavco Industries, Inc. (I) 144 7,416
Ethan Allen Interiors, Inc. 603 17,493
Hovnanian Enterprises, Inc., Class A (I)(L) 1,521 7,940
iRobot Corp. (I) 606 11,417
KB Home 1,048 15,049
La-Z-Boy, Inc. 1,215 18,128
Libbey, Inc. (I) 464 9,057
M/I Homes, Inc. (I) 488 10,741
MDC Holdings, Inc. 8,390 295,664
Meritage Homes Corp. (I) 508 17,790
NACCO Industries, Inc., Class A 42 2,239
Sealy Corp. (I)(L) 958 2,079
Skullcandy, Inc. (I) 358 3,086
Standard Pacific Corp. (I) 2,963 19,852
The Ryland Group, Inc. 1,039 34,755
Zagg, Inc. (I)(L) 222 1,605
482,317
Internet & Catalog Retail - 0.8%
Blue Nile, Inc. (I) 288 11,330
Groupon, Inc. (I) 6,811 28,538
HomeAway, Inc. (I) 762 15,606
HSN, Inc. 6,746 356,796
Liberty Ventures, Series A (I) 813 47,601
Orbitz Worldwide, Inc. (I) 666 1,538
Overstock.com, Inc. (I) 387 5,871
Shutterfly, Inc. (I)(L) 12,577 338,950
Vitacost.com, Inc. (I)(L) 557 4,038
810,268
Leisure Equipment & Products - 0.4%
Arctic Cat, Inc. (I) 8,231 309,733
Brunswick Corp. 2,079 53,576
LeapFrog Enterprises, Inc. (I) 1,294 11,788
Smith & Wesson Holding Corp. (I)(L) 1,509 15,995
Sturm Ruger & Company, Inc. (L) 445 26,073
417,165
Media - 1.2%
AMC Networks, Inc., Class A (I) 1,218 64,262
Arbitron, Inc. (L) 606 22,040
Clear Channel Outdoor Holdings, Inc., Class A 456 2,964
Cumulus Media, Inc., Class A (I)(L) 1,490 3,412
Fisher Communications, Inc. 43 1,080
IMAX Corp. (I) 43,100 933,115
Lions Gate Entertainment Corp. (I) 1,680 27,518
Live Nation Entertainment, Inc. (I) 3,320 29,150
Martha Stewart Living
Omnimedia, Inc., Class A 495 1,307
Morningstar, Inc. 563 35,936
Pandora Media, Inc. (I)(L) 1,348 11,755
ReachLocal, Inc. (I) 210 2,302
The Madison Square Garden, Inc., Class A (I) 1,371 60,050
The New York Times Company, Class A (I) 1,542 12,506
Smaller Company Growth Fund (continued)Shares or
Principal
Amount Value
COMMON STOCKS (continued)
Media (continued)
Valassis Communications, Inc. (I) 323 $ 8,392
1,215,789
Multiline Retail - 0.1%
Big Lots, Inc. (I)(L) 1,481 41,705
Dillard’s, Inc., Class A 652 57,969
Gordmans Stores, Inc. (I) 207 2,993
Saks, Inc. (I)(L) 869 9,125
111,792
Specialty Retail - 4.4%
Copyright © 2013 www.secdatabase.com. All Rights Reserved.Please Consider the Environment Before Printing This Document
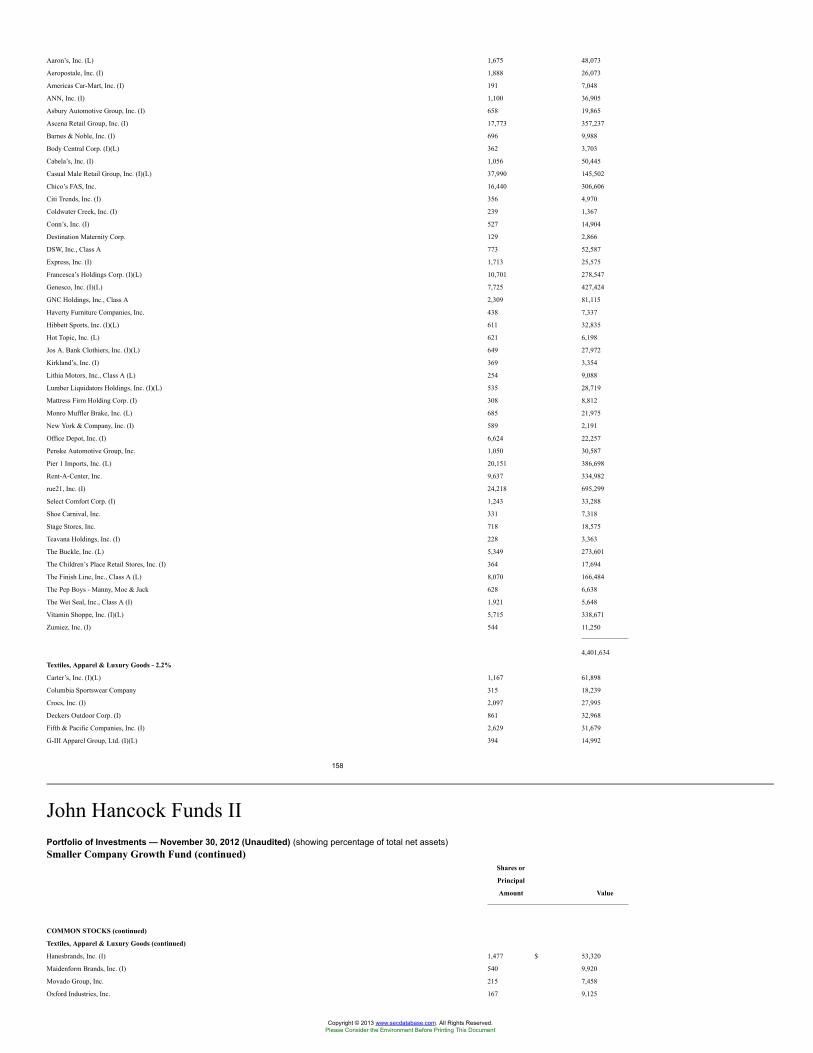
Aaron’s, Inc. (L) 1,675 48,073
Aeropostale, Inc. (I) 1,888 26,073
Americas Car-Mart, Inc. (I) 191 7,048
ANN, Inc. (I) 1,100 36,905
Asbury Automotive Group, Inc. (I) 658 19,865
Ascena Retail Group, Inc. (I) 17,773 357,237
Barnes & Noble, Inc. (I) 696 9,988
Body Central Corp. (I)(L) 362 3,703
Cabela’s, Inc. (I) 1,056 50,445
Casual Male Retail Group, Inc. (I)(L) 37,990 145,502
Chico’s FAS, Inc. 16,440 306,606
Citi Trends, Inc. (I) 356 4,970
Coldwater Creek, Inc. (I) 239 1,367
Conn’s, Inc. (I) 527 14,904
Destination Maternity Corp. 129 2,866
DSW, Inc., Class A 773 52,587
Express, Inc. (I) 1,713 25,575
Francesca’s Holdings Corp. (I)(L) 10,701 278,547
Genesco, Inc. (I)(L) 7,725 427,424
GNC Holdings, Inc., Class A 2,309 81,115
Haverty Furniture Companies, Inc. 438 7,337
Hibbett Sports, Inc. (I)(L) 611 32,835
Hot Topic, Inc. (L) 621 6,198
Jos A. Bank Clothiers, Inc. (I)(L) 649 27,972
Kirkland’s, Inc. (I) 369 3,354
Lithia Motors, Inc., Class A (L) 254 9,088
Lumber Liquidators Holdings, Inc. (I)(L) 535 28,719
Mattress Firm Holding Corp. (I) 308 8,812
Monro Muffler Brake, Inc. (L) 685 21,975
New York & Company, Inc. (I) 589 2,191
Office Depot, Inc. (I) 6,624 22,257
Penske Automotive Group, Inc. 1,050 30,587
Pier 1 Imports, Inc. (L) 20,151 386,698
Rent-A-Center, Inc. 9,637 334,982
rue21, Inc. (I) 24,218 695,299
Select Comfort Corp. (I) 1,243 33,288
Shoe Carnival, Inc. 331 7,318
Stage Stores, Inc. 718 18,575
Teavana Holdings, Inc. (I) 228 3,363
The Buckle, Inc. (L) 5,349 273,601
The Children’s Place Retail Stores, Inc. (I) 364 17,694
The Finish Line, Inc., Class A (L) 8,070 166,484
The Pep Boys - Manny, Moe & Jack 628 6,638
The Wet Seal, Inc., Class A (I) 1,921 5,648
Vitamin Shoppe, Inc. (I)(L) 5,715 338,671
Zumiez, Inc. (I) 544 11,250
4,401,634
Textiles, Apparel & Luxury Goods - 2.2%
Carter’s, Inc. (I)(L) 1,167 61,898
Columbia Sportswear Company 315 18,239
Crocs, Inc. (I) 2,097 27,995
Deckers Outdoor Corp. (I) 861 32,968
Fifth & Pacific Companies, Inc. (I) 2,629 31,679
G-III Apparel Group, Ltd. (I)(L) 394 14,992
158
John Hancock Funds IIPortfolio of Investments — November 30, 2012 (Unaudited) (showing percentage of total net assets)Smaller Company Growth Fund (continued)
Shares or
Principal
Amount Value
COMMON STOCKS (continued)
Textiles, Apparel & Luxury Goods (continued)
Hanesbrands, Inc. (I) 1,477 $ 53,320
Maidenform Brands, Inc. (I) 540 9,920
Movado Group, Inc. 215 7,458
Oxford Industries, Inc. 167 9,125
Copyright © 2013 www.secdatabase.com. All Rights Reserved.Please Consider the Environment Before Printing This Document
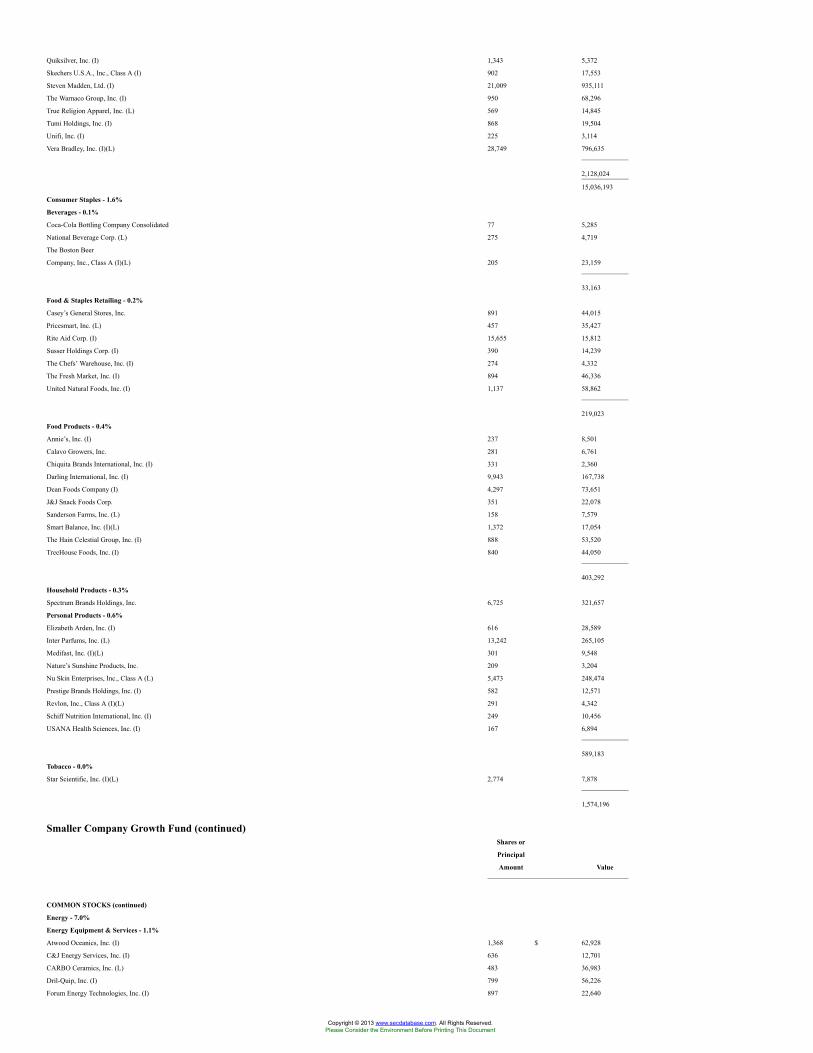
Quiksilver, Inc. (I) 1,343 5,372
Skechers U.S.A., Inc., Class A (I) 902 17,553
Steven Madden, Ltd. (I) 21,009 935,111
The Warnaco Group, Inc. (I) 950 68,296
True Religion Apparel, Inc. (L) 569 14,845
Tumi Holdings, Inc. (I) 868 19,504
Unifi, Inc. (I) 225 3,114
Vera Bradley, Inc. (I)(L) 28,749 796,635
2,128,024
15,036,193
Consumer Staples - 1.6%
Beverages - 0.1%
Coca-Cola Bottling Company Consolidated 77 5,285
National Beverage Corp. (L) 275 4,719
The Boston Beer
Company, Inc., Class A (I)(L) 205 23,159
33,163
Food & Staples Retailing - 0.2%
Casey’s General Stores, Inc. 891 44,015
Pricesmart, Inc. (L) 457 35,427
Rite Aid Corp. (I) 15,655 15,812
Susser Holdings Corp. (I) 390 14,239
The Chefs’ Warehouse, Inc. (I) 274 4,332
The Fresh Market, Inc. (I) 894 46,336
United Natural Foods, Inc. (I) 1,137 58,862
219,023
Food Products - 0.4%
Annie’s, Inc. (I) 237 8,501
Calavo Growers, Inc. 281 6,761
Chiquita Brands International, Inc. (I) 331 2,360
Darling International, Inc. (I) 9,943 167,738
Dean Foods Company (I) 4,297 73,651
J&J Snack Foods Corp. 351 22,078
Sanderson Farms, Inc. (L) 158 7,579
Smart Balance, Inc. (I)(L) 1,372 17,054
The Hain Celestial Group, Inc. (I) 888 53,520
TreeHouse Foods, Inc. (I) 840 44,050
403,292
Household Products - 0.3%
Spectrum Brands Holdings, Inc. 6,725 321,657
Personal Products - 0.6%
Elizabeth Arden, Inc. (I) 616 28,589
Inter Parfums, Inc. (L) 13,242 265,105
Medifast, Inc. (I)(L) 301 9,548
Nature’s Sunshine Products, Inc. 209 3,204
Nu Skin Enterprises, Inc., Class A (L) 5,473 248,474
Prestige Brands Holdings, Inc. (I) 582 12,571
Revlon, Inc., Class A (I)(L) 291 4,342
Schiff Nutrition International, Inc. (I) 249 10,456
USANA Health Sciences, Inc. (I) 167 6,894
589,183
Tobacco - 0.0%
Star Scientific, Inc. (I)(L) 2,774 7,878
1,574,196
Smaller Company Growth Fund (continued)Shares or
Principal
Amount Value
COMMON STOCKS (continued)
Energy - 7.0%
Energy Equipment & Services - 1.1%
Atwood Oceanics, Inc. (I) 1,368 $ 62,928
C&J Energy Services, Inc. (I) 636 12,701
CARBO Ceramics, Inc. (L) 483 36,983
Dril-Quip, Inc. (I) 799 56,226
Forum Energy Technologies, Inc. (I) 897 22,640
Copyright © 2013 www.secdatabase.com. All Rights Reserved.Please Consider the Environment Before Printing This Document
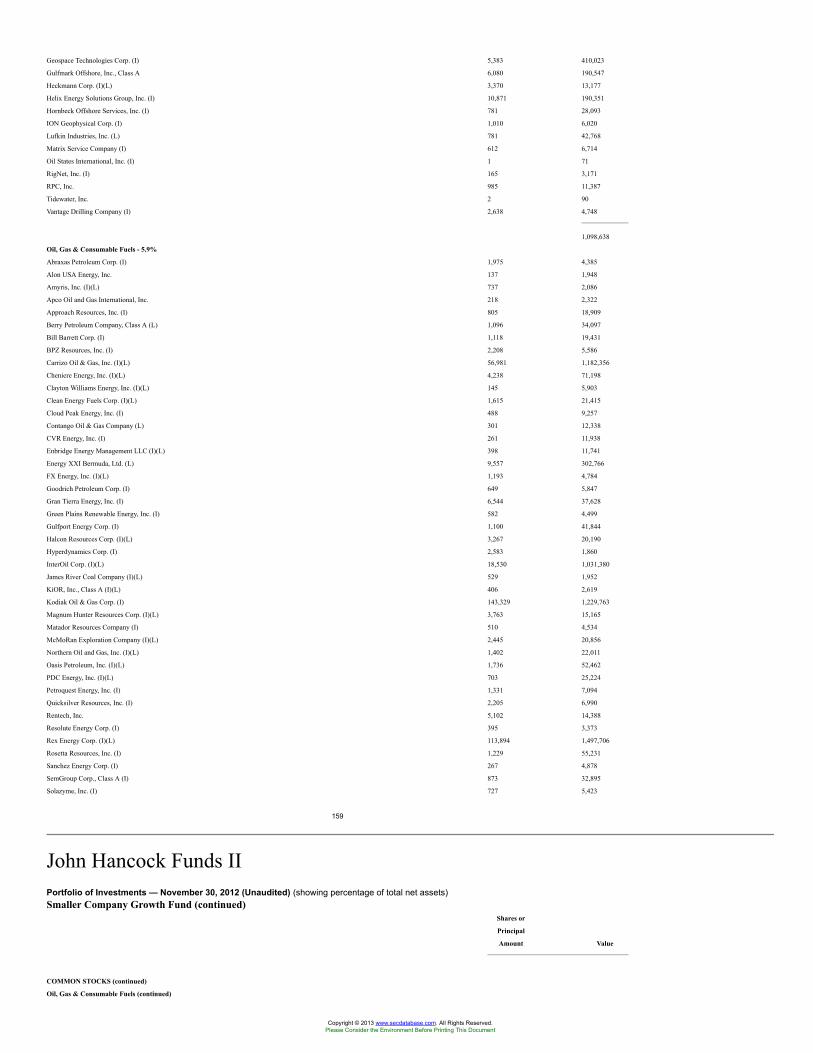
Geospace Technologies Corp. (I) 5,383 410,023
Gulfmark Offshore, Inc., Class A 6,080 190,547
Heckmann Corp. (I)(L) 3,370 13,177
Helix Energy Solutions Group, Inc. (I) 10,871 190,351
Hornbeck Offshore Services, Inc. (I) 781 28,093
ION Geophysical Corp. (I) 1,010 6,020
Lufkin Industries, Inc. (L) 781 42,768
Matrix Service Company (I) 612 6,714
Oil States International, Inc. (I) 1 71
RigNet, Inc. (I) 165 3,171
RPC, Inc. 985 11,387
Tidewater, Inc. 2 90
Vantage Drilling Company (I) 2,638 4,748
1,098,638
Oil, Gas & Consumable Fuels - 5.9%
Abraxas Petroleum Corp. (I) 1,975 4,385
Alon USA Energy, Inc. 137 1,948
Amyris, Inc. (I)(L) 737 2,086
Apco Oil and Gas International, Inc. 218 2,322
Approach Resources, Inc. (I) 805 18,909
Berry Petroleum Company, Class A (L) 1,096 34,097
Bill Barrett Corp. (I) 1,118 19,431
BPZ Resources, Inc. (I) 2,208 5,586
Carrizo Oil & Gas, Inc. (I)(L) 56,981 1,182,356
Cheniere Energy, Inc. (I)(L) 4,238 71,198
Clayton Williams Energy, Inc. (I)(L) 145 5,903
Clean Energy Fuels Corp. (I)(L) 1,615 21,415
Cloud Peak Energy, Inc. (I) 488 9,257
Contango Oil & Gas Company (L) 301 12,338
CVR Energy, Inc. (I) 261 11,938
Enbridge Energy Management LLC (I)(L) 398 11,741
Energy XXI Bermuda, Ltd. (L) 9,557 302,766
FX Energy, Inc. (I)(L) 1,193 4,784
Goodrich Petroleum Corp. (I) 649 5,847
Gran Tierra Energy, Inc. (I) 6,544 37,628
Green Plains Renewable Energy, Inc. (I) 582 4,499
Gulfport Energy Corp. (I) 1,100 41,844
Halcon Resources Corp. (I)(L) 3,267 20,190
Hyperdynamics Corp. (I) 2,583 1,860
InterOil Corp. (I)(L) 18,530 1,031,380
James River Coal Company (I)(L) 529 1,952
KiOR, Inc., Class A (I)(L) 406 2,619
Kodiak Oil & Gas Corp. (I) 143,329 1,229,763
Magnum Hunter Resources Corp. (I)(L) 3,763 15,165
Matador Resources Company (I) 510 4,534
McMoRan Exploration Company (I)(L) 2,445 20,856
Northern Oil and Gas, Inc. (I)(L) 1,402 22,011
Oasis Petroleum, Inc. (I)(L) 1,736 52,462
PDC Energy, Inc. (I)(L) 703 25,224
Petroquest Energy, Inc. (I) 1,331 7,094
Quicksilver Resources, Inc. (I) 2,205 6,990
Rentech, Inc. 5,102 14,388
Resolute Energy Corp. (I) 395 3,373
Rex Energy Corp. (I)(L) 113,894 1,497,706
Rosetta Resources, Inc. (I) 1,229 55,231
Sanchez Energy Corp. (I) 267 4,878
SemGroup Corp., Class A (I) 873 32,895
Solazyme, Inc. (I) 727 5,423
159
John Hancock Funds IIPortfolio of Investments — November 30, 2012 (Unaudited) (showing percentage of total net assets)Smaller Company Growth Fund (continued)
Shares or
Principal
Amount Value
COMMON STOCKS (continued)
Oil, Gas & Consumable Fuels (continued)
Copyright © 2013 www.secdatabase.com. All Rights Reserved.Please Consider the Environment Before Printing This Document
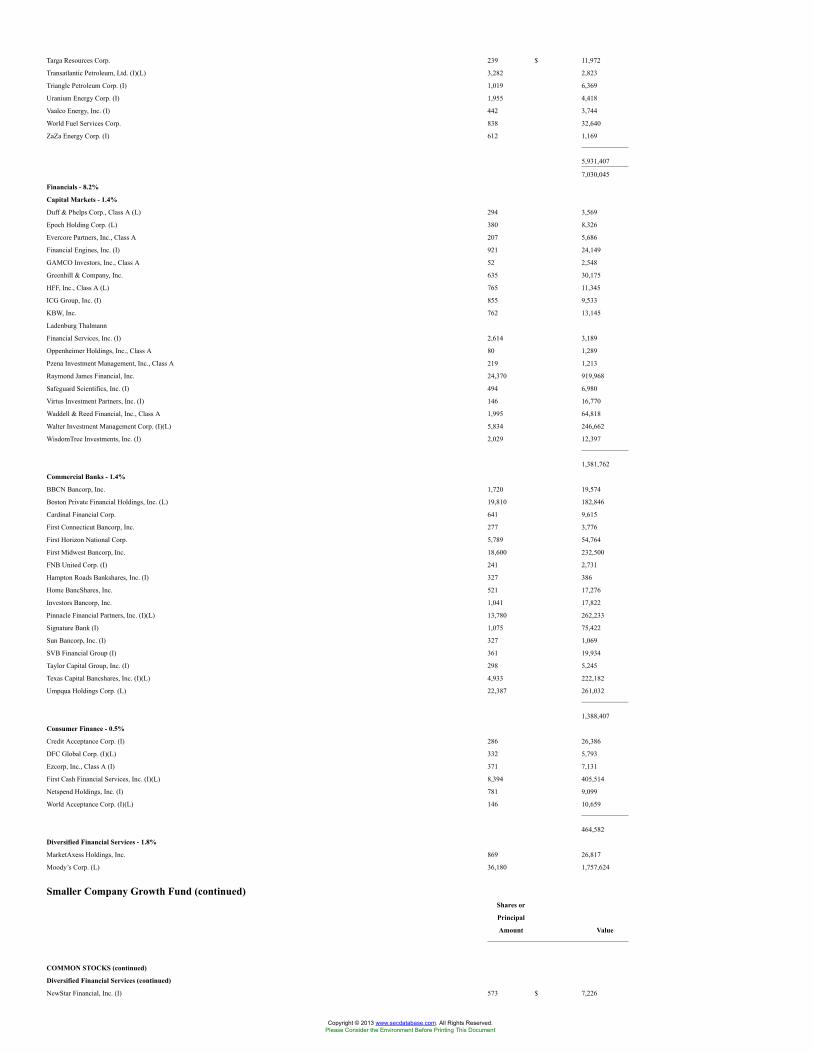
Targa Resources Corp. 239 $ 11,972
Transatlantic Petroleum, Ltd. (I)(L) 3,282 2,823
Triangle Petroleum Corp. (I) 1,019 6,369
Uranium Energy Corp. (I) 1,955 4,418
Vaalco Energy, Inc. (I) 442 3,744
World Fuel Services Corp. 838 32,640
ZaZa Energy Corp. (I) 612 1,169
5,931,407
7,030,045
Financials - 8.2%
Capital Markets - 1.4%
Duff & Phelps Corp., Class A (L) 294 3,569
Epoch Holding Corp. (L) 380 8,326
Evercore Partners, Inc., Class A 207 5,686
Financial Engines, Inc. (I) 921 24,149
GAMCO Investors, Inc., Class A 52 2,548
Greenhill & Company, Inc. 635 30,175
HFF, Inc., Class A (L) 765 11,345
ICG Group, Inc. (I) 855 9,533
KBW, Inc. 762 13,145
Ladenburg Thalmann
Financial Services, Inc. (I) 2,614 3,189
Oppenheimer Holdings, Inc., Class A 80 1,289
Pzena Investment Management, Inc., Class A 219 1,213
Raymond James Financial, Inc. 24,370 919,968
Safeguard Scientifics, Inc. (I) 494 6,980
Virtus Investment Partners, Inc. (I) 146 16,770
Waddell & Reed Financial, Inc., Class A 1,995 64,818
Walter Investment Management Corp. (I)(L) 5,834 246,662
WisdomTree Investments, Inc. (I) 2,029 12,397
1,381,762
Commercial Banks - 1.4%
BBCN Bancorp, Inc. 1,720 19,574
Boston Private Financial Holdings, Inc. (L) 19,810 182,846
Cardinal Financial Corp. 641 9,615
First Connecticut Bancorp, Inc. 277 3,776
First Horizon National Corp. 5,789 54,764
First Midwest Bancorp, Inc. 18,600 232,500
FNB United Corp. (I) 241 2,731
Hampton Roads Bankshares, Inc. (I) 327 386
Home BancShares, Inc. 521 17,276
Investors Bancorp, Inc. 1,041 17,822
Pinnacle Financial Partners, Inc. (I)(L) 13,780 262,233
Signature Bank (I) 1,075 75,422
Sun Bancorp, Inc. (I) 327 1,069
SVB Financial Group (I) 361 19,934
Taylor Capital Group, Inc. (I) 298 5,245
Texas Capital Bancshares, Inc. (I)(L) 4,933 222,182
Umpqua Holdings Corp. (L) 22,387 261,032
1,388,407
Consumer Finance - 0.5%
Credit Acceptance Corp. (I) 286 26,386
DFC Global Corp. (I)(L) 332 5,793
Ezcorp, Inc., Class A (I) 371 7,131
First Cash Financial Services, Inc. (I)(L) 8,394 405,514
Netspend Holdings, Inc. (I) 781 9,099
World Acceptance Corp. (I)(L) 146 10,659
464,582
Diversified Financial Services - 1.8%
MarketAxess Holdings, Inc. 869 26,817
Moody’s Corp. (L) 36,180 1,757,624
Smaller Company Growth Fund (continued)Shares or
Principal
Amount Value
COMMON STOCKS (continued)
Diversified Financial Services (continued)
NewStar Financial, Inc. (I) 573 $ 7,226
Copyright © 2013 www.secdatabase.com. All Rights Reserved.Please Consider the Environment Before Printing This Document
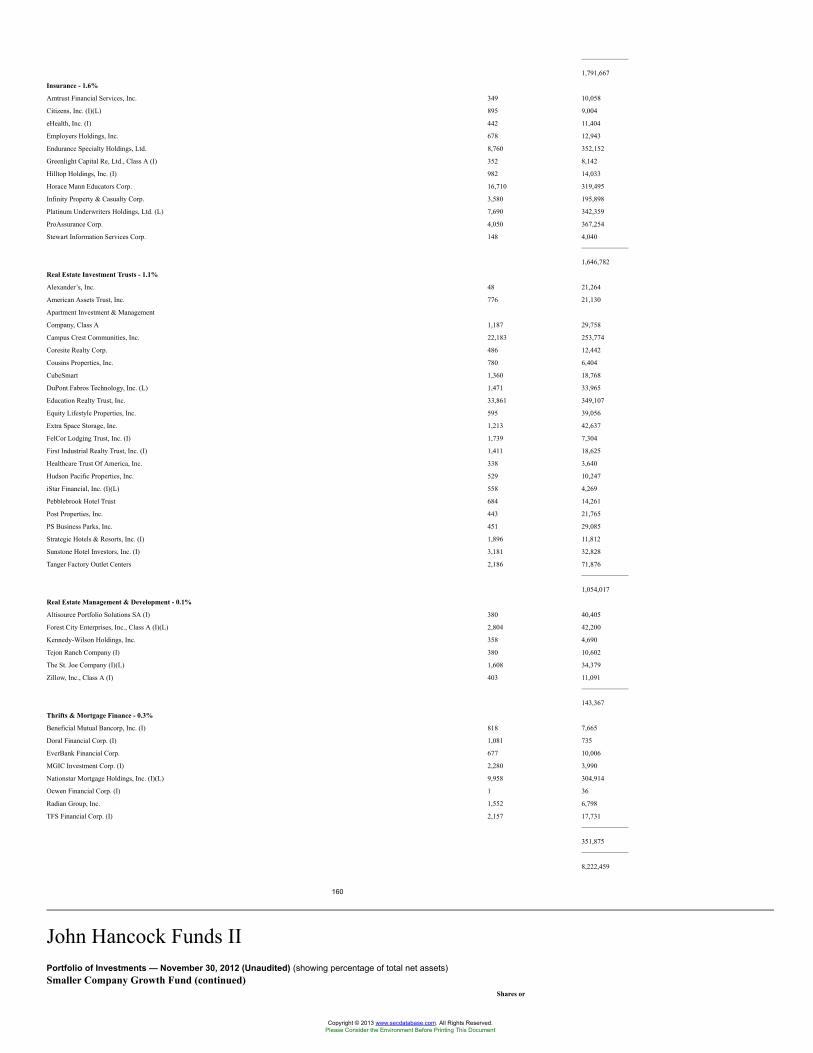
1,791,667
Insurance - 1.6%
Amtrust Financial Services, Inc. 349 10,058
Citizens, Inc. (I)(L) 895 9,004
eHealth, Inc. (I) 442 11,404
Employers Holdings, Inc. 678 12,943
Endurance Specialty Holdings, Ltd. 8,760 352,152
Greenlight Capital Re, Ltd., Class A (I) 352 8,142
Hilltop Holdings, Inc. (I) 982 14,033
Horace Mann Educators Corp. 16,710 319,495
Infinity Property & Casualty Corp. 3,580 195,898
Platinum Underwriters Holdings, Ltd. (L) 7,690 342,359
ProAssurance Corp. 4,050 367,254
Stewart Information Services Corp. 148 4,040
1,646,782
Real Estate Investment Trusts - 1.1%
Alexander’s, Inc. 48 21,264
American Assets Trust, Inc. 776 21,130
Apartment Investment & Management
Company, Class A 1,187 29,758
Campus Crest Communities, Inc. 22,183 253,774
Coresite Realty Corp. 486 12,442
Cousins Properties, Inc. 780 6,404
CubeSmart 1,360 18,768
DuPont Fabros Technology, Inc. (L) 1,471 33,965
Education Realty Trust, Inc. 33,861 349,107
Equity Lifestyle Properties, Inc. 595 39,056
Extra Space Storage, Inc. 1,213 42,637
FelCor Lodging Trust, Inc. (I) 1,739 7,304
First Industrial Realty Trust, Inc. (I) 1,411 18,625
Healthcare Trust Of America, Inc. 338 3,640
Hudson Pacific Properties, Inc. 529 10,247
iStar Financial, Inc. (I)(L) 558 4,269
Pebblebrook Hotel Trust 684 14,261
Post Properties, Inc. 443 21,765
PS Business Parks, Inc. 451 29,085
Strategic Hotels & Resorts, Inc. (I) 1,896 11,812
Sunstone Hotel Investors, Inc. (I) 3,181 32,828
Tanger Factory Outlet Centers 2,186 71,876
1,054,017
Real Estate Management & Development - 0.1%
Altisource Portfolio Solutions SA (I) 380 40,405
Forest City Enterprises, Inc., Class A (I)(L) 2,804 42,200
Kennedy-Wilson Holdings, Inc. 358 4,690
Tejon Ranch Company (I) 380 10,602
The St. Joe Company (I)(L) 1,608 34,379
Zillow, Inc., Class A (I) 403 11,091
143,367
Thrifts & Mortgage Finance - 0.3%
Beneficial Mutual Bancorp, Inc. (I) 818 7,665
Doral Financial Corp. (I) 1,081 735
EverBank Financial Corp. 677 10,006
MGIC Investment Corp. (I) 2,280 3,990
Nationstar Mortgage Holdings, Inc. (I)(L) 9,958 304,914
Ocwen Financial Corp. (I) 1 36
Radian Group, Inc. 1,552 6,798
TFS Financial Corp. (I) 2,157 17,731
351,875
8,222,459
160
John Hancock Funds IIPortfolio of Investments — November 30, 2012 (Unaudited) (showing percentage of total net assets)Smaller Company Growth Fund (continued)
Shares or
Copyright © 2013 www.secdatabase.com. All Rights Reserved.Please Consider the Environment Before Printing This Document
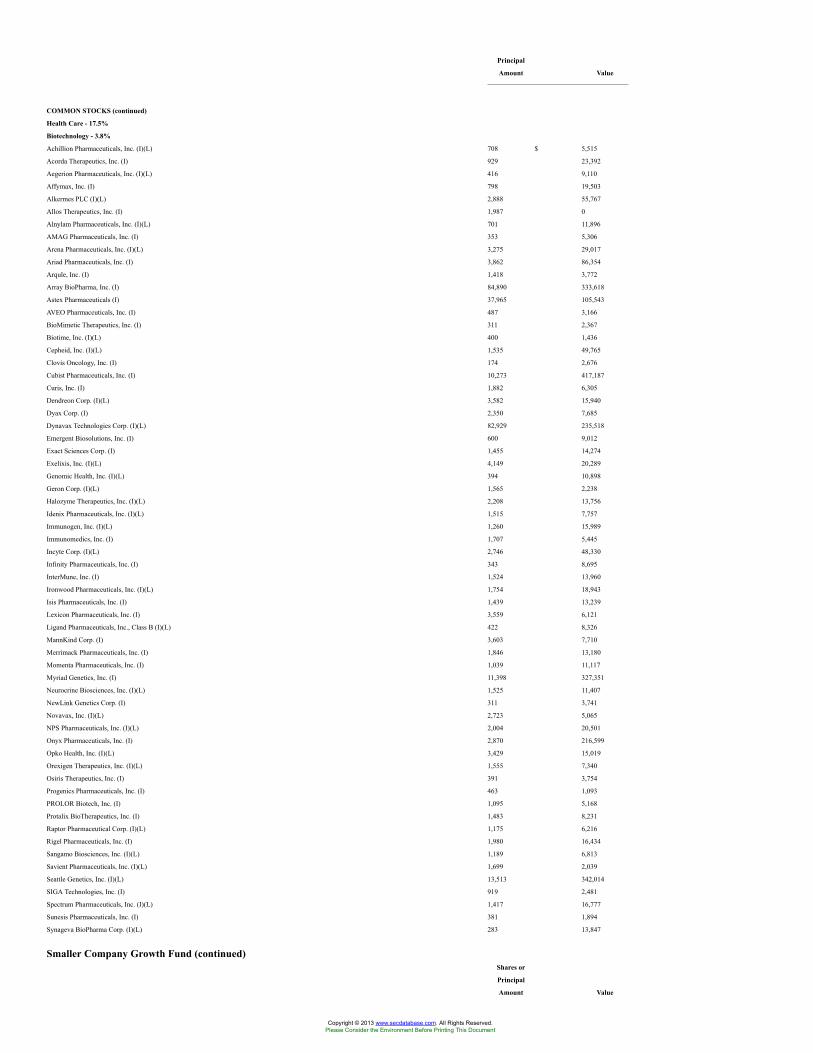
Principal
Amount Value
COMMON STOCKS (continued)
Health Care - 17.5%
Biotechnology - 3.8%
Achillion Pharmaceuticals, Inc. (I)(L) 708 $ 5,515
Acorda Therapeutics, Inc. (I) 929 23,392
Aegerion Pharmaceuticals, Inc. (I)(L) 416 9,110
Affymax, Inc. (I) 798 19,503
Alkermes PLC (I)(L) 2,888 55,767
Allos Therapeutics, Inc. (I) 1,987 0
Alnylam Pharmaceuticals, Inc. (I)(L) 701 11,896
AMAG Pharmaceuticals, Inc. (I) 353 5,306
Arena Pharmaceuticals, Inc. (I)(L) 3,275 29,017
Ariad Pharmaceuticals, Inc. (I) 3,862 86,354
Arqule, Inc. (I) 1,418 3,772
Array BioPharma, Inc. (I) 84,890 333,618
Astex Pharmaceuticals (I) 37,965 105,543
AVEO Pharmaceuticals, Inc. (I) 487 3,166
BioMimetic Therapeutics, Inc. (I) 311 2,367
Biotime, Inc. (I)(L) 400 1,436
Cepheid, Inc. (I)(L) 1,535 49,765
Clovis Oncology, Inc. (I) 174 2,676
Cubist Pharmaceuticals, Inc. (I) 10,273 417,187
Curis, Inc. (I) 1,882 6,305
Dendreon Corp. (I)(L) 3,582 15,940
Dyax Corp. (I) 2,350 7,685
Dynavax Technologies Corp. (I)(L) 82,929 235,518
Emergent Biosolutions, Inc. (I) 600 9,012
Exact Sciences Corp. (I) 1,455 14,274
Exelixis, Inc. (I)(L) 4,149 20,289
Genomic Health, Inc. (I)(L) 394 10,898
Geron Corp. (I)(L) 1,565 2,238
Halozyme Therapeutics, Inc. (I)(L) 2,208 13,756
Idenix Pharmaceuticals, Inc. (I)(L) 1,515 7,757
Immunogen, Inc. (I)(L) 1,260 15,989
Immunomedics, Inc. (I) 1,707 5,445
Incyte Corp. (I)(L) 2,746 48,330
Infinity Pharmaceuticals, Inc. (I) 343 8,695
InterMune, Inc. (I) 1,524 13,960
Ironwood Pharmaceuticals, Inc. (I)(L) 1,754 18,943
Isis Pharmaceuticals, Inc. (I) 1,439 13,239
Lexicon Pharmaceuticals, Inc. (I) 3,559 6,121
Ligand Pharmaceuticals, Inc., Class B (I)(L) 422 8,326
MannKind Corp. (I) 3,603 7,710
Merrimack Pharmaceuticals, Inc. (I) 1,846 13,180
Momenta Pharmaceuticals, Inc. (I) 1,039 11,117
Myriad Genetics, Inc. (I) 11,398 327,351
Neurocrine Biosciences, Inc. (I)(L) 1,525 11,407
NewLink Genetics Corp. (I) 311 3,741
Novavax, Inc. (I)(L) 2,723 5,065
NPS Pharmaceuticals, Inc. (I)(L) 2,004 20,501
Onyx Pharmaceuticals, Inc. (I) 2,870 216,599
Opko Health, Inc. (I)(L) 3,429 15,019
Orexigen Therapeutics, Inc. (I)(L) 1,555 7,340
Osiris Therapeutics, Inc. (I) 391 3,754
Progenics Pharmaceuticals, Inc. (I) 463 1,093
PROLOR Biotech, Inc. (I) 1,095 5,168
Protalix BioTherapeutics, Inc. (I) 1,483 8,231
Raptor Pharmaceutical Corp. (I)(L) 1,175 6,216
Rigel Pharmaceuticals, Inc. (I) 1,980 16,434
Sangamo Biosciences, Inc. (I)(L) 1,189 6,813
Savient Pharmaceuticals, Inc. (I)(L) 1,699 2,039
Seattle Genetics, Inc. (I)(L) 13,513 342,014
SIGA Technologies, Inc. (I) 919 2,481
Spectrum Pharmaceuticals, Inc. (I)(L) 1,417 16,777
Sunesis Pharmaceuticals, Inc. (I) 381 1,894
Synageva BioPharma Corp. (I)(L) 283 13,847
Smaller Company Growth Fund (continued)Shares or
Principal
Amount Value
Copyright © 2013 www.secdatabase.com. All Rights Reserved.Please Consider the Environment Before Printing This Document
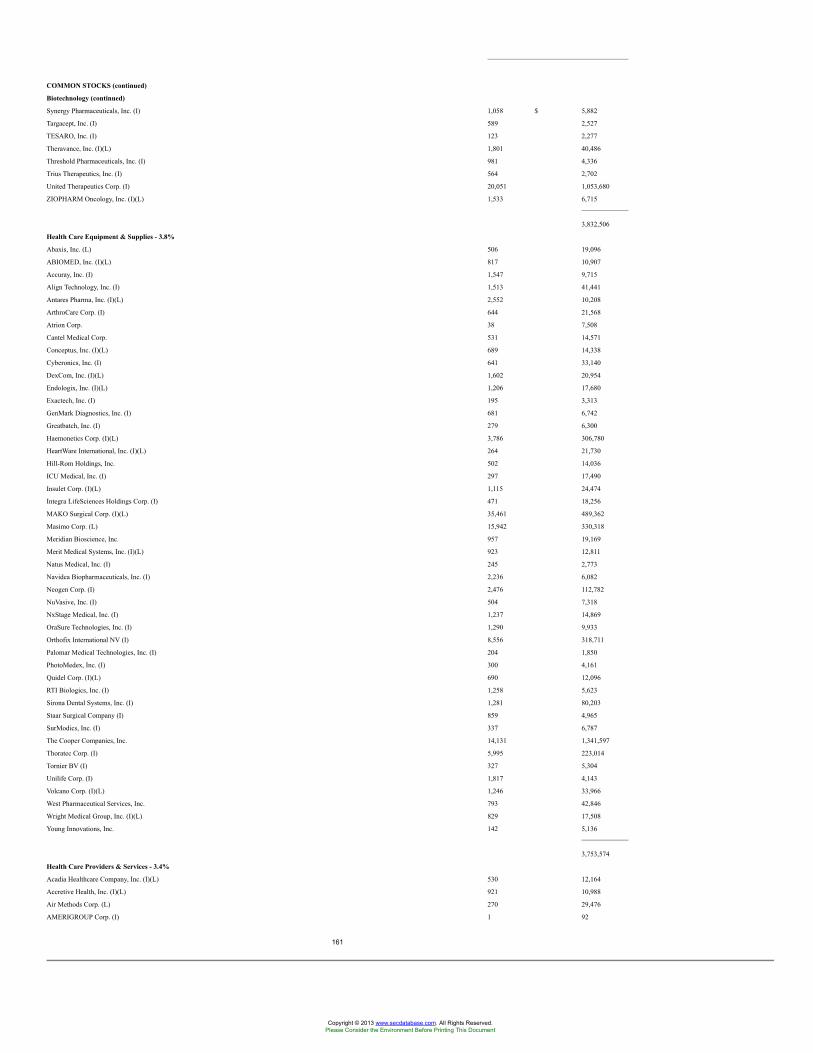
COMMON STOCKS (continued)
Biotechnology (continued)
Synergy Pharmaceuticals, Inc. (I) 1,058 $ 5,882
Targacept, Inc. (I) 589 2,527
TESARO, Inc. (I) 123 2,277
Theravance, Inc. (I)(L) 1,801 40,486
Threshold Pharmaceuticals, Inc. (I) 981 4,336
Trius Therapeutics, Inc. (I) 564 2,702
United Therapeutics Corp. (I) 20,051 1,053,680
ZIOPHARM Oncology, Inc. (I)(L) 1,533 6,715
3,832,506
Health Care Equipment & Supplies - 3.8%
Abaxis, Inc. (L) 506 19,096
ABIOMED, Inc. (I)(L) 817 10,907
Accuray, Inc. (I) 1,547 9,715
Align Technology, Inc. (I) 1,513 41,441
Antares Pharma, Inc. (I)(L) 2,552 10,208
ArthroCare Corp. (I) 644 21,568
Atrion Corp. 38 7,508
Cantel Medical Corp. 531 14,571
Conceptus, Inc. (I)(L) 689 14,338
Cyberonics, Inc. (I) 641 33,140
DexCom, Inc. (I)(L) 1,602 20,954
Endologix, Inc. (I)(L) 1,206 17,680
Exactech, Inc. (I) 195 3,313
GenMark Diagnostics, Inc. (I) 681 6,742
Greatbatch, Inc. (I) 279 6,300
Haemonetics Corp. (I)(L) 3,786 306,780
HeartWare International, Inc. (I)(L) 264 21,730
Hill-Rom Holdings, Inc. 502 14,036
ICU Medical, Inc. (I) 297 17,490
Insulet Corp. (I)(L) 1,115 24,474
Integra LifeSciences Holdings Corp. (I) 471 18,256
MAKO Surgical Corp. (I)(L) 35,461 489,362
Masimo Corp. (L) 15,942 330,318
Meridian Bioscience, Inc. 957 19,169
Merit Medical Systems, Inc. (I)(L) 923 12,811
Natus Medical, Inc. (I) 245 2,773
Navidea Biopharmaceuticals, Inc. (I) 2,236 6,082
Neogen Corp. (I) 2,476 112,782
NuVasive, Inc. (I) 504 7,318
NxStage Medical, Inc. (I) 1,237 14,869
OraSure Technologies, Inc. (I) 1,290 9,933
Orthofix International NV (I) 8,556 318,711
Palomar Medical Technologies, Inc. (I) 204 1,850
PhotoMedex, Inc. (I) 300 4,161
Quidel Corp. (I)(L) 690 12,096
RTI Biologics, Inc. (I) 1,258 5,623
Sirona Dental Systems, Inc. (I) 1,281 80,203
Staar Surgical Company (I) 859 4,965
SurModics, Inc. (I) 337 6,787
The Cooper Companies, Inc. 14,131 1,341,597
Thoratec Corp. (I) 5,995 223,014
Tornier BV (I) 327 5,304
Unilife Corp. (I) 1,817 4,143
Volcano Corp. (I)(L) 1,246 33,966
West Pharmaceutical Services, Inc. 793 42,846
Wright Medical Group, Inc. (I)(L) 829 17,508
Young Innovations, Inc. 142 5,136
3,753,574
Health Care Providers & Services - 3.4%
Acadia Healthcare Company, Inc. (I)(L) 530 12,164
Accretive Health, Inc. (I)(L) 921 10,988
Air Methods Corp. (L) 270 29,476
AMERIGROUP Corp. (I) 1 92
161
Copyright © 2013 www.secdatabase.com. All Rights Reserved.Please Consider the Environment Before Printing This Document
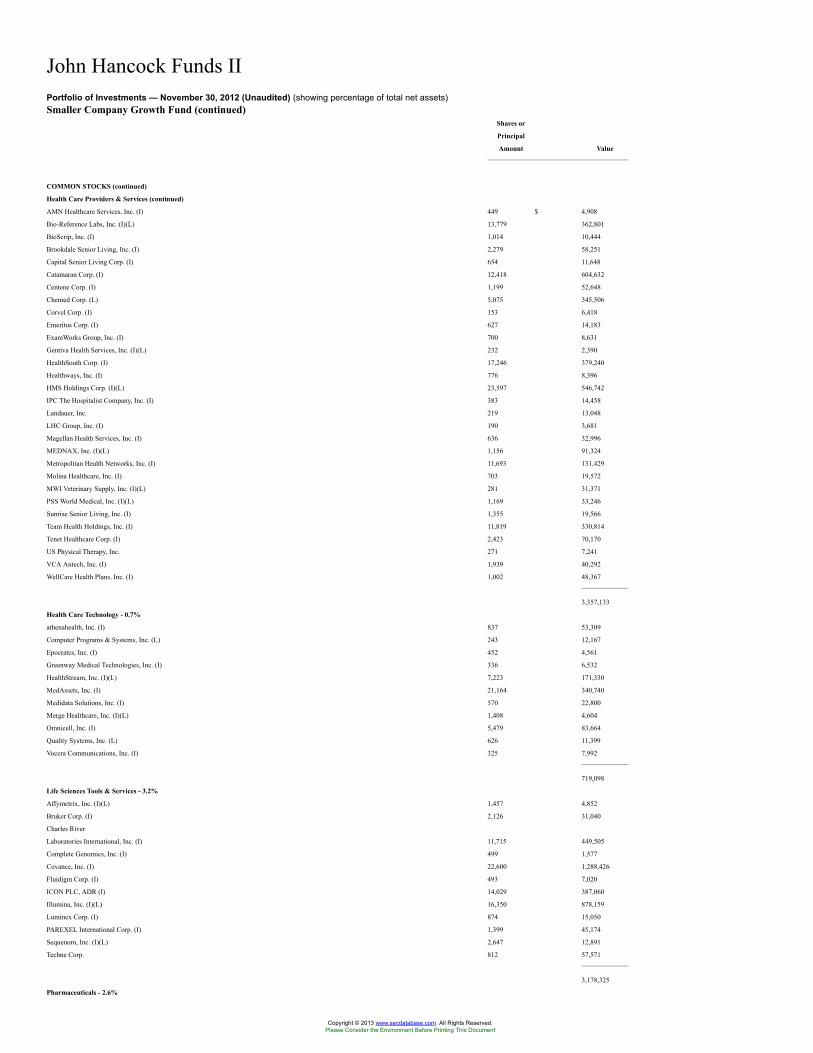
John Hancock Funds IIPortfolio of Investments — November 30, 2012 (Unaudited) (showing percentage of total net assets)Smaller Company Growth Fund (continued)
Shares or
Principal
Amount Value
COMMON STOCKS (continued)
Health Care Providers & Services (continued)
AMN Healthcare Services, Inc. (I) 449 $ 4,908
Bio-Reference Labs, Inc. (I)(L) 13,779 362,801
BioScrip, Inc. (I) 1,014 10,444
Brookdale Senior Living, Inc. (I) 2,279 58,251
Capital Senior Living Corp. (I) 654 11,648
Catamaran Corp. (I) 12,418 604,632
Centene Corp. (I) 1,199 52,648
Chemed Corp. (L) 5,075 345,506
Corvel Corp. (I) 153 6,418
Emeritus Corp. (I) 627 14,183
ExamWorks Group, Inc. (I) 700 8,631
Gentiva Health Services, Inc. (I)(L) 232 2,390
HealthSouth Corp. (I) 17,246 379,240
Healthways, Inc. (I) 776 8,396
HMS Holdings Corp. (I)(L) 23,597 546,742
IPC The Hospitalist Company, Inc. (I) 383 14,458
Landauer, Inc. 219 13,048
LHC Group, Inc. (I) 190 3,681
Magellan Health Services, Inc. (I) 636 32,996
MEDNAX, Inc. (I)(L) 1,156 91,324
Metropolitan Health Networks, Inc. (I) 11,693 131,429
Molina Healthcare, Inc. (I) 703 19,572
MWI Veterinary Supply, Inc. (I)(L) 281 31,371
PSS World Medical, Inc. (I)(L) 1,169 33,246
Sunrise Senior Living, Inc. (I) 1,355 19,566
Team Health Holdings, Inc. (I) 11,819 330,814
Tenet Healthcare Corp. (I) 2,423 70,170
US Physical Therapy, Inc. 271 7,241
VCA Antech, Inc. (I) 1,939 40,292
WellCare Health Plans, Inc. (I) 1,002 48,367
3,357,133
Health Care Technology - 0.7%
athenahealth, Inc. (I) 837 53,309
Computer Programs & Systems, Inc. (L) 243 12,167
Epocrates, Inc. (I) 452 4,561
Greenway Medical Technologies, Inc. (I) 336 6,532
HealthStream, Inc. (I)(L) 7,223 171,330
MedAssets, Inc. (I) 21,164 340,740
Medidata Solutions, Inc. (I) 570 22,800
Merge Healthcare, Inc. (I)(L) 1,408 4,604
Omnicell, Inc. (I) 5,479 83,664
Quality Systems, Inc. (L) 626 11,399
Vocera Communications, Inc. (I) 325 7,992
719,098
Life Sciences Tools & Services - 3.2%
Affymetrix, Inc. (I)(L) 1,457 4,852
Bruker Corp. (I) 2,126 31,040
Charles River
Laboratories International, Inc. (I) 11,715 449,505
Complete Genomics, Inc. (I) 499 1,577
Covance, Inc. (I) 22,600 1,288,426
Fluidigm Corp. (I) 493 7,020
ICON PLC, ADR (I) 14,029 387,060
Illumina, Inc. (I)(L) 16,350 878,159
Luminex Corp. (I) 874 15,050
PAREXEL International Corp. (I) 1,399 45,174
Sequenom, Inc. (I)(L) 2,647 12,891
Techne Corp. 812 57,571
3,178,325
Pharmaceuticals - 2.6%
Copyright © 2013 www.secdatabase.com. All Rights Reserved.Please Consider the Environment Before Printing This Document
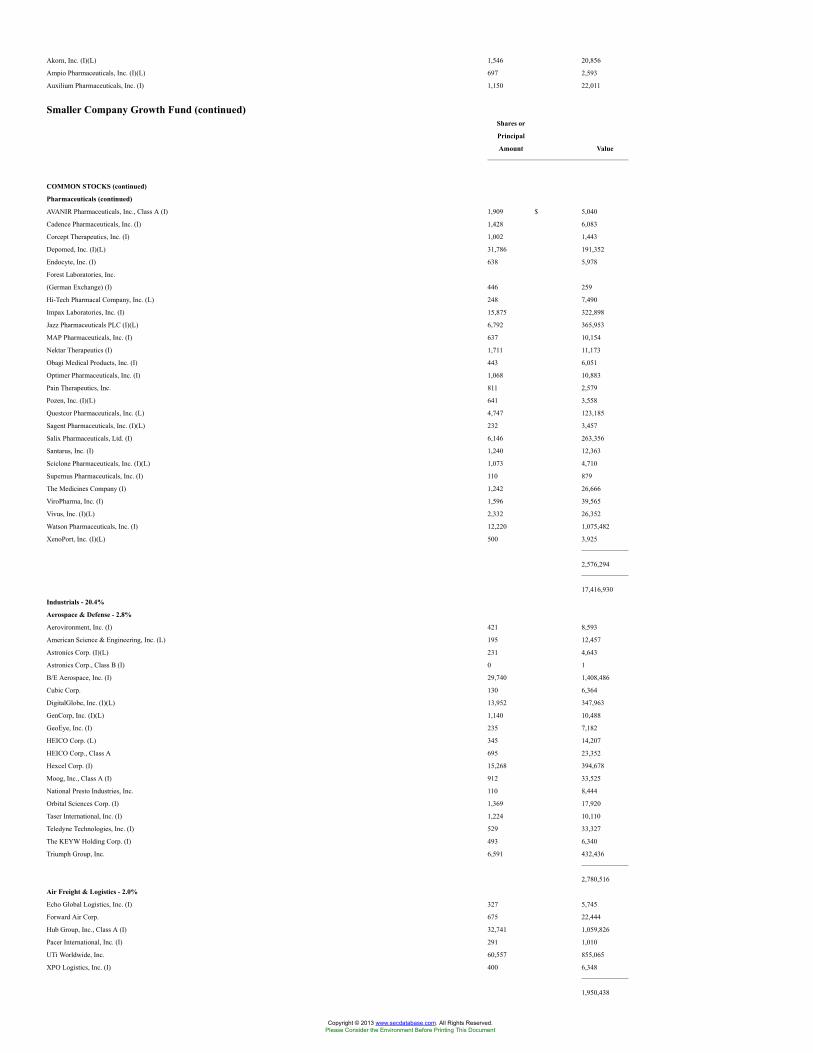
Akorn, Inc. (I)(L) 1,546 20,856
Ampio Pharmaceuticals, Inc. (I)(L) 697 2,593
Auxilium Pharmaceuticals, Inc. (I) 1,150 22,011
Smaller Company Growth Fund (continued)Shares or
Principal
Amount Value
COMMON STOCKS (continued)
Pharmaceuticals (continued)
AVANIR Pharmaceuticals, Inc., Class A (I) 1,909 $ 5,040
Cadence Pharmaceuticals, Inc. (I) 1,428 6,083
Corcept Therapeutics, Inc. (I) 1,002 1,443
Depomed, Inc. (I)(L) 31,786 191,352
Endocyte, Inc. (I) 638 5,978
Forest Laboratories, Inc.
(German Exchange) (I) 446 259
Hi-Tech Pharmacal Company, Inc. (L) 248 7,490
Impax Laboratories, Inc. (I) 15,875 322,898
Jazz Pharmaceuticals PLC (I)(L) 6,792 365,953
MAP Pharmaceuticals, Inc. (I) 637 10,154
Nektar Therapeutics (I) 1,711 11,173
Obagi Medical Products, Inc. (I) 443 6,051
Optimer Pharmaceuticals, Inc. (I) 1,068 10,883
Pain Therapeutics, Inc. 811 2,579
Pozen, Inc. (I)(L) 641 3,558
Questcor Pharmaceuticals, Inc. (L) 4,747 123,185
Sagent Pharmaceuticals, Inc. (I)(L) 232 3,457
Salix Pharmaceuticals, Ltd. (I) 6,146 263,356
Santarus, Inc. (I) 1,240 12,363
Sciclone Pharmaceuticals, Inc. (I)(L) 1,073 4,710
Supernus Pharmaceuticals, Inc. (I) 110 879
The Medicines Company (I) 1,242 26,666
ViroPharma, Inc. (I) 1,596 39,565
Vivus, Inc. (I)(L) 2,332 26,352
Watson Pharmaceuticals, Inc. (I) 12,220 1,075,482
XenoPort, Inc. (I)(L) 500 3,925
2,576,294
17,416,930
Industrials - 20.4%
Aerospace & Defense - 2.8%
Aerovironment, Inc. (I) 421 8,593
American Science & Engineering, Inc. (L) 195 12,457
Astronics Corp. (I)(L) 231 4,643
Astronics Corp., Class B (I) 0 1
B/E Aerospace, Inc. (I) 29,740 1,408,486
Cubic Corp. 130 6,364
DigitalGlobe, Inc. (I)(L) 13,952 347,963
GenCorp, Inc. (I)(L) 1,140 10,488
GeoEye, Inc. (I) 235 7,182
HEICO Corp. (L) 345 14,207
HEICO Corp., Class A 695 23,352
Hexcel Corp. (I) 15,268 394,678
Moog, Inc., Class A (I) 912 33,525
National Presto Industries, Inc. 110 8,444
Orbital Sciences Corp. (I) 1,369 17,920
Taser International, Inc. (I) 1,224 10,110
Teledyne Technologies, Inc. (I) 529 33,327
The KEYW Holding Corp. (I) 493 6,340
Triumph Group, Inc. 6,591 432,436
2,780,516
Air Freight & Logistics - 2.0%
Echo Global Logistics, Inc. (I) 327 5,745
Forward Air Corp. 675 22,444
Hub Group, Inc., Class A (I) 32,741 1,059,826
Pacer International, Inc. (I) 291 1,010
UTi Worldwide, Inc. 60,557 855,065
XPO Logistics, Inc. (I) 400 6,348
1,950,438
Copyright © 2013 www.secdatabase.com. All Rights Reserved.Please Consider the Environment Before Printing This Document
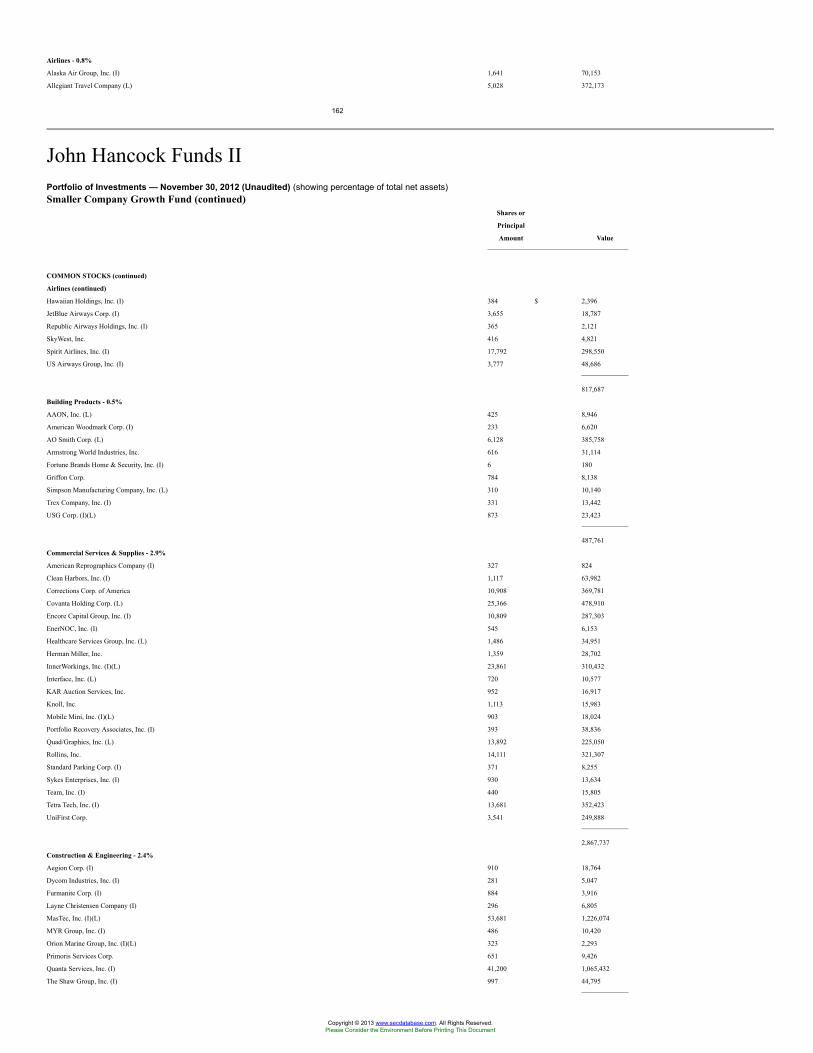
Airlines - 0.8%
Alaska Air Group, Inc. (I) 1,641 70,153
Allegiant Travel Company (L) 5,028 372,173
162
John Hancock Funds IIPortfolio of Investments — November 30, 2012 (Unaudited) (showing percentage of total net assets)Smaller Company Growth Fund (continued)
Shares or
Principal
Amount Value
COMMON STOCKS (continued)
Airlines (continued)
Hawaiian Holdings, Inc. (I) 384 $ 2,396
JetBlue Airways Corp. (I) 3,655 18,787
Republic Airways Holdings, Inc. (I) 365 2,121
SkyWest, Inc. 416 4,821
Spirit Airlines, Inc. (I) 17,792 298,550
US Airways Group, Inc. (I) 3,777 48,686
817,687
Building Products - 0.5%
AAON, Inc. (L) 425 8,946
American Woodmark Corp. (I) 233 6,620
AO Smith Corp. (L) 6,128 385,758
Armstrong World Industries, Inc. 616 31,114
Fortune Brands Home & Security, Inc. (I) 6 180
Griffon Corp. 784 8,138
Simpson Manufacturing Company, Inc. (L) 310 10,140
Trex Company, Inc. (I) 331 13,442
USG Corp. (I)(L) 873 23,423
487,761
Commercial Services & Supplies - 2.9%
American Reprographics Company (I) 327 824
Clean Harbors, Inc. (I) 1,117 63,982
Corrections Corp. of America 10,908 369,781
Covanta Holding Corp. (L) 25,366 478,910
Encore Capital Group, Inc. (I) 10,809 287,303
EnerNOC, Inc. (I) 545 6,153
Healthcare Services Group, Inc. (L) 1,486 34,951
Herman Miller, Inc. 1,359 28,702
InnerWorkings, Inc. (I)(L) 23,861 310,432
Interface, Inc. (L) 720 10,577
KAR Auction Services, Inc. 952 16,917
Knoll, Inc. 1,113 15,983
Mobile Mini, Inc. (I)(L) 903 18,024
Portfolio Recovery Associates, Inc. (I) 393 38,836
Quad/Graphics, Inc. (L) 13,892 225,050
Rollins, Inc. 14,111 321,307
Standard Parking Corp. (I) 371 8,255
Sykes Enterprises, Inc. (I) 930 13,634
Team, Inc. (I) 440 15,805
Tetra Tech, Inc. (I) 13,681 352,423
UniFirst Corp. 3,541 249,888
2,867,737
Construction & Engineering - 2.4%
Aegion Corp. (I) 910 18,764
Dycom Industries, Inc. (I) 281 5,047
Furmanite Corp. (I) 884 3,916
Layne Christensen Company (I) 296 6,805
MasTec, Inc. (I)(L) 53,681 1,226,074
MYR Group, Inc. (I) 486 10,420
Orion Marine Group, Inc. (I)(L) 323 2,293
Primoris Services Corp. 651 9,426
Quanta Services, Inc. (I) 41,200 1,065,432
The Shaw Group, Inc. (I) 997 44,795
Copyright © 2013 www.secdatabase.com. All Rights Reserved.Please Consider the Environment Before Printing This Document
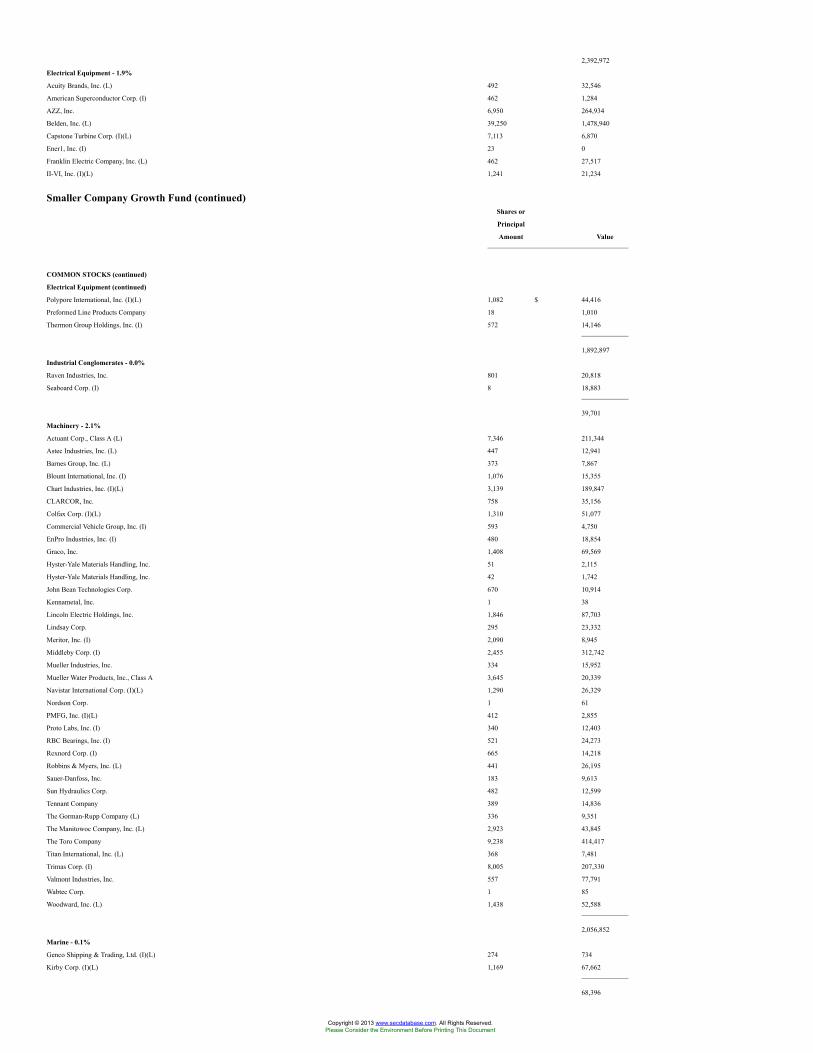
2,392,972
Electrical Equipment - 1.9%
Acuity Brands, Inc. (L) 492 32,546
American Superconductor Corp. (I) 462 1,284
AZZ, Inc. 6,950 264,934
Belden, Inc. (L) 39,250 1,478,940
Capstone Turbine Corp. (I)(L) 7,113 6,870
Ener1, Inc. (I) 23 0
Franklin Electric Company, Inc. (L) 462 27,517
II-VI, Inc. (I)(L) 1,241 21,234
Smaller Company Growth Fund (continued)Shares or
Principal
Amount Value
COMMON STOCKS (continued)
Electrical Equipment (continued)
Polypore International, Inc. (I)(L) 1,082 $ 44,416
Preformed Line Products Company 18 1,010
Thermon Group Holdings, Inc. (I) 572 14,146
1,892,897
Industrial Conglomerates - 0.0%
Raven Industries, Inc. 801 20,818
Seaboard Corp. (I) 8 18,883
39,701
Machinery - 2.1%
Actuant Corp., Class A (L) 7,346 211,344
Astec Industries, Inc. (L) 447 12,941
Barnes Group, Inc. (L) 373 7,867
Blount International, Inc. (I) 1,076 15,355
Chart Industries, Inc. (I)(L) 3,139 189,847
CLARCOR, Inc. 758 35,156
Colfax Corp. (I)(L) 1,310 51,077
Commercial Vehicle Group, Inc. (I) 593 4,750
EnPro Industries, Inc. (I) 480 18,854
Graco, Inc. 1,408 69,569
Hyster-Yale Materials Handling, Inc. 51 2,115
Hyster-Yale Materials Handling, Inc. 42 1,742
John Bean Technologies Corp. 670 10,914
Kennametal, Inc. 1 38
Lincoln Electric Holdings, Inc. 1,846 87,703
Lindsay Corp. 295 23,332
Meritor, Inc. (I) 2,090 8,945
Middleby Corp. (I) 2,455 312,742
Mueller Industries, Inc. 334 15,952
Mueller Water Products, Inc., Class A 3,645 20,339
Navistar International Corp. (I)(L) 1,290 26,329
Nordson Corp. 1 61
PMFG, Inc. (I)(L) 412 2,855
Proto Labs, Inc. (I) 340 12,403
RBC Bearings, Inc. (I) 521 24,273
Rexnord Corp. (I) 665 14,218
Robbins & Myers, Inc. (L) 441 26,195
Sauer-Danfoss, Inc. 183 9,613
Sun Hydraulics Corp. 482 12,599
Tennant Company 389 14,836
The Gorman-Rupp Company (L) 336 9,351
The Manitowoc Company, Inc. (L) 2,923 43,845
The Toro Company 9,238 414,417
Titan International, Inc. (L) 368 7,481
Trimas Corp. (I) 8,005 207,330
Valmont Industries, Inc. 557 77,791
Wabtec Corp. 1 85
Woodward, Inc. (L) 1,438 52,588
2,056,852
Marine - 0.1%
Genco Shipping & Trading, Ltd. (I)(L) 274 734
Kirby Corp. (I)(L) 1,169 67,662
68,396
Copyright © 2013 www.secdatabase.com. All Rights Reserved.Please Consider the Environment Before Printing This Document
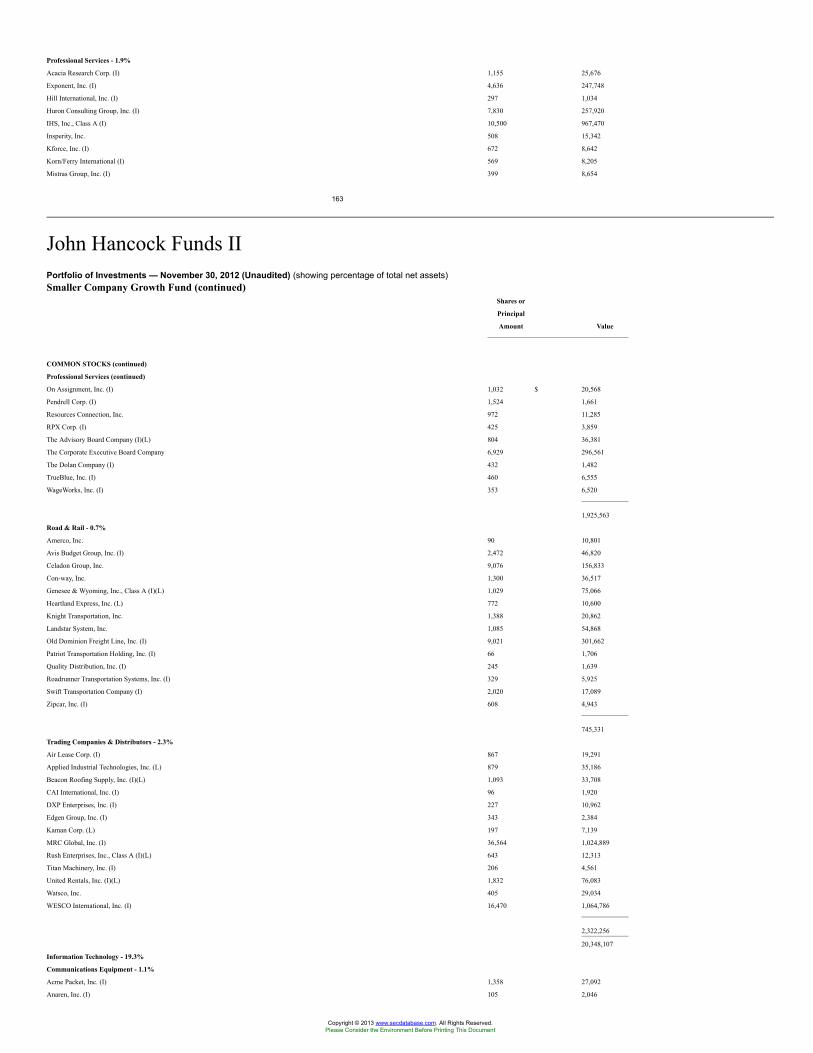
Professional Services - 1.9%
Acacia Research Corp. (I) 1,155 25,676
Exponent, Inc. (I) 4,636 247,748
Hill International, Inc. (I) 297 1,034
Huron Consulting Group, Inc. (I) 7,830 257,920
IHS, Inc., Class A (I) 10,500 967,470
Insperity, Inc. 508 15,342
Kforce, Inc. (I) 672 8,642
Korn/Ferry International (I) 569 8,205
Mistras Group, Inc. (I) 399 8,654
163
John Hancock Funds IIPortfolio of Investments — November 30, 2012 (Unaudited) (showing percentage of total net assets)Smaller Company Growth Fund (continued)
Shares or
Principal
Amount Value
COMMON STOCKS (continued)
Professional Services (continued)
On Assignment, Inc. (I) 1,032 $ 20,568
Pendrell Corp. (I) 1,524 1,661
Resources Connection, Inc. 972 11,285
RPX Corp. (I) 425 3,859
The Advisory Board Company (I)(L) 804 36,381
The Corporate Executive Board Company 6,929 296,561
The Dolan Company (I) 432 1,482
TrueBlue, Inc. (I) 460 6,555
WageWorks, Inc. (I) 353 6,520
1,925,563
Road & Rail - 0.7%
Amerco, Inc. 90 10,801
Avis Budget Group, Inc. (I) 2,472 46,820
Celadon Group, Inc. 9,076 156,833
Con-way, Inc. 1,300 36,517
Genesee & Wyoming, Inc., Class A (I)(L) 1,029 75,066
Heartland Express, Inc. (L) 772 10,600
Knight Transportation, Inc. 1,388 20,862
Landstar System, Inc. 1,085 54,868
Old Dominion Freight Line, Inc. (I) 9,021 301,662
Patriot Transportation Holding, Inc. (I) 66 1,706
Quality Distribution, Inc. (I) 245 1,639
Roadrunner Transportation Systems, Inc. (I) 329 5,925
Swift Transportation Company (I) 2,020 17,089
Zipcar, Inc. (I) 608 4,943
745,331
Trading Companies & Distributors - 2.3%
Air Lease Corp. (I) 867 19,291
Applied Industrial Technologies, Inc. (L) 879 35,186
Beacon Roofing Supply, Inc. (I)(L) 1,093 33,708
CAI International, Inc. (I) 96 1,920
DXP Enterprises, Inc. (I) 227 10,962
Edgen Group, Inc. (I) 343 2,384
Kaman Corp. (L) 197 7,139
MRC Global, Inc. (I) 36,564 1,024,889
Rush Enterprises, Inc., Class A (I)(L) 643 12,313
Titan Machinery, Inc. (I) 206 4,561
United Rentals, Inc. (I)(L) 1,832 76,083
Watsco, Inc. 405 29,034
WESCO International, Inc. (I) 16,470 1,064,786
2,322,256
20,348,107
Information Technology - 19.3%
Communications Equipment - 1.1%
Acme Packet, Inc. (I) 1,358 27,092
Anaren, Inc. (I) 105 2,046
Copyright © 2013 www.secdatabase.com. All Rights Reserved.Please Consider the Environment Before Printing This Document
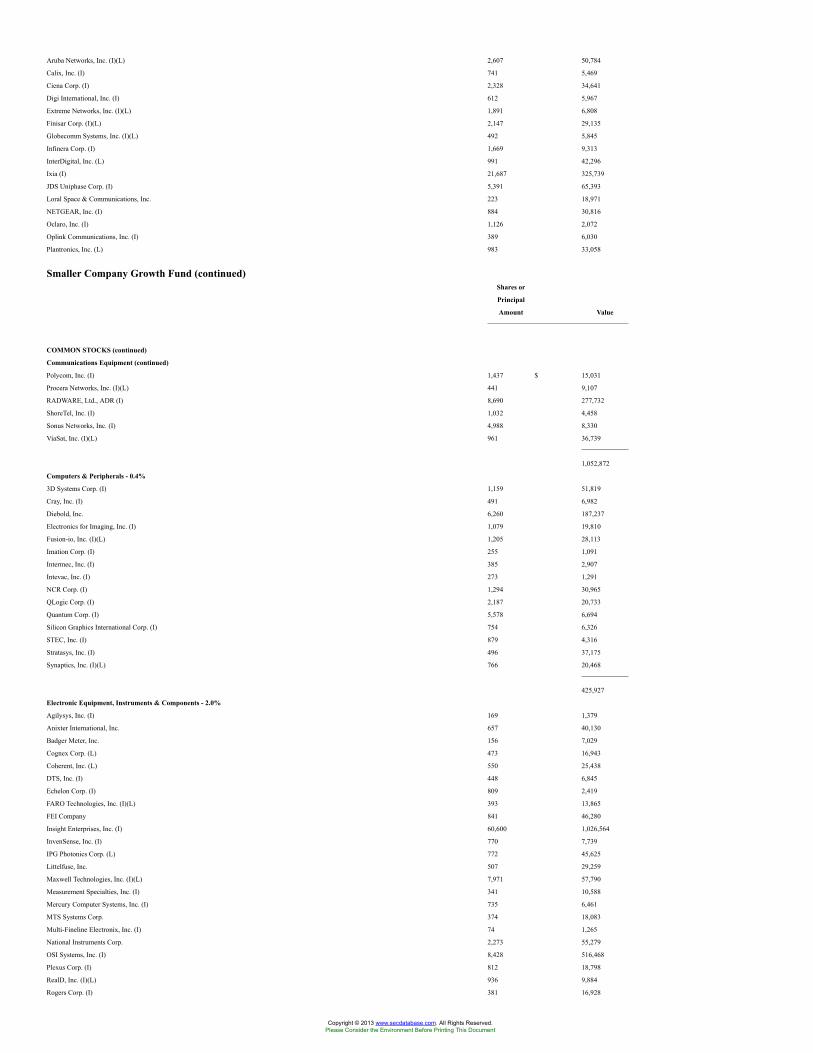
Aruba Networks, Inc. (I)(L) 2,607 50,784
Calix, Inc. (I) 741 5,469
Ciena Corp. (I) 2,328 34,641
Digi International, Inc. (I) 612 5,967
Extreme Networks, Inc. (I)(L) 1,891 6,808
Finisar Corp. (I)(L) 2,147 29,135
Globecomm Systems, Inc. (I)(L) 492 5,845
Infinera Corp. (I) 1,669 9,313
InterDigital, Inc. (L) 991 42,296
Ixia (I) 21,687 325,739
JDS Uniphase Corp. (I) 5,391 65,393
Loral Space & Communications, Inc. 223 18,971
NETGEAR, Inc. (I) 884 30,816
Oclaro, Inc. (I) 1,126 2,072
Oplink Communications, Inc. (I) 389 6,030
Plantronics, Inc. (L) 983 33,058
Smaller Company Growth Fund (continued)Shares or
Principal
Amount Value
COMMON STOCKS (continued)
Communications Equipment (continued)
Polycom, Inc. (I) 1,437 $ 15,031
Procera Networks, Inc. (I)(L) 441 9,107
RADWARE, Ltd., ADR (I) 8,690 277,732
ShoreTel, Inc. (I) 1,032 4,458
Sonus Networks, Inc. (I) 4,988 8,330
ViaSat, Inc. (I)(L) 961 36,739
1,052,872
Computers & Peripherals - 0.4%
3D Systems Corp. (I) 1,159 51,819
Cray, Inc. (I) 491 6,982
Diebold, Inc. 6,260 187,237
Electronics for Imaging, Inc. (I) 1,079 19,810
Fusion-io, Inc. (I)(L) 1,205 28,113
Imation Corp. (I) 255 1,091
Intermec, Inc. (I) 385 2,907
Intevac, Inc. (I) 273 1,291
NCR Corp. (I) 1,294 30,965
QLogic Corp. (I) 2,187 20,733
Quantum Corp. (I) 5,578 6,694
Silicon Graphics International Corp. (I) 754 6,326
STEC, Inc. (I) 879 4,316
Stratasys, Inc. (I) 496 37,175
Synaptics, Inc. (I)(L) 766 20,468
425,927
Electronic Equipment, Instruments & Components - 2.0%
Agilysys, Inc. (I) 169 1,379
Anixter International, Inc. 657 40,130
Badger Meter, Inc. 156 7,029
Cognex Corp. (L) 473 16,943
Coherent, Inc. (L) 550 25,438
DTS, Inc. (I) 448 6,845
Echelon Corp. (I) 809 2,419
FARO Technologies, Inc. (I)(L) 393 13,865
FEI Company 841 46,280
Insight Enterprises, Inc. (I) 60,600 1,026,564
InvenSense, Inc. (I) 770 7,739
IPG Photonics Corp. (L) 772 45,625
Littelfuse, Inc. 507 29,259
Maxwell Technologies, Inc. (I)(L) 7,971 57,790
Measurement Specialties, Inc. (I) 341 10,588
Mercury Computer Systems, Inc. (I) 735 6,461
MTS Systems Corp. 374 18,083
Multi-Fineline Electronix, Inc. (I) 74 1,265
National Instruments Corp. 2,273 55,279
OSI Systems, Inc. (I) 8,428 516,468
Plexus Corp. (I) 812 18,798
RealD, Inc. (I)(L) 936 9,884
Rogers Corp. (I) 381 16,928
Copyright © 2013 www.secdatabase.com. All Rights Reserved.Please Consider the Environment Before Printing This Document
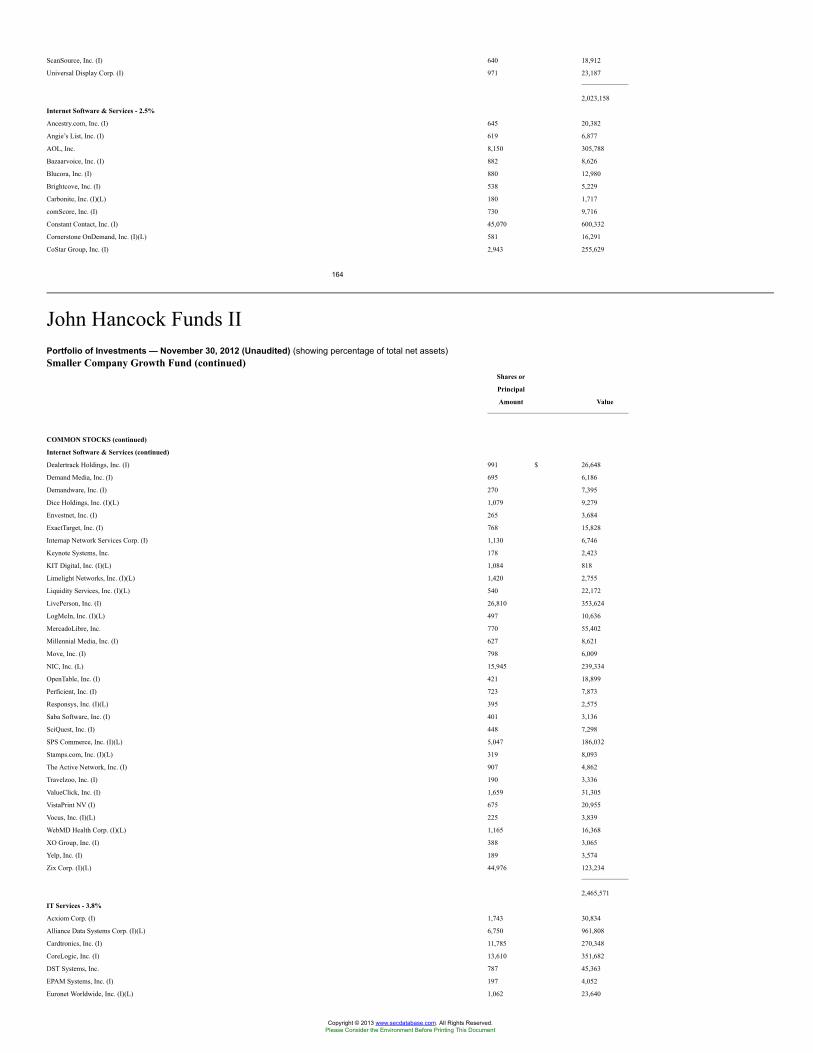
ScanSource, Inc. (I) 640 18,912
Universal Display Corp. (I) 971 23,187
2,023,158
Internet Software & Services - 2.5%
Ancestry.com, Inc. (I) 645 20,382
Angie’s List, Inc. (I) 619 6,877
AOL, Inc. 8,150 305,788
Bazaarvoice, Inc. (I) 882 8,626
Blucora, Inc. (I) 880 12,980
Brightcove, Inc. (I) 538 5,229
Carbonite, Inc. (I)(L) 180 1,717
comScore, Inc. (I) 730 9,716
Constant Contact, Inc. (I) 45,070 600,332
Cornerstone OnDemand, Inc. (I)(L) 581 16,291
CoStar Group, Inc. (I) 2,943 255,629
164
John Hancock Funds IIPortfolio of Investments — November 30, 2012 (Unaudited) (showing percentage of total net assets)Smaller Company Growth Fund (continued)
Shares or
Principal
Amount Value
COMMON STOCKS (continued)
Internet Software & Services (continued)
Dealertrack Holdings, Inc. (I) 991 $ 26,648
Demand Media, Inc. (I) 695 6,186
Demandware, Inc. (I) 270 7,395
Dice Holdings, Inc. (I)(L) 1,079 9,279
Envestnet, Inc. (I) 265 3,684
ExactTarget, Inc. (I) 768 15,828
Internap Network Services Corp. (I) 1,130 6,746
Keynote Systems, Inc. 178 2,423
KIT Digital, Inc. (I)(L) 1,084 818
Limelight Networks, Inc. (I)(L) 1,420 2,755
Liquidity Services, Inc. (I)(L) 540 22,172
LivePerson, Inc. (I) 26,810 353,624
LogMeIn, Inc. (I)(L) 497 10,636
MercadoLibre, Inc. 770 55,402
Millennial Media, Inc. (I) 627 8,621
Move, Inc. (I) 798 6,009
NIC, Inc. (L) 15,945 239,334
OpenTable, Inc. (I) 421 18,899
Perficient, Inc. (I) 723 7,873
Responsys, Inc. (I)(L) 395 2,575
Saba Software, Inc. (I) 401 3,136
SciQuest, Inc. (I) 448 7,298
SPS Commerce, Inc. (I)(L) 5,047 186,032
Stamps.com, Inc. (I)(L) 319 8,093
The Active Network, Inc. (I) 907 4,862
Travelzoo, Inc. (I) 190 3,336
ValueClick, Inc. (I) 1,659 31,305
VistaPrint NV (I) 675 20,955
Vocus, Inc. (I)(L) 225 3,839
WebMD Health Corp. (I)(L) 1,165 16,368
XO Group, Inc. (I) 388 3,065
Yelp, Inc. (I) 189 3,574
Zix Corp. (I)(L) 44,976 123,234
2,465,571
IT Services - 3.8%
Acxiom Corp. (I) 1,743 30,834
Alliance Data Systems Corp. (I)(L) 6,750 961,808
Cardtronics, Inc. (I) 11,785 270,348
CoreLogic, Inc. (I) 13,610 351,682
DST Systems, Inc. 787 45,363
EPAM Systems, Inc. (I) 197 4,052
Euronet Worldwide, Inc. (I)(L) 1,062 23,640
Copyright © 2013 www.secdatabase.com. All Rights Reserved.Please Consider the Environment Before Printing This Document
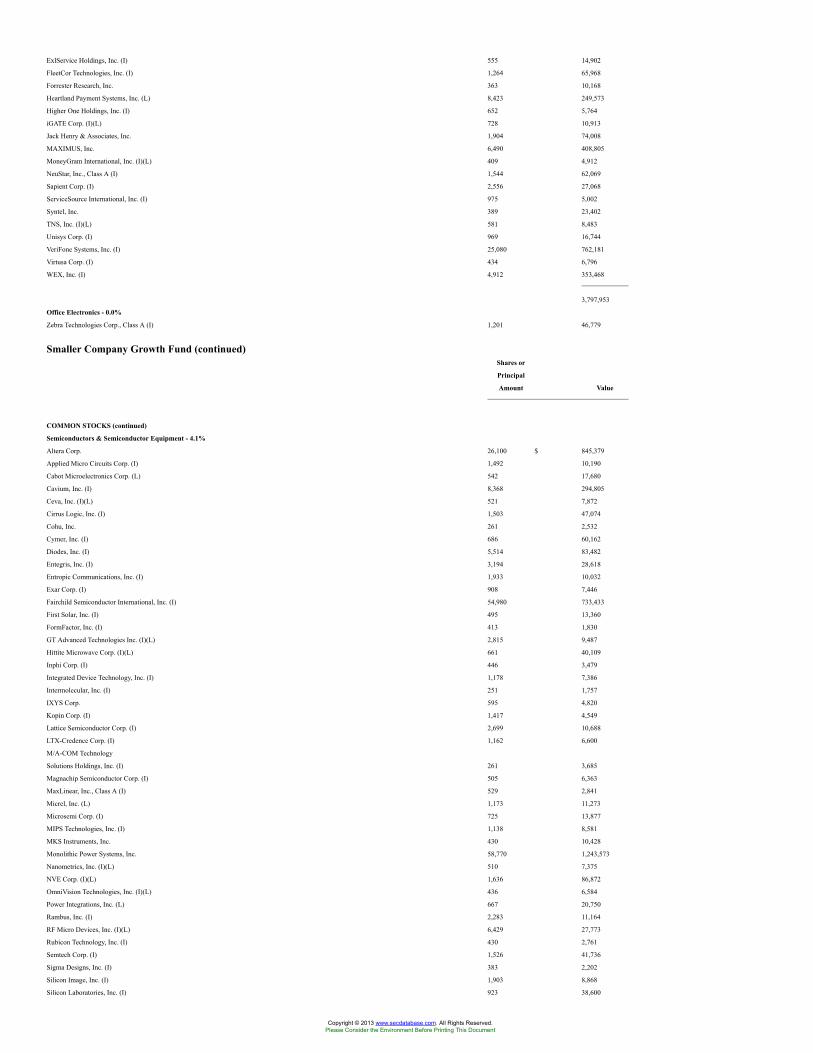
ExlService Holdings, Inc. (I) 555 14,902
FleetCor Technologies, Inc. (I) 1,264 65,968
Forrester Research, Inc. 363 10,168
Heartland Payment Systems, Inc. (L) 8,423 249,573
Higher One Holdings, Inc. (I) 652 5,764
iGATE Corp. (I)(L) 728 10,913
Jack Henry & Associates, Inc. 1,904 74,008
MAXIMUS, Inc. 6,490 408,805
MoneyGram International, Inc. (I)(L) 409 4,912
NeuStar, Inc., Class A (I) 1,544 62,069
Sapient Corp. (I) 2,556 27,068
ServiceSource International, Inc. (I) 975 5,002
Syntel, Inc. 389 23,402
TNS, Inc. (I)(L) 581 8,483
Unisys Corp. (I) 969 16,744
VeriFone Systems, Inc. (I) 25,080 762,181
Virtusa Corp. (I) 434 6,796
WEX, Inc. (I) 4,912 353,468
3,797,953
Office Electronics - 0.0%
Zebra Technologies Corp., Class A (I) 1,201 46,779
Smaller Company Growth Fund (continued)Shares or
Principal
Amount Value
COMMON STOCKS (continued)
Semiconductors & Semiconductor Equipment - 4.1%
Altera Corp. 26,100 $ 845,379
Applied Micro Circuits Corp. (I) 1,492 10,190
Cabot Microelectronics Corp. (L) 542 17,680
Cavium, Inc. (I) 8,368 294,805
Ceva, Inc. (I)(L) 521 7,872
Cirrus Logic, Inc. (I) 1,503 47,074
Cohu, Inc. 261 2,532
Cymer, Inc. (I) 686 60,162
Diodes, Inc. (I) 5,514 83,482
Entegris, Inc. (I) 3,194 28,618
Entropic Communications, Inc. (I) 1,933 10,032
Exar Corp. (I) 908 7,446
Fairchild Semiconductor International, Inc. (I) 54,980 733,433
First Solar, Inc. (I) 495 13,360
FormFactor, Inc. (I) 413 1,830
GT Advanced Technologies Inc. (I)(L) 2,815 9,487
Hittite Microwave Corp. (I)(L) 661 40,109
Inphi Corp. (I) 446 3,479
Integrated Device Technology, Inc. (I) 1,178 7,386
Intermolecular, Inc. (I) 251 1,757
IXYS Corp. 595 4,820
Kopin Corp. (I) 1,417 4,549
Lattice Semiconductor Corp. (I) 2,699 10,688
LTX-Credence Corp. (I) 1,162 6,600
M/A-COM Technology
Solutions Holdings, Inc. (I) 261 3,685
Magnachip Semiconductor Corp. (I) 505 6,363
MaxLinear, Inc., Class A (I) 529 2,841
Micrel, Inc. (L) 1,173 11,273
Microsemi Corp. (I) 725 13,877
MIPS Technologies, Inc. (I) 1,138 8,581
MKS Instruments, Inc. 430 10,428
Monolithic Power Systems, Inc. 58,770 1,243,573
Nanometrics, Inc. (I)(L) 510 7,375
NVE Corp. (I)(L) 1,636 86,872
OmniVision Technologies, Inc. (I)(L) 436 6,584
Power Integrations, Inc. (L) 667 20,750
Rambus, Inc. (I) 2,283 11,164
RF Micro Devices, Inc. (I)(L) 6,429 27,773
Rubicon Technology, Inc. (I) 430 2,761
Semtech Corp. (I) 1,526 41,736
Sigma Designs, Inc. (I) 383 2,202
Silicon Image, Inc. (I) 1,903 8,868
Silicon Laboratories, Inc. (I) 923 38,600
Copyright © 2013 www.secdatabase.com. All Rights Reserved.Please Consider the Environment Before Printing This Document
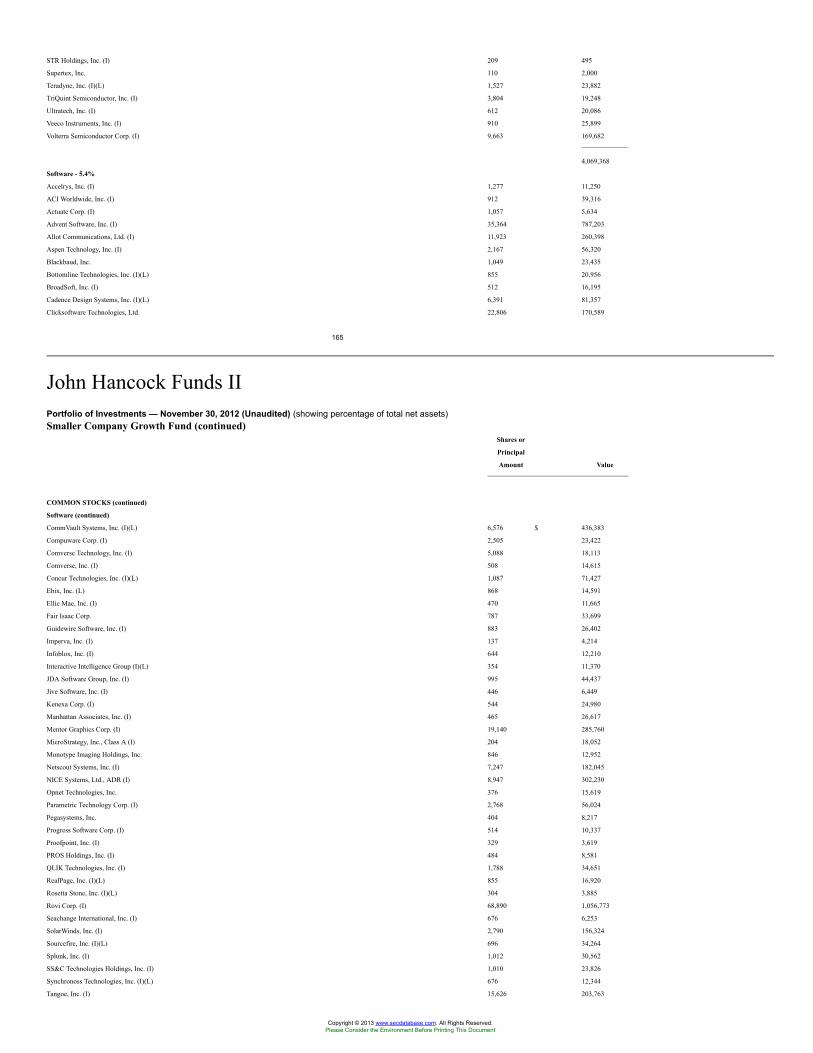
STR Holdings, Inc. (I) 209 495
Supertex, Inc. 110 2,000
Teradyne, Inc. (I)(L) 1,527 23,882
TriQuint Semiconductor, Inc. (I) 3,804 19,248
Ultratech, Inc. (I) 612 20,086
Veeco Instruments, Inc. (I) 910 25,899
Volterra Semiconductor Corp. (I) 9,663 169,682
4,069,368
Software - 5.4%
Accelrys, Inc. (I) 1,277 11,250
ACI Worldwide, Inc. (I) 912 39,316
Actuate Corp. (I) 1,057 5,634
Advent Software, Inc. (I) 35,364 787,203
Allot Communications, Ltd. (I) 11,923 260,398
Aspen Technology, Inc. (I) 2,167 56,320
Blackbaud, Inc. 1,049 23,435
Bottomline Technologies, Inc. (I)(L) 855 20,956
BroadSoft, Inc. (I) 512 16,195
Cadence Design Systems, Inc. (I)(L) 6,391 81,357
Clicksoftware Technologies, Ltd. 22,806 170,589
165
John Hancock Funds IIPortfolio of Investments — November 30, 2012 (Unaudited) (showing percentage of total net assets)Smaller Company Growth Fund (continued)
Shares or
Principal
Amount Value
COMMON STOCKS (continued)
Software (continued)
CommVault Systems, Inc. (I)(L) 6,576 $ 436,383
Compuware Corp. (I) 2,505 23,422
Comverse Technology, Inc. (I) 5,088 18,113
Comverse, Inc. (I) 508 14,615
Concur Technologies, Inc. (I)(L) 1,087 71,427
Ebix, Inc. (L) 868 14,591
Ellie Mae, Inc. (I) 470 11,665
Fair Isaac Corp. 787 33,699
Guidewire Software, Inc. (I) 883 26,402
Imperva, Inc. (I) 137 4,214
Infoblox, Inc. (I) 644 12,210
Interactive Intelligence Group (I)(L) 354 11,370
JDA Software Group, Inc. (I) 995 44,437
Jive Software, Inc. (I) 446 6,449
Kenexa Corp. (I) 544 24,980
Manhattan Associates, Inc. (I) 465 26,617
Mentor Graphics Corp. (I) 19,140 285,760
MicroStrategy, Inc., Class A (I) 204 18,052
Monotype Imaging Holdings, Inc. 846 12,952
Netscout Systems, Inc. (I) 7,247 182,045
NICE Systems, Ltd., ADR (I) 8,947 302,230
Opnet Technologies, Inc. 376 15,619
Parametric Technology Corp. (I) 2,768 56,024
Pegasystems, Inc. 404 8,217
Progress Software Corp. (I) 514 10,337
Proofpoint, Inc. (I) 329 3,619
PROS Holdings, Inc. (I) 484 8,581
QLIK Technologies, Inc. (I) 1,788 34,651
RealPage, Inc. (I)(L) 855 16,920
Rosetta Stone, Inc. (I)(L) 304 3,885
Rovi Corp. (I) 68,890 1,056,773
Seachange International, Inc. (I) 676 6,253
SolarWinds, Inc. (I) 2,790 156,324
Sourcefire, Inc. (I)(L) 696 34,264
Splunk, Inc. (I) 1,012 30,562
SS&C Technologies Holdings, Inc. (I) 1,010 23,826
Synchronoss Technologies, Inc. (I)(L) 676 12,344
Tangoe, Inc. (I) 15,626 203,763
Copyright © 2013 www.secdatabase.com. All Rights Reserved.Please Consider the Environment Before Printing This Document
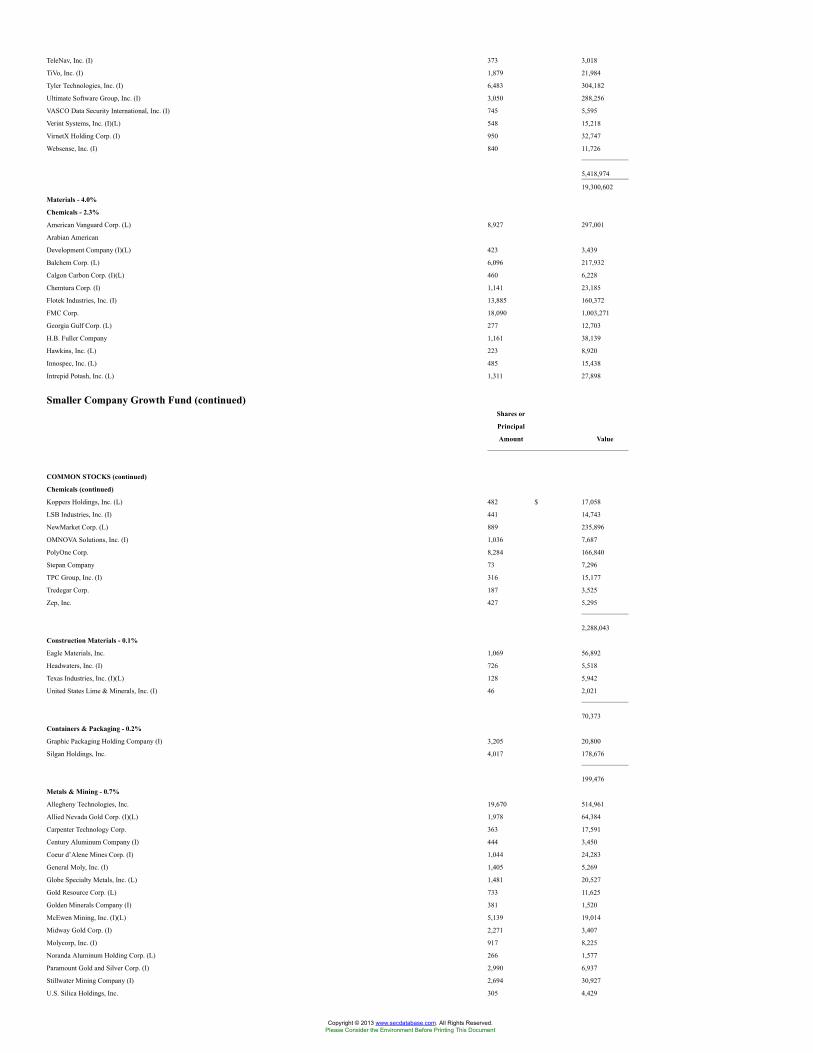
TeleNav, Inc. (I) 373 3,018
TiVo, Inc. (I) 1,879 21,984
Tyler Technologies, Inc. (I) 6,483 304,182
Ultimate Software Group, Inc. (I) 3,050 288,256
VASCO Data Security International, Inc. (I) 745 5,595
Verint Systems, Inc. (I)(L) 548 15,218
VirnetX Holding Corp. (I) 950 32,747
Websense, Inc. (I) 840 11,726
5,418,974
19,300,602
Materials - 4.0%
Chemicals - 2.3%
American Vanguard Corp. (L) 8,927 297,001
Arabian American
Development Company (I)(L) 423 3,439
Balchem Corp. (L) 6,096 217,932
Calgon Carbon Corp. (I)(L) 460 6,228
Chemtura Corp. (I) 1,141 23,185
Flotek Industries, Inc. (I) 13,885 160,372
FMC Corp. 18,090 1,003,271
Georgia Gulf Corp. (L) 277 12,703
H.B. Fuller Company 1,161 38,139
Hawkins, Inc. (L) 223 8,920
Innospec, Inc. (L) 485 15,438
Intrepid Potash, Inc. (L) 1,311 27,898
Smaller Company Growth Fund (continued)Shares or
Principal
Amount Value
COMMON STOCKS (continued)
Chemicals (continued)
Koppers Holdings, Inc. (L) 482 $ 17,058
LSB Industries, Inc. (I) 441 14,743
NewMarket Corp. (L) 889 235,896
OMNOVA Solutions, Inc. (I) 1,036 7,687
PolyOne Corp. 8,284 166,840
Stepan Company 73 7,296
TPC Group, Inc. (I) 316 15,177
Tredegar Corp. 187 3,525
Zep, Inc. 427 5,295
2,288,043
Construction Materials - 0.1%
Eagle Materials, Inc. 1,069 56,892
Headwaters, Inc. (I) 726 5,518
Texas Industries, Inc. (I)(L) 128 5,942
United States Lime & Minerals, Inc. (I) 46 2,021
70,373
Containers & Packaging - 0.2%
Graphic Packaging Holding Company (I) 3,205 20,800
Silgan Holdings, Inc. 4,017 178,676
199,476
Metals & Mining - 0.7%
Allegheny Technologies, Inc. 19,670 514,961
Allied Nevada Gold Corp. (I)(L) 1,978 64,384
Carpenter Technology Corp. 363 17,591
Century Aluminum Company (I) 444 3,450
Coeur d’Alene Mines Corp. (I) 1,044 24,283
General Moly, Inc. (I) 1,405 5,269
Globe Specialty Metals, Inc. (L) 1,481 20,527
Gold Resource Corp. (L) 733 11,625
Golden Minerals Company (I) 381 1,520
McEwen Mining, Inc. (I)(L) 5,139 19,014
Midway Gold Corp. (I) 2,271 3,407
Molycorp, Inc. (I) 917 8,225
Noranda Aluminum Holding Corp. (L) 266 1,577
Paramount Gold and Silver Corp. (I) 2,990 6,937
Stillwater Mining Company (I) 2,694 30,927
U.S. Silica Holdings, Inc. 305 4,429
Copyright © 2013 www.secdatabase.com. All Rights Reserved.Please Consider the Environment Before Printing This Document
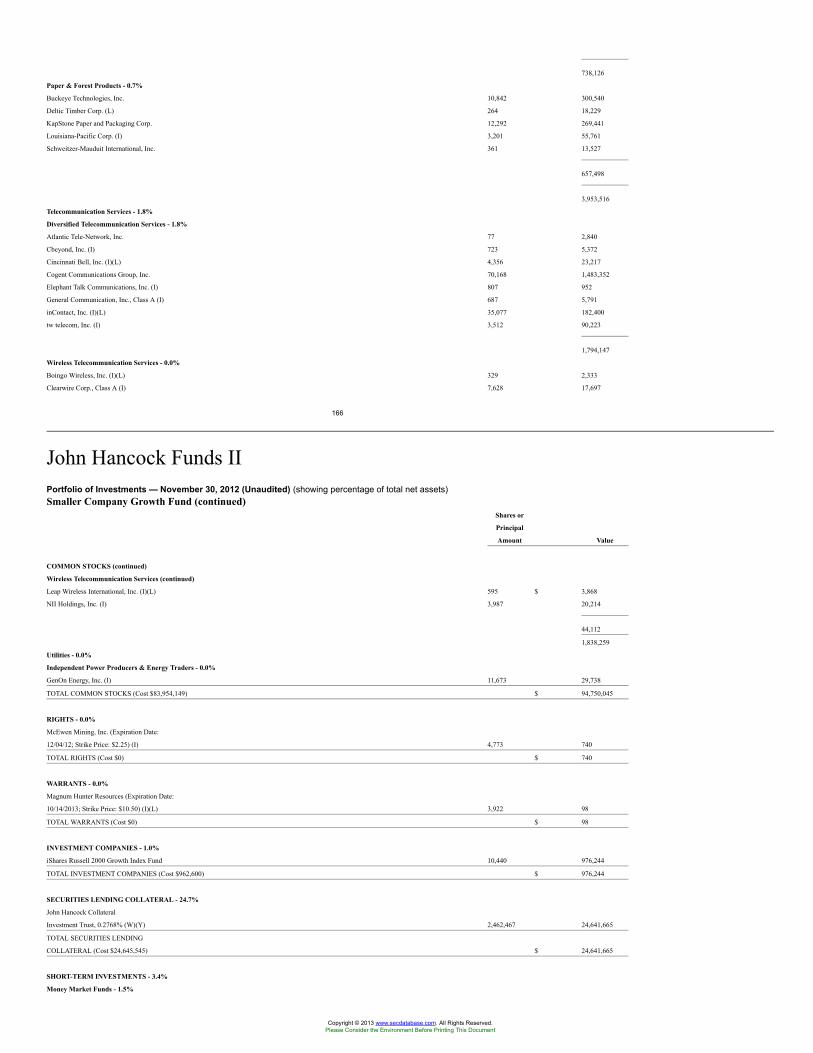
738,126
Paper & Forest Products - 0.7%
Buckeye Technologies, Inc. 10,842 300,540
Deltic Timber Corp. (L) 264 18,229
KapStone Paper and Packaging Corp. 12,292 269,441
Louisiana-Pacific Corp. (I) 3,201 55,761
Schweitzer-Mauduit International, Inc. 361 13,527
657,498
3,953,516
Telecommunication Services - 1.8%
Diversified Telecommunication Services - 1.8%
Atlantic Tele-Network, Inc. 77 2,840
Cbeyond, Inc. (I) 723 5,372
Cincinnati Bell, Inc. (I)(L) 4,356 23,217
Cogent Communications Group, Inc. 70,168 1,483,352
Elephant Talk Communications, Inc. (I) 807 952
General Communication, Inc., Class A (I) 687 5,791
inContact, Inc. (I)(L) 35,077 182,400
tw telecom, Inc. (I) 3,512 90,223
1,794,147
Wireless Telecommunication Services - 0.0%
Boingo Wireless, Inc. (I)(L) 329 2,333
Clearwire Corp., Class A (I) 7,628 17,697
166
John Hancock Funds IIPortfolio of Investments — November 30, 2012 (Unaudited) (showing percentage of total net assets)Smaller Company Growth Fund (continued)
Shares or
Principal
Amount Value
COMMON STOCKS (continued)
Wireless Telecommunication Services (continued)
Leap Wireless International, Inc. (I)(L) 595 $ 3,868
NII Holdings, Inc. (I) 3,987 20,214
44,112
1,838,259
Utilities - 0.0%
Independent Power Producers & Energy Traders - 0.0%
GenOn Energy, Inc. (I) 11,673 29,738
TOTAL COMMON STOCKS (Cost $83,954,149) $ 94,750,045
RIGHTS - 0.0%
McEwen Mining, Inc. (Expiration Date:
12/04/12; Strike Price: $2.25) (I) 4,773 740
TOTAL RIGHTS (Cost $0) $ 740
WARRANTS - 0.0%
Magnum Hunter Resources (Expiration Date:
10/14/2013; Strike Price: $10.50) (I)(L) 3,922 98
TOTAL WARRANTS (Cost $0) $ 98
INVESTMENT COMPANIES - 1.0%
iShares Russell 2000 Growth Index Fund 10,440 976,244
TOTAL INVESTMENT COMPANIES (Cost $962,600) $ 976,244
SECURITIES LENDING COLLATERAL - 24.7%
John Hancock Collateral
Investment Trust, 0.2768% (W)(Y) 2,462,467 24,641,665
TOTAL SECURITIES LENDING
COLLATERAL (Cost $24,645,545) $ 24,641,665
SHORT-TERM INVESTMENTS - 3.4%
Money Market Funds - 1.5%
Copyright © 2013 www.secdatabase.com. All Rights Reserved.Please Consider the Environment Before Printing This Document
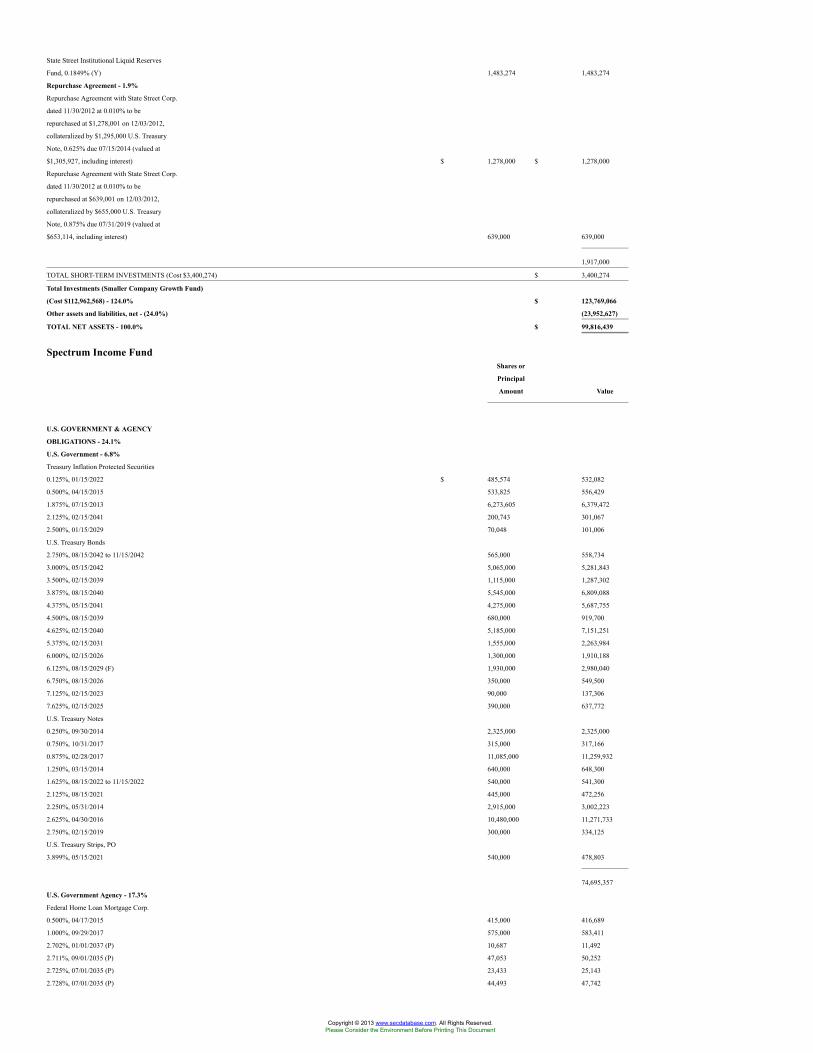
State Street Institutional Liquid Reserves
Fund, 0.1849% (Y) 1,483,274 1,483,274
Repurchase Agreement - 1.9%
Repurchase Agreement with State Street Corp.
dated 11/30/2012 at 0.010% to be
repurchased at $1,278,001 on 12/03/2012,
collateralized by $1,295,000 U.S. Treasury
Note, 0.625% due 07/15/2014 (valued at
$1,305,927, including interest) $ 1,278,000 $ 1,278,000
Repurchase Agreement with State Street Corp.
dated 11/30/2012 at 0.010% to be
repurchased at $639,001 on 12/03/2012,
collateralized by $655,000 U.S. Treasury
Note, 0.875% due 07/31/2019 (valued at
$653,114, including interest) 639,000 639,000
1,917,000
TOTAL SHORT-TERM INVESTMENTS (Cost $3,400,274) $ 3,400,274
Total Investments (Smaller Company Growth Fund)
(Cost $112,962,568) - 124.0% $ 123,769,066
Other assets and liabilities, net - (24.0%) (23,952,627)
TOTAL NET ASSETS - 100.0% $ 99,816,439
Spectrum Income FundShares or
Principal
Amount Value
U.S. GOVERNMENT & AGENCY
OBLIGATIONS - 24.1%
U.S. Government - 6.8%
Treasury Inflation Protected Securities
0.125%, 01/15/2022 $ 485,574 532,082
0.500%, 04/15/2015 533,825 556,429
1.875%, 07/15/2013 6,273,605 6,379,472
2.125%, 02/15/2041 200,743 301,067
2.500%, 01/15/2029 70,048 101,006
U.S. Treasury Bonds
2.750%, 08/15/2042 to 11/15/2042 565,000 558,734
3.000%, 05/15/2042 5,065,000 5,281,843
3.500%, 02/15/2039 1,115,000 1,287,302
3.875%, 08/15/2040 5,545,000 6,809,088
4.375%, 05/15/2041 4,275,000 5,687,755
4.500%, 08/15/2039 680,000 919,700
4.625%, 02/15/2040 5,185,000 7,151,251
5.375%, 02/15/2031 1,555,000 2,263,984
6.000%, 02/15/2026 1,300,000 1,910,188
6.125%, 08/15/2029 (F) 1,930,000 2,980,040
6.750%, 08/15/2026 350,000 549,500
7.125%, 02/15/2023 90,000 137,306
7.625%, 02/15/2025 390,000 637,772
U.S. Treasury Notes
0.250%, 09/30/2014 2,325,000 2,325,000
0.750%, 10/31/2017 315,000 317,166
0.875%, 02/28/2017 11,085,000 11,259,932
1.250%, 03/15/2014 640,000 648,300
1.625%, 08/15/2022 to 11/15/2022 540,000 541,300
2.125%, 08/15/2021 445,000 472,256
2.250%, 05/31/2014 2,915,000 3,002,223
2.625%, 04/30/2016 10,480,000 11,271,733
2.750%, 02/15/2019 300,000 334,125
U.S. Treasury Strips, PO
3.899%, 05/15/2021 540,000 478,803
74,695,357
U.S. Government Agency - 17.3%
Federal Home Loan Mortgage Corp.
0.500%, 04/17/2015 415,000 416,689
1.000%, 09/29/2017 575,000 583,411
2.702%, 01/01/2037 (P) 10,687 11,492
2.711%, 09/01/2035 (P) 47,053 50,252
2.725%, 07/01/2035 (P) 23,433 25,143
2.728%, 07/01/2035 (P) 44,493 47,742
Copyright © 2013 www.secdatabase.com. All Rights Reserved.Please Consider the Environment Before Printing This Document
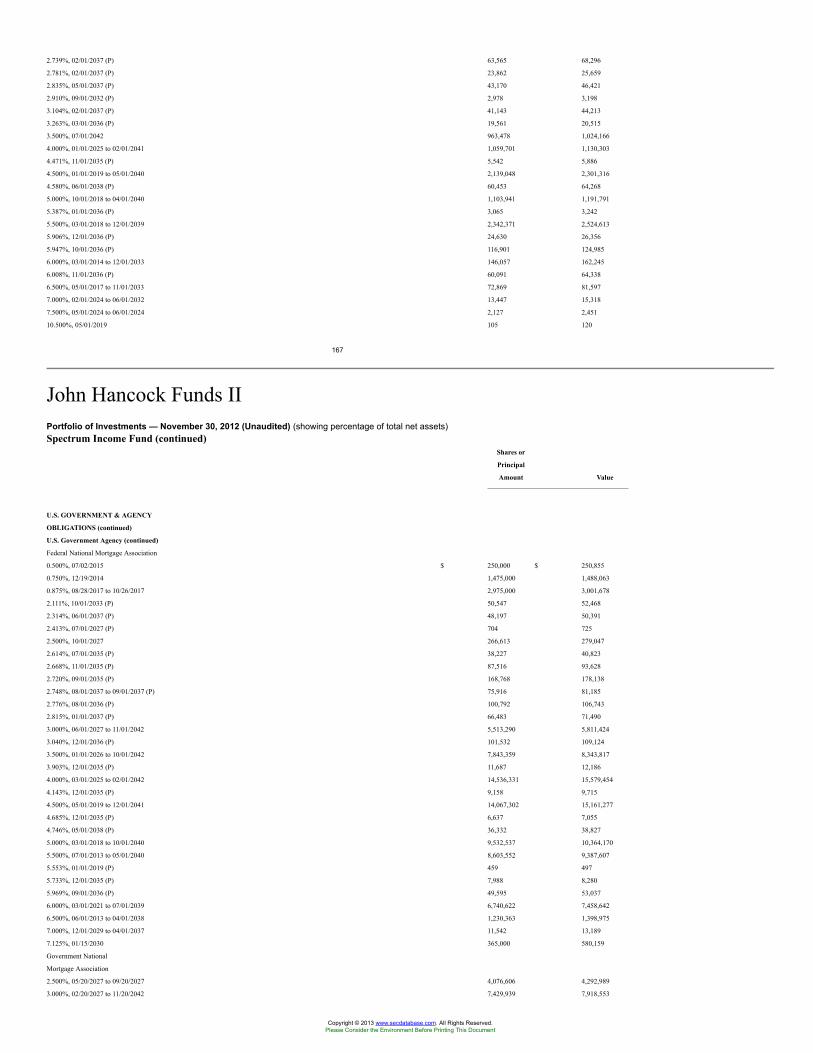
2.739%, 02/01/2037 (P) 63,565 68,296
2.781%, 02/01/2037 (P) 23,862 25,659
2.835%, 05/01/2037 (P) 43,170 46,421
2.910%, 09/01/2032 (P) 2,978 3,198
3.104%, 02/01/2037 (P) 41,143 44,213
3.263%, 03/01/2036 (P) 19,561 20,515
3.500%, 07/01/2042 963,478 1,024,166
4.000%, 01/01/2025 to 02/01/2041 1,059,701 1,130,303
4.471%, 11/01/2035 (P) 5,542 5,886
4.500%, 01/01/2019 to 05/01/2040 2,139,048 2,301,316
4.580%, 06/01/2038 (P) 60,453 64,268
5.000%, 10/01/2018 to 04/01/2040 1,103,941 1,191,791
5.387%, 01/01/2036 (P) 3,065 3,242
5.500%, 03/01/2018 to 12/01/2039 2,342,371 2,524,613
5.906%, 12/01/2036 (P) 24,630 26,356
5.947%, 10/01/2036 (P) 116,901 124,985
6.000%, 03/01/2014 to 12/01/2033 146,057 162,245
6.008%, 11/01/2036 (P) 60,091 64,338
6.500%, 05/01/2017 to 11/01/2033 72,869 81,597
7.000%, 02/01/2024 to 06/01/2032 13,447 15,318
7.500%, 05/01/2024 to 06/01/2024 2,127 2,451
10.500%, 05/01/2019 105 120
167
John Hancock Funds IIPortfolio of Investments — November 30, 2012 (Unaudited) (showing percentage of total net assets)Spectrum Income Fund (continued)
Shares or
Principal
Amount Value
U.S. GOVERNMENT & AGENCY
OBLIGATIONS (continued)
U.S. Government Agency (continued)
Federal National Mortgage Association
0.500%, 07/02/2015 $ 250,000 $ 250,855
0.750%, 12/19/2014 1,475,000 1,488,063
0.875%, 08/28/2017 to 10/26/2017 2,975,000 3,001,678
2.111%, 10/01/2033 (P) 50,547 52,468
2.314%, 06/01/2037 (P) 48,197 50,391
2.413%, 07/01/2027 (P) 704 725
2.500%, 10/01/2027 266,613 279,047
2.614%, 07/01/2035 (P) 38,227 40,823
2.668%, 11/01/2035 (P) 87,516 93,628
2.720%, 09/01/2035 (P) 168,768 178,138
2.748%, 08/01/2037 to 09/01/2037 (P) 75,916 81,185
2.776%, 08/01/2036 (P) 100,792 106,743
2.815%, 01/01/2037 (P) 66,483 71,490
3.000%, 06/01/2027 to 11/01/2042 5,513,290 5,811,424
3.040%, 12/01/2036 (P) 101,532 109,124
3.500%, 01/01/2026 to 10/01/2042 7,843,359 8,343,817
3.903%, 12/01/2035 (P) 11,687 12,186
4.000%, 03/01/2025 to 02/01/2042 14,536,331 15,579,454
4.143%, 12/01/2035 (P) 9,158 9,715
4.500%, 05/01/2019 to 12/01/2041 14,067,302 15,161,277
4.685%, 12/01/2035 (P) 6,637 7,055
4.746%, 05/01/2038 (P) 36,332 38,827
5.000%, 03/01/2018 to 10/01/2040 9,532,537 10,364,170
5.500%, 07/01/2013 to 05/01/2040 8,603,552 9,387,607
5.553%, 01/01/2019 (P) 459 497
5.733%, 12/01/2035 (P) 7,988 8,280
5.969%, 09/01/2036 (P) 49,595 53,037
6.000%, 03/01/2021 to 07/01/2039 6,740,622 7,458,642
6.500%, 06/01/2013 to 04/01/2038 1,230,363 1,398,975
7.000%, 12/01/2029 to 04/01/2037 11,542 13,189
7.125%, 01/15/2030 365,000 580,159
Government National
Mortgage Association
2.500%, 05/20/2027 to 09/20/2027 4,076,606 4,292,989
3.000%, 02/20/2027 to 11/20/2042 7,429,939 7,918,553
Copyright © 2013 www.secdatabase.com. All Rights Reserved.Please Consider the Environment Before Printing This Document
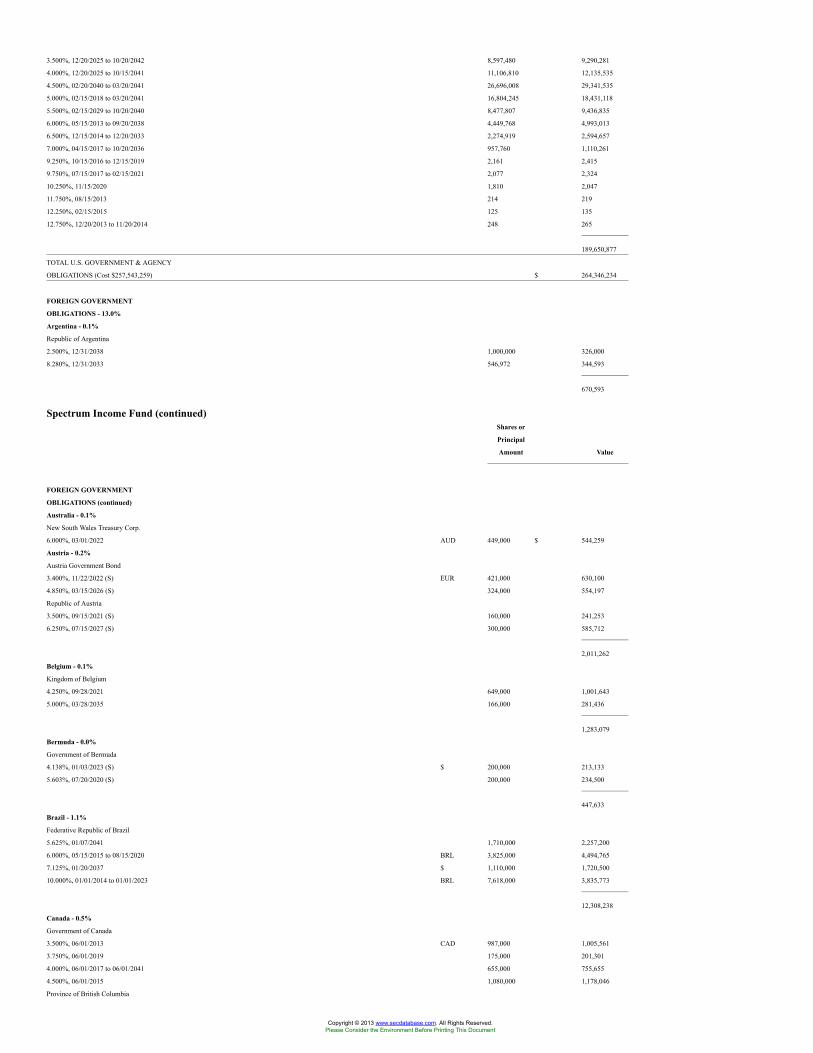
3.500%, 12/20/2025 to 10/20/2042 8,597,480 9,290,281
4.000%, 12/20/2025 to 10/15/2041 11,106,810 12,135,535
4.500%, 02/20/2040 to 03/20/2041 26,696,008 29,341,535
5.000%, 02/15/2018 to 03/20/2041 16,804,245 18,431,118
5.500%, 02/15/2029 to 10/20/2040 8,477,807 9,436,835
6.000%, 05/15/2013 to 09/20/2038 4,449,768 4,993,013
6.500%, 12/15/2014 to 12/20/2033 2,274,919 2,594,657
7.000%, 04/15/2017 to 10/20/2036 957,760 1,110,261
9.250%, 10/15/2016 to 12/15/2019 2,161 2,415
9.750%, 07/15/2017 to 02/15/2021 2,077 2,324
10.250%, 11/15/2020 1,810 2,047
11.750%, 08/15/2013 214 219
12.250%, 02/15/2015 125 135
12.750%, 12/20/2013 to 11/20/2014 248 265
189,650,877
TOTAL U.S. GOVERNMENT & AGENCY
OBLIGATIONS (Cost $257,543,259) $ 264,346,234
FOREIGN GOVERNMENT
OBLIGATIONS - 13.0%
Argentina - 0.1%
Republic of Argentina
2.500%, 12/31/2038 1,000,000 326,000
8.280%, 12/31/2033 546,972 344,593
670,593
Spectrum Income Fund (continued)Shares or
Principal
Amount Value
FOREIGN GOVERNMENT
OBLIGATIONS (continued)
Australia - 0.1%
New South Wales Treasury Corp.
6.000%, 03/01/2022 AUD 449,000 $ 544,259
Austria - 0.2%
Austria Government Bond
3.400%, 11/22/2022 (S) EUR 421,000 630,100
4.850%, 03/15/2026 (S) 324,000 554,197
Republic of Austria
3.500%, 09/15/2021 (S) 160,000 241,253
6.250%, 07/15/2027 (S) 300,000 585,712
2,011,262
Belgium - 0.1%
Kingdom of Belgium
4.250%, 09/28/2021 649,000 1,001,643
5.000%, 03/28/2035 166,000 281,436
1,283,079
Bermuda - 0.0%
Government of Bermuda
4.138%, 01/03/2023 (S) $ 200,000 213,133
5.603%, 07/20/2020 (S) 200,000 234,500
447,633
Brazil - 1.1%
Federative Republic of Brazil
5.625%, 01/07/2041 1,710,000 2,257,200
6.000%, 05/15/2015 to 08/15/2020 BRL 3,825,000 4,494,765
7.125%, 01/20/2037 $ 1,110,000 1,720,500
10.000%, 01/01/2014 to 01/01/2023 BRL 7,618,000 3,835,773
12,308,238
Canada - 0.5%
Government of Canada
3.500%, 06/01/2013 CAD 987,000 1,005,561
3.750%, 06/01/2019 175,000 201,301
4.000%, 06/01/2017 to 06/01/2041 655,000 755,655
4.500%, 06/01/2015 1,080,000 1,178,046
Province of British Columbia
Copyright © 2013 www.secdatabase.com. All Rights Reserved.Please Consider the Environment Before Printing This Document
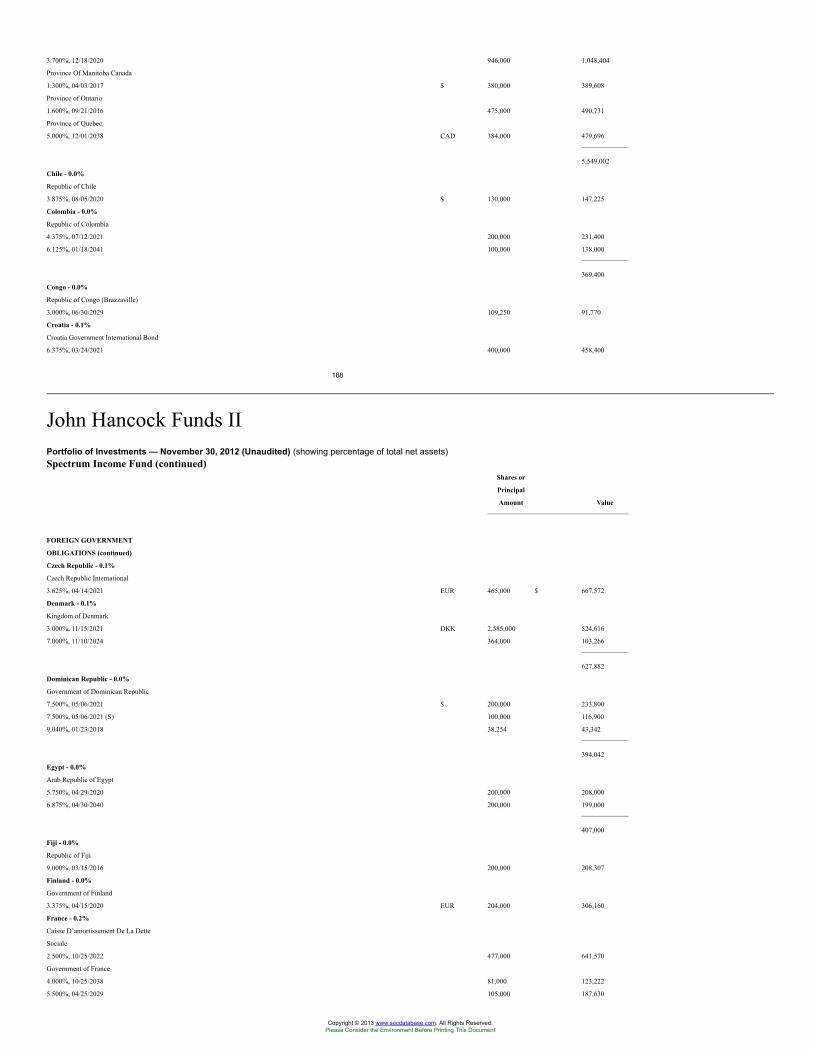
3.700%, 12/18/2020 946,000 1,048,404
Province Of Manitoba Canada
1.300%, 04/03/2017 $ 380,000 389,608
Province of Ontario
1.600%, 09/21/2016 475,000 490,731
Province of Quebec
5.000%, 12/01/2038 CAD 384,000 479,696
5,549,002
Chile - 0.0%
Republic of Chile
3.875%, 08/05/2020 $ 130,000 147,225
Colombia - 0.0%
Republic of Colombia
4.375%, 07/12/2021 200,000 231,400
6.125%, 01/18/2041 100,000 138,000
369,400
Congo - 0.0%
Republic of Congo (Brazzaville)
3.000%, 06/30/2029 109,250 91,770
Croatia - 0.1%
Croatia Government International Bond
6.375%, 03/24/2021 400,000 458,400
168
John Hancock Funds IIPortfolio of Investments — November 30, 2012 (Unaudited) (showing percentage of total net assets)Spectrum Income Fund (continued)
Shares or
Principal
Amount Value
FOREIGN GOVERNMENT
OBLIGATIONS (continued)
Czech Republic - 0.1%
Czech Republic International
3.625%, 04/14/2021 EUR 465,000 $ 667,572
Denmark - 0.1%
Kingdom of Denmark
3.000%, 11/15/2021 DKK 2,585,000 524,616
7.000%, 11/10/2024 364,000 103,266
627,882
Dominican Republic - 0.0%
Government of Dominican Republic
7.500%, 05/06/2021 $ 200,000 233,800
7.500%, 05/06/2021 (S) 100,000 116,900
9.040%, 01/23/2018 38,254 43,342
394,042
Egypt - 0.0%
Arab Republic of Egypt
5.750%, 04/29/2020 200,000 208,000
6.875%, 04/30/2040 200,000 199,000
407,000
Fiji - 0.0%
Republic of Fiji
9.000%, 03/15/2016 200,000 208,307
Finland - 0.0%
Government of Finland
3.375%, 04/15/2020 EUR 204,000 306,160
France - 0.2%
Caisse D’amortissement De La Dette
Sociale
2.500%, 10/25/2022 477,000 641,570
Government of France
4.000%, 10/25/2038 81,000 123,222
5.500%, 04/25/2029 105,000 187,630
Copyright © 2013 www.secdatabase.com. All Rights Reserved.Please Consider the Environment Before Printing This Document
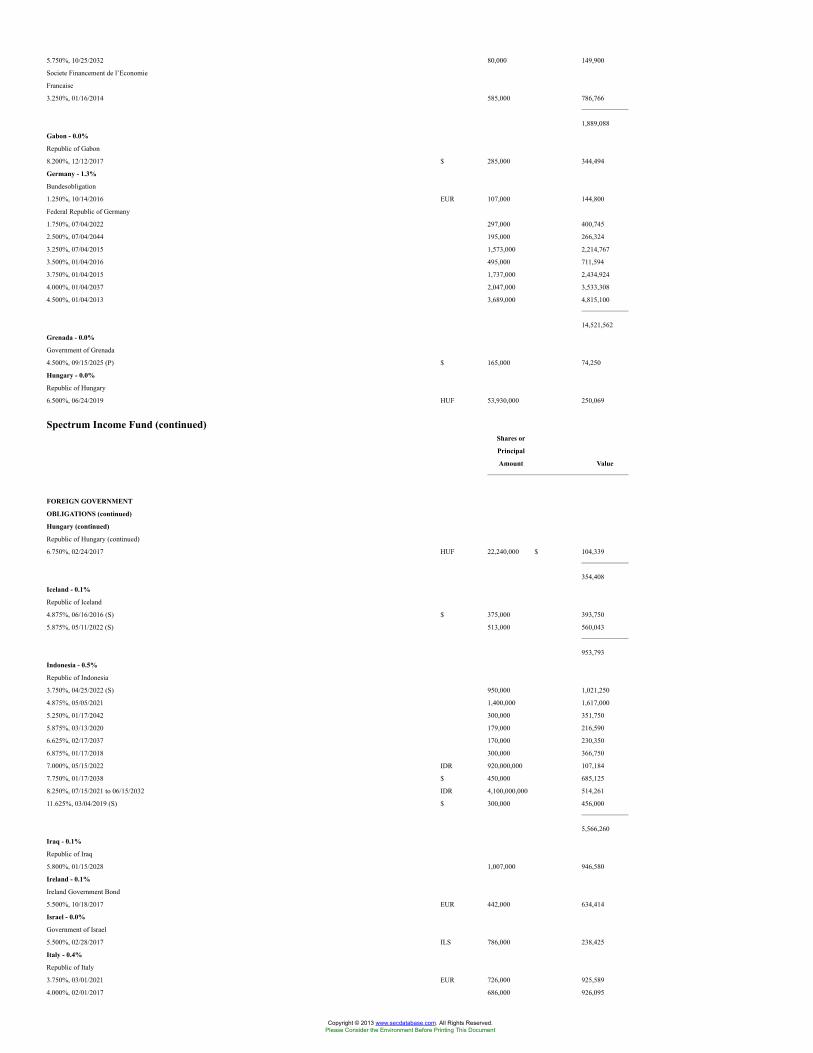
5.750%, 10/25/2032 80,000 149,900
Societe Financement de l’Economie
Francaise
3.250%, 01/16/2014 585,000 786,766
1,889,088
Gabon - 0.0%
Republic of Gabon
8.200%, 12/12/2017 $ 285,000 344,494
Germany - 1.3%
Bundesobligation
1.250%, 10/14/2016 EUR 107,000 144,800
Federal Republic of Germany
1.750%, 07/04/2022 297,000 400,745
2.500%, 07/04/2044 195,000 266,324
3.250%, 07/04/2015 1,573,000 2,214,767
3.500%, 01/04/2016 495,000 711,594
3.750%, 01/04/2015 1,737,000 2,434,924
4.000%, 01/04/2037 2,047,000 3,533,308
4.500%, 01/04/2013 3,689,000 4,815,100
14,521,562
Grenada - 0.0%
Government of Grenada
4.500%, 09/15/2025 (P) $ 165,000 74,250
Hungary - 0.0%
Republic of Hungary
6.500%, 06/24/2019 HUF 53,930,000 250,069
Spectrum Income Fund (continued)Shares or
Principal
Amount Value
FOREIGN GOVERNMENT
OBLIGATIONS (continued)
Hungary (continued)
Republic of Hungary (continued)
6.750%, 02/24/2017 HUF 22,240,000 $ 104,339
354,408
Iceland - 0.1%
Republic of Iceland
4.875%, 06/16/2016 (S) $ 375,000 393,750
5.875%, 05/11/2022 (S) 513,000 560,043
953,793
Indonesia - 0.5%
Republic of Indonesia
3.750%, 04/25/2022 (S) 950,000 1,021,250
4.875%, 05/05/2021 1,400,000 1,617,000
5.250%, 01/17/2042 300,000 351,750
5.875%, 03/13/2020 179,000 216,590
6.625%, 02/17/2037 170,000 230,350
6.875%, 01/17/2018 300,000 366,750
7.000%, 05/15/2022 IDR 920,000,000 107,184
7.750%, 01/17/2038 $ 450,000 685,125
8.250%, 07/15/2021 to 06/15/2032 IDR 4,100,000,000 514,261
11.625%, 03/04/2019 (S) $ 300,000 456,000
5,566,260
Iraq - 0.1%
Republic of Iraq
5.800%, 01/15/2028 1,007,000 946,580
Ireland - 0.1%
Ireland Government Bond
5.500%, 10/18/2017 EUR 442,000 634,414
Israel - 0.0%
Government of Israel
5.500%, 02/28/2017 ILS 786,000 238,425
Italy - 0.4%
Republic of Italy
3.750%, 03/01/2021 EUR 726,000 925,589
4.000%, 02/01/2017 686,000 926,095
Copyright © 2013 www.secdatabase.com. All Rights Reserved.Please Consider the Environment Before Printing This Document
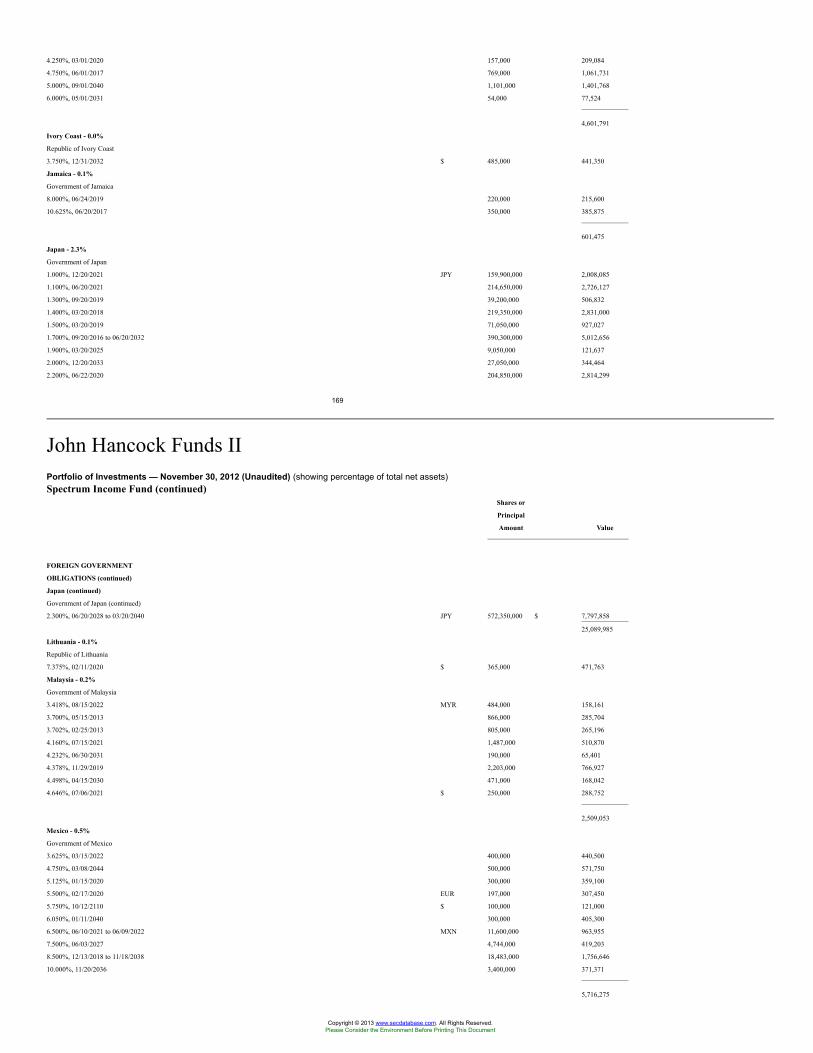
4.250%, 03/01/2020 157,000 209,084
4.750%, 06/01/2017 769,000 1,061,731
5.000%, 09/01/2040 1,101,000 1,401,768
6.000%, 05/01/2031 54,000 77,524
4,601,791
Ivory Coast - 0.0%
Republic of Ivory Coast
3.750%, 12/31/2032 $ 485,000 441,350
Jamaica - 0.1%
Government of Jamaica
8.000%, 06/24/2019 220,000 215,600
10.625%, 06/20/2017 350,000 385,875
601,475
Japan - 2.3%
Government of Japan
1.000%, 12/20/2021 JPY 159,900,000 2,008,085
1.100%, 06/20/2021 214,650,000 2,726,127
1.300%, 09/20/2019 39,200,000 506,832
1.400%, 03/20/2018 219,350,000 2,831,000
1.500%, 03/20/2019 71,050,000 927,027
1.700%, 09/20/2016 to 06/20/2032 390,300,000 5,012,656
1.900%, 03/20/2025 9,050,000 121,637
2.000%, 12/20/2033 27,050,000 344,464
2.200%, 06/22/2020 204,850,000 2,814,299
169
John Hancock Funds IIPortfolio of Investments — November 30, 2012 (Unaudited) (showing percentage of total net assets)Spectrum Income Fund (continued)
Shares or
Principal
Amount Value
FOREIGN GOVERNMENT
OBLIGATIONS (continued)
Japan (continued)
Government of Japan (continued)
2.300%, 06/20/2028 to 03/20/2040 JPY 572,350,000 $ 7,797,858
25,089,985
Lithuania - 0.1%
Republic of Lithuania
7.375%, 02/11/2020 $ 365,000 471,763
Malaysia - 0.2%
Government of Malaysia
3.418%, 08/15/2022 MYR 484,000 158,161
3.700%, 05/15/2013 866,000 285,704
3.702%, 02/25/2013 805,000 265,196
4.160%, 07/15/2021 1,487,000 510,870
4.232%, 06/30/2031 190,000 65,401
4.378%, 11/29/2019 2,203,000 766,927
4.498%, 04/15/2030 471,000 168,042
4.646%, 07/06/2021 $ 250,000 288,752
2,509,053
Mexico - 0.5%
Government of Mexico
3.625%, 03/15/2022 400,000 440,500
4.750%, 03/08/2044 500,000 571,750
5.125%, 01/15/2020 300,000 359,100
5.500%, 02/17/2020 EUR 197,000 307,450
5.750%, 10/12/2110 $ 100,000 121,000
6.050%, 01/11/2040 300,000 405,300
6.500%, 06/10/2021 to 06/09/2022 MXN 11,600,000 963,955
7.500%, 06/03/2027 4,744,000 419,203
8.500%, 12/13/2018 to 11/18/2038 18,483,000 1,756,646
10.000%, 11/20/2036 3,400,000 371,371
5,716,275
Copyright © 2013 www.secdatabase.com. All Rights Reserved.Please Consider the Environment Before Printing This Document
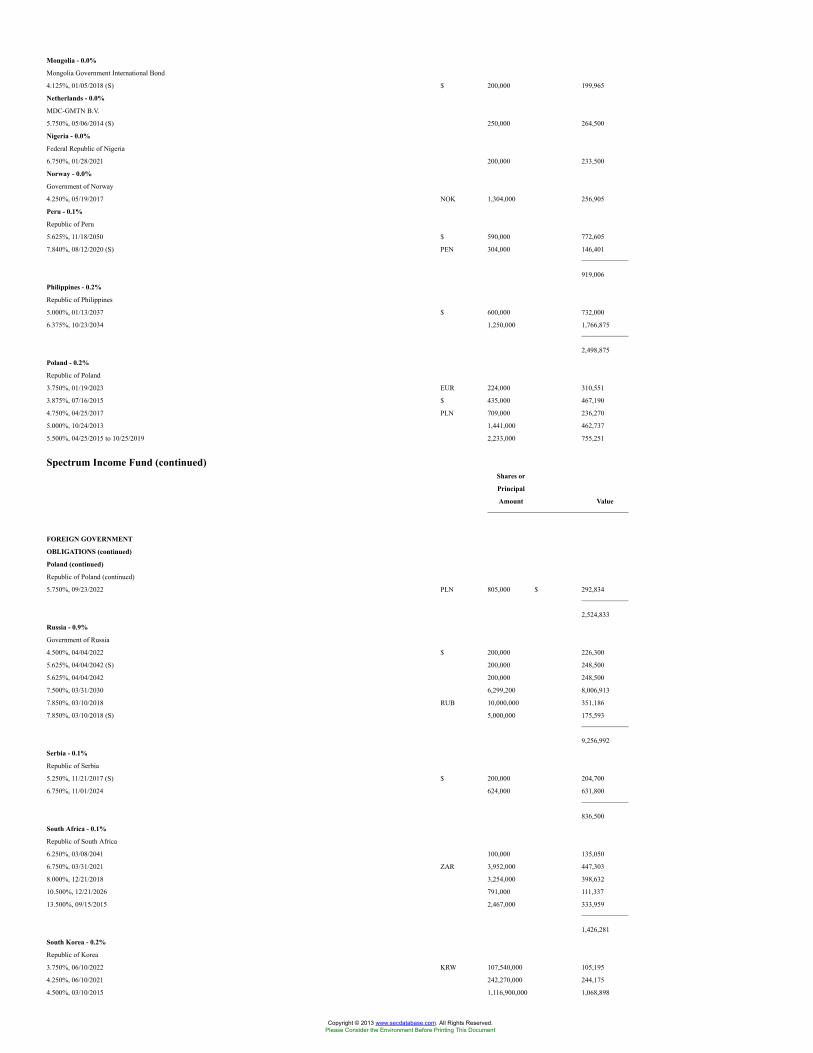
Mongolia - 0.0%
Mongolia Government International Bond
4.125%, 01/05/2018 (S) $ 200,000 199,965
Netherlands - 0.0%
MDC-GMTN B.V.
5.750%, 05/06/2014 (S) 250,000 264,500
Nigeria - 0.0%
Federal Republic of Nigeria
6.750%, 01/28/2021 200,000 233,500
Norway - 0.0%
Government of Norway
4.250%, 05/19/2017 NOK 1,304,000 256,905
Peru - 0.1%
Republic of Peru
5.625%, 11/18/2050 $ 590,000 772,605
7.840%, 08/12/2020 (S) PEN 304,000 146,401
919,006
Philippines - 0.2%
Republic of Philippines
5.000%, 01/13/2037 $ 600,000 732,000
6.375%, 10/23/2034 1,250,000 1,766,875
2,498,875
Poland - 0.2%
Republic of Poland
3.750%, 01/19/2023 EUR 224,000 310,551
3.875%, 07/16/2015 $ 435,000 467,190
4.750%, 04/25/2017 PLN 709,000 236,270
5.000%, 10/24/2013 1,441,000 462,737
5.500%, 04/25/2015 to 10/25/2019 2,233,000 755,251
Spectrum Income Fund (continued)Shares or
Principal
Amount Value
FOREIGN GOVERNMENT
OBLIGATIONS (continued)
Poland (continued)
Republic of Poland (continued)
5.750%, 09/23/2022 PLN 805,000 $ 292,834
2,524,833
Russia - 0.9%
Government of Russia
4.500%, 04/04/2022 $ 200,000 226,300
5.625%, 04/04/2042 (S) 200,000 248,500
5.625%, 04/04/2042 200,000 248,500
7.500%, 03/31/2030 6,299,200 8,006,913
7.850%, 03/10/2018 RUB 10,000,000 351,186
7.850%, 03/10/2018 (S) 5,000,000 175,593
9,256,992
Serbia - 0.1%
Republic of Serbia
5.250%, 11/21/2017 (S) $ 200,000 204,700
6.750%, 11/01/2024 624,000 631,800
836,500
South Africa - 0.1%
Republic of South Africa
6.250%, 03/08/2041 100,000 135,050
6.750%, 03/31/2021 ZAR 3,952,000 447,303
8.000%, 12/21/2018 3,254,000 398,632
10.500%, 12/21/2026 791,000 111,337
13.500%, 09/15/2015 2,467,000 333,959
1,426,281
South Korea - 0.2%
Republic of Korea
3.750%, 06/10/2022 KRW 107,540,000 105,195
4.250%, 06/10/2021 242,270,000 244,175
4.500%, 03/10/2015 1,116,900,000 1,068,898
Copyright © 2013 www.secdatabase.com. All Rights Reserved.Please Consider the Environment Before Printing This Document
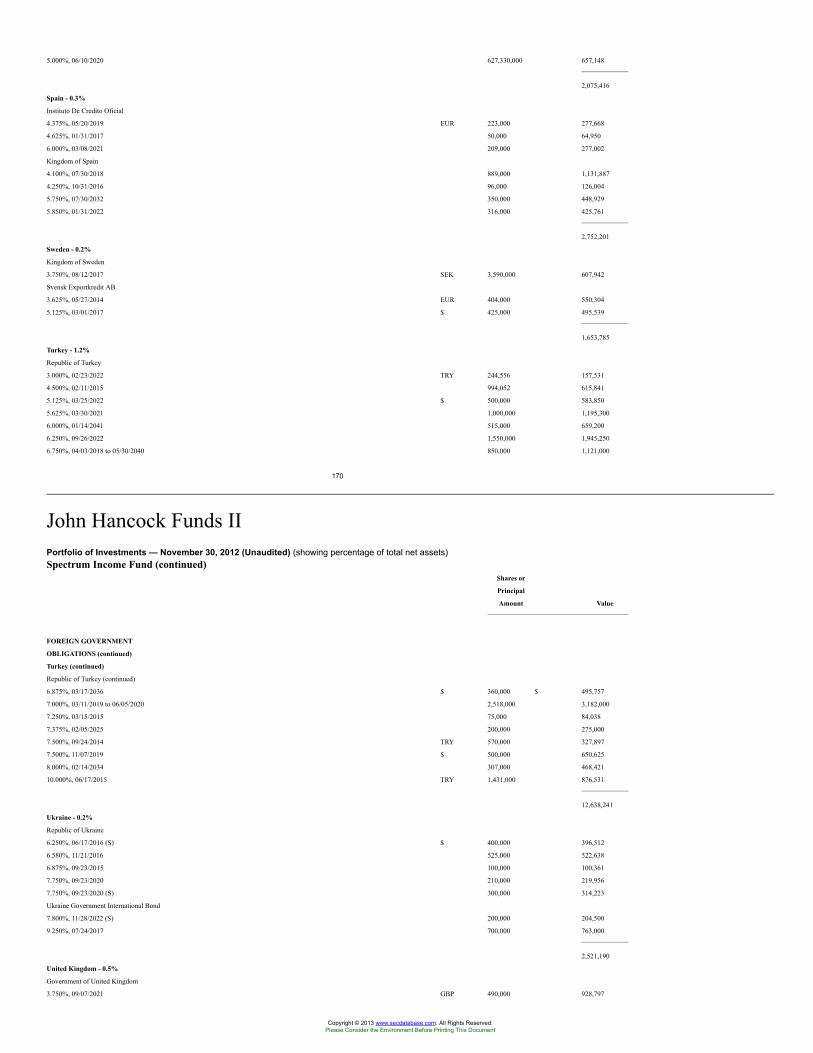
5.000%, 06/10/2020 627,330,000 657,148
2,075,416
Spain - 0.3%
Instituto De Credito Oficial
4.375%, 05/20/2019 EUR 223,000 277,668
4.625%, 01/31/2017 50,000 64,950
6.000%, 03/08/2021 209,000 277,002
Kingdom of Spain
4.100%, 07/30/2018 889,000 1,131,887
4.250%, 10/31/2016 96,000 126,004
5.750%, 07/30/2032 350,000 448,929
5.850%, 01/31/2022 316,000 425,761
2,752,201
Sweden - 0.2%
Kingdom of Sweden
3.750%, 08/12/2017 SEK 3,590,000 607,942
Svensk Exportkredit AB
3.625%, 05/27/2014 EUR 404,000 550,304
5.125%, 03/01/2017 $ 425,000 495,539
1,653,785
Turkey - 1.2%
Republic of Turkey
3.000%, 02/23/2022 TRY 244,556 157,531
4.500%, 02/11/2015 994,052 615,841
5.125%, 03/25/2022 $ 500,000 583,850
5.625%, 03/30/2021 1,000,000 1,195,300
6.000%, 01/14/2041 515,000 659,200
6.250%, 09/26/2022 1,550,000 1,945,250
6.750%, 04/03/2018 to 05/30/2040 850,000 1,121,000
170
John Hancock Funds IIPortfolio of Investments — November 30, 2012 (Unaudited) (showing percentage of total net assets)Spectrum Income Fund (continued)
Shares or
Principal
Amount Value
FOREIGN GOVERNMENT
OBLIGATIONS (continued)
Turkey (continued)
Republic of Turkey (continued)
6.875%, 03/17/2036 $ 360,000 $ 495,757
7.000%, 03/11/2019 to 06/05/2020 2,518,000 3,182,000
7.250%, 03/15/2015 75,000 84,038
7.375%, 02/05/2025 200,000 275,000
7.500%, 09/24/2014 TRY 570,000 327,897
7.500%, 11/07/2019 $ 500,000 650,625
8.000%, 02/14/2034 307,000 468,421
10.000%, 06/17/2015 TRY 1,431,000 876,531
12,638,241
Ukraine - 0.2%
Republic of Ukraine
6.250%, 06/17/2016 (S) $ 400,000 396,512
6.580%, 11/21/2016 525,000 522,638
6.875%, 09/23/2015 100,000 100,361
7.750%, 09/23/2020 210,000 219,956
7.750%, 09/23/2020 (S) 300,000 314,223
Ukraine Government International Bond
7.800%, 11/28/2022 (S) 200,000 204,500
9.250%, 07/24/2017 700,000 763,000
2,521,190
United Kingdom - 0.5%
Government of United Kingdom
3.750%, 09/07/2021 GBP 490,000 928,797
Copyright © 2013 www.secdatabase.com. All Rights Reserved.Please Consider the Environment Before Printing This Document
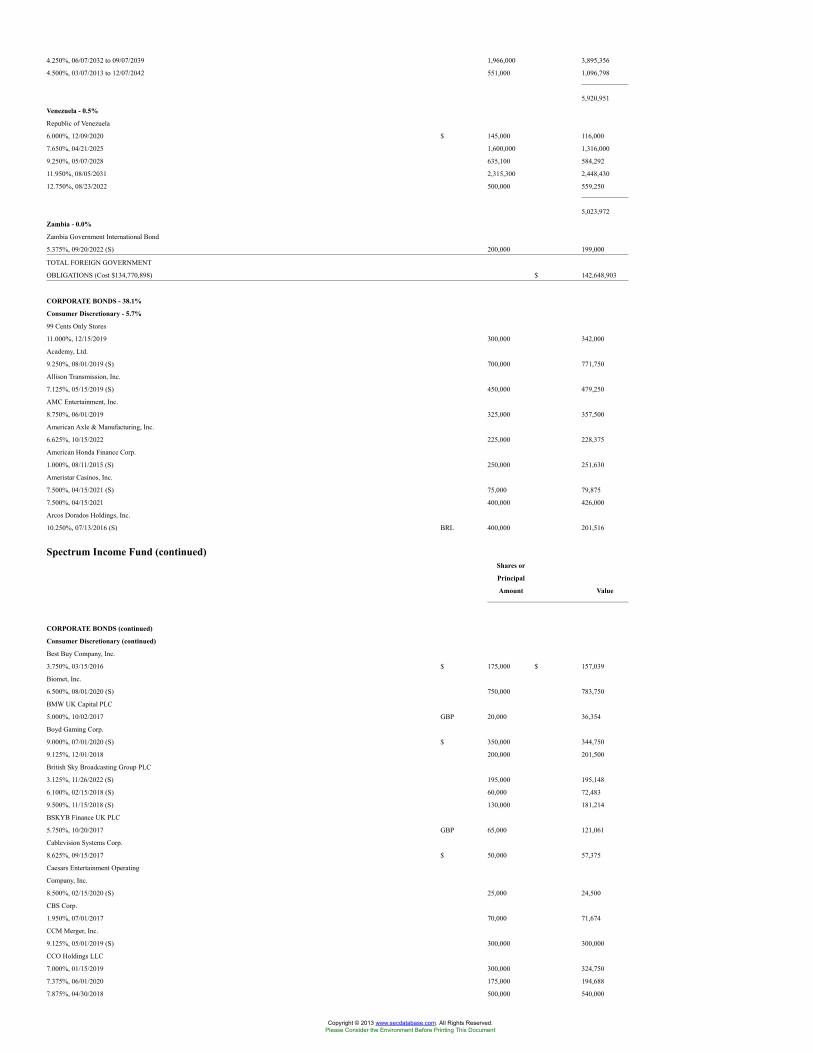
4.250%, 06/07/2032 to 09/07/2039 1,966,000 3,895,356
4.500%, 03/07/2013 to 12/07/2042 551,000 1,096,798
5,920,951
Venezuela - 0.5%
Republic of Venezuela
6.000%, 12/09/2020 $ 145,000 116,000
7.650%, 04/21/2025 1,600,000 1,316,000
9.250%, 05/07/2028 635,100 584,292
11.950%, 08/05/2031 2,315,300 2,448,430
12.750%, 08/23/2022 500,000 559,250
5,023,972
Zambia - 0.0%
Zambia Government International Bond
5.375%, 09/20/2022 (S) 200,000 199,000
TOTAL FOREIGN GOVERNMENT
OBLIGATIONS (Cost $134,770,898) $ 142,648,903
CORPORATE BONDS - 38.1%
Consumer Discretionary - 5.7%
99 Cents Only Stores
11.000%, 12/15/2019 300,000 342,000
Academy, Ltd.
9.250%, 08/01/2019 (S) 700,000 771,750
Allison Transmission, Inc.
7.125%, 05/15/2019 (S) 450,000 479,250
AMC Entertainment, Inc.
8.750%, 06/01/2019 325,000 357,500
American Axle & Manufacturing, Inc.
6.625%, 10/15/2022 225,000 228,375
American Honda Finance Corp.
1.000%, 08/11/2015 (S) 250,000 251,630
Ameristar Casinos, Inc.
7.500%, 04/15/2021 (S) 75,000 79,875
7.500%, 04/15/2021 400,000 426,000
Arcos Dorados Holdings, Inc.
10.250%, 07/13/2016 (S) BRL 400,000 201,516
Spectrum Income Fund (continued)Shares or
Principal
Amount Value
CORPORATE BONDS (continued)
Consumer Discretionary (continued)
Best Buy Company, Inc.
3.750%, 03/15/2016 $ 175,000 $ 157,039
Biomet, Inc.
6.500%, 08/01/2020 (S) 750,000 783,750
BMW UK Capital PLC
5.000%, 10/02/2017 GBP 20,000 36,354
Boyd Gaming Corp.
9.000%, 07/01/2020 (S) $ 350,000 344,750
9.125%, 12/01/2018 200,000 201,500
British Sky Broadcasting Group PLC
3.125%, 11/26/2022 (S) 195,000 195,148
6.100%, 02/15/2018 (S) 60,000 72,483
9.500%, 11/15/2018 (S) 130,000 181,214
BSKYB Finance UK PLC
5.750%, 10/20/2017 GBP 65,000 121,061
Cablevision Systems Corp.
8.625%, 09/15/2017 $ 50,000 57,375
Caesars Entertainment Operating
Company, Inc.
8.500%, 02/15/2020 (S) 25,000 24,500
CBS Corp.
1.950%, 07/01/2017 70,000 71,674
CCM Merger, Inc.
9.125%, 05/01/2019 (S) 300,000 300,000
CCO Holdings LLC
7.000%, 01/15/2019 300,000 324,750
7.375%, 06/01/2020 175,000 194,688
7.875%, 04/30/2018 500,000 540,000
Copyright © 2013 www.secdatabase.com. All Rights Reserved.Please Consider the Environment Before Printing This Document
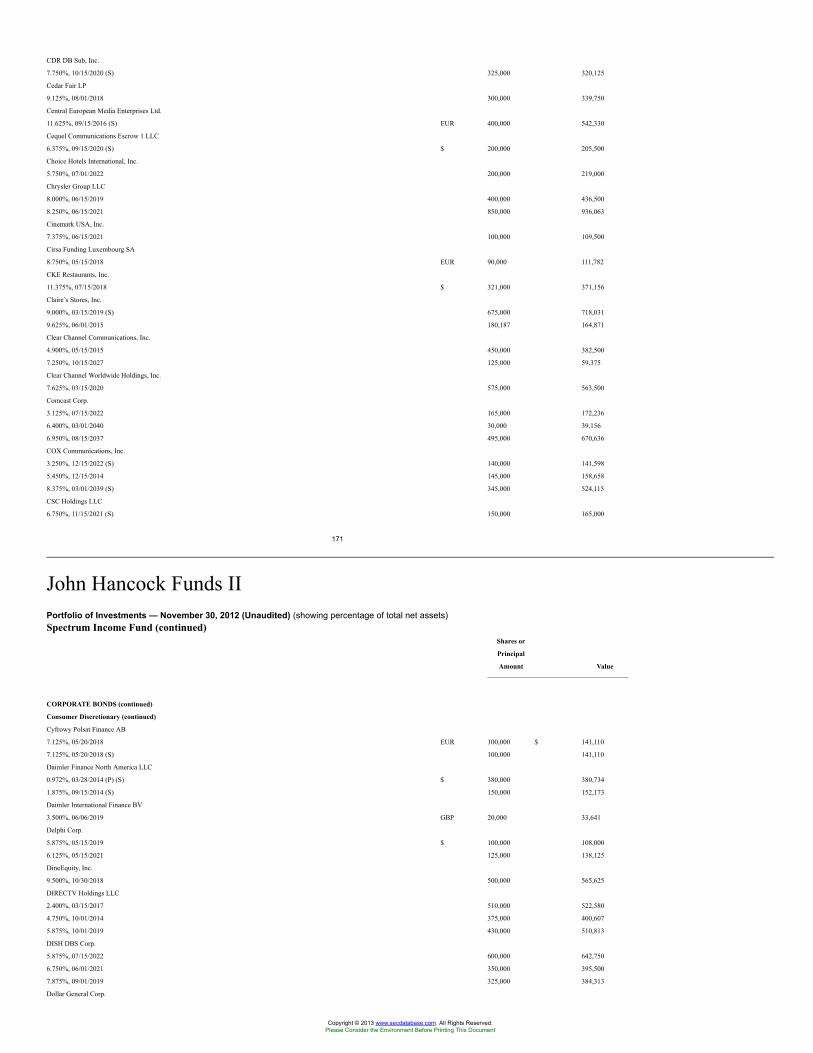
CDR DB Sub, Inc.
7.750%, 10/15/2020 (S) 325,000 320,125
Cedar Fair LP
9.125%, 08/01/2018 300,000 339,750
Central European Media Enterprises Ltd.
11.625%, 09/15/2016 (S) EUR 400,000 542,330
Cequel Communications Escrow 1 LLC
6.375%, 09/15/2020 (S) $ 200,000 205,500
Choice Hotels International, Inc.
5.750%, 07/01/2022 200,000 219,000
Chrysler Group LLC
8.000%, 06/15/2019 400,000 436,500
8.250%, 06/15/2021 850,000 936,063
Cinemark USA, Inc.
7.375%, 06/15/2021 100,000 109,500
Cirsa Funding Luxembourg SA
8.750%, 05/15/2018 EUR 90,000 111,782
CKE Restaurants, Inc.
11.375%, 07/15/2018 $ 321,000 371,156
Claire’s Stores, Inc.
9.000%, 03/15/2019 (S) 675,000 718,031
9.625%, 06/01/2015 180,187 164,871
Clear Channel Communications, Inc.
4.900%, 05/15/2015 450,000 382,500
7.250%, 10/15/2027 125,000 59,375
Clear Channel Worldwide Holdings, Inc.
7.625%, 03/15/2020 575,000 563,500
Comcast Corp.
3.125%, 07/15/2022 165,000 172,236
6.400%, 03/01/2040 30,000 39,156
6.950%, 08/15/2037 495,000 670,636
COX Communications, Inc.
3.250%, 12/15/2022 (S) 140,000 141,598
5.450%, 12/15/2014 145,000 158,658
8.375%, 03/01/2039 (S) 345,000 524,115
CSC Holdings LLC
6.750%, 11/15/2021 (S) 150,000 165,000
171
John Hancock Funds IIPortfolio of Investments — November 30, 2012 (Unaudited) (showing percentage of total net assets)Spectrum Income Fund (continued)
Shares or
Principal
Amount Value
CORPORATE BONDS (continued)
Consumer Discretionary (continued)
Cyfrowy Polsat Finance AB
7.125%, 05/20/2018 EUR 100,000 $ 141,110
7.125%, 05/20/2018 (S) 100,000 141,110
Daimler Finance North America LLC
0.972%, 03/28/2014 (P) (S) $ 380,000 380,734
1.875%, 09/15/2014 (S) 150,000 152,173
Daimler International Finance BV
3.500%, 06/06/2019 GBP 20,000 33,641
Delphi Corp.
5.875%, 05/15/2019 $ 100,000 108,000
6.125%, 05/15/2021 125,000 138,125
DineEquity, Inc.
9.500%, 10/30/2018 500,000 565,625
DIRECTV Holdings LLC
2.400%, 03/15/2017 510,000 522,580
4.750%, 10/01/2014 375,000 400,607
5.875%, 10/01/2019 430,000 510,813
DISH DBS Corp.
5.875%, 07/15/2022 600,000 642,750
6.750%, 06/01/2021 350,000 395,500
7.875%, 09/01/2019 325,000 384,313
Dollar General Corp.
Copyright © 2013 www.secdatabase.com. All Rights Reserved.Please Consider the Environment Before Printing This Document
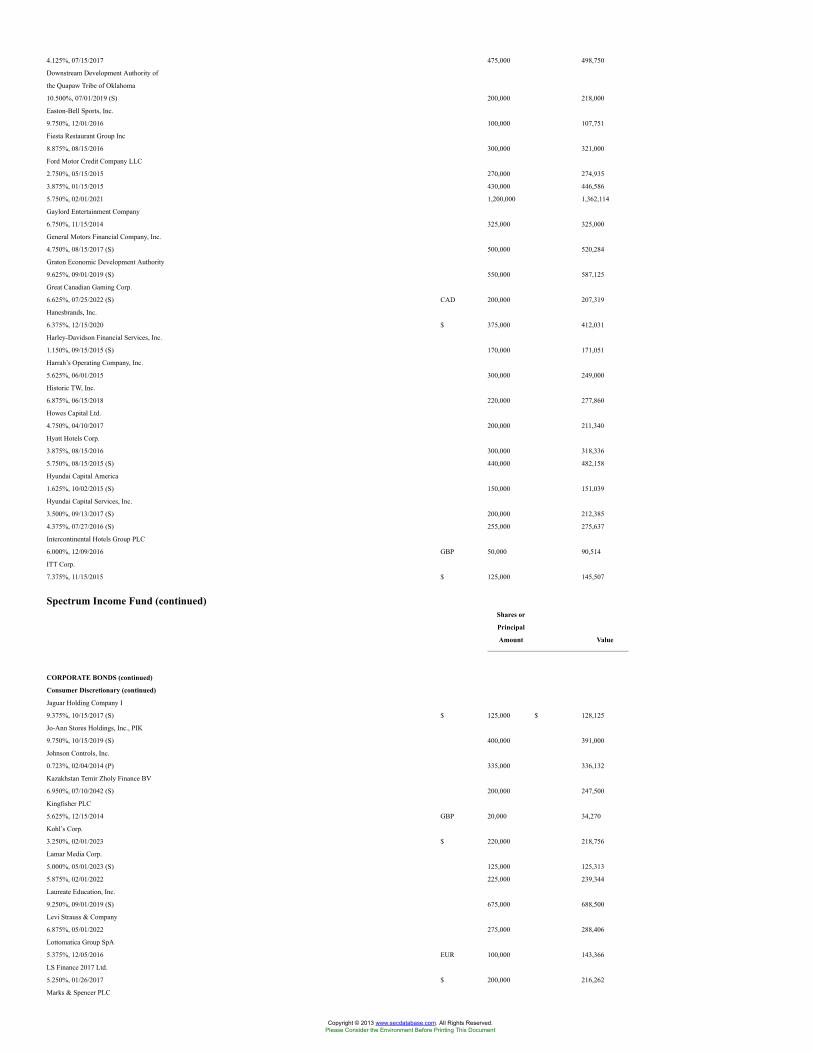
4.125%, 07/15/2017 475,000 498,750
Downstream Development Authority of
the Quapaw Tribe of Oklahoma
10.500%, 07/01/2019 (S) 200,000 218,000
Easton-Bell Sports, Inc.
9.750%, 12/01/2016 100,000 107,751
Fiesta Restaurant Group Inc
8.875%, 08/15/2016 300,000 321,000
Ford Motor Credit Company LLC
2.750%, 05/15/2015 270,000 274,935
3.875%, 01/15/2015 430,000 446,586
5.750%, 02/01/2021 1,200,000 1,362,114
Gaylord Entertainment Company
6.750%, 11/15/2014 325,000 325,000
General Motors Financial Company, Inc.
4.750%, 08/15/2017 (S) 500,000 520,284
Graton Economic Development Authority
9.625%, 09/01/2019 (S) 550,000 587,125
Great Canadian Gaming Corp.
6.625%, 07/25/2022 (S) CAD 200,000 207,319
Hanesbrands, Inc.
6.375%, 12/15/2020 $ 375,000 412,031
Harley-Davidson Financial Services, Inc.
1.150%, 09/15/2015 (S) 170,000 171,051
Harrah’s Operating Company, Inc.
5.625%, 06/01/2015 300,000 249,000
Historic TW, Inc.
6.875%, 06/15/2018 220,000 277,860
Howes Capital Ltd.
4.750%, 04/10/2017 200,000 211,340
Hyatt Hotels Corp.
3.875%, 08/15/2016 300,000 318,336
5.750%, 08/15/2015 (S) 440,000 482,158
Hyundai Capital America
1.625%, 10/02/2015 (S) 150,000 151,039
Hyundai Capital Services, Inc.
3.500%, 09/13/2017 (S) 200,000 212,385
4.375%, 07/27/2016 (S) 255,000 275,637
Intercontinental Hotels Group PLC
6.000%, 12/09/2016 GBP 50,000 90,514
ITT Corp.
7.375%, 11/15/2015 $ 125,000 145,507
Spectrum Income Fund (continued)Shares or
Principal
Amount Value
CORPORATE BONDS (continued)
Consumer Discretionary (continued)
Jaguar Holding Company I
9.375%, 10/15/2017 (S) $ 125,000 $ 128,125
Jo-Ann Stores Holdings, Inc., PIK
9.750%, 10/15/2019 (S) 400,000 391,000
Johnson Controls, Inc.
0.723%, 02/04/2014 (P) 335,000 336,132
Kazakhstan Temir Zholy Finance BV
6.950%, 07/10/2042 (S) 200,000 247,500
Kingfisher PLC
5.625%, 12/15/2014 GBP 20,000 34,270
Kohl’s Corp.
3.250%, 02/01/2023 $ 220,000 218,756
Lamar Media Corp.
5.000%, 05/01/2023 (S) 125,000 125,313
5.875%, 02/01/2022 225,000 239,344
Laureate Education, Inc.
9.250%, 09/01/2019 (S) 675,000 688,500
Levi Strauss & Company
6.875%, 05/01/2022 275,000 288,406
Lottomatica Group SpA
5.375%, 12/05/2016 EUR 100,000 143,366
LS Finance 2017 Ltd.
5.250%, 01/26/2017 $ 200,000 216,262
Marks & Spencer PLC
Copyright © 2013 www.secdatabase.com. All Rights Reserved.Please Consider the Environment Before Printing This Document
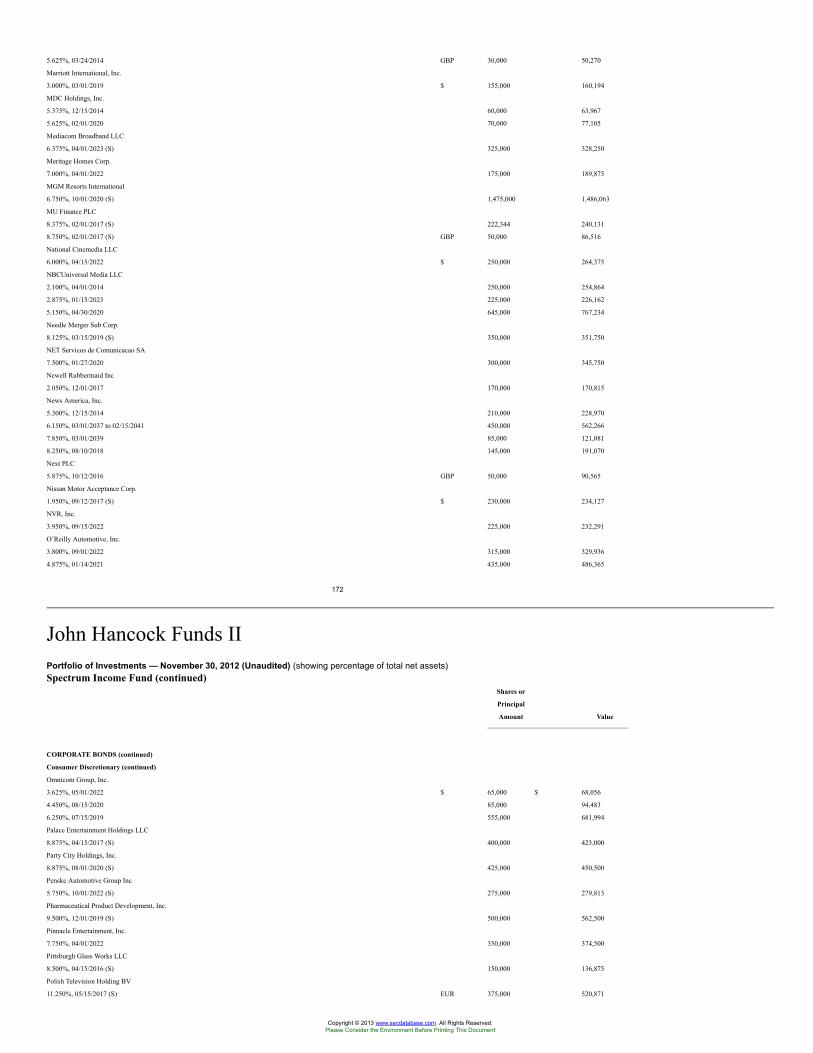
5.625%, 03/24/2014 GBP 30,000 50,270
Marriott International, Inc.
3.000%, 03/01/2019 $ 155,000 160,194
MDC Holdings, Inc.
5.375%, 12/15/2014 60,000 63,967
5.625%, 02/01/2020 70,000 77,105
Mediacom Broadband LLC
6.375%, 04/01/2023 (S) 325,000 328,250
Meritage Homes Corp.
7.000%, 04/01/2022 175,000 189,875
MGM Resorts International
6.750%, 10/01/2020 (S) 1,475,000 1,486,063
MU Finance PLC
8.375%, 02/01/2017 (S) 222,344 240,131
8.750%, 02/01/2017 (S) GBP 50,000 86,516
National Cinemedia LLC
6.000%, 04/15/2022 $ 250,000 264,375
NBCUniversal Media LLC
2.100%, 04/01/2014 250,000 254,864
2.875%, 01/15/2023 225,000 226,162
5.150%, 04/30/2020 645,000 767,234
Needle Merger Sub Corp.
8.125%, 03/15/2019 (S) 350,000 351,750
NET Servicos de Comunicacao SA
7.500%, 01/27/2020 300,000 345,750
Newell Rubbermaid Inc
2.050%, 12/01/2017 170,000 170,815
News America, Inc.
5.300%, 12/15/2014 210,000 228,970
6.150%, 03/01/2037 to 02/15/2041 450,000 562,266
7.850%, 03/01/2039 85,000 121,081
8.250%, 08/10/2018 145,000 191,070
Next PLC
5.875%, 10/12/2016 GBP 50,000 90,565
Nissan Motor Acceptance Corp.
1.950%, 09/12/2017 (S) $ 230,000 234,127
NVR, Inc.
3.950%, 09/15/2022 225,000 232,291
O’Reilly Automotive, Inc.
3.800%, 09/01/2022 315,000 329,936
4.875%, 01/14/2021 435,000 486,365
172
John Hancock Funds IIPortfolio of Investments — November 30, 2012 (Unaudited) (showing percentage of total net assets)Spectrum Income Fund (continued)
Shares or
Principal
Amount Value
CORPORATE BONDS (continued)
Consumer Discretionary (continued)
Omnicom Group, Inc.
3.625%, 05/01/2022 $ 65,000 $ 68,056
4.450%, 08/15/2020 85,000 94,483
6.250%, 07/15/2019 555,000 681,994
Palace Entertainment Holdings LLC
8.875%, 04/15/2017 (S) 400,000 423,000
Party City Holdings, Inc.
8.875%, 08/01/2020 (S) 425,000 450,500
Penske Automotive Group Inc
5.750%, 10/01/2022 (S) 275,000 279,813
Pharmaceutical Product Development, Inc.
9.500%, 12/01/2019 (S) 500,000 562,500
Pinnacle Entertainment, Inc.
7.750%, 04/01/2022 350,000 374,500
Pittsburgh Glass Works LLC
8.500%, 04/15/2016 (S) 150,000 136,875
Polish Television Holding BV
11.250%, 05/15/2017 (S) EUR 375,000 520,871
Copyright © 2013 www.secdatabase.com. All Rights Reserved.Please Consider the Environment Before Printing This Document
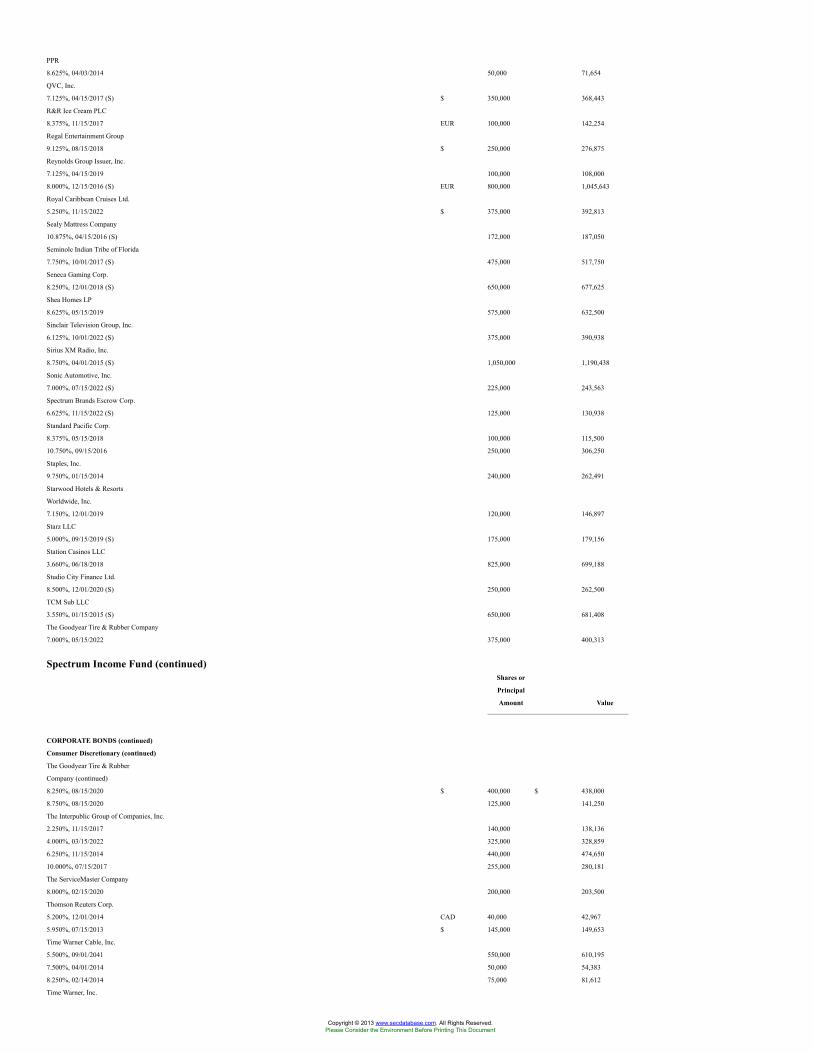
PPR
8.625%, 04/03/2014 50,000 71,654
QVC, Inc.
7.125%, 04/15/2017 (S) $ 350,000 368,443
R&R Ice Cream PLC
8.375%, 11/15/2017 EUR 100,000 142,254
Regal Entertainment Group
9.125%, 08/15/2018 $ 250,000 276,875
Reynolds Group Issuer, Inc.
7.125%, 04/15/2019 100,000 108,000
8.000%, 12/15/2016 (S) EUR 800,000 1,045,643
Royal Caribbean Cruises Ltd.
5.250%, 11/15/2022 $ 375,000 392,813
Sealy Mattress Company
10.875%, 04/15/2016 (S) 172,000 187,050
Seminole Indian Tribe of Florida
7.750%, 10/01/2017 (S) 475,000 517,750
Seneca Gaming Corp.
8.250%, 12/01/2018 (S) 650,000 677,625
Shea Homes LP
8.625%, 05/15/2019 575,000 632,500
Sinclair Television Group, Inc.
6.125%, 10/01/2022 (S) 375,000 390,938
Sirius XM Radio, Inc.
8.750%, 04/01/2015 (S) 1,050,000 1,190,438
Sonic Automotive, Inc.
7.000%, 07/15/2022 (S) 225,000 243,563
Spectrum Brands Escrow Corp.
6.625%, 11/15/2022 (S) 125,000 130,938
Standard Pacific Corp.
8.375%, 05/15/2018 100,000 115,500
10.750%, 09/15/2016 250,000 306,250
Staples, Inc.
9.750%, 01/15/2014 240,000 262,491
Starwood Hotels & Resorts
Worldwide, Inc.
7.150%, 12/01/2019 120,000 146,897
Starz LLC
5.000%, 09/15/2019 (S) 175,000 179,156
Station Casinos LLC
3.660%, 06/18/2018 825,000 699,188
Studio City Finance Ltd.
8.500%, 12/01/2020 (S) 250,000 262,500
TCM Sub LLC
3.550%, 01/15/2015 (S) 650,000 681,408
The Goodyear Tire & Rubber Company
7.000%, 05/15/2022 375,000 400,313
Spectrum Income Fund (continued)Shares or
Principal
Amount Value
CORPORATE BONDS (continued)
Consumer Discretionary (continued)
The Goodyear Tire & Rubber
Company (continued)
8.250%, 08/15/2020 $ 400,000 $ 438,000
8.750%, 08/15/2020 125,000 141,250
The Interpublic Group of Companies, Inc.
2.250%, 11/15/2017 140,000 138,136
4.000%, 03/15/2022 325,000 328,859
6.250%, 11/15/2014 440,000 474,650
10.000%, 07/15/2017 255,000 280,181
The ServiceMaster Company
8.000%, 02/15/2020 200,000 203,500
Thomson Reuters Corp.
5.200%, 12/01/2014 CAD 40,000 42,967
5.950%, 07/15/2013 $ 145,000 149,653
Time Warner Cable, Inc.
5.500%, 09/01/2041 550,000 610,195
7.500%, 04/01/2014 50,000 54,383
8.250%, 02/14/2014 75,000 81,612
Time Warner, Inc.
Copyright © 2013 www.secdatabase.com. All Rights Reserved.Please Consider the Environment Before Printing This Document
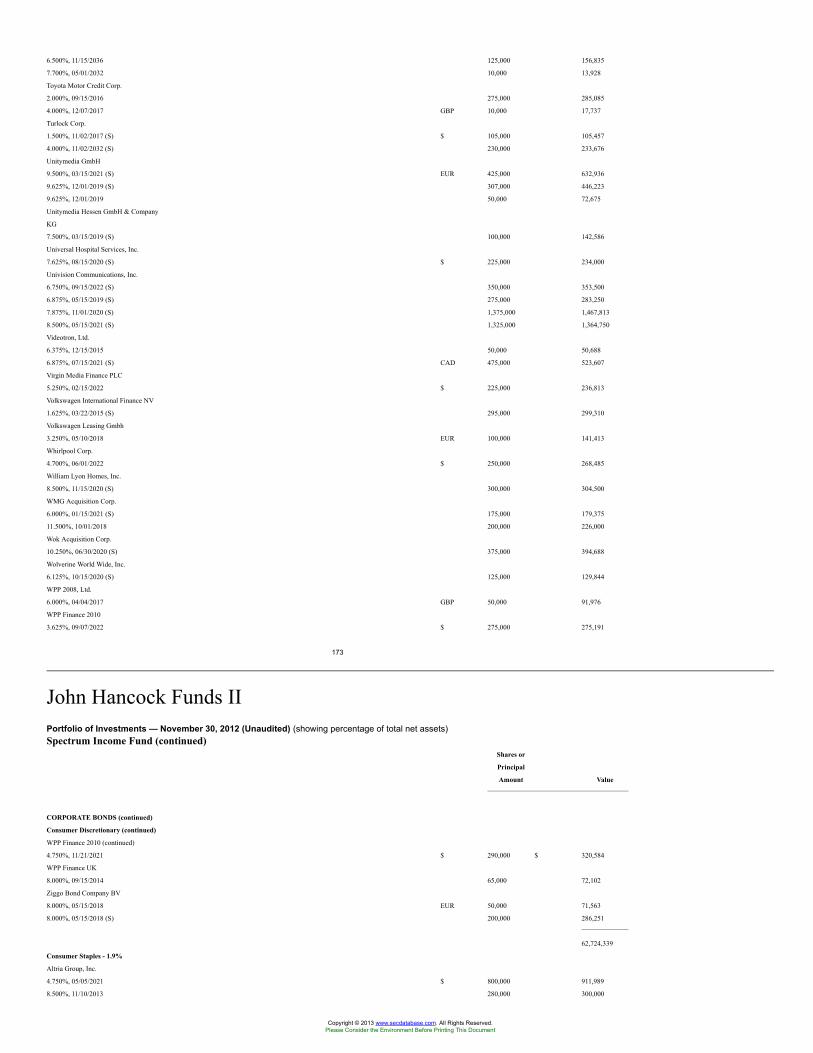
6.500%, 11/15/2036 125,000 156,835
7.700%, 05/01/2032 10,000 13,928
Toyota Motor Credit Corp.
2.000%, 09/15/2016 275,000 285,085
4.000%, 12/07/2017 GBP 10,000 17,737
Turlock Corp.
1.500%, 11/02/2017 (S) $ 105,000 105,457
4.000%, 11/02/2032 (S) 230,000 233,676
Unitymedia GmbH
9.500%, 03/15/2021 (S) EUR 425,000 632,936
9.625%, 12/01/2019 (S) 307,000 446,223
9.625%, 12/01/2019 50,000 72,675
Unitymedia Hessen GmbH & Company
KG
7.500%, 03/15/2019 (S) 100,000 142,586
Universal Hospital Services, Inc.
7.625%, 08/15/2020 (S) $ 225,000 234,000
Univision Communications, Inc.
6.750%, 09/15/2022 (S) 350,000 353,500
6.875%, 05/15/2019 (S) 275,000 283,250
7.875%, 11/01/2020 (S) 1,375,000 1,467,813
8.500%, 05/15/2021 (S) 1,325,000 1,364,750
Videotron, Ltd.
6.375%, 12/15/2015 50,000 50,688
6.875%, 07/15/2021 (S) CAD 475,000 523,607
Virgin Media Finance PLC
5.250%, 02/15/2022 $ 225,000 236,813
Volkswagen International Finance NV
1.625%, 03/22/2015 (S) 295,000 299,310
Volkswagen Leasing Gmbh
3.250%, 05/10/2018 EUR 100,000 141,413
Whirlpool Corp.
4.700%, 06/01/2022 $ 250,000 268,485
William Lyon Homes, Inc.
8.500%, 11/15/2020 (S) 300,000 304,500
WMG Acquisition Corp.
6.000%, 01/15/2021 (S) 175,000 179,375
11.500%, 10/01/2018 200,000 226,000
Wok Acquisition Corp.
10.250%, 06/30/2020 (S) 375,000 394,688
Wolverine World Wide, Inc.
6.125%, 10/15/2020 (S) 125,000 129,844
WPP 2008, Ltd.
6.000%, 04/04/2017 GBP 50,000 91,976
WPP Finance 2010
3.625%, 09/07/2022 $ 275,000 275,191
173
John Hancock Funds IIPortfolio of Investments — November 30, 2012 (Unaudited) (showing percentage of total net assets)Spectrum Income Fund (continued)
Shares or
Principal
Amount Value
CORPORATE BONDS (continued)
Consumer Discretionary (continued)
WPP Finance 2010 (continued)
4.750%, 11/21/2021 $ 290,000 $ 320,584
WPP Finance UK
8.000%, 09/15/2014 65,000 72,102
Ziggo Bond Company BV
8.000%, 05/15/2018 EUR 50,000 71,563
8.000%, 05/15/2018 (S) 200,000 286,251
62,724,339
Consumer Staples - 1.9%
Altria Group, Inc.
4.750%, 05/05/2021 $ 800,000 911,989
8.500%, 11/10/2013 280,000 300,000
Copyright © 2013 www.secdatabase.com. All Rights Reserved.Please Consider the Environment Before Printing This Document
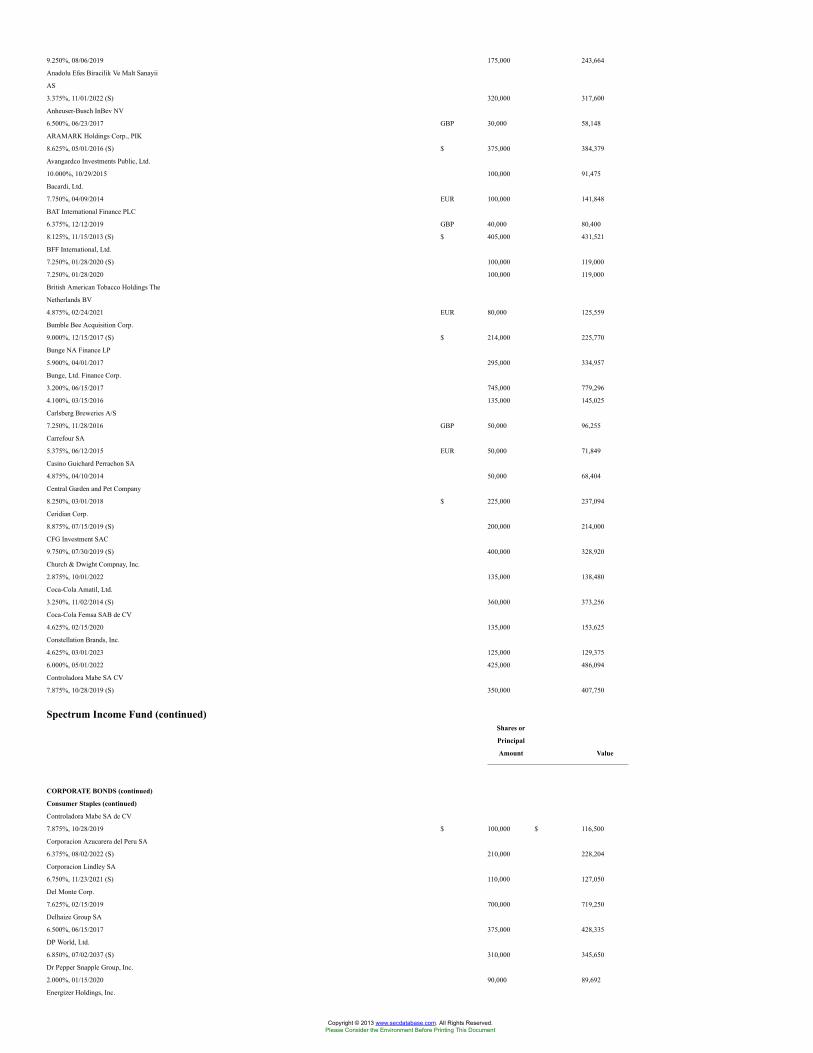
9.250%, 08/06/2019 175,000 243,664
Anadolu Efes Biracilik Ve Malt Sanayii
AS
3.375%, 11/01/2022 (S) 320,000 317,600
Anheuser-Busch InBev NV
6.500%, 06/23/2017 GBP 30,000 58,148
ARAMARK Holdings Corp., PIK
8.625%, 05/01/2016 (S) $ 375,000 384,379
Avangardco Investments Public, Ltd.
10.000%, 10/29/2015 100,000 91,475
Bacardi, Ltd.
7.750%, 04/09/2014 EUR 100,000 141,848
BAT International Finance PLC
6.375%, 12/12/2019 GBP 40,000 80,400
8.125%, 11/15/2013 (S) $ 405,000 431,521
BFF International, Ltd.
7.250%, 01/28/2020 (S) 100,000 119,000
7.250%, 01/28/2020 100,000 119,000
British American Tobacco Holdings The
Netherlands BV
4.875%, 02/24/2021 EUR 80,000 125,559
Bumble Bee Acquisition Corp.
9.000%, 12/15/2017 (S) $ 214,000 225,770
Bunge NA Finance LP
5.900%, 04/01/2017 295,000 334,957
Bunge, Ltd. Finance Corp.
3.200%, 06/15/2017 745,000 779,296
4.100%, 03/15/2016 135,000 145,025
Carlsberg Breweries A/S
7.250%, 11/28/2016 GBP 50,000 96,255
Carrefour SA
5.375%, 06/12/2015 EUR 50,000 71,849
Casino Guichard Perrachon SA
4.875%, 04/10/2014 50,000 68,404
Central Garden and Pet Company
8.250%, 03/01/2018 $ 225,000 237,094
Ceridian Corp.
8.875%, 07/15/2019 (S) 200,000 214,000
CFG Investment SAC
9.750%, 07/30/2019 (S) 400,000 328,920
Church & Dwight Compnay, Inc.
2.875%, 10/01/2022 135,000 138,480
Coca-Cola Amatil, Ltd.
3.250%, 11/02/2014 (S) 360,000 373,256
Coca-Cola Femsa SAB de CV
4.625%, 02/15/2020 135,000 153,625
Constellation Brands, Inc.
4.625%, 03/01/2023 125,000 129,375
6.000%, 05/01/2022 425,000 486,094
Controladora Mabe SA CV
7.875%, 10/28/2019 (S) 350,000 407,750
Spectrum Income Fund (continued)Shares or
Principal
Amount Value
CORPORATE BONDS (continued)
Consumer Staples (continued)
Controladora Mabe SA de CV
7.875%, 10/28/2019 $ 100,000 $ 116,500
Corporacion Azucarera del Peru SA
6.375%, 08/02/2022 (S) 210,000 228,204
Corporacion Lindley SA
6.750%, 11/23/2021 (S) 110,000 127,050
Del Monte Corp.
7.625%, 02/15/2019 700,000 719,250
Delhaize Group SA
6.500%, 06/15/2017 375,000 428,335
DP World, Ltd.
6.850%, 07/02/2037 (S) 310,000 345,650
Dr Pepper Snapple Group, Inc.
2.000%, 01/15/2020 90,000 89,692
Energizer Holdings, Inc.
Copyright © 2013 www.secdatabase.com. All Rights Reserved.Please Consider the Environment Before Printing This Document
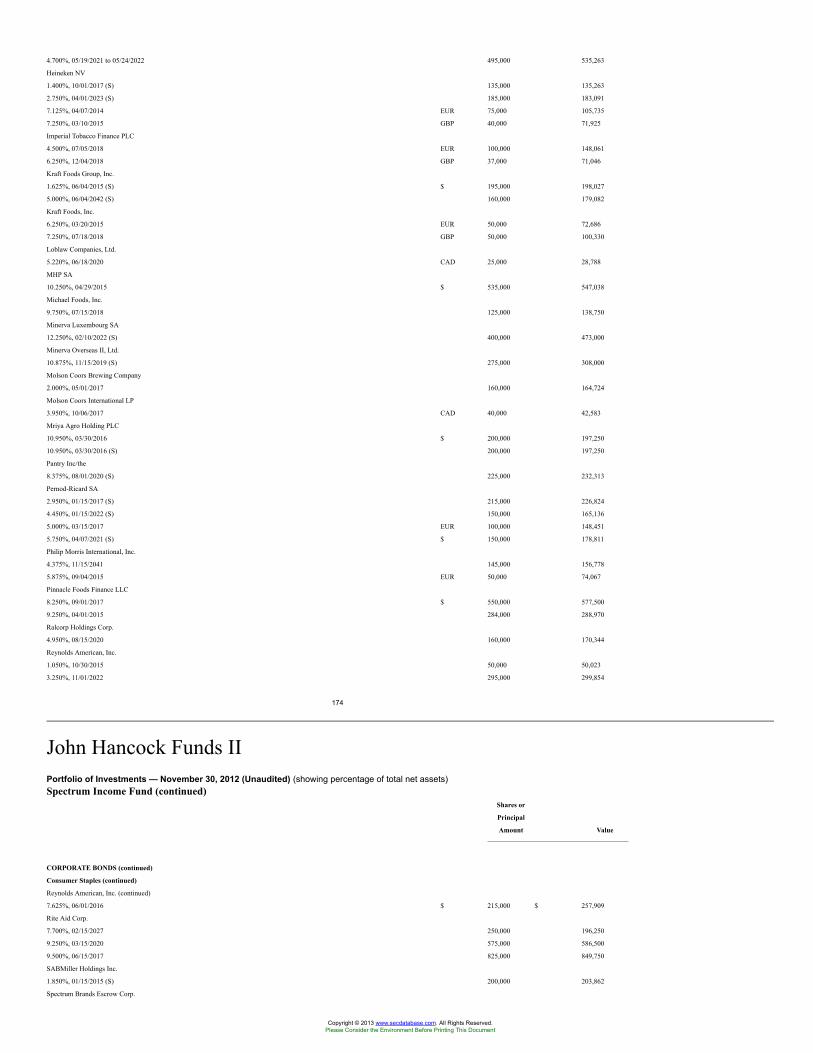
4.700%, 05/19/2021 to 05/24/2022 495,000 535,263
Heineken NV
1.400%, 10/01/2017 (S) 135,000 135,263
2.750%, 04/01/2023 (S) 185,000 183,091
7.125%, 04/07/2014 EUR 75,000 105,735
7.250%, 03/10/2015 GBP 40,000 71,925
Imperial Tobacco Finance PLC
4.500%, 07/05/2018 EUR 100,000 148,061
6.250%, 12/04/2018 GBP 37,000 71,046
Kraft Foods Group, Inc.
1.625%, 06/04/2015 (S) $ 195,000 198,027
5.000%, 06/04/2042 (S) 160,000 179,082
Kraft Foods, Inc.
6.250%, 03/20/2015 EUR 50,000 72,686
7.250%, 07/18/2018 GBP 50,000 100,330
Loblaw Companies, Ltd.
5.220%, 06/18/2020 CAD 25,000 28,788
MHP SA
10.250%, 04/29/2015 $ 535,000 547,038
Michael Foods, Inc.
9.750%, 07/15/2018 125,000 138,750
Minerva Luxembourg SA
12.250%, 02/10/2022 (S) 400,000 473,000
Minerva Overseas II, Ltd.
10.875%, 11/15/2019 (S) 275,000 308,000
Molson Coors Brewing Company
2.000%, 05/01/2017 160,000 164,724
Molson Coors International LP
3.950%, 10/06/2017 CAD 40,000 42,583
Mriya Agro Holding PLC
10.950%, 03/30/2016 $ 200,000 197,250
10.950%, 03/30/2016 (S) 200,000 197,250
Pantry Inc/the
8.375%, 08/01/2020 (S) 225,000 232,313
Pernod-Ricard SA
2.950%, 01/15/2017 (S) 215,000 226,824
4.450%, 01/15/2022 (S) 150,000 165,136
5.000%, 03/15/2017 EUR 100,000 148,451
5.750%, 04/07/2021 (S) $ 150,000 178,811
Philip Morris International, Inc.
4.375%, 11/15/2041 145,000 156,778
5.875%, 09/04/2015 EUR 50,000 74,067
Pinnacle Foods Finance LLC
8.250%, 09/01/2017 $ 550,000 577,500
9.250%, 04/01/2015 284,000 288,970
Ralcorp Holdings Corp.
4.950%, 08/15/2020 160,000 170,344
Reynolds American, Inc.
1.050%, 10/30/2015 50,000 50,023
3.250%, 11/01/2022 295,000 299,854
174
John Hancock Funds IIPortfolio of Investments — November 30, 2012 (Unaudited) (showing percentage of total net assets)Spectrum Income Fund (continued)
Shares or
Principal
Amount Value
CORPORATE BONDS (continued)
Consumer Staples (continued)
Reynolds American, Inc. (continued)
7.625%, 06/01/2016 $ 215,000 $ 257,909
Rite Aid Corp.
7.700%, 02/15/2027 250,000 196,250
9.250%, 03/15/2020 575,000 586,500
9.500%, 06/15/2017 825,000 849,750
SABMiller Holdings Inc.
1.850%, 01/15/2015 (S) 200,000 203,862
Spectrum Brands Escrow Corp.
Copyright © 2013 www.secdatabase.com. All Rights Reserved.Please Consider the Environment Before Printing This Document
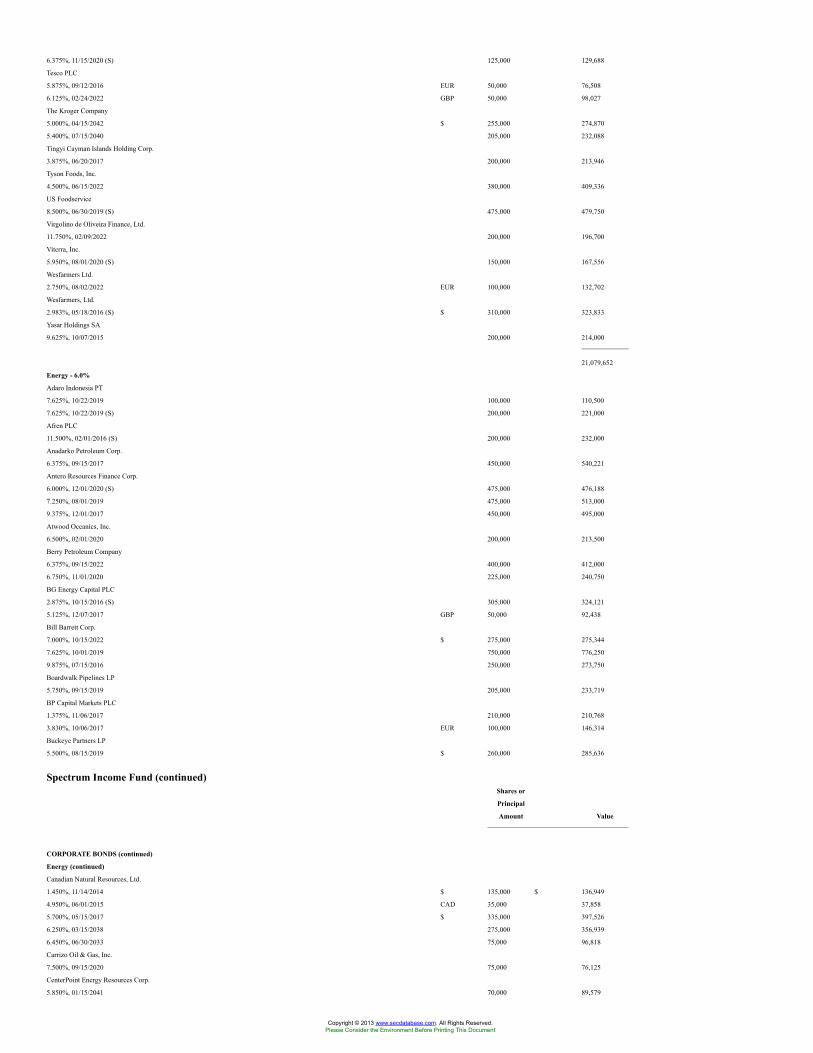
6.375%, 11/15/2020 (S) 125,000 129,688
Tesco PLC
5.875%, 09/12/2016 EUR 50,000 76,508
6.125%, 02/24/2022 GBP 50,000 98,027
The Kroger Company
5.000%, 04/15/2042 $ 255,000 274,870
5.400%, 07/15/2040 205,000 232,088
Tingyi Cayman Islands Holding Corp.
3.875%, 06/20/2017 200,000 213,946
Tyson Foods, Inc.
4.500%, 06/15/2022 380,000 409,336
US Foodservice
8.500%, 06/30/2019 (S) 475,000 479,750
Virgolino de Oliveira Finance, Ltd.
11.750%, 02/09/2022 200,000 196,700
Viterra, Inc.
5.950%, 08/01/2020 (S) 150,000 167,556
Wesfarmers Ltd.
2.750%, 08/02/2022 EUR 100,000 132,702
Wesfarmers, Ltd.
2.983%, 05/18/2016 (S) $ 310,000 323,833
Yasar Holdings SA
9.625%, 10/07/2015 200,000 214,000
21,079,652
Energy - 6.0%
Adaro Indonesia PT
7.625%, 10/22/2019 100,000 110,500
7.625%, 10/22/2019 (S) 200,000 221,000
Afren PLC
11.500%, 02/01/2016 (S) 200,000 232,000
Anadarko Petroleum Corp.
6.375%, 09/15/2017 450,000 540,221
Antero Resources Finance Corp.
6.000%, 12/01/2020 (S) 475,000 476,188
7.250%, 08/01/2019 475,000 513,000
9.375%, 12/01/2017 450,000 495,000
Atwood Oceanics, Inc.
6.500%, 02/01/2020 200,000 213,500
Berry Petroleum Company
6.375%, 09/15/2022 400,000 412,000
6.750%, 11/01/2020 225,000 240,750
BG Energy Capital PLC
2.875%, 10/15/2016 (S) 305,000 324,121
5.125%, 12/07/2017 GBP 50,000 92,438
Bill Barrett Corp.
7.000%, 10/15/2022 $ 275,000 275,344
7.625%, 10/01/2019 750,000 776,250
9.875%, 07/15/2016 250,000 273,750
Boardwalk Pipelines LP
5.750%, 09/15/2019 205,000 233,719
BP Capital Markets PLC
1.375%, 11/06/2017 210,000 210,768
3.830%, 10/06/2017 EUR 100,000 146,314
Buckeye Partners LP
5.500%, 08/15/2019 $ 260,000 285,636
Spectrum Income Fund (continued)Shares or
Principal
Amount Value
CORPORATE BONDS (continued)
Energy (continued)
Canadian Natural Resources, Ltd.
1.450%, 11/14/2014 $ 135,000 $ 136,949
4.950%, 06/01/2015 CAD 35,000 37,858
5.700%, 05/15/2017 $ 335,000 397,526
6.250%, 03/15/2038 275,000 356,939
6.450%, 06/30/2033 75,000 96,818
Carrizo Oil & Gas, Inc.
7.500%, 09/15/2020 75,000 76,125
CenterPoint Energy Resources Corp.
5.850%, 01/15/2041 70,000 89,579
Copyright © 2013 www.secdatabase.com. All Rights Reserved.Please Consider the Environment Before Printing This Document
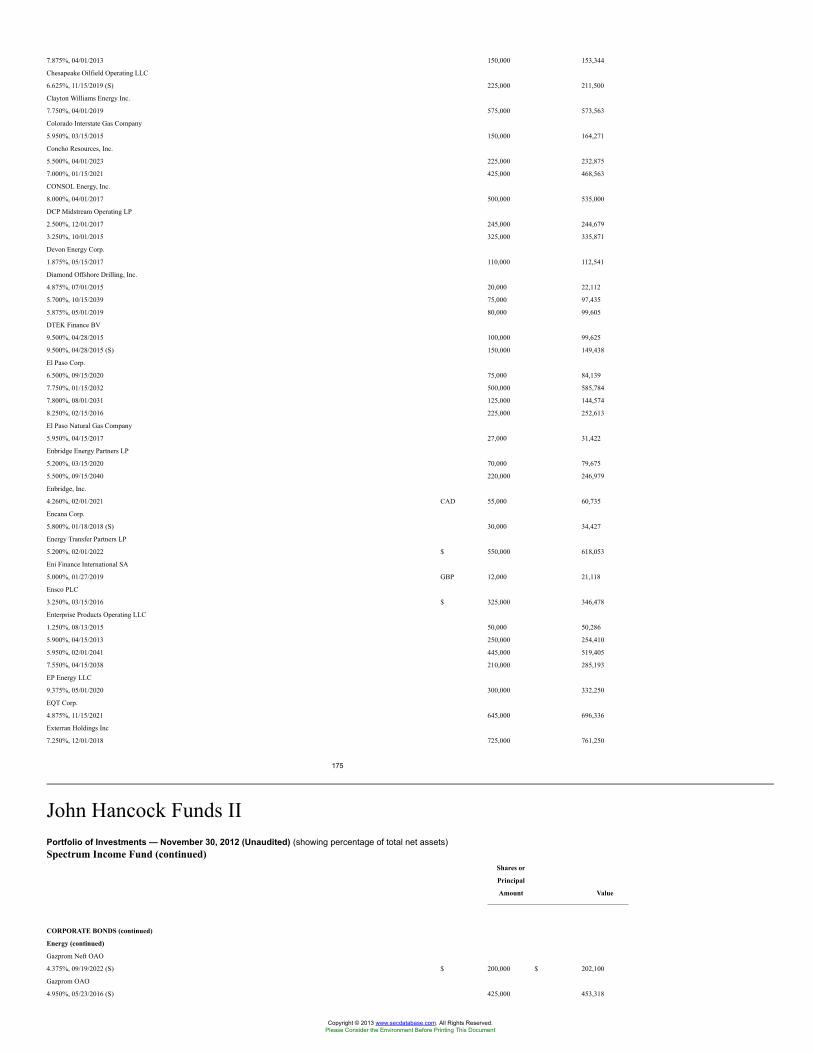
7.875%, 04/01/2013 150,000 153,344
Chesapeake Oilfield Operating LLC
6.625%, 11/15/2019 (S) 225,000 211,500
Clayton Williams Energy Inc.
7.750%, 04/01/2019 575,000 573,563
Colorado Interstate Gas Company
5.950%, 03/15/2015 150,000 164,271
Concho Resources, Inc.
5.500%, 04/01/2023 225,000 232,875
7.000%, 01/15/2021 425,000 468,563
CONSOL Energy, Inc.
8.000%, 04/01/2017 500,000 535,000
DCP Midstream Operating LP
2.500%, 12/01/2017 245,000 244,679
3.250%, 10/01/2015 325,000 335,871
Devon Energy Corp.
1.875%, 05/15/2017 110,000 112,541
Diamond Offshore Drilling, Inc.
4.875%, 07/01/2015 20,000 22,112
5.700%, 10/15/2039 75,000 97,435
5.875%, 05/01/2019 80,000 99,605
DTEK Finance BV
9.500%, 04/28/2015 100,000 99,625
9.500%, 04/28/2015 (S) 150,000 149,438
El Paso Corp.
6.500%, 09/15/2020 75,000 84,139
7.750%, 01/15/2032 500,000 585,784
7.800%, 08/01/2031 125,000 144,574
8.250%, 02/15/2016 225,000 252,613
El Paso Natural Gas Company
5.950%, 04/15/2017 27,000 31,422
Enbridge Energy Partners LP
5.200%, 03/15/2020 70,000 79,675
5.500%, 09/15/2040 220,000 246,979
Enbridge, Inc.
4.260%, 02/01/2021 CAD 55,000 60,735
Encana Corp.
5.800%, 01/18/2018 (S) 30,000 34,427
Energy Transfer Partners LP
5.200%, 02/01/2022 $ 550,000 618,053
Eni Finance International SA
5.000%, 01/27/2019 GBP 12,000 21,118
Ensco PLC
3.250%, 03/15/2016 $ 325,000 346,478
Enterprise Products Operating LLC
1.250%, 08/13/2015 50,000 50,286
5.900%, 04/15/2013 250,000 254,410
5.950%, 02/01/2041 445,000 519,405
7.550%, 04/15/2038 210,000 285,193
EP Energy LLC
9.375%, 05/01/2020 300,000 332,250
EQT Corp.
4.875%, 11/15/2021 645,000 696,336
Exterran Holdings Inc
7.250%, 12/01/2018 725,000 761,250
175
John Hancock Funds IIPortfolio of Investments — November 30, 2012 (Unaudited) (showing percentage of total net assets)Spectrum Income Fund (continued)
Shares or
Principal
Amount Value
CORPORATE BONDS (continued)
Energy (continued)
Gazprom Neft OAO
4.375%, 09/19/2022 (S) $ 200,000 $ 202,100
Gazprom OAO
4.950%, 05/23/2016 (S) 425,000 453,318
Copyright © 2013 www.secdatabase.com. All Rights Reserved.Please Consider the Environment Before Printing This Document
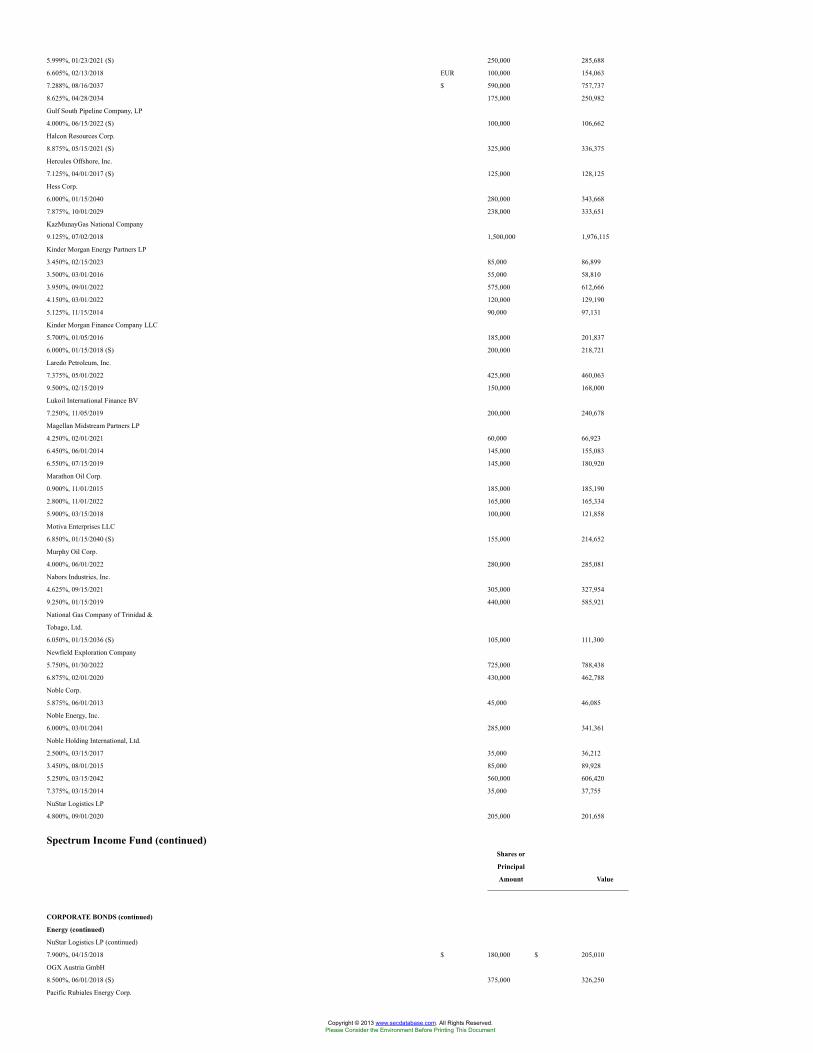
5.999%, 01/23/2021 (S) 250,000 285,688
6.605%, 02/13/2018 EUR 100,000 154,063
7.288%, 08/16/2037 $ 590,000 757,737
8.625%, 04/28/2034 175,000 250,982
Gulf South Pipeline Company, LP
4.000%, 06/15/2022 (S) 100,000 106,662
Halcon Resources Corp.
8.875%, 05/15/2021 (S) 325,000 336,375
Hercules Offshore, Inc.
7.125%, 04/01/2017 (S) 125,000 128,125
Hess Corp.
6.000%, 01/15/2040 280,000 343,668
7.875%, 10/01/2029 238,000 333,651
KazMunayGas National Company
9.125%, 07/02/2018 1,500,000 1,976,115
Kinder Morgan Energy Partners LP
3.450%, 02/15/2023 85,000 86,899
3.500%, 03/01/2016 55,000 58,810
3.950%, 09/01/2022 575,000 612,666
4.150%, 03/01/2022 120,000 129,190
5.125%, 11/15/2014 90,000 97,131
Kinder Morgan Finance Company LLC
5.700%, 01/05/2016 185,000 201,837
6.000%, 01/15/2018 (S) 200,000 218,721
Laredo Petroleum, Inc.
7.375%, 05/01/2022 425,000 460,063
9.500%, 02/15/2019 150,000 168,000
Lukoil International Finance BV
7.250%, 11/05/2019 200,000 240,678
Magellan Midstream Partners LP
4.250%, 02/01/2021 60,000 66,923
6.450%, 06/01/2014 145,000 155,083
6.550%, 07/15/2019 145,000 180,920
Marathon Oil Corp.
0.900%, 11/01/2015 185,000 185,190
2.800%, 11/01/2022 165,000 165,334
5.900%, 03/15/2018 100,000 121,858
Motiva Enterprises LLC
6.850%, 01/15/2040 (S) 155,000 214,652
Murphy Oil Corp.
4.000%, 06/01/2022 280,000 285,081
Nabors Industries, Inc.
4.625%, 09/15/2021 305,000 327,954
9.250%, 01/15/2019 440,000 585,921
National Gas Company of Trinidad &
Tobago, Ltd.
6.050%, 01/15/2036 (S) 105,000 111,300
Newfield Exploration Company
5.750%, 01/30/2022 725,000 788,438
6.875%, 02/01/2020 430,000 462,788
Noble Corp.
5.875%, 06/01/2013 45,000 46,085
Noble Energy, Inc.
6.000%, 03/01/2041 285,000 341,361
Noble Holding International, Ltd.
2.500%, 03/15/2017 35,000 36,212
3.450%, 08/01/2015 85,000 89,928
5.250%, 03/15/2042 560,000 606,420
7.375%, 03/15/2014 35,000 37,755
NuStar Logistics LP
4.800%, 09/01/2020 205,000 201,658
Spectrum Income Fund (continued)Shares or
Principal
Amount Value
CORPORATE BONDS (continued)
Energy (continued)
NuStar Logistics LP (continued)
7.900%, 04/15/2018 $ 180,000 $ 205,010
OGX Austria GmbH
8.500%, 06/01/2018 (S) 375,000 326,250
Pacific Rubiales Energy Corp.
Copyright © 2013 www.secdatabase.com. All Rights Reserved.Please Consider the Environment Before Printing This Document
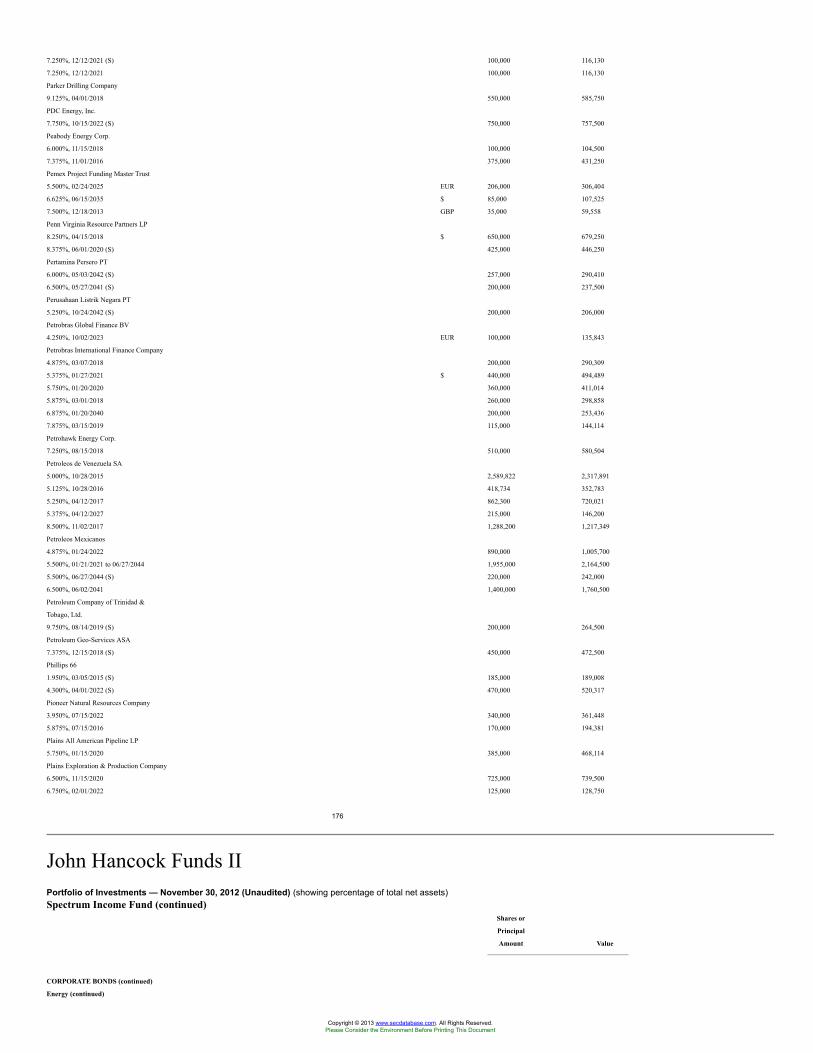
7.250%, 12/12/2021 (S) 100,000 116,130
7.250%, 12/12/2021 100,000 116,130
Parker Drilling Company
9.125%, 04/01/2018 550,000 585,750
PDC Energy, Inc.
7.750%, 10/15/2022 (S) 750,000 757,500
Peabody Energy Corp.
6.000%, 11/15/2018 100,000 104,500
7.375%, 11/01/2016 375,000 431,250
Pemex Project Funding Master Trust
5.500%, 02/24/2025 EUR 206,000 306,404
6.625%, 06/15/2035 $ 85,000 107,525
7.500%, 12/18/2013 GBP 35,000 59,558
Penn Virginia Resource Partners LP
8.250%, 04/15/2018 $ 650,000 679,250
8.375%, 06/01/2020 (S) 425,000 446,250
Pertamina Persero PT
6.000%, 05/03/2042 (S) 257,000 290,410
6.500%, 05/27/2041 (S) 200,000 237,500
Perusahaan Listrik Negara PT
5.250%, 10/24/2042 (S) 200,000 206,000
Petrobras Global Finance BV
4.250%, 10/02/2023 EUR 100,000 135,843
Petrobras International Finance Company
4.875%, 03/07/2018 200,000 290,309
5.375%, 01/27/2021 $ 440,000 494,489
5.750%, 01/20/2020 360,000 411,014
5.875%, 03/01/2018 260,000 298,858
6.875%, 01/20/2040 200,000 253,436
7.875%, 03/15/2019 115,000 144,114
Petrohawk Energy Corp.
7.250%, 08/15/2018 510,000 580,504
Petroleos de Venezuela SA
5.000%, 10/28/2015 2,589,822 2,317,891
5.125%, 10/28/2016 418,734 352,783
5.250%, 04/12/2017 862,300 720,021
5.375%, 04/12/2027 215,000 146,200
8.500%, 11/02/2017 1,288,200 1,217,349
Petroleos Mexicanos
4.875%, 01/24/2022 890,000 1,005,700
5.500%, 01/21/2021 to 06/27/2044 1,955,000 2,164,500
5.500%, 06/27/2044 (S) 220,000 242,000
6.500%, 06/02/2041 1,400,000 1,760,500
Petroleum Company of Trinidad &
Tobago, Ltd.
9.750%, 08/14/2019 (S) 200,000 264,500
Petroleum Geo-Services ASA
7.375%, 12/15/2018 (S) 450,000 472,500
Phillips 66
1.950%, 03/05/2015 (S) 185,000 189,008
4.300%, 04/01/2022 (S) 470,000 520,317
Pioneer Natural Resources Company
3.950%, 07/15/2022 340,000 361,448
5.875%, 07/15/2016 170,000 194,381
Plains All American Pipeline LP
5.750%, 01/15/2020 385,000 468,114
Plains Exploration & Production Company
6.500%, 11/15/2020 725,000 739,500
6.750%, 02/01/2022 125,000 128,750
176
John Hancock Funds IIPortfolio of Investments — November 30, 2012 (Unaudited) (showing percentage of total net assets)Spectrum Income Fund (continued)
Shares or
Principal
Amount Value
CORPORATE BONDS (continued)
Energy (continued)
Copyright © 2013 www.secdatabase.com. All Rights Reserved.Please Consider the Environment Before Printing This Document
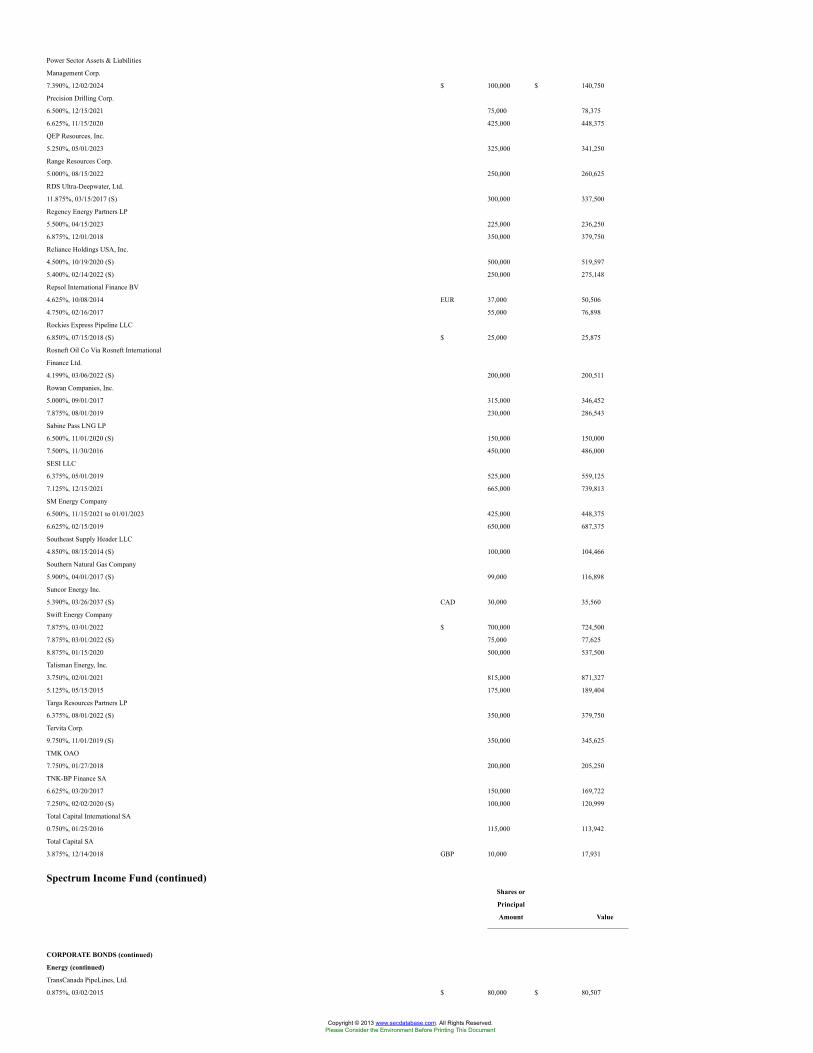
Power Sector Assets & Liabilities
Management Corp.
7.390%, 12/02/2024 $ 100,000 $ 140,750
Precision Drilling Corp.
6.500%, 12/15/2021 75,000 78,375
6.625%, 11/15/2020 425,000 448,375
QEP Resources, Inc.
5.250%, 05/01/2023 325,000 341,250
Range Resources Corp.
5.000%, 08/15/2022 250,000 260,625
RDS Ultra-Deepwater, Ltd.
11.875%, 03/15/2017 (S) 300,000 337,500
Regency Energy Partners LP
5.500%, 04/15/2023 225,000 236,250
6.875%, 12/01/2018 350,000 379,750
Reliance Holdings USA, Inc.
4.500%, 10/19/2020 (S) 500,000 519,597
5.400%, 02/14/2022 (S) 250,000 275,148
Repsol International Finance BV
4.625%, 10/08/2014 EUR 37,000 50,506
4.750%, 02/16/2017 55,000 76,898
Rockies Express Pipeline LLC
6.850%, 07/15/2018 (S) $ 25,000 25,875
Rosneft Oil Co Via Rosneft International
Finance Ltd.
4.199%, 03/06/2022 (S) 200,000 200,511
Rowan Companies, Inc.
5.000%, 09/01/2017 315,000 346,452
7.875%, 08/01/2019 230,000 286,543
Sabine Pass LNG LP
6.500%, 11/01/2020 (S) 150,000 150,000
7.500%, 11/30/2016 450,000 486,000
SESI LLC
6.375%, 05/01/2019 525,000 559,125
7.125%, 12/15/2021 665,000 739,813
SM Energy Company
6.500%, 11/15/2021 to 01/01/2023 425,000 448,375
6.625%, 02/15/2019 650,000 687,375
Southeast Supply Header LLC
4.850%, 08/15/2014 (S) 100,000 104,466
Southern Natural Gas Company
5.900%, 04/01/2017 (S) 99,000 116,898
Suncor Energy Inc.
5.390%, 03/26/2037 (S) CAD 30,000 35,560
Swift Energy Company
7.875%, 03/01/2022 $ 700,000 724,500
7.875%, 03/01/2022 (S) 75,000 77,625
8.875%, 01/15/2020 500,000 537,500
Talisman Energy, Inc.
3.750%, 02/01/2021 815,000 871,327
5.125%, 05/15/2015 175,000 189,404
Targa Resources Partners LP
6.375%, 08/01/2022 (S) 350,000 379,750
Tervita Corp.
9.750%, 11/01/2019 (S) 350,000 345,625
TMK OAO
7.750%, 01/27/2018 200,000 205,250
TNK-BP Finance SA
6.625%, 03/20/2017 150,000 169,722
7.250%, 02/02/2020 (S) 100,000 120,999
Total Capital International SA
0.750%, 01/25/2016 115,000 113,942
Total Capital SA
3.875%, 12/14/2018 GBP 10,000 17,931
Spectrum Income Fund (continued)Shares or
Principal
Amount Value
CORPORATE BONDS (continued)
Energy (continued)
TransCanada PipeLines, Ltd.
0.875%, 03/02/2015 $ 80,000 $ 80,507
Copyright © 2013 www.secdatabase.com. All Rights Reserved.Please Consider the Environment Before Printing This Document
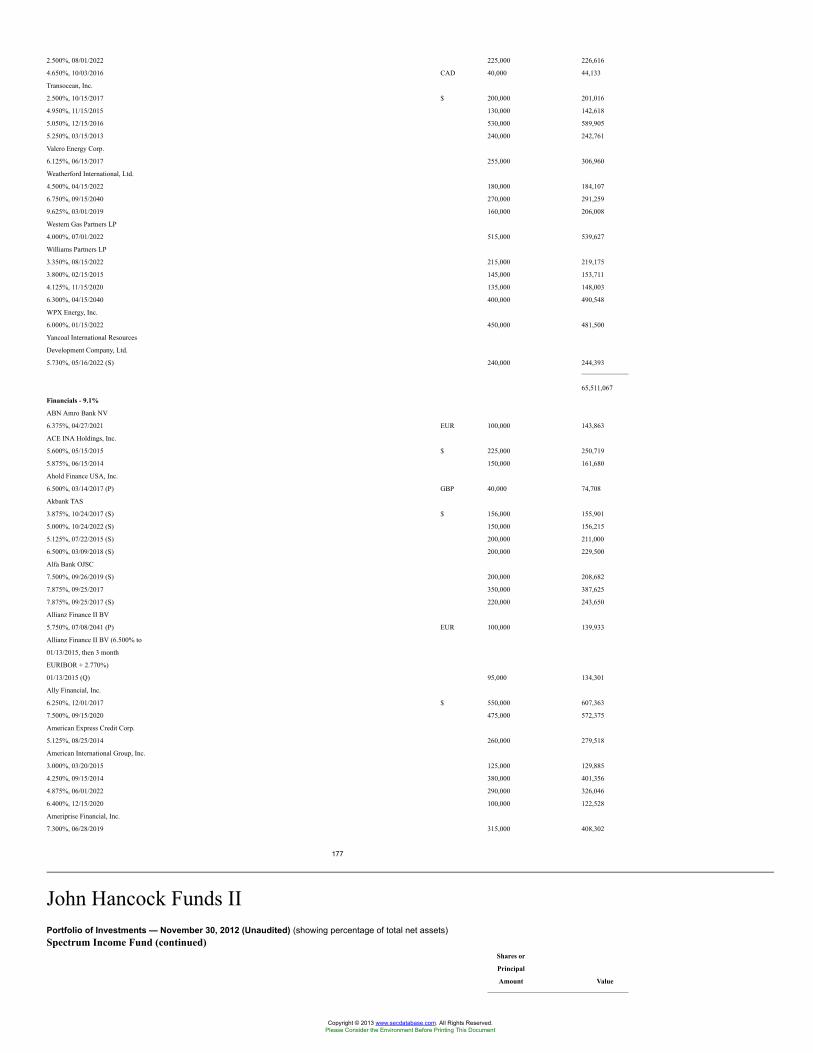
2.500%, 08/01/2022 225,000 226,616
4.650%, 10/03/2016 CAD 40,000 44,133
Transocean, Inc.
2.500%, 10/15/2017 $ 200,000 201,016
4.950%, 11/15/2015 130,000 142,618
5.050%, 12/15/2016 530,000 589,905
5.250%, 03/15/2013 240,000 242,761
Valero Energy Corp.
6.125%, 06/15/2017 255,000 306,960
Weatherford International, Ltd.
4.500%, 04/15/2022 180,000 184,107
6.750%, 09/15/2040 270,000 291,259
9.625%, 03/01/2019 160,000 206,008
Western Gas Partners LP
4.000%, 07/01/2022 515,000 539,627
Williams Partners LP
3.350%, 08/15/2022 215,000 219,175
3.800%, 02/15/2015 145,000 153,711
4.125%, 11/15/2020 135,000 148,003
6.300%, 04/15/2040 400,000 490,548
WPX Energy, Inc.
6.000%, 01/15/2022 450,000 481,500
Yancoal International Resources
Development Company, Ltd.
5.730%, 05/16/2022 (S) 240,000 244,393
65,511,067
Financials - 9.1%
ABN Amro Bank NV
6.375%, 04/27/2021 EUR 100,000 143,863
ACE INA Holdings, Inc.
5.600%, 05/15/2015 $ 225,000 250,719
5.875%, 06/15/2014 150,000 161,680
Ahold Finance USA, Inc.
6.500%, 03/14/2017 (P) GBP 40,000 74,708
Akbank TAS
3.875%, 10/24/2017 (S) $ 156,000 155,901
5.000%, 10/24/2022 (S) 150,000 156,215
5.125%, 07/22/2015 (S) 200,000 211,000
6.500%, 03/09/2018 (S) 200,000 229,500
Alfa Bank OJSC
7.500%, 09/26/2019 (S) 200,000 208,682
7.875%, 09/25/2017 350,000 387,625
7.875%, 09/25/2017 (S) 220,000 243,650
Allianz Finance II BV
5.750%, 07/08/2041 (P) EUR 100,000 139,933
Allianz Finance II BV (6.500% to
01/13/2015, then 3 month
EURIBOR + 2.770%)
01/13/2015 (Q) 95,000 134,301
Ally Financial, Inc.
6.250%, 12/01/2017 $ 550,000 607,363
7.500%, 09/15/2020 475,000 572,375
American Express Credit Corp.
5.125%, 08/25/2014 260,000 279,518
American International Group, Inc.
3.000%, 03/20/2015 125,000 129,885
4.250%, 09/15/2014 380,000 401,356
4.875%, 06/01/2022 290,000 326,046
6.400%, 12/15/2020 100,000 122,528
Ameriprise Financial, Inc.
7.300%, 06/28/2019 315,000 408,302
177
John Hancock Funds IIPortfolio of Investments — November 30, 2012 (Unaudited) (showing percentage of total net assets)Spectrum Income Fund (continued)
Shares or
Principal
Amount Value
Copyright © 2013 www.secdatabase.com. All Rights Reserved.Please Consider the Environment Before Printing This Document
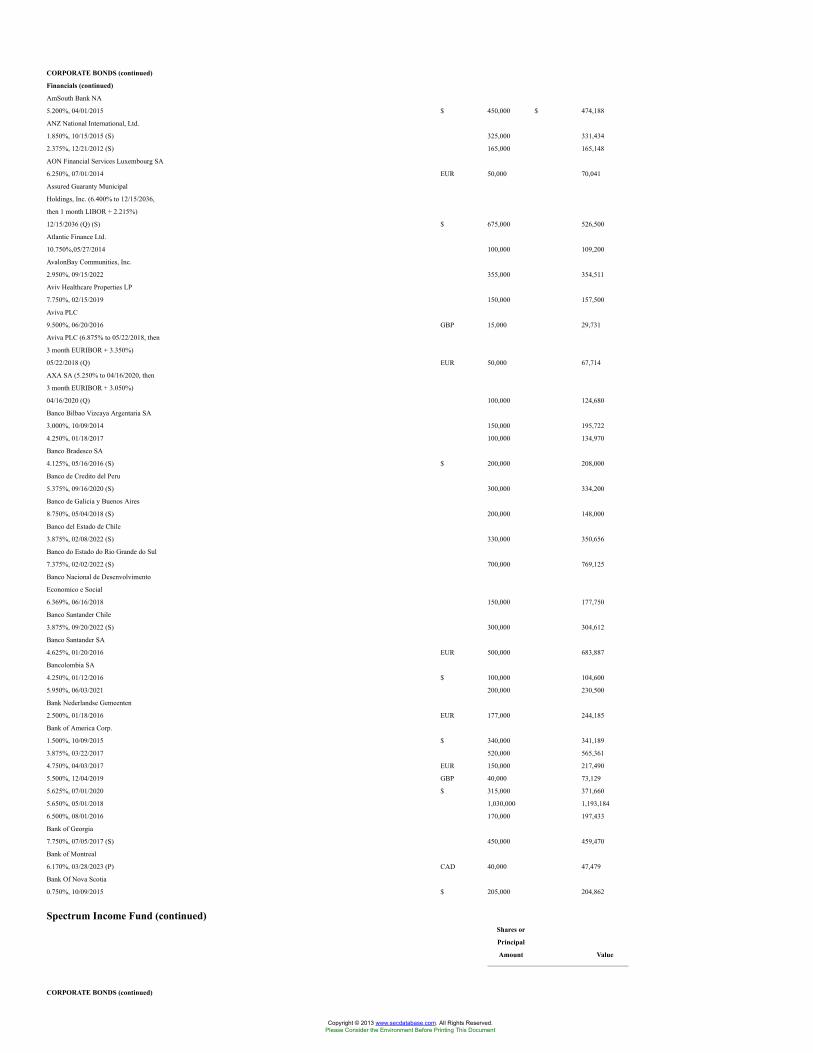
CORPORATE BONDS (continued)
Financials (continued)
AmSouth Bank NA
5.200%, 04/01/2015 $ 450,000 $ 474,188
ANZ National International, Ltd.
1.850%, 10/15/2015 (S) 325,000 331,434
2.375%, 12/21/2012 (S) 165,000 165,148
AON Financial Services Luxembourg SA
6.250%, 07/01/2014 EUR 50,000 70,041
Assured Guaranty Municipal
Holdings, Inc. (6.400% to 12/15/2036,
then 1 month LIBOR + 2.215%)
12/15/2036 (Q) (S) $ 675,000 526,500
Atlantic Finance Ltd.
10.750%,05/27/2014 100,000 109,200
AvalonBay Communities, Inc.
2.950%, 09/15/2022 355,000 354,511
Aviv Healthcare Properties LP
7.750%, 02/15/2019 150,000 157,500
Aviva PLC
9.500%, 06/20/2016 GBP 15,000 29,731
Aviva PLC (6.875% to 05/22/2018, then
3 month EURIBOR + 3.350%)
05/22/2018 (Q) EUR 50,000 67,714
AXA SA (5.250% to 04/16/2020, then
3 month EURIBOR + 3.050%)
04/16/2020 (Q) 100,000 124,680
Banco Bilbao Vizcaya Argentaria SA
3.000%, 10/09/2014 150,000 195,722
4.250%, 01/18/2017 100,000 134,970
Banco Bradesco SA
4.125%, 05/16/2016 (S) $ 200,000 208,000
Banco de Credito del Peru
5.375%, 09/16/2020 (S) 300,000 334,200
Banco de Galicia y Buenos Aires
8.750%, 05/04/2018 (S) 200,000 148,000
Banco del Estado de Chile
3.875%, 02/08/2022 (S) 330,000 350,656
Banco do Estado do Rio Grande do Sul
7.375%, 02/02/2022 (S) 700,000 769,125
Banco Nacional de Desenvolvimento
Economico e Social
6.369%, 06/16/2018 150,000 177,750
Banco Santander Chile
3.875%, 09/20/2022 (S) 300,000 304,612
Banco Santander SA
4.625%, 01/20/2016 EUR 500,000 683,887
Bancolombia SA
4.250%, 01/12/2016 $ 100,000 104,600
5.950%, 06/03/2021 200,000 230,500
Bank Nederlandse Gemeenten
2.500%, 01/18/2016 EUR 177,000 244,185
Bank of America Corp.
1.500%, 10/09/2015 $ 340,000 341,189
3.875%, 03/22/2017 520,000 565,361
4.750%, 04/03/2017 EUR 150,000 217,490
5.500%, 12/04/2019 GBP 40,000 73,129
5.625%, 07/01/2020 $ 315,000 371,660
5.650%, 05/01/2018 1,030,000 1,193,184
6.500%, 08/01/2016 170,000 197,433
Bank of Georgia
7.750%, 07/05/2017 (S) 450,000 459,470
Bank of Montreal
6.170%, 03/28/2023 (P) CAD 40,000 47,479
Bank Of Nova Scotia
0.750%, 10/09/2015 $ 205,000 204,862
Spectrum Income Fund (continued)Shares or
Principal
Amount Value
CORPORATE BONDS (continued)
Copyright © 2013 www.secdatabase.com. All Rights Reserved.Please Consider the Environment Before Printing This Document
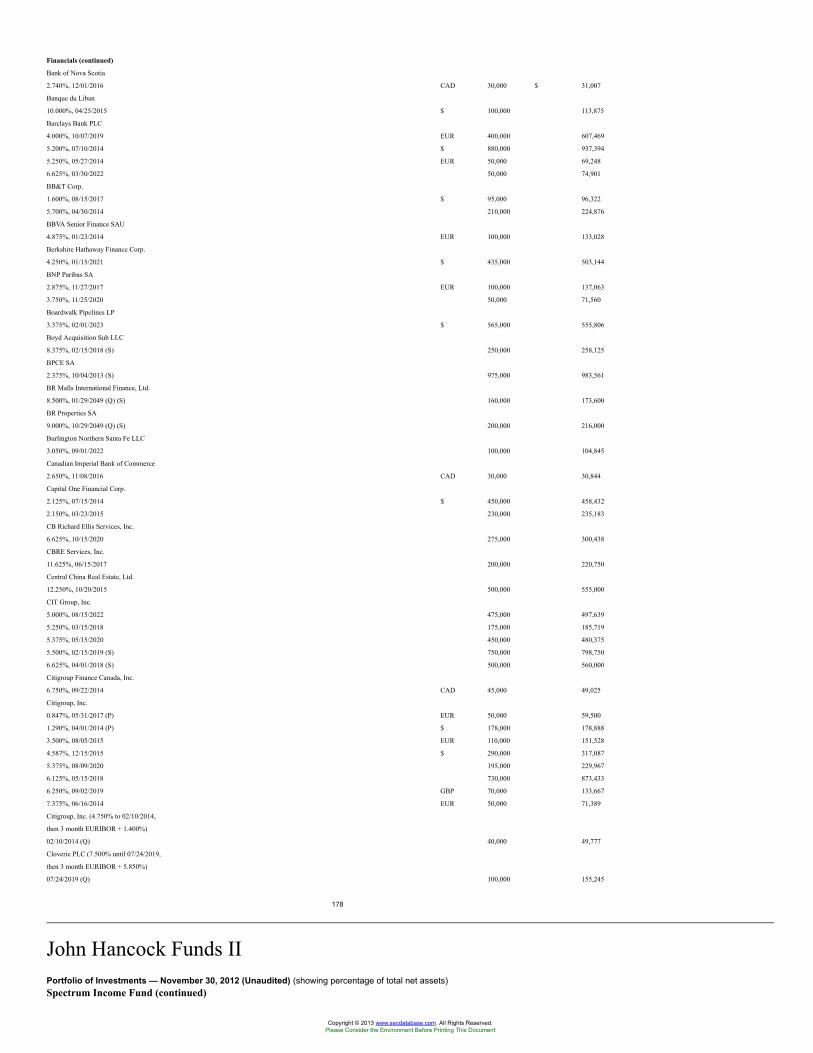
Financials (continued)
Bank of Nova Scotia
2.740%, 12/01/2016 CAD 30,000 $ 31,007
Banque du Liban
10.000%, 04/25/2015 $ 100,000 113,875
Barclays Bank PLC
4.000%, 10/07/2019 EUR 400,000 607,469
5.200%, 07/10/2014 $ 880,000 937,394
5.250%, 05/27/2014 EUR 50,000 69,248
6.625%, 03/30/2022 50,000 74,901
BB&T Corp.
1.600%, 08/15/2017 $ 95,000 96,322
5.700%, 04/30/2014 210,000 224,876
BBVA Senior Finance SAU
4.875%, 01/23/2014 EUR 100,000 133,028
Berkshire Hathaway Finance Corp.
4.250%, 01/15/2021 $ 435,000 503,144
BNP Paribas SA
2.875%, 11/27/2017 EUR 100,000 137,063
3.750%, 11/25/2020 50,000 71,560
Boardwalk Pipelines LP
3.375%, 02/01/2023 $ 565,000 555,806
Boyd Acquisition Sub LLC
8.375%, 02/15/2018 (S) 250,000 258,125
BPCE SA
2.375%, 10/04/2013 (S) 975,000 983,561
BR Malls International Finance, Ltd.
8.500%, 01/29/2049 (Q) (S) 160,000 173,600
BR Properties SA
9.000%, 10/29/2049 (Q) (S) 200,000 216,000
Burlington Northern Santa Fe LLC
3.050%, 09/01/2022 100,000 104,845
Canadian Imperial Bank of Commerce
2.650%, 11/08/2016 CAD 30,000 30,844
Capital One Financial Corp.
2.125%, 07/15/2014 $ 450,000 458,432
2.150%, 03/23/2015 230,000 235,183
CB Richard Ellis Services, Inc.
6.625%, 10/15/2020 275,000 300,438
CBRE Services, Inc.
11.625%, 06/15/2017 200,000 220,750
Central China Real Estate, Ltd.
12.250%, 10/20/2015 500,000 555,000
CIT Group, Inc.
5.000%, 08/15/2022 475,000 497,639
5.250%, 03/15/2018 175,000 185,719
5.375%, 05/15/2020 450,000 480,375
5.500%, 02/15/2019 (S) 750,000 798,750
6.625%, 04/01/2018 (S) 500,000 560,000
Citigroup Finance Canada, Inc.
6.750%, 09/22/2014 CAD 45,000 49,025
Citigroup, Inc.
0.847%, 05/31/2017 (P) EUR 50,000 59,500
1.290%, 04/01/2014 (P) $ 178,000 178,888
3.500%, 08/05/2015 EUR 110,000 151,528
4.587%, 12/15/2015 $ 290,000 317,087
5.375%, 08/09/2020 195,000 229,967
6.125%, 05/15/2018 730,000 873,433
6.250%, 09/02/2019 GBP 70,000 133,667
7.375%, 06/16/2014 EUR 50,000 71,389
Citigroup, Inc. (4.750% to 02/10/2014,
then 3 month EURIBOR + 1.400%)
02/10/2014 (Q) 40,000 49,777
Cloverie PLC (7.500% until 07/24/2019,
then 3 month EURIBOR + 5.850%)
07/24/2019 (Q) 100,000 155,245
178
John Hancock Funds IIPortfolio of Investments — November 30, 2012 (Unaudited) (showing percentage of total net assets)Spectrum Income Fund (continued)
Copyright © 2013 www.secdatabase.com. All Rights Reserved.Please Consider the Environment Before Printing This Document
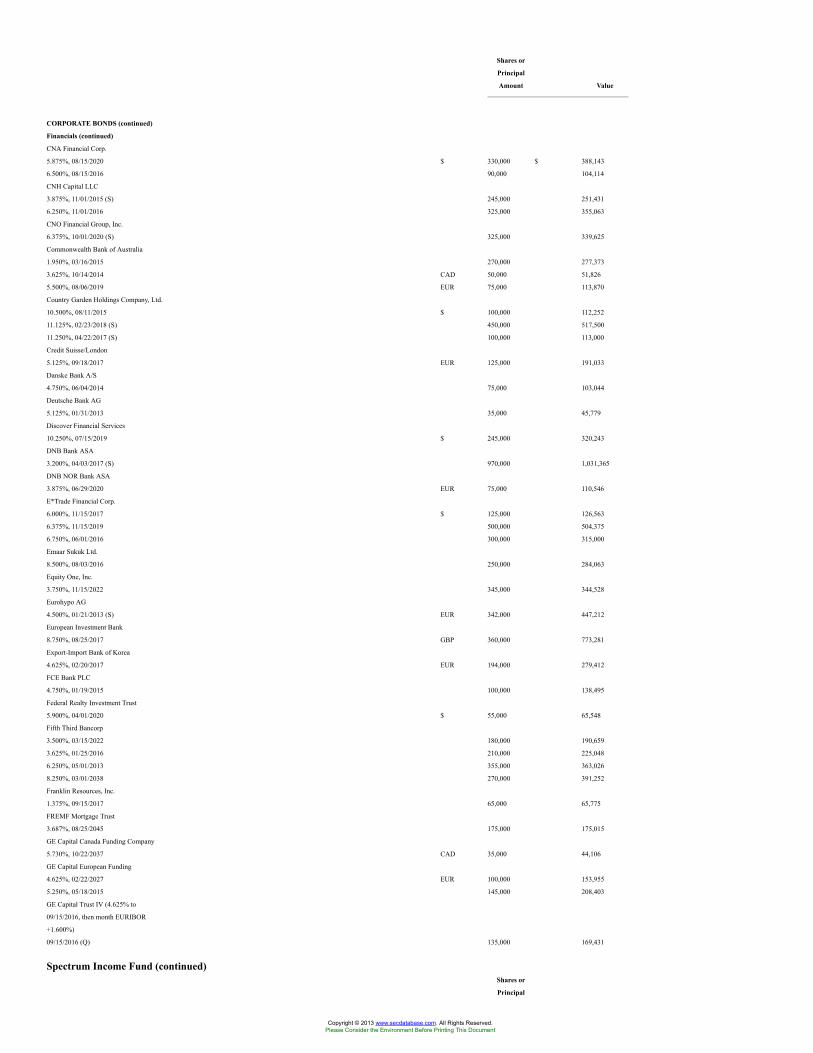
Shares or
Principal
Amount Value
CORPORATE BONDS (continued)
Financials (continued)
CNA Financial Corp.
5.875%, 08/15/2020 $ 330,000 $ 388,143
6.500%, 08/15/2016 90,000 104,114
CNH Capital LLC
3.875%, 11/01/2015 (S) 245,000 251,431
6.250%, 11/01/2016 325,000 355,063
CNO Financial Group, Inc.
6.375%, 10/01/2020 (S) 325,000 339,625
Commonwealth Bank of Australia
1.950%, 03/16/2015 270,000 277,373
3.625%, 10/14/2014 CAD 50,000 51,826
5.500%, 08/06/2019 EUR 75,000 113,870
Country Garden Holdings Company, Ltd.
10.500%, 08/11/2015 $ 100,000 112,252
11.125%, 02/23/2018 (S) 450,000 517,500
11.250%, 04/22/2017 (S) 100,000 113,000
Credit Suisse/London
5.125%, 09/18/2017 EUR 125,000 191,033
Danske Bank A/S
4.750%, 06/04/2014 75,000 103,044
Deutsche Bank AG
5.125%, 01/31/2013 35,000 45,779
Discover Financial Services
10.250%, 07/15/2019 $ 245,000 320,243
DNB Bank ASA
3.200%, 04/03/2017 (S) 970,000 1,031,365
DNB NOR Bank ASA
3.875%, 06/29/2020 EUR 75,000 110,546
E*Trade Financial Corp.
6.000%, 11/15/2017 $ 125,000 126,563
6.375%, 11/15/2019 500,000 504,375
6.750%, 06/01/2016 300,000 315,000
Emaar Sukuk Ltd.
8.500%, 08/03/2016 250,000 284,063
Equity One, Inc.
3.750%, 11/15/2022 345,000 344,528
Eurohypo AG
4.500%, 01/21/2013 (S) EUR 342,000 447,212
European Investment Bank
8.750%, 08/25/2017 GBP 360,000 773,281
Export-Import Bank of Korea
4.625%, 02/20/2017 EUR 194,000 279,412
FCE Bank PLC
4.750%, 01/19/2015 100,000 138,495
Federal Realty Investment Trust
5.900%, 04/01/2020 $ 55,000 65,548
Fifth Third Bancorp
3.500%, 03/15/2022 180,000 190,659
3.625%, 01/25/2016 210,000 225,048
6.250%, 05/01/2013 355,000 363,026
8.250%, 03/01/2038 270,000 391,252
Franklin Resources, Inc.
1.375%, 09/15/2017 65,000 65,775
FREMF Mortgage Trust
3.687%, 08/25/2045 175,000 175,015
GE Capital Canada Funding Company
5.730%, 10/22/2037 CAD 35,000 44,106
GE Capital European Funding
4.625%, 02/22/2027 EUR 100,000 153,955
5.250%, 05/18/2015 145,000 208,403
GE Capital Trust IV (4.625% to
09/15/2016, then month EURIBOR
+1.600%)
09/15/2016 (Q) 135,000 169,431
Spectrum Income Fund (continued)Shares or
Principal
Copyright © 2013 www.secdatabase.com. All Rights Reserved.Please Consider the Environment Before Printing This Document
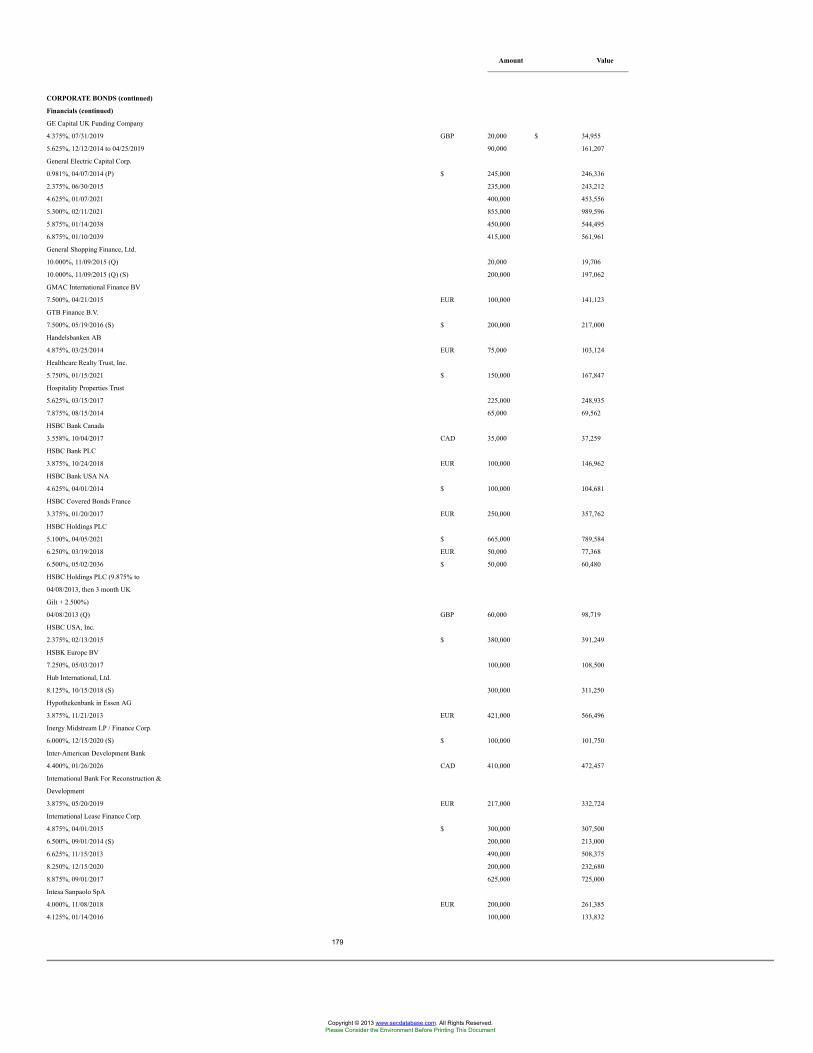
Amount Value
CORPORATE BONDS (continued)
Financials (continued)
GE Capital UK Funding Company
4.375%, 07/31/2019 GBP 20,000 $ 34,955
5.625%, 12/12/2014 to 04/25/2019 90,000 161,207
General Electric Capital Corp.
0.981%, 04/07/2014 (P) $ 245,000 246,336
2.375%, 06/30/2015 235,000 243,212
4.625%, 01/07/2021 400,000 453,556
5.300%, 02/11/2021 855,000 989,596
5.875%, 01/14/2038 450,000 544,495
6.875%, 01/10/2039 415,000 561,961
General Shopping Finance, Ltd.
10.000%, 11/09/2015 (Q) 20,000 19,706
10.000%, 11/09/2015 (Q) (S) 200,000 197,062
GMAC International Finance BV
7.500%, 04/21/2015 EUR 100,000 141,123
GTB Finance B.V.
7.500%, 05/19/2016 (S) $ 200,000 217,000
Handelsbanken AB
4.875%, 03/25/2014 EUR 75,000 103,124
Healthcare Realty Trust, Inc.
5.750%, 01/15/2021 $ 150,000 167,847
Hospitality Properties Trust
5.625%, 03/15/2017 225,000 248,935
7.875%, 08/15/2014 65,000 69,562
HSBC Bank Canada
3.558%, 10/04/2017 CAD 35,000 37,259
HSBC Bank PLC
3.875%, 10/24/2018 EUR 100,000 146,962
HSBC Bank USA NA
4.625%, 04/01/2014 $ 100,000 104,681
HSBC Covered Bonds France
3.375%, 01/20/2017 EUR 250,000 357,762
HSBC Holdings PLC
5.100%, 04/05/2021 $ 665,000 789,584
6.250%, 03/19/2018 EUR 50,000 77,368
6.500%, 05/02/2036 $ 50,000 60,480
HSBC Holdings PLC (9.875% to
04/08/2013, then 3 month UK
Gilt + 2.500%)
04/08/2013 (Q) GBP 60,000 98,719
HSBC USA, Inc.
2.375%, 02/13/2015 $ 380,000 391,249
HSBK Europe BV
7.250%, 05/03/2017 100,000 108,500
Hub International, Ltd.
8.125%, 10/15/2018 (S) 300,000 311,250
Hypothekenbank in Essen AG
3.875%, 11/21/2013 EUR 421,000 566,496
Inergy Midstream LP / Finance Corp.
6.000%, 12/15/2020 (S) $ 100,000 101,750
Inter-American Development Bank
4.400%, 01/26/2026 CAD 410,000 472,457
International Bank For Reconstruction &
Development
3.875%, 05/20/2019 EUR 217,000 332,724
International Lease Finance Corp.
4.875%, 04/01/2015 $ 300,000 307,500
6.500%, 09/01/2014 (S) 200,000 213,000
6.625%, 11/15/2013 490,000 508,375
8.250%, 12/15/2020 200,000 232,680
8.875%, 09/01/2017 625,000 725,000
Intesa Sanpaolo SpA
4.000%, 11/08/2018 EUR 200,000 261,385
4.125%, 01/14/2016 100,000 133,832
179
Copyright © 2013 www.secdatabase.com. All Rights Reserved.Please Consider the Environment Before Printing This Document
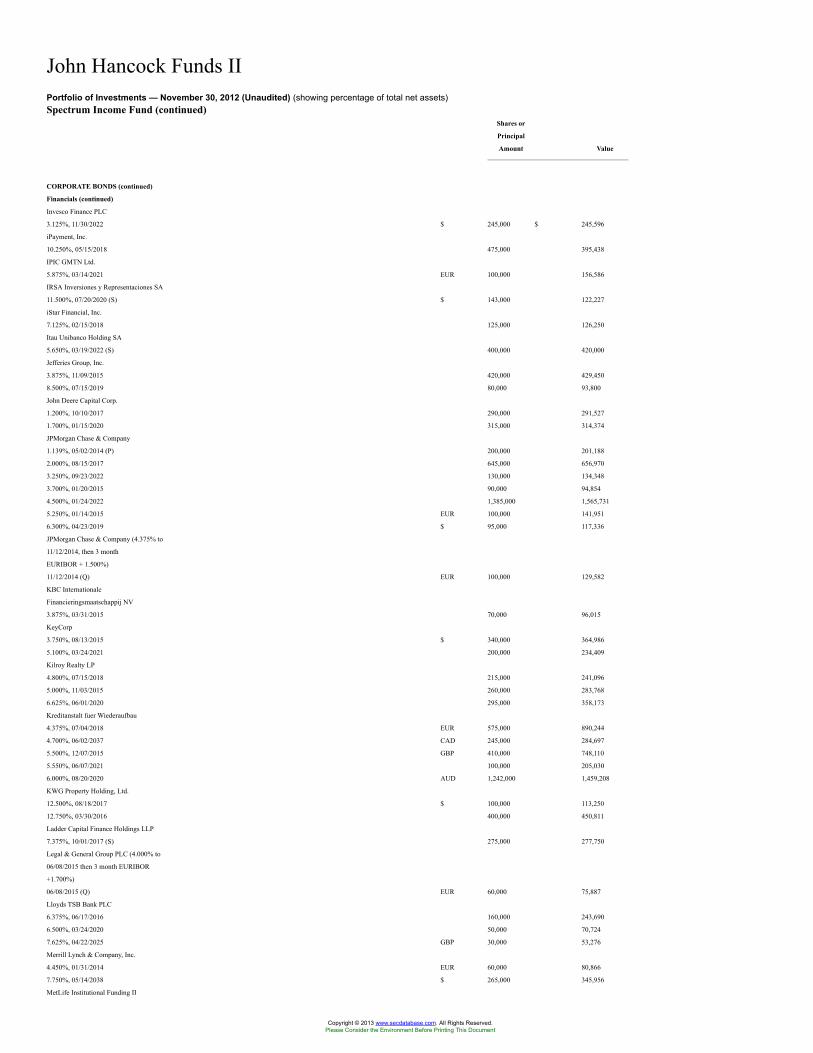
John Hancock Funds IIPortfolio of Investments — November 30, 2012 (Unaudited) (showing percentage of total net assets)Spectrum Income Fund (continued)
Shares or
Principal
Amount Value
CORPORATE BONDS (continued)
Financials (continued)
Invesco Finance PLC
3.125%, 11/30/2022 $ 245,000 $ 245,596
iPayment, Inc.
10.250%, 05/15/2018 475,000 395,438
IPIC GMTN Ltd.
5.875%, 03/14/2021 EUR 100,000 156,586
IRSA Inversiones y Representaciones SA
11.500%, 07/20/2020 (S) $ 143,000 122,227
iStar Financial, Inc.
7.125%, 02/15/2018 125,000 126,250
Itau Unibanco Holding SA
5.650%, 03/19/2022 (S) 400,000 420,000
Jefferies Group, Inc.
3.875%, 11/09/2015 420,000 429,450
8.500%, 07/15/2019 80,000 93,800
John Deere Capital Corp.
1.200%, 10/10/2017 290,000 291,527
1.700%, 01/15/2020 315,000 314,374
JPMorgan Chase & Company
1.139%, 05/02/2014 (P) 200,000 201,188
2.000%, 08/15/2017 645,000 656,970
3.250%, 09/23/2022 130,000 134,348
3.700%, 01/20/2015 90,000 94,854
4.500%, 01/24/2022 1,385,000 1,565,731
5.250%, 01/14/2015 EUR 100,000 141,951
6.300%, 04/23/2019 $ 95,000 117,336
JPMorgan Chase & Company (4.375% to
11/12/2014, then 3 month
EURIBOR + 1.500%)
11/12/2014 (Q) EUR 100,000 129,582
KBC Internationale
Financieringsmaatschappij NV
3.875%, 03/31/2015 70,000 96,015
KeyCorp
3.750%, 08/13/2015 $ 340,000 364,986
5.100%, 03/24/2021 200,000 234,409
Kilroy Realty LP
4.800%, 07/15/2018 215,000 241,096
5.000%, 11/03/2015 260,000 283,768
6.625%, 06/01/2020 295,000 358,173
Kreditanstalt fuer Wiederaufbau
4.375%, 07/04/2018 EUR 575,000 890,244
4.700%, 06/02/2037 CAD 245,000 284,697
5.500%, 12/07/2015 GBP 410,000 748,110
5.550%, 06/07/2021 100,000 205,030
6.000%, 08/20/2020 AUD 1,242,000 1,459,208
KWG Property Holding, Ltd.
12.500%, 08/18/2017 $ 100,000 113,250
12.750%, 03/30/2016 400,000 450,811
Ladder Capital Finance Holdings LLP
7.375%, 10/01/2017 (S) 275,000 277,750
Legal & General Group PLC (4.000% to
06/08/2015 then 3 month EURIBOR
+1.700%)
06/08/2015 (Q) EUR 60,000 75,887
Lloyds TSB Bank PLC
6.375%, 06/17/2016 160,000 243,690
6.500%, 03/24/2020 50,000 70,724
7.625%, 04/22/2025 GBP 30,000 53,276
Merrill Lynch & Company, Inc.
4.450%, 01/31/2014 EUR 60,000 80,866
7.750%, 05/14/2038 $ 265,000 345,956
MetLife Institutional Funding II
Copyright © 2013 www.secdatabase.com. All Rights Reserved.Please Consider the Environment Before Printing This Document
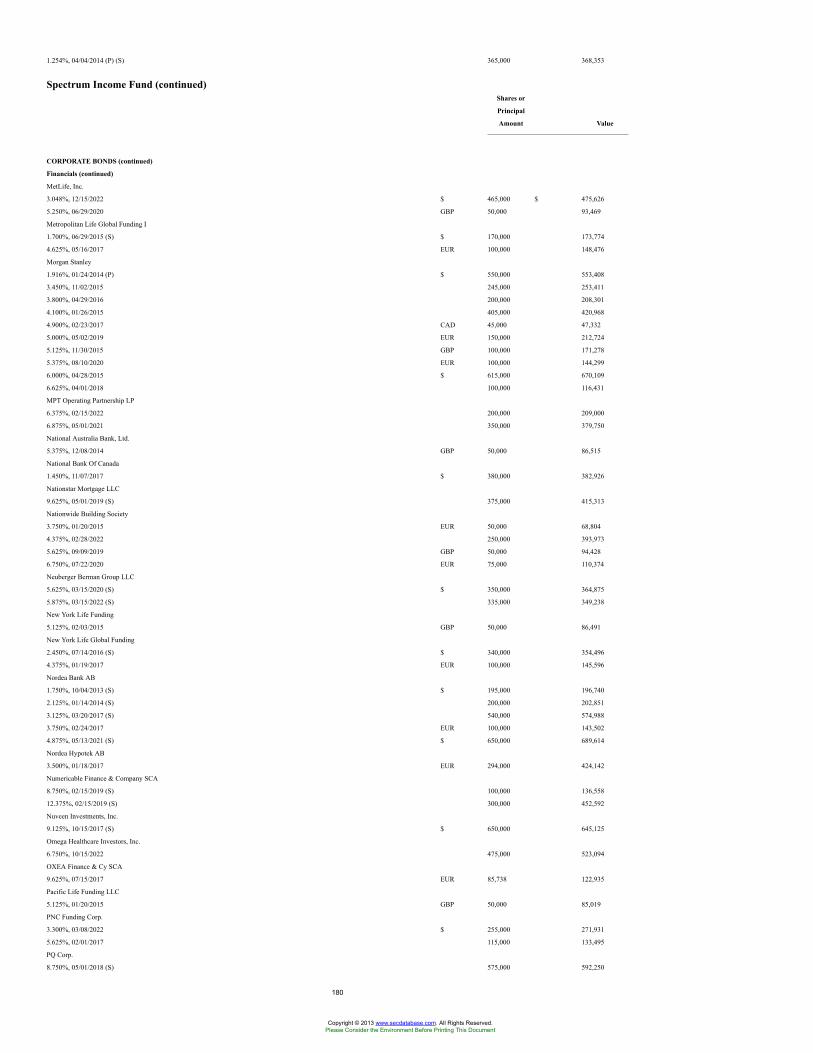
1.254%, 04/04/2014 (P) (S) 365,000 368,353
Spectrum Income Fund (continued)Shares or
Principal
Amount Value
CORPORATE BONDS (continued)
Financials (continued)
MetLife, Inc.
3.048%, 12/15/2022 $ 465,000 $ 475,626
5.250%, 06/29/2020 GBP 50,000 93,469
Metropolitan Life Global Funding I
1.700%, 06/29/2015 (S) $ 170,000 173,774
4.625%, 05/16/2017 EUR 100,000 148,476
Morgan Stanley
1.916%, 01/24/2014 (P) $ 550,000 553,408
3.450%, 11/02/2015 245,000 253,411
3.800%, 04/29/2016 200,000 208,301
4.100%, 01/26/2015 405,000 420,968
4.900%, 02/23/2017 CAD 45,000 47,332
5.000%, 05/02/2019 EUR 150,000 212,724
5.125%, 11/30/2015 GBP 100,000 171,278
5.375%, 08/10/2020 EUR 100,000 144,299
6.000%, 04/28/2015 $ 615,000 670,109
6.625%, 04/01/2018 100,000 116,431
MPT Operating Partnership LP
6.375%, 02/15/2022 200,000 209,000
6.875%, 05/01/2021 350,000 379,750
National Australia Bank, Ltd.
5.375%, 12/08/2014 GBP 50,000 86,515
National Bank Of Canada
1.450%, 11/07/2017 $ 380,000 382,926
Nationstar Mortgage LLC
9.625%, 05/01/2019 (S) 375,000 415,313
Nationwide Building Society
3.750%, 01/20/2015 EUR 50,000 68,804
4.375%, 02/28/2022 250,000 393,973
5.625%, 09/09/2019 GBP 50,000 94,428
6.750%, 07/22/2020 EUR 75,000 110,374
Neuberger Berman Group LLC
5.625%, 03/15/2020 (S) $ 350,000 364,875
5.875%, 03/15/2022 (S) 335,000 349,238
New York Life Funding
5.125%, 02/03/2015 GBP 50,000 86,491
New York Life Global Funding
2.450%, 07/14/2016 (S) $ 340,000 354,496
4.375%, 01/19/2017 EUR 100,000 145,596
Nordea Bank AB
1.750%, 10/04/2013 (S) $ 195,000 196,740
2.125%, 01/14/2014 (S) 200,000 202,851
3.125%, 03/20/2017 (S) 540,000 574,988
3.750%, 02/24/2017 EUR 100,000 143,502
4.875%, 05/13/2021 (S) $ 650,000 689,614
Nordea Hypotek AB
3.500%, 01/18/2017 EUR 294,000 424,142
Numericable Finance & Company SCA
8.750%, 02/15/2019 (S) 100,000 136,558
12.375%, 02/15/2019 (S) 300,000 452,592
Nuveen Investments, Inc.
9.125%, 10/15/2017 (S) $ 650,000 645,125
Omega Healthcare Investors, Inc.
6.750%, 10/15/2022 475,000 523,094
OXEA Finance & Cy SCA
9.625%, 07/15/2017 EUR 85,738 122,935
Pacific Life Funding LLC
5.125%, 01/20/2015 GBP 50,000 85,019
PNC Funding Corp.
3.300%, 03/08/2022 $ 255,000 271,931
5.625%, 02/01/2017 115,000 133,495
PQ Corp.
8.750%, 05/01/2018 (S) 575,000 592,250
180
Copyright © 2013 www.secdatabase.com. All Rights Reserved.Please Consider the Environment Before Printing This Document
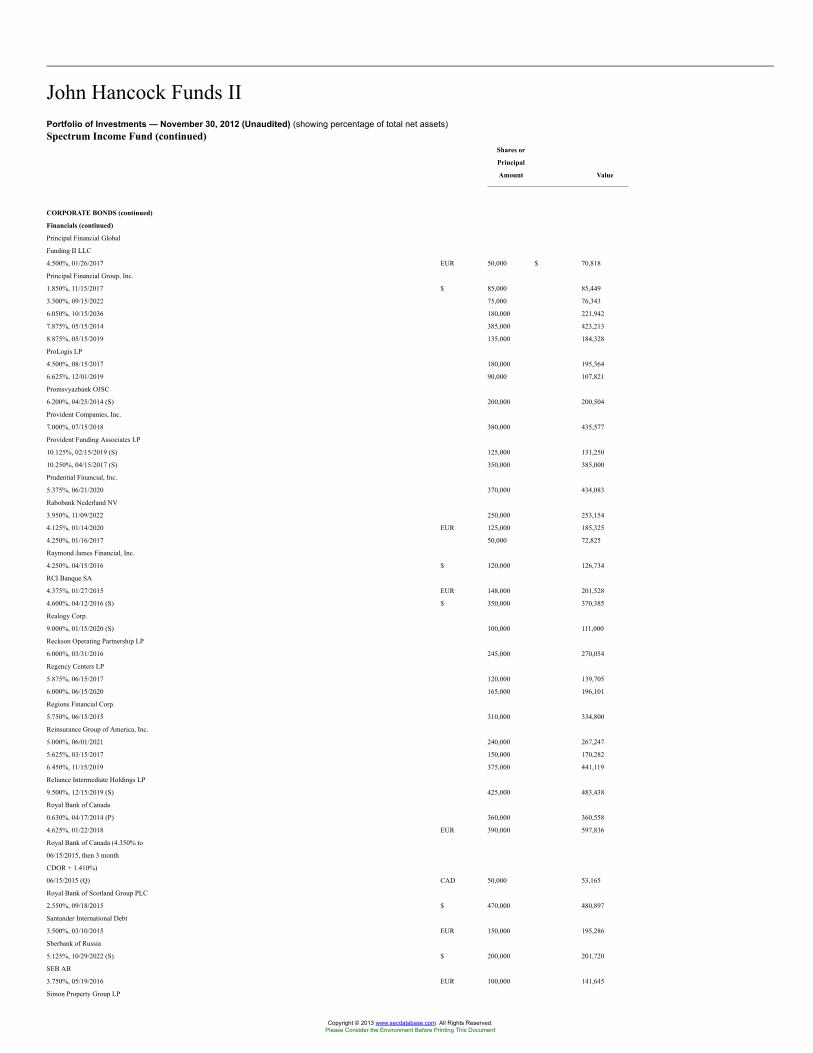
John Hancock Funds IIPortfolio of Investments — November 30, 2012 (Unaudited) (showing percentage of total net assets)Spectrum Income Fund (continued)
Shares or
Principal
Amount Value
CORPORATE BONDS (continued)
Financials (continued)
Principal Financial Global
Funding II LLC
4.500%, 01/26/2017 EUR 50,000 $ 70,818
Principal Financial Group, Inc.
1.850%, 11/15/2017 $ 85,000 85,449
3.300%, 09/15/2022 75,000 76,343
6.050%, 10/15/2036 180,000 221,942
7.875%, 05/15/2014 385,000 423,213
8.875%, 05/15/2019 135,000 184,328
ProLogis LP
4.500%, 08/15/2017 180,000 195,364
6.625%, 12/01/2019 90,000 107,821
Promsvyazbank OJSC
6.200%, 04/25/2014 (S) 200,000 200,504
Provident Companies, Inc.
7.000%, 07/15/2018 380,000 435,577
Provident Funding Associates LP
10.125%, 02/15/2019 (S) 125,000 131,250
10.250%, 04/15/2017 (S) 350,000 385,000
Prudential Financial, Inc.
5.375%, 06/21/2020 370,000 434,083
Rabobank Nederland NV
3.950%, 11/09/2022 250,000 253,154
4.125%, 01/14/2020 EUR 125,000 185,325
4.250%, 01/16/2017 50,000 72,825
Raymond James Financial, Inc.
4.250%, 04/15/2016 $ 120,000 126,734
RCI Banque SA
4.375%, 01/27/2015 EUR 148,000 201,528
4.600%, 04/12/2016 (S) $ 350,000 370,385
Realogy Corp.
9.000%, 01/15/2020 (S) 100,000 111,000
Reckson Operating Partnership LP
6.000%, 03/31/2016 245,000 270,054
Regency Centers LP
5.875%, 06/15/2017 120,000 139,705
6.000%, 06/15/2020 165,000 196,101
Regions Financial Corp.
5.750%, 06/15/2015 310,000 334,800
Reinsurance Group of America, Inc.
5.000%, 06/01/2021 240,000 267,247
5.625%, 03/15/2017 150,000 170,282
6.450%, 11/15/2019 375,000 441,119
Reliance Intermediate Holdings LP
9.500%, 12/15/2019 (S) 425,000 483,438
Royal Bank of Canada
0.630%, 04/17/2014 (P) 360,000 360,558
4.625%, 01/22/2018 EUR 390,000 597,836
Royal Bank of Canada (4.350% to
06/15/2015, then 3 month
CDOR + 1.410%)
06/15/2015 (Q) CAD 50,000 53,165
Royal Bank of Scotland Group PLC
2.550%, 09/18/2015 $ 470,000 480,897
Santander International Debt
3.500%, 03/10/2015 EUR 150,000 195,286
Sberbank of Russia
5.125%, 10/29/2022 (S) $ 200,000 201,720
SEB AB
3.750%, 05/19/2016 EUR 100,000 141,645
Simon Property Group LP
Copyright © 2013 www.secdatabase.com. All Rights Reserved.Please Consider the Environment Before Printing This Document
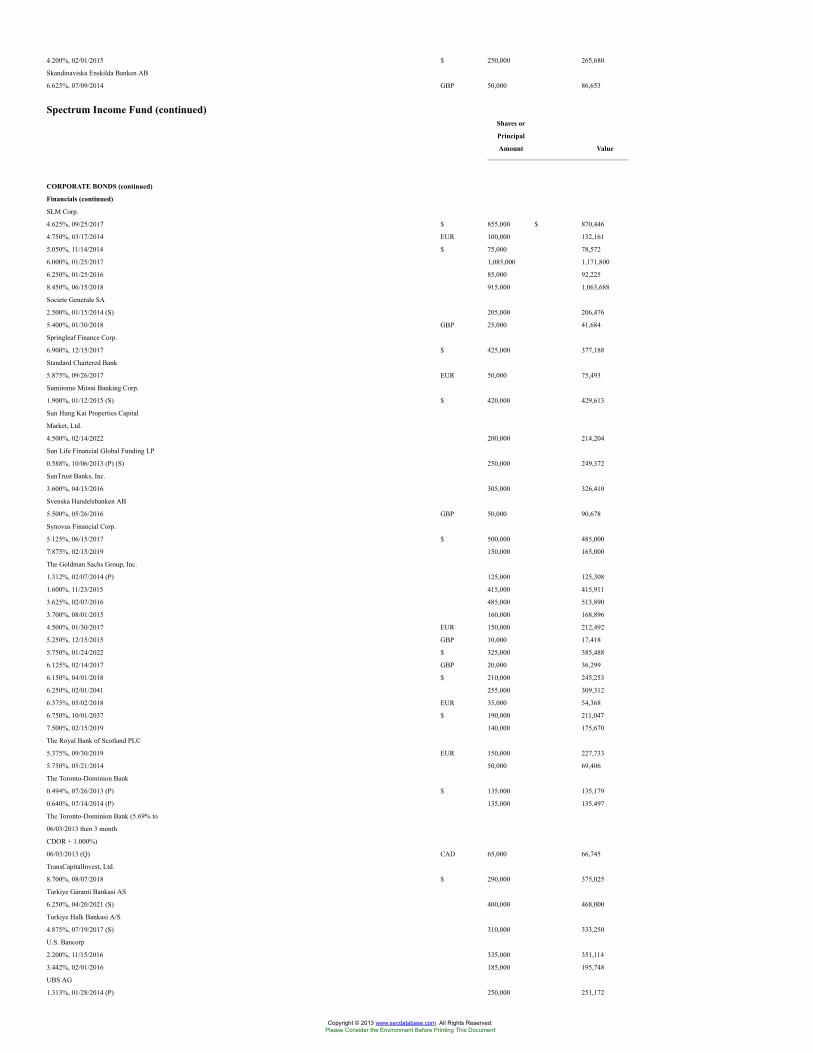
4.200%, 02/01/2015 $ 250,000 265,680
Skandinaviska Enskilda Banken AB
6.625%, 07/09/2014 GBP 50,000 86,653
Spectrum Income Fund (continued)Shares or
Principal
Amount Value
CORPORATE BONDS (continued)
Financials (continued)
SLM Corp.
4.625%, 09/25/2017 $ 855,000 $ 870,446
4.750%, 03/17/2014 EUR 100,000 132,161
5.050%, 11/14/2014 $ 75,000 78,572
6.000%, 01/25/2017 1,085,000 1,171,800
6.250%, 01/25/2016 85,000 92,225
8.450%, 06/15/2018 915,000 1,063,688
Societe Generale SA
2.500%, 01/15/2014 (S) 205,000 206,476
5.400%, 01/30/2018 GBP 25,000 41,684
Springleaf Finance Corp.
6.900%, 12/15/2017 $ 425,000 377,188
Standard Chartered Bank
5.875%, 09/26/2017 EUR 50,000 75,493
Sumitomo Mitsui Banking Corp.
1.900%, 01/12/2015 (S) $ 420,000 429,613
Sun Hung Kai Properties Capital
Market, Ltd.
4.500%, 02/14/2022 200,000 214,204
Sun Life Financial Global Funding LP
0.588%, 10/06/2013 (P) (S) 250,000 249,372
SunTrust Banks, Inc.
3.600%, 04/15/2016 305,000 326,410
Svenska Handelsbanken AB
5.500%, 05/26/2016 GBP 50,000 90,678
Synovus Financial Corp.
5.125%, 06/15/2017 $ 500,000 485,000
7.875%, 02/15/2019 150,000 165,000
The Goldman Sachs Group, Inc.
1.312%, 02/07/2014 (P) 125,000 125,308
1.600%, 11/23/2015 415,000 415,911
3.625%, 02/07/2016 485,000 513,890
3.700%, 08/01/2015 160,000 168,896
4.500%, 01/30/2017 EUR 150,000 212,492
5.250%, 12/15/2015 GBP 10,000 17,418
5.750%, 01/24/2022 $ 325,000 385,488
6.125%, 02/14/2017 GBP 20,000 36,299
6.150%, 04/01/2018 $ 210,000 245,253
6.250%, 02/01/2041 255,000 309,312
6.375%, 05/02/2018 EUR 35,000 54,368
6.750%, 10/01/2037 $ 190,000 211,047
7.500%, 02/15/2019 140,000 175,670
The Royal Bank of Scotland PLC
5.375%, 09/30/2019 EUR 150,000 227,733
5.750%, 05/21/2014 50,000 69,406
The Toronto-Dominion Bank
0.494%, 07/26/2013 (P) $ 135,000 135,179
0.640%, 07/14/2014 (P) 135,000 135,497
The Toronto-Dominion Bank (5.69% to
06/03/2013 then 3 month
CDOR + 1.000%)
06/03/2013 (Q) CAD 65,000 66,745
TransCapitalInvest, Ltd.
8.700%, 08/07/2018 $ 290,000 375,025
Turkiye Garanti Bankasi AS
6.250%, 04/20/2021 (S) 400,000 468,000
Turkiye Halk Bankasi A/S
4.875%, 07/19/2017 (S) 310,000 333,250
U.S. Bancorp
2.200%, 11/15/2016 335,000 351,114
3.442%, 02/01/2016 185,000 195,748
UBS AG
1.313%, 01/28/2014 (P) 250,000 251,172
Copyright © 2013 www.secdatabase.com. All Rights Reserved.Please Consider the Environment Before Printing This Document
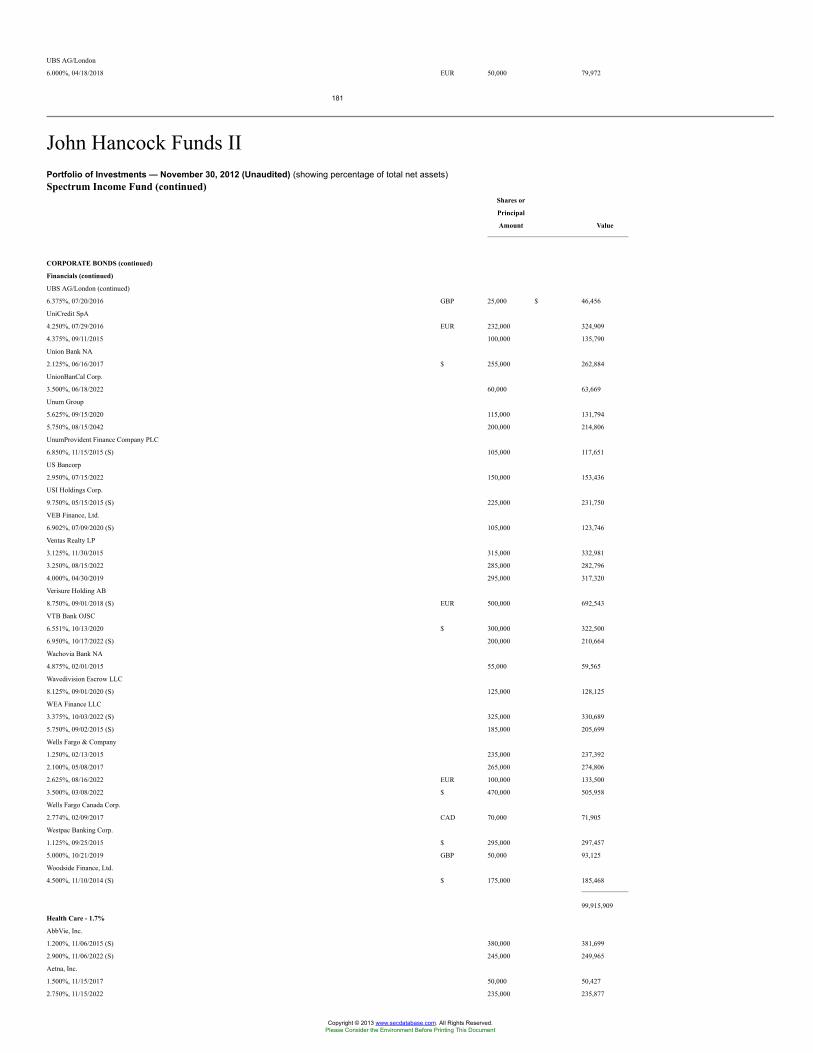
UBS AG/London
6.000%, 04/18/2018 EUR 50,000 79,972
181
John Hancock Funds IIPortfolio of Investments — November 30, 2012 (Unaudited) (showing percentage of total net assets)Spectrum Income Fund (continued)
Shares or
Principal
Amount Value
CORPORATE BONDS (continued)
Financials (continued)
UBS AG/London (continued)
6.375%, 07/20/2016 GBP 25,000 $ 46,456
UniCredit SpA
4.250%, 07/29/2016 EUR 232,000 324,909
4.375%, 09/11/2015 100,000 135,790
Union Bank NA
2.125%, 06/16/2017 $ 255,000 262,884
UnionBanCal Corp.
3.500%, 06/18/2022 60,000 63,669
Unum Group
5.625%, 09/15/2020 115,000 131,794
5.750%, 08/15/2042 200,000 214,806
UnumProvident Finance Company PLC
6.850%, 11/15/2015 (S) 105,000 117,651
US Bancorp
2.950%, 07/15/2022 150,000 153,436
USI Holdings Corp.
9.750%, 05/15/2015 (S) 225,000 231,750
VEB Finance, Ltd.
6.902%, 07/09/2020 (S) 105,000 123,746
Ventas Realty LP
3.125%, 11/30/2015 315,000 332,981
3.250%, 08/15/2022 285,000 282,796
4.000%, 04/30/2019 295,000 317,320
Verisure Holding AB
8.750%, 09/01/2018 (S) EUR 500,000 692,543
VTB Bank OJSC
6.551%, 10/13/2020 $ 300,000 322,500
6.950%, 10/17/2022 (S) 200,000 210,664
Wachovia Bank NA
4.875%, 02/01/2015 55,000 59,565
Wavedivision Escrow LLC
8.125%, 09/01/2020 (S) 125,000 128,125
WEA Finance LLC
3.375%, 10/03/2022 (S) 325,000 330,689
5.750%, 09/02/2015 (S) 185,000 205,699
Wells Fargo & Company
1.250%, 02/13/2015 235,000 237,392
2.100%, 05/08/2017 265,000 274,806
2.625%, 08/16/2022 EUR 100,000 133,500
3.500%, 03/08/2022 $ 470,000 505,958
Wells Fargo Canada Corp.
2.774%, 02/09/2017 CAD 70,000 71,905
Westpac Banking Corp.
1.125%, 09/25/2015 $ 295,000 297,457
5.000%, 10/21/2019 GBP 50,000 93,125
Woodside Finance, Ltd.
4.500%, 11/10/2014 (S) $ 175,000 185,468
99,915,909
Health Care - 1.7%
AbbVie, Inc.
1.200%, 11/06/2015 (S) 380,000 381,699
2.900%, 11/06/2022 (S) 245,000 249,965
Aetna, Inc.
1.500%, 11/15/2017 50,000 50,427
2.750%, 11/15/2022 235,000 235,877
Copyright © 2013 www.secdatabase.com. All Rights Reserved.Please Consider the Environment Before Printing This Document
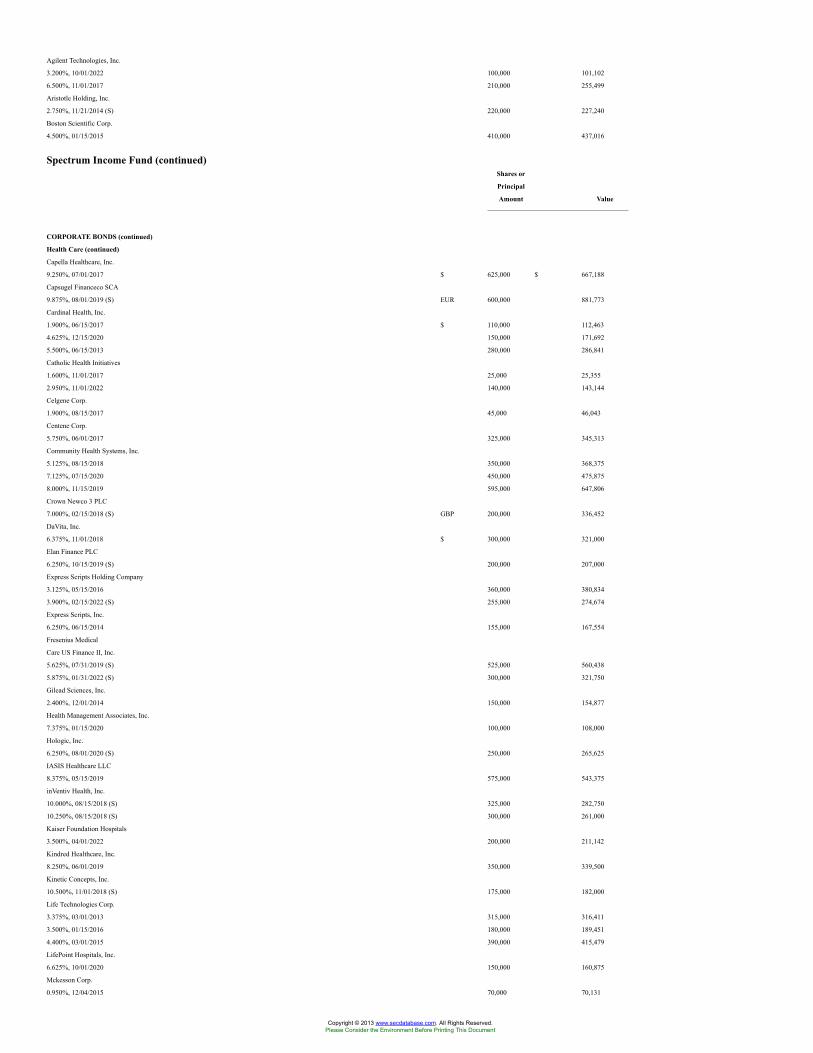
Agilent Technologies, Inc.
3.200%, 10/01/2022 100,000 101,102
6.500%, 11/01/2017 210,000 255,499
Aristotle Holding, Inc.
2.750%, 11/21/2014 (S) 220,000 227,240
Boston Scientific Corp.
4.500%, 01/15/2015 410,000 437,016
Spectrum Income Fund (continued)Shares or
Principal
Amount Value
CORPORATE BONDS (continued)
Health Care (continued)
Capella Healthcare, Inc.
9.250%, 07/01/2017 $ 625,000 $ 667,188
Capsugel Financeco SCA
9.875%, 08/01/2019 (S) EUR 600,000 881,773
Cardinal Health, Inc.
1.900%, 06/15/2017 $ 110,000 112,463
4.625%, 12/15/2020 150,000 171,692
5.500%, 06/15/2013 280,000 286,841
Catholic Health Initiatives
1.600%, 11/01/2017 25,000 25,355
2.950%, 11/01/2022 140,000 143,144
Celgene Corp.
1.900%, 08/15/2017 45,000 46,043
Centene Corp.
5.750%, 06/01/2017 325,000 345,313
Community Health Systems, Inc.
5.125%, 08/15/2018 350,000 368,375
7.125%, 07/15/2020 450,000 475,875
8.000%, 11/15/2019 595,000 647,806
Crown Newco 3 PLC
7.000%, 02/15/2018 (S) GBP 200,000 336,452
DaVita, Inc.
6.375%, 11/01/2018 $ 300,000 321,000
Elan Finance PLC
6.250%, 10/15/2019 (S) 200,000 207,000
Express Scripts Holding Company
3.125%, 05/15/2016 360,000 380,834
3.900%, 02/15/2022 (S) 255,000 274,674
Express Scripts, Inc.
6.250%, 06/15/2014 155,000 167,554
Fresenius Medical
Care US Finance II, Inc.
5.625%, 07/31/2019 (S) 525,000 560,438
5.875%, 01/31/2022 (S) 300,000 321,750
Gilead Sciences, Inc.
2.400%, 12/01/2014 150,000 154,877
Health Management Associates, Inc.
7.375%, 01/15/2020 100,000 108,000
Hologic, Inc.
6.250%, 08/01/2020 (S) 250,000 265,625
IASIS Healthcare LLC
8.375%, 05/15/2019 575,000 543,375
inVentiv Health, Inc.
10.000%, 08/15/2018 (S) 325,000 282,750
10.250%, 08/15/2018 (S) 300,000 261,000
Kaiser Foundation Hospitals
3.500%, 04/01/2022 200,000 211,142
Kindred Healthcare, Inc.
8.250%, 06/01/2019 350,000 339,500
Kinetic Concepts, Inc.
10.500%, 11/01/2018 (S) 175,000 182,000
Life Technologies Corp.
3.375%, 03/01/2013 315,000 316,411
3.500%, 01/15/2016 180,000 189,451
4.400%, 03/01/2015 390,000 415,479
LifePoint Hospitals, Inc.
6.625%, 10/01/2020 150,000 160,875
Mckesson Corp.
0.950%, 12/04/2015 70,000 70,131
Copyright © 2013 www.secdatabase.com. All Rights Reserved.Please Consider the Environment Before Printing This Document
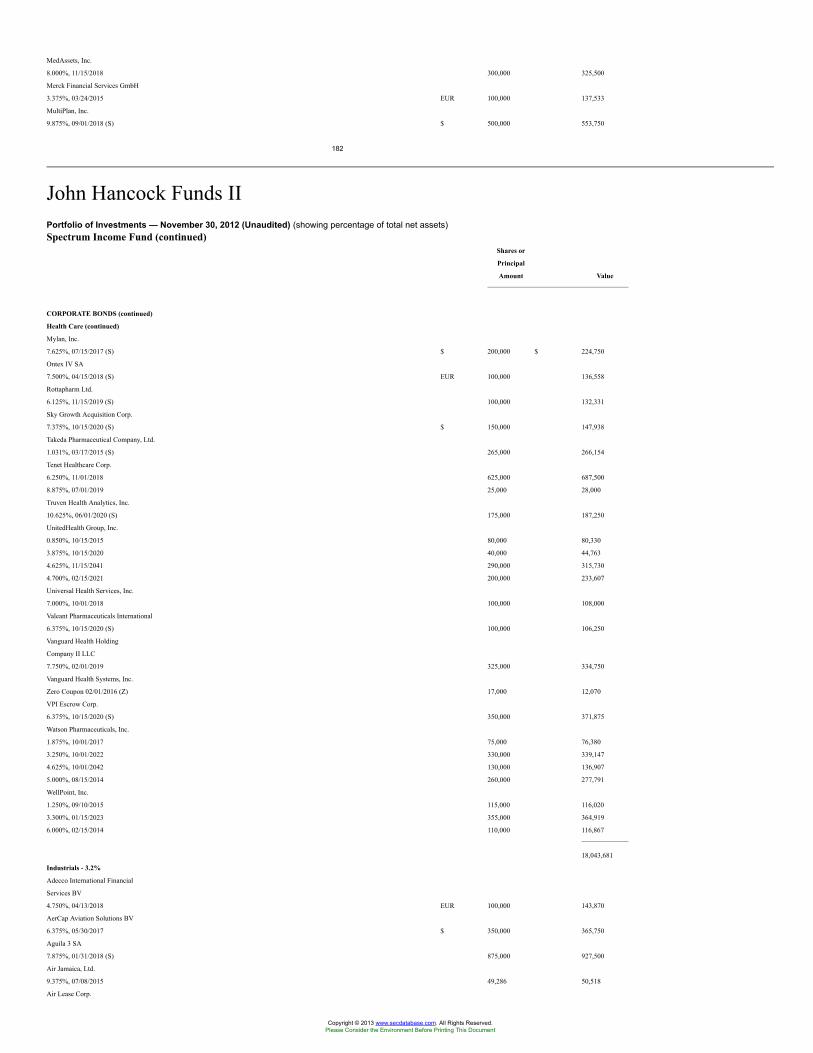
MedAssets, Inc.
8.000%, 11/15/2018 300,000 325,500
Merck Financial Services GmbH
3.375%, 03/24/2015 EUR 100,000 137,533
MultiPlan, Inc.
9.875%, 09/01/2018 (S) $ 500,000 553,750
182
John Hancock Funds IIPortfolio of Investments — November 30, 2012 (Unaudited) (showing percentage of total net assets)Spectrum Income Fund (continued)
Shares or
Principal
Amount Value
CORPORATE BONDS (continued)
Health Care (continued)
Mylan, Inc.
7.625%, 07/15/2017 (S) $ 200,000 $ 224,750
Ontex IV SA
7.500%, 04/15/2018 (S) EUR 100,000 136,558
Rottapharm Ltd.
6.125%, 11/15/2019 (S) 100,000 132,331
Sky Growth Acquisition Corp.
7.375%, 10/15/2020 (S) $ 150,000 147,938
Takeda Pharmaceutical Company, Ltd.
1.031%, 03/17/2015 (S) 265,000 266,154
Tenet Healthcare Corp.
6.250%, 11/01/2018 625,000 687,500
8.875%, 07/01/2019 25,000 28,000
Truven Health Analytics, Inc.
10.625%, 06/01/2020 (S) 175,000 187,250
UnitedHealth Group, Inc.
0.850%, 10/15/2015 80,000 80,330
3.875%, 10/15/2020 40,000 44,763
4.625%, 11/15/2041 290,000 315,730
4.700%, 02/15/2021 200,000 233,607
Universal Health Services, Inc.
7.000%, 10/01/2018 100,000 108,000
Valeant Pharmaceuticals International
6.375%, 10/15/2020 (S) 100,000 106,250
Vanguard Health Holding
Company II LLC
7.750%, 02/01/2019 325,000 334,750
Vanguard Health Systems, Inc.
Zero Coupon 02/01/2016 (Z) 17,000 12,070
VPI Escrow Corp.
6.375%, 10/15/2020 (S) 350,000 371,875
Watson Pharmaceuticals, Inc.
1.875%, 10/01/2017 75,000 76,380
3.250%, 10/01/2022 330,000 339,147
4.625%, 10/01/2042 130,000 136,907
5.000%, 08/15/2014 260,000 277,791
WellPoint, Inc.
1.250%, 09/10/2015 115,000 116,020
3.300%, 01/15/2023 355,000 364,919
6.000%, 02/15/2014 110,000 116,867
18,043,681
Industrials - 3.2%
Adecco International Financial
Services BV
4.750%, 04/13/2018 EUR 100,000 143,870
AerCap Aviation Solutions BV
6.375%, 05/30/2017 $ 350,000 365,750
Aguila 3 SA
7.875%, 01/31/2018 (S) 875,000 927,500
Air Jamaica, Ltd.
9.375%, 07/08/2015 49,286 50,518
Air Lease Corp.
Copyright © 2013 www.secdatabase.com. All Rights Reserved.Please Consider the Environment Before Printing This Document
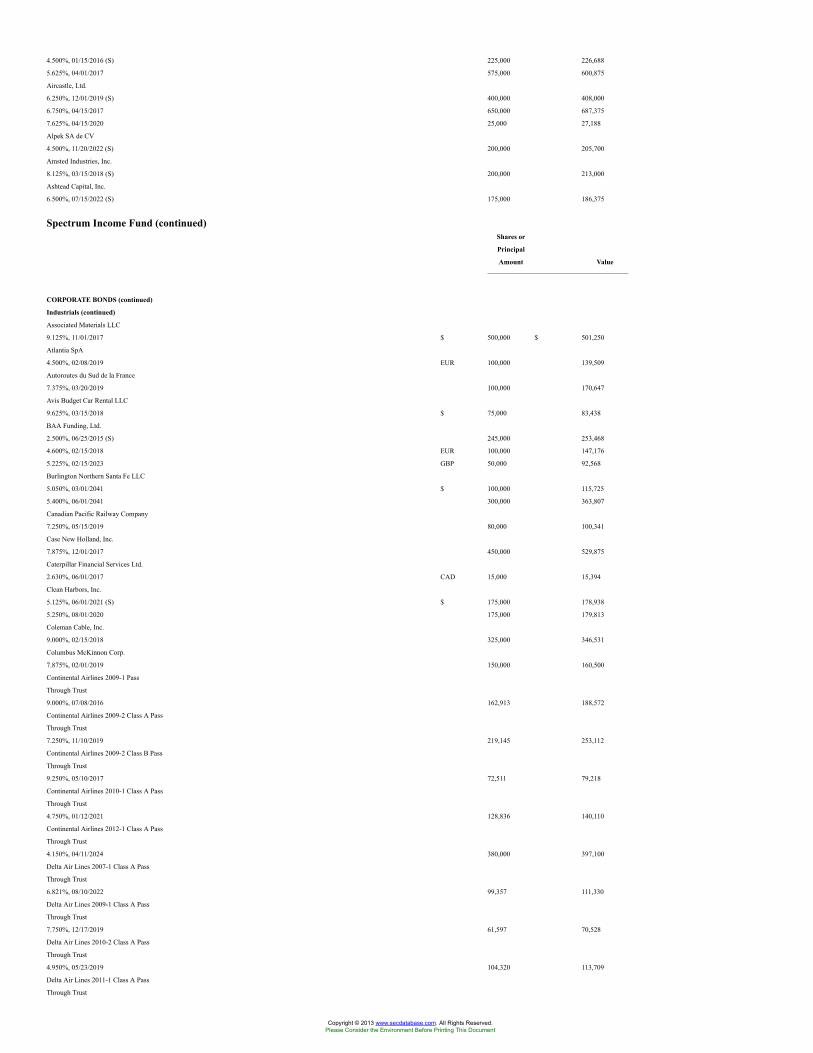
4.500%, 01/15/2016 (S) 225,000 226,688
5.625%, 04/01/2017 575,000 600,875
Aircastle, Ltd.
6.250%, 12/01/2019 (S) 400,000 408,000
6.750%, 04/15/2017 650,000 687,375
7.625%, 04/15/2020 25,000 27,188
Alpek SA de CV
4.500%, 11/20/2022 (S) 200,000 205,700
Amsted Industries, Inc.
8.125%, 03/15/2018 (S) 200,000 213,000
Ashtead Capital, Inc.
6.500%, 07/15/2022 (S) 175,000 186,375
Spectrum Income Fund (continued)Shares or
Principal
Amount Value
CORPORATE BONDS (continued)
Industrials (continued)
Associated Materials LLC
9.125%, 11/01/2017 $ 500,000 $ 501,250
Atlantia SpA
4.500%, 02/08/2019 EUR 100,000 139,509
Autoroutes du Sud de la France
7.375%, 03/20/2019 100,000 170,647
Avis Budget Car Rental LLC
9.625%, 03/15/2018 $ 75,000 83,438
BAA Funding, Ltd.
2.500%, 06/25/2015 (S) 245,000 253,468
4.600%, 02/15/2018 EUR 100,000 147,176
5.225%, 02/15/2023 GBP 50,000 92,568
Burlington Northern Santa Fe LLC
5.050%, 03/01/2041 $ 100,000 115,725
5.400%, 06/01/2041 300,000 363,807
Canadian Pacific Railway Company
7.250%, 05/15/2019 80,000 100,341
Case New Holland, Inc.
7.875%, 12/01/2017 450,000 529,875
Caterpillar Financial Services Ltd.
2.630%, 06/01/2017 CAD 15,000 15,394
Clean Harbors, Inc.
5.125%, 06/01/2021 (S) $ 175,000 178,938
5.250%, 08/01/2020 175,000 179,813
Coleman Cable, Inc.
9.000%, 02/15/2018 325,000 346,531
Columbus McKinnon Corp.
7.875%, 02/01/2019 150,000 160,500
Continental Airlines 2009-1 Pass
Through Trust
9.000%, 07/08/2016 162,913 188,572
Continental Airlines 2009-2 Class A Pass
Through Trust
7.250%, 11/10/2019 219,145 253,112
Continental Airlines 2009-2 Class B Pass
Through Trust
9.250%, 05/10/2017 72,511 79,218
Continental Airlines 2010-1 Class A Pass
Through Trust
4.750%, 01/12/2021 128,836 140,110
Continental Airlines 2012-1 Class A Pass
Through Trust
4.150%, 04/11/2024 380,000 397,100
Delta Air Lines 2007-1 Class A Pass
Through Trust
6.821%, 08/10/2022 99,357 111,330
Delta Air Lines 2009-1 Class A Pass
Through Trust
7.750%, 12/17/2019 61,597 70,528
Delta Air Lines 2010-2 Class A Pass
Through Trust
4.950%, 05/23/2019 104,320 113,709
Delta Air Lines 2011-1 Class A Pass
Through Trust
Copyright © 2013 www.secdatabase.com. All Rights Reserved.Please Consider the Environment Before Printing This Document
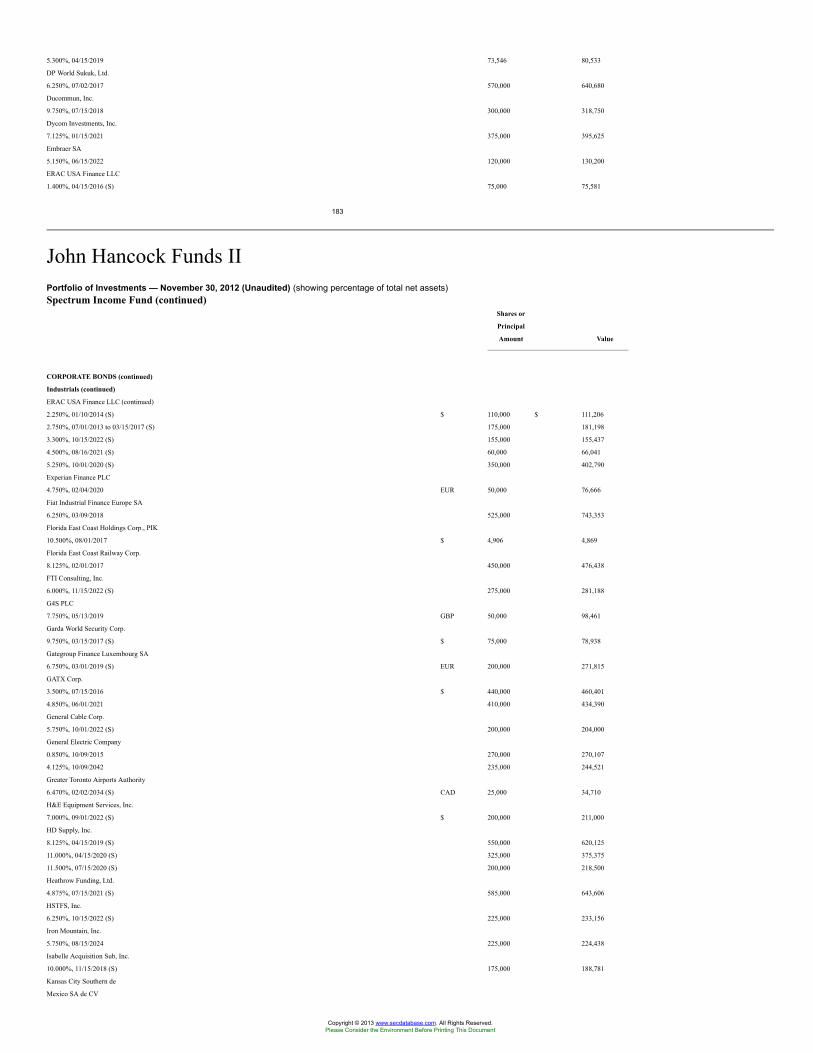
5.300%, 04/15/2019 73,546 80,533
DP World Sukuk, Ltd.
6.250%, 07/02/2017 570,000 640,680
Ducommun, Inc.
9.750%, 07/15/2018 300,000 318,750
Dycom Investments, Inc.
7.125%, 01/15/2021 375,000 395,625
Embraer SA
5.150%, 06/15/2022 120,000 130,200
ERAC USA Finance LLC
1.400%, 04/15/2016 (S) 75,000 75,581
183
John Hancock Funds IIPortfolio of Investments — November 30, 2012 (Unaudited) (showing percentage of total net assets)Spectrum Income Fund (continued)
Shares or
Principal
Amount Value
CORPORATE BONDS (continued)
Industrials (continued)
ERAC USA Finance LLC (continued)
2.250%, 01/10/2014 (S) $ 110,000 $ 111,206
2.750%, 07/01/2013 to 03/15/2017 (S) 175,000 181,198
3.300%, 10/15/2022 (S) 155,000 155,437
4.500%, 08/16/2021 (S) 60,000 66,041
5.250%, 10/01/2020 (S) 350,000 402,790
Experian Finance PLC
4.750%, 02/04/2020 EUR 50,000 76,666
Fiat Industrial Finance Europe SA
6.250%, 03/09/2018 525,000 743,353
Florida East Coast Holdings Corp., PIK
10.500%, 08/01/2017 $ 4,906 4,869
Florida East Coast Railway Corp.
8.125%, 02/01/2017 450,000 476,438
FTI Consulting, Inc.
6.000%, 11/15/2022 (S) 275,000 281,188
G4S PLC
7.750%, 05/13/2019 GBP 50,000 98,461
Garda World Security Corp.
9.750%, 03/15/2017 (S) $ 75,000 78,938
Gategroup Finance Luxembourg SA
6.750%, 03/01/2019 (S) EUR 200,000 271,815
GATX Corp.
3.500%, 07/15/2016 $ 440,000 460,401
4.850%, 06/01/2021 410,000 434,390
General Cable Corp.
5.750%, 10/01/2022 (S) 200,000 204,000
General Electric Company
0.850%, 10/09/2015 270,000 270,107
4.125%, 10/09/2042 235,000 244,521
Greater Toronto Airports Authority
6.470%, 02/02/2034 (S) CAD 25,000 34,710
H&E Equipment Services, Inc.
7.000%, 09/01/2022 (S) $ 200,000 211,000
HD Supply, Inc.
8.125%, 04/15/2019 (S) 550,000 620,125
11.000%, 04/15/2020 (S) 325,000 375,375
11.500%, 07/15/2020 (S) 200,000 218,500
Heathrow Funding, Ltd.
4.875%, 07/15/2021 (S) 585,000 643,606
HSTFS, Inc.
6.250%, 10/15/2022 (S) 225,000 233,156
Iron Mountain, Inc.
5.750%, 08/15/2024 225,000 224,438
Isabelle Acquisition Sub, Inc.
10.000%, 11/15/2018 (S) 175,000 188,781
Kansas City Southern de
Mexico SA de CV
Copyright © 2013 www.secdatabase.com. All Rights Reserved.Please Consider the Environment Before Printing This Document
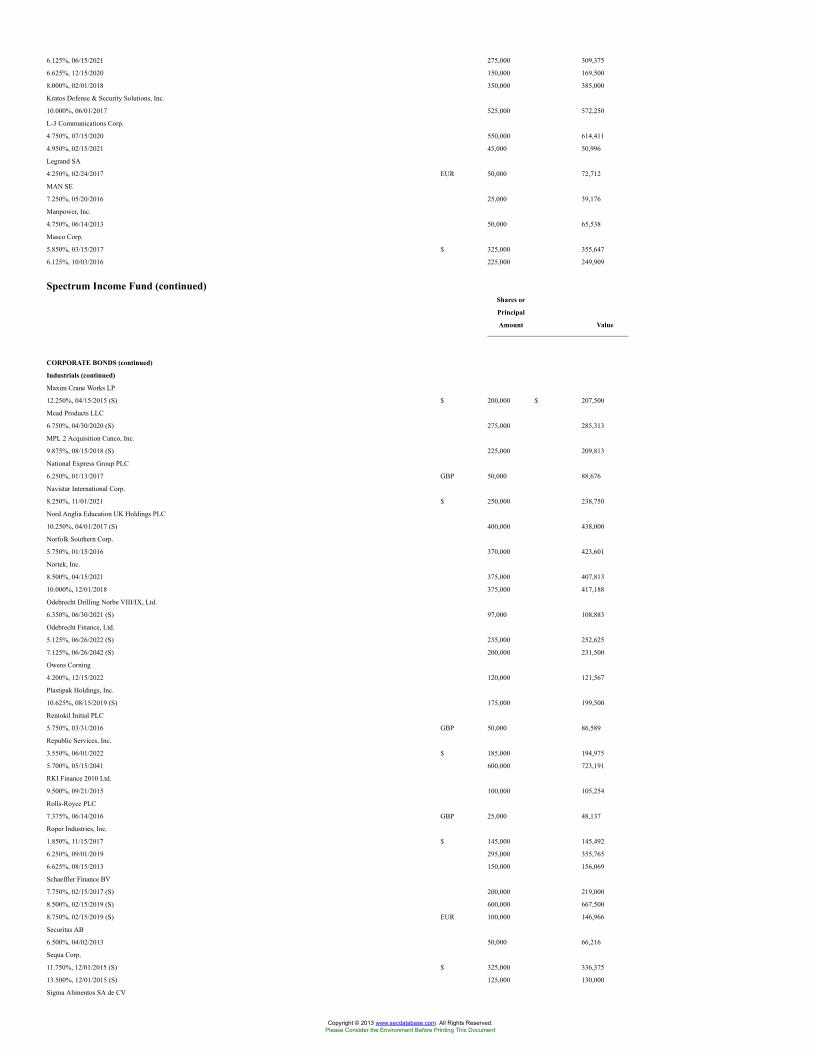
6.125%, 06/15/2021 275,000 309,375
6.625%, 12/15/2020 150,000 169,500
8.000%, 02/01/2018 350,000 385,000
Kratos Defense & Security Solutions, Inc.
10.000%, 06/01/2017 525,000 572,250
L-3 Communications Corp.
4.750%, 07/15/2020 550,000 614,411
4.950%, 02/15/2021 45,000 50,996
Legrand SA
4.250%, 02/24/2017 EUR 50,000 72,712
MAN SE
7.250%, 05/20/2016 25,000 39,176
Manpower, Inc.
4.750%, 06/14/2013 50,000 65,538
Masco Corp.
5.850%, 03/15/2017 $ 325,000 355,647
6.125%, 10/03/2016 225,000 249,909
Spectrum Income Fund (continued)Shares or
Principal
Amount Value
CORPORATE BONDS (continued)
Industrials (continued)
Maxim Crane Works LP
12.250%, 04/15/2015 (S) $ 200,000 $ 207,500
Mead Products LLC
6.750%, 04/30/2020 (S) 275,000 285,313
MPL 2 Acquisition Canco, Inc.
9.875%, 08/15/2018 (S) 225,000 209,813
National Express Group PLC
6.250%, 01/13/2017 GBP 50,000 88,676
Navistar International Corp.
8.250%, 11/01/2021 $ 250,000 238,750
Nord Anglia Education UK Holdings PLC
10.250%, 04/01/2017 (S) 400,000 438,000
Norfolk Southern Corp.
5.750%, 01/15/2016 370,000 423,601
Nortek, Inc.
8.500%, 04/15/2021 375,000 407,813
10.000%, 12/01/2018 375,000 417,188
Odebrecht Drilling Norbe VIII/IX, Ltd.
6.350%, 06/30/2021 (S) 97,000 108,883
Odebrecht Finance, Ltd.
5.125%, 06/26/2022 (S) 235,000 252,625
7.125%, 06/26/2042 (S) 200,000 231,500
Owens Corning
4.200%, 12/15/2022 120,000 121,567
Plastipak Holdings, Inc.
10.625%, 08/15/2019 (S) 175,000 199,500
Rentokil Initial PLC
5.750%, 03/31/2016 GBP 50,000 86,589
Republic Services, Inc.
3.550%, 06/01/2022 $ 185,000 194,975
5.700%, 05/15/2041 600,000 723,191
RKI Finance 2010 Ltd.
9.500%, 09/21/2015 100,000 105,254
Rolls-Royce PLC
7.375%, 06/14/2016 GBP 25,000 48,137
Roper Industries, Inc.
1.850%, 11/15/2017 $ 145,000 145,492
6.250%, 09/01/2019 295,000 355,765
6.625%, 08/15/2013 150,000 156,069
Schaeffler Finance BV
7.750%, 02/15/2017 (S) 200,000 219,000
8.500%, 02/15/2019 (S) 600,000 667,500
8.750%, 02/15/2019 (S) EUR 100,000 146,966
Securitas AB
6.500%, 04/02/2013 50,000 66,216
Sequa Corp.
11.750%, 12/01/2015 (S) $ 325,000 336,375
13.500%, 12/01/2015 (S) 125,000 130,000
Sigma Alimentos SA de CV
Copyright © 2013 www.secdatabase.com. All Rights Reserved.Please Consider the Environment Before Printing This Document
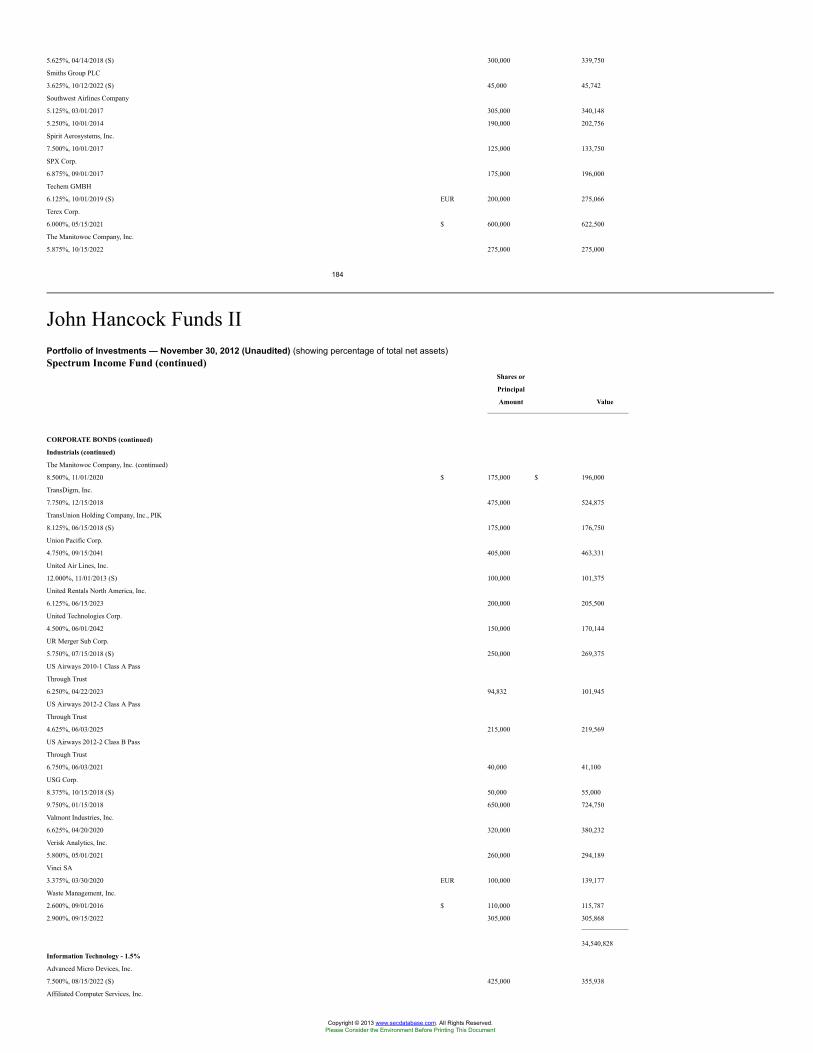
5.625%, 04/14/2018 (S) 300,000 339,750
Smiths Group PLC
3.625%, 10/12/2022 (S) 45,000 45,742
Southwest Airlines Company
5.125%, 03/01/2017 305,000 340,148
5.250%, 10/01/2014 190,000 202,756
Spirit Aerosystems, Inc.
7.500%, 10/01/2017 125,000 133,750
SPX Corp.
6.875%, 09/01/2017 175,000 196,000
Techem GMBH
6.125%, 10/01/2019 (S) EUR 200,000 275,066
Terex Corp.
6.000%, 05/15/2021 $ 600,000 622,500
The Manitowoc Company, Inc.
5.875%, 10/15/2022 275,000 275,000
184
John Hancock Funds IIPortfolio of Investments — November 30, 2012 (Unaudited) (showing percentage of total net assets)Spectrum Income Fund (continued)
Shares or
Principal
Amount Value
CORPORATE BONDS (continued)
Industrials (continued)
The Manitowoc Company, Inc. (continued)
8.500%, 11/01/2020 $ 175,000 $ 196,000
TransDigm, Inc.
7.750%, 12/15/2018 475,000 524,875
TransUnion Holding Company, Inc., PIK
8.125%, 06/15/2018 (S) 175,000 176,750
Union Pacific Corp.
4.750%, 09/15/2041 405,000 463,331
United Air Lines, Inc.
12.000%, 11/01/2013 (S) 100,000 101,375
United Rentals North America, Inc.
6.125%, 06/15/2023 200,000 205,500
United Technologies Corp.
4.500%, 06/01/2042 150,000 170,144
UR Merger Sub Corp.
5.750%, 07/15/2018 (S) 250,000 269,375
US Airways 2010-1 Class A Pass
Through Trust
6.250%, 04/22/2023 94,832 101,945
US Airways 2012-2 Class A Pass
Through Trust
4.625%, 06/03/2025 215,000 219,569
US Airways 2012-2 Class B Pass
Through Trust
6.750%, 06/03/2021 40,000 41,100
USG Corp.
8.375%, 10/15/2018 (S) 50,000 55,000
9.750%, 01/15/2018 650,000 724,750
Valmont Industries, Inc.
6.625%, 04/20/2020 320,000 380,232
Verisk Analytics, Inc.
5.800%, 05/01/2021 260,000 294,189
Vinci SA
3.375%, 03/30/2020 EUR 100,000 139,177
Waste Management, Inc.
2.600%, 09/01/2016 $ 110,000 115,787
2.900%, 09/15/2022 305,000 305,868
34,540,828
Information Technology - 1.5%
Advanced Micro Devices, Inc.
7.500%, 08/15/2022 (S) 425,000 355,938
Affiliated Computer Services, Inc.
Copyright © 2013 www.secdatabase.com. All Rights Reserved.Please Consider the Environment Before Printing This Document
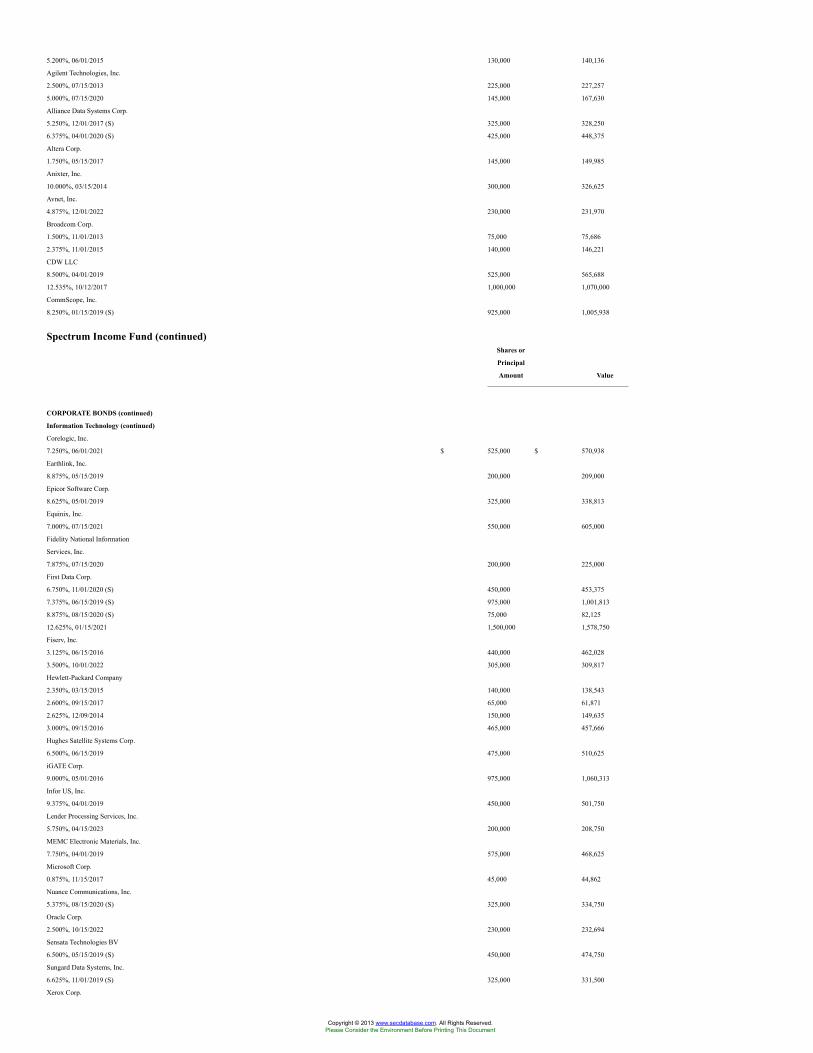
5.200%, 06/01/2015 130,000 140,136
Agilent Technologies, Inc.
2.500%, 07/15/2013 225,000 227,257
5.000%, 07/15/2020 145,000 167,630
Alliance Data Systems Corp.
5.250%, 12/01/2017 (S) 325,000 328,250
6.375%, 04/01/2020 (S) 425,000 448,375
Altera Corp.
1.750%, 05/15/2017 145,000 149,985
Anixter, Inc.
10.000%, 03/15/2014 300,000 326,625
Avnet, Inc.
4.875%, 12/01/2022 230,000 231,970
Broadcom Corp.
1.500%, 11/01/2013 75,000 75,686
2.375%, 11/01/2015 140,000 146,221
CDW LLC
8.500%, 04/01/2019 525,000 565,688
12.535%, 10/12/2017 1,000,000 1,070,000
CommScope, Inc.
8.250%, 01/15/2019 (S) 925,000 1,005,938
Spectrum Income Fund (continued)Shares or
Principal
Amount Value
CORPORATE BONDS (continued)
Information Technology (continued)
Corelogic, Inc.
7.250%, 06/01/2021 $ 525,000 $ 570,938
Earthlink, Inc.
8.875%, 05/15/2019 200,000 209,000
Epicor Software Corp.
8.625%, 05/01/2019 325,000 338,813
Equinix, Inc.
7.000%, 07/15/2021 550,000 605,000
Fidelity National Information
Services, Inc.
7.875%, 07/15/2020 200,000 225,000
First Data Corp.
6.750%, 11/01/2020 (S) 450,000 453,375
7.375%, 06/15/2019 (S) 975,000 1,001,813
8.875%, 08/15/2020 (S) 75,000 82,125
12.625%, 01/15/2021 1,500,000 1,578,750
Fiserv, Inc.
3.125%, 06/15/2016 440,000 462,028
3.500%, 10/01/2022 305,000 309,817
Hewlett-Packard Company
2.350%, 03/15/2015 140,000 138,543
2.600%, 09/15/2017 65,000 61,871
2.625%, 12/09/2014 150,000 149,635
3.000%, 09/15/2016 465,000 457,666
Hughes Satellite Systems Corp.
6.500%, 06/15/2019 475,000 510,625
iGATE Corp.
9.000%, 05/01/2016 975,000 1,060,313
Infor US, Inc.
9.375%, 04/01/2019 450,000 501,750
Lender Processing Services, Inc.
5.750%, 04/15/2023 200,000 208,750
MEMC Electronic Materials, Inc.
7.750%, 04/01/2019 575,000 468,625
Microsoft Corp.
0.875%, 11/15/2017 45,000 44,862
Nuance Communications, Inc.
5.375%, 08/15/2020 (S) 325,000 334,750
Oracle Corp.
2.500%, 10/15/2022 230,000 232,694
Sensata Technologies BV
6.500%, 05/15/2019 (S) 450,000 474,750
Sungard Data Systems, Inc.
6.625%, 11/01/2019 (S) 325,000 331,500
Xerox Corp.
Copyright © 2013 www.secdatabase.com. All Rights Reserved.Please Consider the Environment Before Printing This Document
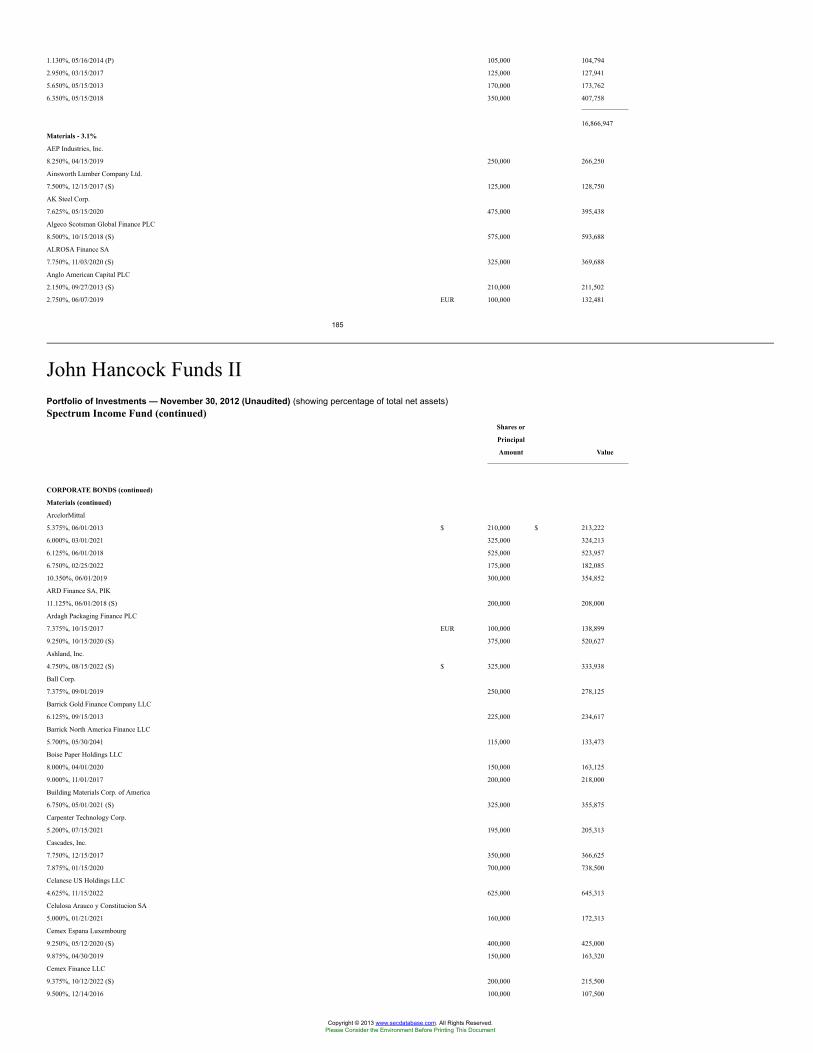
1.130%, 05/16/2014 (P) 105,000 104,794
2.950%, 03/15/2017 125,000 127,941
5.650%, 05/15/2013 170,000 173,762
6.350%, 05/15/2018 350,000 407,758
16,866,947
Materials - 3.1%
AEP Industries, Inc.
8.250%, 04/15/2019 250,000 266,250
Ainsworth Lumber Company Ltd.
7.500%, 12/15/2017 (S) 125,000 128,750
AK Steel Corp.
7.625%, 05/15/2020 475,000 395,438
Algeco Scotsman Global Finance PLC
8.500%, 10/15/2018 (S) 575,000 593,688
ALROSA Finance SA
7.750%, 11/03/2020 (S) 325,000 369,688
Anglo American Capital PLC
2.150%, 09/27/2013 (S) 210,000 211,502
2.750%, 06/07/2019 EUR 100,000 132,481
185
John Hancock Funds IIPortfolio of Investments — November 30, 2012 (Unaudited) (showing percentage of total net assets)Spectrum Income Fund (continued)
Shares or
Principal
Amount Value
CORPORATE BONDS (continued)
Materials (continued)
ArcelorMittal
5.375%, 06/01/2013 $ 210,000 $ 213,222
6.000%, 03/01/2021 325,000 324,213
6.125%, 06/01/2018 525,000 523,957
6.750%, 02/25/2022 175,000 182,085
10.350%, 06/01/2019 300,000 354,852
ARD Finance SA, PIK
11.125%, 06/01/2018 (S) 200,000 208,000
Ardagh Packaging Finance PLC
7.375%, 10/15/2017 EUR 100,000 138,899
9.250%, 10/15/2020 (S) 375,000 520,627
Ashland, Inc.
4.750%, 08/15/2022 (S) $ 325,000 333,938
Ball Corp.
7.375%, 09/01/2019 250,000 278,125
Barrick Gold Finance Company LLC
6.125%, 09/15/2013 225,000 234,617
Barrick North America Finance LLC
5.700%, 05/30/2041 115,000 133,473
Boise Paper Holdings LLC
8.000%, 04/01/2020 150,000 163,125
9.000%, 11/01/2017 200,000 218,000
Building Materials Corp. of America
6.750%, 05/01/2021 (S) 325,000 355,875
Carpenter Technology Corp.
5.200%, 07/15/2021 195,000 205,313
Cascades, Inc.
7.750%, 12/15/2017 350,000 366,625
7.875%, 01/15/2020 700,000 738,500
Celanese US Holdings LLC
4.625%, 11/15/2022 625,000 645,313
Celulosa Arauco y Constitucion SA
5.000%, 01/21/2021 160,000 172,313
Cemex Espana Luxembourg
9.250%, 05/12/2020 (S) 400,000 425,000
9.875%, 04/30/2019 150,000 163,320
Cemex Finance LLC
9.375%, 10/12/2022 (S) 200,000 215,500
9.500%, 12/14/2016 100,000 107,500
Copyright © 2013 www.secdatabase.com. All Rights Reserved.Please Consider the Environment Before Printing This Document
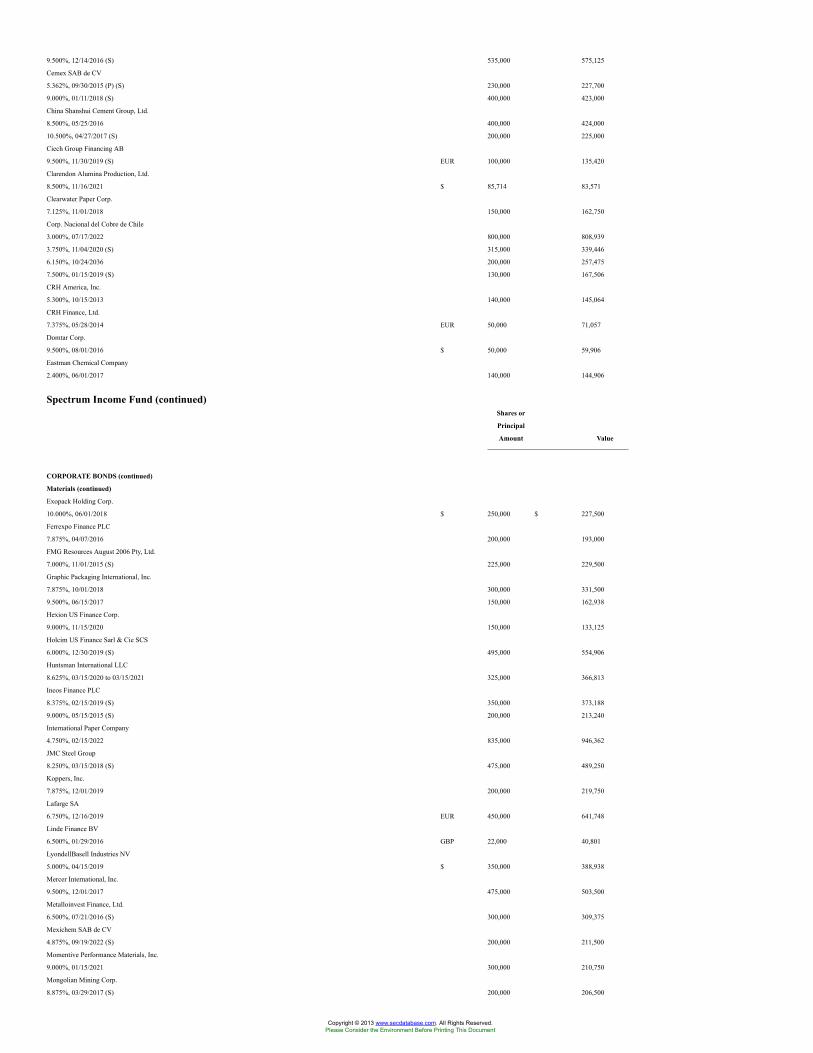
9.500%, 12/14/2016 (S) 535,000 575,125
Cemex SAB de CV
5.362%, 09/30/2015 (P) (S) 230,000 227,700
9.000%, 01/11/2018 (S) 400,000 423,000
China Shanshui Cement Group, Ltd.
8.500%, 05/25/2016 400,000 424,000
10.500%, 04/27/2017 (S) 200,000 225,000
Ciech Group Financing AB
9.500%, 11/30/2019 (S) EUR 100,000 135,420
Clarendon Alumina Production, Ltd.
8.500%, 11/16/2021 $ 85,714 83,571
Clearwater Paper Corp.
7.125%, 11/01/2018 150,000 162,750
Corp. Nacional del Cobre de Chile
3.000%, 07/17/2022 800,000 808,939
3.750%, 11/04/2020 (S) 315,000 339,446
6.150%, 10/24/2036 200,000 257,475
7.500%, 01/15/2019 (S) 130,000 167,506
CRH America, Inc.
5.300%, 10/15/2013 140,000 145,064
CRH Finance, Ltd.
7.375%, 05/28/2014 EUR 50,000 71,057
Domtar Corp.
9.500%, 08/01/2016 $ 50,000 59,906
Eastman Chemical Company
2.400%, 06/01/2017 140,000 144,906
Spectrum Income Fund (continued)Shares or
Principal
Amount Value
CORPORATE BONDS (continued)
Materials (continued)
Exopack Holding Corp.
10.000%, 06/01/2018 $ 250,000 $ 227,500
Ferrexpo Finance PLC
7.875%, 04/07/2016 200,000 193,000
FMG Resources August 2006 Pty, Ltd.
7.000%, 11/01/2015 (S) 225,000 229,500
Graphic Packaging International, Inc.
7.875%, 10/01/2018 300,000 331,500
9.500%, 06/15/2017 150,000 162,938
Hexion US Finance Corp.
9.000%, 11/15/2020 150,000 133,125
Holcim US Finance Sarl & Cie SCS
6.000%, 12/30/2019 (S) 495,000 554,906
Huntsman International LLC
8.625%, 03/15/2020 to 03/15/2021 325,000 366,813
Ineos Finance PLC
8.375%, 02/15/2019 (S) 350,000 373,188
9.000%, 05/15/2015 (S) 200,000 213,240
International Paper Company
4.750%, 02/15/2022 835,000 946,362
JMC Steel Group
8.250%, 03/15/2018 (S) 475,000 489,250
Koppers, Inc.
7.875%, 12/01/2019 200,000 219,750
Lafarge SA
6.750%, 12/16/2019 EUR 450,000 641,748
Linde Finance BV
6.500%, 01/29/2016 GBP 22,000 40,801
LyondellBasell Industries NV
5.000%, 04/15/2019 $ 350,000 388,938
Mercer International, Inc.
9.500%, 12/01/2017 475,000 503,500
Metalloinvest Finance, Ltd.
6.500%, 07/21/2016 (S) 300,000 309,375
Mexichem SAB de CV
4.875%, 09/19/2022 (S) 200,000 211,500
Momentive Performance Materials, Inc.
9.000%, 01/15/2021 300,000 210,750
Mongolian Mining Corp.
8.875%, 03/29/2017 (S) 200,000 206,500
Copyright © 2013 www.secdatabase.com. All Rights Reserved.Please Consider the Environment Before Printing This Document
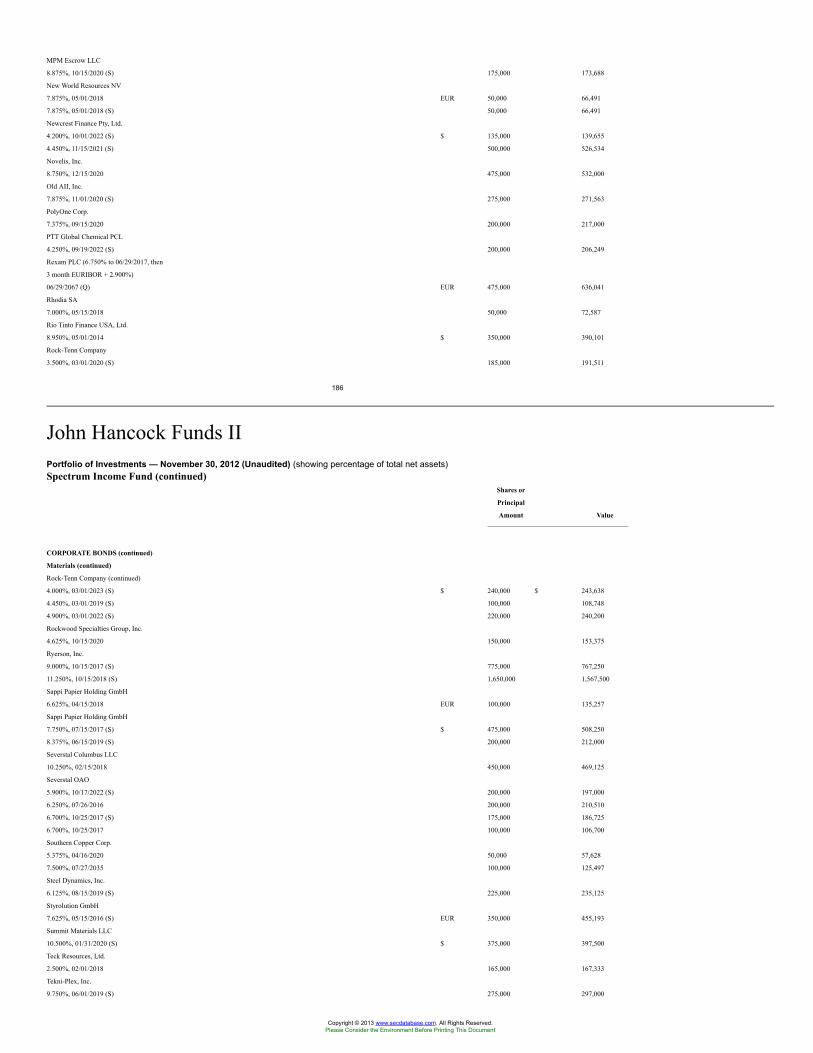
MPM Escrow LLC
8.875%, 10/15/2020 (S) 175,000 173,688
New World Resources NV
7.875%, 05/01/2018 EUR 50,000 66,491
7.875%, 05/01/2018 (S) 50,000 66,491
Newcrest Finance Pty, Ltd.
4.200%, 10/01/2022 (S) $ 135,000 139,655
4.450%, 11/15/2021 (S) 500,000 526,534
Novelis, Inc.
8.750%, 12/15/2020 475,000 532,000
Old AII, Inc.
7.875%, 11/01/2020 (S) 275,000 271,563
PolyOne Corp.
7.375%, 09/15/2020 200,000 217,000
PTT Global Chemical PCL
4.250%, 09/19/2022 (S) 200,000 206,249
Rexam PLC (6.750% to 06/29/2017, then
3 month EURIBOR + 2.900%)
06/29/2067 (Q) EUR 475,000 636,041
Rhodia SA
7.000%, 05/15/2018 50,000 72,587
Rio Tinto Finance USA, Ltd.
8.950%, 05/01/2014 $ 350,000 390,101
Rock-Tenn Company
3.500%, 03/01/2020 (S) 185,000 191,511
186
John Hancock Funds IIPortfolio of Investments — November 30, 2012 (Unaudited) (showing percentage of total net assets)Spectrum Income Fund (continued)
Shares or
Principal
Amount Value
CORPORATE BONDS (continued)
Materials (continued)
Rock-Tenn Company (continued)
4.000%, 03/01/2023 (S) $ 240,000 $ 243,638
4.450%, 03/01/2019 (S) 100,000 108,748
4.900%, 03/01/2022 (S) 220,000 240,200
Rockwood Specialties Group, Inc.
4.625%, 10/15/2020 150,000 153,375
Ryerson, Inc.
9.000%, 10/15/2017 (S) 775,000 767,250
11.250%, 10/15/2018 (S) 1,650,000 1,567,500
Sappi Papier Holding GmbH
6.625%, 04/15/2018 EUR 100,000 135,257
Sappi Papier Holding GmbH
7.750%, 07/15/2017 (S) $ 475,000 508,250
8.375%, 06/15/2019 (S) 200,000 212,000
Severstal Columbus LLC
10.250%, 02/15/2018 450,000 469,125
Severstal OAO
5.900%, 10/17/2022 (S) 200,000 197,000
6.250%, 07/26/2016 200,000 210,510
6.700%, 10/25/2017 (S) 175,000 186,725
6.700%, 10/25/2017 100,000 106,700
Southern Copper Corp.
5.375%, 04/16/2020 50,000 57,628
7.500%, 07/27/2035 100,000 125,497
Steel Dynamics, Inc.
6.125%, 08/15/2019 (S) 225,000 235,125
Styrolution GmbH
7.625%, 05/15/2016 (S) EUR 350,000 455,193
Summit Materials LLC
10.500%, 01/31/2020 (S) $ 375,000 397,500
Teck Resources, Ltd.
2.500%, 02/01/2018 165,000 167,333
Tekni-Plex, Inc.
9.750%, 06/01/2019 (S) 275,000 297,000
Copyright © 2013 www.secdatabase.com. All Rights Reserved.Please Consider the Environment Before Printing This Document
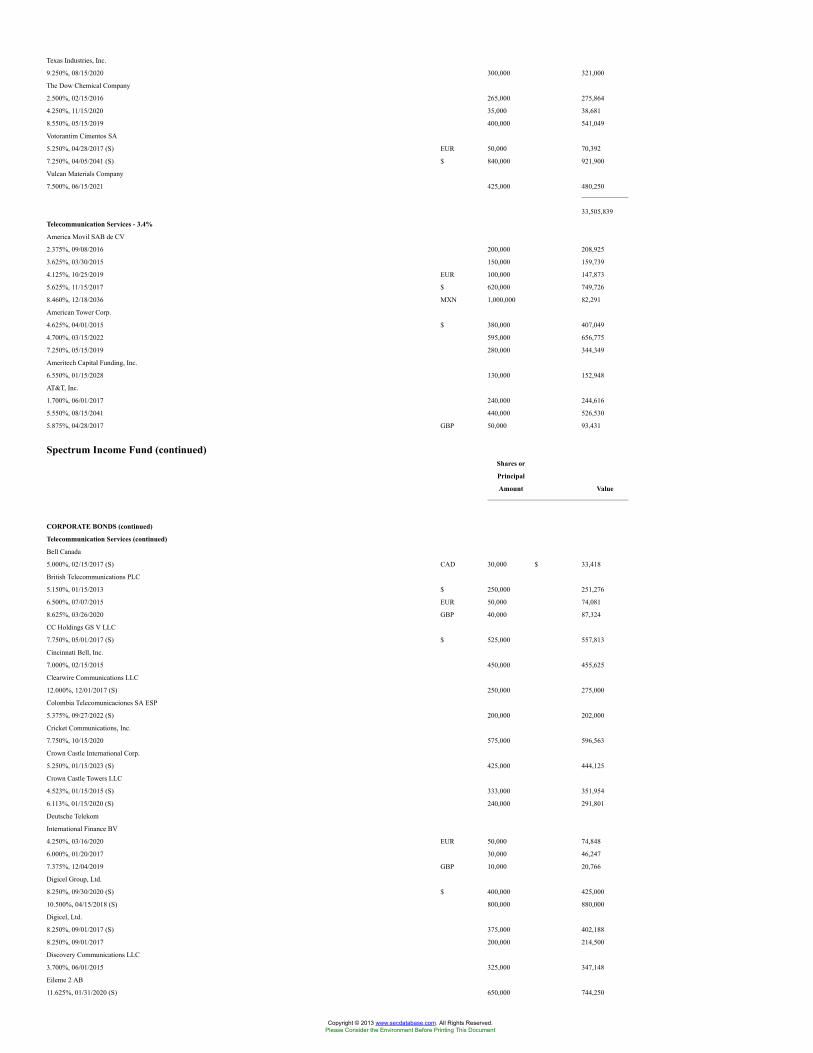
Texas Industries, Inc.
9.250%, 08/15/2020 300,000 321,000
The Dow Chemical Company
2.500%, 02/15/2016 265,000 275,864
4.250%, 11/15/2020 35,000 38,681
8.550%, 05/15/2019 400,000 541,049
Votorantim Cimentos SA
5.250%, 04/28/2017 (S) EUR 50,000 70,392
7.250%, 04/05/2041 (S) $ 840,000 921,900
Vulcan Materials Company
7.500%, 06/15/2021 425,000 480,250
33,505,839
Telecommunication Services - 3.4%
America Movil SAB de CV
2.375%, 09/08/2016 200,000 208,925
3.625%, 03/30/2015 150,000 159,739
4.125%, 10/25/2019 EUR 100,000 147,873
5.625%, 11/15/2017 $ 620,000 749,726
8.460%, 12/18/2036 MXN 1,000,000 82,291
American Tower Corp.
4.625%, 04/01/2015 $ 380,000 407,049
4.700%, 03/15/2022 595,000 656,775
7.250%, 05/15/2019 280,000 344,349
Ameritech Capital Funding, Inc.
6.550%, 01/15/2028 130,000 152,948
AT&T, Inc.
1.700%, 06/01/2017 240,000 244,616
5.550%, 08/15/2041 440,000 526,530
5.875%, 04/28/2017 GBP 50,000 93,431
Spectrum Income Fund (continued)Shares or
Principal
Amount Value
CORPORATE BONDS (continued)
Telecommunication Services (continued)
Bell Canada
5.000%, 02/15/2017 (S) CAD 30,000 $ 33,418
British Telecommunications PLC
5.150%, 01/15/2013 $ 250,000 251,276
6.500%, 07/07/2015 EUR 50,000 74,081
8.625%, 03/26/2020 GBP 40,000 87,324
CC Holdings GS V LLC
7.750%, 05/01/2017 (S) $ 525,000 557,813
Cincinnati Bell, Inc.
7.000%, 02/15/2015 450,000 455,625
Clearwire Communications LLC
12.000%, 12/01/2017 (S) 250,000 275,000
Colombia Telecomunicaciones SA ESP
5.375%, 09/27/2022 (S) 200,000 202,000
Cricket Communications, Inc.
7.750%, 10/15/2020 575,000 596,563
Crown Castle International Corp.
5.250%, 01/15/2023 (S) 425,000 444,125
Crown Castle Towers LLC
4.523%, 01/15/2015 (S) 333,000 351,954
6.113%, 01/15/2020 (S) 240,000 291,801
Deutsche Telekom
International Finance BV
4.250%, 03/16/2020 EUR 50,000 74,848
6.000%, 01/20/2017 30,000 46,247
7.375%, 12/04/2019 GBP 10,000 20,766
Digicel Group, Ltd.
8.250%, 09/30/2020 (S) $ 400,000 425,000
10.500%, 04/15/2018 (S) 800,000 880,000
Digicel, Ltd.
8.250%, 09/01/2017 (S) 375,000 402,188
8.250%, 09/01/2017 200,000 214,500
Discovery Communications LLC
3.700%, 06/01/2015 325,000 347,148
Eileme 2 AB
11.625%, 01/31/2020 (S) 650,000 744,250
Copyright © 2013 www.secdatabase.com. All Rights Reserved.Please Consider the Environment Before Printing This Document
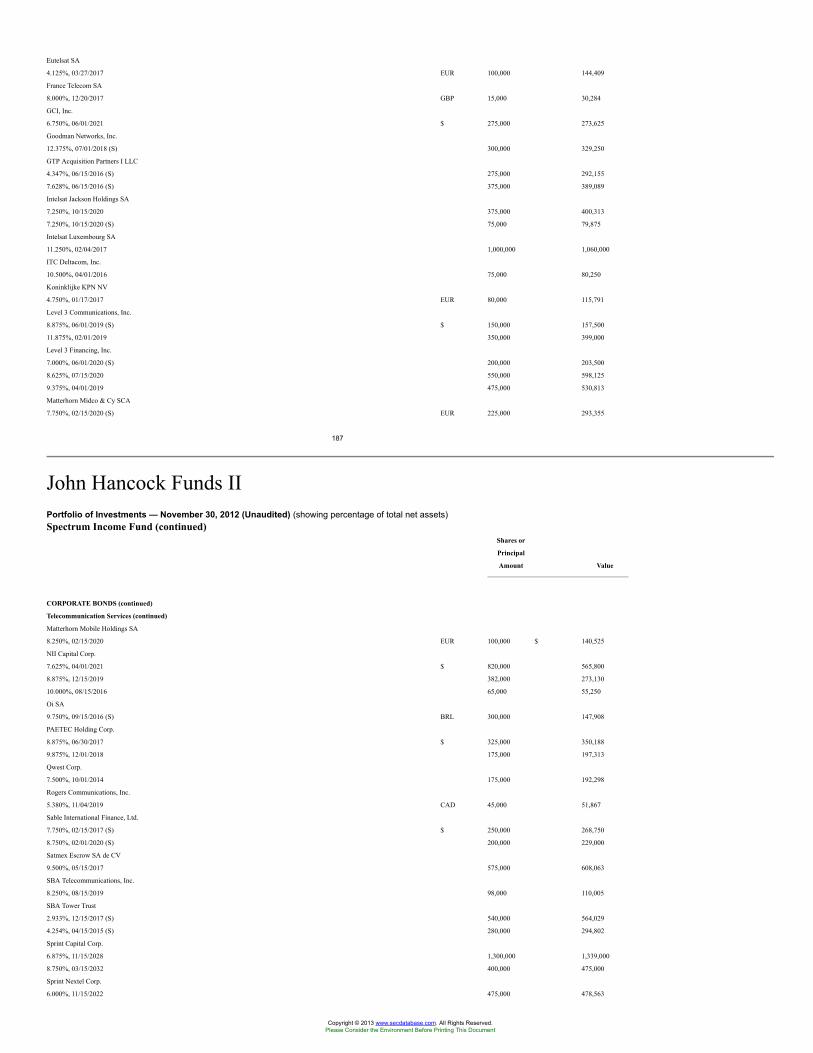
Eutelsat SA
4.125%, 03/27/2017 EUR 100,000 144,409
France Telecom SA
8.000%, 12/20/2017 GBP 15,000 30,284
GCI, Inc.
6.750%, 06/01/2021 $ 275,000 273,625
Goodman Networks, Inc.
12.375%, 07/01/2018 (S) 300,000 329,250
GTP Acquisition Partners I LLC
4.347%, 06/15/2016 (S) 275,000 292,155
7.628%, 06/15/2016 (S) 375,000 389,089
Intelsat Jackson Holdings SA
7.250%, 10/15/2020 375,000 400,313
7.250%, 10/15/2020 (S) 75,000 79,875
Intelsat Luxembourg SA
11.250%, 02/04/2017 1,000,000 1,060,000
ITC Deltacom, Inc.
10.500%, 04/01/2016 75,000 80,250
Koninklijke KPN NV
4.750%, 01/17/2017 EUR 80,000 115,791
Level 3 Communications, Inc.
8.875%, 06/01/2019 (S) $ 150,000 157,500
11.875%, 02/01/2019 350,000 399,000
Level 3 Financing, Inc.
7.000%, 06/01/2020 (S) 200,000 203,500
8.625%, 07/15/2020 550,000 598,125
9.375%, 04/01/2019 475,000 530,813
Matterhorn Midco & Cy SCA
7.750%, 02/15/2020 (S) EUR 225,000 293,355
187
John Hancock Funds IIPortfolio of Investments — November 30, 2012 (Unaudited) (showing percentage of total net assets)Spectrum Income Fund (continued)
Shares or
Principal
Amount Value
CORPORATE BONDS (continued)
Telecommunication Services (continued)
Matterhorn Mobile Holdings SA
8.250%, 02/15/2020 EUR 100,000 $ 140,525
NII Capital Corp.
7.625%, 04/01/2021 $ 820,000 565,800
8.875%, 12/15/2019 382,000 273,130
10.000%, 08/15/2016 65,000 55,250
Oi SA
9.750%, 09/15/2016 (S) BRL 300,000 147,908
PAETEC Holding Corp.
8.875%, 06/30/2017 $ 325,000 350,188
9.875%, 12/01/2018 175,000 197,313
Qwest Corp.
7.500%, 10/01/2014 175,000 192,298
Rogers Communications, Inc.
5.380%, 11/04/2019 CAD 45,000 51,867
Sable International Finance, Ltd.
7.750%, 02/15/2017 (S) $ 250,000 268,750
8.750%, 02/01/2020 (S) 200,000 229,000
Satmex Escrow SA de CV
9.500%, 05/15/2017 575,000 608,063
SBA Telecommunications, Inc.
8.250%, 08/15/2019 98,000 110,005
SBA Tower Trust
2.933%, 12/15/2017 (S) 540,000 564,029
4.254%, 04/15/2015 (S) 280,000 294,802
Sprint Capital Corp.
6.875%, 11/15/2028 1,300,000 1,339,000
8.750%, 03/15/2032 400,000 475,000
Sprint Nextel Corp.
6.000%, 11/15/2022 475,000 478,563
Copyright © 2013 www.secdatabase.com. All Rights Reserved.Please Consider the Environment Before Printing This Document
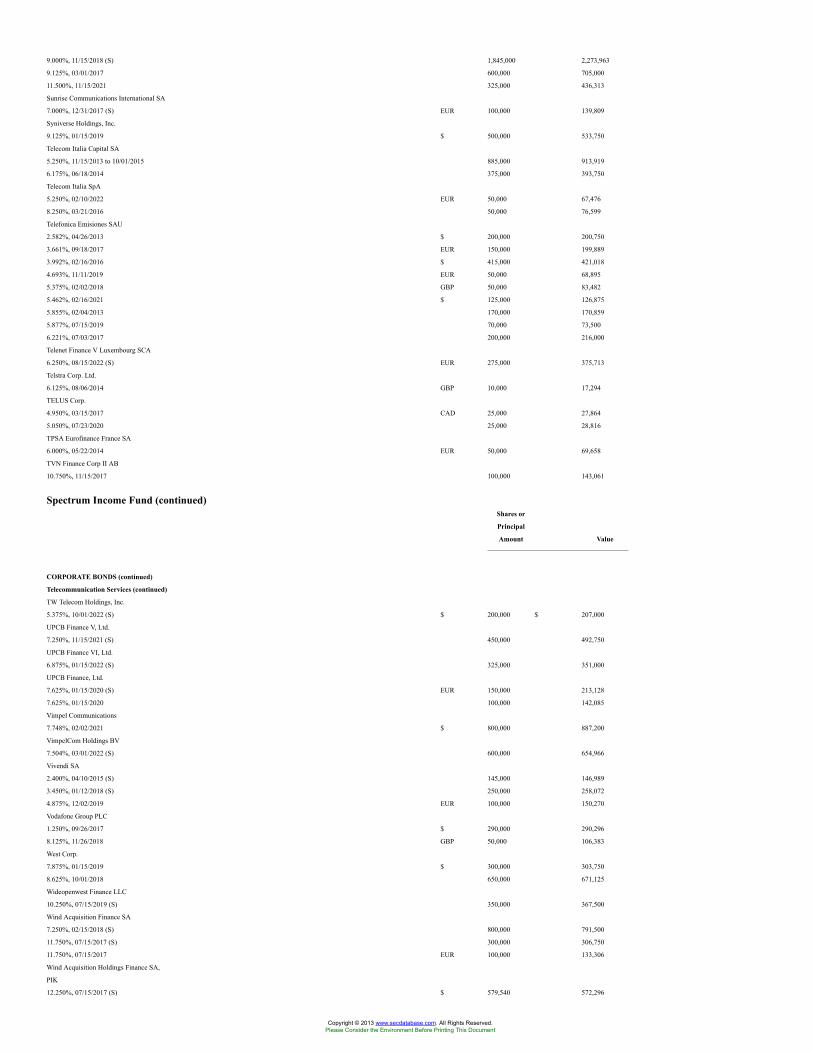
9.000%, 11/15/2018 (S) 1,845,000 2,273,963
9.125%, 03/01/2017 600,000 705,000
11.500%, 11/15/2021 325,000 436,313
Sunrise Communications International SA
7.000%, 12/31/2017 (S) EUR 100,000 139,809
Syniverse Holdings, Inc.
9.125%, 01/15/2019 $ 500,000 533,750
Telecom Italia Capital SA
5.250%, 11/15/2013 to 10/01/2015 885,000 913,919
6.175%, 06/18/2014 375,000 393,750
Telecom Italia SpA
5.250%, 02/10/2022 EUR 50,000 67,476
8.250%, 03/21/2016 50,000 76,599
Telefonica Emisiones SAU
2.582%, 04/26/2013 $ 200,000 200,750
3.661%, 09/18/2017 EUR 150,000 199,889
3.992%, 02/16/2016 $ 415,000 421,018
4.693%, 11/11/2019 EUR 50,000 68,895
5.375%, 02/02/2018 GBP 50,000 83,482
5.462%, 02/16/2021 $ 125,000 126,875
5.855%, 02/04/2013 170,000 170,859
5.877%, 07/15/2019 70,000 73,500
6.221%, 07/03/2017 200,000 216,000
Telenet Finance V Luxembourg SCA
6.250%, 08/15/2022 (S) EUR 275,000 375,713
Telstra Corp. Ltd.
6.125%, 08/06/2014 GBP 10,000 17,294
TELUS Corp.
4.950%, 03/15/2017 CAD 25,000 27,864
5.050%, 07/23/2020 25,000 28,816
TPSA Eurofinance France SA
6.000%, 05/22/2014 EUR 50,000 69,658
TVN Finance Corp II AB
10.750%, 11/15/2017 100,000 143,061
Spectrum Income Fund (continued)Shares or
Principal
Amount Value
CORPORATE BONDS (continued)
Telecommunication Services (continued)
TW Telecom Holdings, Inc.
5.375%, 10/01/2022 (S) $ 200,000 $ 207,000
UPCB Finance V, Ltd.
7.250%, 11/15/2021 (S) 450,000 492,750
UPCB Finance VI, Ltd.
6.875%, 01/15/2022 (S) 325,000 351,000
UPCB Finance, Ltd.
7.625%, 01/15/2020 (S) EUR 150,000 213,128
7.625%, 01/15/2020 100,000 142,085
Vimpel Communications
7.748%, 02/02/2021 $ 800,000 887,200
VimpelCom Holdings BV
7.504%, 03/01/2022 (S) 600,000 654,966
Vivendi SA
2.400%, 04/10/2015 (S) 145,000 146,989
3.450%, 01/12/2018 (S) 250,000 258,072
4.875%, 12/02/2019 EUR 100,000 150,270
Vodafone Group PLC
1.250%, 09/26/2017 $ 290,000 290,296
8.125%, 11/26/2018 GBP 50,000 106,383
West Corp.
7.875%, 01/15/2019 $ 300,000 303,750
8.625%, 10/01/2018 650,000 671,125
Wideopenwest Finance LLC
10.250%, 07/15/2019 (S) 350,000 367,500
Wind Acquisition Finance SA
7.250%, 02/15/2018 (S) 800,000 791,500
11.750%, 07/15/2017 (S) 300,000 306,750
11.750%, 07/15/2017 EUR 100,000 133,306
Wind Acquisition Holdings Finance SA,
PIK
12.250%, 07/15/2017 (S) $ 579,540 572,296
Copyright © 2013 www.secdatabase.com. All Rights Reserved.Please Consider the Environment Before Printing This Document
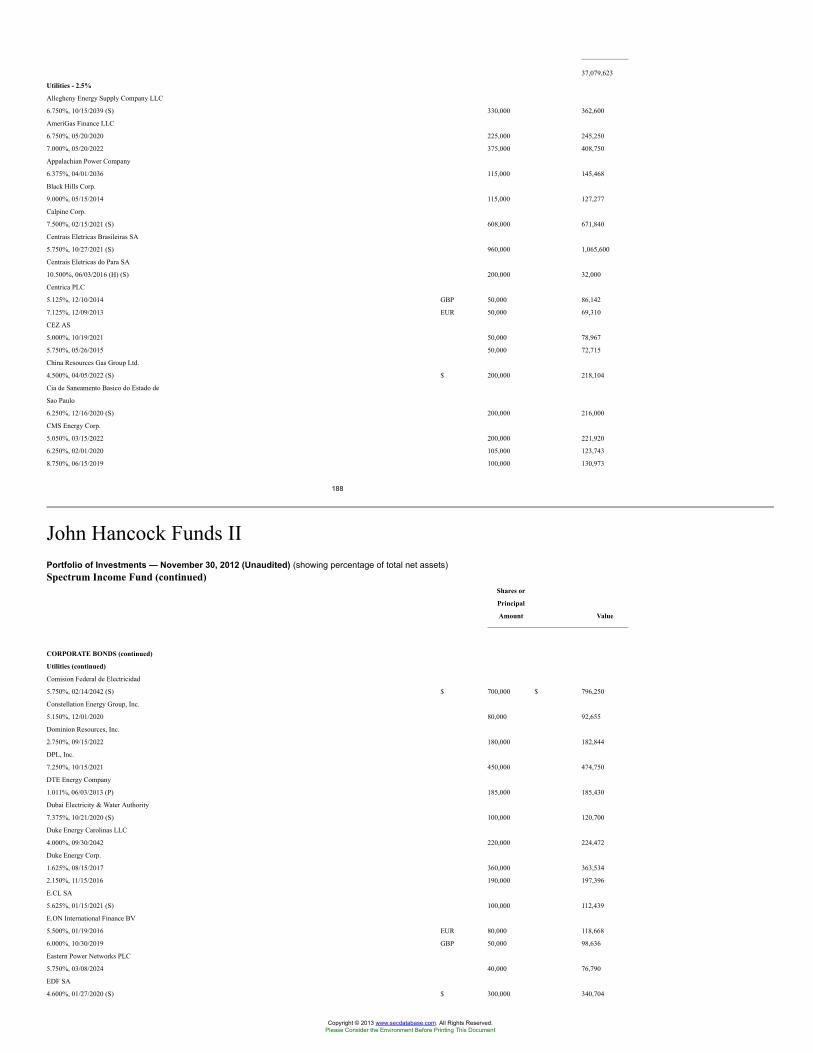
37,079,623
Utilities - 2.5%
Allegheny Energy Supply Company LLC
6.750%, 10/15/2039 (S) 330,000 362,600
AmeriGas Finance LLC
6.750%, 05/20/2020 225,000 245,250
7.000%, 05/20/2022 375,000 408,750
Appalachian Power Company
6.375%, 04/01/2036 115,000 145,468
Black Hills Corp.
9.000%, 05/15/2014 115,000 127,277
Calpine Corp.
7.500%, 02/15/2021 (S) 608,000 671,840
Centrais Eletricas Brasileiras SA
5.750%, 10/27/2021 (S) 960,000 1,065,600
Centrais Eletricas do Para SA
10.500%, 06/03/2016 (H) (S) 200,000 32,000
Centrica PLC
5.125%, 12/10/2014 GBP 50,000 86,142
7.125%, 12/09/2013 EUR 50,000 69,310
CEZ AS
5.000%, 10/19/2021 50,000 78,967
5.750%, 05/26/2015 50,000 72,715
China Resources Gas Group Ltd.
4.500%, 04/05/2022 (S) $ 200,000 218,104
Cia de Saneamento Basico do Estado de
Sao Paulo
6.250%, 12/16/2020 (S) 200,000 216,000
CMS Energy Corp.
5.050%, 03/15/2022 200,000 221,920
6.250%, 02/01/2020 105,000 123,743
8.750%, 06/15/2019 100,000 130,973
188
John Hancock Funds IIPortfolio of Investments — November 30, 2012 (Unaudited) (showing percentage of total net assets)Spectrum Income Fund (continued)
Shares or
Principal
Amount Value
CORPORATE BONDS (continued)
Utilities (continued)
Comision Federal de Electricidad
5.750%, 02/14/2042 (S) $ 700,000 $ 796,250
Constellation Energy Group, Inc.
5.150%, 12/01/2020 80,000 92,655
Dominion Resources, Inc.
2.750%, 09/15/2022 180,000 182,844
DPL, Inc.
7.250%, 10/15/2021 450,000 474,750
DTE Energy Company
1.011%, 06/03/2013 (P) 185,000 185,430
Dubai Electricity & Water Authority
7.375%, 10/21/2020 (S) 100,000 120,700
Duke Energy Carolinas LLC
4.000%, 09/30/2042 220,000 224,472
Duke Energy Corp.
1.625%, 08/15/2017 360,000 363,534
2.150%, 11/15/2016 190,000 197,396
E.CL SA
5.625%, 01/15/2021 (S) 100,000 112,439
E.ON International Finance BV
5.500%, 01/19/2016 EUR 80,000 118,668
6.000%, 10/30/2019 GBP 50,000 98,636
Eastern Power Networks PLC
5.750%, 03/08/2024 40,000 76,790
EDF SA
4.600%, 01/27/2020 (S) $ 300,000 340,704
Copyright © 2013 www.secdatabase.com. All Rights Reserved.Please Consider the Environment Before Printing This Document
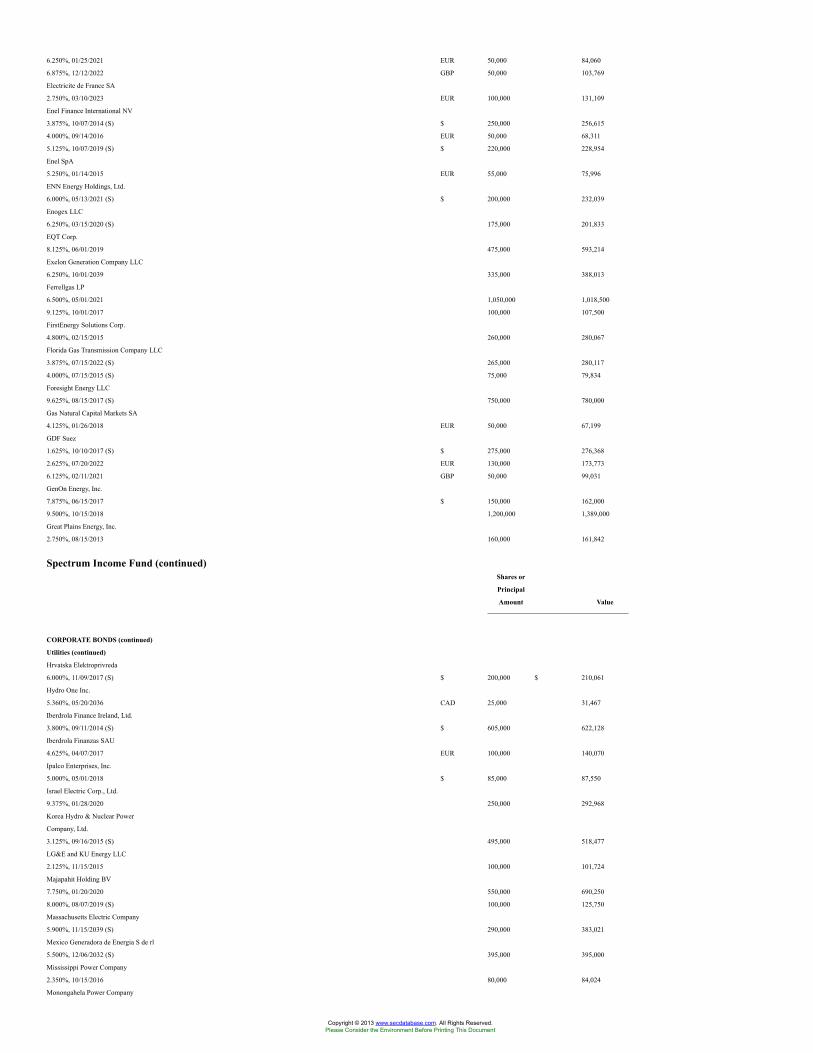
6.250%, 01/25/2021 EUR 50,000 84,060
6.875%, 12/12/2022 GBP 50,000 103,769
Electricite de France SA
2.750%, 03/10/2023 EUR 100,000 131,109
Enel Finance International NV
3.875%, 10/07/2014 (S) $ 250,000 256,615
4.000%, 09/14/2016 EUR 50,000 68,311
5.125%, 10/07/2019 (S) $ 220,000 228,954
Enel SpA
5.250%, 01/14/2015 EUR 55,000 75,996
ENN Energy Holdings, Ltd.
6.000%, 05/13/2021 (S) $ 200,000 232,039
Enogex LLC
6.250%, 03/15/2020 (S) 175,000 201,833
EQT Corp.
8.125%, 06/01/2019 475,000 593,214
Exelon Generation Company LLC
6.250%, 10/01/2039 335,000 388,013
Ferrellgas LP
6.500%, 05/01/2021 1,050,000 1,018,500
9.125%, 10/01/2017 100,000 107,500
FirstEnergy Solutions Corp.
4.800%, 02/15/2015 260,000 280,067
Florida Gas Transmission Company LLC
3.875%, 07/15/2022 (S) 265,000 280,117
4.000%, 07/15/2015 (S) 75,000 79,834
Foresight Energy LLC
9.625%, 08/15/2017 (S) 750,000 780,000
Gas Natural Capital Markets SA
4.125%, 01/26/2018 EUR 50,000 67,199
GDF Suez
1.625%, 10/10/2017 (S) $ 275,000 276,368
2.625%, 07/20/2022 EUR 130,000 173,773
6.125%, 02/11/2021 GBP 50,000 99,031
GenOn Energy, Inc.
7.875%, 06/15/2017 $ 150,000 162,000
9.500%, 10/15/2018 1,200,000 1,389,000
Great Plains Energy, Inc.
2.750%, 08/15/2013 160,000 161,842
Spectrum Income Fund (continued)Shares or
Principal
Amount Value
CORPORATE BONDS (continued)
Utilities (continued)
Hrvatska Elektroprivreda
6.000%, 11/09/2017 (S) $ 200,000 $ 210,061
Hydro One Inc.
5.360%, 05/20/2036 CAD 25,000 31,467
Iberdrola Finance Ireland, Ltd.
3.800%, 09/11/2014 (S) $ 605,000 622,128
Iberdrola Finanzas SAU
4.625%, 04/07/2017 EUR 100,000 140,070
Ipalco Enterprises, Inc.
5.000%, 05/01/2018 $ 85,000 87,550
Israel Electric Corp., Ltd.
9.375%, 01/28/2020 250,000 292,968
Korea Hydro & Nuclear Power
Company, Ltd.
3.125%, 09/16/2015 (S) 495,000 518,477
LG&E and KU Energy LLC
2.125%, 11/15/2015 100,000 101,724
Majapahit Holding BV
7.750%, 01/20/2020 550,000 690,250
8.000%, 08/07/2019 (S) 100,000 125,750
Massachusetts Electric Company
5.900%, 11/15/2039 (S) 290,000 383,021
Mexico Generadora de Energia S de rl
5.500%, 12/06/2032 (S) 395,000 395,000
Mississippi Power Company
2.350%, 10/15/2016 80,000 84,024
Monongahela Power Company
Copyright © 2013 www.secdatabase.com. All Rights Reserved.Please Consider the Environment Before Printing This Document
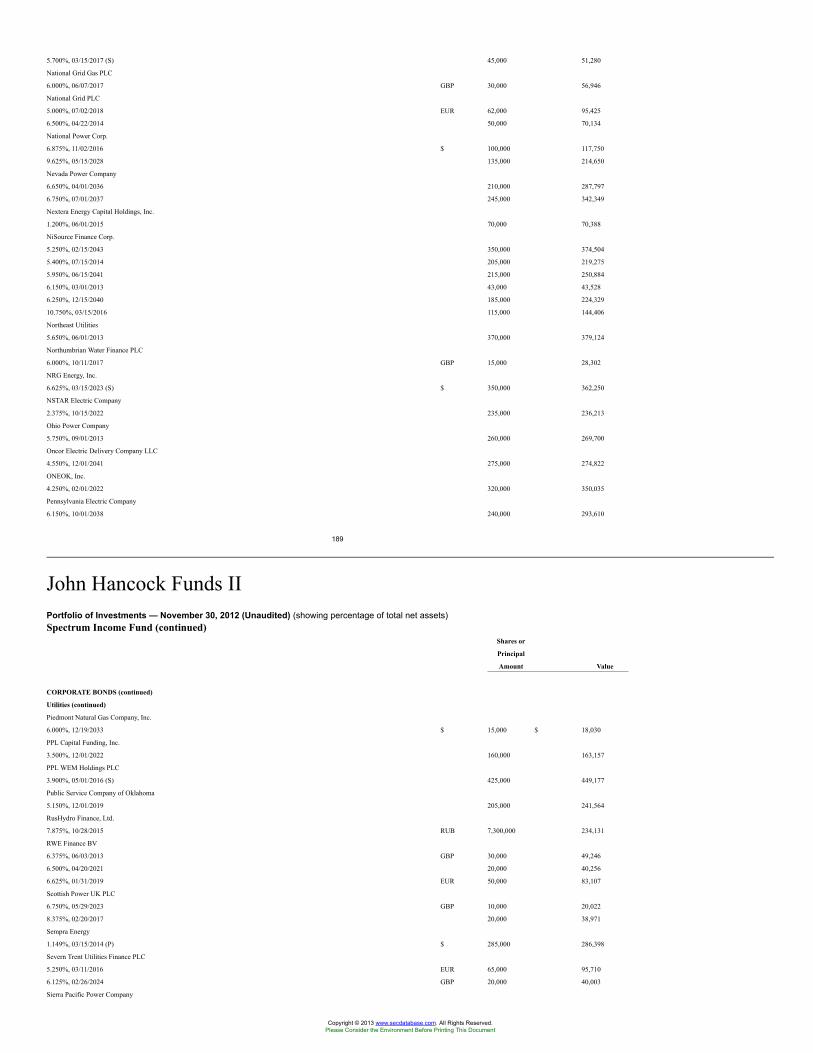
5.700%, 03/15/2017 (S) 45,000 51,280
National Grid Gas PLC
6.000%, 06/07/2017 GBP 30,000 56,946
National Grid PLC
5.000%, 07/02/2018 EUR 62,000 95,425
6.500%, 04/22/2014 50,000 70,134
National Power Corp.
6.875%, 11/02/2016 $ 100,000 117,750
9.625%, 05/15/2028 135,000 214,650
Nevada Power Company
6.650%, 04/01/2036 210,000 287,797
6.750%, 07/01/2037 245,000 342,349
Nextera Energy Capital Holdings, Inc.
1.200%, 06/01/2015 70,000 70,388
NiSource Finance Corp.
5.250%, 02/15/2043 350,000 374,504
5.400%, 07/15/2014 205,000 219,275
5.950%, 06/15/2041 215,000 250,884
6.150%, 03/01/2013 43,000 43,528
6.250%, 12/15/2040 185,000 224,329
10.750%, 03/15/2016 115,000 144,406
Northeast Utilities
5.650%, 06/01/2013 370,000 379,124
Northumbrian Water Finance PLC
6.000%, 10/11/2017 GBP 15,000 28,302
NRG Energy, Inc.
6.625%, 03/15/2023 (S) $ 350,000 362,250
NSTAR Electric Company
2.375%, 10/15/2022 235,000 236,213
Ohio Power Company
5.750%, 09/01/2013 260,000 269,700
Oncor Electric Delivery Company LLC
4.550%, 12/01/2041 275,000 274,822
ONEOK, Inc.
4.250%, 02/01/2022 320,000 350,035
Pennsylvania Electric Company
6.150%, 10/01/2038 240,000 293,610
189
John Hancock Funds IIPortfolio of Investments — November 30, 2012 (Unaudited) (showing percentage of total net assets)Spectrum Income Fund (continued)
Shares or
Principal
Amount Value
CORPORATE BONDS (continued)
Utilities (continued)
Piedmont Natural Gas Company, Inc.
6.000%, 12/19/2033 $ 15,000 $ 18,030
PPL Capital Funding, Inc.
3.500%, 12/01/2022 160,000 163,157
PPL WEM Holdings PLC
3.900%, 05/01/2016 (S) 425,000 449,177
Public Service Company of Oklahoma
5.150%, 12/01/2019 205,000 241,564
RusHydro Finance, Ltd.
7.875%, 10/28/2015 RUB 7,300,000 234,131
RWE Finance BV
6.375%, 06/03/2013 GBP 30,000 49,246
6.500%, 04/20/2021 20,000 40,256
6.625%, 01/31/2019 EUR 50,000 83,107
Scottish Power UK PLC
6.750%, 05/29/2023 GBP 10,000 20,022
8.375%, 02/20/2017 20,000 38,971
Sempra Energy
1.149%, 03/15/2014 (P) $ 285,000 286,398
Severn Trent Utilities Finance PLC
5.250%, 03/11/2016 EUR 65,000 95,710
6.125%, 02/26/2024 GBP 20,000 40,003
Sierra Pacific Power Company
Copyright © 2013 www.secdatabase.com. All Rights Reserved.Please Consider the Environment Before Printing This Document
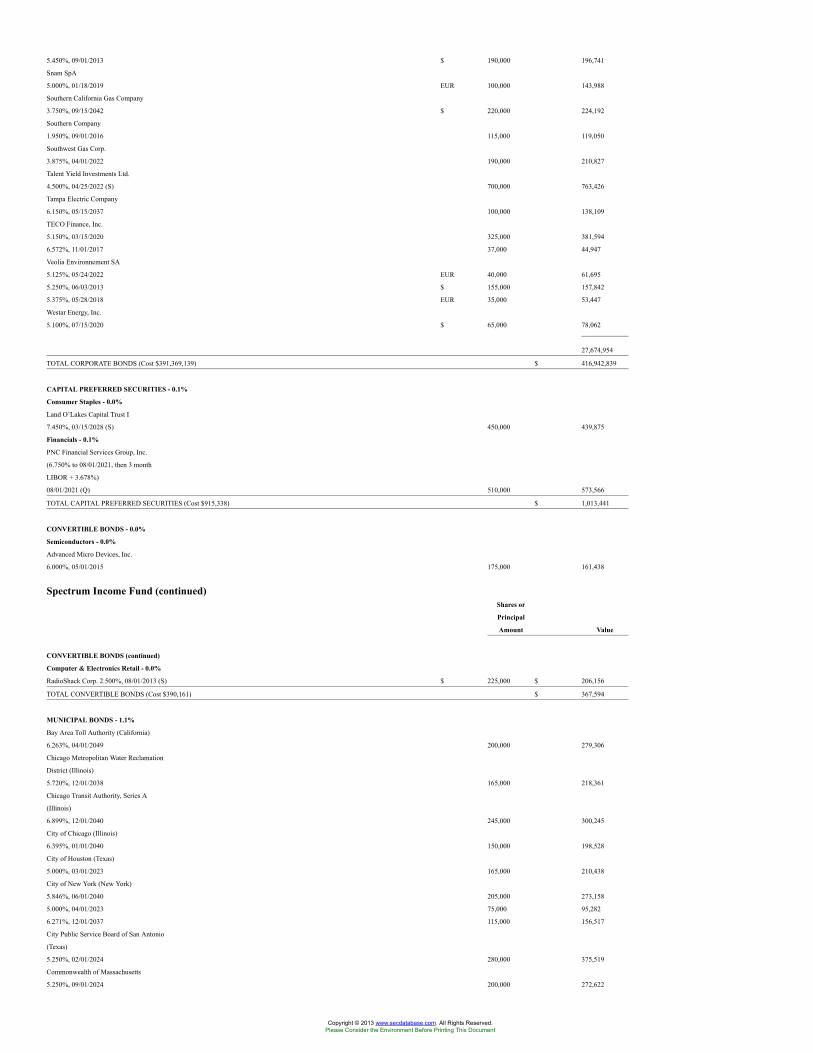
5.450%, 09/01/2013 $ 190,000 196,741
Snam SpA
5.000%, 01/18/2019 EUR 100,000 143,988
Southern California Gas Company
3.750%, 09/15/2042 $ 220,000 224,192
Southern Company
1.950%, 09/01/2016 115,000 119,050
Southwest Gas Corp.
3.875%, 04/01/2022 190,000 210,827
Talent Yield Investments Ltd.
4.500%, 04/25/2022 (S) 700,000 763,426
Tampa Electric Company
6.150%, 05/15/2037 100,000 138,109
TECO Finance, Inc.
5.150%, 03/15/2020 325,000 381,594
6.572%, 11/01/2017 37,000 44,947
Veolia Environnement SA
5.125%, 05/24/2022 EUR 40,000 61,695
5.250%, 06/03/2013 $ 155,000 157,842
5.375%, 05/28/2018 EUR 35,000 53,447
Westar Energy, Inc.
5.100%, 07/15/2020 $ 65,000 78,062
27,674,954
TOTAL CORPORATE BONDS (Cost $391,369,139) $ 416,942,839
CAPITAL PREFERRED SECURITIES - 0.1%
Consumer Staples - 0.0%
Land O’Lakes Capital Trust I
7.450%, 03/15/2028 (S) 450,000 439,875
Financials - 0.1%
PNC Financial Services Group, Inc.
(6.750% to 08/01/2021, then 3 month
LIBOR + 3.678%)
08/01/2021 (Q) 510,000 573,566
TOTAL CAPITAL PREFERRED SECURITIES (Cost $915,338) $ 1,013,441
CONVERTIBLE BONDS - 0.0%
Semiconductors - 0.0%
Advanced Micro Devices, Inc.
6.000%, 05/01/2015 175,000 161,438
Spectrum Income Fund (continued)Shares or
Principal
Amount Value
CONVERTIBLE BONDS (continued)
Computer & Electronics Retail - 0.0%
RadioShack Corp. 2.500%, 08/01/2013 (S) $ 225,000 $ 206,156
TOTAL CONVERTIBLE BONDS (Cost $390,161) $ 367,594
MUNICIPAL BONDS - 1.1%
Bay Area Toll Authority (California)
6.263%, 04/01/2049 200,000 279,306
Chicago Metropolitan Water Reclamation
District (Illinois)
5.720%, 12/01/2038 165,000 218,361
Chicago Transit Authority, Series A
(Illinois)
6.899%, 12/01/2040 245,000 300,245
City of Chicago (Illinois)
6.395%, 01/01/2040 150,000 198,528
City of Houston (Texas)
5.000%, 03/01/2023 165,000 210,438
City of New York (New York)
5.846%, 06/01/2040 205,000 273,158
5.000%, 04/01/2023 75,000 95,282
6.271%, 12/01/2037 115,000 156,517
City Public Service Board of San Antonio
(Texas)
5.250%, 02/01/2024 280,000 375,519
Commonwealth of Massachusetts
5.250%, 09/01/2024 200,000 272,622
Copyright © 2013 www.secdatabase.com. All Rights Reserved.Please Consider the Environment Before Printing This Document
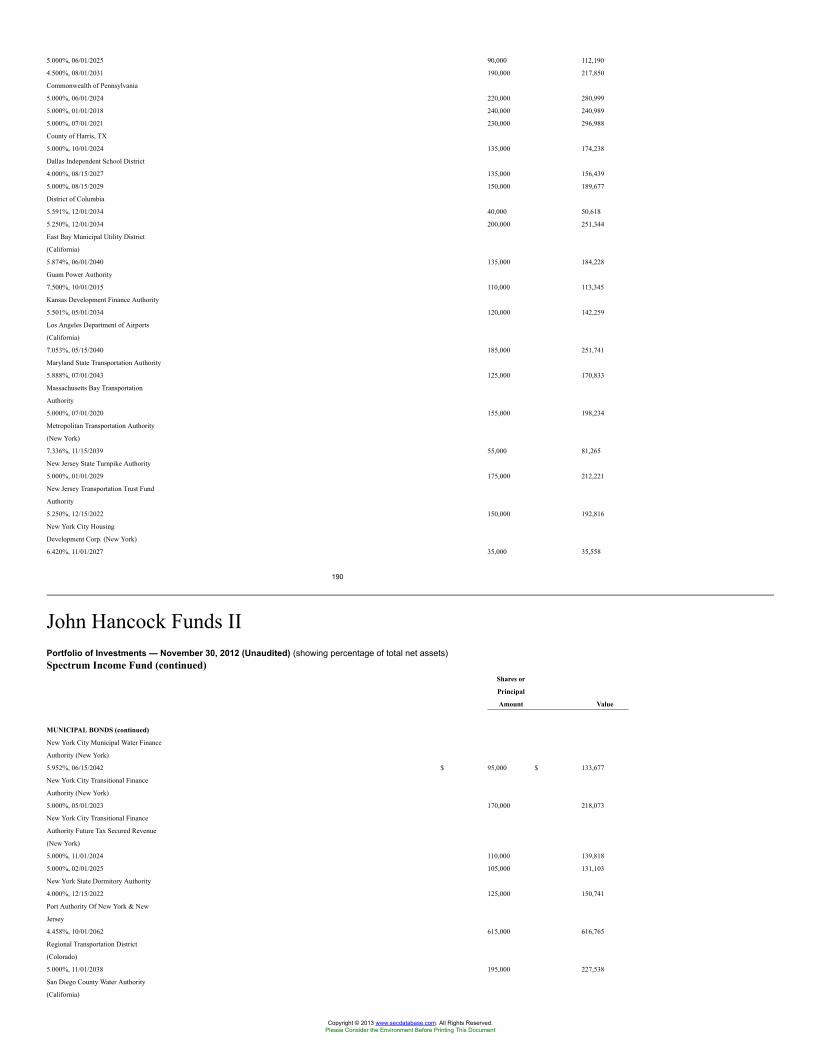
5.000%, 06/01/2025 90,000 112,190
4.500%, 08/01/2031 190,000 217,850
Commonwealth of Pennsylvania
5.000%, 06/01/2024 220,000 280,999
5.000%, 01/01/2018 240,000 240,989
5.000%, 07/01/2021 230,000 296,988
County of Harris, TX
5.000%, 10/01/2024 135,000 174,238
Dallas Independent School District
4.000%, 08/15/2027 135,000 156,439
5.000%, 08/15/2029 150,000 189,677
District of Columbia
5.591%, 12/01/2034 40,000 50,618
5.250%, 12/01/2034 200,000 251,344
East Bay Municipal Utility District
(California)
5.874%, 06/01/2040 135,000 184,228
Guam Power Authority
7.500%, 10/01/2015 110,000 113,345
Kansas Development Finance Authority
5.501%, 05/01/2034 120,000 142,259
Los Angeles Department of Airports
(California)
7.053%, 05/15/2040 185,000 251,741
Maryland State Transportation Authority
5.888%, 07/01/2043 125,000 170,833
Massachusetts Bay Transportation
Authority
5.000%, 07/01/2020 155,000 198,234
Metropolitan Transportation Authority
(New York)
7.336%, 11/15/2039 55,000 81,265
New Jersey State Turnpike Authority
5.000%, 01/01/2029 175,000 212,221
New Jersey Transportation Trust Fund
Authority
5.250%, 12/15/2022 150,000 192,816
New York City Housing
Development Corp. (New York)
6.420%, 11/01/2027 35,000 35,558
190
John Hancock Funds IIPortfolio of Investments — November 30, 2012 (Unaudited) (showing percentage of total net assets)Spectrum Income Fund (continued)
Shares or
Principal
Amount Value
MUNICIPAL BONDS (continued)
New York City Municipal Water Finance
Authority (New York)
5.952%, 06/15/2042 $ 95,000 $ 133,677
New York City Transitional Finance
Authority (New York)
5.000%, 05/01/2023 170,000 218,073
New York City Transitional Finance
Authority Future Tax Secured Revenue
(New York)
5.000%, 11/01/2024 110,000 139,818
5.000%, 02/01/2025 105,000 131,103
New York State Dormitory Authority
4.000%, 12/15/2022 125,000 150,741
Port Authority Of New York & New
Jersey
4.458%, 10/01/2062 615,000 616,765
Regional Transportation District
(Colorado)
5.000%, 11/01/2038 195,000 227,538
San Diego County Water Authority
(California)
Copyright © 2013 www.secdatabase.com. All Rights Reserved.Please Consider the Environment Before Printing This Document
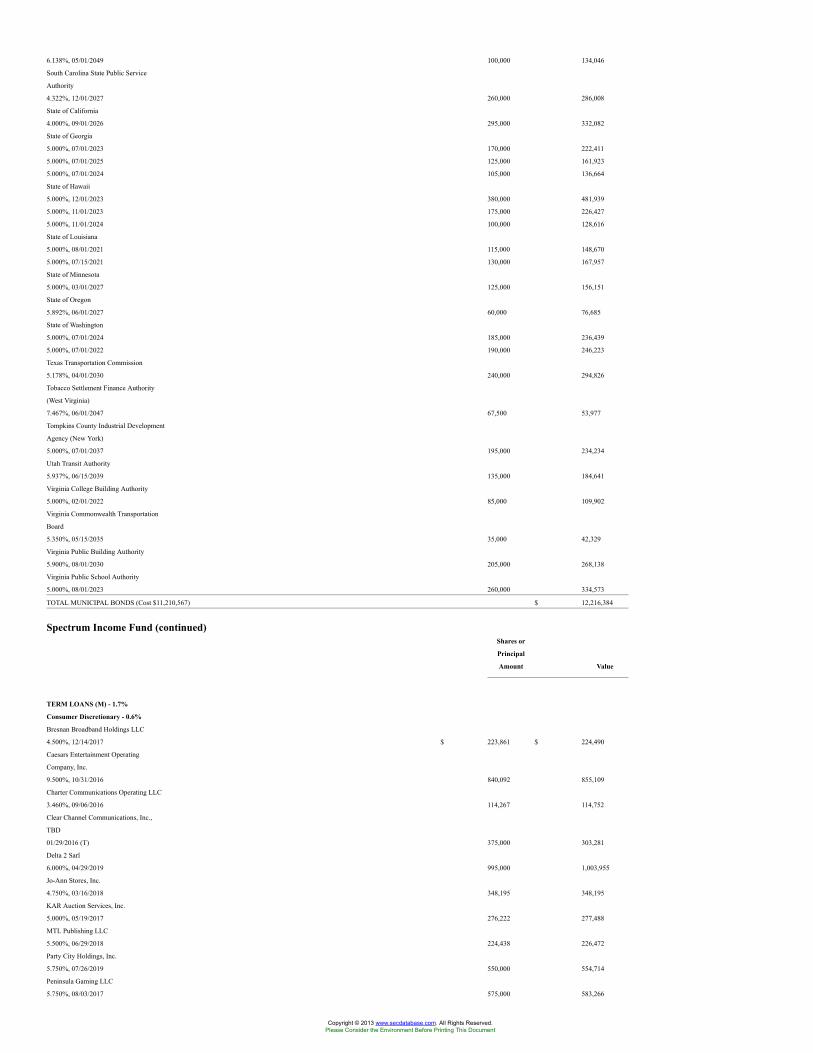
6.138%, 05/01/2049 100,000 134,046
South Carolina State Public Service
Authority
4.322%, 12/01/2027 260,000 286,008
State of California
4.000%, 09/01/2026 295,000 332,082
State of Georgia
5.000%, 07/01/2023 170,000 222,411
5.000%, 07/01/2025 125,000 161,923
5.000%, 07/01/2024 105,000 136,664
State of Hawaii
5.000%, 12/01/2023 380,000 481,939
5.000%, 11/01/2023 175,000 226,427
5.000%, 11/01/2024 100,000 128,616
State of Louisiana
5.000%, 08/01/2021 115,000 148,670
5.000%, 07/15/2021 130,000 167,957
State of Minnesota
5.000%, 03/01/2027 125,000 156,151
State of Oregon
5.892%, 06/01/2027 60,000 76,685
State of Washington
5.000%, 07/01/2024 185,000 236,439
5.000%, 07/01/2022 190,000 246,223
Texas Transportation Commission
5.178%, 04/01/2030 240,000 294,826
Tobacco Settlement Finance Authority
(West Virginia)
7.467%, 06/01/2047 67,500 53,977
Tompkins County Industrial Development
Agency (New York)
5.000%, 07/01/2037 195,000 234,234
Utah Transit Authority
5.937%, 06/15/2039 135,000 184,641
Virginia College Building Authority
5.000%, 02/01/2022 85,000 109,902
Virginia Commonwealth Transportation
Board
5.350%, 05/15/2035 35,000 42,329
Virginia Public Building Authority
5.900%, 08/01/2030 205,000 268,138
Virginia Public School Authority
5.000%, 08/01/2023 260,000 334,573
TOTAL MUNICIPAL BONDS (Cost $11,210,567) $ 12,216,384
Spectrum Income Fund (continued)Shares or
Principal
Amount Value
TERM LOANS (M) - 1.7%
Consumer Discretionary - 0.6%
Bresnan Broadband Holdings LLC
4.500%, 12/14/2017 $ 223,861 $ 224,490
Caesars Entertainment Operating
Company, Inc.
9.500%, 10/31/2016 840,092 855,109
Charter Communications Operating LLC
3.460%, 09/06/2016 114,267 114,752
Clear Channel Communications, Inc.,
TBD
01/29/2016 (T) 375,000 303,281
Delta 2 Sarl
6.000%, 04/29/2019 995,000 1,003,955
Jo-Ann Stores, Inc.
4.750%, 03/16/2018 348,195 348,195
KAR Auction Services, Inc.
5.000%, 05/19/2017 276,222 277,488
MTL Publishing LLC
5.500%, 06/29/2018 224,438 226,472
Party City Holdings, Inc.
5.750%, 07/26/2019 550,000 554,714
Peninsula Gaming LLC
5.750%, 08/03/2017 575,000 583,266
Copyright © 2013 www.secdatabase.com. All Rights Reserved.Please Consider the Environment Before Printing This Document
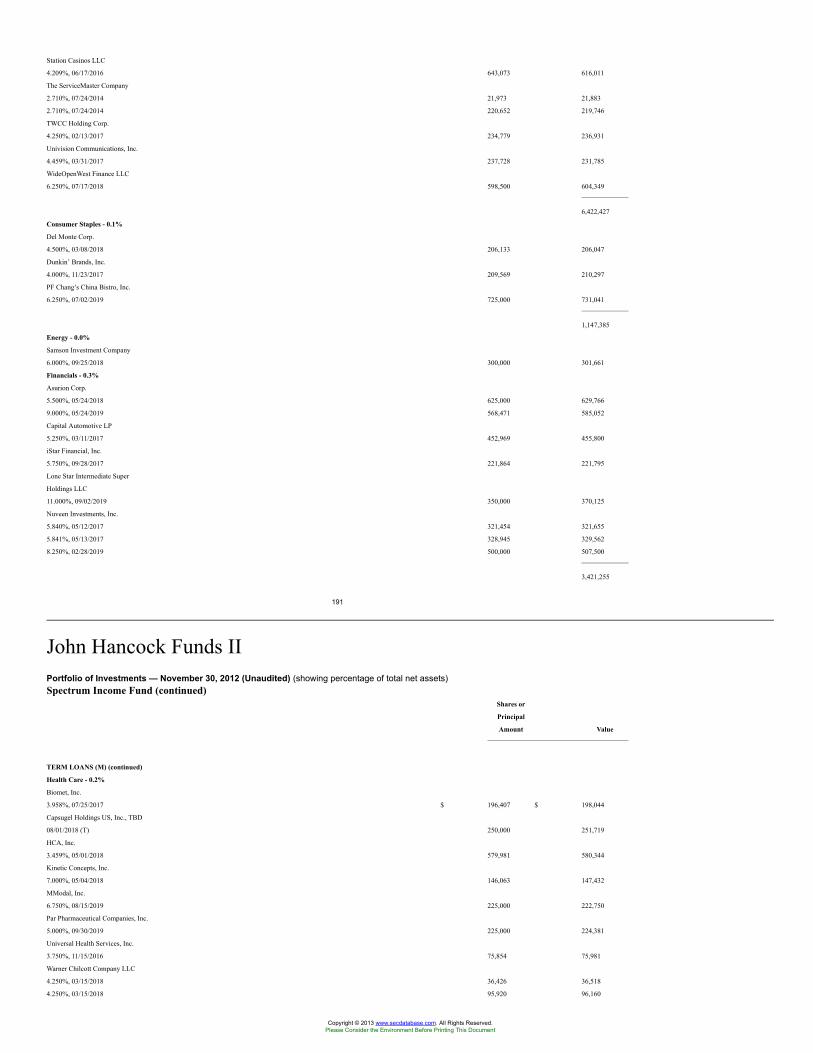
Station Casinos LLC
4.209%, 06/17/2016 643,073 616,011
The ServiceMaster Company
2.710%, 07/24/2014 21,973 21,883
2.710%, 07/24/2014 220,652 219,746
TWCC Holding Corp.
4.250%, 02/13/2017 234,779 236,931
Univision Communications, Inc.
4.459%, 03/31/2017 237,728 231,785
WideOpenWest Finance LLC
6.250%, 07/17/2018 598,500 604,349
6,422,427
Consumer Staples - 0.1%
Del Monte Corp.
4.500%, 03/08/2018 206,133 206,047
Dunkin’ Brands, Inc.
4.000%, 11/23/2017 209,569 210,297
PF Chang’s China Bistro, Inc.
6.250%, 07/02/2019 725,000 731,041
1,147,385
Energy - 0.0%
Samson Investment Company
6.000%, 09/25/2018 300,000 301,661
Financials - 0.3%
Asurion Corp.
5.500%, 05/24/2018 625,000 629,766
9.000%, 05/24/2019 568,471 585,052
Capital Automotive LP
5.250%, 03/11/2017 452,969 455,800
iStar Financial, Inc.
5.750%, 09/28/2017 221,864 221,795
Lone Star Intermediate Super
Holdings LLC
11.000%, 09/02/2019 350,000 370,125
Nuveen Investments, Inc.
5.840%, 05/12/2017 321,454 321,655
5.841%, 05/13/2017 328,945 329,562
8.250%, 02/28/2019 500,000 507,500
3,421,255
191
John Hancock Funds IIPortfolio of Investments — November 30, 2012 (Unaudited) (showing percentage of total net assets)Spectrum Income Fund (continued)
Shares or
Principal
Amount Value
TERM LOANS (M) (continued)
Health Care - 0.2%
Biomet, Inc.
3.958%, 07/25/2017 $ 196,407 $ 198,044
Capsugel Holdings US, Inc., TBD
08/01/2018 (T) 250,000 251,719
HCA, Inc.
3.459%, 05/01/2018 579,981 580,344
Kinetic Concepts, Inc.
7.000%, 05/04/2018 146,063 147,432
MModal, Inc.
6.750%, 08/15/2019 225,000 222,750
Par Pharmaceutical Companies, Inc.
5.000%, 09/30/2019 225,000 224,381
Universal Health Services, Inc.
3.750%, 11/15/2016 75,854 75,981
Warner Chilcott Company LLC
4.250%, 03/15/2018 36,426 36,518
4.250%, 03/15/2018 95,920 96,160
Copyright © 2013 www.secdatabase.com. All Rights Reserved.Please Consider the Environment Before Printing This Document
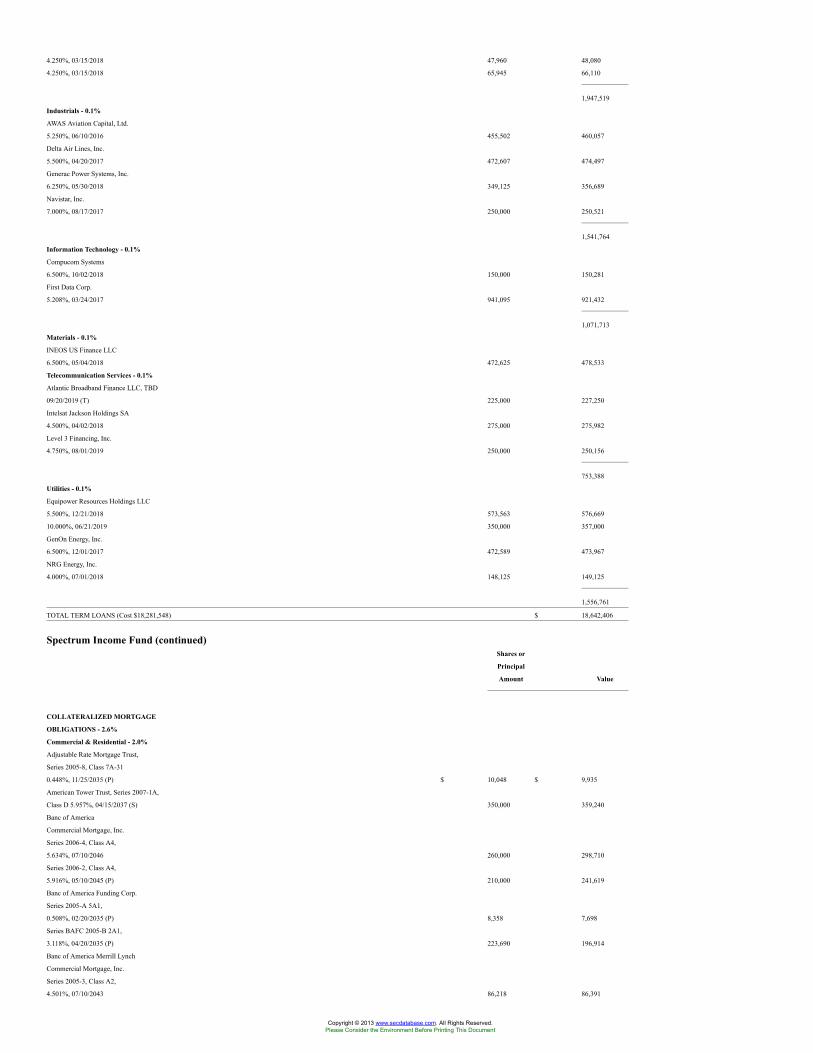
4.250%, 03/15/2018 47,960 48,080
4.250%, 03/15/2018 65,945 66,110
1,947,519
Industrials - 0.1%
AWAS Aviation Capital, Ltd.
5.250%, 06/10/2016 455,502 460,057
Delta Air Lines, Inc.
5.500%, 04/20/2017 472,607 474,497
Generac Power Systems, Inc.
6.250%, 05/30/2018 349,125 356,689
Navistar, Inc.
7.000%, 08/17/2017 250,000 250,521
1,541,764
Information Technology - 0.1%
Compucom Systems
6.500%, 10/02/2018 150,000 150,281
First Data Corp.
5.208%, 03/24/2017 941,095 921,432
1,071,713
Materials - 0.1%
INEOS US Finance LLC
6.500%, 05/04/2018 472,625 478,533
Telecommunication Services - 0.1%
Atlantic Broadband Finance LLC, TBD
09/20/2019 (T) 225,000 227,250
Intelsat Jackson Holdings SA
4.500%, 04/02/2018 275,000 275,982
Level 3 Financing, Inc.
4.750%, 08/01/2019 250,000 250,156
753,388
Utilities - 0.1%
Equipower Resources Holdings LLC
5.500%, 12/21/2018 573,563 576,669
10.000%, 06/21/2019 350,000 357,000
GenOn Energy, Inc.
6.500%, 12/01/2017 472,589 473,967
NRG Energy, Inc.
4.000%, 07/01/2018 148,125 149,125
1,556,761
TOTAL TERM LOANS (Cost $18,281,548) $ 18,642,406
Spectrum Income Fund (continued)Shares or
Principal
Amount Value
COLLATERALIZED MORTGAGE
OBLIGATIONS - 2.6%
Commercial & Residential - 2.0%
Adjustable Rate Mortgage Trust,
Series 2005-8, Class 7A-31
0.448%, 11/25/2035 (P) $ 10,048 $ 9,935
American Tower Trust, Series 2007-1A,
Class D 5.957%, 04/15/2037 (S) 350,000 359,240
Banc of America
Commercial Mortgage, Inc.
Series 2006-4, Class A4,
5.634%, 07/10/2046 260,000 298,710
Series 2006-2, Class A4,
5.916%, 05/10/2045 (P) 210,000 241,619
Banc of America Funding Corp.
Series 2005-A 5A1,
0.508%, 02/20/2035 (P) 8,358 7,698
Series BAFC 2005-B 2A1,
3.118%, 04/20/2035 (P) 223,690 196,914
Banc of America Merrill Lynch
Commercial Mortgage, Inc.
Series 2005-3, Class A2,
4.501%, 07/10/2043 86,218 86,391
Copyright © 2013 www.secdatabase.com. All Rights Reserved.Please Consider the Environment Before Printing This Document
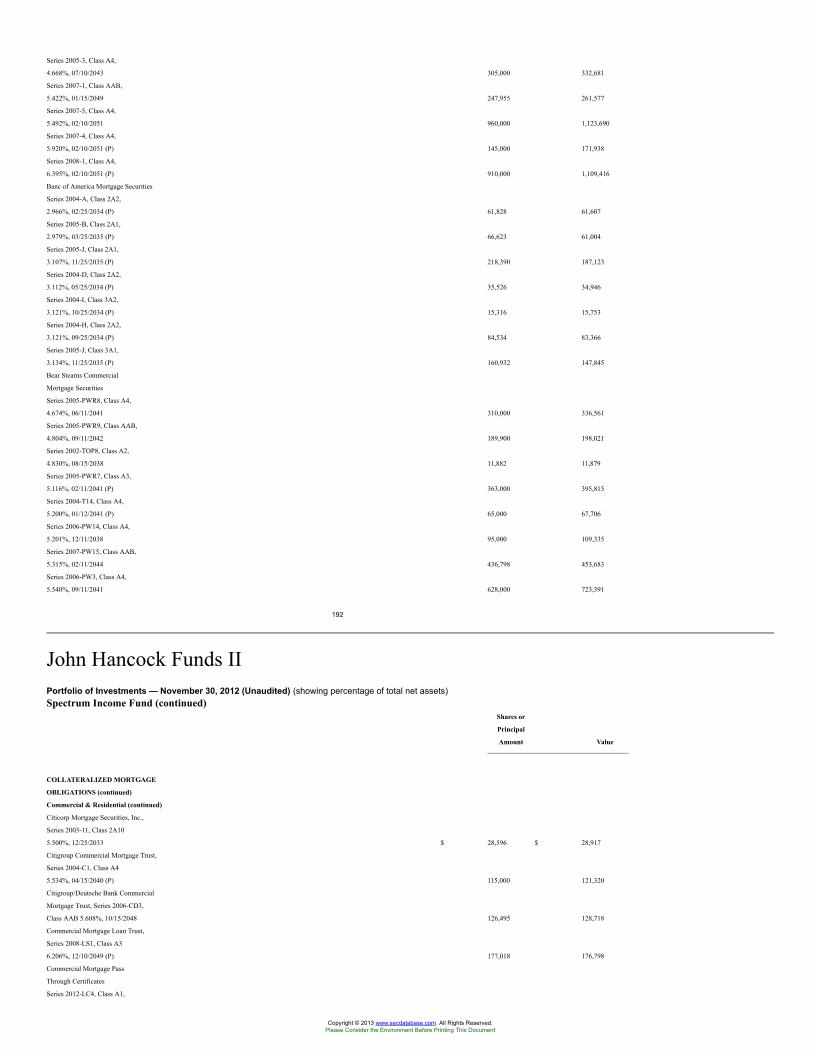
Series 2005-3, Class A4,
4.668%, 07/10/2043 305,000 332,681
Series 2007-1, Class AAB,
5.422%, 01/15/2049 247,955 261,577
Series 2007-5, Class A4,
5.492%, 02/10/2051 960,000 1,123,690
Series 2007-4, Class A4,
5.920%, 02/10/2051 (P) 145,000 171,938
Series 2008-1, Class A4,
6.395%, 02/10/2051 (P) 910,000 1,109,416
Banc of America Mortgage Securities
Series 2004-A, Class 2A2,
2.966%, 02/25/2034 (P) 61,828 61,607
Series 2005-B, Class 2A1,
2.979%, 03/25/2035 (P) 66,623 61,004
Series 2005-J, Class 2A1,
3.107%, 11/25/2035 (P) 218,390 187,123
Series 2004-D, Class 2A2,
3.112%, 05/25/2034 (P) 35,526 34,946
Series 2004-I, Class 3A2,
3.121%, 10/25/2034 (P) 15,316 15,753
Series 2004-H, Class 2A2,
3.121%, 09/25/2034 (P) 84,534 83,366
Series 2005-J, Class 3A1,
3.134%, 11/25/2035 (P) 160,932 147,845
Bear Stearns Commercial
Mortgage Securities
Series 2005-PWR8, Class A4,
4.674%, 06/11/2041 310,000 336,561
Series 2005-PWR9, Class AAB,
4.804%, 09/11/2042 189,900 198,021
Series 2002-TOP8, Class A2,
4.830%, 08/15/2038 11,882 11,879
Series 2005-PWR7, Class A3,
5.116%, 02/11/2041 (P) 363,000 395,815
Series 2004-T14, Class A4,
5.200%, 01/12/2041 (P) 65,000 67,706
Series 2006-PW14, Class A4,
5.201%, 12/11/2038 95,000 109,335
Series 2007-PW15, Class AAB,
5.315%, 02/11/2044 436,798 453,683
Series 2006-PW3, Class A4,
5.540%, 09/11/2041 628,000 723,391
192
John Hancock Funds IIPortfolio of Investments — November 30, 2012 (Unaudited) (showing percentage of total net assets)Spectrum Income Fund (continued)
Shares or
Principal
Amount Value
COLLATERALIZED MORTGAGE
OBLIGATIONS (continued)
Commercial & Residential (continued)
Citicorp Mortgage Securities, Inc.,
Series 2003-11, Class 2A10
5.500%, 12/25/2033 $ 28,596 $ 28,917
Citigroup Commercial Mortgage Trust,
Series 2004-C1, Class A4
5.534%, 04/15/2040 (P) 115,000 121,320
Citigroup/Deutsche Bank Commercial
Mortgage Trust, Series 2006-CD3,
Class AAB 5.608%, 10/15/2048 126,495 128,718
Commercial Mortgage Loan Trust,
Series 2008-LS1, Class A3
6.206%, 12/10/2049 (P) 177,018 176,798
Commercial Mortgage Pass
Through Certificates
Series 2012-LC4, Class A1,
Copyright © 2013 www.secdatabase.com. All Rights Reserved.Please Consider the Environment Before Printing This Document
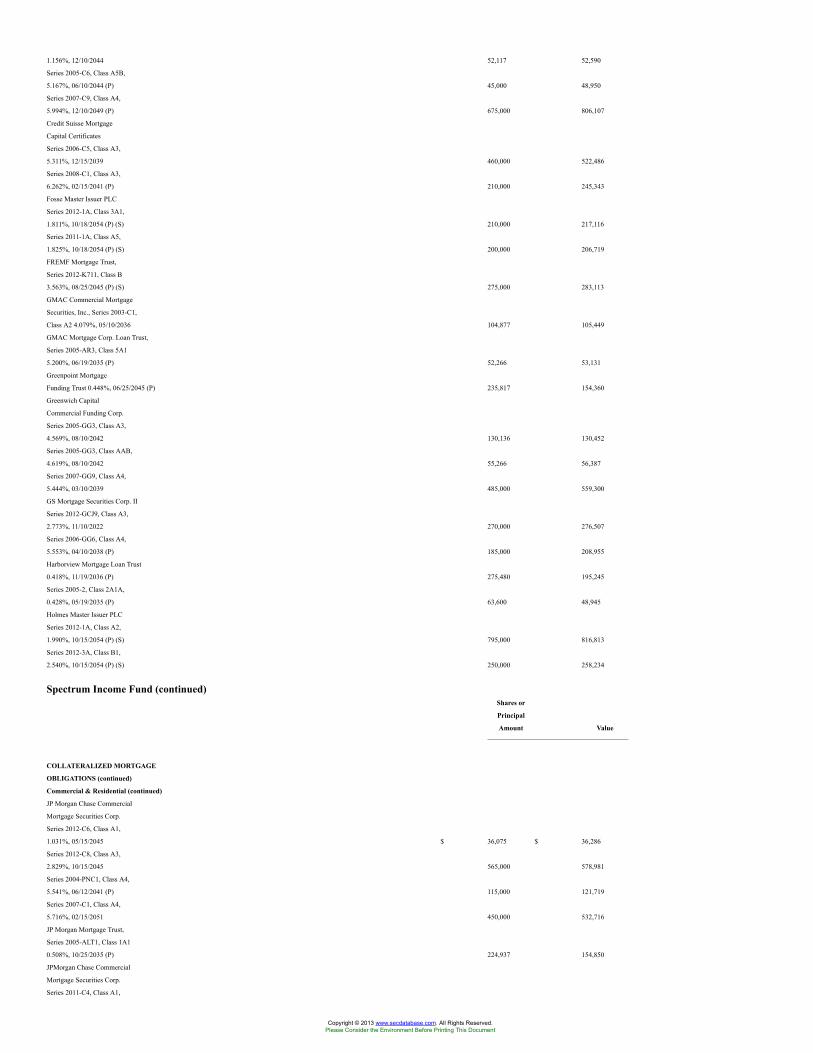
1.156%, 12/10/2044 52,117 52,590
Series 2005-C6, Class A5B,
5.167%, 06/10/2044 (P) 45,000 48,950
Series 2007-C9, Class A4,
5.994%, 12/10/2049 (P) 675,000 806,107
Credit Suisse Mortgage
Capital Certificates
Series 2006-C5, Class A3,
5.311%, 12/15/2039 460,000 522,486
Series 2008-C1, Class A3,
6.262%, 02/15/2041 (P) 210,000 245,343
Fosse Master Issuer PLC
Series 2012-1A, Class 3A1,
1.811%, 10/18/2054 (P) (S) 210,000 217,116
Series 2011-1A, Class A5,
1.825%, 10/18/2054 (P) (S) 200,000 206,719
FREMF Mortgage Trust,
Series 2012-K711, Class B
3.563%, 08/25/2045 (P) (S) 275,000 283,113
GMAC Commercial Mortgage
Securities, Inc., Series 2003-C1,
Class A2 4.079%, 05/10/2036 104,877 105,449
GMAC Mortgage Corp. Loan Trust,
Series 2005-AR3, Class 5A1
5.200%, 06/19/2035 (P) 52,266 53,131
Greenpoint Mortgage
Funding Trust 0.448%, 06/25/2045 (P) 235,817 154,360
Greenwich Capital
Commercial Funding Corp.
Series 2005-GG3, Class A3,
4.569%, 08/10/2042 130,136 130,452
Series 2005-GG3, Class AAB,
4.619%, 08/10/2042 55,266 56,387
Series 2007-GG9, Class A4,
5.444%, 03/10/2039 485,000 559,300
GS Mortgage Securities Corp. II
Series 2012-GCJ9, Class A3,
2.773%, 11/10/2022 270,000 276,507
Series 2006-GG6, Class A4,
5.553%, 04/10/2038 (P) 185,000 208,955
Harborview Mortgage Loan Trust
0.418%, 11/19/2036 (P) 275,480 195,245
Series 2005-2, Class 2A1A,
0.428%, 05/19/2035 (P) 63,600 48,945
Holmes Master Issuer PLC
Series 2012-1A, Class A2,
1.990%, 10/15/2054 (P) (S) 795,000 816,813
Series 2012-3A, Class B1,
2.540%, 10/15/2054 (P) (S) 250,000 258,234
Spectrum Income Fund (continued)Shares or
Principal
Amount Value
COLLATERALIZED MORTGAGE
OBLIGATIONS (continued)
Commercial & Residential (continued)
JP Morgan Chase Commercial
Mortgage Securities Corp.
Series 2012-C6, Class A1,
1.031%, 05/15/2045 $ 36,075 $ 36,286
Series 2012-C8, Class A3,
2.829%, 10/15/2045 565,000 578,981
Series 2004-PNC1, Class A4,
5.541%, 06/12/2041 (P) 115,000 121,719
Series 2007-C1, Class A4,
5.716%, 02/15/2051 450,000 532,716
JP Morgan Mortgage Trust,
Series 2005-ALT1, Class 1A1
0.508%, 10/25/2035 (P) 224,937 154,850
JPMorgan Chase Commercial
Mortgage Securities Corp.
Series 2011-C4, Class A1,
Copyright © 2013 www.secdatabase.com. All Rights Reserved.Please Consider the Environment Before Printing This Document
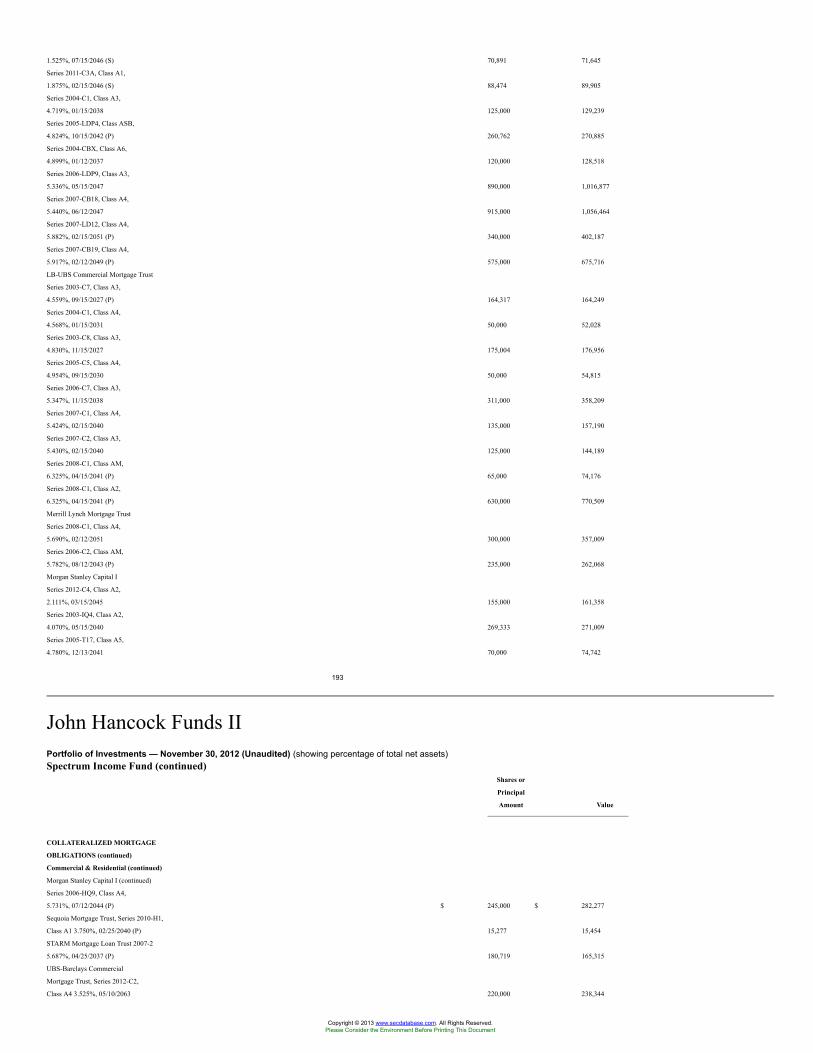
1.525%, 07/15/2046 (S) 70,891 71,645
Series 2011-C3A, Class A1,
1.875%, 02/15/2046 (S) 88,474 89,905
Series 2004-C1, Class A3,
4.719%, 01/15/2038 125,000 129,239
Series 2005-LDP4, Class ASB,
4.824%, 10/15/2042 (P) 260,762 270,885
Series 2004-CBX, Class A6,
4.899%, 01/12/2037 120,000 128,518
Series 2006-LDP9, Class A3,
5.336%, 05/15/2047 890,000 1,016,877
Series 2007-CB18, Class A4,
5.440%, 06/12/2047 915,000 1,056,464
Series 2007-LD12, Class A4,
5.882%, 02/15/2051 (P) 340,000 402,187
Series 2007-CB19, Class A4,
5.917%, 02/12/2049 (P) 575,000 675,716
LB-UBS Commercial Mortgage Trust
Series 2003-C7, Class A3,
4.559%, 09/15/2027 (P) 164,317 164,249
Series 2004-C1, Class A4,
4.568%, 01/15/2031 50,000 52,028
Series 2003-C8, Class A3,
4.830%, 11/15/2027 175,004 176,956
Series 2005-C5, Class A4,
4.954%, 09/15/2030 50,000 54,815
Series 2006-C7, Class A3,
5.347%, 11/15/2038 311,000 358,209
Series 2007-C1, Class A4,
5.424%, 02/15/2040 135,000 157,190
Series 2007-C2, Class A3,
5.430%, 02/15/2040 125,000 144,189
Series 2008-C1, Class AM,
6.325%, 04/15/2041 (P) 65,000 74,176
Series 2008-C1, Class A2,
6.325%, 04/15/2041 (P) 630,000 770,509
Merrill Lynch Mortgage Trust
Series 2008-C1, Class A4,
5.690%, 02/12/2051 300,000 357,009
Series 2006-C2, Class AM,
5.782%, 08/12/2043 (P) 235,000 262,068
Morgan Stanley Capital I
Series 2012-C4, Class A2,
2.111%, 03/15/2045 155,000 161,358
Series 2003-IQ4, Class A2,
4.070%, 05/15/2040 269,333 271,009
Series 2005-T17, Class A5,
4.780%, 12/13/2041 70,000 74,742
193
John Hancock Funds IIPortfolio of Investments — November 30, 2012 (Unaudited) (showing percentage of total net assets)Spectrum Income Fund (continued)
Shares or
Principal
Amount Value
COLLATERALIZED MORTGAGE
OBLIGATIONS (continued)
Commercial & Residential (continued)
Morgan Stanley Capital I (continued)
Series 2006-HQ9, Class A4,
5.731%, 07/12/2044 (P) $ 245,000 $ 282,277
Sequoia Mortgage Trust, Series 2010-H1,
Class A1 3.750%, 02/25/2040 (P) 15,277 15,454
STARM Mortgage Loan Trust 2007-2
5.687%, 04/25/2037 (P) 180,719 165,315
UBS-Barclays Commercial
Mortgage Trust, Series 2012-C2,
Class A4 3.525%, 05/10/2063 220,000 238,344
Copyright © 2013 www.secdatabase.com. All Rights Reserved.Please Consider the Environment Before Printing This Document
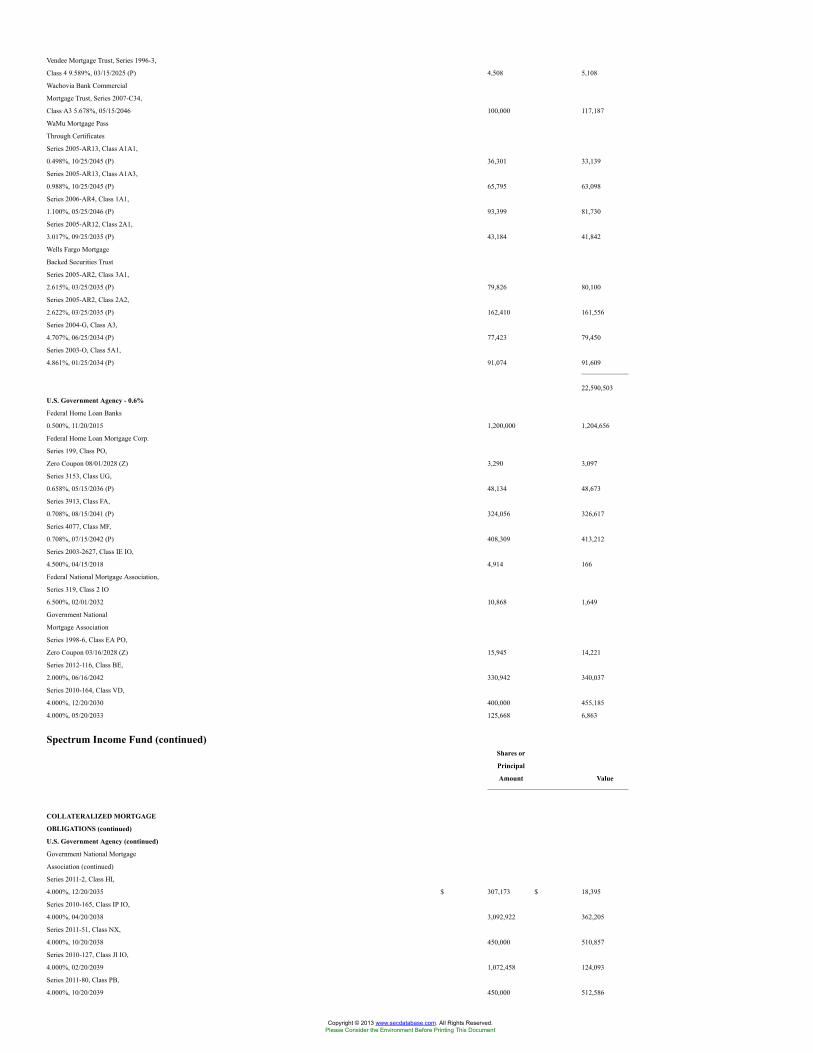
Vendee Mortgage Trust, Series 1996-3,
Class 4 9.589%, 03/15/2025 (P) 4,508 5,108
Wachovia Bank Commercial
Mortgage Trust, Series 2007-C34,
Class A3 5.678%, 05/15/2046 100,000 117,187
WaMu Mortgage Pass
Through Certificates
Series 2005-AR13, Class A1A1,
0.498%, 10/25/2045 (P) 36,301 33,139
Series 2005-AR13, Class A1A3,
0.988%, 10/25/2045 (P) 65,795 63,098
Series 2006-AR4, Class 1A1,
1.100%, 05/25/2046 (P) 93,399 81,730
Series 2005-AR12, Class 2A1,
3.017%, 09/25/2035 (P) 43,184 41,842
Wells Fargo Mortgage
Backed Securities Trust
Series 2005-AR2, Class 3A1,
2.615%, 03/25/2035 (P) 79,826 80,100
Series 2005-AR2, Class 2A2,
2.622%, 03/25/2035 (P) 162,410 161,556
Series 2004-G, Class A3,
4.707%, 06/25/2034 (P) 77,423 79,450
Series 2003-O, Class 5A1,
4.861%, 01/25/2034 (P) 91,074 91,609
22,590,503
U.S. Government Agency - 0.6%
Federal Home Loan Banks
0.500%, 11/20/2015 1,200,000 1,204,656
Federal Home Loan Mortgage Corp.
Series 199, Class PO,
Zero Coupon 08/01/2028 (Z) 3,290 3,097
Series 3153, Class UG,
0.658%, 05/15/2036 (P) 48,134 48,673
Series 3913, Class FA,
0.708%, 08/15/2041 (P) 324,056 326,617
Series 4077, Class MF,
0.708%, 07/15/2042 (P) 408,309 413,212
Series 2003-2627, Class IE IO,
4.500%, 04/15/2018 4,914 166
Federal National Mortgage Association,
Series 319, Class 2 IO
6.500%, 02/01/2032 10,868 1,649
Government National
Mortgage Association
Series 1998-6, Class EA PO,
Zero Coupon 03/16/2028 (Z) 15,945 14,221
Series 2012-116, Class BE,
2.000%, 06/16/2042 330,942 340,037
Series 2010-164, Class VD,
4.000%, 12/20/2030 400,000 455,185
4.000%, 05/20/2033 125,668 6,863
Spectrum Income Fund (continued)Shares or
Principal
Amount Value
COLLATERALIZED MORTGAGE
OBLIGATIONS (continued)
U.S. Government Agency (continued)
Government National Mortgage
Association (continued)
Series 2011-2, Class HI,
4.000%, 12/20/2035 $ 307,173 $ 18,395
Series 2010-165, Class IP IO,
4.000%, 04/20/2038 3,092,922 362,205
Series 2011-51, Class NX,
4.000%, 10/20/2038 450,000 510,857
Series 2010-127, Class JI IO,
4.000%, 02/20/2039 1,072,458 124,093
Series 2011-80, Class PB,
4.000%, 10/20/2039 450,000 512,586
Copyright © 2013 www.secdatabase.com. All Rights Reserved.Please Consider the Environment Before Printing This Document
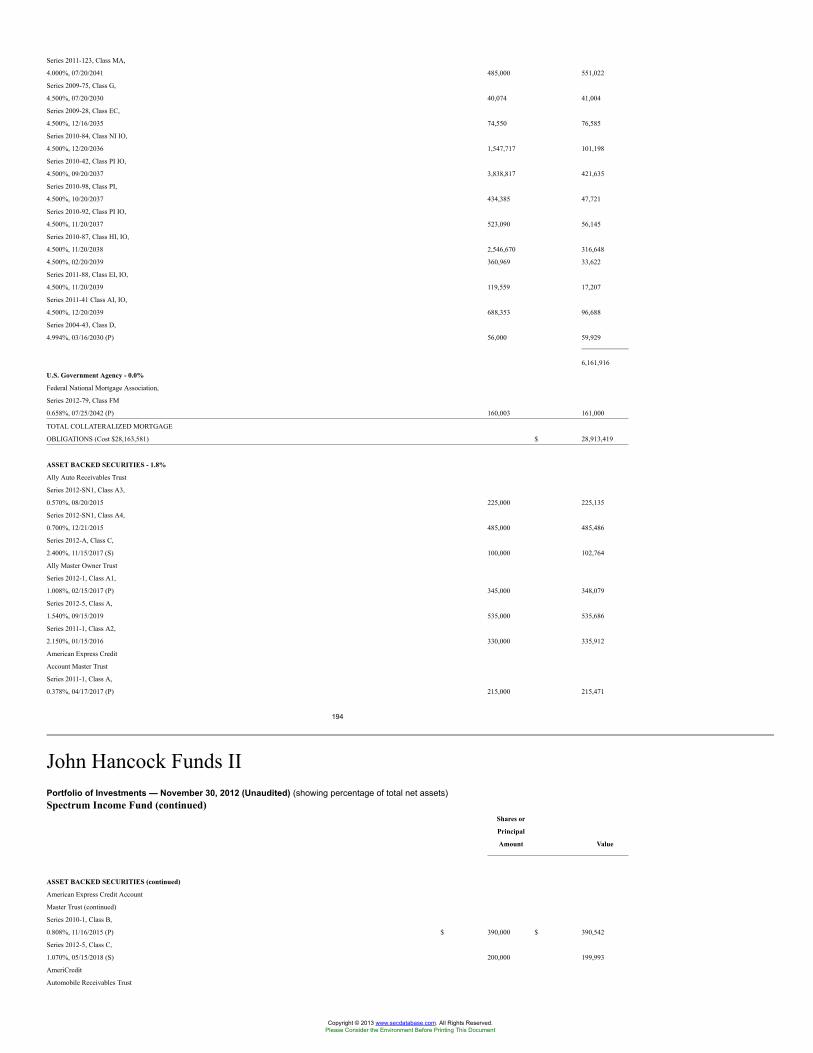
Series 2011-123, Class MA,
4.000%, 07/20/2041 485,000 551,022
Series 2009-75, Class G,
4.500%, 07/20/2030 40,074 41,004
Series 2009-28, Class EC,
4.500%, 12/16/2035 74,550 76,585
Series 2010-84, Class NI IO,
4.500%, 12/20/2036 1,547,717 101,198
Series 2010-42, Class PI IO,
4.500%, 09/20/2037 3,838,817 421,635
Series 2010-98, Class PI,
4.500%, 10/20/2037 434,385 47,721
Series 2010-92, Class PI IO,
4.500%, 11/20/2037 523,090 56,145
Series 2010-87, Class HI, IO,
4.500%, 11/20/2038 2,546,670 316,648
4.500%, 02/20/2039 360,969 33,622
Series 2011-88, Class EI, IO,
4.500%, 11/20/2039 119,559 17,207
Series 2011-41 Class AI, IO,
4.500%, 12/20/2039 688,353 96,688
Series 2004-43, Class D,
4.994%, 03/16/2030 (P) 56,000 59,929
6,161,916
U.S. Government Agency - 0.0%
Federal National Mortgage Association,
Series 2012-79, Class FM
0.658%, 07/25/2042 (P) 160,003 161,000
TOTAL COLLATERALIZED MORTGAGE
OBLIGATIONS (Cost $28,163,581) $ 28,913,419
ASSET BACKED SECURITIES - 1.8%
Ally Auto Receivables Trust
Series 2012-SN1, Class A3,
0.570%, 08/20/2015 225,000 225,135
Series 2012-SN1, Class A4,
0.700%, 12/21/2015 485,000 485,486
Series 2012-A, Class C,
2.400%, 11/15/2017 (S) 100,000 102,764
Ally Master Owner Trust
Series 2012-1, Class A1,
1.008%, 02/15/2017 (P) 345,000 348,079
Series 2012-5, Class A,
1.540%, 09/15/2019 535,000 535,686
Series 2011-1, Class A2,
2.150%, 01/15/2016 330,000 335,912
American Express Credit
Account Master Trust
Series 2011-1, Class A,
0.378%, 04/17/2017 (P) 215,000 215,471
194
John Hancock Funds IIPortfolio of Investments — November 30, 2012 (Unaudited) (showing percentage of total net assets)Spectrum Income Fund (continued)
Shares or
Principal
Amount Value
ASSET BACKED SECURITIES (continued)
American Express Credit Account
Master Trust (continued)
Series 2010-1, Class B,
0.808%, 11/16/2015 (P) $ 390,000 $ 390,542
Series 2012-5, Class C,
1.070%, 05/15/2018 (S) 200,000 199,993
AmeriCredit
Automobile Receivables Trust
Copyright © 2013 www.secdatabase.com. All Rights Reserved.Please Consider the Environment Before Printing This Document
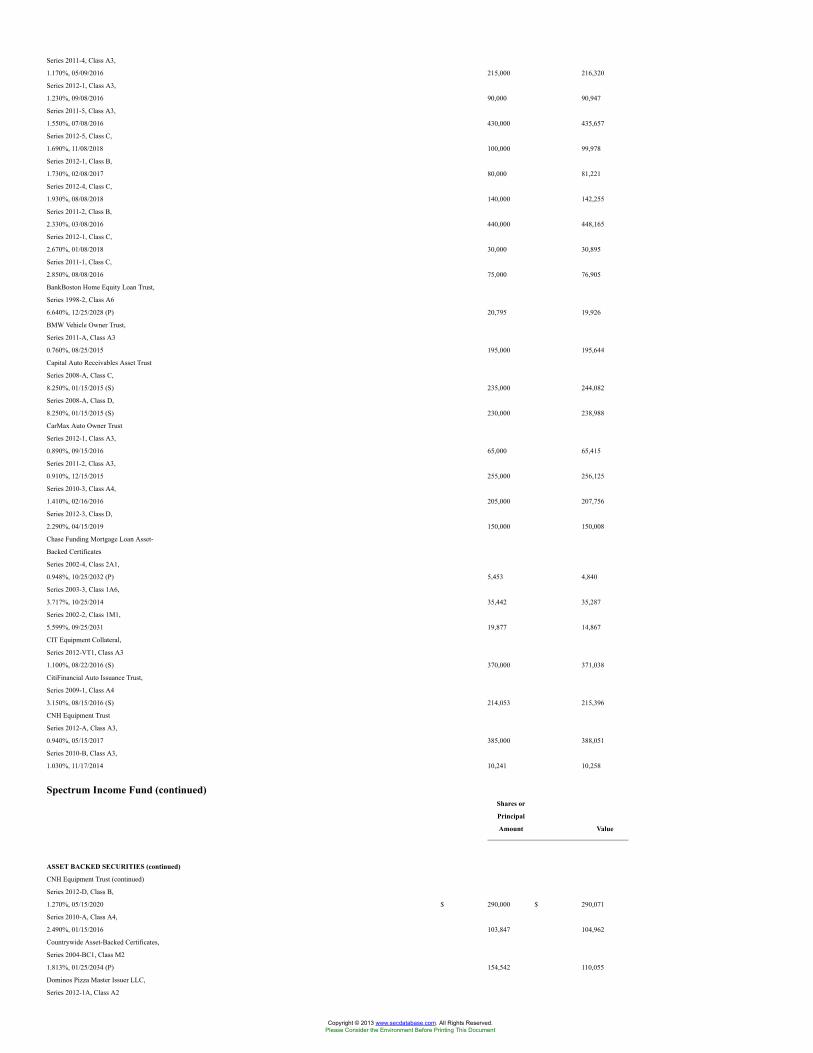
Series 2011-4, Class A3,
1.170%, 05/09/2016 215,000 216,320
Series 2012-1, Class A3,
1.230%, 09/08/2016 90,000 90,947
Series 2011-5, Class A3,
1.550%, 07/08/2016 430,000 435,657
Series 2012-5, Class C,
1.690%, 11/08/2018 100,000 99,978
Series 2012-1, Class B,
1.730%, 02/08/2017 80,000 81,221
Series 2012-4, Class C,
1.930%, 08/08/2018 140,000 142,255
Series 2011-2, Class B,
2.330%, 03/08/2016 440,000 448,165
Series 2012-1, Class C,
2.670%, 01/08/2018 30,000 30,895
Series 2011-1, Class C,
2.850%, 08/08/2016 75,000 76,905
BankBoston Home Equity Loan Trust,
Series 1998-2, Class A6
6.640%, 12/25/2028 (P) 20,795 19,926
BMW Vehicle Owner Trust,
Series 2011-A, Class A3
0.760%, 08/25/2015 195,000 195,644
Capital Auto Receivables Asset Trust
Series 2008-A, Class C,
8.250%, 01/15/2015 (S) 235,000 244,082
Series 2008-A, Class D,
8.250%, 01/15/2015 (S) 230,000 238,988
CarMax Auto Owner Trust
Series 2012-1, Class A3,
0.890%, 09/15/2016 65,000 65,415
Series 2011-2, Class A3,
0.910%, 12/15/2015 255,000 256,125
Series 2010-3, Class A4,
1.410%, 02/16/2016 205,000 207,756
Series 2012-3, Class D,
2.290%, 04/15/2019 150,000 150,008
Chase Funding Mortgage Loan Asset-
Backed Certificates
Series 2002-4, Class 2A1,
0.948%, 10/25/2032 (P) 5,453 4,840
Series 2003-3, Class 1A6,
3.717%, 10/25/2014 35,442 35,287
Series 2002-2, Class 1M1,
5.599%, 09/25/2031 19,877 14,867
CIT Equipment Collateral,
Series 2012-VT1, Class A3
1.100%, 08/22/2016 (S) 370,000 371,038
CitiFinancial Auto Issuance Trust,
Series 2009-1, Class A4
3.150%, 08/15/2016 (S) 214,053 215,396
CNH Equipment Trust
Series 2012-A, Class A3,
0.940%, 05/15/2017 385,000 388,051
Series 2010-B, Class A3,
1.030%, 11/17/2014 10,241 10,258
Spectrum Income Fund (continued)Shares or
Principal
Amount Value
ASSET BACKED SECURITIES (continued)
CNH Equipment Trust (continued)
Series 2012-D, Class B,
1.270%, 05/15/2020 $ 290,000 $ 290,071
Series 2010-A, Class A4,
2.490%, 01/15/2016 103,847 104,962
Countrywide Asset-Backed Certificates,
Series 2004-BC1, Class M2
1.813%, 01/25/2034 (P) 154,542 110,055
Dominos Pizza Master Issuer LLC,
Series 2012-1A, Class A2
Copyright © 2013 www.secdatabase.com. All Rights Reserved.Please Consider the Environment Before Printing This Document
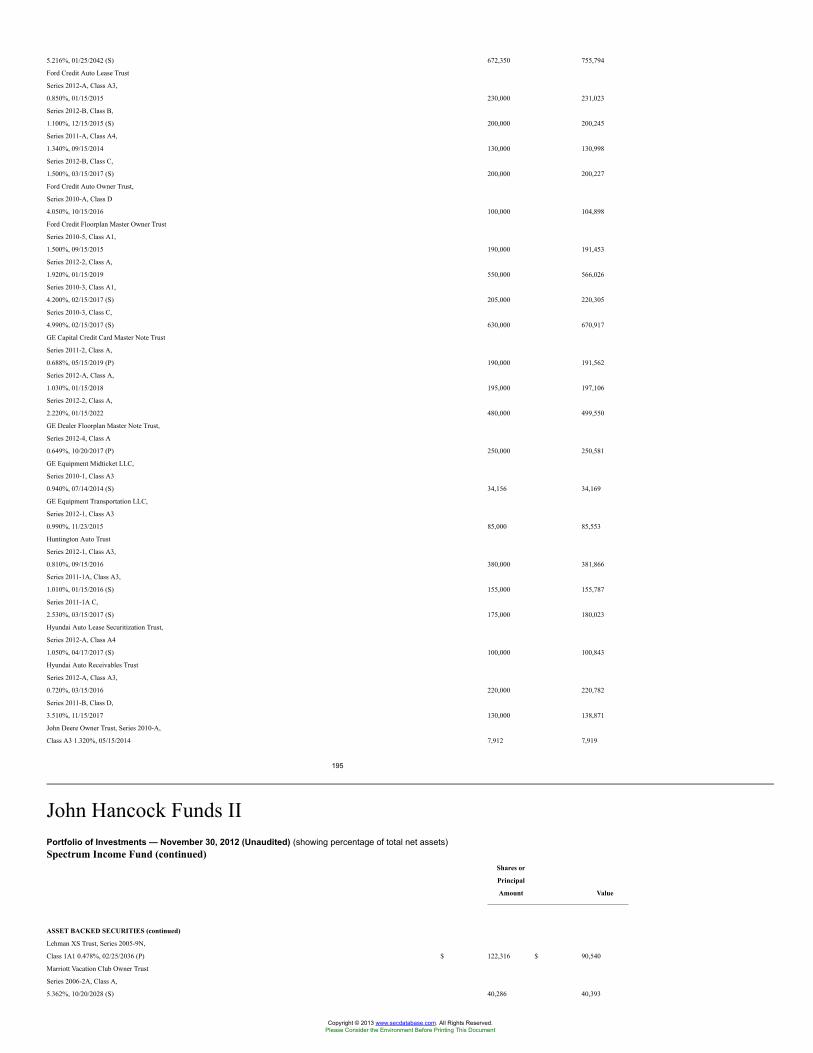
5.216%, 01/25/2042 (S) 672,350 755,794
Ford Credit Auto Lease Trust
Series 2012-A, Class A3,
0.850%, 01/15/2015 230,000 231,023
Series 2012-B, Class B,
1.100%, 12/15/2015 (S) 200,000 200,245
Series 2011-A, Class A4,
1.340%, 09/15/2014 130,000 130,998
Series 2012-B, Class C,
1.500%, 03/15/2017 (S) 200,000 200,227
Ford Credit Auto Owner Trust,
Series 2010-A, Class D
4.050%, 10/15/2016 100,000 104,898
Ford Credit Floorplan Master Owner Trust
Series 2010-5, Class A1,
1.500%, 09/15/2015 190,000 191,453
Series 2012-2, Class A,
1.920%, 01/15/2019 550,000 566,026
Series 2010-3, Class A1,
4.200%, 02/15/2017 (S) 205,000 220,305
Series 2010-3, Class C,
4.990%, 02/15/2017 (S) 630,000 670,917
GE Capital Credit Card Master Note Trust
Series 2011-2, Class A,
0.688%, 05/15/2019 (P) 190,000 191,562
Series 2012-A, Class A,
1.030%, 01/15/2018 195,000 197,106
Series 2012-2, Class A,
2.220%, 01/15/2022 480,000 499,550
GE Dealer Floorplan Master Note Trust,
Series 2012-4, Class A
0.649%, 10/20/2017 (P) 250,000 250,581
GE Equipment Midticket LLC,
Series 2010-1, Class A3
0.940%, 07/14/2014 (S) 34,156 34,169
GE Equipment Transportation LLC,
Series 2012-1, Class A3
0.990%, 11/23/2015 85,000 85,553
Huntington Auto Trust
Series 2012-1, Class A3,
0.810%, 09/15/2016 380,000 381,866
Series 2011-1A, Class A3,
1.010%, 01/15/2016 (S) 155,000 155,787
Series 2011-1A C,
2.530%, 03/15/2017 (S) 175,000 180,023
Hyundai Auto Lease Securitization Trust,
Series 2012-A, Class A4
1.050%, 04/17/2017 (S) 100,000 100,843
Hyundai Auto Receivables Trust
Series 2012-A, Class A3,
0.720%, 03/15/2016 220,000 220,782
Series 2011-B, Class D,
3.510%, 11/15/2017 130,000 138,871
John Deere Owner Trust, Series 2010-A,
Class A3 1.320%, 05/15/2014 7,912 7,919
195
John Hancock Funds IIPortfolio of Investments — November 30, 2012 (Unaudited) (showing percentage of total net assets)Spectrum Income Fund (continued)
Shares or
Principal
Amount Value
ASSET BACKED SECURITIES (continued)
Lehman XS Trust, Series 2005-9N,
Class 1A1 0.478%, 02/25/2036 (P) $ 122,316 $ 90,540
Marriott Vacation Club Owner Trust
Series 2006-2A, Class A,
5.362%, 10/20/2028 (S) 40,286 40,393
Copyright © 2013 www.secdatabase.com. All Rights Reserved.Please Consider the Environment Before Printing This Document
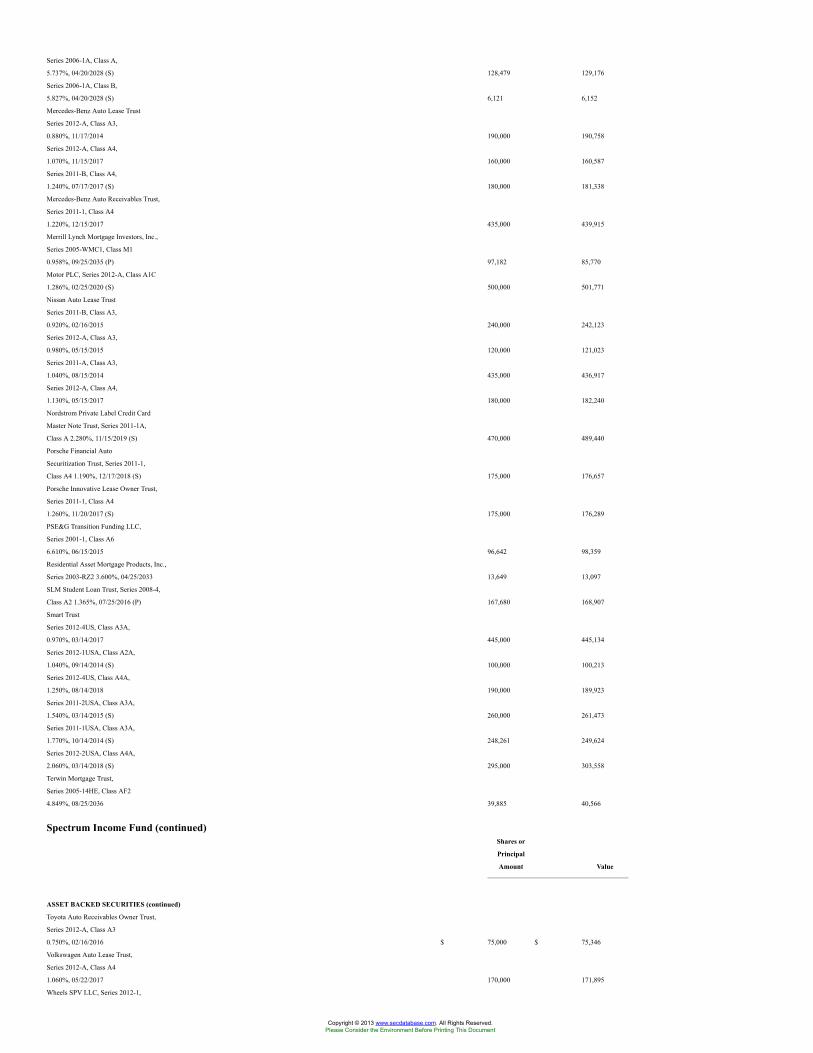
Series 2006-1A, Class A,
5.737%, 04/20/2028 (S) 128,479 129,176
Series 2006-1A, Class B,
5.827%, 04/20/2028 (S) 6,121 6,152
Mercedes-Benz Auto Lease Trust
Series 2012-A, Class A3,
0.880%, 11/17/2014 190,000 190,758
Series 2012-A, Class A4,
1.070%, 11/15/2017 160,000 160,587
Series 2011-B, Class A4,
1.240%, 07/17/2017 (S) 180,000 181,338
Mercedes-Benz Auto Receivables Trust,
Series 2011-1, Class A4
1.220%, 12/15/2017 435,000 439,915
Merrill Lynch Mortgage Investors, Inc.,
Series 2005-WMC1, Class M1
0.958%, 09/25/2035 (P) 97,182 85,770
Motor PLC, Series 2012-A, Class A1C
1.286%, 02/25/2020 (S) 500,000 501,771
Nissan Auto Lease Trust
Series 2011-B, Class A3,
0.920%, 02/16/2015 240,000 242,123
Series 2012-A, Class A3,
0.980%, 05/15/2015 120,000 121,023
Series 2011-A, Class A3,
1.040%, 08/15/2014 435,000 436,917
Series 2012-A, Class A4,
1.130%, 05/15/2017 180,000 182,240
Nordstrom Private Label Credit Card
Master Note Trust, Series 2011-1A,
Class A 2.280%, 11/15/2019 (S) 470,000 489,440
Porsche Financial Auto
Securitization Trust, Series 2011-1,
Class A4 1.190%, 12/17/2018 (S) 175,000 176,657
Porsche Innovative Lease Owner Trust,
Series 2011-1, Class A4
1.260%, 11/20/2017 (S) 175,000 176,289
PSE&G Transition Funding LLC,
Series 2001-1, Class A6
6.610%, 06/15/2015 96,642 98,359
Residential Asset Mortgage Products, Inc.,
Series 2003-RZ2 3.600%, 04/25/2033 13,649 13,097
SLM Student Loan Trust, Series 2008-4,
Class A2 1.365%, 07/25/2016 (P) 167,680 168,907
Smart Trust
Series 2012-4US, Class A3A,
0.970%, 03/14/2017 445,000 445,134
Series 2012-1USA, Class A2A,
1.040%, 09/14/2014 (S) 100,000 100,213
Series 2012-4US, Class A4A,
1.250%, 08/14/2018 190,000 189,923
Series 2011-2USA, Class A3A,
1.540%, 03/14/2015 (S) 260,000 261,473
Series 2011-1USA, Class A3A,
1.770%, 10/14/2014 (S) 248,261 249,624
Series 2012-2USA, Class A4A,
2.060%, 03/14/2018 (S) 295,000 303,558
Terwin Mortgage Trust,
Series 2005-14HE, Class AF2
4.849%, 08/25/2036 39,885 40,566
Spectrum Income Fund (continued)Shares or
Principal
Amount Value
ASSET BACKED SECURITIES (continued)
Toyota Auto Receivables Owner Trust,
Series 2012-A, Class A3
0.750%, 02/16/2016 $ 75,000 $ 75,346
Volkswagen Auto Lease Trust,
Series 2012-A, Class A4
1.060%, 05/22/2017 170,000 171,895
Wheels SPV LLC, Series 2012-1,
Copyright © 2013 www.secdatabase.com. All Rights Reserved.Please Consider the Environment Before Printing This Document
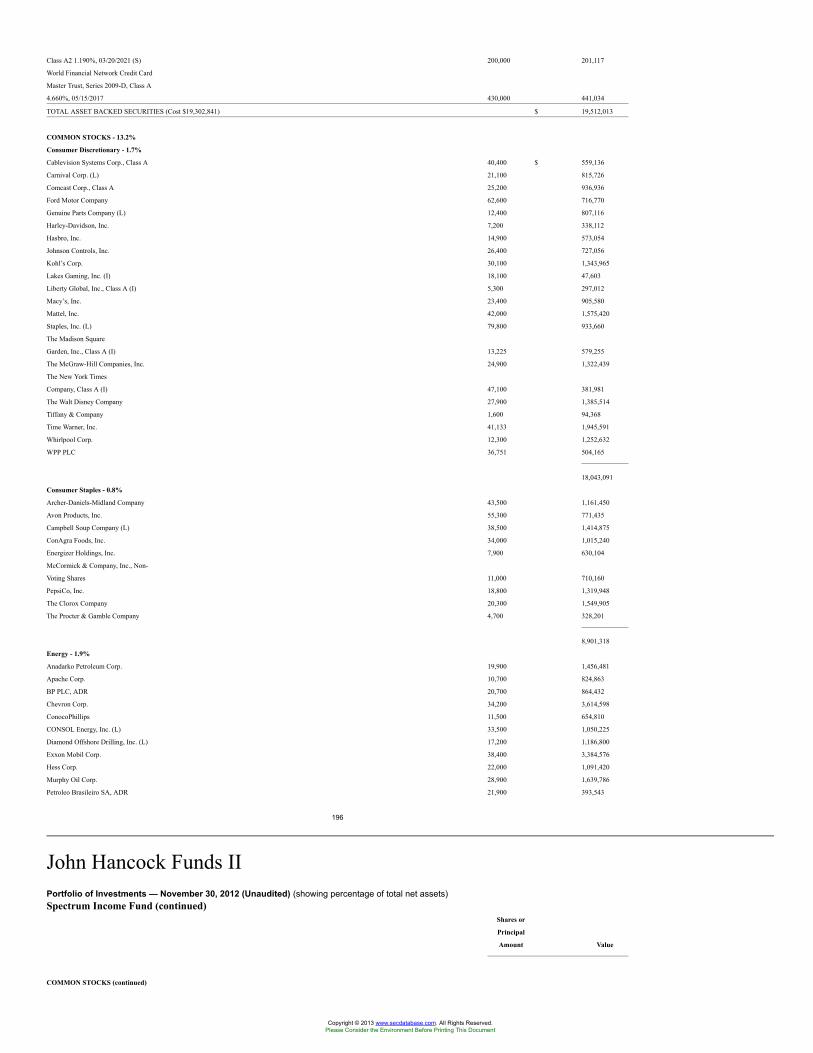
Class A2 1.190%, 03/20/2021 (S) 200,000 201,117
World Financial Network Credit Card
Master Trust, Series 2009-D, Class A
4.660%, 05/15/2017 430,000 441,034
TOTAL ASSET BACKED SECURITIES (Cost $19,302,841) $ 19,512,013
COMMON STOCKS - 13.2%
Consumer Discretionary - 1.7%
Cablevision Systems Corp., Class A 40,400 $ 559,136
Carnival Corp. (L) 21,100 815,726
Comcast Corp., Class A 25,200 936,936
Ford Motor Company 62,600 716,770
Genuine Parts Company (L) 12,400 807,116
Harley-Davidson, Inc. 7,200 338,112
Hasbro, Inc. 14,900 573,054
Johnson Controls, Inc. 26,400 727,056
Kohl’s Corp. 30,100 1,343,965
Lakes Gaming, Inc. (I) 18,100 47,603
Liberty Global, Inc., Class A (I) 5,300 297,012
Macy’s, Inc. 23,400 905,580
Mattel, Inc. 42,000 1,575,420
Staples, Inc. (L) 79,800 933,660
The Madison Square
Garden, Inc., Class A (I) 13,225 579,255
The McGraw-Hill Companies, Inc. 24,900 1,322,439
The New York Times
Company, Class A (I) 47,100 381,981
The Walt Disney Company 27,900 1,385,514
Tiffany & Company 1,600 94,368
Time Warner, Inc. 41,133 1,945,591
Whirlpool Corp. 12,300 1,252,632
WPP PLC 36,751 504,165
18,043,091
Consumer Staples - 0.8%
Archer-Daniels-Midland Company 43,500 1,161,450
Avon Products, Inc. 55,300 771,435
Campbell Soup Company (L) 38,500 1,414,875
ConAgra Foods, Inc. 34,000 1,015,240
Energizer Holdings, Inc. 7,900 630,104
McCormick & Company, Inc., Non-
Voting Shares 11,000 710,160
PepsiCo, Inc. 18,800 1,319,948
The Clorox Company 20,300 1,549,905
The Procter & Gamble Company 4,700 328,201
8,901,318
Energy - 1.9%
Anadarko Petroleum Corp. 19,900 1,456,481
Apache Corp. 10,700 824,863
BP PLC, ADR 20,700 864,432
Chevron Corp. 34,200 3,614,598
ConocoPhillips 11,500 654,810
CONSOL Energy, Inc. (L) 33,500 1,050,225
Diamond Offshore Drilling, Inc. (L) 17,200 1,186,800
Exxon Mobil Corp. 38,400 3,384,576
Hess Corp. 22,000 1,091,420
Murphy Oil Corp. 28,900 1,639,786
Petroleo Brasileiro SA, ADR 21,900 393,543
196
John Hancock Funds IIPortfolio of Investments — November 30, 2012 (Unaudited) (showing percentage of total net assets)Spectrum Income Fund (continued)
Shares or
Principal
Amount Value
COMMON STOCKS (continued)
Copyright © 2013 www.secdatabase.com. All Rights Reserved.Please Consider the Environment Before Printing This Document
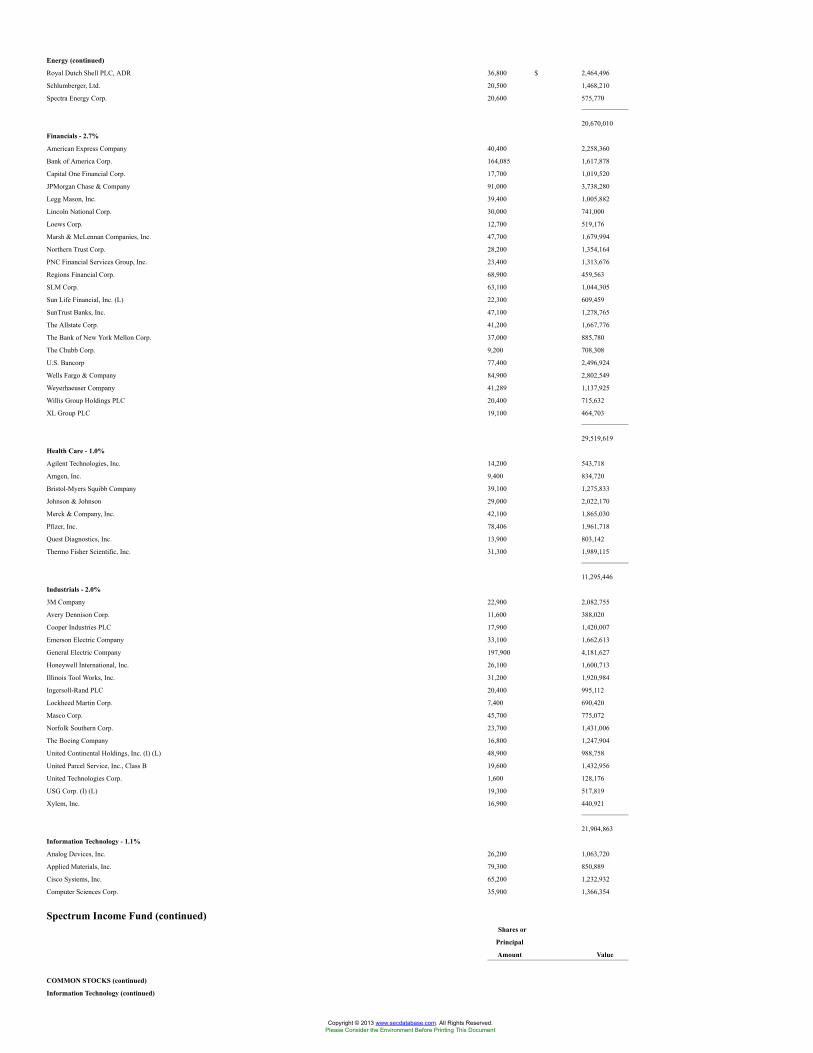
Energy (continued)
Royal Dutch Shell PLC, ADR 36,800 $ 2,464,496
Schlumberger, Ltd. 20,500 1,468,210
Spectra Energy Corp. 20,600 575,770
20,670,010
Financials - 2.7%
American Express Company 40,400 2,258,360
Bank of America Corp. 164,085 1,617,878
Capital One Financial Corp. 17,700 1,019,520
JPMorgan Chase & Company 91,000 3,738,280
Legg Mason, Inc. 39,400 1,005,882
Lincoln National Corp. 30,000 741,000
Loews Corp. 12,700 519,176
Marsh & McLennan Companies, Inc. 47,700 1,679,994
Northern Trust Corp. 28,200 1,354,164
PNC Financial Services Group, Inc. 23,400 1,313,676
Regions Financial Corp. 68,900 459,563
SLM Corp. 63,100 1,044,305
Sun Life Financial, Inc. (L) 22,300 609,459
SunTrust Banks, Inc. 47,100 1,278,765
The Allstate Corp. 41,200 1,667,776
The Bank of New York Mellon Corp. 37,000 885,780
The Chubb Corp. 9,200 708,308
U.S. Bancorp 77,400 2,496,924
Wells Fargo & Company 84,900 2,802,549
Weyerhaeuser Company 41,289 1,137,925
Willis Group Holdings PLC 20,400 715,632
XL Group PLC 19,100 464,703
29,519,619
Health Care - 1.0%
Agilent Technologies, Inc. 14,200 543,718
Amgen, Inc. 9,400 834,720
Bristol-Myers Squibb Company 39,100 1,275,833
Johnson & Johnson 29,000 2,022,170
Merck & Company, Inc. 42,100 1,865,030
Pfizer, Inc. 78,406 1,961,718
Quest Diagnostics, Inc. 13,900 803,142
Thermo Fisher Scientific, Inc. 31,300 1,989,115
11,295,446
Industrials - 2.0%
3M Company 22,900 2,082,755
Avery Dennison Corp. 11,600 388,020
Cooper Industries PLC 17,900 1,420,007
Emerson Electric Company 33,100 1,662,613
General Electric Company 197,900 4,181,627
Honeywell International, Inc. 26,100 1,600,713
Illinois Tool Works, Inc. 31,200 1,920,984
Ingersoll-Rand PLC 20,400 995,112
Lockheed Martin Corp. 7,400 690,420
Masco Corp. 45,700 775,072
Norfolk Southern Corp. 23,700 1,431,006
The Boeing Company 16,800 1,247,904
United Continental Holdings, Inc. (I) (L) 48,900 988,758
United Parcel Service, Inc., Class B 19,600 1,432,956
United Technologies Corp. 1,600 128,176
USG Corp. (I) (L) 19,300 517,819
Xylem, Inc. 16,900 440,921
21,904,863
Information Technology - 1.1%
Analog Devices, Inc. 26,200 1,063,720
Applied Materials, Inc. 79,300 850,889
Cisco Systems, Inc. 65,200 1,232,932
Computer Sciences Corp. 35,900 1,366,354
Spectrum Income Fund (continued)Shares or
Principal
Amount Value
COMMON STOCKS (continued)
Information Technology (continued)
Copyright © 2013 www.secdatabase.com. All Rights Reserved.Please Consider the Environment Before Printing This Document
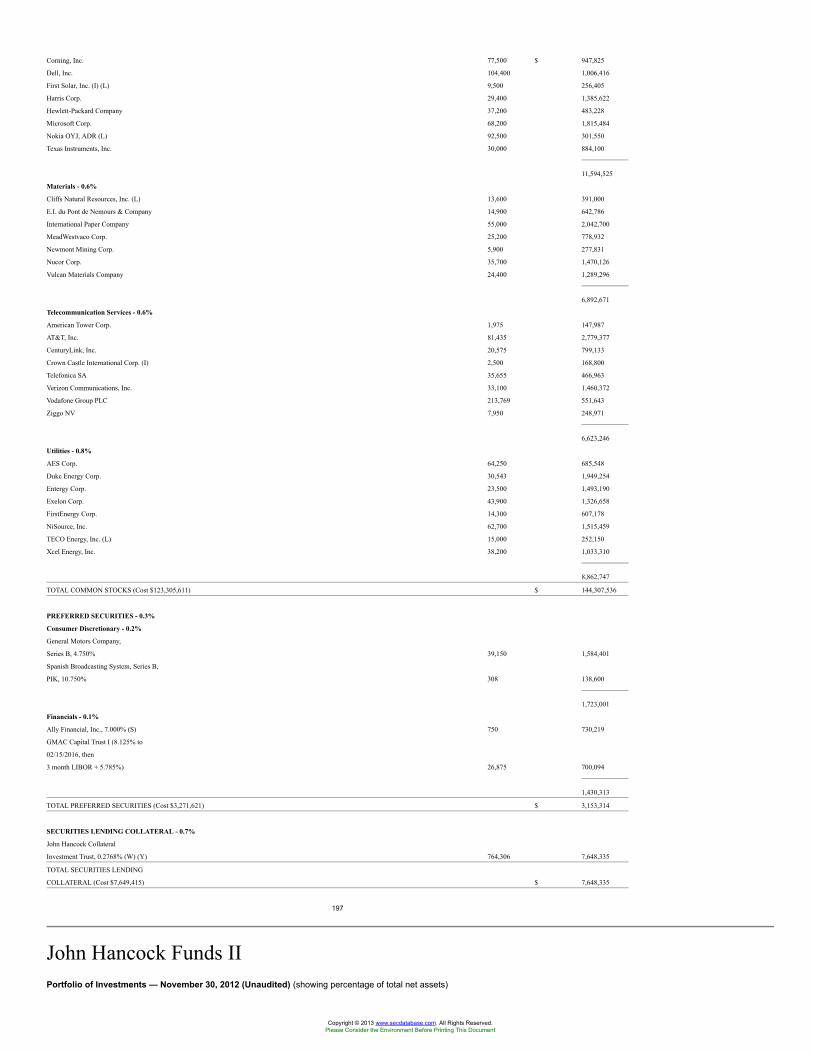
Corning, Inc. 77,500 $ 947,825
Dell, Inc. 104,400 1,006,416
First Solar, Inc. (I) (L) 9,500 256,405
Harris Corp. 29,400 1,385,622
Hewlett-Packard Company 37,200 483,228
Microsoft Corp. 68,200 1,815,484
Nokia OYJ, ADR (L) 92,500 301,550
Texas Instruments, Inc. 30,000 884,100
11,594,525
Materials - 0.6%
Cliffs Natural Resources, Inc. (L) 13,600 391,000
E.I. du Pont de Nemours & Company 14,900 642,786
International Paper Company 55,000 2,042,700
MeadWestvaco Corp. 25,200 778,932
Newmont Mining Corp. 5,900 277,831
Nucor Corp. 35,700 1,470,126
Vulcan Materials Company 24,400 1,289,296
6,892,671
Telecommunication Services - 0.6%
American Tower Corp. 1,975 147,987
AT&T, Inc. 81,435 2,779,377
CenturyLink, Inc. 20,575 799,133
Crown Castle International Corp. (I) 2,500 168,800
Telefonica SA 35,655 466,963
Verizon Communications, Inc. 33,100 1,460,372
Vodafone Group PLC 213,769 551,643
Ziggo NV 7,950 248,971
6,623,246
Utilities - 0.8%
AES Corp. 64,250 685,548
Duke Energy Corp. 30,543 1,949,254
Entergy Corp. 23,500 1,493,190
Exelon Corp. 43,900 1,326,658
FirstEnergy Corp. 14,300 607,178
NiSource, Inc. 62,700 1,515,459
TECO Energy, Inc. (L) 15,000 252,150
Xcel Energy, Inc. 38,200 1,033,310
8,862,747
TOTAL COMMON STOCKS (Cost $123,305,611) $ 144,307,536
PREFERRED SECURITIES - 0.3%
Consumer Discretionary - 0.2%
General Motors Company,
Series B, 4.750% 39,150 1,584,401
Spanish Broadcasting System, Series B,
PIK, 10.750% 308 138,600
1,723,001
Financials - 0.1%
Ally Financial, Inc., 7.000% (S) 750 730,219
GMAC Capital Trust I (8.125% to
02/15/2016, then
3 month LIBOR + 5.785%) 26,875 700,094
1,430,313
TOTAL PREFERRED SECURITIES (Cost $3,271,621) $ 3,153,314
SECURITIES LENDING COLLATERAL - 0.7%
John Hancock Collateral
Investment Trust, 0.2768% (W) (Y) 764,306 7,648,335
TOTAL SECURITIES LENDING
COLLATERAL (Cost $7,649,415) $ 7,648,335
197
John Hancock Funds IIPortfolio of Investments — November 30, 2012 (Unaudited) (showing percentage of total net assets)
Copyright © 2013 www.secdatabase.com. All Rights Reserved.Please Consider the Environment Before Printing This Document
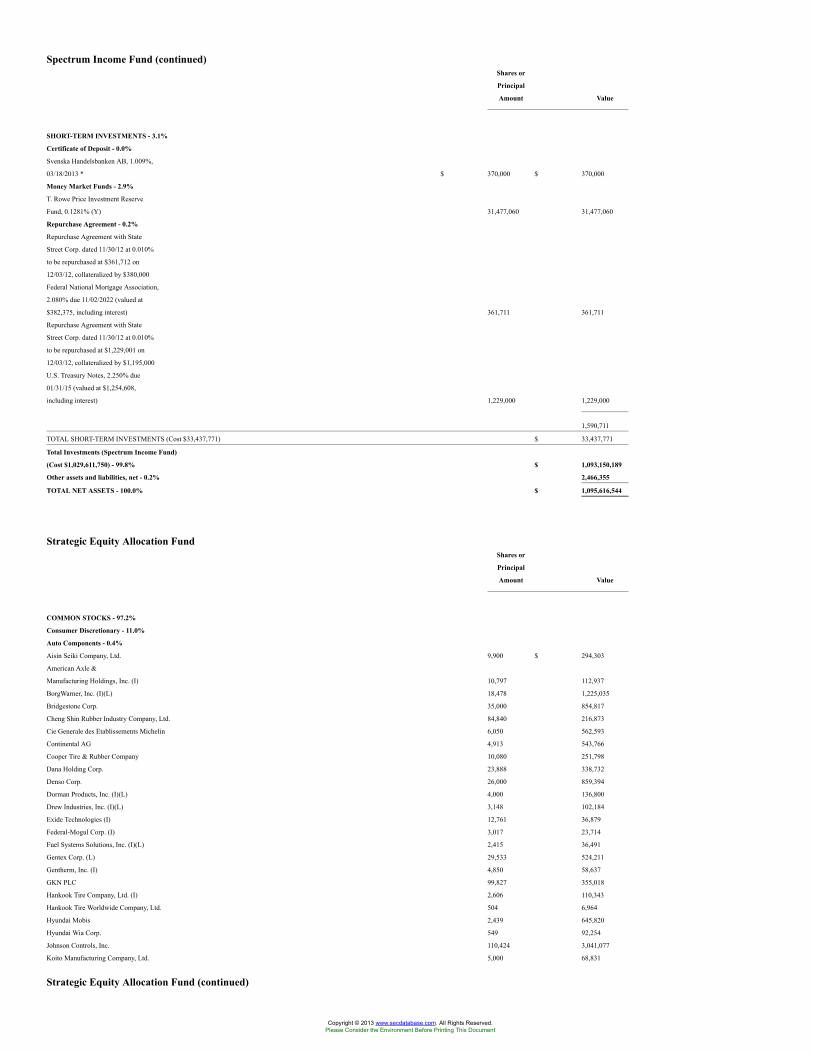
Spectrum Income Fund (continued)Shares or
Principal
Amount Value
SHORT-TERM INVESTMENTS - 3.1%
Certificate of Deposit - 0.0%
Svenska Handelsbanken AB, 1.009%,
03/18/2013 * $ 370,000 $ 370,000
Money Market Funds - 2.9%
T. Rowe Price Investment Reserve
Fund, 0.1281% (Y) 31,477,060 31,477,060
Repurchase Agreement - 0.2%
Repurchase Agreement with State
Street Corp. dated 11/30/12 at 0.010%
to be repurchased at $361,712 on
12/03/12, collateralized by $380,000
Federal National Mortgage Association,
2.080% due 11/02/2022 (valued at
$382,375, including interest) 361,711 361,711
Repurchase Agreement with State
Street Corp. dated 11/30/12 at 0.010%
to be repurchased at $1,229,001 on
12/03/12, collateralized by $1,195,000
U.S. Treasury Notes, 2.250% due
01/31/15 (valued at $1,254,608,
including interest) 1,229,000 1,229,000
1,590,711
TOTAL SHORT-TERM INVESTMENTS (Cost $33,437,771) $ 33,437,771
Total Investments (Spectrum Income Fund)
(Cost $1,029,611,750) - 99.8% $ 1,093,150,189
Other assets and liabilities, net - 0.2% 2,466,355
TOTAL NET ASSETS - 100.0% $ 1,095,616,544
Strategic Equity Allocation FundShares or
Principal
Amount Value
COMMON STOCKS - 97.2%
Consumer Discretionary - 11.0%
Auto Components - 0.4%
Aisin Seiki Company, Ltd. 9,900 $ 294,303
American Axle &
Manufacturing Holdings, Inc. (I) 10,797 112,937
BorgWarner, Inc. (I)(L) 18,478 1,225,035
Bridgestone Corp. 35,000 854,817
Cheng Shin Rubber Industry Company, Ltd. 84,840 216,873
Cie Generale des Etablissements Michelin 6,050 562,593
Continental AG 4,913 543,766
Cooper Tire & Rubber Company 10,080 251,798
Dana Holding Corp. 23,888 338,732
Denso Corp. 26,000 859,394
Dorman Products, Inc. (I)(L) 4,000 136,800
Drew Industries, Inc. (I)(L) 3,148 102,184
Exide Technologies (I) 12,761 36,879
Federal-Mogul Corp. (I) 3,017 23,714
Fuel Systems Solutions, Inc. (I)(L) 2,415 36,491
Gentex Corp. (L) 29,533 524,211
Gentherm, Inc. (I) 4,850 58,637
GKN PLC 99,827 355,018
Hankook Tire Company, Ltd. (I) 2,606 110,343
Hankook Tire Worldwide Company, Ltd. 504 6,964
Hyundai Mobis 2,439 645,820
Hyundai Wia Corp. 549 92,254
Johnson Controls, Inc. 110,424 3,041,077
Koito Manufacturing Company, Ltd. 5,000 68,831
Strategic Equity Allocation Fund (continued)
Copyright © 2013 www.secdatabase.com. All Rights Reserved.Please Consider the Environment Before Printing This Document
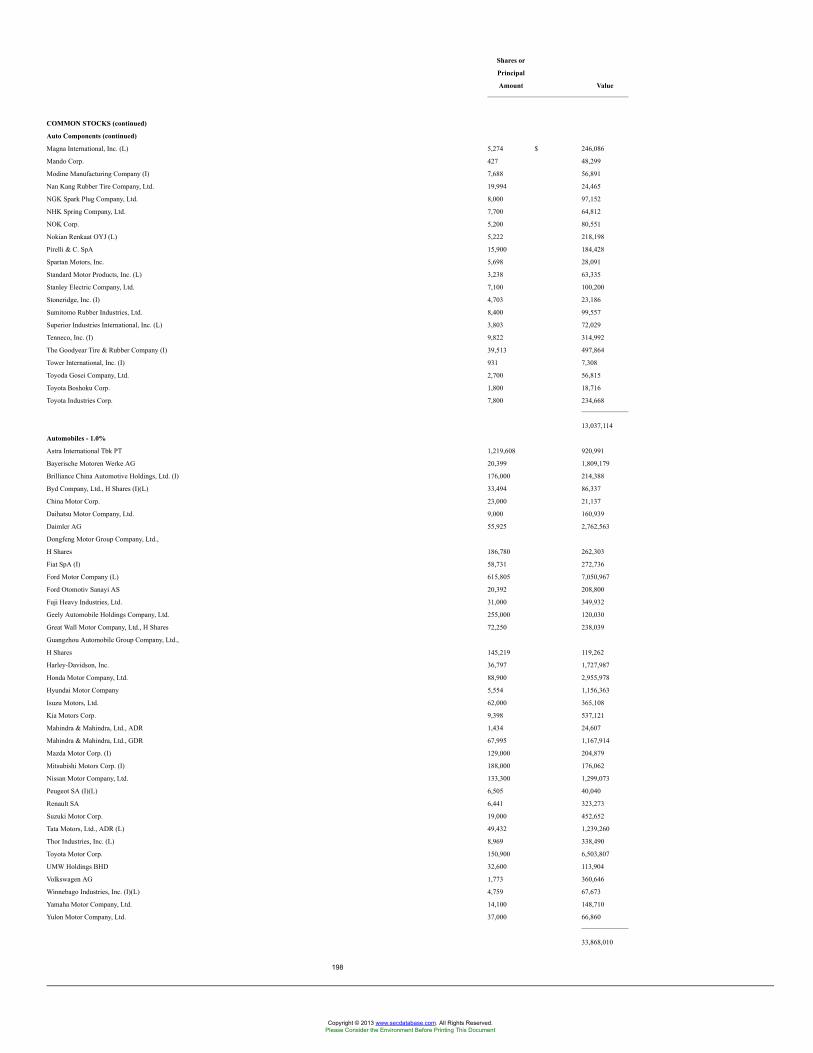
Shares or
Principal
Amount Value
COMMON STOCKS (continued)
Auto Components (continued)
Magna International, Inc. (L) 5,274 $ 246,086
Mando Corp. 427 48,299
Modine Manufacturing Company (I) 7,688 56,891
Nan Kang Rubber Tire Company, Ltd. 19,994 24,465
NGK Spark Plug Company, Ltd. 8,000 97,152
NHK Spring Company, Ltd. 7,700 64,812
NOK Corp. 5,200 80,551
Nokian Renkaat OYJ (L) 5,222 218,198
Pirelli & C. SpA 15,900 184,428
Spartan Motors, Inc. 5,698 28,091
Standard Motor Products, Inc. (L) 3,238 63,335
Stanley Electric Company, Ltd. 7,100 100,200
Stoneridge, Inc. (I) 4,703 23,186
Sumitomo Rubber Industries, Ltd. 8,400 99,557
Superior Industries International, Inc. (L) 3,803 72,029
Tenneco, Inc. (I) 9,822 314,992
The Goodyear Tire & Rubber Company (I) 39,513 497,864
Tower International, Inc. (I) 931 7,308
Toyoda Gosei Company, Ltd. 2,700 56,815
Toyota Boshoku Corp. 1,800 18,716
Toyota Industries Corp. 7,800 234,668
13,037,114
Automobiles - 1.0%
Astra International Tbk PT 1,219,608 920,991
Bayerische Motoren Werke AG 20,399 1,809,179
Brilliance China Automotive Holdings, Ltd. (I) 176,000 214,388
Byd Company, Ltd., H Shares (I)(L) 33,494 86,337
China Motor Corp. 23,000 21,137
Daihatsu Motor Company, Ltd. 9,000 160,939
Daimler AG 55,925 2,762,563
Dongfeng Motor Group Company, Ltd.,
H Shares 186,780 262,303
Fiat SpA (I) 58,731 272,736
Ford Motor Company (L) 615,805 7,050,967
Ford Otomotiv Sanayi AS 20,392 208,800
Fuji Heavy Industries, Ltd. 31,000 349,932
Geely Automobile Holdings Company, Ltd. 255,000 120,030
Great Wall Motor Company, Ltd., H Shares 72,250 238,039
Guangzhou Automobile Group Company, Ltd.,
H Shares 145,219 119,262
Harley-Davidson, Inc. 36,797 1,727,987
Honda Motor Company, Ltd. 88,900 2,955,978
Hyundai Motor Company 5,554 1,156,363
Isuzu Motors, Ltd. 62,000 365,108
Kia Motors Corp. 9,398 537,121
Mahindra & Mahindra, Ltd., ADR 1,434 24,607
Mahindra & Mahindra, Ltd., GDR 67,995 1,167,914
Mazda Motor Corp. (I) 129,000 204,879
Mitsubishi Motors Corp. (I) 188,000 176,062
Nissan Motor Company, Ltd. 133,300 1,299,073
Peugeot SA (I)(L) 6,505 40,040
Renault SA 6,441 323,273
Suzuki Motor Corp. 19,000 452,652
Tata Motors, Ltd., ADR (L) 49,432 1,239,260
Thor Industries, Inc. (L) 8,969 338,490
Toyota Motor Corp. 150,900 6,503,807
UMW Holdings BHD 32,600 113,904
Volkswagen AG 1,773 360,646
Winnebago Industries, Inc. (I)(L) 4,759 67,673
Yamaha Motor Company, Ltd. 14,100 148,710
Yulon Motor Company, Ltd. 37,000 66,860
33,868,010
198
Copyright © 2013 www.secdatabase.com. All Rights Reserved.Please Consider the Environment Before Printing This Document
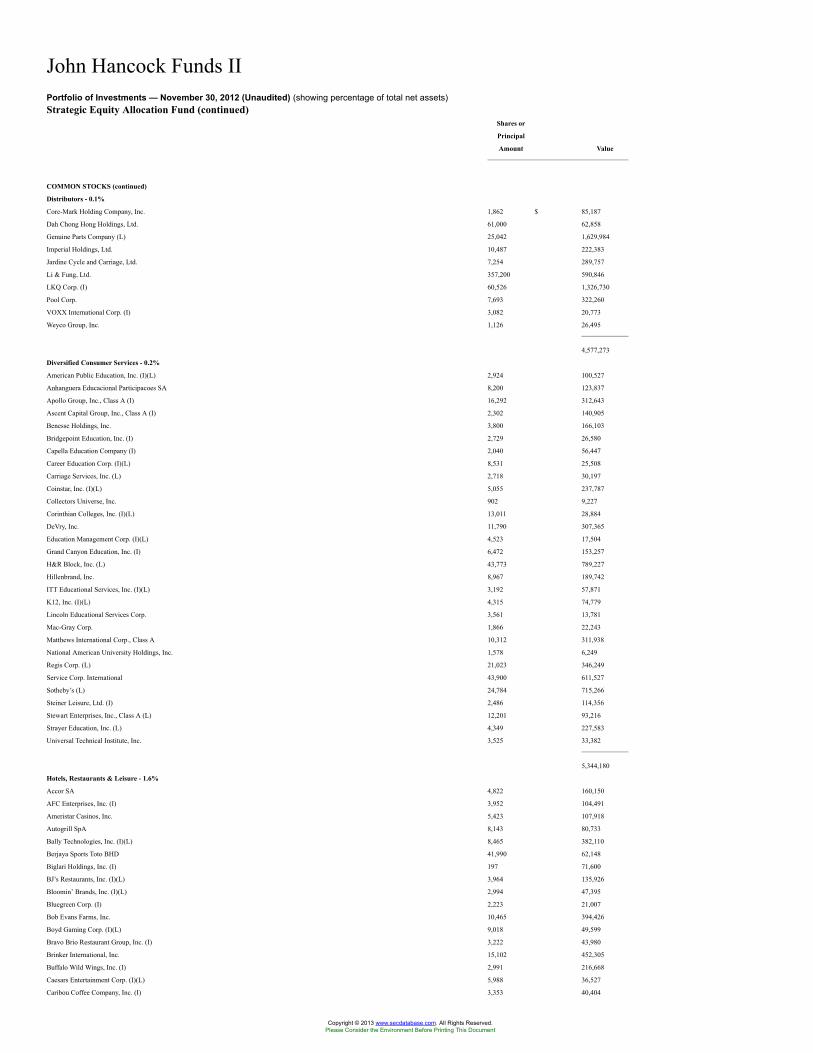
John Hancock Funds IIPortfolio of Investments — November 30, 2012 (Unaudited) (showing percentage of total net assets)Strategic Equity Allocation Fund (continued)
Shares or
Principal
Amount Value
COMMON STOCKS (continued)
Distributors - 0.1%
Core-Mark Holding Company, Inc. 1,862 $ 85,187
Dah Chong Hong Holdings, Ltd. 61,000 62,858
Genuine Parts Company (L) 25,042 1,629,984
Imperial Holdings, Ltd. 10,487 222,383
Jardine Cycle and Carriage, Ltd. 7,254 289,757
Li & Fung, Ltd. 357,200 590,846
LKQ Corp. (I) 60,526 1,326,730
Pool Corp. 7,693 322,260
VOXX International Corp. (I) 3,082 20,773
Weyco Group, Inc. 1,126 26,495
4,577,273
Diversified Consumer Services - 0.2%
American Public Education, Inc. (I)(L) 2,924 100,527
Anhanguera Educacional Participacoes SA 8,200 123,837
Apollo Group, Inc., Class A (I) 16,292 312,643
Ascent Capital Group, Inc., Class A (I) 2,302 140,905
Benesse Holdings, Inc. 3,800 166,103
Bridgepoint Education, Inc. (I) 2,729 26,580
Capella Education Company (I) 2,040 56,447
Career Education Corp. (I)(L) 8,531 25,508
Carriage Services, Inc. (L) 2,718 30,197
Coinstar, Inc. (I)(L) 5,055 237,787
Collectors Universe, Inc. 902 9,227
Corinthian Colleges, Inc. (I)(L) 13,011 28,884
DeVry, Inc. 11,790 307,365
Education Management Corp. (I)(L) 4,523 17,504
Grand Canyon Education, Inc. (I) 6,472 153,257
H&R Block, Inc. (L) 43,773 789,227
Hillenbrand, Inc. 8,967 189,742
ITT Educational Services, Inc. (I)(L) 3,192 57,871
K12, Inc. (I)(L) 4,315 74,779
Lincoln Educational Services Corp. 3,561 13,781
Mac-Gray Corp. 1,866 22,243
Matthews International Corp., Class A 10,312 311,938
National American University Holdings, Inc. 1,578 6,249
Regis Corp. (L) 21,023 346,249
Service Corp. International 43,900 611,527
Sotheby’s (L) 24,784 715,266
Steiner Leisure, Ltd. (I) 2,486 114,356
Stewart Enterprises, Inc., Class A (L) 12,201 93,216
Strayer Education, Inc. (L) 4,349 227,583
Universal Technical Institute, Inc. 3,525 33,382
5,344,180
Hotels, Restaurants & Leisure - 1.6%
Accor SA 4,822 160,150
AFC Enterprises, Inc. (I) 3,952 104,491
Ameristar Casinos, Inc. 5,423 107,918
Autogrill SpA 8,143 80,733
Bally Technologies, Inc. (I)(L) 8,465 382,110
Berjaya Sports Toto BHD 41,990 62,148
Biglari Holdings, Inc. (I) 197 71,600
BJ’s Restaurants, Inc. (I)(L) 3,964 135,926
Bloomin’ Brands, Inc. (I)(L) 2,994 47,395
Bluegreen Corp. (I) 2,223 21,007
Bob Evans Farms, Inc. 10,465 394,426
Boyd Gaming Corp. (I)(L) 9,018 49,599
Bravo Brio Restaurant Group, Inc. (I) 3,222 43,980
Brinker International, Inc. 15,102 452,305
Buffalo Wild Wings, Inc. (I) 2,991 216,668
Caesars Entertainment Corp. (I)(L) 5,988 36,527
Caribou Coffee Company, Inc. (I) 3,353 40,404
Copyright © 2013 www.secdatabase.com. All Rights Reserved.Please Consider the Environment Before Printing This Document
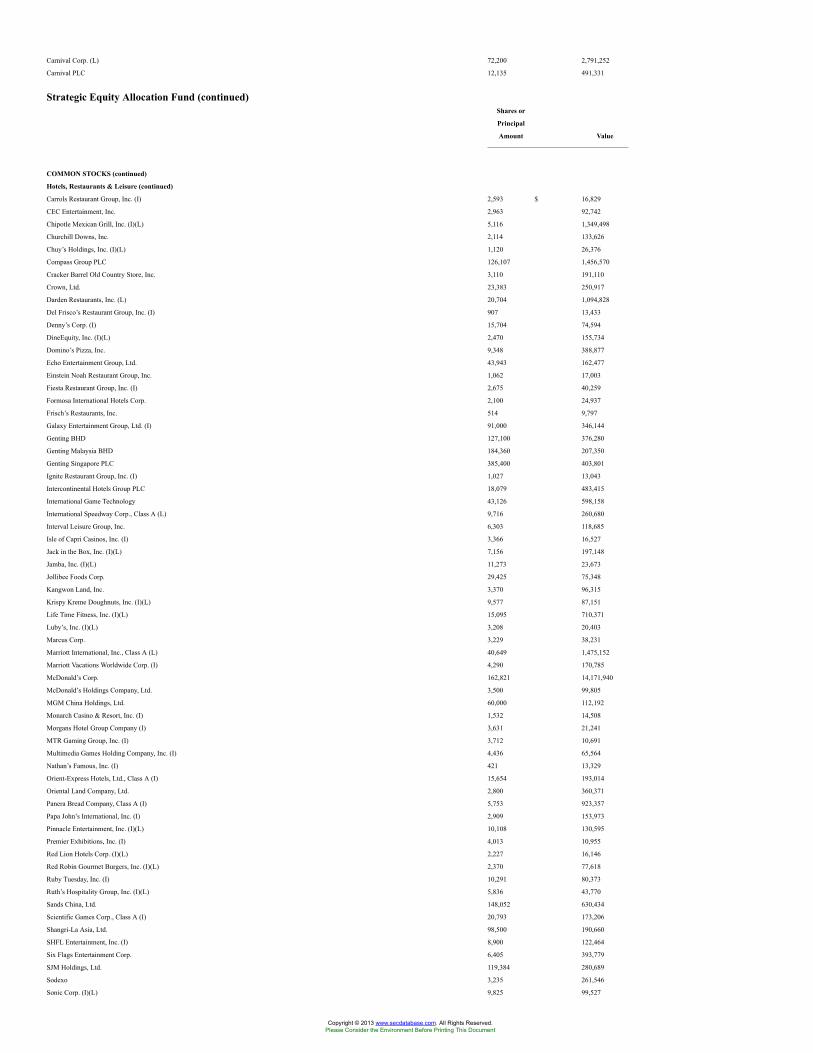
Carnival Corp. (L) 72,200 2,791,252
Carnival PLC 12,135 491,331
Strategic Equity Allocation Fund (continued)Shares or
Principal
Amount Value
COMMON STOCKS (continued)
Hotels, Restaurants & Leisure (continued)
Carrols Restaurant Group, Inc. (I) 2,593 $ 16,829
CEC Entertainment, Inc. 2,963 92,742
Chipotle Mexican Grill, Inc. (I)(L) 5,116 1,349,498
Churchill Downs, Inc. 2,114 133,626
Chuy’s Holdings, Inc. (I)(L) 1,120 26,376
Compass Group PLC 126,107 1,456,570
Cracker Barrel Old Country Store, Inc. 3,110 191,110
Crown, Ltd. 23,383 250,917
Darden Restaurants, Inc. (L) 20,704 1,094,828
Del Frisco’s Restaurant Group, Inc. (I) 907 13,433
Denny’s Corp. (I) 15,704 74,594
DineEquity, Inc. (I)(L) 2,470 155,734
Domino’s Pizza, Inc. 9,348 388,877
Echo Entertainment Group, Ltd. 43,943 162,477
Einstein Noah Restaurant Group, Inc. 1,062 17,003
Fiesta Restaurant Group, Inc. (I) 2,675 40,259
Formosa International Hotels Corp. 2,100 24,937
Frisch’s Restaurants, Inc. 514 9,797
Galaxy Entertainment Group, Ltd. (I) 91,000 346,144
Genting BHD 127,100 376,280
Genting Malaysia BHD 184,360 207,350
Genting Singapore PLC 385,400 403,801
Ignite Restaurant Group, Inc. (I) 1,027 13,043
Intercontinental Hotels Group PLC 18,079 483,415
International Game Technology 43,126 598,158
International Speedway Corp., Class A (L) 9,716 260,680
Interval Leisure Group, Inc. 6,303 118,685
Isle of Capri Casinos, Inc. (I) 3,366 16,527
Jack in the Box, Inc. (I)(L) 7,156 197,148
Jamba, Inc. (I)(L) 11,273 23,673
Jollibee Foods Corp. 29,425 75,348
Kangwon Land, Inc. 3,370 96,315
Krispy Kreme Doughnuts, Inc. (I)(L) 9,577 87,151
Life Time Fitness, Inc. (I)(L) 15,095 710,371
Luby’s, Inc. (I)(L) 3,208 20,403
Marcus Corp. 3,229 38,231
Marriott International, Inc., Class A (L) 40,649 1,475,152
Marriott Vacations Worldwide Corp. (I) 4,290 170,785
McDonald’s Corp. 162,821 14,171,940
McDonald’s Holdings Company, Ltd. 3,500 99,805
MGM China Holdings, Ltd. 60,000 112,192
Monarch Casino & Resort, Inc. (I) 1,532 14,508
Morgans Hotel Group Company (I) 3,631 21,241
MTR Gaming Group, Inc. (I) 3,712 10,691
Multimedia Games Holding Company, Inc. (I) 4,436 65,564
Nathan’s Famous, Inc. (I) 421 13,329
Orient-Express Hotels, Ltd., Class A (I) 15,654 193,014
Oriental Land Company, Ltd. 2,800 360,371
Panera Bread Company, Class A (I) 5,753 923,357
Papa John’s International, Inc. (I) 2,909 153,973
Pinnacle Entertainment, Inc. (I)(L) 10,108 130,595
Premier Exhibitions, Inc. (I) 4,013 10,955
Red Lion Hotels Corp. (I)(L) 2,227 16,146
Red Robin Gourmet Burgers, Inc. (I)(L) 2,370 77,618
Ruby Tuesday, Inc. (I) 10,291 80,373
Ruth’s Hospitality Group, Inc. (I)(L) 5,836 43,770
Sands China, Ltd. 148,052 630,434
Scientific Games Corp., Class A (I) 20,793 173,206
Shangri-La Asia, Ltd. 98,500 190,660
SHFL Entertainment, Inc. (I) 8,900 122,464
Six Flags Entertainment Corp. 6,405 393,779
SJM Holdings, Ltd. 119,384 280,689
Sodexo 3,235 261,546
Sonic Corp. (I)(L) 9,825 99,527
Copyright © 2013 www.secdatabase.com. All Rights Reserved.Please Consider the Environment Before Printing This Document
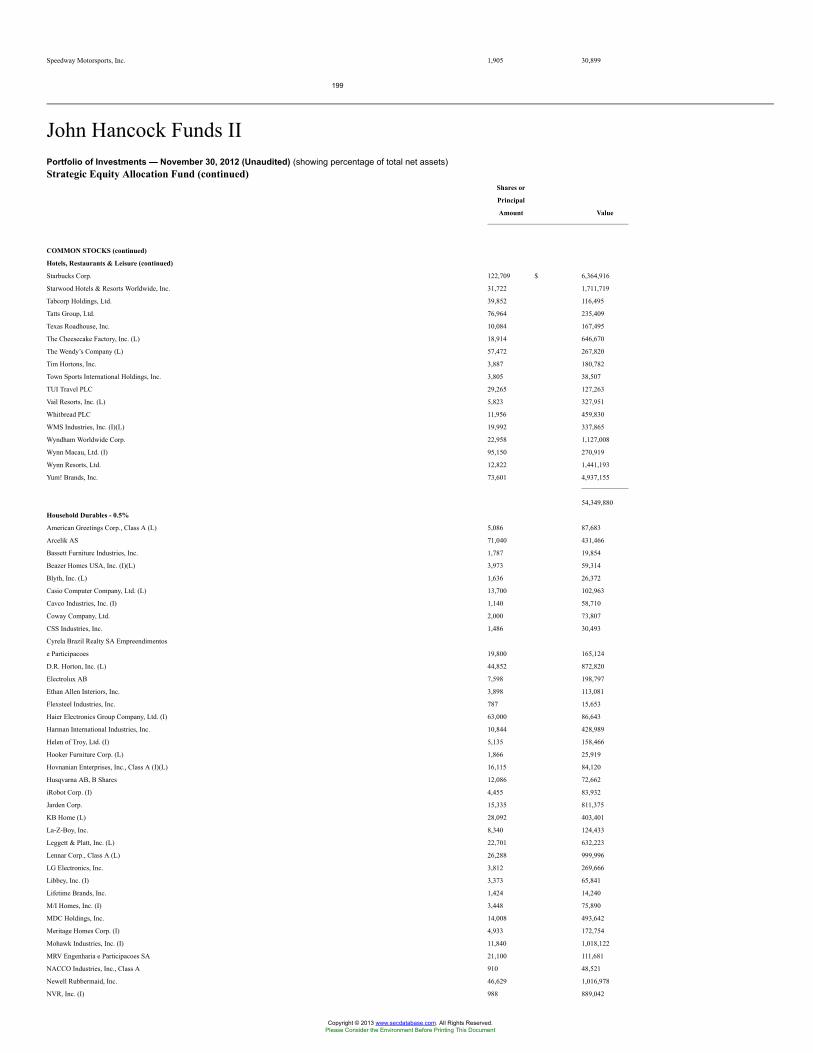
Speedway Motorsports, Inc. 1,905 30,899
199
John Hancock Funds IIPortfolio of Investments — November 30, 2012 (Unaudited) (showing percentage of total net assets)Strategic Equity Allocation Fund (continued)
Shares or
Principal
Amount Value
COMMON STOCKS (continued)
Hotels, Restaurants & Leisure (continued)
Starbucks Corp. 122,709 $ 6,364,916
Starwood Hotels & Resorts Worldwide, Inc. 31,722 1,711,719
Tabcorp Holdings, Ltd. 39,852 116,495
Tatts Group, Ltd. 76,964 235,409
Texas Roadhouse, Inc. 10,084 167,495
The Cheesecake Factory, Inc. (L) 18,914 646,670
The Wendy’s Company (L) 57,472 267,820
Tim Hortons, Inc. 3,887 180,782
Town Sports International Holdings, Inc. 3,805 38,507
TUI Travel PLC 29,265 127,263
Vail Resorts, Inc. (L) 5,823 327,951
Whitbread PLC 11,956 459,830
WMS Industries, Inc. (I)(L) 19,992 337,865
Wyndham Worldwide Corp. 22,958 1,127,008
Wynn Macau, Ltd. (I) 95,150 270,919
Wynn Resorts, Ltd. 12,822 1,441,193
Yum! Brands, Inc. 73,601 4,937,155
54,349,880
Household Durables - 0.5%
American Greetings Corp., Class A (L) 5,086 87,683
Arcelik AS 71,040 431,466
Bassett Furniture Industries, Inc. 1,787 19,854
Beazer Homes USA, Inc. (I)(L) 3,973 59,314
Blyth, Inc. (L) 1,636 26,372
Casio Computer Company, Ltd. (L) 13,700 102,963
Cavco Industries, Inc. (I) 1,140 58,710
Coway Company, Ltd. 2,000 73,807
CSS Industries, Inc. 1,486 30,493
Cyrela Brazil Realty SA Empreendimentos
e Participacoes 19,800 165,124
D.R. Horton, Inc. (L) 44,852 872,820
Electrolux AB 7,598 198,797
Ethan Allen Interiors, Inc. 3,898 113,081
Flexsteel Industries, Inc. 787 15,653
Haier Electronics Group Company, Ltd. (I) 63,000 86,643
Harman International Industries, Inc. 10,844 428,989
Helen of Troy, Ltd. (I) 5,135 158,466
Hooker Furniture Corp. (L) 1,866 25,919
Hovnanian Enterprises, Inc., Class A (I)(L) 16,115 84,120
Husqvarna AB, B Shares 12,086 72,662
iRobot Corp. (I) 4,455 83,932
Jarden Corp. 15,335 811,375
KB Home (L) 28,092 403,401
La-Z-Boy, Inc. 8,340 124,433
Leggett & Platt, Inc. (L) 22,701 632,223
Lennar Corp., Class A (L) 26,288 999,996
LG Electronics, Inc. 3,812 269,666
Libbey, Inc. (I) 3,373 65,841
Lifetime Brands, Inc. 1,424 14,240
M/I Homes, Inc. (I) 3,448 75,890
MDC Holdings, Inc. 14,008 493,642
Meritage Homes Corp. (I) 4,933 172,754
Mohawk Industries, Inc. (I) 11,840 1,018,122
MRV Engenharia e Participacoes SA 21,100 111,681
NACCO Industries, Inc., Class A 910 48,521
Newell Rubbermaid, Inc. 46,629 1,016,978
NVR, Inc. (I) 988 889,042
Copyright © 2013 www.secdatabase.com. All Rights Reserved.Please Consider the Environment Before Printing This Document
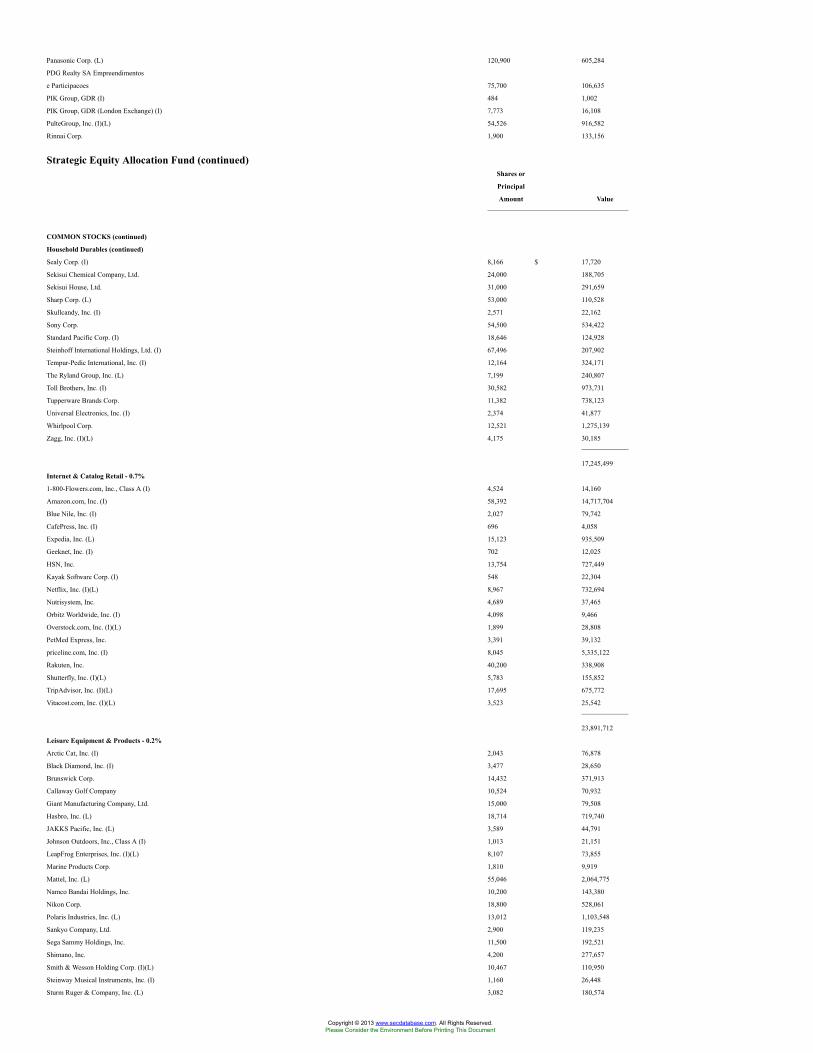
Panasonic Corp. (L) 120,900 605,284
PDG Realty SA Empreendimentos
e Participacoes 75,700 106,635
PIK Group, GDR (I) 484 1,002
PIK Group, GDR (London Exchange) (I) 7,773 16,108
PulteGroup, Inc. (I)(L) 54,526 916,582
Rinnai Corp. 1,900 133,156
Strategic Equity Allocation Fund (continued)Shares or
Principal
Amount Value
COMMON STOCKS (continued)
Household Durables (continued)
Sealy Corp. (I) 8,166 $ 17,720
Sekisui Chemical Company, Ltd. 24,000 188,705
Sekisui House, Ltd. 31,000 291,659
Sharp Corp. (L) 53,000 110,528
Skullcandy, Inc. (I) 2,571 22,162
Sony Corp. 54,500 534,422
Standard Pacific Corp. (I) 18,646 124,928
Steinhoff International Holdings, Ltd. (I) 67,496 207,902
Tempur-Pedic International, Inc. (I) 12,164 324,171
The Ryland Group, Inc. (L) 7,199 240,807
Toll Brothers, Inc. (I) 30,582 973,731
Tupperware Brands Corp. 11,382 738,123
Universal Electronics, Inc. (I) 2,374 41,877
Whirlpool Corp. 12,521 1,275,139
Zagg, Inc. (I)(L) 4,175 30,185
17,245,499
Internet & Catalog Retail - 0.7%
1-800-Flowers.com, Inc., Class A (I) 4,524 14,160
Amazon.com, Inc. (I) 58,392 14,717,704
Blue Nile, Inc. (I) 2,027 79,742
CafePress, Inc. (I) 696 4,058
Expedia, Inc. (L) 15,123 935,509
Geeknet, Inc. (I) 702 12,025
HSN, Inc. 13,754 727,449
Kayak Software Corp. (I) 548 22,304
Netflix, Inc. (I)(L) 8,967 732,694
Nutrisystem, Inc. 4,689 37,465
Orbitz Worldwide, Inc. (I) 4,098 9,466
Overstock.com, Inc. (I)(L) 1,899 28,808
PetMed Express, Inc. 3,391 39,132
priceline.com, Inc. (I) 8,045 5,335,122
Rakuten, Inc. 40,200 338,908
Shutterfly, Inc. (I)(L) 5,783 155,852
TripAdvisor, Inc. (I)(L) 17,695 675,772
Vitacost.com, Inc. (I)(L) 3,523 25,542
23,891,712
Leisure Equipment & Products - 0.2%
Arctic Cat, Inc. (I) 2,043 76,878
Black Diamond, Inc. (I) 3,477 28,650
Brunswick Corp. 14,432 371,913
Callaway Golf Company 10,524 70,932
Giant Manufacturing Company, Ltd. 15,000 79,508
Hasbro, Inc. (L) 18,714 719,740
JAKKS Pacific, Inc. (L) 3,589 44,791
Johnson Outdoors, Inc., Class A (I) 1,013 21,151
LeapFrog Enterprises, Inc. (I)(L) 8,107 73,855
Marine Products Corp. 1,810 9,919
Mattel, Inc. (L) 55,046 2,064,775
Namco Bandai Holdings, Inc. 10,200 143,380
Nikon Corp. 18,800 528,061
Polaris Industries, Inc. (L) 13,012 1,103,548
Sankyo Company, Ltd. 2,900 119,235
Sega Sammy Holdings, Inc. 11,500 192,521
Shimano, Inc. 4,200 277,657
Smith & Wesson Holding Corp. (I)(L) 10,467 110,950
Steinway Musical Instruments, Inc. (I) 1,160 26,448
Sturm Ruger & Company, Inc. (L) 3,082 180,574
Copyright © 2013 www.secdatabase.com. All Rights Reserved.Please Consider the Environment Before Printing This Document
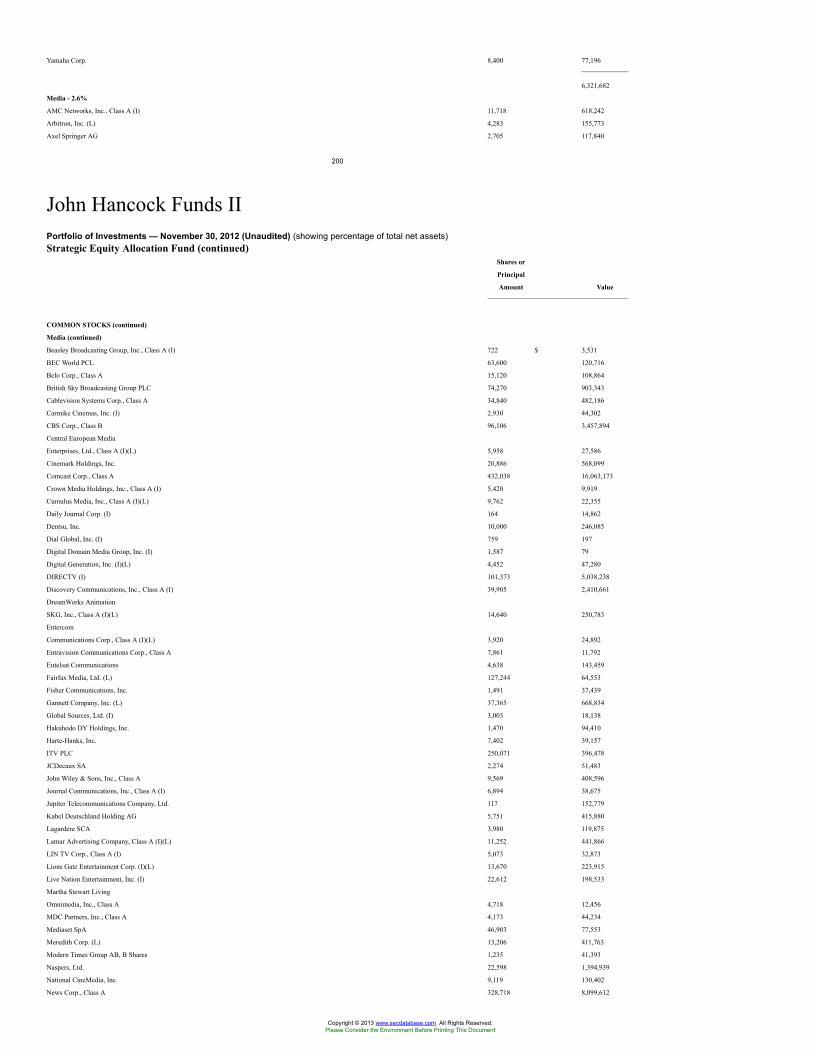
Yamaha Corp. 8,400 77,196
6,321,682
Media - 2.6%
AMC Networks, Inc., Class A (I) 11,718 618,242
Arbitron, Inc. (L) 4,283 155,773
Axel Springer AG 2,705 117,840
200
John Hancock Funds IIPortfolio of Investments — November 30, 2012 (Unaudited) (showing percentage of total net assets)Strategic Equity Allocation Fund (continued)
Shares or
Principal
Amount Value
COMMON STOCKS (continued)
Media (continued)
Beasley Broadcasting Group, Inc., Class A (I) 722 $ 3,531
BEC World PCL 63,600 120,716
Belo Corp., Class A 15,120 108,864
British Sky Broadcasting Group PLC 74,270 903,343
Cablevision Systems Corp., Class A 34,840 482,186
Carmike Cinemas, Inc. (I) 2,930 44,302
CBS Corp., Class B 96,106 3,457,894
Central European Media
Enterprises, Ltd., Class A (I)(L) 5,958 27,586
Cinemark Holdings, Inc. 20,886 568,099
Comcast Corp., Class A 432,038 16,063,173
Crown Media Holdings, Inc., Class A (I) 5,420 9,919
Cumulus Media, Inc., Class A (I)(L) 9,762 22,355
Daily Journal Corp. (I) 164 14,862
Dentsu, Inc. 10,000 246,085
Dial Global, Inc. (I) 759 197
Digital Domain Media Group, Inc. (I) 1,587 79
Digital Generation, Inc. (I)(L) 4,452 47,280
DIRECTV (I) 101,373 5,038,238
Discovery Communications, Inc., Class A (I) 39,905 2,410,661
DreamWorks Animation
SKG, Inc., Class A (I)(L) 14,640 250,783
Entercom
Communications Corp., Class A (I)(L) 3,920 24,892
Entravision Communications Corp., Class A 7,861 11,792
Eutelsat Communications 4,638 143,459
Fairfax Media, Ltd. (L) 127,244 64,553
Fisher Communications, Inc. 1,491 37,439
Gannett Company, Inc. (L) 37,365 668,834
Global Sources, Ltd. (I) 3,003 18,138
Hakuhodo DY Holdings, Inc. 1,470 94,410
Harte-Hanks, Inc. 7,402 39,157
ITV PLC 250,071 396,478
JCDecaux SA 2,274 51,483
John Wiley & Sons, Inc., Class A 9,569 408,596
Journal Communications, Inc., Class A (I) 6,894 38,675
Jupiter Telecommunications Company, Ltd. 117 152,779
Kabel Deutschland Holding AG 5,751 415,880
Lagardere SCA 3,980 119,875
Lamar Advertising Company, Class A (I)(L) 11,252 441,866
LIN TV Corp., Class A (I) 5,073 32,873
Lions Gate Entertainment Corp. (I)(L) 13,670 223,915
Live Nation Entertainment, Inc. (I) 22,612 198,533
Martha Stewart Living
Omnimedia, Inc., Class A 4,718 12,456
MDC Partners, Inc., Class A 4,173 44,234
Mediaset SpA 46,903 77,553
Meredith Corp. (L) 13,206 411,763
Modern Times Group AB, B Shares 1,235 41,393
Naspers, Ltd. 22,598 1,394,939
National CineMedia, Inc. 9,119 130,402
News Corp., Class A 328,718 8,099,612
Copyright © 2013 www.secdatabase.com. All Rights Reserved.Please Consider the Environment Before Printing This Document
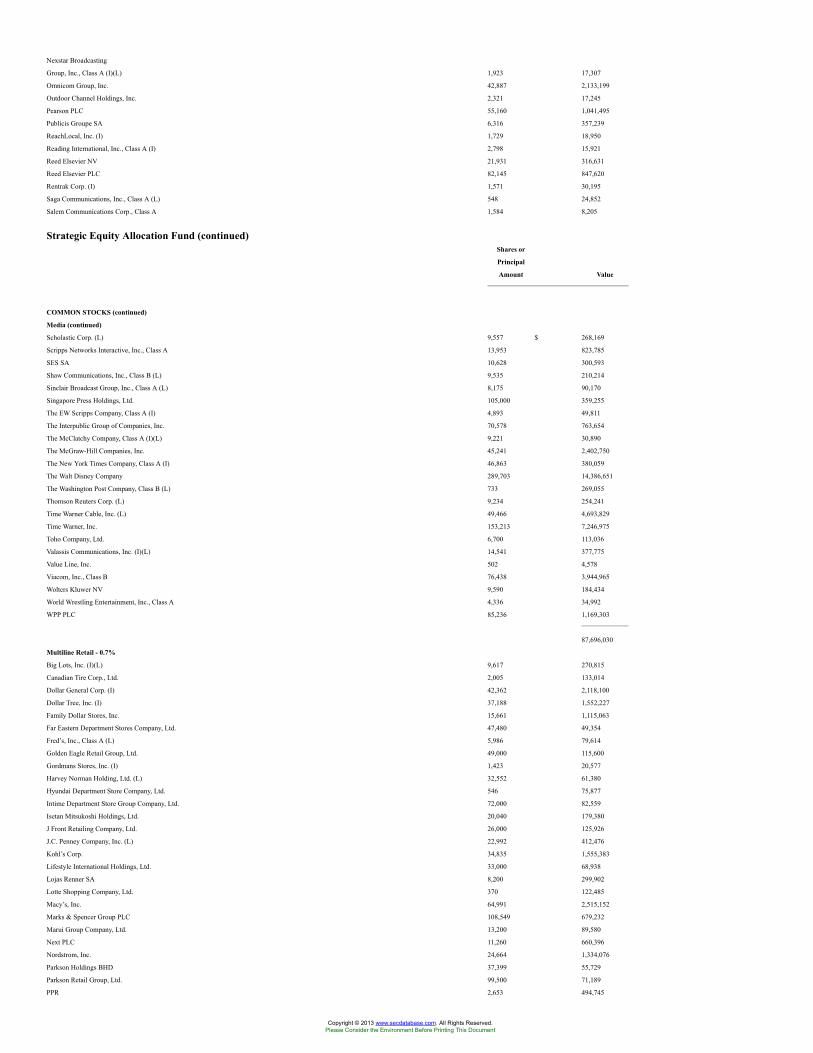
Nexstar Broadcasting
Group, Inc., Class A (I)(L) 1,923 17,307
Omnicom Group, Inc. 42,887 2,133,199
Outdoor Channel Holdings, Inc. 2,321 17,245
Pearson PLC 55,160 1,041,495
Publicis Groupe SA 6,316 357,239
ReachLocal, Inc. (I) 1,729 18,950
Reading International, Inc., Class A (I) 2,798 15,921
Reed Elsevier NV 21,931 316,631
Reed Elsevier PLC 82,145 847,620
Rentrak Corp. (I) 1,571 30,195
Saga Communications, Inc., Class A (L) 548 24,852
Salem Communications Corp., Class A 1,584 8,205
Strategic Equity Allocation Fund (continued)Shares or
Principal
Amount Value
COMMON STOCKS (continued)
Media (continued)
Scholastic Corp. (L) 9,557 $ 268,169
Scripps Networks Interactive, Inc., Class A 13,953 823,785
SES SA 10,628 300,593
Shaw Communications, Inc., Class B (L) 9,535 210,214
Sinclair Broadcast Group, Inc., Class A (L) 8,175 90,170
Singapore Press Holdings, Ltd. 105,000 359,255
The EW Scripps Company, Class A (I) 4,893 49,811
The Interpublic Group of Companies, Inc. 70,578 763,654
The McClatchy Company, Class A (I)(L) 9,221 30,890
The McGraw-Hill Companies, Inc. 45,241 2,402,750
The New York Times Company, Class A (I) 46,863 380,059
The Walt Disney Company 289,703 14,386,651
The Washington Post Company, Class B (L) 733 269,055
Thomson Reuters Corp. (L) 9,234 254,241
Time Warner Cable, Inc. (L) 49,466 4,693,829
Time Warner, Inc. 153,213 7,246,975
Toho Company, Ltd. 6,700 113,036
Valassis Communications, Inc. (I)(L) 14,541 377,775
Value Line, Inc. 502 4,578
Viacom, Inc., Class B 76,438 3,944,965
Wolters Kluwer NV 9,590 184,434
World Wrestling Entertainment, Inc., Class A 4,336 34,992
WPP PLC 85,236 1,169,303
87,696,030
Multiline Retail - 0.7%
Big Lots, Inc. (I)(L) 9,617 270,815
Canadian Tire Corp., Ltd. 2,005 133,014
Dollar General Corp. (I) 42,362 2,118,100
Dollar Tree, Inc. (I) 37,188 1,552,227
Family Dollar Stores, Inc. 15,661 1,115,063
Far Eastern Department Stores Company, Ltd. 47,480 49,354
Fred’s, Inc., Class A (L) 5,986 79,614
Golden Eagle Retail Group, Ltd. 49,000 115,600
Gordmans Stores, Inc. (I) 1,423 20,577
Harvey Norman Holding, Ltd. (L) 32,552 61,380
Hyundai Department Store Company, Ltd. 546 75,877
Intime Department Store Group Company, Ltd. 72,000 82,559
Isetan Mitsukoshi Holdings, Ltd. 20,040 179,380
J Front Retailing Company, Ltd. 26,000 125,926
J.C. Penney Company, Inc. (L) 22,992 412,476
Kohl’s Corp. 34,835 1,555,383
Lifestyle International Holdings, Ltd. 33,000 68,938
Lojas Renner SA 8,200 299,902
Lotte Shopping Company, Ltd. 370 122,485
Macy’s, Inc. 64,991 2,515,152
Marks & Spencer Group PLC 108,549 679,232
Marui Group Company, Ltd. 13,200 89,580
Next PLC 11,260 660,396
Nordstrom, Inc. 24,664 1,334,076
Parkson Holdings BHD 37,399 55,729
Parkson Retail Group, Ltd. 99,500 71,189
PPR 2,653 494,745
Copyright © 2013 www.secdatabase.com. All Rights Reserved.Please Consider the Environment Before Printing This Document
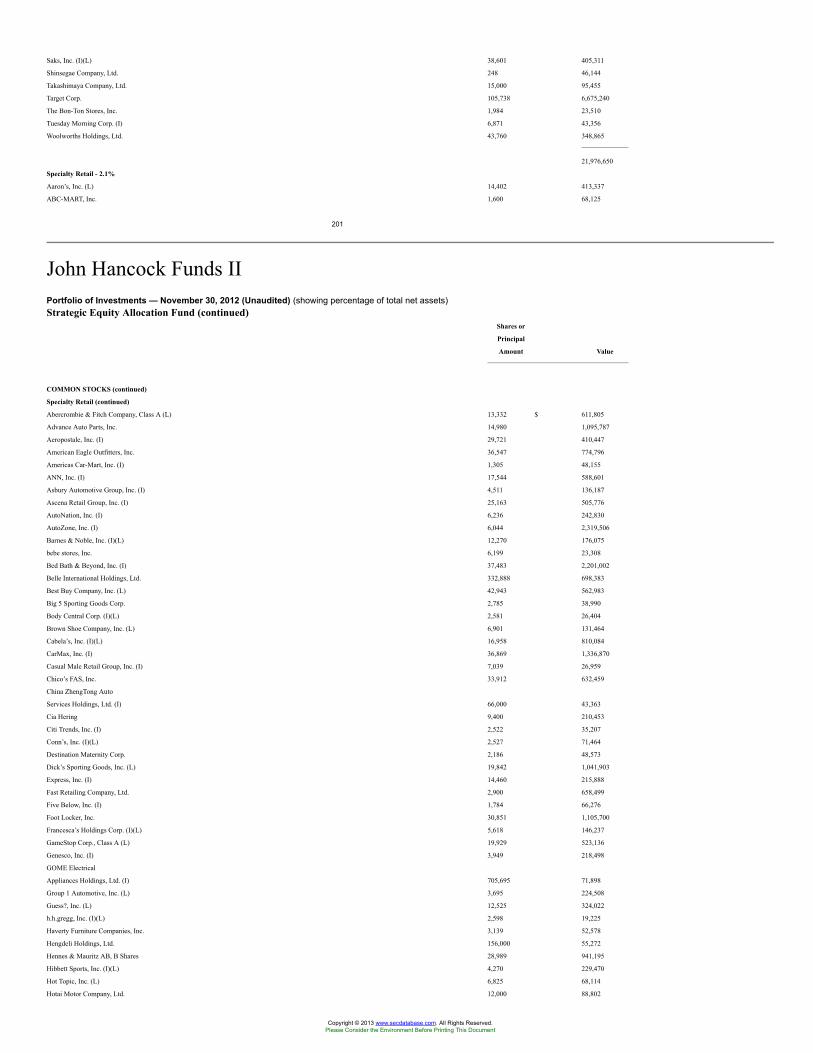
Saks, Inc. (I)(L) 38,601 405,311
Shinsegae Company, Ltd. 248 46,144
Takashimaya Company, Ltd. 15,000 95,455
Target Corp. 105,738 6,675,240
The Bon-Ton Stores, Inc. 1,984 23,510
Tuesday Morning Corp. (I) 6,871 43,356
Woolworths Holdings, Ltd. 43,760 348,865
21,976,650
Specialty Retail - 2.1%
Aaron’s, Inc. (L) 14,402 413,337
ABC-MART, Inc. 1,600 68,125
201
John Hancock Funds IIPortfolio of Investments — November 30, 2012 (Unaudited) (showing percentage of total net assets)Strategic Equity Allocation Fund (continued)
Shares or
Principal
Amount Value
COMMON STOCKS (continued)
Specialty Retail (continued)
Abercrombie & Fitch Company, Class A (L) 13,332 $ 611,805
Advance Auto Parts, Inc. 14,980 1,095,787
Aeropostale, Inc. (I) 29,721 410,447
American Eagle Outfitters, Inc. 36,547 774,796
Americas Car-Mart, Inc. (I) 1,305 48,155
ANN, Inc. (I) 17,544 588,601
Asbury Automotive Group, Inc. (I) 4,511 136,187
Ascena Retail Group, Inc. (I) 25,163 505,776
AutoNation, Inc. (I) 6,236 242,830
AutoZone, Inc. (I) 6,044 2,319,506
Barnes & Noble, Inc. (I)(L) 12,270 176,075
bebe stores, Inc. 6,199 23,308
Bed Bath & Beyond, Inc. (I) 37,483 2,201,002
Belle International Holdings, Ltd. 332,888 698,383
Best Buy Company, Inc. (L) 42,943 562,983
Big 5 Sporting Goods Corp. 2,785 38,990
Body Central Corp. (I)(L) 2,581 26,404
Brown Shoe Company, Inc. (L) 6,901 131,464
Cabela’s, Inc. (I)(L) 16,958 810,084
CarMax, Inc. (I) 36,869 1,336,870
Casual Male Retail Group, Inc. (I) 7,039 26,959
Chico’s FAS, Inc. 33,912 632,459
China ZhengTong Auto
Services Holdings, Ltd. (I) 66,000 43,363
Cia Hering 9,400 210,453
Citi Trends, Inc. (I) 2,522 35,207
Conn’s, Inc. (I)(L) 2,527 71,464
Destination Maternity Corp. 2,186 48,573
Dick’s Sporting Goods, Inc. (L) 19,842 1,041,903
Express, Inc. (I) 14,460 215,888
Fast Retailing Company, Ltd. 2,900 658,499
Five Below, Inc. (I) 1,784 66,276
Foot Locker, Inc. 30,851 1,105,700
Francesca’s Holdings Corp. (I)(L) 5,618 146,237
GameStop Corp., Class A (L) 19,929 523,136
Genesco, Inc. (I) 3,949 218,498
GOME Electrical
Appliances Holdings, Ltd. (I) 705,695 71,898
Group 1 Automotive, Inc. (L) 3,695 224,508
Guess?, Inc. (L) 12,525 324,022
h.h.gregg, Inc. (I)(L) 2,598 19,225
Haverty Furniture Companies, Inc. 3,139 52,578
Hengdeli Holdings, Ltd. 156,000 55,272
Hennes & Mauritz AB, B Shares 28,989 941,195
Hibbett Sports, Inc. (I)(L) 4,270 229,470
Hot Topic, Inc. (L) 6,825 68,114
Hotai Motor Company, Ltd. 12,000 88,802
Copyright © 2013 www.secdatabase.com. All Rights Reserved.Please Consider the Environment Before Printing This Document
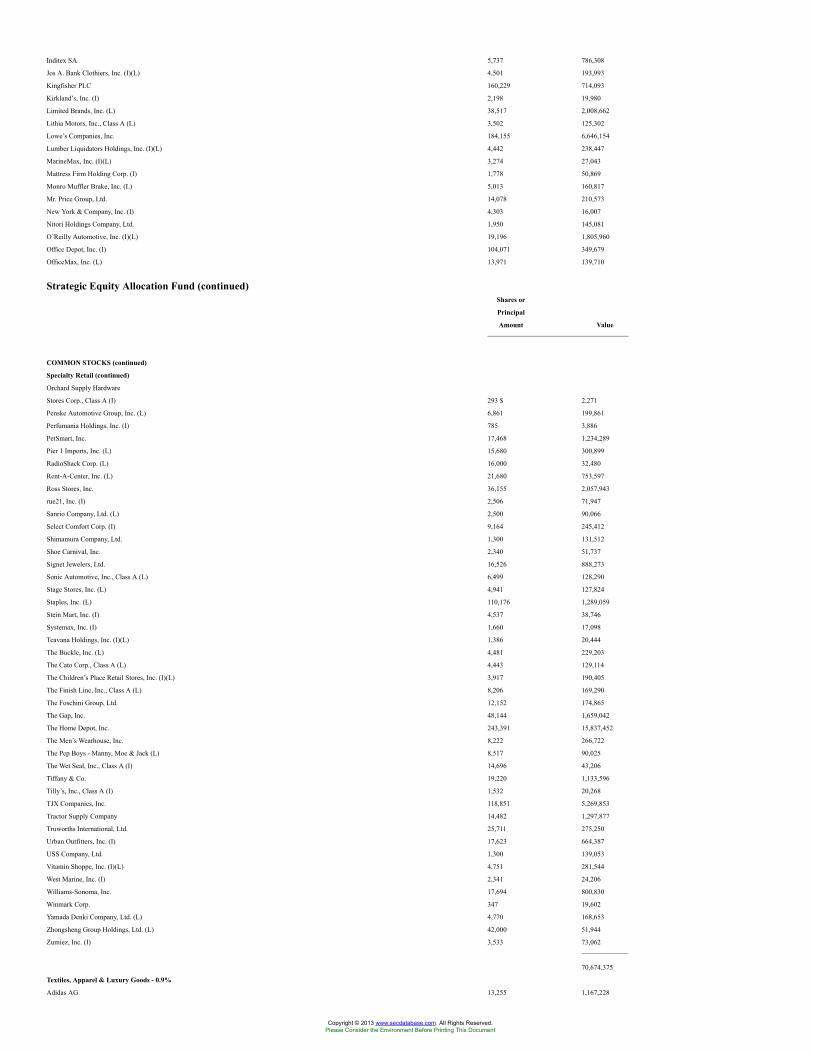
Inditex SA 5,737 786,308
Jos A. Bank Clothiers, Inc. (I)(L) 4,501 193,993
Kingfisher PLC 160,229 714,093
Kirkland’s, Inc. (I) 2,198 19,980
Limited Brands, Inc. (L) 38,517 2,008,662
Lithia Motors, Inc., Class A (L) 3,502 125,302
Lowe’s Companies, Inc. 184,155 6,646,154
Lumber Liquidators Holdings, Inc. (I)(L) 4,442 238,447
MarineMax, Inc. (I)(L) 3,274 27,043
Mattress Firm Holding Corp. (I) 1,778 50,869
Monro Muffler Brake, Inc. (L) 5,013 160,817
Mr. Price Group, Ltd. 14,078 210,573
New York & Company, Inc. (I) 4,303 16,007
Nitori Holdings Company, Ltd. 1,950 145,081
O’Reilly Automotive, Inc. (I)(L) 19,196 1,805,960
Office Depot, Inc. (I) 104,071 349,679
OfficeMax, Inc. (L) 13,971 139,710
Strategic Equity Allocation Fund (continued)Shares or
Principal
Amount Value
COMMON STOCKS (continued)
Specialty Retail (continued)
Orchard Supply Hardware
Stores Corp., Class A (I) 293 $ 2,271
Penske Automotive Group, Inc. (L) 6,861 199,861
Perfumania Holdings, Inc. (I) 785 3,886
PetSmart, Inc. 17,468 1,234,289
Pier 1 Imports, Inc. (L) 15,680 300,899
RadioShack Corp. (L) 16,000 32,480
Rent-A-Center, Inc. (L) 21,680 753,597
Ross Stores, Inc. 36,155 2,057,943
rue21, Inc. (I) 2,506 71,947
Sanrio Company, Ltd. (L) 2,500 90,066
Select Comfort Corp. (I) 9,164 245,412
Shimamura Company, Ltd. 1,300 131,512
Shoe Carnival, Inc. 2,340 51,737
Signet Jewelers, Ltd. 16,526 888,273
Sonic Automotive, Inc., Class A (L) 6,499 128,290
Stage Stores, Inc. (L) 4,941 127,824
Staples, Inc. (L) 110,176 1,289,059
Stein Mart, Inc. (I) 4,537 38,746
Systemax, Inc. (I) 1,660 17,098
Teavana Holdings, Inc. (I)(L) 1,386 20,444
The Buckle, Inc. (L) 4,481 229,203
The Cato Corp., Class A (L) 4,443 129,114
The Children’s Place Retail Stores, Inc. (I)(L) 3,917 190,405
The Finish Line, Inc., Class A (L) 8,206 169,290
The Foschini Group, Ltd. 12,152 174,865
The Gap, Inc. 48,144 1,659,042
The Home Depot, Inc. 243,391 15,837,452
The Men’s Wearhouse, Inc. 8,222 266,722
The Pep Boys - Manny, Moe & Jack (L) 8,517 90,025
The Wet Seal, Inc., Class A (I) 14,696 43,206
Tiffany & Co. 19,220 1,133,596
Tilly’s, Inc., Class A (I) 1,532 20,268
TJX Companies, Inc. 118,851 5,269,853
Tractor Supply Company 14,482 1,297,877
Truworths International, Ltd. 25,711 275,250
Urban Outfitters, Inc. (I) 17,623 664,387
USS Company, Ltd. 1,300 139,053
Vitamin Shoppe, Inc. (I)(L) 4,751 281,544
West Marine, Inc. (I) 2,341 24,206
Williams-Sonoma, Inc. 17,694 800,830
Winmark Corp. 347 19,602
Yamada Denki Company, Ltd. (L) 4,770 168,653
Zhongsheng Group Holdings, Ltd. (L) 42,000 51,944
Zumiez, Inc. (I) 3,533 73,062
70,674,375
Textiles, Apparel & Luxury Goods - 0.9%
Adidas AG 13,255 1,167,228
Copyright © 2013 www.secdatabase.com. All Rights Reserved.Please Consider the Environment Before Printing This Document
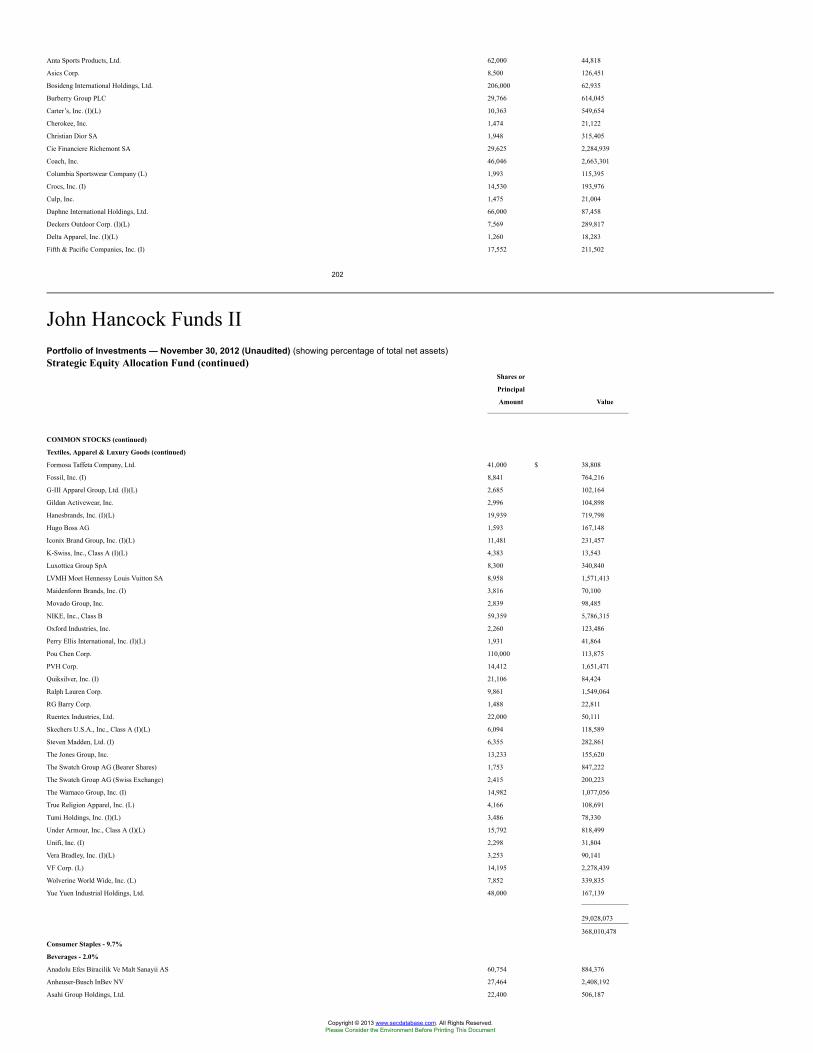
Anta Sports Products, Ltd. 62,000 44,818
Asics Corp. 8,500 126,451
Bosideng International Holdings, Ltd. 206,000 62,935
Burberry Group PLC 29,766 614,045
Carter’s, Inc. (I)(L) 10,363 549,654
Cherokee, Inc. 1,474 21,122
Christian Dior SA 1,948 315,405
Cie Financiere Richemont SA 29,625 2,284,939
Coach, Inc. 46,046 2,663,301
Columbia Sportswear Company (L) 1,993 115,395
Crocs, Inc. (I) 14,530 193,976
Culp, Inc. 1,475 21,004
Daphne International Holdings, Ltd. 66,000 87,458
Deckers Outdoor Corp. (I)(L) 7,569 289,817
Delta Apparel, Inc. (I)(L) 1,260 18,283
Fifth & Pacific Companies, Inc. (I) 17,552 211,502
202
John Hancock Funds IIPortfolio of Investments — November 30, 2012 (Unaudited) (showing percentage of total net assets)Strategic Equity Allocation Fund (continued)
Shares or
Principal
Amount Value
COMMON STOCKS (continued)
Textiles, Apparel & Luxury Goods (continued)
Formosa Taffeta Company, Ltd. 41,000 $ 38,808
Fossil, Inc. (I) 8,841 764,216
G-III Apparel Group, Ltd. (I)(L) 2,685 102,164
Gildan Activewear, Inc. 2,996 104,898
Hanesbrands, Inc. (I)(L) 19,939 719,798
Hugo Boss AG 1,593 167,148
Iconix Brand Group, Inc. (I)(L) 11,481 231,457
K-Swiss, Inc., Class A (I)(L) 4,383 13,543
Luxottica Group SpA 8,300 340,840
LVMH Moet Hennessy Louis Vuitton SA 8,958 1,571,413
Maidenform Brands, Inc. (I) 3,816 70,100
Movado Group, Inc. 2,839 98,485
NIKE, Inc., Class B 59,359 5,786,315
Oxford Industries, Inc. 2,260 123,486
Perry Ellis International, Inc. (I)(L) 1,931 41,864
Pou Chen Corp. 110,000 113,875
PVH Corp. 14,412 1,651,471
Quiksilver, Inc. (I) 21,106 84,424
Ralph Lauren Corp. 9,861 1,549,064
RG Barry Corp. 1,488 22,811
Ruentex Industries, Ltd. 22,000 50,111
Skechers U.S.A., Inc., Class A (I)(L) 6,094 118,589
Steven Madden, Ltd. (I) 6,355 282,861
The Jones Group, Inc. 13,233 155,620
The Swatch Group AG (Bearer Shares) 1,753 847,222
The Swatch Group AG (Swiss Exchange) 2,415 200,223
The Warnaco Group, Inc. (I) 14,982 1,077,056
True Religion Apparel, Inc. (L) 4,166 108,691
Tumi Holdings, Inc. (I)(L) 3,486 78,330
Under Armour, Inc., Class A (I)(L) 15,792 818,499
Unifi, Inc. (I) 2,298 31,804
Vera Bradley, Inc. (I)(L) 3,253 90,141
VF Corp. (L) 14,195 2,278,439
Wolverine World Wide, Inc. (L) 7,852 339,835
Yue Yuen Industrial Holdings, Ltd. 48,000 167,139
29,028,073
368,010,478
Consumer Staples - 9.7%
Beverages - 2.0%
Anadolu Efes Biracilik Ve Malt Sanayii AS 60,754 884,376
Anheuser-Busch InBev NV 27,464 2,408,192
Asahi Group Holdings, Ltd. 22,400 506,187
Copyright © 2013 www.secdatabase.com. All Rights Reserved.Please Consider the Environment Before Printing This Document
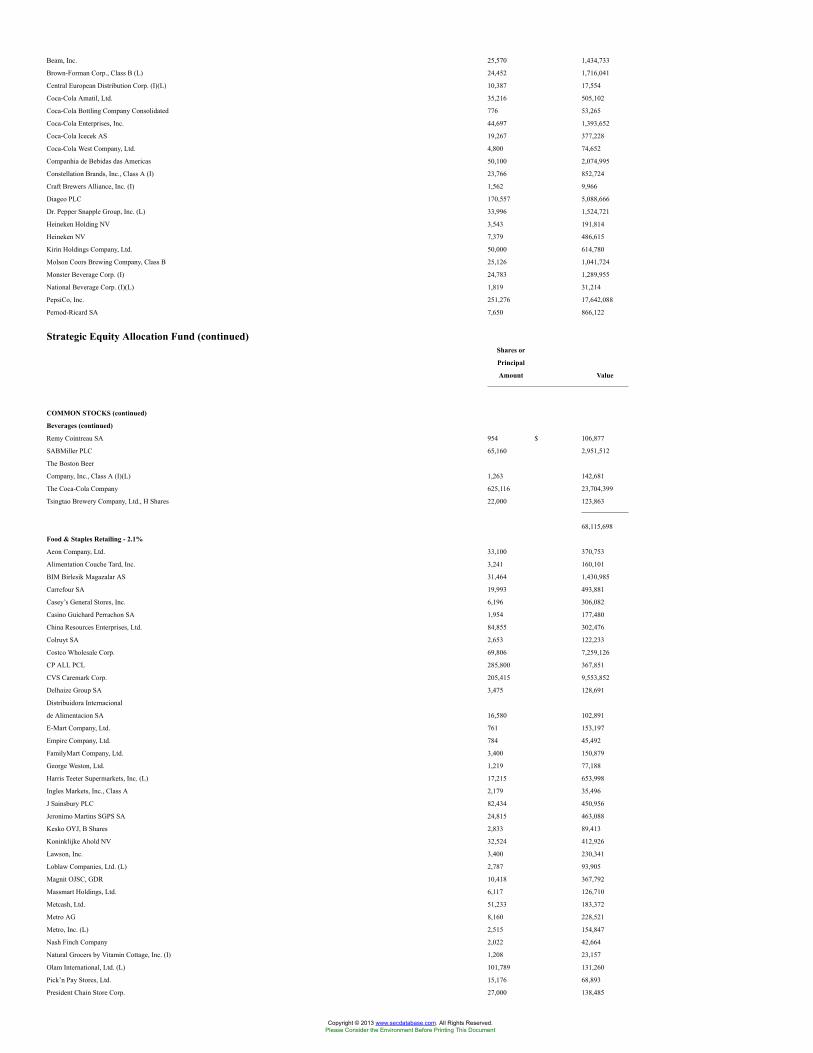
Beam, Inc. 25,570 1,434,733
Brown-Forman Corp., Class B (L) 24,452 1,716,041
Central European Distribution Corp. (I)(L) 10,387 17,554
Coca-Cola Amatil, Ltd. 35,216 505,102
Coca-Cola Bottling Company Consolidated 776 53,265
Coca-Cola Enterprises, Inc. 44,697 1,393,652
Coca-Cola Icecek AS 19,267 377,228
Coca-Cola West Company, Ltd. 4,800 74,652
Companhia de Bebidas das Americas 50,100 2,074,995
Constellation Brands, Inc., Class A (I) 23,766 852,724
Craft Brewers Alliance, Inc. (I) 1,562 9,966
Diageo PLC 170,557 5,088,666
Dr. Pepper Snapple Group, Inc. (L) 33,996 1,524,721
Heineken Holding NV 3,543 191,814
Heineken NV 7,379 486,615
Kirin Holdings Company, Ltd. 50,000 614,780
Molson Coors Brewing Company, Class B 25,126 1,041,724
Monster Beverage Corp. (I) 24,783 1,289,955
National Beverage Corp. (I)(L) 1,819 31,214
PepsiCo, Inc. 251,276 17,642,088
Pernod-Ricard SA 7,650 866,122
Strategic Equity Allocation Fund (continued)Shares or
Principal
Amount Value
COMMON STOCKS (continued)
Beverages (continued)
Remy Cointreau SA 954 $ 106,877
SABMiller PLC 65,160 2,951,512
The Boston Beer
Company, Inc., Class A (I)(L) 1,263 142,681
The Coca-Cola Company 625,116 23,704,399
Tsingtao Brewery Company, Ltd., H Shares 22,000 123,863
68,115,698
Food & Staples Retailing - 2.1%
Aeon Company, Ltd. 33,100 370,753
Alimentation Couche Tard, Inc. 3,241 160,101
BIM Birlesik Magazalar AS 31,464 1,430,985
Carrefour SA 19,993 493,881
Casey’s General Stores, Inc. 6,196 306,082
Casino Guichard Perrachon SA 1,954 177,480
China Resources Enterprises, Ltd. 84,855 302,476
Colruyt SA 2,653 122,233
Costco Wholesale Corp. 69,806 7,259,126
CP ALL PCL 285,800 367,851
CVS Caremark Corp. 205,415 9,553,852
Delhaize Group SA 3,475 128,691
Distribuidora Internacional
de Alimentacion SA 16,580 102,891
E-Mart Company, Ltd. 761 153,197
Empire Company, Ltd. 784 45,492
FamilyMart Company, Ltd. 3,400 150,879
George Weston, Ltd. 1,219 77,188
Harris Teeter Supermarkets, Inc. (L) 17,215 653,998
Ingles Markets, Inc., Class A 2,179 35,496
J Sainsbury PLC 82,434 450,956
Jeronimo Martins SGPS SA 24,815 463,088
Kesko OYJ, B Shares 2,833 89,413
Koninklijke Ahold NV 32,524 412,926
Lawson, Inc. 3,400 230,341
Loblaw Companies, Ltd. (L) 2,787 93,905
Magnit OJSC, GDR 10,418 367,792
Massmart Holdings, Ltd. 6,117 126,710
Metcash, Ltd. 51,233 183,372
Metro AG 8,160 228,521
Metro, Inc. (L) 2,515 154,847
Nash Finch Company 2,022 42,664
Natural Grocers by Vitamin Cottage, Inc. (I) 1,208 23,157
Olam International, Ltd. (L) 101,789 131,260
Pick’n Pay Stores, Ltd. 15,176 68,893
President Chain Store Corp. 27,000 138,485
Copyright © 2013 www.secdatabase.com. All Rights Reserved.Please Consider the Environment Before Printing This Document
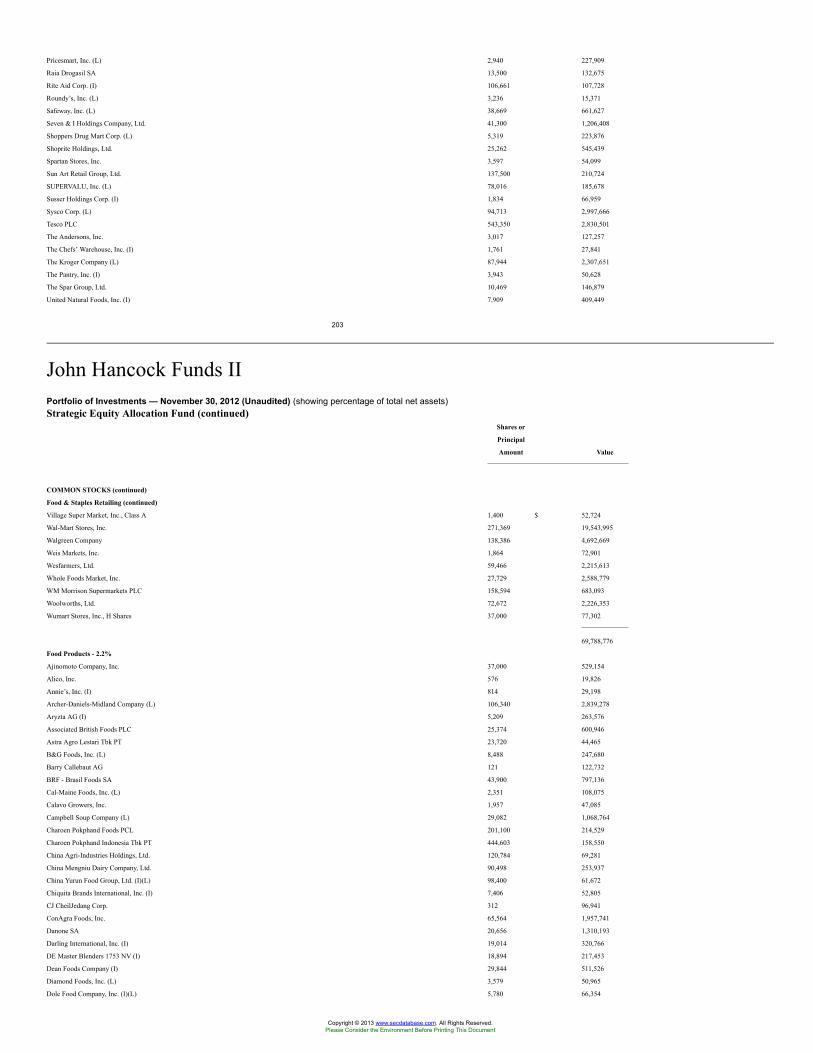
Pricesmart, Inc. (L) 2,940 227,909
Raia Drogasil SA 13,500 132,675
Rite Aid Corp. (I) 106,661 107,728
Roundy’s, Inc. (L) 3,236 15,371
Safeway, Inc. (L) 38,669 661,627
Seven & I Holdings Company, Ltd. 41,300 1,206,408
Shoppers Drug Mart Corp. (L) 5,319 223,876
Shoprite Holdings, Ltd. 25,262 545,439
Spartan Stores, Inc. 3,597 54,099
Sun Art Retail Group, Ltd. 137,500 210,724
SUPERVALU, Inc. (L) 78,016 185,678
Susser Holdings Corp. (I) 1,834 66,959
Sysco Corp. (L) 94,713 2,997,666
Tesco PLC 543,350 2,830,501
The Andersons, Inc. 3,017 127,257
The Chefs’ Warehouse, Inc. (I) 1,761 27,841
The Kroger Company (L) 87,944 2,307,651
The Pantry, Inc. (I) 3,943 50,628
The Spar Group, Ltd. 10,469 146,879
United Natural Foods, Inc. (I) 7,909 409,449
203
John Hancock Funds IIPortfolio of Investments — November 30, 2012 (Unaudited) (showing percentage of total net assets)Strategic Equity Allocation Fund (continued)
Shares or
Principal
Amount Value
COMMON STOCKS (continued)
Food & Staples Retailing (continued)
Village Super Market, Inc., Class A 1,400 $ 52,724
Wal-Mart Stores, Inc. 271,369 19,543,995
Walgreen Company 138,386 4,692,669
Weis Markets, Inc. 1,864 72,901
Wesfarmers, Ltd. 59,466 2,215,613
Whole Foods Market, Inc. 27,729 2,588,779
WM Morrison Supermarkets PLC 158,594 683,093
Woolworths, Ltd. 72,672 2,226,353
Wumart Stores, Inc., H Shares 37,000 77,302
69,788,776
Food Products - 2.2%
Ajinomoto Company, Inc. 37,000 529,154
Alico, Inc. 576 19,826
Annie’s, Inc. (I) 814 29,198
Archer-Daniels-Midland Company (L) 106,340 2,839,278
Aryzta AG (I) 5,209 263,576
Associated British Foods PLC 25,374 600,946
Astra Agro Lestari Tbk PT 23,720 44,465
B&G Foods, Inc. (L) 8,488 247,680
Barry Callebaut AG 121 122,732
BRF - Brasil Foods SA 43,900 797,136
Cal-Maine Foods, Inc. (L) 2,351 108,075
Calavo Growers, Inc. 1,957 47,085
Campbell Soup Company (L) 29,082 1,068,764
Charoen Pokphand Foods PCL 201,100 214,529
Charoen Pokphand Indonesia Tbk PT 444,603 158,550
China Agri-Industries Holdings, Ltd. 120,784 69,281
China Mengniu Dairy Company, Ltd. 90,498 253,937
China Yurun Food Group, Ltd. (I)(L) 98,400 61,672
Chiquita Brands International, Inc. (I) 7,406 52,805
CJ CheilJedang Corp. 312 96,941
ConAgra Foods, Inc. 65,564 1,957,741
Danone SA 20,656 1,310,193
Darling International, Inc. (I) 19,014 320,766
DE Master Blenders 1753 NV (I) 18,894 217,453
Dean Foods Company (I) 29,844 511,526
Diamond Foods, Inc. (L) 3,579 50,965
Dole Food Company, Inc. (I)(L) 5,780 66,354
Copyright © 2013 www.secdatabase.com. All Rights Reserved.Please Consider the Environment Before Printing This Document
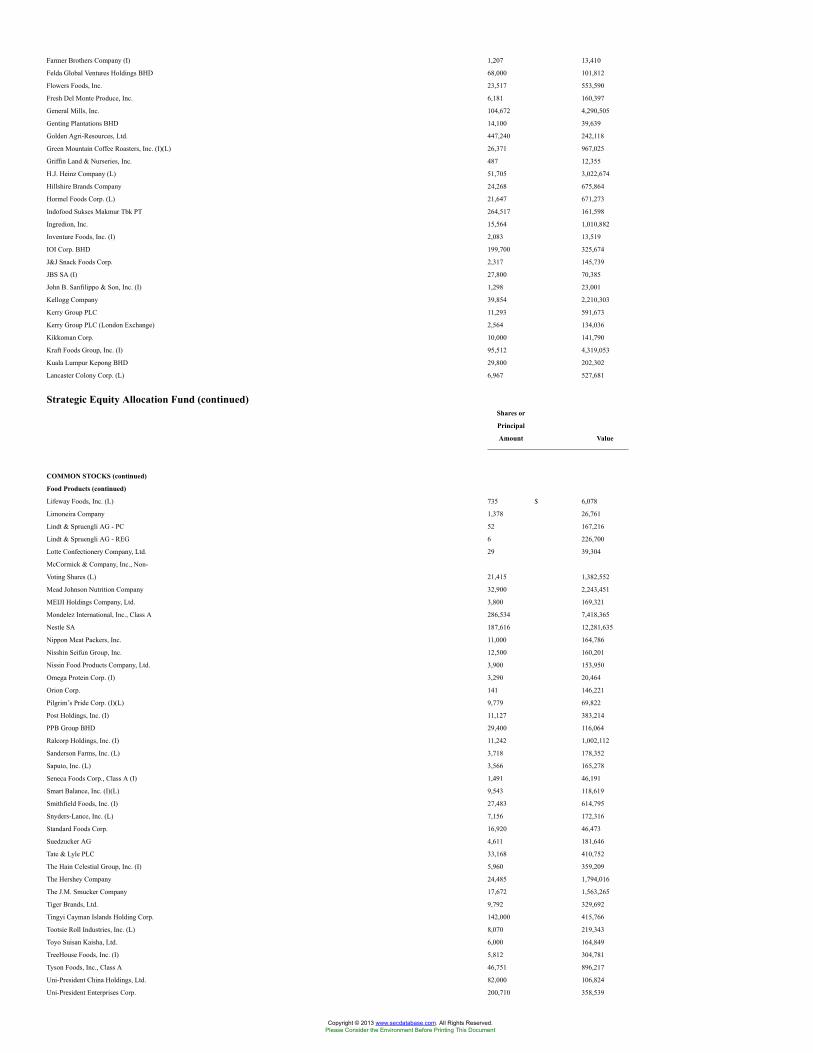
Farmer Brothers Company (I) 1,207 13,410
Felda Global Ventures Holdings BHD 68,000 101,812
Flowers Foods, Inc. 23,517 553,590
Fresh Del Monte Produce, Inc. 6,181 160,397
General Mills, Inc. 104,672 4,290,505
Genting Plantations BHD 14,100 39,639
Golden Agri-Resources, Ltd. 447,240 242,118
Green Mountain Coffee Roasters, Inc. (I)(L) 26,371 967,025
Griffin Land & Nurseries, Inc. 487 12,355
H.J. Heinz Company (L) 51,705 3,022,674
Hillshire Brands Company 24,268 675,864
Hormel Foods Corp. (L) 21,647 671,273
Indofood Sukses Makmur Tbk PT 264,517 161,598
Ingredion, Inc. 15,564 1,010,882
Inventure Foods, Inc. (I) 2,083 13,519
IOI Corp. BHD 199,700 325,674
J&J Snack Foods Corp. 2,317 145,739
JBS SA (I) 27,800 70,385
John B. Sanfilippo & Son, Inc. (I) 1,298 23,001
Kellogg Company 39,854 2,210,303
Kerry Group PLC 11,293 591,673
Kerry Group PLC (London Exchange) 2,564 134,036
Kikkoman Corp. 10,000 141,790
Kraft Foods Group, Inc. (I) 95,512 4,319,053
Kuala Lumpur Kepong BHD 29,800 202,302
Lancaster Colony Corp. (L) 6,967 527,681
Strategic Equity Allocation Fund (continued)Shares or
Principal
Amount Value
COMMON STOCKS (continued)
Food Products (continued)
Lifeway Foods, Inc. (L) 735 $ 6,078
Limoneira Company 1,378 26,761
Lindt & Spruengli AG - PC 52 167,216
Lindt & Spruengli AG - REG 6 226,700
Lotte Confectionery Company, Ltd. 29 39,304
McCormick & Company, Inc., Non-
Voting Shares (L) 21,415 1,382,552
Mead Johnson Nutrition Company 32,900 2,243,451
MEIJI Holdings Company, Ltd. 3,800 169,321
Mondelez International, Inc., Class A 286,534 7,418,365
Nestle SA 187,616 12,281,635
Nippon Meat Packers, Inc. 11,000 164,786
Nisshin Seifun Group, Inc. 12,500 160,201
Nissin Food Products Company, Ltd. 3,900 153,950
Omega Protein Corp. (I) 3,290 20,464
Orion Corp. 141 146,221
Pilgrim’s Pride Corp. (I)(L) 9,779 69,822
Post Holdings, Inc. (I) 11,127 383,214
PPB Group BHD 29,400 116,064
Ralcorp Holdings, Inc. (I) 11,242 1,002,112
Sanderson Farms, Inc. (L) 3,718 178,352
Saputo, Inc. (L) 3,566 165,278
Seneca Foods Corp., Class A (I) 1,491 46,191
Smart Balance, Inc. (I)(L) 9,543 118,619
Smithfield Foods, Inc. (I) 27,483 614,795
Snyders-Lance, Inc. (L) 7,156 172,316
Standard Foods Corp. 16,920 46,473
Suedzucker AG 4,611 181,646
Tate & Lyle PLC 33,168 410,752
The Hain Celestial Group, Inc. (I) 5,960 359,209
The Hershey Company 24,485 1,794,016
The J.M. Smucker Company 17,672 1,563,265
Tiger Brands, Ltd. 9,792 329,692
Tingyi Cayman Islands Holding Corp. 142,000 415,766
Tootsie Roll Industries, Inc. (L) 8,070 219,343
Toyo Suisan Kaisha, Ltd. 6,000 164,849
TreeHouse Foods, Inc. (I) 5,812 304,781
Tyson Foods, Inc., Class A 46,751 896,217
Uni-President China Holdings, Ltd. 82,000 106,824
Uni-President Enterprises Corp. 200,710 358,539
Copyright © 2013 www.secdatabase.com. All Rights Reserved.Please Consider the Environment Before Printing This Document
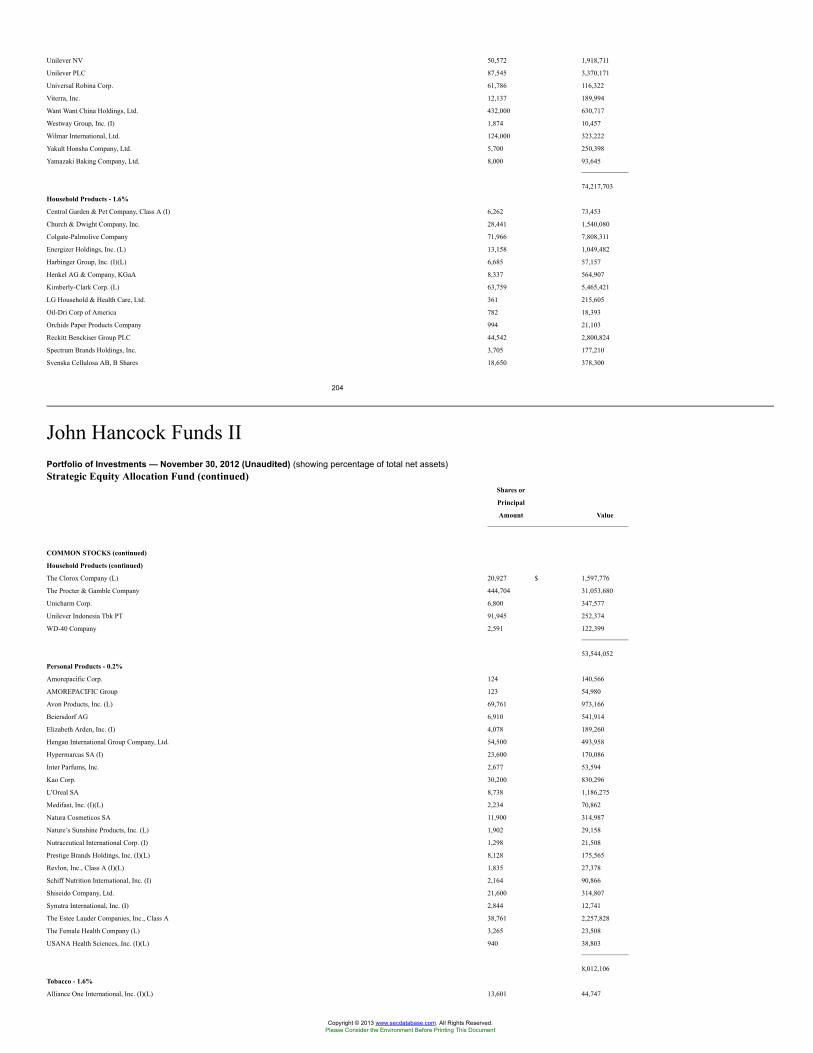
Unilever NV 50,572 1,918,711
Unilever PLC 87,545 3,370,171
Universal Robina Corp. 61,786 116,322
Viterra, Inc. 12,137 189,994
Want Want China Holdings, Ltd. 432,000 630,717
Westway Group, Inc. (I) 1,874 10,457
Wilmar International, Ltd. 124,000 323,222
Yakult Honsha Company, Ltd. 5,700 250,398
Yamazaki Baking Company, Ltd. 8,000 93,645
74,217,703
Household Products - 1.6%
Central Garden & Pet Company, Class A (I) 6,262 73,453
Church & Dwight Company, Inc. 28,441 1,540,080
Colgate-Palmolive Company 71,966 7,808,311
Energizer Holdings, Inc. (L) 13,158 1,049,482
Harbinger Group, Inc. (I)(L) 6,685 57,157
Henkel AG & Company, KGaA 8,337 564,907
Kimberly-Clark Corp. (L) 63,759 5,465,421
LG Household & Health Care, Ltd. 361 215,605
Oil-Dri Corp of America 782 18,393
Orchids Paper Products Company 994 21,103
Reckitt Benckiser Group PLC 44,542 2,800,824
Spectrum Brands Holdings, Inc. 3,705 177,210
Svenska Cellulosa AB, B Shares 18,650 378,300
204
John Hancock Funds IIPortfolio of Investments — November 30, 2012 (Unaudited) (showing percentage of total net assets)Strategic Equity Allocation Fund (continued)
Shares or
Principal
Amount Value
COMMON STOCKS (continued)
Household Products (continued)
The Clorox Company (L) 20,927 $ 1,597,776
The Procter & Gamble Company 444,704 31,053,680
Unicharm Corp. 6,800 347,577
Unilever Indonesia Tbk PT 91,945 252,374
WD-40 Company 2,591 122,399
53,544,052
Personal Products - 0.2%
Amorepacific Corp. 124 140,566
AMOREPACIFIC Group 123 54,980
Avon Products, Inc. (L) 69,761 973,166
Beiersdorf AG 6,910 541,914
Elizabeth Arden, Inc. (I) 4,078 189,260
Hengan International Group Company, Ltd. 54,500 493,958
Hypermarcas SA (I) 23,600 170,086
Inter Parfums, Inc. 2,677 53,594
Kao Corp. 30,200 830,296
L’Oreal SA 8,738 1,186,275
Medifast, Inc. (I)(L) 2,234 70,862
Natura Cosmeticos SA 11,900 314,987
Nature’s Sunshine Products, Inc. (L) 1,902 29,158
Nutraceutical International Corp. (I) 1,298 21,508
Prestige Brands Holdings, Inc. (I)(L) 8,128 175,565
Revlon, Inc., Class A (I)(L) 1,835 27,378
Schiff Nutrition International, Inc. (I) 2,164 90,866
Shiseido Company, Ltd. 21,600 314,807
Synutra International, Inc. (I) 2,844 12,741
The Estee Lauder Companies, Inc., Class A 38,761 2,257,828
The Female Health Company (L) 3,265 23,508
USANA Health Sciences, Inc. (I)(L) 940 38,803
8,012,106
Tobacco - 1.6%
Alliance One International, Inc. (I)(L) 13,601 44,747
Copyright © 2013 www.secdatabase.com. All Rights Reserved.Please Consider the Environment Before Printing This Document
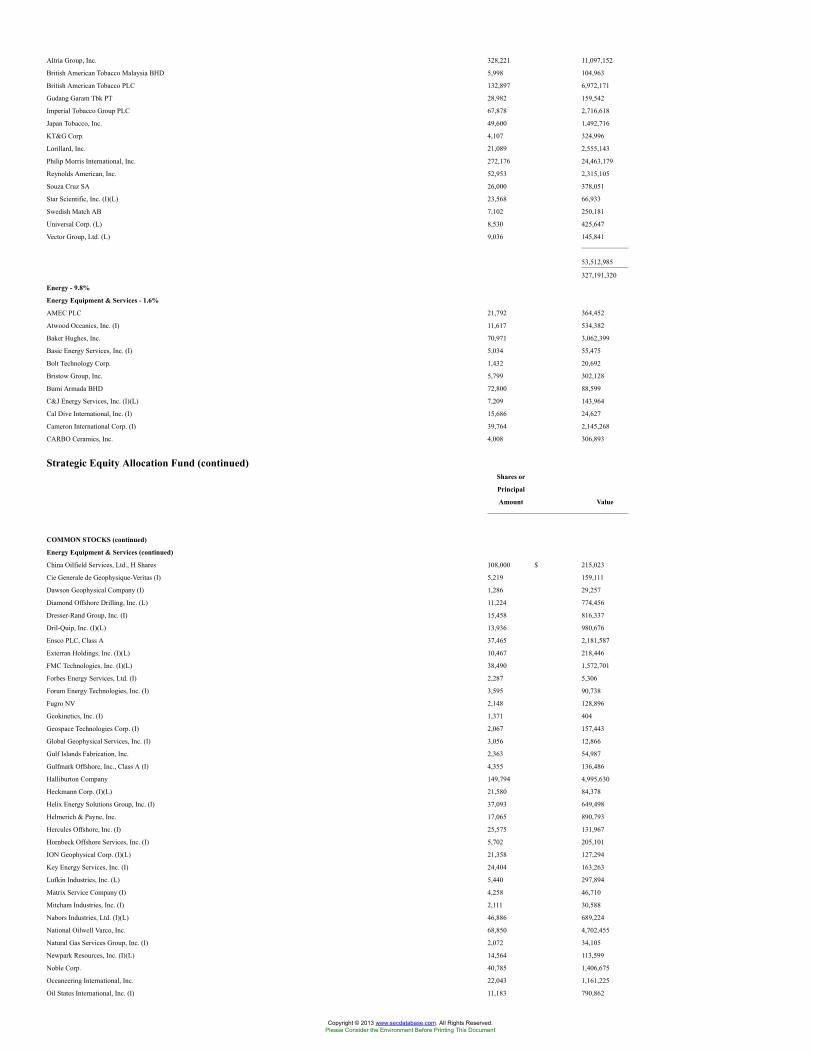
Altria Group, Inc. 328,221 11,097,152
British American Tobacco Malaysia BHD 5,998 104,963
British American Tobacco PLC 132,897 6,972,171
Gudang Garam Tbk PT 28,982 159,542
Imperial Tobacco Group PLC 67,878 2,716,618
Japan Tobacco, Inc. 49,600 1,492,716
KT&G Corp. 4,107 324,996
Lorillard, Inc. 21,089 2,555,143
Philip Morris International, Inc. 272,176 24,463,179
Reynolds American, Inc. 52,953 2,315,105
Souza Cruz SA 26,000 378,051
Star Scientific, Inc. (I)(L) 23,568 66,933
Swedish Match AB 7,102 250,181
Universal Corp. (L) 8,530 425,647
Vector Group, Ltd. (L) 9,036 145,841
53,512,985
327,191,320
Energy - 9.8%
Energy Equipment & Services - 1.6%
AMEC PLC 21,792 364,452
Atwood Oceanics, Inc. (I) 11,617 534,382
Baker Hughes, Inc. 70,971 3,062,399
Basic Energy Services, Inc. (I) 5,034 55,475
Bolt Technology Corp. 1,432 20,692
Bristow Group, Inc. 5,799 302,128
Bumi Armada BHD 72,800 88,599
C&J Energy Services, Inc. (I)(L) 7,209 143,964
Cal Dive International, Inc. (I) 15,686 24,627
Cameron International Corp. (I) 39,764 2,145,268
CARBO Ceramics, Inc. 4,008 306,893
Strategic Equity Allocation Fund (continued)Shares or
Principal
Amount Value
COMMON STOCKS (continued)
Energy Equipment & Services (continued)
China Oilfield Services, Ltd., H Shares 108,000 $ 215,023
Cie Generale de Geophysique-Veritas (I) 5,219 159,111
Dawson Geophysical Company (I) 1,286 29,257
Diamond Offshore Drilling, Inc. (L) 11,224 774,456
Dresser-Rand Group, Inc. (I) 15,458 816,337
Dril-Quip, Inc. (I)(L) 13,936 980,676
Ensco PLC, Class A 37,465 2,181,587
Exterran Holdings, Inc. (I)(L) 10,467 218,446
FMC Technologies, Inc. (I)(L) 38,490 1,572,701
Forbes Energy Services, Ltd. (I) 2,287 5,306
Forum Energy Technologies, Inc. (I) 3,595 90,738
Fugro NV 2,148 128,896
Geokinetics, Inc. (I) 1,371 404
Geospace Technologies Corp. (I) 2,067 157,443
Global Geophysical Services, Inc. (I) 3,056 12,866
Gulf Islands Fabrication, Inc. 2,363 54,987
Gulfmark Offshore, Inc., Class A (I) 4,355 136,486
Halliburton Company 149,794 4,995,630
Heckmann Corp. (I)(L) 21,580 84,378
Helix Energy Solutions Group, Inc. (I) 37,093 649,498
Helmerich & Payne, Inc. 17,065 890,793
Hercules Offshore, Inc. (I) 25,575 131,967
Hornbeck Offshore Services, Inc. (I) 5,702 205,101
ION Geophysical Corp. (I)(L) 21,358 127,294
Key Energy Services, Inc. (I) 24,404 163,263
Lufkin Industries, Inc. (L) 5,440 297,894
Matrix Service Company (I) 4,258 46,710
Mitcham Industries, Inc. (I) 2,111 30,588
Nabors Industries, Ltd. (I)(L) 46,886 689,224
National Oilwell Varco, Inc. 68,850 4,702,455
Natural Gas Services Group, Inc. (I) 2,072 34,105
Newpark Resources, Inc. (I)(L) 14,564 113,599
Noble Corp. 40,785 1,406,675
Oceaneering International, Inc. 22,043 1,161,225
Oil States International, Inc. (I) 11,183 790,862
Copyright © 2013 www.secdatabase.com. All Rights Reserved.Please Consider the Environment Before Printing This Document
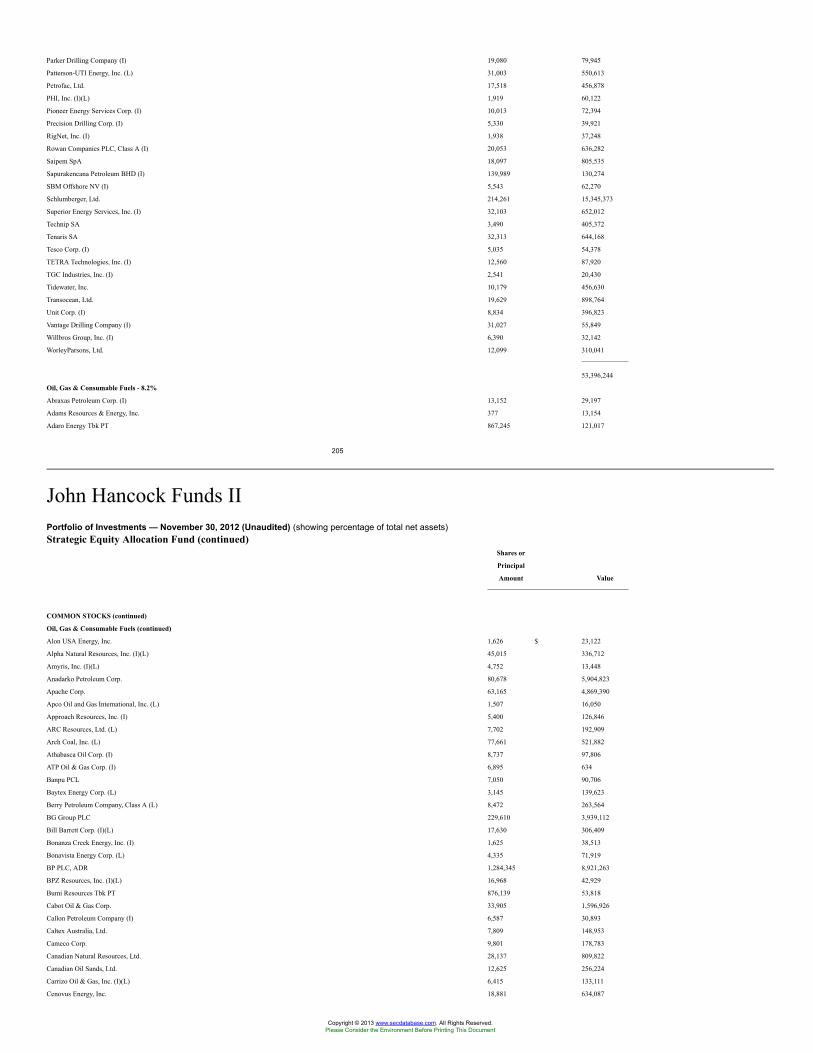
Parker Drilling Company (I) 19,080 79,945
Patterson-UTI Energy, Inc. (L) 31,003 550,613
Petrofac, Ltd. 17,518 456,878
PHI, Inc. (I)(L) 1,919 60,122
Pioneer Energy Services Corp. (I) 10,013 72,394
Precision Drilling Corp. (I) 5,330 39,921
RigNet, Inc. (I) 1,938 37,248
Rowan Companies PLC, Class A (I) 20,053 636,282
Saipem SpA 18,097 805,535
Sapurakencana Petroleum BHD (I) 139,989 130,274
SBM Offshore NV (I) 5,543 62,270
Schlumberger, Ltd. 214,261 15,345,373
Superior Energy Services, Inc. (I) 32,103 652,012
Technip SA 3,490 405,372
Tenaris SA 32,313 644,168
Tesco Corp. (I) 5,035 54,378
TETRA Technologies, Inc. (I) 12,560 87,920
TGC Industries, Inc. (I) 2,541 20,430
Tidewater, Inc. 10,179 456,630
Transocean, Ltd. 19,629 898,764
Unit Corp. (I) 8,834 396,823
Vantage Drilling Company (I) 31,027 55,849
Willbros Group, Inc. (I) 6,390 32,142
WorleyParsons, Ltd. 12,099 310,041
53,396,244
Oil, Gas & Consumable Fuels - 8.2%
Abraxas Petroleum Corp. (I) 13,152 29,197
Adams Resources & Energy, Inc. 377 13,154
Adaro Energy Tbk PT 867,245 121,017
205
John Hancock Funds IIPortfolio of Investments — November 30, 2012 (Unaudited) (showing percentage of total net assets)Strategic Equity Allocation Fund (continued)
Shares or
Principal
Amount Value
COMMON STOCKS (continued)
Oil, Gas & Consumable Fuels (continued)
Alon USA Energy, Inc. 1,626 $ 23,122
Alpha Natural Resources, Inc. (I)(L) 45,015 336,712
Amyris, Inc. (I)(L) 4,752 13,448
Anadarko Petroleum Corp. 80,678 5,904,823
Apache Corp. 63,165 4,869,390
Apco Oil and Gas International, Inc. (L) 1,507 16,050
Approach Resources, Inc. (I) 5,400 126,846
ARC Resources, Ltd. (L) 7,702 192,909
Arch Coal, Inc. (L) 77,661 521,882
Athabasca Oil Corp. (I) 8,737 97,806
ATP Oil & Gas Corp. (I) 6,895 634
Banpu PCL 7,050 90,706
Baytex Energy Corp. (L) 3,145 139,623
Berry Petroleum Company, Class A (L) 8,472 263,564
BG Group PLC 229,610 3,939,112
Bill Barrett Corp. (I)(L) 17,630 306,409
Bonanza Creek Energy, Inc. (I) 1,625 38,513
Bonavista Energy Corp. (L) 4,335 71,919
BP PLC, ADR 1,284,345 8,921,263
BPZ Resources, Inc. (I)(L) 16,968 42,929
Bumi Resources Tbk PT 876,139 53,818
Cabot Oil & Gas Corp. 33,905 1,596,926
Callon Petroleum Company (I) 6,587 30,893
Caltex Australia, Ltd. 7,809 148,953
Cameco Corp. 9,801 178,783
Canadian Natural Resources, Ltd. 28,137 809,822
Canadian Oil Sands, Ltd. 12,625 256,224
Carrizo Oil & Gas, Inc. (I)(L) 6,415 133,111
Cenovus Energy, Inc. 18,881 634,087
Copyright © 2013 www.secdatabase.com. All Rights Reserved.Please Consider the Environment Before Printing This Document
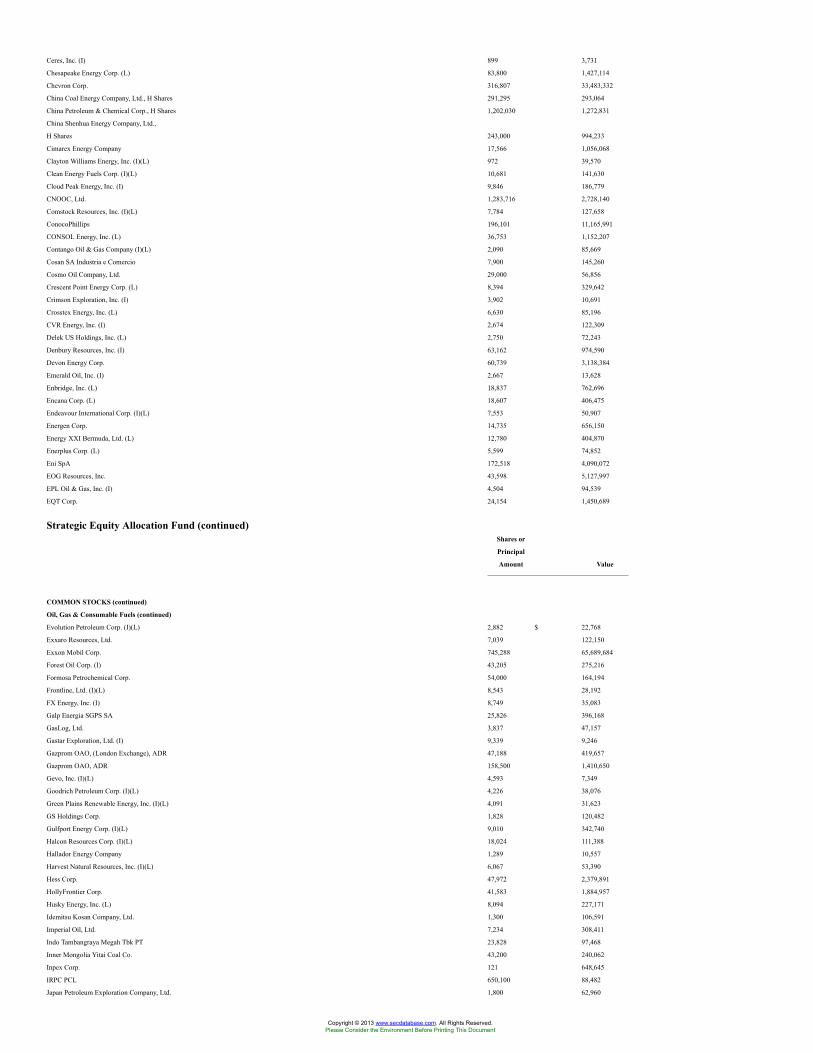
Ceres, Inc. (I) 899 3,731
Chesapeake Energy Corp. (L) 83,800 1,427,114
Chevron Corp. 316,807 33,483,332
China Coal Energy Company, Ltd., H Shares 291,295 293,064
China Petroleum & Chemical Corp., H Shares 1,202,030 1,272,831
China Shenhua Energy Company, Ltd.,
H Shares 243,000 994,233
Cimarex Energy Company 17,566 1,056,068
Clayton Williams Energy, Inc. (I)(L) 972 39,570
Clean Energy Fuels Corp. (I)(L) 10,681 141,630
Cloud Peak Energy, Inc. (I) 9,846 186,779
CNOOC, Ltd. 1,283,716 2,728,140
Comstock Resources, Inc. (I)(L) 7,784 127,658
ConocoPhillips 196,101 11,165,991
CONSOL Energy, Inc. (L) 36,753 1,152,207
Contango Oil & Gas Company (I)(L) 2,090 85,669
Cosan SA Industria e Comercio 7,900 145,260
Cosmo Oil Company, Ltd. 29,000 56,856
Crescent Point Energy Corp. (L) 8,394 329,642
Crimson Exploration, Inc. (I) 3,902 10,691
Crosstex Energy, Inc. (L) 6,630 85,196
CVR Energy, Inc. (I) 2,674 122,309
Delek US Holdings, Inc. (L) 2,750 72,243
Denbury Resources, Inc. (I) 63,162 974,590
Devon Energy Corp. 60,739 3,138,384
Emerald Oil, Inc. (I) 2,667 13,628
Enbridge, Inc. (L) 18,837 762,696
Encana Corp. (L) 18,607 406,475
Endeavour International Corp. (I)(L) 7,553 50,907
Energen Corp. 14,735 656,150
Energy XXI Bermuda, Ltd. (L) 12,780 404,870
Enerplus Corp. (L) 5,599 74,852
Eni SpA 172,518 4,090,072
EOG Resources, Inc. 43,598 5,127,997
EPL Oil & Gas, Inc. (I) 4,504 94,539
EQT Corp. 24,154 1,450,689
Strategic Equity Allocation Fund (continued)Shares or
Principal
Amount Value
COMMON STOCKS (continued)
Oil, Gas & Consumable Fuels (continued)
Evolution Petroleum Corp. (I)(L) 2,882 $ 22,768
Exxaro Resources, Ltd. 7,039 122,150
Exxon Mobil Corp. 745,288 65,689,684
Forest Oil Corp. (I) 43,205 275,216
Formosa Petrochemical Corp. 54,000 164,194
Frontline, Ltd. (I)(L) 8,543 28,192
FX Energy, Inc. (I) 8,749 35,083
Galp Energia SGPS SA 25,826 396,168
GasLog, Ltd. 3,837 47,157
Gastar Exploration, Ltd. (I) 9,339 9,246
Gazprom OAO, (London Exchange), ADR 47,188 419,657
Gazprom OAO, ADR 158,500 1,410,650
Gevo, Inc. (I)(L) 4,593 7,349
Goodrich Petroleum Corp. (I)(L) 4,226 38,076
Green Plains Renewable Energy, Inc. (I)(L) 4,091 31,623
GS Holdings Corp. 1,828 120,482
Gulfport Energy Corp. (I)(L) 9,010 342,740
Halcon Resources Corp. (I)(L) 18,024 111,388
Hallador Energy Company 1,289 10,557
Harvest Natural Resources, Inc. (I)(L) 6,067 53,390
Hess Corp. 47,972 2,379,891
HollyFrontier Corp. 41,583 1,884,957
Husky Energy, Inc. (L) 8,094 227,171
Idemitsu Kosan Company, Ltd. 1,300 106,591
Imperial Oil, Ltd. 7,234 308,411
Indo Tambangraya Megah Tbk PT 23,828 97,468
Inner Mongolia Yitai Coal Co. 43,200 240,062
Inpex Corp. 121 648,645
IRPC PCL 650,100 88,482
Japan Petroleum Exploration Company, Ltd. 1,800 62,960
Copyright © 2013 www.secdatabase.com. All Rights Reserved.Please Consider the Environment Before Printing This Document
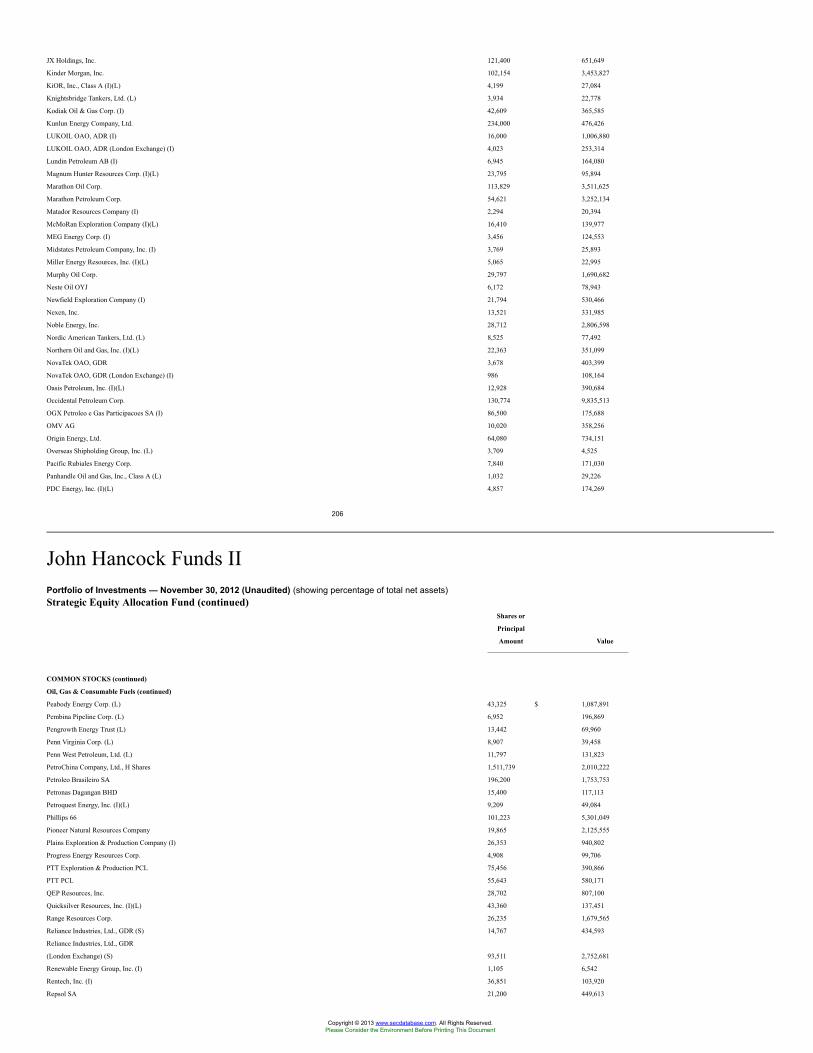
JX Holdings, Inc. 121,400 651,649
Kinder Morgan, Inc. 102,154 3,453,827
KiOR, Inc., Class A (I)(L) 4,199 27,084
Knightsbridge Tankers, Ltd. (L) 3,934 22,778
Kodiak Oil & Gas Corp. (I) 42,609 365,585
Kunlun Energy Company, Ltd. 234,000 476,426
LUKOIL OAO, ADR (I) 16,000 1,006,880
LUKOIL OAO, ADR (London Exchange) (I) 4,023 253,314
Lundin Petroleum AB (I) 6,945 164,080
Magnum Hunter Resources Corp. (I)(L) 23,795 95,894
Marathon Oil Corp. 113,829 3,511,625
Marathon Petroleum Corp. 54,621 3,252,134
Matador Resources Company (I) 2,294 20,394
McMoRan Exploration Company (I)(L) 16,410 139,977
MEG Energy Corp. (I) 3,456 124,553
Midstates Petroleum Company, Inc. (I) 3,769 25,893
Miller Energy Resources, Inc. (I)(L) 5,065 22,995
Murphy Oil Corp. 29,797 1,690,682
Neste Oil OYJ 6,172 78,943
Newfield Exploration Company (I) 21,794 530,466
Nexen, Inc. 13,521 331,985
Noble Energy, Inc. 28,712 2,806,598
Nordic American Tankers, Ltd. (L) 8,525 77,492
Northern Oil and Gas, Inc. (I)(L) 22,363 351,099
NovaTek OAO, GDR 3,678 403,399
NovaTek OAO, GDR (London Exchange) (I) 986 108,164
Oasis Petroleum, Inc. (I)(L) 12,928 390,684
Occidental Petroleum Corp. 130,774 9,835,513
OGX Petroleo e Gas Participacoes SA (I) 86,500 175,688
OMV AG 10,020 358,256
Origin Energy, Ltd. 64,080 734,151
Overseas Shipholding Group, Inc. (L) 3,709 4,525
Pacific Rubiales Energy Corp. 7,840 171,030
Panhandle Oil and Gas, Inc., Class A (L) 1,032 29,226
PDC Energy, Inc. (I)(L) 4,857 174,269
206
John Hancock Funds IIPortfolio of Investments — November 30, 2012 (Unaudited) (showing percentage of total net assets)Strategic Equity Allocation Fund (continued)
Shares or
Principal
Amount Value
COMMON STOCKS (continued)
Oil, Gas & Consumable Fuels (continued)
Peabody Energy Corp. (L) 43,325 $ 1,087,891
Pembina Pipeline Corp. (L) 6,952 196,869
Pengrowth Energy Trust (L) 13,442 69,960
Penn Virginia Corp. (L) 8,907 39,458
Penn West Petroleum, Ltd. (L) 11,797 131,823
PetroChina Company, Ltd., H Shares 1,511,739 2,010,222
Petroleo Brasileiro SA 196,200 1,753,753
Petronas Dagangan BHD 15,400 117,113
Petroquest Energy, Inc. (I)(L) 9,209 49,084
Phillips 66 101,223 5,301,049
Pioneer Natural Resources Company 19,865 2,125,555
Plains Exploration & Production Company (I) 26,353 940,802
Progress Energy Resources Corp. 4,908 99,706
PTT Exploration & Production PCL 75,456 390,866
PTT PCL 55,643 580,171
QEP Resources, Inc. 28,702 807,100
Quicksilver Resources, Inc. (I)(L) 43,360 137,451
Range Resources Corp. 26,235 1,679,565
Reliance Industries, Ltd., GDR (S) 14,767 434,593
Reliance Industries, Ltd., GDR
(London Exchange) (S) 93,511 2,752,681
Renewable Energy Group, Inc. (I) 1,105 6,542
Rentech, Inc. (I) 36,851 103,920
Repsol SA 21,200 449,613
Copyright © 2013 www.secdatabase.com. All Rights Reserved.Please Consider the Environment Before Printing This Document
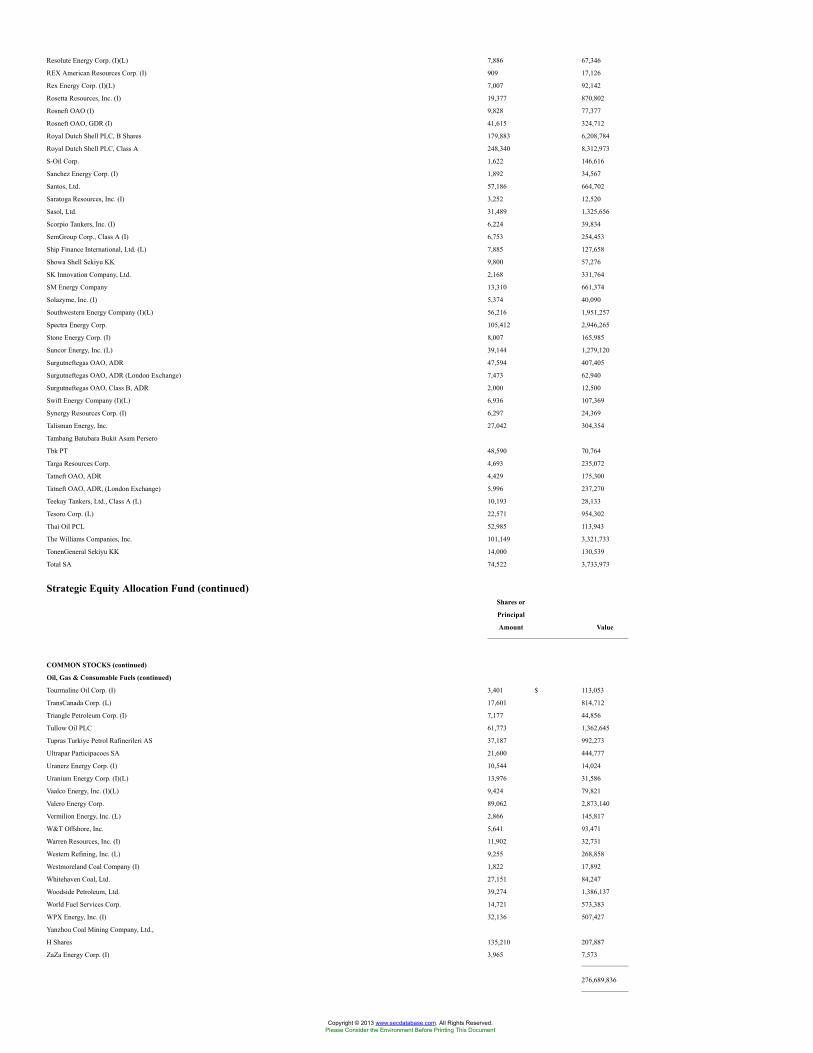
Resolute Energy Corp. (I)(L) 7,886 67,346
REX American Resources Corp. (I) 909 17,126
Rex Energy Corp. (I)(L) 7,007 92,142
Rosetta Resources, Inc. (I) 19,377 870,802
Rosneft OAO (I) 9,828 77,377
Rosneft OAO, GDR (I) 41,615 324,712
Royal Dutch Shell PLC, B Shares 179,883 6,208,784
Royal Dutch Shell PLC, Class A 248,340 8,312,973
S-Oil Corp. 1,622 146,616
Sanchez Energy Corp. (I) 1,892 34,567
Santos, Ltd. 57,186 664,702
Saratoga Resources, Inc. (I) 3,252 12,520
Sasol, Ltd. 31,489 1,325,656
Scorpio Tankers, Inc. (I) 6,224 39,834
SemGroup Corp., Class A (I) 6,753 254,453
Ship Finance International, Ltd. (L) 7,885 127,658
Showa Shell Sekiyu KK 9,800 57,276
SK Innovation Company, Ltd. 2,168 331,764
SM Energy Company 13,310 661,374
Solazyme, Inc. (I) 5,374 40,090
Southwestern Energy Company (I)(L) 56,216 1,951,257
Spectra Energy Corp. 105,412 2,946,265
Stone Energy Corp. (I) 8,007 165,985
Suncor Energy, Inc. (L) 39,144 1,279,120
Surgutneftegas OAO, ADR 47,594 407,405
Surgutneftegas OAO, ADR (London Exchange) 7,473 62,940
Surgutneftegas OAO, Class B, ADR 2,000 12,500
Swift Energy Company (I)(L) 6,936 107,369
Synergy Resources Corp. (I) 6,297 24,369
Talisman Energy, Inc. 27,042 304,354
Tambang Batubara Bukit Asam Persero
Tbk PT 48,590 70,764
Targa Resources Corp. 4,693 235,072
Tatneft OAO, ADR 4,429 175,300
Tatneft OAO, ADR, (London Exchange) 5,996 237,270
Teekay Tankers, Ltd., Class A (L) 10,193 28,133
Tesoro Corp. (L) 22,571 954,302
Thai Oil PCL 52,985 113,943
The Williams Companies, Inc. 101,149 3,321,733
TonenGeneral Sekiyu KK 14,000 130,539
Total SA 74,522 3,733,973
Strategic Equity Allocation Fund (continued)Shares or
Principal
Amount Value
COMMON STOCKS (continued)
Oil, Gas & Consumable Fuels (continued)
Tourmaline Oil Corp. (I) 3,401 $ 113,053
TransCanada Corp. (L) 17,601 814,712
Triangle Petroleum Corp. (I) 7,177 44,856
Tullow Oil PLC 61,773 1,362,645
Tupras Turkiye Petrol Rafinerileri AS 37,187 992,273
Ultrapar Participacoes SA 21,600 444,777
Uranerz Energy Corp. (I) 10,544 14,024
Uranium Energy Corp. (I)(L) 13,976 31,586
Vaalco Energy, Inc. (I)(L) 9,424 79,821
Valero Energy Corp. 89,062 2,873,140
Vermilion Energy, Inc. (L) 2,866 145,817
W&T Offshore, Inc. 5,641 93,471
Warren Resources, Inc. (I) 11,902 32,731
Western Refining, Inc. (L) 9,255 268,858
Westmoreland Coal Company (I) 1,822 17,892
Whitehaven Coal, Ltd. 27,151 84,247
Woodside Petroleum, Ltd. 39,274 1,386,137
World Fuel Services Corp. 14,721 573,383
WPX Energy, Inc. (I) 32,136 507,427
Yanzhou Coal Mining Company, Ltd.,
H Shares 135,210 207,887
ZaZa Energy Corp. (I) 3,965 7,573
276,689,836
Copyright © 2013 www.secdatabase.com. All Rights Reserved.Please Consider the Environment Before Printing This Document
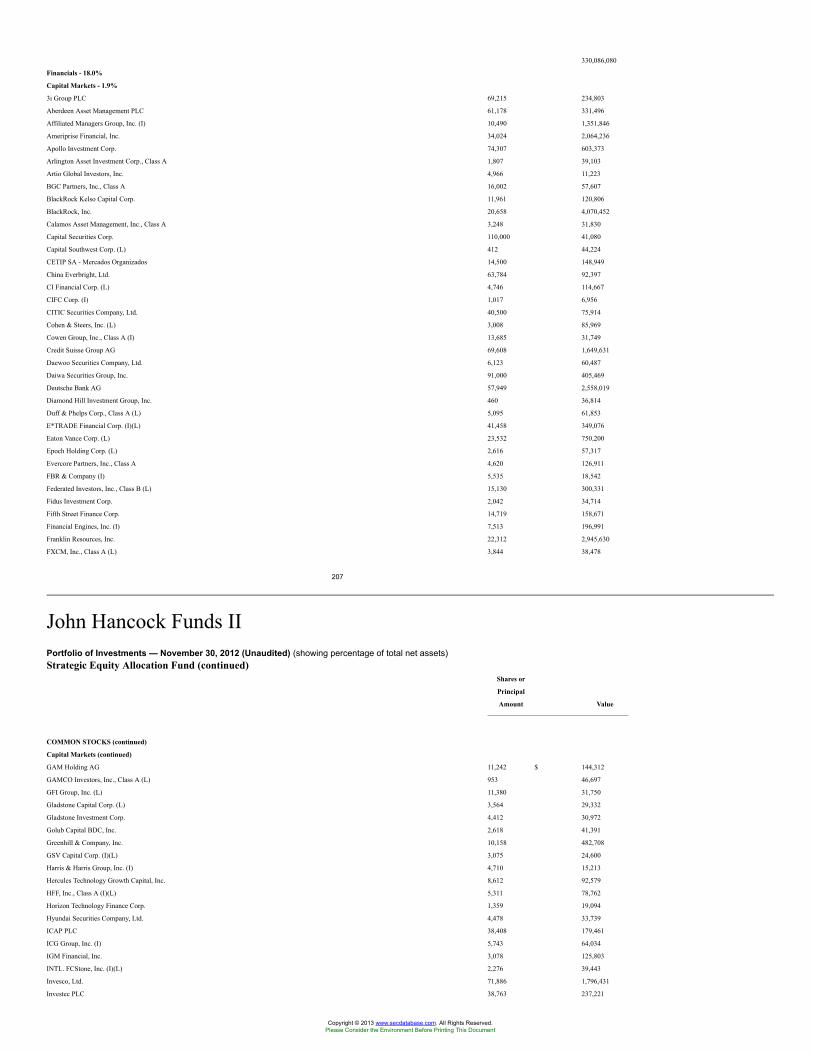
330,086,080
Financials - 18.0%
Capital Markets - 1.9%
3i Group PLC 69,215 234,803
Aberdeen Asset Management PLC 61,178 331,496
Affiliated Managers Group, Inc. (I) 10,490 1,351,846
Ameriprise Financial, Inc. 34,024 2,064,236
Apollo Investment Corp. 74,307 603,373
Arlington Asset Investment Corp., Class A 1,807 39,103
Artio Global Investors, Inc. 4,966 11,223
BGC Partners, Inc., Class A 16,002 57,607
BlackRock Kelso Capital Corp. 11,961 120,806
BlackRock, Inc. 20,658 4,070,452
Calamos Asset Management, Inc., Class A 3,248 31,830
Capital Securities Corp. 110,000 41,080
Capital Southwest Corp. (L) 412 44,224
CETIP SA - Mercados Organizados 14,500 148,949
China Everbright, Ltd. 63,784 92,397
CI Financial Corp. (L) 4,746 114,667
CIFC Corp. (I) 1,017 6,956
CITIC Securities Company, Ltd. 40,500 75,914
Cohen & Steers, Inc. (L) 3,008 85,969
Cowen Group, Inc., Class A (I) 13,685 31,749
Credit Suisse Group AG 69,608 1,649,631
Daewoo Securities Company, Ltd. 6,123 60,487
Daiwa Securities Group, Inc. 91,000 405,469
Deutsche Bank AG 57,949 2,558,019
Diamond Hill Investment Group, Inc. 460 36,814
Duff & Phelps Corp., Class A (L) 5,095 61,853
E*TRADE Financial Corp. (I)(L) 41,458 349,076
Eaton Vance Corp. (L) 23,532 750,200
Epoch Holding Corp. (L) 2,616 57,317
Evercore Partners, Inc., Class A 4,620 126,911
FBR & Company (I) 5,535 18,542
Federated Investors, Inc., Class B (L) 15,130 300,331
Fidus Investment Corp. 2,042 34,714
Fifth Street Finance Corp. 14,719 158,671
Financial Engines, Inc. (I) 7,513 196,991
Franklin Resources, Inc. 22,312 2,945,630
FXCM, Inc., Class A (L) 3,844 38,478
207
John Hancock Funds IIPortfolio of Investments — November 30, 2012 (Unaudited) (showing percentage of total net assets)Strategic Equity Allocation Fund (continued)
Shares or
Principal
Amount Value
COMMON STOCKS (continued)
Capital Markets (continued)
GAM Holding AG 11,242 $ 144,312
GAMCO Investors, Inc., Class A (L) 953 46,697
GFI Group, Inc. (L) 11,380 31,750
Gladstone Capital Corp. (L) 3,564 29,332
Gladstone Investment Corp. 4,412 30,972
Golub Capital BDC, Inc. 2,618 41,391
Greenhill & Company, Inc. 10,158 482,708
GSV Capital Corp. (I)(L) 3,075 24,600
Harris & Harris Group, Inc. (I) 4,710 15,213
Hercules Technology Growth Capital, Inc. 8,612 92,579
HFF, Inc., Class A (I)(L) 5,311 78,762
Horizon Technology Finance Corp. 1,359 19,094
Hyundai Securities Company, Ltd. 4,478 33,739
ICAP PLC 38,408 179,461
ICG Group, Inc. (I) 5,743 64,034
IGM Financial, Inc. 3,078 125,803
INTL. FCStone, Inc. (I)(L) 2,276 39,443
Invesco, Ltd. 71,886 1,796,431
Investec PLC 38,763 237,221
Copyright © 2013 www.secdatabase.com. All Rights Reserved.Please Consider the Environment Before Printing This Document
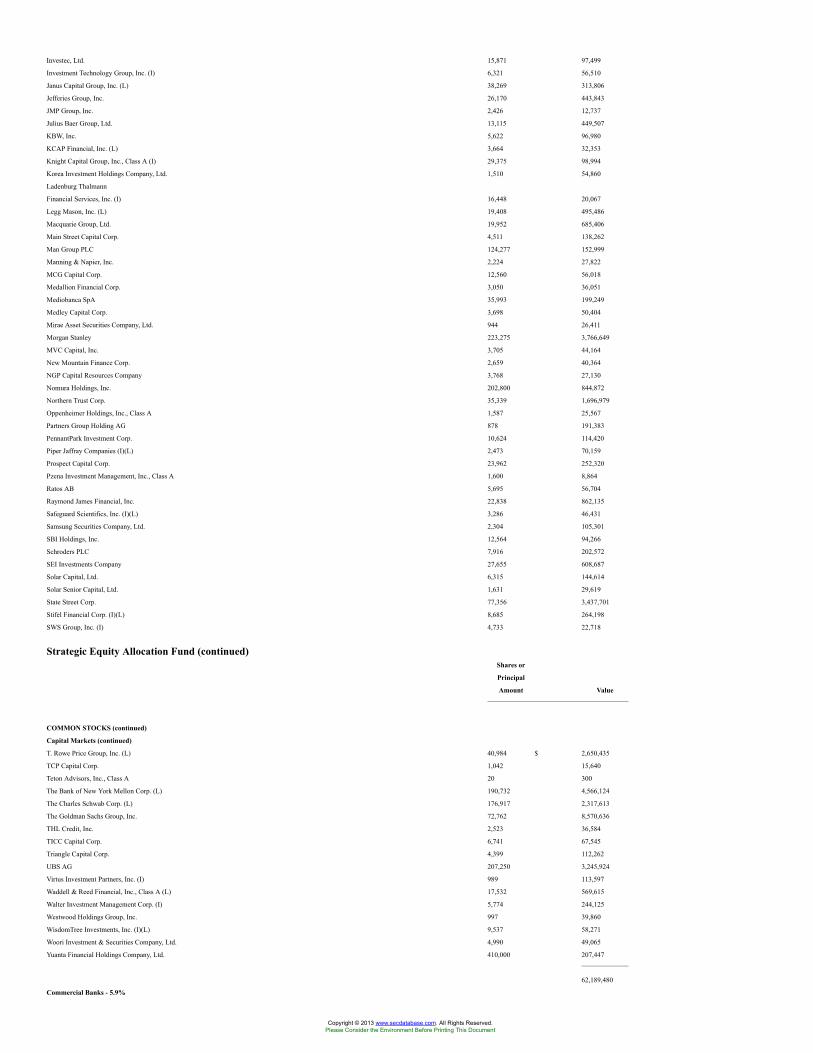
Investec, Ltd. 15,871 97,499
Investment Technology Group, Inc. (I) 6,321 56,510
Janus Capital Group, Inc. (L) 38,269 313,806
Jefferies Group, Inc. 26,170 443,843
JMP Group, Inc. 2,426 12,737
Julius Baer Group, Ltd. 13,115 449,507
KBW, Inc. 5,622 96,980
KCAP Financial, Inc. (L) 3,664 32,353
Knight Capital Group, Inc., Class A (I) 29,375 98,994
Korea Investment Holdings Company, Ltd. 1,510 54,860
Ladenburg Thalmann
Financial Services, Inc. (I) 16,448 20,067
Legg Mason, Inc. (L) 19,408 495,486
Macquarie Group, Ltd. 19,952 685,406
Main Street Capital Corp. 4,511 138,262
Man Group PLC 124,277 152,999
Manning & Napier, Inc. 2,224 27,822
MCG Capital Corp. 12,560 56,018
Medallion Financial Corp. 3,050 36,051
Mediobanca SpA 35,993 199,249
Medley Capital Corp. 3,698 50,404
Mirae Asset Securities Company, Ltd. 944 26,411
Morgan Stanley 223,275 3,766,649
MVC Capital, Inc. 3,705 44,164
New Mountain Finance Corp. 2,659 40,364
NGP Capital Resources Company 3,768 27,130
Nomura Holdings, Inc. 202,800 844,872
Northern Trust Corp. 35,339 1,696,979
Oppenheimer Holdings, Inc., Class A 1,587 25,567
Partners Group Holding AG 878 191,383
PennantPark Investment Corp. 10,624 114,420
Piper Jaffray Companies (I)(L) 2,473 70,159
Prospect Capital Corp. 23,962 252,320
Pzena Investment Management, Inc., Class A 1,600 8,864
Ratos AB 5,695 56,704
Raymond James Financial, Inc. 22,838 862,135
Safeguard Scientifics, Inc. (I)(L) 3,286 46,431
Samsung Securities Company, Ltd. 2,304 105,301
SBI Holdings, Inc. 12,564 94,266
Schroders PLC 7,916 202,572
SEI Investments Company 27,655 608,687
Solar Capital, Ltd. 6,315 144,614
Solar Senior Capital, Ltd. 1,631 29,619
State Street Corp. 77,356 3,437,701
Stifel Financial Corp. (I)(L) 8,685 264,198
SWS Group, Inc. (I) 4,733 22,718
Strategic Equity Allocation Fund (continued)Shares or
Principal
Amount Value
COMMON STOCKS (continued)
Capital Markets (continued)
T. Rowe Price Group, Inc. (L) 40,984 $ 2,650,435
TCP Capital Corp. 1,042 15,640
Teton Advisors, Inc., Class A 20 300
The Bank of New York Mellon Corp. (L) 190,732 4,566,124
The Charles Schwab Corp. (L) 176,917 2,317,613
The Goldman Sachs Group, Inc. 72,762 8,570,636
THL Credit, Inc. 2,523 36,584
TICC Capital Corp. 6,741 67,545
Triangle Capital Corp. 4,399 112,262
UBS AG 207,250 3,245,924
Virtus Investment Partners, Inc. (I) 989 113,597
Waddell & Reed Financial, Inc., Class A (L) 17,532 569,615
Walter Investment Management Corp. (I) 5,774 244,125
Westwood Holdings Group, Inc. 997 39,860
WisdomTree Investments, Inc. (I)(L) 9,537 58,271
Woori Investment & Securities Company, Ltd. 4,990 49,065
Yuanta Financial Holdings Company, Ltd. 410,000 207,447
62,189,480
Commercial Banks - 5.9%
Copyright © 2013 www.secdatabase.com. All Rights Reserved.Please Consider the Environment Before Printing This Document
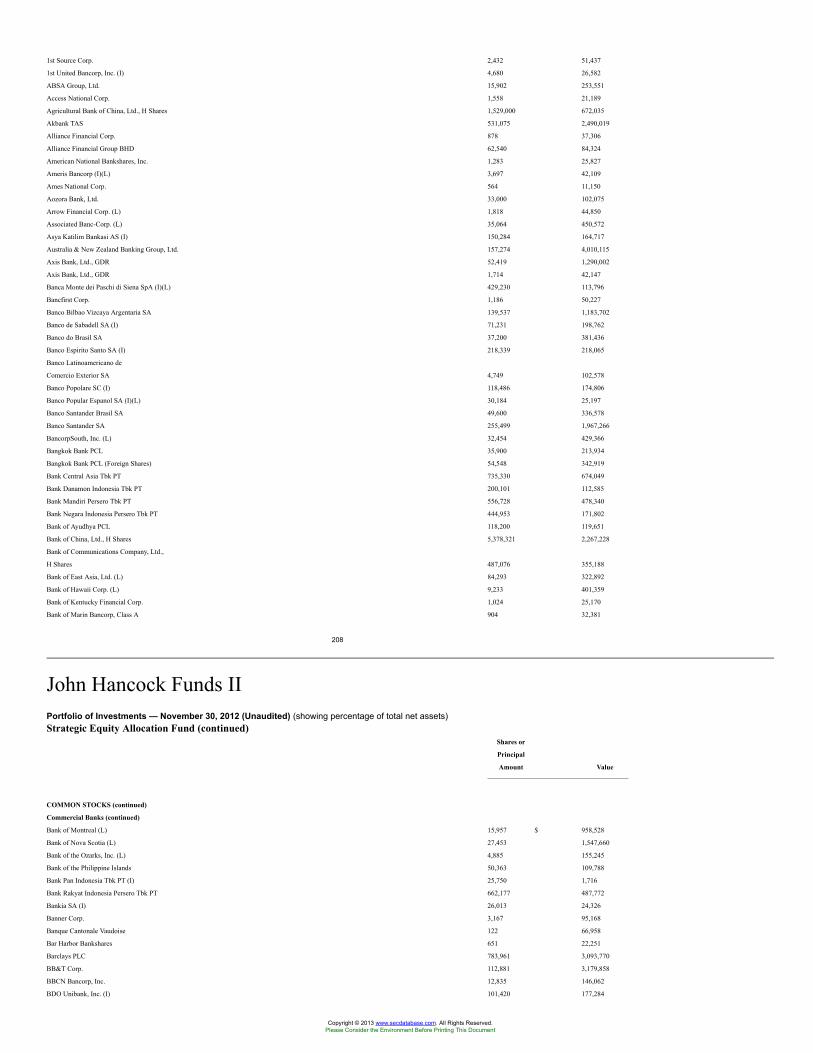
1st Source Corp. 2,432 51,437
1st United Bancorp, Inc. (I) 4,680 26,582
ABSA Group, Ltd. 15,902 253,551
Access National Corp. 1,558 21,189
Agricultural Bank of China, Ltd., H Shares 1,529,000 672,035
Akbank TAS 531,075 2,490,019
Alliance Financial Corp. 878 37,306
Alliance Financial Group BHD 62,540 84,324
American National Bankshares, Inc. 1,283 25,827
Ameris Bancorp (I)(L) 3,697 42,109
Ames National Corp. 564 11,150
Aozora Bank, Ltd. 33,000 102,075
Arrow Financial Corp. (L) 1,818 44,850
Associated Banc-Corp. (L) 35,064 450,572
Asya Katilim Bankasi AS (I) 150,284 164,717
Australia & New Zealand Banking Group, Ltd. 157,274 4,010,115
Axis Bank, Ltd., GDR 52,419 1,290,002
Axis Bank, Ltd., GDR 1,714 42,147
Banca Monte dei Paschi di Siena SpA (I)(L) 429,230 113,796
Bancfirst Corp. 1,186 50,227
Banco Bilbao Vizcaya Argentaria SA 139,537 1,183,702
Banco de Sabadell SA (I) 71,231 198,762
Banco do Brasil SA 37,200 381,436
Banco Espirito Santo SA (I) 218,339 218,065
Banco Latinoamericano de
Comercio Exterior SA 4,749 102,578
Banco Popolare SC (I) 118,486 174,806
Banco Popular Espanol SA (I)(L) 30,184 25,197
Banco Santander Brasil SA 49,600 336,578
Banco Santander SA 255,499 1,967,266
BancorpSouth, Inc. (L) 32,454 429,366
Bangkok Bank PCL 35,900 213,934
Bangkok Bank PCL (Foreign Shares) 54,548 342,919
Bank Central Asia Tbk PT 735,330 674,049
Bank Danamon Indonesia Tbk PT 200,101 112,585
Bank Mandiri Persero Tbk PT 556,728 478,340
Bank Negara Indonesia Persero Tbk PT 444,953 171,802
Bank of Ayudhya PCL 118,200 119,651
Bank of China, Ltd., H Shares 5,378,321 2,267,228
Bank of Communications Company, Ltd.,
H Shares 487,076 355,188
Bank of East Asia, Ltd. (L) 84,293 322,892
Bank of Hawaii Corp. (L) 9,233 401,359
Bank of Kentucky Financial Corp. 1,024 25,170
Bank of Marin Bancorp, Class A 904 32,381
208
John Hancock Funds IIPortfolio of Investments — November 30, 2012 (Unaudited) (showing percentage of total net assets)Strategic Equity Allocation Fund (continued)
Shares or
Principal
Amount Value
COMMON STOCKS (continued)
Commercial Banks (continued)
Bank of Montreal (L) 15,957 $ 958,528
Bank of Nova Scotia (L) 27,453 1,547,660
Bank of the Ozarks, Inc. (L) 4,885 155,245
Bank of the Philippine Islands 50,363 109,788
Bank Pan Indonesia Tbk PT (I) 25,750 1,716
Bank Rakyat Indonesia Persero Tbk PT 662,177 487,772
Bankia SA (I) 26,013 24,326
Banner Corp. 3,167 95,168
Banque Cantonale Vaudoise 122 66,958
Bar Harbor Bankshares 651 22,251
Barclays PLC 783,961 3,093,770
BB&T Corp. 112,881 3,179,858
BBCN Bancorp, Inc. 12,835 146,062
BDO Unibank, Inc. (I) 101,420 177,284
Copyright © 2013 www.secdatabase.com. All Rights Reserved.Please Consider the Environment Before Printing This Document
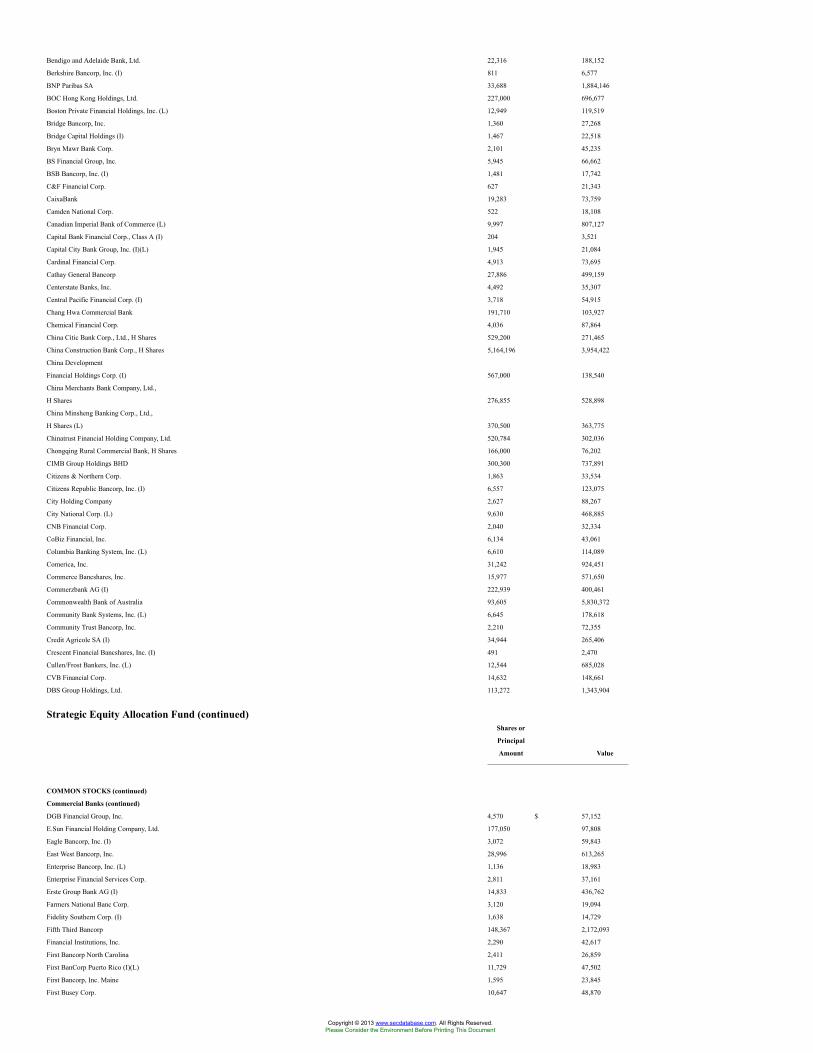
Bendigo and Adelaide Bank, Ltd. 22,316 188,152
Berkshire Bancorp, Inc. (I) 811 6,577
BNP Paribas SA 33,688 1,884,146
BOC Hong Kong Holdings, Ltd. 227,000 696,677
Boston Private Financial Holdings, Inc. (L) 12,949 119,519
Bridge Bancorp, Inc. 1,360 27,268
Bridge Capital Holdings (I) 1,467 22,518
Bryn Mawr Bank Corp. 2,101 45,235
BS Financial Group, Inc. 5,945 66,662
BSB Bancorp, Inc. (I) 1,481 17,742
C&F Financial Corp. 627 21,343
CaixaBank 19,283 73,759
Camden National Corp. 522 18,108
Canadian Imperial Bank of Commerce (L) 9,997 807,127
Capital Bank Financial Corp., Class A (I) 204 3,521
Capital City Bank Group, Inc. (I)(L) 1,945 21,084
Cardinal Financial Corp. 4,913 73,695
Cathay General Bancorp 27,886 499,159
Centerstate Banks, Inc. 4,492 35,307
Central Pacific Financial Corp. (I) 3,718 54,915
Chang Hwa Commercial Bank 191,710 103,927
Chemical Financial Corp. 4,036 87,864
China Citic Bank Corp., Ltd., H Shares 529,200 271,465
China Construction Bank Corp., H Shares 5,164,196 3,954,422
China Development
Financial Holdings Corp. (I) 567,000 138,540
China Merchants Bank Company, Ltd.,
H Shares 276,855 528,898
China Minsheng Banking Corp., Ltd.,
H Shares (L) 370,500 363,775
Chinatrust Financial Holding Company, Ltd. 520,784 302,036
Chongqing Rural Commercial Bank, H Shares 166,000 76,202
CIMB Group Holdings BHD 300,300 737,891
Citizens & Northern Corp. 1,863 33,534
Citizens Republic Bancorp, Inc. (I) 6,557 123,075
City Holding Company 2,627 88,267
City National Corp. (L) 9,630 468,885
CNB Financial Corp. 2,040 32,334
CoBiz Financial, Inc. 6,134 43,061
Columbia Banking System, Inc. (L) 6,610 114,089
Comerica, Inc. 31,242 924,451
Commerce Bancshares, Inc. 15,977 571,650
Commerzbank AG (I) 222,939 400,461
Commonwealth Bank of Australia 93,605 5,830,372
Community Bank Systems, Inc. (L) 6,645 178,618
Community Trust Bancorp, Inc. 2,210 72,355
Credit Agricole SA (I) 34,944 265,406
Crescent Financial Bancshares, Inc. (I) 491 2,470
Cullen/Frost Bankers, Inc. (L) 12,544 685,028
CVB Financial Corp. 14,632 148,661
DBS Group Holdings, Ltd. 113,272 1,343,904
Strategic Equity Allocation Fund (continued)Shares or
Principal
Amount Value
COMMON STOCKS (continued)
Commercial Banks (continued)
DGB Financial Group, Inc. 4,570 $ 57,152
E.Sun Financial Holding Company, Ltd. 177,050 97,808
Eagle Bancorp, Inc. (I) 3,072 59,843
East West Bancorp, Inc. 28,996 613,265
Enterprise Bancorp, Inc. (L) 1,136 18,983
Enterprise Financial Services Corp. 2,811 37,161
Erste Group Bank AG (I) 14,833 436,762
Farmers National Banc Corp. 3,120 19,094
Fidelity Southern Corp. (I) 1,638 14,729
Fifth Third Bancorp 148,367 2,172,093
Financial Institutions, Inc. 2,290 42,617
First Bancorp North Carolina 2,411 26,859
First BanCorp Puerto Rico (I)(L) 11,729 47,502
First Bancorp, Inc. Maine 1,595 23,845
First Busey Corp. 10,647 48,870
Copyright © 2013 www.secdatabase.com. All Rights Reserved.Please Consider the Environment Before Printing This Document
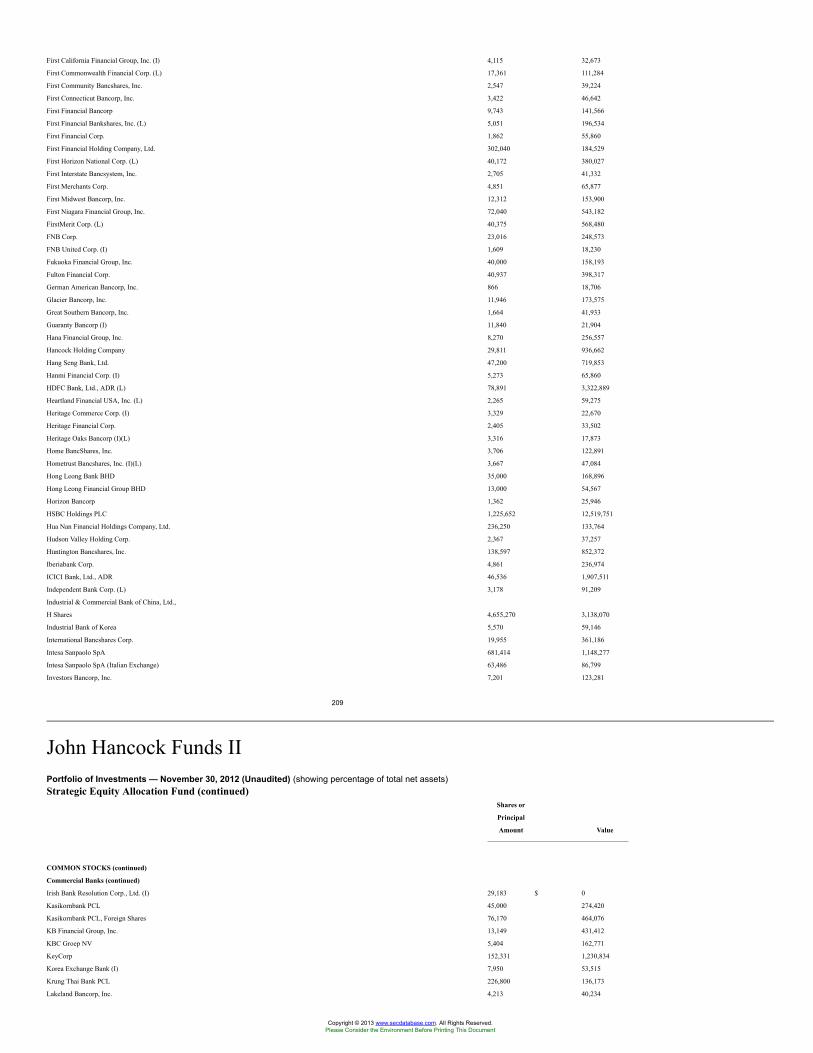
First California Financial Group, Inc. (I) 4,115 32,673
First Commonwealth Financial Corp. (L) 17,361 111,284
First Community Bancshares, Inc. 2,547 39,224
First Connecticut Bancorp, Inc. 3,422 46,642
First Financial Bancorp 9,743 141,566
First Financial Bankshares, Inc. (L) 5,051 196,534
First Financial Corp. 1,862 55,860
First Financial Holding Company, Ltd. 302,040 184,529
First Horizon National Corp. (L) 40,172 380,027
First Interstate Bancsystem, Inc. 2,705 41,332
First Merchants Corp. 4,851 65,877
First Midwest Bancorp, Inc. 12,312 153,900
First Niagara Financial Group, Inc. 72,040 543,182
FirstMerit Corp. (L) 40,375 568,480
FNB Corp. 23,016 248,573
FNB United Corp. (I) 1,609 18,230
Fukuoka Financial Group, Inc. 40,000 158,193
Fulton Financial Corp. 40,937 398,317
German American Bancorp, Inc. 866 18,706
Glacier Bancorp, Inc. 11,946 173,575
Great Southern Bancorp, Inc. 1,664 41,933
Guaranty Bancorp (I) 11,840 21,904
Hana Financial Group, Inc. 8,270 256,557
Hancock Holding Company 29,811 936,662
Hang Seng Bank, Ltd. 47,200 719,853
Hanmi Financial Corp. (I) 5,273 65,860
HDFC Bank, Ltd., ADR (L) 78,891 3,322,889
Heartland Financial USA, Inc. (L) 2,265 59,275
Heritage Commerce Corp. (I) 3,329 22,670
Heritage Financial Corp. 2,405 33,502
Heritage Oaks Bancorp (I)(L) 3,316 17,873
Home BancShares, Inc. 3,706 122,891
Hometrust Bancshares, Inc. (I)(L) 3,667 47,084
Hong Leong Bank BHD 35,000 168,896
Hong Leong Financial Group BHD 13,000 54,567
Horizon Bancorp 1,362 25,946
HSBC Holdings PLC 1,225,652 12,519,751
Hua Nan Financial Holdings Company, Ltd. 236,250 133,764
Hudson Valley Holding Corp. 2,367 37,257
Huntington Bancshares, Inc. 138,597 852,372
Iberiabank Corp. 4,861 236,974
ICICI Bank, Ltd., ADR 46,536 1,907,511
Independent Bank Corp. (L) 3,178 91,209
Industrial & Commercial Bank of China, Ltd.,
H Shares 4,655,270 3,138,070
Industrial Bank of Korea 5,570 59,146
International Bancshares Corp. 19,955 361,186
Intesa Sanpaolo SpA 681,414 1,148,277
Intesa Sanpaolo SpA (Italian Exchange) 63,486 86,799
Investors Bancorp, Inc. 7,201 123,281
209
John Hancock Funds IIPortfolio of Investments — November 30, 2012 (Unaudited) (showing percentage of total net assets)Strategic Equity Allocation Fund (continued)
Shares or
Principal
Amount Value
COMMON STOCKS (continued)
Commercial Banks (continued)
Irish Bank Resolution Corp., Ltd. (I) 29,183 $ 0
Kasikornbank PCL 45,000 274,420
Kasikornbank PCL, Foreign Shares 76,170 464,076
KB Financial Group, Inc. 13,149 431,412
KBC Groep NV 5,404 162,771
KeyCorp 152,331 1,230,834
Korea Exchange Bank (I) 7,950 53,515
Krung Thai Bank PCL 226,800 136,173
Lakeland Bancorp, Inc. 4,213 40,234
Copyright © 2013 www.secdatabase.com. All Rights Reserved.Please Consider the Environment Before Printing This Document
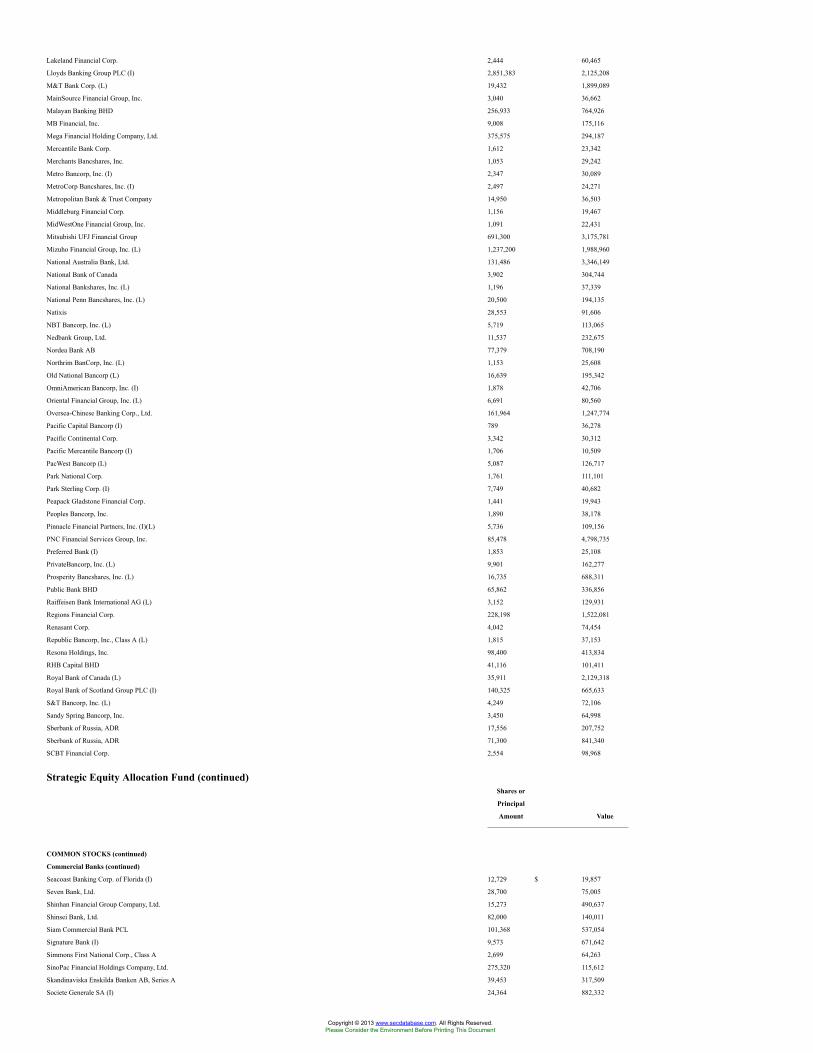
Lakeland Financial Corp. 2,444 60,465
Lloyds Banking Group PLC (I) 2,851,383 2,125,208
M&T Bank Corp. (L) 19,432 1,899,089
MainSource Financial Group, Inc. 3,040 36,662
Malayan Banking BHD 256,933 764,926
MB Financial, Inc. 9,008 175,116
Mega Financial Holding Company, Ltd. 375,575 294,187
Mercantile Bank Corp. 1,612 23,342
Merchants Bancshares, Inc. 1,053 29,242
Metro Bancorp, Inc. (I) 2,347 30,089
MetroCorp Bancshares, Inc. (I) 2,497 24,271
Metropolitan Bank & Trust Company 14,950 36,503
Middleburg Financial Corp. 1,156 19,467
MidWestOne Financial Group, Inc. 1,091 22,431
Mitsubishi UFJ Financial Group 691,300 3,175,781
Mizuho Financial Group, Inc. (L) 1,237,200 1,988,960
National Australia Bank, Ltd. 131,486 3,346,149
National Bank of Canada 3,902 304,744
National Bankshares, Inc. (L) 1,196 37,339
National Penn Bancshares, Inc. (L) 20,500 194,135
Natixis 28,553 91,606
NBT Bancorp, Inc. (L) 5,719 113,065
Nedbank Group, Ltd. 11,537 232,675
Nordea Bank AB 77,379 708,190
Northrim BanCorp, Inc. (L) 1,153 25,608
Old National Bancorp (L) 16,639 195,342
OmniAmerican Bancorp, Inc. (I) 1,878 42,706
Oriental Financial Group, Inc. (L) 6,691 80,560
Oversea-Chinese Banking Corp., Ltd. 161,964 1,247,774
Pacific Capital Bancorp (I) 789 36,278
Pacific Continental Corp. 3,342 30,312
Pacific Mercantile Bancorp (I) 1,706 10,509
PacWest Bancorp (L) 5,087 126,717
Park National Corp. 1,761 111,101
Park Sterling Corp. (I) 7,749 40,682
Peapack Gladstone Financial Corp. 1,441 19,943
Peoples Bancorp, Inc. 1,890 38,178
Pinnacle Financial Partners, Inc. (I)(L) 5,736 109,156
PNC Financial Services Group, Inc. 85,478 4,798,735
Preferred Bank (I) 1,853 25,108
PrivateBancorp, Inc. (L) 9,901 162,277
Prosperity Bancshares, Inc. (L) 16,735 688,311
Public Bank BHD 65,862 336,856
Raiffeisen Bank International AG (L) 3,152 129,931
Regions Financial Corp. 228,198 1,522,081
Renasant Corp. 4,042 74,454
Republic Bancorp, Inc., Class A (L) 1,815 37,153
Resona Holdings, Inc. 98,400 413,834
RHB Capital BHD 41,116 101,411
Royal Bank of Canada (L) 35,911 2,129,318
Royal Bank of Scotland Group PLC (I) 140,325 665,633
S&T Bancorp, Inc. (L) 4,249 72,106
Sandy Spring Bancorp, Inc. 3,450 64,998
Sberbank of Russia, ADR 17,556 207,752
Sberbank of Russia, ADR 71,300 841,340
SCBT Financial Corp. 2,554 98,968
Strategic Equity Allocation Fund (continued)Shares or
Principal
Amount Value
COMMON STOCKS (continued)
Commercial Banks (continued)
Seacoast Banking Corp. of Florida (I) 12,729 $ 19,857
Seven Bank, Ltd. 28,700 75,005
Shinhan Financial Group Company, Ltd. 15,273 490,637
Shinsei Bank, Ltd. 82,000 140,011
Siam Commercial Bank PCL 101,368 537,054
Signature Bank (I) 9,573 671,642
Simmons First National Corp., Class A 2,699 64,263
SinoPac Financial Holdings Company, Ltd. 275,320 115,612
Skandinaviska Enskilda Banken AB, Series A 39,453 317,509
Societe Generale SA (I) 24,364 882,332
Copyright © 2013 www.secdatabase.com. All Rights Reserved.Please Consider the Environment Before Printing This Document
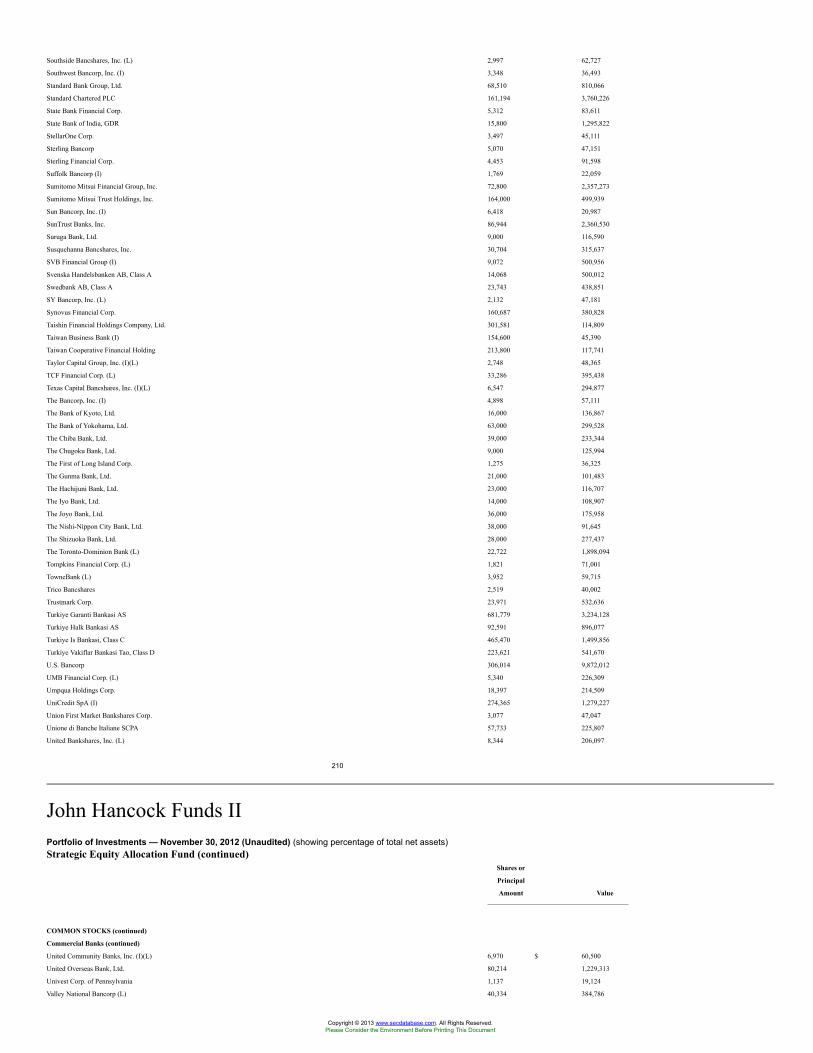
Southside Bancshares, Inc. (L) 2,997 62,727
Southwest Bancorp, Inc. (I) 3,348 36,493
Standard Bank Group, Ltd. 68,510 810,066
Standard Chartered PLC 161,194 3,760,226
State Bank Financial Corp. 5,312 83,611
State Bank of India, GDR 15,800 1,295,822
StellarOne Corp. 3,497 45,111
Sterling Bancorp 5,070 47,151
Sterling Financial Corp. 4,453 91,598
Suffolk Bancorp (I) 1,769 22,059
Sumitomo Mitsui Financial Group, Inc. 72,800 2,357,273
Sumitomo Mitsui Trust Holdings, Inc. 164,000 499,939
Sun Bancorp, Inc. (I) 6,418 20,987
SunTrust Banks, Inc. 86,944 2,360,530
Suruga Bank, Ltd. 9,000 116,590
Susquehanna Bancshares, Inc. 30,704 315,637
SVB Financial Group (I) 9,072 500,956
Svenska Handelsbanken AB, Class A 14,068 500,012
Swedbank AB, Class A 23,743 438,851
SY Bancorp, Inc. (L) 2,132 47,181
Synovus Financial Corp. 160,687 380,828
Taishin Financial Holdings Company, Ltd. 301,581 114,809
Taiwan Business Bank (I) 154,600 45,390
Taiwan Cooperative Financial Holding 213,800 117,741
Taylor Capital Group, Inc. (I)(L) 2,748 48,365
TCF Financial Corp. (L) 33,286 395,438
Texas Capital Bancshares, Inc. (I)(L) 6,547 294,877
The Bancorp, Inc. (I) 4,898 57,111
The Bank of Kyoto, Ltd. 16,000 136,867
The Bank of Yokohama, Ltd. 63,000 299,528
The Chiba Bank, Ltd. 39,000 233,344
The Chugoku Bank, Ltd. 9,000 125,994
The First of Long Island Corp. 1,275 36,325
The Gunma Bank, Ltd. 21,000 101,483
The Hachijuni Bank, Ltd. 23,000 116,707
The Iyo Bank, Ltd. 14,000 108,907
The Joyo Bank, Ltd. 36,000 175,958
The Nishi-Nippon City Bank, Ltd. 38,000 91,645
The Shizuoka Bank, Ltd. 28,000 277,437
The Toronto-Dominion Bank (L) 22,722 1,898,094
Tompkins Financial Corp. (L) 1,821 71,001
TowneBank (L) 3,952 59,715
Trico Bancshares 2,519 40,002
Trustmark Corp. 23,971 532,636
Turkiye Garanti Bankasi AS 681,779 3,234,128
Turkiye Halk Bankasi AS 92,591 896,077
Turkiye Is Bankasi, Class C 465,470 1,499,856
Turkiye Vakiflar Bankasi Tao, Class D 223,621 541,670
U.S. Bancorp 306,014 9,872,012
UMB Financial Corp. (L) 5,340 226,309
Umpqua Holdings Corp. 18,397 214,509
UniCredit SpA (I) 274,365 1,279,227
Union First Market Bankshares Corp. 3,077 47,047
Unione di Banche Italiane SCPA 57,733 225,807
United Bankshares, Inc. (L) 8,344 206,097
210
John Hancock Funds IIPortfolio of Investments — November 30, 2012 (Unaudited) (showing percentage of total net assets)Strategic Equity Allocation Fund (continued)
Shares or
Principal
Amount Value
COMMON STOCKS (continued)
Commercial Banks (continued)
United Community Banks, Inc. (I)(L) 6,970 $ 60,500
United Overseas Bank, Ltd. 80,214 1,229,313
Univest Corp. of Pennsylvania 1,137 19,124
Valley National Bancorp (L) 40,334 384,786
Copyright © 2013 www.secdatabase.com. All Rights Reserved.Please Consider the Environment Before Printing This Document
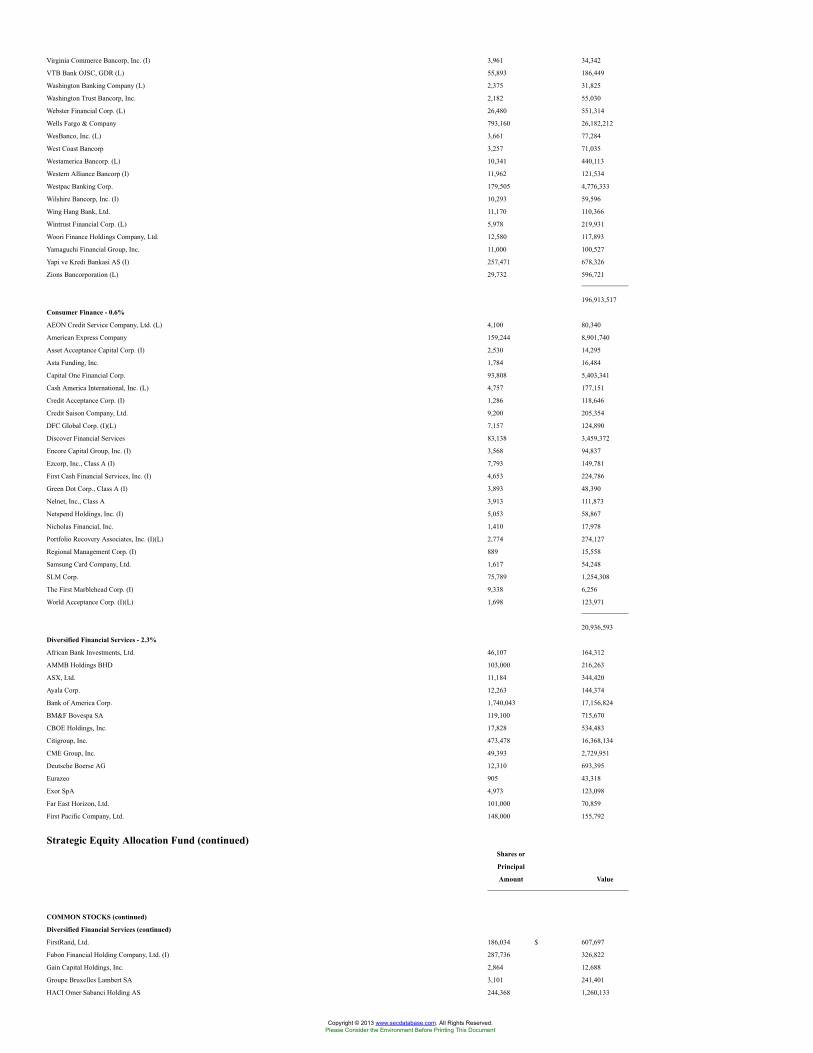
Virginia Commerce Bancorp, Inc. (I) 3,961 34,342
VTB Bank OJSC, GDR (L) 55,893 186,449
Washington Banking Company (L) 2,375 31,825
Washington Trust Bancorp, Inc. 2,182 55,030
Webster Financial Corp. (L) 26,480 551,314
Wells Fargo & Company 793,160 26,182,212
WesBanco, Inc. (L) 3,661 77,284
West Coast Bancorp 3,257 71,035
Westamerica Bancorp. (L) 10,341 440,113
Western Alliance Bancorp (I) 11,962 121,534
Westpac Banking Corp. 179,505 4,776,333
Wilshire Bancorp, Inc. (I) 10,293 59,596
Wing Hang Bank, Ltd. 11,170 110,366
Wintrust Financial Corp. (L) 5,978 219,931
Woori Finance Holdings Company, Ltd. 12,580 117,893
Yamaguchi Financial Group, Inc. 11,000 100,527
Yapi ve Kredi Bankasi AS (I) 257,471 678,326
Zions Bancorporation (L) 29,732 596,721
196,913,517
Consumer Finance - 0.6%
AEON Credit Service Company, Ltd. (L) 4,100 80,340
American Express Company 159,244 8,901,740
Asset Acceptance Capital Corp. (I) 2,530 14,295
Asta Funding, Inc. 1,784 16,484
Capital One Financial Corp. 93,808 5,403,341
Cash America International, Inc. (L) 4,757 177,151
Credit Acceptance Corp. (I) 1,286 118,646
Credit Saison Company, Ltd. 9,200 205,354
DFC Global Corp. (I)(L) 7,157 124,890
Discover Financial Services 83,138 3,459,372
Encore Capital Group, Inc. (I) 3,568 94,837
Ezcorp, Inc., Class A (I) 7,793 149,781
First Cash Financial Services, Inc. (I) 4,653 224,786
Green Dot Corp., Class A (I) 3,893 48,390
Nelnet, Inc., Class A 3,913 111,873
Netspend Holdings, Inc. (I) 5,053 58,867
Nicholas Financial, Inc. 1,410 17,978
Portfolio Recovery Associates, Inc. (I)(L) 2,774 274,127
Regional Management Corp. (I) 889 15,558
Samsung Card Company, Ltd. 1,617 54,248
SLM Corp. 75,789 1,254,308
The First Marblehead Corp. (I) 9,338 6,256
World Acceptance Corp. (I)(L) 1,698 123,971
20,936,593
Diversified Financial Services - 2.3%
African Bank Investments, Ltd. 46,107 164,312
AMMB Holdings BHD 103,000 216,263
ASX, Ltd. 11,184 344,420
Ayala Corp. 12,263 144,374
Bank of America Corp. 1,740,043 17,156,824
BM&F Bovespa SA 119,100 715,670
CBOE Holdings, Inc. 17,828 534,483
Citigroup, Inc. 473,478 16,368,134
CME Group, Inc. 49,393 2,729,951
Deutsche Boerse AG 12,310 693,395
Eurazeo 905 43,318
Exor SpA 4,973 123,098
Far East Horizon, Ltd. 101,000 70,859
First Pacific Company, Ltd. 148,000 155,792
Strategic Equity Allocation Fund (continued)Shares or
Principal
Amount Value
COMMON STOCKS (continued)
Diversified Financial Services (continued)
FirstRand, Ltd. 186,034 $ 607,697
Fubon Financial Holding Company, Ltd. (I) 287,736 326,822
Gain Capital Holdings, Inc. 2,864 12,688
Groupe Bruxelles Lambert SA 3,101 241,401
HACI Omer Sabanci Holding AS 244,368 1,260,133
Copyright © 2013 www.secdatabase.com. All Rights Reserved.Please Consider the Environment Before Printing This Document
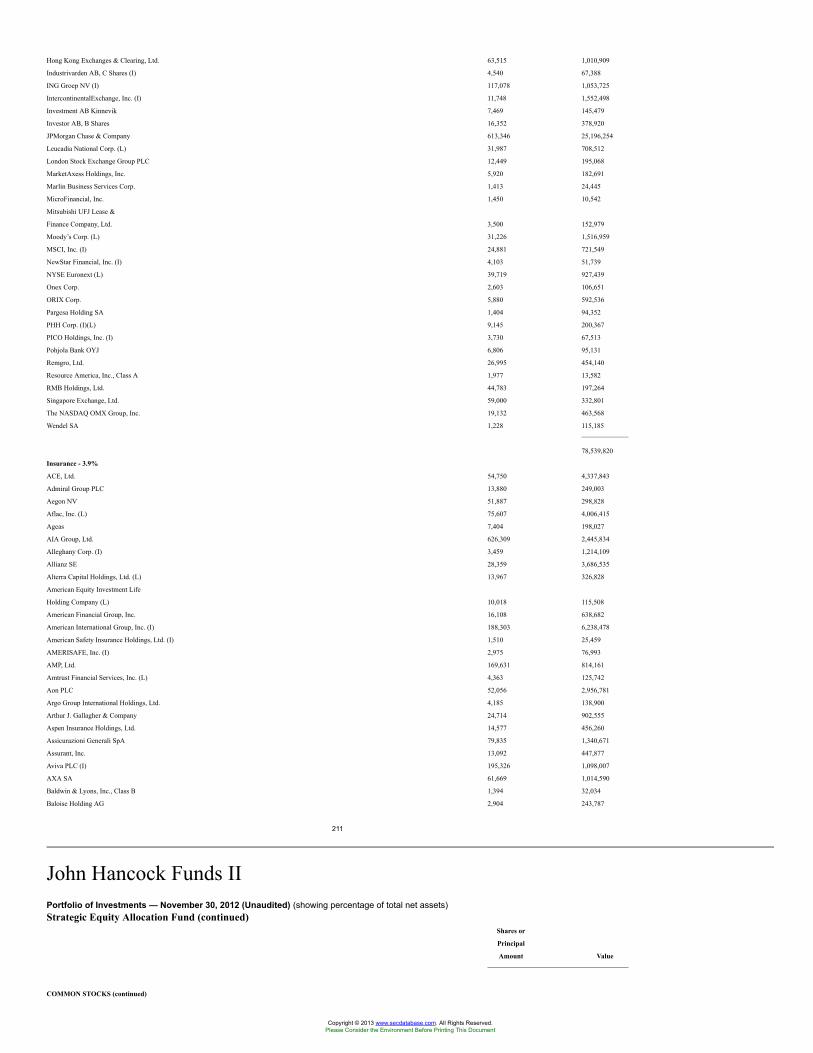
Hong Kong Exchanges & Clearing, Ltd. 63,515 1,010,909
Industrivarden AB, C Shares (I) 4,540 67,388
ING Groep NV (I) 117,078 1,053,725
IntercontinentalExchange, Inc. (I) 11,748 1,552,498
Investment AB Kinnevik 7,469 145,479
Investor AB, B Shares 16,352 378,920
JPMorgan Chase & Company 613,346 25,196,254
Leucadia National Corp. (L) 31,987 708,512
London Stock Exchange Group PLC 12,449 195,068
MarketAxess Holdings, Inc. 5,920 182,691
Marlin Business Services Corp. 1,413 24,445
MicroFinancial, Inc. 1,450 10,542
Mitsubishi UFJ Lease &
Finance Company, Ltd. 3,500 152,979
Moody’s Corp. (L) 31,226 1,516,959
MSCI, Inc. (I) 24,881 721,549
NewStar Financial, Inc. (I) 4,103 51,739
NYSE Euronext (L) 39,719 927,439
Onex Corp. 2,603 106,651
ORIX Corp. 5,880 592,536
Pargesa Holding SA 1,404 94,352
PHH Corp. (I)(L) 9,145 200,367
PICO Holdings, Inc. (I) 3,730 67,513
Pohjola Bank OYJ 6,806 95,131
Remgro, Ltd. 26,995 454,140
Resource America, Inc., Class A 1,977 13,582
RMB Holdings, Ltd. 44,783 197,264
Singapore Exchange, Ltd. 59,000 332,801
The NASDAQ OMX Group, Inc. 19,132 463,568
Wendel SA 1,228 115,185
78,539,820
Insurance - 3.9%
ACE, Ltd. 54,750 4,337,843
Admiral Group PLC 13,880 249,003
Aegon NV 51,887 298,828
Aflac, Inc. (L) 75,607 4,006,415
Ageas 7,404 198,027
AIA Group, Ltd. 626,309 2,445,834
Alleghany Corp. (I) 3,459 1,214,109
Allianz SE 28,359 3,686,535
Alterra Capital Holdings, Ltd. (L) 13,967 326,828
American Equity Investment Life
Holding Company (L) 10,018 115,508
American Financial Group, Inc. 16,108 638,682
American International Group, Inc. (I) 188,303 6,238,478
American Safety Insurance Holdings, Ltd. (I) 1,510 25,459
AMERISAFE, Inc. (I) 2,975 76,993
AMP, Ltd. 169,631 814,161
Amtrust Financial Services, Inc. (L) 4,363 125,742
Aon PLC 52,056 2,956,781
Argo Group International Holdings, Ltd. 4,185 138,900
Arthur J. Gallagher & Company 24,714 902,555
Aspen Insurance Holdings, Ltd. 14,577 456,260
Assicurazioni Generali SpA 79,835 1,340,671
Assurant, Inc. 13,092 447,877
Aviva PLC (I) 195,326 1,098,007
AXA SA 61,669 1,014,590
Baldwin & Lyons, Inc., Class B 1,394 32,034
Baloise Holding AG 2,904 243,787
211
John Hancock Funds IIPortfolio of Investments — November 30, 2012 (Unaudited) (showing percentage of total net assets)Strategic Equity Allocation Fund (continued)
Shares or
Principal
Amount Value
COMMON STOCKS (continued)
Copyright © 2013 www.secdatabase.com. All Rights Reserved.Please Consider the Environment Before Printing This Document
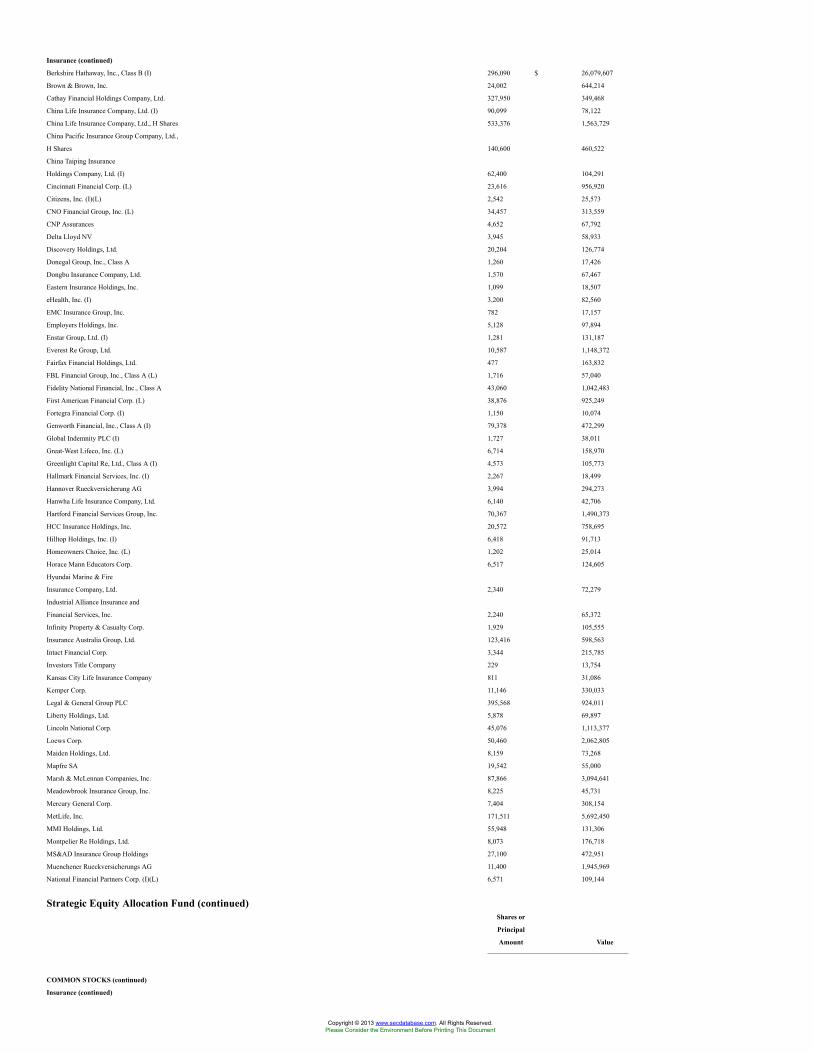
Insurance (continued)
Berkshire Hathaway, Inc., Class B (I) 296,090 $ 26,079,607
Brown & Brown, Inc. 24,002 644,214
Cathay Financial Holdings Company, Ltd. 327,950 349,468
China Life Insurance Company, Ltd. (I) 90,099 78,122
China Life Insurance Company, Ltd., H Shares 533,376 1,563,729
China Pacific Insurance Group Company, Ltd.,
H Shares 140,600 460,522
China Taiping Insurance
Holdings Company, Ltd. (I) 62,400 104,291
Cincinnati Financial Corp. (L) 23,616 956,920
Citizens, Inc. (I)(L) 2,542 25,573
CNO Financial Group, Inc. (L) 34,457 313,559
CNP Assurances 4,652 67,792
Delta Lloyd NV 3,945 58,933
Discovery Holdings, Ltd. 20,204 126,774
Donegal Group, Inc., Class A 1,260 17,426
Dongbu Insurance Company, Ltd. 1,570 67,467
Eastern Insurance Holdings, Inc. 1,099 18,507
eHealth, Inc. (I) 3,200 82,560
EMC Insurance Group, Inc. 782 17,157
Employers Holdings, Inc. 5,128 97,894
Enstar Group, Ltd. (I) 1,281 131,187
Everest Re Group, Ltd. 10,587 1,148,372
Fairfax Financial Holdings, Ltd. 477 163,832
FBL Financial Group, Inc., Class A (L) 1,716 57,040
Fidelity National Financial, Inc., Class A 43,060 1,042,483
First American Financial Corp. (L) 38,876 925,249
Fortegra Financial Corp. (I) 1,150 10,074
Genworth Financial, Inc., Class A (I) 79,378 472,299
Global Indemnity PLC (I) 1,727 38,011
Great-West Lifeco, Inc. (L) 6,714 158,970
Greenlight Capital Re, Ltd., Class A (I) 4,573 105,773
Hallmark Financial Services, Inc. (I) 2,267 18,499
Hannover Rueckversicherung AG 3,994 294,273
Hanwha Life Insurance Company, Ltd. 6,140 42,706
Hartford Financial Services Group, Inc. 70,367 1,490,373
HCC Insurance Holdings, Inc. 20,572 758,695
Hilltop Holdings, Inc. (I) 6,418 91,713
Homeowners Choice, Inc. (L) 1,202 25,014
Horace Mann Educators Corp. 6,517 124,605
Hyundai Marine & Fire
Insurance Company, Ltd. 2,340 72,279
Industrial Alliance Insurance and
Financial Services, Inc. 2,240 65,372
Infinity Property & Casualty Corp. 1,929 105,555
Insurance Australia Group, Ltd. 123,416 598,563
Intact Financial Corp. 3,344 215,785
Investors Title Company 229 13,754
Kansas City Life Insurance Company 811 31,086
Kemper Corp. 11,146 330,033
Legal & General Group PLC 395,568 924,011
Liberty Holdings, Ltd. 5,878 69,897
Lincoln National Corp. 45,076 1,113,377
Loews Corp. 50,460 2,062,805
Maiden Holdings, Ltd. 8,159 73,268
Mapfre SA 19,542 55,000
Marsh & McLennan Companies, Inc. 87,866 3,094,641
Meadowbrook Insurance Group, Inc. 8,225 45,731
Mercury General Corp. 7,404 308,154
MetLife, Inc. 171,511 5,692,450
MMI Holdings, Ltd. 55,948 131,306
Montpelier Re Holdings, Ltd. 8,073 176,718
MS&AD Insurance Group Holdings 27,100 472,951
Muenchener Rueckversicherungs AG 11,400 1,945,969
National Financial Partners Corp. (I)(L) 6,571 109,144
Strategic Equity Allocation Fund (continued)Shares or
Principal
Amount Value
COMMON STOCKS (continued)
Insurance (continued)
Copyright © 2013 www.secdatabase.com. All Rights Reserved.Please Consider the Environment Before Printing This Document
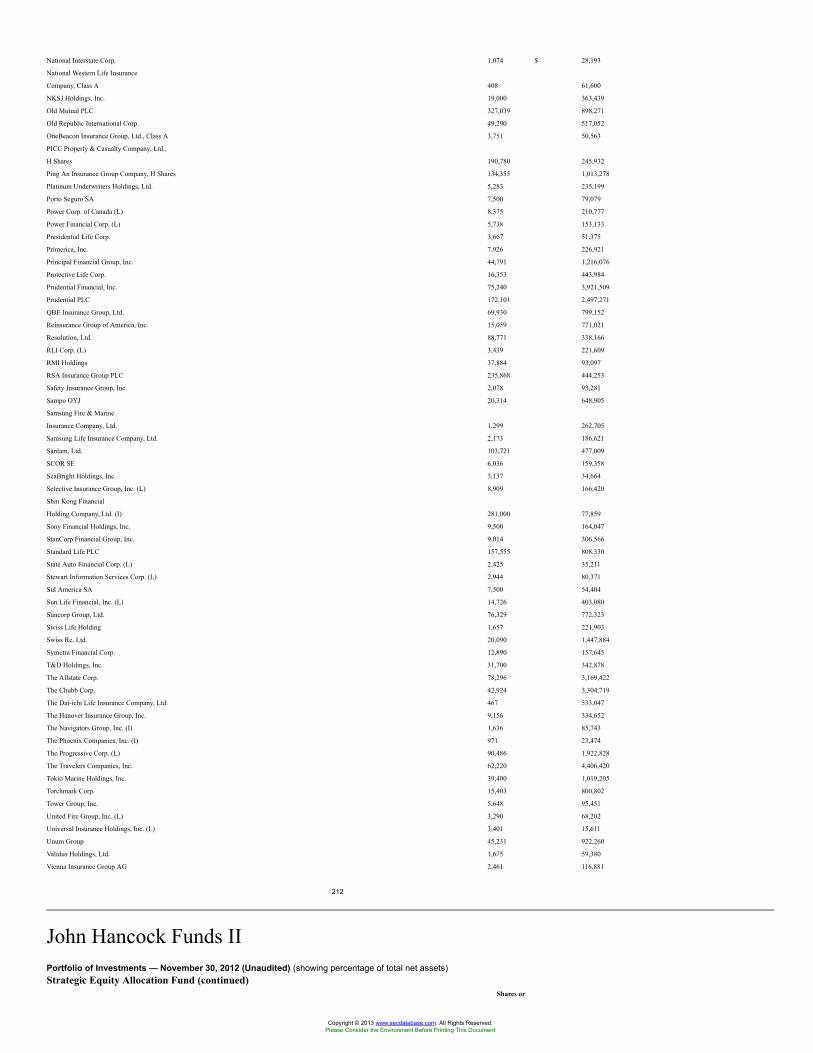
National Interstate Corp. 1,074 $ 28,193
National Western Life Insurance
Company, Class A 408 61,600
NKSJ Holdings, Inc. 19,000 363,439
Old Mutual PLC 327,039 898,271
Old Republic International Corp. 49,290 517,052
OneBeacon Insurance Group, Ltd., Class A 3,751 50,563
PICC Property & Casualty Company, Ltd.,
H Shares 190,780 245,932
Ping An Insurance Group Company, H Shares 134,355 1,013,278
Platinum Underwriters Holdings, Ltd. 5,283 235,199
Porto Seguro SA 7,500 79,079
Power Corp. of Canada (L) 8,375 210,777
Power Financial Corp. (L) 5,738 153,133
Presidential Life Corp. 3,667 51,375
Primerica, Inc. 7,926 226,921
Principal Financial Group, Inc. 44,791 1,216,076
Protective Life Corp. 16,353 443,984
Prudential Financial, Inc. 75,240 3,921,509
Prudential PLC 172,101 2,497,271
QBE Insurance Group, Ltd. 69,930 799,152
Reinsurance Group of America, Inc. 15,059 771,021
Resolution, Ltd. 88,771 338,166
RLI Corp. (L) 3,439 221,609
RMI Holdings 37,884 93,097
RSA Insurance Group PLC 235,868 444,253
Safety Insurance Group, Inc. 2,078 93,281
Sampo OYJ 20,314 648,905
Samsung Fire & Marine
Insurance Company, Ltd. 1,299 262,705
Samsung Life Insurance Company, Ltd. 2,173 186,621
Sanlam, Ltd. 103,721 477,009
SCOR SE 6,036 159,358
SeaBright Holdings, Inc. 3,137 34,664
Selective Insurance Group, Inc. (L) 8,909 166,420
Shin Kong Financial
Holding Company, Ltd. (I) 281,000 77,859
Sony Financial Holdings, Inc. 9,500 164,047
StanCorp Financial Group, Inc. 9,014 306,566
Standard Life PLC 157,555 808,330
State Auto Financial Corp. (L) 2,425 35,211
Stewart Information Services Corp. (L) 2,944 80,371
Sul America SA 7,500 54,404
Sun Life Financial, Inc. (L) 14,726 403,080
Suncorp Group, Ltd. 76,329 772,323
Swiss Life Holding 1,657 221,903
Swiss Re, Ltd. 20,090 1,447,884
Symetra Financial Corp. 12,890 157,645
T&D Holdings, Inc. 31,700 342,878
The Allstate Corp. 78,296 3,169,422
The Chubb Corp. 42,924 3,304,719
The Dai-ichi Life Insurance Company, Ltd. 467 533,047
The Hanover Insurance Group, Inc. 9,156 334,652
The Navigators Group, Inc. (I) 1,636 85,743
The Phoenix Companies, Inc. (I) 971 23,474
The Progressive Corp. (L) 90,486 1,922,828
The Travelers Companies, Inc. 62,220 4,406,420
Tokio Marine Holdings, Inc. 39,400 1,019,205
Torchmark Corp. 15,403 800,802
Tower Group, Inc. 5,648 95,451
United Fire Group, Inc. (L) 3,290 68,202
Universal Insurance Holdings, Inc. (L) 3,401 15,611
Unum Group 45,231 922,260
Validus Holdings, Ltd. 1,675 59,380
Vienna Insurance Group AG 2,461 116,881
212
John Hancock Funds IIPortfolio of Investments — November 30, 2012 (Unaudited) (showing percentage of total net assets)Strategic Equity Allocation Fund (continued)
Shares or
Copyright © 2013 www.secdatabase.com. All Rights Reserved.Please Consider the Environment Before Printing This Document
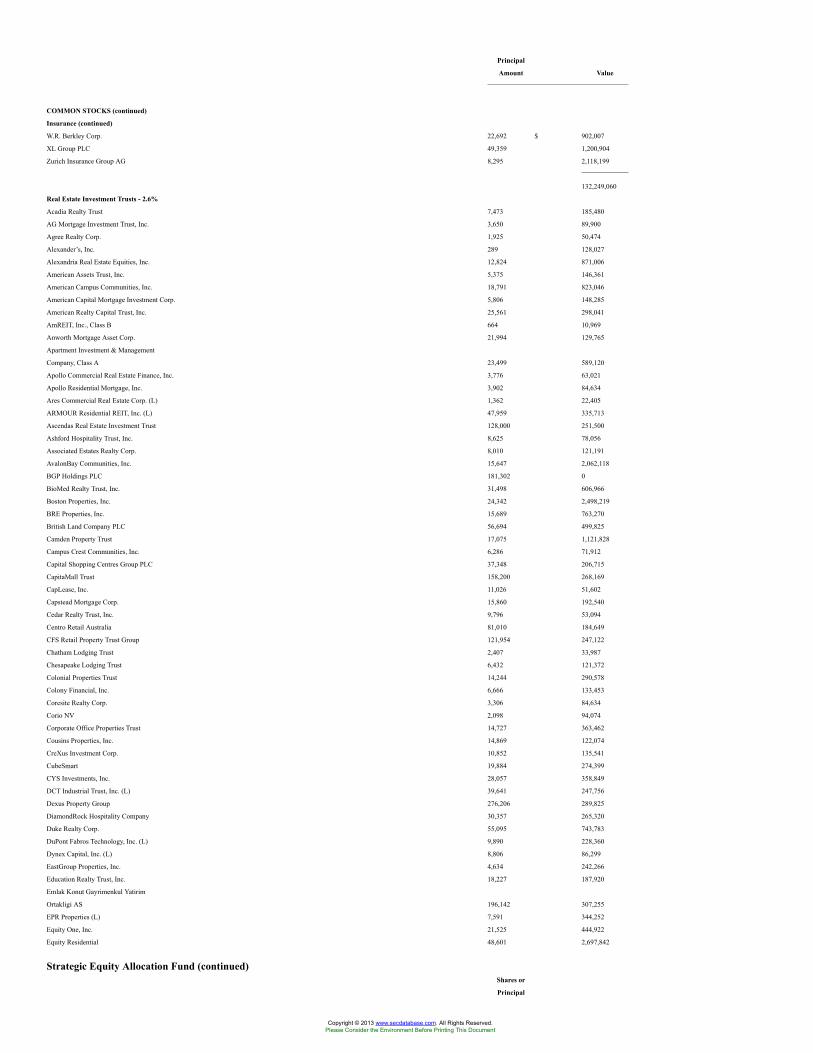
Principal
Amount Value
COMMON STOCKS (continued)
Insurance (continued)
W.R. Berkley Corp. 22,692 $ 902,007
XL Group PLC 49,359 1,200,904
Zurich Insurance Group AG 8,295 2,118,199
132,249,060
Real Estate Investment Trusts - 2.6%
Acadia Realty Trust 7,473 185,480
AG Mortgage Investment Trust, Inc. 3,650 89,900
Agree Realty Corp. 1,925 50,474
Alexander’s, Inc. 289 128,027
Alexandria Real Estate Equities, Inc. 12,824 871,006
American Assets Trust, Inc. 5,375 146,361
American Campus Communities, Inc. 18,791 823,046
American Capital Mortgage Investment Corp. 5,806 148,285
American Realty Capital Trust, Inc. 25,561 298,041
AmREIT, Inc., Class B 664 10,969
Anworth Mortgage Asset Corp. 21,994 129,765
Apartment Investment & Management
Company, Class A 23,499 589,120
Apollo Commercial Real Estate Finance, Inc. 3,776 63,021
Apollo Residential Mortgage, Inc. 3,902 84,634
Ares Commercial Real Estate Corp. (L) 1,362 22,405
ARMOUR Residential REIT, Inc. (L) 47,959 335,713
Ascendas Real Estate Investment Trust 128,000 251,500
Ashford Hospitality Trust, Inc. 8,625 78,056
Associated Estates Realty Corp. 8,010 121,191
AvalonBay Communities, Inc. 15,647 2,062,118
BGP Holdings PLC 181,302 0
BioMed Realty Trust, Inc. 31,498 606,966
Boston Properties, Inc. 24,342 2,498,219
BRE Properties, Inc. 15,689 763,270
British Land Company PLC 56,694 499,825
Camden Property Trust 17,075 1,121,828
Campus Crest Communities, Inc. 6,286 71,912
Capital Shopping Centres Group PLC 37,348 206,715
CapitaMall Trust 158,200 268,169
CapLease, Inc. 11,026 51,602
Capstead Mortgage Corp. 15,860 192,540
Cedar Realty Trust, Inc. 9,796 53,094
Centro Retail Australia 81,010 184,649
CFS Retail Property Trust Group 121,954 247,122
Chatham Lodging Trust 2,407 33,987
Chesapeake Lodging Trust 6,432 121,372
Colonial Properties Trust 14,244 290,578
Colony Financial, Inc. 6,666 133,453
Coresite Realty Corp. 3,306 84,634
Corio NV 2,098 94,074
Corporate Office Properties Trust 14,727 363,462
Cousins Properties, Inc. 14,869 122,074
CreXus Investment Corp. 10,852 135,541
CubeSmart 19,884 274,399
CYS Investments, Inc. 28,057 358,849
DCT Industrial Trust, Inc. (L) 39,641 247,756
Dexus Property Group 276,206 289,825
DiamondRock Hospitality Company 30,357 265,320
Duke Realty Corp. 55,095 743,783
DuPont Fabros Technology, Inc. (L) 9,890 228,360
Dynex Capital, Inc. (L) 8,806 86,299
EastGroup Properties, Inc. 4,634 242,266
Education Realty Trust, Inc. 18,227 187,920
Emlak Konut Gayrimenkul Yatirim
Ortakligi AS 196,142 307,255
EPR Properties (L) 7,591 344,252
Equity One, Inc. 21,525 444,922
Equity Residential 48,601 2,697,842
Strategic Equity Allocation Fund (continued)Shares or
Principal
Copyright © 2013 www.secdatabase.com. All Rights Reserved.Please Consider the Environment Before Printing This Document
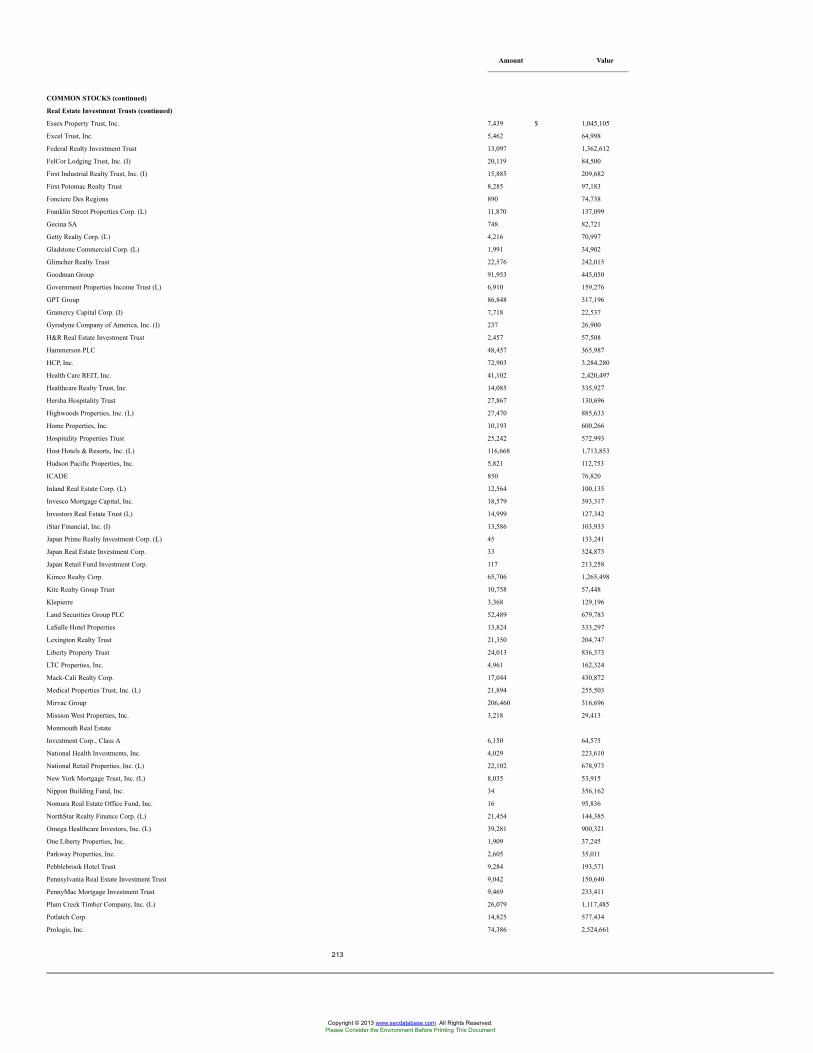
Amount Value
COMMON STOCKS (continued)
Real Estate Investment Trusts (continued)
Essex Property Trust, Inc. 7,439 $ 1,045,105
Excel Trust, Inc. 5,462 64,998
Federal Realty Investment Trust 13,097 1,362,612
FelCor Lodging Trust, Inc. (I) 20,119 84,500
First Industrial Realty Trust, Inc. (I) 15,885 209,682
First Potomac Realty Trust 8,285 97,183
Fonciere Des Regions 890 74,738
Franklin Street Properties Corp. (L) 11,870 137,099
Gecina SA 748 82,721
Getty Realty Corp. (L) 4,216 70,997
Gladstone Commercial Corp. (L) 1,991 34,902
Glimcher Realty Trust 22,576 242,015
Goodman Group 91,953 445,050
Government Properties Income Trust (L) 6,910 159,276
GPT Group 86,848 317,196
Gramercy Capital Corp. (I) 7,718 22,537
Gyrodyne Company of America, Inc. (I) 237 26,900
H&R Real Estate Investment Trust 2,457 57,508
Hammerson PLC 48,457 365,987
HCP, Inc. 72,903 3,284,280
Health Care REIT, Inc. 41,102 2,420,497
Healthcare Realty Trust, Inc. 14,085 335,927
Hersha Hospitality Trust 27,867 130,696
Highwoods Properties, Inc. (L) 27,470 885,633
Home Properties, Inc. 10,193 600,266
Hospitality Properties Trust 25,242 572,993
Host Hotels & Resorts, Inc. (L) 116,668 1,713,853
Hudson Pacific Properties, Inc. 5,821 112,753
ICADE 850 76,820
Inland Real Estate Corp. (L) 12,564 100,135
Invesco Mortgage Capital, Inc. 18,579 393,317
Investors Real Estate Trust (L) 14,999 127,342
iStar Financial, Inc. (I) 13,586 103,933
Japan Prime Realty Investment Corp. (L) 45 133,241
Japan Real Estate Investment Corp. 33 324,873
Japan Retail Fund Investment Corp. 117 213,258
Kimco Realty Corp. 65,706 1,265,498
Kite Realty Group Trust 10,758 57,448
Klepierre 3,368 129,196
Land Securities Group PLC 52,489 679,783
LaSalle Hotel Properties 13,824 333,297
Lexington Realty Trust 21,350 204,747
Liberty Property Trust 24,013 836,373
LTC Properties, Inc. 4,961 162,324
Mack-Cali Realty Corp. 17,044 430,872
Medical Properties Trust, Inc. (L) 21,894 255,503
Mirvac Group 206,460 316,696
Mission West Properties, Inc. 3,218 29,413
Monmouth Real Estate
Investment Corp., Class A 6,150 64,575
National Health Investments, Inc. 4,029 223,610
National Retail Properties, Inc. (L) 22,102 678,973
New York Mortgage Trust, Inc. (L) 8,035 53,915
Nippon Building Fund, Inc. 34 356,162
Nomura Real Estate Office Fund, Inc. 16 95,836
NorthStar Realty Finance Corp. (L) 21,454 144,385
Omega Healthcare Investors, Inc. (L) 39,281 900,321
One Liberty Properties, Inc. 1,909 37,245
Parkway Properties, Inc. 2,605 35,011
Pebblebrook Hotel Trust 9,284 193,571
Pennsylvania Real Estate Investment Trust 9,042 150,640
PennyMac Mortgage Investment Trust 9,469 233,411
Plum Creek Timber Company, Inc. (L) 26,079 1,117,485
Potlatch Corp. 14,825 577,434
Prologis, Inc. 74,386 2,524,661
213
Copyright © 2013 www.secdatabase.com. All Rights Reserved.Please Consider the Environment Before Printing This Document
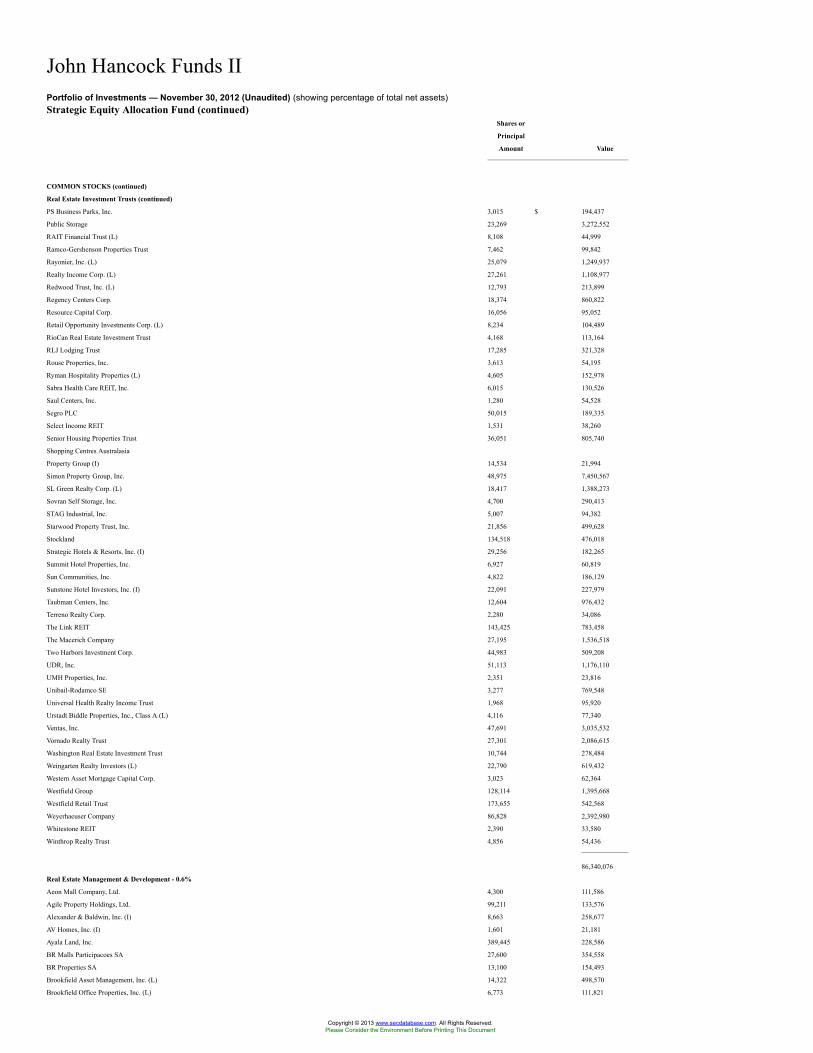
John Hancock Funds IIPortfolio of Investments — November 30, 2012 (Unaudited) (showing percentage of total net assets)Strategic Equity Allocation Fund (continued)
Shares or
Principal
Amount Value
COMMON STOCKS (continued)
Real Estate Investment Trusts (continued)
PS Business Parks, Inc. 3,015 $ 194,437
Public Storage 23,269 3,272,552
RAIT Financial Trust (L) 8,108 44,999
Ramco-Gershenson Properties Trust 7,462 99,842
Rayonier, Inc. (L) 25,079 1,249,937
Realty Income Corp. (L) 27,261 1,108,977
Redwood Trust, Inc. (L) 12,793 213,899
Regency Centers Corp. 18,374 860,822
Resource Capital Corp. 16,056 95,052
Retail Opportunity Investments Corp. (L) 8,234 104,489
RioCan Real Estate Investment Trust 4,168 113,164
RLJ Lodging Trust 17,285 321,328
Rouse Properties, Inc. 3,613 54,195
Ryman Hospitality Properties (L) 4,605 152,978
Sabra Health Care REIT, Inc. 6,015 130,526
Saul Centers, Inc. 1,280 54,528
Segro PLC 50,015 189,335
Select Income REIT 1,531 38,260
Senior Housing Properties Trust 36,051 805,740
Shopping Centres Australasia
Property Group (I) 14,534 21,994
Simon Property Group, Inc. 48,975 7,450,567
SL Green Realty Corp. (L) 18,417 1,388,273
Sovran Self Storage, Inc. 4,700 290,413
STAG Industrial, Inc. 5,007 94,382
Starwood Property Trust, Inc. 21,856 499,628
Stockland 134,518 476,018
Strategic Hotels & Resorts, Inc. (I) 29,256 182,265
Summit Hotel Properties, Inc. 6,927 60,819
Sun Communities, Inc. 4,822 186,129
Sunstone Hotel Investors, Inc. (I) 22,091 227,979
Taubman Centers, Inc. 12,604 976,432
Terreno Realty Corp. 2,280 34,086
The Link REIT 143,425 783,458
The Macerich Company 27,195 1,536,518
Two Harbors Investment Corp. 44,983 509,208
UDR, Inc. 51,113 1,176,110
UMH Properties, Inc. 2,351 23,816
Unibail-Rodamco SE 3,277 769,548
Universal Health Realty Income Trust 1,968 95,920
Urstadt Biddle Properties, Inc., Class A (L) 4,116 77,340
Ventas, Inc. 47,691 3,035,532
Vornado Realty Trust 27,301 2,086,615
Washington Real Estate Investment Trust 10,744 278,484
Weingarten Realty Investors (L) 22,790 619,432
Western Asset Mortgage Capital Corp. 3,023 62,364
Westfield Group 128,114 1,395,668
Westfield Retail Trust 173,655 542,568
Weyerhaeuser Company 86,828 2,392,980
Whitestone REIT 2,390 33,580
Winthrop Realty Trust 4,856 54,436
86,340,076
Real Estate Management & Development - 0.6%
Aeon Mall Company, Ltd. 4,300 111,586
Agile Property Holdings, Ltd. 99,211 133,576
Alexander & Baldwin, Inc. (I) 8,663 258,677
AV Homes, Inc. (I) 1,601 21,181
Ayala Land, Inc. 389,445 228,586
BR Malls Participacoes SA 27,600 354,558
BR Properties SA 13,100 154,493
Brookfield Asset Management, Inc. (L) 14,322 498,570
Brookfield Office Properties, Inc. (L) 6,773 111,821
Copyright © 2013 www.secdatabase.com. All Rights Reserved.Please Consider the Environment Before Printing This Document
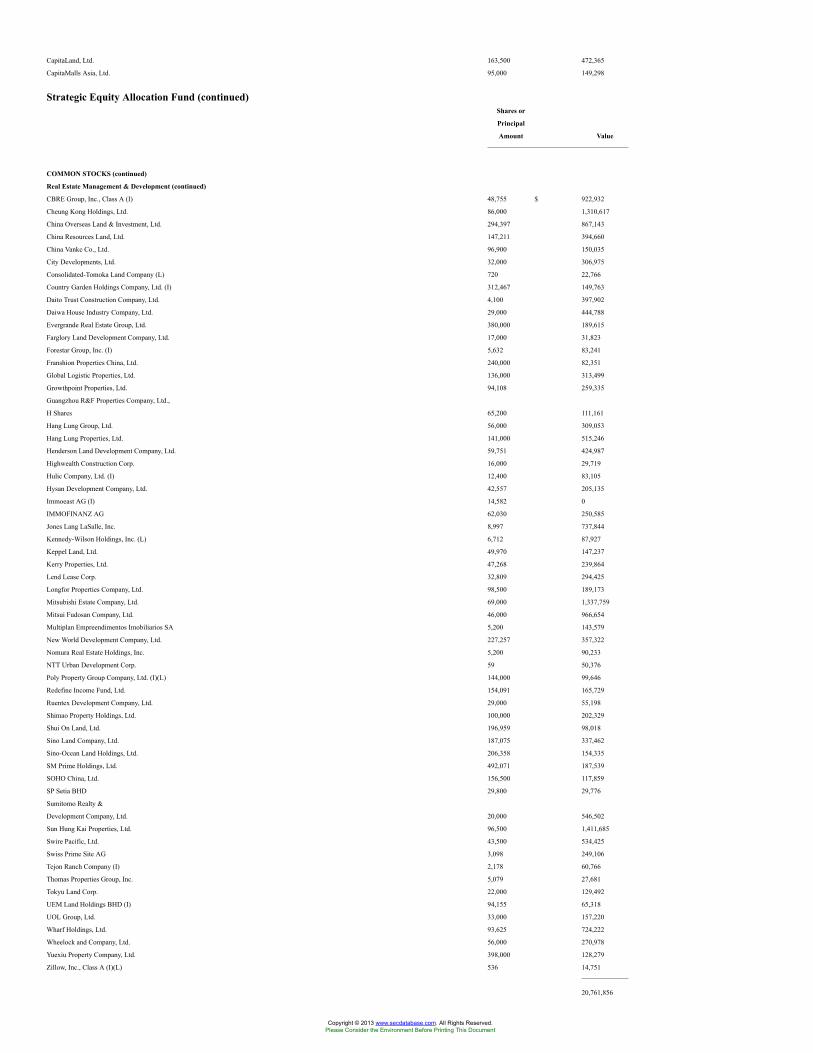
CapitaLand, Ltd. 163,500 472,365
CapitaMalls Asia, Ltd. 95,000 149,298
Strategic Equity Allocation Fund (continued)Shares or
Principal
Amount Value
COMMON STOCKS (continued)
Real Estate Management & Development (continued)
CBRE Group, Inc., Class A (I) 48,755 $ 922,932
Cheung Kong Holdings, Ltd. 86,000 1,310,617
China Overseas Land & Investment, Ltd. 294,397 867,143
China Resources Land, Ltd. 147,211 394,660
China Vanke Co., Ltd. 96,900 150,035
City Developments, Ltd. 32,000 306,975
Consolidated-Tomoka Land Company (L) 720 22,766
Country Garden Holdings Company, Ltd. (I) 312,467 149,763
Daito Trust Construction Company, Ltd. 4,100 397,902
Daiwa House Industry Company, Ltd. 29,000 444,788
Evergrande Real Estate Group, Ltd. 380,000 189,615
Farglory Land Development Company, Ltd. 17,000 31,823
Forestar Group, Inc. (I) 5,632 83,241
Franshion Properties China, Ltd. 240,000 82,351
Global Logistic Properties, Ltd. 136,000 313,499
Growthpoint Properties, Ltd. 94,108 259,335
Guangzhou R&F Properties Company, Ltd.,
H Shares 65,200 111,161
Hang Lung Group, Ltd. 56,000 309,053
Hang Lung Properties, Ltd. 141,000 515,246
Henderson Land Development Company, Ltd. 59,751 424,987
Highwealth Construction Corp. 16,000 29,719
Hulic Company, Ltd. (I) 12,400 83,105
Hysan Development Company, Ltd. 42,557 205,135
Immoeast AG (I) 14,582 0
IMMOFINANZ AG 62,030 250,585
Jones Lang LaSalle, Inc. 8,997 737,844
Kennedy-Wilson Holdings, Inc. (L) 6,712 87,927
Keppel Land, Ltd. 49,970 147,237
Kerry Properties, Ltd. 47,268 239,864
Lend Lease Corp. 32,809 294,425
Longfor Properties Company, Ltd. 98,500 189,173
Mitsubishi Estate Company, Ltd. 69,000 1,337,759
Mitsui Fudosan Company, Ltd. 46,000 966,654
Multiplan Empreendimentos Imobiliarios SA 5,200 143,579
New World Development Company, Ltd. 227,257 357,322
Nomura Real Estate Holdings, Inc. 5,200 90,233
NTT Urban Development Corp. 59 50,376
Poly Property Group Company, Ltd. (I)(L) 144,000 99,646
Redefine Income Fund, Ltd. 154,091 165,729
Ruentex Development Company, Ltd. 29,000 55,198
Shimao Property Holdings, Ltd. 100,000 202,329
Shui On Land, Ltd. 196,959 98,018
Sino Land Company, Ltd. 187,075 337,462
Sino-Ocean Land Holdings, Ltd. 206,358 154,335
SM Prime Holdings, Ltd. 492,071 187,539
SOHO China, Ltd. 156,500 117,859
SP Setia BHD 29,800 29,776
Sumitomo Realty &
Development Company, Ltd. 20,000 546,502
Sun Hung Kai Properties, Ltd. 96,500 1,411,685
Swire Pacific, Ltd. 43,500 534,425
Swiss Prime Site AG 3,098 249,106
Tejon Ranch Company (I) 2,178 60,766
Thomas Properties Group, Inc. 5,079 27,681
Tokyu Land Corp. 22,000 129,492
UEM Land Holdings BHD (I) 94,155 65,318
UOL Group, Ltd. 33,000 157,220
Wharf Holdings, Ltd. 93,625 724,222
Wheelock and Company, Ltd. 56,000 270,978
Yuexiu Property Company, Ltd. 398,000 128,279
Zillow, Inc., Class A (I)(L) 536 14,751
20,761,856
Copyright © 2013 www.secdatabase.com. All Rights Reserved.Please Consider the Environment Before Printing This Document
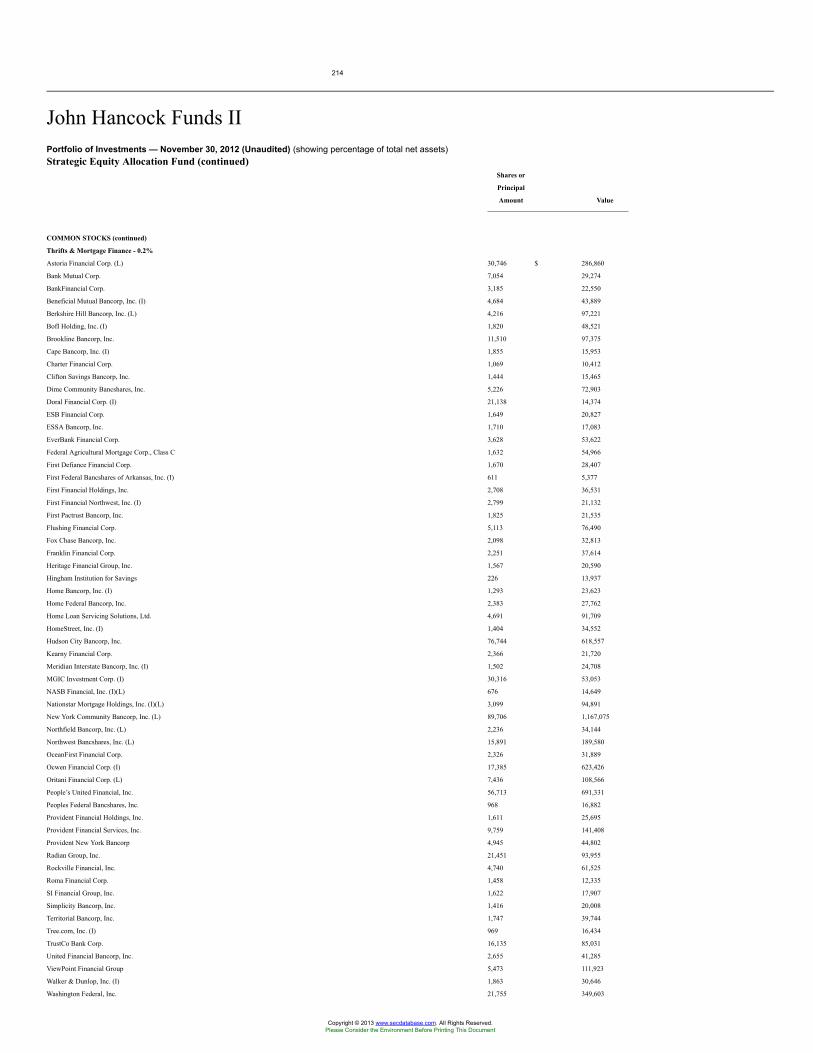
214
John Hancock Funds IIPortfolio of Investments — November 30, 2012 (Unaudited) (showing percentage of total net assets)Strategic Equity Allocation Fund (continued)
Shares or
Principal
Amount Value
COMMON STOCKS (continued)
Thrifts & Mortgage Finance - 0.2%
Astoria Financial Corp. (L) 30,746 $ 286,860
Bank Mutual Corp. 7,054 29,274
BankFinancial Corp. 3,185 22,550
Beneficial Mutual Bancorp, Inc. (I) 4,684 43,889
Berkshire Hill Bancorp, Inc. (L) 4,216 97,221
BofI Holding, Inc. (I) 1,820 48,521
Brookline Bancorp, Inc. 11,510 97,375
Cape Bancorp, Inc. (I) 1,855 15,953
Charter Financial Corp. 1,069 10,412
Clifton Savings Bancorp, Inc. 1,444 15,465
Dime Community Bancshares, Inc. 5,226 72,903
Doral Financial Corp. (I) 21,138 14,374
ESB Financial Corp. 1,649 20,827
ESSA Bancorp, Inc. 1,710 17,083
EverBank Financial Corp. 3,628 53,622
Federal Agricultural Mortgage Corp., Class C 1,632 54,966
First Defiance Financial Corp. 1,670 28,407
First Federal Bancshares of Arkansas, Inc. (I) 611 5,377
First Financial Holdings, Inc. 2,708 36,531
First Financial Northwest, Inc. (I) 2,799 21,132
First Pactrust Bancorp, Inc. 1,825 21,535
Flushing Financial Corp. 5,113 76,490
Fox Chase Bancorp, Inc. 2,098 32,813
Franklin Financial Corp. 2,251 37,614
Heritage Financial Group, Inc. 1,567 20,590
Hingham Institution for Savings 226 13,937
Home Bancorp, Inc. (I) 1,293 23,623
Home Federal Bancorp, Inc. 2,383 27,762
Home Loan Servicing Solutions, Ltd. 4,691 91,709
HomeStreet, Inc. (I) 1,404 34,552
Hudson City Bancorp, Inc. 76,744 618,557
Kearny Financial Corp. 2,366 21,720
Meridian Interstate Bancorp, Inc. (I) 1,502 24,708
MGIC Investment Corp. (I) 30,316 53,053
NASB Financial, Inc. (I)(L) 676 14,649
Nationstar Mortgage Holdings, Inc. (I)(L) 3,099 94,891
New York Community Bancorp, Inc. (L) 89,706 1,167,075
Northfield Bancorp, Inc. (L) 2,236 34,144
Northwest Bancshares, Inc. (L) 15,891 189,580
OceanFirst Financial Corp. 2,326 31,889
Ocwen Financial Corp. (I) 17,385 623,426
Oritani Financial Corp. (L) 7,436 108,566
People’s United Financial, Inc. 56,713 691,331
Peoples Federal Bancshares, Inc. 968 16,882
Provident Financial Holdings, Inc. 1,611 25,695
Provident Financial Services, Inc. 9,759 141,408
Provident New York Bancorp 4,945 44,802
Radian Group, Inc. 21,451 93,955
Rockville Financial, Inc. 4,740 61,525
Roma Financial Corp. 1,458 12,335
SI Financial Group, Inc. 1,622 17,907
Simplicity Bancorp, Inc. 1,416 20,008
Territorial Bancorp, Inc. 1,747 39,744
Tree.com, Inc. (I) 969 16,434
TrustCo Bank Corp. 16,135 85,031
United Financial Bancorp, Inc. 2,655 41,285
ViewPoint Financial Group 5,473 111,923
Walker & Dunlop, Inc. (I) 1,863 30,646
Washington Federal, Inc. 21,755 349,603
Copyright © 2013 www.secdatabase.com. All Rights Reserved.Please Consider the Environment Before Printing This Document
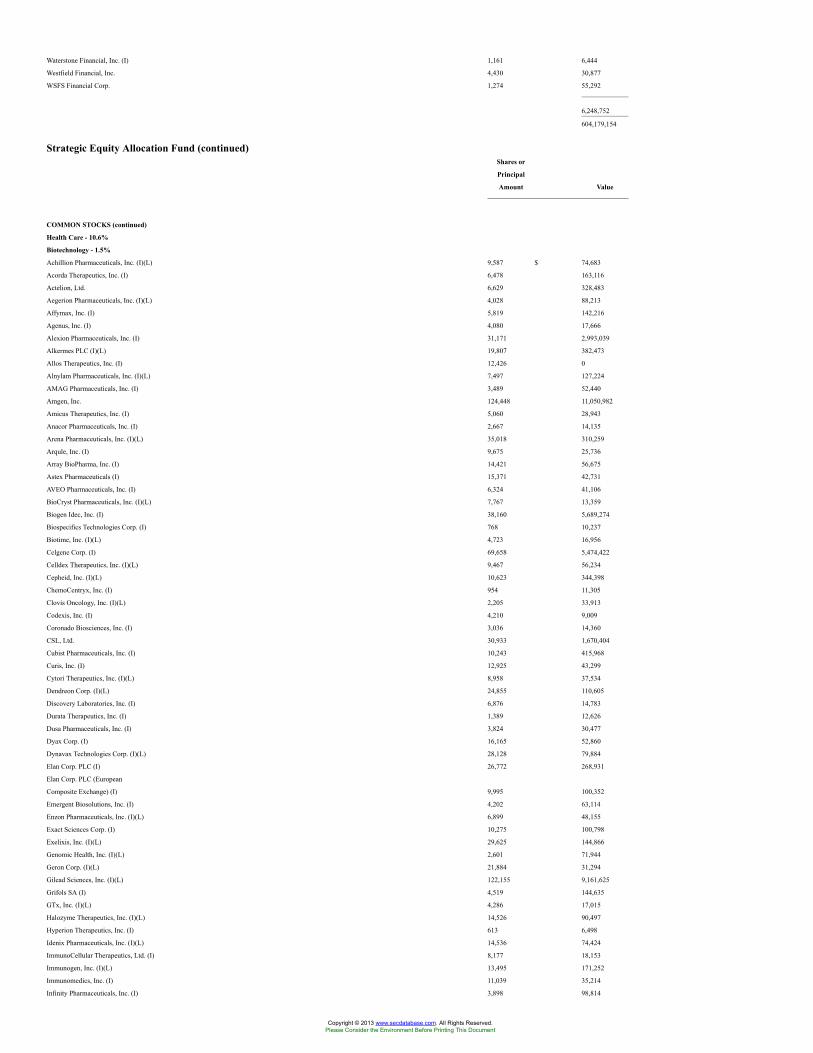
Waterstone Financial, Inc. (I) 1,161 6,444
Westfield Financial, Inc. 4,430 30,877
WSFS Financial Corp. 1,274 55,292
6,248,752
604,179,154
Strategic Equity Allocation Fund (continued)Shares or
Principal
Amount Value
COMMON STOCKS (continued)
Health Care - 10.6%
Biotechnology - 1.5%
Achillion Pharmaceuticals, Inc. (I)(L) 9,587 $ 74,683
Acorda Therapeutics, Inc. (I) 6,478 163,116
Actelion, Ltd. 6,629 328,483
Aegerion Pharmaceuticals, Inc. (I)(L) 4,028 88,213
Affymax, Inc. (I) 5,819 142,216
Agenus, Inc. (I) 4,080 17,666
Alexion Pharmaceuticals, Inc. (I) 31,171 2,993,039
Alkermes PLC (I)(L) 19,807 382,473
Allos Therapeutics, Inc. (I) 12,426 0
Alnylam Pharmaceuticals, Inc. (I)(L) 7,497 127,224
AMAG Pharmaceuticals, Inc. (I) 3,489 52,440
Amgen, Inc. 124,448 11,050,982
Amicus Therapeutics, Inc. (I) 5,060 28,943
Anacor Pharmaceuticals, Inc. (I) 2,667 14,135
Arena Pharmaceuticals, Inc. (I)(L) 35,018 310,259
Arqule, Inc. (I) 9,675 25,736
Array BioPharma, Inc. (I) 14,421 56,675
Astex Pharmaceuticals (I) 15,371 42,731
AVEO Pharmaceuticals, Inc. (I) 6,324 41,106
BioCryst Pharmaceuticals, Inc. (I)(L) 7,767 13,359
Biogen Idec, Inc. (I) 38,160 5,689,274
Biospecifics Technologies Corp. (I) 768 10,237
Biotime, Inc. (I)(L) 4,723 16,956
Celgene Corp. (I) 69,658 5,474,422
Celldex Therapeutics, Inc. (I)(L) 9,467 56,234
Cepheid, Inc. (I)(L) 10,623 344,398
ChemoCentryx, Inc. (I) 954 11,305
Clovis Oncology, Inc. (I)(L) 2,205 33,913
Codexis, Inc. (I) 4,210 9,009
Coronado Biosciences, Inc. (I) 3,036 14,360
CSL, Ltd. 30,933 1,670,404
Cubist Pharmaceuticals, Inc. (I) 10,243 415,968
Curis, Inc. (I) 12,925 43,299
Cytori Therapeutics, Inc. (I)(L) 8,958 37,534
Dendreon Corp. (I)(L) 24,855 110,605
Discovery Laboratories, Inc. (I) 6,876 14,783
Durata Therapeutics, Inc. (I) 1,389 12,626
Dusa Pharmaceuticals, Inc. (I) 3,824 30,477
Dyax Corp. (I) 16,165 52,860
Dynavax Technologies Corp. (I)(L) 28,128 79,884
Elan Corp. PLC (I) 26,772 268,931
Elan Corp. PLC (European
Composite Exchange) (I) 9,995 100,352
Emergent Biosolutions, Inc. (I) 4,202 63,114
Enzon Pharmaceuticals, Inc. (I)(L) 6,899 48,155
Exact Sciences Corp. (I) 10,275 100,798
Exelixis, Inc. (I)(L) 29,625 144,866
Genomic Health, Inc. (I)(L) 2,601 71,944
Geron Corp. (I)(L) 21,884 31,294
Gilead Sciences, Inc. (I)(L) 122,155 9,161,625
Grifols SA (I) 4,519 144,635
GTx, Inc. (I)(L) 4,286 17,015
Halozyme Therapeutics, Inc. (I)(L) 14,526 90,497
Hyperion Therapeutics, Inc. (I) 613 6,498
Idenix Pharmaceuticals, Inc. (I)(L) 14,536 74,424
ImmunoCellular Therapeutics, Ltd. (I) 8,177 18,153
Immunogen, Inc. (I)(L) 13,495 171,252
Immunomedics, Inc. (I) 11,039 35,214
Infinity Pharmaceuticals, Inc. (I) 3,898 98,814
Copyright © 2013 www.secdatabase.com. All Rights Reserved.Please Consider the Environment Before Printing This Document
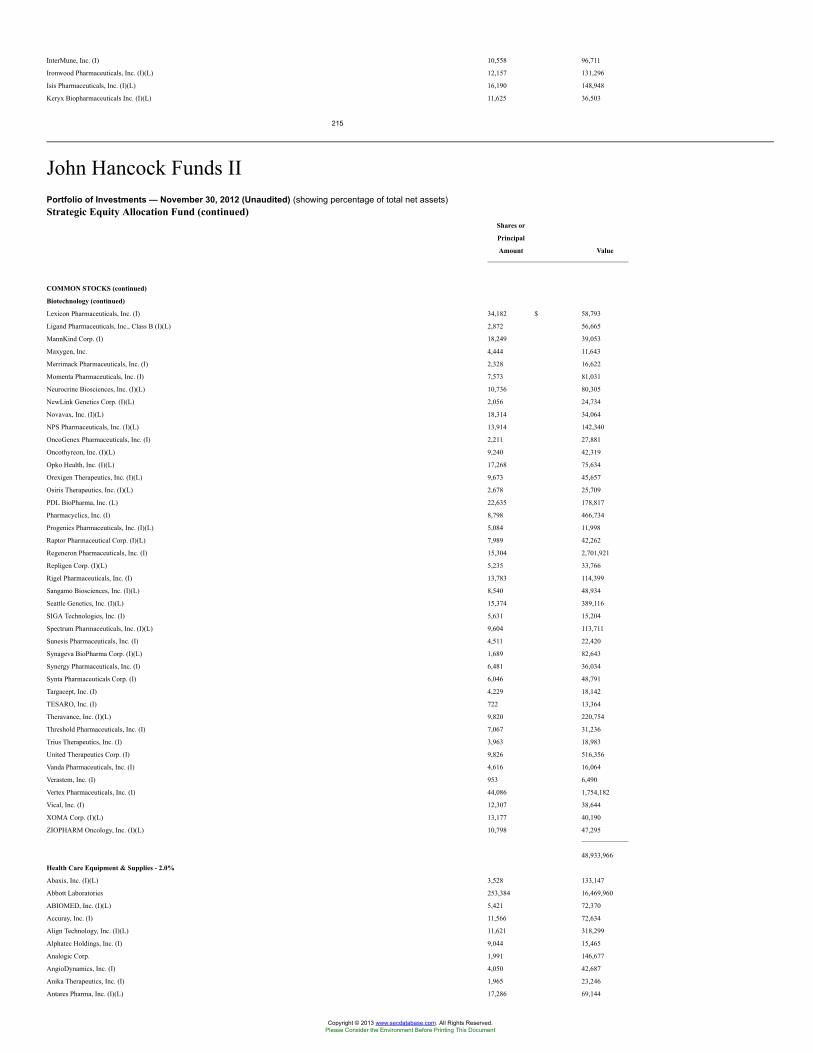
InterMune, Inc. (I) 10,558 96,711
Ironwood Pharmaceuticals, Inc. (I)(L) 12,157 131,296
Isis Pharmaceuticals, Inc. (I)(L) 16,190 148,948
Keryx Biopharmaceuticals Inc. (I)(L) 11,625 36,503
215
John Hancock Funds IIPortfolio of Investments — November 30, 2012 (Unaudited) (showing percentage of total net assets)Strategic Equity Allocation Fund (continued)
Shares or
Principal
Amount Value
COMMON STOCKS (continued)
Biotechnology (continued)
Lexicon Pharmaceuticals, Inc. (I) 34,182 $ 58,793
Ligand Pharmaceuticals, Inc., Class B (I)(L) 2,872 56,665
MannKind Corp. (I) 18,249 39,053
Maxygen, Inc. 4,444 11,643
Merrimack Pharmaceuticals, Inc. (I) 2,328 16,622
Momenta Pharmaceuticals, Inc. (I) 7,573 81,031
Neurocrine Biosciences, Inc. (I)(L) 10,736 80,305
NewLink Genetics Corp. (I)(L) 2,056 24,734
Novavax, Inc. (I)(L) 18,314 34,064
NPS Pharmaceuticals, Inc. (I)(L) 13,914 142,340
OncoGenex Pharmaceuticals, Inc. (I) 2,211 27,881
Oncothyreon, Inc. (I)(L) 9,240 42,319
Opko Health, Inc. (I)(L) 17,268 75,634
Orexigen Therapeutics, Inc. (I)(L) 9,673 45,657
Osiris Therapeutics, Inc. (I)(L) 2,678 25,709
PDL BioPharma, Inc. (L) 22,635 178,817
Pharmacyclics, Inc. (I) 8,798 466,734
Progenics Pharmaceuticals, Inc. (I)(L) 5,084 11,998
Raptor Pharmaceutical Corp. (I)(L) 7,989 42,262
Regeneron Pharmaceuticals, Inc. (I) 15,304 2,701,921
Repligen Corp. (I)(L) 5,235 33,766
Rigel Pharmaceuticals, Inc. (I) 13,783 114,399
Sangamo Biosciences, Inc. (I)(L) 8,540 48,934
Seattle Genetics, Inc. (I)(L) 15,374 389,116
SIGA Technologies, Inc. (I) 5,631 15,204
Spectrum Pharmaceuticals, Inc. (I)(L) 9,604 113,711
Sunesis Pharmaceuticals, Inc. (I) 4,511 22,420
Synageva BioPharma Corp. (I)(L) 1,689 82,643
Synergy Pharmaceuticals, Inc. (I) 6,481 36,034
Synta Pharmaceuticals Corp. (I) 6,046 48,791
Targacept, Inc. (I) 4,229 18,142
TESARO, Inc. (I) 722 13,364
Theravance, Inc. (I)(L) 9,820 220,754
Threshold Pharmaceuticals, Inc. (I) 7,067 31,236
Trius Therapeutics, Inc. (I) 3,963 18,983
United Therapeutics Corp. (I) 9,826 516,356
Vanda Pharmaceuticals, Inc. (I) 4,616 16,064
Verastem, Inc. (I) 953 6,490
Vertex Pharmaceuticals, Inc. (I) 44,086 1,754,182
Vical, Inc. (I) 12,307 38,644
XOMA Corp. (I)(L) 13,177 40,190
ZIOPHARM Oncology, Inc. (I)(L) 10,798 47,295
48,933,966
Health Care Equipment & Supplies - 2.0%
Abaxis, Inc. (I)(L) 3,528 133,147
Abbott Laboratories 253,384 16,469,960
ABIOMED, Inc. (I)(L) 5,421 72,370
Accuray, Inc. (I) 11,566 72,634
Align Technology, Inc. (I)(L) 11,621 318,299
Alphatec Holdings, Inc. (I) 9,044 15,465
Analogic Corp. 1,991 146,677
AngioDynamics, Inc. (I) 4,050 42,687
Anika Therapeutics, Inc. (I) 1,965 23,246
Antares Pharma, Inc. (I)(L) 17,286 69,144
Copyright © 2013 www.secdatabase.com. All Rights Reserved.Please Consider the Environment Before Printing This Document
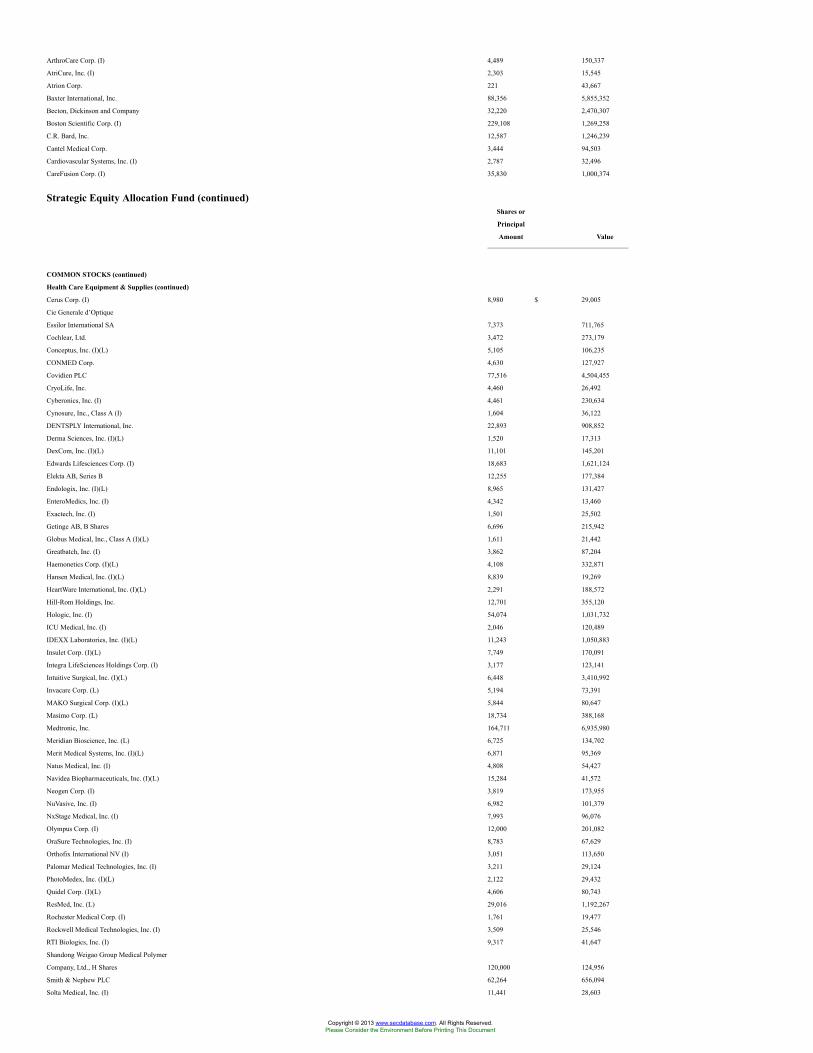
ArthroCare Corp. (I) 4,489 150,337
AtriCure, Inc. (I) 2,303 15,545
Atrion Corp. 221 43,667
Baxter International, Inc. 88,356 5,855,352
Becton, Dickinson and Company 32,220 2,470,307
Boston Scientific Corp. (I) 229,108 1,269,258
C.R. Bard, Inc. 12,587 1,246,239
Cantel Medical Corp. 3,444 94,503
Cardiovascular Systems, Inc. (I) 2,787 32,496
CareFusion Corp. (I) 35,830 1,000,374
Strategic Equity Allocation Fund (continued)Shares or
Principal
Amount Value
COMMON STOCKS (continued)
Health Care Equipment & Supplies (continued)
Cerus Corp. (I) 8,980 $ 29,005
Cie Generale d’Optique
Essilor International SA 7,373 711,765
Cochlear, Ltd. 3,472 273,179
Conceptus, Inc. (I)(L) 5,105 106,235
CONMED Corp. 4,630 127,927
Covidien PLC 77,516 4,504,455
CryoLife, Inc. 4,460 26,492
Cyberonics, Inc. (I) 4,461 230,634
Cynosure, Inc., Class A (I) 1,604 36,122
DENTSPLY International, Inc. 22,893 908,852
Derma Sciences, Inc. (I)(L) 1,520 17,313
DexCom, Inc. (I)(L) 11,101 145,201
Edwards Lifesciences Corp. (I) 18,683 1,621,124
Elekta AB, Series B 12,255 177,384
Endologix, Inc. (I)(L) 8,965 131,427
EnteroMedics, Inc. (I) 4,342 13,460
Exactech, Inc. (I) 1,501 25,502
Getinge AB, B Shares 6,696 215,942
Globus Medical, Inc., Class A (I)(L) 1,611 21,442
Greatbatch, Inc. (I) 3,862 87,204
Haemonetics Corp. (I)(L) 4,108 332,871
Hansen Medical, Inc. (I)(L) 8,839 19,269
HeartWare International, Inc. (I)(L) 2,291 188,572
Hill-Rom Holdings, Inc. 12,701 355,120
Hologic, Inc. (I) 54,074 1,031,732
ICU Medical, Inc. (I) 2,046 120,489
IDEXX Laboratories, Inc. (I)(L) 11,243 1,050,883
Insulet Corp. (I)(L) 7,749 170,091
Integra LifeSciences Holdings Corp. (I) 3,177 123,141
Intuitive Surgical, Inc. (I)(L) 6,448 3,410,992
Invacare Corp. (L) 5,194 73,391
MAKO Surgical Corp. (I)(L) 5,844 80,647
Masimo Corp. (L) 18,734 388,168
Medtronic, Inc. 164,711 6,935,980
Meridian Bioscience, Inc. (L) 6,725 134,702
Merit Medical Systems, Inc. (I)(L) 6,871 95,369
Natus Medical, Inc. (I) 4,808 54,427
Navidea Biopharmaceuticals, Inc. (I)(L) 15,284 41,572
Neogen Corp. (I) 3,819 173,955
NuVasive, Inc. (I) 6,982 101,379
NxStage Medical, Inc. (I) 7,993 96,076
Olympus Corp. (I) 12,000 201,082
OraSure Technologies, Inc. (I) 8,783 67,629
Orthofix International NV (I) 3,051 113,650
Palomar Medical Technologies, Inc. (I) 3,211 29,124
PhotoMedex, Inc. (I)(L) 2,122 29,432
Quidel Corp. (I)(L) 4,606 80,743
ResMed, Inc. (L) 29,016 1,192,267
Rochester Medical Corp. (I) 1,761 19,477
Rockwell Medical Technologies, Inc. (I) 3,509 25,546
RTI Biologics, Inc. (I) 9,317 41,647
Shandong Weigao Group Medical Polymer
Company, Ltd., H Shares 120,000 124,956
Smith & Nephew PLC 62,264 656,094
Solta Medical, Inc. (I) 11,441 28,603
Copyright © 2013 www.secdatabase.com. All Rights Reserved.Please Consider the Environment Before Printing This Document
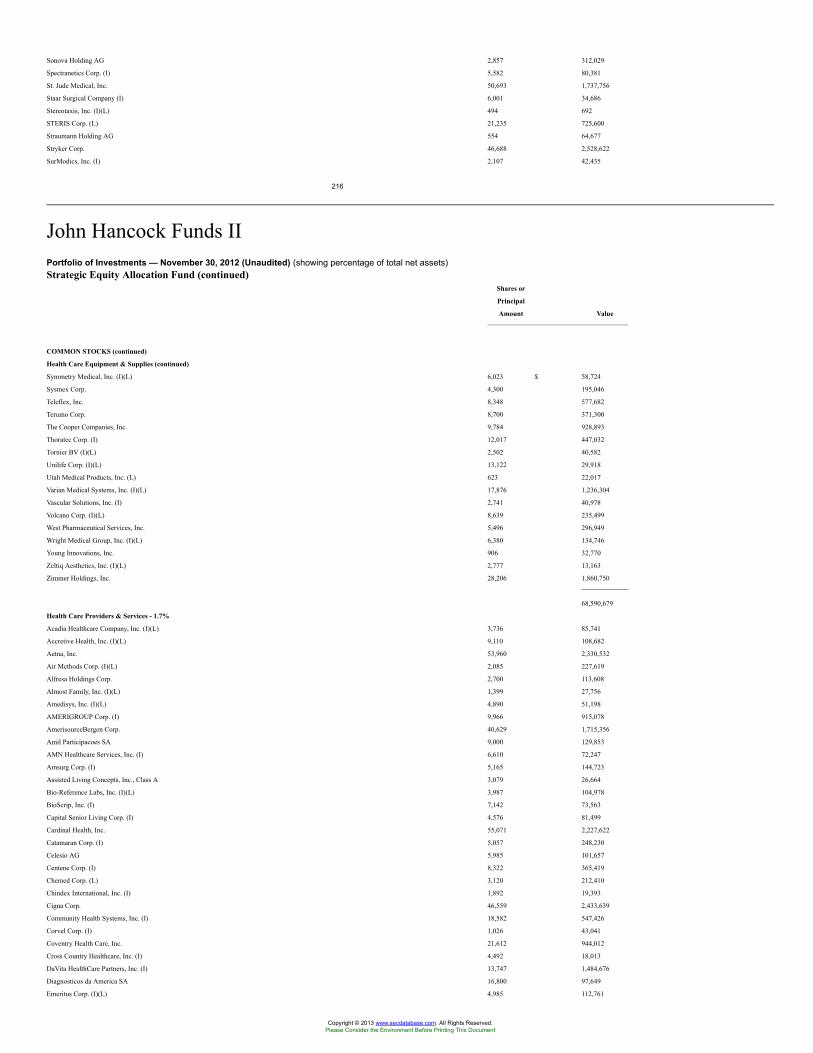
Sonova Holding AG 2,857 312,029
Spectranetics Corp. (I) 5,582 80,381
St. Jude Medical, Inc. 50,693 1,737,756
Staar Surgical Company (I) 6,001 34,686
Stereotaxis, Inc. (I)(L) 494 692
STERIS Corp. (L) 21,235 725,600
Straumann Holding AG 554 64,677
Stryker Corp. 46,688 2,528,622
SurModics, Inc. (I) 2,107 42,435
216
John Hancock Funds IIPortfolio of Investments — November 30, 2012 (Unaudited) (showing percentage of total net assets)Strategic Equity Allocation Fund (continued)
Shares or
Principal
Amount Value
COMMON STOCKS (continued)
Health Care Equipment & Supplies (continued)
Symmetry Medical, Inc. (I)(L) 6,023 $ 58,724
Sysmex Corp. 4,300 195,046
Teleflex, Inc. 8,348 577,682
Terumo Corp. 8,700 371,300
The Cooper Companies, Inc. 9,784 928,893
Thoratec Corp. (I) 12,017 447,032
Tornier BV (I)(L) 2,502 40,582
Unilife Corp. (I)(L) 13,122 29,918
Utah Medical Products, Inc. (L) 623 22,017
Varian Medical Systems, Inc. (I)(L) 17,876 1,236,304
Vascular Solutions, Inc. (I) 2,741 40,978
Volcano Corp. (I)(L) 8,639 235,499
West Pharmaceutical Services, Inc. 5,496 296,949
Wright Medical Group, Inc. (I)(L) 6,380 134,746
Young Innovations, Inc. 906 32,770
Zeltiq Aesthetics, Inc. (I)(L) 2,777 13,163
Zimmer Holdings, Inc. 28,206 1,860,750
68,590,679
Health Care Providers & Services - 1.7%
Acadia Healthcare Company, Inc. (I)(L) 3,736 85,741
Accretive Health, Inc. (I)(L) 9,110 108,682
Aetna, Inc. 53,960 2,330,532
Air Methods Corp. (I)(L) 2,085 227,619
Alfresa Holdings Corp. 2,700 113,608
Almost Family, Inc. (I)(L) 1,399 27,756
Amedisys, Inc. (I)(L) 4,890 51,198
AMERIGROUP Corp. (I) 9,966 915,078
AmerisourceBergen Corp. 40,629 1,715,356
Amil Participacoes SA 9,000 129,853
AMN Healthcare Services, Inc. (I) 6,610 72,247
Amsurg Corp. (I) 5,165 144,723
Assisted Living Concepts, Inc., Class A 3,079 26,664
Bio-Reference Labs, Inc. (I)(L) 3,987 104,978
BioScrip, Inc. (I) 7,142 73,563
Capital Senior Living Corp. (I) 4,576 81,499
Cardinal Health, Inc. 55,071 2,227,622
Catamaran Corp. (I) 5,057 248,230
Celesio AG 5,985 101,657
Centene Corp. (I) 8,322 365,419
Chemed Corp. (L) 3,120 212,410
Chindex International, Inc. (I) 1,892 19,393
Cigna Corp. 46,559 2,433,639
Community Health Systems, Inc. (I) 18,582 547,426
Corvel Corp. (I) 1,026 43,041
Coventry Health Care, Inc. 21,612 944,012
Cross Country Healthcare, Inc. (I) 4,492 18,013
DaVita HealthCare Partners, Inc. (I) 13,747 1,484,676
Diagnosticos da America SA 16,800 97,649
Emeritus Corp. (I)(L) 4,985 112,761
Copyright © 2013 www.secdatabase.com. All Rights Reserved.Please Consider the Environment Before Printing This Document
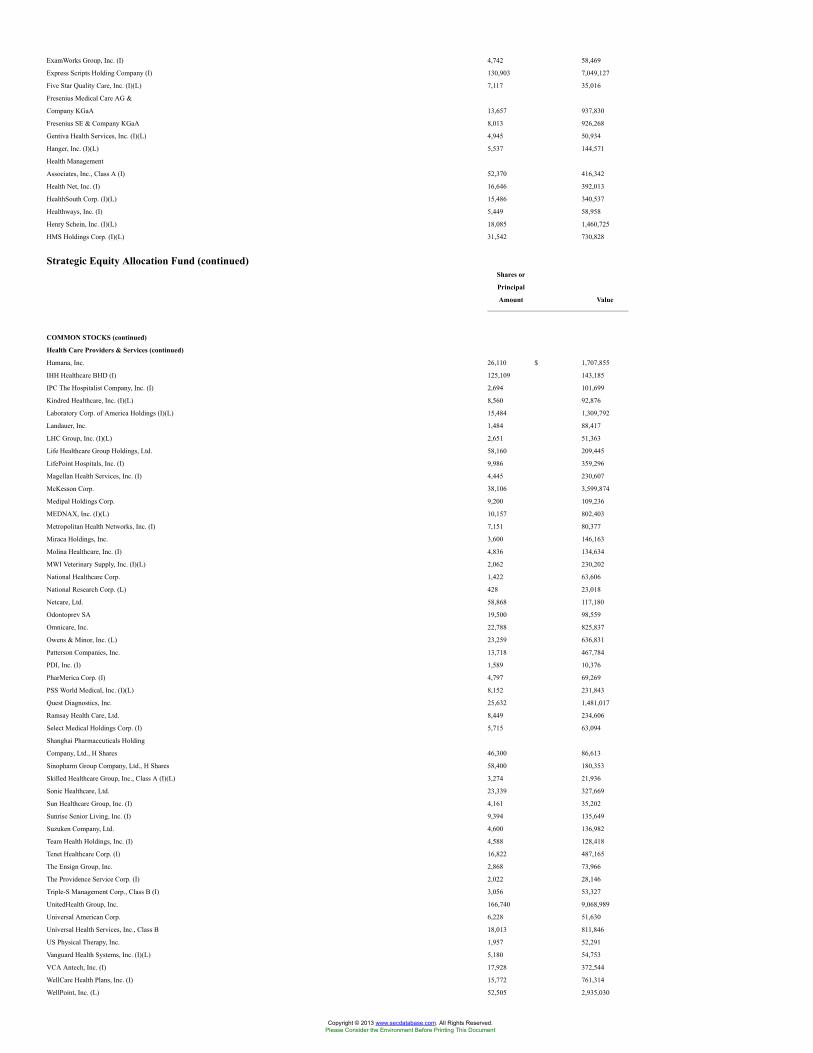
ExamWorks Group, Inc. (I) 4,742 58,469
Express Scripts Holding Company (I) 130,903 7,049,127
Five Star Quality Care, Inc. (I)(L) 7,117 35,016
Fresenius Medical Care AG &
Company KGaA 13,657 937,830
Fresenius SE & Company KGaA 8,013 926,268
Gentiva Health Services, Inc. (I)(L) 4,945 50,934
Hanger, Inc. (I)(L) 5,537 144,571
Health Management
Associates, Inc., Class A (I) 52,370 416,342
Health Net, Inc. (I) 16,646 392,013
HealthSouth Corp. (I)(L) 15,486 340,537
Healthways, Inc. (I) 5,449 58,958
Henry Schein, Inc. (I)(L) 18,085 1,460,725
HMS Holdings Corp. (I)(L) 31,542 730,828
Strategic Equity Allocation Fund (continued)Shares or
Principal
Amount Value
COMMON STOCKS (continued)
Health Care Providers & Services (continued)
Humana, Inc. 26,110 $ 1,707,855
IHH Healthcare BHD (I) 125,109 143,185
IPC The Hospitalist Company, Inc. (I) 2,694 101,699
Kindred Healthcare, Inc. (I)(L) 8,560 92,876
Laboratory Corp. of America Holdings (I)(L) 15,484 1,309,792
Landauer, Inc. 1,484 88,417
LHC Group, Inc. (I)(L) 2,651 51,363
Life Healthcare Group Holdings, Ltd. 58,160 209,445
LifePoint Hospitals, Inc. (I) 9,986 359,296
Magellan Health Services, Inc. (I) 4,445 230,607
McKesson Corp. 38,106 3,599,874
Medipal Holdings Corp. 9,200 109,236
MEDNAX, Inc. (I)(L) 10,157 802,403
Metropolitan Health Networks, Inc. (I) 7,151 80,377
Miraca Holdings, Inc. 3,600 146,163
Molina Healthcare, Inc. (I) 4,836 134,634
MWI Veterinary Supply, Inc. (I)(L) 2,062 230,202
National Healthcare Corp. 1,422 63,606
National Research Corp. (L) 428 23,018
Netcare, Ltd. 58,868 117,180
Odontoprev SA 19,500 98,559
Omnicare, Inc. 22,788 825,837
Owens & Minor, Inc. (L) 23,259 636,831
Patterson Companies, Inc. 13,718 467,784
PDI, Inc. (I) 1,589 10,376
PharMerica Corp. (I) 4,797 69,269
PSS World Medical, Inc. (I)(L) 8,152 231,843
Quest Diagnostics, Inc. 25,632 1,481,017
Ramsay Health Care, Ltd. 8,449 234,606
Select Medical Holdings Corp. (I) 5,715 63,094
Shanghai Pharmaceuticals Holding
Company, Ltd., H Shares 46,300 86,613
Sinopharm Group Company, Ltd., H Shares 58,400 180,353
Skilled Healthcare Group, Inc., Class A (I)(L) 3,274 21,936
Sonic Healthcare, Ltd. 23,339 327,669
Sun Healthcare Group, Inc. (I) 4,161 35,202
Sunrise Senior Living, Inc. (I) 9,394 135,649
Suzuken Company, Ltd. 4,600 136,982
Team Health Holdings, Inc. (I) 4,588 128,418
Tenet Healthcare Corp. (I) 16,822 487,165
The Ensign Group, Inc. 2,868 73,966
The Providence Service Corp. (I) 2,022 28,146
Triple-S Management Corp., Class B (I) 3,056 53,327
UnitedHealth Group, Inc. 166,740 9,068,989
Universal American Corp. 6,228 51,630
Universal Health Services, Inc., Class B 18,013 811,846
US Physical Therapy, Inc. 1,957 52,291
Vanguard Health Systems, Inc. (I)(L) 5,180 54,753
VCA Antech, Inc. (I) 17,928 372,544
WellCare Health Plans, Inc. (I) 15,772 761,314
WellPoint, Inc. (L) 52,505 2,935,030
Copyright © 2013 www.secdatabase.com. All Rights Reserved.Please Consider the Environment Before Printing This Document
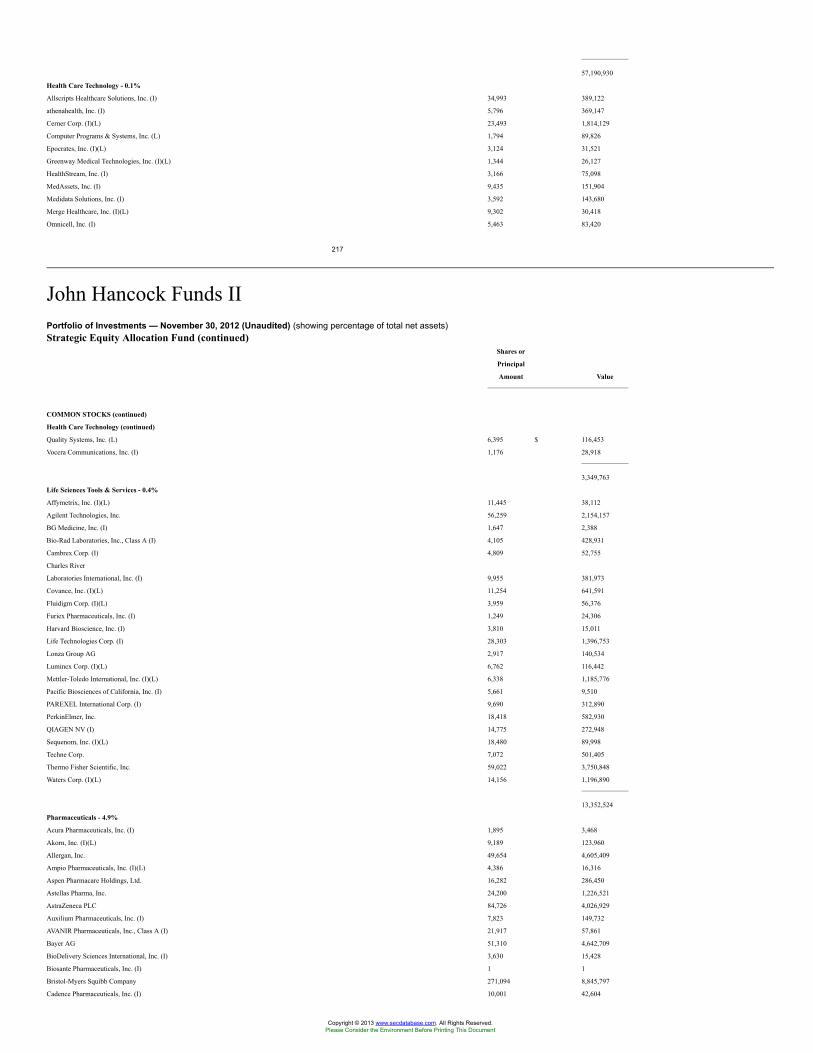
57,190,930
Health Care Technology - 0.1%
Allscripts Healthcare Solutions, Inc. (I) 34,993 389,122
athenahealth, Inc. (I) 5,796 369,147
Cerner Corp. (I)(L) 23,493 1,814,129
Computer Programs & Systems, Inc. (L) 1,794 89,826
Epocrates, Inc. (I)(L) 3,124 31,521
Greenway Medical Technologies, Inc. (I)(L) 1,344 26,127
HealthStream, Inc. (I) 3,166 75,098
MedAssets, Inc. (I) 9,435 151,904
Medidata Solutions, Inc. (I) 3,592 143,680
Merge Healthcare, Inc. (I)(L) 9,302 30,418
Omnicell, Inc. (I) 5,463 83,420
217
John Hancock Funds IIPortfolio of Investments — November 30, 2012 (Unaudited) (showing percentage of total net assets)Strategic Equity Allocation Fund (continued)
Shares or
Principal
Amount Value
COMMON STOCKS (continued)
Health Care Technology (continued)
Quality Systems, Inc. (L) 6,395 $ 116,453
Vocera Communications, Inc. (I) 1,176 28,918
3,349,763
Life Sciences Tools & Services - 0.4%
Affymetrix, Inc. (I)(L) 11,445 38,112
Agilent Technologies, Inc. 56,259 2,154,157
BG Medicine, Inc. (I) 1,647 2,388
Bio-Rad Laboratories, Inc., Class A (I) 4,105 428,931
Cambrex Corp. (I) 4,809 52,755
Charles River
Laboratories International, Inc. (I) 9,955 381,973
Covance, Inc. (I)(L) 11,254 641,591
Fluidigm Corp. (I)(L) 3,959 56,376
Furiex Pharmaceuticals, Inc. (I) 1,249 24,306
Harvard Bioscience, Inc. (I) 3,810 15,011
Life Technologies Corp. (I) 28,303 1,396,753
Lonza Group AG 2,917 140,534
Luminex Corp. (I)(L) 6,762 116,442
Mettler-Toledo International, Inc. (I)(L) 6,338 1,185,776
Pacific Biosciences of California, Inc. (I) 5,661 9,510
PAREXEL International Corp. (I) 9,690 312,890
PerkinElmer, Inc. 18,418 582,930
QIAGEN NV (I) 14,775 272,948
Sequenom, Inc. (I)(L) 18,480 89,998
Techne Corp. 7,072 501,405
Thermo Fisher Scientific, Inc. 59,022 3,750,848
Waters Corp. (I)(L) 14,156 1,196,890
13,352,524
Pharmaceuticals - 4.9%
Acura Pharmaceuticals, Inc. (I) 1,895 3,468
Akorn, Inc. (I)(L) 9,189 123,960
Allergan, Inc. 49,654 4,605,409
Ampio Pharmaceuticals, Inc. (I)(L) 4,386 16,316
Aspen Pharmacare Holdings, Ltd. 16,282 286,450
Astellas Pharma, Inc. 24,200 1,226,521
AstraZeneca PLC 84,726 4,026,929
Auxilium Pharmaceuticals, Inc. (I) 7,823 149,732
AVANIR Pharmaceuticals, Inc., Class A (I) 21,917 57,861
Bayer AG 51,310 4,642,709
BioDelivery Sciences International, Inc. (I) 3,630 15,428
Biosante Pharmaceuticals, Inc. (I) 1 1
Bristol-Myers Squibb Company 271,094 8,845,797
Cadence Pharmaceuticals, Inc. (I) 10,001 42,604
Copyright © 2013 www.secdatabase.com. All Rights Reserved.Please Consider the Environment Before Printing This Document
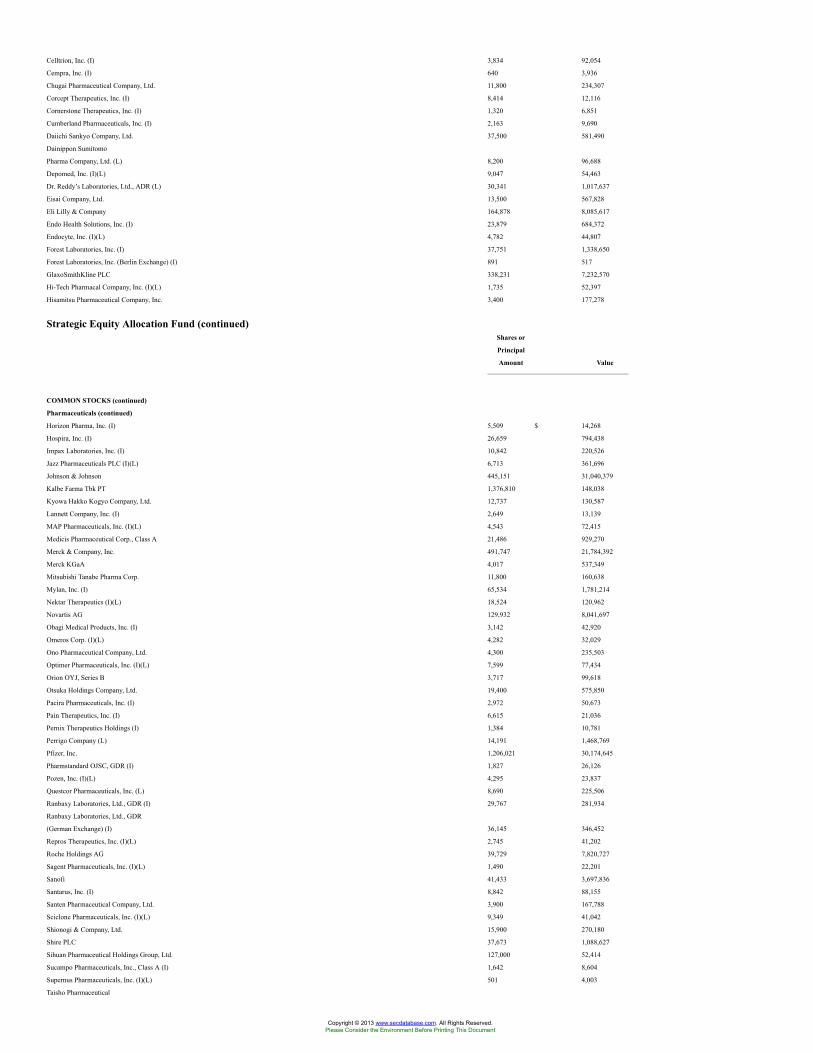
Celltrion, Inc. (I) 3,834 92,054
Cempra, Inc. (I) 640 3,936
Chugai Pharmaceutical Company, Ltd. 11,800 234,307
Corcept Therapeutics, Inc. (I) 8,414 12,116
Cornerstone Therapeutics, Inc. (I) 1,320 6,851
Cumberland Pharmaceuticals, Inc. (I) 2,163 9,690
Daiichi Sankyo Company, Ltd. 37,500 581,490
Dainippon Sumitomo
Pharma Company, Ltd. (L) 8,200 96,688
Depomed, Inc. (I)(L) 9,047 54,463
Dr. Reddy’s Laboratories, Ltd., ADR (L) 30,341 1,017,637
Eisai Company, Ltd. 13,500 567,828
Eli Lilly & Company 164,878 8,085,617
Endo Health Solutions, Inc. (I) 23,879 684,372
Endocyte, Inc. (I)(L) 4,782 44,807
Forest Laboratories, Inc. (I) 37,751 1,338,650
Forest Laboratories, Inc. (Berlin Exchange) (I) 891 517
GlaxoSmithKline PLC 338,231 7,232,570
Hi-Tech Pharmacal Company, Inc. (I)(L) 1,735 52,397
Hisamitsu Pharmaceutical Company, Inc. 3,400 177,278
Strategic Equity Allocation Fund (continued)Shares or
Principal
Amount Value
COMMON STOCKS (continued)
Pharmaceuticals (continued)
Horizon Pharma, Inc. (I) 5,509 $ 14,268
Hospira, Inc. (I) 26,659 794,438
Impax Laboratories, Inc. (I) 10,842 220,526
Jazz Pharmaceuticals PLC (I)(L) 6,713 361,696
Johnson & Johnson 445,151 31,040,379
Kalbe Farma Tbk PT 1,376,810 148,038
Kyowa Hakko Kogyo Company, Ltd. 12,737 130,587
Lannett Company, Inc. (I) 2,649 13,139
MAP Pharmaceuticals, Inc. (I)(L) 4,543 72,415
Medicis Pharmaceutical Corp., Class A 21,486 929,270
Merck & Company, Inc. 491,747 21,784,392
Merck KGaA 4,017 537,349
Mitsubishi Tanabe Pharma Corp. 11,800 160,638
Mylan, Inc. (I) 65,534 1,781,214
Nektar Therapeutics (I)(L) 18,524 120,962
Novartis AG 129,932 8,041,697
Obagi Medical Products, Inc. (I) 3,142 42,920
Omeros Corp. (I)(L) 4,282 32,029
Ono Pharmaceutical Company, Ltd. 4,300 235,503
Optimer Pharmaceuticals, Inc. (I)(L) 7,599 77,434
Orion OYJ, Series B 3,717 99,618
Otsuka Holdings Company, Ltd. 19,400 575,850
Pacira Pharmaceuticals, Inc. (I) 2,972 50,673
Pain Therapeutics, Inc. (I) 6,615 21,036
Pernix Therapeutics Holdings (I) 1,384 10,781
Perrigo Company (L) 14,191 1,468,769
Pfizer, Inc. 1,206,021 30,174,645
Pharmstandard OJSC, GDR (I) 1,827 26,126
Pozen, Inc. (I)(L) 4,295 23,837
Questcor Pharmaceuticals, Inc. (L) 8,690 225,506
Ranbaxy Laboratories, Ltd., GDR (I) 29,767 281,934
Ranbaxy Laboratories, Ltd., GDR
(German Exchange) (I) 36,145 346,452
Repros Therapeutics, Inc. (I)(L) 2,745 41,202
Roche Holdings AG 39,729 7,820,727
Sagent Pharmaceuticals, Inc. (I)(L) 1,490 22,201
Sanofi 41,433 3,697,836
Santarus, Inc. (I) 8,842 88,155
Santen Pharmaceutical Company, Ltd. 3,900 167,788
Sciclone Pharmaceuticals, Inc. (I)(L) 9,349 41,042
Shionogi & Company, Ltd. 15,900 270,180
Shire PLC 37,673 1,088,627
Sihuan Pharmaceutical Holdings Group, Ltd. 127,000 52,414
Sucampo Pharmaceuticals, Inc., Class A (I) 1,642 8,604
Supernus Pharmaceuticals, Inc. (I)(L) 501 4,003
Taisho Pharmaceutical
Copyright © 2013 www.secdatabase.com. All Rights Reserved.Please Consider the Environment Before Printing This Document
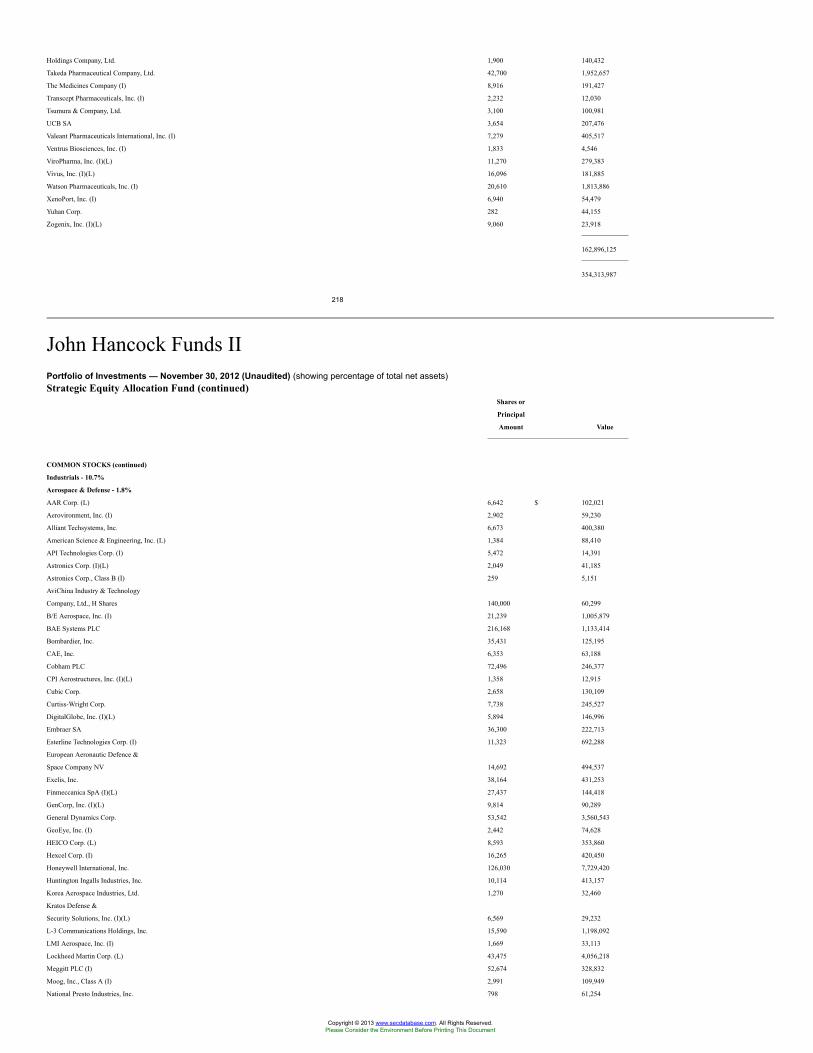
Holdings Company, Ltd. 1,900 140,432
Takeda Pharmaceutical Company, Ltd. 42,700 1,952,657
The Medicines Company (I) 8,916 191,427
Transcept Pharmaceuticals, Inc. (I) 2,232 12,030
Tsumura & Company, Ltd. 3,100 100,981
UCB SA 3,654 207,476
Valeant Pharmaceuticals International, Inc. (I) 7,279 405,517
Ventrus Biosciences, Inc. (I) 1,833 4,546
ViroPharma, Inc. (I)(L) 11,270 279,383
Vivus, Inc. (I)(L) 16,096 181,885
Watson Pharmaceuticals, Inc. (I) 20,610 1,813,886
XenoPort, Inc. (I) 6,940 54,479
Yuhan Corp. 282 44,155
Zogenix, Inc. (I)(L) 9,060 23,918
162,896,125
354,313,987
218
John Hancock Funds IIPortfolio of Investments — November 30, 2012 (Unaudited) (showing percentage of total net assets)Strategic Equity Allocation Fund (continued)
Shares or
Principal
Amount Value
COMMON STOCKS (continued)
Industrials - 10.7%
Aerospace & Defense - 1.8%
AAR Corp. (L) 6,642 $ 102,021
Aerovironment, Inc. (I) 2,902 59,230
Alliant Techsystems, Inc. 6,673 400,380
American Science & Engineering, Inc. (L) 1,384 88,410
API Technologies Corp. (I) 5,472 14,391
Astronics Corp. (I)(L) 2,049 41,185
Astronics Corp., Class B (I) 259 5,151
AviChina Industry & Technology
Company, Ltd., H Shares 140,000 60,299
B/E Aerospace, Inc. (I) 21,239 1,005,879
BAE Systems PLC 216,168 1,133,414
Bombardier, Inc. 35,431 125,195
CAE, Inc. 6,353 63,188
Cobham PLC 72,496 246,377
CPI Aerostructures, Inc. (I)(L) 1,358 12,915
Cubic Corp. 2,658 130,109
Curtiss-Wright Corp. 7,738 245,527
DigitalGlobe, Inc. (I)(L) 5,894 146,996
Embraer SA 36,300 222,713
Esterline Technologies Corp. (I) 11,323 692,288
European Aeronautic Defence &
Space Company NV 14,692 494,537
Exelis, Inc. 38,164 431,253
Finmeccanica SpA (I)(L) 27,437 144,418
GenCorp, Inc. (I)(L) 9,814 90,289
General Dynamics Corp. 53,542 3,560,543
GeoEye, Inc. (I) 2,442 74,628
HEICO Corp. (L) 8,593 353,860
Hexcel Corp. (I) 16,265 420,450
Honeywell International, Inc. 126,030 7,729,420
Huntington Ingalls Industries, Inc. 10,114 413,157
Korea Aerospace Industries, Ltd. 1,270 32,460
Kratos Defense &
Security Solutions, Inc. (I)(L) 6,569 29,232
L-3 Communications Holdings, Inc. 15,590 1,198,092
LMI Aerospace, Inc. (I) 1,669 33,113
Lockheed Martin Corp. (L) 43,475 4,056,218
Meggitt PLC (I) 52,674 328,832
Moog, Inc., Class A (I) 2,991 109,949
National Presto Industries, Inc. 798 61,254
Copyright © 2013 www.secdatabase.com. All Rights Reserved.Please Consider the Environment Before Printing This Document
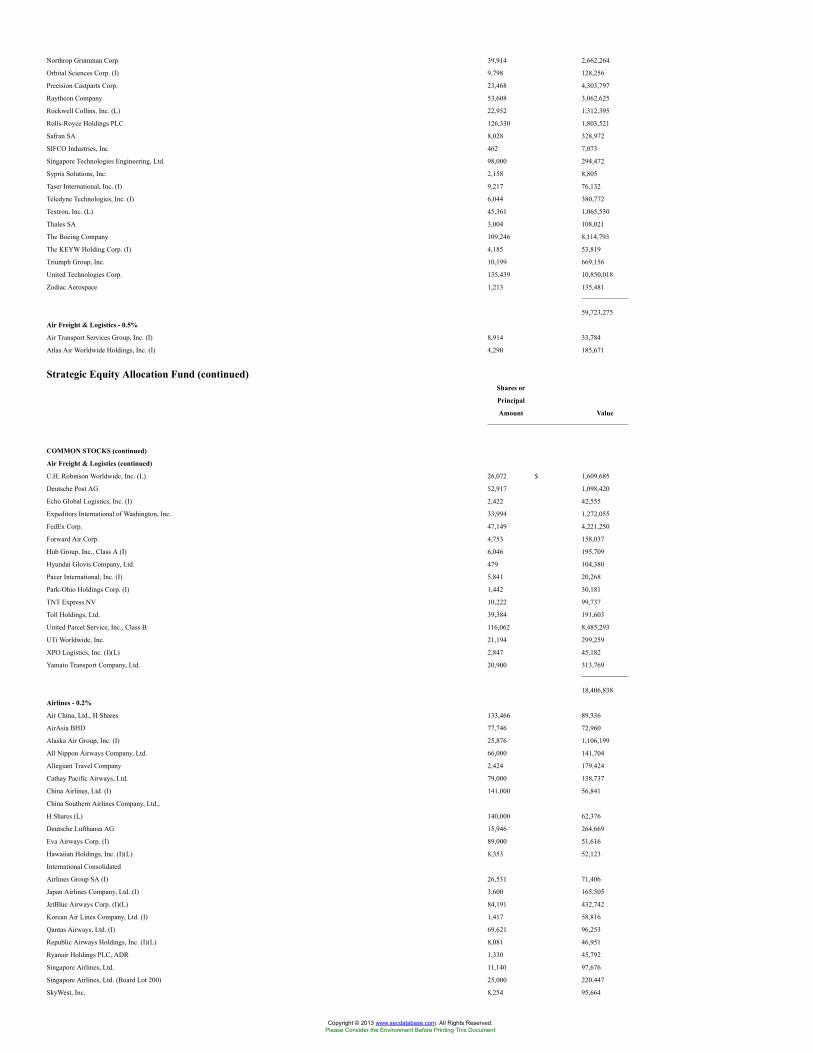
Northrop Grumman Corp. 39,914 2,662,264
Orbital Sciences Corp. (I) 9,798 128,256
Precision Castparts Corp. 23,468 4,303,797
Raytheon Company 53,608 3,062,625
Rockwell Collins, Inc. (L) 22,952 1,312,395
Rolls-Royce Holdings PLC 126,330 1,803,521
Safran SA 8,028 328,972
SIFCO Industries, Inc. 462 7,073
Singapore Technologies Engineering, Ltd. 98,000 294,472
Sypris Solutions, Inc. 2,158 8,805
Taser International, Inc. (I) 9,217 76,132
Teledyne Technologies, Inc. (I) 6,044 380,772
Textron, Inc. (L) 45,361 1,065,530
Thales SA 3,004 108,021
The Boeing Company 109,246 8,114,793
The KEYW Holding Corp. (I) 4,185 53,819
Triumph Group, Inc. 10,199 669,156
United Technologies Corp. 135,439 10,850,018
Zodiac Aerospace 1,213 135,481
59,723,275
Air Freight & Logistics - 0.5%
Air Transport Services Group, Inc. (I) 8,914 33,784
Atlas Air Worldwide Holdings, Inc. (I) 4,290 185,671
Strategic Equity Allocation Fund (continued)Shares or
Principal
Amount Value
COMMON STOCKS (continued)
Air Freight & Logistics (continued)
C.H. Robinson Worldwide, Inc. (L) 26,072 $ 1,609,685
Deutsche Post AG 52,917 1,098,420
Echo Global Logistics, Inc. (I) 2,422 42,555
Expeditors International of Washington, Inc. 33,994 1,272,055
FedEx Corp. 47,149 4,221,250
Forward Air Corp. 4,753 158,037
Hub Group, Inc., Class A (I) 6,046 195,709
Hyundai Glovis Company, Ltd. 479 104,380
Pacer International, Inc. (I) 5,841 20,268
Park-Ohio Holdings Corp. (I) 1,442 30,181
TNT Express NV 10,222 99,737
Toll Holdings, Ltd. 39,384 191,603
United Parcel Service, Inc., Class B 116,062 8,485,293
UTi Worldwide, Inc. 21,194 299,259
XPO Logistics, Inc. (I)(L) 2,847 45,182
Yamato Transport Company, Ltd. 20,900 313,769
18,406,838
Airlines - 0.2%
Air China, Ltd., H Shares 133,466 89,336
AirAsia BHD 77,746 72,960
Alaska Air Group, Inc. (I) 25,876 1,106,199
All Nippon Airways Company, Ltd. 66,000 141,704
Allegiant Travel Company 2,424 179,424
Cathay Pacific Airways, Ltd. 79,000 138,737
China Airlines, Ltd. (I) 141,000 56,841
China Southern Airlines Company, Ltd.,
H Shares (L) 140,000 62,376
Deutsche Lufthansa AG 15,946 264,669
Eva Airways Corp. (I) 89,000 51,616
Hawaiian Holdings, Inc. (I)(L) 8,353 52,123
International Consolidated
Airlines Group SA (I) 26,531 71,406
Japan Airlines Company, Ltd. (I) 3,600 165,505
JetBlue Airways Corp. (I)(L) 84,191 432,742
Korean Air Lines Company, Ltd. (I) 1,417 58,816
Qantas Airways, Ltd. (I) 69,621 96,253
Republic Airways Holdings, Inc. (I)(L) 8,081 46,951
Ryanair Holdings PLC, ADR 1,330 45,792
Singapore Airlines, Ltd. 11,140 97,676
Singapore Airlines, Ltd. (Board Lot 200) 25,000 220,447
SkyWest, Inc. 8,254 95,664
Copyright © 2013 www.secdatabase.com. All Rights Reserved.Please Consider the Environment Before Printing This Document
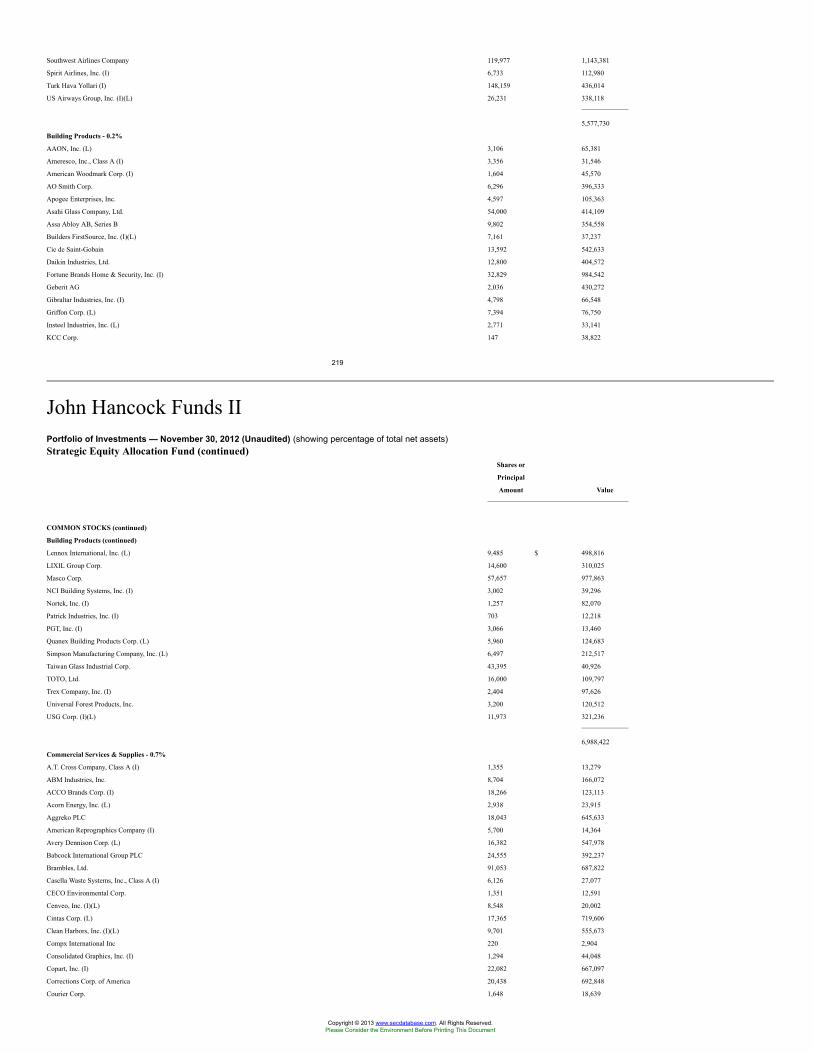
Southwest Airlines Company 119,977 1,143,381
Spirit Airlines, Inc. (I) 6,733 112,980
Turk Hava Yollari (I) 148,159 436,014
US Airways Group, Inc. (I)(L) 26,231 338,118
5,577,730
Building Products - 0.2%
AAON, Inc. (L) 3,106 65,381
Ameresco, Inc., Class A (I) 3,356 31,546
American Woodmark Corp. (I) 1,604 45,570
AO Smith Corp. 6,296 396,333
Apogee Enterprises, Inc. 4,597 105,363
Asahi Glass Company, Ltd. 54,000 414,109
Assa Abloy AB, Series B 9,802 354,558
Builders FirstSource, Inc. (I)(L) 7,161 37,237
Cie de Saint-Gobain 13,592 542,633
Daikin Industries, Ltd. 12,800 404,572
Fortune Brands Home & Security, Inc. (I) 32,829 984,542
Geberit AG 2,036 430,272
Gibraltar Industries, Inc. (I) 4,798 66,548
Griffon Corp. (L) 7,394 76,750
Insteel Industries, Inc. (L) 2,771 33,141
KCC Corp. 147 38,822
219
John Hancock Funds IIPortfolio of Investments — November 30, 2012 (Unaudited) (showing percentage of total net assets)Strategic Equity Allocation Fund (continued)
Shares or
Principal
Amount Value
COMMON STOCKS (continued)
Building Products (continued)
Lennox International, Inc. (L) 9,485 $ 498,816
LIXIL Group Corp. 14,600 310,025
Masco Corp. 57,657 977,863
NCI Building Systems, Inc. (I) 3,002 39,296
Nortek, Inc. (I) 1,257 82,070
Patrick Industries, Inc. (I) 703 12,218
PGT, Inc. (I) 3,066 13,460
Quanex Building Products Corp. (L) 5,960 124,683
Simpson Manufacturing Company, Inc. (L) 6,497 212,517
Taiwan Glass Industrial Corp. 43,395 40,926
TOTO, Ltd. 16,000 109,797
Trex Company, Inc. (I) 2,404 97,626
Universal Forest Products, Inc. 3,200 120,512
USG Corp. (I)(L) 11,973 321,236
6,988,422
Commercial Services & Supplies - 0.7%
A.T. Cross Company, Class A (I) 1,355 13,279
ABM Industries, Inc. 8,704 166,072
ACCO Brands Corp. (I) 18,266 123,113
Acorn Energy, Inc. (L) 2,938 23,915
Aggreko PLC 18,043 645,633
American Reprographics Company (I) 5,700 14,364
Avery Dennison Corp. (L) 16,382 547,978
Babcock International Group PLC 24,555 392,237
Brambles, Ltd. 91,053 687,822
Casella Waste Systems, Inc., Class A (I) 6,126 27,077
CECO Environmental Corp. 1,351 12,591
Cenveo, Inc. (I)(L) 8,548 20,002
Cintas Corp. (L) 17,365 719,606
Clean Harbors, Inc. (I)(L) 9,701 555,673
Compx International Inc 220 2,904
Consolidated Graphics, Inc. (I) 1,294 44,048
Copart, Inc. (I) 22,082 667,097
Corrections Corp. of America 20,438 692,848
Courier Corp. 1,648 18,639
Copyright © 2013 www.secdatabase.com. All Rights Reserved.Please Consider the Environment Before Printing This Document
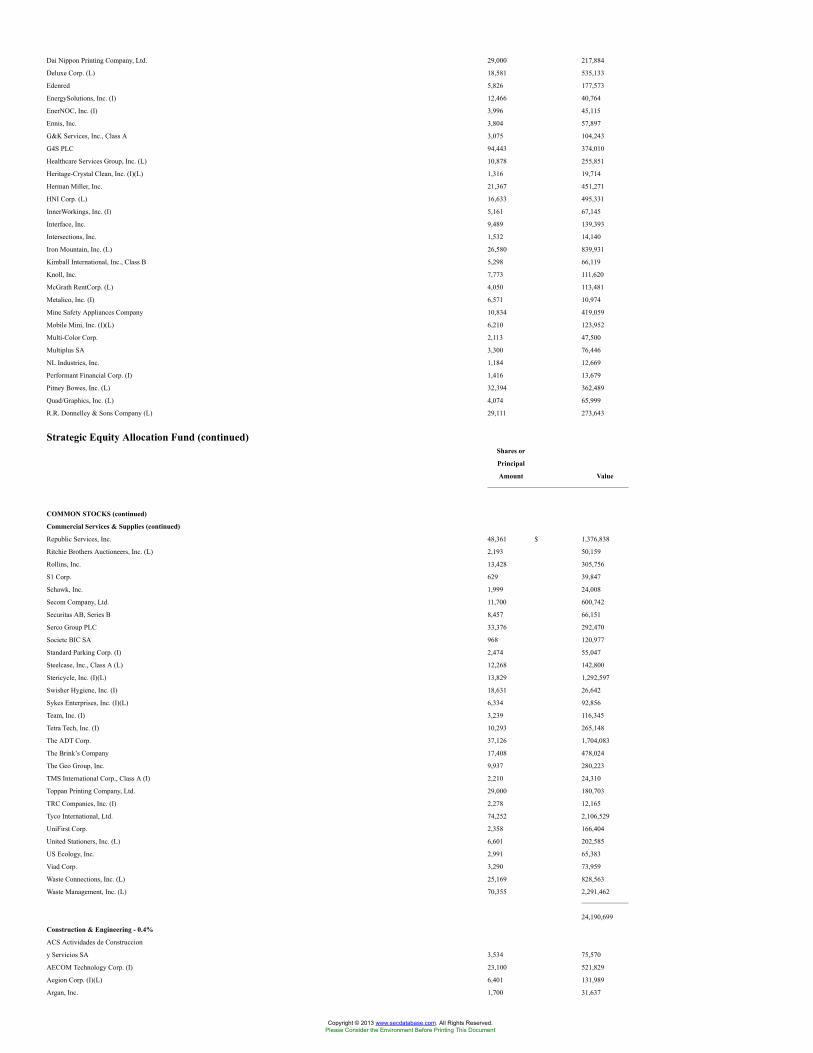
Dai Nippon Printing Company, Ltd. 29,000 217,884
Deluxe Corp. (L) 18,581 535,133
Edenred 5,826 177,573
EnergySolutions, Inc. (I) 12,466 40,764
EnerNOC, Inc. (I) 3,996 45,115
Ennis, Inc. 3,804 57,897
G&K Services, Inc., Class A 3,075 104,243
G4S PLC 94,443 374,010
Healthcare Services Group, Inc. (L) 10,878 255,851
Heritage-Crystal Clean, Inc. (I)(L) 1,316 19,714
Herman Miller, Inc. 21,367 451,271
HNI Corp. (L) 16,633 495,331
InnerWorkings, Inc. (I) 5,161 67,145
Interface, Inc. 9,489 139,393
Intersections, Inc. 1,532 14,140
Iron Mountain, Inc. (L) 26,580 839,931
Kimball International, Inc., Class B 5,298 66,119
Knoll, Inc. 7,773 111,620
McGrath RentCorp. (L) 4,050 113,481
Metalico, Inc. (I) 6,571 10,974
Mine Safety Appliances Company 10,834 419,059
Mobile Mini, Inc. (I)(L) 6,210 123,952
Multi-Color Corp. 2,113 47,500
Multiplus SA 3,300 76,446
NL Industries, Inc. 1,184 12,669
Performant Financial Corp. (I) 1,416 13,679
Pitney Bowes, Inc. (L) 32,394 362,489
Quad/Graphics, Inc. (L) 4,074 65,999
R.R. Donnelley & Sons Company (L) 29,111 273,643
Strategic Equity Allocation Fund (continued)Shares or
Principal
Amount Value
COMMON STOCKS (continued)
Commercial Services & Supplies (continued)
Republic Services, Inc. 48,361 $ 1,376,838
Ritchie Brothers Auctioneers, Inc. (L) 2,193 50,159
Rollins, Inc. 13,428 305,756
S1 Corp. 629 39,847
Schawk, Inc. 1,999 24,008
Secom Company, Ltd. 11,700 600,742
Securitas AB, Series B 8,457 66,151
Serco Group PLC 33,376 292,470
Societe BIC SA 968 120,977
Standard Parking Corp. (I) 2,474 55,047
Steelcase, Inc., Class A (L) 12,268 142,800
Stericycle, Inc. (I)(L) 13,829 1,292,597
Swisher Hygiene, Inc. (I) 18,631 26,642
Sykes Enterprises, Inc. (I)(L) 6,334 92,856
Team, Inc. (I) 3,239 116,345
Tetra Tech, Inc. (I) 10,293 265,148
The ADT Corp. 37,126 1,704,083
The Brink’s Company 17,408 478,024
The Geo Group, Inc. 9,937 280,223
TMS International Corp., Class A (I) 2,210 24,310
Toppan Printing Company, Ltd. 29,000 180,703
TRC Companies, Inc. (I) 2,278 12,165
Tyco International, Ltd. 74,252 2,106,529
UniFirst Corp. 2,358 166,404
United Stationers, Inc. (L) 6,601 202,585
US Ecology, Inc. 2,991 65,383
Viad Corp. 3,290 73,959
Waste Connections, Inc. (L) 25,169 828,563
Waste Management, Inc. (L) 70,355 2,291,462
24,190,699
Construction & Engineering - 0.4%
ACS Actividades de Construccion
y Servicios SA 3,534 75,570
AECOM Technology Corp. (I) 23,100 521,829
Aegion Corp. (I)(L) 6,401 131,989
Argan, Inc. 1,700 31,637
Copyright © 2013 www.secdatabase.com. All Rights Reserved.Please Consider the Environment Before Printing This Document
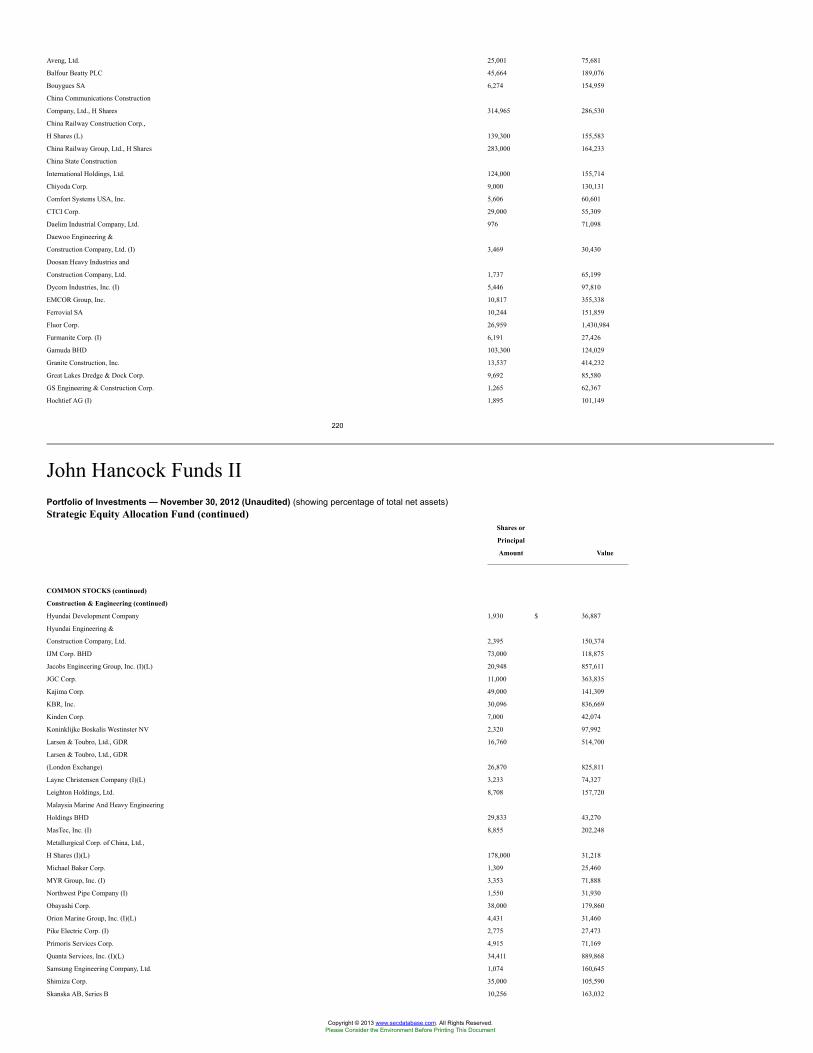
Aveng, Ltd. 25,001 75,681
Balfour Beatty PLC 45,664 189,076
Bouygues SA 6,274 154,959
China Communications Construction
Company, Ltd., H Shares 314,965 286,530
China Railway Construction Corp.,
H Shares (L) 139,300 155,583
China Railway Group, Ltd., H Shares 283,000 164,233
China State Construction
International Holdings, Ltd. 124,000 155,714
Chiyoda Corp. 9,000 130,131
Comfort Systems USA, Inc. 5,606 60,601
CTCI Corp. 29,000 55,309
Daelim Industrial Company, Ltd. 976 71,098
Daewoo Engineering &
Construction Company, Ltd. (I) 3,469 30,430
Doosan Heavy Industries and
Construction Company, Ltd. 1,737 65,199
Dycom Industries, Inc. (I) 5,446 97,810
EMCOR Group, Inc. 10,817 355,338
Ferrovial SA 10,244 151,859
Fluor Corp. 26,959 1,430,984
Furmanite Corp. (I) 6,191 27,426
Gamuda BHD 103,300 124,029
Granite Construction, Inc. 13,537 414,232
Great Lakes Dredge & Dock Corp. 9,692 85,580
GS Engineering & Construction Corp. 1,265 62,367
Hochtief AG (I) 1,895 101,149
220
John Hancock Funds IIPortfolio of Investments — November 30, 2012 (Unaudited) (showing percentage of total net assets)Strategic Equity Allocation Fund (continued)
Shares or
Principal
Amount Value
COMMON STOCKS (continued)
Construction & Engineering (continued)
Hyundai Development Company 1,930 $ 36,887
Hyundai Engineering &
Construction Company, Ltd. 2,395 150,374
IJM Corp. BHD 73,000 118,875
Jacobs Engineering Group, Inc. (I)(L) 20,948 857,611
JGC Corp. 11,000 363,835
Kajima Corp. 49,000 141,309
KBR, Inc. 30,096 836,669
Kinden Corp. 7,000 42,074
Koninklijke Boskalis Westinster NV 2,320 97,992
Larsen & Toubro, Ltd., GDR 16,760 514,700
Larsen & Toubro, Ltd., GDR
(London Exchange) 26,870 825,811
Layne Christensen Company (I)(L) 3,233 74,327
Leighton Holdings, Ltd. 8,708 157,720
Malaysia Marine And Heavy Engineering
Holdings BHD 29,833 43,270
MasTec, Inc. (I) 8,855 202,248
Metallurgical Corp. of China, Ltd.,
H Shares (I)(L) 178,000 31,218
Michael Baker Corp. 1,309 25,460
MYR Group, Inc. (I) 3,353 71,888
Northwest Pipe Company (I) 1,550 31,930
Obayashi Corp. 38,000 179,860
Orion Marine Group, Inc. (I)(L) 4,431 31,460
Pike Electric Corp. (I) 2,775 27,473
Primoris Services Corp. 4,915 71,169
Quanta Services, Inc. (I)(L) 34,411 889,868
Samsung Engineering Company, Ltd. 1,074 160,645
Shimizu Corp. 35,000 105,590
Skanska AB, Series B 10,256 163,032
Copyright © 2013 www.secdatabase.com. All Rights Reserved.Please Consider the Environment Before Printing This Document
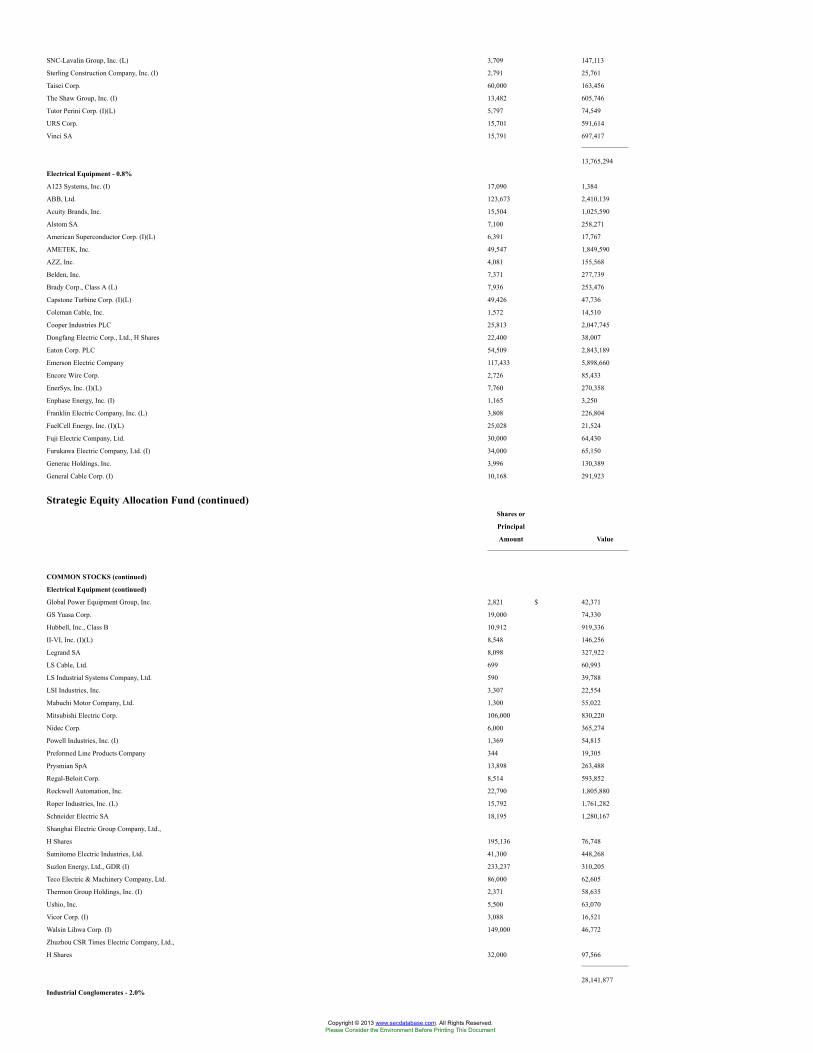
SNC-Lavalin Group, Inc. (L) 3,709 147,113
Sterling Construction Company, Inc. (I) 2,791 25,761
Taisei Corp. 60,000 163,456
The Shaw Group, Inc. (I) 13,482 605,746
Tutor Perini Corp. (I)(L) 5,797 74,549
URS Corp. 15,701 591,614
Vinci SA 15,791 697,417
13,765,294
Electrical Equipment - 0.8%
A123 Systems, Inc. (I) 17,090 1,384
ABB, Ltd. 123,673 2,410,139
Acuity Brands, Inc. 15,504 1,025,590
Alstom SA 7,100 258,271
American Superconductor Corp. (I)(L) 6,391 17,767
AMETEK, Inc. 49,547 1,849,590
AZZ, Inc. 4,081 155,568
Belden, Inc. 7,371 277,739
Brady Corp., Class A (L) 7,936 253,476
Capstone Turbine Corp. (I)(L) 49,426 47,736
Coleman Cable, Inc. 1,572 14,510
Cooper Industries PLC 25,813 2,047,745
Dongfang Electric Corp., Ltd., H Shares 22,400 38,007
Eaton Corp. PLC 54,509 2,843,189
Emerson Electric Company 117,433 5,898,660
Encore Wire Corp. 2,726 85,433
EnerSys, Inc. (I)(L) 7,760 270,358
Enphase Energy, Inc. (I) 1,165 3,250
Franklin Electric Company, Inc. (L) 3,808 226,804
FuelCell Energy, Inc. (I)(L) 25,028 21,524
Fuji Electric Company, Ltd. 30,000 64,430
Furukawa Electric Company, Ltd. (I) 34,000 65,150
Generac Holdings, Inc. 3,996 130,389
General Cable Corp. (I) 10,168 291,923
Strategic Equity Allocation Fund (continued)Shares or
Principal
Amount Value
COMMON STOCKS (continued)
Electrical Equipment (continued)
Global Power Equipment Group, Inc. 2,821 $ 42,371
GS Yuasa Corp. 19,000 74,330
Hubbell, Inc., Class B 10,912 919,336
II-VI, Inc. (I)(L) 8,548 146,256
Legrand SA 8,098 327,922
LS Cable, Ltd. 699 60,993
LS Industrial Systems Company, Ltd. 590 39,788
LSI Industries, Inc. 3,307 22,554
Mabuchi Motor Company, Ltd. 1,300 55,022
Mitsubishi Electric Corp. 106,000 830,220
Nidec Corp. 6,000 365,274
Powell Industries, Inc. (I) 1,369 54,815
Preformed Line Products Company 344 19,305
Prysmian SpA 13,898 263,488
Regal-Beloit Corp. 8,514 593,852
Rockwell Automation, Inc. 22,790 1,805,880
Roper Industries, Inc. (L) 15,792 1,761,282
Schneider Electric SA 18,195 1,280,167
Shanghai Electric Group Company, Ltd.,
H Shares 195,136 76,748
Sumitomo Electric Industries, Ltd. 41,300 448,268
Suzlon Energy, Ltd., GDR (I) 233,237 310,205
Teco Electric & Machinery Company, Ltd. 86,000 62,605
Thermon Group Holdings, Inc. (I) 2,371 58,635
Ushio, Inc. 5,500 63,070
Vicor Corp. (I) 3,088 16,521
Walsin Lihwa Corp. (I) 149,000 46,772
Zhuzhou CSR Times Electric Company, Ltd.,
H Shares 32,000 97,566
28,141,877
Industrial Conglomerates - 2.0%
Copyright © 2013 www.secdatabase.com. All Rights Reserved.Please Consider the Environment Before Printing This Document
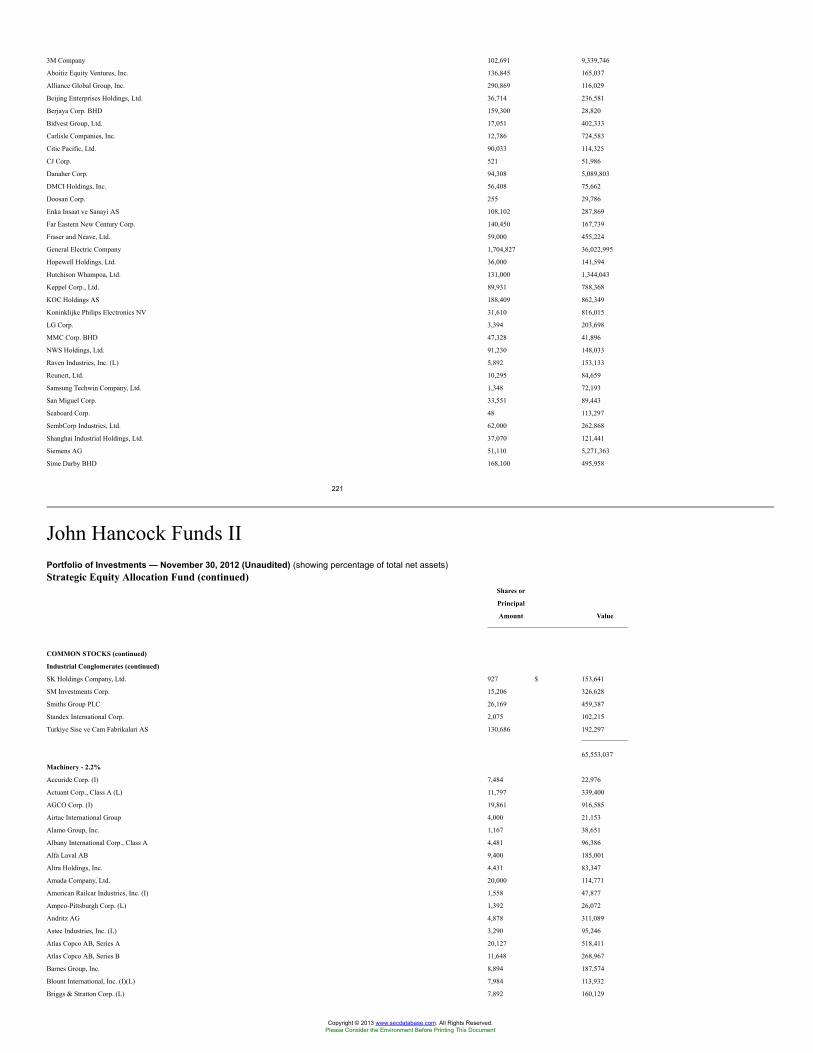
3M Company 102,691 9,339,746
Aboitiz Equity Ventures, Inc. 136,845 165,037
Alliance Global Group, Inc. 290,869 116,029
Beijing Enterprises Holdings, Ltd. 36,714 236,581
Berjaya Corp. BHD 159,300 28,820
Bidvest Group, Ltd. 17,051 402,333
Carlisle Companies, Inc. 12,786 724,583
Citic Pacific, Ltd. 90,033 114,325
CJ Corp. 521 51,986
Danaher Corp. 94,308 5,089,803
DMCI Holdings, Inc. 56,408 75,662
Doosan Corp. 255 29,786
Enka Insaat ve Sanayi AS 108,102 287,869
Far Eastern New Century Corp. 140,450 167,739
Fraser and Neave, Ltd. 59,000 455,224
General Electric Company 1,704,827 36,022,995
Hopewell Holdings, Ltd. 36,000 141,594
Hutchison Whampoa, Ltd. 131,000 1,344,043
Keppel Corp., Ltd. 89,931 788,368
KOC Holdings AS 188,409 862,349
Koninklijke Philips Electronics NV 31,610 816,015
LG Corp. 3,394 203,698
MMC Corp. BHD 47,328 41,896
NWS Holdings, Ltd. 91,230 148,033
Raven Industries, Inc. (L) 5,892 153,133
Reunert, Ltd. 10,295 84,659
Samsung Techwin Company, Ltd. 1,348 72,193
San Miguel Corp. 33,551 89,443
Seaboard Corp. 48 113,297
SembCorp Industries, Ltd. 62,000 262,868
Shanghai Industrial Holdings, Ltd. 37,070 121,441
Siemens AG 51,110 5,271,363
Sime Darby BHD 168,100 495,958
221
John Hancock Funds IIPortfolio of Investments — November 30, 2012 (Unaudited) (showing percentage of total net assets)Strategic Equity Allocation Fund (continued)
Shares or
Principal
Amount Value
COMMON STOCKS (continued)
Industrial Conglomerates (continued)
SK Holdings Company, Ltd. 927 $ 153,641
SM Investments Corp. 15,206 326,628
Smiths Group PLC 26,169 459,387
Standex International Corp. 2,075 102,215
Turkiye Sise ve Cam Fabrikalari AS 130,686 192,297
65,553,037
Machinery - 2.2%
Accuride Corp. (I) 7,484 22,976
Actuant Corp., Class A (L) 11,797 339,400
AGCO Corp. (I) 19,861 916,585
Airtac International Group 4,000 21,153
Alamo Group, Inc. 1,167 38,651
Albany International Corp., Class A 4,481 96,386
Alfa Laval AB 9,400 185,001
Altra Holdings, Inc. 4,431 83,347
Amada Company, Ltd. 20,000 114,771
American Railcar Industries, Inc. (I) 1,558 47,877
Ampco-Pittsburgh Corp. (L) 1,392 26,072
Andritz AG 4,878 311,089
Astec Industries, Inc. (L) 3,290 95,246
Atlas Copco AB, Series A 20,127 518,411
Atlas Copco AB, Series B 11,648 268,967
Barnes Group, Inc. 8,894 187,574
Blount International, Inc. (I)(L) 7,984 113,932
Briggs & Stratton Corp. (L) 7,892 160,129
Copyright © 2013 www.secdatabase.com. All Rights Reserved.Please Consider the Environment Before Printing This Document
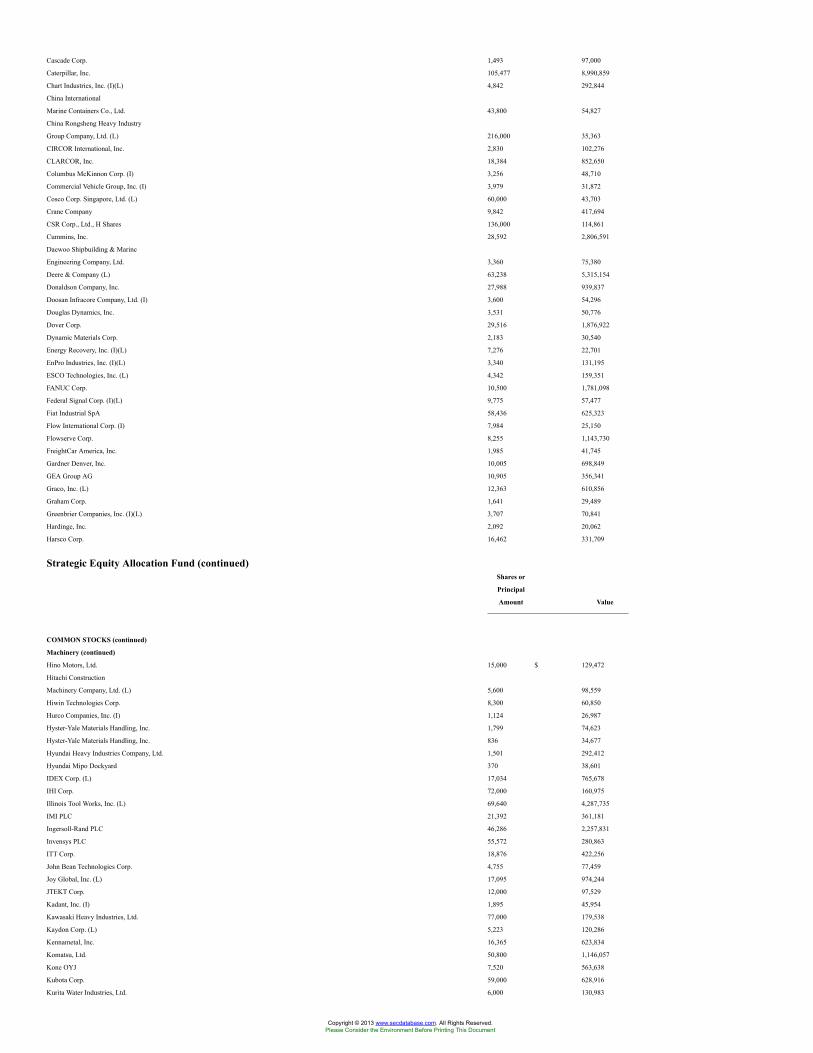
Cascade Corp. 1,493 97,000
Caterpillar, Inc. 105,477 8,990,859
Chart Industries, Inc. (I)(L) 4,842 292,844
China International
Marine Containers Co., Ltd. 43,800 54,827
China Rongsheng Heavy Industry
Group Company, Ltd. (L) 216,000 35,363
CIRCOR International, Inc. 2,830 102,276
CLARCOR, Inc. 18,384 852,650
Columbus McKinnon Corp. (I) 3,256 48,710
Commercial Vehicle Group, Inc. (I) 3,979 31,872
Cosco Corp. Singapore, Ltd. (L) 60,000 43,703
Crane Company 9,842 417,694
CSR Corp., Ltd., H Shares 136,000 114,861
Cummins, Inc. 28,592 2,806,591
Daewoo Shipbuilding & Marine
Engineering Company, Ltd. 3,360 75,380
Deere & Company (L) 63,238 5,315,154
Donaldson Company, Inc. 27,988 939,837
Doosan Infracore Company, Ltd. (I) 3,600 54,296
Douglas Dynamics, Inc. 3,531 50,776
Dover Corp. 29,516 1,876,922
Dynamic Materials Corp. 2,183 30,540
Energy Recovery, Inc. (I)(L) 7,276 22,701
EnPro Industries, Inc. (I)(L) 3,340 131,195
ESCO Technologies, Inc. (L) 4,342 159,351
FANUC Corp. 10,500 1,781,098
Federal Signal Corp. (I)(L) 9,775 57,477
Fiat Industrial SpA 58,436 625,323
Flow International Corp. (I) 7,984 25,150
Flowserve Corp. 8,255 1,143,730
FreightCar America, Inc. 1,985 41,745
Gardner Denver, Inc. 10,005 698,849
GEA Group AG 10,905 356,341
Graco, Inc. (L) 12,363 610,856
Graham Corp. 1,641 29,489
Greenbrier Companies, Inc. (I)(L) 3,707 70,841
Hardinge, Inc. 2,092 20,062
Harsco Corp. 16,462 331,709
Strategic Equity Allocation Fund (continued)Shares or
Principal
Amount Value
COMMON STOCKS (continued)
Machinery (continued)
Hino Motors, Ltd. 15,000 $ 129,472
Hitachi Construction
Machinery Company, Ltd. (L) 5,600 98,559
Hiwin Technologies Corp. 8,300 60,850
Hurco Companies, Inc. (I) 1,124 26,987
Hyster-Yale Materials Handling, Inc. 1,799 74,623
Hyster-Yale Materials Handling, Inc. 836 34,677
Hyundai Heavy Industries Company, Ltd. 1,501 292,412
Hyundai Mipo Dockyard 370 38,601
IDEX Corp. (L) 17,034 765,678
IHI Corp. 72,000 160,975
Illinois Tool Works, Inc. (L) 69,640 4,287,735
IMI PLC 21,392 361,181
Ingersoll-Rand PLC 46,286 2,257,831
Invensys PLC 55,572 280,863
ITT Corp. 18,876 422,256
John Bean Technologies Corp. 4,755 77,459
Joy Global, Inc. (L) 17,095 974,244
JTEKT Corp. 12,000 97,529
Kadant, Inc. (I) 1,895 45,954
Kawasaki Heavy Industries, Ltd. 77,000 179,538
Kaydon Corp. (L) 5,223 120,286
Kennametal, Inc. 16,365 623,834
Komatsu, Ltd. 50,800 1,146,057
Kone OYJ 7,520 563,638
Kubota Corp. 59,000 628,916
Kurita Water Industries, Ltd. 6,000 130,983
Copyright © 2013 www.secdatabase.com. All Rights Reserved.Please Consider the Environment Before Printing This Document
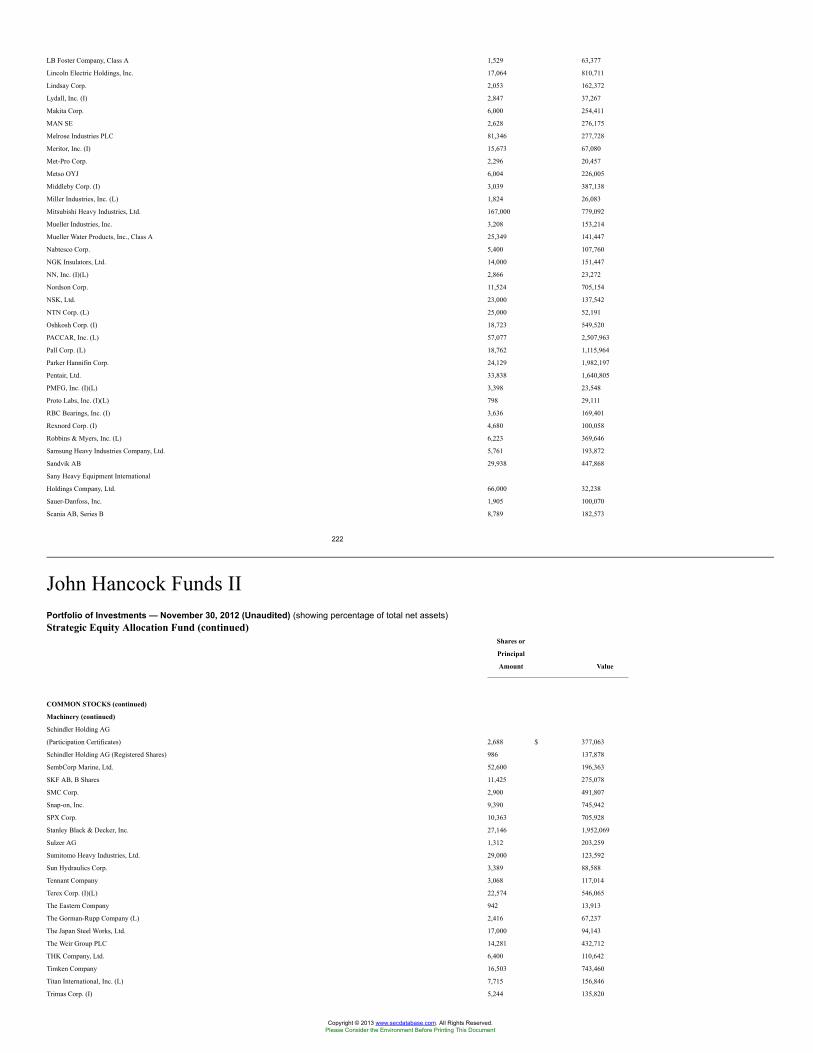
LB Foster Company, Class A 1,529 63,377
Lincoln Electric Holdings, Inc. 17,064 810,711
Lindsay Corp. 2,053 162,372
Lydall, Inc. (I) 2,847 37,267
Makita Corp. 6,000 254,411
MAN SE 2,628 276,175
Melrose Industries PLC 81,346 277,728
Meritor, Inc. (I) 15,673 67,080
Met-Pro Corp. 2,296 20,457
Metso OYJ 6,004 226,005
Middleby Corp. (I) 3,039 387,138
Miller Industries, Inc. (L) 1,824 26,083
Mitsubishi Heavy Industries, Ltd. 167,000 779,092
Mueller Industries, Inc. 3,208 153,214
Mueller Water Products, Inc., Class A 25,349 141,447
Nabtesco Corp. 5,400 107,760
NGK Insulators, Ltd. 14,000 151,447
NN, Inc. (I)(L) 2,866 23,272
Nordson Corp. 11,524 705,154
NSK, Ltd. 23,000 137,542
NTN Corp. (L) 25,000 52,191
Oshkosh Corp. (I) 18,723 549,520
PACCAR, Inc. (L) 57,077 2,507,963
Pall Corp. (L) 18,762 1,115,964
Parker Hannifin Corp. 24,129 1,982,197
Pentair, Ltd. 33,838 1,640,805
PMFG, Inc. (I)(L) 3,398 23,548
Proto Labs, Inc. (I)(L) 798 29,111
RBC Bearings, Inc. (I) 3,636 169,401
Rexnord Corp. (I) 4,680 100,058
Robbins & Myers, Inc. (L) 6,223 369,646
Samsung Heavy Industries Company, Ltd. 5,761 193,872
Sandvik AB 29,938 447,868
Sany Heavy Equipment International
Holdings Company, Ltd. 66,000 32,238
Sauer-Danfoss, Inc. 1,905 100,070
Scania AB, Series B 8,789 182,573
222
John Hancock Funds IIPortfolio of Investments — November 30, 2012 (Unaudited) (showing percentage of total net assets)Strategic Equity Allocation Fund (continued)
Shares or
Principal
Amount Value
COMMON STOCKS (continued)
Machinery (continued)
Schindler Holding AG
(Participation Certificates) 2,688 $ 377,063
Schindler Holding AG (Registered Shares) 986 137,878
SembCorp Marine, Ltd. 52,600 196,363
SKF AB, B Shares 11,425 275,078
SMC Corp. 2,900 491,807
Snap-on, Inc. 9,390 745,942
SPX Corp. 10,363 705,928
Stanley Black & Decker, Inc. 27,146 1,952,069
Sulzer AG 1,312 203,259
Sumitomo Heavy Industries, Ltd. 29,000 123,592
Sun Hydraulics Corp. 3,389 88,588
Tennant Company 3,068 117,014
Terex Corp. (I)(L) 22,574 546,065
The Eastern Company 942 13,913
The Gorman-Rupp Company (L) 2,416 67,237
The Japan Steel Works, Ltd. 17,000 94,143
The Weir Group PLC 14,281 432,712
THK Company, Ltd. 6,400 110,642
Timken Company 16,503 743,460
Titan International, Inc. (L) 7,715 156,846
Trimas Corp. (I) 5,244 135,820
Copyright © 2013 www.secdatabase.com. All Rights Reserved.Please Consider the Environment Before Printing This Document
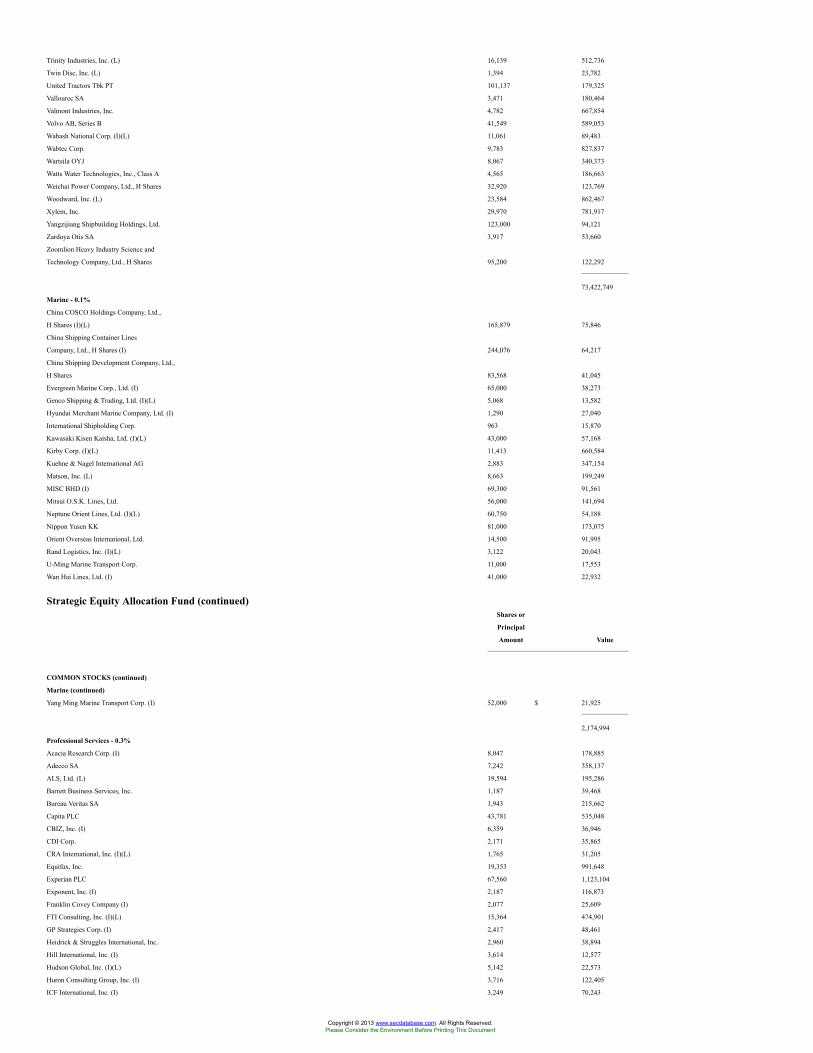
Trinity Industries, Inc. (L) 16,139 512,736
Twin Disc, Inc. (L) 1,394 23,782
United Tractors Tbk PT 101,137 179,325
Vallourec SA 3,471 180,464
Valmont Industries, Inc. 4,782 667,854
Volvo AB, Series B 41,549 589,053
Wabash National Corp. (I)(L) 11,061 89,483
Wabtec Corp. 9,783 827,837
Wartsila OYJ 8,067 340,373
Watts Water Technologies, Inc., Class A 4,565 186,663
Weichai Power Company, Ltd., H Shares 32,920 123,769
Woodward, Inc. (L) 23,584 862,467
Xylem, Inc. 29,970 781,917
Yangzijiang Shipbuilding Holdings, Ltd. 123,000 94,121
Zardoya Otis SA 3,917 53,660
Zoomlion Heavy Industry Science and
Technology Company, Ltd., H Shares 95,200 122,292
73,422,749
Marine - 0.1%
China COSCO Holdings Company, Ltd.,
H Shares (I)(L) 165,879 75,846
China Shipping Container Lines
Company, Ltd., H Shares (I) 244,076 64,217
China Shipping Development Company, Ltd.,
H Shares 83,568 41,045
Evergreen Marine Corp., Ltd. (I) 65,000 38,273
Genco Shipping & Trading, Ltd. (I)(L) 5,068 13,582
Hyundai Merchant Marine Company, Ltd. (I) 1,290 27,040
International Shipholding Corp. 963 15,870
Kawasaki Kisen Kaisha, Ltd. (I)(L) 43,000 57,168
Kirby Corp. (I)(L) 11,413 660,584
Kuehne & Nagel International AG 2,883 347,154
Matson, Inc. (L) 8,663 199,249
MISC BHD (I) 69,300 91,561
Mitsui O.S.K. Lines, Ltd. 56,000 141,694
Neptune Orient Lines, Ltd. (I)(L) 60,750 54,188
Nippon Yusen KK 81,000 173,075
Orient Overseas International, Ltd. 14,500 91,995
Rand Logistics, Inc. (I)(L) 3,122 20,043
U-Ming Marine Transport Corp. 11,000 17,553
Wan Hai Lines, Ltd. (I) 41,000 22,932
Strategic Equity Allocation Fund (continued)Shares or
Principal
Amount Value
COMMON STOCKS (continued)
Marine (continued)
Yang Ming Marine Transport Corp. (I) 52,000 $ 21,925
2,174,994
Professional Services - 0.3%
Acacia Research Corp. (I) 8,047 178,885
Adecco SA 7,242 358,137
ALS, Ltd. (L) 19,594 195,286
Barrett Business Services, Inc. 1,187 39,468
Bureau Veritas SA 1,943 215,662
Capita PLC 43,781 535,048
CBIZ, Inc. (I) 6,359 36,946
CDI Corp. 2,171 35,865
CRA International, Inc. (I)(L) 1,765 31,205
Equifax, Inc. 19,353 991,648
Experian PLC 67,560 1,123,104
Exponent, Inc. (I) 2,187 116,873
Franklin Covey Company (I) 2,077 25,609
FTI Consulting, Inc. (I)(L) 15,364 474,901
GP Strategies Corp. (I) 2,417 48,461
Heidrick & Struggles International, Inc. 2,960 38,894
Hill International, Inc. (I) 3,614 12,577
Hudson Global, Inc. (I)(L) 5,142 22,573
Huron Consulting Group, Inc. (I) 3,716 122,405
ICF International, Inc. (I) 3,249 70,243
Copyright © 2013 www.secdatabase.com. All Rights Reserved.Please Consider the Environment Before Printing This Document
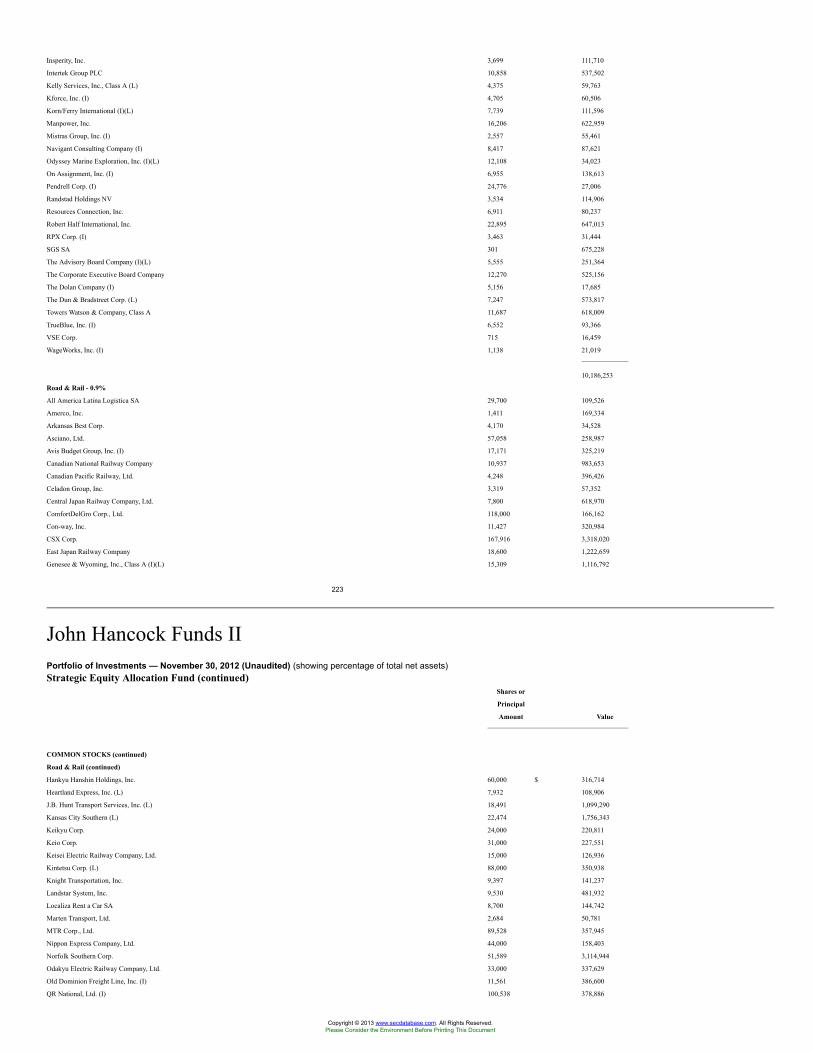
Insperity, Inc. 3,699 111,710
Intertek Group PLC 10,858 537,502
Kelly Services, Inc., Class A (L) 4,375 59,763
Kforce, Inc. (I) 4,705 60,506
Korn/Ferry International (I)(L) 7,739 111,596
Manpower, Inc. 16,206 622,959
Mistras Group, Inc. (I) 2,557 55,461
Navigant Consulting Company (I) 8,417 87,621
Odyssey Marine Exploration, Inc. (I)(L) 12,108 34,023
On Assignment, Inc. (I) 6,955 138,613
Pendrell Corp. (I) 24,776 27,006
Randstad Holdings NV 3,534 114,906
Resources Connection, Inc. 6,911 80,237
Robert Half International, Inc. 22,895 647,013
RPX Corp. (I) 3,463 31,444
SGS SA 301 675,228
The Advisory Board Company (I)(L) 5,555 251,364
The Corporate Executive Board Company 12,270 525,156
The Dolan Company (I) 5,156 17,685
The Dun & Bradstreet Corp. (L) 7,247 573,817
Towers Watson & Company, Class A 11,687 618,009
TrueBlue, Inc. (I) 6,552 93,366
VSE Corp. 715 16,459
WageWorks, Inc. (I) 1,138 21,019
10,186,253
Road & Rail - 0.9%
All America Latina Logistica SA 29,700 109,526
Amerco, Inc. 1,411 169,334
Arkansas Best Corp. 4,170 34,528
Asciano, Ltd. 57,058 258,987
Avis Budget Group, Inc. (I) 17,171 325,219
Canadian National Railway Company 10,937 983,653
Canadian Pacific Railway, Ltd. 4,248 396,426
Celadon Group, Inc. 3,319 57,352
Central Japan Railway Company, Ltd. 7,800 618,970
ComfortDelGro Corp., Ltd. 118,000 166,162
Con-way, Inc. 11,427 320,984
CSX Corp. 167,916 3,318,020
East Japan Railway Company 18,600 1,222,659
Genesee & Wyoming, Inc., Class A (I)(L) 15,309 1,116,792
223
John Hancock Funds IIPortfolio of Investments — November 30, 2012 (Unaudited) (showing percentage of total net assets)Strategic Equity Allocation Fund (continued)
Shares or
Principal
Amount Value
COMMON STOCKS (continued)
Road & Rail (continued)
Hankyu Hanshin Holdings, Inc. 60,000 $ 316,714
Heartland Express, Inc. (L) 7,932 108,906
J.B. Hunt Transport Services, Inc. (L) 18,491 1,099,290
Kansas City Southern (L) 22,474 1,756,343
Keikyu Corp. 24,000 220,811
Keio Corp. 31,000 227,551
Keisei Electric Railway Company, Ltd. 15,000 126,936
Kintetsu Corp. (L) 88,000 350,938
Knight Transportation, Inc. 9,397 141,237
Landstar System, Inc. 9,530 481,932
Localiza Rent a Car SA 8,700 144,742
Marten Transport, Ltd. 2,684 50,781
MTR Corp., Ltd. 89,528 357,945
Nippon Express Company, Ltd. 44,000 158,403
Norfolk Southern Corp. 51,589 3,114,944
Odakyu Electric Railway Company, Ltd. 33,000 337,629
Old Dominion Freight Line, Inc. (I) 11,561 386,600
QR National, Ltd. (I) 100,538 378,886
Copyright © 2013 www.secdatabase.com. All Rights Reserved.Please Consider the Environment Before Printing This Document
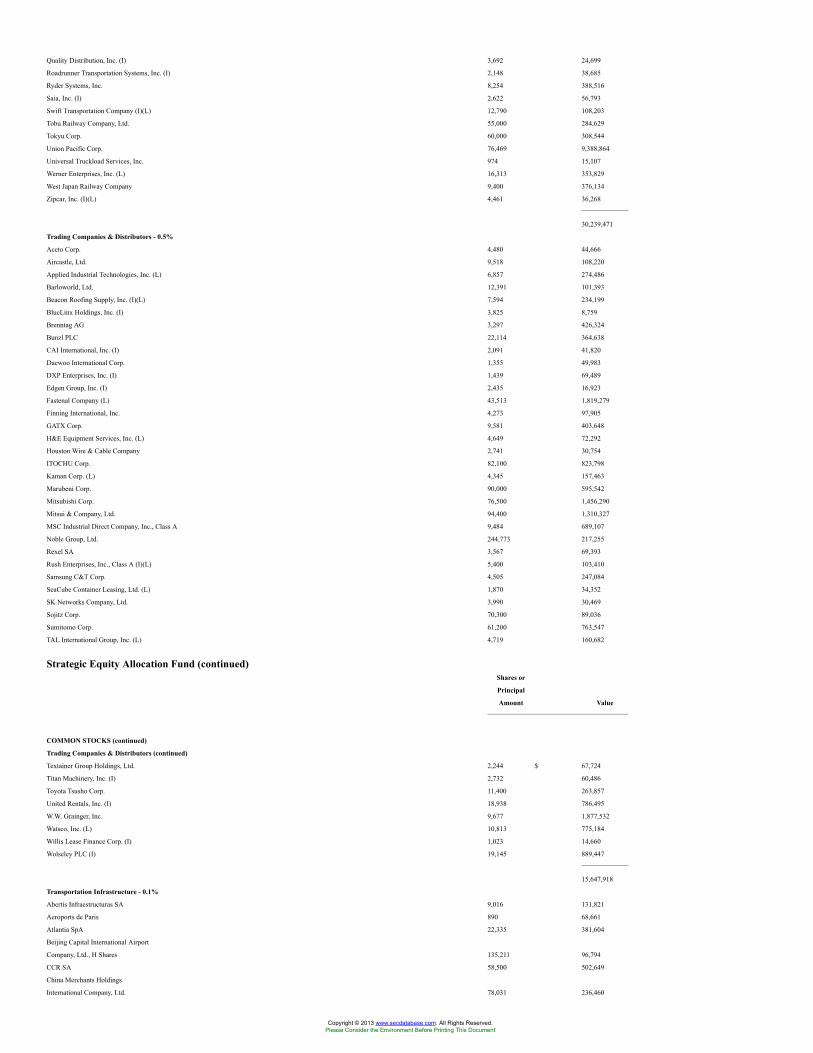
Quality Distribution, Inc. (I) 3,692 24,699
Roadrunner Transportation Systems, Inc. (I) 2,148 38,685
Ryder Systems, Inc. 8,254 388,516
Saia, Inc. (I) 2,622 56,793
Swift Transportation Company (I)(L) 12,790 108,203
Tobu Railway Company, Ltd. 55,000 284,629
Tokyu Corp. 60,000 308,544
Union Pacific Corp. 76,469 9,388,864
Universal Truckload Services, Inc. 974 15,107
Werner Enterprises, Inc. (L) 16,313 353,829
West Japan Railway Company 9,400 376,134
Zipcar, Inc. (I)(L) 4,461 36,268
30,239,471
Trading Companies & Distributors - 0.5%
Aceto Corp. 4,480 44,666
Aircastle, Ltd. 9,518 108,220
Applied Industrial Technologies, Inc. (L) 6,857 274,486
Barloworld, Ltd. 12,391 101,393
Beacon Roofing Supply, Inc. (I)(L) 7,594 234,199
BlueLinx Holdings, Inc. (I) 3,825 8,759
Brenntag AG 3,297 426,324
Bunzl PLC 22,114 364,638
CAI International, Inc. (I) 2,091 41,820
Daewoo International Corp. 1,355 49,983
DXP Enterprises, Inc. (I) 1,439 69,489
Edgen Group, Inc. (I) 2,435 16,923
Fastenal Company (L) 43,513 1,819,279
Finning International, Inc. 4,273 97,905
GATX Corp. 9,581 403,648
H&E Equipment Services, Inc. (L) 4,649 72,292
Houston Wire & Cable Company 2,741 30,754
ITOCHU Corp. 82,100 823,798
Kaman Corp. (L) 4,345 157,463
Marubeni Corp. 90,000 595,542
Mitsubishi Corp. 76,500 1,456,290
Mitsui & Company, Ltd. 94,400 1,310,327
MSC Industrial Direct Company, Inc., Class A 9,484 689,107
Noble Group, Ltd. 244,773 217,255
Rexel SA 3,567 69,393
Rush Enterprises, Inc., Class A (I)(L) 5,400 103,410
Samsung C&T Corp. 4,505 247,084
SeaCube Container Leasing, Ltd. (L) 1,870 34,352
SK Networks Company, Ltd. 3,990 30,469
Sojitz Corp. 70,300 89,036
Sumitomo Corp. 61,200 763,547
TAL International Group, Inc. (L) 4,719 160,682
Strategic Equity Allocation Fund (continued)Shares or
Principal
Amount Value
COMMON STOCKS (continued)
Trading Companies & Distributors (continued)
Textainer Group Holdings, Ltd. 2,244 $ 67,724
Titan Machinery, Inc. (I) 2,732 60,486
Toyota Tsusho Corp. 11,400 263,857
United Rentals, Inc. (I) 18,938 786,495
W.W. Grainger, Inc. 9,677 1,877,532
Watsco, Inc. (L) 10,813 775,184
Willis Lease Finance Corp. (I) 1,023 14,660
Wolseley PLC (I) 19,145 889,447
15,647,918
Transportation Infrastructure - 0.1%
Abertis Infraestructuras SA 9,016 131,821
Aeroports de Paris 890 68,661
Atlantia SpA 22,335 381,604
Beijing Capital International Airport
Company, Ltd., H Shares 135,211 96,794
CCR SA 58,500 502,649
China Merchants Holdings
International Company, Ltd. 78,031 236,460
Copyright © 2013 www.secdatabase.com. All Rights Reserved.Please Consider the Environment Before Printing This Document
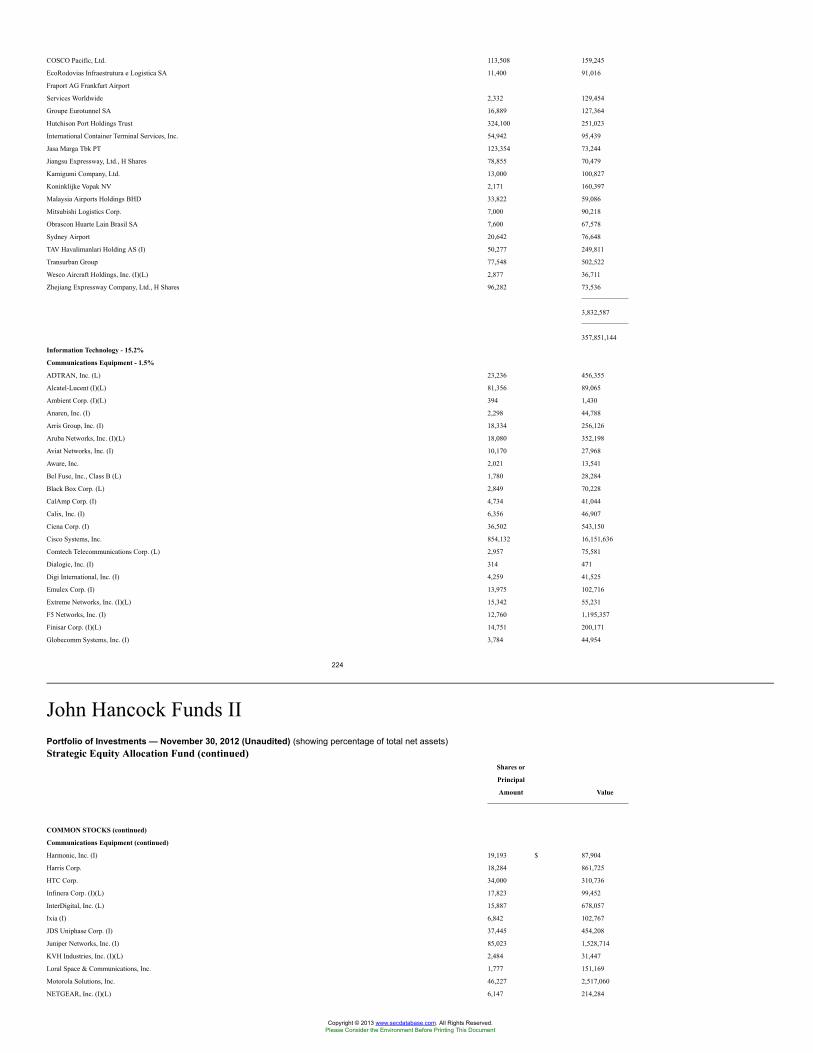
COSCO Pacific, Ltd. 113,508 159,245
EcoRodovias Infraestrutura e Logistica SA 11,400 91,016
Fraport AG Frankfurt Airport
Services Worldwide 2,332 129,454
Groupe Eurotunnel SA 16,889 127,364
Hutchison Port Holdings Trust 324,100 251,023
International Container Terminal Services, Inc. 54,942 95,439
Jasa Marga Tbk PT 123,354 73,244
Jiangsu Expressway, Ltd., H Shares 78,855 70,479
Kamigumi Company, Ltd. 13,000 100,827
Koninklijke Vopak NV 2,171 160,397
Malaysia Airports Holdings BHD 33,822 59,086
Mitsubishi Logistics Corp. 7,000 90,218
Obrascon Huarte Lain Brasil SA 7,600 67,578
Sydney Airport 20,642 76,648
TAV Havalimanlari Holding AS (I) 50,277 249,811
Transurban Group 77,548 502,522
Wesco Aircraft Holdings, Inc. (I)(L) 2,877 36,711
Zhejiang Expressway Company, Ltd., H Shares 96,282 73,536
3,832,587
357,851,144
Information Technology - 15.2%
Communications Equipment - 1.5%
ADTRAN, Inc. (L) 23,236 456,355
Alcatel-Lucent (I)(L) 81,356 89,065
Ambient Corp. (I)(L) 394 1,430
Anaren, Inc. (I) 2,298 44,788
Arris Group, Inc. (I) 18,334 256,126
Aruba Networks, Inc. (I)(L) 18,080 352,198
Aviat Networks, Inc. (I) 10,170 27,968
Aware, Inc. 2,021 13,541
Bel Fuse, Inc., Class B (L) 1,780 28,284
Black Box Corp. (L) 2,849 70,228
CalAmp Corp. (I) 4,734 41,044
Calix, Inc. (I) 6,356 46,907
Ciena Corp. (I) 36,502 543,150
Cisco Systems, Inc. 854,132 16,151,636
Comtech Telecommunications Corp. (L) 2,957 75,581
Dialogic, Inc. (I) 314 471
Digi International, Inc. (I) 4,259 41,525
Emulex Corp. (I) 13,975 102,716
Extreme Networks, Inc. (I)(L) 15,342 55,231
F5 Networks, Inc. (I) 12,760 1,195,357
Finisar Corp. (I)(L) 14,751 200,171
Globecomm Systems, Inc. (I) 3,784 44,954
224
John Hancock Funds IIPortfolio of Investments — November 30, 2012 (Unaudited) (showing percentage of total net assets)Strategic Equity Allocation Fund (continued)
Shares or
Principal
Amount Value
COMMON STOCKS (continued)
Communications Equipment (continued)
Harmonic, Inc. (I) 19,193 $ 87,904
Harris Corp. 18,284 861,725
HTC Corp. 34,000 310,736
Infinera Corp. (I)(L) 17,823 99,452
InterDigital, Inc. (L) 15,887 678,057
Ixia (I) 6,842 102,767
JDS Uniphase Corp. (I) 37,445 454,208
Juniper Networks, Inc. (I) 85,023 1,528,714
KVH Industries, Inc. (I)(L) 2,484 31,447
Loral Space & Communications, Inc. 1,777 151,169
Motorola Solutions, Inc. 46,227 2,517,060
NETGEAR, Inc. (I)(L) 6,147 214,284
Copyright © 2013 www.secdatabase.com. All Rights Reserved.Please Consider the Environment Before Printing This Document
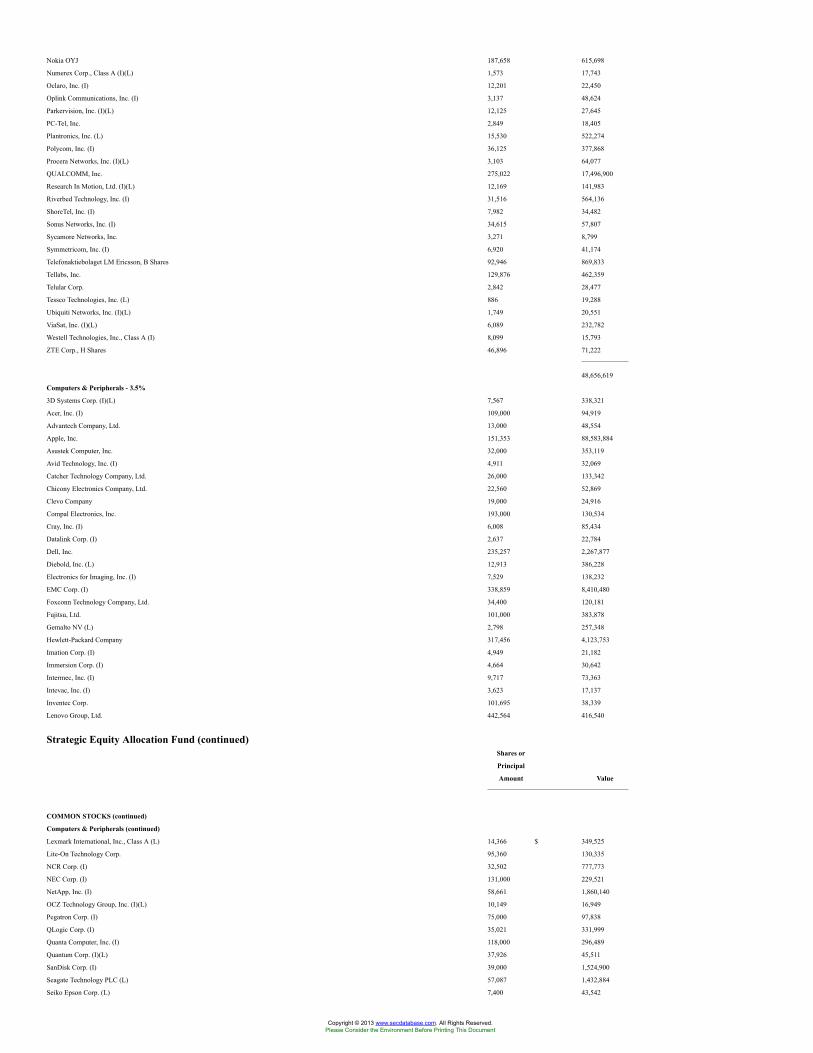
Nokia OYJ 187,658 615,698
Numerex Corp., Class A (I)(L) 1,573 17,743
Oclaro, Inc. (I) 12,201 22,450
Oplink Communications, Inc. (I) 3,137 48,624
Parkervision, Inc. (I)(L) 12,125 27,645
PC-Tel, Inc. 2,849 18,405
Plantronics, Inc. (L) 15,530 522,274
Polycom, Inc. (I) 36,125 377,868
Procera Networks, Inc. (I)(L) 3,103 64,077
QUALCOMM, Inc. 275,022 17,496,900
Research In Motion, Ltd. (I)(L) 12,169 141,983
Riverbed Technology, Inc. (I) 31,516 564,136
ShoreTel, Inc. (I) 7,982 34,482
Sonus Networks, Inc. (I) 34,615 57,807
Sycamore Networks, Inc. 3,271 8,799
Symmetricom, Inc. (I) 6,920 41,174
Telefonaktiebolaget LM Ericsson, B Shares 92,946 869,833
Tellabs, Inc. 129,876 462,359
Telular Corp. 2,842 28,477
Tessco Technologies, Inc. (L) 886 19,288
Ubiquiti Networks, Inc. (I)(L) 1,749 20,551
ViaSat, Inc. (I)(L) 6,089 232,782
Westell Technologies, Inc., Class A (I) 8,099 15,793
ZTE Corp., H Shares 46,896 71,222
48,656,619
Computers & Peripherals - 3.5%
3D Systems Corp. (I)(L) 7,567 338,321
Acer, Inc. (I) 109,000 94,919
Advantech Company, Ltd. 13,000 48,554
Apple, Inc. 151,353 88,583,884
Asustek Computer, Inc. 32,000 353,119
Avid Technology, Inc. (I) 4,911 32,069
Catcher Technology Company, Ltd. 26,000 133,342
Chicony Electronics Company, Ltd. 22,560 52,869
Clevo Company 19,000 24,916
Compal Electronics, Inc. 193,000 130,534
Cray, Inc. (I) 6,008 85,434
Datalink Corp. (I) 2,637 22,784
Dell, Inc. 235,257 2,267,877
Diebold, Inc. (L) 12,913 386,228
Electronics for Imaging, Inc. (I) 7,529 138,232
EMC Corp. (I) 338,859 8,410,480
Foxconn Technology Company, Ltd. 34,400 120,181
Fujitsu, Ltd. 101,000 383,878
Gemalto NV (L) 2,798 257,348
Hewlett-Packard Company 317,456 4,123,753
Imation Corp. (I) 4,949 21,182
Immersion Corp. (I) 4,664 30,642
Intermec, Inc. (I) 9,717 73,363
Intevac, Inc. (I) 3,623 17,137
Inventec Corp. 101,695 38,339
Lenovo Group, Ltd. 442,564 416,540
Strategic Equity Allocation Fund (continued)Shares or
Principal
Amount Value
COMMON STOCKS (continued)
Computers & Peripherals (continued)
Lexmark International, Inc., Class A (L) 14,366 $ 349,525
Lite-On Technology Corp. 95,360 130,335
NCR Corp. (I) 32,502 777,773
NEC Corp. (I) 131,000 229,521
NetApp, Inc. (I) 58,661 1,860,140
OCZ Technology Group, Inc. (I)(L) 10,149 16,949
Pegatron Corp. (I) 75,000 97,838
QLogic Corp. (I) 35,021 331,999
Quanta Computer, Inc. (I) 118,000 296,489
Quantum Corp. (I)(L) 37,926 45,511
SanDisk Corp. (I) 39,000 1,524,900
Seagate Technology PLC (L) 57,087 1,432,884
Seiko Epson Corp. (L) 7,400 43,542
Copyright © 2013 www.secdatabase.com. All Rights Reserved.Please Consider the Environment Before Printing This Document
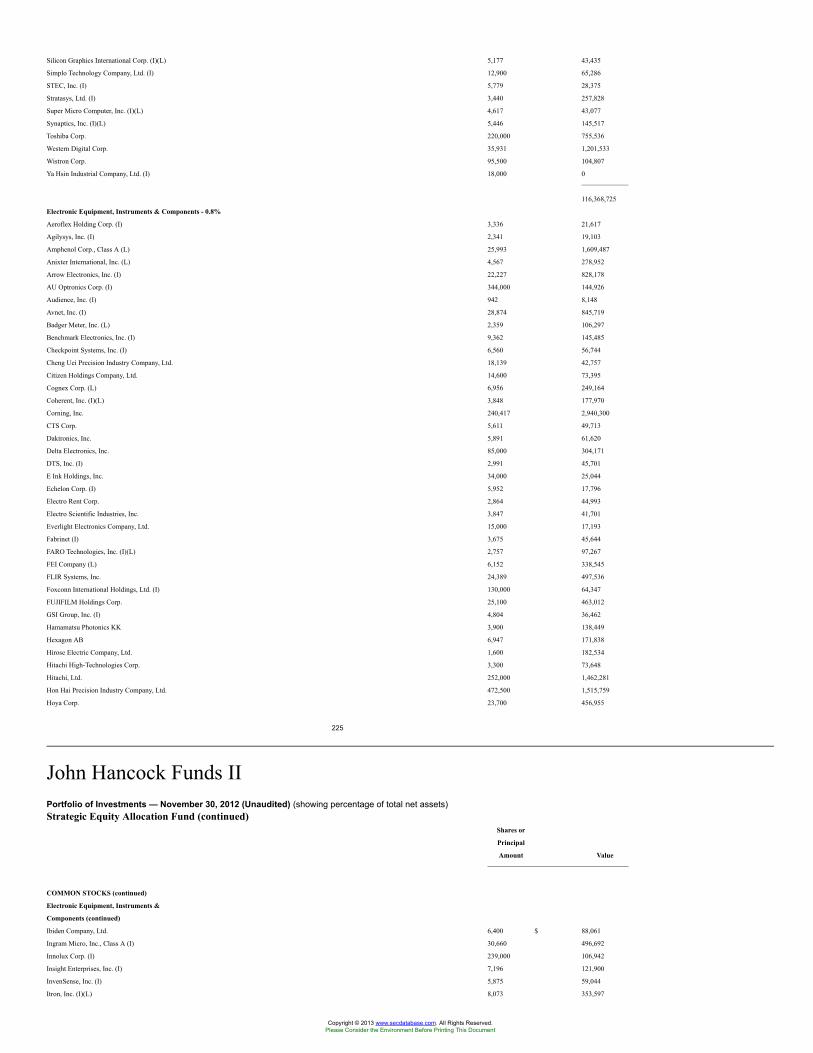
Silicon Graphics International Corp. (I)(L) 5,177 43,435
Simplo Technology Company, Ltd. (I) 12,900 65,286
STEC, Inc. (I) 5,779 28,375
Stratasys, Ltd. (I) 3,440 257,828
Super Micro Computer, Inc. (I)(L) 4,617 43,077
Synaptics, Inc. (I)(L) 5,446 145,517
Toshiba Corp. 220,000 755,536
Western Digital Corp. 35,931 1,201,533
Wistron Corp. 95,500 104,807
Ya Hsin Industrial Company, Ltd. (I) 18,000 0
116,368,725
Electronic Equipment, Instruments & Components - 0.8%
Aeroflex Holding Corp. (I) 3,336 21,617
Agilysys, Inc. (I) 2,341 19,103
Amphenol Corp., Class A (L) 25,993 1,609,487
Anixter International, Inc. (L) 4,567 278,952
Arrow Electronics, Inc. (I) 22,227 828,178
AU Optronics Corp. (I) 344,000 144,926
Audience, Inc. (I) 942 8,148
Avnet, Inc. (I) 28,874 845,719
Badger Meter, Inc. (L) 2,359 106,297
Benchmark Electronics, Inc. (I) 9,362 145,485
Checkpoint Systems, Inc. (I) 6,560 56,744
Cheng Uei Precision Industry Company, Ltd. 18,139 42,757
Citizen Holdings Company, Ltd. 14,600 73,395
Cognex Corp. (L) 6,956 249,164
Coherent, Inc. (I)(L) 3,848 177,970
Corning, Inc. 240,417 2,940,300
CTS Corp. 5,611 49,713
Daktronics, Inc. 5,891 61,620
Delta Electronics, Inc. 85,000 304,171
DTS, Inc. (I) 2,991 45,701
E Ink Holdings, Inc. 34,000 25,044
Echelon Corp. (I) 5,952 17,796
Electro Rent Corp. 2,864 44,993
Electro Scientific Industries, Inc. 3,847 41,701
Everlight Electronics Company, Ltd. 15,000 17,193
Fabrinet (I) 3,675 45,644
FARO Technologies, Inc. (I)(L) 2,757 97,267
FEI Company (L) 6,152 338,545
FLIR Systems, Inc. 24,389 497,536
Foxconn International Holdings, Ltd. (I) 130,000 64,347
FUJIFILM Holdings Corp. 25,100 463,012
GSI Group, Inc. (I) 4,804 36,462
Hamamatsu Photonics KK 3,900 138,449
Hexagon AB 6,947 171,838
Hirose Electric Company, Ltd. 1,600 182,534
Hitachi High-Technologies Corp. 3,300 73,648
Hitachi, Ltd. 252,000 1,462,281
Hon Hai Precision Industry Company, Ltd. 472,500 1,515,759
Hoya Corp. 23,700 456,955
225
John Hancock Funds IIPortfolio of Investments — November 30, 2012 (Unaudited) (showing percentage of total net assets)Strategic Equity Allocation Fund (continued)
Shares or
Principal
Amount Value
COMMON STOCKS (continued)
Electronic Equipment, Instruments &
Components (continued)
Ibiden Company, Ltd. 6,400 $ 88,061
Ingram Micro, Inc., Class A (I) 30,660 496,692
Innolux Corp. (I) 239,000 106,942
Insight Enterprises, Inc. (I) 7,196 121,900
InvenSense, Inc. (I) 5,875 59,044
Itron, Inc. (I)(L) 8,073 353,597
Copyright © 2013 www.secdatabase.com. All Rights Reserved.Please Consider the Environment Before Printing This Document
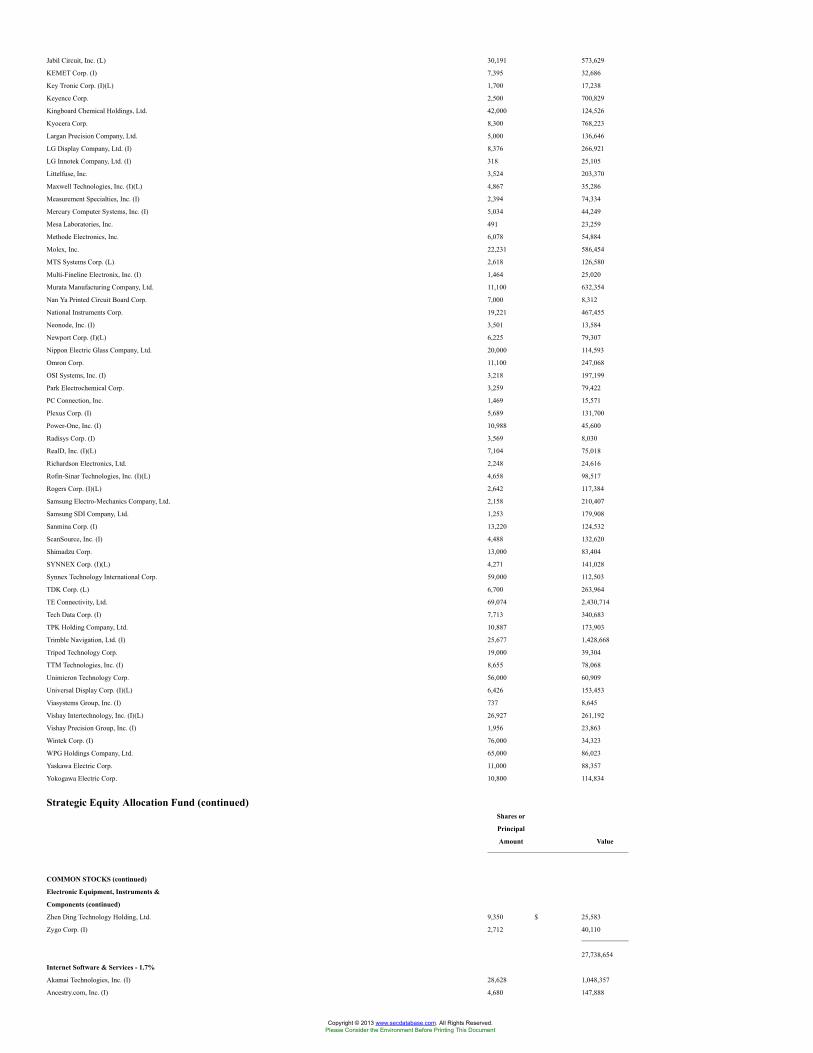
Jabil Circuit, Inc. (L) 30,191 573,629
KEMET Corp. (I) 7,395 32,686
Key Tronic Corp. (I)(L) 1,700 17,238
Keyence Corp. 2,500 700,829
Kingboard Chemical Holdings, Ltd. 42,000 124,526
Kyocera Corp. 8,300 768,223
Largan Precision Company, Ltd. 5,000 136,646
LG Display Company, Ltd. (I) 8,376 266,921
LG Innotek Company, Ltd. (I) 318 25,105
Littelfuse, Inc. 3,524 203,370
Maxwell Technologies, Inc. (I)(L) 4,867 35,286
Measurement Specialties, Inc. (I) 2,394 74,334
Mercury Computer Systems, Inc. (I) 5,034 44,249
Mesa Laboratories, Inc. 491 23,259
Methode Electronics, Inc. 6,078 54,884
Molex, Inc. 22,231 586,454
MTS Systems Corp. (L) 2,618 126,580
Multi-Fineline Electronix, Inc. (I) 1,464 25,020
Murata Manufacturing Company, Ltd. 11,100 632,354
Nan Ya Printed Circuit Board Corp. 7,000 8,312
National Instruments Corp. 19,221 467,455
Neonode, Inc. (I) 3,501 13,584
Newport Corp. (I)(L) 6,225 79,307
Nippon Electric Glass Company, Ltd. 20,000 114,593
Omron Corp. 11,100 247,068
OSI Systems, Inc. (I) 3,218 197,199
Park Electrochemical Corp. 3,259 79,422
PC Connection, Inc. 1,469 15,571
Plexus Corp. (I) 5,689 131,700
Power-One, Inc. (I) 10,988 45,600
Radisys Corp. (I) 3,569 8,030
RealD, Inc. (I)(L) 7,104 75,018
Richardson Electronics, Ltd. 2,248 24,616
Rofin-Sinar Technologies, Inc. (I)(L) 4,658 98,517
Rogers Corp. (I)(L) 2,642 117,384
Samsung Electro-Mechanics Company, Ltd. 2,158 210,407
Samsung SDI Company, Ltd. 1,253 179,908
Sanmina Corp. (I) 13,220 124,532
ScanSource, Inc. (I) 4,488 132,620
Shimadzu Corp. 13,000 83,404
SYNNEX Corp. (I)(L) 4,271 141,028
Synnex Technology International Corp. 59,000 112,503
TDK Corp. (L) 6,700 263,964
TE Connectivity, Ltd. 69,074 2,430,714
Tech Data Corp. (I) 7,713 340,683
TPK Holding Company, Ltd. 10,887 173,903
Trimble Navigation, Ltd. (I) 25,677 1,428,668
Tripod Technology Corp. 19,000 39,304
TTM Technologies, Inc. (I) 8,655 78,068
Unimicron Technology Corp. 56,000 60,909
Universal Display Corp. (I)(L) 6,426 153,453
Viasystems Group, Inc. (I) 737 8,645
Vishay Intertechnology, Inc. (I)(L) 26,927 261,192
Vishay Precision Group, Inc. (I) 1,956 23,863
Wintek Corp. (I) 76,000 34,323
WPG Holdings Company, Ltd. 65,000 86,023
Yaskawa Electric Corp. 11,000 88,357
Yokogawa Electric Corp. 10,800 114,834
Strategic Equity Allocation Fund (continued)Shares or
Principal
Amount Value
COMMON STOCKS (continued)
Electronic Equipment, Instruments &
Components (continued)
Zhen Ding Technology Holding, Ltd. 9,350 $ 25,583
Zygo Corp. (I) 2,712 40,110
27,738,654
Internet Software & Services - 1.7%
Akamai Technologies, Inc. (I) 28,628 1,048,357
Ancestry.com, Inc. (I) 4,680 147,888
Copyright © 2013 www.secdatabase.com. All Rights Reserved.Please Consider the Environment Before Printing This Document
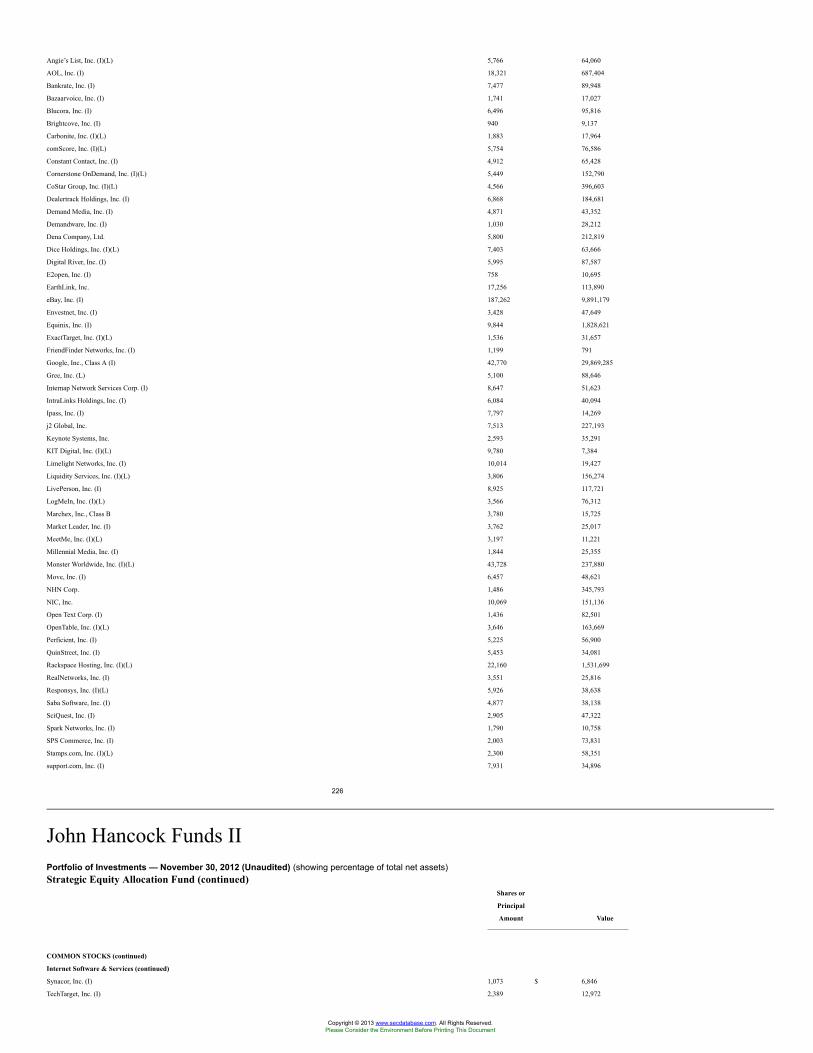
Angie’s List, Inc. (I)(L) 5,766 64,060
AOL, Inc. (I) 18,321 687,404
Bankrate, Inc. (I) 7,477 89,948
Bazaarvoice, Inc. (I) 1,741 17,027
Blucora, Inc. (I) 6,496 95,816
Brightcove, Inc. (I) 940 9,137
Carbonite, Inc. (I)(L) 1,883 17,964
comScore, Inc. (I)(L) 5,754 76,586
Constant Contact, Inc. (I) 4,912 65,428
Cornerstone OnDemand, Inc. (I)(L) 5,449 152,790
CoStar Group, Inc. (I)(L) 4,566 396,603
Dealertrack Holdings, Inc. (I) 6,868 184,681
Demand Media, Inc. (I) 4,871 43,352
Demandware, Inc. (I) 1,030 28,212
Dena Company, Ltd. 5,800 212,819
Dice Holdings, Inc. (I)(L) 7,403 63,666
Digital River, Inc. (I) 5,995 87,587
E2open, Inc. (I) 758 10,695
EarthLink, Inc. 17,256 113,890
eBay, Inc. (I) 187,262 9,891,179
Envestnet, Inc. (I) 3,428 47,649
Equinix, Inc. (I) 9,844 1,828,621
ExactTarget, Inc. (I)(L) 1,536 31,657
FriendFinder Networks, Inc. (I) 1,199 791
Google, Inc., Class A (I) 42,770 29,869,285
Gree, Inc. (L) 5,100 88,646
Internap Network Services Corp. (I) 8,647 51,623
IntraLinks Holdings, Inc. (I) 6,084 40,094
Ipass, Inc. (I) 7,797 14,269
j2 Global, Inc. 7,513 227,193
Keynote Systems, Inc. 2,593 35,291
KIT Digital, Inc. (I)(L) 9,780 7,384
Limelight Networks, Inc. (I) 10,014 19,427
Liquidity Services, Inc. (I)(L) 3,806 156,274
LivePerson, Inc. (I) 8,925 117,721
LogMeIn, Inc. (I)(L) 3,566 76,312
Marchex, Inc., Class B 3,780 15,725
Market Leader, Inc. (I) 3,762 25,017
MeetMe, Inc. (I)(L) 3,197 11,221
Millennial Media, Inc. (I) 1,844 25,355
Monster Worldwide, Inc. (I)(L) 43,728 237,880
Move, Inc. (I) 6,457 48,621
NHN Corp. 1,486 345,793
NIC, Inc. 10,069 151,136
Open Text Corp. (I) 1,436 82,501
OpenTable, Inc. (I)(L) 3,646 163,669
Perficient, Inc. (I) 5,225 56,900
QuinStreet, Inc. (I) 5,453 34,081
Rackspace Hosting, Inc. (I)(L) 22,160 1,531,699
RealNetworks, Inc. (I) 3,551 25,816
Responsys, Inc. (I)(L) 5,926 38,638
Saba Software, Inc. (I) 4,877 38,138
SciQuest, Inc. (I) 2,905 47,322
Spark Networks, Inc. (I) 1,790 10,758
SPS Commerce, Inc. (I) 2,003 73,831
Stamps.com, Inc. (I)(L) 2,300 58,351
support.com, Inc. (I) 7,931 34,896
226
John Hancock Funds IIPortfolio of Investments — November 30, 2012 (Unaudited) (showing percentage of total net assets)Strategic Equity Allocation Fund (continued)
Shares or
Principal
Amount Value
COMMON STOCKS (continued)
Internet Software & Services (continued)
Synacor, Inc. (I) 1,073 $ 6,846
TechTarget, Inc. (I) 2,389 12,972
Copyright © 2013 www.secdatabase.com. All Rights Reserved.Please Consider the Environment Before Printing This Document
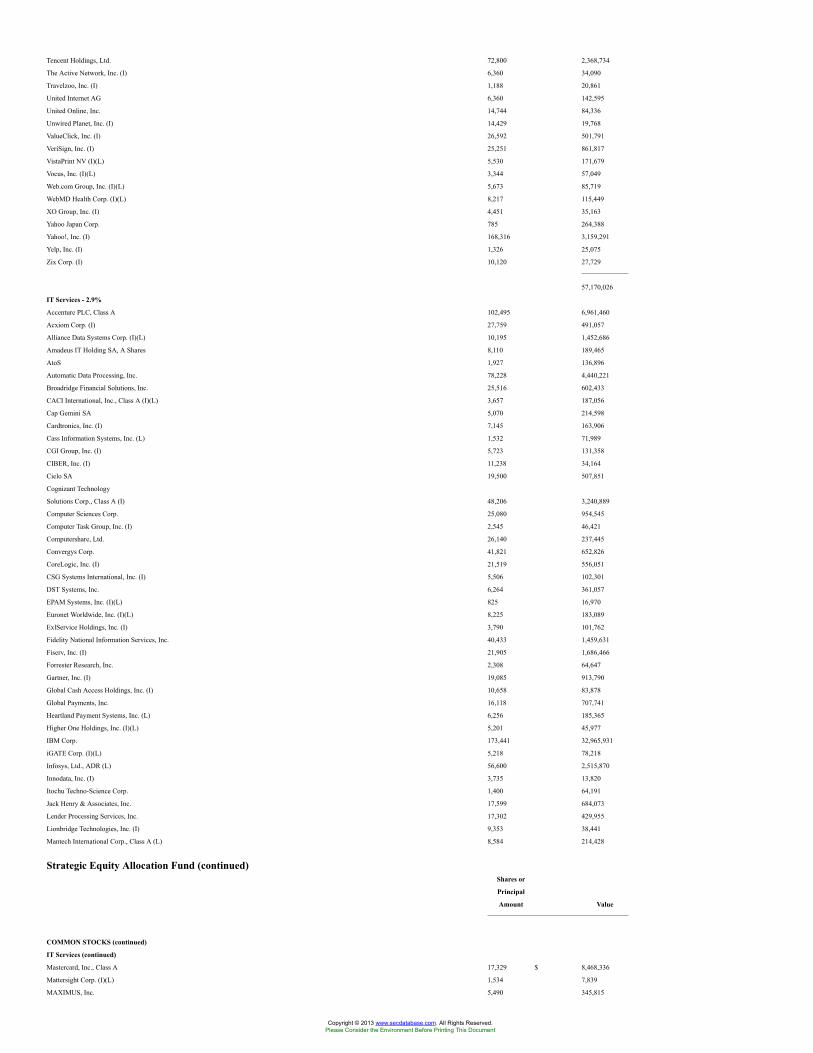
Tencent Holdings, Ltd. 72,800 2,368,734
The Active Network, Inc. (I) 6,360 34,090
Travelzoo, Inc. (I) 1,188 20,861
United Internet AG 6,360 142,595
United Online, Inc. 14,744 84,336
Unwired Planet, Inc. (I) 14,429 19,768
ValueClick, Inc. (I) 26,592 501,791
VeriSign, Inc. (I) 25,251 861,817
VistaPrint NV (I)(L) 5,530 171,679
Vocus, Inc. (I)(L) 3,344 57,049
Web.com Group, Inc. (I)(L) 5,673 85,719
WebMD Health Corp. (I)(L) 8,217 115,449
XO Group, Inc. (I) 4,451 35,163
Yahoo Japan Corp. 785 264,388
Yahoo!, Inc. (I) 168,316 3,159,291
Yelp, Inc. (I) 1,326 25,075
Zix Corp. (I) 10,120 27,729
57,170,026
IT Services - 2.9%
Accenture PLC, Class A 102,495 6,961,460
Acxiom Corp. (I) 27,759 491,057
Alliance Data Systems Corp. (I)(L) 10,195 1,452,686
Amadeus IT Holding SA, A Shares 8,110 189,465
AtoS 1,927 136,896
Automatic Data Processing, Inc. 78,228 4,440,221
Broadridge Financial Solutions, Inc. 25,516 602,433
CACI International, Inc., Class A (I)(L) 3,657 187,056
Cap Gemini SA 5,070 214,598
Cardtronics, Inc. (I) 7,145 163,906
Cass Information Systems, Inc. (L) 1,532 71,989
CGI Group, Inc. (I) 5,723 131,358
CIBER, Inc. (I) 11,238 34,164
Cielo SA 19,500 507,851
Cognizant Technology
Solutions Corp., Class A (I) 48,206 3,240,889
Computer Sciences Corp. 25,080 954,545
Computer Task Group, Inc. (I) 2,545 46,421
Computershare, Ltd. 26,140 237,445
Convergys Corp. 41,821 652,826
CoreLogic, Inc. (I) 21,519 556,051
CSG Systems International, Inc. (I) 5,506 102,301
DST Systems, Inc. 6,264 361,057
EPAM Systems, Inc. (I)(L) 825 16,970
Euronet Worldwide, Inc. (I)(L) 8,225 183,089
ExlService Holdings, Inc. (I) 3,790 101,762
Fidelity National Information Services, Inc. 40,433 1,459,631
Fiserv, Inc. (I) 21,905 1,686,466
Forrester Research, Inc. 2,308 64,647
Gartner, Inc. (I) 19,085 913,790
Global Cash Access Holdings, Inc. (I) 10,658 83,878
Global Payments, Inc. 16,118 707,741
Heartland Payment Systems, Inc. (L) 6,256 185,365
Higher One Holdings, Inc. (I)(L) 5,201 45,977
IBM Corp. 173,441 32,965,931
iGATE Corp. (I)(L) 5,218 78,218
Infosys, Ltd., ADR (L) 56,600 2,515,870
Innodata, Inc. (I) 3,735 13,820
Itochu Techno-Science Corp. 1,400 64,191
Jack Henry & Associates, Inc. 17,599 684,073
Lender Processing Services, Inc. 17,302 429,955
Lionbridge Technologies, Inc. (I) 9,353 38,441
Mantech International Corp., Class A (L) 8,584 214,428
Strategic Equity Allocation Fund (continued)Shares or
Principal
Amount Value
COMMON STOCKS (continued)
IT Services (continued)
Mastercard, Inc., Class A 17,329 $ 8,468,336
Mattersight Corp. (I)(L) 1,534 7,839
MAXIMUS, Inc. 5,490 345,815
Copyright © 2013 www.secdatabase.com. All Rights Reserved.Please Consider the Environment Before Printing This Document
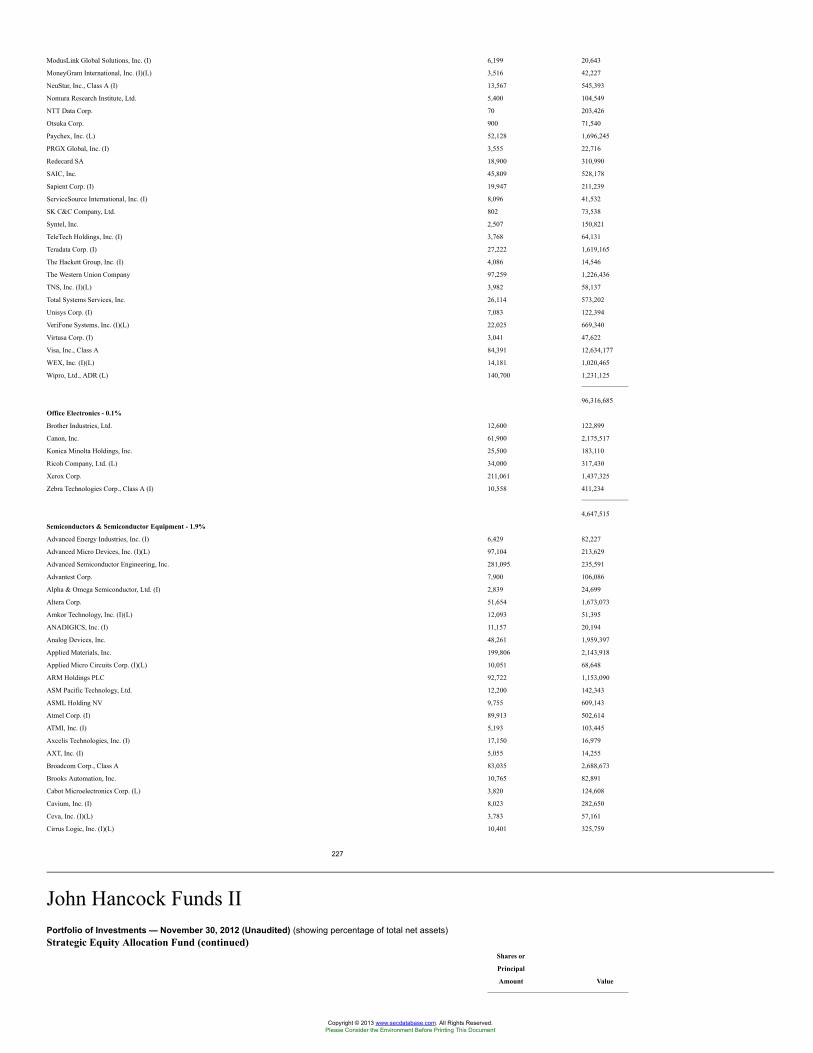
ModusLink Global Solutions, Inc. (I) 6,199 20,643
MoneyGram International, Inc. (I)(L) 3,516 42,227
NeuStar, Inc., Class A (I) 13,567 545,393
Nomura Research Institute, Ltd. 5,400 104,549
NTT Data Corp. 70 203,426
Otsuka Corp. 900 71,540
Paychex, Inc. (L) 52,128 1,696,245
PRGX Global, Inc. (I) 3,555 22,716
Redecard SA 18,900 310,990
SAIC, Inc. 45,809 528,178
Sapient Corp. (I) 19,947 211,239
ServiceSource International, Inc. (I) 8,096 41,532
SK C&C Company, Ltd. 802 73,538
Syntel, Inc. 2,507 150,821
TeleTech Holdings, Inc. (I) 3,768 64,131
Teradata Corp. (I) 27,222 1,619,165
The Hackett Group, Inc. (I) 4,086 14,546
The Western Union Company 97,259 1,226,436
TNS, Inc. (I)(L) 3,982 58,137
Total Systems Services, Inc. 26,114 573,202
Unisys Corp. (I) 7,083 122,394
VeriFone Systems, Inc. (I)(L) 22,025 669,340
Virtusa Corp. (I) 3,041 47,622
Visa, Inc., Class A 84,391 12,634,177
WEX, Inc. (I)(L) 14,181 1,020,465
Wipro, Ltd., ADR (L) 140,700 1,231,125
96,316,685
Office Electronics - 0.1%
Brother Industries, Ltd. 12,600 122,899
Canon, Inc. 61,900 2,175,517
Konica Minolta Holdings, Inc. 25,500 183,110
Ricoh Company, Ltd. (L) 34,000 317,430
Xerox Corp. 211,061 1,437,325
Zebra Technologies Corp., Class A (I) 10,558 411,234
4,647,515
Semiconductors & Semiconductor Equipment - 1.9%
Advanced Energy Industries, Inc. (I) 6,429 82,227
Advanced Micro Devices, Inc. (I)(L) 97,104 213,629
Advanced Semiconductor Engineering, Inc. 281,095 235,591
Advantest Corp. 7,900 106,086
Alpha & Omega Semiconductor, Ltd. (I) 2,839 24,699
Altera Corp. 51,654 1,673,073
Amkor Technology, Inc. (I)(L) 12,093 51,395
ANADIGICS, Inc. (I) 11,157 20,194
Analog Devices, Inc. 48,261 1,959,397
Applied Materials, Inc. 199,806 2,143,918
Applied Micro Circuits Corp. (I)(L) 10,051 68,648
ARM Holdings PLC 92,722 1,153,090
ASM Pacific Technology, Ltd. 12,200 142,343
ASML Holding NV 9,755 609,143
Atmel Corp. (I) 89,913 502,614
ATMI, Inc. (I) 5,193 103,445
Axcelis Technologies, Inc. (I) 17,150 16,979
AXT, Inc. (I) 5,055 14,255
Broadcom Corp., Class A 83,035 2,688,673
Brooks Automation, Inc. 10,765 82,891
Cabot Microelectronics Corp. (L) 3,820 124,608
Cavium, Inc. (I) 8,023 282,650
Ceva, Inc. (I)(L) 3,783 57,161
Cirrus Logic, Inc. (I)(L) 10,401 325,759
227
John Hancock Funds IIPortfolio of Investments — November 30, 2012 (Unaudited) (showing percentage of total net assets)Strategic Equity Allocation Fund (continued)
Shares or
Principal
Amount Value
Copyright © 2013 www.secdatabase.com. All Rights Reserved.Please Consider the Environment Before Printing This Document
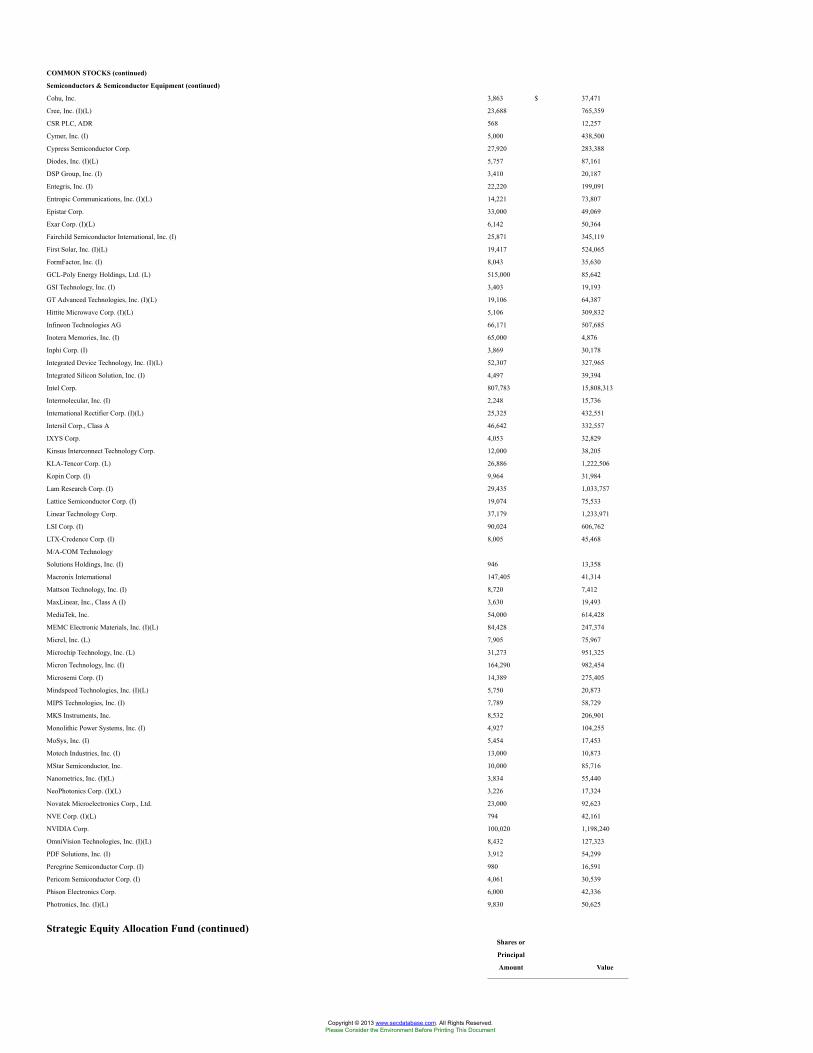
COMMON STOCKS (continued)
Semiconductors & Semiconductor Equipment (continued)
Cohu, Inc. 3,863 $ 37,471
Cree, Inc. (I)(L) 23,688 765,359
CSR PLC, ADR 568 12,257
Cymer, Inc. (I) 5,000 438,500
Cypress Semiconductor Corp. 27,920 283,388
Diodes, Inc. (I)(L) 5,757 87,161
DSP Group, Inc. (I) 3,410 20,187
Entegris, Inc. (I) 22,220 199,091
Entropic Communications, Inc. (I)(L) 14,221 73,807
Epistar Corp. 33,000 49,069
Exar Corp. (I)(L) 6,142 50,364
Fairchild Semiconductor International, Inc. (I) 25,871 345,119
First Solar, Inc. (I)(L) 19,417 524,065
FormFactor, Inc. (I) 8,043 35,630
GCL-Poly Energy Holdings, Ltd. (L) 515,000 85,642
GSI Technology, Inc. (I) 3,403 19,193
GT Advanced Technologies, Inc. (I)(L) 19,106 64,387
Hittite Microwave Corp. (I)(L) 5,106 309,832
Infineon Technologies AG 66,171 507,685
Inotera Memories, Inc. (I) 65,000 4,876
Inphi Corp. (I) 3,869 30,178
Integrated Device Technology, Inc. (I)(L) 52,307 327,965
Integrated Silicon Solution, Inc. (I) 4,497 39,394
Intel Corp. 807,783 15,808,313
Intermolecular, Inc. (I) 2,248 15,736
International Rectifier Corp. (I)(L) 25,325 432,551
Intersil Corp., Class A 46,642 332,557
IXYS Corp. 4,053 32,829
Kinsus Interconnect Technology Corp. 12,000 38,205
KLA-Tencor Corp. (L) 26,886 1,222,506
Kopin Corp. (I) 9,964 31,984
Lam Research Corp. (I) 29,435 1,033,757
Lattice Semiconductor Corp. (I) 19,074 75,533
Linear Technology Corp. 37,179 1,233,971
LSI Corp. (I) 90,024 606,762
LTX-Credence Corp. (I) 8,005 45,468
M/A-COM Technology
Solutions Holdings, Inc. (I) 946 13,358
Macronix International 147,405 41,314
Mattson Technology, Inc. (I) 8,720 7,412
MaxLinear, Inc., Class A (I) 3,630 19,493
MediaTek, Inc. 54,000 614,428
MEMC Electronic Materials, Inc. (I)(L) 84,428 247,374
Micrel, Inc. (L) 7,905 75,967
Microchip Technology, Inc. (L) 31,273 951,325
Micron Technology, Inc. (I) 164,290 982,454
Microsemi Corp. (I) 14,389 275,405
Mindspeed Technologies, Inc. (I)(L) 5,750 20,873
MIPS Technologies, Inc. (I) 7,789 58,729
MKS Instruments, Inc. 8,532 206,901
Monolithic Power Systems, Inc. (I) 4,927 104,255
MoSys, Inc. (I) 5,454 17,453
Motech Industries, Inc. (I) 13,000 10,873
MStar Semiconductor, Inc. 10,000 85,716
Nanometrics, Inc. (I)(L) 3,834 55,440
NeoPhotonics Corp. (I)(L) 3,226 17,324
Novatek Microelectronics Corp., Ltd. 23,000 92,623
NVE Corp. (I)(L) 794 42,161
NVIDIA Corp. 100,020 1,198,240
OmniVision Technologies, Inc. (I)(L) 8,432 127,323
PDF Solutions, Inc. (I) 3,912 54,299
Peregrine Semiconductor Corp. (I) 980 16,591
Pericom Semiconductor Corp. (I) 4,061 30,539
Phison Electronics Corp. 6,000 42,336
Photronics, Inc. (I)(L) 9,830 50,625
Strategic Equity Allocation Fund (continued)Shares or
Principal
Amount Value
Copyright © 2013 www.secdatabase.com. All Rights Reserved.Please Consider the Environment Before Printing This Document
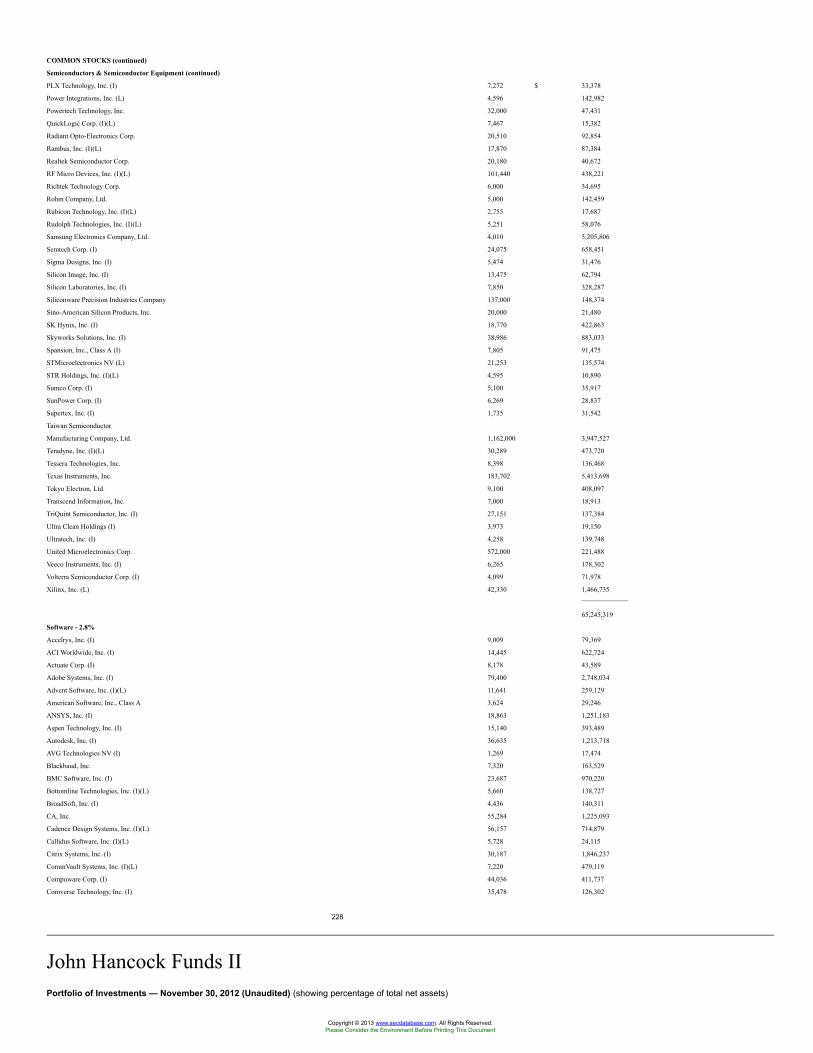
COMMON STOCKS (continued)
Semiconductors & Semiconductor Equipment (continued)
PLX Technology, Inc. (I) 7,272 $ 33,378
Power Integrations, Inc. (L) 4,596 142,982
Powertech Technology, Inc. 32,000 47,431
QuickLogic Corp. (I)(L) 7,467 15,382
Radiant Opto-Electronics Corp. 20,510 92,854
Rambus, Inc. (I)(L) 17,870 87,384
Realtek Semiconductor Corp. 20,180 40,672
RF Micro Devices, Inc. (I)(L) 101,440 438,221
Richtek Technology Corp. 6,000 34,695
Rohm Company, Ltd. 5,000 142,459
Rubicon Technology, Inc. (I)(L) 2,755 17,687
Rudolph Technologies, Inc. (I)(L) 5,251 58,076
Samsung Electronics Company, Ltd. 4,010 5,205,806
Semtech Corp. (I) 24,075 658,451
Sigma Designs, Inc. (I) 5,474 31,476
Silicon Image, Inc. (I) 13,475 62,794
Silicon Laboratories, Inc. (I) 7,850 328,287
Siliconware Precision Industries Company 137,000 148,374
Sino-American Silicon Products, Inc. 20,000 21,480
SK Hynix, Inc. (I) 18,770 422,863
Skyworks Solutions, Inc. (I) 38,986 883,033
Spansion, Inc., Class A (I) 7,805 91,475
STMicroelectronics NV (L) 21,253 135,574
STR Holdings, Inc. (I)(L) 4,595 10,890
Sumco Corp. (I) 5,100 35,917
SunPower Corp. (I) 6,269 28,837
Supertex, Inc. (I) 1,735 31,542
Taiwan Semiconductor
Manufacturing Company, Ltd. 1,162,000 3,947,527
Teradyne, Inc. (I)(L) 30,289 473,720
Tessera Technologies, Inc. 8,398 136,468
Texas Instruments, Inc. 183,702 5,413,698
Tokyo Electron, Ltd. 9,100 408,097
Transcend Information, Inc. 7,000 18,913
TriQuint Semiconductor, Inc. (I) 27,151 137,384
Ultra Clean Holdings (I) 3,973 19,150
Ultratech, Inc. (I) 4,258 139,748
United Microelectronics Corp. 572,000 221,488
Veeco Instruments, Inc. (I) 6,265 178,302
Volterra Semiconductor Corp. (I) 4,099 71,978
Xilinx, Inc. (L) 42,330 1,466,735
65,245,319
Software - 2.8%
Accelrys, Inc. (I) 9,009 79,369
ACI Worldwide, Inc. (I) 14,445 622,724
Actuate Corp. (I) 8,178 43,589
Adobe Systems, Inc. (I) 79,400 2,748,034
Advent Software, Inc. (I)(L) 11,641 259,129
American Software, Inc., Class A 3,624 29,246
ANSYS, Inc. (I) 18,863 1,251,183
Aspen Technology, Inc. (I) 15,140 393,489
Autodesk, Inc. (I) 36,635 1,213,718
AVG Technologies NV (I) 1,269 17,474
Blackbaud, Inc. 7,320 163,529
BMC Software, Inc. (I) 23,687 970,220
Bottomline Technologies, Inc. (I)(L) 5,660 138,727
BroadSoft, Inc. (I) 4,436 140,311
CA, Inc. 55,284 1,225,093
Cadence Design Systems, Inc. (I)(L) 56,157 714,879
Callidus Software, Inc. (I)(L) 5,728 24,115
Citrix Systems, Inc. (I) 30,187 1,846,237
CommVault Systems, Inc. (I)(L) 7,220 479,119
Compuware Corp. (I) 44,036 411,737
Comverse Technology, Inc. (I) 35,478 126,302
228
John Hancock Funds IIPortfolio of Investments — November 30, 2012 (Unaudited) (showing percentage of total net assets)
Copyright © 2013 www.secdatabase.com. All Rights Reserved.Please Consider the Environment Before Printing This Document
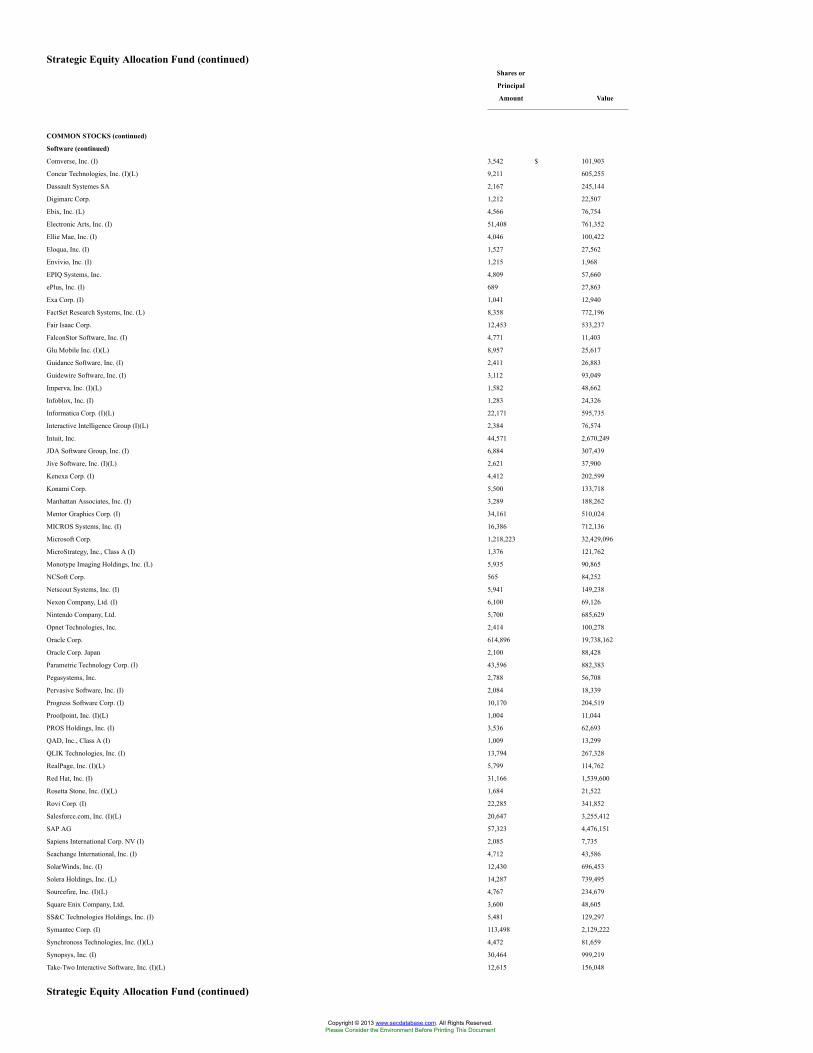
Strategic Equity Allocation Fund (continued)Shares or
Principal
Amount Value
COMMON STOCKS (continued)
Software (continued)
Comverse, Inc. (I) 3,542 $ 101,903
Concur Technologies, Inc. (I)(L) 9,211 605,255
Dassault Systemes SA 2,167 245,144
Digimarc Corp. 1,212 22,507
Ebix, Inc. (L) 4,566 76,754
Electronic Arts, Inc. (I) 51,408 761,352
Ellie Mae, Inc. (I) 4,046 100,422
Eloqua, Inc. (I) 1,527 27,562
Envivio, Inc. (I) 1,215 1,968
EPIQ Systems, Inc. 4,809 57,660
ePlus, Inc. (I) 689 27,863
Exa Corp. (I) 1,041 12,940
FactSet Research Systems, Inc. (L) 8,358 772,196
Fair Isaac Corp. 12,453 533,237
FalconStor Software, Inc. (I) 4,771 11,403
Glu Mobile Inc. (I)(L) 8,957 25,617
Guidance Software, Inc. (I) 2,411 26,883
Guidewire Software, Inc. (I) 3,112 93,049
Imperva, Inc. (I)(L) 1,582 48,662
Infoblox, Inc. (I) 1,283 24,326
Informatica Corp. (I)(L) 22,171 595,735
Interactive Intelligence Group (I)(L) 2,384 76,574
Intuit, Inc. 44,571 2,670,249
JDA Software Group, Inc. (I) 6,884 307,439
Jive Software, Inc. (I)(L) 2,621 37,900
Kenexa Corp. (I) 4,412 202,599
Konami Corp. 5,500 133,718
Manhattan Associates, Inc. (I) 3,289 188,262
Mentor Graphics Corp. (I) 34,161 510,024
MICROS Systems, Inc. (I) 16,386 712,136
Microsoft Corp. 1,218,223 32,429,096
MicroStrategy, Inc., Class A (I) 1,376 121,762
Monotype Imaging Holdings, Inc. (L) 5,935 90,865
NCSoft Corp. 565 84,252
Netscout Systems, Inc. (I) 5,941 149,238
Nexon Company, Ltd. (I) 6,100 69,126
Nintendo Company, Ltd. 5,700 685,629
Opnet Technologies, Inc. 2,414 100,278
Oracle Corp. 614,896 19,738,162
Oracle Corp. Japan 2,100 88,428
Parametric Technology Corp. (I) 43,596 882,383
Pegasystems, Inc. 2,788 56,708
Pervasive Software, Inc. (I) 2,084 18,339
Progress Software Corp. (I) 10,170 204,519
Proofpoint, Inc. (I)(L) 1,004 11,044
PROS Holdings, Inc. (I) 3,536 62,693
QAD, Inc., Class A (I) 1,009 13,299
QLIK Technologies, Inc. (I) 13,794 267,328
RealPage, Inc. (I)(L) 5,799 114,762
Red Hat, Inc. (I) 31,166 1,539,600
Rosetta Stone, Inc. (I)(L) 1,684 21,522
Rovi Corp. (I) 22,285 341,852
Salesforce.com, Inc. (I)(L) 20,647 3,255,412
SAP AG 57,323 4,476,151
Sapiens International Corp. NV (I) 2,085 7,735
Seachange International, Inc. (I) 4,712 43,586
SolarWinds, Inc. (I) 12,430 696,453
Solera Holdings, Inc. (L) 14,287 739,495
Sourcefire, Inc. (I)(L) 4,767 234,679
Square Enix Company, Ltd. 3,600 48,605
SS&C Technologies Holdings, Inc. (I) 5,481 129,297
Symantec Corp. (I) 113,498 2,129,222
Synchronoss Technologies, Inc. (I)(L) 4,472 81,659
Synopsys, Inc. (I) 30,464 999,219
Take-Two Interactive Software, Inc. (I)(L) 12,615 156,048
Strategic Equity Allocation Fund (continued)
Copyright © 2013 www.secdatabase.com. All Rights Reserved.Please Consider the Environment Before Printing This Document
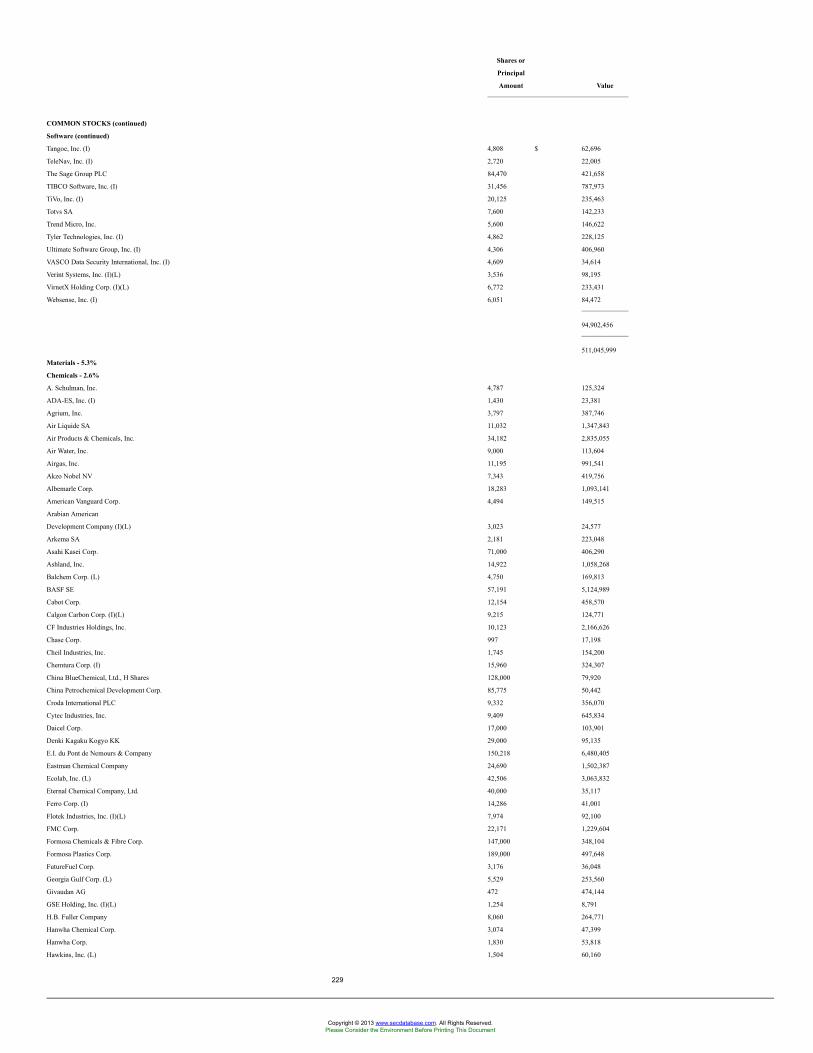
Shares or
Principal
Amount Value
COMMON STOCKS (continued)
Software (continued)
Tangoe, Inc. (I) 4,808 $ 62,696
TeleNav, Inc. (I) 2,720 22,005
The Sage Group PLC 84,470 421,658
TIBCO Software, Inc. (I) 31,456 787,973
TiVo, Inc. (I) 20,125 235,463
Totvs SA 7,600 142,233
Trend Micro, Inc. 5,600 146,622
Tyler Technologies, Inc. (I) 4,862 228,125
Ultimate Software Group, Inc. (I) 4,306 406,960
VASCO Data Security International, Inc. (I) 4,609 34,614
Verint Systems, Inc. (I)(L) 3,536 98,195
VirnetX Holding Corp. (I)(L) 6,772 233,431
Websense, Inc. (I) 6,051 84,472
94,902,456
511,045,999
Materials - 5.3%
Chemicals - 2.6%
A. Schulman, Inc. 4,787 125,324
ADA-ES, Inc. (I) 1,430 23,381
Agrium, Inc. 3,797 387,746
Air Liquide SA 11,032 1,347,843
Air Products & Chemicals, Inc. 34,182 2,835,055
Air Water, Inc. 9,000 113,604
Airgas, Inc. 11,195 991,541
Akzo Nobel NV 7,343 419,756
Albemarle Corp. 18,283 1,093,141
American Vanguard Corp. 4,494 149,515
Arabian American
Development Company (I)(L) 3,023 24,577
Arkema SA 2,181 223,048
Asahi Kasei Corp. 71,000 406,290
Ashland, Inc. 14,922 1,058,268
Balchem Corp. (L) 4,750 169,813
BASF SE 57,191 5,124,989
Cabot Corp. 12,154 458,570
Calgon Carbon Corp. (I)(L) 9,215 124,771
CF Industries Holdings, Inc. 10,123 2,166,626
Chase Corp. 997 17,198
Cheil Industries, Inc. 1,745 154,200
Chemtura Corp. (I) 15,960 324,307
China BlueChemical, Ltd., H Shares 128,000 79,920
China Petrochemical Development Corp. 85,775 50,442
Croda International PLC 9,332 356,070
Cytec Industries, Inc. 9,409 645,834
Daicel Corp. 17,000 103,901
Denki Kagaku Kogyo KK 29,000 95,135
E.I. du Pont de Nemours & Company 150,218 6,480,405
Eastman Chemical Company 24,690 1,502,387
Ecolab, Inc. (L) 42,506 3,063,832
Eternal Chemical Company, Ltd. 40,000 35,117
Ferro Corp. (I) 14,286 41,001
Flotek Industries, Inc. (I)(L) 7,974 92,100
FMC Corp. 22,171 1,229,604
Formosa Chemicals & Fibre Corp. 147,000 348,104
Formosa Plastics Corp. 189,000 497,648
FutureFuel Corp. 3,176 36,048
Georgia Gulf Corp. (L) 5,529 253,560
Givaudan AG 472 474,144
GSE Holding, Inc. (I)(L) 1,254 8,791
H.B. Fuller Company 8,060 264,771
Hanwha Chemical Corp. 3,074 47,399
Hanwha Corp. 1,830 53,818
Hawkins, Inc. (L) 1,504 60,160
229
Copyright © 2013 www.secdatabase.com. All Rights Reserved.Please Consider the Environment Before Printing This Document
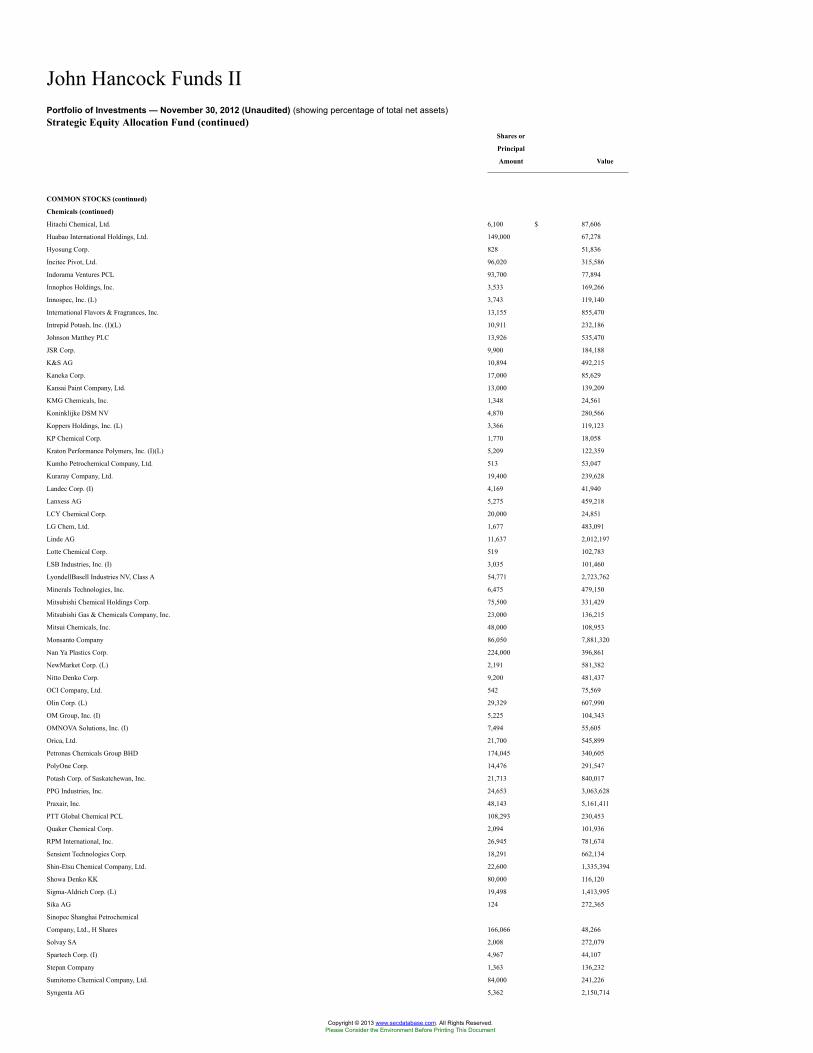
John Hancock Funds IIPortfolio of Investments — November 30, 2012 (Unaudited) (showing percentage of total net assets)Strategic Equity Allocation Fund (continued)
Shares or
Principal
Amount Value
COMMON STOCKS (continued)
Chemicals (continued)
Hitachi Chemical, Ltd. 6,100 $ 87,606
Huabao International Holdings, Ltd. 149,000 67,278
Hyosung Corp. 828 51,836
Incitec Pivot, Ltd. 96,020 315,586
Indorama Ventures PCL 93,700 77,894
Innophos Holdings, Inc. 3,533 169,266
Innospec, Inc. (L) 3,743 119,140
International Flavors & Fragrances, Inc. 13,155 855,470
Intrepid Potash, Inc. (I)(L) 10,911 232,186
Johnson Matthey PLC 13,926 535,470
JSR Corp. 9,900 184,188
K&S AG 10,894 492,215
Kaneka Corp. 17,000 85,629
Kansai Paint Company, Ltd. 13,000 139,209
KMG Chemicals, Inc. 1,348 24,561
Koninklijke DSM NV 4,870 280,566
Koppers Holdings, Inc. (L) 3,366 119,123
KP Chemical Corp. 1,770 18,058
Kraton Performance Polymers, Inc. (I)(L) 5,209 122,359
Kumho Petrochemical Company, Ltd. 513 53,047
Kuraray Company, Ltd. 19,400 239,628
Landec Corp. (I) 4,169 41,940
Lanxess AG 5,275 459,218
LCY Chemical Corp. 20,000 24,851
LG Chem, Ltd. 1,677 483,091
Linde AG 11,637 2,012,197
Lotte Chemical Corp. 519 102,783
LSB Industries, Inc. (I) 3,035 101,460
LyondellBasell Industries NV, Class A 54,771 2,723,762
Minerals Technologies, Inc. 6,475 479,150
Mitsubishi Chemical Holdings Corp. 75,500 331,429
Mitsubishi Gas & Chemicals Company, Inc. 23,000 136,215
Mitsui Chemicals, Inc. 48,000 108,953
Monsanto Company 86,050 7,881,320
Nan Ya Plastics Corp. 224,000 396,861
NewMarket Corp. (L) 2,191 581,382
Nitto Denko Corp. 9,200 481,437
OCI Company, Ltd. 542 75,569
Olin Corp. (L) 29,329 607,990
OM Group, Inc. (I) 5,225 104,343
OMNOVA Solutions, Inc. (I) 7,494 55,605
Orica, Ltd. 21,700 545,899
Petronas Chemicals Group BHD 174,045 340,605
PolyOne Corp. 14,476 291,547
Potash Corp. of Saskatchewan, Inc. 21,713 840,017
PPG Industries, Inc. 24,653 3,063,628
Praxair, Inc. 48,143 5,161,411
PTT Global Chemical PCL 108,293 230,453
Quaker Chemical Corp. 2,094 101,936
RPM International, Inc. 26,945 781,674
Sensient Technologies Corp. 18,291 662,134
Shin-Etsu Chemical Company, Ltd. 22,600 1,335,394
Showa Denko KK 80,000 116,120
Sigma-Aldrich Corp. (L) 19,498 1,413,995
Sika AG 124 272,365
Sinopec Shanghai Petrochemical
Company, Ltd., H Shares 166,066 48,266
Solvay SA 2,008 272,079
Spartech Corp. (I) 4,967 44,107
Stepan Company 1,363 136,232
Sumitomo Chemical Company, Ltd. 84,000 241,226
Syngenta AG 5,362 2,150,714
Copyright © 2013 www.secdatabase.com. All Rights Reserved.Please Consider the Environment Before Printing This Document
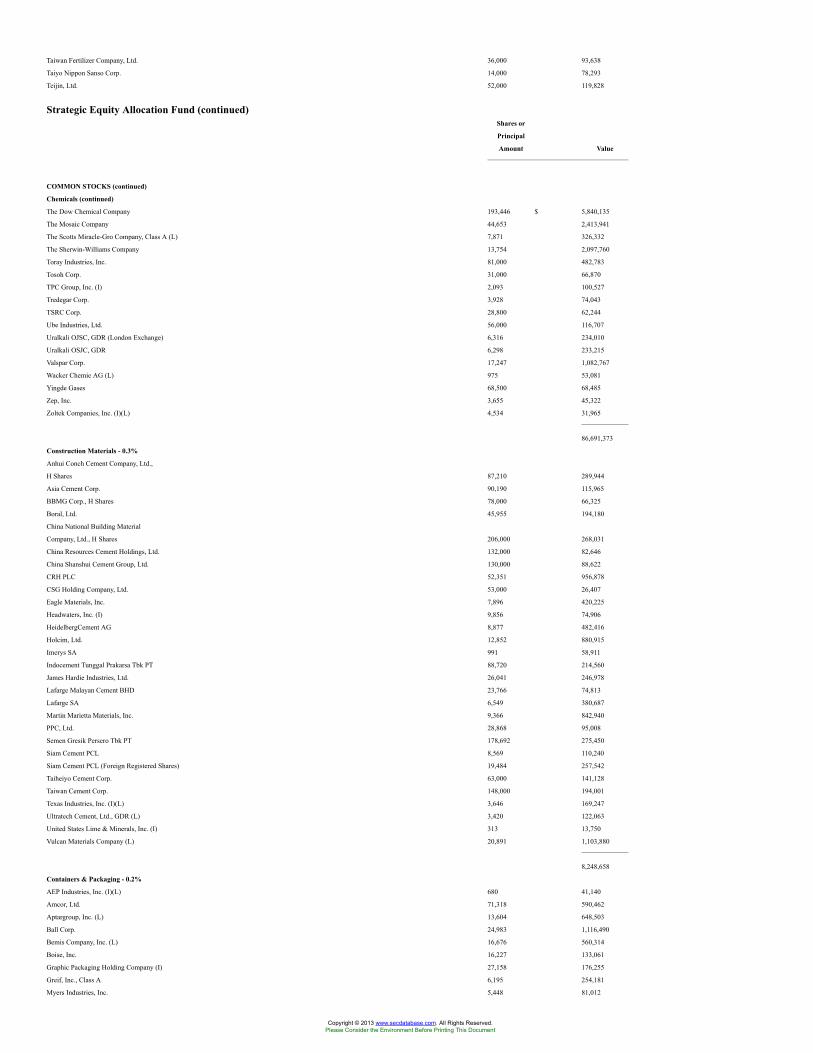
Taiwan Fertilizer Company, Ltd. 36,000 93,638
Taiyo Nippon Sanso Corp. 14,000 78,293
Teijin, Ltd. 52,000 119,828
Strategic Equity Allocation Fund (continued)Shares or
Principal
Amount Value
COMMON STOCKS (continued)
Chemicals (continued)
The Dow Chemical Company 193,446 $ 5,840,135
The Mosaic Company 44,653 2,413,941
The Scotts Miracle-Gro Company, Class A (L) 7,871 326,332
The Sherwin-Williams Company 13,754 2,097,760
Toray Industries, Inc. 81,000 482,783
Tosoh Corp. 31,000 66,870
TPC Group, Inc. (I) 2,093 100,527
Tredegar Corp. 3,928 74,043
TSRC Corp. 28,800 62,244
Ube Industries, Ltd. 56,000 116,707
Uralkali OJSC, GDR (London Exchange) 6,316 234,010
Uralkali OSJC, GDR 6,298 233,215
Valspar Corp. 17,247 1,082,767
Wacker Chemie AG (L) 975 53,081
Yingde Gases 68,500 68,485
Zep, Inc. 3,655 45,322
Zoltek Companies, Inc. (I)(L) 4,534 31,965
86,691,373
Construction Materials - 0.3%
Anhui Conch Cement Company, Ltd.,
H Shares 87,210 289,944
Asia Cement Corp. 90,190 115,965
BBMG Corp., H Shares 78,000 66,325
Boral, Ltd. 45,955 194,180
China National Building Material
Company, Ltd., H Shares 206,000 268,031
China Resources Cement Holdings, Ltd. 132,000 82,646
China Shanshui Cement Group, Ltd. 130,000 88,622
CRH PLC 52,351 956,878
CSG Holding Company, Ltd. 53,000 26,407
Eagle Materials, Inc. 7,896 420,225
Headwaters, Inc. (I) 9,856 74,906
HeidelbergCement AG 8,877 482,416
Holcim, Ltd. 12,852 880,915
Imerys SA 991 58,911
Indocement Tunggal Prakarsa Tbk PT 88,720 214,560
James Hardie Industries, Ltd. 26,041 246,978
Lafarge Malayan Cement BHD 23,766 74,813
Lafarge SA 6,549 380,687
Martin Marietta Materials, Inc. 9,366 842,940
PPC, Ltd. 28,868 95,008
Semen Gresik Persero Tbk PT 178,692 275,450
Siam Cement PCL 8,569 110,240
Siam Cement PCL (Foreign Registered Shares) 19,484 257,542
Taiheiyo Cement Corp. 63,000 141,128
Taiwan Cement Corp. 148,000 194,001
Texas Industries, Inc. (I)(L) 3,646 169,247
Ultratech Cement, Ltd., GDR (L) 3,420 122,063
United States Lime & Minerals, Inc. (I) 313 13,750
Vulcan Materials Company (L) 20,891 1,103,880
8,248,658
Containers & Packaging - 0.2%
AEP Industries, Inc. (I)(L) 680 41,140
Amcor, Ltd. 71,318 590,462
Aptargroup, Inc. (L) 13,604 648,503
Ball Corp. 24,983 1,116,490
Bemis Company, Inc. (L) 16,676 560,314
Boise, Inc. 16,227 133,061
Graphic Packaging Holding Company (I) 27,158 176,255
Greif, Inc., Class A 6,195 254,181
Myers Industries, Inc. 5,448 81,012
Copyright © 2013 www.secdatabase.com. All Rights Reserved.Please Consider the Environment Before Printing This Document
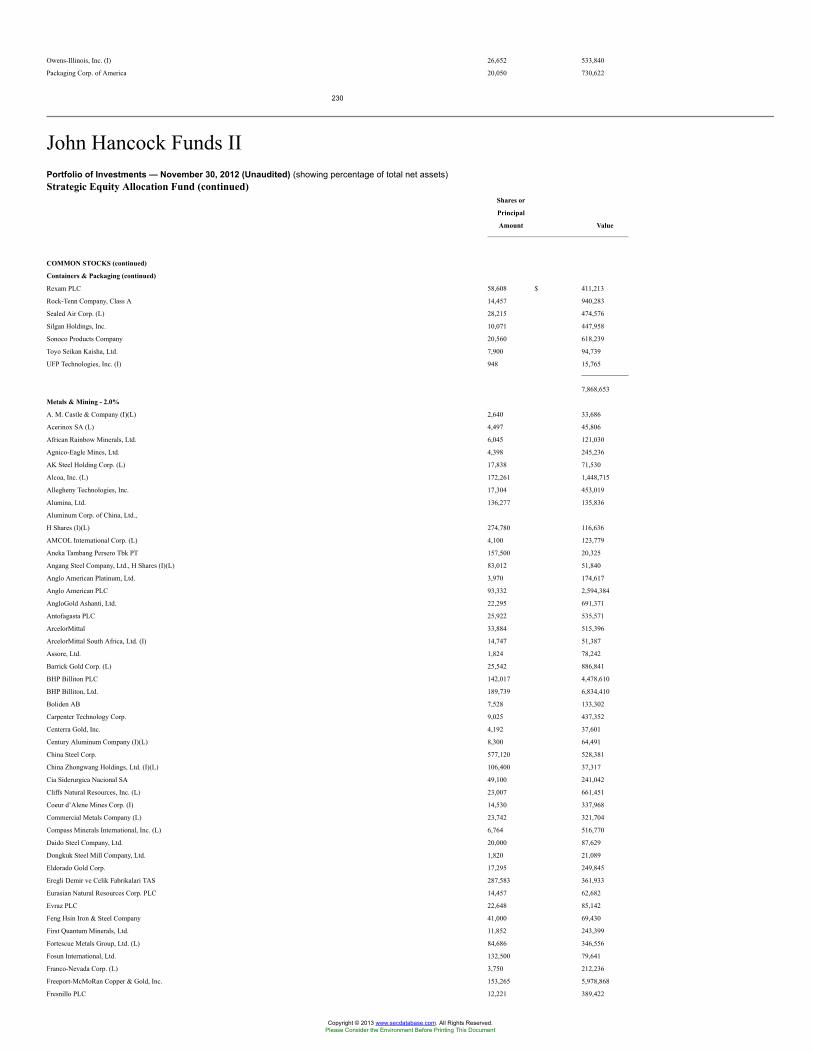
Owens-Illinois, Inc. (I) 26,652 533,840
Packaging Corp. of America 20,050 730,622
230
John Hancock Funds IIPortfolio of Investments — November 30, 2012 (Unaudited) (showing percentage of total net assets)Strategic Equity Allocation Fund (continued)
Shares or
Principal
Amount Value
COMMON STOCKS (continued)
Containers & Packaging (continued)
Rexam PLC 58,608 $ 411,213
Rock-Tenn Company, Class A 14,457 940,283
Sealed Air Corp. (L) 28,215 474,576
Silgan Holdings, Inc. 10,071 447,958
Sonoco Products Company 20,560 618,239
Toyo Seikan Kaisha, Ltd. 7,900 94,739
UFP Technologies, Inc. (I) 948 15,765
7,868,653
Metals & Mining - 2.0%
A. M. Castle & Company (I)(L) 2,640 33,686
Acerinox SA (L) 4,497 45,806
African Rainbow Minerals, Ltd. 6,045 121,030
Agnico-Eagle Mines, Ltd. 4,398 245,236
AK Steel Holding Corp. (L) 17,838 71,530
Alcoa, Inc. (L) 172,261 1,448,715
Allegheny Technologies, Inc. 17,304 453,019
Alumina, Ltd. 136,277 135,836
Aluminum Corp. of China, Ltd.,
H Shares (I)(L) 274,780 116,636
AMCOL International Corp. (L) 4,100 123,779
Aneka Tambang Persero Tbk PT 157,500 20,325
Angang Steel Company, Ltd., H Shares (I)(L) 83,012 51,840
Anglo American Platinum, Ltd. 3,970 174,617
Anglo American PLC 93,332 2,594,384
AngloGold Ashanti, Ltd. 22,295 691,371
Antofagasta PLC 25,922 535,571
ArcelorMittal 33,884 515,396
ArcelorMittal South Africa, Ltd. (I) 14,747 51,387
Assore, Ltd. 1,824 78,242
Barrick Gold Corp. (L) 25,542 886,841
BHP Billiton PLC 142,017 4,478,610
BHP Billiton, Ltd. 189,739 6,834,410
Boliden AB 7,528 133,302
Carpenter Technology Corp. 9,025 437,352
Centerra Gold, Inc. 4,192 37,601
Century Aluminum Company (I)(L) 8,300 64,491
China Steel Corp. 577,120 528,381
China Zhongwang Holdings, Ltd. (I)(L) 106,400 37,317
Cia Siderurgica Nacional SA 49,100 241,042
Cliffs Natural Resources, Inc. (L) 23,007 661,451
Coeur d’Alene Mines Corp. (I) 14,530 337,968
Commercial Metals Company (L) 23,742 321,704
Compass Minerals International, Inc. (L) 6,764 516,770
Daido Steel Company, Ltd. 20,000 87,629
Dongkuk Steel Mill Company, Ltd. 1,820 21,089
Eldorado Gold Corp. 17,295 249,845
Eregli Demir ve Celik Fabrikalari TAS 287,583 361,933
Eurasian Natural Resources Corp. PLC 14,457 62,682
Evraz PLC 22,648 85,142
Feng Hsin Iron & Steel Company 41,000 69,430
First Quantum Minerals, Ltd. 11,852 243,399
Fortescue Metals Group, Ltd. (L) 84,686 346,556
Fosun International, Ltd. 132,500 79,641
Franco-Nevada Corp. (L) 3,750 212,236
Freeport-McMoRan Copper & Gold, Inc. 153,265 5,978,868
Fresnillo PLC 12,221 389,422
Copyright © 2013 www.secdatabase.com. All Rights Reserved.Please Consider the Environment Before Printing This Document
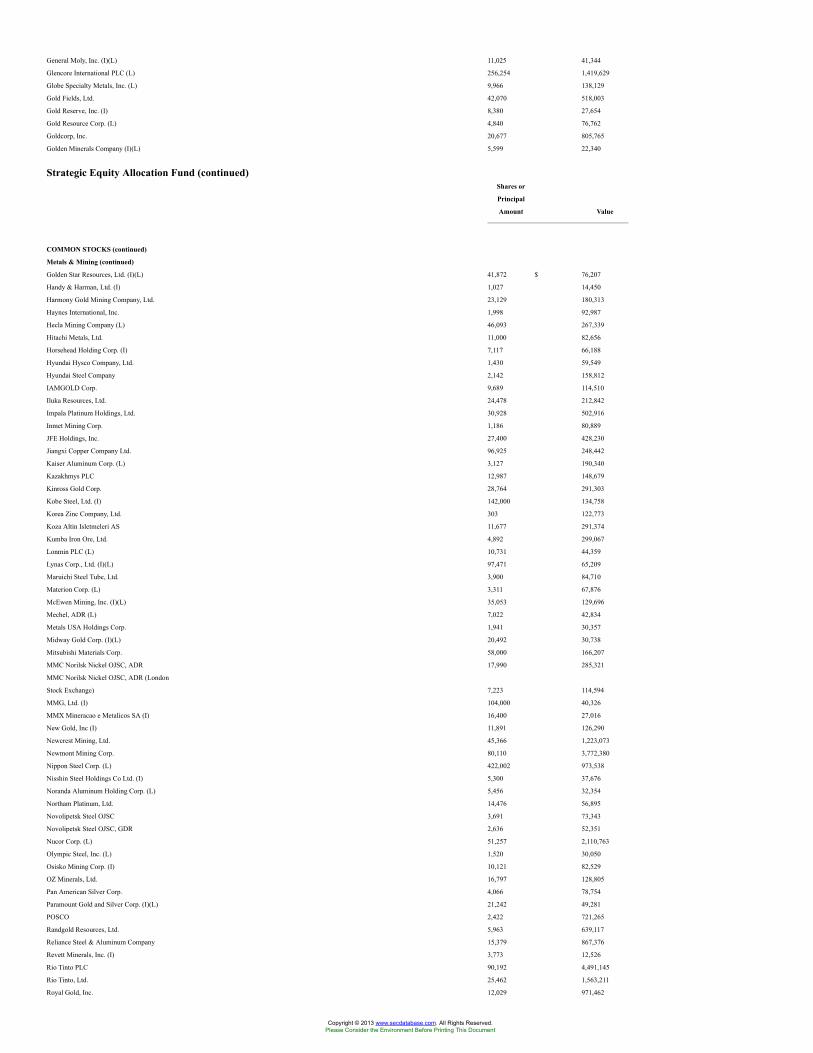
General Moly, Inc. (I)(L) 11,025 41,344
Glencore International PLC (L) 256,254 1,419,629
Globe Specialty Metals, Inc. (L) 9,966 138,129
Gold Fields, Ltd. 42,070 518,003
Gold Reserve, Inc. (I) 8,380 27,654
Gold Resource Corp. (L) 4,840 76,762
Goldcorp, Inc. 20,677 805,765
Golden Minerals Company (I)(L) 5,599 22,340
Strategic Equity Allocation Fund (continued)Shares or
Principal
Amount Value
COMMON STOCKS (continued)
Metals & Mining (continued)
Golden Star Resources, Ltd. (I)(L) 41,872 $ 76,207
Handy & Harman, Ltd. (I) 1,027 14,450
Harmony Gold Mining Company, Ltd. 23,129 180,313
Haynes International, Inc. 1,998 92,987
Hecla Mining Company (L) 46,093 267,339
Hitachi Metals, Ltd. 11,000 82,656
Horsehead Holding Corp. (I) 7,117 66,188
Hyundai Hysco Company, Ltd. 1,430 59,549
Hyundai Steel Company 2,142 158,812
IAMGOLD Corp. 9,689 114,510
Iluka Resources, Ltd. 24,478 212,842
Impala Platinum Holdings, Ltd. 30,928 502,916
Inmet Mining Corp. 1,186 80,889
JFE Holdings, Inc. 27,400 428,230
Jiangxi Copper Company Ltd. 96,925 248,442
Kaiser Aluminum Corp. (L) 3,127 190,340
Kazakhmys PLC 12,987 148,679
Kinross Gold Corp. 28,764 291,303
Kobe Steel, Ltd. (I) 142,000 134,758
Korea Zinc Company, Ltd. 303 122,773
Koza Altin Isletmeleri AS 11,677 291,374
Kumba Iron Ore, Ltd. 4,892 299,067
Lonmin PLC (L) 10,731 44,359
Lynas Corp., Ltd. (I)(L) 97,471 65,209
Maruichi Steel Tube, Ltd. 3,900 84,710
Materion Corp. (L) 3,311 67,876
McEwen Mining, Inc. (I)(L) 35,053 129,696
Mechel, ADR (L) 7,022 42,834
Metals USA Holdings Corp. 1,941 30,357
Midway Gold Corp. (I)(L) 20,492 30,738
Mitsubishi Materials Corp. 58,000 166,207
MMC Norilsk Nickel OJSC, ADR 17,990 285,321
MMC Norilsk Nickel OJSC, ADR (London
Stock Exchange) 7,223 114,594
MMG, Ltd. (I) 104,000 40,326
MMX Mineracao e Metalicos SA (I) 16,400 27,016
New Gold, Inc (I) 11,891 126,290
Newcrest Mining, Ltd. 45,366 1,223,073
Newmont Mining Corp. 80,110 3,772,380
Nippon Steel Corp. (L) 422,002 973,538
Nisshin Steel Holdings Co Ltd. (I) 5,300 37,676
Noranda Aluminum Holding Corp. (L) 5,456 32,354
Northam Platinum, Ltd. 14,476 56,895
Novolipetsk Steel OJSC 3,691 73,343
Novolipetsk Steel OJSC, GDR 2,636 52,351
Nucor Corp. (L) 51,257 2,110,763
Olympic Steel, Inc. (L) 1,520 30,050
Osisko Mining Corp. (I) 10,121 82,529
OZ Minerals, Ltd. 16,797 128,805
Pan American Silver Corp. 4,066 78,754
Paramount Gold and Silver Corp. (I)(L) 21,242 49,281
POSCO 2,422 721,265
Randgold Resources, Ltd. 5,963 639,117
Reliance Steel & Aluminum Company 15,379 867,376
Revett Minerals, Inc. (I) 3,773 12,526
Rio Tinto PLC 90,192 4,491,145
Rio Tinto, Ltd. 25,462 1,563,211
Royal Gold, Inc. 12,029 971,462
Copyright © 2013 www.secdatabase.com. All Rights Reserved.Please Consider the Environment Before Printing This Document
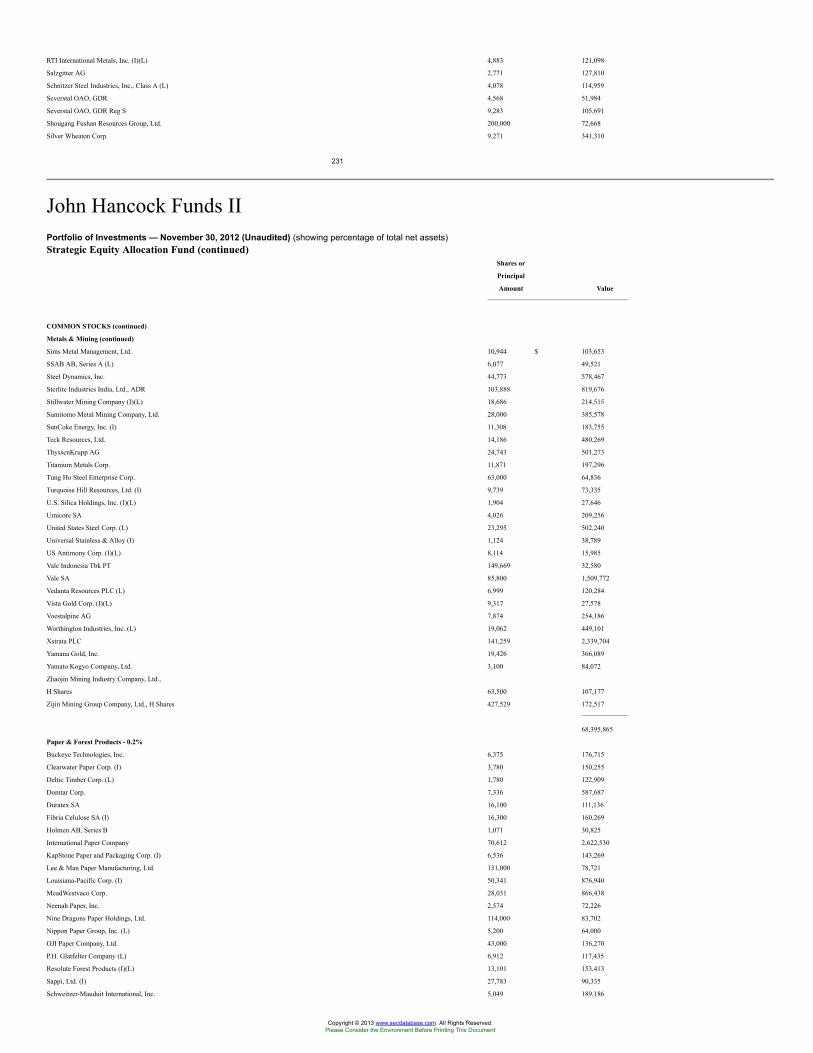
RTI International Metals, Inc. (I)(L) 4,883 121,098
Salzgitter AG 2,771 127,810
Schnitzer Steel Industries, Inc., Class A (L) 4,078 114,959
Severstal OAO, GDR 4,568 51,984
Severstal OAO, GDR Reg S 9,283 105,691
Shougang Fushan Resources Group, Ltd. 200,000 72,668
Silver Wheaton Corp. 9,271 341,310
231
John Hancock Funds IIPortfolio of Investments — November 30, 2012 (Unaudited) (showing percentage of total net assets)Strategic Equity Allocation Fund (continued)
Shares or
Principal
Amount Value
COMMON STOCKS (continued)
Metals & Mining (continued)
Sims Metal Management, Ltd. 10,944 $ 103,653
SSAB AB, Series A (L) 6,077 49,521
Steel Dynamics, Inc. 44,773 578,467
Sterlite Industries India, Ltd., ADR 103,888 819,676
Stillwater Mining Company (I)(L) 18,686 214,515
Sumitomo Metal Mining Company, Ltd. 28,000 385,578
SunCoke Energy, Inc. (I) 11,308 183,755
Teck Resources, Ltd. 14,186 480,269
ThyssenKrupp AG 24,743 501,273
Titanium Metals Corp. 11,871 197,296
Tung Ho Steel Enterprise Corp. 63,000 64,836
Turquoise Hill Resources, Ltd. (I) 9,739 73,335
U.S. Silica Holdings, Inc. (I)(L) 1,904 27,646
Umicore SA 4,026 209,256
United States Steel Corp. (L) 23,295 502,240
Universal Stainless & Alloy (I) 1,124 38,789
US Antimony Corp. (I)(L) 8,114 15,985
Vale Indonesia Tbk PT 149,669 32,580
Vale SA 85,800 1,509,772
Vedanta Resources PLC (L) 6,999 120,284
Vista Gold Corp. (I)(L) 9,317 27,578
Voestalpine AG 7,874 254,186
Worthington Industries, Inc. (L) 19,062 449,101
Xstrata PLC 141,259 2,339,704
Yamana Gold, Inc. 19,426 366,089
Yamato Kogyo Company, Ltd. 3,100 84,072
Zhaojin Mining Industry Company, Ltd.,
H Shares 63,500 107,177
Zijin Mining Group Company, Ltd., H Shares 427,529 172,517
68,395,865
Paper & Forest Products - 0.2%
Buckeye Technologies, Inc. 6,375 176,715
Clearwater Paper Corp. (I) 3,780 150,255
Deltic Timber Corp. (L) 1,780 122,909
Domtar Corp. 7,336 587,687
Duratex SA 16,100 111,136
Fibria Celulose SA (I) 16,300 160,269
Holmen AB, Series B 1,071 30,825
International Paper Company 70,612 2,622,530
KapStone Paper and Packaging Corp. (I) 6,536 143,269
Lee & Man Paper Manufacturing, Ltd. 131,000 78,721
Louisiana-Pacific Corp. (I) 50,341 876,940
MeadWestvaco Corp. 28,031 866,438
Neenah Paper, Inc. 2,574 72,226
Nine Dragons Paper Holdings, Ltd. 114,000 83,702
Nippon Paper Group, Inc. (L) 5,200 64,000
OJI Paper Company, Ltd. 43,000 136,270
P.H. Glatfelter Company (L) 6,912 117,435
Resolute Forest Products (I)(L) 13,101 153,413
Sappi, Ltd. (I) 27,783 90,335
Schweitzer-Mauduit International, Inc. 5,049 189,186
Copyright © 2013 www.secdatabase.com. All Rights Reserved.Please Consider the Environment Before Printing This Document
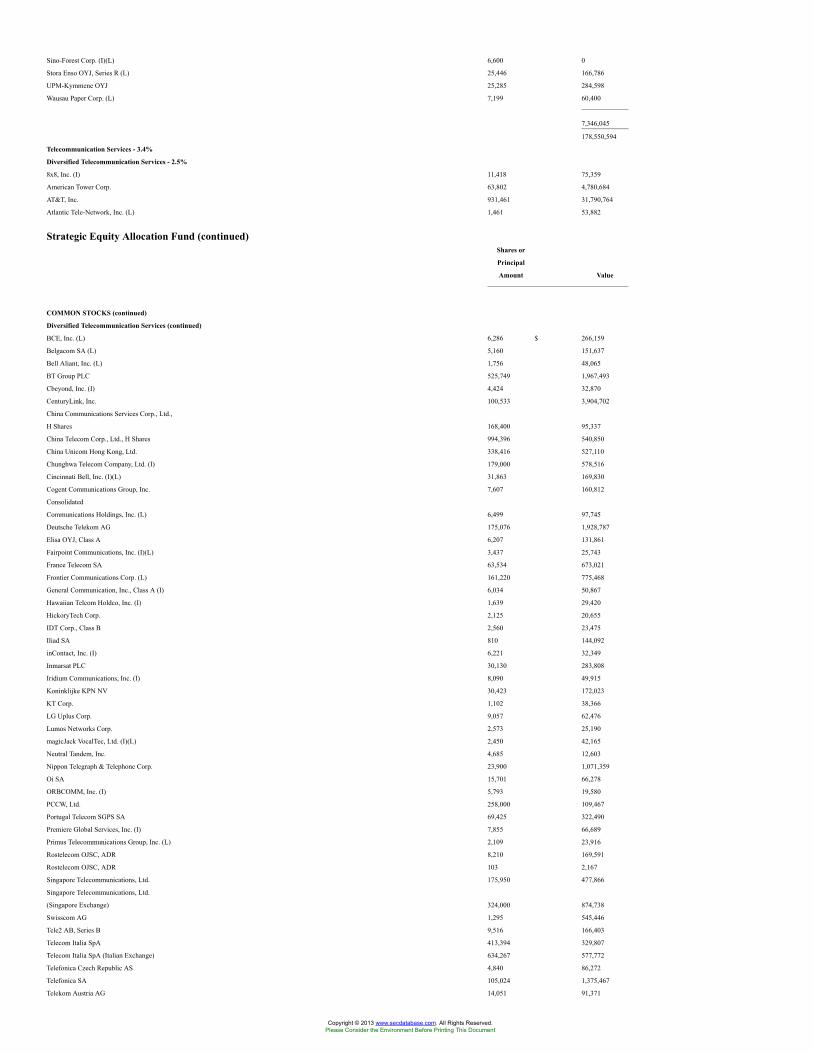
Sino-Forest Corp. (I)(L) 6,600 0
Stora Enso OYJ, Series R (L) 25,446 166,786
UPM-Kymmene OYJ 25,285 284,598
Wausau Paper Corp. (L) 7,199 60,400
7,346,045
178,550,594
Telecommunication Services - 3.4%
Diversified Telecommunication Services - 2.5%
8x8, Inc. (I) 11,418 75,359
American Tower Corp. 63,802 4,780,684
AT&T, Inc. 931,461 31,790,764
Atlantic Tele-Network, Inc. (L) 1,461 53,882
Strategic Equity Allocation Fund (continued)Shares or
Principal
Amount Value
COMMON STOCKS (continued)
Diversified Telecommunication Services (continued)
BCE, Inc. (L) 6,286 $ 266,159
Belgacom SA (L) 5,160 151,637
Bell Aliant, Inc. (L) 1,756 48,065
BT Group PLC 525,749 1,967,493
Cbeyond, Inc. (I) 4,424 32,870
CenturyLink, Inc. 100,533 3,904,702
China Communications Services Corp., Ltd.,
H Shares 168,400 95,337
China Telecom Corp., Ltd., H Shares 994,396 540,850
China Unicom Hong Kong, Ltd. 338,416 527,110
Chunghwa Telecom Company, Ltd. (I) 179,000 578,516
Cincinnati Bell, Inc. (I)(L) 31,863 169,830
Cogent Communications Group, Inc. 7,607 160,812
Consolidated
Communications Holdings, Inc. (L) 6,499 97,745
Deutsche Telekom AG 175,076 1,928,787
Elisa OYJ, Class A 6,207 131,861
Fairpoint Communications, Inc. (I)(L) 3,437 25,743
France Telecom SA 63,534 673,021
Frontier Communications Corp. (L) 161,220 775,468
General Communication, Inc., Class A (I) 6,034 50,867
Hawaiian Telcom Holdco, Inc. (I) 1,639 29,420
HickoryTech Corp. 2,125 20,655
IDT Corp., Class B 2,560 23,475
Iliad SA 810 144,092
inContact, Inc. (I) 6,221 32,349
Inmarsat PLC 30,130 283,808
Iridium Communications, Inc. (I) 8,090 49,915
Koninklijke KPN NV 30,423 172,023
KT Corp. 1,102 38,366
LG Uplus Corp. 9,057 62,476
Lumos Networks Corp. 2,573 25,190
magicJack VocalTec, Ltd. (I)(L) 2,450 42,165
Neutral Tandem, Inc. 4,685 12,603
Nippon Telegraph & Telephone Corp. 23,900 1,071,359
Oi SA 15,701 66,278
ORBCOMM, Inc. (I) 5,793 19,580
PCCW, Ltd. 258,000 109,467
Portugal Telecom SGPS SA 69,425 322,490
Premiere Global Services, Inc. (I) 7,855 66,689
Primus Telecommunications Group, Inc. (L) 2,109 23,916
Rostelecom OJSC, ADR 8,210 169,591
Rostelecom OJSC, ADR 103 2,167
Singapore Telecommunications, Ltd. 175,950 477,866
Singapore Telecommunications, Ltd.
(Singapore Exchange) 324,000 874,738
Swisscom AG 1,295 545,446
Tele2 AB, Series B 9,516 166,403
Telecom Italia SpA 413,394 329,807
Telecom Italia SpA (Italian Exchange) 634,267 577,772
Telefonica Czech Republic AS 4,840 86,272
Telefonica SA 105,024 1,375,467
Telekom Austria AG 14,051 91,371
Copyright © 2013 www.secdatabase.com. All Rights Reserved.Please Consider the Environment Before Printing This Document
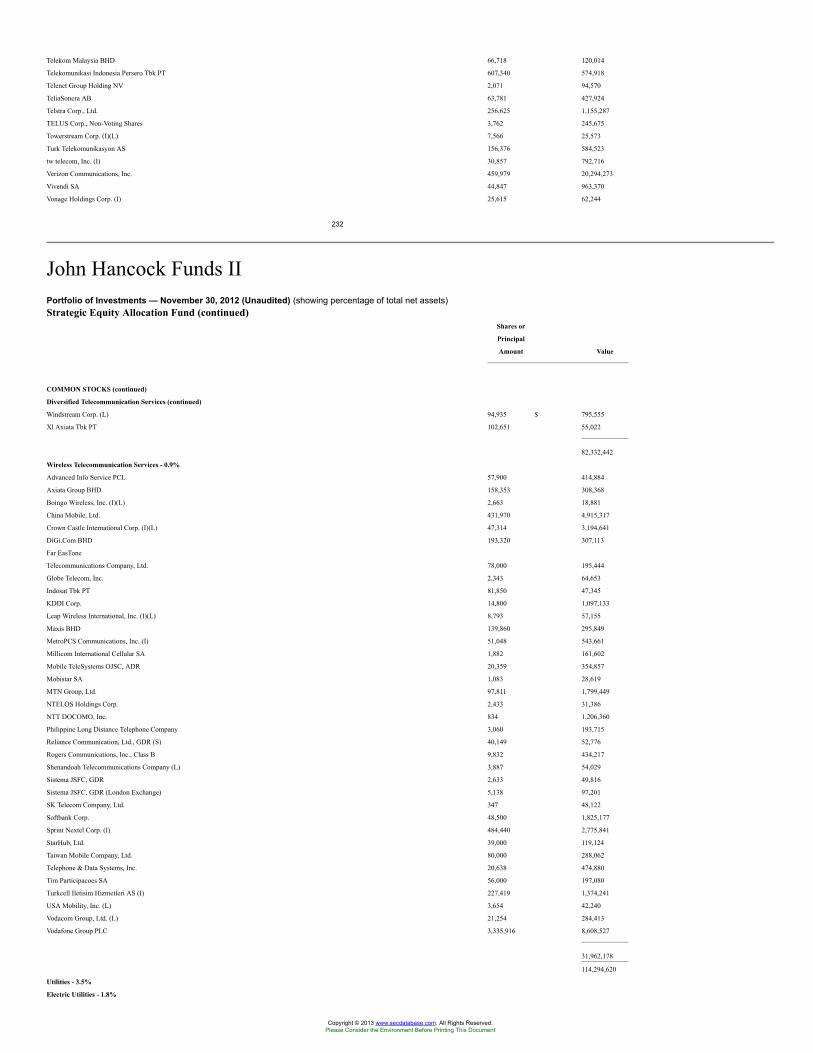
Telekom Malaysia BHD 66,718 120,014
Telekomunikasi Indonesia Persero Tbk PT 607,340 574,918
Telenet Group Holding NV 2,071 94,570
TeliaSonera AB 63,781 427,924
Telstra Corp., Ltd. 256,625 1,155,287
TELUS Corp., Non-Voting Shares 3,762 245,675
Towerstream Corp. (I)(L) 7,566 25,573
Turk Telekomunikasyon AS 156,376 584,523
tw telecom, Inc. (I) 30,857 792,716
Verizon Communications, Inc. 459,979 20,294,273
Vivendi SA 44,847 963,370
Vonage Holdings Corp. (I) 25,615 62,244
232
John Hancock Funds IIPortfolio of Investments — November 30, 2012 (Unaudited) (showing percentage of total net assets)Strategic Equity Allocation Fund (continued)
Shares or
Principal
Amount Value
COMMON STOCKS (continued)
Diversified Telecommunication Services (continued)
Windstream Corp. (L) 94,935 $ 795,555
Xl Axiata Tbk PT 102,651 55,022
82,332,442
Wireless Telecommunication Services - 0.9%
Advanced Info Service PCL 57,900 414,884
Axiata Group BHD 158,353 308,368
Boingo Wireless, Inc. (I)(L) 2,663 18,881
China Mobile, Ltd. 431,970 4,915,317
Crown Castle International Corp. (I)(L) 47,314 3,194,641
DiGi.Com BHD 193,320 307,113
Far EasTone
Telecommunications Company, Ltd. 78,000 195,444
Globe Telecom, Inc. 2,343 64,653
Indosat Tbk PT 81,850 47,345
KDDI Corp. 14,800 1,097,133
Leap Wireless International, Inc. (I)(L) 8,793 57,155
Maxis BHD 139,860 295,849
MetroPCS Communications, Inc. (I) 51,048 543,661
Millicom International Cellular SA 1,882 161,602
Mobile TeleSystems OJSC, ADR 20,359 354,857
Mobistar SA 1,083 28,619
MTN Group, Ltd. 97,811 1,799,449
NTELOS Holdings Corp. 2,433 31,386
NTT DOCOMO, Inc. 834 1,206,360
Philippine Long Distance Telephone Company 3,060 193,715
Reliance Communication, Ltd., GDR (S) 40,149 52,776
Rogers Communications, Inc., Class B 9,832 434,217
Shenandoah Telecommunications Company (L) 3,887 54,029
Sistema JSFC, GDR 2,633 49,816
Sistema JSFC, GDR (London Exchange) 5,138 97,201
SK Telecom Company, Ltd. 347 48,122
Softbank Corp. 48,500 1,825,177
Sprint Nextel Corp. (I) 484,440 2,775,841
StarHub, Ltd. 39,000 119,124
Taiwan Mobile Company, Ltd. 80,000 288,062
Telephone & Data Systems, Inc. 20,638 474,880
Tim Participacoes SA 56,000 197,080
Turkcell Iletisim Hizmetleri AS (I) 227,419 1,374,241
USA Mobility, Inc. (L) 3,654 42,240
Vodacom Group, Ltd. (L) 21,254 284,413
Vodafone Group PLC 3,335,916 8,608,527
31,962,178
114,294,620
Utilities - 3.5%
Electric Utilities - 1.8%
Copyright © 2013 www.secdatabase.com. All Rights Reserved.Please Consider the Environment Before Printing This Document
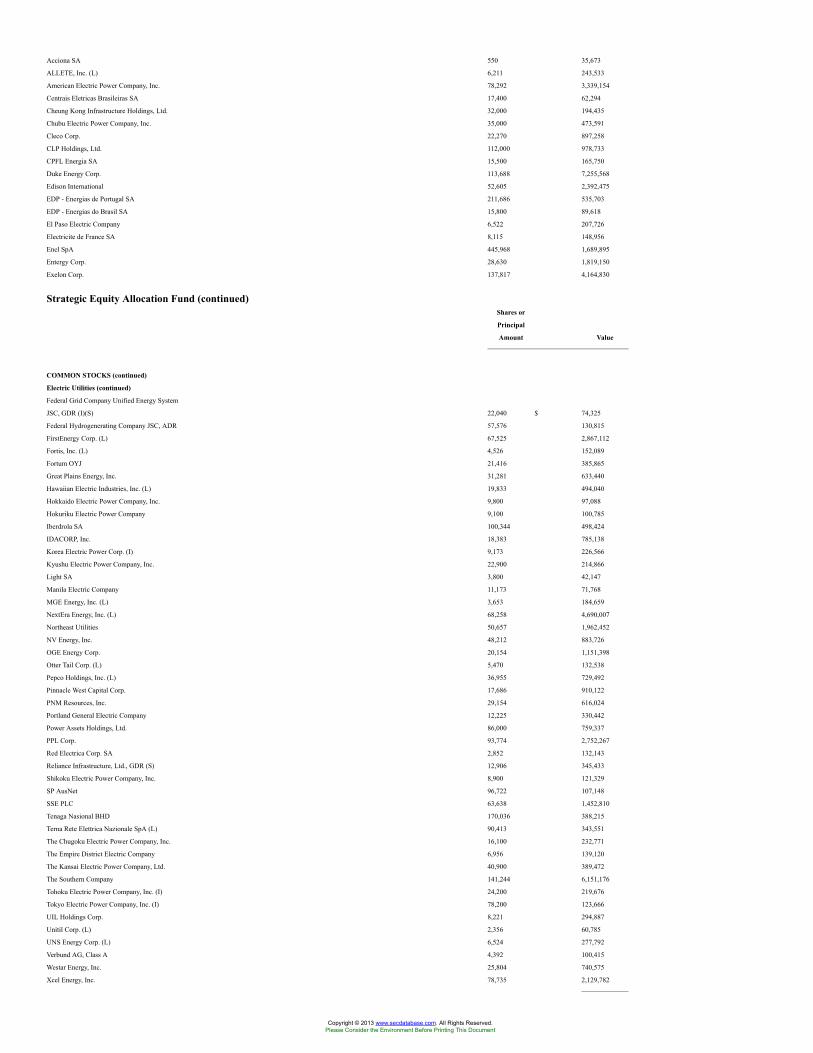
Acciona SA 550 35,673
ALLETE, Inc. (L) 6,211 243,533
American Electric Power Company, Inc. 78,292 3,339,154
Centrais Eletricas Brasileiras SA 17,400 62,294
Cheung Kong Infrastructure Holdings, Ltd. 32,000 194,435
Chubu Electric Power Company, Inc. 35,000 473,591
Cleco Corp. 22,270 897,258
CLP Holdings, Ltd. 112,000 978,733
CPFL Energia SA 15,500 165,750
Duke Energy Corp. 113,688 7,255,568
Edison International 52,605 2,392,475
EDP - Energias de Portugal SA 211,686 535,703
EDP - Energias do Brasil SA 15,800 89,618
El Paso Electric Company 6,522 207,726
Electricite de France SA 8,115 148,956
Enel SpA 445,968 1,689,895
Entergy Corp. 28,630 1,819,150
Exelon Corp. 137,817 4,164,830
Strategic Equity Allocation Fund (continued)Shares or
Principal
Amount Value
COMMON STOCKS (continued)
Electric Utilities (continued)
Federal Grid Company Unified Energy System
JSC, GDR (I)(S) 22,040 $ 74,325
Federal Hydrogenerating Company JSC, ADR 57,576 130,815
FirstEnergy Corp. (L) 67,525 2,867,112
Fortis, Inc. (L) 4,526 152,089
Fortum OYJ 21,416 385,865
Great Plains Energy, Inc. 31,281 633,440
Hawaiian Electric Industries, Inc. (L) 19,833 494,040
Hokkaido Electric Power Company, Inc. 9,800 97,088
Hokuriku Electric Power Company 9,100 100,785
Iberdrola SA 100,344 498,424
IDACORP, Inc. 18,383 785,138
Korea Electric Power Corp. (I) 9,173 226,566
Kyushu Electric Power Company, Inc. 22,900 214,866
Light SA 3,800 42,147
Manila Electric Company 11,173 71,768
MGE Energy, Inc. (L) 3,653 184,659
NextEra Energy, Inc. (L) 68,258 4,690,007
Northeast Utilities 50,657 1,962,452
NV Energy, Inc. 48,212 883,726
OGE Energy Corp. 20,154 1,151,398
Otter Tail Corp. (L) 5,470 132,538
Pepco Holdings, Inc. (L) 36,955 729,492
Pinnacle West Capital Corp. 17,686 910,122
PNM Resources, Inc. 29,154 616,024
Portland General Electric Company 12,225 330,442
Power Assets Holdings, Ltd. 86,000 759,337
PPL Corp. 93,774 2,752,267
Red Electrica Corp. SA 2,852 132,143
Reliance Infrastructure, Ltd., GDR (S) 12,906 345,433
Shikoku Electric Power Company, Inc. 8,900 121,329
SP AusNet 96,722 107,148
SSE PLC 63,638 1,452,810
Tenaga Nasional BHD 170,036 388,215
Terna Rete Elettrica Nazionale SpA (L) 90,413 343,551
The Chugoku Electric Power Company, Inc. 16,100 232,771
The Empire District Electric Company 6,956 139,120
The Kansai Electric Power Company, Ltd. 40,900 389,472
The Southern Company 141,244 6,151,176
Tohoku Electric Power Company, Inc. (I) 24,200 219,676
Tokyo Electric Power Company, Inc. (I) 78,200 123,666
UIL Holdings Corp. 8,221 294,887
Unitil Corp. (L) 2,356 60,785
UNS Energy Corp. (L) 6,524 277,792
Verbund AG, Class A 4,392 100,415
Westar Energy, Inc. 25,804 740,575
Xcel Energy, Inc. 78,735 2,129,782
Copyright © 2013 www.secdatabase.com. All Rights Reserved.Please Consider the Environment Before Printing This Document
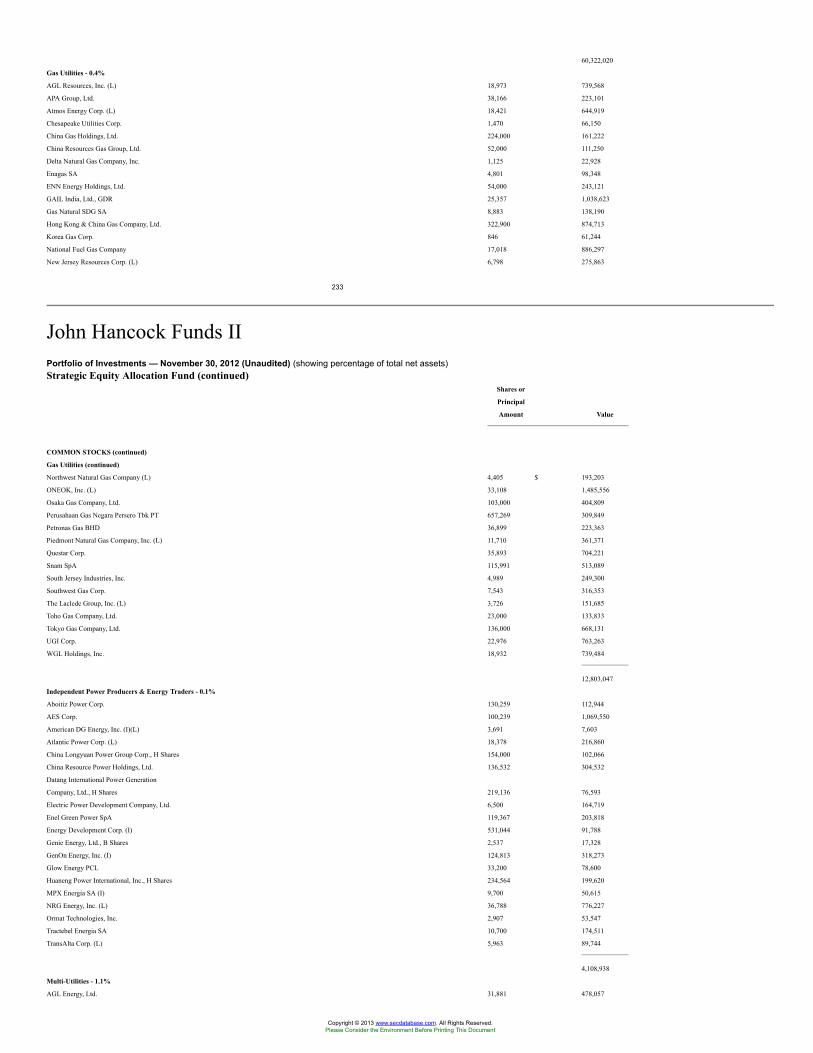
60,322,020
Gas Utilities - 0.4%
AGL Resources, Inc. (L) 18,973 739,568
APA Group, Ltd. 38,166 223,101
Atmos Energy Corp. (L) 18,421 644,919
Chesapeake Utilities Corp. 1,470 66,150
China Gas Holdings, Ltd. 224,000 161,222
China Resources Gas Group, Ltd. 52,000 111,250
Delta Natural Gas Company, Inc. 1,125 22,928
Enagas SA 4,801 98,348
ENN Energy Holdings, Ltd. 54,000 243,121
GAIL India, Ltd., GDR 25,357 1,038,623
Gas Natural SDG SA 8,883 138,190
Hong Kong & China Gas Company, Ltd. 322,900 874,713
Korea Gas Corp. 846 61,244
National Fuel Gas Company 17,018 886,297
New Jersey Resources Corp. (L) 6,798 275,863
233
John Hancock Funds IIPortfolio of Investments — November 30, 2012 (Unaudited) (showing percentage of total net assets)Strategic Equity Allocation Fund (continued)
Shares or
Principal
Amount Value
COMMON STOCKS (continued)
Gas Utilities (continued)
Northwest Natural Gas Company (L) 4,405 $ 193,203
ONEOK, Inc. (L) 33,108 1,485,556
Osaka Gas Company, Ltd. 103,000 404,809
Perusahaan Gas Negara Persero Tbk PT 657,269 309,849
Petronas Gas BHD 36,899 223,363
Piedmont Natural Gas Company, Inc. (L) 11,710 361,371
Questar Corp. 35,893 704,221
Snam SpA 115,991 513,089
South Jersey Industries, Inc. 4,989 249,300
Southwest Gas Corp. 7,543 316,353
The Laclede Group, Inc. (L) 3,726 151,685
Toho Gas Company, Ltd. 23,000 133,833
Tokyo Gas Company, Ltd. 136,000 668,131
UGI Corp. 22,976 763,263
WGL Holdings, Inc. 18,932 739,484
12,803,047
Independent Power Producers & Energy Traders - 0.1%
Aboitiz Power Corp. 130,259 112,944
AES Corp. 100,239 1,069,550
American DG Energy, Inc. (I)(L) 3,691 7,603
Atlantic Power Corp. (L) 18,378 216,860
China Longyuan Power Group Corp., H Shares 154,000 102,066
China Resource Power Holdings, Ltd. 136,532 304,532
Datang International Power Generation
Company, Ltd., H Shares 219,136 76,593
Electric Power Development Company, Ltd. 6,500 164,719
Enel Green Power SpA 119,367 203,818
Energy Development Corp. (I) 531,044 91,788
Genie Energy, Ltd., B Shares 2,537 17,328
GenOn Energy, Inc. (I) 124,813 318,273
Glow Energy PCL 33,200 78,600
Huaneng Power International, Inc., H Shares 234,564 199,620
MPX Energia SA (I) 9,700 50,615
NRG Energy, Inc. (L) 36,788 776,227
Ormat Technologies, Inc. 2,907 53,547
Tractebel Energia SA 10,700 174,511
TransAlta Corp. (L) 5,963 89,744
4,108,938
Multi-Utilities - 1.1%
AGL Energy, Ltd. 31,881 478,057
Copyright © 2013 www.secdatabase.com. All Rights Reserved.Please Consider the Environment Before Printing This Document
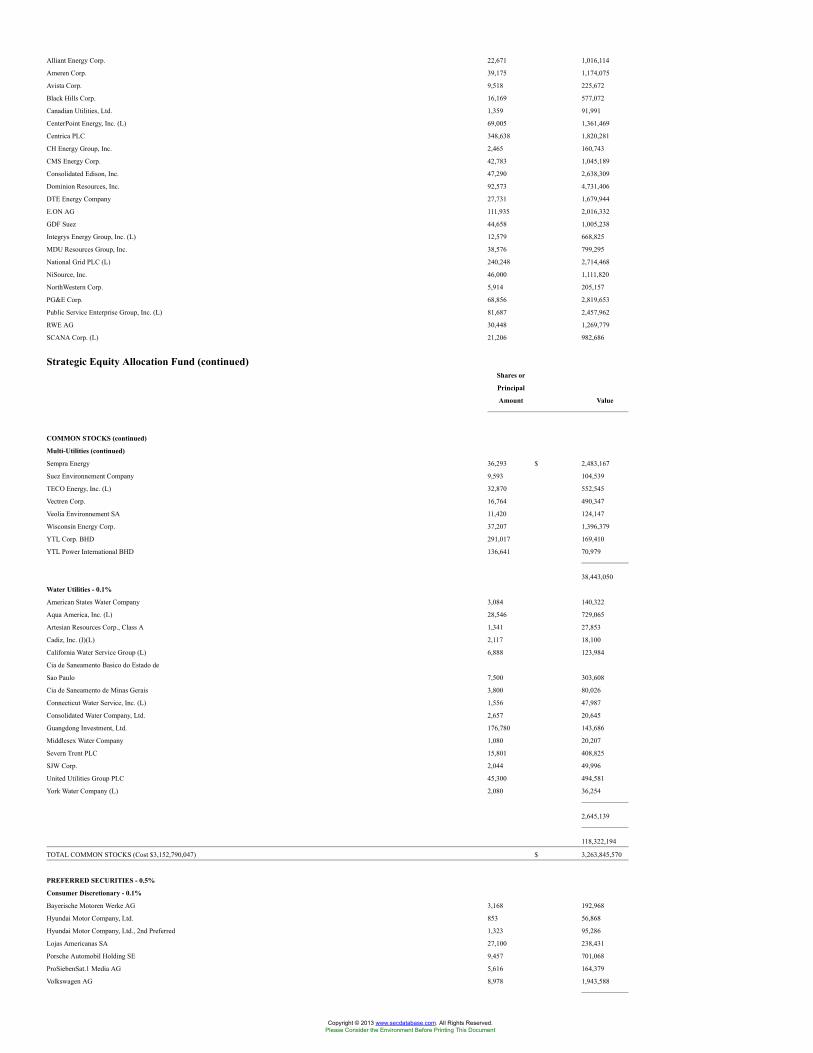
Alliant Energy Corp. 22,671 1,016,114
Ameren Corp. 39,175 1,174,075
Avista Corp. 9,518 225,672
Black Hills Corp. 16,169 577,072
Canadian Utilities, Ltd. 1,359 91,991
CenterPoint Energy, Inc. (L) 69,005 1,361,469
Centrica PLC 348,638 1,820,281
CH Energy Group, Inc. 2,465 160,743
CMS Energy Corp. 42,783 1,045,189
Consolidated Edison, Inc. 47,290 2,638,309
Dominion Resources, Inc. 92,573 4,731,406
DTE Energy Company 27,731 1,679,944
E.ON AG 111,935 2,016,332
GDF Suez 44,658 1,005,238
Integrys Energy Group, Inc. (L) 12,579 668,825
MDU Resources Group, Inc. 38,576 799,295
National Grid PLC (L) 240,248 2,714,468
NiSource, Inc. 46,000 1,111,820
NorthWestern Corp. 5,914 205,157
PG&E Corp. 68,856 2,819,653
Public Service Enterprise Group, Inc. (L) 81,687 2,457,962
RWE AG 30,448 1,269,779
SCANA Corp. (L) 21,206 982,686
Strategic Equity Allocation Fund (continued)Shares or
Principal
Amount Value
COMMON STOCKS (continued)
Multi-Utilities (continued)
Sempra Energy 36,293 $ 2,483,167
Suez Environnement Company 9,593 104,539
TECO Energy, Inc. (L) 32,870 552,545
Vectren Corp. 16,764 490,347
Veolia Environnement SA 11,420 124,147
Wisconsin Energy Corp. 37,207 1,396,379
YTL Corp. BHD 291,017 169,410
YTL Power International BHD 136,641 70,979
38,443,050
Water Utilities - 0.1%
American States Water Company 3,084 140,322
Aqua America, Inc. (L) 28,546 729,065
Artesian Resources Corp., Class A 1,341 27,853
Cadiz, Inc. (I)(L) 2,117 18,100
California Water Service Group (L) 6,888 123,984
Cia de Saneamento Basico do Estado de
Sao Paulo 7,500 303,608
Cia de Saneamento de Minas Gerais 3,800 80,026
Connecticut Water Service, Inc. (L) 1,556 47,987
Consolidated Water Company, Ltd. 2,657 20,645
Guangdong Investment, Ltd. 176,780 143,686
Middlesex Water Company 1,080 20,207
Severn Trent PLC 15,801 408,825
SJW Corp. 2,044 49,996
United Utilities Group PLC 45,300 494,581
York Water Company (L) 2,080 36,254
2,645,139
118,322,194
TOTAL COMMON STOCKS (Cost $3,152,790,047) $ 3,263,845,570
PREFERRED SECURITIES - 0.5%
Consumer Discretionary - 0.1%
Bayerische Motoren Werke AG 3,168 192,968
Hyundai Motor Company, Ltd. 853 56,868
Hyundai Motor Company, Ltd., 2nd Preferred 1,323 95,286
Lojas Americanas SA 27,100 238,431
Porsche Automobil Holding SE 9,457 701,068
ProSiebenSat.1 Media AG 5,616 164,379
Volkswagen AG 8,978 1,943,588
Copyright © 2013 www.secdatabase.com. All Rights Reserved.Please Consider the Environment Before Printing This Document
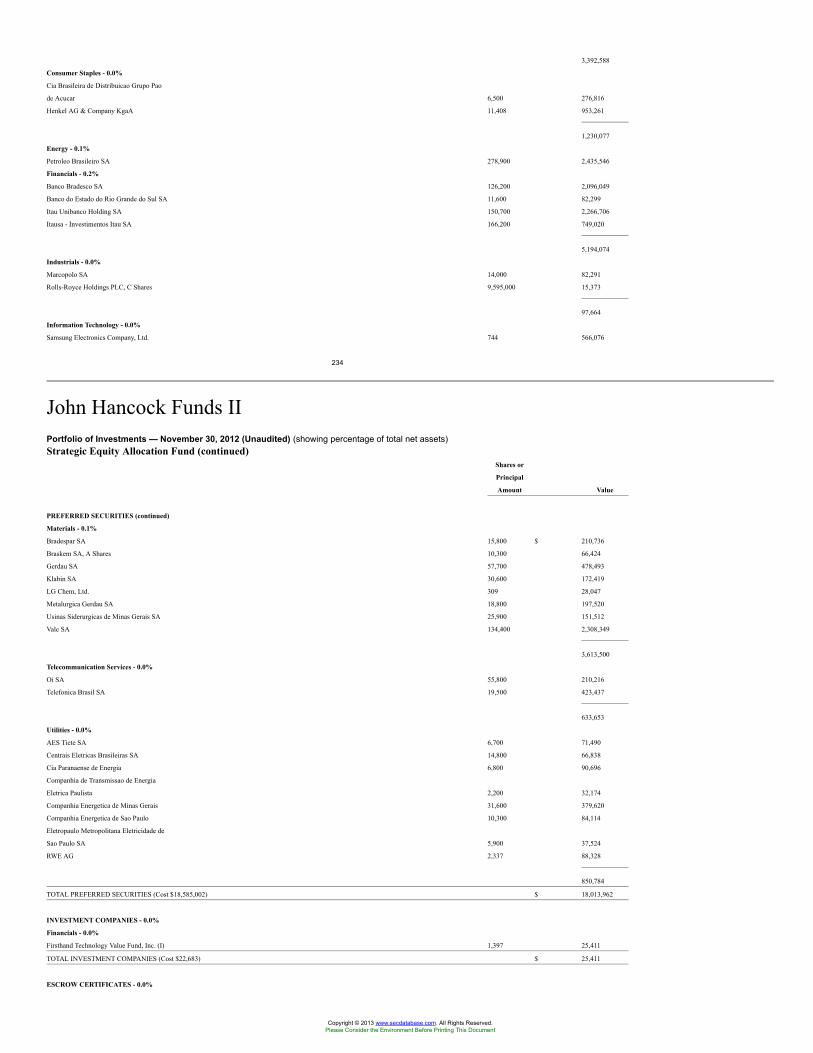
3,392,588
Consumer Staples - 0.0%
Cia Brasileira de Distribuicao Grupo Pao
de Acucar 6,500 276,816
Henkel AG & Company KgaA 11,408 953,261
1,230,077
Energy - 0.1%
Petroleo Brasileiro SA 278,900 2,435,546
Financials - 0.2%
Banco Bradesco SA 126,200 2,096,049
Banco do Estado do Rio Grande do Sul SA 11,600 82,299
Itau Unibanco Holding SA 150,700 2,266,706
Itausa - Investimentos Itau SA 166,200 749,020
5,194,074
Industrials - 0.0%
Marcopolo SA 14,000 82,291
Rolls-Royce Holdings PLC, C Shares 9,595,000 15,373
97,664
Information Technology - 0.0%
Samsung Electronics Company, Ltd. 744 566,076
234
John Hancock Funds IIPortfolio of Investments — November 30, 2012 (Unaudited) (showing percentage of total net assets)Strategic Equity Allocation Fund (continued)
Shares or
Principal
Amount Value
PREFERRED SECURITIES (continued)
Materials - 0.1%
Bradespar SA 15,800 $ 210,736
Braskem SA, A Shares 10,300 66,424
Gerdau SA 57,700 478,493
Klabin SA 30,600 172,419
LG Chem, Ltd. 309 28,047
Metalurgica Gerdau SA 18,800 197,520
Usinas Siderurgicas de Minas Gerais SA 25,900 151,512
Vale SA 134,400 2,308,349
3,613,500
Telecommunication Services - 0.0%
Oi SA 55,800 210,216
Telefonica Brasil SA 19,500 423,437
633,653
Utilities - 0.0%
AES Tiete SA 6,700 71,490
Centrais Eletricas Brasileiras SA 14,800 66,838
Cia Paranaense de Energia 6,800 90,696
Companhia de Transmissao de Energia
Eletrica Paulista 2,200 32,174
Companhia Energetica de Minas Gerais 31,600 379,620
Companhia Energetica de Sao Paulo 10,300 84,114
Eletropaulo Metropolitana Eletricidade de
Sao Paulo SA 5,900 37,524
RWE AG 2,337 88,328
850,784
TOTAL PREFERRED SECURITIES (Cost $18,585,002) $ 18,013,962
INVESTMENT COMPANIES - 0.0%
Financials - 0.0%
Firsthand Technology Value Fund, Inc. (I) 1,397 25,411
TOTAL INVESTMENT COMPANIES (Cost $22,683) $ 25,411
ESCROW CERTIFICATES - 0.0%
Copyright © 2013 www.secdatabase.com. All Rights Reserved.Please Consider the Environment Before Printing This Document
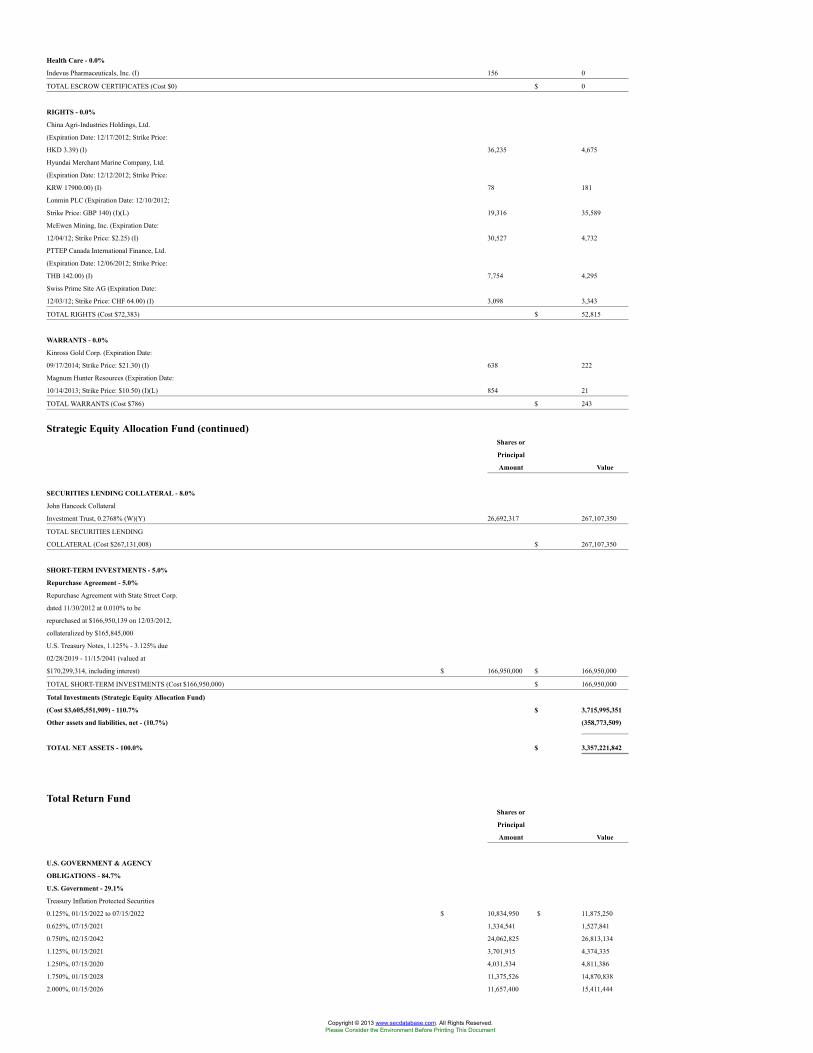
Health Care - 0.0%
Indevus Pharmaceuticals, Inc. (I) 156 0
TOTAL ESCROW CERTIFICATES (Cost $0) $ 0
RIGHTS - 0.0%
China Agri-Industries Holdings, Ltd.
(Expiration Date: 12/17/2012; Strike Price:
HKD 3.39) (I) 36,235 4,675
Hyundai Merchant Marine Company, Ltd.
(Expiration Date: 12/12/2012; Strike Price:
KRW 17900.00) (I) 78 181
Lonmin PLC (Expiration Date: 12/10/2012;
Strike Price: GBP 140) (I)(L) 19,316 35,589
McEwen Mining, Inc. (Expiration Date:
12/04/12; Strike Price: $2.25) (I) 30,527 4,732
PTTEP Canada International Finance, Ltd.
(Expiration Date: 12/06/2012; Strike Price:
THB 142.00) (I) 7,754 4,295
Swiss Prime Site AG (Expiration Date:
12/03/12; Strike Price: CHF 64.00) (I) 3,098 3,343
TOTAL RIGHTS (Cost $72,383) $ 52,815
WARRANTS - 0.0%
Kinross Gold Corp. (Expiration Date:
09/17/2014; Strike Price: $21.30) (I) 638 222
Magnum Hunter Resources (Expiration Date:
10/14/2013; Strike Price: $10.50) (I)(L) 854 21
TOTAL WARRANTS (Cost $786) $ 243
Strategic Equity Allocation Fund (continued)Shares or
Principal
Amount Value
SECURITIES LENDING COLLATERAL - 8.0%
John Hancock Collateral
Investment Trust, 0.2768% (W)(Y) 26,692,317 267,107,350
TOTAL SECURITIES LENDING
COLLATERAL (Cost $267,131,008) $ 267,107,350
SHORT-TERM INVESTMENTS - 5.0%
Repurchase Agreement - 5.0%
Repurchase Agreement with State Street Corp.
dated 11/30/2012 at 0.010% to be
repurchased at $166,950,139 on 12/03/2012,
collateralized by $165,845,000
U.S. Treasury Notes, 1.125% - 3.125% due
02/28/2019 - 11/15/2041 (valued at
$170,299,314, including interest) $ 166,950,000 $ 166,950,000
TOTAL SHORT-TERM INVESTMENTS (Cost $166,950,000) $ 166,950,000
Total Investments (Strategic Equity Allocation Fund)
(Cost $3,605,551,909) - 110.7% $ 3,715,995,351
Other assets and liabilities, net - (10.7%) (358,773,509)
TOTAL NET ASSETS - 100.0% $ 3,357,221,842
Total Return FundShares or
Principal
Amount Value
U.S. GOVERNMENT & AGENCY
OBLIGATIONS - 84.7%
U.S. Government - 29.1%
Treasury Inflation Protected Securities
0.125%, 01/15/2022 to 07/15/2022 $ 10,834,950 $ 11,875,250
0.625%, 07/15/2021 1,334,541 1,527,841
0.750%, 02/15/2042 24,062,825 26,813,134
1.125%, 01/15/2021 3,701,915 4,374,335
1.250%, 07/15/2020 4,031,534 4,811,386
1.750%, 01/15/2028 11,375,526 14,870,838
2.000%, 01/15/2026 11,657,400 15,411,444
Copyright © 2013 www.secdatabase.com. All Rights Reserved.Please Consider the Environment Before Printing This Document
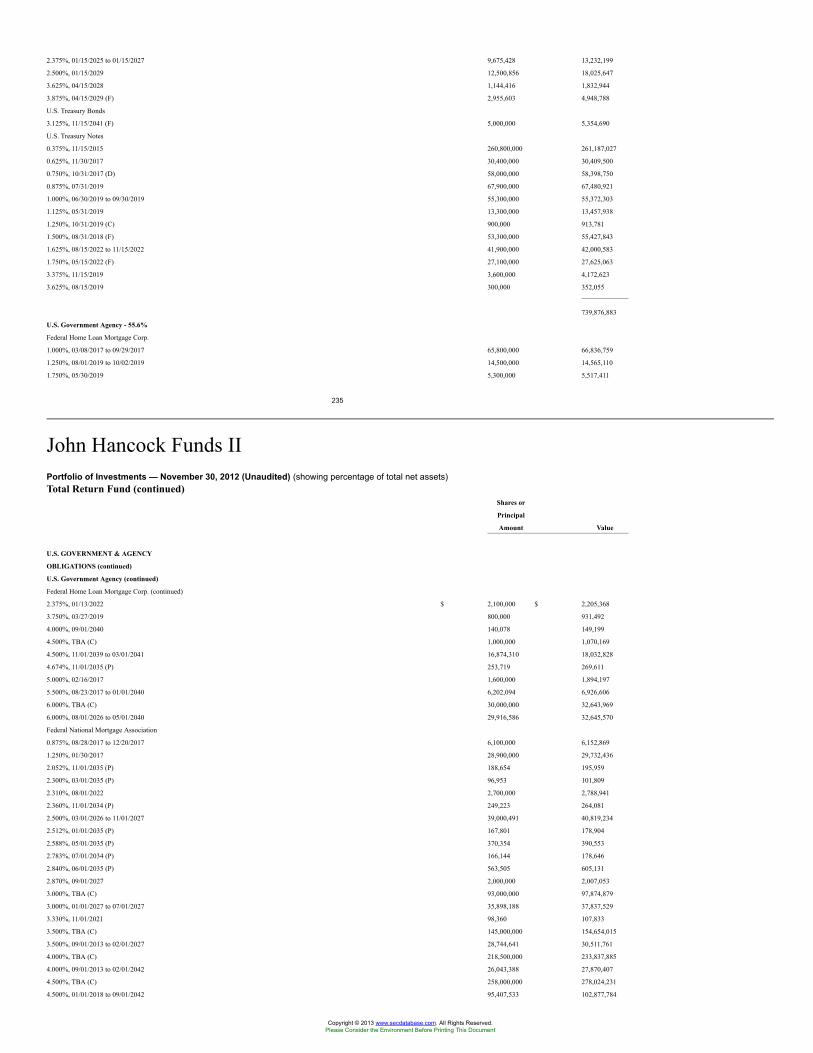
2.375%, 01/15/2025 to 01/15/2027 9,675,428 13,232,199
2.500%, 01/15/2029 12,500,856 18,025,647
3.625%, 04/15/2028 1,144,416 1,832,944
3.875%, 04/15/2029 (F) 2,955,603 4,948,788
U.S. Treasury Bonds
3.125%, 11/15/2041 (F) 5,000,000 5,354,690
U.S. Treasury Notes
0.375%, 11/15/2015 260,800,000 261,187,027
0.625%, 11/30/2017 30,400,000 30,409,500
0.750%, 10/31/2017 (D) 58,000,000 58,398,750
0.875%, 07/31/2019 67,900,000 67,480,921
1.000%, 06/30/2019 to 09/30/2019 55,300,000 55,372,303
1.125%, 05/31/2019 13,300,000 13,457,938
1.250%, 10/31/2019 (C) 900,000 913,781
1.500%, 08/31/2018 (F) 53,300,000 55,427,843
1.625%, 08/15/2022 to 11/15/2022 41,900,000 42,000,583
1.750%, 05/15/2022 (F) 27,100,000 27,625,063
3.375%, 11/15/2019 3,600,000 4,172,623
3.625%, 08/15/2019 300,000 352,055
739,876,883
U.S. Government Agency - 55.6%
Federal Home Loan Mortgage Corp.
1.000%, 03/08/2017 to 09/29/2017 65,800,000 66,836,759
1.250%, 08/01/2019 to 10/02/2019 14,500,000 14,565,110
1.750%, 05/30/2019 5,300,000 5,517,411
235
John Hancock Funds IIPortfolio of Investments — November 30, 2012 (Unaudited) (showing percentage of total net assets)Total Return Fund (continued)
Shares or
Principal
Amount Value
U.S. GOVERNMENT & AGENCY
OBLIGATIONS (continued)
U.S. Government Agency (continued)
Federal Home Loan Mortgage Corp. (continued)
2.375%, 01/13/2022 $ 2,100,000 $ 2,205,368
3.750%, 03/27/2019 800,000 931,492
4.000%, 09/01/2040 140,078 149,199
4.500%, TBA (C) 1,000,000 1,070,169
4.500%, 11/01/2039 to 03/01/2041 16,874,310 18,032,828
4.674%, 11/01/2035 (P) 253,719 269,611
5.000%, 02/16/2017 1,600,000 1,894,197
5.500%, 08/23/2017 to 01/01/2040 6,202,094 6,926,606
6.000%, TBA (C) 30,000,000 32,643,969
6.000%, 08/01/2026 to 05/01/2040 29,916,586 32,645,570
Federal National Mortgage Association
0.875%, 08/28/2017 to 12/20/2017 6,100,000 6,152,869
1.250%, 01/30/2017 28,900,000 29,732,436
2.052%, 11/01/2035 (P) 188,654 195,959
2.300%, 03/01/2035 (P) 96,953 101,809
2.310%, 08/01/2022 2,700,000 2,788,941
2.360%, 11/01/2034 (P) 249,223 264,081
2.500%, 03/01/2026 to 11/01/2027 39,000,491 40,819,234
2.512%, 01/01/2035 (P) 167,801 178,904
2.588%, 05/01/2035 (P) 370,354 390,553
2.783%, 07/01/2034 (P) 166,144 178,646
2.840%, 06/01/2035 (P) 563,505 605,131
2.870%, 09/01/2027 2,000,000 2,007,053
3.000%, TBA (C) 93,000,000 97,874,879
3.000%, 01/01/2027 to 07/01/2027 35,898,188 37,837,529
3.330%, 11/01/2021 98,360 107,833
3.500%, TBA (C) 145,000,000 154,654,015
3.500%, 09/01/2013 to 02/01/2027 28,744,641 30,511,761
4.000%, TBA (C) 218,500,000 233,837,885
4.000%, 09/01/2013 to 02/01/2042 26,043,388 27,870,407
4.500%, TBA (C) 258,000,000 278,024,231
4.500%, 01/01/2018 to 09/01/2042 95,407,533 102,877,784
Copyright © 2013 www.secdatabase.com. All Rights Reserved.Please Consider the Environment Before Printing This Document
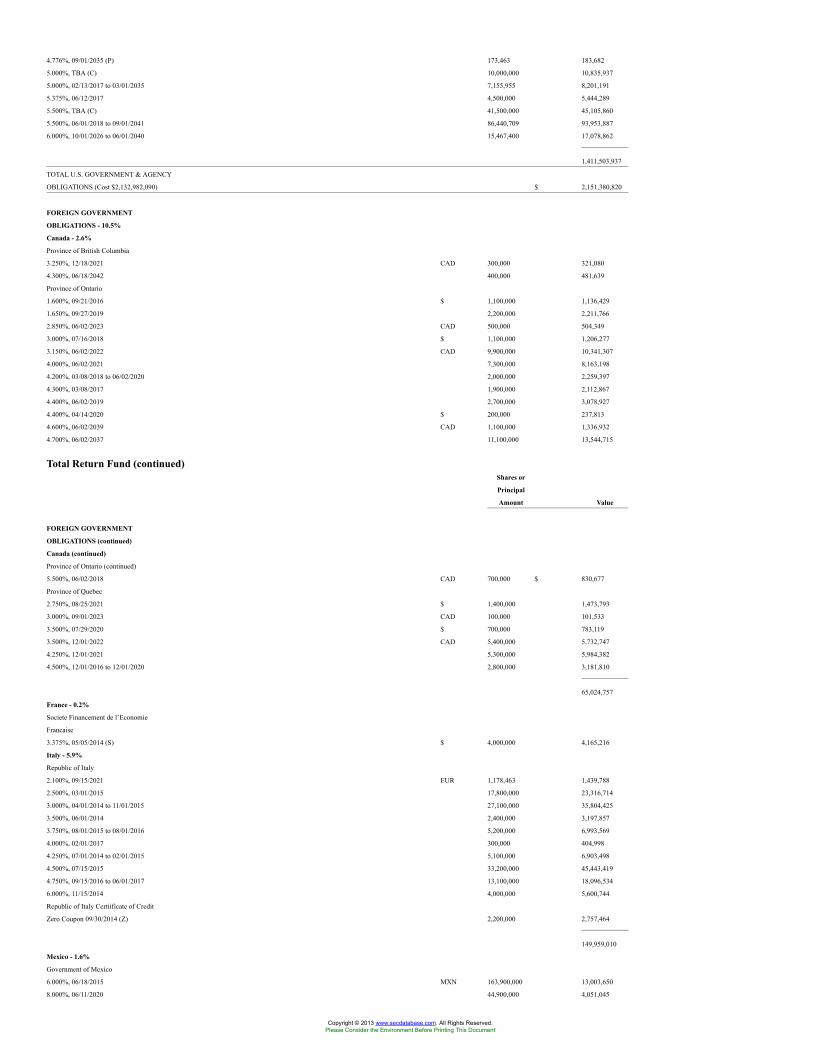
4.776%, 09/01/2035 (P) 173,463 183,682
5.000%, TBA (C) 10,000,000 10,835,937
5.000%, 02/13/2017 to 03/01/2035 7,155,955 8,201,191
5.375%, 06/12/2017 4,500,000 5,444,289
5.500%, TBA (C) 41,500,000 45,105,860
5.500%, 06/01/2018 to 09/01/2041 86,440,709 93,953,887
6.000%, 10/01/2026 to 06/01/2040 15,467,400 17,078,862
1,411,503,937
TOTAL U.S. GOVERNMENT & AGENCY
OBLIGATIONS (Cost $2,132,982,090) $ 2,151,380,820
FOREIGN GOVERNMENT
OBLIGATIONS - 10.5%
Canada - 2.6%
Province of British Columbia
3.250%, 12/18/2021 CAD 300,000 321,080
4.300%, 06/18/2042 400,000 481,639
Province of Ontario
1.600%, 09/21/2016 $ 1,100,000 1,136,429
1.650%, 09/27/2019 2,200,000 2,211,766
2.850%, 06/02/2023 CAD 500,000 504,349
3.000%, 07/16/2018 $ 1,100,000 1,206,277
3.150%, 06/02/2022 CAD 9,900,000 10,341,307
4.000%, 06/02/2021 7,300,000 8,163,198
4.200%, 03/08/2018 to 06/02/2020 2,000,000 2,259,397
4.300%, 03/08/2017 1,900,000 2,112,867
4.400%, 06/02/2019 2,700,000 3,078,927
4.400%, 04/14/2020 $ 200,000 237,813
4.600%, 06/02/2039 CAD 1,100,000 1,336,932
4.700%, 06/02/2037 11,100,000 13,544,715
Total Return Fund (continued)Shares or
Principal
Amount Value
FOREIGN GOVERNMENT
OBLIGATIONS (continued)
Canada (continued)
Province of Ontario (continued)
5.500%, 06/02/2018 CAD 700,000 $ 830,677
Province of Quebec
2.750%, 08/25/2021 $ 1,400,000 1,473,793
3.000%, 09/01/2023 CAD 100,000 101,533
3.500%, 07/29/2020 $ 700,000 783,119
3.500%, 12/01/2022 CAD 5,400,000 5,732,747
4.250%, 12/01/2021 5,300,000 5,984,382
4.500%, 12/01/2016 to 12/01/2020 2,800,000 3,181,810
65,024,757
France - 0.2%
Societe Financement de l’Economie
Francaise
3.375%, 05/05/2014 (S) $ 4,000,000 4,165,216
Italy - 5.9%
Republic of Italy
2.100%, 09/15/2021 EUR 1,178,463 1,439,788
2.500%, 03/01/2015 17,800,000 23,316,714
3.000%, 04/01/2014 to 11/01/2015 27,100,000 35,804,425
3.500%, 06/01/2014 2,400,000 3,197,857
3.750%, 08/01/2015 to 08/01/2016 5,200,000 6,993,569
4.000%, 02/01/2017 300,000 404,998
4.250%, 07/01/2014 to 02/01/2015 5,100,000 6,903,498
4.500%, 07/15/2015 33,200,000 45,443,419
4.750%, 09/15/2016 to 06/01/2017 13,100,000 18,096,534
6.000%, 11/15/2014 4,000,000 5,600,744
Republic of Italy Certiificate of Credit
Zero Coupon 09/30/2014 (Z) 2,200,000 2,757,464
149,959,010
Mexico - 1.6%
Government of Mexico
6.000%, 06/18/2015 MXN 163,900,000 13,003,650
8.000%, 06/11/2020 44,900,000 4,051,045
Copyright © 2013 www.secdatabase.com. All Rights Reserved.Please Consider the Environment Before Printing This Document
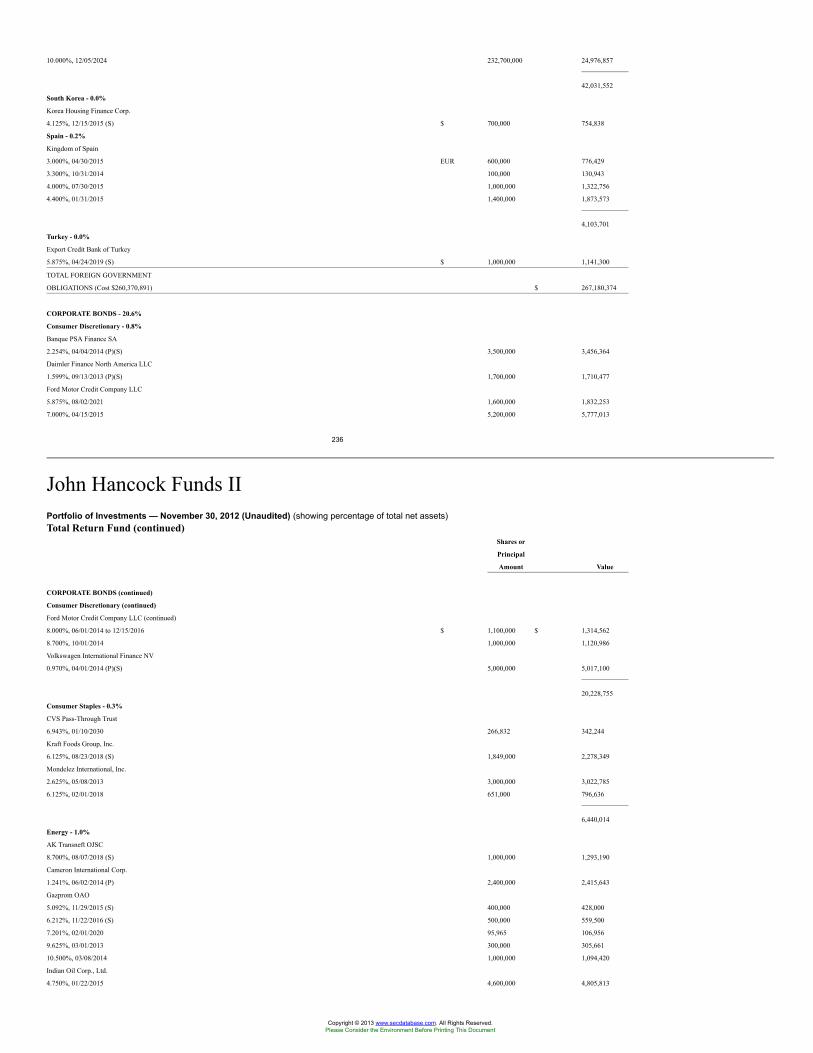
10.000%, 12/05/2024 232,700,000 24,976,857
42,031,552
South Korea - 0.0%
Korea Housing Finance Corp.
4.125%, 12/15/2015 (S) $ 700,000 754,838
Spain - 0.2%
Kingdom of Spain
3.000%, 04/30/2015 EUR 600,000 776,429
3.300%, 10/31/2014 100,000 130,943
4.000%, 07/30/2015 1,000,000 1,322,756
4.400%, 01/31/2015 1,400,000 1,873,573
4,103,701
Turkey - 0.0%
Export Credit Bank of Turkey
5.875%, 04/24/2019 (S) $ 1,000,000 1,141,300
TOTAL FOREIGN GOVERNMENT
OBLIGATIONS (Cost $260,370,891) $ 267,180,374
CORPORATE BONDS - 20.6%
Consumer Discretionary - 0.8%
Banque PSA Finance SA
2.254%, 04/04/2014 (P)(S) 3,500,000 3,456,364
Daimler Finance North America LLC
1.599%, 09/13/2013 (P)(S) 1,700,000 1,710,477
Ford Motor Credit Company LLC
5.875%, 08/02/2021 1,600,000 1,832,253
7.000%, 04/15/2015 5,200,000 5,777,013
236
John Hancock Funds IIPortfolio of Investments — November 30, 2012 (Unaudited) (showing percentage of total net assets)Total Return Fund (continued)
Shares or
Principal
Amount Value
CORPORATE BONDS (continued)
Consumer Discretionary (continued)
Ford Motor Credit Company LLC (continued)
8.000%, 06/01/2014 to 12/15/2016 $ 1,100,000 $ 1,314,562
8.700%, 10/01/2014 1,000,000 1,120,986
Volkswagen International Finance NV
0.970%, 04/01/2014 (P)(S) 5,000,000 5,017,100
20,228,755
Consumer Staples - 0.3%
CVS Pass-Through Trust
6.943%, 01/10/2030 266,832 342,244
Kraft Foods Group, Inc.
6.125%, 08/23/2018 (S) 1,849,000 2,278,349
Mondelez International, Inc.
2.625%, 05/08/2013 3,000,000 3,022,785
6.125%, 02/01/2018 651,000 796,636
6,440,014
Energy - 1.0%
AK Transneft OJSC
8.700%, 08/07/2018 (S) 1,000,000 1,293,190
Cameron International Corp.
1.241%, 06/02/2014 (P) 2,400,000 2,415,643
Gazprom OAO
5.092%, 11/29/2015 (S) 400,000 428,000
6.212%, 11/22/2016 (S) 500,000 559,500
7.201%, 02/01/2020 95,965 106,956
9.625%, 03/01/2013 300,000 305,661
10.500%, 03/08/2014 1,000,000 1,094,420
Indian Oil Corp., Ltd.
4.750%, 01/22/2015 4,600,000 4,805,813
Copyright © 2013 www.secdatabase.com. All Rights Reserved.Please Consider the Environment Before Printing This Document
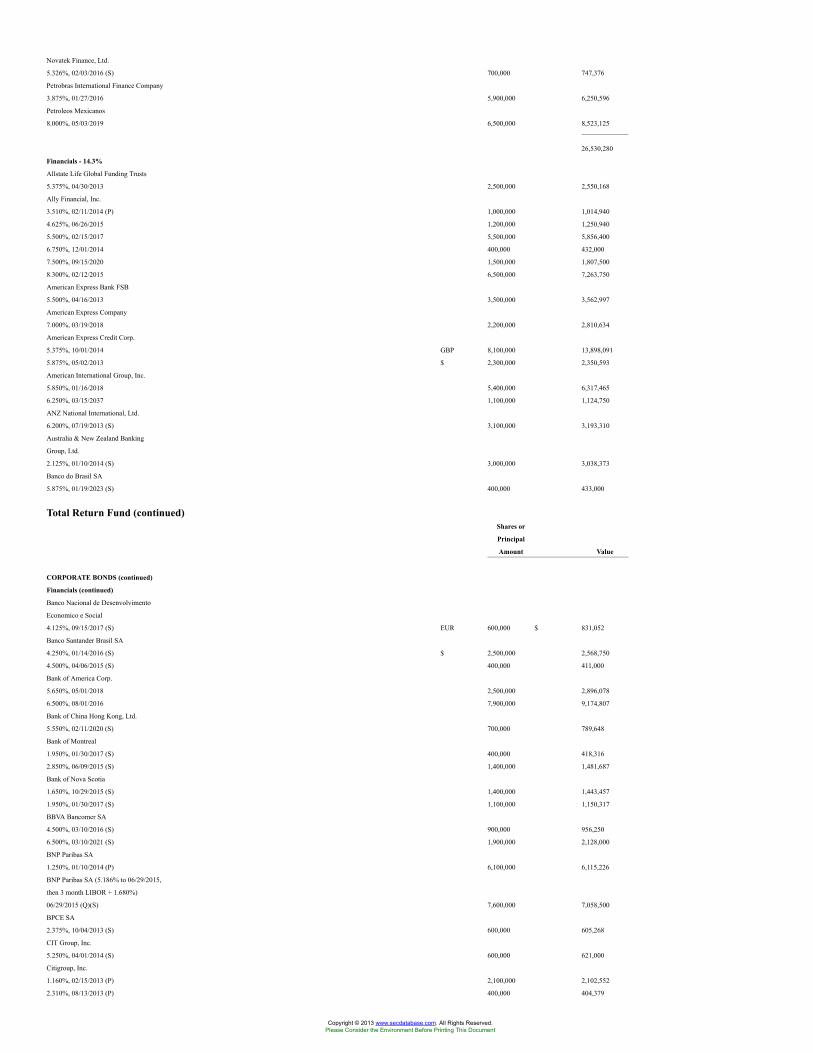
Novatek Finance, Ltd.
5.326%, 02/03/2016 (S) 700,000 747,376
Petrobras International Finance Company
3.875%, 01/27/2016 5,900,000 6,250,596
Petroleos Mexicanos
8.000%, 05/03/2019 6,500,000 8,523,125
26,530,280
Financials - 14.3%
Allstate Life Global Funding Trusts
5.375%, 04/30/2013 2,500,000 2,550,168
Ally Financial, Inc.
3.510%, 02/11/2014 (P) 1,000,000 1,014,940
4.625%, 06/26/2015 1,200,000 1,250,940
5.500%, 02/15/2017 5,500,000 5,856,400
6.750%, 12/01/2014 400,000 432,000
7.500%, 09/15/2020 1,500,000 1,807,500
8.300%, 02/12/2015 6,500,000 7,263,750
American Express Bank FSB
5.500%, 04/16/2013 3,500,000 3,562,997
American Express Company
7.000%, 03/19/2018 2,200,000 2,810,634
American Express Credit Corp.
5.375%, 10/01/2014 GBP 8,100,000 13,898,091
5.875%, 05/02/2013 $ 2,300,000 2,350,593
American International Group, Inc.
5.850%, 01/16/2018 5,400,000 6,317,465
6.250%, 03/15/2037 1,100,000 1,124,750
ANZ National International, Ltd.
6.200%, 07/19/2013 (S) 3,100,000 3,193,310
Australia & New Zealand Banking
Group, Ltd.
2.125%, 01/10/2014 (S) 3,000,000 3,038,373
Banco do Brasil SA
5.875%, 01/19/2023 (S) 400,000 433,000
Total Return Fund (continued)Shares or
Principal
Amount Value
CORPORATE BONDS (continued)
Financials (continued)
Banco Nacional de Desenvolvimento
Economico e Social
4.125%, 09/15/2017 (S) EUR 600,000 $ 831,052
Banco Santander Brasil SA
4.250%, 01/14/2016 (S) $ 2,500,000 2,568,750
4.500%, 04/06/2015 (S) 400,000 411,000
Bank of America Corp.
5.650%, 05/01/2018 2,500,000 2,896,078
6.500%, 08/01/2016 7,900,000 9,174,807
Bank of China Hong Kong, Ltd.
5.550%, 02/11/2020 (S) 700,000 789,648
Bank of Montreal
1.950%, 01/30/2017 (S) 400,000 418,316
2.850%, 06/09/2015 (S) 1,400,000 1,481,687
Bank of Nova Scotia
1.650%, 10/29/2015 (S) 1,400,000 1,443,457
1.950%, 01/30/2017 (S) 1,100,000 1,150,317
BBVA Bancomer SA
4.500%, 03/10/2016 (S) 900,000 956,250
6.500%, 03/10/2021 (S) 1,900,000 2,128,000
BNP Paribas SA
1.250%, 01/10/2014 (P) 6,100,000 6,115,226
BNP Paribas SA (5.186% to 06/29/2015,
then 3 month LIBOR + 1.680%)
06/29/2015 (Q)(S) 7,600,000 7,058,500
BPCE SA
2.375%, 10/04/2013 (S) 600,000 605,268
CIT Group, Inc.
5.250%, 04/01/2014 (S) 600,000 621,000
Citigroup, Inc.
1.160%, 02/15/2013 (P) 2,100,000 2,102,552
2.310%, 08/13/2013 (P) 400,000 404,379
Copyright © 2013 www.secdatabase.com. All Rights Reserved.Please Consider the Environment Before Printing This Document

5.500%, 04/11/2013 to 10/15/2014 18,700,000 19,594,575
5.850%, 07/02/2013 600,000 617,545
Citigroup, Inc. (4.750% to 02/10/2014,
then 3 month EURIBOR + 1.400%)
02/10/2019 EUR 1,500,000 1,866,629
Credit Suisse New York
2.200%, 01/14/2014 $ 1,300,000 1,320,907
Dexia Credit Local
0.793%, 04/29/2014 (P)(S) 7,100,000 6,998,955
DNB Bank ASA
3.200%, 04/03/2017 (S) 2,100,000 2,232,852
General Electric Capital Corp. (5.500% to
09/15/2017, then 3 month
EURIBOR + 2.000%)
09/15/2067 (S) EUR 9,900,000 12,811,166
General Electric Capital Corp. (6.375% to
11/15/2017, then 3 month
LIBOR + 2.289%)
11/15/2067 $ 4,100,000 4,348,870
HSBC Bank PLC
2.000%, 01/19/2014 (S) 1,400,000 1,415,578
ICICI Bank, Ltd.
4.750%, 11/25/2016 (S) 10,400,000 10,835,760
International Lease Finance Corp.
5.750%, 05/15/2016 600,000 627,176
6.500%, 09/01/2014 (S) 3,000,000 3,195,000
6.625%, 11/15/2013 2,900,000 3,008,750
6.750%, 09/01/2016 (S) 1,300,000 1,449,500
Intesa Sanpaolo SpA
2.712%, 02/24/2014 (P)(S) 3,300,000 3,296,070
IPIC, Ltd.
5.000%, 11/15/2020 (S) 800,000 898,000
237
John Hancock Funds IIPortfolio of Investments — November 30, 2012 (Unaudited) (showing percentage of total net assets)Total Return Fund (continued)
Shares or
Principal
Amount Value
CORPORATE BONDS (continued)
Financials (continued)
JPMorgan Chase & Company
0.475%, 09/26/2013 (P) EUR 1,700,000 $ 2,212,727
LBG Capital No.1 PLC
7.875%, 11/01/2020 (S) $ 1,900,000 2,009,250
Merrill Lynch & Company, Inc.
5.450%, 02/05/2013 1,400,000 1,411,654
6.400%, 08/28/2017 3,100,000 3,630,630
6.875%, 04/25/2018 7,500,000 9,019,440
MetLife, Inc.
6.400%, 12/15/2036 2,600,000 2,757,308
Monumental Global Funding, Ltd.
5.500%, 04/22/2013 (S) 1,900,000 1,935,705
Morgan Stanley
2.810%, 05/14/2013 (P) 4,100,000 4,134,379
7.300%, 05/13/2019 21,375,000 25,930,055
Murray Street Investment Trust I
4.647%, 03/09/2017 3,800,000 4,078,935
National Australia Bank, Ltd.
5.350%, 06/12/2013 (S) 2,600,000 2,664,353
National Bank of Canada
2.200%, 10/19/2016 (S) 300,000 316,321
Nationwide Building Society
6.250%, 02/25/2020 (S) 3,000,000 3,549,528
Nordea Bank AB
2.125%, 01/14/2014 (S) 600,000 608,552
Northern Rock Asset Management PLC
5.625%, 06/22/2017 (S) 15,300,000 18,018,810
Pacific LifeCorp.
Copyright © 2013 www.secdatabase.com. All Rights Reserved.Please Consider the Environment Before Printing This Document
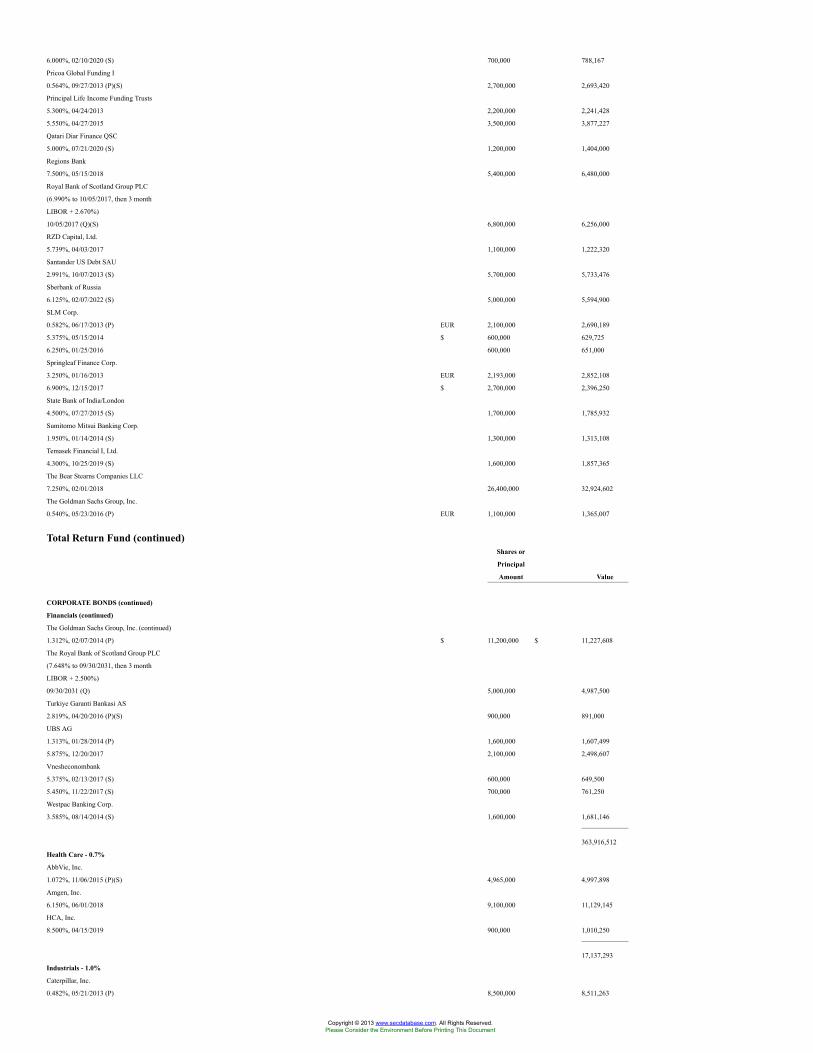
6.000%, 02/10/2020 (S) 700,000 788,167
Pricoa Global Funding I
0.564%, 09/27/2013 (P)(S) 2,700,000 2,693,420
Principal Life Income Funding Trusts
5.300%, 04/24/2013 2,200,000 2,241,428
5.550%, 04/27/2015 3,500,000 3,877,227
Qatari Diar Finance QSC
5.000%, 07/21/2020 (S) 1,200,000 1,404,000
Regions Bank
7.500%, 05/15/2018 5,400,000 6,480,000
Royal Bank of Scotland Group PLC
(6.990% to 10/05/2017, then 3 month
LIBOR + 2.670%)
10/05/2017 (Q)(S) 6,800,000 6,256,000
RZD Capital, Ltd.
5.739%, 04/03/2017 1,100,000 1,222,320
Santander US Debt SAU
2.991%, 10/07/2013 (S) 5,700,000 5,733,476
Sberbank of Russia
6.125%, 02/07/2022 (S) 5,000,000 5,594,900
SLM Corp.
0.582%, 06/17/2013 (P) EUR 2,100,000 2,690,189
5.375%, 05/15/2014 $ 600,000 629,725
6.250%, 01/25/2016 600,000 651,000
Springleaf Finance Corp.
3.250%, 01/16/2013 EUR 2,193,000 2,852,108
6.900%, 12/15/2017 $ 2,700,000 2,396,250
State Bank of India/London
4.500%, 07/27/2015 (S) 1,700,000 1,785,932
Sumitomo Mitsui Banking Corp.
1.950%, 01/14/2014 (S) 1,300,000 1,313,108
Temasek Financial I, Ltd.
4.300%, 10/25/2019 (S) 1,600,000 1,857,365
The Bear Stearns Companies LLC
7.250%, 02/01/2018 26,400,000 32,924,602
The Goldman Sachs Group, Inc.
0.540%, 05/23/2016 (P) EUR 1,100,000 1,365,007
Total Return Fund (continued)Shares or
Principal
Amount Value
CORPORATE BONDS (continued)
Financials (continued)
The Goldman Sachs Group, Inc. (continued)
1.312%, 02/07/2014 (P) $ 11,200,000 $ 11,227,608
The Royal Bank of Scotland Group PLC
(7.648% to 09/30/2031, then 3 month
LIBOR + 2.500%)
09/30/2031 (Q) 5,000,000 4,987,500
Turkiye Garanti Bankasi AS
2.819%, 04/20/2016 (P)(S) 900,000 891,000
UBS AG
1.313%, 01/28/2014 (P) 1,600,000 1,607,499
5.875%, 12/20/2017 2,100,000 2,498,607
Vnesheconombank
5.375%, 02/13/2017 (S) 600,000 649,500
5.450%, 11/22/2017 (S) 700,000 761,250
Westpac Banking Corp.
3.585%, 08/14/2014 (S) 1,600,000 1,681,146
363,916,512
Health Care - 0.7%
AbbVie, Inc.
1.072%, 11/06/2015 (P)(S) 4,965,000 4,997,898
Amgen, Inc.
6.150%, 06/01/2018 9,100,000 11,129,145
HCA, Inc.
8.500%, 04/15/2019 900,000 1,010,250
17,137,293
Industrials - 1.0%
Caterpillar, Inc.
0.482%, 05/21/2013 (P) 8,500,000 8,511,263
Copyright © 2013 www.secdatabase.com. All Rights Reserved.Please Consider the Environment Before Printing This Document
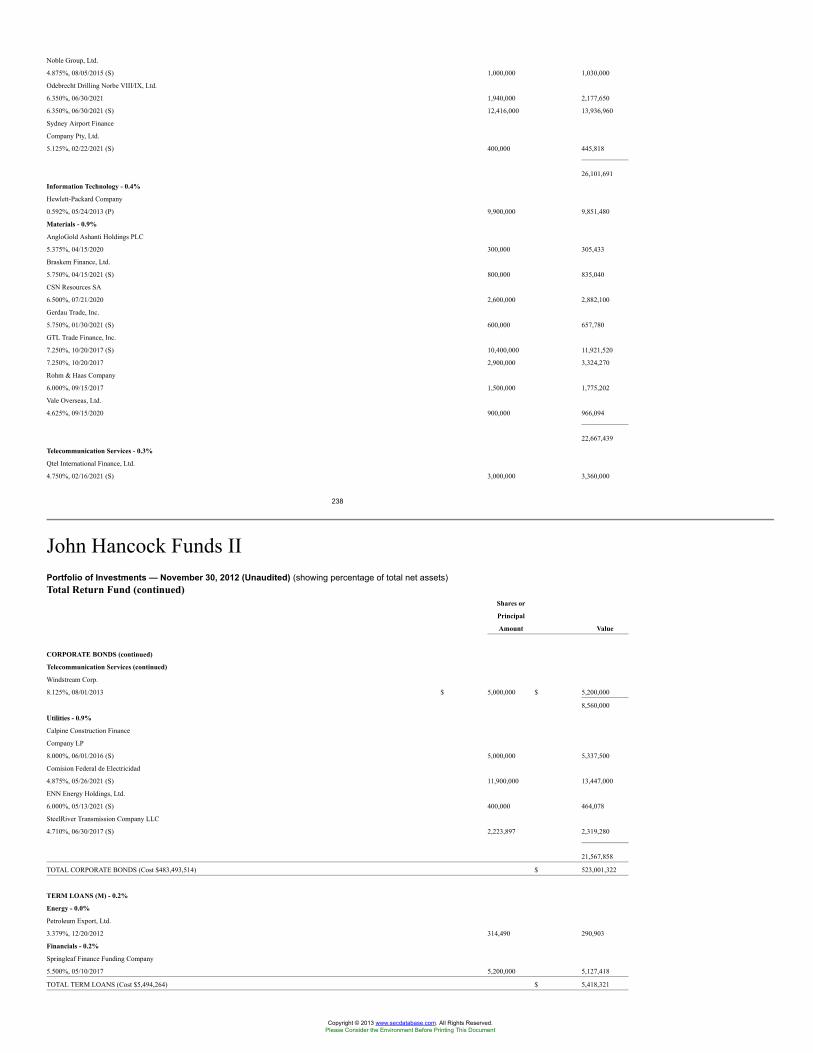
Noble Group, Ltd.
4.875%, 08/05/2015 (S) 1,000,000 1,030,000
Odebrecht Drilling Norbe VIII/IX, Ltd.
6.350%, 06/30/2021 1,940,000 2,177,650
6.350%, 06/30/2021 (S) 12,416,000 13,936,960
Sydney Airport Finance
Company Pty, Ltd.
5.125%, 02/22/2021 (S) 400,000 445,818
26,101,691
Information Technology - 0.4%
Hewlett-Packard Company
0.592%, 05/24/2013 (P) 9,900,000 9,851,480
Materials - 0.9%
AngloGold Ashanti Holdings PLC
5.375%, 04/15/2020 300,000 305,433
Braskem Finance, Ltd.
5.750%, 04/15/2021 (S) 800,000 835,040
CSN Resources SA
6.500%, 07/21/2020 2,600,000 2,882,100
Gerdau Trade, Inc.
5.750%, 01/30/2021 (S) 600,000 657,780
GTL Trade Finance, Inc.
7.250%, 10/20/2017 (S) 10,400,000 11,921,520
7.250%, 10/20/2017 2,900,000 3,324,270
Rohm & Haas Company
6.000%, 09/15/2017 1,500,000 1,775,202
Vale Overseas, Ltd.
4.625%, 09/15/2020 900,000 966,094
22,667,439
Telecommunication Services - 0.3%
Qtel International Finance, Ltd.
4.750%, 02/16/2021 (S) 3,000,000 3,360,000
238
John Hancock Funds IIPortfolio of Investments — November 30, 2012 (Unaudited) (showing percentage of total net assets)Total Return Fund (continued)
Shares or
Principal
Amount Value
CORPORATE BONDS (continued)
Telecommunication Services (continued)
Windstream Corp.
8.125%, 08/01/2013 $ 5,000,000 $ 5,200,000
8,560,000
Utilities - 0.9%
Calpine Construction Finance
Company LP
8.000%, 06/01/2016 (S) 5,000,000 5,337,500
Comision Federal de Electricidad
4.875%, 05/26/2021 (S) 11,900,000 13,447,000
ENN Energy Holdings, Ltd.
6.000%, 05/13/2021 (S) 400,000 464,078
SteelRiver Transmission Company LLC
4.710%, 06/30/2017 (S) 2,223,897 2,319,280
21,567,858
TOTAL CORPORATE BONDS (Cost $483,493,514) $ 523,001,322
TERM LOANS (M) - 0.2%
Energy - 0.0%
Petroleum Export, Ltd.
3.379%, 12/20/2012 314,490 290,903
Financials - 0.2%
Springleaf Finance Funding Company
5.500%, 05/10/2017 5,200,000 5,127,418
TOTAL TERM LOANS (Cost $5,494,264) $ 5,418,321
Copyright © 2013 www.secdatabase.com. All Rights Reserved.Please Consider the Environment Before Printing This Document
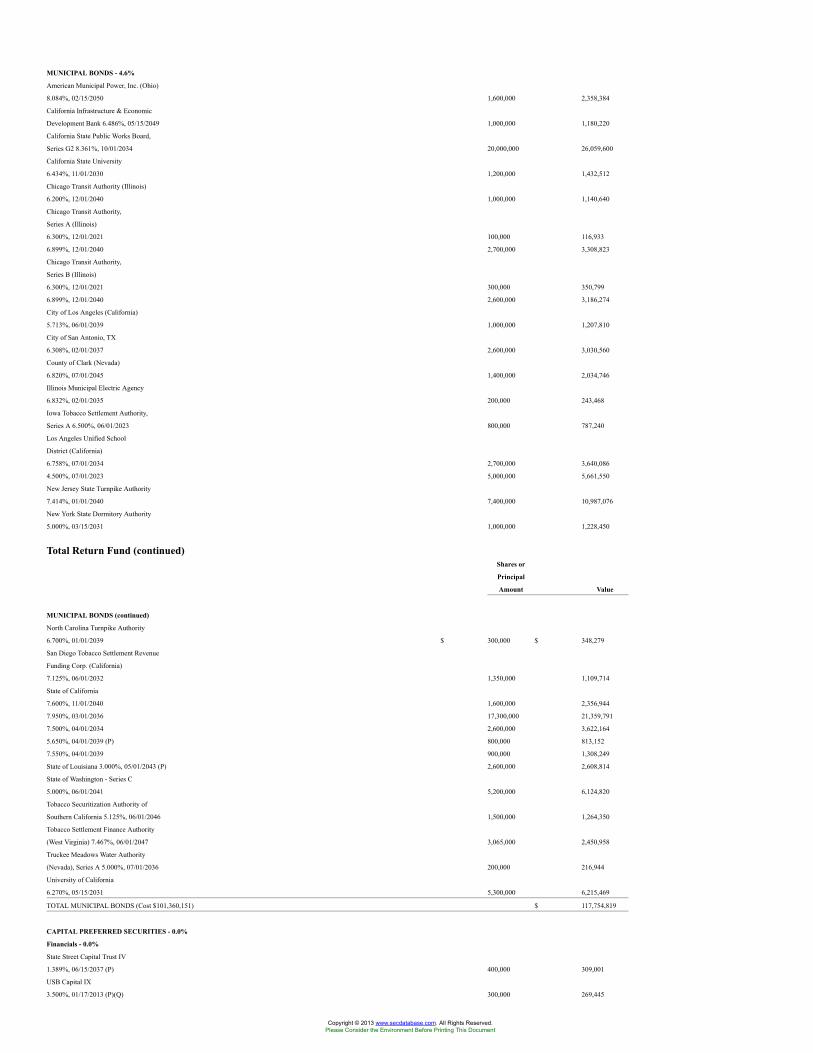
MUNICIPAL BONDS - 4.6%
American Municipal Power, Inc. (Ohio)
8.084%, 02/15/2050 1,600,000 2,358,384
California Infrastructure & Economic
Development Bank 6.486%, 05/15/2049 1,000,000 1,180,220
California State Public Works Board,
Series G2 8.361%, 10/01/2034 20,000,000 26,059,600
California State University
6.434%, 11/01/2030 1,200,000 1,432,512
Chicago Transit Authority (Illinois)
6.200%, 12/01/2040 1,000,000 1,140,640
Chicago Transit Authority,
Series A (Illinois)
6.300%, 12/01/2021 100,000 116,933
6.899%, 12/01/2040 2,700,000 3,308,823
Chicago Transit Authority,
Series B (Illinois)
6.300%, 12/01/2021 300,000 350,799
6.899%, 12/01/2040 2,600,000 3,186,274
City of Los Angeles (California)
5.713%, 06/01/2039 1,000,000 1,207,810
City of San Antonio, TX
6.308%, 02/01/2037 2,600,000 3,030,560
County of Clark (Nevada)
6.820%, 07/01/2045 1,400,000 2,034,746
Illinois Municipal Electric Agency
6.832%, 02/01/2035 200,000 243,468
Iowa Tobacco Settlement Authority,
Series A 6.500%, 06/01/2023 800,000 787,240
Los Angeles Unified School
District (California)
6.758%, 07/01/2034 2,700,000 3,640,086
4.500%, 07/01/2023 5,000,000 5,661,550
New Jersey State Turnpike Authority
7.414%, 01/01/2040 7,400,000 10,987,076
New York State Dormitory Authority
5.000%, 03/15/2031 1,000,000 1,228,450
Total Return Fund (continued)Shares or
Principal
Amount Value
MUNICIPAL BONDS (continued)
North Carolina Turnpike Authority
6.700%, 01/01/2039 $ 300,000 $ 348,279
San Diego Tobacco Settlement Revenue
Funding Corp. (California)
7.125%, 06/01/2032 1,350,000 1,109,714
State of California
7.600%, 11/01/2040 1,600,000 2,356,944
7.950%, 03/01/2036 17,300,000 21,359,791
7.500%, 04/01/2034 2,600,000 3,622,164
5.650%, 04/01/2039 (P) 800,000 813,152
7.550%, 04/01/2039 900,000 1,308,249
State of Louisiana 3.000%, 05/01/2043 (P) 2,600,000 2,608,814
State of Washington - Series C
5.000%, 06/01/2041 5,200,000 6,124,820
Tobacco Securitization Authority of
Southern California 5.125%, 06/01/2046 1,500,000 1,264,350
Tobacco Settlement Finance Authority
(West Virginia) 7.467%, 06/01/2047 3,065,000 2,450,958
Truckee Meadows Water Authority
(Nevada), Series A 5.000%, 07/01/2036 200,000 216,944
University of California
6.270%, 05/15/2031 5,300,000 6,215,469
TOTAL MUNICIPAL BONDS (Cost $101,360,151) $ 117,754,819
CAPITAL PREFERRED SECURITIES - 0.0%
Financials - 0.0%
State Street Capital Trust IV
1.389%, 06/15/2037 (P) 400,000 309,001
USB Capital IX
3.500%, 01/17/2013 (P)(Q) 300,000 269,445
Copyright © 2013 www.secdatabase.com. All Rights Reserved.Please Consider the Environment Before Printing This Document
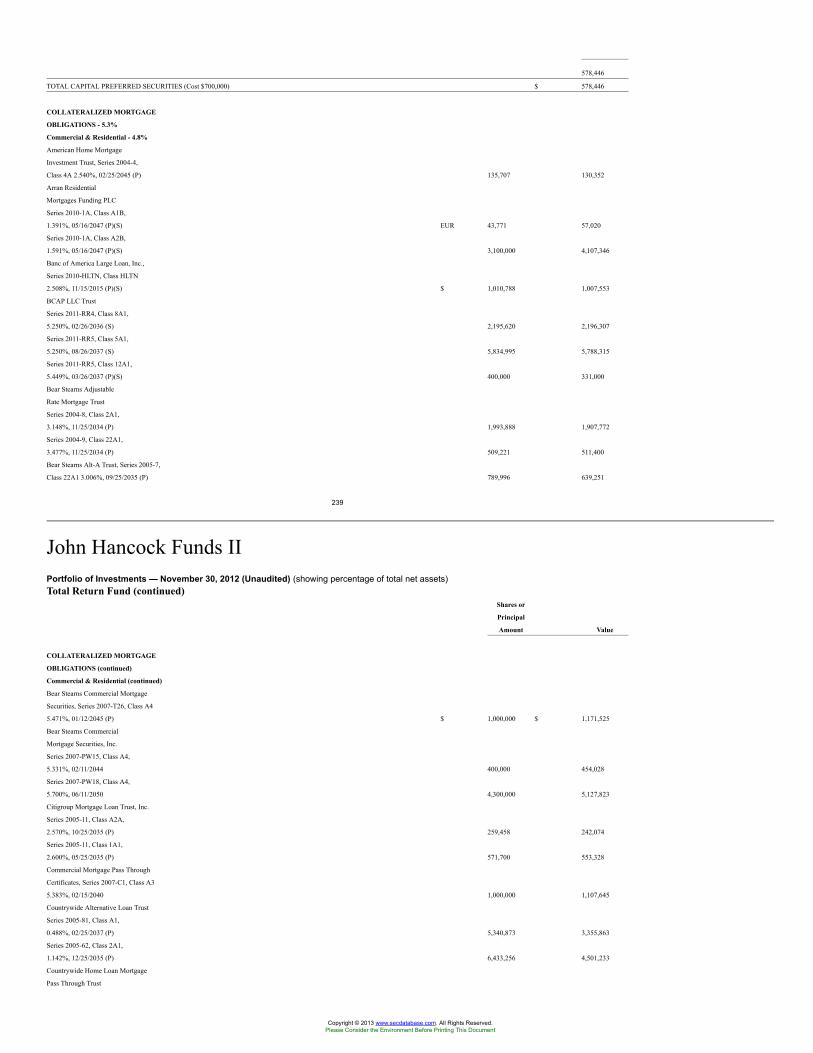
578,446
TOTAL CAPITAL PREFERRED SECURITIES (Cost $700,000) $ 578,446
COLLATERALIZED MORTGAGE
OBLIGATIONS - 5.3%
Commercial & Residential - 4.8%
American Home Mortgage
Investment Trust, Series 2004-4,
Class 4A 2.540%, 02/25/2045 (P) 135,707 130,352
Arran Residential
Mortgages Funding PLC
Series 2010-1A, Class A1B,
1.391%, 05/16/2047 (P)(S) EUR 43,771 57,020
Series 2010-1A, Class A2B,
1.591%, 05/16/2047 (P)(S) 3,100,000 4,107,346
Banc of America Large Loan, Inc.,
Series 2010-HLTN, Class HLTN
2.508%, 11/15/2015 (P)(S) $ 1,010,788 1,007,553
BCAP LLC Trust
Series 2011-RR4, Class 8A1,
5.250%, 02/26/2036 (S) 2,195,620 2,196,307
Series 2011-RR5, Class 5A1,
5.250%, 08/26/2037 (S) 5,834,995 5,788,315
Series 2011-RR5, Class 12A1,
5.449%, 03/26/2037 (P)(S) 400,000 331,000
Bear Stearns Adjustable
Rate Mortgage Trust
Series 2004-8, Class 2A1,
3.148%, 11/25/2034 (P) 1,993,888 1,907,772
Series 2004-9, Class 22A1,
3.477%, 11/25/2034 (P) 509,221 511,400
Bear Stearns Alt-A Trust, Series 2005-7,
Class 22A1 3.006%, 09/25/2035 (P) 789,996 639,251
239
John Hancock Funds IIPortfolio of Investments — November 30, 2012 (Unaudited) (showing percentage of total net assets)Total Return Fund (continued)
Shares or
Principal
Amount Value
COLLATERALIZED MORTGAGE
OBLIGATIONS (continued)
Commercial & Residential (continued)
Bear Stearns Commercial Mortgage
Securities, Series 2007-T26, Class A4
5.471%, 01/12/2045 (P) $ 1,000,000 $ 1,171,525
Bear Stearns Commercial
Mortgage Securities, Inc.
Series 2007-PW15, Class A4,
5.331%, 02/11/2044 400,000 454,028
Series 2007-PW18, Class A4,
5.700%, 06/11/2050 4,300,000 5,127,823
Citigroup Mortgage Loan Trust, Inc.
Series 2005-11, Class A2A,
2.570%, 10/25/2035 (P) 259,458 242,074
Series 2005-11, Class 1A1,
2.600%, 05/25/2035 (P) 571,700 553,328
Commercial Mortgage Pass Through
Certificates, Series 2007-C1, Class A3
5.383%, 02/15/2040 1,000,000 1,107,645
Countrywide Alternative Loan Trust
Series 2005-81, Class A1,
0.488%, 02/25/2037 (P) 5,340,873 3,355,863
Series 2005-62, Class 2A1,
1.142%, 12/25/2035 (P) 6,433,256 4,501,233
Countrywide Home Loan Mortgage
Pass Through Trust
Copyright © 2013 www.secdatabase.com. All Rights Reserved.Please Consider the Environment Before Printing This Document
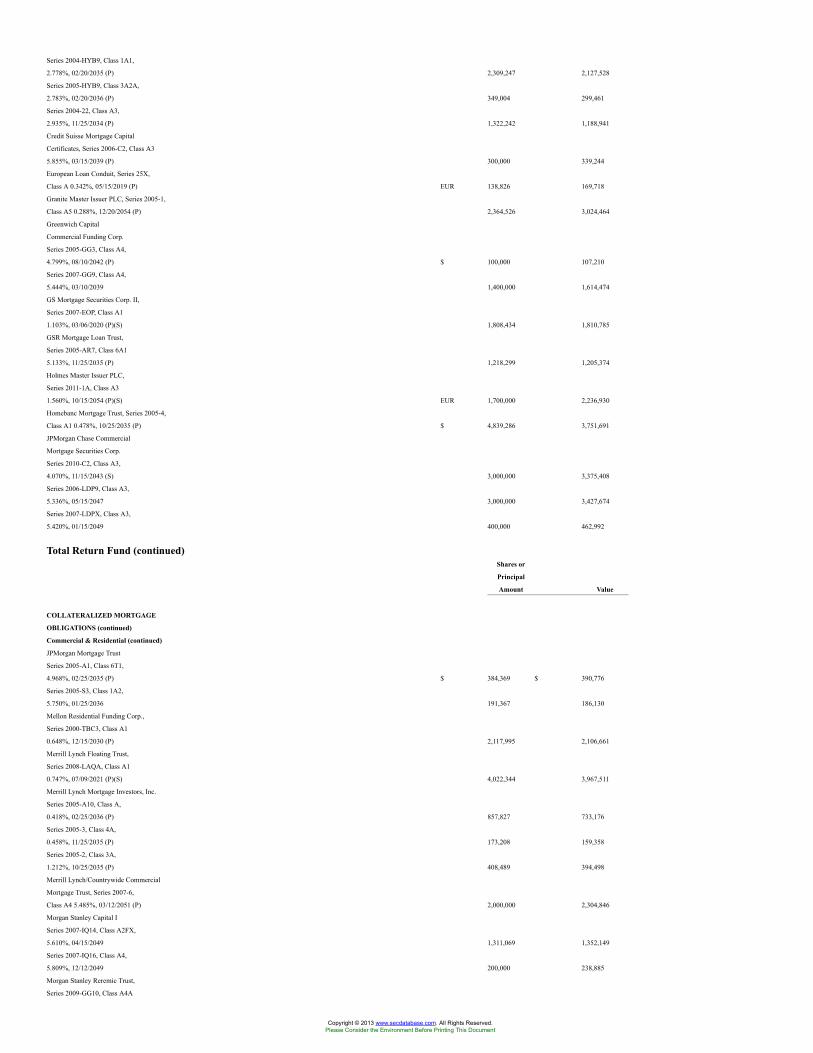
Series 2004-HYB9, Class 1A1,
2.778%, 02/20/2035 (P) 2,309,247 2,127,528
Series 2005-HYB9, Class 3A2A,
2.783%, 02/20/2036 (P) 349,004 299,461
Series 2004-22, Class A3,
2.935%, 11/25/2034 (P) 1,322,242 1,188,941
Credit Suisse Mortgage Capital
Certificates, Series 2006-C2, Class A3
5.855%, 03/15/2039 (P) 300,000 339,244
European Loan Conduit, Series 25X,
Class A 0.342%, 05/15/2019 (P) EUR 138,826 169,718
Granite Master Issuer PLC, Series 2005-1,
Class A5 0.288%, 12/20/2054 (P) 2,364,526 3,024,464
Greenwich Capital
Commercial Funding Corp.
Series 2005-GG3, Class A4,
4.799%, 08/10/2042 (P) $ 100,000 107,210
Series 2007-GG9, Class A4,
5.444%, 03/10/2039 1,400,000 1,614,474
GS Mortgage Securities Corp. II,
Series 2007-EOP, Class A1
1.103%, 03/06/2020 (P)(S) 1,808,434 1,810,785
GSR Mortgage Loan Trust,
Series 2005-AR7, Class 6A1
5.133%, 11/25/2035 (P) 1,218,299 1,205,374
Holmes Master Issuer PLC,
Series 2011-1A, Class A3
1.560%, 10/15/2054 (P)(S) EUR 1,700,000 2,236,930
Homebanc Mortgage Trust, Series 2005-4,
Class A1 0.478%, 10/25/2035 (P) $ 4,839,286 3,751,691
JPMorgan Chase Commercial
Mortgage Securities Corp.
Series 2010-C2, Class A3,
4.070%, 11/15/2043 (S) 3,000,000 3,375,408
Series 2006-LDP9, Class A3,
5.336%, 05/15/2047 3,000,000 3,427,674
Series 2007-LDPX, Class A3,
5.420%, 01/15/2049 400,000 462,992
Total Return Fund (continued)Shares or
Principal
Amount Value
COLLATERALIZED MORTGAGE
OBLIGATIONS (continued)
Commercial & Residential (continued)
JPMorgan Mortgage Trust
Series 2005-A1, Class 6T1,
4.968%, 02/25/2035 (P) $ 384,369 $ 390,776
Series 2005-S3, Class 1A2,
5.750%, 01/25/2036 191,367 186,130
Mellon Residential Funding Corp.,
Series 2000-TBC3, Class A1
0.648%, 12/15/2030 (P) 2,117,995 2,106,661
Merrill Lynch Floating Trust,
Series 2008-LAQA, Class A1
0.747%, 07/09/2021 (P)(S) 4,022,344 3,967,511
Merrill Lynch Mortgage Investors, Inc.
Series 2005-A10, Class A,
0.418%, 02/25/2036 (P) 857,827 733,176
Series 2005-3, Class 4A,
0.458%, 11/25/2035 (P) 173,208 159,358
Series 2005-2, Class 3A,
1.212%, 10/25/2035 (P) 408,489 394,498
Merrill Lynch/Countrywide Commercial
Mortgage Trust, Series 2007-6,
Class A4 5.485%, 03/12/2051 (P) 2,000,000 2,304,846
Morgan Stanley Capital I
Series 2007-IQ14, Class A2FX,
5.610%, 04/15/2049 1,311,069 1,352,149
Series 2007-IQ16, Class A4,
5.809%, 12/12/2049 200,000 238,885
Morgan Stanley Reremic Trust,
Series 2009-GG10, Class A4A
Copyright © 2013 www.secdatabase.com. All Rights Reserved.Please Consider the Environment Before Printing This Document
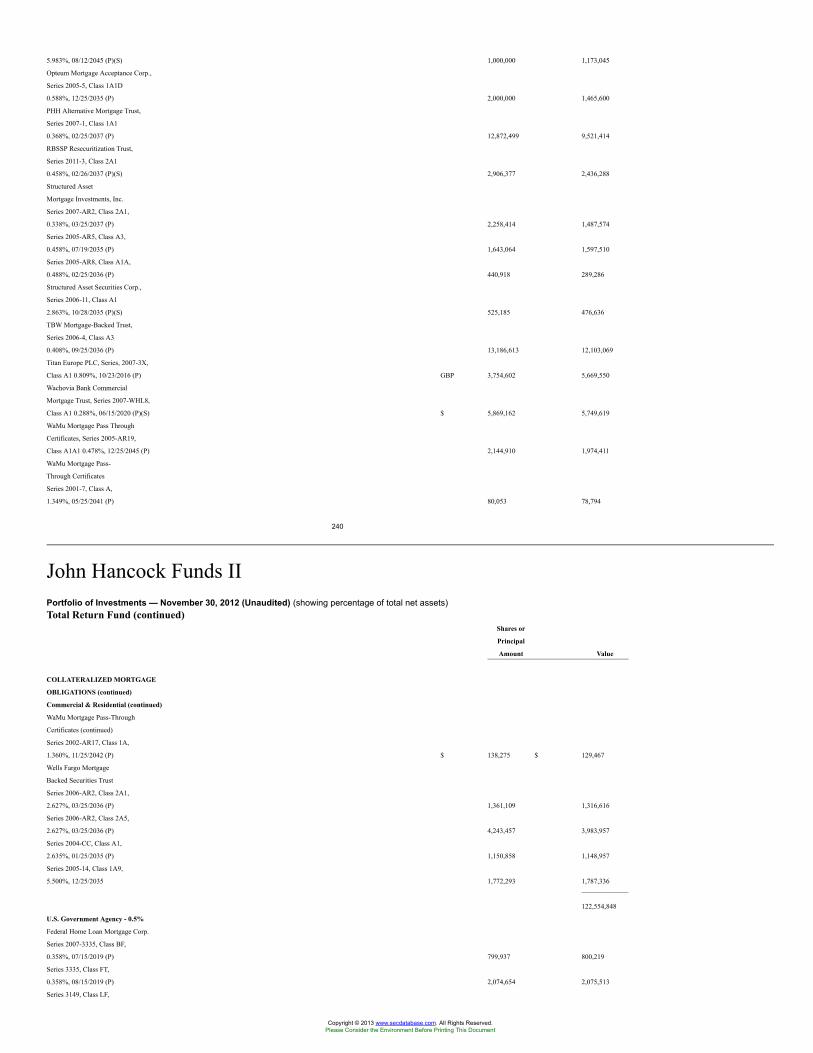
5.983%, 08/12/2045 (P)(S) 1,000,000 1,173,045
Opteum Mortgage Acceptance Corp.,
Series 2005-5, Class 1A1D
0.588%, 12/25/2035 (P) 2,000,000 1,465,600
PHH Alternative Mortgage Trust,
Series 2007-1, Class 1A1
0.368%, 02/25/2037 (P) 12,872,499 9,521,414
RBSSP Resecuritization Trust,
Series 2011-3, Class 2A1
0.458%, 02/26/2037 (P)(S) 2,906,377 2,436,288
Structured Asset
Mortgage Investments, Inc.
Series 2007-AR2, Class 2A1,
0.338%, 03/25/2037 (P) 2,258,414 1,487,574
Series 2005-AR5, Class A3,
0.458%, 07/19/2035 (P) 1,643,064 1,597,510
Series 2005-AR8, Class A1A,
0.488%, 02/25/2036 (P) 440,918 289,286
Structured Asset Securities Corp.,
Series 2006-11, Class A1
2.863%, 10/28/2035 (P)(S) 525,185 476,636
TBW Mortgage-Backed Trust,
Series 2006-4, Class A3
0.408%, 09/25/2036 (P) 13,186,613 12,103,069
Titan Europe PLC, Series, 2007-3X,
Class A1 0.809%, 10/23/2016 (P) GBP 3,754,602 5,669,550
Wachovia Bank Commercial
Mortgage Trust, Series 2007-WHL8,
Class A1 0.288%, 06/15/2020 (P)(S) $ 5,869,162 5,749,619
WaMu Mortgage Pass Through
Certificates, Series 2005-AR19,
Class A1A1 0.478%, 12/25/2045 (P) 2,144,910 1,974,411
WaMu Mortgage Pass-
Through Certificates
Series 2001-7, Class A,
1.349%, 05/25/2041 (P) 80,053 78,794
240
John Hancock Funds IIPortfolio of Investments — November 30, 2012 (Unaudited) (showing percentage of total net assets)Total Return Fund (continued)
Shares or
Principal
Amount Value
COLLATERALIZED MORTGAGE
OBLIGATIONS (continued)
Commercial & Residential (continued)
WaMu Mortgage Pass-Through
Certificates (continued)
Series 2002-AR17, Class 1A,
1.360%, 11/25/2042 (P) $ 138,275 $ 129,467
Wells Fargo Mortgage
Backed Securities Trust
Series 2006-AR2, Class 2A1,
2.627%, 03/25/2036 (P) 1,361,109 1,316,616
Series 2006-AR2, Class 2A5,
2.627%, 03/25/2036 (P) 4,243,457 3,983,957
Series 2004-CC, Class A1,
2.635%, 01/25/2035 (P) 1,150,858 1,148,957
Series 2005-14, Class 1A9,
5.500%, 12/25/2035 1,772,293 1,787,336
122,554,848
U.S. Government Agency - 0.5%
Federal Home Loan Mortgage Corp.
Series 2007-3335, Class BF,
0.358%, 07/15/2019 (P) 799,937 800,219
Series 3335, Class FT,
0.358%, 08/15/2019 (P) 2,074,654 2,075,513
Series 3149, Class LF,
Copyright © 2013 www.secdatabase.com. All Rights Reserved.Please Consider the Environment Before Printing This Document
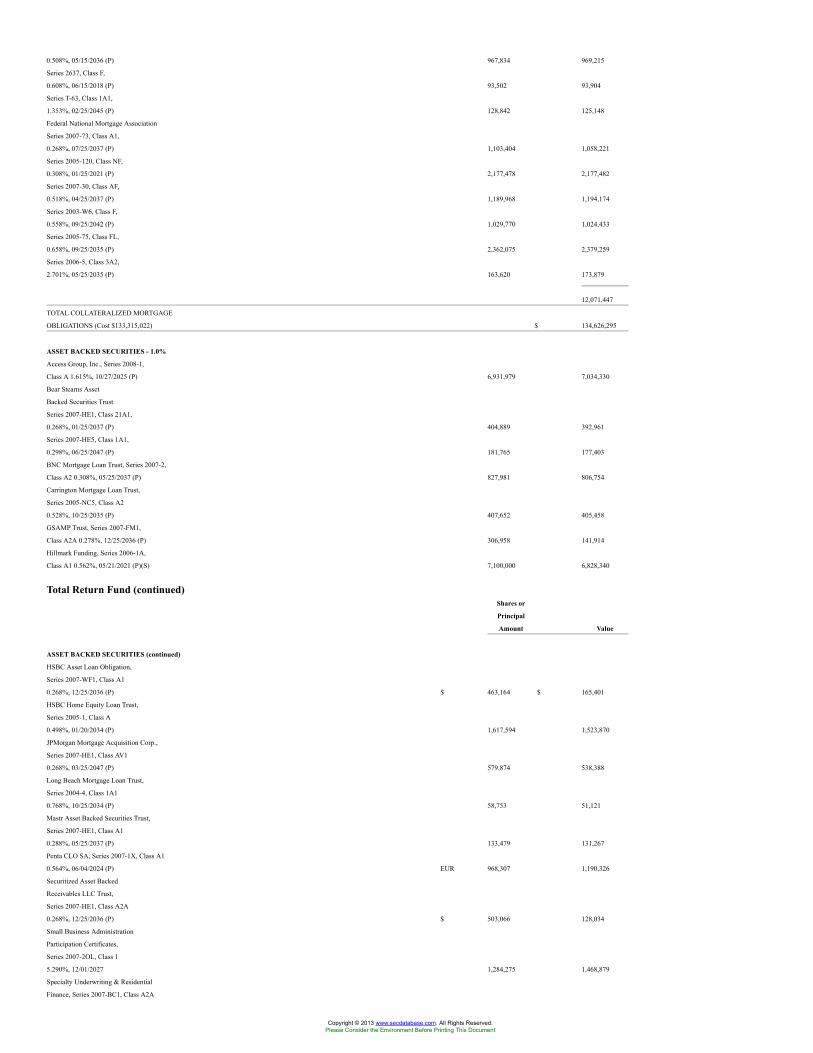
0.508%, 05/15/2036 (P) 967,834 969,215
Series 2637, Class F,
0.608%, 06/15/2018 (P) 93,502 93,904
Series T-63, Class 1A1,
1.353%, 02/25/2045 (P) 128,842 125,148
Federal National Mortgage Association
Series 2007-73, Class A1,
0.268%, 07/25/2037 (P) 1,103,404 1,058,221
Series 2005-120, Class NF,
0.308%, 01/25/2021 (P) 2,177,478 2,177,482
Series 2007-30, Class AF,
0.518%, 04/25/2037 (P) 1,189,968 1,194,174
Series 2003-W6, Class F,
0.558%, 09/25/2042 (P) 1,029,770 1,024,433
Series 2005-75, Class FL,
0.658%, 09/25/2035 (P) 2,362,075 2,379,259
Series 2006-5, Class 3A2,
2.701%, 05/25/2035 (P) 163,620 173,879
12,071,447
TOTAL COLLATERALIZED MORTGAGE
OBLIGATIONS (Cost $133,315,022) $ 134,626,295
ASSET BACKED SECURITIES - 1.0%
Access Group, Inc., Series 2008-1,
Class A 1.615%, 10/27/2025 (P) 6,931,979 7,034,330
Bear Stearns Asset
Backed Securities Trust
Series 2007-HE1, Class 21A1,
0.268%, 01/25/2037 (P) 404,889 392,961
Series 2007-HE5, Class 1A1,
0.298%, 06/25/2047 (P) 181,765 177,403
BNC Mortgage Loan Trust, Series 2007-2,
Class A2 0.308%, 05/25/2037 (P) 827,981 806,754
Carrington Mortgage Loan Trust,
Series 2005-NC5, Class A2
0.528%, 10/25/2035 (P) 407,652 405,458
GSAMP Trust, Series 2007-FM1,
Class A2A 0.278%, 12/25/2036 (P) 306,958 141,914
Hillmark Funding, Series 2006-1A,
Class A1 0.562%, 05/21/2021 (P)(S) 7,100,000 6,828,340
Total Return Fund (continued)Shares or
Principal
Amount Value
ASSET BACKED SECURITIES (continued)
HSBC Asset Loan Obligation,
Series 2007-WF1, Class A1
0.268%, 12/25/2036 (P) $ 463,164 $ 165,401
HSBC Home Equity Loan Trust,
Series 2005-1, Class A
0.498%, 01/20/2034 (P) 1,617,594 1,523,870
JPMorgan Mortgage Acquisition Corp.,
Series 2007-HE1, Class AV1
0.268%, 03/25/2047 (P) 579,874 538,388
Long Beach Mortgage Loan Trust,
Series 2004-4, Class 1A1
0.768%, 10/25/2034 (P) 58,753 51,121
Mastr Asset Backed Securities Trust,
Series 2007-HE1, Class A1
0.288%, 05/25/2037 (P) 133,479 131,267
Penta CLO SA, Series 2007-1X, Class A1
0.564%, 06/04/2024 (P) EUR 968,307 1,190,326
Securitized Asset Backed
Receivables LLC Trust,
Series 2007-HE1, Class A2A
0.268%, 12/25/2036 (P) $ 503,066 128,034
Small Business Administration
Participation Certificates,
Series 2007-2OL, Class 1
5.290%, 12/01/2027 1,284,275 1,468,879
Specialty Underwriting & Residential
Finance, Series 2007-BC1, Class A2A
Copyright © 2013 www.secdatabase.com. All Rights Reserved.Please Consider the Environment Before Printing This Document
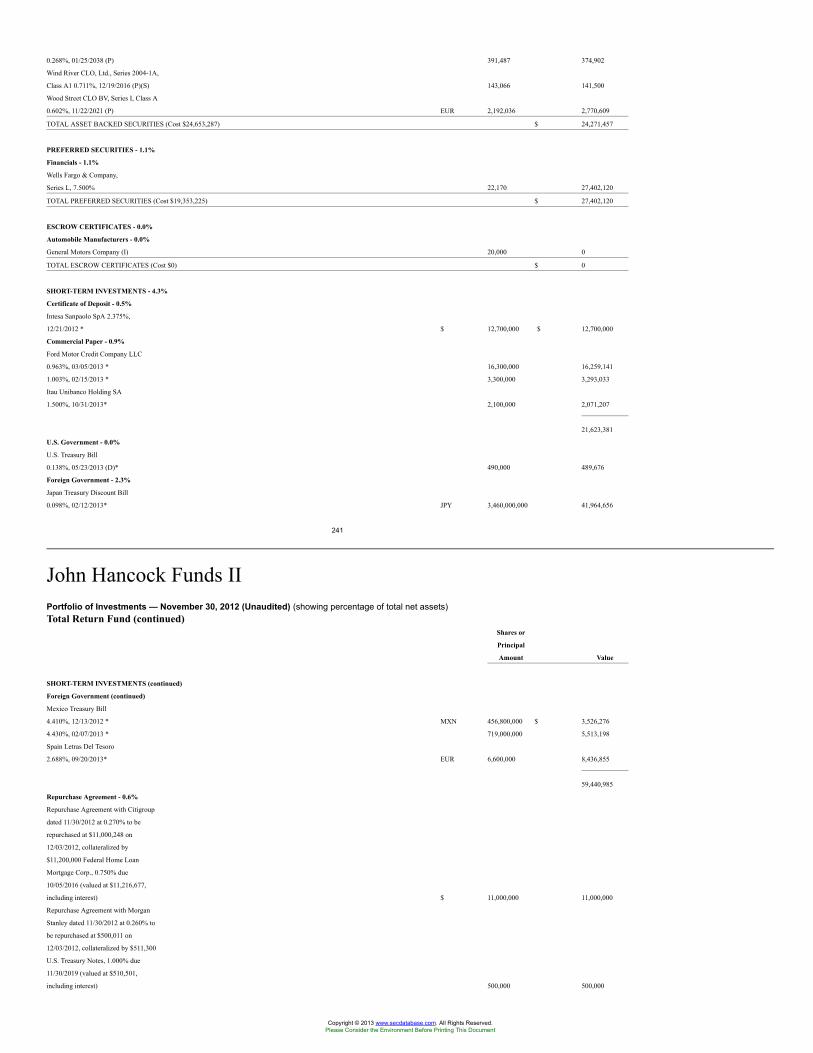
0.268%, 01/25/2038 (P) 391,487 374,902
Wind River CLO, Ltd., Series 2004-1A,
Class A1 0.711%, 12/19/2016 (P)(S) 143,066 141,500
Wood Street CLO BV, Series I, Class A
0.602%, 11/22/2021 (P) EUR 2,192,036 2,770,609
TOTAL ASSET BACKED SECURITIES (Cost $24,653,287) $ 24,271,457
PREFERRED SECURITIES - 1.1%
Financials - 1.1%
Wells Fargo & Company,
Series L, 7.500% 22,170 27,402,120
TOTAL PREFERRED SECURITIES (Cost $19,353,225) $ 27,402,120
ESCROW CERTIFICATES - 0.0%
Automobile Manufacturers - 0.0%
General Motors Company (I) 20,000 0
TOTAL ESCROW CERTIFICATES (Cost $0) $ 0
SHORT-TERM INVESTMENTS - 4.3%
Certificate of Deposit - 0.5%
Intesa Sanpaolo SpA 2.375%,
12/21/2012 * $ 12,700,000 $ 12,700,000
Commercial Paper - 0.9%
Ford Motor Credit Company LLC
0.963%, 03/05/2013 * 16,300,000 16,259,141
1.003%, 02/15/2013 * 3,300,000 3,293,033
Itau Unibanco Holding SA
1.500%, 10/31/2013* 2,100,000 2,071,207
21,623,381
U.S. Government - 0.0%
U.S. Treasury Bill
0.138%, 05/23/2013 (D)* 490,000 489,676
Foreign Government - 2.3%
Japan Treasury Discount Bill
0.098%, 02/12/2013* JPY 3,460,000,000 41,964,656
241
John Hancock Funds IIPortfolio of Investments — November 30, 2012 (Unaudited) (showing percentage of total net assets)Total Return Fund (continued)
Shares or
Principal
Amount Value
SHORT-TERM INVESTMENTS (continued)
Foreign Government (continued)
Mexico Treasury Bill
4.410%, 12/13/2012 * MXN 456,800,000 $ 3,526,276
4.430%, 02/07/2013 * 719,000,000 5,513,198
Spain Letras Del Tesoro
2.688%, 09/20/2013* EUR 6,600,000 8,436,855
59,440,985
Repurchase Agreement - 0.6%
Repurchase Agreement with Citigroup
dated 11/30/2012 at 0.270% to be
repurchased at $11,000,248 on
12/03/2012, collateralized by
$11,200,000 Federal Home Loan
Mortgage Corp., 0.750% due
10/05/2016 (valued at $11,216,677,
including interest) $ 11,000,000 11,000,000
Repurchase Agreement with Morgan
Stanley dated 11/30/2012 at 0.260% to
be repurchased at $500,011 on
12/03/2012, collateralized by $511,300
U.S. Treasury Notes, 1.000% due
11/30/2019 (valued at $510,501,
including interest) 500,000 500,000
Copyright © 2013 www.secdatabase.com. All Rights Reserved.Please Consider the Environment Before Printing This Document
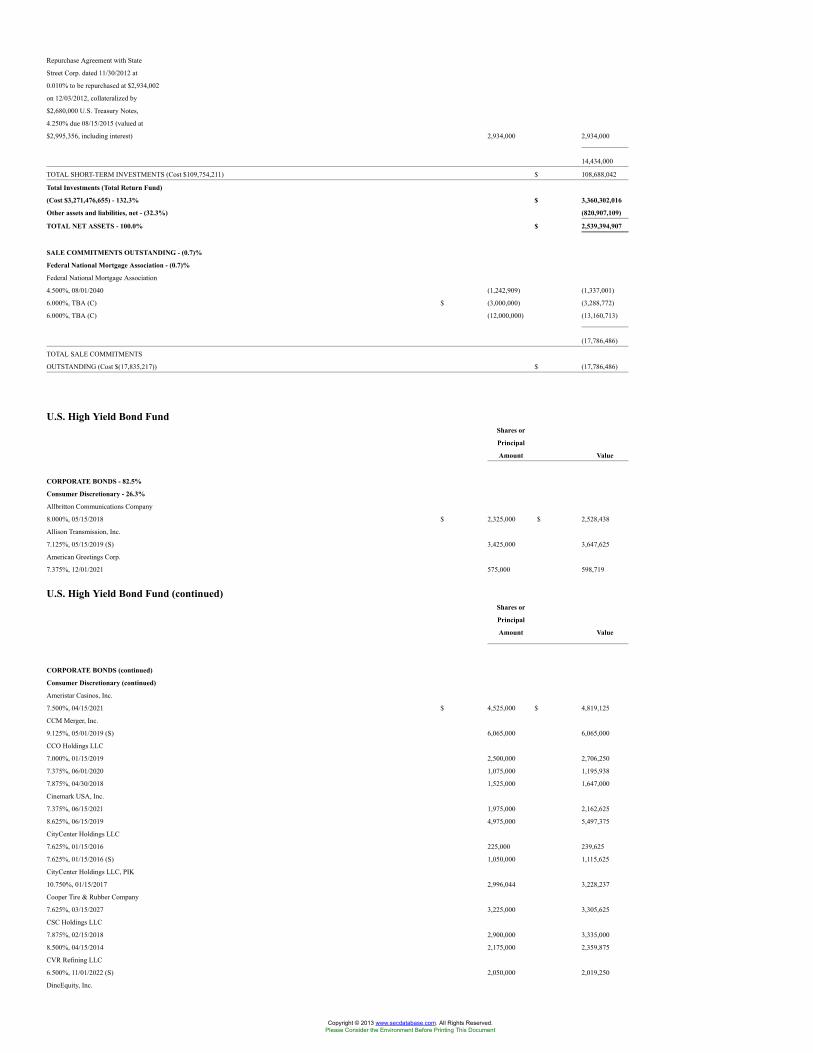
Repurchase Agreement with State
Street Corp. dated 11/30/2012 at
0.010% to be repurchased at $2,934,002
on 12/03/2012, collateralized by
$2,680,000 U.S. Treasury Notes,
4.250% due 08/15/2015 (valued at
$2,995,356, including interest) 2,934,000 2,934,000
14,434,000
TOTAL SHORT-TERM INVESTMENTS (Cost $109,754,211) $ 108,688,042
Total Investments (Total Return Fund)
(Cost $3,271,476,655) - 132.3% $ 3,360,302,016
Other assets and liabilities, net - (32.3%) (820,907,109)
TOTAL NET ASSETS - 100.0% $ 2,539,394,907
SALE COMMITMENTS OUTSTANDING - (0.7)%
Federal National Mortgage Association - (0.7)%
Federal National Mortgage Association
4.500%, 08/01/2040 (1,242,909) (1,337,001)
6.000%, TBA (C) $ (3,000,000) (3,288,772)
6.000%, TBA (C) (12,000,000) (13,160,713)
(17,786,486)
TOTAL SALE COMMITMENTS
OUTSTANDING (Cost $(17,835,217)) $ (17,786,486)
U.S. High Yield Bond FundShares or
Principal
Amount Value
CORPORATE BONDS - 82.5%
Consumer Discretionary - 26.3%
Allbritton Communications Company
8.000%, 05/15/2018 $ 2,325,000 $ 2,528,438
Allison Transmission, Inc.
7.125%, 05/15/2019 (S) 3,425,000 3,647,625
American Greetings Corp.
7.375%, 12/01/2021 575,000 598,719
U.S. High Yield Bond Fund (continued)Shares or
Principal
Amount Value
CORPORATE BONDS (continued)
Consumer Discretionary (continued)
Ameristar Casinos, Inc.
7.500%, 04/15/2021 $ 4,525,000 $ 4,819,125
CCM Merger, Inc.
9.125%, 05/01/2019 (S) 6,065,000 6,065,000
CCO Holdings LLC
7.000%, 01/15/2019 2,500,000 2,706,250
7.375%, 06/01/2020 1,075,000 1,195,938
7.875%, 04/30/2018 1,525,000 1,647,000
Cinemark USA, Inc.
7.375%, 06/15/2021 1,975,000 2,162,625
8.625%, 06/15/2019 4,975,000 5,497,375
CityCenter Holdings LLC
7.625%, 01/15/2016 225,000 239,625
7.625%, 01/15/2016 (S) 1,050,000 1,115,625
CityCenter Holdings LLC, PIK
10.750%, 01/15/2017 2,996,044 3,228,237
Cooper Tire & Rubber Company
7.625%, 03/15/2027 3,225,000 3,305,625
CSC Holdings LLC
7.875%, 02/15/2018 2,900,000 3,335,000
8.500%, 04/15/2014 2,175,000 2,359,875
CVR Refining LLC
6.500%, 11/01/2022 (S) 2,050,000 2,019,250
DineEquity, Inc.
Copyright © 2013 www.secdatabase.com. All Rights Reserved.Please Consider the Environment Before Printing This Document

9.500%, 10/30/2018 5,588,000 6,321,425
DISH DBS Corp.
5.875%, 07/15/2022 950,000 1,017,688
6.625%, 10/01/2014 800,000 864,000
6.750%, 06/01/2021 400,000 452,000
7.750%, 05/31/2015 2,750,000 3,100,625
EchoStar DBS Corp.
7.125%, 02/01/2016 3,150,000 3,531,938
Ford Motor Credit Company LLC
7.000%, 10/01/2013 820,000 857,588
8.000%, 12/15/2016 5,350,000 6,449,709
General Motors Financial Company, Inc.
4.750%, 08/15/2017 (S) 310,000 322,576
6.750%, 06/01/2018 1,975,000 2,225,981
Gray Television, Inc.
7.500%, 10/01/2020 (S) 4,450,000 4,450,000
Greektown Superholdings, Inc.
13.000%, 07/01/2015 6,400,000 6,848,000
Interactive Data Corp.
10.250%, 08/01/2018 3,350,000 3,752,000
KAR Auction Services, Inc.
4.313%, 05/01/2014 (P) 850,000 851,071
Lamar Media Corp.
5.000%, 05/01/2023 (S) 775,000 776,938
5.875%, 02/01/2022 450,000 478,688
7.875%, 04/15/2018 970,000 1,070,638
9.750%, 04/01/2014 3,370,000 3,707,000
Limited Brands, Inc.
5.625%, 02/15/2022 2,125,000 2,295,000
6.625%, 04/01/2021 625,000 716,406
Lin Television Corp.
6.375%, 01/15/2021 (S) 350,000 357,875
8.375%, 04/15/2018 2,425,000 2,631,125
Local TV Finance LLC
9.250%, 06/15/2015 (S) 4,275,491 4,328,935
NAI Entertainment Holdings LLC
8.250%, 12/15/2017 (S) 5,685,000 6,281,925
National Cinemedia LLC
6.000%, 04/15/2022 2,520,000 2,664,900
National CineMedia LLC
7.875%, 07/15/2021 750,000 828,750
242
John Hancock Funds IIPortfolio of Investments — November 30, 2012 (Unaudited) (showing percentage of total net assets)U.S. High Yield Bond Fund (continued)
Shares or
Principal
Amount Value
CORPORATE BONDS (continued)
Consumer Discretionary (continued)
Nexstar Broadcasting, Inc.
6.875%, 11/15/2020 (S) $ 1,650,000 $ 1,658,250
8.875%, 04/15/2017 700,000 764,750
Nielsen Finance LLC
4.500%, 10/01/2020 (S) 1,380,000 1,376,550
7.750%, 10/15/2018 9,885,000 11,021,775
Penn National Gaming, Inc.
8.750%, 08/15/2019 1,175,000 1,340,969
Penske Automotive Group Inc
5.750%, 10/01/2022 (S) 170,000 172,975
RadioShack Corp.
6.750%, 05/15/2019 2,875,000 1,800,469
Regal Cinemas Corp.
8.625%, 07/15/2019 6,515,000 7,150,213
Rent-A-Center, Inc.
6.625%, 11/15/2020 1,390,000 1,508,150
Ruby Tuesday, Inc.
7.625%, 05/15/2020 (S) 2,700,000 2,551,500
Copyright © 2013 www.secdatabase.com. All Rights Reserved.Please Consider the Environment Before Printing This Document
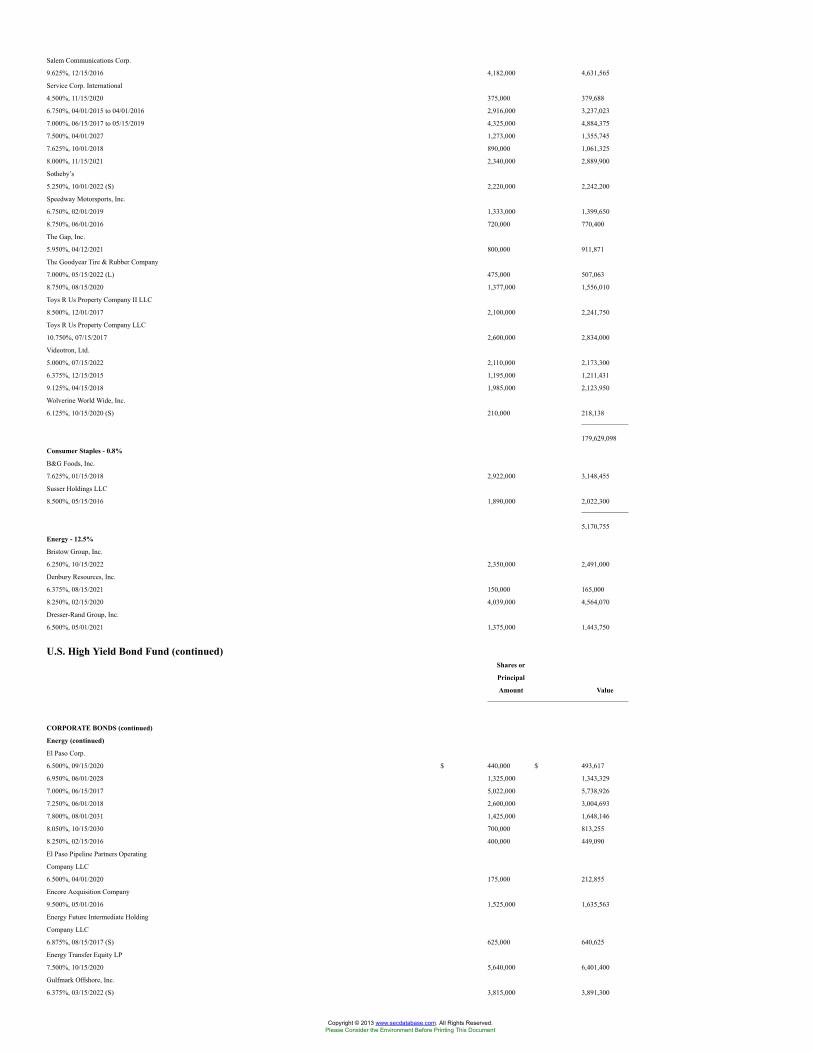
Salem Communications Corp.
9.625%, 12/15/2016 4,182,000 4,631,565
Service Corp. International
4.500%, 11/15/2020 375,000 379,688
6.750%, 04/01/2015 to 04/01/2016 2,916,000 3,237,023
7.000%, 06/15/2017 to 05/15/2019 4,325,000 4,884,375
7.500%, 04/01/2027 1,273,000 1,355,745
7.625%, 10/01/2018 890,000 1,061,325
8.000%, 11/15/2021 2,340,000 2,889,900
Sotheby’s
5.250%, 10/01/2022 (S) 2,220,000 2,242,200
Speedway Motorsports, Inc.
6.750%, 02/01/2019 1,333,000 1,399,650
8.750%, 06/01/2016 720,000 770,400
The Gap, Inc.
5.950%, 04/12/2021 800,000 911,871
The Goodyear Tire & Rubber Company
7.000%, 05/15/2022 (L) 475,000 507,063
8.750%, 08/15/2020 1,377,000 1,556,010
Toys R Us Property Company II LLC
8.500%, 12/01/2017 2,100,000 2,241,750
Toys R Us Property Company LLC
10.750%, 07/15/2017 2,600,000 2,834,000
Videotron, Ltd.
5.000%, 07/15/2022 2,110,000 2,173,300
6.375%, 12/15/2015 1,195,000 1,211,431
9.125%, 04/15/2018 1,985,000 2,123,950
Wolverine World Wide, Inc.
6.125%, 10/15/2020 (S) 210,000 218,138
179,629,098
Consumer Staples - 0.8%
B&G Foods, Inc.
7.625%, 01/15/2018 2,922,000 3,148,455
Susser Holdings LLC
8.500%, 05/15/2016 1,890,000 2,022,300
5,170,755
Energy - 12.5%
Bristow Group, Inc.
6.250%, 10/15/2022 2,350,000 2,491,000
Denbury Resources, Inc.
6.375%, 08/15/2021 150,000 165,000
8.250%, 02/15/2020 4,039,000 4,564,070
Dresser-Rand Group, Inc.
6.500%, 05/01/2021 1,375,000 1,443,750
U.S. High Yield Bond Fund (continued)Shares or
Principal
Amount Value
CORPORATE BONDS (continued)
Energy (continued)
El Paso Corp.
6.500%, 09/15/2020 $ 440,000 $ 493,617
6.950%, 06/01/2028 1,325,000 1,343,329
7.000%, 06/15/2017 5,022,000 5,738,926
7.250%, 06/01/2018 2,600,000 3,004,693
7.800%, 08/01/2031 1,425,000 1,648,146
8.050%, 10/15/2030 700,000 813,255
8.250%, 02/15/2016 400,000 449,090
El Paso Pipeline Partners Operating
Company LLC
6.500%, 04/01/2020 175,000 212,855
Encore Acquisition Company
9.500%, 05/01/2016 1,525,000 1,635,563
Energy Future Intermediate Holding
Company LLC
6.875%, 08/15/2017 (S) 625,000 640,625
Energy Transfer Equity LP
7.500%, 10/15/2020 5,640,000 6,401,400
Gulfmark Offshore, Inc.
6.375%, 03/15/2022 (S) 3,815,000 3,891,300
Copyright © 2013 www.secdatabase.com. All Rights Reserved.Please Consider the Environment Before Printing This Document
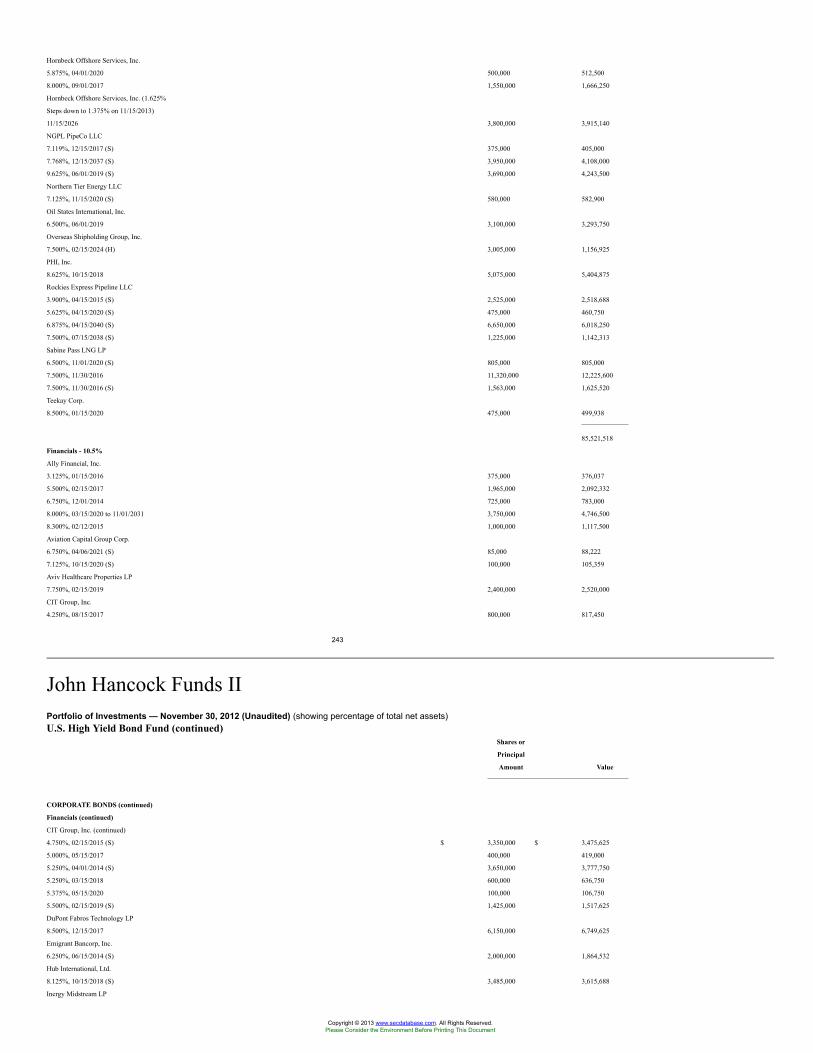
Hornbeck Offshore Services, Inc.
5.875%, 04/01/2020 500,000 512,500
8.000%, 09/01/2017 1,550,000 1,666,250
Hornbeck Offshore Services, Inc. (1.625%
Steps down to 1.375% on 11/15/2013)
11/15/2026 3,800,000 3,915,140
NGPL PipeCo LLC
7.119%, 12/15/2017 (S) 375,000 405,000
7.768%, 12/15/2037 (S) 3,950,000 4,108,000
9.625%, 06/01/2019 (S) 3,690,000 4,243,500
Northern Tier Energy LLC
7.125%, 11/15/2020 (S) 580,000 582,900
Oil States International, Inc.
6.500%, 06/01/2019 3,100,000 3,293,750
Overseas Shipholding Group, Inc.
7.500%, 02/15/2024 (H) 3,005,000 1,156,925
PHI, Inc.
8.625%, 10/15/2018 5,075,000 5,404,875
Rockies Express Pipeline LLC
3.900%, 04/15/2015 (S) 2,525,000 2,518,688
5.625%, 04/15/2020 (S) 475,000 460,750
6.875%, 04/15/2040 (S) 6,650,000 6,018,250
7.500%, 07/15/2038 (S) 1,225,000 1,142,313
Sabine Pass LNG LP
6.500%, 11/01/2020 (S) 805,000 805,000
7.500%, 11/30/2016 11,320,000 12,225,600
7.500%, 11/30/2016 (S) 1,563,000 1,625,520
Teekay Corp.
8.500%, 01/15/2020 475,000 499,938
85,521,518
Financials - 10.5%
Ally Financial, Inc.
3.125%, 01/15/2016 375,000 376,037
5.500%, 02/15/2017 1,965,000 2,092,332
6.750%, 12/01/2014 725,000 783,000
8.000%, 03/15/2020 to 11/01/2031 3,750,000 4,746,500
8.300%, 02/12/2015 1,000,000 1,117,500
Aviation Capital Group Corp.
6.750%, 04/06/2021 (S) 85,000 88,222
7.125%, 10/15/2020 (S) 100,000 105,359
Aviv Healthcare Properties LP
7.750%, 02/15/2019 2,400,000 2,520,000
CIT Group, Inc.
4.250%, 08/15/2017 800,000 817,450
243
John Hancock Funds IIPortfolio of Investments — November 30, 2012 (Unaudited) (showing percentage of total net assets)U.S. High Yield Bond Fund (continued)
Shares or
Principal
Amount Value
CORPORATE BONDS (continued)
Financials (continued)
CIT Group, Inc. (continued)
4.750%, 02/15/2015 (S) $ 3,350,000 $ 3,475,625
5.000%, 05/15/2017 400,000 419,000
5.250%, 04/01/2014 (S) 3,650,000 3,777,750
5.250%, 03/15/2018 600,000 636,750
5.375%, 05/15/2020 100,000 106,750
5.500%, 02/15/2019 (S) 1,425,000 1,517,625
DuPont Fabros Technology LP
8.500%, 12/15/2017 6,150,000 6,749,625
Emigrant Bancorp, Inc.
6.250%, 06/15/2014 (S) 2,000,000 1,864,532
Hub International, Ltd.
8.125%, 10/15/2018 (S) 3,485,000 3,615,688
Inergy Midstream LP
Copyright © 2013 www.secdatabase.com. All Rights Reserved.Please Consider the Environment Before Printing This Document
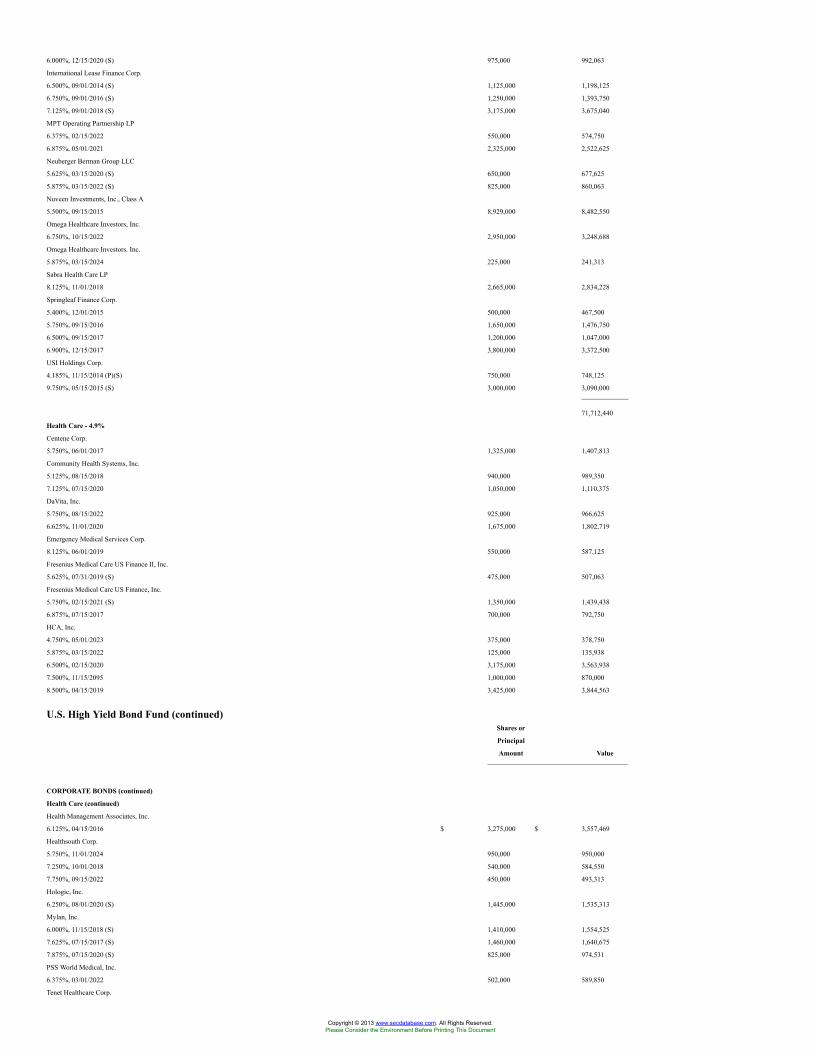
6.000%, 12/15/2020 (S) 975,000 992,063
International Lease Finance Corp.
6.500%, 09/01/2014 (S) 1,125,000 1,198,125
6.750%, 09/01/2016 (S) 1,250,000 1,393,750
7.125%, 09/01/2018 (S) 3,175,000 3,675,040
MPT Operating Partnership LP
6.375%, 02/15/2022 550,000 574,750
6.875%, 05/01/2021 2,325,000 2,522,625
Neuberger Berman Group LLC
5.625%, 03/15/2020 (S) 650,000 677,625
5.875%, 03/15/2022 (S) 825,000 860,063
Nuveen Investments, Inc., Class A
5.500%, 09/15/2015 8,929,000 8,482,550
Omega Healthcare Investors, Inc.
6.750%, 10/15/2022 2,950,000 3,248,688
Omega Healthcare Investors. Inc.
5.875%, 03/15/2024 225,000 241,313
Sabra Health Care LP
8.125%, 11/01/2018 2,665,000 2,834,228
Springleaf Finance Corp.
5.400%, 12/01/2015 500,000 467,500
5.750%, 09/15/2016 1,650,000 1,476,750
6.500%, 09/15/2017 1,200,000 1,047,000
6.900%, 12/15/2017 3,800,000 3,372,500
USI Holdings Corp.
4.185%, 11/15/2014 (P)(S) 750,000 748,125
9.750%, 05/15/2015 (S) 3,000,000 3,090,000
71,712,440
Health Care - 4.9%
Centene Corp.
5.750%, 06/01/2017 1,325,000 1,407,813
Community Health Systems, Inc.
5.125%, 08/15/2018 940,000 989,350
7.125%, 07/15/2020 1,050,000 1,110,375
DaVita, Inc.
5.750%, 08/15/2022 925,000 966,625
6.625%, 11/01/2020 1,675,000 1,802,719
Emergency Medical Services Corp.
8.125%, 06/01/2019 550,000 587,125
Fresenius Medical Care US Finance II, Inc.
5.625%, 07/31/2019 (S) 475,000 507,063
Fresenius Medical Care US Finance, Inc.
5.750%, 02/15/2021 (S) 1,350,000 1,439,438
6.875%, 07/15/2017 700,000 792,750
HCA, Inc.
4.750%, 05/01/2023 375,000 378,750
5.875%, 03/15/2022 125,000 135,938
6.500%, 02/15/2020 3,175,000 3,563,938
7.500%, 11/15/2095 1,000,000 870,000
8.500%, 04/15/2019 3,425,000 3,844,563
U.S. High Yield Bond Fund (continued)Shares or
Principal
Amount Value
CORPORATE BONDS (continued)
Health Care (continued)
Health Management Associates, Inc.
6.125%, 04/15/2016 $ 3,275,000 $ 3,557,469
Healthsouth Corp.
5.750%, 11/01/2024 950,000 950,000
7.250%, 10/01/2018 540,000 584,550
7.750%, 09/15/2022 450,000 493,313
Hologic, Inc.
6.250%, 08/01/2020 (S) 1,445,000 1,535,313
Mylan, Inc.
6.000%, 11/15/2018 (S) 1,410,000 1,554,525
7.625%, 07/15/2017 (S) 1,460,000 1,640,675
7.875%, 07/15/2020 (S) 825,000 974,531
PSS World Medical, Inc.
6.375%, 03/01/2022 502,000 589,850
Tenet Healthcare Corp.
Copyright © 2013 www.secdatabase.com. All Rights Reserved.Please Consider the Environment Before Printing This Document
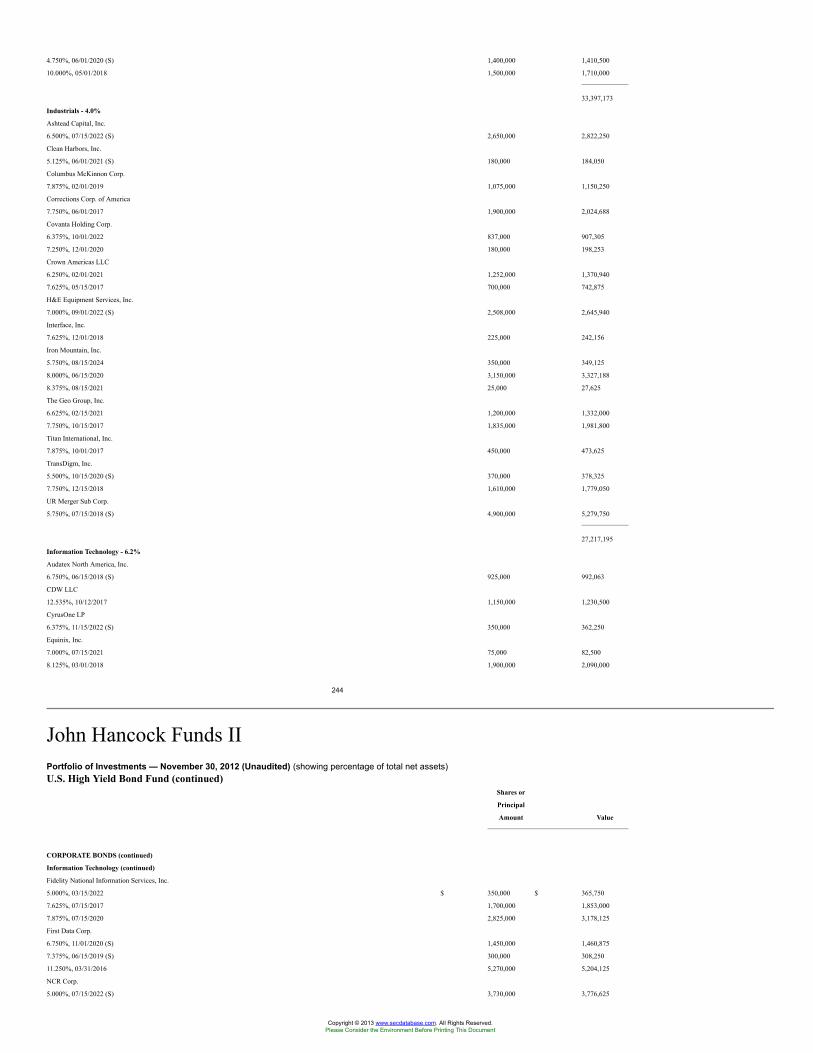
4.750%, 06/01/2020 (S) 1,400,000 1,410,500
10.000%, 05/01/2018 1,500,000 1,710,000
33,397,173
Industrials - 4.0%
Ashtead Capital, Inc.
6.500%, 07/15/2022 (S) 2,650,000 2,822,250
Clean Harbors, Inc.
5.125%, 06/01/2021 (S) 180,000 184,050
Columbus McKinnon Corp.
7.875%, 02/01/2019 1,075,000 1,150,250
Corrections Corp. of America
7.750%, 06/01/2017 1,900,000 2,024,688
Covanta Holding Corp.
6.375%, 10/01/2022 837,000 907,305
7.250%, 12/01/2020 180,000 198,253
Crown Americas LLC
6.250%, 02/01/2021 1,252,000 1,370,940
7.625%, 05/15/2017 700,000 742,875
H&E Equipment Services, Inc.
7.000%, 09/01/2022 (S) 2,508,000 2,645,940
Interface, Inc.
7.625%, 12/01/2018 225,000 242,156
Iron Mountain, Inc.
5.750%, 08/15/2024 350,000 349,125
8.000%, 06/15/2020 3,150,000 3,327,188
8.375%, 08/15/2021 25,000 27,625
The Geo Group, Inc.
6.625%, 02/15/2021 1,200,000 1,332,000
7.750%, 10/15/2017 1,835,000 1,981,800
Titan International, Inc.
7.875%, 10/01/2017 450,000 473,625
TransDigm, Inc.
5.500%, 10/15/2020 (S) 370,000 378,325
7.750%, 12/15/2018 1,610,000 1,779,050
UR Merger Sub Corp.
5.750%, 07/15/2018 (S) 4,900,000 5,279,750
27,217,195
Information Technology - 6.2%
Audatex North America, Inc.
6.750%, 06/15/2018 (S) 925,000 992,063
CDW LLC
12.535%, 10/12/2017 1,150,000 1,230,500
CyrusOne LP
6.375%, 11/15/2022 (S) 350,000 362,250
Equinix, Inc.
7.000%, 07/15/2021 75,000 82,500
8.125%, 03/01/2018 1,900,000 2,090,000
244
John Hancock Funds IIPortfolio of Investments — November 30, 2012 (Unaudited) (showing percentage of total net assets)U.S. High Yield Bond Fund (continued)
Shares or
Principal
Amount Value
CORPORATE BONDS (continued)
Information Technology (continued)
Fidelity National Information Services, Inc.
5.000%, 03/15/2022 $ 350,000 $ 365,750
7.625%, 07/15/2017 1,700,000 1,853,000
7.875%, 07/15/2020 2,825,000 3,178,125
First Data Corp.
6.750%, 11/01/2020 (S) 1,450,000 1,460,875
7.375%, 06/15/2019 (S) 300,000 308,250
11.250%, 03/31/2016 5,270,000 5,204,125
NCR Corp.
5.000%, 07/15/2022 (S) 3,730,000 3,776,625
Copyright © 2013 www.secdatabase.com. All Rights Reserved.Please Consider the Environment Before Printing This Document
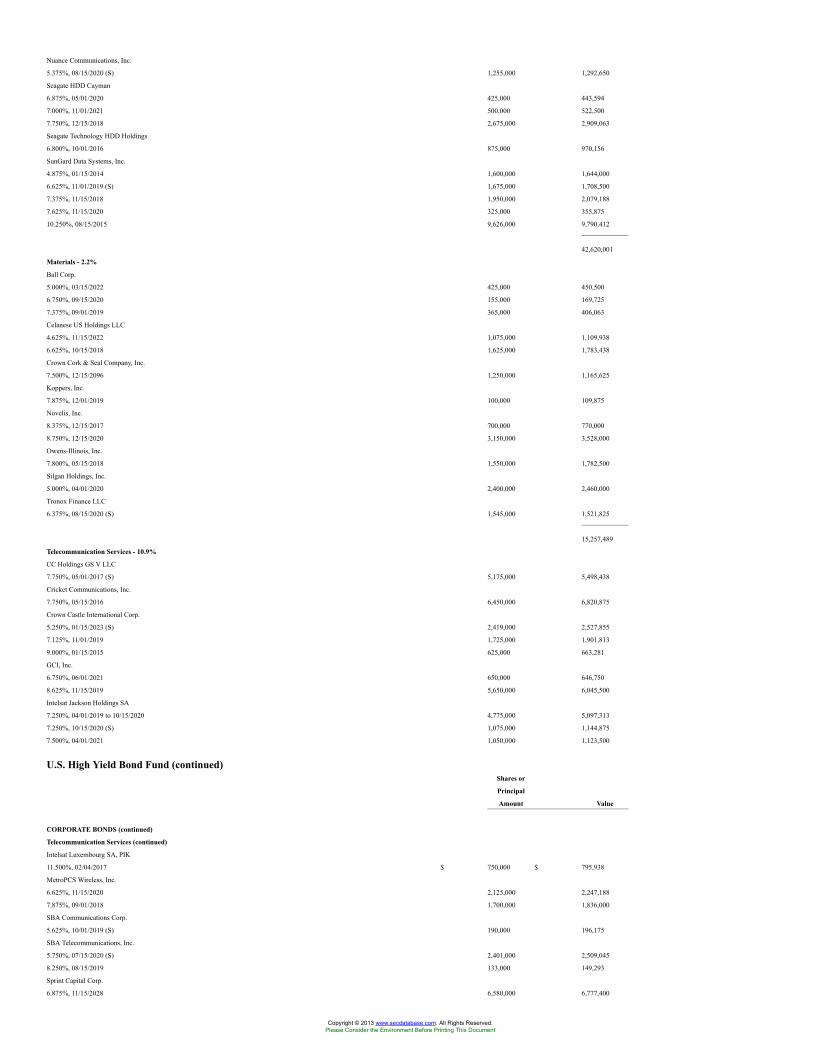
Nuance Communications, Inc.
5.375%, 08/15/2020 (S) 1,255,000 1,292,650
Seagate HDD Cayman
6.875%, 05/01/2020 425,000 443,594
7.000%, 11/01/2021 500,000 522,500
7.750%, 12/15/2018 2,675,000 2,909,063
Seagate Technology HDD Holdings
6.800%, 10/01/2016 875,000 970,156
SunGard Data Systems, Inc.
4.875%, 01/15/2014 1,600,000 1,644,000
6.625%, 11/01/2019 (S) 1,675,000 1,708,500
7.375%, 11/15/2018 1,950,000 2,079,188
7.625%, 11/15/2020 325,000 355,875
10.250%, 08/15/2015 9,626,000 9,790,412
42,620,001
Materials - 2.2%
Ball Corp.
5.000%, 03/15/2022 425,000 450,500
6.750%, 09/15/2020 155,000 169,725
7.375%, 09/01/2019 365,000 406,063
Celanese US Holdings LLC
4.625%, 11/15/2022 1,075,000 1,109,938
6.625%, 10/15/2018 1,625,000 1,783,438
Crown Cork & Seal Company, Inc.
7.500%, 12/15/2096 1,250,000 1,165,625
Koppers, Inc.
7.875%, 12/01/2019 100,000 109,875
Novelis, Inc.
8.375%, 12/15/2017 700,000 770,000
8.750%, 12/15/2020 3,150,000 3,528,000
Owens-Illinois, Inc.
7.800%, 05/15/2018 1,550,000 1,782,500
Silgan Holdings, Inc.
5.000%, 04/01/2020 2,400,000 2,460,000
Tronox Finance LLC
6.375%, 08/15/2020 (S) 1,545,000 1,521,825
15,257,489
Telecommunication Services - 10.9%
CC Holdings GS V LLC
7.750%, 05/01/2017 (S) 5,175,000 5,498,438
Cricket Communications, Inc.
7.750%, 05/15/2016 6,450,000 6,820,875
Crown Castle International Corp.
5.250%, 01/15/2023 (S) 2,419,000 2,527,855
7.125%, 11/01/2019 1,725,000 1,901,813
9.000%, 01/15/2015 625,000 663,281
GCI, Inc.
6.750%, 06/01/2021 650,000 646,750
8.625%, 11/15/2019 5,650,000 6,045,500
Intelsat Jackson Holdings SA
7.250%, 04/01/2019 to 10/15/2020 4,775,000 5,097,313
7.250%, 10/15/2020 (S) 1,075,000 1,144,875
7.500%, 04/01/2021 1,050,000 1,123,500
U.S. High Yield Bond Fund (continued)Shares or
Principal
Amount Value
CORPORATE BONDS (continued)
Telecommunication Services (continued)
Intelsat Luxembourg SA, PIK
11.500%, 02/04/2017 $ 750,000 $ 795,938
MetroPCS Wireless, Inc.
6.625%, 11/15/2020 2,125,000 2,247,188
7.875%, 09/01/2018 1,700,000 1,836,000
SBA Communications Corp.
5.625%, 10/01/2019 (S) 190,000 196,175
SBA Telecommunications, Inc.
5.750%, 07/15/2020 (S) 2,401,000 2,509,045
8.250%, 08/15/2019 133,000 149,293
Sprint Capital Corp.
6.875%, 11/15/2028 6,580,000 6,777,400
Copyright © 2013 www.secdatabase.com. All Rights Reserved.Please Consider the Environment Before Printing This Document
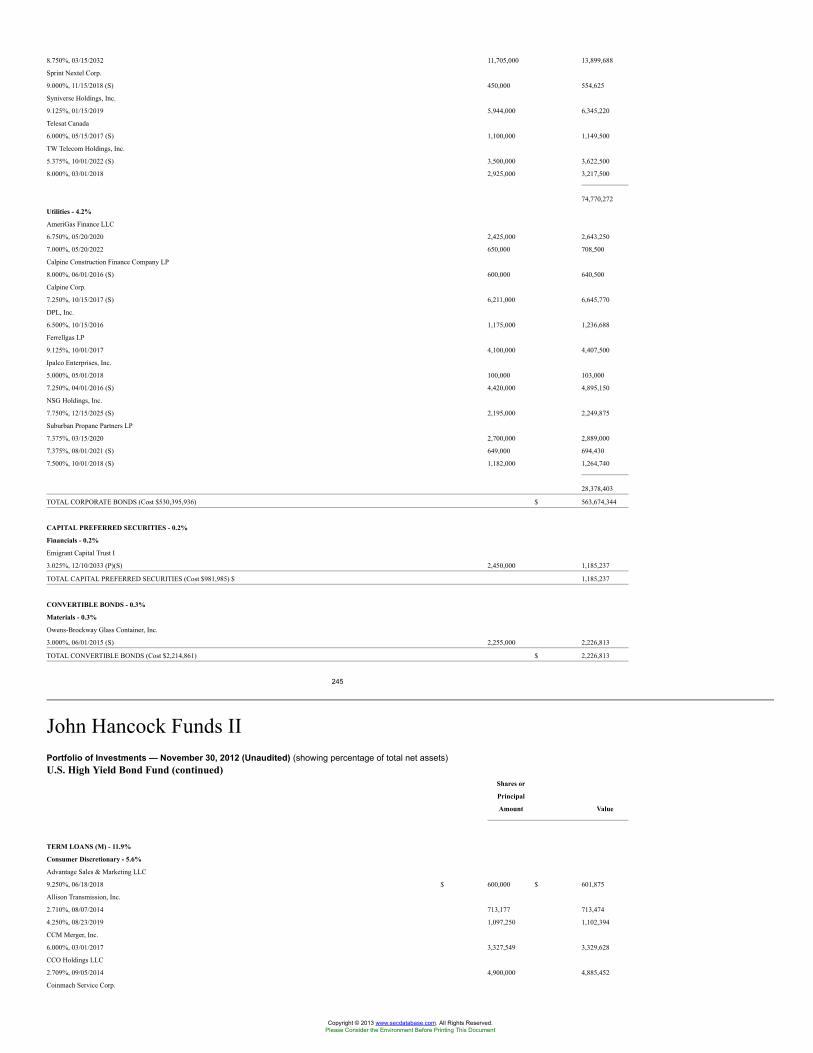
8.750%, 03/15/2032 11,705,000 13,899,688
Sprint Nextel Corp.
9.000%, 11/15/2018 (S) 450,000 554,625
Syniverse Holdings, Inc.
9.125%, 01/15/2019 5,944,000 6,345,220
Telesat Canada
6.000%, 05/15/2017 (S) 1,100,000 1,149,500
TW Telecom Holdings, Inc.
5.375%, 10/01/2022 (S) 3,500,000 3,622,500
8.000%, 03/01/2018 2,925,000 3,217,500
74,770,272
Utilities - 4.2%
AmeriGas Finance LLC
6.750%, 05/20/2020 2,425,000 2,643,250
7.000%, 05/20/2022 650,000 708,500
Calpine Construction Finance Company LP
8.000%, 06/01/2016 (S) 600,000 640,500
Calpine Corp.
7.250%, 10/15/2017 (S) 6,211,000 6,645,770
DPL, Inc.
6.500%, 10/15/2016 1,175,000 1,236,688
Ferrellgas LP
9.125%, 10/01/2017 4,100,000 4,407,500
Ipalco Enterprises, Inc.
5.000%, 05/01/2018 100,000 103,000
7.250%, 04/01/2016 (S) 4,420,000 4,895,150
NSG Holdings, Inc.
7.750%, 12/15/2025 (S) 2,195,000 2,249,875
Suburban Propane Partners LP
7.375%, 03/15/2020 2,700,000 2,889,000
7.375%, 08/01/2021 (S) 649,000 694,430
7.500%, 10/01/2018 (S) 1,182,000 1,264,740
28,378,403
TOTAL CORPORATE BONDS (Cost $530,395,936) $ 563,674,344
CAPITAL PREFERRED SECURITIES - 0.2%
Financials - 0.2%
Emigrant Capital Trust I
3.025%, 12/10/2033 (P)(S) 2,450,000 1,185,237
TOTAL CAPITAL PREFERRED SECURITIES (Cost $981,985) $ 1,185,237
CONVERTIBLE BONDS - 0.3%
Materials - 0.3%
Owens-Brockway Glass Container, Inc.
3.000%, 06/01/2015 (S) 2,255,000 2,226,813
TOTAL CONVERTIBLE BONDS (Cost $2,214,861) $ 2,226,813
245
John Hancock Funds IIPortfolio of Investments — November 30, 2012 (Unaudited) (showing percentage of total net assets)U.S. High Yield Bond Fund (continued)
Shares or
Principal
Amount Value
TERM LOANS (M) - 11.9%
Consumer Discretionary - 5.6%
Advantage Sales & Marketing LLC
9.250%, 06/18/2018 $ 600,000 $ 601,875
Allison Transmission, Inc.
2.710%, 08/07/2014 713,177 713,474
4.250%, 08/23/2019 1,097,250 1,102,394
CCM Merger, Inc.
6.000%, 03/01/2017 3,327,549 3,329,628
CCO Holdings LLC
2.709%, 09/05/2014 4,900,000 4,885,452
Coinmach Service Corp.
Copyright © 2013 www.secdatabase.com. All Rights Reserved.Please Consider the Environment Before Printing This Document
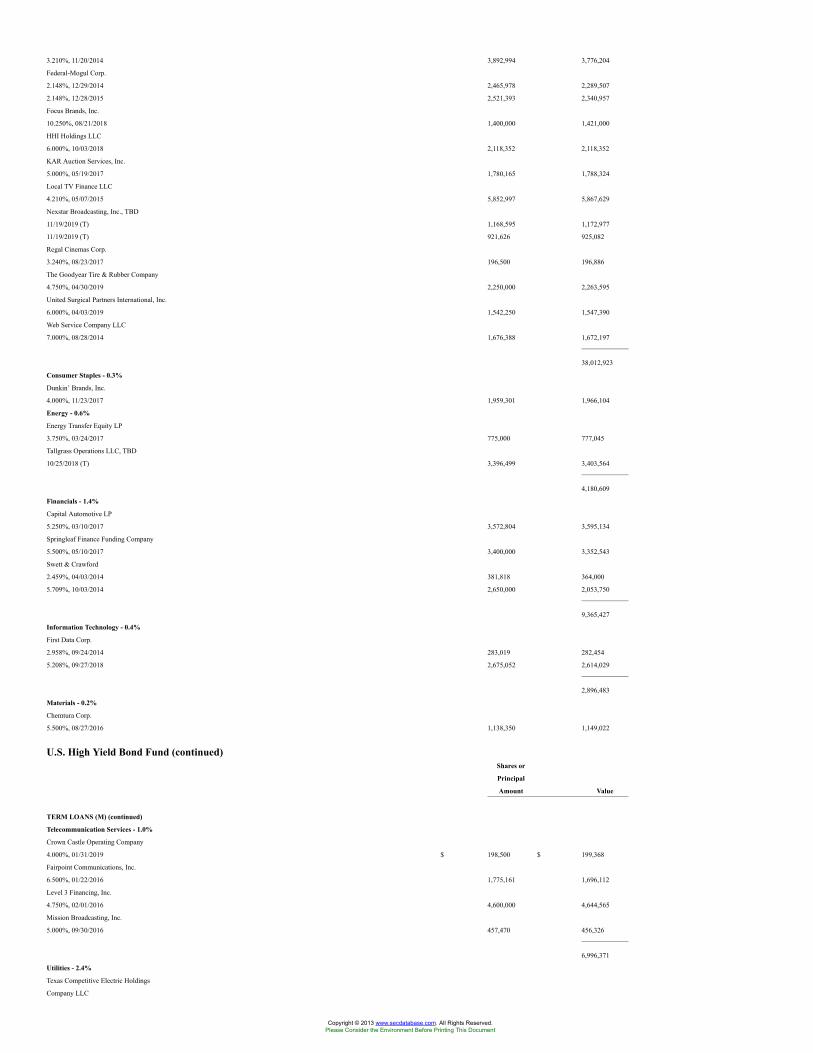
3.210%, 11/20/2014 3,892,994 3,776,204
Federal-Mogul Corp.
2.148%, 12/29/2014 2,465,978 2,289,507
2.148%, 12/28/2015 2,521,393 2,340,957
Focus Brands, Inc.
10.250%, 08/21/2018 1,400,000 1,421,000
HHI Holdings LLC
6.000%, 10/03/2018 2,118,352 2,118,352
KAR Auction Services, Inc.
5.000%, 05/19/2017 1,780,165 1,788,324
Local TV Finance LLC
4.210%, 05/07/2015 5,852,997 5,867,629
Nexstar Broadcasting, Inc., TBD
11/19/2019 (T) 1,168,595 1,172,977
11/19/2019 (T) 921,626 925,082
Regal Cinemas Corp.
3.240%, 08/23/2017 196,500 196,886
The Goodyear Tire & Rubber Company
4.750%, 04/30/2019 2,250,000 2,263,595
United Surgical Partners International, Inc.
6.000%, 04/03/2019 1,542,250 1,547,390
Web Service Company LLC
7.000%, 08/28/2014 1,676,388 1,672,197
38,012,923
Consumer Staples - 0.3%
Dunkin’ Brands, Inc.
4.000%, 11/23/2017 1,959,301 1,966,104
Energy - 0.6%
Energy Transfer Equity LP
3.750%, 03/24/2017 775,000 777,045
Tallgrass Operations LLC, TBD
10/25/2018 (T) 3,396,499 3,403,564
4,180,609
Financials - 1.4%
Capital Automotive LP
5.250%, 03/10/2017 3,572,804 3,595,134
Springleaf Finance Funding Company
5.500%, 05/10/2017 3,400,000 3,352,543
Swett & Crawford
2.459%, 04/03/2014 381,818 364,000
5.709%, 10/03/2014 2,650,000 2,053,750
9,365,427
Information Technology - 0.4%
First Data Corp.
2.958%, 09/24/2014 283,019 282,454
5.208%, 09/27/2018 2,675,052 2,614,029
2,896,483
Materials - 0.2%
Chemtura Corp.
5.500%, 08/27/2016 1,138,350 1,149,022
U.S. High Yield Bond Fund (continued)Shares or
Principal
Amount Value
TERM LOANS (M) (continued)
Telecommunication Services - 1.0%
Crown Castle Operating Company
4.000%, 01/31/2019 $ 198,500 $ 199,368
Fairpoint Communications, Inc.
6.500%, 01/22/2016 1,775,161 1,696,112
Level 3 Financing, Inc.
4.750%, 02/01/2016 4,600,000 4,644,565
Mission Broadcasting, Inc.
5.000%, 09/30/2016 457,470 456,326
6,996,371
Utilities - 2.4%
Texas Competitive Electric Holdings
Company LLC
Copyright © 2013 www.secdatabase.com. All Rights Reserved.Please Consider the Environment Before Printing This Document
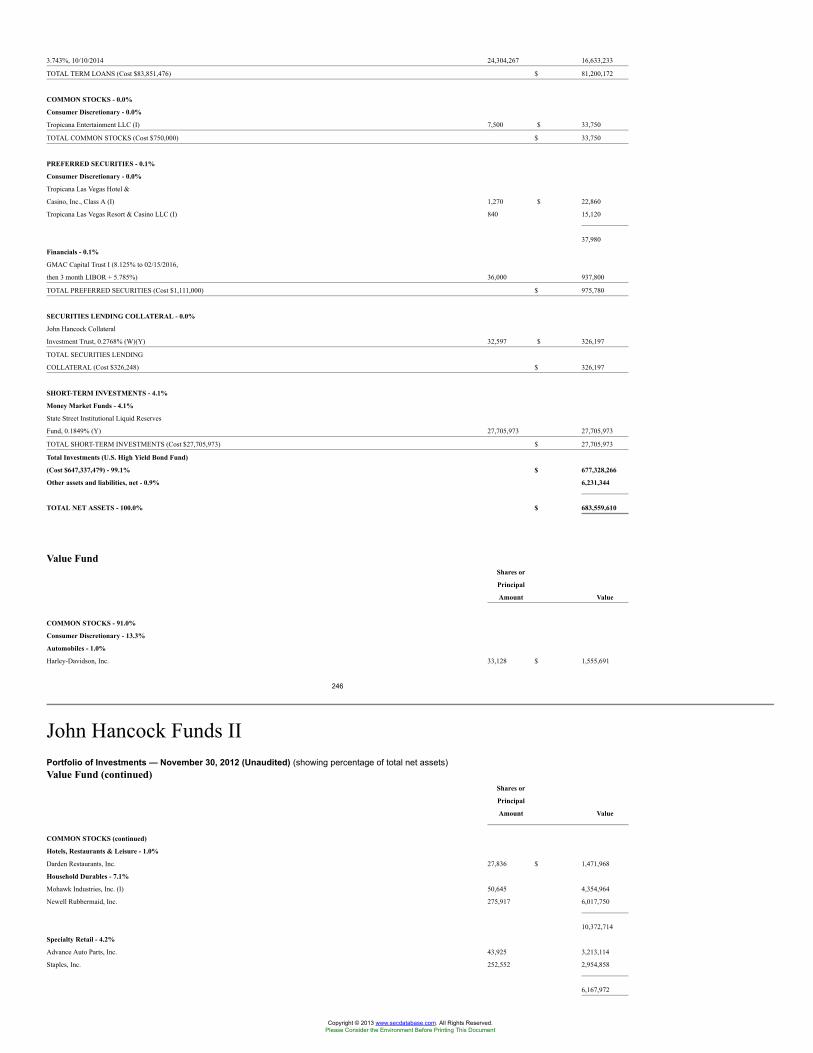
3.743%, 10/10/2014 24,304,267 16,633,233
TOTAL TERM LOANS (Cost $83,851,476) $ 81,200,172
COMMON STOCKS - 0.0%
Consumer Discretionary - 0.0%
Tropicana Entertainment LLC (I) 7,500 $ 33,750
TOTAL COMMON STOCKS (Cost $750,000) $ 33,750
PREFERRED SECURITIES - 0.1%
Consumer Discretionary - 0.0%
Tropicana Las Vegas Hotel &
Casino, Inc., Class A (I) 1,270 $ 22,860
Tropicana Las Vegas Resort & Casino LLC (I) 840 15,120
37,980
Financials - 0.1%
GMAC Capital Trust I (8.125% to 02/15/2016,
then 3 month LIBOR + 5.785%) 36,000 937,800
TOTAL PREFERRED SECURITIES (Cost $1,111,000) $ 975,780
SECURITIES LENDING COLLATERAL - 0.0%
John Hancock Collateral
Investment Trust, 0.2768% (W)(Y) 32,597 $ 326,197
TOTAL SECURITIES LENDING
COLLATERAL (Cost $326,248) $ 326,197
SHORT-TERM INVESTMENTS - 4.1%
Money Market Funds - 4.1%
State Street Institutional Liquid Reserves
Fund, 0.1849% (Y) 27,705,973 27,705,973
TOTAL SHORT-TERM INVESTMENTS (Cost $27,705,973) $ 27,705,973
Total Investments (U.S. High Yield Bond Fund)
(Cost $647,337,479) - 99.1% $ 677,328,266
Other assets and liabilities, net - 0.9% 6,231,344
TOTAL NET ASSETS - 100.0% $ 683,559,610
Value FundShares or
Principal
Amount Value
COMMON STOCKS - 91.0%
Consumer Discretionary - 13.3%
Automobiles - 1.0%
Harley-Davidson, Inc. 33,128 $ 1,555,691
246
John Hancock Funds IIPortfolio of Investments — November 30, 2012 (Unaudited) (showing percentage of total net assets)Value Fund (continued)
Shares or
Principal
Amount Value
COMMON STOCKS (continued)
Hotels, Restaurants & Leisure - 1.0%
Darden Restaurants, Inc. 27,836 $ 1,471,968
Household Durables - 7.1%
Mohawk Industries, Inc. (I) 50,645 4,354,964
Newell Rubbermaid, Inc. 275,917 6,017,750
10,372,714
Specialty Retail - 4.2%
Advance Auto Parts, Inc. 43,925 3,213,114
Staples, Inc. 252,552 2,954,858
6,167,972
Copyright © 2013 www.secdatabase.com. All Rights Reserved.Please Consider the Environment Before Printing This Document
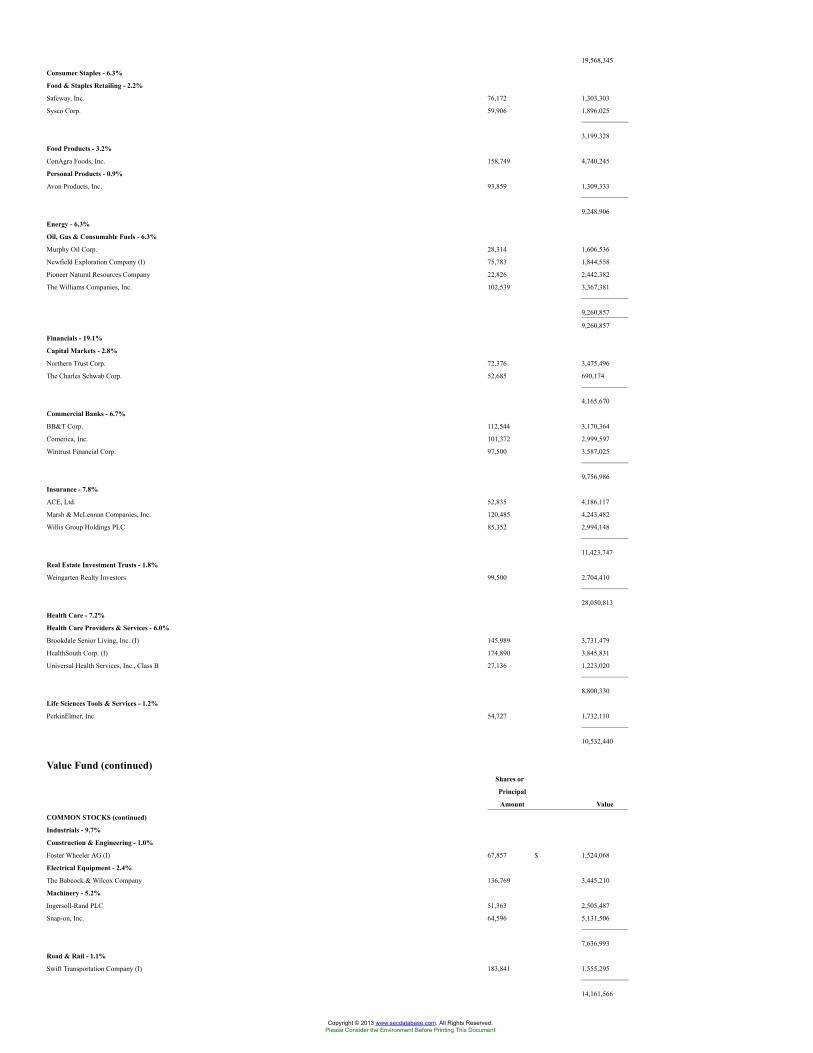
19,568,345
Consumer Staples - 6.3%
Food & Staples Retailing - 2.2%
Safeway, Inc. 76,172 1,303,303
Sysco Corp. 59,906 1,896,025
3,199,328
Food Products - 3.2%
ConAgra Foods, Inc. 158,749 4,740,245
Personal Products - 0.9%
Avon Products, Inc. 93,859 1,309,333
9,248,906
Energy - 6.3%
Oil, Gas & Consumable Fuels - 6.3%
Murphy Oil Corp. 28,314 1,606,536
Newfield Exploration Company (I) 75,783 1,844,558
Pioneer Natural Resources Company 22,826 2,442,382
The Williams Companies, Inc. 102,539 3,367,381
9,260,857
9,260,857
Financials - 19.1%
Capital Markets - 2.8%
Northern Trust Corp. 72,376 3,475,496
The Charles Schwab Corp. 52,685 690,174
4,165,670
Commercial Banks - 6.7%
BB&T Corp. 112,544 3,170,364
Comerica, Inc. 101,372 2,999,597
Wintrust Financial Corp. 97,500 3,587,025
9,756,986
Insurance - 7.8%
ACE, Ltd. 52,835 4,186,117
Marsh & McLennan Companies, Inc. 120,485 4,243,482
Willis Group Holdings PLC 85,352 2,994,148
11,423,747
Real Estate Investment Trusts - 1.8%
Weingarten Realty Investors 99,500 2,704,410
28,050,813
Health Care - 7.2%
Health Care Providers & Services - 6.0%
Brookdale Senior Living, Inc. (I) 145,989 3,731,479
HealthSouth Corp. (I) 174,890 3,845,831
Universal Health Services, Inc., Class B 27,136 1,223,020
8,800,330
Life Sciences Tools & Services - 1.2%
PerkinElmer, Inc. 54,727 1,732,110
10,532,440
Value Fund (continued)Shares or
Principal
Amount Value
COMMON STOCKS (continued)
Industrials - 9.7%
Construction & Engineering - 1.0%
Foster Wheeler AG (I) 67,857 $ 1,524,068
Electrical Equipment - 2.4%
The Babcock & Wilcox Company 136,769 3,445,210
Machinery - 5.2%
Ingersoll-Rand PLC 51,363 2,505,487
Snap-on, Inc. 64,596 5,131,506
7,636,993
Road & Rail - 1.1%
Swift Transportation Company (I) 183,841 1,555,295
14,161,566
Copyright © 2013 www.secdatabase.com. All Rights Reserved.Please Consider the Environment Before Printing This Document
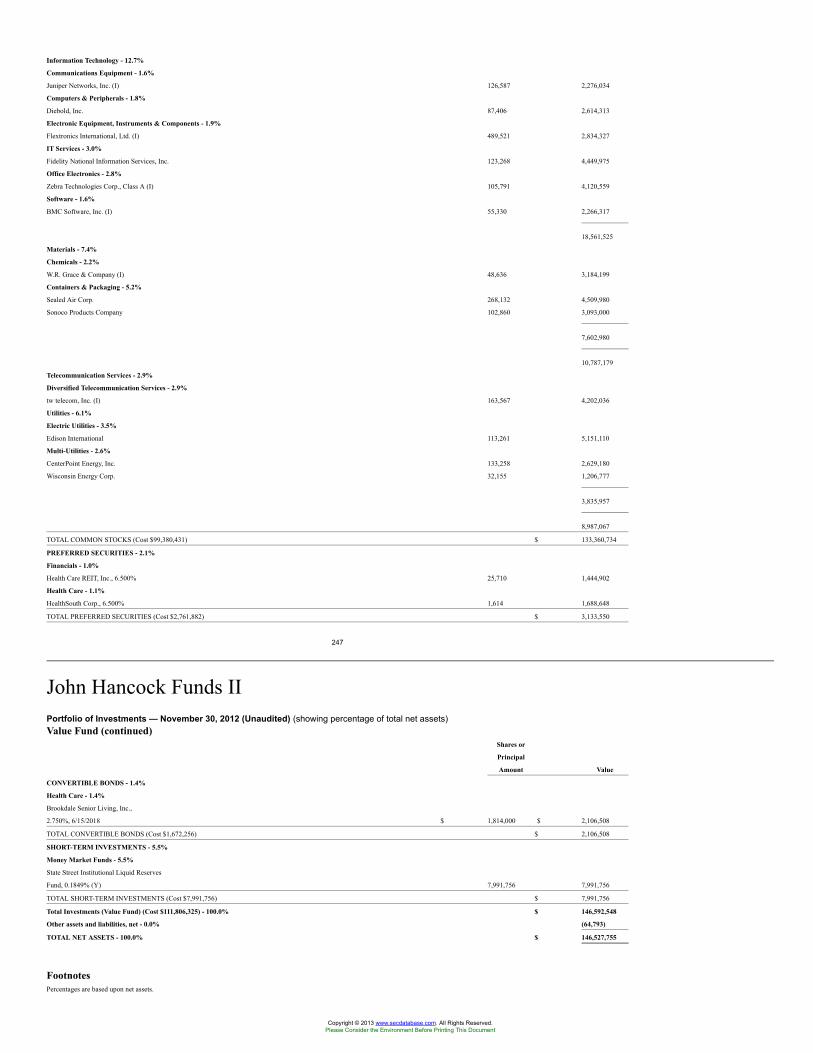
Information Technology - 12.7%
Communications Equipment - 1.6%
Juniper Networks, Inc. (I) 126,587 2,276,034
Computers & Peripherals - 1.8%
Diebold, Inc. 87,406 2,614,313
Electronic Equipment, Instruments & Components - 1.9%
Flextronics International, Ltd. (I) 489,521 2,834,327
IT Services - 3.0%
Fidelity National Information Services, Inc. 123,268 4,449,975
Office Electronics - 2.8%
Zebra Technologies Corp., Class A (I) 105,791 4,120,559
Software - 1.6%
BMC Software, Inc. (I) 55,330 2,266,317
18,561,525
Materials - 7.4%
Chemicals - 2.2%
W.R. Grace & Company (I) 48,636 3,184,199
Containers & Packaging - 5.2%
Sealed Air Corp. 268,132 4,509,980
Sonoco Products Company 102,860 3,093,000
7,602,980
10,787,179
Telecommunication Services - 2.9%
Diversified Telecommunication Services - 2.9%
tw telecom, Inc. (I) 163,567 4,202,036
Utilities - 6.1%
Electric Utilities - 3.5%
Edison International 113,261 5,151,110
Multi-Utilities - 2.6%
CenterPoint Energy, Inc. 133,258 2,629,180
Wisconsin Energy Corp. 32,155 1,206,777
3,835,957
8,987,067
TOTAL COMMON STOCKS (Cost $99,380,431) $ 133,360,734
PREFERRED SECURITIES - 2.1%
Financials - 1.0%
Health Care REIT, Inc., 6.500% 25,710 1,444,902
Health Care - 1.1%
HealthSouth Corp., 6.500% 1,614 1,688,648
TOTAL PREFERRED SECURITIES (Cost $2,761,882) $ 3,133,550
247
John Hancock Funds IIPortfolio of Investments — November 30, 2012 (Unaudited) (showing percentage of total net assets)Value Fund (continued)
Shares or
Principal
Amount Value
CONVERTIBLE BONDS - 1.4%
Health Care - 1.4%
Brookdale Senior Living, Inc.,
2.750%, 6/15/2018 $ 1,814,000 $ 2,106,508
TOTAL CONVERTIBLE BONDS (Cost $1,672,256) $ 2,106,508
SHORT-TERM INVESTMENTS - 5.5%
Money Market Funds - 5.5%
State Street Institutional Liquid Reserves
Fund, 0.1849% (Y) 7,991,756 7,991,756
TOTAL SHORT-TERM INVESTMENTS (Cost $7,991,756) $ 7,991,756
Total Investments (Value Fund) (Cost $111,806,325) - 100.0% $ 146,592,548
Other assets and liabilities, net - 0.0% (64,793)
TOTAL NET ASSETS - 100.0% $ 146,527,755
FootnotesPercentages are based upon net assets.
Copyright © 2013 www.secdatabase.com. All Rights Reserved.Please Consider the Environment Before Printing This Document
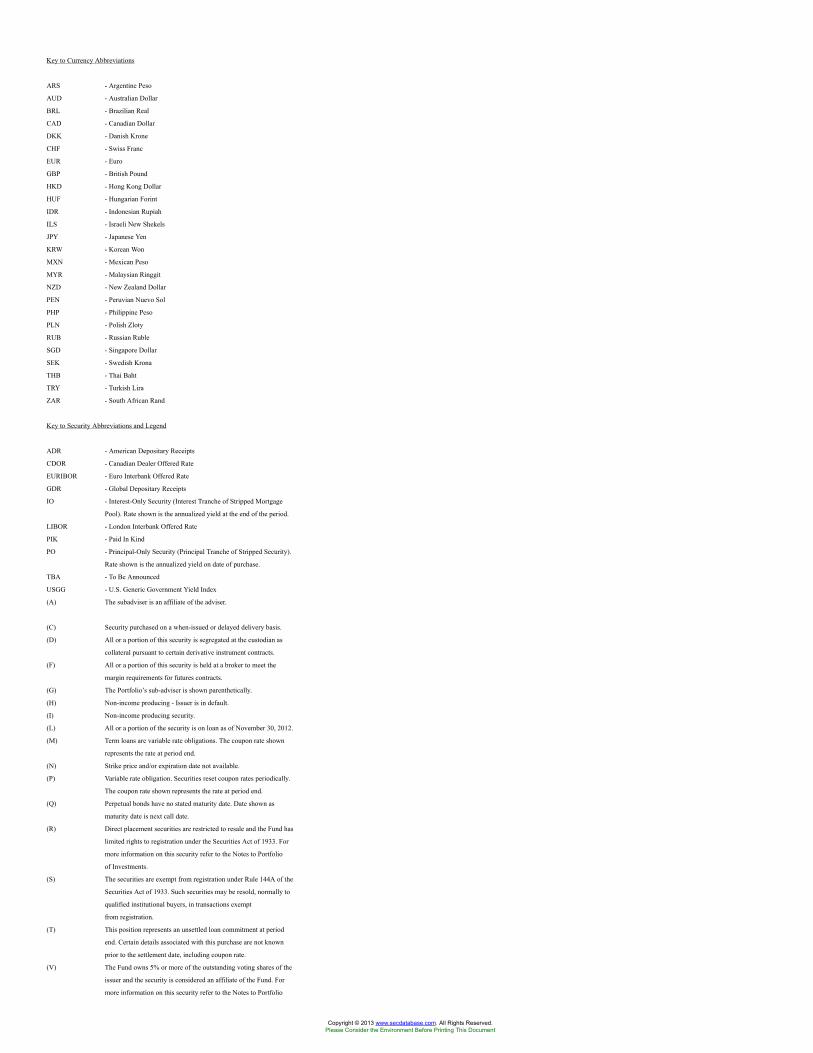
Key to Currency Abbreviations
ARS - Argentine Peso
AUD - Australian Dollar
BRL - Brazilian Real
CAD - Canadian Dollar
DKK - Danish Krone
CHF - Swiss Franc
EUR - Euro
GBP - British Pound
HKD - Hong Kong Dollar
HUF - Hungarian Forint
IDR - Indonesian Rupiah
ILS - Israeli New Shekels
JPY - Japanese Yen
KRW - Korean Won
MXN - Mexican Peso
MYR - Malaysian Ringgit
NZD - New Zealand Dollar
PEN - Peruvian Nuevo Sol
PHP - Philippine Peso
PLN - Polish Zloty
RUB - Russian Ruble
SGD - Singapore Dollar
SEK - Swedish Krona
THB - Thai Baht
TRY - Turkish Lira
ZAR - South African Rand
Key to Security Abbreviations and Legend
ADR - American Depositary Receipts
CDOR - Canadian Dealer Offered Rate
EURIBOR - Euro Interbank Offered Rate
GDR - Global Depositary Receipts
IO - Interest-Only Security (Interest Tranche of Stripped Mortgage
Pool). Rate shown is the annualized yield at the end of the period.
LIBOR - London Interbank Offered Rate
PIK - Paid In Kind
PO - Principal-Only Security (Principal Tranche of Stripped Security).
Rate shown is the annualized yield on date of purchase.
TBA - To Be Announced
USGG - U.S. Generic Government Yield Index
(A) The subadviser is an affiliate of the adviser.
(C) Security purchased on a when-issued or delayed delivery basis.
(D) All or a portion of this security is segregated at the custodian as
collateral pursuant to certain derivative instrument contracts.
(F) All or a portion of this security is held at a broker to meet the
margin requirements for futures contracts.
(G) The Portfolio’s sub-adviser is shown parenthetically.
(H) Non-income producing - Issuer is in default.
(I) Non-income producing security.
(L) All or a portion of the security is on loan as of November 30, 2012.
(M) Term loans are variable rate obligations. The coupon rate shown
represents the rate at period end.
(N) Strike price and/or expiration date not available.
(P) Variable rate obligation. Securities reset coupon rates periodically.
The coupon rate shown represents the rate at period end.
(Q) Perpetual bonds have no stated maturity date. Date shown as
maturity date is next call date.
(R) Direct placement securities are restricted to resale and the Fund has
limited rights to registration under the Securities Act of 1933. For
more information on this security refer to the Notes to Portfolio
of Investments.
(S) The securities are exempt from registration under Rule 144A of the
Securities Act of 1933. Such securities may be resold, normally to
qualified institutional buyers, in transactions exempt
from registration.
(T) This position represents an unsettled loan commitment at period
end. Certain details associated with this purchase are not known
prior to the settlement date, including coupon rate.
(V) The Fund owns 5% or more of the outstanding voting shares of the
issuer and the security is considered an affiliate of the Fund. For
more information on this security refer to the Notes to Portfolio
Copyright © 2013 www.secdatabase.com. All Rights Reserved.Please Consider the Environment Before Printing This Document

of Investments.
(W) Investment is an affiliate of the Portfolio, the adviser and/or
subadviser. This investment represents securities lending
collateral received.
(Y) The rate shown is the annualized seven-day yield as of
November 30, 2012.
(Z) Zero coupon bonds are issued at a discount from their principal
amount in lieu of paying interest periodically.
(1) Manulife Asset Management (US) LLC is doing business as John
Hancock Asset Management.
* Yield represents either the annualized yield at the date of purchase,
the stated coupon rate or, for floating rate securities, the rate at
period end.
248
Notes to Portfolios of Investments (Unaudited)Three Month Period Ended November 30, 2012
Security valuation. Investments are stated at value as of the close of regular trading on the New York Stock Exchange (NYSE), normally at 4:00 p.m., Eastern Time. In order to value the securities, the Fundsuse the following valuation techniques: Equity securities, including exchange-traded funds, held by the Funds are valued at the last sale price or official closing price on the principal securities exchange onwhich they trade. In the event there were no sales during the day or closing prices are not available, then the securities are valued using the last quoted bid or evaluated price. Investments by the Funds inopen-end mutual funds, including John Hancock Collateral Investment Trust, are valued at their respective net asset values each business day. Debt obligations are valued based on the evaluated pricesprovided by an independent pricing service, which utilizes both dealer-supplied and electronic data processing techniques, taking into account factors such as institutional-size trading in similar groups ofsecurities, yield, quality, coupon rate, maturity, type of issue, trading characteristics and other market data. Options listed on an exchange are valued at the mean between the last bid and ask prices fromthe exchange on which they are principally traded. For options not listed on an exchange, an independent pricing source is used to value the options at the mean between the last bid and ask prices.Futures contracts are valued at the quoted daily settlement prices established by the exchange on which they trade. Swaps are marked-to-market daily based upon values from third party vendors, whichmay include a registered commodities exchange, or broker quotations. Foreign securities and currencies, including forward foreign currency contracts, are valued in U.S. dollars, based on foreign currencyexchange rates supplied by an independent pricing service. Certain securities and forward foreign currency contracts traded only in the over-the-counter market are valued at the last bid price quoted bybrokers making markets in the securities at the close of trading. Certain short-term securities are valued at amortized cost.
Other portfolio securities and assets, where reliable market quotations are not available, are valued at fair value as determined in good faith by the Funds’ Pricing Committee following procedures establishedby the Board of Trustees, which include price verification procedures. The frequency with which these fair valuation procedures are used cannot be predicted. Generally, trading in non-U.S. securities issubstantially completed each day at various times prior to the close of trading on the NYSE. Significant market events that affect the values of non-U.S. securities may occur between the time when thevaluation of the securities is generally determined and the close of the NYSE. During significant market events, these securities will be valued at fair value, as determined in good faith, following proceduresestablished by the Board of Trustees. The Funds may use a fair valuation model to value non-U.S. securities in order to adjust for events which may occur between the close of foreign exchanges and the closeof the NYSE.
The Funds use a three-tier hierarchy to prioritize the pricing assumptions, referred to as inputs, used in valuation techniques to measure fair value. Level 1 includes securities valued using quoted prices inactive markets for identical securities. Level 2 includes securities valued using significant observable inputs. Observable inputs may include quoted prices for similar securities, interest rates, prepaymentspeeds and credit risk. Prices for securities valued using these inputs are received from independent pricing vendors and brokers and are based on an evaluation of the inputs described. Level 3 includessecurities valued using significant unobservable inputs when market prices are not readily available or reliable, including the Funds’ own assumptions in determining the fair value of investments. Factorsused in determining value may include market or issuer specific events or trends, changes in interest rates and credit quality. The inputs or methodology used for valuing securities are not necessarily anindication of the risks associated with investing in those securities. Changes in valuation techniques may result in transfers into or out of an assigned level within the disclosure hierarchy.
As of November 30, 2012, all investments for All Cap Core Fund, Core Diversified Growth & Income, Core Fundamental Holdings Portfolio, Core Global Diversification Portfolio and Small Company GrowthFund are categorized as Level 1 under the hierarchy described above.
All investments for All Cap Value Fund, Mid Cap Growth Index Fund, Mid Cap Value Index Fund, Real Estate Securities Fund, Redwood Fund, Small Cap Growth Fund and Small Cap Value Fund arecategorized as Level 1 under the hierarchy described above, except for repurchase agreements and/or short term discount notes which are categorized as Level 2.
All investments for Small Company Value Fund are categorized as Level 1 under the hierarchy described above except for preferred securities which are categorized as Level 2.
All investments for Emerging Markets Debt Fund are categorized as Level 2 under the hierarchy described above.
All investments for Short Term Government Income Fund are categorized as Level 2 under the hierarchy described above, except for futures, which are categorized as Level 1.
The following is a summary of the values by input classification of the Funds’ investments as of November 30, 2012, by major security category or type:
Total Market Value at 11-30-12 Level 1 Quoted Price Level 2 SignificantObservable Inputs
Level 3 SignificantUnobservable Inputs
Active Bond FundU.S. Government & Agency Obligations $523,010,051 - $523,010,051 -Foreign Government Obligations 1,382,721 - 1,382,721 -Corporate Bonds 698,642,413 - 697,241,001 $1,401,412Capital Preferred Securities 16,949,895 - 16,949,895 -Convertible Bonds 1,030,190 - 1,030,190 -Term Loans 4,549,670 - 4,549,670 -Municipal Bonds 3,592,094 - 3,592,094 -Collateralized Mortgage Obligations 340,234,857 - 338,936,488 1,298,369Asset Backed Securities 54,394,931 - 54,394,931 -Common Stocks 8,853 - 20 8,833Preferred Securities 10,901,503 $9,704,971 954,969 241,563Escrow Certificates 253,400 - 253,400 -Securities Lending Collateral 3,286,686 3,286,686 - -Short-Term Investments 143,402,501 128,291,501 15,111,000 -Total Investments in Securities $1,801,639,765 $141,283,158 $1,657,406,430 $2,950,177Other Financial Instruments:Futures $17,280 $17,280 - -
Alpha Opportunities FundCommon StocksConsumer Discretionary $224,951,556 $214,747,309 $10,204,247 -Consumer Staples 51,719,748 44,916,619 6,803,129 -Energy 129,364,231 114,738,523 14,625,708 -Financials 164,322,799 147,700,964 16,621,835 -Health Care 179,761,065 160,327,808 19,433,257 -Industrials 148,279,917 135,453,202 12,826,715 -Information Technology 180,834,063 176,722,938 4,111,125 -Materials 72,505,132 66,634,245 5,870,887 -
Copyright © 2013 www.secdatabase.com. All Rights Reserved.Please Consider the Environment Before Printing This Document
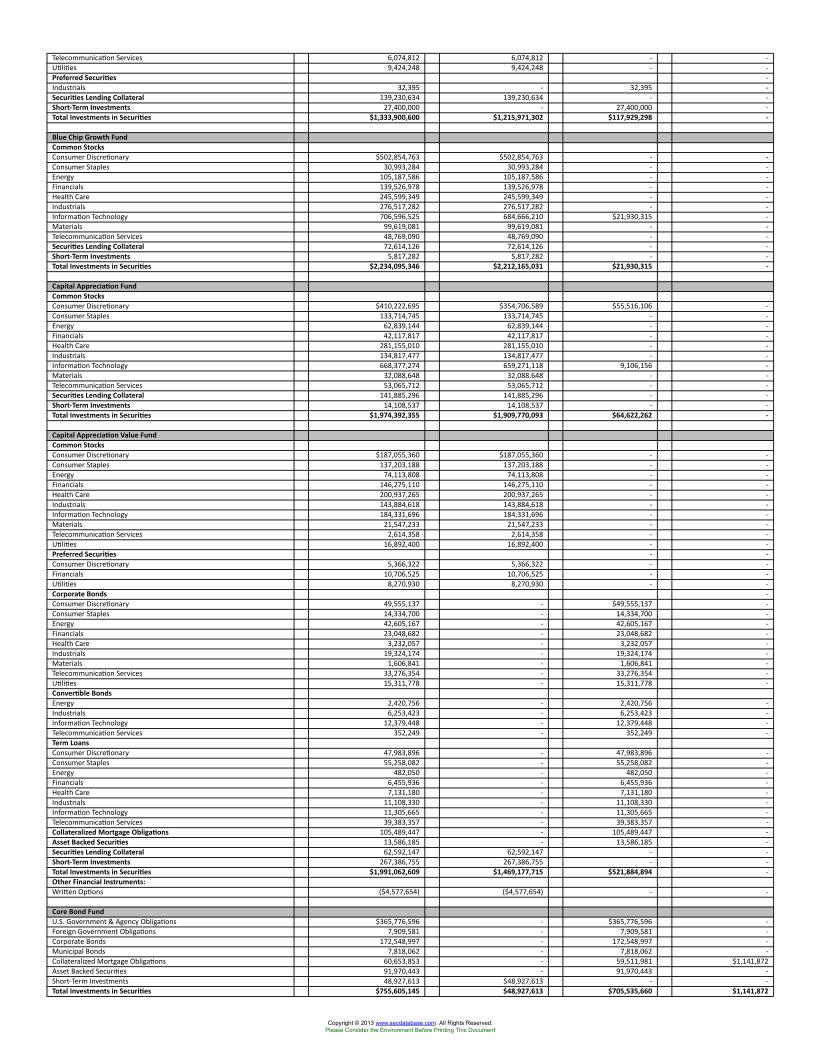
Telecommunication Services 6,074,812 6,074,812 - -Utilities 9,424,248 9,424,248 - -Preferred Securities -Industrials 32,395 - 32,395 -Securities Lending Collateral 139,230,634 139,230,634 - -Short-Term Investments 27,400,000 - 27,400,000 -Total Investments in Securities $1,333,900,600 $1,215,971,302 $117,929,298 -
Blue Chip Growth FundCommon StocksConsumer Discretionary $502,854,763 $502,854,763 - -Consumer Staples 30,993,284 30,993,284 - -Energy 105,187,586 105,187,586 - -Financials 139,526,978 139,526,978 - -Health Care 245,599,349 245,599,349 - -Industrials 276,517,282 276,517,282 - -Information Technology 706,596,525 684,666,210 $21,930,315 -Materials 99,619,081 99,619,081 - -Telecommunication Services 48,769,090 48,769,090 - -Securities Lending Collateral 72,614,126 72,614,126 - -Short-Term Investments 5,817,282 5,817,282 - -Total Investments in Securities $2,234,095,346 $2,212,165,031 $21,930,315 -
Capital Appreciation FundCommon StocksConsumer Discretionary $410,222,695 $354,706,589 $55,516,106 -Consumer Staples 133,714,745 133,714,745 - -Energy 62,839,144 62,839,144 - -Financials 42,117,817 42,117,817 - -Health Care 281,155,010 281,155,010 - -Industrials 134,817,477 134,817,477 - -Information Technology 668,377,274 659,271,118 9,106,156 -Materials 32,088,648 32,088,648 - -Telecommunication Services 53,065,712 53,065,712 - -Securities Lending Collateral 141,885,296 141,885,296 - -Short-Term Investments 14,108,537 14,108,537 - -Total Investments in Securities $1,974,392,355 $1,909,770,093 $64,622,262 -
Capital Appreciation Value FundCommon StocksConsumer Discretionary $187,055,360 $187,055,360 - -Consumer Staples 137,203,188 137,203,188 - -Energy 74,113,808 74,113,808 - -Financials 146,275,110 146,275,110 - -Health Care 200,937,265 200,937,265 - -Industrials 143,884,618 143,884,618 - -Information Technology 184,331,696 184,331,696 - -Materials 21,547,233 21,547,233 - -Telecommunication Services 2,614,358 2,614,358 - -Utilities 16,892,400 16,892,400 - -Preferred Securities - -Consumer Discretionary 5,366,322 5,366,322 - -Financials 10,706,525 10,706,525 - -Utilities 8,270,930 8,270,930 - -Corporate Bonds -Consumer Discretionary 49,555,137 - $49,555,137 -Consumer Staples 14,334,700 - 14,334,700 -Energy 42,605,167 - 42,605,167 -Financials 23,048,682 - 23,048,682 -Health Care 3,232,057 - 3,232,057 -Industrials 19,324,174 - 19,324,174 -Materials 1,606,841 - 1,606,841 -Telecommunication Services 33,276,354 - 33,276,354 -Utilities 15,311,778 - 15,311,778 -Convertible BondsEnergy 2,420,756 - 2,420,756 -Industrials 6,253,423 - 6,253,423 -Information Technology 12,379,448 - 12,379,448 -Telecommunication Services 352,249 - 352,249 -Term LoansConsumer Discretionary 47,983,896 - 47,983,896 -Consumer Staples 55,258,082 - 55,258,082 -Energy 482,050 - 482,050 -Financials 6,455,936 - 6,455,936 -Health Care 7,131,180 - 7,131,180 -Industrials 11,108,330 - 11,108,330 -Information Technology 11,305,665 - 11,305,665 -Telecommunication Services 39,383,357 - 39,383,357 -Collateralized Mortgage Obligations 105,489,447 - 105,489,447 -Asset Backed Securities 13,586,185 - 13,586,185 -Securities Lending Collateral 62,592,147 62,592,147 - -Short-Term Investments 267,386,755 267,386,755 - -Total Investments in Securities $1,991,062,609 $1,469,177,715 $521,884,894 -Other Financial Instruments:Written Options ($4,577,654) ($4,577,654) - -
Core Bond FundU.S. Government & Agency Obligations $365,776,596 - $365,776,596 -Foreign Government Obligations 7,909,581 - 7,909,581 -Corporate Bonds 172,548,997 - 172,548,997 -Municipal Bonds 7,818,062 - 7,818,062 -Collateralized Mortgage Obligations 60,653,853 - 59,511,981 $1,141,872Asset Backed Securities 91,970,443 - 91,970,443 -Short-Term Investments 48,927,613 $48,927,613 - -Total Investments in Securities $755,605,145 $48,927,613 $705,535,660 $1,141,872
Copyright © 2013 www.secdatabase.com. All Rights Reserved.Please Consider the Environment Before Printing This Document
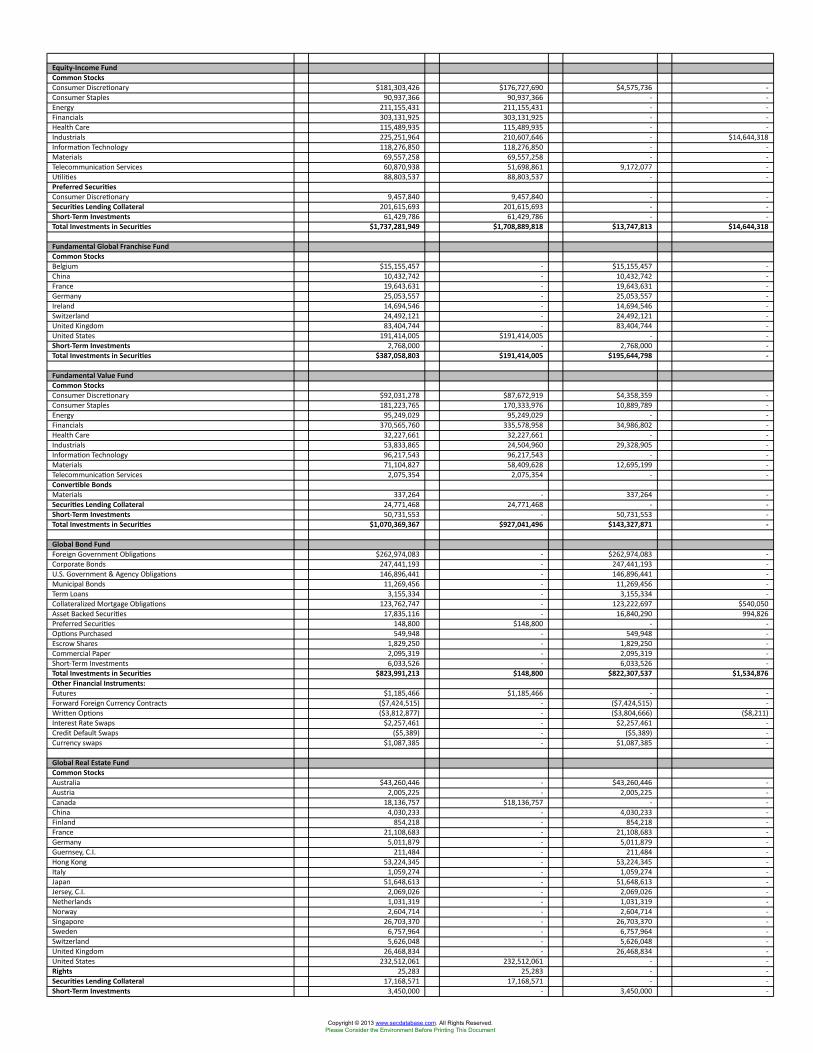
Equity-Income FundCommon StocksConsumer Discretionary $181,303,426 $176,727,690 $4,575,736 -Consumer Staples 90,937,366 90,937,366 - -Energy 211,155,431 211,155,431 - -Financials 303,131,925 303,131,925 - -Health Care 115,489,935 115,489,935 - -Industrials 225,251,964 210,607,646 - $14,644,318Information Technology 118,276,850 118,276,850 - -Materials 69,557,258 69,557,258 - -Telecommunication Services 60,870,938 51,698,861 9,172,077 -Utilities 88,803,537 88,803,537 - -Preferred SecuritiesConsumer Discretionary 9,457,840 9,457,840 - -Securities Lending Collateral 201,615,693 201,615,693 - -Short-Term Investments 61,429,786 61,429,786 - -Total Investments in Securities $1,737,281,949 $1,708,889,818 $13,747,813 $14,644,318
Fundamental Global Franchise FundCommon StocksBelgium $15,155,457 - $15,155,457 -China 10,432,742 - 10,432,742 -France 19,643,631 - 19,643,631 -Germany 25,053,557 - 25,053,557 -Ireland 14,694,546 - 14,694,546 -Switzerland 24,492,121 - 24,492,121 -United Kingdom 83,404,744 - 83,404,744 -United States 191,414,005 $191,414,005 - -Short-Term Investments 2,768,000 - 2,768,000 -Total Investments in Securities $387,058,803 $191,414,005 $195,644,798 -
Fundamental Value FundCommon StocksConsumer Discretionary $92,031,278 $87,672,919 $4,358,359 -Consumer Staples 181,223,765 170,333,976 10,889,789 -Energy 95,249,029 95,249,029 - -Financials 370,565,760 335,578,958 34,986,802 -Health Care 32,227,661 32,227,661 - -Industrials 53,833,865 24,504,960 29,328,905 -Information Technology 96,217,543 96,217,543 - -Materials 71,104,827 58,409,628 12,695,199 -Telecommunication Services 2,075,354 2,075,354 - -Convertible BondsMaterials 337,264 - 337,264 -Securities Lending Collateral 24,771,468 24,771,468 - -Short-Term Investments 50,731,553 - 50,731,553 -Total Investments in Securities $1,070,369,367 $927,041,496 $143,327,871 -
Global Bond FundForeign Government Obligations $262,974,083 - $262,974,083 -Corporate Bonds 247,441,193 - 247,441,193 -U.S. Government & Agency Obligations 146,896,441 - 146,896,441 -Municipal Bonds 11,269,456 - 11,269,456 -Term Loans 3,155,334 - 3,155,334 -Collateralized Mortgage Obligations 123,762,747 - 123,222,697 $540,050Asset Backed Securities 17,835,116 - 16,840,290 994,826Preferred Securities 148,800 $148,800 - -Options Purchased 549,948 - 549,948 -Escrow Shares 1,829,250 - 1,829,250 -Commercial Paper 2,095,319 - 2,095,319 -Short-Term Investments 6,033,526 - 6,033,526 -Total Investments in Securities $823,991,213 $148,800 $822,307,537 $1,534,876Other Financial Instruments:Futures $1,185,466 $1,185,466 - -Forward Foreign Currency Contracts ($7,424,515) - ($7,424,515) -Written Options ($3,812,877) - ($3,804,666) ($8,211)Interest Rate Swaps $2,257,461 - $2,257,461 -Credit Default Swaps ($5,389) - ($5,389) -Currency swaps $1,087,385 - $1,087,385 -
Global Real Estate FundCommon StocksAustralia $43,260,446 - $43,260,446 -Austria 2,005,225 - 2,005,225 -Canada 18,136,757 $18,136,757 - -China 4,030,233 - 4,030,233 -Finland 854,218 - 854,218 -France 21,108,683 - 21,108,683 -Germany 5,011,879 - 5,011,879 -Guernsey, C.I. 211,484 - 211,484 -Hong Kong 53,224,345 - 53,224,345 -Italy 1,059,274 - 1,059,274 -Japan 51,648,613 - 51,648,613 -Jersey, C.I. 2,069,026 - 2,069,026 -Netherlands 1,031,319 - 1,031,319 -Norway 2,604,714 - 2,604,714 -Singapore 26,703,370 - 26,703,370 -Sweden 6,757,964 - 6,757,964 -Switzerland 5,626,048 - 5,626,048 -United Kingdom 26,468,834 - 26,468,834 -United States 232,512,061 232,512,061 - -Rights 25,283 25,283 - -Securities Lending Collateral 17,168,571 17,168,571 - -Short-Term Investments 3,450,000 - 3,450,000 -
Copyright © 2013 www.secdatabase.com. All Rights Reserved.Please Consider the Environment Before Printing This Document
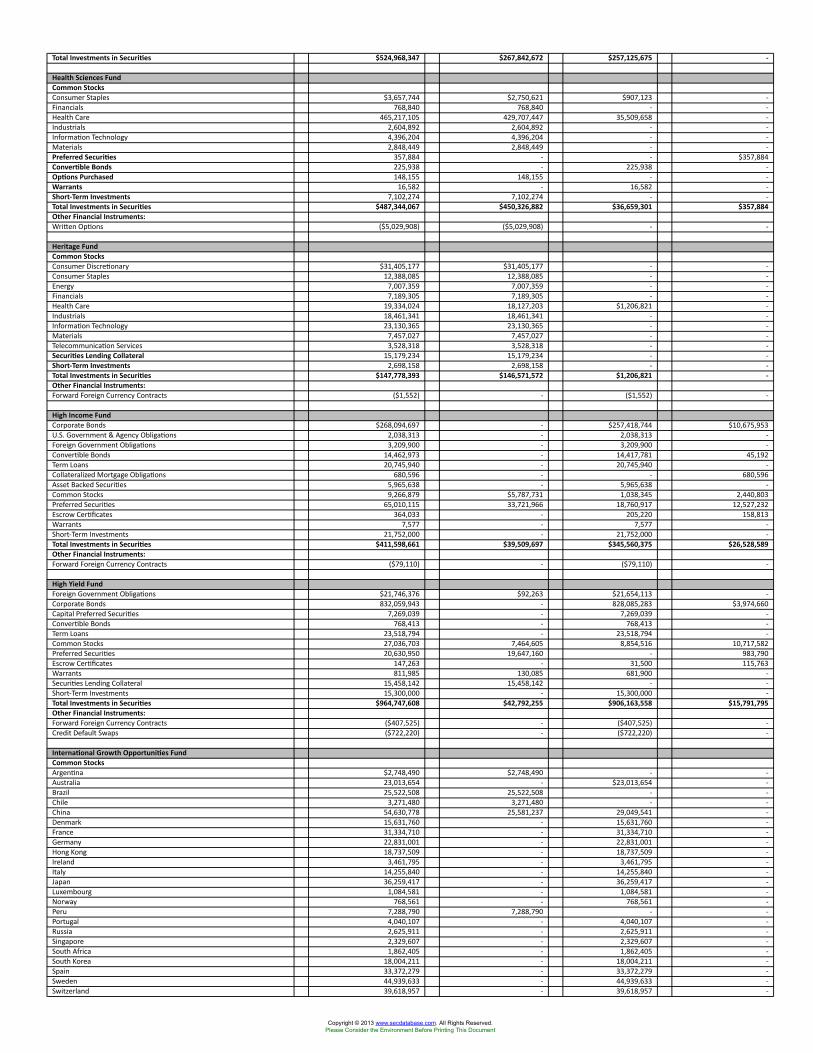
Total Investments in Securities $524,968,347 $267,842,672 $257,125,675 -
Health Sciences FundCommon StocksConsumer Staples $3,657,744 $2,750,621 $907,123 -Financials 768,840 768,840 - -Health Care 465,217,105 429,707,447 35,509,658 -Industrials 2,604,892 2,604,892 - -Information Technology 4,396,204 4,396,204 - -Materials 2,848,449 2,848,449 - -Preferred Securities 357,884 - - $357,884Convertible Bonds 225,938 - 225,938 -Options Purchased 148,155 148,155 - -Warrants 16,582 - 16,582 -Short-Term Investments 7,102,274 7,102,274 - -Total Investments in Securities $487,344,067 $450,326,882 $36,659,301 $357,884Other Financial Instruments:Written Options ($5,029,908) ($5,029,908) - -
Heritage FundCommon StocksConsumer Discretionary $31,405,177 $31,405,177 - -Consumer Staples 12,388,085 12,388,085 - -Energy 7,007,359 7,007,359 - -Financials 7,189,305 7,189,305 - -Health Care 19,334,024 18,127,203 $1,206,821 -Industrials 18,461,341 18,461,341 - -Information Technology 23,130,365 23,130,365 - -Materials 7,457,027 7,457,027 - -Telecommunication Services 3,528,318 3,528,318 - -Securities Lending Collateral 15,179,234 15,179,234 - -Short-Term Investments 2,698,158 2,698,158 - -Total Investments in Securities $147,778,393 $146,571,572 $1,206,821 -Other Financial Instruments:Forward Foreign Currency Contracts ($1,552) - ($1,552) -
High Income FundCorporate Bonds $268,094,697 - $257,418,744 $10,675,953U.S. Government & Agency Obligations 2,038,313 - 2,038,313 -Foreign Government Obligations 3,209,900 - 3,209,900 -Convertible Bonds 14,462,973 - 14,417,781 45,192Term Loans 20,745,940 - 20,745,940 -Collateralized Mortgage Obligations 680,596 - - 680,596Asset Backed Securities 5,965,638 - 5,965,638 -Common Stocks 9,266,879 $5,787,731 1,038,345 2,440,803Preferred Securities 65,010,115 33,721,966 18,760,917 12,527,232Escrow Certificates 364,033 - 205,220 158,813Warrants 7,577 - 7,577 -Short-Term Investments 21,752,000 - 21,752,000 -Total Investments in Securities $411,598,661 $39,509,697 $345,560,375 $26,528,589Other Financial Instruments:Forward Foreign Currency Contracts ($79,110) - ($79,110) -
High Yield FundForeign Government Obligations $21,746,376 $92,263 $21,654,113 -Corporate Bonds 832,059,943 - 828,085,283 $3,974,660Capital Preferred Securities 7,269,039 - 7,269,039 -Convertible Bonds 768,413 - 768,413 -Term Loans 23,518,794 - 23,518,794 -Common Stocks 27,036,703 7,464,605 8,854,516 10,717,582Preferred Securities 20,630,950 19,647,160 - 983,790Escrow Certificates 147,263 - 31,500 115,763Warrants 811,985 130,085 681,900 -Securities Lending Collateral 15,458,142 15,458,142 - -Short-Term Investments 15,300,000 - 15,300,000 -Total Investments in Securities $964,747,608 $42,792,255 $906,163,558 $15,791,795Other Financial Instruments:Forward Foreign Currency Contracts ($407,525) - ($407,525) -Credit Default Swaps ($722,220) - ($722,220) -
International Growth Opportunities FundCommon StocksArgentina $2,748,490 $2,748,490 - -Australia 23,013,654 - $23,013,654 -Brazil 25,522,508 25,522,508 - -Chile 3,271,480 3,271,480 - -China 54,630,778 25,581,237 29,049,541 -Denmark 15,631,760 - 15,631,760 -France 31,334,710 - 31,334,710 -Germany 22,831,001 - 22,831,001 -Hong Kong 18,737,509 - 18,737,509 -Ireland 3,461,795 - 3,461,795 -Italy 14,255,840 - 14,255,840 -Japan 36,259,417 - 36,259,417 -Luxembourg 1,084,581 - 1,084,581 -Norway 768,561 - 768,561 -Peru 7,288,790 7,288,790 - -Portugal 4,040,107 - 4,040,107 -Russia 2,625,911 - 2,625,911 -Singapore 2,329,607 - 2,329,607 -South Africa 1,862,405 - 1,862,405 -South Korea 18,004,211 - 18,004,211 -Spain 33,372,279 - 33,372,279 -Sweden 44,939,633 - 44,939,633 -Switzerland 39,618,957 - 39,618,957 -
Copyright © 2013 www.secdatabase.com. All Rights Reserved.Please Consider the Environment Before Printing This Document
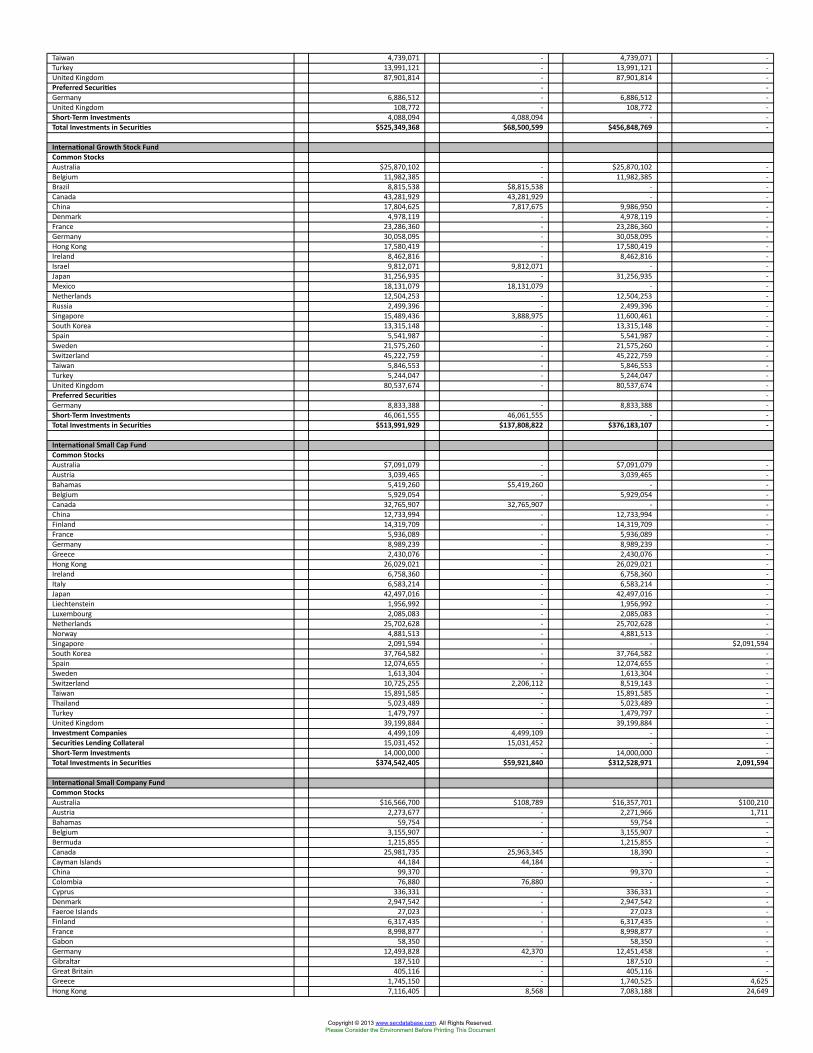
Taiwan 4,739,071 - 4,739,071 -Turkey 13,991,121 - 13,991,121 -United Kingdom 87,901,814 - 87,901,814 -Preferred Securities - -Germany 6,886,512 - 6,886,512 -United Kingdom 108,772 - 108,772 -Short-Term Investments 4,088,094 4,088,094 - -Total Investments in Securities $525,349,368 $68,500,599 $456,848,769 -
International Growth Stock FundCommon StocksAustralia $25,870,102 - $25,870,102 -Belgium 11,982,385 - 11,982,385 -Brazil 8,815,538 $8,815,538 - -Canada 43,281,929 43,281,929 - -China 17,804,625 7,817,675 9,986,950 -Denmark 4,978,119 - 4,978,119 -France 23,286,360 - 23,286,360 -Germany 30,058,095 - 30,058,095 -Hong Kong 17,580,419 - 17,580,419 -Ireland 8,462,816 - 8,462,816 -Israel 9,812,071 9,812,071 - -Japan 31,256,935 - 31,256,935 -Mexico 18,131,079 18,131,079 - -Netherlands 12,504,253 - 12,504,253 -Russia 2,499,396 - 2,499,396 -Singapore 15,489,436 3,888,975 11,600,461 -South Korea 13,315,148 - 13,315,148 -Spain 5,541,987 - 5,541,987 -Sweden 21,575,260 - 21,575,260 -Switzerland 45,222,759 - 45,222,759 -Taiwan 5,846,553 - 5,846,553 -Turkey 5,244,047 - 5,244,047 -United Kingdom 80,537,674 - 80,537,674 -Preferred Securities -Germany 8,833,388 - 8,833,388 -Short-Term Investments 46,061,555 46,061,555 - -Total Investments in Securities $513,991,929 $137,808,822 $376,183,107 -
International Small Cap FundCommon StocksAustralia $7,091,079 - $7,091,079 -Austria 3,039,465 - 3,039,465 -Bahamas 5,419,260 $5,419,260 - -Belgium 5,929,054 - 5,929,054 -Canada 32,765,907 32,765,907 - -China 12,733,994 - 12,733,994 -Finland 14,319,709 - 14,319,709 -France 5,936,089 - 5,936,089 -Germany 8,989,239 - 8,989,239 -Greece 2,430,076 - 2,430,076 -Hong Kong 26,029,021 - 26,029,021 -Ireland 6,758,360 - 6,758,360 -Italy 6,583,214 - 6,583,214 -Japan 42,497,016 - 42,497,016 -Liechtenstein 1,956,992 - 1,956,992 -Luxembourg 2,085,083 - 2,085,083 -Netherlands 25,702,628 - 25,702,628 -Norway 4,881,513 - 4,881,513 -Singapore 2,091,594 - - $2,091,594South Korea 37,764,582 - 37,764,582 -Spain 12,074,655 - 12,074,655 -Sweden 1,613,304 - 1,613,304 -Switzerland 10,725,255 2,206,112 8,519,143 -Taiwan 15,891,585 - 15,891,585 -Thailand 5,023,489 - 5,023,489 -Turkey 1,479,797 - 1,479,797 -United Kingdom 39,199,884 - 39,199,884 -Investment Companies 4,499,109 4,499,109 - -Securities Lending Collateral 15,031,452 15,031,452 - -Short-Term Investments 14,000,000 - 14,000,000 -Total Investments in Securities $374,542,405 $59,921,840 $312,528,971 2,091,594
International Small Company FundCommon StocksAustralia $16,566,700 $108,789 $16,357,701 $100,210Austria 2,273,677 - 2,271,966 1,711Bahamas 59,754 - 59,754 -Belgium 3,155,907 - 3,155,907 -Bermuda 1,215,855 - 1,215,855 -Canada 25,981,735 25,963,345 18,390 -Cayman Islands 44,184 44,184 - -China 99,370 - 99,370 -Colombia 76,880 76,880 - -Cyprus 336,331 - 336,331 -Denmark 2,947,542 - 2,947,542 -Faeroe Islands 27,023 - 27,023 -Finland 6,317,435 - 6,317,435 -France 8,998,877 - 8,998,877 -Gabon 58,350 - 58,350 -Germany 12,493,828 42,370 12,451,458 -Gibraltar 187,510 - 187,510 -Great Britain 405,116 - 405,116 -Greece 1,745,150 - 1,740,525 4,625Hong Kong 7,116,405 8,568 7,083,188 24,649
Copyright © 2013 www.secdatabase.com. All Rights Reserved.Please Consider the Environment Before Printing This Document
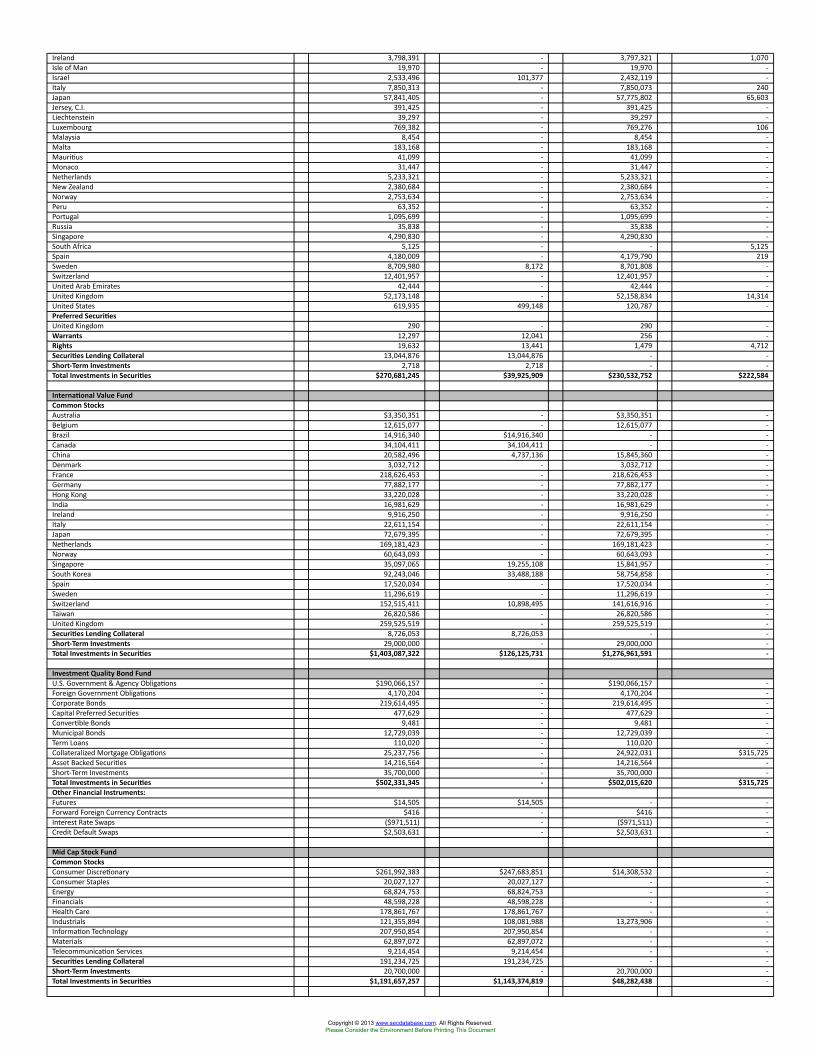
Ireland 3,798,391 - 3,797,321 1,070Isle of Man 19,970 - 19,970 -Israel 2,533,496 101,377 2,432,119 -Italy 7,850,313 - 7,850,073 240Japan 57,841,405 - 57,775,802 65,603Jersey, C.I. 391,425 - 391,425 -Liechtenstein 39,297 - 39,297 -Luxembourg 769,382 - 769,276 106Malaysia 8,454 - 8,454 -Malta 183,168 - 183,168 -Mauritius 41,099 - 41,099 -Monaco 31,447 - 31,447 -Netherlands 5,233,321 - 5,233,321 -New Zealand 2,380,684 - 2,380,684 -Norway 2,753,634 - 2,753,634 -Peru 63,352 - 63,352 -Portugal 1,095,699 - 1,095,699 -Russia 35,838 - 35,838 -Singapore 4,290,830 - 4,290,830 -South Africa 5,125 - - 5,125Spain 4,180,009 - 4,179,790 219Sweden 8,709,980 8,172 8,701,808 -Switzerland 12,401,957 - 12,401,957 -United Arab Emirates 42,444 - 42,444 -United Kingdom 52,173,148 - 52,158,834 14,314United States 619,935 499,148 120,787 -Preferred SecuritiesUnited Kingdom 290 - 290 -Warrants 12,297 12,041 256 -Rights 19,632 13,441 1,479 4,712Securities Lending Collateral 13,044,876 13,044,876 - -Short-Term Investments 2,718 2,718 - -Total Investments in Securities $270,681,245 $39,925,909 $230,532,752 $222,584
International Value FundCommon StocksAustralia $3,350,351 - $3,350,351 -Belgium 12,615,077 - 12,615,077 -Brazil 14,916,340 $14,916,340 - -Canada 34,104,411 34,104,411 - -China 20,582,496 4,737,136 15,845,360 -Denmark 3,032,712 - 3,032,712 -France 218,626,453 - 218,626,453 -Germany 77,882,177 - 77,882,177 -Hong Kong 33,220,028 - 33,220,028 -India 16,981,629 - 16,981,629 -Ireland 9,916,250 - 9,916,250 -Italy 22,611,154 - 22,611,154 -Japan 72,679,395 - 72,679,395 -Netherlands 169,181,423 - 169,181,423 -Norway 60,643,093 - 60,643,093 -Singapore 35,097,065 19,255,108 15,841,957 -South Korea 92,243,046 33,488,188 58,754,858 -Spain 17,520,034 - 17,520,034 -Sweden 11,296,619 - 11,296,619 -Switzerland 152,515,411 10,898,495 141,616,916 -Taiwan 26,820,586 - 26,820,586 -United Kingdom 259,525,519 - 259,525,519 -Securities Lending Collateral 8,726,053 8,726,053 - -Short-Term Investments 29,000,000 - 29,000,000 -Total Investments in Securities $1,403,087,322 $126,125,731 $1,276,961,591 -
Investment Quality Bond FundU.S. Government & Agency Obligations $190,066,157 - $190,066,157 -Foreign Government Obligations 4,170,204 - 4,170,204 -Corporate Bonds 219,614,495 - 219,614,495 -Capital Preferred Securities 477,629 - 477,629 -Convertible Bonds 9,481 - 9,481 -Municipal Bonds 12,729,039 - 12,729,039 -Term Loans 110,020 - 110,020 -Collateralized Mortgage Obligations 25,237,756 - 24,922,031 $315,725Asset Backed Securities 14,216,564 - 14,216,564 -Short-Term Investments 35,700,000 - 35,700,000 -Total Investments in Securities $502,331,345 - $502,015,620 $315,725Other Financial Instruments:Futures $14,505 $14,505 - -Forward Foreign Currency Contracts $416 - $416 -Interest Rate Swaps ($971,511) - ($971,511) -Credit Default Swaps $2,503,631 - $2,503,631 -
Mid Cap Stock FundCommon StocksConsumer Discretionary $261,992,383 $247,683,851 $14,308,532 -Consumer Staples 20,027,127 20,027,127 - -Energy 68,824,753 68,824,753 - -Financials 48,598,228 48,598,228 - -Health Care 178,861,767 178,861,767 - -Industrials 121,355,894 108,081,988 13,273,906 -Information Technology 207,950,854 207,950,854 - -Materials 62,897,072 62,897,072 - -Telecommunication Services 9,214,454 9,214,454 - -Securities Lending Collateral 191,234,725 191,234,725 - -Short-Term Investments 20,700,000 - 20,700,000 -Total Investments in Securities $1,191,657,257 $1,143,374,819 $48,282,438 -
Copyright © 2013 www.secdatabase.com. All Rights Reserved.Please Consider the Environment Before Printing This Document
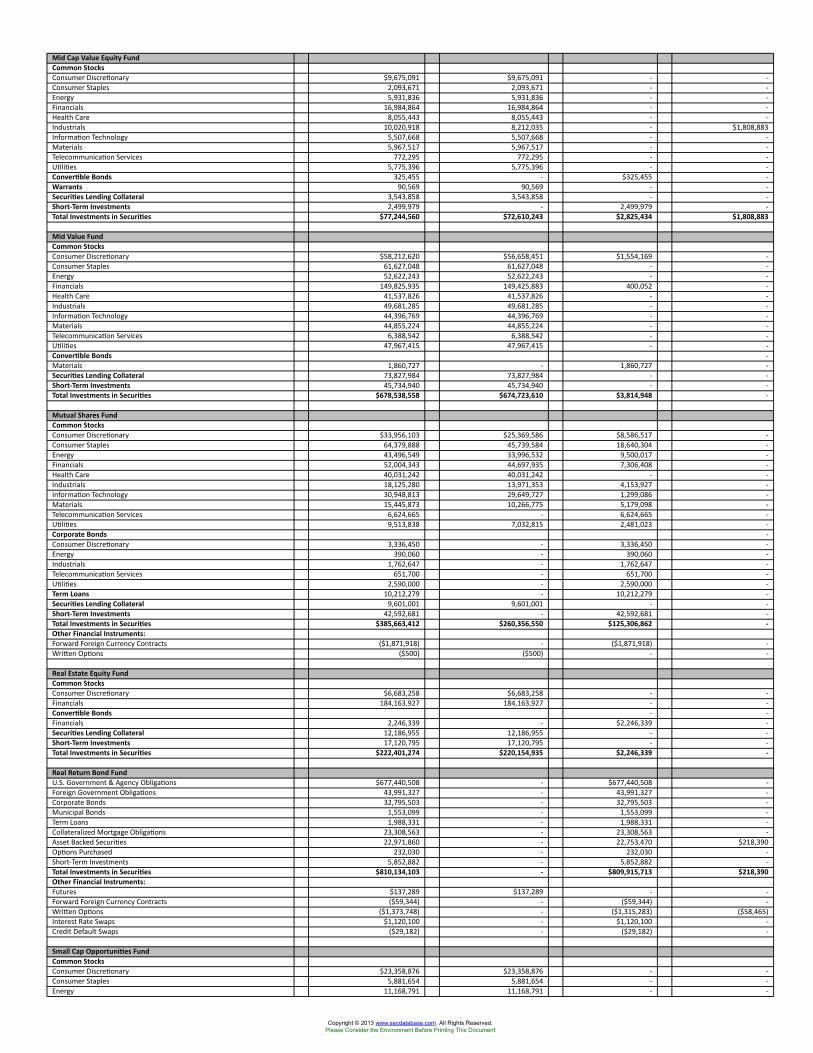
Mid Cap Value Equity FundCommon StocksConsumer Discretionary $9,675,091 $9,675,091 - -Consumer Staples 2,093,671 2,093,671 - -Energy 5,931,836 5,931,836 - -Financials 16,984,864 16,984,864 - -Health Care 8,055,443 8,055,443 - -Industrials 10,020,918 8,212,035 - $1,808,883Information Technology 5,507,668 5,507,668 - -Materials 5,967,517 5,967,517 - -Telecommunication Services 772,295 772,295 - -Utilities 5,775,396 5,775,396 - -Convertible Bonds 325,455 - $325,455 -Warrants 90,569 90,569 - -Securities Lending Collateral 3,543,858 3,543,858 - -Short-Term Investments 2,499,979 - 2,499,979 -Total Investments in Securities $77,244,560 $72,610,243 $2,825,434 $1,808,883
Mid Value FundCommon StocksConsumer Discretionary $58,212,620 $56,658,451 $1,554,169 -Consumer Staples 61,627,048 61,627,048 - -Energy 52,622,243 52,622,243 - -Financials 149,825,935 149,425,883 400,052 -Health Care 41,537,826 41,537,826 - -Industrials 49,681,285 49,681,285 - -Information Technology 44,396,769 44,396,769 - -Materials 44,855,224 44,855,224 - -Telecommunication Services 6,388,542 6,388,542 - -Utilities 47,967,415 47,967,415 - -Convertible Bonds -Materials 1,860,727 - 1,860,727 -Securities Lending Collateral 73,827,984 73,827,984 - -Short-Term Investments 45,734,940 45,734,940 - -Total Investments in Securities $678,538,558 $674,723,610 $3,814,948 -
Mutual Shares FundCommon StocksConsumer Discretionary $33,956,103 $25,369,586 $8,586,517 -Consumer Staples 64,379,888 45,739,584 18,640,304 -Energy 43,496,549 33,996,532 9,500,017 -Financials 52,004,343 44,697,935 7,306,408 -Health Care 40,031,242 40,031,242 - -Industrials 18,125,280 13,971,353 4,153,927 -Information Technology 30,948,813 29,649,727 1,299,086 -Materials 15,445,873 10,266,775 5,179,098 -Telecommunication Services 6,624,665 - 6,624,665 -Utilities 9,513,838 7,032,815 2,481,023 -Corporate Bonds -Consumer Discretionary 3,336,450 - 3,336,450 -Energy 390,060 - 390,060 -Industrials 1,762,647 - 1,762,647 -Telecommunication Services 651,700 - 651,700 -Utilities 2,590,000 - 2,590,000 -Term Loans 10,212,279 - 10,212,279 -Securities Lending Collateral 9,601,001 9,601,001 - -Short-Term Investments 42,592,681 - 42,592,681 -Total Investments in Securities $385,663,412 $260,356,550 $125,306,862 -Other Financial Instruments:Forward Foreign Currency Contracts ($1,871,918) - ($1,871,918) -Written Options ($500) ($500) - -
Real Estate Equity FundCommon StocksConsumer Discretionary $6,683,258 $6,683,258 - -Financials 184,163,927 184,163,927 - -Convertible Bonds - -Financials 2,246,339 - $2,246,339 -Securities Lending Collateral 12,186,955 12,186,955 - -Short-Term Investments 17,120,795 17,120,795 - -Total Investments in Securities $222,401,274 $220,154,935 $2,246,339 -
Real Return Bond FundU.S. Government & Agency Obligations $677,440,508 - $677,440,508 -Foreign Government Obligations 43,991,327 - 43,991,327 -Corporate Bonds 32,795,503 - 32,795,503 -Municipal Bonds 1,553,099 - 1,553,099 -Term Loans 1,988,331 - 1,988,331 -Collateralized Mortgage Obligations 23,308,563 - 23,308,563 -Asset Backed Securities 22,971,860 - 22,753,470 $218,390Options Purchased 232,030 - 232,030 -Short-Term Investments 5,852,882 - 5,852,882 -Total Investments in Securities $810,134,103 - $809,915,713 $218,390Other Financial Instruments:Futures $137,289 $137,289 - -Forward Foreign Currency Contracts ($59,344) - ($59,344) -Written Options ($1,373,748) - ($1,315,283) ($58,465)Interest Rate Swaps $1,120,100 - $1,120,100 -Credit Default Swaps ($29,182) - ($29,182) -
Small Cap Opportunities FundCommon StocksConsumer Discretionary $23,358,876 $23,358,876 - -Consumer Staples 5,881,654 5,881,654 - -Energy 11,168,791 11,168,791 - -
Copyright © 2013 www.secdatabase.com. All Rights Reserved.Please Consider the Environment Before Printing This Document
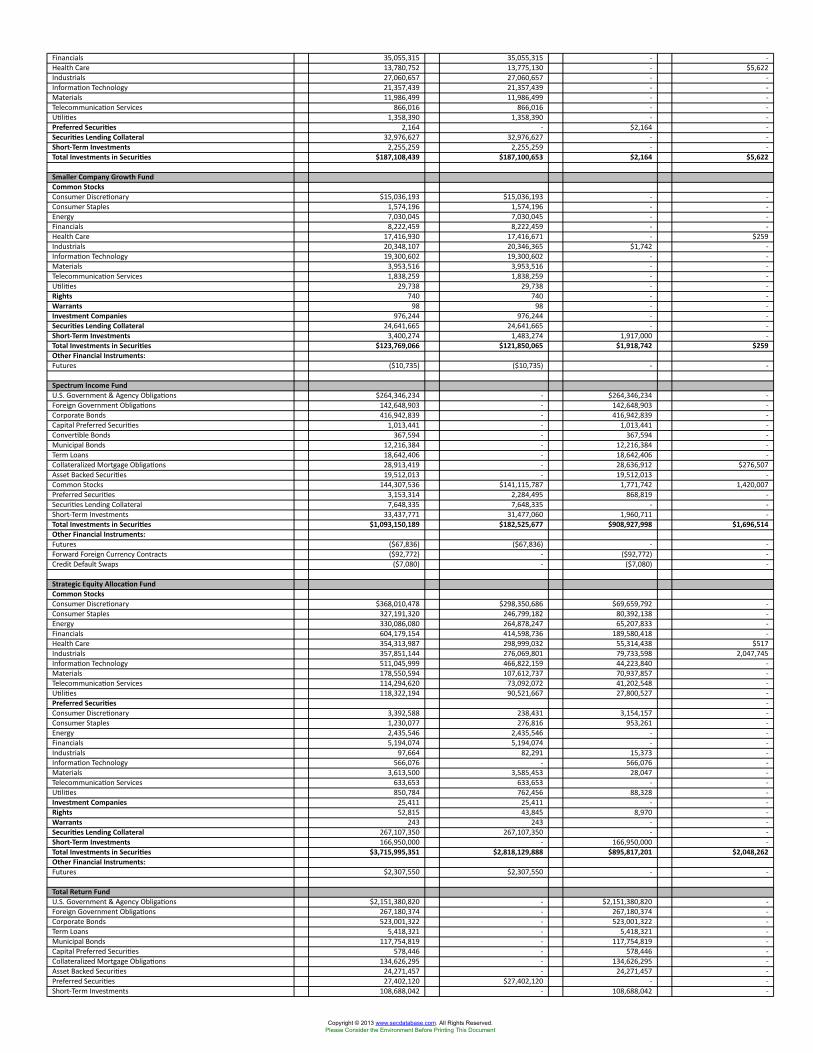
Financials 35,055,315 35,055,315 - -Health Care 13,780,752 13,775,130 - $5,622Industrials 27,060,657 27,060,657 - -Information Technology 21,357,439 21,357,439 - -Materials 11,986,499 11,986,499 - -Telecommunication Services 866,016 866,016 - -Utilities 1,358,390 1,358,390 - -Preferred Securities 2,164 - $2,164 -Securities Lending Collateral 32,976,627 32,976,627 - -Short-Term Investments 2,255,259 2,255,259 - -Total Investments in Securities $187,108,439 $187,100,653 $2,164 $5,622
Smaller Company Growth FundCommon StocksConsumer Discretionary $15,036,193 $15,036,193 - -Consumer Staples 1,574,196 1,574,196 - -Energy 7,030,045 7,030,045 - -Financials 8,222,459 8,222,459 - -Health Care 17,416,930 17,416,671 - $259Industrials 20,348,107 20,346,365 $1,742 -Information Technology 19,300,602 19,300,602 - -Materials 3,953,516 3,953,516 - -Telecommunication Services 1,838,259 1,838,259 - -Utilities 29,738 29,738 - -Rights 740 740 - -Warrants 98 98 - -Investment Companies 976,244 976,244 - -Securities Lending Collateral 24,641,665 24,641,665 - -Short-Term Investments 3,400,274 1,483,274 1,917,000 -Total Investments in Securities $123,769,066 $121,850,065 $1,918,742 $259Other Financial Instruments:Futures ($10,735) ($10,735) - -
Spectrum Income FundU.S. Government & Agency Obligations $264,346,234 - $264,346,234 -Foreign Government Obligations 142,648,903 - 142,648,903 -Corporate Bonds 416,942,839 - 416,942,839 -Capital Preferred Securities 1,013,441 - 1,013,441 -Convertible Bonds 367,594 - 367,594 -Municipal Bonds 12,216,384 - 12,216,384 -Term Loans 18,642,406 - 18,642,406 -Collateralized Mortgage Obligations 28,913,419 - 28,636,912 $276,507Asset Backed Securities 19,512,013 - 19,512,013 -Common Stocks 144,307,536 $141,115,787 1,771,742 1,420,007Preferred Securities 3,153,314 2,284,495 868,819 -Securities Lending Collateral 7,648,335 7,648,335 - -Short-Term Investments 33,437,771 31,477,060 1,960,711 -Total Investments in Securities $1,093,150,189 $182,525,677 $908,927,998 $1,696,514Other Financial Instruments:Futures ($67,836) ($67,836) - -Forward Foreign Currency Contracts ($92,772) - ($92,772) -Credit Default Swaps ($7,080) - ($7,080) -
Strategic Equity Allocation FundCommon StocksConsumer Discretionary $368,010,478 $298,350,686 $69,659,792 -Consumer Staples 327,191,320 246,799,182 80,392,138 -Energy 330,086,080 264,878,247 65,207,833 -Financials 604,179,154 414,598,736 189,580,418 -Health Care 354,313,987 298,999,032 55,314,438 $517Industrials 357,851,144 276,069,801 79,733,598 2,047,745Information Technology 511,045,999 466,822,159 44,223,840 -Materials 178,550,594 107,612,737 70,937,857 -Telecommunication Services 114,294,620 73,092,072 41,202,548 -Utilities 118,322,194 90,521,667 27,800,527 -Preferred Securities -Consumer Discretionary 3,392,588 238,431 3,154,157 -Consumer Staples 1,230,077 276,816 953,261 -Energy 2,435,546 2,435,546 - -Financials 5,194,074 5,194,074 - -Industrials 97,664 82,291 15,373 -Information Technology 566,076 - 566,076 -Materials 3,613,500 3,585,453 28,047 -Telecommunication Services 633,653 633,653 - -Utilities 850,784 762,456 88,328 -Investment Companies 25,411 25,411 - -Rights 52,815 43,845 8,970 -Warrants 243 243 - -Securities Lending Collateral 267,107,350 267,107,350 - -Short-Term Investments 166,950,000 - 166,950,000 -Total Investments in Securities $3,715,995,351 $2,818,129,888 $895,817,201 $2,048,262Other Financial Instruments:Futures $2,307,550 $2,307,550 - -
Total Return FundU.S. Government & Agency Obligations $2,151,380,820 - $2,151,380,820 -Foreign Government Obligations 267,180,374 - 267,180,374 -Corporate Bonds 523,001,322 - 523,001,322 -Term Loans 5,418,321 - 5,418,321 -Municipal Bonds 117,754,819 - 117,754,819 -Capital Preferred Securities 578,446 - 578,446 -Collateralized Mortgage Obligations 134,626,295 - 134,626,295 -Asset Backed Securities 24,271,457 - 24,271,457 -Preferred Securities 27,402,120 $27,402,120 - -Short-Term Investments 108,688,042 - 108,688,042 -
Copyright © 2013 www.secdatabase.com. All Rights Reserved.Please Consider the Environment Before Printing This Document
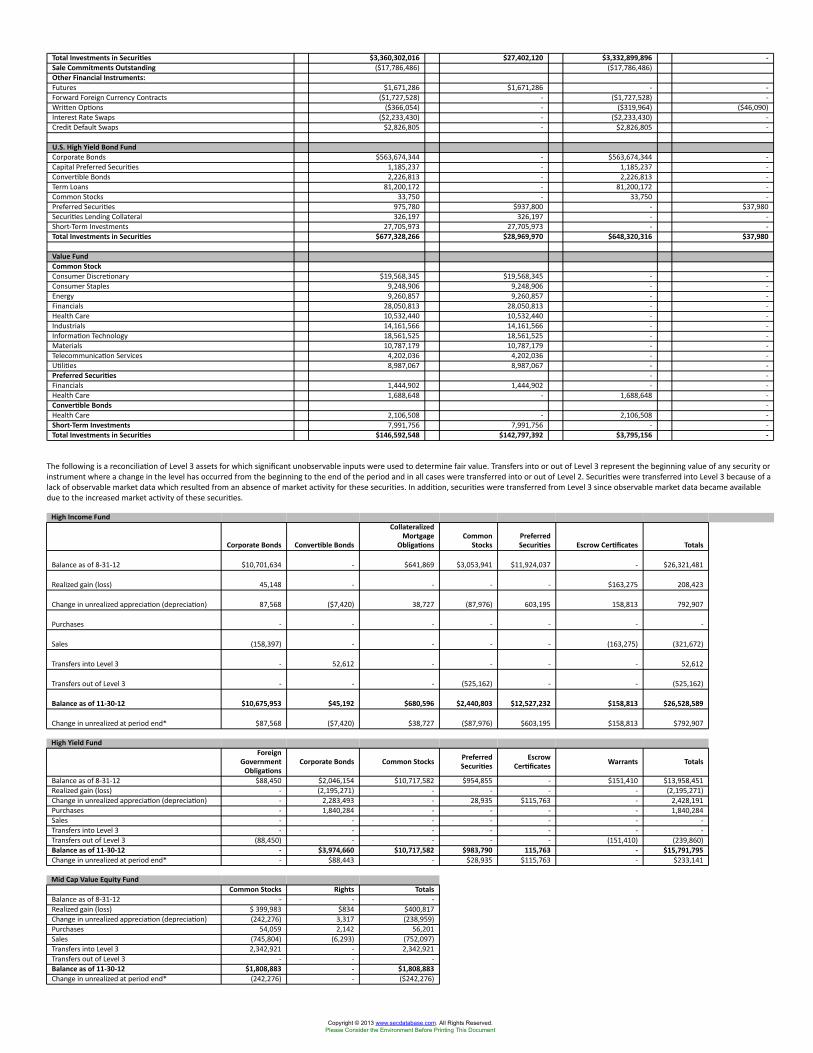
Total Investments in Securities $3,360,302,016 $27,402,120 $3,332,899,896 -Sale Commitments Outstanding ($17,786,486) ($17,786,486)Other Financial Instruments:Futures $1,671,286 $1,671,286 - -Forward Foreign Currency Contracts ($1,727,528) - ($1,727,528) -Written Options ($366,054) - ($319,964) ($46,090)Interest Rate Swaps ($2,233,430) - ($2,233,430) -Credit Default Swaps $2,826,805 - $2,826,805 -
U.S. High Yield Bond FundCorporate Bonds $563,674,344 - $563,674,344 -Capital Preferred Securities 1,185,237 - 1,185,237 -Convertible Bonds 2,226,813 - 2,226,813 -Term Loans 81,200,172 - 81,200,172 -Common Stocks 33,750 - 33,750 -Preferred Securities 975,780 $937,800 - $37,980Securities Lending Collateral 326,197 326,197 - -Short-Term Investments 27,705,973 27,705,973 - -Total Investments in Securities $677,328,266 $28,969,970 $648,320,316 $37,980
Value FundCommon StockConsumer Discretionary $19,568,345 $19,568,345 - -Consumer Staples 9,248,906 9,248,906 - -Energy 9,260,857 9,260,857 - -Financials 28,050,813 28,050,813 - -Health Care 10,532,440 10,532,440 - -Industrials 14,161,566 14,161,566 - -Information Technology 18,561,525 18,561,525 - -Materials 10,787,179 10,787,179 - -Telecommunication Services 4,202,036 4,202,036 - -Utilities 8,987,067 8,987,067 - -Preferred Securities - -Financials 1,444,902 1,444,902 - -Health Care 1,688,648 - 1,688,648 -Convertible Bonds -Health Care 2,106,508 - 2,106,508 -Short-Term Investments 7,991,756 7,991,756 - -Total Investments in Securities $146,592,548 $142,797,392 $3,795,156 -
The following is a reconciliation of Level 3 assets for which significant unobservable inputs were used to determine fair value. Transfers into or out of Level 3 represent the beginning value of any security orinstrument where a change in the level has occurred from the beginning to the end of the period and in all cases were transferred into or out of Level 2. Securities were transferred into Level 3 because of alack of observable market data which resulted from an absence of market activity for these securities. In addition, securities were transferred from Level 3 since observable market data became availabledue to the increased market activity of these securities.
High Income Fund
Corporate Bonds Convertible Bonds
CollateralizedMortgage
ObligationsCommon
StocksPreferredSecurities Escrow Certificates Totals
Balance as of 8-31-12 $10,701,634 - $641,869 $3,053,941 $11,924,037 - $26,321,481
Realized gain (loss) 45,148 - - - - $163,275 208,423
Change in unrealized appreciation (depreciation) 87,568 ($7,420) 38,727 (87,976) 603,195 158,813 792,907
Purchases - - - - - - -
Sales (158,397) - - - - (163,275) (321,672)
Transfers into Level 3 - 52,612 - - - - 52,612
Transfers out of Level 3 - - - (525,162) - - (525,162)
Balance as of 11-30-12 $10,675,953 $45,192 $680,596 $2,440,803 $12,527,232 $158,813 $26,528,589
Change in unrealized at period end* $87,568 ($7,420) $38,727 ($87,976) $603,195 $158,813 $792,907
High Yield FundForeign
GovernmentObligations
Corporate Bonds Common Stocks PreferredSecurities
EscrowCertificates Warrants Totals
Balance as of 8-31-12 $88,450 $2,046,154 $10,717,582 $954,855 - $151,410 $13,958,451Realized gain (loss) - (2,195,271) - - - - (2,195,271)Change in unrealized appreciation (depreciation) - 2,283,493 - 28,935 $115,763 - 2,428,191Purchases - 1,840,284 - - - - 1,840,284Sales - - - - - - -Transfers into Level 3 - - - - - - -Transfers out of Level 3 (88,450) - - - - (151,410) (239,860)Balance as of 11-30-12 - $3,974,660 $10,717,582 $983,790 115,763 - $15,791,795Change in unrealized at period end* - $88,443 - $28,935 $115,763 - $233,141
Mid Cap Value Equity FundCommon Stocks Rights Totals
Balance as of 8-31-12 - - -Realized gain (loss) $ 399,983 $834 $400,817Change in unrealized appreciation (depreciation) (242,276) 3,317 (238,959)Purchases 54,059 2,142 56,201Sales (745,804) (6,293) (752,097)Transfers into Level 3 2,342,921 - 2,342,921Transfers out of Level 3 - - -Balance as of 11-30-12 $1,808,883 - $1,808,883Change in unrealized at period end* (242,276) - ($242,276)
Copyright © 2013 www.secdatabase.com. All Rights Reserved.Please Consider the Environment Before Printing This Document
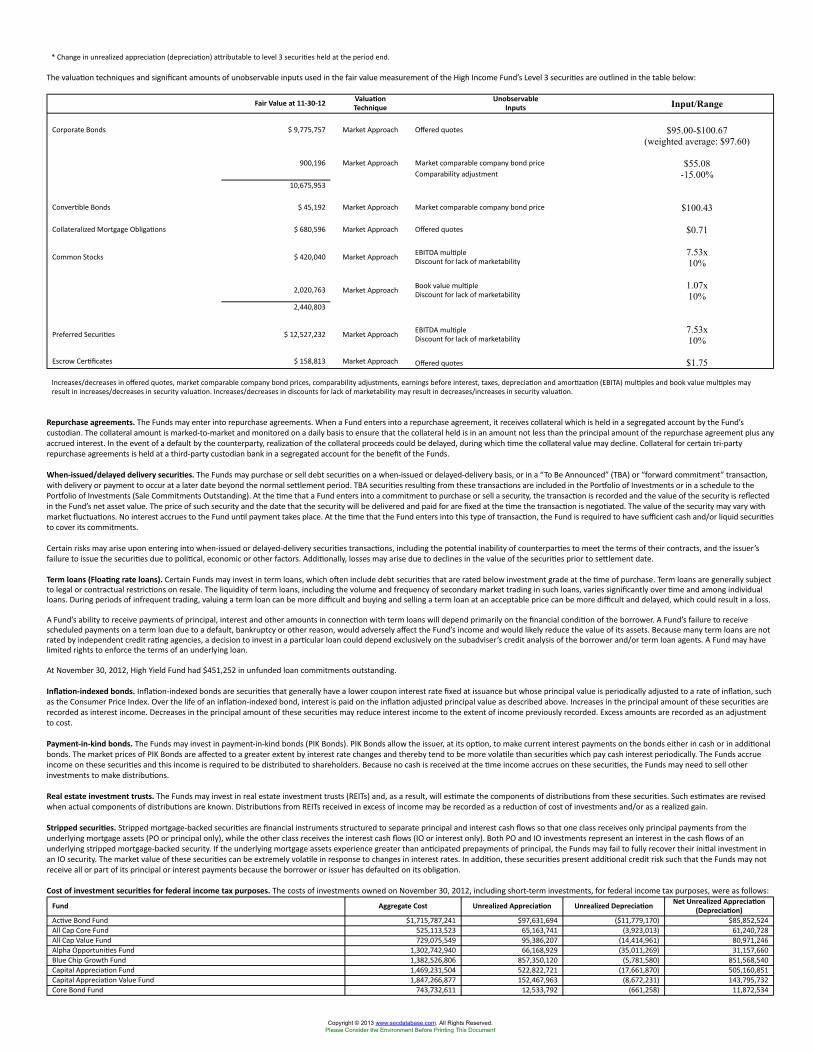
* Change in unrealized appreciation (depreciation) attributable to level 3 securities held at the period end.
The valuation techniques and significant amounts of unobservable inputs used in the fair value measurement of the High Income Fund’s Level 3 securities are outlined in the table below:
Fair Value at 11-30-12 ValuationTechnique
UnobservableInputs Input/Range
Corporate Bonds $ 9,775,757 Market Approach Offered quotes $95.00-$100.67(weighted average: $97.60)
900,196 Market Approach Market comparable company bond price $55.08Comparability adjustment -15.00%
10,675,953
Convertible Bonds $ 45,192 Market Approach Market comparable company bond price $100.43
Collateralized Mortgage Obligations $ 680,596 Market Approach Offered quotes $0.71
Common Stocks $ 420,040 Market Approach EBITDA multipleDiscount for lack of marketability
7.53x10%
2,020,763 Market Approach Book value multipleDiscount for lack of marketability
1.07x10%
2,440,803
Preferred Securities $ 12,527,232 Market Approach EBITDA multipleDiscount for lack of marketability
7.53x10%
Escrow Certificates $ 158,813 Market Approach Offered quotes $1.75
Increases/decreases in offered quotes, market comparable company bond prices, comparability adjustments, earnings before interest, taxes, depreciation and amortization (EBITA) multiples and book value multiples mayresult in increases/decreases in security valuation. Increases/decreases in discounts for lack of marketability may result in decreases/increases in security valuation.
Repurchase agreements. The Funds may enter into repurchase agreements. When a Fund enters into a repurchase agreement, it receives collateral which is held in a segregated account by the Fund’scustodian. The collateral amount is marked-to-market and monitored on a daily basis to ensure that the collateral held is in an amount not less than the principal amount of the repurchase agreement plus anyaccrued interest. In the event of a default by the counterparty, realization of the collateral proceeds could be delayed, during which time the collateral value may decline. Collateral for certain tri-partyrepurchase agreements is held at a third-party custodian bank in a segregated account for the benefit of the Funds.
When-issued/delayed delivery securities. The Funds may purchase or sell debt securities on a when-issued or delayed-delivery basis, or in a “To Be Announced” (TBA) or “forward commitment” transaction,with delivery or payment to occur at a later date beyond the normal settlement period. TBA securities resulting from these transactions are included in the Portfolio of Investments or in a schedule to thePortfolio of Investments (Sale Commitments Outstanding). At the time that a Fund enters into a commitment to purchase or sell a security, the transaction is recorded and the value of the security is reflectedin the Fund’s net asset value. The price of such security and the date that the security will be delivered and paid for are fixed at the time the transaction is negotiated. The value of the security may vary withmarket fluctuations. No interest accrues to the Fund until payment takes place. At the time that the Fund enters into this type of transaction, the Fund is required to have sufficient cash and/or liquid securitiesto cover its commitments.
Certain risks may arise upon entering into when-issued or delayed-delivery securities transactions, including the potential inability of counterparties to meet the terms of their contracts, and the issuer’sfailure to issue the securities due to political, economic or other factors. Additionally, losses may arise due to declines in the value of the securities prior to settlement date.
Term loans (Floating rate loans). Certain Funds may invest in term loans, which often include debt securities that are rated below investment grade at the time of purchase. Term loans are generally subjectto legal or contractual restrictions on resale. The liquidity of term loans, including the volume and frequency of secondary market trading in such loans, varies significantly over time and among individualloans. During periods of infrequent trading, valuing a term loan can be more difficult and buying and selling a term loan at an acceptable price can be more difficult and delayed, which could result in a loss.
A Fund’s ability to receive payments of principal, interest and other amounts in connection with term loans will depend primarily on the financial condition of the borrower. A Fund’s failure to receivescheduled payments on a term loan due to a default, bankruptcy or other reason, would adversely affect the Fund’s income and would likely reduce the value of its assets. Because many term loans are notrated by independent credit rating agencies, a decision to invest in a particular loan could depend exclusively on the subadviser’s credit analysis of the borrower and/or term loan agents. A Fund may havelimited rights to enforce the terms of an underlying loan.
At November 30, 2012, High Yield Fund had $451,252 in unfunded loan commitments outstanding.
Inflation-indexed bonds. Inflation-indexed bonds are securities that generally have a lower coupon interest rate fixed at issuance but whose principal value is periodically adjusted to a rate of inflation, suchas the Consumer Price Index. Over the life of an inflation-indexed bond, interest is paid on the inflation adjusted principal value as described above. Increases in the principal amount of these securities arerecorded as interest income. Decreases in the principal amount of these securities may reduce interest income to the extent of income previously recorded. Excess amounts are recorded as an adjustmentto cost.
Payment-in-kind bonds. The Funds may invest in payment-in-kind bonds (PIK Bonds). PIK Bonds allow the issuer, at its option, to make current interest payments on the bonds either in cash or in additionalbonds. The market prices of PIK Bonds are affected to a greater extent by interest rate changes and thereby tend to be more volatile than securities which pay cash interest periodically. The Funds accrueincome on these securities and this income is required to be distributed to shareholders. Because no cash is received at the time income accrues on these securities, the Funds may need to sell otherinvestments to make distributions.
Real estate investment trusts. The Funds may invest in real estate investment trusts (REITs) and, as a result, will estimate the components of distributions from these securities. Such estimates are revisedwhen actual components of distributions are known. Distributions from REITs received in excess of income may be recorded as a reduction of cost of investments and/or as a realized gain.
Stripped securities. Stripped mortgage-backed securities are financial instruments structured to separate principal and interest cash flows so that one class receives only principal payments from theunderlying mortgage assets (PO or principal only), while the other class receives the interest cash flows (IO or interest only). Both PO and IO investments represent an interest in the cash flows of anunderlying stripped mortgage-backed security. If the underlying mortgage assets experience greater than anticipated prepayments of principal, the Funds may fail to fully recover their initial investment inan IO security. The market value of these securities can be extremely volatile in response to changes in interest rates. In addition, these securities present additional credit risk such that the Funds may notreceive all or part of its principal or interest payments because the borrower or issuer has defaulted on its obligation.
Cost of investment securities for federal income tax purposes. The costs of investments owned on November 30, 2012, including short-term investments, for federal income tax purposes, were as follows:
Fund Aggregate Cost Unrealized Appreciation Unrealized Depreciation Net Unrealized Appreciation(Depreciation)
Active Bond Fund $1,715,787,241 $97,631,694 ($11,779,170) $85,852,524All Cap Core Fund 525,113,523 65,163,741 (3,923,013) 61,240,728All Cap Value Fund 729,075,549 95,386,207 (14,414,961) 80,971,246Alpha Opportunities Fund 1,302,742,940 66,168,929 (35,011,269) 31,157,660Blue Chip Growth Fund 1,382,526,806 857,350,120 (5,781,580) 851,568,540Capital Appreciation Fund 1,469,231,504 522,822,721 (17,661,870) 505,160,851Capital Appreciation Value Fund 1,847,266,877 152,467,963 (8,672,231) 143,795,732Core Bond Fund 743,732,611 12,533,792 (661,258) 11,872,534
Copyright © 2013 www.secdatabase.com. All Rights Reserved.Please Consider the Environment Before Printing This Document
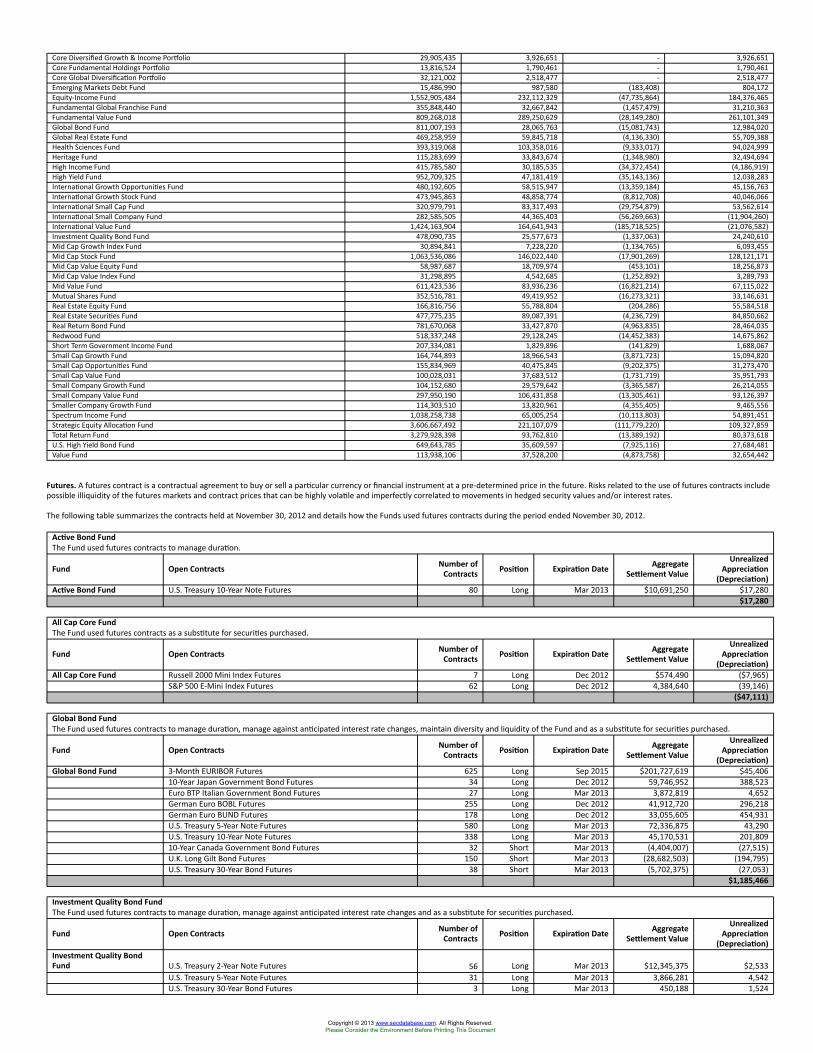
Core Diversified Growth & Income Portfolio 29,905,435 3,926,651 - 3,926,651Core Fundamental Holdings Portfolio 13,816,524 1,790,461 - 1,790,461Core Global Diversification Portfolio 32,121,002 2,518,477 - 2,518,477Emerging Markets Debt Fund 15,486,990 987,580 (183,408) 804,172Equity-Income Fund 1,552,905,484 232,112,329 (47,735,864) 184,376,465Fundamental Global Franchise Fund 355,848,440 32,667,842 (1,457,479) 31,210,363Fundamental Value Fund 809,268,018 289,250,629 (28,149,280) 261,101,349Global Bond Fund 811,007,193 28,065,763 (15,081,743) 12,984,020Global Real Estate Fund 469,258,959 59,845,718 (4,136,330) 55,709,388Health Sciences Fund 393,319,068 103,358,016 (9,333,017) 94,024,999Heritage Fund 115,283,699 33,843,674 (1,348,980) 32,494,694High Income Fund 415,785,580 30,185,535 (34,372,454) (4,186,919)High Yield Fund 952,709,325 47,181,419 (35,143,136) 12,038,283International Growth Opportunities Fund 480,192,605 58,515,947 (13,359,184) 45,156,763International Growth Stock Fund 473,945,863 48,858,774 (8,812,708) 40,046,066International Small Cap Fund 320,979,791 83,317,493 (29,754,879) 53,562,614International Small Company Fund 282,585,505 44,365,403 (56,269,663) (11,904,260)International Value Fund 1,424,163,904 164,641,943 (185,718,525) (21,076,582)Investment Quality Bond Fund 478,090,735 25,577,673 (1,337,063) 24,240,610Mid Cap Growth Index Fund 30,894,841 7,228,220 (1,134,765) 6,093,455Mid Cap Stock Fund 1,063,536,086 146,022,440 (17,901,269) 128,121,171Mid Cap Value Equity Fund 58,987,687 18,709,974 (453,101) 18,256,873Mid Cap Value Index Fund 31,298,895 4,542,685 (1,252,892) 3,289,793Mid Value Fund 611,423,536 83,936,236 (16,821,214) 67,115,022Mutual Shares Fund 352,516,781 49,419,952 (16,273,321) 33,146,631Real Estate Equity Fund 166,816,756 55,788,804 (204,286) 55,584,518Real Estate Securities Fund 477,775,235 89,087,391 (4,236,729) 84,850,662Real Return Bond Fund 781,670,068 33,427,870 (4,963,835) 28,464,035Redwood Fund 518,337,248 29,128,245 (14,452,383) 14,675,862Short Term Government Income Fund 207,334,081 1,829,896 (141,829) 1,688,067Small Cap Growth Fund 164,744,893 18,966,543 (3,871,723) 15,094,820Small Cap Opportunities Fund 155,834,969 40,475,845 (9,202,375) 31,273,470Small Cap Value Fund 100,028,031 37,683,512 (1,731,719) 35,951,793Small Company Growth Fund 104,152,680 29,579,642 (3,365,587) 26,214,055Small Company Value Fund 297,950,190 106,431,858 (13,305,461) 93,126,397Smaller Company Growth Fund 114,303,510 13,820,961 (4,355,405) 9,465,556Spectrum Income Fund 1,038,258,738 65,005,254 (10,113,803) 54,891,451Strategic Equity Allocation Fund 3,606,667,492 221,107,079 (111,779,220) 109,327,859Total Return Fund 3,279,928,398 93,762,810 (13,389,192) 80,373,618U.S. High Yield Bond Fund 649,643,785 35,609,597 (7,925,116) 27,684,481Value Fund 113,938,106 37,528,200 (4,873,758) 32,654,442
Futures. A futures contract is a contractual agreement to buy or sell a particular currency or financial instrument at a pre-determined price in the future. Risks related to the use of futures contracts includepossible illiquidity of the futures markets and contract prices that can be highly volatile and imperfectly correlated to movements in hedged security values and/or interest rates.
The following table summarizes the contracts held at November 30, 2012 and details how the Funds used futures contracts during the period ended November 30, 2012.
Active Bond FundThe Fund used futures contracts to manage duration.
Fund Open Contracts Number ofContracts Position Expiration Date Aggregate
Settlement Value
UnrealizedAppreciation
(Depreciation)Active Bond Fund U.S. Treasury 10-Year Note Futures 80 Long Mar 2013 $10,691,250 $17,280
$17,280
All Cap Core FundThe Fund used futures contracts as a substitute for securities purchased.
Fund Open Contracts Number ofContracts Position Expiration Date Aggregate
Settlement Value
UnrealizedAppreciation
(Depreciation)All Cap Core Fund Russell 2000 Mini Index Futures 7 Long Dec 2012 $574,490 ($7,965)
S&P 500 E-Mini Index Futures 62 Long Dec 2012 4,384,640 (39,146)($47,111)
Global Bond FundThe Fund used futures contracts to manage duration, manage against anticipated interest rate changes, maintain diversity and liquidity of the Fund and as a substitute for securities purchased.
Fund Open Contracts Number ofContracts Position Expiration Date Aggregate
Settlement Value
UnrealizedAppreciation
(Depreciation)Global Bond Fund 3-Month EURIBOR Futures 625 Long Sep 2015 $201,727,619 $45,406
10-Year Japan Government Bond Futures 34 Long Dec 2012 59,746,952 388,523Euro BTP Italian Government Bond Futures 27 Long Mar 2013 3,872,819 4,652German Euro BOBL Futures 255 Long Dec 2012 41,912,720 296,218German Euro BUND Futures 178 Long Dec 2012 33,055,605 454,931U.S. Treasury 5-Year Note Futures 580 Long Mar 2013 72,336,875 43,290U.S. Treasury 10-Year Note Futures 338 Long Mar 2013 45,170,531 201,80910-Year Canada Government Bond Futures 32 Short Mar 2013 (4,404,007) (27,515)U.K. Long Gilt Bond Futures 150 Short Mar 2013 (28,682,503) (194,795)U.S. Treasury 30-Year Bond Futures 38 Short Mar 2013 (5,702,375) (27,053)
$1,185,466
Investment Quality Bond FundThe Fund used futures contracts to manage duration, manage against anticipated interest rate changes and as a substitute for securities purchased.
Fund Open Contracts Number ofContracts Position Expiration Date Aggregate
Settlement Value
UnrealizedAppreciation
(Depreciation)Investment Quality BondFund U.S. Treasury 2-Year Note Futures 56 Long Mar 2013 $12,345,375 $2,533
U.S. Treasury 5-Year Note Futures 31 Long Mar 2013 3,866,281 4,542U.S. Treasury 30-Year Bond Futures 3 Long Mar 2013 450,188 1,524
Copyright © 2013 www.secdatabase.com. All Rights Reserved.Please Consider the Environment Before Printing This Document
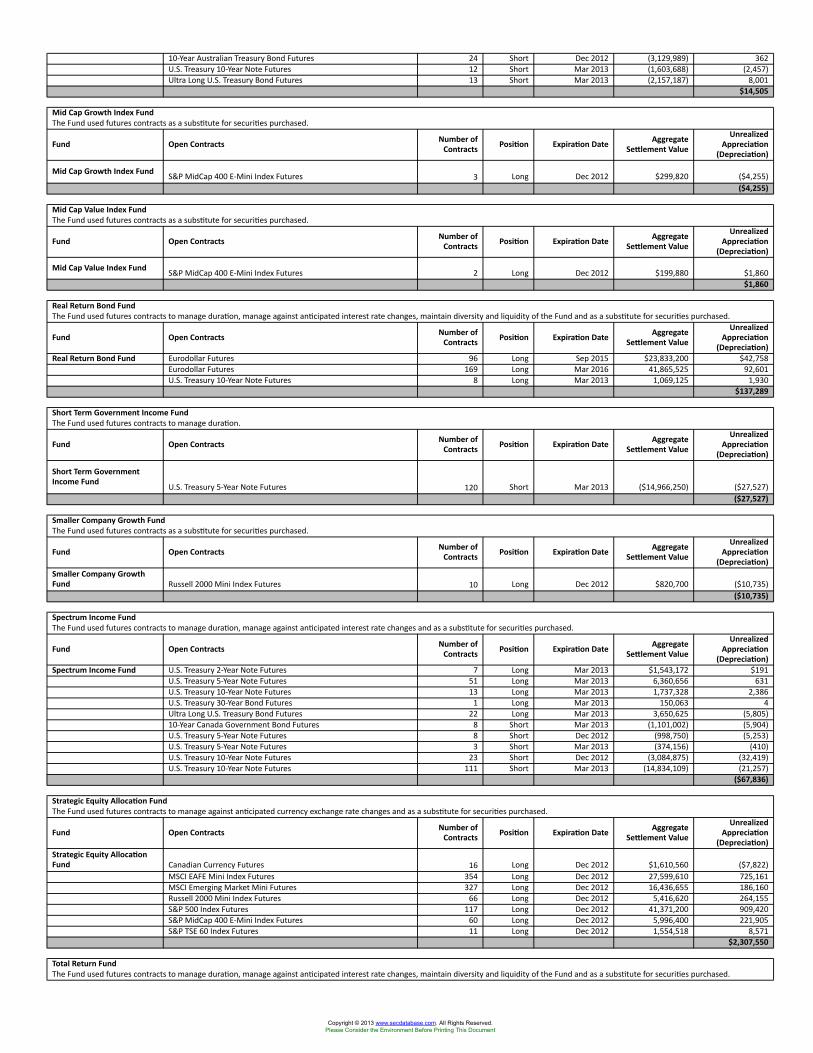
10-Year Australian Treasury Bond Futures 24 Short Dec 2012 (3,129,989) 362U.S. Treasury 10-Year Note Futures 12 Short Mar 2013 (1,603,688) (2,457)Ultra Long U.S. Treasury Bond Futures 13 Short Mar 2013 (2,157,187) 8,001
$14,505
Mid Cap Growth Index FundThe Fund used futures contracts as a substitute for securities purchased.
Fund Open Contracts Number ofContracts Position Expiration Date Aggregate
Settlement Value
UnrealizedAppreciation
(Depreciation)
Mid Cap Growth Index Fund S&P MidCap 400 E-Mini Index Futures 3 Long Dec 2012 $299,820 ($4,255)($4,255)
Mid Cap Value Index FundThe Fund used futures contracts as a substitute for securities purchased.
Fund Open Contracts Number ofContracts Position Expiration Date Aggregate
Settlement Value
UnrealizedAppreciation
(Depreciation)
Mid Cap Value Index Fund S&P MidCap 400 E-Mini Index Futures 2 Long Dec 2012 $199,880 $1,860$1,860
Real Return Bond FundThe Fund used futures contracts to manage duration, manage against anticipated interest rate changes, maintain diversity and liquidity of the Fund and as a substitute for securities purchased.
Fund Open Contracts Number ofContracts Position Expiration Date Aggregate
Settlement Value
UnrealizedAppreciation
(Depreciation)Real Return Bond Fund Eurodollar Futures 96 Long Sep 2015 $23,833,200 $42,758
Eurodollar Futures 169 Long Mar 2016 41,865,525 92,601U.S. Treasury 10-Year Note Futures 8 Long Mar 2013 1,069,125 1,930
$137,289
Short Term Government Income FundThe Fund used futures contracts to manage duration.
Fund Open Contracts Number ofContracts Position Expiration Date Aggregate
Settlement Value
UnrealizedAppreciation
(Depreciation)
Short Term GovernmentIncome Fund U.S. Treasury 5-Year Note Futures 120 Short Mar 2013 ($14,966,250) ($27,527)
($27,527)
Smaller Company Growth FundThe Fund used futures contracts as a substitute for securities purchased.
Fund Open Contracts Number ofContracts Position Expiration Date Aggregate
Settlement Value
UnrealizedAppreciation
(Depreciation)Smaller Company GrowthFund Russell 2000 Mini Index Futures 10 Long Dec 2012 $820,700 ($10,735)
($10,735)
Spectrum Income FundThe Fund used futures contracts to manage duration, manage against anticipated interest rate changes and as a substitute for securities purchased.
Fund Open Contracts Number ofContracts Position Expiration Date Aggregate
Settlement Value
UnrealizedAppreciation
(Depreciation)Spectrum Income Fund U.S. Treasury 2-Year Note Futures 7 Long Mar 2013 $1,543,172 $191
U.S. Treasury 5-Year Note Futures 51 Long Mar 2013 6,360,656 631U.S. Treasury 10-Year Note Futures 13 Long Mar 2013 1,737,328 2,386U.S. Treasury 30-Year Bond Futures 1 Long Mar 2013 150,063 4Ultra Long U.S. Treasury Bond Futures 22 Long Mar 2013 3,650,625 (5,805)10-Year Canada Government Bond Futures 8 Short Mar 2013 (1,101,002) (5,904)U.S. Treasury 5-Year Note Futures 8 Short Dec 2012 (998,750) (5,253)U.S. Treasury 5-Year Note Futures 3 Short Mar 2013 (374,156) (410)U.S. Treasury 10-Year Note Futures 23 Short Dec 2012 (3,084,875) (32,419)U.S. Treasury 10-Year Note Futures 111 Short Mar 2013 (14,834,109) (21,257)
($67,836)
Strategic Equity Allocation FundThe Fund used futures contracts to manage against anticipated currency exchange rate changes and as a substitute for securities purchased.
Fund Open Contracts Number ofContracts Position Expiration Date Aggregate
Settlement Value
UnrealizedAppreciation
(Depreciation)Strategic Equity AllocationFund Canadian Currency Futures 16 Long Dec 2012 $1,610,560 ($7,822)
MSCI EAFE Mini Index Futures 354 Long Dec 2012 27,599,610 725,161MSCI Emerging Market Mini Futures 327 Long Dec 2012 16,436,655 186,160Russell 2000 Mini Index Futures 66 Long Dec 2012 5,416,620 264,155S&P 500 Index Futures 117 Long Dec 2012 41,371,200 909,420S&P MidCap 400 E-Mini Index Futures 60 Long Dec 2012 5,996,400 221,905S&P TSE 60 Index Futures 11 Long Dec 2012 1,554,518 8,571
$2,307,550
Total Return FundThe Fund used futures contracts to manage duration, manage against anticipated interest rate changes, maintain diversity and liquidity of the Fund and as a substitute for securities purchased.
Copyright © 2013 www.secdatabase.com. All Rights Reserved.Please Consider the Environment Before Printing This Document
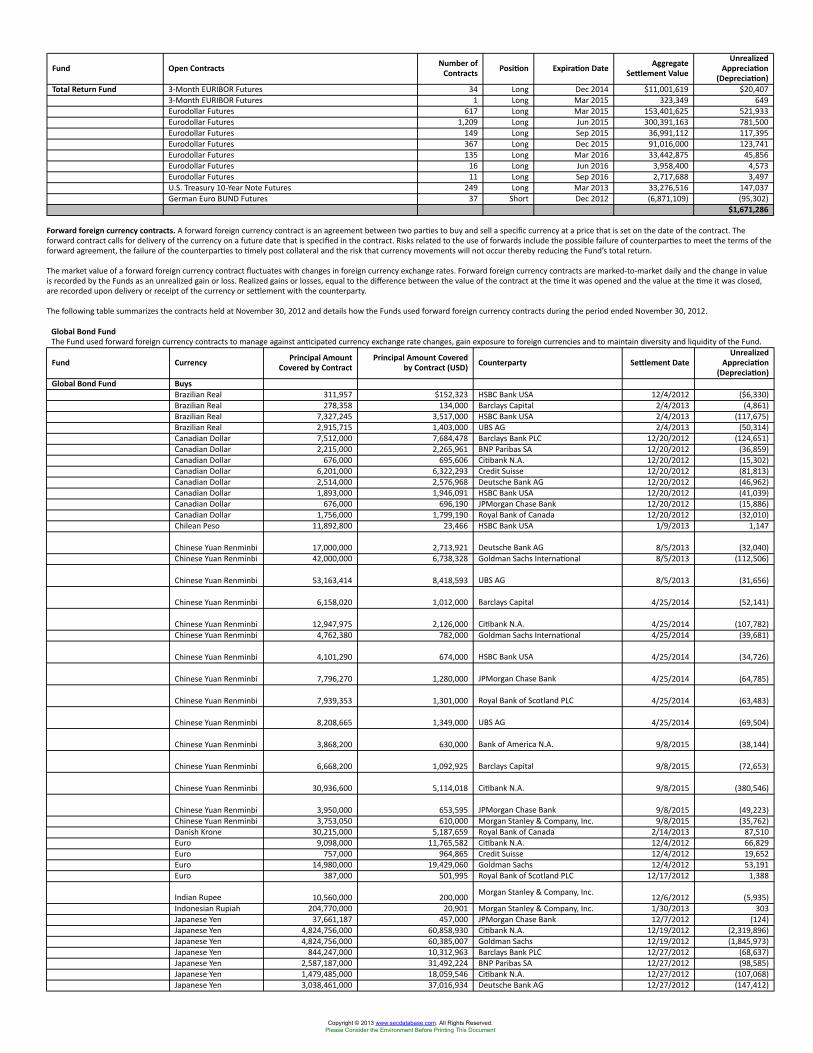
Fund Open Contracts Number ofContracts Position Expiration Date Aggregate
Settlement Value
UnrealizedAppreciation
(Depreciation)Total Return Fund 3-Month EURIBOR Futures 34 Long Dec 2014 $11,001,619 $20,407
3-Month EURIBOR Futures 1 Long Mar 2015 323,349 649Eurodollar Futures 617 Long Mar 2015 153,401,625 521,933Eurodollar Futures 1,209 Long Jun 2015 300,391,163 781,500Eurodollar Futures 149 Long Sep 2015 36,991,112 117,395Eurodollar Futures 367 Long Dec 2015 91,016,000 123,741Eurodollar Futures 135 Long Mar 2016 33,442,875 45,856Eurodollar Futures 16 Long Jun 2016 3,958,400 4,573Eurodollar Futures 11 Long Sep 2016 2,717,688 3,497U.S. Treasury 10-Year Note Futures 249 Long Mar 2013 33,276,516 147,037German Euro BUND Futures 37 Short Dec 2012 (6,871,109) (95,302)
$1,671,286
Forward foreign currency contracts. A forward foreign currency contract is an agreement between two parties to buy and sell a specific currency at a price that is set on the date of the contract. Theforward contract calls for delivery of the currency on a future date that is specified in the contract. Risks related to the use of forwards include the possible failure of counterparties to meet the terms of theforward agreement, the failure of the counterparties to timely post collateral and the risk that currency movements will not occur thereby reducing the Fund’s total return.
The market value of a forward foreign currency contract fluctuates with changes in foreign currency exchange rates. Forward foreign currency contracts are marked-to-market daily and the change in valueis recorded by the Funds as an unrealized gain or loss. Realized gains or losses, equal to the difference between the value of the contract at the time it was opened and the value at the time it was closed,are recorded upon delivery or receipt of the currency or settlement with the counterparty.
The following table summarizes the contracts held at November 30, 2012 and details how the Funds used forward foreign currency contracts during the period ended November 30, 2012.
Global Bond FundThe Fund used forward foreign currency contracts to manage against anticipated currency exchange rate changes, gain exposure to foreign currencies and to maintain diversity and liquidity of the Fund.
Fund Currency Principal AmountCovered by Contract
Principal Amount Coveredby Contract (USD) Counterparty Settlement Date
UnrealizedAppreciation
(Depreciation)Global Bond Fund Buys
Brazilian Real 311,957 $152,323 HSBC Bank USA 12/4/2012 ($6,330)Brazilian Real 278,358 134,000 Barclays Capital 2/4/2013 (4,861)Brazilian Real 7,327,245 3,517,000 HSBC Bank USA 2/4/2013 (117,675)Brazilian Real 2,915,715 1,403,000 UBS AG 2/4/2013 (50,314)Canadian Dollar 7,512,000 7,684,478 Barclays Bank PLC 12/20/2012 (124,651)Canadian Dollar 2,215,000 2,265,961 BNP Paribas SA 12/20/2012 (36,859)Canadian Dollar 676,000 695,606 Citibank N.A. 12/20/2012 (15,302)Canadian Dollar 6,201,000 6,322,293 Credit Suisse 12/20/2012 (81,813)Canadian Dollar 2,514,000 2,576,968 Deutsche Bank AG 12/20/2012 (46,962)Canadian Dollar 1,893,000 1,946,091 HSBC Bank USA 12/20/2012 (41,039)Canadian Dollar 676,000 696,190 JPMorgan Chase Bank 12/20/2012 (15,886)Canadian Dollar 1,756,000 1,799,190 Royal Bank of Canada 12/20/2012 (32,010)Chilean Peso 11,892,800 23,466 HSBC Bank USA 1/9/2013 1,147
Chinese Yuan Renminbi 17,000,000 2,713,921 Deutsche Bank AG 8/5/2013 (32,040)Chinese Yuan Renminbi 42,000,000 6,738,328 Goldman Sachs International 8/5/2013 (112,506)
Chinese Yuan Renminbi 53,163,414 8,418,593 UBS AG 8/5/2013 (31,656)
Chinese Yuan Renminbi 6,158,020 1,012,000 Barclays Capital 4/25/2014 (52,141)
Chinese Yuan Renminbi 12,947,975 2,126,000 Citibank N.A. 4/25/2014 (107,782)Chinese Yuan Renminbi 4,762,380 782,000 Goldman Sachs International 4/25/2014 (39,681)
Chinese Yuan Renminbi 4,101,290 674,000 HSBC Bank USA 4/25/2014 (34,726)
Chinese Yuan Renminbi 7,796,270 1,280,000 JPMorgan Chase Bank 4/25/2014 (64,785)
Chinese Yuan Renminbi 7,939,353 1,301,000 Royal Bank of Scotland PLC 4/25/2014 (63,483)
Chinese Yuan Renminbi 8,208,665 1,349,000 UBS AG 4/25/2014 (69,504)
Chinese Yuan Renminbi 3,868,200 630,000 Bank of America N.A. 9/8/2015 (38,144)
Chinese Yuan Renminbi 6,668,200 1,092,925 Barclays Capital 9/8/2015 (72,653)
Chinese Yuan Renminbi 30,936,600 5,114,018 Citibank N.A. 9/8/2015 (380,546)
Chinese Yuan Renminbi 3,950,000 653,595 JPMorgan Chase Bank 9/8/2015 (49,223)Chinese Yuan Renminbi 3,753,050 610,000 Morgan Stanley & Company, Inc. 9/8/2015 (35,762)Danish Krone 30,215,000 5,187,659 Royal Bank of Canada 2/14/2013 87,510Euro 9,098,000 11,765,582 Citibank N.A. 12/4/2012 66,829Euro 757,000 964,865 Credit Suisse 12/4/2012 19,652Euro 14,980,000 19,429,060 Goldman Sachs 12/4/2012 53,191Euro 387,000 501,995 Royal Bank of Scotland PLC 12/17/2012 1,388
Indian Rupee 10,560,000 200,000 Morgan Stanley & Company, Inc. 12/6/2012 (5,935)Indonesian Rupiah 204,770,000 20,901 Morgan Stanley & Company, Inc. 1/30/2013 303Japanese Yen 37,661,187 457,000 JPMorgan Chase Bank 12/7/2012 (124)Japanese Yen 4,824,756,000 60,858,930 Citibank N.A. 12/19/2012 (2,319,896)Japanese Yen 4,824,756,000 60,385,007 Goldman Sachs 12/19/2012 (1,845,973)Japanese Yen 844,247,000 10,312,963 Barclays Bank PLC 12/27/2012 (68,637)Japanese Yen 2,587,187,000 31,492,224 BNP Paribas SA 12/27/2012 (98,585)Japanese Yen 1,479,485,000 18,059,546 Citibank N.A. 12/27/2012 (107,068)Japanese Yen 3,038,461,000 37,016,934 Deutsche Bank AG 12/27/2012 (147,412)
Copyright © 2013 www.secdatabase.com. All Rights Reserved.Please Consider the Environment Before Printing This Document
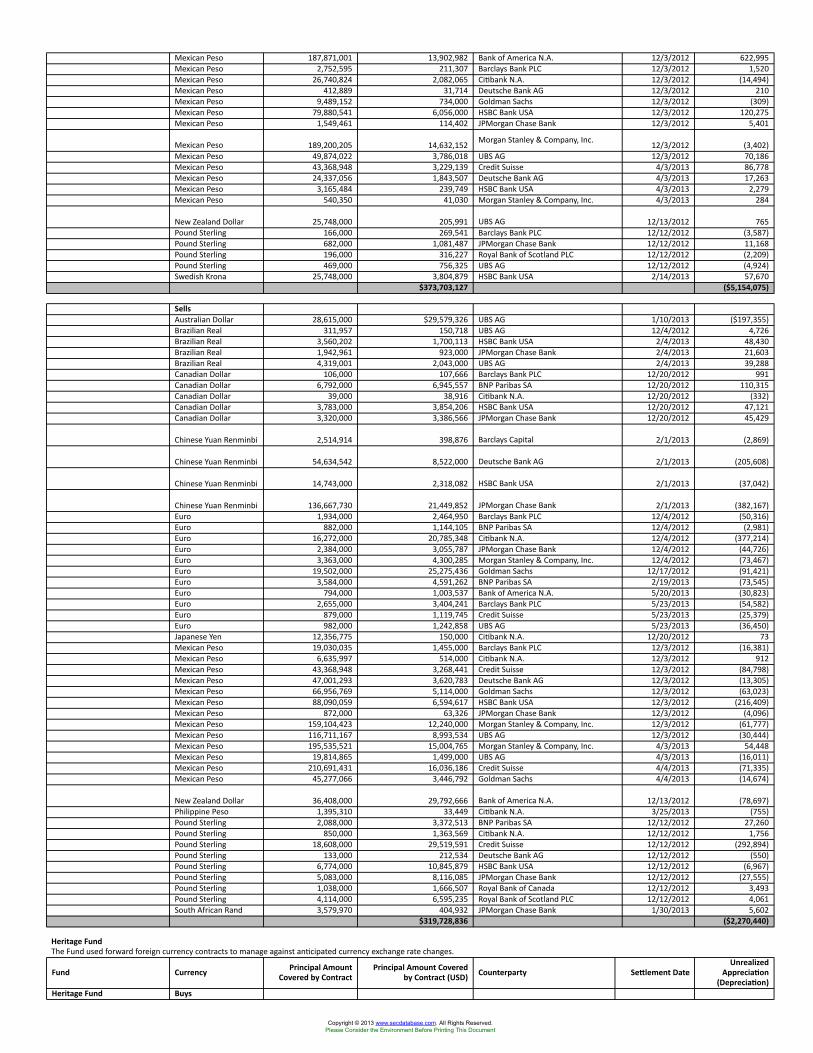
Mexican Peso 187,871,001 13,902,982 Bank of America N.A. 12/3/2012 622,995Mexican Peso 2,752,595 211,307 Barclays Bank PLC 12/3/2012 1,520Mexican Peso 26,740,824 2,082,065 Citibank N.A. 12/3/2012 (14,494)Mexican Peso 412,889 31,714 Deutsche Bank AG 12/3/2012 210Mexican Peso 9,489,152 734,000 Goldman Sachs 12/3/2012 (309)Mexican Peso 79,880,541 6,056,000 HSBC Bank USA 12/3/2012 120,275Mexican Peso 1,549,461 114,402 JPMorgan Chase Bank 12/3/2012 5,401
Mexican Peso 189,200,205 14,632,152 Morgan Stanley & Company, Inc. 12/3/2012 (3,402)Mexican Peso 49,874,022 3,786,018 UBS AG 12/3/2012 70,186Mexican Peso 43,368,948 3,229,139 Credit Suisse 4/3/2013 86,778Mexican Peso 24,337,056 1,843,507 Deutsche Bank AG 4/3/2013 17,263Mexican Peso 3,165,484 239,749 HSBC Bank USA 4/3/2013 2,279Mexican Peso 540,350 41,030 Morgan Stanley & Company, Inc. 4/3/2013 284
New Zealand Dollar 25,748,000 205,991 UBS AG 12/13/2012 765Pound Sterling 166,000 269,541 Barclays Bank PLC 12/12/2012 (3,587)Pound Sterling 682,000 1,081,487 JPMorgan Chase Bank 12/12/2012 11,168Pound Sterling 196,000 316,227 Royal Bank of Scotland PLC 12/12/2012 (2,209)Pound Sterling 469,000 756,325 UBS AG 12/12/2012 (4,924)Swedish Krona 25,748,000 3,804,879 HSBC Bank USA 2/14/2013 57,670
$373,703,127 ($5,154,075)
SellsAustralian Dollar 28,615,000 $29,579,326 UBS AG 1/10/2013 ($197,355)Brazilian Real 311,957 150,718 UBS AG 12/4/2012 4,726Brazilian Real 3,560,202 1,700,113 HSBC Bank USA 2/4/2013 48,430Brazilian Real 1,942,961 923,000 JPMorgan Chase Bank 2/4/2013 21,603Brazilian Real 4,319,001 2,043,000 UBS AG 2/4/2013 39,288Canadian Dollar 106,000 107,666 Barclays Bank PLC 12/20/2012 991Canadian Dollar 6,792,000 6,945,557 BNP Paribas SA 12/20/2012 110,315Canadian Dollar 39,000 38,916 Citibank N.A. 12/20/2012 (332)Canadian Dollar 3,783,000 3,854,206 HSBC Bank USA 12/20/2012 47,121Canadian Dollar 3,320,000 3,386,566 JPMorgan Chase Bank 12/20/2012 45,429
Chinese Yuan Renminbi 2,514,914 398,876 Barclays Capital 2/1/2013 (2,869)
Chinese Yuan Renminbi 54,634,542 8,522,000 Deutsche Bank AG 2/1/2013 (205,608)
Chinese Yuan Renminbi 14,743,000 2,318,082 HSBC Bank USA 2/1/2013 (37,042)
Chinese Yuan Renminbi 136,667,730 21,449,852 JPMorgan Chase Bank 2/1/2013 (382,167)Euro 1,934,000 2,464,950 Barclays Bank PLC 12/4/2012 (50,316)Euro 882,000 1,144,105 BNP Paribas SA 12/4/2012 (2,981)Euro 16,272,000 20,785,348 Citibank N.A. 12/4/2012 (377,214)Euro 2,384,000 3,055,787 JPMorgan Chase Bank 12/4/2012 (44,726)Euro 3,363,000 4,300,285 Morgan Stanley & Company, Inc. 12/4/2012 (73,467)Euro 19,502,000 25,275,436 Goldman Sachs 12/17/2012 (91,421)Euro 3,584,000 4,591,262 BNP Paribas SA 2/19/2013 (73,545)Euro 794,000 1,003,537 Bank of America N.A. 5/20/2013 (30,823)Euro 2,655,000 3,404,241 Barclays Bank PLC 5/23/2013 (54,582)Euro 879,000 1,119,745 Credit Suisse 5/23/2013 (25,379)Euro 982,000 1,242,858 UBS AG 5/23/2013 (36,450)Japanese Yen 12,356,775 150,000 Citibank N.A. 12/20/2012 73Mexican Peso 19,030,035 1,455,000 Barclays Bank PLC 12/3/2012 (16,381)Mexican Peso 6,635,997 514,000 Citibank N.A. 12/3/2012 912Mexican Peso 43,368,948 3,268,441 Credit Suisse 12/3/2012 (84,798)Mexican Peso 47,001,293 3,620,783 Deutsche Bank AG 12/3/2012 (13,305)Mexican Peso 66,956,769 5,114,000 Goldman Sachs 12/3/2012 (63,023)Mexican Peso 88,090,059 6,594,617 HSBC Bank USA 12/3/2012 (216,409)Mexican Peso 872,000 63,326 JPMorgan Chase Bank 12/3/2012 (4,096)Mexican Peso 159,104,423 12,240,000 Morgan Stanley & Company, Inc. 12/3/2012 (61,777)Mexican Peso 116,711,167 8,993,534 UBS AG 12/3/2012 (30,444)Mexican Peso 195,535,521 15,004,765 Morgan Stanley & Company, Inc. 4/3/2013 54,448Mexican Peso 19,814,865 1,499,000 UBS AG 4/3/2013 (16,011)Mexican Peso 210,691,431 16,036,186 Credit Suisse 4/4/2013 (71,335)Mexican Peso 45,277,066 3,446,792 Goldman Sachs 4/4/2013 (14,674)
New Zealand Dollar 36,408,000 29,792,666 Bank of America N.A. 12/13/2012 (78,697)Philippine Peso 1,395,310 33,449 Citibank N.A. 3/25/2013 (755)Pound Sterling 2,088,000 3,372,513 BNP Paribas SA 12/12/2012 27,260Pound Sterling 850,000 1,363,569 Citibank N.A. 12/12/2012 1,756Pound Sterling 18,608,000 29,519,591 Credit Suisse 12/12/2012 (292,894)Pound Sterling 133,000 212,534 Deutsche Bank AG 12/12/2012 (550)Pound Sterling 6,774,000 10,845,879 HSBC Bank USA 12/12/2012 (6,967)Pound Sterling 5,083,000 8,116,085 JPMorgan Chase Bank 12/12/2012 (27,555)Pound Sterling 1,038,000 1,666,507 Royal Bank of Canada 12/12/2012 3,493Pound Sterling 4,114,000 6,595,235 Royal Bank of Scotland PLC 12/12/2012 4,061South African Rand 3,579,970 404,932 JPMorgan Chase Bank 1/30/2013 5,602
$319,728,836 ($2,270,440)
Heritage FundThe Fund used forward foreign currency contracts to manage against anticipated currency exchange rate changes.
Fund Currency Principal AmountCovered by Contract
Principal Amount Coveredby Contract (USD) Counterparty Settlement Date
UnrealizedAppreciation
(Depreciation)Heritage Fund Buys
Copyright © 2013 www.secdatabase.com. All Rights Reserved.Please Consider the Environment Before Printing This Document
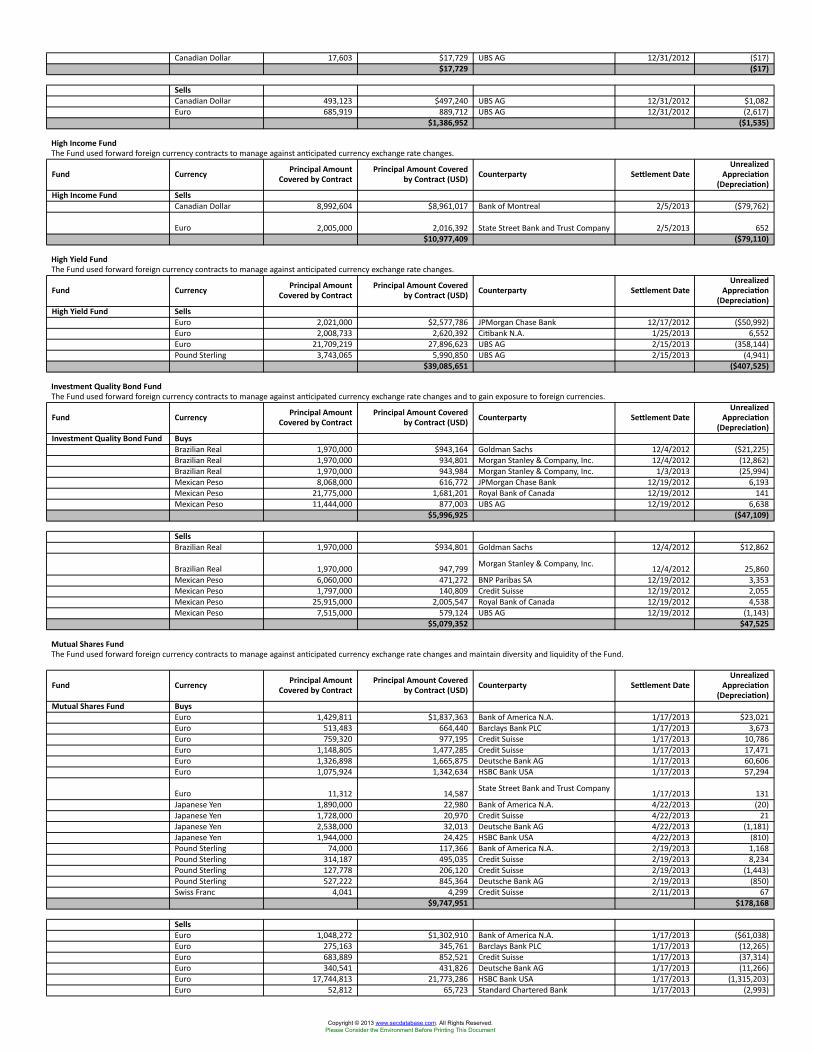
Canadian Dollar 17,603 $17,729 UBS AG 12/31/2012 ($17)$17,729 ($17)
SellsCanadian Dollar 493,123 $497,240 UBS AG 12/31/2012 $1,082Euro 685,919 889,712 UBS AG 12/31/2012 (2,617)
$1,386,952 ($1,535)
High Income FundThe Fund used forward foreign currency contracts to manage against anticipated currency exchange rate changes.
Fund Currency Principal AmountCovered by Contract
Principal Amount Coveredby Contract (USD) Counterparty Settlement Date
UnrealizedAppreciation
(Depreciation)High Income Fund Sells
Canadian Dollar 8,992,604 $8,961,017 Bank of Montreal 2/5/2013 ($79,762)
Euro 2,005,000 2,016,392 State Street Bank and Trust Company 2/5/2013 652$10,977,409 ($79,110)
High Yield FundThe Fund used forward foreign currency contracts to manage against anticipated currency exchange rate changes.
Fund Currency Principal AmountCovered by Contract
Principal Amount Coveredby Contract (USD) Counterparty Settlement Date
UnrealizedAppreciation
(Depreciation)High Yield Fund Sells
Euro 2,021,000 $2,577,786 JPMorgan Chase Bank 12/17/2012 ($50,992)Euro 2,008,733 2,620,392 Citibank N.A. 1/25/2013 6,552Euro 21,709,219 27,896,623 UBS AG 2/15/2013 (358,144)Pound Sterling 3,743,065 5,990,850 UBS AG 2/15/2013 (4,941)
$39,085,651 ($407,525)
Investment Quality Bond FundThe Fund used forward foreign currency contracts to manage against anticipated currency exchange rate changes and to gain exposure to foreign currencies.
Fund Currency Principal AmountCovered by Contract
Principal Amount Coveredby Contract (USD) Counterparty Settlement Date
UnrealizedAppreciation
(Depreciation)Investment Quality Bond Fund Buys
Brazilian Real 1,970,000 $943,164 Goldman Sachs 12/4/2012 ($21,225)Brazilian Real 1,970,000 934,801 Morgan Stanley & Company, Inc. 12/4/2012 (12,862)Brazilian Real 1,970,000 943,984 Morgan Stanley & Company, Inc. 1/3/2013 (25,994)Mexican Peso 8,068,000 616,772 JPMorgan Chase Bank 12/19/2012 6,193Mexican Peso 21,775,000 1,681,201 Royal Bank of Canada 12/19/2012 141Mexican Peso 11,444,000 877,003 UBS AG 12/19/2012 6,638
$5,996,925 ($47,109)
SellsBrazilian Real 1,970,000 $934,801 Goldman Sachs 12/4/2012 $12,862
Brazilian Real 1,970,000 947,799 Morgan Stanley & Company, Inc. 12/4/2012 25,860Mexican Peso 6,060,000 471,272 BNP Paribas SA 12/19/2012 3,353Mexican Peso 1,797,000 140,809 Credit Suisse 12/19/2012 2,055Mexican Peso 25,915,000 2,005,547 Royal Bank of Canada 12/19/2012 4,538Mexican Peso 7,515,000 579,124 UBS AG 12/19/2012 (1,143)
$5,079,352 $47,525
Mutual Shares FundThe Fund used forward foreign currency contracts to manage against anticipated currency exchange rate changes and maintain diversity and liquidity of the Fund.
Fund Currency Principal AmountCovered by Contract
Principal Amount Coveredby Contract (USD) Counterparty Settlement Date
UnrealizedAppreciation
(Depreciation)Mutual Shares Fund Buys
Euro 1,429,811 $1,837,363 Bank of America N.A. 1/17/2013 $23,021Euro 513,483 664,440 Barclays Bank PLC 1/17/2013 3,673Euro 759,320 977,195 Credit Suisse 1/17/2013 10,786Euro 1,148,805 1,477,285 Credit Suisse 1/17/2013 17,471Euro 1,326,898 1,665,875 Deutsche Bank AG 1/17/2013 60,606Euro 1,075,924 1,342,634 HSBC Bank USA 1/17/2013 57,294
Euro 11,312 14,587 State Street Bank and Trust Company 1/17/2013 131Japanese Yen 1,890,000 22,980 Bank of America N.A. 4/22/2013 (20)Japanese Yen 1,728,000 20,970 Credit Suisse 4/22/2013 21Japanese Yen 2,538,000 32,013 Deutsche Bank AG 4/22/2013 (1,181)Japanese Yen 1,944,000 24,425 HSBC Bank USA 4/22/2013 (810)Pound Sterling 74,000 117,366 Bank of America N.A. 2/19/2013 1,168Pound Sterling 314,187 495,035 Credit Suisse 2/19/2013 8,234Pound Sterling 127,778 206,120 Credit Suisse 2/19/2013 (1,443)Pound Sterling 527,222 845,364 Deutsche Bank AG 2/19/2013 (850)Swiss Franc 4,041 4,299 Credit Suisse 2/11/2013 67
$9,747,951 $178,168
SellsEuro 1,048,272 $1,302,910 Bank of America N.A. 1/17/2013 ($61,038)Euro 275,163 345,761 Barclays Bank PLC 1/17/2013 (12,265)Euro 683,889 852,521 Credit Suisse 1/17/2013 (37,314)Euro 340,541 431,826 Deutsche Bank AG 1/17/2013 (11,266)Euro 17,744,813 21,773,286 HSBC Bank USA 1/17/2013 (1,315,203)Euro 52,812 65,723 Standard Chartered Bank 1/17/2013 (2,993)
Copyright © 2013 www.secdatabase.com. All Rights Reserved.Please Consider the Environment Before Printing This Document
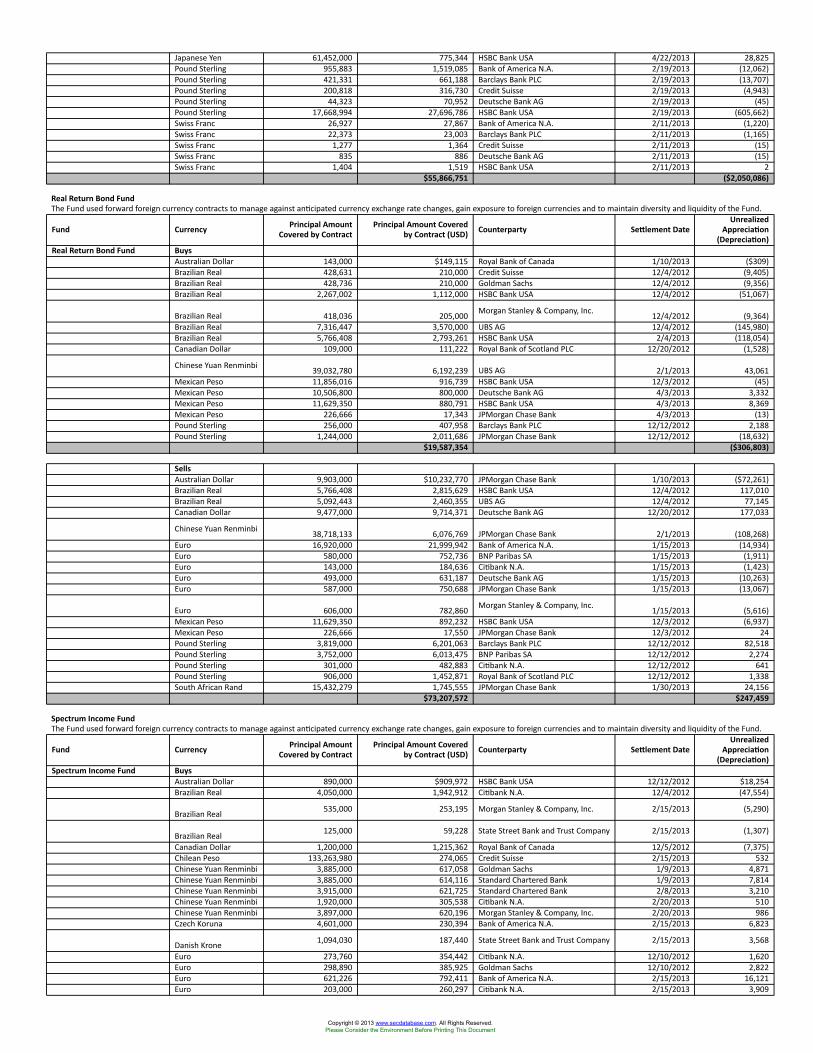
Japanese Yen 61,452,000 775,344 HSBC Bank USA 4/22/2013 28,825Pound Sterling 955,883 1,519,085 Bank of America N.A. 2/19/2013 (12,062)Pound Sterling 421,331 661,188 Barclays Bank PLC 2/19/2013 (13,707)Pound Sterling 200,818 316,730 Credit Suisse 2/19/2013 (4,943)Pound Sterling 44,323 70,952 Deutsche Bank AG 2/19/2013 (45)Pound Sterling 17,668,994 27,696,786 HSBC Bank USA 2/19/2013 (605,662)Swiss Franc 26,927 27,867 Bank of America N.A. 2/11/2013 (1,220)Swiss Franc 22,373 23,003 Barclays Bank PLC 2/11/2013 (1,165)Swiss Franc 1,277 1,364 Credit Suisse 2/11/2013 (15)Swiss Franc 835 886 Deutsche Bank AG 2/11/2013 (15)Swiss Franc 1,404 1,519 HSBC Bank USA 2/11/2013 2
$55,866,751 ($2,050,086)
Real Return Bond FundThe Fund used forward foreign currency contracts to manage against anticipated currency exchange rate changes, gain exposure to foreign currencies and to maintain diversity and liquidity of the Fund.
Fund Currency Principal AmountCovered by Contract
Principal Amount Coveredby Contract (USD) Counterparty Settlement Date
UnrealizedAppreciation
(Depreciation)Real Return Bond Fund Buys
Australian Dollar 143,000 $149,115 Royal Bank of Canada 1/10/2013 ($309)Brazilian Real 428,631 210,000 Credit Suisse 12/4/2012 (9,405)Brazilian Real 428,736 210,000 Goldman Sachs 12/4/2012 (9,356)Brazilian Real 2,267,002 1,112,000 HSBC Bank USA 12/4/2012 (51,067)
Brazilian Real 418,036 205,000 Morgan Stanley & Company, Inc. 12/4/2012 (9,364)Brazilian Real 7,316,447 3,570,000 UBS AG 12/4/2012 (145,980)Brazilian Real 5,766,408 2,793,261 HSBC Bank USA 2/4/2013 (118,054)Canadian Dollar 109,000 111,222 Royal Bank of Scotland PLC 12/20/2012 (1,528)
Chinese Yuan Renminbi 39,032,780 6,192,239 UBS AG 2/1/2013 43,061Mexican Peso 11,856,016 916,739 HSBC Bank USA 12/3/2012 (45)Mexican Peso 10,506,800 800,000 Deutsche Bank AG 4/3/2013 3,332Mexican Peso 11,629,350 880,791 HSBC Bank USA 4/3/2013 8,369Mexican Peso 226,666 17,343 JPMorgan Chase Bank 4/3/2013 (13)Pound Sterling 256,000 407,958 Barclays Bank PLC 12/12/2012 2,188Pound Sterling 1,244,000 2,011,686 JPMorgan Chase Bank 12/12/2012 (18,632)
$19,587,354 ($306,803)
SellsAustralian Dollar 9,903,000 $10,232,770 JPMorgan Chase Bank 1/10/2013 ($72,261)Brazilian Real 5,766,408 2,815,629 HSBC Bank USA 12/4/2012 117,010Brazilian Real 5,092,443 2,460,355 UBS AG 12/4/2012 77,145Canadian Dollar 9,477,000 9,714,371 Deutsche Bank AG 12/20/2012 177,033
Chinese Yuan Renminbi 38,718,133 6,076,769 JPMorgan Chase Bank 2/1/2013 (108,268)Euro 16,920,000 21,999,942 Bank of America N.A. 1/15/2013 (14,934)Euro 580,000 752,736 BNP Paribas SA 1/15/2013 (1,911)Euro 143,000 184,636 Citibank N.A. 1/15/2013 (1,423)Euro 493,000 631,187 Deutsche Bank AG 1/15/2013 (10,263)Euro 587,000 750,688 JPMorgan Chase Bank 1/15/2013 (13,067)
Euro 606,000 782,860 Morgan Stanley & Company, Inc. 1/15/2013 (5,616)Mexican Peso 11,629,350 892,232 HSBC Bank USA 12/3/2012 (6,937)Mexican Peso 226,666 17,550 JPMorgan Chase Bank 12/3/2012 24Pound Sterling 3,819,000 6,201,063 Barclays Bank PLC 12/12/2012 82,518Pound Sterling 3,752,000 6,013,475 BNP Paribas SA 12/12/2012 2,274Pound Sterling 301,000 482,883 Citibank N.A. 12/12/2012 641Pound Sterling 906,000 1,452,871 Royal Bank of Scotland PLC 12/12/2012 1,338South African Rand 15,432,279 1,745,555 JPMorgan Chase Bank 1/30/2013 24,156
$73,207,572 $247,459
Spectrum Income FundThe Fund used forward foreign currency contracts to manage against anticipated currency exchange rate changes, gain exposure to foreign currencies and to maintain diversity and liquidity of the Fund.
Fund Currency Principal AmountCovered by Contract
Principal Amount Coveredby Contract (USD) Counterparty Settlement Date
UnrealizedAppreciation
(Depreciation)Spectrum Income Fund Buys
Australian Dollar 890,000 $909,972 HSBC Bank USA 12/12/2012 $18,254Brazilian Real 4,050,000 1,942,912 Citibank N.A. 12/4/2012 (47,554)
Brazilian Real 535,000 253,195 Morgan Stanley & Company, Inc. 2/15/2013 (5,290)
Brazilian Real 125,000 59,228 State Street Bank and Trust Company 2/15/2013 (1,307)
Canadian Dollar 1,200,000 1,215,362 Royal Bank of Canada 12/5/2012 (7,375)Chilean Peso 133,263,980 274,065 Credit Suisse 2/15/2013 532Chinese Yuan Renminbi 3,885,000 617,058 Goldman Sachs 1/9/2013 4,871Chinese Yuan Renminbi 3,885,000 614,116 Standard Chartered Bank 1/9/2013 7,814Chinese Yuan Renminbi 3,915,000 621,725 Standard Chartered Bank 2/8/2013 3,210Chinese Yuan Renminbi 1,920,000 305,538 Citibank N.A. 2/20/2013 510Chinese Yuan Renminbi 3,897,000 620,196 Morgan Stanley & Company, Inc. 2/20/2013 986Czech Koruna 4,601,000 230,394 Bank of America N.A. 2/15/2013 6,823
Danish Krone 1,094,030 187,440 State Street Bank and Trust Company 2/15/2013 3,568
Euro 273,760 354,442 Citibank N.A. 12/10/2012 1,620Euro 298,890 385,925 Goldman Sachs 12/10/2012 2,822Euro 621,226 792,411 Bank of America N.A. 2/15/2013 16,121Euro 203,000 260,297 Citibank N.A. 2/15/2013 3,909
Copyright © 2013 www.secdatabase.com. All Rights Reserved.Please Consider the Environment Before Printing This Document
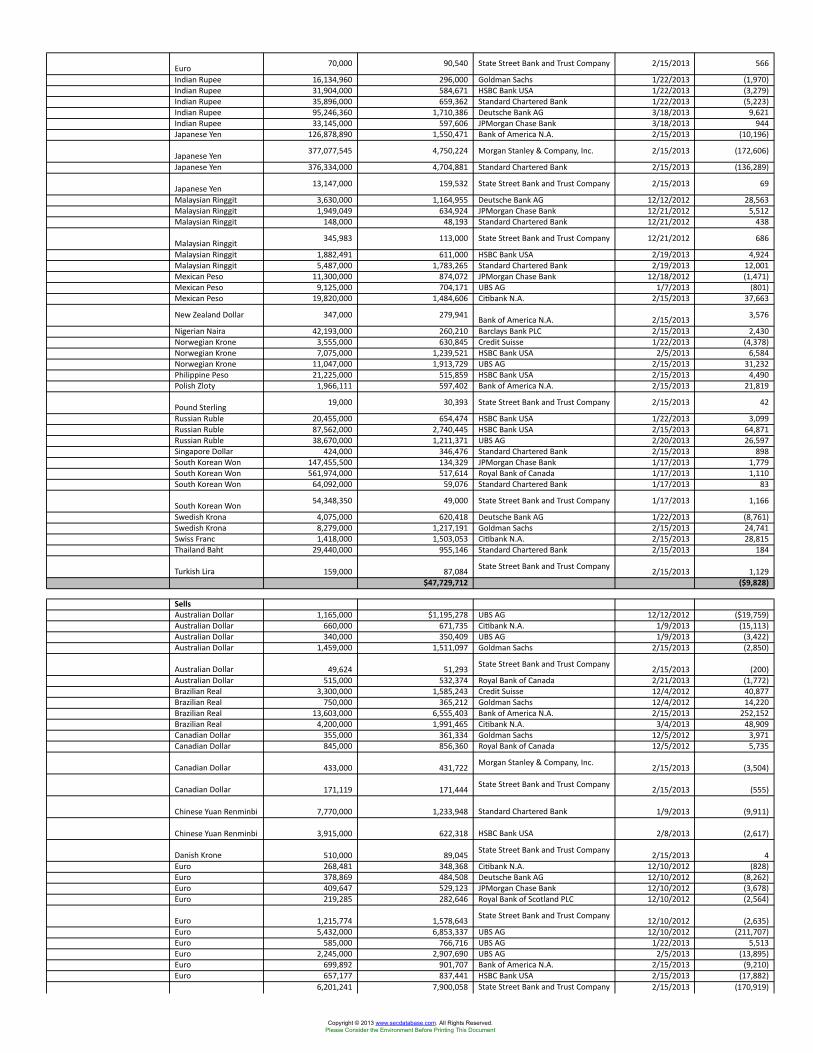
Euro 70,000 90,540 State Street Bank and Trust Company 2/15/2013 566
Indian Rupee 16,134,960 296,000 Goldman Sachs 1/22/2013 (1,970)Indian Rupee 31,904,000 584,671 HSBC Bank USA 1/22/2013 (3,279)Indian Rupee 35,896,000 659,362 Standard Chartered Bank 1/22/2013 (5,223)Indian Rupee 95,246,360 1,710,386 Deutsche Bank AG 3/18/2013 9,621Indian Rupee 33,145,000 597,606 JPMorgan Chase Bank 3/18/2013 944Japanese Yen 126,878,890 1,550,471 Bank of America N.A. 2/15/2013 (10,196)
Japanese Yen 377,077,545 4,750,224 Morgan Stanley & Company, Inc. 2/15/2013 (172,606)
Japanese Yen 376,334,000 4,704,881 Standard Chartered Bank 2/15/2013 (136,289)
Japanese Yen 13,147,000 159,532 State Street Bank and Trust Company 2/15/2013 69
Malaysian Ringgit 3,630,000 1,164,955 Deutsche Bank AG 12/12/2012 28,563Malaysian Ringgit 1,949,049 634,924 JPMorgan Chase Bank 12/21/2012 5,512Malaysian Ringgit 148,000 48,193 Standard Chartered Bank 12/21/2012 438
Malaysian Ringgit 345,983 113,000 State Street Bank and Trust Company 12/21/2012 686
Malaysian Ringgit 1,882,491 611,000 HSBC Bank USA 2/19/2013 4,924Malaysian Ringgit 5,487,000 1,783,265 Standard Chartered Bank 2/19/2013 12,001Mexican Peso 11,300,000 874,072 JPMorgan Chase Bank 12/18/2012 (1,471)Mexican Peso 9,125,000 704,171 UBS AG 1/7/2013 (801)Mexican Peso 19,820,000 1,484,606 Citibank N.A. 2/15/2013 37,663
New Zealand Dollar 347,000 279,941 Bank of America N.A. 2/15/2013 3,576
Nigerian Naira 42,193,000 260,210 Barclays Bank PLC 2/15/2013 2,430Norwegian Krone 3,555,000 630,845 Credit Suisse 1/22/2013 (4,378)Norwegian Krone 7,075,000 1,239,521 HSBC Bank USA 2/5/2013 6,584Norwegian Krone 11,047,000 1,913,729 UBS AG 2/15/2013 31,232Philippine Peso 21,225,000 515,859 HSBC Bank USA 2/15/2013 4,490Polish Zloty 1,966,111 597,402 Bank of America N.A. 2/15/2013 21,819
Pound Sterling 19,000 30,393 State Street Bank and Trust Company 2/15/2013 42
Russian Ruble 20,455,000 654,474 HSBC Bank USA 1/22/2013 3,099Russian Ruble 87,562,000 2,740,445 HSBC Bank USA 2/15/2013 64,871Russian Ruble 38,670,000 1,211,371 UBS AG 2/20/2013 26,597Singapore Dollar 424,000 346,476 Standard Chartered Bank 2/15/2013 898South Korean Won 147,455,500 134,329 JPMorgan Chase Bank 1/17/2013 1,779South Korean Won 561,974,000 517,614 Royal Bank of Canada 1/17/2013 1,110South Korean Won 64,092,000 59,076 Standard Chartered Bank 1/17/2013 83
South Korean Won 54,348,350 49,000 State Street Bank and Trust Company 1/17/2013 1,166
Swedish Krona 4,075,000 620,418 Deutsche Bank AG 1/22/2013 (8,761)Swedish Krona 8,279,000 1,217,191 Goldman Sachs 2/15/2013 24,741Swiss Franc 1,418,000 1,503,053 Citibank N.A. 2/15/2013 28,815Thailand Baht 29,440,000 955,146 Standard Chartered Bank 2/15/2013 184
Turkish Lira 159,000 87,084 State Street Bank and Trust Company 2/15/2013 1,129$47,729,712 ($9,828)
SellsAustralian Dollar 1,165,000 $1,195,278 UBS AG 12/12/2012 ($19,759)Australian Dollar 660,000 671,735 Citibank N.A. 1/9/2013 (15,113)Australian Dollar 340,000 350,409 UBS AG 1/9/2013 (3,422)Australian Dollar 1,459,000 1,511,097 Goldman Sachs 2/15/2013 (2,850)
Australian Dollar 49,624 51,293 State Street Bank and Trust Company 2/15/2013 (200)Australian Dollar 515,000 532,374 Royal Bank of Canada 2/21/2013 (1,772)Brazilian Real 3,300,000 1,585,243 Credit Suisse 12/4/2012 40,877Brazilian Real 750,000 365,212 Goldman Sachs 12/4/2012 14,220Brazilian Real 13,603,000 6,555,403 Bank of America N.A. 2/15/2013 252,152Brazilian Real 4,200,000 1,991,465 Citibank N.A. 3/4/2013 48,909Canadian Dollar 355,000 361,334 Goldman Sachs 12/5/2012 3,971Canadian Dollar 845,000 856,360 Royal Bank of Canada 12/5/2012 5,735
Canadian Dollar 433,000 431,722 Morgan Stanley & Company, Inc. 2/15/2013 (3,504)
Canadian Dollar 171,119 171,444 State Street Bank and Trust Company 2/15/2013 (555)
Chinese Yuan Renminbi 7,770,000 1,233,948 Standard Chartered Bank 1/9/2013 (9,911)
Chinese Yuan Renminbi 3,915,000 622,318 HSBC Bank USA 2/8/2013 (2,617)
Danish Krone 510,000 89,045 State Street Bank and Trust Company 2/15/2013 4Euro 268,481 348,368 Citibank N.A. 12/10/2012 (828)Euro 378,869 484,508 Deutsche Bank AG 12/10/2012 (8,262)Euro 409,647 529,123 JPMorgan Chase Bank 12/10/2012 (3,678)Euro 219,285 282,646 Royal Bank of Scotland PLC 12/10/2012 (2,564)
Euro 1,215,774 1,578,643 State Street Bank and Trust Company 12/10/2012 (2,635)Euro 5,432,000 6,853,337 UBS AG 12/10/2012 (211,707)Euro 585,000 766,716 UBS AG 1/22/2013 5,513Euro 2,245,000 2,907,690 UBS AG 2/5/2013 (13,895)Euro 699,892 901,707 Bank of America N.A. 2/15/2013 (9,210)Euro 657,177 837,441 HSBC Bank USA 2/15/2013 (17,882)
6,201,241 7,900,058 State Street Bank and Trust Company 2/15/2013 (170,919)
Copyright © 2013 www.secdatabase.com. All Rights Reserved.Please Consider the Environment Before Printing This Document
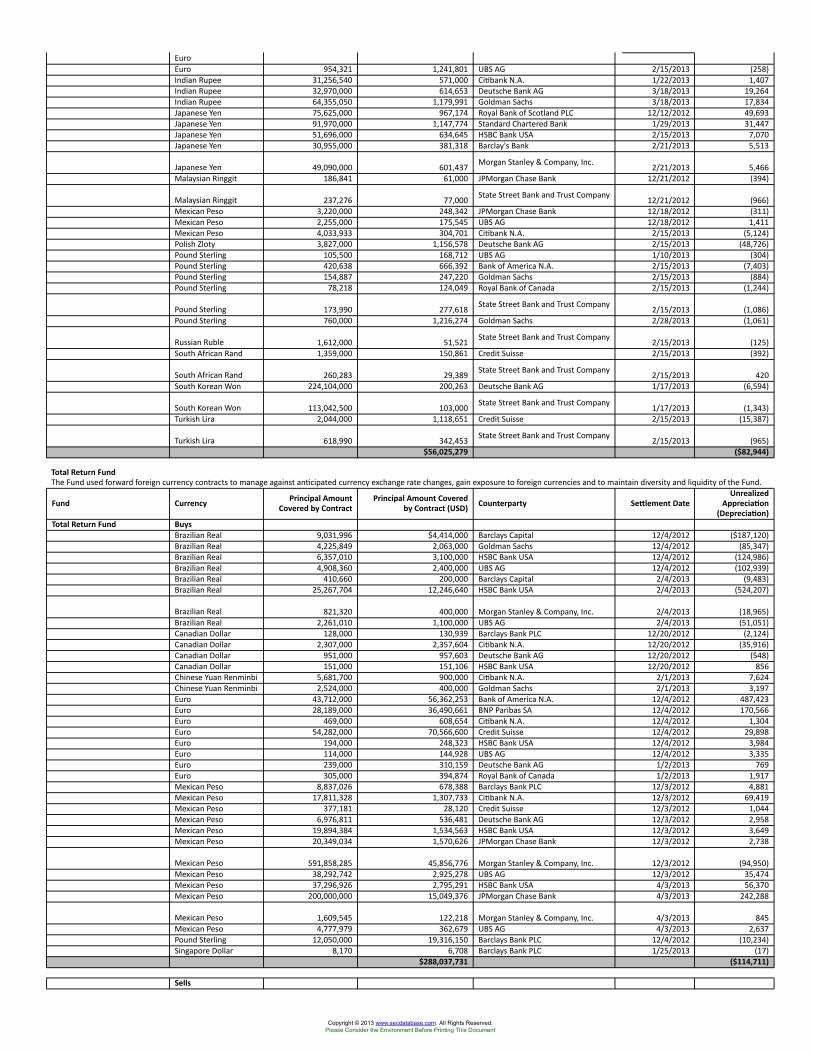
EuroEuro 954,321 1,241,801 UBS AG 2/15/2013 (258)Indian Rupee 31,256,540 571,000 Citibank N.A. 1/22/2013 1,407Indian Rupee 32,970,000 614,653 Deutsche Bank AG 3/18/2013 19,264Indian Rupee 64,355,050 1,179,991 Goldman Sachs 3/18/2013 17,834Japanese Yen 75,625,000 967,174 Royal Bank of Scotland PLC 12/12/2012 49,693Japanese Yen 91,970,000 1,147,774 Standard Chartered Bank 1/29/2013 31,447Japanese Yen 51,696,000 634,645 HSBC Bank USA 2/15/2013 7,070Japanese Yen 30,955,000 381,318 Barclay's Bank 2/21/2013 5,513
Japanese Yen 49,090,000 601,437 Morgan Stanley & Company, Inc. 2/21/2013 5,466Malaysian Ringgit 186,841 61,000 JPMorgan Chase Bank 12/21/2012 (394)
Malaysian Ringgit 237,276 77,000 State Street Bank and Trust Company 12/21/2012 (966)Mexican Peso 3,220,000 248,342 JPMorgan Chase Bank 12/18/2012 (311)Mexican Peso 2,255,000 175,545 UBS AG 12/18/2012 1,411Mexican Peso 4,033,933 304,701 Citibank N.A. 2/15/2013 (5,124)Polish Zloty 3,827,000 1,156,578 Deutsche Bank AG 2/15/2013 (48,726)Pound Sterling 105,500 168,712 UBS AG 1/10/2013 (304)Pound Sterling 420,638 666,392 Bank of America N.A. 2/15/2013 (7,403)Pound Sterling 154,887 247,220 Goldman Sachs 2/15/2013 (884)Pound Sterling 78,218 124,049 Royal Bank of Canada 2/15/2013 (1,244)
Pound Sterling 173,990 277,618 State Street Bank and Trust Company 2/15/2013 (1,086)Pound Sterling 760,000 1,216,274 Goldman Sachs 2/28/2013 (1,061)
Russian Ruble 1,612,000 51,521 State Street Bank and Trust Company 2/15/2013 (125)South African Rand 1,359,000 150,861 Credit Suisse 2/15/2013 (392)
South African Rand 260,283 29,389 State Street Bank and Trust Company 2/15/2013 420South Korean Won 224,104,000 200,263 Deutsche Bank AG 1/17/2013 (6,594)
South Korean Won 113,042,500 103,000 State Street Bank and Trust Company 1/17/2013 (1,343)Turkish Lira 2,044,000 1,118,651 Credit Suisse 2/15/2013 (15,387)
Turkish Lira 618,990 342,453 State Street Bank and Trust Company 2/15/2013 (965)$56,025,279 ($82,944)
Total Return FundThe Fund used forward foreign currency contracts to manage against anticipated currency exchange rate changes, gain exposure to foreign currencies and to maintain diversity and liquidity of the Fund.
Fund Currency Principal AmountCovered by Contract
Principal Amount Coveredby Contract (USD) Counterparty Settlement Date
UnrealizedAppreciation
(Depreciation)Total Return Fund Buys
Brazilian Real 9,031,996 $4,414,000 Barclays Capital 12/4/2012 ($187,120)Brazilian Real 4,225,849 2,063,000 Goldman Sachs 12/4/2012 (85,347)Brazilian Real 6,357,010 3,100,000 HSBC Bank USA 12/4/2012 (124,986)Brazilian Real 4,908,360 2,400,000 UBS AG 12/4/2012 (102,939)Brazilian Real 410,660 200,000 Barclays Capital 2/4/2013 (9,483)Brazilian Real 25,267,704 12,246,640 HSBC Bank USA 2/4/2013 (524,207)
Brazilian Real 821,320 400,000 Morgan Stanley & Company, Inc. 2/4/2013 (18,965)Brazilian Real 2,261,010 1,100,000 UBS AG 2/4/2013 (51,051)Canadian Dollar 128,000 130,939 Barclays Bank PLC 12/20/2012 (2,124)Canadian Dollar 2,307,000 2,357,604 Citibank N.A. 12/20/2012 (35,916)Canadian Dollar 951,000 957,603 Deutsche Bank AG 12/20/2012 (548)Canadian Dollar 151,000 151,106 HSBC Bank USA 12/20/2012 856Chinese Yuan Renminbi 5,681,700 900,000 Citibank N.A. 2/1/2013 7,624Chinese Yuan Renminbi 2,524,000 400,000 Goldman Sachs 2/1/2013 3,197Euro 43,712,000 56,362,253 Bank of America N.A. 12/4/2012 487,423Euro 28,189,000 36,490,661 BNP Paribas SA 12/4/2012 170,566Euro 469,000 608,654 Citibank N.A. 12/4/2012 1,304Euro 54,282,000 70,566,600 Credit Suisse 12/4/2012 29,898Euro 194,000 248,323 HSBC Bank USA 12/4/2012 3,984Euro 114,000 144,928 UBS AG 12/4/2012 3,335Euro 239,000 310,159 Deutsche Bank AG 1/2/2013 769Euro 305,000 394,874 Royal Bank of Canada 1/2/2013 1,917Mexican Peso 8,837,026 678,388 Barclays Bank PLC 12/3/2012 4,881Mexican Peso 17,811,328 1,307,733 Citibank N.A. 12/3/2012 69,419Mexican Peso 377,181 28,120 Credit Suisse 12/3/2012 1,044Mexican Peso 6,976,811 536,481 Deutsche Bank AG 12/3/2012 2,958Mexican Peso 19,894,384 1,534,563 HSBC Bank USA 12/3/2012 3,649Mexican Peso 20,349,034 1,570,626 JPMorgan Chase Bank 12/3/2012 2,738
Mexican Peso 591,858,285 45,856,776 Morgan Stanley & Company, Inc. 12/3/2012 (94,950)Mexican Peso 38,292,742 2,925,278 UBS AG 12/3/2012 35,474Mexican Peso 37,296,926 2,795,291 HSBC Bank USA 4/3/2013 56,370Mexican Peso 200,000,000 15,049,376 JPMorgan Chase Bank 4/3/2013 242,288
Mexican Peso 1,609,545 122,218 Morgan Stanley & Company, Inc. 4/3/2013 845Mexican Peso 4,777,979 362,679 UBS AG 4/3/2013 2,637Pound Sterling 12,050,000 19,316,150 Barclays Bank PLC 12/4/2012 (10,234)Singapore Dollar 8,170 6,708 Barclays Bank PLC 1/25/2013 (17)
$288,037,731 ($114,711)
Sells
Copyright © 2013 www.secdatabase.com. All Rights Reserved.Please Consider the Environment Before Printing This Document
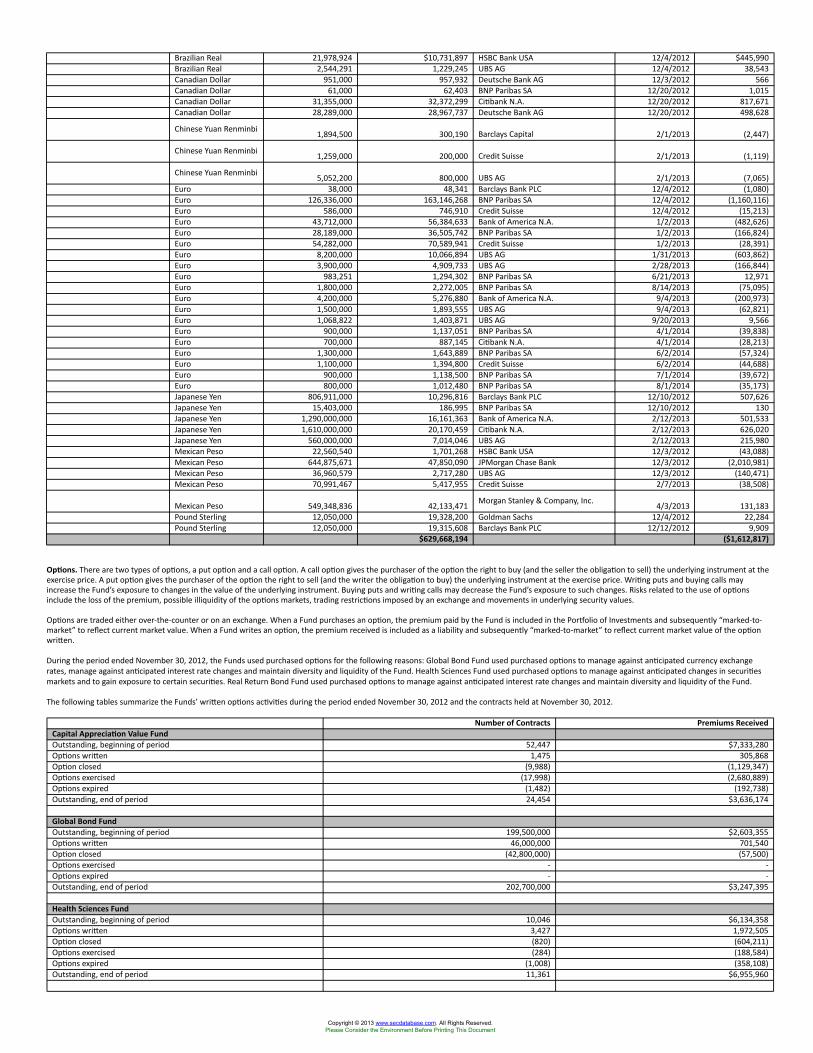
Brazilian Real 21,978,924 $10,731,897 HSBC Bank USA 12/4/2012 $445,990Brazilian Real 2,544,291 1,229,245 UBS AG 12/4/2012 38,543Canadian Dollar 951,000 957,932 Deutsche Bank AG 12/3/2012 566Canadian Dollar 61,000 62,403 BNP Paribas SA 12/20/2012 1,015Canadian Dollar 31,355,000 32,372,299 Citibank N.A. 12/20/2012 817,671Canadian Dollar 28,289,000 28,967,737 Deutsche Bank AG 12/20/2012 498,628
Chinese Yuan Renminbi 1,894,500 300,190 Barclays Capital 2/1/2013 (2,447)
Chinese Yuan Renminbi 1,259,000 200,000 Credit Suisse 2/1/2013 (1,119)
Chinese Yuan Renminbi 5,052,200 800,000 UBS AG 2/1/2013 (7,065)Euro 38,000 48,341 Barclays Bank PLC 12/4/2012 (1,080)Euro 126,336,000 163,146,268 BNP Paribas SA 12/4/2012 (1,160,116)Euro 586,000 746,910 Credit Suisse 12/4/2012 (15,213)Euro 43,712,000 56,384,633 Bank of America N.A. 1/2/2013 (482,626)Euro 28,189,000 36,505,742 BNP Paribas SA 1/2/2013 (166,824)Euro 54,282,000 70,589,941 Credit Suisse 1/2/2013 (28,391)Euro 8,200,000 10,066,894 UBS AG 1/31/2013 (603,862)Euro 3,900,000 4,909,733 UBS AG 2/28/2013 (166,844)Euro 983,251 1,294,302 BNP Paribas SA 6/21/2013 12,971Euro 1,800,000 2,272,005 BNP Paribas SA 8/14/2013 (75,095)Euro 4,200,000 5,276,880 Bank of America N.A. 9/4/2013 (200,973)Euro 1,500,000 1,893,555 UBS AG 9/4/2013 (62,821)Euro 1,068,822 1,403,871 UBS AG 9/20/2013 9,566Euro 900,000 1,137,051 BNP Paribas SA 4/1/2014 (39,838)Euro 700,000 887,145 Citibank N.A. 4/1/2014 (28,213)Euro 1,300,000 1,643,889 BNP Paribas SA 6/2/2014 (57,324)Euro 1,100,000 1,394,800 Credit Suisse 6/2/2014 (44,688)Euro 900,000 1,138,500 BNP Paribas SA 7/1/2014 (39,672)Euro 800,000 1,012,480 BNP Paribas SA 8/1/2014 (35,173)Japanese Yen 806,911,000 10,296,816 Barclays Bank PLC 12/10/2012 507,626Japanese Yen 15,403,000 186,995 BNP Paribas SA 12/10/2012 130Japanese Yen 1,290,000,000 16,161,363 Bank of America N.A. 2/12/2013 501,533Japanese Yen 1,610,000,000 20,170,459 Citibank N.A. 2/12/2013 626,020Japanese Yen 560,000,000 7,014,046 UBS AG 2/12/2013 215,980Mexican Peso 22,560,540 1,701,268 HSBC Bank USA 12/3/2012 (43,088)Mexican Peso 644,875,671 47,850,090 JPMorgan Chase Bank 12/3/2012 (2,010,981)Mexican Peso 36,960,579 2,717,280 UBS AG 12/3/2012 (140,471)Mexican Peso 70,991,467 5,417,955 Credit Suisse 2/7/2013 (38,508)
Mexican Peso 549,348,836 42,133,471 Morgan Stanley & Company, Inc. 4/3/2013 131,183Pound Sterling 12,050,000 19,328,200 Goldman Sachs 12/4/2012 22,284Pound Sterling 12,050,000 19,315,608 Barclays Bank PLC 12/12/2012 9,909
$629,668,194 ($1,612,817)
Options. There are two types of options, a put option and a call option. A call option gives the purchaser of the option the right to buy (and the seller the obligation to sell) the underlying instrument at theexercise price. A put option gives the purchaser of the option the right to sell (and the writer the obligation to buy) the underlying instrument at the exercise price. Writing puts and buying calls mayincrease the Fund’s exposure to changes in the value of the underlying instrument. Buying puts and writing calls may decrease the Fund’s exposure to such changes. Risks related to the use of optionsinclude the loss of the premium, possible illiquidity of the options markets, trading restrictions imposed by an exchange and movements in underlying security values.
Options are traded either over-the-counter or on an exchange. When a Fund purchases an option, the premium paid by the Fund is included in the Portfolio of Investments and subsequently “marked-to-market” to reflect current market value. When a Fund writes an option, the premium received is included as a liability and subsequently “marked-to-market” to reflect current market value of the optionwritten.
During the period ended November 30, 2012, the Funds used purchased options for the following reasons: Global Bond Fund used purchased options to manage against anticipated currency exchangerates, manage against anticipated interest rate changes and maintain diversity and liquidity of the Fund. Health Sciences Fund used purchased options to manage against anticipated changes in securitiesmarkets and to gain exposure to certain securities. Real Return Bond Fund used purchased options to manage against anticipated interest rate changes and maintain diversity and liquidity of the Fund.
The following tables summarize the Funds’ written options activities during the period ended November 30, 2012 and the contracts held at November 30, 2012.
Number of Contracts Premiums ReceivedCapital Appreciation Value FundOutstanding, beginning of period 52,447 $7,333,280Options written 1,475 305,868Option closed (9,988) (1,129,347)Options exercised (17,998) (2,680,889)Options expired (1,482) (192,738)Outstanding, end of period 24,454 $3,636,174
Global Bond FundOutstanding, beginning of period 199,500,000 $2,603,355Options written 46,000,000 701,540Option closed (42,800,000) (57,500)Options exercised - -Options expired - -Outstanding, end of period 202,700,000 $3,247,395
Health Sciences FundOutstanding, beginning of period 10,046 $6,134,358Options written 3,427 1,972,505Option closed (820) (604,211)Options exercised (284) (188,584)Options expired (1,008) (358,108)Outstanding, end of period 11,361 $6,955,960
Copyright © 2013 www.secdatabase.com. All Rights Reserved.Please Consider the Environment Before Printing This Document
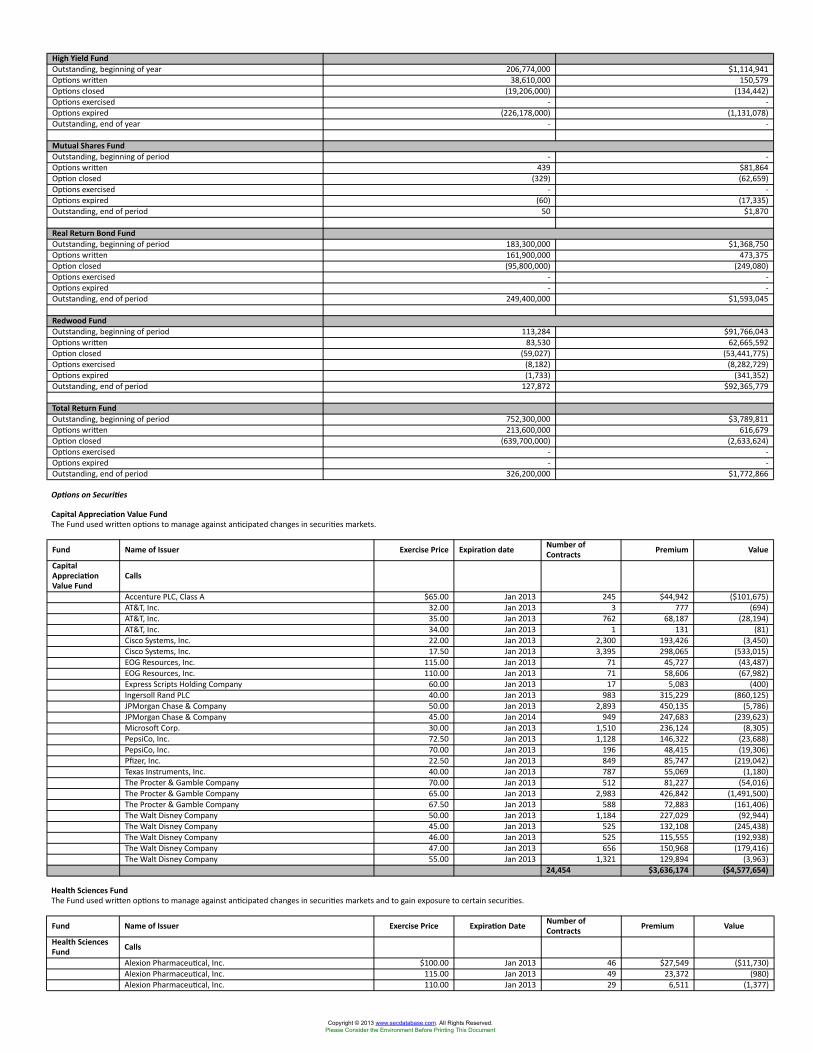
High Yield FundOutstanding, beginning of year 206,774,000 $1,114,941Options written 38,610,000 150,579Options closed (19,206,000) (134,442)Options exercised - -Options expired (226,178,000) (1,131,078)Outstanding, end of year - -
Mutual Shares FundOutstanding, beginning of period - -Options written 439 $81,864Option closed (329) (62,659)Options exercised - -Options expired (60) (17,335)Outstanding, end of period 50 $1,870
Real Return Bond FundOutstanding, beginning of period 183,300,000 $1,368,750Options written 161,900,000 473,375Option closed (95,800,000) (249,080)Options exercised - -Options expired - -Outstanding, end of period 249,400,000 $1,593,045
Redwood FundOutstanding, beginning of period 113,284 $91,766,043Options written 83,530 62,665,592Option closed (59,027) (53,441,775)Options exercised (8,182) (8,282,729)Options expired (1,733) (341,352)Outstanding, end of period 127,872 $92,365,779
Total Return FundOutstanding, beginning of period 752,300,000 $3,789,811Options written 213,600,000 616,679Option closed (639,700,000) (2,633,624)Options exercised - -Options expired - -Outstanding, end of period 326,200,000 $1,772,866
Options on Securities
Capital Appreciation Value FundThe Fund used written options to manage against anticipated changes in securities markets.
Fund Name of Issuer Exercise Price Expiration date Number ofContracts Premium Value
CapitalAppreciationValue Fund
Calls
Accenture PLC, Class A $65.00 Jan 2013 245 $44,942 ($101,675)AT&T, Inc. 32.00 Jan 2013 3 777 (694)AT&T, Inc. 35.00 Jan 2013 762 68,187 (28,194)AT&T, Inc. 34.00 Jan 2013 1 131 (81)Cisco Systems, Inc. 22.00 Jan 2013 2,300 193,426 (3,450)Cisco Systems, Inc. 17.50 Jan 2013 3,395 298,065 (533,015)EOG Resources, Inc. 115.00 Jan 2013 71 45,727 (43,487)EOG Resources, Inc. 110.00 Jan 2013 71 58,606 (67,982)Express Scripts Holding Company 60.00 Jan 2013 17 5,083 (400)Ingersoll Rand PLC 40.00 Jan 2013 983 315,229 (860,125)JPMorgan Chase & Company 50.00 Jan 2013 2,893 450,135 (5,786)JPMorgan Chase & Company 45.00 Jan 2014 949 247,683 (239,623)Microsoft Corp. 30.00 Jan 2013 1,510 236,124 (8,305)PepsiCo, Inc. 72.50 Jan 2013 1,128 146,322 (23,688)PepsiCo, Inc. 70.00 Jan 2013 196 48,415 (19,306)Pfizer, Inc. 22.50 Jan 2013 849 85,747 (219,042)Texas Instruments, Inc. 40.00 Jan 2013 787 55,069 (1,180)The Procter & Gamble Company 70.00 Jan 2013 512 81,227 (54,016)The Procter & Gamble Company 65.00 Jan 2013 2,983 426,842 (1,491,500)The Procter & Gamble Company 67.50 Jan 2013 588 72,883 (161,406)The Walt Disney Company 50.00 Jan 2013 1,184 227,029 (92,944)The Walt Disney Company 45.00 Jan 2013 525 132,108 (245,438)The Walt Disney Company 46.00 Jan 2013 525 115,555 (192,938)The Walt Disney Company 47.00 Jan 2013 656 150,968 (179,416)The Walt Disney Company 55.00 Jan 2013 1,321 129,894 (3,963)
24,454 $3,636,174 ($4,577,654)
Health Sciences FundThe Fund used written options to manage against anticipated changes in securities markets and to gain exposure to certain securities.
Fund Name of Issuer Exercise Price Expiration Date Number ofContracts Premium Value
Health SciencesFund Calls
Alexion Pharmaceutical, Inc. $100.00 Jan 2013 46 $27,549 ($11,730)Alexion Pharmaceutical, Inc. 115.00 Jan 2013 49 23,372 (980)Alexion Pharmaceutical, Inc. 110.00 Jan 2013 29 6,511 (1,377)
Copyright © 2013 www.secdatabase.com. All Rights Reserved.Please Consider the Environment Before Printing This Document
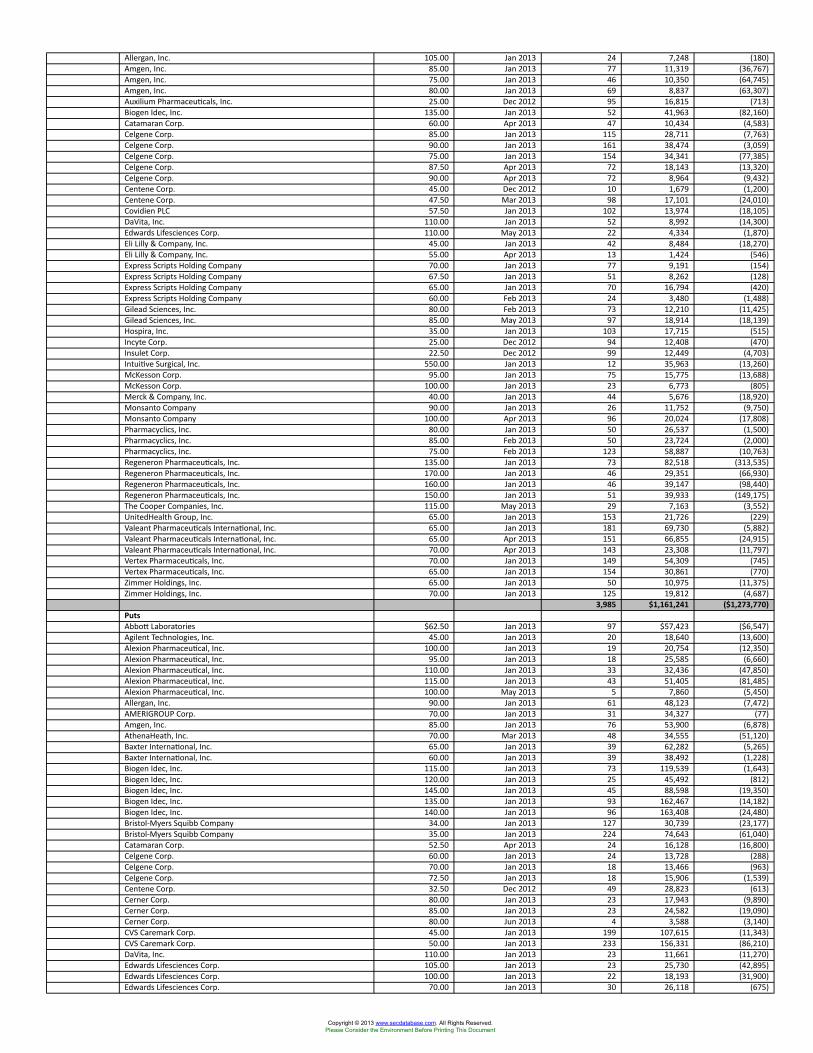
Allergan, Inc. 105.00 Jan 2013 24 7,248 (180)Amgen, Inc. 85.00 Jan 2013 77 11,319 (36,767)Amgen, Inc. 75.00 Jan 2013 46 10,350 (64,745)Amgen, Inc. 80.00 Jan 2013 69 8,837 (63,307)Auxilium Pharmaceuticals, Inc. 25.00 Dec 2012 95 16,815 (713)Biogen Idec, Inc. 135.00 Jan 2013 52 41,963 (82,160)Catamaran Corp. 60.00 Apr 2013 47 10,434 (4,583)Celgene Corp. 85.00 Jan 2013 115 28,711 (7,763)Celgene Corp. 90.00 Jan 2013 161 38,474 (3,059)Celgene Corp. 75.00 Jan 2013 154 34,341 (77,385)Celgene Corp. 87.50 Apr 2013 72 18,143 (13,320)Celgene Corp. 90.00 Apr 2013 72 8,964 (9,432)Centene Corp. 45.00 Dec 2012 10 1,679 (1,200)Centene Corp. 47.50 Mar 2013 98 17,101 (24,010)Covidien PLC 57.50 Jan 2013 102 13,974 (18,105)DaVita, Inc. 110.00 Jan 2013 52 8,992 (14,300)Edwards Lifesciences Corp. 110.00 May 2013 22 4,334 (1,870)Eli Lilly & Company, Inc. 45.00 Jan 2013 42 8,484 (18,270)Eli Lilly & Company, Inc. 55.00 Apr 2013 13 1,424 (546)Express Scripts Holding Company 70.00 Jan 2013 77 9,191 (154)Express Scripts Holding Company 67.50 Jan 2013 51 8,262 (128)Express Scripts Holding Company 65.00 Jan 2013 70 16,794 (420)Express Scripts Holding Company 60.00 Feb 2013 24 3,480 (1,488)Gilead Sciences, Inc. 80.00 Feb 2013 73 12,210 (11,425)Gilead Sciences, Inc. 85.00 May 2013 97 18,914 (18,139)Hospira, Inc. 35.00 Jan 2013 103 17,715 (515)Incyte Corp. 25.00 Dec 2012 94 12,408 (470)Insulet Corp. 22.50 Dec 2012 99 12,449 (4,703)Intuitive Surgical, Inc. 550.00 Jan 2013 12 35,963 (13,260)McKesson Corp. 95.00 Jan 2013 75 15,775 (13,688)McKesson Corp. 100.00 Jan 2013 23 6,773 (805)Merck & Company, Inc. 40.00 Jan 2013 44 5,676 (18,920)Monsanto Company 90.00 Jan 2013 26 11,752 (9,750)Monsanto Company 100.00 Apr 2013 96 20,024 (17,808)Pharmacyclics, Inc. 80.00 Jan 2013 50 26,537 (1,500)Pharmacyclics, Inc. 85.00 Feb 2013 50 23,724 (2,000)Pharmacyclics, Inc. 75.00 Feb 2013 123 58,887 (10,763)Regeneron Pharmaceuticals, Inc. 135.00 Jan 2013 73 82,518 (313,535)Regeneron Pharmaceuticals, Inc. 170.00 Jan 2013 46 29,351 (66,930)Regeneron Pharmaceuticals, Inc. 160.00 Jan 2013 46 39,147 (98,440)Regeneron Pharmaceuticals, Inc. 150.00 Jan 2013 51 39,933 (149,175)The Cooper Companies, Inc. 115.00 May 2013 29 7,163 (3,552)UnitedHealth Group, Inc. 65.00 Jan 2013 153 21,726 (229)Valeant Pharmaceuticals International, Inc. 65.00 Jan 2013 181 69,730 (5,882)Valeant Pharmaceuticals International, Inc. 65.00 Apr 2013 151 66,855 (24,915)Valeant Pharmaceuticals International, Inc. 70.00 Apr 2013 143 23,308 (11,797)Vertex Pharmaceuticals, Inc. 70.00 Jan 2013 149 54,309 (745)Vertex Pharmaceuticals, Inc. 65.00 Jan 2013 154 30,861 (770)Zimmer Holdings, Inc. 65.00 Jan 2013 50 10,975 (11,375)Zimmer Holdings, Inc. 70.00 Jan 2013 125 19,812 (4,687)
3,985 $1,161,241 ($1,273,770)PutsAbbott Laboratories $62.50 Jan 2013 97 $57,423 ($6,547)Agilent Technologies, Inc. 45.00 Jan 2013 20 18,640 (13,600)Alexion Pharmaceutical, Inc. 100.00 Jan 2013 19 20,754 (12,350)Alexion Pharmaceutical, Inc. 95.00 Jan 2013 18 25,585 (6,660)Alexion Pharmaceutical, Inc. 110.00 Jan 2013 33 32,436 (47,850)Alexion Pharmaceutical, Inc. 115.00 Jan 2013 43 51,405 (81,485)Alexion Pharmaceutical, Inc. 100.00 May 2013 5 7,860 (5,450)Allergan, Inc. 90.00 Jan 2013 61 48,123 (7,472)AMERIGROUP Corp. 70.00 Jan 2013 31 34,327 (77)Amgen, Inc. 85.00 Jan 2013 76 53,900 (6,878)AthenaHeath, Inc. 70.00 Mar 2013 48 34,555 (51,120)Baxter International, Inc. 65.00 Jan 2013 39 62,282 (5,265)Baxter International, Inc. 60.00 Jan 2013 39 38,492 (1,228)Biogen Idec, Inc. 115.00 Jan 2013 73 119,539 (1,643)Biogen Idec, Inc. 120.00 Jan 2013 25 45,492 (812)Biogen Idec, Inc. 145.00 Jan 2013 45 88,598 (19,350)Biogen Idec, Inc. 135.00 Jan 2013 93 162,467 (14,182)Biogen Idec, Inc. 140.00 Jan 2013 96 163,408 (24,480)Bristol-Myers Squibb Company 34.00 Jan 2013 127 30,739 (23,177)Bristol-Myers Squibb Company 35.00 Jan 2013 224 74,643 (61,040)Catamaran Corp. 52.50 Apr 2013 24 16,128 (16,800)Celgene Corp. 60.00 Jan 2013 24 13,728 (288)Celgene Corp. 70.00 Jan 2013 18 13,466 (963)Celgene Corp. 72.50 Jan 2013 18 15,906 (1,539)Centene Corp. 32.50 Dec 2012 49 28,823 (613)Cerner Corp. 80.00 Jan 2013 23 17,943 (9,890)Cerner Corp. 85.00 Jan 2013 23 24,582 (19,090)Cerner Corp. 80.00 Jun 2013 4 3,588 (3,140)CVS Caremark Corp. 45.00 Jan 2013 199 107,615 (11,343)CVS Caremark Corp. 50.00 Jan 2013 233 156,331 (86,210)DaVita, Inc. 110.00 Jan 2013 23 11,661 (11,270)Edwards Lifesciences Corp. 105.00 Jan 2013 23 25,730 (42,895)Edwards Lifesciences Corp. 100.00 Jan 2013 22 18,193 (31,900)Edwards Lifesciences Corp. 70.00 Jan 2013 30 26,118 (675)
Copyright © 2013 www.secdatabase.com. All Rights Reserved.Please Consider the Environment Before Printing This Document
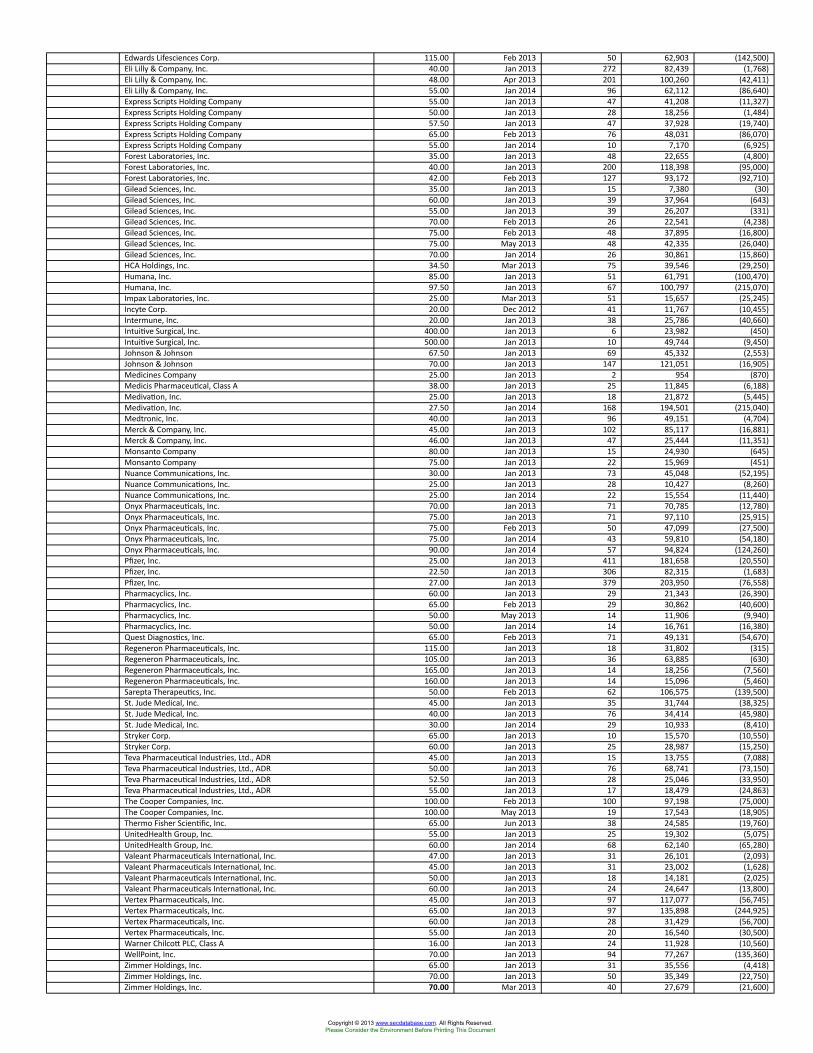
Edwards Lifesciences Corp. 115.00 Feb 2013 50 62,903 (142,500)Eli Lilly & Company, Inc. 40.00 Jan 2013 272 82,439 (1,768)Eli Lilly & Company, Inc. 48.00 Apr 2013 201 100,260 (42,411)Eli Lilly & Company, Inc. 55.00 Jan 2014 96 62,112 (86,640)Express Scripts Holding Company 55.00 Jan 2013 47 41,208 (11,327)Express Scripts Holding Company 50.00 Jan 2013 28 18,256 (1,484)Express Scripts Holding Company 57.50 Jan 2013 47 37,928 (19,740)Express Scripts Holding Company 65.00 Feb 2013 76 48,031 (86,070)Express Scripts Holding Company 55.00 Jan 2014 10 7,170 (6,925)Forest Laboratories, Inc. 35.00 Jan 2013 48 22,655 (4,800)Forest Laboratories, Inc. 40.00 Jan 2013 200 118,398 (95,000)Forest Laboratories, Inc. 42.00 Feb 2013 127 93,172 (92,710)Gilead Sciences, Inc. 35.00 Jan 2013 15 7,380 (30)Gilead Sciences, Inc. 60.00 Jan 2013 39 37,964 (643)Gilead Sciences, Inc. 55.00 Jan 2013 39 26,207 (331)Gilead Sciences, Inc. 70.00 Feb 2013 26 22,541 (4,238)Gilead Sciences, Inc. 75.00 Feb 2013 48 37,895 (16,800)Gilead Sciences, Inc. 75.00 May 2013 48 42,335 (26,040)Gilead Sciences, Inc. 70.00 Jan 2014 26 30,861 (15,860)HCA Holdings, Inc. 34.50 Mar 2013 75 39,546 (29,250)Humana, Inc. 85.00 Jan 2013 51 61,791 (100,470)Humana, Inc. 97.50 Jan 2013 67 100,797 (215,070)Impax Laboratories, Inc. 25.00 Mar 2013 51 15,657 (25,245)Incyte Corp. 20.00 Dec 2012 41 11,767 (10,455)Intermune, Inc. 20.00 Jan 2013 38 25,786 (40,660)Intuitive Surgical, Inc. 400.00 Jan 2013 6 23,982 (450)Intuitive Surgical, Inc. 500.00 Jan 2013 10 49,744 (9,450)Johnson & Johnson 67.50 Jan 2013 69 45,332 (2,553)Johnson & Johnson 70.00 Jan 2013 147 121,051 (16,905)Medicines Company 25.00 Jan 2013 2 954 (870)Medicis Pharmaceutical, Class A 38.00 Jan 2013 25 11,845 (6,188)Medivation, Inc. 25.00 Jan 2013 18 21,872 (5,445)Medivation, Inc. 27.50 Jan 2014 168 194,501 (215,040)Medtronic, Inc. 40.00 Jan 2013 96 49,151 (4,704)Merck & Company, Inc. 45.00 Jan 2013 102 85,117 (16,881)Merck & Company, Inc. 46.00 Jan 2013 47 25,444 (11,351)Monsanto Company 80.00 Jan 2013 15 24,930 (645)Monsanto Company 75.00 Jan 2013 22 15,969 (451)Nuance Communications, Inc. 30.00 Jan 2013 73 45,048 (52,195)Nuance Communications, Inc. 25.00 Jan 2013 28 10,427 (8,260)Nuance Communications, Inc. 25.00 Jan 2014 22 15,554 (11,440)Onyx Pharmaceuticals, Inc. 70.00 Jan 2013 71 70,785 (12,780)Onyx Pharmaceuticals, Inc. 75.00 Jan 2013 71 97,110 (25,915)Onyx Pharmaceuticals, Inc. 75.00 Feb 2013 50 47,099 (27,500)Onyx Pharmaceuticals, Inc. 75.00 Jan 2014 43 59,810 (54,180)Onyx Pharmaceuticals, Inc. 90.00 Jan 2014 57 94,824 (124,260)Pfizer, Inc. 25.00 Jan 2013 411 181,658 (20,550)Pfizer, Inc. 22.50 Jan 2013 306 82,315 (1,683)Pfizer, Inc. 27.00 Jan 2013 379 203,950 (76,558)Pharmacyclics, Inc. 60.00 Jan 2013 29 21,343 (26,390)Pharmacyclics, Inc. 65.00 Feb 2013 29 30,862 (40,600)Pharmacyclics, Inc. 50.00 May 2013 14 11,906 (9,940)Pharmacyclics, Inc. 50.00 Jan 2014 14 16,761 (16,380)Quest Diagnostics, Inc. 65.00 Feb 2013 71 49,131 (54,670)Regeneron Pharmaceuticals, Inc. 115.00 Jan 2013 18 31,802 (315)Regeneron Pharmaceuticals, Inc. 105.00 Jan 2013 36 63,885 (630)Regeneron Pharmaceuticals, Inc. 165.00 Jan 2013 14 18,256 (7,560)Regeneron Pharmaceuticals, Inc. 160.00 Jan 2013 14 15,096 (5,460)Sarepta Therapeutics, Inc. 50.00 Feb 2013 62 106,575 (139,500)St. Jude Medical, Inc. 45.00 Jan 2013 35 31,744 (38,325)St. Jude Medical, Inc. 40.00 Jan 2013 76 34,414 (45,980)St. Jude Medical, Inc. 30.00 Jan 2014 29 10,933 (8,410)Stryker Corp. 65.00 Jan 2013 10 15,570 (10,550)Stryker Corp. 60.00 Jan 2013 25 28,987 (15,250)Teva Pharmaceutical Industries, Ltd., ADR 45.00 Jan 2013 15 13,755 (7,088)Teva Pharmaceutical Industries, Ltd., ADR 50.00 Jan 2013 76 68,741 (73,150)Teva Pharmaceutical Industries, Ltd., ADR 52.50 Jan 2013 28 25,046 (33,950)Teva Pharmaceutical Industries, Ltd., ADR 55.00 Jan 2013 17 18,479 (24,863)The Cooper Companies, Inc. 100.00 Feb 2013 100 97,198 (75,000)The Cooper Companies, Inc. 100.00 May 2013 19 17,543 (18,905)Thermo Fisher Scientific, Inc. 65.00 Jun 2013 38 24,585 (19,760)UnitedHealth Group, Inc. 55.00 Jan 2013 25 19,302 (5,075)UnitedHealth Group, Inc. 60.00 Jan 2014 68 62,140 (65,280)Valeant Pharmaceuticals International, Inc. 47.00 Jan 2013 31 26,101 (2,093)Valeant Pharmaceuticals International, Inc. 45.00 Jan 2013 31 23,002 (1,628)Valeant Pharmaceuticals International, Inc. 50.00 Jan 2013 18 14,181 (2,025)Valeant Pharmaceuticals International, Inc. 60.00 Jan 2013 24 24,647 (13,800)Vertex Pharmaceuticals, Inc. 45.00 Jan 2013 97 117,077 (56,745)Vertex Pharmaceuticals, Inc. 65.00 Jan 2013 97 135,898 (244,925)Vertex Pharmaceuticals, Inc. 60.00 Jan 2013 28 31,429 (56,700)Vertex Pharmaceuticals, Inc. 55.00 Jan 2013 20 16,540 (30,500)Warner Chilcott PLC, Class A 16.00 Jan 2013 24 11,928 (10,560)WellPoint, Inc. 70.00 Jan 2013 94 77,267 (135,360)Zimmer Holdings, Inc. 65.00 Jan 2013 31 35,556 (4,418)Zimmer Holdings, Inc. 70.00 Jan 2013 50 35,349 (22,750)Zimmer Holdings, Inc. 70.00 Mar 2013 40 27,679 (21,600)
Copyright © 2013 www.secdatabase.com. All Rights Reserved.Please Consider the Environment Before Printing This Document
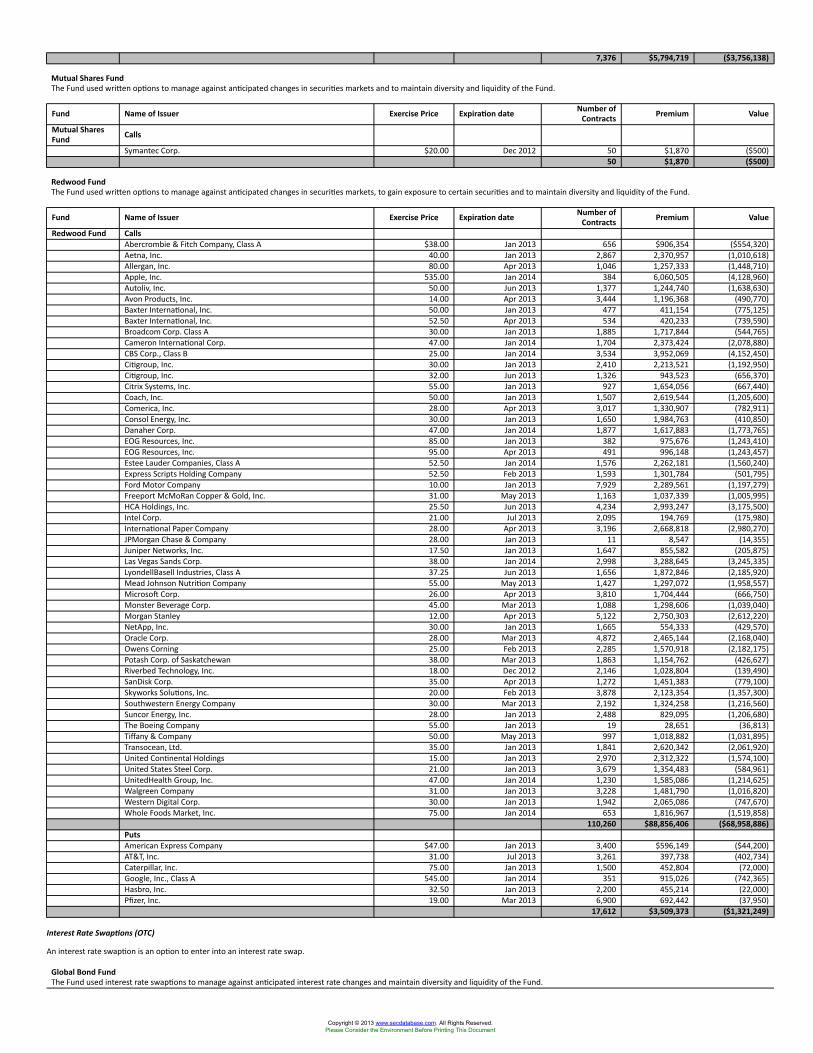
7,376 $5,794,719 ($3,756,138)
Mutual Shares FundThe Fund used written options to manage against anticipated changes in securities markets and to maintain diversity and liquidity of the Fund.
Fund Name of Issuer Exercise Price Expiration date Number ofContracts Premium Value
Mutual SharesFund Calls
Symantec Corp. $20.00 Dec 2012 50 $1,870 ($500)50 $1,870 ($500)
Redwood FundThe Fund used written options to manage against anticipated changes in securities markets, to gain exposure to certain securities and to maintain diversity and liquidity of the Fund.
Fund Name of Issuer Exercise Price Expiration date Number ofContracts Premium Value
Redwood Fund CallsAbercrombie & Fitch Company, Class A $38.00 Jan 2013 656 $906,354 ($554,320)Aetna, Inc. 40.00 Jan 2013 2,867 2,370,957 (1,010,618)Allergan, Inc. 80.00 Apr 2013 1,046 1,257,333 (1,448,710)Apple, Inc. 535.00 Jan 2014 384 6,060,505 (4,128,960)Autoliv, Inc. 50.00 Jun 2013 1,377 1,244,740 (1,638,630)Avon Products, Inc. 14.00 Apr 2013 3,444 1,196,368 (490,770)Baxter International, Inc. 50.00 Jan 2013 477 411,154 (775,125)Baxter International, Inc. 52.50 Apr 2013 534 420,233 (739,590)Broadcom Corp. Class A 30.00 Jan 2013 1,885 1,717,844 (544,765)Cameron International Corp. 47.00 Jan 2014 1,704 2,373,424 (2,078,880)CBS Corp., Class B 25.00 Jan 2014 3,534 3,952,069 (4,152,450)Citigroup, Inc. 30.00 Jan 2013 2,410 2,213,521 (1,192,950)Citigroup, Inc. 32.00 Jun 2013 1,326 943,523 (656,370)Citrix Systems, Inc. 55.00 Jan 2013 927 1,654,056 (667,440)Coach, Inc. 50.00 Jan 2013 1,507 2,619,544 (1,205,600)Comerica, Inc. 28.00 Apr 2013 3,017 1,330,907 (782,911)Consol Energy, Inc. 30.00 Jan 2013 1,650 1,984,763 (410,850)Danaher Corp. 47.00 Jan 2014 1,877 1,617,883 (1,773,765)EOG Resources, Inc. 85.00 Jan 2013 382 975,676 (1,243,410)EOG Resources, Inc. 95.00 Apr 2013 491 996,148 (1,243,457)Estee Lauder Companies, Class A 52.50 Jan 2014 1,576 2,262,181 (1,560,240)Express Scripts Holding Company 52.50 Feb 2013 1,593 1,301,784 (501,795)Ford Motor Company 10.00 Jan 2013 7,929 2,289,561 (1,197,279)Freeport McMoRan Copper & Gold, Inc. 31.00 May 2013 1,163 1,037,339 (1,005,995)HCA Holdings, Inc. 25.50 Jun 2013 4,234 2,993,247 (3,175,500)Intel Corp. 21.00 Jul 2013 2,095 194,769 (175,980)International Paper Company 28.00 Apr 2013 3,196 2,668,818 (2,980,270)JPMorgan Chase & Company 28.00 Jan 2013 11 8,547 (14,355)Juniper Networks, Inc. 17.50 Jan 2013 1,647 855,582 (205,875)Las Vegas Sands Corp. 38.00 Jan 2014 2,998 3,288,645 (3,245,335)LyondellBasell Industries, Class A 37.25 Jun 2013 1,656 1,872,846 (2,185,920)Mead Johnson Nutrition Company 55.00 May 2013 1,427 1,297,072 (1,958,557)Microsoft Corp. 26.00 Apr 2013 3,810 1,704,444 (666,750)Monster Beverage Corp. 45.00 Mar 2013 1,088 1,298,606 (1,039,040)Morgan Stanley 12.00 Apr 2013 5,122 2,750,303 (2,612,220)NetApp, Inc. 30.00 Jan 2013 1,665 554,333 (429,570)Oracle Corp. 28.00 Mar 2013 4,872 2,465,144 (2,168,040)Owens Corning 25.00 Feb 2013 2,285 1,570,918 (2,182,175)Potash Corp. of Saskatchewan 38.00 Mar 2013 1,863 1,154,762 (426,627)Riverbed Technology, Inc. 18.00 Dec 2012 2,146 1,028,804 (139,490)SanDisk Corp. 35.00 Apr 2013 1,272 1,451,383 (779,100)Skyworks Solutions, Inc. 20.00 Feb 2013 3,878 2,123,354 (1,357,300)Southwestern Energy Company 30.00 Mar 2013 2,192 1,324,258 (1,216,560)Suncor Energy, Inc. 28.00 Jan 2013 2,488 829,095 (1,206,680)The Boeing Company 55.00 Jan 2013 19 28,651 (36,813)Tiffany & Company 50.00 May 2013 997 1,018,882 (1,031,895)Transocean, Ltd. 35.00 Jan 2013 1,841 2,620,342 (2,061,920)United Continental Holdings 15.00 Jan 2013 2,970 2,312,322 (1,574,100)United States Steel Corp. 21.00 Jan 2013 3,679 1,354,483 (584,961)UnitedHealth Group, Inc. 47.00 Jan 2014 1,230 1,585,086 (1,214,625)Walgreen Company 31.00 Jan 2013 3,228 1,481,790 (1,016,820)Western Digital Corp. 30.00 Jan 2013 1,942 2,065,086 (747,670)Whole Foods Market, Inc. 75.00 Jan 2014 653 1,816,967 (1,519,858)
110,260 $88,856,406 ($68,958,886)PutsAmerican Express Company $47.00 Jan 2013 3,400 $596,149 ($44,200)AT&T, Inc. 31.00 Jul 2013 3,261 397,738 (402,734)Caterpillar, Inc. 75.00 Jan 2013 1,500 452,804 (72,000)Google, Inc., Class A 545.00 Jan 2014 351 915,026 (742,365)Hasbro, Inc. 32.50 Jan 2013 2,200 455,214 (22,000)Pfizer, Inc. 19.00 Mar 2013 6,900 692,442 (37,950)
17,612 $3,509,373 ($1,321,249)
Interest Rate Swaptions (OTC)
An interest rate swaption is an option to enter into an interest rate swap.
Global Bond FundThe Fund used interest rate swaptions to manage against anticipated interest rate changes and maintain diversity and liquidity of the Fund.
Copyright © 2013 www.secdatabase.com. All Rights Reserved.Please Consider the Environment Before Printing This Document
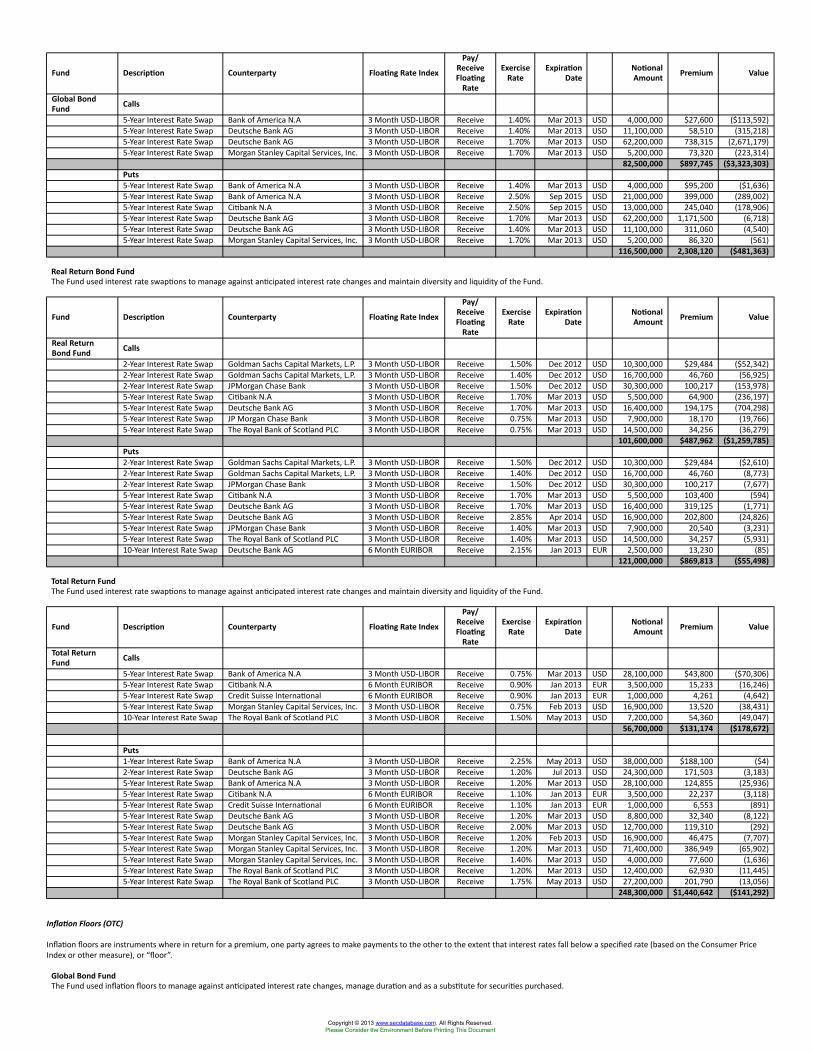
Fund Description Counterparty Floating Rate Index
Pay/ReceiveFloating
Rate
ExerciseRate
ExpirationDate
NotionalAmount Premium Value
Global BondFund Calls
5-Year Interest Rate Swap Bank of America N.A 3 Month USD-LIBOR Receive 1.40% Mar 2013 USD 4,000,000 $27,600 ($113,592)5-Year Interest Rate Swap Deutsche Bank AG 3 Month USD-LIBOR Receive 1.40% Mar 2013 USD 11,100,000 58,510 (315,218)5-Year Interest Rate Swap Deutsche Bank AG 3 Month USD-LIBOR Receive 1.70% Mar 2013 USD 62,200,000 738,315 (2,671,179)5-Year Interest Rate Swap Morgan Stanley Capital Services, Inc. 3 Month USD-LIBOR Receive 1.70% Mar 2013 USD 5,200,000 73,320 (223,314)
82,500,000 $897,745 ($3,323,303)Puts5-Year Interest Rate Swap Bank of America N.A 3 Month USD-LIBOR Receive 1.40% Mar 2013 USD 4,000,000 $95,200 ($1,636)5-Year Interest Rate Swap Bank of America N.A 3 Month USD-LIBOR Receive 2.50% Sep 2015 USD 21,000,000 399,000 (289,002)5-Year Interest Rate Swap Citibank N.A 3 Month USD-LIBOR Receive 2.50% Sep 2015 USD 13,000,000 245,040 (178,906)5-Year Interest Rate Swap Deutsche Bank AG 3 Month USD-LIBOR Receive 1.70% Mar 2013 USD 62,200,000 1,171,500 (6,718)5-Year Interest Rate Swap Deutsche Bank AG 3 Month USD-LIBOR Receive 1.40% Mar 2013 USD 11,100,000 311,060 (4,540)5-Year Interest Rate Swap Morgan Stanley Capital Services, Inc. 3 Month USD-LIBOR Receive 1.70% Mar 2013 USD 5,200,000 86,320 (561)
116,500,000 2,308,120 ($481,363)
Real Return Bond FundThe Fund used interest rate swaptions to manage against anticipated interest rate changes and maintain diversity and liquidity of the Fund.
Fund Description Counterparty Floating Rate Index
Pay/ReceiveFloating
Rate
ExerciseRate
ExpirationDate
NotionalAmount Premium Value
Real ReturnBond Fund Calls
2-Year Interest Rate Swap Goldman Sachs Capital Markets, L.P. 3 Month USD-LIBOR Receive 1.50% Dec 2012 USD 10,300,000 $29,484 ($52,342)2-Year Interest Rate Swap Goldman Sachs Capital Markets, L.P. 3 Month USD-LIBOR Receive 1.40% Dec 2012 USD 16,700,000 46,760 (56,925)2-Year Interest Rate Swap JPMorgan Chase Bank 3 Month USD-LIBOR Receive 1.50% Dec 2012 USD 30,300,000 100,217 (153,978)5-Year Interest Rate Swap Citibank N.A 3 Month USD-LIBOR Receive 1.70% Mar 2013 USD 5,500,000 64,900 (236,197)5-Year Interest Rate Swap Deutsche Bank AG 3 Month USD-LIBOR Receive 1.70% Mar 2013 USD 16,400,000 194,175 (704,298)5-Year Interest Rate Swap JP Morgan Chase Bank 3 Month USD-LIBOR Receive 0.75% Mar 2013 USD 7,900,000 18,170 (19,766)5-Year Interest Rate Swap The Royal Bank of Scotland PLC 3 Month USD-LIBOR Receive 0.75% Mar 2013 USD 14,500,000 34,256 (36,279)
101,600,000 $487,962 ($1,259,785)Puts2-Year Interest Rate Swap Goldman Sachs Capital Markets, L.P. 3 Month USD-LIBOR Receive 1.50% Dec 2012 USD 10,300,000 $29,484 ($2,610)2-Year Interest Rate Swap Goldman Sachs Capital Markets, L.P. 3 Month USD-LIBOR Receive 1.40% Dec 2012 USD 16,700,000 46,760 (8,773)2-Year Interest Rate Swap JPMorgan Chase Bank 3 Month USD-LIBOR Receive 1.50% Dec 2012 USD 30,300,000 100,217 (7,677)5-Year Interest Rate Swap Citibank N.A 3 Month USD-LIBOR Receive 1.70% Mar 2013 USD 5,500,000 103,400 (594)5-Year Interest Rate Swap Deutsche Bank AG 3 Month USD-LIBOR Receive 1.70% Mar 2013 USD 16,400,000 319,125 (1,771)5-Year Interest Rate Swap Deutsche Bank AG 3 Month USD-LIBOR Receive 2.85% Apr 2014 USD 16,900,000 202,800 (24,826)5-Year Interest Rate Swap JPMorgan Chase Bank 3 Month USD-LIBOR Receive 1.40% Mar 2013 USD 7,900,000 20,540 (3,231)5-Year Interest Rate Swap The Royal Bank of Scotland PLC 3 Month USD-LIBOR Receive 1.40% Mar 2013 USD 14,500,000 34,257 (5,931)10-Year Interest Rate Swap Deutsche Bank AG 6 Month EURIBOR Receive 2.15% Jan 2013 EUR 2,500,000 13,230 (85)
121,000,000 $869,813 ($55,498)
Total Return FundThe Fund used interest rate swaptions to manage against anticipated interest rate changes and maintain diversity and liquidity of the Fund.
Fund Description Counterparty Floating Rate Index
Pay/ReceiveFloating
Rate
ExerciseRate
ExpirationDate
NotionalAmount Premium Value
Total ReturnFund Calls
5-Year Interest Rate Swap Bank of America N.A 3 Month USD-LIBOR Receive 0.75% Mar 2013 USD 28,100,000 $43,800 ($70,306)5-Year Interest Rate Swap Citibank N.A 6 Month EURIBOR Receive 0.90% Jan 2013 EUR 3,500,000 15,233 (16,246)5-Year Interest Rate Swap Credit Suisse International 6 Month EURIBOR Receive 0.90% Jan 2013 EUR 1,000,000 4,261 (4,642)5-Year Interest Rate Swap Morgan Stanley Capital Services, Inc. 3 Month USD-LIBOR Receive 0.75% Feb 2013 USD 16,900,000 13,520 (38,431)10-Year Interest Rate Swap The Royal Bank of Scotland PLC 3 Month USD-LIBOR Receive 1.50% May 2013 USD 7,200,000 54,360 (49,047)
56,700,000 $131,174 ($178,672)
Puts1-Year Interest Rate Swap Bank of America N.A 3 Month USD-LIBOR Receive 2.25% May 2013 USD 38,000,000 $188,100 ($4)2-Year Interest Rate Swap Deutsche Bank AG 3 Month USD-LIBOR Receive 1.20% Jul 2013 USD 24,300,000 171,503 (3,183)5-Year Interest Rate Swap Bank of America N.A 3 Month USD-LIBOR Receive 1.20% Mar 2013 USD 28,100,000 124,855 (25,936)5-Year Interest Rate Swap Citibank N.A 6 Month EURIBOR Receive 1.10% Jan 2013 EUR 3,500,000 22,237 (3,118)5-Year Interest Rate Swap Credit Suisse International 6 Month EURIBOR Receive 1.10% Jan 2013 EUR 1,000,000 6,553 (891)5-Year Interest Rate Swap Deutsche Bank AG 3 Month USD-LIBOR Receive 1.20% Mar 2013 USD 8,800,000 32,340 (8,122)5-Year Interest Rate Swap Deutsche Bank AG 3 Month USD-LIBOR Receive 2.00% Mar 2013 USD 12,700,000 119,310 (292)5-Year Interest Rate Swap Morgan Stanley Capital Services, Inc. 3 Month USD-LIBOR Receive 1.20% Feb 2013 USD 16,900,000 46,475 (7,707)5-Year Interest Rate Swap Morgan Stanley Capital Services, Inc. 3 Month USD-LIBOR Receive 1.20% Mar 2013 USD 71,400,000 386,949 (65,902)5-Year Interest Rate Swap Morgan Stanley Capital Services, Inc. 3 Month USD-LIBOR Receive 1.40% Mar 2013 USD 4,000,000 77,600 (1,636)5-Year Interest Rate Swap The Royal Bank of Scotland PLC 3 Month USD-LIBOR Receive 1.20% Mar 2013 USD 12,400,000 62,930 (11,445)5-Year Interest Rate Swap The Royal Bank of Scotland PLC 3 Month USD-LIBOR Receive 1.75% May 2013 USD 27,200,000 201,790 (13,056)
248,300,000 $1,440,642 ($141,292)
Inflation Floors (OTC)
Inflation floors are instruments where in return for a premium, one party agrees to make payments to the other to the extent that interest rates fall below a specified rate (based on the Consumer PriceIndex or other measure), or “floor”.
Global Bond FundThe Fund used inflation floors to manage against anticipated interest rate changes, manage duration and as a substitute for securities purchased.
Copyright © 2013 www.secdatabase.com. All Rights Reserved.Please Consider the Environment Before Printing This Document
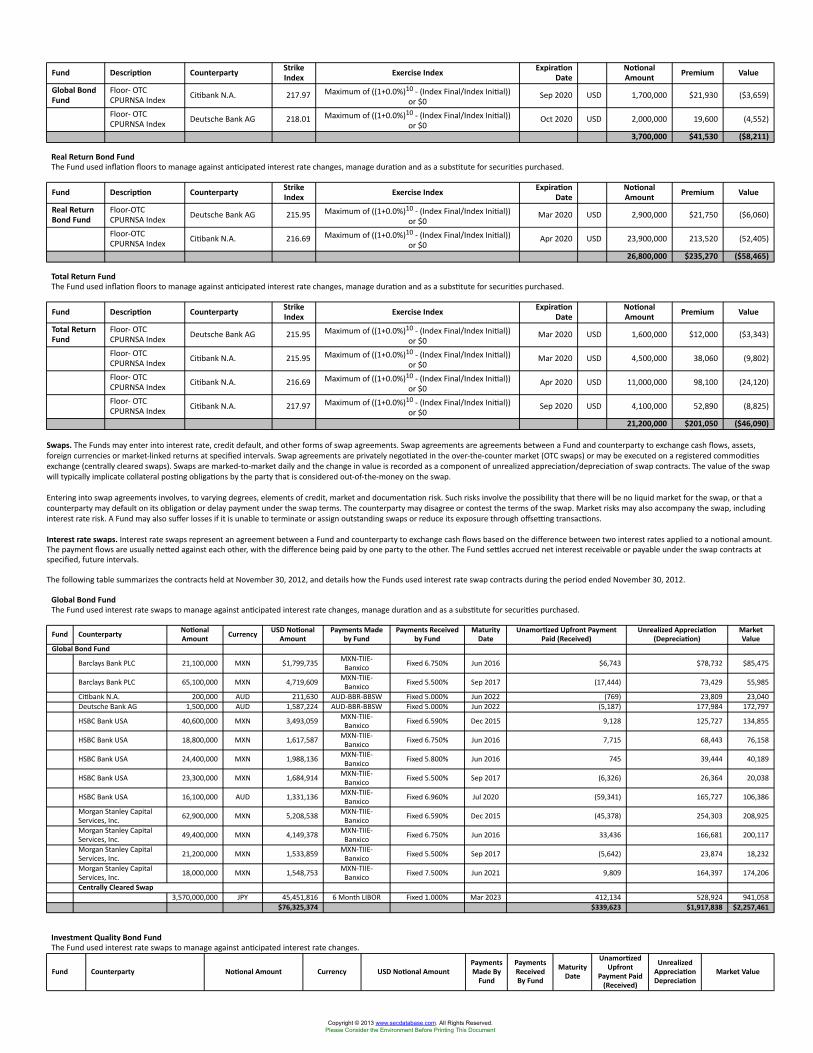
Fund Description Counterparty StrikeIndex Exercise Index Expiration
DateNotionalAmount Premium Value
Global BondFund
Floor- OTCCPURNSA Index Citibank N.A. 217.97 Maximum of ((1+0.0%)10 - (Index Final/Index Initial))
or $0Sep 2020 USD 1,700,000 $21,930 ($3,659)
Floor- OTCCPURNSA Index Deutsche Bank AG 218.01 Maximum of ((1+0.0%)10 - (Index Final/Index Initial))
or $0Oct 2020 USD 2,000,000 19,600 (4,552)
3,700,000 $41,530 ($8,211)
Real Return Bond FundThe Fund used inflation floors to manage against anticipated interest rate changes, manage duration and as a substitute for securities purchased.
Fund Description Counterparty StrikeIndex Exercise Index Expiration
DateNotionalAmount Premium Value
Real ReturnBond Fund
Floor-OTCCPURNSA Index Deutsche Bank AG 215.95 Maximum of ((1+0.0%)10 - (Index Final/Index Initial))
or $0Mar 2020 USD 2,900,000 $21,750 ($6,060)
Floor-OTCCPURNSA Index Citibank N.A. 216.69 Maximum of ((1+0.0%)10 - (Index Final/Index Initial))
or $0Apr 2020 USD 23,900,000 213,520 (52,405)
26,800,000 $235,270 ($58,465)
Total Return FundThe Fund used inflation floors to manage against anticipated interest rate changes, manage duration and as a substitute for securities purchased.
Fund Description Counterparty StrikeIndex Exercise Index Expiration
DateNotionalAmount Premium Value
Total ReturnFund
Floor- OTCCPURNSA Index Deutsche Bank AG 215.95 Maximum of ((1+0.0%)10 - (Index Final/Index Initial))
or $0Mar 2020 USD 1,600,000 $12,000 ($3,343)
Floor- OTCCPURNSA Index Citibank N.A. 215.95 Maximum of ((1+0.0%)10 - (Index Final/Index Initial))
or $0Mar 2020 USD 4,500,000 38,060 (9,802)
Floor- OTCCPURNSA Index Citibank N.A. 216.69 Maximum of ((1+0.0%)10 - (Index Final/Index Initial))
or $0Apr 2020 USD 11,000,000 98,100 (24,120)
Floor- OTCCPURNSA Index Citibank N.A. 217.97 Maximum of ((1+0.0%)10 - (Index Final/Index Initial))
or $0Sep 2020 USD 4,100,000 52,890 (8,825)
21,200,000 $201,050 ($46,090)
Swaps. The Funds may enter into interest rate, credit default, and other forms of swap agreements. Swap agreements are agreements between a Fund and counterparty to exchange cash flows, assets,foreign currencies or market-linked returns at specified intervals. Swap agreements are privately negotiated in the over-the-counter market (OTC swaps) or may be executed on a registered commoditiesexchange (centrally cleared swaps). Swaps are marked-to-market daily and the change in value is recorded as a component of unrealized appreciation/depreciation of swap contracts. The value of the swapwill typically implicate collateral posting obligations by the party that is considered out-of-the-money on the swap.
Entering into swap agreements involves, to varying degrees, elements of credit, market and documentation risk. Such risks involve the possibility that there will be no liquid market for the swap, or that acounterparty may default on its obligation or delay payment under the swap terms. The counterparty may disagree or contest the terms of the swap. Market risks may also accompany the swap, includinginterest rate risk. A Fund may also suffer losses if it is unable to terminate or assign outstanding swaps or reduce its exposure through offsetting transactions.
Interest rate swaps. Interest rate swaps represent an agreement between a Fund and counterparty to exchange cash flows based on the difference between two interest rates applied to a notional amount.The payment flows are usually netted against each other, with the difference being paid by one party to the other. The Fund settles accrued net interest receivable or payable under the swap contracts atspecified, future intervals.
The following table summarizes the contracts held at November 30, 2012, and details how the Funds used interest rate swap contracts during the period ended November 30, 2012.
Global Bond FundThe Fund used interest rate swaps to manage against anticipated interest rate changes, manage duration and as a substitute for securities purchased.
Fund Counterparty NotionalAmount Currency USD Notional
AmountPayments Made
by FundPayments Received
by FundMaturity
DateUnamortized Upfront Payment
Paid (Received)Unrealized Appreciation
(Depreciation)MarketValue
Global Bond Fund
Barclays Bank PLC 21,100,000 MXN $1,799,735 MXN-TIIE-Banxico Fixed 6.750% Jun 2016 $6,743 $78,732 $85,475
Barclays Bank PLC 65,100,000 MXN 4,719,609 MXN-TIIE-Banxico Fixed 5.500% Sep 2017 (17,444) 73,429 55,985
Citibank N.A. 200,000 AUD 211,630 AUD-BBR-BBSW Fixed 5.000% Jun 2022 (769) 23,809 23,040Deutsche Bank AG 1,500,000 AUD 1,587,224 AUD-BBR-BBSW Fixed 5.000% Jun 2022 (5,187) 177,984 172,797
HSBC Bank USA 40,600,000 MXN 3,493,059 MXN-TIIE-Banxico Fixed 6.590% Dec 2015 9,128 125,727 134,855
HSBC Bank USA 18,800,000 MXN 1,617,587 MXN-TIIE-Banxico Fixed 6.750% Jun 2016 7,715 68,443 76,158
HSBC Bank USA 24,400,000 MXN 1,988,136 MXN-TIIE-Banxico Fixed 5.800% Jun 2016 745 39,444 40,189
HSBC Bank USA 23,300,000 MXN 1,684,914 MXN-TIIE-Banxico Fixed 5.500% Sep 2017 (6,326) 26,364 20,038
HSBC Bank USA 16,100,000 AUD 1,331,136 MXN-TIIE-Banxico Fixed 6.960% Jul 2020 (59,341) 165,727 106,386
Morgan Stanley CapitalServices, Inc. 62,900,000 MXN 5,208,538 MXN-TIIE-
Banxico Fixed 6.590% Dec 2015 (45,378) 254,303 208,925
Morgan Stanley CapitalServices, Inc. 49,400,000 MXN 4,149,378 MXN-TIIE-
Banxico Fixed 6.750% Jun 2016 33,436 166,681 200,117
Morgan Stanley CapitalServices, Inc. 21,200,000 MXN 1,533,859 MXN-TIIE-
Banxico Fixed 5.500% Sep 2017 (5,642) 23,874 18,232
Morgan Stanley CapitalServices, Inc. 18,000,000 MXN 1,548,753 MXN-TIIE-
Banxico Fixed 7.500% Jun 2021 9,809 164,397 174,206
Centrally Cleared Swap3,570,000,000 JPY 45,451,816 6 Month LIBOR Fixed 1.000% Mar 2023 412,134 528,924 941,058
$76,325,374 $339,623 $1,917,838 $2,257,461
Investment Quality Bond FundThe Fund used interest rate swaps to manage against anticipated interest rate changes.
Fund Counterparty Notional Amount Currency USD Notional AmountPaymentsMade By
Fund
PaymentsReceivedBy Fund
MaturityDate
UnamortizedUpfront
Payment Paid(Received)
UnrealizedAppreciationDepreciation
Market Value
Copyright © 2013 www.secdatabase.com. All Rights Reserved.Please Consider the Environment Before Printing This Document
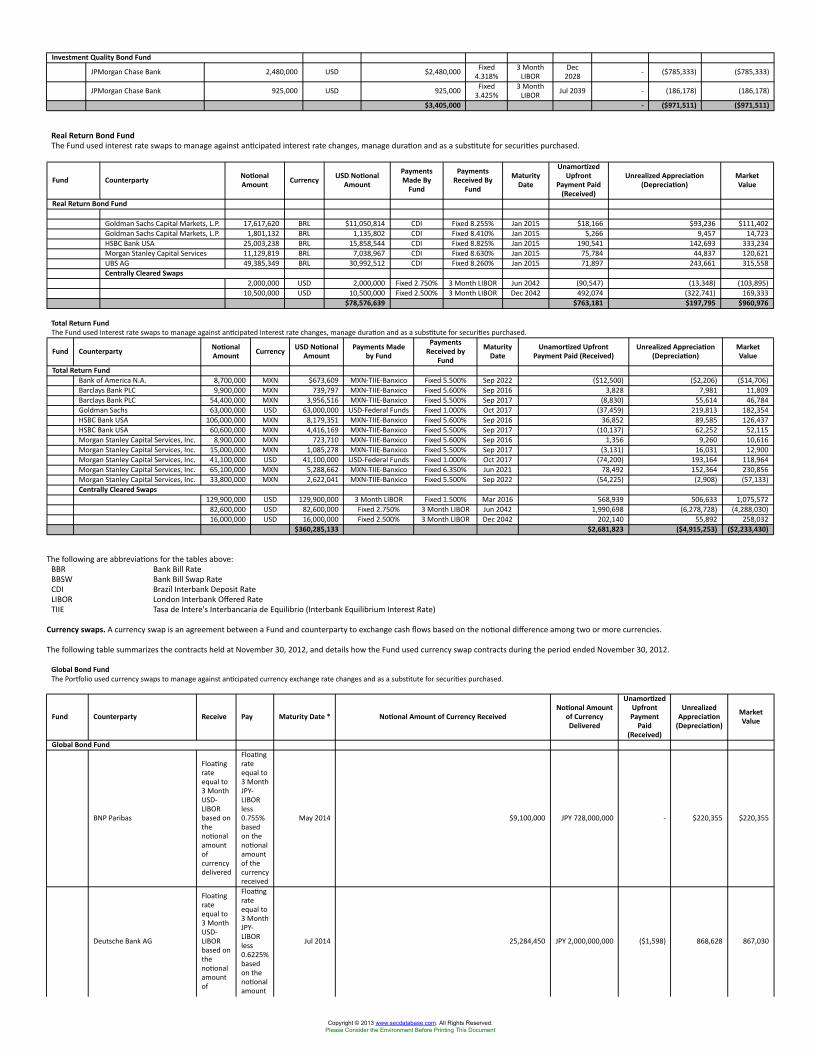
Investment Quality Bond Fund
JPMorgan Chase Bank 2,480,000 USD $2,480,000 Fixed4.318%
3 MonthLIBOR
Dec2028 - ($785,333) ($785,333)
JPMorgan Chase Bank 925,000 USD 925,000 Fixed3.425%
3 MonthLIBOR Jul 2039 - (186,178) (186,178)
$3,405,000 - ($971,511) ($971,511)
Real Return Bond FundThe Fund used interest rate swaps to manage against anticipated interest rate changes, manage duration and as a substitute for securities purchased.
Fund Counterparty NotionalAmount Currency USD Notional
Amount
PaymentsMade By
Fund
PaymentsReceived By
Fund
MaturityDate
UnamortizedUpfront
Payment Paid(Received)
Unrealized Appreciation(Depreciation)
MarketValue
Real Return Bond Fund
Goldman Sachs Capital Markets, L.P. 17,617,620 BRL $11,050,814 CDI Fixed 8.255% Jan 2015 $18,166 $93,236 $111,402Goldman Sachs Capital Markets, L.P. 1,801,132 BRL 1,135,802 CDI Fixed 8.410% Jan 2015 5,266 9,457 14,723HSBC Bank USA 25,003,238 BRL 15,858,544 CDI Fixed 8.825% Jan 2015 190,541 142,693 333,234Morgan Stanley Capital Services 11,129,819 BRL 7,038,967 CDI Fixed 8.630% Jan 2015 75,784 44,837 120,621UBS AG 49,385,349 BRL 30,992,512 CDI Fixed 8.260% Jan 2015 71,897 243,661 315,558Centrally Cleared Swaps
2,000,000 USD 2,000,000 Fixed 2.750% 3 Month LIBOR Jun 2042 (90,547) (13,348) (103,895)10,500,000 USD 10,500,000 Fixed 2.500% 3 Month LIBOR Dec 2042 492,074 (322,741) 169,333
$78,576,639 $763,181 $197,795 $960,976
Total Return FundThe Fund used interest rate swaps to manage against anticipated interest rate changes, manage duration and as a substitute for securities purchased.
Fund Counterparty NotionalAmount Currency USD Notional
AmountPayments Made
by Fund
PaymentsReceived by
Fund
MaturityDate
Unamortized UpfrontPayment Paid (Received)
Unrealized Appreciation(Depreciation)
MarketValue
Total Return FundBank of America N.A. 8,700,000 MXN $673,609 MXN-TIIE-Banxico Fixed 5.500% Sep 2022 ($12,500) ($2,206) ($14,706)Barclays Bank PLC 9,900,000 MXN 739,797 MXN-TIIE-Banxico Fixed 5.600% Sep 2016 3,828 7,981 11,809Barclays Bank PLC 54,400,000 MXN 3,956,516 MXN-TIIE-Banxico Fixed 5.500% Sep 2017 (8,830) 55,614 46,784Goldman Sachs 63,000,000 USD 63,000,000 USD-Federal Funds Fixed 1.000% Oct 2017 (37,459) 219,813 182,354HSBC Bank USA 106,000,000 MXN 8,179,351 MXN-TIIE-Banxico Fixed 5.600% Sep 2016 36,852 89,585 126,437HSBC Bank USA 60,600,000 MXN 4,416,169 MXN-TIIE-Banxico Fixed 5.500% Sep 2017 (10,137) 62,252 52,115Morgan Stanley Capital Services, Inc. 8,900,000 MXN 723,710 MXN-TIIE-Banxico Fixed 5.600% Sep 2016 1,356 9,260 10,616Morgan Stanley Capital Services, Inc. 15,000,000 MXN 1,085,278 MXN-TIIE-Banxico Fixed 5.500% Sep 2017 (3,131) 16,031 12,900Morgan Stanley Capital Services, Inc. 41,100,000 USD 41,100,000 USD-Federal Funds Fixed 1.000% Oct 2017 (74,200) 193,164 118,964Morgan Stanley Capital Services, Inc. 65,100,000 MXN 5,288,662 MXN-TIIE-Banxico Fixed 6.350% Jun 2021 78,492 152,364 230,856Morgan Stanley Capital Services, Inc. 33,800,000 MXN 2,622,041 MXN-TIIE-Banxico Fixed 5.500% Sep 2022 (54,225) (2,908) (57,133)Centrally Cleared Swaps
129,900,000 USD 129,900,000 3 Month LIBOR Fixed 1.500% Mar 2016 568,939 506,633 1,075,57282,600,000 USD 82,600,000 Fixed 2.750% 3 Month LIBOR Jun 2042 1,990,698 (6,278,728) (4,288,030)16,000,000 USD 16,000,000 Fixed 2.500% 3 Month LIBOR Dec 2042 202,140 55,892 258,032
$360,285,133 $2,681,823 ($4,915,253) ($2,233,430)
The following are abbreviations for the tables above:BBR Bank Bill RateBBSW Bank Bill Swap RateCDI Brazil Interbank Deposit RateLIBOR London Interbank Offered RateTIIE Tasa de Intere's Interbancaria de Equilibrio (Interbank Equilibrium Interest Rate)
Currency swaps. A currency swap is an agreement between a Fund and counterparty to exchange cash flows based on the notional difference among two or more currencies.
The following table summarizes the contracts held at November 30, 2012, and details how the Fund used currency swap contracts during the period ended November 30, 2012.
Global Bond FundThe Portfolio used currency swaps to manage against anticipated currency exchange rate changes and as a substitute for securities purchased.
Fund Counterparty Receive Pay Maturity Date * Notional Amount of Currency ReceivedNotional Amount
of CurrencyDelivered
UnamortizedUpfrontPayment
Paid(Received)
UnrealizedAppreciation
(Depreciation)
MarketValue
Global Bond Fund
BNP Paribas
Floatingrateequal to3 MonthUSD-LIBORbased onthenotionalamountofcurrencydelivered
Floatingrateequal to3 MonthJPY-LIBORless0.755%basedon thenotionalamountof thecurrencyreceived
May 2014 $9,100,000 JPY 728,000,000 - $220,355 $220,355
Deutsche Bank AG
Floatingrateequal to3 MonthUSD-LIBORbased onthenotionalamountof
Floatingrateequal to3 MonthJPY-LIBORless0.6225%basedon thenotionalamount
Jul 2014 25,284,450 JPY 2,000,000,000 ($1,598) 868,628 867,030
Copyright © 2013 www.secdatabase.com. All Rights Reserved.Please Consider the Environment Before Printing This Document
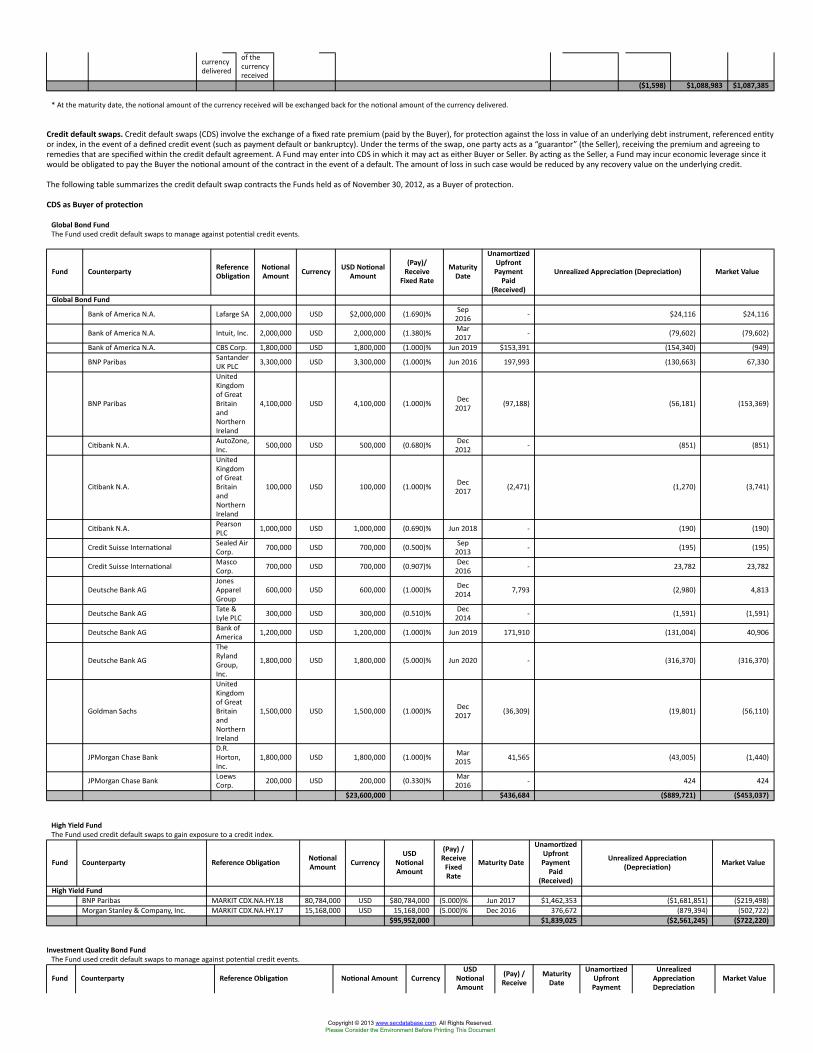
currencydelivered
of thecurrencyreceived
($1,598) $1,088,983 $1,087,385
* At the maturity date, the notional amount of the currency received will be exchanged back for the notional amount of the currency delivered.
Credit default swaps. Credit default swaps (CDS) involve the exchange of a fixed rate premium (paid by the Buyer), for protection against the loss in value of an underlying debt instrument, referenced entityor index, in the event of a defined credit event (such as payment default or bankruptcy). Under the terms of the swap, one party acts as a “guarantor” (the Seller), receiving the premium and agreeing toremedies that are specified within the credit default agreement. A Fund may enter into CDS in which it may act as either Buyer or Seller. By acting as the Seller, a Fund may incur economic leverage since itwould be obligated to pay the Buyer the notional amount of the contract in the event of a default. The amount of loss in such case would be reduced by any recovery value on the underlying credit.
The following table summarizes the credit default swap contracts the Funds held as of November 30, 2012, as a Buyer of protection.
CDS as Buyer of protection
Global Bond FundThe Fund used credit default swaps to manage against potential credit events.
Fund Counterparty ReferenceObligation
NotionalAmount Currency USD Notional
Amount
(Pay)/Receive
Fixed Rate
MaturityDate
UnamortizedUpfrontPayment
Paid(Received)
Unrealized Appreciation (Depreciation) Market Value
Global Bond Fund
Bank of America N.A. Lafarge SA 2,000,000 USD $2,000,000 (1.690)% Sep2016 - $24,116 $24,116
Bank of America N.A. Intuit, Inc. 2,000,000 USD 2,000,000 (1.380)% Mar2017 - (79,602) (79,602)
Bank of America N.A. CBS Corp. 1,800,000 USD 1,800,000 (1.000)% Jun 2019 $153,391 (154,340) (949)
BNP Paribas SantanderUK PLC 3,300,000 USD 3,300,000 (1.000)% Jun 2016 197,993 (130,663) 67,330
BNP Paribas
UnitedKingdomof GreatBritainandNorthernIreland
4,100,000 USD 4,100,000 (1.000)% Dec2017 (97,188) (56,181) (153,369)
Citibank N.A. AutoZone,Inc. 500,000 USD 500,000 (0.680)% Dec
2012 - (851) (851)
Citibank N.A.
UnitedKingdomof GreatBritainandNorthernIreland
100,000 USD 100,000 (1.000)% Dec2017 (2,471) (1,270) (3,741)
Citibank N.A. PearsonPLC 1,000,000 USD 1,000,000 (0.690)% Jun 2018 - (190) (190)
Credit Suisse International Sealed AirCorp. 700,000 USD 700,000 (0.500)% Sep
2013 - (195) (195)
Credit Suisse International MascoCorp. 700,000 USD 700,000 (0.907)% Dec
2016 - 23,782 23,782
Deutsche Bank AGJonesApparelGroup
600,000 USD 600,000 (1.000)% Dec2014 7,793 (2,980) 4,813
Deutsche Bank AG Tate &Lyle PLC 300,000 USD 300,000 (0.510)% Dec
2014 - (1,591) (1,591)
Deutsche Bank AG Bank ofAmerica 1,200,000 USD 1,200,000 (1.000)% Jun 2019 171,910 (131,004) 40,906
Deutsche Bank AG
TheRylandGroup,Inc.
1,800,000 USD 1,800,000 (5.000)% Jun 2020 - (316,370) (316,370)
Goldman Sachs
UnitedKingdomof GreatBritainandNorthernIreland
1,500,000 USD 1,500,000 (1.000)% Dec2017 (36,309) (19,801) (56,110)
JPMorgan Chase BankD.R.Horton,Inc.
1,800,000 USD 1,800,000 (1.000)% Mar2015 41,565 (43,005) (1,440)
JPMorgan Chase Bank LoewsCorp. 200,000 USD 200,000 (0.330)% Mar
2016 - 424 424
$23,600,000 $436,684 ($889,721) ($453,037)
High Yield FundThe Fund used credit default swaps to gain exposure to a credit index.
Fund Counterparty Reference Obligation NotionalAmount Currency
USDNotionalAmount
(Pay) /Receive
FixedRate
Maturity Date
UnamortizedUpfrontPayment
Paid(Received)
Unrealized Appreciation(Depreciation) Market Value
High Yield FundBNP Paribas MARKIT CDX.NA.HY.18 80,784,000 USD $80,784,000 (5.000)% Jun 2017 $1,462,353 ($1,681,851) ($219,498)Morgan Stanley & Company, Inc. MARKIT CDX.NA.HY.17 15,168,000 USD 15,168,000 (5.000)% Dec 2016 376,672 (879,394) (502,722)
$95,952,000 $1,839,025 ($2,561,245) ($722,220)
Investment Quality Bond FundThe Fund used credit default swaps to manage against potential credit events.
Fund Counterparty Reference Obligation Notional Amount CurrencyUSD
NotionalAmount
(Pay) /Receive
MaturityDate
UnamortizedUpfrontPayment
UnrealizedAppreciationDepreciation
Market Value
Copyright © 2013 www.secdatabase.com. All Rights Reserved.Please Consider the Environment Before Printing This Document
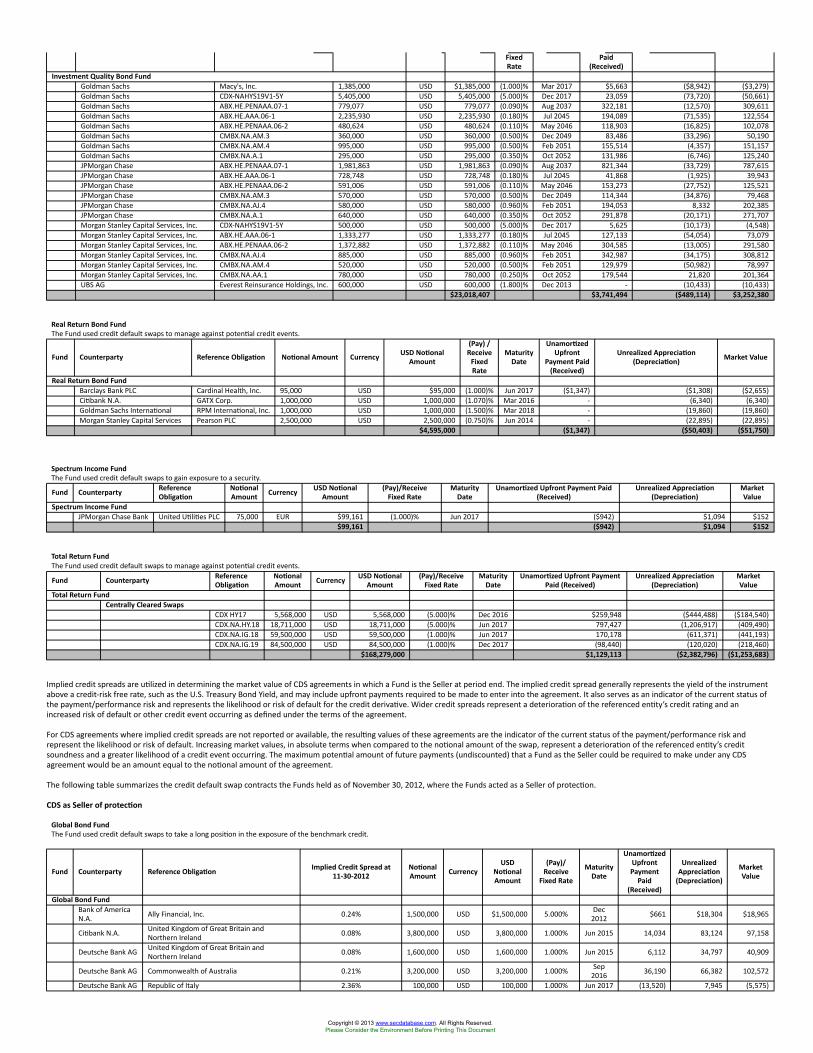
FixedRate
Paid(Received)
Investment Quality Bond FundGoldman Sachs Macy's, Inc. 1,385,000 USD $1,385,000 (1.000)% Mar 2017 $5,663 ($8,942) ($3,279)Goldman Sachs CDX-NAHYS19V1-5Y 5,405,000 USD 5,405,000 (5.000)% Dec 2017 23,059 (73,720) (50,661)Goldman Sachs ABX.HE.PENAAA.07-1 779,077 USD 779,077 (0.090)% Aug 2037 322,181 (12,570) 309,611Goldman Sachs ABX.HE.AAA.06-1 2,235,930 USD 2,235,930 (0.180)% Jul 2045 194,089 (71,535) 122,554Goldman Sachs ABX.HE.PENAAA.06-2 480,624 USD 480,624 (0.110)% May 2046 118,903 (16,825) 102,078Goldman Sachs CMBX.NA.AM.3 360,000 USD 360,000 (0.500)% Dec 2049 83,486 (33,296) 50,190Goldman Sachs CMBX.NA.AM.4 995,000 USD 995,000 (0.500)% Feb 2051 155,514 (4,357) 151,157Goldman Sachs CMBX.NA.A.1 295,000 USD 295,000 (0.350)% Oct 2052 131,986 (6,746) 125,240JPMorgan Chase ABX.HE.PENAAA.07-1 1,981,863 USD 1,981,863 (0.090)% Aug 2037 821,344 (33,729) 787,615JPMorgan Chase ABX.HE.AAA.06-1 728,748 USD 728,748 (0.180)% Jul 2045 41,868 (1,925) 39,943JPMorgan Chase ABX.HE.PENAAA.06-2 591,006 USD 591,006 (0.110)% May 2046 153,273 (27,752) 125,521JPMorgan Chase CMBX.NA.AM.3 570,000 USD 570,000 (0.500)% Dec 2049 114,344 (34,876) 79,468JPMorgan Chase CMBX.NA.AJ.4 580,000 USD 580,000 (0.960)% Feb 2051 194,053 8,332 202,385JPMorgan Chase CMBX.NA.A.1 640,000 USD 640,000 (0.350)% Oct 2052 291,878 (20,171) 271,707Morgan Stanley Capital Services, Inc. CDX-NAHYS19V1-5Y 500,000 USD 500,000 (5.000)% Dec 2017 5,625 (10,173) (4,548)Morgan Stanley Capital Services, Inc. ABX.HE.AAA.06-1 1,333,277 USD 1,333,277 (0.180)% Jul 2045 127,133 (54,054) 73,079Morgan Stanley Capital Services, Inc. ABX.HE.PENAAA.06-2 1,372,882 USD 1,372,882 (0.110)% May 2046 304,585 (13,005) 291,580Morgan Stanley Capital Services, Inc. CMBX.NA.AJ.4 885,000 USD 885,000 (0.960)% Feb 2051 342,987 (34,175) 308,812Morgan Stanley Capital Services, Inc. CMBX.NA.AM.4 520,000 USD 520,000 (0.500)% Feb 2051 129,979 (50,982) 78,997Morgan Stanley Capital Services, Inc. CMBX.NA.AA.1 780,000 USD 780,000 (0.250)% Oct 2052 179,544 21,820 201,364UBS AG Everest Reinsurance Holdings, Inc. 600,000 USD 600,000 (1.800)% Dec 2013 - (10,433) (10,433)
$23,018,407 $3,741,494 ($489,114) $3,252,380
Real Return Bond FundThe Fund used credit default swaps to manage against potential credit events.
Fund Counterparty Reference Obligation Notional Amount Currency USD NotionalAmount
(Pay) /Receive
FixedRate
MaturityDate
UnamortizedUpfront
Payment Paid(Received)
Unrealized Appreciation(Depreciation) Market Value
Real Return Bond FundBarclays Bank PLC Cardinal Health, Inc. 95,000 USD $95,000 (1.000)% Jun 2017 ($1,347) ($1,308) ($2,655)Citibank N.A. GATX Corp. 1,000,000 USD 1,000,000 (1.070)% Mar 2016 - (6,340) (6,340)Goldman Sachs International RPM International, Inc. 1,000,000 USD 1,000,000 (1.500)% Mar 2018 - (19,860) (19,860)Morgan Stanley Capital Services Pearson PLC 2,500,000 USD 2,500,000 (0.750)% Jun 2014 - (22,895) (22,895)
$4,595,000 ($1,347) ($50,403) ($51,750)
Spectrum Income FundThe Fund used credit default swaps to gain exposure to a security.
Fund Counterparty ReferenceObligation
NotionalAmount Currency USD Notional
Amount(Pay)/Receive
Fixed RateMaturity
DateUnamortized Upfront Payment Paid
(Received)Unrealized Appreciation
(Depreciation)MarketValue
Spectrum Income FundJPMorgan Chase Bank United Utilities PLC 75,000 EUR $99,161 (1.000)% Jun 2017 ($942) $1,094 $152
$99,161 ($942) $1,094 $152
Total Return FundThe Fund used credit default swaps to manage against potential credit events.
Fund Counterparty ReferenceObligation
NotionalAmount Currency USD Notional
Amount(Pay)/Receive
Fixed RateMaturity
DateUnamortized Upfront Payment
Paid (Received)Unrealized Appreciation
(Depreciation)MarketValue
Total Return FundCentrally Cleared Swaps
CDX HY17 5,568,000 USD 5,568,000 (5.000)% Dec 2016 $259,948 ($444,488) ($184,540)CDX.NA.HY.18 18,711,000 USD 18,711,000 (5.000)% Jun 2017 797,427 (1,206,917) (409,490)CDX.NA.IG.18 59,500,000 USD 59,500,000 (1.000)% Jun 2017 170,178 (611,371) (441,193)CDX.NA.IG.19 84,500,000 USD 84,500,000 (1.000)% Dec 2017 (98,440) (120,020) (218,460)
$168,279,000 $1,129,113 ($2,382,796) ($1,253,683)
Implied credit spreads are utilized in determining the market value of CDS agreements in which a Fund is the Seller at period end. The implied credit spread generally represents the yield of the instrumentabove a credit-risk free rate, such as the U.S. Treasury Bond Yield, and may include upfront payments required to be made to enter into the agreement. It also serves as an indicator of the current status ofthe payment/performance risk and represents the likelihood or risk of default for the credit derivative. Wider credit spreads represent a deterioration of the referenced entity’s credit rating and anincreased risk of default or other credit event occurring as defined under the terms of the agreement.
For CDS agreements where implied credit spreads are not reported or available, the resulting values of these agreements are the indicator of the current status of the payment/performance risk andrepresent the likelihood or risk of default. Increasing market values, in absolute terms when compared to the notional amount of the swap, represent a deterioration of the referenced entity’s creditsoundness and a greater likelihood of a credit event occurring. The maximum potential amount of future payments (undiscounted) that a Fund as the Seller could be required to make under any CDSagreement would be an amount equal to the notional amount of the agreement.
The following table summarizes the credit default swap contracts the Funds held as of November 30, 2012, where the Funds acted as a Seller of protection.
CDS as Seller of protection
Global Bond FundThe Fund used credit default swaps to take a long position in the exposure of the benchmark credit.
Fund Counterparty Reference Obligation Implied Credit Spread at11-30-2012
NotionalAmount Currency
USDNotionalAmount
(Pay)/Receive
Fixed Rate
MaturityDate
UnamortizedUpfrontPayment
Paid(Received)
UnrealizedAppreciation
(Depreciation)
MarketValue
Global Bond FundBank of AmericaN.A. Ally Financial, Inc. 0.24% 1,500,000 USD $1,500,000 5.000% Dec
2012 $661 $18,304 $18,965
Citibank N.A. United Kingdom of Great Britain andNorthern Ireland 0.08% 3,800,000 USD 3,800,000 1.000% Jun 2015 14,034 83,124 97,158
Deutsche Bank AG United Kingdom of Great Britain andNorthern Ireland 0.08% 1,600,000 USD 1,600,000 1.000% Jun 2015 6,112 34,797 40,909
Deutsche Bank AG Commonwealth of Australia 0.21% 3,200,000 USD 3,200,000 1.000% Sep2016 36,190 66,382 102,572
Deutsche Bank AG Republic of Italy 2.36% 100,000 USD 100,000 1.000% Jun 2017 (13,520) 7,945 (5,575)
Copyright © 2013 www.secdatabase.com. All Rights Reserved.Please Consider the Environment Before Printing This Document
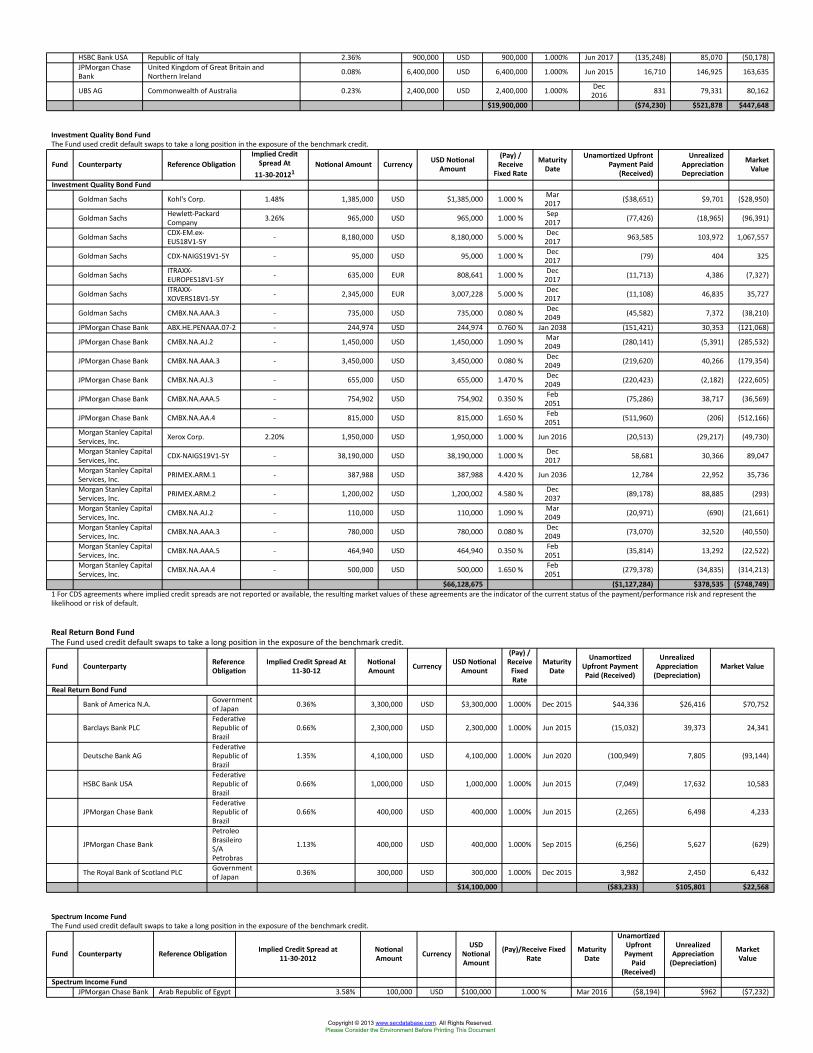
HSBC Bank USA Republic of Italy 2.36% 900,000 USD 900,000 1.000% Jun 2017 (135,248) 85,070 (50,178)JPMorgan ChaseBank
United Kingdom of Great Britain andNorthern Ireland 0.08% 6,400,000 USD 6,400,000 1.000% Jun 2015 16,710 146,925 163,635
UBS AG Commonwealth of Australia 0.23% 2,400,000 USD 2,400,000 1.000% Dec2016 831 79,331 80,162
$19,900,000 ($74,230) $521,878 $447,648
Investment Quality Bond FundThe Fund used credit default swaps to take a long position in the exposure of the benchmark credit.
Fund Counterparty Reference ObligationImplied Credit
Spread At11-30-20121
Notional Amount Currency USD NotionalAmount
(Pay) /Receive
Fixed Rate
MaturityDate
Unamortized UpfrontPayment Paid
(Received)
UnrealizedAppreciationDepreciation
MarketValue
Investment Quality Bond Fund
Goldman Sachs Kohl's Corp. 1.48% 1,385,000 USD $1,385,000 1.000 % Mar2017 ($38,651) $9,701 ($28,950)
Goldman Sachs Hewlett-PackardCompany 3.26% 965,000 USD 965,000 1.000 % Sep
2017 (77,426) (18,965) (96,391)
Goldman Sachs CDX-EM.ex-EUS18V1-5Y - 8,180,000 USD 8,180,000 5.000 % Dec
2017 963,585 103,972 1,067,557
Goldman Sachs CDX-NAIGS19V1-5Y - 95,000 USD 95,000 1.000 % Dec2017 (79) 404 325
Goldman Sachs ITRAXX-EUROPES18V1-5Y - 635,000 EUR 808,641 1.000 % Dec
2017 (11,713) 4,386 (7,327)
Goldman Sachs ITRAXX-XOVERS18V1-5Y - 2,345,000 EUR 3,007,228 5.000 % Dec
2017 (11,108) 46,835 35,727
Goldman Sachs CMBX.NA.AAA.3 - 735,000 USD 735,000 0.080 % Dec2049 (45,582) 7,372 (38,210)
JPMorgan Chase Bank ABX.HE.PENAAA.07-2 - 244,974 USD 244,974 0.760 % Jan 2038 (151,421) 30,353 (121,068)
JPMorgan Chase Bank CMBX.NA.AJ.2 - 1,450,000 USD 1,450,000 1.090 % Mar2049 (280,141) (5,391) (285,532)
JPMorgan Chase Bank CMBX.NA.AAA.3 - 3,450,000 USD 3,450,000 0.080 % Dec2049 (219,620) 40,266 (179,354)
JPMorgan Chase Bank CMBX.NA.AJ.3 - 655,000 USD 655,000 1.470 % Dec2049 (220,423) (2,182) (222,605)
JPMorgan Chase Bank CMBX.NA.AAA.5 - 754,902 USD 754,902 0.350 % Feb2051 (75,286) 38,717 (36,569)
JPMorgan Chase Bank CMBX.NA.AA.4 - 815,000 USD 815,000 1.650 % Feb2051 (511,960) (206) (512,166)
Morgan Stanley CapitalServices, Inc. Xerox Corp. 2.20% 1,950,000 USD 1,950,000 1.000 % Jun 2016 (20,513) (29,217) (49,730)
Morgan Stanley CapitalServices, Inc. CDX-NAIGS19V1-5Y - 38,190,000 USD 38,190,000 1.000 % Dec
2017 58,681 30,366 89,047
Morgan Stanley CapitalServices, Inc. PRIMEX.ARM.1 - 387,988 USD 387,988 4.420 % Jun 2036 12,784 22,952 35,736
Morgan Stanley CapitalServices, Inc. PRIMEX.ARM.2 - 1,200,002 USD 1,200,002 4.580 % Dec
2037 (89,178) 88,885 (293)
Morgan Stanley CapitalServices, Inc. CMBX.NA.AJ.2 - 110,000 USD 110,000 1.090 % Mar
2049 (20,971) (690) (21,661)
Morgan Stanley CapitalServices, Inc. CMBX.NA.AAA.3 - 780,000 USD 780,000 0.080 % Dec
2049 (73,070) 32,520 (40,550)
Morgan Stanley CapitalServices, Inc. CMBX.NA.AAA.5 - 464,940 USD 464,940 0.350 % Feb
2051 (35,814) 13,292 (22,522)
Morgan Stanley CapitalServices, Inc. CMBX.NA.AA.4 - 500,000 USD 500,000 1.650 % Feb
2051 (279,378) (34,835) (314,213)
$66,128,675 ($1,127,284) $378,535 ($748,749)1 For CDS agreements where implied credit spreads are not reported or available, the resulting market values of these agreements are the indicator of the current status of the payment/performance risk and represent thelikelihood or risk of default.
Real Return Bond FundThe Fund used credit default swaps to take a long position in the exposure of the benchmark credit.
Fund Counterparty ReferenceObligation
Implied Credit Spread At11-30-12
NotionalAmount Currency USD Notional
Amount
(Pay) /Receive
FixedRate
MaturityDate
UnamortizedUpfront PaymentPaid (Received)
UnrealizedAppreciation
(Depreciation)Market Value
Real Return Bond Fund
Bank of America N.A. Governmentof Japan 0.36% 3,300,000 USD $3,300,000 1.000% Dec 2015 $44,336 $26,416 $70,752
Barclays Bank PLCFederativeRepublic ofBrazil
0.66% 2,300,000 USD 2,300,000 1.000% Jun 2015 (15,032) 39,373 24,341
Deutsche Bank AGFederativeRepublic ofBrazil
1.35% 4,100,000 USD 4,100,000 1.000% Jun 2020 (100,949) 7,805 (93,144)
HSBC Bank USAFederativeRepublic ofBrazil
0.66% 1,000,000 USD 1,000,000 1.000% Jun 2015 (7,049) 17,632 10,583
JPMorgan Chase BankFederativeRepublic ofBrazil
0.66% 400,000 USD 400,000 1.000% Jun 2015 (2,265) 6,498 4,233
JPMorgan Chase Bank
PetroleoBrasileiroS/APetrobras
1.13% 400,000 USD 400,000 1.000% Sep 2015 (6,256) 5,627 (629)
The Royal Bank of Scotland PLC Governmentof Japan 0.36% 300,000 USD 300,000 1.000% Dec 2015 3,982 2,450 6,432
$14,100,000 ($83,233) $105,801 $22,568
Spectrum Income FundThe Fund used credit default swaps to take a long position in the exposure of the benchmark credit.
Fund Counterparty Reference Obligation Implied Credit Spread at11-30-2012
NotionalAmount Currency
USDNotionalAmount
(Pay)/Receive FixedRate
MaturityDate
UnamortizedUpfrontPayment
Paid(Received)
UnrealizedAppreciation
(Depreciation)
MarketValue
Spectrum Income FundJPMorgan Chase Bank Arab Republic of Egypt 3.58% 100,000 USD $100,000 1.000 % Mar 2016 ($8,194) $962 ($7,232)
Copyright © 2013 www.secdatabase.com. All Rights Reserved.Please Consider the Environment Before Printing This Document
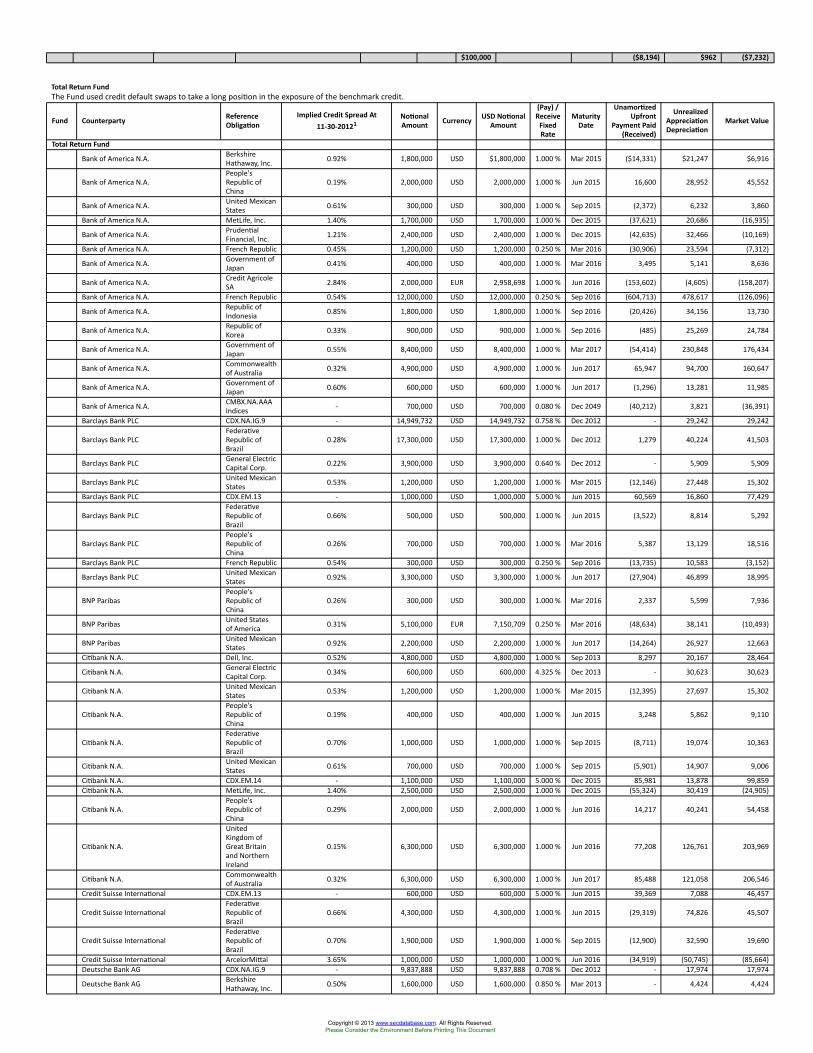
$100,000 ($8,194) $962 ($7,232)
Total Return FundThe Fund used credit default swaps to take a long position in the exposure of the benchmark credit.
Fund Counterparty ReferenceObligation
Implied Credit Spread At11-30-20121
NotionalAmount Currency USD Notional
Amount
(Pay) /Receive
FixedRate
MaturityDate
UnamortizedUpfront
Payment Paid(Received)
UnrealizedAppreciationDepreciation
Market Value
Total Return Fund
Bank of America N.A. BerkshireHathaway, Inc. 0.92% 1,800,000 USD $1,800,000 1.000 % Mar 2015 ($14,331) $21,247 $6,916
Bank of America N.A.People'sRepublic ofChina
0.19% 2,000,000 USD 2,000,000 1.000 % Jun 2015 16,600 28,952 45,552
Bank of America N.A. United MexicanStates 0.61% 300,000 USD 300,000 1.000 % Sep 2015 (2,372) 6,232 3,860
Bank of America N.A. MetLife, Inc. 1.40% 1,700,000 USD 1,700,000 1.000 % Dec 2015 (37,621) 20,686 (16,935)
Bank of America N.A. PrudentialFinancial, Inc. 1.21% 2,400,000 USD 2,400,000 1.000 % Dec 2015 (42,635) 32,466 (10,169)
Bank of America N.A. French Republic 0.45% 1,200,000 USD 1,200,000 0.250 % Mar 2016 (30,906) 23,594 (7,312)
Bank of America N.A. Government ofJapan 0.41% 400,000 USD 400,000 1.000 % Mar 2016 3,495 5,141 8,636
Bank of America N.A. Credit AgricoleSA 2.84% 2,000,000 EUR 2,958,698 1.000 % Jun 2016 (153,602) (4,605) (158,207)
Bank of America N.A. French Republic 0.54% 12,000,000 USD 12,000,000 0.250 % Sep 2016 (604,713) 478,617 (126,096)
Bank of America N.A. Republic ofIndonesia 0.85% 1,800,000 USD 1,800,000 1.000 % Sep 2016 (20,426) 34,156 13,730
Bank of America N.A. Republic ofKorea 0.33% 900,000 USD 900,000 1.000 % Sep 2016 (485) 25,269 24,784
Bank of America N.A. Government ofJapan 0.55% 8,400,000 USD 8,400,000 1.000 % Mar 2017 (54,414) 230,848 176,434
Bank of America N.A. Commonwealthof Australia 0.32% 4,900,000 USD 4,900,000 1.000 % Jun 2017 65,947 94,700 160,647
Bank of America N.A. Government ofJapan 0.60% 600,000 USD 600,000 1.000 % Jun 2017 (1,296) 13,281 11,985
Bank of America N.A. CMBX.NA.AAAIndices - 700,000 USD 700,000 0.080 % Dec 2049 (40,212) 3,821 (36,391)
Barclays Bank PLC CDX.NA.IG.9 - 14,949,732 USD 14,949,732 0.758 % Dec 2012 - 29,242 29,242
Barclays Bank PLCFederativeRepublic ofBrazil
0.28% 17,300,000 USD 17,300,000 1.000 % Dec 2012 1,279 40,224 41,503
Barclays Bank PLC General ElectricCapital Corp. 0.22% 3,900,000 USD 3,900,000 0.640 % Dec 2012 - 5,909 5,909
Barclays Bank PLC United MexicanStates 0.53% 1,200,000 USD 1,200,000 1.000 % Mar 2015 (12,146) 27,448 15,302
Barclays Bank PLC CDX.EM.13 - 1,000,000 USD 1,000,000 5.000 % Jun 2015 60,569 16,860 77,429
Barclays Bank PLCFederativeRepublic ofBrazil
0.66% 500,000 USD 500,000 1.000 % Jun 2015 (3,522) 8,814 5,292
Barclays Bank PLCPeople'sRepublic ofChina
0.26% 700,000 USD 700,000 1.000 % Mar 2016 5,387 13,129 18,516
Barclays Bank PLC French Republic 0.54% 300,000 USD 300,000 0.250 % Sep 2016 (13,735) 10,583 (3,152)
Barclays Bank PLC United MexicanStates 0.92% 3,300,000 USD 3,300,000 1.000 % Jun 2017 (27,904) 46,899 18,995
BNP ParibasPeople'sRepublic ofChina
0.26% 300,000 USD 300,000 1.000 % Mar 2016 2,337 5,599 7,936
BNP Paribas United Statesof America 0.31% 5,100,000 EUR 7,150,709 0.250 % Mar 2016 (48,634) 38,141 (10,493)
BNP Paribas United MexicanStates 0.92% 2,200,000 USD 2,200,000 1.000 % Jun 2017 (14,264) 26,927 12,663
Citibank N.A. Dell, Inc. 0.52% 4,800,000 USD 4,800,000 1.000 % Sep 2013 8,297 20,167 28,464
Citibank N.A. General ElectricCapital Corp. 0.34% 600,000 USD 600,000 4.325 % Dec 2013 - 30,623 30,623
Citibank N.A. United MexicanStates 0.53% 1,200,000 USD 1,200,000 1.000 % Mar 2015 (12,395) 27,697 15,302
Citibank N.A.People'sRepublic ofChina
0.19% 400,000 USD 400,000 1.000 % Jun 2015 3,248 5,862 9,110
Citibank N.A.FederativeRepublic ofBrazil
0.70% 1,000,000 USD 1,000,000 1.000 % Sep 2015 (8,711) 19,074 10,363
Citibank N.A. United MexicanStates 0.61% 700,000 USD 700,000 1.000 % Sep 2015 (5,901) 14,907 9,006
Citibank N.A. CDX.EM.14 - 1,100,000 USD 1,100,000 5.000 % Dec 2015 85,981 13,878 99,859Citibank N.A. MetLife, Inc. 1.40% 2,500,000 USD 2,500,000 1.000 % Dec 2015 (55,324) 30,419 (24,905)
Citibank N.A.People'sRepublic ofChina
0.29% 2,000,000 USD 2,000,000 1.000 % Jun 2016 14,217 40,241 54,458
Citibank N.A.
UnitedKingdom ofGreat Britainand NorthernIreland
0.15% 6,300,000 USD 6,300,000 1.000 % Jun 2016 77,208 126,761 203,969
Citibank N.A. Commonwealthof Australia 0.32% 6,300,000 USD 6,300,000 1.000 % Jun 2017 85,488 121,058 206,546
Credit Suisse International CDX.EM.13 - 600,000 USD 600,000 5.000 % Jun 2015 39,369 7,088 46,457
Credit Suisse InternationalFederativeRepublic ofBrazil
0.66% 4,300,000 USD 4,300,000 1.000 % Jun 2015 (29,319) 74,826 45,507
Credit Suisse InternationalFederativeRepublic ofBrazil
0.70% 1,900,000 USD 1,900,000 1.000 % Sep 2015 (12,900) 32,590 19,690
Credit Suisse International ArcelorMittal 3.65% 1,000,000 USD 1,000,000 1.000 % Jun 2016 (34,919) (50,745) (85,664)Deutsche Bank AG CDX.NA.IG.9 - 9,837,888 USD 9,837,888 0.708 % Dec 2012 - 17,974 17,974
Deutsche Bank AG BerkshireHathaway, Inc. 0.50% 1,600,000 USD 1,600,000 0.850 % Mar 2013 - 4,424 4,424
Copyright © 2013 www.secdatabase.com. All Rights Reserved.Please Consider the Environment Before Printing This Document
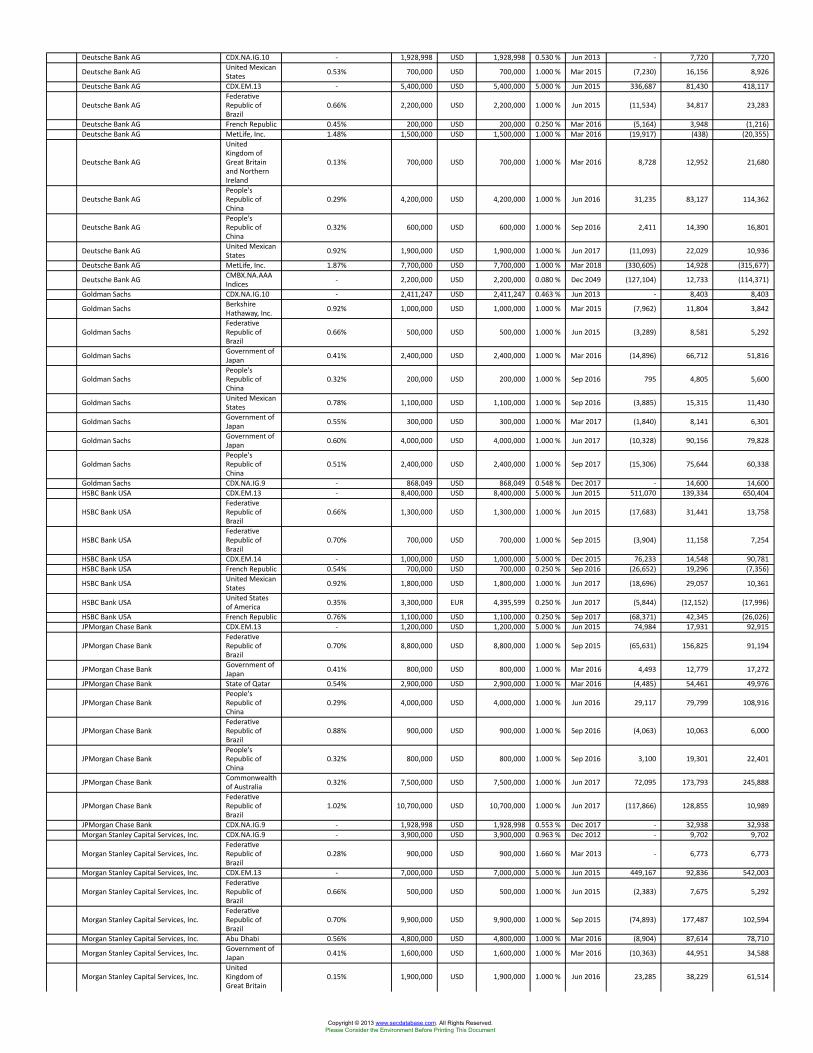
Deutsche Bank AG CDX.NA.IG.10 - 1,928,998 USD 1,928,998 0.530 % Jun 2013 - 7,720 7,720
Deutsche Bank AG United MexicanStates 0.53% 700,000 USD 700,000 1.000 % Mar 2015 (7,230) 16,156 8,926
Deutsche Bank AG CDX.EM.13 - 5,400,000 USD 5,400,000 5.000 % Jun 2015 336,687 81,430 418,117
Deutsche Bank AGFederativeRepublic ofBrazil
0.66% 2,200,000 USD 2,200,000 1.000 % Jun 2015 (11,534) 34,817 23,283
Deutsche Bank AG French Republic 0.45% 200,000 USD 200,000 0.250 % Mar 2016 (5,164) 3,948 (1,216)Deutsche Bank AG MetLife, Inc. 1.48% 1,500,000 USD 1,500,000 1.000 % Mar 2016 (19,917) (438) (20,355)
Deutsche Bank AG
UnitedKingdom ofGreat Britainand NorthernIreland
0.13% 700,000 USD 700,000 1.000 % Mar 2016 8,728 12,952 21,680
Deutsche Bank AGPeople'sRepublic ofChina
0.29% 4,200,000 USD 4,200,000 1.000 % Jun 2016 31,235 83,127 114,362
Deutsche Bank AGPeople'sRepublic ofChina
0.32% 600,000 USD 600,000 1.000 % Sep 2016 2,411 14,390 16,801
Deutsche Bank AG United MexicanStates 0.92% 1,900,000 USD 1,900,000 1.000 % Jun 2017 (11,093) 22,029 10,936
Deutsche Bank AG MetLife, Inc. 1.87% 7,700,000 USD 7,700,000 1.000 % Mar 2018 (330,605) 14,928 (315,677)
Deutsche Bank AG CMBX.NA.AAAIndices - 2,200,000 USD 2,200,000 0.080 % Dec 2049 (127,104) 12,733 (114,371)
Goldman Sachs CDX.NA.IG.10 - 2,411,247 USD 2,411,247 0.463 % Jun 2013 - 8,403 8,403
Goldman Sachs BerkshireHathaway, Inc. 0.92% 1,000,000 USD 1,000,000 1.000 % Mar 2015 (7,962) 11,804 3,842
Goldman SachsFederativeRepublic ofBrazil
0.66% 500,000 USD 500,000 1.000 % Jun 2015 (3,289) 8,581 5,292
Goldman Sachs Government ofJapan 0.41% 2,400,000 USD 2,400,000 1.000 % Mar 2016 (14,896) 66,712 51,816
Goldman SachsPeople'sRepublic ofChina
0.32% 200,000 USD 200,000 1.000 % Sep 2016 795 4,805 5,600
Goldman Sachs United MexicanStates 0.78% 1,100,000 USD 1,100,000 1.000 % Sep 2016 (3,885) 15,315 11,430
Goldman Sachs Government ofJapan 0.55% 300,000 USD 300,000 1.000 % Mar 2017 (1,840) 8,141 6,301
Goldman Sachs Government ofJapan 0.60% 4,000,000 USD 4,000,000 1.000 % Jun 2017 (10,328) 90,156 79,828
Goldman SachsPeople'sRepublic ofChina
0.51% 2,400,000 USD 2,400,000 1.000 % Sep 2017 (15,306) 75,644 60,338
Goldman Sachs CDX.NA.IG.9 - 868,049 USD 868,049 0.548 % Dec 2017 - 14,600 14,600HSBC Bank USA CDX.EM.13 - 8,400,000 USD 8,400,000 5.000 % Jun 2015 511,070 139,334 650,404
HSBC Bank USAFederativeRepublic ofBrazil
0.66% 1,300,000 USD 1,300,000 1.000 % Jun 2015 (17,683) 31,441 13,758
HSBC Bank USAFederativeRepublic ofBrazil
0.70% 700,000 USD 700,000 1.000 % Sep 2015 (3,904) 11,158 7,254
HSBC Bank USA CDX.EM.14 - 1,000,000 USD 1,000,000 5.000 % Dec 2015 76,233 14,548 90,781HSBC Bank USA French Republic 0.54% 700,000 USD 700,000 0.250 % Sep 2016 (26,652) 19,296 (7,356)
HSBC Bank USA United MexicanStates 0.92% 1,800,000 USD 1,800,000 1.000 % Jun 2017 (18,696) 29,057 10,361
HSBC Bank USA United Statesof America 0.35% 3,300,000 EUR 4,395,599 0.250 % Jun 2017 (5,844) (12,152) (17,996)
HSBC Bank USA French Republic 0.76% 1,100,000 USD 1,100,000 0.250 % Sep 2017 (68,371) 42,345 (26,026)JPMorgan Chase Bank CDX.EM.13 - 1,200,000 USD 1,200,000 5.000 % Jun 2015 74,984 17,931 92,915
JPMorgan Chase BankFederativeRepublic ofBrazil
0.70% 8,800,000 USD 8,800,000 1.000 % Sep 2015 (65,631) 156,825 91,194
JPMorgan Chase Bank Government ofJapan 0.41% 800,000 USD 800,000 1.000 % Mar 2016 4,493 12,779 17,272
JPMorgan Chase Bank State of Qatar 0.54% 2,900,000 USD 2,900,000 1.000 % Mar 2016 (4,485) 54,461 49,976
JPMorgan Chase BankPeople'sRepublic ofChina
0.29% 4,000,000 USD 4,000,000 1.000 % Jun 2016 29,117 79,799 108,916
JPMorgan Chase BankFederativeRepublic ofBrazil
0.88% 900,000 USD 900,000 1.000 % Sep 2016 (4,063) 10,063 6,000
JPMorgan Chase BankPeople'sRepublic ofChina
0.32% 800,000 USD 800,000 1.000 % Sep 2016 3,100 19,301 22,401
JPMorgan Chase Bank Commonwealthof Australia 0.32% 7,500,000 USD 7,500,000 1.000 % Jun 2017 72,095 173,793 245,888
JPMorgan Chase BankFederativeRepublic ofBrazil
1.02% 10,700,000 USD 10,700,000 1.000 % Jun 2017 (117,866) 128,855 10,989
JPMorgan Chase Bank CDX.NA.IG.9 - 1,928,998 USD 1,928,998 0.553 % Dec 2017 - 32,938 32,938Morgan Stanley Capital Services, Inc. CDX.NA.IG.9 - 3,900,000 USD 3,900,000 0.963 % Dec 2012 - 9,702 9,702
Morgan Stanley Capital Services, Inc.FederativeRepublic ofBrazil
0.28% 900,000 USD 900,000 1.660 % Mar 2013 - 6,773 6,773
Morgan Stanley Capital Services, Inc. CDX.EM.13 - 7,000,000 USD 7,000,000 5.000 % Jun 2015 449,167 92,836 542,003
Morgan Stanley Capital Services, Inc.FederativeRepublic ofBrazil
0.66% 500,000 USD 500,000 1.000 % Jun 2015 (2,383) 7,675 5,292
Morgan Stanley Capital Services, Inc.FederativeRepublic ofBrazil
0.70% 9,900,000 USD 9,900,000 1.000 % Sep 2015 (74,893) 177,487 102,594
Morgan Stanley Capital Services, Inc. Abu Dhabi 0.56% 4,800,000 USD 4,800,000 1.000 % Mar 2016 (8,904) 87,614 78,710
Morgan Stanley Capital Services, Inc. Government ofJapan 0.41% 1,600,000 USD 1,600,000 1.000 % Mar 2016 (10,363) 44,951 34,588
Morgan Stanley Capital Services, Inc.UnitedKingdom ofGreat Britain
0.15% 1,900,000 USD 1,900,000 1.000 % Jun 2016 23,285 38,229 61,514
Copyright © 2013 www.secdatabase.com. All Rights Reserved.Please Consider the Environment Before Printing This Document
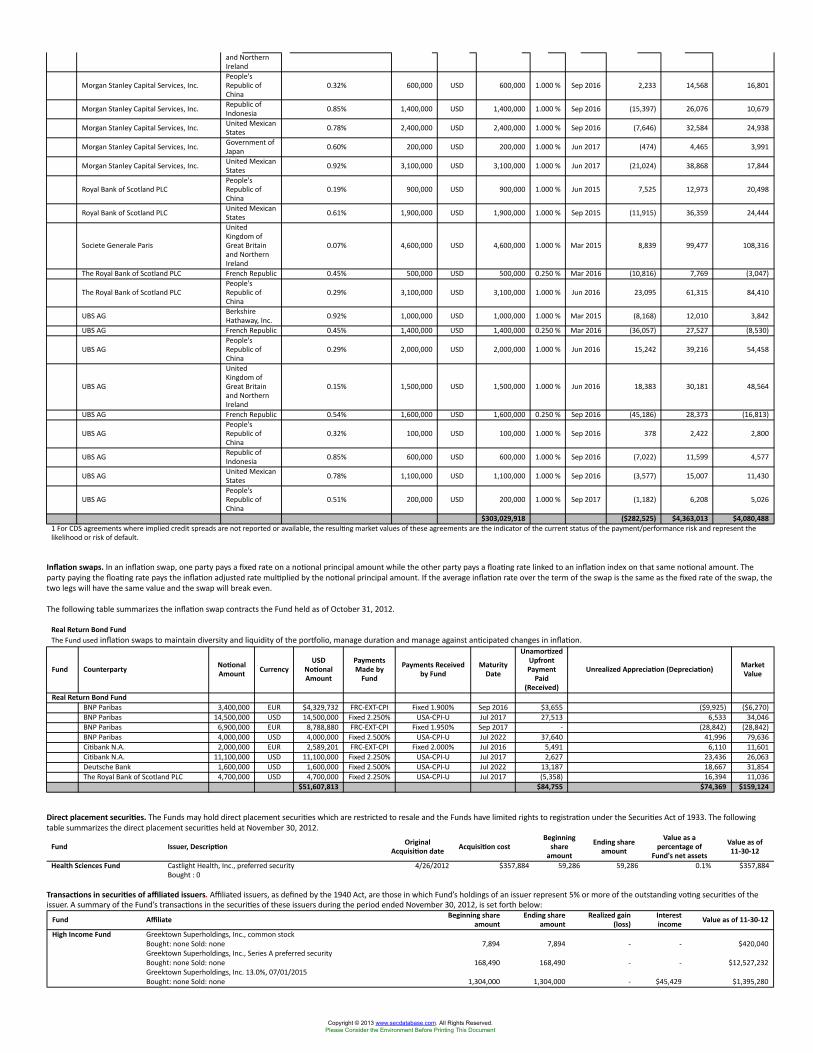
and NorthernIreland
Morgan Stanley Capital Services, Inc.People'sRepublic ofChina
0.32% 600,000 USD 600,000 1.000 % Sep 2016 2,233 14,568 16,801
Morgan Stanley Capital Services, Inc. Republic ofIndonesia 0.85% 1,400,000 USD 1,400,000 1.000 % Sep 2016 (15,397) 26,076 10,679
Morgan Stanley Capital Services, Inc. United MexicanStates 0.78% 2,400,000 USD 2,400,000 1.000 % Sep 2016 (7,646) 32,584 24,938
Morgan Stanley Capital Services, Inc. Government ofJapan 0.60% 200,000 USD 200,000 1.000 % Jun 2017 (474) 4,465 3,991
Morgan Stanley Capital Services, Inc. United MexicanStates 0.92% 3,100,000 USD 3,100,000 1.000 % Jun 2017 (21,024) 38,868 17,844
Royal Bank of Scotland PLCPeople'sRepublic ofChina
0.19% 900,000 USD 900,000 1.000 % Jun 2015 7,525 12,973 20,498
Royal Bank of Scotland PLC United MexicanStates 0.61% 1,900,000 USD 1,900,000 1.000 % Sep 2015 (11,915) 36,359 24,444
Societe Generale Paris
UnitedKingdom ofGreat Britainand NorthernIreland
0.07% 4,600,000 USD 4,600,000 1.000 % Mar 2015 8,839 99,477 108,316
The Royal Bank of Scotland PLC French Republic 0.45% 500,000 USD 500,000 0.250 % Mar 2016 (10,816) 7,769 (3,047)
The Royal Bank of Scotland PLCPeople'sRepublic ofChina
0.29% 3,100,000 USD 3,100,000 1.000 % Jun 2016 23,095 61,315 84,410
UBS AG BerkshireHathaway, Inc. 0.92% 1,000,000 USD 1,000,000 1.000 % Mar 2015 (8,168) 12,010 3,842
UBS AG French Republic 0.45% 1,400,000 USD 1,400,000 0.250 % Mar 2016 (36,057) 27,527 (8,530)
UBS AGPeople'sRepublic ofChina
0.29% 2,000,000 USD 2,000,000 1.000 % Jun 2016 15,242 39,216 54,458
UBS AG
UnitedKingdom ofGreat Britainand NorthernIreland
0.15% 1,500,000 USD 1,500,000 1.000 % Jun 2016 18,383 30,181 48,564
UBS AG French Republic 0.54% 1,600,000 USD 1,600,000 0.250 % Sep 2016 (45,186) 28,373 (16,813)
UBS AGPeople'sRepublic ofChina
0.32% 100,000 USD 100,000 1.000 % Sep 2016 378 2,422 2,800
UBS AG Republic ofIndonesia 0.85% 600,000 USD 600,000 1.000 % Sep 2016 (7,022) 11,599 4,577
UBS AG United MexicanStates 0.78% 1,100,000 USD 1,100,000 1.000 % Sep 2016 (3,577) 15,007 11,430
UBS AGPeople'sRepublic ofChina
0.51% 200,000 USD 200,000 1.000 % Sep 2017 (1,182) 6,208 5,026
$303,029,918 ($282,525) $4,363,013 $4,080,4881 For CDS agreements where implied credit spreads are not reported or available, the resulting market values of these agreements are the indicator of the current status of the payment/performance risk and represent thelikelihood or risk of default.
Inflation swaps. In an inflation swap, one party pays a fixed rate on a notional principal amount while the other party pays a floating rate linked to an inflation index on that same notional amount. Theparty paying the floating rate pays the inflation adjusted rate multiplied by the notional principal amount. If the average inflation rate over the term of the swap is the same as the fixed rate of the swap, thetwo legs will have the same value and the swap will break even.
The following table summarizes the inflation swap contracts the Fund held as of October 31, 2012.
Real Return Bond FundThe Fund used inflation swaps to maintain diversity and liquidity of the portfolio, manage duration and manage against anticipated changes in inflation.
Fund Counterparty NotionalAmount Currency
USDNotionalAmount
PaymentsMade by
Fund
Payments Receivedby Fund
MaturityDate
UnamortizedUpfrontPayment
Paid(Received)
Unrealized Appreciation (Depreciation) MarketValue
Real Return Bond FundBNP Paribas 3,400,000 EUR $4,329,732 FRC-EXT-CPI Fixed 1.900% Sep 2016 $3,655 ($9,925) ($6,270)BNP Paribas 14,500,000 USD 14,500,000 Fixed 2.250% USA-CPI-U Jul 2017 27,513 6,533 34,046BNP Paribas 6,900,000 EUR 8,788,880 FRC-EXT-CPI Fixed 1.950% Sep 2017 - (28,842) (28,842)BNP Paribas 4,000,000 USD 4,000,000 Fixed 2.500% USA-CPI-U Jul 2022 37,640 41,996 79,636Citibank N.A. 2,000,000 EUR 2,589,201 FRC-EXT-CPI Fixed 2.000% Jul 2016 5,491 6,110 11,601Citibank N.A. 11,100,000 USD 11,100,000 Fixed 2.250% USA-CPI-U Jul 2017 2,627 23,436 26,063Deutsche Bank 1,600,000 USD 1,600,000 Fixed 2.500% USA-CPI-U Jul 2022 13,187 18,667 31,854The Royal Bank of Scotland PLC 4,700,000 USD 4,700,000 Fixed 2.250% USA-CPI-U Jul 2017 (5,358) 16,394 11,036
$51,607,813 $84,755 $74,369 $159,124
Direct placement securities. The Funds may hold direct placement securities which are restricted to resale and the Funds have limited rights to registration under the Securities Act of 1933. The followingtable summarizes the direct placement securities held at November 30, 2012.
Fund Issuer, Description OriginalAcquisition date Acquisition cost
Beginningshare
amount
Ending shareamount
Value as apercentage of
Fund's net assets
Value as of11-30-12
Health Sciences Fund Castlight Health, Inc., preferred security 4/26/2012 $357,884 59,286 59,286 0.1% $357,884Bought : 0
Transactions in securities of affiliated issuers. Affiliated issuers, as defined by the 1940 Act, are those in which Fund’s holdings of an issuer represent 5% or more of the outstanding voting securities of theissuer. A summary of the Fund’s transactions in the securities of these issuers during the period ended November 30, 2012, is set forth below:
Fund Affiliate Beginning shareamount
Ending shareamount
Realized gain(loss)
Interestincome Value as of 11-30-12
High Income Fund Greektown Superholdings, Inc., common stockBought: none Sold: none 7,894 7,894 - - $420,040Greektown Superholdings, Inc., Series A preferred securityBought: none Sold: none 168,490 168,490 - - $12,527,232Greektown Superholdings, Inc. 13.0%, 07/01/2015Bought: none Sold: none 1,304,000 1,304,000 - $45,429 $1,395,280
Copyright © 2013 www.secdatabase.com. All Rights Reserved.Please Consider the Environment Before Printing This Document
For additional information on the Funds' significant accounting policies, please refer to the Funds' most recent semiannual or annual shareholder report.
Retirement Living through 2050 PortfolioAs of 11-30-12 (Unaudited)
Shares Value
Affiliated Investment Companies - 99.9%
EQUITY- 92.7%
John Hancock Funds II (G) - 86.2%
All Cap Value, Class NAV (Lord Abbett) 72,579 $808,534Alpha Opportunities, Class NAV (Wellington) 148,717 1,635,885Blue Chip Growth, Class NAV (T. Rowe Price) 80,583 1,972,666Capital Appreciation, Class NAV (Jennison) 129,331 1,681,309Capital Appreciation Value, Class NAV (T.Rowe Price) 272,833 3,134,852China Emerging Leaders, Class NAV (Atlantis) (I) 65,746 658,776Emerging Markets, Class NAV (DFA) 416,209 4,266,144Equity-Income, Class NAV (T. Rowe Price) 87,778 1,403,578
Copyright © 2013 www.secdatabase.com. All Rights Reserved.Please Consider the Environment Before Printing This Document
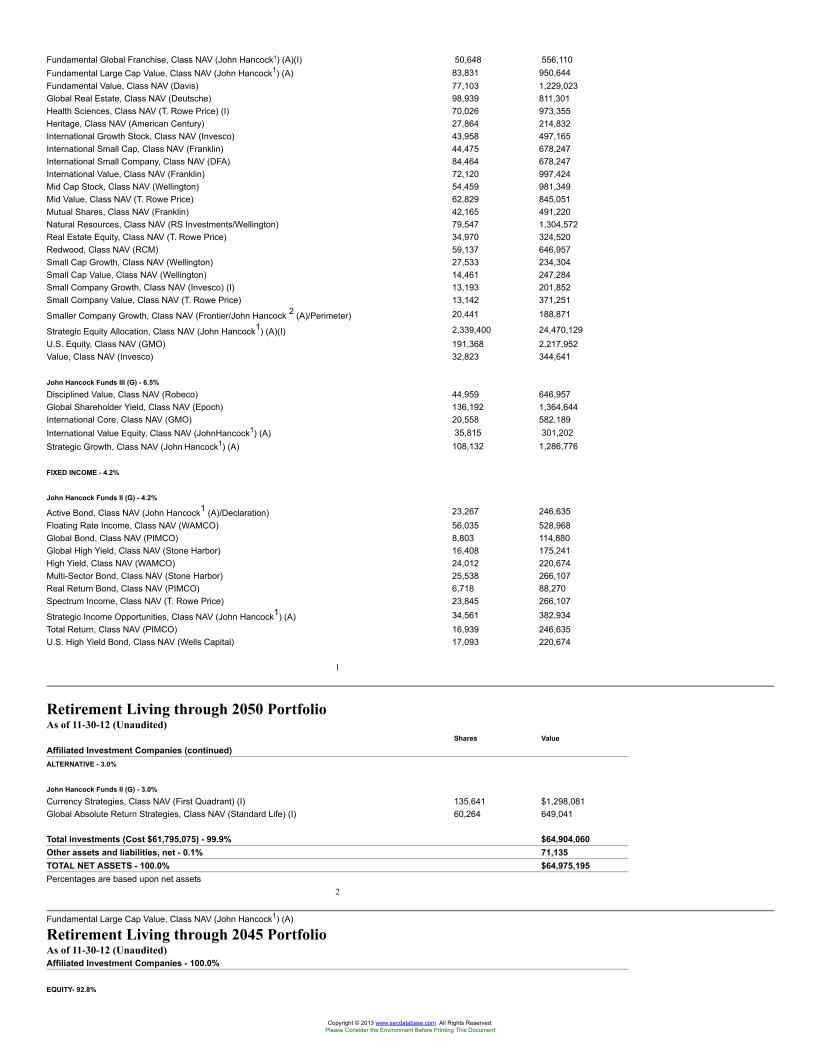
Fundamental Global Franchise, Class NAV (John Hancock1) (A)(I) 50,648 556,110Fundamental Large Cap Value, Class NAV (John Hancock1) (A) 83,831 950,644Fundamental Value, Class NAV (Davis) 77,103 1,229,023Global Real Estate, Class NAV (Deutsche) 98,939 811,301Health Sciences, Class NAV (T. Rowe Price) (I) 70,026 973,355Heritage, Class NAV (American Century) 27,864 214,832International Growth Stock, Class NAV (Invesco) 43,958 497,165International Small Cap, Class NAV (Franklin) 44,475 678,247International Small Company, Class NAV (DFA) 84,464 678,247International Value, Class NAV (Franklin) 72,120 997,424Mid Cap Stock, Class NAV (Wellington) 54,459 981,349Mid Value, Class NAV (T. Rowe Price) 62,829 845,051Mutual Shares, Class NAV (Franklin) 42,165 491,220Natural Resources, Class NAV (RS Investments/Wellington) 79,547 1,304,572Real Estate Equity, Class NAV (T. Rowe Price) 34,970 324,520Redwood, Class NAV (RCM) 59,137 646,957Small Cap Growth, Class NAV (Wellington) 27,533 234,304Small Cap Value, Class NAV (Wellington) 14,461 247,284Small Company Growth, Class NAV (Invesco) (I) 13,193 201,852Small Company Value, Class NAV (T. Rowe Price) 13,142 371,251
Smaller Company Growth, Class NAV (Frontier/John Hancock 2 (A)/Perimeter) 20,441 188,871
Strategic Equity Allocation, Class NAV (John Hancock1) (A)(I) 2,339,400 24,470,129U.S. Equity, Class NAV (GMO) 191,368 2,217,952Value, Class NAV (Invesco) 32,823 344,641
John Hancock Funds III (G) - 6.5%
Disciplined Value, Class NAV (Robeco) 44,959 646,957Global Shareholder Yield, Class NAV (Epoch) 136,192 1,364,644International Core, Class NAV (GMO) 20,558 582,189International Value Equity, Class NAV (JohnHancock1) (A) 35,815 301,202Strategic Growth, Class NAV (John Hancock1) (A) 108,132 1,286,776
FIXED INCOME - 4.2%
John Hancock Funds II (G) - 4.2%
Active Bond, Class NAV (John Hancock1 (A)/Declaration) 23,267 246,635Floating Rate Income, Class NAV (WAMCO) 56,035 528,968Global Bond, Class NAV (PIMCO) 8,803 114,880Global High Yield, Class NAV (Stone Harbor) 16,408 175,241High Yield, Class NAV (WAMCO) 24,012 220,674Multi-Sector Bond, Class NAV (Stone Harbor) 25,538 266,107Real Return Bond, Class NAV (PIMCO) 6,718 88,270Spectrum Income, Class NAV (T. Rowe Price) 23,845 266,107
Strategic Income Opportunities, Class NAV (John Hancock1) (A) 34,561 382,934Total Return, Class NAV (PIMCO) 16,939 246,635U.S. High Yield Bond, Class NAV (Wells Capital) 17,093 220,674
1
Retirement Living through 2050 PortfolioAs of 11-30-12 (Unaudited)
Shares Value
Affiliated Investment Companies (continued)ALTERNATIVE - 3.0%
John Hancock Funds II (G) - 3.0%
Currency Strategies, Class NAV (First Quadrant) (I) 135,641 $1,298,081Global Absolute Return Strategies, Class NAV (Standard Life) (I) 60,264 649,041
Total investments (Cost $61,795,075) - 99.9% $64,904,060Other assets and liabilities, net - 0.1% 71,135TOTAL NET ASSETS - 100.0% $64,975,195Percentages are based upon net assets
2
Fundamental Large Cap Value, Class NAV (John Hancock1) (A)
Retirement Living through 2045 PortfolioAs of 11-30-12 (Unaudited)Affiliated Investment Companies - 100.0%
EQUITY- 92.8%
Copyright © 2013 www.secdatabase.com. All Rights Reserved.Please Consider the Environment Before Printing This Document
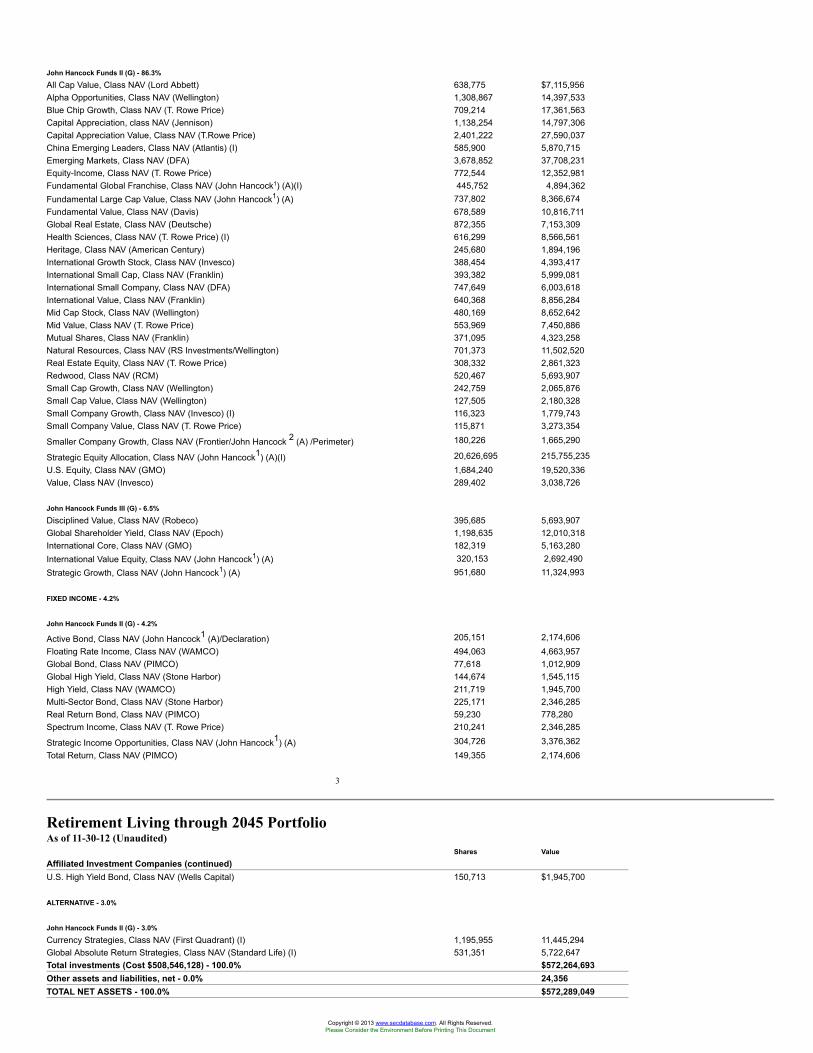
John Hancock Funds II (G) - 86.3%
All Cap Value, Class NAV (Lord Abbett) 638,775 $7,115,956Alpha Opportunities, Class NAV (Wellington) 1,308,867 14,397,533Blue Chip Growth, Class NAV (T. Rowe Price) 709,214 17,361,563Capital Appreciation, class NAV (Jennison) 1,138,254 14,797,306Capital Appreciation Value, Class NAV (T.Rowe Price) 2,401,222 27,590,037China Emerging Leaders, Class NAV (Atlantis) (I) 585,900 5,870,715Emerging Markets, Class NAV (DFA) 3,678,852 37,708,231Equity-Income, Class NAV (T. Rowe Price) 772,544 12,352,981Fundamental Global Franchise, Class NAV (John Hancock1) (A)(I) 445,752 4,894,362Fundamental Large Cap Value, Class NAV (John Hancock1) (A) 737,802 8,366,674Fundamental Value, Class NAV (Davis) 678,589 10,816,711Global Real Estate, Class NAV (Deutsche) 872,355 7,153,309Health Sciences, Class NAV (T. Rowe Price) (I) 616,299 8,566,561Heritage, Class NAV (American Century) 245,680 1,894,196International Growth Stock, Class NAV (Invesco) 388,454 4,393,417International Small Cap, Class NAV (Franklin) 393,382 5,999,081International Small Company, Class NAV (DFA) 747,649 6,003,618International Value, Class NAV (Franklin) 640,368 8,856,284Mid Cap Stock, Class NAV (Wellington) 480,169 8,652,642Mid Value, Class NAV (T. Rowe Price) 553,969 7,450,886Mutual Shares, Class NAV (Franklin) 371,095 4,323,258Natural Resources, Class NAV (RS Investments/Wellington) 701,373 11,502,520Real Estate Equity, Class NAV (T. Rowe Price) 308,332 2,861,323Redwood, Class NAV (RCM) 520,467 5,693,907Small Cap Growth, Class NAV (Wellington) 242,759 2,065,876Small Cap Value, Class NAV (Wellington) 127,505 2,180,328Small Company Growth, Class NAV (Invesco) (I) 116,323 1,779,743Small Company Value, Class NAV (T. Rowe Price) 115,871 3,273,354
Smaller Company Growth, Class NAV (Frontier/John Hancock 2 (A) /Perimeter) 180,226 1,665,290
Strategic Equity Allocation, Class NAV (John Hancock1) (A)(I) 20,626,695 215,755,235U.S. Equity, Class NAV (GMO) 1,684,240 19,520,336Value, Class NAV (Invesco) 289,402 3,038,726
John Hancock Funds III (G) - 6.5%
Disciplined Value, Class NAV (Robeco) 395,685 5,693,907Global Shareholder Yield, Class NAV (Epoch) 1,198,635 12,010,318International Core, Class NAV (GMO) 182,319 5,163,280International Value Equity, Class NAV (John Hancock1) (A) 320,153 2,692,490Strategic Growth, Class NAV (John Hancock1) (A) 951,680 11,324,993
FIXED INCOME - 4.2%
John Hancock Funds II (G) - 4.2%
Active Bond, Class NAV (John Hancock1 (A)/Declaration) 205,151 2,174,606Floating Rate Income, Class NAV (WAMCO) 494,063 4,663,957Global Bond, Class NAV (PIMCO) 77,618 1,012,909Global High Yield, Class NAV (Stone Harbor) 144,674 1,545,115High Yield, Class NAV (WAMCO) 211,719 1,945,700Multi-Sector Bond, Class NAV (Stone Harbor) 225,171 2,346,285Real Return Bond, Class NAV (PIMCO) 59,230 778,280Spectrum Income, Class NAV (T. Rowe Price) 210,241 2,346,285
Strategic Income Opportunities, Class NAV (John Hancock1) (A) 304,726 3,376,362Total Return, Class NAV (PIMCO) 149,355 2,174,606
3
Retirement Living through 2045 PortfolioAs of 11-30-12 (Unaudited)
Shares Value
Affiliated Investment Companies (continued)U.S. High Yield Bond, Class NAV (Wells Capital) 150,713 $1,945,700
ALTERNATIVE - 3.0%
John Hancock Funds II (G) - 3.0%
Currency Strategies, Class NAV (First Quadrant) (I) 1,195,955 11,445,294Global Absolute Return Strategies, Class NAV (Standard Life) (I) 531,351 5,722,647Total investments (Cost $508,546,128) - 100.0% $572,264,693Other assets and liabilities, net - 0.0% 24,356TOTAL NET ASSETS - 100.0% $572,289,049
Copyright © 2013 www.secdatabase.com. All Rights Reserved.Please Consider the Environment Before Printing This Document
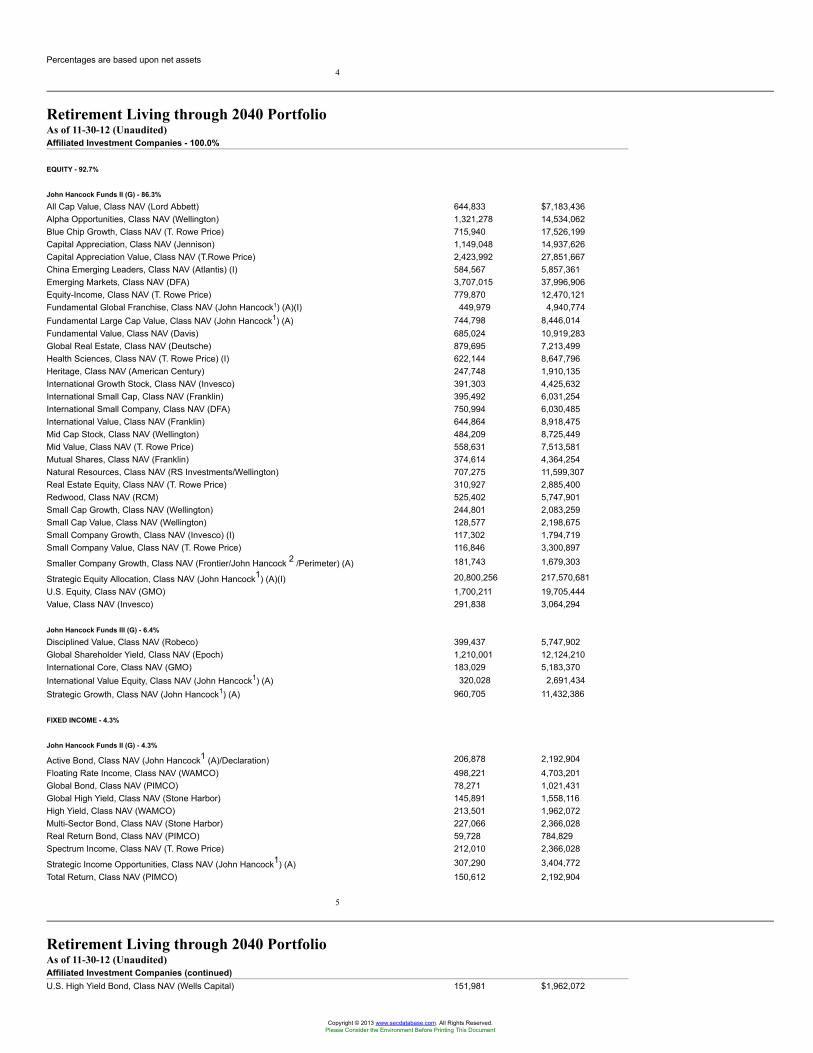
Percentages are based upon net assets4
Retirement Living through 2040 PortfolioAs of 11-30-12 (Unaudited)Affiliated Investment Companies - 100.0%
EQUITY - 92.7%
John Hancock Funds II (G) - 86.3%
All Cap Value, Class NAV (Lord Abbett) 644,833 $7,183,436Alpha Opportunities, Class NAV (Wellington) 1,321,278 14,534,062Blue Chip Growth, Class NAV (T. Rowe Price) 715,940 17,526,199Capital Appreciation, Class NAV (Jennison) 1,149,048 14,937,626Capital Appreciation Value, Class NAV (T.Rowe Price) 2,423,992 27,851,667China Emerging Leaders, Class NAV (Atlantis) (I) 584,567 5,857,361Emerging Markets, Class NAV (DFA) 3,707,015 37,996,906Equity-Income, Class NAV (T. Rowe Price) 779,870 12,470,121Fundamental Global Franchise, Class NAV (John Hancock1) (A)(I) 449,979 4,940,774Fundamental Large Cap Value, Class NAV (John Hancock1) (A) 744,798 8,446,014Fundamental Value, Class NAV (Davis) 685,024 10,919,283Global Real Estate, Class NAV (Deutsche) 879,695 7,213,499Health Sciences, Class NAV (T. Rowe Price) (I) 622,144 8,647,796Heritage, Class NAV (American Century) 247,748 1,910,135International Growth Stock, Class NAV (Invesco) 391,303 4,425,632International Small Cap, Class NAV (Franklin) 395,492 6,031,254International Small Company, Class NAV (DFA) 750,994 6,030,485International Value, Class NAV (Franklin) 644,864 8,918,475Mid Cap Stock, Class NAV (Wellington) 484,209 8,725,449Mid Value, Class NAV (T. Rowe Price) 558,631 7,513,581Mutual Shares, Class NAV (Franklin) 374,614 4,364,254Natural Resources, Class NAV (RS Investments/Wellington) 707,275 11,599,307Real Estate Equity, Class NAV (T. Rowe Price) 310,927 2,885,400Redwood, Class NAV (RCM) 525,402 5,747,901Small Cap Growth, Class NAV (Wellington) 244,801 2,083,259Small Cap Value, Class NAV (Wellington) 128,577 2,198,675Small Company Growth, Class NAV (Invesco) (I) 117,302 1,794,719Small Company Value, Class NAV (T. Rowe Price) 116,846 3,300,897
Smaller Company Growth, Class NAV (Frontier/John Hancock 2 /Perimeter) (A) 181,743 1,679,303
Strategic Equity Allocation, Class NAV (John Hancock1) (A)(I) 20,800,256 217,570,681U.S. Equity, Class NAV (GMO) 1,700,211 19,705,444Value, Class NAV (Invesco) 291,838 3,064,294
John Hancock Funds III (G) - 6.4%
Disciplined Value, Class NAV (Robeco) 399,437 5,747,902Global Shareholder Yield, Class NAV (Epoch) 1,210,001 12,124,210International Core, Class NAV (GMO) 183,029 5,183,370International Value Equity, Class NAV (John Hancock1) (A) 320,028 2,691,434Strategic Growth, Class NAV (John Hancock1) (A) 960,705 11,432,386
FIXED INCOME - 4.3%
John Hancock Funds II (G) - 4.3%
Active Bond, Class NAV (John Hancock1 (A)/Declaration) 206,878 2,192,904Floating Rate Income, Class NAV (WAMCO) 498,221 4,703,201Global Bond, Class NAV (PIMCO) 78,271 1,021,431Global High Yield, Class NAV (Stone Harbor) 145,891 1,558,116High Yield, Class NAV (WAMCO) 213,501 1,962,072Multi-Sector Bond, Class NAV (Stone Harbor) 227,066 2,366,028Real Return Bond, Class NAV (PIMCO) 59,728 784,829Spectrum Income, Class NAV (T. Rowe Price) 212,010 2,366,028
Strategic Income Opportunities, Class NAV (John Hancock1) (A) 307,290 3,404,772Total Return, Class NAV (PIMCO) 150,612 2,192,904
5
Retirement Living through 2040 PortfolioAs of 11-30-12 (Unaudited)Affiliated Investment Companies (continued)U.S. High Yield Bond, Class NAV (Wells Capital) 151,981 $1,962,072
Copyright © 2013 www.secdatabase.com. All Rights Reserved.Please Consider the Environment Before Printing This Document
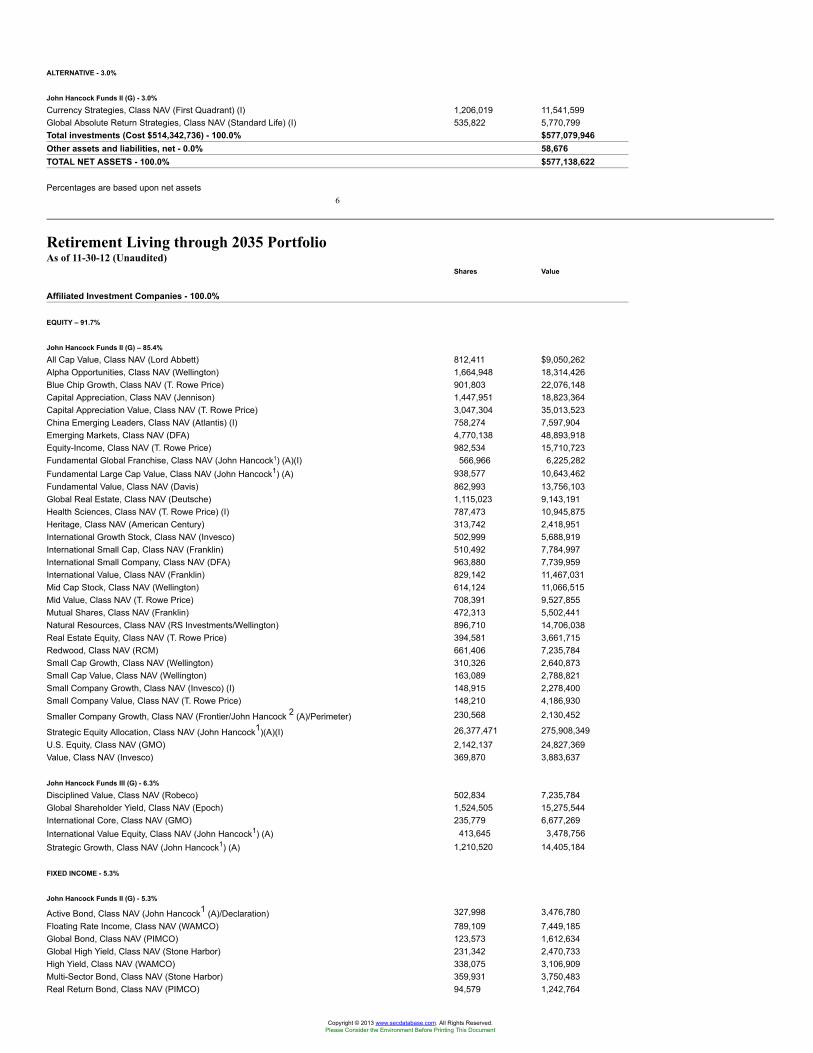
ALTERNATIVE - 3.0%
John Hancock Funds II (G) - 3.0%
Currency Strategies, Class NAV (First Quadrant) (I) 1,206,019 11,541,599Global Absolute Return Strategies, Class NAV (Standard Life) (I) 535,822 5,770,799Total investments (Cost $514,342,736) - 100.0% $577,079,946Other assets and liabilities, net - 0.0% 58,676TOTAL NET ASSETS - 100.0% $577,138,622
Percentages are based upon net assets6
Retirement Living through 2035 PortfolioAs of 11-30-12 (Unaudited)
Shares Value
Affiliated Investment Companies - 100.0%
EQUITY – 91.7%
John Hancock Funds II (G) – 85.4%
All Cap Value, Class NAV (Lord Abbett) 812,411 $9,050,262Alpha Opportunities, Class NAV (Wellington) 1,664,948 18,314,426Blue Chip Growth, Class NAV (T. Rowe Price) 901,803 22,076,148Capital Appreciation, Class NAV (Jennison) 1,447,951 18,823,364Capital Appreciation Value, Class NAV (T. Rowe Price) 3,047,304 35,013,523China Emerging Leaders, Class NAV (Atlantis) (I) 758,274 7,597,904Emerging Markets, Class NAV (DFA) 4,770,138 48,893,918Equity-Income, Class NAV (T. Rowe Price) 982,534 15,710,723Fundamental Global Franchise, Class NAV (John Hancock1) (A)(I) 566,966 6,225,282Fundamental Large Cap Value, Class NAV (John Hancock1) (A) 938,577 10,643,462Fundamental Value, Class NAV (Davis) 862,993 13,756,103Global Real Estate, Class NAV (Deutsche) 1,115,023 9,143,191Health Sciences, Class NAV (T. Rowe Price) (I) 787,473 10,945,875Heritage, Class NAV (American Century) 313,742 2,418,951International Growth Stock, Class NAV (Invesco) 502,999 5,688,919International Small Cap, Class NAV (Franklin) 510,492 7,784,997International Small Company, Class NAV (DFA) 963,880 7,739,959International Value, Class NAV (Franklin) 829,142 11,467,031Mid Cap Stock, Class NAV (Wellington) 614,124 11,066,515Mid Value, Class NAV (T. Rowe Price) 708,391 9,527,855Mutual Shares, Class NAV (Franklin) 472,313 5,502,441Natural Resources, Class NAV (RS Investments/Wellington) 896,710 14,706,038Real Estate Equity, Class NAV (T. Rowe Price) 394,581 3,661,715Redwood, Class NAV (RCM) 661,406 7,235,784Small Cap Growth, Class NAV (Wellington) 310,326 2,640,873Small Cap Value, Class NAV (Wellington) 163,089 2,788,821Small Company Growth, Class NAV (Invesco) (I) 148,915 2,278,400Small Company Value, Class NAV (T. Rowe Price) 148,210 4,186,930
Smaller Company Growth, Class NAV (Frontier/John Hancock 2 (A)/Perimeter) 230,568 2,130,452
Strategic Equity Allocation, Class NAV (John Hancock1)(A)(I) 26,377,471 275,908,349U.S. Equity, Class NAV (GMO) 2,142,137 24,827,369Value, Class NAV (Invesco) 369,870 3,883,637
John Hancock Funds III (G) - 6.3%
Disciplined Value, Class NAV (Robeco) 502,834 7,235,784Global Shareholder Yield, Class NAV (Epoch) 1,524,505 15,275,544International Core, Class NAV (GMO) 235,779 6,677,269International Value Equity, Class NAV (John Hancock1) (A) 413,645 3,478,756Strategic Growth, Class NAV (John Hancock1) (A) 1,210,520 14,405,184
FIXED INCOME - 5.3%
John Hancock Funds II (G) - 5.3%
Active Bond, Class NAV (John Hancock1 (A)/Declaration) 327,998 3,476,780Floating Rate Income, Class NAV (WAMCO) 789,109 7,449,185Global Bond, Class NAV (PIMCO) 123,573 1,612,634Global High Yield, Class NAV (Stone Harbor) 231,342 2,470,733High Yield, Class NAV (WAMCO) 338,075 3,106,909Multi-Sector Bond, Class NAV (Stone Harbor) 359,931 3,750,483Real Return Bond, Class NAV (PIMCO) 94,579 1,242,764
Copyright © 2013 www.secdatabase.com. All Rights Reserved.Please Consider the Environment Before Printing This Document
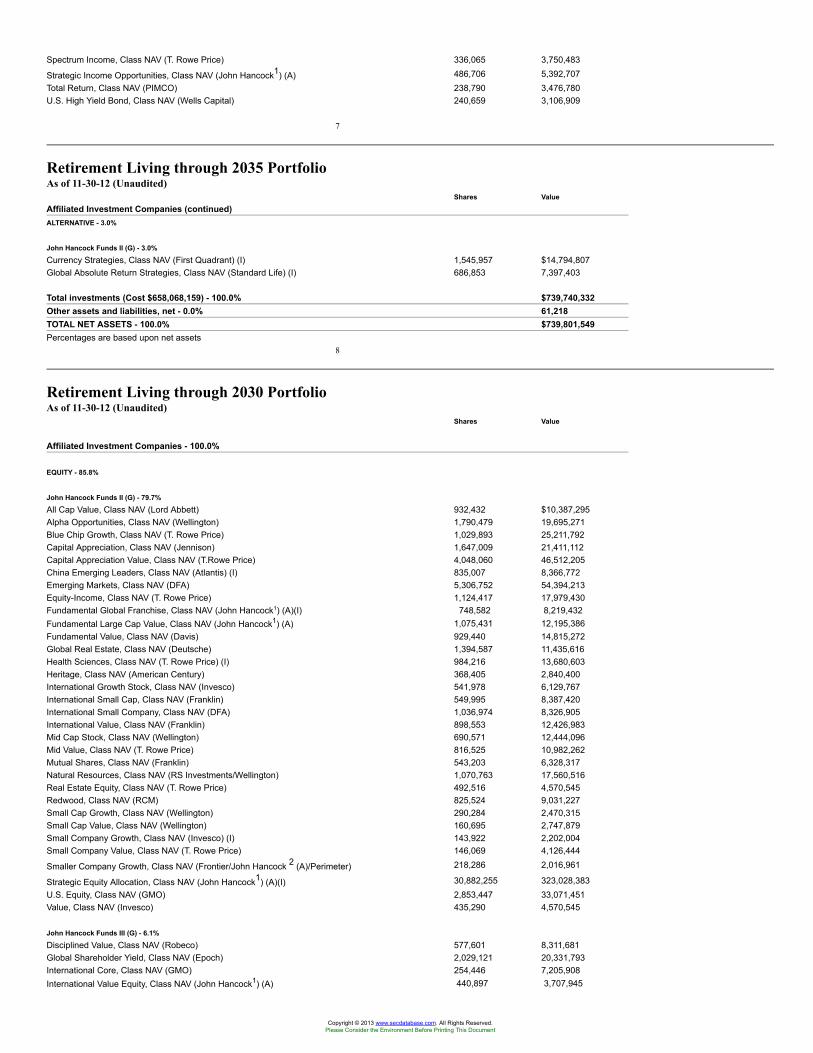
Spectrum Income, Class NAV (T. Rowe Price) 336,065 3,750,483
Strategic Income Opportunities, Class NAV (John Hancock1) (A) 486,706 5,392,707Total Return, Class NAV (PIMCO) 238,790 3,476,780U.S. High Yield Bond, Class NAV (Wells Capital) 240,659 3,106,909
7
Retirement Living through 2035 PortfolioAs of 11-30-12 (Unaudited)
Shares Value
Affiliated Investment Companies (continued)ALTERNATIVE - 3.0%
John Hancock Funds II (G) - 3.0%
Currency Strategies, Class NAV (First Quadrant) (I) 1,545,957 $14,794,807Global Absolute Return Strategies, Class NAV (Standard Life) (I) 686,853 7,397,403
Total investments (Cost $658,068,159) - 100.0% $739,740,332Other assets and liabilities, net - 0.0% 61,218TOTAL NET ASSETS - 100.0% $739,801,549Percentages are based upon net assets
8
Retirement Living through 2030 PortfolioAs of 11-30-12 (Unaudited)
Shares Value
Affiliated Investment Companies - 100.0%
EQUITY - 85.8%
John Hancock Funds II (G) - 79.7%
All Cap Value, Class NAV (Lord Abbett) 932,432 $10,387,295Alpha Opportunities, Class NAV (Wellington) 1,790,479 19,695,271Blue Chip Growth, Class NAV (T. Rowe Price) 1,029,893 25,211,792Capital Appreciation, Class NAV (Jennison) 1,647,009 21,411,112Capital Appreciation Value, Class NAV (T.Rowe Price) 4,048,060 46,512,205China Emerging Leaders, Class NAV (Atlantis) (I) 835,007 8,366,772Emerging Markets, Class NAV (DFA) 5,306,752 54,394,213Equity-Income, Class NAV (T. Rowe Price) 1,124,417 17,979,430Fundamental Global Franchise, Class NAV (John Hancock1) (A)(I) 748,582 8,219,432Fundamental Large Cap Value, Class NAV (John Hancock1) (A) 1,075,431 12,195,386Fundamental Value, Class NAV (Davis) 929,440 14,815,272Global Real Estate, Class NAV (Deutsche) 1,394,587 11,435,616Health Sciences, Class NAV (T. Rowe Price) (I) 984,216 13,680,603Heritage, Class NAV (American Century) 368,405 2,840,400International Growth Stock, Class NAV (Invesco) 541,978 6,129,767International Small Cap, Class NAV (Franklin) 549,995 8,387,420International Small Company, Class NAV (DFA) 1,036,974 8,326,905International Value, Class NAV (Franklin) 898,553 12,426,983Mid Cap Stock, Class NAV (Wellington) 690,571 12,444,096Mid Value, Class NAV (T. Rowe Price) 816,525 10,982,262Mutual Shares, Class NAV (Franklin) 543,203 6,328,317Natural Resources, Class NAV (RS Investments/Wellington) 1,070,763 17,560,516Real Estate Equity, Class NAV (T. Rowe Price) 492,516 4,570,545Redwood, Class NAV (RCM) 825,524 9,031,227Small Cap Growth, Class NAV (Wellington) 290,284 2,470,315Small Cap Value, Class NAV (Wellington) 160,695 2,747,879Small Company Growth, Class NAV (Invesco) (I) 143,922 2,202,004Small Company Value, Class NAV (T. Rowe Price) 146,069 4,126,444
Smaller Company Growth, Class NAV (Frontier/John Hancock 2 (A)/Perimeter) 218,286 2,016,961
Strategic Equity Allocation, Class NAV (John Hancock1) (A)(I) 30,882,255 323,028,383U.S. Equity, Class NAV (GMO) 2,853,447 33,071,451Value, Class NAV (Invesco) 435,290 4,570,545
John Hancock Funds III (G) - 6.1%
Disciplined Value, Class NAV (Robeco) 577,601 8,311,681Global Shareholder Yield, Class NAV (Epoch) 2,029,121 20,331,793International Core, Class NAV (GMO) 254,446 7,205,908International Value Equity, Class NAV (John Hancock1) (A) 440,897 3,707,945
Copyright © 2013 www.secdatabase.com. All Rights Reserved.Please Consider the Environment Before Printing This Document
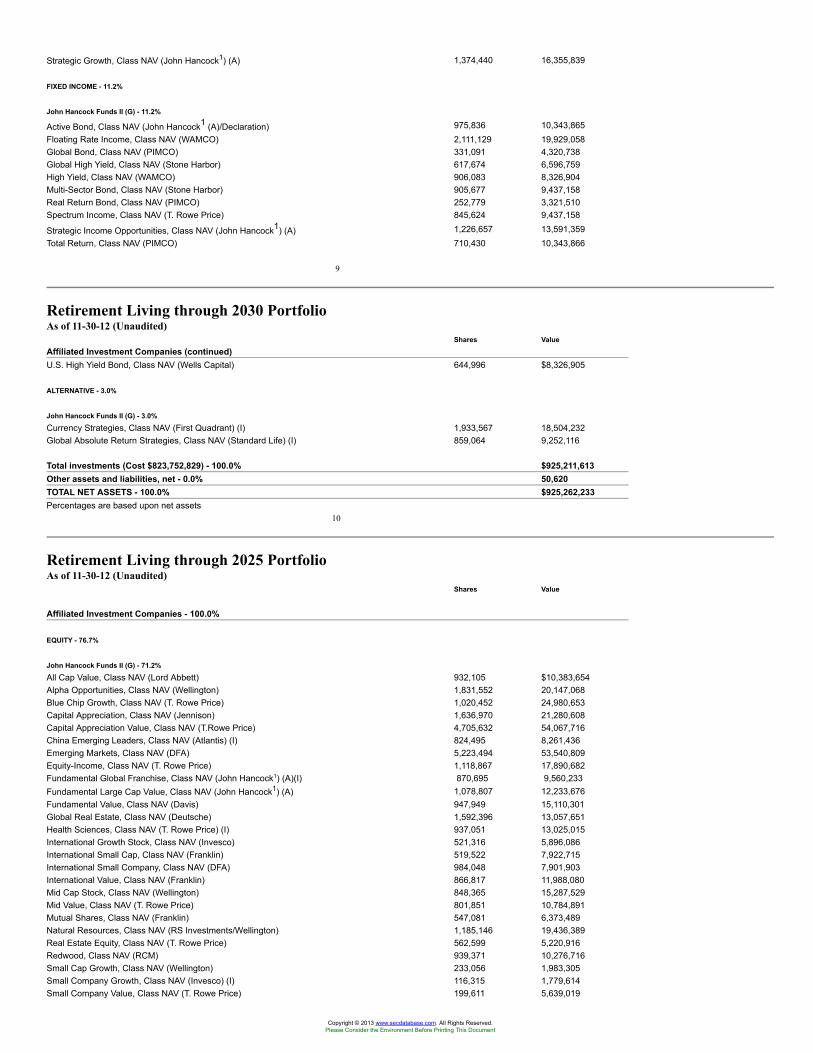
Strategic Growth, Class NAV (John Hancock1) (A) 1,374,440 16,355,839
FIXED INCOME - 11.2%
John Hancock Funds II (G) - 11.2%
Active Bond, Class NAV (John Hancock1 (A)/Declaration) 975,836 10,343,865Floating Rate Income, Class NAV (WAMCO) 2,111,129 19,929,058Global Bond, Class NAV (PIMCO) 331,091 4,320,738Global High Yield, Class NAV (Stone Harbor) 617,674 6,596,759High Yield, Class NAV (WAMCO) 906,083 8,326,904Multi-Sector Bond, Class NAV (Stone Harbor) 905,677 9,437,158Real Return Bond, Class NAV (PIMCO) 252,779 3,321,510Spectrum Income, Class NAV (T. Rowe Price) 845,624 9,437,158
Strategic Income Opportunities, Class NAV (John Hancock1) (A) 1,226,657 13,591,359Total Return, Class NAV (PIMCO) 710,430 10,343,866
9
Retirement Living through 2030 PortfolioAs of 11-30-12 (Unaudited)
Shares Value
Affiliated Investment Companies (continued)U.S. High Yield Bond, Class NAV (Wells Capital) 644,996 $8,326,905
ALTERNATIVE - 3.0%
John Hancock Funds II (G) - 3.0%
Currency Strategies, Class NAV (First Quadrant) (I) 1,933,567 18,504,232Global Absolute Return Strategies, Class NAV (Standard Life) (I) 859,064 9,252,116
Total investments (Cost $823,752,829) - 100.0% $925,211,613Other assets and liabilities, net - 0.0% 50,620TOTAL NET ASSETS - 100.0% $925,262,233Percentages are based upon net assets
10
Retirement Living through 2025 PortfolioAs of 11-30-12 (Unaudited)
Shares Value
Affiliated Investment Companies - 100.0%
EQUITY - 76.7%
John Hancock Funds II (G) - 71.2%
All Cap Value, Class NAV (Lord Abbett) 932,105 $10,383,654Alpha Opportunities, Class NAV (Wellington) 1,831,552 20,147,068Blue Chip Growth, Class NAV (T. Rowe Price) 1,020,452 24,980,653Capital Appreciation, Class NAV (Jennison) 1,636,970 21,280,608Capital Appreciation Value, Class NAV (T.Rowe Price) 4,705,632 54,067,716China Emerging Leaders, Class NAV (Atlantis) (I) 824,495 8,261,436Emerging Markets, Class NAV (DFA) 5,223,494 53,540,809Equity-Income, Class NAV (T. Rowe Price) 1,118,867 17,890,682Fundamental Global Franchise, Class NAV (John Hancock1) (A)(I) 870,695 9,560,233Fundamental Large Cap Value, Class NAV (John Hancock1) (A) 1,078,807 12,233,676Fundamental Value, Class NAV (Davis) 947,949 15,110,301Global Real Estate, Class NAV (Deutsche) 1,592,396 13,057,651Health Sciences, Class NAV (T. Rowe Price) (I) 937,051 13,025,015International Growth Stock, Class NAV (Invesco) 521,316 5,896,086International Small Cap, Class NAV (Franklin) 519,522 7,922,715International Small Company, Class NAV (DFA) 984,048 7,901,903International Value, Class NAV (Franklin) 866,817 11,988,080Mid Cap Stock, Class NAV (Wellington) 848,365 15,287,529Mid Value, Class NAV (T. Rowe Price) 801,851 10,784,891Mutual Shares, Class NAV (Franklin) 547,081 6,373,489Natural Resources, Class NAV (RS Investments/Wellington) 1,185,146 19,436,389Real Estate Equity, Class NAV (T. Rowe Price) 562,599 5,220,916Redwood, Class NAV (RCM) 939,371 10,276,716Small Cap Growth, Class NAV (Wellington) 233,056 1,983,305Small Company Growth, Class NAV (Invesco) (I) 116,315 1,779,614Small Company Value, Class NAV (T. Rowe Price) 199,611 5,639,019
Copyright © 2013 www.secdatabase.com. All Rights Reserved.Please Consider the Environment Before Printing This Document
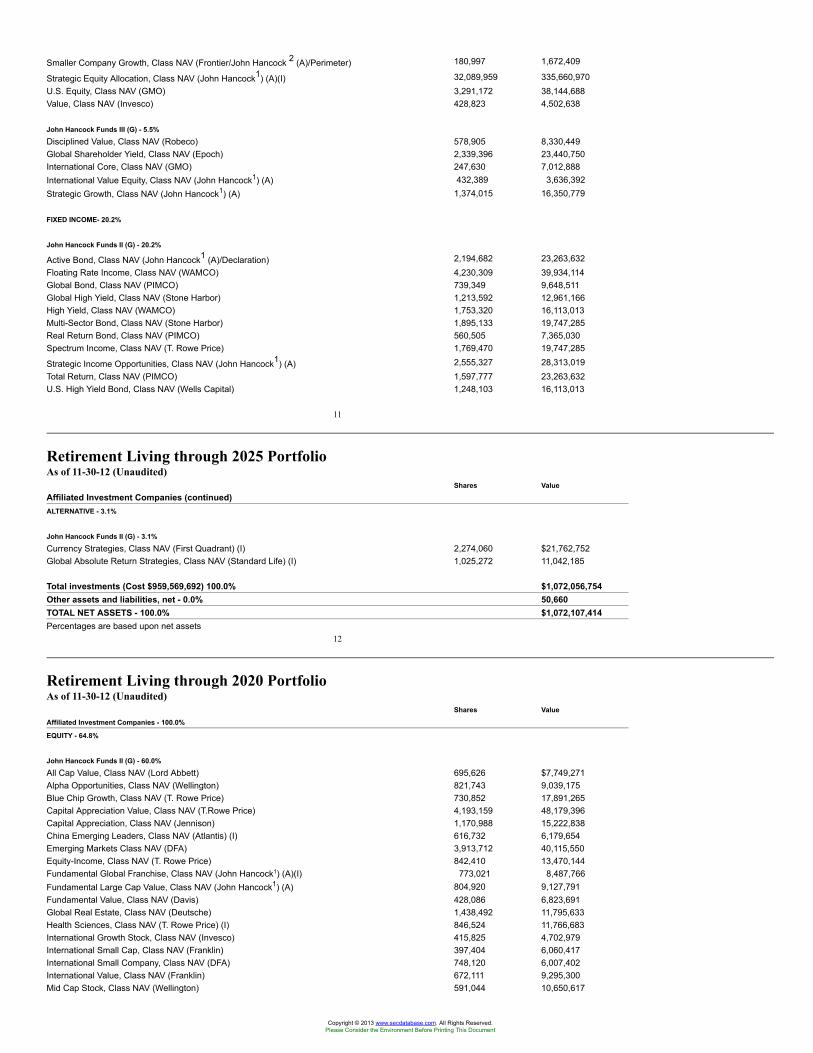
Smaller Company Growth, Class NAV (Frontier/John Hancock 2 (A)/Perimeter) 180,997 1,672,409
Strategic Equity Allocation, Class NAV (John Hancock1) (A)(I) 32,089,959 335,660,970U.S. Equity, Class NAV (GMO) 3,291,172 38,144,688Value, Class NAV (Invesco) 428,823 4,502,638
John Hancock Funds III (G) - 5.5%
Disciplined Value, Class NAV (Robeco) 578,905 8,330,449Global Shareholder Yield, Class NAV (Epoch) 2,339,396 23,440,750International Core, Class NAV (GMO) 247,630 7,012,888International Value Equity, Class NAV (John Hancock1) (A) 432,389 3,636,392Strategic Growth, Class NAV (John Hancock1) (A) 1,374,015 16,350,779
FIXED INCOME- 20.2%
John Hancock Funds II (G) - 20.2%
Active Bond, Class NAV (John Hancock1 (A)/Declaration) 2,194,682 23,263,632Floating Rate Income, Class NAV (WAMCO) 4,230,309 39,934,114Global Bond, Class NAV (PIMCO) 739,349 9,648,511Global High Yield, Class NAV (Stone Harbor) 1,213,592 12,961,166High Yield, Class NAV (WAMCO) 1,753,320 16,113,013Multi-Sector Bond, Class NAV (Stone Harbor) 1,895,133 19,747,285Real Return Bond, Class NAV (PIMCO) 560,505 7,365,030Spectrum Income, Class NAV (T. Rowe Price) 1,769,470 19,747,285
Strategic Income Opportunities, Class NAV (John Hancock1) (A) 2,555,327 28,313,019Total Return, Class NAV (PIMCO) 1,597,777 23,263,632U.S. High Yield Bond, Class NAV (Wells Capital) 1,248,103 16,113,013
11
Retirement Living through 2025 PortfolioAs of 11-30-12 (Unaudited)
Shares Value
Affiliated Investment Companies (continued)ALTERNATIVE - 3.1%
John Hancock Funds II (G) - 3.1%
Currency Strategies, Class NAV (First Quadrant) (I) 2,274,060 $21,762,752Global Absolute Return Strategies, Class NAV (Standard Life) (I) 1,025,272 11,042,185
Total investments (Cost $959,569,692) 100.0% $1,072,056,754Other assets and liabilities, net - 0.0% 50,660TOTAL NET ASSETS - 100.0% $1,072,107,414Percentages are based upon net assets
12
Retirement Living through 2020 PortfolioAs of 11-30-12 (Unaudited)
Shares Value
Affiliated Investment Companies - 100.0%
EQUITY - 64.8%
John Hancock Funds II (G) - 60.0%
All Cap Value, Class NAV (Lord Abbett) 695,626 $7,749,271Alpha Opportunities, Class NAV (Wellington) 821,743 9,039,175Blue Chip Growth, Class NAV (T. Rowe Price) 730,852 17,891,265Capital Appreciation Value, Class NAV (T.Rowe Price) 4,193,159 48,179,396Capital Appreciation, Class NAV (Jennison) 1,170,988 15,222,838China Emerging Leaders, Class NAV (Atlantis) (I) 616,732 6,179,654Emerging Markets Class NAV (DFA) 3,913,712 40,115,550Equity-Income, Class NAV (T. Rowe Price) 842,410 13,470,144Fundamental Global Franchise, Class NAV (John Hancock1) (A)(I) 773,021 8,487,766Fundamental Large Cap Value, Class NAV (John Hancock1) (A) 804,920 9,127,791Fundamental Value, Class NAV (Davis) 428,086 6,823,691Global Real Estate, Class NAV (Deutsche) 1,438,492 11,795,633Health Sciences, Class NAV (T. Rowe Price) (I) 846,524 11,766,683International Growth Stock, Class NAV (Invesco) 415,825 4,702,979International Small Cap, Class NAV (Franklin) 397,404 6,060,417International Small Company, Class NAV (DFA) 748,120 6,007,402International Value, Class NAV (Franklin) 672,111 9,295,300Mid Cap Stock, Class NAV (Wellington) 591,044 10,650,617
Copyright © 2013 www.secdatabase.com. All Rights Reserved.Please Consider the Environment Before Printing This Document
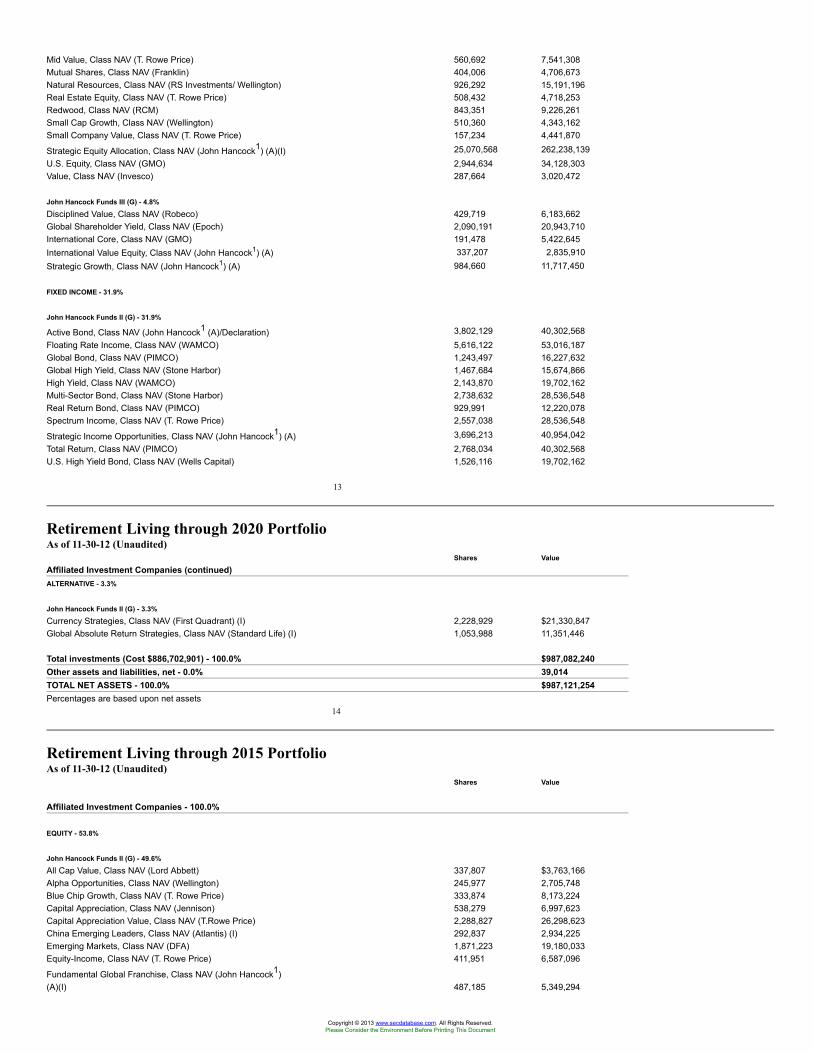
Mid Value, Class NAV (T. Rowe Price) 560,692 7,541,308Mutual Shares, Class NAV (Franklin) 404,006 4,706,673Natural Resources, Class NAV (RS Investments/ Wellington) 926,292 15,191,196Real Estate Equity, Class NAV (T. Rowe Price) 508,432 4,718,253Redwood, Class NAV (RCM) 843,351 9,226,261Small Cap Growth, Class NAV (Wellington) 510,360 4,343,162Small Company Value, Class NAV (T. Rowe Price) 157,234 4,441,870
Strategic Equity Allocation, Class NAV (John Hancock1) (A)(I) 25,070,568 262,238,139U.S. Equity, Class NAV (GMO) 2,944,634 34,128,303Value, Class NAV (Invesco) 287,664 3,020,472
John Hancock Funds III (G) - 4.8%
Disciplined Value, Class NAV (Robeco) 429,719 6,183,662Global Shareholder Yield, Class NAV (Epoch) 2,090,191 20,943,710International Core, Class NAV (GMO) 191,478 5,422,645International Value Equity, Class NAV (John Hancock1) (A) 337,207 2,835,910Strategic Growth, Class NAV (John Hancock1) (A) 984,660 11,717,450
FIXED INCOME - 31.9%
John Hancock Funds II (G) - 31.9%
Active Bond, Class NAV (John Hancock1 (A)/Declaration) 3,802,129 40,302,568Floating Rate Income, Class NAV (WAMCO) 5,616,122 53,016,187Global Bond, Class NAV (PIMCO) 1,243,497 16,227,632Global High Yield, Class NAV (Stone Harbor) 1,467,684 15,674,866High Yield, Class NAV (WAMCO) 2,143,870 19,702,162Multi-Sector Bond, Class NAV (Stone Harbor) 2,738,632 28,536,548Real Return Bond, Class NAV (PIMCO) 929,991 12,220,078Spectrum Income, Class NAV (T. Rowe Price) 2,557,038 28,536,548
Strategic Income Opportunities, Class NAV (John Hancock1) (A) 3,696,213 40,954,042Total Return, Class NAV (PIMCO) 2,768,034 40,302,568U.S. High Yield Bond, Class NAV (Wells Capital) 1,526,116 19,702,162
13
Retirement Living through 2020 PortfolioAs of 11-30-12 (Unaudited)
Shares Value
Affiliated Investment Companies (continued)ALTERNATIVE - 3.3%
John Hancock Funds II (G) - 3.3%
Currency Strategies, Class NAV (First Quadrant) (I) 2,228,929 $21,330,847Global Absolute Return Strategies, Class NAV (Standard Life) (I) 1,053,988 11,351,446
Total investments (Cost $886,702,901) - 100.0% $987,082,240Other assets and liabilities, net - 0.0% 39,014TOTAL NET ASSETS - 100.0% $987,121,254Percentages are based upon net assets
14
Retirement Living through 2015 PortfolioAs of 11-30-12 (Unaudited)
Shares Value
Affiliated Investment Companies - 100.0%
EQUITY - 53.8%
John Hancock Funds II (G) - 49.6%
All Cap Value, Class NAV (Lord Abbett) 337,807 $3,763,166Alpha Opportunities, Class NAV (Wellington) 245,977 2,705,748Blue Chip Growth, Class NAV (T. Rowe Price) 333,874 8,173,224Capital Appreciation, Class NAV (Jennison) 538,279 6,997,623Capital Appreciation Value, Class NAV (T.Rowe Price) 2,288,827 26,298,623China Emerging Leaders, Class NAV (Atlantis) (I) 292,837 2,934,225Emerging Markets, Class NAV (DFA) 1,871,223 19,180,033Equity-Income, Class NAV (T. Rowe Price) 411,951 6,587,096
Fundamental Global Franchise, Class NAV (John Hancock1)(A)(I) 487,185 5,349,294
Copyright © 2013 www.secdatabase.com. All Rights Reserved.Please Consider the Environment Before Printing This Document
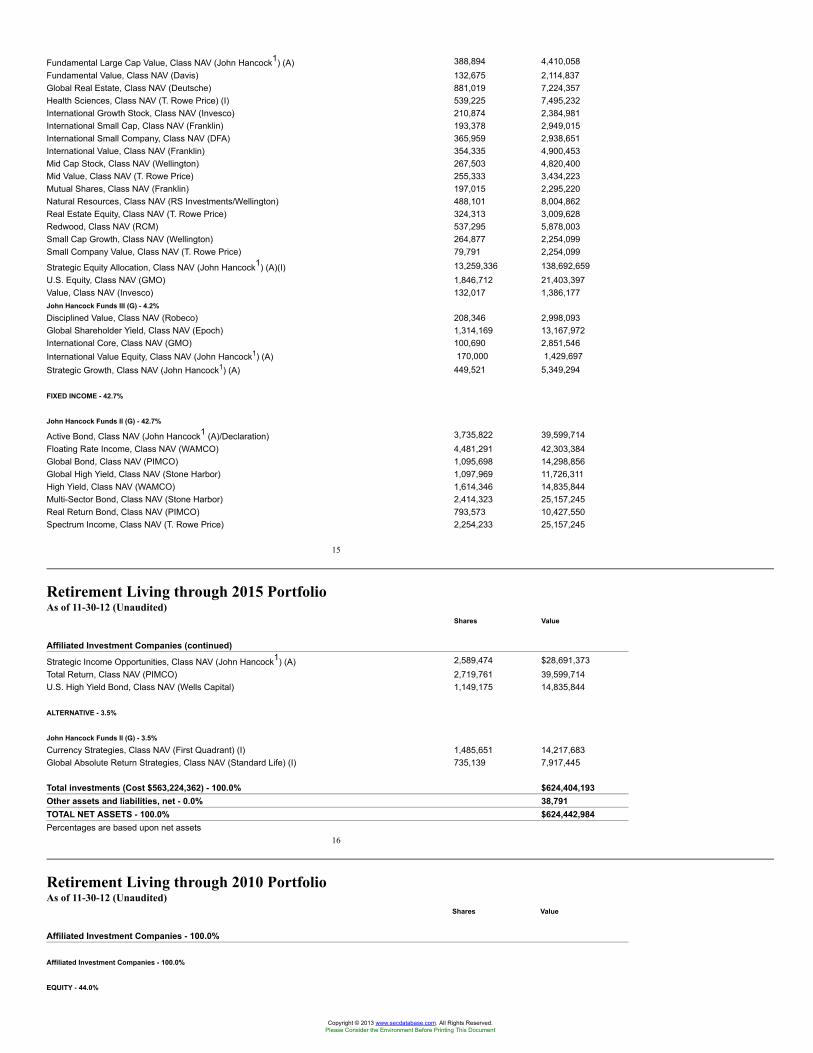
Fundamental Large Cap Value, Class NAV (John Hancock1) (A) 388,894 4,410,058Fundamental Value, Class NAV (Davis) 132,675 2,114,837Global Real Estate, Class NAV (Deutsche) 881,019 7,224,357Health Sciences, Class NAV (T. Rowe Price) (I) 539,225 7,495,232International Growth Stock, Class NAV (Invesco) 210,874 2,384,981International Small Cap, Class NAV (Franklin) 193,378 2,949,015International Small Company, Class NAV (DFA) 365,959 2,938,651International Value, Class NAV (Franklin) 354,335 4,900,453Mid Cap Stock, Class NAV (Wellington) 267,503 4,820,400Mid Value, Class NAV (T. Rowe Price) 255,333 3,434,223Mutual Shares, Class NAV (Franklin) 197,015 2,295,220Natural Resources, Class NAV (RS Investments/Wellington) 488,101 8,004,862Real Estate Equity, Class NAV (T. Rowe Price) 324,313 3,009,628Redwood, Class NAV (RCM) 537,295 5,878,003Small Cap Growth, Class NAV (Wellington) 264,877 2,254,099Small Company Value, Class NAV (T. Rowe Price) 79,791 2,254,099
Strategic Equity Allocation, Class NAV (John Hancock1) (A)(I) 13,259,336 138,692,659U.S. Equity, Class NAV (GMO) 1,846,712 21,403,397Value, Class NAV (Invesco) 132,017 1,386,177John Hancock Funds III (G) - 4.2%
Disciplined Value, Class NAV (Robeco) 208,346 2,998,093Global Shareholder Yield, Class NAV (Epoch) 1,314,169 13,167,972International Core, Class NAV (GMO) 100,690 2,851,546International Value Equity, Class NAV (John Hancock1) (A) 170,000 1,429,697Strategic Growth, Class NAV (John Hancock1) (A) 449,521 5,349,294
FIXED INCOME - 42.7%
John Hancock Funds II (G) - 42.7%
Active Bond, Class NAV (John Hancock1 (A)/Declaration) 3,735,822 39,599,714Floating Rate Income, Class NAV (WAMCO) 4,481,291 42,303,384Global Bond, Class NAV (PIMCO) 1,095,698 14,298,856Global High Yield, Class NAV (Stone Harbor) 1,097,969 11,726,311High Yield, Class NAV (WAMCO) 1,614,346 14,835,844Multi-Sector Bond, Class NAV (Stone Harbor) 2,414,323 25,157,245Real Return Bond, Class NAV (PIMCO) 793,573 10,427,550Spectrum Income, Class NAV (T. Rowe Price) 2,254,233 25,157,245
15
Retirement Living through 2015 PortfolioAs of 11-30-12 (Unaudited)
Shares Value
Affiliated Investment Companies (continued)
Strategic Income Opportunities, Class NAV (John Hancock1) (A) 2,589,474 $28,691,373Total Return, Class NAV (PIMCO) 2,719,761 39,599,714U.S. High Yield Bond, Class NAV (Wells Capital) 1,149,175 14,835,844
ALTERNATIVE - 3.5%
John Hancock Funds II (G) - 3.5%
Currency Strategies, Class NAV (First Quadrant) (I) 1,485,651 14,217,683Global Absolute Return Strategies, Class NAV (Standard Life) (I) 735,139 7,917,445
Total investments (Cost $563,224,362) - 100.0% $624,404,193Other assets and liabilities, net - 0.0% 38,791TOTAL NET ASSETS - 100.0% $624,442,984Percentages are based upon net assets
16
Retirement Living through 2010 PortfolioAs of 11-30-12 (Unaudited)
Shares Value
Affiliated Investment Companies - 100.0%
Affiliated Investment Companies - 100.0%
EQUITY - 44.0%
Copyright © 2013 www.secdatabase.com. All Rights Reserved.Please Consider the Environment Before Printing This Document
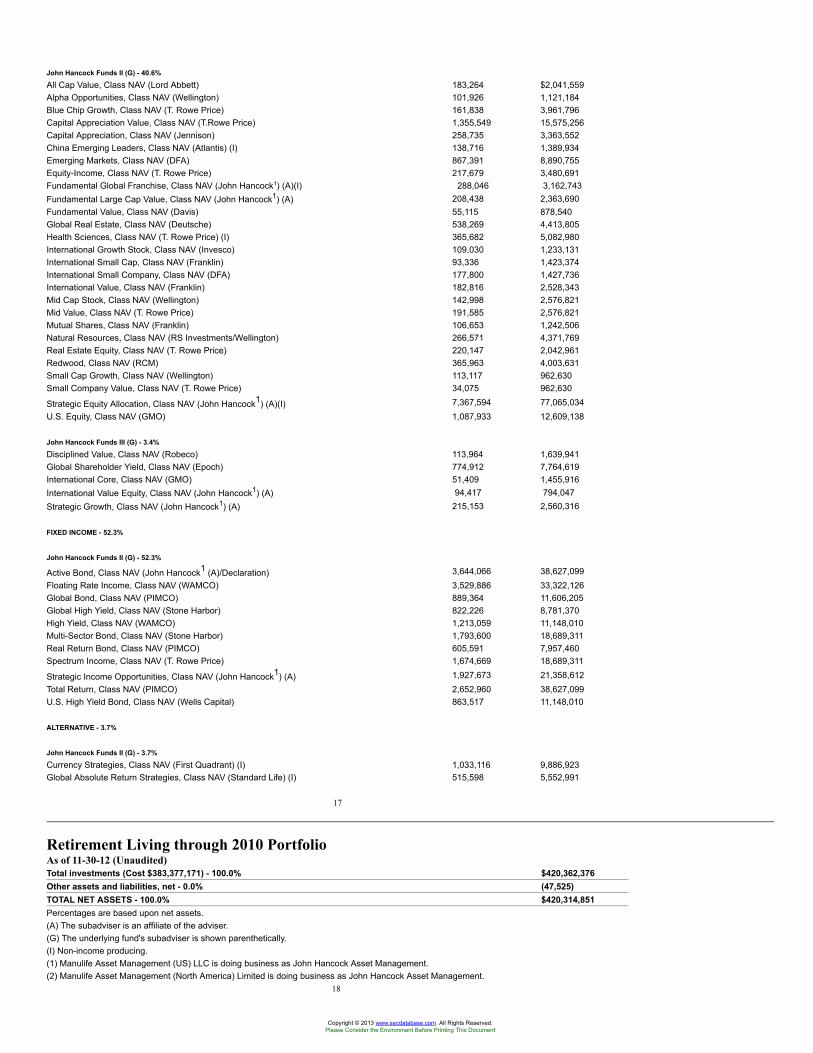
John Hancock Funds II (G) - 40.6%
All Cap Value, Class NAV (Lord Abbett) 183,264 $2,041,559Alpha Opportunities, Class NAV (Wellington) 101,926 1,121,184Blue Chip Growth, Class NAV (T. Rowe Price) 161,838 3,961,796Capital Appreciation Value, Class NAV (T.Rowe Price) 1,355,549 15,575,256Capital Appreciation, Class NAV (Jennison) 258,735 3,363,552China Emerging Leaders, Class NAV (Atlantis) (I) 138,716 1,389,934Emerging Markets, Class NAV (DFA) 867,391 8,890,755Equity-Income, Class NAV (T. Rowe Price) 217,679 3,480,691Fundamental Global Franchise, Class NAV (John Hancock1) (A)(I) 288,046 3,162,743Fundamental Large Cap Value, Class NAV (John Hancock1) (A) 208,438 2,363,690Fundamental Value, Class NAV (Davis) 55,115 878,540Global Real Estate, Class NAV (Deutsche) 538,269 4,413,805Health Sciences, Class NAV (T. Rowe Price) (I) 365,682 5,082,980International Growth Stock, Class NAV (Invesco) 109,030 1,233,131International Small Cap, Class NAV (Franklin) 93,336 1,423,374International Small Company, Class NAV (DFA) 177,800 1,427,736International Value, Class NAV (Franklin) 182,816 2,528,343Mid Cap Stock, Class NAV (Wellington) 142,998 2,576,821Mid Value, Class NAV (T. Rowe Price) 191,585 2,576,821Mutual Shares, Class NAV (Franklin) 106,653 1,242,506Natural Resources, Class NAV (RS Investments/Wellington) 266,571 4,371,769Real Estate Equity, Class NAV (T. Rowe Price) 220,147 2,042,961Redwood, Class NAV (RCM) 365,963 4,003,631Small Cap Growth, Class NAV (Wellington) 113,117 962,630Small Company Value, Class NAV (T. Rowe Price) 34,075 962,630
Strategic Equity Allocation, Class NAV (John Hancock1) (A)(I) 7,367,594 77,065,034U.S. Equity, Class NAV (GMO) 1,087,933 12,609,138
John Hancock Funds III (G) - 3.4%
Disciplined Value, Class NAV (Robeco) 113,964 1,639,941Global Shareholder Yield, Class NAV (Epoch) 774,912 7,764,619International Core, Class NAV (GMO) 51,409 1,455,916International Value Equity, Class NAV (John Hancock1) (A) 94,417 794,047Strategic Growth, Class NAV (John Hancock1) (A) 215,153 2,560,316
FIXED INCOME - 52.3%
John Hancock Funds II (G) - 52.3%
Active Bond, Class NAV (John Hancock1 (A)/Declaration) 3,644,066 38,627,099Floating Rate Income, Class NAV (WAMCO) 3,529,886 33,322,126Global Bond, Class NAV (PIMCO) 889,364 11,606,205Global High Yield, Class NAV (Stone Harbor) 822,226 8,781,370High Yield, Class NAV (WAMCO) 1,213,059 11,148,010Multi-Sector Bond, Class NAV (Stone Harbor) 1,793,600 18,689,311Real Return Bond, Class NAV (PIMCO) 605,591 7,957,460Spectrum Income, Class NAV (T. Rowe Price) 1,674,669 18,689,311
Strategic Income Opportunities, Class NAV (John Hancock1) (A) 1,927,673 21,358,612Total Return, Class NAV (PIMCO) 2,652,960 38,627,099U.S. High Yield Bond, Class NAV (Wells Capital) 863,517 11,148,010
ALTERNATIVE - 3.7%
John Hancock Funds II (G) - 3.7%
Currency Strategies, Class NAV (First Quadrant) (I) 1,033,116 9,886,923Global Absolute Return Strategies, Class NAV (Standard Life) (I) 515,598 5,552,991
17
Retirement Living through 2010 PortfolioAs of 11-30-12 (Unaudited)Total investments (Cost $383,377,171) - 100.0% $420,362,376Other assets and liabilities, net - 0.0% (47,525)TOTAL NET ASSETS - 100.0% $420,314,851Percentages are based upon net assets.(A) The subadviser is an affiliate of the adviser.(G) The underlying fund's subadviser is shown parenthetically.(I) Non-income producing.(1) Manulife Asset Management (US) LLC is doing business as John Hancock Asset Management.(2) Manulife Asset Management (North America) Limited is doing business as John Hancock Asset Management.
18
Copyright © 2013 www.secdatabase.com. All Rights Reserved.Please Consider the Environment Before Printing This Document
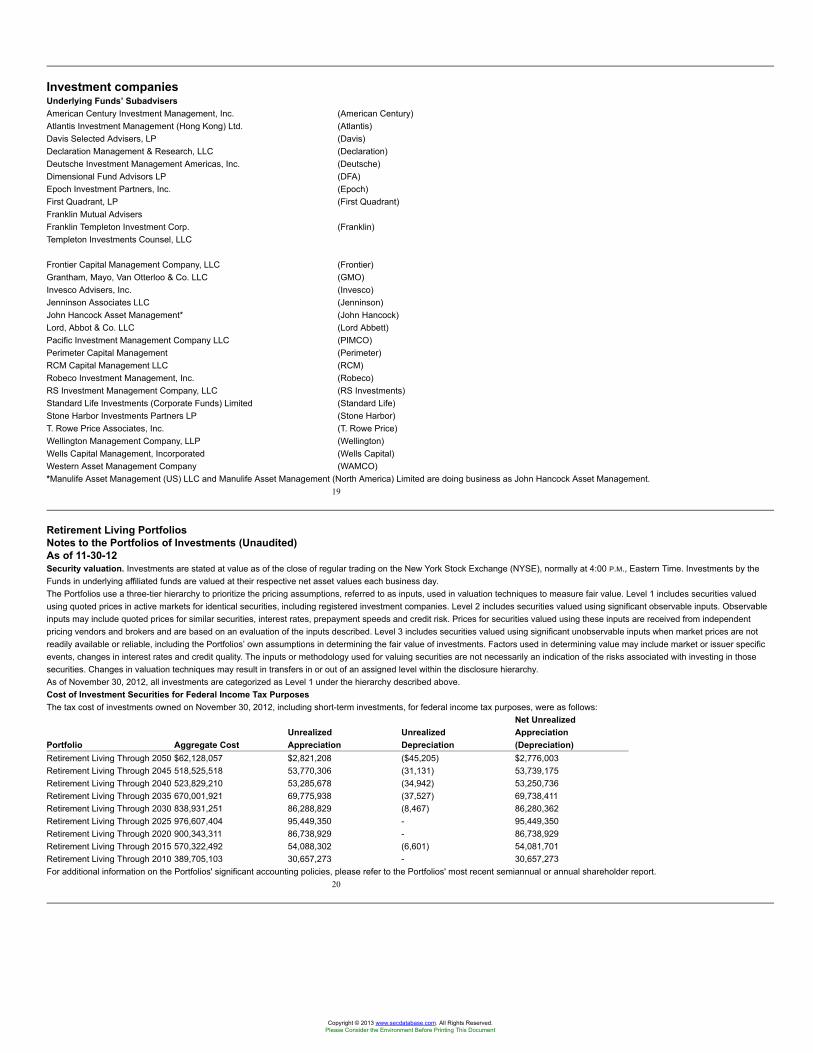
Investment companiesUnderlying Funds’ SubadvisersAmerican Century Investment Management, Inc. (American Century)Atlantis Investment Management (Hong Kong) Ltd. (Atlantis)Davis Selected Advisers, LP (Davis)Declaration Management & Research, LLC (Declaration)Deutsche Investment Management Americas, Inc. (Deutsche)Dimensional Fund Advisors LP (DFA)Epoch Investment Partners, Inc. (Epoch)First Quadrant, LP (First Quadrant)Franklin Mutual AdvisersFranklin Templeton Investment Corp. (Franklin)Templeton Investments Counsel, LLC
Frontier Capital Management Company, LLC (Frontier)Grantham, Mayo, Van Otterloo & Co. LLC (GMO)Invesco Advisers, Inc. (Invesco)Jenninson Associates LLC (Jenninson)John Hancock Asset Management* (John Hancock)Lord, Abbot & Co. LLC (Lord Abbett)Pacific Investment Management Company LLC (PIMCO)Perimeter Capital Management (Perimeter)RCM Capital Management LLC (RCM)Robeco Investment Management, Inc. (Robeco)RS Investment Management Company, LLC (RS Investments)Standard Life Investments (Corporate Funds) Limited (Standard Life)Stone Harbor Investments Partners LP (Stone Harbor)T. Rowe Price Associates, Inc. (T. Rowe Price)Wellington Management Company, LLP (Wellington)Wells Capital Management, Incorporated (Wells Capital)Western Asset Management Company (WAMCO)*Manulife Asset Management (US) LLC and Manulife Asset Management (North America) Limited are doing business as John Hancock Asset Management.
19
Retirement Living PortfoliosNotes to the Portfolios of Investments (Unaudited)As of 11-30-12Security valuation. Investments are stated at value as of the close of regular trading on the New York Stock Exchange (NYSE), normally at 4:00 P.M., Eastern Time. Investments by theFunds in underlying affiliated funds are valued at their respective net asset values each business day.The Portfolios use a three-tier hierarchy to prioritize the pricing assumptions, referred to as inputs, used in valuation techniques to measure fair value. Level 1 includes securities valuedusing quoted prices in active markets for identical securities, including registered investment companies. Level 2 includes securities valued using significant observable inputs. Observableinputs may include quoted prices for similar securities, interest rates, prepayment speeds and credit risk. Prices for securities valued using these inputs are received from independentpricing vendors and brokers and are based on an evaluation of the inputs described. Level 3 includes securities valued using significant unobservable inputs when market prices are notreadily available or reliable, including the Portfolios’ own assumptions in determining the fair value of investments. Factors used in determining value may include market or issuer specificevents, changes in interest rates and credit quality. The inputs or methodology used for valuing securities are not necessarily an indication of the risks associated with investing in thosesecurities. Changes in valuation techniques may result in transfers in or out of an assigned level within the disclosure hierarchy.As of November 30, 2012, all investments are categorized as Level 1 under the hierarchy described above.Cost of Investment Securities for Federal Income Tax PurposesThe tax cost of investments owned on November 30, 2012, including short-term investments, for federal income tax purposes, were as follows:
Net UnrealizedUnrealized Unrealized Appreciation
Portfolio Aggregate Cost Appreciation Depreciation (Depreciation)Retirement Living Through 2050 $62,128,057 $2,821,208 ($45,205) $2,776,003Retirement Living Through 2045 518,525,518 53,770,306 (31,131) 53,739,175Retirement Living Through 2040 523,829,210 53,285,678 (34,942) 53,250,736Retirement Living Through 2035 670,001,921 69,775,938 (37,527) 69,738,411Retirement Living Through 2030 838,931,251 86,288,829 (8,467) 86,280,362Retirement Living Through 2025 976,607,404 95,449,350 - 95,449,350Retirement Living Through 2020 900,343,311 86,738,929 - 86,738,929Retirement Living Through 2015 570,322,492 54,088,302 (6,601) 54,081,701Retirement Living Through 2010 389,705,103 30,657,273 - 30,657,273For additional information on the Portfolios' significant accounting policies, please refer to the Portfolios' most recent semiannual or annual shareholder report.
20
Copyright © 2013 www.secdatabase.com. All Rights Reserved.Please Consider the Environment Before Printing This Document
Copyright © 2013 www.secdatabase.com. All Rights Reserved.Please Consider the Environment Before Printing This Document
Retirement Choices at 2050 PortfolioAs of 11-30-12 (Unaudited)
Shares Value
Affiliated Investment Companies 68.2%
EQUITY 67.7%
John Hancock Funds II (G) 67.7%
Strategic Equity Allocation, Class NAV (John Hancock1 ) (A)(I) 7,585,364 $79,342,911
FIXED INCOME 0.5%
John Hancock Funds II (G) 0.5%
Short Term Government Income, Class NAV (John Hancock1 ) (A) 58,270 585,612
Unaffiliated Exchange Traded Funds 31.8%
Copyright © 2013 www.secdatabase.com. All Rights Reserved.Please Consider the Environment Before Printing This Document
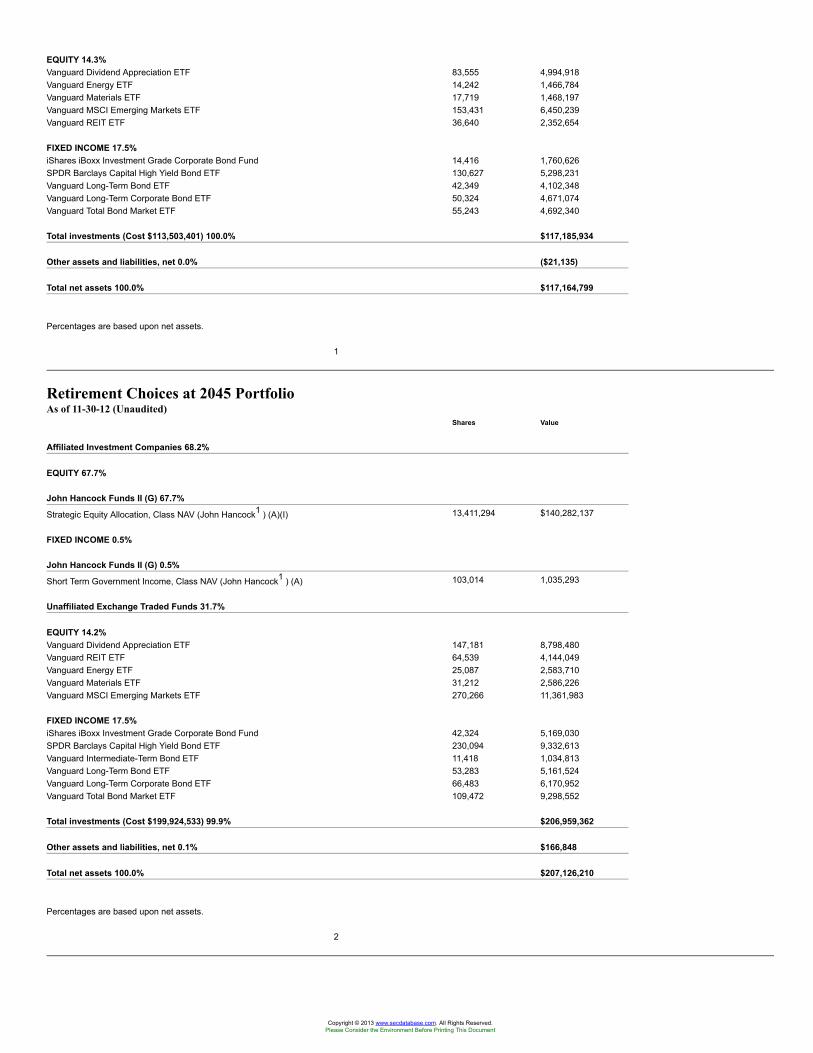
EQUITY 14.3%Vanguard Dividend Appreciation ETF 83,555 4,994,918Vanguard Energy ETF 14,242 1,466,784Vanguard Materials ETF 17,719 1,468,197Vanguard MSCI Emerging Markets ETF 153,431 6,450,239Vanguard REIT ETF 36,640 2,352,654
FIXED INCOME 17.5%iShares iBoxx Investment Grade Corporate Bond Fund 14,416 1,760,626SPDR Barclays Capital High Yield Bond ETF 130,627 5,298,231Vanguard Long-Term Bond ETF 42,349 4,102,348Vanguard Long-Term Corporate Bond ETF 50,324 4,671,074Vanguard Total Bond Market ETF 55,243 4,692,340
Total investments (Cost $113,503,401) 100.0% $117,185,934
Other assets and liabilities, net 0.0% ($21,135)
Total net assets 100.0% $117,164,799
Percentages are based upon net assets.
1
Retirement Choices at 2045 PortfolioAs of 11-30-12 (Unaudited)
Shares Value
Affiliated Investment Companies 68.2%
EQUITY 67.7%
John Hancock Funds II (G) 67.7%
Strategic Equity Allocation, Class NAV (John Hancock1 ) (A)(I) 13,411,294 $140,282,137
FIXED INCOME 0.5%
John Hancock Funds II (G) 0.5%
Short Term Government Income, Class NAV (John Hancock1 ) (A) 103,014 1,035,293
Unaffiliated Exchange Traded Funds 31.7%
EQUITY 14.2%Vanguard Dividend Appreciation ETF 147,181 8,798,480Vanguard REIT ETF 64,539 4,144,049Vanguard Energy ETF 25,087 2,583,710Vanguard Materials ETF 31,212 2,586,226Vanguard MSCI Emerging Markets ETF 270,266 11,361,983
FIXED INCOME 17.5%iShares iBoxx Investment Grade Corporate Bond Fund 42,324 5,169,030SPDR Barclays Capital High Yield Bond ETF 230,094 9,332,613Vanguard Intermediate-Term Bond ETF 11,418 1,034,813Vanguard Long-Term Bond ETF 53,283 5,161,524Vanguard Long-Term Corporate Bond ETF 66,483 6,170,952Vanguard Total Bond Market ETF 109,472 9,298,552
Total investments (Cost $199,924,533) 99.9% $206,959,362
Other assets and liabilities, net 0.1% $166,848
Total net assets 100.0% $207,126,210
Percentages are based upon net assets.
2
Copyright © 2013 www.secdatabase.com. All Rights Reserved.Please Consider the Environment Before Printing This Document
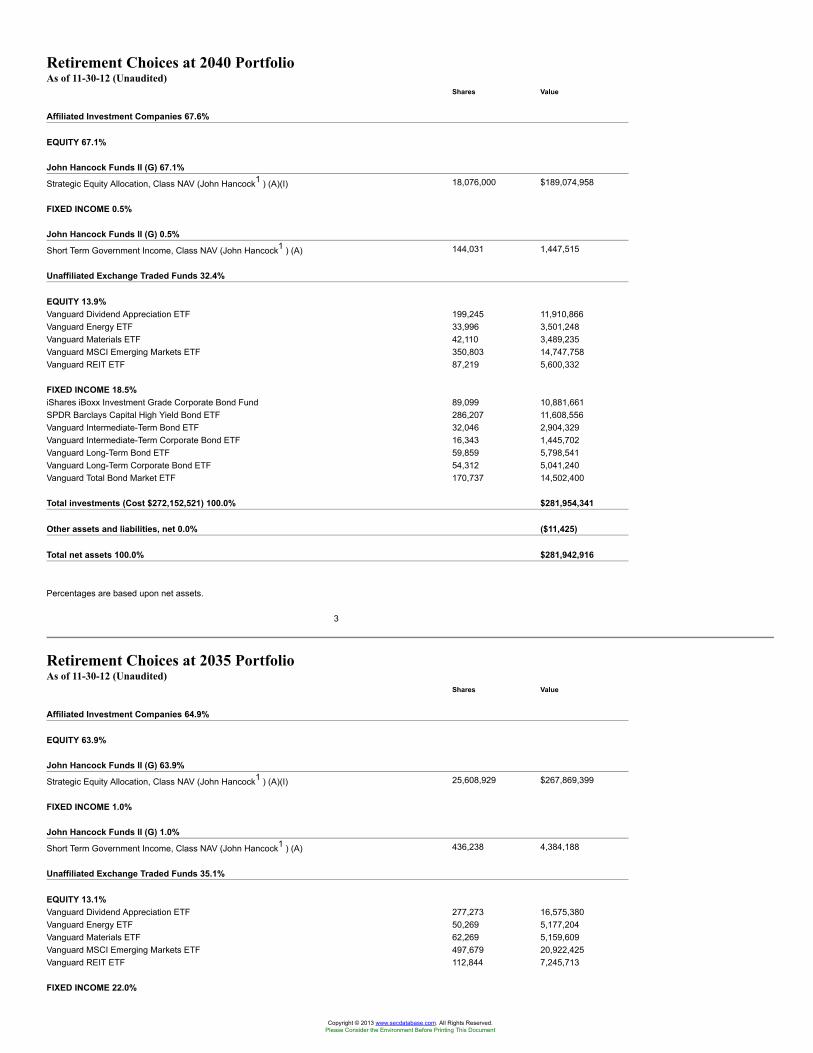
Retirement Choices at 2040 PortfolioAs of 11-30-12 (Unaudited)
Shares Value
Affiliated Investment Companies 67.6%
EQUITY 67.1%
John Hancock Funds II (G) 67.1%
Strategic Equity Allocation, Class NAV (John Hancock1 ) (A)(I) 18,076,000 $189,074,958
FIXED INCOME 0.5%
John Hancock Funds II (G) 0.5%
Short Term Government Income, Class NAV (John Hancock1 ) (A) 144,031 1,447,515
Unaffiliated Exchange Traded Funds 32.4%
EQUITY 13.9%Vanguard Dividend Appreciation ETF 199,245 11,910,866Vanguard Energy ETF 33,996 3,501,248Vanguard Materials ETF 42,110 3,489,235Vanguard MSCI Emerging Markets ETF 350,803 14,747,758Vanguard REIT ETF 87,219 5,600,332
FIXED INCOME 18.5%iShares iBoxx Investment Grade Corporate Bond Fund 89,099 10,881,661SPDR Barclays Capital High Yield Bond ETF 286,207 11,608,556Vanguard Intermediate-Term Bond ETF 32,046 2,904,329Vanguard Intermediate-Term Corporate Bond ETF 16,343 1,445,702Vanguard Long-Term Bond ETF 59,859 5,798,541Vanguard Long-Term Corporate Bond ETF 54,312 5,041,240Vanguard Total Bond Market ETF 170,737 14,502,400
Total investments (Cost $272,152,521) 100.0% $281,954,341
Other assets and liabilities, net 0.0% ($11,425)
Total net assets 100.0% $281,942,916
Percentages are based upon net assets.
3
Retirement Choices at 2035 PortfolioAs of 11-30-12 (Unaudited)
Shares Value
Affiliated Investment Companies 64.9%
EQUITY 63.9%
John Hancock Funds II (G) 63.9%
Strategic Equity Allocation, Class NAV (John Hancock1 ) (A)(I) 25,608,929 $267,869,399
FIXED INCOME 1.0%
John Hancock Funds II (G) 1.0%
Short Term Government Income, Class NAV (John Hancock1 ) (A) 436,238 4,384,188
Unaffiliated Exchange Traded Funds 35.1%
EQUITY 13.1%Vanguard Dividend Appreciation ETF 277,273 16,575,380Vanguard Energy ETF 50,269 5,177,204Vanguard Materials ETF 62,269 5,159,609Vanguard MSCI Emerging Markets ETF 497,679 20,922,425Vanguard REIT ETF 112,844 7,245,713
FIXED INCOME 22.0%
Copyright © 2013 www.secdatabase.com. All Rights Reserved.Please Consider the Environment Before Printing This Document
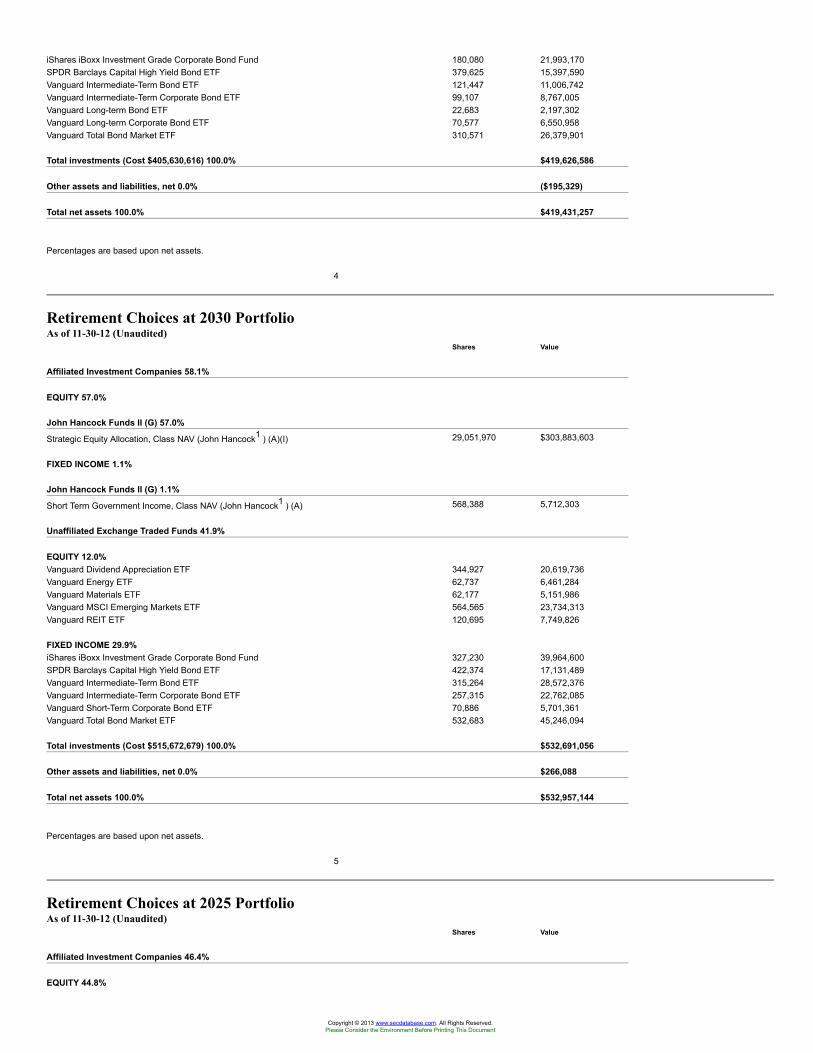
iShares iBoxx Investment Grade Corporate Bond Fund 180,080 21,993,170SPDR Barclays Capital High Yield Bond ETF 379,625 15,397,590Vanguard Intermediate-Term Bond ETF 121,447 11,006,742Vanguard Intermediate-Term Corporate Bond ETF 99,107 8,767,005Vanguard Long-term Bond ETF 22,683 2,197,302Vanguard Long-term Corporate Bond ETF 70,577 6,550,958Vanguard Total Bond Market ETF 310,571 26,379,901
Total investments (Cost $405,630,616) 100.0% $419,626,586
Other assets and liabilities, net 0.0% ($195,329)
Total net assets 100.0% $419,431,257
Percentages are based upon net assets.
4
Retirement Choices at 2030 PortfolioAs of 11-30-12 (Unaudited)
Shares Value
Affiliated Investment Companies 58.1%
EQUITY 57.0%
John Hancock Funds II (G) 57.0%
Strategic Equity Allocation, Class NAV (John Hancock1 ) (A)(I) 29,051,970 $303,883,603
FIXED INCOME 1.1%
John Hancock Funds II (G) 1.1%
Short Term Government Income, Class NAV (John Hancock1 ) (A) 568,388 5,712,303
Unaffiliated Exchange Traded Funds 41.9%
EQUITY 12.0%Vanguard Dividend Appreciation ETF 344,927 20,619,736Vanguard Energy ETF 62,737 6,461,284Vanguard Materials ETF 62,177 5,151,986Vanguard MSCI Emerging Markets ETF 564,565 23,734,313Vanguard REIT ETF 120,695 7,749,826
FIXED INCOME 29.9%iShares iBoxx Investment Grade Corporate Bond Fund 327,230 39,964,600SPDR Barclays Capital High Yield Bond ETF 422,374 17,131,489Vanguard Intermediate-Term Bond ETF 315,264 28,572,376Vanguard Intermediate-Term Corporate Bond ETF 257,315 22,762,085Vanguard Short-Term Corporate Bond ETF 70,886 5,701,361Vanguard Total Bond Market ETF 532,683 45,246,094
Total investments (Cost $515,672,679) 100.0% $532,691,056
Other assets and liabilities, net 0.0% $266,088
Total net assets 100.0% $532,957,144
Percentages are based upon net assets.
5
Retirement Choices at 2025 PortfolioAs of 11-30-12 (Unaudited)
Shares Value
Affiliated Investment Companies 46.4%
EQUITY 44.8%
Copyright © 2013 www.secdatabase.com. All Rights Reserved.Please Consider the Environment Before Printing This Document
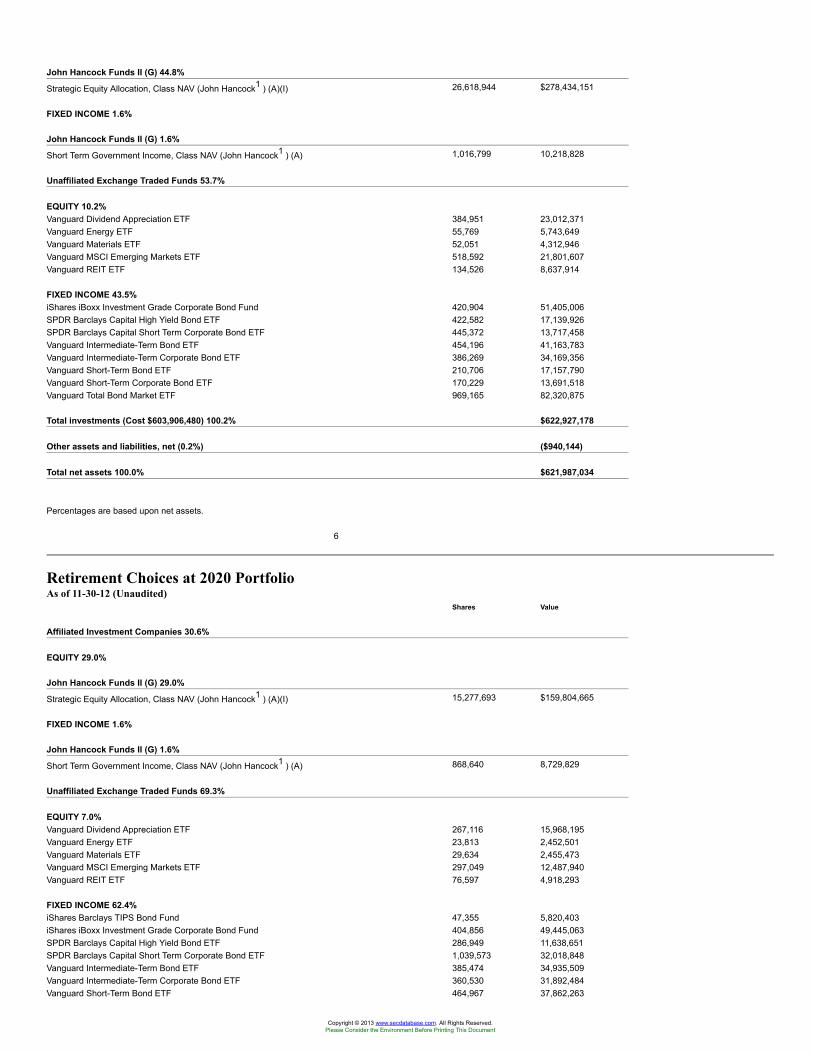
John Hancock Funds II (G) 44.8%
Strategic Equity Allocation, Class NAV (John Hancock1 ) (A)(I) 26,618,944 $278,434,151
FIXED INCOME 1.6%
John Hancock Funds II (G) 1.6%
Short Term Government Income, Class NAV (John Hancock1 ) (A) 1,016,799 10,218,828
Unaffiliated Exchange Traded Funds 53.7%
EQUITY 10.2%Vanguard Dividend Appreciation ETF 384,951 23,012,371Vanguard Energy ETF 55,769 5,743,649Vanguard Materials ETF 52,051 4,312,946Vanguard MSCI Emerging Markets ETF 518,592 21,801,607Vanguard REIT ETF 134,526 8,637,914
FIXED INCOME 43.5%iShares iBoxx Investment Grade Corporate Bond Fund 420,904 51,405,006SPDR Barclays Capital High Yield Bond ETF 422,582 17,139,926SPDR Barclays Capital Short Term Corporate Bond ETF 445,372 13,717,458Vanguard Intermediate-Term Bond ETF 454,196 41,163,783Vanguard Intermediate-Term Corporate Bond ETF 386,269 34,169,356Vanguard Short-Term Bond ETF 210,706 17,157,790Vanguard Short-Term Corporate Bond ETF 170,229 13,691,518Vanguard Total Bond Market ETF 969,165 82,320,875
Total investments (Cost $603,906,480) 100.2% $622,927,178
Other assets and liabilities, net (0.2%) ($940,144)
Total net assets 100.0% $621,987,034
Percentages are based upon net assets.
6
Retirement Choices at 2020 PortfolioAs of 11-30-12 (Unaudited)
Shares Value
Affiliated Investment Companies 30.6%
EQUITY 29.0%
John Hancock Funds II (G) 29.0%
Strategic Equity Allocation, Class NAV (John Hancock1 ) (A)(I) 15,277,693 $159,804,665
FIXED INCOME 1.6%
John Hancock Funds II (G) 1.6%
Short Term Government Income, Class NAV (John Hancock1 ) (A) 868,640 8,729,829
Unaffiliated Exchange Traded Funds 69.3%
EQUITY 7.0%Vanguard Dividend Appreciation ETF 267,116 15,968,195Vanguard Energy ETF 23,813 2,452,501Vanguard Materials ETF 29,634 2,455,473Vanguard MSCI Emerging Markets ETF 297,049 12,487,940Vanguard REIT ETF 76,597 4,918,293
FIXED INCOME 62.4%iShares Barclays TIPS Bond Fund 47,355 5,820,403iShares iBoxx Investment Grade Corporate Bond Fund 404,856 49,445,063SPDR Barclays Capital High Yield Bond ETF 286,949 11,638,651SPDR Barclays Capital Short Term Corporate Bond ETF 1,039,573 32,018,848Vanguard Intermediate-Term Bond ETF 385,474 34,935,509Vanguard Intermediate-Term Corporate Bond ETF 360,530 31,892,484Vanguard Short-Term Bond ETF 464,967 37,862,263
Copyright © 2013 www.secdatabase.com. All Rights Reserved.Please Consider the Environment Before Printing This Document
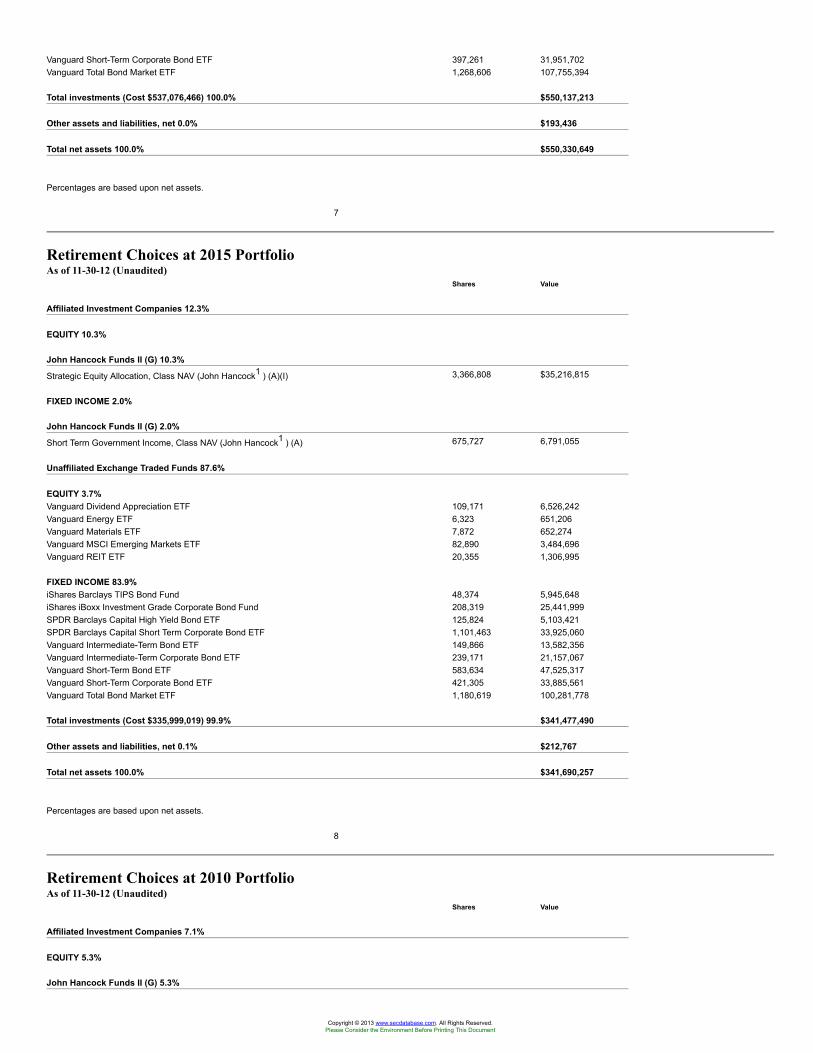
Vanguard Short-Term Corporate Bond ETF 397,261 31,951,702Vanguard Total Bond Market ETF 1,268,606 107,755,394
Total investments (Cost $537,076,466) 100.0% $550,137,213
Other assets and liabilities, net 0.0% $193,436
Total net assets 100.0% $550,330,649
Percentages are based upon net assets.
7
Retirement Choices at 2015 PortfolioAs of 11-30-12 (Unaudited)
Shares Value
Affiliated Investment Companies 12.3%
EQUITY 10.3%
John Hancock Funds II (G) 10.3%
Strategic Equity Allocation, Class NAV (John Hancock1 ) (A)(I) 3,366,808 $35,216,815
FIXED INCOME 2.0%
John Hancock Funds II (G) 2.0%
Short Term Government Income, Class NAV (John Hancock1 ) (A) 675,727 6,791,055
Unaffiliated Exchange Traded Funds 87.6%
EQUITY 3.7%Vanguard Dividend Appreciation ETF 109,171 6,526,242Vanguard Energy ETF 6,323 651,206Vanguard Materials ETF 7,872 652,274Vanguard MSCI Emerging Markets ETF 82,890 3,484,696Vanguard REIT ETF 20,355 1,306,995
FIXED INCOME 83.9%iShares Barclays TIPS Bond Fund 48,374 5,945,648iShares iBoxx Investment Grade Corporate Bond Fund 208,319 25,441,999SPDR Barclays Capital High Yield Bond ETF 125,824 5,103,421SPDR Barclays Capital Short Term Corporate Bond ETF 1,101,463 33,925,060Vanguard Intermediate-Term Bond ETF 149,866 13,582,356Vanguard Intermediate-Term Corporate Bond ETF 239,171 21,157,067Vanguard Short-Term Bond ETF 583,634 47,525,317Vanguard Short-Term Corporate Bond ETF 421,305 33,885,561Vanguard Total Bond Market ETF 1,180,619 100,281,778
Total investments (Cost $335,999,019) 99.9% $341,477,490
Other assets and liabilities, net 0.1% $212,767
Total net assets 100.0% $341,690,257
Percentages are based upon net assets.
8
Retirement Choices at 2010 PortfolioAs of 11-30-12 (Unaudited)
Shares Value
Affiliated Investment Companies 7.1%
EQUITY 5.3%
John Hancock Funds II (G) 5.3%
Copyright © 2013 www.secdatabase.com. All Rights Reserved.Please Consider the Environment Before Printing This Document
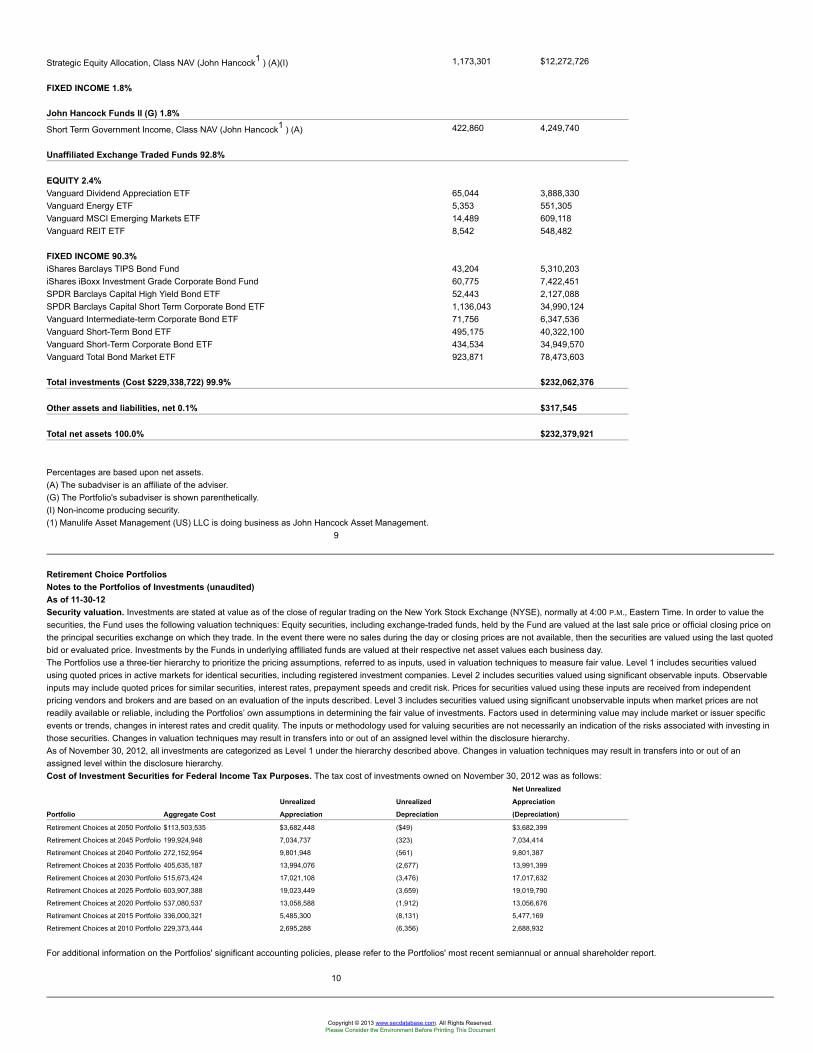
Strategic Equity Allocation, Class NAV (John Hancock1 ) (A)(I) 1,173,301 $12,272,726
FIXED INCOME 1.8%
John Hancock Funds II (G) 1.8%
Short Term Government Income, Class NAV (John Hancock1 ) (A) 422,860 4,249,740
Unaffiliated Exchange Traded Funds 92.8%
EQUITY 2.4%Vanguard Dividend Appreciation ETF 65,044 3,888,330Vanguard Energy ETF 5,353 551,305Vanguard MSCI Emerging Markets ETF 14,489 609,118Vanguard REIT ETF 8,542 548,482
FIXED INCOME 90.3%iShares Barclays TIPS Bond Fund 43,204 5,310,203iShares iBoxx Investment Grade Corporate Bond Fund 60,775 7,422,451SPDR Barclays Capital High Yield Bond ETF 52,443 2,127,088SPDR Barclays Capital Short Term Corporate Bond ETF 1,136,043 34,990,124Vanguard Intermediate-term Corporate Bond ETF 71,756 6,347,536Vanguard Short-Term Bond ETF 495,175 40,322,100Vanguard Short-Term Corporate Bond ETF 434,534 34,949,570Vanguard Total Bond Market ETF 923,871 78,473,603
Total investments (Cost $229,338,722) 99.9% $232,062,376
Other assets and liabilities, net 0.1% $317,545
Total net assets 100.0% $232,379,921
Percentages are based upon net assets.(A) The subadviser is an affiliate of the adviser.(G) The Portfolio's subadviser is shown parenthetically.(I) Non-income producing security.(1) Manulife Asset Management (US) LLC is doing business as John Hancock Asset Management.
9
Retirement Choice PortfoliosNotes to the Portfolios of Investments (unaudited)As of 11-30-12Security valuation. Investments are stated at value as of the close of regular trading on the New York Stock Exchange (NYSE), normally at 4:00 P.M., Eastern Time. In order to value thesecurities, the Fund uses the following valuation techniques: Equity securities, including exchange-traded funds, held by the Fund are valued at the last sale price or official closing price onthe principal securities exchange on which they trade. In the event there were no sales during the day or closing prices are not available, then the securities are valued using the last quotedbid or evaluated price. Investments by the Funds in underlying affiliated funds are valued at their respective net asset values each business day.The Portfolios use a three-tier hierarchy to prioritize the pricing assumptions, referred to as inputs, used in valuation techniques to measure fair value. Level 1 includes securities valuedusing quoted prices in active markets for identical securities, including registered investment companies. Level 2 includes securities valued using significant observable inputs. Observableinputs may include quoted prices for similar securities, interest rates, prepayment speeds and credit risk. Prices for securities valued using these inputs are received from independentpricing vendors and brokers and are based on an evaluation of the inputs described. Level 3 includes securities valued using significant unobservable inputs when market prices are notreadily available or reliable, including the Portfolios’ own assumptions in determining the fair value of investments. Factors used in determining value may include market or issuer specificevents or trends, changes in interest rates and credit quality. The inputs or methodology used for valuing securities are not necessarily an indication of the risks associated with investing inthose securities. Changes in valuation techniques may result in transfers into or out of an assigned level within the disclosure hierarchy.As of November 30, 2012, all investments are categorized as Level 1 under the hierarchy described above. Changes in valuation techniques may result in transfers into or out of anassigned level within the disclosure hierarchy.Cost of Investment Securities for Federal Income Tax Purposes. The tax cost of investments owned on November 30, 2012 was as follows:
Net Unrealized
Unrealized Unrealized Appreciation
Portfolio Aggregate Cost Appreciation Depreciation (Depreciation)
Retirement Choices at 2050 Portfolio $113,503,535 $3,682,448 ($49) $3,682,399
Retirement Choices at 2045 Portfolio 199,924,948 7,034,737 (323) 7,034,414
Retirement Choices at 2040 Portfolio 272,152,954 9,801,948 (561) 9,801,387
Retirement Choices at 2035 Portfolio 405,635,187 13,994,076 (2,677) 13,991,399
Retirement Choices at 2030 Portfolio 515,673,424 17,021,108 (3,476) 17,017,632
Retirement Choices at 2025 Portfolio 603,907,388 19,023,449 (3,659) 19,019,790
Retirement Choices at 2020 Portfolio 537,080,537 13,058,588 (1,912) 13,056,676
Retirement Choices at 2015 Portfolio 336,000,321 5,485,300 (8,131) 5,477,169
Retirement Choices at 2010 Portfolio 229,373,444 2,695,288 (6,356) 2,688,932
For additional information on the Portfolios' significant accounting policies, please refer to the Portfolios' most recent semiannual or annual shareholder report.
10
Copyright © 2013 www.secdatabase.com. All Rights Reserved.Please Consider the Environment Before Printing This Document
Item 2. Controls and Procedures.
(a)
The Registrant’s principal executive and principal financial officers have concluded, based upon their evaluation of the Registrant’s disclosure controls and procedures as of a date within 90 daysof the filing date of this report, that the Registrant’s disclosure controls and procedures are reasonably designed to ensure that information required to be disclosed by the Registrant on Form N-Qis recorded, processed, summarized and reported within the required time periods and that information required to be disclosed by the Registrant in the reports that it files or submits on form N-Q is accumulated and communicated to the Registrant’s management, including its principal executive and principal financial officers, as appropriate to allow timely decisions regarding requireddisclosure.
(b)There were no changes to the Registrant’s internal control over financial reporting that occurred during the Registrant’s most recently ended fiscal quarter that have materially affected, or arereasonably likely to materially affect, the Registrant’s internal control over financial reporting.
Item 3. Exhibits.
(a) Certifications of principal executive and principal financial officers as required by Rule 30a-2(a) under the Investment Company Act of 1940 are attached hereto as EX-99.CERT.
Copyright © 2013 www.secdatabase.com. All Rights Reserved.Please Consider the Environment Before Printing This Document
SIGNATURES
Pursuant to the requirements of the Securities Exchange Act of 1934 and the Investment Company Act of 1940, the registrant has duly caused this report to be signed on its behalf by the undersigned,thereunto duly authorized.
Registrant: John Hancock Funds II
/s/ Hugh McHaffie________________________________Hugh McHaffiePresident
Date: January 22, 2013
Pursuant to the requirements of the Securities Exchange Act of 1934 and the Investment Company Act of 1940, this report has been signed below by the following persons on behalf of the registrant and inthe capacities and on the dates indicated.
/s/ Hugh McHaffie________________________________Hugh McHaffiePresident
Date: January 22, 2013
/s/ Charles A. Rizzo________________________________Charles A. RizzoChief Financial Officer
Date: January 22, 2013
Copyright © 2013 www.secdatabase.com. All Rights Reserved.Please Consider the Environment Before Printing This Document
CERTIFICATIONS
I, Hugh McHaffie, certify that:
1. I have reviewed this report on Form N-Q of John Hancock Funds II;
2. Based on my knowledge, this report does not contain any untrue statement of a material fact or omit to state a material factnecessary to make the statements made, in light of the circumstances under which such statements were made, not misleadingwith respect to the period covered by this report;
3. Based on my knowledge, the schedules of investments included in this report fairly present in all material respects theinvestments of the registrant as of the end of the fiscal quarter for which the report is filed;
4. The registrant’s other certifying officer(s) and I are responsible for establishing and maintaining disclosure controls andprocedures (as defined in Rule 30a-3(c) under the Investment Company Act of 1940) and internal control over financialreporting (as defined in Rule 30a-3(d) under the Investment Company Act of 1940) for the registrant and have:
(a) Designed such disclosure controls and procedures, or caused such disclosure controls and procedures to be designed underour supervision, to ensure that material information relating to the registrant, including its consolidated subsidiaries, is madeknown to us by others within those entities, particularly during the period in which this report is being prepared;
(b) Designed such internal control over financial reporting, or caused such internal control over financial reporting to bedesigned under our supervision, to provide reasonable assurance regarding the reliability of financial reporting and thepreparation of financial statements for external purposes in accordance with generally accepted accounting principles;
(c) Evaluated the effectiveness of the registrant’s disclosure controls and procedures and presented in this report ourconclusions about the effectiveness of the disclosure controls and procedures, as of a date within 90 days prior to the filing dateof this report, based on such evaluation; and
(d) Disclosed in this report any change in the registrant’s internal control over financial reporting that occurred during theregistrant’s most recent fiscal quarter that has materially affected, or is reasonably likely to materially affect, the registrant’sinternal control over financial reporting; and
5. The registrant’s other certifying officer(s) and I have disclosed to the registrant’s auditors and the audit committee of theregistrant’s board of directors (or persons performing the equivalent functions):
(a)All significant deficiencies and material weaknesses in the design or operation of internal control over financial reportingwhich are reasonably likely to adversely affect the registrant’s ability to record, process, summarize, and report financialinformation; and
(b) Any fraud, whether or not material, that involves management or other employees who have asignificant role in the registrant’s internal control over financial reporting.
Date: January 22, 2013 /s/ Hugh McHaffie________________________________Hugh McHaffiePresident
I, Charles A. Rizzo, certify that:
1. I have reviewed this report on Form N-Q of John Hancock Funds II;
Copyright © 2013 www.secdatabase.com. All Rights Reserved.Please Consider the Environment Before Printing This Document
2. Based on my knowledge, this report does not contain any untrue statement of a material fact or omit to state a material factnecessary to make the statements made, in light of the circumstances under which such statements were made, not misleadingwith respect to the period covered by this report;
3. Based on my knowledge, the schedules of investments included in this report fairly present in all material respects theinvestments of the registrant as of the end of the fiscal quarter for which the report is filed;
4. The registrant’s other certifying officer(s) and I are responsible for establishing and maintaining disclosure controls andprocedures (as defined in Rule 30a-3(c) under the Investment Company Act of 1940) and internal control over financialreporting (as defined in Rule 30a-3(d) under the Investment Company Act of 1940) for the registrant and have:
(a) Designed such disclosure controls and procedures, or caused such disclosure controls and procedures to be designed underour supervision, to ensure that material information relating to the registrant, including its consolidated subsidiaries, is madeknown to us by others within those entities, particularly during the period in which this report is being prepared;
(b) Designed such internal control over financial reporting, or caused such internal control over financial reporting to bedesigned under our supervision, to provide reasonable assurance regarding the reliability of financial reporting and thepreparation of financial statements for external purposes in accordance with generally accepted accounting principles;
(c) Evaluated the effectiveness of the registrant’s disclosure controls and procedures and presented in this report ourconclusions about the effectiveness of the disclosure controls and procedures, as of a date within 90 days prior to the filing dateof this report, based on such evaluation; and
(d) Disclosed in this report any change in the registrant’s internal control over financial reporting that occurred during theregistrant’s most recent fiscal quarter that has materially affected, or is reasonably likely to materially affect, the registrant’sinternal control over financial reporting; and
5. The registrant’s other certifying officer(s) and I have disclosed to the registrant’s auditors and the auditcommittee of theregistrant’s board of directors (or persons performing the equivalent functions):
(a) All significant deficiencies and material weaknesses in the design or operation of internal control over financial reportingwhich are reasonably likely to adversely affect the registrant’s ability to record, process, summarize, and report financialinformation; and
(b) Any fraud, whether or not material, that involves management or other employees who have asignificant role in the registrant’s internal control over financial reporting.
Date: January 22, 2013 /s/ Charles A. Rizzo________________________________Charles A. RizzoChief Financial Officer
Copyright © 2013 www.secdatabase.com. All Rights Reserved.Please Consider the Environment Before Printing This Document