John Hancock Funds II (Form: NQ, Filing Date - SECDatabase
742
Business Address 601 CONGRESS STREET BOSTON MA 02210 617-663-2166 Mailing Address 601 CONGRESS STREET BOSTON MA 02210 SECURITIES AND EXCHANGE COMMISSION FORM N-Q Quarterly schedule of portfolio holdings of registered management investment company filed on Form N-Q Filing Date: 2009-07-29 | Period of Report: 2009-05-31 SEC Accession No. 0000928816-09-000698 (HTML Version on secdatabase.com) FILER John Hancock Funds II CIK:1331971| IRS No.: 000000000 | State of Incorp.:MA | Fiscal Year End: 1031 Type: N-Q | Act: 40 | File No.: 811-21779 | Film No.: 09968928 Copyright © 2012 www.secdatabase.com . All Rights Reserved. Please Consider the Environment Before Printing This Document
-
Upload
khangminh22 -
Category
Documents
-
view
0 -
download
0
Transcript of John Hancock Funds II (Form: NQ, Filing Date - SECDatabase

Business Address601 CONGRESS STREETBOSTON MA 02210617-663-2166
Mailing Address601 CONGRESS STREETBOSTON MA 02210
SECURITIES AND EXCHANGE COMMISSION
FORM N-QQuarterly schedule of portfolio holdings of registered management investment company filed on
Form N-Q
Filing Date: 2009-07-29 | Period of Report: 2009-05-31SEC Accession No. 0000928816-09-000698
(HTML Version on secdatabase.com)
FILERJohn Hancock Funds IICIK:1331971| IRS No.: 000000000 | State of Incorp.:MA | Fiscal Year End: 1031Type: N-Q | Act: 40 | File No.: 811-21779 | Film No.: 09968928
Copyright © 2012 www.secdatabase.com. All Rights Reserved.Please Consider the Environment Before Printing This Document

UNITED STATESSECURITIES AND EXCHANGE COMMISSION
Washington, DC 20549
FORM N-Q
QUARTERLY SCHEDULE OF PORTFOLIO HOLDINGS OF REGISTEREDMANAGEMENT INVESTMENT COMPANY
Investment Company Act file number: 811-21779
JOHN HANCOCK FUNDS II
(Exact name of registrant as specified in charter)
601 CONGRESS STREET, BOSTON, MA 02210
(Address of principal executive offices) (Zip code)
Michael J. Leary, 601 CONGRESS STREET, BOSTON, MA 02210
(Name and address of agent for service)
Registrant�s telephone number, including area code: 617-663-4490
Date of fiscal year end: August 31
Date of reporting period: May 31, 2009
Item 1. Schedule of Investments.
Copyright © 2012 www.secdatabase.com. All Rights Reserved.Please Consider the Environment Before Printing This Document

JOHN HANCOCK FUNDS II
PORTFOLIO OF INVESTMENTS - May 31, 2009 (Unaudited)(showing percentage of total net assets)
Floating Rate Income FundShares or
Principal
Amount Value
Copyright © 2012 www.secdatabase.com. All Rights Reserved.Please Consider the Environment Before Printing This Document

TERM LOANS - 80.24%
Aerospace - 1.35%
Dubai Aerospace Enterprise, Term Loan Strip
4.444% due 07/31/2014 (b) $ 6,964,185 $ 4,874,929
Transdigm, Term Loan B
3.227% due 07/01/2012 (b) 7,285,000 6,749,043
11,623,972
Air Travel - 0.52%
Hawker Beechcraft Corp., Inc., Tranche B
2.616% due 03/26/2014 (b) 7,848,802 4,504,341
Airlines - 1.34%
Delta Air Lines, Inc., Tranche A
2.425% due 04/30/2012 (b) 7,335,657 6,210,858
United Air Lines, Inc., Tranche B
2.375% due 01/12/2014 (b) 8,836,663 5,313,044
11,523,902
Aluminum - 0.50%
Norada Aluminum, Inc., Term Loan B
2.316% due 05/18/2014 (b) 6,518,302 4,334,671
Amusement & Theme Parks - 0.80%
Cedar Fair LP, Tranche B
2.319% due 06/13/2012 (b) 7,367,879 6,904,757
Apparel & Textiles - 1.16%
Hanes Brands, Inc., Tranche B
5.796% due 10/15/2013 (b) 3,743,918 3,658,343
Iconix, Inc., Tranche B
3.470% due 05/01/2014 (b) 2,488,116 2,214,423
Novelis, Inc., Term Loan
2.320% due 07/06/2014 (b) 4,974,717 4,094,814
9,967,580
Auto Parts - 0.87%
Allison Transmission, Inc., Tranche B
3.147% due 08/07/2014 (b) 9,703,614 7,483,912
Auto Services - 1.39%
Hertz Corp.
1.227% due 01/21/2012 (b) 9,915,404 8,917,666
Visteon, Tranche B
4.250% due 06/20/2013 (b) 6,500,000 3,033,336
11,951,002
Automobiles - 2.01%
Adesa, Inc., Tranche B
3.051% due 09/22/2013 (b) 6,847,608 5,863,265
Ford Motor Company, Tranche B
3.613% due 11/29/2013 (b) 13,208,141 9,348,894
General Motors Corp., Tranche B
8.00% due 12/15/2013 (b) 2,198,162 2,058,945
17,271,104
Broadcasting - 0.48%
Citadel Broadcasting Corp., Tranche A
2.701% due 06/12/2013 (b) 500,000 234,375
Citadel Broadcasting Corp., Tranche B
2.953% due 06/12/2014 (b) 7,000,000 3,196,669
CMP Susquehanna Corp.
2.367% due 06/07/2013 (b) 1,411,696 681,143
4,112,187
Floating Rate Income Fund (continued)Shares or
Principal
Amount Value
Copyright © 2012 www.secdatabase.com. All Rights Reserved.Please Consider the Environment Before Printing This Document
TERM LOANS (continued)
Building Materials & Construction - 1.23%
Sunguard Homes, Tranche B
2.477% due 08/15/2012 (b) $ 11,636,841 $ 10,551,705
Business Services - 0.47%
Rental Service Corp., 2nd Lien
4.482% due 12/01/2013 (b) 5,500,000 4,015,000
Cable & Television - 6.54%
Cablevision Systems Corp., Tranche B
2.095% due 03/30/2013 (b) 9,072,231 8,502,386
Charter Communications, Inc., Tranche B
6.250% due 03/15/2014 (b) 21,272,467 18,028,415
Charter Communications, Inc., Tranche B2
9.250% due 03/06/2014 (b) 3,523,153 3,420,393
Direct TV Holdings, Inc., Tranche C
5.25% due 04/13/2013 (b) 4,945,025 4,864,669
Insight Midwest Holdings LLC, Tranche B
2.410% due 04/10/2014 (b) 2,250,000 2,074,687
Lodgenet Entertainment Corp., Tranche B
3.154% due 04/04/2014 (b) 5,358,849 4,092,821
Univision Communications, Inc., Tranche B
2.569% due 09/15/2014 (b) 14,875,000 10,137,313
UPC Broadband Holding NV
0.00% due 10/17/2013 (f) 1,934,417 1,778,851
2.161% due 03/30/2014 (b) 3,565,583 3,300,393
56,199,928
Cellular Communications - 1.23%
Centennial Cellular, Tranche B
3.181% due 02/09/2011 (b) 3,556,722 3,519,486
Metropcs Wireless, Inc. Tranche B
3.066% due 02/20/2014 (b) 7,460,540 7,017,571
10,537,057
Chemicals - 2.58%
Ashland, Inc.
0.00% due 11/20/2013 (f) 2,979,059 2,941,820
Brenntag, Term Loan B
2.367% due 12/23/2013 (b) 2,481,446 2,088,559
Lyondell Chemical Company
5.00% due 12/20/2014 (b) 10,163,431 4,330,343
10.441% due 12/15/2009 (b) 3,751,397 3,843,306
Lyondell Chemical Company, Roll-Up Dip Term
4.208% due 12/15/2009 (b) 3,749,549 2,991,307
Nalco Company
4.50% due 05/06/2016 (b) 6,000,000 5,946,000
22,141,335
Commercial Services - 3.61%
Affinion Group, Tranche B
2.809% due 10/17/2012 (b) 5,941,374 5,466,064
Asurion Corp. Tranche B
3.635% due 07/02/2014 (b) 6,500,000 5,850,000
Sensata Technologies, Term Loan B
2.803% due 04/27/2013 (b) 4,544,886 3,196,569
Thomson Learning, Tranche B
8.50% due 07/05/2014 (b) 9,447,292 7,373,319
Ticketmaster, Term Loan
3.840% due 08/01/2014 (b) 3,000,000 2,790,000
US Investigations Services, Inc., Tranche B
3.977% due 02/21/2015 (b) 6,063,947 5,078,555
The accompanying notes are an integral part of the financial statements.
1
Copyright © 2012 www.secdatabase.com. All Rights Reserved.Please Consider the Environment Before Printing This Document

JOHN HANCOCK FUNDS II
PORTFOLIO OF INVESTMENTS - May 31, 2009 (Unaudited) - continued(showing percentage of total net assets)
Floating Rate Income Fund (continued)Shares or
Principal
Amount Value
TERM LOANS (continued)
Commercial Services (continued)
West Corp., Tranche B
2.733% due 10/01/2013 (b) $ 1,481,109 $ 1,279,925
31,034,432
Computer Services - 0.18%
Activant Solutions, Inc., Tranche B
2.881% due 05/02/2013 (b) 2,113,903 1,550,195
Containers & Glass - 2.36%
Graham Packaging Company, Inc.
2.679% due 10/07/2011 (b) 848,542 797,932
Graham Packaging Company, Inc., Tranche C
0.00% due 04/05/2014 (f) 8,491,159 8,300,108
Graphic Packaging, Inc., Tranche B
3.042% due 05/03/2014 (b) 5,119,776 4,713,393
Graphic Packaging, Inc., Tranche C
3.767% due 05/16/2014 (b) 6,929,826 6,426,332
20,237,765
Cosmetics & Toiletries - 0.75%
Sally Holdings LLC, Tranche B
2.712% due 11/15/2013 (b) 6,915,487 6,401,763
Data Processing & Management - 1.40%
First Data Corp., Tranche B2
3.059% due 10/15/2014 (b) 16,393,325 12,028,603
Educational Services - 0.37%
Education Management, Tranche C
3.00% due 06/12/2013 (b) 3,561,772 3,187,786
Electrical Utilities - 4.41%
Calpine Corp.,Tranche B
4.095% due 03/29/2014 (b) 13,122,214 11,324,063
Energy Future Holdings Corp., Tranche B3
3.881% due 10/10/2014 (b) 19,804,497 13,536,374
NRG Energy, Inc.
0.00% due 02/01/2013 (f) 3,500,000 3,237,136
NRG Energy, Inc., Tranche B
2.820% due 02/01/2013 (b) 1,011,753 935,767
2.970% due 02/01/2013 (b) 9,509,954 8,795,719
37,829,059
Energy - 1.54%
Brand Energy Services, Tranche B
3.493% due 02/07/2014 (b) 5,158,781 4,023,849
Express Energy Service, Term Loan
8.35% due 07/02/2013 (b) 3,769,869 1,633,609
TXU Energy, Tranche B2
3.881% due 10/10/2014 (b) 10,937,131 7,530,215
13,187,673
Financial Services - 0.52%
Chrysler Financial, Tranche B
4.350% due 08/03/2012 (b) 4,497,468 3,948,134
Lender Processing Services, Tranche B
2.819% due 06/18/2014 (b) 495,000 480,150
Copyright © 2012 www.secdatabase.com. All Rights Reserved.Please Consider the Environment Before Printing This Document

4,428,284
Food & Beverages - 2.93%
Aramark Corp.
2.336% due 01/31/2014 (b) 10,342,961 9,401,752
Floating Rate Income Fund (continued)Shares or
Principal
Amount Value
TERM LOANS (continued)
Food & Beverages (continued)
Bolthouse Farms, Inc., Tranche B
2.625% due 12/16/2012 (b) $ 4,948,504 $ 4,548,502
Dole Food Company, Inc., Letter of Credit
3.019% due 04/12/2013 (b) 5,379,415 5,337,391
Wrigley WM Jr. Company, Term Loan B
6.500% due 09/30/2014 (b) 5,875,625 5,883,557
25,171,202
Healthcare Products - 4.06%
Bausch & Lomb, Inc., Tranche B
3.529% due 04/11/2015 (b) 7,934,896 6,903,359
Biomet, Inc., Tranche B
4.136% due 03/25/2015 (b) 9,439,590 8,864,955
Fenwal, Inc.
2.923% due 03/01/2014 (b) 7,997,668 6,084,890
Hanger Orthopedic Group, Inc., Tranche B
2.320% due 07/15/2014 (b) 4,941,771 4,497,011
Pharmaceutical Health Technologies, Tranche B
2.569% due 04/15/2014 (b) 4,516,556 3,477,748
Royalty Pharma, Tranche B
3.470% due 05/15/2014 (b) 5,346,720 5,043,738
34,871,701
Healthcare Services - 1.19%
DaVita, Tranche B1
2.214% due 03/15/2014 (b) 6,000,000 5,603,436
Manor Care, Tranche B
8.009% due 11/15/2014 (b) 5,435,443 4,633,715
10,237,151
Hotels & Restaurants - 1.82%
Harrahs Operating Company, Inc., Tranche B2
4.090% due 02/28/2015 (b) 18,794,837 14,404,156
QUIZNO'S Corp.
3.50% due 05/05/2012 (b) 1,959,810 1,250,359
15,654,515
Leisure Time - 5.32%
AMC Entertainment, Inc., Term Loan B
1.813% due 01/26/2013 (b) 2,055,972 1,879,158
Carmike Cinemas, Inc., Term Loan
3.820% due 05/19/2012 (b) 3,876,035 3,466,628
5.190% due 05/19/2012 (b) 3,218,497 2,878,543
CCM Merger, Inc., Tranche B
8.50% due 07/21/2012 (b) 5,761,594 4,364,408
Cinemark, Inc., Tranche C
2.157% due 03/31/2011 (b) 1,994,885 1,848,594
Golden Nugget, Inc., Tranche B
7.35% due 06/14/2014 (b) 3,747,727 2,229,898
Las Vegas Sands LLC, Tranche B
2.070% due 05/08/2014 (b) 10,432,914 7,462,799
Metro-Goldwyn-Mayer, Inc., Term Loan B
3.569% due 04/08/2011 (b) 7,712,263 4,403,702
Oceania Cruises, Inc., Tranche B
Copyright © 2012 www.secdatabase.com. All Rights Reserved.Please Consider the Environment Before Printing This Document

7.599% due 05/01/2014 (b) 1,483,287 645,230
Penn National Gaming, Inc., Term Loan B
2.115% due 10/03/2012 (b) 6,951,130 6,536,544
Regal Cinemas, Tranche B
2.542% due 10/19/2010 (b) 5,699,167 5,458,720
The accompanying notes are an integral part of the financial statements.
2
JOHN HANCOCK FUNDS II
PORTFOLIO OF INVESTMENTS - May 31, 2009 (Unaudited) - continued(showing percentage of total net assets)
Floating Rate Income Fund (continued)Shares or
Principal
Amount Value
TERM LOANS (continued)
Leisure Time (continued)
Tropicana Entertainment, Tranche B
6.50% due 12/15/2011 (b) $ 4,000,000 $ 1,138,752
Venetian Macau, Tranche B
2.570% due 04/01/2013 (b) 3,655,000 3,048,270
Venetian Macau, Tranche Delayed Draw
2.570% due 04/01/2013 (b) 345,000 287,730
45,648,976
Medical-Hospitals - 7.61%
Community Health Systems, Inc., Tranche B
2.569% due 07/02/2014 (b) 21,066,305 18,691,563
HCA, Inc., Tranche A
2.970% due 11/16/2012 (b) 3,382,909 3,026,550
HCA, Inc., Tranche B
3.470% due 11/01/2013 (b) 19,246,662 17,127,123
Health Management Associates, Inc., Tranche B
2.970% due 01/16/2014 (b) 8,625,890 7,448,456
HVHC, Inc., Tranche B
3.470% due 08/15/2013 (b) 2,836,108 2,595,038
Iasis Healthcare Corp., Tranche B
2.319% due 05/01/2014 (b) 11,983,299 10,737,036
Vanguard Health Holdings, Tranche B
2.569% due 05/18/2011 (b) 6,019,237 5,688,179
65,313,945
Oil & Gas Drilling - 2.45%
Ashmore Energy International, Tranche B
3.313% due 05/30/2014 (b) 7,603,255 5,664,425
Hercules Offshore LLC, Tranche B
2.960% due 07/11/2013 (b) 6,922,273 5,549,358
Quicksilver Resource, Inc., 2nd Lien
7.802% due 08/08/2013 (b) 3,326,828 3,260,291
Venoco, Inc.
4.375% due 05/01/2014 (b) 9,472,428 6,559,656
21,033,730
Paper - 2.53%
Georgia Pacific LLC, Tranche B1
3.229% due 12/23/2013 (b) 16,524,689 15,312,190
Georgia Pacific LLC, Tranche B2
2.653% due 12/20/2012 (b) 2,269,855 2,103,304
NewPage Corp., Tranche B
4.740% due 11/05/2014 (b) 5,384,686 4,328,905
Copyright © 2012 www.secdatabase.com. All Rights Reserved.Please Consider the Environment Before Printing This Document
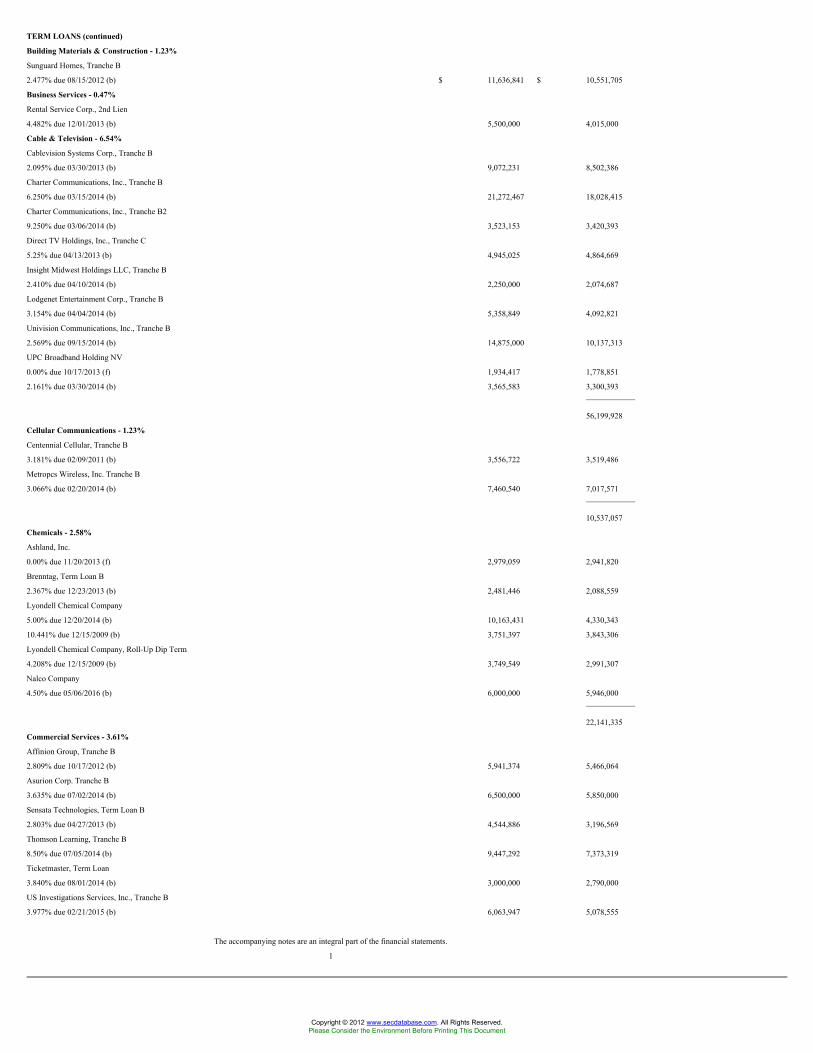
21,744,399
Pipelines - 0.78%
Dynegy Holdings, Inc.
1.820% due 04/02/2013 (b) 7,493,995 6,725,860
Plastics - 0.83%
Berry Plastics Holding Company
2.382% due 04/03/2015 (b) 8,935,704 7,103,885
Publishing - 2.61%
Dex Media West LLC, Tranche B
7.00% due 10/13/2014 (b) 6,000,000 4,894,998
Idearc, Inc., Tranche B
6.250% due 11/01/2014 (b) 9,083,080 3,568,351
Newsday LLC
9.75% due 07/15/2013 (b) 4,500,000 4,488,750
Nielsen Finance, Tranche B
2.382% due 08/15/2013 (b) 7,430,318 6,580,475
Floating Rate Income Fund (continued)Shares or
Principal
Amount Value
TERM LOANS (continued)
Publishing (continued)
Quebecor World, Inc., Tranche B
3.131% due 01/17/2013 (b) $ 2,389,133 $ 2,174,111
Tribune Company
5.00% due 06/04/2009 (b) 2,462,857 734,459
22,441,144
Retail Trade - 3.94%
Amscan Holdings, Inc., Tranche B
3.533% due 05/01/2013 (b) 7,626,574 6,654,186
Dollar General Corp., Tranche B
3.438% due 07/15/2014 (b) 5,000,000 4,682,145
General Nutrition Center, Tranche B
3.257% due 09/06/2013 (b) 6,687,864 5,751,563
Michaels Stores, Inc., Tranche B
2.679% due 10/31/2013 (b) 7,426,303 5,303,621
Neiman Marcus Group, Inc., Tranche B
2.945% due 03/13/2013 (b) 9,733,805 6,835,973
Petco Animal Supplies, Inc., Tranche B
3.122% due 11/15/2013 (b) 4,949,434 4,587,507
33,814,995
Semiconductors - 0.38%
Freescale Semiconductor, Inc., Tranche B
2.168% due 12/01/2013 (b) 5,908,322 3,256,962
Software - 0.40%
CGG, Tranche B
4.556% due 01/30/2014 (b) 3,647,553 3,392,224
Telecommunications Equipment &
Services - 5.00%
Level 3 Communications, Inc.
11.50% due 03/13/2014 (b) 4,000,000 3,208,332
Level 3 Communications, Inc., Tranche B
3.164% due 03/01/2014 (b) 9,000,000 7,218,747
Panamsat Corp., Tranche B
2.914% due 06/30/2013 (b) 16,111,943 14,679,108
Qwest Corp., Term Loan B
6.950% due 06/30/2010 (b) 8,500,000 8,473,437
Telesat Canada, Tranche D Delayed Draw
4.220% due 10/15/2014 (b) 7,176,832 6,650,534
Virgin Media Tranche B4
3.100% due 01/15/2014 (b) 2,823,167 2,682,009
Copyright © 2012 www.secdatabase.com. All Rights Reserved.Please Consider the Environment Before Printing This Document

42,912,167
Telephone - 0.25%
Windstream Corp., Tranche B
1.931% due 07/17/2013 (b) 2,261,081 2,108,458
Transportation - 0.53%
Swift Transport, Term Loan B
3.688% due 05/15/2014 (b) 6,742,293 4,560,682
TOTAL TERM LOANS (Cost $710,588,215) $ 689,000,009
U.S. GOVERNMENT AGENCY OBLIGATIONS - 3.85%
Federal Home Loan Bank - 3.85%
4.50% due 10/09/2009 25,100,000 25,475,170
The accompanying notes are an integral part of the financial statements.
3
JOHN HANCOCK FUNDS II
PORTFOLIO OF INVESTMENTS - May 31, 2009 (Unaudited) - continued(showing percentage of total net assets)
Floating Rate Income Fund (continued)Shares or
Principal
Amount Value
U.S. GOVERNMENT AGENCY
OBLIGATIONS (continued)
Federal Home Loan Bank (continued)
5.00% due 09/18/2009 $ 7,500,000 $ 7,601,647
33,076,817
TOTAL U.S. GOVERNMENT AGENCY OBLIGATIONS
(Cost $33,635,308) $ 33,076,817
CORPORATE BONDS - 11.59%
Air Travel - 0.28%
Continental Airlines, Inc., Series 01-1
6.503% due 06/15/2011 1,030,000 952,750
Continental Airlines, Inc., Series 974A
6.90% due 01/02/2018 1,193,843 978,952
Continental Airlines, Inc., Series 991A
6.545% due 02/02/2019 484,953 436,457
2,368,159
Building Materials & Construction - 0.19%
Nortek, Inc.
10.00% due 12/01/2013 (g) 2,500,000 1,618,750
Cable & Television - 0.94%
DirecTV Holdings LLC
7.625% due 05/15/2016 2,500,000 2,418,750
Time Warner Cable, Inc.
8.75% due 02/14/2019 4,900,000 5,619,565
8,038,315
Chemicals - 0.05%
Georgia Gulf Corp.
9.50% due 10/15/2014 ^ 1,500,000 401,250
Crude Petroleum & Natural Gas - 1.79%
Chesapeake Energy Corp.
7.625% due 07/15/2013 8,895,000 8,316,825
Hess Corp.
8.125% due 02/15/2019 2,100,000 2,307,396
SandRidge Energy, Inc.
Copyright © 2012 www.secdatabase.com. All Rights Reserved.Please Consider the Environment Before Printing This Document

9.875% due 05/15/2016 (g) 5,000,000 4,762,500
15,386,721
Electrical Utilities - 0.78%
Calpine Construction Finance Company LP
8.00% due 06/01/2016 (g) 7,000,000 6,658,750
Financial Services - 2.45%
American Express Company
7.25% due 05/20/2014 10,000,000 10,209,030
Ford Motor Credit Company LLC
12.00% due 05/15/2015 5,400,000 4,964,927
GMAC LLC
6.50% due 10/15/2009 (g) 5,000,000 4,950,000
7.75% due 01/19/2010 (g) 1,000,000 955,000
21,078,957
Food & Beverages - 0.09%
Dole Food Company, Inc.
13.875% due 03/15/2014 (g) 760,000 813,200
Healthcare Products - 0.19%
Universal Hospital Services, Inc.
5.9425% due 06/01/2015 (b) 2,000,000 1,620,000
Floating Rate Income Fund (continued)Shares or
Principal
Amount Value
CORPORATE BONDS (continued)
Leisure Time - 1.03%
Harrahs Operating Escrow LLC
11.25% due 06/01/2017 (g) $ 1,500,000 $ 1,458,750
MGM Mirage, Inc.
10.375% due 05/15/2014 (g) 2,250,000 2,317,500
Station Casinos, Inc.
7.75% due 08/15/2016 ^ 1,596,000 574,560
WMG Acquisition Corp.
9.50% due 06/15/2016 (g) 4,500,000 4,488,750
8,839,560
Mining - 1.44%
Rio Tinto Finance USA, Ltd.
5.875% due 07/15/2013 3,000,000 2,930,016
8.95% due 05/01/2014 4,000,000 4,298,840
Teck Resources, Ltd.
9.75% due 05/15/2014 (g) 5,190,000 5,164,050
12,392,906
Paper - 0.29%
Georgia-Pacific LLC
8.25% due 05/01/2016 (g) 2,500,000 2,462,500
Railroads & Equipment - 0.34%
Grupo Transportacion Ferroviaria Mexicana,
SA de CV
9.375% due 05/01/2012 3,255,000 2,921,362
Real Estate - 0.03%
Forest City Enterprises, Inc.
7.625% due 06/01/2015 530,000 291,500
Retail Trade - 0.05%
Neiman Marcus Group, Inc., PIK
9.00% due 10/15/2015 (g) 819,500 438,433
Semiconductors - 0.05%
Freescale Semiconductor, Inc.
10.125% due 12/15/2016 950,000 251,750
NXP BV/NXP Funding LLC
3.8812% due 10/15/2013 (b) 740,000 209,050
Copyright © 2012 www.secdatabase.com. All Rights Reserved.Please Consider the Environment Before Printing This Document

460,800
Telecommunications Equipment &
Services - 1.02%
CC Holdings GS V LLC/Crown Castle GS III Corp.
7.75% due 05/01/2017 (g) 3,000,000 2,955,000
iPCS, Inc.
3.1525% due 05/01/2013 (b)(g) 7,000,000 5,792,500
8,747,500
Telephone - 0.58%
Sprint Capital Corp.
7.625% due 01/30/2011 5,000,000 4,937,500
TOTAL CORPORATE BONDS (Cost $99,916,325) $ 99,476,163
The accompanying notes are an integral part of the financial statements.
4
JOHN HANCOCK FUNDS IIPORTFOLIO OF INVESTMENTS - May 31, 2009 (Unaudited) - continued(showing percentage of total net assets)
Floating Rate Income Fund (continued)Shares or
Principal
Amount Value
REPURCHASE AGREEMENTS - 8.23%
Bank of America Tri-Party
Repurchase Agreement dated
05/29/2009 at 0.12% to be
repurchased at $70,700,707 on
06/01/2009, collateralized by
$72,385,000 U.S. Treasury Bills,
zero coupon due 04/01/2010
(valued at $72,113,980, including
interest) $ 70,700,000 $ 70,700,000
TOTAL REPURCHASE AGREEMENTS
(Cost $70,700,000) $ 70,700,000
Total Investments (Floating Rate Income Fund)
(Cost $914,839,848)��
- 103.91% $ 892,252,989
Other Assets and Liabilities, Net- (3.91)% (33,545,890)
TOTAL NET ASSETS - 100.00 $ 858,707,099
Footnotes
Percentages are stated as a percent of net assets.
^ Non-Income Producing, issuer is in bankruptcy and is in default of interest payments
(b) Variable rate obligation. The coupon rate shown represents the rate at period end.
(f) All or a portion of this position represents unsettled loan commitment. The coupon rate will be determined at time of settlement
(g) 144A: Security exempt from registration under Rule 144A of the Securities Act of 1933. These securities may be resold in transactions exempt from registration, normally to qualified institutional buyers.
� At May 31, 2009, the aggregate cost of investment securities for federal income tax purposes was $915,676,082. Net unrealized depreciation aggregated $24,423,093, of which $23, 522,616 related to appreciated investment
securities and $46,945,709 related to depreciated investment securities.
The accompanying notes are an integral part of the financial statements
5
Copyright © 2012 www.secdatabase.com. All Rights Reserved.Please Consider the Environment Before Printing This Document

Notes to the Scheduled of Investments (Unaudited)
Security Valuation
Investments are stated at value as of the close of the regular trading on the New York Stock Exchange (NYSE), normally at 4:00 P.M., Eastern Time. Securities held by the Funds are valued at the last sale price or official closing price
(closing bid price or last evaluated price if no sale has occurred) as of the close of business on the principal securities exchange (domestic or foreign) on which they trade. Debt obligations are valued based on the evaluated prices
provided by an independent pricing service, which utilizes both dealer-supplied and electronic data processing techniques, which take into account factors such as institutional-size trading in similar groups of securities, yield, quality,
coupon rate, maturity, type of issue, trading characteristics and other market data. Foreign securities and currencies are valued in U.S. dollars, based on foreign currency exchange rates supplied by an independent pricing service.
Securities sold short are valued at the closing asking price. Securities traded only in the over-the-counter market are valued at the last bid price quoted by brokers making markets in the securities at the close of trading. Equity and debt
obligations, for which there are no prices available from an independent pricing service, are valued based on broker quotes or fair valued, as described below. Short-term debt investments that have a remaining maturity of 60 days or
less are valued at amortized cost, and thereafter assume a constant amortization to maturity of any discount or premium, which approximates market value.
Other assets and securities for which no such quotations are readily available are valued at fair value as determined in good faith under consistently applied procedures established by and under the general supervision of the Board of
Trustees. Generally, trading in non-U.S. securities is substantially completed each day at various times prior to the close of trading on the NYSE. The values of such securities used in computing the net asset value of the Fund�s shares
are generally determined as of such times. Occasionally, significant events that affect the values of such securities may occur between the times at which such values are generally determined and the close of the NYSE. Upon such an
occurrence, these securities will be valued at fair value as determined in good faith under consistently applied procedures established by and under the general supervision of the Board of Trustees.
Valuations change in response to many factors including the historical and prospective earnings of the issuer, the value of the issuer�s assets, general economic and market conditions, interest rates, investor perceptions and market
liquidity.
The Fund adopted Statement of Financial Accounting Standards No. 157 (FAS 157), Fair Value Measurements, effective with the beginning of the Fund�s fiscal year. FAS 157 established a three-tier hierarchy to prioritize the
assumptions, referred to as inputs, used in valuation techniques to measure fair value. The three-tier hierarchy of inputs is summarized in the three broad levels listed below:
� Level 1 � Quoted prices in active markets for identical securities.
� Level 2 � Prices determined using other significant observable inputs. Inputs other than quoted prices included in Level 1 that are observable either directly or indirectly through corroboration with observable market data. These may
include quoted prices for similar securities, interest rates, prepayment speeds, credit risk and others.
� Level 3 � Prices determined using significant unobservable inputs. In situations where quoted prices or observable inputs are unavailable, such as when there is little or no market activity for an investment, unobservable inputs may
be used. Unobservable inputs reflect the Funds� own assumptions about the factors that market participants would use in pricing an investment and would be based on the best information available.
The inputs or methodology used for valuing securities are not necessarily an indication of the risk associated with investing in those securities.
The following is a summary of the inputs used to value the Funds� net assets as of May 31, 2009:
Investments in Other Financial
Valuation Inputs Securities Instruments*
Level 1 � Quoted Prices - -
Level 2 � Other Significant Observable Inputs $892,252,989 -
Level 3 � Significant Unobservable Inputs - -
Total $892,252,989 -
* Other financial instruments are derivative instruments not reflected in the Portfolio of Investments, such as futures, forwards, options and swap contracts are stated at market value.
Repurchase Agreements
Each Fund may enter into repurchase agreements. When a Fund enters into a repurchase agreement through its custodian, it receives delivery of securities, the amount of which, at the time of purchase and each subsequent business
day, is required to be maintained at such a level that the market value is generally at least 102% of the repurchase amount. Each Fund will take receipt of all securities underlying the repurchase agreements it has entered into, until such
agreements expire. If the seller defaults, a Fund would suffer a loss to the extent that proceeds from the sale of underlying securities were less than the repurchase amount. Each Fund may enter into repurchase agreements maturing
within seven days with domestic dealers, banks or other financial institutions deemed to be creditworthy by the Adviser. Collateral for certain tri-party repurchase agreements is held at a third-party custodian bank in a segregated
account for the benefit of the Fund and the counterparty.
Risks and Uncertainties
Fixed Income Risk
Fixed income securities are subject to credit and interest rate risk and involve some risk of default in connection with principal and interest payments.
Term Loan Liquidity Risk
Term loans are generally subject to legal or contractual restrictions on resale. The liquidity of term loans, including the volume and frequency of secondary market trading in such loans, varies significantly over time and among
individual term loans. During periods of infrequent trading, valuing a term loan can be more difficult and buying and selling a term loan at an acceptable price can be more difficult and delayed.
Copyright © 2012 www.secdatabase.com. All Rights Reserved.Please Consider the Environment Before Printing This Document

Copyright © 2012 www.secdatabase.com. All Rights Reserved.Please Consider the Environment Before Printing This Document

JOHN HANCOCK FUNDS II
PORTFOLIO OF INVESTMENTS - May 31, 2009 (Unaudited)(showing percentage of total net assets)
Lifecycle 2045 PortfolioShares or
Principal
Amount Value
Copyright © 2012 www.secdatabase.com. All Rights Reserved.Please Consider the Environment Before Printing This Document

INVESTMENT COMPANIES - 100.04%
JOHN HANCOCK FUNDS (g) - 0.76%
Small Cap Intrinsic Value (MFC Global U.S.A.) (f) 144,309 $ 1,150,140
JOHN HANCOCK FUNDS II (g) - 96.78%
Alpha Opportunites (Wellington) 462,296 4,539,748
Blue Chip Growth (T. Rowe Price) 502,978 7,202,639
Capital Appreciation (Jennison) 838,623 6,809,621
Emerging Markets Value (DFA) 1,052,024 8,426,712
Floating Rate Income (WAMCO) 176,011 1,504,897
Fundamental Value (Davis) 477,581 5,296,372
Global Bond (PIMCO) 2,624 30,098
High Yield (WAMCO) 210,770 1,504,897
Index 500 (MFC Global U.S.A.) (f) 5,199,029 35,561,355
International Equity Index (SSgA) 1,192,956 16,546,294
International Opportunities (Marsico) 348,533 3,865,230
International Small Cap (Templeton) 287,234 2,878,087
International Small Company (DFA) 458,927 2,836,172
International Value (Templeton) 335,448 3,783,857
Large Cap Value (BlackRock) 353,563 5,296,372
Mid Cap Index (MFC Global U.S.A.) (f) 415,728 5,296,372
Mid Cap Stock (Wellington) 511,233 5,674,684
Mid Cap Value Equity (RiverSource) 236,445 1,513,249
Natural Resources (Wellington) 251,854 4,450,261
Real Return Bond (PIMCO) 125,944 1,474,799
Small Cap Growth (Wellington) 675,558 4,918,060
Small Cap Index (MFC Global U.S.A.) (f) 439,387 3,783,123
Small Company Value (T. Rowe Price) 222,408 3,785,387
Strategic Bond (WAMCO) 156,760 1,504,897
Total Bond Market (Declaration) (f) 147,250 1,504,897
Value & Restructuring (Columbia) 676,057 5,320,571
Value (Van Kampen) 283,699 1,883,763
147,192,414
JOHN HANCOCK FUNDS III (g) - 2.50%
International Core (GMO) 158,915 3,806,015
TOTAL INVESTMENT COMPANIES (Cost $171,162,383) $ 152,148,569
Total Investments (Lifecycle 2045 Portfolio)
(Cost $171,162,383) - 100.04% $ 152,148,569
Other assets and liabilities, net - (0.04)% (59,366)
TOTAL NET ASSETS - 100.00% $ 152,089,203
Lifecycle 2040 PortfolioShares or
Principal
Amount Value
INVESTMENT COMPANIES - 100.03%
JOHN HANCOCK FUNDS (g) - 0.78%
Small Cap Intrinsic Value (MFC Global U.S.A.) (f) 156,576 $ 1,247,912
JOHN HANCOCK FUNDS II (g) - 96.76%
Alpha Opportunites (Wellington) 482,585 4,738,982
Blue Chip Growth (T. Rowe Price) 525,267 7,521,818
Capital Appreciation (Jennison) 875,428 7,108,473
Emerging Markets Value (DFA) 1,159,804 9,290,028
Floating Rate Income (WAMCO) 183,869 1,572,076
Fundamental Value (Davis) 498,540 5,528,812
Lifecycle 2040 Portfolio (continued)Shares or
Principal
Amount Value
Copyright © 2012 www.secdatabase.com. All Rights Reserved.Please Consider the Environment Before Printing This Document
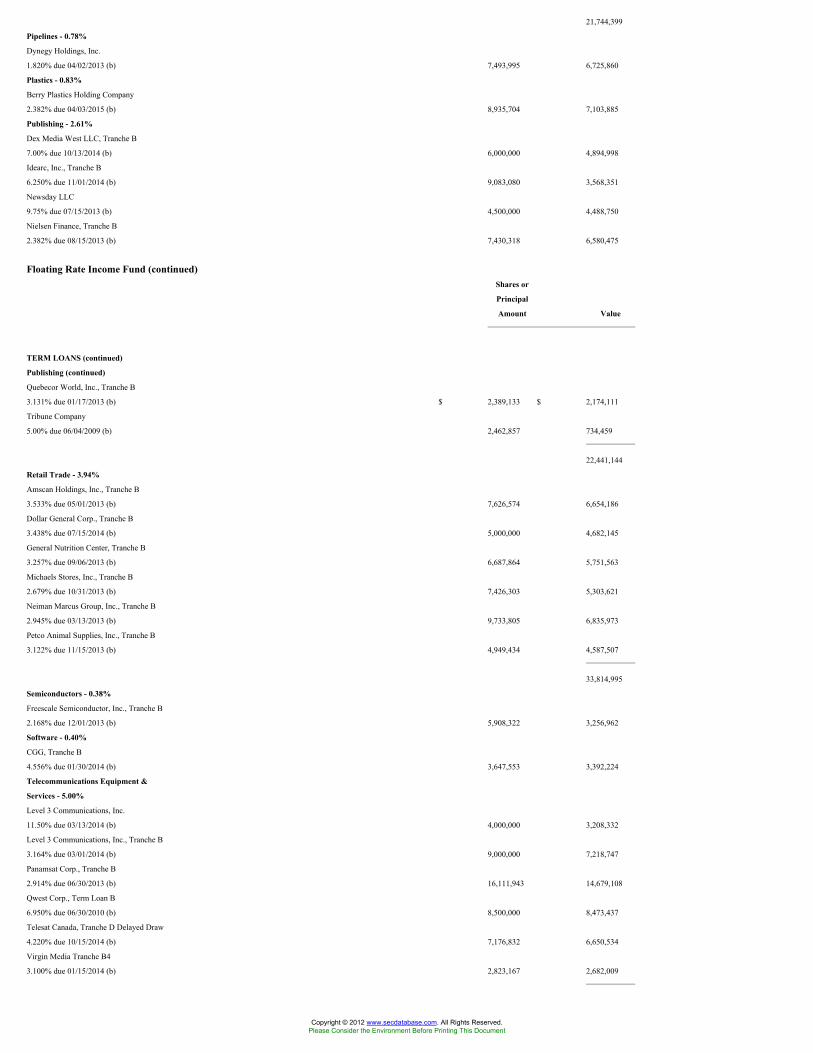
INVESTMENT COMPANIES (continued)
JOHN HANCOCK FUNDS II (g)
(continued)
Global Bond (PIMCO) 2,769 $ 31,761
High Yield (WAMCO) 220,179 1,572,076
Index 500 (MFC Global U.S.A.) (f) 5,427,197 37,122,025
International Equity Index (SSgA) 1,274,412 17,676,091
International Opportunities (Marsico) 372,213 4,127,842
International Small Cap (Templeton) 321,315 3,219,575
International Small Company (DFA) 503,669 3,112,672
International Value (Templeton) 355,586 4,011,014
Large Cap Value (BlackRock) 369,080 5,528,812
Mid Cap Index (MFC Global U.S.A.) (f) 433,973 5,528,812
Mid Cap Stock (Wellington) 533,669 5,923,728
Mid Cap Value Equity (RiverSource) 246,848 1,579,828
Natural Resources (Wellington) 268,710 4,748,112
Real Return Bond (PIMCO) 131,566 1,540,635
Small Cap Growth (Wellington) 705,206 5,133,897
Small Cap Index (MFC Global U.S.A.) (f) 458,850 3,950,696
Small Company Value (T. Rowe Price) 232,206 3,952,142
Strategic Bond (WAMCO) 163,758 1,572,076
Total Bond Market (Declaration) (f) 153,824 1,572,076
Value & Restructuring (Columbia) 710,440 5,591,159
Value (Van Kampen) 316,792 2,103,500
155,358,718
JOHN HANCOCK FUNDS III (g) - 2.49%
International Core (GMO) 167,325 4,007,442
TOTAL INVESTMENT COMPANIES (Cost $185,670,632) $ 160,614,072
Total Investments (Lifecycle 2040 Portfolio)
(Cost $185,670,632) - 100.03% $ 160,614,072
Other assets and liabilities, net - (0.03)% (49,220)
TOTAL NET ASSETS - 100.00% $ 160,564,852
Lifecycle 2035 PortfolioShares or
Principal
Amount Value
INVESTMENT COMPANIES - 100.03%
JOHN HANCOCK FUNDS (g) - 0.78%
Small Cap Intrinsic Value (MFC Global U.S.A.) (f) 213,117 $ 1,698,541
JOHN HANCOCK FUNDS II (g) - 96.77%
Alpha Opportunites (Wellington) 660,757 6,488,632
Blue Chip Growth (T. Rowe Price) 718,136 10,283,712
Capital Appreciation (Jennison) 1,198,639 9,732,949
Emerging Markets Value (DFA) 1,582,668 12,677,171
Floating Rate Income (WAMCO) 251,928 2,153,983
Fundamental Value (Davis) 682,603 7,570,071
Global Bond (PIMCO) 3,756 43,080
High Yield (WAMCO) 301,678 2,153,983
Index 500 (MFC Global U.S.A.) (f) 7,430,939 50,827,620
International Equity Index (SSgA) 1,720,630 23,865,132
International Opportunities (Marsico) 502,423 5,571,866
International Small Cap (Templeton) 430,318 4,311,789
International Small Company (DFA) 672,836 4,158,125
The accompanying notes are an integral part of the financial statements.
1
JOHN HANCOCK FUNDS II
Copyright © 2012 www.secdatabase.com. All Rights Reserved.Please Consider the Environment Before Printing This Document

PORTFOLIO OF INVESTMENTS - May 31, 2009 (Unaudited) - continued(showing percentage of total net assets)
Lifecycle 2035 Portfolio (continued)Shares or
Principal
Amount Value
INVESTMENT COMPANIES (continued)
JOHN HANCOCK FUNDS II (g)
(continued)
International Value (Templeton) 480,090 $ 5,415,416
Large Cap Value (BlackRock) 505,345 7,570,071
Mid Cap Index (MFC Global U.S.A.) (f) 594,197 7,570,065
Mid Cap Stock (Wellington) 730,702 8,110,790
Mid Cap Value Equity (RiverSource) 337,950 2,162,877
Natural Resources (Wellington) 362,824 6,411,095
Real Return Bond (PIMCO) 180,265 2,110,904
Small Cap Growth (Wellington) 965,570 7,029,352
Small Cap Index (MFC Global U.S.A.) (f) 628,013 5,407,194
Small Company Value (T. Rowe Price) 317,696 5,407,194
Strategic Bond (WAMCO) 224,373 2,153,983
Total Bond Market (Declaration) (f) 210,762 2,153,983
Value & Restructuring (Columbia) 966,280 7,604,620
Value (Van Kampen) 452,514 3,004,695
211,950,352
JOHN HANCOCK FUNDS III (g) - 2.48%
International Core (GMO) 227,195 5,441,315
TOTAL INVESTMENT COMPANIES (Cost $257,489,302) $ 219,090,208
Total Investments (Lifecycle 2035 Portfolio)
(Cost $257,489,302) - 100.03% $ 219,090,208
Other assets and liabilities, net - (0.03)% (55,407)
TOTAL NET ASSETS - 100.00% $ 219,034,801
Lifecycle 2030 PortfolioShares or
Principal
Amount Value
INVESTMENT COMPANIES - 100.00%
JOHN HANCOCK FUNDS (g) - 0.91%
Small Cap Intrinsic Value (MFC Global U.S.A.) (f) 328,364 $ 2,617,064
JOHN HANCOCK FUNDS II (g) - 96.58%
Alpha Opportunites (Wellington) 862,912 8,473,796
Blue Chip Growth (T. Rowe Price) 946,860 13,559,033
Capital Appreciation (Jennison) 1,569,766 12,746,496
Emerging Markets Value (DFA) 1,993,120 15,964,887
Floating Rate Income (WAMCO) 425,762 3,640,267
Fundamental Value (Davis) 891,290 9,884,401
Global Bond (PIMCO) 128,355 1,472,228
Global Real Estate (Deutsche) 272,390 1,479,077
High Yield (WAMCO) 435,782 3,111,486
Index 500 (MFC Global U.S.A.) (f) 9,393,071 64,248,605
International Equity Index (SSgA) 2,277,630 31,590,729
International Opportunities (Marsico) 665,198 7,377,048
International Small Cap (Templeton) 549,030 5,501,279
International Small Company (DFA) 871,720 5,387,230
International Value (Templeton) 635,504 7,168,489
Large Cap Value (BlackRock) 659,840 9,884,401
Mid Cap Index (MFC Global U.S.A.) (f) 722,726 9,207,531
Mid Cap Stock (Wellington) 954,093 10,590,429
Copyright © 2012 www.secdatabase.com. All Rights Reserved.Please Consider the Environment Before Printing This Document

Mid Cap Value Equity (RiverSource) 442,196 2,830,055
Natural Resources (Wellington) 436,517 7,713,257
Lifecycle 2030 Portfolio (continued)Shares or
Principal
Amount Value
INVESTMENT COMPANIES (continued)
JOHN HANCOCK FUNDS II (g)
(continued)
Real Return Bond (PIMCO) 248,695 $ 2,912,213
Small Cap Growth (Wellington) 1,263,218 9,196,224
Small Cap Index (MFC Global U.S.A.) (f) 827,135 7,121,632
Small Company Value (T. Rowe Price) 417,899 7,112,647
Strategic Bond (WAMCO) 303,356 2,912,213
Total Bond Market (Declaration) (f) 284,952 2,912,213
Value & Restructuring (Columbia) 1,269,698 9,992,526
Value (Van Kampen) 567,563 3,768,617
277,759,009
JOHN HANCOCK FUNDS III (g) - 2.51%
International Core (GMO) 301,841 7,229,084
TOTAL INVESTMENT COMPANIES (Cost $340,325,950) $ 287,605,157
Total Investments (Lifecycle 2030 Portfolio)
(Cost $340,325,950) - 100.00% $ 287,605,157
Other assets and liabilities, net - 0.00% (6,503)
TOTAL NET ASSETS - 100.00% $ 287,598,654
Lifecycle 2025 PortfolioShares or
Principal
Amount Value
INVESTMENT COMPANIES - 100.01%
JOHN HANCOCK FUNDS (g) - 0.81%
Small Cap Intrinsic Value (MFC Global U.S.A.) (f) 355,975 $ 2,837,120
JOHN HANCOCK FUNDS II (g) - 97.47%
Alpha Opportunites (Wellington) 1,051,484 10,325,569
Blue Chip Growth (T. Rowe Price) 1,087,769 15,576,845
Capital Appreciation (Jennison) 1,908,985 15,500,959
Emerging Markets Value (DFA) 2,364,721 18,941,412
Floating Rate Income (WAMCO) 713,085 6,096,879
Fundamental Value (Davis) 1,086,692 12,051,418
Global Bond (PIMCO) 152,102 1,744,616
Global Real Estate (Deutsche) 661,432 3,591,576
High Income (MFC Global U.S.) (f) 652,669 3,504,835
High Yield (WAMCO) 550,168 3,928,202
Index 500 (MFC Global U.S.A.) (f) 11,825,092 80,883,626
International Equity Index (SSgA) 2,767,286 38,382,253
International Opportunities (Marsico) 569,607 6,316,943
International Small Cap (Templeton) 620,413 6,216,542
International Small Company (DFA) 972,729 6,011,468
International Value (Templeton) 543,004 6,125,080
Large Cap Value (BlackRock) 804,172 12,046,497
Mid Cap Index (MFC Global U.S.A.) (f) 878,118 11,187,223
Mid Cap Stock (Wellington) 852,712 9,465,105
Mid Cap Value Equity (RiverSource) 539,520 3,452,927
Natural Resources (Wellington) 429,124 7,582,628
Real Estate Equity (T. Rowe Price) 444,679 1,969,928
Real Return Bond (PIMCO) 520,656 6,096,879
Small Cap Growth (Wellington) 1,276,513 9,293,012
Copyright © 2012 www.secdatabase.com. All Rights Reserved.Please Consider the Environment Before Printing This Document

Small Cap Index (MFC Global U.S.A.) (f) 601,810 5,181,585
Small Company Value (T. Rowe Price) 406,014 6,910,353
The accompanying notes are an integral part of the financial statements.
2
JOHN HANCOCK FUNDS II
PORTFOLIO OF INVESTMENTS - May 31, 2009 (Unaudited) - continued(showing percentage of total net assets)
Lifecycle 2025 Portfolio (continued)Shares or
Principal
Amount Value
INVESTMENT COMPANIES (continued)
JOHN HANCOCK FUNDS II (g)
(continued)
Strategic Bond (WAMCO) 362,909 $ 3,483,931
Strategic Income (MFC Global U.S.) (f) 490,418 4,350,009
Total Bond Market (Declaration) (f) 596,563 6,096,879
Total Return (PIMCO) 193,839 2,612,948
U.S. High Yield Bond (Wells Capital) 316,433 3,483,931
Value & Restructuring (Columbia) 1,549,839 12,197,235
Value (Van Kampen) 373,475 2,479,873
343,089,166
JOHN HANCOCK FUNDS III (g) - 1.73%
International Core (GMO) 254,229 6,088,784
TOTAL INVESTMENT COMPANIES (Cost $414,080,765) $ 352,015,070
Total Investments (Lifecycle 2025 Portfolio)
(Cost $414,080,765) - 100.01% $ 352,015,070
Other assets and liabilities, net - (0.01)% (26,925)
TOTAL NET ASSETS - 100.00% $ 351,988,145
Lifecycle 2020 PortfolioShares or
Principal
Amount Value
INVESTMENT COMPANIES - 100.02%
JOHN HANCOCK FUNDS (g) - 0.77%
Small Cap Intrinsic Value (MFC Global U.S.A.) (f) 339,274 $ 2,704,017
JOHN HANCOCK FUNDS II (g) - 97.86%
Alpha Opportunites (Wellington) 1,050,494 10,315,850
Blue Chip Growth (T. Rowe Price) 1,088,413 15,586,076
Capital Appreciation (Jennison) 1,903,645 15,457,594
Emerging Markets Value (DFA) 2,126,029 17,029,492
Floating Rate Income (WAMCO) 1,216,161 10,398,177
Fundamental Value (Davis) 1,008,808 11,187,676
Global Bond (PIMCO) 305,839 3,507,970
Global Real Estate (Deutsche) 994,751 5,401,495
High Income (MFC Global U.S.) (f) 1,299,729 6,979,545
High Yield (WAMCO) 771,328 5,507,285
Index 500 (MFC Global U.S.A.) (f) 11,926,348 81,576,220
International Equity Index (SSgA) 2,337,772 32,424,895
International Opportunities (Marsico) 458,248 5,081,974
International Small Cap (Templeton) 511,744 5,127,671
International Small Company (DFA) 812,136 5,019,001
International Value (Templeton) 438,336 4,944,425
Copyright © 2012 www.secdatabase.com. All Rights Reserved.Please Consider the Environment Before Printing This Document
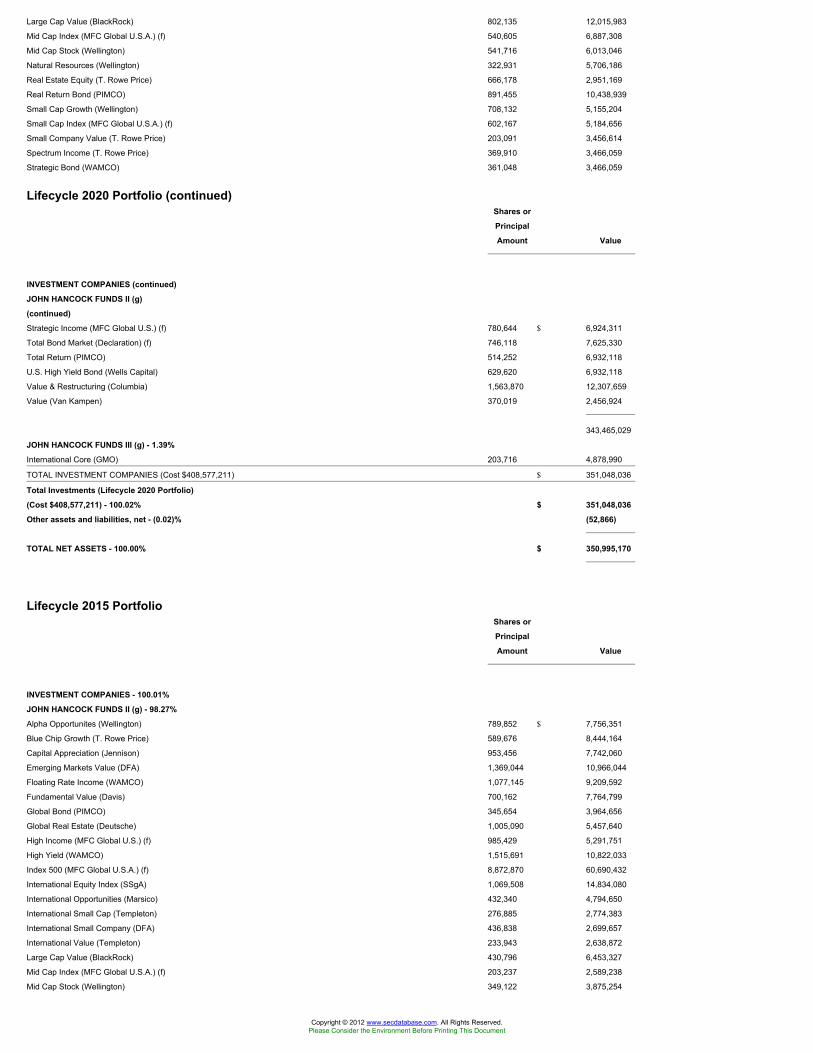
Large Cap Value (BlackRock) 802,135 12,015,983
Mid Cap Index (MFC Global U.S.A.) (f) 540,605 6,887,308
Mid Cap Stock (Wellington) 541,716 6,013,046
Natural Resources (Wellington) 322,931 5,706,186
Real Estate Equity (T. Rowe Price) 666,178 2,951,169
Real Return Bond (PIMCO) 891,455 10,438,939
Small Cap Growth (Wellington) 708,132 5,155,204
Small Cap Index (MFC Global U.S.A.) (f) 602,167 5,184,656
Small Company Value (T. Rowe Price) 203,091 3,456,614
Spectrum Income (T. Rowe Price) 369,910 3,466,059
Strategic Bond (WAMCO) 361,048 3,466,059
Lifecycle 2020 Portfolio (continued)Shares or
Principal
Amount Value
INVESTMENT COMPANIES (continued)
JOHN HANCOCK FUNDS II (g)
(continued)
Strategic Income (MFC Global U.S.) (f) 780,644 $ 6,924,311
Total Bond Market (Declaration) (f) 746,118 7,625,330
Total Return (PIMCO) 514,252 6,932,118
U.S. High Yield Bond (Wells Capital) 629,620 6,932,118
Value & Restructuring (Columbia) 1,563,870 12,307,659
Value (Van Kampen) 370,019 2,456,924
343,465,029
JOHN HANCOCK FUNDS III (g) - 1.39%
International Core (GMO) 203,716 4,878,990
TOTAL INVESTMENT COMPANIES (Cost $408,577,211) $ 351,048,036
Total Investments (Lifecycle 2020 Portfolio)
(Cost $408,577,211) - 100.02% $ 351,048,036
Other assets and liabilities, net - (0.02)% (52,866)
TOTAL NET ASSETS - 100.00% $ 350,995,170
Lifecycle 2015 PortfolioShares or
Principal
Amount Value
INVESTMENT COMPANIES - 100.01%
JOHN HANCOCK FUNDS II (g) - 98.27%
Alpha Opportunites (Wellington) 789,852 $ 7,756,351
Blue Chip Growth (T. Rowe Price) 589,676 8,444,164
Capital Appreciation (Jennison) 953,456 7,742,060
Emerging Markets Value (DFA) 1,369,044 10,966,044
Floating Rate Income (WAMCO) 1,077,145 9,209,592
Fundamental Value (Davis) 700,162 7,764,799
Global Bond (PIMCO) 345,654 3,964,656
Global Real Estate (Deutsche) 1,005,090 5,457,640
High Income (MFC Global U.S.) (f) 985,429 5,291,751
High Yield (WAMCO) 1,515,691 10,822,033
Index 500 (MFC Global U.S.A.) (f) 8,872,870 60,690,432
International Equity Index (SSgA) 1,069,508 14,834,080
International Opportunities (Marsico) 432,340 4,794,650
International Small Cap (Templeton) 276,885 2,774,383
International Small Company (DFA) 436,838 2,699,657
International Value (Templeton) 233,943 2,638,872
Large Cap Value (BlackRock) 430,796 6,453,327
Mid Cap Index (MFC Global U.S.A.) (f) 203,237 2,589,238
Mid Cap Stock (Wellington) 349,122 3,875,254
Copyright © 2012 www.secdatabase.com. All Rights Reserved.Please Consider the Environment Before Printing This Document

Natural Resources (Wellington) 243,775 4,307,503
Real Estate Equity (T. Rowe Price) 452,331 2,003,825
Real Return Bond (PIMCO) 787,640 9,223,270
Small Cap Growth (Wellington) 354,957 2,584,086
Small Cap Index (MFC Global U.S.A.) (f) 452,412 3,895,272
Small Company Value (T. Rowe Price) 152,702 2,598,982
Spectrum Income (T. Rowe Price) 842,469 7,893,936
Strategic Bond (WAMCO) 548,190 5,262,624
Strategic Income (MFC Global U.S.) (f) 592,638 5,256,698
Total Bond Market (Declaration) (f) 1,544,802 15,787,872
Total Return (PIMCO) 390,402 5,262,624
U.S. High Yield Bond (Wells Capital) 716,979 7,893,936
The accompanying notes are an integral part of the financial statements.
3
JOHN HANCOCK FUNDS II
PORTFOLIO OF INVESTMENTS - May 31, 2009 (Unaudited) - continued(showing percentage of total net assets)
Lifecycle 2015 Portfolio (continued)Shares or
Principal
Amount Value
INVESTMENT COMPANIES (continued)
JOHN HANCOCK FUNDS II (g)
(continued)
Value & Restructuring (Columbia) 840,409 $ 6,614,022
Value (Van Kampen) 331,679 2,202,347
259,555,980
JOHN HANCOCK FUNDS III (g) - 1.74%
International Core (GMO) 191,846 4,594,708
TOTAL INVESTMENT COMPANIES (Cost $306,530,707) $ 264,150,688
Total Investments (Lifecycle 2015 Portfolio)
(Cost $306,530,707) - 100.01% $ 264,150,688
Other assets and liabilities, net - (0.01)% (32,461)
TOTAL NET ASSETS - 100.00% $ 264,118,227
Lifecycle 2010 PortfolioShares or
Principal
Amount Value
INVESTMENT COMPANIES - 100.05%
JOHN HANCOCK FUNDS II (g) - 99.02%
Alpha Opportunites (Wellington) 171,242 $ 1,681,594
Blue Chip Growth (T. Rowe Price) 260,180 3,725,782
Capital Appreciation (Jennison) 454,564 3,691,060
Emerging Markets Value (DFA) 543,693 4,354,977
Floating Rate Income (WAMCO) 620,544 5,305,652
Fundamental Value (Davis) 243,087 2,695,829
Global Bond (PIMCO) 234,191 2,686,172
Global Real Estate (Deutsche) 650,793 3,533,805
High Income (MFC Global U.S.) (f) 631,165 3,389,354
High Yield (WAMCO) 844,970 6,033,087
Index 500 (MFC Global U.S.A.) (f) 4,210,940 28,802,828
International Equity Index (SSgA) 517,971 7,184,257
International Opportunities (Marsico) 129,418 1,435,245
Copyright © 2012 www.secdatabase.com. All Rights Reserved.Please Consider the Environment Before Printing This Document

International Small Cap (Templeton) 105,552 1,057,632
International Small Company (DFA) 173,949 1,075,003
International Value (Templeton) 124,108 1,399,937
Large Cap Value (BlackRock) 200,858 3,008,855
Mid Cap Index (MFC Global U.S.A.) (f) 211,091 2,689,301
Natural Resources (Wellington) 123,494 2,182,132
Real Estate Equity (T. Rowe Price) 236,136 1,046,080
Real Return Bond (PIMCO) 453,087 5,305,652
Small Cap Index (MFC Global U.S.A.) (f) 314,062 2,704,078
Spectrum Income (T. Rowe Price) 707,798 6,632,065
Strategic Bond (WAMCO) 276,336 2,652,826
Strategic Income (MFC Global U.S.) (f) 448,113 3,974,758
Total Bond Market (Declaration) (f) 1,427,646 14,590,544
Total Return (PIMCO) 196,797 2,652,826
U.S. High Yield Bond (Wells Capital) 483,511 5,323,457
Value & Restructuring (Columbia) 398,355 3,135,052
133,949,840
Lifecycle 2010 Portfolio (continued)Shares or
Principal
Amount Value
INVESTMENT COMPANIES (continued)
JOHN HANCOCK FUNDS III (g) - 1.03%
International Core (GMO) 58,005 $ 1,389,216
TOTAL INVESTMENT COMPANIES (Cost $155,066,107) $ 135,339,056
Total Investments (Lifecycle 2010 Portfolio)
(Cost $155,066,107) - 100.05% $ 135,339,056
Other assets and liabilities, net - (0.05)% (66,242)
TOTAL NET ASSETS - 100.00% $ 135,272,814
Lifecycle Retirement PortfolioShares or
Principal
Amount Value
INVESTMENT COMPANIES - 93.36%
Investment Companies - 10.34%
iShares iBoxx Investment Grade Corporate
Bond Fund 130,600 $ 12,792,270
PowerShares DB Commodity Index Tracking
Fund 353,002 8,193,176
SPDR Barclays Capital High Yield Bond ETF 75,000 2,625,000
23,610,446
JOHN HANCOCK FUNDS II (g) - 79.99%
Alpha Opportunites (Wellington) 401,690 3,944,599
Fundamental Value (Davis) 620,589 6,882,328
Global Bond (PIMCO) 796,592 9,136,911
Global Real Estate (Deutsche) 1,734,219 9,416,810
High Income (MFC Global U.S.) (f) 1,264,447 6,790,082
High Yield (WAMCO) 954,349 6,814,055
Index 500 (MFC Global U.S.A.) (f) 3,176,823 21,729,469
International Equity Index (SSgA) 337,839 4,685,821
International Small Cap (Templeton) 229,197 2,296,556
International Small Company (DFA) 392,990 2,428,679
International Value (Templeton) 205,733 2,320,665
Investment Quality Bond (Wellington) 807,347 9,090,729
Mid Cap Index (MFC Global U.S.A.) (f) 1,072,922 13,669,024
Natural Resources (Wellington) 534,713 9,448,383
Copyright © 2012 www.secdatabase.com. All Rights Reserved.Please Consider the Environment Before Printing This Document

Real Estate Equity (T. Rowe Price) 1,104,002 4,890,730
Real Return Bond (PIMCO) 1,361,392 15,941,897
Small Cap Index (MFC Global U.S.A.) (f) 398,060 3,427,300
Spectrum Income (T. Rowe Price) 966,555 9,056,616
Strategic Bond (WAMCO) 945,166 9,073,595
Strategic Income (MFC Global U.S.) (f) 1,015,813 9,010,259
Total Bond Market (Declaration) (f) 887,203 9,067,219
Total Return (PIMCO) 504,289 6,797,820
U.S. High Yield Bond (Wells Capital) 612,679 6,745,600
182,665,147
JOHN HANCOCK FUNDS III (g) - 3.03%
International Core (GMO) 289,047 6,922,687
TOTAL INVESTMENT COMPANIES (Cost $222,879,115) $ 213,198,280
SHORT TERM INVESTMENTS - 0.66%
Federal Home Loan Bank Discount Notes
0.00% due 06/05/2009 1,000,000 $ 999,973
The accompanying notes are an integral part of the financial statements.
4
JOHN HANCOCK FUNDS IIPORTFOLIO OF INVESTMENTS - May 31, 2009 (Unaudited) - continued(showing percentage of total net assets)
Lifecycle Retirement Portfolio (continued)Shares or
Principal
Amount Value
SHORT TERM INVESTMENTS (continued)
Federal Home Loan Mortgage Corp. Discount Notes
0.00% due 06/15/2009 $ 500,000 $ 499,942
TOTAL SHORT TERM INVESTMENTS
(Cost $1,499,915) $ 1,499,915
REPURCHASE AGREEMENTS - 6.00%
Repurchase Agreement with State
Street Corp. dated 05/29/2009 at
0.07% to be repurchased at
$13,717,080 on 06/01/2009,
collateralized by $14,015,000 U.S.
Treasury Bills, 0% due 11/27/2009
(valued at $13,993,978, including
interest) 13,717,000 $ 13,717,000
TOTAL REPURCHASE AGREEMENTS
(Cost $13,717,000) $ 13,717,000
Total Investments (Lifecycle Retirement Portfolio)
(Cost $238,096,030) - 100.02% $ 228,415,195
Other assets and liabilities, net - (0.02)% (49,933)
TOTAL NET ASSETS - 100.00% 228,365,262
Footnotes
Percentages are stated as a percent of net assets.
(f) The subadviser is an affiliate of the adviser.
(g) The underlying fund's subadviser is shown parenthetically.
The accompanying notes are an integral part of the financial statements.
5
Copyright © 2012 www.secdatabase.com. All Rights Reserved.Please Consider the Environment Before Printing This Document

Notes to the Schedule of Investments (Unaudited)
Securities valuation
Investments are stated at value as of the close of the regular trading on the New York Stock Exchange (NYSE), normally at 4:00 p.m., Eastern Time. Investments by thePortfolio in underlying affiliated funds are valued at their respective net asset values each business day and securities in the underlying funds are valued in accordancewith their respective valuation polices, as outlined in the underlying funds� financial statements. Securities held by the Portfolio and by the underlying affiliated funds arevalued at the last sale price or official closing price (closing bid price or last evaluated quote if no sale has occurred) as of the close of business on the principal securitiesexchange (domestic or foreign) on which they trade. Short-term debt investments that have a remaining maturity of 60 days or less are valued at amortized cost, andthereafter assume a constant amortization to maturity of any discount or premium, which approximates market value.
The Portfolios adopted Statement of Financial Accounting Standards No. 157 (FAS 157), Fair Value Measurements, effective with the beginning of the Portfolios� fiscalyear. FAS 157 established a three-tier hierarchy to prioritize the assumptions, referred to as inputs, used in valuation techniques to measure fair value. The three-tierhierarchy of inputs is summarized in the three broad levels listed below:
� Level 1 � Quoted prices in active markets for identical securities.
� Level 2 � Prices determined using other significant observable inputs. Inputs other than quoted prices included in Level 1 that are observable either directly or indirectlythrough corroboration with observable market data. These may include quoted prices for similar securities, interest rates, prepayment speeds, credit risk and others.
� Level 3 � Prices determined using significant unobservable inputs. In situations where quoted prices or observable inputs are unavailable, such as when there is little orno market activity for an investment, unobservable inputs may be used. Unobservable inputs reflect the Portfolios� Pricing Committee�s own assumptions about thefactors that market participants would use in pricing an investment and would be based on the best information available.
The inputs or methodology used for valuing securities are not necessarily an indication of the risk associated with investing in those securities.
The following is a summary of the inputs used to value the Funds� net assets as of May 31, 2009:
Lifecycle 2045 Lifecycle 2040Other Other
Investments in Financial Investments in FinancialValuation Inputs: Securities Instruments* Valuation Inputs: Securities Instruments*Level 1 - Quoted Prices $152,148,569 - Level 1 - Quoted Prices $160,614,072 -Level 2 - Other Significant Level 2 - Other SignificantObservable Inputs - - Observable Inputs - -Level 3 � Significant Level 3 � SignificantUnobservable Inputs - - Unobservable Inputs - -Total $152,148,569 - Total $160,614,072 -
Lifecycle 2035 Lifecycle 2030Other Other
Investments in Financial Investments in FinancialValuation Inputs: Securities Instruments* Valuation Inputs: Securities Instruments*Level 1 - Quoted Prices $219,090,208 - Level 1 - Quoted Prices $287,605,157 -Level 2 - Other Significant Level 2 - Other SignificantObservable Inputs - - Observable Inputs - -
Level 3 � Significant Level 3 � SignificantUnobservable Inputs - - Unobservable Inputs - -Total $219,090,208 - Total $287,605,157 -
Lifecycle 2025 Lifecycle 2020Other Other
Investments in Financial Investments in FinancialValuation Inputs: Securities Instruments* Valuation Inputs: Securities Instruments*Level 1 - Quoted Prices $352,015,070 - Level 1 - Quoted Prices $351,048,036 -Level 2 - Other Significant Level 2 - Other SignificantObservable Inputs - - Observable Inputs - -Level 3 � Significant Level 3 � SignificantUnobservable Inputs - - Unobservable Inputs - -Total $352,015,070 - Total $351,048,036 -
Lifecycle 2015 Lifecycle 2010Other Other
Investments in Financial Investments in FinancialValuation Inputs: Securities Instruments* Valuation Inputs: Securities Instruments*Level 1 - Quoted Prices $264,150,688 - Level 1 - Quoted Prices $135,339,056 -Level 2 - Other Significant Level 2 - Other Significant
Copyright © 2012 www.secdatabase.com. All Rights Reserved.Please Consider the Environment Before Printing This Document
Observable Inputs - - Observable Inputs - -Level 3 � Significant Level 3 � SignificantUnobservable Inputs - - Unobservable Inputs - -Total $264,150,688 - Total $135,339,056 -
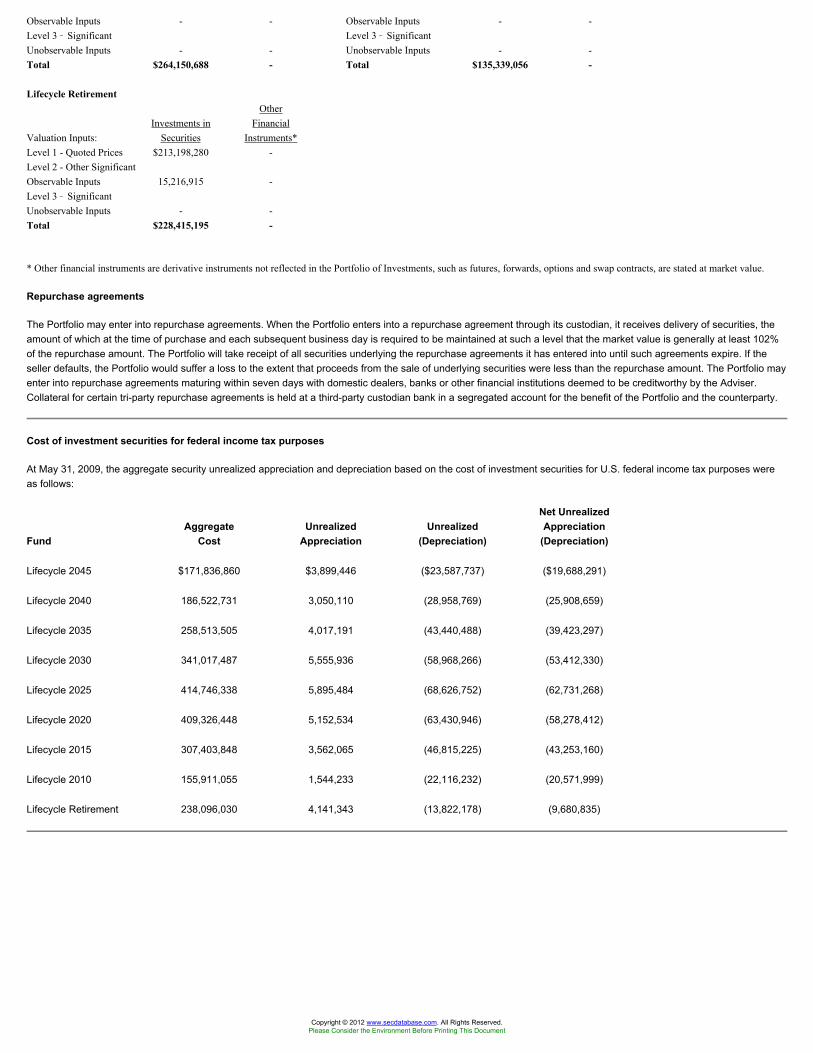
Lifecycle RetirementOther
Investments in FinancialValuation Inputs: Securities Instruments*Level 1 - Quoted Prices $213,198,280 -Level 2 - Other SignificantObservable Inputs 15,216,915 -Level 3 � SignificantUnobservable Inputs - -Total $228,415,195 -
* Other financial instruments are derivative instruments not reflected in the Portfolio of Investments, such as futures, forwards, options and swap contracts, are stated at market value.
Repurchase agreements
The Portfolio may enter into repurchase agreements. When the Portfolio enters into a repurchase agreement through its custodian, it receives delivery of securities, theamount of which at the time of purchase and each subsequent business day is required to be maintained at such a level that the market value is generally at least 102%of the repurchase amount. The Portfolio will take receipt of all securities underlying the repurchase agreements it has entered into until such agreements expire. If theseller defaults, the Portfolio would suffer a loss to the extent that proceeds from the sale of underlying securities were less than the repurchase amount. The Portfolio mayenter into repurchase agreements maturing within seven days with domestic dealers, banks or other financial institutions deemed to be creditworthy by the Adviser.Collateral for certain tri-party repurchase agreements is held at a third-party custodian bank in a segregated account for the benefit of the Portfolio and the counterparty.
Cost of investment securities for federal income tax purposes
At May 31, 2009, the aggregate security unrealized appreciation and depreciation based on the cost of investment securities for U.S. federal income tax purposes wereas follows:
Net UnrealizedAggregate Unrealized Unrealized Appreciation
Fund Cost Appreciation (Depreciation) (Depreciation)
Lifecycle 2045 $171,836,860 $3,899,446 ($23,587,737) ($19,688,291)
Lifecycle 2040 186,522,731 3,050,110 (28,958,769) (25,908,659)
Lifecycle 2035 258,513,505 4,017,191 (43,440,488) (39,423,297)
Lifecycle 2030 341,017,487 5,555,936 (58,968,266) (53,412,330)
Lifecycle 2025 414,746,338 5,895,484 (68,626,752) (62,731,268)
Lifecycle 2020 409,326,448 5,152,534 (63,430,946) (58,278,412)
Lifecycle 2015 307,403,848 3,562,065 (46,815,225) (43,253,160)
Lifecycle 2010 155,911,055 1,544,233 (22,116,232) (20,571,999)
Lifecycle Retirement 238,096,030 4,141,343 (13,822,178) (9,680,835)
Copyright © 2012 www.secdatabase.com. All Rights Reserved.Please Consider the Environment Before Printing This Document

JOHN HANCOCK FUNDS II
PORTFOLIO OF INVESTMENTS - May 31, 2009 (Unaudited)(showing percentage of total net assets)
Active Bond FundShares or
Principal
Amount Value
Copyright © 2012 www.secdatabase.com. All Rights Reserved.Please Consider the Environment Before Printing This Document

U.S. TREASURY OBLIGATIONS - 3.65%
U.S. Treasury Bonds - 0.82%
3.50% due 02/15/2039 $ 3,940,000 $ 3,395,177
4.375% due 02/15/2038 985,000 989,463
4,384,640
U.S. Treasury Notes - 2.83%
1.375% due 04/15/2012 4,265,000 4,269,666
1.875% due 04/30/2014 545,000 533,674
2.00% due 02/28/2010 241,000 243,852
3.125% due 05/15/2019 1,590,000 1,544,542
3.75% due 11/15/2018 780,000 797,183
4.25% due 08/15/2015 1,475,000 1,603,026
4.75% due 02/15/2010 5,865,000 6,044,387
15,036,330
TOTAL U.S. TREASURY OBLIGATIONS
(Cost $19,280,671) $ 19,420,970
U.S. GOVERNMENT AGENCY OBLIGATIONS - 33.35%
Federal Farm Credit Bank - 0.24%
2.625% due 04/17/2014 1,315,000 1,300,283
Federal Home Loan Bank - 5.37%
zero coupon due 06/10/2009 to
06/16/2009 28,619,000 28,616,494
Federal Home Loan Mortgage Corp. - 1.53%
4.50% due 03/01/2039 to 04/01/2039 5,403,797 5,444,748
5.706% due 04/01/2037 661,986 692,569
5.865% due 03/01/2037 (b) 1,813,978 1,899,709
5.875% due 03/21/2011 81,000 85,251
8,122,277
Federal National Mortgage
Association - 25.18%
zero coupon due 02/01/2015 390,000 287,615
3.757% due 05/01/2035 (b) 2,307,266 2,352,710
4.00% TBA ** 11,610,000 11,698,888
4.375% due 03/15/2013 20,000 21,639
4.50% TBA ** 6,000,000 6,142,500
4.931% due 12/01/2038 (b) 846,485 879,213
5.00% due 05/01/2018 to 05/01/2038 27,421,835 28,225,721
5.00% TBA ** 5,000,000 5,172,265
5.041% due 07/01/2033 (b) 2,183 2,273
5.347% due 12/01/2038 (b) 1,058,063 1,105,013
5.367% due 12/01/2038 (b) 684,737 715,077
5.50% due 03/15/2011 to 07/01/2038 52,382,145 54,601,101
5.576% due 01/01/2036 (b) 1,280,698 1,332,848
5.716% due 04/01/2036 (b) 924,518 964,644
6.00% due 09/01/2022 to 02/01/2036 19,250,624 20,288,542
6.25% due 05/15/2029 157,000 182,258
6.50% due 02/01/2036 59,071 63,144
7.00% due 09/01/2010 to 10/25/2041 55,183 58,169
7.50% due 09/01/2029 to 08/01/2031 4,773 5,215
134,098,835
Government National Mortgage
Association - 1.03%
4.50% due 03/15/2039 to 04/15/2039 5,191,118 5,248,301
5.00% due 04/15/2035 91,050 94,115
5.50% due 03/15/2035 87,751 91,453
6.00% due 03/15/2033 to 06/15/2033 36,722 38,811
6.50% due 09/15/2028 to 08/15/2031 6,362 6,823
Copyright © 2012 www.secdatabase.com. All Rights Reserved.Please Consider the Environment Before Printing This Document

Active Bond Fund (continued)Shares or
Principal
Amount Value
U.S. GOVERNMENT AGENCY
OBLIGATIONS (continued)
Government National Mortgage
Association (continued)
7.00% due 04/15/2029 $ 2,325 $ 2,532
8.00% due 10/15/2026 2,197 2,384
5,484,419
TOTAL U.S. GOVERNMENT AGENCY OBLIGATIONS
(Cost $173,282,487) $ 177,622,308
FOREIGN GOVERNMENT OBLIGATIONS - 0.07%
Argentina - 0.00%
Republic of Argentina
0.63% due 12/31/2038 (b) ARS 177,218 9,526
2.455% due 12/15/2035 ^ (b) 393,449 4,325
5.83% due 12/31/2033 (b) 72,870 11,421
25,272
Canada - 0.00%
Government of Canada
5.50% due 06/01/2010 CAD 5,000 4,806
Colombia - 0.01%
Republic of Colombia
10.00% due 01/23/2012 $ 20,000 23,000
11.75% due 03/01/2010 COP 8,000,000 3,860
26,860
Japan - 0.01%
Government of Japan
1.50% due 09/20/2014 JPY 1,350,000 14,603
1.80% due 03/22/2010 2,650,000 28,168
42,771
Mexico - 0.05%
Government of Mexico
8.00% due 12/07/2023 MXN 238,900 17,604
8.00% due 12/19/2013 167,800 13,233
9.875% due 02/01/2010 $ 205,000 216,275
247,112
Panama - 0.00%
Republic of Panama
8.875% due 09/30/2027 6,000 7,080
9.375% due 04/01/2029 1,000 1,235
8,315
Peru - 0.00%
Republic of Peru
9.875% due 02/06/2015 2,000 2,450
Philippines - 0.00%
Republic of Philippines
9.125% due 02/22/2010 EUR 2,000 2,948
Sweden - 0.00%
Kingdom of Sweden
Copyright © 2012 www.secdatabase.com. All Rights Reserved.Please Consider the Environment Before Printing This Document

5.25% due 03/15/2011 SEK 30,000 4,245
TOTAL FOREIGN GOVERNMENT OBLIGATIONS
(Cost $422,739) $ 364,779
The accompanying notes are an integral part of the financial statements.
1
JOHN HANCOCK FUNDS II
PORTFOLIO OF INVESTMENTS - May 31, 2009 (Unaudited) - continued(showing percentage of total net assets)
Active Bond Fund (continued)Shares or
Principal
Amount Value
CORPORATE BONDS - 49.26%
Advertising - 0.01%
R.H. Donnelley Corp.
8.875% due 10/15/2017 ^ $ 560,000 $ 39,200
Aerospace - 0.09%
BAE Systems Asset Trust
6.664% due 09/15/2013 (f) 32,430 30,160
BE Aerospace, Inc.
8.50% due 07/01/2018 250,000 236,250
Vought Aircraft Industries, Inc.
8.00% due 07/15/2011 460,000 225,400
491,810
Agriculture - 0.26%
Archer-Daniels-Midland Company
6.45% due 01/15/2038 1,000,000 1,040,074
Mosaic Company
7.625% due 12/01/2016 (f) 360,000 358,200
1,398,274
Air Travel - 0.28%
Continental Airlines, Inc., Series 00-2
8.307% due 10/02/2019 162,234 118,431
Continental Airlines, Inc., Series 991A
6.545% due 02/02/2019 97,714 87,943
Delta Air Lines, Inc.
6.821% due 08/10/2022 508,234 409,128
Delta Air Lines, Inc., Series 02-1
6.417% due 07/02/2012 515,000 437,750
Northwest Airlines, Inc., Series 07-1
7.027% due 11/01/2019 309,029 222,501
US Airways Group, Inc.
7.25% due 05/15/2014 290,000 223,329
1,499,082
Aluminum - 0.08%
Alcoa, Inc.
5.72% due 02/23/2019 150,000 118,786
Rio Tinto Alcan, Inc.
6.125% due 12/15/2033 395,000 287,892
406,678
Amusement & Theme Parks - 0.00%
HRP Myrtle Beach Operations LLC
Copyright © 2012 www.secdatabase.com. All Rights Reserved.Please Consider the Environment Before Printing This Document

zero coupon due 04/01/2012 ^ (f) 140,000 1,400
Auto Parts - 0.20%
Allison Transmission, Inc.
11.00% due 11/01/2015 (f) 475,000 370,500
Delphi Corp.
6.197% due 11/15/2033 ^ 2,000 0
Goodyear Tire & Rubber Company
8.625% due 12/01/2011 415,000 403,588
Tenneco Automotive, Inc.
8.625% due 11/15/2014 515,000 316,725
1,090,813
Auto Services - 0.11%
ERAC USA Finance Company
6.375% due 10/15/2017 (f) 320,000 268,770
7.95% due 12/15/2009 (f) 10,000 9,902
United Rentals North America, Inc.
7.00% due 02/15/2014 310,000 238,700
Active Bond Fund (continued)Shares or
Principal
Amount Value
CORPORATE BONDS (continued)
Auto Services (continued)
United Rentals North America, Inc. (continued)
7.75% due 11/15/2013 (a) $ 100,000 $ 81,500
598,872
Automobiles - 0.07%
DaimlerChrysler NA Holding Corp.
5.875% due 03/15/2011 395,000 399,885
Banking - 2.56%
Allied Irish Banks PLC
7.50% due 12/29/2049 (b) EUR 1,000 601
BAC Capital Trust XIII
1.72% due 03/15/2043 (b) $ 640,000 243,933
BAC Capital Trust XV
2.0612% due 06/01/2056 (b) 925,000 373,128
Banco Santander Chile
1.6337% due 12/09/2009 (b)(f) 18,000 17,871
5.375% due 12/09/2014 (f) 5,000 4,794
Bank of America Corp.
5.65% due 05/01/2018 565,000 505,610
5.75% due 12/01/2017 2,470,000 2,206,162
7.625% due 06/01/2019 1,210,000 1,223,845
Bank of Ireland
6.45% due 02/10/2010 EUR 1,000 1,429
Chuo Mitsui Trust & Banking Company
5.506% due 12/29/2049 (b)(f) $ 500,000 340,000
Comerica Capital Trust II
6.576% due 02/20/2037 (b) 1,000,000 547,970
HBOS PLC
5.375% due 12/29/2049 (b)(f) 22,000 10,821
HSBC Holdings PLC
6.50% due 09/15/2037 435,000 394,499
Independence Community Bank Corp.
3.0275% due 04/01/2014 (b) 85,000 60,671
Lloyds TSB Group PLC
6.267% due 12/31/2049 (b)(f) 545,000 209,825
6.413% due 12/31/2049 (f) 450,000 175,500
Mellon Capital IV, Series 1
6.244% due 06/29/2049 (b) 400,000 264,014
Copyright © 2012 www.secdatabase.com. All Rights Reserved.Please Consider the Environment Before Printing This Document

Natixis
10.00% due 04/29/2049 (b)(f) 325,000 178,822
Northern Trust Company
6.50% due 08/15/2018 190,000 201,164
Northern Trust Corp.
4.625% due 05/01/2014 410,000 413,576
Rabobank Capital Funding II
5.26% due 12/29/2049 (b)(f) 790,000 608,300
Royal Bank of Scotland Group PLC, MTN
7.64% due 03/31/2049 300,000 112,890
Shinhan Bank
6.819% due 09/20/2036 (b) 515,000 351,082
Silicon Valley Bank
6.05% due 06/01/2017 415,000 302,786
Standard Chartered PLC
6.40% due 09/26/2017 (f) 1,000,000 851,621
6.409% due 01/30/2017 (b)(f) 1,215,000 838,350
SunTrust Capital VIII
6.10% due 12/01/2066 (b) 630,000 407,945
SunTrust Preferred Capital I
5.853% due 12/31/2049 (b) 605,000 369,050
The accompanying notes are an integral part of the financial statements.
2
JOHN HANCOCK FUNDS II
PORTFOLIO OF INVESTMENTS - May 31, 2009 (Unaudited) - continued(showing percentage of total net assets)
Active Bond Fund (continued)Shares or
Principal
Amount Value
CORPORATE BONDS (continued)
Banking (continued)
TuranAlem Finance BV
7.875% due 06/02/2010 $ 12,000 $ 2,880
UBS AG/Stamford Branch, Series DPNT
5.875% due 12/20/2017 550,000 499,220
USB Capital IX
6.189% due 03/29/2049 (b) 2,025,000 1,321,313
Wachovia Bank NA
5.85% due 02/01/2037 395,000 293,208
Wachovia Bank NA, BKNT
6.60% due 01/15/2038 325,000 274,981
13,607,861
Broadcasting - 0.40%
CSC Holdings, Inc.
7.875% due 02/15/2018 405,000 381,712
News America Holdings, Inc.
6.75% due 01/09/2038 2,000 2,022
6.90% due 03/01/2019 (f) 385,000 376,458
7.75% due 12/01/2045 9,000 7,113
8.25% due 08/10/2018 375,000 380,511
News America, Inc.
6.65% due 11/15/2037 865,000 732,122
Sirius XM Radio, Inc.
13.00% due 08/01/2013 (f) 360,000 259,200
2,139,138
Copyright © 2012 www.secdatabase.com. All Rights Reserved.Please Consider the Environment Before Printing This Document

Building Materials & Construction - 0.32%
CRH America, Inc.
8.125% due 07/15/2018 425,000 397,885
Masco Corp.
5.85% due 03/15/2017 705,000 556,964
USG Corp.
6.30% due 11/15/2016 1,000,000 725,000
1,679,849
Business Services - 0.20%
Electronic Data Systems Corp.
7.125% due 10/15/2009 2,000 2,047
Science Applications International Corp.
5.50% due 07/01/2033 825,000 692,628
Xerox Corp.
6.75% due 02/01/2017 435,000 388,237
1,082,912
Cable & Television - 1.84%
Charter Communications Holdings II LLC
10.25% due 10/01/2013 ^ (f) 312,000 288,600
Comcast Corp.
4.95% due 06/15/2016 360,000 344,185
6.50% due 01/15/2015 300,000 310,399
COX Communications, Inc.
4.625% due 01/15/2010 22,000 22,097
5.45% due 12/15/2014 218,000 215,130
6.75% due 03/15/2011 209,000 218,469
7.75% due 11/01/2010 207,000 215,108
8.375% due 03/01/2039 195,000 204,811
Cox Communications, Inc., Class A
4.625% due 06/01/2013 340,000 328,280
Rogers Cable, Inc.
6.75% due 03/15/2015 300,000 309,834
Active Bond Fund (continued)Shares or
Principal
Amount Value
CORPORATE BONDS (continued)
Cable & Television (continued)
TCI Communications, Inc.
9.80% due 02/01/2012 $ 845,000 $ 937,481
Time Warner Cable, Inc.
6.55% due 05/01/2037 550,000 511,418
6.75% due 07/01/2018 1,185,000 1,224,093
8.75% due 02/14/2019 295,000 338,321
Time Warner Companies, Inc.
7.57% due 02/01/2024 34,000 30,684
Time Warner Entertainment Company LP
8.375% due 07/15/2033 535,000 555,517
8.375% due 03/15/2023 335,000 348,668
Time Warner, Inc.
6.75% due 04/15/2011 575,000 602,257
7.625% due 04/15/2031 9,000 8,196
Viacom, Inc.
5.75% due 04/30/2011 1,000,000 1,013,746
6.625% due 05/15/2011 575,000 581,031
6.75% due 10/05/2037 630,000 525,055
6.875% due 04/30/2036 760,000 645,346
9,778,726
Copyright © 2012 www.secdatabase.com. All Rights Reserved.Please Consider the Environment Before Printing This Document

Cellular Communications - 0.29%
America Movil SAB de CV
5.75% due 01/15/2015 305,000 313,389
American Tower Corp.
7.50% due 05/01/2012 12,000 12,225
AT&T Wireless Services, Inc.
7.875% due 03/01/2011 211,000 229,346
8.75% due 03/01/2031 209,000 243,468
Nextel Communications, Inc.
6.875% due 10/31/2013 400,000 333,000
Rogers Wireless, Inc.
9.625% due 05/01/2011 8,000 8,556
Verizon Wireless Capital LLC
7.375% due 11/15/2013 (f) 360,000 403,956
1,543,940
Chemicals - 0.35%
American Pacific Corp.
9.00% due 02/01/2015 425,000 370,813
E.I. Du Pont de Nemours & Company
5.875% due 01/15/2014 305,000 331,546
Ecolab, Inc.
4.875% due 02/15/2015 265,000 258,022
Momentive Performance Materials, Inc.
9.75% due 12/01/2014 480,000 182,400
Potash Corp. of Saskatchewan, Inc.
5.25% due 05/15/2014 420,000 433,678
Sterling Chemicals, Inc.
10.25% due 04/01/2015 305,000 265,731
1,842,190
Chemicals-Diversified - 0.18%
Dow Chemical Company
8.55% due 05/15/2019 350,000 349,966
The Dow Chemical Company
5.70% due 05/15/2018 700,000 587,758
937,724
The accompanying notes are an integral part of the financial statements.
3
JOHN HANCOCK FUNDS II
PORTFOLIO OF INVESTMENTS - May 31, 2009 (Unaudited) - continued(showing percentage of total net assets)
Active Bond Fund (continued)Shares or
Principal
Amount Value
CORPORATE BONDS (continued)
Computers & Business Equipment - 0.34%
Cisco Systems, Inc.
5.50% due 02/22/2016 $ 510,000 $ 539,416
Computer Sciences Corp.
6.50% due 03/15/2018 965,000 966,794
Xerox Corp.
8.25% due 05/15/2014 300,000 304,487
1,810,697
Copyright © 2012 www.secdatabase.com. All Rights Reserved.Please Consider the Environment Before Printing This Document
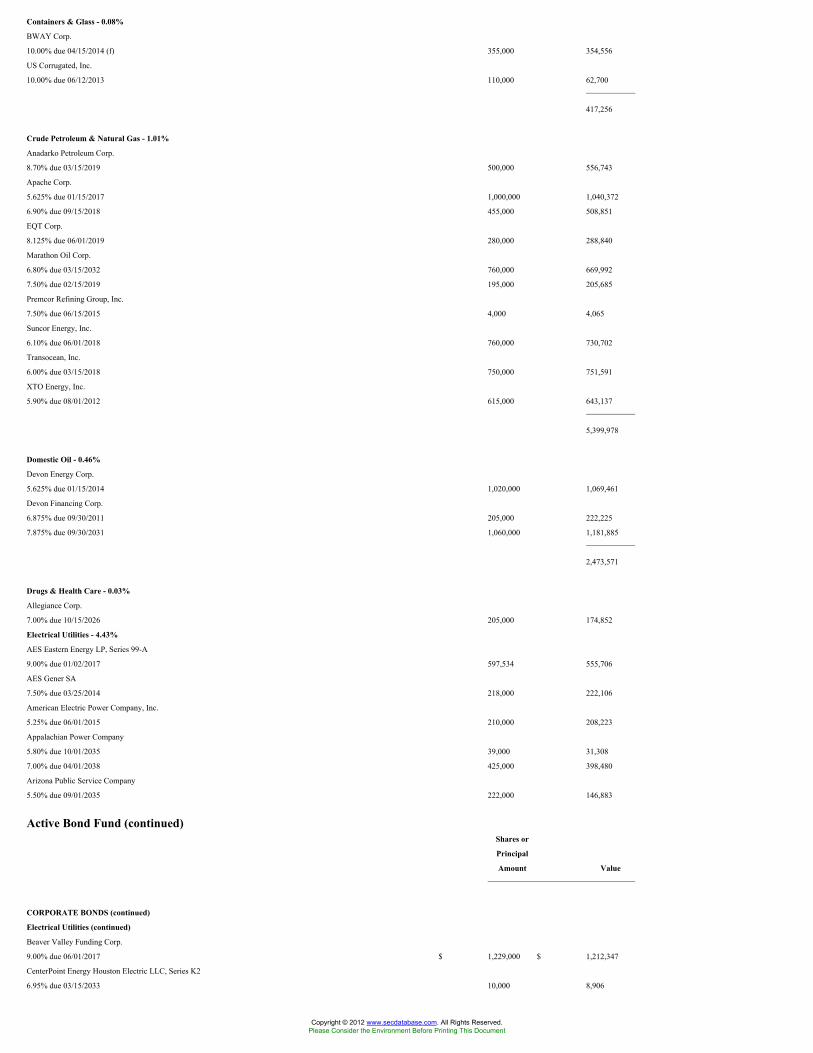
Containers & Glass - 0.08%
BWAY Corp.
10.00% due 04/15/2014 (f) 355,000 354,556
US Corrugated, Inc.
10.00% due 06/12/2013 110,000 62,700
417,256
Crude Petroleum & Natural Gas - 1.01%
Anadarko Petroleum Corp.
8.70% due 03/15/2019 500,000 556,743
Apache Corp.
5.625% due 01/15/2017 1,000,000 1,040,372
6.90% due 09/15/2018 455,000 508,851
EQT Corp.
8.125% due 06/01/2019 280,000 288,840
Marathon Oil Corp.
6.80% due 03/15/2032 760,000 669,992
7.50% due 02/15/2019 195,000 205,685
Premcor Refining Group, Inc.
7.50% due 06/15/2015 4,000 4,065
Suncor Energy, Inc.
6.10% due 06/01/2018 760,000 730,702
Transocean, Inc.
6.00% due 03/15/2018 750,000 751,591
XTO Energy, Inc.
5.90% due 08/01/2012 615,000 643,137
5,399,978
Domestic Oil - 0.46%
Devon Energy Corp.
5.625% due 01/15/2014 1,020,000 1,069,461
Devon Financing Corp.
6.875% due 09/30/2011 205,000 222,225
7.875% due 09/30/2031 1,060,000 1,181,885
2,473,571
Drugs & Health Care - 0.03%
Allegiance Corp.
7.00% due 10/15/2026 205,000 174,852
Electrical Utilities - 4.43%
AES Eastern Energy LP, Series 99-A
9.00% due 01/02/2017 597,534 555,706
AES Gener SA
7.50% due 03/25/2014 218,000 222,106
American Electric Power Company, Inc.
5.25% due 06/01/2015 210,000 208,223
Appalachian Power Company
5.80% due 10/01/2035 39,000 31,308
7.00% due 04/01/2038 425,000 398,480
Arizona Public Service Company
5.50% due 09/01/2035 222,000 146,883
Active Bond Fund (continued)Shares or
Principal
Amount Value
CORPORATE BONDS (continued)
Electrical Utilities (continued)
Beaver Valley Funding Corp.
9.00% due 06/01/2017 $ 1,229,000 $ 1,212,347
CenterPoint Energy Houston Electric LLC, Series K2
6.95% due 03/15/2033 10,000 8,906
Copyright © 2012 www.secdatabase.com. All Rights Reserved.Please Consider the Environment Before Printing This Document

CenterPoint Energy Resources Corp.
7.875% due 04/01/2013 235,000 246,750
CenterPoint Energy Resources Corp., MTN
6.00% due 05/15/2018 1,000,000 881,590
CenterPoint Energy, Inc.
6.50% due 05/01/2018 1,000,000 856,165
Commonwealth Edison Company
5.80% due 03/15/2018 1,985,000 1,955,741
Constellation Energy Group, Inc.
7.60% due 04/01/2032 246,000 208,008
Delmarva Power & Light Company
6.40% due 12/01/2013 390,000 410,486
Dominion Resources, Inc.
5.00% due 03/15/2013 575,000 577,355
5.70% due 09/17/2012 207,000 214,001
6.30% due 09/30/2066 (b) 800,000 482,000
7.50% due 06/30/2066 (b) 320,000 221,600
DTE Energy Company
7.625% due 05/15/2014 335,000 346,038
Enel Finance International SA
6.25% due 09/15/2017 (f) 565,000 567,938
Enersis SA
7.375% due 01/15/2014 12,000 12,917
Entergy Louisiana LLC
8.09% due 01/02/2017 450,375 442,260
FirstEnergy Corp.
6.45% due 11/15/2011 209,000 218,679
7.375% due 11/15/2031 676,000 586,319
Indiantown Cogeneration LP, Series A-9
9.26% due 12/15/2010 52,146 51,067
Ipalco Enterprises, Inc.
8.625% due 11/14/2011 365,000 366,825
Israel Electric Corp., Ltd.
7.25% due 01/15/2019 (f) 1,720,000 1,735,540
ITC Holdings Corp.
5.875% due 09/30/2016 (f) 170,000 154,028
Midwest Generation LLC, Series B
8.56% due 01/02/2016 584,360 566,829
Monongahela Power Company
7.95% due 12/15/2013 (f) 665,000 706,914
National Grid PLC
6.30% due 08/01/2016 485,000 490,035
Nevada Power Company
5.875% due 01/15/2015 340,000 332,176
6.65% due 04/01/2036 530,000 473,624
Oncor Electric Delivery Company
6.375% due 05/01/2012 850,000 873,655
Pacific Gas & Electric Company
4.20% due 03/01/2011 246,000 254,226
4.80% due 03/01/2014 212,000 219,455
8.25% due 10/15/2018 455,000 541,288
Peco Energy Company
5.35% due 03/01/2018 1,000,000 1,002,196
PG&E Corp.
5.75% due 04/01/2014 390,000 404,442
The accompanying notes are an integral part of the financial statements.
4
JOHN HANCOCK FUNDS II
PORTFOLIO OF INVESTMENTS - May 31, 2009 (Unaudited) - continued(showing percentage of total net assets)
Active Bond Fund (continued)Shares or
Copyright © 2012 www.secdatabase.com. All Rights Reserved.Please Consider the Environment Before Printing This Document

Principal
Amount Value
CORPORATE BONDS (continued)
Electrical Utilities (continued)
PSEG Power LLC
5.00% due 04/01/2014 $ 214,000 $ 208,370
8.625% due 04/15/2031 214,000 236,397
San Diego Gas & Electric Company, Series FFF
6.125% due 09/15/2037 1,000,000 1,026,200
Scottish Power PLC
4.91% due 03/15/2010 225,000 227,623
Sierra Pacific Power Company, Series M
6.00% due 05/15/2016 840,000 818,280
Southern Power Company, Series D
4.875% due 07/15/2015 295,000 277,952
Texas Competitive Electric Holdings Company
LLC, Series A
10.25% due 11/01/2015 600,000 355,500
TransAlta Corp.
6.65% due 05/15/2018 580,000 518,094
United Energy Distribution Property, Ltd.
4.70% due 04/15/2011 (f) 96,000 97,395
Virginia Electric and Power Company
6.00% due 01/15/2036 620,000 621,426
23,571,343
Electronics - 0.00%
Jabil Circuit, Inc.
5.875% due 07/15/2010 17,000 16,660
Energy - 0.94%
Duke Capital LLC
6.75% due 02/15/2032 511,000 420,415
Duke Energy Corp.
6.30% due 02/01/2014 335,000 355,337
Enterprise Products Operating LP
4.95% due 06/01/2010 210,000 211,161
6.30% due 09/15/2017 820,000 788,242
Enterprise Products Operating LP, Series B
5.60% due 10/15/2014 (f) 680,000 668,373
6.875% due 03/01/2033 209,000 187,589
Exide Technologies, Series B
10.50% due 03/15/2013 375,000 315,000
Nexen, Inc.
5.875% due 03/10/2035 577,000 457,960
6.40% due 05/15/2037 625,000 533,981
Salton Sea Funding Corp., Series F
7.475% due 11/30/2018 220,811 207,708
Sempra Energy
6.50% due 06/01/2016 450,000 459,124
8.90% due 11/15/2013 360,000 397,602
5,002,492
Financial Services - 9.56%
Allied Capital Corp.
6.625% due 07/15/2011 255,000 116,026
American Express Bank FSB, BKNT
6.00% due 09/13/2017 805,000 718,866
American Express Company
7.00% due 03/19/2018 1,110,000 1,060,140
American Express Credit Corp., Series C
7.30% due 08/20/2013 585,000 592,194
American General Finance Corp.
6.90% due 12/15/2017 335,000 165,730
Copyright © 2012 www.secdatabase.com. All Rights Reserved.Please Consider the Environment Before Printing This Document

Active Bond Fund (continued)Shares or
Principal
Amount Value
CORPORATE BONDS (continued)
Financial Services (continued)
American Honda Finance Corp.
7.625% due 10/01/2018 (f) $ 615,000 $ 588,152
Astoria Depositor Corp.
8.144% due 05/01/2021 (f) 600,000 456,000
AXA Financial, Inc.
7.75% due 08/01/2010 210,000 211,011
Bear Stearns Companies, Inc.
7.25% due 02/01/2018 380,000 391,756
Bear Stearns Companies, Inc., MTN
0.8537% due 11/28/2011 (b) 640,000 617,229
Bosphorus Financial Services, Ltd.
2.6831% due 02/15/2012 (b)(f) 257,812 223,441
Bunge, Ltd. Finance Corp.
5.35% due 04/15/2014 430,000 399,604
5.875% due 05/15/2013 25,000 24,285
Capital One Financial Corp.
6.75% due 09/15/2017 550,000 520,928
7.375% due 05/23/2014 330,000 340,014
Capmark Financial Group, Inc.
7.875% due 05/10/2012 1,300,000 382,053
Caterpillar Financial Services Corp.
4.50% due 06/15/2009 210,000 210,138
Caterpillar Financial Services Corp., MTN
5.45% due 04/15/2018 870,000 796,825
5.50% due 03/15/2016 405,000 387,936
CIT Group, Inc.
5.00% due 02/13/2014 95,000 64,017
5.65% due 02/13/2017 125,000 82,686
CIT Group, Inc., MTN
5.125% due 09/30/2014 95,000 63,651
Citigroup, Inc.
5.50% due 04/11/2013 850,000 815,214
5.625% due 08/27/2012 219,000 204,763
5.85% due 12/11/2034 285,000 225,946
6.125% due 11/21/2017 1,395,000 1,250,390
6.125% due 05/15/2018 2,540,000 2,266,023
8.50% due 05/22/2019 2,030,000 2,101,842
CME Group, Inc.
5.75% due 02/15/2014 470,000 495,671
CNOOC Finance 2003, Ltd.
5.50% due 05/21/2033 (f) 10,000 9,200
Credit Suisse First Boston USA, Inc.
0.865% due 11/20/2009 (b) 1,220,000 1,212,384
6.50% due 01/15/2012 209,000 221,919
Dresdner Bank AG
7.25% due 09/15/2015 281,000 225,886
ESI Tractebel Acquisition Corp., Series B
7.99% due 12/30/2011 394,000 381,661
FPL Group Capital, Inc.
6.35% due 10/01/2066 (b) 650,000 487,500
General Electric Capital Corp.
5.45% due 01/15/2013 261,000 264,255
5.625% due 05/01/2018 455,000 434,549
5.875% due 01/14/2038 580,000 469,563
Goldman Sachs Capital II
5.793% due 12/29/2049 (b) 760,000 440,919
Goldman Sachs Group, Inc.
5.125% due 01/15/2015 640,000 623,014
Copyright © 2012 www.secdatabase.com. All Rights Reserved.Please Consider the Environment Before Printing This Document

5.95% due 01/18/2018 1,500,000 1,430,301
The accompanying notes are an integral part of the financial statements.
5
JOHN HANCOCK FUNDS II
PORTFOLIO OF INVESTMENTS - May 31, 2009 (Unaudited) - continued(showing percentage of total net assets)
Active Bond Fund (continued)Shares or
Principal
Amount Value
CORPORATE BONDS (continued)
Financial Services (continued)
Goldman Sachs Group, Inc. (continued)
6.00% due 05/01/2014 $ 645,000 $ 655,792
6.75% due 10/01/2037 420,000 352,096
7.50% due 02/15/2019 930,000 978,592
Harley-Davidson Funding Corp.
6.80% due 06/15/2018 (f) 1,000,000 818,352
HSBC Finance Corp.
5.00% due 06/30/2015 645,000 586,166
HVB Funding Trust III
9.00% due 10/22/2031 (f) 10,000 4,500
International Lease Finance Corp.
4.55% due 10/15/2009 7,000 6,719
4.75% due 07/01/2009 30,000 29,529
International Lease Finance Corp., MTN
5.45% due 03/24/2011 555,000 469,522
International Lease Finance Corp., Series P
1.5313% due 01/15/2010 (b) 13,000 12,382
Jefferies Group, Inc.
6.45% due 06/08/2027 210,000 132,757
John Deere Capital Corp., Series D
4.125% due 01/15/2010 39,000 39,589
JPMorgan Chase & Company
4.65% due 06/01/2014 655,000 650,591
6.30% due 04/23/2019 2,127,000 2,116,171
6.75% due 02/01/2011 218,000 228,737
JPMorgan Chase & Company, Series 1
7.90 due 12/31/2049 (b) 2,070,000 1,728,512
JPMorgan Chase Capital XX, Series T
6.55% due 09/29/2036 750,000 590,821
JPMorgan Chase Capital XXIII
1.8831% due 05/15/2047 (b) 915,000 419,879
Kaupthing Bank HF
5.75% due 10/04/2011 ^ (f) 750,000 67,500
Lehman Brothers Holdings, Inc., MTN
zero coupon due 01/26/2017 ^ 1,120,000 165,200
MBNA Capital, Series B
1.8275% due 02/01/2027 (b) 23,000 10,366
Merrill Lynch & Company, Inc.
1.5662% due 05/02/2017 (b) 1,000,000 467,177
7.75% due 05/14/2038 1,855,000 1,638,032
Merrill Lynch & Company, Inc., MTN
1.5013% due 06/05/2012 (b) 472,000 411,885
6.875% due 04/25/2018 1,515,000 1,406,009
Mizuho Financial Group (Cayman), Ltd.
8.375% due 12/29/2049 300,000 282,000
Morgan Stanley
1.5569% due 10/18/2016 (b) 830,000 611,305
4.25% due 05/15/2010 232,000 234,560
Copyright © 2012 www.secdatabase.com. All Rights Reserved.Please Consider the Environment Before Printing This Document

7.30% due 05/13/2019 535,000 548,023
Morgan Stanley, MTN
5.95% due 12/28/2017 290,000 272,441
6.625% due 04/01/2018 825,000 815,579
Nelnet, Inc.
7.40% due 09/29/2036 (b) 400,000 180,000
NiSource Finance Corp.
6.15% due 03/01/2013 219,000 211,023
Osiris Capital PLC, Series C
3.9813% due 01/15/2010 (b)(f) 920,000 896,488
Active Bond Fund (continued)Shares or
Principal
Amount Value
CORPORATE BONDS (continued)
Financial Services (continued)
Osiris Capital PLC, Series D
6.1312% due 01/15/2010 (b)(f) $ 360,000 $ 351,656
PNC Financial Services Group, Inc.
8.25% due 12/31/2049 (b) 760,000 647,702
PNC Funding Corp.
1.1794% due 01/31/2012 (b) 1,000,000 885,528
4.50% due 03/10/2010 1,500,000 1,509,038
Popular North America, Inc.
4.70% due 06/30/2009 12,000 11,969
Schwab Capital Trust I
7.50% due 11/15/2037 (b) 1,435,000 1,264,622
Skandinaviska Enskilda Banken AB
5.471% due 03/29/2049 (b)(f) 400,000 212,000
SLM Corp.
1.3919% due 01/27/2014 (b) 1,840,000 1,115,012
4.50% due 07/26/2010 410,000 378,225
SLM Corp., MTN
8.45% due 06/15/2018 370,000 253,450
SLM Corp., MTN, Series A
1.2319% due 07/27/2009 (b) 1,000,000 988,514
SMFG Preferred Capital
6.078% due 01/29/2049 (b)(f) 400,000 308,876
Sovereign Capital Trust VI
7.908% due 06/13/2036 295,000 223,794
Teco Finance, Inc.
6.572% due 11/01/2017 302,000 272,224
7.00% due 05/01/2012 233,000 234,022
Ucar Finance, Inc.
10.25% due 02/15/2012 20,000 18,650
Vita Capital III, Ltd., Series B-I
2.3075% due 01/01/2011 (b)(f) 870,000 792,831
Waddell & Reed Financial, Inc.
5.60% due 01/15/2011 400,000 366,432
Wells Fargo Capital XIII, Series GMTN
7.70% due 12/29/2049 (b) 1,000,000 780,000
Westfield Capital Corp., Ltd.
4.375% due 11/15/2010 (f) 304,000 296,601
50,923,123
Food & Beverages - 1.92%
Anheuser-Busch InBev NV
7.20% due 01/15/2014 390,000 418,314
ASG Consolidated LLC/ASG Finance, Inc.
11.50% due 11/01/2011 (f) 395,000 353,525
Cargill, Inc.
6.125% due 09/15/2036 (f) 665,000 531,674
Dr Pepper Snapple Group, Inc.
Copyright © 2012 www.secdatabase.com. All Rights Reserved.Please Consider the Environment Before Printing This Document

6.12% due 05/01/2013 230,000 235,140
Dr. Pepper Snapple Group, Inc.
6.82% due 05/01/2018 305,000 306,995
General Mills, Inc.
5.20% due 03/17/2015 160,000 166,355
5.65% due 09/10/2012 600,000 641,161
5.70% due 02/15/2017 245,000 254,832
Kellogg Company, Series B
6.60% due 04/01/2011 209,000 225,158
Kraft Foods, Inc.
5.625% due 11/01/2011 219,000 232,861
6.00% due 02/11/2013 605,000 643,399
The accompanying notes are an integral part of the financial statements.
6
JOHN HANCOCK FUNDS II
PORTFOLIO OF INVESTMENTS - May 31, 2009 (Unaudited) - continued(showing percentage of total net assets)
Active Bond Fund (continued)Shares or
Principal
Amount Value
CORPORATE BONDS (continued)
Food & Beverages (continued)
Kraft Foods, Inc. (continued)
6.125% due 02/01/2018 $ 1,360,000 $ 1,387,778
Kroger Company
6.80% due 12/15/2018 920,000 953,495
7.00% due 05/01/2018 580,000 620,782
McCormick & Company, Inc.
5.75% due 12/15/2017 1,000,000 963,166
Nabisco, Inc.
7.55% due 06/15/2015 229,000 249,560
SABMiller PLC
6.50% due 07/15/2018 (f) 875,000 856,135
Smithfield Foods, Inc.
7.00% due 08/01/2011 18,000 15,480
Supervalu, Inc.
7.50% due 11/15/2014 500,000 483,750
Tate & Lyle International Finance PLC
5.00% due 11/15/2014 (f) 208,000 183,984
Tesco PLC
6.15% due 11/15/2037 (f) 570,000 521,487
10,245,031
Gas & Pipeline Utilities - 3.25%
Atmos Energy Corp.
8.50% due 03/15/2019 380,000 420,760
Buckeye Partners LP
5.125% due 07/01/2017 225,000 185,043
DCP Midstream LLC
9.75% due 03/15/2019 (f) 395,000 412,153
Dynegy-Roseton Danskammer, Series B
7.67% due 11/08/2016 360,000 304,200
Enbridge Energy Partners LP, Series B
6.50% due 04/15/2018 600,000 548,268
Energy Transfer Partners LP
6.70% due 07/01/2018 1,000,000 962,519
7.50% due 07/01/2038 1,440,000 1,354,448
8.50% due 04/15/2014 375,000 417,342
Copyright © 2012 www.secdatabase.com. All Rights Reserved.Please Consider the Environment Before Printing This Document
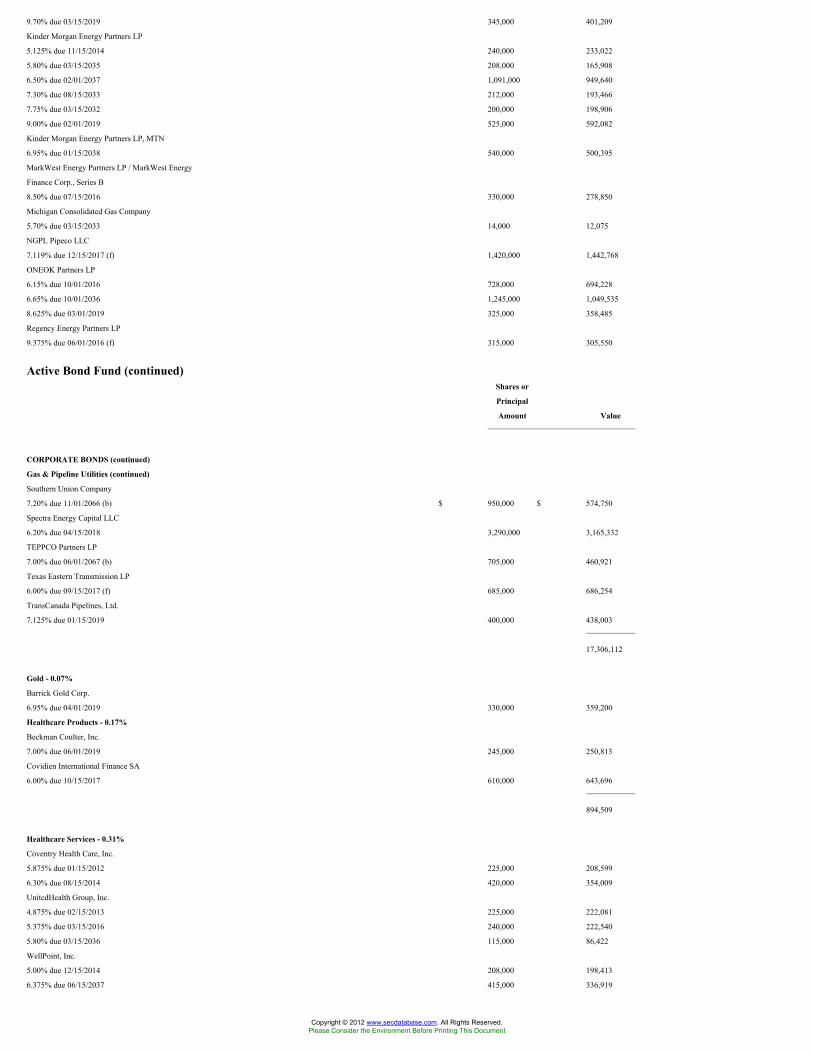
9.70% due 03/15/2019 345,000 401,209
Kinder Morgan Energy Partners LP
5.125% due 11/15/2014 240,000 233,022
5.80% due 03/15/2035 208,000 165,908
6.50% due 02/01/2037 1,091,000 949,640
7.30% due 08/15/2033 212,000 193,466
7.75% due 03/15/2032 200,000 198,906
9.00% due 02/01/2019 525,000 592,082
Kinder Morgan Energy Partners LP, MTN
6.95% due 01/15/2038 540,000 500,395
MarkWest Energy Partners LP / MarkWest Energy
Finance Corp., Series B
8.50% due 07/15/2016 330,000 278,850
Michigan Consolidated Gas Company
5.70% due 03/15/2033 14,000 12,075
NGPL Pipeco LLC
7.119% due 12/15/2017 (f) 1,420,000 1,442,768
ONEOK Partners LP
6.15% due 10/01/2016 728,000 694,228
6.65% due 10/01/2036 1,245,000 1,049,535
8.625% due 03/01/2019 325,000 358,485
Regency Energy Partners LP
9.375% due 06/01/2016 (f) 315,000 305,550
Active Bond Fund (continued)Shares or
Principal
Amount Value
CORPORATE BONDS (continued)
Gas & Pipeline Utilities (continued)
Southern Union Company
7.20% due 11/01/2066 (b) $ 950,000 $ 574,750
Spectra Energy Capital LLC
6.20% due 04/15/2018 3,290,000 3,165,332
TEPPCO Partners LP
7.00% due 06/01/2067 (b) 705,000 460,921
Texas Eastern Transmission LP
6.00% due 09/15/2017 (f) 685,000 686,254
TransCanada Pipelines, Ltd.
7.125% due 01/15/2019 400,000 438,003
17,306,112
Gold - 0.07%
Barrick Gold Corp.
6.95% due 04/01/2019 330,000 359,200
Healthcare Products - 0.17%
Beckman Coulter, Inc.
7.00% due 06/01/2019 245,000 250,813
Covidien International Finance SA
6.00% due 10/15/2017 610,000 643,696
894,509
Healthcare Services - 0.31%
Coventry Health Care, Inc.
5.875% due 01/15/2012 225,000 208,599
6.30% due 08/15/2014 420,000 354,009
UnitedHealth Group, Inc.
4.875% due 02/15/2013 225,000 222,081
5.375% due 03/15/2016 240,000 222,540
5.80% due 03/15/2036 115,000 86,422
WellPoint, Inc.
5.00% due 12/15/2014 208,000 198,413
6.375% due 06/15/2037 415,000 336,919
Copyright © 2012 www.secdatabase.com. All Rights Reserved.Please Consider the Environment Before Printing This Document

1,628,983
Holdings Companies/Conglomerates - 0.21%
General Electric Company
5.00% due 02/01/2013 1,057,000 1,088,198
SPI Electricity & Gas Australia Holdings Party, Ltd.
6.15% due 11/15/2013 (f) 16,000 15,799
1,103,997
Homebuilders - 0.41%
Centex Corp.
4.55% due 11/01/2010 1,200,000 1,170,000
5.80% due 09/15/2009 830,000 830,000
Pulte Homes, Inc.
6.25% due 02/15/2013 210,000 195,300
2,195,300
Hotels & Restaurants - 0.42%
Darden Restaurants, Inc.
6.80% due 10/15/2037 835,000 679,875
Marriott International, Inc.
4.625% due 06/15/2012 26,000 25,407
Starwood Hotels & Resorts Worldwide, Inc.
6.25% due 02/15/2013 315,000 288,225
Yum! Brands, Inc.
6.25% due 03/15/2018 405,000 396,404
The accompanying notes are an integral part of the financial statements.
7
JOHN HANCOCK FUNDS II
PORTFOLIO OF INVESTMENTS - May 31, 2009 (Unaudited) - continued(showing percentage of total net assets)
Active Bond Fund (continued)Shares or
Principal
Amount Value
CORPORATE BONDS (continued)
Hotels & Restaurants (continued)
Yum! Brands, Inc. (continued)
6.875% due 11/15/2037 $ 965,000 $ 858,492
2,248,403
Household Appliances - 0.14%
Whirlpool Corp.
8.00% due 05/01/2012 370,000 377,080
8.60% due 05/01/2014 370,000 373,943
751,023
Household Products - 0.28%
Clorox Company
5.00% due 03/01/2013 600,000 615,487
5.95% due 10/15/2017 500,000 502,573
Yankee Acquisition Corp., Series B
8.50% due 02/15/2015 495,000 373,725
1,491,785
Copyright © 2012 www.secdatabase.com. All Rights Reserved.Please Consider the Environment Before Printing This Document

Industrial Machinery - 0.09%
Caterpillar, Inc.
7.25% due 09/15/2009 213,000 216,369
Terex Corp.
10.875% due 06/01/2016 265,000 258,727
475,096
Industrials - 0.18%
Parker Hannifin Corp., Series MTN
5.50% due 05/15/2018 1,000,000 965,107
Insurance - 3.30%
Aflac, Inc.
8.50% due 05/15/2019 365,000 377,997
Allied World Assurance Holdings, Ltd.
7.50% due 08/01/2016 1,490,000 1,162,863
American International Group, Inc.
8.175% due 05/15/2058 (b)(f) 700,000 161,777
Aon Capital Trust A
8.205% due 01/01/2027 990,000 892,027
Assurant, Inc.
5.625% due 02/15/2014 209,000 178,132
6.75% due 02/15/2034 550,000 361,498
AXA SA
6.379% due 12/14/2049 (b)(f) 585,000 362,718
6.463% due 12/31/2049 (b)(f) 275,000 165,393
Catlin Insurance Company, Ltd.
7.249% due 12/31/2049 (b)(f) 500,000 239,982
Chubb Corp.
5.75% due 05/15/2018 230,000 231,807
Cigna Corp.
6.15% due 11/15/2036 500,000 328,059
CNA Financial Corp.
6.00% due 08/15/2011 280,000 270,186
Endurance Specialty Holdings, Ltd.
7.00% due 07/15/2034 800,000 513,045
Financial Security Assurance Holdings, Ltd.
6.40% due 12/15/2066 (b)(f) 795,000 278,250
Foundation Re II, Ltd.
7.5756% due 11/26/2010 (b)(f) 250,000 236,252
Genworth Financial, Inc.
6.15% due 11/15/2066 (b) 790,000 238,635
Active Bond Fund (continued)Shares or
Principal
Amount Value
CORPORATE BONDS (continued)
Insurance (continued)
Hartford Financial Services Group, Inc.
4.625% due 07/15/2013 $ 8,000 $ 6,906
Horace Mann Educators Corp.
6.85% due 04/15/2016 210,000 177,692
Liberty Mutual Group, Inc.
6.50% due 03/15/2035 (f) 683,000 381,053
7.30% due 06/15/2014 (f) 380,000 298,442
7.50% due 08/15/2036 (f) 1,470,000 942,316
7.80% due 03/15/2037 (f) 455,000 222,950
Lincoln National Corp.
6.05% due 04/20/2067 (b) 495,000 277,200
7.00% due 05/17/2066 (b) 555,000 321,900
Markel Corp.
6.80% due 02/15/2013 325,000 319,889
Massachusetts Mutual Life Insurance Company
Copyright © 2012 www.secdatabase.com. All Rights Reserved.Please Consider the Environment Before Printing This Document

8.875% due 06/01/2039 440,000 462,768
Merna Reinsurance, Ltd., Series B
2.97% due 07/07/2010 (b)(f) 1,000,000 925,500
MetLife, Inc.
6.75% due 06/01/2016 360,000 366,335
Metropolitan Life Global Funding I
5.125% due 04/10/2013 (f) 405,000 399,809
Oil Casualty Insurance, Ltd.
8.00% due 09/15/2034 (f) 1,873,000 936,500
Progressive Corp.
6.70% due 06/15/2037 (b) 225,000 150,690
Prudential Financial, Inc.
4.75% due 04/01/2014 227,000 204,286
6.10% due 06/15/2017 1,100,000 1,067,936
Prudential Financial, Inc., MTN
5.15% due 01/15/2013 540,000 507,869
QBE Insurance Group, Ltd.
9.75% due 03/14/2014 301,000 329,896
StanCorp Financial Group, Inc.
6.90% due 06/01/2067 (b) 1,150,000 483,360
Symetra Financial Corp.
6.125% due 04/01/2016 (f) 350,000 263,088
8.30% due 10/15/2037 (b)(f) 310,000 111,600
Transatlantic Holdings, Inc.
5.75% due 12/14/2015 575,000 365,186
W.R. Berkley Corp.
5.125% due 09/30/2010 900,000 852,043
6.15% due 08/15/2019 14,000 10,649
White Mountains Re Group, Ltd.
7.506% due 05/29/2049 (b)(f) 1,540,000 862,862
XL Capital, Ltd.
5.25% due 09/15/2014 214,000 174,472
XL Capital, Ltd., Series E
6.50% due 12/31/2049 (b) 275,000 137,500
17,559,318
International Oil - 0.91%
ConocoPhillips Canada Funding Company
5.95% due 10/15/2036 1,000,000 929,988
Delek & Avner-Yam Tethys, Ltd.
5.326% due 08/01/2013 (f) 152,291 151,962
EnCana Corp.
6.50% due 08/15/2034 1,000,000 904,870
6.50% due 05/15/2019 230,000 236,311
The accompanying notes are an integral part of the financial statements.
8
JOHN HANCOCK FUNDS II
PORTFOLIO OF INVESTMENTS - May 31, 2009 (Unaudited) - continued(showing percentage of total net assets)
Active Bond Fund (continued)Shares or
Principal
Amount Value
CORPORATE BONDS (continued)
International Oil (continued)
Pemex Project Funding Master Trust
2.62% due 06/15/2010 (b)(f) $ 218,000 $ 215,820
Petro-Canada
6.05% due 05/15/2018 716,000 669,169
Copyright © 2012 www.secdatabase.com. All Rights Reserved.Please Consider the Environment Before Printing This Document

Ras Laffan Liquefied Natural Gas Company, Ltd.
3.437% due 09/15/2009 (f) 2,700 2,698
Ras Laffan Liquefied Natural Gas Company, Ltd. III
5.838% due 09/30/2027 (f) 330,000 302,448
Talisman Energy, Inc.
6.25% due 02/01/2038 1,150,000 954,489
Weatherford International, Ltd.
6.50% due 08/01/2036 600,000 459,200
4,826,955
Leisure Time - 1.09%
AMC Entertainment, Inc.
8.00% due 03/01/2014 495,000 445,500
8.75% due 06/01/2019 (f) 130,000 126,262
Ameristar Casinos, Inc.
9.25% due 06/01/2014 (f) 430,000 430,000
Cinemark, Inc.
9.75 due 03/15/2014 150,000 152,250
Fontainebleau Las Vegas
11.00% due 06/15/2015 ^ (f) 350,000 15,750
Greektown Holdings LLC
10.75% due 12/01/2013 ^ (f) 220,000 15,400
Jacobs Entertainment, Inc.
9.75% due 06/15/2014 385,000 288,750
Little Traverse Bay Bands of Odawa Indians
10.25% due 02/15/2014 (f) 460,000 198,950
Mashantucket Western Pequot Tribe
8.50% due 11/15/2015 (f) 85,000 33,150
MGM Mirage, Inc.
10.375% due 05/15/2014 (f) 90,000 92,700
Mohegan Tribal Gaming Authority
6.375% due 07/15/2009 208,000 202,800
8.00% due 04/01/2012 325,000 244,563
MTR Gaming Group, Inc., Series B
9.00% due 06/01/2012 185,000 114,700
9.75% due 04/01/2010 285,000 256,500
Seminole Indian Tribe of Florida
6.535% due 10/01/2020 (f) 405,000 311,963
Turning Stone Resort Casino
9.125% due 09/15/2014 (f) 370,000 303,400
Vivendi
5.75% due 04/04/2013 (f) 2,515,000 2,449,281
Waterford Gaming LLC
8.625% due 09/15/2014 (f) 207,000 134,550
5,816,469
Liquor - 0.07%
Anheuser-Busch Companies, Inc.
6.50% due 02/01/2043 10,000 8,637
Miller Brewing Company
5.50% due 08/15/2013 (f) 380,000 378,560
387,197
Manufacturing - 0.55%
Eaton Corp.
4.90% due 05/15/2013 450,000 451,624
Active Bond Fund (continued)Shares or
Principal
Amount Value
CORPORATE BONDS (continued)
Copyright © 2012 www.secdatabase.com. All Rights Reserved.Please Consider the Environment Before Printing This Document

Manufacturing (continued)
Ingersoll-Rand Global Holding Company, Ltd.
6.875% due 08/15/2018 $ 460,000 $ 449,398
Tyco Electronics Group SA
6.00% due 10/01/2012 410,000 400,746
6.55% due 10/01/2017 910,000 807,106
7.125% due 10/01/2037 501,000 359,162
Tyco International Finance SA
8.50% due 01/15/2019 400,000 441,522
2,909,558
Medical-Hospitals - 0.22%
Community Health Systems, Inc.
8.875% due 07/15/2015 285,000 281,794
HCA, Inc.
8.50% due 04/15/2019 (f) 440,000 430,100
Humana, Inc.
8.15% due 06/15/2038 590,000 449,972
1,161,866
Metal & Metal Products - 0.11%
Alcan, Inc.
5.00% due 06/01/2015 6,000 5,034
Blaze Recycling & Metals LLC
10.875% due 07/15/2012 (f) 210,000 94,500
CII Carbon LLC
11.125% due 11/15/2015 (f) 405,000 279,450
Commercial Metals Company
7.35% due 08/15/2018 270,000 227,978
606,962
Mining - 0.36%
Corporacion Nacional del Cobre
5.50% due 10/15/2013 (f) 209,000 220,254
Drummond Company, Inc.
7.375% due 02/15/2016 (f) 465,000 344,100
Rio Tinto Finance USA, Ltd.
8.95% due 05/01/2014 790,000 849,021
Teck Resources, Ltd.
10.75% due 05/15/2019 (f) 215,000 220,375
Vedanta Resources PLC
8.75% due 01/15/2014 (f) 315,000 305,550
1,939,300
Oil Comp-Integrated - 0.13%
Occidental Petroleum Corp.
7.00% due 11/01/2013 600,000 686,365
Oil Field Mach&Equip - 0.15%
BJ Services Company
6.00% due 06/01/2018 880,000 791,035
Paper - 0.24%
International Paper Company
7.95% due 06/15/2018 395,000 372,017
9.375% due 05/15/2019 425,000 427,802
Plum Creek Timberlands LP
5.875% due 11/15/2015 320,000 270,494
Verso Paper, Inc., Series B
9.125% due 08/01/2014 380,000 226,100
1,296,413
The accompanying notes are an integral part of the financial statements.
9
Copyright © 2012 www.secdatabase.com. All Rights Reserved.Please Consider the Environment Before Printing This Document

JOHN HANCOCK FUNDS II
PORTFOLIO OF INVESTMENTS - May 31, 2009 (Unaudited) - continued(showing percentage of total net assets)
Active Bond Fund (continued)Shares or
Principal
Amount Value
CORPORATE BONDS (continued)
Petroleum Services - 0.56%
Allis-Chalmers Energy, Inc.
8.50% due 03/01/2017 $ 210,000 $ 113,400
Anadarko Finance Company, Series B
7.50% due 05/01/2031 900,000 815,217
Anadarko Petroleum Corp.
6.45% due 09/15/2036 1,000,000 832,698
Enterprise Products Operating LP
7.034% due 01/15/2068 (b) 405,000 283,500
8.375 due 08/01/2066 (b) 700,000 532,000
McMoRan Exploration Company
11.875% due 11/15/2014 245,000 189,875
Valero Logistics Operations LP
6.05% due 03/15/2013 248,000 237,034
3,003,724
Pharmaceuticals - 0.99%
Allergan, Inc.
5.75% due 04/01/2016 400,000 383,986
AstraZeneca PLC
5.90% due 09/15/2017 485,000 517,757
Hospira, Inc.
5.90% due 06/15/2014 8,000 7,957
Hospira, Inc., GMTN
6.40% due 05/15/2015 180,000 182,944
Medco Health Solutions, Inc.
7.25% due 08/15/2013 1,380,000 1,402,160
Schering Plough Corp.
5.55% due 12/01/2013 218,000 231,977
6.00% due 09/15/2017 1,200,000 1,238,004
Teva Pharmaceutical Finance LLC
5.55% due 02/01/2016 170,000 172,755
6.15% due 02/01/2036 170,000 159,797
Wyeth
5.50% due 03/15/2013 900,000 959,029
5,256,366
Pipelines - 0.42%
Enbridge Energy Partners LP, Series B
7.50% due 04/15/2038 600,000 511,434
Plains All American Pipeline LP
6.50% due 05/01/2018 265,000 255,963
8.75% due 05/01/2019 500,000 553,400
Texas Gas Transmission LLC
5.50% due 04/01/2013 (f) 1,000,000 936,826
2,257,623
Railroads & Equipment - 0.55%
CSX Corp.
5.50% due 08/01/2013 580,000 582,089
Copyright © 2012 www.secdatabase.com. All Rights Reserved.Please Consider the Environment Before Printing This Document

6.25% due 04/01/2015 170,000 168,212
7.375% due 02/01/2019 727,000 752,497
Union Pacific Corp.
5.45% due 01/31/2013 650,000 660,499
5.70% due 08/15/2018 785,000 748,721
2,912,018
Real Estate - 2.95%
AvalonBay Communities, Inc.
5.50% due 01/15/2012 605,000 599,135
Active Bond Fund (continued)Shares or
Principal
Amount Value
CORPORATE BONDS (continued)
Real Estate (continued)
Boston Properties, Ltd.
6.25% due 01/15/2013 $ 215,000 $ 209,481
BRE Properties, Inc.
5.50% due 03/15/2017 430,000 342,944
Camden Property Trust
5.00% due 06/15/2015 216,000 183,257
Colonial Properties Trust
6.25% due 06/15/2014 211,000 173,818
Colonial Realty LP
5.50% due 10/01/2015 231,000 175,722
Developers Diversified Realty Corp.
4.625% due 08/01/2010 22,000 19,515
Duke Realty LP
5.95% due 02/15/2017 1,505,000 1,103,678
6.25% due 05/15/2013 1,000,000 850,919
ERP Operating LP
6.625% due 03/15/2012 748,000 756,034
Health Care Property Investors, Inc.
6.30% due 09/15/2016 1,000,000 855,558
Health Care Property Investors, Inc., MTN
4.875% due 09/15/2010 229,000 225,095
5.625% due 02/28/2013 520,000 466,994
Health Care, Inc.
6.00% due 11/15/2013 215,000 190,775
6.20% due 06/01/2016 680,000 562,826
Healthcare Realty Trust, Inc.
8.125% due 05/01/2011 360,000 353,815
Hospitality Properties Trust
6.75% due 02/15/2013 1,212,000 1,070,459
HRPT Properties Trust
6.65% due 01/15/2018 200,000 159,770
Kimco Realty Corp.
5.70% due 05/01/2017 1,190,000 944,204
Nationwide Health Properties, Inc.
6.50% due 07/15/2011 285,000 261,318
ProLogis
5.625% due 11/15/2015 375,000 290,110
5.625% due 11/15/2016 1,075,000 811,627
6.625% due 05/15/2018 480,000 375,218
Realty Income Corp.
5.95% due 09/15/2016 560,000 437,450
Rouse Company LP
3.625% due 03/15/2049 ^ 645,000 401,513
Simon Property Group LP
5.625% due 08/15/2014 935,000 880,806
5.875% due 03/01/2017 595,000 531,005
Simon Property Group LP, REIT
Copyright © 2012 www.secdatabase.com. All Rights Reserved.Please Consider the Environment Before Printing This Document

5.75% due 12/01/2015 530,000 490,869
10.35% due 04/01/2019 330,000 371,680
USB Realty Corp.
6.091% due 12/22/2049 (b)(f) 500,000 272,500
Westfield Group
5.40% due 10/01/2012 (f) 1,410,000 1,352,825
15,720,920
Retail - 0.63%
CVS Caremark Corp.
1.5613% due 06/01/2010 (b) 900,000 890,281
5.75% due 06/01/2017 360,000 359,542
The accompanying notes are an integral part of the financial statements.
10
JOHN HANCOCK FUNDS II
PORTFOLIO OF INVESTMENTS - May 31, 2009 (Unaudited) - continued(showing percentage of total net assets)
Active Bond Fund (continued)Shares or
Principal
Amount Value
CORPORATE BONDS (continued)
Retail (continued)
CVS Caremark Corp. (continued)
6.125% due 08/15/2016 $ 515,000 $ 528,600
6.302% due 06/01/2037 (b) 710,000 482,800
Home Depot, Inc.
5.875% due 12/16/2036 335,000 268,701
Macy's Retail Holdings, Inc.
8.875% due 07/15/2015 335,000 322,766
Staples, Inc.
9.75% due 01/15/2014 440,000 485,156
3,337,846
Retail Grocery - 0.19%
Kroger Company
6.40% due 08/15/2017 980,000 1,024,988
Retail Trade - 0.10%
Nordstrom, Inc.
6.75% due 06/01/2014 245,000 246,611
Sotheby's
7.75% due 06/15/2015 360,000 278,100
524,711
Software - 0.06%
Fiserv, Inc.
6.80% due 11/20/2017 330,000 319,301
Steel - 0.23%
Allegheny Technologies, Inc.
8.375% due 12/15/2011 270,000 286,880
9.375% due 06/01/2019 300,000 304,500
ArcelorMittal
9.85% due 06/01/2019 600,000 616,112
1,207,492
Telecommunications Equipment &
Copyright © 2012 www.secdatabase.com. All Rights Reserved.Please Consider the Environment Before Printing This Document
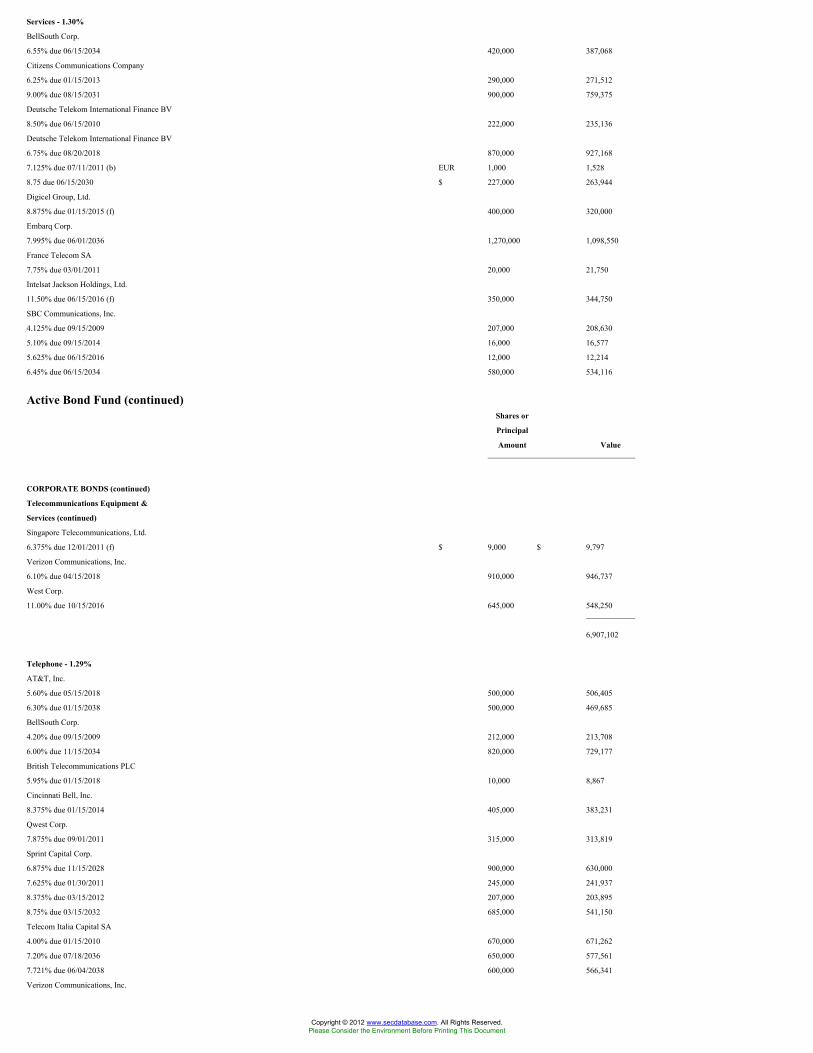
Services - 1.30%
BellSouth Corp.
6.55% due 06/15/2034 420,000 387,068
Citizens Communications Company
6.25% due 01/15/2013 290,000 271,512
9.00% due 08/15/2031 900,000 759,375
Deutsche Telekom International Finance BV
8.50% due 06/15/2010 222,000 235,136
Deutsche Telekom International Finance BV
6.75% due 08/20/2018 870,000 927,168
7.125% due 07/11/2011 (b) EUR 1,000 1,528
8.75 due 06/15/2030 $ 227,000 263,944
Digicel Group, Ltd.
8.875% due 01/15/2015 (f) 400,000 320,000
Embarq Corp.
7.995% due 06/01/2036 1,270,000 1,098,550
France Telecom SA
7.75% due 03/01/2011 20,000 21,750
Intelsat Jackson Holdings, Ltd.
11.50% due 06/15/2016 (f) 350,000 344,750
SBC Communications, Inc.
4.125% due 09/15/2009 207,000 208,630
5.10% due 09/15/2014 16,000 16,577
5.625% due 06/15/2016 12,000 12,214
6.45% due 06/15/2034 580,000 534,116
Active Bond Fund (continued)Shares or
Principal
Amount Value
CORPORATE BONDS (continued)
Telecommunications Equipment &
Services (continued)
Singapore Telecommunications, Ltd.
6.375% due 12/01/2011 (f) $ 9,000 $ 9,797
Verizon Communications, Inc.
6.10% due 04/15/2018 910,000 946,737
West Corp.
11.00% due 10/15/2016 645,000 548,250
6,907,102
Telephone - 1.29%
AT&T, Inc.
5.60% due 05/15/2018 500,000 506,405
6.30% due 01/15/2038 500,000 469,685
BellSouth Corp.
4.20% due 09/15/2009 212,000 213,708
6.00% due 11/15/2034 820,000 729,177
British Telecommunications PLC
5.95% due 01/15/2018 10,000 8,867
Cincinnati Bell, Inc.
8.375% due 01/15/2014 405,000 383,231
Qwest Corp.
7.875% due 09/01/2011 315,000 313,819
Sprint Capital Corp.
6.875% due 11/15/2028 900,000 630,000
7.625% due 01/30/2011 245,000 241,937
8.375% due 03/15/2012 207,000 203,895
8.75% due 03/15/2032 685,000 541,150
Telecom Italia Capital SA
4.00% due 01/15/2010 670,000 671,262
7.20% due 07/18/2036 650,000 577,561
7.721% due 06/04/2038 600,000 566,341
Verizon Communications, Inc.
Copyright © 2012 www.secdatabase.com. All Rights Reserved.Please Consider the Environment Before Printing This Document

6.90% due 04/15/2038 770,000 783,321
Verizon of New York, Inc., Series A
6.875% due 04/01/2012 15,000 15,761
6,856,120
Tobacco - 0.45%
Alliance One International, Inc.
8.50% due 05/15/2012 190,000 176,700
Altria Group, Inc.
8.50% due 11/10/2013 840,000 944,981
Philip Morris International, Inc.
4.875% due 05/16/2013 300,000 314,733
5.65% due 05/16/2018 620,000 634,404
Reynolds American, Inc.
7.25% due 06/01/2013 350,000 350,596
2,421,414
Toys, Amusements & Sporting Goods - 0.07%
Hasbro, Inc.
6.125% due 05/15/2014 375,000 377,760
Transportation - 0.39%
Canadian Pacific Railway Company
5.75% due 05/15/2013 570,000 575,700
CMA CGM SA
7.25% due 02/01/2013 (f) 455,000 209,300
FedEx Corp.
7.375% due 01/15/2014 375,000 406,468
The accompanying notes are an integral part of the financial statements.
11
JOHN HANCOCK FUNDS II
PORTFOLIO OF INVESTMENTS - May 31, 2009 (Unaudited) - continued(showing percentage of total net assets)
Active Bond Fund (continued)Shares or
Principal
Amount Value
CORPORATE BONDS (continued)
Transportation (continued)
GATX Corp.
8.75% due 05/15/2014 $ 610,000 $ 613,941
Navios Maritime Holdings, Inc.
9.50% due 12/15/2014 385,000 294,525
2,099,934
Utility Service - 0.30%
Public Service Company of New Mexico
7.95% due 05/15/2018 1,000,000 998,860
Veolia Environnement
6.00% due 06/01/2018 600,000 586,976
1,585,836
Water Treatment Systems - 0.11%
American Water Capital Corp.
6.085% due 10/15/2017 600,000 570,342
TOTAL CORPORATE BONDS (Cost $285,037,565) $ 262,357,807
Copyright © 2012 www.secdatabase.com. All Rights Reserved.Please Consider the Environment Before Printing This Document

MUNICIPAL BONDS - 0.42%
California - 0.10%
State of California
5.65% due 04/01/2039 525,000 537,023
District of Columbia - 0.21%
George Washington University, DC, Series B
5.095% due 09/15/2032 1,175,000 1,117,648
New Jersey - 0.11%
New Jersey State Turnpike Authority
7.414% due 01/01/2040 540,000 597,413
TOTAL MUNICIPAL BONDS (Cost $2,294,940) $ 2,252,084
COLLATERALIZED MORTGAGE
OBLIGATIONS - 13.50%
American Home Mortgage Assets, Series 2006-6,
Class A1A
0.4988% due 12/25/2046 (b) 497,047 192,377
American Home Mortgage Assets, Series 2006-6,
Class XP
3.0845% IO due 12/25/2046 8,659,476 211,075
American Home Mortgage Assets, Series 2007-5,
Class XP
3.9277% IO due 06/25/2047 3,371,189 147,489
American Home Mortgage Investment Trust,
Series 2004-4, Class 5A
4.44% due 02/25/2045 615,637 459,792
American Home Mortgage Investment Trust,
Series 2007-1, Class GIOP
2.0784% IO due 05/25/2047 6,227,634 276,351
American Tower Trust, Series 2007-1A, Class D
5.9568% due 04/15/2037 (f) 535,000 441,375
Banc of America Commercial Mortgage Inc, Series
2006-3, Class AM
5.8126% due 07/10/2044 (b) 1,855,000 837,663
Banc of America Commercial Mortgage, Inc.,
Series 2004-4, Class A3
4.128% due 07/10/2042 28,970 28,725
Banc of America Commercial Mortgage, Inc.,
Series 2005-2, Class AJ
4.953% due 07/10/2042 (b) 50,846 26,322
Active Bond Fund (continued)Shares or
Principal
Amount Value
COLLATERALIZED MORTGAGE
OBLIGATIONS (continued)
Banc of America Commercial Mortgage, Inc.,
Series 2005-6, Class A4
5.1793% due 09/10/2047 (b) $ 470,000 $ 415,825
Banc of America Commercial Mortgage, Inc.,
Series 2006-1, Class AM
5.421% due 09/10/2045 (b) 1,600,000 842,090
Banc of America Commercial Mortgage, Inc.,
Series 2006-2, Class A3
5.7111% due 05/10/2045 (b) 970,000 841,943
Banc of America Commercial Mortgage, Inc.,
Series 2006-3, Class A4
5.889% due 07/10/2044 (b) 995,000 764,289
Banc of America Commercial Mortgage, Inc.,
Series 2006-4, Class A3A
5.60% due 08/10/2013 750,000 640,285
Banc of America Funding Corp., Series 2006-B,
Class 6A1
5.8808% due 03/20/2036 (b) 422,121 281,812
Copyright © 2012 www.secdatabase.com. All Rights Reserved.Please Consider the Environment Before Printing This Document

Banc of America Funding Corp., Series 2007-E,
Class 4A1
5.811% due 09/20/2037 (b) 349,540 193,884
Banc of America Large Loan,
Series 2005-MIB1, Class B
0.6044% due 03/15/2022 (b)(f) 895,000 685,928
Banc of America Large Loan, Series 2006-BIX1,
Class C
0.5244% due 10/15/2019 (b)(f) 1,000,000 663,878
Bank of America Commercial Mortgage, Inc.,
Series 2005-5, Class XC
0.0662% IO due 10/10/2045 (f) 81,484,172 241,519
Bank of America Commercial Mortgage, Inc.,
Series 2001-3, Class A1
4.89% due 04/11/2037 14,561 14,578
Bear Stearns Alt-A Trust, Series 2005-3, Class B2
5.2489% due 04/25/2035 (b) 179,356 30,035
Bear Stearns Asset Backed Securities, Inc.,
Series 2003-AC4, Class A
5.00% due 09/25/2033 8,774 5,251
Bear Stearns Commercial Mortgage Securities, Inc.
4.997% due 06/11/2041 (f) 665,000 217,389
Bear Stearns Commercial Mortgage Securities,
Inc., Series 2004-PWR6, Class X1
0.2348% IO due 11/11/2041 57,184,955 625,426
Bear Stearns Commercial Mortgage Securities,
Series 2005-PWR8, Class X1
0.1564% IO due 06/11/2041 66,738,930 759,202
Bear Stearns Commercial Mortgage Securities,
Inc., Series 2004-PWR5, Class X1
0.3418% IO due 07/11/2042 445,289 5,644
Bear Stearns Commercial Mortgage Securities,
Inc., Series 2004-T16, Class X1
0.2176% IO due 08/13/2046 547,111 6,682
Bear Stearns Commercial Mortgage Securities,
Inc., Series 2005-PWR8, Class AJ
4.75% due 06/11/2041 47,292 23,870
Bear Stearns Commercial Mortgage Securities,
Inc., Series 2006-BBA7, Class G
0.7844% due 03/15/2019 (f) 700,000 327,300
Bear Stearns Commercial Mortgage Securities,
Inc., Series 2006-PW14, Class D
5.412% due 12/11/2038 (f) 400,000 77,622
The accompanying notes are an integral part of the financial statements.
12
JOHN HANCOCK FUNDS II
PORTFOLIO OF INVESTMENTS - May 31, 2009 (Unaudited) - continued(showing percentage of total net assets)
Active Bond Fund (continued)Shares or
Principal
Amount Value
COLLATERALIZED MORTGAGE
OBLIGATIONS (continued)
Bear Stearns Commercial Mortgage Securities,
Inc., Series 2006-T24, Class AY
0.4244% IO due 10/12/2041 $ 28,875,170 $ 406,398
Bear Stearns Mortgage Funding Trust, Series
2006-AR1, Class 2A1
0.5288% due 08/25/2036 (b) 401,688 146,257
Copyright © 2012 www.secdatabase.com. All Rights Reserved.Please Consider the Environment Before Printing This Document

Bear Stearns Mortgage Funding Trust,
Series 2006-AR4, Class A1
0.5188% due 12/25/2036 (b) 1,891,264 762,076
Chase Commercial Mortgage Securities Corp.,
Series 2000-2, Class C
7.928% due 07/15/2032 29,619 29,559
Chaseflex Trust, Series 2005-2, Class 4A1
5.00% due 06/25/2035 223,764 197,822
Citigroup Commercial Mortgage Trust,
Series 2006-C4, Class A3
5.7258% due 03/15/2049 (b) 700,000 587,198
Citigroup Mortgage Loan Trust, Inc.,
Series 2005-10, Class 1A5A
5.8273% due 12/25/2035 (b) 340,711 215,047
Citigroup Mortgage Loan Trust, Inc., Series 2005-5,
Class 2A3
5.00% due 08/25/2035 199,504 166,399
Citigroup/Deutsche Bank Commercial Mortgage
Trust, Series 2005-CD1, Class C
5.2251% due 09/15/2020 (b) 190,000 86,397
Citigroup/Deutsche Bank Commercial
Mortgage Trust, Series 2005-CD1, Class A4
5.2251% due 09/15/2020 (b) 360,000 317,835
Citigroup/Deutsche Bank Commercial Mortgage,
Series 2006-CD2, Class AM
5.4094% due 01/15/2046 (b) 1,000,000 526,211
Commercial Mortgage Pass Through Certificates,
Series 2003-LB1A, Class A2
4.084% due 06/10/2038 424,859 401,578
Commercial Mortgage Pass Through Certificates,
Series 2005-C6, Class B
5.2171% due 06/10/2044 (b) 49,365 10,353
Commercial Mortgage Pass Through Certificates,
Series 2005-FL11, Class AJ
0.5444% due 11/15/2017 (b)(f) 478,649 411,347
Countrywide Alternative Loan Trust, Series
2007-25, Class 1A2
6.50% due 11/25/2037 1,178,114 724,908
Countrywide Alternative Loan Trust, Series
2006-OA3, Class X
2.9107% IO due 05/25/2036 2,553,698 84,990
Countrywide Alternative Loan Trust,
Series 2005-59, Class 2X
3.352% IO due 11/20/2035 3,337,688 95,437
Countrywide Alternative Loan Trust,
Series 2006-11CB, Class 3A1
6.50% due 05/25/2036 531,790 261,931
Countrywide Alternative Loan Trust,
Series 2006-OA12, Class X
3.7768% IO due 09/20/2046 21,848,673 669,116
Countrywide Home Loan Mortgage Pass Through
Trust, Series 2004-HYB2, Class 4A
3.0433% due 07/20/2034 (b) 1,200,415 1,069,875
Active Bond Fund (continued)Shares or
Principal
Amount Value
COLLATERALIZED MORTGAGE
OBLIGATIONS (continued)
Credit Suisse Mortgage Capital Certificates,
Series 2006-TFLA, Class B
0.5744% due 04/15/2021 (b)(f) $ 870,000 $ 567,601
Crown Castle Towers LLC, Series 2006-1A, Class F
6.6496% due 11/15/2036 (f) 1,760,000 1,654,400
Copyright © 2012 www.secdatabase.com. All Rights Reserved.Please Consider the Environment Before Printing This Document

Crown Castle Towers LLC, Series 2006-1A, Class G
6.7954% due 11/15/2036 (f) 1,225,000 1,151,500
Crown Castle Towers LLC, Series 2005-1A, Class D
5.612% due 06/15/2035 (f) 531,000 515,070
Crown Castle Towers LLC, Series 2006-1A, Class E
6.0652% due 11/15/2036 (f) 550,000 517,000
CS First Boston Mortgage Securities Corp, Series
2005-C1, Class A3
4.813% due 02/15/2038 670,000 620,677
CS First Boston Mortgage Securities Corp.,
Series 2001-CKN5, Class A4
5.435% due 09/15/2034 259,692 259,998
CS First Boston Mortgage Securities Corp.,
Series 2001-CP4, Class A4
6.18% due 12/15/2035 307,055 308,710
CS First Boston Mortgage Securities Corp.,
Series 2002-CKN2, Class A3
6.133% due 04/15/2037 144,746 143,506
CS First Boston Mortgage Securities Corp.,
Series 2004-C4, Class A4
4.283% due 10/15/2039 160,860 154,349
CS First Boston Mortgage Securities Corp.,
Series 2005-C1, Class AX
0.1999% IO due 02/15/2038 (f) 94,368,488 641,149
CS First Boston Mortgage Securities Corp.,
Series 2005-C2, Class B
5.016% due 04/15/2037 58,053 27,487
DB Master Finance LLC, Series 2006-1, Class-A2
5.779% due 06/20/2031 (f) 3,045,000 2,209,087
DB Master Finance LLC, Series 2006-1, Class-M1
8.285% due 06/20/2031 (f) 125,000 81,842
DSLA Mortgage Loan Trust, Series 2005-AR5,
Class X2
3.4275% IO due 08/19/2045 5,736,941 100,396
Federal Home Loan Mortgage Corp.,
Series 2005-3019, Class MD
4.75% due 01/15/2031 371,195 381,033
Federal Home Loan Mortgage Corp.,
Series T-41, Class 3A
7.50% due 07/25/2032 3,267 3,270
Federal National Mortgage Association,
Series 2002-W3, Class A5
7.50% due 11/25/2041 34,688 34,847
Federal National Mortgage Association,
Series 2003-18, Class EX
4.00% due 06/25/2017 1,038,728 1,064,991
First Horizon Alternative Mortgage Securities,
Series 2006-RE1, Class A1
5.50% due 05/25/2035 750,198 437,811
First Horizon Alternative Mortgage Securities,
Series 2004-AA2, Class 2A1
4.9971% due 08/25/2034 (b) 1,451,276 1,018,736
First Horizon Alternative Mortgage Securities,
Series 2004-AA5, Class B1
5.2124% due 12/25/2034 (b) 126,053 15,722
The accompanying notes are an integral part of the financial statements.
13
JOHN HANCOCK FUNDS II
PORTFOLIO OF INVESTMENTS - May 31, 2009 (Unaudited) - continued(showing percentage of total net assets)
Active Bond Fund (continued)Shares or
Copyright © 2012 www.secdatabase.com. All Rights Reserved.Please Consider the Environment Before Printing This Document

Principal
Amount Value
COLLATERALIZED MORTGAGE
OBLIGATIONS (continued)
First Union National Bank Commercial Mortgage
Trust, Series 2002-C1, Class A1
5.585% due 02/12/2034 $ 74,724 $ 75,107
GE Capital Commercial Mortgage Corp.,
Series 2001-3, Class A2
6.07% due 06/10/2038 22,214 22,678
GE Capital Commercial Mortgage Corp.,
Series 2002-2A, Class A3
5.349% due 08/11/2036 164,809 160,610
GE Capital Commercial Mortgage Corp.,
Series 2005-C1, Class XC
0.1806% IO due 06/10/2048 (f) 1,666,022 14,048
GE Capital Commercial Mortgage Corp.,
Series 2005-C2, Class C
5.133% due 05/10/2043 (b) 43,737 20,562
Global Signal Trust, Series 2004-2A, Class D
5.093% due 12/15/2014 (f) 295,000 292,050
Global Tower Partners Acquisition Partners LLC,
Series 2007-1A, Class F
7.0496% due 05/15/2037 (f) 135,000 105,798
GMAC Commercial Mortgage Securities Inc, Series
2004-C2, Class A2
4.76% due 08/10/2038 910,000 897,502
GMAC Commercial Mortgage Securities, Inc.,
Series 2003-C2, Class B
5.501% due 05/10/2040 (b) 1,370,000 1,152,350
GMAC Mortgage Corp. Loan Trust,
Series 2006-AR1, Class 2A1
5.6319% due 04/19/2036 (b) 254,303 187,397
Greenpoint Mortgage Funding Trust, Series
2005-AR1, Class A3
0.5888% due 06/25/2045 (b) 123,966 31,799
Greenpoint Mortgage Funding Trust, Series
2005-AR4, Class 4A2
0.6687% due 10/25/2045 (b) 542,721 171,795
Greenpoint Mortgage Funding Trust, Series
2006-AR1, Class A2A
0.6787% due 02/25/2036 (b) 873,186 314,009
Greenwich Capital Commercial Funding Corp.,
Series 2005-GG3, Class XC
0.3574% IO due 08/10/2042 (f) 63,807,668 827,471
Greenwich Capital Commercial Funding Corp.,
Series 2007-GG9, Class C
5.554% due 02/10/2017 315,000 82,666
Greenwich Capital Commercial Funding Corp.,
Series 2007-GG9, Class F
5.633% due 02/10/2017 170,000 24,247
Greenwich Capital Commercial Funding Corp.,
Series 2002-C1, Class A2
4.112% due 01/11/2017 178,636 176,975
GS Mortgage Securities Corp II, Series
2007-GG10, Class A4
5.9932% due 08/10/2045 (b) 1,100,000 841,211
GS Mortgage Securities Corp. II, Series 2004-GG2,
Class E
5.5892% due 08/10/2038 (b) 800,000 317,939
GS Mortgage Securities Corp. II, Series 2005-GG4,
Class XC
0.21% IO due 07/10/2039 (f) 2,026,177 27,613
Active Bond Fund (continued)
Copyright © 2012 www.secdatabase.com. All Rights Reserved.Please Consider the Environment Before Printing This Document

Shares or
Principal
Amount Value
COLLATERALIZED MORTGAGE
OBLIGATIONS (continued)
GS Mortgage Securities Corp. II, Series 2006-GG6,
Class AM
5.622% due 04/10/2038 $ 1,350,000 $ 782,526
GSR Mortgage Loan Trust, Series 2004-14,
Class 3A2
5.2426% due 12/25/2034 (b) 367,977 242,991
GSR Mortgage Loan Trust, Series 2004-9, Class B1
4.5861% due 08/25/2034 (b) 282,130 82,340
GSR Mortgage Loan Trust, Series 2006-AR1,
Class 3A1
5.3527% due 01/25/2036 (b) 677,641 448,078
Harborview Mortgage Loan Trust, Series 2005-16,
Class 2A1B
0.6581% due 01/19/2036 (b) 314,417 92,603
Harborview Mortgage Loan Trust, Series 2005-16,
Class X3
3.3489% IO due 01/19/2036 (b) 16,277,814 427,293
Harborview Mortgage Loan Trust,
Series 2005-8, Class 1X
3.2005% IO due 09/19/2035 4,708,395 47,084
Harborview Mortgage Loan Trust,
Series 2006-SB1, Class A1A
2.289% due 12/19/2036 (b) 643,988 226,163
Harborview Mortgage Loan Trust,
Series 2007-3, Class ES
0.35% due 05/19/2047 14,041,763 65,821
Harborview Mortgage Loan Trust,
Series 2007-4, Class ES
0.35% due 07/19/2047 14,485,561 72,428
Harborview Mortgage Loan Trust,
Series 2007-6, Class ES
0.3425% due 08/19/2037 (f) 10,333,337 48,437
IndyMac Index Mortgage Loan Trust,
Series 2004-AR13, Class B1
5.2962% due 01/25/2035 184,119 37,088
IndyMac Index Mortgage Loan Trust,
Series 2005-AR18, Class 1X
3.2335% IO due 10/25/2036 10,630,815 159,462
IndyMac Index Mortgage Loan Trust,
Series 2005-AR18, Class 2X
2.9696% IO due 10/25/2036 14,134,021 168,195
IndyMac Index Mortgage Loan Trust,
Series 2005-AR5, Class B1
4.5733% due 05/25/2035 (b) 296,510 16,377
JPMorgan Chase Commercial Mortgage Securities
Corp, Series 2005-CB11, Class A3
5.197% due 08/12/2037 1,175,000 1,080,782
JPMorgan Chase Commercial Mortgage Securities
Corp, Series 2007-LDPX, Class A2S
5.305% due 01/15/2049 670,000 606,225
JPMorgan Chase Commercial Mortgage Securities
Corp., Series 2005-LDP5, Class G
5.3342% due 12/15/2044 (b) 600,000 188,996
JPMorgan Chase Commercial Mortgage Securities
Corp., Series 2005-LDP5, Class A4
5.1792% due 12/15/2044 (b) 2,025,000 1,786,999
JPMorgan Chase Commercial Mortgage Securities
Corp., Series 2002-C1, Class A3
5.376% due 07/12/2037 421,734 410,631
Copyright © 2012 www.secdatabase.com. All Rights Reserved.Please Consider the Environment Before Printing This Document
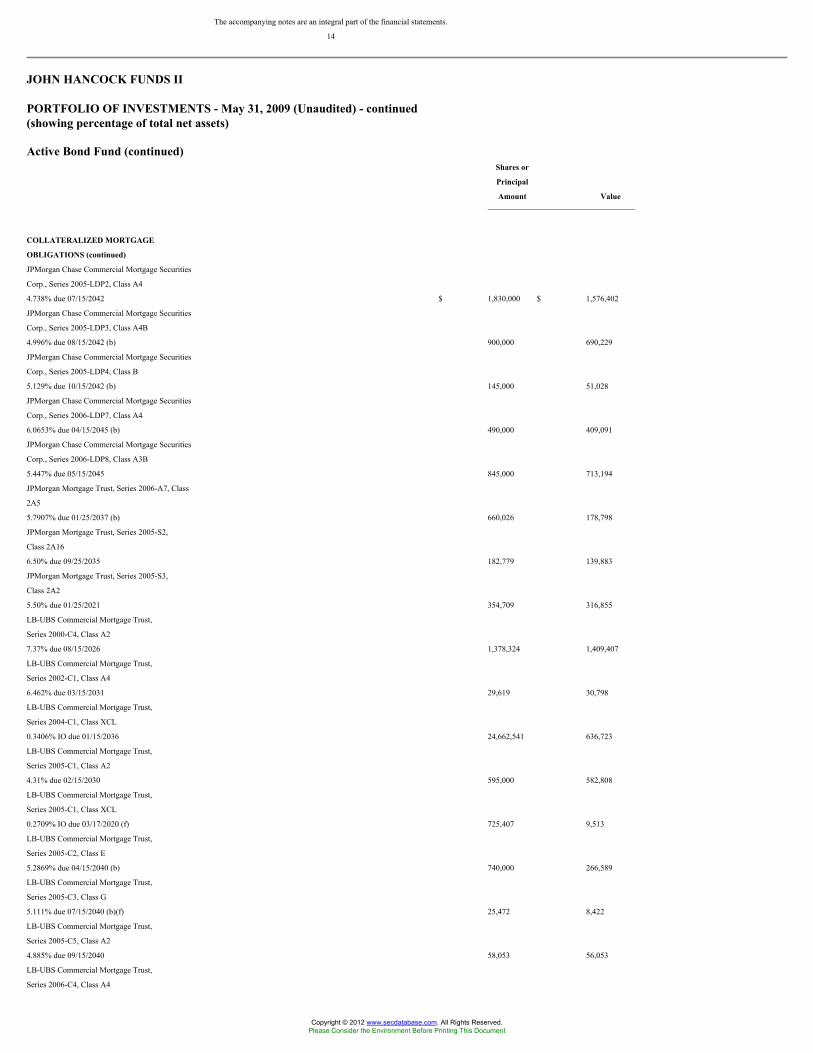
The accompanying notes are an integral part of the financial statements.
14
JOHN HANCOCK FUNDS II
PORTFOLIO OF INVESTMENTS - May 31, 2009 (Unaudited) - continued(showing percentage of total net assets)
Active Bond Fund (continued)Shares or
Principal
Amount Value
COLLATERALIZED MORTGAGE
OBLIGATIONS (continued)
JPMorgan Chase Commercial Mortgage Securities
Corp., Series 2005-LDP2, Class A4
4.738% due 07/15/2042 $ 1,830,000 $ 1,576,402
JPMorgan Chase Commercial Mortgage Securities
Corp., Series 2005-LDP3, Class A4B
4.996% due 08/15/2042 (b) 900,000 690,229
JPMorgan Chase Commercial Mortgage Securities
Corp., Series 2005-LDP4, Class B
5.129% due 10/15/2042 (b) 145,000 51,028
JPMorgan Chase Commercial Mortgage Securities
Corp., Series 2006-LDP7, Class A4
6.0653% due 04/15/2045 (b) 490,000 409,091
JPMorgan Chase Commercial Mortgage Securities
Corp., Series 2006-LDP8, Class A3B
5.447% due 05/15/2045 845,000 713,194
JPMorgan Mortgage Trust, Series 2006-A7, Class
2A5
5.7907% due 01/25/2037 (b) 660,026 178,798
JPMorgan Mortgage Trust, Series 2005-S2,
Class 2A16
6.50% due 09/25/2035 182,779 139,883
JPMorgan Mortgage Trust, Series 2005-S3,
Class 2A2
5.50% due 01/25/2021 354,709 316,855
LB-UBS Commercial Mortgage Trust,
Series 2000-C4, Class A2
7.37% due 08/15/2026 1,378,324 1,409,407
LB-UBS Commercial Mortgage Trust,
Series 2002-C1, Class A4
6.462% due 03/15/2031 29,619 30,798
LB-UBS Commercial Mortgage Trust,
Series 2004-C1, Class XCL
0.3406% IO due 01/15/2036 24,662,541 636,723
LB-UBS Commercial Mortgage Trust,
Series 2005-C1, Class A2
4.31% due 02/15/2030 595,000 582,808
LB-UBS Commercial Mortgage Trust,
Series 2005-C1, Class XCL
0.2709% IO due 03/17/2020 (f) 725,407 9,513
LB-UBS Commercial Mortgage Trust,
Series 2005-C2, Class E
5.2869% due 04/15/2040 (b) 740,000 266,589
LB-UBS Commercial Mortgage Trust,
Series 2005-C3, Class G
5.111% due 07/15/2040 (b)(f) 25,472 8,422
LB-UBS Commercial Mortgage Trust,
Series 2005-C5, Class A2
4.885% due 09/15/2040 58,053 56,053
LB-UBS Commercial Mortgage Trust,
Series 2006-C4, Class A4
Copyright © 2012 www.secdatabase.com. All Rights Reserved.Please Consider the Environment Before Printing This Document

5.8823% due 06/15/2038 (b) 575,000 483,523
Lehman XS Trust, Series 2007-10H, Class 2A2
7.50% due 07/25/2037 1,794,411 1,159,690
Mastr Adjustable Rate Mortgages Trust,
Series 2004-13, Class 2A1
4.3747% due 04/21/2034 (b) 1,096,499 965,685
Mastr Adjustable Rate Mortgages Trust,
Series 2004-8, Class 5A1
4.5272% due 08/25/2034 (b) 677,374 446,477
Active Bond Fund (continued)Shares or
Principal
Amount Value
COLLATERALIZED MORTGAGE
OBLIGATIONS (continued)
Mastr Adjustable Rate Mortgages Trust,
Series 2005-2, Class 2A1
4.7491% due 03/25/2035 (b) $ 1,151,287 $ 613,963
Mastr Adjustable Rate Mortgages Trust,
Series 2006-2, Class 4A1
4.9834% due 02/25/2036 (b) 547,397 421,903
Merrill Lynch Mortgage Trust, Series 2008-C1,
Class A4
5.69% due 02/12/2051 1,080,000 736,703
Merrill Lynch Mortgage Trust, Series 2008-C1,
Class X
0.564% IO due 02/14/2051 (f) 33,147,215 603,866
Merrill Lynch Mortgage Trust,
Series 2004-KEY2, Class A4
4.864% due 08/12/2039 (b) 31,988 27,345
Merrill Lynch Mortgage Trust, Series 2005-CIP1,
Class XC
0.0666% IO due 08/12/2020 (f) 217,206,868 837,528
Merrill Lynch Mortgage Trust, Series 2005-CKI1,
Class A6
5.2421% due 11/12/2037 (b) 435,000 385,090
Merrill Lynch Mortgage Trust,
Series 2005-CKI1, Class A1
5.077% due 11/12/2037 316,928 316,709
Merrill Lynch Mortgage Trust, Series 2006-C1,
Class AM
5.6566% due 05/12/2039 (b) 1,000,000 488,370
Merrill Lynch Mortgage Trust, Series 2006-C2,
Class X
0.3625% IO due 08/12/2026 20,969,487 303,898
Merrill Lynch/Countrywide Commercial Mortgage
Trust, Series 2006-2, Class A4
5.9093% due 06/12/2046 (b) 785,000 675,521
MLCC Mortgage Investors, Inc., Series 2007-3,
Class M1
5.9304% due 09/25/2037 (b) 289,944 69,024
MLCC Mortgage Investors, Inc., Series 2007-3,
Class M2
5.9304% due 09/25/2037 (b) 109,979 8,392
MLCC Mortgage Investors, Inc., Series 2007-3,
Class M3
5.9304% due 09/25/2037 (b) 69,987 3,913
Morgan Stanley Capital I, Series 2007-T27, Class A4
5.6497% due 06/11/2042 (b) 275,000 229,684
Morgan Stanley Capital I, Series 2004-T13, Class A2
3.94% due 09/13/2045 11,184 10,995
Morgan Stanley Capital I, Series 2005-HQ6,
Class A2A
4.882% due 08/13/2042 1,595,000 1,555,639
Copyright © 2012 www.secdatabase.com. All Rights Reserved.Please Consider the Environment Before Printing This Document

Morgan Stanley Capital I, Series 2005-HQ7,
Class A2
5.2076% due 11/14/2042 (b) 415,000 383,632
Morgan Stanley Capital I, Series 2005-HQ7,
Class A4
5.2076% due 11/14/2042 (b) 415,000 372,552
Morgan Stanley Capital I, Series 2005-HQ7,
Class AJ
5.2076% due 11/14/2042 (b) 1,500,000 761,408
Morgan Stanley Capital I, Series 2005-IQ10,
Class A4A
5.23% due 09/15/2042 (b) 555,000 501,312
The accompanying notes are an integral part of the financial statements.
15
JOHN HANCOCK FUNDS II
PORTFOLIO OF INVESTMENTS - May 31, 2009 (Unaudited) - continued(showing percentage of total net assets)
Active Bond Fund (continued)Shares or
Principal
Amount Value
COLLATERALIZED MORTGAGE
OBLIGATIONS (continued)
Morgan Stanley Capital I, Series 2005-IQ9, Class X1
0.2423% IO due 07/15/2056 (f) $ 665,891 $ 12,113
Morgan Stanley Capital I, Series 2005-T17, Class X1
0.1774% IO due 12/31/2041 (f) 1,442,128 14,328
Morgan Stanley Capital I, Series 2006-IQ11,
Class AJ
5.7748% due 10/15/2042 (b) 4,300,000 1,464,675
Morgan Stanley Capital I, Series 2006-IQ12, Class E
5.538% due 12/15/2043 (b) 390,000 74,073
Morgan Stanley Capital I, Series 2007-SRR3,
Class A
0.6162% due 12/20/2049 (b)(f) 1,000,000 80,000
Morgan Stanley Capital I, Series 2007-SRR3,
Class B
0.7163% due 12/20/2049 (b)(f) 1,000,000 50,000
Provident Funding Mortgage Loan Trust,
Series 2005-1, Class B1
4.4247% due 05/25/2035 (b) 308,965 59,474
Residential Accredit Loans, Inc., Series 2005-QO4,
Class XIO
3.3912% IO due 12/25/2045 (b) 13,000,526 325,013
Residential Accredit Loans, Inc., Series
2007-QS10, Class A1
6.50% due 09/25/2037 715,965 404,744
Residential Accredit Loans, Inc.,
Series 2005-QA12, Class NB5
5.9521% due 12/25/2035 (b) 445,150 216,584
Residential Accredit Loans, Inc.,
Series 2007-QS11, Class A1
7.00% due 10/25/2037 599,291 319,216
Residential Asset Securitization Trust,
Series 2006-A7CB, Class 2A1
6.50% due 07/25/2036 532,431 300,990
Salomon Brothers Mortgage Securities VII,
Series 2000-C3, Class A2
6.592% due 12/18/2033 122,506 124,235
Salomon Brothers Mortgage Securities VII,
Copyright © 2012 www.secdatabase.com. All Rights Reserved.Please Consider the Environment Before Printing This Document

Series 2001-C1, Class A3
6.428% due 12/18/2035 22,706 23,177
SBA CMBS Trust, Series 2006-1A, Class H
7.389% due 11/15/2036 (f) 980,000 862,400
SBA CMBS Trust, Series 2006-1A, Class J
7.825% due 11/15/2036 (f) 135,000 118,800
SBA CMBS Trust, Series 2005-1A, Class C
5.731% due 11/15/2035 (f) 797,000 769,105
SBA CMBS Trust, Series 2005-1A, Class D
6.219% due 11/15/2035 (f) 100,000 96,000
SBA CMBS Trust, Series 2005-1A, Class E
6.706% due 11/15/2035 (f) 110,000 105,600
Sequoia Mortgage Trust, Series 2005-3, Class A1
0.5163% due 04/15/2032 (b) 4,992 3,110
Structured Asset Securities Corp.,
Series 2003-6A, Class B1
4.9407% due 03/25/2033 (b) 504,760 145,965
Suntrust Adjustable Rate Mortgage Loan Trust,
Series 2007-2, Class 4A1
5.7309% due 04/25/2037 (b) 1,533,098 910,672
Timberstar Trust, Series 2006-1A, Class A
5.668% due 10/15/2036 (f) 900,000 720,000
Active Bond Fund (continued)Shares or
Principal
Amount Value
COLLATERALIZED MORTGAGE
OBLIGATIONS (continued)
Wachovia Bank Commercial Mortgage Trust,
Series 2005-C22, Class E
5.355% due 12/15/2044 (b) $ 915,000 $ 302,340
Wachovia Bank Commercial Mortgage Trust,
Series 2005-C17, Class XC
0.1116% IO due 03/15/2042 (f) 76,361,253 405,341
Wachovia Bank Commercial Mortgage Trust,
Series 2005-C19, Class AJ
4.793% due 05/15/2044 37,517 18,952
WAMU Commercial Mortgage Securities Trust,
Series 2007-SL3, Class A
6.1161% due 03/23/2045 (f) 548,258 536,008
WAMU Commercial Mortgage Securities Trust,
Series 2006-SL1, Class A
5.42% due 11/23/2043 (f) 840,006 466,287
WAMU Mortgage Pass Through Certificates, Series
2005-AR13, Class X
2.5161% IO due 10/25/2045 33,634,559 462,475
WAMU Mortgage Pass Through Certificates, Series
2005-AR19, Class A1B3
0.6587% due 12/25/2045 (b) 220,178 58,825
WAMU Mortgage Pass Through Certificates, Series
2006-AR4, Class 1A1B
2.3792% due 05/25/2046 (b) 548,268 93,206
WAMU Mortgage Pass Through Certificates,
Series 2005-AR13, Class B1
0.9087% due 10/25/2045 (b) 839,844 104,981
WAMU Mortgage Pass Through Certificates,
Series 2005-AR6, Class B1
0.9087% due 04/25/2045 (b) 956,724 71,754
WAMU Mortgage Pass Through Certificates,
Series 2007-OA5, Class 1XPP
1.0088% IO due 06/25/2017 14,544,986 109,087
WAMU Mortgage Pass Through Certificates,
Series 2007-OA6, Class 1XPP
0.9503% IO due 07/25/2047 16,088,763 100,555
Copyright © 2012 www.secdatabase.com. All Rights Reserved.Please Consider the Environment Before Printing This Document

Washington Mutual Alternative Mortgage
Pass-Through Certificates, Series 2005-AR19,
Class B1
1.0087% due 12/25/2045 (b) 505,171 63,146
Washington Mutual Alternative Mortgage
Pass-Through Certificates, Series 2005-6,
Class 1CB
6.50% due 08/25/2035 206,864 127,286
Washington Mutual Mortgage Pass Through
Certificates, Series 2007-OA4, Class XPPP
0.9426% IO due 04/25/2047 12,160,862 68,405
Washington Mutual Mortgage Pass-Through,
Series 2005-1, Class 6A1
6.50% due 03/25/2035 15,013 10,289
Wells Fargo Mortgage Backed Securities Trust,
Series 2006-AR15, Class A3
5.6567% due 10/25/2036 (b) 714,083 148,534
TOTAL COLLATERALIZED MORTGAGE OBLIGATIONS
(Cost $95,047,828) $ 71,886,243
ASSET BACKED SECURITIES - 1.96%
Alesco Preferred Funding, Ltd., Series 12A, Class B
1.7313% due 07/15/2037 (b)(f) 430,000 51,600
The accompanying notes are an integral part of the financial statements.
16
JOHN HANCOCK FUNDS II
PORTFOLIO OF INVESTMENTS - May 31, 2009 (Unaudited) - continued(showing percentage of total net assets)
Active Bond Fund (continued)Shares or
Principal
Amount Value
ASSET BACKED SECURITIES
(continued)
Alesco Preferred Funding, Ltd., Series 14A, Class B
1.8769% due 09/23/2037 (b)(f) $ 930,000 $ 65,100
Alesco Preferred Funding, Ltd.,
Series 15A, Class B1
1.9069% due 12/23/2037 (b)(f) 220,000 11,000
American Express Issuance Trust, Series 2008-1,
Class A
1.2944% due 12/15/2010 (b) 2,235,000 2,243,336
Amresco Residential Securities Mortgage Loan
Trust, Series 1998-1, Class A6
6.51% due 08/25/2027 617 533
Ansonia CDO, Ltd.
5.812% due 07/28/2046 (f) 1,150,000 92,000
Anthracite, Ltd., Series 2002-2A, Class B
5.488% due 12/24/2037 (b)(f) 600,000 300,000
Anthracite, Ltd., Series 2002-CIBA, Class A
0.7588% due 05/24/2017 (b)(f) 683,453 410,072
Arbor Realty Mortgage Securities, Series
2006-1A, Class C
1.6919% due 01/26/2042 (b)(f) 370,000 44,400
Arbor Realty Mortgage Securities, Series
2006-1A, Class F
2.1419% due 01/26/2042 (b)(f) 615,000 30,750
Argent Securities, Inc., Series 2004-W1, Class M3
1.7587% due 03/25/2034 (b) 9,599 1,112
Capital Trust Re CDO, Ltd., Series 2005-1A, Class B
Copyright © 2012 www.secdatabase.com. All Rights Reserved.Please Consider the Environment Before Printing This Document

0.7862% due 03/20/2050 (b)(f) 400,000 36,000
Cedarwoods Credit CDO, Ltd.,
Series 2007-2A, Class B
0.6888% due 02/25/2052 (b)(f) 1,000,000 150,000
Chase Issuance Trust, Series 2008-A1, Class A1
0.7944% due 01/15/2012 (b) 800,000 799,688
CNH Equipment Trust, Series 2008-B, Class A2B
1.3444% due 04/15/2011 (b) 462,113 462,496
Credit-Based Asset Servicing and Securitization,
Series 2006-CB2, Class AF2
5.501% due 12/25/2036 693,968 520,728
Credit-Based Asset Servicing and Securitization,
Series 2006-MH1, Class B1
6.25% due 10/25/2036 (f) 460,000 188,756
Crest, Ltd., Series 2000-1A, Class C
7.75% due 08/31/2036 (f) 860,000 172,000
Crest, Ltd., Series 2002-IGA, Class A
1.5225% due 07/28/2017 (b)(f) 1,270,629 800,496
Crest, Ltd., Series 2003-1A, Class B1
1.6137% due 05/28/2038 (b)(f) 600,000 186,000
CW Capital Cobalt I, Series 2005-1A, Class A1
0.9413% due 05/25/2045 (b)(f) 445,124 117,806
Dillon Read CMBS CDO, Ltd., Series 2006-1A,
Class A3
1.9713% due 12/05/2046 (b)(e)(f) 975,000 10
Dominos Pizza Master Issuer LLC, Series 2007-1,
Class M1
7.629% due 04/27/2037 (f) 535,000 235,400
Equity One ABS, Inc., Series 2004-2, Class AV2
0.5587% due 07/25/2034 (b) 647 239
GSAA Home Equity Trust, Series 2006-10,
Class AF3
5.9846% due 06/25/2036 (b) 1,000,000 396,875
Active Bond Fund (continued)Shares or
Principal
Amount Value
ASSET BACKED SECURITIES
(continued)
Highland Park CDO, Ltd., Series 2006-1A, Class A2
1.0612% due 11/25/2051 (b)(f) $ 1,230,000 $ 123,000
JER CDO, Series 2006-2A, Class AFL
0.6388% due 03/25/2045 (b)(f) 681,007 34,050
Lehman XS Trust, Series 2005-5N, Class 3A2
0.6687% due 11/25/2035 (b) 614,603 162,523
Lehman XS Trust, Series 2005-7N, Class 1A1B
0.6087% due 12/25/2035 (b) 451,152 95,441
Lehman XS Trust, Series 2006-2N, Class 1A2
0.6488% due 02/25/2046 (b) 1,378,925 293,751
LNR CDO, Ltd., Series 2006-1A, Class BFL
0.8662% due 05/28/2043 (b)(f) 700,000 7,000
Newcastle CDO, Ltd., Series 2005-7A, Class 2FL
0.8087% due 12/24/2050 (b)(f) 570,000 28,500
North Street Referenced Linked Notes, Series
2000-1A, Class C
2.7894% due 07/30/2010 (b)(f) 500,000 35,000
N-Star Real Estate CDO, Ltd.
0.6631% due 07/27/2040 (b)(f) 700,000 210,000
N-Star Real Estate CDO, Ltd.,
Series 2006-7A, Class B
0.6888% due 06/22/2051 (b)(f) 900,000 45,000
N-Star Real Estate CDO, Ltd.,
Series 2006-8A, Class E
1.1681% due 02/01/2041 (b)(f) 475,000 14,250
Copyright © 2012 www.secdatabase.com. All Rights Reserved.Please Consider the Environment Before Printing This Document

Ownit Mortgage Loan, Series 2006-1, Class AF2
5.29% due 12/25/2036 825,588 500,672
Ownit Mortgage Loan, Series 2006-2, Class A2B
5.6329% due 01/25/2037 730,148 534,733
Prima Capital, Ltd., Series 2006-CR1A, Class A1
5.417% due 12/25/2048 1,243,903 676,683
RAIT Preferred Funding, Ltd., Series 2007-2A,
Class B
1.1087% due 06/25/2045 (b)(f) 685,000 68,500
Renaissance Home Equity Loan Trust,
Series 2005-2, Class AF3
4.499% due 07/25/2035 99,839 91,005
Renaissance Home Equity Loan Trust,
Series 2005-2, Class AF4
4.934% due 07/25/2035 335,000 150,813
Wells Fargo Home Equity Trust,
Series 2004-2, Class AI5
4.89% due 05/25/2034 (b) 49,000 35,930
Residential Accredit Loans, Inc.,
Series 2004-QS16, Class 1A1
5.50% due 12/25/2034 14,412 10,421
TOTAL ASSET BACKED SECURITIES
(Cost $27,496,230) $ 10,433,669
SUPRANATIONAL OBLIGATIONS - 0.05%
Honduras - 0.00%
Central American Bank for Economic Integration
6.75% due 04/15/2013 (f) 12,000 12,856
Venezuela - 0.05%
Corporacion Andina de Fomento
5.20% due 05/21/2013 214,000 206,731
The accompanying notes are an integral part of the financial statements.
17
JOHN HANCOCK FUNDS II
PORTFOLIO OF INVESTMENTS - May 31, 2009 (Unaudited) - continued(showing percentage of total net assets)
Active Bond Fund (continued)Shares or
Principal
Amount Value
SUPRANATIONAL OBLIGATIONS
(continued)
Venezuela (continued)
Corporacion Andina de Fomento (continued)
6.875% due 03/15/2012 $ 20,000 $ 21,023
227,754
TOTAL SUPRANATIONAL OBLIGATIONS
(Cost $249,296) $ 240,610
PREFERRED STOCKS - 0.36%
Banking - 0.07%
Bank of America Corp., Series MER, 8.625% 20,775 399,711
Financial Services - 0.17%
Citigroup, Inc., Series E, 8.40% ^ * 1,010,000 883,740
Food & Beverages - 0.06%
Ocean Spray Cranberries, Inc., 6.25% 5,034 321,704
Telephone - 0.06%
Telephone & Data Systems, Inc., 7.60% 16,000 318,560
Copyright © 2012 www.secdatabase.com. All Rights Reserved.Please Consider the Environment Before Printing This Document

TOTAL PREFERRED STOCKS (Cost $2,351,891) $ 1,923,715
WARRANTS - 0.00%
Metal & Metal Products - 0.00%
New Gold, Inc.
(Expiration date 06/28/2017, strike
price CAD 15.00) * 3,852 1,570
TOTAL WARRANTS (Cost $0) $ 1,570
REPURCHASE AGREEMENTS - 0.02%
Repurchase Agreement with State
Street Corp. dated 05/29/2009 at
0.07% to be repurchased at
$110,001 on 06/01/2009,
collateralized by $105,000 Federal
National Mortgage Association,
7.125% due 06/15/2010 (valued at
$115,385, including interest) $ 110,000 $ 110,000
TOTAL REPURCHASE AGREEMENTS
(Cost $110,000) $ 110,000
SHORT TERM INVESTMENTS - 0.12%
Federal Home Loan Bank Discount Notes
zero coupon due 06/01/2009 $ 600,000 $ 600,000
John Hancock Collateral Investment Trust,
0.7339% (c)(g) 5,146 51,460
TOTAL SHORT TERM INVESTMENTS
(Cost $651,460) $ 651,460
Total Investments (Active Bond Fund)
(Cost $606,225,107) - 102.76% $ 547,265,215
Other assets and liabilities, net - (2.76)% (14,689,614)
TOTAL NET ASSETS - 100.00% $ 532,575,601
All Cap Core FundShares or
Principal
Amount Value
COMMON STOCKS - 88.48%
Aerospace - 4.50%
General Dynamics Corp. 64,023 $ 3,642,909
Lockheed Martin Corp. 69,776 5,835,367
Northrop Grumman Corp. 102,909 4,900,526
Raytheon Company 39,000 1,741,350
United Technologies Corp. 17,310 910,679
17,030,831
Agriculture - 2.83%
Archer-Daniels-Midland Company 206,129 5,672,670
Bunge, Ltd. 79,600 5,036,292
10,708,962
Apparel & Textiles - 0.40%
Carter's, Inc. * 21,200 501,380
Jones Apparel Group, Inc. 110,475 1,005,323
1,506,703
Auto Parts - 0.23%
TRW Automotive Holdings Corp. * 29,200 260,464
WABCO Holdings, Inc. 35,381 600,769
861,233
Banking - 1.18%
Comerica, Inc. 30,238 655,560
Copyright © 2012 www.secdatabase.com. All Rights Reserved.Please Consider the Environment Before Printing This Document

KeyCorp 102,100 510,500
Marshall & Ilsley Corp. 145,855 959,726
PNC Financial Services Group, Inc. 3,900 177,645
Popular, Inc. (a) 189,700 557,718
Regions Financial Corp. 47,600 199,444
Signature Bank * 2,200 59,510
SunTrust Banks, Inc. 68,570 903,067
Zions Bancorp (a) 31,636 432,780
4,455,950
Building Materials & Construction - 0.01%
Granite Construction, Inc. 800 29,240
Business Services - 4.15%
Automatic Data Processing, Inc. 76,800 2,919,168
Brinks Company 55,004 1,462,557
Computer Sciences Corp. * 56,561 2,401,580
Fluor Corp. 52,982 2,489,094
Global Sources, Ltd. * 9,566 65,240
Manpower, Inc. 73,400 3,120,234
R.R. Donnelley & Sons Company 159,536 2,150,545
SAIC, Inc. * 48,924 854,702
URS Corp. * 4,600 221,168
15,684,288
Cable & Television - 2.94%
Comcast Corp., Class A 269,107 3,705,603
Time Warner Cable, Inc. * 158,560 4,882,062
Time Warner, Inc. 108,444 2,539,759
11,127,424
Cellular Communications - 0.01%
USA Mobility, Inc. * 4,800 53,664
Chemicals - 1.42%
Ashland, Inc. 84,700 2,269,960
Cytec Industries, Inc. 20,314 436,345
The accompanying notes are an integral part of the financial statements.
18
JOHN HANCOCK FUNDS II
PORTFOLIO OF INVESTMENTS - May 31, 2009 (Unaudited) - continued(showing percentage of total net assets)
All Cap Core Fund (continued)Shares or
Principal
Amount Value
COMMON STOCKS (continued)
Chemicals (continued)
Dow Chemical Company 128,259 $ 2,267,619
Terra Industries, Inc. 14,776 410,625
5,384,549
Commercial Services - 0.24%
Brink's Home Security Holdings, Inc. * 32,073 923,702
Computers & Business Equipment - 4.50%
Apple, Inc. * 51,739 7,026,674
Cisco Systems, Inc. * 86,626 1,602,581
Ingram Micro, Inc., Class A * 21,031 347,432
International Business Machines Corp. 54,606 5,803,526
Tech Data Corp. * 19,294 617,794
Western Digital Corp. * 65,025 1,615,871
Copyright © 2012 www.secdatabase.com. All Rights Reserved.Please Consider the Environment Before Printing This Document
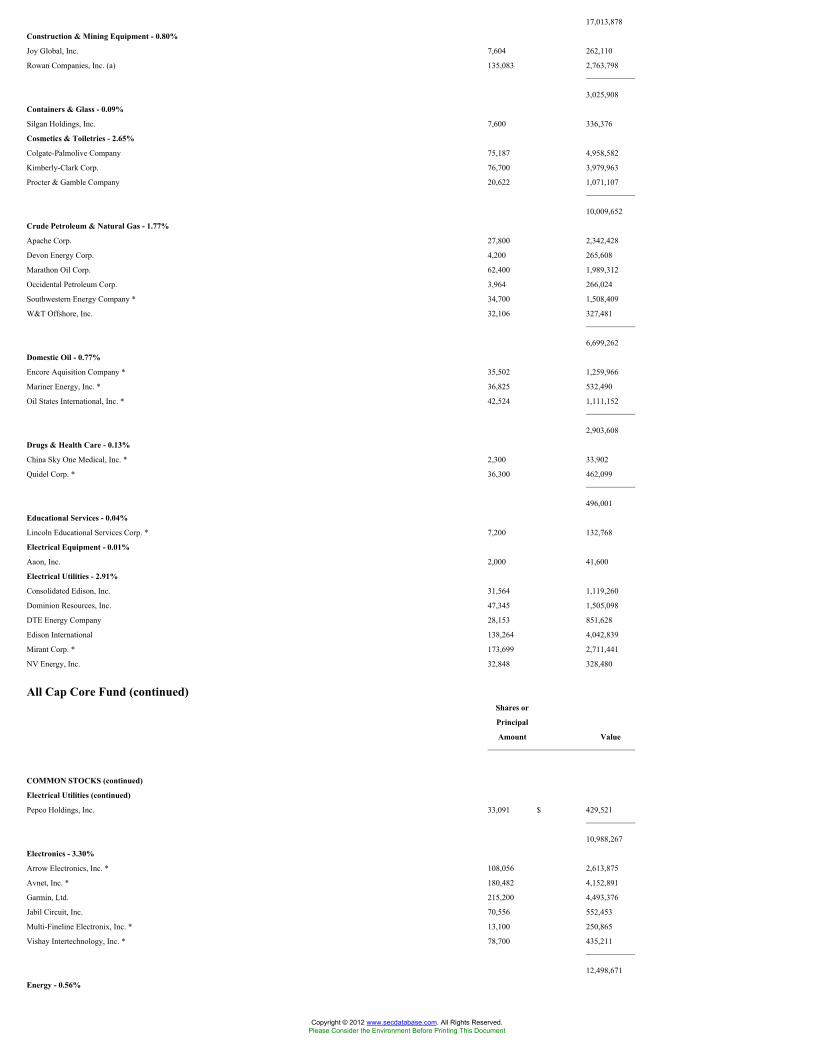
17,013,878
Construction & Mining Equipment - 0.80%
Joy Global, Inc. 7,604 262,110
Rowan Companies, Inc. (a) 135,083 2,763,798
3,025,908
Containers & Glass - 0.09%
Silgan Holdings, Inc. 7,600 336,376
Cosmetics & Toiletries - 2.65%
Colgate-Palmolive Company 75,187 4,958,582
Kimberly-Clark Corp. 76,700 3,979,963
Procter & Gamble Company 20,622 1,071,107
10,009,652
Crude Petroleum & Natural Gas - 1.77%
Apache Corp. 27,800 2,342,428
Devon Energy Corp. 4,200 265,608
Marathon Oil Corp. 62,400 1,989,312
Occidental Petroleum Corp. 3,964 266,024
Southwestern Energy Company * 34,700 1,508,409
W&T Offshore, Inc. 32,106 327,481
6,699,262
Domestic Oil - 0.77%
Encore Aquisition Company * 35,502 1,259,966
Mariner Energy, Inc. * 36,825 532,490
Oil States International, Inc. * 42,524 1,111,152
2,903,608
Drugs & Health Care - 0.13%
China Sky One Medical, Inc. * 2,300 33,902
Quidel Corp. * 36,300 462,099
496,001
Educational Services - 0.04%
Lincoln Educational Services Corp. * 7,200 132,768
Electrical Equipment - 0.01%
Aaon, Inc. 2,000 41,600
Electrical Utilities - 2.91%
Consolidated Edison, Inc. 31,564 1,119,260
Dominion Resources, Inc. 47,345 1,505,098
DTE Energy Company 28,153 851,628
Edison International 138,264 4,042,839
Mirant Corp. * 173,699 2,711,441
NV Energy, Inc. 32,848 328,480
All Cap Core Fund (continued)Shares or
Principal
Amount Value
COMMON STOCKS (continued)
Electrical Utilities (continued)
Pepco Holdings, Inc. 33,091 $ 429,521
10,988,267
Electronics - 3.30%
Arrow Electronics, Inc. * 108,056 2,613,875
Avnet, Inc. * 180,482 4,152,891
Garmin, Ltd. 215,200 4,493,376
Jabil Circuit, Inc. 70,556 552,453
Multi-Fineline Electronix, Inc. * 13,100 250,865
Vishay Intertechnology, Inc. * 78,700 435,211
12,498,671
Energy - 0.56%
Copyright © 2012 www.secdatabase.com. All Rights Reserved.Please Consider the Environment Before Printing This Document

Duke Energy Corp. 64,655 914,869
Progress Energy, Inc. 20,822 739,389
Sempra Energy 9,825 448,806
2,103,064
Financial Services - 6.81%
Bank of America Corp. 425,103 4,790,911
Broadridge Financial Solutions, Inc. 125,239 2,073,958
Citigroup, Inc. (a) 392,300 1,459,356
CME Group, Inc. 3,634 1,168,840
Goldman Sachs Group, Inc. 34,842 5,037,108
JPMorgan Chase & Company 228,986 8,449,583
Synovus Financial Corp. 151,100 494,097
Wells Fargo & Company 64,300 1,639,650
Western Union Company 36,500 643,495
25,756,998
Food & Beverages - 0.98%
Sysco Corp. 155,055 3,715,118
Forest Products - 0.05%
Rayonier, Inc. 5,100 204,000
Gas & Pipeline Utilities - 0.34%
Atmos Energy Corp. 14,610 350,640
NiSource, Inc. 86,444 924,086
1,274,726
Healthcare Products - 1.80%
Cypress Biosciences, Inc. * 82,800 629,280
Herbalife, Ltd. 49,220 1,437,716
Johnson & Johnson 84,580 4,665,433
Medicines Company * 8,300 63,578
6,796,007
Healthcare Services - 3.18%
Alliance Imaging, Inc. * 1,500 10,350
Centene Corp. * 11,200 203,616
Coventry Health Care, Inc. * 180,727 3,262,122
Express Scripts, Inc. * 56,895 3,644,125
Gentiva Health Services, Inc. * 21,000 334,530
Healthspring, Inc. * 7,000 67,970
Medco Health Solutions, Inc. * 98,000 4,497,220
12,019,933
Homebuilders - 0.10%
D.R. Horton, Inc. 40,400 372,084
The accompanying notes are an integral part of the financial statements.
19
JOHN HANCOCK FUNDS II
PORTFOLIO OF INVESTMENTS - May 31, 2009 (Unaudited) - continued(showing percentage of total net assets)
All Cap Core Fund (continued)Shares or
Principal
Amount Value
COMMON STOCKS (continued)
Hotels & Restaurants - 1.43%
CEC Entertainment, Inc. * 21,000 $ 674,730
McDonald's Corp. 64,138 3,783,501
Yum! Brands, Inc. 27,500 952,325
Copyright © 2012 www.secdatabase.com. All Rights Reserved.Please Consider the Environment Before Printing This Document

5,410,556
Industrial Machinery - 0.20%
Gardner Denver, Inc. * 27,227 771,613
Industrials - 0.11%
General Electric Company 31,800 428,664
Insurance - 2.99%
Aetna, Inc. 198,225 5,308,466
Allied World Assurance Holdings, Ltd. 50,123 1,892,143
First American Corp. 24,338 555,393
Old Republic International Corp. 102,400 1,047,552
PartnerRe, Ltd. 4,900 319,774
The Travelers Companies, Inc. 54,015 2,196,250
11,319,578
International Oil - 5.32%
Chevron Corp. 8,914 594,296
ConocoPhillips 89,366 4,096,538
Exxon Mobil Corp. 144,700 10,034,945
Murphy Oil Corp. 91,493 5,399,002
20,124,781
Internet Content - 1.13%
Google, Inc., Class A * 7,786 3,248,553
Sohu.com, Inc. * 15,977 1,008,788
4,257,341
Internet Retail - 0.24%
Amazon.com, Inc. * 11,704 912,795
Internet Software - 0.48%
Symantec Corp. * 74,908 1,167,816
VeriSign, Inc. * 28,300 662,503
1,830,319
Life Sciences - 0.15%
Waters Corp. * 13,300 576,156
Manufacturing - 0.15%
Trinity Industries, Inc. 36,909 562,493
Metal & Metal Products - 0.69%
Timken Company 154,809 2,617,820
Mining - 0.95%
Cliffs Natural Resources, Inc. 132,353 3,606,619
Paper - 1.14%
International Paper Company 298,736 4,292,836
Petroleum Services - 1.37%
Diamond Offshore Drilling, Inc. (a) 42,700 3,598,756
Key Energy Services, Inc. * 49,900 321,855
Tidewater, Inc. 6,649 316,958
World Fuel Services Corp. 22,300 946,412
5,183,981
Pharmaceuticals - 6.33%
Abbott Laboratories 116,168 5,234,530
Eli Lilly & Company 166,034 5,739,795
All Cap Core Fund (continued)Shares or
Principal
Amount Value
COMMON STOCKS (continued)
Pharmaceuticals (continued)
Enzon Pharmaceuticals, Inc. * 35,200 $ 282,304
Gilead Sciences, Inc. * 76,589 3,300,986
Merck & Company, Inc. 62,557 1,725,322
PDL BioPharma, Inc. 25,600 177,920
Pfizer, Inc. 490,794 7,455,161
Copyright © 2012 www.secdatabase.com. All Rights Reserved.Please Consider the Environment Before Printing This Document
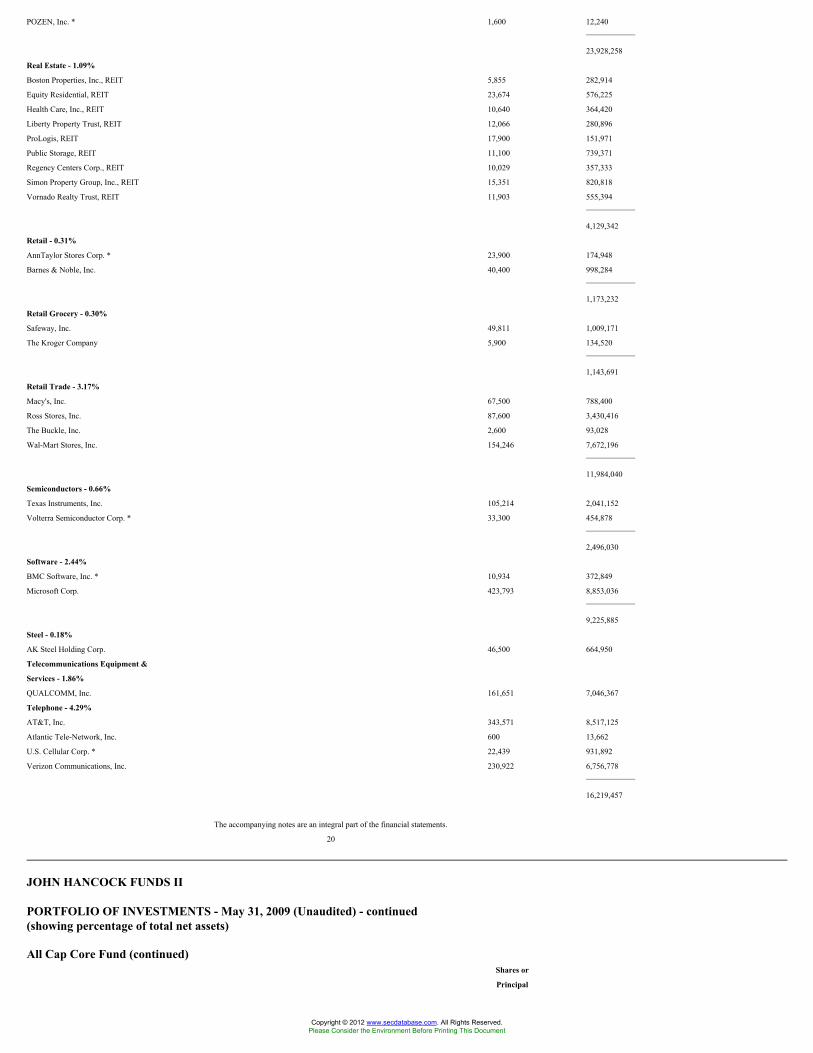
POZEN, Inc. * 1,600 12,240
23,928,258
Real Estate - 1.09%
Boston Properties, Inc., REIT 5,855 282,914
Equity Residential, REIT 23,674 576,225
Health Care, Inc., REIT 10,640 364,420
Liberty Property Trust, REIT 12,066 280,896
ProLogis, REIT 17,900 151,971
Public Storage, REIT 11,100 739,371
Regency Centers Corp., REIT 10,029 357,333
Simon Property Group, Inc., REIT 15,351 820,818
Vornado Realty Trust, REIT 11,903 555,394
4,129,342
Retail - 0.31%
AnnTaylor Stores Corp. * 23,900 174,948
Barnes & Noble, Inc. 40,400 998,284
1,173,232
Retail Grocery - 0.30%
Safeway, Inc. 49,811 1,009,171
The Kroger Company 5,900 134,520
1,143,691
Retail Trade - 3.17%
Macy's, Inc. 67,500 788,400
Ross Stores, Inc. 87,600 3,430,416
The Buckle, Inc. 2,600 93,028
Wal-Mart Stores, Inc. 154,246 7,672,196
11,984,040
Semiconductors - 0.66%
Texas Instruments, Inc. 105,214 2,041,152
Volterra Semiconductor Corp. * 33,300 454,878
2,496,030
Software - 2.44%
BMC Software, Inc. * 10,934 372,849
Microsoft Corp. 423,793 8,853,036
9,225,885
Steel - 0.18%
AK Steel Holding Corp. 46,500 664,950
Telecommunications Equipment &
Services - 1.86%
QUALCOMM, Inc. 161,651 7,046,367
Telephone - 4.29%
AT&T, Inc. 343,571 8,517,125
Atlantic Tele-Network, Inc. 600 13,662
U.S. Cellular Corp. * 22,439 931,892
Verizon Communications, Inc. 230,922 6,756,778
16,219,457
The accompanying notes are an integral part of the financial statements.
20
JOHN HANCOCK FUNDS II
PORTFOLIO OF INVESTMENTS - May 31, 2009 (Unaudited) - continued(showing percentage of total net assets)
All Cap Core Fund (continued)Shares or
Principal
Copyright © 2012 www.secdatabase.com. All Rights Reserved.Please Consider the Environment Before Printing This Document

Amount Value
COMMON STOCKS (continued)
Tobacco - 1.73%
Altria Group, Inc. 96,371 $ 1,646,981
Lorillard, Inc. 53,183 3,633,994
Philip Morris International, Inc. 29,820 1,271,525
6,552,500
Transportation - 0.12%
Marten Transport, Ltd. * 3,200 68,256
Overseas Shipholding Group, Inc. 11,700 395,694
463,950
Trucking & Freight - 0.95%
Ryder Systems, Inc. 26,218 738,823
United Parcel Service, Inc., Class B 55,900 2,858,726
3,597,549
TOTAL COMMON STOCKS (Cost $326,160,712) $ 334,675,270
SHORT TERM INVESTMENTS - 3.22%
John Hancock Collateral Investment
Trust, 0.7339% (c)(g) $ 424,454 $ 4,244,541
U.S. Treasury Bills
zero coupon due 06/11/2009 *** 7,940,000 7,939,735
TOTAL SHORT TERM INVESTMENTS
(Cost $12,184,276) $ 12,184,276
REPURCHASE AGREEMENTS - 8.95%
Repurchase Agreement with State
Street Corp. dated 05/29/2009 at
0.07% to be repurchased at
$33,870,198 on 06/01/2009,
collateralized by $195,000 Federal
Home Loan Mortgage Corp.,
5.625% due 11/23/2035 (valued at
$189,033, including interest) and
$25,685,000 Federal Home Loan
Bank, 5.25% due 12/11/2020
(valued at $27,515,056, including
interest) and $80,000 Federal
Home Loan Bank, 5.50% due
07/15/2036 (valued at $82,200,
including interest) and $7,270,000
Federal National Mortgage
Association, 5.50% due
07/14/2028 (valued at $6,766,189,
including interest) $ 33,870,000 $ 33,870,000
TOTAL REPURCHASE AGREEMENTS
(Cost $33,870,000) $ 33,870,000
Total Investments (All Cap Core Fund)
(Cost $372,214,988) - 100.65% $ 380,729,546
Other assets and liabilities, net - (0.65)% (2,464,336)
TOTAL NET ASSETS - 100.00% $ 378,265,210
All Cap Growth FundShares or
Principal
Amount Value
COMMON STOCKS - 95.69%
Copyright © 2012 www.secdatabase.com. All Rights Reserved.Please Consider the Environment Before Printing This Document

Aerospace - 7.77%
General Dynamics Corp. 11,104 $ 631,817
Goodrich Corp. 6,765 328,373
Lockheed Martin Corp. 20,445 1,709,815
Raytheon Company 40,943 1,828,105
Rockwell Collins, Inc. 9,992 423,861
United Technologies Corp. 30,511 1,605,184
6,527,155
Agriculture - 0.68%
Monsanto Company 2,978 244,643
The Mosaic Company 5,982 327,215
571,858
Apparel & Textiles - 0.54%
NIKE, Inc., Class B 8,019 457,484
Biotechnology - 0.35%
Biogen Idec, Inc. * 5,714 295,928
Business Services - 3.06%
Accenture, Ltd., Class A 62,370 1,866,734
Fluor Corp. 9,983 469,002
Robert Half International, Inc. 11,093 237,279
2,573,015
Cellular Communications - 0.45%
China Mobile, Ltd. 39,116 382,495
Chemicals - 0.41%
Potash Corp. of Saskatchewan, Inc. 3,007 348,331
Commercial Services - 0.25%
Morningstar, Inc. * (a) 5,117 211,946
Computers & Business Equipment - 7.68%
Apple, Inc. * 9,726 1,320,888
Cisco Systems, Inc. * 43,869 811,577
Cognizant Technology Solutions Corp.,
Class A * 31,119 783,888
International Business Machines Corp. 11,778 1,251,766
Research In Motion, Ltd. * 29,032 2,283,076
6,451,195
Cosmetics & Toiletries - 5.92%
Colgate-Palmolive Company 32,345 2,133,153
Procter & Gamble Company 54,727 2,842,520
4,975,673
Crude Petroleum & Natural Gas - 0.79%
Occidental Petroleum Corp. 9,940 667,073
Drugs & Health Care - 0.81%
Shire, Ltd. 48,906 678,590
Educational Services - 1.23%
Apollo Group, Inc., Class A * 17,526 1,035,787
Financial Services - 4.25%
CME Group, Inc. 2,139 687,988
IntercontinentalExchange, Inc. * 5,944 640,704
MasterCard, Inc., Class A 9,153 1,613,948
Visa, Inc. 9,274 627,943
3,570,583
The accompanying notes are an integral part of the financial statements.
21
JOHN HANCOCK FUNDS II
PORTFOLIO OF INVESTMENTS - May 31, 2009 (Unaudited) - continued(showing percentage of total net assets)
Copyright © 2012 www.secdatabase.com. All Rights Reserved.Please Consider the Environment Before Printing This Document

All Cap Growth Fund (continued)Shares or
Principal
Amount Value
COMMON STOCKS (continued)
Food & Beverages - 9.71%
General Mills, Inc. 19,035 $ 974,211
Kellogg Company 44,284 1,915,283
PepsiCo, Inc. 46,814 2,436,669
The Coca-Cola Company 57,680 2,835,549
8,161,712
Healthcare Products - 12.07%
Baxter International, Inc. 54,584 2,794,155
Becton, Dickinson & Company 42,214 2,857,043
Johnson & Johnson 51,280 2,828,605
Medtronic, Inc. 39,334 1,351,123
Varian Medical Systems, Inc. * 8,705 311,291
10,142,217
Healthcare Services - 0.90%
Express Scripts, Inc. * 6,610 423,370
UnitedHealth Group, Inc. 12,471 331,729
755,099
Hotels & Restaurants - 1.68%
McDonald's Corp. 17,008 1,003,302
Yum! Brands, Inc. 11,911 412,478
1,415,780
Household Products - 0.75%
Clorox Company 12,056 632,217
Industrial Machinery - 0.48%
W.W. Grainger, Inc. 5,163 406,999
Insurance - 2.64%
ACE, Ltd. 22,912 1,007,899
Chubb Corp. 30,513 1,209,840
2,217,739
International Oil - 0.74%
Exxon Mobil Corp. 9,009 624,774
Internet Content - 2.07%
Google, Inc., Class A * 4,166 1,738,180
Internet Retail - 0.35%
eBay, Inc. * 16,857 297,020
Internet Software - 1.02%
Check Point Software Technologies, Ltd. * 15,098 352,538
McAfee, Inc. * 8,273 324,550
Symantec Corp. * 11,296 176,105
853,193
Manufacturing - 1.03%
Honeywell International, Inc. 26,035 863,321
Mining - 0.39%
BHP Billiton, Ltd. 11,541 324,235
Petroleum Services - 0.81%
Transocean, Ltd. * 4,984 396,128
Valero Energy Corp. 12,738 284,949
681,077
Pharmaceuticals - 3.42%
Abbott Laboratories 35,990 1,621,709
All Cap Growth Fund (continued)Shares or
Copyright © 2012 www.secdatabase.com. All Rights Reserved.Please Consider the Environment Before Printing This Document

Principal
Amount Value
COMMON STOCKS (continued)
Pharmaceuticals (continued)
Gilead Sciences, Inc. * 29,048 $ 1,251,969
2,873,678
Railroads & Equipment - 0.69%
Norfolk Southern Corp. 7,651 284,617
Union Pacific Corp. 5,958 293,551
578,168
Retail Grocery - 2.36%
The Kroger Company 86,913 1,981,616
Retail Trade - 4.79%
Costco Wholesale Corp. 10,136 491,799
Home Depot, Inc. 23,671 548,220
Kohl's Corp. * 14,400 611,568
Lowe's Companies, Inc. 30,888 587,181
The Gap, Inc. 51,812 924,844
Wal-Mart Stores, Inc. 17,393 865,128
4,028,740
Sanitary Services - 1.64%
Waste Management, Inc. 49,953 1,378,203
Semiconductors - 1.79%
Altera Corp. 12,464 212,137
Intel Corp. 39,685 623,848
Texas Instruments, Inc. 22,938 444,997
Xilinx, Inc. 10,698 221,877
1,502,859
Software - 5.80%
Adobe Systems, Inc. * 51,069 1,439,125
Intuit, Inc. * 11,608 315,970
Microsoft Corp. 149,478 3,122,595
4,877,690
Telecommunications Equipment &
Services - 5.88%
Amdocs, Ltd. * 16,971 367,252
Corning, Inc. 34,255 503,549
KDDI Corp. 330 1,727,466
Nokia Oyj, SADR 41,711 638,178
QUALCOMM, Inc. 39,115 1,705,023
4,941,468
Transportation - 0.49%
Expeditors International of Washington, Inc. 12,468 409,075
TOTAL COMMON STOCKS (Cost $75,073,410) $ 80,432,173
SHORT TERM INVESTMENTS - 0.09%
John Hancock Collateral Investment
Trust, 0.7339% (c)(g) $ 7,140 $ 71,400
TOTAL SHORT TERM INVESTMENTS
(Cost $71,400) $ 71,400
The accompanying notes are an integral part of the financial statements.
22
JOHN HANCOCK FUNDS II
PORTFOLIO OF INVESTMENTS - May 31, 2009 (Unaudited) - continued(showing percentage of total net assets)
Copyright © 2012 www.secdatabase.com. All Rights Reserved.Please Consider the Environment Before Printing This Document

All Cap Growth Fund (continued)Shares or
Principal
Amount Value
REPURCHASE AGREEMENTS - 3.56%
Repurchase Agreement with State
Street Corp. dated 05/29/2009 at
0.07% to be repurchased at
$2,996,017 on 06/01/2009,
collateralized by $3,155,000
Federal Home Loan Mortgage
Corp., 5.625% due 11/23/2035
(valued at $3,058,457, including
interest) $ 2,996,000 $ 2,996,000
TOTAL REPURCHASE AGREEMENTS
(Cost $2,996,000) $ 2,996,000
Total Investments (All Cap Growth Fund)
(Cost $78,140,810) - 99.34% $ 83,499,573
Other assets and liabilities, net - 0.66% 553,165
TOTAL NET ASSETS - 100.00% $ 84,052,738
All Cap Value FundShares or
Principal
Amount Value
COMMON STOCKS - 86.73%
Advertising - 0.50%
Omnicom Group, Inc. 29,900 $ 911,950
Aerospace - 4.93%
Alliant Techsystems, Inc. * 25,800 2,226,282
Curtiss-Wright Corp. 13,500 395,280
General Dynamics Corp. 53,200 3,027,080
United Technologies Corp. 62,820 3,304,960
8,953,602
Agriculture - 0.21%
Archer-Daniels-Midland Company 13,621 374,850
Air Travel - 0.79%
Continental Airlines, Inc., Class B * 68,700 640,284
Southwest Airlines Company 117,200 789,928
1,430,212
Apparel & Textiles - 0.39%
Guess?, Inc. 27,700 715,214
Auto Parts - 1.95%
Autoliv, Inc. 55,500 1,541,790
BorgWarner, Inc. (a) 37,400 1,206,150
WABCO Holdings, Inc. 46,700 792,966
3,540,906
Automobiles - 2.51%
Honda Motor Company, Ltd., ADR 107,100 3,109,113
PACCAR, Inc. 48,200 1,438,770
4,547,883
Banking - 4.30%
Bank of New York Mellon Corp. 83,798 2,327,909
City National Corp. (a) 21,100 771,627
Commerce Bancshares, Inc. 37,049 1,165,932
Cullen Frost Bankers, Inc. 39,235 1,920,553
Copyright © 2012 www.secdatabase.com. All Rights Reserved.Please Consider the Environment Before Printing This Document

All Cap Value Fund (continued)Shares or
Principal
Amount Value
COMMON STOCKS (continued)
Banking (continued)
Northern Trust Corp. 28,000 $ 1,614,200
7,800,221
Biotechnology - 2.61%
Amgen, Inc. * 70,600 3,525,764
Biogen Idec, Inc. * 23,400 1,211,886
4,737,650
Building Materials & Construction - 0.16%
Quanex Building Products Corp. 26,285 290,186
Business Services - 1.24%
Jacobs Engineering Group, Inc. * 37,900 1,625,910
URS Corp. * 13,000 625,040
2,250,950
Chemicals - 0.71%
Celanese Corp., Series A 63,100 1,294,181
Crude Petroleum & Natural Gas - 4.73%
Apache Corp. 8,900 749,914
EQT Corp. 35,700 1,329,825
Forest Oil Corp. * 43,500 826,935
Hess Corp. 40,000 2,663,600
Noble Energy, Inc. 21,100 1,255,028
XTO Energy, Inc. 41,200 1,762,124
8,587,426
Domestic Oil - 0.64%
Range Resources Corp. 3,700 169,497
Suncor Energy, Inc. 28,100 995,021
1,164,518
Electrical Equipment - 0.63%
Anixter International, Inc. * 27,689 1,135,803
Financial Services - 9.51%
Charles Schwab Corp. 117,600 2,069,760
GATX Corp. 26,700 672,306
JPMorgan Chase & Company 87,100 3,213,990
Lazard, Ltd., Class A 87,200 2,466,016
Morgan Stanley 97,400 2,953,168
Raymond James Financial, Inc. (a) 56,100 891,990
State Street Corp. 78,900 3,664,905
Wells Fargo & Company 51,600 1,315,800
17,247,935
Food & Beverages - 1.17%
Diageo PLC, SADR 24,000 1,309,440
J.M. Smucker Company 17,500 704,550
Ralcorp Holdings, Inc. * 1,900 108,813
2,122,803
Furniture & Fixtures - 0.05%
Ethan Allen Interiors, Inc. 7,500 91,950
Gas & Pipeline Utilities - 2.95%
El Paso Corp. 233,100 2,272,725
Piedmont Natural Gas, Inc. 1,200 27,192
UGI Corp. 18,500 446,035
Williams Companies, Inc. 155,600 2,610,968
Copyright © 2012 www.secdatabase.com. All Rights Reserved.Please Consider the Environment Before Printing This Document

5,356,920
The accompanying notes are an integral part of the financial statements.
23
JOHN HANCOCK FUNDS II
PORTFOLIO OF INVESTMENTS - May 31, 2009 (Unaudited) - continued(showing percentage of total net assets)
All Cap Value Fund (continued)Shares or
Principal
Amount Value
COMMON STOCKS (continued)
Gold - 1.93%
Barrick Gold Corp. 91,797 $ 3,495,630
Healthcare Products - 0.47%
Patterson Companies, Inc. * 41,400 852,426
Healthcare Services - 2.41%
DaVita, Inc. * 96,800 4,366,648
Holdings Companies/Conglomerates - 0.49%
Berkshire Hathaway, Inc., Class B * 300 891,600
Hotels & Restaurants - 3.90%
Marriott International, Inc., Class A 90,000 2,102,400
Starwood Hotels & Resorts Worldwide, Inc. 74,700 1,827,909
Wendy's/Arby's Group, Inc. 207,600 871,920
Wynn Resorts, Ltd. * (a) 61,400 2,275,484
7,077,713
Industrial Machinery - 4.30%
Cameron International Corp. * 36,300 1,133,649
Donaldson Company, Inc. 16,300 549,147
ITT Corp. 63,400 2,610,812
Kennametal, Inc. 42,400 800,512
Parker-Hannifin Corp. 64,300 2,717,318
7,811,438
Insurance - 2.54%
ACE, Ltd. 8,200 360,718
Aon Corp. 51,100 1,839,600
Markel Corp. * 3,600 1,026,000
MetLife, Inc. 43,700 1,376,550
4,602,868
International Oil - 1.61%
EnCana Corp. 52,800 2,926,704
Internet Software - 1.04%
McAfee, Inc. * 47,999 1,883,001
Leisure Time - 0.97%
International Game Technology 101,000 1,753,360
Manufacturing - 3.65%
AptarGroup, Inc. 24,000 744,240
Eaton Corp. 52,890 2,300,715
Hexcel Corp. * 55,500 593,295
Honeywell International, Inc. 43,000 1,425,880
Nordson Corp. 4,600 176,640
Roper Industries, Inc. 10,500 451,290
SPX Corp. 20,300 931,973
6,624,033
Metal & Metal Products - 1.48%
Precision Castparts Corp. 11,300 933,041
Reliance Steel & Aluminum Company 46,000 1,747,540
Copyright © 2012 www.secdatabase.com. All Rights Reserved.Please Consider the Environment Before Printing This Document

2,680,581
Petroleum Services - 4.35%
Halliburton Company 78,358 1,796,749
Helmerich & Payne, Inc. (a) 6,400 223,808
Oceaneering International, Inc. * 9,700 498,774
PetroHawk Energy Corp. * 32,300 813,960
Schlumberger, Ltd. 27,800 1,590,994
Smith International, Inc. 58,500 1,707,615
All Cap Value Fund (continued)Shares or
Principal
Amount Value
COMMON STOCKS (continued)
Petroleum Services (continued)
Superior Energy Services, Inc. * 54,800 $ 1,263,688
7,895,588
Pharmaceuticals - 6.59%
Abbott Laboratories 126,300 5,691,078
AmerisourceBergen Corp. 71,000 2,634,100
Onyx Pharmaceuticals, Inc. * 42,200 998,452
OSI Pharmaceuticals, Inc. * 20,300 686,140
Watson Pharmaceuticals, Inc. * 64,400 1,948,100
11,957,870
Railroads & Equipment - 1.24%
Canadian National Railway Company 30,100 1,308,146
Kansas City Southern * 56,600 933,334
2,241,480
Retail Grocery - 0.69%
The Kroger Company 54,534 1,243,375
Retail Trade - 5.91%
American Eagle Outfitters, Inc. 134,200 1,987,502
Costco Wholesale Corp. 16,500 800,580
Fossil, Inc. * 63,900 1,430,082
Kohl's Corp. * 9,000 382,230
Lowe's Companies, Inc. 102,300 1,944,723
MSC Industrial Direct Company, Inc., Class A 400 14,552
Nordstrom, Inc. (a) 45,800 901,802
Target Corp. 23,000 903,900
TJX Companies, Inc. 51,200 1,510,912
Wal-Mart Stores, Inc. 17,000 845,580
10,721,863
Software - 1.67%
Adobe Systems, Inc. * 107,800 3,037,804
Steel - 0.58%
Carpenter Technology Corp. 47,100 1,058,808
Transportation - 0.59%
Bristow Group, Inc. * 8,953 283,183
Kirby Corp. * 23,300 783,346
1,066,529
Trucking & Freight - 0.34%
Heartland Express, Inc. (a) 39,800 624,860
TOTAL COMMON STOCKS (Cost $151,623,217) $ 157,369,339
SHORT TERM INVESTMENTS - 2.35%
John Hancock Collateral Investment
Trust, 0.7339% (c)(g) $ 425,470 $ 4,254,701
TOTAL SHORT TERM INVESTMENTS
(Cost $4,254,701) $ 4,254,701
Copyright © 2012 www.secdatabase.com. All Rights Reserved.Please Consider the Environment Before Printing This Document

The accompanying notes are an integral part of the financial statements.
24
JOHN HANCOCK FUNDS II
PORTFOLIO OF INVESTMENTS - May 31, 2009 (Unaudited) - continued(showing percentage of total net assets)
All Cap Value Fund (continued)Shares or
Principal
Amount Value
REPURCHASE AGREEMENTS - 13.29%
Repurchase Agreement with State
Street Corp. dated 05/29/2009 at
0.07% to be repurchased at
$24,118,141 on 06/01/2009,
collateralized by $24,510,000
Federal Home Loan Bank, 0.875%
due 03/30/2010 (valued at
$24,601,913, including interest) $ 24,118,000 $ 24,118,000
TOTAL REPURCHASE AGREEMENTS
(Cost $24,118,000) $ 24,118,000
Total Investments (All Cap Value Fund)
(Cost $179,995,918) - 102.37% $ 185,742,040
Other assets and liabilities, net - (2.37)% (4,300,164)
TOTAL NET ASSETS - 100.00% $ 181,441,876
Alpha Opportunities FundShares or
Principal
Amount Value
COMMON STOCKS - 91.82%
Advertising - 0.10%
Monster Worldwide, Inc. * 45,058 $ 526,277
Aerospace - 0.76%
BE Aerospace, Inc. * 34,000 505,920
Boeing Company 72,916 3,270,283
Cubic Corp. 5,400 206,010
3,982,213
Agriculture - 0.69%
Agrium, Inc. * 8,100 398,682
Bunge, Ltd. 30,400 1,923,408
The Mosaic Company 23,528 1,286,982
3,609,072
Air Travel - 0.82%
Delta Air Lines, Inc. * 735,353 4,272,401
Aluminum - 0.14%
Alcoa, Inc. 49,300 454,546
Century Aluminum Company * 44,750 268,948
723,494
Apparel & Textiles - 2.03%
Anta Sports Products Ltd 223,420 245,654
Coach, Inc. 52,100 1,368,667
Gymboree Corp. * 21,400 788,590
Copyright © 2012 www.secdatabase.com. All Rights Reserved.Please Consider the Environment Before Printing This Document

Hanesbrands, Inc. * 283,178 4,785,708
Iconix Brand Group, Inc. * 56,774 919,171
Li Ning Company, Ltd. 132,720 322,937
NIKE, Inc., Class B 33,687 1,921,843
XTEP International Holdings 524,810 248,125
10,600,695
Automobiles - 0.46%
Astra International Tbk PT 65,500 132,554
Dongfeng Motor Group Company, Ltd. 428,660 412,307
Ford Motor Company * 163,300 938,975
Alpha Opportunities Fund (continued)Shares or
Principal
Amount Value
COMMON STOCKS (continued)
Automobiles (continued)
PACCAR, Inc. 31,641 $ 944,484
2,428,320
Banking - 0.77%
Bank of China, Ltd. 1,145,000 515,576
China Construction Bank Corp. 427,000 278,652
Huntington Bancshares, Inc. 127,900 501,368
Itau Unibanco Holding SA * 52,270 838,934
Julius Baer Holding AG 3,176 135,324
PNC Financial Services Group, Inc. 16,913 770,387
U.S. Bancorp 51,000 979,200
4,019,441
Biotechnology - 1.03%
Amgen, Inc. * 45,800 2,287,252
Cephalon, Inc. * 7,000 408,170
Charles River Laboratories International, Inc. * 18,500 581,455
Genzyme Corp. * 21,685 1,282,451
Life Technologies Corp. * 15,100 585,578
Myriad Genetics, Inc. * 7,160 258,906
5,403,812
Building Materials & Construction - 0.49%
Anhui Conch Cement Company, Ltd., Class H 84,100 605,216
China National Building Material Company,
Ltd. 133,990 294,055
Lennox International, Inc. 25,200 781,452
Masco Corp. 84,000 870,240
2,550,963
Business Services - 2.16%
Accenture, Ltd., Class A 95,848 2,868,731
Alliance Data Systems Corp. * 26,400 1,069,200
Automatic Data Processing, Inc. 80,861 3,073,526
Coinstar, Inc. * 89,500 2,650,990
Fluor Corp. 22,200 1,042,956
PHH Corp. * 36,700 565,180
11,270,583
Cable & Television - 1.41%
Comcast Corp., Class A 317,400 4,126,200
Virgin Media, Inc. 374,800 3,260,760
7,386,960
Cellular Communications - 1.95%
China Mobile, Ltd., SADR 18,300 900,543
Leap Wireless International, Inc. * 25,600 959,744
Copyright © 2012 www.secdatabase.com. All Rights Reserved.Please Consider the Environment Before Printing This Document

MetroPCS Communications, Inc. * 323,608 5,543,405
Motorola, Inc. 459,943 2,787,255
10,190,947
Chemicals - 1.07%
Huabao International Holdings, Ltd. 204,910 185,397
Potash Corp. of Saskatchewan, Inc. 27,441 3,178,765
PPG Industries, Inc. 26,997 1,200,557
UCB SA 30,900 1,028,379
5,593,098
Coal - 0.73%
CONSOL Energy, Inc. 65,536 2,697,462
The accompanying notes are an integral part of the financial statements.
25
JOHN HANCOCK FUNDS II
PORTFOLIO OF INVESTMENTS - May 31, 2009 (Unaudited) - continued(showing percentage of total net assets)
Alpha Opportunities Fund (continued)Shares or
Principal
Amount Value
COMMON STOCKS (continued)
Coal (continued)
Walter Energy, Inc. 34,800 $ 1,135,872
3,833,334
Colleges & Universities - 0.60%
Corinthian Colleges, Inc. * 202,160 3,109,221
Commercial Services - 0.51%
Brink's Home Security Holdings, Inc. * 37,600 1,082,880
Pool Corp. (a) 89,321 1,556,865
2,639,745
Computer Services - 0.07%
NetApp, Inc. * 19,600 382,200
Computers & Business Equipment - 4.16%
3Com Corp. * 100,650 434,808
Apple, Inc. * 25,442 3,455,278
Cisco Systems, Inc. * 319,000 5,901,500
Cognizant Technology Solutions Corp.,
Class A * 21,000 528,990
EMC Corp. * 61,000 716,750
Hewlett-Packard Company 73,100 2,510,985
Research In Motion, Ltd. * 42,560 3,346,918
Seagate Technology 244,946 2,133,480
Xerox Corp. 393,960 2,678,928
21,707,637
Computers-Integrated Sys - 0.09%
NCR Corp. * 43,814 470,562
Construction & Mining Equipment - 0.49%
National Oilwell Varco, Inc. * 66,730 2,577,113
Construction Materials - 0.28%
The Sherwin-Williams Company 27,727 1,463,986
Containers & Glass - 0.97%
Owens-Illinois, Inc. * 176,369 5,049,444
Correctional Facilities - 0.13%
Corrections Corp. of America * 42,700 655,445
Cosmetics & Toiletries - 0.37%
Copyright © 2012 www.secdatabase.com. All Rights Reserved.Please Consider the Environment Before Printing This Document
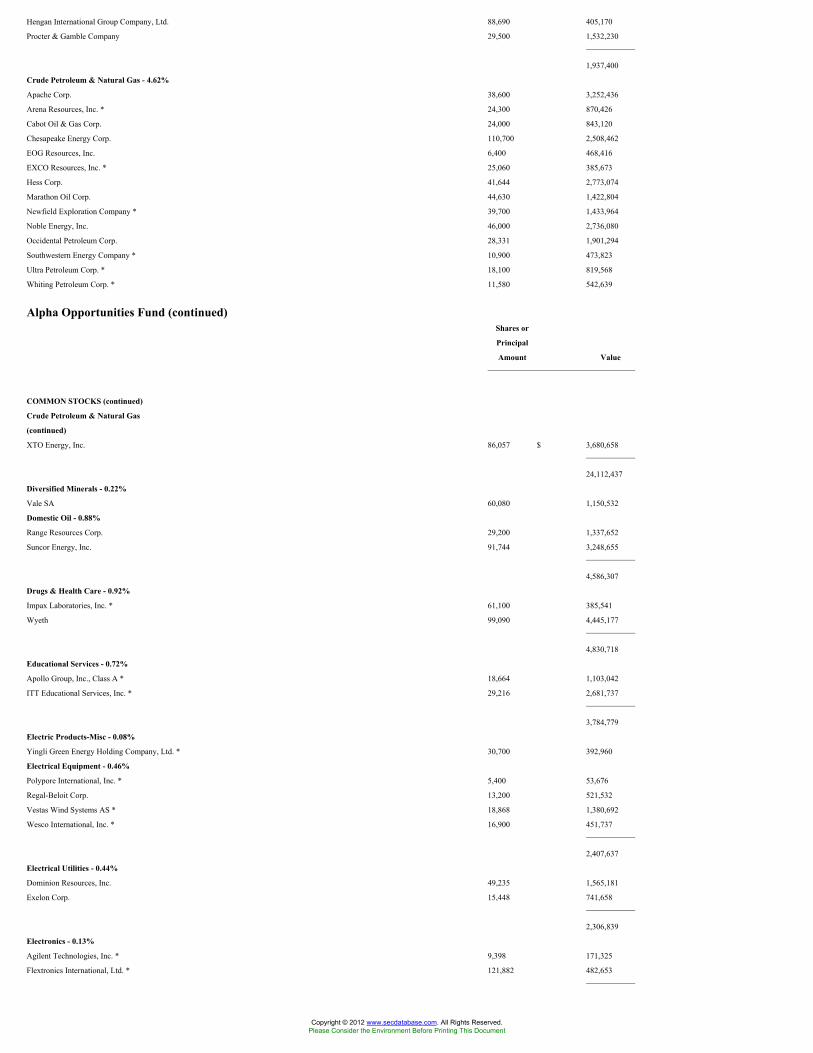
Hengan International Group Company, Ltd. 88,690 405,170
Procter & Gamble Company 29,500 1,532,230
1,937,400
Crude Petroleum & Natural Gas - 4.62%
Apache Corp. 38,600 3,252,436
Arena Resources, Inc. * 24,300 870,426
Cabot Oil & Gas Corp. 24,000 843,120
Chesapeake Energy Corp. 110,700 2,508,462
EOG Resources, Inc. 6,400 468,416
EXCO Resources, Inc. * 25,060 385,673
Hess Corp. 41,644 2,773,074
Marathon Oil Corp. 44,630 1,422,804
Newfield Exploration Company * 39,700 1,433,964
Noble Energy, Inc. 46,000 2,736,080
Occidental Petroleum Corp. 28,331 1,901,294
Southwestern Energy Company * 10,900 473,823
Ultra Petroleum Corp. * 18,100 819,568
Whiting Petroleum Corp. * 11,580 542,639
Alpha Opportunities Fund (continued)Shares or
Principal
Amount Value
COMMON STOCKS (continued)
Crude Petroleum & Natural Gas
(continued)
XTO Energy, Inc. 86,057 $ 3,680,658
24,112,437
Diversified Minerals - 0.22%
Vale SA 60,080 1,150,532
Domestic Oil - 0.88%
Range Resources Corp. 29,200 1,337,652
Suncor Energy, Inc. 91,744 3,248,655
4,586,307
Drugs & Health Care - 0.92%
Impax Laboratories, Inc. * 61,100 385,541
Wyeth 99,090 4,445,177
4,830,718
Educational Services - 0.72%
Apollo Group, Inc., Class A * 18,664 1,103,042
ITT Educational Services, Inc. * 29,216 2,681,737
3,784,779
Electric Products-Misc - 0.08%
Yingli Green Energy Holding Company, Ltd. * 30,700 392,960
Electrical Equipment - 0.46%
Polypore International, Inc. * 5,400 53,676
Regal-Beloit Corp. 13,200 521,532
Vestas Wind Systems AS * 18,868 1,380,692
Wesco International, Inc. * 16,900 451,737
2,407,637
Electrical Utilities - 0.44%
Dominion Resources, Inc. 49,235 1,565,181
Exelon Corp. 15,448 741,658
2,306,839
Electronics - 0.13%
Agilent Technologies, Inc. * 9,398 171,325
Flextronics International, Ltd. * 121,882 482,653
Copyright © 2012 www.secdatabase.com. All Rights Reserved.Please Consider the Environment Before Printing This Document

653,978
Energy - 1.49%
AGL Energy, Ltd. 12,035 135,231
First Solar, Inc. * 16,912 3,213,280
SunPower Corp., Class A * (a) 60,422 1,760,697
Sunpower Corp., Class B * (a) 103,949 2,673,568
7,782,776
Engineering/R&D Services - 0.06%
Chiyoda Corp. 33,500 289,302
Financial Services - 8.41%
Ameriprise Financial, Inc. 54,400 1,642,880
Bank of America Corp. 904,624 10,195,112
Brookfield Asset Management, Inc. 7,070 124,361
China Everbright, Ltd. 157,430 379,950
CME Group, Inc. 800 257,312
Deutsche Boerse AG (a) 9,415 822,027
Discover Financial Services 132,944 1,270,945
Goldman Sachs Group, Inc. 23,557 3,405,635
Hong Kong Exchanges & Clearing, Ltd. 34,680 538,321
IntercontinentalExchange, Inc. * 2,200 237,138
The accompanying notes are an integral part of the financial statements.
26
JOHN HANCOCK FUNDS II
PORTFOLIO OF INVESTMENTS - May 31, 2009 (Unaudited) - continued(showing percentage of total net assets)
Alpha Opportunities Fund (continued)Shares or
Principal
Amount Value
COMMON STOCKS (continued)
Financial Services (continued)
Invesco, Ltd. 32,600 $ 510,190
JPMorgan Chase & Company 153,770 5,674,113
MasterCard, Inc., Class A 7,050 1,243,126
PennantPark Investment Corp. 155,065 1,054,442
TD Ameritrade Holding Corp. * 58,900 1,003,656
UBS AG * 29,761 447,308
Visa, Inc. 15,790 1,069,141
Wells Fargo & Company 504,275 12,859,013
Western Union Company 67,540 1,190,730
43,925,400
Food & Beverages - 1.54%
Dr Pepper Snapple Group, Inc. * 17,700 384,621
General Mills, Inc. 22,349 1,143,822
Green Mountain Coffee Roasters, Inc. * 3,080 257,087
Nestle SA, SADR 31,658 1,154,567
Nestle SA 13,580 493,477
Pan Fish ASA * 839,000 494,721
PepsiCo, Inc. 46,819 2,436,929
Tingyi Cayman Islands Holding Corp. 94,000 140,824
Tsingtao Brewery Company, Ltd., Series H 65,460 185,538
Tyson Foods, Inc., Class A 57,900 771,228
Want Want China Holdings, Ltd. 1,136,520 554,178
8,016,992
Gas & Pipeline Utilities - 0.78%
BG Group PLC 122,847 2,251,318
Gazprom OAO, SADR 77,308 1,815,955
Copyright © 2012 www.secdatabase.com. All Rights Reserved.Please Consider the Environment Before Printing This Document

4,067,273
Gold - 0.95%
AngloGold Ashanti, Ltd., SADR 24,240 1,026,079
Barrick Gold Corp. 20,800 792,064
IAMGOLD Corp 44,890 505,910
Osisko Mining Corp. * 1,600 10,496
Randgold Resources, Ltd., ADR 17,740 1,238,430
Red Back Mining, Inc. * 26,940 257,864
Yamana Gold, Inc. 94,130 1,107,910
4,938,753
Healthcare Products - 2.61%
ATS Medical, Inc. * (a) 272,200 816,600
China Medical Technologies, Inc., SADR 36,533 746,004
Covidien, Ltd. 26,750 955,510
Edwards Lifesciences Corp. * 6,600 421,344
Herbalife, Ltd. 39,100 1,142,111
Hologic, Inc. * 2,979 37,744
Intuitive Surgical, Inc. * 3,872 579,561
Inverness Medical Innovations, Inc. * 20,900 679,877
Johnson & Johnson 27,903 1,539,130
Medtronic, Inc. 89,518 3,074,943
NutriSystem, Inc. 80,400 1,101,480
St. Jude Medical, Inc. * 27,100 1,057,442
Varian Medical Systems, Inc. * 9,700 346,872
Volcano Corp. * 49,470 611,449
Zoll Medical Corp. * 31,300 525,527
13,635,594
Alpha Opportunities Fund (continued)Shares or
Principal
Amount Value
COMMON STOCKS (continued)
Healthcare Services - 1.55%
Cardinal Health, Inc. 91,636 $ 3,275,987
UnitedHealth Group, Inc. 181,083 4,816,808
8,092,795
Homebuilders - 0.20%
M.D.C. Holdings, Inc. 33,910 1,041,376
Hotels & Restaurants - 0.05%
Starbucks Corp. * 15,600 224,484
The Cheesecake Factory, Inc. * 3,000 51,330
275,814
Household Appliances - 0.29%
Stanley Works 27,720 989,604
Whirlpool Corp. (a) 12,638 532,565
1,522,169
Household Products - 0.54%
Jarden Corp. * 157,962 2,808,564
Industrial Machinery - 1.32%
Briggs & Stratton Corp. 28,939 439,873
Caterpillar, Inc. 70,414 2,496,880
Cummins, Inc. 14,470 469,262
Flowserve Corp. 15,200 1,118,264
Ingersoll-Rand Company, Ltd., Class A 70,116 1,418,447
Terex Corp. * 53,138 713,112
The Japan Steel Works, Ltd. 17,000 222,085
6,877,923
Copyright © 2012 www.secdatabase.com. All Rights Reserved.Please Consider the Environment Before Printing This Document

Industrials - 0.86%
Aecom Technology Corp. * 82,952 2,646,998
Beijing Enterprises Holdings, Ltd. 105,470 481,385
Foster Wheeler AG * 21,298 564,823
General Electric Company 44,300 597,164
Orient Overseas International, Ltd. 44,500 195,137
4,485,507
Insurance - 4.15%
ACE, Ltd. 113,600 4,997,264
AFLAC, Inc. 122,231 4,339,201
China Life Insurance Company, Ltd., SADR 8,200 454,608
China Life Insurance Company, Ltd. 80,230 292,993
CIGNA Corp. 127,100 2,817,807
Hartford Financial Services Group, Inc. 108,566 1,556,836
Marsh & McLennan Companies, Inc. 173,118 3,275,393
Principal Financial Group, Inc. 27,700 614,940
The Travelers Companies, Inc. 16,500 670,890
Unum Group 155,600 2,662,316
21,682,248
International Oil - 2.11%
Anadarko Petroleum Corp. 60,147 2,873,824
BP PLC, SADR 24,487 1,212,107
Canadian Natural Resources, Ltd. 32,400 1,936,224
Lundin Petroleum AB, Series A * 106,527 944,638
Nabors Industries, Ltd. * 92,943 1,661,821
Petroleo Brasileiro SA, ADR 54,879 2,416,322
11,044,936
The accompanying notes are an integral part of the financial statements.
27
JOHN HANCOCK FUNDS II
PORTFOLIO OF INVESTMENTS - May 31, 2009 (Unaudited) - continued(showing percentage of total net assets)
Alpha Opportunities Fund (continued)Shares or
Principal
Amount Value
COMMON STOCKS (continued)
Internet Content - 0.29%
Google, Inc., Class A * 3,600 $ 1,502,028
Internet Retail - 0.23%
Amazon.com, Inc. * 11,300 881,287
Rakuten, Inc. 580 318,966
1,200,253
Internet Service Provider - 0.79%
Alibaba.com, Ltd. * 68,500 134,328
Equinix, Inc. * 48,545 3,611,748
Netease.com, Inc., ADR * 11,110 384,184
4,130,260
Internet Software - 0.97%
Akamai Technologies, Inc. * 18,100 402,906
Electronic Arts, Inc. * 22,400 514,976
McAfee, Inc. * 47,238 1,853,147
Shanda Interactive Entertainment, Ltd. * (a) 9,850 567,557
Tencent Holdings, Ltd. 56,360 627,636
VeriSign, Inc. * 9,600 224,736
Copyright © 2012 www.secdatabase.com. All Rights Reserved.Please Consider the Environment Before Printing This Document
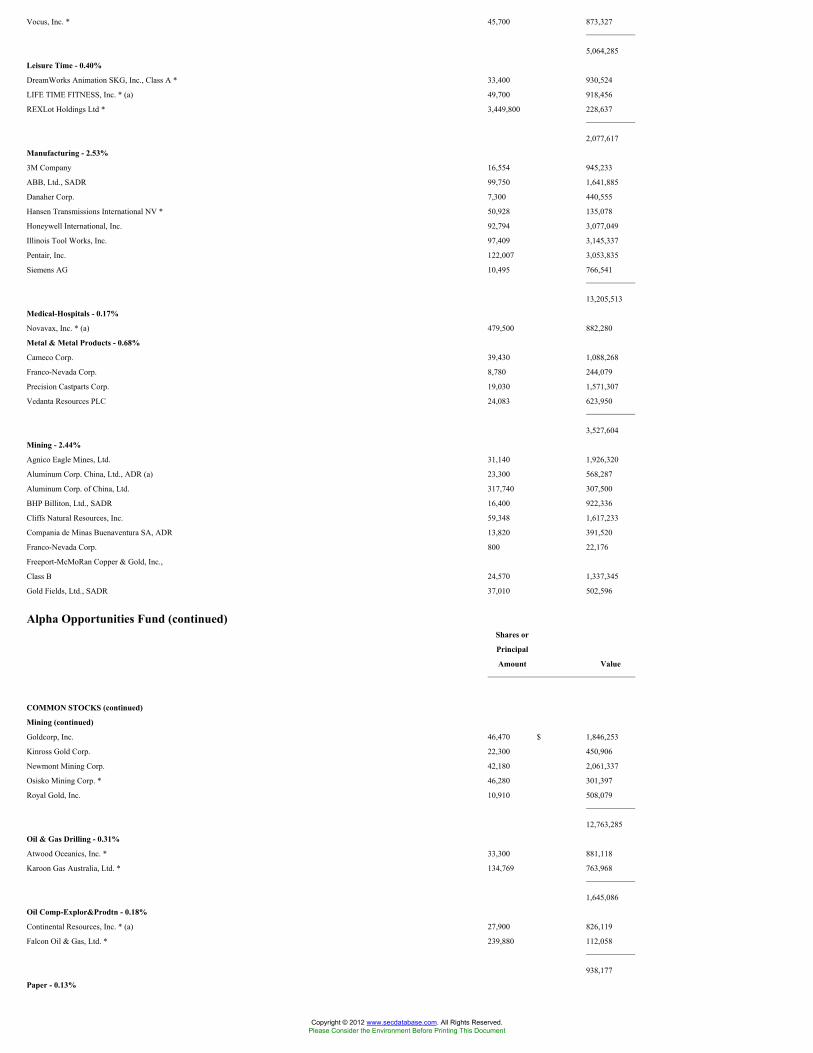
Vocus, Inc. * 45,700 873,327
5,064,285
Leisure Time - 0.40%
DreamWorks Animation SKG, Inc., Class A * 33,400 930,524
LIFE TIME FITNESS, Inc. * (a) 49,700 918,456
REXLot Holdings Ltd * 3,449,800 228,637
2,077,617
Manufacturing - 2.53%
3M Company 16,554 945,233
ABB, Ltd., SADR 99,750 1,641,885
Danaher Corp. 7,300 440,555
Hansen Transmissions International NV * 50,928 135,078
Honeywell International, Inc. 92,794 3,077,049
Illinois Tool Works, Inc. 97,409 3,145,337
Pentair, Inc. 122,007 3,053,835
Siemens AG 10,495 766,541
13,205,513
Medical-Hospitals - 0.17%
Novavax, Inc. * (a) 479,500 882,280
Metal & Metal Products - 0.68%
Cameco Corp. 39,430 1,088,268
Franco-Nevada Corp. 8,780 244,079
Precision Castparts Corp. 19,030 1,571,307
Vedanta Resources PLC 24,083 623,950
3,527,604
Mining - 2.44%
Agnico Eagle Mines, Ltd. 31,140 1,926,320
Aluminum Corp. China, Ltd., ADR (a) 23,300 568,287
Aluminum Corp. of China, Ltd. 317,740 307,500
BHP Billiton, Ltd., SADR 16,400 922,336
Cliffs Natural Resources, Inc. 59,348 1,617,233
Compania de Minas Buenaventura SA, ADR 13,820 391,520
Franco-Nevada Corp. 800 22,176
Freeport-McMoRan Copper & Gold, Inc.,
Class B 24,570 1,337,345
Gold Fields, Ltd., SADR 37,010 502,596
Alpha Opportunities Fund (continued)Shares or
Principal
Amount Value
COMMON STOCKS (continued)
Mining (continued)
Goldcorp, Inc. 46,470 $ 1,846,253
Kinross Gold Corp. 22,300 450,906
Newmont Mining Corp. 42,180 2,061,337
Osisko Mining Corp. * 46,280 301,397
Royal Gold, Inc. 10,910 508,079
12,763,285
Oil & Gas Drilling - 0.31%
Atwood Oceanics, Inc. * 33,300 881,118
Karoon Gas Australia, Ltd. * 134,769 763,968
1,645,086
Oil Comp-Explor&Prodtn - 0.18%
Continental Resources, Inc. * (a) 27,900 826,119
Falcon Oil & Gas, Ltd. * 239,880 112,058
938,177
Paper - 0.13%
Copyright © 2012 www.secdatabase.com. All Rights Reserved.Please Consider the Environment Before Printing This Document

Aracruz Celulose SA, SADR (a) 8,860 151,417
International Paper Company 35,116 504,617
656,034
Petroleum Services - 2.73%
Halliburton Company 20,000 458,600
Helmerich & Payne, Inc. (a) 12,300 430,131
Petro-Canada 38,539 1,716,142
PetroHawk Energy Corp. * 22,300 561,960
SandRidge Energy, Inc. * 37,610 409,573
Schlumberger, Ltd. 38,957 2,229,509
Total SA, SADR (a) 74,687 4,305,706
Weatherford International, Ltd. * 200,685 4,154,179
14,265,800
Pharmaceuticals - 5.54%
Abbott Laboratories 32,396 1,459,764
Amylin Pharmaceuticals, Inc. * 33,276 376,684
Bristol-Myers Squibb Company 41,120 819,110
Elan Corp. PLC, SADR * 216,145 1,508,692
Eli Lilly & Company 83,359 2,881,721
Gilead Sciences, Inc. * 11,500 495,650
Merck & Company, Inc. 294,221 8,114,615
Pfizer, Inc. 558,473 8,483,205
Teva Pharmaceutical Industries, Ltd., SADR 98,008 4,543,651
Vertex Pharmaceuticals, Inc. * 7,600 226,556
28,909,648
Publishing - 0.11%
VistaPrint, Ltd. * 14,500 555,205
Railroads & Equipment - 0.07%
China Railway Group, Ltd. * 447,080 371,127
Real Estate - 1.28%
Camden Property Trust, REIT 18,700 561,374
Chimera Investment Corp. 813,343 2,838,567
China Overseas Land & Investment, Ltd. 346,500 732,772
China Resources Land, Ltd. 230,560 546,080
Host Hotels & Resorts, Inc., REIT 49,700 466,186
Liberty Property Trust, REIT 21,400 498,192
MFA Mortgage Investments, Inc., REIT 24,400 152,744
Sino-Ocean Land Holdings, Ltd. 362,580 373,106
The accompanying notes are an integral part of the financial statements.
28
JOHN HANCOCK FUNDS II
PORTFOLIO OF INVESTMENTS - May 31, 2009 (Unaudited) - continued(showing percentage of total net assets)
Alpha Opportunities Fund (continued)Shares or
Principal
Amount Value
COMMON STOCKS (continued)
Real Estate (continued)
Taubman Centers, Inc., REIT 21,600 $ 534,384
6,703,405
Real Estate Mgmnt/Servic - 0.04%
E-House China Holdings Ltd * 15,180 222,387
Retail - 0.07%
China Dongxiang Group Company 657,010 370,627
Retail Grocery - 0.22%
Copyright © 2012 www.secdatabase.com. All Rights Reserved.Please Consider the Environment Before Printing This Document

The Kroger Company 51,300 1,169,640
Retail Trade - 5.00%
Advance Auto Parts, Inc. 83,399 3,551,963
Aeropostale, Inc. * 66,400 2,298,768
Best Buy Company, Inc. 90,532 3,177,673
Dick's Sporting Goods, Inc. * 36,000 640,800
Home Depot, Inc. 63,961 1,481,337
Kohl's Corp. * 79,518 3,377,129
Lowe's Companies, Inc. 48,900 929,589
Lumber Liquidators, Inc. * 35,100 531,765
Staples, Inc. 307,328 6,284,858
The Gap, Inc. 161,234 2,878,027
Wal-Mart Stores, Inc. 18,800 935,112
26,087,021
Sanitary Services - 0.19%
Waste Management, Inc. 36,533 1,007,945
Semiconductors - 1.86%
Intel Corp. 88,800 1,395,936
MEMC Electronic Materials, Inc. * 68,600 1,323,294
ON Semiconductor Corp. * 501,880 3,437,878
Texas Instruments, Inc. 184,280 3,575,032
9,732,140
Software - 2.97%
Adobe Systems, Inc. * 93,853 2,644,778
ArcSight, Inc. * 36,700 591,237
AsiaInfo Holdings, Inc. * 26,130 547,685
BMC Software, Inc. * 57,300 1,953,930
Concur Technologies, Inc. * 31,400 926,300
Microsoft Corp. 179,873 3,757,547
Red Hat, Inc. * 159,539 3,182,803
Solera Holdings, Inc. * 82,545 1,890,280
15,494,560
Steel - 0.60%
ArcelorMittal (a) 53,186 1,764,712
Gerdau SA, SADR 29,100 302,640
Nucor Corp. 19,800 869,418
Steel Dynamics, Inc. 13,014 194,429
3,131,199
Telecommunications Equipment &
Services - 1.49%
Amdocs, Ltd. * 20,400 441,456
Corning, Inc. 141,410 2,078,727
HUGHES Telematics Inc * 28,605 121,285
Koninklijke KPN NV 59,382 781,220
Alpha Opportunities Fund (continued)Shares or
Principal
Amount Value
COMMON STOCKS (continued)
Telecommunications Equipment &
Services (continued)
QUALCOMM, Inc. 100,530 $ 4,382,103
7,804,791
Telephone - 0.73%
AT&T, Inc. 154,438 3,828,518
Tobacco - 0.23%
Altria Group, Inc. 45,358 775,168
Japan Tobacco, Inc. 142 410,395
Copyright © 2012 www.secdatabase.com. All Rights Reserved.Please Consider the Environment Before Printing This Document

1,185,563
Toys, Amusements & Sporting Goods - 0.18%
Marvel Entertainment, Inc. * 28,000 929,040
Transportation - 0.71%
Con-way, Inc. 41,700 1,338,570
DryShips, Inc. 58,770 480,739
Genco Shipping & Trading, Ltd. 14,860 388,589
Overseas Shipholding Group, Inc. 21,500 727,130
Tsakos Energy Navigation, Ltd. 33,300 750,582
3,685,610
Trucking & Freight - 1.02%
FedEx Corp. 7,930 439,560
Hub Group, Inc., Class A * 13,600 268,736
J.B. Hunt Transport Services, Inc. 37,100 1,140,083
United Parcel Service, Inc., Class B 67,750 3,464,735
5,313,114
TOTAL COMMON STOCKS (Cost $424,347,243) $ 479,457,734
INVESTMENT COMPANIES - 1.61%
Investment Companies - 1.61%
iShares Russell 1000 Index Fund 69,000 3,498,990
Midcap SPDR Trust, Series 1 23,500 2,458,335
SPDR Trust Series 1 26,600 2,458,106
8,415,431
TOTAL INVESTMENT COMPANIES (Cost $7,382,541) $ 8,415,431
SHORT TERM INVESTMENTS - 2.41%
John Hancock Collateral Investment
Trust, 0.7339% (c)(g) $ 1,255,594 $ 12,555,944
TOTAL SHORT TERM INVESTMENTS
(Cost $12,555,944) $ 12,555,944
The accompanying notes are an integral part of the financial statements.
29
JOHN HANCOCK FUNDS II
PORTFOLIO OF INVESTMENTS - May 31, 2009 (Unaudited) - continued(showing percentage of total net assets)
Alpha Opportunities Fund (continued)Shares or
Principal
Amount Value
REPURCHASE AGREEMENTS - 8.98%
Bank of New York Tri-Party
Repurchase Agreement dated
05/29/2009 at 0.18% to be
repurchased at $46,900,704 on
06/01/2009, collateralized by
$69,989,003 Federal National
Mortgage Association, 7.00% due
11/01/2038 (valued at
$47,838,000, including interest) $ 46,900,000 $ 46,900,000
TOTAL REPURCHASE AGREEMENTS
(Cost $46,900,000) $ 46,900,000
Total Investments (Alpha Opportunities Fund)
(Cost $491,185,728) - 104.82% $ 547,329,109
Other assets and liabilities, net - (4.82)% (25,154,325)
Copyright © 2012 www.secdatabase.com. All Rights Reserved.Please Consider the Environment Before Printing This Document

TOTAL NET ASSETS - 100.00% $ 522,174,784
Alternative Asset Allocation FundShares or
Principal
Amount Value
INVESTMENT COMPANIES - 99.90%
Investment Companies - 9.86%
PowerShares DB Commodity Index Tracking
Fund 5,000 $ 116,050
JOHN HANCOCK FUNDS II (g) - 90.04%
Emerging Markets Value (DFA) 23,976 192,048
Floating Rate Income (WAMCO) 18,568 158,757
Global Bond (PIMCO) 9,892 113,462
Global Real Estate (Deutsche) 33,010 179,243
High Income (MFC Global U.S.) (h) 6,752 36,257
High Yield (WAMCO) 3,441 24,571
International Small Cap (Templeton) 5,006 50,163
International Small Company (DFA) 7,533 46,554
Natural Resources (Wellington) 4,521 79,894
Real Return Bond (PIMCO) 12,172 142,537
U.S. High Yield Bond (Wells Capital) 3,338 36,754
1,060,240
TOTAL INVESTMENT COMPANIES (Cost $1,003,595) $ 1,176,290
Total Investments (Alternative Asset Allocation Fund)
(Cost $1,003,595) - 99.90% $ 1,176,290
Other assets and liabilities, net - 0.10% 1,177
TOTAL NET ASSETS - 100.00% $ 1,177,467
American Diversified Growth & Income FundShares or
Principal
Amount Value
INVESTMENT COMPANIES - 100.33%
American Funds Insurance Series - 100.33%
American Capital World Bond Fund, Class R5 21,148 $ 403,293
American High-Income Trust, Class R5 15,165 134,364
Capital Income Builder Fund, Class R5 6,340 268,862
American Diversified Growth & Income Fund(continued)
Shares or
Principal
Amount Value
INVESTMENT COMPANIES (continued)
American Funds Insurance Series
(continued)
Capital World Growth and Income Fund,
Class R5 11,890 338,865
EuroPacific Growth Fund, Class R5 10,778 345,321
Fundamental Investors Fund, Class R5 29,605 808,520
Investment Company of America, Class R5 43,067 941,018
New Perspective Fund, Class R5 12,936 271,388
New World Fund, Class R5 3,589 138,732
Copyright © 2012 www.secdatabase.com. All Rights Reserved.Please Consider the Environment Before Printing This Document

SMALLCAP World Fund, Class R5 5,535 136,761
The Bond Fund of America, Class R5 84,999 940,093
The Growth Fund of America, Class R5 40,967 941,018
The Income Fund of America 20,384 268,862
Washington Mutual Investors Fund, Class R5 38,708 807,068
6,744,165
TOTAL INVESTMENT COMPANIES (Cost $6,537,112) 6,744,165
Total Investments (American Diversified Growth & Income $ 6,744,165
Fund) (Cost $6,537,112) - 100.33%
Other assets and liabilities, net - (0.33)% (22,003)
TOTAL NET ASSETS - 100.00% $ 6,722,162
American Fundamental Holdings FundShares or
Principal
Amount Value
INVESTMENT COMPANIES - 100.56%
American Funds Insurance Series - 100.56%
EuroPacific Growth Fund, Class R5 18,473 591,867
Fundamental Investors Fund, Class R5 19,888 $ 543,144
Investment Company of America, Class R5 24,781 541,457
The Bond Fund of America, Class R5 101,895 1,126,957
The Growth Fund of America, Class R5 23,614 542,423
The Income Fund of America 27,367 360,971
U.S. Government Securities Fund 25,741 360,895
Washington Mutual Investors Fund, Class R5 21,660 451,612
4,519,326
TOTAL INVESTMENT COMPANIES (Cost $4,354,394) $ 4,519,326
Total Investments (American Fundamental Holdings Fund)
(Cost $4,354,394) - 100.56% $ 4,519,326
Other assets and liabilities, net - (0.56)% (24,986)
TOTAL NET ASSETS - 100.00% $ 4,494,340
American Global Diversification FundShares or
Principal
Amount Value
INVESTMENT COMPANIES - 100.57%
American Funds Insurance Series - 100.57%
American High-Income Trust, Class R5 34,861 $ 308,866
Capital Income Builder Fund, Class R5 8,328 353,170
The accompanying notes are an integral part of the financial statements.
30
JOHN HANCOCK FUNDS II
PORTFOLIO OF INVESTMENTS - May 31, 2009 (Unaudited) - continued(showing percentage of total net assets)
American Global Diversification Fund (continued)
Copyright © 2012 www.secdatabase.com. All Rights Reserved.Please Consider the Environment Before Printing This Document

Shares or
Principal
Amount Value
INVESTMENT COMPANIES (continued)
American Funds Insurance Series
(continued)
Capital World Growth and Income Fund,
Class R5 24,822 $ 707,440
EuroPacific Growth Fund, Class R5 13,825 442,946
New Perspective Fund, Class R5 25,343 531,699
New World Fund, Class R5 11,451 442,691
SMALLCAP World Fund, Class R5 28,650 707,940
The Bond Fund of America, Class R5 83,742 926,184
4,420,936
TOTAL INVESTMENT COMPANIES (Cost $4,302,759) $ 4,420,936
Total Investments (American Global Diversification Fund)
(Cost $4,302,759) - 100.57% $ 4,420,936
Other assets and liabilities, net - (0.57)% (25,183)
TOTAL NET ASSETS - 100.00% $ 4,395,753
Blue Chip Growth FundShares or
Principal
Amount Value
COMMON STOCKS - 98.96%
Aerospace - 1.28%
Goodrich Corp. 52,700 $ 2,558,058
Lockheed Martin Corp. 169,800 14,200,374
16,758,432
Agriculture - 0.81%
Monsanto Company 129,704 10,655,184
Apparel & Textiles - 0.40%
NIKE, Inc., Class B 91,800 5,237,190
Auto Parts - 0.32%
O'Reilly Automotive, Inc. * 117,300 4,228,665
Banking - 2.72%
Bank of New York Mellon Corp. 418,439 11,624,236
Northern Trust Corp. 321,611 18,540,874
PNC Financial Services Group, Inc. 42,300 1,926,765
U.S. Bancorp 183,200 3,517,440
35,609,315
Biotechnology - 0.25%
Amgen, Inc. * 45,300 2,262,282
Genzyme Corp. * 16,100 952,154
3,214,436
Broadcasting - 1.09%
Discovery Communications, Inc., Series A * 378,500 8,497,325
Discovery Communications, Inc., Series C * 275,400 5,739,336
14,236,661
Business Services - 2.10%
Accenture, Ltd., Class A 226,000 6,764,180
Automatic Data Processing, Inc. 2,067 78,567
Fiserv, Inc. * 288,100 12,203,916
Fluor Corp. 103,600 4,867,128
Copyright © 2012 www.secdatabase.com. All Rights Reserved.Please Consider the Environment Before Printing This Document

Blue Chip Growth Fund (continued)Shares or
Principal
Amount Value
COMMON STOCKS (continued)
Business Services (continued)
Moody's Corp. 132,000 $ 3,615,480
27,529,271
Cable & Television - 0.53%
Time Warner, Inc. 293,633 6,876,885
Cellular Communications - 0.52%
MetroPCS Communications, Inc. * 394,000 6,749,220
Chemicals - 2.21%
Potash Corp. of Saskatchewan, Inc. 94,200 10,912,128
Praxair, Inc. 246,300 18,029,160
28,941,288
Computers & Business Equipment - 9.36%
Apple, Inc. * 478,100 64,930,761
Cisco Systems, Inc. * 474,882 8,785,317
Dell, Inc. * 2,327 26,946
Hewlett-Packard Company 30,200 1,037,370
Juniper Networks, Inc. * 943,279 23,327,290
Research In Motion, Ltd. * 310,000 24,378,400
122,486,084
Cosmetics & Toiletries - 0.01%
Procter & Gamble Company 1,628 84,558
Crude Petroleum & Natural Gas - 1.35%
EOG Resources, Inc. 146,300 10,707,697
Southwestern Energy Company * 161,100 7,003,017
17,710,714
Domestic Oil - 0.51%
Suncor Energy, Inc. 190,400 6,742,064
Drugs & Health Care - 0.51%
Wyeth 147,546 6,618,914
Educational Services - 0.57%
Apollo Group, Inc., Class A * 125,700 7,428,870
Electrical Utilities - 0.09%
Entergy Corp. 16,100 1,201,382
Energy - 1.34%
First Solar, Inc. * 54,700 10,393,000
NRG Energy, Inc. * 320,200 7,204,500
17,597,500
Financial Services - 16.47%
American Express Company 413,848 10,284,123
Ameriprise Financial, Inc. 112,489 3,397,168
Bank of America Corp. 504,400 5,684,588
BlackRock, Inc. 15,570 2,483,415
Charles Schwab Corp. 591,914 10,417,686
CME Group, Inc. 13,450 4,326,058
Credit Suisse Group AG 1,600 71,602
Franklin Resources, Inc. 311,135 20,799,375
Goldman Sachs Group, Inc. 225,924 32,661,833
IntercontinentalExchange, Inc. * 141,850 15,290,011
JPMorgan Chase & Company 526,500 19,427,850
MasterCard, Inc., Class A 73,960 13,041,367
Morgan Stanley 436,700 13,240,744
State Street Corp. 595,029 27,639,097
Visa, Inc. 199,300 13,494,603
The accompanying notes are an integral part of the financial statements.
Copyright © 2012 www.secdatabase.com. All Rights Reserved.Please Consider the Environment Before Printing This Document

31
JOHN HANCOCK FUNDS II
PORTFOLIO OF INVESTMENTS - May 31, 2009 (Unaudited) - continued(showing percentage of total net assets)
Blue Chip Growth Fund (continued)Shares or
Principal
Amount Value
COMMON STOCKS (continued)
Financial Services (continued)
Wells Fargo & Company 565,600 $ 14,422,800
Western Union Company 498,900 8,795,607
215,477,927
Food & Beverages - 0.80%
PepsiCo, Inc. 60,366 3,142,050
The Coca-Cola Company 149,000 7,324,840
10,466,890
Healthcare Products - 3.42%
Alcon, Inc. 17,400 1,887,900
Baxter International, Inc. 203,300 10,406,927
Becton, Dickinson & Company 31,200 2,111,616
C.R. Bard, Inc. 43,300 3,095,517
Intuitive Surgical, Inc. * 11,250 1,683,900
Medtronic, Inc. 119,146 4,092,665
St. Jude Medical, Inc. * 441,164 17,214,220
Stryker Corp. 109,921 4,225,363
44,718,108
Healthcare Services - 5.27%
Cardinal Health, Inc. 22,500 804,375
Cerner Corp. * 15,400 897,666
Express Scripts, Inc. * 306,200 19,612,110
McKesson Corp. 270,400 11,126,960
Medco Health Solutions, Inc. * 611,700 28,070,913
WellPoint, Inc. * 182,528 8,500,329
69,012,353
Hotels & Restaurants - 2.91%
Marriott International, Inc., Class A 388,912 9,084,984
McDonald's Corp. 261,300 15,414,087
Wynn Resorts, Ltd. * 200 7,412
Yum! Brands, Inc. 393,200 13,616,516
38,122,999
Industrial Machinery - 1.00%
Cameron International Corp. * 139,700 4,362,831
FMC Technologies, Inc. * 194,600 8,099,252
W.W. Grainger, Inc. 7,700 606,991
13,069,074
Industrials - 0.10%
Fastenal Company 38,900 1,292,258
Insurance - 0.04%
Aon Corp. 15,300 550,800
International Oil - 1.36%
Chevron Corp. 6,200 413,354
Exxon Mobil Corp. 35,962 2,493,965
Petroleo Brasileiro SA, SADR 427,600 14,953,172
Copyright © 2012 www.secdatabase.com. All Rights Reserved.Please Consider the Environment Before Printing This Document

17,860,491
Internet Content - 3.79%
Google, Inc., Class A * 118,784 49,560,248
Internet Retail - 4.91%
Amazon.com, Inc. * 651,111 50,780,147
eBay, Inc. * 1,662 29,284
Expedia, Inc. * 324,300 5,613,633
Blue Chip Growth Fund (continued)Shares or
Principal
Amount Value
COMMON STOCKS (continued)
Internet Retail (continued)
Priceline.com, Inc. * 71,000 $ 7,817,810
64,240,874
Internet Software - 3.30%
Electronic Arts, Inc. * 415,896 9,561,449
McAfee, Inc. * 390,600 15,323,238
Tencent Holdings, Ltd. 1,026,200 11,427,970
VeriSign, Inc. * 293,600 6,873,176
43,185,833
Manufacturing - 2.69%
Danaher Corp. 582,937 35,180,248
Metal & Metal Products - 0.13%
Precision Castparts Corp. 20,600 1,700,942
Mining - 0.13%
Freeport-McMoRan Copper & Gold, Inc.,
Class B 32,200 1,752,646
Petroleum Services - 3.75%
Schlumberger, Ltd. 505,408 28,924,500
Smith International, Inc. 691,128 20,174,026
49,098,526
Pharmaceuticals - 5.18%
Allergan, Inc. 358,900 15,838,257
Celgene Corp. * 348,700 14,729,088
Gilead Sciences, Inc. * 599,438 25,835,778
Novo Nordisk AS 22,300 1,161,230
Roche Holdings AG - Genusschein 1,606 219,157
Schering-Plough Corp. 1,100 26,840
Teva Pharmaceutical Industries, Ltd., SADR 214,500 9,944,220
67,754,570
Publishing - 1.25%
McGraw-Hill Companies, Inc. 543,000 16,338,870
Railroads & Equipment - 0.12%
Union Pacific Corp. 31,300 1,542,151
Retail Trade - 4.90%
Bed Bath & Beyond, Inc. * 320,200 9,000,822
Best Buy Company, Inc. 15,100 530,010
Costco Wholesale Corp. 15,300 742,356
CVS Caremark Corp. 490,232 14,608,913
Kohl's Corp. * 356,770 15,152,022
Lowe's Companies, Inc. 180,100 3,423,701
Wal-Mart Stores, Inc. 415,336 20,658,813
64,116,637
Sanitary Services - 0.05%
Republic Services, Inc. 31,700 722,443
Semiconductors - 3.54%
Altera Corp. 354,000 6,025,080
Broadcom Corp., Class A * 434,500 11,071,060
Copyright © 2012 www.secdatabase.com. All Rights Reserved.Please Consider the Environment Before Printing This Document

Marvell Technology Group, Ltd. * 1,363,090 15,580,119
Xilinx, Inc. 656,375 13,613,217
46,289,476
Software - 3.08%
Adobe Systems, Inc. * 110,525 3,114,595
Autodesk, Inc. * 105,000 2,253,300
The accompanying notes are an integral part of the financial statements.
32
JOHN HANCOCK FUNDS II
PORTFOLIO OF INVESTMENTS - May 31, 2009 (Unaudited) - continued(showing percentage of total net assets)
Blue Chip Growth Fund (continued)Shares or
Principal
Amount Value
COMMON STOCKS (continued)
Software (continued)
Microsoft Corp. 1,557,666 $ 32,539,643
Oracle Corp. 119,638 2,343,708
40,251,246
Telecommunications Equipment &
Services - 4.30%
American Tower Corp., Class A * 650,162 20,720,663
Corning, Inc. 321,600 4,727,520
QUALCOMM, Inc. 706,723 30,806,055
56,254,238
Toys, Amusements & Sporting Goods - 0.10%
Nintendo Company, Ltd. 4,600 1,249,697
Transportation - 0.40%
Expeditors International of Washington, Inc. 160,600 5,269,286
TOTAL COMMON STOCKS (Cost $1,196,157,445) $ 1,294,985,464
SHORT TERM INVESTMENTS - 0.85%
John Hancock Collateral Investment
Trust, 0.7339% (c)(g) $ 742,058 $ 7,420,579
T. Rowe Price Reserve Investment Fund,
0.5211% 3,742,205 3,742,205
TOTAL SHORT TERM INVESTMENTS
(Cost $11,162,784) $ 11,162,784
REPURCHASE AGREEMENTS - 0.07%
Repurchase Agreement with State
Street Corp. dated 05/29/2009 at
0.07% to be repurchased at
$841,005 on 06/01/2009,
collateralized by $675,000 U.S.
Treasury Bonds, 7.50% due
11/15/2016 (valued at $862,988,
including interest) $ 841,000 $ 841,000
TOTAL REPURCHASE AGREEMENTS
(Cost $841,000) $ 841,000
Total Investments (Blue Chip Growth Fund)
(Cost $1,208,161,229) - 99.88% $ 1,306,989,248
Other assets and liabilities, net - 0.12% 1,585,268
TOTAL NET ASSETS - 100.00% $ 1,308,574,516
Copyright © 2012 www.secdatabase.com. All Rights Reserved.Please Consider the Environment Before Printing This Document

Capital Appreciation FundShares or
Principal
Amount Value
COMMON STOCKS - 97.23%
Aerospace - 1.95%
Lockheed Martin Corp. 222,100 $ 18,574,223
Agriculture - 1.87%
Monsanto Company 216,700 17,801,905
Apparel & Textiles - 2.14%
Coach, Inc. * 154,690 4,063,706
NIKE, Inc., Class B 286,642 16,352,926
20,416,632
Capital Appreciation Fund (continued)Shares or
Principal
Amount Value
COMMON STOCKS (continued)
Computers & Business Equipment - 12.26%
Apple, Inc. * 226,176 $ 30,716,963
Cisco Systems, Inc. * 1,239,630 22,933,155
Hewlett-Packard Company 505,000 17,346,750
International Business Machines Corp. 174,700 18,567,116
Research In Motion, Ltd. * 345,900 27,201,576
116,765,560
Cosmetics & Toiletries - 1.46%
Colgate-Palmolive Company 210,300 13,869,285
Crude Petroleum & Natural Gas - 5.43%
Occidental Petroleum Corp. 285,200 19,139,772
Southwestern Energy Company * 459,900 19,991,853
XTO Energy, Inc. 294,700 12,604,319
51,735,944
Domestic Oil - 0.54%
Suncor Energy, Inc. 144,600 5,120,286
Energy - 1.96%
First Solar, Inc. * (a) 98,000 18,620,000
Financial Services - 11.14%
Bank of America Corp. 573,200 6,459,964
Charles Schwab Corp. 1,039,231 18,290,465
Goldman Sachs Group, Inc. 209,510 30,288,861
MasterCard, Inc., Class A 112,300 19,801,859
Visa, Inc. 461,800 31,268,478
106,109,627
Food & Beverages - 2.81%
Cadbury PLC 1,170,300 10,229,152
PepsiCo, Inc. 318,535 16,579,747
26,808,899
Healthcare Products - 4.56%
Alcon, Inc. (a) 192,619 20,899,162
Baxter International, Inc. 440,400 22,544,076
43,443,238
Healthcare Services - 2.20%
Medco Health Solutions, Inc. * 456,900 20,967,141
International Oil - 1.39%
Copyright © 2012 www.secdatabase.com. All Rights Reserved.Please Consider the Environment Before Printing This Document

Petroleo Brasileiro SA, ADR 299,600 13,191,388
Internet Content - 5.02%
Google, Inc., Class A * 114,693 47,853,360
Internet Retail - 3.21%
Amazon.com, Inc. * 392,400 30,603,276
Internet Service Provider - 1.06%
Baidu.com, Inc., SADR * 38,300 10,109,285
Leisure Time - 1.47%
Walt Disney Company 576,200 13,955,564
Petroleum Services - 1.71%
Schlumberger, Ltd. 167,494 9,585,682
Weatherford International, Ltd. * 325,900 6,746,130
16,331,812
Pharmaceuticals - 12.91%
Abbott Laboratories 275,700 12,423,042
The accompanying notes are an integral part of the financial statements.
33
JOHN HANCOCK FUNDS II
PORTFOLIO OF INVESTMENTS - May 31, 2009 (Unaudited) - continued(showing percentage of total net assets)
Capital Appreciation Fund (continued)Shares or
Principal
Amount Value
COMMON STOCKS (continued)
Pharmaceuticals (continued)
Celgene Corp. * 401,200 $ 16,946,688
Gilead Sciences, Inc. * 802,072 34,569,303
Mylan, Inc. * (a) 433,500 5,726,535
Roche Holding AG, SADR 437,500 14,980,000
Shire Pharmaceuticals Group PLC, ADR 191,270 7,975,959
Teva Pharmaceutical Industries, Ltd., SADR (a) 555,600 25,757,616
Vertex Pharmaceuticals, Inc. * 152,300 4,540,063
122,919,206
Retail Trade - 8.12%
Costco Wholesale Corp. 316,900 15,375,988
CVS Caremark Corp. 587,600 17,510,480
Home Depot, Inc. 193,000 4,469,880
Kohl's Corp. * 229,600 9,751,112
Staples, Inc. 230,300 4,709,635
Tiffany & Company 89,611 2,542,264
Wal-Mart Stores, Inc. 461,000 22,930,140
77,289,499
Semiconductors - 4.30%
Analog Devices, Inc. 143,000 3,490,630
Applied Materials, Inc. 1,044,900 11,765,574
Intel Corp. 1,167,940 18,360,017
KLA-Tencor Corp. 271,400 7,327,800
40,944,021
Software - 4.85%
Adobe Systems, Inc. * 594,315 16,747,797
Microsoft Corp. 325,341 6,796,373
Oracle Corp. 640,600 12,549,354
SAP AG, SADR (a) 233,400 10,117,890
46,211,414
Copyright © 2012 www.secdatabase.com. All Rights Reserved.Please Consider the Environment Before Printing This Document

Telecommunications Equipment &
Services - 4.87%
QUALCOMM, Inc. 1,064,300 46,392,837
TOTAL COMMON STOCKS (Cost $835,056,336) $ 926,034,402
SHORT TERM INVESTMENTS - 1.77%
John Hancock Collateral Investment
Trust, 0.7339% (c)(g) $ 1,687,377 $ 16,873,768
TOTAL SHORT TERM INVESTMENTS
(Cost $16,873,768) $ 16,873,768
Capital Appreciation Fund (continued)Shares or
Principal
Amount Value
REPURCHASE AGREEMENTS - 5.43%
Repurchase Agreement with State
Street Corp. dated 05/29/2009 at
0.07% to be repurchased at
$51,711,302 on 6/1/2009,
collateralized by $52,550,000
Federal Home Loan Bank, 0.875%
due 03/30/2010 (valued at
$52,747,063, including interest) $ 51,711,000 $ 51,711,000
TOTAL REPURCHASE AGREEMENTS
(Cost $51,711,000) $ 51,711,000
Total Investments (Capital Appreciation Fund)
(Cost $903,641,104) - 104.43% $ 994,619,170
Other assets and liabilities, net - (4.43)% (42,183,930)
TOTAL NET ASSETS - 100.00% $ 952,435,240
Core Bond FundShares or
Principal
Amount Value
U.S. TREASURY OBLIGATIONS - 16.42%
U.S. Treasury Bonds - 2.92%
3.50% due 02/15/2039 $ 3,990,000 $ 3,438,263
4.375% due 02/15/2038 543,000 545,460
4.50% due 05/15/2038 1,000 1,027
5.00% due 05/15/2037 700 773
5.375% due 02/15/2031 3,806,000 4,344,191
8,329,714
U.S. Treasury Notes - 13.50%
0.875% due 04/30/2011 17,835,000 17,832,146
1.25% due 11/30/2010 73,000 73,622
1.50% due 12/31/2013 89,000 86,434
1.75% due 03/31/2014 1,248,000 1,217,189
1.875% due 04/30/2014 7,466,000 7,310,848
2.00% due 11/30/2013 204,000 202,693
2.75% due 02/15/2019 2,885,000 2,711,237
3.125% due 05/15/2019 7,320,000 7,110,721
3.75% due 11/15/2018 167,000 170,679
3.875% due 05/15/2018 1,412,000 1,464,950
4.00% due 08/15/2018 292,600 305,470
38,485,989
Copyright © 2012 www.secdatabase.com. All Rights Reserved.Please Consider the Environment Before Printing This Document

TOTAL U.S. TREASURY OBLIGATIONS
(Cost $47,695,664) $ 46,815,703
U.S. GOVERNMENT AGENCY OBLIGATIONS - 48.45%
Federal Home Loan Mortgage Corp. - 15.86%
3.57% due 06/15/2029 127,231 129,157
3.90% due 01/15/2023 480,945 493,204
4.00% due 09/01/2018 504,146 514,879
4.50% due 06/15/2025 409,000 399,157
5.00% due 10/01/2014 to 04/01/2023 5,730,862 5,954,735
5.50% due 01/01/2017 to 12/01/2037 23,813,150 24,895,206
5.50% TBA ** 10,000,000 10,295,312
5.977% due 11/01/2037 (b) 122,822 128,511
6.00% due 08/01/2016 to 03/01/2034 1,332,873 1,411,143
6.254% due 03/01/2037 (b) 3,567 3,710
6.371% due 10/01/2037 (b) 242,116 254,300
The accompanying notes are an integral part of the financial statements.
34
JOHN HANCOCK FUNDS II
PORTFOLIO OF INVESTMENTS - May 31, 2009 (Unaudited) - continued(showing percentage of total net assets)
Core Bond Fund (continued)Shares or
Principal
Amount Value
U.S. GOVERNMENT AGENCY
OBLIGATIONS (continued)
Federal Home Loan Mortgage Corp.
(continued)
6.50% due 07/01/2034 $ 676,668 $ 726,704
45,206,018
Federal National Mortgage
Association - 26.38%
4.50% due 09/01/2034 to 05/01/2039 3,076,987 3,114,451
4.50% TBA ** 6,500,000 6,527,422
5.00% due 04/01/2024 to 07/01/2035 12,255,179 12,621,850
5.50% due 01/01/2019 to 12/01/2038 23,709,531 24,802,347
5.50% TBA ** 9,500,000 9,855,625
5.561% due 11/01/2038 (b) 4,263,403 4,426,439
5.768% due 08/01/2037 (b) 499,789 524,355
5.884% due 02/01/2037 (b) 183,514 191,167
5.936% due 01/01/2037 to 03/01/2037 (b) 537,468 561,378
5.981% due 04/01/2037 (b) 224,810 234,935
6.00% due 12/01/2020 to 02/01/2039 5,996,736 6,335,662
6.02% due 01/01/2037 (b) 220,913 230,477
6.037% due 10/01/2037 (b) 344,987 361,462
6.11% due 12/01/2036 to 11/01/2037 (b) 719,685 752,669
6.207% due 09/01/2037 (b) 568,418 596,347
6.50% due 12/01/2037 2,305,477 2,454,342
7.00% due 08/01/2028 to 06/01/2035 1,467,381 1,600,284
75,191,212
Government National Mortgage
Association - 6.21%
4.50% TBA ** 8,000,000 8,032,500
5.50% TBA ** 3,000,000 3,107,813
Copyright © 2012 www.secdatabase.com. All Rights Reserved.Please Consider the Environment Before Printing This Document

6.00% TBA ** 5,000,000 5,217,969
6.50% due 12/15/2032 1,247,875 1,338,717
17,696,999
TOTAL U.S. GOVERNMENT AGENCY OBLIGATIONS
(Cost $136,706,001) $ 138,094,229
FOREIGN GOVERNMENT OBLIGATIONS - 0.69%
South Africa - 0.20%
South Africa Government International Bond
6.875% due 05/27/2019 555,000 557,775
South Korea - 0.49%
Republic of Korea
7.125% due 04/16/2019 1,325,000 1,396,219
TOTAL FOREIGN GOVERNMENT OBLIGATIONS
(Cost $1,910,348) $ 1,953,994
CORPORATE BONDS - 29.12%
Automobiles - 0.17%
DaimlerChrysler N.A. Holding Corp.
6.50% due 11/15/2013 490,000 490,725
Banking - 2.32%
Bank of America Corp.
5.375% due 06/15/2014 145,000 140,011
5.75% due 12/01/2017 540,000 482,319
7.375% due 05/15/2014 650,000 684,070
7.625% due 06/01/2019 1,355,000 1,370,504
Credit Suisse New York
5.50% due 05/01/2014 1,025,000 1,035,249
Core Bond Fund (continued)Shares or
Principal
Amount Value
CORPORATE BONDS (continued)
Banking (continued)
Credit Suisse New York (continued)
6.00% due 02/15/2018 $ 855,000 $ 794,609
Credit Suisse New York, MTN
5.00% due 05/15/2013 760,000 756,254
HSBC Holdings PLC
6.80% due 06/01/2038 235,000 221,453
US Bank NA, MTN
5.92% due 05/25/2012 1,068,289 1,124,706
6,609,175
Biotechnology - 0.18%
Amgen, Inc.
6.40% due 02/01/2039 505,000 515,099
Broadcasting - 0.75%
British Sky Broadcasting Group PLC
9.50% due 11/15/2018 (f) 1,855,000 2,127,663
Business Services - 0.07%
Thomson Reuters Corp.
5.95% due 07/15/2013 210,000 213,362
Cable & Television - 0.55%
AT&T Broadband Corp.
8.375% due 03/15/2013 1,272,000 1,416,867
Rogers Cable, Inc.
5.50% due 03/15/2014 145,000 146,028
1,562,895
Copyright © 2012 www.secdatabase.com. All Rights Reserved.Please Consider the Environment Before Printing This Document

Cellular Communications - 2.07%
Rogers Wireless, Inc.
6.375% due 03/01/2014 820,000 852,013
Verizon Wireless Capital LLC
3.75% due 05/20/2011 (f) 1,075,000 1,096,792
5.55% due 02/01/2014 (f) 1,220,000 1,290,150
7.375% due 11/15/2013 (f) 1,745,000 1,958,064
8.50% due 11/15/2018 (f) 585,000 709,740
5,906,759
Chemicals-Diversified - 0.88%
Dow Chemical Company
7.60% due 05/15/2014 1,630,000 1,649,893
8.55% due 05/15/2019 865,000 864,915
2,514,808
Commercial Services - 0.20%
Hutchison Whampoa International, Ltd.
7.625% due 04/09/2019 (f) 525,000 558,879
Computers & Business Equipment - 0.62%
Cisco Systems, Inc.
5.90% due 02/15/2039 240,000 232,469
Hewlett-Packard Company
4.75% due 06/02/2014 804,000 842,068
International Business Machines Corp.
7.625% due 10/15/2018 210,000 247,878
Xerox Corp.
6.35% due 05/15/2018 250,000 217,500
8.25% due 05/15/2014 215,000 218,216
1,758,131
The accompanying notes are an integral part of the financial statements.
35
JOHN HANCOCK FUNDS II
PORTFOLIO OF INVESTMENTS - May 31, 2009 (Unaudited) - continued(showing percentage of total net assets)
Core Bond Fund (continued)Shares or
Principal
Amount Value
CORPORATE BONDS (continued)
Crude Petroleum & Natural Gas - 2.02%
Anadarko Petroleum Corp.
7.625% due 03/15/2014 $ 1,740,000 $ 1,866,964
8.70% due 03/15/2019 970,000 1,080,082
Petrobras International Finance Company
5.875% due 03/01/2018 259,000 253,065
7.875% due 03/15/2019 615,000 670,350
Ras Laffan Liquefied Natural Gas Company, Ltd. III
6.332% due 09/30/2027 (f) 355,000 317,853
Spectra Energy Capital LLC
7.50% due 09/15/2038 205,000 184,646
StatoilHydro ASA
5.25% due 04/15/2019 485,000 489,917
Weatherford International, Inc.
5.95% due 06/15/2012 170,000 167,563
6.35% due 06/15/2017 200,000 187,215
XTO Energy, Inc.
Copyright © 2012 www.secdatabase.com. All Rights Reserved.Please Consider the Environment Before Printing This Document

5.75% due 12/15/2013 505,000 527,461
5,745,116
Domestic Oil - 0.40%
Valero Energy Corp.
9.375% due 03/15/2019 1,010,000 1,130,673
Drugs & Health Care - 0.10%
GlaxoSmithKline Capital, Inc.
6.375% due 05/15/2038 275,000 290,639
Electrical Utilities - 1.74%
Allegheny Energy Supply Company LLC
8.25% due 04/15/2012 (f) 450,000 467,802
Commonwealth Edison
6.15% due 09/15/2017 335,000 340,015
Dominion Resources, Inc.
8.875% due 01/15/2019 1,520,000 1,778,902
DPL, Inc.
6.875% due 09/01/2011 465,000 492,023
FPL Group Capital, Inc.
6.00% due 03/01/2019 660,000 686,235
Nevada Power Company, Series A
8.25% due 06/01/2011 565,000 596,339
Progress Energy, Inc.
6.85% due 04/15/2012 215,000 229,594
San Diego Gas & Electric Company
6.00% due 06/01/2039 150,000 152,479
Southern Company
4.15% due 05/15/2014 215,000 215,206
4,958,595
Electric-Integrated - 0.06%
Public Service Company of Colorado
5.125% due 06/01/2019 175,000 179,235
Energy - 0.25%
Duke Energy Corp.
6.30% due 02/01/2014 670,000 710,673
Financial Services - 8.32%
American Express Company
7.25% due 05/20/2014 535,000 546,183
8.15% due 03/19/2038 600,000 583,939
Capital One Financial Corp.
7.375% due 05/23/2014 430,000 443,048
Core Bond Fund (continued)Shares or
Principal
Amount Value
CORPORATE BONDS (continued)
Financial Services (continued)
Citigroup Funding, Inc.
2.00% due 03/30/2012 $ 920,000 $ 924,820
Citigroup, Inc.
6.125% due 05/15/2018 1,355,000 1,208,843
6.50% due 08/19/2013 2,490,000 2,467,528
Goldman Sachs Capital II
5.793% due 12/29/2049 (b) 1,540,000 893,442
Goldman Sachs Group, Inc.
2.15% due 03/15/2012 1,100,000 1,114,798
5.125% due 01/15/2015 280,000 272,569
5.15% due 01/15/2014 330,000 323,823
5.45% due 11/01/2012 1,080,000 1,106,540
6.00% due 05/01/2014 965,000 981,145
6.75% due 10/01/2037 735,000 616,169
Copyright © 2012 www.secdatabase.com. All Rights Reserved.Please Consider the Environment Before Printing This Document

7.50% due 02/15/2019 711,000 748,150
JPMorgan Chase & Company
4.65% due 06/01/2014 855,000 849,244
5.375% due 10/01/2012 1,080,000 1,128,331
6.30% due 04/23/2019 1,655,000 1,646,574
JPMorgan Chase Bank NA, BKNT
6.00% due 10/01/2017 910,000 874,222
JPMorgan Chase Capital XXV, Series Y
6.80% due 10/01/2037 410,000 346,652
Lazard Group LLC
6.85% due 06/15/2017 485,000 419,505
7.125% due 05/15/2015 545,000 475,547
Merrill Lynch & Company, Inc.
5.45% due 02/05/2013 110,000 102,535
Morgan Stanley
5.30% due 03/01/2013 1,010,000 1,012,903
6.00% due 05/13/2014 2,685,000 2,698,156
7.30% due 05/13/2019 675,000 691,431
Morgan Stanley, MTN
5.95% due 12/28/2017 760,000 713,982
6.625% due 04/01/2018 535,000 528,891
23,718,970
Food & Beverages - 1.26%
Anheuser-Busch InBev Worldwide, Inc.
6.875% due 11/15/2019 (f) 360,000 364,121
7.75% due 01/15/2019 (f) 850,000 914,300
Diageo Capital PLC
7.375% due 01/15/2014 170,000 188,934
Kellogg Company
4.45% due 05/30/2016 320,000 317,313
Kraft Foods, Inc.
6.125% due 02/01/2018 1,605,000 1,637,782
6.75% due 02/19/2014 145,000 157,737
3,580,187
Gas & Pipeline Utilities - 1.44%
Energy Transfer Partners LP
8.50% due 04/15/2014 1,080,000 1,201,946
9.00% due 04/15/2019 815,000 909,856
Kinder Morgan, Inc.
6.50% due 09/01/2012 1,750,000 1,693,125
TransCanada Pipelines, Ltd.
7.625% due 01/15/2039 285,000 313,135
4,118,062
The accompanying notes are an integral part of the financial statements.
36
JOHN HANCOCK FUNDS II
PORTFOLIO OF INVESTMENTS - May 31, 2009 (Unaudited) - continued(showing percentage of total net assets)
Core Bond Fund (continued)Shares or
Principal
Amount Value
CORPORATE BONDS (continued)
Healthcare Products - 0.39%
Roche Holdings, Inc.
Copyright © 2012 www.secdatabase.com. All Rights Reserved.Please Consider the Environment Before Printing This Document

6.00% due 03/01/2019 $ 1,076,000 $ 1,114,401
Healthcare Services - 0.20%
Coventry Health Care, Inc.
5.95% due 03/15/2017 445,000 338,209
UnitedHealth Group, Inc.
6.875% due 02/15/2038 255,000 225,976
564,185
Hotels & Restaurants - 0.08%
Yum! Brands, Inc.
6.875% due 11/15/2037 270,000 240,200
Insurance - 0.06%
Liberty Mutual Group, Inc.
7.50% due 08/15/2036 (f) 263,000 168,591
International Oil - 1.04%
BP AMI Leasing, Inc.
5.523% due 05/08/2019 (f) 1,540,000 1,537,063
Husky Energy, Inc.
5.90% due 06/15/2014 260,000 265,795
6.80% due 09/15/2037 240,000 215,675
7.25% due 12/15/2019 765,000 798,341
Weatherford International, Ltd.
9.625% due 03/01/2019 120,000 135,429
2,952,303
Mining - 0.08%
Rio Tinto Finance USA, Ltd.
5.875% due 07/15/2013 245,000 239,285
Pharmaceuticals - 0.72%
Pfizer, Inc.
6.20% due 03/15/2019 665,000 711,756
7.20% due 03/15/2039 785,000 887,479
Schering-Plough Corp.
6.55% due 09/15/2037 440,000 446,669
2,045,904
Pipelines - 0.03%
Plains All American Pipeline LP
6.50% due 05/01/2018 81,000 78,238
Real Estate - 1.46%
HCP, Inc.
6.00% due 01/30/2017 80,000 67,027
HCP, Inc., MTN
6.70% due 01/30/2018 120,000 102,998
Health Care Property Investors, Inc.
6.30% due 09/15/2016 125,000 106,945
Health Care Property, Inc.
5.65% due 12/15/2013 775,000 692,703
WEA Finance LLC
7.125% due 04/15/2018 (f) 1,435,000 1,345,179
7.50% due 06/02/2014 (f) 1,275,000 1,260,532
Westfield Group
5.40% due 10/01/2012 (f) 606,000 581,427
4,156,811
Core Bond Fund (continued)Shares or
Principal
Amount Value
CORPORATE BONDS (continued)
Retail Trade - 0.26%
Copyright © 2012 www.secdatabase.com. All Rights Reserved.Please Consider the Environment Before Printing This Document

Nordstrom, Inc.
6.75% due 06/01/2014 $ 750,000 $ 754,932
Telecommunications Equipment &
Services - 0.17%
France Telecom SA
7.75% due 03/01/2011 455,000 494,822
Telephone - 0.68%
British Telecommunications PLC
9.125% due 12/15/2030 665,000 698,410
Qwest Corp.
7.50% due 10/01/2014 430,000 410,650
Telefonica Emisiones SAU
5.984% due 06/20/2011 455,000 480,521
Verizon Communications, Inc.
6.35% due 04/01/2019 215,000 225,928
7.35% due 04/01/2039 120,000 126,271
1,941,780
Tobacco - 0.44%
Altria Group, Inc.
9.70% due 11/10/2018 885,000 1,007,202
9.95% due 11/10/2038 215,000 240,101
1,247,303
Utility Service - 0.11%
Pacificorp
6.25% due 10/15/2037 290,000 302,560
TOTAL CORPORATE BONDS (Cost $81,602,157) $ 82,990,961
COLLATERALIZED MORTGAGE
OBLIGATIONS - 16.32%
American Tower Trust, Series 2007-1A, Class AFX
5.4197% due 04/15/2037 (f) 484,000 430,760
Banc of America Commercial Mortgage, Inc.,
Series 2004-2, Class A3
4.05% due 11/10/2038 156,000 149,629
Banc of America Commercial Mortgage, Inc.,
Series 2006-5, Class A2
5.317% due 09/10/2047 249,000 231,330
Banc of America Commercial Mortgage, Inc.,
Series 2007-2, Class A2
5.634% due 04/10/2049 (b) 1,170,000 1,082,091
Banc of America Commercial Mortgage, Inc.,
Series 2000-1, Class A2A
7.333% due 11/15/2031 (b) 337,464 339,107
Banc of America Commercial Mortgage, Inc.,
Series 2002-PB2, Class B
6.309% due 06/11/2035 143,000 135,960
Banc of America Commercial Mortgage, Inc.,
Series 2003-1, Class A2
4.648% due 09/11/2036 318,000 295,286
Banc of America Commercial Mortgage, Inc.,
Series 2004-2, Class A5
4.58% due 02/10/2014 78,000 69,515
Bear Stearns Commercial Mortgage Securities,
Inc., Series 2001-TOP4, Class A3
5.61% due 11/15/2033 132,000 132,031
The accompanying notes are an integral part of the financial statements.
37
JOHN HANCOCK FUNDS II
Copyright © 2012 www.secdatabase.com. All Rights Reserved.Please Consider the Environment Before Printing This Document

PORTFOLIO OF INVESTMENTS - May 31, 2009 (Unaudited) - continued(showing percentage of total net assets)
Core Bond Fund (continued)Shares or
Principal
Amount Value
COLLATERALIZED MORTGAGE
OBLIGATIONS (continued)
Bear Stearns Commercial Mortgage Securities,
Inc., Series 2002-PBW1, Class A2
4.72% due 11/11/2035 (b) $ 246,000 $ 238,365
Bear Stearns Commercial Mortgage Securities,
Inc., Series 2004-PWR6, Class A6
4.825% due 11/11/2041 88,000 78,139
Bear Stearns Commercial Mortgage Securities,
Series 2003-T12, Class A3
4.24% due 08/13/2039 (b) 127,000 123,587
Bear Stearns Commercial Mortgage Securities,
Series 2005-PW10, Class A4
5.405% due 12/11/2040 917,000 830,940
Bear Stearns Commercial Mortgage Securities,
Series 2007-PW16, Class A2
5.6672% due 06/11/2040 (b) 3,069,000 2,883,897
Bear Stearns Commercial Mortgage Securities,
Series 2002-TOP8, Class A2
4.83% due 08/15/2038 730,000 694,991
Commercial Mortgage Asset Trust
6.975% due 01/17/2032 203,000 210,331
Commercial Mortgage Pass Through Certificates,
Series 2001-J2A, Class A2
6.096% due 07/16/2034 868,000 869,544
Countrywide Alternative Loan Trust,
Series 2006-OC6, Class 2A1
0.3787% due 07/25/2036 (b) 238,980 202,080
CS First Boston Mortgage Securities Corp.
6.53% due 06/15/2034 451,000 456,060
CS First Boston Mortgage Securities Corp., Series
2002-CP5, Class A2
4.94% due 12/15/2035 616,000 587,229
CS First Boston Mortgage Securities Corp.,
Series 2001-CF2, Class A4
6.505% due 02/15/2034 124,373 127,781
CS First Boston Mortgage Securities Corp.,
Series 2001-CK1, Class A3
6.38% due 12/18/2035 172,723 174,311
CS First Boston Mortgage Securities Corp.,
Series 2001-CKN5, Class A4
5.435% due 09/15/2034 174,311 174,517
CS First Boston Mortgage Securities Corp.,
Series 2002-CKN2, Class A3
6.133% due 04/15/2037 33,000 32,717
CS First Boston Mortgage Securities Corp.,
Series 2002-CKS4, Class A2
5.183% due 11/15/2036 1,017,000 981,500
CS First Boston Mortgage Securities Corp.,
Series 2003-C5, Class A4
4.90% due 12/15/2036 (b) 210,000 195,423
CS First Boston Mortgage Securities Corp.,
Series 2003-CK2, Class A4
4.801% due 03/15/2036 180,000 172,988
CS First Boston Mortgage Securities Corp.,
Series 2003-CPN1, Class A2
4.597% due 03/15/2035 131,000 121,518
DLJ Commercial Mortgage Corp.,
Copyright © 2012 www.secdatabase.com. All Rights Reserved.Please Consider the Environment Before Printing This Document

Series 1999-CG3, Class A1B
7.34% due 10/10/2032 152,847 153,033
DLJ Commercial Mortgage Corp.,
Series 2000-CKP1, Class A1B
7.18% due 11/10/2033 348,214 355,733
Core Bond Fund (continued)Shares or
Principal
Amount Value
COLLATERALIZED MORTGAGE
OBLIGATIONS (continued)
Federal Home Loan Mortgage Corp., Series
2003-2676, Class CY
4.00% due 09/15/2018 $ 282,000 $ 282,618
Federal Home Loan Mortgage Corp., Series
2003-2690, Class TV
4.50% due 11/15/2025 217,000 212,567
Federal Home Loan Mortgage Corp., Series
2004-2765, Class CT
4.00% due 03/15/2019 193,000 192,705
Federal Home Loan Mortgage Corp., Series
2004-2875, Class HB
4.00% due 10/15/2019 202,000 195,960
Federal Home Loan Mortgage Corp., Series
2005-3008, Class JM
4.50% due 07/15/2025 302,000 294,110
Federal Home Loan Mortgage Corp., Series
2008-3455, Class MB
4.50% due 06/15/2023 625,000 619,298
Federal Home Loan Mortgage Corp., Series
2008-3498, Class GB
6.50% due 11/15/2036 1,876,252 1,998,840
Federal Home Loan Mortgage Corp., Series 2564,
Class BQ
5.50% due 10/15/2017 149,714 159,278
Federal Home Loan Mortgage Corp., Series 2590,
Class BY
5.00% due 03/15/2018 73,000 76,136
Federal Home Loan Mortgage Corp., Series 3465,
Class HA
4.00% due 07/15/2017 403,834 415,946
Federal Home Loan Mortgage Corp.,
Series 2003-2590, Class NU
5.00% due 06/15/2017 381,000 396,968
Federal Home Loan Mortgage Corp.,
Series 2003-2603, Class KT
4.75% due 07/15/2014 676,983 709,323
Federal Home Loan Mortgage Corp.,
Series 2003-2623, Class AJ
4.50% due 07/15/2016 330,000 341,684
Federal Home Loan Mortgage Corp.,
Series 2003-2672, Class HA
4.00% due 09/15/2016 125,814 129,424
Federal Home Loan Mortgage Corp.,
Series 2004-2780, Class TB
3.00% due 12/15/2024 18,031 17,991
Federal Home Loan Mortgage Corp.,
Series 2004-2790, Class TN
4.00% due 05/15/2024 408,000 395,947
Federal Home Loan Mortgage Corp.,
Series 2005-3035, Class PA
5.50% due 09/15/2035 244,901 257,562
Federal Home Loan Mortgage Corp.,
Series 2007-3372, Class BD
Copyright © 2012 www.secdatabase.com. All Rights Reserved.Please Consider the Environment Before Printing This Document

4.50% due 10/15/2022 339,000 342,302
Federal Home Loan Mortgage Corp., Series 24989,
Class PE
6.00% due 08/15/2032 119,044 124,890
Federal National Mortgage Association, Series
2001-81, Class HE
6.50% due 01/25/2032 3,085,490 3,277,233
The accompanying notes are an integral part of the financial statements.
38
JOHN HANCOCK FUNDS II
PORTFOLIO OF INVESTMENTS - May 31, 2009 (Unaudited) - continued(showing percentage of total net assets)
Core Bond Fund (continued)Shares or
Principal
Amount Value
COLLATERALIZED MORTGAGE
OBLIGATIONS (continued)
Federal National Mortgage Association, Series
2002-94, Class HQ
4.50% due 01/25/2018 $ 280,000 $ 290,565
Federal National Mortgage Association, Series
2003-125, Class AY
4.00% due 12/25/2018 82,000 82,302
Federal National Mortgage Association, Series
2004-3, Class HT
4.00% due 02/25/2019 111,000 111,027
Federal National Mortgage Association, Series
2008-66, Class B
5.00% due 08/25/2023 83,000 83,106
Federal National Mortgage Association,
Series 2003-108, Class BE
4.00% due 11/25/2018 333,000 335,779
Federal National Mortgage Association,
Series 2003-15, Class CH
4.00% due 02/25/2017 111,469 113,798
Federal National Mortgage Association,
Series 2003-16, Class PN
4.50% due 10/25/2015 117,940 119,110
Federal National Mortgage Association,
Series 2003-3, Class HJ
5.00% due 02/25/2018 324,000 342,688
Federal National Mortgage Association,
Series 2003-30, Class ET
3.50% due 08/25/2016 270,160 274,192
Federal National Mortgage Association,
Series 2004-60, Class PA
5.50% due 04/25/2034 243,622 253,048
Federal National Mortgage Association,
Series 2005-58, Class MA
5.50% due 07/25/2035 203,447 213,823
Federal National Mortgage Association,
Series 2005-69, Class JM
4.50% due 08/25/2025 331,000 321,792
Federal National Mortgage Association,
Series 2007-113, Class DB
4.50% due 12/25/2022 340,000 337,010
Federal National Mortgage Association,
Series 2007-30, Class MA
4.25% due 02/25/2037 561,044 567,945
Copyright © 2012 www.secdatabase.com. All Rights Reserved.Please Consider the Environment Before Printing This Document

First Horizon Alternative Mortgage Securities,
Series 2006-FA6, Class 2A10
6.00% due 11/25/2036 218,624 189,792
First Union National Bank Commercial Mortgage,
Series 2000-C2, Class A2
7.202% due 10/15/2032 239,891 243,998
First Union National Bank Commercial Mortgage,
Series 1999-C4, Class A2
7.39% due 12/15/2031 17,816 17,969
First Union National Bank Commercial Mortgage,
Series 2001-C4, Class B
6.417% due 12/12/2033 188,000 179,113
GE Capital Commercial Mortgage Corp., Series
2002-1A, Class A3
6.269% due 12/10/2035 252,000 258,117
GE Capital Commercial Mortgage Corp.,
Series 2001-2, Class A3
6.03% due 08/11/2033 95,702 96,169
Core Bond Fund (continued)Shares or
Principal
Amount Value
COLLATERALIZED MORTGAGE
OBLIGATIONS (continued)
GMAC Commercial Mortgage Securities, Inc.,
Series 2000-C1, Class A2
7.724% due 03/15/2033 (b) $ 375,407 $ 379,780
GMAC Commercial Mortgage Securities, Inc.,
Series 2000-C3, Class A2
6.957% due 09/15/2035 766,875 788,689
GMAC Commercial Mortgage Securities, Inc.,
Series 2002-C3, Class A2
4.93% due 07/10/2039 197,000 189,161
GMAC Commercial Mortgage Securities, Inc.,
Series 2003-C2, Class A2
5.485% due 05/10/2040 (b) 193,000 191,654
GMAC Commercial Mortgage Securities, Inc.,
Series 2003-C3, Class A4
5.023% due 04/10/2040 428,000 398,260
Government National Mortgage Association,
Series 2006-37, Class JG
5.00% due 07/20/2036 254,000 258,372
Greenwich Capital Commercial Funding Corp.,
Series 2005-GG5, Class A5
5.224% due 04/10/2037 (b) 2,526,000 2,134,733
GS Mortgage Securities Corp II, Series
2001-GL3A, Class A2
6.449% due 08/05/2018 (b) 826,000 851,769
JPMorgan Chase Commercial Mortgage Securities
Corp, Series 2007-CB19, Class A2
5.7463% due 02/12/2049 (b) 189,000 179,819
JPMorgan Chase Commercial Mortgage Securities
Corp., Series 2001-CIB3, Class A3
6.465% due 11/15/2035 876,000 893,547
JPMorgan Chase Commercial Mortgage Securities
Corp., Series 2005-CB13, Class A4
5.28% due 01/12/2043 (b) 198,000 178,677
JPMorgan Chase Commercial Mortgage Securities
Corp., Series 2006-LDP7, Class A2
5.861% due 04/15/2045 (b) 309,000 293,824
JPMorgan Chase Commercial Mortgage Securities
Corp., Series 2002-CIB5, Class A2
5.161% due 10/12/2037 149,000 145,153
JPMorgan Chase Commercial Mortgage Securities
Copyright © 2012 www.secdatabase.com. All Rights Reserved.Please Consider the Environment Before Printing This Document

Corp., Series 2004-C3, Class A1
3.765% due 01/15/2042 114,008 113,600
JPMorgan Chase Commercial Mortgage Securities
Corp., Series 2005-LDP3, Class A1
4.655% due 08/15/2042 42,088 41,975
JPMorgan Commercial Mortgage Finance Corp.,
Series 2000-C10, Class A2
7.371% due 08/15/2032 (b) 256,158 258,177
LB-UBS Commercial Mortgage Trust, Series
2000-C5, Class A2
6.51% due 12/15/2026 273,252 278,408
LB-UBS Commercial Mortgage Trust, Series
2002-C4, Class A5
4.853% due 09/15/2031 516,000 500,079
LB-UBS Commercial Mortgage Trust, Series
2006-C1, Class A2
5.084% due 02/15/2031 586,000 571,487
LB-UBS Commercial Mortgage Trust, Series
2007-C1, Class A2
5.318% due 02/15/2040 469,000 450,228
The accompanying notes are an integral part of the financial statements.
39
JOHN HANCOCK FUNDS II
PORTFOLIO OF INVESTMENTS - May 31, 2009 (Unaudited) - continued(showing percentage of total net assets)
Core Bond Fund (continued)Shares or
Principal
Amount Value
COLLATERALIZED MORTGAGE
OBLIGATIONS (continued)
LB-UBS Commercial Mortgage Trust, Series
2007-C1, Class A3
5.398% due 02/15/2040 $ 451,000 $ 375,448
LB-UBS Commercial Mortgage Trust,
Series 2000-C4, Class A2
7.37% due 08/15/2026 114,573 117,157
LB-UBS Commercial Mortgage Trust,
Series 2001-C2, Class A2
6.653% due 11/15/2027 242,000 244,327
LB-UBS Commercial Mortgage Trust,
Series 2002-C2, Class A4
5.594% due 06/15/2031 451,000 449,211
LB-UBS Commercial Mortgage Trust,
Series 2003-C3, Class A4
4.166% due 05/15/2032 88,000 81,135
Morgan Stanley Capital I, Series 2005-HQ6,
Class A4A
4.989% due 08/13/2042 217,000 190,956
Morgan Stanley Capital I, Series 2007-IQ14, Class
A2
5.61% due 04/15/2049 506,000 458,085
Morgan Stanley Capital I, Series 2003-IQ5, Class A4
5.01% due 04/15/2038 303,000 292,539
Morgan Stanley Capital I, Series 2003-T11, Class A4
5.15% due 06/13/2041 731,000 682,147
Morgan Stanley Capital I,
Series 2004-HQ3, Class A4
4.80% due 01/13/2041 134,000 121,166
Morgan Stanley Capital I,
Copyright © 2012 www.secdatabase.com. All Rights Reserved.Please Consider the Environment Before Printing This Document

Series 2005-HQ5, Class AAB
5.037% due 01/14/2042 444,000 439,006
Morgan Stanley Capital I,
Series 2005-HQ7, Class AAB
5.1849% due 11/14/2042 (b) 494,000 487,012
Morgan Stanley Dean Witter Capital I, Series
2003-HQ2, Class A2
4.92% due 03/12/2035 500,000 481,394
Morgan Stanley Dean Witter Capital I,
Series 2001-TOP1, Class A4
6.66% due 02/15/2033 536,524 545,163
Morgan Stanley Dean Witter Capital I,
Series 2001-TOP5, Class A4
6.39% due 10/15/2035 1,006,000 1,024,732
Morgan Stanley Mortgage Loan Trust,
Series 2007-6XS, Class 2A1S
0.4187% due 02/25/2047 (b) 110,087 73,032
Nomura Asset Securities Corp.
6.69% due 03/15/2030 354,000 375,703
Salomon Brothers Mortgage Securities VII, Series
2002-KEY2, Class A2
4.467% due 03/18/2036 266,810 265,207
Salomon Brothers Mortgage Securities VII,
Series 2000-C3, Class A2
6.592% due 12/18/2033 229,157 232,390
Wachovia Bank Commercial Mortgage Trust,
Series 2002-C1, Class A4
6.287% due 04/15/2034 347,000 346,811
Wachovia Bank Commercial Mortgage Trust,
Series 2002-C2, Class A4
4.98% due 11/15/2034 537,000 527,628
Core Bond Fund (continued)Shares or
Principal
Amount Value
COLLATERALIZED MORTGAGE
OBLIGATIONS (continued)
Wachovia Bank Commercial Mortgage Trust,
Series 2003-C5, Class A2
3.989% due 06/15/2035 $ 136,000 $ 129,779
Wachovia Bank Commercial Mortgage Trust,
Series 2003-C6, Class A3
4.957% due 08/15/2035 1,360,000 1,296,218
Wachovia Bank Commercial Mortgage Trust,
Series 2003-C8, Class A3
4.445% due 11/15/2035 197,000 189,802
Wachovia Bank Commercial Mortgage Trust,
Series 2004-C11, Class A4
5.03% due 01/15/2041 379,000 321,995
Wachovia Bank Commercial Mortgage Trust,
Series 2005-C18, Class A4
4.935% due 04/15/2042 105,000 91,253
WaMu Mortgage Pass Through Certificates, Series
2006-AR12, Class 1A1
6.0513% due 10/25/2036 (b) 233,681 174,195
TOTAL COLLATERALIZED MORTGAGE OBLIGATIONS
(Cost $45,805,917) $ 46,513,401
ASSET BACKED SECURITIES - 4.57%
Americredit Prime Automobile Receivable,
Series 2007-1, Class A3
5.27% due 11/08/2011 (b) 339,553 342,805
BA Credit Card Trust, Series 2006-A8, Class A8
0.3744% due 05/16/2016 (b) 286,000 263,964
Copyright © 2012 www.secdatabase.com. All Rights Reserved.Please Consider the Environment Before Printing This Document

Bank of America Credit Card Trust, Series
2006-A7, Class A7
0.3844% due 12/15/2016 (b) 749,000 680,299
Capital One Multi-Asset Execution Trust, Series
2006-A11, Class A11
0.4344% due 06/17/2019 (b) 1,732,000 1,481,173
Chase Issuance Trust, Series 2007-A17, Class A
5.12% due 10/15/2014 447,000 472,078
Chase Issuance Trust, Series 2008-A9, Class A9
4.26% due 05/15/2013 916,000 948,096
Citicorp Residential Mortgage Securities, Inc.,
Series 2006-1, Class A2
5.682% due 07/25/2036 178,286 173,348
Citicorp Residential Mortgage Securities, Inc.,
Series 2006-2, Class A2
5.557% due 09/25/2036 123,243 122,448
Citigroup Mortgage Loan Trust, Inc.,
Series 2007-AHL1, Class A2A
0.3487% due 12/25/2036 (b) 145,057 111,824
Countrywide Asset-Backed Certificates,
Series 2006-S1, Class A2
5.549% due 08/25/2021 287,119 208,041
Daimler Chrysler Auto Trust,
Series 2007-A, Class A4
2.00% due 03/08/2013 742,000 669,696
Daimler Chrysler Master Owner Trust, Series
2006-A, Class A
0.3744% due 11/15/2011 (b) 157,989 122,118
Discover Card Master Trust I, Series 2006-2, Class
A3
0.4244% due 01/19/2016 (b) 817,000 727,553
The accompanying notes are an integral part of the financial statements.
40
JOHN HANCOCK FUNDS II
PORTFOLIO OF INVESTMENTS - May 31, 2009 (Unaudited) - continued(showing percentage of total net assets)
Core Bond Fund (continued)Shares or
Principal
Amount Value
ASSET BACKED SECURITIES
(continued)
Dominos Pizza Master Issuer LLC,
Series 2007-1, Class A2
5.261% due 04/25/2037 (f) $ 480,000 $ 305,239
Ford Credit Floorplan Master Owner Trust, Series
2006-4, Class A
0.5944% due 06/15/2013 (b) 783,000 639,174
Great America Leasing Receivables,
Series 2006-1, Class A3
5.34% due 01/15/2010 (f) 42,384 42,489
Harley-Davidson Motorcycle Trust, Series 2007-2,
Class A4
5.12% due 08/15/2013 321,000 324,867
Harley-Davidson Motorcycle Trust, Series 2009-1,
Class A4
4.55% due 01/15/2017 242,000 244,733
Harley-Davidson Motorcycle Trust,
Series 2008-1, Class A3A
4.25% due 02/15/2013 361,000 365,214
Copyright © 2012 www.secdatabase.com. All Rights Reserved.Please Consider the Environment Before Printing This Document

Honda Auto Receivables Owner Trust, Series
2009-2, Class A4
4.90% due 01/15/2013 618,000 618,784
MBNA Master Credit Card Trust, Series 1997-B,
Class A
0.5044% due 08/15/2014 (b) 1,162,000 1,118,065
Morgan Stanley ABS Capital I,
Series 2007-HE2, Class A2A
0.3487% due 01/25/2037 (b) 76,593 62,305
Morgan Stanley Home Equity Loans,
Series 2007-1, Class A1
0.3587% due 12/25/2036 (b) 73,572 64,562
Nissan Auto Receivables Owner Trust, Series
2009-A, Class A4
4.74% due 08/17/2015 237,000 242,174
SLM Student Loan Trust, Series 2005-6, Class A5B
2.2919% due 07/27/2026 (b) 1,222,000 1,183,431
SLM Student Loan Trust, Series 2008-6, Class A4
2.1919% due 07/25/2023 (b) 221,000 208,085
Swift Master Auto Receivables Trust, Series
2007-1, Class A
0.4444% due 06/15/2012 (b) 164,000 149,240
Triad Auto Receivables Owner Trust,
Series 2006-B, Class A3
5.41% due 08/12/2011 308,437 310,037
Triad Auto Receivables Owner Trust,
Series 2006-C, Class A3
5.26% due 11/14/2011 158,028 158,973
Volkswagen Auto Loan Enhanced Trust, Series
2008-1, Class A3
4.50% due 07/20/2012 412,000 418,824
World Omni Auto Receivables Trust, Series
2009-A, Class A4
5.12% due 05/15/2014 245,000 248,751
TOTAL ASSET BACKED SECURITIES
(Cost $13,082,248) $ 13,028,390
Core Bond Fund (continued)Shares or
Principal
Amount Value
SUPRANATIONAL OBLIGATIONS - 0.09%
Banking - 0.09%
Export-Import Bank Of Korea
5.50% due 10/17/2012 $ 245,000 $ 250,397
TOTAL SUPRANATIONAL OBLIGATIONS
(Cost $246,922) $ 250,397
REPURCHASE AGREEMENTS - 2.93%
Repurchase Agreement with State
Street Corp. dated 05/29/2009 at
0.07% to be repurchased at
$8,363,049 on 06/01/2009,
collateralized by $8,390,000
Federal Home Loan Mortgage
Corp., 2.375% due 05/28/2010
(valued at $8,531,791, including
interest) $ 8,363,000 $ 8,363,000
TOTAL REPURCHASE AGREEMENTS
(Cost $8,363,000) $ 8,363,000
SHORT TERM INVESTMENTS - 5.95%
Bank of America Corp.
0.18% due 06/01/2009 $ 4,243,000 $ 4,243,000
JPMorgan Chase & Company
Copyright © 2012 www.secdatabase.com. All Rights Reserved.Please Consider the Environment Before Printing This Document
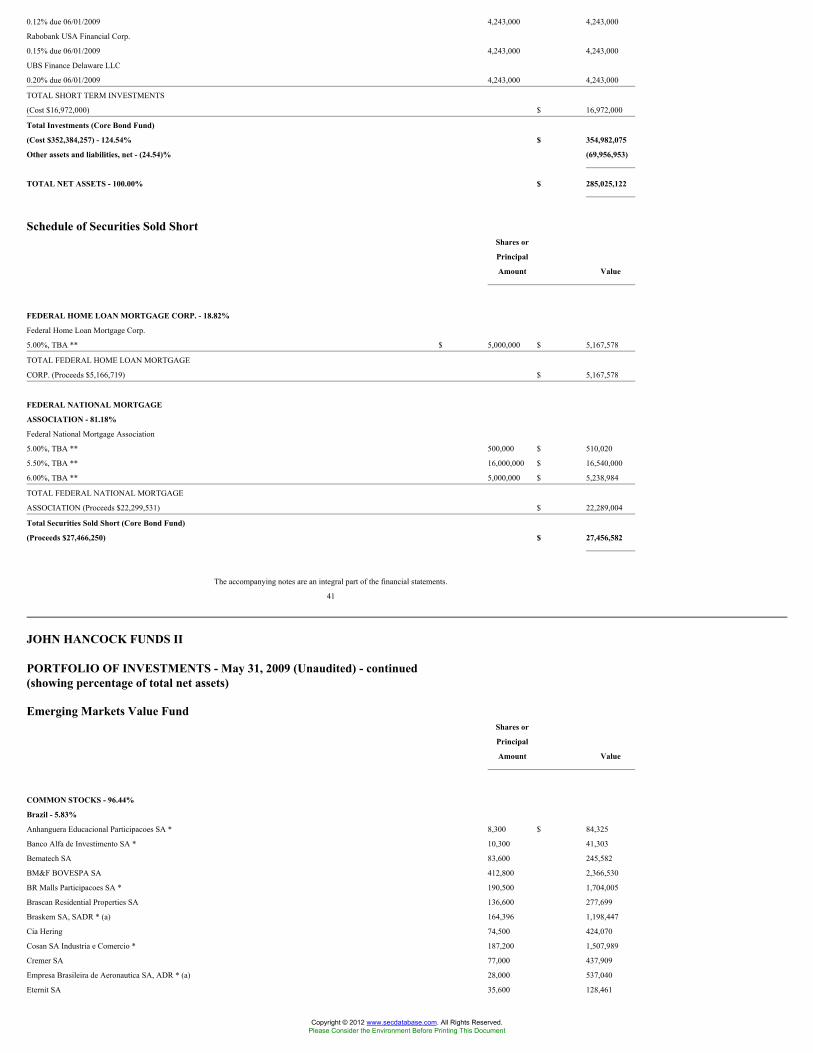
0.12% due 06/01/2009 4,243,000 4,243,000
Rabobank USA Financial Corp.
0.15% due 06/01/2009 4,243,000 4,243,000
UBS Finance Delaware LLC
0.20% due 06/01/2009 4,243,000 4,243,000
TOTAL SHORT TERM INVESTMENTS
(Cost $16,972,000) $ 16,972,000
Total Investments (Core Bond Fund)
(Cost $352,384,257) - 124.54% $ 354,982,075
Other assets and liabilities, net - (24.54)% (69,956,953)
TOTAL NET ASSETS - 100.00% $ 285,025,122
Schedule of Securities Sold ShortShares or
Principal
Amount Value
FEDERAL HOME LOAN MORTGAGE CORP. - 18.82%
Federal Home Loan Mortgage Corp.
5.00%, TBA ** $ 5,000,000 $ 5,167,578
TOTAL FEDERAL HOME LOAN MORTGAGE
CORP. (Proceeds $5,166,719) $ 5,167,578
FEDERAL NATIONAL MORTGAGE
ASSOCIATION - 81.18%
Federal National Mortgage Association
5.00%, TBA ** 500,000 $ 510,020
5.50%, TBA ** 16,000,000 $ 16,540,000
6.00%, TBA ** 5,000,000 $ 5,238,984
TOTAL FEDERAL NATIONAL MORTGAGE
ASSOCIATION (Proceeds $22,299,531) $ 22,289,004
Total Securities Sold Short (Core Bond Fund)
(Proceeds $27,466,250) $ 27,456,582
The accompanying notes are an integral part of the financial statements.
41
JOHN HANCOCK FUNDS II
PORTFOLIO OF INVESTMENTS - May 31, 2009 (Unaudited) - continued(showing percentage of total net assets)
Emerging Markets Value FundShares or
Principal
Amount Value
COMMON STOCKS - 96.44%
Brazil - 5.83%
Anhanguera Educacional Participacoes SA * 8,300 $ 84,325
Banco Alfa de Investimento SA * 10,300 41,303
Bematech SA 83,600 245,582
BM&F BOVESPA SA 412,800 2,366,530
BR Malls Participacoes SA * 190,500 1,704,005
Brascan Residential Properties SA 136,600 277,699
Braskem SA, SADR * (a) 164,396 1,198,447
Cia Hering 74,500 424,070
Cosan SA Industria e Comercio * 187,200 1,507,989
Cremer SA 77,000 437,909
Empresa Brasileira de Aeronautica SA, ADR * (a) 28,000 537,040
Eternit SA 35,600 128,461
Copyright © 2012 www.secdatabase.com. All Rights Reserved.Please Consider the Environment Before Printing This Document

Even Construtora e Incorporadora SA 223,200 373,210
Gafisa SA 256,600 2,321,346
Gerdau SA, SADR (a) 1,530,852 15,920,861
Gerdau SA 419,700 3,415,022
Grendene SA 80,200 631,785
Guararapes Confeccoes SA 11,400 140,791
IdeiasNet SA * 161,600 239,821
Iguatemi Empresa de Shopping Centers SA 54,900 538,230
Industrias Romi SA * 138,700 558,296
JBS SA 895,800 3,064,004
JHSF Participacoes SA 53,900 51,226
Medial Saude SA * 84,300 344,466
MPX Energia SA 2,000 288,575
Obrascon Huarte Lain Brasil SA 53,600 512,137
Paranapanema SA * 361,900 616,164
PDG Realty SA Empreendimentos e
Participacoes 214,500 2,448,501
Plascar Participacoes Industriais SA * 58,100 67,325
Porto Seguro SA * 84,500 642,038
Positivo Informatica SA 57,300 270,541
Rossi Residencial SA 242,100 996,651
Sao Carlos Empreendimentos e
Participacoes SA 79,700 667,947
Sao Martinho SA * 109,400 945,212
Sul America SA 36,700 530,654
Suzano Papel e Celulose SA * (i) 337,400 2,843,104
Ultrapar Participacoes SA, ADR 161,060 5,284,379
Usinas Siderurgicas de Minas Gerais SA 142,200 2,726,777
Votorantim Celulose e Papel SA, SADR * 170,550 2,024,428
57,416,851
Chile - 3.05%
Banco de Credito e Inversiones 25,954 619,043
Cementos Bio-Bio SA 2,795 5,079
Cia General de Electricidad 589,454 3,671,957
Cintac SA 78,352 25,799
Companhia de Consumidores de Gas de
Santiago SA 260,365 1,158,516
Companhia Sudamericana de Vapores SA * 1,011,318 854,990
Corpbanca SA, SADR 11,885 326,837
Cristalerias de Chile SA 62,943 666,791
Empresas CMPC SA 178,028 4,657,531
Empresas Copec SA 663,096 8,403,032
Enersis SA, SADR (a) 459,633 7,864,321
Industrias Forestales SA 150,246 32,090
Emerging Markets Value Fund (continued)Shares or
Principal
Amount Value
COMMON STOCKS (continued)
Chile (continued)
Madeco SA, SADR 50,956 $ 315,418
Masisa SA 9,321,348 1,327,237
Vina San Pedro SA 16,425,632 119,863
30,048,504
China - 4.35%
Angang New Steel Company, Ltd., Class H 1,356,000 2,027,609
AviChina Industry & Technology Company,
Ltd. * 1,408,000 374,734
Bank of China, Ltd. 17,875,000 8,048,835
Beijing Capital International Airport Company,
Ltd., Class H * 3,364,000 2,663,015
Chaoda Modern Agriculture Holdings, Ltd. 3,681,656 2,308,978
Copyright © 2012 www.secdatabase.com. All Rights Reserved.Please Consider the Environment Before Printing This Document

China COSCO Holdings Company, Ltd. * 2,490,000 3,434,963
China Rare Earth Holdings, Ltd. - Hong Kong
Exchange 1,514,000 266,066
China Shineway Pharmaceutical Group, Ltd. -
Hong Kong Exchange 142,000 114,642
China Shipping Container Lines Company, Ltd. * 5,308,850 1,664,326
China Shipping Development Company, Ltd.,
Class H 1,188,000 1,762,490
Country Garden Holdings Company, Ltd. 3,687,000 1,812,094
Dongfeng Motor Group Company, Ltd. 4,910,000 4,722,693
Guangshen Railway Company, Ltd., Class H 110,000 52,447
Guangshen Railway Company, Ltd., SADR (a) 38,900 922,708
Hunan Non Ferrous Metal Corp., Ltd. * 2,694,000 648,772
Jiangxi Copper Company, Ltd., Class H 1,272,000 2,120,942
KWG Property Holding, Ltd. * 1,358,487 814,283
Lenovo Group, Ltd. 3,394,000 1,379,610
Maanshan Iron & Steel Company, Ltd. * 2,954,000 1,637,849
Qingling Motors Company, Ltd. 1,428,000 279,949
Semiconductor Manufacturing International
Corp., SADR * 209,323 548,426
Semiconductor Manufacturing
International Corp. * 14,639,000 783,815
Shanghai Forte Land Company 1,903,405 634,560
Shui On Land, Ltd. 3,566,750 2,323,880
Sinopec Shanghai Petrochemical Company,
Ltd., SADR * (a) 6,658 248,943
Sinopec Yizheng Chemical Fibre
Company, Ltd. * 2,302,000 469,575
Sinotrans, Ltd., Class H 2,715,000 716,030
42,782,234
Czech Republic - 0.61%
Telefonica Czech Republic AS 195,274 4,206,723
Unipetrol AS (a) 306,126 1,816,748
6,023,471
Hong Kong - 8.75%
Agile Property Holdings, Ltd. 2,894,000 3,610,452
Amvig Holdings, Ltd. 666,000 374,552
Baoye Group Company, Ltd. 588,000 362,364
Beijing Capital Land, Ltd. 1,548,000 580,730
Beijing Development Hong Kong, Ltd. * 190,000 29,763
Beijing Enterprises Holdings, Ltd. 647,500 2,955,310
Beijing North Star Company, Ltd. 1,318,000 457,210
Bosideng International Holdings, Ltd. 4,444,000 605,581
Brilliance China Automotive Holdings, Ltd. * 4,796,000 465,670
The accompanying notes are an integral part of the financial statements.
42
JOHN HANCOCK FUNDS II
PORTFOLIO OF INVESTMENTS - May 31, 2009 (Unaudited) - continued(showing percentage of total net assets)
Emerging Markets Value Fund (continued)Shares or
Principal
Amount Value
COMMON STOCKS (continued)
Hong Kong (continued)
Catic Shenzhen Holdings, Ltd. * 140,000 $ 47,673
China Aerospace International Holdings, Ltd. * 2,697,400 247,045
China Agri-Industries Holdings, Ltd. * 2,594,000 1,699,530
Copyright © 2012 www.secdatabase.com. All Rights Reserved.Please Consider the Environment Before Printing This Document

China Aoyuan Property Group, Ltd. 1,569,000 444,002
China Everbright, Ltd. 1,235,000 2,980,612
China Grand Forestry Resources Group, Ltd. * 8,382,000 515,898
China Haidian Holdings, Ltd. * 726,000 69,423
China Merchants Holdings International
Company, Ltd. 1,186,000 3,654,270
China Molybdenum Company, Ltd. (f) 1,008,000 673,396
China Nickel Resources Holding Company,
Ltd. 1,154,000 206,943
China Pharmaceutical Group, Ltd. 1,390,000 794,460
China Properties Group, Ltd. * 1,116,000 351,457
China Resources Enterprises, Ltd. 2,162,000 4,771,511
China State Construction International
Holdings, Ltd. 1,246,000 458,171
China Travel International Investment
Hong Kong, Ltd. 5,184,000 1,254,031
Chongqing Iron & Steel Company, Ltd. 886,000 345,096
Citic Pacific, Ltd. 1,661,923 3,874,441
CITIC Resources Holdings, Ltd. * 4,496,000 1,298,823
CNPC Hong Kong, Ltd. 4,180,000 2,871,506
COFCO International, Ltd. 866,000 494,614
Comba Telecom Systems Holdings, Ltd. 618,200 322,941
Cosco International Holdings, Ltd. 1,290,000 569,250
Cosco Pacific, Ltd. 2,010,000 2,732,996
DaChan Food Asia, Ltd. 655,000 122,572
Dalian Port PDA Company, Ltd. 1,438,000 585,899
Denway Motors, Ltd. 5,532,000 2,680,011
Digital China Holdings, Ltd. 103,000 71,976
Dynasty Fine Wines Group, Ltd. 654,000 138,066
First Tractor Company, Ltd. 236,000 78,654
Fosun International 2,868,500 1,786,121
Fu Ji Food & Catering Services Holdings, Ltd. 410,000 342,651
Geely Automobile Holdings Company, Ltd. 2,210,000 433,766
Global Bio-Chem Technology
Group Company, Ltd. 2,462,000 476,071
Great Wall Motor Company, Ltd. 684,000 562,265
Great Wall Technology Company, Ltd. 142,000 35,499
Greentown China Holdings, Ltd. * 959,500 1,046,947
Guangzhou Investment Company, Ltd. 6,852,000 1,569,396
Guangzhou Pharmaceutical Company, Ltd. 478,000 197,213
Hainan Meilan International Airport Company,
Ltd. 235,000 143,856
Harbin Power Equipment Company, Ltd. 1,112,000 1,204,907
Hidili Industry International Development, Ltd. 1,709,000 1,065,238
HKC Holdings, Ltd. 4,448,409 428,248
Hopson Development Holdings, Ltd., GDR 1,006,000 1,461,371
Innomaxx Biotechnology Group, Ltd. * 8,120,000 359,650
Intime Department Store Group Company, Ltd. * 1,168,000 495,009
Jingwei Textile Machinery Company, Ltd. 62,000 12,698
Ju Teng International Holdings, Ltd. 936,000 574,653
Kingway Brewery Holdings, Ltd. * 522,000 77,922
Lingbao Gold Company, Ltd. * 572,000 232,438
Lonking Holdings, Ltd. 1,354,000 713,010
Emerging Markets Value Fund (continued)Shares or
Principal
Amount Value
COMMON STOCKS (continued)
Hong Kong (continued)
Mingyuan Medicare Development
Company, Ltd. * 740,000 $ 68,130
Minmetals Resources, Ltd. * 1,240,000 338,054
Minth Group, Ltd. 1,004,000 768,584
Nan Hai Corp., Ltd. * 20,500,000 215,970
Copyright © 2012 www.secdatabase.com. All Rights Reserved.Please Consider the Environment Before Printing This Document

Neo-China Group Holdings, Ltd. 341,500 109,028
Nine Dragons Paper Holdings, Ltd. 2,491,000 1,811,036
Poly Hong Kong Investment, Ltd. 776,000 383,806
Qin Jia Yuan Media Services Company, Ltd. 712,800 164,217
Qunxing Paper Holdings Company, Ltd. 549,000 223,320
Shanghai Industrial Holdings, Ltd. 973,000 3,872,803
Shanghai Prime Machinery Company, Ltd. 1,392,000 304,049
Shanghai Real Estate, Ltd. * 3,224,000 429,947
Shenzhen International Holdings, Ltd. 14,325,000 1,037,228
Shenzhen Investment, Ltd. 2,946,000 1,266,413
Shenzhou International Group Holdings, Ltd. 274,000 109,827
Shimao Property Holdings, Ltd., GDR 2,428,000 4,167,709
Shougang Concord International Enterprises
Company, Ltd. 5,152,000 906,795
Sichuan Xinhua Winshare Chainstore
Company, Ltd. 628,000 218,210
Sino Biopharmaceutical, Ltd. 268,000 64,257
Sino Union Petroleum & Chemical
International, Ltd. * 3,390,000 447,936
SinoCom Software Group, Ltd. 17,000 1,889
Sinofert Holdings, Ltd. * 172,000 83,775
Sinolink Worldwide Holdings, Ltd. 2,614,000 355,032
Sino-Ocean Land Holdings, Ltd. 5,394,500 5,551,116
Sinopec Kantons Holdings, Ltd. 620,000 116,099
Skyworth Digital Holdings, Ltd. 2,112,000 291,884
Stone Group Holdings, Ltd. * 750,000 41,739
TCL Communication Technology
Holdings, Ltd. * 275,600 25,098
TCL Multimedia Technology Holdings, Ltd. * 911,200 261,215
Tian An China Investment, Ltd. 888,000 470,587
Tianjin Port Development Holdings, Ltd. 1,366,000 443,709
TPV Technology, Ltd. 2,652,000 1,082,580
Travelsky Technology, Ltd., Class H 1,155,000 609,192
Vinda International Holdings, Ltd. 658,000 364,502
Wasion Group Holdings, Ltd. 206,000 117,743
Weiqiao Textile Company, Ltd. 695,500 385,205
Wuyi International Pharmaceutical Company,
Ltd. * 525,000 59,130
Xiamen International Port Company, Ltd. 1,678,000 391,404
Xingda International Holdings, Ltd. 1,164,000 356,539
Xinjiang Xinxin Mining Industry Company, Ltd. 1,273,000 681,676
Xinyu Hengdeli Holdings, Ltd. 952,000 370,134
Xiwang Sugar Holdings Company, Ltd. * 440,000 94,907
Zhejiang Glass Company, Ltd. * 172,000 50,225
86,128,527
Hungary - 2.07%
Danubius Hotel and Spa PLC * 951 17,985
Egis Gyogyszergyar Nyrt. 11,535 818,321
FHB Mortgage Bank PLC * (a) 29,649 107,086
Fotex PLC * 65,740 128,714
MOL Magyar Olaj & Gazipari Rt. (a) 169,232 10,478,824
OTP Bank Rt. * (a) 485,656 8,650,896
The accompanying notes are an integral part of the financial statements.
43
JOHN HANCOCK FUNDS II
PORTFOLIO OF INVESTMENTS - May 31, 2009 (Unaudited) - continued(showing percentage of total net assets)
Emerging Markets Value Fund (continued)Shares or
Principal
Amount Value
Copyright © 2012 www.secdatabase.com. All Rights Reserved.Please Consider the Environment Before Printing This Document

COMMON STOCKS (continued)
Hungary (continued)
Pannonplast PLC * 16,510 $ 69,941
Raba Jarmuipari Holding Nyilvanosan
Mukodo Rt. * 11,794 39,146
Synergon Information Systems, Ltd. * 2,700 8,890
20,319,803
India - 12.88%
ABG Shipyard, Ltd. 4,049 19,385
ACC, Ltd. 39,341 655,348
Aditya Birla Nuvo, Ltd. 56,676 1,113,698
Ador Welding, Ltd. 8,367 25,478
Aftek, Ltd. 28,741 10,088
Alembic, Ltd. 38,000 33,785
Allahabad Bank 295,867 542,081
Alok Industries, Ltd. 223,780 113,453
Ambuja Cements, Ltd. 684,511 1,330,502
Amtek Auto, Ltd. 98,948 303,092
Andhra Bank 215,172 433,972
Ansal Properties & Infrastructure, Ltd. 9,294 13,514
Apollo Hospitals Enterprise, Ltd. 37,049 403,852
Apollo Tyres, Ltd. 154,850 103,873
Arvind Mills, Ltd. * 104,142 74,985
Ashapura Minechem, Ltd. 5,400 6,260
Ashok Leyland, Ltd. 1,278,503 881,669
Aurobindo Pharma, Ltd. 79,440 663,553
Avaya Global Connect, Ltd. 5,668 14,723
Axis Bank, Ltd. 158,880 2,634,685
Bajaj Auto Finance, Ltd. 11,946 35,426
Bajaj Auto, Ltd. 53,373 410,421
Bajaj Finserv, Ltd. 24,676 191,655
Bajaj Hindusthan, Ltd. 135,981 411,654
Balaji Telefilms, Ltd. 11,528 13,890
Ballarpur Industries, Ltd. 597,281 316,176
Balmer Lawrie & Company, Ltd. 1,500 14,253
Balrampur Chini Mills, Ltd. 392,549 730,656
Bank of Maharashtra * 130,888 106,283
Bank of Rajasthan 47,965 62,088
Bata India, Ltd. 25,249 80,338
Bharat Earth Movers, Ltd. 27,755 447,114
Bharat Forge, Ltd. 126,661 484,436
Bhushan Steel, Ltd. 16,585 224,657
Biocon, Ltd. 149,090 573,308
Birla Corp., Ltd. 41,760 202,674
Bombay Dyeing & Manufacturing Company,
Ltd. 6,668 49,061
Bombay Rayon Fashions, Ltd. 46,150 222,171
Cairn India, Ltd. * 537,071 2,646,487
Century Textile & Industries, Ltd. 32,699 315,305
Chambal Fertilizers & Chemicals, Ltd. 265,767 360,858
Chi Investments, Ltd. * 6,513 5,017
Cholamandalam DBS Finance, Ltd. 7,563 9,655
City Union Bank, Ltd. 58,500 30,207
CMC, Ltd. 1,800 21,549
Coromandel Fertilisers, Ltd. 12,000 46,728
Cranes Software International, Ltd. 3,000 3,605
Dalmia Cement Bharat, Ltd. 6,800 19,987
DCM Shriram Consolidated, Ltd. 26,804 27,387
Emerging Markets Value Fund (continued)Shares or
Principal
Amount Value
Copyright © 2012 www.secdatabase.com. All Rights Reserved.Please Consider the Environment Before Printing This Document

COMMON STOCKS (continued)
India (continued)
Deepak Fertilizers & Petrochemicals Corp.,
Ltd. 34,858 $ 72,059
DLF, Ltd. 264,611 2,333,550
Dr. Reddy's Laboratories, Ltd., ADR 133,510 1,794,374
Dr. Reddy's Laboratories, Ltd. 62,300 853,745
Edelweiss Capital, Ltd. 11,400 103,015
Eicher Motors, Ltd. 7,035 42,372
EID Parry India, Ltd. 40,945 231,191
Elder Pharmaceuticals, Ltd. 3,200 15,359
Electrosteel Castings, Ltd. 47,000 30,501
Escorts, Ltd. * 36,222 50,542
Essel Propack, Ltd. 6,500 3,891
Eveready Industries, Ltd. * 21,000 14,809
FDC, Ltd. 31,000 25,418
Federal Bank, Ltd. 274,293 1,437,381
Financial Technologies (India), Ltd. 37,632 1,156,232
Finolex Cables, Ltd. 27,100 22,922
Finolex Industries, Ltd. 62,340 60,931
Fortis Healthcare, Ltd. * 135,361 286,355
Gammon India, Ltd. 66,972 239,034
Geodesic, Ltd. 40,000 101,429
Gitanjali Gems, Ltd. 31,915 83,639
Godrej Industries, Ltd. 116,069 344,655
Graphite India, Ltd. 75,397 77,207
Grasim Industries, Ltd. 70,103 3,111,563
Great Eastern Shipping Company, Ltd. 121,552 731,333
Great Offshore, Ltd. 45,068 346,929
GTL, Ltd. * 48,244 286,837
Gujarat Alkalies & Chemicals, Ltd. 35,989 79,476
Gujarat Ambuja Exports, Ltd. 15,000 8,303
Gujarat Flourochemicals, Ltd. 13,363 45,667
Gujarat Narmada Valley Fertilizers Company,
Ltd. 51,735 104,446
Gujarat State Fertilisers & Chemicals, Ltd. 17,219 62,192
HCL Infosystems, Ltd. 148,100 369,171
HCL Technologies, Ltd. 351,250 1,252,398
HEG, Ltd. 13,300 51,346
Hexaware Technologies, Ltd. 38,931 36,543
Himatsingka Seide, Ltd. * 4,000 3,423
Hindalco Industries, Ltd. 151,306 270,636
Hinduja TMT, Ltd. * 5,652 24,076
Hindustan Construction Company, Ltd. 237,251 599,084
Hindustan Motors, Ltd. * 62,438 30,645
Hotel Leela Venture, Ltd. 112,844 79,078
Housing Development & Infrastructure, Ltd. 11,538 69,378
ICICI Bank, Ltd., SADR (a) 736,341 22,929,659
I-Flex Solutions, Ltd. * 38,652 960,381
India Cements, Ltd. 453,680 1,485,032
India Glycols, Ltd. 14,305 31,453
India Infoline, Ltd. 155,315 502,204
Indiabulls Financial Services, Ltd. 304,539 1,406,235
Indiabulls Real Estate, Ltd. 122,920 637,315
Indian Hotels Company, Ltd. * 746,525 1,064,162
Indian Overseas Bank 261,467 507,328
IndusInd Bank, Ltd. 348,258 531,883
Industrial Development Bank of India, Ltd. 415,032 818,822
Infomedia India, Ltd. 7,700 15,166
The accompanying notes are an integral part of the financial statements.
44
JOHN HANCOCK FUNDS II
Copyright © 2012 www.secdatabase.com. All Rights Reserved.Please Consider the Environment Before Printing This Document

PORTFOLIO OF INVESTMENTS - May 31, 2009 (Unaudited) - continued(showing percentage of total net assets)
Emerging Markets Value Fund (continued)Shares or
Principal
Amount Value
COMMON STOCKS (continued)
India (continued)
Infotech Enterprises, Ltd. 2,000 $ 7,626
Infrastructure Development Finance
Company, Ltd. 1,272,514 3,343,327
Ingersoll-Rand India, Ltd. 6,375 40,892
Ipca Laboratories, Ltd. 4,298 52,260
IVRCL Infrastructures & Projects, Ltd. 172,406 1,221,979
Jammu & Kashmir Bank, Ltd. 22,831 239,522
JB Chemicals & Pharmaceuticals, Ltd. 21,800 21,226
JBF Industries, Ltd. 33,159 46,775
Jet Airways India, Ltd. * 32,379 211,818
Jindal Saw, Ltd. * 42,642 332,411
Jindal Stainless, Ltd. 44,557 89,960
JK Tyre & Industries, Ltd. * 14,533 21,598
JSW Steel, Ltd. * 125,202 1,462,864
Jubilant Organosys, Ltd. 29,000 105,067
Jyoti Structures, Ltd. * 10,126 31,277
Kalpataru Power Transmission, Ltd. 5,788 88,578
Karnataka Bank, Ltd. 155,196 454,700
Karur Vysya Bank, Ltd. 21,841 146,230
Kesoram Industries, Ltd. 31,455 202,514
Kirloskar Oil Engines, Ltd. 57,456 109,963
Kotak Mahindra Bank, Ltd. 207,362 2,989,264
Lakshmi Machine Works, Ltd. 1,969 37,958
LIC Housing Finance, Ltd. 122,389 1,379,094
Madras Cements, Ltd. 90,107 204,209
Maharashtra Seamless, Ltd. 62,316 321,882
Mahindra & Mahindra Financial Services, Ltd. 10,200 58,131
Mahindra & Mahindra, Ltd. 291,412 4,123,064
Mahindra Lifespace Developers, Ltd. 9,110 54,993
Mangalam Cement, Ltd. 14,461 34,976
Maruti Udyog, Ltd. 65,711 1,434,268
Mastek, Ltd. 11,271 59,773
Matrix Laboratories, Ltd. * 58,149 242,950
MAX India, Ltd. * 130,355 529,116
Mercator Lines, Ltd. 182,292 245,745
Monnet Ispat & Energy, Ltd. 19,233 126,022
Moser Baer India, Ltd. 335,661 654,008
MRF, Ltd. 680 45,243
Mukand, Ltd. 28,732 24,908
Nagarjuna Construction Company, Ltd. 246,877 722,309
Nagarjuna Fertilizers & Chemicals, Ltd. * 229,114 195,471
Nahar Spinning Mills, Ltd. 6,600 7,205
National Organic Chemical Industries, Ltd. 80,241 46,818
Navneet Publications India, Ltd. * 46,585 72,878
NIIT Technologies, Ltd. 18,577 43,301
NIIT, Ltd. 35,844 38,721
Nirma, Ltd. 20,100 62,668
OCL India, Ltd. 1,500 2,947
Orchid Chemicals & Pharmaceuticals, Ltd. 56,302 152,751
Orient Paper & Industries, Ltd. 51,770 52,668
Oriental Bank of Commerce 124,848 494,613
Panacea Biotec, Ltd. 26,548 76,836
Pantaloon Retail India, Ltd. 800 5,272
Patel Engineering Ltd 15,429 123,634
Patni Computer Systems, Ltd. 70,484 327,718
Petronet LNG, Ltd. * 548,610 825,940
Copyright © 2012 www.secdatabase.com. All Rights Reserved.Please Consider the Environment Before Printing This Document

Emerging Markets Value Fund (continued)Shares or
Principal
Amount Value
COMMON STOCKS (continued)
India (continued)
Polaris Software Lab, Ltd. 39,735 $ 77,294
Prism Cement, Ltd. 45,201 34,870
PSL, Ltd. 6,900 18,754
PTC India, Ltd. 311,479 610,614
Punj Lloyd, Ltd. 224,909 975,536
Raymond, Ltd. * 33,679 110,169
REI Six Ten Retail, Ltd. * 1,558 39,832
Reliance Capital, Ltd. 122,106 2,440,640
Reliance Communications, Ltd. 907,725 5,897,689
Reliance Industries, Ltd., GDR * (f) 121,038 11,716,478
Reliance Industries, Ltd. * 6,070 291,200
Rolta India, Ltd. 140,629 348,936
Ruchi Soya Industries, Ltd. 153,126 151,594
Sakthi Sugars, Ltd. * 25,066 25,357
Satyam Computer Services, Ltd. 519,000 594,523
Seamec, Ltd. * 14,000 46,354
Sicagen India, Ltd. * 4,881 751
Sical Logistics, Ltd. * 4,881 4,464
SKF India, Ltd. 4,700 22,646
Sonata Software, Ltd. 23,000 16,395
South Indian Bank, Ltd. 182,894 373,553
SREI Infrastructure Finance, Ltd. 135,957 224,775
SRF, Ltd. 37,385 97,766
Sterlite Optical Technologies, Ltd. 20,008 68,323
Strides Arcolab, Ltd. * 13,608 38,148
Suzlon Energy, Ltd. 534,875 1,119,349
Syndicate Bank, Ltd. 230,001 385,378
Tanla Solutions, Ltd. 86,834 146,574
Tata Chemicals, Ltd. 121,519 563,837
Tata Investment Corp., Ltd. 6,928 59,328
Tata Metaliks, Ltd. 7,900 18,283
Tata Motors, Ltd., SADR (a) 64,300 622,424
Tata Motors, Ltd. 270,232 1,923,894
Tata Steel, Ltd. 254,815 2,195,556
Tata Tea, Ltd. 60,799 893,477
Teledata Marine Solutions * 23,607 17,161
Teledata Technology Solutions * 23,607 17,161
Torrent Pharmaceuticals, Ltd. 11,441 43,350
Triveni Engineering & Industries, Ltd. 172,863 321,208
Tube Investments of India, Ltd. 59,975 56,945
TVS Motor Company, Ltd. 63,451 60,456
Unichem Laboratories, Ltd. 6,400 30,622
Union Bank of India, Ltd. 213,838 923,380
Unitech, Ltd. 481,987 814,907
United Phosphorus, Ltd. 172,150 588,773
Usha Martin, Ltd. 106,610 124,510
Uttam Galva Steels, Ltd. * 56,948 56,703
Varun Shipping Company, Ltd. 62,246 82,906
Videocon Industries, Ltd. 91,080 335,916
Vimta Labs, Ltd. 13,038 10,062
Welspun-Gujarat Stahl Rohren, Ltd. 120,815 433,983
Wockhardt, Ltd. * 79,241 202,682
Yes Bank, Ltd. * 213,967 572,919
Zee Entertainment Enterprises, Ltd. 147,094 529,373
Zensar Technologies, Ltd. 12,328 31,348
The accompanying notes are an integral part of the financial statements.
45
Copyright © 2012 www.secdatabase.com. All Rights Reserved.Please Consider the Environment Before Printing This Document

JOHN HANCOCK FUNDS II
PORTFOLIO OF INVESTMENTS - May 31, 2009 (Unaudited) - continued(showing percentage of total net assets)
Emerging Markets Value Fund (continued)Shares or
Principal
Amount Value
COMMON STOCKS (continued)
India (continued)
Zuari Industries, Ltd. 3,500 $ 22,405
126,753,289
Indonesia - 2.51%
Astra Graphia Tbk PT 606,500 17,112
Bakrie & Brothers Tbk PT * 5,064,750 43,383
Bakrieland Development Tbk PT * 95,600,000 2,758,917
Bank Pan Indonesia Tbk PT * 3,737,500 221,873
Berlian Laju Tanker Tbk PT 13,397,500 1,069,261
Bhakti Investama Tbk PT 3,342,825 56,911
Budi Acid Jaya Tbk PT 2,039,000 32,400
Bumi Resources Tbk PT 40,414,000 7,728,281
Central Proteinaprima Tbk PT * 7,696,500 78,733
Charoen Pokphand Indonesia Tbk PT * 2,106,000 134,009
Ciputra Development Tbk PT * 4,399,000 237,433
Ciputra Surya Tbk PT * 971,000 40,630
Davomas Abadi Tbk PT * 8,435,500 59,844
Energi Mega Persada Tbk PT * 9,102,500 413,736
Enseval Putera Megatrading Tbk PT 1,104,500 68,746
Global Mediacom Tbk PT * 4,826,500 90,184
Gudang Garam Tbk PT 1,433,500 1,582,867
Indofood Sukses Makmur Tbk PT 19,287,000 3,350,932
Kalbe Farma Tbk PT 12,893,000 1,103,768
Kawasan Industri Jababeka Tbk PT * 71,857,000 700,850
Matahari Putra Prima Tbk PT * 2,845,500 171,626
Medco Energi Internasional Tbk PT * 6,583,500 2,113,313
Mitra Adiperkasa Tbk PT 866,000 28,356
Panin Insurance Tbk PT * 1,443,000 27,069
Panin Life Tbk PT * 16,575,000 166,920
Polychem Indonesia Tbk PT * 1,930,000 16,707
Samudera Indonesia Tbk PT 74,500 28,960
Sumalindo Lestari Jaya Tbk PT * 920,000 64,547
Summarecon Agung Tbk PT * 13,532,000 469,279
Suryainti Permata Tbk PT * 1,802,000 31,600
Timah Tbk PT 5,105,000 978,486
Trias Sentosa Tbk PT 1,000,000 17,007
Trimegah Securities Tbk PT 1,540,500 29,942
Truba Alam Manunggal Engineering PT * 37,136,000 659,181
Tunas Ridean Tbk PT 948,500 126,282
24,719,145
Israel - 2.82%
Africa-Israel Investments, Ltd. * 8,070 156,628
Alvarion, Ltd. * 116,282 359,607
American Israeli Paper Mills, Inc. * 4,745 203,016
AudioCodes, Ltd. * 26,116 39,200
Azorim Investment Development &
Construction Company, Ltd. * 15,529 50,697
Bank Hapoalim, Ltd. * 2,321,779 6,207,128
Bank Leumi Le-Israel, Ltd. 2,508,838 7,122,289
Baran Group, Ltd. * 3,200 16,229
Clal Industries & Investments, Ltd. 152,518 558,182
Copyright © 2012 www.secdatabase.com. All Rights Reserved.Please Consider the Environment Before Printing This Document

Clal Insurance Enterprise Holdings, Ltd. * 29,578 418,023
Delta Galil Industries, Ltd. * 8,190 23,363
Direct Insurance Financial Investments, Ltd. * 15,338 25,195
Discount Investment Corp. 25,268 443,850
Electra, Ltd. 3,149 312,047
Emerging Markets Value Fund (continued)Shares or
Principal
Amount Value
COMMON STOCKS (continued)
Israel (continued)
Elron Electronic Industries, Ltd. * 23,021 $ 66,080
First International Bank of Israel, Ltd. * 98,744 182,123
First International Bank of Israel, Ltd. * 41,750 386,976
Formula Systems, Ltd., GDR 3,500 24,710
Formula Systems, Ltd. 5,626 41,005
Frutarom Industries, Ltd. 4,526 32,895
Harel Insurance Investments, Ltd. * 17,134 654,873
Ituran Location & Control, Ltd. 2,562 23,428
Koor Industries, Ltd. 11,087 278,947
Leader Holding & Investments, Ltd. * 21,500 8,133
Makhteshim-Agam Industries, Ltd. 745,218 4,295,536
Matav-Cable Systems Media Ltd * 23,434 202,251
Menorah Mivtachim Holdings, Ltd. * 58,296 518,052
Migdal Insurance Holdings, Ltd. * 681,428 898,662
Mivtach Shamir Holdings, Ltd. * 7,505 122,750
Oil Refineries, Ltd. 1,716,777 619,597
Orbotech, Ltd. * 45,156 327,833
Ormat Industries, Ltd. 63,914 526,502
Packer Plada, Ltd. 575 25,623
Radvision, Ltd. * 33,400 257,571
Retalix, Ltd. * 43,124 394,418
Scailex Corp., Ltd. * 16,565 141,614
Union Bank of Israel, Ltd. * 25,609 78,393
United Mizrahi Bank, Ltd. * 290,497 1,724,597
Urdan Industries, Ltd. * 59,724 21,592
27,789,615
Malaysia - 3.21%
Affin Holdings BHD 1,046,800 504,748
AMDB BHD * 540,000 27,282
AMMB Holdings BHD 3,884,450 3,679,801
Ann Joo Resources BHD 374,700 210,381
Asas Dunia BHD * 94,000 14,257
Asia Pacific Land BHD * 282,100 22,722
Bandar Raya Developments BHD 1,074,900 444,088
Berjaya Corp. BHD 2,109,800 560,189
Berjaya Land BHD 170,200 160,278
BIMB Holdings BHD 266,000 79,387
Boustead Holdings BHD 484,900 599,750
Cahya Mata Sarawak BHD 235,100 96,263
Dijaya Corp. BHD 16,900 4,850
DNP Holdings BHD 132,800 31,882
DRB-Hicom BHD 1,777,900 510,969
Eastern & Oriental BHD * 66,000 14,562
Eastern Pacific Industrial Corp. BHD 155,700 74,684
ECM Libra Avenue BHD 957,700 191,019
Encorp BHD 114,800 23,617
EON Capital BHD 593,000 663,196
Esso Malaysia BHD * 89,000 60,647
General Corp. BHD 242,500 56,082
Globetronics Technology BHD 172,980 37,009
Glomac BHD 108,200 20,336
Goldis BHD 179,000 76,835
Copyright © 2012 www.secdatabase.com. All Rights Reserved.Please Consider the Environment Before Printing This Document

Hap Seng Consolidated BHD 452,800 342,771
Hap Seng Plantations Holdings BHD * 254,800 164,135
Hong Leong Credit BHD 400,800 574,844
Hong Leong Industries BHD 52,000 51,189
The accompanying notes are an integral part of the financial statements.
46
JOHN HANCOCK FUNDS II
PORTFOLIO OF INVESTMENTS - May 31, 2009 (Unaudited) - continued(showing percentage of total net assets)
Emerging Markets Value Fund (continued)Shares or
Principal
Amount Value
COMMON STOCKS (continued)
Malaysia (continued)
Hume Industries Malaysia BHD 138,900 $ 122,483
Hunza Properties BHD 102,400 41,025
Hwang-DBS Malaysia BHD 69,400 29,307
IGB Corp. BHD 1,989,800 930,761
IJM Corp. BHD * 1,696,500 2,748,196
Insas BHD * 460,100 51,679
Integrated Logistics BHD 167,200 37,563
Jaks Resources BHD * 245,000 55,805
Jaya Tiasa Holdings BHD 56,700 31,442
K & N Kenanga Holdings BHD * 154,200 28,966
Karambunai Corp. BHD * 2,558,200 67,260
Keck Seng BHD 178,900 186,474
Kian Joo Can Factory BHD 332,000 112,256
Kim Loong Resources BHD 37,800 23,390
KLCC Property Holdings BHD 1,299,200 1,163,110
KPJ Healthcare BHD 147,000 136,449
KSL Holdings BHD 155,066 41,346
KUB Malaysia BHD * 592,900 85,842
Kulim Malaysia BHD 411,200 747,799
Kumpulan Hartanah Selangor BHD * 410,900 62,162
Land & General BHD * 1,048,300 85,644
Landmarks BHD 491,000 154,779
LBS Bina Group BHD * 210,000 22,613
Leader Universal Holdings BHD 717,000 132,176
Lion Corp. BHD * 454,900 62,613
Lion Diversified Holdings BHD 358,600 62,072
Lion Industries Corp. BHD 1,085,100 406,487
MAA Holdings BHD * 139,500 26,702
Malaysian Plantations BHD 1,817,500 1,129,849
Matrix International BHD * 258,500 30,841
MBM Resources BHD 5,000 3,091
Measat Global BHD * 7,500 2,441
Mega First Corp. BHD 193,700 51,786
Melewar Industrial Group BHD 62,200 11,157
MK Land Holdings BHD * 656,100 67,730
MMC Corp. BHD * 1,962,100 994,627
MNRB Holdings BHD 18,000 16,335
MTD ACPI Engineering BHD 88,100 11,703
Muhibbah Engineering M BHD 859,000 317,556
Mulpha International BHD * 1,678,800 252,745
Naim Cendera Holdings, Ltd. BHD 54,000 29,415
NCB Holdings BHD 4,000 3,091
New Straits Times Press BHD 183,500 61,617
Nylex Malaysia BHD 54,600 8,785
Oriental Holdings BHD 333,200 464,132
Copyright © 2012 www.secdatabase.com. All Rights Reserved.Please Consider the Environment Before Printing This Document

OSK Holdings BHD 1,435,500 570,454
OSK Property Holdings BHD 80,236 12,491
Padiberas Nasional BHD 428,300 191,354
Panasonic Manufacturing Malaysia BHD 8,100 26,426
PJ Development Holdings BHD 297,900 46,983
PPB Group BHD 1,067,000 3,208,241
Protasco BHD 141,500 33,225
Proton Holdings BHD 656,100 561,838
Ranhill BHD 382,200 106,193
RB Land Holdings BHD * 263,000 114,476
RHB Capital BHD 572,600 673,736
Emerging Markets Value Fund (continued)Shares or
Principal
Amount Value
COMMON STOCKS (continued)
Malaysia (continued)
Sarawak Energy BHD 670,900 $ 420,074
Scomi Group BHD 2,062,900 408,036
Selangor Dredging BHD 328,000 46,676
Shangri-La Hotels BHD 24,100 12,897
Shell Refining Company Federation
of Malaya BHD 150,600 470,037
SHL Consolidated BHD 185,100 52,969
Sunrise BHD * 333,000 159,269
Sunway City BHD 519,300 428,132
Sunway Holdings, Inc. BHD 224,800 76,288
Suria Capital Holdings BHD 286,100 94,438
Ta Ann Holdings BHD 246,100 253,662
TA Enterprise BHD 2,443,400 722,724
Talam Corp. BHD * 1,080,000 32,603
Tan Chong Motor Holdings BHD 861,500 420,030
TDM BHD 150,700 73,305
Tebrau Teguh BHD * 333,800 74,170
Time.com BHD * 1,972,700 213,052
Titan Chemicals Corp. * 1,009,700 252,345
Tradewinds Corp. BHD * 660,000 125,780
Tradewinds Malaysia BHD 82,400 69,997
Tronoh Consolidated M BHD 218,400 61,063
Unisem M BHD 516,900 180,194
United Malacca BHD 58,900 116,330
V.S. Industry BHD 166,897 58,588
Wah Seong Corp. BHD 337,000 174,611
WTK Holdings BHD * 477,500 154,550
YNH Property BHD 1,118,236 495,190
31,603,502
Mexico - 7.40%
Alfa SA de CV 793,000 2,128,192
Alsea SAB de CV * 483,850 268,152
Axtel SAB de CV, ADR * 1,028,937 580,398
Carso Infraestructura y Construccion SA de
CV * 483,300 255,373
Cemex SA de CV, SADR * 1,506,954 14,707,869
Coca-Cola Femsa SAB de CV, SADR 40,521 1,672,707
Consorcio ARA SA de CV * 1,364,000 640,993
Corp Moctezuma SAB de CV 629,300 1,241,687
Corp. GEO SA de CV, Series B * 842,752 1,465,155
Desarrolladora Homex SA de CV * 419,700 1,864,625
Dine SA de CV * 103,700 47,236
Embotelladoras Arca SA de CV 916,541 2,329,623
Empresas ICA SA de CV, SADR * 201,733 1,650,176
Empresas ICA Sociedad
Controladora SA de CV * 25,600 50,182
Copyright © 2012 www.secdatabase.com. All Rights Reserved.Please Consider the Environment Before Printing This Document

Fomento Economico Mexicano SA de CV,
SADR 366,825 11,991,509
GMD Resorts SAB de CV * 69,300 26,306
Gruma SA de CV, SADR * 70,893 311,929
Gruma SA de CV * 19,921 21,960
Grupo Aeroportuario del Centro Norte Sab de
CV 292,200 349,611
Grupo Aeroportuario del Pacifico SA de CV,
Series B, SADR 128,400 2,705,388
Grupo Aeroportuario del Sureste SA de CV,
SADR (a) 39,550 1,375,153
The accompanying notes are an integral part of the financial statements.
47
JOHN HANCOCK FUNDS II
PORTFOLIO OF INVESTMENTS - May 31, 2009 (Unaudited) - continued(showing percentage of total net assets)
Emerging Markets Value Fund (continued)Shares or
Principal
Amount Value
COMMON STOCKS (continued)
Mexico (continued)
Grupo Aeroportuario del Sureste SA de CV 27,200 $ 93,544
Grupo Carso SA de CV 1,218,100 3,486,363
Grupo Cementos de Chihuahua SA de CV 57,000 129,604
Grupo Continential SA de CV 461,100 917,159
Grupo Famsa SAB de CV * 203,300 226,575
Grupo Financiero Banorte SA de CV 2,763,470 6,503,763
Grupo Industrial Maseca SA de CV 2,600 1,500
Grupo Industrial Saltillo SA de CV * 100,600 19,857
Grupo Kuo SA de CV * 164,700 87,527
Grupo Mexicano de Desarrollo, SAB * 69,300 37,617
Grupo Mexico SA 6,905,343 6,500,627
Grupo Modelo SA * 728,500 2,489,355
Grupo Simec SAB de CV * 198,600 429,707
Industrias CH SA de CV * 358,600 1,113,751
Organizacion Soriana SA de CV * 1,728,200 3,631,687
Qualitas Compania de Seguros SA de CV * 258,200 78,801
Urbi Desarrollos Urbanos SA de CV * 915,100 1,254,685
Vitro SA de CV, SADR * 92,452 152,546
72,838,892
Philippines - 0.58%
Ayala Corp. 45,000 275,296
Belle Corp. * 1,800,000 31,212
Benpres Holdings Corp. * 1,630,000 66,715
China Banking Corp. 4,140 31,777
DMCI Holdings, Inc. * 3,234,000 500,759
Empire East Land Holdings, Inc. * 5,890,000 52,487
Filinvest Development Corp. 404,000 15,513
Filinvest Land, Inc. 28,408,750 444,218
First Philippine Holdings Corp. * 546,800 320,406
Megaworld Corp. 21,969,000 446,910
Metropolitan Bank & Trust Company 1,329,500 959,598
Philippine National Bank * 330,400 149,088
Rizal Commercial Banking Corp. 455,400 148,122
Robinsons Land Corp. 3,333,000 517,828
Security Bank Corp. 155,100 138,348
SM Investments Corp. 114,000 811,962
Union Bank of Philippines 221,200 115,890
Copyright © 2012 www.secdatabase.com. All Rights Reserved.Please Consider the Environment Before Printing This Document

Universal Robina Corp. 1,858,100 322,555
Vista Land & Lifescapes, Inc. * 8,538,000 315,226
5,663,910
Poland - 2.09%
Agora SA 92,656 406,187
Bank BPH SA * 23,715 276,754
Bank Millennium SA * 548,772 418,447
Bioton SA * 3,395,447 247,350
Boryszew SA * 21,709 16,838
Ciech SA 26,379 267,401
Computerland SA * 28,494 167,873
Debica SA 7,943 139,755
Dom Development SA * 4,937 60,544
Echo Investment SA * 671,909 623,715
Emperia Holding SA 2,613 44,444
Fabryki Mebli Forte SA * 23,417 65,442
Farmacol SA * 11,889 115,846
Firma Chemiczna Dwory SA * 1,964,944 555,700
Emerging Markets Value Fund (continued)Shares or
Principal
Amount Value
COMMON STOCKS (continued)
Poland (continued)
Getin Holding SA * 674,320 $ 1,208,750
Grupa Kety SA 23,810 546,291
Grupa Lotos SA * 100,854 602,773
Impexmetal SA 74,550 39,839
KGHM Polska Miedz SA 230,009 5,072,020
Kredyt Bank SA 59,632 110,462
MNI SA * 41,057 35,608
Mostostal-Export SA * 22,387 14,852
Netia SA * 376,393 400,827
Orbis SA 61,821 699,010
Pekaes SA 6,381 19,864
Pfleiderer Grajewo SA 6,153 18,424
Polnord SA * 13,014 130,689
Polska Grupa Farmaceutyczna SA * 7,974 81,884
Polski Koncern Naftowy Orlen SA 766,761 6,991,002
Przedsiebiorstwo Eksportu i Importu Kopex SA * 54,503 323,234
Softbank SA 46,450 794,478
Stalexport Autostrady SA * 202,394 97,313
20,593,616
South Africa - 10.69%
ABSA Group, Ltd. 423,364 5,414,654
Aeci, Ltd. 187,934 1,086,972
Afgri, Ltd. 672,603 444,971
African Bank Investments, Ltd. 874,834 2,876,085
AG Industries, Ltd. * 94,914 3,589
Allied Electronics Corp., Ltd. 93,711 271,956
Argent Industrial, Ltd. 106,615 99,122
Aveng, Ltd. 774,939 3,404,307
Barloworld, Ltd. 411,101 1,919,700
Bell Equipment, Ltd. * 83,308 86,237
Caxton & CTP Publishers & Printers, Ltd. 251,175 363,155
Ceramic Industries, Ltd. 1,781 16,789
DataTec, Ltd. * 323,118 663,025
Drdgold, Ltd. 262,858 268,289
Enaleni Pharmaceuticals, Ltd. * 553,406 245,079
Eqstra Holdings, Ltd. * 91,166 76,249
FirstRand, Ltd. 1,011,210 1,750,028
Freeworld Coatings, Ltd. 26,940 20,300
Copyright © 2012 www.secdatabase.com. All Rights Reserved.Please Consider the Environment Before Printing This Document

Gijima Ast Group, Ltd. 338,993 20,482
Gold Fields, Ltd., SADR 1,201,658 16,318,516
Grindrod, Ltd. 745,786 1,464,570
Harmony Gold Mining Company, Ltd., SADR * 576,931 6,980,865
Highveld Steel & Vanadium Corp., Ltd. 3,483 27,556
Hulamin, Ltd. 109,348 158,026
Iliad Africa, Ltd. 338,998 319,890
Imperial Holdings, Ltd. 332,645 2,533,099
Investec, Ltd. 414,998 2,307,096
JD Group, Ltd. 360,070 1,710,662
Kap International Holdings, Ltd. * 90,584 14,801
Lewis Group, Ltd. 100,651 570,756
Medi-Clinic Corp., Ltd. 467,425 1,163,957
Merafe Resources, Ltd. * 2,035,010 248,340
Metair Investments, Ltd. * 99,170 55,468
Metorex, Ltd. * 16,745 4,636
Metropolitan Holdings, Ltd. 1,019,364 1,498,174
Mittal Steel South Africa, Ltd. 366,219 4,399,328
The accompanying notes are an integral part of the financial statements.
48
JOHN HANCOCK FUNDS II
PORTFOLIO OF INVESTMENTS - May 31, 2009 (Unaudited) - continued(showing percentage of total net assets)
Emerging Markets Value Fund (continued)Shares or
Principal
Amount Value
COMMON STOCKS (continued)
South Africa (continued)
Mondi, Ltd. 291,630 $ 1,320,329
Mustek, Ltd. 97,803 12,518
Mvelaphanda Group, Ltd. 632,791 366,259
Nampak, Ltd. * 1,079,367 1,918,961
Nedbank Group, Ltd. 435,990 4,905,497
Northam Platinum, Ltd. 195,797 843,308
Nu-World Holdings, Ltd. * 9,429 17,185
Omnia Holdings, Ltd. 93,963 604,662
Palabora Mining Company, Ltd. 7,609 78,021
Peregrine Holdings, Ltd. 219,538 186,416
PSG Group, Ltd. 183,733 361,581
Sanlam, Ltd. 4,143,344 8,976,466
Sappi, Ltd., SADR * (a) 413,417 1,442,825
Sappi, Ltd. 189,700 656,358
Simmer and Jack Mines, Ltd. * 604,228 235,439
Spur Corp., Ltd. 9,000 10,075
Standard Bank Group, Ltd. 1,927,232 20,121,049
Steinhoff International Holdings, Ltd. * 2,185,608 3,589,075
Super Group, Ltd. * 371,170 27,070
Trans Hex Group, Ltd. 57,462 11,604
Trencor, Ltd. 225,876 568,897
Value Group, Ltd. 267,946 101,035
105,161,359
South Korea - 12.00%
Aekyung Petrochemical Company, Ltd. 1,450 19,560
Asia Cement Company, Ltd. 4,430 164,743
Asia Paper Manufacturing Company, Ltd. * 2,000 17,912
Asiana Airlines * 120,880 372,597
AUK Corp. * 5,400 8,986
BNG Steel Company, Ltd. * 1,630 8,858
Copyright © 2012 www.secdatabase.com. All Rights Reserved.Please Consider the Environment Before Printing This Document

Boryung Pharmaceutical Company, Ltd. 1,188 27,163
Busan Bank 184,360 1,154,150
Byucksan Engineering & Construction
Company, Ltd. * 6,140 14,517
Cheil Industries, Inc. 14,720 539,869
Chokwang Leather Company, Ltd. * 2,300 12,030
Chong Kun Dang Pharm Corp. 1,200 16,793
Choongwae Pharma Corp. 2,667 30,379
Chosun Refractories Company, Ltd. 1,160 52,134
CJ Corp. 17,996 690,704
Dae Chang Industrial Company, Ltd. * 27,000 17,719
Dae Dong Industrial Company, Ltd. 2,600 43,650
Dae Han Flour Mills Company, Ltd. 1,742 161,774
Dae Won Kang Up Company, Ltd. 18,000 22,103
Daeduck Electronics Company, Ltd. 58,880 184,247
Daeduck GDS Company, Ltd. 5,010 37,060
Daegu Bank 185,600 1,500,590
Daehan Steel Company, Ltd. 9,350 100,012
Daehan Synthetic Fiber Company, Ltd. 130 7,053
Daekyo Company, Ltd. 62,070 291,553
Daelim Industrial Company, Ltd. 39,600 1,934,465
Daesang Corp. * 18,320 94,837
Daesung Industrial Company, Ltd. 1,883 108,125
Daewoo Engineering & Construction
Company, Ltd. 122,910 1,020,452
Daewoo Motor Sales Corp. * 39,530 379,489
Emerging Markets Value Fund (continued)Shares or
Principal
Amount Value
COMMON STOCKS (continued)
South Korea (continued)
Daewoong Company, Ltd. 620 $ 10,503
Daishin Securities Company, Ltd. 67,580 895,899
Daiyang Metal * 4,090 8,636
Daou Technology, Inc. 48,110 317,478
DI Corp. * 8,700 8,866
Digital Power Communications Company, Ltd. 14,000 16,655
Dong Ah Tire & Rubber Company, Ltd. 3,100 21,640
Dong Su Industrial Company, Ltd. 10,880 70,178
Dong Wha Pharmaceutical Industrial
Company, Ltd. 4,030 145,978
Dongbang Transport Logistics Company, Ltd. 5,650 11,933
Dongbu Corp. 16,730 134,277
Dongbu Hannong Chemicals Company, Ltd. * 41,060 313,916
Dongbu Securities Company, Ltd. * 28,389 162,612
Dongbu Steel Company, Ltd. 16,470 130,506
Dong-Il Corp. 630 25,361
Dongil Paper Manufacturing Company, Ltd. 13,000 10,407
Dongkuk Steel Mill Company, Ltd. 54,660 1,301,401
Dongwon F & B Company, Ltd. 800 23,057
Dongyang Engineering & Construction Corp. 1,280 27,219
Dongyang Mechatronics Corp. 24,424 71,544
Doosan Industrial Development Company, Ltd. 44,670 266,976
En Paper Manufacturing Company, Ltd. * 4,292 9,766
F&F Company, Ltd. 5,100 12,166
Fursys, Inc. 1,550 28,619
Gaon Cable Company, Ltd. 1,160 29,258
Global & Yuasa Battery Company, Ltd. 4,200 97,714
GS Holdings Corp. 72,730 1,811,698
Gwangju Shinsegae Company, Ltd. 220 22,555
H.S. R & A Company, Ltd. * 2,200 12,827
Hae In Corp. 1,846 7,603
Halla Climate Control Company, Ltd. 43,190 376,385
Copyright © 2012 www.secdatabase.com. All Rights Reserved.Please Consider the Environment Before Printing This Document

Halla Engineering & Construction Corp. 7,790 141,366
Han Kuk Carbon Company, Ltd. 16,340 121,954
Hana Financial Group, Inc. 169,830 4,111,163
Handok Pharmaceuticals Company, Ltd. 1,000 10,680
Handsome Company, Ltd. 16,628 123,370
Hanil Cement Manufacturing Company, Ltd. 8,549 526,718
Hanil Construction Company, Ltd. 1,470 7,262
Hanil E-Wha Company, Ltd. 6,400 12,804
Hanjin Heavy Industries & Construction
Holdings Company, Ltd. 15,080 227,009
Hanjin Shipping Company, Ltd. 84,630 1,343,535
Hanjin Transportation Company, Ltd. 12,470 330,345
Hankook Cosmetics Company, Ltd. 6,300 16,922
Hankook Tire Company, Ltd. 51,710 576,316
Hankuk Electric Glass Company, Ltd. 3,370 67,134
Hankuk Glass Industries, Inc. 1,820 31,216
Hankuk Paper Manufacturing Company, Ltd. 3,690 120,229
Hanmi Capital Company, Ltd. 3,100 13,872
Hanshin Construction Company, Ltd. 3,010 34,831
Hansol Chemical Company, Ltd. 3,500 25,279
Hansol CSN Company, Ltd. 23,450 22,968
Hansol LCD, Inc. 2,650 49,315
Hansol Paper Company, Inc. * 48,030 352,306
Hanssem Company, Ltd. 6,330 37,133
Hanwha Chemical Corp. 113,670 940,879
The accompanying notes are an integral part of the financial statements.
49
JOHN HANCOCK FUNDS II
PORTFOLIO OF INVESTMENTS - May 31, 2009 (Unaudited) - continued(showing percentage of total net assets)
Emerging Markets Value Fund (continued)Shares or
Principal
Amount Value
COMMON STOCKS (continued)
South Korea (continued)
Hanwha Securities Company, Ltd. 57,600 $ 485,514
Hanwha Timeworld Company, Ltd. 1,700 15,999
Hanyang Securities Company, Ltd. 12,220 113,761
Heung-A Shipping Company, Ltd. 19,140 20,587
Hite Holdings Company, Ltd. 8,280 190,917
Honam Petrochemical Corp. 20,627 1,272,445
Hotel Shilla Company, Ltd. 22,640 271,069
Husteel Company, Ltd. 5,310 83,693
Hwa Shin Company, Ltd. 14,690 24,824
Hwa Sung Industrial Company, Ltd. 3,530 17,352
Hwacheon Machine Tool Company, Ltd. 730 18,735
Hynix Semiconductor, Inc. * 454,020 4,726,714
Hyosung Corp. 16,050 1,358,137
Hyundai Cement Company, Ltd. * 2,370 25,702
Hyundai Department Store Company, Ltd. 660 43,736
Hyundai Development Company 42,000 1,380,862
Hyundai DSF Company, Ltd. 2,800 20,027
Hyundai Elevator Company, Ltd. 3,641 180,072
Hyundai H & S Company, Ltd. 5,183 236,394
Hyundai Hysco Company, Ltd. 41,680 408,477
Hyundai Mipo Dockyard Company, Ltd. 17,062 1,895,569
Hyundai Motor Company, Ltd. 197,506 10,995,208
Hyundai Pharmaceutical Industrial Company,
Ltd. 9,400 19,652
Copyright © 2012 www.secdatabase.com. All Rights Reserved.Please Consider the Environment Before Printing This Document

Hyundai Securities Company, Ltd. 194,107 2,136,421
Hyundai Steel Company 78,472 3,778,621
Il Dong Pharmaceutical Company, Ltd. 4,520 127,967
Iljin Diamond Company, Ltd. 712 7,032
Iljin Electric, Ltd. * 15,328 43,027
Ilsung Pharmaceutical Company, Ltd. 1,470 76,979
Inzi Controls Company, Ltd. 6,490 17,843
Isu Chemical Company, Ltd. 7,260 76,820
Jahwa Electronics Company, Ltd. 5,200 32,133
Jeil Mutual Savings Bank 1,850 6,871
Jeil Pharmaceutical Company 1,910 14,680
Jeonbuk Bank, Ltd. 59,800 277,946
Joongang Construction Company, Ltd. * 2,700 13,033
KB Financial Group, Inc., ADR * (a) 258,174 8,251,241
KC Tech Company, Ltd. 13,863 41,976
KCC Corp. 6,948 2,264,260
KCTC 1,100 12,314
Keangnam Enterprises, Ltd. * 11,908 104,527
Keyang Electric Machinery Company, Ltd. 18,120 35,484
KG Chemical Corp. 5,600 36,704
Kia Motors Corp. * 269,640 2,586,539
KISCO Corp. 4,286 195,816
Kiswire, Ltd. 6,149 225,633
Kolon Engineering &
Construction Company, Ltd. 27,010 179,523
Kolon Industries, Inc. 14,120 475,826
Korea Airport Service Company, Ltd. 1,020 28,142
Korea Cast Iron Pipe Industries Company, Ltd. 6,600 28,480
Korea Circuit Company, Ltd. * 5,500 11,991
Korea Development Corp. * 2,330 11,291
Korea Development Financing Corp. 1,960 47,396
Korea Electric Terminal Company, Ltd. 7,230 97,007
Korea Exchange Bank 344,640 2,529,737
Emerging Markets Value Fund (continued)Shares or
Principal
Amount Value
COMMON STOCKS (continued)
South Korea (continued)
Korea Flange Company, Ltd. * 1,830 $ 19,728
Korea Green Paper Manufacturing Company,
Ltd. * 3,607 5,920
Korea Investment Holdings Company, Ltd. 58,647 1,514,338
Korea Iron & Steel Company, Ltd. 783 41,633
Korea Kumho Petrochemical Company, Ltd. 15,040 391,370
Korea Line Corp. 10,777 643,281
Korea Mutual Savings Bank 870 11,918
Korea Polyol Company, Ltd. 1,522 62,364
Korea Zinc Company, Ltd. 6,355 720,890
Korean Air Lines Company, Ltd. * 51,180 1,542,227
Korean Petrochemical Industrial Company,
Ltd. * 2,450 85,754
KP Chemical Corp. * 43,550 283,669
KTB Network Corp. * 70,470 268,775
Kukdo Chemical Company, Ltd. 4,840 144,817
Kumho Electric Company, Ltd. 6,750 183,928
Kumho Industrial Company, Ltd. 36,950 677,078
Kumho Investment Bank 60,370 30,645
Kumho Tire Company, Inc. * 53,240 227,538
Kumkang Industrial Company, Ltd. 1,400 11,297
Kwang Dong Pharmaceutical Company, Ltd. 54,350 136,703
Kyeryong Construction
Industrial Company, Ltd. 8,060 158,163
Kyobo Securities Company, Ltd. 24,810 216,223
Copyright © 2012 www.secdatabase.com. All Rights Reserved.Please Consider the Environment Before Printing This Document

Kyung Nong Corp. 11,060 38,590
Kyungbang, Ltd. * 681 76,898
Lee Ku Industrial Company, Ltd. 8,740 11,983
LG Dacom Corp. 20,670 303,222
LG Display Company, Ltd., ADR (a) 151,850 1,790,312
LG International Corp. 9,400 206,641
Lotte Chilsung Beverage Company, Ltd. 1,027 659,154
Lotte Confectionery Company, Ltd. 1,049 839,147
Lotte Midopa Company, Ltd. 18,300 215,766
Lotte Samkang Company, Ltd. 902 125,245
Lotte Shopping Company, Ltd. 13,543 2,603,177
Manho Rope & Wire, Ltd. 1,400 21,686
Meritz Investment Bank * 33,274 20,944
Meritz Securities Company, Ltd. 259,560 254,371
Moorim Paper Company, Ltd. 4,880 36,136
Namyang Dairy Products Company, Ltd. 646 258,176
Nexen Tire Corp. 48,820 168,776
NH Investment & Securities Company, Ltd. 37,650 227,916
Nong Shim Holdings Company, Ltd. 1,340 68,948
On*Media Corp. * 92,630 212,516
Pacific Corp. 4,328 431,793
Pang Rim Company, Ltd. 950 12,247
PaperCorea, Inc. * 2,900 18,512
Pohang Coated Steel Company, Ltd. 1,600 31,761
Poonglim Industrial Company, Ltd. * 5,520 13,585
Poongsan Corp. * 1,300 19,808
Poongsan Corp. * 6,919 103,544
Pulmuone Company, Ltd. 1,122 60,482
Pumyang Construction Company, Ltd. 1,610 12,507
Pusan City Gas Company, Ltd. 7,810 123,846
S&T Corp. 2,360 23,161
S&T Dynamics Company, Ltd. 10,410 126,505
The accompanying notes are an integral part of the financial statements.
50
JOHN HANCOCK FUNDS II
PORTFOLIO OF INVESTMENTS - May 31, 2009 (Unaudited) - continued(showing percentage of total net assets)
Emerging Markets Value Fund (continued)Shares or
Principal
Amount Value
COMMON STOCKS (continued)
South Korea (continued)
Saehan Media Company, Ltd. * 6,266 $ 13,124
Sam Kwang Glass Industrial Company, Ltd. 800 24,001
Sam Lip General Foods Company, Ltd. 3,850 28,128
Sam Young Electronics Company, Ltd. 13,690 138,395
Sam Yung Trading Company, Ltd. 4,500 14,828
Sambu Construction Company, Ltd. 4,918 92,204
Samho International Company, Ltd. * 6,780 25,111
Samick Musical Instruments Company, Ltd. * 8,830 6,171
Samick THK Company, Ltd. 11,120 18,068
Samsung Card Company, Ltd. 33,000 1,257,083
Samsung Corp. 34,785 1,300,397
Samsung SDI Company, Ltd. 48,621 4,021,204
Samwhan Corp. 3,850 43,466
Samyang Corp. 7,861 243,331
Samyang Genex Company, Ltd. 1,932 87,880
Samyang Tongsang Company, Ltd. 690 14,405
Savezone I & C Corp. * 16,880 19,407
Copyright © 2012 www.secdatabase.com. All Rights Reserved.Please Consider the Environment Before Printing This Document

Seah Besteel Corp. 15,200 189,437
SeAH Holdings Corp. 1,133 60,223
SeAH Steel Corp. 2,632 90,401
Sebang Company, Ltd. 10,890 112,669
Sejong Industrial Company, Ltd. 7,830 34,614
Seoul Securities Company, Ltd. * 642,760 639,336
Sgwicus Corp. * 4,800 10,781
SH Chemical Company, Ltd. * 31,743 17,505
Shin Poong Pharmaceutical Company, Ltd. 1,880 34,638
Shinhan Engineering & Construction
Company, Ltd. 3,177 37,234
Shinhan Financial Group Company, Ltd.,
SADR * (a) 154,662 7,884,669
Shinhan Financial Group Company, Ltd. * 65,000 1,655,623
Shinheung Securities Company, Ltd. * 7,640 163,176
Shinsegae Engineering & Construction
Company, Ltd. 1,110 13,657
Shinsung ENG Company, Ltd. 3,222 7,629
Shinsung FA Company, Ltd. 3,222 6,997
Shinyoung Securities Company, Ltd. 7,210 222,001
Silla Company, Ltd. 11,550 145,417
Sindo Ricoh Company, Ltd. 5,604 243,880
SJM Company, Ltd. 8,130 27,936
SK Corp. 46,864 4,081,185
SK Gas Company, Ltd. 2,662 119,486
SKC Company, Ltd. 28,030 576,336
SL Corp. 5,830 15,856
Solomon Mutual Savings Bank 3,600 15,035
Ssangyong Cement Industrial Company, Ltd. * 21,560 132,252
Suheung Capsule Company, Ltd. 2,900 18,763
Sung Bo Chemicals Company, Ltd. 410 8,876
Sungjee Construction Company, Ltd. 2,210 11,802
Sungshin Cement Company, Ltd. * 5,760 32,949
Sungwon Corp. * 4,230 15,119
Sunjin Company, Ltd. * 1,010 21,519
Tae Kyung Industrial Company, Ltd. 14,930 64,231
Taegu Department Store Company, Ltd. 2,740 22,080
Taekwang Industrial Company, Ltd. 613 323,708
Taeyoung Engineering & Construction, Ltd. 62,140 370,043
Taihan Electric Wire Company, Ltd. 34,660 611,745
Emerging Markets Value Fund (continued)Shares or
Principal
Amount Value
COMMON STOCKS (continued)
South Korea (continued)
Telcoware Company, Ltd. 4,000 $ 25,636
Tong Yang Investment Bank 109,230 1,094,896
Tong Yang Major Corp. * 30,340 95,462
Trybrands, Inc. * 5,723 11,608
Trybrands, Inc. * 3,036 7,469
TS Corp. 2,406 115,285
Uangel Corp. 7,990 49,012
Unid Company, Ltd. 2,000 60,121
Union Steel Company, Ltd. 5,560 74,772
Wiscom Company, Ltd. 3,680 11,867
Woongjin Holdings Company, Ltd. * 39,680 382,689
Woori Investment & Securities Company, Ltd. 122,940 1,657,521
Yesco Company, Ltd. 1,480 32,398
Yoosung Enterprise Company, Ltd. 9,880 20,777
Youlchon Chemical Company, Ltd. 18,290 112,530
Youngone Corp. 23,530 181,790
Yuhwa Securities Company, Ltd. 3,240 36,987
Copyright © 2012 www.secdatabase.com. All Rights Reserved.Please Consider the Environment Before Printing This Document

118,092,914
Taiwan - 12.41%
Accton Technology Corp. * 834,000 292,361
Achem Technology Corp. 282,000 89,197
AGV Products Corp. * 753,505 300,260
Allis Electric Company, Ltd. 135,000 29,055
AmTRAN Technology Company, Ltd. 1,112,000 713,952
Arima Communication Corp. * 202,000 69,656
Arima Computer Corp. * 276,814 21,881
Arima Optoelectronics Corp. * 100,134 33,483
Asia Polymer Corp. 337,000 240,491
Asia Vital Components Company, Ltd. 395,800 258,081
AU Optronics Corp. ADR (a) 1,179,851 12,258,652
Audix Corp. 81,200 43,074
Avision, Inc. 111,916 37,315
Bank of Kaohsiung, Ltd. 495,680 178,800
Basso Industry Corp. 105,000 88,998
Behavior Technology Computer Corp. * 48,800 2,405
BenQ Corp. 2,449,512 1,062,601
BES Engineering Corp. 2,538,200 709,146
Biostar Microtech International Corp. 85,280 52,062
C Sun Manufacturing, Ltd. 49,469 17,384
Carnival Industrial Corp. * 198,000 39,435
Cathay Chemical Works, Inc. 73,000 24,547
Cathay Real Estate Development
Company, Ltd. 1,529,000 717,726
Central Reinsurance Company, Ltd. 269,535 93,125
Chain Qui Development Company, Ltd. 76,000 65,461
Champion Building Materials Company, Ltd. 378,950 138,980
Chang Hwa Commercial Bank, Ltd. 2,733,000 1,370,830
Cheng Loong Corp. 1,606,000 554,804
Chenming Mold Industrial Corp. 92,128 26,680
Chi Mei Optoelectronics Corp. 5,448,950 3,210,782
Chia Hsin Cement Corp. * 797,560 461,738
Chien Shing Stainless Steel Company, Ltd. * 181,000 36,806
Chilisin Electronics Corp. 63,240 22,154
China Airlines, Ltd. * 2,853,874 776,107
China Chemical & Pharmaceutical Company,
Ltd. 129,000 87,417
The accompanying notes are an integral part of the financial statements.
51
JOHN HANCOCK FUNDS II
PORTFOLIO OF INVESTMENTS - May 31, 2009 (Unaudited) - continued(showing percentage of total net assets)
Emerging Markets Value Fund (continued)Shares or
Principal
Amount Value
COMMON STOCKS (continued)
Taiwan (continued)
China Development Financial Holdings Corp. 14,866,216 $ 4,323,771
China Electric Manufacturing Corp. 456,000 206,489
China General Plastics Corp. * 588,000 234,567
China Glaze Company, Ltd. 109,203 32,725
China Manmade Fibers Corp. 2,062,000 432,558
China Metal Products Company, Ltd. 350,000 447,219
China Motor Company, Ltd. 1,144,905 577,858
China Petrochemical Development Corp. * 3,005,780 981,868
China Steel Structure Company, Ltd. 107,000 63,132
China Wire & Cable Company, Ltd. * 120,000 28,248
Copyright © 2012 www.secdatabase.com. All Rights Reserved.Please Consider the Environment Before Printing This Document

Ching Feng Home Fashions Company, Ltd. 108,780 22,945
Chin-Poon Industrial Company, Ltd. 466,000 236,845
Chun Yu Works & Company, Ltd. 115,000 43,248
Chun Yuan Steel Industrial Company, Ltd. 633,962 218,126
Chung Hwa Pulp Corp. 622,000 242,089
Chunghwa Picture Tubes, Ltd. 12,554,000 2,057,019
CMC Magnetics Corp. * 4,140,000 998,861
Collins Company, Ltd. * 155,400 43,297
Compeq Manufactuing Company, Ltd. 1,614,000 483,538
Continental Engineering Corp. 875,000 385,304
Delpha Construction Company, Ltd. * 174,000 34,490
D-Link Corp. 368,220 313,287
E.Sun Financial Holding Company, Ltd. 5,415,720 1,878,933
Eastern Media International Corp. 1,061,053 208,978
Eclat Textile Company, Ltd. 123,600 60,547
Edom Technology Company, Ltd. 64,000 17,786
Elite Material Company, Ltd. 200,955 104,362
Elitegroup Computer Systems Company, Ltd. 1,024,576 368,689
Enlight Corp. 164,799 3,930
Eternal Chemical Company, Ltd. 267,300 215,333
EVA Airways Corp. * 3,388,000 977,362
Everest Textile Company, Ltd. 224,000 41,951
Evergreen Marine Corp. 1,785,000 1,079,694
Everlight Chemical Industrial Corp. 597,000 312,749
Everspring Industry Company, Ltd. * 61,000 11,978
Evertop Wire Cable Corp. * 98,275 18,219
Excel Cell Electronic Company, Ltd. 29,000 9,615
Far Eastern Department Stores Company, Ltd. 1,351,000 1,437,381
Far Eastern International Bank * 2,731,000 818,755
Federal Corp. 609,527 329,189
First Copper Technology Company, Ltd. 169,000 45,452
First Insurance Company, Ltd. 150,165 52,118
Formosa Taffeta Company, Ltd. 1,516,000 1,115,375
Formosan Rubber Group, Inc. 767,000 466,046
Formosan Union Chemical * 173,264 66,490
FSP Technology, Inc. 344,000 304,187
FU I Industrial * 159,000 43,961
Fwusow Industry Company, Ltd. 103,000 33,685
Gigabyte Technology Company, Ltd. 827,000 556,168
Gigastorage Corp. * 146,000 35,617
Gold Circuit Electronics, Ltd. 771,040 273,480
Goldsun Development & Construction
Company, Ltd. 1,887,301 1,054,191
Gordon Auto Body Parts Company, Ltd. 50,181 15,467
Grand Pacific Petrochemical Corp. * 1,153,000 416,183
Great China Metal Industry Company, Ltd. 303,000 220,526
Emerging Markets Value Fund (continued)Shares or
Principal
Amount Value
COMMON STOCKS (continued)
Taiwan (continued)
GTM Corp. 95,000 $ 47,371
Hey Song Corp. 572,000 300,947
Hitron Technology, Inc. * 67,000 25,742
Ho Tung Chemical Corp. * 701,000 288,951
Hocheng Group Corp. * 177,000 49,814
Hold-Key Electric Wire & Cable Company, Ltd. * 132,000 120,623
Hong TAI Electric Industrial 328,000 124,083
Hsin Kuang Steel Co Ltd 416,000 322,872
Hsing TA Cement Company, Ltd. 227,000 71,430
Hua Eng Wire & Cable Company, Ltd. 1,053,000 255,125
Hung Ching Development Company, Ltd. 147,000 51,723
Hung Sheng Construction Company, Ltd. 821,000 408,012
Copyright © 2012 www.secdatabase.com. All Rights Reserved.Please Consider the Environment Before Printing This Document

Hwa Fong Rubber Company, Ltd. * 584,770 196,114
Ichia Technologies, Inc. 512,300 210,713
InnoLux Display Corp. 2,165,000 3,034,733
International Semiconductor Technology, Ltd. * 171,000 42,764
Inventec Company, Ltd. 2,891,050 1,832,540
Jui Li Enterprise Company, Ltd. 66,950 18,359
K Laser Technology, Inc. 82,214 34,243
Kang Na Hsiung Enterprise Company, Ltd. 135,000 79,675
Kao Hsing Chang Iron & Steel Corp. * 130,000 31,856
Kaulin Manufacturing Company, Ltd. 164,490 77,079
KEE TAI Properties Company, Ltd. 550,512 274,079
Kindom Construction Company, Ltd. 561,000 388,996
King Yuan Electronics Company, Ltd. 1,860,056 655,687
King's Town Bank * 847,000 213,997
Kinpo Electronics, Inc. 2,071,724 535,190
Kuoyang Construction Company, Ltd. 594,000 353,276
Kwong Fong Industries Corp. * 933,000 222,165
Lan Fa Textile Company, Ltd. 169,781 43,462
Lead Data, Inc. * 205,000 26,081
Lealea Enterprise Company, Ltd. * 1,142,500 202,867
LEE CHI Enterprises Company, Ltd. 110,000 38,210
Lelon Electronics Corp. 92,000 25,344
Leofoo Development Company, Ltd. * 432,000 282,159
Li Peng Enterprise Company, Ltd. * 292,864 55,123
Lien Hwa Industrial Corp. 896,574 471,219
Lingsen Precision Industries, Ltd. 146,178 50,640
Lite-On Technology Corp. 1,451,950 1,289,564
Long Bon Development Company, Ltd. 223,000 96,549
Long Chen Paper Company, Ltd. * 277,060 76,068
Lucky Cement Corp. 190,000 47,812
Macronix International Company, Ltd. 2,289,063 1,061,244
Mayer Steel Pipe Corp. 58,000 39,519
Mega Financial Holding Company, Ltd. 13,548,000 6,905,025
Meiloon Industrial Company, Ltd. 112,231 35,221
Mercuries & Associates, Ltd. 329,700 159,364
Micro-Star International Company, Ltd. 1,281,479 924,978
Mitac International 2,182,916 986,306
Mitac Technology Corp. 601,000 375,397
Mobiletron Electronics Company, Ltd. 31,000 14,782
Mustek Systems, Inc. * 103,576 4,701
Namchow Chemical Industrial Company, Ltd. * 100,000 27,034
Nanya Technology Corp. * 3,863,057 730,216
Nien Hsing Textile Company, Ltd. 658,000 257,622
Optimax Technology Corp. * 319,000 13,403
The accompanying notes are an integral part of the financial statements.
52
JOHN HANCOCK FUNDS II
PORTFOLIO OF INVESTMENTS - May 31, 2009 (Unaudited) - continued(showing percentage of total net assets)
Emerging Markets Value Fund (continued)Shares or
Principal
Amount Value
COMMON STOCKS (continued)
Taiwan (continued)
Oriental Union Chemical Corp. 183,000 $ 111,881
Pacific Construction Company, Ltd. * 267,000 29,964
Pan Jit International, Inc. 418,806 229,265
Phihong Technology Company, Ltd. 666,573 343,363
Phoenix Precision Technology Corp. 983,847 436,891
Copyright © 2012 www.secdatabase.com. All Rights Reserved.Please Consider the Environment Before Printing This Document

Prince Housing Development Corp. 1,154,650 704,807
Prodisc Technology, Inc. * 540,000 0
Quintain Steel Company, Ltd. * 169,000 37,013
Radium Life Tech Company, Ltd. 660,000 578,771
Ralec Electronic Corp. 39,000 33,580
Rexon Industrial Corp., Ltd. * 153,000 23,955
Ritek Corp. * 4,218,000 998,891
Sampo Corp. * 1,763,000 347,298
Sanyang Industrial Company, Ltd. 1,060,481 413,190
SDI Corp. 137,000 74,803
Sheng Yu Steel Company, Ltd. 151,000 127,524
Shinkong Insurance Company, Ltd. 151,788 62,876
Shinkong Synthetic Fibers Corp. 2,445,000 694,257
Shuttle, Inc. 122,000 79,276
Sigurd Microelectronics Corp. 151,326 59,940
Sinon Corp. 515,000 251,914
SinoPac Holdings Company, Ltd. 11,016,000 3,490,060
Sintek Photronic Corp. * 621,140 369,804
Siward Crystal Technology Company, Ltd. 62,192 24,204
Solomon Technology Corp. * 101,200 27,799
Southeast Cement Company, Ltd. 390,000 154,023
Spirox Corp. 59,971 31,038
Springsoft, Inc. 348,000 250,726
Stark Technology, Inc. 57,000 31,311
Sunplus Technology Company, Ltd. 760,595 444,617
Ta Chen Stainless Pipe Company, Ltd. 720,000 513,620
Ta Chong Bank, Ltd. * 2,375,000 455,188
Ta Ya Electric Wire & Cable Company, Ltd. 905,571 187,002
Tah Hsin Industrial Company, Ltd. 105,000 65,289
TA-I Technology Company, Ltd. 174,944 99,823
Taichung Commercial Bank 1,673,072 441,154
Tainan Enterprises Company, Ltd. 59,000 43,365
Tainan Spinning Company, Ltd. 1,984,000 674,253
Taishin Financial Holdings Company, Ltd. 5,420,000 1,977,980
Taisun Enterprise Company, Ltd. * 220,000 86,388
Taita Chemical Company, Ltd. 95,790 26,626
Taiwan Acceptance Corp. 83,000 70,057
Taiwan Business Bank * 3,765,000 1,126,643
Taiwan Cooperative Bank 4,525,275 2,982,424
Taiwan Fu Hsing Industrial Company, Ltd. 83,000 42,026
Taiwan Glass Industrial Corp. 580,011 402,626
Taiwan Kai Yih Industrial Company, Ltd. 121,563 71,655
Taiwan Kolin Company, Ltd. * (j) 400,000 0
Taiwan Mask Corp. 321,000 120,735
Taiwan Paiho, Ltd. 449,900 236,467
Taiwan Pulp & Paper Corp. * 385,000 134,703
Taiwan Sakura Corp. 87,868 41,853
Taiwan Styrene Monomer Corp. 1,000,479 429,820
Taiyen Biotech Company, Ltd. 395,000 265,602
Tatung Company, Ltd. * 6,643,000 1,851,081
Teapo Electronic Corp. * 205,000 33,501
Emerging Markets Value Fund (continued)Shares or
Principal
Amount Value
COMMON STOCKS (continued)
Taiwan (continued)
Teco Electric & Machinery Company, Ltd. 3,283,000 $ 1,482,718
Tex-Ray Industrial Company, Ltd. 90,000 19,227
Thinking Electronic Industrial Company, Ltd. 59,000 39,186
Ton Yi Industrial Corp. 1,073,000 429,600
Tong Yang Industry Company, Ltd. 579,020 618,112
Tsann Kuen Enterprise Company, Ltd. 411,000 351,706
Twinhead International Corp. * 224,000 23,714
Copyright © 2012 www.secdatabase.com. All Rights Reserved.Please Consider the Environment Before Printing This Document
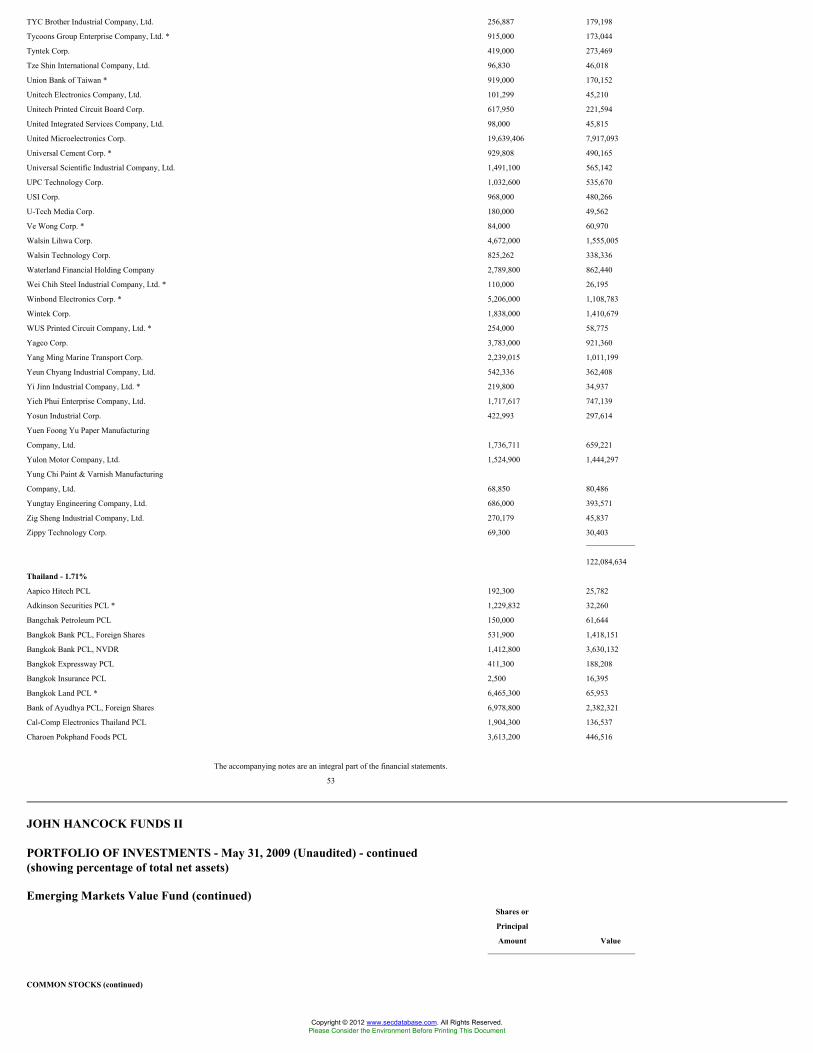
TYC Brother Industrial Company, Ltd. 256,887 179,198
Tycoons Group Enterprise Company, Ltd. * 915,000 173,044
Tyntek Corp. 419,000 273,469
Tze Shin International Company, Ltd. 96,830 46,018
Union Bank of Taiwan * 919,000 170,152
Unitech Electronics Company, Ltd. 101,299 45,210
Unitech Printed Circuit Board Corp. 617,950 221,594
United Integrated Services Company, Ltd. 98,000 45,815
United Microelectronics Corp. 19,639,406 7,917,093
Universal Cement Corp. * 929,808 490,165
Universal Scientific Industrial Company, Ltd. 1,491,100 565,142
UPC Technology Corp. 1,032,600 535,670
USI Corp. 968,000 480,266
U-Tech Media Corp. 180,000 49,562
Ve Wong Corp. * 84,000 60,970
Walsin Lihwa Corp. 4,672,000 1,555,005
Walsin Technology Corp. 825,262 338,336
Waterland Financial Holding Company 2,789,800 862,440
Wei Chih Steel Industrial Company, Ltd. * 110,000 26,195
Winbond Electronics Corp. * 5,206,000 1,108,783
Wintek Corp. 1,838,000 1,410,679
WUS Printed Circuit Company, Ltd. * 254,000 58,775
Yageo Corp. 3,783,000 921,360
Yang Ming Marine Transport Corp. 2,239,015 1,011,199
Yeun Chyang Industrial Company, Ltd. 542,336 362,408
Yi Jinn Industrial Company, Ltd. * 219,800 34,937
Yieh Phui Enterprise Company, Ltd. 1,717,617 747,139
Yosun Industrial Corp. 422,993 297,614
Yuen Foong Yu Paper Manufacturing
Company, Ltd. 1,736,711 659,221
Yulon Motor Company, Ltd. 1,524,900 1,444,297
Yung Chi Paint & Varnish Manufacturing
Company, Ltd. 68,850 80,486
Yungtay Engineering Company, Ltd. 686,000 393,571
Zig Sheng Industrial Company, Ltd. 270,179 45,837
Zippy Technology Corp. 69,300 30,403
122,084,634
Thailand - 1.71%
Aapico Hitech PCL 192,300 25,782
Adkinson Securities PCL * 1,229,832 32,260
Bangchak Petroleum PCL 150,000 61,644
Bangkok Bank PCL, Foreign Shares 531,900 1,418,151
Bangkok Bank PCL, NVDR 1,412,800 3,630,132
Bangkok Expressway PCL 411,300 188,208
Bangkok Insurance PCL 2,500 16,395
Bangkok Land PCL * 6,465,300 65,953
Bank of Ayudhya PCL, Foreign Shares 6,978,800 2,382,321
Cal-Comp Electronics Thailand PCL 1,904,300 136,537
Charoen Pokphand Foods PCL 3,613,200 446,516
The accompanying notes are an integral part of the financial statements.
53
JOHN HANCOCK FUNDS II
PORTFOLIO OF INVESTMENTS - May 31, 2009 (Unaudited) - continued(showing percentage of total net assets)
Emerging Markets Value Fund (continued)Shares or
Principal
Amount Value
COMMON STOCKS (continued)
Copyright © 2012 www.secdatabase.com. All Rights Reserved.Please Consider the Environment Before Printing This Document

Thailand (continued)
Delta Electronics Thailand PCL 382,600 $ 162,808
Eastern Water Resources Development &
Management PCL 140,000 14,445
Hana Microelectronics PCL 430,000 200,525
Hemaraj Land & Development PCL 5,223,400 97,434
Jasmine International PCL 3,860,700 45,010
KGI Securities Thailand PCL 1,922,600 65,562
Kiatnakin Finance PCL 282,500 138,327
Krung Thai Bank PCL 5,336,300 1,127,606
Krungthai Card PCL 126,000 29,930
Loxley PCL * 988,200 70,853
MBK PCL 57,800 88,022
Nakornthai Strip Mill PCL * 14,300,000 66,686
National Finance PCL 1,295,500 487,087
Padaeng Industry PCL 20,000 7,753
Polyplex PCL 190,000 28,242
Power Line Engineering PCL * 246,200 10,477
Pranda Jewelry PCL 214,300 24,984
Precious Shipping PCL 565,400 281,794
PTT Aromatics & Refining PCL 1,422,500 820,912
PTT Chemical PCL 713,700 1,092,080
Quality House PCL 5,703,500 251,014
Regional Container Lines PCL * 209,100 49,365
Saha-Union PCL 134,800 55,397
Sahaviriya Steel Industries PCL * 6,536,000 129,539
Sansiri PCL 1,102,100 88,656
SC Asset Corp. PCL 168,200 38,729
Seamico Securities PCL 421,400 23,459
Shin Satellite PCL * 544,900 67,021
Siam City Bank PCL 1,111,350 450,241
Siam Industrial Credit PCL 402,200 30,010
Sino Thai Engineering & Construction PCL * 512,900 58,002
Supalai PCL 985,400 95,352
Tata Steel Thailand PCL 3,732,200 157,729
Thai Oil PCL 972,100 1,154,563
Thai Plastic & Chemical PCL 292,800 152,758
Thoresen Thai Agencies PCL 292,270 187,407
Tipco Asphalt PCL * 103,300 33,420
Tisco Financial Group PCL * 295,100 144,497
TMB Bank PCL * 7,318,998 157,856
TPI Polene PCL * 921,000 136,902
Vanachai Group PCL 672,000 30,750
Vinythai PCL 100,000 17,925
16,775,028
Turkey - 1.99%
Adana Cimento Sanayii TAS 140,546 49,548
Akcansa Cimento AS 113,818 264,460
Aksa Akrilik Kimya Sanayii AS * 135,333 193,556
Aksigorta AS 290,218 687,930
Alarko Holding AS 225,435 383,954
Anadolu Cam Sanayii AS * 205,846 192,629
Anadolu Isuzu Otomotiv Sanayi AS * 7,282 20,432
Anadolu Sigorta AS 384,999 309,057
Arcelik AS * 216,400 311,618
Ayen Enerji AS 20,072 26,481
Aygaz AS 201,651 402,224
Emerging Markets Value Fund (continued)Shares or
Principal
Amount Value
COMMON STOCKS (continued)
Turkey (continued)
Copyright © 2012 www.secdatabase.com. All Rights Reserved.Please Consider the Environment Before Printing This Document

BatiSoke AS * 24,824 $ 16,365
Bolu Cimento Sanayii AS 83,405 85,137
Borusan Mannesmann Boru Sanayi AS * 13,810 67,900
Brisa Bridgestone Sabanci Lastik San ve Tic
AS 831 20,754
Cemtas Celik Makina Sanayi ve Ticaret AS 56,218 37,638
Cimsa Cimento Sanayi ve Ticaret AS 125,463 333,453
Dogan Gazetecilik AS * 26,131 28,150
Dogan Sirketler Grubu Holdings AS * 1,991,109 1,170,570
Dogan Yayin Holding AS * 390,600 275,212
Dogus Otomotiv Servis ve Ticaret AS * 105,253 229,653
Eczacibasi Ilac Sanayi AS 368,380 301,993
Eczacibasi Yapi Gerecleri Sanayi ve Ticaret
AS * 20,408 19,335
EGE Seramik Sanayi ve Ticaret AS * 26,340 12,739
Eregli Demir ve Celik Fabrikalari TAS * 1,040,199 2,914,773
Ford Otomotiv Sanayi AS 28,857 113,230
Gentas Genel Metal Sanayi ve Ticaret AS * 46,226 31,696
Global Yatirim Holding AS * 508,853 169,459
Goldas Kuyumculuk Sanayi AS * 54,847 40,335
Goodyear Lastikleri TAS 17,513 96,641
GSD Holding AS * 559,767 208,528
Gunes Sigorta AS * 31,526 32,954
Hektas Ticaret TAS * 57,406 35,224
Hurriyet Gazetecilik AS * 428,259 269,989
Ihlas Holding AS * 798,884 193,133
Izmir Demir Celik Sanayi AS * 88,817 138,682
Kardemir Karabuk Demir Celik Sanayi ve
Ticaret AS * 261,926 204,538
Kartonsan Karton Sanayi ve Ticaret AS 638 26,931
KOC Holdings AS * 907,018 2,100,699
Konya Cimento Sanayii AS 977 30,360
Kordsa Global Endustriyel Iplik ve Kord Bezi
Sanayi ve Ticaret Anonim Sirketi AS * 316,320 378,941
Marmaris Marti Otel Isletmeleri AS * 71,538 30,977
Menderes Tekstil Sanayi ve Ticaret AS * 126,374 28,009
Mutlu Aku ve Malzemeleri Sanayi AS * 28,331 24,429
Net Turizm Ticaret ve Sanayi AS * 98,336 47,063
Nortel Networks Netas Telekomunikasyon AS 14,863 240,140
Parsan Makina Parcalari Sanayii AS * 24,048 19,796
Petkim Petrokimya Holding AS * 195,073 716,911
Pinar Entegre Et ve Un Sanayi AS 36,324 63,259
Pinar Sut Mamulleri Sanayii AS 15,498 40,608
Sanko Pazarlama Ithalat Ihracat AS * 20,076 33,685
Sarkuysan Elektrolitik Bakir AS * 91,563 125,662
Sekerbank TAS * 316,617 364,963
Selcuk Ecza Deposu Ticaret ve Sanayi A.S. 175,810 225,043
Tekfen Holding AS * 57,366 142,445
Tekstil Bankasi AS * 140,973 75,537
Tofas Turk Otomobil Fabrik AS 35,538 58,568
Trakya Cam Sanayi AS * 486,067 387,343
Turcas Petrolculuk AS 93,599 217,778
Turk Ekonomi Bankasi AS * 521,636 394,631
Turk Sise ve Cam Fabrikalari AS * 721,989 617,858
Turkiye Sinai Kalkinma Bankasi AS * 561,063 403,187
Turkiye Vakiflar Bankasi Tao * 1,702,069 2,388,100
Ulker Gida Sanayi ve Ticaret AS 153,696 241,832
The accompanying notes are an integral part of the financial statements.
54
JOHN HANCOCK FUNDS II
PORTFOLIO OF INVESTMENTS - May 31, 2009 (Unaudited) - continued(showing percentage of total net assets)
Copyright © 2012 www.secdatabase.com. All Rights Reserved.Please Consider the Environment Before Printing This Document

Emerging Markets Value Fund (continued)Shares or
Principal
Amount Value
COMMON STOCKS (continued)
Turkey (continued)
Usas Ucak Servisi AS 18,304 $ 16,090
Vestel Elektronik Sanayi ve Tracaret AS * 239,841 231,831
19,562,646
United States - 1.49%
Aluminum Corp. China, Ltd., ADR (a) 285,000 6,951,150
Blue Square-Israel, Ltd., ADR 3,800 29,260
Patni Computer Systems, Ltd., SADR 28,382 288,929
Sterlite Industries India, Ltd. 445,812 5,871,344
Yanzhou Coal Mining Company, Ltd. (a) 123,791 1,563,480
14,704,163
TOTAL COMMON STOCKS (Cost $914,701,544) $ 949,062,103
PREFERRED STOCKS - 3.00%
Brazil - 3.00%
Banco ABC Brasil SA * (i) 37,000 135,958
Banco Daycoval SA (i) 37,000 138,214
Banco Industrial e Comercial SA * (i) 83,200 283,310
Banco Panamericano SA (i) 87,600 188,325
Banco Pine SA (i) 48,200 193,280
Banco Sofisa SA (i) 101,000 218,159
Bardella SA Industrias Mecanicas * (i) 916 61,447
Companhia de Tecidos Norte de Minas SA (i) 170,600 382,367
Confab Industrial SA (i) 432,868 963,591
Duratex SA (i) 182,600 1,746,560
Forjas Taurus SA (i) 12,540 34,543
Gol Linhas Aereas Inteligentes SA * (i) 140,700 611,397
Klabin SA (i) 878,800 1,509,628
Marcopolo SA (i) 314,000 734,092
Metalurgica Gerdau SA (i) 336,600 4,464,962
Randon Participacoes SA (i) 191,600 895,873
Sao Paulo Alpargatas SA (i) 14,700 597,608
Saraiva SA Livreiros Editores (i) 5,200 58,697
Telemar Norte Leste SA, Series A (i) 112,500 3,259,047
Uniao de Industrias Petroquimicas SA, Series
B (i) 1,334,210 569,596
Universo Online SA (i) 87,100 320,937
Usinas Siderurgicas de Minas Gerais SA,
Series A (i) 613,050 12,151,326
29,518,917
TOTAL PREFERRED STOCKS (Cost $26,502,292) $ 29,518,917
WARRANTS - 0.00%
Hong Kong - 0.00%
HKC Holdings, Ltd.
(Expiration Date 05/26/2011, Strike
Price HKD 0.40) * 444,840 22,379
Hong Kong Energy Holdings
(Expiration Date 05/13/2011, Strike
Price HKD 0.30) * 30,891 1,813
24,192
TOTAL WARRANTS (Cost $0) $ 24,192
Emerging Markets Value Fund (continued)Shares or
Copyright © 2012 www.secdatabase.com. All Rights Reserved.Please Consider the Environment Before Printing This Document

Principal
Amount Value
RIGHTS - 0.03%
Brazil - 0.01%
PDG Realty SA Empreendimentos e
Participacoes (Expiration Date 06/10/2009) * 40 $ 63,442
Chile - 0.02%
Companhia Sudamericana de Vapores SA
(Expiration Date 06/27/2009) * 410,037 163,840
Poland - 0.00%
Polski Koncern Miesny Duda SA (Expiration
Date 03/18/2009) * 91,151 0
South Korea - 0.00%
Heung-A Shipping Company, Ltd. (Expiration
Date 06/16/2009) * 31,965 14,517
HMC Investment Securities Company, Ltd.
(Expiration Date 06/26/2009) * 5,210 24,906
Meritz Investment Bank (Expiration Date
06/18/2009) * 25,775 3,799
43,222
TOTAL RIGHTS (Cost $250,775) $ 270,504
SHORT TERM INVESTMENTS - 3.41%
John Hancock Collateral Investment
Trust, 0.7339% (c)(g) $ 3,352,766 $ 33,527,664
TOTAL SHORT TERM INVESTMENTS
(Cost $33,527,664) $ 33,527,664
Total Investments (Emerging Markets Value Fund)
(Cost $974,982,275) - 102.88% $ 1,012,403,380
Other assets and liabilities, net - (2.88)% (28,325,063)
TOTAL NET ASSETS - 100.00% $ 984,078,317
The portfolio had the following five top industry concentrations
as of May 31, 2009 (as a percentage of total net assets):
Banking 13.47%
Financial Services 8.50%
Steel 6.85%
Real Estate 5.50%
Mining 4.90%
Emerging Small Company FundShares or
Principal
Amount Value
COMMON STOCKS - 97.22%
Aerospace - 1.79%
BE Aerospace, Inc. * 18,922 $ 281,559
Esterline Technologies Corp. * 6,135 167,731
449,290
Apparel & Textiles - 1.86%
Gymboree Corp. * 4,420 162,877
Warnaco Group, Inc. * 9,575 302,570
465,447
Auto Parts - 0.85%
Autoliv, Inc. 7,690 213,628
The accompanying notes are an integral part of the financial statements.
Copyright © 2012 www.secdatabase.com. All Rights Reserved.Please Consider the Environment Before Printing This Document
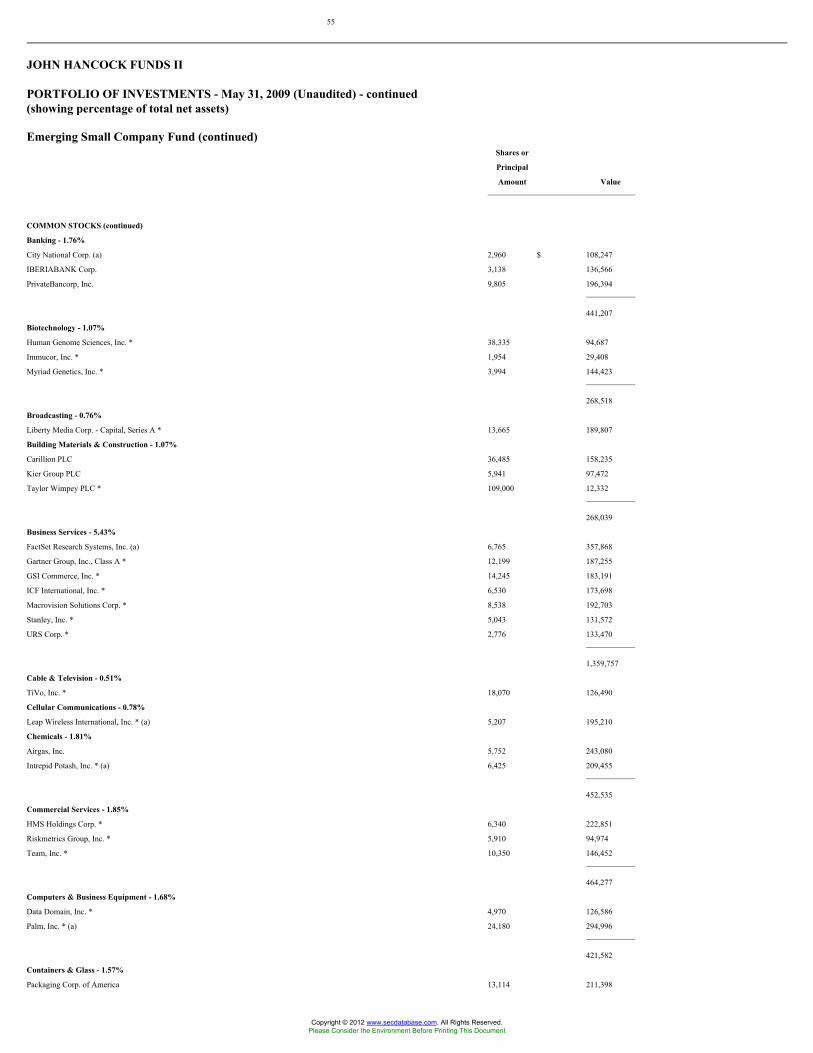
55
JOHN HANCOCK FUNDS II
PORTFOLIO OF INVESTMENTS - May 31, 2009 (Unaudited) - continued(showing percentage of total net assets)
Emerging Small Company Fund (continued)Shares or
Principal
Amount Value
COMMON STOCKS (continued)
Banking - 1.76%
City National Corp. (a) 2,960 $ 108,247
IBERIABANK Corp. 3,138 136,566
PrivateBancorp, Inc. 9,805 196,394
441,207
Biotechnology - 1.07%
Human Genome Sciences, Inc. * 38,335 94,687
Immucor, Inc. * 1,954 29,408
Myriad Genetics, Inc. * 3,994 144,423
268,518
Broadcasting - 0.76%
Liberty Media Corp. - Capital, Series A * 13,665 189,807
Building Materials & Construction - 1.07%
Carillion PLC 36,485 158,235
Kier Group PLC 5,941 97,472
Taylor Wimpey PLC * 109,000 12,332
268,039
Business Services - 5.43%
FactSet Research Systems, Inc. (a) 6,765 357,868
Gartner Group, Inc., Class A * 12,199 187,255
GSI Commerce, Inc. * 14,245 183,191
ICF International, Inc. * 6,530 173,698
Macrovision Solutions Corp. * 8,538 192,703
Stanley, Inc. * 5,043 131,572
URS Corp. * 2,776 133,470
1,359,757
Cable & Television - 0.51%
TiVo, Inc. * 18,070 126,490
Cellular Communications - 0.78%
Leap Wireless International, Inc. * (a) 5,207 195,210
Chemicals - 1.81%
Airgas, Inc. 5,752 243,080
Intrepid Potash, Inc. * (a) 6,425 209,455
452,535
Commercial Services - 1.85%
HMS Holdings Corp. * 6,340 222,851
Riskmetrics Group, Inc. * 5,910 94,974
Team, Inc. * 10,350 146,452
464,277
Computers & Business Equipment - 1.68%
Data Domain, Inc. * 4,970 126,586
Palm, Inc. * (a) 24,180 294,996
421,582
Containers & Glass - 1.57%
Packaging Corp. of America 13,114 211,398
Copyright © 2012 www.secdatabase.com. All Rights Reserved.Please Consider the Environment Before Printing This Document

Silgan Holdings, Inc. 4,075 180,359
391,757
Correctional Facilities - 0.79%
The Geo Group, Inc. * 12,145 198,449
Cosmetics & Toiletries - 0.75%
Alberto-Culver Company 8,080 187,779
Emerging Small Company Fund (continued)Shares or
Principal
Amount Value
COMMON STOCKS (continued)
Crude Petroleum & Natural Gas - 5.14%
Arena Resources, Inc. * 4,380 $ 156,892
Carrizo Oil & Gas, Inc. * (a) 12,855 274,454
Concho Resources, Inc. * 4,894 156,853
Dana Petroleum PLC * 7,200 153,984
EXCO Resources, Inc. * 13,955 214,767
Goodrich Petroleum Corp. * 5,585 149,231
Penn Virginia Corp. 9,495 181,544
1,287,725
Educational Services - 1.04%
American Public Education, Inc. * 3,155 103,074
Capella Education Company * (a) 2,997 156,413
259,487
Electrical Equipment - 0.92%
DTS, Inc. * 8,725 230,951
Financial Services - 3.30%
Affiliated Managers Group, Inc. * 3,638 204,128
GFI Group, Inc. 25,265 151,843
Janus Capital Group, Inc. 12,325 124,976
Lazard, Ltd., Class A 6,115 172,932
Stifel Financial Corp. * 3,980 173,289
827,168
Food & Beverages - 0.64%
Hansen Natural Corp. * 4,375 160,475
Healthcare Products - 5.20%
CardioNet, Inc. * (a) 7,135 126,361
Masimo Corp. * 5,065 121,256
Natus Medical, Inc. * 17,829 182,212
Nuvasive, Inc. * (a) 4,496 162,395
Sirona Dental Systems, Inc. * 3,680 72,386
Thoratec Corp. * 4,755 119,255
Ulta Salon, Cosmetics & Fragrance, Inc. * 24,360 208,522
Volcano Corp. * 11,185 138,247
Wright Medical Group, Inc. * 10,960 170,976
1,301,610
Healthcare Services - 3.73%
Alliance Imaging, Inc. * 23,875 164,738
Amedisys, Inc. * 3,455 105,101
ICON PLC, SADR * 11,150 194,456
Phase Forward, Inc. * 9,920 138,880
Psychiatric Solutions, Inc. * 7,878 145,349
Sun Healthcare Group, Inc. * 20,083 186,169
934,693
Homebuilders - 1.05%
Desarrolladora Homex SA de CV * 4,050 109,147
M.D.C. Holdings, Inc. 1,520 46,679
Taylor Woodrow PLC * 204,740 106,364
Copyright © 2012 www.secdatabase.com. All Rights Reserved.Please Consider the Environment Before Printing This Document

262,190
Hotels & Restaurants - 2.30%
Brinker International, Inc. 11,910 213,189
CKE Restaurants, Inc. 22,350 183,717
Texas Roadhouse, Inc., Class A * 15,465 179,858
576,764
The accompanying notes are an integral part of the financial statements.
56
JOHN HANCOCK FUNDS II
PORTFOLIO OF INVESTMENTS - May 31, 2009 (Unaudited) - continued(showing percentage of total net assets)
Emerging Small Company Fund (continued)Shares or
Principal
Amount Value
COMMON STOCKS (continued)
Industrials - 2.08%
Clean Harbors, Inc. * 3,823 $ 208,430
Harsco Corp. 10,720 311,523
519,953
Insurance - 1.19%
Argo Group International Holdings, Ltd. * 4,580 128,423
Tower Group, Inc. 7,134 170,432
298,855
Internet Content - 0.33%
Moneysupermarket.com Group PLC 100,230 82,738
Internet Retail - 0.61%
Internet Brands, Inc., Class A * 22,785 153,343
Internet Software - 3.04%
Art Technology Group, Inc. * 46,500 167,400
Cybersource Corp. * 15,450 200,850
Switch & Data Facilities Company, Inc. * 10,877 143,033
Vocus, Inc. * 13,045 249,290
760,573
Leisure Time - 1.24%
Bally Technologies, Inc. * 11,080 310,240
Manufacturing - 5.29%
Aalberts Industries NV 15,070 149,172
Barnes Group, Inc. 15,914 242,848
Hansen Transmissions International NV * 41,100 109,011
Kaydon Corp. 5,875 202,100
Mettler-Toledo International, Inc. * 3,231 230,015
Peace Mark Holdings, Ltd. * (e) 204,000 0
Snap-on, Inc. 8,419 262,252
SPX Corp. 2,793 128,226
1,323,624
Medical-Hospitals - 0.65%
Genoptix, Inc. * 5,622 163,488
Metal & Metal Products - 0.61%
RTI International Metals, Inc. * 10,595 151,615
Office Furnishings & Supplies - 0.70%
Knoll, Inc. 25,275 175,156
Petroleum Services - 2.30%
SandRidge Energy, Inc. * 16,800 182,952
Copyright © 2012 www.secdatabase.com. All Rights Reserved.Please Consider the Environment Before Printing This Document

Superior Energy Services, Inc. * 11,485 264,844
T-3 Energy Services, Inc. * 8,753 127,094
574,890
Pharmaceuticals - 3.23%
Alexion Pharmaceuticals, Inc. * (a) 3,706 135,269
Eurand NV * 14,540 187,566
Onyx Pharmaceuticals, Inc. * 4,781 113,118
OSI Pharmaceuticals, Inc. * 4,490 151,762
United Therapeutics Corp. * 2,753 220,653
808,368
Railroads & Equipment - 0.78%
Genesee & Wyoming, Inc., Class A * 6,740 194,921
Real Estate - 3.38%
Alexandria Real Estate Equities, Inc., REIT 3,965 142,344
Emerging Small Company Fund (continued)Shares or
Principal
Amount Value
COMMON STOCKS (continued)
Real Estate (continued)
Corporate Office Properties Trust, REIT 6,725 $ 199,598
DiamondRock Hospitality Company, REIT 11,850 77,025
DuPont Fabros Technology, Inc., REIT 15,335 145,222
LaSalle Hotel Properties, REIT 8,441 115,473
Sunstone Hotel Investors, Inc., REIT 28,895 167,880
847,542
Retail - 2.18%
Chico's FAS, Inc. * 7,735 75,494
Citi Trends, Inc. * 7,515 193,737
Conn's, Inc. * (a) 15,315 152,690
Saks, Inc. * (a) 32,675 124,818
546,739
Retail Grocery - 0.91%
United Natural Foods, Inc. * 9,980 226,845
Retail Trade - 3.75%
Aaron, Inc., Class B 6,370 207,471
Abercrombie & Fitch Company, Class A (a) 5,285 159,131
Hibbett Sports, Inc. * 9,390 169,302
Lumber Liquidators, Inc. * (a) 13,275 201,116
MSC Industrial Direct Company, Inc., Class A 5,550 201,909
938,929
Semiconductors - 6.77%
Atmel Corp. * 54,295 209,036
Fairchild Semiconductor International, Inc. * 27,330 192,950
FormFactor, Inc. * 9,130 165,709
Hittite Microwave Corp. * 4,720 169,354
Microsemi Corp. * 9,495 127,803
Monolithic Power Systems, Inc. * 12,045 249,452
Netlogic Microsystems, Inc. * 1,775 58,078
ON Semiconductor Corp. * 43,390 297,221
Teradyne, Inc. * 31,660 226,369
1,695,972
Software - 6.77%
AsiaInfo Holdings, Inc. * 10,450 219,032
Blackboard, Inc. * 6,385 184,016
Commvault Systems, Inc. * 14,135 174,567
JDA Software Group, Inc. * 16,985 253,077
MedAssets, Inc. * 10,806 170,843
Copyright © 2012 www.secdatabase.com. All Rights Reserved.Please Consider the Environment Before Printing This Document

Nuance Communications, Inc. * 12,565 155,806
Progress Software Corp. * 7,936 177,925
Rosetta Stone, Inc. * 1,589 38,311
SimCorp A/S 530 88,113
Solera Holdings, Inc. * 10,257 234,885
1,696,575
Telecommunications Equipment &
Services - 1.82%
ADC Telecommunications, Inc. * 37,405 263,331
Comtech Telecommunications Corp. * 6,615 192,761
456,092
Tires & Rubber - 0.58%
Nokian Renkaat Oyj 7,706 146,260
Transportation - 1.36%
Atlas Air Worldwide Holdings, Inc. * 7,365 190,606
The accompanying notes are an integral part of the financial statements.
57
JOHN HANCOCK FUNDS II
PORTFOLIO OF INVESTMENTS - May 31, 2009 (Unaudited) - continued(showing percentage of total net assets)
Emerging Small Company Fund (continued)Shares or
Principal
Amount Value
COMMON STOCKS (continued)
Transportation (continued)
UTI Worldwide, Inc. 11,520 $ 151,027
341,633
TOTAL COMMON STOCKS (Cost $23,478,349) $ 24,349,186
SHORT TERM INVESTMENTS - 8.08%
John Hancock Collateral Investment
Trust, 0.7339% (c)(g) $ 202,422 $ 2,024,216
TOTAL SHORT TERM INVESTMENTS
(Cost $2,024,216) $ 2,024,216
REPURCHASE AGREEMENTS - 3.02%
Repurchase Agreement with State
Street Corp. dated 05/29/2009 at
0.07% to be repurchased at
$757,004 on 06/01/2009,
collateralized by $755,000 Federal
National Mortgage Association,
5.625% due 09/18/2017 (valued at
$772,931, including interest) $ 757,000 $ 757,000
TOTAL REPURCHASE AGREEMENTS
(Cost $757,000) $ 757,000
Total Investments (Emerging Small Company Fund)
(Cost $26,259,565) - 108.32% $ 27,130,402
Other assets and liabilities, net - (8.32)% (2,083,108)
TOTAL NET ASSETS - 100.00% $ 25,047,294
Equity-Income FundShares or
Copyright © 2012 www.secdatabase.com. All Rights Reserved.Please Consider the Environment Before Printing This Document

Principal
Amount Value
COMMON STOCKS - 95.95%
Aerospace - 1.02%
Boeing Company 164,200 $ 7,364,370
Air Travel - 0.47%
Southwest Airlines Company 505,100 3,404,374
Aluminum - 0.31%
Alcoa, Inc. 246,300 2,270,886
Auto Parts - 0.47%
Genuine Parts Company 101,050 3,383,154
Banking - 3.96%
Allied Irish Banks PLC - London Exchange 340,002 643,927
Bank of New York Mellon Corp. 353,600 9,823,008
KeyCorp 467,600 2,338,000
Marshall & Ilsley Corp. (a) 176,800 1,163,344
SunTrust Banks, Inc. 261,800 3,447,906
U.S. Bancorp 581,000 11,155,200
28,571,385
Biotechnology - 0.70%
Amgen, Inc. * 101,000 5,043,940
Broadcasting - 0.19%
CBS Corp., Class B 184,600 1,362,348
Equity-Income Fund (continued)Shares or
Principal
Amount Value
COMMON STOCKS (continued)
Building Materials & Construction - 0.62%
Masco Corp. 432,500 $ 4,480,700
Business Services - 1.27%
Accenture, Ltd., Class A 50,700 1,517,451
Computer Sciences Corp. * 152,600 6,479,396
H & R Block, Inc. 79,600 1,162,160
9,159,007
Cable & Television - 1.97%
Cablevision Systems Corp., Class A 248,300 4,725,149
Time Warner, Inc. 405,966 9,507,724
14,232,873
Cellular Communications - 0.38%
Vodafone Group PLC 1,456,283 2,740,572
Chemicals - 0.89%
E.I. Du Pont de Nemours & Company 226,100 6,437,067
Coal - 0.43%
CONSOL Energy, Inc. 75,800 3,119,928
Computers & Business Equipment - 1.03%
Cisco Systems, Inc. * 164,200 3,037,700
Dell, Inc. * 378,800 4,386,504
7,424,204
Construction Materials - 1.03%
USG Corp. * 152,700 1,832,400
Vulcan Materials Company (a) 126,300 5,593,827
7,426,227
Cosmetics & Toiletries - 1.51%
International Flavors & Fragrances, Inc. 176,800 5,639,920
Kimberly-Clark Corp. 101,000 5,240,890
Copyright © 2012 www.secdatabase.com. All Rights Reserved.Please Consider the Environment Before Printing This Document

10,880,810
Crude Petroleum & Natural Gas - 0.64%
Sunoco, Inc. 151,100 4,597,973
Drugs & Health Care - 1.65%
Wyeth 265,200 11,896,872
Electrical Equipment - 0.59%
Cooper Industries, Ltd., Class A 129,700 4,256,754
Electrical Utilities - 3.89%
Constellation Energy Group, Inc. 129,700 3,538,216
Entergy Corp. 93,800 6,999,356
FirstEnergy Corp. 75,775 2,863,537
PG&E Corp. 126,300 4,636,473
Pinnacle West Capital Corp. 126,300 3,492,195
Teco Energy, Inc. (a) 121,500 1,363,230
Xcel Energy, Inc. 303,100 5,198,165
28,091,172
Electronics - 0.25%
Harman International Industries, Inc. 96,600 1,800,624
Energy - 1.74%
Duke Energy Corp. 353,600 5,003,440
NRG Energy, Inc. * 77,000 1,732,500
Progress Energy, Inc. 164,200 5,830,742
12,566,682
The accompanying notes are an integral part of the financial statements.
58
JOHN HANCOCK FUNDS II
PORTFOLIO OF INVESTMENTS - May 31, 2009 (Unaudited) - continued(showing percentage of total net assets)
Equity-Income Fund (continued)Shares or
Principal
Amount Value
COMMON STOCKS (continued)
Financial Services - 12.50%
American Express Company 479,900 $ 11,925,515
Bank of America Corp. 1,276,222 14,383,022
Capital One Financial Corp. 170,100 4,157,244
Federal National Mortgage Association 198,917 145,209
Goldman Sachs Group, Inc. 68,200 9,859,674
JPMorgan Chase & Company 757,714 27,959,647
Legg Mason, Inc. 99,000 1,908,720
SLM Corp. * 485,000 3,205,850
UBS AG * 250,160 3,759,905
Wells Fargo & Company 505,100 12,880,050
90,184,836
Food & Beverages - 3.57%
Anheuser-Busch InBev NV 124,106 4,386,522
Hershey Company 340,900 12,006,498
Kraft Foods, Inc., Class A 239,900 6,263,789
McCormick & Company, Inc. 101,000 3,082,520
25,739,329
Forest Products - 0.37%
Weyerhaeuser Company 79,400 2,666,252
Gas & Pipeline Utilities - 1.12%
NiSource, Inc. 471,700 5,042,473
Spectra Energy Corp. 189,500 3,041,475
Copyright © 2012 www.secdatabase.com. All Rights Reserved.Please Consider the Environment Before Printing This Document

8,083,948
Healthcare Products - 0.96%
Johnson & Johnson 126,300 6,966,708
Healthcare Services - 0.49%
WellPoint, Inc. * 75,800 3,530,006
Homebuilders - 0.21%
D.R. Horton, Inc. 165,700 1,526,097
Hotels & Restaurants - 0.69%
Marriott International, Inc., Class A 214,700 5,015,392
Household Appliances - 1.26%
Black & Decker Corp. 62,600 2,007,582
Whirlpool Corp. (a) 168,600 7,104,804
9,112,386
Household Products - 1.23%
Fortune Brands, Inc. 252,600 8,843,526
Industrial Machinery - 1.26%
Deere & Company 176,800 7,685,496
Pall Corp. 55,300 1,420,104
9,105,600
Industrials - 2.50%
General Electric Company 1,338,600 18,044,328
Insurance - 3.21%
Chubb Corp. 75,800 3,005,470
Lincoln National Corp. 277,798 5,264,272
Marsh & McLennan Companies, Inc. 404,100 7,645,572
Progressive Corp. * 227,300 3,666,349
The Travelers Companies, Inc. 88,349 3,592,270
23,173,933
Equity-Income Fund (continued)Shares or
Principal
Amount Value
COMMON STOCKS (continued)
International Oil - 12.10%
Anadarko Petroleum Corp. 151,500 $ 7,238,670
BP PLC, SADR 189,392 9,374,904
Chevron Corp. 303,060 20,205,010
ConocoPhillips 58,200 2,667,888
Exxon Mobil Corp. 303,024 21,014,715
Murphy Oil Corp. 189,400 11,176,494
Royal Dutch Shell PLC, ADR 290,400 15,655,464
87,333,145
Internet Content - 0.78%
Yahoo!, Inc. * 356,500 5,646,960
Internet Retail - 0.63%
eBay, Inc. * 259,400 4,570,628
Leisure Time - 1.38%
MGM Mirage, Inc. * 256,200 1,911,252
Walt Disney Company 332,000 8,041,040
9,952,292
Manufacturing - 4.12%
3M Company 189,400 10,814,740
Eaton Corp. 52,900 2,301,150
Harley-Davidson, Inc. (a) 176,800 3,000,296
Honeywell International, Inc. 164,200 5,444,872
Illinois Tool Works, Inc. 252,600 8,156,454
29,717,512
Copyright © 2012 www.secdatabase.com. All Rights Reserved.Please Consider the Environment Before Printing This Document

Office Furnishings & Supplies - 0.63%
Avery Dennison Corp. 164,100 4,522,596
Paper - 1.79%
International Paper Company 489,825 7,038,785
MeadWestvaco Corp. 226,100 3,610,817
WPP PLC 303,823 2,275,072
12,924,674
Petroleum Services - 1.58%
BJ Services Company 126,300 1,975,332
Schlumberger, Ltd. 164,200 9,397,166
11,372,498
Pharmaceuticals - 2.80%
Bristol-Myers Squibb Company 303,100 6,037,752
Eli Lilly & Company 203,700 7,041,909
Merck & Company, Inc. 257,600 7,104,608
20,184,269
Publishing - 1.63%
McGraw-Hill Companies, Inc. 304,300 9,156,387
The New York Times Company, Class A (a) 396,900 2,619,540
11,775,927
Railroads & Equipment - 0.14%
Norfolk Southern Corp. 26,600 989,520
Retail Trade - 3.64%
Bed Bath & Beyond, Inc. * 288,900 8,120,979
Home Depot, Inc. 505,800 11,714,328
Macy's, Inc. 184,800 2,158,464
Tiffany & Company 149,900 4,252,663
26,246,434
The accompanying notes are an integral part of the financial statements.
59
JOHN HANCOCK FUNDS II
PORTFOLIO OF INVESTMENTS - May 31, 2009 (Unaudited) - continued(showing percentage of total net assets)
Equity-Income Fund (continued)Shares or
Principal
Amount Value
COMMON STOCKS (continued)
Semiconductors - 1.79%
Analog Devices, Inc. 265,200 $ 6,473,532
Applied Materials, Inc. 224,900 2,532,374
Intel Corp. 251,300 3,950,436
12,956,342
Software - 1.35%
Microsoft Corp. 467,200 9,759,808
Steel - 1.11%
Nucor Corp. 181,800 7,982,838
Telephone - 4.35%
AT&T, Inc. 606,173 15,027,029
Qwest Communications International, Inc. (a) 1,262,800 5,505,808
Sprint Nextel Corp. * 597,000 3,074,550
Verizon Communications, Inc. 266,452 7,796,385
31,403,772
Copyright © 2012 www.secdatabase.com. All Rights Reserved.Please Consider the Environment Before Printing This Document

Toys, Amusements & Sporting Goods - 0.67%
Mattel, Inc. 308,100 4,809,441
Trucking & Freight - 1.08%
United Parcel Service, Inc., Class B 152,800 7,814,192
TOTAL COMMON STOCKS (Cost $849,130,456) $ 692,467,111
CONVERTIBLE BONDS - 0.45%
Automobiles - 0.45%
Ford Motor Company
4.25% due 12/15/2036 3,989,000 3,206,159
TOTAL CONVERTIBLE BONDS (Cost $2,000,072) $ 3,206,159
SHORT TERM INVESTMENTS - 3.55%
John Hancock Collateral Investment
Trust, 0.7339% (c)(g) $ 1,945,706 $ 19,457,063
T. Rowe Price Reserve Investment Fund,
0.5211% 6,156,924 6,153,868
TOTAL SHORT TERM INVESTMENTS
(Cost $25,610,931) $ 25,610,931
REPURCHASE AGREEMENTS - 0.07%
Repurchase Agreement with State
Street Corp. dated 05/29/2009 at
0.07% to be repurchased at
$500,003 on 6/1/2009,
collateralized by $530,000 Federal
Home Loan Mortgage Corp.,
5.625% due 11/23/2035 (valued at
$513,782, including interest) $ 500,000 $ 500,000
TOTAL REPURCHASE AGREEMENTS
(Cost $500,000) $ 500,000
Total Investments (Equity-Income Fund)
(Cost $877,241,459) - 100.02% $ 721,784,201
Other assets and liabilities, net - (0.02)% (117,803)
TOTAL NET ASSETS - 100.00% $ 721,666,398
Fundamental Value FundShares or
Principal
Amount Value
COMMON STOCKS - 92.22%
Agriculture - 0.57%
Monsanto Company 81,920 $ 6,729,728
Automobiles - 0.26%
PACCAR, Inc. 101,640 3,033,954
Banking - 3.67%
Bank of New York Mellon Corp. 787,995 21,890,501
Julius Baer Holding AG 508,700 21,674,858
43,565,359
Broadcasting - 2.51%
Grupo Televisa SA, SADR 618,809 11,002,424
Liberty Media Corp. - Entertainment, Series A * 219,348 5,299,447
News Corp., Class A 1,372,760 13,425,593
29,727,464
Business Services - 3.52%
Dun & Bradstreet Corp. 25,405 2,077,875
H & R Block, Inc. 420,773 6,143,286
Iron Mountain, Inc. * 864,504 23,557,734
Moody's Corp. 365,237 10,003,841
41,782,736
Copyright © 2012 www.secdatabase.com. All Rights Reserved.Please Consider the Environment Before Printing This Document

Cable & Television - 1.50%
Comcast Corp., Class A 1,366,315 17,762,095
Chemicals - 0.15%
Potash Corp. of Saskatchewan, Inc. 15,502 1,795,752
Coal - 0.57%
China Coal Energy Company, Series H 5,588,652 6,722,795
Computers & Business Equipment - 1.79%
Cisco Systems, Inc. * 401,897 7,435,094
Hewlett-Packard Company 400,940 13,772,289
21,207,383
Construction Materials - 1.10%
Martin Marietta Materials, Inc. (a) 80,838 6,585,872
Vulcan Materials Company (a) 146,331 6,481,000
13,066,872
Containers & Glass - 2.14%
Sealed Air Corp. 1,271,096 25,434,631
Cosmetics & Toiletries - 1.40%
Procter & Gamble Company 320,636 16,653,834
Crude Petroleum & Natural Gas - 10.97%
Devon Energy Corp. 589,054 37,251,775
EOG Resources, Inc. 496,607 36,346,666
Occidental Petroleum Corp. 804,545 53,993,015
OGX Petroleo e Gas Participacoes SA 5,200 2,550,342
130,141,798
Electrical Utilities - 0.16%
AES Corp. * 190,750 1,905,592
Electronics - 0.99%
Agilent Technologies, Inc. * 560,040 10,209,529
Garmin, Ltd. 70,690 1,476,007
11,685,536
Financial Services - 11.68%
American Express Company 1,287,840 32,002,824
The accompanying notes are an integral part of the financial statements.
60
JOHN HANCOCK FUNDS II
PORTFOLIO OF INVESTMENTS - May 31, 2009 (Unaudited) - continued(showing percentage of total net assets)
Fundamental Value Fund (continued)Shares or
Principal
Amount Value
COMMON STOCKS (continued)
Financial Services (continued)
Ameriprise Financial, Inc. 264,787 $ 7,996,567
Brookfield Asset Management, Inc. 276,410 4,862,052
Goldman Sachs Group, Inc. 45,960 6,644,437
JPMorgan Chase & Company 917,043 33,838,887
Visa, Inc. 44,730 3,028,668
Wells Fargo & Company 1,968,181 50,188,616
138,562,051
Food & Beverages - 1.68%
Diageo PLC, SADR 312,748 17,063,531
Hershey Company 82,399 2,902,093
19,965,624
Copyright © 2012 www.secdatabase.com. All Rights Reserved.Please Consider the Environment Before Printing This Document

Forest Products - 0.62%
Sino-Forest Corp. * 632,240 7,354,658
Healthcare Products - 2.16%
Becton, Dickinson & Company 117,340 7,941,571
Johnson & Johnson 320,880 17,699,741
25,641,312
Healthcare Services - 2.90%
Cardinal Health, Inc. 254,839 9,110,494
Express Scripts, Inc. * 194,700 12,470,535
Laboratory Corp. of America Holdings * 44,900 2,737,104
UnitedHealth Group, Inc. 376,420 10,012,772
34,330,905
Holdings Companies/Conglomerates - 5.80%
Berkshire Hathaway, Inc., Class A * 636 58,257,600
China Merchants Holdings International
Company, Ltd. 3,423,531 10,548,487
68,806,087
Household Products - 0.16%
Hunter Douglas NV 46,893 1,866,821
Industrials - 0.24%
Cosco Pacific, Ltd. 2,127,926 2,893,339
Insurance - 6.12%
American International Group, Inc. (a) 646,698 1,092,920
Hartford Financial Services Group, Inc. 237,070 3,399,584
Loews Corp. 929,902 25,153,849
Markel Corp. * 3,385 964,725
NIPPONKOA Insurance Company, Ltd. 306,565 1,789,003
Principal Financial Group, Inc. 97,330 2,160,726
Progressive Corp. * 1,597,214 25,763,062
Sun Life Financial, Inc. 61,855 1,631,735
Transatlantic Holdings, Inc. 275,041 10,646,837
72,602,441
International Oil - 4.86%
Canadian Natural Resources, Ltd. 440,633 26,332,228
ConocoPhillips 682,172 31,270,765
57,602,993
Internet Content - 1.36%
Google, Inc., Class A * 38,536 16,078,375
Internet Retail - 0.80%
Amazon.com, Inc. * 65,143 5,080,502
eBay, Inc. * 163,180 2,875,232
Fundamental Value Fund (continued)Shares or
Principal
Amount Value
COMMON STOCKS (continued)
Internet Retail (continued)
Liberty Media Corp. - Interactive A * 268,366 $ 1,572,625
9,528,359
Leisure Time - 0.71%
Walt Disney Company 348,130 8,431,709
Liquor - 0.91%
Heineken Holding NV 358,258 10,783,974
Manufacturing - 1.69%
ABB, Ltd., SADR 126,390 2,080,380
Harley-Davidson, Inc. (a) 544,522 9,240,538
Tyco International, Ltd. * 314,267 8,676,912
Copyright © 2012 www.secdatabase.com. All Rights Reserved.Please Consider the Environment Before Printing This Document

19,997,830
Mining - 0.70%
BHP Billiton PLC 206,472 4,946,361
Rio Tinto PLC 73,647 3,336,541
8,282,902
Petroleum Services - 0.88%
Transocean, Ltd. * 131,543 10,455,038
Pharmaceuticals - 3.35%
Merck & Company, Inc. 358,400 9,884,672
Pfizer, Inc. 649,800 9,870,462
Schering-Plough Corp. 818,060 19,960,664
39,715,798
Real Estate - 0.56%
Hang Lung Group, Ltd. 1,456,509 6,630,710
Retail Trade - 7.56%
Bed Bath & Beyond, Inc. * 416,323 11,702,839
CarMax, Inc. * (a) 347,708 3,897,807
Costco Wholesale Corp. 992,533 48,157,701
CVS Caremark Corp. 870,330 25,935,834
89,694,181
Semiconductors - 1.68%
Texas Instruments, Inc. 1,025,613 19,896,892
Shipbuilding - 0.34%
China Shipping Development Company, Ltd.,
Class H 2,739,063 4,063,613
Software - 2.33%
Activision Blizzard, Inc. * 495,200 5,982,016
Microsoft Corp. 1,034,581 21,612,397
27,594,413
Tobacco - 0.85%
Philip Morris International, Inc. 236,540 10,086,066
Trucking & Freight - 0.98%
Kuehne & Nagel International AG 73,516 5,732,920
United Parcel Service, Inc., Class B 115,741 5,918,994
11,651,914
TOTAL COMMON STOCKS (Cost $1,261,484,185) $ 1,093,733,534
The accompanying notes are an integral part of the financial statements.
61
JOHN HANCOCK FUNDS II
PORTFOLIO OF INVESTMENTS - May 31, 2009 (Unaudited) - continued(showing percentage of total net assets)
Fundamental Value Fund (continued)Shares or
Principal
Amount Value
CONVERTIBLE BONDS - 0.16%
Forest Products - 0.16%
Sino-Forest Corp.
5.00% due 08/01/2013 (f) $ 2,257,900 $ 1,851,478
TOTAL CONVERTIBLE BONDS (Cost $2,240,832) $ 1,851,478
CORPORATE BONDS - 1.05%
Containers & Glass - 0.43%
Sealed Air Corp.
12.00% due 02/14/2014 (f) 5,000,000 5,059,615
Copyright © 2012 www.secdatabase.com. All Rights Reserved.Please Consider the Environment Before Printing This Document

Manufacturing - 0.62%
Harley-Davidson, Inc.
15.00% due 02/01/2014 7,000,000 7,380,520
TOTAL CORPORATE BONDS (Cost $12,000,000) $ 12,440,135
SHORT TERM INVESTMENTS - 8.75%
Federal Home Loan Mortgage Corp. Discount Notes
zero coupon due 06/08/2009 $ 850,000 $ 849,976
John Hancock Collateral Investment Trust,
0.7339% (c)(g) 2,025,297 20,252,972
San Paolo IMI US Financial Company
0.17% due 06/01/2009 35,000,000 35,000,000
UBS Americas, Inc.
0.20% due 06/01/2009 47,743,000 47,743,000
TOTAL SHORT TERM INVESTMENTS
(Cost $103,845,939) $ 103,845,948
Total Investments (Fundamental Value Fund)
(Cost $1,379,570,956) - 102.18% $ 1,211,871,095
Other assets and liabilities, net - (2.18)% (25,870,588)
TOTAL NET ASSETS - 100.00% $ 1,186,000,507
Global Agribusiness FundShares or
Principal
Amount Value
COMMON STOCKS - 96.91%
Australia - 1.02%
Metcash, Ltd. 7,000 $ 23,468
Canada - 19.21%
Agrium, Inc. 1,900 93,518
Migao Corp. * 6,400 47,366
Potash Corp. of Saskatchewan, Inc. 2,300 266,432
Potash One Inc * 6,000 17,202
Saputo, Inc. 500 9,892
Viterra, Inc. * 1,000 8,473
442,883
France - 0.64%
DANONE S.A. SADR 1,500 14,775
Germany - 3.43%
K&S AG 700 52,122
Suedzucker AG 1,300 27,022
79,144
Global Agribusiness Fund (continued)Shares or
Principal
Amount Value
COMMON STOCKS (continued)
Norway - 3.60%
Yara International ASA, ADR 2,500 $ 82,875
Singapore - 5.56%
Golden Agri-Resources, Ltd. 125,000 36,858
Olam International, Ltd. 22,000 29,826
Wilmar International, Ltd. 18,000 61,428
128,112
Switzerland - 12.58%
Nestle SA, SADR 2,600 94,822
Copyright © 2012 www.secdatabase.com. All Rights Reserved.Please Consider the Environment Before Printing This Document
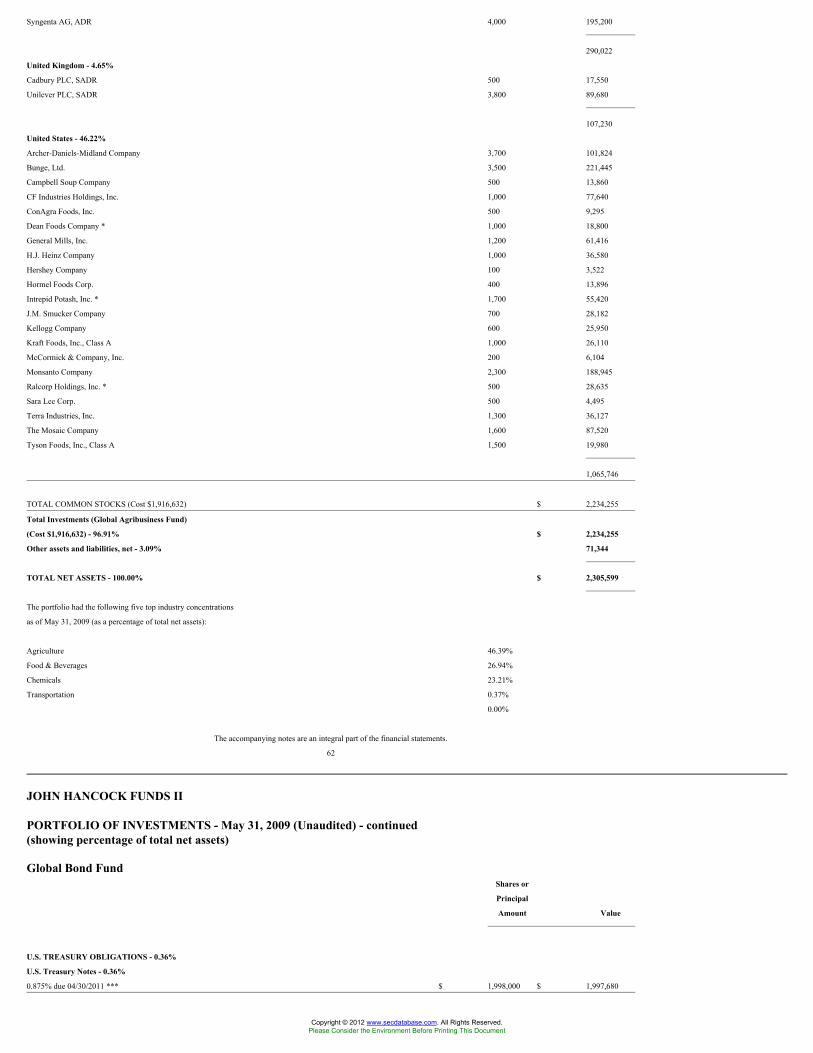
Syngenta AG, ADR 4,000 195,200
290,022
United Kingdom - 4.65%
Cadbury PLC, SADR 500 17,550
Unilever PLC, SADR 3,800 89,680
107,230
United States - 46.22%
Archer-Daniels-Midland Company 3,700 101,824
Bunge, Ltd. 3,500 221,445
Campbell Soup Company 500 13,860
CF Industries Holdings, Inc. 1,000 77,640
ConAgra Foods, Inc. 500 9,295
Dean Foods Company * 1,000 18,800
General Mills, Inc. 1,200 61,416
H.J. Heinz Company 1,000 36,580
Hershey Company 100 3,522
Hormel Foods Corp. 400 13,896
Intrepid Potash, Inc. * 1,700 55,420
J.M. Smucker Company 700 28,182
Kellogg Company 600 25,950
Kraft Foods, Inc., Class A 1,000 26,110
McCormick & Company, Inc. 200 6,104
Monsanto Company 2,300 188,945
Ralcorp Holdings, Inc. * 500 28,635
Sara Lee Corp. 500 4,495
Terra Industries, Inc. 1,300 36,127
The Mosaic Company 1,600 87,520
Tyson Foods, Inc., Class A 1,500 19,980
1,065,746
TOTAL COMMON STOCKS (Cost $1,916,632) $ 2,234,255
Total Investments (Global Agribusiness Fund)
(Cost $1,916,632) - 96.91% $ 2,234,255
Other assets and liabilities, net - 3.09% 71,344
TOTAL NET ASSETS - 100.00% $ 2,305,599
The portfolio had the following five top industry concentrations
as of May 31, 2009 (as a percentage of total net assets):
Agriculture 46.39%
Food & Beverages 26.94%
Chemicals 23.21%
Transportation 0.37%
0.00%
The accompanying notes are an integral part of the financial statements.
62
JOHN HANCOCK FUNDS II
PORTFOLIO OF INVESTMENTS - May 31, 2009 (Unaudited) - continued(showing percentage of total net assets)
Global Bond FundShares or
Principal
Amount Value
U.S. TREASURY OBLIGATIONS - 0.36%
U.S. Treasury Notes - 0.36%
0.875% due 04/30/2011 *** $ 1,998,000 $ 1,997,680
Copyright © 2012 www.secdatabase.com. All Rights Reserved.Please Consider the Environment Before Printing This Document

TOTAL U.S. TREASURY OBLIGATIONS
(Cost $1,996,498) $ 1,997,680
U.S. GOVERNMENT AGENCY OBLIGATIONS - 30.37%
Federal Home Loan Mortgage Corp. - 0.21%
4.00% due 03/01/2010 625,512 628,484
4.50% due 02/01/2010 282,456 284,603
0.8875% due 02/01/2011 (b)*** 279,000 278,501
1,191,588
Federal National Mortgage
Association - 16.70%
0.6587% due 03/25/2044 (b) 500,937 394,086
2.709% due 11/01/2042 to 10/01/2044 (b) 3,673,028 3,656,255
3.443% due 11/01/2035 (b) 648,897 655,222
5.144% due 09/01/2035 (b) 321,396 334,162
5.18% due 07/01/2035 (b) 334,727 348,693
5.50% due 02/01/2033 to 10/01/2038 20,100,002 20,810,063
5.50% TBA ** 29,000,000 29,978,750
6.00% due 04/01/2036 to 12/01/2038 29,797,542 31,245,909
6.00% TBA ** 5,000,000 5,235,156
92,658,296
Government National Mortgage
Association - 13.46%
6.00% due 09/15/2023 to 01/15/2039 48,599,875 50,913,705
6.00% due 09/20/2038 *** 3,742,166 3,915,534
6.00% TBA ** 17,600,000 18,383,749
6.50% due 10/20/2038 1,413,735 1,497,012
74,710,000
TOTAL U.S. GOVERNMENT AGENCY OBLIGATIONS
(Cost $168,521,819) $ 168,559,884
FOREIGN GOVERNMENT OBLIGATIONS - 18.14%
Canada - 1.42%
Province of Ontario, Canada
4.70% due 06/02/2037 CAD 1,300,000 1,129,087
5.00% due 12/01/2038 3,700,000 3,285,654
5.75% due 12/01/2036 2,800,000 2,746,860
5.85% due 03/08/2033 600,000 602,033
6.20% due 06/02/2031 100,000 104,123
7,867,757
France - 2.66%
Government of France
3.75% due 01/12/2013 EUR 9,000,000 13,308,438
4.00% due 10/25/2038 1,150,000 1,486,427
14,794,865
Germany - 2.87%
Federal Republic of Germany
4.00% due 01/04/2037 4,000,000 5,285,030
4.25% due 07/04/2039 7,700,000 10,647,419
15,932,449
Japan - 8.98%
Government of Japan
1.00% due 06/10/2016 JPY 666,600,000 5,985,268
1.20% due 03/10/2017 160,960,000 1,452,830
Copyright © 2012 www.secdatabase.com. All Rights Reserved.Please Consider the Environment Before Printing This Document
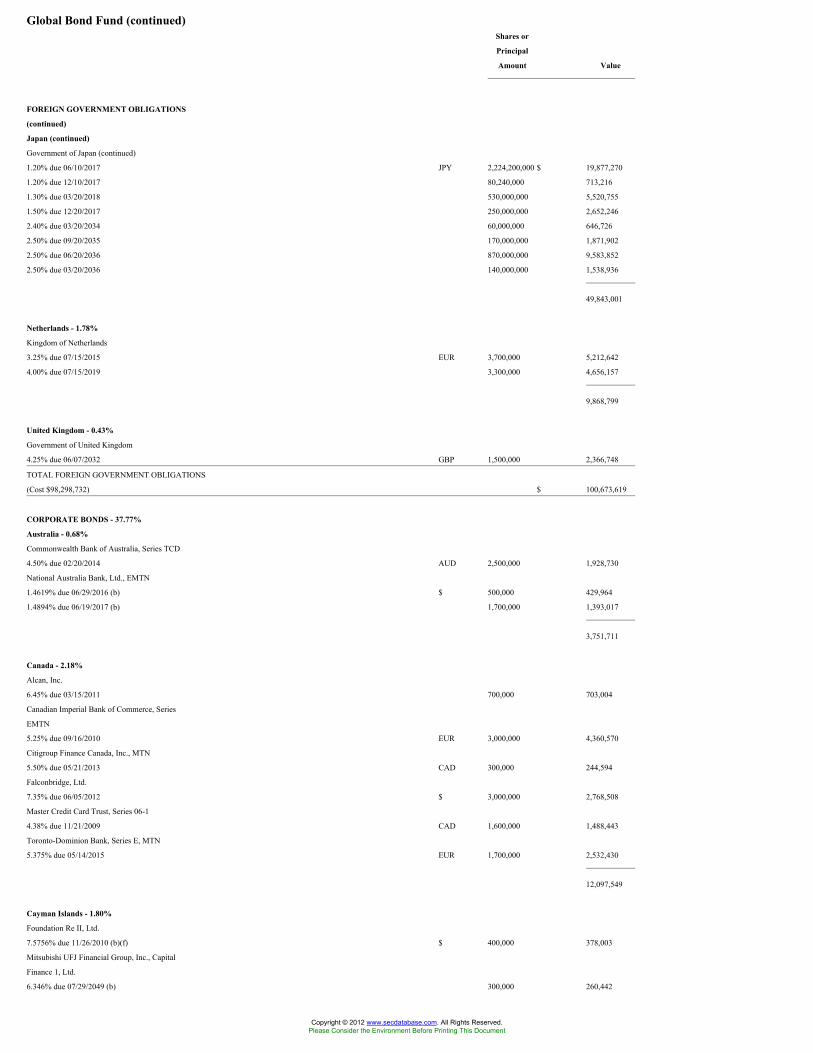
Global Bond Fund (continued)Shares or
Principal
Amount Value
FOREIGN GOVERNMENT OBLIGATIONS
(continued)
Japan (continued)
Government of Japan (continued)
1.20% due 06/10/2017 JPY 2,224,200,000 $ 19,877,270
1.20% due 12/10/2017 80,240,000 713,216
1.30% due 03/20/2018 530,000,000 5,520,755
1.50% due 12/20/2017 250,000,000 2,652,246
2.40% due 03/20/2034 60,000,000 646,726
2.50% due 09/20/2035 170,000,000 1,871,902
2.50% due 06/20/2036 870,000,000 9,583,852
2.50% due 03/20/2036 140,000,000 1,538,936
49,843,001
Netherlands - 1.78%
Kingdom of Netherlands
3.25% due 07/15/2015 EUR 3,700,000 5,212,642
4.00% due 07/15/2019 3,300,000 4,656,157
9,868,799
United Kingdom - 0.43%
Government of United Kingdom
4.25% due 06/07/2032 GBP 1,500,000 2,366,748
TOTAL FOREIGN GOVERNMENT OBLIGATIONS
(Cost $98,298,732) $ 100,673,619
CORPORATE BONDS - 37.77%
Australia - 0.68%
Commonwealth Bank of Australia, Series TCD
4.50% due 02/20/2014 AUD 2,500,000 1,928,730
National Australia Bank, Ltd., EMTN
1.4619% due 06/29/2016 (b) $ 500,000 429,964
1.4894% due 06/19/2017 (b) 1,700,000 1,393,017
3,751,711
Canada - 2.18%
Alcan, Inc.
6.45% due 03/15/2011 700,000 703,004
Canadian Imperial Bank of Commerce, Series
EMTN
5.25% due 09/16/2010 EUR 3,000,000 4,360,570
Citigroup Finance Canada, Inc., MTN
5.50% due 05/21/2013 CAD 300,000 244,594
Falconbridge, Ltd.
7.35% due 06/05/2012 $ 3,000,000 2,768,508
Master Credit Card Trust, Series 06-1
4.38% due 11/21/2009 CAD 1,600,000 1,488,443
Toronto-Dominion Bank, Series E, MTN
5.375% due 05/14/2015 EUR 1,700,000 2,532,430
12,097,549
Cayman Islands - 1.80%
Foundation Re II, Ltd.
7.5756% due 11/26/2010 (b)(f) $ 400,000 378,003
Mitsubishi UFJ Financial Group, Inc., Capital
Finance 1, Ltd.
6.346% due 07/29/2049 (b) 300,000 260,442
Copyright © 2012 www.secdatabase.com. All Rights Reserved.Please Consider the Environment Before Printing This Document

Mizuho Financial Group (Cayman), Ltd.
8.375% due 12/29/2049 2,500,000 2,350,000
MUFG Capital Finance 2, Ltd.
4.85% due 12/31/2049 (b) EUR 2,500,000 2,377,029
The accompanying notes are an integral part of the financial statements.
63
JOHN HANCOCK FUNDS II
PORTFOLIO OF INVESTMENTS - May 31, 2009 (Unaudited) - continued(showing percentage of total net assets)
Global Bond Fund (continued)Shares or
Principal
Amount Value
CORPORATE BONDS (continued)
Cayman Islands (continued)
MUFG Capital Finance 5, Ltd.
6.299% due 01/25/2049 (b) GBP 1,513,000 $ 1,525,663
Residential Reinsurance 2007, Ltd., Series CL4
7.2613% due 06/07/2010 (b)(f) $ 1,900,000 1,808,040
SMFG Preferred Capital
6.078% due 01/29/2049 (b)(f) 1,700,000 1,312,723
10,011,900
France - 2.23%
BNP Paribas Covered Bonds SA, EMTN
4.75% due 05/28/2013 EUR 1,700,000 2,507,327
Lafarge SA
6.50% due 07/15/2016 $ 2,000,000 1,687,362
Societe Financement de l'Economie Francaise
3.375% due 05/05/2014 (f) 2,300,000 2,304,828
Societe Financement de l'Economie Francaise,
EMTN
2.125% due 05/20/2012 EUR 1,200,000 1,693,295
Vivendi
5.75% due 04/04/2013 (f) $ 4,300,000 4,187,637
12,380,449
Germany - 0.60%
Kreditanstalt fuer Wiederaufbau, MTN
5.50% due 06/05/2014 AUD 4,200,000 3,339,629
Ireland - 0.35%
Osiris Capital PLC, Series D
6.1312% due 01/15/2010 (b)(f) $ 500,000 488,412
TransCapitalInvest, Ltd., for OJSC AK Transneft
8.70% due 08/07/2018 (f) 1,500,000 1,440,720
1,929,132
Japan - 0.14%
Bank of Tokyo-Mitsubishi UFJ, Ltd., Series E, MTN
3.50% due 12/16/2015 (b) EUR 600,000 805,313
Luxembourg - 0.29%
Gaz Capital SA
7.343% due 04/11/2013 (f) $ 1,000,000 960,000
8.146% due 04/11/2018 (f) 700,000 637,840
1,597,840
Copyright © 2012 www.secdatabase.com. All Rights Reserved.Please Consider the Environment Before Printing This Document

Netherlands - 2.83%
Deutsche Telekom International Finance BV
8.75 due 06/15/2030 500,000 581,375
Fortis Bank Nederland Holding NV, EMTN
3.375% due 05/19/2014 EUR 2,400,000 3,381,115
ING Bank NV, EMTN
3.375% due 03/03/2014 1,800,000 2,545,387
LeasePlan Corp NV, EMTN
3.25% due 05/22/2014 1,100,000 1,541,182
NIBC Bank NV, EMTN
3.50% due 04/07/2014 4,000,000 5,652,479
Rabobank Nederland
11.00% due 06/30/2019 (b)(f) $ 2,000,000 2,000,000
15,701,538
Norway - 0.45%
DnB NOR Boligkreditt, EMTN
4.50% due 05/16/2011 EUR 1,700,000 2,488,221
Global Bond Fund (continued)Shares or
Principal
Amount Value
CORPORATE BONDS (continued)
South Korea - 0.27%
Export-Import Bank of Korea, Series E, MTN
5.75% due 05/22/2013 EUR 1,100,000 $ 1,471,562
Spain - 1.62%
Bankinter SA, Series D, MTN
5.00% due 05/14/2010 3,600,000 5,192,702
Caja de Ahorros y Monte de Piedad de Madrid, SA
4.25% due 02/21/2014 2,700,000 3,812,483
9,005,185
Sweden - 0.21%
Swedbank AB, EMTN
3.625% due 12/02/2011 800,000 1,170,044
Switzerland - 0.81%
UBS AG/Stamford Branch, MTN
5.75% due 04/25/2018 $ 5,000,000 4,485,315
United Kingdom - 1.57%
Barclays Bank PLC
7.70% due 12/31/2049 (b)(f) 1,000,000 775,390
Barclays Bank PLC, EMTN
1.585% due 04/20/2016 (b) EUR 600,000 626,987
HBOS Treasury Services PLC, MTN
1.1525% due 07/17/2009 (b)(f) $ 200,000 199,627
Lloyds TSB Bank PLC
2.2075% due 04/02/2012 (b)(f) 1,900,000 1,895,609
Pearson Dollar Finance Two PLC
6.25% due 05/06/2018 (f) 1,000,000 909,540
Royal Bank of Scotland Group PLC
7.0916% due 10/29/2049 EUR 3,500,000 1,533,864
Royal Bank of Scotland PLC
2.625% due 05/11/2012 (f) $ 2,400,000 2,401,840
XL Capital Finance PLC
6.50% due 01/15/2012 400,000 348,894
8,691,751
United States - 21.74%
ACE INA Holdings, Inc.
5.875% due 06/15/2014 300,000 307,821
Copyright © 2012 www.secdatabase.com. All Rights Reserved.Please Consider the Environment Before Printing This Document

Altria Group, Inc.
9.25% due 08/06/2019 2,000,000 2,212,582
American Electric Power Company, Inc.
5.25% due 06/01/2015 2,000,000 1,983,080
American Express Bank FSB, BKNT
0.5175% due 06/12/2012 (b) 900,000 802,069
American Express Company
7.00% due 03/19/2018 4,500,000 4,297,864
American General Finance Corp.
6.90% due 12/15/2017 2,000,000 989,434
American International Group, Inc.
8.175% due 05/15/2058 (b)(f) 3,600,000 831,996
8.25% due 08/15/2018 (f) 1,800,000 857,686
American International Group, Inc., MTN
5.85% due 01/16/2018 2,200,000 932,382
American International Group, Inc., Series A3
4.875% due 03/15/2067 (b) EUR 1,000,000 204,986
American International Group, Inc., Series REGS
8.00% due 05/22/2038 (b) 1,150,000 276,378
Autozone, Inc.
5.875% due 10/15/2012 $ 500,000 515,909
The accompanying notes are an integral part of the financial statements.
64
JOHN HANCOCK FUNDS II
PORTFOLIO OF INVESTMENTS - May 31, 2009 (Unaudited) - continued(showing percentage of total net assets)
Global Bond Fund (continued)Shares or
Principal
Amount Value
CORPORATE BONDS (continued)
United States (continued)
BAE Systems Holdings, Inc.
6.40% due 12/15/2011 (f) $ 700,000 $ 737,078
Bank of America Corp., Series E, MTN
4.625% due 02/07/2017 EUR 1,500,000 1,423,785
Bear Stearns Companies, Inc.
7.25% due 02/01/2018 $ 4,400,000 4,536,127
Boston Scientific Corp.
6.00% due 06/15/2011 700,000 689,500
Capital One Financial Corp., MTN
5.70% due 09/15/2011 600,000 609,729
CBS Corp.
8.875% due 05/15/2019 1,800,000 1,788,707
Citigroup, Inc.
5.50% due 04/11/2013 3,400,000 3,260,855
6.00% due 08/15/2017 1,900,000 1,690,054
6.125% due 11/21/2017 3,400,000 3,047,546
6.125% due 05/15/2018 900,000 802,921
Citigroup, Inc., EMTN
1.527% due 02/09/2016 (b) EUR 2,500,000 2,582,217
1.939% due 03/05/2014 (b) 5,900,000 6,537,762
CNA Financial Corp.
6.00% due 08/15/2011 $ 1,000,000 964,950
CVS Caremark Corp.
5.75% due 08/15/2011 700,000 740,601
D.R. Horton, Inc.
6.00% due 04/15/2011 800,000 770,000
DaimlerChrysler NA Holding Corp., MTN
5.75% due 09/08/2011 300,000 302,484
Copyright © 2012 www.secdatabase.com. All Rights Reserved.Please Consider the Environment Before Printing This Document

FPL Group Capital, Inc.
2.1956% due 06/17/2011 (b) 1,200,000 1,208,983
General Electric Capital Corp.
6.375% due 11/15/2067 (b) 1,000,000 705,970
General Electric Capital Corp., MTN
1.6163% due 05/22/2013 (b) 1,900,000 1,724,816
GlaxoSmithKline Capital, Inc.
5.65% due 05/15/2018 1,900,000 1,974,284
Goldman Sachs Group, Inc.
5.25% due 06/01/2016 CAD 1,500,000 1,303,513
5.95% due 01/18/2018 $ 1,300,000 1,239,594
6.15% due 04/01/2018 400,000 386,151
Goldman Sachs Group, Inc., Series E, MTN
5.375% due 02/15/2013 EUR 700,000 984,601
6.375% due 05/02/2018 1,000,000 1,376,052
Hewlett-Packard Company
2.25% due 05/27/2011 $ 2,600,000 2,619,490
Home Depot, Inc.
5.40% due 03/01/2016 1,000,000 980,973
HSBC Finance Corp.
1.67% due 09/14/2012 (b) 1,700,000 1,476,943
5.25% due 01/15/2014 400,000 386,524
Intuit, Inc.
5.75% due 03/15/2017 2,000,000 1,853,714
Johnson Controls, Inc.
5.25% due 01/15/2011 600,000 600,326
JPMorgan Chase & Company
6.00% due 01/15/2018 1,500,000 1,492,914
6.40% due 05/15/2038 1,900,000 1,917,467
JPMorgan Chase & Company, MTN
5.058% due 02/22/2021 (b) CAD 700,000 538,251
Global Bond Fund (continued)Shares or
Principal
Amount Value
CORPORATE BONDS (continued)
United States (continued)
JPMorgan Chase Bank NA
4.375% due 11/30/2021 (b) EUR 500,000 $ 555,543
JPMorgan Chase Capital XX, Series T
6.55% due 09/29/2036 $ 900,000 708,986
Kinder Morgan Energy Partners LP, MTN
6.95% due 01/15/2038 2,500,000 2,316,642
Lehman Brothers Holdings, Inc., MTN
5.625% due 01/24/2013 ^ 3,600,000 549,000
6.875% due 05/02/2018 ^ 4,200,000 693,000
Loews Corp.
5.25% due 03/15/2016 200,000 200,025
Masco Corp.
6.125% due 10/03/2016 700,000 571,708
McKesson Corp.
5.70% due 03/01/2017 600,000 581,081
Merrill Lynch & Company, Inc., EMTN
2.148% due 05/30/2014 (b) EUR 600,000 647,422
Merrill Lynch & Company, Inc., MTN
6.875% due 04/25/2018 $ 3,200,000 2,969,789
Morgan Stanley
1.5569% due 10/18/2016 (b) 600,000 441,907
1.6113% due 10/15/2015 (b) 4,600,000 3,728,521
Morgan Stanley, EMTN
1.845% due 04/13/2016 (b) EUR 200,000 213,424
2.165% due 03/01/2013 (b) 1,100,000 1,319,081
Morgan Stanley, MTN
6.00% due 04/28/2015 $ 2,700,000 2,636,974
Copyright © 2012 www.secdatabase.com. All Rights Reserved.Please Consider the Environment Before Printing This Document

Motorola, Inc.
6.00% due 11/15/2017 700,000 582,357
Nabors Industries, Inc.
6.15% due 02/15/2018 2,000,000 1,875,514
Nationwide Health Properties, Inc.
6.50% due 07/15/2011 600,000 550,144
Nisource Finance Corp.
5.40% due 07/15/2014 200,000 177,454
Norfolk Southern Corp.
5.257% due 09/17/2014 2,000,000 2,018,114
President and Fellows of Harvard College
6.50% due 01/15/2039 (f) 1,700,000 1,841,848
Pricoa Global Funding I
1.1394% due 01/30/2012 (b)(f) 1,500,000 1,308,710
1.3563% due 06/26/2012 (b)(f) 2,900,000 2,480,353
Prudential Financial, Inc., MTN
6.625% due 12/01/2037 2,000,000 1,720,670
Rabobank Capital Funding Trust
5.254% due 12/29/2049 (b)(f) 1,700,000 1,275,000
Reynolds American, Inc.
2.02% due 06/15/2011 (b) 800,000 741,557
Sabre Holdings Corp.
7.35% due 08/01/2011 700,000 525,000
Sara Lee Corp.
6.25% due 09/15/2011 500,000 526,644
Sealed Air Corp.
5.625% due 07/15/2013 (f) 700,000 636,423
Simon Property Group LP
6.10% due 05/01/2016 1,000,000 929,918
Southwest Airlines Company
5.125% due 03/01/2017 500,000 412,042
The accompanying notes are an integral part of the financial statements.
65
JOHN HANCOCK FUNDS II
PORTFOLIO OF INVESTMENTS - May 31, 2009 (Unaudited) - continued (showing percentage of total net assets)
Global Bond Fund (continued)Shares or
Principal
Amount Value
CORPORATE BONDS (continued)
United States (continued)
Sprint Capital Corp.
8.75% due 03/15/2032 $ 200,000 $ 158,000
Sprint Nextel Corp.
6.00% due 12/01/2016 1,000,000 812,500
State Street Capital Trust IV
2.32% due 06/15/2037 (b) 1,800,000 830,205
Target Corp.
7.00% due 01/15/2038 2,100,000 2,198,853
Tate & Lyle International Finance PLC
5.00% due 11/15/2014 (f) 300,000 265,361
The Board of Trustees of The Leland Stanford
Junior University
4.75% due 05/01/2019 1,900,000 1,877,751
Verizon Wireless Capital LLC
3.3163% due 05/20/2011 (b)(f) 2,600,000 2,677,421
Viacom, Inc.
5.75% due 04/30/2011 600,000 608,248
Virginia Electric & Power Company
6.35% due 11/30/2037 100,000 103,606
Copyright © 2012 www.secdatabase.com. All Rights Reserved.Please Consider the Environment Before Printing This Document
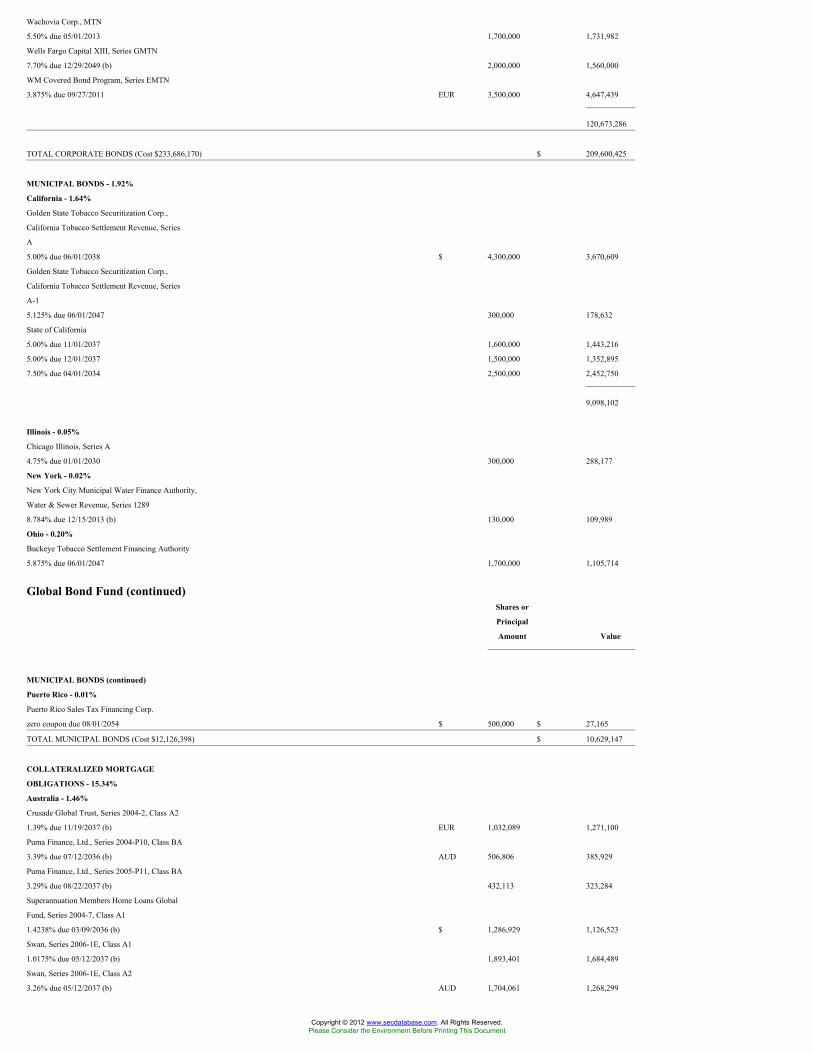
Wachovia Corp., MTN
5.50% due 05/01/2013 1,700,000 1,731,982
Wells Fargo Capital XIII, Series GMTN
7.70% due 12/29/2049 (b) 2,000,000 1,560,000
WM Covered Bond Program, Series EMTN
3.875% due 09/27/2011 EUR 3,500,000 4,647,439
120,673,286
TOTAL CORPORATE BONDS (Cost $233,686,170) $ 209,600,425
MUNICIPAL BONDS - 1.92%
California - 1.64%
Golden State Tobacco Securitization Corp.,
California Tobacco Settlement Revenue, Series
A
5.00% due 06/01/2038 $ 4,300,000 3,670,609
Golden State Tobacco Securitization Corp.,
California Tobacco Settlement Revenue, Series
A-1
5.125% due 06/01/2047 300,000 178,632
State of California
5.00% due 11/01/2037 1,600,000 1,443,216
5.00% due 12/01/2037 1,500,000 1,352,895
7.50% due 04/01/2034 2,500,000 2,452,750
9,098,102
Illinois - 0.05%
Chicago Illinois, Series A
4.75% due 01/01/2030 300,000 288,177
New York - 0.02%
New York City Municipal Water Finance Authority,
Water & Sewer Revenue, Series 1289
8.784% due 12/15/2013 (b) 130,000 109,989
Ohio - 0.20%
Buckeye Tobacco Settlement Financing Authority
5.875% due 06/01/2047 1,700,000 1,105,714
Global Bond Fund (continued)Shares or
Principal
Amount Value
MUNICIPAL BONDS (continued)
Puerto Rico - 0.01%
Puerto Rico Sales Tax Financing Corp.
zero coupon due 08/01/2054 $ 500,000 $ 27,165
TOTAL MUNICIPAL BONDS (Cost $12,126,398) $ 10,629,147
COLLATERALIZED MORTGAGE
OBLIGATIONS - 15.34%
Australia - 1.46%
Crusade Global Trust, Series 2004-2, Class A2
1.39% due 11/19/2037 (b) EUR 1,032,089 1,271,100
Puma Finance, Ltd., Series 2004-P10, Class BA
3.39% due 07/12/2036 (b) AUD 506,806 385,929
Puma Finance, Ltd., Series 2005-P11, Class BA
3.29% due 08/22/2037 (b) 432,113 323,284
Superannuation Members Home Loans Global
Fund, Series 2004-7, Class A1
1.4238% due 03/09/2036 (b) $ 1,286,929 1,126,523
Swan, Series 2006-1E, Class A1
1.0175% due 05/12/2037 (b) 1,893,401 1,684,489
Swan, Series 2006-1E, Class A2
3.26% due 05/12/2037 (b) AUD 1,704,061 1,268,299
Copyright © 2012 www.secdatabase.com. All Rights Reserved.Please Consider the Environment Before Printing This Document

Torrens Trust, Series 2007-1, Class A
3.5267% due 09/19/2014 (b)(e) 2,760,265 2,054,139
8,113,763
Ireland - 0.43%
German Residential Asset Note Distributor PLC,
Series 2006-1, Class A
1.65% due 07/20/2016 (b) EUR 1,230,292 1,231,153
Immeo Residential Finance PLC, Series 2007-2,
Class A
1.81% due 12/15/2016 (b) 1,330,578 1,191,637
2,422,790
Italy - 0.06%
IntesaBci Sec 2 SRL, Series 2003-1, Class A2
1.546% due 08/28/2023 (b) 233,958 317,311
Netherlands - 0.56%
Atomium Mortgage Finance BV,
Series 2003-I, Class A
2.266% due 04/18/2009 (b) 519,420 676,037
Delphinus BV, Series 2001-II, Class A1
1.556% due 11/28/2031 (b) 867,260 1,173,998
Dutch Mortgage Portfolio Loans, BV,
Series III, Class A
1.494% due 11/20/2035 (b) 982,091 1,251,872
3,101,907
Spain - 0.08%
Bancaja Fondo de Titulizacion de Activos, Series
2005-8, Class A
1.516% due 10/25/2037 (b) 475,032 448,797
United States - 12.75%
Adjustable Rate Mortgage Trust, Series 2005-5,
Class 2A1
5.1519% due 09/25/2035 (b) $ 165,399 112,881
American Home Mortgage Investment Trust, Series
2007-1, Class GA2
0.6775% due 05/25/2047 (b) 446,437 88,448
The accompanying notes are an integral part of the financial statements.
66
JOHN HANCOCK FUNDS II
PORTFOLIO OF INVESTMENTS - May 31, 2009 (Unaudited) - continued(showing percentage of total net assets)
Global Bond Fund (continued)Shares or
Principal
Amount Value
COLLATERALIZED MORTGAGE
OBLIGATIONS (continued)
United States (continued)
American Home Mortgage Investment Trust,
Series 2004-3, Class 5A
4.29% due 10/25/2034 (b) $ 500,215 $ 348,936
Banc of America Funding Corp., Series 2006-A,
Class 1A1
4.5869% due 02/20/2036 (b) 1,666,659 1,273,331
Banc of America Funding Corp., Series 2006-J,
Copyright © 2012 www.secdatabase.com. All Rights Reserved.Please Consider the Environment Before Printing This Document

Class 4A1
6.1037% due 01/20/2047 (b) 230,513 116,874
Banc of America Mortgage Securities,
Series 2004-4, Class 1A9
5.00% due 05/25/2034 1,283,449 1,236,835
BCAP LLC Trust, Series 2006-AA2, Class A1
0.4787% due 01/25/2037 (b) 2,657,972 998,956
Bear Stearns Adjustable Rate Mortgage Trust,
Series 2003-5, Class 1A2
4.6259% due 08/25/2033 (b) 106,118 90,176
Bear Stearns Adjustable Rate Mortgage Trust,
Series 2003-7, Class 6A
4.657% due 10/25/2033 (b) 254,566 225,295
Bear Stearns Adjustable Rate Mortgage Trust,
Series 2003-9, Class 2A1
5.2361% due 02/25/2034 (b) 31,329 22,495
Bear Stearns Adjustable Rate Mortgage Trust,
Series 2004-2, Class 22A
4.2739% due 05/25/2034 (b) 412,300 361,014
Bear Stearns Adjustable Rate Mortgage Trust,
Series 2004-2, Class 23A
4.6301% due 05/25/2034 (b) 183,352 128,660
Bear Stearns Adjustable Rate Mortgage Trust,
Series 2005-2, Class A1
2.94% due 03/25/2035 (b) 2,545,239 2,193,140
Bear Stearns Adjustable Rate Mortgage Trust,
Series 2005-2, Class A2
2.2588% due 03/25/2035 (b) 797,645 684,556
Bear Stearns Adjustable Rate Mortgage Trust,
Series 2005-5, Class A1
2.63% due 08/25/2035 (b) 1,366,672 1,194,522
Bear Stearns Adjustable Rate Mortgage Trust,
Series 2005-5, Class A2
4.55% due 08/25/2035 (b) 1,515,905 1,319,729
Bear Stearns Adjustable Rate Mortgage Trust,
Series 2005-9, Class A1
4.625% due 10/25/2035 (b) 3,011,396 2,250,695
Bear Stearns Alt-A Trust, Series 2005-7, Class 22A1
5.49% due 09/25/2036 (b) 2,039,316 1,139,918
Bear Stearns Alt-A Trust, Series 2005-9, Class 24A1
5.5272% due 11/25/2035 (b) 1,058,666 513,885
Bear Stearns Alt-A Trust, Series 2006-8, Class 3A1
0.4688% due 02/25/2034 (b) 97,491 48,915
Bear Stearns Alt-A Trust, Series 2006-6, Class 31A1
5.7087% due 11/25/2036 (b) 2,400,373 1,232,628
Bear Stearns Alt-A Trust, Series 2006-6, Class 32A1
5.7157% due 10/25/2036 (b) 1,836,396 947,787
Bear Stearns Structured Products, Inc., Series
2007-R6, Class 1A1
5.6476% due 01/26/2036 (b) 1,093,436 484,606
Global Bond Fund (continued)Shares or
Principal
Amount Value
COLLATERALIZED MORTGAGE
OBLIGATIONS (continued)
United States (continued)
Bella Vista Mortgage Trust,
Series 2005-2, Class 2A1
0.5662% due 05/20/2045 (b) $ 787,727 $ 305,039
Citigroup Commercial Mortgage Trust, Series
2007-C6, Class A3B
5.6999% due 02/10/2017 (b) 900,000 654,550
Citigroup Mortgage Loan Trust, Inc., Series
Copyright © 2012 www.secdatabase.com. All Rights Reserved.Please Consider the Environment Before Printing This Document

2005-11, Class 1A1
2.99% due 12/25/2035 (b) 418,287 320,907
Citigroup Mortgage Loan Trust, Inc., Series
2005-11, Class A2A
4.70% due 12/25/2035 2,126,834 1,607,089
Citigroup Mortgage Loan Trust, Inc., Series
2005-12, Class 2A1
1.2375% due 08/25/2035 (b) 1,135,071 718,627
Citigroup Mortgage Loan Trust, Inc., Series 2005-6,
Class A1
4.7475% due 08/25/2035 (b) 770,570 566,146
Citigroup Mortgage Loan Trust, Inc., Series 2005-6,
Class A2
4.2475% due 08/25/2035 (b) 878,389 634,879
Commercial Mortgage Pass Through
Certificates, Series 2006-CN2A, Class A2FL
0.6313% due 02/05/2019 (b)(f) 2,600,000 2,022,501
Countrywide Alternative Loan Trust, Series
2005-21CB, Class A3
5.25% due 06/25/2035 262,300 223,192
Countrywide Alternative Loan Trust, Series
2005-56, Class 2A2
3.4792% due 11/25/2035 (b) 121,571 54,382
Countrywide Alternative Loan Trust, Series
2005-56, Class 2A3
2.9392% due 11/25/2035 (b) 121,488 52,349
Countrywide Alternative Loan Trust, Series
2006-OA19, Class A1
0.4962% due 02/20/2047 (b) 2,305,734 839,314
Countrywide Alternative Loan Trust, Series
2007-11T1, Class A12
0.6587% due 05/25/2037 (b) 530,109 190,509
Countrywide Alternative Loan Trust, Series
2007-16CB, Class 5A1
6.25% due 08/25/2037 252,101 127,902
Countrywide Alternative Loan Trust, Series
2007-7T2, Class A9
6.00% due 04/25/2037 396,511 202,549
Countrywide Alternative Loan Trust, Series
2007-OA7, Class A1A
0.4888% due 05/25/2047 (b) 2,398,202 842,755
Countrywide Alternative Loan Trust,
Series 2005-11CB, Class 2A8
4.50% due 06/25/2035 235,094 228,193
Countrywide Alternative Loan Trust,
Series 2005-81, Class A1
0.5888% due 02/25/2037 (b) 4,295,674 1,889,033
Countrywide Alternative Loan Trust,
Series 2006-OA1, Class 2A1
0.5262% due 03/20/2046 (b) 1,435,598 544,586
The accompanying notes are an integral part of the financial statements.
67
JOHN HANCOCK FUNDS II
PORTFOLIO OF INVESTMENTS - May 31, 2009 (Unaudited) - continued(showing percentage of total net assets)
Global Bond Fund (continued)Shares or
Principal
Amount Value
COLLATERALIZED MORTGAGE
Copyright © 2012 www.secdatabase.com. All Rights Reserved.Please Consider the Environment Before Printing This Document

OBLIGATIONS (continued)
United States (continued)
Countrywide Home Loan Mortgage Pass Through
Trust, Series 2004-12, Class 11A1
4.6887% due 08/25/2034 (b) $ 105,347 $ 65,002
Countrywide Home Loan Mortgage Pass Through
Trust, Series 2004-22, Class A3
4.7875% due 11/25/2034 (b) 321,693 245,260
Countrywide Home Loan Mortgage Pass Through
Trust, Series 2005-R2, Class 1AF1
0.7775% due 06/25/2035 (b)(f) 143,069 103,732
Countrywide Home Loan Mortgage
Pass Through Trust, Series 2005-HYB9,
Class 5A1
5.25% due 02/20/2036 (b) 625,291 365,674
Countrywide Home Loans,
Series 2004-12, Class 12A1
4.7171% due 08/25/2034 (b) 972,816 779,783
Countrywide Home Loans,
Series 2004-25, Class 1A1
0.6388% due 02/25/2035 (b) 272,069 137,831
Countrywide Home Loans,
Series 2004-25, Class 2A1
0.6488% due 02/25/2035 (b) 324,050 165,517
Countrywide Home Loans,
Series 2005-HYB9, Class 3A2A
5.25% due 11/20/2025 (b) 685,169 468,144
CS First Boston Mortgage Securities Corp., Series
2003-AR18, Class 2A3
4.0735% due 07/25/2033 (b) 31,068 27,538
CS First Boston Mortgage Securities Corp., Series
2003-AR20, Class 2A1
4.415% due 08/25/2033 (b) 361,937 317,550
Federal Home Loan Mortgage Corp., Series T-63,
Class 1A1
2.714% due 02/25/2045 (b) 299,305 287,019
Federal Home Loan Mortgage Corp.,
Series 2004-2895, Class F
0.6944% due 06/15/2031 (b) 537,933 535,609
Federal Home Loan Mortgage Corp.,
Series 2006-3117, Class PN
5.00% due 11/15/2021 135,537 135,464
Federal National Mortgage Association, Series
2003-W6, Class F
0.6587% due 09/25/2042 (b) 642,361 601,857
Federal National Mortgage Association, Series
2005-120, Class NF
0.4087% due 01/25/2021 (b) 343,645 337,733
Federal National Mortgage Association, Series
2006-15, Class FC
0.5675% due 03/25/2036 (b) 1,028,908 810,849
Federal National Mortgage Association, Series
2006-16, Class FC
0.7375% due 03/25/2036 (b) 2,116,613 2,078,246
Federal National Mortgage Association, Series
2006-5, Class 3A2
4.628% due 02/25/2036 (b) 912,497 904,752
First Horizon Asset Securities, Inc., Series
2003-AR2, Class 2A1
3.4843% due 07/25/2033 (b) 88,879 79,366
Global Bond Fund (continued)Shares or
Principal
Amount Value
Copyright © 2012 www.secdatabase.com. All Rights Reserved.Please Consider the Environment Before Printing This Document

COLLATERALIZED MORTGAGE
OBLIGATIONS (continued)
United States (continued)
First Horizon Asset Securities, Inc., Series
2003-AR4, Class 2A1
4.7422% due 12/25/2033 (b) $ 201,243 $ 167,338
First Horizon Asset Securities, Inc., Series
2005-AR3, Class 2A1
5.3586% due 08/25/2035 (b) 158,830 121,808
First Republic Mortgage Loan Trust,
Series 2001-FRB1, Class A
0.6944% due 11/15/2031 (b) 378,755 302,649
GMAC Mortgage Corp. Loan Trust, Series
2004-AR1, Class 22A
4.7581% due 06/25/2034 (b) 23,952 13,947
GMAC Mortgage Corp. Loan Trust,
Series 2004-J4, Class A1
5.50% due 09/25/2034 682,202 683,527
Greenpoint Mortgage Funding Trust, Series
2006-AR6, Class A1A
0.3887% due 10/25/2046 (b) 1,573,562 1,283,851
Greenpoint Mortgage Pass-Through Certificates,
Series 2003-1, Class A1
4.8232% due 10/25/2033 (b) 22,292 17,059
GS Mortgage Securities Corp., Series 2003-1,
Class A2
1.0087% due 01/25/2032 (b) 278,731 179,392
GSR Mortgage Loan Trust, Series 2003-1, Class A2
4.5352% due 03/25/2033 (b) 202,464 183,423
Harborview Mortgage Loan Trust, Series 2003-1,
Class A
4.3881% due 05/19/2033 (b) 343,463 295,167
Harborview Mortgage Loan Trust, Series 2005-4,
Class 3A1
5.1433% due 07/19/2035 (b) 50,008 30,462
Harborview Mortgage Loan Trust, Series 2006-1,
Class 2A1A
0.5681% due 03/19/2037 (b) 1,485,351 566,724
Harborview Mortgage Loan Trust, Series 2006-12,
Class 2A11
0.4181% due 01/19/2038 (b) 752,805 688,875
Harborview Mortgage Loan Trust,
Series 2006-12, Class 2A2A
0.5181% due 01/19/2038 2,234,875 829,953
Impac Secured Assets Corp., Series 2006-4, Class
A2A
0.5175% due 01/25/2037 (b) 702,477 518,702
Indymac Index Mortgage Loan Trust, Series
2004-AR11, Class 2A
4.9877% due 12/25/2034 (b) 90,877 69,086
JPMorgan Alternative Loan Trust, Series 2006-A6,
Class 2A1
5.50% due 11/25/2036 (b) 648,848 525,413
JPMorgan Chase Commercial Mortgage Securities
Corp, Series 2006-CB17, Class A4
5.429% due 12/12/2043 1,100,000 877,990
JPMorgan Mortgage Trust, Series 2003-A2, Class
3A1
4.3727% due 11/25/2033 (b) 270,182 237,746
JPMorgan Mortgage Trust, Series 2005-A1, Class
6T1
5.0159% due 02/25/2035 (b) 503,201 441,245
The accompanying notes are an integral part of the financial statements.
68
Copyright © 2012 www.secdatabase.com. All Rights Reserved.Please Consider the Environment Before Printing This Document

JOHN HANCOCK FUNDS II
PORTFOLIO OF INVESTMENTS - May 31, 2009 (Unaudited) - continued(showing percentage of total net assets)
Global Bond Fund (continued)Shares or
Principal
Amount Value
COLLATERALIZED MORTGAGE
OBLIGATIONS (continued)
United States (continued)
JPMorgan Mortgage Trust,
Series 2004-S1, Class 1A3
4.50% due 08/25/2019 $ 1,255,851 $ 1,217,840
Lehman Brothers Floating Rate Commercial
Mortgage Trust, Series 2006-LLFA, Class A1
0.4244% due 09/15/2021 (b)(f) 326,431 287,386
Mellon Residential Funding Corp., Series
2000-TBC3, Class A1
0.7844% due 12/15/2030 (b) 983,708 791,663
Merrill Lynch Mortgage Investors, Inc., Series
2003-A2, Class 1A1
5.1544% due 02/25/2033 (b) 132,262 112,619
Merrill Lynch Mortgage Investors, Inc., Series
2005-2, Class 1A
2.42% due 10/25/2035 (b) 1,264,485 934,533
Merrill Lynch Mortgage Investors, Inc., Series
2005-A8, Class A3A2
0.5587% due 08/25/2036 (b) 207,310 92,584
Merrill Lynch Mortgage Investors, Inc.,
Series 2003-C, Class A1
0.7675% due 06/25/2028 (b) 628,777 364,260
Merrill Lynch/Countrywide Commercial Mortgage
Trust, Series 2007-5, Class A4
5.378% due 08/12/2048 900,000 613,268
Merrill Lynch/Countrywide Commercial Mortgage
Trust, Series 2007-8, Class A3
5.957% due 08/12/2049 (b) 2,000,000 1,535,004
Puma Finance, Ltd., Series 2006-G5, Class A1
0.8225% due 02/21/2038 (b)(e) 1,419,320 1,048,000
Residential Accredit Loans, Inc., Series 2006-QO6,
Class A1
0.4888% due 06/25/2046 (b) 2,611,983 987,899
Residential Accredit Loans, Inc., Series 2007-QO2,
Class A1
0.4588% due 02/25/2047 (b) 591,274 224,611
Residential Accredit Loans, Inc.,
Series 2006-QO3, Class A1
0.6475% due 04/25/2046 (b) 1,619,190 600,866
Residential Asset Securitization Trust, Series
2005-A15, Class 5A1
5.75% due 02/25/2036 354,891 254,679
Residential Asset Securitization Trust, Series
2006-R1, Class A2
0.7088% due 01/25/2046 (b) 691,328 273,663
Residential Funding Mortgage Securities I, Series
2005-SA4, Class 1A21
5.1999% due 09/25/2035 (b) 197,676 141,856
Sequoia Mortgage Trust, Series 5, Class A
0.6781% due 10/19/2026 (b) 247,970 187,526
Structured Adjustable Rate Mortgage Loan Trust,
Series 2004-1, Class 4A1
4.9046% due 02/25/2034 (b) 179,633 140,435
Structured Adjustable Rate Mortgage Loan Trust,
Copyright © 2012 www.secdatabase.com. All Rights Reserved.Please Consider the Environment Before Printing This Document

Series 2004-1, Class 4A2
4.9182% due 02/25/2034 (b) 987,983 747,359
Structured Adjustable Rate Mortgage Loan Trust,
Series 2004-12, Class 7A1
5.1932% due 09/25/2034 (b) 813,679 694,773
Global Bond Fund (continued)Shares or
Principal
Amount Value
COLLATERALIZED MORTGAGE
OBLIGATIONS (continued)
United States (continued)
Structured Adjustable Rate Mortgage Loan Trust,
Series 2004-19, Class 2A1
2.8391% due 01/25/2035 (b) $ 824,547 $ 365,204
Structured Adjustable Rate Mortgage Loan Trust,
Series 2004-4, Class 3A2
4.0836% due 04/25/2034 (b) 397,480 320,952
Structured Asset Mortgage Investments, Inc.,
Series 2006-AR3, Class 12A1
0.6575% due 05/25/2036 (b) 1,941,682 712,853
Thornburg Mortgage Securities Trust, Series
2006-5, Class A1
0.4288% due 08/25/2011 (b) 1,793,534 1,636,693
WaMu Mortgage Pass Through Certificates, Series
2003-AR9, Class 1A5
4.5547% due 09/25/2033 (b) 398,978 394,600
WaMu Mortgage Pass Through Certificates, Series
2003-AR9, Class 1A6
4.5496% due 09/25/2033 (b) 4,000,000 3,405,484
WaMu Mortgage Pass Through Certificates, Series
2004-AR9, Class A7
4.13% due 08/25/2034 (b) 1,500,000 1,489,484
WaMu Mortgage Pass Through Certificates, Series
2006-AR19, Class 1A
2.1792% due 01/25/2047 (b) 652,154 235,193
WaMu Mortgage Pass-Through Certificates, Series
2002-AR17, Class 1A
2.6392% due 11/25/2042 (b) 430,927 250,420
WaMu Mortgage Pass-Through Certificates, Series
2003-AR5, Class A7
2.9279% due 06/25/2033 (b) 120,903 96,329
WaMu Mortgage Pass-Through Certificates, Series
2005-AR13, Class A1A1
0.5987% due 10/25/2045 (b) 197,419 92,853
WaMu Mortgage Pass-Through Certificates, Series
2005-AR2, Class 2A1A
0.6187% due 01/25/2045 (b) 335,533 158,152
WaMu Mortgage Pass-Through Certificates, Series
2005-AR6, Class 2A1A
0.5387% due 04/25/2045 (b) 574,558 277,189
WaMu Mortgage Pass-Through Certificates, Series
2006-AR17, Class 1A1A
2.3242% due 12/25/2046 (b) 483,588 193,023
WaMu Mortgage Pass-Through Certificates, Series
2006-AR3, Class A1A
2.514% due 02/25/2046 (b) 1,098,445 442,690
WaMu Mortgage Pass-Through Certificates,
Series 2003-R1, Class A1
0.8487% due 12/25/2027 (b) 1,004,905 713,835
Washington Mutual Alternative Mortgage
Pass-Through Certificates, Series 2006-AR5,
Class 3A
2.3792% due 07/25/2046 (b) 449,922 156,230
Copyright © 2012 www.secdatabase.com. All Rights Reserved.Please Consider the Environment Before Printing This Document

Wells Fargo Mortgage Backed Securities Trust,
Series 2004-S, Class A1
3.7197% due 09/25/2034 (b) 1,791,264 1,563,951
The accompanying notes are an integral part of the financial statements.
69
JOHN HANCOCK FUNDS II
PORTFOLIO OF INVESTMENTS - May 31, 2009 (Unaudited) - continued(showing percentage of total net assets)
Global Bond Fund (continued)Shares or
Principal
Amount Value
COLLATERALIZED MORTGAGE
OBLIGATIONS (continued)
United States (continued)
Wells Fargo Mortgage Backed Securities Trust,
Series 2006-AR2, Class 2A1
4.95% due 03/25/2036 (b) $ 2,092,263 $ 1,482,516
70,758,542
TOTAL COLLATERALIZED MORTGAGE OBLIGATIONS
(Cost $119,555,585) $ 85,163,110
ASSET BACKED SECURITIES - 3.88%
Ireland - 0.57%
Cars Alliance Funding PLC, Series 2007-1, Class A
1.586% due 10/08/2023 (b) EUR 1,700,000 2,121,299
SC Germany Auto, Series 2007-1, Class A
0.974% due 08/11/2015 (b) 779,344 1,055,020
3,176,319
Italy - 0.21%
Locat Securitisation Vehicle Srl, Series 2006-4,
Class A2
1.847% due 12/12/2028 (b) 900,000 1,177,253
Luxembourg - 0.14%
Silver Arrow SA, Series 2006-2, Class A
0.915% due 08/15/2014 (b) 557,704 784,311
United States - 2.96%
Access Group, Inc., Series 2008-1, Class A
2.3919% due 10/27/2025 (b) $ 2,612,807 2,589,130
ACE Securities Corp., Series 2006-NC1, Class A2B
0.5875% due 12/25/2035 (b) 266,189 258,216
Citigroup Commercial Mortgage Trust, Series
2006-FL2, Class A1
0.4144% due 08/15/2021 (b)(f) 9,614 8,035
Countrywide Asset-Backed Certificates, Series
2007-2, Class 2A1
0.4875% due 02/25/2037 (b) 593,763 527,960
Countrywide Asset-Backed Certificates,
Series 2006-25, Class 2A1
0.3787% due 06/25/2047 (b) 1,121,166 1,030,681
First Franklin Mortgage Loan Asset Backed
Certificates, Series 2006-FF15, Class A3
0.3587% due 11/25/2036 (b) 820,463 769,594
First Franklin Mortgage Loan Asset Backed
Certificates, Series 2006-FF18, Class A2A
0.5075% due 12/25/2037 (b) 607,269 566,690
Copyright © 2012 www.secdatabase.com. All Rights Reserved.Please Consider the Environment Before Printing This Document

Ford Credit Auto Owner Trust, Series 2008-C,
Class A2B
1.2444% due 01/15/2011 (b) 1,148,558 1,149,389
Franklin Auto Trust, Series 2008-A, Class A2
1.3162% due 10/20/2011 (b) 1,090,093 1,079,275
HSI Asset Securitization Corp. Trust, Series
2006-HE2, Class 2A1
0.3587% due 12/25/2036 (b) 926,919 594,040
JPMorgan Mortgage Acquisition Corp., Series
2006-WMC3, Class A2
0.3587% due 08/25/2036 (b) 276,354 261,875
Long Beach Mortgage Loan Trust, Series 2004-4,
Class 1A1
0.5888% due 10/25/2034 (b) 134,514 84,860
Global Bond Fund (continued)Shares or
Principal
Amount Value
ASSET BACKED SECURITIES
(continued)
United States (continued)
Mid-State Trust, Series 1995-4, Class A
8.33% due 04/01/2030 $ 1,400,909 $ 1,123,644
Nelnet Student Loan Trust, Series 2008-4, Class A1
1.6219% due 04/27/2015 (b) 1,312,354 1,311,806
Nomura Asset Acceptance Corp., Series 2006-S1,
Class A1
0.5775% due 01/25/2036 (b)(f) 33,998 29,407
Residential Asset Mortgage Products, Inc., Series
2006-RZ5, Class A1A
0.5375% due 08/25/2046 (b) 538,299 511,420
Residential Asset Securities Corp., Series
2006-KS9, Class AI1
0.3787% due 11/25/2036 (b) 275,736 271,346
SACO I, Inc., Series 2005-10, Class 1A
0.6975% due 11/25/2033 (b) 455,391 196,269
SLM Student Loan Trust, Series 2003-6, Class A4
1.52% due 12/17/2018 (b) 461,205 452,461
Soundview Home Equity Loan Trust, Series
2006-EQ2, Class A1
0.5175% due 01/25/2037 (b) 295,973 287,123
Structured Asset Securities Corp., Series 2006-11,
Class A1
4.6881% due 10/25/2035 (b)(e)(f) 658,353 408,145
Wachovia Bank Commercial Mortgage Trust,
Series 2006-C28, Class A4
5.572% due 10/15/2048 (b) 3,000,000 2,395,600
Wells Fargo Home Equity Trust,
Series 2005-2, Class AI1A
0.5387% due 10/25/2035 (b)(f) 363,925 342,710
Wells Fargo Home Equity Trust,
Series 2005-3, Class AII2
0.6775% due 11/25/2035 (b)(f) 159,159 156,176
16,405,852
TOTAL ASSET BACKED SECURITIES
(Cost $24,339,453) $ 21,543,735
PREFERRED STOCKS - 0.01%
United States - 0.01%
SLM Corp., 2.14% (i) 6,200 64,728
TOTAL PREFERRED STOCKS (Cost $69,750) $ 64,728
Copyright © 2012 www.secdatabase.com. All Rights Reserved.Please Consider the Environment Before Printing This Document

TERM LOANS - 0.49%
United States - 0.49%
Chrysler Financial
4.46% due 08/03/2012 (b) 2,296,185 2,015,723
Ford Motor Company, Term B
3.46% due 11/29/2013 (b) 977,500 691,887
2,707,610
TOTAL TERM LOANS (Cost $3,212,919) $ 2,707,610
The accompanying notes are an integral part of the financial statements.
70
JOHN HANCOCK FUNDS II
PORTFOLIO OF INVESTMENTS - May 31, 2009 (Unaudited) - continued(showing percentage of total net assets)
Global Bond Fund (continued)Shares or
Principal
Amount Value
OPTIONS - 0.00%
Germany - 0.00%
Over The Counter European Purchase Put Option
on the EUR vs. USD
Expiration 06/18/2009 at $1.13 * 78,000,000 $ 3,859
TOTAL OPTIONS (Cost $10,571) $ 3,859
REPURCHASE AGREEMENTS - 7.94%
JPMorgan Chase & Company
Tri-Party Repurchase Agreement
dated 05/29/2009 at 0.20% to be
repurchased at $37,100,618 on
06/01/2009, collateralized by
$35,460,000 Federal National
Mortgage Association, 3.875% due
07/12/2013 (valued at
$38,017,375, including interest) $ 37,100,000 $ 37,100,000
Repurchase Agreement with State Street
Corp. dated 05/29/2009 at 0.07% to be
repurchased at $6,952,041 on 06/01/2009,
collateralized by $6,975,000 Federal
National Mortgage Association, 2.375%
due 05/20/2010 (valued at $7,091,483,
including interest) 6,952,000 6,952,000
TOTAL REPURCHASE AGREEMENTS
(Cost $44,052,000) $ 44,052,000
SHORT TERM INVESTMENTS - 0.12%
U.S. Treasury Bills
zero coupon due 07/02/2009 *** $ 670,000 $ 669,934
TOTAL SHORT TERM INVESTMENTS
(Cost $669,934) $ 669,934
Total Investments (Global Bond Fund)
(Cost $706,539,829) - 116.34% $ 645,665,731
Other assets and liabilities, net - (16.34)% (90,681,723)
TOTAL NET ASSETS - 100.00% $ 554,984,008
Schedule of Securities Sold ShortShares or
Copyright © 2012 www.secdatabase.com. All Rights Reserved.Please Consider the Environment Before Printing This Document

Principal
Amount Value
GOVERNMENT NATIONAL MORTGAGE
ASSOCIATION - 100.00%
Government National Mortgage Association
6.00%, TBA ** $ 24,600,000 $ 25,695,468
TOTAL GOVERNMENT NATIONAL
MORTGAGE
ASSOCIATION (Proceeds $25,735,548) $ 25,695,468
Total Securities Sold Short (Global Bond Fund)
(Proceeds $25,735,548) $ 25,695,468
Global Infrastructure FundShares or
Principal
Amount Value
COMMON STOCKS - 97.94%
Australia - 3.78%
Macquarie Infrastructure Group 14,000 $ 15,725
SP Ausnet 25,000 16,041
Transurban Group, Ltd. * 12,000 39,091
70,857
Bermuda - 0.12%
Frontline, Ltd. 100 2,338
Brazil - 2.00%
Brasil Telecom SA, ADR * 302 6,562
Cia Energetica de Minas Gerais, ADR 422 5,583
Companhia de Saneamento Basico do
Estado de Sao Paulo, ADR * 512 16,000
Telecomunicacoes de Sao Paulo SA 408 9,433
37,578
Canada - 13.04%
Aecon Group, Inc. 600 6,485
ATCO, Ltd., Class I 120 3,937
Canadian Utilities, Ltd. 400 12,963
Enbridge, Inc. 1,800 63,918
SNC-Lavalin Group, Inc. 1,200 43,054
The Churchill Corp. * 2,300 24,943
TransCanada Corp. 3,000 89,220
244,520
France - 3.51%
France Telecom SA, SADR 1,441 33,633
GDF Suez 816 32,170
65,803
Germany - 2.55%
E.ON AG, ADR 491 17,421
Fraport AG, ADR 300 12,307
RWE AG 217 18,046
47,774
Italy - 1.45%
Enel SpA 2,700 16,110
Terna SpA 3,000 11,025
27,135
Japan - 5.29%
Kamigumi Company, Ltd. 1,000 7,726
Copyright © 2012 www.secdatabase.com. All Rights Reserved.Please Consider the Environment Before Printing This Document

Nippon Telegraph & Telephone Corp., ADR 2,207 45,839
NTT DoCoMo, Inc., SADR 3,058 45,687
99,252
Mexico - 0.23%
Telefonos de Mexico SAB de CV, Series L,
SADR 261 4,335
Netherlands - 3.71%
Koninklijke KPN NV, SADR 5,306 69,509
Portugal - 4.34%
Electricidade de Portugal SA 13,317 53,539
Portugal Telecom SGPS SA, ADR * 3,112 27,884
81,423
Spain - 11.46%
Abertis Infraestructuras SA 2,400 45,258
Enagas 500 9,237
The accompanying notes are an integral part of the financial statements.
71
JOHN HANCOCK FUNDS II
PORTFOLIO OF INVESTMENTS - May 31, 2009 (Unaudited) - continued(showing percentage of total net assets)
Global Infrastructure Fund (continued)Shares or
Principal
Amount Value
COMMON STOCKS (continued)
Spain (continued)
Gas Natural SDG SA 1,447 $ 26,097
Iberdrola SA 4,444 38,047
Telefonica SA, SADR 1,484 96,341
214,980
Switzerland - 1.76%
Swisscom AG 1,116 32,978
Taiwan - 0.26%
Chunghwa Telecom Company, Ltd., ADR 258 4,904
Turkey - 0.25%
Turkcell Iletisim Hizmetleri AS, ADR 355 4,725
United Kingdom - 8.89%
BT Group PLC 1,509 21,352
National Grid PLC, SADR 399 19,396
Severn Trent PLC 1,172 21,283
United Utilities Group PLC 2,219 19,253
Vodafone Group PLC, SADR 4,546 85,556
166,840
United States - 35.30%
Alliant Energy Corp. 1,371 32,534
Apollo Group, Inc., Class A * 900 53,190
AT&T, Inc. 2,807 69,586
CenterPoint Energy, Inc. 1,585 16,040
DeVry, Inc. 700 30,499
DTE Energy Company 1,121 33,910
Edison International 1,245 36,404
El Paso Corp. 2,600 25,350
Energen Corp. 682 25,384
Entergy Corp. 241 17,984
FirstEnergy Corp. 323 12,206
FPL Group, Inc. 500 28,265
Copyright © 2012 www.secdatabase.com. All Rights Reserved.Please Consider the Environment Before Printing This Document

ITT Educational Services, Inc. * 300 27,537
Kinder Morgan Management LLC * 629 28,236
OGE Energy Corp. 387 9,992
ONEOK, Inc. 687 20,129
Pinnacle West Capital Corp. 245 6,774
Sempra Energy 469 21,424
Shenandoah Telecommunications Company 188 3,630
Spectra Energy Corp. 2,700 43,335
Telephone & Data Systems, Inc. 152 4,607
USA Mobility, Inc. * 440 4,919
Verizon Communications, Inc. 1,475 43,159
Williams Companies, Inc. 4,000 67,120
662,214
TOTAL COMMON STOCKS (Cost $1,924,439) $1,837,165
RIGHTS - 0.13%
Australia - 0.01%
SP Ausnet (Expiration Date: 06/05/2009) * 6,250 100
Global Infrastructure Fund (continued)Shares or
Principal
Amount Value
RIGHTS (continued)
Spain - 0.12%
Abertis Infraestructuras SA (Expiration Date:
05/27/2009) * 120 $ $2,256
TOTAL RIGHTS (Cost $2,045) $ 2,356
Total Investments (Global Infrastructure Fund)
(Cost $1,926,484) - 98.07% $ 1,839,521
Other assets and liabilities, net - 1.93% 36,199
TOTAL NET ASSETS - 100.00% $ 1,875,720
The portfolio had the following five top industry concentrations
as of May 31, 2009 (as a percentage of total net assets):
Electrical Utilities 20.00%
Gas & Pipeline Utilities 19.87%
Telecommunications Equipment & Services 12.58%
Telephone 10.68%
Cellular Communications 7.76%
Global Real Estate FundShares or
Principal
Amount Value
COMMON STOCKS - 97.51%
Australia - 6.99%
CFS Gandel Retail Trust 1,685,863 $ 2,231,425
Charter Hall Group, Ltd 252,081 87,585
Commonwealth Property Office Fund, Ltd. 762,307 490,142
Dexus Property Group, REIT 3,681,979 2,255,270
General Property Trust, Ltd. 7,819,073 3,256,088
ING Office Fund 1,892,426 877,988
Lend Lease Corp. 15,032 83,414
Macquarie CountryWide Trust 1,445,518 501,540
Macquarie Goodman Group, Ltd. 2,151,974 434,286
Macquarie Leisure Trust Group 129,064 150,170
Macquarie Office Trust 2,050,133 315,532
Mirvac Group, Ltd. 1,734,363 1,604,870
Copyright © 2012 www.secdatabase.com. All Rights Reserved.Please Consider the Environment Before Printing This Document

Stockland Company, Ltd. 1,332,520 3,322,557
Westfield Group 1,501,511 13,215,152
28,826,019
Canada - 2.35%
Allied Properties Real Estate Investment Trust 144,900 1,964,296
Boardwalk Real Estate Investment Trust 53,300 1,530,041
Extendicare Real Estate Investment Trust 239,400 1,304,722
RioCan Real Estate Investment Trust 361,300 4,887,933
9,686,992
Finland - 0.34%
Technopolis Oyj 350,000 1,401,428
France - 4.06%
Fonciere Des Regions (a) 19,651 1,490,139
Klepierre SA (a) 90,107 2,287,219
Unibail-Rodamco, REIT 80,400 12,939,691
16,717,049
The accompanying notes are an integral part of the financial statements.
72
JOHN HANCOCK FUNDS II
PORTFOLIO OF INVESTMENTS - May 31, 2009 (Unaudited) - continued(showing percentage of total net assets)
Global Real Estate Fund (continued)Shares or
Principal
Amount Value
COMMON STOCKS (continued)
Guernsey - 0.12%
Camper & Nicholsons Marina Investments, Ltd. * 1,250,000 $ 505,094
Hong Kong - 19.35%
China Overseas Land & Investment, Ltd. 5,163,452 10,919,572
China Resources Land, Ltd. 2,449,000 5,800,443
Hang Lung Properties, Ltd. 2,077,592 6,947,043
Henderson Land Development Company, Ltd. 1,031,000 6,208,882
Kerry Properties, Ltd. 915,303 3,953,643
Link, REIT 1,902,000 3,736,250
New World China Land, Ltd. 5,929,200 3,373,328
New World Development Company, Ltd. 2,748,863 5,192,160
Shimao Property Holdings, Ltd., GDR 1,619,000 2,779,045
Sino Land Company, Ltd. 1,994,000 3,734,606
Sun Hung Kai Properties, Ltd. 2,169,173 27,099,475
79,744,447
Japan - 16.11%
Aeon Mall Company, Ltd. 148,900 2,549,992
Goldcrest Company, Ltd. 13,880 351,019
Japan Real Estate Investment Corp., REIT 526 4,073,012
Japan Retail Fund Investment Corp., REIT 527 2,417,325
Kenedix Realty Investment Corp. * 819 2,189,534
Mitsubishi Estate Company, Ltd. 1,169,000 19,276,875
Mitsui Fudosan Company, Ltd. 1,081,000 18,058,265
Nippon Building Fund, Inc., REIT 647 5,712,039
NTT Urban Development Corp. 1,776 1,684,747
Orix JREIT, Inc. * 553 2,447,503
Sumitomo Realty &
Development Company, Ltd. 500,000 7,651,573
66,411,884
Copyright © 2012 www.secdatabase.com. All Rights Reserved.Please Consider the Environment Before Printing This Document

Netherlands - 1.56%
Corio NV 80,000 3,938,332
NR Nordic and Russia Properties, Ltd. 1,750,000 522,968
Wereldhave NV 25,000 1,980,694
6,441,994
Singapore - 4.84%
Ascendas, REIT * 3,227,088 3,403,382
Capitaland, Ltd. 3,112,500 8,208,318
CapitaMall Trust * 2,494,100 2,306,958
Hong Kong Land Holdings, Ltd. 1,448,000 5,047,651
Suntec Real Estate Investment Trust * 1,502,000 993,125
19,959,434
Sweden - 0.11%
Lennart Wallenstam Byggnads AB, Series B 39,580 438,814
United Kingdom - 7.22%
Big Yellow Group PLC 170,000 862,103
British Land Company PLC 315,000 1,999,566
Capital & Regional PLC 1,000,000 596,816
Derwent Valley Holdings PLC (a) 170,000 2,330,328
Equest Balkan Properties PLC * 647,078 219,633
Great Portland Estates PLC (a) 260,000 1,305,729
Hammerson PLC 690,000 3,295,301
Hansteen Holdings PLC 600,000 761,277
Helical Bar PLC 350,000 1,974,559
Land Securities Group PLC 610,000 4,862,588
London & Stamford Property, Ltd. 620,000 1,222,292
Global Real Estate Fund (continued)Shares or
Principal
Amount Value
COMMON STOCKS (continued)
United Kingdom (continued)
Max Property Group PLC * 404,532 $ 817,306
Minerva PLC * 624,000 129,535
Safestore Holdings, Ltd. 900,000 1,069,337
Segro PLC, REIT 8,850,000 3,847,716
South African Property Opportunities PLC * 1,400,000 1,527,404
Terrace Hill Group PLC 2,100,000 512,084
Unite Group PLC 1,200,000 2,434,396
29,767,970
United States - 34.46%
AMB Property Corp., REIT 203,000 3,623,550
American Campus Communities, Inc., REIT 232,850 5,353,221
Avalon Bay Communities, Inc., REIT 116,728 7,176,437
BioMed Realty Trust, Inc., REIT 230,250 2,263,357
Boston Properties, Inc., REIT 213,950 10,338,064
DiamondRock Hospitality Company, REIT 82,050 533,325
Digital Realty Trust, Inc., REIT 170,100 6,084,477
Duke Realty Corp., REIT 388,600 3,695,586
Equity Lifestyle Properties, Inc., REIT 31,380 1,231,351
Equity Residential, REIT 312,500 7,606,250
Essex Property Trust, Inc., REIT 48,350 3,292,152
HCP, Inc., REIT 227,300 5,280,179
Host Hotels & Resorts, Inc., REIT 357,260 3,351,099
Kilroy Realty Corp., REIT 78,200 1,664,878
Kimco Realty Corp., REIT 567,600 6,635,244
Kite Realty Group Trust, REIT 196,600 636,984
LaSalle Hotel Properties, REIT 35,350 483,588
LTC Properties, Inc., REIT 46,730 972,451
Macerich Company, REIT (a) 35,700 602,616
Medical Properties Trust, Inc., REIT 241,822 1,523,479
Copyright © 2012 www.secdatabase.com. All Rights Reserved.Please Consider the Environment Before Printing This Document

Nationwide Health Properties, Inc., REIT 203,718 5,412,787
Post Properties, Inc., REIT 37,350 568,841
ProLogis, REIT 934,200 7,931,358
Public Storage, REIT 153,550 10,227,966
Regency Centers Corp., REIT 230,080 8,197,750
Senior Housing Properties Trust, REIT 326,463 5,468,255
Simon Property Group, Inc., REIT 272,923 14,593,193
SL Green Realty Corp., REIT 137,400 3,146,460
Ventas, Inc., REIT 195,321 5,929,946
Vornado Realty Trust, REIT 134,315 6,267,138
Weingarten Realty Investors, REIT 123,900 1,967,532
142,059,514
TOTAL COMMON STOCKS (Cost $372,003,877) $ 401,960,639
INVESTMENT COMPANIES - 0.40%
Cayman Islands - 0.02%
ARGO Real Estate Opportunities Fund, Ltd. * 600,000 97,545
Luxembourg - 0.38%
ProLogis European Properties * 450,000 1,568,320
TOTAL INVESTMENT COMPANIES (Cost $3,623,310) $ 1,665,865
The accompanying notes are an integral part of the financial statements.
73
JOHN HANCOCK FUNDS II
PORTFOLIO OF INVESTMENTS - May 31, 2009 (Unaudited) - continued(showing percentage of total net assets)
Global Real Estate Fund (continued)Shares or
Principal
Amount Value
RIGHTS - 0.05%
Australia - 0.05%
Stockland Company, Ltd. (Expiration Date:
06/11/2009) 588,447 $ 188,515
TOTAL RIGHTS (Cost $0) $ 188,515
CORPORATE BONDS - 0.38%
United Kingdom - 0.38%
Liberty International PLC, Series LII
3.95% due 09/30/2010 (a) GBP 1,211,000 1,556,085
TOTAL CORPORATE BONDS (Cost $1,425,251) $ 1,556,085
CONVERTIBLE BONDS - 0.03%
Germany - 0.03%
Colonia Real Estate AG, Series COLO
1.875% due 12/07/2011 EUR 167,300 109,754
TOTAL CONVERTIBLE BONDS (Cost $222,952) $ 109,754
SHORT TERM INVESTMENTS - 2.02%
John Hancock Collateral Investment
Trust, 0.7339% (c)(g) $ 833,816 8,338,159
TOTAL SHORT TERM INVESTMENTS
(Cost $8,338,159) $ 8,338,159
REPURCHASE AGREEMENTS - 0.18%
Repurchase Agreement with State
Street Corp. dated 05/29/2009 at
0.07% to be repurchased at
Copyright © 2012 www.secdatabase.com. All Rights Reserved.Please Consider the Environment Before Printing This Document
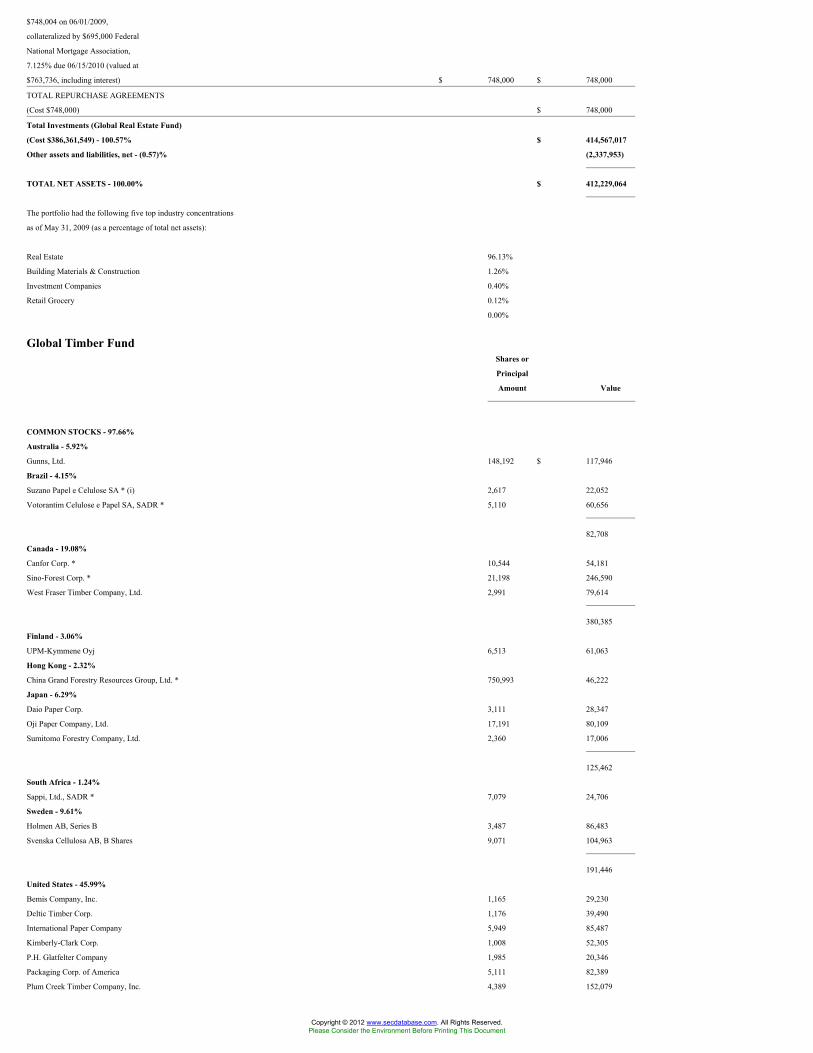
$748,004 on 06/01/2009,
collateralized by $695,000 Federal
National Mortgage Association,
7.125% due 06/15/2010 (valued at
$763,736, including interest) $ 748,000 $ 748,000
TOTAL REPURCHASE AGREEMENTS
(Cost $748,000) $ 748,000
Total Investments (Global Real Estate Fund)
(Cost $386,361,549) - 100.57% $ 414,567,017
Other assets and liabilities, net - (0.57)% (2,337,953)
TOTAL NET ASSETS - 100.00% $ 412,229,064
The portfolio had the following five top industry concentrations
as of May 31, 2009 (as a percentage of total net assets):
Real Estate 96.13%
Building Materials & Construction 1.26%
Investment Companies 0.40%
Retail Grocery 0.12%
0.00%
Global Timber FundShares or
Principal
Amount Value
COMMON STOCKS - 97.66%
Australia - 5.92%
Gunns, Ltd. 148,192 $ 117,946
Brazil - 4.15%
Suzano Papel e Celulose SA * (i) 2,617 22,052
Votorantim Celulose e Papel SA, SADR * 5,110 60,656
82,708
Canada - 19.08%
Canfor Corp. * 10,544 54,181
Sino-Forest Corp. * 21,198 246,590
West Fraser Timber Company, Ltd. 2,991 79,614
380,385
Finland - 3.06%
UPM-Kymmene Oyj 6,513 61,063
Hong Kong - 2.32%
China Grand Forestry Resources Group, Ltd. * 750,993 46,222
Japan - 6.29%
Daio Paper Corp. 3,111 28,347
Oji Paper Company, Ltd. 17,191 80,109
Sumitomo Forestry Company, Ltd. 2,360 17,006
125,462
South Africa - 1.24%
Sappi, Ltd., SADR * 7,079 24,706
Sweden - 9.61%
Holmen AB, Series B 3,487 86,483
Svenska Cellulosa AB, B Shares 9,071 104,963
191,446
United States - 45.99%
Bemis Company, Inc. 1,165 29,230
Deltic Timber Corp. 1,176 39,490
International Paper Company 5,949 85,487
Kimberly-Clark Corp. 1,008 52,305
P.H. Glatfelter Company 1,985 20,346
Packaging Corp. of America 5,111 82,389
Plum Creek Timber Company, Inc. 4,389 152,079
Copyright © 2012 www.secdatabase.com. All Rights Reserved.Please Consider the Environment Before Printing This Document

Potlatch Corp. 3,145 82,336
Rayonier, Inc. 4,948 197,920
Rock-Tenn Company, Class A 1,586 60,871
Schweitzer Mauduit International, Inc. 875 19,661
Sonoco Products Company 357 8,697
Wausau-Mosinee Paper Corp. 1,581 11,446
The accompanying notes are an integral part of the financial statements.
74
JOHN HANCOCK FUNDS II
PORTFOLIO OF INVESTMENTS - May 31, 2009 (Unaudited) - continued(showing percentage of total net assets)
Global Timber Fund (continued)Shares or
Principal
Amount Value
COMMON STOCKS (continued)
United States (continued)
Weyerhaeuser Company 2,218 74,481
916,738
TOTAL COMMON STOCKS (Cost $1,736,511) $ 1,946,676
Total Investments (Global Timber Fund)
(Cost $1,736,511) - 97.66% $ 1,946,676
Other assets and liabilities, net - 2.34% 46,625
TOTAL NET ASSETS - 100.00% $ 1,993,301
The portfolio had the following five top industry concentrations
as of May 31, 2009 (as a percentage of total net assets):
Paper 44.20%
Forest Products 41.50%
Containers & Glass 6.04%
Cosmetics & Toiletries 2.62%
Building Materials & Construction 2.32%
High Income FundShares or
Principal
Amount Value
CORPORATE BONDS - 64.81%
Advertising - 0.43%
R.H. Donnelley Corp.
6.875% due 01/15/2013 ^ $ 385,000 $ 26,950
8.875% due 10/15/2017 ^ 7,640,000 534,800
R.H. Donnelley Corp., Series A-1
6.875% due 01/15/2013 ^ 2,890,000 202,300
R.H. Donnelley Corp., Series A-3
8.875% due 01/15/2016 ^ 8,686,000 608,020
Vertis, Inc.
13.50% due 04/01/2014 903,776 4,428
Vertis, Inc., Series A
18.50% due 10/01/2012 3,369,935 256,958
1,633,456
Copyright © 2012 www.secdatabase.com. All Rights Reserved.Please Consider the Environment Before Printing This Document

Air Travel - 7.36%
Alaska Airlines, Inc., Series D
9.50% due 04/12/2012 78,468 56,890
American Airlines Pass Through Trust 2001-01,
Series 01-1
7.379% due 05/23/2016 5,967,339 2,923,996
American Airlines, Inc., Series 90-K
9.93% due 06/15/2010 512,000 384,000
American Airlines, Inc., Series 91B2
10.32% due 07/30/2014 (f) 875,821 481,702
AMR Corp., MTN, Series B
10.40% due 03/10/2011 4,500,000 2,475,000
Continental Airlines, Inc.
5.00% due 06/15/2023 8,280,000 7,576,200
Delta Air Lines, Inc., Series 01-1
7.711% due 03/18/2013 5,830,000 4,430,800
Gol Finance
8.75% due 12/31/2049 (f) 3,470,000 1,735,000
High Income Fund (continued)Shares or
Principal
Amount Value
CORPORATE BONDS (continued)
Air Travel (continued)
Northwest Airlines
1.00% due 01/16/2017 $ 4,470,000 $ 2,816
6.625% due 02/15/2023 15,690,000 78,450
7.625% due 11/15/2023 8,745,000 43,725
8.70% due 03/15/2049 2,055,000 10,480
8.875% due 06/01/2049 6,360,000 32,436
9.875% due 03/15/2037 7,045,000 35,929
10.00% due 02/01/2049 3,115,000 15,887
US Airways Group, Inc.
7.00% due 09/30/2020 5,920,000 4,854,400
7.25% due 05/15/2014 3,350,000 2,579,835
27,717,546
Auto Parts - 7.30%
Allison Transmission, Inc.
11.00% due 11/01/2015 (f) 6,840,000 5,335,200
Allison Transmission, Inc., PIK
11.25% due 11/01/2015 (f) 14,175,000 9,568,125
Goodyear Tire & Rubber Company
8.625% due 12/01/2011 3,995,000 3,885,137
10.50% due 05/15/2016 1,480,000 1,472,600
Tenneco Automotive, Inc.
8.625% due 11/15/2014 6,815,000 4,191,225
TRW Automotive, Inc.
7.00% due 03/15/2014 (f) 800,000 588,000
7.25% due 03/15/2017 (f) 3,500,000 2,450,000
27,490,287
Auto Services - 0.07%
United Rentals North America, Inc.
7.00% due 02/15/2014 335,000 257,950
Broadcasting - 8.51%
Canadian Satellite Radio Holdings, Inc.
1.00% due 02/14/2016 (b)(e) 534,184 153,097
12.75% due 02/15/2014 4,045,000 950,575
Canadian Satellite Radio Holdings, Inc., ADR
8.00% due 09/10/2014 1,700,000 155,713
Sirius XM Radio, Inc.
Copyright © 2012 www.secdatabase.com. All Rights Reserved.Please Consider the Environment Before Printing This Document

7.00% due 12/01/2014 (f) 10,275,000 3,711,844
9.625% due 08/01/2013 7,352,000 4,760,420
13.00% due 08/01/2013 (f) 21,680,000 15,609,600
Sirius XM Radio, Inc., Series AI
10.00% due 06/01/2011 12,885,000 6,700,200
32,041,449
Building Materials & Construction - 0.24%
Odebrecht Overseas, Ltd.
9.625% due 12/31/2049 1,006,000 905,400
Business Services - 0.07%
MSX International UK
12.50% due 04/01/2012 (f) 1,185,000 266,625
Cable & Television - 5.20%
Adelphia Communications Corp.
7.75% due 01/15/2049 3,000,000 48,750
9.875% due 03/01/2049 1,965,000 31,931
10.25% due 11/01/2049 985,000 16,006
Century Communications
8.375% due 12/15/2049 ^ 1,000,000 0
The accompanying notes are an integral part of the financial statements.
75
JOHN HANCOCK FUNDS II
PORTFOLIO OF INVESTMENTS - May 31, 2009 (Unaudited) - continued(showing percentage of total net assets)
High Income Fund (continued)Shares or
Principal
Amount Value
CORPORATE BONDS (continued)
Cable & Television (continued)
Charter Communications Holdings I LLC
9.92% due 04/01/2014 ^ $ 7,475,000 $ 65,406
10.00% due 05/15/2014 ^ 4,055,000 35,481
11.00% due 10/01/2015 ^ 13,145,000 1,511,675
11.125% due 01/15/2014 ^ 2,830,000 24,763
12.125% due 01/15/2015 ^ 2,925,000 25,594
Charter Communications Holdings II LLC
10.25% due 09/15/2010 ^ (f) 2,035,000 2,014,650
10.25% due 10/01/2013 ^ (f) 5,494,000 5,081,950
10.25% due 09/15/2010 ^ 4,970,000 4,870,600
Charter Communications Holdings LLC
8.75% due 11/15/2013 ^ 3,335,000 3,051,525
Charter Communications, Inc.
10.875% due 09/15/2014 ^ (f) 2,680,000 2,760,400
Young Broadcasting, Inc.
10.00% due 03/01/2011 ^ 8,135,000 61,013
19,599,744
Cellular Communications - 1.45%
American Tower Corp.
5.00% due 02/15/2010 441,000 439,011
Nextel Communications, Inc., Series D
7.375% due 08/01/2015 6,360,000 5,040,300
5,479,311
Chemicals - 1.73%
Copyright © 2012 www.secdatabase.com. All Rights Reserved.Please Consider the Environment Before Printing This Document

American Pacific Corp.
9.00% due 02/01/2015 7,485,000 6,530,663
Containers & Glass - 1.31%
Graham Packaging Company
9.875% due 10/15/2014 610,000 542,900
Pliant Corp.
11.125% due 09/01/2009 ^ (a) 552,000 2,070
11.625% due 06/15/2009 ^ 1,015,725 411,369
Smurfit-Stone Container Enterprises, Inc.
8.00% due 03/15/2017 ^ 11,000,000 3,575,000
8.375% due 07/01/2012 ^ 400,000 126,000
US Corrugated, Inc.
10.00% due 06/12/2013 460,000 262,200
4,919,539
Drugs & Health Care - 0.73%
Duane Reade, Inc.
9.75% due 08/01/2011 3,450,000 2,760,000
Electrical Utilities - 2.99%
CMS Energy Corp.
8.50% due 04/15/2011 37,000 37,371
Texas Competitive Electric Holdings Company
LLC, PIK
10.50% due 11/01/2016 4,478,500 1,791,400
Texas Competitive Electric Holdings Company
LLC, Series A
10.25% due 11/01/2015 15,915,000 9,429,637
11,258,408
Electronics - 0.29%
Muzak LLC/Muzak Finance Corp.
9.875% due 03/15/2010 ^ 919,000 321,650
10.00% due 02/15/2010 ^ 2,170,000 759,500
1,081,150
High Income Fund (continued)Shares or
Principal
Amount Value
CORPORATE BONDS (continued)
Energy - 1.73%
Exide Technologies, Series B
10.50% due 03/15/2013 $ 7,735,000 $ 6,497,400
Financial Services - 1.66%
JPMorgan Chase & Company, Series 1
7.90 due 12/31/2049 (b) 5,403,000 4,511,667
TAM Capital, Inc.
7.375% due 04/25/2017 2,090,000 1,494,350
Ucar Finance, Inc.
10.25% due 02/15/2012 282,000 262,965
6,268,982
Food & Beverages - 1.04%
ASG Consolidated LLC/ASG Finance, Inc.
11.50% due 11/01/2011 (f) 4,360,000 3,902,200
Healthcare Services - 0.12%
Healthsouth Corp.
8.3225% due 06/15/2014 (b) 500,000 460,000
Household Products - 0.48%
Yankee Acquisition Corp., Series B
8.50% due 02/15/2015 2,405,000 1,815,775
Copyright © 2012 www.secdatabase.com. All Rights Reserved.Please Consider the Environment Before Printing This Document

International Oil - 0.37%
Dominion Petroleum Acquisitions
10.00% due 10/01/2011 1,685,000 1,388,128
Leisure Time - 12.29%
Fontainebleau Las Vegas
11.00% due 06/15/2015 ^ (f) 20,530,000 923,850
Fontainebleau Senior Note
12.50% due 06/01/2022 3,583,980 1,032,588
Greektown Holdings LLC
10.75% due 12/01/2013 ^ (f) 7,679,000 537,530
Indianapolis Downs Capital LLC
11.00% due 11/01/2012 (f) 1,110,000 810,300
Isle of Capri Casinos, Inc.
7.00% due 03/01/2014 13,361,000 10,354,775
Jacobs Entertainment, Inc.
9.75% due 06/15/2014 2,575,000 1,931,250
Little Traverse Bay Bands of Odawa Indians
10.25% due 02/15/2014 (f) 7,335,000 3,172,387
Majestic Star Casino LLC
9.50% due 10/15/2010 ^ 19,180,000 11,172,350
9.75% due 01/15/2011 ^ 4,515,000 519,225
Marquee Holdings, Inc.
12.00 due 08/15/2014 820,000 664,200
Mashantucket Western Pequot Tribe
8.50% due 11/15/2015 (f) 12,272,000 4,786,080
MGM Mirage, Inc.
6.75% due 09/01/2012 3,855,000 2,659,950
11.125% due 11/15/2017 (f) 1,035,000 1,098,394
Mohegan Tribal Gaming Authority
8.00% due 04/01/2012 3,101,000 2,333,502
MTR Gaming Group, Inc., Series B
9.00% due 06/01/2012 2,720,000 1,686,400
9.75% due 04/01/2010 95,000 85,500
Seminole Hard Rock Entertainment, Inc.
3.82% due 03/15/2014 (b)(f) 805,000 555,450
Travelport LLC
11.875% due 09/01/2016 715,000 371,800
The accompanying notes are an integral part of the financial statements.
76
JOHN HANCOCK FUNDS II
PORTFOLIO OF INVESTMENTS - May 31, 2009 (Unaudited) - continued(showing percentage of total net assets)
High Income Fund (continued)Shares or
Principal
Amount Value
CORPORATE BONDS (continued)
Leisure Time (continued)
Trump Entertainment Resorts, Inc.
8.50% due 06/01/2015 $ 13,440,000 $ 1,612,800
46,308,331
Manufacturing - 0.20%
Sequa Corp.
11.75% due 12/01/2015 (f) 1,655,000 736,475
Metal & Metal Products - 3.26%
Blaze Recycling & Metals LLC
10.875% due 07/15/2012 (f) 705,000 317,250
CII Carbon LLC
Copyright © 2012 www.secdatabase.com. All Rights Reserved.Please Consider the Environment Before Printing This Document

11.125% due 11/15/2015 (f) 17,330,000 11,957,700
12,274,950
Mining - 0.87%
Teck Resources, Ltd.
7.00% due 09/15/2012 1,330,000 1,283,450
10.25% due 05/15/2016 (f) 790,000 801,850
10.75% due 05/15/2019 (f) 1,165,000 1,194,125
3,279,425
Paper - 0.79%
AbitibiBowater, Inc.
11.50% due 04/30/2009 ^ (b) 338,226 259,166
Abitibi-Consolidated Company of Canada
6.00% due 06/20/2013 ^ 1,620,000 145,800
7.75% due 06/15/2011 ^ 2,051,000 194,845
8.375% due 04/01/2015 ^ 2,850,000 270,750
13.75% due 04/01/2011 ^ (f) 385,000 354,200
15.50% due 07/15/2010 ^ (f) 360,000 57,600
Abitibi-Consolidated, Inc.
7.40% due 04/01/2018 ^ 500,000 47,500
7.50% due 04/01/2028 ^ 347,000 32,965
Jefferson Smurfit Corp.
8.25% due 10/01/2012 740,000 233,100
Newark Group, Inc.
9.75% due 03/15/2014 411,000 4,110
NewPage Corp.
10.00% due 05/01/2012 1,500,000 840,000
Norske Skog Canada, Ltd.
7.375% due 03/01/2014 441,000 189,630
Pope & Talbot, Inc.
8.375% due 06/01/2013 ^ 400,000 1,000
8.375% due 06/01/2013 ^ 1,800,000 4,500
Verso Paper Holdings LLC
11.50% due 07/01/2014 (f) 385,000 358,050
2,993,216
Publishing - 0.27%
Idearc, Inc.
8.00% due 11/15/2016 ^ 18,405,000 414,113
Quebecor World Capital Corp.
6.125% due 11/15/2013 ^ 3,255,000 272,606
8.75% due 03/15/2016 ^ (f) 560,000 50,400
Quebecor World, Inc.
9.75% due 01/15/2015 ^ (f) 3,155,000 283,950
1,021,069
High Income Fund (continued)Shares or
Principal
Amount Value
CORPORATE BONDS (continued)
Real Estate - 0.54%
iStar Financial, Inc.
10.00% due 06/15/2014 (f) $ 1,455,000 $ 1,076,700
iStar Financial, Inc., Series 1
5.875% due 03/15/2016 1,995,000 758,100
Realogy Corp.
10.50% due 04/15/2014 505,000 185,588
2,020,388
Copyright © 2012 www.secdatabase.com. All Rights Reserved.Please Consider the Environment Before Printing This Document

Retail - 0.56%
Eye Care Centers of America
10.75% due 02/15/2015 1,545,000 1,545,000
Steinway Musical Instruments, Inc.
7.00% due 03/01/2014 (f) 745,000 581,100
2,126,100
Telecommunications Equipment &
Services - 1.38%
Digicel Group, Ltd.
8.875% due 01/15/2015 (f) 3,815,000 3,052,000
Intelsat Jackson Holdings, Ltd.
11.50% due 06/15/2016 (f) 1,230,000 1,211,550
Mobile Satellite Ventures LP
zero coupon, Step up to 14.00% on
04/01/2010 due 04/01/2013 1,190,000 464,100
Terrestar Networks, Inc., PIK
15.00% due 02/15/2014 (f) 1,429,625 471,776
5,199,426
Tobacco - 0.86%
Alliance One International, Inc.
12.75% due 11/15/2012 2,330,000 2,260,100
North Atlantic Trading Company
10.00% due 03/01/2012 (f) 2,626,750 971,897
3,231,997
Travel Services - 0.71%
Travelport LLC
9.875% due 09/01/2014 4,250,000 2,677,500
TOTAL CORPORATE BONDS (Cost $388,582,548) $ 244,142,890
CONVERTIBLE BONDS - 5.27%
Air Travel - 3.99%
Pinnacle Airlines Corp.
3.25% due 02/15/2025 3,035,000 2,519,639
UAL Corp.
4.50% due 06/30/2021 32,051,000 12,521,236
15,040,875
Cable & Television - 1.00%
Charter Communications, Inc.
6.50% due 10/01/2027 ^ 26,004,000 3,770,580
Insurance - 0.28%
MBIA Insurance Company
14.00% due 01/15/2033 (f) 2,585,000 1,059,850
TOTAL CONVERTIBLE BONDS (Cost $33,798,689) $ 19,871,305
The accompanying notes are an integral part of the financial statements.
77
JOHN HANCOCK FUNDS II
PORTFOLIO OF INVESTMENTS - May 31, 2009 (Unaudited) - continued(showing percentage of total net assets)
High Income Fund (continued)Shares or
Principal
Amount Value
Copyright © 2012 www.secdatabase.com. All Rights Reserved.Please Consider the Environment Before Printing This Document

COLLATERALIZED MORTGAGE
OBLIGATIONS - 2.59%
Countrywide Alternative Loan Trust, Series
2007-OA9, Class B1
2.2719% due 06/25/2047 (b)(f) $ 980,262 $ 2,345
Countrywide Alternative Loan Trust, Series
2007-OA9, Class XP
3.5365% IO due 06/25/2047 48,744,330 1,081,515
DB Master Finance LLC, Series 2006-1, Class-M1
8.285% due 06/20/2031 (f) 2,370,000 1,551,734
DSLA Mortgage Loan Trust, Series 2005-AR5,
Class X2
3.4275% IO due 08/19/2045 42,770,000 748,475
Global Tower Partners Acquisition
LLC, Series 2007-1A, Class G
7.8737% due 05/15/2037 (f) 515,000 384,178
GS Mortgage Securities
Corp., Series 2006-NIM3, Class OS
zero coupon due 10/26/2037 5,000 500
Harborview Mortgage Loan Trust, Series
2006-BU1, Class R
1.00% due 02/19/2046 174,930,716 1,749,307
Harborview Mortgage Loan Trust,
Series 2007-3, Class ES
0.35% due 05/19/2047 63,187,935 296,194
Harborview Mortgage Loan Trust,
Series 2007-4, Class ES
0.35% due 07/19/2047 65,185,025 325,925
Harborview Mortgage Loan Trust,
Series 2007-6, Class ES
0.3425% due 08/19/2037 (f) 46,500,016 217,969
Lehman XS Net Interest Margin
Notes, Series 2007-GPM8, Class A3
9.00% due 01/28/2047 (f) 317,665 6,353
Lehman XS Net Interest Margin
Notes, Series 2007-GPM8, Class A4
9.00% due 01/28/2047 (f) 470,000 4,700
SBA CMBS Trust, Series 2006-1A, Class H
7.389% due 11/15/2036 (f) 1,750,000 1,540,000
SBA CMBS Trust, Series 2006-1A, Class J
7.825% due 11/15/2036 (f) 1,659,000 1,459,920
Washington Mutual Alternative Mortgage
Pass-Through Certificates, Series 2005-AR19,
Class B1
1.0087% due 12/25/2045 (b) 3,000,275 375,034
TOTAL COLLATERALIZED MORTGAGE OBLIGATIONS
(Cost $16,390,758) $ 9,744,149
ASSET BACKED SECURITIES - 0.42%
Dominos Pizza Master Issuer LLC, Series 2007-1,
Class M1
7.629% due 04/27/2037 (f) 3,560,000 1,566,400
TOTAL ASSET BACKED SECURITIES
(Cost $3,559,976) $ 1,566,400
COMMON STOCKS - 6.16%
Advertising - 0.00%
Vertis Holdings, Inc. * 48,700 0
Air Travel - 3.54%
Delta Air Lines, Inc. * 2,155,395 12,522,846
UAL Corp. * 47,000 219,020
High Income Fund (continued)Shares or
Principal
Amount Value
Copyright © 2012 www.secdatabase.com. All Rights Reserved.Please Consider the Environment Before Printing This Document

COMMON STOCKS (continued)
Air Travel (continued)
US Airways Group, Inc. * 234,532 $ 605,092
13,346,958
Auto Parts - 0.08%
Federal Mogul Corp. * 31,002 310,020
Broadcasting - 0.72%
Canadian Satellite Radio Holdings, Inc. * 577,161 290,761
Canadian Satellite Radio Holdings, Series A * 136,975 69,005
Sirius XM Radio, Inc. * 6,726,931 2,351,063
2,710,829
Cable & Television - 1.12%
Adelphia Recovery Trust, Series ACC-1 * 5,806,367 116,127
Adelphia Recovery Trust, Series Arahova * 424,949 38,246
Comcast Corp., Class A 222,469 2,892,097
Time Warner Cable, Inc. * 37,985 1,169,558
4,216,028
Containers & Glass - 0.00%
Pliant Corp. ^ 78 0
Forest Products - 0.00%
Tembec, Inc. * 25,800 16,779
International Oil - 0.14%
Dominion Petroleum, Ltd., GDR * 4,000,372 525,211
Leisure Time - 0.03%
Fontainebleau Resorts LLC, Class A * 65,203 97,746
Retail Trade - 0.09%
CVS Caremark Corp. 11,000 327,800
Telephone - 0.44%
Sprint Nextel Corp. * 321,650 1,656,497
TOTAL COMMON STOCKS (Cost $67,726,324) $ 23,207,868
PREFERRED STOCKS - 6.96%
Air Travel - 2.01%
Continental Airlines Finance Trust II, 6.00% * 515,074 7,565,150
Banking - 2.65%
Bank of America Corp., 8.20% * 368,400 6,999,600
Bank of America Corp., Series L, 7.25% * 3,950 3,002,000
10,001,600
Containers & Glass - 0.00%
Pliant Corp., Series AA, 13.00%, PIK ^ 685 34
Financial Services - 0.74%
CIT Group, Inc., 7.75% 86,874 591,612
Wells Fargo & Company, Series L, 7.50% 2,945 2,194,025
2,785,637
Real Estate - 1.56%
iStar Financial, Inc., Series E, 7.875% 310,545 2,251,451
iStar Financial, Inc., Series F, 7.80% 198,032 1,433,752
iStar Financial, Inc., Series G, 7.65% 79,317 575,048
iStar Financial, Inc., Series I, 7.50% 232,232 1,625,624
5,885,875
TOTAL PREFERRED STOCKS (Cost $26,493,502) $ 26,238,296
The accompanying notes are an integral part of the financial statements.
78
JOHN HANCOCK FUNDS II
Copyright © 2012 www.secdatabase.com. All Rights Reserved.Please Consider the Environment Before Printing This Document

PORTFOLIO OF INVESTMENTS - May 31, 2009 (Unaudited) - continued(showing percentage of total net assets)
High Income Fund (continued)Shares or
Principal
Amount Value
TERM LOANS - 10.52%
Advertising - 0.43%
R.H. Donnelley Corp.
6.75% due 06/30/2011 ^ (b) $ 2,092,492 $ 1,607,731
Air Travel - 3.93%
Delta Airlines, Inc.
2.4144% due 04/30/2012 (b) 1,528,800 1,294,385
3.6644% due 04/30/2014 (b) 6,920,871 4,412,055
Northwest Airlines
2.36% due 08/21/2013 (b) 1,657,440 1,538,320
US Airways Group, Inc.
2.8088% due 03/26/2014 (b) 14,011,576 7,550,684
14,795,444
Broadcasting - 0.07%
Sirius XM Radio, Inc.
2.625% due 12/20/2012 (b) 329,975 277,179
Electrical Utilities - 0.00%
Texas Competitive Electric Holdings Company LLC
4.0181% due 10/10/2014 (b) 1 1
Forest Products - 0.03%
Tembec, Inc.
7.4275% due 02/28/2012 (b) 180,000 111,600
Leisure Time - 1.00%
East Valley Tourist Development
7.9963% due 08/06/2012 (b) 765,000 459,000
Fontainebleau
4.3163% due 06/06/2014 (b) 2,812,500 358,594
Greektown Holdings LLC
0.00% due 09/09/2009 (k) 208,696 204,522
0.00% due 09/09/2009 (k) 90,892 88,165
1.00% due 09/09/2009 (k) 486,957 477,217
1.00% due 09/09/2009 (k) 1,813,456 1,777,187
1.00% due 12/03/2012 ^ 1,750,000 408,333
3,773,018
Medical-Hospitals - 0.00%
Ralin Medical, Inc.
zero coupon due 11/21/2037 (b) 170 0
Newspapers - 0.13%
Star Tribune Corp.
6.25% due 03/01/2014 (b) 2,826,950 480,581
10.83% due 03/01/2015 (b) 3,880,000 0
480,581
Publishing - 1.57%
Idearc, Inc.
4.25% due 04/11/2017 (b) 11,036,915 4,335,929
4.25% due 11/17/2014 (b) 3,960,486 1,555,905
5,891,834
Real Estate - 0.27%
Realogy Corp.
3.5182% due 10/10/2013 (b) 1,473,750 1,024,256
Retail - 0.42%
Michaels Stores, Inc.
2.625% due 10/31/2013 (b) 467,760 334,059
Copyright © 2012 www.secdatabase.com. All Rights Reserved.Please Consider the Environment Before Printing This Document

2.6875% due 10/31/2013 1,069,149 763,551
3.6875% due 10/31/2013 695,915 496,999
1,594,609
High Income Fund (continued)Shares or
Principal
Amount Value
TERM LOANS (continued)
Trucking & Freight - 2.67%
Saint Acquisition Corp.
3.6875% due 05/06/2014 (b) $ 14,867,188 $ 10,056,597
TOTAL TERM LOANS (Cost $56,784,022) $ 39,612,850
WARRANTS - 0.00%
Metal & Metal Products - 0.00%
New Gold, Inc.
(Expiration date 06/28/2017, strike
price CAD 15.00) * 44,388 18,092
TOTAL WARRANTS (Cost $0) $ 18,092
OPTIONS - 0.99%
Call Options - 0.99%
Comcast Corp.
Expiration 01/16/2010 at $15.00 * 43,700 52,440
Expiration 01/16/2010 at $20.00 * 161,500 40,375
Expiration 01/16/2010 at $25.00 * 8,450,000 4,225
Delta Airlines, Inc.
Expiration 01/16/2010 at $5.00 * 350,000 735,000
Expiration 01/16/2010 at $7.50 * 150,000 157,500
Expiration 01/16/2010 at $10.00 * 150,000 85,500
Over The Counter Purchase Call on the USD vs.
CAD
Expiration 04/20/2010 at $1.30 * 98,000,000 1,321,040
Expiration 04/01/2010 at $1.30 * 98,000,000 1,321,040
3,717,120
TOTAL OPTIONS (Cost $5,566,003) $ 3,717,120
SHORT TERM INVESTMENTS - 0.07%
John Hancock Collateral Investment
Trust, 0.7339% (c)(g) $ 4 $ 40
Quebecor World Capital Corp.
0.01% due 11/15/2009 ^ 365,000 251,314
TOTAL SHORT TERM INVESTMENTS
(Cost $251,354) $ 251,354
Total Investments (High Income Fund)
(Cost $599,153,176) - 97.79% $ 368,370,324
Other assets and liabilities, net - 2.21% 8,314,563
TOTAL NET ASSETS - 100.00% $ 376,684,887
High Yield FundShares or
Principal
Amount Value
FOREIGN GOVERNMENT OBLIGATIONS - 3.61%
Argentina - 0.05%
Copyright © 2012 www.secdatabase.com. All Rights Reserved.Please Consider the Environment Before Printing This Document

Republic of Argentina
1.00% due 12/15/2035 ^ (b) ARS 1,938,355 $ 21,304
1.00% due 10/30/2009 ^ EUR 175,000,000 12,061
1.3182% due 12/15/2035 ^ (b) $ 48,000 1,546
1.9852% due 12/15/2035 ^ (b) EUR 587,000 21,742
7.00% due 09/12/2013 ^ $ 751,000 345,460
The accompanying notes are an integral part of the financial statements.
79
JOHN HANCOCK FUNDS II
PORTFOLIO OF INVESTMENTS - May 31, 2009 (Unaudited) - continued(showing percentage of total net assets)
High Yield Fund (continued)Shares or
Principal
Amount Value
FOREIGN GOVERNMENT OBLIGATIONS
(continued)
Argentina (continued)
Republic of Argentina (continued)
11.75% due 05/20/2011 ^ EUR 2,425,000 $ 201,574
603,687
Brazil - 1.29%
Federative Republic of Brazil
10.00% due 01/01/2012 BRL 10,336,000 5,377,704
10.00% due 07/01/2010 17,039,000 9,055,879
10.00% due 01/01/2010 1,000 530
14,434,113
Indonesia - 0.37%
Republic of Indonesia
9.75% due 05/15/2037 IDR 11,122,000,000 907,000
10.25% due 07/15/2027 9,327,000,000 820,159
10.25% due 07/15/2022 14,706,000,000 1,349,846
11.00% due 09/15/2025 11,174,000,000 1,050,612
4,127,617
Panama - 0.24%
Republic of Panama
9.375% due 04/01/2029 $ 2,150,000 2,655,250
Peru - 0.16%
Republic of Peru
6.55% due 03/14/2037 648,000 629,532
7.35% due 07/21/2025 77,000 82,505
8.75% due 11/21/2033 862,000 1,043,020
1,755,057
Turkey - 0.99%
Republic of Turkey
6.875% due 03/17/2036 9,296,000 8,412,880
7.00% due 06/05/2020 146,000 143,080
7.00% due 09/26/2016 535,000 540,350
7.375% due 02/05/2025 1,929,000 1,933,823
11,030,133
Copyright © 2012 www.secdatabase.com. All Rights Reserved.Please Consider the Environment Before Printing This Document

Venezuela - 0.51%
Republic of Venezuela
5.75% due 02/26/2016 4,667,000 2,578,517
7.65% due 04/21/2025 949,000 483,990
8.50% due 10/08/2014 339,000 227,130
9.375% due 01/13/2034 1,588,000 921,040
10.75% due 09/19/2013 1,952,000 1,542,080
5,752,757
TOTAL FOREIGN GOVERNMENT OBLIGATIONS
(Cost $46,684,990) $ 40,358,614
CORPORATE BONDS - 86.40%
Advertising - 0.01%
R.H. Donnelley Corp., Series A-3
8.875% due 01/15/2016 ^ 1,960,000 137,200
Air Travel - 0.86%
Continental Airlines, Inc., Series C
7.339% due 04/19/2014 4,060,000 2,760,800
DAE Aviation Holdings, Inc.
11.25% due 08/01/2015 (f) 15,560,000 6,846,400
9,607,200
High Yield Fund (continued)Shares or
Principal
Amount Value
CORPORATE BONDS (continued)
Airlines - 0.40%
Delta Air Lines, Inc.
8.954% due 08/10/2014 $ 2,943,751 $ 1,884,001
United Airlines, Inc.
7.452% due 01/12/2014 4,400,000 2,645,500
4,529,501
Aluminum - 0.44%
Novelis, Inc.
7.25% due 02/15/2015 7,516,000 4,941,770
Apparel & Textiles - 0.30%
Oxford Industries, Inc.
8.875% due 06/01/2011 3,725,000 3,315,250
Auto Parts - 0.57%
Allison Transmission, Inc., PIK
11.25% due 11/01/2015 (f) 7,257,000 4,898,475
Keystone Automotive Operations, Inc.
9.75% due 11/01/2013 1,820,000 600,600
Visteon Corp.
8.25% due 08/01/2010 ^ 7,089,000 354,450
12.25% due 12/31/2016 ^ (f) 10,525,000 526,250
6,379,775
Auto Services - 0.95%
Ashtead Holdings PLC
8.625% due 08/01/2015 (f) 815,000 611,250
AutoNation, Inc.
3.1313% due 04/15/2013 (b) 2,430,000 2,114,100
Hertz Corp.
10.50% due 01/01/2016 5,525,000 4,806,750
Penhall International Corp.
12.00% due 08/01/2014 (f) 8,930,000 3,125,500
Copyright © 2012 www.secdatabase.com. All Rights Reserved.Please Consider the Environment Before Printing This Document

10,657,600
Automobiles - 0.24%
General Motors Corp.
7.20% due 01/15/2011 ^ 13,580,000 1,188,250
8.375% due 07/15/2033 ^ 16,535,000 1,488,150
2,676,400
Banking - 2.14%
ATF Capital BV
9.25% due 02/21/2014 (f) 7,890,000 5,128,500
Bank of America Corp.
8.125% due 12/29/2049 (b) 670,000 524,288
HSBK Europe BV
7.25% due 05/03/2017 (f) 7,660,000 4,442,800
9.25% due 10/16/2013 (f) 360,000 241,200
ICICI Bank, Ltd.
6.375% due 04/30/2022 (b)(f) 1,864,000 1,404,185
6.375% due 04/30/2022 (b) 1,573,000 1,169,447
Rabobank Nederland
11.00% due 06/30/2019 (b)(f) 3,040,000 3,040,000
RSHB Capital SA for OJSC Russian Agricultural
Bank
6.299% due 05/15/2017 (f) 944,000 811,840
6.299% due 05/15/2017 760,000 653,600
7.125% due 01/14/2014 (f) 1,180,000 1,112,386
7.125% due 01/14/2014 2,300,000 2,176,284
7.175% due 05/16/2013 (f) 1,069,000 1,017,046
7.175% due 05/16/2013 900,000 857,250
The accompanying notes are an integral part of the financial statements.
80
JOHN HANCOCK FUNDS II
PORTFOLIO OF INVESTMENTS - May 31, 2009 (Unaudited) - continued(showing percentage of total net assets)
High Yield Fund (continued)Shares or
Principal
Amount Value
CORPORATE BONDS (continued)
Banking (continued)
TuranAlem Finance BV
8.25% due 01/22/2037 (f) $ 4,265,000 $ 853,000
8.25% due 01/22/2037 2,738,000 574,980
24,006,806
Broadcasting - 0.01%
CMP Susquehanna Radio Holdings, Corp.
9.875% due 05/15/2014 192,000 72,000
Building Materials & Construction - 1.76%
Associated Materials, Inc.
9.75% due 04/15/2012 7,465,000 6,307,925
11.25 due 03/01/2014 11,295,000 3,614,400
K Hovnanian Enterprises, Inc.
8.625% due 01/15/2017 820,000 332,100
Nortek, Inc.
10.00% due 12/01/2013 (f) 5,060,000 3,276,350
NTK Holdings, Inc.
10.75% due 03/01/2014 10,440,000 1,030,950
Copyright © 2012 www.secdatabase.com. All Rights Reserved.Please Consider the Environment Before Printing This Document

Odebrecht Finance, Ltd.
7.50% due 10/18/2017 (f) 5,200,000 5,148,000
19,709,725
Business Services - 1.54%
Affinion Group, Inc.
10.125% due 10/15/2013 3,055,000 2,871,700
11.50% due 10/15/2015 9,345,000 8,060,062
U.S. Investigations Services, Inc.
10.50% due 11/01/2015 (f) 620,000 505,300
11.75% due 05/01/2016 (f) 7,790,000 5,842,500
17,279,562
Cable & Television - 1.68%
Cablevision Systems Corp., Series B
8.00% due 04/15/2012 270,000 265,275
Charter Communications Holdings I LLC
11.00% due 10/01/2015 ^ 21,184,000 2,436,160
11.00% due 10/01/2015 ^ 2,830,000 297,150
Charter Communications Holdings II LLC
10.25% due 10/01/2013 ^ (a) 3,338,000 3,287,930
Charter Communications Holdings LLC
11.75% due 05/15/2011 ^ 1,355,000 6,775
12.125% due 01/15/2012 ^ 1,230,000 12,300
Charter Communications, Inc.
10.875% due 09/15/2014 ^ (f) 4,475,000 4,609,250
CSC Holdings, Inc.
6.75% due 04/15/2012 1,000,000 965,000
8.50% due 06/15/2015 (f) 45,000 44,325
CSC Holdings, Inc., Series B
7.625% due 04/01/2011 780,000 778,050
DirecTV Holdings LLC
8.375% due 03/15/2013 1,000,000 1,007,500
EchoStar DBS Corp.
6.625% due 10/01/2014 1,860,000 1,687,950
7.75% due 05/31/2015 505,000 477,225
Univision Communications, Inc.
7.85% due 07/15/2011 1,735,000 1,535,475
UPC Holding BV
9.875% due 04/15/2018 (f) 1,455,000 1,403,876
18,814,241
High Yield Fund (continued)Shares or
Principal
Amount Value
CORPORATE BONDS (continued)
Cellular Communications - 2.75%
ALLTEL Communications, Inc., PIK
10.375% due 12/01/2017 (f) $ 3,940,000 $ 4,694,234
America Movil SAB de CV
5.625% due 11/15/2017 1,410,000 1,364,698
Cricket Communications, Inc.
7.75% due 05/15/2016 (f) 1,425,000 1,376,906
MetroPCS Wireless, Inc.
9.25% due 11/01/2014 1,030,000 1,033,863
9.25% due 11/01/2014 (f) 2,885,000 2,885,000
True Move Company, Ltd.
10.375% due 08/01/2014 (f) 2,610,000 1,774,800
10.75% due 12/16/2013 (f) 18,540,000 13,348,800
10.75% due 12/16/2013 700,000 455,000
UBS Luxembourg SA for OJSC Vimpel
Copyright © 2012 www.secdatabase.com. All Rights Reserved.Please Consider the Environment Before Printing This Document

Communications
8.25% due 05/23/2016 3,600,000 2,988,000
Vimpelcom
8.375% due 04/30/2013 (f) 940,000 855,400
30,776,701
Chemicals - 0.65%
Ashland, Inc.
9.125% due 06/01/2017 (f) 2,750,000 2,791,250
Georgia Gulf Corp.
10.75% due 10/15/2016 ^ 11,480,000 1,119,300
Methanex Corp.
8.75% due 08/15/2012 3,485,000 3,258,475
Westlake Chemical Corp.
6.625% due 01/15/2016 75,000 63,000
7,232,025
Coal - 0.55%
International Coal Group, Inc.
10.25% due 07/15/2014 8,855,000 6,109,950
Commercial Services - 1.71%
American Achievement Corp.
8.25% due 04/01/2012 (f) 1,300,000 1,092,000
Ceridian Corp.
11.25% due 11/15/2015 840,000 656,250
Ceridian Corp., PIK
12.25% due 11/15/2015 4,200,000 2,814,000
DI Finance/DynCorp International LLC, Series B
9.50% due 02/15/2013 8,844,000 8,600,790
Rental Service Corp.
9.50% due 12/01/2014 7,685,000 5,994,300
19,157,340
Computers & Business Equipment - 0.36%
Activant Solutions, Inc.
9.50% due 05/01/2016 5,445,000 3,988,462
Construction & Mining Equipment - 0.03%
Terex Corp.
7.375% due 01/15/2014 330,000 302,775
Construction Materials - 0.00%
Nortek, Inc.
8.50% due 09/01/2014 70,000 18,550
The accompanying notes are an integral part of the financial statements.
81
JOHN HANCOCK FUNDS II
PORTFOLIO OF INVESTMENTS - May 31, 2009 (Unaudited) - continued(showing percentage of total net assets)
High Yield Fund (continued)Shares or
Principal
Amount Value
CORPORATE BONDS (continued)
Containers & Glass - 0.76%
Berry Plastics Holdings Corp.
8.875% due 09/15/2014 $ 2,130,000 $ 1,693,350
BWAY Corp.
10.00% due 04/15/2014 (f) 2,095,000 2,092,381
Copyright © 2012 www.secdatabase.com. All Rights Reserved.Please Consider the Environment Before Printing This Document

Graham Packaging Company
9.875% due 10/15/2014 910,000 809,900
Solo Cup Company
8.50% due 02/15/2014 4,835,000 3,868,000
8,463,631
Containers-Paper/Plastic - 0.05%
Graham Packaging Company
8.50% due 10/15/2012 545,000 523,200
Radnor Holdings, Inc.
11.00% due 03/15/2010 ^ 2,350,000 2,938
526,138
Crude Petroleum & Natural Gas - 4.14%
Berry Petroleum Company
10.25% due 06/01/2014 1,990,000 1,952,687
Chesapeake Energy Corp.
6.25% due 01/15/2018 6,185,000 5,017,581
6.375% due 06/15/2015 815,000 698,862
6.625% due 01/15/2016 1,000,000 857,500
7.25% due 12/15/2018 3,300,000 2,755,500
Encore Acquisition Company
9.50% due 05/01/2016 1,035,000 1,003,950
Forest Oil Corp.
8.50% due 02/15/2014 (f) 2,445,000 2,359,425
Mariner Energy, Inc.
7.50% due 04/15/2013 1,820,000 1,592,500
8.00% due 05/15/2017 1,760,000 1,390,400
OPTI Canada, Inc.
7.875% due 12/15/2014 1,335,000 901,125
8.25% due 12/15/2014 3,370,000 2,325,300
Parallel Petroleum Corp.
10.25% due 08/01/2014 4,600,000 3,174,000
PetroHawk Energy Corp.
7.875% due 06/01/2015 (f) 1,390,000 1,289,225
9.125% due 07/15/2013 3,125,000 3,070,313
Plains Exploration & Production Company
10.00% due 03/01/2016 3,355,000 3,346,613
Quicksilver Resources, Inc.
7.125% due 04/01/2016 2,675,000 1,952,750
8.25% due 08/01/2015 415,000 346,525
SandRidge Energy, Inc.
8.00% due 06/01/2018 (f) 1,150,000 971,750
SandRidge Energy, Inc., PIK
8.625% due 04/01/2015 10,310,000 8,789,275
W&T Offshore, Inc.
8.25% due 06/15/2014 (f) 3,320,000 2,523,200
46,318,481
Domestic Oil - 1.10%
Exco Resources, Inc.
7.25% due 01/15/2011 8,115,000 7,262,925
Stone Energy Corp.
6.75% due 12/15/2014 3,855,000 2,245,538
Whiting Petroleum Corp.
7.00% due 02/01/2014 1,485,000 1,329,075
High Yield Fund (continued)Shares or
Principal
Amount Value
CORPORATE BONDS (continued)
Copyright © 2012 www.secdatabase.com. All Rights Reserved.Please Consider the Environment Before Printing This Document

Domestic Oil (continued)
Whiting Petroleum Corp. (continued)
7.25% due 05/01/2012 $ 1,595,000 $ 1,487,337
12,324,875
Educational Services - 0.87%
Education Management Corp.
10.25% due 06/01/2016 9,966,000 9,716,850
Electrical Utilities - 6.37%
AES Corp.
8.00% due 10/15/2017 3,070,000 2,855,100
8.00% due 06/01/2020 (f) 750,000 660,000
8.75% due 05/15/2013 (f) 3,512,000 3,573,460
8.875% due 02/15/2011 2,220,000 2,236,650
9.375% due 09/15/2010 3,000,000 3,022,500
Edison Mission Energy
7.20% due 05/15/2019 3,670,000 2,481,837
7.625% due 05/15/2027 5,700,000 3,484,125
7.75% due 06/15/2016 3,140,000 2,433,500
EEB International Ltd.
8.75% due 10/31/2014 (f) 5,250,000 5,381,250
Energy Future Holdings Corp., PIK
11.25% due 11/01/2017 63,027,600 32,931,921
Midwest Generation LLC, Series A
8.30% due 07/02/2009 301,205 299,699
Mirant Mid Atlantic LLC, Series C
10.06% due 12/30/2028 6,001,654 5,941,637
Orion Power Holdings, Inc.
12.00% due 05/01/2010 3,035,000 3,133,638
Texas Competitive Electric Holdings Company
LLC, PIK
10.50% due 11/01/2016 7,108,562 2,843,425
71,278,742
Electronics - 0.13%
L-3 Communications Corp., Series B
6.375% due 10/15/2015 1,660,000 1,510,600
Energy - 1.47%
Dynegy Holdings, Inc.
7.75% due 06/01/2019 12,970,000 9,435,675
Mirant North America LLC
7.375% due 12/31/2013 825,000 789,938
NRG Energy, Inc.
1.12% due 02/01/2014 931,212 861,274
7.25% due 02/01/2014 2,465,000 2,360,237
Sonat, Inc.
7.625% due 07/15/2011 2,900,000 2,852,289
VeraSun Energy Corp.
9.375% due 06/01/2017 ^ 3,705,000 166,725
16,466,138
Financial Services - 10.02%
AAC Group Holding Corp.
10.25 due 10/01/2012 (f) 240,000 146,400
CIT Group, Inc.
1.4513% due 03/12/2010 (b) 2,615,000 2,354,013
4.125% due 11/03/2009 1,585,000 1,528,279
First Data Corp.
9.875% due 09/24/2015 (f) 6,460,000 4,392,800
The accompanying notes are an integral part of the financial statements.
82
Copyright © 2012 www.secdatabase.com. All Rights Reserved.Please Consider the Environment Before Printing This Document

JOHN HANCOCK FUNDS II
PORTFOLIO OF INVESTMENTS - May 31, 2009 (Unaudited) - continued(showing percentage of total net assets)
High Yield Fund (continued)Shares or
Principal
Amount Value
CORPORATE BONDS (continued)
Financial Services (continued)
Ford Motor Credit Company LLC
3.8888% due 01/13/2012 (b) $ 980,000 $ 774,200
6.57% due 06/15/2011 (b) 3,410,000 2,881,450
12.00% due 05/15/2015 35,210,000 32,373,166
Fresenius US Finance II, Inc.
9.00% due 07/15/2015 (f) 4,115,000 4,269,312
GMAC LLC
2.788% due 06/30/2009 (b)(f) 7,550,000 7,323,500
6.50% due 10/15/2009 (f) 10,965,000 10,855,350
8.00% due 11/01/2031 (f) 15,005,000 11,253,750
8.00% due 12/31/2018 (f) 1,022,000 740,950
Hawker Beechcraft Acquisition Company LLC
1.00% due 03/26/2014 1,750,000 1,004,306
8.50% due 04/01/2015 80,000 33,600
9.75% due 04/01/2017 470,000 145,700
Hawker Beechcraft Acquisition Company LLC, PIK
8.875% due 04/01/2015 21,710,000 6,730,100
JPMorgan Chase & Company, Series 1
7.90 due 12/31/2049 (b) 8,035,000 6,709,466
JSG Funding PLC
7.75% due 04/01/2015 1,275,000 867,000
Lukoil International Finance BV, Series REGS
6.356% due 06/07/2017 3,110,000 2,581,300
Mubadala Development Company
5.75% due 05/06/2014 (f) 2,020,000 1,976,105
Ocwen Capital Trust I
10.875% due 08/01/2027 805,000 559,475
SLM Corp., MTN
1.2519% due 07/26/2010 (b) 180,000 158,409
TNK-BP Finance SA
6.625% due 03/20/2017 (f) 96,000 74,640
6.625% due 03/20/2017 1,870,000 1,453,925
7.50% due 07/18/2016 (f) 2,282,000 1,894,060
7.50% due 07/18/2016 610,000 513,925
7.875% due 03/13/2018 (f) 3,020,000 2,491,500
Wells Fargo Capital XIII, Series GMTN
7.70% due 12/29/2049 (b) 6,295,000 4,910,100
Wells Fargo Capital XV
9.75% due 12/29/2049 (b) 1,210,000 1,125,300
112,122,081
Food & Beverages - 0.60%
Dole Food Company, Inc.
7.25% due 06/15/2010 2,740,000 2,678,350
8.875% due 03/15/2011 3,915,000 3,719,250
13.875% due 03/15/2014 (f) 330,000 353,100
6,750,700
Funeral Services - 0.07%
Service Corp. International
6.75% due 04/01/2016 95,000 87,400
7.50% due 04/01/2027 830,000 659,850
Copyright © 2012 www.secdatabase.com. All Rights Reserved.Please Consider the Environment Before Printing This Document

747,250
Furniture & Fixtures - 1.09%
Norcraft Companies LP
9.00% due 11/01/2011 6,875,000 6,531,250
Norcraft Holdings Capital
9.75 due 09/01/2012 6,395,000 5,627,600
12,158,850
High Yield Fund (continued)Shares or
Principal
Amount Value
CORPORATE BONDS (continued)
Gas & Pipeline Utilities - 1.44%
Atlas Pipeline Partners LP
8.75% due 06/15/2018 $ 5,290,000 $ 3,226,900
Dynegy-Roseton Danskammer, Series B
7.67% due 11/08/2016 1,530,000 1,292,850
El Paso Corp.
7.375% due 12/15/2012 225,000 217,183
7.875% due 06/15/2012 3,025,000 2,964,778
MarkWest Energy Partners LP / MarkWest Energy
Finance Corp., Series B
8.75% due 04/15/2018 (f) 3,140,000 2,606,200
Targa Resources Partners LP
8.25% due 07/01/2016 1,040,000 863,200
Transcontinental Gas Pipe Line Corp.
8.875% due 07/15/2012 2,935,000 3,232,081
Williams Companies, Inc.
7.875% due 09/01/2021 1,745,000 1,692,650
16,095,842
Healthcare Products - 1.21%
Biomet, Inc., PIK
10.375% due 10/15/2017 7,795,000 7,405,250
FMC Finance III SA
6.875% due 07/15/2017 3,430,000 3,275,650
Leiner Health Products, Inc.
11.00% due 06/01/2012 ^ (a) 14,530,000 36,325
Universal Hospital Services, Inc.
5.9425% due 06/01/2015 (b) 1,300,000 1,053,000
Universal Hospital Services, Inc., PIK
8.50% due 06/01/2015 1,855,000 1,780,800
13,551,025
Healthcare Services - 2.35%
CRC Health Corp.
10.75% due 02/01/2016 11,340,000 8,164,800
DaVita, Inc.
6.625% due 03/15/2013 1,650,000 1,546,875
7.25% due 03/15/2015 2,945,000 2,768,300
U.S. Oncology Holdings, Inc., PIK
6.9037% due 03/15/2012 9,580,000 6,514,400
Vanguard Health Holding Company I LLC
zero coupon, Step up to 11.25% on
10/01/2009 due 10/01/2015 3,635,000 3,389,638
Vanguard Health Holding Company II LLC
9.00% due 10/01/2014 4,000,000 3,920,000
26,304,013
Copyright © 2012 www.secdatabase.com. All Rights Reserved.Please Consider the Environment Before Printing This Document

Holdings Companies/Conglomerates - 0.63%
Ashtead Capital, Inc.
9.00% due 08/15/2016 (f) 3,747,000 2,772,780
Leucadia National Corp.
7.125% due 03/15/2017 1,370,000 1,056,613
8.125% due 09/15/2015 3,650,000 3,239,375
7,068,768
Homebuilders - 0.62%
K Hovnanian Enterprises, Inc.
11.50% due 05/01/2013 8,150,000 6,947,875
Hotels & Restaurants - 1.15%
Carrols Corp.
9.00% due 01/15/2013 850,000 796,875
The accompanying notes are an integral part of the financial statements.
83
JOHN HANCOCK FUNDS II
PORTFOLIO OF INVESTMENTS - May 31, 2009 (Unaudited) - continued(showing percentage of total net assets)
High Yield Fund (continued)Shares or
Principal
Amount Value
CORPORATE BONDS (continued)
Hotels & Restaurants (continued)
CCM Merger, Inc.
8.00% due 08/01/2013 (f) $ 3,405,000 $ 2,349,450
Denny's Corp.
10.00% due 10/01/2012 2,500,000 2,412,500
El Pollo Loco, Inc.
11.75% due 11/15/2013 5,085,000 4,068,000
11.75% due 12/01/2012 (f) 1,535,000 1,561,862
Sbarro, Inc.
10.375% due 02/01/2015 3,120,000 1,739,400
12,928,087
Industrial Machinery - 0.58%
H&E Equipment Services, Inc.
8.375% due 07/15/2016 6,040,000 4,741,400
Terex Corp.
8.00% due 11/15/2017 1,370,000 1,109,700
10.875% due 06/01/2016 670,000 654,141
6,505,241
Insurance - 0.26%
American International Group, Inc.
8.175% due 05/15/2058 (b)(f) 8,390,000 1,939,013
Metlife Capital Trust IV
7.875% due 12/15/2037 (f) 1,310,000 1,021,800
2,960,813
International Oil - 1.21%
Corral Finans AB, PIK
2.6313% due 04/15/2010 (b)(f) 12,121,744 5,212,350
Gaz Capital for Gazprom
Copyright © 2012 www.secdatabase.com. All Rights Reserved.Please Consider the Environment Before Printing This Document

6.51% due 03/07/2022 (f) 1,590,000 1,188,525
6.51% due 03/07/2022 103,000 77,765
KazMunaiGaz Finance Sub BV
8.375% due 07/02/2013 (f) 2,860,000 2,602,600
OAO Gazprom
9.625% due 03/01/2013 510,000 522,112
Pemex Project Funding Master Trust
9.125% due 10/13/2010 50,000 54,250
Petroplus Finance, Ltd.
6.75% due 05/01/2014 (f) 1,745,000 1,457,075
7.00% due 05/01/2017 (f) 2,950,000 2,404,250
13,518,927
Leisure Time - 4.53%
AMC Entertainment, Inc.
8.75% due 06/01/2019 (f) 2,240,000 2,175,600
Ameristar Casinos, Inc.
9.25% due 06/01/2014 (f) 2,980,000 2,980,000
Boyd Gaming Corp.
6.75% due 04/15/2014 3,370,000 2,628,600
7.125% due 02/01/2016 2,530,000 1,796,300
Choctaw Resort Development Enterprise
7.25% due 11/15/2019 (f) 1,587,000 841,110
Downstream Development Authority of the Quapaw
Tribe of Oklahoma
12.00% due 10/15/2015 (f) 4,440,000 2,397,600
Fontainebleau Las Vegas
11.00% due 06/15/2015 ^ (f) 3,000,000 135,000
Harrah's Operating Company, Inc.
10.00% due 12/15/2018 72,000 48,060
High Yield Fund (continued)Shares or
Principal
Amount Value
CORPORATE BONDS (continued)
Leisure Time (continued)
Harrah's Operating Company, Inc. (continued)
10.75% due 02/01/2016 $ 316,000 $ 170,640
Harrahs Operating Escrow LLC
11.25% due 06/01/2017 (f) 3,690,000 3,588,525
Indianapolis Downs Capital LLC
11.00% due 11/01/2012 (f) 4,810,000 3,511,300
Inn of the Mountain Gods Resort & Casino
12.00% due 11/15/2010 ^ 8,291,000 1,948,385
Mandalay Resort Group
7.625% due 07/15/2013 1,500,000 791,250
MGM Mirage, Inc.
6.625% due 07/15/2015 260,000 168,025
6.75% due 09/01/2012 2,200,000 1,518,000
8.375% due 02/01/2011 3,120,000 2,605,200
8.50% due 09/15/2010 230,000 216,200
10.375% due 05/15/2014 (f) 460,000 473,800
11.125% due 11/15/2017 (f) 1,105,000 1,172,681
Mohegan Tribal Gaming Authority
6.375% due 07/15/2009 3,100,000 3,022,500
7.125% due 08/15/2014 2,900,000 2,001,000
Park Place Entertainment Corp.
8.125% due 05/15/2011 9,280,000 8,352,000
River Rock Entertainment Authority
9.75% due 11/01/2011 445,000 324,850
Snoqualmie Entertainment Authority
5.3837% due 02/01/2014 (b)(f) 2,315,000 1,209,587
9.125% due 02/01/2015 (f) 570,000 304,950
Copyright © 2012 www.secdatabase.com. All Rights Reserved.Please Consider the Environment Before Printing This Document

Station Casinos, Inc.
6.00% due 04/01/2012 ^ 5,610,000 2,019,600
6.50% due 02/01/2014 ^ 500,000 15,000
6.625% due 03/15/2018 ^ 1,705,000 51,150
7.75% due 08/15/2016 ^ 6,180,000 2,224,800
WMG Acquisition Corp.
9.50% due 06/15/2016 (f) 2,065,000 2,059,838
50,751,551
Medical-Hospitals - 3.21%
Apria Healthcare Group I
11.25% due 11/01/2014 (f) 885,000 860,662
HCA, Inc.
7.50% due 12/15/2023 3,050,000 1,830,000
HCA, Inc., PIK
9.625% due 11/15/2016 18,865,000 18,063,238
Tenet Healthcare Corp.
7.375% due 02/01/2013 3,756,000 3,615,150
9.00% due 05/01/2015 (f) 3,852,000 3,929,040
10.00% due 05/01/2018 (f) 7,292,000 7,620,140
35,918,230
Mining - 2.93%
FMG Finance Pty, Ltd.
10.625% due 09/01/2016 (f) 9,350,000 8,298,125
Noranda Aluminium Acquisition Corp., PIK
5.4125% due 05/15/2015 (b) 14,869,475 7,880,822
Rio Tinto Finance USA, Ltd.
9.00% due 05/01/2019 5,650,000 6,060,133
Teck Resources, Ltd.
9.75% due 05/15/2014 (f) 1,470,000 1,462,650
10.25% due 05/15/2016 (f) 1,220,000 1,238,300
10.75% due 05/15/2019 (f) 2,450,000 2,511,250
The accompanying notes are an integral part of the financial statements.
84
JOHN HANCOCK FUNDS II
PORTFOLIO OF INVESTMENTS - May 31, 2009 (Unaudited) - continued(showing percentage of total net assets)
High Yield Fund (continued)Shares or
Principal
Amount Value
CORPORATE BONDS (continued)
Mining (continued)
Vale Overseas, Ltd.
6.875% due 11/21/2036 $ 1,612,000 $ 1,457,187
8.25% due 01/17/2034 1,021,000 1,058,010
Vedanta Resources PLC
8.75% due 01/15/2014 (f) 2,870,000 2,783,900
32,750,377
Office Furnishings & Supplies - 0.43%
Interface, Inc.
9.50% due 02/01/2014 3,400,000 2,592,500
10.375% due 02/01/2010 2,110,000 2,205,161
4,797,661
Copyright © 2012 www.secdatabase.com. All Rights Reserved.Please Consider the Environment Before Printing This Document

Paper - 3.58%
Abitibi-Consolidated Company of Canada
13.75% due 04/01/2011 ^ (f) 16,365,000 15,055,800
Appleton Papers, Inc.
8.125% due 06/15/2011 2,300,000 1,495,000
Appleton Papers, Inc., Series B
9.75% due 06/15/2014 9,689,000 3,294,260
Georgia-Pacific LLC
8.25% due 05/01/2016 (f) 6,490,000 6,392,650
NewPage Corp.
7.2775% due 05/01/2012 (b) 13,690,000 6,639,650
NewPage Holding Corp., PIK
8.5788% due 11/01/2013 (b) 4,187,479 439,685
Rock-Tenn Company
9.25% due 03/15/2016 2,350,000 2,385,250
Smurfit Capital Funding PLC
7.50% due 11/20/2025 3,280,000 2,017,200
Verso Paper Holdings LLC
11.50% due 07/01/2014 (f) 2,565,000 2,385,450
40,104,945
Petroleum Services - 1.67%
Belden & Blake Corp.
8.75% due 07/15/2012 7,475,000 5,905,250
Compagnie Generale de Geophysique SA
7.50% due 05/15/2015 1,690,000 1,546,350
Complete Production Services, Inc.
8.00% due 12/15/2016 3,495,000 2,830,950
Enterprise Products Operating LP
7.034% due 01/15/2068 (b) 3,350,000 2,345,000
8.375 due 08/01/2066 (b) 1,140,000 866,400
Key Energy Services, Inc.
8.375% due 12/01/2014 5,165,000 4,545,200
SemGroup LP
8.75% due 11/15/2015 ^ (f) 10,803,000 702,195
18,741,345
Publishing - 0.43%
Idearc, Inc.
8.00% due 11/15/2016 ^ 6,615,000 148,838
Sun Media Corp.
7.625% due 02/15/2013 1,350,000 870,750
TL Acquisitions, Inc.
zero coupon, Step up to 13.25% on
07/15/2009 due 07/15/2015 (f) 3,540,000 2,371,800
10.50% due 01/15/2015 (f) 1,875,000 1,462,500
4,853,888
High Yield Fund (continued)Shares or
Principal
Amount Value
CORPORATE BONDS (continued)
Railroads & Equipment - 1.42%
American Railcar Industries, Inc.
7.50% due 03/01/2014 $ 1,610,000 $ 1,392,650
Grupo Transportacion Ferroviaria Mexicana,
SA de CV
9.375% due 05/01/2012 11,055,000 9,921,863
Kansas City Southern de Mexico SA de CV
7.375% due 06/01/2014 2,975,000 2,350,250
Copyright © 2012 www.secdatabase.com. All Rights Reserved.Please Consider the Environment Before Printing This Document

7.625% due 12/01/2013 1,150,000 943,000
Kansas City Southern Railway Company
13.00% due 12/15/2013 1,275,000 1,338,750
15,946,513
Real Estate - 0.95%
Ashton Woods USA LLC/Ashton Woods Finance
Company
zero coupon, Step up to 11.00% on
02/24/2012 due 06/30/2015 (f) 1,638,000 622,112
Forest City Enterprises, Inc.
7.625% due 06/01/2015 145,000 79,750
Host Hotels & Resort LP, REIT
6.375% due 03/15/2015 1,140,000 974,700
Realogy Corp.
10.50% due 04/15/2014 7,440,000 2,734,200
12.375% due 04/15/2015 5,800,000 1,450,000
Realogy Corp., PIK
11.00% due 04/15/2014 644,732 151,512
Ventas Realty LP
6.50% due 06/01/2016 675,000 615,938
6.75% due 04/01/2017 4,390,000 4,049,775
10,677,987
Retail - 0.70%
Eye Care Centers of America
10.75% due 02/15/2015 3,170,000 3,170,000
Inergy LP/Inergy Finance Corp.
8.25% due 03/01/2016 (f) 135,000 131,963
Michaels Stores, Inc.
10.00% due 11/01/2014 2,645,000 1,904,400
Suburban Propane Partners LP
6.875% due 12/15/2013 2,745,000 2,580,300
7,786,663
Retail Trade - 1.35%
American Greetings Corp.
7.375% due 06/01/2016 375,000 236,250
Blockbuster, Inc.
9.00% due 09/01/2012 (a) 6,145,000 3,133,950
Dollar General Corp.
10.625% due 07/15/2015 3,105,000 3,283,538
Dollar General Corp., PIK
11.875% due 07/15/2017 470,000 495,850
Neiman Marcus Group, Inc.
7.125% due 06/01/2028 1,870,000 981,750
Neiman Marcus Group, Inc., PIK
9.00% due 10/15/2015 (f) 13,026,146 6,968,988
15,100,326
Semiconductors - 0.36%
Freescale Semiconductor, Inc.
8.875% due 12/15/2014 4,250,000 1,912,500
10.125% due 12/15/2016 3,907,000 1,035,355
The accompanying notes are an integral part of the financial statements.
85
JOHN HANCOCK FUNDS II
PORTFOLIO OF INVESTMENTS - May 31, 2009 (Unaudited) - continued(showing percentage of total net assets)
Copyright © 2012 www.secdatabase.com. All Rights Reserved.Please Consider the Environment Before Printing This Document

High Yield Fund (continued)Shares or
Principal
Amount Value
CORPORATE BONDS (continued)
Semiconductors (continued)
Freescale Semiconductor, Inc., PIK
9.125% due 12/15/2014 $ 1,110,000 $ 305,250
Sensata Technologies B.V.
8.00% due 05/01/2014 (f) 1,720,000 791,200
4,044,305
Steel - 2.31%
Evraz Group SA
8.875% due 04/24/2013 (f) 2,140,000 1,701,300
8.875% due 04/24/2013 4,070,000 3,248,877
9.50% due 04/24/2018 (f) 910,000 659,750
GTL Trade Finance, Inc.
7.25% due 10/20/2017 (f) 4,215,000 4,046,400
7.25% due 10/20/2017 4,530,000 4,347,517
Metals USA, Inc.
11.125% due 12/01/2015 5,400,000 4,063,500
Ryerson, Inc.
8.4025% due 11/01/2014 (b) 230,000 126,788
12.00% due 11/01/2015 11,280,000 7,614,000
25,808,132
Telecommunications Equipment &
Services - 3.51%
Axtel SAB de CV
7.625% due 02/01/2017 (f) 7,200,000 5,400,000
7.625% due 02/01/2017 350,000 264,166
CC Holdings GS V LLC/Crown Castle GS III Corp.
7.75% due 05/01/2017 (f) 2,430,000 2,393,550
Citizens Communications Company
9.25% due 05/15/2011 100,000 103,625
Globo Comunicacoes e Participacoes SA
7.25% due 04/26/2022 (f) 3,798,000 3,520,746
Hawaiian Telcom Communications, Inc., Series B
12.50% due 05/01/2015 ^ 3,360,000 4,200
Intelsat Bermuda, Ltd.
11.25% due 06/15/2016 4,690,000 4,807,250
Intelsat Intermediate Holding Company, Ltd.
zero coupon, Step up to 9.50% on
02/01/2010 due 02/01/2015 (f) 3,550,000 3,203,875
Intelsat Jackson Holdings, Ltd.
11.50% due 06/15/2016 (f) 17,220,000 16,961,700
iPCS, Inc.
3.1525% due 05/01/2013 (b)(f) 3,140,000 2,598,350
World Access, Inc.
13.25% due 01/15/2049 ^ (e) 1,450,274 10,152
39,267,614
Telephone - 4.33%
Cincinnati Bell Telephone Company
6.30% due 12/01/2028 2,115,000 1,628,550
Level 3 Financing, Inc.
5.4738% due 02/15/2015 (b) 1,700,000 1,054,000
9.25% due 11/01/2014 6,655,000 5,199,219
12.25% due 03/15/2013 1,625,000 1,486,875
Nordic Telephone Company Holdings
8.875% due 05/01/2016 (f) 7,040,000 7,040,000
Copyright © 2012 www.secdatabase.com. All Rights Reserved.Please Consider the Environment Before Printing This Document

Qwest Communications International, Inc., Series B
7.50% due 02/15/2014 2,883,000 2,652,360
Sprint Capital Corp.
6.875% due 11/15/2028 2,015,000 1,410,500
High Yield Fund (continued)Shares or
Principal
Amount Value
CORPORATE BONDS (continued)
Telephone (continued)
Sprint Capital Corp. (continued)
7.625% due 01/30/2011 $ 1,255,000 $ 1,239,312
8.375% due 03/15/2012 5,000,000 4,925,000
8.75% due 03/15/2032 14,735,000 11,640,650
Virgin Media, Inc.
9.125% due 08/15/2016 3,815,000 3,681,475
Windstream Corp.
8.625% due 08/01/2016 6,605,000 6,489,413
48,447,354
Tobacco - 0.39%
Alliance One International, Inc.
8.50% due 05/15/2012 1,870,000 1,739,100
11.00% due 05/15/2012 2,580,000 2,599,350
4,338,450
Transportation - 0.77%
Gulfmark Offshore, Inc.
7.75% due 07/15/2014 1,930,000 1,727,350
Horizon Lines, Inc.
4.25% due 08/15/2012 5,375,000 3,285,469
Teekay Shipping Corp.
8.875% due 07/15/2011 3,627,000 3,581,662
8,594,481
Trucking & Freight - 0.46%
Swift Transportation Company, Inc.
8.6331% due 05/15/2015 (b)(f) 4,610,000 1,982,300
12.50% due 05/15/2017 (f) 6,925,000 3,185,500
5,167,800
TOTAL CORPORATE BONDS (Cost $1,264,127,838) $ 967,075,382
CONVERTIBLE BONDS - 0.82%
Industrials - 0.06%
Allegheny Technologies, Inc.
4.25% due 06/01/2014 595,000 640,369
Telephone - 0.76%
Virgin Media, Inc.
6.50% due 11/15/2016 (f) 10,960,000 8,480,300
TOTAL CONVERTIBLE BONDS (Cost $6,635,433) $ 9,120,669
DEFAULTED BONDS BEYOND MATURITY
DATES - 0.09%
Argentina - 0.09%
Republic of Argentina
1.00% due 02/26/2008 ^ EUR 304,137 30,097
1.00 due 08/11/2007 ^ 505,000,000 42,400
1.00% due 03/18/2049 ^ 625,000 61,849
7.00% due 03/18/2049 ^ 6,100,000,000 311,742
Copyright © 2012 www.secdatabase.com. All Rights Reserved.Please Consider the Environment Before Printing This Document

8.125% due 04/21/2008 ^ 625,000 61,849
8.125% due 10/04/2049 ^ 375,000 37,110
8.50% due 02/23/2049 ^ 2,400,000 121,433
9.00% due 06/20/2049 ^ 600,000 59,375
9.25% due 10/21/2049 ^ 225,000 22,266
9.50% due 03/04/2049 ^ 456,000 74,134
9.75% due 11/26/2049 ^ 425,000 42,058
10.00% due 02/22/2007 ^ 775,000 76,693
The accompanying notes are an integral part of the financial statements.
86
JOHN HANCOCK FUNDS II
PORTFOLIO OF INVESTMENTS - May 31, 2009 (Unaudited) - continued(showing percentage of total net assets)
High Yield Fund (continued)Shares or
Principal
Amount Value
DEFAULTED BONDS BEYOND MATURITY
DATES (continued)
Argentina (continued)
Republic of Argentina (continued)
11.75% due 11/13/2026 ^ EUR 1,800,000 $ 91,074
1,032,080
TOTAL DEFAULTED BONDS BEYOND MATURITY DATES
(Cost $3,769,199) $ 1,032,080
COMMON STOCKS - 0.00%
Hotels & Restaurants - 0.00%
Buffets Restaurants Holdings, Inc. * 11,308 0
Real Estate - 0.00%
Ashton Woods USA LLC/Ashton Woods
Finance Company, Class B * 1 0
Telecommunications Equipment &
Services - 0.00%
XO Holdings, Inc. * 821 255
TOTAL COMMON STOCKS (Cost $6,081,755) $ 255
PREFERRED STOCKS - 0.82%
Banking - 0.68%
Bank of America Corp., Series L, 7.25% 9,380 7,128,800
Bank of America Corp. (i) 560,000 438,217
7,567,017
Broadcasting - 0.00%
CMP Susquehanna Radio Holdings, Corp.,
Series A (f) 44,870 16,826
Cable & Television - 0.00%
ION Media Networks, Inc., Series B, 12.00% (e) 10 0
Financial Services - 0.14%
Preferred Blocker, Inc., 7.00% (f) 3,645 1,537,228
TOTAL PREFERRED STOCKS (Cost $10,450,515) $ 9,121,071
TERM LOANS - 3.64%
Apparel & Textiles - 0.00%
Simmons Holdco, Inc., PIK
8.2238% due 02/15/2012 (b) 2,617,547 27,047
Auto Parts - 0.57%
Allison Transmission, Inc.
Copyright © 2012 www.secdatabase.com. All Rights Reserved.Please Consider the Environment Before Printing This Document

3.29% due 08/07/2014 (b) 8,249,714 6,362,592
Auto Services - 0.06%
Penhall Holdings, PIK
9.995% due 04/01/2012 (b) 3,310,854 662,171
Automobiles - 0.09%
Ford Motor Term Loan
3.56% due 11/29/2013 1,497,449 1,059,914
Banking - 0.43%
HSBC Bank PLC
8.90% due 12/20/2010 (b) 52,153,000 1,237,381
RSHB Capital
9.50% due 02/11/2011 (b) 120,168,000 3,522,421
4,759,802
High Yield Fund (continued)Shares or
Principal
Amount Value
TERM LOANS (continued)
Containers & Glass - 0.00%
Berry Plastics Group, Inc.
8.1609% due 06/15/2014 (b) $ 158,511 $ 33,287
Crude Petroleum & Natural Gas - 0.49%
Turbo Beta, Ltd.
14.50% due 03/15/2018 7,841,091 5,469,161
Domestic Oil - 0.23%
Ashmore Energy
4.22% due 03/30/2014 (b) 3,473,699 2,587,906
Energy - 0.04%
NRG Energy, Inc.
1.3588% due 02/01/2014 (b) 487,787 451,152
Gas & Pipeline Utilities - 0.10%
Stallion Oilfield Services
7.5069% due 07/31/2012 (b) 4,200,000 1,109,514
Healthcare Services - 0.38%
Iasis Holdco, Inc., PIK
6.2894% due 06/15/2014 (b) 5,985,774 4,279,828
Paper - 0.01%
Georgia Pacific Corp.
5.5119% due 12/20/2012 (b) 6,978 6,466
Verso Paper Holdings, Inc.
6.6681% due 02/01/2013 (b) 1,413,356 98,935
105,401
Publishing - 0.56%
Idearc, Inc.
2.48% due 11/01/2014 ^ (b) 3,180,527 1,249,492
Newsday LLC
9.75% due 07/15/2013 (b) 1,000,000 997,500
9.75% due 08/01/2013 (b) 4,000,000 3,990,000
6,236,992
Telecommunications Equipment &
Services - 0.68%
Wind Acquisition Finance SA, PIK
8.3569% due 12/21/2011 (b) 8,914,777 7,562,673
TOTAL TERM LOANS (Cost $58,947,281) $ 40,707,440
WARRANTS - 0.00%
Banking - 0.00%
CNB Capital Trust I
(Expiration Date 03/23/2019) * (f) 51,274 1,361
Copyright © 2012 www.secdatabase.com. All Rights Reserved.Please Consider the Environment Before Printing This Document

Hotels & Restaurants - 0.00%
Buffets Restaurants Holdings, Inc.
(Expiration Date 04/28/2014) * 4,996 0
Republic of Venezuela - 0.00%
Republic of Venezuela
(Expiration date 04/15/2020; strike
price $26.00) * 305,000 51,575
TOTAL WARRANTS (Cost $95,911) $ 52,936
The accompanying notes are an integral part of the financial statements.
87
JOHN HANCOCK FUNDS II
PORTFOLIO OF INVESTMENTS - May 31, 2009 (Unaudited) - continued(showing percentage of total net assets)
High Yield Fund (continued)Shares or
Principal
Amount Value
REPURCHASE AGREEMENTS - 1.80%
Bank of America Tri-Party
Repurchase Agreement dated
05/29/2009 at 0.12% to be
repurchased at $20,200,202 on
06/01/2009, collateralized by
$20,685,000 United States
Treasury Bill, zero coupon due
04/01/2010 (valued at
$20,603,998, including interest) $ 20,200,000 $ 20,200,000
TOTAL REPURCHASE AGREEMENTS
(Cost $20,200,000) $ 20,200,000
SHORT TERM INVESTMENTS - 0.31%
John Hancock Collateral Investment
Trust, 0.7339% (c)(g) $ 346,198 $ 3,461,975
TOTAL SHORT TERM INVESTMENTS
(Cost $3,461,975) $ 3,461,975
Total Investments (High Yield Fund)
(Cost $1,420,454,897) - 97.49% $ 1,091,130,422
Other assets and liabilities, net - 2.51% 28,138,563
TOTAL NET ASSETS - 100.00% $ 1,119,268,985
Index 500 FundShares or
Principal
Amount Value
COMMON STOCKS - 95.10%
Advertising - 0.16%
Interpublic Group of Companies, Inc. * 109,499 $ 573,775
Monster Worldwide, Inc. * 29,410 343,509
Omnicom Group, Inc. 71,463 2,179,621
3,096,905
Aerospace - 2.11%
Boeing Company 166,891 7,485,061
General Dynamics Corp. 88,732 5,048,851
Goodrich Corp. 28,446 1,380,769
Copyright © 2012 www.secdatabase.com. All Rights Reserved.Please Consider the Environment Before Printing This Document

Lockheed Martin Corp. 76,312 6,381,973
Northrop Grumman Corp. 75,197 3,580,881
Raytheon Company 91,961 4,106,059
Rockwell Collins, Inc. 36,339 1,541,500
United Technologies Corp. 216,574 11,393,958
40,919,052
Agriculture - 0.74%
Archer-Daniels-Midland Company 147,529 4,059,998
Monsanto Company 125,935 10,345,560
14,405,558
Air Travel - 0.06%
Southwest Airlines Company 170,113 1,146,562
Aluminum - 0.10%
Alcoa, Inc. 218,417 2,013,805
Apparel & Textiles - 0.49%
Cintas Corp. 30,200 703,358
Coach, Inc. * 73,785 1,938,332
Index 500 Fund (continued)Shares or
Principal
Amount Value
COMMON STOCKS (continued)
Apparel & Textiles (continued)
NIKE, Inc., Class B 89,007 $ 5,077,850
Polo Ralph Lauren Corp., Class A 12,982 698,691
VF Corp. 20,254 1,150,832
9,569,063
Auto Parts - 0.33%
AutoZone, Inc. * 8,716 1,326,139
Genuine Parts Company 36,647 1,226,942
Johnson Controls, Inc. 136,572 2,721,880
O'Reilly Automotive, Inc. * 31,017 1,118,163
6,393,124
Auto Services - 0.02%
AutoNation, Inc. * 24,795 393,745
Automobiles - 0.35%
Ford Motor Company * 727,161 4,181,176
General Motors Corp. * (a) 140,315 105,236
PACCAR, Inc. 83,377 2,488,803
6,775,215
Banking - 1.79%
Bank of New York Mellon Corp. 264,079 7,336,115
BB&T Corp. 145,785 3,268,500
Comerica, Inc. 34,754 753,467
Fifth Third Bancorp 132,704 915,658
First Horizon National Corp. 48,500 588,790
Hudson City Bancorp, Inc. 120,053 1,540,280
Huntington Bancshares, Inc. 83,843 328,665
KeyCorp 113,701 568,505
M&T Bank Corp. (a) 17,855 898,106
Marshall & Ilsley Corp. 60,982 401,261
Northern Trust Corp. 54,807 3,159,623
PNC Financial Services Group, Inc. 98,359 4,480,252
Regions Financial Corp. 158,401 663,700
SunTrust Banks, Inc. 81,978 1,079,650
U.S. Bancorp 435,343 8,358,586
Zions Bancorp (a) 26,510 362,657
34,703,815
Copyright © 2012 www.secdatabase.com. All Rights Reserved.Please Consider the Environment Before Printing This Document

Biotechnology - 1.15%
Amgen, Inc. * 237,642 11,867,842
Biogen Idec, Inc. * 68,320 3,538,293
Cephalon, Inc. * (a) 15,799 921,240
Genzyme Corp. * 62,367 3,688,384
Life Technologies Corp. * 39,946 1,549,106
Millipore Corp. * 12,732 800,715
22,365,580
Broadcasting - 0.33%
CBS Corp., Class B 156,080 1,151,870
News Corp., Class A 528,656 5,170,256
6,322,126
Building Materials & Construction - 0.04%
Masco Corp. 82,625 855,995
Business Services - 1.09%
Affiliated Computer Services, Inc., Class A * 22,422 1,007,645
Automatic Data Processing, Inc. 116,042 4,410,756
Computer Sciences Corp. * 34,820 1,478,457
The accompanying notes are an integral part of the financial statements.
88
JOHN HANCOCK FUNDS II
PORTFOLIO OF INVESTMENTS - May 31, 2009 (Unaudited) - continued(showing percentage of total net assets)
Index 500 Fund (continued)Shares or
Principal
Amount Value
COMMON STOCKS (continued)
Business Services (continued)
Convergys Corp. * 28,085 $ 259,786
Dun & Bradstreet Corp. 12,269 1,003,482
Equifax, Inc. 29,070 791,285
Fiserv, Inc. * 35,854 1,518,775
Fluor Corp. 41,721 1,960,053
H & R Block, Inc. 78,067 1,139,778
Iron Mountain, Inc. * 41,283 1,124,962
Jacobs Engineering Group, Inc. * 28,289 1,213,598
Moody's Corp. 43,787 1,199,326
Paychex, Inc. 73,807 2,020,098
R.R. Donnelley & Sons Company 47,164 635,771
Robert Half International, Inc. 34,788 744,115
Total Systems Services, Inc. 45,340 618,891
21,126,778
Cable & Television - 1.26%
Comcast Corp., Class A 662,076 9,116,786
DIRECTV Group, Inc. * (a) 121,582 2,735,595
Scripps Networks Interactive, Inc., Class A 20,720 574,773
Time Warner Cable, Inc. * 80,971 2,493,097
Time Warner, Inc. 274,868 6,437,409
Viacom, Inc., Class B * 139,351 3,089,412
24,447,072
Cellular Communications - 0.16%
Motorola, Inc. 523,238 3,170,822
Chemicals - 1.19%
Air Products & Chemicals, Inc. 48,186 3,121,489
CF Industries Holdings, Inc. 11,123 863,590
Copyright © 2012 www.secdatabase.com. All Rights Reserved.Please Consider the Environment Before Printing This Document

Dow Chemical Company 242,426 4,286,092
E.I. Du Pont de Nemours & Company 207,434 5,905,646
Eastman Chemical Company 16,673 690,929
PPG Industries, Inc. 37,747 1,678,609
Praxair, Inc. 70,578 5,166,309
Sigma-Aldrich Corp. 28,070 1,360,272
23,072,936
Coal - 0.22%
CONSOL Energy, Inc. 41,505 1,708,346
Massey Energy Company 19,650 449,788
Peabody Energy Corp. 61,449 2,088,037
4,246,171
Commercial Services - 0.02%
CB Richard Ellis Group, Inc. * 51,695 377,374
Computer Services - 0.08%
NetApp, Inc. * 76,016 1,482,312
Computers & Business Equipment - 6.39%
Apple, Inc. * 204,682 27,797,862
Cisco Systems, Inc. * 1,341,558 24,818,823
Cognizant Technology Solutions Corp.,
Class A * 67,056 1,689,141
Dell, Inc. * 397,742 4,605,852
EMC Corp. * 462,402 5,433,223
Hewlett-Packard Company 550,829 18,920,976
International Business Machines Corp. 308,366 32,773,138
Juniper Networks, Inc. * 120,005 2,967,724
Lexmark International, Inc. * 17,876 292,094
Index 500 Fund (continued)Shares or
Principal
Amount Value
COMMON STOCKS (continued)
Computers & Business Equipment
(continued)
Metavante Technologies, Inc. * 1 $ 26
Pitney Bowes, Inc. 47,420 1,084,970
SanDisk Corp. * 51,977 813,960
Sun Microsystems, Inc. * 171,160 1,540,440
Xerox Corp. 198,759 1,351,561
124,089,790
Construction & Mining Equipment - 0.22%
National Oilwell Varco, Inc. * 95,928 3,704,739
Rowan Companies, Inc. 25,973 531,408
4,236,147
Construction Materials - 0.12%
The Sherwin-Williams Company 22,629 1,194,811
Vulcan Materials Company (a) 25,365 1,123,416
2,318,227
Containers & Glass - 0.20%
Ball Corp. 21,554 857,849
Bemis Company, Inc. 22,954 575,916
Owens-Illinois, Inc. * 38,417 1,099,879
Pactiv Corp. * 30,230 677,152
Sealed Air Corp. 36,286 726,083
3,936,879
Cosmetics & Toiletries - 2.66%
Avon Products, Inc. 97,989 2,602,588
Colgate-Palmolive Company 115,220 7,598,759
Copyright © 2012 www.secdatabase.com. All Rights Reserved.Please Consider the Environment Before Printing This Document
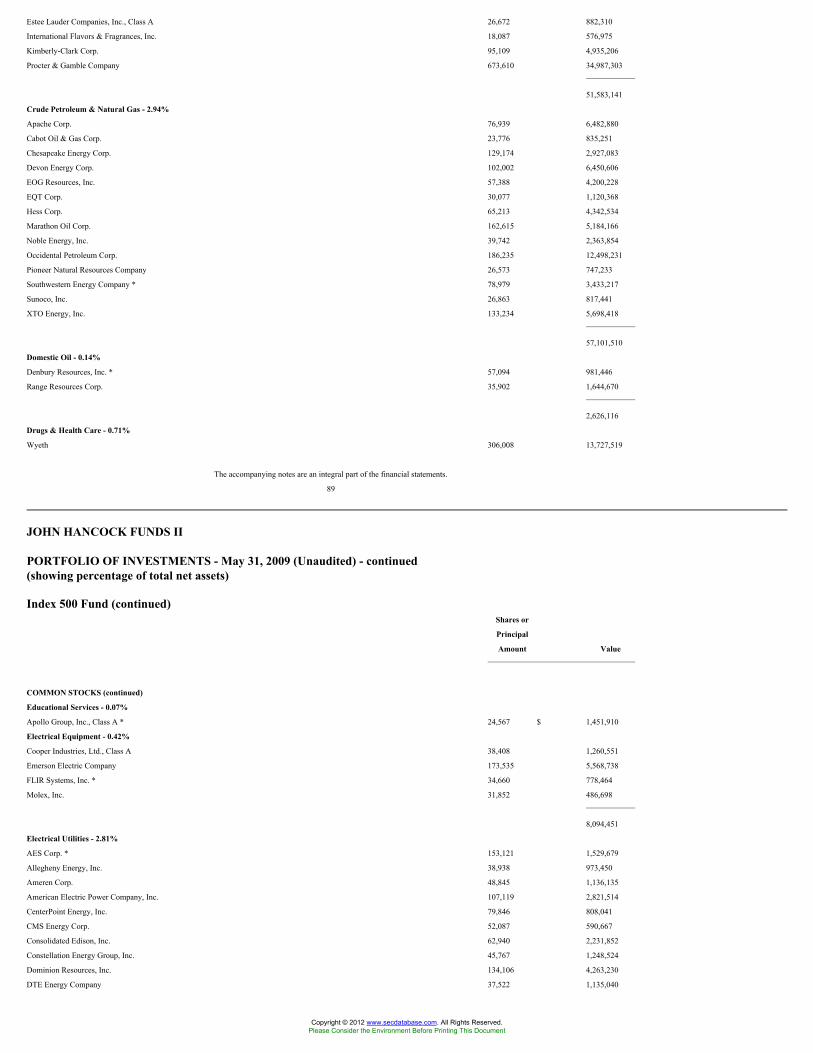
Estee Lauder Companies, Inc., Class A 26,672 882,310
International Flavors & Fragrances, Inc. 18,087 576,975
Kimberly-Clark Corp. 95,109 4,935,206
Procter & Gamble Company 673,610 34,987,303
51,583,141
Crude Petroleum & Natural Gas - 2.94%
Apache Corp. 76,939 6,482,880
Cabot Oil & Gas Corp. 23,776 835,251
Chesapeake Energy Corp. 129,174 2,927,083
Devon Energy Corp. 102,002 6,450,606
EOG Resources, Inc. 57,388 4,200,228
EQT Corp. 30,077 1,120,368
Hess Corp. 65,213 4,342,534
Marathon Oil Corp. 162,615 5,184,166
Noble Energy, Inc. 39,742 2,363,854
Occidental Petroleum Corp. 186,235 12,498,231
Pioneer Natural Resources Company 26,573 747,233
Southwestern Energy Company * 78,979 3,433,217
Sunoco, Inc. 26,863 817,441
XTO Energy, Inc. 133,234 5,698,418
57,101,510
Domestic Oil - 0.14%
Denbury Resources, Inc. * 57,094 981,446
Range Resources Corp. 35,902 1,644,670
2,626,116
Drugs & Health Care - 0.71%
Wyeth 306,008 13,727,519
The accompanying notes are an integral part of the financial statements.
89
JOHN HANCOCK FUNDS II
PORTFOLIO OF INVESTMENTS - May 31, 2009 (Unaudited) - continued(showing percentage of total net assets)
Index 500 Fund (continued)Shares or
Principal
Amount Value
COMMON STOCKS (continued)
Educational Services - 0.07%
Apollo Group, Inc., Class A * 24,567 $ 1,451,910
Electrical Equipment - 0.42%
Cooper Industries, Ltd., Class A 38,408 1,260,551
Emerson Electric Company 173,535 5,568,738
FLIR Systems, Inc. * 34,660 778,464
Molex, Inc. 31,852 486,698
8,094,451
Electrical Utilities - 2.81%
AES Corp. * 153,121 1,529,679
Allegheny Energy, Inc. 38,938 973,450
Ameren Corp. 48,845 1,136,135
American Electric Power Company, Inc. 107,119 2,821,514
CenterPoint Energy, Inc. 79,846 808,041
CMS Energy Corp. 52,087 590,667
Consolidated Edison, Inc. 62,940 2,231,852
Constellation Energy Group, Inc. 45,767 1,248,524
Dominion Resources, Inc. 134,106 4,263,230
DTE Energy Company 37,522 1,135,040
Copyright © 2012 www.secdatabase.com. All Rights Reserved.Please Consider the Environment Before Printing This Document

Dynegy, Inc., Class A * 116,343 233,849
Edison International 74,884 2,189,608
Entergy Corp. 43,542 3,249,104
Exelon Corp. 151,288 7,263,337
FirstEnergy Corp. 70,062 2,647,643
FPL Group, Inc. 93,991 5,313,311
Integrys Energy Group, Inc. 17,565 475,836
Northeast Utilities 39,578 822,827
Pepco Holdings, Inc. 50,360 653,673
PG&E Corp. 84,066 3,086,063
Pinnacle West Capital Corp. 23,211 641,784
PPL Corp. 86,262 2,800,927
Southern Company 178,726 5,077,606
Teco Energy, Inc. (a) 48,940 549,107
Wisconsin Energy Corp. 26,873 1,060,409
Xcel Energy, Inc. 104,396 1,790,391
54,593,607
Electronics - 0.57%
Agilent Technologies, Inc. * 80,898 1,474,771
Amphenol Corp., Class A 39,345 1,313,730
Harman International Industries, Inc. 13,463 250,950
Jabil Circuit, Inc. 49,148 384,829
L-3 Communications Holdings, Inc. 27,255 2,003,515
Thermo Fisher Scientific, Inc. * 96,110 3,739,640
Tyco Electronics, Ltd. 105,268 1,828,505
10,995,940
Energy - 0.50%
Duke Energy Corp. 294,455 4,166,538
Progress Energy, Inc. 63,340 2,249,203
SCANA Corp. 27,851 836,087
Sempra Energy 55,948 2,555,705
9,807,533
Financial Services - 8.05%
American Express Company 269,151 6,688,402
Ameriprise Financial, Inc. 50,293 1,518,849
Bank of America Corp. 1,845,621 20,800,149
Index 500 Fund (continued)Shares or
Principal
Amount Value
COMMON STOCKS (continued)
Financial Services (continued)
Capital One Financial Corp. 102,926 $ 2,515,511
Charles Schwab Corp. 215,453 3,791,973
CIT Group, Inc. 89,353 342,222
Citigroup, Inc. (a) 1,258,633 4,682,115
CME Group, Inc. 15,249 4,904,688
Discover Financial Services 110,655 1,057,862
E*TRADE Financial Corp. * (a) 131,477 189,327
Federated Investors, Inc., Class B 20,452 511,914
Fidelity National Information Services, Inc. 43,880 845,129
Franklin Resources, Inc. 34,797 2,326,179
Goldman Sachs Group, Inc. 115,478 16,694,654
IntercontinentalExchange, Inc. * 16,698 1,799,877
Invesco, Ltd. 86,726 1,357,262
Janus Capital Group, Inc. 36,342 368,508
JPMorgan Chase & Company 863,707 31,870,788
Legg Mason, Inc. 32,823 632,827
Leucadia National Corp. * (a) 41,660 869,861
MasterCard, Inc., Class A 16,651 2,936,071
Morgan Stanley 280,514 8,505,184
Copyright © 2012 www.secdatabase.com. All Rights Reserved.Please Consider the Environment Before Printing This Document

NASDAQ OMX Group, Inc. * 31,559 666,211
NYSE Euronext 59,529 1,785,870
People's United Financial, Inc. 80,036 1,264,569
SLM Corp. * 107,426 710,086
State Street Corp. 98,837 4,590,979
T. Rowe Price Group, Inc. 58,846 2,387,382
Wells Fargo & Company 1,052,370 26,835,435
Western Union Company 163,182 2,876,899
156,326,783
Food & Beverages - 3.91%
Campbell Soup Company 47,075 1,304,919
Coca-Cola Enterprises, Inc. 72,883 1,214,231
ConAgra Foods, Inc. 102,762 1,910,346
Dean Foods Company * 40,644 764,107
Dr Pepper Snapple Group, Inc. * 58,306 1,266,989
General Mills, Inc. 75,352 3,856,515
H.J. Heinz Company 72,314 2,645,246
Hershey Company 38,085 1,341,354
Hormel Foods Corp. 16,049 557,542
J.M. Smucker Company 27,220 1,095,877
Kellogg Company 57,937 2,505,775
Kraft Foods, Inc., Class A 337,719 8,817,843
McCormick & Company, Inc. 29,903 912,640
Pepsi Bottling Group, Inc. 31,124 1,022,735
PepsiCo, Inc. 357,692 18,617,869
Sara Lee Corp. 159,861 1,437,150
Sysco Corp. 135,424 3,244,759
The Coca-Cola Company 457,514 22,491,388
Tyson Foods, Inc., Class A 69,484 925,527
75,932,812
Forest Products - 0.08%
Weyerhaeuser Company 48,548 1,630,242
Furniture & Fixtures - 0.03%
Leggett & Platt, Inc. 36,052 529,243
Gas & Pipeline Utilities - 0.44%
El Paso Corp. 160,567 1,565,528
The accompanying notes are an integral part of the financial statements.
90
JOHN HANCOCK FUNDS II
PORTFOLIO OF INVESTMENTS - May 31, 2009 (Unaudited) - continued(showing percentage of total net assets)
Index 500 Fund (continued)Shares or
Principal
Amount Value
COMMON STOCKS (continued)
Gas & Pipeline Utilities (continued)
Nicor, Inc. 10,389 $ 326,734
NiSource, Inc. 63,046 673,962
Questar Corp. 39,899 1,352,177
Spectra Energy Corp. 147,862 2,373,185
Williams Companies, Inc. 133,124 2,233,821
8,525,407
Healthcare Products - 3.87%
Baxter International, Inc. 141,085 7,222,141
Becton, Dickinson & Company 55,094 3,728,762
Boston Scientific Corp. * 345,269 3,245,529
Copyright © 2012 www.secdatabase.com. All Rights Reserved.Please Consider the Environment Before Printing This Document

C.R. Bard, Inc. 22,853 1,633,761
Covidien, Ltd. 115,812 4,136,805
DENTSPLY International, Inc. 34,155 999,375
Intuitive Surgical, Inc. * 9,007 1,348,168
Johnson & Johnson 635,682 35,064,219
Medtronic, Inc. 257,009 8,828,259
Patterson Companies, Inc. * (a) 21,023 432,864
St. Jude Medical, Inc. * 79,558 3,104,353
Stryker Corp. 54,682 2,101,976
Varian Medical Systems, Inc. * 28,590 1,022,378
Zimmer Holdings, Inc. * 51,217 2,281,717
75,150,307
Healthcare Services - 1.75%
Cardinal Health, Inc. 82,831 2,961,208
Coventry Health Care, Inc. * 34,084 615,216
DaVita, Inc. * 23,880 1,077,227
Express Scripts, Inc. * 56,925 3,646,046
Humana, Inc. * 38,808 1,215,855
IMS Health, Inc. 41,739 502,538
Laboratory Corp. of America Holdings * 24,892 1,517,416
McKesson Corp. 62,936 2,589,816
Medco Health Solutions, Inc. * 112,854 5,178,870
Quest Diagnostics, Inc. 35,480 1,852,766
UnitedHealth Group, Inc. 279,393 7,431,854
WellPoint, Inc. * 114,548 5,334,500
33,923,312
Holdings Companies/Conglomerates - 0.04%
Textron, Inc. 60,596 696,854
Homebuilders - 0.09%
Centex Corp. 28,580 240,929
D.R. Horton, Inc. 63,339 583,352
KB Home 17,300 259,500
Lennar Corp., Class A (a) 32,469 308,780
Pulte Homes, Inc. (a) 49,328 434,087
1,826,648
Hotels & Restaurants - 1.34%
Darden Restaurants, Inc. 31,485 1,138,813
Marriott International, Inc., Class A 67,545 1,577,851
McDonald's Corp. 255,950 15,098,491
Starbucks Corp. * 168,837 2,429,564
Starwood Hotels & Resorts Worldwide, Inc. 41,932 1,026,076
Wyndham Worldwide Corp. 40,798 481,008
Wynn Resorts, Ltd. * (a) 15,373 569,723
Index 500 Fund (continued)Shares or
Principal
Amount Value
COMMON STOCKS (continued)
Hotels & Restaurants (continued)
Yum! Brands, Inc. 105,709 $ 3,660,703
25,982,229
Household Appliances - 0.09%
Black & Decker Corp. 13,821 443,239
Stanley Works 18,130 647,241
Whirlpool Corp. 16,905 712,377
1,802,857
Household Products - 0.19%
Clorox Company 31,953 1,675,615
Fortune Brands, Inc. 34,510 1,208,195
Copyright © 2012 www.secdatabase.com. All Rights Reserved.Please Consider the Environment Before Printing This Document

Newell Rubbermaid, Inc. 63,711 733,314
3,617,124
Industrial Machinery - 1.10%
Cameron International Corp. * 49,852 1,556,878
Caterpillar, Inc. 138,253 4,902,451
Cummins, Inc. 46,279 1,500,828
Deere & Company 97,146 4,222,937
Dover Corp. 42,753 1,344,154
Flowserve Corp. 12,852 945,522
Ingersoll-Rand Company, Ltd., Class A 73,286 1,482,576
ITT Corp. 41,785 1,720,706
Manitowoc Company, Inc. 29,962 195,352
Pall Corp. 27,138 696,904
Parker-Hannifin Corp. 36,927 1,560,535
W.W. Grainger, Inc. 14,624 1,152,810
21,281,653
Industrials - 1.74%
Fastenal Company (a) 29,700 986,634
General Electric Company 2,427,170 32,718,252
33,704,886
Insurance - 2.52%
Aetna, Inc. 104,231 2,791,306
AFLAC, Inc. 107,451 3,814,511
Allstate Corp. 123,202 3,169,987
American International Group, Inc. (a) 618,431 1,045,148
Aon Corp. 62,869 2,263,284
Assurant, Inc. 27,070 639,664
Chubb Corp. 80,977 3,210,738
CIGNA Corp. 62,295 1,381,080
Cincinnati Financial Corp. 37,349 844,461
Genworth Financial, Inc., Class A 99,556 589,372
Hartford Financial Services Group, Inc. 74,750 1,071,915
Lincoln National Corp. 58,848 1,115,170
Loews Corp. 83,008 2,245,366
Marsh & McLennan Companies, Inc. 118,362 2,239,409
MBIA, Inc. * 39,336 253,717
MetLife, Inc. 188,024 5,922,756
Principal Financial Group, Inc. 71,297 1,582,793
Progressive Corp. * 155,537 2,508,812
Prudential Financial, Inc. 97,450 3,889,230
The Travelers Companies, Inc. 134,425 5,465,721
Torchmark Corp. 19,423 780,028
Unum Group 76,113 1,302,293
The accompanying notes are an integral part of the financial statements.
91
JOHN HANCOCK FUNDS II
PORTFOLIO OF INVESTMENTS - May 31, 2009 (Unaudited) - continued(showing percentage of total net assets)
Index 500 Fund (continued)Shares or
Principal
Amount Value
COMMON STOCKS (continued)
Insurance (continued)
XL Capital, Ltd., Class A (a) 78,652 $ 795,958
48,922,719
Copyright © 2012 www.secdatabase.com. All Rights Reserved.Please Consider the Environment Before Printing This Document

International Oil - 6.91%
Anadarko Petroleum Corp. 112,593 5,379,694
Chevron Corp. 460,720 30,716,202
ConocoPhillips 340,213 15,595,364
Exxon Mobil Corp. 1,135,766 78,765,372
Murphy Oil Corp. 43,839 2,586,939
Nabors Industries, Ltd. * 65,028 1,162,701
134,206,272
Internet Content - 1.44%
Google, Inc., Class A * 55,074 22,978,525
Yahoo!, Inc. * 320,439 5,075,754
28,054,279
Internet Retail - 0.56%
Amazon.com, Inc. * 73,878 5,761,745
eBay, Inc. * 247,692 4,364,333
Expedia, Inc. * 48,210 834,515
10,960,593
Internet Software - 0.46%
Akamai Technologies, Inc. * 39,185 872,258
Electronic Arts, Inc. * 73,966 1,700,478
McAfee, Inc. * 35,417 1,389,409
Salesforce.com, Inc. * (a) 24,293 921,920
Symantec Corp. * 188,692 2,941,708
VeriSign, Inc. * 44,205 1,034,839
8,860,612
Leisure Time - 0.72%
Carnival Corp. 100,614 2,559,620
International Game Technology 67,894 1,178,640
Walt Disney Company 426,653 10,333,536
14,071,796
Life Sciences - 0.07%
PerkinElmer, Inc. 26,702 434,441
Waters Corp. * 22,306 966,296
1,400,737
Liquor - 0.16%
Brown Forman Corp., Class B 22,541 988,423
Constellation Brands, Inc., Class A * 44,754 517,356
Molson Coors Brewing Company, Class B 34,443 1,515,148
3,020,927
Manufacturing - 1.29%
3M Company 159,459 9,105,109
Danaher Corp. 58,599 3,536,450
Eaton Corp. 37,970 1,651,695
Harley-Davidson, Inc. 53,687 911,068
Honeywell International, Inc. 168,971 5,603,078
Illinois Tool Works, Inc. 88,340 2,852,499
Rockwell Automation, Inc. 32,586 1,000,064
Snap-on, Inc. 13,206 411,367
25,071,330
Index 500 Fund (continued)Shares or
Principal
Amount Value
COMMON STOCKS (continued)
Medical-Hospitals - 0.02%
Tenet Healthcare Corp. * 95,461 $ 346,523
Copyright © 2012 www.secdatabase.com. All Rights Reserved.Please Consider the Environment Before Printing This Document

Metal & Metal Products - 0.15%
Precision Castparts Corp. 32,163 2,655,699
Titanium Metals Corp. 19,562 181,144
2,836,843
Mining - 0.55%
Freeport-McMoRan Copper & Gold, Inc.,
Class B 94,617 5,150,003
Newmont Mining Corp. 112,434 5,494,650
10,644,653
Office Furnishings & Supplies - 0.05%
Avery Dennison Corp. 25,911 714,107
Office Depot, Inc. * 63,166 294,354
1,008,461
Paper - 0.17%
International Paper Company 98,316 1,412,801
MeadWestvaco Corp. 39,260 626,982
Plum Creek Timber Company, Inc. (a) 37,886 1,312,750
3,352,533
Petroleum Services - 1.63%
Baker Hughes, Inc. 70,991 2,772,908
BJ Services Company 67,123 1,049,804
Diamond Offshore Drilling, Inc. 15,974 1,346,289
ENSCO International, Inc. 32,595 1,267,620
Halliburton Company 206,203 4,728,235
Schlumberger, Ltd. 274,882 15,731,497
Smith International, Inc. 50,392 1,470,942
Tesoro Corp. 31,803 538,743
Valero Energy Corp. 118,666 2,654,558
31,560,596
Pharmaceuticals - 5.26%
Abbott Laboratories 355,185 16,004,636
Allergan, Inc. 70,677 3,118,976
AmerisourceBergen Corp. 34,999 1,298,463
Bristol-Myers Squibb Company 454,963 9,062,863
Celgene Corp. * 105,601 4,460,586
Eli Lilly & Company 232,396 8,033,930
Forest Laboratories, Inc. * 69,322 1,642,238
Gilead Sciences, Inc. * 209,370 9,023,847
Hospira, Inc. * 36,689 1,265,771
King Pharmaceuticals, Inc. * 56,653 535,937
Merck & Company, Inc. 484,430 13,360,580
Mylan, Inc. * (a) 70,033 925,136
Pfizer, Inc. 1,550,307 23,549,163
Schering-Plough Corp. 373,808 9,120,915
Watson Pharmaceuticals, Inc. * 24,047 727,422
102,130,463
Photography - 0.01%
Eastman Kodak Company 61,642 160,886
Publishing - 0.17%
Gannett Company, Inc. 52,497 250,411
McGraw-Hill Companies, Inc. 72,263 2,174,393
Meredith Corp. 8,276 223,121
The accompanying notes are an integral part of the financial statements.
92
JOHN HANCOCK FUNDS II
PORTFOLIO OF INVESTMENTS - May 31, 2009 (Unaudited) - continued(showing percentage of total net assets)
Copyright © 2012 www.secdatabase.com. All Rights Reserved.Please Consider the Environment Before Printing This Document

Index 500 Fund (continued)Shares or
Principal
Amount Value
COMMON STOCKS (continued)
Publishing (continued)
The New York Times Company, Class A (a) 26,800 $ 176,880
The Washington Post Company, Class B 1,383 497,880
3,322,685
Railroads & Equipment - 0.84%
Burlington Northern Santa Fe Corp. 63,964 4,633,552
CSX Corp. 91,763 2,914,393
Norfolk Southern Corp. 84,227 3,133,244
Union Pacific Corp. 115,652 5,698,174
16,379,363
Real Estate - 0.90%
Apartment Investment & Management
Company, Class A, REIT (a) 26,959 254,763
Avalon Bay Communities, Inc., REIT 18,329 1,126,867
Boston Properties, Inc., REIT 27,871 1,346,727
Developers Diversified Realty Corp., REIT 1,873 9,196
Equity Residential, REIT 62,697 1,526,045
HCP, Inc., REIT 62,499 1,451,852
Health Care, Inc., REIT 25,451 871,697
Host Hotels & Resorts, Inc., REIT 135,938 1,275,098
Kimco Realty Corp., REIT 71,667 837,787
ProLogis, REIT 96,369 818,173
Public Storage, REIT 28,822 1,919,833
Simon Property Group, Inc., REIT 62,472 3,340,378
Ventas, Inc., REIT 35,890 1,089,620
Vornado Realty Trust, REIT 35,442 1,653,724
17,521,760
Retail Grocery - 0.35%
Safeway, Inc. 98,577 1,997,170
SUPERVALU, Inc. 48,667 807,872
The Kroger Company 149,958 3,419,043
Whole Foods Market, Inc. (a) 32,269 608,916
6,833,001
Retail Trade - 4.82%
Abercrombie & Fitch Company, Class A 20,008 602,441
Bed Bath & Beyond, Inc. * 59,694 1,677,998
Best Buy Company, Inc. 77,917 2,734,887
Big Lots, Inc. * 18,874 434,291
Costco Wholesale Corp. 99,575 4,831,379
CVS Caremark Corp. 334,530 9,968,994
Family Dollar Stores, Inc. 32,158 973,423
GameStop Corp., Class A * 37,642 939,168
Home Depot, Inc. 389,678 9,024,943
J.C. Penney Company, Inc. 51,066 1,332,312
Kohl's Corp. * 70,035 2,974,386
Limited Brands, Inc. 62,189 777,984
Lowe's Companies, Inc. 336,867 6,403,842
Macy's, Inc. 96,661 1,129,000
Nordstrom, Inc. (a) 36,633 721,304
RadioShack Corp. 28,749 386,387
Sears Holdings Corp. * (a) 12,617 717,276
Staples, Inc. 163,962 3,353,023
Target Corp. 173,016 6,799,529
The Gap, Inc. 107,168 1,912,949
Tiffany & Company 28,295 802,729
Copyright © 2012 www.secdatabase.com. All Rights Reserved.Please Consider the Environment Before Printing This Document

Index 500 Fund (continued)Shares or
Principal
Amount Value
COMMON STOCKS (continued)
Retail Trade (continued)
TJX Companies, Inc. 95,691 $ 2,823,841
Walgreen Company 226,790 6,756,074
Wal-Mart Stores, Inc. 513,880 25,560,391
93,638,551
Sanitary Services - 0.37%
Ecolab, Inc. 38,543 1,439,581
Republic Services, Inc. 74,000 1,686,460
Stericycle, Inc. * 19,602 979,708
Waste Management, Inc. 112,956 3,116,456
7,222,205
Semiconductors - 2.32%
Advanced Micro Devices, Inc. * 128,673 584,175
Altera Corp. 67,408 1,147,284
Analog Devices, Inc. 66,935 1,633,883
Applied Materials, Inc. 305,533 3,440,302
Broadcom Corp., Class A * 97,778 2,491,383
Intel Corp. 1,278,350 20,095,662
KLA-Tencor Corp. 39,038 1,054,026
Linear Technology Corp. (a) 50,992 1,193,723
LSI Logic Corp. * 148,965 665,874
MEMC Electronic Materials, Inc. * 51,362 990,773
Microchip Technology, Inc. (a) 41,860 902,920
Micron Technology, Inc. * 189,393 958,329
National Semiconductor Corp. 44,810 621,963
Novellus Systems, Inc. * 22,312 400,054
NVIDIA Corp. * 123,437 1,287,448
QLogic Corp. * 27,865 380,357
Teradyne, Inc. * 39,692 283,798
Texas Instruments, Inc. 293,399 5,691,941
Xilinx, Inc. 63,000 1,306,620
45,130,515
Software - 3.42%
Adobe Systems, Inc. * 120,443 3,394,084
Autodesk, Inc. * 52,010 1,116,134
BMC Software, Inc. * 42,438 1,447,136
CA, Inc. 90,633 1,581,546
Citrix Systems, Inc. * 41,397 1,300,280
Compuware Corp. * 56,680 432,468
Intuit, Inc. * 73,828 2,009,598
Microsoft Corp. 1,757,302 36,710,039
Novell, Inc. * 79,154 329,281
Oracle Corp. 881,444 17,267,488
Teradata Corp. * 39,775 859,140
66,447,194
Steel - 0.28%
AK Steel Holding Corp. 25,491 364,521
Allegheny Technologies, Inc. 22,399 793,149
Nucor Corp. 72,176 3,169,248
United States Steel Corp. 32,130 1,094,990
5,421,908
Telecommunications Equipment &
Services - 1.40%
American Tower Corp., Class A * 91,267 2,908,679
Ciena Corp. * (a) 20,840 229,240
Copyright © 2012 www.secdatabase.com. All Rights Reserved.Please Consider the Environment Before Printing This Document

The accompanying notes are an integral part of the financial statements.
93
JOHN HANCOCK FUNDS II
PORTFOLIO OF INVESTMENTS - May 31, 2009 (Unaudited) - continued(showing percentage of total net assets)
Index 500 Fund (continued)Shares or
Principal
Amount Value
COMMON STOCKS (continued)
Telecommunications Equipment &
Services (continued)
Corning, Inc. 357,401 $ 5,253,795
Embarq Corp. 32,771 1,377,037
Harris Stratex Networks, Inc., Class A * 8,126 38,760
JDS Uniphase Corp. * 49,444 266,503
QUALCOMM, Inc. 379,104 16,525,143
Tellabs, Inc. * 90,939 504,712
27,103,869
Telephone - 3.12%
AT&T, Inc. 1,354,496 33,577,956
CenturyTel, Inc. 23,057 711,308
Frontier Communications Corp. 71,551 520,891
Harris Corp. 30,711 954,498
Qwest Communications International, Inc. (a) 337,763 1,472,647
Sprint Nextel Corp. * 658,472 3,391,131
Verizon Communications, Inc. 652,866 19,102,859
Windstream Corp. 101,380 852,606
60,583,896
Tires & Rubber - 0.03%
Goodyear Tire & Rubber Company * 55,471 635,143
Tobacco - 1.65%
Altria Group, Inc. 474,886 8,115,802
Lorillard, Inc. 38,631 2,639,656
Philip Morris International, Inc. 460,581 19,639,174
Reynolds American, Inc. 38,853 1,552,954
31,947,586
Toys, Amusements & Sporting Goods - 0.10%
Hasbro, Inc. 28,488 723,880
Mattel, Inc. 82,389 1,286,092
2,009,972
Transportation - 0.18%
C.H. Robinson Worldwide, Inc. 39,120 1,988,079
Expeditors International of Washington, Inc. 48,751 1,599,520
3,587,599
Trucking & Freight - 0.83%
FedEx Corp. 71,546 3,965,795
Ryder Systems, Inc. 12,787 360,338
United Parcel Service, Inc., Class B 228,789 11,700,269
16,026,402
Utility Service - 0.19%
Public Service Enterprise Group, Inc. 116,296 3,706,354
TOTAL COMMON STOCKS (Cost $1,997,170,914) $ 1,846,505,363
Copyright © 2012 www.secdatabase.com. All Rights Reserved.Please Consider the Environment Before Printing This Document

SHORT TERM INVESTMENTS - 3.24%
Federal Home Loan Bank Discount Notes
zero coupon due 08/19/2009 $ 40,000,000 $ 39,982,444
John Hancock Collateral Investment Trust,
0.7339% (c)(g) 2,298,388 22,983,877
TOTAL SHORT TERM INVESTMENTS
(Cost $62,966,321) $ 62,966,321
Index 500 Fund (continued)Shares or
Principal
Amount Value
REPURCHASE AGREEMENTS - 1.97%
Repurchase Agreement with State
Street Corp. dated 05/29/2009 at
0.07% to be repurchased at
$38,294,223 on 06/01/2009,
collateralized by $39,120,000 U.S.
Treasury Bills, 0.00% due
11/27/2009 (valued at
$39,061,320, including interest) $ 38,294,000 $ 38,294,000
TOTAL REPURCHASE AGREEMENTS
(Cost $38,294,000) $ 38,294,000
Total Investments (Index 500 Fund)
(Cost $2,098,431,235) - 100.31% $ 1,947,765,684
Other assets and liabilities, net - (0.31)% (6,071,746)
TOTAL NET ASSETS - 100.00% $ 1,941,693,938
International Equity Index FundShares or
Principal
Amount Value
COMMON STOCKS - 92.83%
Argentina - 0.01%
Petrobras Energia Participaciones SA, ADR,
B Shares 2,810 $ 14,275
Telecom Argentina SA, ADR, B Shares * 2,416 20,294
34,569
Australia - 4.63%
AGL Energy, Ltd. 14,879 167,187
Alumina, Ltd. 37,887 41,566
Amcor, Ltd. 23,124 95,037
AMP, Ltd. 65,480 256,199
Aristocrat Leisure, Ltd. 9,625 28,064
Arrow Energy NL * 16,861 50,897
Asciano Group 13,391 14,963
Australia and New Zealand
Banking Group, Ltd. 63,922 822,316
Australian Stock Exchange, Ltd. 5,604 156,468
Axa Asia Pacific Holdings, Ltd. 33,245 101,593
Babcock & Brown, Ltd. * 6,031 1,570
Bendigo Bank, Ltd. 7,479 36,788
BHP Billiton, Ltd. 106,150 2,982,196
Billabong International, Ltd. 4,665 29,528
Bluescope Steel, Ltd. 50,750 98,032
Boral, Ltd. 17,086 55,916
Brambles, Ltd. 43,154 204,911
Caltex Australia, Ltd. 3,106 29,848
Centro Properties Group, Ltd. * 20,831 1,474
Copyright © 2012 www.secdatabase.com. All Rights Reserved.Please Consider the Environment Before Printing This Document

Centro Retail Group 32,506 2,198
CFS Gandel Retail Trust 66,172 87,586
Coca-Cola Amatil, Ltd. 20,615 139,538
Cochlear, Ltd. 2,251 98,393
Commonwealth Bank of Australia, Ltd. 46,277 1,315,308
Computershare, Ltd. 13,747 97,856
Crown, Ltd. 12,519 73,238
CSL, Ltd. 19,489 456,378
CSR, Ltd. 28,011 37,043
The accompanying notes are an integral part of the financial statements.
94
JOHN HANCOCK FUNDS II
PORTFOLIO OF INVESTMENTS - May 31, 2009 (Unaudited) - continued(showing percentage of total net assets)
International Equity Index Fund (continued)Shares or
Principal
Amount Value
COMMON STOCKS (continued)
Australia (continued)
Dexus Property Group, REIT 148,596 $ 91,017
Energy Resources of Australia, Ltd. 1,964 38,585
Fortescue Metals Group, Ltd. * (a) 39,653 84,237
Foster's Group, Ltd. 57,690 226,581
General Property Trust, Ltd. 343,104 142,878
Goodman Fielder, Ltd. 50,836 52,240
Harvey Norman Holding, Ltd. 11,715 27,660
Incitec Pivot, Ltd. 50,675 109,644
James Hardie Industries, Ltd. * 10,713 37,436
John Fairfax Holdings, Ltd. 76,313 70,670
Leighton Holdings, Ltd. 4,881 89,577
Lend Lease Corp. 11,812 65,546
Lion Nathan, Ltd. 8,290 78,217
Macquarie Airports, Ltd. 17,250 29,086
Macquarie Group, Ltd. 9,570 246,220
Macquarie Infrastructure Group 68,523 76,965
Metcash, Ltd. 20,343 68,201
Mirvac Group, Ltd. 65,667 60,764
National Australia Bank, Ltd. 58,655 1,043,144
Newcrest Mining, Ltd. 14,750 390,428
NRMA Insurance Group, Ltd. 61,712 179,847
Nufarm, Ltd. 6,202 61,222
OneSteel, Ltd. 40,647 89,153
Orica, Ltd. 10,550 170,678
Origin Energy, Ltd. 29,720 352,772
Oxiana, Ltd. 101,319 71,130
Paladin Resources, Ltd. * 17,025 69,132
Perpetual Trust of Australia, Ltd. 899 20,556
Qantas Airways, Ltd. 26,932 41,411
QBE Insurance Group, Ltd. 30,550 478,459
Rio Tinto, Ltd. 8,829 461,030
Santos, Ltd. 30,519 358,485
Sims Group, Ltd. 5,035 93,613
Sonic Healthcare, Ltd. 13,734 130,954
Stockland Company, Ltd. * 2,635 6,015
Stockland Company, Ltd. 77,698 193,735
Suncorp-Metway, Ltd. 42,717 204,338
TABCORP Holdings, Ltd. 17,142 101,318
Tattersall's, Ltd. 31,088 61,052
Telstra Corp., Ltd. 140,795 351,100
Copyright © 2012 www.secdatabase.com. All Rights Reserved.Please Consider the Environment Before Printing This Document

Toll Holdings, Ltd. 21,846 124,016
Transurban Group, Ltd. * 39,425 128,432
Virgin Blue Holdings, Ltd. * 12,681 2,855
Wesfarmers, Ltd., Price Protected Shares 4,019 68,765
Wesfarmers, Ltd. 31,392 539,093
Westfield Group 62,440 549,549
Westpac Banking Corp., Ltd. 87,935 1,335,948
Woodside Petroleum, Ltd. 15,162 528,981
Woolworths, Ltd. 38,273 778,873
WorleyParsons, Ltd. 5,077 91,865
18,155,564
Austria - 0.23%
Erste Bank der Oesterreichischen
Sparkassen AG (a) 5,754 139,882
Oesterreichische Elektrizitaets AG, Class A 2,716 147,136
OMV AG 5,106 207,057
International Equity Index Fund (continued)Shares or
Principal
Amount Value
COMMON STOCKS (continued)
Austria (continued)
Raiffeisen International Bank Holding AG (a) 1,810 $ 77,483
Telekom Austria AG (a) 12,512 193,248
Voestalpine AG 3,165 91,311
Wiener Staedtische Allgemeine
Versicherung AG 1,338 56,949
913,066
Belgium - 0.68%
Anheuser-Busch InBev NV 23,538 831,950
Anheuser-Busch InBev NV * 9,984 28
Belgacom SA 5,210 163,750
Colruyt SA 637 150,139
Compagnie Nationale A Portefeuille, ADR 1,550 80,703
Delhaize Group * (a) 3,315 244,063
Dexia SA * 19,659 125,198
Fortis Group SA * 70,261 269,556
Groupe Bruxelles Lambert SA 2,397 194,101
KBC Ancora, ADR * 3,251 40,449
KBC Bancassurance Holding NV * 5,137 107,443
Mobistar SA 1,281 79,195
Solvay SA 1,918 175,777
UCB SA (a) 3,846 127,998
Umicore 3,377 81,540
2,671,890
Bermuda - 0.06%
China Yurun Food Group, Ltd 38,000 53,173
Chinese Estates Holdings, Ltd. 28,561 43,443
SeaDrill, Ltd., GDR 8,231 120,967
217,583
Brazil - 1.46%
All America Latina Logistica SA 16,900 98,947
Aracruz Celulose SA, SADR * 845 14,441
B2W Companhia Global Do Varejo 2,100 44,058
Banco do Brasil SA 9,200 98,939
Banco Nossa Caixa SA 1,562 57,999
BM&F BOVESPA SA 38,241 219,231
Brasil Telecom Participacoes SA, ADR * 686 30,712
Brasil Telecom Participacoes SA * 2,800 90,862
Centrais Eletricas Brasileiras SA, ADR,
Copyright © 2012 www.secdatabase.com. All Rights Reserved.Please Consider the Environment Before Printing This Document

B Shares * 2,071 26,852
Centrais Eletricas Brasileiras SA, ADR * 3,447 46,373
Centrais Eletricas Brasileiras SA * 5,000 68,205
Cia de Concessoes Rodoviarias, ADR 5,400 84,996
Cia de Saneamento Basico do Estado de Sao
Paulo * 4,622 72,351
Cia Energetica de Minas Gerais, ADR 6,763 89,474
Companhia Brasileira de Distribuicao Grupo
Pao de Acucar, ADR 436 16,324
Companhia de Bebidas das Americas 9 592
Companhia Siderurgica Nacional SA, SADR 5,571 136,601
Companhia Siderurgica Nacional SA 5,866 143,788
Companhia Vale do Rio Doce 35,806 691,880
Cosan SA Industria e Comercio * 3,405 27,429
CPFL Energia SA 5,100 82,970
Cyrela Brazil Realty SA 8,000 61,395
EDP - Energias do Brasil SA 2,700 37,736
The accompanying notes are an integral part of the financial statements.
95
JOHN HANCOCK FUNDS II
PORTFOLIO OF INVESTMENTS - May 31, 2009 (Unaudited) - continued(showing percentage of total net assets)
International Equity Index Fund (continued)Shares or
Principal
Amount Value
COMMON STOCKS (continued)
Brazil (continued)
Empresa Brasileira de Aeronautica SA, ADR * 1,575 $ 30,208
Empresa Brasileira de Aeronautica SA * 13,400 66,060
Gerdau SA, SADR 5,235 54,444
Gerdau SA 7,058 57,430
Global Village Telecom Holding SA * 2,699 45,418
Itau Unibanco Holding SA * 2,485 39,884
JBS SA 13,126 44,896
LLX Logistica SA * 12,720 22,433
MRV Engenharia e Participacoes SA 2,629 36,209
Natura Cosmeticos SA 4,800 63,184
OGX Petroleo e Gas Participacoes SA 400 196,180
Perdigao SA * 4,400 86,408
Petroleo Brasileiro SA, ADR 9,352 411,768
Petroleo Brasileiro SA, SADR 13,446 470,207
Petroleo Brasileiro SA 53,184 1,166,610
Porto Seguro SA * 5,213 39,609
Redecard SA 9,694 141,695
Souza Cruz SA 3,200 83,757
Suzano Papel e Celulose SA * (i) 4,700 39,605
Tele Norte Leste Participacoes SA, ADR * 5,457 96,698
Tele Norte Leste Participacoes SA 2,500 54,635
Tractebel Energia SA 5,100 47,563
Ultrapar Participacoes SA 2,900 95,050
Usinas Siderurgicas de Minas Gerais
SA, SADR 1,235 24,452
Usinas Siderurgicas de Minas Gerais SA 2,800 53,692
Vivo Participacoes SA 802 16,176
Votorantim Celulose e Papel SA, SADR * 1,189 14,113
5,740,539
Canada - 7.08%
Addax Petroleum Corp. 2,600 85,496
Copyright © 2012 www.secdatabase.com. All Rights Reserved.Please Consider the Environment Before Printing This Document

Agnico-Eagle Mines, Ltd. 4,600 284,364
Agrium, Inc. 5,200 253,915
Alimentation Couche Tard, Inc. 3,500 42,991
ARC Energy Trust 2,700 42,958
Astral Media, Inc. 1,200 34,008
Bank of Montreal 16,800 674,000
Bank of Nova Scotia 31,100 1,087,610
Barrick Gold Corp. 27,408 1,038,579
BCE, Inc. 8,973 205,062
Biovail Corp. 3,800 48,242
Bombardier, Inc. 41,800 140,131
Brookfield Asset Management, Inc. 14,825 258,411
Brookfield Properties Corp. (a) 7,550 56,776
CAE, Inc. 9,300 61,333
Cameco Corp. 11,900 327,107
Canadian Imperial Bank of Commerce 11,800 589,703
Canadian National Railway Company 15,200 654,223
Canadian Natural Resources, Ltd. 16,900 1,001,694
Canadian Oil Sands Trust 7,700 197,481
Canadian Pacific Railway, Ltd. 5,500 223,678
Canadian Tire Corp., Ltd. 2,700 119,698
Canadian Utilities, Ltd. 3,000 97,220
CGI Group, Inc. * 7,600 70,657
CI Financial Corp. 4,500 74,193
Crescent Point Energy Trust 2,600 75,898
International Equity Index Fund (continued)Shares or
Principal
Amount Value
COMMON STOCKS (continued)
Canada (continued)
Eldorado Gold Corp. * 10,600 $ 105,053
Empire Company, Ltd. 1,100 47,940
Enbridge, Inc. 10,800 382,835
EnCana Corp. - CAD 23,600 1,297,000
Enerplus Resources Fund 5,400 127,166
Ensign Energy Services, Inc. 4,800 73,028
Fairfax Financial Holdings, Ltd. 500 129,164
Finning International, Inc. 6,000 81,392
First Quantum Minerals, Ltd. 2,400 106,926
Fortis, Inc. 5,500 120,907
Franco-Nevada Corp. 2,900 80,618
George Weston, Ltd. 1,500 84,841
Gerdau Ameristeel Corp. 5,700 37,800
Gildan Activewear, Inc. * 4,300 71,289
Goldcorp, Inc. 22,853 903,235
Great-West Lifeco, Inc. 9,200 187,918
Groupe Aeroplan, Inc. 6,736 46,398
Husky Energy, Inc. 8,400 257,828
IAMGOLD Corp. 12,000 134,976
IGM Financial, Inc. 4,000 139,592
Imperial Oil, Ltd. 9,700 394,308
Industrial Alliance Insurance and Financial
Services, Inc. 3,100 74,451
Inmet Mining Corp. 1,300 51,774
Intact Financial Corp. 2,500 79,208
Ivanhoe Mines, Ltd. * 5,800 31,344
Jazz Air Income Fund, ADR * 415 935
Kinross Gold Corp. 20,258 406,552
Loblaw Companies, Ltd. 3,900 128,315
Magna International, Inc. 3,000 99,473
Manitoba Telecom Services, Inc. 1,000 31,097
Manulife Financial Corp. (c) 51,400 1,106,389
MDS, Inc. * 1,400 6,925
Copyright © 2012 www.secdatabase.com. All Rights Reserved.Please Consider the Environment Before Printing This Document
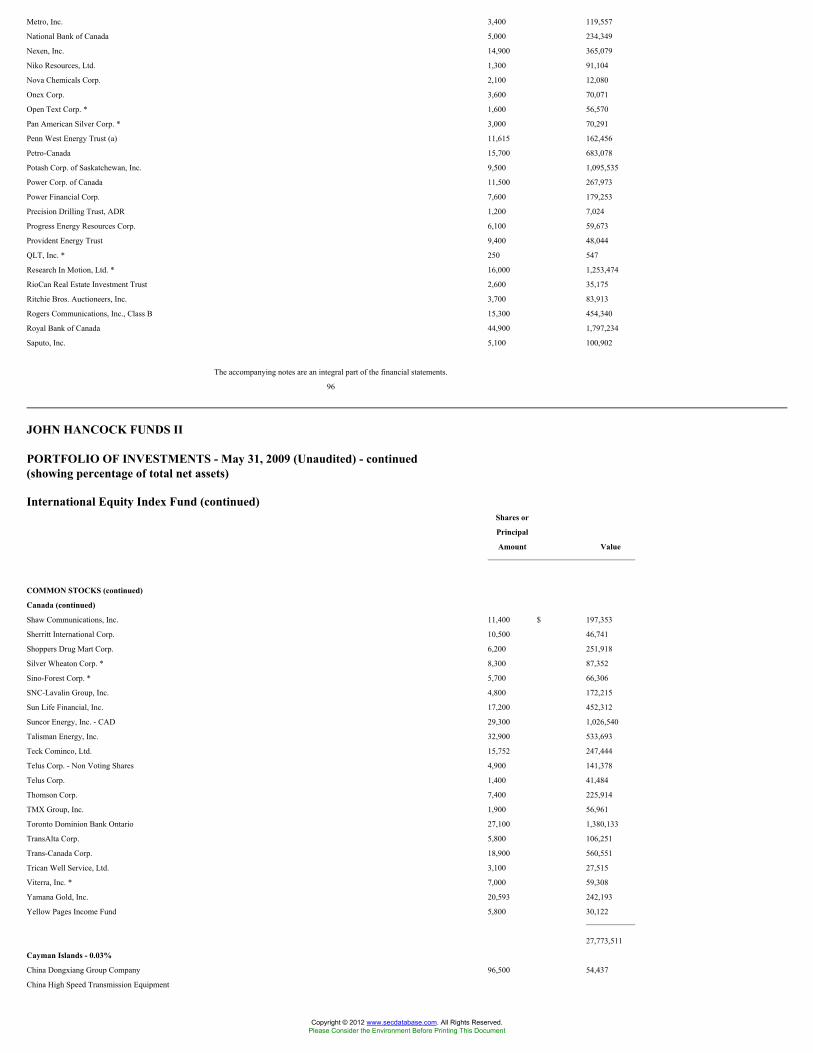
Metro, Inc. 3,400 119,557
National Bank of Canada 5,000 234,349
Nexen, Inc. 14,900 365,079
Niko Resources, Ltd. 1,300 91,104
Nova Chemicals Corp. 2,100 12,080
Onex Corp. 3,600 70,071
Open Text Corp. * 1,600 56,570
Pan American Silver Corp. * 3,000 70,291
Penn West Energy Trust (a) 11,615 162,456
Petro-Canada 15,700 683,078
Potash Corp. of Saskatchewan, Inc. 9,500 1,095,535
Power Corp. of Canada 11,500 267,973
Power Financial Corp. 7,600 179,253
Precision Drilling Trust, ADR 1,200 7,024
Progress Energy Resources Corp. 6,100 59,673
Provident Energy Trust 9,400 48,044
QLT, Inc. * 250 547
Research In Motion, Ltd. * 16,000 1,253,474
RioCan Real Estate Investment Trust 2,600 35,175
Ritchie Bros. Auctioneers, Inc. 3,700 83,913
Rogers Communications, Inc., Class B 15,300 454,340
Royal Bank of Canada 44,900 1,797,234
Saputo, Inc. 5,100 100,902
The accompanying notes are an integral part of the financial statements.
96
JOHN HANCOCK FUNDS II
PORTFOLIO OF INVESTMENTS - May 31, 2009 (Unaudited) - continued(showing percentage of total net assets)
International Equity Index Fund (continued)Shares or
Principal
Amount Value
COMMON STOCKS (continued)
Canada (continued)
Shaw Communications, Inc. 11,400 $ 197,353
Sherritt International Corp. 10,500 46,741
Shoppers Drug Mart Corp. 6,200 251,918
Silver Wheaton Corp. * 8,300 87,352
Sino-Forest Corp. * 5,700 66,306
SNC-Lavalin Group, Inc. 4,800 172,215
Sun Life Financial, Inc. 17,200 452,312
Suncor Energy, Inc. - CAD 29,300 1,026,540
Talisman Energy, Inc. 32,900 533,693
Teck Cominco, Ltd. 15,752 247,444
Telus Corp. - Non Voting Shares 4,900 141,378
Telus Corp. 1,400 41,484
Thomson Corp. 7,400 225,914
TMX Group, Inc. 1,900 56,961
Toronto Dominion Bank Ontario 27,100 1,380,133
TransAlta Corp. 5,800 106,251
Trans-Canada Corp. 18,900 560,551
Trican Well Service, Ltd. 3,100 27,515
Viterra, Inc. * 7,000 59,308
Yamana Gold, Inc. 20,593 242,193
Yellow Pages Income Fund 5,800 30,122
27,773,511
Cayman Islands - 0.03%
China Dongxiang Group Company 96,500 54,437
China High Speed Transmission Equipment
Copyright © 2012 www.secdatabase.com. All Rights Reserved.Please Consider the Environment Before Printing This Document

Group Company, Ltd. 29,000 60,833
Hopewell Highway Infrastructure, Ltd. 2,300 1,302
116,572
Chile - 0.29%
Banco Santander Chile SA, ADR 2,667 111,080
Banco Santander SA 1,001 10,646
Cia Cervecerias Unidas SA, ADR 1,107 35,911
Corpbanca SA, SADR 650 17,875
Embotelladora Andina SA, ADR, Series A 915 12,004
Embotelladora Andina SA, ADR, Series B 1,006 16,800
Empresa Nacional de Electricidad SA, ADR 7,069 315,914
Enersis SA, SADR 16,935 289,758
Lan Airlines SA, SADR 4,620 51,652
Sociedad Quimica y Minera de
Chile SA, ADR, B Shares (a) 7,170 260,701
Vina Concha Y Toro SA, ADR 911 33,753
1,156,094
China - 2.19%
Air China, Ltd., Class H * 123,466 61,298
Aluminum Corp. of China, Ltd. 112,780 109,145
Angang New Steel Company, Ltd., Class H 29,012 43,381
Bank of China, Ltd. 1,815,474 817,480
Bank of Communications Company, Ltd.,
Class H 208,879 192,935
Beijing Capital International Airport Company,
Ltd., Class H * 81,211 64,288
Beijing Datang Power Generation
Company, Ltd., Class H 141,136 72,620
BYD Company, Ltd., H Shares * 24,494 97,293
Chaoda Modern Agriculture Holdings, Ltd. 73,214 45,917
International Equity Index Fund (continued)Shares or
Principal
Amount Value
COMMON STOCKS (continued)
China (continued)
China BlueChemical, Ltd. 68,000 $ 40,443
China CITIC Bank 232,000 130,096
China Coal Energy Company, Series H 97,595 117,401
China Communications
Construction Company, Ltd. 129,665 180,125
China Communications Services Corp., Ltd.,
Class H 82,000 50,041
China Construction Bank Corp. 1,407,118 918,259
China COSCO Holdings Company, Ltd. * 72,879 100,537
China Life Insurance Company, Ltd. 231,376 844,966
China Merchants Bank Company, Ltd. 103,390 211,900
China National Building Material Company,
Ltd. 36,000 79,006
China Oilfield Services, Ltd., H Shares 70,000 77,217
China Petroleum & Chemical Corp., Class H 518,030 423,082
China Railway Construction Corp. - Hong
Kong Exchange * 66,000 95,264
China Railway Group, Ltd. * 146,000 121,196
China Shenhua Energy Company, Ltd. 103,000 343,880
China Shipping Container Lines Company, Ltd. * 134,076 42,033
China Shipping Development Company, Ltd.,
Class H 55,568 82,439
China Telecom Corp., Ltd. 432,396 204,748
Country Garden Holdings Company, Ltd. 161,000 79,128
Dongfeng Motor Group Company, Ltd. 78,780 75,775
Foxconn International Holdings, Ltd. * 81,000 58,289
Copyright © 2012 www.secdatabase.com. All Rights Reserved.Please Consider the Environment Before Printing This Document

Guangdong Investment, Ltd. 96,780 49,436
Guangshen Railway Company, Ltd., Class H 61,211 29,185
Guangzhou R&F Properties Company, Ltd., H
Shares 28,000 64,108
Huaneng Power International, Inc., Class H 120,564 80,403
Industrial & Commercial Bank of China, Ltd. 1,358,000 854,677
Jiangsu Expressway, Ltd. 46,855 32,541
Jiangxi Copper Company, Ltd., Class H 36,925 61,569
Lenovo Group, Ltd. 200,564 81,526
Maanshan Iron & Steel Company, Ltd. * 77,925 43,206
PetroChina Company, Ltd., Class H 687,739 789,572
PICC Property & Casualty Company, Ltd.,
Class H * 106,780 72,011
Shanghai Electric Group Company, Ltd. 133,136 63,921
Shui On Land, Ltd. 78,650 51,244
Sinopec Shanghai Petrochemical
Company, Ltd., Class H * 92,066 34,457
Tingyi Cayman Islands Holding Corp. * 60,000 89,888
Tsingtao Brewery Company, Ltd., Series H 16,000 45,350
Want Want China Holdings, Ltd. 87,000 42,422
Weichai Power Company, Ltd. 12,800 48,862
Yanzhou Coal Mining Company, Ltd., Class H 51,210 64,517
Zhejiang Expressway Company, Ltd., Class H 54,282 42,202
Zijin Mining Group, Ltd. 151,686 138,285
ZTE Corp., Class H 14,480 48,275
8,607,839
Colombia - 0.11%
BanColombia SA, ADR 15,548 446,228
Czech Republic - 0.11%
CEZ AS 6,307 284,939
Komercni Banka AS 489 61,129
The accompanying notes are an integral part of the financial statements.
97
JOHN HANCOCK FUNDS II
PORTFOLIO OF INVESTMENTS - May 31, 2009 (Unaudited) - continued(showing percentage of total net assets)
International Equity Index Fund (continued)Shares or
Principal
Amount Value
COMMON STOCKS (continued)
Czech Republic (continued)
Telefonica Czech Republic AS 4,409 $ 94,982
441,050
Denmark - 0.65%
A P Moller Maersk AS, Series A 15 92,770
A P Moller Maersk AS 39 242,473
Carlsberg AS, B Shares 3,400 217,483
Coloplast AS 923 63,704
Danske Bank AS * 15,000 258,032
DSV AS, ADR * 7,100 88,189
H. Lundbeck AS 1,700 38,100
Novo Nordisk AS 14,600 760,267
Novozymes AS, B Shares 1,750 138,709
Topdanmark AS * 650 78,525
TrygVesta AS 997 59,188
Vestas Wind Systems AS * 6,400 468,329
William Demant Holdings AS * 900 50,837
Copyright © 2012 www.secdatabase.com. All Rights Reserved.Please Consider the Environment Before Printing This Document

2,556,606
Egypt - 0.12%
Commercial International Bank 9,439 77,102
Egypt Kuwait Holding Company 23,460 38,267
Egyptian Company for Mobile Services 751 25,535
Egyptian Financial Group-Hermes Holding 7,160 29,336
EL Ezz Aldekhela Steel Alexandria 171 20,416
EL EZZ Steel Company 14,640 28,120
ElSwedy Cables Holding Company 1,960 21,771
Orascom Construction Industries 3,060 111,774
Orascom Telecom Holding SAE 12,269 72,385
Sidi Kerir Petrochemicals Company 9,437 16,337
Talaat Moustafa Group * 21,101 16,751
Telecom Egypt 6,820 21,594
479,388
Finland - 0.95%
Elisa Oyj, Class A 5,350 79,557
Fortum Corp. Oyj 14,168 348,094
Kesko Oyj 2,700 78,244
Kone Corp. Oyj 5,548 168,527
Metra Oyj, B Shares 2,400 86,855
Metso Oyj 3,500 67,312
Neste Oil Oyj 5,252 81,407
Nokia AB Oyj 119,950 1,837,180
Nokian Renkaat Oyj (a) 4,480 85,031
Orion Oyj, Series B 3,723 60,667
Outokumpu Oyj 5,200 104,336
Pohjola Bank PLC 4,484 34,583
Rautaruukki Oyj (a) 3,200 72,767
Sampo Oyj, A Shares 13,270 250,673
Sanoma WSOY Oyj (a) 3,520 56,330
Stora Enso Oyj, Series R * 21,400 128,402
UPM-Kymmene Oyj 19,298 180,931
3,720,896
France - 6.76%
Accor SA (a) 4,497 200,115
Aeroports de Paris 897 65,369
Air France KLM 4,789 76,475
International Equity Index Fund (continued)Shares or
Principal
Amount Value
COMMON STOCKS (continued)
France (continued)
Air Liquide (a) 7,728 $ 718,869
Alcatel-Lucent * 73,858 188,307
Alstom 6,883 437,224
Atos Origin SA 2,001 67,558
AXA Group SA 48,466 907,591
BNP Paribas SA 25,868 1,798,435
Bouygues SA 7,656 315,084
Bureau Veritas SA 1,080 53,144
Cap Gemini SA 4,470 173,014
Carrefour SA (a) 19,844 888,955
Casino Guichard-Perrachon SA (a) 1,207 88,089
Christian Dior SA 1,715 131,192
Cie Generale de Geophysique-Veritas * 4,403 77,825
CNP Assurances SA 1,135 107,734
Compagnie de Saint-Gobain SA 11,893 433,966
Compagnie Generale des Etablissements
Michelin, Class B (a) 4,385 266,695
Copyright © 2012 www.secdatabase.com. All Rights Reserved.Please Consider the Environment Before Printing This Document
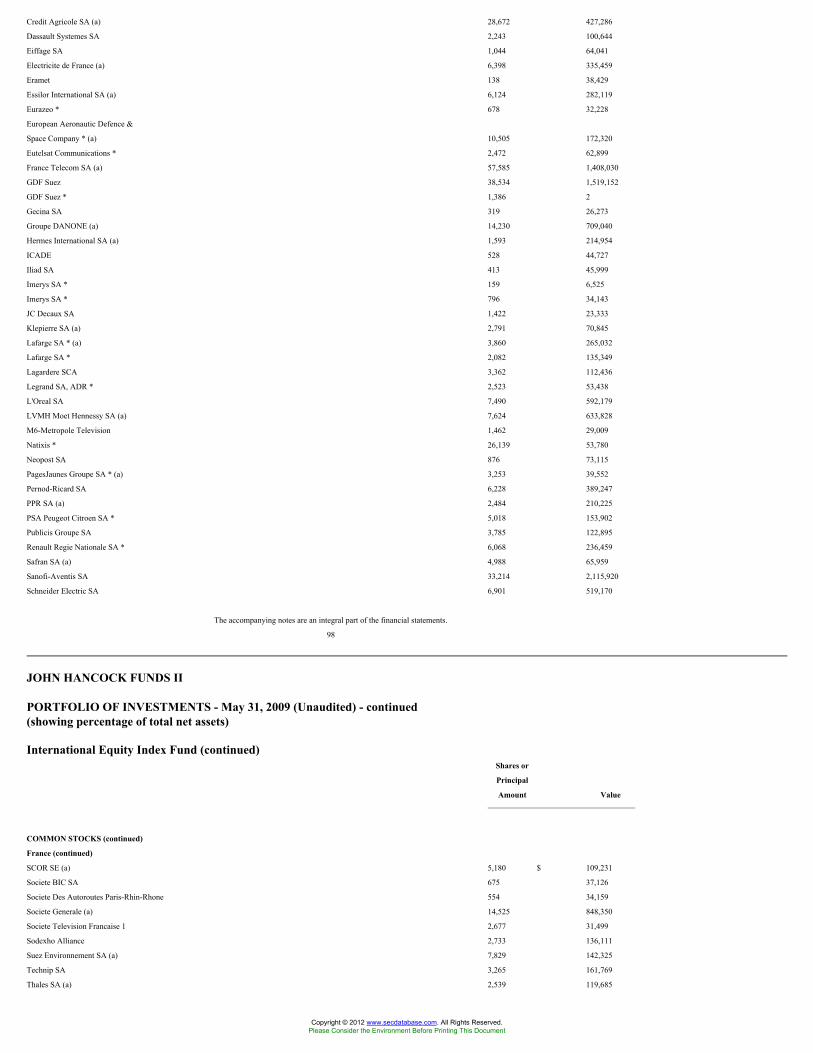
Credit Agricole SA (a) 28,672 427,286
Dassault Systemes SA 2,243 100,644
Eiffage SA 1,044 64,041
Electricite de France (a) 6,398 335,459
Eramet 138 38,429
Essilor International SA (a) 6,124 282,119
Eurazeo * 678 32,228
European Aeronautic Defence &
Space Company * (a) 10,505 172,320
Eutelsat Communications * 2,472 62,899
France Telecom SA (a) 57,585 1,408,030
GDF Suez 38,534 1,519,152
GDF Suez * 1,386 2
Gecina SA 319 26,273
Groupe DANONE (a) 14,230 709,040
Hermes International SA (a) 1,593 214,954
ICADE 528 44,727
Iliad SA 413 45,999
Imerys SA * 159 6,525
Imerys SA * 796 34,143
JC Decaux SA 1,422 23,333
Klepierre SA (a) 2,791 70,845
Lafarge SA * (a) 3,860 265,032
Lafarge SA * 2,082 135,349
Lagardere SCA 3,362 112,436
Legrand SA, ADR * 2,523 53,438
L'Oreal SA 7,490 592,179
LVMH Moet Hennessy SA (a) 7,624 633,828
M6-Metropole Television 1,462 29,009
Natixis * 26,139 53,780
Neopost SA 876 73,115
PagesJaunes Groupe SA * (a) 3,253 39,552
Pernod-Ricard SA 6,228 389,247
PPR SA (a) 2,484 210,225
PSA Peugeot Citroen SA * 5,018 153,902
Publicis Groupe SA 3,785 122,895
Renault Regie Nationale SA * 6,068 236,459
Safran SA (a) 4,988 65,959
Sanofi-Aventis SA 33,214 2,115,920
Schneider Electric SA 6,901 519,170
The accompanying notes are an integral part of the financial statements.
98
JOHN HANCOCK FUNDS II
PORTFOLIO OF INVESTMENTS - May 31, 2009 (Unaudited) - continued(showing percentage of total net assets)
International Equity Index Fund (continued)Shares or
Principal
Amount Value
COMMON STOCKS (continued)
France (continued)
SCOR SE (a) 5,180 $ 109,231
Societe BIC SA 675 37,126
Societe Des Autoroutes Paris-Rhin-Rhone 554 34,159
Societe Generale (a) 14,525 848,350
Societe Television Francaise 1 2,677 31,499
Sodexho Alliance 2,733 136,111
Suez Environnement SA (a) 7,829 142,325
Technip SA 3,265 161,769
Thales SA (a) 2,539 119,685
Copyright © 2012 www.secdatabase.com. All Rights Reserved.Please Consider the Environment Before Printing This Document

Total SA (a) 67,550 3,910,030
Unibail-Rodamco, REIT 2,639 424,724
Vallourec SA (a) 1,577 199,262
Veolia Environnement SA 11,569 341,850
Vinci SA (a) 13,126 631,971
Vivendi SA 36,675 968,230
26,511,906
Germany - 5.24%
Adidas-Salomon AG 5,942 217,428
Allianz SE 14,257 1,405,462
BASF SE 29,017 1,225,382
Bayer AG (a) 24,036 1,368,649
Bayerische Motoren Werke (BMW) AG 10,615 382,573
Beiersdorf AG 2,980 146,680
Celesio AG 2,977 67,469
Commerzbank AG * (a) 22,317 176,074
Daimler AG 28,286 1,037,405
Deutsche Bank AG (a) 17,033 1,145,903
Deutsche Boerse AG 6,041 527,442
Deutsche Lufthansa AG 7,756 107,440
Deutsche Post AG 27,363 378,524
Deutsche Postbank AG * 2,776 65,137
Deutsche Telekom AG 88,926 1,022,719
E.ON AG 60,021 2,122,182
Fraport AG, ADR (a) 1,246 51,117
Fresenius AG 1,062 51,244
Fresenius Medical Care AG (a) 6,624 277,633
Fresenius SE 2,984 170,798
GEA Group AG 4,996 78,511
Hamburger Hafen und Logistik AG 676 28,277
Hannover Rueckversicherung AG * 2,238 84,144
Henkel AG & Company KGaA 4,924 132,629
Hochtief AG 1,513 73,393
K&S AG (a) 4,736 352,644
Linde AG 4,124 344,501
MAN AG 3,416 208,787
Merck KGaA 2,080 200,282
Metro AG 3,637 196,022
Muenchener Rueckversicherungs-
Gesellschaft AG (MunichRe) 6,459 906,256
Puma AG 247 57,013
Qiagen AG * 5,443 96,772
RWE AG 13,978 1,162,422
Salzgitter AG (a) 1,375 128,625
SAP AG (a) 26,950 1,160,207
Siemens AG 26,295 1,920,553
Solarworld AG (a) 2,809 87,879
International Equity Index Fund (continued)Shares or
Principal
Amount Value
COMMON STOCKS (continued)
Germany (continued)
Suedzucker AG 3,085 $ 64,125
Thyssen Krupp AG 10,897 278,126
TUI AG * 8,419 74,726
United Internet AG * 4,956 63,724
Volkswagen AG 2,769 838,992
Wacker Chemie AG 569 71,225
20,557,096
Greece - 0.43%
Alpha Bank A.E. * 11,424 137,499
Copyright © 2012 www.secdatabase.com. All Rights Reserved.Please Consider the Environment Before Printing This Document

Bank of Cyprus PCL 3,674 18,438
Bank of Piraeus SA * 9,212 106,703
Coca-Cola Hellenic Bottling Company SA 6,355 130,924
EFG Eurobank Ergas SA * (a) 9,227 107,688
Hellenic Petroleum SA 4,660 46,783
Hellenic Telecommunications Organization SA 9,860 160,285
Marfin Financial Group SA Holdings * 20,772 110,879
National Bank of Greece SA * 15,939 441,147
OPAP SA 8,010 247,483
Public Power Corp. SA 4,480 101,751
Titan Cement Company SA * 2,180 63,324
1,672,904
Hong Kong - 3.20%
Agile Property Holdings, Ltd. 63,211 78,860
Alibaba.com, Ltd. * 26,000 50,986
Anhui Conch Cement Company, Ltd., Class H 17,070 122,842
ASM Pacific Technology, Ltd. 4,500 26,552
Bank of East Asia, Ltd. 54,451 180,648
Beijing Enterprises Holdings, Ltd. 16,714 76,286
Belle International Holdings, Ltd., GDR 108,888 85,279
BOC Hong Kong Holdings, Ltd. 120,500 191,067
Cathay Pacific Airways, Ltd. 31,000 43,442
Cheung Kong Holdings, Ltd. 43,000 533,193
Cheung Kong Infrastructure Holdings, Ltd. 17,000 63,062
China Agri-Industries Holdings, Ltd. * 65,784 43,100
China Everbright, Ltd. 31,784 76,709
China Insurance International Holdings
Company, Ltd. * 26,000 48,984
China Mengniu Dairy Company, Ltd. * 46,498 99,583
China Merchants Holdings International
Company, Ltd. 30,693 94,570
China Mobile, Ltd. 189,970 1,857,617
China Overseas Land & Investment, Ltd. 136,397 288,450
China Resource Power Holdings, Ltd. 53,211 114,882
China Resources Enterprises, Ltd. 44,855 98,994
China Resources Land, Ltd. 51,211 121,293
China Travel International Investment
Hong Kong, Ltd. 175,709 42,505
China Unicom, Ltd. 178,416 220,934
Citic Pacific, Ltd. 29,033 67,685
CLP Holdings, Ltd. 66,000 442,618
CNOOC, Ltd. 568,716 748,892
CNPC Hong Kong, Ltd. 100,000 68,696
Cosco Pacific, Ltd. 52,855 71,867
Denway Motors, Ltd. 175,559 85,051
Dongfang Electrical Machinery Company, Ltd. 12,000 46,762
Esprit Holdings, Ltd. 37,500 238,549
The accompanying notes are an integral part of the financial statements.
99
JOHN HANCOCK FUNDS II
PORTFOLIO OF INVESTMENTS - May 31, 2009 (Unaudited) - continued(showing percentage of total net assets)
International Equity Index Fund (continued)Shares or
Principal
Amount Value
COMMON STOCKS (continued)
Hong Kong (continued)
Fosun International 65,500 $ 40,785
Copyright © 2012 www.secdatabase.com. All Rights Reserved.Please Consider the Environment Before Printing This Document

Gome Electrical Appliances Holdings, Ltd. 277,708 40,122
Hang Lung Group, Ltd. 30,000 136,574
Hang Lung Properties, Ltd. 72,000 240,753
Hang Seng Bank, Ltd. 24,400 350,310
Harbin Power Equipment Company, Ltd. 42,000 45,509
Henderson Land Development Company, Ltd. 37,508 225,880
Hengan International Group Company, Ltd. 26,000 118,778
Hong Kong & China Gas Company, Ltd. 120,870 245,029
Hong Kong Aircraft Engineering Company, Ltd. 1,600 19,367
Hong Kong Electric Holdings, Ltd. 48,500 260,458
Hong Kong Exchanges & Clearing, Ltd. 32,000 496,721
Hopewell Holdings, Ltd. 23,000 70,660
Huabao International Holdings, Ltd. 45,000 40,715
Hutchison Telecommunications Hong Kong
Holdings, Ltd. * 59,000 5,556
Hutchison Telecommunications
International, Ltd. * 59,000 11,938
Hutchison Whampoa, Ltd. 66,000 462,028
Hysan Development Company, Ltd. 16,071 37,120
Kerry Properties, Ltd. 18,768 81,068
Kingboard Chemical Holdings, Ltd. 14,000 36,278
Li & Fung, Ltd. 69,600 186,369
Li Ning Company, Ltd. 29,749 72,386
Lifestyle International Holdings, Ltd. 15,500 19,111
Link, REIT 65,166 128,011
Mongolia Energy Company, Ltd. * 89,000 37,242
MTR Corp., Ltd. 40,073 126,588
New World Development Company, Ltd. 76,586 144,659
Noble Group, Ltd. 40,400 44,300
NWS Holdings, Ltd. 25,152 54,989
Orient Overseas International, Ltd. 5,000 21,926
Parkson Retail Group, Ltd. 42,500 67,183
Ping An Insurance Group Company of China,
Ltd. 40,355 281,050
Shanghai Industrial Holdings, Ltd. 14,070 56,002
Shangri-La Asia, Ltd. 36,000 56,114
Shimao Property Holdings, Ltd., GDR 49,500 84,968
Sino Land Company, Ltd. 52,482 98,295
Sinofert Holdings, Ltd. * 76,000 37,017
Sino-Ocean Land Holdings, Ltd. 122,500 126,056
Soho China, Ltd. 73,500 47,591
Sun Hung Kai Properties, Ltd. 44,000 549,692
Swire Pacific, Ltd., Class A 27,000 270,631
Television Broadcasting Company, Ltd. 13,000 53,911
Tencent Holdings, Ltd. 29,000 322,950
Wharf Holdings, Ltd. 41,625 172,975
Wheelock and Company, Ltd. 26,000 74,476
Wing Hang Bank, Ltd. 6,085 54,880
Yue Yuen Industrial Holdings, Ltd. 25,500 58,585
12,543,564
Hungary - 0.10%
Gedeon Richter Rt. 541 79,258
Magyar Telekom Rt. 18,477 54,789
MOL Magyar Olaj & Gazipari Rt. 1,808 111,951
International Equity Index Fund (continued)Shares or
Principal
Amount Value
COMMON STOCKS (continued)
Hungary (continued)
OTP Bank Rt. * (a) 9,254 $ 164,840
410,838
Copyright © 2012 www.secdatabase.com. All Rights Reserved.Please Consider the Environment Before Printing This Document

India - 1.47%
Dr. Reddy's Laboratories, Ltd., ADR 13,663 183,631
Grasim Industries, Ltd., ADR (f) 3,064 144,560
ICICI Bank, Ltd., SADR 30,265 942,452
Infosys Technologies, Ltd., ADR 36,658 1,267,634
Larsen & Toubro, Ltd., ADR (f) 2,732 81,308
Ranbaxy Laboratories, Ltd., ADR * 13,077 78,462
Reliance Communication, Ltd., ADR (f) 46,973 304,728
Reliance Energy, Ltd., ADR (a)(f) 447 36,204
Reliance Industries, Ltd., GDR * (f) 19,633 1,900,474
Reliance Natural Resources, Ltd., ADR * (f) 8,956 31,497
Satyam Computer Services, Ltd., ADR 17,159 36,377
State Bank of India GDR * 3,526 280,317
State Bank of India GDR * 50 3,999
Tata Communications, Ltd., ADR 1,347 25,458
Tata Motors, Ltd., SADR (a) 14,360 139,005
Wipro, Ltd., ADR (a) 24,778 292,380
5,748,486
Indonesia - 0.32%
Aneka Tambang Tbk PT 82,500 15,919
Astra Agro Lestari Tbk PT 10,000 17,319
Astra International Tbk PT 64,000 129,518
Bank Central Asia Tbk PT 368,000 120,842
Bank Danamon Indonesia Tbk PT * 55,426 20,234
Bank Mandiri Tbk PT 256,500 74,262
Bank Rakyat Indonesia Tbk PT 180,000 109,902
Bumi Resources Tbk PT 594,500 113,685
Indocement Tunggal Prakarsa Tbk PT 23,000 14,899
Indofood Sukses Makmur Tbk PT 105,500 18,330
Indosat Tbk PT 45,500 23,439
International Nickel Indonesia Tbk PT * 50,000 17,518
Lippo Karawaci Tbk PT * 547,000 39,935
Perusahaan Gas Negara Tbk PT 347,500 97,550
PT Telekomunikiasi Indonesia Tbk PT, SADR 4,500 133,110
Semen Gresik Persero Tbk PT * 94,000 42,789
Tambang Batubara Bukit Asam Tbk PT 41,500 45,412
Telekomunikasi Indonesia Tbk PT 162,500 118,052
Unilever Indonesia Tbk PT 69,000 52,656
United Tractors Tbk PT 35,333 35,081
1,240,452
Ireland - 0.29%
Allied Irish Banks PLC - London Exchange 1,000 1,894
Anglo Irish Bank Corp. PLC * 29,183 8,952
Bank of Ireland - London Exchange * 21,681 51,769
Bank of Ireland * 21,227 50,516
C&C Group PLC 187 597
CRH PLC - London Exchange 5,888 137,357
CRH PLC 15,575 368,888
Elan Corp. PLC (Ordinary Shares) * 10,203 73,620
Elan Corp. PLC * 3,097 22,410
Experian Group, Ltd. 36,713 271,861
Greencore Group PLC 32 52
Kerry Group PLC 2,619 62,336
The accompanying notes are an integral part of the financial statements.
100
JOHN HANCOCK FUNDS II
PORTFOLIO OF INVESTMENTS - May 31, 2009 (Unaudited) - continued(showing percentage of total net assets)
International Equity Index Fund (continued)Shares or
Copyright © 2012 www.secdatabase.com. All Rights Reserved.Please Consider the Environment Before Printing This Document

Principal
Amount Value
COMMON STOCKS (continued)
Ireland (continued)
Kerry Group PLC 1,276 $ 30,505
Ryanair Holdings PLC, SADR * 1,496 43,563
1,124,320
Israel - 0.59%
Alvarion, Ltd., ADR * 649 1,895
Audio Codes, Ltd., ADR * 664 943
Bank Hapoalim, Ltd. * 32,717 87,467
Bank Leumi Le-Israel, Ltd. 38,799 110,146
Bezek Israeli Telecommunications Corp., Ltd. 40,956 76,455
Cellcom Israel, Ltd. 1,500 40,050
Check Point Software Technologies, Ltd. * 4,907 114,578
Delek Group, Ltd. 273 31,404
Delek Real Estate, Ltd. * 2,787 2,932
Discount Investment Corp. 1,168 20,517
Elbit Systems, Ltd. 841 51,441
Given Imaging Corp., ADR * 209 1,979
ICL Israel Chemicals, Ltd. 16,402 185,437
Israel Corp., Ltd. 77 41,653
Israel Discount Bank, Ltd. 28,917 36,529
Makhteshim-Agam Industries, Ltd. 10,965 63,204
Nice Systems, Ltd. * 2,378 55,335
Ormat Industries, Ltd. 1,927 15,874
Partner Communications, Ltd. 1,898 32,746
RADWARE, Ltd., ADR * 413 3,143
Syneron Medical, Ltd., ADR * 423 3,050
Teva Pharmaceutical Industries, Ltd. 27,825 1,294,009
United Mizrahi Bank, Ltd. * 6,424 38,137
2,308,924
Italy - 2.57%
A2A SpA 49,116 92,725
Acea SpA 4,493 58,249
Alleanza Assicurazioni SpA 16,566 121,140
Assicurazioni Generali SpA 33,014 738,276
Autogrill SpA 5,120 47,880
Autostrade SpA 9,839 208,427
Banca Carige SpA 30,476 94,927
Banca Intesa SpA - Non convertible 35,747 107,151
Banca Monte dei Paschi Siena SpA (a) 93,457 159,671
Banca Popolare di Milano SpA 16,093 108,552
Banche Popolari Unite SpA 19,214 266,642
Banco Popolare Societa Cooperativa * 24,495 203,227
Enel SpA 141,606 844,901
Eni SpA 82,162 1,988,956
Exor SpA 1,598 27,074
Fiat SpA * 22,282 237,423
Finmeccanica SpA 15,085 213,674
Fondiaria-Sai SpA 3,169 52,573
Intesa Sanpaolo SpA * 252,099 911,964
Italcementi SpA 3,618 41,812
Lottomatica SpA 2,709 54,271
Luxottica Group SpA * 5,478 114,071
Mediaset SpA 29,599 174,498
Mediobanca SpA 14,539 175,765
Mediolanum SpA 10,638 52,877
Parmalat SpA 64,300 159,428
International Equity Index Fund (continued)Shares or
Principal
Copyright © 2012 www.secdatabase.com. All Rights Reserved.Please Consider the Environment Before Printing This Document

Amount Value
COMMON STOCKS (continued)
Italy (continued)
Pirelli & Company SpA * 135,780 $ 54,899
Prysmian SpA 4,879 71,099
Saipem SpA 8,257 210,861
Saras SpA 15,162 45,179
Snam Rete Gas SpA 29,485 127,698
Telecom Italia SpA 340,104 479,485
Telecom Italia SpA 224,644 229,858
Tenaris SA * 14,111 215,983
Terna SpA 45,500 167,216
UniCredit Italiano SpA * 452,831 1,190,687
Unipol Gruppo Finanziario SpA, ADR * 31,121 40,862
10,089,981
Japan - 15.82%
ABC-MART, Inc. 1,100 24,846
Acom Company, Ltd. (a) 1,860 48,634
Advantest Corp. 5,200 93,405
AEON Company, Ltd. 21,900 203,604
AEON Credit Service Company, Ltd. 1,600 21,186
Aeon Mall Company, Ltd. 1,700 29,113
Aioi Insurance Company, Ltd. 17,000 79,916
Aisin Seiki Company 6,000 119,723
Ajinomoto Company, Inc. 23,000 171,488
Alfresa Holdings Corp. 800 33,225
All Nippon Airways Company, Ltd. 24,000 89,006
Amada Company, Ltd. 10,000 66,706
Aozora Bank, Ltd. 13,000 21,010
Asahi Breweries, Ltd. 13,200 181,883
Asahi Glass Company, Ltd. 30,000 220,783
Asahi Kasei Corp. 37,000 183,098
ASICS Corp. 4,000 31,173
Astellas Pharmaceuticals, Inc. 15,500 526,909
Bank of Kyoto, Ltd. 10,000 89,347
Benesse Corp. 2,600 109,296
Bridgestone Corp. 18,500 282,580
Brother Industries, Ltd. 7,400 70,248
Canon Sales Company, Inc. 1,800 24,497
Canon, Inc. 33,500 1,112,208
Casio Computer Company, Ltd. 6,300 56,798
Central Japan Railway Company, Ltd. 50 320,436
Chiba Bank, Ltd. 23,000 140,016
Chubu Electric Power Company, Inc. 20,500 457,041
Chugai Pharmaceutical Company, Ltd. 6,700 122,373
Chugoku Bank, Ltd. 6,000 81,153
Chugoku Electric Power Company, Inc. 8,600 177,373
Citizen Watch Company, Ltd. 8,600 43,499
Coca-Cola West Japan Company, Ltd. 2,300 39,276
Cosmo Oil Company, Ltd. 19,000 69,180
Credit Saison Company, Ltd. 4,800 64,877
Dai Nippon Printing Company, Ltd. 19,000 243,583
Daicel Chemical Industries, Ltd. 7,000 37,739
Daido Steel Company, Ltd. 7,000 30,585
Daihatsu Motor Company, Ltd. 7,000 67,910
Daiichi Sankyo Company, Ltd. 20,700 387,635
Daikin Industries, Ltd. 8,300 256,576
Dainippon Ink & Chemicals, Inc. 16,000 25,757
Dainippon Sumitomo Pharma Company, Ltd. 3,700 30,501
The accompanying notes are an integral part of the financial statements.
101
Copyright © 2012 www.secdatabase.com. All Rights Reserved.Please Consider the Environment Before Printing This Document

JOHN HANCOCK FUNDS II
PORTFOLIO OF INVESTMENTS - May 31, 2009 (Unaudited) - continued(showing percentage of total net assets)
International Equity Index Fund (continued)Shares or
Principal
Amount Value
COMMON STOCKS (continued)
Japan (continued)
Daito Trust Construction Company, Ltd. 2,800 $ 127,100
Daiwa House Industry Company, Ltd. 15,000 143,161
Daiwa Securities Group, Inc. 44,000 277,549
Dena Company, Ltd. 8 27,500
Denki Kagaku Kogyo Kabushiki Kaisha 12,000 32,991
Denso Corp. 14,900 357,812
Dentsu, Inc. (a) 6,100 118,045
Dowa Mining Company, Ltd. 7,000 31,551
East Japan Railway Company 10,600 633,207
Eisai Company, Ltd. 8,000 273,594
Electric Power Development Company, Ltd. 4,700 134,177
Elpida Memory, Inc. * 3,500 36,555
FamilyMart Company, Ltd. 2,100 61,817
Fanuc, Ltd. 5,900 476,788
Fast Retailing Company, Ltd. 1,600 190,095
Fuji Electric Holdings Company, Ltd. 15,000 24,721
Fuji Heavy Industries, Ltd. 20,000 79,119
Fuji Photo Film Company, Ltd. 15,100 436,475
Fuji Television Network, Inc. 11 14,414
Fujitsu, Ltd. 59,000 307,164
Fukuoka Financial Group, Inc. 27,000 118,572
Furukawa Electric Company, Ltd. 23,000 83,974
GS Yuasa Corp. 10,000 79,704
Gunma Bank 15,000 79,707
Hakuhodo DY Holdings, Inc. 650 33,223
Hankyu Hanshin Holdings, Inc. 37,200 182,574
Hikari Tsushin, Inc. 500 11,311
Hino Motors, Ltd. 6,000 17,791
Hirose Electric Company, Ltd. 1,000 111,543
Hisamitsu Pharmaceutical Company, Inc. 2,500 81,171
Hitachi Chemical, Ltd. 3,800 59,259
Hitachi Construction Machinery Company, Ltd. 3,400 56,517
Hitachi High-Technologies Corp. 2,900 44,834
Hitachi Metals, Ltd. 6,000 57,163
Hitachi, Ltd. 108,000 359,986
Hokkaido Electric Power Company, Inc. 5,700 107,485
Hokuhoku Financial Group, Inc. 44,000 92,639
Hokuriku Electric Power Company 6,200 144,425
Honda Motor Company, Ltd. 52,000 1,509,463
Hoya Corp. 13,100 274,441
Ibiden Company, Ltd. 4,100 117,895
Idemitsu Kosan Company, Ltd. 500 42,119
Inpex Holdings, Inc. 28 228,184
Isetan Mitsukoshi Holdings, Ltd. 10,940 97,911
Ishikawajima-Harima Heavy Industries
Company, Ltd. 50,000 90,091
Isuzu Motors, Ltd. 43,000 74,737
ITO EN, Ltd. 2,800 38,264
Itochu Corp. 48,000 348,836
Itochu Techno-Science Corp. 800 20,663
Iyo Bank, Ltd. 9,000 95,856
J Front Retailing Company, Ltd. 13,000 53,399
JAFCO Company, Ltd. * 900 27,693
Japan Airlines System Corp. * 36,000 69,974
Copyright © 2012 www.secdatabase.com. All Rights Reserved.Please Consider the Environment Before Printing This Document

Japan Petroleum Exploration Company, Ltd. 800 41,497
Japan Prime Realty Investment Corp., REIT 24 47,175
International Equity Index Fund (continued)Shares or
Principal
Amount Value
COMMON STOCKS (continued)
Japan (continued)
Japan Real Estate Investment Corp., REIT 12 $ 92,920
Japan Retail Fund Investment Corp., REIT 8 36,696
Japan Tobacco, Inc. 139 401,724
JFE Holdings, Inc. 16,900 566,931
JGC Corp. 7,000 116,990
Joyo Bank, Ltd. 23,000 113,496
JS Group Corp. 7,900 115,041
JSR Corp. 5,900 88,313
Jupiter Telecommunications Company, Ltd. 59 43,543
Kajima Corp. 31,000 96,332
Kamigumi Company, Ltd. 7,000 54,081
Kaneka Corp. 8,000 55,885
Kansai Electric Power Company, Ltd. 24,800 539,311
Kansai Paint Company, Ltd. 6,000 38,125
Kao Corp. 16,000 352,391
Kawasaki Heavy Industries, Ltd. 52,000 116,725
Kawasaki Kisen Kaisha, Ltd. 17,000 77,285
KDDI Corp. 90 471,127
Keihin Electric Express Railway Company, Ltd. 12,000 92,175
Keio Corp. 19,000 112,885
Keisei Electric Railway Company, Ltd. 7,000 36,757
Keyence Corp. 1,300 271,384
Kikkoman Corp. 6,000 60,828
Kinden Corp. 4,000 33,143
Kintetsu Corp. (a) 51,000 228,715
Kirin Brewery Company, Ltd. 26,000 327,861
Kobe Steel Company, Ltd. 77,000 134,839
Komatsu, Ltd. 27,700 404,595
Konami Corp. 3,200 59,299
Konica Minolta Holdings, Inc. 14,500 152,415
Koyo Seiko Company, Ltd. 5,300 46,652
Kubota Corp. 36,000 267,488
Kuraray Company, Ltd. 12,000 120,572
Kurita Water Industries, Ltd. 4,000 110,862
Kyocera Corp. 5,000 396,152
Kyowa Hakko Kogyo Company, Ltd. 7,737 81,311
Kyushu Electric Power Company, Inc. 11,500 241,763
Lawson, Inc. 2,300 95,843
LeoPalace21 Corp. 3,300 29,177
Mabuchi Motor Company, Ltd. 700 34,967
Makita Corp. 3,500 78,084
Marubeni Corp. 50,000 227,179
Marui Company, Ltd. 7,100 41,917
Maruichi Steel Tube, Ltd. (a) 1,500 28,587
Matsui Securities Company, Ltd. 5,400 43,831
Matsushita Electric Industrial Company, Ltd. 57,500 829,246
Matsushita Electric Works, Ltd. 13,000 107,901
Mazda Motor Corp. 28,000 72,932
McDonald's Holdings Company (Japan), Ltd. 1,900 37,310
Mediceo Holdings Company, Ltd. 3,700 43,261
MEIJI Holdings Company, Ltd. * 1,900 63,612
Minebea Company, Ltd. 10,000 40,812
Mitsubishi Chemical Holdings Corp., ADR 41,500 192,678
Mitsubishi Corp. 42,400 804,658
Mitsubishi Electric Corp. 62,000 360,871
Mitsubishi Estate Company, Ltd. 38,000 626,622
Copyright © 2012 www.secdatabase.com. All Rights Reserved.Please Consider the Environment Before Printing This Document

The accompanying notes are an integral part of the financial statements.
102
JOHN HANCOCK FUNDS II
PORTFOLIO OF INVESTMENTS - May 31, 2009 (Unaudited) - continued(showing percentage of total net assets)
International Equity Index Fund (continued)Shares or
Principal
Amount Value
COMMON STOCKS (continued)
Japan (continued)
Mitsubishi Gas & Chemicals Company, Inc. 11,000 $ 62,829
Mitsubishi Heavy Industries, Ltd. 98,000 353,874
Mitsubishi Logistics Corp. 3,000 31,733
Mitsubishi Materials Corp. 36,000 120,743
Mitsubishi Motors Corp. * (a) 117,000 187,425
Mitsubishi Rayon Company, Ltd. (a) 12,000 32,377
Mitsubishi UFJ Financial Group, Inc. 297,400 1,876,687
Mitsubishi UFJ Lease & Finance
Company, Ltd. 1,990 54,906
Mitsui & Company, Ltd. 54,100 686,973
Mitsui Chemicals, Inc. 22,000 76,548
Mitsui Engineering & Shipbuilding
Company, Ltd. 19,000 45,878
Mitsui Fudosan Company, Ltd. 27,000 451,039
Mitsui Mining & Smelting Company, Ltd. 13,000 30,700
Mitsui O.S.K. Lines, Ltd. 34,000 242,345
Mitsui Sumitomo Insurance Group
Holdings, Inc. 12,200 359,150
Mitsui Trust Holdings, Inc. 29,000 107,053
Mitsumi Electric Company, Ltd. 1,900 36,828
Mizuho Financial Group, Inc. (a) 296,600 713,457
Mizuho Trust & Banking Company, Ltd. 48,000 54,643
Murata Manufacturing Company, Ltd. 6,800 290,876
Namco Bandai Holdings, Inc. 5,100 54,066
NEC Corp. 58,000 226,855
NGK INSULATORS, Ltd. 8,000 143,140
NGK Spark Plug Company, Ltd. 7,000 61,552
NHK Spring Company, Ltd. 3,000 17,262
Nidec Corp. 3,400 195,516
Nikon Corp. 11,000 165,726
Nintendo Company, Ltd. 3,200 869,355
Nippon Building Fund, Inc., REIT 18 158,913
Nippon Electric Glass Company, Ltd. 10,000 97,166
Nippon Express Company, Ltd. 26,000 110,334
Nippon Meat Packers, Inc. 6,000 72,387
Nippon Mining Holdings, Inc. 28,500 162,278
Nippon Oil Corp. 44,000 268,640
Nippon Paper Group, Inc. 3,100 87,726
Nippon Sheet Glass Company, Ltd. 22,000 63,429
Nippon Steel Corp. 166,000 636,892
Nippon Telegraph & Telephone Corp. 16,200 673,413
Nippon Yusen Kabushiki Kaisha 38,000 182,703
NIPPONKOA Insurance Company, Ltd. 23,000 134,220
Nishi-Nippon City Bank, Ltd. 17,000 39,580
Nissan Chemical Industries, Ltd. 4,000 42,156
Nissan Motor Company, Ltd. 72,700 436,526
Nissay Dowa General Insurance Company,
Ltd. 8,000 37,406
Nisshin Seifun Group, Inc. 4,500 51,223
Copyright © 2012 www.secdatabase.com. All Rights Reserved.Please Consider the Environment Before Printing This Document

Nisshin Steel Company 21,000 47,349
Nisshinbo Industries, Inc. 3,000 31,059
Nissin Food Products Company, Ltd. 3,000 93,681
Nitori Company, Ltd. 1,350 81,913
Nitto Denko Corp. 5,400 151,600
NOK Corp. 2,500 32,289
Nomura Holdings, Inc. 81,100 612,698
Nomura Real Estate Holdings, Inc. 2,400 43,059
International Equity Index Fund (continued)Shares or
Principal
Amount Value
COMMON STOCKS (continued)
Japan (continued)
Nomura Real Estate Office Fund, Inc. (a) 11 $ 65,342
Nomura Research Institute, Ltd. 4,100 75,543
NSK, Ltd. 16,000 77,656
NTN Corp. 14,000 47,684
NTT Data Corp. 35 104,310
NTT DoCoMo, Inc. 490 732,490
NTT Urban Development Corp. 31 29,407
Obayashi Corp. 17,000 77,407
OBIC Company, Ltd. 320 47,557
Odakyu Electric Railway Company, Ltd. 18,000 154,375
Oji Paper Company, Ltd. 27,000 125,818
Olympus Optical Company, Ltd. 8,000 157,505
Omron Corp. 7,300 112,171
Ono Pharmaceutical Company, Ltd. 3,300 148,025
Onward Kashiyama Company, Ltd. 3,000 18,917
Oracle Corp. - Japan (a) 1,000 35,741
Oriental Land Company, Ltd. 1,800 119,368
ORIX Corp. 3,090 195,111
Osaka Gas Company, Ltd. 61,000 192,885
Otsuka Corp. 400 18,220
Promise Company, Ltd. (a) 1,700 22,678
Rakuten, Inc. 228 125,387
Resona Holdings, Inc. (a) 16,200 245,024
Ricoh Company, Ltd. 21,000 290,703
Rinnai Corp. 1,100 11,185
Rohm Company, Ltd. 3,300 216,503
SANKYO Company, Ltd. 1,500 79,628
Santen Pharmaceutical Company, Ltd. 1,900 58,002
Sanyo Electric Company, Ltd. * 51,000 128,268
Sapporo Hokuyo Holdings, Inc. 12,000 35,398
Sapporo Holdings, Ltd. 10,000 45,743
SBI Holdings, Inc. 474 76,871
Secom Company, Ltd. 6,700 279,226
SEGA SAMMY HOLDINGS, Inc. 4,700 52,350
Seiko Epson Corp. 4,200 62,026
Sekisui Chemical Company, Ltd. 16,000 97,687
Sekisui House, Ltd. 13,000 126,095
Seven & I Holdings Company, Ltd. 25,400 615,019
Seven Bank, Ltd. 19 49,581
Sharp Corp. 31,000 353,125
Shikoku Electric Power Company, Inc. 6,200 174,888
Shimadzu Corp. 7,000 47,904
Shimamura Company, Ltd. 600 46,399
Shimano, Inc. 2,200 80,762
Shimizu Corp. 17,000 76,751
Shin-Etsu Chemical Company, Ltd. 12,800 671,594
Shinko Electric Industries Company, Ltd. 1,600 18,424
Shinko Securities Company, Ltd. 14,000 40,789
Shinsei Bank, Ltd. * 56,000 75,603
Shionogi & Company, Ltd. 10,000 197,549
Copyright © 2012 www.secdatabase.com. All Rights Reserved.Please Consider the Environment Before Printing This Document
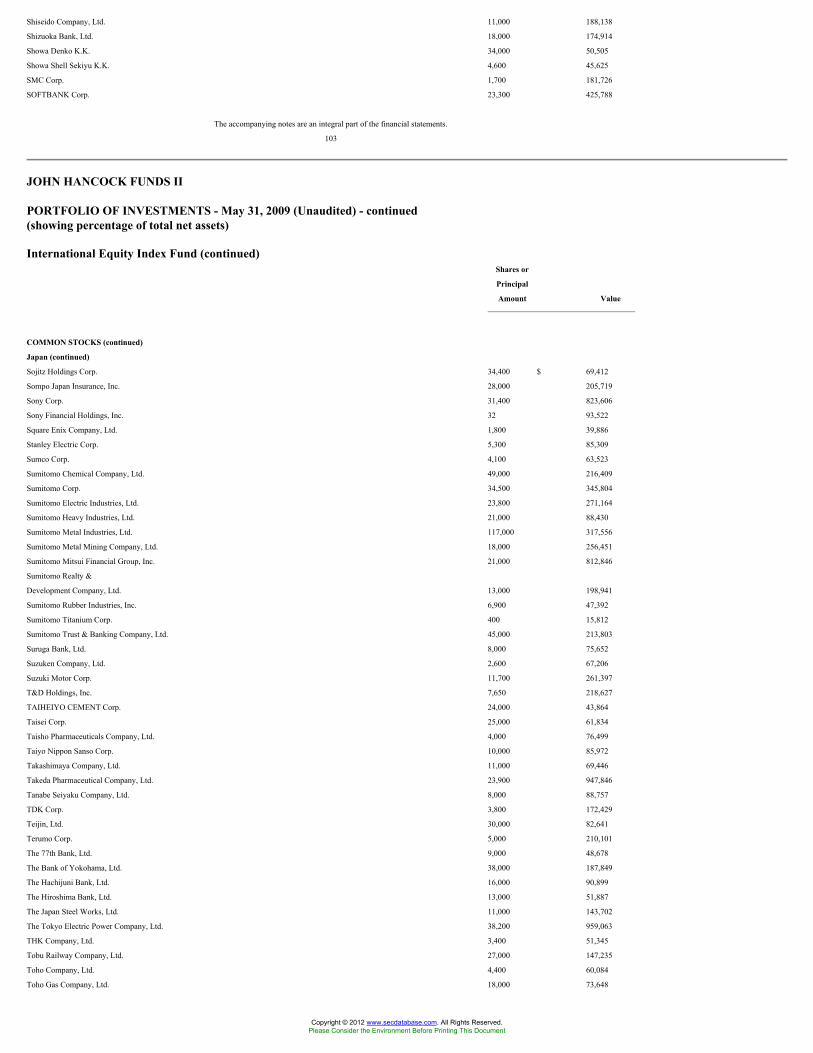
Shiseido Company, Ltd. 11,000 188,138
Shizuoka Bank, Ltd. 18,000 174,914
Showa Denko K.K. 34,000 50,505
Showa Shell Sekiyu K.K. 4,600 45,625
SMC Corp. 1,700 181,726
SOFTBANK Corp. 23,300 425,788
The accompanying notes are an integral part of the financial statements.
103
JOHN HANCOCK FUNDS II
PORTFOLIO OF INVESTMENTS - May 31, 2009 (Unaudited) - continued(showing percentage of total net assets)
International Equity Index Fund (continued)Shares or
Principal
Amount Value
COMMON STOCKS (continued)
Japan (continued)
Sojitz Holdings Corp. 34,400 $ 69,412
Sompo Japan Insurance, Inc. 28,000 205,719
Sony Corp. 31,400 823,606
Sony Financial Holdings, Inc. 32 93,522
Square Enix Company, Ltd. 1,800 39,886
Stanley Electric Corp. 5,300 85,309
Sumco Corp. 4,100 63,523
Sumitomo Chemical Company, Ltd. 49,000 216,409
Sumitomo Corp. 34,500 345,804
Sumitomo Electric Industries, Ltd. 23,800 271,164
Sumitomo Heavy Industries, Ltd. 21,000 88,430
Sumitomo Metal Industries, Ltd. 117,000 317,556
Sumitomo Metal Mining Company, Ltd. 18,000 256,451
Sumitomo Mitsui Financial Group, Inc. 21,000 812,846
Sumitomo Realty &
Development Company, Ltd. 13,000 198,941
Sumitomo Rubber Industries, Inc. 6,900 47,392
Sumitomo Titanium Corp. 400 15,812
Sumitomo Trust & Banking Company, Ltd. 45,000 213,803
Suruga Bank, Ltd. 8,000 75,652
Suzuken Company, Ltd. 2,600 67,206
Suzuki Motor Corp. 11,700 261,397
T&D Holdings, Inc. 7,650 218,627
TAIHEIYO CEMENT Corp. 24,000 43,864
Taisei Corp. 25,000 61,834
Taisho Pharmaceuticals Company, Ltd. 4,000 76,499
Taiyo Nippon Sanso Corp. 10,000 85,972
Takashimaya Company, Ltd. 11,000 69,446
Takeda Pharmaceutical Company, Ltd. 23,900 947,846
Tanabe Seiyaku Company, Ltd. 8,000 88,757
TDK Corp. 3,800 172,429
Teijin, Ltd. 30,000 82,641
Terumo Corp. 5,000 210,101
The 77th Bank, Ltd. 9,000 48,678
The Bank of Yokohama, Ltd. 38,000 187,849
The Hachijuni Bank, Ltd. 16,000 90,899
The Hiroshima Bank, Ltd. 13,000 51,887
The Japan Steel Works, Ltd. 11,000 143,702
The Tokyo Electric Power Company, Ltd. 38,200 959,063
THK Company, Ltd. 3,400 51,345
Tobu Railway Company, Ltd. 27,000 147,235
Toho Company, Ltd. 4,400 60,084
Toho Gas Company, Ltd. 18,000 73,648
Copyright © 2012 www.secdatabase.com. All Rights Reserved.Please Consider the Environment Before Printing This Document

Tohoku Electric Power Company, Inc. 13,600 278,423
Tokio Marine Holdings, Inc. 21,300 628,196
Tokuyama Corp. 9,000 64,557
Tokyo Broadcasting Company, Ltd. 1,000 14,234
Tokyo Electron, Ltd. 5,400 248,447
Tokyo Gas Company, Ltd. 73,000 268,257
Tokyo Steel Manufacturing Company, Ltd. 2,400 28,312
Tokyo Tatemono Company, Ltd. 7,000 33,251
Tokyu Corp. 38,000 173,003
Tokyu Land Corp. 18,000 75,248
TonenGeneral Sekiyu K.K. 8,000 83,993
Toppan Printing Company, Ltd. 18,000 162,701
Toray Industries, Inc. 40,000 198,347
International Equity Index Fund (continued)Shares or
Principal
Amount Value
COMMON STOCKS (continued)
Japan (continued)
Toshiba Corp. (a) 94,000 $ 356,471
Tosoh Corp. 12,000 37,495
Toto, Ltd. 7,000 41,081
Toyo Seikan Kaisha, Ltd. 5,800 108,468
Toyo Suisan Kaisha, Ltd. 3,000 66,162
Toyoda Gosei Company, Ltd. 1,600 35,374
Toyota Boshoku Corp. 1,800 22,752
Toyota Industries Corp. 5,500 142,531
Toyota Motor Corp. 87,300 3,497,226
Toyota Tsusho Corp. 7,300 101,797
Trend Micro, Inc. 3,500 116,263
Tsumura & Company, Ltd. 2,300 68,637
Ube Industries, Ltd. 33,000 78,952
UNI Charm Corp. 1,400 97,807
UNY Company, Ltd. 7,000 55,318
Ushio, Inc. 2,900 43,198
USS Company, Ltd. 570 32,399
West Japan Railway Company, Ltd. 53 173,728
Yahoo Japan Corp. 522 139,255
Yakult Honsha Company, Ltd. 2,800 50,781
Yamada Denki Company, Ltd. 2,550 146,032
Yamaguchi Financial Group, Inc. 6,000 74,591
Yamaha Corp. 5,700 72,320
Yamaha Motor Company, Ltd. 7,100 80,457
Yamato Kogyo Company, Ltd. 1,500 40,428
Yamato Transport Company, Ltd. 11,000 137,020
Yamazaki Baking Company, Ltd. 5,000 51,568
YASKAWA Electric Corp. 8,000 42,927
Yokogawa Electric Corp. 9,700 49,601
62,047,623
Luxembourg - 0.31%
ArcelorMittal 26,829 893,948
Millicom International Cellular SA, ADR * 1,868 114,306
Reinet Investments SCA * 2,402 29,057
SES, ADR 8,710 174,287
1,211,598
Malaysia - 0.56%
AirAsia BHD * 17,100 6,385
AMMB Holdings BHD 66,500 62,997
Asiatic Development BHD 12,400 19,212
Berjaya Sports Toto BHD 37,100 50,206
British American Tobacco Malaysia BHD 5,100 62,825
Bursa Malaysia BHD 7,600 15,628
Copyright © 2012 www.secdatabase.com. All Rights Reserved.Please Consider the Environment Before Printing This Document

Commerce Asset Holdings BHD 94,900 232,397
Digi.Com BHD 10,400 69,062
Gamuda BHD 49,500 35,728
Genting BHD 67,900 106,284
Hong Leong Bank BHD 11,600 18,136
Hong Leong Credit BHD 4,400 6,311
IGB Corp. BHD 13,900 6,502
IJM Corp. BHD * 30,900 50,056
IOI Corp. BHD 120,300 155,769
KLCC Property Holdings BHD 8,900 7,968
KNM Group BHD 100,800 25,867
Kuala Lumpur Kepong BHD 13,400 44,231
The accompanying notes are an integral part of the financial statements.
104
JOHN HANCOCK FUNDS II
PORTFOLIO OF INVESTMENTS - May 31, 2009 (Unaudited) - continued(showing percentage of total net assets)
International Equity Index Fund (continued)Shares or
Principal
Amount Value
COMMON STOCKS (continued)
Malaysia (continued)
Lafarge Malayan Cement BHD 7,380 $ 10,364
Malayan Banking BHD 113,987 165,246
Malaysian Airline System BHD 7,200 6,398
Malaysian Plantations BHD 32,900 20,452
MISC BHD 42,600 99,462
MMC Corp. BHD * 44,200 22,406
Parkson Holdings BHD 18,700 27,931
Petronas Dagangan BHD 5,200 11,839
Petronas Gas BHD 16,800 47,131
PLUS Expressways BHD 35,400 33,436
PPB Group BHD 19,400 58,332
Public Bank BHD - Foreign Market 39,000 96,593
Public Bank BHD 1,114 2,743
Resorts World BHD 114,600 90,854
RHB Capital BHD 3,200 3,765
Sime Darby BHD 72,938 150,757
SP Setia BHD 15,150 16,322
Tanjong PLC 10,200 39,509
Telekom Malaysia BHD 30,000 22,506
Tenaga Nasional BHD 48,600 113,734
TM International BHD * 63,125 41,408
UEM Land Holdings BHD * 20,250 9,621
UMW Holdings BHD 24,700 38,571
YTL Corp. BHD 27,300 51,972
YTL Power International BHD 94,003 56,766
2,213,682
Mexico - 0.91%
Alfa SA de CV 17,600 47,234
America Movil SAB de CV, Series L, ADR 7,565 289,966
America Movil SAB de CV, Series L 456,300 872,624
Carso Global Telecom SAB de CV * 28,800 107,967
Cemex SA de CV, SADR * 5,136 50,123
Cemex SA de CV * 199,631 193,842
Coca-Cola Femsa SA de CV 10,100 41,628
Desarrolladora Homex SA de CV * 12,000 53,313
Fomento Economico Mexicano SA de CV 64,700 211,213
Copyright © 2012 www.secdatabase.com. All Rights Reserved.Please Consider the Environment Before Printing This Document

Grupo Aeroportuario del Pacifico SA de CV,
B Shares 15,900 33,594
Grupo Bimbo SA de CV 12,300 65,366
Grupo Carso SA de CV 20,301 58,104
Grupo Elektra SA de CV 2,300 119,610
Grupo Financiero Banorte SA de CV 49,996 117,664
Grupo Financiero Inbursa SA de CV 26,733 77,731
Grupo Mexico SA 142,454 134,105
Grupo Modelo SA * 22,700 77,568
Grupo Televisa SA, SADR 3,173 56,416
Grupo Televisa SA 65,800 232,088
Industrias Penoles SA de CV * 3,400 51,108
Kimberly-Clark de Mexico SA de CV 21,800 84,241
Mexichem SAB de CV 35,500 40,157
Telefonos de Mexico SA de CV 195,000 161,661
Telmex Internacional SAB de CV 168,800 95,088
Urbi Desarrollos Urbanos SA de CV * 15,400 21,115
Wal-Mart de Mexico SA de CV, Series V 93,688 275,758
3,569,284
International Equity Index Fund (continued)Shares or
Principal
Amount Value
COMMON STOCKS (continued)
Netherlands - 1.67%
Aegon NV 47,434 $ 298,206
Akzo Nobel NV (a) 7,971 371,502
ASML Holding NV 13,665 281,917
Corio NV (a) 1,776 87,431
Fugro NV (a) 2,406 100,643
Heineken Holding NV 4,137 124,529
Heineken NV (a) 7,760 276,937
ING Groep NV 61,045 651,059
Koninklijke (Royal) Philips Electronics N.V. 33,238 626,432
Koninklijke Ahold NV 38,495 466,824
Koninklijke Boskalis Westinster NV 2,160 53,902
Koninklijke DSM NV 4,124 143,918
Koninklijke KPN NV 54,448 716,309
Randstad Holdings NV * 4,401 135,880
Reed Elsevier NV (a) 20,410 246,363
SBM Offshore NV 5,699 96,862
STMicroelectronics NV 21,779 161,958
TNT Post Group NV 13,694 269,389
Unilever NV (a) 53,590 1,284,836
Wolters Kluwer NV 8,365 158,896
6,553,793
New Zealand - 0.08%
Auckland International Airport, Ltd. 27,486 28,281
Contact Energy, Ltd. 13,630 50,102
Fletcher Building, Ltd. 20,120 84,400
Sky City Entertainment Group, Ltd. 13,600 25,044
Telecom Corp. of New Zealand, Ltd. 70,986 114,524
302,351
Norway - 0.46%
Den Norske Bank ASA * 23,800 199,681
Norsk Hydro ASA * 26,727 143,928
Orkla ASA 24,572 201,678
Renewable Energy Corp. ASA * (a) 6,576 71,251
StatoilHydro ASA 35,740 752,934
Telenor ASA * 26,200 221,531
Yara International ASA 6,800 224,162
Copyright © 2012 www.secdatabase.com. All Rights Reserved.Please Consider the Environment Before Printing This Document

1,815,165
Peru - 0.12%
Cia Minera Milpo SAA 20,958 48,111
Compania de Minas Buenaventura SA 5,080 143,343
Compania de Minas Buenaventura SA, ADR 1,499 42,467
Credicorp SA 1,747 104,208
Credicorp, Ltd., ADR 546 32,880
Southern Peru Copper Corp. 4,270 87,962
458,971
Philippines - 0.09%
Ayala Corp. 8,363 51,162
Ayala Land, Inc. 118,600 21,917
Banco De Oro 49,014 34,311
Bank of the Philippine Islands 58,268 54,475
Globe Telecommunications, Inc. 690 13,335
Jollibee Foods Corp. 9,000 9,146
Manila Electric Company 9,142 22,276
Metropolitan Bank & Trust Company 12,800 9,239
The accompanying notes are an integral part of the financial statements.
105
JOHN HANCOCK FUNDS II
PORTFOLIO OF INVESTMENTS - May 31, 2009 (Unaudited) - continued(showing percentage of total net assets)
International Equity Index Fund (continued)Shares or
Principal
Amount Value
COMMON STOCKS (continued)
Philippines (continued)
Philippine Long Distance Telephone Company 2,190 $ 103,107
PNOC Energy Development Corp. 132,801 10,304
SM Investments Corp. 3,594 25,598
SM Prime Holdings, Ltd. 84,941 15,649
370,519
Poland - 0.21%
Bank Handlowy w Warszawie SA 917 14,978
Bank Millennium SA * 18,629 14,205
Bank Pekao SA * 3,741 127,580
Bank Zachodni WBK SA * 915 23,949
Boryszew SA * 550 427
BRE Bank SA * 340 15,826
Computerland SA * 160 943
Cyfrowy Polsat SA 2,783 12,417
Getin Holding SA * 12,724 22,808
Globe Trade Centre SA * 4,447 26,289
Grupa Lotos SA * 2,585 15,450
ING Bank Slaski SA * 96 9,420
KGHM Polska Miedz SA 3,566 78,635
PBG SA * 99 6,508
Polish Oil & Gas Company 41,373 49,168
Polski Koncern Naftowy Orlen SA 10,957 99,901
Powszechna Kasa Oszczednosci Bank
Polski SA 17,163 135,865
Softbank SA 1,956 33,455
Telekomunikacja Polska SA * 21,316 112,146
TVN SA * 7,137 24,355
Copyright © 2012 www.secdatabase.com. All Rights Reserved.Please Consider the Environment Before Printing This Document

824,325
Portugal - 0.27%
Banco Comercial dos Acores SA (a) 88,835 95,826
Banco Espirito Santo SA 14,371 81,711
Brisa Auto Estrada, SA 11,641 85,865
Cimpor-Cimentos De Portugal SA (a) 12,207 83,693
EDP Renovaveis SA * 8,841 93,773
Electricidade de Portugal SA 57,356 230,592
Galp Energia SGPS SA 7,421 116,900
Jeronimo Martins, SGPS SA 8,639 58,131
Portugal Telecom, SGPS, SA 22,291 200,463
1,046,954
Russia - 1.33%
Comstar United Telesystems, GDR * 9,964 49,023
Federal Grid Company Unified Energy
System JSC, GDR * 1,540 6,853
Gazprom OAO, SADR 76,555 1,766,124
Gazprom OAO, SADR 6,452 151,557
JSC MMC Norilsk Nickel, ADR * 28,523 325,162
Lukoil Oil Company, ADR 16,728 886,584
Mechel Steel Group, ADR 7,374 81,188
Mobile Telesystems, SADR 6,679 277,112
NovaTek OAO, ADR 2,716 143,046
Novolipetsk Steel, ADR 5,049 97,698
Polyus Gold Company ZAO, SADR * 3,630 75,322
Rosneft Oil Company, GDR * 19,280 129,369
Rostelecom, ADR 2,115 72,883
Sberbank, GDR (e) 2,294 277,379
International Equity Index Fund (continued)Shares or
Principal
Amount Value
COMMON STOCKS (continued)
Russia (continued)
Severstal, ADR 4,900 $ 27,783
Sibirtelecom, ADR 424 1,611
Sistema JSFC, Reg. S, GDR * 4,060 56,532
Surgutneftegaz, ADR 24,723 208,167
Tatneft, ADR * 7,116 195,761
UralsvyAzinform, ADR 1,471 4,501
Vimpel-Communications, SADR * 17,395 227,179
VolgaTelecom, ADR 1,172 3,141
VTB Bank OJSC, GDR 26,491 79,112
Wimm-Bill-Dann Foods OJSC, ADR * 1,023 55,099
5,198,186
Singapore - 0.95%
Ascendas, REIT * 61,000 64,332
Capitaland, Ltd. 82,500 217,570
CapitaMall Trust * 91,200 84,357
City Developments, Ltd. 17,000 111,476
ComfortDelGro Corp., Ltd. 63,000 56,527
Cosco Corp. Singapore, Ltd. 31,000 27,718
DBS Group Holdings, Ltd. 55,500 454,498
Fraser and Neave, Ltd. 26,000 71,605
Genting International PLC * 117,000 59,403
Golden Agri-Resources, Ltd. 188,240 55,506
Jardine Cycle and Carriage, Ltd. 6,254 71,503
Keppel Corp., Ltd. 38,210 190,878
Neptune Orient Lines, Ltd. 17,000 18,138
Olam International, Ltd. 41,500 56,262
Oversea-Chinese Banking Corp., Ltd. 80,000 401,802
SembCorp Industries, Ltd. 40,000 86,296
Copyright © 2012 www.secdatabase.com. All Rights Reserved.Please Consider the Environment Before Printing This Document

SembCorp Marine, Ltd. 28,600 60,975
Singapore Airlines, Ltd. 19,140 165,889
Singapore Exchange, Ltd. 32,000 163,156
Singapore Press Holdings, Ltd. 57,000 116,951
Singapore Technologies Engineering, Ltd. 52,000 84,014
Singapore Telecommunications, Ltd. 257,950 539,600
StarHub, Ltd. 17,000 25,908
United Overseas Bank, Ltd. 41,000 405,631
UOL Group, Ltd. 18,000 41,317
Wilmar International, Ltd. 23,000 78,492
3,709,804
South Africa - 1.29%
ABSA Group, Ltd. 8,122 103,877
African Bank Investments, Ltd. 14,629 48,094
African Rainbow Minerals, Ltd. 2,661 42,081
Anglo Platinum, Ltd. 2,054 143,586
AngloGold Ashanti, Ltd. 8,536 365,622
Aspen Pharmacare Holdings, Ltd. * 4,629 27,937
Aveng, Ltd. 8,562 37,613
Bidvest Group, Ltd. 7,724 90,649
Discovery Holdings, Ltd., ADR 1 4
FirstRand, Ltd. 81,662 141,327
Foschini, Ltd. 4,844 28,762
Gold Fields, Ltd. 18,692 255,967
Growthpoint Properties, Ltd. 38,607 65,752
Harmony Gold Mining Company, Ltd. * 10,209 124,268
Hulamin, Ltd. 83 120
The accompanying notes are an integral part of the financial statements.
106
JOHN HANCOCK FUNDS II
PORTFOLIO OF INVESTMENTS - May 31, 2009 (Unaudited) - continued(showing percentage of total net assets)
International Equity Index Fund (continued)Shares or
Principal
Amount Value
COMMON STOCKS (continued)
South Africa (continued)
Impala Platinum Holdings, Ltd. 16,652 $ 404,760
Imperial Holdings, Ltd. 4,211 32,067
Investec, Ltd. 4,018 22,337
Kumba Iron Ore, Ltd. 1,848 45,324
Kumba Resources, Ltd. 2,815 28,440
Liberty Holdings, Ltd. 2,755 20,850
Massmart Holdings, Ltd. 4,714 45,632
Mittal Steel South Africa, Ltd. 4,928 59,199
MTN Group, Ltd. 49,470 721,400
Murray & Roberts Holdings, Ltd. 7,152 44,854
Naspers, Ltd. 11,606 279,046
Nedbank Group, Ltd. 4,908 55,222
Network Healthcare Holdings, Ltd. * 29,089 36,465
Pick'n Pay Stores, Ltd. 4,684 20,413
Pretoria Portland Cement Company, Ltd. 12,283 47,470
Remgro, Ltd. 12,039 110,220
Reunert, Ltd. 4,168 21,496
RMB Holdings, Ltd. 19,006 52,786
Sanlam, Ltd. 62,666 135,765
Sappi, Ltd. 11,336 39,222
Sasol, Ltd. 18,713 707,626
Copyright © 2012 www.secdatabase.com. All Rights Reserved.Please Consider the Environment Before Printing This Document

Shoprite Holdings, Ltd. 10,263 71,685
Standard Bank Group, Ltd. 35,105 366,510
Steinhoff International Holdings, Ltd. * 23,609 38,769
Telkom SA, Ltd. 7,148 32,391
Tiger Brands, Ltd. 3,884 68,237
Truworths International, Ltd. 10,796 49,536
Woolworths Holdings, Ltd. 18,895 29,800
5,063,181
South Korea - 2.41%
Amorepacific Corp. 130 64,483
Asiana Airlines * 676 2,084
Busan Bank 5,225 32,710
Cheil Industries, Inc. 1,810 66,383
CJ CheilJedang Corp. 238 30,809
Daegu Bank 4,210 34,038
Daelim Industrial Company, Ltd. 690 33,707
Daewoo Engineering & Construction
Company, Ltd. 7,109 59,022
Daewoo International Corp. 996 22,843
Daewoo Securities Company, Ltd. 3,370 55,901
Daewoo Shipbuilding & Marine Engineering
Company, Ltd. 4,100 67,702
DC Chemical Company, Ltd. 510 82,692
Dongbu Insurance Company, Ltd. 1,320 25,986
Dongkuk Steel Mill Company, Ltd. 1,380 32,856
Doosan Corp. 310 27,137
Doosan Heavy Industries and Construction
Company, Ltd. 1,150 67,317
Doosan Infracore Company, Ltd. 2,880 39,377
GS Engineering & Construction Corp. 860 55,496
GS Holdings Corp. 1,810 45,087
Hana Financial Group, Inc. 4,350 105,303
Hanjin Heavy Industries & Construction
Company, Ltd. 1,508 42,607
Hanjin Shipping Company, Ltd. 2,640 41,911
International Equity Index Fund (continued)Shares or
Principal
Amount Value
COMMON STOCKS (continued)
South Korea (continued)
Hankook Tire Company, Ltd. 4,330 $ 48,258
Hanwha Chemical Corp. 4,264 35,294
Hanwha Corp. 1,930 54,428
Hite Brewery Company, Ltd. 147 18,360
Hite Holdings Company, Ltd. 183 4,219
Honam Petrochemical Corp. 780 48,117
Hynix Semiconductor, Inc. * 12,430 129,406
Hyosung Corp. 840 71,080
Hyundai Department Store Company, Ltd. 680 45,062
Hyundai Development Company 2,470 81,208
Hyundai Engineering & Construction
Company, Ltd. 1,840 95,017
Hyundai Heavy Industries Company, Ltd. 1,320 228,505
Hyundai Mipo Dockyard Company, Ltd. 360 39,996
Hyundai Mobis 1,950 184,621
Hyundai Motor Company, Ltd. 5,120 285,032
Hyundai Securities Company, Ltd. 4,428 48,736
Hyundai Steel Company 1,580 76,081
Industrial Bank of Korea * 6,000 46,986
Kangwon Land, Inc. 4,780 62,187
KB Financial Group, Inc., ADR * 2,379 76,033
KCC Corp. 200 65,177
Copyright © 2012 www.secdatabase.com. All Rights Reserved.Please Consider the Environment Before Printing This Document
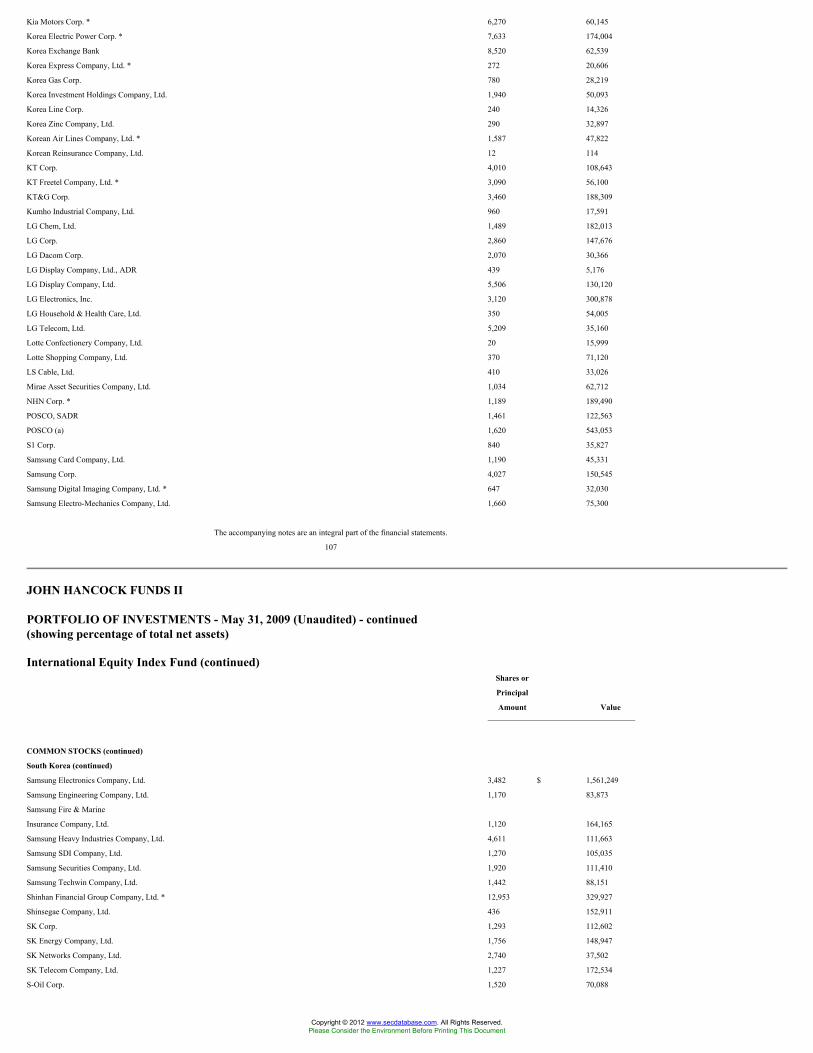
Kia Motors Corp. * 6,270 60,145
Korea Electric Power Corp. * 7,633 174,004
Korea Exchange Bank 8,520 62,539
Korea Express Company, Ltd. * 272 20,606
Korea Gas Corp. 780 28,219
Korea Investment Holdings Company, Ltd. 1,940 50,093
Korea Line Corp. 240 14,326
Korea Zinc Company, Ltd. 290 32,897
Korean Air Lines Company, Ltd. * 1,587 47,822
Korean Reinsurance Company, Ltd. 12 114
KT Corp. 4,010 108,643
KT Freetel Company, Ltd. * 3,090 56,100
KT&G Corp. 3,460 188,309
Kumho Industrial Company, Ltd. 960 17,591
LG Chem, Ltd. 1,489 182,013
LG Corp. 2,860 147,676
LG Dacom Corp. 2,070 30,366
LG Display Company, Ltd., ADR 439 5,176
LG Display Company, Ltd. 5,506 130,120
LG Electronics, Inc. 3,120 300,878
LG Household & Health Care, Ltd. 350 54,005
LG Telecom, Ltd. 5,209 35,160
Lotte Confectionery Company, Ltd. 20 15,999
Lotte Shopping Company, Ltd. 370 71,120
LS Cable, Ltd. 410 33,026
Mirae Asset Securities Company, Ltd. 1,034 62,712
NHN Corp. * 1,189 189,490
POSCO, SADR 1,461 122,563
POSCO (a) 1,620 543,053
S1 Corp. 840 35,827
Samsung Card Company, Ltd. 1,190 45,331
Samsung Corp. 4,027 150,545
Samsung Digital Imaging Company, Ltd. * 647 32,030
Samsung Electro-Mechanics Company, Ltd. 1,660 75,300
The accompanying notes are an integral part of the financial statements.
107
JOHN HANCOCK FUNDS II
PORTFOLIO OF INVESTMENTS - May 31, 2009 (Unaudited) - continued(showing percentage of total net assets)
International Equity Index Fund (continued)Shares or
Principal
Amount Value
COMMON STOCKS (continued)
South Korea (continued)
Samsung Electronics Company, Ltd. 3,482 $ 1,561,249
Samsung Engineering Company, Ltd. 1,170 83,873
Samsung Fire & Marine
Insurance Company, Ltd. 1,120 164,165
Samsung Heavy Industries Company, Ltd. 4,611 111,663
Samsung SDI Company, Ltd. 1,270 105,035
Samsung Securities Company, Ltd. 1,920 111,410
Samsung Techwin Company, Ltd. 1,442 88,151
Shinhan Financial Group Company, Ltd. * 12,953 329,927
Shinsegae Company, Ltd. 436 152,911
SK Corp. 1,293 112,602
SK Energy Company, Ltd. 1,756 148,947
SK Networks Company, Ltd. 2,740 37,502
SK Telecom Company, Ltd. 1,227 172,534
S-Oil Corp. 1,520 70,088
Copyright © 2012 www.secdatabase.com. All Rights Reserved.Please Consider the Environment Before Printing This Document

STX Pan Ocean Company, Ltd. 4,057 43,214
STX Shipbuilding Company, Ltd. 1,620 22,878
Taewoong Company, Ltd. 440 40,386
Taihan Electric Wire Company, Ltd. 900 15,885
Tong Yang Investment Bank 1 10
Woongjin Coway Company, Ltd. 1,690 38,452
Woori Finance Holdings Company, Ltd. * 7,600 68,078
Woori Investment & Securities Company, Ltd. 3,040 40,986
Yuhan Corp. 356 49,672
9,472,670
Spain - 2.94%
Abertis Infraestructuras SA 8,756 165,116
Acciona SA 842 110,371
Acerinox SA 3,833 69,325
ACS Actividades SA 6,157 321,680
Banco Bilbao Vizcaya Argentaria SA 112,030 1,381,788
Banco de Sabadell SA 29,552 190,017
Banco de Valencia SA 7,940 77,975
Banco de Valencia SA * 158 1,544
Banco Popular Espanol SA 27,026 243,397
Banco Santander Central Hispano SA 257,327 2,774,335
Bankinter SA, ADR 7,701 94,923
Cintra Concesiones de Infraestructuras de
Transporte SA 9,045 59,474
Corporacion Mapfre SA 23,722 82,908
Criteria Caixacorp SA 28,458 123,025
Enagas 5,204 96,139
Fomento de Construcciones SA 1,130 45,068
Gamesa Corporacion Tecnologica SA 5,309 119,532
Gas Natural SDG SA 7,424 133,892
Gestevision Telecinco SA 2,563 25,307
Grifols SA 3,516 63,410
Grupo Ferrovial SA 2,220 75,887
Iberdrola Renovables SA * 25,100 124,428
Iberdrola SA 114,748 982,407
Iberia Lineas Aereas de Espana SA 11,209 25,554
Indra Sistemas SA 2,819 64,241
Industria de Diseno Textil SA 7,313 330,048
Red Electrica De Espana 3,466 162,041
Repsol YPF SA 24,920 560,000
Sacyr Vallehermoso SA 2,340 38,302
International Equity Index Fund (continued)Shares or
Principal
Amount Value
COMMON STOCKS (continued)
Spain (continued)
Telefonica SA 133,918 $ 2,892,835
Zardoya Otis SA 3,580 80,302
11,515,271
Sweden - 1.48%
Alfa Laval AB 11,300 108,050
Assa Abloy AB, Series B 9,000 118,845
Atlas Copco AB, Series A, ADR 20,534 207,968
Atlas Copco AB, Series B, ADR 10,954 98,898
Electrolux AB, Series B * 6,123 78,287
Ericsson (LM), Series B 92,000 857,791
Getinge AB, Series B (a) 5,466 73,626
Hennes & Mauritz AB, B shares 15,950 761,814
Holmen AB, Series B 1,300 32,242
Husqvarna AB, B Shares * 9,890 58,004
Investor AB, B shares 13,600 213,501
Copyright © 2012 www.secdatabase.com. All Rights Reserved.Please Consider the Environment Before Printing This Document

Lundin Petroleum AB, Series A * 5,696 50,510
Nordea Bank AB 100,675 806,644
Sandvik AB 30,395 251,319
Scania AB, Series B 8,800 89,088
Securitas AB, Series B (a) 7,800 66,443
Skandinaviska Enskilda Banken AB, Series A * 45,680 201,981
Skanska AB, Series B 11,000 121,548
SKF AB, B Shares 11,200 133,002
SSAB Svenskt Stal AB, Series A (a) 4,300 57,923
SSAB Svenskt Stal AB, Series B 2,150 26,665
Svenska Cellulosa AB, B Shares 16,800 194,397
Svenska Handelsbanken AB, Series A (a) 13,900 271,542
Swedbank AB, A shares 9,600 57,736
Swedish Match AB 7,500 120,540
Tele2 AB, Series B 8,763 88,958
Teliasonera AB 69,000 355,798
Volvo AB, Series A 12,156 77,536
Volvo AB, Series B 33,000 213,049
5,793,705
Switzerland - 5.29%
ABB, Ltd. * 72,262 1,190,972
Actelion, Ltd. * 3,894 201,448
Adecco SA (a) 4,836 211,020
Aryzta AG * 3,099 91,905
Baloise Holding AG 1,998 158,888
BKW FMB Energie AG 713 52,711
Compagnie Financiere Richemont SA 19,595 428,949
Credit Suisse Group AG 35,177 1,574,214
Geberit AG, ADR 1,618 199,732
Givaudan AG 269 176,585
Holcim, Ltd. * 7,862 417,868
Julius Baer Holding AG 7,968 339,503
Kuehne & Nagel International AG 2,056 160,331
Lindt & Spruengli AG-PC 36 65,359
Lindt & Spruengli AG-REG 5 111,559
Logitech International SA * 7,398 105,374
Lonza Group AG (a) 1,831 189,316
Nestle SA 116,401 4,229,837
Nobel Biocare Holding AG, Series BR 4,707 109,210
Novartis AG 67,626 2,703,772
The accompanying notes are an integral part of the financial statements.
108
JOHN HANCOCK FUNDS II
PORTFOLIO OF INVESTMENTS - May 31, 2009 (Unaudited) - continued(showing percentage of total net assets)
International Equity Index Fund (continued)Shares or
Principal
Amount Value
COMMON STOCKS (continued)
Switzerland (continued)
Pargesa Holding SA, ADR 1,087 $ 73,757
Phonak Holding AG 1,850 136,350
Roche Holdings AG - Genusschein 22,225 3,032,856
Schindler Holding AG 2,032 121,723
Societe Generale de Surveillance Holdings AG 176 220,298
Straumann Holding AG 338 63,569
Swatch Group AG, BR shares (a) 1,196 199,356
Swatch Group AG 2,256 78,089
Copyright © 2012 www.secdatabase.com. All Rights Reserved.Please Consider the Environment Before Printing This Document

Swiss Life Holding * 1,350 114,698
Swiss Re 12,797 418,487
Swisscom AG 925 273,590
Syngenta AG 3,027 736,908
Synthes AG 2,281 234,504
UBS AG - CHF * 96,499 1,458,922
Unaxis Holding AG * (a) 774 45,945
Zurich Financial Services AG 4,445 832,296
20,759,901
Taiwan - 1.86%
Acer Sertek, Inc. 56,555 103,194
Advanced Semiconductor Engineering, Inc. 94,302 59,069
Advantech Company, Ltd. 1,512 2,343
Asia Cement Corp. 37,778 42,755
Asia Optical Company, Inc. 79 101
Asustek Computer, Inc. 94,578 133,903
AU Optronics Corp. 175,021 181,880
BenQ Corp. 12,400 5,379
Catcher Technology Company, Ltd. 12,870 36,694
Cathay Financial Holdings Company, Ltd. 158,750 259,695
Chang Hwa Commercial Bank, Ltd. 82,000 41,130
Cheng Shin Rubber Industry Company, Ltd. 19,366 32,796
Cheng Uei Precision Industry Company, Ltd. 2,612 4,282
Chi Mei Optoelectronics Corp. 104,454 61,549
China Airlines, Ltd. * 24,716 6,722
China Development Financial Holdings Corp. 224,352 65,252
China Motor Company, Ltd. 55 28
China Steel Corp. 262,415 224,564
Chinatrust Finance Holding Company, Ltd. 176,110 117,105
Chunghwa Picture Tubes, Ltd. 135,000 22,120
Chunghwa Telecom Company, Ltd. * 135,439 258,178
CMC Magnetics Corp. * 29,000 6,997
Compal Communications, Inc. 410 410
Compal Electronics, Inc. 72,706 61,914
Delta Electronics, Inc. 35,190 82,008
D-Link Corp. 652 555
E.Sun Financial Holding Company, Ltd. 63,440 22,010
Epistar Corp. 8,946 26,711
Eternal Chemical Company, Ltd. 3,320 2,675
EVA Airways Corp. * 24,000 6,923
Evergreen Marine Corp. 11,000 6,654
Everlight Electronics Company, Ltd. 2,039 5,432
Far Eastern Department Stores Company, Ltd. 6,300 6,703
Far Eastern Textile, Ltd. 65,045 74,112
Far EasTone Telecommunications
Company, Ltd. 30,463 35,190
First Financial Holding Company, Ltd. 103,021 69,798
Formosa Chemicals & Fibre Corp. 68,000 116,344
International Equity Index Fund (continued)Shares or
Principal
Amount Value
COMMON STOCKS (continued)
Taiwan (continued)
Formosa Petrochemical Corp. 33,000 $ 85,309
Formosa Plastic Corp. 107,000 212,738
Formosa Taffeta Company, Ltd. 9,000 6,622
Foxconn Technology Company, Ltd. 11,220 35,777
Fubon Group Company, Ltd. 83,000 81,259
Fuhwa Financial Holdings Company, Ltd. 169,825 127,498
HannStar Display Corp. 105,921 28,259
High Tech Computer Corp. 18,520 300,155
Hon Hai Precision Industry Company, Ltd. 179,676 684,090
Copyright © 2012 www.secdatabase.com. All Rights Reserved.Please Consider the Environment Before Printing This Document

Hua Nan Financial Holdings Company, Ltd. 80,580 59,186
InnoLux Display Corp. 52,484 73,568
Inotera Memories, Inc. * 4,780 2,524
Inventec Appliances Corp. 620 654
Inventec Company, Ltd. 35,280 22,363
KGI Securities Company, Ltd. 23,000 11,687
Kinsus Interconnect Technology Corp. 527 960
Largan Precision Company, Ltd. 2,080 22,841
Lite-On Technology Corp. 44,096 39,164
Macronix International Company, Ltd. 66,803 30,971
MediaTek, Inc. 28,048 348,571
Mega Financial Holding Company, Ltd. 206,000 104,992
Mitac International 8,691 3,927
Mosel Vitelic, Inc. * 600 185
Motech Industries, Inc. 2,909 11,616
Nan Ya Plastics Corp. 134,000 192,413
Nan Ya Printed Circuit Board Corp. 2,105 6,323
Nanya Technology Corp. * 56,347 10,651
Novatek Microelectronics Corp., Ltd. 10,275 25,156
Pan-International Industrial Company, Ltd. 100 129
Polaris Securities Company, Ltd. 43,990 26,216
Pou Chen Corp. 48,150 31,859
Powerchip Semiconductor Corp. * 170,386 24,628
Powertech Technology, Inc. 11,055 23,869
President Chain Store Corp. 11,000 28,452
ProMOS Technologies, Inc. * 139,000 4,553
Quanta Computer, Inc. 46,164 75,847
Realtek Semiconductor Corp. 9,103 18,350
Richtek Technology Corp. 1,100 7,740
Shin Kong Financial Holding Company, Ltd. 88,791 44,082
Siliconware Precision Industries Company 62,665 82,626
Sino-American Silicon Products, Inc. 1,086 3,068
SinoPac Holdings Company, Ltd. 144,000 45,622
Synnex Technology International Corp. 19,525 32,279
Taishin Financial Holdings Company, Ltd. 103,000 37,589
Taiwan Cellular Corp. 41,802 74,335
Taiwan Cement Corp. 62,205 65,471
Taiwan Cooperative Bank 62,100 40,928
Taiwan Fertilizer Company, Ltd. 16,000 51,465
Taiwan Glass Industrial Corp. 9,787 6,794
Taiwan Semiconductor
Manufacturing Company, Ltd. 786,028 1,475,395
Tatung Company, Ltd. * 88,000 24,521
Teco Electric & Machinery Company, Ltd. 29,000 13,097
Transcend Information, Inc. 2,099 5,587
Tripod Technology Corp. 8,458 17,568
Tung Ho Steel Enterprise Corp. 6,000 6,311
The accompanying notes are an integral part of the financial statements.
109
JOHN HANCOCK FUNDS II
PORTFOLIO OF INVESTMENTS - May 31, 2009 (Unaudited) - continued(showing percentage of total net assets)
International Equity Index Fund (continued)Shares or
Principal
Amount Value
COMMON STOCKS (continued)
Taiwan (continued)
U-Ming Marine Transport Corp. 7,000 $ 14,581
Unimicron Technology Corp. 17,513 15,797
Copyright © 2012 www.secdatabase.com. All Rights Reserved.Please Consider the Environment Before Printing This Document

Uni-President Enterprises Corp. 70,602 81,038
United Microelectronics Corp. 298,729 120,424
Vanguard International Semiconductor Corp. 284 126
Wafer Works Corp. 30 57
Walsin Lihwa Corp. 39,000 12,981
Wan Hai Lines, Ltd. 11,400 6,375
Wistron Corp. 24,462 38,873
Ya Hsin Industrial Company, Ltd. * (j) 18,000 0
Yang Ming Marine Transport Corp. 7,609 3,436
Yulon Motor Company, Ltd. 15,449 14,632
Zinwell Corp. 180 375
7,289,710
Thailand - 0.26%
Advanced Info Service PCL 23,609 55,737
Bangkok Bank PCL, Foreign Shares 39,500 105,315
Bangkok Bank PCL 17,900 19,599
Bank of Ayudhya PCL, Foreign Shares 141,800 48,406
Banpu PCL 6,400 59,427
BEC World PCL 18,400 10,404
C.P. Seven Eleven PCL 49,000 17,423
Glow Energy PCL 32,900 25,651
IRPC PCL 254,154 27,408
Kasikornbank PCL - Foreign Shares 67,700 116,689
Krung Thai Bank PCL 57,000 12,045
Land & Houses PCL, Foreign Shares 236,700 37,658
PTT Aromatics & Refining PCL 17,600 10,157
PTT Chemical PCL 6,700 10,252
PTT Exploration & Production PCL 30,706 116,792
PTT PCL - Foreign Shares 28,282 181,348
Ratchaburi Electricity Generating Holding PCL 5,900 6,448
Siam Cement PCL - Foreign Shares 13,300 51,241
Siam Commercial Bank PCL 26,128 51,213
Thai Oil PCL 32,800 38,956
TMB Bank PCL * 360,144 7,768
Total Access Communication PCL 32,000 24,276
1,034,213
Turkey - 0.28%
Adana Cimento Sanayii Turk Anonim Sirketi,
Class A 442 1,203
Akbank AS 29,426 124,923
Aksigorta AS 2,924 6,931
Anadolu Efes Biracilik Ve Malt Sanayii AS 8,965 73,522
Arcelik AS * 22 32
Asya Katilim Bankasi AS * 22,456 26,718
BIM Birlesik Magazalar AS 1,567 49,893
Coca-Cola Icecek AS 4,126 23,135
Dogan Sirketler Grubu Holdings AS * 20,271 11,917
Enka Insaat ve Sanayi AS 11,548 56,545
Eregli Demir ve Celik Fabrikalari TAS * 18,200 50,999
HACI Omer Sabanci Holdings, AS 11,671 35,998
KOC Holdings AS * 17,382 40,258
Petkim Petrokimya Holding AS * 1,680 6,174
Tupras Turkiye Petrol Rafine AS 4,261 53,798
International Equity Index Fund (continued)Shares or
Principal
Amount Value
COMMON STOCKS (continued)
Turkey (continued)
Turk Sise ve Cam Fabrikalari AS * 7,938 $ 6,793
Turk Telekomunikasyon AS 20,309 56,797
Turkcell Iletisim Hizmetleri AS, ADR 819 10,901
Copyright © 2012 www.secdatabase.com. All Rights Reserved.Please Consider the Environment Before Printing This Document

Turkcell Iletisim Hizmetleri AS 17,555 94,098
Turkiye Garanti Bankasi AS * 64,001 162,038
Turkiye Halk Bankasi AS 12,137 47,199
Turkiye Is Bankasi AS 31,818 111,012
Turkiye Vakiflar Bankasi Tao * 18,789 26,362
Yapi ve Kredi Bankasi AS * 20,051 30,952
1,108,198
United Kingdom - 14.44%
3i Group PLC 12,727 50,557
Admiral Group PLC 6,815 95,148
AMEC PLC 12,762 139,578
Anglo American PLC 41,313 1,209,260
Antofagasta PLC 15,206 157,091
Associated British Foods PLC 13,219 156,930
AstraZeneca Group PLC 45,671 1,903,828
Astro All Asia Networks PLC, GDR 11,900 10,079
Autonomy Corp. PLC * 6,230 156,078
Aviva PLC 85,599 472,600
BAE Systems PLC 114,908 638,246
Barclays PLC 263,121 1,268,460
Berkeley Group Holdings PLC * 3,634 52,573
BG Group PLC 105,865 1,940,103
BHP Billiton PLC 69,540 1,665,940
BICC PLC 16,786 92,369
BP PLC 593,399 4,897,924
British Airways PLC * 20,191 51,396
British American Tobacco PLC 63,785 1,742,387
British Land Company PLC 27,681 175,714
British Sky Broadcasting Group PLC 34,392 248,122
BT Group PLC 236,553 338,315
Bunzl PLC 12,879 106,572
Burberry Group PLC 18,373 114,731
Cable & Wireless PLC 87,606 191,715
Cadbury PLC 41,720 364,659
Cairn Energy PLC * 5,072 206,143
Capita Group PLC 22,013 255,365
Carnival PLC 5,823 151,672
Carphone Warehouse Group PLC 15,560 42,569
Centrica PLC 165,937 660,933
Cobham PLC 41,681 120,641
Compass Group PLC 56,406 326,426
Diageo PLC 78,534 1,072,075
Drax Group PLC 11,656 92,916
Eurasian Natural Resources Corp. 13,886 147,866
FirstGroup PLC 18,031 108,837
Fresnillo PLC 5,418 58,848
Friends Provident Ethical Investment
Trust PLC 89,439 97,974
G4S PLC 46,804 160,287
GKN PLC 23,154 45,982
GlaxoSmithKline PLC 164,372 2,770,604
Hammerson PLC 21,553 102,933
Home Retail Group PLC 34,770 131,078
The accompanying notes are an integral part of the financial statements.
110
JOHN HANCOCK FUNDS II
PORTFOLIO OF INVESTMENTS - May 31, 2009 (Unaudited) - continued(showing percentage of total net assets)
International Equity Index Fund (continued)Shares or
Principal
Copyright © 2012 www.secdatabase.com. All Rights Reserved.Please Consider the Environment Before Printing This Document

Amount Value
COMMON STOCKS (continued)
United Kingdom (continued)
HSBC Holdings PLC 543,360 $ 4,962,303
ICAP PLC 17,895 115,002
Imperial Tobacco Group PLC 31,784 826,113
Intercontinental Hotels Group PLC 9,172 97,721
International Power PLC 54,340 241,580
Invensys PLC * 33,273 126,294
Investec PLC 14,488 81,062
J Sainsbury PLC 36,509 184,417
Johnson Matthey PLC 6,144 120,222
Kazakhmys PLC 9,445 107,385
Kingfisher PLC 84,371 243,577
Ladbrokes PLC 20,177 66,164
Land Securities Group PLC 24,770 197,453
Legal & General Group PLC 209,334 206,216
Liberty International PLC (a) 10,043 60,517
Lloyds Banking Group PLC * 201,900 96,496
Lloyds TSB Group PLC 324,965 362,468
London Stock Exchange Group PLC 5,241 58,985
Lonmin PLC, ADR 5,064 117,534
Man Group PLC, ADR 61,086 241,948
Marks & Spencer Group PLC 55,363 254,773
National Express Group PLC 4,566 23,995
National Grid PLC 79,242 767,926
Next Group PLC 6,693 159,222
Old Mutual PLC 183,492 218,753
Pearson PLC 24,497 259,258
Pharmstandard * 4,494 71,904
PIK Group, GDR * 15,724 23,531
Prudential PLC 84,234 587,891
Randgold Resources, Ltd. 2,402 170,707
Reckitt Benckiser PLC 18,834 817,005
Reed Elsevier PLC 33,415 271,259
Rexam PLC 23,321 117,523
Rio Tinto PLC 28,690 1,299,786
Rolls-Royce Group PLC * 55,759 296,773
Rolls-Royce Group PLC * 5,735,043 9,270
Rosneft Oil Company 25,704 172,801
Royal & Sun Alliance PLC 120,502 246,685
Royal Bank of Scotland Group PLC * 540,394 338,736
Royal Dutch Shell PLC, A Shares 112,154 3,021,856
Royal Dutch Shell PLC, B Shares 85,153 2,315,534
SABMiller PLC 29,355 602,452
Schroders PLC 4,300 60,664
Scottish & Southern Energy PLC 29,700 560,909
Segro PLC, REIT 186,141 80,929
Serco Group PLC 18,401 120,348
Severn Trent PLC 8,235 149,542
Shire, Ltd. 16,864 233,995
Smith & Nephew PLC 31,563 230,202
Smiths Group PLC 14,403 169,738
Standard Chartered PLC 59,416 1,213,504
Standard Life PLC 68,550 220,237
Tesco PLC 247,446 1,466,172
The Sage Group PLC 44,462 137,587
Thomas Cook Group PLC 18,531 67,045
Thomson Reuters PLC 6,658 182,449
International Equity Index Fund (continued)Shares or
Principal
Amount Value
Copyright © 2012 www.secdatabase.com. All Rights Reserved.Please Consider the Environment Before Printing This Document

COMMON STOCKS (continued)
United Kingdom (continued)
Tomkins PLC 29,638 $ 68,202
TUI Travel PLC 23,195 93,915
Tullow Oil PLC 24,530 396,370
Unilever PLC 40,230 948,671
United Utilities Group PLC 24,406 211,761
Vedanta Resources PLC 4,036 104,566
Vodafone Group PLC 1,660,021 3,123,986
Whitbread PLC 5,858 81,977
William Morrison Supermarket PLC 71,777 281,396
Wolseley PLC * 7,033 119,325
WPP PLC 39,974 299,331
Xstrata PLC 59,296 676,197
56,653,639
United States - 0.23%
Gazpromneft OAO 2,660 44,954
Larsen & Toubro, Ltd. 14,598 424,802
Southern Copper Corp. 3,100 64,883
Vale SA, SADR 12,982 210,698
Vale SA 9,181 175,816
921,153
TOTAL COMMON STOCKS (Cost $430,524,123) $ 364,173,762
PREFERRED STOCKS - 1.84%
Brazil - 1.57%
AES Tiete SA (i) 5,300 49,698
Aracruz Celulose SA * (i) 9,100 15,586
Banco Bradesco SA (i) 48,850 741,589
Banco do Estado do Rio Grande do Sul (i) 8,516 32,894
Banco Itau Holding Financeira SA (i) 58,665 951,115
Bradespar SA * (i) 9,100 133,522
Brasil Telecom Participacoes SA * (i) 3,800 34,280
Brasil Telecom SA * (i) 6,301 44,833
Braskem SA, A Shares * (i) 6,600 24,017
Centrais Eletricas Brasileiras SA * (i) 5,700 73,379
Cia de Transmissao de Energia Eletrica
Paulista (i) 1,900 44,468
Cia Energetica de Minas Gerais (i) 6,708 90,311
Cia Energetica de Sao Paulo * (i) 5,638 49,715
Cia Paranaense de Energia (i) 3,900 55,955
Companhia Brasileira de Distribuicao Grupo
Pao de Acucar (i) 2,120 40,674
Companhia de Bebidas das Americas, ADR * (i) 2,059 134,865
Companhia de Bebidas das Americas * (i) 2,914 191,640
Companhia Vale do Rio Doce (i) 52,182 861,125
Eletropaulo Metropolitana de Sao Paulo SA (i) 3,483 54,238
Fertilizantes Fosfatados SA (i) 5,800 48,933
Gerdau SA (i) 12,360 129,467
Investimentos Itau SA (i) 69,315 315,997
Klabin SA (i) 15,000 25,767
Lojas Americanas SA (i) 15,400 73,728
Metalurgica Gerdau SA (i) 11,300 149,893
Net Servicos de Comunicacao SA * (i) 6,466 65,232
Petroleo Brasileiro SA (i) 72,184 1,262,009
Tele Norte Leste Participacoes SA (i) 4,500 80,298
Telemar Norte Leste SA, Series A * (i) 2,300 66,629
The accompanying notes are an integral part of the financial statements.
111
Copyright © 2012 www.secdatabase.com. All Rights Reserved.Please Consider the Environment Before Printing This Document

JOHN HANCOCK FUNDS II
PORTFOLIO OF INVESTMENTS - May 31, 2009 (Unaudited) - continued(showing percentage of total net assets)
International Equity Index Fund (continued)Shares or
Principal
Amount Value
PREFERRED STOCKS (continued)
Brazil (continued)
Tim Participacoes SA (i) 23,740 $ 47,779
Usinas Siderurgicas de Minas Gerais SA,
Series A (i) 6,842 135,616
Vivo Participacoes SA (i) 3,999 81,094
Votorantim Celulose e Papel SA * (i) 2,600 30,802
6,137,148
Germany - 0.18%
Bayerische Motoren Werke (BMW) AG - Non
Voting Shares (i) 2,073 46,336
Henkel AG & Company KGaA - Non Voting
Shares (i) 5,249 161,890
Porsche Automobil Holding SE (i) 3,154 192,475
RWE AG (i) 1,167 84,241
Volkswagen AG (i) 3,299 236,021
720,963
Malaysia - 0.00%
Malaysian Airline System BHD * 1,800 407
Russia - 0.02%
Surgutneftegaz SADR (a)(i) 22,697 72,630
South Korea - 0.07%
Hyundai Motor Company, Ltd. (i) 1,820 46,044
LG Electronics, Inc. (i) 980 44,858
Samsung Electronics Company, Ltd. (i) 640 189,159
280,061
TOTAL PREFERRED STOCKS (Cost $7,564,709) $ 7,211,209
WARRANTS - 0.00%
Indonesia - 0.00%
Bank Pan Indonesia Tbk PT
(Expiration Date 07/10/2009, Strike
Price: IDR 400.00) * 25,750 551
Italy - 0.00%
UBI Banca SCPA
(Expiration Date 06/30/2011, Strike
Price EUR 12.30) * (a) 23,168 2,163
Malaysia - 0.00%
IJM Land Berhad
(Expiration Date 09/11/2013, Strike
Price: MYR 1.35) * 3,090 553
TOTAL WARRANTS (Cost $244) $ 3,267
RIGHTS - 0.02%
Australia - 0.00%
Santos, Ltd. * 8,720 14,665
Stockland Company, Ltd. * 1,054 338
15,003
Belgium - 0.00%
Fortis Group SA (Expiration Date 07/04/2014) * 71,652 0
Brazil - 0.00%
Companhia Brasileira de Distribuicao Grupo * 20 31
Copyright © 2012 www.secdatabase.com. All Rights Reserved.Please Consider the Environment Before Printing This Document

Investimentos Itau SA * 1,495 2,264
2,295
International Equity Index Fund (continued)Shares or
Principal
Amount Value
RIGHTS (continued)
Canada - 0.00%
Precision Drilling Trust * 1,200 $ 495
France - 0.00%
Casino Guichard-Perrachon SA * 1,207 4,558
Pernod-Ricard SA 12 59
4,617
Japan - 0.00%
Dowa Mining Company, Ltd. (Expiration Date
01/29/2010, Strike Price: JPY 1.00) * 5,000 1,110
Norway - 0.00%
Lighthouse Caledonia ASA (Expiration Date
04/30/2009) * 530 13
Spain - 0.01%
Abertis Infraestructuras SA (Expiration Date:
05/27/2009) 437 8,216
Bankinter SA * 10,025 7,795
16,011
United Kingdom - 0.01%
3i Group PLC * 16,363 27,770
Lonmin PLC * 1,125 9,192
36,962
TOTAL RIGHTS (Cost $103,373) $ 76,506
SHORT TERM INVESTMENTS - 6.48%
AIM Short-Term Investment Trust,
STIC Prime Portfolio,
Institutional Class 1,594,109 $ 1,594,109
John Hancock Collateral Investment Trust,
0.7339% (c)(g) 2,384,371 23,843,714
TOTAL SHORT TERM INVESTMENTS
(Cost $25,437,823) $ 25,437,823
Total Investments (International Equity Index Fund)
(Cost $463,630,272) - 101.17% $ 396,902,567
Other assets and liabilities, net - (1.17)% (4,579,335)
TOTAL NET ASSETS - 100.00% $ 392,323,232
The portfolio had the following five top industry concentrations
as of May 31, 2009 (as a percentage of total net assets):
Banking 12.14%
International Oil 5.88%
Telecommunications Equipment & Services 4.87%
Insurance 4.19%
Financial Services 4.13%
International Opportunities FundShares or
Principal
Amount Value
Copyright © 2012 www.secdatabase.com. All Rights Reserved.Please Consider the Environment Before Printing This Document

COMMON STOCKS - 93.44%
Australia - 2.38%
CSL, Ltd. 719,039 $ 16,837,899
The accompanying notes are an integral part of the financial statements.
112
JOHN HANCOCK FUNDS II
PORTFOLIO OF INVESTMENTS - May 31, 2009 (Unaudited) - continued(showing percentage of total net assets)
International Opportunities Fund (continued)Shares or
Principal
Amount Value
COMMON STOCKS (continued)
Belgium - 2.52%
Anheuser-Busch InBev NV 505,204 $ 17,856,418
Brazil - 5.86%
Gafisa SA 706,883 6,394,856
Itau Unibanco Holding SA * 879,667 14,118,655
Petroleo Brasileiro SA, ADR 476,274 20,970,344
41,483,855
Canada - 5.87%
Petro-Canada 84,677 3,684,138
Potash Corp. of Saskatchewan, Inc. 162,900 18,870,336
Rogers Communications, Inc., Class B 493,970 14,668,658
Suncor Energy, Inc. - CAD 124,047 4,346,048
41,569,180
China - 1.77%
Industrial & Commercial Bank of China, Ltd. 19,952,000 12,557,083
Denmark - 4.42%
Vestas Wind Systems AS * 427,902 31,312,312
France - 3.93%
Accor SA (a) 156,824 6,978,610
Alstom 149,505 9,496,903
BNP Paribas SA (a) 163,075 11,337,555
27,813,068
Germany - 2.42%
Bayerische Motoren Werke (BMW) AG (a) 174,119 6,275,388
Daimler AG 200,125 7,339,700
Hochtief AG 73,034 3,542,742
17,157,830
Hong Kong - 4.30%
Cheung Kong Holdings, Ltd. 816,000 10,118,271
CNOOC, Ltd. 6,256,600 8,238,761
Esprit Holdings, Ltd. 1,384,500 8,807,214
Hang Lung Properties, Ltd. 984,000 3,290,295
30,454,541
India - 1.50%
ICICI Bank, Ltd., SADR 341,794 10,643,465
Ireland - 0.51%
CRH PLC - London Exchange 155,352 3,624,104
Israel - 2.47%
Teva Pharmaceutical Industries, Ltd., SADR 376,366 17,448,328
Japan - 7.75%
Daikin Industries, Ltd. 209,605 6,479,463
Daiwa Securities Group, Inc. 2,208,000 13,927,917
Copyright © 2012 www.secdatabase.com. All Rights Reserved.Please Consider the Environment Before Printing This Document

Honda Motor Company, Ltd. 220,600 6,403,608
Marubeni Corp. 3,173,000 14,416,810
Mizuho Financial Group, Inc. (a) 3,240,200 7,794,140
Sumitomo Realty &
Development Company, Ltd. 382,000 5,845,802
54,867,740
Mexico - 3.09%
Cemex SA de CV, SADR * 2,242,037 21,882,281
Netherlands - 1.04%
ASML Holding NV 355,777 7,339,890
International Opportunities Fund (continued)Shares or
Principal
Amount Value
COMMON STOCKS (continued)
Singapore - 2.95%
Capitaland, Ltd. 4,813,000 $ 12,692,894
DBS Group Holdings, Ltd. 539,000 4,413,953
Singapore Airlines, Ltd. 434,000 3,761,532
20,868,379
South Korea - 0.47%
Hyundai Motor Company, Ltd. 59,694 3,323,180
Spain - 6.98%
Banco Bilbao Vizcaya Argentaria SA 890,272 10,980,697
Gamesa Corporacion Tecnologica SA 806,043 18,148,045
Telefonica SA 938,129 20,265,028
49,393,770
Sweden - 0.47%
Hennes & Mauritz AB, B shares 69,653 3,326,812
Switzerland - 15.85%
ABB, Ltd. * 443,078 7,302,505
Actelion, Ltd. * 107,332 5,552,601
Compagnie Financiere Richemont SA 181,854 3,980,917
Credit Suisse Group AG 613,992 27,476,892
Julius Baer Holding AG 242,062 10,313,858
Lonza Group AG 164,505 17,008,979
Nestle SA 483,342 17,563,921
Transocean, Ltd. * 290,023 23,051,028
112,250,701
Taiwan - 5.16%
Hon Hai Precision Industry Company, Ltd. 4,779,050 18,195,539
Taiwan Semiconductor
Manufacturing Company, Ltd., SADR 1,672,509 18,297,248
36,492,787
United Kingdom - 10.29%
BG Group PLC 354,745 6,501,126
BP PLC 2,572,117 21,230,291
Reckitt Benckiser PLC 162,263 7,038,850
Rio Tinto PLC 241,656 10,948,106
Tesco PLC 1,279,385 7,580,638
Vodafone Group PLC 10,388,289 19,549,673
72,848,684
United States - 1.44%
Vale SA 533,200 10,210,780
TOTAL COMMON STOCKS (Cost $575,901,025) $ 661,563,087
SHORT TERM INVESTMENTS - 2.90%
John Hancock Collateral Investment
Copyright © 2012 www.secdatabase.com. All Rights Reserved.Please Consider the Environment Before Printing This Document
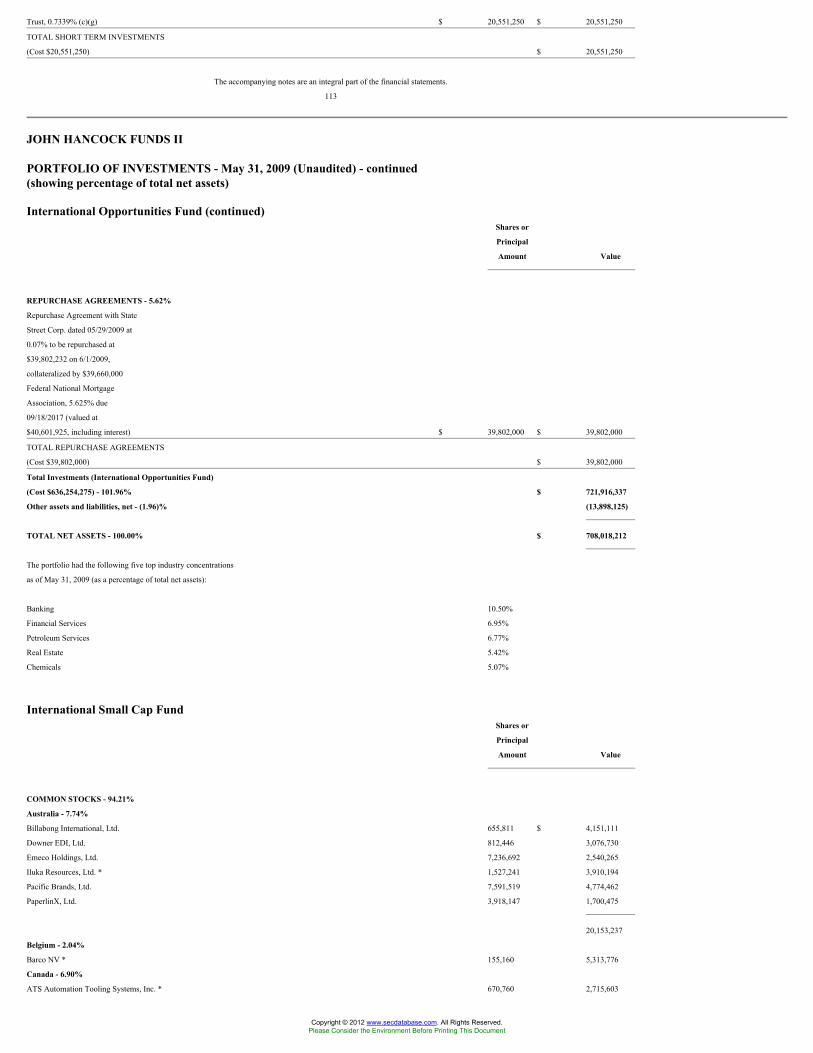
Trust, 0.7339% (c)(g) $ 20,551,250 $ 20,551,250
TOTAL SHORT TERM INVESTMENTS
(Cost $20,551,250) $ 20,551,250
The accompanying notes are an integral part of the financial statements.
113
JOHN HANCOCK FUNDS II
PORTFOLIO OF INVESTMENTS - May 31, 2009 (Unaudited) - continued(showing percentage of total net assets)
International Opportunities Fund (continued)Shares or
Principal
Amount Value
REPURCHASE AGREEMENTS - 5.62%
Repurchase Agreement with State
Street Corp. dated 05/29/2009 at
0.07% to be repurchased at
$39,802,232 on 6/1/2009,
collateralized by $39,660,000
Federal National Mortgage
Association, 5.625% due
09/18/2017 (valued at
$40,601,925, including interest) $ 39,802,000 $ 39,802,000
TOTAL REPURCHASE AGREEMENTS
(Cost $39,802,000) $ 39,802,000
Total Investments (International Opportunities Fund)
(Cost $636,254,275) - 101.96% $ 721,916,337
Other assets and liabilities, net - (1.96)% (13,898,125)
TOTAL NET ASSETS - 100.00% $ 708,018,212
The portfolio had the following five top industry concentrations
as of May 31, 2009 (as a percentage of total net assets):
Banking 10.50%
Financial Services 6.95%
Petroleum Services 6.77%
Real Estate 5.42%
Chemicals 5.07%
International Small Cap FundShares or
Principal
Amount Value
COMMON STOCKS - 94.21%
Australia - 7.74%
Billabong International, Ltd. 655,811 $ 4,151,111
Downer EDI, Ltd. 812,446 3,076,730
Emeco Holdings, Ltd. 7,236,692 2,540,265
Iluka Resources, Ltd. * 1,527,241 3,910,194
Pacific Brands, Ltd. 7,591,519 4,774,462
PaperlinX, Ltd. 3,918,147 1,700,475
20,153,237
Belgium - 2.04%
Barco NV * 155,160 5,313,776
Canada - 6.90%
ATS Automation Tooling Systems, Inc. * 670,760 2,715,603
Copyright © 2012 www.secdatabase.com. All Rights Reserved.Please Consider the Environment Before Printing This Document

Biovail Corp. 434,000 5,509,723
Canaccord Capital, Inc. 940,900 6,989,420
Dorel Industries, Inc., Class B 103,000 2,132,173
GSI Group, Inc. * 404,674 364,206
MDS, Inc. * 45,377 224,443
Mullen Group Ltd 600 7,408
17,942,976
China - 4.03%
Bio-Treat Technology, Ltd. * (a) 6,890,612 265,143
People's Food Holdings, Ltd. 7,721,174 3,307,048
Sinotrans, Ltd., Class H 26,268,000 6,927,690
10,499,881
International Small Cap Fund (continued)Shares or
Principal
Amount Value
COMMON STOCKS (continued)
Finland - 3.69%
Amer Sports Oyj, A Shares (a) 484,044 $ 4,859,721
Elcoteq SE, A Shares * 167,981 207,702
Huhtamaki Oyj 435,136 4,527,900
9,595,323
Germany - 1.16%
Jenoptik AG * 633,625 3,017,493
Hong Kong - 12.54%
AAC Acoustic Technology Holdings, Inc. 3,870,000 3,197,744
Dah Sing Financial Group 1,558,374 6,467,864
Fountain Set Holdings, Ltd. 9,725,425 870,165
Giordano International, Ltd. 15,908,365 3,412,790
Lerado Group Holding Company, Ltd. 10,873,682 926,168
Stella International Holdings, Ltd. 3,036,500 5,109,089
TCL Communication Technology
Holdings, Ltd. * 3,213,619 292,656
Texwinca Holdings, Ltd. 7,122,907 5,009,447
Travelsky Technology, Ltd., Class H 4,329,132 2,283,354
Weiqiao Textile Company, Ltd. 2,698,106 1,494,354
Yue Yuen Industrial Holdings, Ltd. 1,555,140 3,572,838
32,636,469
Japan - 6.70%
Aiful Corp. (a) 279,200 893,470
ASICS Corp. 28,000 218,212
Descente, Ltd. 925,860 4,208,617
Meitec Corp. 89,411 1,212,713
Nichii Gakkan Company, Ltd. (a) 394,066 3,346,928
Sohgo Security Services Company, Ltd. 208,573 1,903,331
Takuma Company, Ltd. 1,098,000 2,321,688
USS Company, Ltd. 58,560 3,328,553
17,433,512
Netherlands - 6.84%
Draka Holding NV * 253,906 3,313,031
Imtech NV 151,422 3,031,398
OPG Groep NV (a) 217,228 2,737,715
SBM Offshore NV 149,054 2,533,359
TKH Group NV 129,201 1,838,733
USG People NV * 339,355 4,353,912
17,808,148
Norway - 1.32%
Tomra Systems ASA 870,020 3,427,991
Copyright © 2012 www.secdatabase.com. All Rights Reserved.Please Consider the Environment Before Printing This Document
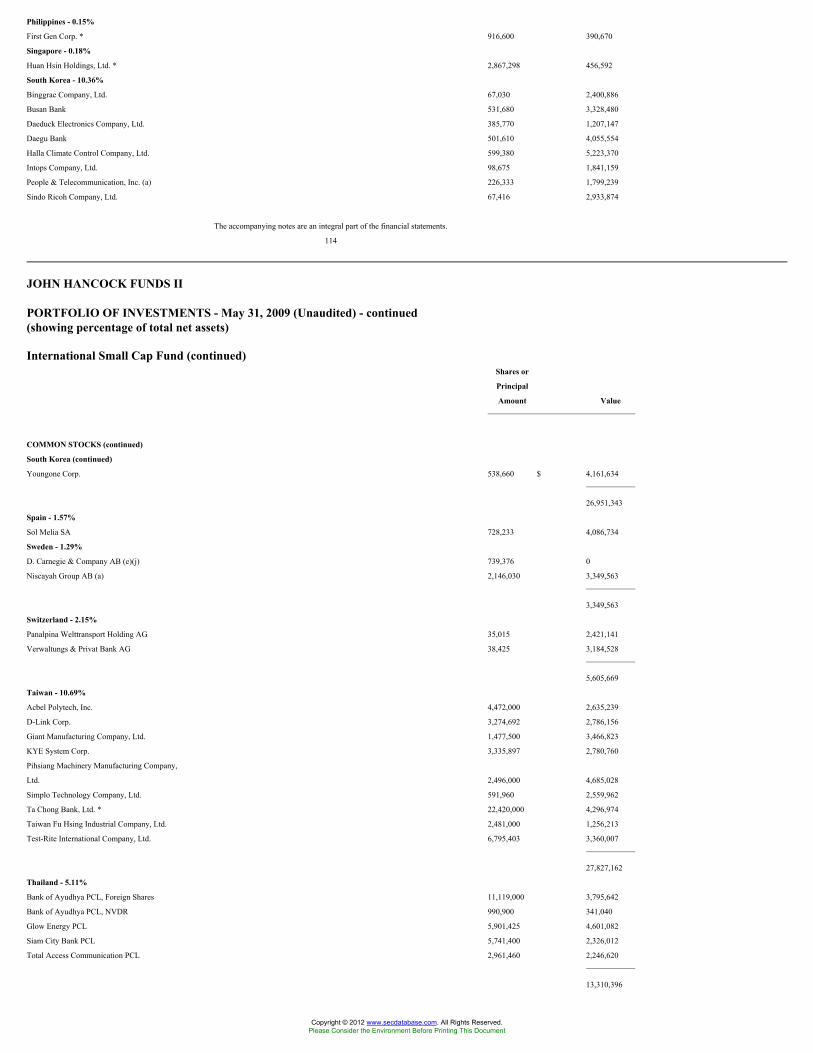
Philippines - 0.15%
First Gen Corp. * 916,600 390,670
Singapore - 0.18%
Huan Hsin Holdings, Ltd. * 2,867,298 456,592
South Korea - 10.36%
Binggrae Company, Ltd. 67,030 2,400,886
Busan Bank 531,680 3,328,480
Daeduck Electronics Company, Ltd. 385,770 1,207,147
Daegu Bank 501,610 4,055,554
Halla Climate Control Company, Ltd. 599,380 5,223,370
Intops Company, Ltd. 98,675 1,841,159
People & Telecommunication, Inc. (a) 226,333 1,799,239
Sindo Ricoh Company, Ltd. 67,416 2,933,874
The accompanying notes are an integral part of the financial statements.
114
JOHN HANCOCK FUNDS II
PORTFOLIO OF INVESTMENTS - May 31, 2009 (Unaudited) - continued(showing percentage of total net assets)
International Small Cap Fund (continued)Shares or
Principal
Amount Value
COMMON STOCKS (continued)
South Korea (continued)
Youngone Corp. 538,660 $ 4,161,634
26,951,343
Spain - 1.57%
Sol Melia SA 728,233 4,086,734
Sweden - 1.29%
D. Carnegie & Company AB (e)(j) 739,376 0
Niscayah Group AB (a) 2,146,030 3,349,563
3,349,563
Switzerland - 2.15%
Panalpina Welttransport Holding AG 35,015 2,421,141
Verwaltungs & Privat Bank AG 38,425 3,184,528
5,605,669
Taiwan - 10.69%
Acbel Polytech, Inc. 4,472,000 2,635,239
D-Link Corp. 3,274,692 2,786,156
Giant Manufacturing Company, Ltd. 1,477,500 3,466,823
KYE System Corp. 3,335,897 2,780,760
Pihsiang Machinery Manufacturing Company,
Ltd. 2,496,000 4,685,028
Simplo Technology Company, Ltd. 591,960 2,559,962
Ta Chong Bank, Ltd. * 22,420,000 4,296,974
Taiwan Fu Hsing Industrial Company, Ltd. 2,481,000 1,256,213
Test-Rite International Company, Ltd. 6,795,403 3,360,007
27,827,162
Thailand - 5.11%
Bank of Ayudhya PCL, Foreign Shares 11,119,000 3,795,642
Bank of Ayudhya PCL, NVDR 990,900 341,040
Glow Energy PCL 5,901,425 4,601,082
Siam City Bank PCL 5,741,400 2,326,012
Total Access Communication PCL 2,961,460 2,246,620
13,310,396
Copyright © 2012 www.secdatabase.com. All Rights Reserved.Please Consider the Environment Before Printing This Document

United Kingdom - 7.69%
Bodycote PLC 1,020,665 2,336,546
Burberry Group PLC 629,859 3,933,181
Fiberweb PLC 2,378,750 2,036,373
Future PLC 5,260,036 1,541,146
Game Group PLC 1,247,705 3,453,786
Henderson Group PLC 3,166,390 4,197,112
Yule Catto & Company PLC 1,888,164 2,522,110
20,020,254
United States - 2.06%
Steiner Leisure, Ltd. * 183,825 5,358,499
TOTAL COMMON STOCKS (Cost $318,739,891) $ 245,185,688
RIGHTS - 0.37%
Australia - 0.37%
Pacific Brands, Ltd. (Expiration Date
06/04/2009, Strike Price AUD 0.60) 6,623,688 954,884
TOTAL RIGHTS (Cost $1,428,390) $ 954,884
International Small Cap Fund (continued)Shares or
Principal
Amount Value
SHORT TERM INVESTMENTS - 5.94%
John Hancock Collateral Investment
Trust, 0.7339% (c)(g) $ 4,576,141 $ 4,576,142
Paribas Corp.
0.22% due 06/01/2009 10,880,000 10,880,000
TOTAL SHORT TERM INVESTMENTS
(Cost $15,456,141) $ 15,456,142
Total Investments (International Small Cap Fund)
(Cost $335,624,422) - 100.52% $ 261,596,714
Other assets and liabilities, net - (0.52)% (1,353,209)
TOTAL NET ASSETS - 100.00% $ 260,243,505
The portfolio had the following five top industry concentrations
as of May 31, 2009 (as a percentage of total net assets):
Apparel & Textiles 11.99%
Banking 8.20%
Financial Services 5.17%
Computers & Business Equipment 4.32%
Industrial Machinery 4.23%
International Small Company FundShares or
Principal
Amount Value
COMMON STOCKS - 90.35%
Australia - 5.96%
Acrux, Ltd. * 23,000 $ 22,410
Adelaide Brighton, Ltd. 44,149 81,159
Aditya Birla Minerals, Ltd. * 40,783 18,462
Admiralty Resources NL * 399,847 9,416
AED Oil, Ltd. * 34,925 26,016
Aevum, Ltd. 36,814 28,028
AJ Lucas Group, Ltd. 13,180 25,017
Alchemia, Ltd. * 43,512 12,658
Alesco Corp., Ltd. 27,563 73,347
Alkane Resources, Ltd. * 7,000 1,861
Copyright © 2012 www.secdatabase.com. All Rights Reserved.Please Consider the Environment Before Printing This Document

Alliance Resources, Ltd. * 36,000 22,213
Alliance Resources, Ltd. * 1,788 1,117
Amadeus Energy, Ltd. * 46,767 11,647
Amalgamated Holdings, Ltd. 23,828 86,818
Andean Resources, Ltd. * 79,891 132,204
APA Group, Ltd 19,000 41,891
APN News & Media, Ltd. 68,035 71,832
Aquila Resources, Ltd. * 41,695 160,679
ARB Corp., Ltd. 16,596 47,474
Atlas Iron, Ltd. * 50,850 63,537
Ausdrill, Ltd. 48,551 34,281
Ausenco, Ltd. 20,669 61,445
Austal, Ltd. 37,191 76,014
Austar United Communications, Ltd. * 166,358 96,832
Austereo Group, Ltd. 68,999 75,277
Australian Agricultural Company, Ltd. 57,508 73,483
Australian Infrastructure Fund 81,176 110,705
Australian Pharmaceutical Industries, Ltd. 68,318 38,054
Australian Worldwide Exploration, Ltd. * 67,017 155,935
The accompanying notes are an integral part of the financial statements.
115
JOHN HANCOCK FUNDS II
PORTFOLIO OF INVESTMENTS - May 31, 2009 (Unaudited) - continued(showing percentage of total net assets)
International Small Company Fund (continued)Shares or
Principal
Amount Value
COMMON STOCKS (continued)
Australia (continued)
Automotive Holdings Group, Ltd 11,804 $ 11,948
AVJennings, Ltd. 48,073 11,939
Avoca Resources, Ltd. * 43,450 62,595
AWB, Ltd. 75,717 72,295
Babcock & Brown Wind Partners, Ltd 166,952 168,511
Beach Petroleum, Ltd. 249,135 156,384
Becton Property Group 11,935 1,691
Bendigo Mining, Ltd. * 178,194 41,340
Biota Holdings, Ltd. * 39,986 45,158
Blackmores, Ltd. 2,329 29,734
Boom Logistics, Ltd. 54,447 14,224
Bradken, Ltd. 26,793 74,913
Brickworks, Ltd. 22,390 204,100
Brockman Resources, Ltd. * 29,655 24,683
Buru Energy, Ltd. * 31,633 5,710
Cabcharge Australia, Ltd. 20,341 103,161
Campbell Brothers, Ltd. 9,964 157,809
Candle Australia, Ltd. 19,623 8,267
Cardno, Ltd. (a) 23,287 59,192
Carnarvon Petroleum, Ltd. * 170,442 102,870
CBH Resources, Ltd. * 158,181 17,905
CEC Group, Ltd. * 8,875 993
Cellestis, Ltd. 15,855 37,291
Centamin Egypt, Ltd. * 113,331 154,122
Ceramic Fuel Cells, Ltd. * 126,217 15,715
Challenger Financial Services Group, Ltd. 81,817 133,082
Charter Hall Group, Ltd 137,391 47,736
Citadel Resource Group, Ltd. * 206,164 34,715
Citigold Corp., Ltd. * 151,498 20,670
Clinuvel Pharmaceuticals, Ltd. * 69,980 20,199
Copyright © 2012 www.secdatabase.com. All Rights Reserved.Please Consider the Environment Before Printing This Document

Clough, Ltd. 80,697 45,948
Coal of Africa, Ltd. * (a) 56,451 83,310
Cockatoo Coal, Ltd. * 88,688 33,490
Coeur d'Alene Mines Corp. * 3,660 57,971
Coffey International, Ltd. 16,002 25,932
Comdek, Ltd. * 9,069 5,292
Compass Resources NL * 15,577 1,871
ConnectEast Group 95,000 24,431
Consolidated Rutile, Ltd. 52,500 18,938
CopperCo, Ltd. * 173,658 6,954
Corporate Express Australia, Ltd. 30,364 79,617
Count Financial, Ltd. 44,540 46,386
Coventry Group, Ltd. * 4,500 3,822
Crane Group, Ltd. 15,638 121,709
Crescent Gold, Ltd. * 120,652 13,506
CuDeco, Ltd. * 25,525 73,201
Customers, Ltd. * 27,207 52,121
Deep Yellow, Ltd. * 341,154 104,244
Devine, Ltd. 55,419 21,327
Dominion Mining, Ltd. 15,905 62,273
Eastern Star Gas, Ltd. * 169,832 115,906
Emeco Holdings, Ltd. 143,215 50,272
Emitch, Ltd. 50,921 22,061
Energy Developments, Ltd. 45,482 54,010
Energy World Corp., Ltd. * 186,552 99,033
International Small Company Fund (continued)Shares or
Principal
Amount Value
COMMON STOCKS (continued)
Australia (continued)
Entertainment Media & Telecoms
Corporation, Ltd. * 26,746 $ 10,193
Envestra, Ltd. 275,907 104,432
Extract Resources, Ltd. * 22,986 101,391
Ferraus, Ltd. * 30,170 6,003
FKP Property Group, Ltd. 70,879 46,391
Fleetwood Corp., Ltd. 15,455 79,936
FlexiGroup, Ltd. 67,000 37,817
Flight Centre, Ltd. 15,759 93,385
Flinders Mines, Ltd. * 272,280 11,881
Forest Enterprises Australia, Ltd. 101,860 13,009
Fox Resources, Ltd. * 49,000 5,542
Funtastic, Ltd. * 33,265 4,268
Futuris Corp., Ltd. 235,162 47,549
Geodynamics, Ltd. * 56,620 51,280
Gindalbie Metals, Ltd. * 112,045 65,852
Giralia Resources NL * 63,474 33,892
Golden West Resources, Ltd. * 15,800 5,073
GrainCorp., Ltd. * 18,063 103,523
Grange Resources Corp., Ltd. * 20,914 10,064
GRD, Ltd. 54,499 17,970
Great Southern Plantations, Ltd. 47,114 4,528
GUD Holdings, Ltd. 13,336 65,671
Gunns, Ltd. 141,755 112,823
GWA International, Ltd. 44,041 85,240
Hastie Group, Ltd. 39,263 40,036
Healthscope, Ltd. 48,863 155,534
Heron Resources, Ltd. * 9,000 1,563
HFA Holdings, Ltd. 76,943 9,447
Hills Industries, Ltd. 54,208 66,137
Horizon Oil, Ltd. * 172,869 25,069
Housewares International, Ltd. 41,416 27,016
IBA Health, Ltd. * 198,695 106,275
Copyright © 2012 www.secdatabase.com. All Rights Reserved.Please Consider the Environment Before Printing This Document

IBT Education, Ltd. 64,328 141,630
iiNET, Ltd. 45,707 63,392
Imdex, Ltd. 41,654 15,737
Independence Group NL 25,263 79,182
Indophil Resources NL * 72,190 27,030
Industrea, Ltd. 171,666 30,560
Infomedia, Ltd. 87,333 20,278
Innamincka Petroleum, Ltd. * 35,386 6,116
Intrepid Mines, Ltd. * 121,756 33,190
Invocare, Ltd. 24,152 103,895
IOOF Holdings, Ltd. 26,609 83,073
Iress Market Technology, Ltd. 22,352 125,865
Jabiru Metals, Ltd. * 30,000 7,176
JB Hi-Fi, Ltd. 11,526 116,205
Kagara Zinc, Ltd. * 47,616 46,126
Karoon Gas Australia, Ltd. * 18,847 106,838
Kimberley Metals, Ltd. * 16,629 1,838
Kings Minerals NL * 37,728 3,647
Kingsgate Consolidated, Ltd. * 19,704 96,007
Linc Energy, Ltd. * 39,427 66,966
Lynas Corp, Ltd. * 195,371 76,798
MAC Services Group, Ltd 14,408 13,160
MacArthur Coal, Ltd. 24,217 106,448
The accompanying notes are an integral part of the financial statements.
116
JOHN HANCOCK FUNDS II
PORTFOLIO OF INVESTMENTS - May 31, 2009 (Unaudited) - continued(showing percentage of total net assets)
International Small Company Fund (continued)Shares or
Principal
Amount Value
COMMON STOCKS (continued)
Australia (continued)
Macmahon Holdings, Ltd. 156,391 $ 44,576
Macquarie Media Group, Ltd. 54,334 63,311
Mantra Resources, Ltd. * 2,000 5,217
Marion Energy, Ltd. * 54,928 16,322
Maxitrans Industries, Ltd. 90,065 17,456
McGuigan Simeon Wines, Ltd. * 35,945 8,210
McPherson's, Ltd. 18,009 18,503
Melbourne IT, Ltd. 27,191 37,051
MEO Australia, Ltd. * 115,196 11,089
Mermaid Marine Australia, Ltd. 51,871 68,583
Metals X, Ltd. * 128,000 11,334
Minara Resources, Ltd. * 52,139 27,095
Mincor Resources NL 54,880 59,546
Mineral Deposits, Ltd. * 137,144 76,874
Mineral Resources, Ltd. 19,193 53,947
Mirabela Nickel, Ltd. * 18,896 36,702
Molopo Australia, Ltd. * 35,633 31,512
Moly Mines, Ltd. * 23,306 7,106
Monadelphous Group, Ltd. 16,397 132,068
Mortgage Choice, Ltd. 19,081 13,161
Mosaic Oil NL * 67,228 8,086
Mount Gibson Iron, Ltd. * 151,507 94,974
Murchison Metals, Ltd. * 35,041 45,309
Nexus Energy, Ltd. * 164,231 40,117
Nido Petroleum, Ltd. * 256,103 31,867
Nomad Building Solutions, Ltd. 17,217 6,687
Copyright © 2012 www.secdatabase.com. All Rights Reserved.Please Consider the Environment Before Printing This Document

Oakton, Ltd. 15,760 21,034
Otto Energy, Ltd. * 245,691 15,206
Pacific Brands, Ltd. 174,508 109,752
Pan Australian Resources, Ltd. * 353,715 103,768
Pan Australian Resources, Ltd. * 82,358 25,725
Pan Pacific Petroleum NL * 67,247 17,317
PaperlinX, Ltd. 149,977 65,090
Peet & Company, Ltd. 47,342 59,261
Peptech, Ltd. * 60,402 67,566
Perilya, Ltd. * 22,845 8,174
Perpetual Trust of Australia, Ltd. 4,327 98,940
Perseus Mining, Ltd. * 50,479 36,051
Petsec Energy, Ltd. * 36,147 8,473
Pharmaxis, Ltd. * 50,510 105,272
Photon Group, Ltd. 14,016 14,945
Platinum Australia Ltd * 49,395 45,333
PMP, Ltd. 84,363 27,738
Port Bouvard, Ltd. * 14,000 4,568
Poseidon Nickel, Ltd. * 47,198 7,792
Premier Investments, Ltd. 8,238 35,376
Prime Retirement & Aged Care Property Trust * 44,376 3,417
Prime Television, Ltd. 15,587 7,121
Primelife Corp., Ltd. 66,564 6,149
Programmed Maintenance Services, Ltd. 32,546 65,248
pSivida Corp. * 2,379 3,950
RCR Tomlinson, Ltd. 22,598 7,832
Realestate.com.au, Ltd. * 2,110 9,399
Reckon, Ltd. 37,302 37,354
Redflex Holdings, Ltd. 29,562 59,254
Resolute Mining, Ltd. * 43,345 24,360
International Small Company Fund (continued)Shares or
Principal
Amount Value
COMMON STOCKS (continued)
Australia (continued)
Reverse Corp., Ltd. 22,464 $ 11,425
Ridley Corp., Ltd. 56,940 35,234
Riversdale Mining, Ltd. * 33,818 176,826
Roc Oil Company, Ltd. * 116,744 58,122
SAI Global, Ltd. 33,038 71,147
Salinas Energy, Ltd. * 105,014 7,292
Sally Malay Mining, Ltd. 55,567 91,915
Salmat, Ltd. 25,789 76,468
Sedgman, Ltd. 9,796 7,702
Seek, Ltd. 49,060 161,591
Select Harvests, Ltd. 7,043 14,693
ServCorp, Ltd. 13,939 31,827
Service Stream, Ltd. 5,752 1,800
Seven Network, Ltd. * 27,223 120,577
Sigma Pharmaceuticals, Ltd. 197,103 158,458
Silex Systems, Ltd. * 26,129 123,706
Sino Strategic International, Ltd. * 11,948 5,933
Sirtex Medical, Ltd. * 11,366 27,573
Skilled Group, Ltd. 15,185 15,670
SMS Management & Technology, Ltd. 12,633 31,911
SP Telemedia, Ltd. 63,587 19,936
Specialty Fashion Group, Ltd. 51,331 17,277
Sphere Investments Ltd * 18,205 8,233
Spotless Group, Ltd. 48,696 74,865
St. Barbara, Ltd. * 137,516 28,067
Straits Resources, Ltd. * 61,211 83,380
Strike Resources, Ltd. * 22,520 7,598
STW Communications Group, Ltd. 36,346 15,188
Copyright © 2012 www.secdatabase.com. All Rights Reserved.Please Consider the Environment Before Printing This Document

Sundance Resources, Ltd. * 344,338 34,853
Sunland Group, Ltd. 74,292 36,053
Super Cheap Auto Group, Ltd. 17,728 48,479
Swick Mining Services, Ltd. * 28,000 8,750
Talent2 International, Ltd. 6,000 3,106
Tamaya Resources, Ltd. * (a) 219,476 2,461
Tap Oil, Ltd. * 40,556 35,882
Tassal Group, Ltd. 32,997 58,917
Technology One, Ltd. 46,859 28,635
Ten Network Holdings, Ltd. 99,034 79,127
Terramin Australia, Ltd. * 14,500 8,883
TFS Corp., Ltd. 53,876 44,959
Thakral Holdings Group, Ltd. 137,513 24,280
The Reject Shop, Ltd. 8,900 79,308
Tower Australia Group, Ltd. 75,112 159,542
Tox Free Solutions, Ltd. * 16,000 22,627
Transfield Services Infrastructure Fund 65,590 57,395
Transfield Services, Ltd. 45,115 94,376
Transpacific Industries Group, Ltd. 2,950 4,253
Troy Resources NL 18,408 23,294
United Minerals Corp. * 26,754 19,673
UXC, Ltd. 55,945 18,469
Village Roadshow, Ltd. 27,228 22,601
Virgin Blue Holdings, Ltd. * 29,257 6,586
Vision Group Holdings, Ltd. 12,357 6,718
Watpac, Ltd. (a) 43,044 33,886
Wattyl, Ltd. 18,165 6,192
WDS, Ltd. 23,751 27,939
The accompanying notes are an integral part of the financial statements.
117
JOHN HANCOCK FUNDS II
PORTFOLIO OF INVESTMENTS - May 31, 2009 (Unaudited) - continued(showing percentage of total net assets)
International Small Company Fund (continued)Shares or
Principal
Amount Value
COMMON STOCKS (continued)
Australia (continued)
Webster, Ltd. 30,574 $ 16,071
West Australian Newspapers Holdings, Ltd. (a) 12,000 38,707
Western Areas NL * 19,736 75,614
White Energy Company, Ltd. * 20,704 26,126
Whitehaven Coal, Ltd. 26,881 63,550
WHK Group, Ltd. 56,586 44,861
Wide Bay Australia, Ltd. 5,746 29,933
Windimurra Vanadium, Ltd. * 26,928 3,666
Wotif.com Holdings, Ltd. 19,783 70,211
12,560,901
Austria - 0.77%
Agrana Beteiligungs AG 892 70,870
Andritz AG 4,647 189,470
A-TEC Industries AG * 4,140 54,551
Austrian Airlines AG * (a) 1,351 7,659
BetandWin.com Interactive Entertainment AG * 3,315 134,447
BWT AG 1,398 30,408
Constantia Packaging AG 1,971 70,750
EVN AG 2,879 50,607
Flughafen Wien AG 3,516 136,053
Copyright © 2012 www.secdatabase.com. All Rights Reserved.Please Consider the Environment Before Printing This Document

Frauenthal Holdings AG * 2,607 23,418
Intercell AG * 4,221 127,161
Lenzing AG 262 61,155
Mayr-Melnhof Karton AG 917 80,877
Oesterreichische Post AG 4,024 117,610
Palfinger AG 4,482 70,986
RHI AG * 2,919 53,476
Rosenbauer International AG 1,472 61,872
S&T System Integration & Technology
Distribution AG * 541 7,844
Schoeller-Bleckmann Oilfield Equipment AG 3,462 128,399
Uniqa Versicherungen AG 5,704 118,601
Warimpex Finanz- und Beteiligungs AG 3,221 9,241
Wolford AG 1,578 22,585
1,628,040
Belgium - 1.09%
Ackermans & Van Haaren NV (a) 2,716 174,739
Agfa Gevaert NV * 23,899 73,278
Banque Nationale de Belgique 47 158,871
Barco NV * 3,889 133,187
Bekaert SA 2,018 205,433
Compagnie d'Entreprises (CFE) 2,678 123,549
Compagnie Immobiliere de Belgique SA * 645 16,427
Compagnie Maritime Belge SA 2,799 86,381
Deceuninck NV * 4,147 13,106
Devgen * 2,298 22,756
Duvel Moortgat SA 873 50,573
Econocom Group SA 5,040 35,144
Elia System Operator SA/NV (a) 3,003 111,466
Euronav NV 7,637 127,991
EVS Broadcast Equipment SA 1,283 62,375
Exmar NV 4,863 58,082
Image Recognition Integrated Systems 78 4,807
International Brachytherapy SA * 5,699 28,276
Ion Beam Applications SA 4,206 37,339
International Small Company Fund (continued)Shares or
Principal
Amount Value
COMMON STOCKS (continued)
Belgium (continued)
Kinepolis Group NV 391 $ 12,273
Lotus Bakeries SA 34 13,537
Melexis NV 4,995 33,735
Omega Pharma SA 3,818 121,365
Recticel SA 3,266 15,252
Roularta Media Group NV 668 15,197
SA D'Ieteren Trading NV 498 102,215
Sapec SA 305 31,359
Sioen Industries NV 1,985 10,590
Sipef SA 1,700 75,573
Telenet Group Holding NV * 10,072 200,707
Tessenderlo Chemie NV 2,408 81,542
Van De Velde NV 1,407 52,949
2,290,074
Canada - 7.05%
20-20 Technologies, Inc. * 6,400 12,310
Absolute Software Corp. * 12,800 57,332
Aecon Group, Inc. 13,800 149,155
AGF Management, Ltd. 8,493 102,297
Akita Drilling, Ltd. 2,900 19,922
Alamos Gold, Inc. * 14,960 133,602
Copyright © 2012 www.secdatabase.com. All Rights Reserved.Please Consider the Environment Before Printing This Document

Alberta Clipper Energy, Inc. * 19,300 13,082
Alexco Resource Corp. * 5,500 11,688
Allen-Vanguard Corp. * 12,747 1,518
Altius Minerals Corp. * 6,200 41,229
Amerigo Resources, Ltd. 22,400 7,899
Anderson Energy, Ltd. * 20,300 17,106
Angiotech Pharmaceuticals, Inc. * 20,094 36,627
Antrim Energy, Inc. * 29,900 20,540
Anvil Mining, Ltd. * 20,649 25,912
Aquiline Resources, Inc. * 15,500 33,364
Argosy Energy, Inc. * 1,723 2,288
Astral Media, Inc. 7,081 200,674
Atrium Innovations, Inc. * 4,200 54,012
ATS Automation Tooling Systems, Inc. * 16,823 68,109
Augusta Resource Corp. * 17,500 36,547
Aurizon Mines, Ltd. * 17,846 79,116
Axia NetMedia Corp. * 9,200 12,050
B2Gold Corp. * 14,147 10,884
Baffinland Iron Mines Corp. * 24,800 9,541
Baja Mining Corp. * 16,100 7,079
Ballard Power Systems, Inc. * 21,400 40,183
Bankers Petroleum, Ltd. * 43,086 87,612
Bellus Health, Inc. * 3,500 882
Bioms Medical Corp. * 21,000 75,017
Bioteq Environment Technologies, Inc. * 11,100 5,999
Birch Mountain Resources, Ltd. * 11,200 513
Birchcliff Energy, Ltd. * 10,153 58,588
BNK Petroleum, Inc. * 12,925 4,499
Boralex, Inc., Class A * 9,100 58,763
Breaker Energy, Ltd., Class A * 8,800 37,481
Breakwater Resources, Ltd. * 63,300 16,814
Calfrac Well Services, Ltd. 7,700 90,418
Calvalley Petroleums, Inc., Class A * 15,977 23,708
Canaccord Capital, Inc. 9,300 69,084
Canada Bread Company, Ltd. 3,340 125,432
The accompanying notes are an integral part of the financial statements.
118
JOHN HANCOCK FUNDS II
PORTFOLIO OF INVESTMENTS - May 31, 2009 (Unaudited) - continued(showing percentage of total net assets)
International Small Company Fund (continued)Shares or
Principal
Amount Value
COMMON STOCKS (continued)
Canada (continued)
Canadian Hydro Developers, Inc. * 39,880 $ 112,873
Canadian Royalties, Inc. * 24,900 7,755
Canadian Western Bank 13,677 180,397
Canam Group, Inc., Class A 15,300 103,845
Candax Energy, Inc. * 82,101 9,400
Canfor Corp. * 19,401 99,693
Cangene Corp. * 6,400 31,714
CanWest Global Communications Corp. * 15,050 2,895
Capstone Mining Corp. * 17,200 36,550
Cardiome Pharma Corp. * 18,800 77,490
Carpathian Gold, Inc. * 20,000 4,946
Cascades, Inc. 24,850 104,703
Catalyst Paper Corp. * 54,263 5,467
CCL Industries, Inc., Class B 5,827 116,460
Copyright © 2012 www.secdatabase.com. All Rights Reserved.Please Consider the Environment Before Printing This Document

CE Franklin, Ltd. * 2,786 15,796
Celestica, Inc. * 27,901 182,727
Celtic Exploration, Ltd. * 3,946 58,119
Chariot Resources, Ltd. * 40,500 8,532
Clarke, Inc. 10,800 25,028
Claude Resources, Inc. * 35,700 29,103
Coalcorp Mining, Inc. * 33,771 5,568
Cogeco Cable, Inc. 5,100 126,128
COM DEV International, Ltd. * 14,900 48,586
Comaplex Minerals Corp. * 5,776 22,273
Compton Petroleum Corp. * 33,118 44,895
Connacher Oil & Gas, Ltd. * (a) 71,923 71,808
Constellation Software, Inc. 2,100 62,707
Corby Distilleries, Ltd. 7,022 106,705
Corridor Resources, Inc. * 24,300 47,632
Corus Entertainment, Inc., Class B 10,707 155,444
Cott Corp. * 20,400 119,588
Crew Energy, Inc. * 18,023 99,050
Crew Gold Corp. * 1,862 1,279
Crystallex International Corp. * 43,800 11,434
Dalsa Corp. 6,700 34,981
Delphi Energy Corp. * 30,700 31,213
Denison Mines Corp. * 59,616 115,218
Descartes Systems Group, Inc. * 10,100 39,780
Detour Gold Corp. * 3,650 45,368
Divestco, Inc. * 2,800 1,013
Dorel Industries, Inc., Class B 6,836 141,510
Dundee Precious Metals, Inc. * 17,200 31,194
DundeeWealth, Inc. 12,076 85,503
Eastern Platinum, Ltd. * 203,624 104,446
Endeavour Silver Corp. * 6,200 13,573
Enghouse Systems, Ltd. 1,100 7,154
Entree Gold, Inc. * 31,600 37,338
Equinox Minerals, Ltd. * 69,745 172,486
Equitable Group, Inc. 4,400 70,207
Etruscan Resources, Inc. * 15,700 4,746
European Goldfields, Ltd. * 15,219 46,281
Evertz Technologies, Ltd. 5,801 85,547
Exco Technologies, Ltd. 7,900 8,104
Exfo Electro Optical Engineering, Inc. * 912 4,269
Fairborne Energy, Ltd. * 21,600 90,218
Farallon Resources, Ltd. * 70,400 21,280
International Small Company Fund (continued)Shares or
Principal
Amount Value
COMMON STOCKS (continued)
Canada (continued)
First Nickel, Inc. * 30,500 $ 3,632
Flint Energy Services, Ltd. * 13,600 135,284
FNX Mining Company, Inc. * 9,825 60,745
Forsys Metals Corp. * 15,300 77,639
Forzani Group, Ltd., Class A 9,900 125,501
Fraser Papers, Inc. * 4,800 1,033
Fronteer Development Group, Inc. * 22,680 84,966
Galleon Energy, Inc. * 20,050 93,111
Garda World Security Corp. * 7,700 25,743
Gennum Corp. 9,858 47,224
Gluskin Sheff & Associates, Inc. 2,500 32,677
Golden Star Resources, Ltd. * (a) 53,518 123,531
Grande Cache Coal Corp. * 30,900 42,172
Great Basin Gold, Ltd. * 65,400 102,436
Great Canadian Gaming Corp. * 19,450 93,531
Grey Wolf Exploration, Inc. * 8,500 5,684
Copyright © 2012 www.secdatabase.com. All Rights Reserved.Please Consider the Environment Before Printing This Document

Greystar Resources, Ltd. * 4,600 15,505
Guyana Goldfields, Inc. * 10,700 42,633
Hanfeng Evergreen, Inc. * 13,500 91,504
Harry Winston Diamond Corp. 18,800 124,157
Heroux-Devtek, Inc. * 6,800 26,534
High River Gold Mines, Ltd. * 94,050 18,521
Highpine Oil & Gas, Ltd. * 21,142 91,598
Home Capital Group, Inc. 6,182 183,804
HudBay Minerals, Inc. * 21,392 157,146
Hydrogenics Corp. * 21,000 12,118
Imax Corp. * 1,500 11,198
Imperial Metals Corp. * 6,500 23,220
Industrial Alliance Insurance and Financial
Services, Inc. 7,288 175,032
Intermap Technologies Corp., Class A * 7,800 12,860
International Forest Products, Ltd., Class A * 10,250 24,129
International Royalty Corp. 24,000 89,691
Intertape Polymer Group, Inc. * 9,300 11,074
Iteration Energy, Ltd. * 57,560 73,812
Ivanhoe Energy, Inc. * 51,200 83,477
Jinshan Gold Mines, Inc. * 34,900 23,975
Kaboose, Inc. * 44,000 24,181
Kimber Resources, Inc. * 1,750 1,138
Kingsway Financial Services, Inc. 19,200 53,815
Kirkland Lake Gold, Inc. * 14,900 129,791
Labopharm, Inc. * 12,200 22,573
Lake Shore Gold, Corp. * 50,500 110,552
Laramide Resources, Ltd. * 11,900 20,928
Laurentian Bank of Canada 2,691 78,234
Le Chateau, Inc. 4,700 42,189
Leon's Furniture, Ltd. 6,709 59,608
Linamar Corp. 12,009 84,918
MacDonald Dettwiler & Associates, Ltd. * 4,105 104,529
Mahalo Energy, Ltd. * 12,900 236
Major Drilling Group International 6,900 109,970
Maple Leaf Foods, Inc. 14,594 112,555
March Networks Corp. * 7,500 24,731
Martinrea International, Inc. * 21,300 95,013
Maxim Power Corp. * 10,800 25,720
MDS, Inc. * 23,168 114,593
The accompanying notes are an integral part of the financial statements.
119
JOHN HANCOCK FUNDS II
PORTFOLIO OF INVESTMENTS - May 31, 2009 (Unaudited) - continued(showing percentage of total net assets)
International Small Company Fund (continued)Shares or
Principal
Amount Value
COMMON STOCKS (continued)
Canada (continued)
Mega Brands, Inc. * 14,500 $ 5,047
Mega Uranium, Ltd. * 26,600 50,435
Methanex Corp. 12,867 153,921
Migao Corp. * 9,400 69,569
Miranda Technologies, Inc. * 4,000 16,780
Mosaid Technologies, Inc. 4,400 53,521
Neo Material Technologies, Inc. * 15,700 23,009
Norbord, Inc. * 26,000 38,104
North American Palladium, Ltd. * 12,650 33,834
Copyright © 2012 www.secdatabase.com. All Rights Reserved.Please Consider the Environment Before Printing This Document

Northgate Minerals Corp. * 58,004 140,262
Nova Chemicals Corp. 29,069 167,212
NuVista Energy, Ltd. * 16,157 156,871
Oncolytics Biotech, Inc. * 10,923 19,410
Orvana Minerals, Corp. * 48,020 32,548
Osisko Mining Corp. * 1,597 10,400
Paladin Labs, Inc. * 3,300 59,547
Pan American Silver Corp. * 12,600 295,221
Paramount Resources, Ltd. * 12,700 83,523
Pason Systems, Inc. 6,895 59,366
Pelangio Exploration, Inc. * 14,200 2,992
Petaquilla Minerals Company, Ltd. * 29,100 16,792
Petrolifera Petroleum, Ltd. * 7,550 16,597
Platinum Group Metals, Ltd. * 11,200 13,952
Points International, Ltd. * 16,500 7,557
Polymet Mining Corp. * 35,100 45,332
Progress Energy Resources Corp. 25,155 246,078
ProspEx Resources, Ltd. * 8,365 5,593
Pulse Data, Inc. 15,318 17,538
QLT, Inc. * 22,800 49,913
Quadra Mining, Ltd. * 19,900 141,082
Quebecor, Inc. 8,501 148,957
Quest Capital Corp. 50,300 55,287
Reitman's Canada, Ltd., Class A 5,776 67,984
Resin Systems, Inc. * 36,820 14,502
Resverlogix Corp. * 5,300 12,865
Richelieu Hardware, Ltd. 5,700 87,869
Rock Energy, Inc. * 373 581
RONA, Inc. * 13,109 150,092
Rubicon Minerals Corp. * 21,100 51,989
Russel Metals, Inc. (a) 6,737 88,860
Samuel Manu-Tech, Inc. 3,200 12,310
Savanna Energy Services Corp. 13,368 74,080
Sceptre Investment Counsel, Ltd. 7,200 33,898
Scorpio Mining Corp. * 22,600 7,866
Semafo, Inc. * 42,000 96,176
ShawCor, Ltd., Class A 6,731 126,081
Shore Gold, Inc. * 400 205
Sierra Wireless, Inc. * 9,350 60,635
Silver Standard Resources, Inc. * 9,591 227,355
Silvercorp Metals, Inc. 38,694 125,465
Softchoice Corp. 2,000 7,328
Stantec, Inc. * 5,068 131,789
Starfield Resources, Inc. * 52,500 11,060
Stella-Jones, Inc. 2,100 46,241
Storm Cat Energy Corp. * 2,400 88
Storm Exploration, Inc. * 9,200 113,509
International Small Company Fund (continued)Shares or
Principal
Amount Value
COMMON STOCKS (continued)
Canada (continued)
Stornoway Diamond Corp. * 44,100 $ 6,059
SunOpta, Inc. * 17,900 31,972
SXC Health Solutions Corp. * 4,200 103,755
Tanzanian Royalty Exploration Corp. * 17,900 63,943
Taseko Mines, Ltd. * 39,900 69,439
Tembec, Inc. * 7,330 4,767
The Churchill Corp. * 2,800 30,366
Theratechnologies, Inc. * 12,198 30,725
Thompson Creek Metals Company, Inc. * 13,797 130,040
Timminco, Ltd. * (a) 12,400 17,037
TLC Vision Corp. * 13,700 4,141
Copyright © 2012 www.secdatabase.com. All Rights Reserved.Please Consider the Environment Before Printing This Document

Toromont Industries, Ltd. * 7,593 158,502
Torstar Corp., Class B 19,400 88,848
Transcontinental, Inc., Class A 14,665 104,102
Transglobe Energy Corp. * 16,600 44,855
Transition Therapeutics, Inc. * 4,900 20,017
Treasury Metals, Inc. * 3,131 746
Trican Well Service, Ltd. 18,100 160,649
Trinidad Drilling, Ltd. 19,200 99,363
Tristar Oil & Gas, Ltd. * 14,589 151,937
Tundra Semiconductor Corp. * 2,300 13,125
Turnkey E&P, Inc. * 1,100 5
Uex Corp. * 35,200 45,139
Uni-Select, Inc. * 4,200 107,717
Uranium One, Inc. * 55,113 111,059
Uranium Participation Corp. * 19,758 141,523
Ur-Energy, Inc. * 10,200 11,305
Vecima Networks, Inc. * 5,621 24,971
Vector Aerospace Corp. * 2,100 10,291
Verenex Energy, Inc. * 8,500 70,071
Vero Energy, Inc. * 6,700 23,443
Vitran Corp., Inc. * 300 2,424
Wesdome Gold Mines, Ltd. 17,100 30,386
West Energy, Ltd. * 23,625 45,876
West Fraser Timber Company, Ltd. 3,755 99,950
Western Canadian Coal Corp. * 25,500 35,503
Western Financial Group, Inc. 10,800 18,598
Westport Innovations, Inc. * 7,700 44,715
Wi-LAN, Inc. * 27,400 46,932
Winpak, Ltd. 9,900 55,496
Xceed Mortgage Corp. * 1,800 1,995
Xtreme Coil Drilling Corp. * 6,548 26,690
Zarlink Semiconductor, Inc. * 200 93
ZCL Composites, Inc. 5,200 18,766
14,841,973
Denmark - 0.90%
ALK-Abello A/S 1,064 83,679
Alm. Brand Skadesforsikring A/S * 3,700 75,618
Amagerbanken A/S * 3,400 45,566
Ambu A/S 800 12,933
Auriga Industries (a) 3,093 58,426
Bang & Olufsen AS, Series B 6,300 53,256
Bavarian Nordic A/S * 1,260 48,172
BoConcept Holding A/S 75 1,286
Bonusbanken A/S * 7,500 499
Brodrene Hartmann A/S * 900 13,782
The accompanying notes are an integral part of the financial statements.
120
JOHN HANCOCK FUNDS II
PORTFOLIO OF INVESTMENTS - May 31, 2009 (Unaudited) - continued(showing percentage of total net assets)
International Small Company Fund (continued)Shares or
Principal
Amount Value
COMMON STOCKS (continued)
Denmark (continued)
Brondbyernes IF Fodbold A/S * 1,244 $ 7,951
Capinordic A/S * 9,300 4,795
Dalhoff Larsen & Horneman A/S, Series B * 2,500 9,813
Copyright © 2012 www.secdatabase.com. All Rights Reserved.Please Consider the Environment Before Printing This Document

Dantherm A/S * 800 4,575
Det Ostasiatiske Kompagni AS 3,066 102,817
DFDS A/S * 745 45,313
DiBa Bank A/S * 550 7,424
Fionia Bank A/S * 1,250 7,594
Fluegger A/S, Series B 300 13,018
GN Store Nord A/S * 12,589 54,002
Greentech Energy Systems A/S * 13,500 58,007
Gronlandsbanken * 20 1,584
H&H International A/S * 280 20,044
Harboes Bryggeri A/S 1,900 46,889
IC Companys A/S 3,450 72,943
Jeudan A/S 650 54,936
Maconomy Corp. * 1,500 1,925
NeuroSearch A/S * 4,338 84,349
Nordjyske Bank A/S * 1,190 28,591
Ostjydsk Bank A/S * 190 14,099
Parken Sport & Entertainment A/S * 610 61,468
PER Aarsleff A/S 600 67,309
Pharmexa A/S * 10,600 1,693
Ringkjoebing Landbobank A/S * 797 74,506
Roskilde Bank A/S * (e)(j) 495 0
Royal Unibrew A/S * 1,200 18,049
Sanistal A/S, Series B * 250 5,154
Satair A/S 1,000 27,203
Schouw & Company A/S, Series B 4,900 92,668
SimCorp A/S 551 91,604
Sjaelso Gruppen A/S * 5,500 30,345
Solar Holdings A/S 900 39,659
Spar Nord Bank A/S * 9,818 101,716
Sparbank Vest A/S * 275 5,575
Sydbank AS * 4,119 88,955
Thrane & Thrane A/S 800 25,342
TK Development A/S * 12,600 69,611
TopoTarget A/S * 15,000 12,590
Vestjysk Bank A/S * 3,600 57,438
1,904,771
Finland - 2.25%
Ahlstrom OYJ 995 8,889
Aldata Solution Oyj * 13,900 9,698
Alma Media Oyj 11,810 83,526
Amer Sports Oyj, A Shares (a) 15,352 154,132
Aspo Oyj 4,950 41,097
Atria PLC 4,565 60,383
BasWare Oyj 299 4,656
Cargotec Corp. Oyj, B Shares 7,834 131,516
Comptel PLC 20,738 24,139
Cramo Oyj, Series B 5,674 61,794
Digia PLC 2,622 7,327
Elcoteq SE, A Shares * 5,952 7,359
Elektrobit Corp. * 9,773 8,479
Elisa Oyj, Class A 16,633 247,341
Etteplan Oyj 276 1,144
International Small Company Fund (continued)Shares or
Principal
Amount Value
COMMON STOCKS (continued)
Finland (continued)
Finnair Oyj * 12,756 $ 79,953
Finnlines Oyj * 6,400 57,994
Fiskars Corp. 6,906 86,616
F-Secure Oyj 27,788 99,137
Copyright © 2012 www.secdatabase.com. All Rights Reserved.Please Consider the Environment Before Printing This Document

HK Ruokatalo Oyj, Series A 6,090 68,260
Huhtamaki Oyj 9,309 96,867
Ilkka-Yhtyma Oyj 1,073 10,654
KCI Konecranes Oyj 7,861 189,300
Kemira Oyj (a) 13,832 149,857
Kesko Oyj 7,779 225,430
Lannen Tehtaat Oyj 1,246 21,812
Lassila & Tikanoja Oyj 9,284 156,739
Lemminkainen Oyj 2,350 65,320
M-real Oyj, Series B * 51,438 45,948
Olvi Oyj, Series A 2,000 47,381
Oriola-KD Oyj 22,667 76,068
Orion Oyj, Series A 11,644 191,393
Orion Oyj, Series B 12,373 201,621
Outokumpu Oyj 2,109 42,316
Outotec Oyj 7,821 198,170
PKC Group Oyj 5,756 31,475
Pohjola Bank PLC 14,532 112,079
Ponsse Oyj 2,415 13,076
Poyry Oyj 10,673 140,401
Raisio Oyj (a) 33,851 91,793
Ramirent Oyj 21,264 129,175
Rapala VMC Oyj 617 3,581
Rautaruukki Oyj 3,109 70,698
Ruukki Group Oyj * 42,123 97,278
Sanoma WSOY Oyj 9,611 153,803
Scanfil Oyj 3,082 8,928
Stockmann Oyj Abp, Series A 1,949 43,435
Stockmann Oyj Abp, Series B (a) 6,604 140,504
Talentum Oyj 2,462 6,355
Tecnomen Oyj 21,184 32,468
Teleste Oyj 1,377 6,672
TietoEnator Oyj 13,965 201,560
Uponor Oyj 12,147 158,350
Vacon Oyj 2,844 91,516
Vaisala Oyj, Series A 2,677 98,295
YIT Oyj 14,717 155,961
4,749,719
France - 4.46%
Ales Groupe SA 1,081 14,986
Alten SA * 4,916 85,745
Altran Technologies SA * 34,473 118,260
April Group SA 1,609 58,858
Arkema * 5,678 156,144
Assystem SA 4,109 30,315
Atos Origin SA 7,703 260,069
Audika SA (a) 1,625 42,159
Avanquest Software SA * 1,218 4,312
Bacou Dalloz SA 1,693 75,890
Beneteau SA (a) 3,926 53,802
BioMerieux SA 158 13,677
Boiron SA 1,874 55,965
The accompanying notes are an integral part of the financial statements.
121
JOHN HANCOCK FUNDS II
PORTFOLIO OF INVESTMENTS - May 31, 2009 (Unaudited) - continued(showing percentage of total net assets)
International Small Company Fund (continued)Shares or
Principal
Amount Value
Copyright © 2012 www.secdatabase.com. All Rights Reserved.Please Consider the Environment Before Printing This Document

COMMON STOCKS (continued)
France (continued)
Bonduelle SCA 961 $ 78,636
Bongrain SA * 2,010 109,452
Bourbon SA 4,596 205,418
Bull SA * 11,140 32,986
Canal Plus SA 16,823 116,544
Carbone Lorraine SA 1,610 46,972
Cegedim SA * 323 21,902
Cegid SA 1,808 28,522
Club Mediterranee SA * (a) 5,220 75,943
Compagnie Plastic Omnium SA 2,137 25,800
Delachaux SA 1,563 95,880
EDF Energies Nouvelles, SA 4,742 222,023
Electricite de Strasbourg SA 366 56,441
Esso SAF 925 123,765
Etablissements Maurel et Prom SA 9,991 174,154
Etam Developpement SA 1,728 34,225
Euler Hermes SA (a) 3,247 223,919
Euro Disney SCA * 5,771 30,610
Exel Industries SA 185 6,772
Faurecia * (a) 7,645 74,211
Financiere Marc de Lacharriere SA (Fimalac) 2,123 110,174
Fleury Michon SA 344 13,865
Gaumont SA 589 30,723
Gemalto NV * 8,005 265,127
GFI Informatique SA * 13,516 58,191
GIFI 620 29,756
GL Events SA * 2,064 40,298
Groupe Open SA 2,447 21,518
Groupe Steria SA 7,290 146,787
Guerbet SA 558 91,367
Guyenne & Gascogne SA 1,224 108,626
Havas SA 40,771 109,198
Imerys SA * (a) 1,279 52,490
Imerys SA * (a) 3,746 160,680
Infogrames Entertainment SA * 4,900 34,021
Ingenico SA 7,280 151,745
Ipsos SA 4,995 124,416
Kaufman & Broad SA 1,176 23,526
Korian 2,594 60,911
Lafuma SA * 424 5,131
Laurent-Perrier SA 996 57,195
Lectra SA * 6,134 19,612
Lisi SA 1,002 45,337
LVL Medical Groupe SA * 3,125 66,521
M6-Metropole Television (a) 8,737 173,361
Maisons France Confort SA 709 22,114
Manitou BF SA 4,367 50,847
Manutan SA 1,304 59,040
Marseill Tunnel Prado-Carena 219 7,303
Montupet SA 553 2,470
Mr. Bricolage SA * 1,756 33,677
Naturex 382 12,818
Neopost SA 3,443 287,370
Nexans SA (a) 5,084 281,656
Nexity SA (a) 5,346 184,254
Norbert Dentressangle SA 1,107 44,114
International Small Company Fund (continued)Shares or
Principal
Amount Value
Copyright © 2012 www.secdatabase.com. All Rights Reserved.Please Consider the Environment Before Printing This Document

COMMON STOCKS (continued)
France (continued)
NRJ Group 8,402 $ 54,258
Orco Property Group SA * 1,119 10,525
Orpea SA * 2,078 91,152
Parrot SA * 1,593 13,319
Penauille Polyservices SA 35,222 83,485
Pierre & Vacances SA 1,327 90,840
Pinguely-Haulotte SA * 2,723 19,089
Radiall SA 349 21,297
Rallye SA 1,670 45,047
Remy Cointreau SA 2,399 84,863
Rexel SA 22,387 224,025
Rhodia SA * 20,440 191,283
Robertet SA 258 25,574
Rubis SA 2,109 142,645
Saft Groupe SA * 3,605 151,215
Samse SA 317 26,202
SEB SA 5,046 202,142
Sechilienne-Sidec SA 1,879 63,608
Silicon-On-Insulator Technologies SA * 19,448 136,322
Societe BIC SA (a) 2,951 162,309
Societe des Bains de Mer & du Cercle des
Etrangers a Monaco SA 930 60,628
Societe Industrielle D'Aviations Latecoere SA * 552 3,054
Somfy SA 554 94,242
Sopra Group SA 1,600 60,098
Spir Communication SA * 493 10,209
SR Teleperformance SA 5,607 165,420
Stallergenes SA 813 54,666
Stef-TFE Group 2,575 108,368
Sucriere de Pithiviers-Le-Vieil SA 73 51,686
Synergie SA 1,224 24,223
Tessi SA 206 11,384
Theolia SA * 7,086 31,491
Toupargel-Agrigel SA 936 22,535
Trigano SA 2,853 30,337
UbiSoft Entertainment SA * 9,538 194,116
Union Financiere de France Banque SA 725 27,148
Valeo SA 8,209 162,940
Viel & Compagnie SA 9,385 31,932
Vilmorin & Compagnie SA 1,096 97,244
Virbac SA 1,389 108,039
VM Materiaux SA * 579 32,389
Vranken-Pommery Monopole Group SA 721 23,693
Wendel 6,049 259,374
Zodiac SA 4,613 149,946
9,394,958
Germany - 4.35%
Aareal Bank AG * 8,830 100,228
Adlink Internet Media AG * 2,151 11,812
ADVA AG Optical Networking * 10,567 20,045
Aixtron AG (a) 15,670 185,490
Amadeus Fire AG 724 11,174
Augusta Technologie AG 2,266 24,081
Baader Wertpapierhandelsbank AG 12,306 41,892
Balda AG * 3,189 3,802
Bauer AG 3,054 132,505
The accompanying notes are an integral part of the financial statements.
122
JOHN HANCOCK FUNDS II
Copyright © 2012 www.secdatabase.com. All Rights Reserved.Please Consider the Environment Before Printing This Document

PORTFOLIO OF INVESTMENTS - May 31, 2009 (Unaudited) - continued(showing percentage of total net assets)
International Small Company Fund (continued)Shares or
Principal
Amount Value
COMMON STOCKS (continued)
Germany (continued)
Beate Uhse AG * 8,223 $ 8,178
Bechtle AG 3,518 64,664
Bertrandt AG 519 10,822
Bilfinger Berger AG (a) 5,150 256,981
Biotest AG 1,095 55,836
Boewe Systec AG * 1,342 10,142
Borussia Dortmund GMBH & Company KGAA * 20,750 27,637
Carl Zeiss Meditec AG 7,343 94,102
Cenit AG 2,140 13,641
Centrotec Sustainable AG * 2,162 24,173
Cewe Color Holding AG 1,320 42,497
Comdirect Bank AG 7,971 58,777
Conergy AG * 21,120 20,975
Constantin Medien AG * 17,451 51,921
Constantin Medien AG * 1,745 5,156
CropEnergies AG * 4,847 19,719
CTS Eventim AG 2,979 110,705
Curanum AG 4,385 20,987
D Logistics AG * 17,468 30,483
DAB Bank AG 4,358 17,621
Data Modul AG 850 10,170
Demag Cranes AG 2,393 58,611
Deutsche Wohnen AG * 5,958 95,007
Deutz AG * 22,110 97,099
Douglas Holding AG (a) 3,551 146,404
Drillisch AG 6,749 17,920
Duerr AG 2,766 48,277
DVB Bank AG 110 3,701
Elexis AG 1,550 17,910
ElringKlinger AG (a) 6,772 125,379
Escada AG * 2,739 11,106
Evotec AG * 32,378 33,911
Fielmann AG 1,424 93,768
Freenet AG * 15,902 141,508
Fuchs Petrolub AG 1,810 105,411
Gerresheimer AG 7,089 164,114
Gerry Weber International AG 3,162 75,184
Gesco AG 829 50,049
GFK AG 3,140 70,599
GFT Technologies AG * 6,130 19,923
Gildemeister AG 10,914 106,329
GPC Biotech AG * 5,604 10,334
Grammer AG * 1,905 14,433
Grenkeleasing AG 1,594 60,418
Hawesko Holding AG 1,432 39,147
Heidelberger Druckmaschinen AG (a) 14,096 99,326
IDS Scheer AG 3,889 57,314
Indus Holding AG 3,773 60,021
Integralis AG * 30 192
Interseroh AG 1,177 57,498
Intershop Communications AG * 2,654 5,947
IVG Immobilien AG * (a) 20,952 150,786
IWKA AG * 6,306 96,603
Jenoptik AG * 14,465 68,886
KIZOO AG * 2,445 19,103
Kloeckner & Company SE 5,255 106,677
Copyright © 2012 www.secdatabase.com. All Rights Reserved.Please Consider the Environment Before Printing This Document
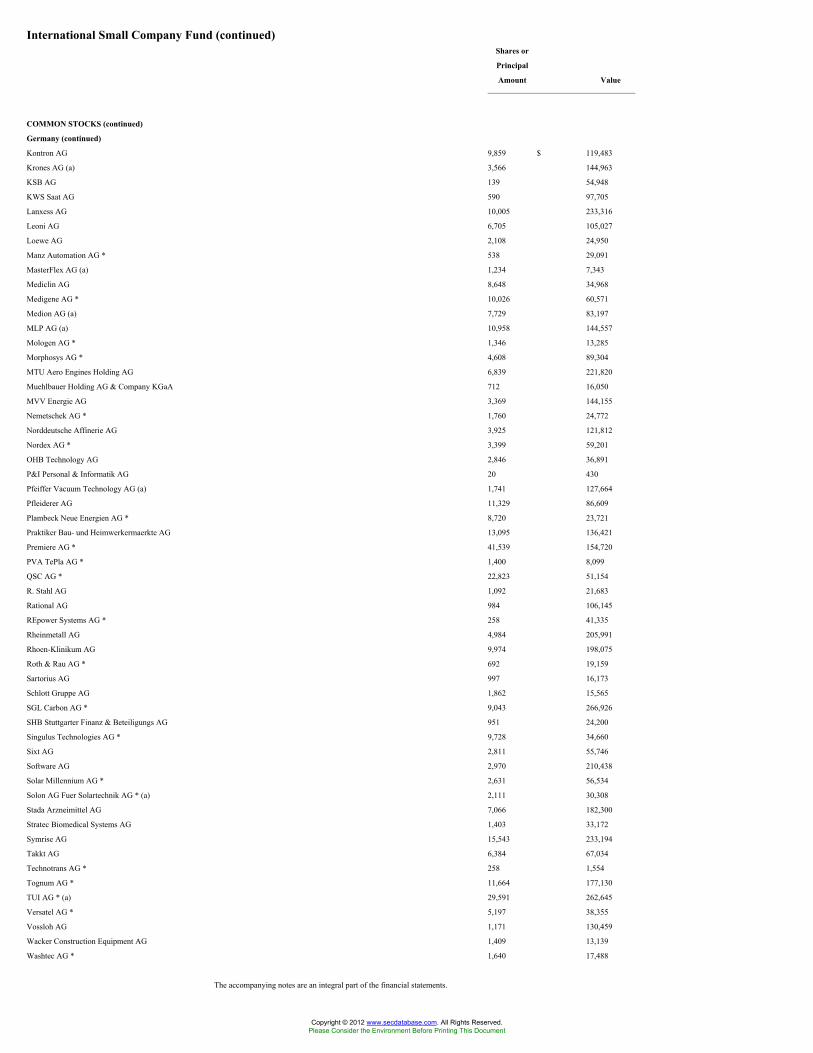
International Small Company Fund (continued)Shares or
Principal
Amount Value
COMMON STOCKS (continued)
Germany (continued)
Kontron AG 9,859 $ 119,483
Krones AG (a) 3,566 144,963
KSB AG 139 54,948
KWS Saat AG 590 97,705
Lanxess AG 10,005 233,316
Leoni AG 6,705 105,027
Loewe AG 2,108 24,950
Manz Automation AG * 538 29,091
MasterFlex AG (a) 1,234 7,343
Mediclin AG 8,648 34,968
Medigene AG * 10,026 60,571
Medion AG (a) 7,729 83,197
MLP AG (a) 10,958 144,557
Mologen AG * 1,346 13,285
Morphosys AG * 4,608 89,304
MTU Aero Engines Holding AG 6,839 221,820
Muehlbauer Holding AG & Company KGaA 712 16,050
MVV Energie AG 3,369 144,155
Nemetschek AG * 1,760 24,772
Norddeutsche Affinerie AG 3,925 121,812
Nordex AG * 3,399 59,201
OHB Technology AG 2,846 36,891
P&I Personal & Informatik AG 20 430
Pfeiffer Vacuum Technology AG (a) 1,741 127,664
Pfleiderer AG 11,329 86,609
Plambeck Neue Energien AG * 8,720 23,721
Praktiker Bau- und Heimwerkermaerkte AG 13,095 136,421
Premiere AG * 41,539 154,720
PVA TePla AG * 1,400 8,099
QSC AG * 22,823 51,154
R. Stahl AG 1,092 21,683
Rational AG 984 106,145
REpower Systems AG * 258 41,335
Rheinmetall AG 4,984 205,991
Rhoen-Klinikum AG 9,974 198,075
Roth & Rau AG * 692 19,159
Sartorius AG 997 16,173
Schlott Gruppe AG 1,862 15,565
SGL Carbon AG * 9,043 266,926
SHB Stuttgarter Finanz & Beteiligungs AG 951 24,200
Singulus Technologies AG * 9,728 34,660
Sixt AG 2,811 55,746
Software AG 2,970 210,438
Solar Millennium AG * 2,631 56,534
Solon AG Fuer Solartechnik AG * (a) 2,111 30,308
Stada Arzneimittel AG 7,066 182,300
Stratec Biomedical Systems AG 1,403 33,172
Symrise AG 15,543 233,194
Takkt AG 6,384 67,034
Technotrans AG * 258 1,554
Tognum AG * 11,664 177,130
TUI AG * (a) 29,591 262,645
Versatel AG * 5,197 38,355
Vossloh AG 1,171 130,459
Wacker Construction Equipment AG 1,409 13,139
Washtec AG * 1,640 17,488
The accompanying notes are an integral part of the financial statements.
Copyright © 2012 www.secdatabase.com. All Rights Reserved.Please Consider the Environment Before Printing This Document
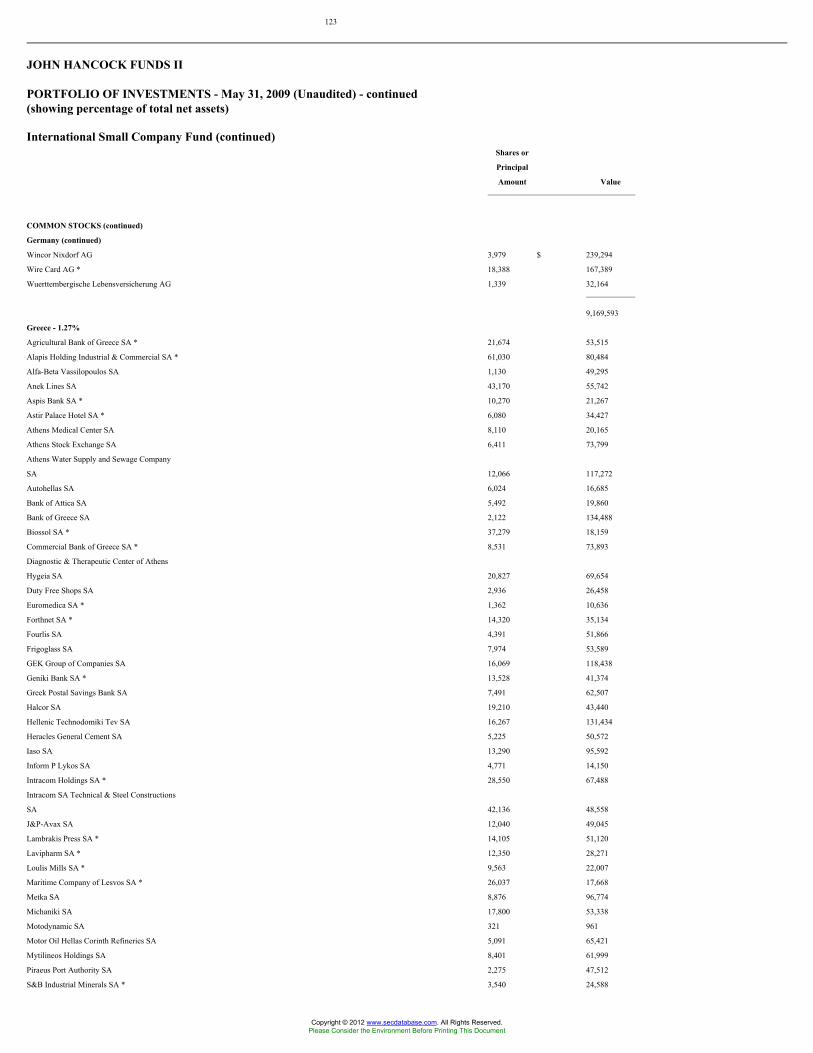
123
JOHN HANCOCK FUNDS II
PORTFOLIO OF INVESTMENTS - May 31, 2009 (Unaudited) - continued(showing percentage of total net assets)
International Small Company Fund (continued)Shares or
Principal
Amount Value
COMMON STOCKS (continued)
Germany (continued)
Wincor Nixdorf AG 3,979 $ 239,294
Wire Card AG * 18,388 167,389
Wuerttembergische Lebensversicherung AG 1,339 32,164
9,169,593
Greece - 1.27%
Agricultural Bank of Greece SA * 21,674 53,515
Alapis Holding Industrial & Commercial SA * 61,030 80,484
Alfa-Beta Vassilopoulos SA 1,130 49,295
Anek Lines SA 43,170 55,742
Aspis Bank SA * 10,270 21,267
Astir Palace Hotel SA * 6,080 34,427
Athens Medical Center SA 8,110 20,165
Athens Stock Exchange SA 6,411 73,799
Athens Water Supply and Sewage Company
SA 12,066 117,272
Autohellas SA 6,024 16,685
Bank of Attica SA 5,492 19,860
Bank of Greece SA 2,122 134,488
Biossol SA * 37,279 18,159
Commercial Bank of Greece SA * 8,531 73,893
Diagnostic & Therapeutic Center of Athens
Hygeia SA 20,827 69,654
Duty Free Shops SA 2,936 26,458
Euromedica SA * 1,362 10,636
Forthnet SA * 14,320 35,134
Fourlis SA 4,391 51,866
Frigoglass SA 7,974 53,589
GEK Group of Companies SA 16,069 118,438
Geniki Bank SA * 13,528 41,374
Greek Postal Savings Bank SA 7,491 62,507
Halcor SA 19,210 43,440
Hellenic Technodomiki Tev SA 16,267 131,434
Heracles General Cement SA 5,225 50,572
Iaso SA 13,290 95,592
Inform P Lykos SA 4,771 14,150
Intracom Holdings SA * 28,550 67,488
Intracom SA Technical & Steel Constructions
SA 42,136 48,558
J&P-Avax SA 12,040 49,045
Lambrakis Press SA * 14,105 51,120
Lavipharm SA * 12,350 28,271
Loulis Mills SA * 9,563 22,007
Maritime Company of Lesvos SA * 26,037 17,668
Metka SA 8,876 96,774
Michaniki SA 17,800 53,338
Motodynamic SA 321 961
Motor Oil Hellas Corinth Refineries SA 5,091 65,421
Mytilineos Holdings SA 8,401 61,999
Piraeus Port Authority SA 2,275 47,512
S&B Industrial Minerals SA * 3,540 24,588
Copyright © 2012 www.secdatabase.com. All Rights Reserved.Please Consider the Environment Before Printing This Document

Sarantis SA * 3,820 20,662
Sfakianakis SA 3,897 9,721
Sidenor Steel Products Manufacturing
Company SA 4,142 26,683
Singularlogic SA * 10,414 34,421
Teletypos SA Mega Channel * 8,637 68,469
International Small Company Fund (continued)Shares or
Principal
Amount Value
COMMON STOCKS (continued)
Greece (continued)
Terna Energy SA 7,652 $ 54,186
Thessaloniki Port Authority SA 488 11,687
Titan Cement Company SA * 6,632 192,643
Viohalco SA 8,595 55,227
2,682,344
Hong Kong - 2.27%
Alco Holdings, Ltd. 94,000 21,076
Allied Group, Ltd. 34,000 78,857
Allied Properties HK, Ltd. * 592,000 81,251
Asia Financial Holdings, Ltd. 98,000 28,394
Asia Satellite Telecom Holdings Company, Ltd. 41,220 48,131
Asia Standard Hotel Group, Ltd. 3,655,368 24,132
Asia Standard International Group, Ltd. 2,458,427 32,715
Asian Union New Media Group, Ltd. * 2,550,000 21,437
Associated International Hotels * 52,000 103,299
Burwill Holdings, Ltd. * 1,114,400 30,196
C C Land Holdings, Ltd. 191,000 106,193
C Y Foundation Group, Ltd. * 605,000 12,052
Capital Estate, Ltd. * 3,465,000 23,880
Capital Strategic Investment, Ltd. 880,000 21,560
Century City International Holdings, Ltd. 349,600 19,555
Champion Technology Holdings, Ltd. 327,597 10,263
Chen Hsong Holdings, Ltd. 74,000 19,649
Chevalier International Holdings, Ltd. 32,000 20,010
China Infrastructure Investment, Ltd. * 790,000 18,967
China Metal International Holdings, Inc. 108,000 18,054
China Renji Medical Group, Ltd. * 3,286,000 31,198
China Sci-Tech Holdings, Ltd. * 263,040 13,127
China Seven Star Shopping, Ltd. * 850,000 12,623
China Solar Energy Holdings, Ltd. * 540,000 11,923
China Timber Resources Group, Ltd. 2,100,000 25,569
China Yunnan Tin Minerals Group Company,
Ltd. * 772,000 22,981
China Zenith Chemical Group, Ltd. * 350,000 9,938
China Zirconium, Ltd. 23,600 14,328
Chinese People Gas Holdings Company, Ltd. * 654,000 27,477
Chong Hing Bank, Ltd. 43,000 71,839
Chow Sang Sang Holdings, Ltd. 72,000 56,614
Chuang's China Investments, Ltd. 271,000 14,571
Chuang's Consortium International, Ltd. 156,000 12,906
Clear Media, Ltd. * 37,000 14,665
Coastal Greenland, Ltd. * 240,000 24,437
COL Capital, Ltd. 28,000 3,403
Coslight Technology International Group, Ltd. 52,000 27,185
Cross-Harbour Holdings, Ltd. 32,000 24,375
Daphne International Holdings, Ltd. 256,000 134,991
Dickson Concepts International, Ltd. 37,000 15,904
EganaGoldpfeil Holdings, Ltd. * (e) 131,750 0
Emperor Capital Group, Ltd. * 33,600 1,953
Emperor Entertainment Hotel, Ltd. 165,000 14,496
Emperor International Holdings, Ltd. 214,000 30,707
Copyright © 2012 www.secdatabase.com. All Rights Reserved.Please Consider the Environment Before Printing This Document

eSun Holdings, Ltd. * 195,000 30,055
Far East Consortium International, Ltd. 330,750 76,986
First Natural Foods Holdings, Ltd. 375,000 14,270
First Sign International Holdings, Ltd. 200,000 42,480
Fong's Industries Company, Ltd. 66,000 8,876
The accompanying notes are an integral part of the financial statements.
124
JOHN HANCOCK FUNDS II
PORTFOLIO OF INVESTMENTS - May 31, 2009 (Unaudited) - continued(showing percentage of total net assets)
International Small Company Fund (continued)Shares or
Principal
Amount Value
COMMON STOCKS (continued)
Hong Kong (continued)
Fubon Bank, Ltd. 110,000 $ 56,229
Genesis Energy Holdings, Ltd. * 980,000 45,010
Get Nice Holdings, Ltd. 488,000 31,072
Giordano International, Ltd. 295,708 63,438
Global Green Tech Group, Ltd. * 301,920 16,269
Glorious Sun Enterprises, Ltd. 88,000 25,615
Golden Resorts Group, Ltd. 500,000 9,553
Hang Fung Gold Technology, Ltd. (e) 310,000 0
Hanny Holdings, Ltd. * 59,520 6,419
Harbour Centre Development, Ltd. 37,500 27,093
Heng Tai Consumables Group, Ltd. * 325,000 15,958
Hi Sun Technology China, Ltd. * 375,000 44,518
HKR International, Ltd. 216,800 100,710
Hon Kwok Land Investment Company, Ltd. 104,000 26,078
Hongkong Chinese, Ltd. 402,300 43,303
Hung Hing Printing Group, Ltd. 134,216 27,453
Hutchison Harbour Ring, Ltd. 990,000 78,097
I.T., Ltd. 242,000 20,869
i-Cable Communications, Ltd. * 179,000 19,168
Imagi International Holdings, Ltd. * 140,000 7,585
Integrated Distribution Services Group, Ltd. 55,000 79,494
Interchina Holdings Company * 3,585,000 15,723
International Luk Fook Holdings, Ltd. 62,000 28,591
ITC Corp., Ltd. 169,635 13,203
Jinhui Holdings, Ltd. 42,000 14,305
K Wah International Holdings, Ltd. 302,227 97,331
Kantone Holdings, Ltd. 948,881 23,638
Karl Thomson Holdings, Ltd. * 92,000 10,777
Keck Seng Investments, Ltd. 61,000 28,159
Lai Sun Development Company, Ltd. * 2,414,000 42,172
Lai Sun Garment International, Ltd. * 609,000 36,036
Lippo, Ltd. 31,250 7,618
Liu Chong Hing Investment, Ltd. 74,000 58,256
Luks Group Vietnam Holdings Company, Ltd. 42,000 20,511
Lung Kee Holdings, Ltd. 76,000 29,765
Macau Success, Ltd. * 276,000 14,635
Magnificent Estates, Ltd. * 1,130,000 18,471
Matsunichi Communication Holdings, Ltd. * 145,000 53,404
Media Chinese International, Ltd. 30,000 4,450
Melco International Development * 118,000 87,718
Midland Holdings, Ltd. 132,000 87,973
Miramar Hotel & Investment Company, Ltd. 8,000 8,133
Nam Tai Electronic & Electrical Products, Ltd. 181,000 33,975
Natural Beauty Bio-Technology, Ltd. 200,000 34,140
Copyright © 2012 www.secdatabase.com. All Rights Reserved.Please Consider the Environment Before Printing This Document

Next Media, Ltd. 150,000 25,030
Norstar Founders Group, Ltd. 168,000 15,820
Oriental Press Group, Ltd. 202,000 22,155
Pacific Andes International Holdings, Ltd. 302,611 31,752
Pacific Century Premium Developments, Ltd. * 324,000 74,533
Paliburg Holdings, Ltd. 133,380 25,713
Peace Mark Holdings, Ltd. * (e) 180,000 0
Pico Far East Holdings, Ltd. 200,000 23,881
Playmates Holdings, Ltd. 38,400 9,637
Public Financial Holdings, Ltd. 126,000 53,743
PYI Corp., Ltd. * 358,801 36,625
Regal Hotels International Holdings, Ltd. 157,200 40,902
International Small Company Fund (continued)Shares or
Principal
Amount Value
COMMON STOCKS (continued)
Hong Kong (continued)
Road King Infrastructure, Ltd. 78,000 $ 56,531
Sa Sa International Holdings, Ltd. 112,000 43,476
SEA Holdings, Ltd. 52,000 23,222
Shanghai Zendai Property, Ltd. * 525,000 17,383
Shell Electric Manufacturing Company, Ltd. 102,000 41,258
Shui On Construction & Materials, Ltd. 38,000 60,373
Singamas Container Holdings, Ltd. 180,000 20,872
Sino-I Technology, Ltd. * 2,940,000 24,137
Skyfame Realty Holdings, Ltd. * 216,000 12,678
Smartone Telecommunications Holdings, Ltd. 82,000 52,690
Solomon Systech International, Ltd. 354,000 23,335
Stella International Holdings, Ltd. 44,000 74,033
Sun Hung Kai & Company, Ltd. 25,000 16,900
Superb Summit International Timber
Company, Ltd. * 5,630,000 29,776
Symphony Holdings, Ltd. 296,000 10,146
Tack Fat Group International, Ltd. * (e) 200,000 0
TAI Cheung Holdings, Ltd. 143,000 81,309
Tai Fook Securities Group, Ltd. 99,120 29,211
TAK Sing Alliance Holdings, Ltd. 94,000 12,181
Tan Chong International, Ltd. 63,000 11,459
TCC International Holdings, Ltd. * 105,444 50,757
Techtronic Industries Company, Ltd. 207,500 156,804
Texwinca Holdings, Ltd. 137,961 97,026
Titan Petrochemicals Group, Ltd. * 600,000 11,532
Tongda Group Holdings, Ltd. 740,000 11,478
Truly International Holdings, Ltd. 46,000 31,695
Upbest Group, Ltd. 158,000 15,380
USI Holding Corp. 72,000 22,069
Varitronix International, Ltd. 68,000 18,917
Vedan International Holdings, Ltd. 220,000 13,409
Victory City International Holdings, Ltd. 207,753 21,252
Vitasoy International Holdings, Ltd. 196,000 93,940
VST Holdings Company, Ltd. * 182,000 22,472
Wai Kee Holdings, Ltd. * 130,000 23,610
Wing On Company International, Ltd. 51,000 55,574
Wonson International Holdings, Ltd. * 2,300,000 5,053
Yau Lee Holdings, Ltd. 88,000 12,646
Yip's Chemical Holdings, Ltd. 112,000 50,657
Yugang International, Ltd. * 1,366,000 15,394
4,772,889
Ireland - 1.02%
AER Lingus Group PLC * 38,993 36,702
C&C Group PLC - London Exchange 65,887 210,338
DCC PLC 17,138 358,767
Copyright © 2012 www.secdatabase.com. All Rights Reserved.Please Consider the Environment Before Printing This Document

Dragon Oil PLC * 34,938 182,350
Dragon Oil PLC * 16,269 81,950
FBD Holdings PLC - London Exchange 5,526 39,061
FBD Holdings PLC 3,299 33,431
Fyffes PLC 96,403 46,478
Glanbia PLC 27,562 85,688
Greencore Group PLC 35,539 57,875
IFG Group PLC 17,394 23,764
Independent News & Media PLC - London
Exchange 157,817 64,285
Independent News & Media PLC 42,581 15,176
The accompanying notes are an integral part of the financial statements.
125
JOHN HANCOCK FUNDS II
PORTFOLIO OF INVESTMENTS - May 31, 2009 (Unaudited) - continued(showing percentage of total net assets)
International Small Company Fund (continued)Shares or
Principal
Amount Value
COMMON STOCKS (continued)
Ireland (continued)
Irish Continental Group PLC * 3,329 $ 46,356
Irish Life & Permanent PLC - London
Exchange 57,749 278,484
Kenmare Resources PLC * 114,460 35,973
Kingspan Group PLC - London Exchange 26,801 176,274
McInerney Holdings PLC * 27,705 4,321
Paddy Power PLC - London Exchange 1,790 44,143
Paddy Power PLC 7,635 185,551
United Drug PLC 55,573 146,789
2,153,756
Italy - 3.32%
Acea SpA 10,921 141,584
Acegas-APS SpA 7,419 51,822
Actelios SpA 5,720 32,018
Aedes SpA * 6,455 6,321
Amplifon SpA * 26,381 102,292
Ansaldo STS SpA 11,958 201,636
AS Roma SpA * 21,755 29,591
Astaldi SpA 11,817 83,561
Autogrill SpA 11,596 108,442
Azimut Holding SpA (a) 14,547 137,007
Banca Finnat Euramerica SpA 35,792 25,923
Banca Generali SpA 10,115 80,656
Banca IFIS SpA 3,357 38,726
Banca Intermobiliare SpA * 17,737 86,567
Banca Italease SpA * 26,060 55,131
Banca Popolare dell'Etruria e del Lazio SpA 16,014 117,765
Banca Popolare di Milano SpA 47,251 318,723
Banca Profilo SpA 11,108 12,177
Banco di Desio e della Brianza SpA 15,821 103,062
Benetton Group SpA, SADR 200 3,720
Benetton Group SpA 13,791 129,300
Biesse SpA * 3,083 22,188
Bonifica Ferraresi e Imprese Agricole SpA 918 49,457
Brembo SpA 10,250 62,361
Bulgari SpA (a) 29,957 165,632
Caltagirone Editore SpA 9,281 23,006
Copyright © 2012 www.secdatabase.com. All Rights Reserved.Please Consider the Environment Before Printing This Document

Caltagirone SpA 7,345 27,316
Carraro SpA * 4,324 18,666
Cementir SpA 20,453 77,001
CIR-Compagnie Industriali Riunite SpA * 87,800 137,681
Class Editori SpA * 25,163 27,187
Credito Artigiano SpA 27,027 70,445
Credito Bergamasco SpA 2,414 84,958
Credito Emiliano SpA * 14,077 77,543
Danieli & Company SpA 4,285 81,501
Davide Campari Milano SpA 16,547 130,059
De Longhi SpA 22,152 75,320
DiaSorin SpA 2,212 56,241
Digital Multimedia Technologies SpA * 2,000 28,294
EEMS Italia SpA * 10,929 26,769
ERG SpA 10,485 158,150
Esprinet SpA 4,770 44,121
Eurotech SpA * 7,921 37,610
Fastweb SpA * 4,456 111,897
Fiera Milano SpA 3,657 27,440
International Small Company Fund (continued)Shares or
Principal
Amount Value
COMMON STOCKS (continued)
Italy (continued)
Gemina SpA * 66,969 $ 50,178
Geox SpA 17,140 135,596
Gewiss SpA 11,161 46,477
GranitiFiandre SpA 7,189 27,481
GreenergyCapital SpA * 175 152
Gruppo Beghelli SpA 13,844 14,754
Gruppo Coin SpA * 12,232 51,104
Gruppo Editoriale L'Espresso SpA * 39,531 73,760
Hera SpA (a) 64,727 149,489
Immsi SpA * 62,921 75,830
Impregilo SpA 32,104 103,019
Indesit Company SpA * 10,710 71,804
Industria Macchine Automatiche SpA 1,659 31,275
Intek SpA 48,925 21,754
Interpump SpA * 16,266 79,780
Iride SpA * 87,159 164,489
Italcementi SpA 1,849 21,368
Italmobiliare SpA * 2,854 105,508
Juventus Football Club SpA * 20,443 23,126
KME Group SpA 17,570 15,455
Mariella Burani SpA * 2,607 15,463
Marr SpA 5,328 41,812
Milano Assicurazioni SpA 28,585 90,906
Mirato SpA * 3,489 19,017
Mondadori (Arnoldo) Editore SpA * 23,266 102,368
Nice SpA 8,114 34,263
Panariagroup Industrie Ceramiche SpA 3,544 8,797
Permasteelisa SpA 4,223 68,070
Piccolo Credito Valtellinese SCRL 22,405 179,622
Pirelli & C Real Estate SpA * 5,311 45,214
Pirelli & Company SpA * 298,175 120,560
Premafin Finanziaria SpA * 61,649 78,938
Prysmian SpA 12,119 176,603
Recordati SpA 20,825 139,175
Reno de Medici SpA * 57,383 16,886
Risanamento SpA * 13,318 8,561
Sabaf SpA 1,389 24,799
SAES Getters SpA 2,559 29,100
Safilo Group SpA * 62,514 38,664
Copyright © 2012 www.secdatabase.com. All Rights Reserved.Please Consider the Environment Before Printing This Document

Save SpA 3,613 26,101
Seat Pagine Gialle SpA * 2,391 698
Snai SpA * 16,027 74,036
Societa' Cattolica di Assicurazioni SCRL * 4,939 168,399
Societa Iniziative Autostradali e Servizi SpA 6,448 43,722
Societa Partecipazioni Finanziarie SpA 121,974 30,426
Socotherm SpA * 2,703 6,180
Sogefi SpA * 14,065 21,528
Sol SpA 10,699 54,780
Sorin SpA * 67,066 89,509
Stefanel SpA * 25,713 13,828
Telecom Italia Media SpA * 455,979 78,605
Tiscali SpA * 92,000 49,843
Tod's SpA 2,126 120,281
Trevi Finanziaria SpA 9,055 106,882
Vianini Lavori SpA 8,336 47,172
The accompanying notes are an integral part of the financial statements.
126
JOHN HANCOCK FUNDS II
PORTFOLIO OF INVESTMENTS - May 31, 2009 (Unaudited) - continued(showing percentage of total net assets)
International Small Company Fund (continued)Shares or
Principal
Amount Value
COMMON STOCKS (continued)
Italy (continued)
Vittoria Assicurazioni SpA 11,898 $ 67,456
6,987,530
Japan - 28.09%
A&A Material Corp. 19,000 16,793
Abilit Corp. * 3,000 3,658
Achilles Corp. 46,000 75,006
Adeka Corp. 20,400 176,525
Aderans Company, Ltd. (a) 8,200 88,734
Advan Company, Ltd. 7,000 35,235
Advanex, Inc. * 2,000 1,747
Aeon Delight Company, Ltd. 4,000 61,993
Aeon Fantasy Company, Ltd. 4,700 39,773
Ahresty Corp. 6,700 21,708
AI Holdings Corp. 12,600 44,376
Aica Kogyo Company, Ltd. 12,700 125,647
Aichi Bank, Ltd. 1,800 136,854
Aichi Corp. 8,100 35,115
Aichi Machine Industry Company, Ltd. 21,000 55,111
Aichi Steel Corp. 25,000 99,395
Aichi Tokei Denki Company, Ltd. 10,000 24,981
Aida Engineering, Ltd. 19,500 65,003
Aigan Company, Ltd. 4,600 27,469
Aiphone Company, Ltd. (a) 4,500 71,921
Airport Facilities Company, Ltd. 6,600 34,435
Aisan Industry Company, Ltd. 7,200 46,715
Akebono Brake Industry Company, Ltd. 10,700 51,670
Akita Bank, Ltd. 40,000 138,857
Allied Telesis Holdings, Inc. * 34,900 29,570
Aloka Company, Ltd. 5,000 43,669
Alpha Corp. 1,000 5,029
Alpha Systems, Inc. 2,000 42,012
Alpine Electronics, Inc. 13,000 119,628
Copyright © 2012 www.secdatabase.com. All Rights Reserved.Please Consider the Environment Before Printing This Document

Alps Electric Company, Ltd. 20,700 112,184
Alps Logistics Company, Ltd. 2,000 15,133
Altech Corp. 3,700 21,071
Amano Corp. 13,600 128,979
Amuse, Inc. 2,400 23,640
Ando Corp. 14,000 20,754
Anest Iwata Corp. 6,000 15,965
Anritsu Corp. 31,000 119,056
AOC Holdings, Inc. 11,200 105,185
AOI Advertising Promotion, Inc. 3,000 15,204
AOI Electronic Company, Ltd. 1,700 11,070
AOKI Holdings, Inc. 7,000 74,245
Aomori Bank, Ltd. 35,000 138,382
Aoyama Trading Company, Ltd. 6,900 117,236
Arakawa Chemical Industries, Ltd. 3,500 30,852
Araya Industrial Company, Ltd. 14,000 20,604
Arealink Company, Ltd. 70 4,577
Ariake Japan Company, Ltd. (a) 4,900 74,722
Arisawa Manufacturing Company, Ltd. 8,200 36,367
Aronkasei Company, Ltd. 7,000 21,692
Art Corp. 2,000 22,846
As One Corp. 3,900 65,299
Asahi Diamond Industrial Company, Ltd. 15,000 80,823
Asahi Holdings, Inc. * 5,900 112,328
International Small Company Fund (continued)Shares or
Principal
Amount Value
COMMON STOCKS (continued)
Japan (continued)
Asahi Kogyosha Company, Ltd. 8,000 $ 28,007
Asahi Organic Chemicals
Industry Company, Ltd. 20,000 53,453
Asahi Tec Corp. * 74,000 35,767
Asanuma Corp. * 17,000 13,802
ASATSU-DK, Inc. 6,600 133,391
Ashimori Industry Company, Ltd. 13,000 18,520
Asia Securities Printing Company, Ltd. 7,700 54,339
ASKA Pharmaceutical Company, Ltd. 5,000 44,266
Asunaro Aoki Construction Company, Ltd. 11,000 51,523
Atsugi Company, Ltd. 50,000 72,538
Autobacs Seven Company, Ltd. 3,400 113,760
Avex Group Holdings, Inc. (a) 8,200 76,000
Azel Corp. * 17,000 178
Bando Chemical Industries, Ltd. 25,000 61,544
Bank of Ikeda, Ltd. * (a) 3,900 155,907
Bank of Iwate, Ltd. 1,800 96,925
Bank of Nagoya, Ltd. 32,000 146,527
Bank of Okinawa, Ltd. 4,400 150,369
Bank of Saga, Ltd. 32,000 95,894
Bank of the Ryukyus, Ltd. * 11,800 101,448
Belluna Company, Ltd. 9,298 36,313
Best Denki Company, Ltd. (a) 18,000 77,124
Bookoff Corp. 3,000 26,188
BSL Corp. * 27,000 4,540
Bunka Shutter Company, Ltd. 14,000 50,227
CAC Corp. 3,400 24,121
Calsonic Kansei Corp. 42,000 84,621
Canon Electronics, Inc. 4,500 61,907
Canon Finetech, Inc. 5,600 61,531
Catena Corp. 8,300 25,477
Cawachi, Ltd. 4,400 82,276
Central Glass Company, Ltd. 40,000 151,894
Century Leasing System, Inc. 14,400 132,728
Copyright © 2012 www.secdatabase.com. All Rights Reserved.Please Consider the Environment Before Printing This Document
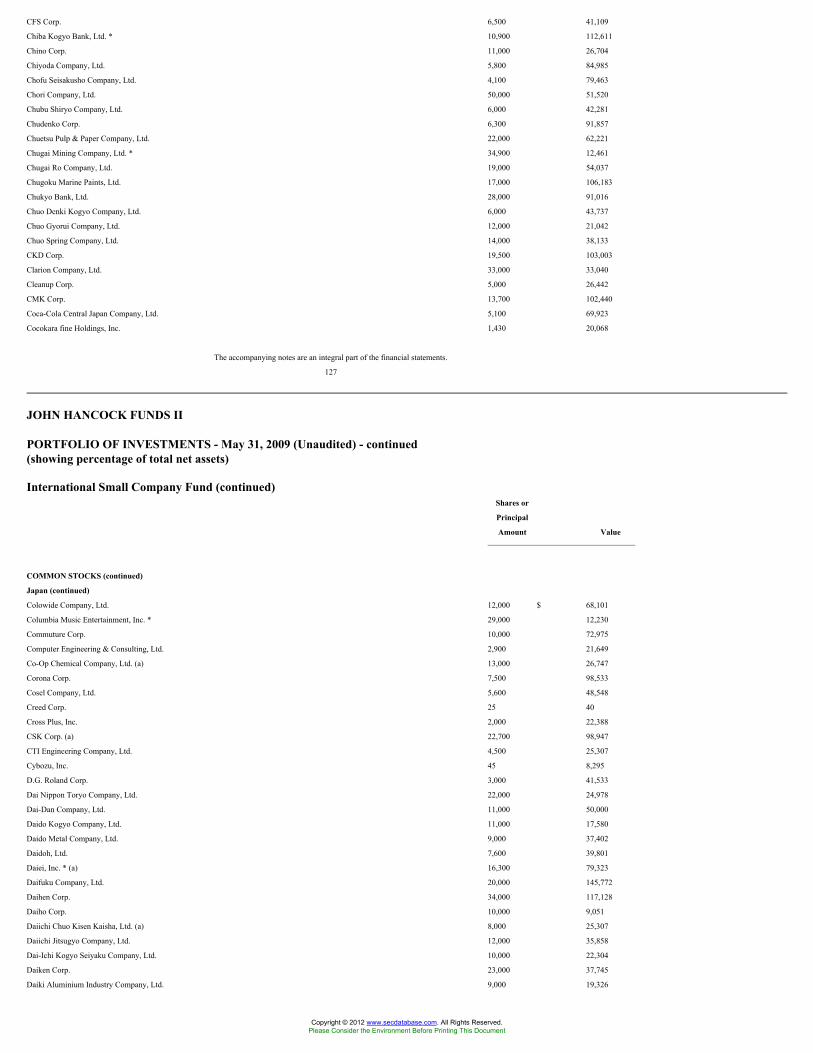
CFS Corp. 6,500 41,109
Chiba Kogyo Bank, Ltd. * 10,900 112,611
Chino Corp. 11,000 26,704
Chiyoda Company, Ltd. 5,800 84,985
Chofu Seisakusho Company, Ltd. 4,100 79,463
Chori Company, Ltd. 50,000 51,520
Chubu Shiryo Company, Ltd. 6,000 42,281
Chudenko Corp. 6,300 91,857
Chuetsu Pulp & Paper Company, Ltd. 22,000 62,221
Chugai Mining Company, Ltd. * 34,900 12,461
Chugai Ro Company, Ltd. 19,000 54,037
Chugoku Marine Paints, Ltd. 17,000 106,183
Chukyo Bank, Ltd. 28,000 91,016
Chuo Denki Kogyo Company, Ltd. 6,000 43,737
Chuo Gyorui Company, Ltd. 12,000 21,042
Chuo Spring Company, Ltd. 14,000 38,133
CKD Corp. 19,500 103,003
Clarion Company, Ltd. 33,000 33,040
Cleanup Corp. 5,000 26,442
CMK Corp. 13,700 102,440
Coca-Cola Central Japan Company, Ltd. 5,100 69,923
Cocokara fine Holdings, Inc. 1,430 20,068
The accompanying notes are an integral part of the financial statements.
127
JOHN HANCOCK FUNDS II
PORTFOLIO OF INVESTMENTS - May 31, 2009 (Unaudited) - continued(showing percentage of total net assets)
International Small Company Fund (continued)Shares or
Principal
Amount Value
COMMON STOCKS (continued)
Japan (continued)
Colowide Company, Ltd. 12,000 $ 68,101
Columbia Music Entertainment, Inc. * 29,000 12,230
Commuture Corp. 10,000 72,975
Computer Engineering & Consulting, Ltd. 2,900 21,649
Co-Op Chemical Company, Ltd. (a) 13,000 26,747
Corona Corp. 7,500 98,533
Cosel Company, Ltd. 5,600 48,548
Creed Corp. 25 40
Cross Plus, Inc. 2,000 22,388
CSK Corp. (a) 22,700 98,947
CTI Engineering Company, Ltd. 4,500 25,307
Cybozu, Inc. 45 8,295
D.G. Roland Corp. 3,000 41,533
Dai Nippon Toryo Company, Ltd. 22,000 24,978
Dai-Dan Company, Ltd. 11,000 50,000
Daido Kogyo Company, Ltd. 11,000 17,580
Daido Metal Company, Ltd. 9,000 37,402
Daidoh, Ltd. 7,600 39,801
Daiei, Inc. * (a) 16,300 79,323
Daifuku Company, Ltd. 20,000 145,772
Daihen Corp. 34,000 117,128
Daiho Corp. 10,000 9,051
Daiichi Chuo Kisen Kaisha, Ltd. (a) 8,000 25,307
Daiichi Jitsugyo Company, Ltd. 12,000 35,858
Dai-Ichi Kogyo Seiyaku Company, Ltd. 10,000 22,304
Daiken Corp. 23,000 37,745
Daiki Aluminium Industry Company, Ltd. 9,000 19,326
Copyright © 2012 www.secdatabase.com. All Rights Reserved.Please Consider the Environment Before Printing This Document

Daiko Clearing Services Corp. 3,000 17,008
Daikoku Denki Company, Ltd. 3,200 42,995
Daikyo, Inc. 66,144 108,042
Daimei Telecom Engineering Corp. 11,000 97,558
Dainichi Company, Ltd. 3,800 22,112
Dainichiseika Color & Chemicals
Manufacturing Company, Ltd. 21,000 54,099
Dainippon Screen Manufacturing
Company, Ltd. 25,000 66,467
Daisan Bank, Ltd. 30,000 80,700
Daiseki Company, Ltd. 7,000 138,830
Daiso Company, Ltd. 20,000 42,280
Daisyo Corp. 4,800 66,800
Daito Bank, Ltd. 19,000 13,389
Daiwa Industries, Ltd. 10,000 41,324
Daiwa Seiko, Inc. 18,000 26,312
Daiwabo Company, Ltd. 33,000 91,981
Danto Holdings Corp. 12,000 15,634
DC Company, Ltd. 8,000 25,970
DCM Japan Holdings Company, Ltd. 17,520 99,866
Denki Kogyo Company, Ltd. 15,000 81,022
Denyo Company, Ltd. 5,600 42,950
Descente, Ltd. 15,000 68,184
Disco Corp. 2,500 88,515
Doshisha Company, Ltd. 3,100 41,565
Doutor Nichires Holdings Company, Ltd. 6,893 94,202
DTS Corp. 4,800 47,775
Dwango Company, Ltd. 33 54,250
Dydo Drinco, Inc. 2,900 75,634
Dynic Corp. 13,000 18,285
International Small Company Fund (continued)Shares or
Principal
Amount Value
COMMON STOCKS (continued)
Japan (continued)
E-Access, Ltd. 136 $ 111,363
Eagle Industry Company, Ltd. 5,000 20,080
EDION Corp. (a) 8,400 54,730
Ehime Bank, Ltd. 47,000 119,643
Eighteenth Bank, Ltd. 37,000 115,251
Eiken Chemical Company, Ltd. 4,000 31,437
Eizo Nanao Corp. 5,400 101,496
Enplas Corp. 4,400 39,391
Enshu, Ltd. * 15,000 11,585
Espec Corp. 4,600 26,972
Exedy Corp. 7,400 144,554
F&A Aqua Holdings, Inc. 3,800 42,699
Falco Biosystems, Ltd. 1,500 11,619
Fancl Corp. 7,400 87,306
FDK Corp. * 21,000 38,955
Foster Electric Company, Ltd. 5,200 61,260
FP Corp. 3,000 143,437
France Bed Holdings Company, Ltd. 42,000 55,205
Fudo Tetra Corp. * 27,000 23,868
Fuji Company, Ltd. 3,300 58,927
Fuji Corp., Ltd. 5,000 13,129
Fuji Kiko Company, Ltd. * 11,000 13,653
Fuji Kosan Company, Ltd. * 21,000 22,324
Fuji Kyuko Company, Ltd. 17,000 72,409
Fuji Oil Company, Ltd. 13,600 154,316
Fuji Software ABC, Inc. 6,000 112,338
Fujibo Holdings, Inc. 15,000 15,086
Fujicco Company, Ltd. 6,000 69,576
Copyright © 2012 www.secdatabase.com. All Rights Reserved.Please Consider the Environment Before Printing This Document

Fujikura Kasei Company, Ltd. 5,300 28,813
Fujikura Rubber, Ltd. 5,000 16,980
Fujita Kanko, Inc. (a) 19,000 82,346
Fujitec Company, Ltd. 17,000 76,214
Fujitsu Business Systems, Ltd. 4,200 75,915
Fujitsu Frontech, Ltd. 4,000 38,367
Fujitsu General, Ltd. 14,000 43,802
Fujiya Company, Ltd. * 31,000 41,685
Fukuda Corp. 8,000 13,112
Fukui Bank, Ltd. 47,000 154,156
Fukushima Bank, Ltd. 69,000 38,436
Fukushima Industries Corp. 3,000 19,480
Fukuyama Transporting Company, Ltd. 21,000 82,056
Fumakilla, Ltd. 6,000 27,612
Funai Consulting Company, Ltd. 5,000 24,782
Furukawa Battery Company, Ltd. * 10,000 96,348
Furukawa Company, Ltd. 73,000 77,338
Furusato Industries, Ltd. 2,700 20,158
Fuso Pharmaceutical Industries, Ltd. 21,000 68,431
Futaba Corp. 7,700 152,613
Futaba Industrial Company, Ltd. 14,300 59,580
Future System Consulting Corp. 109 45,731
Fuyo General Lease Company, Ltd. 5,500 113,413
Gakken Company, Ltd. 23,000 42,471
Gecoss Corp. 5,500 24,338
Geo Corp. 96 66,021
Gigas K's Denki Corp. 4,900 107,995
GMO Internet, Inc. * 12,600 51,028
The accompanying notes are an integral part of the financial statements.
128
JOHN HANCOCK FUNDS II
PORTFOLIO OF INVESTMENTS - May 31, 2009 (Unaudited) - continued(showing percentage of total net assets)
International Small Company Fund (continued)Shares or
Principal
Amount Value
COMMON STOCKS (continued)
Japan (continued)
Godo Steel, Ltd. 38,000 $ 122,187
Goldcrest Company, Ltd. 4,050 102,423
Goldwin, Inc. * 12,000 25,606
Goodwill Group, Inc. * 327 1,455
Gourmet Kineya Company, Ltd. 5,000 31,669
Green Hospital Supply, Inc. 42 25,959
GSI Creos Corp. * 11,000 12,160
Gulliver International Company, Ltd. 1,130 25,308
Gun-Ei Chemical Industry Company, Ltd. 11,000 23,727
Gunze, Ltd. 39,000 135,741
Hakuto Company, Ltd. 5,000 32,114
Hakuyosha Company, Ltd. 5,000 13,148
Hanwa Company, Ltd. 23,000 96,496
Happinet Corp. 1,600 18,989
Harashin Narus Holdings Company, Ltd. 3,000 28,614
Harima Chemicals, Inc. 5,000 19,206
Haruyama Trading Company, Ltd. 2,700 10,663
Hayashikane Sangyo Company, Ltd. * 14,000 11,781
Hazama Corp. 18,700 20,705
Heiwa Real Estate Company, Ltd. 36,500 106,851
Heiwado Company, Ltd. 7,200 88,124
Copyright © 2012 www.secdatabase.com. All Rights Reserved.Please Consider the Environment Before Printing This Document

Hibiya Engineering, Ltd. 7,000 61,905
Higashi-Nippon Bank, Ltd. 40,000 92,561
HIS Company, Ltd. 4,600 81,307
Hitachi Cable, Ltd. 39,000 127,297
Hitachi Information Systems, Ltd. 4,300 85,415
Hitachi Koki Company, Ltd. 7,800 77,607
Hitachi Kokusai Electric, Inc. 13,000 83,674
Hitachi Maxell, Ltd. 10,800 130,673
Hitachi Medical Corp. 6,000 58,215
Hitachi Plant Technologies, Ltd. 13,000 68,083
Hitachi Software Engineering Company, Ltd. 5,600 87,229
Hitachi Systems & Services, Ltd. 4,000 49,515
Hitachi Tool Engineering, Ltd. 5,900 44,657
Hitachi Zosen Corp. * 85,500 98,107
Hochiki Corp. 7,000 41,709
Hodogaya Chemical Company, Ltd. 18,000 36,199
Hogy Medical Company, Ltd. 2,200 117,859
Hokkaido Gas Company, Ltd. 14,000 35,610
Hokkan Holdings, Ltd. 11,000 28,011
Hokuetsu Bank, Ltd. 22,000 42,585
Hokuetsu Industries Company, Ltd. 10,000 13,850
Hokuetsu Paper Mills, Ltd. 24,500 110,328
Hokuriku Electric Industry Company, Ltd. 12,000 19,178
Hokuto Corp. 4,800 94,845
Horiba, Ltd. 6,600 161,709
Horipro, Inc. 3,300 26,966
Hosiden Corp. 12,100 164,541
Hosokawa Micron Corp. 10,000 36,813
Howa Machinery, Ltd. 20,000 13,088
I Metal Technology Company, Ltd. 10,000 17,954
IBJ Leasing Company, Ltd. 6,000 76,172
Ichikoh Industries, Ltd. 12,000 22,487
Ichinen Company, Ltd. 5,300 22,891
Ichiyoshi Securities Company, Ltd. 10,600 77,068
ICOM, Inc. 3,000 61,825
International Small Company Fund (continued)Shares or
Principal
Amount Value
COMMON STOCKS (continued)
Japan (continued)
IDEC Corp. 7,000 $ 44,780
Ihara Chemical Industry Company, Ltd. 10,000 35,747
Iino Kaiun Kaisha, Ltd. 20,700 121,224
Ikegami Tsushinki Company, Ltd. * 13,000 13,216
Imasen Electric Industrial Company, Ltd. 3,900 31,608
Imperial Hotel, Ltd. 3,800 74,872
Impress Holdings, Inc. * 10,500 25,585
Inaba Denki Sangyo Company, Ltd. 4,800 109,587
Inaba Seisakusho Company, Ltd. 4,900 50,066
Inabata & Company, Ltd. 13,900 46,044
Inageya Company, Ltd. 6,000 57,017
Ines Corp. 9,900 59,893
Information Services International -
Dentsu, Ltd. 3,400 17,675
Inui Steamship Company, Ltd. 4,900 36,695
Invoice, Inc. 2,047 27,970
Ise Chemical Corp. 6,000 32,483
Iseki & Company, Ltd. * 41,000 136,825
Ishihara Sangyo Kaisha, Ltd. * 105,000 111,572
Ishii Hyoki Company, Ltd. 1,600 23,367
Itochu Enex Company, Ltd. 13,200 84,177
Itochu-Shokuhin Company, Ltd. 1,800 60,996
Itoham Foods, Inc. 33,000 115,525
Copyright © 2012 www.secdatabase.com. All Rights Reserved.Please Consider the Environment Before Printing This Document

Itoki Corp. 10,800 29,197
Iwasaki Electric Company, Ltd. 11,000 23,024
Iwatani International Corp. 42,000 116,696
Iwatsu Electric Company, Ltd. * 17,000 16,943
Izumiya Company, Ltd. 23,000 123,487
Izutsuya Company, Ltd. * 26,000 15,721
J. Bridge Corp. * 7,000 1,327
Jalux, Inc. 2,200 28,481
Jamco Corp. 3,000 12,501
Janome Sewing Machine Company, Ltd. * 73,000 46,068
Japan Aviation Electronics Industry, Ltd. 18,000 108,325
Japan Carlit Company, Ltd. 5,100 18,977
Japan Cash Machine Company, Ltd. 6,200 60,121
Japan Digital Laboratory Company, Ltd. 6,600 70,821
Japan Foundation Engineering Company, Ltd. 7,000 16,044
Japan Pulp & Paper Company, Ltd. 23,000 67,447
Japan Radio Company, Ltd. 29,000 76,953
Japan Servo Company, Ltd. 10,000 34,578
Japan Transcity Corp., Ltd. 15,000 42,014
Japan Vilene Company, Ltd. 7,000 32,213
Japan Wool Textile Company, Ltd. 19,000 112,807
Jastec Company, Ltd. 3,900 20,173
JBCC Holdings, Inc. 4,200 28,086
JBIS Holdings, Inc. 7,000 24,307
Jeans Mate Corp. 2,300 12,416
Jeol, Ltd. 19,000 64,967
JFE Shoji Holdings, Inc. 24,000 87,720
Jidosha Buhin Kogyo Company, Ltd. 9,000 15,464
JK Holdings Company, Ltd. 5,700 28,540
JMS Company, Ltd. 9,000 33,567
Joban Kosan Company, Ltd. 15,000 23,674
J-Oil Mills, Inc. 23,000 76,934
Joint Corp. 9,800 22,068
The accompanying notes are an integral part of the financial statements.
129
JOHN HANCOCK FUNDS II
PORTFOLIO OF INVESTMENTS - May 31, 2009 (Unaudited) - continued(showing percentage of total net assets)
International Small Company Fund (continued)Shares or
Principal
Amount Value
COMMON STOCKS (continued)
Japan (continued)
Joshin Denki Company, Ltd. (a) 12,000 $ 85,299
JSP Corp. 8,200 47,842
Juki Corp. 33,000 46,427
JVC KENWOOD Holdings, Ltd. * 198,000 145,893
Jyomo Company, Ltd. 24,000 7,606
Kabuki-Za Company, Ltd. 1,000 41,247
Kadokawa Holdings, Inc. (a) 5,400 113,293
Kaga Electronics Company, Ltd. 6,800 68,176
Kagawa Bank, Ltd. 22,000 93,444
Kakaku.com, Inc. 18 66,830
Kaken Pharmaceutical Company, Ltd. 10,000 89,138
Kameda Seika Company, Ltd. 4,000 60,838
Kamei Corp. 5,000 23,752
Kanaden Corp. 6,000 27,773
Kanagawa Chuo Kotsu Company, Ltd. 8,000 42,511
Kanamoto Company, Ltd. 5,000 21,858
Copyright © 2012 www.secdatabase.com. All Rights Reserved.Please Consider the Environment Before Printing This Document

Kanematsu Corp. * 124,000 115,013
Kanematsu Electronics, Ltd. 4,500 37,609
Kanto Auto Works, Ltd. 7,600 70,501
Kanto Denka Kogyo Company, Ltd. 13,000 52,866
Kanto Natural Gas Development, Ltd. 9,000 56,720
Kanto Tsukuba Bank, Ltd. 17,200 60,417
Kasai Kogyo Company, Ltd. 8,000 20,692
Kasumi Company, Ltd. 12,000 51,912
Katakura Industries Company, Ltd. 7,900 66,489
Kato Sangyo Company, Ltd. 6,200 92,645
Kato Works Company, Ltd. 10,000 24,546
KAWADA TECHNOLOGIES, INC. * 1,600 22,115
Kawai Musical Instruments Manufacturing
Company, Ltd. 16,000 14,803
Kawasaki Kinkai Kisen Kaisha, Ltd. 5,000 14,819
Kawashima Selkon Textiles Company, Ltd. * 17,000 15,734
Kawasumi Laboratories, Inc. 4,000 23,665
Kayaba Industry Company, Ltd. 49,000 91,425
Keihin Company, Ltd. 10,000 12,293
Keihin Corp. 9,400 126,029
Keiiyu Company, Ltd. 4,400 14,168
Keiyo Company, Ltd. (a) 12,400 61,637
Kenedix, Inc. 215 66,520
Kentucky Fried Chicken Japan, Ltd. 3,000 53,042
KEY Coffee, Inc. (a) 4,400 72,924
Kimura Chemical Plants Company, Ltd. 3,700 35,721
Kinki Nippon Tourist Company, Ltd. * 21,000 24,314
Kinki Sharyo Company, Ltd. 7,000 45,827
Kintetsu World Express, Inc. 4,300 102,057
Kinugawa Rubber Industrial Company, Ltd. 17,000 26,144
Kirindo Company, Ltd. 2,800 14,956
Kishu Paper Company, Ltd. * 17,000 14,480
Kisoji Company, Ltd. 5,600 110,988
Kitagawa Iron Works Company, Ltd. 12,000 14,330
Kita-Nippon Bank, Ltd. 2,100 59,717
Kitano Construction Corp. 12,000 29,907
Kitz Corp. 28,000 94,228
Kiyo Holdings, Inc. 146,000 172,731
Koa Corp. 10,700 65,996
Koatsu Gas Kogyo Company, Ltd. 9,000 45,439
International Small Company Fund (continued)Shares or
Principal
Amount Value
COMMON STOCKS (continued)
Japan (continued)
Kohnan Shoji Company, Ltd. 7,300 $ 66,607
Koike Sanso Kogyo Company, Ltd. 9,000 25,965
Kojima Company, Ltd. (a) 7,800 44,623
Kokuyo Company, Ltd. 19,400 149,966
Komatsu Seiren Company, Ltd. 9,000 35,899
Komatsu Wall Industry Company, Ltd. 2,100 23,236
Komori Corp. 13,600 164,420
Konaka Company, Ltd. 4,600 12,237
Kondotec, Inc. 3,000 18,736
Konishi Company, Ltd. 3,900 34,268
Kosaido Company, Ltd. * 2,300 5,947
Kosei Securities Company, Ltd. 18,000 19,131
Krosaki Harima Corp. 15,000 32,778
KRS Corp. 2,700 25,601
Kumagai Gumi Company, Ltd. 54,000 42,049
Kumiai Chemical Industry Company, Ltd. 21,000 97,891
Kura Corp. 16 21,937
Kurabo Industries, Ltd. 64,000 106,312
Copyright © 2012 www.secdatabase.com. All Rights Reserved.Please Consider the Environment Before Printing This Document

Kureha Corp. 29,000 128,203
Kurimoto, Ltd. 28,000 26,545
Kuroda Electric Company, Ltd. 7,600 73,577
Kyoden Company, Ltd. 7,000 7,436
Kyodo Printing Company, Ltd. 23,000 56,573
Kyodo Shiryo Company, Ltd. 24,000 28,026
Kyoei Tanker Company, Ltd. 8,000 21,401
Kyokuto Kaihatsu Kogyo Company, Ltd. 10,200 47,599
Kyokuyo Company, Ltd. 16,000 32,170
Kyoritsu Maintenance Company, Ltd. 3,100 51,644
Kyosan Electric Manufacturing Company, Ltd. 11,000 39,451
Kyoto Kimono Yuzen Company, Ltd. 2,400 17,579
Kyowa Exeo Corp. 10,000 95,818
Kyowa Leather Cloth Company, Ltd. 5,200 21,317
Kyudenko Corp. 14,000 88,307
Life Corp. 8,900 150,423
Lintec Corp. 5,200 85,607
Livedoor Auto Company, Ltd. * 29,500 10,833
Macnica, Inc. 3,400 45,856
Maeda Corp. 31,000 118,214
Maeda Road Construction Company, Ltd. 13,000 118,020
Maezawa Industries, Inc. 3,700 7,322
Maezawa Kasei Industries Company, Ltd. 2,000 19,086
Maezawa Kyuso Industries Company, Ltd. 3,500 55,615
Makino Milling Machine Company, Ltd. 35,000 116,236
Mandom Corp. 5,800 131,770
Mars Engineering Corp. 2,500 71,674
Marubun Corp. 7,400 30,296
Marudai Food Company, Ltd. 33,000 82,190
Maruei Department Store Company, Ltd. 7,000 12,917
Maruetsu, Inc. * 19,000 84,322
Maruha Group, Inc. 91,815 141,106
Maruka Machinery Company, Ltd. 3,000 20,801
Marusan Securities Company, Ltd. 20,300 121,840
Maruwa Company, Ltd. 2,600 40,851
Maruyama Manufacturing Company, Inc. (a) 10,000 20,208
Maruzen Company, Ltd. * 23,000 21,604
Maruzen Company, Ltd. 4,000 15,701
The accompanying notes are an integral part of the financial statements.
130
JOHN HANCOCK FUNDS II
PORTFOLIO OF INVESTMENTS - May 31, 2009 (Unaudited) - continued(showing percentage of total net assets)
International Small Company Fund (continued)Shares or
Principal
Amount Value
COMMON STOCKS (continued)
Japan (continued)
Maruzen Showa Unyu Company, Ltd. 19,000 $ 54,319
Maspro Denkoh Corp. 4,000 36,474
Matsuda Sangyo Company, Ltd. (a) 3,520 51,229
Matsui Construction Company, Ltd. 8,000 31,300
Matsuya Company, Ltd. (a) 6,000 71,671
Matsuya Foods Company, Ltd. 4,300 60,261
Max Company, Ltd. 8,000 87,071
Maxvalu Tokai Company, Ltd. 4,500 56,021
MEC Company, Ltd. 2,400 10,946
Megachips Corp. 4,900 87,827
Meidensha Corp. (a) 37,000 149,882
Copyright © 2012 www.secdatabase.com. All Rights Reserved.Please Consider the Environment Before Printing This Document

Meiji Shipping Company, Ltd. 3,900 17,840
Meitec Corp. 3,800 51,541
Meito Sangyo Company, Ltd. 4,700 74,629
Meiwa Corp. * 8,000 13,211
Meiwa Estate Company, Ltd. 5,000 24,087
Mercian Corp. 19,400 37,190
Michinoku Bank, Ltd. 39,000 86,102
Mikuni Coca-Cola Bottling Company, Ltd. 9,000 72,618
Mikuni Corp. 9,000 11,670
Milbon Company, Ltd. 2,700 56,067
Mimasu Semiconductor Industry Company,
Ltd. 3,600 42,512
Minato Bank, Ltd. 45,000 62,864
Ministop Company, Ltd. 3,700 57,842
Misawa Homes Holdings, Inc. * 10,200 36,814
Mitani Corp. 4,000 21,761
Mito Securities Company, Ltd. 17,000 49,459
Mitsuba Corp., Ltd. 10,000 28,444
Mitsubishi Cable Industries, Ltd. 37,000 33,882
Mitsubishi Kakoki Kaisha, Ltd. 11,000 28,258
Mitsubishi Paper Mills, Ltd. 84,000 125,660
Mitsubishi Pencil Company, Ltd. 5,600 64,246
Mitsubishi Steel Manufacturing Company, Ltd. 33,000 79,959
Mitsuboshi Belting Company, Ltd. 19,000 80,940
Mitsui High-Tec, Inc. 8,100 67,256
Mitsui Home Company, Ltd. 7,000 35,116
Mitsui Knowledge Industry Company, Ltd. 253 44,759
Mitsui Matsushima Company, Ltd. 17,000 23,853
Mitsui Mining & Smelting Company, Ltd. 63,000 148,777
Mitsui Mining Company, Ltd. 51,000 63,598
Mitsui Sugar Company, Ltd. 27,000 77,798
Mitsui-Soko Company, Ltd. 29,000 110,701
Mitsumura Printing Company, Ltd. 7,000 24,051
Mitsuuroko Company, Ltd. 9,200 54,273
Miura Company, Ltd. 6,700 144,763
Miyazaki Bank, Ltd. 28,000 113,600
Miyoshi Oil & Fat Company, Ltd. 14,000 20,518
Miyuki Holdings Company, Ltd. 8,000 23,559
Mizuno Corp. 21,000 96,973
Modec, Inc. 3,900 67,774
Monex Group, Inc. 287 108,601
Mori Seiki Company, Ltd. 8,800 98,050
Morinaga & Company, Ltd. 45,000 91,740
Morinaga Milk Industry Company, Ltd. 42,000 143,817
Morita Corp. 6,000 21,823
International Small Company Fund (continued)Shares or
Principal
Amount Value
COMMON STOCKS (continued)
Japan (continued)
Mory Industries, Inc. 11,000 $ 24,072
MOS Food Services, Inc. 7,000 112,487
Moshi Moshi Hotline, Inc. 5,150 95,038
Mr. Max Corp. 7,300 32,988
Musashino Bank, Ltd. 3,400 98,963
Mutoh Holdings Company, Ltd. * 8,000 13,298
Mutow Company, Ltd. 7,300 31,523
Nabtesco Corp. 15,000 134,692
Nachi-Fujikoshi Corp. 47,000 91,613
Nagano Bank, Ltd. 25,000 60,432
Nagatanien Company, Ltd. 8,000 74,772
Nakabayashi Company, Ltd. 14,000 32,666
Nakamuraya Company, Ltd. 12,000 59,275
Copyright © 2012 www.secdatabase.com. All Rights Reserved.Please Consider the Environment Before Printing This Document

Nakayama Steel Works, Ltd. 29,000 67,797
NEC Electronics Corp. * 8,800 91,465
NEC Fielding, Ltd. 3,400 39,335
NEC Leasing, Ltd. 5,000 59,082
NEC Mobiling, Ltd. 3,600 61,330
NEC Networks & System Integration Corp. 7,700 84,776
NEC Tokin Corp. * 11,000 26,864
Net One Systems Company, Ltd. 105 168,606
Netmarks, Inc. * 29 6,126
Neturen Company, Ltd. 9,900 81,007
New Tachikawa Aircraft Company, Ltd. 1,400 65,708
Nice Corp. 22,000 36,118
Nichia Steel Works, Ltd. 14,000 38,711
Nichias Corp. 30,000 86,879
Nichiban Company, Ltd. 10,000 30,697
Nichicon Corp. 14,600 161,717
Nichiha Corp. 6,000 37,071
Nichii Gakkan Company, Ltd. 10,600 90,029
Nichimo Corp. 29,000 304
Nichireki Company, Ltd. 1,000 3,477
Nidec Copal Corp. 5,700 50,426
Nidec Sankyo Corp. 14,000 62,533
Nidec Tosok Corp. 2,800 20,299
Nifco, Inc. 11,000 146,453
Nihon Chouzai Company, Ltd. 1,080 18,423
Nihon Dempa Kogyo Company, Ltd. 4,500 88,189
Nihon Eslead Corp. 2,000 10,360
Nihon Inter Electronics Corp. 5,000 10,161
Nihon Kagaku Sangyo Company, Ltd. 5,000 26,178
Nihon Kohden Corp. 7,900 98,410
Nihon Matai Company, Ltd. 21,000 21,854
Nihon Nohyaku Company, Ltd. 10,000 93,394
Nihon Parkerizing Company, Ltd. 12,000 123,867
Nihon Spindle Manufacturing Company, Ltd. 15,000 23,259
Nihon Tokushu Toryo Company, Ltd. 6,000 19,614
Nihon Unisys, Ltd. 8,500 63,373
Nihon Yamamura Glass Company, Ltd. 26,000 57,949
Nikkiso Company, Ltd. 12,000 84,182
Nikko Company, Ltd. 5,000 15,372
Nippo Corp. 13,000 118,589
Nippon Beet Sugar
Manufacturing Company, Ltd. 37,000 85,317
Nippon Carbide Industries Company, Inc. * 16,000 16,840
The accompanying notes are an integral part of the financial statements.
131
JOHN HANCOCK FUNDS II
PORTFOLIO OF INVESTMENTS - May 31, 2009 (Unaudited) - continued(showing percentage of total net assets)
International Small Company Fund (continued)Shares or
Principal
Amount Value
COMMON STOCKS (continued)
Japan (continued)
Nippon Carbon Company, Ltd. (a) 30,000 $ 83,208
Nippon Ceramic Company, Ltd. 5,300 55,565
Nippon Chemical Industrial Company, Ltd. 20,000 44,036
Nippon Chemi-Con Corp. 39,000 118,568
Nippon Chemiphar Company, Ltd. (a) 5,000 13,991
Nippon Concrete Industries Company, Ltd. 15,000 24,318
Copyright © 2012 www.secdatabase.com. All Rights Reserved.Please Consider the Environment Before Printing This Document

Nippon Denko Company, Ltd. 21,000 116,345
Nippon Densetsu Kogyo Company, Ltd. 8,000 78,600
Nippon Denwa Shisetsu Company, Ltd. 10,000 28,915
Nippon Felt Company, Ltd. 5,000 21,337
Nippon Filcon Company, Ltd. 3,100 16,285
Nippon Fine Chemical Company, Ltd. 6,000 32,138
Nippon Flour Mills Company, Ltd. 26,000 113,873
Nippon Formula Feed Manufacturing
Company, Ltd. 22,000 25,679
Nippon Gas Company, Ltd. 7,300 108,513
Nippon Hume Corp. 6,000 17,564
Nippon Jogesuido Sekkei Company, Ltd. 28 27,198
Nippon Kanzai Company, Ltd. 3,600 51,235
Nippon Kasei Chemical Company, Ltd. 16,000 26,786
Nippon Kayaku Company, Ltd. 19,000 117,807
Nippon Kinzoku Company, Ltd. 16,000 26,287
Nippon Koei Company, Ltd. 21,000 58,743
Nippon Konpo Unyu Soko Company, Ltd. 12,000 117,424
Nippon Koshuha Steel Company, Ltd. 17,000 17,894
Nippon Light Metal Company, Ltd. 111,000 116,909
Nippon Metal Industry Company, Ltd. 30,000 63,028
Nippon Parking Development Company, Ltd. 293 15,367
Nippon Pillar Packing Company, Ltd. 4,000 14,848
Nippon Piston Ring Company, Ltd. 13,000 14,056
Nippon Road Company, Ltd. 15,000 43,689
Nippon Seiki Company, Ltd. * 10,000 101,728
Nippon Seisen Company, Ltd. 7,000 15,763
Nippon Shinyaku Company, Ltd. 12,000 140,522
Nippon Signal Company, Ltd. 14,300 110,345
Nippon Soda Company, Ltd. 15,000 66,282
Nippon Steel Trading Company, Ltd. 16,000 26,432
Nippon Suisan Kaisha, Ltd. 53,900 151,086
Nippon Synthetic Chemical Industry
Company, Ltd. 16,000 71,115
Nippon System Development Company, Ltd. 12,500 116,060
Nippon Thompson Company, Ltd. 21,000 107,794
Nippon Valqua Industries, Ltd. 25,000 55,689
Nippon Yakin Kogyo Company, Ltd. 13,000 56,820
Nippon Yusoki Company, Ltd. 5,000 11,713
Nippon Zeon Company, Ltd. 43,000 159,466
Nipro Corp. 6,000 112,620
NIS Group Company, Ltd. * 37,913 17,548
Nishimatsu Construction Company, Ltd. 30,000 44,230
Nishimatsuya Chain Company, Ltd. 13,400 109,304
Nissan Shatai Company, Ltd. 20,000 148,833
Nissei Corp. 6,000 40,949
Nissei Plastic Industrial Company, Ltd. 4,000 11,591
Nissen Company, Ltd. 12,600 55,229
Nisshin Fudosan Company, Ltd. 3,000 10,936
Nisshin Oillio Group, Ltd. 25,000 129,946
Nissin Corp. 21,000 44,737
International Small Company Fund (continued)Shares or
Principal
Amount Value
COMMON STOCKS (continued)
Japan (continued)
Nissin Electric Company, Ltd. 16,000 $ 73,810
Nissin Kogyo Company, Ltd. 8,200 100,823
Nissin Sugar Manufacturing Company, Ltd. 12,000 24,073
Nissui Pharmaceutical Company, Ltd. 5,000 39,479
Nitta Corp. 6,600 94,160
Nittan Valve Company, Ltd. 4,000 13,079
Nittetsu Mining Company, Ltd. 17,000 77,498
Copyright © 2012 www.secdatabase.com. All Rights Reserved.Please Consider the Environment Before Printing This Document

Nitto Boseki Company, Ltd. 74,000 132,470
Nitto Kogyo Corp. 8,300 67,538
Nitto Kohki Company, Ltd. 3,700 74,444
Nitto Seiko Company, Ltd. 8,000 21,602
NOF Corp. 38,000 143,896
Nohmi Bosai, Ltd. 7,000 56,401
Nomura Company, Ltd. 12,000 31,150
Noritake Company, Ltd. 31,000 94,241
Noritsu Koki Company, Ltd. 5,300 44,516
Noritz Corp. 5,100 64,330
Nosan Corp. 18,000 42,943
NS Solutions Corp. 4,000 55,229
Obayashi Road Corp. 23,000 44,628
Oenon Holdings, Inc. 9,000 19,319
Oiles Corp. 8,500 122,258
Oita Bank, Ltd. 28,000 147,075
Okabe Company, Ltd. 14,000 56,085
Okamoto Industries, Inc. 22,000 78,431
Okamura Corp. 16,000 84,571
Okano Valve Manufacturing Company 4,000 31,416
Okasan Holdings, Inc. 22,000 98,947
Oki Electric Industry Company, Ltd. * 74,000 78,009
Okinawa Electric Power Company, Inc. 1,500 79,437
OKK Corp. 10,000 9,516
Okuma Holdings, Inc. 34,000 158,618
Okumura Corp. (a) 35,000 132,567
Okura Industrial Company, Ltd. 8,000 22,196
Okuwa Company, Ltd. 5,000 55,129
Olympic Corp. 4,600 29,937
O-M, Ltd. 8,000 29,891
OMC Card, Inc. * 25,655 59,148
ONO Sokki Company, Ltd. 5,000 21,831
Onoken Company, Ltd. 4,500 45,935
Organo Corp. 10,000 81,300
Oriental Yeast Company, Ltd. 6,000 26,054
Origin Electric Company, Ltd. 6,000 16,361
Osaka Steel Company, Ltd. 3,600 63,761
Osaki Electric Company, Ltd. 8,000 73,863
OSG Corp. 18,800 133,233
Oyo Corp. 6,000 64,736
Pacific Industrial Company, Ltd. 12,000 38,258
PanaHome Corp. 18,000 104,500
Paramount Bed Company, Ltd. 5,000 68,029
Parco Company, Ltd. 17,200 133,903
Paris Miki, Inc. 9,200 88,454
Pasco Corp. * 10,000 20,403
Pasona Group, Inc. 89 49,040
PCA Corp. 1,500 13,759
Penta-Ocean Construction Company, Ltd. 74,000 107,482
The accompanying notes are an integral part of the financial statements.
132
JOHN HANCOCK FUNDS II
PORTFOLIO OF INVESTMENTS - May 31, 2009 (Unaudited) - continued(showing percentage of total net assets)
International Small Company Fund (continued)Shares or
Principal
Amount Value
COMMON STOCKS (continued)
Japan (continued)
Copyright © 2012 www.secdatabase.com. All Rights Reserved.Please Consider the Environment Before Printing This Document

PIA Corp. * 2,600 $ 30,377
Pigeon Corp. (a) 4,700 119,180
Pilot Corp. 46 53,895
Piolax, Inc. 2,900 41,181
Press Kogyo Company, Ltd. 31,000 57,260
Prima Meat Packers, Ltd. 55,000 70,144
PS Mitsubishi Construction Company, Ltd. * 6,400 28,140
Raito Kogyo Company, Ltd. 9,900 23,216
Rasa Industries, Ltd. (a) 18,000 24,350
Renown, Inc. * 8,000 12,312
Resort Solution Company, Ltd. 9,000 15,124
Resorttrust, Inc. 11,100 106,824
Rhythm Watch Company, Ltd. 40,000 43,498
Ricoh Leasing Company, Ltd. 4,800 84,789
Right On Company, Ltd. 3,900 30,887
Riken Corp. 25,000 67,075
Riken Keiki Company, Ltd. 4,000 24,486
Riken Technos Corp. 8,000 14,994
Riken Vitamin Company, Ltd. 2,000 57,372
Ringer Hut Company, Ltd. 4,800 65,939
Risa Partners, Inc. 52 34,323
Rock Field Company, Ltd. 1,800 22,510
Roland Corp. 6,100 69,048
Round One Corp. 10,700 99,975
Royal Holdings Company, Ltd. (a) 8,100 86,237
Ryobi, Ltd. 40,000 111,595
Ryoden Trading Company, Ltd. 10,000 50,563
Ryosan Company, Ltd. 6,900 156,091
Ryoshoku, Ltd. 2,500 60,473
Ryoyo Electro Corp. 6,900 57,914
S Foods, Inc. 7,500 60,688
S Science Company, Ltd. * 102,000 2,141
Sagami Chain Company, Ltd. 4,000 37,018
Saibu Gas Company, Ltd. (a) 59,000 152,509
Saizeriya Company, Ltd. 9,700 114,840
Sakai Chemical Industry Company, Ltd. 29,000 105,581
Sakai Heavy Industries, Ltd. 9,000 16,012
Sakai Ovex Company, Ltd. 20,000 19,623
Sakata INX Corp. 17,000 54,637
Sakata Seed Corp. 7,400 102,667
Sala Corp. 8,000 43,282
San-Ai Oil Company, Ltd. 16,000 64,577
Sanden Corp. 34,000 71,669
Sanei-International Company, Ltd. 4,100 28,320
Sankei Building Company, Ltd. 8,700 44,561
Sanken Electric Company, Ltd. 32,000 134,717
Sanki Engineering Company, Ltd. 16,000 115,841
Sankyo Seiko Company, Ltd. 12,300 22,761
Sankyo-Tateyama Holdings, Inc. 82,000 65,879
Sanoh Industrial Company, Ltd. 8,700 38,180
Sanrio Company, Ltd. 10,700 86,601
Sanshin Electronics Company, Ltd. 9,000 65,677
Sanwa Shutter Corp. 50,000 152,814
Sanyo Chemical Industries, Ltd. 14,000 70,357
Sanyo Denki Company, Ltd. 15,000 42,138
Sanyo Shokai, Ltd. 29,000 100,973
International Small Company Fund (continued)Shares or
Principal
Amount Value
COMMON STOCKS (continued)
Japan (continued)
Sanyo Special Steel Company, Ltd. 32,000 $ 134,637
Sasebo Heavy Industries Company, Ltd. 32,000 72,180
Copyright © 2012 www.secdatabase.com. All Rights Reserved.Please Consider the Environment Before Printing This Document

Sato Corp. 7,300 69,476
Sato Shoji Corp. 6,000 32,375
Satori Electric Company, Ltd. 2,400 11,430
Secom Techno Service Company, Ltd. 1,500 39,879
Seibu Electric Industry Company, Ltd. 3,000 12,326
Seika Corp. 16,000 37,007
Seikagaku Corp. 7,100 72,411
Seiko Corp. 23,000 62,899
Seiren Company, Ltd. 14,800 66,357
Sekisui Jushi Corp. 10,000 82,045
Sekisui Plastics Company, Ltd. 22,000 68,141
Senko Company, Ltd. 24,000 73,050
Senshu Electric Company, Ltd. 1,500 15,232
Senshukai Company, Ltd. 10,300 67,680
Shibaura Mechatronics Corp. 8,000 35,796
Shibusawa Warehouse Company, Ltd. (a) 17,000 67,596
Shibuya Kogyo Company, Ltd. 3,300 25,799
Shikibo, Ltd. 20,000 28,417
Shikoku Bank, Ltd. 40,000 147,337
Shikoku Chemicals Corp. 15,000 59,850
Shikoku Coca-Cola Bottling Company, Ltd. 4,900 41,703
Shima Seiki Manufacturing, Ltd. 5,400 138,923
Shimachu Company, Ltd. 5,600 111,875
Shimizu Bank, Ltd. 2,400 95,970
Shin Nippon Air Technologies Company, Ltd. 4,500 34,540
Shinagawa Refractories Company, Ltd. 16,000 34,971
Shindengen Electric Manufacturing
Company, Ltd. 21,000 44,391
Shin-Etsu Polymer Company, Ltd. 14,700 83,278
Shinkawa, Ltd. 5,500 71,825
Shin-Keisei Electric Railway Company, Ltd. 10,000 34,344
Shinko Electric Company, Ltd. (a) 24,000 58,487
Shinko Plantech Company, Ltd. 9,900 94,132
Shinko Shoji Company, Ltd. 5,300 43,900
Shinko Wire Company, Ltd. 11,000 21,802
Shin-Kobe Electric Machinery Company, Ltd. 6,000 49,658
Shinmaywa Industries, Ltd. 29,000 96,475
Shinnihon Corp. 8,000 12,555
Shinsho Corp. 13,000 23,275
Shinwa Kaiun Kaisha, Ltd. 21,000 65,348
Shiroki Corp. 21,000 40,620
Shizuki Electric Company, Inc. 8,000 28,401
Shizuoka Gas Company, Ltd. 14,000 74,755
SHO-BOND Holdings Company, Ltd. 4,200 78,737
Shobunsha Publications, Inc. 2,400 13,041
Shochiku Company, Ltd. 17,000 126,333
Shoko Company, Ltd. (a) 20,000 22,510
Showa Aircraft Industry Company, Ltd. 3,000 11,664
Showa Corp. 16,100 71,012
Showa KDE Company, Ltd. 10,000 10,000
Showa Sangyo Company, Ltd. 29,000 83,576
Siix Corp. 4,000 16,949
Silver Seiko, Ltd. * 70,000 6,637
Sinanen Company, Ltd. 13,000 68,296
The accompanying notes are an integral part of the financial statements.
133
JOHN HANCOCK FUNDS II
PORTFOLIO OF INVESTMENTS - May 31, 2009 (Unaudited) - continued(showing percentage of total net assets)
International Small Company Fund (continued)Shares or
Principal
Copyright © 2012 www.secdatabase.com. All Rights Reserved.Please Consider the Environment Before Printing This Document

Amount Value
COMMON STOCKS (continued)
Japan (continued)
Sintokogio, Ltd. 13,300 $ 102,612
SMK Corp. 21,000 74,497
Snow Brand Milk Products Company, Ltd. 46,500 137,904
SNT Corp. 7,000 21,073
Soda Nikka Company, Ltd. 4,000 12,033
Sodick Company, Ltd. 13,100 32,299
Soft99 Corp. 3,500 15,950
Sogo Medical Company, Ltd. 1,400 31,041
Sohgo Security Services Company, Ltd. 13,500 123,194
Sorun Corp. 4,700 26,236
Space Company, Ltd. 4,200 28,900
SRA Holdings, Inc. 3,300 27,458
SSP Company, Ltd. 10,000 53,310
ST Chemical Company, Ltd. 3,600 35,645
St. Marc Holdings Company, Ltd. 1,700 50,431
Star Micronics Company, Ltd. 10,900 102,317
Starzen Company, Ltd. 14,000 32,649
Stella Chemifa Corp. 2,300 72,981
Sugimoto & Company, Ltd. 2,000 17,384
Sumida Corp. 4,100 22,980
Suminoe Textile Company, Ltd. 11,000 14,008
Sumiseki Holdings, Inc. * 9,800 11,034
Sumisho Computer Systems Corp. 5,400 77,502
Sumitomo Densetsu Company, Ltd. 8,300 41,804
Sumitomo Light Metal Industries, Ltd. 82,000 95,187
Sumitomo Mitsui Company, Ltd. * 61,900 65,105
Sumitomo Osaka Cement Company, Ltd. 44,000 100,474
Sumitomo Pipe & Tube Company, Ltd. 6,000 32,002
Sumitomo Precision Products Company, Ltd. 6,000 24,220
Sumitomo Real Estate Sales Company, Ltd. 1,900 83,991
Sumitomo Seika Chemicals Company, Ltd. 13,000 50,598
Sumitomo Warehouse Company, Ltd. 33,952 139,707
Sun Wave Corp. 11,000 16,659
Sunx, Ltd. 5,400 17,010
SWCC Showa Holdings Company, Ltd. 80,000 68,646
SxL Corp. * 25,000 14,994
SystemPro Company, Ltd. 49 21,375
T. Hasegawa Company, Ltd. 6,900 71,436
T. Rad Company, Ltd. 15,000 30,941
Tachibana Eletech Company, Ltd. 4,000 29,472
Tachikawa Corp. 4,600 21,528
Tachi-S Company, Ltd. 8,300 53,992
Tadano, Ltd. 25,000 130,558
Taihei Dengyo Kaisha, Ltd. 9,000 91,000
Taihei Kogyo Company, Ltd. 12,000 38,040
Taiheiyo Kaiun Company, Ltd. * 13,000 16,846
Taiho Kogyo Company, Ltd. 7,900 57,885
Taikisha, Ltd. 9,000 97,482
Taisei Lamick Company, Ltd. 900 19,187
Taisei Rotec Corp. 18,000 30,647
Taiyo Yuden Company, Ltd. 13,000 136,456
Takagi Securities Company, Ltd. 15,000 25,128
Takamatsu Corp. 4,600 67,940
Takano Company, Ltd. 2,000 12,225
Takaoka Electric Manufacturing Company, Ltd. 18,000 55,184
Takara Holdings, Inc. 33,000 193,493
International Small Company Fund (continued)Shares or
Principal
Amount Value
Copyright © 2012 www.secdatabase.com. All Rights Reserved.Please Consider the Environment Before Printing This Document

COMMON STOCKS (continued)
Japan (continued)
Takara Printing Company, Ltd. 3,300 $ 29,104
Takara Standard Company, Ltd. 20,000 114,809
Takasago International Corp. 23,000 121,321
Takasago Thermal Engineering Company, Ltd. 7,000 55,614
Takiron Company, Ltd. 10,000 28,007
Takisawa Machine Tool Company, Ltd. 3,000 2,502
Takuma Company, Ltd. 19,000 40,175
Tamura Corp. 22,000 71,338
Tamura Taiko Holdings, Inc. 9,000 12,116
Tasaki Shinju Company, Ltd. 7,000 4,640
Tatsuta Electric Wire & Cable Company, Ltd. 12,000 29,011
Tayca Corp. 11,000 29,245
TBK Company, Ltd. 3,000 5,210
TCM Corp. 22,000 30,670
Teac Corp. * 67,000 35,269
Techno Ryowa, Ltd. 4,900 26,699
TECMO KOEI HOLDINGS COMPANY, LTD. * 9,800 71,895
Teikoku Electric Manufacturing Company, Ltd. 2,000 39,943
Teikoku Piston Ring Company, Ltd. 4,800 20,711
Teikoku Sen-I Company, Ltd. 6,000 24,178
Teikoku Tsushin Kogyo Company, Ltd. 10,000 24,498
Tekken Corp. * 41,000 41,884
Telepark Corp. 44 57,560
Tenma Corp. 5,700 59,688
The Fuji Fire and Marine Insurance Company,
Ltd. 33,000 47,315
The Pack Corp. 4,800 80,498
Tigers Polymer Corp. 2,000 7,437
TKC Corp. 4,900 93,619
TOA Corp. 58,000 78,631
TOA Oil Company, Ltd. 22,000 30,798
TOA Road Corp. 15,000 35,182
Toagosei Company, Ltd. 48,000 124,228
Tobishima Corp. * 107,500 40,739
Tobu Store Company, Ltd. 14,000 44,702
TOC Company, Ltd. 29,500 112,013
Tocalo Company, Ltd. 4,300 59,586
Tochigi Bank, Ltd. 22,000 109,589
Toda Kogyo Corp. 9,000 36,278
Todentsu Corp. 6,000 10,680
Toei Company, Ltd. 16,000 68,976
Toenec Corp. 12,000 60,174
Toho Bank, Ltd. 20,000 78,267
Toho Company, Ltd. 12,000 43,629
Toho Real Estate Company, Ltd. 7,000 34,520
Toho Titanium Company, Ltd. (a) 7,000 122,587
Toho Zinc Company, Ltd. 14,000 59,488
Tohoku Bank, Ltd. 15,000 23,023
Tohto Suisan Company, Ltd. 5,000 7,821
Tokai Carbon Company, Ltd. 22,000 106,297
Tokai Corp. 12,000 47,333
Tokai Kanko Company, Ltd. 62,000 22,870
Tokai Rubber Industries, Ltd. 8,000 80,226
Tokai Tokyo Securities Company, Ltd. 51,000 148,326
Tokimec, Inc. 13,000 20,648
Toko Electric Corp. 8,000 19,762
The accompanying notes are an integral part of the financial statements.
134
JOHN HANCOCK FUNDS II
Copyright © 2012 www.secdatabase.com. All Rights Reserved.Please Consider the Environment Before Printing This Document

PORTFOLIO OF INVESTMENTS - May 31, 2009 (Unaudited) - continued(showing percentage of total net assets)
International Small Company Fund (continued)Shares or
Principal
Amount Value
COMMON STOCKS (continued)
Japan (continued)
Toko, Inc. * 16,000 $ 24,076
Tokushima Bank, Ltd. 23,000 115,772
Tokushu Tokai Holdings Company, Ltd. 25,000 70,508
Tokyo Dome Corp. 40,000 133,425
Tokyo Electron Device, Ltd. 22 28,429
Tokyo Energy & Systems, Inc. 9,000 77,528
Tokyo Kikai Seisakusho, Ltd. 10,000 16,617
Tokyo Ohka Kogyo Company, Ltd. 4,500 86,555
Tokyo Rakutenchi Company, Ltd. 9,000 36,114
Tokyo Rope Manufacturing Company, Ltd. 34,000 94,927
Tokyo Sangyo Company, Ltd. 9,500 26,928
Tokyo Seimitsu Company, Ltd. 4,100 50,375
Tokyo Style Company, Ltd. 14,000 107,861
Tokyo Tekko Company, Ltd. 10,000 39,442
Tokyo Theatres Company, Inc. 18,000 36,204
Tokyo Tomin Bank, Ltd. 7,600 125,118
Tokyotokeiba Company, Ltd. 49,000 74,927
Tokyu Community Corp. 3,200 64,340
Tokyu Construction Company, Ltd. (a) 22,940 68,299
Tokyu Livable, Inc. 4,400 31,398
Tokyu Recreation Company, Ltd. 6,000 34,116
Toli Corp. 10,000 19,243
Tomato Bank, Ltd. 27,000 64,978
Tomen Electronics Corp. 4,000 38,727
Tomoe Corp. 8,000 20,170
Tomoegawa Company, Ltd. * (a) 12,000 25,061
Tomoku Company, Ltd. 16,000 30,888
Tomy Company, Ltd. (a) 18,500 110,528
Tonami Transportation Company, Ltd. 23,000 56,055
Topcon Corp. 15,500 89,246
Topre Corp. 11,500 92,936
Topy Industries, Ltd. 58,000 100,794
Tori Holdings Company, Ltd. * 73,000 3,834
Torigoe Company, Ltd. 5,000 37,081
Torii Pharmaceutical Company, Ltd. 4,300 64,472
Torishima Pump Manufacturing Company, Ltd. 5,000 75,943
Toshiba Machine Company, Ltd. 33,000 127,957
Toshiba Plant Systems & Services Corp. 9,000 100,430
TOSHIBA TEC CORP. 30,000 122,645
Tosho Printing Company, Ltd. 21,000 52,686
Totetsu Kogyo Company, Ltd. 6,000 29,983
Tottori Bank, Ltd. 23,000 62,619
Towa Bank, Ltd. * 46,000 24,644
Towa Corp. 4,900 18,790
Towa Pharmaceutical Company, Ltd. 2,100 92,882
Toyo Construction Company, Ltd. 80,000 52,370
Toyo Corp. 8,400 82,601
Toyo Electric Manufacturing Company, Ltd. 6,000 38,015
Toyo Engineering Corp. 30,000 107,541
Toyo Ink Manufacturing Company, Ltd. 41,000 116,556
Toyo Kanetsu KK 36,000 67,729
Toyo Kohan Company, Ltd. 16,000 75,391
Toyo Machinery & Metal Company, Ltd. 4,000 6,123
Toyo Securities Company, Ltd. * 19,000 38,070
Toyo Sugar Refining Company, Ltd. 16,000 17,828
Toyo Tire & Rubber Company, Ltd. 40,000 93,535
Copyright © 2012 www.secdatabase.com. All Rights Reserved.Please Consider the Environment Before Printing This Document

International Small Company Fund (continued)Shares or
Principal
Amount Value
COMMON STOCKS (continued)
Japan (continued)
Toyo Wharf & Warehouse Company, Ltd. 17,000 $ 23,811
Toyobo Company, Ltd. 71,064 107,316
Trans Cosmos, Inc. 8,800 82,570
Trusco Nakayama Corp. 5,800 83,816
Tsubakimoto Chain Company, Ltd. 36,000 124,525
Tsubakimoto Kogyo Company, Ltd. 10,000 22,625
Tsudakoma Corp. 20,000 26,459
Tsugami Corp. 14,000 28,730
Tsukishima Kikai Company, Ltd. 7,000 38,081
Tsurumi Manufacturing Company, Ltd. 4,000 24,311
Tsutsumi Jewelry Company, Ltd. 3,000 55,173
TTK Company, Ltd. 6,000 22,991
TYK Corp. 8,000 18,910
Ube Material Industries, Ltd. 12,000 23,324
Uchida Yoko Company, Ltd. 13,000 42,223
Unicharm Petcare Corp. 3,000 86,421
Uniden Corp. 19,000 71,764
Unimat Life Corp. 5,400 49,812
Union Tool Company, Ltd. 3,000 78,393
Unitika, Ltd. 114,000 103,579
U-Shin, Ltd. 6,700 28,902
Utoc Corp. 4,300 14,021
Valor Company, Ltd. 9,900 75,643
Venture Link Company, Ltd. * 9,800 2,370
VITAL KSK HOLDINGS, Inc. * 12,300 73,196
Wakachiku Construction Company, Ltd. * 17,000 11,328
Warabeya Nichiyo Company, Ltd. 4,000 49,980
Watabe Wedding Corp. 2,000 33,579
Watami Company, Ltd. 5,000 96,465
Weathernews, Inc. 1,900 24,634
Wood One Company, Ltd. 13,000 41,024
Xebio Company, Ltd. 5,800 107,878
Yahagi Construction Company, Ltd. 8,000 54,663
Yaizu Suisankagaku Industry Company, Ltd. 2,700 28,043
Yamabiko Corp. * 2,700 38,148
Yamagata Bank, Ltd. 31,000 145,732
Yamaichi Electronics Company, Ltd. 3,100 6,641
Yamanashi Chuo Bank, Ltd. 30,686 157,856
Yamatane Corp. 20,000 22,825
Yamazen Corp. 13,400 43,685
Yaoko Company, Ltd. 1,500 43,658
Yasuda Warehouse Company, Ltd. 4,000 29,279
Yellow Hat, Ltd. 3,600 13,669
Yodogawa Steel Works, Ltd. 29,000 152,340
Yokogawa Bridge Corp. 11,000 94,743
Yokohama Reito Company, Ltd. 12,000 73,129
Yokowo Company, Ltd. 2,800 13,371
Yomeishu Seizo Company, Ltd. 4,000 36,879
Yomiuri Land Company, Ltd. 13,000 39,768
Yondenko Corp. 7,000 34,943
Yonekyu Corp. 6,000 59,782
Yorozu Corp. 5,600 53,751
Yoshimoto Kogyo Company, Ltd. 8,900 85,132
Yoshinoya D&C Company, Ltd. 116 128,191
Yuasa Funashoku Company, Ltd. 4,000 8,107
Yuasa Trading Company, Ltd. 50,000 55,429
The accompanying notes are an integral part of the financial statements.
Copyright © 2012 www.secdatabase.com. All Rights Reserved.Please Consider the Environment Before Printing This Document
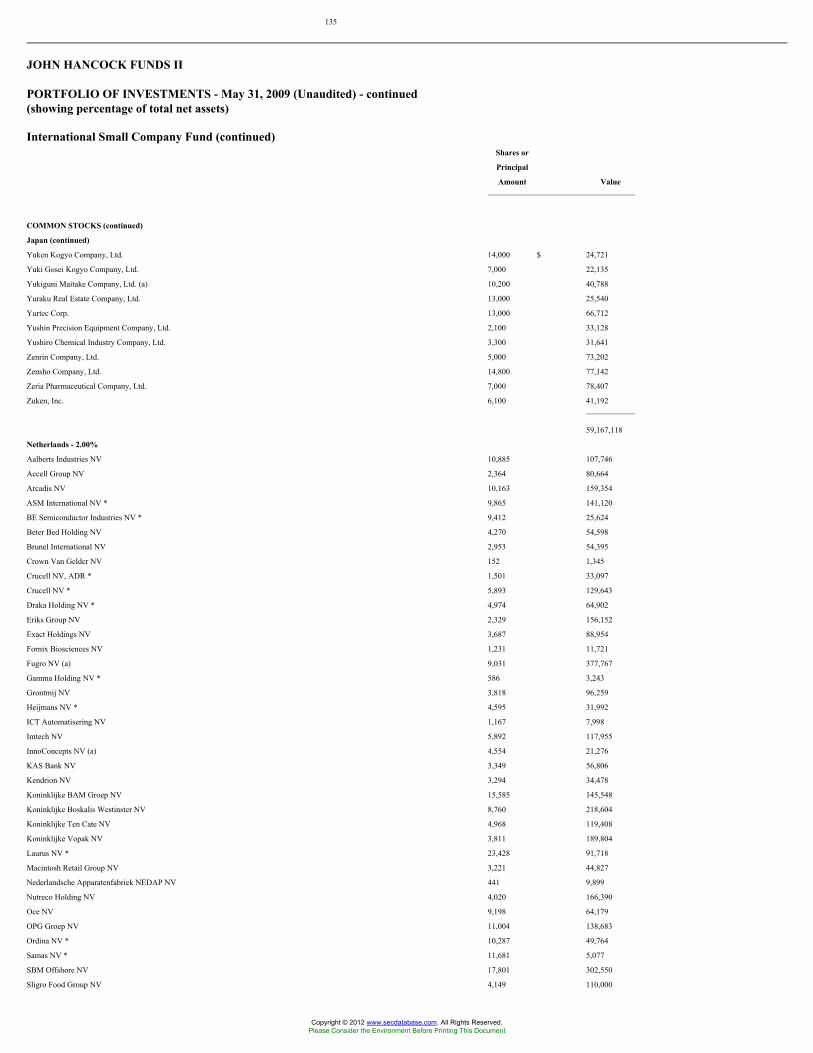
135
JOHN HANCOCK FUNDS II
PORTFOLIO OF INVESTMENTS - May 31, 2009 (Unaudited) - continued(showing percentage of total net assets)
International Small Company Fund (continued)Shares or
Principal
Amount Value
COMMON STOCKS (continued)
Japan (continued)
Yuken Kogyo Company, Ltd. 14,000 $ 24,721
Yuki Gosei Kogyo Company, Ltd. 7,000 22,135
Yukiguni Maitake Company, Ltd. (a) 10,200 40,788
Yuraku Real Estate Company, Ltd. 13,000 25,540
Yurtec Corp. 13,000 66,712
Yushin Precision Equipment Company, Ltd. 2,100 33,128
Yushiro Chemical Industry Company, Ltd. 3,300 31,641
Zenrin Company, Ltd. 5,000 73,202
Zensho Company, Ltd. 14,800 77,142
Zeria Pharmaceutical Company, Ltd. 7,000 78,407
Zuken, Inc. 6,100 41,192
59,167,118
Netherlands - 2.00%
Aalberts Industries NV 10,885 107,746
Accell Group NV 2,364 80,664
Arcadis NV 10,163 159,354
ASM International NV * 9,865 141,120
BE Semiconductor Industries NV * 9,412 25,624
Beter Bed Holding NV 4,270 54,598
Brunel International NV 2,953 54,395
Crown Van Gelder NV 152 1,345
Crucell NV, ADR * 1,501 33,097
Crucell NV * 5,893 129,643
Draka Holding NV * 4,974 64,902
Eriks Group NV 2,329 156,152
Exact Holdings NV 3,687 88,954
Fornix Biosciences NV 1,231 11,721
Fugro NV (a) 9,031 377,767
Gamma Holding NV * 586 3,243
Grontmij NV 3,818 96,259
Heijmans NV * 4,595 31,992
ICT Automatisering NV 1,167 7,998
Imtech NV 5,892 117,955
InnoConcepts NV (a) 4,554 21,276
KAS Bank NV 3,349 56,806
Kendrion NV 3,294 34,478
Koninklijke BAM Groep NV 15,585 145,548
Koninklijke Boskalis Westinster NV 8,760 218,604
Koninklijke Ten Cate NV 4,968 119,408
Koninklijke Vopak NV 3,811 189,804
Laurus NV * 23,428 91,718
Macintosh Retail Group NV 3,221 44,827
Nederlandsche Apparatenfabriek NEDAP NV 441 9,899
Nutreco Holding NV 4,020 166,390
Oce NV 9,198 64,179
OPG Groep NV 11,004 138,683
Ordina NV * 10,287 49,764
Samas NV * 11,681 5,077
SBM Offshore NV 17,801 302,550
Sligro Food Group NV 4,149 110,000
Copyright © 2012 www.secdatabase.com. All Rights Reserved.Please Consider the Environment Before Printing This Document
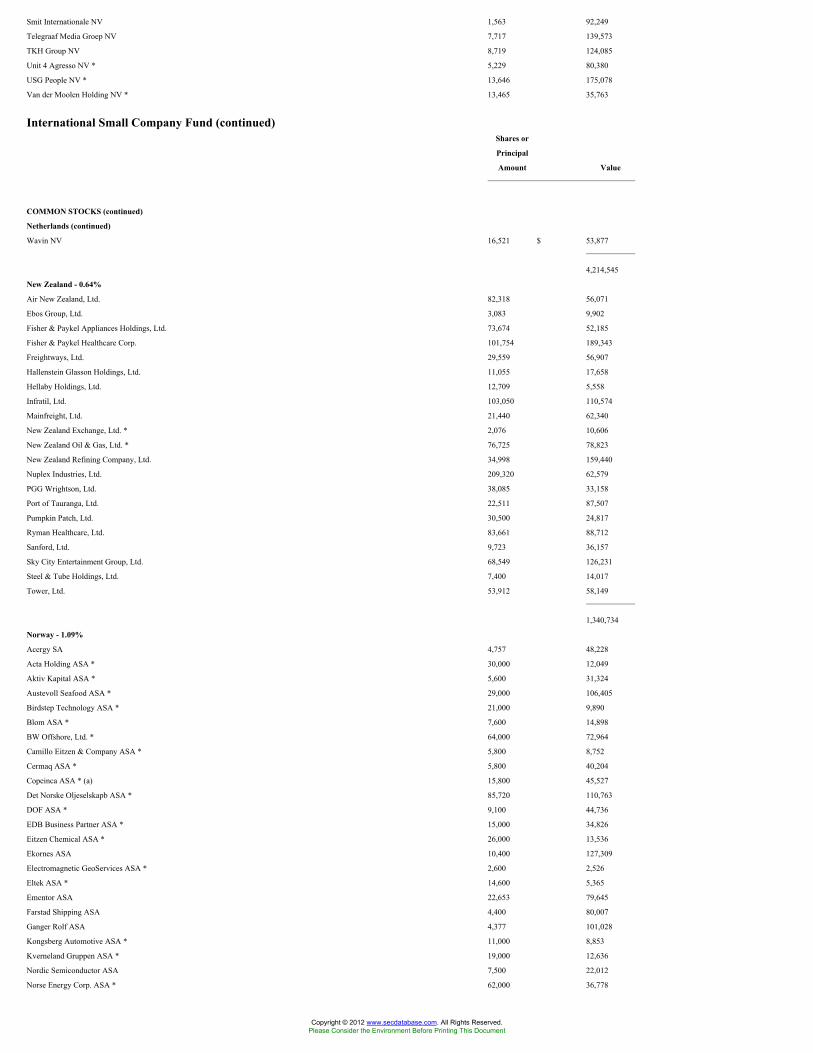
Smit Internationale NV 1,563 92,249
Telegraaf Media Groep NV 7,717 139,573
TKH Group NV 8,719 124,085
Unit 4 Agresso NV * 5,229 80,380
USG People NV * 13,646 175,078
Van der Moolen Holding NV * 13,465 35,763
International Small Company Fund (continued)Shares or
Principal
Amount Value
COMMON STOCKS (continued)
Netherlands (continued)
Wavin NV 16,521 $ 53,877
4,214,545
New Zealand - 0.64%
Air New Zealand, Ltd. 82,318 56,071
Ebos Group, Ltd. 3,083 9,902
Fisher & Paykel Appliances Holdings, Ltd. 73,674 52,185
Fisher & Paykel Healthcare Corp. 101,754 189,343
Freightways, Ltd. 29,559 56,907
Hallenstein Glasson Holdings, Ltd. 11,055 17,658
Hellaby Holdings, Ltd. 12,709 5,558
Infratil, Ltd. 103,050 110,574
Mainfreight, Ltd. 21,440 62,340
New Zealand Exchange, Ltd. * 2,076 10,606
New Zealand Oil & Gas, Ltd. * 76,725 78,823
New Zealand Refining Company, Ltd. 34,998 159,440
Nuplex Industries, Ltd. 209,320 62,579
PGG Wrightson, Ltd. 38,085 33,158
Port of Tauranga, Ltd. 22,511 87,507
Pumpkin Patch, Ltd. 30,500 24,817
Ryman Healthcare, Ltd. 83,661 88,712
Sanford, Ltd. 9,723 36,157
Sky City Entertainment Group, Ltd. 68,549 126,231
Steel & Tube Holdings, Ltd. 7,400 14,017
Tower, Ltd. 53,912 58,149
1,340,734
Norway - 1.09%
Acergy SA 4,757 48,228
Acta Holding ASA * 30,000 12,049
Aktiv Kapital ASA * 5,600 31,324
Austevoll Seafood ASA * 29,000 106,405
Birdstep Technology ASA * 21,000 9,890
Blom ASA * 7,600 14,898
BW Offshore, Ltd. * 64,000 72,964
Camillo Eitzen & Company ASA * 5,800 8,752
Cermaq ASA * 5,800 40,204
Copeinca ASA * (a) 15,800 45,527
Det Norske Oljeselskapb ASA * 85,720 110,763
DOF ASA * 9,100 44,736
EDB Business Partner ASA * 15,000 34,826
Eitzen Chemical ASA * 26,000 13,536
Ekornes ASA 10,400 127,309
Electromagnetic GeoServices ASA * 2,600 2,526
Eltek ASA * 14,600 5,365
Ementor ASA 22,653 79,645
Farstad Shipping ASA 4,400 80,007
Ganger Rolf ASA 4,377 101,028
Kongsberg Automotive ASA * 11,000 8,853
Kverneland Gruppen ASA * 19,000 12,636
Nordic Semiconductor ASA 7,500 22,012
Norse Energy Corp. ASA * 62,000 36,778
Copyright © 2012 www.secdatabase.com. All Rights Reserved.Please Consider the Environment Before Printing This Document

Norske Skogindustrier ASA * 51,000 99,961
Norwegian Air Shuttle ASA * 2,792 25,053
Odfjell ASA 6,507 43,573
ODIM ASA (a) 7,900 46,639
Petrolia Drilling ASA * 165,000 14,567
The accompanying notes are an integral part of the financial statements.
136
JOHN HANCOCK FUNDS II
PORTFOLIO OF INVESTMENTS - May 31, 2009 (Unaudited) - continued(showing percentage of total net assets)
International Small Company Fund (continued)Shares or
Principal
Amount Value
COMMON STOCKS (continued)
Norway (continued)
PhotoCure ASA * 1,408 $ 7,594
ProSafe ASA 7,000 35,720
Prosafe Production Public, Ltd. * 8,635 19,594
Q-Free ASA * 22,000 54,274
Scana Industrier ASA 28,396 24,143
Schibsted ASA 10,200 128,131
Sevan Marine ASA * (a) 55,533 74,534
Solstad Offshore ASA 4,000 54,420
Songa Offshore SE * 22,500 61,860
Sparebanken Midt-Norge ASA 10,452 61,921
Subsea 7 Inc * 7,600 80,595
Tandberg ASA 1,400 23,295
TGS Nopec Geophysical Company ASA * 10,385 103,302
Tomra Systems ASA 17,056 67,203
TTS Marine ASA * 6,100 9,346
Veidekke ASA 18,700 98,352
Wilhelm Wilhelmsen ASA 5,400 85,882
2,290,220
Portugal - 0.49%
Altri SGPS SA 12,342 42,481
Banco BPI SA 36,329 102,644
Finibanco Holding SGPS SA * 5,017 12,441
Impresa, SGPS SA * 29,906 33,097
Investimentos Participacoes e Gestao SA * 57,093 44,009
Mota Engil, SGPS SA 18,540 85,848
Novabase SGPS SA * 5,234 36,659
Pararede SGPS SA * 19,555 24,169
Portucel - Empresa Produtora de Pasta e
Papel SA 52,152 124,326
PT Multimedia.com, SGPS, SA (a) 22,874 130,496
SAG GEST-Solucoes Automovel Globais
SGPS SA 9,334 14,272
Semapa-Sociedade de Investimento &
Gestao, SGPS SA 13,425 119,092
Sonae Industria, SGPS SA * 21,800 72,878
Sonae, SGPS SA 42,153 42,804
Sonaecom, SGPS SA * 36,742 98,748
Teixeira Duarte-Engenharia & Construcoes SA 37,298 51,916
1,035,880
Singapore - 1.65%
Allgreen Properties, Ltd. 153,000 111,603
Asia Food & Properties, Ltd. * 464,000 92,794
Copyright © 2012 www.secdatabase.com. All Rights Reserved.Please Consider the Environment Before Printing This Document

ASL Marine Holdings, Ltd. 37,000 23,354
Beyonics Technology, Ltd. 178,000 22,491
Bonvests Holdings, Ltd. 56,400 32,644
Bukit Sembawang Estates, Ltd. 18,000 43,421
Cerebos Pacific, Ltd. 22,000 45,966
CH Offshore, Ltd. 136,000 47,981
Chartered Semiconductor Manufacturing, Ltd. * 70,670 107,154
China Merchants Holdings Pacific, Ltd. 70,000 24,959
Chip Eng Seng Corp., Ltd. 107,000 30,050
Chuan Hup Holdings, Ltd. 192,000 30,640
Creative Technology, Ltd. * 15,150 42,518
CSC Holdings, Ltd. 191,000 23,345
CSE Global, Ltd. 113,000 49,484
CWT, Ltd. 31,000 10,570
International Small Company Fund (continued)Shares or
Principal
Amount Value
COMMON STOCKS (continued)
Singapore (continued)
Delong Holdings, Ltd. * 45,500 $ 21,045
Ezra Holdings, Ltd. * 82,000 75,127
FJ Benjamin Holdings, Ltd. 66,000 9,489
Food Empire Holdings, Ltd. 52,800 11,733
Fu Yu Corp., Ltd. * 220,000 12,947
Furama, Ltd. 12,000 8,807
Goodpack, Ltd. 57,000 42,749
Guocoland, Ltd. 64,300 81,124
Hersing Corp., Ltd. 88,000 14,013
Hi-P International, Ltd. 80,000 37,220
Ho Bee Investment, Ltd. 128,000 77,294
Hong Fok Corp., Ltd. * 74,800 26,908
Hong Leong Asia, Ltd. 43,000 42,250
Hotel Plaza, Ltd. 60,000 37,080
Hotel Properties, Ltd. 67,100 83,086
HTL International Holdings, Ltd. 57,000 11,659
HupSteel, Ltd. 100,000 14,363
Hwa Hong Corp., Ltd. 92,000 27,781
Hyflux, Ltd. 62,000 91,584
Innotek, Ltd. 65,000 9,487
Jaya Holdings, Ltd. 102,000 43,274
Jurong Technologies Industrial Corp., Ltd. 83,200 1,440
K1 Ventures, Ltd. 374,000 41,779
Keppel Telecommunications & Transportation
Company, Ltd. 47,000 53,803
Kim Eng Holdings, Ltd. 63,795 74,846
KS Energy Services, Ltd. 48,000 41,956
Low Keng Huat Singapore, Ltd. 110,000 21,499
Manhattan Resources, Ltd. * 61,000 23,341
MediaRing, Ltd. * 145,000 11,691
Metro Holdings, Ltd. 118,000 48,321
MFS Technology, Ltd. 56,000 6,591
Midas Holdings, Ltd. 77,000 36,009
MobileOne, Ltd. 116,000 118,915
NatSteel, Ltd. 41,000 35,887
Orchard Parade Holdings, Ltd. * 70,000 44,666
Osim International, Ltd. * 81,000 14,885
Pan-United Corp., Ltd. 61,000 24,162
Parkway Holdings, Ltd. 161,000 166,449
Petra Foods, Ltd. 46,000 21,997
Raffles Education Corp., Ltd. 285,957 106,709
Rotary Engineering, Ltd. 57,000 25,284
SBS Transit, Ltd. 29,500 32,574
SC Global Developments, Ltd. * 55,000 45,367
Copyright © 2012 www.secdatabase.com. All Rights Reserved.Please Consider the Environment Before Printing This Document

Sim Lian Group, Ltd. 42,000 13,958
Singapore Land, Ltd. 38,000 142,400
Singapore Post, Ltd. 177,000 104,222
Singapore Reinsurance Corp., Ltd. 72,000 10,488
Singapore Shipping Corp., Ltd. 90,000 17,881
Sinomem Technology, Ltd. * 76,000 8,989
Sunningdale Tech, Ltd. * 200,000 14,591
Tat Hong Holdings, Ltd. 76,000 58,780
TT International, Ltd. * 190,000 5,920
Tuan Sing Holdings, Ltd. * 188,000 22,415
United Engineers, Ltd. 39,000 43,165
UOB-Kay Hian Holdings, Ltd. 75,000 70,016
The accompanying notes are an integral part of the financial statements.
137
JOHN HANCOCK FUNDS II
PORTFOLIO OF INVESTMENTS - May 31, 2009 (Unaudited) - continued(showing percentage of total net assets)
International Small Company Fund (continued)Shares or
Principal
Amount Value
COMMON STOCKS (continued)
Singapore (continued)
Venture Corp., Ltd. 27,000 $ 133,407
WBL Corp., Ltd. 30,000 73,632
Wheelock Properties (S), Ltd. 90,000 104,860
Wing Tai Holdings, Ltd. 84,300 87,530
Yongnam Holdings, Ltd. 247,000 39,544
3,467,963
South Korea - 0.00%
Pantech & Curitel Communications, Inc. * (e)(j) 882 0
Pantech Company, Ltd. * (e)(j) 1,112 0
Spain - 1.97%
Abengoa SA 7,977 199,222
Adolfo Dominguez SA 1,580 23,790
Amper SA 6,189 56,322
Antena 3 de Television SA 14,478 102,483
Avanzit SA * 25,467 34,666
Azkoyen SA * 6,990 34,099
Banco Guipuzcoano SA 12,997 84,517
Banco Pastor SA 14,006 101,857
Baron de Ley SA * 1,392 51,638
Bolsas y Mercados Espanoles 2,758 88,724
Campofrio Alimentacion SA 7,918 71,954
Cementos Portland Valderrivas SA 1,909 93,192
Construcciones & Auxiliar de Ferrocarriles SA 299 128,097
Corporacion Dermoestetica SA * 3,631 22,606
Duro Felguera SA 12,223 96,989
Ebro Puleva SA 9,693 151,850
Elecnor SA 10,132 119,154
Ercros SA * 305,710 62,778
FAES FARMA SA 20,129 121,873
General de Alquiler de Maquinaria * 6,056 60,647
Gestevision Telecinco SA 2,864 28,279
Grupo Catalana Occidente SA 4,695 75,873
Grupo Empresarial Ence SA 27,493 99,439
Iberia Lineas Aereas de Espana SA 53,275 121,455
Iberpapel Gestion SA 2,124 25,968
La Seda de Barcelona SA 148,568 76,400
Copyright © 2012 www.secdatabase.com. All Rights Reserved.Please Consider the Environment Before Printing This Document

Mecalux SA * 3,385 48,934
Miquel y Costas SA 3,706 72,925
Natra SA 4,190 28,694
Natraceutical SA * 49,023 36,278
NH Hoteles SA 17,593 90,943
Obrascon Huarte Lain SA 7,714 143,846
Papeles & Cartones de Europa SA 10,706 47,147
Pescanova SA 1,698 53,395
Prim SA 3,135 27,787
Promotora de Informaciones SA * (a) 27,789 111,841
Prosegur Cia de Seguridad SA 2,415 73,634
Redes Energeticas Nacionais SA 9,082 37,721
Service Point Solutions SA * 25,764 37,960
Sociedad Nacional Inds., Aplicaciones
Celulosa Espanola SA * 18,863 25,415
Sol Melia SA 15,848 88,937
SOS Cuetara SA 12,361 65,562
Tavex Algodonera SA * 8,440 6,609
Tecnicas Reunidas SA 4,345 192,930
Tecnocom, Telecomunicaciones & Energia SA * 9,491 51,437
International Small Company Fund (continued)Shares or
Principal
Amount Value
COMMON STOCKS (continued)
Spain (continued)
Tubacex SA 34,476 $ 130,171
Tubos Reunidos SA 33,434 101,832
Unipapel SA 2,109 33,538
Urbas Proyectos Urbanisticos SA * 10,449 2,599
Vertice Trescientos Sesenta Grados * 1,265 1,450
Vidrala SA 5,408 113,700
Viscofan SA 9,157 193,953
Vocento SA * 16,004 85,667
Zeltia SA * 18,631 117,260
4,156,037
Sweden - 1.88%
AarhusKarlshamn AB (a) 8,830 121,154
Acando AB, Series B 14,000 23,753
Active Biotech AB * 4,550 29,988
AddTech AB, Series B 3,800 54,357
Angpanneforeningen AB, Series B 3,400 63,699
Anoto Group AB * 31,000 20,397
Axfood AB 5,039 114,073
Axis Communications AB 9,900 95,060
BE Group AB 7,800 35,404
Beijer Alma AB 5,200 56,414
Beijer Electronics AB 1,777 22,850
Bergman & Beving AB, Series B 6,950 80,425
Bilia AB, Series A * 5,300 32,662
Billerud Aktibolag AB * 11,500 67,527
BioGaia AB 5,360 41,990
Biotage AB 25,000 23,756
Biovitrum AB * 8,300 72,682
Bong Ljungdahl AB, Series B 4,000 12,233
Cardo AB 2,290 48,902
Clas Ohlson AB, Series B 7,150 83,044
Cloetta AB, Class B * 11,625 42,058
Concordia Maritime AB, Series B 6,500 17,255
D. Carnegie & Company AB * (e)(j) 52,789 0
Elekta AB, Series B (a) 11,633 162,095
Enea AB * 3,795 16,812
Eniro AB * (a) 19,745 26,614
Copyright © 2012 www.secdatabase.com. All Rights Reserved.Please Consider the Environment Before Printing This Document

Fagerhult AB 600 8,552
G & L Beijer AB 2,000 43,155
Gunnebo AB * 5,274 20,077
Hakon Invest AB 1,900 18,366
Haldex AB * 8,300 51,649
Hemtex AB 3,578 12,576
Hemtex AB * 1,430 4,970
HIQ International AB * 18,000 64,181
Hoganas AB, Series B 5,760 67,913
Industrial & Financial Systems AB 5,600 47,055
Indutrade AB 5,550 87,765
Intrum Justitia AB 7,011 71,390
JM AB * 15,984 113,477
KappAhl Holding AB 13,900 68,929
Lagercrantz AB 4,000 14,084
Lindab International AB 12,094 111,518
Medivir AB * 4,800 34,649
Mekonomen AB 2,200 33,524
Micronic Laser Systems AB * 7,700 11,221
The accompanying notes are an integral part of the financial statements.
138
JOHN HANCOCK FUNDS II
PORTFOLIO OF INVESTMENTS - May 31, 2009 (Unaudited) - continued(showing percentage of total net assets)
International Small Company Fund (continued)Shares or
Principal
Amount Value
COMMON STOCKS (continued)
Sweden (continued)
Munters AB * 14,350 $ 72,054
NCC AB (a) 16,100 158,484
Net Insight AB * 50,000 38,781
New Wave Group AB, Series B (a) 6,000 10,912
Nibe Industrier AB, Series B (a) 13,185 120,086
Nobia AB 27,287 106,228
Nolato AB, Series B 4,700 29,908
OEM International AB, Series B 12,643 65,601
ORC Software AB 1,800 31,787
PA Resources AB * 33,946 140,949
Peab AB, Series B (a) 19,597 92,861
Proffice AB * 10,000 22,493
Q-Med AB * 14,300 80,935
Rederi AB Transatlantic, Series B 9,000 31,047
Rezidor Hotel Group AB * 33,400 70,495
RNB Retail & Brands AB * 41,200 34,346
SAS AB * 94,725 51,641
Semcon AB * 4,200 11,404
Sensys Traffic AB 60,000 29,230
Skanditek Industriforvaltning AB 9,500 22,276
SkiStar AB, Series B 5,100 66,913
Studsvik AB 1,200 11,073
Sweco AB, Series B 13,000 73,684
TradeDoubler AB * 6,000 50,937
Trelleborg AB, Series B - New * (a) 57,640 185,100
Trelleborg AB, Series B * (a) 28,820 99,943
3,959,423
Switzerland - 3.91%
Advanced Digital Broadcast Holdings SA * 1,275 38,528
Copyright © 2012 www.secdatabase.com. All Rights Reserved.Please Consider the Environment Before Printing This Document
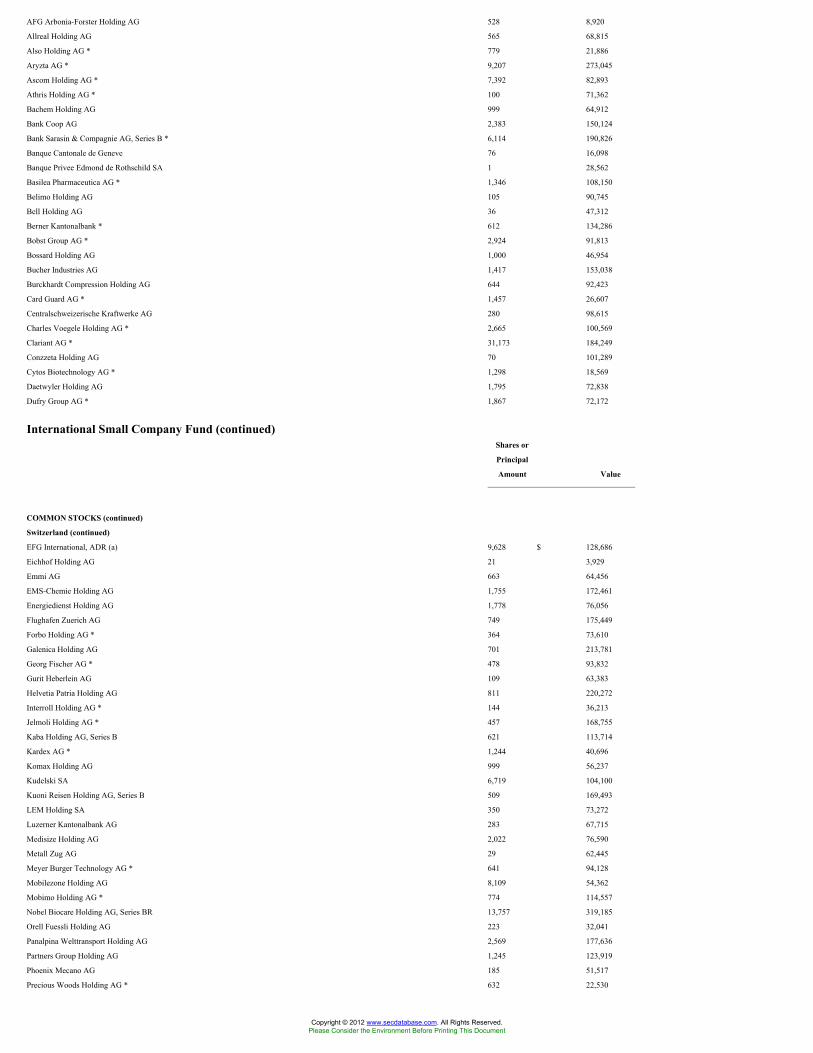
AFG Arbonia-Forster Holding AG 528 8,920
Allreal Holding AG 565 68,815
Also Holding AG * 779 21,886
Aryzta AG * 9,207 273,045
Ascom Holding AG * 7,392 82,893
Athris Holding AG * 100 71,362
Bachem Holding AG 999 64,912
Bank Coop AG 2,383 150,124
Bank Sarasin & Compagnie AG, Series B * 6,114 190,826
Banque Cantonale de Geneve 76 16,098
Banque Privee Edmond de Rothschild SA 1 28,562
Basilea Pharmaceutica AG * 1,346 108,150
Belimo Holding AG 105 90,745
Bell Holding AG 36 47,312
Berner Kantonalbank * 612 134,286
Bobst Group AG * 2,924 91,813
Bossard Holding AG 1,000 46,954
Bucher Industries AG 1,417 153,038
Burckhardt Compression Holding AG 644 92,423
Card Guard AG * 1,457 26,607
Centralschweizerische Kraftwerke AG 280 98,615
Charles Voegele Holding AG * 2,665 100,569
Clariant AG * 31,173 184,249
Conzzeta Holding AG 70 101,289
Cytos Biotechnology AG * 1,298 18,569
Daetwyler Holding AG 1,795 72,838
Dufry Group AG * 1,867 72,172
International Small Company Fund (continued)Shares or
Principal
Amount Value
COMMON STOCKS (continued)
Switzerland (continued)
EFG International, ADR (a) 9,628 $ 128,686
Eichhof Holding AG 21 3,929
Emmi AG 663 64,456
EMS-Chemie Holding AG 1,755 172,461
Energiedienst Holding AG 1,778 76,056
Flughafen Zuerich AG 749 175,449
Forbo Holding AG * 364 73,610
Galenica Holding AG 701 213,781
Georg Fischer AG * 478 93,832
Gurit Heberlein AG 109 63,383
Helvetia Patria Holding AG 811 220,272
Interroll Holding AG * 144 36,213
Jelmoli Holding AG * 457 168,755
Kaba Holding AG, Series B 621 113,714
Kardex AG * 1,244 40,696
Komax Holding AG 999 56,237
Kudelski SA 6,719 104,100
Kuoni Reisen Holding AG, Series B 509 169,493
LEM Holding SA 350 73,272
Luzerner Kantonalbank AG 283 67,715
Medisize Holding AG 2,022 76,590
Metall Zug AG 29 62,445
Meyer Burger Technology AG * 641 94,128
Mobilezone Holding AG 8,109 54,362
Mobimo Holding AG * 774 114,557
Nobel Biocare Holding AG, Series BR 13,757 319,185
Orell Fuessli Holding AG 223 32,041
Panalpina Welttransport Holding AG 2,569 177,636
Partners Group Holding AG 1,245 123,919
Phoenix Mecano AG 185 51,517
Precious Woods Holding AG * 632 22,530
Copyright © 2012 www.secdatabase.com. All Rights Reserved.Please Consider the Environment Before Printing This Document

PubliGroupe SA 531 40,060
Quadrant AG * 737 64,271
Rieter Holding AG * 909 155,428
Romande Energie Holding SA 74 139,720
Schaffner Holding AG * 90 11,633
Schulthess Group AG 805 47,232
Schweiter Technologies AG 263 97,199
Schweizerhall Holding AG 533 91,581
Schweizerische
National-Versicherungs-Gesellschaft AG * 3,720 87,792
Siegfried Holding AG 595 48,471
Sika AG 189 194,999
St. Galler Kantonalbank 470 174,269
Sulzer AG 3,481 234,966
Swissfirst AG 1,224 46,563
Swisslog Holding AG 60,097 43,441
Swissquote Group Holding SA 1,660 89,159
Tamedia AG 591 31,417
Tecan Group AG 2,658 108,002
Temenos Group AG * (a) 6,535 102,741
Tornos SA * 2,391 15,283
Valora Holding AG 738 144,578
Vaudoise Assurances Holding SA 226 38,104
Verwaltungs & Privat Bank AG 465 38,538
Vontobel Holding AG 5,811 150,453
The accompanying notes are an integral part of the financial statements.
139
JOHN HANCOCK FUNDS II
PORTFOLIO OF INVESTMENTS - May 31, 2009 (Unaudited) - continued(showing percentage of total net assets)
International Small Company Fund (continued)Shares or
Principal
Amount Value
COMMON STOCKS (continued)
Switzerland (continued)
VZ Holding AG 879 $ 47,804
WMH Walter Meier AG, Series A 120 6,465
Ypsomed Holding AG * 908 63,230
Zehnder Group AG 82 73,021
Zuger Kantonalbank 41 150,630
8,237,670
United Kingdom - 13.63%
A.G. Barr PLC 2,441 49,844
Aberdeen Asset Management PLC 108,473 229,702
Acal PLC 5,883 10,697
AEA Technology PLC * 18,852 5,036
Aegis Group PLC 149,269 198,152
Aga Rangemaster Group PLC 17,247 25,332
Aggreko PLC 26,156 249,182
Alexon Group PLC 6,881 6,255
Alizyme PLC * 58,896 5,612
Alphameric PLC * 33,484 15,281
Anglo Pacific Group PLC 35,012 77,571
Anglo-Eastern Plantations PLC 3,369 20,111
Anite PLC 70,873 38,068
Antisoma PLC * 137,552 63,308
ARC International PLC * 45,915 8,370
Arena Leisure PLC 50,686 15,807
Copyright © 2012 www.secdatabase.com. All Rights Reserved.Please Consider the Environment Before Printing This Document

Ark Therapeutics Group PLC * 48,780 39,556
Arm Holdings PLC, ADR 48,858 256,993
Arriva PLC 28,243 204,901
Ashtead Group PLC 142,231 119,552
Assura Group, Ltd. * 58,590 33,668
Aveva Group PLC 7,585 90,347
Avis Europe PLC * 85,382 24,864
Avon Rubber PLC * 11,107 13,913
Axis-Shield PLC * 13,255 64,403
Babcock International Group PLC 32,638 244,596
Barratt Developments PLC * 46,827 121,086
BBA Aviation PLC 68,361 135,094
Beazley Group PLC 95,741 157,372
Bellway PLC 15,528 163,238
Berkeley Group Holdings PLC * 12,625 182,647
Bespak PLC 7,040 42,091
Biocompatibles International PLC 10,935 29,999
Blacks Leisure Group PLC 5,193 3,251
Bloomsbury Publishing PLC 15,244 30,250
BlueBay Asset Management PLC 15,668 47,790
Bodycote PLC 39,345 90,070
Bovis Homes Group PLC 13,533 86,146
BPP Holdings PLC 8,591 79,293
Braemar Seascope Group PLC 1,189 6,676
Brammer PLC 13,505 25,898
Brewin Dolphin Holdings PLC 41,062 92,429
Brit Insurance Holdings PLC 36,517 114,489
British Polythene Industries PLC 4,400 10,444
Britvic PLC 20,538 92,039
BSS Group PLC 20,378 89,997
BTG PLC * 28,558 71,134
Business Post Group PLC 6,109 23,840
Care UK PLC 18,019 88,809
International Small Company Fund (continued)Shares or
Principal
Amount Value
COMMON STOCKS (continued)
United Kingdom (continued)
Carillion PLC 44,283 $ 192,054
Carpetright PLC 8,793 90,110
Carphone Warehouse Group PLC 72,585 198,578
Castings PLC 7,764 18,321
Catlin Group, Ltd. 50,861 292,711
Centaur Media PLC 37,860 21,554
Charles Stanley Group PLC 5,789 22,398
Charles Taylor Consulting PLC 5,241 15,587
Charter International PLC 23,728 205,017
Chemring Group PLC 5,015 163,404
Chesnara PLC 28,486 66,873
Chime Communications PLC 5,000 8,914
Chloride Group PLC 46,548 115,621
Chrysalis Group PLC * 7,473 6,822
Clarkson PLC 3,067 28,715
Clinton Cards PLC 33,476 12,028
Close Brothers Group PLC 18,402 197,782
Collins Stewart PLC 49,196 60,767
Colt Telecom Group PLC * 73,320 146,982
Communisis PLC 29,820 13,464
Computacenter PLC 34,471 106,278
Connaught PLC 26,116 143,748
Cookson Group PLC * 5,913 26,263
Corin Group PLC 4,524 4,268
Costain Group PLC 147,453 57,963
Copyright © 2012 www.secdatabase.com. All Rights Reserved.Please Consider the Environment Before Printing This Document

Cranswick PLC 5,196 53,236
Creston PLC 10,587 10,037
Croda International PLC 19,362 165,481
CSR PLC * 14,919 84,969
D.S. Smith PLC 102,881 121,855
Daily Mail and General Trust PLC 32,295 170,785
Dairy Crest Group PLC 14,905 68,474
Dana Petroleum PLC * 12,353 264,189
Davis Service Group PLC 19,057 96,831
Dawson Holdings PLC 18,937 2,399
De La Rue Plc Group 13,902 186,564
Debenhams PLC 125,507 188,167
Dechra Pharmaceuticals PLC 6,959 45,924
Delta PLC 57,839 112,460
Development Securities PLC 14,917 66,559
Devro PLC 33,835 54,475
Dicom Group PLC 23,156 43,945
Dignity PLC 7,129 65,968
Dimension Data Holdings PLC 240,924 218,939
Diploma PLC 29,370 64,583
Dixons Group PLC 397,888 152,686
Domino Printing Sciences PLC 29,115 102,864
DTZ Holdings PLC 19,551 17,335
Dunelm Group PLC 6,499 24,134
easyJet PLC * 30,683 156,306
Electrocomponents PLC 61,894 146,695
Elementis PLC 144,030 60,529
Emerald Energy PLC * 6,316 55,090
Ennstone PLC 77,985 1,450
Euromoney Institutional Investor PLC 13,969 46,812
Evolution Group PLC 61,725 138,038
The accompanying notes are an integral part of the financial statements.
140
JOHN HANCOCK FUNDS II
PORTFOLIO OF INVESTMENTS - May 31, 2009 (Unaudited) - continued(showing percentage of total net assets)
International Small Company Fund (continued)Shares or
Principal
Amount Value
COMMON STOCKS (continued)
United Kingdom (continued)
F&C Asset Management PLC 69,949 $ 90,315
Fenner PLC 51,492 73,430
Filtrona PLC 66,655 136,890
Filtronic PLC * 7,589 3,687
Findel PLC 15,671 18,070
Forth Ports PLC 4,084 67,659
Fortune Oil PLC * 359,509 39,779
French Connection Group PLC 23,390 26,045
Fuller Smith & Turner PLC 8,112 65,818
Future PLC 44,714 13,101
Galiform PLC * 112,844 68,100
Galliford Try PLC 100,742 77,070
Game Group PLC 49,235 136,288
Games Workshop Group PLC * 3,609 12,186
Genus PLC 14,237 138,518
Go-Ahead Group PLC 4,501 92,305
Goldshield Group PLC 6,425 34,247
Grafton Group PLC * 43,226 174,352
Copyright © 2012 www.secdatabase.com. All Rights Reserved.Please Consider the Environment Before Printing This Document

Greene King PLC 43,272 307,006
Greggs PLC 20,830 134,709
Halfords Group PLC 21,961 115,841
Halma PLC 53,156 141,670
Hampson Industries PLC 46,761 78,061
Hansard Global PLC 11,952 26,453
Hardy Oil & Gas PLC * 12,212 68,655
Hardy Underwriting Bermuda, Ltd. 7,824 35,651
Hargreaves Lansdown PLC 21,220 72,966
Hays PLC 195,587 262,845
Headlam Group PLC 26,325 108,571
Helical Bar PLC 23,786 134,191
Helphire PLC 91,728 61,481
Henderson Group PLC 105,364 139,662
Henry Boot PLC 22,990 26,364
Heritage Oil, Ltd. * (a) 19,736 167,315
Hikma Pharmaceuticals PLC 15,408 107,153
Hill & Smith Holdings PLC 19,511 59,521
Hiscox PLC 53,569 283,240
HMV Group PLC 45,007 89,942
Hochschild Mining PLC 27,852 129,782
Hogg Robinson Group PLC 39,788 14,832
Holidaybreak PLC 9,477 48,001
Homeserve PLC 7,431 167,016
Hunting PLC 14,071 103,581
Huntsworth PLC 22,389 20,167
Hyder Consulting PLC 475 883
IG Group Holdings PLC 48,562 178,612
Imagination Technologies Group PLC * 42,827 57,843
IMI PLC 45,470 256,365
Inchcape PLC 24,252 6,794
Informa PLC 47,547 186,398
Intec Telecom Systems PLC * 40,144 45,291
Intermediate Capital Group PLC 9,643 71,899
International Personal Finance PLC 67,796 85,013
Interserve PLC 32,398 94,622
ITE Group PLC 55,431 80,639
J.D. Wetherspoon PLC 24,171 165,622
International Small Company Fund (continued)Shares or
Principal
Amount Value
COMMON STOCKS (continued)
United Kingdom (continued)
James Fisher & Sons PLC 11,043 $ 77,722
Jardine Lloyd Thompson Group PLC 21,139 146,492
JKX Oil & Gas PLC 27,808 97,187
John Menzies PLC 7,960 16,440
John Wood Group PLC 44,277 204,049
Johnston Press PLC * 162,592 64,110
Keller Group PLC 6,780 68,575
Kesa Electricals PLC 61,595 120,798
Kier Group PLC 5,263 86,348
Kingston Communications PLC 123,424 54,533
Ladbrokes PLC 85,476 280,290
Laird Group PLC 48,620 113,825
Laura Ashley Holdings PLC 68,094 17,636
Lavendon Group PLC 9,915 22,075
Liontrust Asset Management PLC 5,127 8,156
Logica PLC 185,914 222,606
Lookers PLC 35,795 30,207
Low & Bonar PLC 45,266 21,308
LSL Property Services PLC * 7,930 15,506
Luminar Group Holdings PLC 16,062 36,492
Copyright © 2012 www.secdatabase.com. All Rights Reserved.Please Consider the Environment Before Printing This Document

M.J. Gleeson Group PLC * 11,305 12,906
Management Consulting Group PLC 104,375 52,361
Manganese Bronze Holdings PLC 3,263 8,565
Marshalls PLC 38,912 66,748
Marston's PLC 30,387 84,003
McBride PLC 45,783 100,150
Medusa Mining, Ltd. * 31,637 51,727
Meggitt PLC 74,444 192,359
Melrose PLC 67,203 116,778
Melrose Resources PLC 14,176 61,823
Metalrax Group PLC * 29,412 2,850
Michael Page International PLC 45,889 191,250
Micro Focus International PLC 30,657 196,812
Millennium & Copthorne Hotels PLC 16,903 66,944
Minerva PLC * 48,210 10,008
Misys PLC 69,993 189,441
Mitie Group PLC 37,573 133,284
Mondi PLC 42,716 150,304
Morgan Crucible Company PLC 71,096 123,699
Morgan Sindall PLC 8,215 87,668
Morse PLC 17,420 3,588
Mothercare PLC 17,699 124,455
Mouchel Parkman PLC 27,771 112,025
MWB Group Holdings PLC * 16,610 10,760
N. Brown Group PLC 18,394 74,231
National Express Group PLC 14,547 76,447
Northern Foods PLC 126,835 119,690
Northgate PLC 23,512 60,785
Northumbrian Water Group PLC 65,840 259,106
Novae Group PLC 16,766 102,035
Oxford Biomedica PLC * 90,000 14,496
Oxford Instruments PLC 9,649 22,055
Pace Micro Technology PLC * 44,430 144,200
PartyGaming PLC * 35,444 145,962
Paypoint PLC 15,414 119,070
Pendragon PLC 119,021 48,812
The accompanying notes are an integral part of the financial statements.
141
JOHN HANCOCK FUNDS II
PORTFOLIO OF INVESTMENTS - May 31, 2009 (Unaudited) - continued (showing percentage of total net assets)
International Small Company Fund (continued)Shares or
Principal
Amount Value
COMMON STOCKS (continued)
United Kingdom (continued)
Persimmon PLC 42,711 $ 253,600
Peter Hambro Mining PLC 18,090 194,346
Phoenix IT Group, Ltd. 9,852 24,208
Photo-Me International PLC * 22,753 5,778
Pinewood Shepperton PLC 8,060 19,671
Premier Farnell PLC 51,929 112,493
Premier Foods PLC 306,827 187,058
Premier Oil PLC * 11,284 209,249
Prostrakan Group PLC * 2,053 2,935
Provident Financial PLC 18,750 247,490
Psion PLC 30,129 26,784
Punch Taverns PLC 60,285 143,460
PV Crystalox Solar PLC 68,005 87,062
PZ Cussons PLC 59,341 165,255
Copyright © 2012 www.secdatabase.com. All Rights Reserved.Please Consider the Environment Before Printing This Document

Qinetiq PLC 93,898 222,945
Quintain Estates & Development PLC 40,357 32,777
Rank Group PLC * 117,546 122,467
Rathbone Brothers PLC 10,169 133,514
Raymarine PLC 13,480 3,902
REA Holdings PLC 2,127 12,303
Redrow PLC * 37,090 119,187
Regus PLC 142,965 160,112
Renishaw PLC 9,164 67,252
Rensburg Sheppards PLC 5,718 45,028
Restaurant Group PLC 47,761 118,176
Ricardo PlC 13,155 43,712
Rightmove PLC 14,759 84,246
RM PLC 13,965 39,238
Robert Walters PLC 17,416 33,710
Robert Wiseman Dairies PLC 9,457 59,708
ROK PLC 47,492 42,569
Rotork PLC 12,299 170,394
Royalblue Group PLC 5,481 101,187
RPC Group PLC 19,627 47,382
RPS Group PLC 23,867 73,167
Salamander Energy PLC * 26,350 81,691
Savills PLC 29,596 126,849
Scott Wilson Group PLC 138 126
SDL PLC * 16,966 91,025
Senior PLC 114,487 66,700
Severfield Rowen PLC 21,880 70,928
Shanks Group PLC 68,152 107,860
Shore Capital Group PLC 82,607 33,444
SIG PLC 66,079 125,338
Skyepharma PLC * 1,272 3,578
Smiths News PLC 49,558 87,206
Soco International PLC * 6,950 145,525
Southern Cross Healthcare, Ltd. * 50,751 107,165
Spectris PLC 12,897 104,237
Speedy Hire PLC 13,195 27,117
Spirax-Sarco Engineering PLC 10,811 143,909
Spirent Communications PLC, ADR 1,208 5,182
Spirent Communications PLC 100,652 110,649
Sportech PLC * 14,940 17,420
Sports Direct International PLC 54,705 73,630
Spring Group PLC 29,466 19,563
International Small Company Fund (continued)Shares or
Principal
Amount Value
COMMON STOCKS (continued)
United Kingdom (continued)
SSL International PLC 30,017 $ 248,181
St James's Place PLC 53,128 142,639
St. Ives Group PLC 24,755 32,301
St. Modwen Properties PLC 19,877 60,494
St. Modwen Properties PLC * 9,938 43,851
Stagecoach Group PLC 78,051 166,030
Sthree PLC 28,317 91,085
STV Group PLC * 6,014 5,516
Taylor Woodrow PLC * 478,410 248,537
Ted Baker PLC 5,384 31,709
Telecom Plus PLC 9,371 42,121
Thorntons PLC 10,805 11,989
Tomkins PLC, SADR 21,690 199,114
Topps Tiles PLC 25,009 36,319
Town Centre Securities PLC 4,430 9,158
Travis Perkins PLC 15,702 137,809
Copyright © 2012 www.secdatabase.com. All Rights Reserved.Please Consider the Environment Before Printing This Document

Tribal Group PLC 11,250 16,786
Trinity Mirror PLC 60,100 68,983
TT electronics PLC 41,687 18,112
Tullett Prebon PLC 25,044 120,396
UK Coal PLC * 38,818 94,218
Ultra Electronics Holdings PLC 9,689 173,134
Umeco PLC 12,886 33,766
Uniq PLC * 31,252 9,430
United Business Media, Ltd. 26,971 190,796
UTV Media PLC 12,462 12,450
Vectura Group PLC * 86,275 104,481
Venture Production PLC 18,099 235,792
Victrex PLC 8,814 80,392
Vislink PLC 22,958 9,645
Vitec Group PLC 8,660 37,919
VP PLC 664 1,578
VT Group PLC 25,417 192,509
W.S. Atkins PLC 11,197 93,974
Weir Group PLC 23,506 196,287
Wellstream Holdings PLC 9,675 82,546
WH Smith PLC 18,245 130,217
White Young Green PLC 9,034 4,059
William Hill PLC 98,943 342,114
Wilmington Group PLC 8,311 16,571
Wincanton PLC 33,587 90,093
Wolfson Microelectronics PLC * 35,719 61,917
WSP Group PLC 16,690 56,566
Xaar PLC 17,577 23,578
Xchanging PLC 23,627 68,131
Yell Group PLC 176,417 102,772
Yule Catto & Company PLC 29,330 39,177
28,720,222
United States - 0.29%
Arsenal Energy, Inc. * 12,500 3,149
Aurora Oil and Gas, Ltd. * 74,000 7,705
Berens Energy, Ltd. * 14,100 7,620
Calian Technologies, Ltd. 500 7,323
Canadian Gold Hunter Corp. * 7,916 3,263
Candente Resource Corp. * 8,600 3,387
Cardero Resource Corp. * 13,100 14,039
The accompanying notes are an integral part of the financial statements.
142
JOHN HANCOCK FUNDS II
PORTFOLIO OF INVESTMENTS - May 31, 2009 (Unaudited) - continued(showing percentage of total net assets)
International Small Company Fund (continued)Shares or
Principal
Amount Value
COMMON STOCKS (continued)
United States (continued)
Chartered Semiconductor Manufacturing,
Ltd., ADR * 1,103 $ 16,710
Cinch Energy Corp. * 11,600 8,606
City Telecom HK, Ltd. 1,717 7,623
Computer Modelling Group, Ltd. 800 10,625
Diagnocure, Inc. * 10,300 10,567
Eastmain Resources, Inc. * 21,300 25,948
Easyhome, Ltd. 700 5,771
Copyright © 2012 www.secdatabase.com. All Rights Reserved.Please Consider the Environment Before Printing This Document

Far West Mining, Ltd. * 4,700 8,610
Formation Capital Corp. * 29,000 9,961
Fortune Minerals, Ltd. * 3,334 1,619
GBS Gold International, Inc. * 30,800 141
Glacier Media, Inc. * 22,800 38,635
Glentel, Inc. 4,200 38,663
Globestar Mining Corp. * 12,700 10,004
Great Panther Resources, Ltd. * 22,200 10,981
Great Plains Exploration, Inc. * 41,500 11,404
Hemisphere GPS, Inc. * 10,400 11,908
Hillsborough Resources, Ltd. * 4,900 1,391
Inter-Citic Minerals, Inc. * 21,300 13,657
Intrinsyc Software International, Inc. * 15,509 1,847
Isotechnika, Inc. * 33,700 4,322
Magellan Aerospace Corp. * 2,240 4,452
Marsulex, Inc. 4,700 40,639
Matrikon, Inc. 3,200 6,448
MDN, Inc. * 17,700 11,187
Midnight Oil Exploration, Ltd. * 5,400 5,391
Minco Silver Corp. * 7,600 14,340
MKS, Inc. 18,100 28,184
Open Range Energy Corp. * 5,000 8,381
Parkbridge Lifestyles Communities, Inc. * 9,830 31,514
Profound Energy, Inc. * 80 117
Prometic Life Sciences, Inc. * 31,089 4,983
Pure Energy Services, Ltd. * 5,900 10,484
Queenston Mining, Inc. * 16,000 64,484
Questerre Energy Corp. * 50,000 59,537
Redcorp Ventures, Ltd. * 9,000 82
Technicoil Corp. * 14,900 5,323
Webtech Wireless, Inc. * 12,200 17,209
608,234
TOTAL COMMON STOCKS (Cost $301,477,968) $ 190,334,594
PREFERRED STOCKS - 0.01%
Australia - 0.01%
Village Roadshow, Ltd., 5.00% 33,387 17,417
TOTAL PREFERRED STOCKS (Cost $81,756) $ 17,417
WARRANTS - 0.00%
Australia - 0.00%
UXC, Ltd.
(Expiration Date 03/31/2010, Strike
Price AUD 0.45) * 5,594 101
International Small Company Fund (continued)Shares or
Principal
Amount Value
WARRANTS (continued)
Hong Kong - 0.00%
Asia Standard International Group, Ltd.
(Expiration Date 09/07/2009, Strike
Price HKD 0.63) * 474,951 $ 640
China Sci-Tech Holdings, Ltd.
(Expiration Date 03/09/2011) * 43,840 0
Golden Resorts Group, Ltd.
(Expiration Date 06/09/2010, Strike
Price HKD 0.35) * 100,000 142
ITC Corp., Ltd.
(Expiration Date 11/04/2009, Strike
Price HKD 0.22) * 135,711 175
Lippo, Ltd.
Copyright © 2012 www.secdatabase.com. All Rights Reserved.Please Consider the Environment Before Printing This Document

(Expiration Date 07/04/2011, Strike
Price HKD 4.70) * 3,125 52
Matsunichi Communication Holdings, Ltd.
(Expiration Date 08/22/2010, Strike
Price HKD 6.00) * 9,300 45
1,054
Singapore - 0.00%
Manhattan Resources, Ltd.
(Expiration Date 04/09/2011, Strike
Price SGD 0.70) * 18,300 634
TOTAL WARRANTS (Cost $3,193) $ 1,789
RIGHTS - 0.09%
Australia - 0.02%
Alliance Resources, Ltd. (Expiration Date
06/25/2009, Strike Price AUD 0.60) * 3,000 397
APN News & Media, Ltd. (Expiration Date
06/15/2009, Strike Price AUD 1.00) * 13,607 3,269
Charter Hall Group, Ltd (Expiration Date
06/18/2009, Strike Price AUD 0.33) * 39,255 3,144
Hastie Group, Ltd. (Expiration Date
06/10/2009, Strike Price AUD 1.15) * 9,815 943
Macmahon Holdings, Ltd. (Expiration Date
06/09/2009, Strike Price AUD 0.32) * 31,278 877
Pacific Brands, Ltd. (Expiration Date
06/04/2009, Strike Price AUD 0.60) * 130,881 18,868
PanAust, Ltd. (Expiration Date 06/22/2009,
Strike Price AUD 0.28) * 78,603 5,036
Perseus Mining, Ltd. (Expiration Date
06/15/2009, Strike Price AUD 0.82) * 5,047 283
32,817
Finland - 0.00%
Finnlines Oyj (Expiration Date 06/17/2009,
Strike Price EUR 5.50) * 6,400 1,282
Hong Kong - 0.01%
Champion Technology Holdings, Ltd.
(Expiration Date 06/10/2009, Strike Price
HKD 0.10) * 327,597 5,958
Heng Tai Consumables Group, Ltd.
(Expiration Date 06/03/2009, Strike Price
HKD 0.18) * 162,500 4,192
Pacific Andes International Holdings, Ltd.
(Expiration Date 06/16/2009, Strike Price
HKD 0.60) * 151,306 4,099
14,249
The accompanying notes are an integral part of the financial statements.
143
JOHN HANCOCK FUNDS II
PORTFOLIO OF INVESTMENTS - May 31, 2009 (Unaudited) - continued(showing percentage of total net assets)
International Small Company Fund (continued)Shares or
Principal
Amount Value
RIGHTS (continued)
Copyright © 2012 www.secdatabase.com. All Rights Reserved.Please Consider the Environment Before Printing This Document

New Zealand - 0.00%
NZX, Ltd. (Expiration Date 06/17/2009, Strike
Price NZD 4.00) * 415 $ 1,061
Portugal - 0.00%
Finibanco Holding SGPS SA (Expiration Date
06/30/2009, Strike Price EUR 1.25) * 5,017 1,738
Singapore - 0.00%
WBL Corp., Ltd. (Expiration Date 06/02/2009,
Strike Price SGD 1.00) * 22,500 10,904
Sweden - 0.03%
Active Biotech AB (Expiration Date
05/22/2009, Strike Price SEK 20.00) * 4,550 17,859
Eniro AB (Expiration Date 06/11/2009, Strike
Price SEK 5.20) * 59,235 37,966
55,825
Switzerland - 0.00%
Schweizerische
National-Versicherungs-Gesellschaft AG
(Expiration Date 06/04/2009) * 3,720 4,250
United Kingdom - 0.03%
DSG International PLC (Expiration Date
06/03/2009, Strike Price GBP 0.14) * 284,205 43,593
Travis Perkins PLC (Expiration Date
06/11/2009, Strike Price GBP 3.65) * 10,991 30,378
73,971
TOTAL RIGHTS (Cost $396,019) $ 196,097
COMMON STOCKS - 90.35%
Canada - 7.05%
Quebecor World, Inc.
(missing rate) (missing date) CAD 21,545 493
TOTAL COMMON STOCKS (Cost $301,477,968) $ 190,334,594
SHORT TERM INVESTMENTS - 4.44%
John Hancock Collateral Investment
Trust, 0.7339% (c)(g) $ 934,922 $ 9,349,225
TOTAL SHORT TERM INVESTMENTS
(Cost $9,349,225) $ 9,349,225
International Small Company Fund (continued)Shares or
Principal
Amount Value
REPURCHASE AGREEMENTS - 0.99%
Repurchase Agreement with State
Street Corp. dated 05/29/2009 at
0.07% to be repurchased at
$2,075,012 on 06/01/2009,
collateralized by $2,275,000
Federal National Mortgage
Association, 5.5% due 07/14/2028
(valued at $2,117,343, including
interest) $ 2,075,000 $ 2,075,000
TOTAL REPURCHASE AGREEMENTS
(Cost $2,075,000) $ 2,075,000
Total Investments (International Small Company Fund)
(Cost $313,383,161) - 95.88% $ 201,974,122
Other assets and liabilities, net - 4.12% 8,678,847
TOTAL NET ASSETS - 100.00% $ 210,652,969
The portfolio had the following five top industry concentrations
Copyright © 2012 www.secdatabase.com. All Rights Reserved.Please Consider the Environment Before Printing This Document

as of May 31, 2009 (as a percentage of total net assets):
Building Materials & Construction 5.78%
Food & Beverages 4.31%
Banking 3.95%
Business Services 3.68%
Industrial Machinery 3.52%
International Value FundShares or
Principal
Amount Value
COMMON STOCKS - 97.15%
Australia - 0.52%
Brambles, Ltd. 1,150,086 $ 5,461,035
Austria - 1.01%
Telekom Austria AG (a) 685,030 10,580,285
Belgium - 0.73%
Belgacom SA 245,070 7,702,538
Bermuda - 0.39%
PartnerRe, Ltd. 62,580 4,083,971
Brazil - 0.79%
Empresa Brasileira de Aeronautica SA, ADR 435,250 8,348,095
Canada - 0.73%
Biovail Corp. 606,300 7,697,108
China - 1.96%
China Telecom Corp., Ltd. 18,363,589 8,695,516
Shanghai Electric Group Company, Ltd. 24,827,555 11,920,087
20,615,603
Finland - 1.36%
Stora Enso Oyj, Series R 1,041,000 6,246,075
UPM-Kymmene Oyj 853,141 7,998,719
14,244,794
France - 11.11%
AXA Group SA 863,786 16,175,557
The accompanying notes are an integral part of the financial statements.
144
JOHN HANCOCK FUNDS II
PORTFOLIO OF INVESTMENTS - May 31, 2009 (Unaudited) - continued(showing percentage of total net assets)
International Value Fund (continued)Shares or
Principal
Amount Value
COMMON STOCKS (continued)
France (continued)
Cap Gemini SA (a) 108,320 $ 4,192,596
Compagnie Generale des Etablissements
Michelin, Class B (a) 89,910 5,468,302
France Telecom SA (a) 1,397,501 34,170,753
GDF Suez 140,010 5,519,709
Sanofi-Aventis SA 330,216 21,036,630
Total SA (a) 375,252 21,720,898
Vivendi SA (a) 315,560 8,330,871
Copyright © 2012 www.secdatabase.com. All Rights Reserved.Please Consider the Environment Before Printing This Document

116,615,316
Germany - 9.25%
Bayerische Motoren Werke (BMW) AG (a) 326,524 11,768,186
Celesio AG (a) 162,540 3,683,719
Deutsche Post AG 971,861 13,444,178
E.ON AG 197,480 6,982,364
Infineon Technologies AG * (a) 2,518,830 8,006,445
Merck KGaA 46,010 4,430,280
Muenchener Rueckversicherungs-
Gesellschaft AG (MunichRe) 122,646 17,208,345
SAP AG (a) 394,750 16,994,132
Siemens AG 199,739 14,588,677
97,106,326
Hong Kong - 1.37%
Hutchison Whampoa, Ltd. 1,836,620 12,857,112
Kingboard Chemical Holdings, Ltd. 590,500 1,530,144
14,387,256
Israel - 1.95%
Check Point Software Technologies, Ltd. * 877,420 20,487,757
Italy - 1.83%
Autogrill SpA 1,143,515 10,693,740
UniCredit Italiano SpA * 3,242,158 8,525,027
19,218,767
Japan - 6.80%
Aiful Corp. 49 157
Mitsubishi UFJ Financial Group, Inc. 1,716,800 10,833,544
Nintendo Company, Ltd. 25,600 6,954,838
Olympus Optical Company, Ltd. 298,000 5,867,048
Promise Company, Ltd. (a) 264,600 3,529,793
Sony Corp. 429,514 11,265,937
Takeda Pharmaceutical Company, Ltd. 125,300 4,969,252
Toyota Motor Corp. 312,200 12,506,689
USS Company, Ltd. 271,530 15,433,777
71,361,035
Netherlands - 4.78%
ING Groep NV 1,496,102 15,956,262
Koninklijke (Royal) Philips Electronics N.V. 537,666 10,133,323
Randstad Holdings NV 482,790 14,905,989
Reed Elsevier NV 760,558 9,180,461
50,176,035
Norway - 4.22%
Aker Kvaerner ASA 979,950 8,598,961
StatoilHydro ASA 809,080 17,044,887
Telenor ASA 2,204,341 18,638,525
44,282,373
International Value Fund (continued)Shares or
Principal
Amount Value
COMMON STOCKS (continued)
Russia - 0.68%
Gazprom OAO, SADR 308,000 $ 7,105,560
Singapore - 3.35%
Flextronics International, Ltd. * 4,568,010 18,089,320
Singapore Telecommunications, Ltd. 8,144,000 17,036,271
35,125,591
South Korea - 3.15%
Copyright © 2012 www.secdatabase.com. All Rights Reserved.Please Consider the Environment Before Printing This Document

KB Financial Group, Inc., ADR * 291,671 9,321,805
Samsung Electronics Company, Ltd., GDR (f) 106,764 23,732,890
33,054,695
Spain - 2.14%
Telefonica SA 1,037,699 22,415,892
Sweden - 1.91%
Ericsson (LM), Series B 1,652,914 15,411,470
Niscayah Group AB 2,955,338 4,612,745
20,024,215
Switzerland - 7.02%
Adecco SA (a) 488,160 21,300,941
Nestle SA 491,890 17,874,542
Novartis AG 282,470 11,293,502
Roche Holdings AG - Genusschein 37,670 5,140,504
Swiss Re 316,853 10,361,727
UBS AG - CHF * 511,498 7,733,093
73,704,309
Taiwan - 6.91%
Chunghwa Telecom Company, Ltd., ADR 247,662 4,708,055
Compal Electronics, Inc., GDR (f) 3,013,358 12,732,944
Lite-On Technology Corp., GDR 1,154,109 10,161,237
Lite-On Technology Corp. * 6,360,462 5,649,109
Mega Financial Holding Company, Ltd. * 38,983,000 19,868,511
Taiwan Semiconductor
Manufacturing Company, Ltd. * 10,340,874 19,410,094
72,529,950
United Kingdom - 21.05%
Aviva PLC 1,990,750 10,991,104
BP PLC 3,265,112 26,950,282
British Sky Broadcasting Group PLC 1,840,516 13,278,443
Compass Group PLC 1,610,677 9,321,106
G4S PLC 3,063,280 10,490,634
GlaxoSmithKline PLC 992,205 16,724,300
HSBC Holdings PLC 678,150 6,193,290
Kingfisher PLC 6,983,770 20,162,006
Marks & Spencer Group PLC 1,848,950 8,508,624
Old Mutual PLC 9,928,392 11,836,299
Pearson PLC 985,766 10,432,592
Persimmon PLC 2,125,840 12,622,349
Premier Foods PLC 8,745,586 5,331,780
Reed Elsevier PLC 106,368 863,483
Rentokil Initial PLC 5,303,917 6,865,558
Royal Dutch Shell PLC, B Shares 797,033 21,673,427
Tesco PLC 1,125,680 6,669,902
Vodafone Group PLC 11,707,036 22,031,416
220,946,595
The accompanying notes are an integral part of the financial statements.
145
JOHN HANCOCK FUNDS II
PORTFOLIO OF INVESTMENTS - May 31, 2009 (Unaudited) - continued(showing percentage of total net assets)
International Value Fund (continued)Shares or
Principal
Amount Value
Copyright © 2012 www.secdatabase.com. All Rights Reserved.Please Consider the Environment Before Printing This Document

COMMON STOCKS (continued)
United States - 2.14%
ACE, Ltd. 405,496 $ 17,837,769
Invesco, Ltd. 299,056 4,680,226
22,517,995
TOTAL COMMON STOCKS (Cost $1,339,689,483) $ 1,019,793,096
SHORT TERM INVESTMENTS - 13.18%
John Hancock Collateral Investment
Trust, 0.7339% (c)(g) $ 114,891,021 $ 114,891,021
Paribas Corp.
0.22% due 06/01/2009 23,420,000 23,420,000
TOTAL SHORT TERM INVESTMENTS
(Cost $138,311,021) $ 138,311,021
Total Investments (International Value Fund)
(Cost $1,478,000,504) - 110.33% $ 1,158,104,117
Other assets and liabilities, net - (10.33)% (108,389,449)
TOTAL NET ASSETS - 100.00% $ 1,049,714,668
The portfolio had the following five top industry concentrations
as of May 31, 2009 (as a percentage of total net assets):
Telecommunications Equipment & Services 13.28%
Insurance 9.95%
Electronics 6.02%
Pharmaceuticals 5.72%
Business Services 5.46%
Investment Quality Bond FundShares or
Principal
Amount Value
U.S. TREASURY OBLIGATIONS - 28.26%
U.S. Treasury Bonds - 26.42%
5.375% due 02/15/2031 $ 1,000,000 $ 1,141,406
7.25% due 08/15/2022 1,375,000 1,802,109
7.50% due 11/15/2016 5,450,000 6,998,138
7.875% due 02/15/2021 9,250,000 12,564,124
8.125% due 08/15/2021 3,300,000 4,580,813
8.125% due 08/15/2019 *** 2,900,000 3,977,530
8.75% due 05/15/2017 to 08/15/2020 9,785,000 13,896,882
44,961,002
U.S. Treasury Notes - 1.84%
3.125% due 08/31/2013 2,000,000 2,091,250
6.50% due 02/15/2010 1,000,000 1,042,891
3,134,141
TOTAL U.S. TREASURY OBLIGATIONS
(Cost $47,523,395) $ 48,095,143
U.S. GOVERNMENT AGENCY OBLIGATIONS - 5.75%
Federal Home Loan Mortgage Corp. - 1.82%
4.00% due 11/15/2019 135,265 133,969
5.00% due 03/01/2019 to 12/01/2034 2,857,574 2,942,808
6.50% due 04/01/2029 to 08/01/2034 22,553 24,157
Investment Quality Bond Fund (continued)Shares or
Principal
Amount Value
Copyright © 2012 www.secdatabase.com. All Rights Reserved.Please Consider the Environment Before Printing This Document

U.S. GOVERNMENT AGENCY
OBLIGATIONS (continued)
Federal Home Loan Mortgage Corp.
(continued)
7.50% due 06/01/2010 to 05/01/2028 $ 5,825 $ 6,292
3,107,226
Federal National Mortgage
Association - 3.73%
4.654% due 06/01/2013 177,066 186,143
4.86% due 01/01/2015 2,843,218 2,892,515
4.918% due 02/01/2013 257,663 273,048
5.00% due 03/01/2019 to 06/01/2019 1,105,507 1,156,175
5.50% due 08/01/2035 to 11/01/2035 1,091,373 1,131,873
5.63% due 12/01/2011 203,568 217,933
5.937% due 11/01/2011 108,536 116,785
6.046% due 05/01/2012 125,184 135,858
6.085% due 10/01/2011 137,437 148,120
6.095% due 03/01/2012 83,803 90,966
6.50% due 09/01/2031 94 101
7.00% due 06/01/2029 316 346
6,349,863
Government National Mortgage
Association - 0.15%
6.00% due 12/15/2013 to 04/15/2035 57,412 60,691
6.50% due 06/15/2028 to 08/15/2034 43,598 46,620
7.00% due 11/15/2031 to 10/15/2034 128,906 140,437
8.00% due 07/15/2030 to 10/15/2030 3,445 3,738
251,486
Housing & Urban Development - 0.05%
7.498% due 08/01/2011 81,000 81,934
TOTAL U.S. GOVERNMENT AGENCY OBLIGATIONS
(Cost $7,705,298) $ 9,790,509
FOREIGN GOVERNMENT OBLIGATIONS - 1.17%
Brazil - 1.17%
Federative Republic of Brazil
5.875% due 01/15/2019 775,000 780,037
10.00% due 01/01/2017 BRL 2,500,000 1,208,427
1,988,464
TOTAL FOREIGN GOVERNMENT OBLIGATIONS
(Cost $1,710,924) $ 1,988,464
CORPORATE BONDS - 44.60%
Aerospace - 0.06%
Goodrich Corp.
7.10% due 11/15/2027 $ 115,000 107,720
Vought Aircraft Industries, Inc.
8.00% due 07/15/2011 5,000 2,450
110,170
Agriculture - 0.40%
Cargill, Inc.
5.60% due 09/15/2012 (f) 635,000 653,753
Case New Holland, Inc.
7.125% due 03/01/2014 10,000 9,275
Mosaic Company
7.375% due 12/01/2014 (f) 5,000 5,076
Copyright © 2012 www.secdatabase.com. All Rights Reserved.Please Consider the Environment Before Printing This Document

The accompanying notes are an integral part of the financial statements.
146
JOHN HANCOCK FUNDS II
PORTFOLIO OF INVESTMENTS - May 31, 2009 (Unaudited) - continued(showing percentage of total net assets)
Investment Quality Bond Fund (continued)Shares or
Principal
Amount Value
CORPORATE BONDS (continued)
Agriculture (continued)
Mosaic Company (continued)
7.625% due 12/01/2016 (f) $ 5,000 $ 4,975
673,079
Air Travel - 0.33%
American Airlines Pass Through Trust 2003-01
3.857% due 07/09/2010 17,871 16,496
Continental Airlines, Inc., Series 071A
5.983% due 04/19/2022 30,000 24,600
Continental Airlines, Inc., Series 974A
6.90% due 01/02/2018 105,463 86,480
Continental Airlines, Inc., Series 981A
6.648% due 09/15/2017 204,498 163,599
Continental Airlines, Inc., Series ERJ1
9.798% due 04/01/2021 8,659 4,849
Southwest Airlines Company, Series 07-1
6.15% due 08/01/2022 294,750 270,363
566,387
Aluminum - 0.04%
Alcan, Inc.
6.45% due 03/15/2011 59,000 59,253
Novelis, Inc.
7.25% due 02/15/2015 3,000 1,973
61,226
Auto Services - 0.01%
Avis Budget Car Rental LLC
7.625% due 05/15/2014 15,000 10,725
Automobiles - 0.11%
DaimlerChrysler NA Holding Corp.
8.50% due 01/18/2031 175,000 174,285
Ford Motor Company
7.45% due 07/16/2031 10,000 5,800
180,085
Banking - 3.43%
BAC Capital Trust XI
6.625% due 05/23/2036 15,000 10,840
BAC Capital Trust XIV
5.63% due 12/31/2049 (b) 10,000 4,611
Bank of America Corp.
4.375% due 12/01/2010 436,000 433,567
5.42% due 03/15/2017 800,000 670,093
5.65% due 05/01/2018 125,000 111,861
Copyright © 2012 www.secdatabase.com. All Rights Reserved.Please Consider the Environment Before Printing This Document

5.75% due 12/01/2017 100,000 89,318
Chase Manhattan Corp.
7.00% due 11/15/2009 135,000 137,510
First Republic Bank of San Francisco
7.75% due 09/15/2012 111,000 103,230
First Union National Bank
7.80% due 08/18/2010 350,000 366,696
HBOS PLC
6.00% due 11/01/2033 (f) 210,000 117,867
HSBC Bank USA NA, BKNT
7.00% due 01/15/2039 250,000 251,534
HSBC Holdings PLC
6.80% due 06/01/2038 850,000 800,999
National Australia Bank, Ltd.
8.60% due 05/19/2010 23,000 24,565
Investment Quality Bond Fund (continued)Shares or
Principal
Amount Value
CORPORATE BONDS (continued)
Banking (continued)
NB Capital Trust IV
8.25% due 04/15/2027 $ 15,000 $ 11,852
NBD Bancorp
8.25% due 11/01/2024 270,000 259,054
Republic New York Corp.
9.50% due 04/15/2014 135,000 143,365
Sanwa Bank, Ltd., New York Branch
7.40% due 06/15/2011 300,000 310,187
Sovereign Bancorp, Inc.
4.80% due 09/01/2010 30,000 29,333
Wachovia Corp.
5.75% due 06/15/2017 385,000 368,011
Wachovia Corp., MTN
5.50% due 05/01/2013 570,000 580,723
Wells Fargo & Company
4.95% due 10/16/2013 1,020,000 1,016,729
5,841,945
Biotechnology - 0.15%
Amgen, Inc.
6.40% due 02/01/2039 245,000 249,900
Broadcasting - 0.64%
British Sky Broadcasting Group PLC
5.625% due 10/15/2015 (f) 131,000 123,353
CanWest Media, Inc.
8.00% due 09/15/2012 ^ 20,000 5,600
CBS Corp.
8.20% due 05/15/2014 335,000 343,137
Liberty Media Corp.
5.70% due 05/15/2013 4,000 3,410
8.25% due 02/01/2030 2,000 1,340
News America Holdings, Inc.
6.90% due 03/01/2019 (f) 100,000 97,781
7.75% due 01/20/2024 453,000 398,265
9.25% due 02/01/2013 109,000 119,698
Sinclair Broadcast Group, Inc.
4.875 due 07/15/2018 6,000 3,870
1,096,454
Building Materials & Construction - 0.08%
D.R. Horton, Inc.
Copyright © 2012 www.secdatabase.com. All Rights Reserved.Please Consider the Environment Before Printing This Document

9.75% due 09/15/2010 14,000 14,245
SCL Terminal Aereo Santiago SA
6.95% due 07/01/2012 (f) 98,631 106,129
Texas Industries, Inc.
7.25% due 07/15/2013 10,000 8,600
128,974
Business Services - 0.04%
Deluxe Corp.
7.375% due 06/01/2015 50,000 39,500
Harland Clarke Holdings Corp.
9.50% due 05/15/2015 10,000 7,450
Lender Processing Services, Inc.
8.125% due 07/01/2016 5,000 4,925
SunGard Data Systems, Inc.
9.125% due 08/15/2013 13,000 12,513
64,388
The accompanying notes are an integral part of the financial statements.
147
JOHN HANCOCK FUNDS II
PORTFOLIO OF INVESTMENTS - May 31, 2009 (Unaudited) - continued(showing percentage of total net assets)
Investment Quality Bond Fund (continued)Shares or
Principal
Amount Value
CORPORATE BONDS (continued)
Cable & Television - 3.00%
Cablevision Systems Corp., Series B
8.00% due 04/15/2012 $ 8,000 $ 7,860
Comcast Corp.
5.70% due 05/15/2018 275,000 272,770
5.85% due 11/15/2015 600,000 602,629
COX Communications, Inc.
5.875% due 12/01/2016 (f) 350,000 334,512
7.125% due 10/01/2012 458,000 479,830
CSC Holdings, Inc.
7.625% due 07/15/2018 21,000 19,530
DirecTV Holdings LLC
6.375% due 06/15/2015 15,000 13,650
HSN, Inc.
11.25% due 08/01/2016 (f) 5,000 4,381
Mediacom Broadband LLC
8.50% due 10/15/2015 27,000 24,570
Mediacom LLC/Mediacom Capital Corp.
7.875% due 02/15/2011 5,000 4,875
Quebecor Media, Inc.
7.75% due 03/15/2016 15,000 13,312
7.75% due 03/15/2016 5,000 4,438
Rogers Cable, Inc.
6.25% due 06/15/2013 130,000 133,821
TCI Communications, Inc.
7.875% due 02/15/2026 150,000 146,778
8.75% due 08/01/2015 183,000 205,168
Time Warner Cable, Inc.
5.85% due 05/01/2017 815,000 804,967
6.55% due 05/01/2037 150,000 139,478
8.25% due 02/14/2014 140,000 155,863
Copyright © 2012 www.secdatabase.com. All Rights Reserved.Please Consider the Environment Before Printing This Document

Time Warner Companies, Inc.
7.25% due 10/15/2017 60,000 58,612
Time Warner, Inc.
6.75% due 04/15/2011 150,000 157,110
7.70% due 05/01/2032 602,000 551,883
Viacom, Inc.
6.125% due 10/05/2017 600,000 557,634
6.25% due 04/30/2016 252,000 240,877
6.625% due 05/15/2011 175,000 176,836
5,111,384
Cellular Communications - 0.93%
AT&T Wireless Services, Inc.
7.875% due 03/01/2011 94,000 102,173
8.125% due 05/01/2012 56,000 62,277
8.75% due 03/01/2031 397,000 462,473
Cingular Wireless LLC
7.125% due 12/15/2031 67,000 69,239
Cricket Communications, Inc.
9.375% due 11/01/2014 5,000 4,975
MetroPCS Wireless, Inc.
9.25% due 11/01/2014 (f) 10,000 10,000
Rogers Wireless, Inc.
9.625% due 05/01/2011 27,000 28,874
Verizon Wireless Capital LLC
5.55% due 02/01/2014 (f) 595,000 629,213
Vodafone Group PLC
7.75% due 02/15/2010 211,000 218,653
1,587,877
Investment Quality Bond Fund (continued)Shares or
Principal
Amount Value
CORPORATE BONDS (continued)
Chemicals - 0.37%
Agrium, Inc.
7.125% due 05/23/2036 $ 225,000 $ 190,753
Ashland, Inc.
9.125% due 06/01/2017 (f) 10,000 10,150
Cytec Industries, Inc.
4.60% due 07/01/2013 170,000 144,662
5.50% due 10/01/2010 105,000 104,394
6.00% due 10/01/2015 200,000 166,799
IMC Global, Inc.
7.30% due 01/15/2028 3,000 2,520
Momentive Performance Materials, Inc.
9.75% due 12/01/2014 10,000 3,800
Terra Capital, Inc., Series B
7.00% due 02/01/2017 5,000 4,675
627,753
Coal - 0.06%
Peabody Energy Corp.
6.875% due 03/15/2013 6,000 5,790
7.375% due 11/01/2016 100,000 95,250
101,040
Commercial Services - 0.01%
Aramark Services, Inc.
8.50% due 02/01/2015 15,000 14,306
Copyright © 2012 www.secdatabase.com. All Rights Reserved.Please Consider the Environment Before Printing This Document

Computers & Business Equipment - 0.19%
Seagate Technology HDD Holdings
6.375% due 10/01/2011 5,000 4,675
Seagate Technology International
10.00% due 05/01/2014 (f) 5,000 5,050
Unisys Corp.
6.875% due 03/15/2010 10,000 7,950
8.00% due 10/15/2012 5,000 2,362
Xerox Corp.
5.50% due 05/15/2012 170,000 167,130
6.40% due 03/15/2016 125,000 115,791
7.20% due 04/01/2016 15,000 13,845
316,803
Containers & Glass - 0.09%
Owens-Brockway Glass Container, Inc.
8.25% due 05/15/2013 16,000 16,000
Pactiv Corp.
5.875% due 07/15/2012 135,000 135,666
151,666
Correctional Facilities - 0.06%
Corrections Corp. of America
6.75% due 01/31/2014 100,000 96,000
Crude Petroleum & Natural Gas - 0.85%
Atmos Energy Corp.
6.35% due 06/15/2017 75,000 72,410
Burlington Resources Finance Company
7.40% due 12/01/2031 309,000 325,428
Canadian Natural Resources, Ltd.
5.15% due 02/01/2013 150,000 153,513
6.45% due 06/30/2033 37,000 32,030
Chesapeake Energy Corp.
6.50% due 08/15/2017 20,000 16,550
6.625% due 01/15/2016 97,000 83,177
The accompanying notes are an integral part of the financial statements.
148
JOHN HANCOCK FUNDS II
PORTFOLIO OF INVESTMENTS - May 31, 2009 (Unaudited) - continued(showing percentage of total net assets)
Investment Quality Bond Fund (continued)Shares or
Principal
Amount Value
CORPORATE BONDS (continued)
Crude Petroleum & Natural Gas
(continued)
Chesapeake Energy Corp. (continued)
7.50% due 09/15/2013 $ 3,000 $ 2,805
7.625% due 07/15/2013 10,000 9,350
EnCana Corp.
5.90% due 12/01/2017 450,000 449,493
Marathon Oil Corp.
6.50% due 02/15/2014 255,000 268,642
PetroHawk Energy Corp.
9.125% due 07/15/2013 15,000 14,737
Plains Exploration & Production Company
7.75% due 06/15/2015 10,000 9,325
Copyright © 2012 www.secdatabase.com. All Rights Reserved.Please Consider the Environment Before Printing This Document

SandRidge Energy, Inc.
8.00% due 06/01/2018 (f) 5,000 4,225
Southwestern Energy Company
7.50% due 02/01/2018 (f) 10,000 9,525
1,451,210
Domestic Oil - 0.19%
Motiva Enterprises LLC
5.20% due 09/15/2012 (f) 148,000 152,863
Range Resources Corp.
7.50% due 05/15/2016 10,000 9,600
Valero Energy Corp.
8.75% due 06/15/2030 162,000 158,794
321,257
Drugs & Health Care - 0.01%
Allegiance Corp.
7.00% due 10/15/2026 13,000 11,088
Rite Aid Corp.
10.375% due 07/15/2016 5,000 4,463
15,551
Electrical Utilities - 4.94%
Carolina Power & Light Company
6.50% due 07/15/2012 671,000 712,022
CenterPoint Energy, Inc.
6.50% due 05/01/2018 560,000 479,452
CMS Energy Corp.
8.50% due 04/15/2011 4,000 4,040
Commonwealth Edison Company
5.95% due 08/15/2016 125,000 125,589
6.15% due 03/15/2012 92,000 96,400
Dominion Resources, Inc.
6.40% due 06/15/2018 395,000 409,589
7.00% due 06/15/2038 150,000 152,205
Duke Energy Corp.
5.65% due 06/15/2013 600,000 608,000
Dynegy Holdings, Inc.
7.125% due 05/15/2018 15,000 9,600
Edison Mission Energy
7.75% due 06/15/2016 20,000 15,500
Electricite de France SA
6.50% due 01/26/2019 (f) 400,000 432,182
Enel Finance International SA
6.80% due 09/15/2037 (f) 555,000 507,640
Exelon Generation Company, LLC
6.95% due 06/15/2011 185,000 195,060
Investment Quality Bond Fund (continued)Shares or
Principal
Amount Value
CORPORATE BONDS (continued)
Electrical Utilities (continued)
Georgia Power Company
5.25% due 12/15/2015 $ 600,000 $ 614,404
Israel Electric Corp., Ltd.
7.25% due 01/15/2019 (f) 475,000 479,292
Midamerican Energy Holdings
6.125% due 04/01/2036 250,000 231,245
New York State Electric & Gas Corp.
5.75% due 05/01/2023 74,000 61,905
Copyright © 2012 www.secdatabase.com. All Rights Reserved.Please Consider the Environment Before Printing This Document

Northern States Power Company
6.25% due 06/01/2036 125,000 131,185
6.50% due 03/01/2028 67,000 71,657
NSTAR
8.00% due 02/15/2010 270,000 281,032
Ohio Edison Company
6.875% due 07/15/2036 150,000 133,936
Old Dominion Electric Cooperative
6.25% due 06/01/2011 141,000 146,933
Oncor Electric Delivery Company
7.50% due 09/01/2038 150,000 149,411
Potomac Electric Power Company
6.50% due 11/15/2037 250,000 252,195
PPL Electric Utilities Corp.
6.25% due 05/15/2039 80,000 80,299
PSEG Power LLC
8.625% due 04/15/2031 154,000 170,118
Puget Sound Energy, Inc.
7.00% due 03/09/2029 54,000 49,965
RRI Energy, Inc.
6.75% due 12/15/2014 10,000 9,550
Southern California Edison Company
6.00% due 01/15/2034 326,000 330,945
Taqa Abu Dhabi National Energy Company
6.50% due 10/27/2036 (f) 475,000 379,541
TXU Corp., Series P
5.55% due 11/15/2014 26,000 13,900
Union Electric Company
6.40% due 06/15/2017 850,000 851,717
Wisconsin Electric Power Company
6.50% due 06/01/2028 94,000 96,254
Wisconsin Energy Corp.
6.20% due 04/01/2033 138,000 124,070
8,406,833
Electronics - 0.11%
Avnet, Inc.
6.625% due 09/15/2016 200,000 163,526
L-3 Communications Corp., Series B
6.375% due 10/15/2015 10,000 9,100
Sanmina-SCI Corp.
4.07% due 06/15/2010 (b)(f) 9,000 8,595
181,221
Energy - 0.43%
Abu Dhabi National Energy Company
5.875% due 10/27/2016 (f) 110,000 103,076
Aquila, Inc.
7.95 due 02/01/2011 5,000 5,125
11.875% due 07/01/2012 20,000 21,425
Dynegy Holdings, Inc.
8.375% due 05/01/2016 10,000 8,050
The accompanying notes are an integral part of the financial statements.
149
JOHN HANCOCK FUNDS II
PORTFOLIO OF INVESTMENTS - May 31, 2009 (Unaudited) - continued(showing percentage of total net assets)
Investment Quality Bond Fund (continued)Shares or
Principal
Copyright © 2012 www.secdatabase.com. All Rights Reserved.Please Consider the Environment Before Printing This Document

Amount Value
CORPORATE BONDS (continued)
Energy (continued)
Midamerican Funding LLC
6.75% due 03/01/2011 $ 260,000 $ 275,628
Mirant North America LLC
7.375% due 12/31/2013 20,000 19,150
Nevada Power Company
6.50% due 08/01/2018 150,000 147,782
NRG Energy, Inc.
7.25% due 02/01/2014 25,000 23,938
7.375% due 01/15/2017 5,000 4,700
XTO Energy, Inc.
6.75% due 08/01/2037 120,000 119,088
727,962
Financial Services - 9.45%
AGFC Capital Trust I
6.00% due 01/15/2067 (b)(f) 170,000 35,921
American Express Company
7.25% due 05/20/2014 500,000 510,451
American General Finance Corp.
5.375% due 10/01/2012 154,000 84,834
Arch Western Finance LLC
6.75% due 07/01/2013 16,000 14,560
Associates Corp. of North America
8.55% due 07/15/2009 81,000 81,159
BAT International Finance PLC
9.50% due 11/15/2018 (f) 200,000 230,136
Bear Stearns Companies, Inc.
5.35% due 02/01/2012 80,000 82,899
6.40% due 10/02/2017 105,000 102,871
6.95% due 08/10/2012 345,000 373,053
Capital One Capital IV
6.745% due 02/17/2037 (b) 125,000 83,319
Capital One Financial Corp.
7.375% due 05/23/2014 60,000 61,821
Capmark Financial Group, Inc.
7.875% due 05/10/2012 95,000 27,919
CIT Group Funding Company of Canada
4.65% due 07/01/2010 10,000 8,901
CIT Group, Inc.
5.00% due 02/01/2015 91,000 60,333
5.65% due 02/13/2017 5,000 3,307
5.80% due 07/28/2011 10,000 7,814
7.625% due 11/30/2012 45,000 35,455
Citigroup Capital XXI
8.30% due 12/21/2057 (b) 5,000 4,452
Citigroup, Inc.
4.875% due 05/07/2015 286,000 238,841
5.50% due 08/27/2012 900,000 879,923
6.50% due 08/19/2013 420,000 416,209
6.875% due 03/05/2038 275,000 241,999
Countrywide Financial Corp.
4.50% due 06/15/2010 70,000 69,246
Discover Financial Services
6.45% due 06/12/2017 300,000 243,416
Equitable Companies, Inc.
7.00% due 04/01/2028 235,000 165,366
Erac USA Finance Company
8.00% due 01/15/2011 (f) 534,000 518,883
Investment Quality Bond Fund (continued)Shares or
Copyright © 2012 www.secdatabase.com. All Rights Reserved.Please Consider the Environment Before Printing This Document

Principal
Amount Value
CORPORATE BONDS (continued)
Financial Services (continued)
Farmers Exchange Capital
7.05% due 07/15/2028 (f) $ 350,000 $ 224,043
Ford Motor Credit Company LLC
7.00% due 10/01/2013 21,000 16,946
7.375% due 10/28/2009 5,000 4,877
7.875% due 06/15/2010 5,000 4,759
GATX Financial Corp.
5.50% due 02/15/2012 200,000 191,727
General Electric Capital Corp.
4.80% due 05/01/2013 475,000 469,278
6.125% due 02/22/2011 67,000 70,121
6.75% due 03/15/2032 934,000 834,652
GMAC LLC
7.75% due 01/19/2010 (f) 15,000 14,325
8.00% due 11/01/2031 (f) 18,000 13,500
Goldman Sachs Group, Inc.
5.45% due 11/01/2012 340,000 348,355
6.00% due 05/01/2014 60,000 61,004
6.15% due 04/01/2018 750,000 724,033
6.75% due 10/01/2037 905,000 758,684
6.875% due 01/15/2011 208,000 219,406
7.50% due 02/15/2019 235,000 247,279
International Lease Finance Corp.
5.625% due 09/15/2010 170,000 154,227
5.875% due 05/01/2013 250,000 194,360
6.375% due 03/25/2013 145,000 112,791
Janus Capital Group, Inc.
6.50% due 06/15/2012 100,000 82,463
JPMorgan Chase & Company
5.15% due 10/01/2015 200,000 192,905
5.375% due 10/01/2012 760,000 794,011
6.00% due 01/15/2018 555,000 552,378
JPMorgan Chase Capital XV
5.875% due 03/15/2035 567,000 450,531
Lazard Group LLC
6.85% due 06/15/2017 585,000 506,001
Merrill Lynch & Company, Inc.
6.40% due 08/28/2017 740,000 670,733
7.75% due 05/14/2038 135,000 119,210
Merrill Lynch & Company, Inc., MTN
6.875% due 04/25/2018 425,000 394,425
Mizuho Financial Group, Cayman, Ltd.
5.79% due 04/15/2014 (f) 246,000 254,622
Morgan Stanley
5.55% due 04/27/2017 225,000 205,991
6.25% due 08/28/2017 500,000 477,075
6.75% due 04/15/2011 106,000 110,392
Morgan Stanley, MTN
6.00% due 04/28/2015 350,000 341,830
6.625% due 04/01/2018 675,000 667,292
NiSource Finance Corp.
6.40% due 03/15/2018 200,000 175,783
Sun Canada Financial Company
7.25% due 12/15/2015 (f) 229,000 227,464
Sunamerica, Inc.
8.125% due 04/28/2023 135,000 36,114
The accompanying notes are an integral part of the financial statements.
150
Copyright © 2012 www.secdatabase.com. All Rights Reserved.Please Consider the Environment Before Printing This Document

JOHN HANCOCK FUNDS II
PORTFOLIO OF INVESTMENTS - May 31, 2009 (Unaudited) - continued(showing percentage of total net assets)
Investment Quality Bond Fund (continued)Shares or
Principal
Amount Value
CORPORATE BONDS (continued)
Financial Services (continued)
US Bancorp
7.50% due 06/01/2026 $ 750,000 $ 581,524
16,088,199
Food & Beverages - 1.90%
Anheuser-Busch InBev Worldwide, Inc.
6.875% due 11/15/2019 (f) 125,000 126,431
7.75% due 01/15/2019 (f) 400,000 430,259
Companhia de Bebidas das Americas
8.75% due 09/15/2013 365,000 419,750
ConAgra Foods, Inc.
5.819% due 06/15/2017 74,000 73,526
6.75% due 09/15/2011 5,000 5,363
Dr. Pepper Snapple Group, Inc.
6.82% due 05/01/2018 100,000 100,654
General Mills, Inc.
5.20% due 03/17/2015 190,000 197,547
5.65% due 02/15/2019 105,000 107,428
Kellogg Company
4.45% due 05/30/2016 400,000 396,641
Kraft Foods, Inc.
6.125% due 02/01/2018 150,000 153,064
6.50% due 11/01/2031 266,000 255,685
6.875% due 02/01/2038 250,000 252,953
PepsiCo, Inc.
7.90% due 11/01/2018 235,000 281,375
SABMiller PLC
6.20% due 07/01/2011 (f) 300,000 308,442
Smithfield Foods, Inc., Series B
7.75% due 05/15/2013 10,000 7,550
Tyson Foods, Inc.
7.85% due 04/01/2016 125,000 117,663
10.50% due 03/01/2014 (f) 5,000 5,300
3,239,631
Forest Products - 0.20%
Weyerhaeuser Company
6.75% due 03/15/2012 308,000 306,436
7.95% due 03/15/2025 40,000 31,903
338,339
Funeral Services - 0.01%
Service Corp. International
7.625% due 10/01/2018 10,000 9,250
Gas & Pipeline Utilities - 1.13%
CenterPoint Energy Resources Corp.
6.125% due 11/01/2017 125,000 112,485
El Paso Corp.
7.00% due 06/15/2017 10,000 9,366
El Paso Natural Gas Company
5.95% due 04/15/2017 25,000 23,192
Copyright © 2012 www.secdatabase.com. All Rights Reserved.Please Consider the Environment Before Printing This Document

Kinder Morgan Energy Partners LP
6.85% due 02/15/2020 530,000 527,275
7.125% due 03/15/2012 208,000 218,484
Kinder Morgan Finance Company
5.70% due 01/05/2016 20,000 17,100
NGPL PipeCo LLC
6.514% due 12/15/2012 (f) 675,000 674,684
Investment Quality Bond Fund (continued)Shares or
Principal
Amount Value
CORPORATE BONDS (continued)
Gas & Pipeline Utilities (continued)
TransCanada Pipelines, Ltd.
7.625% due 01/15/2039 $ 310,000 $ 340,603
1,923,189
Healthcare Products - 0.30%
Biomet, Inc.
10.00% due 10/15/2017 5,000 5,113
Inverness Medical Innovations, Inc.
9.00% due 05/15/2016 10,000 9,600
Roche Holdings, Inc.
6.00% due 03/01/2019 475,000 491,952
Universal Hospital Services, Inc., PIK
8.50% due 06/01/2015 10,000 9,600
516,265
Healthcare Services - 0.15%
DaVita, Inc.
6.625% due 03/15/2013 2,000 1,875
7.25% due 03/15/2015 2,000 1,880
McKesson Corp.
7.50% due 02/15/2019 30,000 33,106
WellPoint, Inc.
7.00% due 02/15/2019 220,000 225,247
262,108
Homebuilders - 0.25%
Centex Corp.
7.875% due 02/01/2011 59,000 59,295
D.R. Horton, Inc.
7.875% due 08/15/2011 250,000 248,750
Pulte Homes, Inc.
8.125% due 03/01/2011 125,000 125,625
433,670
Hotels & Restaurants - 0.03%
Buffalo Thunder Development Authority
9.375% due 12/15/2014 (f) 20,000 2,800
Wyndham Worldwide Corp.
6.00% due 12/01/2016 60,000 44,966
47,766
Household Products - 0.19%
Procter & Gamble, Series A
9.36% due 01/01/2021 268,719 320,829
Industrials - 0.01%
Airgas, Inc.
Copyright © 2012 www.secdatabase.com. All Rights Reserved.Please Consider the Environment Before Printing This Document

7.125% due 10/01/2018 (f) 10,000 9,325
Insurance - 2.64%
ACE Capital Trust II
9.70% due 04/01/2030 248,000 215,454
ACE INA Holdings, Inc.
5.70% due 02/15/2017 100,000 96,550
5.875% due 06/15/2014 125,000 128,259
Aflac, Inc.
8.50% due 05/15/2019 65,000 67,315
AIG SunAmerica Global Financing X
6.90% due 03/15/2032 (f) 100,000 47,634
Allied World Assurance Holdings, Ltd.
7.50% due 08/01/2016 145,000 113,165
The accompanying notes are an integral part of the financial statements.
151
JOHN HANCOCK FUNDS II
PORTFOLIO OF INVESTMENTS - May 31, 2009 (Unaudited) - continued(showing percentage of total net assets)
Investment Quality Bond Fund (continued)Shares or
Principal
Amount Value
CORPORATE BONDS (continued)
Insurance (continued)
AXA Equitable Life Insurance
7.70% due 12/01/2015 (f) $ 250,000 $ 234,076
Everest Reinsurance Holdings, Inc.
6.60% due 05/15/2037 (b) 495,000 252,450
8.75% due 03/15/2010 294,000 298,795
Fidelity National Title Group, Inc.
7.30% due 08/15/2011 26,000 25,884
Jackson National Life Insurance Company
8.15% due 03/15/2027 (f) 377,000 313,201
Liberty Mutual Insurance Company
7.697% due 10/15/2097 (f) 925,000 544,107
Metlife, Inc.
5.375% due 12/15/2012 150,000 150,704
Metropolitan Life Global Funding I
5.125% due 04/10/2013 (f) 335,000 330,706
Nationwide Mutual Insurance Company
8.25% due 12/01/2031 (f) 260,000 176,120
Navigators Group, Inc.
7.00% due 05/01/2016 59,000 38,531
Ohio National Life Insurance Company
8.50% due 05/15/2026 (f) 155,000 130,864
Principal Life Global Funding I
5.125% due 10/15/2013 (f) 225,000 214,007
6.125% due 10/15/2033 (f) 108,000 78,098
Prudential Financial, Inc., MTN
5.15% due 01/15/2013 355,000 333,877
Reinsurance Group of America, Inc.
6.75% due 12/15/2011 135,000 132,564
Unitrin, Inc.
6.00% due 05/15/2017 350,000 207,888
UnumProvident Finance Company, PLC
6.85% due 11/15/2015 (f) 125,000 95,863
W.R. Berkley Corp.
5.125% due 09/30/2010 54,000 51,123
5.60% due 05/15/2015 263,000 222,701
Copyright © 2012 www.secdatabase.com. All Rights Reserved.Please Consider the Environment Before Printing This Document

4,499,936
International Oil - 0.25%
ConocoPhillips
4.60% due 01/15/2015 330,000 337,197
Newfield Exploration Company
6.625% due 04/15/2016 10,000 9,050
Pioneer Natural Resources Company
6.65% due 03/15/2017 85,000 74,550
6.875% due 05/01/2018 15,000 13,101
433,898
Leisure Time - 0.03%
AMC Entertainment, Inc.
8.75% due 06/01/2019 (f) 10,000 9,712
11.00% due 02/01/2016 15,000 15,075
OED Corp./ Diamond Jo
8.75% due 04/15/2012 5,000 4,363
Scientific Games International, Inc., Series 144A
9.25% due 06/15/2019 5,000 4,863
Seneca Gaming Corp.
7.25% due 05/01/2012 10,000 8,100
Wynn Las Vegas LLC
6.625% due 12/01/2014 4,000 3,425
Investment Quality Bond Fund (continued)Shares or
Principal
Amount Value
CORPORATE BONDS (continued)
Leisure Time (continued)
Wynn Las Vegas LLC (continued)
6.625% due 12/01/2014 $ 5,000 $ 4,256
49,794
Liquor - 0.30%
Constellation Brands, Inc.
7.25% due 09/01/2016 10,000 9,325
Miller Brewing Company
5.50% due 08/15/2013 (f) 390,000 388,523
Molson Coors Capital Financial
4.85% due 09/22/2010 117,000 119,179
517,027
Manufacturing - 0.49%
General Electric Company
5.25% due 12/06/2017 735,000 728,011
Sally Holdings LLC
9.25% due 11/15/2014 5,000 5,038
SPX Corp.
7.625% due 12/15/2014 10,000 9,700
Tyco International Group SA
6.75% due 02/15/2011 85,000 88,651
831,400
Medical-Hospitals - 0.47%
Community Health Systems, Inc.
8.875% due 07/15/2015 10,000 9,887
HCA, Inc.
6.375% due 01/15/2015 20,000 15,450
7.875% due 02/01/2011 20,000 19,500
Copyright © 2012 www.secdatabase.com. All Rights Reserved.Please Consider the Environment Before Printing This Document

HCA, Inc., PIK
9.625% due 11/15/2016 21,000 20,107
Quest Diagnostics, Inc.
5.45% due 11/01/2015 275,000 253,219
6.95% due 07/01/2037 390,000 355,292
7.50% due 07/12/2011 100,000 104,342
Tenet Healthcare Corp.
9.875% due 07/01/2014 20,000 20,000
797,797
Metal & Metal Products - 0.12%
Inco, Ltd.
5.70% due 10/15/2015 233,000 213,301
Mining - 0.12%
Corporacion Nacional Del Cobre de Chile -
CODELCO
6.375% due 11/30/2012 (f) 165,000 177,218
Freeport-McMoRan Copper & Gold, Inc.
8.25% due 04/01/2015 5,000 5,000
8.375% due 04/01/2017 25,000 24,813
207,031
Office Furnishings & Supplies - 0.00%
ACCO Brands Corp.
7.625% due 08/15/2015 15,000 6,675
Paper - 0.35%
International Paper Company
7.40% due 06/15/2014 505,000 497,415
The accompanying notes are an integral part of the financial statements.
152
JOHN HANCOCK FUNDS II
PORTFOLIO OF INVESTMENTS - May 31, 2009 (Unaudited) - continued(showing percentage of total net assets)
Investment Quality Bond Fund (continued)Shares or
Principal
Amount Value
CORPORATE BONDS (continued)
Paper (continued)
Temple-Inland, Inc.
6.875% due 01/15/2018 $ 125,000 $ 107,148
604,563
Petroleum Services - 0.16%
Halliburton Company
5.50% due 10/15/2010 192,000 201,148
Petroleum Export, Ltd.
5.265% due 06/15/2011 (f) 67,491 61,535
Pride International, Inc.
7.375% due 07/15/2014 5,000 4,981
267,664
Pharmaceuticals - 0.96%
AmerisourceBergen Corp.
5.875% due 09/15/2015 670,000 643,374
Elan Finance PLC
Copyright © 2012 www.secdatabase.com. All Rights Reserved.Please Consider the Environment Before Printing This Document

7.75% due 11/15/2011 40,000 36,000
Medco Health Solutions, Inc.
7.125% due 03/15/2018 135,000 134,588
Novartis Securities Investment, Ltd.
5.125% due 02/10/2019 320,000 324,317
Omnicare, Inc.
6.75% due 12/15/2013 5,000 4,537
6.875% due 12/15/2015 5,000 4,500
Pfizer, Inc.
6.20% due 03/15/2019 450,000 481,639
1,628,955
Publishing - 0.02%
Scholastic Corp.
5.00% due 04/15/2013 35,000 28,350
Railroads & Equipment - 0.00%
American Railcar Industries, Inc.
7.50% due 03/01/2014 5,000 4,325
Real Estate - 2.66%
AMB Property LP
7.50% due 06/30/2018 106,000 75,540
AvalonBay Communities, Inc.
5.50% due 01/15/2012 150,000 148,546
Brandywine Operating Partnership
5.70% due 05/01/2017 335,000 219,855
Developers Diversified Realty Corp.
4.625% due 08/01/2010 55,000 48,787
5.00% due 05/03/2010 25,000 22,492
Duke Realty Corp. LP
5.25% due 01/15/2010 275,000 273,062
Equity One, Inc.
6.00% due 09/15/2017 235,000 174,275
Federal Realty Investment Trust, REIT
5.65% due 06/01/2016 55,000 45,252
Health Care Property, Inc.
5.65% due 12/15/2013 200,000 178,762
5.95% due 09/15/2011 150,000 145,042
7.072 due 06/08/2015 67,000 58,847
Health Care Property, Inc., REIT
6.00% due 03/01/2015 175,000 154,905
Healthcare Realty Trust, Inc.
8.125% due 05/01/2011 377,000 370,523
Investment Quality Bond Fund (continued)Shares or
Principal
Amount Value
CORPORATE BONDS (continued)
Real Estate (continued)
Host Marriott LP
7.125% due 11/01/2013 $ 10,000 $ 9,300
Kimco Realty Corp.
5.584% due 11/23/2015 125,000 104,913
Liberty Property LP
6.625% due 10/01/2017 100,000 79,965
7.25% due 03/15/2011 195,000 191,562
Realty Income Corp.
6.75% due 08/15/2019 550,000 477,007
Regency Centers LP
7.95% due 01/15/2011 319,000 313,557
Simon Property Group LP
6.10% due 05/01/2016 150,000 139,488
Simon Property Group LP, REIT
5.30% due 05/30/2013 450,000 433,718
Copyright © 2012 www.secdatabase.com. All Rights Reserved.Please Consider the Environment Before Printing This Document

United Dominion Realty Trust, Inc.
6.05% due 06/01/2013 200,000 168,547
Ventas Realty LP, Series 1
6.50% due 06/01/2016 5,000 4,550
Ventas Realty LP/Ventas Capital Corp.
6.625% due 10/15/2014 95,000 89,062
7.125% due 06/01/2015 3,000 2,842
WEA Finance LLC
7.125% due 04/15/2018 (f) 250,000 234,352
7.50% due 06/02/2014 (f) 130,000 128,525
Westfield Group
5.40% due 10/01/2012 (f) 250,000 239,863
4,533,139
Retail - 0.26%
Staples, Inc.
9.75% due 01/15/2014 395,000 435,538
Retail Grocery - 0.12%
Kroger Company
6.75% due 04/15/2012 179,000 194,229
SUPERVALU, Inc.
8.00% due 05/01/2016 10,000 9,800
204,029
Retail Trade - 0.52%
CVS Caremark Corp.
6.943% due 01/10/2030 (f) 48,670 42,454
CVS Lease Pass Through Certificate
5.88% due 01/10/2028 (f) 335,442 273,795
Dollar General Corp., PIK
11.875% due 07/15/2017 5,000 5,275
Federated Department Stores, Inc.
6.90% due 04/01/2029 156,000 112,725
Macys Retail Holdings, Inc.
5.875% due 01/15/2013 494,000 445,684
879,933
Sanitary Services - 0.07%
Waste Management, Inc.
6.375% due 03/11/2015 125,000 126,159
Software - 0.16%
Fiserv, Inc.
6.125% due 11/20/2012 200,000 204,313
The accompanying notes are an integral part of the financial statements.
153
JOHN HANCOCK FUNDS II
PORTFOLIO OF INVESTMENTS - May 31, 2009 (Unaudited) - continued(showing percentage of total net assets)
Investment Quality Bond Fund (continued)Shares or
Principal
Amount Value
CORPORATE BONDS (continued)
Software (continued)
Intuit, Inc.
5.40% due 03/15/2012 $ 75,000 $ 76,011
Copyright © 2012 www.secdatabase.com. All Rights Reserved.Please Consider the Environment Before Printing This Document

280,324
Steel - 0.33%
ArcelorMittal
5.375% due 06/01/2013 150,000 138,306
6.125% due 06/01/2018 500,000 424,770
563,076
Telecommunications Equipment &
Services - 0.62%
Bellsouth Corp.
4.75% due 11/15/2012 302,000 314,113
Citizens Communications Company
9.25% due 05/15/2011 12,000 12,435
GCI, Inc.
7.25% due 02/15/2014 15,000 13,594
Intelsat Subsidiary Holding Company, Ltd.
8.875% due 01/15/2015 (f) 25,000 24,500
SBC Communications, Inc.
5.625% due 06/15/2016 360,000 366,426
5.875% due 08/15/2012 150,000 160,087
Telefonica Europe BV
7.75% due 09/15/2010 150,000 159,123
1,050,278
Telephone - 2.70%
Ameritech Capital Funding Corp.
6.45% due 01/15/2018 148,000 140,944
AT&T, Inc.
5.50% due 02/01/2018 180,000 181,008
6.30% due 01/15/2038 675,000 634,075
British Telecommunications PLC
5.15% due 01/15/2013 350,000 344,795
8.625% due 12/15/2010 156,000 165,559
Qwest Corp.
7.50% due 10/01/2014 25,000 23,875
8.375% due 05/01/2016 (f) 135,000 132,638
Sprint Capital Corp.
8.375% due 03/15/2012 10,000 9,850
Sprint Nextel Corp.
6.00% due 12/01/2016 5,000 4,062
Telecom Italia Capital SA
5.25% due 11/15/2013 325,000 315,863
6.00% due 09/30/2034 146,000 114,071
6.20% due 07/18/2011 675,000 696,818
Telefonica Emisones SAU
7.045% due 06/20/2036 275,000 298,331
Verizon Communications, Inc.
5.55% due 02/15/2016 570,000 585,430
6.40% due 02/15/2038 365,000 351,886
6.90% due 04/15/2038 275,000 279,757
8.75% due 11/01/2021 285,000 316,672
4,595,634
Tobacco - 1.03%
Alliance One International, Inc.
11.00% due 05/15/2012 12,000 12,090
Investment Quality Bond Fund (continued)Shares or
Principal
Amount Value
Copyright © 2012 www.secdatabase.com. All Rights Reserved.Please Consider the Environment Before Printing This Document

CORPORATE BONDS (continued)
Tobacco (continued)
Altria Group, Inc.
9.25% due 08/06/2019 $ 125,000 $ 138,286
9.70% due 11/10/2018 395,000 449,542
10.20% due 02/06/2039 200,000 228,591
Philip Morris International, Inc.
5.65% due 05/16/2018 800,000 818,586
Reynolds American, Inc.
7.25% due 06/01/2013 95,000 95,162
7.30% due 07/15/2015 6,000 5,582
1,747,839
Utility Service - 0.07%
PacifiCorp
6.35% due 07/15/2038 110,000 116,329
TOTAL CORPORATE BONDS (Cost $81,714,316) $ 75,905,761
MUNICIPAL BONDS - 0.66%
Florida - 0.09%
Miami Beach Florida Redevelopment Agency Tax
Increment Revenue
8.95% due 12/01/2022 135,000 155,924
Illinois - 0.24%
Illinois State Toll Highway Authority
6.184% due 01/01/2034 415,000 404,048
Indiana - 0.01%
Indiana Bond Bank Revenue
5.02% due 01/15/2016 15,000 15,288
Maryland - 0.02%
Maryland State Transportation Authority, Ltd.
5.84% due 07/01/2011 40,000 42,517
New Jersey - 0.26%
Jersey City Municipal Utilities Authority
4.55% due 05/15/2012 20,000 18,981
New Jersey State Turnpike Authority
7.414% due 01/01/2040 380,000 420,402
439,383
New York - 0.04%
Sales Tax Asset Receivable Corp., Series B
4.25% due 10/15/2011 65,000 67,075
TOTAL MUNICIPAL BONDS (Cost $1,102,554) $ 1,124,235
COLLATERALIZED MORTGAGE
OBLIGATIONS - 8.38%
American Tower Trust, Series 2007-1A, Class AFX
5.4197% due 04/15/2037 (f) 300,000 267,000
Banc of America Commercial Mortgage, Inc, Series
2006-2, Class A4
5.9287% due 05/10/2045 (b) 1,000,000 844,216
Banc of America Commercial Mortgage, Inc.,
Series 2002-PB2 Class A4
6.186% due 06/11/2035 405,797 416,874
Bear Stearns Commercial Mortgage Securities,
Inc., Series 2003-T12, Class A4
4.68% due 08/13/2039 (b) 405,797 381,928
The accompanying notes are an integral part of the financial statements.
154
JOHN HANCOCK FUNDS II
PORTFOLIO OF INVESTMENTS - May 31, 2009 (Unaudited) - continued (showing percentage of total net assets)
Copyright © 2012 www.secdatabase.com. All Rights Reserved.Please Consider the Environment Before Printing This Document

Investment Quality Bond Fund (continued)Shares or
Principal
Amount Value
COLLATERALIZED MORTGAGE
OBLIGATIONS (continued)
Bear Stearns Commercial Mortgage Securities,
Series 2005-PWR9, Class A4A
4.871% due 09/11/2042 $ 560,000 $ 483,834
Bear Stearns Commercial Mortgage Securities,
Inc., Series 2005-T20, Class A4A
5.1504% due 10/12/2042 (b) 575,000 503,510
Bear Stearns Commercial Mortgage Securities,
Series 2007-PW17, Class A4
5.694% due 06/11/2050 450,000 363,532
Bear Stearns Commercial Mortgage Securities,
Series 2007-T28, Class A4
5.742% due 09/11/2042 145,000 117,663
Citigroup/Deutsche Bank Commercial Mortgage
Trust, Series 2007-CD4, Class A4
5.322% due 12/11/2049 750,000 575,869
Citigroup/Deutsche Bank Commercial
Mortgage Trust, Series 2005-CD1, Class A4
5.2251% due 09/15/2020 (b) 500,000 441,437
Commercial Mortgage Asset Trust, Series
1999-C1, Class A3
6.64% due 01/17/2032 114,629 114,948
Commercial Mortgage Pass Through Certificates,
Series 2005-C6, Class A5A
5.116% due 06/10/2044 (b) 500,000 436,290
Commercial Mortgage Pass Through Certificates,
Series 2006-C7, Class A4
5.9609% due 06/10/2046 (b) 500,000 416,314
Credit Suisse Mortgage Capital Certificates, Series
2006-C1, Class A4
5.551% due 02/15/2039 (b) 1,000,000 829,232
Credit Suisse Mortgage Capital Certificates,
Series 2006-C4, Class A3
5.467% due 09/15/2039 1,000,000 743,772
Crown Castle Towers LLC, Series 2005-1A, Class B
4.878% due 06/15/2035 (f) 375,000 363,750
CS First Boston Mortgage Securities Corp, Series
2003-C3, Class A5
3.936% due 05/15/2038 500,000 460,799
General Electric Capital Assurance Company,
Series 2003-1, Class A5
5.7426% due 05/12/2035 (b)(f) 89,275 76,822
Government National Mortgage Association, Series
2006-38, Class XS
6.915% IO due 09/16/2035 (b) 66,038 5,996
GS Mortgage Securities Corp. II, Series 2006-GG6,
Class A4
5.553% due 04/10/2038 (b) 1,000,000 831,583
JPMorgan Chase Commercial Mortgage Securities
Corp, Series 2004-CBX, Class A6
4.899% due 01/12/2037 315,000 272,269
JPMorgan Chase Commercial Mortgage Securities
Corp., Series 2006-LDP7, Class A4
6.0653% due 04/15/2045 (b) 1,645,000 1,373,376
JPMorgan Chase Commercial Mortgage
Securities Corp., Series 2005-LDP4, Class A4
4.918% due 10/15/2042 (b) 940,000 813,413
LB-UBS Commercial Mortgage Trust,
Series 2001-C7, Class A3
5.642% due 12/15/2025 67,675 67,855
Copyright © 2012 www.secdatabase.com. All Rights Reserved.Please Consider the Environment Before Printing This Document

Investment Quality Bond Fund (continued)Shares or
Principal
Amount Value
COLLATERALIZED MORTGAGE
OBLIGATIONS (continued)
LB-UBS Commercial Mortgage Trust,
Series 2006-C4, Class A4
5.8823% due 06/15/2038 (b) $ 500,000 $ 420,455
Merrill Lynch Mortgage Trust, Series 2005-CIP1,
Class A4
5.047% due 07/12/2038 (b) 500,000 437,671
Merrill Lynch Mortgage Trust, Series 2006-C1,
Class A4
5.8399% due 05/12/2039 (b) 500,000 429,510
Morgan Stanley Capital I, Series 2007-HQ11,
Class A4
5.447% due 02/12/2044 (b) 1,000,000 713,138
Morgan Stanley Capital I, Series 2008-T29, Class A4
6.4579% due 01/11/2043 (b) 140,000 120,703
Morgan Stanley Dean Witter Capital I,
Series 2001, Class A4
6.39% due 06/15/2011 106,588 106,774
Morgan Stanley Dean Witter
Capital I, Series 2002-TOP7, Class A2
5.98% due 01/15/2039 40,579 40,323
Nomura Asset Securities Corp.,
Series 1998-D6, Class A1B
6.59% due 03/15/2030 5,449 5,454
Prudential Commercial Mortgage Trust, Series
2003-PWR1, Class A1
3.669% due 02/11/2036 141,971 139,628
Prudential Commercial Mortgage Trust,
Series 2003-PWR1, Class A2
4.493% due 02/11/2036 405,797 378,580
Wachovia Bank Commercial Mortgage Trust,
Series 2005-C20, Class A7
5.118% due 07/15/2042 (b) 310,000 265,789
TOTAL COLLATERALIZED MORTGAGE OBLIGATIONS
(Cost $16,493,980) $ 14,260,307
ASSET BACKED SECURITIES - 1.57%
AmeriCredit Automobile Receivables Trust,
Series 2005-AX, Class A4
3.93% due 10/06/2011 269,581 259,164
Chase Issuance Trust, Series 2008-A4, Class A4
4.65% due 03/15/2015 345,000 357,034
Dominos Pizza Master Issuer LLC,
Series 2007-1, Class A2
5.261% due 04/25/2037 (f) 300,000 190,774
Harley-Davidson Motorcycle Trust,
Series 2005-1, Class A2
3.76% due 12/17/2012 149,230 146,299
M&I Auto Loan Trust, Series 2005-1, Class A4
4.86% due 03/21/2011 244,664 244,931
Massachusetts RRB Special Purpose Trust,
Series 1999-1, Class A5
7.03% due 03/15/2012 239,477 247,034
Massachusetts RRB Special Purpose Trust,
Series 2001-1, Class A
6.53% due 06/01/2013 60,647 65,728
USAA Auto Owner Trust, Series 2005-4, Class A4
4.89% due 08/15/2012 446,788 454,027
Copyright © 2012 www.secdatabase.com. All Rights Reserved.Please Consider the Environment Before Printing This Document

The accompanying notes are an integral part of the financial statements.
155
JOHN HANCOCK FUNDS II
PORTFOLIO OF INVESTMENTS - May 31, 2009 (Unaudited) - continued (showing percentage of total net assets)
Investment Quality Bond Fund (continued)Shares or
Principal
Amount Value
ASSET BACKED SECURITIES
(continued)
Wachovia Auto Owner Trust,
Series 2005-B, Class A5
4.93% due 11/20/2012 $ 700,000 $ 711,340
TOTAL ASSET BACKED SECURITIES
(Cost $2,770,537) $ 2,676,331
PREFERRED STOCKS - 0.01%
Financial Services - 0.01%
Citigroup Capital IX, 6.00% 500 6,775
Wells Fargo & Company, Series K (i) 10,000 7,800
14,575
TOTAL PREFERRED STOCKS (Cost $13,870) $ 14,575
REPURCHASE AGREEMENTS - 9.05%
Bank of New York Tri-Party
Repurchase Agreement dated
05/29/2009 at 0.18% to be
repurchased at $15,400,231 on
06/01/2009, collateralized by
$22,236,296 Federal Home Loan
Mortgage Corp., 7.00% due
05/01/2038 (valued at
$15,708,000, including interest) $ 15,400,000 $ 15,400,000
TOTAL REPURCHASE AGREEMENTS
(Cost $15,400,000) $ 15,400,000
Total Investments (Investment Quality Bond Fund)
(Cost $174,434,874) - 99.45% $ 169,255,325
Other assets and liabilities, net - 0.55% 928,587
TOTAL NET ASSETS - 100.00% $ 170,183,912
Large Cap FundShares or
Principal
Amount Value
COMMON STOCKS - 94.90%
Advertising - 1.96%
Interpublic Group of Companies, Inc. * 302,600 $ 1,585,624
Omnicom Group, Inc. 68,650 2,093,825
3,679,449
Aerospace - 1.57%
General Dynamics Corp. 51,900 2,953,110
Agriculture - 0.83%
Copyright © 2012 www.secdatabase.com. All Rights Reserved.Please Consider the Environment Before Printing This Document

Monsanto Company 18,900 1,552,635
Aluminum - 0.07%
Alcoa, Inc. 13,200 121,704
Apparel & Textiles - 0.65%
Coach, Inc. * 46,700 1,226,809
Auto Parts - 2.34%
BorgWarner, Inc. 56,338 1,816,901
Johnson Controls, Inc. 129,181 2,574,577
4,391,478
Large Cap Fund (continued)Shares or
Principal
Amount Value
COMMON STOCKS (continued)
Automobiles - 1.60%
PACCAR, Inc. 100,400 $ 2,996,940
Banking - 1.92%
Bank of New York Mellon Corp. 98,468 2,735,441
City National Corp. (a) 24,000 877,680
3,613,121
Biotechnology - 3.25%
Amgen, Inc. * 45,900 2,292,246
Genzyme Corp. * 44,902 2,655,504
Millipore Corp. * 18,500 1,163,465
6,111,215
Cable & Television - 3.29%
Comcast Corp., Class A 304,000 4,186,080
Viacom, Inc., Class B * 89,800 1,990,866
6,176,946
Chemicals - 0.65%
Celanese Corp., Series A 59,700 1,224,447
Coal - 1.66%
Peabody Energy Corp. 92,000 3,126,160
Computers & Business Equipment - 3.79%
Apple, Inc. * 40,800 5,541,048
Seagate Technology 182,300 1,587,833
7,128,881
Cosmetics & Toiletries - 1.57%
Avon Products, Inc. 55,600 1,476,736
Estee Lauder Companies, Inc., Class A 44,500 1,472,060
2,948,796
Crude Petroleum & Natural Gas - 5.33%
EOG Resources, Inc. 19,100 1,397,929
Hess Corp. 46,200 3,076,458
Marathon Oil Corp. 80,400 2,563,152
Ultra Petroleum Corp. * 65,800 2,979,424
10,016,963
Electrical Utilities - 3.73%
American Electric Power Company, Inc. 75,043 1,976,633
Dynegy, Inc., Class A * 154,200 309,942
Exelon Corp. 86,013 4,129,484
Pepco Holdings, Inc. 44,981 583,853
6,999,912
Energy - 1.11%
Sempra Energy 45,714 2,088,216
Financial Services - 6.74%
Copyright © 2012 www.secdatabase.com. All Rights Reserved.Please Consider the Environment Before Printing This Document

Discover Financial Services 246,456 2,356,119
JPMorgan Chase & Company 102,300 3,774,870
Morgan Stanley 127,613 3,869,226
Wells Fargo & Company 104,378 2,661,639
12,661,854
Food & Beverages - 2.76%
PepsiCo, Inc. 74,000 3,851,700
Sysco Corp. 55,600 1,332,176
5,183,876
The accompanying notes are an integral part of the financial statements.
156
JOHN HANCOCK FUNDS II
PORTFOLIO OF INVESTMENTS - May 31, 2009 (Unaudited) - continued(showing percentage of total net assets)
Large Cap Fund (continued)Shares or
Principal
Amount Value
COMMON STOCKS (continued)
Gas & Pipeline Utilities - 1.41%
Williams Companies, Inc. 157,600 $ 2,644,528
Healthcare Products - 4.42%
Covidien, Ltd. 123,800 4,422,136
Medtronic, Inc. 80,734 2,773,213
Zimmer Holdings, Inc. * 25,000 1,113,750
8,309,099
Healthcare Services - 2.23%
DaVita, Inc. * 13,200 595,452
Medco Health Solutions, Inc. * 40,100 1,840,189
UnitedHealth Group, Inc. 65,900 1,752,940
4,188,581
Household Products - 1.43%
Fortune Brands, Inc. 76,600 2,681,766
Industrial Machinery - 0.86%
Pall Corp. 63,100 1,620,408
Industrials - 2.83%
General Electric Company 394,800 5,321,904
Insurance - 3.58%
ACE, Ltd. 54,700 2,406,253
AFLAC, Inc. 36,600 1,299,300
MetLife, Inc. 34,900 1,099,350
Principal Financial Group, Inc. 86,600 1,922,520
6,727,423
International Oil - 3.11%
Anadarko Petroleum Corp. 53,600 2,561,008
Chevron Corp. 49,200 3,280,164
5,841,172
Leisure Time - 1.29%
Carnival Corp. 95,199 2,421,863
Life Sciences - 0.18%
Waters Corp. * 7,900 342,228
Manufacturing - 1.87%
Illinois Tool Works, Inc. 109,048 3,521,160
Petroleum Services - 3.40%
Copyright © 2012 www.secdatabase.com. All Rights Reserved.Please Consider the Environment Before Printing This Document
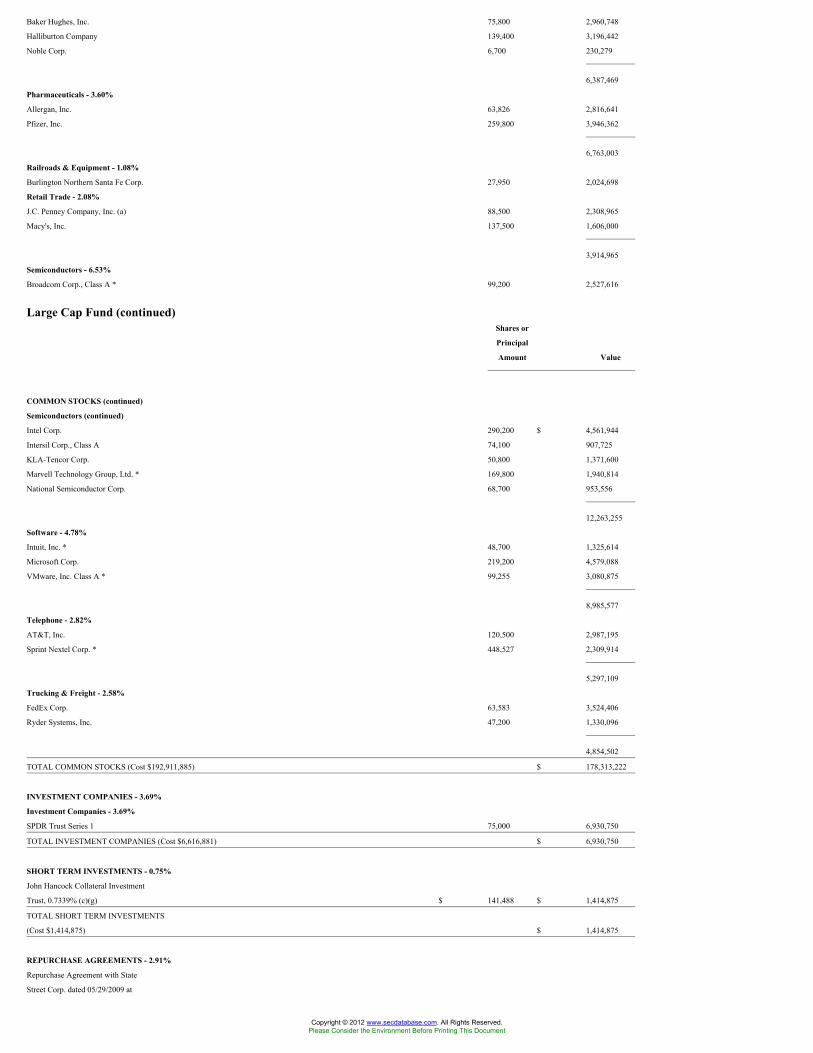
Baker Hughes, Inc. 75,800 2,960,748
Halliburton Company 139,400 3,196,442
Noble Corp. 6,700 230,279
6,387,469
Pharmaceuticals - 3.60%
Allergan, Inc. 63,826 2,816,641
Pfizer, Inc. 259,800 3,946,362
6,763,003
Railroads & Equipment - 1.08%
Burlington Northern Santa Fe Corp. 27,950 2,024,698
Retail Trade - 2.08%
J.C. Penney Company, Inc. (a) 88,500 2,308,965
Macy's, Inc. 137,500 1,606,000
3,914,965
Semiconductors - 6.53%
Broadcom Corp., Class A * 99,200 2,527,616
Large Cap Fund (continued)Shares or
Principal
Amount Value
COMMON STOCKS (continued)
Semiconductors (continued)
Intel Corp. 290,200 $ 4,561,944
Intersil Corp., Class A 74,100 907,725
KLA-Tencor Corp. 50,800 1,371,600
Marvell Technology Group, Ltd. * 169,800 1,940,814
National Semiconductor Corp. 68,700 953,556
12,263,255
Software - 4.78%
Intuit, Inc. * 48,700 1,325,614
Microsoft Corp. 219,200 4,579,088
VMware, Inc. Class A * 99,255 3,080,875
8,985,577
Telephone - 2.82%
AT&T, Inc. 120,500 2,987,195
Sprint Nextel Corp. * 448,527 2,309,914
5,297,109
Trucking & Freight - 2.58%
FedEx Corp. 63,583 3,524,406
Ryder Systems, Inc. 47,200 1,330,096
4,854,502
TOTAL COMMON STOCKS (Cost $192,911,885) $ 178,313,222
INVESTMENT COMPANIES - 3.69%
Investment Companies - 3.69%
SPDR Trust Series 1 75,000 6,930,750
TOTAL INVESTMENT COMPANIES (Cost $6,616,881) $ 6,930,750
SHORT TERM INVESTMENTS - 0.75%
John Hancock Collateral Investment
Trust, 0.7339% (c)(g) $ 141,488 $ 1,414,875
TOTAL SHORT TERM INVESTMENTS
(Cost $1,414,875) $ 1,414,875
REPURCHASE AGREEMENTS - 2.91%
Repurchase Agreement with State
Street Corp. dated 05/29/2009 at
Copyright © 2012 www.secdatabase.com. All Rights Reserved.Please Consider the Environment Before Printing This Document

0.07% to be repurchased at
$5,462,032 on 6/1/2009,
collateralized by $5,660,000
Federal National Mortgage
Association, 2.50% due
04/23/2014 (valued at $5,575,100,
including interest) $ 5,462,000 $ 5,462,000
TOTAL REPURCHASE AGREEMENTS
(Cost $5,462,000) $ 5,462,000
Total Investments (Large Cap Fund)
(Cost $206,405,641) - 102.25% $ 192,120,847
Other assets and liabilities, net - (2.25)% (4,218,823)
TOTAL NET ASSETS - 100.00% $ 187,902,024
The accompanying notes are an integral part of the financial statements.
157
JOHN HANCOCK FUNDS II
PORTFOLIO OF INVESTMENTS - May 31, 2009 (Unaudited) - continued(showing percentage of total net assets)
Large Cap Value FundShares or
Principal
Amount Value
COMMON STOCKS - 99.46%
Advertising - 0.85%
Interpublic Group of Companies, Inc. * 729,000 $ 3,819,960
Aerospace - 3.44%
Alliant Techsystems, Inc. * 11,000 949,190
General Dynamics Corp. 65,000 3,698,500
Northrop Grumman Corp. 115,000 5,476,300
Raytheon Company 121,000 5,402,650
15,526,640
Agriculture - 2.62%
Archer-Daniels-Midland Company 240,000 6,604,800
Bunge, Ltd. 83,000 5,251,410
11,856,210
Banking - 0.89%
BB&T Corp. 179,000 4,013,180
Biotechnology - 2.23%
Amgen, Inc. * 202,000 10,087,880
Business Services - 0.49%
Computer Sciences Corp. * 52,000 2,207,920
Chemicals - 1.37%
Dow Chemical Company 350,000 6,188,000
Computers & Business Equipment - 1.28%
EMC Corp. * 409,000 4,805,750
Ingram Micro, Inc., Class A * 59,000 974,680
5,780,430
Cosmetics & Toiletries - 0.41%
Procter & Gamble Company 36,000 1,869,840
Crude Petroleum & Natural Gas - 2.31%
Marathon Oil Corp. 213,000 6,790,440
Sunoco, Inc. 120,000 3,651,600
10,442,040
Electronics - 1.34%
Copyright © 2012 www.secdatabase.com. All Rights Reserved.Please Consider the Environment Before Printing This Document

L-3 Communications Holdings, Inc. 63,000 4,631,130
Synopsys, Inc. * 72,000 1,402,560
6,033,690
Energy - 0.92%
NRG Energy, Inc. * 185,000 4,162,500
Financial Services - 5.24%
Goldman Sachs Group, Inc. 79,000 11,421,030
JPMorgan Chase & Company 151,000 5,571,900
NASDAQ OMX Group, Inc. * 211,000 4,454,210
Wells Fargo & Company 87,000 2,218,500
23,665,640
Healthcare Products - 3.84%
Johnson & Johnson 299,000 16,492,840
The Cooper Companies, Inc. 33,000 874,830
17,367,670
Healthcare Services - 5.29%
Health Net, Inc. * 267,000 3,999,660
McKesson Corp. 115,000 4,732,250
Medco Health Solutions, Inc. * 30,000 1,376,700
MEDNAX, Inc. * 11,000 445,500
UnitedHealth Group, Inc. 247,000 6,570,200
Large Cap Value Fund (continued)Shares or
Principal
Amount Value
COMMON STOCKS (continued)
Healthcare Services (continued)
WellPoint, Inc. * 145,000 $ 6,752,650
23,876,960
Homebuilders - 1.81%
D.R. Horton, Inc. 21,000 193,410
Pulte Homes, Inc. (a) 386,000 3,396,800
Toll Brothers, Inc. * 247,000 4,589,260
8,179,470
Hotels & Restaurants - 0.98%
McDonald's Corp. 75,000 4,424,250
Industrials - 1.33%
General Electric Company 445,000 5,998,600
Insurance - 10.19%
Aetna, Inc. 110,000 2,945,800
Chubb Corp. 150,000 5,947,500
CIGNA Corp. 217,000 4,810,890
Everest Re Group, Ltd. 69,000 4,776,870
HCC Insurance Holdings, Inc. 179,000 4,419,510
PartnerRe, Ltd. 75,000 4,894,500
RenaissanceRe Holdings, Ltd. 69,000 3,158,130
The Travelers Companies, Inc. 172,000 6,993,520
Unum Group 303,000 5,184,330
W.R. Berkley Corp. 133,000 2,884,770
46,015,820
International Oil - 15.71%
Anadarko Petroleum Corp. 151,000 7,214,780
Chevron Corp. 278,000 18,534,260
ConocoPhillips 256,000 11,735,040
Exxon Mobil Corp. 483,000 33,496,050
70,980,130
Medical-Hospitals - 0.04%
Copyright © 2012 www.secdatabase.com. All Rights Reserved.Please Consider the Environment Before Printing This Document

LifePoint Hospitals, Inc. * 7,000 190,750
Petroleum Services - 4.21%
ENSCO International, Inc. 106,000 4,122,340
Tesoro Corp. 239,000 4,048,660
Tidewater, Inc. 110,000 5,243,700
Valero Energy Corp. 250,000 5,592,500
19,007,200
Pharmaceuticals - 8.69%
AmerisourceBergen Corp. 107,000 3,969,700
Bristol-Myers Squibb Company 234,000 4,661,280
Eli Lilly & Company 220,000 7,605,400
Hospira, Inc. * 119,000 4,105,500
Merck & Company, Inc. 135,000 3,723,300
Pfizer, Inc. 1,001,000 15,205,190
39,270,370
Railroads & Equipment - 0.75%
CSX Corp. 106,000 3,366,560
Retail Grocery - 2.47%
Safeway, Inc. 271,000 5,490,460
The Kroger Company 248,000 5,654,400
11,144,860
The accompanying notes are an integral part of the financial statements.
158
JOHN HANCOCK FUNDS II
PORTFOLIO OF INVESTMENTS - May 31, 2009 (Unaudited) - continued(showing percentage of total net assets)
Large Cap Value Fund (continued)Shares or
Principal
Amount Value
COMMON STOCKS (continued)
Retail Trade - 5.55%
BJ's Wholesale Club, Inc. * 115,000 $ 4,052,600
Limited Brands, Inc. 185,000 2,314,350
Macy's, Inc. 433,000 5,057,440
RadioShack Corp. 355,000 4,771,200
The Gap, Inc. 299,000 5,337,150
Wal-Mart Stores, Inc. 71,000 3,531,540
25,064,280
Semiconductors - 1.91%
Integrated Device Technology, Inc. * 148,000 833,240
Novellus Systems, Inc. * 196,000 3,514,280
QLogic Corp. * 313,000 4,272,450
8,619,970
Software - 1.07%
CA, Inc. 106,000 1,849,700
Compuware Corp. * 175,000 1,335,250
Oracle Corp. 83,441 1,634,609
4,819,559
Telecommunications Equipment &
Services - 0.35%
Amdocs, Ltd. * 74,000 1,601,360
Telephone - 9.76%
AT&T, Inc. 811,000 20,104,690
Copyright © 2012 www.secdatabase.com. All Rights Reserved.Please Consider the Environment Before Printing This Document

Qwest Communications International, Inc. (a) 1,103,000 4,809,080
Sprint Nextel Corp. * 1,155,000 5,948,250
Verizon Communications, Inc. 452,000 13,225,520
44,087,540
Tobacco - 1.14%
Reynolds American, Inc. 129,000 5,156,130
Toys, Amusements & Sporting Goods - 0.98%
Hasbro, Inc. 174,000 4,421,340
TOTAL COMMON STOCKS (Cost $474,079,925) $ 449,246,749
SHORT TERM INVESTMENTS - 0.70%
John Hancock Collateral Investment
Trust, 0.7339% (c)(g) $ 316,636 $ 3,166,362
TOTAL SHORT TERM INVESTMENTS
(Cost $3,166,362) $ 3,166,362
REPURCHASE AGREEMENTS - 0.20%
Repurchase Agreement with State
Street Corp. dated 05/29/2009 at
0.07% to be repurchased at
$907,005 on 6/1/2009,
collateralized by $905,000 Federal
National Mortgage Association,
5.85% due 08/17/2017 (valued at
$929,888, including interest) $ 907,000 $ 907,000
TOTAL REPURCHASE AGREEMENTS
(Cost $907,000) $ 907,000
Total Investments (Large Cap Value Fund)
(Cost $478,153,287) - 100.36% $ 453,320,111
Other assets and liabilities, net - (0.36)% (1,628,283)
TOTAL NET ASSETS - 100.00% $ 451,691,828
Mid Cap Index FundShares or
Principal
Amount Value
COMMON STOCKS - 88.21%
Advertising - 0.29%
Lamar Advertising Company, Class A * (a) 36,106 $ 670,488
ValueClick, Inc. * 41,237 455,669
1,126,157
Aerospace - 0.67%
Alliant Techsystems, Inc. * 15,559 1,342,586
BE Aerospace, Inc. * 48,021 714,553
Woodward Governor Company 26,113 536,100
2,593,239
Air Travel - 0.25%
Airtran Holdings, Inc. * 56,813 288,042
Alaska Air Group, Inc. * 17,253 268,629
JetBlue Airways Corp. * 87,370 395,786
952,457
Apparel & Textiles - 1.21%
Guess?, Inc. 28,659 739,975
Hanesbrands, Inc. * 44,482 751,746
Mohawk Industries, Inc. * (a) 26,678 1,020,967
Phillips-Van Heusen Corp. 24,470 721,131
Timberland Company, Class A * 21,874 314,548
Under Armour, Inc., Class A * (a) 17,352 425,818
Warnaco Group, Inc. * 22,164 700,383
Copyright © 2012 www.secdatabase.com. All Rights Reserved.Please Consider the Environment Before Printing This Document

4,674,568
Auto Parts - 0.97%
BorgWarner, Inc. (a) 54,919 1,771,138
Federal Signal Corp. 22,308 191,403
Gentex Corp. 65,423 771,337
LKQ Corp. * 66,518 1,017,060
3,750,938
Auto Services - 0.24%
Copart, Inc. * 30,085 923,309
Banking - 3.92%
Associated Banc Corp. (a) 60,797 879,733
Astoria Financial Corp. 38,759 298,832
BancorpSouth, Inc. 34,370 764,389
Bank of Hawaii Corp. 22,698 849,586
Cathay General Bancorp (a) 23,550 243,978
City National Corp. (a) 20,288 741,932
Colonial Bancgroup, Inc. (a) 95,273 123,855
Commerce Bancshares, Inc. 31,394 987,969
Cullen Frost Bankers, Inc. 28,244 1,382,544
First Niagara Financial Group, Inc. 69,131 877,272
FirstMerit Corp. 38,896 677,182
International Bancshares Corp. 24,132 270,761
New York Community Bancorp, Inc. (a) 163,970 1,813,508
NewAlliance Bancshares, Inc. 50,795 657,287
PacWest Bancorp 11,543 163,103
SVB Financial Group * 15,655 421,902
TCF Financial Corp. 53,417 767,068
Trustmark Corp. 23,162 453,744
Valley National Bancorp (a) 67,393 818,151
Washington Federal, Inc. 41,853 549,111
Webster Financial Corp. (a) 24,814 185,113
The accompanying notes are an integral part of the financial statements.
159
JOHN HANCOCK FUNDS II
PORTFOLIO OF INVESTMENTS - May 31, 2009 (Unaudited) - continued(showing percentage of total net assets)
Mid Cap Index Fund (continued)Shares or
Principal
Amount Value
COMMON STOCKS (continued)
Banking (continued)
WestAmerica Bancorp 13,726 $ 711,830
Wilmington Trust Corp. 32,853 473,412
15,112,262
Biotechnology - 0.88%
Affymetrix, Inc. * 33,040 158,922
Bio-Rad Laboratories, Inc., Class A * 9,092 676,809
Charles River Laboratories International, Inc. * 31,749 997,871
Immucor, Inc. * 33,442 503,302
Techne Corp. 17,821 1,074,072
3,410,976
Building Materials & Construction - 0.99%
Dycom Industries, Inc. * 18,529 216,604
Granite Construction, Inc. (a) 15,636 571,496
KBR, Inc. 76,918 1,416,829
Copyright © 2012 www.secdatabase.com. All Rights Reserved.Please Consider the Environment Before Printing This Document

Lennox International, Inc. 22,271 690,624
RPM International, Inc. 61,041 935,148
3,830,701
Business Services - 4.92%
Acxiom Corp. 32,371 346,046
Alliance Data Systems Corp. * (a) 28,334 1,147,527
Brinks Company 19,171 509,757
Cadence Design Systems, Inc. * 125,780 710,657
Corporate Executive Board Company 16,183 281,422
Deluxe Corp. 24,326 343,970
DST Systems, Inc. * 19,380 742,254
FactSet Research Systems, Inc. (a) 19,931 1,054,350
Fair Isaac Corp. 23,214 408,102
FTI Consulting, Inc. * 24,299 1,220,296
Gartner Group, Inc., Class A * 28,116 431,581
Global Payments, Inc. 38,182 1,373,025
Harte-Hanks, Inc. 17,876 150,695
Hewitt Associates, Inc., Class A * 39,716 1,151,764
Kelly Services, Inc., Class A 12,925 137,781
Korn/Ferry International * 21,060 233,555
Macrovision Solutions Corp. * 38,877 877,454
Manpower, Inc. 37,246 1,583,327
MPS Group, Inc. * 43,448 329,770
Navigant Consulting Company * 22,484 267,784
Rollins, Inc. 19,463 325,227
SAIC, Inc. * 96,367 1,683,531
Sotheby's (a) 31,669 335,691
SRA International, Inc., Class A * 20,039 355,492
URS Corp. * 40,386 1,941,759
Watson Wyatt Worldwide, Inc., Class A 20,231 767,564
Wind River Systems, Inc. * 32,257 254,508
18,964,889
Cellular Communications - 0.56%
RF Micro Devices, Inc. * 123,836 352,933
Syniverse Holdings, Inc. * 24,729 369,698
Telephone & Data Systems, Inc. 48,000 1,454,880
2,177,511
Chemicals - 3.24%
Airgas, Inc. 38,656 1,633,602
Albemarle Corp. 43,437 1,225,792
Mid Cap Index Fund (continued)Shares or
Principal
Amount Value
COMMON STOCKS (continued)
Chemicals (continued)
Ashland, Inc. 31,520 $ 844,736
Cabot Corp. 31,081 496,364
Cytec Industries, Inc. 22,415 481,474
FMC Corp. 34,468 1,873,336
Lubrizol Corp. 32,237 1,440,027
Minerals Technologies, Inc. 8,886 347,620
Olin Corp. 36,861 492,463
Sensient Technologies Corp. 23,114 529,773
Terra Industries, Inc. 47,393 1,317,051
The Scotts Company, Class A 20,876 716,047
Valspar Corp. 47,547 1,086,449
12,484,734
Coal - 0.40%
Arch Coal, Inc. 67,910 1,258,372
Copyright © 2012 www.secdatabase.com. All Rights Reserved.Please Consider the Environment Before Printing This Document

Patriot Coal Corp. * (a) 30,459 275,959
1,534,331
Colleges & Universities - 0.35%
Career Education Corp. * 34,984 702,479
Corinthian Colleges, Inc. * 40,984 630,334
1,332,813
Commercial Services - 0.18%
Brink's Home Security Holdings, Inc. * 19,363 557,654
United Rentals, Inc. * 28,188 133,893
691,547
Computers & Business Equipment - 2.68%
3Com Corp. * 183,848 794,223
Avocent Corp. * 21,765 304,710
Diebold, Inc. 31,463 777,765
Ingram Micro, Inc., Class A * 76,781 1,268,422
Jack Henry & Associates, Inc. 39,918 733,294
Metavante Technologies, Inc. * 42,716 1,095,665
National Instruments Corp. 26,539 562,892
Palm, Inc. * 63,787 778,202
Parametric Technology Corp. * 54,944 636,252
Tech Data Corp. * 23,776 761,308
Western Digital Corp. * 105,818 2,629,577
10,342,310
Computers-Integrated Sys - 0.21%
NCR Corp. * 75,201 807,659
Construction & Mining Equipment - 0.70%
Bucyrus International, Inc., Class A 35,586 1,020,607
Joy Global, Inc. 48,586 1,674,759
2,695,366
Construction Materials - 0.50%
Louisiana-Pacific Corp. * 42,780 185,665
Martin Marietta Materials, Inc. (a) 21,553 1,755,923
1,941,588
Containers & Glass - 0.71%
Greif, Inc., Class A 16,240 784,717
Packaging Corp. of America 48,676 784,657
Sonoco Products Company 47,406 1,154,810
2,724,184
The accompanying notes are an integral part of the financial statements.
160
JOHN HANCOCK FUNDS II
PORTFOLIO OF INVESTMENTS - May 31, 2009 (Unaudited) - continued(showing percentage of total net assets)
Mid Cap Index Fund (continued)Shares or
Principal
Amount Value
COMMON STOCKS (continued)
Correctional Facilities - 0.23%
Corrections Corp. of America * 57,027 $ 875,364
Cosmetics & Toiletries - 0.24%
Alberto-Culver Company 40,553 942,452
Crude Petroleum & Natural Gas - 2.32%
Copyright © 2012 www.secdatabase.com. All Rights Reserved.Please Consider the Environment Before Printing This Document

Bill Barrett Corp. * 17,592 598,656
Cimarex Energy Company (a) 39,621 1,292,437
Forest Oil Corp. * 48,846 928,562
Newfield Exploration Company * 63,124 2,280,039
Patterson-UTI Energy, Inc. 72,769 1,043,508
Plains Exploration & Production Company * 51,148 1,446,465
Quicksilver Resources, Inc. * (a) 53,746 604,643
Unit Corp. * 22,465 752,802
8,947,112
Domestic Oil - 0.98%
Comstock Resources, Inc. * 22,077 879,327
Encore Aquisition Company * 24,632 874,190
Frontier Oil Corp. 49,398 862,983
Helix Energy Solutions Group, Inc. * 46,769 526,151
Mariner Energy, Inc. * 42,809 619,018
3,761,669
Drugs & Health Care - 0.26%
Perrigo Company 36,908 991,349
Educational Services - 1.01%
DeVry, Inc. 29,276 1,275,555
ITT Educational Services, Inc. * 14,948 1,372,077
Strayer Education, Inc. (a) 6,695 1,233,688
3,881,320
Electrical Equipment - 0.77%
AMETEK, Inc. 50,747 1,595,993
Hubbell, Inc., Class B 26,414 877,209
Varian, Inc. * 13,782 479,889
2,953,091
Electrical Utilities - 3.40%
Alliant Energy Corp. 52,519 1,246,276
Black Hills Corp. 18,396 393,674
Cleco Corp. 42,500 869,550
DPL, Inc. (a) 55,123 1,199,477
Great Plains Energy, Inc. 61,320 924,092
Hawaiian Electric Industries, Inc. 43,071 742,975
IDACORP, Inc. 22,299 518,898
NSTAR 50,771 1,526,684
NV Energy, Inc. 111,386 1,113,860
OGE Energy Corp. 45,042 1,162,984
PNM Resources, Inc. 41,106 380,231
Quanta Services, Inc. * 92,682 2,114,076
Westar Energy, Inc. 51,569 920,507
13,113,284
Electronics - 2.48%
Arrow Electronics, Inc. * 56,727 1,372,226
Avnet, Inc. * 71,324 1,641,165
Imation Corp. 14,187 137,046
Itron, Inc. * (a) 17,420 1,016,283
Mentor Graphics Corp. * 43,469 244,296
Mid Cap Index Fund (continued)Shares or
Principal
Amount Value
COMMON STOCKS (continued)
Electronics (continued)
Synopsys, Inc. * 68,183 $ 1,328,205
Teleflex, Inc. 18,797 843,045
Thomas & Betts Corp. * 25,339 777,401
Trimble Navigation, Ltd. * 56,611 1,085,799
Copyright © 2012 www.secdatabase.com. All Rights Reserved.Please Consider the Environment Before Printing This Document

Vishay Intertechnology, Inc. * 88,679 490,395
Zebra Technologies Corp., Class A * 28,793 628,551
9,564,412
Energy - 0.75%
Energen Corp. 34,083 1,268,569
MDU Resources Group, Inc. 87,312 1,611,780
2,880,349
Financial Services - 3.38%
Affiliated Managers Group, Inc. * 19,522 1,095,379
AmeriCredit Corp. * (a) 62,584 795,443
Apollo Investment Corp. 66,935 368,812
Broadridge Financial Solutions, Inc. 66,731 1,105,065
Eaton Vance Corp. 55,570 1,505,947
Fidelity National Financial, Inc., Class A 109,622 1,528,131
Fulton Financial Corp. (a) 83,392 484,507
GATX Corp. 23,150 582,917
Jefferies Group, Inc. * 58,341 1,261,916
Lender Processing Services, Inc. 39,852 1,157,701
Raymond James Financial, Inc. (a) 46,628 741,385
SEI Investments Company 63,624 981,718
Synovus Financial Corp. (a) 133,471 436,450
Waddell & Reed Financial, Inc., Class A 40,372 985,077
13,030,448
Food & Beverages - 1.62%
Corn Products International, Inc. 35,530 938,347
Flowers Foods, Inc. 37,596 795,907
Hansen Natural Corp. * 34,378 1,260,985
PepsiAmericas, Inc. 27,236 716,307
Ralcorp Holdings, Inc. * 26,888 1,539,876
Smithfield Foods, Inc. * (a) 56,482 702,071
Tootsie Roll Industries, Inc. (a) 12,659 284,828
6,238,321
Forest Products - 0.39%
Rayonier, Inc. 37,536 1,501,440
Funeral Services - 0.17%
Service Corp. International 121,502 650,036
Gas & Pipeline Utilities - 1.98%
AGL Resources, Inc. 36,556 1,057,200
National Fuel Gas Company 37,798 1,267,367
ONEOK, Inc. 50,026 1,465,762
Southern Union Company 58,966 1,024,829
UGI Corp. 51,344 1,237,904
Vectren Corp. 38,515 876,216
WGL Holdings, Inc. 23,827 708,138
7,637,416
Healthcare Products - 3.53%
Beckman Coulter, Inc. 30,033 1,627,789
Edwards Lifesciences Corp. * 26,560 1,695,590
Gen-Probe, Inc. * 24,879 1,060,592
The accompanying notes are an integral part of the financial statements.
161
JOHN HANCOCK FUNDS II
PORTFOLIO OF INVESTMENTS - May 31, 2009 (Unaudited) - continued(showing percentage of total net assets)
Mid Cap Index Fund (continued)Shares or
Principal
Copyright © 2012 www.secdatabase.com. All Rights Reserved.Please Consider the Environment Before Printing This Document

Amount Value
COMMON STOCKS (continued)
Healthcare Products (continued)
Henry Schein, Inc. * 42,477 $ 1,934,403
Hologic, Inc. * 121,850 1,543,839
IDEXX Laboratories, Inc. * (a) 28,107 1,176,278
Kinetic Concepts, Inc. * (a) 26,149 678,044
Masimo Corp. * 22,918 548,657
Owens & Minor, Inc. 19,669 689,595
ResMed, Inc. * 36,070 1,337,115
STERIS Corp. 27,710 654,787
Thoratec Corp. * 26,816 672,545
13,619,234
Healthcare Services - 1.95%
Cerner Corp. * (a) 32,075 1,869,652
Covance, Inc. * 30,115 1,265,432
Health Net, Inc. * 49,298 738,484
Hill-Rom Holdings, Inc. 29,745 480,679
Kindred Healthcare, Inc. * 14,241 186,985
Lincare Holdings, Inc. * 35,363 770,206
Omnicare, Inc. 49,561 1,339,634
Psychiatric Solutions, Inc. * 26,594 490,659
WellCare Health Plans, Inc. * 20,077 381,463
7,523,194
Homebuilders - 0.87%
M.D.C. Holdings, Inc. 17,524 538,162
NVR, Inc. * 2,712 1,342,169
Ryland Group, Inc. 20,380 348,090
Toll Brothers, Inc. * 61,684 1,146,089
3,374,510
Hotels & Restaurants - 1.26%
Bob Evans Farms, Inc. 14,592 376,474
Boyd Gaming Corp. * (a) 26,863 269,704
Brinker International, Inc. 48,433 866,951
Chipotle Mexican Grill, Inc., Class A * (a) 15,629 1,237,660
Panera Bread Company, Class A * 14,692 782,202
The Cheesecake Factory, Inc. * 28,409 486,078
Wendy's/Arby's Group, Inc. 198,743 834,721
4,853,790
Household Products - 1.08%
Blyth, Inc. 2,844 94,449
Church & Dwight, Inc. 33,342 1,676,102
Energizer Holdings, Inc. * 32,225 1,684,079
Tupperware Brands Corp. 29,738 723,228
4,177,858
Industrial Machinery - 2.36%
AGCO Corp. * 43,658 1,259,970
Crane Company 22,502 530,597
Donaldson Company, Inc. 36,653 1,234,840
FMC Technologies, Inc. * 59,757 2,487,086
Graco, Inc. 28,305 630,919
IDEX Corp. 38,187 891,666
Kennametal, Inc. 34,754 656,156
Lincoln Electric Holdings, Inc. 20,153 822,242
Terex Corp. * 45,159 606,034
9,119,510
Mid Cap Index Fund (continued)Shares or
Copyright © 2012 www.secdatabase.com. All Rights Reserved.Please Consider the Environment Before Printing This Document
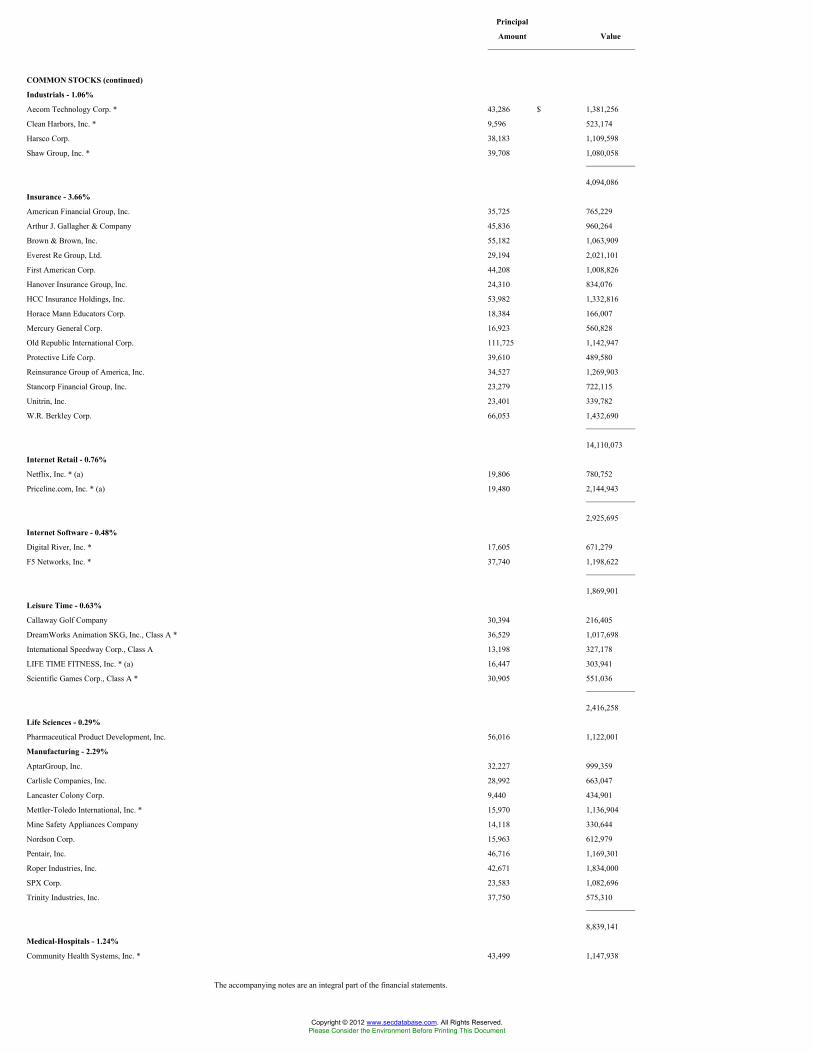
Principal
Amount Value
COMMON STOCKS (continued)
Industrials - 1.06%
Aecom Technology Corp. * 43,286 $ 1,381,256
Clean Harbors, Inc. * 9,596 523,174
Harsco Corp. 38,183 1,109,598
Shaw Group, Inc. * 39,708 1,080,058
4,094,086
Insurance - 3.66%
American Financial Group, Inc. 35,725 765,229
Arthur J. Gallagher & Company 45,836 960,264
Brown & Brown, Inc. 55,182 1,063,909
Everest Re Group, Ltd. 29,194 2,021,101
First American Corp. 44,208 1,008,826
Hanover Insurance Group, Inc. 24,310 834,076
HCC Insurance Holdings, Inc. 53,982 1,332,816
Horace Mann Educators Corp. 18,384 166,007
Mercury General Corp. 16,923 560,828
Old Republic International Corp. 111,725 1,142,947
Protective Life Corp. 39,610 489,580
Reinsurance Group of America, Inc. 34,527 1,269,903
Stancorp Financial Group, Inc. 23,279 722,115
Unitrin, Inc. 23,401 339,782
W.R. Berkley Corp. 66,053 1,432,690
14,110,073
Internet Retail - 0.76%
Netflix, Inc. * (a) 19,806 780,752
Priceline.com, Inc. * (a) 19,480 2,144,943
2,925,695
Internet Software - 0.48%
Digital River, Inc. * 17,605 671,279
F5 Networks, Inc. * 37,740 1,198,622
1,869,901
Leisure Time - 0.63%
Callaway Golf Company 30,394 216,405
DreamWorks Animation SKG, Inc., Class A * 36,529 1,017,698
International Speedway Corp., Class A 13,198 327,178
LIFE TIME FITNESS, Inc. * (a) 16,447 303,941
Scientific Games Corp., Class A * 30,905 551,036
2,416,258
Life Sciences - 0.29%
Pharmaceutical Product Development, Inc. 56,016 1,122,001
Manufacturing - 2.29%
AptarGroup, Inc. 32,227 999,359
Carlisle Companies, Inc. 28,992 663,047
Lancaster Colony Corp. 9,440 434,901
Mettler-Toledo International, Inc. * 15,970 1,136,904
Mine Safety Appliances Company 14,118 330,644
Nordson Corp. 15,963 612,979
Pentair, Inc. 46,716 1,169,301
Roper Industries, Inc. 42,671 1,834,000
SPX Corp. 23,583 1,082,696
Trinity Industries, Inc. 37,750 575,310
8,839,141
Medical-Hospitals - 1.24%
Community Health Systems, Inc. * 43,499 1,147,938
The accompanying notes are an integral part of the financial statements.
Copyright © 2012 www.secdatabase.com. All Rights Reserved.Please Consider the Environment Before Printing This Document

162
JOHN HANCOCK FUNDS II
PORTFOLIO OF INVESTMENTS - May 31, 2009 (Unaudited) - continued (showing percentage of total net assets)
Mid Cap Index Fund (continued)Shares or
Principal
Amount Value
COMMON STOCKS (continued)
Medical-Hospitals (continued)
Health Management Associates, Inc., Class A * 117,228 $ 681,095
LifePoint Hospitals, Inc. * (a) 24,764 674,819
Universal Health Services, Inc., Class B 23,514 1,291,624
VCA Antech, Inc. * 40,266 977,256
4,772,732
Metal & Metal Products - 0.82%
Commercial Metals Company 53,558 908,879
Matthews International Corp., Class A 14,666 418,714
Reliance Steel & Aluminum Company 30,319 1,151,819
Timken Company 40,395 683,080
3,162,492
Mining - 0.38%
Cliffs Natural Resources, Inc. 53,965 1,470,546
Mobile Homes - 0.09%
Thor Industries, Inc. (a) 16,867 339,195
Office Furnishings & Supplies - 0.19%
Herman Miller, Inc. 25,517 363,107
HNI Corp. 21,070 365,564
728,671
Paper - 0.30%
Potlatch Corp. 18,891 494,566
Temple-Inland, Inc. 50,627 647,013
1,141,579
Petroleum Services - 1.99%
Exterran Holdings, Inc. * 29,313 583,622
Helmerich & Payne, Inc. (a) 50,064 1,750,738
Oceaneering International, Inc. * 25,966 1,335,172
Pride International, Inc. * 82,510 1,998,392
Superior Energy Services, Inc. * 37,099 855,503
Tidewater, Inc. 24,499 1,167,867
7,691,294
Pharmaceuticals - 1.89%
Endo Pharmaceutical Holdings, Inc. * 55,477 883,749
Medicis Pharmaceutical Corp., Class A 26,963 423,858
OSI Pharmaceuticals, Inc. * 27,533 930,615
Sepracor, Inc. * 51,895 812,157
United Therapeutics Corp. * 11,058 886,299
Valeant Pharmaceuticals International * (a) 39,064 898,081
Vertex Pharmaceuticals, Inc. * 82,200 2,450,382
7,285,141
Publishing - 0.27%
American Greetings Corp., Class A 21,373 146,405
John Wiley & Sons, Inc., Class A 20,152 637,005
Scholastic Corp. 12,444 243,902
1,027,312
Copyright © 2012 www.secdatabase.com. All Rights Reserved.Please Consider the Environment Before Printing This Document

Railroads & Equipment - 0.40%
Kansas City Southern * 43,523 717,694
Wabtec Corp. 22,819 814,182
1,531,876
Real Estate - 4.82%
Alexandria Real Estate Equities, Inc., REIT (a) 18,714 671,833
AMB Property Corp., REIT 46,784 835,095
Mid Cap Index Fund (continued)Shares or
Principal
Amount Value
COMMON STOCKS (continued)
Real Estate (continued)
BRE Properties, Inc., Class A, REIT 24,315 $ 607,389
Camden Property Trust, REIT 29,707 891,804
Corporate Office Properties Trust, REIT 24,600 730,128
Cousins Properties, Inc., REIT (a) 20,556 185,004
Duke Realty Corp., REIT 99,289 944,238
Equity One, Inc., REIT (a) 15,853 228,917
Essex Property Trust, Inc., REIT 12,748 868,011
Federal Realty Investment Trust, REIT 28,082 1,478,517
Highwoods Properties, Inc., REIT 30,220 683,576
Hospitality Properties Trust, REIT 44,680 624,180
Jones Lang LaSalle, Inc. 16,456 576,783
Liberty Property Trust, REIT 48,176 1,121,537
Macerich Company, REIT (a) 36,618 618,112
Mack-Cali Realty Corp., REIT 34,853 861,218
Nationwide Health Properties, Inc., REIT 48,654 1,292,737
OMEGA Healthcare Investors, Inc., REIT 39,173 625,593
Realty Income Corp., REIT (a) 49,588 1,064,654
Regency Centers Corp., REIT 37,286 1,328,500
SL Green Realty Corp., REIT (a) 35,258 807,408
UDR, Inc., REIT 70,741 778,151
Weingarten Realty Investors, REIT 47,300 751,124
18,574,509
Retail - 1.19%
AnnTaylor Stores Corp. * 26,890 196,835
Barnes & Noble, Inc. (a) 17,614 435,242
Chico's FAS, Inc. * 84,276 822,534
Coldwater Creek, Inc. * 22,316 84,801
Collective Brands, Inc. * 30,309 447,361
Foot Locker, Inc. 73,641 818,151
J. Crew Group, Inc. * (a) 24,651 637,475
Regis Corp. 20,541 360,083
Saks, Inc. * (a) 66,865 255,424
Williams-Sonoma, Inc. 41,187 532,960
4,590,866
Retail Grocery - 0.12%
Ruddick Corp. 18,677 469,913
Retail Trade - 4.22%
99 Cents Only Stores * 22,278 208,745
Advance Auto Parts, Inc. 45,159 1,923,322
Aeropostale, Inc. * 31,762 1,099,601
American Eagle Outfitters, Inc. 98,000 1,451,380
BJ's Wholesale Club, Inc. * (a) 27,954 985,099
CarMax, Inc. * (a) 104,768 1,174,449
Dick's Sporting Goods, Inc. * 40,444 719,903
Dollar Tree, Inc. * 43,077 1,928,557
MSC Industrial Direct Company, Inc., Class A (a) 21,310 775,258
NBTY, Inc. * 26,061 643,446
PetSmart, Inc. 60,426 1,230,274
Copyright © 2012 www.secdatabase.com. All Rights Reserved.Please Consider the Environment Before Printing This Document

Rent-A-Center, Inc. * 31,421 613,652
Ross Stores, Inc. 61,502 2,408,418
Urban Outfitters, Inc. * 54,210 1,106,968
16,269,072
Sanitary Services - 0.52%
Aqua America, Inc. (a) 64,369 1,061,445
The accompanying notes are an integral part of the financial statements.
163
JOHN HANCOCK FUNDS II
PORTFOLIO OF INVESTMENTS - May 31, 2009 (Unaudited) - continued(showing percentage of total net assets)
Mid Cap Index Fund (continued)Shares or
Principal
Amount Value
COMMON STOCKS (continued)
Sanitary Services (continued)
Waste Connections, Inc. * 37,960 $ 964,184
2,025,629
Semiconductors - 1.79%
Atmel Corp. * 213,413 821,640
Cree, Inc. * (a) 42,066 1,280,068
Fairchild Semiconductor International, Inc. * 58,422 412,459
Integrated Device Technology, Inc. * 78,298 440,818
International Rectifier Corp. * 34,300 496,321
Intersil Corp., Class A 57,809 708,160
Lam Research Corp. * 59,672 1,562,810
Semtech Corp. * 28,717 462,057
Silicon Laboratories, Inc. * 21,273 715,198
6,899,531
Software - 0.89%
ACI Worldwide, Inc. * (a) 16,605 247,580
Advent Software, Inc. * (a) 7,936 243,556
ANSYS, Inc. * (a) 42,517 1,269,558
ManTech International Corp. * 9,956 381,812
Sybase, Inc. * 39,171 1,274,233
3,416,739
Steel - 0.52%
Carpenter Technology Corp. 20,945 470,844
Steel Dynamics, Inc. 76,995 1,150,305
Worthington Industries, Inc. 28,488 398,547
2,019,696
Telecommunications Equipment &
Services - 0.93%
ADC Telecommunications, Inc. * 45,924 323,305
ADTRAN, Inc. 25,962 539,491
CommScope, Inc. * 34,497 905,201
NeuStar, Inc., Class A * (a) 35,285 707,464
Plantronics, Inc. 22,998 410,285
Polycom, Inc. * 39,730 687,726
3,573,472
Telephone - 0.08%
Cincinnati Bell, Inc. * 108,435 302,534
Tobacco - 0.11%
Copyright © 2012 www.secdatabase.com. All Rights Reserved.Please Consider the Environment Before Printing This Document

Universal Corp. 11,878 439,842
Toys, Amusements & Sporting Goods - 0.20%
Marvel Entertainment, Inc. * 23,224 770,572
Transportation - 0.41%
Alexander & Baldwin, Inc. 19,462 481,684
Con-way, Inc. 21,943 704,370
Overseas Shipholding Group, Inc. 11,363 384,297
1,570,351
Trucking & Freight - 0.77%
J.B. Hunt Transport Services, Inc. (a) 38,960 1,197,241
Landstar Systems, Inc. 24,571 933,698
Oshkosh Corp. 35,381 419,973
Werner Enterprises, Inc. 20,414 367,248
Mid Cap Index Fund (continued)Shares or
Principal
Amount Value
COMMON STOCKS (continued)
Trucking & Freight (continued)
YRC Worldwide, Inc. * (a) 27,887 $ 71,948
2,990,108
TOTAL COMMON STOCKS (Cost $405,604,211) $ 340,148,525
SHORT TERM INVESTMENTS - 9.83%
John Hancock Collateral Investment
Trust, 0.7339% (c)(g) $ 3,790,280 $ 37,902,805
TOTAL SHORT TERM INVESTMENTS
(Cost $37,902,805) $ 37,902,805
REPURCHASE AGREEMENTS - 10.27%
Repurchase Agreement with State
Street Corp. dated 05/29/2009 at
0.07% to be repurchased at
$39,607,231 on 06/01/2009,
collateralized by $40,735,000
Federal National Mortgage
Association, 6.00% due
04/18/2036 (valued at
$40,400,973, including interest) $ 39,607,000 $ 39,607,000
TOTAL REPURCHASE AGREEMENTS
(Cost $39,607,000) $ 39,607,000
Total Investments (Mid Cap Index Fund)
(Cost $483,114,016) - 108.31% $ 417,658,330
Other assets and liabilities, net - (8.31)% (32,047,197)
TOTAL NET ASSETS - 100.00% $ 385,611,133
Mid Cap Intersection FundShares or
Principal
Amount Value
COMMON STOCKS - 98.16%
Advertising - 0.26%
ValueClick, Inc. * 16,800 $ 185,640
Aerospace - 0.35%
TransDigm Group, Inc. * 6,400 251,008
Apparel & Textiles - 1.21%
Carter's, Inc. * 6,900 163,185
Copyright © 2012 www.secdatabase.com. All Rights Reserved.Please Consider the Environment Before Printing This Document

Guess?, Inc. 6,600 170,412
Under Armour, Inc., Class A * (a) 8,200 201,228
Warnaco Group, Inc. * 10,320 326,112
860,937
Auto Parts - 0.26%
O'Reilly Automotive, Inc. * 5,200 187,460
Banking - 2.56%
Astoria Financial Corp. 46,930 361,830
BOK Financial Corp. (a) 10,300 417,768
Comerica, Inc. 17,100 370,728
International Bancshares Corp. (a) 41,000 460,020
Provident Financial Services, Inc. 20,700 203,688
1,814,034
The accompanying notes are an integral part of the financial statements.
164
JOHN HANCOCK FUNDS II
PORTFOLIO OF INVESTMENTS - May 31, 2009 (Unaudited) - continued(showing percentage of total net assets)
Mid Cap Intersection Fund (continued)Shares or
Principal
Amount Value
COMMON STOCKS (continued)
Biotechnology - 0.78%
Bio-Rad Laboratories, Inc., Class A * 1,860 $ 138,458
Cephalon, Inc. * (a) 7,045 410,794
549,252
Building Materials & Construction - 2.32%
Eagle Materials, Inc. 6,200 152,520
EMCOR Group, Inc. * 19,600 440,412
Granite Construction, Inc. 10,000 365,500
KBR, Inc. 27,700 510,234
Lennox International, Inc. 5,700 176,757
1,645,423
Business Services - 4.09%
Acxiom Corp. 19,300 206,317
Alliance Data Systems Corp. * (a) 13,800 558,900
Fluor Corp. 3,400 159,732
Jacobs Engineering Group, Inc. * 3,300 141,570
Manpower, Inc. 17,519 744,733
PHH Corp. * 9,400 144,760
Pre-Paid Legal Services, Inc. * (a) 3,900 165,204
URS Corp. * 8,800 423,104
Watson Wyatt Worldwide, Inc., Class A 6,400 242,816
Wind River Systems, Inc. * 14,300 112,827
2,899,963
Chemicals - 4.31%
Calgon Carbon Corp. * 5,660 65,260
CF Industries Holdings, Inc. 7,000 543,480
FMC Corp. 13,718 745,573
Intrepid Potash, Inc. * (a) 7,000 228,200
Lubrizol Corp. 12,100 540,507
Minerals Technologies, Inc. 4,400 172,128
Terra Industries, Inc. 14,800 411,292
The Scotts Company, Class A 10,100 346,430
Copyright © 2012 www.secdatabase.com. All Rights Reserved.Please Consider the Environment Before Printing This Document

3,052,870
Coal - 0.57%
Arch Coal, Inc. 12,300 227,919
Walter Energy, Inc. 5,400 176,256
404,175
Computer Services - 0.55%
NetApp, Inc. * 20,100 391,950
Computers & Business Equipment - 3.71%
3Com Corp. * 92,700 400,464
Avocent Corp. * 28,100 393,400
Ingram Micro, Inc., Class A * 29,701 490,661
Palm, Inc. * (a) 28,000 341,600
Parametric Technology Corp. * 22,680 262,634
Western Digital Corp. * 29,900 743,015
2,631,774
Construction & Mining Equipment - 0.84%
Joy Global, Inc. 17,220 593,573
Cosmetics & Toiletries - 0.46%
Nu Skin Enterprises, Inc., Class A 22,600 327,926
Crude Petroleum & Natural Gas - 1.99%
Cimarex Energy Company (a) 13,589 443,273
Mid Cap Intersection Fund (continued)Shares or
Principal
Amount Value
COMMON STOCKS (continued)
Crude Petroleum & Natural Gas
(continued)
Ultra Petroleum Corp. * 10,700 $ 484,496
Unit Corp. * 14,500 485,895
1,413,664
Domestic Oil - 2.06%
Comstock Resources, Inc. * 13,440 535,315
Denbury Resources, Inc. * 29,420 505,730
Encore Aquisition Company * 11,845 420,379
1,461,424
Drugs & Health Care - 0.27%
Perrigo Company 7,140 191,780
Educational Services - 1.94%
American Public Education, Inc. * 8,840 288,803
ITT Educational Services, Inc. * 11,823 1,085,233
1,374,036
Electrical Equipment - 0.25%
Wesco International, Inc. * 6,600 176,418
Electrical Utilities - 4.08%
Alliant Energy Corp. 8,400 199,332
CenterPoint Energy, Inc. 38,800 392,656
DPL, Inc. 18,950 412,352
El Paso Electric Company * 15,100 199,924
Northeast Utilities 8,500 176,715
NV Energy, Inc. 21,800 218,000
OGE Energy Corp. 10,200 263,364
Quanta Services, Inc. * 19,800 451,638
Unisource Energy Corp. 11,500 292,560
Westar Energy, Inc. 15,840 282,744
2,889,285
Electronics - 1.54%
Copyright © 2012 www.secdatabase.com. All Rights Reserved.Please Consider the Environment Before Printing This Document
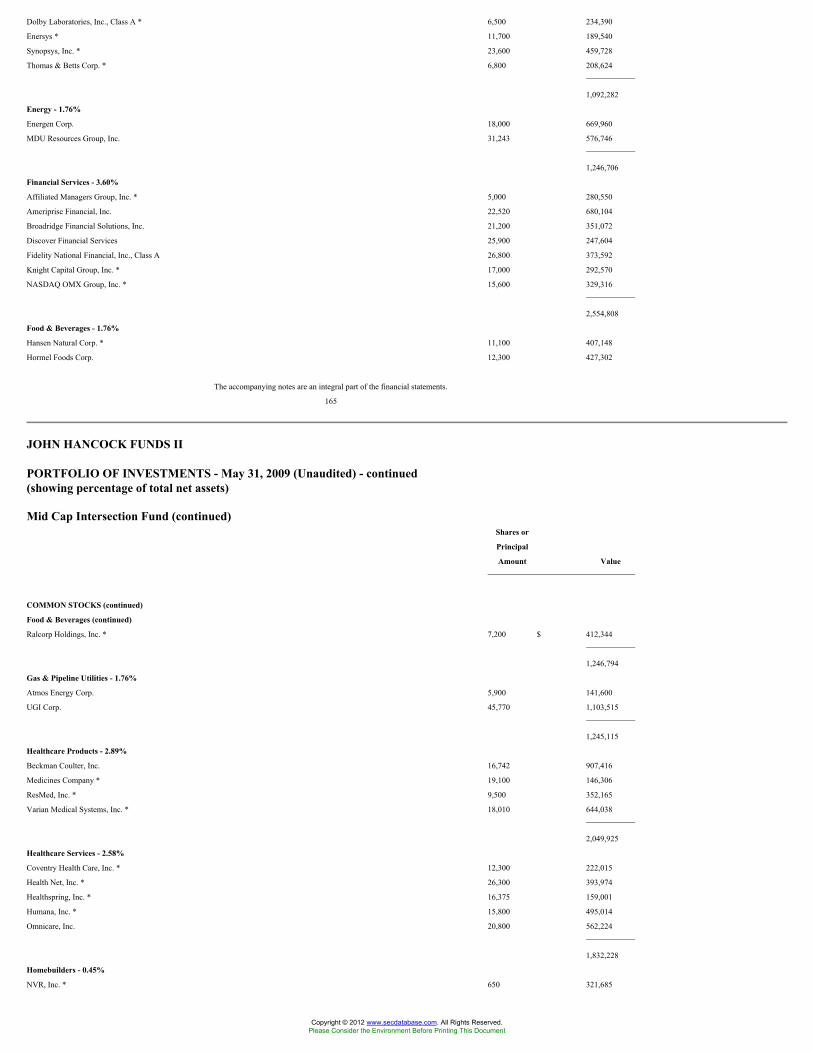
Dolby Laboratories, Inc., Class A * 6,500 234,390
Enersys * 11,700 189,540
Synopsys, Inc. * 23,600 459,728
Thomas & Betts Corp. * 6,800 208,624
1,092,282
Energy - 1.76%
Energen Corp. 18,000 669,960
MDU Resources Group, Inc. 31,243 576,746
1,246,706
Financial Services - 3.60%
Affiliated Managers Group, Inc. * 5,000 280,550
Ameriprise Financial, Inc. 22,520 680,104
Broadridge Financial Solutions, Inc. 21,200 351,072
Discover Financial Services 25,900 247,604
Fidelity National Financial, Inc., Class A 26,800 373,592
Knight Capital Group, Inc. * 17,000 292,570
NASDAQ OMX Group, Inc. * 15,600 329,316
2,554,808
Food & Beverages - 1.76%
Hansen Natural Corp. * 11,100 407,148
Hormel Foods Corp. 12,300 427,302
The accompanying notes are an integral part of the financial statements.
165
JOHN HANCOCK FUNDS II
PORTFOLIO OF INVESTMENTS - May 31, 2009 (Unaudited) - continued(showing percentage of total net assets)
Mid Cap Intersection Fund (continued)Shares or
Principal
Amount Value
COMMON STOCKS (continued)
Food & Beverages (continued)
Ralcorp Holdings, Inc. * 7,200 $ 412,344
1,246,794
Gas & Pipeline Utilities - 1.76%
Atmos Energy Corp. 5,900 141,600
UGI Corp. 45,770 1,103,515
1,245,115
Healthcare Products - 2.89%
Beckman Coulter, Inc. 16,742 907,416
Medicines Company * 19,100 146,306
ResMed, Inc. * 9,500 352,165
Varian Medical Systems, Inc. * 18,010 644,038
2,049,925
Healthcare Services - 2.58%
Coventry Health Care, Inc. * 12,300 222,015
Health Net, Inc. * 26,300 393,974
Healthspring, Inc. * 16,375 159,001
Humana, Inc. * 15,800 495,014
Omnicare, Inc. 20,800 562,224
1,832,228
Homebuilders - 0.45%
NVR, Inc. * 650 321,685
Copyright © 2012 www.secdatabase.com. All Rights Reserved.Please Consider the Environment Before Printing This Document

Hotels & Restaurants - 0.25%
Brinker International, Inc. 10,000 179,000
Household Products - 0.82%
Jarden Corp. * 14,300 254,254
Tempur-Pedic International, Inc. 29,500 325,385
579,639
Industrial Machinery - 3.91%
AGCO Corp. * 18,099 522,337
Dover Corp. 25,780 810,523
Flowserve Corp. 6,380 469,376
FMC Technologies, Inc. * 12,140 505,267
Parker-Hannifin Corp. 8,810 372,311
Robbins & Myers, Inc. 4,900 93,786
2,773,600
Industrials - 0.86%
Harsco Corp. 13,217 384,086
Shaw Group, Inc. * 8,200 223,040
607,126
Insurance - 5.60%
Allied World Assurance Holdings, Ltd. 11,200 422,800
American Financial Group, Inc. 19,940 427,115
Axis Capital Holdings, Ltd. 19,900 475,212
Everest Re Group, Ltd. 12,706 879,636
Platinum Underwriters Holdings, Ltd. 10,600 305,598
Reinsurance Group of America, Inc. 10,330 379,937
Stancorp Financial Group, Inc. 5,690 176,504
Transatlantic Holdings, Inc. 9,390 363,487
Unum Group 31,500 538,965
3,969,254
International Oil - 0.55%
Nabors Industries, Ltd. * 21,800 389,784
Mid Cap Intersection Fund (continued)Shares or
Principal
Amount Value
COMMON STOCKS (continued)
Internet Retail - 1.03%
Netflix, Inc. * (a) 12,297 $ 484,748
Priceline.com, Inc. * (a) 2,200 242,242
726,990
Internet Software - 0.47%
F5 Networks, Inc. * 10,400 330,304
Leisure Time - 1.18%
WMS Industries, Inc. * 23,600 837,092
Manufacturing - 0.36%
SPX Corp. 5,500 252,505
Medical-Hospitals - 1.10%
Community Health Systems, Inc. * 10,200 269,178
LifePoint Hospitals, Inc. * 18,645 508,076
777,254
Metal & Metal Products - 1.50%
Precision Castparts Corp. 9,159 756,259
Timken Company 18,100 306,071
1,062,330
Mining - 0.98%
Cliffs Natural Resources, Inc. 25,480 694,330
Office Furnishings & Supplies - 0.51%
Copyright © 2012 www.secdatabase.com. All Rights Reserved.Please Consider the Environment Before Printing This Document

OfficeMax, Inc. 44,200 364,650
Oil Comp-Explor&Prodtn - 0.31%
Continental Resources, Inc. * (a) 7,400 219,114
Petroleum Services - 1.60%
Helmerich & Payne, Inc. (a) 12,300 430,131
Oceaneering International, Inc. * 5,100 262,242
Tidewater, Inc. 9,300 443,331
1,135,704
Pharmaceuticals - 3.46%
Alkermes, Inc. * 29,500 240,130
Cubist Pharmaceuticals, Inc. * 33,590 573,045
Forest Laboratories, Inc. * 6,200 146,878
Hospira, Inc. * 5,600 193,200
Mylan, Inc. * (a) 17,700 233,817
Sepracor, Inc. * 34,900 546,185
Vertex Pharmaceuticals, Inc. * 5,000 149,050
Watson Pharmaceuticals, Inc. * 12,200 369,050
2,451,355
Real Estate - 5.35%
Alexander's, Inc., REIT * 500 135,005
Annaly Capital Management, Inc., REIT 30,500 425,170
Anworth Mortgage Asset Corp., REIT 30,500 203,130
Brandywine Realty Trust, REIT 90,700 675,715
Capstead Mortage Corp., REIT 15,600 186,108
Douglas Emmett, Inc., REIT 27,690 257,517
Hatteras Financial Corp., REIT 14,700 366,324
Kimco Realty Corp., REIT 8,700 101,703
Liberty Property Trust, REIT 15,310 356,417
Mack-Cali Realty Corp., REIT 19,300 476,903
MFA Mortgage Investments, Inc., REIT 49,700 311,122
UDR, Inc., REIT 14,390 158,290
The accompanying notes are an integral part of the financial statements.
166
JOHN HANCOCK FUNDS II
PORTFOLIO OF INVESTMENTS - May 31, 2009 (Unaudited) - continued(showing percentage of total net assets)
Mid Cap Intersection Fund (continued)Shares or
Principal
Amount Value
COMMON STOCKS (continued)
Real Estate (continued)
Weingarten Realty Investors, REIT 8,600 $ 136,568
3,789,972
Retail - 0.95%
Collective Brands, Inc. * 21,200 312,912
Foot Locker, Inc. 32,400 359,964
672,876
Retail Grocery - 0.55%
SUPERVALU, Inc. 23,500 390,100
Retail Trade - 6.51%
Abercrombie & Fitch Company, Class A (a) 5,200 156,572
Advance Auto Parts, Inc. 10,500 447,195
American Eagle Outfitters, Inc. 27,315 404,535
Big Lots, Inc. * 29,800 685,698
BJ's Wholesale Club, Inc. * (a) 23,210 817,921
Copyright © 2012 www.secdatabase.com. All Rights Reserved.Please Consider the Environment Before Printing This Document

Dollar Tree, Inc. * 4,700 210,419
Rent-A-Center, Inc. * 18,300 357,399
Ross Stores, Inc. 27,300 1,069,068
Urban Outfitters, Inc. * 22,900 467,618
4,616,425
Semiconductors - 0.74%
Lam Research Corp. * 20,122 526,995
Software - 2.60%
BMC Software, Inc. * 10,900 371,690
Quest Software, Inc. * 27,900 360,468
Red Hat, Inc. * 16,100 321,195
Riverbed Technology, Inc. * 14,100 283,269
Sybase, Inc. * 15,579 506,785
1,843,407
Steel - 0.77%
Steel Dynamics, Inc. 36,300 542,322
Telecommunications Equipment &
Services - 2.12%
Atheros Communications, Inc. * 23,400 392,184
InterDigital, Inc. * 9,500 243,390
NeuStar, Inc., Class A * (a) 29,590 593,280
Starent Networks Corp. * (a) 12,800 270,464
1,499,318
Telephone - 0.85%
CenturyTel, Inc. (a) 19,500 601,575
Tobacco - 0.81%
Universal Corp. 15,500 573,965
Toys, Amusements & Sporting Goods - 1.06%
Hasbro, Inc. 13,600 345,576
Marvel Entertainment, Inc. * 12,200 404,796
750,372
Transportation - 0.29%
Overseas Shipholding Group, Inc. 6,100 206,302
Trucking & Freight - 1.87%
J.B. Hunt Transport Services, Inc. 14,900 457,877
Oshkosh Corp. 47,100 559,077
Mid Cap Intersection Fund (continued)Shares or
Principal
Amount Value
COMMON STOCKS (continued)
Trucking & Freight (continued)
Werner Enterprises, Inc. 17,100 $ 307,629
1,324,583
TOTAL COMMON STOCKS (Cost $70,953,356) $ 69,580,378
SHORT TERM INVESTMENTS - 10.00%
John Hancock Collateral Investment
Trust, 0.7339% (c)(g) $ 708,947 $ 7,089,470
TOTAL SHORT TERM INVESTMENTS
(Cost $7,089,470) $ 7,089,470
REPURCHASE AGREEMENTS - 1.55%
JPMorgan Chase Tri-party
Repurchase Agreement dated
05/29/2009 at 0.19% to be
repurchased at $1,100,017 on
06/01/2009, collateralized by
$1,553,463 Federal National
Copyright © 2012 www.secdatabase.com. All Rights Reserved.Please Consider the Environment Before Printing This Document

Mortgage Association, 5.00% due
12/01/2017 (valued at $1,122,058,
including interest) $ 1,100,000 $ 1,100,000
TOTAL REPURCHASE AGREEMENTS
(Cost $1,100,000) $ 1,100,000
Total Investments (Mid Cap Intersection Fund)
(Cost $79,142,826) - 109.71% $ 77,769,848
Other assets and liabilities, net - (9.71)% (6,881,205)
TOTAL NET ASSETS - 100.00% $ 70,888,643
Mid Cap Stock FundShares or
Principal
Amount Value
COMMON STOCKS - 96.87%
Air Travel - 1.02%
Ryanair Holdings PLC, SADR * 54,100 $ 1,575,392
Tam SA * 479,500 4,138,085
5,713,477
Apparel & Textiles - 2.76%
Gymboree Corp. * 100,542 3,704,973
Hanesbrands, Inc. * 690,300 11,666,070
15,371,043
Banking - 0.82%
Huntington Bancshares, Inc. 1,171,300 4,591,496
Biotechnology - 1.45%
Cephalon, Inc. * (a) 87,577 5,106,615
Charles River Laboratories International, Inc. * 94,000 2,954,420
8,061,035
Building Materials & Construction - 2.08%
Lennox International, Inc. 205,600 6,375,656
Masco Corp. 505,700 5,239,052
11,614,708
The accompanying notes are an integral part of the financial statements.
167
JOHN HANCOCK FUNDS II
PORTFOLIO OF INVESTMENTS - May 31, 2009 (Unaudited) - continued(showing percentage of total net assets)
Mid Cap Stock Fund (continued)Shares or
Principal
Amount Value
COMMON STOCKS (continued)
Business Services - 1.52%
Coinstar, Inc. * 285,900 $ 8,468,358
Cellular Communications - 4.33%
Leap Wireless International, Inc. * 146,400 5,488,536
MetroPCS Communications, Inc. * 700,900 12,006,417
Motorola, Inc. 1,096,000 6,641,760
24,136,713
Copyright © 2012 www.secdatabase.com. All Rights Reserved.Please Consider the Environment Before Printing This Document

Chemicals - 1.06%
Huabao International Holdings, Ltd. 6,515,000 5,894,591
Colleges & Universities - 1.70%
Corinthian Colleges, Inc. * 616,500 9,481,770
Commercial Services - 1.87%
Brink's Home Security Holdings, Inc. * 206,700 5,952,960
Pool Corp. 255,652 4,456,014
10,408,974
Computer Services - 0.59%
NetApp, Inc. * 167,475 3,265,762
Computers & Business Equipment - 2.89%
Juniper Networks, Inc. * 260,700 6,447,111
Logitech International SA * (a) 227,620 3,193,509
Seagate Technology 741,500 6,458,465
16,099,085
Construction & Mining Equipment - 0.52%
National Oilwell Varco, Inc. * 74,800 2,888,776
Construction Materials - 0.48%
Martin Marietta Materials, Inc. 33,200 2,704,804
Correctional Facilities - 0.77%
Corrections Corp. of America * 279,400 4,288,790
Crude Petroleum & Natural Gas - 2.13%
EOG Resources, Inc. 52,500 3,842,475
Forest Oil Corp. * 223,400 4,246,834
Ultra Petroleum Corp. * 83,900 3,798,992
11,888,301
Drugs & Health Care - 0.85%
Shionogi & Company, Ltd. 240,947 4,759,874
Educational Services - 1.20%
ITT Educational Services, Inc. * 72,700 6,673,133
Electrical Equipment - 0.83%
AMETEK, Inc. 147,400 4,635,730
Energy - 2.27%
First Solar, Inc. * 26,400 5,016,000
SunPower Corp., Class A * (a) 262,800 7,657,992
12,673,992
Financial Services - 3.45%
Interactive Data Corp. 223,600 5,243,420
NASDAQ OMX Group, Inc. * 348,647 7,359,938
Western Union Company 376,993 6,646,387
19,249,745
Food & Beverages - 4.28%
China Mengniu Dairy Company, Ltd. * 3,148,000 6,741,964
Coca-Cola Enterprises, Inc. 310,400 5,171,264
Mid Cap Stock Fund (continued)Shares or
Principal
Amount Value
COMMON STOCKS (continued)
Food & Beverages (continued)
Dr Pepper Snapple Group, Inc. * 269,700 $ 5,860,581
Fomento Economico Mexicano SA de CV,
SADR 118,900 3,886,841
Heckmann Corp. * (a) 533,200 2,186,120
23,846,770
Healthcare Products - 4.22%
Edwards Lifesciences Corp. * 77,700 4,960,368
Herbalife, Ltd. 275,700 8,053,197
Copyright © 2012 www.secdatabase.com. All Rights Reserved.Please Consider the Environment Before Printing This Document

Inverness Medical Innovations, Inc. * 122,100 3,971,913
Medicines Company * 158,439 1,213,643
St. Jude Medical, Inc. * 136,800 5,337,936
23,537,057
Hotels & Restaurants - 0.31%
The Cheesecake Factory, Inc. * 100,890 1,726,228
Household Products - 4.09%
Energizer Holdings, Inc. * 147,000 7,682,220
Jarden Corp. * 802,468 14,267,881
Tempur-Pedic International, Inc. 78,000 860,340
22,810,441
Industrial Machinery - 1.63%
Pall Corp. 190,100 4,881,768
Parker-Hannifin Corp. 100,000 4,226,000
9,107,768
Industrials - 1.50%
Aecom Technology Corp. * 261,600 8,347,656
Insurance - 5.10%
ACE, Ltd. 96,800 4,258,232
AFLAC, Inc. 161,400 5,729,700
Arch Capital Group, Ltd. * 74,700 4,251,177
Everest Re Group, Ltd. 59,600 4,126,108
Hartford Financial Services Group, Inc. 279,900 4,013,766
Marsh & McLennan Companies, Inc. 115,000 2,175,800
W.R. Berkley Corp. 180,200 3,908,538
28,463,321
International Oil - 0.74%
Nabors Industries, Ltd. * 232,300 4,153,524
Internet Service Provider - 1.41%
Equinix, Inc. * 105,500 7,849,200
Internet Software - 1.13%
McAfee, Inc. * 160,790 6,307,792
Leisure Time - 2.39%
DreamWorks Animation SKG, Inc., Class A * 284,439 7,924,470
MGM Mirage, Inc. * 724,584 5,405,397
13,329,867
Manufacturing - 2.79%
Illinois Tool Works, Inc. 201,600 6,509,664
Pentair, Inc. 222,300 5,564,169
SMA Solar Technology AG * 43,167 3,483,484
15,557,317
Oil & Gas Drilling - 0.43%
Atwood Oceanics, Inc. * 90,200 2,386,692
The accompanying notes are an integral part of the financial statements.
168
JOHN HANCOCK FUNDS II
PORTFOLIO OF INVESTMENTS - May 31, 2009 (Unaudited) - continued(showing percentage of total net assets)
Mid Cap Stock Fund (continued)Shares or
Principal
Amount Value
COMMON STOCKS (continued)
Petroleum Services - 1.41%
Copyright © 2012 www.secdatabase.com. All Rights Reserved.Please Consider the Environment Before Printing This Document

Helmerich & Payne, Inc. (a) 93,700 $ 3,276,689
Smith International, Inc. 157,600 4,600,344
7,877,033
Pharmaceuticals - 3.01%
Alkermes, Inc. * 280,901 2,286,534
Amylin Pharmaceuticals, Inc. * 252,067 2,853,399
Auxilium Pharmaceuticals, Inc. * 147,000 3,444,210
Daiichi Sankyo Company, Ltd. 266,800 4,996,179
Elan Corp. PLC, SADR * 174,900 1,220,802
Regeneron Pharmaceuticals, Inc. * 131,000 2,005,610
16,806,734
Retail Trade - 9.90%
Advance Auto Parts, Inc. 223,300 9,510,347
Aeropostale, Inc. * 202,100 6,996,702
Best Buy Company, Inc. 181,500 6,370,650
BJ's Wholesale Club, Inc. * 179,610 6,329,456
Dick's Sporting Goods, Inc. * 153,900 2,739,420
Kohl's Corp. * 178,800 7,593,636
Staples, Inc. 394,900 8,075,705
The Gap, Inc. 426,600 7,614,810
55,230,726
Semiconductors - 4.41%
Marvell Technology Group, Ltd. * 471,600 5,390,388
Maxim Integrated Products, Inc. 357,300 5,798,979
MEMC Electronic Materials, Inc. * 365,500 7,050,495
ON Semiconductor Corp. * 931,700 6,382,145
24,622,007
Software - 4.70%
Adobe Systems, Inc. * 201,300 5,672,634
BMC Software, Inc. * 219,100 7,471,310
Red Hat, Inc. * 383,100 7,642,845
Solera Holdings, Inc. * 237,100 5,429,590
26,216,379
Telecommunications Equipment &
Services - 3.04%
Atheros Communications, Inc. * 329,800 5,527,448
NICE Systems, Ltd., ADR * 217,600 4,996,096
Polycom, Inc. * 371,420 6,429,280
16,952,824
Toys, Amusements & Sporting Goods - 1.09%
Marvel Entertainment, Inc. * 182,900 6,068,622
Transportation - 2.97%
Con-way, Inc. 173,100 5,556,510
Nordic American Tanker Shipping, Ltd. (a) 164,400 5,513,976
Overseas Shipholding Group, Inc. 111,800 3,781,076
Tsakos Energy Navigation, Ltd. 75,835 1,709,321
16,560,883
Trucking & Freight - 1.73%
Hub Group, Inc., Class A * 161,057 3,182,486
J.B. Hunt Transport Services, Inc. 211,100 6,487,103
9,669,589
TOTAL COMMON STOCKS (Cost $528,587,876) $ 540,298,587
Mid Cap Stock Fund (continued)Shares or
Principal
Amount Value
Copyright © 2012 www.secdatabase.com. All Rights Reserved.Please Consider the Environment Before Printing This Document

SHORT TERM INVESTMENTS - 3.02%
John Hancock Collateral Investment
Trust, 0.7339% (c)(g) $ 1,683,058 $ 16,830,580
TOTAL SHORT TERM INVESTMENTS
(Cost $16,830,580) $ 16,830,580
REPURCHASE AGREEMENTS - 6.55%
Bank of New York Tri-Party
Repurchase Agreement dated
05/29/2009 at 0.18% to be
repurchased at $36,500,548 on
06/01/2009, collateralized by
$65,308,881 Federal Home Loan
Mortgage Corp., 7.00% due
02/01/2038 (valued at
$37,230,000, including interest) $ 36,500,000 $ 36,500,000
TOTAL REPURCHASE AGREEMENTS
(Cost $36,500,000) $ 36,500,000
Total Investments (Mid Cap Stock Fund)
(Cost $581,918,456) - 106.44% $ 593,629,167
Other assets and liabilities, net - (6.44)% (35,895,384)
TOTAL NET ASSETS - 100.00% $ 557,733,783
Mid Cap Value Equity FundShares or
Principal
Amount Value
COMMON STOCKS - 97.17%
Aerospace - 1.34%
Goodrich Corp. 28,722 $ 1,394,166
Air Travel - 1.40%
AMR Corp. * 58,628 260,895
Continental Airlines, Inc., Class B * 29,905 278,715
Delta Air Lines, Inc. * 101,989 592,556
UAL Corp. * (a) 26,022 121,262
US Airways Group, Inc. * (a) 78,430 202,349
1,455,777
Apparel & Textiles - 1.62%
Mohawk Industries, Inc. * (a) 16,365 626,289
VF Corp. 18,642 1,059,238
1,685,527
Auto Parts - 0.51%
Genuine Parts Company 15,951 534,040
Banking - 1.13%
Cullen Frost Bankers, Inc. 12,237 599,001
M&T Bank Corp. (a) 11,447 575,784
1,174,785
Biotechnology - 0.68%
Life Technologies Corp. * 18,059 700,328
Building Materials & Construction - 0.80%
Chicago Bridge & Iron Company N.V. 33,058 426,779
KBR, Inc. 21,828 402,072
828,851
The accompanying notes are an integral part of the financial statements.
169
Copyright © 2012 www.secdatabase.com. All Rights Reserved.Please Consider the Environment Before Printing This Document

JOHN HANCOCK FUNDS II
PORTFOLIO OF INVESTMENTS - May 31, 2009 (Unaudited) - continued(showing percentage of total net assets)
Mid Cap Value Equity Fund (continued)Shares or
Principal
Amount Value
COMMON STOCKS (continued)
Business Services - 1.01%
Fluor Corp. 11,118 $ 522,323
Jacobs Engineering Group, Inc. * 12,212 523,895
1,046,218
Chemicals - 4.60%
Eastman Chemical Company 45,157 1,871,306
Lubrizol Corp. 31,079 1,388,299
PPG Industries, Inc. 34,045 1,513,981
4,773,586
Computers & Business Equipment - 0.23%
Brocade Communications Systems, Inc. * 32,058 235,306
Construction Materials - 0.72%
Cemex SA de CV, SADR * 76,889 750,432
Crude Petroleum & Natural Gas - 5.36%
EQT Corp. 18,856 702,386
Newfield Exploration Company * 34,805 1,257,157
Pioneer Natural Resources Company 30,227 849,983
Southwestern Energy Company * 30,064 1,306,882
Sunoco, Inc. 12,773 388,682
Ultra Petroleum Corp. * 23,318 1,055,839
5,560,929
Electrical Equipment - 2.45%
A.O. Smith Corp. 22,659 679,544
Cooper Industries, Ltd., Class A 56,666 1,859,778
2,539,322
Electrical Utilities - 4.19%
Allegheny Energy, Inc. 44,007 1,100,175
DTE Energy Company 22,615 684,104
Pepco Holdings, Inc. 81,197 1,053,937
Pinnacle West Capital Corp. 13,169 364,123
Wisconsin Energy Corp. 29,154 1,150,417
4,352,756
Electronics - 1.66%
Agilent Technologies, Inc. * 42,540 775,504
Celestica, Inc. * 144,297 950,917
1,726,421
Energy - 1.90%
McDermott International, Inc. * 23,399 514,076
Sempra Energy 32,025 1,462,902
1,976,978
Financial Services - 2.74%
CIT Group, Inc. (a) 469,150 1,796,845
Invesco, Ltd. 66,739 1,044,465
2,841,310
Forest Products - 1.14%
Rayonier, Inc. 29,625 1,185,000
Gas & Pipeline Utilities - 3.17%
Copyright © 2012 www.secdatabase.com. All Rights Reserved.Please Consider the Environment Before Printing This Document

El Paso Corp. 93,996 916,461
Enbridge, Inc. 41,644 1,478,778
Questar Corp. 26,427 895,611
3,290,850
Mid Cap Value Equity Fund (continued)Shares or
Principal
Amount Value
COMMON STOCKS (continued)
Healthcare Services - 1.75%
Covance, Inc. * 14,511 $ 609,752
Humana, Inc. * 19,765 619,237
McKesson Corp. 14,285 587,828
1,816,817
Homebuilders - 1.37%
Centex Corp. 30,345 255,808
D.R. Horton, Inc. 56,399 519,435
KB Home 20,254 303,810
Pulte Homes, Inc. (a) 39,326 346,069
1,425,122
Hotels & Restaurants - 0.30%
Starwood Hotels & Resorts Worldwide, Inc. 12,815 313,583
Household Appliances - 0.96%
Stanley Works 27,971 998,565
Industrial Machinery - 4.36%
AGCO Corp. * 17,437 503,232
Cameron International Corp. * 29,134 909,855
Cummins, Inc. 16,449 533,441
Ingersoll-Rand Company, Ltd., Class A 51,417 1,040,166
Manitowoc Company, Inc. 62,898 410,095
Parker-Hannifin Corp. 18,745 792,164
Terex Corp. * 25,420 341,136
4,530,089
Industrials - 0.47%
Foster Wheeler AG * 18,360 486,907
Insurance - 11.35%
Aon Corp. 25,873 931,428
Arch Capital Group, Ltd. * 5,384 306,403
Assurant, Inc. 38,788 916,560
Axis Capital Holdings, Ltd. 45,971 1,097,788
Everest Re Group, Ltd. 29,802 2,063,192
Lincoln National Corp. 54,085 1,024,911
Marsh & McLennan Companies, Inc. 29,140 551,329
PartnerRe, Ltd. 27,323 1,783,099
Willis Group Holdings, Ltd. 31,951 850,855
XL Capital, Ltd., Class A (a) 222,548 2,252,186
11,777,751
Internet Software - 1.43%
McAfee, Inc. * 37,868 1,485,562
Leisure Time - 2.58%
National Cinemedia, Inc. 57,486 719,150
Regal Entertainment Group, Class A 89,060 1,136,405
Royal Caribbean Cruises, Ltd. (a) 54,264 817,216
2,672,771
Manufacturing - 2.32%
Eaton Corp. 42,805 1,862,017
Rockwell Automation, Inc. 17,710 543,520
Copyright © 2012 www.secdatabase.com. All Rights Reserved.Please Consider the Environment Before Printing This Document

2,405,537
Medical-Hospitals - 0.34%
Universal Health Services, Inc., Class B 6,487 356,331
The accompanying notes are an integral part of the financial statements.
170
JOHN HANCOCK FUNDS II
PORTFOLIO OF INVESTMENTS - May 31, 2009 (Unaudited) - continued(showing percentage of total net assets)
Mid Cap Value Equity Fund (continued)Shares or
Principal
Amount Value
COMMON STOCKS (continued)
Mining - 1.14%
Freeport-McMoRan Copper & Gold, Inc.,
Class B 21,720 $ 1,182,220
Petroleum Services - 2.83%
BJ Services Company 72,497 1,133,853
Transocean, Ltd. * 8,992 714,684
Weatherford International, Ltd. * 52,395 1,084,577
2,933,114
Pharmaceuticals - 3.77%
Hospira, Inc. * 23,043 794,984
King Pharmaceuticals, Inc. * 67,455 638,124
Mylan, Inc. * (a) 187,606 2,478,275
3,911,383
Railroads & Equipment - 1.60%
CSX Corp. 27,472 872,511
Kansas City Southern * 47,558 784,231
1,656,742
Real Estate - 3.54%
Avalon Bay Communities, Inc., REIT 13,537 832,255
Boston Properties, Inc., REIT 8,882 429,178
Equity Residential, REIT 36,486 888,069
ProLogis, REIT 22,877 194,226
The St. Joe Company * 27,378 699,234
Ventas, Inc., REIT 20,765 630,426
3,673,388
Retail Trade - 3.55%
Bed Bath & Beyond, Inc. * 29,259 822,470
Family Dollar Stores, Inc. 30,482 922,690
Macy's, Inc. 74,870 874,482
Ritchie Brothers Auctioneers, Inc. (a) 46,665 1,068,629
3,688,271
Sanitary Services - 0.12%
Insituform Technologies, Inc., Class A * 8,782 128,129
Semiconductors - 5.07%
ASML Holding NV 30,250 626,175
Lam Research Corp. * 29,154 763,543
LSI Logic Corp. * 221,231 988,902
Maxim Integrated Products, Inc. 68,664 1,114,417
Microchip Technology, Inc. (a) 46,509 1,003,199
Micron Technology, Inc. * 150,695 762,517
5,258,753
Copyright © 2012 www.secdatabase.com. All Rights Reserved.Please Consider the Environment Before Printing This Document

Software - 2.44%
Adobe Systems, Inc. * 27,038 761,931
Autodesk, Inc. * 38,334 822,648
BMC Software, Inc. * 27,821 948,696
2,533,275
Steel - 1.72%
Nucor Corp. 25,330 1,112,240
United States Steel Corp. 19,738 672,671
1,784,911
Telecommunications Equipment &
Services - 0.75%
Embarq Corp. 18,595 781,362
Mid Cap Value Equity Fund (continued)Shares or
Principal
Amount Value
COMMON STOCKS (continued)
Telephone - 2.71%
CenturyTel, Inc. 24,904 $ 768,288
Qwest Communications International, Inc. (a) 316,963 1,381,959
Windstream Corp. 79,167 665,795
2,816,042
Tires & Rubber - 0.34%
Goodyear Tire & Rubber Company * 31,089 355,969
Tobacco - 3.12%
Lorillard, Inc. 47,346 3,235,152
Toys, Amusements & Sporting Goods - 0.59%
Hasbro, Inc. 24,154 613,753
TOTAL COMMON STOCKS (Cost $113,736,236) $ 100,874,081
CONVERTIBLE BONDS - 0.29%
Telephone - 0.29%
Qwest Communications International, Inc.
3.50% due 11/15/2025 302,000 303,888
TOTAL CONVERTIBLE BONDS (Cost $408,455) $ 303,888
SHORT TERM INVESTMENTS - 19.08%
Federal Home Loan Bank Discount Notes
zero coupon due 06/01/2009 $ 11,100,000 $ 11,100,000
John Hancock Collateral Investment Trust,
0.7339% (c)(g) 870,653 8,706,529
TOTAL SHORT TERM INVESTMENTS
(Cost $19,806,530) $ 19,806,529
Total Investments (Mid Cap Value Equity Fund)
(Cost $133,951,221) - 116.54% $ 120,984,498
Other assets and liabilities, net - (16.54)% (17,168,178)
TOTAL NET ASSETS - 100.00% $ 103,816,320
Mid Value FundShares or
Principal
Amount Value
COMMON STOCKS - 92.73%
Air Travel - 1.78%
Delta Air Lines, Inc. * 12,800 $ 74,368
Southwest Airlines Company 334,500 2,254,530
Copyright © 2012 www.secdatabase.com. All Rights Reserved.Please Consider the Environment Before Printing This Document

2,328,898
Aluminum - 0.75%
Alcoa, Inc. 106,100 978,242
Apparel & Textiles - 0.52%
Cintas Corp. 29,100 677,739
Auto Parts - 1.59%
BorgWarner, Inc. 38,300 1,235,175
TRW Automotive Holdings Corp. * 41,000 365,720
WABCO Holdings, Inc. 28,600 485,628
2,086,523
Auto Services - 0.86%
Hertz Global Holdings, Inc. * 163,800 1,122,030
The accompanying notes are an integral part of the financial statements.
171
JOHN HANCOCK FUNDS II
PORTFOLIO OF INVESTMENTS - May 31, 2009 (Unaudited) - continued(showing percentage of total net assets)
Mid Value Fund (continued)Shares or
Principal
Amount Value
COMMON STOCKS (continued)
Banking - 5.60%
Commerce Bancshares, Inc. 27,700 $ 871,719
First Horizon National Corp. 96,233 1,168,269
First Niagara Financial Group, Inc. 52,300 663,687
Greenhill & Company, Inc. 7,200 529,200
KeyCorp 130,300 651,500
Northern Trust Corp. 13,700 789,805
Valley National Bancorp 30,730 373,062
WestAmerica Bancorp 23,200 1,203,152
Wilmington Trust Corp. 75,300 1,085,073
7,335,467
Biotechnology - 0.22%
Biogen Idec, Inc. * 5,600 290,024
Broadcasting - 0.58%
Cox Radio, Inc., Class A * 5,700 27,873
Discovery Communications, Inc., Series A * 5,000 112,250
Discovery Communications, Inc., Series C * 29,600 616,864
756,987
Business Services - 3.16%
Automatic Data Processing, Inc. 8,300 315,483
Equifax, Inc. 20,100 547,122
Manpower, Inc. 43,900 1,866,189
Total Systems Services, Inc. 103,600 1,414,140
4,142,934
Cable & Television - 1.88%
Cablevision Systems Corp., Class A 2,100 39,963
DISH Network Corp. * 66,500 1,090,600
Scripps Networks Interactive, Inc., Class A 40,900 1,134,566
Time Warner Cable, Inc. * 6,433 198,072
2,463,201
Cellular Communications - 2.33%
Motorola, Inc. 236,300 1,431,978
Copyright © 2012 www.secdatabase.com. All Rights Reserved.Please Consider the Environment Before Printing This Document

Telephone & Data Systems, Inc. - Special
Shares 43,100 1,257,658
Telephone & Data Systems, Inc. 12,000 363,720
3,053,356
Colleges & Universities - 0.77%
Career Education Corp. * 50,200 1,008,016
Computers & Business Equipment - 1.75%
National Instruments Corp. 31,300 663,873
Seagate Technology 187,200 1,630,512
2,294,385
Cosmetics & Toiletries - 2.67%
Alberto-Culver Company 67,300 1,564,052
Estee Lauder Companies, Inc., Class A 37,700 1,247,116
International Flavors & Fragrances, Inc. 21,700 692,230
3,503,398
Crude Petroleum & Natural Gas - 1.64%
Cimarex Energy Company 65,800 2,146,396
Electrical Equipment - 1.38%
Molex, Inc. 131,500 1,814,700
Electrical Utilities - 6.09%
Ameren Corp. 38,800 902,488
Mid Value Fund (continued)Shares or
Principal
Amount Value
COMMON STOCKS (continued)
Electrical Utilities (continued)
American Electric Power Company, Inc. 28,200 $ 742,788
Constellation Energy Group, Inc. 21,800 594,704
FirstEnergy Corp. 7,700 290,983
Integrys Energy Group, Inc. 17,900 484,911
Mirant Corp. * 140,900 2,199,449
Pepco Holdings, Inc. 33,200 430,936
Pinnacle West Capital Corp. 45,900 1,269,135
PNM Resources, Inc. 61,300 567,025
Teco Energy, Inc. 44,500 499,290
7,981,709
Electronics - 1.44%
AVX Corp. 111,200 1,031,936
Harman International Industries, Inc. 8,900 165,896
Tyco Electronics, Ltd. 39,600 687,852
1,885,684
Energy - 3.88%
Duke Energy Corp. 73,600 1,041,440
Nexen, Inc. 112,400 2,795,388
NRG Energy, Inc. * 55,300 1,244,250
5,081,078
Financial Services - 2.84%
Discover Financial Services 241,700 2,310,652
Janus Capital Group, Inc. 138,500 1,404,390
3,715,042
Food & Beverages - 4.91%
Campbell Soup Company 50,800 1,408,176
Coca-Cola Enterprises, Inc. 33,800 563,108
Hershey Company 35,000 1,232,700
McCormick & Company, Inc. 32,400 988,848
Sysco Corp. 73,400 1,758,664
Copyright © 2012 www.secdatabase.com. All Rights Reserved.Please Consider the Environment Before Printing This Document

Tootsie Roll Industries, Inc. 21,228 477,630
6,429,126
Forest Products - 2.09%
Weyerhaeuser Company 81,700 2,743,486
Gas & Pipeline Utilities - 1.02%
NiSource, Inc. 4,100 43,829
Williams Companies, Inc. 77,300 1,297,094
1,340,923
Gold - 0.20%
AngloGold Ashanti, Ltd., SADR 6,300 266,679
Healthcare Products - 2.11%
Boston Scientific Corp. * 56,200 528,280
Mead Johnson Nutrition Company * 9,700 302,252
St. Jude Medical, Inc. * 13,000 507,260
Stryker Corp. 30,600 1,176,264
Zimmer Holdings, Inc. * 5,700 253,935
2,767,991
Healthcare Services - 3.68%
Healthsouth Corp. * 187,100 2,215,264
Lincare Holdings, Inc. * 58,900 1,282,842
Weight Watchers International, Inc. 56,400 1,321,452
4,819,558
The accompanying notes are an integral part of the financial statements.
172
JOHN HANCOCK FUNDS II
PORTFOLIO OF INVESTMENTS - May 31, 2009 (Unaudited) - continued(showing percentage of total net assets)
Mid Value Fund (continued)Shares or
Principal
Amount Value
COMMON STOCKS (continued)
Holdings Companies/Conglomerates - 0.35%
Textron, Inc. 39,700 $ 456,550
Household Products - 0.71%
Fortune Brands, Inc. 26,700 934,767
Industrial Machinery - 0.49%
Dover Corp. 20,400 641,376
Insurance - 6.74%
Allstate Corp. 45,000 1,157,850
Arthur J. Gallagher & Company 15,300 320,535
Axis Capital Holdings, Ltd. 17,500 417,900
CIGNA Corp. 42,800 948,876
Cincinnati Financial Corp. 46,600 1,053,626
First American Corp. 17,900 408,478
Marsh & McLennan Companies, Inc. 63,300 1,197,636
Montpelier Re Holdings, Ltd. 38,300 512,454
OneBeacon Insurance Group, Ltd. 34,900 379,014
Progressive Corp. * 91,900 1,482,347
Prudential Financial, Inc. 6,400 255,424
The Travelers Companies, Inc. 17,200 699,352
8,833,492
International Oil - 1.75%
Murphy Oil Corp. 38,900 2,295,489
Internet Retail - 1.06%
Copyright © 2012 www.secdatabase.com. All Rights Reserved.Please Consider the Environment Before Printing This Document

Expedia, Inc. * 39,600 685,476
Liberty Media Corp. - Interactive A * 119,300 699,098
1,384,574
Internet Software - 0.77%
Electronic Arts, Inc. * 44,100 1,013,859
Leisure Time - 1.20%
International Game Technology 90,700 1,574,552
Life Sciences - 0.32%
Waters Corp. * 9,600 415,872
Liquor - 0.35%
Brown Forman Corp., Class B 10,500 460,425
Metal & Metal Products - 0.74%
Franco-Nevada Corp. 34,800 967,419
Mining - 0.61%
Freeport-McMoRan Copper & Gold, Inc.,
Class B 10,200 555,186
Gold Fields, Ltd., SADR 17,700 240,366
795,552
Paper - 1.32%
Domtar Corp. * 435,600 496,584
International Paper Company 14,500 208,365
Temple-Inland, Inc. 79,900 1,021,122
1,726,071
Petroleum Services - 3.55%
Baker Hughes, Inc. 12,300 480,438
BJ Services Company 102,900 1,609,356
Petro-Canada 57,500 2,560,475
4,650,269
Mid Value Fund (continued)Shares or
Principal
Amount Value
COMMON STOCKS (continued)
Pharmaceuticals - 0.64%
Onyx Pharmaceuticals, Inc. * 15,300 $ 361,998
OSI Pharmaceuticals, Inc. * 4,200 141,960
Sepracor, Inc. * 21,100 330,215
834,173
Publishing - 3.08%
Meredith Corp. 79,600 2,146,016
Scholastic Corp. 63,400 1,242,640
The Washington Post Company, Class B 1,800 648,000
4,036,656
Real Estate - 4.23%
Alexandria Real Estate Equities, Inc., REIT 14,000 502,600
Duke Realty Corp., REIT 61,200 582,012
Kimco Realty Corp., REIT 88,400 1,033,396
SL Green Realty Corp., REIT 26,200 599,980
The St. Joe Company * 64,100 1,637,114
Vornado Realty Trust, REIT 12,900 601,914
Weingarten Realty Investors, REIT 36,900 585,972
5,542,988
Retail Grocery - 0.46%
Whole Foods Market, Inc. 31,900 601,953
Retail Trade - 3.48%
Bed Bath & Beyond, Inc. * 26,100 733,671
CarMax, Inc. * 49,800 558,258
Copyright © 2012 www.secdatabase.com. All Rights Reserved.Please Consider the Environment Before Printing This Document

The Gap, Inc. 140,900 2,515,065
Tiffany & Company 26,700 757,479
4,564,473
Sanitary Services - 0.94%
Nalco Holding Company 70,800 1,229,088
Semiconductors - 2.30%
ASML Holding NV 19,600 405,720
Novellus Systems, Inc. * 105,100 1,884,443
Teradyne, Inc. * 61,700 441,155
Xilinx, Inc. 13,900 288,286
3,019,604
Telephone - 0.60%
Harris Corp. 25,500 792,540
Toys, Amusements & Sporting Goods - 1.30%
Mattel, Inc. 108,700 1,696,807
TOTAL COMMON STOCKS (Cost $115,115,121) $ 121,502,121
CORPORATE BONDS - 1.25%
Auto Services - 0.42%
Hertz Global Holdings, Inc.
5.25% due 06/01/2014 539,000 543,366
Holdings Companies/Conglomerates - 0.46%
Textron Inc, Series TXT
4.50% due 05/01/2013 550,000 605,220
Steel - 0.37%
United States Steel Corp.
4.00% due 05/15/2014 391,000 482,885
TOTAL CORPORATE BONDS (Cost $1,542,952) $ 1,631,471
The accompanying notes are an integral part of the financial statements.
173
JOHN HANCOCK FUNDS II
PORTFOLIO OF INVESTMENTS - May 31, 2009 (Unaudited) - continued (showing percentage of total net assets)
Mid Value Fund (continued)Shares or
Principal
Amount Value
CONVERTIBLE BONDS - 0.38%
Aluminum - 0.08%
Alcoa, Inc.
5.25% due 03/15/2014 $ 62,000 $ 98,890
Healthcare Products - 0.05%
Henry Schein, Inc.
3.00% due 08/15/2034 57,000 63,127
Insurance - 0.22%
Prudential Financial, Inc.
0.3663% due 12/15/2037 (b) 290,000 289,420
Semiconductors - 0.03%
Teradyne, Inc., Series TER
4.50% due 03/15/2014 28,000 41,265
TOTAL CONVERTIBLE BONDS (Cost $427,835) $ 492,702
SHORT TERM INVESTMENTS - 21.02%
GDF Suez
0.26% due 06/10/2009 $ 4,187,000 $ 4,186,728
Old Line Funding LLC
0.37% due 08/10/2009 3,000,000 2,997,842
T. Rowe Price Reserve Investment Fund,
0.5211% 20,362,170 20,362,170
Copyright © 2012 www.secdatabase.com. All Rights Reserved.Please Consider the Environment Before Printing This Document

TOTAL SHORT TERM INVESTMENTS
(Cost $27,546,740) $ 27,546,740
Total Investments (Mid Value Fund)
(Cost $144,632,648) - 115.38% $ 151,173,034
Other assets and liabilities, net - (15.38)% (20,152,157)
TOTAL NET ASSETS - 100.00% $ 131,020,877
Natural Resources FundShares or
Principal
Amount Value
COMMON STOCKS - 94.82%
Coal - 4.13%
CONSOL Energy, Inc. 419,986 $ 17,286,624
Peabody Energy Corp. 271,300 9,218,774
26,505,398
Crude Petroleum & Natural Gas - 18.77%
Chesapeake Energy Corp. 713,600 16,170,176
Devon Energy Corp. 152,600 9,650,424
EOG Resources, Inc. 355,969 26,053,371
EQT Corp. 312,760 11,650,310
Marathon Oil Corp. 370,509 11,811,827
Newfield Exploration Company * 251,152 9,071,610
Noble Energy, Inc. 148,964 8,860,379
Ultra Petroleum Corp. * 145,500 6,588,240
XTO Energy, Inc. 480,132 20,535,246
120,391,583
Diversified Minerals - 4.21%
Vale SA, SADR 1,663,604 27,000,293
Domestic Oil - 5.44%
Denbury Resources, Inc. * 706,500 12,144,735
Natural Resources Fund (continued)Shares or
Principal
Amount Value
COMMON STOCKS (continued)
Domestic Oil (continued)
Suncor Energy, Inc. - CAD 649,214 $ 22,745,533
34,890,268
Gas & Pipeline Utilities - 5.53%
Eni SpA, SADR (a) 131,000 6,350,880
Gazprom OAO, SADR 957,492 22,491,366
Williams Companies, Inc. 395,600 6,638,168
35,480,414
Gold - 4.76%
AngloGold Ashanti, Ltd., SADR 292,941 12,400,193
Barrick Gold Corp. 233,356 8,886,196
Gold Fields, Ltd. 673,370 9,221,067
30,507,456
International Oil - 23.95%
BP PLC, SADR 393,427 19,474,636
Canadian Natural Resources, Ltd. 504,133 29,880,876
ConocoPhillips 104,128 4,773,228
Copyright © 2012 www.secdatabase.com. All Rights Reserved.Please Consider the Environment Before Printing This Document

EnCana Corp. - CAD 383,154 21,057,238
Exxon Mobil Corp. 182,405 12,649,787
Lukoil Oil Company, ADR (a) 128,727 6,822,531
Petroleo Brasileiro SA, ADR 637,896 28,086,561
Royal Dutch Shell PLC, ADR 363,369 19,589,223
Talisman Energy, Inc. 695,998 11,290,245
153,624,325
Metal & Metal Products - 7.24%
Alumina, Ltd. 3,710,556 4,070,915
Cameco Corp. 586,022 16,174,207
Sumitomo Metal Industries, Ltd. 2,391,000 6,489,547
Vedanta Resources PLC 760,160 19,694,463
46,429,132
Mining - 4.97%
Anglo American PLC 208,648 6,107,272
Anglo Platinum, Ltd. 200,756 14,034,008
Compania de Minas Buenaventura SA, ADR 61,900 1,753,627
Xstrata PLC 875,511 9,984,108
31,879,015
Petroleum Services - 12.59%
Baker Hughes, Inc. 285,800 11,163,348
Halliburton Company 352,802 8,089,750
Petro-Canada 290,431 12,636,110
Reliance Industries, Ltd., GDR (a) 99,585 9,717,814
Total SA, SADR (a) 329,462 18,993,484
Valero Energy Corp. 517,066 11,566,766
Weatherford International, Ltd. * 412,600 8,540,820
80,708,092
Steel - 3.23%
ArcelorMittal (a) 356,025 11,812,909
POSCO, SADR (a) 105,800 8,875,562
20,688,471
TOTAL COMMON STOCKS (Cost $627,681,919) $ 608,104,447
The accompanying notes are an integral part of the financial statements.
174
JOHN HANCOCK FUNDS II
PORTFOLIO OF INVESTMENTS - May 31, 2009 (Unaudited) - continued(showing percentage of total net assets)
Natural Resources Fund (continued)Shares or
Principal
Amount Value
PREFERRED STOCKS - 0.10%
Mining - 0.10%
Anglo Platinum, Ltd., 6.38% (i) 32,311 $ 661,978
TOTAL PREFERRED STOCKS (Cost $952,131) $ 661,978
SHORT TERM INVESTMENTS - 6.26%
John Hancock Collateral Investment
Trust, 0.7339% (c)(g) $ 4,015,875 $ 40,158,745
TOTAL SHORT TERM INVESTMENTS
(Cost $40,158,745) $ 40,158,745
REPURCHASE AGREEMENTS - 4.66%
Copyright © 2012 www.secdatabase.com. All Rights Reserved.Please Consider the Environment Before Printing This Document

Bank of New York Tri-Party
Repurchase Agreement dated
05/29/2009 at 0.18% to be
repurchased at $29,900,449 on
06/01/2009, collateralized by
$50,823,103 Government National
Mortgage Association, 7.00% due
11/15/2038 (valued at
$30,498,000, including interest) $ 29,900,000 $ 29,900,000
TOTAL REPURCHASE AGREEMENTS
(Cost $29,900,000) $ 29,900,000
Total Investments (Natural Resources Fund)
(Cost $698,692,795) - 105.84% $ 678,825,170
Other assets and liabilities, net - (5.84)% (37,476,571)
TOTAL NET ASSETS - 100.00% $ 641,348,599
Optimized All Cap FundShares or
Principal
Amount Value
COMMON STOCKS - 100.12%
Aerospace - 1.47%
General Dynamics Corp. 876 $ 49,844
Agriculture - 0.71%
Monsanto Company 294 24,152
Air Travel - 1.58%
Continental Airlines, Inc., Class B * 1,483 13,822
Delta Air Lines, Inc. * 4,452 25,866
Hawaiian Holdings, Inc. * 2,651 13,944
53,632
Auto Parts - 0.86%
LKQ Corp. * 1,896 28,990
Banking - 2.40%
Banco Santander Central Hispano
SA-Sponsored ADR 1,981 21,276
PNC Financial Services Group, Inc. 902 41,086
Valley National Bancorp 1,547 18,781
81,143
Building Materials & Construction - 1.02%
Chicago Bridge & Iron Company N.V. 1,255 16,202
Owens Corning, Inc. * 1,305 18,179
34,381
Optimized All Cap Fund (continued)Shares or
Principal
Amount Value
COMMON STOCKS (continued)
Business Services - 1.76%
Acxiom Corp. 1,482 $ 15,843
Convergys Corp. * 1,789 16,548
Deluxe Corp. 931 13,164
FactSet Research Systems, Inc. 266 14,072
59,627
Cable & Television - 2.36%
Copyright © 2012 www.secdatabase.com. All Rights Reserved.Please Consider the Environment Before Printing This Document

Comcast Corp., Class A 2,087 28,738
DISH Network Corp. * 2,255 36,982
Viacom, Inc., Class B * 641 14,211
79,931
Cellular Communications - 0.78%
NII Holdings, Inc. * 1,293 26,455
Chemicals - 0.40%
Innophos Holdings, Inc. 869 13,548
Coal - 0.62%
Massey Energy Company 913 20,899
Computers & Business Equipment - 8.41%
Apple, Inc. * 256 34,767
Cisco Systems, Inc. * 2,884 53,354
Diebold, Inc. 618 15,277
EMC Corp. * 2,298 27,002
Hewlett-Packard Company 926 31,808
International Business Machines Corp. 865 91,932
Metavante Technologies, Inc. * 1,184 30,370
284,510
Cosmetics & Toiletries - 2.52%
Colgate-Palmolive Company 1,292 85,207
Crude Petroleum & Natural Gas - 1.33%
Forest Oil Corp. * 1,067 20,284
Sunoco, Inc. 816 24,831
45,115
Electrical Equipment - 2.94%
AMETEK, Inc. 1,248 39,250
Emerson Electric Company 1,880 60,329
99,579
Electrical Utilities - 2.72%
CMS Energy Corp. 4,217 47,821
Dominion Resources, Inc. 466 14,814
FirstEnergy Corp. 778 29,401
92,036
Electronics - 0.74%
Belden, Inc. 786 14,399
Enersys * 665 10,773
25,172
Energy - 0.40%
GT Solar International, Inc. * 2,094 13,443
Financial Services - 7.49%
Bank of America Corp. 902 10,166
Broadridge Financial Solutions, Inc. 1,565 25,916
Charles Schwab Corp. 1,044 18,374
Goldman Sachs Group, Inc. 307 44,383
The accompanying notes are an integral part of the financial statements.
175
JOHN HANCOCK FUNDS II
PORTFOLIO OF INVESTMENTS - May 31, 2009 (Unaudited) - continued(showing percentage of total net assets)
Optimized All Cap Fund (continued)Shares or
Principal
Amount Value
Copyright © 2012 www.secdatabase.com. All Rights Reserved.Please Consider the Environment Before Printing This Document

COMMON STOCKS (continued)
Financial Services (continued)
JPMorgan Chase & Company 1,271 $ 46,900
Morgan Stanley 526 15,948
NASDAQ OMX Group, Inc. * 1,523 32,151
SLM Corp. * 3,765 24,887
TD Ameritrade Holding Corp. * 1,041 17,739
Wells Fargo & Company 673 17,161
253,625
Food & Beverages - 3.09%
Coca-Cola Enterprises, Inc. 1,274 21,225
Flowers Foods, Inc. 1,509 31,945
General Mills, Inc. 344 17,606
The Coca-Cola Company 686 33,724
104,500
Funeral Services - 0.64%
Hillenbrand, Inc. 1,267 21,742
Gas & Pipeline Utilities - 1.41%
Eni SpA, SADR 982 47,607
Healthcare Products - 7.51%
Baxter International, Inc. 911 46,634
Covidien, Ltd. 1,651 58,974
Gen-Probe, Inc. * 633 26,985
Herbalife, Ltd. 791 23,105
Johnson & Johnson 1,055 58,194
St. Jude Medical, Inc. * 1,032 40,268
254,160
Hotels & Restaurants - 0.72%
CEC Entertainment, Inc. * 431 13,848
Yum! Brands, Inc. 303 10,493
24,341
Household Products - 1.12%
Jarden Corp. * 903 16,055
Tupperware Brands Corp. 900 21,888
37,943
Industrials - 1.12%
Companhia de Saneamento Basico do
Estado de Sao Paulo, ADR * 1,214 37,937
Insurance - 4.16%
ACE, Ltd. 1,302 57,275
Allied World Assurance Holdings, Ltd. 1,066 40,242
American Financial Group, Inc. 885 18,957
Assurant, Inc. 1,023 24,173
140,647
International Oil - 5.00%
ConocoPhillips 1,044 47,857
Exxon Mobil Corp. 1,163 80,654
Sasol, Ltd., SADR 1,082 40,889
169,400
Internet Retail - 0.77%
Amazon.com, Inc. * 332 25,893
Internet Software - 1.91%
Shanda Interactive Entertainment, Ltd. * 534 30,769
Optimized All Cap Fund (continued)Shares or
Principal
Amount Value
Copyright © 2012 www.secdatabase.com. All Rights Reserved.Please Consider the Environment Before Printing This Document

COMMON STOCKS (continued)
Internet Software (continued)
Symantec Corp. * 2,167 $ 33,784
64,553
Leisure Time - 0.63%
Bally Technologies, Inc. * 767 21,476
Life Sciences - 0.45%
PerkinElmer, Inc. 946 15,391
Manufacturing - 0.30%
Snap-on, Inc. 329 10,248
Mining - 1.61%
Anglo American PLC, ADR 3,802 54,559
Petroleum Services - 5.54%
ENSCO International, Inc. 1,021 39,707
Noble Corp. 1,676 57,604
Repsol YPF SA, ADR 760 17,092
Transocean, Ltd. * 920 73,122
187,525
Pharmaceuticals - 5.03%
Abbott Laboratories 936 42,176
Celgene Corp. * 716 30,244
Gilead Sciences, Inc. * 954 41,117
Pfizer, Inc. 3,730 56,659
170,196
Real Estate - 1.80%
Apartment Investment & Management
Company, Class A, REIT 1,476 13,948
Hospitality Properties Trust, REIT 964 13,467
HRPT Properties Trust, REIT 3,794 18,022
Macerich Company, REIT (a) 923 15,580
61,017
Retail - 0.40%
Pantry, Inc. * 671 13,366
Retail Grocery - 0.38%
Spartan Stores, Inc. 1,045 12,968
Retail Trade - 5.30%
Aaron, Inc., Class B 1,180 38,432
CVS Caremark Corp. 327 9,745
Dollar Tree, Inc. * 1,032 46,203
Hot Topic, Inc. * 1,215 8,760
Ross Stores, Inc. 1,318 51,613
TJX Companies, Inc. 839 24,759
179,512
Sanitary Services - 0.74%
Republic Services, Inc. 535 12,192
Stericycle, Inc. * 260 12,995
25,187
Semiconductors - 3.96%
Intel Corp. 2,065 32,462
PMC-Sierra, Inc. * 3,319 25,191
Skyworks Solutions, Inc. * 3,437 32,755
Taiwan Semiconductor
Manufacturing Company, Ltd., SADR 3,994 43,694
134,102
The accompanying notes are an integral part of the financial statements.
176
Copyright © 2012 www.secdatabase.com. All Rights Reserved.Please Consider the Environment Before Printing This Document

JOHN HANCOCK FUNDS II
PORTFOLIO OF INVESTMENTS - May 31, 2009 (Unaudited) - continued(showing percentage of total net assets)
Optimized All Cap Fund (continued)Shares or
Principal
Amount Value
COMMON STOCKS (continued)
Software - 3.75%
Nuance Communications, Inc. * 2,261 $ 28,036
Oracle Corp. 2,780 54,460
Red Hat, Inc. * 857 17,097
Sybase, Inc. * 835 27,163
126,756
Telephone - 1.74%
AT&T, Inc. 1,034 25,633
Nippon Telegraph & Telephone Corp., ADR 1,594 33,107
58,740
Transportation - 0.53%
Genco Shipping & Trading, Ltd. 682 17,834
TOTAL COMMON STOCKS (Cost $3,383,707) $ 3,388,889
SHORT TERM INVESTMENTS - 0.45%
John Hancock Collateral Investment
Trust, 0.7339% (c)(g) $ 1,513 $ 15,128
TOTAL SHORT TERM INVESTMENTS
(Cost $15,128) $ 15,128
Total Investments (Optimized All Cap Fund)
(Cost $3,398,835) - 100.57% $ 3,404,017
Other assets and liabilities, net - (0.57)% (19,243)
TOTAL NET ASSETS - 100.00% $ 3,384,774
Real Estate Equity FundShares or
Principal
Amount Value
COMMON STOCKS - 89.26%
Hotels & Restaurants - 2.47%
Marriott International, Inc., Class A 147,100 $ 3,436,256
Starwood Hotels & Resorts Worldwide, Inc. 23,100 565,257
4,001,513
Leisure Time - 0.96%
Gaylord Entertainment Company * (a) 109,300 1,552,060
Paper - 1.79%
Plum Creek Timber Company, Inc. (a) 83,300 2,886,345
Real Estate - 84.04%
Alexandria Real Estate Equities, Inc., REIT (a) 48,800 1,751,920
AMB Property Corp., REIT 176,900 3,157,665
Avalon Bay Communities, Inc., REIT 110,616 6,800,672
Boston Properties, Inc., REIT 94,050 4,544,496
BRE Properties, Inc., Class A, REIT 178,640 4,462,427
Brookfield Properties Corp. REIT 307,600 2,325,456
Camden Property Trust, REIT 194,700 5,844,894
CBL & Associates Properties, Inc., REIT (a) 412,414 2,569,339
Cousins Properties, Inc., REIT (a) 129,100 1,161,900
Copyright © 2012 www.secdatabase.com. All Rights Reserved.Please Consider the Environment Before Printing This Document

DCT Industrial Trust, Inc., REIT 525,900 2,356,032
Douglas Emmett, Inc., REIT 356,300 3,313,590
EastGroup Properties, Inc., REIT 83,200 2,837,952
Equity One, Inc., REIT (a) 334,700 4,833,068
Equity Residential, REIT 271,950 6,619,263
Real Estate Equity Fund (continued)Shares or
Principal
Amount Value
COMMON STOCKS (continued)
Real Estate (continued)
Essex Property Trust, Inc., REIT 65,400 $ 4,453,086
Federal Realty Investment Trust, REIT 89,880 4,732,182
Healthcare Realty Trust, Inc., REIT 191,000 3,145,770
Highwoods Properties, Inc., REIT 101,900 2,304,978
Host Hotels & Resorts, Inc., REIT 399,650 3,748,717
Kilroy Realty Corp., REIT 187,200 3,985,488
Kimco Realty Corp., REIT 480,900 5,621,721
LaSalle Hotel Properties, REIT 131,020 1,792,354
Macerich Company, REIT (a) 190,500 3,215,640
Mack-Cali Realty Corp., REIT 50,610 1,250,573
Post Properties, Inc., REIT 102,200 1,556,506
Public Storage, REIT 85,100 5,668,511
Regency Centers Corp., REIT 187,450 6,678,844
Simon Property Group, Inc., REIT 258,419 13,817,664
SL Green Realty Corp., REIT (a) 168,900 3,867,810
Taubman Centers, Inc., REIT 127,200 3,146,928
The St. Joe Company * 38,800 990,952
Vornado Realty Trust, REIT 162,043 7,560,926
Washington Real Estate Investment Trust,
REIT (a) 108,800 2,378,368
Weingarten Realty Investors, REIT 214,200 3,401,496
135,897,188
TOTAL COMMON STOCKS (Cost $166,147,148) $ 144,337,106
CONVERTIBLE BONDS - 9.15%
Real Estate - 9.15%
Alexandria Real Estate Equities Inc, Series 144A
8.00% due 04/15/2029 (f) 1,844,000 1,936,200
Boston Properties LP
2.875% due 02/15/2037 702,000 602,842
General Growth Properties LP
3.98% due 04/15/2027 ^ (f) 7,681,000 2,649,945
Kilroy Realty LP
3.25% due 04/15/2012 (f) 3,538,000 2,803,925
Macerich Company
3.25% due 03/15/2012 (f) 2,353,000 1,804,702
ProLogis
2.25% due 04/01/2037 3,622,000 2,816,105
SL Green Realty Corp.
3.00% due 03/30/2027 (f) 2,671,000 2,180,204
14,793,923
TOTAL CONVERTIBLE BONDS (Cost $13,831,347) $ 14,793,923
SHORT TERM INVESTMENTS - 15.38%
John Hancock Collateral Investment
Trust, 0.7339% (c)(g) $ 20,363,399 $ 20,363,399
T. Rowe Price Reserve Investment Fund,
0.5211% 4,505,944 4,505,944
TOTAL SHORT TERM INVESTMENTS
(Cost $24,869,343) $ 24,869,343
Copyright © 2012 www.secdatabase.com. All Rights Reserved.Please Consider the Environment Before Printing This Document

The accompanying notes are an integral part of the financial statements.
177
JOHN HANCOCK FUNDS II
PORTFOLIO OF INVESTMENTS - May 31, 2009 (Unaudited) - continued(showing percentage of total net assets)
Real Estate Equity Fund (continued)Shares or
Principal
Amount Value
REPURCHASE AGREEMENTS - 0.22%
Repurchase Agreement with State
Street Corp. dated 05/29/2009 at
0.07% to be repurchased at
$361,002 on 6/1/2009,
collateralized by $380,000 Federal
Home Loan Mortgage Corp.,
5.625% due 11/23/2035 (valued at
$368,372, including interest) $ 361,000 $ 361,000
TOTAL REPURCHASE AGREEMENTS
(Cost $361,000) $ 361,000
Total Investments (Real Estate Equity Fund)
(Cost $205,208,838) - 114.01% $ 184,361,372
Other assets and liabilities, net - (14.01)% (22,655,946)
TOTAL NET ASSETS - 100.00% $ 161,705,426
Real Estate Securities FundShares or
Principal
Amount Value
COMMON STOCKS - 98.72%
Real Estate - 98.72%
AMB Property Corp., REIT 89,400 $ 1,595,790
American Campus Communities, Inc., REIT 96,700 2,223,133
Avalon Bay Communities, Inc., REIT 51,137 3,143,903
BioMed Realty Trust, Inc., REIT 108,250 1,064,097
Boston Properties, Inc., REIT 67,100 3,242,272
Brandywine Realty Trust, REIT 73,950 550,927
Camden Property Trust, REIT 18,950 568,879
Cogdell Spencer, Inc., REIT 79,000 296,250
DiamondRock Hospitality Company, REIT 36,750 238,875
Digital Realty Trust, Inc., REIT 74,268 2,656,566
Duke Realty Corp., REIT 159,100 1,513,041
Entertainment Properties Trust, REIT 12,393 251,826
Equity Lifestyle Properties, Inc., REIT 13,261 520,362
Equity Residential, REIT 132,410 3,222,859
Essex Property Trust, Inc., REIT 20,300 1,382,227
HCP, Inc., REIT 87,350 2,029,140
Host Hotels & Resorts, Inc., REIT 152,250 1,428,105
Kilroy Realty Corp., REIT 63,450 1,350,851
Kimco Realty Corp., REIT 226,200 2,644,278
Kite Realty Group Trust, REIT 71,600 231,984
LaSalle Hotel Properties, REIT 20,200 276,336
LTC Properties, Inc., REIT 27,987 582,409
Macerich Company, REIT (a) 17,100 288,648
Medical Properties Trust, Inc., REIT 129,800 817,740
Nationwide Health Properties, Inc., REIT 93,129 2,474,438
Copyright © 2012 www.secdatabase.com. All Rights Reserved.Please Consider the Environment Before Printing This Document

Post Properties, Inc., REIT 61,175 931,695
ProLogis, REIT (a) 365,350 3,101,822
Public Storage, REIT 75,180 5,007,740
Regency Centers Corp., REIT 87,470 3,116,556
Senior Housing Properties Trust, REIT 127,190 2,130,433
Simon Property Group, Inc., REIT 127,386 6,811,329
SL Green Realty Corp., REIT (a) 57,300 1,312,170
Sunstone Hotel Investors, Inc., REIT 103,250 599,883
Ventas, Inc., REIT 88,374 2,683,035
Real Estate Securities Fund (continued)Shares or
Principal
Amount Value
COMMON STOCKS (continued)
Real Estate (continued)
Vornado Realty Trust, REIT 66,128 $ 3,085,532
Weingarten Realty Investors, REIT 48,050 763,034
64,138,165
TOTAL COMMON STOCKS (Cost $62,877,915) $ 64,138,165
SHORT TERM INVESTMENTS - 1.39%
John Hancock Collateral Investment
Trust, 0.7339% (c)(g) $ 90,330 $ 903,301
TOTAL SHORT TERM INVESTMENTS
(Cost $903,301) $ 903,301
REPURCHASE AGREEMENTS - 1.38%
Repurchase Agreement with State
Street Corp. dated 05/29/2009 at
0.07% to be repurchased at
$898,005 on 06/01/2009,
collateralized by $895,000 Federal
Home Loan Mortgage Corp.,
5.26% due 08/14/2018 (valued at
$916,256, including interest) $ 898,000 $ 898,000
TOTAL REPURCHASE AGREEMENTS
(Cost $898,000) $ 898,000
Total Investments (Real Estate Securities Fund)
(Cost $64,679,216) - 101.49% $ 65,939,466
Other assets and liabilities, net - (1.49)% (966,098)
TOTAL NET ASSETS - 100.00% $ 64,973,368
Real Return Bond FundShares or
Principal
Amount Value
U.S. TREASURY OBLIGATIONS - 98.30%
Treasury Inflation Protected
Securities (d) - 98.09%
1.625% due 01/15/2018 $ 203,020 $ 202,449
1.875% due 07/15/2013 to 07/15/2015 127,776,949 131,337,941
2.00% due 07/15/2014 to 01/15/2026 151,965,952 154,035,014
2.125% due 01/15/2019 25,455,850 26,545,666
2.375% due 04/15/2011 to 01/15/2025 195,092,148 199,846,230
2.50% due 07/15/2016 to 01/15/2029 42,174,480 44,380,346
2.625% due 07/15/2017 60,965,824 65,538,261
Copyright © 2012 www.secdatabase.com. All Rights Reserved.Please Consider the Environment Before Printing This Document

3.00% due 07/15/2012 35,570,374 37,882,448
3.375% due 01/15/2012 1,556,932 1,661,539
3.625% due 04/15/2028 9,729,668 11,608,710
3.875% due 04/15/2029 85,457,010 106,020,103
1.25% due 04/15/2014 15,072,750 15,280,000
2.375% due 01/15/2027 1,687,632 1,707,145
1.375% due 07/15/2018 24,950,354 24,396,756
3.50% due 01/15/2011 58,160,536 60,759,614
881,202,222
The accompanying notes are an integral part of the financial statements.
178
JOHN HANCOCK FUNDS II
PORTFOLIO OF INVESTMENTS - May 31, 2009 (Unaudited) - continued(showing percentage of total net assets)
Real Return Bond Fund (continued)Shares or
Principal
Amount Value
U.S. TREASURY OBLIGATIONS
(continued)
U.S. Treasury Notes - 0.21%
0.875% due 04/30/2011 *** $ 1,870,000 $ 1,869,701
TOTAL U.S. TREASURY OBLIGATIONS
(Cost $857,330,942) $ 883,071,923
U.S. GOVERNMENT AGENCY OBLIGATIONS - 26.72%
Federal Home Loan Mortgage Corp. - 8.60%
0.9369% due 08/05/2011 (b)*** 10,000,000 10,006,485
4.50% due 05/15/2017 140,128 144,465
5.50% due 08/01/2037 to 01/01/2039 45,531,975 47,107,490
5.875% due 03/21/2011 10,052,000 10,579,559
6.00% due 11/01/2036 to 02/01/2039 2,969,530 3,110,467
5.00% due 12/14/2018 1,200,000 1,115,591
0.8875% due 02/01/2011 (b) 5,200,000 5,190,708
77,254,765
Federal National Mortgage
Association - 16.67%
2.713% due 10/01/2044 (b) 92,998 92,528
5.50% due 03/01/2034 to 12/01/2038 45,564,901 47,189,443
6.00% due 09/01/2035 to 04/01/2039 83,636,928 87,734,964
6.00% TBA ** 1,000,000 1,047,031
6.50% due 06/01/2035 to 07/01/2038 12,828,721 13,702,768
149,766,734
Government National Mortgage
Association - 1.12%
6.00% due 08/15/2034 to 10/15/2038 9,593,422 10,053,393
Small Business Administration - 0.33%
4.504% due 02/10/2014 681,868 682,105
4.88% due 11/01/2024 2,222,339 2,297,298
2,979,403
TOTAL U.S. GOVERNMENT AGENCY OBLIGATIONS
(Cost $235,904,153) $ 240,054,295
FOREIGN GOVERNMENT OBLIGATIONS - 2.31%
Japan - 2.31%
Copyright © 2012 www.secdatabase.com. All Rights Reserved.Please Consider the Environment Before Printing This Document

Government of Japan
0.80% due 12/10/2015 JPY 30,210,000 272,518
1.10% due 12/10/2016 881,760,000 7,956,014
1.20% due 06/10/2017 787,800,000 7,040,425
1.20% due 12/10/2017 371,190,000 3,299,337
1.40% due 06/10/2018 239,640,000 2,140,110
20,708,404
TOTAL FOREIGN GOVERNMENT OBLIGATIONS
(Cost $20,162,509) $ 20,708,404
CORPORATE BONDS - 18.44%
Advertising - 0.13%
Omnicom Group, Inc.
5.90% due 04/15/2016 $ 1,250,000 1,162,600
Banking - 3.41%
ANZ National International, Ltd.
6.20% due 07/19/2013 (f) 1,900,000 1,939,383
Barclays Bank PLC
5.45% due 09/12/2012 3,200,000 3,273,946
6.05% due 12/04/2017 (f) 5,200,000 4,284,083
Real Return Bond Fund (continued)Shares or
Principal
Amount Value
CORPORATE BONDS (continued)
Banking (continued)
Barclays Bank PLC (continued)
7.434% due 09/29/2049 (b)(f) $ 600,000 $ 381,654
7.70% due 12/31/2049 (b)(f) 200,000 155,078
HBOS PLC
6.75% due 05/21/2018 (f) 1,000,000 709,110
National Australia Bank, Ltd.
1.4238% due 02/08/2010 (b)(f) 7,600,000 7,599,460
5.35% due 06/12/2013 (f) 1,700,000 1,716,616
Royal Bank of Scotland Group PLC
7.0916% due 10/29/2049 EUR 400,000 175,299
Santander Perpetual SA Unipersonal
6.671% due 10/29/2049 (b)(f) $ 2,500,000 1,850,000
Swedbank AB
2.80% due 02/10/2012 (f) 7,200,000 7,273,411
Wachovia Bank NA, BKNT
1.3313% due 12/02/2010 (b) 1,400,000 1,320,106
30,678,146
Computers & Business Equipment - 0.43%
Hewlett-Packard Company
2.25% due 05/27/2011 3,800,000 3,828,485
Financial Services - 8.12%
Allstate Life Global Funding II, MTN
1.4025% due 05/21/2010 (b) 6,700,000 6,602,455
Allstate Life Global Funding Trusts, MTN
5.375% due 04/30/2013 1,200,000 1,243,848
American Express Bank FSB
5.50% due 04/16/2013 900,000 863,312
American Express Bank FSB, BKNT
6.00% due 09/13/2017 2,200,000 1,964,602
American Express Centurion Bank, BKNT
6.00% due 09/13/2017 2,200,000 1,964,602
American Express Company
7.00% due 03/19/2018 1,560,000 1,489,926
Bear Stearns Companies, Inc.
Copyright © 2012 www.secdatabase.com. All Rights Reserved.Please Consider the Environment Before Printing This Document

6.95% due 08/10/2012 1,300,000 1,405,706
7.25% due 02/01/2018 1,000,000 1,030,938
C10 Capital SPV, Ltd.
6.722% due 12/01/2049 (b)(f) 400,000 205,792
Citigroup Capital XXI
8.30% due 12/21/2057 (b) 1,100,000 979,352
Citigroup Funding, Inc., MTN
2.0363% due 05/07/2010 (b) 600,000 584,272
Citigroup, Inc.
1.2619% due 12/28/2009 (b) 4,000,000 3,912,920
5.50% due 04/11/2013 1,300,000 1,246,798
Ford Motor Credit Company LLC
7.25% due 10/25/2011 6,350,000 5,479,853
7.80% due 06/01/2012 450,000 384,275
GATX Financial Corp.
5.80% due 03/01/2016 1,000,000 820,568
General Electric Capital Corp.
5.50% due 09/15/2067 (b)(f) EUR 100,000 81,288
6.375% due 11/15/2067 (b) $ 800,000 564,776
6.50% due 09/15/2067 (b)(f) GBP 4,500,000 4,291,277
Goldman Sachs Group, Inc.
6.15% due 04/01/2018 $ 1,200,000 1,158,452
Green Valley, Ltd.
5.045% due 01/10/2011 (b)(f) EUR 400,000 539,445
The accompanying notes are an integral part of the financial statements.
179
JOHN HANCOCK FUNDS II
PORTFOLIO OF INVESTMENTS - May 31, 2009 (Unaudited) - continued(showing percentage of total net assets)
Real Return Bond Fund (continued)Shares or
Principal
Amount Value
CORPORATE BONDS (continued)
Financial Services (continued)
International Lease Finance Corp., MTN
6.625% due 11/15/2013 $ 600,000 $ 457,687
LeasePlan Corp., NV
3.00% due 05/07/2012 (f) 1,800,000 1,800,604
Lehman Brothers Holdings, Inc.
6.20% due 09/26/2014 ^ 300,000 44,250
7.00% due 09/27/2027 ^ (f) 300,000 44,250
Lehman Brothers Holdings, Inc., EMTN
zero coupon due 04/05/2011 ^ (f) EUR 36,000 6,998
5.125% due 06/27/2014 ^ (f) 850,000 168,230
Lehman Brothers Holdings, Inc., MTN
6.875% due 05/02/2018 ^ $ 1,200,000 198,000
Longpoint Re, Ltd.
6.57% due 05/08/2010 (b)(f) 800,000 776,080
Merna Reinsurance, Ltd., Series A
1.87% due 07/07/2010 (b) 3,500,000 3,235,400
Merrill Lynch & Company, Inc.
6.40% due 08/28/2017 2,300,000 2,084,711
Merrill Lynch & Company, Inc., MTN
6.875% due 04/25/2018 5,000,000 4,640,295
Morgan Stanley
1.3569% due 01/18/2011 (b) 2,000,000 1,903,130
1.5569% due 10/18/2016 (b) 400,000 294,605
Morgan Stanley, MTN
3.0056% due 05/14/2010 (b) 11,500,000 11,411,692
Copyright © 2012 www.secdatabase.com. All Rights Reserved.Please Consider the Environment Before Printing This Document

Mystic Re, Ltd.
10.6737% due 06/07/2011 (b)(f) 1,500,000 1,399,862
New York Life Global Funding
4.65% due 05/09/2013 (f) 1,800,000 1,775,920
Pacific Life Global Funding
5.15% due 04/15/2013 (f) 600,000 565,240
Residential Reinsurance 2007, Ltd., Series CL1
8.5113% due 06/07/2010 (b)(f) 2,200,000 2,120,360
TransCapitalInvest, Ltd. for OJSC AK Transneft
7.70% due 08/07/2013 (f) 1,300,000 1,242,917
Vita Capita II, Ltd.
2.1075% due 01/01/2010 (b)(f) 300,000 291,030
Vita Capital III, Ltd., Series B-II
2.3275% due 01/01/2012 (b)(f) 500,000 432,900
Wells Fargo & Company
4.375% due 01/31/2013 1,200,000 1,201,388
72,910,006
Food & Beverages - 0.21%
Kraft Foods, Inc.
6.00% due 02/11/2013 900,000 957,123
6.125% due 02/01/2018 900,000 918,382
1,875,505
Gas & Pipeline Utilities - 1.03%
NGPL PipeCo LLC
6.514% due 12/15/2012 (f) 9,300,000 9,295,648
Healthcare Services - 1.63%
Roche Holdings, Inc.
2.6613% due 02/25/2011 (b)(f) 14,300,000 14,468,168
UnitedHealth Group, Inc.
4.875% due 02/15/2013 200,000 197,405
14,665,573
Real Return Bond Fund (continued)Shares or
Principal
Amount Value
CORPORATE BONDS (continued)
Hotels & Restaurants - 0.22%
Yum! Brands, Inc.
6.25% due 03/15/2018 $ 2,000,000 $ 1,957,550
Insurance - 1.99%
American International Group, Inc.
8.175% due 05/15/2058 (b)(f) 1,500,000 346,665
American International Group, Inc., MTN
5.85% due 01/16/2018 2,800,000 1,186,668
American International Group, Inc., Series 1
1.2169% due 10/18/2011 (b) 1,200,000 598,342
Berkshire Hathaway Finance Corp.
5.40% due 05/15/2018 (f) 7,800,000 7,921,641
Foundation Re II, Ltd.
7.5756% due 11/26/2010 (b)(f) 600,000 567,005
Metropolitan Life Global Funding I
5.125% due 04/10/2013 (f) 800,000 789,746
Pricoa Global Funding I
1.3563% due 06/26/2012 (b)(f) 7,600,000 6,500,234
17,910,301
International Oil - 0.07%
Gaz Capital SA
Copyright © 2012 www.secdatabase.com. All Rights Reserved.Please Consider the Environment Before Printing This Document
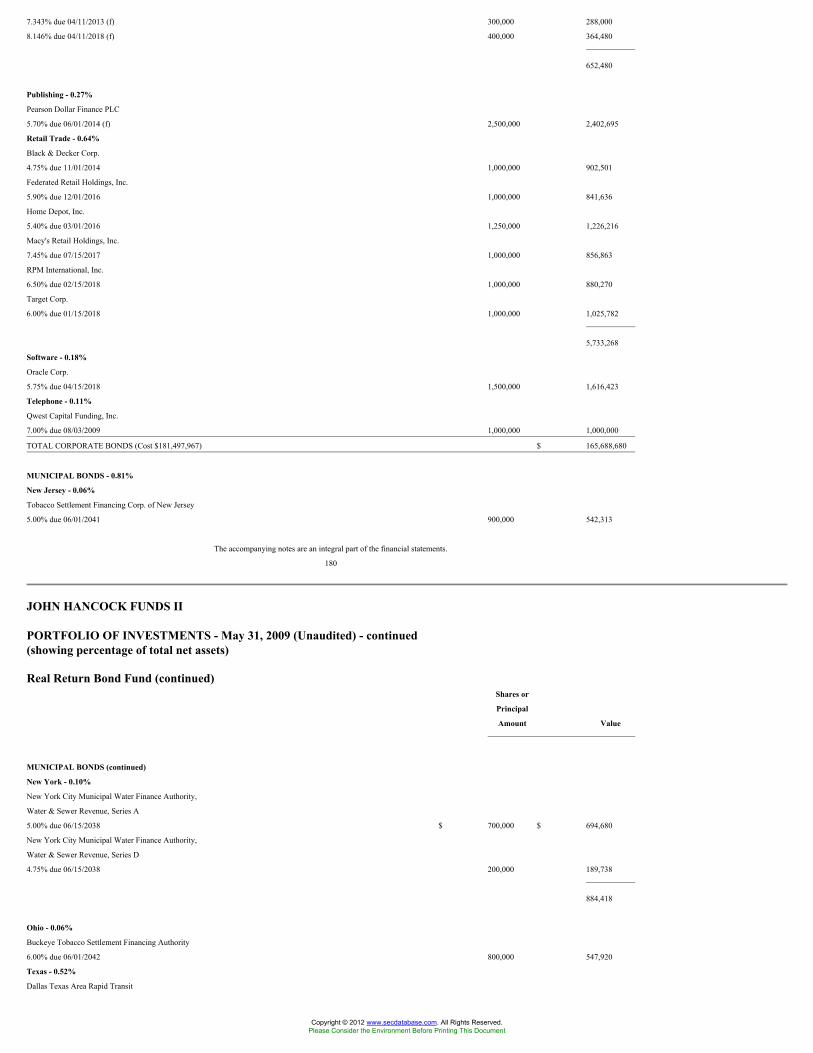
7.343% due 04/11/2013 (f) 300,000 288,000
8.146% due 04/11/2018 (f) 400,000 364,480
652,480
Publishing - 0.27%
Pearson Dollar Finance PLC
5.70% due 06/01/2014 (f) 2,500,000 2,402,695
Retail Trade - 0.64%
Black & Decker Corp.
4.75% due 11/01/2014 1,000,000 902,501
Federated Retail Holdings, Inc.
5.90% due 12/01/2016 1,000,000 841,636
Home Depot, Inc.
5.40% due 03/01/2016 1,250,000 1,226,216
Macy's Retail Holdings, Inc.
7.45% due 07/15/2017 1,000,000 856,863
RPM International, Inc.
6.50% due 02/15/2018 1,000,000 880,270
Target Corp.
6.00% due 01/15/2018 1,000,000 1,025,782
5,733,268
Software - 0.18%
Oracle Corp.
5.75% due 04/15/2018 1,500,000 1,616,423
Telephone - 0.11%
Qwest Capital Funding, Inc.
7.00% due 08/03/2009 1,000,000 1,000,000
TOTAL CORPORATE BONDS (Cost $181,497,967) $ 165,688,680
MUNICIPAL BONDS - 0.81%
New Jersey - 0.06%
Tobacco Settlement Financing Corp. of New Jersey
5.00% due 06/01/2041 900,000 542,313
The accompanying notes are an integral part of the financial statements.
180
JOHN HANCOCK FUNDS II
PORTFOLIO OF INVESTMENTS - May 31, 2009 (Unaudited) - continued(showing percentage of total net assets)
Real Return Bond Fund (continued)Shares or
Principal
Amount Value
MUNICIPAL BONDS (continued)
New York - 0.10%
New York City Municipal Water Finance Authority,
Water & Sewer Revenue, Series A
5.00% due 06/15/2038 $ 700,000 $ 694,680
New York City Municipal Water Finance Authority,
Water & Sewer Revenue, Series D
4.75% due 06/15/2038 200,000 189,738
884,418
Ohio - 0.06%
Buckeye Tobacco Settlement Financing Authority
6.00% due 06/01/2042 800,000 547,920
Texas - 0.52%
Dallas Texas Area Rapid Transit
Copyright © 2012 www.secdatabase.com. All Rights Reserved.Please Consider the Environment Before Printing This Document

5.00% due 12/01/2036 2,100,000 2,127,531
North Texas Municipal Water District,Texas
5.00% due 09/01/2035 2,540,000 2,549,017
4,676,548
West Virginia - 0.07%
Tobacco Settlement Finance Authority of West
Virginia
7.467% due 06/01/2047 985,000 591,818
TOTAL MUNICIPAL BONDS (Cost $8,243,228) $ 7,243,017
COLLATERALIZED MORTGAGE
OBLIGATIONS - 1.94%
Banc of America Commercial Mortgage, Inc.,
Series 2006-5, Class A4
5.414% due 09/10/2047 500,000 411,112
BCAP LLC Trust, Series 2006-AA2, Class A1
0.4787% due 01/25/2037 (b) 869,229 326,685
Bear Stearns Adjustable Rate Mortgage Trust,
Series 2003-3, Class 3A2
4.4746% due 05/25/2033 (b) 238,855 219,839
Bear Stearns Adjustable Rate Mortgage Trust,
Series 2005-2, Class A1
2.94% due 03/25/2035 (b) 1,543,666 1,330,121
Bear Stearns Adjustable Rate Mortgage Trust,
Series 2005-2, Class A2
2.2588% due 03/25/2035 (b) 594,182 509,940
Bear Stearns Adjustable Rate Mortgage Trust,
Series 2005-5, Class A1
2.63% due 08/25/2035 (b) 468,573 409,551
Bear Stearns Adjustable Rate Mortgage Trust,
Series 2005-5, Class A2
4.55% due 08/25/2035 (b) 843,070 733,967
Citigroup Commercial Mortgage Trust, Series
2007-C6, Class A4
5.6999% due 12/10/2049 (b) 183,000 143,135
Citigroup Mortgage Loan Trust, Inc., Series
2005-11, Class 1A1
2.99% due 12/25/2035 (b) 92,953 71,313
Citigroup Mortgage Loan Trust, Inc., Series 2005-6,
Class A1
4.7475% due 08/25/2035 (b) 560,414 411,743
Citigroup Mortgage Loan Trust, Inc., Series 2005-6,
Class A2
4.2475% due 08/25/2035 (b) 627,421 453,485
Real Return Bond Fund (continued)Shares or
Principal
Amount Value
COLLATERALIZED MORTGAGE
OBLIGATIONS (continued)
Citigroup Mortgage Loan Trust, Inc., Series 2005-6,
Class A3
4.0975% due 08/25/2035 (b) $ 144,313 $ 104,735
Citigroup/Deutsche Bank Commercial Mortgage
Trust, Series 2007-CD5, Class A4
5.886% due 11/15/2044 (b) 500,000 414,908
Credit Suisse Mortgage Capital Certificates, Series
2007-C3, Class A4
5.7229% due 06/15/2039 (b) 750,000 547,443
Federal Home Loan Mortgage Corp., Series 2979,
Class MB
5.50% due 11/15/2018 1,992,968 2,081,105
Copyright © 2012 www.secdatabase.com. All Rights Reserved.Please Consider the Environment Before Printing This Document

Federal National Mortgage Association, Series
2007-114, Class A6
0.5088% due 10/27/2037 (b) 5,000,000 4,625,000
JPMorgan Chase Commercial Mortgage Securities
Corp, Series 2006-CB17, Class A4
5.429% due 12/12/2043 620,000 494,867
JPMorgan Chase Commercial Mortgage Securities Corp.,
Series 2006-LDP9, Class A3
5.336% due 05/15/2047 800,000 608,560
LB-UBS Commercial Mortgage Trust, Series
2007-C7, Class A3
5.866% due 09/15/2045 (b) 200,000 158,220
MASTR Alternative Loans Trust, Series 2006-2,
Class 2A1
0.7088% due 03/25/2036 (b) 1,045,122 377,962
Merrill Lynch/Countrywide Commercial Mortgage
Trust, Series 2007-9, Class A4
5.70% due 09/12/2049 400,000 287,275
Morgan Stanley Capital I, Series 2007-IQ15, Class
A4
6.0764% due 06/11/2049 (b) 1,160,000 942,400
Residential Accredit Loans, Inc., Series 2006-QO6,
Class A1
0.4888% due 06/25/2046 (b) 1,623,665 614,099
Wachovia Bank Commercial Mortgage Trust,
Series 2006-C23, Class A4
5.418% due 01/15/2045 870,000 715,671
Washington Mutual Alternative Mortgage
Pass-Through Certificates, Series 2006-5, Class
3A6
6.268% due 07/25/2036 900,000 416,067
TOTAL COLLATERALIZED MORTGAGE OBLIGATIONS
(Cost $19,712,253) $ 17,409,203
ASSET BACKED SECURITIES - 3.09%
BA Credit Card Trust, Series 2008-A5, Class A5
1.5444% due 12/16/2013 (b) 4,000,000 3,992,798
Bravo Mortgage Asset Trust, Series 2006-1A,
Class A1
0.4387% due 07/25/2036 (b)(e)(f) 43,480 42,996
Citigroup Mortgage Loan Trust, Inc., Series
2007-OPX1, Class A5A
5.764% due 01/25/2037 900,000 635,849
Ford Credit Auto Owner Trust, Series 2008-C,
Class A2B
1.2444% due 01/15/2011 (b) 5,607,665 5,611,721
SLM Student Loan Trust, Series 2008-9, Class A
2.5919% due 04/25/2023 (b) 16,992,389 17,079,830
The accompanying notes are an integral part of the financial statements.
181
JOHN HANCOCK FUNDS II
PORTFOLIO OF INVESTMENTS - May 31, 2009 (Unaudited) - continued(showing percentage of total net assets)
Real Return Bond Fund (continued)Shares or
Principal
Amount Value
ASSET BACKED SECURITIES
(continued)
Wachovia Bank Commercial Mortgage Trust,
Copyright © 2012 www.secdatabase.com. All Rights Reserved.Please Consider the Environment Before Printing This Document

Series 2006-C28, Class A4
5.572% due 10/15/2048 (b) $ 500,000 $ 399,266
TOTAL ASSET BACKED SECURITIES
(Cost $27,590,252) $ 27,762,460
PREFERRED STOCKS - 0.39%
Financial Services - 0.39%
Citigroup, Inc., Series E, 8.40% ^ * 2,800,000 2,449,972
Wells Fargo & Company, Series K 900,000 702,000
Wells Fargo & Company, Series L, 7.50% 500 372,500
3,524,472
TOTAL PREFERRED STOCKS (Cost $4,200,000) $ 3,524,472
TERM LOANS - 0.77%
Financial Services - 0.36%
DaimlerChrysler Financial Company
4.56% due 08/03/2012 (b) 3,735,557 3,279,284
Medical-Hospitals - 0.32%
HCA, Inc., Tranche B
3.47% due 11/01/2013 (b) 3,188,146 2,837,052
Paper - 0.09%
Georgia Pacific Corp.
3.258% due 12/20/2012 (b) 865,720 802,198
TOTAL TERM LOANS (Cost $7,659,432) $ 6,918,534
REPURCHASE AGREEMENTS - 2.50%
Repurchase Agreement with State
Street Corp. dated 05/29/2009 at
0.07% to be repurchased at
$22,496,131 on 06/01/2009,
collateralized by $22,565,000
Federal Home Loan Mortgage
Corp., 2.375% due 05/28/2010
(valued at $22,946,349, including
interest) $ 22,496,000 $ 22,496,000
TOTAL REPURCHASE AGREEMENTS
(Cost $22,496,000) $ 22,496,000
SHORT TERM INVESTMENTS - 0.12%
U.S. Treasury Bills
zero coupon due 06/04/2009 *** $ 1,030,000 $ 1,029,992
TOTAL SHORT TERM INVESTMENTS
(Cost $1,029,992) $ 1,029,992
Total Investments (Real Return Bond Fund)
(Cost $1,385,826,728) - 155.39% $ 1,395,906,980
Other assets and liabilities, net - (55.39)% (497,571,693)
TOTAL NET ASSETS - 100.00% $ 898,335,287
Schedule of Securities Sold ShortShares or
Principal
Amount Value
FEDERAL NATIONAL MORTGAGE
ASSOCIATION - 100.00%
Federal National Mortgage Association
5.50%, TBA ** $ 45,000,000 $ 46,518,750
6.50%, TBA ** 13,000,000 $ 13,849,063
TOTAL FEDERAL NATIONAL MORTGAGE
ASSOCIATION (Proceeds $60,418,508) $ 60,367,813
Total Securities Sold Short (Real Return Bond Fund)
Copyright © 2012 www.secdatabase.com. All Rights Reserved.Please Consider the Environment Before Printing This Document

(Proceeds $60,418,508) $ 60,367,813
Short Term Government Income FundShares or
Principal
Amount Value
U.S. TREASURY OBLIGATIONS - 19.43%
Treasury Inflation Protected
Securities (d) - 5.15%
3.50% due 01/15/2011 $ 953,051 $ 995,641
U.S. Treasury Notes - 14.28%
1.125% due 01/15/2012 785,000 783,037
1.375% due 04/15/2012 255,000 255,279
1.50% due 12/31/2013 865,000 840,064
1.75% due 03/31/2014 905,000 882,657
2,761,037
TOTAL U.S. TREASURY OBLIGATIONS
(Cost $3,754,551) $ 3,756,678
U.S. GOVERNMENT AGENCY OBLIGATIONS - 77.65%
Federal Agricultural Mortgage Corp. - 5.74%
5.50% due 07/15/2011 1,035,000 1,109,672
Federal Farm Credit Bank - 12.33%
2.00% due 01/17/2012 1,030,000 1,041,299
3.875% due 10/07/2013 1,280,000 1,343,488
2,384,787
Federal Home Loan Bank - 23.01%
1.375% due 05/16/2011 1,635,000 1,642,724
1.875% due 06/20/2012 430,000 428,403
3.625% due 12/17/2010 to 10/18/2013 2,285,000 2,377,385
4,448,512
Federal Home Loan Mortgage Corp. - 13.85%
1.625% due 04/26/2011 850,000 858,919
2.25% due 02/02/2012 700,000 703,928
4.50% TBA ** 1,090,000 1,114,865
2,677,712
Federal National Mortgage
Association - 17.67%
1.875% due 04/20/2012 1,145,000 1,153,429
2.50% due 05/15/2014 435,000 428,720
2.68% due 12/23/2011 300,000 303,296
3.77% due 06/23/2009 800,000 820,875
4.259% due 05/01/2034 (b) 467,516 480,772
4.931% due 12/01/2038 (b) 163,572 169,896
4.997% due 04/01/2048 (b) 56,080 58,324
3,415,312
The accompanying notes are an integral part of the financial statements.
182
JOHN HANCOCK FUNDS II
PORTFOLIO OF INVESTMENTS - May 31, 2009 (Unaudited) - continued(showing percentage of total net assets)
Copyright © 2012 www.secdatabase.com. All Rights Reserved.Please Consider the Environment Before Printing This Document

Short Term Government Income Fund (continued)Shares or
Principal
Amount Value
U.S. GOVERNMENT AGENCY
OBLIGATIONS (continued)
Tennessee Valley Authority - 5.05%
5.625% due 01/18/2011 $ 910,000 $ 976,386
TOTAL U.S. GOVERNMENT AGENCY OBLIGATIONS
(Cost $15,006,561) $ 15,012,381
SHORT TERM INVESTMENTS - 6.73%
Federal Home Loan Bank Discount Notes
zero coupon due 06/01/2009 $ 1,300,000 $ 1,300,000
TOTAL SHORT TERM INVESTMENTS
(Cost $1,300,000) $ 1,300,000
Total Investments (Short Term Government Income Fund)
(Cost $20,061,112) - 103.81% $ 20,069,059
Other assets and liabilities, net - (3.81)% (736,130)
TOTAL NET ASSETS - 100.00% $ 19,332,929
Small Cap Growth FundShares or
Principal
Amount Value
COMMON STOCKS - 95.93%
Aerospace - 2.35%
BE Aerospace, Inc. * 72,700 $ 1,081,776
Teledyne Technologies, Inc. * 50,580 1,662,565
2,744,341
Apparel & Textiles - 5.55%
Carter's, Inc. * 46,420 1,097,833
Gymboree Corp. * 42,100 1,551,385
Hanesbrands, Inc. * 144,290 2,438,501
Iconix Brand Group, Inc. * 49,000 793,310
Warnaco Group, Inc. * 18,600 587,760
6,468,789
Banking - 1.24%
First Citizens Bancshares, Inc. 746 98,837
International Bancshares Corp. 44,690 501,422
Signature Bank * 31,440 850,452
1,450,711
Biotechnology - 1.49%
Cougar Biotechnology, Inc. * 28,020 1,204,580
Myriad Genetics, Inc. * 14,800 535,168
1,739,748
Building Materials & Construction - 2.44%
Eagle Materials, Inc. 40,190 988,674
Lennox International, Inc. 50,400 1,562,904
Sterling Construction Company, Inc. * 17,230 294,633
2,846,211
Business Services - 2.52%
Coinstar, Inc. * 38,270 1,133,558
Constant Contact, Inc. * 17,900 314,861
FactSet Research Systems, Inc. 14,380 760,702
Copyright © 2012 www.secdatabase.com. All Rights Reserved.Please Consider the Environment Before Printing This Document

Parexel International Corp. * 70,258 723,657
2,932,778
Small Cap Growth Fund (continued)Shares or
Principal
Amount Value
COMMON STOCKS (continued)
Cellular Communications - 2.08%
Leap Wireless International, Inc. * 35,800 $ 1,342,142
MetroPCS Communications, Inc. * 14,810 253,695
RF Micro Devices, Inc. * 290,100 826,785
2,422,622
Chemicals - 0.59%
Cytec Industries, Inc. 32,000 687,360
Colleges & Universities - 1.77%
Corinthian Colleges, Inc. * 134,160 2,063,381
Commercial Services - 2.03%
Pool Corp. 57,640 1,004,665
Wright Express Corp. * 54,530 1,356,161
2,360,826
Computers & Business Equipment - 5.91%
Logitech International SA * 71,834 1,007,831
MICROS Systems, Inc. * 53,630 1,400,816
Plexus Corp. * 52,930 966,502
Seagate Technology 200,010 1,742,087
Sykes Enterprises, Inc. * 56,800 925,840
Western Digital Corp. * 34,120 847,882
6,890,958
Crude Petroleum & Natural Gas - 1.80%
Arena Resources, Inc. * 35,310 1,264,804
St. Mary Land & Exploration Company 38,360 830,878
2,095,682
Electrical Equipment - 1.86%
AMETEK, Inc. 7,260 228,327
Polypore International, Inc. * 17,700 175,938
Regal-Beloit Corp. 31,340 1,238,244
Wesco International, Inc. * 19,640 524,977
2,167,486
Electronics - 1.20%
Jabil Circuit, Inc. 178,140 1,394,836
Energy - 0.83%
Sunpower Corp., Class B * 37,400 961,928
Financial Services - 0.97%
GFI Group, Inc. 73,500 441,735
Interactive Data Corp. 29,350 688,257
1,129,992
Furniture & Fixtures - 0.03%
Sealy Corp. * 19,960 37,924
Healthcare Products - 7.40%
AngioDynamics, Inc. * 54,700 671,169
Beckman Coulter, Inc. 13,650 739,830
Herbalife, Ltd. 59,400 1,735,074
Inverness Medical Innovations, Inc. * 54,420 1,770,283
Medicines Company * 59,700 457,302
Varian Medical Systems, Inc. * 28,660 1,024,881
Volcano Corp. * 105,800 1,307,688
Zoll Medical Corp. * 54,570 916,230
Copyright © 2012 www.secdatabase.com. All Rights Reserved.Please Consider the Environment Before Printing This Document

8,622,457
The accompanying notes are an integral part of the financial statements.
183
JOHN HANCOCK FUNDS II
PORTFOLIO OF INVESTMENTS - May 31, 2009 (Unaudited) - continued(showing percentage of total net assets)
Small Cap Growth Fund (continued)Shares or
Principal
Amount Value
COMMON STOCKS (continued)
Healthcare Services - 4.56%
Cerner Corp. * 6,960 $ 405,698
Coventry Health Care, Inc. * 28,670 517,493
Health Net, Inc. * 67,760 1,015,045
Healthsouth Corp. * 122,120 1,445,901
ICON PLC, SADR * 46,180 805,379
Omnicare, Inc. 41,450 1,120,394
5,309,910
Hotels & Restaurants - 1.09%
Buffalo Wild Wings, Inc. * 21,170 751,535
The Cheesecake Factory, Inc. * 30,000 513,300
1,264,835
Household Products - 1.76%
Jarden Corp. * 115,680 2,056,790
Industrial Machinery - 2.58%
Briggs & Stratton Corp. 52,820 802,864
Dresser-Rand Group, Inc. * 31,100 870,800
Pall Corp. 51,810 1,330,481
3,004,145
Industrials - 1.11%
Aecom Technology Corp. * 40,360 1,287,888
Insurance - 1.17%
Allied World Assurance Holdings, Ltd. 20,850 787,087
Arch Capital Group, Ltd. * 10,100 574,791
1,361,878
Internet Service Provider - 1.74%
Equinix, Inc. * 27,240 2,026,656
Internet Software - 1.84%
McAfee, Inc. * 24,250 951,328
Vocus, Inc. * 62,200 1,188,642
2,139,970
Leisure Time - 1.91%
Bally Technologies, Inc. * 25,130 703,640
LIFE TIME FITNESS, Inc. * 60,535 1,118,687
RC2 Corp. * 33,100 398,193
2,220,520
Life Sciences - 0.60%
Celera Corp. * 92,080 697,046
Manufacturing - 2.15%
Pentair, Inc. 48,105 1,204,068
Snap-on, Inc. 41,770 1,301,136
Copyright © 2012 www.secdatabase.com. All Rights Reserved.Please Consider the Environment Before Printing This Document

2,505,204
Office Furnishings & Supplies - 0.82%
OfficeMax, Inc. 116,400 960,300
Oil & Gas Drilling - 0.98%
Atwood Oceanics, Inc. * 43,110 1,140,691
Petroleum Services - 1.15%
Complete Production Services, Inc. * 126,800 897,744
Helmerich & Payne, Inc. 12,700 444,119
1,341,863
Small Cap Growth Fund (continued)Shares or
Principal
Amount Value
COMMON STOCKS (continued)
Pharmaceuticals - 4.96%
Alkermes, Inc. * 47,030 $ 382,824
Amylin Pharmaceuticals, Inc. * 56,020 634,147
Auxilium Pharmaceuticals, Inc. * 22,030 516,163
Cubist Pharmaceuticals, Inc. * 36,690 625,931
Ligand Pharmaceuticals, Inc., Class B * 188,940 563,041
Onyx Pharmaceuticals, Inc. * 23,750 561,925
OSI Pharmaceuticals, Inc. * 23,960 809,848
Regeneron Pharmaceuticals, Inc. * 50,700 776,217
United Therapeutics Corp. * 11,410 914,512
5,784,608
Publishing - 1.14%
VistaPrint, Ltd. * 34,560 1,323,302
Real Estate - 2.25%
DiamondRock Hospitality Company, REIT 156,750 1,018,875
Kilroy Realty Corp., REIT 6,300 134,127
Regency Centers Corp., REIT 19,410 691,578
Taubman Centers, Inc., REIT 31,620 782,279
2,626,859
Retail - 0.44%
FGX International Holdings, Ltd. * 38,290 515,383
Retail Trade - 4.98%
Advance Auto Parts, Inc. 39,760 1,693,378
Aeropostale, Inc. * 44,040 1,524,665
BJ's Wholesale Club, Inc. * 51,870 1,827,899
Lumber Liquidators, Inc. * 50,020 757,803
5,803,745
Sanitary Services - 0.91%
Waste Connections, Inc. * 41,870 1,063,498
Semiconductors - 1.64%
ON Semiconductor Corp. * 279,850 1,916,972
Software - 4.49%
ArcSight, Inc. * 85,800 1,382,238
Eclipsys Corp. * 55,480 818,330
Red Hat, Inc. * 76,850 1,533,157
Solera Holdings, Inc. * 65,500 1,499,950
5,233,675
Telecommunications Equipment &
Services - 3.46%
Atheros Communications, Inc. * 75,510 1,265,547
NICE Systems, Ltd., ADR * 58,330 1,339,257
Polycom, Inc. * 82,460 1,427,383
4,032,187
Toys, Amusements & Sporting Goods - 1.26%
Copyright © 2012 www.secdatabase.com. All Rights Reserved.Please Consider the Environment Before Printing This Document

Marvel Entertainment, Inc. * 44,250 1,468,215
Transportation - 1.66%
Nordic American Tanker Shipping, Ltd. 22,700 761,358
Overseas Shipholding Group, Inc. 18,500 625,670
Tsakos Energy Navigation, Ltd. 24,200 545,468
1,932,496
Trucking & Freight - 3.22%
Heartland Express, Inc. 61,490 965,393
Hub Group, Inc., Class A * 51,960 1,026,729
The accompanying notes are an integral part of the financial statements.
184
JOHN HANCOCK FUNDS II
PORTFOLIO OF INVESTMENTS - May 31, 2009 (Unaudited) - continued(showing percentage of total net assets)
Small Cap Growth Fund (continued)Shares or
Principal
Amount Value
COMMON STOCKS (continued)
Trucking & Freight (continued)
J.B. Hunt Transport Services, Inc. 45,220 $ 1,389,611
Werner Enterprises, Inc. 20,910 376,171
3,757,904
TOTAL COMMON STOCKS (Cost $99,683,875) $ 111,794,570
RIGHTS - 0.14%
Furniture & Fixtures - 0.14%
Sealy Corp. 79,700 168,167
TOTAL RIGHTS (Cost $184,022) $ 168,167
REPURCHASE AGREEMENTS - 2.66%
Bank of New York Tri-Party
Repurchase Agreement dated
05/29/2009 at 0.18% to be
repurchased at $3,100,047 on
06/01/2009, collateralized by
$4,234,692 Federal National
Mortgage Association, 7.00% due
11/01/2036 (valued at $3,162,000,
including interest) $ 3,100,000 $ 3,100,000
TOTAL REPURCHASE AGREEMENTS
(Cost $3,100,000) $ 3,100,000
Total Investments (Small Cap Growth Fund)
(Cost $102,967,897) - 98.73% $ 115,062,737
Other assets and liabilities, net - 1.27% 1,477,848
TOTAL NET ASSETS - 100.00% $ 116,540,585
Small Cap Index FundShares or
Principal
Amount Value
COMMON STOCKS - 93.29%
Advertising - 0.18%
Copyright © 2012 www.secdatabase.com. All Rights Reserved.Please Consider the Environment Before Printing This Document

inVentiv Health, Inc. * 4,784 $ 60,278
Marchex, Inc., Class B 3,474 11,568
ValueClick, Inc. * 12,411 137,142
208,988
Aerospace - 1.43%
AAR Corp. * 5,537 81,394
Aerovironment, Inc. * 1,566 43,723
Argon ST, Inc. * 1,870 38,746
Cubic Corp. 2,219 84,655
Curtiss-Wright Corp. 6,386 186,982
Ducommun, Inc. 1,535 29,180
Esterline Technologies Corp. * 4,211 115,129
GenCorp, Inc. * 8,546 17,178
HEICO Corp. (a) 3,171 110,605
Herley Industries, Inc. * 1,987 21,201
Integral Systems, Inc. * 2,526 19,198
LMI Aerospace, Inc. * 1,274 12,001
Moog, Inc., Class A * 6,102 145,838
Orbital Sciences Corp., Class A * 8,371 123,221
Teledyne Technologies, Inc. * 5,074 166,782
Small Cap Index Fund (continued)Shares or
Principal
Amount Value
COMMON STOCKS (continued)
Aerospace (continued)
TransDigm Group, Inc. * 4,738 $ 185,824
Triumph Group, Inc. 2,357 92,889
Woodward Governor Company 8,428 173,027
1,647,573
Agriculture - 0.26%
AgFeed Industries, Inc. * (a) 3,391 20,550
Alico, Inc. (a) 544 13,899
Andersons, Inc. 2,610 65,511
Cadiz, Inc. * 1,923 14,634
Fresh Del Monte Produce, Inc. * 6,014 106,688
Griffin Land & Nurseries, Inc. 546 15,758
Maui Land & Pineapple, Inc. * 927 8,065
Omega Protein Corp. * 2,799 13,071
Tejon Ranch Company * 1,642 42,183
300,359
Air Travel - 0.56%
Airtran Holdings, Inc. * (a) 16,701 84,674
Alaska Air Group, Inc. * 5,152 80,217
Allegiant Travel Company * (a) 1,932 77,937
Hawaiian Holdings, Inc. * 6,246 32,854
JetBlue Airways Corp. * 24,761 112,167
Republic Airways Holdings, Inc. * 5,107 29,927
SkyWest, Inc. 8,362 85,711
UAL Corp. * (a) 20,700 96,462
US Airways Group, Inc. * (a) 16,364 42,219
642,168
Apparel & Textiles - 1.89%
American Apparel, Inc. * 4,825 19,107
Bebe Stores, Inc. 5,493 44,274
Brown Shoe, Inc. 6,100 49,532
Carter's, Inc. * 8,067 190,785
Cherokee, Inc. 1,130 23,459
Columbia Sportswear Company 1,773 56,222
Crocs, Inc. * 12,089 35,179
Copyright © 2012 www.secdatabase.com. All Rights Reserved.Please Consider the Environment Before Printing This Document

Deckers Outdoor Corp. * 1,867 108,211
G & K Services, Inc., Class A 2,659 57,009
G-III Apparel Group, Ltd. * 2,068 13,835
Gymboree Corp. * 4,072 150,053
Iconix Brand Group, Inc. * 8,251 133,584
Interface, Inc., Class A 7,686 48,729
Jos. A. Bank Clothiers, Inc. * 2,592 98,107
K-Swiss, Inc., Class A 3,778 33,057
Lululemon Athletica, Inc. * 2,777 35,073
Maidenform Brands, Inc. * 3,242 41,887
Movado Group, Inc. 2,527 19,155
Oxford Industries, Inc. 2,097 19,439
Perry Ellis International, Inc. * 1,694 13,840
Quiksilver, Inc. * 18,244 55,644
Skechers U.S.A., Inc., Class A * 4,708 44,726
Stage Stores, Inc. 5,489 66,582
Steven Madden, Ltd. * 2,521 68,622
Timberland Company, Class A * 6,834 98,273
True Religion Apparel, Inc. * 2,440 56,266
Under Armour, Inc., Class A * (a) 4,705 115,461
Unifi, Inc. * 7,253 11,242
The accompanying notes are an integral part of the financial statements.
185
JOHN HANCOCK FUNDS II
PORTFOLIO OF INVESTMENTS - May 31, 2009 (Unaudited) - continued(showing percentage of total net assets)
Small Cap Index Fund (continued)Shares or
Principal
Amount Value
COMMON STOCKS (continued)
Apparel & Textiles (continued)
Unifirst Corp. 2,057 $ 70,246
Volcom, Inc. * 2,619 35,802
Warnaco Group, Inc. * 6,514 205,842
Weyco Group, Inc. 1,057 25,400
Wolverine World Wide, Inc. 7,119 141,027
2,185,670
Auto Parts - 0.42%
American Axle & Manufacturing Holdings, Inc. 7,328 14,949
Amerigon, Inc. * 3,525 15,651
ArvinMeritor, Inc. 10,755 27,425
Dana Holding Corp. * 14,589 19,112
Dorman Products, Inc. * 1,596 22,663
Exide Technologies * 10,882 66,598
Federal Signal Corp. 6,913 59,313
Fuel Systems Solutions, Inc. * (a) 1,739 36,762
Lear Corp. * 10,049 12,461
Modine Manufacturing Company 4,697 20,996
Superior Industries International, Inc. 3,305 39,924
Tenneco, Inc. * 6,814 41,702
The Pep Boys - Manny, Moe & Jack 6,054 42,681
Titan International, Inc. (a) 4,965 44,884
Wonder Auto Technology, Inc. * 2,237 18,187
483,308
Auto Services - 0.13%
Dollar Thrifty Automotive Group, Inc. * 3,131 26,989
Midas, Inc. * 2,045 20,450
Copyright © 2012 www.secdatabase.com. All Rights Reserved.Please Consider the Environment Before Printing This Document

Monro Muffler Brake, Inc. 2,329 62,231
RSC Holdings, Inc. * 6,843 41,195
150,865
Automobiles - 0.17%
Americas Car Mart, Inc. * 1,459 23,855
Asbury Automotive Group, Inc. 4,574 43,453
Group 1 Automotive, Inc. 3,317 71,017
Rush Enterprises, Inc., Class A * 4,851 56,611
194,936
Banking - 6.48%
1st Source Corp. 2,194 39,273
Abington Bancorp, Inc. 3,350 27,168
Ameris Bancorp 2,254 14,133
Ames National Corp. 975 19,958
Arrow Financial Corp. 1,351 33,910
BancFirst Corp. 1,079 41,628
Banco Latinoamericano de
Exportaciones, S.A. 3,954 50,097
BancTrust Financial Group, Inc. 2,931 12,222
Bank Mutual Corp. 7,023 63,699
Bank of the Ozarks, Inc. 1,806 45,674
BankFinancial Corp. 3,035 27,194
Banner Corp. (a) 2,327 14,311
Beneficial Mutual Bancorp, Inc. * 4,783 45,725
Berkshire Hill Bancorp, Inc. 1,776 38,006
Boston Private Financial Holdings, Inc. 7,955 39,616
Brookline Bancorp, Inc. 8,442 83,069
Bryn Mawr Bank Corp. 1,064 19,312
Small Cap Index Fund (continued)Shares or
Principal
Amount Value
COMMON STOCKS (continued)
Banking (continued)
Camden National Corp. 1,145 $ 37,407
Capital City Bank Group, Inc. (a) 1,761 24,936
Capitol Bancorp, Ltd. 2,436 9,720
Cardinal Financial Corp. 3,583 29,058
Cascade Bancorp (a) 3,715 7,170
Cathay General Bancorp (a) 7,148 74,053
Centerstate Banks of Florida, Inc. 1,573 14,220
Central Pacific Financial Corp. 4,248 25,403
Chemical Financial Corp. 3,474 65,520
Citizens Republic Banking Corp., Inc. * 18,550 21,147
City Bank (a) 2,320 6,960
Clifton Savings Bancorp, Inc. 1,681 16,810
CoBiz, Inc. (a) 2,881 18,726
Colonial Bancgroup, Inc. (a) 29,333 38,133
Columbia Banking System, Inc. 2,691 29,251
Community Bank Systems, Inc. 4,740 73,470
Community Trust Bancorp, Inc. 2,188 60,236
CVB Financial Corp. (a) 9,632 61,163
Danvers Bancorp, Inc. 2,597 38,384
Dime Community Bancshares 3,549 31,622
East West Bancorp, Inc. 9,156 73,889
Encore Bancshares, Inc. * 1,098 7,379
Enterprise Financial Services Corp. 1,864 14,688
ESSA Bancorp, Inc. 2,344 32,699
F.N.B. Corp. 12,433 83,052
Farmers Capital Bank Corp. 935 20,430
Financial Institutions, Inc. 1,606 18,549
First BanCorp (PR) 10,289 50,313
Copyright © 2012 www.secdatabase.com. All Rights Reserved.Please Consider the Environment Before Printing This Document
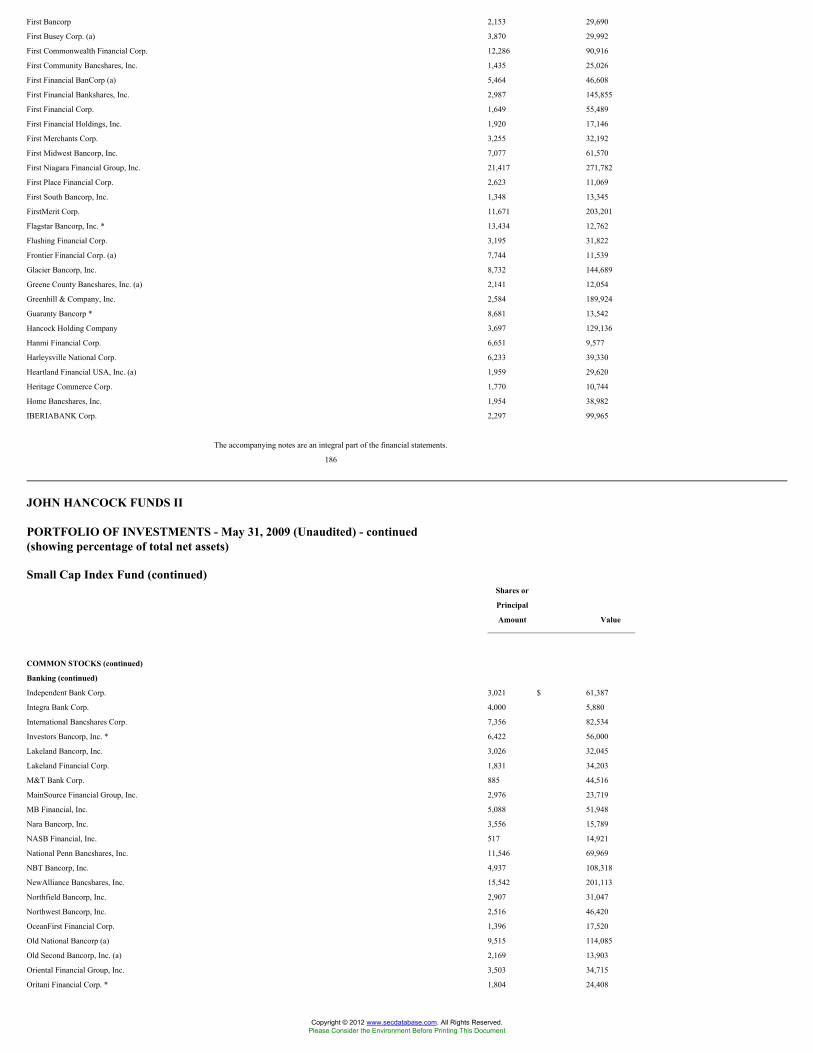
First Bancorp 2,153 29,690
First Busey Corp. (a) 3,870 29,992
First Commonwealth Financial Corp. 12,286 90,916
First Community Bancshares, Inc. 1,435 25,026
First Financial BanCorp (a) 5,464 46,608
First Financial Bankshares, Inc. 2,987 145,855
First Financial Corp. 1,649 55,489
First Financial Holdings, Inc. 1,920 17,146
First Merchants Corp. 3,255 32,192
First Midwest Bancorp, Inc. 7,077 61,570
First Niagara Financial Group, Inc. 21,417 271,782
First Place Financial Corp. 2,623 11,069
First South Bancorp, Inc. 1,348 13,345
FirstMerit Corp. 11,671 203,201
Flagstar Bancorp, Inc. * 13,434 12,762
Flushing Financial Corp. 3,195 31,822
Frontier Financial Corp. (a) 7,744 11,539
Glacier Bancorp, Inc. 8,732 144,689
Greene County Bancshares, Inc. (a) 2,141 12,054
Greenhill & Company, Inc. 2,584 189,924
Guaranty Bancorp * 8,681 13,542
Hancock Holding Company 3,697 129,136
Hanmi Financial Corp. 6,651 9,577
Harleysville National Corp. 6,233 39,330
Heartland Financial USA, Inc. (a) 1,959 29,620
Heritage Commerce Corp. 1,770 10,744
Home Bancshares, Inc. 1,954 38,982
IBERIABANK Corp. 2,297 99,965
The accompanying notes are an integral part of the financial statements.
186
JOHN HANCOCK FUNDS II
PORTFOLIO OF INVESTMENTS - May 31, 2009 (Unaudited) - continued(showing percentage of total net assets)
Small Cap Index Fund (continued)Shares or
Principal
Amount Value
COMMON STOCKS (continued)
Banking (continued)
Independent Bank Corp. 3,021 $ 61,387
Integra Bank Corp. 4,000 5,880
International Bancshares Corp. 7,356 82,534
Investors Bancorp, Inc. * 6,422 56,000
Lakeland Bancorp, Inc. 3,026 32,045
Lakeland Financial Corp. 1,831 34,203
M&T Bank Corp. 885 44,516
MainSource Financial Group, Inc. 2,976 23,719
MB Financial, Inc. 5,088 51,948
Nara Bancorp, Inc. 3,556 15,789
NASB Financial, Inc. 517 14,921
National Penn Bancshares, Inc. 11,546 69,969
NBT Bancorp, Inc. 4,937 108,318
NewAlliance Bancshares, Inc. 15,542 201,113
Northfield Bancorp, Inc. 2,907 31,047
Northwest Bancorp, Inc. 2,516 46,420
OceanFirst Financial Corp. 1,396 17,520
Old National Bancorp (a) 9,515 114,085
Old Second Bancorp, Inc. (a) 2,169 13,903
Oriental Financial Group, Inc. 3,503 34,715
Oritani Financial Corp. * 1,804 24,408
Copyright © 2012 www.secdatabase.com. All Rights Reserved.Please Consider the Environment Before Printing This Document

Pacific Capital Bancorp (a) 6,853 34,334
Pacific Continental Corp. 1,799 21,840
PacWest Bancorp 4,056 57,311
Park National Corp. (a) 1,595 100,485
Pennsylvania Commerce Bancorp, Inc. * (a) 856 15,545
Peoples Bancorp, Inc. 1,525 27,038
Pinnacle Financial Partners, Inc. * 3,459 50,156
PremierWest Bancorp 3,329 11,885
PrivateBancorp, Inc. 3,122 62,534
Prosperity Bancshares, Inc. 5,627 157,894
Provident Financial Services, Inc. 8,608 84,703
Provident New York Bancorp 5,918 48,883
Renasant Corp. 3,082 42,223
Republic Bancorp, Inc., Class A 1,352 32,786
Roma Financial Corp. 1,380 17,360
S & T Bancorp, Inc. (a) 3,501 52,305
S.Y. Bancorp, Inc. 1,967 48,742
Sandy Spring Bancorp, Inc. 2,423 33,074
SCBT Financial Corp. 1,673 37,726
Seacoast Banking Corp. of Florida 2,608 6,703
Shore Bancshares, Inc. 1,253 23,181
Sierra Bancorp (a) 1,207 17,477
Signature Bank * 5,064 136,981
Simmons First National Corp., Class A 2,057 56,218
Smithtown Bancorp, Inc. 1,539 18,930
South Financial Group, Inc. 12,556 23,856
Southside Bancshares, Inc. 1,873 42,929
Southwest Bancorp, Inc. 2,217 20,507
StellarOne Corp. 3,334 41,075
Sterling Bancorp 2,730 25,061
Sterling Bancshares, Inc. 10,614 67,293
Sterling Financial Corp. (a) 7,530 31,250
Suffolk Bancorp 1,431 37,349
Sun Bancorp, Inc., New Jersey * 2,537 17,049
Susquehanna Bancshares, Inc. 12,430 88,750
Small Cap Index Fund (continued)Shares or
Principal
Amount Value
COMMON STOCKS (continued)
Banking (continued)
SVB Financial Group * (a) 4,315 $ 116,289
Texas Capital Bancshares, Inc. * 4,010 61,554
Tompkins Trustco, Inc. 855 41,339
TowneBank/Portsmouth VA 3,016 49,161
Trico Bancshares 2,037 28,966
TrustCo Bank Corp., NY 11,090 62,548
Trustmark Corp. 7,104 139,167
UCBH Holdings, Inc. 17,184 26,635
Umpqua Holdings Corp. 8,703 73,976
Union Bankshares Corp. 1,986 28,757
United Bankshares, Inc. (a) 5,435 114,624
United Community Banks, Inc. (a) 5,991 46,430
United Financial Bancorp, Inc. 2,523 31,487
United Security Bancshares (a) 1,255 7,656
Univest Corp. of Pennsylvania 1,900 37,753
ViewPoint Financial Group 1,663 24,330
W Holding Company, Inc. * 371 7,019
Washington Trust Bancorp, Inc. 2,033 34,337
WesBanco, Inc. 3,855 63,338
West Coast Bancorp 2,586 7,137
WestAmerica Bancorp 4,161 215,789
Western Alliance Bancorp * 3,242 22,435
Westfield Financial, Inc. 4,671 42,973
Copyright © 2012 www.secdatabase.com. All Rights Reserved.Please Consider the Environment Before Printing This Document

Wilshire Bancorp, Inc. 3,145 15,159
Wintrust Financial Corp. 3,427 61,686
WSFS Financial Corp. 932 24,726
Yadkin Valley Financial Corp. 2,532 16,331
7,484,425
Biotechnology - 2.18%
Acorda Therapeutics, Inc. * 5,294 130,709
Affymetrix, Inc. * 10,016 48,177
Alnylam Pharmaceuticals, Inc. * 5,092 103,673
AMAG Pharmaceuticals, Inc. * (a) 2,428 127,713
Arena Pharmaceuticals, Inc. * 10,650 39,298
Arqule, Inc. * 5,860 29,124
Bio Reference Labs, Inc. * 1,652 44,951
BioMimetic Therapeutics, Inc. * (a) 2,069 17,111
Bio-Rad Laboratories, Inc., Class A * 2,700 200,988
Cougar Biotechnology, Inc. * 2,126 91,397
Cytokinetics, Inc. * 5,642 15,459
Discovery Laboratories, Inc. * 16,184 17,641
Exelixis, Inc. * 15,089 83,744
Facet Biotech Corp. * 3,425 33,942
Genomic Health, Inc. * 1,980 38,412
Geron Corp. * (a) 12,326 80,735
GTx, Inc. * (a) 2,720 23,392
Human Genome Sciences, Inc. * (a) 19,510 48,190
Idera Pharmaceuticals, Inc. * 3,039 16,502
Immucor, Inc. * 10,022 150,831
Integra LifeSciences Holdings Corp. * 2,556 66,354
Intermune, Inc. * 5,021 59,348
Lexicon Genetics, Inc. * 12,673 17,615
Life Sciences Research, Inc. * 1,510 10,117
Martek Biosciences Corp. * (a) 4,712 99,847
Medarex, Inc. * 18,282 132,362
Medivation, Inc. * (a) 3,644 82,537
The accompanying notes are an integral part of the financial statements.
187
JOHN HANCOCK FUNDS II
PORTFOLIO OF INVESTMENTS - May 31, 2009 (Unaudited) - continued(showing percentage of total net assets)
Small Cap Index Fund (continued)Shares or
Principal
Amount Value
COMMON STOCKS (continued)
Biotechnology (continued)
Momenta Pharmaceuticals, Inc. * 3,799 $ 33,317
Myriad Genetics, Inc. * 12,753 461,148
Nabi Biopharmaceuticals * 7,576 21,440
Nektar Therapeutics * 13,282 89,653
Neurocrine Biosciences, Inc. * 5,778 17,738
Orexigen Therapeutics, Inc. * 3,047 10,847
Osiris Therapeutics, Inc. * (a) 2,149 27,099
Progenics Pharmaceuticals, Inc. * 3,893 20,127
Protalix BioTherapeutics, Inc. * 1,671 6,350
Sangamo Biosciences, Inc. * (a) 5,359 21,329
2,519,217
Broadcasting - 0.19%
Belo Corp., Class A 13,036 23,465
CKX, Inc. * 7,590 52,902
Copyright © 2012 www.secdatabase.com. All Rights Reserved.Please Consider the Environment Before Printing This Document

Cox Radio, Inc., Class A * 3,875 18,949
Entercom Communications Corp. 4,775 7,592
Fisher Communications, Inc. * 1,054 12,975
Global Traffic Network, Inc. * 2,047 6,386
Journal Communications, Inc. 6,963 10,514
Mediacom Communications Corp., Class A * 5,707 34,185
RHI Entertainment, Inc. * 2,023 6,312
Sinclair Broadcast Group, Inc., Class A 7,574 13,330
World Wrestling Entertainment, Inc., Class A 3,056 38,139
224,749
Building Materials & Construction - 0.98%
Apogee Enterprises, Inc. 4,192 51,645
Beacon Roofing Supply, Inc. * 6,375 92,437
Builders FirstSource, Inc. * 2,478 10,185
Drew Industries, Inc. * 2,835 40,682
Dycom Industries, Inc. * 5,804 67,849
EMCOR Group, Inc. * 9,729 218,611
Granite Construction, Inc. 4,736 173,101
Griffon Corp. * 7,686 74,477
Interline Brands, Inc. * 4,660 62,211
LSI Industries, Inc. 3,121 15,199
NCI Building Systems, Inc. * (a) 3,126 14,067
Orion Marine Group, Inc. * 3,094 65,222
Quanex Building Products Corp. 5,353 59,097
Sterling Construction Company, Inc. * 1,685 28,813
Texas Industries, Inc. 3,357 114,239
Trex Company, Inc. * 2,223 24,698
U.S. Concrete, Inc. * 5,971 13,853
United States Lime & Minerals, Inc. * 259 10,352
1,136,738
Business Services - 5.03%
3PAR, Inc. * 3,903 33,917
ABM Industries, Inc. 6,259 101,271
Acxiom Corp. 8,769 93,741
Administaff, Inc. 3,071 66,026
AMERCO, Inc. * 1,354 49,895
Arbitron, Inc. 3,924 78,127
Ariba, Inc. * 12,257 116,074
Black Box Corp. 2,507 82,530
Bowne & Company, Inc. 4,028 21,629
CDI Corp. 1,811 20,337
Small Cap Index Fund (continued)Shares or
Principal
Amount Value
COMMON STOCKS (continued)
Business Services (continued)
China Security & Surveillance Technology, Inc. * 4,489 $ 31,468
Chindex International, Inc. * 1,743 13,874
Coinstar, Inc. * 4,285 126,922
Compass Diversified Trust 3,455 30,404
Compucredit Corp. * (a) 2,465 7,370
comScore, Inc. * 2,583 28,800
COMSYS IT Partners, Inc. * 2,280 11,537
Constant Contact, Inc. * 2,923 51,416
Core-Mark Holding Company, Inc. * 1,384 36,136
CoStar Group, Inc. * 2,802 99,891
CRA International, Inc. * 1,599 42,134
CSG Systems International, Inc. * 5,010 68,988
Deluxe Corp. 7,377 104,311
DG Fastchannel, Inc. * (a) 2,546 50,385
Electro Rent Corp. 2,975 28,709
Copyright © 2012 www.secdatabase.com. All Rights Reserved.Please Consider the Environment Before Printing This Document

Ennis Business Forms, Inc. 3,751 40,511
Euronet Worldwide, Inc. * 6,763 107,937
Exponent, Inc. * 1,970 51,752
EZCORP, Inc., Class A * 6,447 78,331
Fair Isaac Corp. 6,966 122,462
Forrester Research, Inc. * 2,233 51,739
Gartner Group, Inc., Class A * 8,489 130,306
Gevity HR, Inc. 3,842 15,330
Global Cash Access, Inc. * 5,772 40,289
Global Sources, Ltd. * 2,378 16,218
GSI Commerce, Inc. * 3,362 43,235
Harte-Hanks, Inc. 5,302 44,696
Heidrick & Struggles International, Inc. 2,481 45,526
Hill International, Inc. * 3,491 14,173
Hudson Highland Group, Inc. * 3,945 7,732
Huron Consulting Group, Inc. * 2,965 135,886
ICF International, Inc. * 941 25,031
ICT Group, Inc. * 1,398 12,344
infoGROUP, Inc. * 4,806 26,914
Informatica Corp. * 12,664 206,803
Insight Enterprises, Inc. * 6,753 50,985
Jackson Hewitt Tax Service, Inc. 4,198 16,666
Kelly Services, Inc., Class A 3,807 40,583
Kendle International, Inc. * 1,904 19,802
Kenexa Corp. * 3,292 31,834
Kforce, Inc. * 4,408 41,038
Korn/Ferry International * 6,673 74,004
LECG Corp. * 4,279 12,495
Macrovision Solutions Corp. * 11,783 265,942
MAXIMUS, Inc. 2,521 100,588
McGrath Rentcorp 3,396 61,671
Michael Baker Corp. * 1,049 44,089
MPS Group, Inc. * 13,551 102,852
Navigant Consulting Company * 6,925 82,477
Net 1 UEPS Technologies, Inc. * 7,166 87,497
On Assignment, Inc. * 5,238 18,700
OraSure Technologies, Inc. * 6,861 24,974
Parexel International Corp. * 8,151 83,955
PC Mall, Inc. * 1,685 13,665
Perot Systems Corp., Class A * 12,348 168,674
PHH Corp. * 7,759 119,489
The accompanying notes are an integral part of the financial statements.
188
JOHN HANCOCK FUNDS II
PORTFOLIO OF INVESTMENTS - May 31, 2009 (Unaudited) - continued(showing percentage of total net assets)
Small Cap Index Fund (continued)Shares or
Principal
Amount Value
COMMON STOCKS (continued)
Business Services (continued)
Pre-Paid Legal Services, Inc. * (a) 1,057 $ 44,774
PRG-Schultz International, Inc. * 2,687 7,712
Resource America, Inc. 1,583 8,374
Resources Connection, Inc. * 6,514 120,704
Rollins, Inc. 5,910 98,756
ScanSource, Inc. * 3,759 92,998
Schawk, Inc., Class A 2,238 15,666
Seachange International, Inc. * 4,506 33,344
Copyright © 2012 www.secdatabase.com. All Rights Reserved.Please Consider the Environment Before Printing This Document

SonicWALL, Inc. * 7,700 39,347
Sotheby's (a) 9,653 102,322
Sourcefire, Inc. * 2,882 35,160
Spherion Corp. * 7,442 25,600
SRA International, Inc., Class A * 6,094 108,108
Standard Parking Corp. * 1,099 16,408
Stanley, Inc. * 1,262 32,926
SuccessFactors, Inc. * 3,490 27,362
SYNNEX Corp. * (a) 2,481 64,208
Syntel, Inc. 1,842 52,921
TeleTech Holdings, Inc. * 5,225 60,244
Tetra Tech, Inc. * 8,407 215,808
The Hackett Group, Inc. * 6,301 14,807
TrueBlue, Inc. * 6,356 54,217
Tyler Technologies, Inc. * 5,063 85,058
Viad Corp. 2,985 43,850
Volt Information Sciences, Inc. * 1,759 11,715
VSE Corp. 626 15,719
Watson Wyatt Worldwide, Inc., Class A 6,085 230,865
Wind River Systems, Inc. * 9,781 77,172
5,811,232
Cable & Television - 0.14%
Knology, Inc. * 4,175 33,400
Lin TV Corp. * 4,539 9,033
Outdoor Channel Holdings, Inc. * 2,235 15,645
TiVo, Inc. * 14,620 102,340
160,418
Cellular Communications - 0.34%
Brightpoint, Inc. * 7,259 42,973
iPCS, Inc. * 2,498 45,264
Novatel Wireless, Inc. * 4,557 53,226
RF Micro Devices, Inc. * 37,695 107,431
Syniverse Holdings, Inc. * 7,367 110,136
USA Mobility, Inc. * 2,845 31,807
390,837
Chemicals - 1.68%
A. Schulman, Inc. 3,896 58,167
Aceto Corp. 3,593 21,881
Albany Molecular Research, Inc. * 3,357 29,374
American Vanguard Corp. 2,727 27,843
Arch Chemicals, Inc. 3,570 100,317
Balchem Corp. 2,598 62,664
Calgon Carbon Corp. * 7,723 89,046
Cambrex Corp. * 4,365 15,714
Ferro Corp. 6,376 23,527
H.B. Fuller Company 6,927 117,897
ICO, Inc. * 4,207 12,116
Small Cap Index Fund (continued)Shares or
Principal
Amount Value
COMMON STOCKS (continued)
Chemicals (continued)
Innophos Holdings, Inc. 1,496 $ 23,323
Innospec, Inc. 3,413 30,410
Landec Corp. * 3,419 23,249
LSB Industries, Inc. * 2,509 42,026
Metabolix, Inc. * 2,762 19,444
Minerals Technologies, Inc. 2,714 106,172
Newmarket Corp. 1,923 139,552
Olin Corp. 10,696 142,899
Copyright © 2012 www.secdatabase.com. All Rights Reserved.Please Consider the Environment Before Printing This Document

OM Group, Inc. * 4,368 115,752
Penford Corp. 1,869 11,401
PolyOne Corp. * 13,560 40,816
Quaker Chemical Corp. 1,591 21,940
Rockwood Holdings, Inc. * 5,992 89,401
Sensient Technologies Corp. 6,871 157,483
ShengdaTech, Inc. * 4,454 17,460
Solutia, Inc. * 13,587 66,576
Spartech Corp. 4,519 19,115
Stepan Company 908 38,145
Valence Technology, Inc. * (a) 8,310 14,626
W.R. Grace & Company * 10,353 134,382
Westlake Chemical Corp. 2,720 55,624
Zep, Inc. 2,990 36,388
Zoltek Companies, Inc. * 3,997 39,570
1,944,300
Coal - 0.15%
International Coal Group, Inc. * (a) 18,370 58,784
James River Coal Company * 3,932 88,155
National Coal Corp. * 4,295 7,817
Westmoreland Coal Company * 1,532 13,482
168,238
Colleges & Universities - 0.16%
Corinthian Colleges, Inc. * 12,179 187,313
Commercial Services - 0.89%
CBIZ, Inc. * 6,442 46,576
Cenveo, Inc. * 6,986 34,441
Chemed Corp. 3,177 121,584
DynCorp International, Inc. * 3,533 51,123
Exlservice Holdings, Inc. * 2,115 20,938
First Advantage Corp., Class A * 1,500 20,220
Great Lakes Dredge & Dock Company 5,791 30,171
HMS Holdings Corp. * 3,570 125,485
Live Nation, Inc. * 10,897 62,331
Odyssey Marine Exploration, Inc. * 7,642 29,116
Perficient, Inc. * 4,596 29,231
Pool Corp. (a) 6,897 120,215
Providence Service Corp. * 1,867 20,350
Riskmetrics Group, Inc. * 3,063 49,222
Team, Inc. * 2,673 37,823
TNS, Inc. * 3,512 66,201
Waste Services, Inc. * 3,704 21,520
Wright Express Corp. * 5,556 138,178
1,024,725
Computers & Business Equipment - 3.11%
3Com Corp. * 57,675 249,156
3D Systems Corp. * 2,642 18,230
The accompanying notes are an integral part of the financial statements.
189
JOHN HANCOCK FUNDS II
PORTFOLIO OF INVESTMENTS - May 31, 2009 (Unaudited) - continued(showing percentage of total net assets)
Small Cap Index Fund (continued)Shares or
Principal
Amount Value
COMMON STOCKS (continued)
Copyright © 2012 www.secdatabase.com. All Rights Reserved.Please Consider the Environment Before Printing This Document

Computers & Business Equipment
(continued)
Acme Packet, Inc. * 3,580 $ 27,745
Agilysys, Inc. 3,319 21,441
Avocent Corp. * 6,406 89,684
Benchmark Electronics, Inc. * 9,636 117,559
BigBand Networks, Inc. * 4,756 24,826
Blue Coat Systems, Inc. * 4,748 67,279
CACI International, Inc., Class A * 4,298 164,914
Cogent, Inc. * 5,847 58,762
Compellent Technologies, Inc. * 2,041 23,819
Cray, Inc. * 4,819 20,770
Data Domain, Inc. * 4,969 126,560
Digi International, Inc. * 3,741 32,397
Echelon Corp. * 4,271 31,306
Electronics for Imaging, Inc. * 7,657 77,872
EMS Technologies, Inc. * 2,246 43,909
Extreme Networks, Inc. * 12,945 21,359
Falconstor Software, Inc. * 5,249 19,054
Furmanite Corp. * 5,441 21,873
Gerber Scientific, Inc. * 3,710 11,983
Hurco Companies, Inc. * 970 13,929
Hypercom Corp. * 8,627 11,647
Immersion Corp. * 4,112 18,298
Intermec, Inc. * 8,821 101,265
Internap Network Services Corp. * 7,431 20,881
Isilon Systems, Inc. * 4,075 11,166
Ixia * 5,781 35,264
Jack Henry & Associates, Inc. 10,705 196,651
L-1 Identity Solutions, Inc. * 10,382 90,012
Limelight Networks, Inc. * 4,130 20,320
MICROS Systems, Inc. * 11,670 304,820
MTS Systems Corp. 2,523 55,960
NCI, Inc. * 947 23,827
Ness Technologies, Inc. * 5,826 19,925
Netezza Corp. * 5,671 39,584
NETGEAR, Inc. * 5,050 70,852
Netscout Systems, Inc. * 4,240 39,771
Palm, Inc. * 19,717 240,547
Parametric Technology Corp. * 16,497 191,035
Phoenix Technology, Ltd. * 4,711 13,144
Plexus Corp. * 5,702 104,119
Quantum Corp. * 29,494 33,918
Radiant Systems, Inc. * 3,999 30,192
RadiSys Corp. * 3,260 28,232
Rimage Corp. * 1,434 21,840
Sigma Designs, Inc. * (a) 3,800 58,748
Silicon Graphics International Corp. * 4,338 21,994
Silicon Storage Technology, Inc. * 11,561 21,272
Smart Modular Technologies (WWH), Inc. * 6,466 17,976
Standard Microsystems Corp. * 3,233 59,617
STEC, Inc. * (a) 4,390 71,952
Stratasys, Inc. * 3,011 31,495
Super Micro Computer, Inc. * 3,441 23,055
Sykes Enterprises, Inc. * 4,704 76,675
Synaptics, Inc. * (a) 4,853 170,437
Trident Microsystems, Inc. * 9,677 16,644
Small Cap Index Fund (continued)Shares or
Principal
Amount Value
COMMON STOCKS (continued)
Computers & Business Equipment
(continued)
Copyright © 2012 www.secdatabase.com. All Rights Reserved.Please Consider the Environment Before Printing This Document

Virtusa Corp. * 1,452 $ 10,251
3,587,813
Construction & Mining Equipment - 0.33%
Astec Industries, Inc. * 2,577 78,908
Carbo Ceramics, Inc. (a) 2,923 110,548
Gulf Islands Fabrication, Inc. 1,777 28,254
Kaman Corp., Class A 3,658 57,979
Layne Christensen Company * 2,780 59,437
Matrix Service Company * 3,785 42,846
377,972
Construction Materials - 0.66%
Ameron International Corp. 1,319 73,139
Applied Industrial Technologies, Inc. 6,055 125,762
Clarcor, Inc. 7,222 206,982
Columbus McKinnon Corp. * 2,746 38,142
Comfort Systems USA, Inc. 5,824 54,338
Louisiana-Pacific Corp. * 14,857 64,479
Simpson Manufacturing Company, Inc. (a) 5,336 111,202
Standex International Corp. 1,865 18,986
Universal Forest Products, Inc. 2,384 72,617
765,647
Containers & Glass - 0.26%
Bway Holding Company * 1,074 15,605
Graphic Packaging Holding Company * 20,884 39,262
Mobile Mini, Inc. * 4,972 62,697
Silgan Holdings, Inc. 3,589 158,849
TAL International Group, Inc. 2,127 21,121
297,534
Correctional Facilities - 0.13%
Cornell Corrections, Inc. * 1,610 27,338
The Geo Group, Inc. * 7,298 119,249
146,587
Cosmetics & Toiletries - 0.46%
Chattem, Inc. * 2,458 146,816
Elizabeth Arden, Inc. * 3,599 25,373
Helen of Troy, Ltd. * 4,331 83,631
Intermediate Parfums, Inc. 2,115 17,745
Nu Skin Enterprises, Inc., Class A 7,111 103,181
Sally Beauty Holdings, Inc. * 13,490 95,914
Steiner Leisure, Ltd. * 2,093 61,011
533,671
Crude Petroleum & Natural Gas - 1.72%
Abraxas Petroleum Corp. * 6,855 8,089
Allis-Chalmers Energy, Inc. * 4,408 11,990
Arena Resources, Inc. * 5,431 194,538
Bill Barrett Corp. * 5,259 178,964
BMB Munai, Inc. * 6,921 10,935
Cano Petroleum, Inc. * 8,993 6,295
Carrizo Oil & Gas, Inc. * (a) 3,964 84,631
Concho Resources, Inc. * 7,911 253,548
Contango Oil & Gas Company * 1,900 94,753
Endeavour International Corp. * 16,643 28,626
Energy XXI Bermuda, Ltd. 20,068 12,643
The accompanying notes are an integral part of the financial statements.
190
JOHN HANCOCK FUNDS II
Copyright © 2012 www.secdatabase.com. All Rights Reserved.Please Consider the Environment Before Printing This Document

PORTFOLIO OF INVESTMENTS - May 31, 2009 (Unaudited) - continued(showing percentage of total net assets)
Small Cap Index Fund (continued)Shares or
Principal
Amount Value
COMMON STOCKS (continued)
Crude Petroleum & Natural Gas
(continued)
EXCO Resources, Inc. * 21,410 $ 329,500
FX Energy, Inc. * (a) 6,351 22,673
Geokinetics, Inc. * 830 10,973
Georesources, Inc. * 1,013 8,570
GMX Resources, Inc. * 2,429 42,920
Goodrich Petroleum Corp. * (a) 3,238 86,519
Gran Tierra Energy, Inc. * 31,875 96,900
Gulfport Energy Corp. * 3,939 24,501
Harvest Natural Resources, Inc. * 4,939 26,028
Northern Oil And Gas, Inc. * 3,115 24,640
Oilsands Quest, Inc. * 27,068 27,609
Panhandle Oil and Gas, Inc. 1,132 23,319
Parallel Petroleum Corp. * 6,881 14,312
Penn Virginia Corp. 5,991 114,548
Petroquest Energy, Inc. * 6,365 35,262
SulphCo, Inc. * (a) 9,014 9,375
Swift Energy Company * 4,433 72,834
Toreador Resources Corp. * (a) 2,847 11,018
VAALCO Energy, Inc. * 8,569 39,075
Venoco, Inc. * 3,061 21,978
Western Refining, Inc. * 4,252 60,591
1,988,157
Domestic Oil - 0.61%
Atlas America, Inc. 4,982 91,768
Berry Petroleum Company, Class A 6,133 119,716
Brigham Exploration Company * (a) 6,900 23,322
Clayton Williams Energy, Inc. * 813 19,935
Comstock Resources, Inc. * 6,520 259,692
Delta Petroleum Corp. * 9,755 19,510
GeoGlobal Resources, Inc. * 6,157 6,095
McMoran Exploration Company * 8,743 59,278
Natural Gas Services Group, Inc. * 1,765 26,228
Stone Energy Corp. * 4,643 39,233
Union Drilling, Inc. * 1,900 18,601
Warren Resources, Inc. * 8,782 19,496
702,874
Drugs & Health Care - 1.49%
Abaxis, Inc. * (a) 3,115 54,481
Abiomed, Inc. * 4,943 29,510
Accelrys, Inc. * 4,088 19,173
Almost Family, Inc. * 905 24,037
Ardea Biosciences, Inc. * 2,099 32,870
Ariad Pharmaceuticals, Inc. * 12,753 19,130
China Sky One Medical, Inc. * 1,135 16,730
Columbia Laboratories, Inc. * 7,544 9,505
Cytori Therapeutics, Inc. * (a) 3,741 14,178
Dendreon Corp. * (a) 14,053 318,582
DepoMed, Inc. * 7,594 16,327
Durect Corp. * 11,911 27,872
Dyax Corp. * 8,695 17,390
Hansen Medical, Inc. * (a) 3,682 20,987
I-Flow Corp. * 3,238 17,809
Immunogen, Inc. * 7,240 60,020
Copyright © 2012 www.secdatabase.com. All Rights Reserved.Please Consider the Environment Before Printing This Document

Immunomedics, Inc. * 9,629 23,976
Small Cap Index Fund (continued)Shares or
Principal
Amount Value
COMMON STOCKS (continued)
Drugs & Health Care (continued)
Invacare Corp. 4,594 $ 78,006
Landauer, Inc. 1,323 76,245
Luminex Corp. * 5,901 93,531
Mannatech, Inc. (a) 2,421 7,432
Maxygen, Inc. * 3,637 25,786
Medical Action, Inc. * 2,070 21,135
Meridian Bioscience, Inc. 5,741 109,711
MiddleBrook Pharmaceuticals, Inc. * (a) 6,099 9,514
Molina Healthcare, Inc. * 1,963 46,994
Opko Health, Inc. * 7,417 8,900
Pain Therapeutics, Inc. * 5,050 22,523
Quidel Corp. * 4,034 51,353
Res-Care, Inc. * 3,547 50,190
Seattle Genetics, Inc. * 9,355 85,972
Synutra International, Inc. * 1,516 15,494
Targacept, Inc. * 2,750 7,810
Vivus, Inc. * 9,954 51,462
West Pharmaceutical Services, Inc. 4,612 149,060
XenoPort, Inc. * 3,912 67,717
Zymogenetics, Inc. * 5,478 22,898
1,724,310
Educational Services - 0.26%
American Public Education, Inc. * 1,579 51,586
Capella Education Company * (a) 2,034 106,154
Grand Canyon Education, Inc. * 1,507 20,435
K12, Inc. * 910 15,925
Leapfrog Enterprises, Inc., Class A * 5,333 15,199
Learning Tree International, Inc. * 1,437 13,695
Lincoln Educational Services Corp. * 617 11,378
Princeton Review, Inc. * 2,130 9,968
Renaissance Learning, Inc. 1,439 14,117
Universal Technical Institute, Inc. * 3,085 42,912
301,369
Electrical Equipment - 1.78%
A.O. Smith Corp. 2,869 86,041
Aaon, Inc. 1,948 40,518
American Science & Engineering, Inc. 1,290 80,664
Anaren, Inc. * 2,119 34,074
Anixter International, Inc. * 4,256 174,581
Audiovox Corp., Class A * 2,600 15,132
AZZ, Inc. * 1,747 60,708
Baldor Electric Company 6,628 153,703
Beacon Power Corp. * 17,260 13,290
Capstone Turbine Corp. * 25,785 16,503
China BAK Battery, Inc. * (a) 5,162 11,511
Cohu, Inc. 3,360 31,080
DTS, Inc. * 2,545 67,366
Encore Wire Corp. 2,652 56,302
GrafTech International, Ltd. * 17,170 174,619
Greatbatch, Inc. * 3,261 67,372
Houston Wire & Cable Company 2,640 31,522
Littelfuse, Inc. * 3,127 54,848
Methode Electronics, Inc. 5,485 32,032
Plug Power, Inc. * 18,930 17,605
Polypore International, Inc. * 2,292 22,783
Copyright © 2012 www.secdatabase.com. All Rights Reserved.Please Consider the Environment Before Printing This Document

The accompanying notes are an integral part of the financial statements.
191
JOHN HANCOCK FUNDS II
PORTFOLIO OF INVESTMENTS - May 31, 2009 (Unaudited) - continued(showing percentage of total net assets)
Small Cap Index Fund (continued)Shares or
Principal
Amount Value
COMMON STOCKS (continued)
Electrical Equipment (continued)
Powell Industries, Inc. * 1,080 $ 42,433
Power-One, Inc. * 11,151 15,723
Regal-Beloit Corp. 4,612 182,220
Ultralife Batteries, Inc. * 1,898 13,172
Universal Electronics, Inc. * 2,048 40,182
US Geothermal, Inc. * 10,100 13,635
Varian, Inc. * 4,228 147,219
Vicor Corp. 2,868 15,602
W.H. Brady Company, Class A 7,194 178,267
Watsco, Inc. 3,339 164,379
2,055,086
Electrical Utilities - 2.23%
Allete, Inc. 3,997 105,601
Avista Corp. 7,617 120,653
Black Hills Corp. 5,532 118,385
Central Vermont Public Service Corp. 1,728 27,924
CH Energy Group, Inc. 2,251 93,349
Cleco Corp. 8,588 175,710
Connecticut Water Service, Inc. 1,346 28,387
El Paso Electric Company * 6,493 85,967
Empire District Electric Company 4,910 76,940
EnerNOC, Inc. * (a) 1,384 32,967
IDACORP, Inc. 6,462 150,371
ITC Holdings Corp. 7,062 302,889
MGE Energy, Inc. 3,200 99,296
NorthWestern Corp. 5,154 110,450
Otter Tail Corp. 5,079 96,349
Pike Electric Corp. * 2,487 27,208
PNM Resources, Inc. 12,434 115,015
Portland General Electric Company 10,721 192,871
Tutor Perini Corp. * 7,231 149,320
UIL Holding Corp. 3,652 75,706
Unisource Energy Corp. 4,910 124,910
Westar Energy, Inc. 14,940 266,679
2,576,947
Electronics - 1.68%
Adaptec, Inc. * 17,360 47,219
Advanced Battery Technologies, Inc. * (a) 6,411 22,951
Anadigics, Inc. * 9,060 35,515
Analogic Corp. 1,924 70,207
Axsys Technologies, Inc. * 1,322 64,884
Bel Fuse, Inc., Class B 1,728 23,328
Belden, Inc. 6,697 122,689
Checkpoint Systems, Inc. * 5,700 80,028
Cogo Group, Inc. * 3,394 22,095
CTS Corp. 4,870 28,100
Cynosure, Inc. * 1,469 9,901
Copyright © 2012 www.secdatabase.com. All Rights Reserved.Please Consider the Environment Before Printing This Document

Daktronics, Inc. (a) 4,742 40,639
Electro Scientific Industries, Inc. * 3,950 35,392
Ener1, Inc. * (a) 5,848 39,182
Enersys * 3,945 63,909
FEI Company * 5,229 113,783
Franklin Electric, Inc. 3,333 79,259
Harbin Electric, Inc. * 1,162 14,630
Hutchinson Technology, Inc. * (a) 3,826 8,073
Small Cap Index Fund (continued)Shares or
Principal
Amount Value
COMMON STOCKS (continued)
Electronics (continued)
ICx Technologies, Inc. * (a) 2,212 $ 9,401
II-VI, Inc. * 3,495 83,880
Imation Corp. 4,305 41,586
Integrated Electrical Services, Inc. * 1,186 11,694
IPG Photonics Corp. * 2,775 28,610
LaBarge, Inc. * 1,847 14,037
Maxwell Technologies, Inc. * 2,852 32,399
Measurement Specialties, Inc. * 2,380 13,090
Mentor Graphics Corp. * 13,058 73,386
Mercury Computer Systems, Inc. * 3,284 24,761
Multi-Fineline Electronix, Inc. * 1,228 23,516
Newport Corp. * 5,278 30,824
NVE Corp. * 669 26,767
OSI Systems, Inc. * 2,268 41,731
Park Electrochemical Corp. 2,904 56,018
Rogers Corp. * 2,248 38,351
Sanmina-SCI Corp. * 76,753 55,262
SiRF Technology Holdings, Inc. * 8,785 34,964
Stoneridge, Inc. * 2,571 8,304
Supertex, Inc. * 1,576 38,596
Sycamore Networks, Inc. * 27,410 82,230
Taser International, Inc. * 9,023 39,340
Technitrol, Inc. 6,004 21,074
TTM Technologies, Inc. * 6,145 54,691
Universal Display Corp. * 4,151 36,487
Zoran Corp. * 7,427 82,291
Zygo Corp. * 2,511 12,681
1,937,755
Energy - 0.64%
Alon USA Energy, Inc. 1,552 20,611
Ascent Solar Technologies, Inc. * (a) 1,180 7,139
Clean Energy Fuels Corp. * (a) 3,537 34,061
Comverge, Inc. * 3,171 32,344
Energy Conversion Devices, Inc. * (a) 6,449 110,987
Evergreen Energy, Inc. * (a) 17,873 18,373
Evergreen Solar, Inc. * 20,599 38,314
Fuelcell Energy, Inc. * 9,994 33,780
GT Solar International, Inc. * 4,338 27,850
Headwaters, Inc. * 6,133 24,348
New Jersey Resources Corp. 5,954 198,090
Ormat Technologies, Inc. 2,561 102,158
PowerSecure International, Inc. * 2,577 11,751
Quantum Fuel Systems Technologies
Worldwide, Inc. * 13,875 10,114
Rosetta Resources, Inc. * 7,520 65,650
735,570
Financial Services - 2.77%
Advance America Cash Advance Centers, Inc. 6,071 27,319
Copyright © 2012 www.secdatabase.com. All Rights Reserved.Please Consider the Environment Before Printing This Document

Advanta Corp., Class B 7,184 5,029
Ampal American Israel Corp. * 3,039 7,506
Apollo Investment Corp. 20,389 112,343
Ares Capital Corp. 13,925 106,526
Asset Acceptance Capital Corp. * 2,335 20,081
Bankrate, Inc. * 1,826 54,981
BGC Partners, Inc. 5,070 17,086
The accompanying notes are an integral part of the financial statements.
192
JOHN HANCOCK FUNDS II
PORTFOLIO OF INVESTMENTS - May 31, 2009 (Unaudited) - continued(showing percentage of total net assets)
Small Cap Index Fund (continued)Shares or
Principal
Amount Value
COMMON STOCKS (continued)
Financial Services (continued)
BlackRock Kelso Capital Corp. 2,023 $ 13,170
Broadpoint Securities Group, Inc. * 3,899 17,078
Calamos Asset Management, Inc. 2,888 35,869
Capital Southwest Corp. 445 31,862
Cass Information Systems, Inc. 982 30,619
City Holding Company 2,361 74,938
Cohen & Steers, Inc. (a) 2,409 37,171
Credit Acceptance Corp. * 912 19,444
Delphi Financial Group, Inc. 5,945 113,193
Diamond Hill Investment Group, Inc. * 341 13,527
Dollar Financial Corp. * 3,518 35,426
Duff & Phelps Corp. * 1,528 22,706
Encore Capital Group, Inc. * 1,986 25,580
Epoch Holding Corp. 1,739 11,077
Evercore Partners, Inc. 1,482 28,632
FBR Capital Markets Corp. * 3,741 18,892
FCStone Group, Inc. * 3,610 14,729
Federal Agricultural Mortgage Corp., Class C 1,621 10,131
Financial Federal Corp. 3,657 90,657
First Financial Northwest, Inc. 3,108 27,319
GAMCO Investors, Inc., Class A 1,079 56,701
GFI Group, Inc. 9,495 57,065
Gladstone Capital Corp. 3,116 22,217
Gladstone Investment Corp. 3,600 15,264
Harris & Harris Group, Inc. * 4,162 18,396
Heartland Payment Systems, Inc. 3,561 27,242
Hercules Technology Growth Capital, Inc. 4,759 35,693
Interactive Brokers Group, Inc. * 5,840 86,841
Interactive Data Corp. 5,210 122,175
International Assets Holding Corp. * 720 10,505
Kayne Anderson Energy Development Fund * 1,529 18,853
KBW, Inc. * 3,930 102,298
Kearny Financial Corp. 2,633 29,542
Knight Capital Group, Inc. * 13,432 231,165
Kohlberg Capital Corp. 2,778 11,556
LaBranche & Company, Inc. * 6,950 29,955
MarketAxess Holdings, Inc. * 4,460 47,053
MCG Capital Corp. 11,133 24,047
Medallion Financial Corp. 2,369 17,507
Meridian Interstate Bancorp, Inc. * 1,819 15,371
MVC Capital, Inc. 3,561 28,844
National Financial Partners Corp. 5,680 34,364
Copyright © 2012 www.secdatabase.com. All Rights Reserved.Please Consider the Environment Before Printing This Document

Nelnet, Inc., Class A * 2,543 21,514
NewStar Financial, Inc. * 3,832 11,534
NGP Capital Resources Company 3,198 25,200
Ocwen Financial Corp. * 5,097 63,611
Oppenheimer Holdings, Inc., Class A 1,212 18,010
optionsXpress Holdings, Inc. 6,061 103,582
PennantPark Investment Corp. 3,059 20,801
Penson Worldwide, Inc. * 2,417 23,880
Piper Jaffray Companies, Inc. * 2,815 101,537
Portfolio Recovery Associates, Inc. * (a) 2,189 78,738
Prospect Capital Corp. 4,332 36,909
Pzena Investment Management, Inc. 913 5,962
Sanders Morris Harris Group, Inc. 3,142 16,967
Stifel Financial Corp. * 3,845 167,411
Small Cap Index Fund (continued)Shares or
Principal
Amount Value
COMMON STOCKS (continued)
Financial Services (continued)
SWS Group, Inc. 3,478 $ 44,553
The First Marblehead Corp. * 10,150 17,864
Thinkorswim Group, Inc. * 7,475 75,423
Thomas Weisel Partners Group, Inc. * 3,103 15,577
U.S. Global Investors, Inc. 2,033 13,926
UMB Financial Corp. 4,449 178,538
United Community Financial Corp. 4,961 6,797
Virtus Investment Partners, Inc. * 913 13,512
Westwood Holdings Group, Inc. 774 31,471
World Acceptance Corp. * (a) 2,352 47,111
3,205,973
Food & Beverages - 1.79%
American Dairy, Inc. * 1,019 37,041
B&G Foods, Inc. 2,684 19,459
Calavo Growers, Inc. 1,534 24,667
Cal-Maine Foods, Inc. (a) 1,860 45,458
Chiquita Brands International, Inc. * (a) 6,238 65,187
Coca-Cola Bottling Company Consolidated 595 29,024
Diamond Foods, Inc. 2,299 67,798
Farmer Brothers Company 1,007 22,466
Flowers Foods, Inc. 11,033 233,569
Green Mountain Coffee Roasters, Inc. * 2,457 205,086
Hain Celestial Group, Inc. * 5,823 99,981
Imperial Sugar Company 1,765 18,250
J & J Snack Foods Corp. 2,023 75,903
Lance, Inc. 3,873 82,611
Lifeway Foods, Inc. * 752 8,437
M & F Worldwide Corp. * 1,692 28,341
Nash Finch Company 1,835 53,784
National Beverage Corp. * 1,542 16,576
Ralcorp Holdings, Inc. * 8,030 459,878
Sanderson Farms, Inc. 2,904 126,643
Seaboard Corp. 48 51,552
Smart Balance, Inc. * (a) 9,002 66,615
Tootsie Roll Industries, Inc. (a) 3,500 78,750
TreeHouse Foods, Inc. * 4,456 119,109
Zhongpin, Inc. * 2,686 28,418
2,064,603
Food-Meat Products - 0.01%
HQ Sustainable Maritime Industries, Inc. * 1,007 9,083
Forest Products - 0.04%
Deltic Timber Corp. 1,523 51,142
Copyright © 2012 www.secdatabase.com. All Rights Reserved.Please Consider the Environment Before Printing This Document

Funeral Services - 0.04%
Stewart Enterprises, Inc., Class A (a) 12,033 49,696
Furniture & Fixtures - 0.15%
American Woodmark Corp. 1,563 30,025
Ethan Allen Interiors, Inc. 3,553 43,560
Furniture Brands International, Inc. 6,059 25,266
Hooker Furniture Corp. 1,384 17,162
Kimball International, Inc., Class B 4,670 28,160
La-Z-Boy, Inc. 7,983 14,928
Sealy Corp. * (a) 6,757 12,838
171,939
The accompanying notes are an integral part of the financial statements.
193
JOHN HANCOCK FUNDS II
PORTFOLIO OF INVESTMENTS - May 31, 2009 (Unaudited) - continued(showing percentage of total net assets)
Small Cap Index Fund (continued)Shares or
Principal
Amount Value
COMMON STOCKS (continued)
Gas & Pipeline Utilities - 1.16%
American States Water Company 2,468 $ 77,372
Chesapeake Utilities Corp. 1,020 33,517
Crosstex Energy, Inc. 5,996 20,986
Middlesex Water Company 2,091 28,793
Nicor, Inc. 6,395 201,123
Northwest Natural Gas Company 3,761 159,617
Piedmont Natural Gas, Inc. 10,446 236,706
RAM Energy Resources, Inc. * 7,976 7,817
South Jersey Industries, Inc. 4,229 141,164
Southwest Gas Corp. 6,212 129,085
The Laclede Group, Inc. 3,123 97,063
WGL Holdings, Inc. 7,028 208,872
1,342,115
Healthcare Products - 2.80%
Accuray, Inc. * 5,214 32,118
Align Technology, Inc. * 8,422 99,632
Alphatec Holdings, Inc. * 4,189 9,216
American Medical Systems Holdings, Inc. * 10,416 158,011
AngioDynamics, Inc. * 3,475 42,638
Atrion Corp. 220 24,244
Bruker BioSciences Corp. * 7,232 47,225
Caliper Life Sciences, Inc. * 7,841 11,683
Cantel Medical Corp. * 1,777 24,185
Cardiac Science Corp. * 3,000 12,390
CardioNet, Inc. * (a) 679 12,025
Clinical Data, Inc. * 1,628 19,927
Computer Programs & Systems, Inc. 1,307 44,699
Conceptus, Inc. * (a) 4,332 68,662
CONMED Corp. * 4,128 65,016
Cryolife, Inc. * 4,067 19,074
Cyberonics, Inc. * 3,409 49,396
Cypress Biosciences, Inc. * 5,396 41,010
Digimarc Corp. * 1,136 11,542
Haemonetics Corp. * 3,656 194,609
Hanger Orthopedic Group, Inc. * 4,391 64,548
ICU Medical, Inc. * 1,670 60,387
Copyright © 2012 www.secdatabase.com. All Rights Reserved.Please Consider the Environment Before Printing This Document

Insulet Corp. * (a) 2,671 19,311
Kensey Nash Corp. * 1,053 26,367
Mannkind Corp. * (a) 7,399 48,685
Masimo Corp. * 6,563 157,118
Medicines Company * 7,530 57,680
Merit Medical Systems, Inc. * 3,944 53,993
Micrus Endovascular Corp. * 2,301 20,732
Natus Medical, Inc. * 3,976 40,635
NutriSystem, Inc. (a) 4,382 60,033
Nuvasive, Inc. * (a) 5,080 183,490
Orthofix International NV * 2,463 62,363
Owens & Minor, Inc. 5,855 205,276
PSS World Medical, Inc. * 8,845 142,139
RTI Biologics, Inc. * 7,833 30,549
Sirona Dental Systems, Inc. * 2,419 47,582
Somanetics Corp. * 1,735 29,165
SonoSite, Inc. * 2,428 44,942
Spectranetics Corp. * 4,681 20,784
Stereotaxis, Inc. * 4,503 15,625
STERIS Corp. 8,347 197,240
Small Cap Index Fund (continued)Shares or
Principal
Amount Value
COMMON STOCKS (continued)
Healthcare Products (continued)
SurModics, Inc. * 2,225 $ 43,988
Symmetry Medical, Inc. * 5,122 39,388
Synovis Life Technologies, Inc. * 1,680 32,626
Thoratec Corp. * 7,768 194,822
TomoTherapy, Inc. * 6,337 14,512
Trans1, Inc. * 1,828 15,392
Ulta Salon, Cosmetics & Fragrance, Inc. * 2,955 25,295
USANA Health Sciences, Inc. * 951 25,221
Vnus Medical Technologies * 1,863 53,953
Volcano Corp. * 6,744 83,356
Wright Medical Group, Inc. * 5,340 83,304
Zoll Medical Corp. * 3,008 50,504
3,238,307
Healthcare Services - 2.10%
Air Methods Corp. * 1,537 40,561
Alliance Imaging, Inc. * 3,679 25,385
Amedisys, Inc. * 3,785 115,140
AMERIGROUP Corp. * 7,630 220,202
AMN Healthcare Services, Inc. * 4,915 35,388
AmSurg Corp. * 4,512 84,284
Assisted Living Concepts, Inc. * 1,493 22,903
athenahealth, Inc. * 2,954 89,152
Capital Senior Living Corp. * 3,555 15,749
Catalyst Health Solutions, Inc. * 4,713 100,811
Centene Corp. * 6,203 112,771
CorVel Corp. * 1,116 23,927
Cross Country Healthcare, Inc. * 4,446 34,501
Emergency Medical Services Corp., Class A * 1,385 42,935
Emeritus Corp. * 2,844 40,868
Enzo Biochem, Inc. * 4,736 19,986
Five Star Quality Care, Inc. * 5,159 10,885
Gentiva Health Services, Inc. * 3,649 58,129
Healthcare Services Group, Inc. 6,187 108,149
Healthsouth Corp. * 12,631 149,551
Healthspring, Inc. * 7,086 68,805
Healthways, Inc. * 5,077 60,772
IPC The Hospitalist Company * 878 21,862
Copyright © 2012 www.secdatabase.com. All Rights Reserved.Please Consider the Environment Before Printing This Document

Kindred Healthcare, Inc. * 4,011 52,664
LHC Group, Inc. * 2,087 48,147
Magellan Health Services, Inc. * 5,237 156,377
National Healthcare Corp. 1,302 50,010
Nighthawk Radiology Holdings, Inc. * 3,249 12,866
Obagi Medical Products, Inc. * 2,629 18,140
Odyssey Healthcare, Inc. * 4,694 46,095
Palomar Medical Technologies, Inc. * 2,660 27,052
Phase Forward, Inc. * 6,144 86,016
Psychiatric Solutions, Inc. * 7,930 146,309
RadNet, Inc. * 3,739 8,375
Skilled Healthcare Group, Inc. * 2,545 23,948
Star Scientific, Inc. * (a) 10,434 52,170
Sun Healthcare Group, Inc. * 6,198 57,455
The Advisory Board Company * 2,336 54,195
The Ensign Group, Inc. 1,172 17,463
Town Sports International Holdings, Inc. * 2,458 9,611
Triple-S Management Corp. * 1,907 27,194
US Physical Therapy, Inc. * 1,754 23,697
The accompanying notes are an integral part of the financial statements.
194
JOHN HANCOCK FUNDS II
PORTFOLIO OF INVESTMENTS - May 31, 2009 (Unaudited) - continued(showing percentage of total net assets)
Small Cap Index Fund (continued)Shares or
Principal
Amount Value
COMMON STOCKS (continued)
Healthcare Services (continued)
Virtual Radiologic Corp. * 1,087 $ 8,326
2,428,826
Homebuilders - 0.27%
Beazer Homes USA, Inc. * (a) 6,095 15,542
Cavco Industries, Inc. * 1,001 23,023
Hovnanian Enterprises, Inc., Class A * (a) 6,797 18,216
M/I Homes, Inc. 2,039 23,571
Meritage Homes Corp. * 4,413 92,099
Ryland Group, Inc. 6,099 104,171
Standard Pacific Corp. * 14,611 35,651
312,273
Hotels & Restaurants - 1.70%
AFC Enterprises, Inc. * 3,769 26,232
Ameristar Casinos, Inc. 3,653 73,316
BJ's Restaurants, Inc. * 2,504 35,907
Bob Evans Farms, Inc. 4,451 114,836
Buffalo Wild Wings, Inc. * (a) 2,542 90,241
California Pizza Kitchen, Inc. * 2,862 39,925
CEC Entertainment, Inc. * 2,886 92,727
CKE Restaurants, Inc. 7,536 61,946
Denny's Corp. * 13,832 34,857
DineEquity, Inc. (a) 2,500 69,325
Domino's Pizza, Inc. * 5,666 51,334
Jack in the Box, Inc. * 8,405 221,051
Krispy Kreme Doughnuts, Inc. * 8,110 28,142
Landry's Restaurants, Inc. * 1,722 17,341
Luby's Cafeterias, Inc. * 3,461 14,951
Marcus Corp. 2,948 32,222
Copyright © 2012 www.secdatabase.com. All Rights Reserved.Please Consider the Environment Before Printing This Document

Morgans Hotel Group Company * 3,759 15,111
O'Charley's, Inc. 2,646 21,353
P.F. Chang's China Bistro, Inc. * (a) 3,460 110,512
Papa John's International, Inc. * 3,139 85,067
Peets Coffee & Tea, Inc. * 1,892 49,362
Red Robin Gourmet Burgers, Inc. * 2,228 38,544
Ruby Tuesday, Inc. * 7,403 45,751
Ruth's Chris Steak House, Inc. * 3,171 12,240
Sonic Corp. * 8,653 81,598
Texas Roadhouse, Inc., Class A * 7,085 82,399
The Cheesecake Factory, Inc. * 8,552 146,325
The Steak & Shake Company * 4,127 35,781
Wendy's/Arby's Group, Inc. 56,761 238,396
1,966,792
Household Appliances - 0.05%
National Presto Industries, Inc. 640 52,147
Household Products - 0.45%
Blyth, Inc. 879 29,192
Central Garden & Pet Company, Class A * 9,199 90,610
Tempur-Pedic International, Inc. 10,666 117,646
Tupperware Brands Corp. 8,863 215,548
WD-40 Company 2,379 61,806
514,802
Industrial Machinery - 1.59%
Actuant Corp., Class A 8,045 98,793
Alamo Group, Inc. 962 11,082
Small Cap Index Fund (continued)Shares or
Principal
Amount Value
COMMON STOCKS (continued)
Industrial Machinery (continued)
Albany International Corp., Class A 4,320 $ 57,672
Altra Holdings, Inc. * 3,926 25,912
Badger Meter, Inc. 2,092 84,977
Briggs & Stratton Corp. 7,095 107,844
Cascade Corp. 1,309 37,791
Chart Industries, Inc. * 4,079 86,597
Circor International, Inc. 2,436 59,438
Cognex Corp. 5,680 74,351
Dionex Corp. * 2,616 147,438
DXP Enterprises, Inc. * 1,051 15,555
EnPro Industries, Inc. * 2,932 51,633
Flow International Corp. * 5,881 12,703
Gorman-Rupp Company 2,082 43,722
H&E Equipment Services, Inc. * 2,403 15,860
Intevac, Inc. * 3,175 23,876
Kadant, Inc. * 1,920 26,803
Key Technology, Inc. * 837 8,596
Lindsay Corp. 1,720 54,799
Lufkin Industries, Inc. 2,121 96,251
Metropolitan Pro Corp. 2,231 19,276
Middleby Corp. * 2,600 116,766
Mitcham Industries, Inc. * 1,574 8,012
NACCO Industries, Inc., Class A 864 30,275
NATCO Group, Inc. * 2,863 81,023
OYO Geospace Corp. * 677 10,493
Presstek, Inc. * 4,232 7,321
Raser Technologies, Inc. * (a) 7,523 29,565
Robbins & Myers, Inc. 4,035 77,230
Rofin-Sinar Technologies, Inc. * 4,298 96,920
Sauer-Danfoss, Inc. 1,794 9,221
Copyright © 2012 www.secdatabase.com. All Rights Reserved.Please Consider the Environment Before Printing This Document
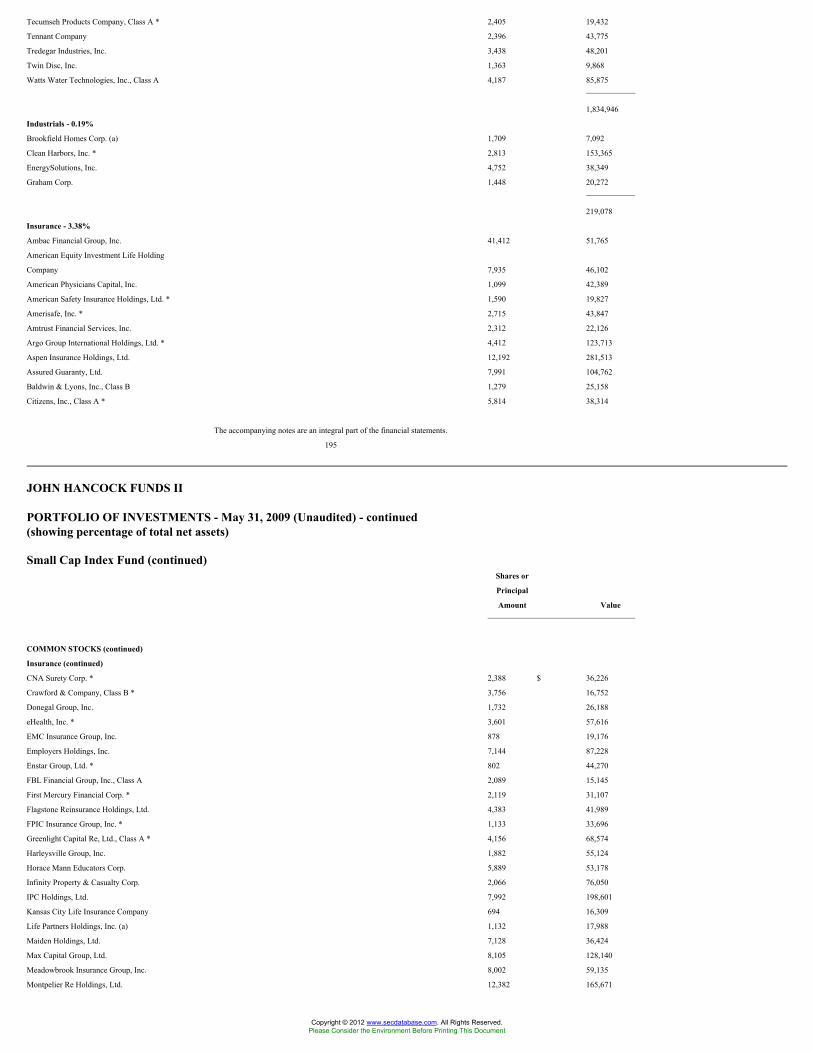
Tecumseh Products Company, Class A * 2,405 19,432
Tennant Company 2,396 43,775
Tredegar Industries, Inc. 3,438 48,201
Twin Disc, Inc. 1,363 9,868
Watts Water Technologies, Inc., Class A 4,187 85,875
1,834,946
Industrials - 0.19%
Brookfield Homes Corp. (a) 1,709 7,092
Clean Harbors, Inc. * 2,813 153,365
EnergySolutions, Inc. 4,752 38,349
Graham Corp. 1,448 20,272
219,078
Insurance - 3.38%
Ambac Financial Group, Inc. 41,412 51,765
American Equity Investment Life Holding
Company 7,935 46,102
American Physicians Capital, Inc. 1,099 42,389
American Safety Insurance Holdings, Ltd. * 1,590 19,827
Amerisafe, Inc. * 2,715 43,847
Amtrust Financial Services, Inc. 2,312 22,126
Argo Group International Holdings, Ltd. * 4,412 123,713
Aspen Insurance Holdings, Ltd. 12,192 281,513
Assured Guaranty, Ltd. 7,991 104,762
Baldwin & Lyons, Inc., Class B 1,279 25,158
Citizens, Inc., Class A * 5,814 38,314
The accompanying notes are an integral part of the financial statements.
195
JOHN HANCOCK FUNDS II
PORTFOLIO OF INVESTMENTS - May 31, 2009 (Unaudited) - continued(showing percentage of total net assets)
Small Cap Index Fund (continued)Shares or
Principal
Amount Value
COMMON STOCKS (continued)
Insurance (continued)
CNA Surety Corp. * 2,388 $ 36,226
Crawford & Company, Class B * 3,756 16,752
Donegal Group, Inc. 1,732 26,188
eHealth, Inc. * 3,601 57,616
EMC Insurance Group, Inc. 878 19,176
Employers Holdings, Inc. 7,144 87,228
Enstar Group, Ltd. * 802 44,270
FBL Financial Group, Inc., Class A 2,089 15,145
First Mercury Financial Corp. * 2,119 31,107
Flagstone Reinsurance Holdings, Ltd. 4,383 41,989
FPIC Insurance Group, Inc. * 1,133 33,696
Greenlight Capital Re, Ltd., Class A * 4,156 68,574
Harleysville Group, Inc. 1,882 55,124
Horace Mann Educators Corp. 5,889 53,178
Infinity Property & Casualty Corp. 2,066 76,050
IPC Holdings, Ltd. 7,992 198,601
Kansas City Life Insurance Company 694 16,309
Life Partners Holdings, Inc. (a) 1,132 17,988
Maiden Holdings, Ltd. 7,128 36,424
Max Capital Group, Ltd. 8,105 128,140
Meadowbrook Insurance Group, Inc. 8,002 59,135
Montpelier Re Holdings, Ltd. 12,382 165,671
Copyright © 2012 www.secdatabase.com. All Rights Reserved.Please Consider the Environment Before Printing This Document

National Interstate Corp. 983 15,718
National Western Life Insurance Company,
Class A 334 40,043
Navigators Group, Inc. * 1,894 82,844
NYMAGIC, Inc. 768 11,520
Odyssey Re Holdings Corp. 3,129 125,817
Phoenix Companies, Inc. 16,695 33,557
Platinum Underwriters Holdings, Ltd. 7,580 218,531
PMA Capital Corp., Class A * 4,717 22,925
PMI Group, Inc. 12,060 20,984
Presidential Life Corp. 3,199 27,575
Primus Guaranty, Ltd. * 3,249 9,032
ProAssurance Corp. * 4,583 207,198
Radian Group, Inc. 11,654 32,981
RLI Corp. 2,659 124,601
Safety Insurance Group, Inc. 2,339 73,000
SeaBright Insurance Holdings, Inc. * 3,147 25,459
Selective Insurance Group, Inc. 7,662 101,215
State Auto Financial Corp. 2,068 34,556
Stewart Information Services Corp. 2,457 37,838
Tower Group, Inc. 5,136 122,699
United America Indemnity, Ltd. * 5,290 25,286
United Fire & Casualty Company 3,291 57,296
Universal American Financial Corp. * 5,666 50,937
Validus Holdings, Ltd. 9,202 209,898
Zenith National Insurance Corp. 5,312 113,942
3,909,555
International Oil - 0.21%
APCO Argentina, Inc. 575 9,137
ATP Oil & Gas Corp. * 4,072 36,689
BPZ Energy, Inc. * (a) 10,291 73,581
Callon Petroleum Company * 3,863 10,198
Cheniere Energy, Inc. * 7,731 32,083
Small Cap Index Fund (continued)Shares or
Principal
Amount Value
COMMON STOCKS (continued)
International Oil (continued)
Parker Drilling Company * 16,219 $ 75,905
237,593
Internet Content - 0.26%
Dice Holdings, Inc. * 2,466 11,713
InfoSpace, Inc. * 4,988 34,916
Internet Capital Group, Inc. * 5,308 30,893
Liquidity Services, Inc. * 2,137 20,921
LoopNet, Inc. * 4,222 34,325
Move, Inc. * 18,500 38,850
RightNow Technologies, Inc. * 3,823 33,604
Safeguard Scientifics, Inc. * 18,087 18,991
TechTarget, Inc. * 2,094 8,418
TeleCommunication Systems, Inc. * 5,146 38,441
The Knot, Inc. * 4,283 35,035
306,107
Internet Incubators - 0.02%
ModusLink Global Solutions, Inc. * 6,707 28,505
Internet Retail - 0.50%
1-800-Flowers.com, Inc., Class A * 4,005 9,332
Blue Nile, Inc. * (a) 1,914 87,853
Drugstore.com, Inc. * 12,328 20,958
Internet Brands, Inc., Class A * 3,194 21,496
Copyright © 2012 www.secdatabase.com. All Rights Reserved.Please Consider the Environment Before Printing This Document

Mercadolibre, Inc. * (a) 3,643 78,834
Netflix, Inc. * (a) 5,463 215,351
Orbitz Worldwide, Inc. * 5,759 12,439
Overstock.com, Inc. * 2,237 25,457
PetMed Express, Inc. * 3,399 49,693
Shutterfly, Inc. * 2,824 40,327
Stamps.com, Inc. * 1,843 16,366
578,106
Internet Service Provider - 0.32%
Cogent Communications Group, Inc. * 6,422 50,156
Earthlink, Inc. * 15,720 123,245
Entrust, Inc. * 9,134 19,273
Online Resources Corp. * 4,206 21,913
Rackspace Hosting, Inc. * 2,474 28,871
Terremark Worldwide, Inc. * 7,633 38,394
United Online, Inc. 11,093 70,995
Web.com Group, Inc. * 4,079 19,498
372,345
Internet Software - 0.94%
Art Technology Group, Inc. * 18,470 66,492
Chordiant Software, Inc. * 4,430 17,809
Cybersource Corp. * 9,878 128,414
DealerTrack Holdings, Inc. * 5,715 82,010
Digital River, Inc. * 5,306 202,318
eResearch Technology, Inc. * 6,299 37,731
Keynote Systems, Inc. * 2,250 16,335
NIC, Inc. * 5,744 34,636
PC-Tel, Inc. * 2,961 16,463
RealNetworks, Inc. * 12,388 31,713
S1 Corp. * 6,753 45,785
Sapient Corp. * 12,620 67,012
SupportSoft, Inc. * 7,095 15,751
The accompanying notes are an integral part of the financial statements.
196
JOHN HANCOCK FUNDS II
PORTFOLIO OF INVESTMENTS - May 31, 2009 (Unaudited) - continued(showing percentage of total net assets)
Small Cap Index Fund (continued)Shares or
Principal
Amount Value
COMMON STOCKS (continued)
Internet Software (continued)
Switch & Data Facilities Company, Inc. * 2,945 $ 38,727
TIBCO Software, Inc. * 25,034 165,975
VASCO Data Security International, Inc. * 3,883 28,773
Vignette Corp. * 3,588 46,429
Vocus, Inc. * 2,315 44,240
1,086,613
Investment Companies - 0.01%
Fifth Street Finance Corp. 1,575 15,089
Teton Advisors, Inc. * 21 0
15,089
Leisure Time - 1.30%
Bally Technologies, Inc. * 7,845 219,660
Blockbuster, Inc., Class A * (a) 26,292 18,404
Copyright © 2012 www.secdatabase.com. All Rights Reserved.Please Consider the Environment Before Printing This Document

Brunswick Corp. 12,635 58,374
Callaway Golf Company 9,613 68,445
Churchill Downs, Inc. 1,403 54,619
Cinemark Holdings, Inc. 4,290 45,560
Dover Downs Gaming & Entertainment, Inc. 2,294 13,603
Gaylord Entertainment Company * (a) 5,894 83,695
Great Wolf Resorts, Inc. * 4,389 11,894
Isle of Capri Casinos, Inc. * 2,288 30,064
LIFE TIME FITNESS, Inc. * (a) 5,004 92,474
Monarch Casino & Resort, Inc. * 1,810 14,715
National Cinemedia, Inc. 6,056 75,761
Parkervision, Inc. * (a) 4,227 13,780
Pinnacle Entertainment, Inc. * 8,615 91,750
Polaris Industries, Inc. (a) 4,729 150,240
RC2 Corp. * 2,543 30,592
Rick's Cabaret International, Inc. * 1,147 7,754
Shuffle Master, Inc. * 7,758 34,058
Speedway Motorsports, Inc. 2,034 31,120
Steinway Musical Instruments, Inc. * 1,172 12,857
Vail Resorts, Inc. * 4,266 117,272
WMS Industries, Inc. * 6,285 222,929
1,499,620
Life Sciences - 0.29%
American Ecology Corp. 2,352 44,806
Celera Corp. * 11,502 87,070
Dawson Geophysical Company * 1,133 30,432
Halozyme Therapeutics, Inc. * 8,701 60,820
Incyte Corp. * 11,132 36,624
Nanosphere, Inc. * 1,988 8,847
Repligen Corp. * 4,574 18,616
Sequenom, Inc. * 8,717 28,679
Symyx Technologies, Inc. * 4,931 23,866
339,760
Liquor - 0.03%
Boston Beer Company, Inc. * 1,217 34,709
Manufacturing - 1.66%
Acuity Brands, Inc. 5,830 158,459
American Railcar Industries, Inc. 1,452 11,703
ATC Technology Corp. * 2,856 41,640
Barnes Group, Inc. 6,861 104,699
Blount International, Inc. * 5,539 46,472
Small Cap Index Fund (continued)Shares or
Principal
Amount Value
COMMON STOCKS (continued)
Manufacturing (continued)
Ceradyne, Inc. * 3,780 $ 85,428
China Fire & Security Group, Inc. * 1,992 24,302
Coherent, Inc. * 3,399 66,348
Colfax Corp. * 3,197 26,024
ESCO Technologies, Inc. * 3,705 150,497
Force Protection, Inc. * 9,755 84,186
Freightcar America, Inc. 1,746 29,211
GenTek, Inc. * 1,316 30,913
Hexcel Corp. * 13,753 147,020
Insteel Industries, Inc. 2,550 21,981
iRobot Corp. * 2,606 32,575
Kaydon Corp. 4,907 168,801
Koppers Holdings, Inc. 3,003 75,946
K-Tron International, Inc. * 357 30,770
Lancaster Colony Corp. 2,877 132,543
Copyright © 2012 www.secdatabase.com. All Rights Reserved.Please Consider the Environment Before Printing This Document

Lydall, Inc. * 2,797 10,321
Mine Safety Appliances Company 4,432 103,797
Nordson Corp. 4,841 185,894
Raven Industries, Inc. 2,291 62,911
Smith & Wesson Holding Corp. * 5,374 28,375
Spartan Motors, Inc. 4,643 43,830
Thermadyne Holdings Corp. * 2,161 9,055
1,913,701
Medical-Biomedical/Gene - 0.02%
Celldex Therapeutics, Inc. * 2,204 19,880
Medical-Generic Drugs - 0.01%
Acura Pharmaceuticals, Inc. * (a) 1,205 8,459
Medical-Hospitals - 0.51%
Cepheid, Inc. * 8,165 82,466
DexCom, Inc. * 5,899 32,798
EV3, Inc. * 10,054 91,894
Exactech, Inc. * 1,134 18,144
Genoptix, Inc. * 1,193 34,692
IRIS International, Inc. * 2,658 31,763
MedCath Corp. * 2,300 24,518
Microvision, Inc. * 9,974 21,245
MWI Veterinary Supply, Inc. * 1,475 43,114
Neogen Corp. * 2,079 45,821
Novavax, Inc. * 8,803 16,198
NxStage Medical, Inc. * 4,157 14,425
Orthovita, Inc. * 9,567 35,494
RehabCare Group, Inc. * 2,591 56,536
Sunrise Senior Living, Inc. * 6,908 16,648
Vital Images, Inc. * 2,161 25,197
590,953
Metal & Metal Products - 0.82%
A. M. Castle & Company 2,401 25,210
Ampco-Pittsburgh Corp. 1,194 30,996
Brush Engineered Materials, Inc. * 2,921 44,837
Dynamic Materials Corp. 1,808 32,436
Fushi Copperweld, Inc. * 2,140 18,169
Gibraltar Industries, Inc. 3,884 29,984
Haynes International, Inc. * 1,717 39,405
Horsehead Holding Corp. * 5,026 36,087
Kaiser Aluminum Corp. 2,269 70,498
The accompanying notes are an integral part of the financial statements.
197
JOHN HANCOCK FUNDS II
PORTFOLIO OF INVESTMENTS - May 31, 2009 (Unaudited) - continued(showing percentage of total net assets)
Small Cap Index Fund (continued)Shares or
Principal
Amount Value
COMMON STOCKS (continued)
Metal & Metal Products (continued)
L.B. Foster Company * 1,480 $ 43,157
Ladish Company, Inc. * 2,339 27,577
Matthews International Corp., Class A 4,470 127,618
Metalico, Inc. * 3,706 9,339
Mueller Industries, Inc. 5,311 116,683
Mueller Water Products, Inc. 16,506 59,587
RBC Bearings, Inc. * 3,154 58,191
Copyright © 2012 www.secdatabase.com. All Rights Reserved.Please Consider the Environment Before Printing This Document

RTI International Metals, Inc. * 3,311 47,380
Sun Hydraulics, Inc. 1,692 26,903
Universal Stainless & Alloy Products, Inc. * 1,074 14,918
USEC, Inc. * (a) 15,828 84,680
943,655
Mining - 0.70%
Allied Nevada Gold Corp. * 6,478 50,205
AMCOL International Corp. (a) 3,923 83,992
Compass Minerals International, Inc. 4,626 248,092
General Moly, Inc. * 9,302 19,813
Hecla Mining Company * 31,298 116,116
Royal Gold, Inc. 5,016 233,595
Stillwater Mining Company * 5,701 42,130
Uranium Resources, Inc. * 7,710 9,560
803,503
Mobile Homes - 0.05%
Skyline Corp. 1,023 20,327
Winnebago Industries, Inc. 4,183 32,084
52,411
Office Furnishings & Supplies - 0.37%
Acco Brands Corp. * 7,874 23,228
Herman Miller, Inc. 8,061 114,708
HNI Corp. 6,371 110,537
Knoll, Inc. 6,999 48,503
The Standard Register Company 2,496 8,312
United Stationers, Inc. * 3,356 120,178
425,466
Paper - 0.50%
Boise, Inc. * 5,669 9,864
Buckeye Technologies, Inc. * 5,689 28,843
Clearwater Paper Corp. * 1,630 38,582
KapStone Paper and Packaging Corp. * 2,964 12,597
Neenah Paper, Inc. 2,234 18,073
P.H. Glatfelter Company 6,539 67,025
Potlatch Corp. 5,621 147,158
Rock-Tenn Company, Class A 5,446 209,018
Wausau-Mosinee Paper Corp. 6,351 45,981
577,141
Petroleum Services - 0.99%
Approach Resources, Inc. * 1,553 13,884
Basic Energy Services, Inc. * 5,924 59,951
Bolt Technology Corp. * 1,357 15,402
Bronco Drilling Company, Inc. * 3,888 23,095
Complete Production Services, Inc. * 6,897 48,831
CVR Energy, Inc. * 3,334 31,873
Delek US Holdings, Inc. 1,897 19,444
Dril-Quip, Inc. * 4,416 182,469
Small Cap Index Fund (continued)Shares or
Principal
Amount Value
COMMON STOCKS (continued)
Petroleum Services (continued)
Flotek Industries, Inc. * 3,875 $ 8,138
GulfMark Offshore, Inc. * 3,231 98,546
Hornbeck Offshore Services, Inc. * 3,310 91,819
ION Geophysical Corp. * 12,947 36,640
Newpark Resources, Inc. * 12,996 37,429
Petroleum Development Corp. * 2,194 39,733
Copyright © 2012 www.secdatabase.com. All Rights Reserved.Please Consider the Environment Before Printing This Document

Pioneer Drilling Company * 7,227 45,241
Rentech, Inc. * 26,119 13,843
Rex Energy Corp. * 2,622 17,856
RPC, Inc. 4,114 42,580
Superior Well Services, Inc. * 2,387 23,965
T-3 Energy Services, Inc. * 1,827 26,528
Trico Marine Services, Inc. * (a) 2,292 6,761
Willbros Group, Inc. * 5,572 85,084
World Fuel Services Corp. 4,099 173,962
1,143,074
Pharmaceuticals - 3.10%
Acadia Pharmaceuticals, Inc. * 5,519 10,817
Adolor Corp. * 7,460 15,293
Affymax, Inc. * 1,871 31,807
Akorn, Inc. * 8,762 9,463
Alexion Pharmaceuticals, Inc. * 11,673 426,064
Alexza Pharmaceuticals, Inc. * 3,725 7,785
Alkermes, Inc. * 13,712 111,616
Allos Therapeutics, Inc. * 7,584 55,212
American Oriental Bioengineering, Inc. * 8,870 43,020
Array BioPharma, Inc. * 7,006 21,789
Auxilium Pharmaceuticals, Inc. * 5,900 138,237
Biodel, Inc. * (a) 1,833 8,047
BMP Sunstone Corp. * 3,812 17,573
Cadence Pharmaceuticals, Inc. * (a) 3,803 40,312
Caraco Pharmaceutical Labs * 1,822 7,616
Cubist Pharmaceuticals, Inc. * 8,056 137,435
Emergent Biosolutions, Inc. * 1,921 21,016
Enzon Pharmaceuticals, Inc. * 6,463 51,833
Idenix Pharmaceuticals, Inc. * 3,723 12,658
Indevus Pharmaceuticals, Inc. * 156 172
Inspire Pharmaceuticals, Inc. * 6,125 25,113
Isis Pharmaceuticals, Inc. * (a) 12,881 177,758
Javelin Pharmaceuticals, Inc. * 7,764 10,714
K-V Pharmaceutical Company, Class A * 5,400 9,072
Ligand Pharmaceuticals, Inc., Class B * 14,691 43,779
MAP Pharmaceuticals, Inc. * 1,155 13,964
Medicis Pharmaceutical Corp., Class A 8,078 126,986
Molecular Insight Pharmaceuticals, Inc. * (a) 2,785 11,029
Noven Pharmaceuticals, Inc. * 3,600 39,960
NPS Pharmaceuticals, Inc. * 6,949 23,071
Onyx Pharmaceuticals, Inc. * 7,948 188,050
Optimer Pharmaceuticals, Inc. * 4,074 50,558
OSI Pharmaceuticals, Inc. * 8,184 276,619
Par Pharmaceutical Companies, Inc. * 4,973 66,390
PDL BioPharma, Inc. 17,038 118,414
Pharmasset, Inc. * 2,970 31,185
PharMerica Corp. * 4,348 76,264
POZEN, Inc. * 3,765 28,802
Prestige Brands Holdings, Inc. * 4,879 30,396
The accompanying notes are an integral part of the financial statements.
198
JOHN HANCOCK FUNDS II
PORTFOLIO OF INVESTMENTS - May 31, 2009 (Unaudited) - continued(showing percentage of total net assets)
Small Cap Index Fund (continued)Shares or
Principal
Amount Value
Copyright © 2012 www.secdatabase.com. All Rights Reserved.Please Consider the Environment Before Printing This Document

COMMON STOCKS (continued)
Pharmaceuticals (continued)
Questcor Pharmaceuticals, Inc. * 7,167 $ 30,531
Regeneron Pharmaceuticals, Inc. * 8,878 135,922
Rigel Pharmaceuticals, Inc. * 5,292 44,135
Salix Pharmaceuticals, Ltd. * 6,840 62,107
Savient Pharmaceuticals, Inc. * 8,778 55,740
Sucampo Pharmaceuticals, Inc. * 1,419 7,961
Synta Pharmaceuticals Corp. * (a) 2,587 10,762
Theravance, Inc. * 7,411 109,683
United Therapeutics Corp. * 3,779 302,887
Valeant Pharmaceuticals International * (a) 9,105 209,324
ViroPharma, Inc. * 11,258 78,243
XOMA, Ltd. * 21,198 17,170
3,580,354
Plastics - 0.02%
AEP Industries, Inc. * 806 19,981
Pollution Control - 0.02%
Fuel Tech, Inc. * (a) 2,728 26,625
Precious Metals - 0.12%
Coeur d'Alene Mines Corp. * 9,696 143,216
Publishing - 0.49%
American Greetings Corp., Class A 6,524 44,689
Consolidated Graphics, Inc. * 1,455 23,615
Courier Corp. 1,555 24,336
Dolan Media Company * 3,647 50,438
Lee Enterprises, Inc. 6,981 6,981
Martha Stewart Living
Omnimedia, Inc., Class A * 4,074 13,240
Media General, Inc., Class A (a) 3,789 10,117
Multi-Color Corp. 1,592 20,266
Playboy Enterprises, Inc., Class B * 3,265 10,872
PRIMEDIA, Inc. 3,766 8,888
Scholastic Corp. 3,450 67,620
Valassis Communications, Inc. * 6,929 44,692
VistaPrint, Ltd. * (a) 6,314 241,763
567,517
Railroads & Equipment - 0.34%
Genesee & Wyoming, Inc., Class A * 4,380 126,670
Greenbrier Company, Inc. (a) 2,405 18,085
Wabtec Corp. 6,912 246,620
391,375
Real Estate - 5.22%
Acadia Realty Trust, REIT 5,721 76,776
Agree Realty Corp., REIT 1,169 20,259
Alexander's, Inc., REIT * 290 78,303
American Campus Communities, Inc., REIT 6,050 139,089
American Capital Agency Corp., REIT 1,451 27,569
Anthracite Capital, Inc., REIT (a) 10,238 11,057
Anworth Mortgage Asset Corp., REIT 14,183 94,459
Ashford Hospitality Trust, Inc., REIT 11,403 46,182
Associated Estates Realty Corp., REIT 2,301 13,737
Avatar Holdings, Inc. * 996 17,599
BioMed Realty Trust, Inc., REIT 11,517 113,212
Capital Lease Funding, Inc., REIT 6,677 20,699
Capstead Mortage Corp., REIT 9,038 107,823
Small Cap Index Fund (continued)Shares or
Principal
Amount Value
COMMON STOCKS (continued)
Copyright © 2012 www.secdatabase.com. All Rights Reserved.Please Consider the Environment Before Printing This Document

Real Estate (continued)
Care Investment Trust, Inc., REIT 2,143 $ 12,751
Cedar Shopping Centers, Inc., REIT 5,576 28,772
Chimera Investment Corp. 19,673 68,659
Colonial Properties Trust, REIT 6,828 53,122
Consolidated Tomoka Land Company 811 25,571
Corporate Office Properties Trust, REIT 6,325 187,726
Cousins Properties, Inc., REIT (a) 6,306 56,754
DCT Industrial Trust, Inc., REIT 24,631 110,347
DiamondRock Hospitality Company, REIT 15,485 100,653
DuPont Fabros Technology, Inc., REIT 1,901 18,002
EastGroup Properties, Inc., REIT 3,568 121,704
Education Realty Trust, Inc., REIT 4,369 20,360
Entertainment Properties Trust, REIT 4,974 101,072
Equity Lifestyle Properties, Inc., REIT 2,913 114,306
Equity One, Inc., REIT (a) 5,190 74,944
Extra Space Storage, Inc., REIT 12,323 92,546
FelCor Lodging Trust, Inc., REIT 9,246 28,848
First Industrial Realty Trust, Inc., REIT (a) 6,528 26,308
First Potomac Realty Trust, REIT 3,988 41,834
Forestar Real Estate Group, Inc. * (a) 5,113 62,174
Franklin Street Properties Corp., REIT 8,450 106,470
Getty Realty Corp., REIT 2,506 45,709
Glimcher Realty Trust, REIT 5,828 16,085
Gramercy Capital Corp., REIT 6,734 15,084
Hatteras Financial Corp., REIT 2,184 54,425
Healthcare Realty Trust, Inc., REIT 8,417 138,628
Hersha Hospitality Trust, REIT 7,159 19,616
Highwoods Properties, Inc., REIT 9,077 205,322
Hilltop Holdings, Inc. * 6,552 77,903
Home Properties, Inc., REIT 4,518 150,449
Inland Real Estate Corp., REIT 8,311 58,011
Investors Real Estate Trust, SBI, REIT 8,324 74,084
Kite Realty Group Trust, REIT 4,015 13,009
LaSalle Hotel Properties, REIT 5,763 78,838
Lexington Corporate Property Trust, REIT 12,190 51,686
LTC Properties, Inc., REIT 3,327 69,235
Maguire Properties, Inc., REIT * 6,216 6,527
Medical Properties Trust, Inc., REIT 11,480 72,324
MFA Mortgage Investments, Inc., REIT 31,816 199,168
Mid-America Apartment Communities, Inc.,
REIT 4,030 146,249
Mission West Properties, Inc., REIT 3,391 23,635
Monmouth Real Estate Investment Corp. 3,034 18,295
National Health Investments, Inc., REIT 3,199 84,550
National Retail Properties, Inc., REIT 11,171 191,136
Newcastle Investment Corp., REIT 8,956 6,359
NorthStar Realty Finance Corp., REIT (a) 8,712 28,924
OMEGA Healthcare Investors, Inc., REIT 11,684 186,593
One Liberty Properties, Inc., REIT 1,369 8,419
Parkway Properties, Inc., REIT 3,155 41,141
Pennsylvania Real Estate
Investment Trust, REIT (a) 5,090 28,402
PICO Holdings, Inc. * 2,340 65,356
Post Properties, Inc., REIT 6,358 96,832
PS Business Parks, Inc., REIT 2,158 96,829
RAIT Financial Trust, REIT 10,064 12,479
Ramco-Gershenson Properties Trust, REIT 2,303 20,750
The accompanying notes are an integral part of the financial statements.
199
JOHN HANCOCK FUNDS II
PORTFOLIO OF INVESTMENTS - May 31, 2009 (Unaudited) - continued(showing percentage of total net assets)
Copyright © 2012 www.secdatabase.com. All Rights Reserved.Please Consider the Environment Before Printing This Document

Small Cap Index Fund (continued)Shares or
Principal
Amount Value
COMMON STOCKS (continued)
Real Estate (continued)
Realty Income Corp., REIT (a) 14,440 $ 310,027
Redwood Trust, Inc., REIT 8,620 137,230
Resource Capital Corp., REIT 3,467 11,406
Saul Centers, Inc., REIT 1,387 39,821
Senior Housing Properties Trust, REIT 17,205 288,184
Sovran Self Storage, Inc., REIT 3,158 76,297
Strategic Hotel & Resorts, Inc., REIT 12,102 13,917
Stratus Properties, Inc. * 800 5,776
Sun Communities, Inc., REIT 2,401 33,902
Sunstone Hotel Investors, Inc., REIT 7,779 45,196
Tanger Factory Outlet Centers, Inc., REIT 4,503 145,717
Universal Health Realty Income Trust, REIT 1,718 55,079
Urstadt Biddle Properties, Inc., REIT 3,007 39,783
U-Store-It Trust, REIT 7,332 22,069
Washington Real Estate Investment Trust,
REIT (a) 7,488 163,688
Winthrop Realty Trust, REIT 1,751 16,915
6,026,746
Retail - 1.66%
Build A Bear Workshop, Inc. * 2,670 11,962
Cabela's, Inc. * 5,634 74,876
Cash America International, Inc. 4,185 96,339
Chico's FAS, Inc. * 25,252 246,459
Christopher & Banks Corp. 5,116 26,501
Citi Trends, Inc. * 2,041 52,617
Coldwater Creek, Inc. * 8,191 31,126
Collective Brands, Inc. * 9,139 134,892
Conn's, Inc. * (a) 1,417 14,127
Cracker Barrel Old Country Store, Inc. 3,175 99,758
Dillard's, Inc., Class A 8,198 77,471
DSW, Inc., Class A * 1,931 21,955
FGX International Holdings, Ltd. * 1,987 26,745
Finish Line, Inc. 6,090 42,082
Fred's, Inc., Class A 5,730 73,516
Fuqi International, Inc. * 1,424 17,387
Genesco, Inc. * 2,733 70,484
J. Crew Group, Inc. * (a) 6,079 157,203
Jo-Ann Stores, Inc. * 3,629 78,423
Kenneth Cole Productions, Inc., Class A 1,495 10,405
Marinemax, Inc. * 2,631 7,788
Pantry, Inc. * 3,161 62,967
Regis Corp. 6,161 108,002
Retail Ventures, Inc. * 4,511 11,774
Rex Stores Corp. * 1,173 11,918
Shoe Carnival, Inc. * 1,405 14,935
Stein Mart, Inc. * 3,654 25,322
Susser Holdings Corp. * 1,140 15,481
Syms Corp. * 1,059 7,201
Systemax, Inc. * 1,574 19,313
Talbots, Inc. (a) 3,919 13,129
The Dress Barn, Inc. * 6,431 101,803
The Men's Wearhouse, Inc. 7,375 126,039
Titan Machinery, Inc. * 1,138 14,293
Tween Brands, Inc. * 3,634 19,151
1,923,444
Small Cap Index Fund (continued)
Copyright © 2012 www.secdatabase.com. All Rights Reserved.Please Consider the Environment Before Printing This Document

Shares or
Principal
Amount Value
COMMON STOCKS (continued)
Retail Grocery - 0.55%
Arden Group, Inc. 168 $ 21,504
Ingles Markets, Inc. 1,842 27,519
PriceSmart, Inc. 2,090 34,966
Ruddick Corp. 6,013 151,287
Spartan Stores, Inc. 3,159 39,203
The Great Atlantic & Pacific Tea Company,
Inc. * 5,127 20,303
United Natural Foods, Inc. * 6,137 139,494
Village Super Market, Inc. 921 26,663
Weis Markets, Inc. 1,559 54,456
Winn-Dixie Stores, Inc. * 7,760 118,418
633,813
Retail Trade - 2.01%
99 Cents Only Stores * 6,689 62,676
Aaron, Inc., Class B 6,474 210,858
Aeropostale, Inc. * 9,565 331,140
Big 5 Sporting Goods Corp. 3,177 34,470
Borders Group, Inc. * 8,735 23,323
Cache, Inc. * 1,749 7,101
Casey's General Stores, Inc. 7,238 182,615
Casual Male Retail Group, Inc. * 5,547 9,707
Cato Corp., Class A 3,956 76,113
Charlotte Russe Holding, Inc. * 3,000 30,450
Charming Shoppes, Inc. * 16,241 61,066
Children's Place Retail Stores, Inc. * 3,336 119,796
CSS Industries, Inc. 1,103 20,075
First Cash Financial Services, Inc. * 2,868 43,336
Fossil, Inc. * 6,526 146,052
Gaiam, Inc., Class A * 2,699 14,953
Haverty Furniture Companies, Inc. 2,585 27,194
hhgregg, Inc. * 1,777 29,409
Hibbett Sports, Inc. * 4,071 73,400
Hot Topic, Inc. * 6,217 44,825
Lumber Liquidators, Inc. * (a) 1,328 20,119
New York & Company, Inc. * 3,564 12,830
Pacific Sunwear of California, Inc. * 9,474 40,644
Pier 1 Imports, Inc. * 12,886 25,772
Rent-A-Center, Inc. * 9,559 186,687
School Specialty, Inc. * 2,717 51,677
Sonic Automotive, Inc. 3,766 35,815
The Buckle, Inc. 3,298 118,002
The Wet Seal, Inc., Class A * 13,886 43,741
Tractor Supply Company * 4,759 182,650
Tuesday Morning Corp. * 4,421 15,518
Zale Corp. * 4,659 18,170
Zumiez, Inc. * (a) 2,843 25,360
2,325,544
Sanitary Services - 0.42%
Casella Waste Systems, Inc., Class A * 3,503 8,758
Darling International, Inc. * 11,718 88,705
Flanders Corp. * 2,509 13,549
Insituform Technologies, Inc., Class A * 5,329 77,750
PMFG, Inc. * 1,988 11,928
Waste Connections, Inc. * 11,361 288,569
489,259
The accompanying notes are an integral part of the financial statements.
Copyright © 2012 www.secdatabase.com. All Rights Reserved.Please Consider the Environment Before Printing This Document

200
JOHN HANCOCK FUNDS II
PORTFOLIO OF INVESTMENTS - May 31, 2009 (Unaudited) - continued(showing percentage of total net assets)
Small Cap Index Fund (continued)Shares or
Principal
Amount Value
COMMON STOCKS (continued)
Semiconductors - 2.97%
Actel Corp. * 3,648 $ 41,149
Advanced Analogic Technologies, Inc. * 6,249 29,558
Advanced Energy Industries, Inc. * 4,719 44,595
American Superconductor Corp. * (a) 6,029 168,089
Amkor Technology, Inc. * 15,645 71,028
Applied Micro Circuits Corp. * 9,295 72,687
ATMI, Inc. * 4,611 74,837
AuthenTec, Inc. * 4,171 7,299
Brooks Automation, Inc. * 9,140 35,737
Cabot Microelectronics Corp. * 3,346 93,521
Cavium Networks, Inc. * 4,343 62,713
Ceva, Inc. * 2,973 22,625
Cirrus Logic, Inc. * 9,353 36,383
Cymer, Inc. * 4,323 120,007
Diodes, Inc. * 4,144 63,693
DSP Group, Inc. * 3,400 24,650
Emcore Corp. * (a) 10,782 14,124
Emulex Corp. * 12,071 132,660
Entegris, Inc. * 16,542 47,641
Exar Corp. * 5,431 35,084
FormFactor, Inc. * 6,983 126,741
Hittite Microwave Corp. * 2,777 99,639
IXYS Corp. * 3,470 32,861
Kopin Corp. * 9,995 39,380
Kulicke & Soffa Industries, Inc. * 8,769 40,425
Lattice Semiconductor Corp. * 16,842 33,347
LTX-Credence Corp. * 20,856 11,679
Mattson Technology, Inc. * 8,116 10,551
Micrel, Inc. 6,558 48,201
Microsemi Corp. * 11,831 159,245
Microtune, Inc. * 8,109 18,651
MIPS Technologies, Inc., Class A * 6,429 25,009
MKS Instruments, Inc. * 7,129 96,313
Monolithic Power Systems, Inc. * 3,730 77,248
Netlogic Microsystems, Inc. * 2,433 79,608
OmniVision Technologies, Inc. * 7,322 83,398
Pericom Semiconductor Corp. * 3,225 30,476
Photronics, Inc. * 6,152 19,440
PLX Technology, Inc. * 5,043 16,239
PMC-Sierra, Inc. * 31,275 237,377
Power Integrations, Inc. 3,940 86,916
Rubicon Technology, Inc. * 1,936 17,792
Rudolph Technologies, Inc. * 4,498 19,926
Semitool, Inc. * 3,411 16,714
Semtech Corp. * 8,799 141,576
Silicon Image, Inc. * 10,682 25,316
Skyworks Solutions, Inc. * 23,306 222,106
Techwell, Inc. * 2,433 15,669
Tessera Technologies, Inc. * 6,928 163,016
Triquint Semiconductor, Inc. * 20,555 91,470
Ultra Clean Holdings, Inc. * 3,273 9,590
Copyright © 2012 www.secdatabase.com. All Rights Reserved.Please Consider the Environment Before Printing This Document

Ultratech, Inc. * 3,356 42,151
Veeco Instruments, Inc. * 4,624 48,691
Volterra Semiconductor Corp. * 3,268 44,641
3,429,482
Small Cap Index Fund (continued)Shares or
Principal
Amount Value
COMMON STOCKS (continued)
Software - 3.70%
ACI Worldwide, Inc. * 4,945 $ 73,730
Actuate Corp. * 6,507 31,494
Advent Software, Inc. * (a) 2,257 69,267
Allscripts Healthcare Solution, Inc. * 20,824 268,838
American Reprographics Company * 5,260 45,815
American Software, Inc., Class A 3,371 16,821
ArcSight, Inc. * 1,017 16,384
AsiaInfo Holdings, Inc. * 4,963 104,024
Avid Technology, Inc. * 4,359 62,072
Blackbaud, Inc. 6,425 89,115
Blackboard, Inc. * 4,423 127,471
Bottomline Technologies, Inc. * 3,219 31,224
Callidus Software, Inc. * 4,821 13,643
China Information Security Technology, Inc. * 3,435 9,515
CIBER, Inc. * 8,850 28,408
Commvault Systems, Inc. * 6,139 75,817
Concur Technologies, Inc. * 6,167 181,926
Deltek, Inc. * 2,288 9,266
DemandTec, Inc. * 2,991 27,667
DivX, Inc. * 4,014 21,274
Double-Take Software, Inc. * 2,534 23,338
Ebix, Inc. * 930 29,453
Eclipsys Corp. * 7,808 115,168
Epicor Software Corp. * 8,554 43,968
EPIQ Systems, Inc. * 5,071 77,231
FARO Technologies, Inc. * 2,417 37,294
i2 Technologies, Inc. * 2,276 27,949
Igate Corp. 3,436 18,348
Innerworkings, Inc. * 4,300 20,038
Interactive Intelligence, Inc. * 1,916 24,946
JDA Software Group, Inc. * 3,696 55,070
Lawson Software, Inc. * 16,951 89,162
Magma Design Automation, Inc. * 7,466 11,050
Manhattan Associates, Inc. * 3,332 58,610
ManTech International Corp. * 2,937 112,634
MedAssets, Inc. * 2,606 41,201
MicroStrategy, Inc., Class A * 1,304 61,027
Monotype Imaging Holdings, Inc. * 2,441 13,792
MSC Software Corp. * 6,524 47,169
NetSuite, Inc. * 1,096 12,670
Omnicell, Inc. * 4,470 41,079
Omniture, Inc. * (a) 9,451 111,711
OpenTV Corp., Class A * 12,750 22,312
Opnet Technologies, Inc. * 1,962 19,934
Pegasystems, Inc. 2,057 54,593
Progress Software Corp. * 5,959 133,601
PROS Holdings, Inc. * 2,019 16,091
Quality Systems, Inc. (a) 2,489 124,276
Quest Software, Inc. * 9,380 121,190
Riverbed Technology, Inc. * 8,011 160,941
Smith Micro Software, Inc. * 4,358 42,534
Solera Holdings, Inc. * 7,904 181,002
SPSS, Inc. * 2,564 85,561
Copyright © 2012 www.secdatabase.com. All Rights Reserved.Please Consider the Environment Before Printing This Document

Sybase, Inc. * 11,301 367,622
Synchronoss Technologies, Inc. * 2,961 35,947
Take-Two Interactive Software, Inc. * 11,054 95,728
The accompanying notes are an integral part of the financial statements.
201
JOHN HANCOCK FUNDS II
PORTFOLIO OF INVESTMENTS - May 31, 2009 (Unaudited) - continued(showing percentage of total net assets)
Small Cap Index Fund (continued)Shares or
Principal
Amount Value
COMMON STOCKS (continued)
Software (continued)
Taleo Corp. * 3,743 $ 58,016
THQ, Inc. * 9,651 62,056
Tradestation Group, Inc. * 4,618 37,868
Ultimate Software Group, Inc. * (a) 3,542 71,938
Unica Corp. * 2,180 9,745
VeriFone Holdings, Inc. * 9,777 74,598
Websense, Inc. * 6,467 117,376
4,269,608
Steel - 0.19%
China Precision Steel, Inc. * 3,048 6,492
General Steel Holdings, Inc. * (a) 1,572 8,331
Northwest Pipe Company * (a) 1,308 50,986
Olympic Steel, Inc. 1,310 24,183
Worthington Industries, Inc. 9,184 128,484
218,476
Telecommunications Equipment &
Services - 3.17%
ADTRAN, Inc. 8,000 166,240
Airvana, Inc. * 3,479 20,457
Alaska Communications Systems Group, Inc. (a) 6,421 43,470
Applied Signal Technology, Inc. 1,789 37,444
Arris Group, Inc. * 17,513 212,258
Aruba Networks, Inc. * 7,503 48,845
Atheros Communications, Inc. * 8,471 141,974
Cbeyond Communications, Inc. * 3,453 59,357
Centennial Communications Corp., Class A * 9,691 81,501
Comtech Telecommunications Corp. * 4,012 116,910
Consolidated Communications Holdings, Inc. 3,456 35,597
CPI International, Inc. * 1,389 15,182
FiberTower Corp. * 19,236 14,427
Finisar Corp. * 56,776 36,904
General Communication, Inc., Class A * 6,589 43,553
GeoEye, Inc. * 2,589 55,560
Global Crossing, Ltd. * 3,837 32,154
Globalstar, Inc. * 7,715 7,175
Globecomm Systems, Inc. * 2,972 19,229
Harmonic, Inc. * 13,460 77,799
Harris Stratex Networks, Inc., Class A * 8,489 40,493
Hughes Communications, Inc. * 1,060 23,235
ICO Global Communications Holdings, Ltd. * 16,542 10,752
Infinera Corp. * 13,312 113,951
InterDigital, Inc. * 6,479 165,992
Iowa Telecommunications Services, Inc. 4,679 55,399
J2 Global Communications, Inc. * 6,347 141,538
Copyright © 2012 www.secdatabase.com. All Rights Reserved.Please Consider the Environment Before Printing This Document

Loral Space & Communications, Inc. * 1,678 51,750
Mastec, Inc. * 6,924 89,666
MRV Communications, Inc. * 25,134 13,824
Neutral Tandem, Inc. * 2,379 68,991
NTELOS Holdings Corp. 4,338 77,520
Oclaro, Inc. * 26,813 16,624
Oplink Communications, Inc. * 2,993 34,419
OpNext, Inc. * 4,289 10,680
Orbcomm, Inc. * 4,850 7,469
PAETEC Holding Corp. * 17,863 54,661
Plantronics, Inc. 7,015 125,148
Small Cap Index Fund (continued)Shares or
Principal
Amount Value
COMMON STOCKS (continued)
Telecommunications Equipment &
Services (continued)
Polycom, Inc. * 12,497 $ 216,323
Powerwave Technologies, Inc. * 19,238 25,971
Premiere Global Services, Inc. * 8,860 106,054
RCN Corp. * 5,551 30,531
SAVVIS, Inc. * 5,399 63,546
Shenandoah Telecommunications Company 3,398 65,615
ShoreTel, Inc. * 6,249 38,181
Sonus Networks, Inc. * 29,318 65,965
Starent Networks Corp. * (a) 4,231 89,401
Symmetricom, Inc. * 6,658 34,222
Tekelec, Inc. * 9,310 152,032
TW Telecom, Inc. * 21,144 250,768
UTStarcom, Inc. * 16,104 33,335
Viasat, Inc. * 3,615 90,664
Virgin Mobile USA, Inc. * 5,379 25,873
3,656,629
Telephone - 0.12%
Atlantic Tele-Network, Inc. 1,405 31,992
Cincinnati Bell, Inc. * 33,261 92,798
Fairpoint Communications, Inc. 14,417 14,561
139,351
Tires & Rubber - 0.11%
Cooper Tire & Rubber Company 8,441 89,475
Myers Industries, Inc. 4,065 41,056
130,531
Tobacco - 0.27%
Alliance One International, Inc. * 12,811 60,981
Schweitzer Mauduit International, Inc. 2,264 50,872
Universal Corp. 3,642 134,863
Vector Group, Ltd. 4,711 69,016
315,732
Toys, Amusements & Sporting Goods - 0.25%
Jakks Pacific, Inc. * 3,990 50,872
Marvel Entertainment, Inc. * 6,998 232,194
Russ Berrie & Company, Inc. * 3,083 9,742
292,808
Transportation - 0.87%
Aircastle, Ltd. 6,691 44,763
Atlas Air Worldwide Holdings, Inc. * 1,914 49,534
Bristow Group, Inc. * 3,471 109,788
DHT Maritime, Inc. 7,074 40,817
Copyright © 2012 www.secdatabase.com. All Rights Reserved.Please Consider the Environment Before Printing This Document

Dynamex, Inc. * 1,299 20,160
Eagle Bulk Shipping, Inc. (a) 6,730 52,359
Genco Shipping & Trading, Ltd. 3,479 90,976
Golar LNG, Ltd. 5,149 39,802
Horizon Lines, Inc. 4,349 23,137
International Shipholding Corp. 841 18,620
Knightsbridge Tankers, Ltd. 2,490 37,275
Marten Transport, Ltd. * 2,190 46,713
Nordic American Tanker Shipping, Ltd. (a) 5,383 180,546
Pacer International, Inc. 5,536 14,394
Patriot Transportation Holding, Inc. * 244 21,108
PHI, Inc. * 2,037 32,164
The accompanying notes are an integral part of the financial statements.
202
JOHN HANCOCK FUNDS II
PORTFOLIO OF INVESTMENTS - May 31, 2009 (Unaudited) - continued(showing percentage of total net assets)
Small Cap Index Fund (continued)Shares or
Principal
Amount Value
COMMON STOCKS (continued)
Transportation (continued)
Saia, Inc. * 1,962 $ 26,978
Ship Finance International, Ltd. 6,081 75,283
TBS International, Ltd. * (a) 1,624 15,866
Teekay Tankers, Ltd. 1,962 24,191
Textainer Group Holdings, Ltd. 1,368 14,214
Ultrapetrol Bahamas, Ltd. * 3,625 17,472
Universal Truckload Services, Inc. * 896 12,177
1,008,337
Transport-Marine - 0.08%
American Commercial Lines, Inc. * 1,315 23,262
General Maritime Corp. 6,958 66,658
89,920
Travel Services - 0.03%
Ambassadors Group, Inc. 2,779 34,265
Trucking & Freight - 0.71%
Arkansas Best Corp. 3,245 91,217
Celadon Group, Inc. * 3,210 24,364
Forward Air Corp. 4,163 88,755
Heartland Express, Inc. 7,511 117,923
Hub Group, Inc., Class A * 5,292 104,570
Knight Transportation, Inc. 8,138 144,368
Old Dominion Freight Lines, Inc. * 3,951 116,357
Wabash National Corp. 5,133 6,416
Werner Enterprises, Inc. 6,058 108,983
YRC Worldwide, Inc. * (a) 8,295 21,401
824,354
Utility Service - 0.24%
Cal Dive International, Inc. * (a) 6,317 63,738
California Water Service Group 2,788 97,078
Consolidated Water Company, Ltd. 2,138 33,374
ENGlobal Corp. * 3,965 21,689
SJW Corp. 1,912 38,718
Southwest Water Company 3,699 19,420
Copyright © 2012 www.secdatabase.com. All Rights Reserved.Please Consider the Environment Before Printing This Document

274,017
Water Treatment Systems - 0.01%
Energy Recovery, Inc. * 2,186 17,444
TOTAL COMMON STOCKS (Cost $103,936,482) $ 107,774,146
PREFERRED STOCKS - 0.02%
Healthcare Products - 0.02%
Inverness Medical Innovations, Inc.,
Series B, 3.00% 134 28,502
TOTAL PREFERRED STOCKS (Cost $32,568) $ 28,502
RIGHTS - 0.01%
Furniture & Fixtures - 0.01%
Sealy Corp. (Expiration Date: 07/02/2009,
Strike Price: USD 2.11) 7,139 15,063
Oil & Gas Drilling - 0.00%
Precision Drilling Trust (Expiration Date:
06/03/2009, Strike Price: USD .400) 329 132
TOTAL RIGHTS (Cost $18,991) $ 15,195
Small Cap Index Fund (continued)Shares or
Principal
Amount Value
SHORT TERM INVESTMENTS - 6.73%
John Hancock Collateral Investment
Trust, 0.7339% (c)(g) $ 777,131 $ 7,771,311
TOTAL SHORT TERM INVESTMENTS
(Cost $7,771,311) $ 7,771,311
REPURCHASE AGREEMENTS - 4.53%
Repurchase Agreement with State
Street Corp. dated 05/29/2009 at
0.07% to be repurchased at
$5,232,031 on 06/01/2009,
collateralized by $5,385,000
Federal National Mortgage
Association, 6.00% due
04/18/2036 (valued at $5,340,843,
including interest) $ 5,232,000 $ 5,232,000
TOTAL REPURCHASE AGREEMENTS
(Cost $5,232,000) $ 5,232,000
Total Investments (Small Cap Index Fund)
(Cost $116,991,352) - 104.58% $ 120,821,154
Other assets and liabilities, net - (4.58)% (5,292,674)
TOTAL NET ASSETS - 100.00% $ 115,528,480
Small Cap Opportunities FundShares or
Principal
Amount Value
COMMON STOCKS - 96.27%
Advertising - 0.19%
inVentiv Health, Inc. * 5,173 $ 65,180
Marchex, Inc., Class B 3,900 12,987
ValueClick, Inc. * 9,558 105,616
183,783
Aerospace - 1.86%
AAR Corp. * 34,389 505,518
Copyright © 2012 www.secdatabase.com. All Rights Reserved.Please Consider the Environment Before Printing This Document

Aerovironment, Inc. * 13,434 375,077
BE Aerospace, Inc. * 16,900 251,472
CPI Aerostructures, Inc. * 42 298
Curtiss-Wright Corp. 13,522 395,924
Ducommun, Inc. 2,456 46,689
Esterline Technologies Corp. * 5,502 150,425
Limco-Piedmont, Inc. * 100 292
LMI Aerospace, Inc. * 716 6,745
SIFCO Industries, Inc. * 400 3,800
Triumph Group, Inc. 2,400 94,584
1,830,824
Agriculture - 0.08%
Andersons, Inc. 2,861 71,811
Fresh Del Monte Produce, Inc. * 500 8,870
Maui Land & Pineapple, Inc. * 100 870
81,551
Air Travel - 0.64%
Airtran Holdings, Inc. * 12,200 61,854
Alaska Air Group, Inc. * 1,100 17,127
Allegiant Travel Company * (a) 11,126 448,823
The accompanying notes are an integral part of the financial statements.
203
PORTFOLIO OF INVESTMENTS - May 31, 2009 (Unaudited) - continued(showing percentage of total net assets)
Small Cap Opportunities Fund (continued)Shares or
Principal
Amount Value
COMMON STOCKS (continued)
Air Travel (continued)
Republic Airways Holdings, Inc. * 387 $ 2,268
SkyWest, Inc. 10,189 104,437
634,509
Aluminum - 0.05%
Century Aluminum Company * 8,300 49,883
Apparel & Textiles - 2.32%
Brown Shoe, Inc. 5,562 45,163
Carter's, Inc. * 22,346 528,483
Culp, Inc. * 200 764
dELiA*s, Inc. * 400 968
Delta Apparel, Inc. * 200 1,540
G-III Apparel Group, Ltd. * 1,378 9,219
Heelys, Inc. * 1,265 2,328
Iconix Brand Group, Inc. * 10,333 167,291
Interface, Inc., Class A 7,749 49,129
K-Swiss, Inc., Class A 5,117 44,774
Lakeland Industries, Inc. * 700 5,740
Liz Claiborne, Inc. 1,000 4,500
Mohawk Industries, Inc. * 2,900 110,983
Movado Group, Inc. 2,000 15,160
Phillips-Van Heusen Corp. 24,962 735,630
RG Barry Corp. * 1,361 8,112
Rocky Brands, Inc. * 395 1,481
Skechers U.S.A., Inc., Class A * 6,609 62,785
Timberland Company, Class A * 2,796 40,206
Unifi, Inc. * 6,029 9,345
Unifirst Corp. 1,724 58,875
Volcom, Inc. * 28,291 386,738
Copyright © 2012 www.secdatabase.com. All Rights Reserved.Please Consider the Environment Before Printing This Document

2,289,214
Auto Parts - 0.57%
ArvinMeritor, Inc. 9,590 24,455
Exide Technologies * 6,179 37,816
Federal Signal Corp. 3,580 30,716
Miller Industries, Inc. * 2,284 17,518
Superior Industries International, Inc. 3,050 36,844
Tenneco, Inc. * 4,784 29,278
The Pep Boys - Manny, Moe & Jack 2,900 20,445
Titan International, Inc. (a) 29,407 265,839
TRW Automotive Holdings Corp. * 11,192 99,833
562,744
Auto Services - 0.60%
AutoNation, Inc. * 25,000 397,000
Hertz Global Holdings, Inc. * 26,841 183,861
Lithia Motors, Inc., Class A 1,948 10,733
591,594
Automobiles - 0.57%
Americas Car Mart, Inc. * 1,901 31,081
Group 1 Automotive, Inc. 4,600 98,486
Penske Auto Group, Inc. 15,600 190,944
Rush Enterprises, Inc., Class B * 24,933 240,853
561,364
Banking - 6.94%
1st Source Corp. 744 13,318
Abington Bancorp, Inc. 4,601 37,314
Small Cap Opportunities Fund (continued)Shares or
Principal
Amount Value
COMMON STOCKS (continued)
Banking (continued)
AMCORE Financial, Inc. 3,500 $ 3,745
Ameris Bancorp 1,940 12,164
Anchor BanCorp Wisconsin, Inc. 2,285 2,948
Associated Banc Corp. 7,990 115,615
Atlantic Coast Federal Corp. 901 2,253
B of I Holding, Inc. * 100 640
BancFirst Corp. 9,657 372,567
Bancorp, Inc. * 2,338 14,425
BancTrust Financial Group, Inc. 2,912 12,143
Bank Granite Corp. 857 3,000
Bank Mutual Corp. 2,812 25,505
Bank of Florida Corp. * 2,087 7,305
Bank of the Ozarks, Inc. 23,041 582,707
BankAtlantic Bancorp, Inc. 1,165 4,369
BankFinancial Corp. 3,921 35,132
Banner Corp. 2,606 16,027
Berkshire Hill Bancorp, Inc. 2,325 49,755
Boston Private Financial Holdings, Inc. 7,834 39,013
Cadence Financial Corp. 768 2,312
Capitol Bancorp, Ltd. 1,108 4,421
Cardinal Financial Corp. 1,774 14,387
Cascade Financial Corp. 800 2,784
Cathay General Bancorp 5,610 58,120
Center Bancorp, Inc. 100 829
Center Financial Corp. 2,517 7,903
Central Jersey Bancorp * 710 4,083
Central Pacific Financial Corp. 5,755 34,415
Citizens First Bancorp, Inc. * 85 71
Copyright © 2012 www.secdatabase.com. All Rights Reserved.Please Consider the Environment Before Printing This Document

Citizens Republic Banking Corp., Inc. * 9,052 10,319
City National Corp. 400 14,628
CoBiz, Inc. 3,084 20,046
Columbia Banking System, Inc. 5,613 61,013
Commerce Bancshares, Inc. 13,712 431,517
Community Trust Bancorp, Inc. 16,910 465,532
Crescent Financial Corp. * 510 2,234
East West Bancorp, Inc. 6,842 55,215
Encore Bancshares, Inc. * 700 4,704
Enterprise Financial Services Corp. 1,783 14,050
ESSA Bancorp, Inc. 162 2,260
F.N.B. Corp. 10,120 67,602
Fidelity Southern Corp. 732 2,306
First BanCorp (PR) 8,900 43,521
First Bancorp 1,415 19,513
First Busey Corp. 4,715 36,541
First Defiance Financial Corp. 1,060 14,999
First Financial Bankshares, Inc. (a) 8,603 420,084
First Financial Holdings, Inc. 600 5,358
First Horizon National Corp. 17,545 212,996
First Merchants Corp. 900 8,901
First Midwest Bancorp, Inc. 7,100 61,770
First Regional Bancorp * 900 1,575
First Security Group, Inc. 1,566 6,906
FirstMerit Corp. 21,709 377,947
Flushing Financial Corp. 3,433 34,193
FNB United Corp. 1,184 3,185
Frontier Financial Corp. 2,370 3,531
The accompanying notes are an integral part of the financial statements.
204
PORTFOLIO OF INVESTMENTS - May 31, 2009 (Unaudited) - continued(showing percentage of total net assets)
Small Cap Opportunities Fund (continued)Shares or
Principal
Amount Value
COMMON STOCKS (continued)
Banking (continued)
Great Southern Bancorp, Inc. 62 $ 1,358
Greene County Bancshares, Inc. 1,600 9,008
Hampton Roads Bankshares, Inc. 1,451 11,318
Heartland Financial USA, Inc. 185 2,797
Heritage Commerce Corp. 1,454 8,826
Home Federal Bancorp, Inc. 4,432 41,927
Horizon Financial Corp. 538 915
Huntington Bancshares, Inc. 1,700 6,664
IBERIABANK Corp. 1,900 82,688
Independent Bank Corp. (MI) 1,032 1,682
Independent Bank Corp. 3,864 78,516
International Bancshares Corp. 8,700 97,614
Intervest Bancshares Corp. * 150 659
K-Fed Bancorp 79 777
Lakeland Bancorp, Inc. 2,316 24,526
Legacy Bancorp, Inc. 2,189 23,488
Louisiana Bancorp, Inc. * 100 1,425
M&T Bank Corp. 868 43,660
Macatawa Bank Corp. 400 1,424
MainSource Financial Group, Inc. 3,164 25,217
MB Financial, Inc. 3,353 34,234
MBT Financial Corp. 1,037 2,333
Mercantile Bank Corp. 431 1,642
Copyright © 2012 www.secdatabase.com. All Rights Reserved.Please Consider the Environment Before Printing This Document

Nara Bancorp, Inc. 3,478 15,442
National Penn Bancshares, Inc. 11,500 69,690
New England Bancshares, Inc. 100 600
NewBridge Bancorp * 500 1,120
North Valley Bancorp 215 1,002
Old Second Bancorp, Inc. 1,654 10,602
Pacific Capital Bancorp 5,073 25,416
Pacific Mercantile Bancorp * 2,200 8,800
Peoples Bancorp, Inc. 2,319 41,116
Pinnacle Financial Partners, Inc. * 4,546 65,917
Preferred Bank/Los Angeles 642 2,889
Provident Financial Holdings, Inc. 400 2,552
Renasant Corp. 3,789 51,909
Rome Bancorp, Inc. 600 5,820
Sandy Spring Bancorp, Inc. 4,220 57,603
Seacoast Banking Corp. of Florida 3,000 7,710
South Financial Group, Inc. 8,407 15,973
Southern Community Financial Corp. 3,500 11,200
Southwest Bancorp, Inc. 2,689 24,873
State Bancorp, Inc. 240 1,831
StellarOne Corp. 4,258 52,459
Sterling Bancshares, Inc. 5,724 36,290
Sterling Financial Corp. 4,224 17,530
Sun Bancorp, Inc., New Jersey * 739 4,966
Superior Bancorp * 117 391
Susquehanna Bancshares, Inc. 13,048 93,163
SVB Financial Group * 4,800 129,360
Texas Capital Bancshares, Inc. * 38,741 594,674
TIB Financial Corp. * 2,459 7,352
Tierone Corp. 921 2,072
Umpqua Holdings Corp. 11,278 95,863
United Community Banks, Inc. 302 2,341
United Financial Bancorp, Inc. 677 8,449
Small Cap Opportunities Fund (continued)Shares or
Principal
Amount Value
COMMON STOCKS (continued)
Banking (continued)
United Western Bancorp, Inc. 828 $ 8,371
Virginia Commerce Bancorp, Inc. * 5,539 13,681
Washington Banking Company 2,100 18,375
Washington Federal, Inc. 8,700 114,144
Webster Financial Corp. 4,659 34,756
WesBanco, Inc. 1,021 16,775
West Coast Bancorp 200 552
Western Alliance Bancorp * 4,832 33,437
Westfield Financial, Inc. 1,715 15,778
Whitney Holding Corp. 35,496 440,150
Wilshire Bancorp, Inc. 939 4,526
Wintrust Financial Corp. 3,069 55,242
Yadkin Valley Financial Corp. 1,614 10,410
Zions Bancorp 16,900 231,192
6,848,778
Biotechnology - 0.46%
ARCA Biopharma, Inc. * 100 929
Bio-Rad Laboratories, Inc., Class A * 3,287 244,685
Harvard Bioscience, Inc. * 3,712 12,695
Intermune, Inc. * 16,471 194,687
452,996
Broadcasting - 0.69%
Fisher Communications, Inc. * 1,611 19,831
Copyright © 2012 www.secdatabase.com. All Rights Reserved.Please Consider the Environment Before Printing This Document

Journal Communications, Inc. 2,480 3,745
Liberty Media Corp. - Capital, Series A * 9,389 130,413
Sinclair Broadcast Group, Inc., Class A 4,066 7,156
World Wrestling Entertainment, Inc., Class A 41,820 521,914
683,059
Building Materials & Construction - 1.37%
Apogee Enterprises, Inc. 3,181 39,190
Beacon Roofing Supply, Inc. * 24,010 348,145
BlueLinx Holdings, Inc. * 527 1,671
Dycom Industries, Inc. * 3,796 44,375
Griffon Corp. * 10,821 104,855
Interline Brands, Inc. * 5,263 70,261
LSI Industries, Inc. 1,192 5,805
MYR Group, Inc. * 26,599 508,041
NCI Building Systems, Inc. * 3,037 13,666
Owens Corning, Inc. * 9,932 138,353
Texas Industries, Inc. 2,400 81,672
1,356,034
Business Services - 3.43%
ABM Industries, Inc. 34,492 558,081
Acxiom Corp. 7,534 80,538
AMERCO, Inc. * 3,360 123,816
Ariba, Inc. * 80,856 765,706
Barrett Business Services, Inc. 100 1,022
CDI Corp. 4,820 54,129
Compass Diversified Trust 3,627 31,918
Compucredit Corp. * 12,208 36,502
Convergys Corp. * 15,251 141,072
Core-Mark Holding Company, Inc. * 2,800 73,108
CRA International, Inc. * 2,139 56,363
The accompanying notes are an integral part of the financial statements.
205
PORTFOLIO OF INVESTMENTS - May 31, 2009 (Unaudited) - continued(showing percentage of total net assets)
Small Cap Opportunities Fund (continued)Shares or
Principal
Amount Value
COMMON STOCKS (continued)
Business Services (continued)
Diamond Management & Technology
Consultants, Inc. 4,100 $ 15,375
Electro Rent Corp. 1,632 15,749
Ennis Business Forms, Inc. 6,895 74,466
Euronet Worldwide, Inc. * 27,689 441,916
Harte-Hanks, Inc. 11,657 98,268
Heidrick & Struggles International, Inc. 1,007 18,478
ICT Group, Inc. * 4,398 38,834
infoGROUP, Inc. * 2,670 14,952
Kelly Services, Inc., Class A 4,014 42,789
Kenexa Corp. * 1,977 19,118
Kforce, Inc. * 2,293 21,348
Korn/Ferry International * 3,249 36,031
LECG Corp. * 3,950 11,534
Macrovision Solutions Corp. * 10,145 228,973
On Assignment, Inc. * 5,371 19,174
OraSure Technologies, Inc. * 2,323 8,456
Parexel International Corp. * 110 1,133
PC Mall, Inc. * 2,632 21,345
Copyright © 2012 www.secdatabase.com. All Rights Reserved.Please Consider the Environment Before Printing This Document

PHH Corp. * 8,361 128,759
Resource America, Inc. 500 2,645
ScanSource, Inc. * 1,044 25,829
Schawk, Inc., Class A 1,975 13,825
SonicWALL, Inc. * 7,879 40,262
SRA International, Inc., Class A * 2,312 41,015
StarTek, Inc. * 3,437 18,663
The Hackett Group, Inc. * 1,472 3,459
Versar, Inc. * 353 1,596
Viad Corp. 2,317 34,037
Volt Information Sciences, Inc. * 3,468 23,097
3,383,381
Cable & Television - 0.00%
Outdoor Channel Holdings, Inc. * 671 4,697
Casino Hotels - 0.00%
Gaming Partners International Corp. * 300 1,860
Cellular Communications - 0.19%
Brightpoint, Inc. * 3,867 22,892
Novatel Wireless, Inc. * 5,100 59,568
Syniverse Holdings, Inc. * 6,967 104,157
Tessco Technologies, Inc. * 379 3,949
190,566
Chemicals - 1.84%
Aceto Corp. 1,200 7,308
American Pacific Corp. * 624 3,919
Cabot Corp. 7,889 125,987
Cambrex Corp. * 3,548 12,773
Cytec Industries, Inc. 7,800 167,544
FMC Corp. 9,666 525,347
ICO, Inc. * 3,571 10,284
KMG Chemicals, Inc. * 2,300 16,100
LSB Industries, Inc. * 1,527 25,577
Minerals Technologies, Inc. 2,100 82,152
OM Group, Inc. * 5,754 152,481
Penford Corp. 1,910 11,651
Quaker Chemical Corp. 975 13,445
Small Cap Opportunities Fund (continued)Shares or
Principal
Amount Value
COMMON STOCKS (continued)
Chemicals (continued)
Rockwood Holdings, Inc. * 9,739 $ 145,306
Spartech Corp. 1,700 7,191
Westlake Chemical Corp. 7,575 154,909
Zep, Inc. 24,374 296,632
Zoltek Companies, Inc. * 5,800 57,420
1,816,026
Commercial Services - 1.20%
Cenveo, Inc. * 7,464 36,798
Collectors Universe, Inc. 1,297 5,850
Great Lakes Dredge & Dock Company 12,600 65,646
Live Nation, Inc. * 9,824 56,193
Perceptron, Inc. * 246 804
Perficient, Inc. * 1,626 10,341
Team, Inc. * 24,673 349,123
United Rentals, Inc. * 10,100 47,975
Waste Services, Inc. * 9,400 54,614
Wright Express Corp. * 22,292 554,402
1,181,746
Copyright © 2012 www.secdatabase.com. All Rights Reserved.Please Consider the Environment Before Printing This Document

Computer Services - 0.03%
Acorn Energy, Inc. * 800 2,104
Dynamics Research Corp. * 1,800 17,118
INX, Inc. * 314 1,413
TechTeam Global, Inc. * 1,203 7,194
27,829
Computers & Business Equipment - 3.11%
3Com Corp. * 26,693 115,314
Avocent Corp. * 7,967 111,538
Benchmark Electronics, Inc. * 12,967 158,197
Blue Coat Systems, Inc. * 767 10,868
CACI International, Inc., Class A * 15,530 595,886
Cray, Inc. * 1,700 7,327
Datalink Corp. * 1,469 6,126
Digi International, Inc. * 2,751 23,824
Electronics for Imaging, Inc. * 8,831 89,811
Gerber Scientific, Inc. * 3,231 10,436
Hurco Companies, Inc. * 200 2,872
Immersion Corp. * 4,187 18,632
Ingram Micro, Inc., Class A * 21,411 353,710
Internap Network Services Corp. * 16,540 46,477
Interphase Corp. * 400 2,232
L-1 Identity Solutions, Inc. * 10,594 91,850
NETGEAR, Inc. * 847 11,884
PAR Technology Corp. * 1,700 10,710
Parametric Technology Corp. * 34,566 400,274
Phoenix Technology, Ltd. * 3,077 8,585
Plexus Corp. * 3,370 61,536
RadiSys Corp. * 1,416 12,263
Sigma Designs, Inc. * 3,900 60,294
Standard Microsystems Corp. * 1,599 29,486
Synaptics, Inc. * (a) 17,955 630,580
Tech Data Corp. * 5,999 192,088
Virage Logic Corp. * 1,237 5,195
3,067,995
The accompanying notes are an integral part of the financial statements.
206
PORTFOLIO OF INVESTMENTS - May 31, 2009 (Unaudited) - continued(showing percentage of total net assets)
Small Cap Opportunities Fund (continued)Shares or
Principal
Amount Value
COMMON STOCKS (continued)
Construction & Mining Equipment - 0.30%
Gulf Islands Fabrication, Inc. 1,369 $ 21,767
Kaman Corp., Class A 2,408 38,167
Layne Christensen Company * 3,484 74,488
Rowan Companies, Inc. 8,000 163,680
298,102
Construction Materials - 0.38%
Ameron International Corp. 1,300 72,085
Columbus McKinnon Corp. * 2,831 39,322
Standex International Corp. 1,850 18,833
Universal Forest Products, Inc. 2,234 68,048
USG Corp. * 15,000 180,000
378,288
Copyright © 2012 www.secdatabase.com. All Rights Reserved.Please Consider the Environment Before Printing This Document

Containers & Glass - 0.16%
Bway Holding Company * 2,549 37,037
Mobile Mini, Inc. * 6,498 81,940
TAL International Group, Inc. 4,002 39,740
158,717
Correctional Facilities - 0.01%
Cornell Corrections, Inc. * 761 12,922
Cosmetics & Toiletries - 0.58%
Alberto-Culver Company 18,752 435,796
CCA Industries, Inc. 100 305
Elizabeth Arden, Inc. * 4,000 28,200
Helen of Troy, Ltd. * 5,400 104,274
Parlux Fragrances, Inc. * 900 1,818
570,393
Crude Petroleum & Natural Gas - 1.67%
Arena Resources, Inc. * 14,511 519,784
Bill Barrett Corp. * 2,756 93,787
Cimarex Energy Company 10,728 349,947
Geokinetics, Inc. * 768 10,153
Georesources, Inc. * 659 5,575
Gulfport Energy Corp. * 2,996 18,635
Patterson-UTI Energy, Inc. 7,900 113,286
Penn Virginia Corp. 16,612 317,622
Petroquest Energy, Inc. * 7,291 40,392
Toreador Resources Corp. * 408 1,579
Western Refining, Inc. * 12,756 181,773
1,652,533
Domestic Oil - 0.86%
Atlas America, Inc. 4,264 78,543
Comstock Resources, Inc. * 10,727 427,256
Encore Aquisition Company * 900 31,941
Mariner Energy, Inc. * 500 7,230
Natural Gas Services Group, Inc. * 3,096 46,007
Oil States International, Inc. * 8,316 217,297
Union Drilling, Inc. * 3,895 38,132
846,406
Drugs & Health Care - 1.63%
Invacare Corp. (a) 24,802 421,138
Mannatech, Inc. 838 2,573
Molina Healthcare, Inc. * 1,816 43,475
Nutraceutical International Corp. * 2,556 24,231
Small Cap Opportunities Fund (continued)Shares or
Principal
Amount Value
COMMON STOCKS (continued)
Drugs & Health Care (continued)
Osteotech, Inc. * 3,500 $ 14,665
Quidel Corp. * 41,581 529,326
Res-Care, Inc. * 606 8,575
Vivus, Inc. * 108,335 560,092
1,604,075
Electrical Equipment - 1.78%
Anixter International, Inc. * 12,735 522,390
Baldor Electric Company 7,800 180,882
C & D Technologies, Inc. * 2,160 3,866
Cohu, Inc. 2,443 22,598
Coleman Cable, Inc. * 300 903
Encore Wire Corp. 3,400 72,182
Copyright © 2012 www.secdatabase.com. All Rights Reserved.Please Consider the Environment Before Printing This Document

General Cable Corp. * 12,258 468,746
GrafTech International, Ltd. * 30,385 309,015
Littelfuse, Inc. * 664 11,646
Magnetek, Inc. * 133 173
Methode Electronics, Inc. 4,959 28,961
Wesco International, Inc. * 4,994 133,490
1,754,852
Electrical Utilities - 0.91%
Avista Corp. 18,767 297,269
EnerNOC, Inc. * 11,008 262,211
Mirant Corp. * 13,400 209,174
Pike Electric Corp. * 4,144 45,335
RRI Energy, Inc. * 16,200 88,776
902,765
Electronics - 2.24%
Anadigics, Inc. * 14,100 55,272
Arrow Electronics, Inc. * 13,883 335,830
AVX Corp. 5,685 52,757
Ballantyne of Omaha, Inc. * 200 394
Bel Fuse, Inc., Class B 2,362 31,887
Belden, Inc. 20,396 373,655
California Micro Devices Corp. * 2,043 4,964
Checkpoint Systems, Inc. * 7,338 103,025
Cynosure, Inc. * 1,700 11,458
DDi Corp. * 2,965 11,860
Enersys * 8,100 131,220
Harman International Industries, Inc. 4,715 87,888
Imation Corp. 4,497 43,441
Integrated Electrical Services, Inc. * 427 4,210
IntriCon Corp. * 80 255
Jabil Circuit, Inc. 8,749 68,505
Keithley Instruments, Inc. 605 2,601
LoJack Corp. * 1,077 3,576
Measurement Specialties, Inc. * 1,381 7,595
Mercury Computer Systems, Inc. * 800 6,032
Multi-Fineline Electronix, Inc. * 1,877 35,945
NU Horizons Electronics Corp. * 1,000 3,720
OSI Systems, Inc. * 23,063 424,359
Rogers Corp. * 1,400 23,884
Spectrum Control, Inc. * 3,517 28,910
SRS Labs, Inc. * 224 1,391
Stoneridge, Inc. * 3,838 12,397
Sycamore Networks, Inc. * 50,735 152,205
The accompanying notes are an integral part of the financial statements.
207
PORTFOLIO OF INVESTMENTS - May 31, 2009 (Unaudited) - continued(showing percentage of total net assets)
Small Cap Opportunities Fund (continued)Shares or
Principal
Amount Value
COMMON STOCKS (continued)
Electronics (continued)
Technitrol, Inc. 2,635 $ 9,249
TTM Technologies, Inc. * 5,177 46,075
Vicon Industries, Inc. * 102 571
Vishay Intertechnology, Inc. * 21,032 116,307
Zoran Corp. * 1,712 18,969
Copyright © 2012 www.secdatabase.com. All Rights Reserved.Please Consider the Environment Before Printing This Document

2,210,407
Energy - 0.51%
Alon USA Energy, Inc. 4,863 64,581
Energen Corp. 9,674 360,066
Evergreen Solar, Inc. * 21,098 39,242
Headwaters, Inc. * 6,604 26,218
Ocean Power Technologies, Inc. * 800 5,824
PowerSecure International, Inc. * 1,924 8,774
504,705
Engineering/R&D Services - 0.19%
National Technical Systems, Inc. * 500 1,600
Tutor Perini Corp. * 9,100 187,915
189,515
Financial Services - 3.64%
Advanta Corp., Class B 1,072 750
Affiliated Managers Group, Inc. * 6,902 387,271
AmeriCredit Corp. * 15,277 194,171
Asset Acceptance Capital Corp. * 1,117 9,606
Asta Funding, Inc. 1,622 7,704
Capital Southwest Corp. 497 35,585
CIT Group, Inc. 43,300 165,839
Cowen Group, Inc. * 3,660 18,556
Delphi Financial Group, Inc. 4,800 91,392
Dollar Financial Corp. * 557 5,609
Encore Capital Group, Inc. * 3,459 44,552
FCStone Group, Inc. * 2,478 10,110
Federal Agricultural Mortgage Corp., Class C 1,387 8,669
Financial Federal Corp. 2,740 67,925
First Financial Northwest, Inc. 5,614 49,347
Fulton Financial Corp. 14,960 86,918
GAMCO Investors, Inc., Class A 9,237 485,404
GATX Corp. 7,284 183,411
GFI Group, Inc. 7,507 45,117
Hampden Bancorp, Inc. 942 9,698
Harris & Harris Group, Inc. * 4,595 20,310
Investment Technology Group, Inc. * 5,191 107,973
Janus Capital Group, Inc. 19,699 199,748
JMP Group, Inc. 2,800 19,600
KBW, Inc. * 25,028 651,479
Legg Mason, Inc. 1,100 21,208
MarketAxess Holdings, Inc. * 467 4,927
Medallion Financial Corp. 1,250 9,238
MF Global, Ltd. * 14,500 88,160
MicroFinancial, Inc. 400 936
National Financial Partners Corp. 6,530 39,507
Nelnet, Inc., Class A * 4,314 36,496
NewStar Financial, Inc. * 3,579 10,773
Ocwen Financial Corp. * 6,390 79,747
Penson Worldwide, Inc. * 3,093 30,559
Student Loan Corp. 1,358 60,363
Small Cap Opportunities Fund (continued)Shares or
Principal
Amount Value
COMMON STOCKS (continued)
Financial Services (continued)
Synovus Financial Corp. 51,541 $ 168,539
Taylor Capital Group, Inc. * 968 5,982
The First Marblehead Corp. * 4,700 8,272
Thomas Weisel Partners Group, Inc. * 2,909 14,603
Tree.com, Inc. * 1,000 10,280
World Acceptance Corp. * 4,617 92,479
Copyright © 2012 www.secdatabase.com. All Rights Reserved.Please Consider the Environment Before Printing This Document

3,588,813
Food & Beverages - 1.47%
B&G Foods, Inc. 9,761 70,767
Chiquita Brands International, Inc. * 3,923 40,995
Del Monte Foods Company 12,377 101,244
Farmer Brothers Company 200 4,462
Flowers Foods, Inc. 16,806 355,783
Hain Celestial Group, Inc. * 6,739 115,709
Imperial Sugar Company 1,700 17,578
Morton's Restaurant Group, Inc. * 5,339 21,463
Smithfield Foods, Inc. * 19,535 242,820
Tasty Baking Company 200 1,190
TreeHouse Foods, Inc. * (a) 18,066 482,904
1,454,915
Food-Meat Products - 0.01%
HQ Sustainable Maritime Industries, Inc. * 1,244 11,221
Funeral Services - 0.15%
Service Corp. International 27,375 146,456
Furniture & Fixtures - 0.11%
Ethan Allen Interiors, Inc. 4,200 51,492
Hooker Furniture Corp. 2,045 25,358
Kimball International, Inc., Class B 1,813 10,932
Stanley Furniture Company, Inc. 1,600 16,016
103,798
Gas & Pipeline Utilities - 0.60%
Global Industries, Ltd. * 19,600 137,200
UGI Corp. 18,907 455,848
593,048
Healthcare Products - 1.82%
Acme United Corp. 300 2,370
AngioDynamics, Inc. * 5,824 71,460
Aspect Medical Systems, Inc. * 723 3,882
Cardiac Science Corp. * 49,035 202,515
Cutera, Inc. * 2,620 20,384
Haemonetics Corp. * 9,524 506,963
Health Tronics, Inc. * 200 322
Home Diagnostics, Inc. * 812 4,904
Integramed America, Inc. * 400 2,928
Inverness Medical Innovations, Inc. * 7,254 235,973
LCA-Vision, Inc. * 4,730 29,373
LeMaitre Vascular, Inc. * 300 855
Medtox Scientific, Inc. * 623 5,538
Owens & Minor, Inc. 11,918 417,845
RTI Biologics, Inc. * 1,803 7,032
SonoSite, Inc. * 1,092 20,213
Spectranetics Corp. * 3,987 17,702
Symmetry Medical, Inc. * 3,526 27,115
The Cooper Companies, Inc. 7,100 188,221
The accompanying notes are an integral part of the financial statements.
208
PORTFOLIO OF INVESTMENTS - May 31, 2009 (Unaudited) - continued(showing percentage of total net assets)
Small Cap Opportunities Fund (continued)Shares or
Principal
Amount Value
COMMON STOCKS (continued)
Copyright © 2012 www.secdatabase.com. All Rights Reserved.Please Consider the Environment Before Printing This Document

Healthcare Products (continued)
TomoTherapy, Inc. * 12,200 $ 27,938
Young Innovations, Inc. 200 3,550
1,797,083
Healthcare Services - 1.73%
Air Methods Corp. * 1,657 43,728
American Dental Partners, Inc. * 3,556 29,728
AMN Healthcare Services, Inc. * 6,015 43,308
Assisted Living Concepts, Inc. * 1,680 25,771
Bio-Imaging Technologies, Inc. * 1,600 6,400
Brookdale Senior Living, Inc. 7,591 87,980
Capital Senior Living Corp. * 1,174 5,201
Eastern Insurance Holdings, Inc. 1,600 15,200
Emeritus Corp. * 4,684 67,309
Enzo Biochem, Inc. * 1,536 6,482
Gentiva Health Services, Inc. * 25,834 411,536
Health Net, Inc. * 13,712 205,406
Healthways, Inc. * 5,668 67,846
Hill-Rom Holdings, Inc. 2,800 45,248
Nighthawk Radiology Holdings, Inc. * 6,414 25,399
NovaMed, Inc. * 2,737 10,510
Skilled Healthcare Group, Inc. * 58,769 553,016
Triple-S Management Corp. * 4,000 57,040
1,707,108
Homebuilders - 0.51%
Cavco Industries, Inc. * 248 5,704
Centex Corp. 8,400 70,812
Lennar Corp., Class A 19,600 186,396
M/I Homes, Inc. 1,600 18,496
Meritage Homes Corp. * 6,100 127,307
Palm Harbor Homes, Inc. * 2,047 4,647
Ryland Group, Inc. 5,000 85,400
498,762
Hotels & Restaurants - 3.15%
BJ's Restaurants, Inc. * 3,322 47,638
Boyd Gaming Corp. * 15,073 151,333
Brinker International, Inc. 30,599 547,722
Caribou Coffee Company, Inc. * 500 3,260
DineEquity, Inc. (a) 19,577 542,870
Luby's Cafeterias, Inc. * 7,397 31,955
Marcus Corp. 4,804 52,508
McCormick & Schmick's Seafood
Restaurants, Inc. * 2,930 20,217
Papa John's International, Inc. * 17,416 471,974
Red Robin Gourmet Burgers, Inc. * 2,300 39,790
Rubio's Restaurants, Inc. * 1,314 8,015
Sonic Corp. * 44,212 416,919
Texas Roadhouse, Inc., Class A * 38,319 445,650
The Steak & Shake Company * 4,448 38,564
Wyndham Worldwide Corp. 24,966 294,349
3,112,764
Household Appliances - 0.00%
Lifetime Brands, Inc. 120 402
Household Products - 0.10%
Blyth, Inc. 347 11,524
Small Cap Opportunities Fund (continued)Shares or
Principal
Amount Value
COMMON STOCKS (continued)
Copyright © 2012 www.secdatabase.com. All Rights Reserved.Please Consider the Environment Before Printing This Document
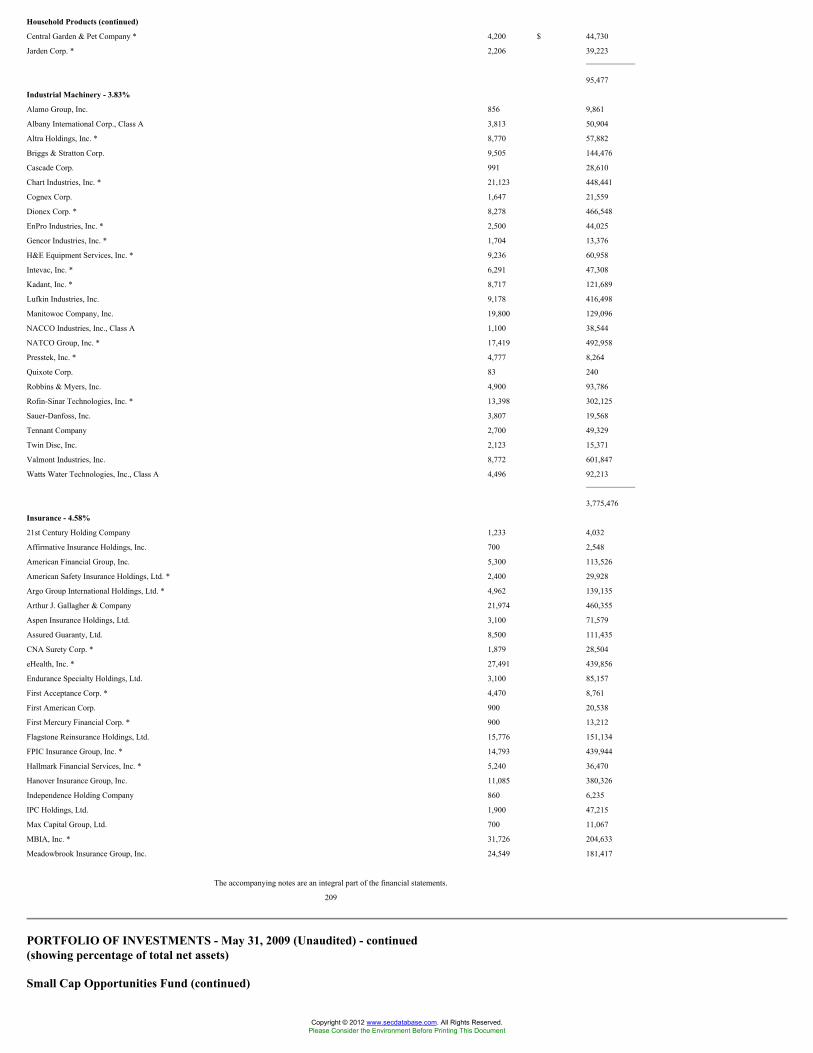
Household Products (continued)
Central Garden & Pet Company * 4,200 $ 44,730
Jarden Corp. * 2,206 39,223
95,477
Industrial Machinery - 3.83%
Alamo Group, Inc. 856 9,861
Albany International Corp., Class A 3,813 50,904
Altra Holdings, Inc. * 8,770 57,882
Briggs & Stratton Corp. 9,505 144,476
Cascade Corp. 991 28,610
Chart Industries, Inc. * 21,123 448,441
Cognex Corp. 1,647 21,559
Dionex Corp. * 8,278 466,548
EnPro Industries, Inc. * 2,500 44,025
Gencor Industries, Inc. * 1,704 13,376
H&E Equipment Services, Inc. * 9,236 60,958
Intevac, Inc. * 6,291 47,308
Kadant, Inc. * 8,717 121,689
Lufkin Industries, Inc. 9,178 416,498
Manitowoc Company, Inc. 19,800 129,096
NACCO Industries, Inc., Class A 1,100 38,544
NATCO Group, Inc. * 17,419 492,958
Presstek, Inc. * 4,777 8,264
Quixote Corp. 83 240
Robbins & Myers, Inc. 4,900 93,786
Rofin-Sinar Technologies, Inc. * 13,398 302,125
Sauer-Danfoss, Inc. 3,807 19,568
Tennant Company 2,700 49,329
Twin Disc, Inc. 2,123 15,371
Valmont Industries, Inc. 8,772 601,847
Watts Water Technologies, Inc., Class A 4,496 92,213
3,775,476
Insurance - 4.58%
21st Century Holding Company 1,233 4,032
Affirmative Insurance Holdings, Inc. 700 2,548
American Financial Group, Inc. 5,300 113,526
American Safety Insurance Holdings, Ltd. * 2,400 29,928
Argo Group International Holdings, Ltd. * 4,962 139,135
Arthur J. Gallagher & Company 21,974 460,355
Aspen Insurance Holdings, Ltd. 3,100 71,579
Assured Guaranty, Ltd. 8,500 111,435
CNA Surety Corp. * 1,879 28,504
eHealth, Inc. * 27,491 439,856
Endurance Specialty Holdings, Ltd. 3,100 85,157
First Acceptance Corp. * 4,470 8,761
First American Corp. 900 20,538
First Mercury Financial Corp. * 900 13,212
Flagstone Reinsurance Holdings, Ltd. 15,776 151,134
FPIC Insurance Group, Inc. * 14,793 439,944
Hallmark Financial Services, Inc. * 5,240 36,470
Hanover Insurance Group, Inc. 11,085 380,326
Independence Holding Company 860 6,235
IPC Holdings, Ltd. 1,900 47,215
Max Capital Group, Ltd. 700 11,067
MBIA, Inc. * 31,726 204,633
Meadowbrook Insurance Group, Inc. 24,549 181,417
The accompanying notes are an integral part of the financial statements.
209
PORTFOLIO OF INVESTMENTS - May 31, 2009 (Unaudited) - continued(showing percentage of total net assets)
Small Cap Opportunities Fund (continued)
Copyright © 2012 www.secdatabase.com. All Rights Reserved.Please Consider the Environment Before Printing This Document

Shares or
Principal
Amount Value
COMMON STOCKS (continued)
Insurance (continued)
Mercer Insurance Group, Inc. 100 $ 1,525
Old Republic International Corp. 31,554 322,797
OneBeacon Insurance Group, Ltd. 3,729 40,497
Protective Life Corp. 10,742 132,771
Reinsurance Group of America, Inc. 1,849 68,006
Safety Insurance Group, Inc. 1,203 37,546
SeaBright Insurance Holdings, Inc. * 499 4,037
Stancorp Financial Group, Inc. 400 12,408
Stewart Information Services Corp. 3,400 52,360
Tower Group, Inc. 6,396 152,801
Transatlantic Holdings, Inc. 6,044 233,963
United America Indemnity, Ltd. * 2,207 10,550
Unitrin, Inc. 7,270 105,560
Universal American Financial Corp. * 13,027 117,113
Universal Insurance Holdings, Inc. 1,687 8,654
White Mountains Insurance Group, Ltd. 770 169,400
Zenith National Insurance Corp. 3,048 65,380
4,522,375
International Oil - 0.06%
ATP Oil & Gas Corp. * 6,100 54,961
Parker Drilling Company * 630 2,948
57,909
Internet Content - 0.13%
Alloy, Inc. * 3,372 17,703
HealthStream, Inc. * 300 735
InfoSpace, Inc. * 9,327 65,289
TechTarget, Inc. * 1,700 6,834
TheStreet.com, Inc. 21,826 42,561
133,122
Internet Incubators - 0.02%
ModusLink Global Solutions, Inc. * 4,424 18,802
Internet Retail - 0.73%
1-800-Flowers.com, Inc., Class A * 2,314 5,392
IAC/InterActiveCorp * 11,000 177,760
Internet Brands, Inc., Class A * 7,700 51,821
Intersections, Inc. * 2,600 7,930
Liberty Media Corp. - Interactive A * 74,802 438,340
Orbitz Worldwide, Inc. * 5,400 11,664
Shutterfly, Inc. * 465 6,640
SumTotal Systems, Inc. * 4,400 21,120
720,667
Internet Service Provider - 0.14%
ePlus, Inc. * 2,120 30,316
Online Resources Corp. * 4,100 21,361
United Online, Inc. 9,838 62,963
Web.com Group, Inc. * 4,251 20,320
134,960
Internet Software - 1.19%
Cybersource Corp. * 42,382 550,966
DealerTrack Holdings, Inc. * 14,940 214,389
eResearch Technology, Inc. * 41,502 248,597
RealNetworks, Inc. * 15,401 39,427
Small Cap Opportunities Fund (continued)Shares or
Copyright © 2012 www.secdatabase.com. All Rights Reserved.Please Consider the Environment Before Printing This Document

Principal
Amount Value
COMMON STOCKS (continued)
Internet Software (continued)
TIBCO Software, Inc. * 17,624 $ 116,847
1,170,226
Investment Companies - 0.00%
Teton Advisors, Inc. * 201 0
Leisure Time - 1.37%
Aldila, Inc. * 1,100 4,246
Arctic Cat, Inc. 2,137 8,569
Brunswick Corp. 16,101 74,387
Callaway Golf Company 11,975 85,262
Canterbury Park Holding Corp. * 100 689
Cinemark Holdings, Inc. 9,951 105,680
Dover Downs Gaming & Entertainment, Inc. 226 1,340
Gaylord Entertainment Company * 6,900 97,980
Great Wolf Resorts, Inc. * 8,200 22,222
Isle of Capri Casinos, Inc. * 2,600 34,164
Lakes Gaming, Inc. * 2,700 8,370
LIFE TIME FITNESS, Inc. * 6,300 116,424
Multimedia Games, Inc. * 6,107 21,863
Pinnacle Entertainment, Inc. * 12,329 131,304
RC2 Corp. * 2,476 29,786
Rick's Cabaret International, Inc. * 1,792 12,114
Royal Caribbean Cruises, Ltd. 24,418 367,735
Speedway Motorsports, Inc. 7,077 108,278
Steinway Musical Instruments, Inc. * 1,091 11,968
Vail Resorts, Inc. * 2,949 81,068
West Marine, Inc. * 5,794 32,910
1,356,359
Life Sciences - 0.06%
Celera Corp. * 4,364 33,035
Dawson Geophysical Company * 1,100 29,546
62,581
Liquor - 0.15%
Central European Distribution Corp. * 5,941 149,535
Manufacturing - 2.25%
American Railcar Industries, Inc. 5,134 41,380
AptarGroup, Inc. 14,657 454,514
Barnes Group, Inc. 6,058 92,445
Ceradyne, Inc. * 5,300 119,780
Chase Corp. 1,432 16,754
Coherent, Inc. * 1,300 25,376
GenTek, Inc. * 420 9,866
Insteel Industries, Inc. 4,627 39,885
MFRI, Inc. * 100 597
Park-Ohio Holdings Corp. * 1,442 4,860
Portec Rail Products, Inc. 854 8,326
Smith & Wesson Holding Corp. * 2,493 13,163
Spartan Motors, Inc. 127,479 1,203,402
Synalloy Corp. 80 647
Trinity Industries, Inc. 12,100 184,404
2,215,399
Medical-Hospitals - 0.87%
Anika Therapeutics, Inc * 2,500 12,625
Community Health Systems, Inc. * 3,100 81,809
Dynacq Healthcare, Inc. * 941 3,463
The accompanying notes are an integral part of the financial statements.
210
Copyright © 2012 www.secdatabase.com. All Rights Reserved.Please Consider the Environment Before Printing This Document

PORTFOLIO OF INVESTMENTS - May 31, 2009 (Unaudited) - continued(showing percentage of total net assets)
Small Cap Opportunities Fund (continued)Shares or
Principal
Amount Value
COMMON STOCKS (continued)
Medical-Hospitals (continued)
EV3, Inc. * 8,041 $ 73,495
LifePoint Hospitals, Inc. * 2,042 55,644
MedCath Corp. * 2,300 24,518
NxStage Medical, Inc. * 1,732 6,010
Universal Health Services, Inc., Class B 10,741 590,003
Vital Images, Inc. * 1,000 11,660
859,227
Metal & Metal Products - 1.78%
A. M. Castle & Company 6,300 66,150
Ampco-Pittsburgh Corp. 836 21,703
Brush Engineered Materials, Inc. * 4,800 73,680
Gibraltar Industries, Inc. 1,901 14,676
Haynes International, Inc. * 2,000 45,900
Horsehead Holding Corp. * 13,808 99,142
Kaiser Aluminum Corp. 3,700 114,959
Ladish Company, Inc. * 2,200 25,938
Mueller Industries, Inc. 2,231 49,015
Mueller Water Products, Inc. 20,625 74,456
North American Galvanizing & Coatings, Inc. * 3,100 17,298
RBC Bearings, Inc. * 19,263 355,402
Reliance Steel & Aluminum Company 10,200 387,498
RTI International Metals, Inc. * 4,100 58,671
Timken Company 13,200 223,212
Universal Stainless & Alloy Products, Inc. * 1,187 16,487
USEC, Inc. * 21,628 115,710
1,759,897
Mining - 0.72%
Compass Minerals International, Inc. 9,065 486,156
Hecla Mining Company * 24,800 92,008
Stillwater Mining Company * 17,982 132,887
U.S. Gold Corp. * 1,100 2,486
713,537
Mobile Homes - 0.02%
Winnebago Industries, Inc. 3,100 23,777
Office Furnishings & Supplies - 0.20%
Acco Brands Corp. * 5,497 16,216
OfficeMax, Inc. 2,633 21,722
Steelcase, Inc. Class A 15,596 75,329
United Stationers, Inc. * 2,307 82,614
Virco Manufacturing 700 2,310
198,191
Oil & Gas Drilling - 0.01%
CREDO Petroleum Corp. * 512 4,690
TGC Industries, Inc. * 260 1,212
5,902
Paper - 0.65%
MeadWestvaco Corp. 24,200 386,474
Neenah Paper, Inc. 1,386 11,213
Temple-Inland, Inc. 18,000 230,040
Copyright © 2012 www.secdatabase.com. All Rights Reserved.Please Consider the Environment Before Printing This Document

Wausau-Mosinee Paper Corp. 2,400 17,376
645,103
Petroleum Services - 2.71%
Approach Resources, Inc. * 2,400 21,456
Small Cap Opportunities Fund (continued)Shares or
Principal
Amount Value
COMMON STOCKS (continued)
Petroleum Services (continued)
Bolt Technology Corp. * 1,159 $ 13,155
Bronco Drilling Company, Inc. * 4,801 28,518
Complete Production Services, Inc. * 81,899 579,845
CVR Energy, Inc. * 15,600 149,136
Delek US Holdings, Inc. 4,500 46,125
Exterran Holdings, Inc. * 8,519 169,613
Flotek Industries, Inc. * 7,794 16,367
GulfMark Offshore, Inc. * 4,300 131,150
Key Energy Services, Inc. * 18,999 122,544
Newpark Resources, Inc. * 13,256 38,177
Oceaneering International, Inc. * 13,267 682,189
Petroleum Development Corp. * 2,500 45,275
SEACOR Holdings, Inc. * 3,000 229,230
Tesoro Corp. 21,000 355,740
TETRA Technologies, Inc. * 4,949 43,056
2,671,576
Pharmaceuticals - 0.59%
Biodel, Inc. * 1,308 5,742
BioScrip, Inc. * 1,900 7,980
BMP Sunstone Corp. * 1,200 5,532
Hi-Tech Pharmacal Company, Inc. * 1,376 10,403
King Pharmaceuticals, Inc. * 3,200 30,272
Lannett Company, Inc. * 350 2,047
Medicis Pharmaceutical Corp., Class A 2,000 31,440
Par Pharmaceutical Companies, Inc. * 2,620 34,977
Prestige Brands Holdings, Inc. * 13,700 85,351
ViroPharma, Inc. * 52,701 366,272
580,016
Photography - 0.11%
Eastman Kodak Company 40,700 106,227
Pollution Control - 0.01%
CECO Environmental Corp. * 2,241 7,395
Publishing - 0.53%
Consolidated Graphics, Inc. * 2,900 47,067
Courier Corp. 449 7,027
Dolan Media Company * 3,854 53,301
Gannett Company, Inc. 32,127 153,245
Meredith Corp. 3,972 107,085
Playboy Enterprises, Inc., Class B * 7,779 25,904
The New York Times Company, Class A 19,448 128,357
521,986
Railroads & Equipment - 0.02%
Greenbrier Company, Inc. 1,647 12,385
P.A.M. Transportation Services, Inc. * 1,563 7,940
20,325
Real Estate - 1.44%
Alexandria Real Estate Equities, Inc., REIT 6,538 234,714
Avatar Holdings, Inc. * 1,050 18,554
Forest City Enterprises, Inc., Class A 6,938 49,190
Copyright © 2012 www.secdatabase.com. All Rights Reserved.Please Consider the Environment Before Printing This Document

Hilltop Holdings, Inc. * 7,179 85,358
Jones Lang LaSalle, Inc. 2,949 103,363
LaSalle Hotel Properties, REIT 15,320 209,578
Senior Housing Properties Trust, REIT 17,631 295,319
Universal Health Realty Income Trust, REIT 13,020 417,421
The accompanying notes are an integral part of the financial statements.
211
PORTFOLIO OF INVESTMENTS - May 31, 2009 (Unaudited) - continued(showing percentage of total net assets)
Small Cap Opportunities Fund (continued)Shares or
Principal
Amount Value
COMMON STOCKS (continued)
Real Estate (continued)
ZipRealty, Inc. * 1,500 $ 4,500
1,417,997
Retail - 5.63%
Allion Healthcare, Inc. * 7,200 38,016
AnnTaylor Stores Corp. * 5,700 41,724
Barnes & Noble, Inc. 9,129 225,578
Benihana, Inc. * 700 4,900
Books-A-Million, Inc. 3,177 22,334
Build A Bear Workshop, Inc. * 4,700 21,056
Cabela's, Inc. * 12,958 172,212
Cash America International, Inc. 4,200 96,684
Chico's FAS, Inc. * 29,800 290,848
Christopher & Banks Corp. 9,827 50,904
Citi Trends, Inc. * 18,314 472,135
Coldwater Creek, Inc. * 4,794 18,217
Collective Brands, Inc. * 51,954 766,841
Conn's, Inc. * 635 6,331
Destination Maternity Corp. * 500 6,900
Dillard's, Inc., Class A 11,994 113,343
DSW, Inc., Class A * 1,200 13,644
FGX International Holdings, Ltd. * 32,612 438,958
Finish Line, Inc. 7,198 49,738
Foot Locker, Inc. 16,400 182,204
Fred's, Inc., Class A 4,402 56,478
Gander Mountain Company * 1,300 7,657
Genesco, Inc. * 1,504 38,788
J. Crew Group, Inc. * (a) 32,075 829,459
Jo-Ann Stores, Inc. * 2,944 63,620
Kenneth Cole Productions, Inc., Class A 1,100 7,656
Lazare Kaplan International, Inc. * 200 450
Marinemax, Inc. * 4,538 13,432
Pantry, Inc. * 28,292 563,577
PC Connection, Inc. * 400 2,140
Regis Corp. 7,767 136,155
Retail Ventures, Inc. * 6,784 17,706
Saks, Inc. * 20,886 79,785
Shoe Carnival, Inc. * 2,044 21,728
Sport Supply Group, Inc. 1,526 11,430
Stein Mart, Inc. * 3,100 21,483
Susser Holdings Corp. * 215 2,920
Systemax, Inc. * 2,345 28,773
Talbots, Inc. 2,794 9,360
The Dress Barn, Inc. * 8,493 134,444
The Men's Wearhouse, Inc. 7,600 129,884
Titan Machinery, Inc. * 7,756 97,415
Copyright © 2012 www.secdatabase.com. All Rights Reserved.Please Consider the Environment Before Printing This Document

Tween Brands, Inc. * 3,180 16,759
Williams-Sonoma, Inc. 17,900 231,626
5,555,292
Retail Grocery - 0.28%
Ingles Markets, Inc. 1,470 21,962
The Great Atlantic & Pacific Tea Company,
Inc. * 9,537 37,766
Weis Markets, Inc. 1,721 60,115
Winn-Dixie Stores, Inc. * 9,951 151,852
271,695
Small Cap Opportunities Fund (continued)Shares or
Principal
Amount Value
COMMON STOCKS (continued)
Sanitary Services - 0.42%
Waste Connections, Inc. * 16,130 $ 409,702
Semiconductors - 4.33%
Advanced Analogic Technologies, Inc. * 1,517 7,175
Advanced Energy Industries, Inc. * 4,427 41,835
Amtech Systems, Inc. * 380 1,729
ATMI, Inc. * 30,728 498,715
BTU International, Inc. * 482 2,188
Cascade Microtech, Inc. * 1,463 4,828
Ceva, Inc. * 1,788 13,607
Cymer, Inc. * 21,106 585,903
Cypress Semiconductor Corp. * 13,656 117,442
Diodes, Inc. * 7,000 107,590
DSP Group, Inc. * 6,910 50,098
Emulex Corp. * 13,777 151,409
Fairchild Semiconductor International, Inc. * 14,780 104,347
FormFactor, Inc. * 4,534 82,292
GSI Technology, Inc. * 3,600 12,348
Integrated Device Technology, Inc. * 25,064 141,110
International Rectifier Corp. * 10,774 155,900
IXYS Corp. * 2,393 22,662
Kopin Corp. * 520 2,049
MKS Instruments, Inc. * 31,013 418,986
Nanometrics, Inc. * 500 1,005
OmniVision Technologies, Inc. * 7,300 83,147
Pericom Semiconductor Corp. * 301 2,844
Power Integrations, Inc. 21,691 478,503
Richardson Electronics, Ltd. 2,762 10,882
Rudolph Technologies, Inc. * 1,000 4,430
Semitool, Inc. * 554 2,715
Semtech Corp. * 49,947 803,647
Silicon Image, Inc. * 13,962 33,090
Skyworks Solutions, Inc. * 18,903 180,146
Tessera Technologies, Inc. * 1,616 38,025
Triquint Semiconductor, Inc. * 15,643 69,611
Veeco Instruments, Inc. * 3,778 39,782
4,270,040
Software - 1.92%
American Software, Inc., Class A 717 3,578
Avid Technology, Inc. * 4,324 61,574
Blackbaud, Inc. 31,020 430,247
Bsquare Corp. * 100 181
Concurrent Computer Corp. * 482 2,304
DivX, Inc. * 4,700 24,910
FARO Technologies, Inc. * 1,507 23,253
JDA Software Group, Inc. * 3,674 54,743
Copyright © 2012 www.secdatabase.com. All Rights Reserved.Please Consider the Environment Before Printing This Document

MSC Software Corp. * 2,149 15,537
Omnicell, Inc. * 45,087 414,350
Omniture, Inc. * 6,692 79,099
Open Text Corp. * 19,293 679,692
Smith Micro Software, Inc. * 1,870 18,251
Soapstone Networks, Inc. * 3,369 12,769
THQ, Inc. * 11,400 73,302
Wayside Technology Group, Inc. 64 448
1,894,238
The accompanying notes are an integral part of the financial statements.
212
PORTFOLIO OF INVESTMENTS - May 31, 2009 (Unaudited) - continued(showing percentage of total net assets)
Small Cap Opportunities Fund (continued)Shares or
Principal
Amount Value
COMMON STOCKS (continued)
Steel - 1.07%
AK Steel Holding Corp. 12,900 $ 184,470
Carpenter Technology Corp. 7,613 171,140
Friedman Industries 490 2,671
Northwest Pipe Company * (a) 15,193 592,223
Olympic Steel, Inc. 2,800 51,688
Worthington Industries, Inc. 3,800 53,162
1,055,354
Telecommunications Equipment &
Services - 3.11%
Alaska Communications Systems Group, Inc. 60,737 411,189
Arris Group, Inc. * 76,845 931,361
Aware, Inc. * 3,300 8,514
Ciena Corp. * 17,200 189,200
CommScope, Inc. * 7,100 186,304
Communications Systems, Inc. 1,488 14,568
Comtech Telecommunications Corp. * 14,758 430,048
CPI International, Inc. * 2,407 26,309
EchoStar Corp., Class A * 1,200 19,236
General Communication, Inc., Class A * 4,937 32,634
Globecomm Systems, Inc. * 4,754 30,758
Harris Stratex Networks, Inc., Class A * 5,700 27,189
Hughes Communications, Inc. * 1,196 26,216
ID Systems, Inc. * 651 2,617
JDS Uniphase Corp. * 30,100 162,239
KVH Industries, Inc. * 2,148 15,637
Loral Space & Communications, Inc. * 3,982 122,805
NTELOS Holdings Corp. 13,833 247,196
Occam Networks, Inc. * 5,050 12,878
Oplink Communications, Inc. * 5,360 61,640
Performance Technologies, Inc. * 1,302 4,036
Plantronics, Inc. 5,418 96,657
Tollgrade Communications, Inc. * 1,621 9,110
3,068,341
Telephone - 0.61%
CenturyTel, Inc. 2,553 78,760
Cincinnati Bell, Inc. * 182,969 510,483
Fairpoint Communications, Inc. 9,081 9,172
598,415
Copyright © 2012 www.secdatabase.com. All Rights Reserved.Please Consider the Environment Before Printing This Document

Tires & Rubber - 0.17%
Cooper Tire & Rubber Company 7,800 82,680
Goodyear Tire & Rubber Company * 2,800 32,060
Myers Industries, Inc. 4,925 49,742
164,482
Tobacco - 0.19%
Alliance One International, Inc. * 2,736 13,023
Schweitzer Mauduit International, Inc. 1,655 37,188
Universal Corp. 3,700 137,011
187,222
Toys, Amusements & Sporting Goods - 0.01%
Russ Berrie & Company, Inc. * 1,967 6,216
Transportation - 1.94%
Aircastle, Ltd. 10,000 66,900
Alexander & Baldwin, Inc. 4,808 118,998
Atlas Air Worldwide Holdings, Inc. * 2,177 56,341
Small Cap Opportunities Fund (continued)Shares or
Principal
Amount Value
COMMON STOCKS (continued)
Transportation (continued)
Bristow Group, Inc. * 5,542 $ 175,293
DryShips, Inc. (a) 62,241 509,131
Dynamex, Inc. * 974 15,117
Eagle Bulk Shipping, Inc. 7,900 61,462
Genco Shipping & Trading, Ltd. 5,300 138,595
Horizon Lines, Inc. 4,317 22,966
Marten Transport, Ltd. * 24,107 514,202
Overseas Shipholding Group, Inc. 4,418 149,417
Pacer International, Inc. 3,866 10,052
PHI, Inc. * 2,100 33,159
USA Truck, Inc. * 2,901 40,962
1,912,595
Trucking & Freight - 1.61%
Celadon Group, Inc. * 5,101 38,717
Landstar Systems, Inc. 14,669 557,422
Old Dominion Freight Lines, Inc. * 18,749 552,158
Oshkosh Corp. 14,200 168,554
Ryder Systems, Inc. 8,700 245,166
Wabash National Corp. 1,950 2,437
YRC Worldwide, Inc. * 8,600 22,188
1,586,642
Utility Service - 0.05%
Cal Dive International, Inc. * 5,136 51,822
Water Treatment Systems - 0.11%
Cascal N.V. 29,534 105,436
TOTAL COMMON STOCKS (Cost $94,647,409) $ 94,980,019
SHORT TERM INVESTMENTS - 3.38%
John Hancock Collateral Investment
Trust, 0.7339% (c)(g) $ 333,662 $ 3,336,618
TOTAL SHORT TERM INVESTMENTS
(Cost $3,336,618) $ 3,336,618
REPURCHASE AGREEMENTS - 3.51%
Repurchase Agreement with State
Street Corp. dated 05/29/2009 at
0.07% to be repurchased at
$3,461,020 on 06/01/2009,
Copyright © 2012 www.secdatabase.com. All Rights Reserved.Please Consider the Environment Before Printing This Document

collateralized by $2,940,000
Federal National Mortgage
Association, 5.85% due
08/17/2017 (valued at $3,020,850,
including interest) and $530,000
Federal Home Loan Mortgage
Corp., 5.625% due 11/23/2035
(valued at $513,782, including
interest) $ 3,461,000 $ 3,461,000
TOTAL REPURCHASE AGREEMENTS
(Cost $3,461,000) $ 3,461,000
Total Investments (Small Cap Opportunities Fund)
(Cost $101,445,027) - 103.16% $ 101,777,637
Other assets and liabilities, net - (3.16)% (3,115,862)
TOTAL NET ASSETS - 100.00% $ 98,661,775
The accompanying notes are an integral part of the financial statements.
213
JOHN HANCOCK FUNDS II
PORTFOLIO OF INVESTMENTS - May 31, 2009 (Unaudited) - continued(showing percentage of total net assets)
Small Cap Value FundShares or
Principal
Amount Value
COMMON STOCKS - 96.34%
Apparel & Textiles - 4.29%
Stage Stores, Inc. 64,700 $ 784,811
Unifirst Corp. 17,100 583,965
1,368,776
Auto Services - 0.25%
Copart, Inc. * 2,600 79,794
Banking - 4.70%
First Midwest Bancorp, Inc. 24,900 216,630
International Bancshares Corp. 30,000 336,600
MB Financial, Inc. 23,500 239,935
NewAlliance Bancshares, Inc. 15,700 203,158
Webster Financial Corp. 22,900 170,834
WestAmerica Bancorp 6,400 331,904
1,499,061
Biotechnology - 1.86%
Charles River Laboratories International, Inc. * 18,900 594,027
Building Materials & Construction - 0.74%
Sterling Construction Company, Inc. * 13,800 235,980
Business Services - 4.61%
Arbitron, Inc. 27,600 549,516
Bowne & Company, Inc. 40,709 218,607
MAXIMUS, Inc. 17,600 702,240
1,470,363
Chemicals - 1.74%
Zep, Inc. 45,700 556,169
Computers & Business Equipment - 3.50%
Diebold, Inc. 22,900 566,088
Electronics for Imaging, Inc. * 35,700 363,069
Xyratex, Ltd. * 56,800 187,440
Copyright © 2012 www.secdatabase.com. All Rights Reserved.Please Consider the Environment Before Printing This Document

1,116,597
Construction Materials - 0.65%
Simpson Manufacturing Company, Inc. 9,900 206,316
Cosmetics & Toiletries - 2.03%
Helen of Troy, Ltd. * 33,500 646,885
Crude Petroleum & Natural Gas - 3.66%
Penn Virginia Corp. 21,900 418,728
St. Mary Land & Exploration Company 11,200 242,592
Whiting Petroleum Corp. * 10,800 506,088
1,167,408
Electrical Utilities - 2.91%
Unisource Energy Corp. 20,000 508,800
Westar Energy, Inc. 23,500 419,475
928,275
Electronics - 4.37%
Belden, Inc. 44,400 813,408
Nam Tai Electronics, Inc. 35,700 143,514
Zebra Technologies Corp., Class A * 20,100 438,783
1,395,705
Energy - 0.68%
New Jersey Resources Corp. 6,500 216,255
Financial Services - 7.19%
Ares Capital Corp. 57,800 442,170
Small Cap Value Fund (continued)Shares or
Principal
Amount Value
COMMON STOCKS (continued)
Financial Services (continued)
Credit Acceptance Corp. * 10,800 $ 230,256
Delphi Financial Group, Inc. 37,500 714,000
Financial Federal Corp. 12,600 312,354
GATX Corp. 23,700 596,766
2,295,546
Food & Beverages - 1.74%
Lance, Inc. 26,000 554,580
Forest Products - 1.18%
Deltic Timber Corp. 11,200 376,096
Gas & Pipeline Utilities - 2.17%
Atmos Energy Corp. 14,800 355,200
WGL Holdings, Inc. 11,400 338,808
694,008
Healthcare Products - 3.64%
Herbalife, Ltd. 23,800 695,198
ICU Medical, Inc. * 11,900 430,304
Orthofix International NV * 1,500 37,980
1,163,482
Healthcare Services - 3.34%
AmSurg Corp. * 20,700 386,676
Centene Corp. * 21,900 398,142
CorVel Corp. * 13,200 283,008
1,067,826
Hotels & Restaurants - 3.71%
CEC Entertainment, Inc. * 11,400 366,282
Choice Hotels International, Inc. 16,800 458,472
Sonic Corp. * 38,100 359,283
Copyright © 2012 www.secdatabase.com. All Rights Reserved.Please Consider the Environment Before Printing This Document

1,184,037
Household Products - 0.67%
Tempur-Pedic International, Inc. 19,500 215,085
Industrial Machinery - 1.24%
Albany International Corp., Class A 29,600 395,160
Insurance - 7.46%
Alleghany Corp. * 1,150 299,000
Assured Guaranty, Ltd. 34,800 456,228
IPC Holdings, Ltd. 12,400 308,140
Platinum Underwriters Holdings, Ltd. 18,000 518,940
Reinsurance Group of America, Inc. 8,300 305,274
Universal American Financial Corp. * 54,900 493,551
2,381,133
Manufacturing - 6.37%
Acuity Brands, Inc. 11,900 323,442
AptarGroup, Inc. 14,300 443,443
Carlisle Companies, Inc. 45,100 1,031,437
ESCO Technologies, Inc. * 5,800 235,596
2,033,918
Metal & Metal Products - 2.93%
Matthews International Corp., Class A 12,400 354,020
Mueller Industries, Inc. 26,400 580,008
934,028
The accompanying notes are an integral part of the financial statements.
214
JOHN HANCOCK FUNDS II
PORTFOLIO OF INVESTMENTS - May 31, 2009 (Unaudited) - continued(showing percentage of total net assets)
Small Cap Value Fund (continued)Shares or
Principal
Amount Value
COMMON STOCKS (continued)
Office Furnishings & Supplies - 2.68%
Acco Brands Corp. * 68,700 $ 202,665
United Stationers, Inc. * 18,200 651,742
854,407
Petroleum Services - 1.08%
SEACOR Holdings, Inc. * 4,500 343,845
Publishing - 0.31%
Valassis Communications, Inc. * 15,300 98,685
Railroads & Equipment - 1.14%
Genesee & Wyoming, Inc., Class A * 12,600 364,392
Real Estate - 5.54%
Acadia Realty Trust, REIT 22,900 307,318
American Campus Communities, Inc., REIT 14,600 335,654
DiamondRock Hospitality Company, REIT 25,800 167,700
Mack-Cali Realty Corp., REIT 9,400 232,274
PS Business Parks, Inc., REIT 4,300 192,941
Realty Income Corp., REIT 24,800 532,456
1,768,343
Retail Trade - 4.54%
Casey's General Stores, Inc. 13,500 340,605
Cato Corp., Class A 42,000 808,080
Hibbett Sports, Inc. * 16,600 299,298
Copyright © 2012 www.secdatabase.com. All Rights Reserved.Please Consider the Environment Before Printing This Document
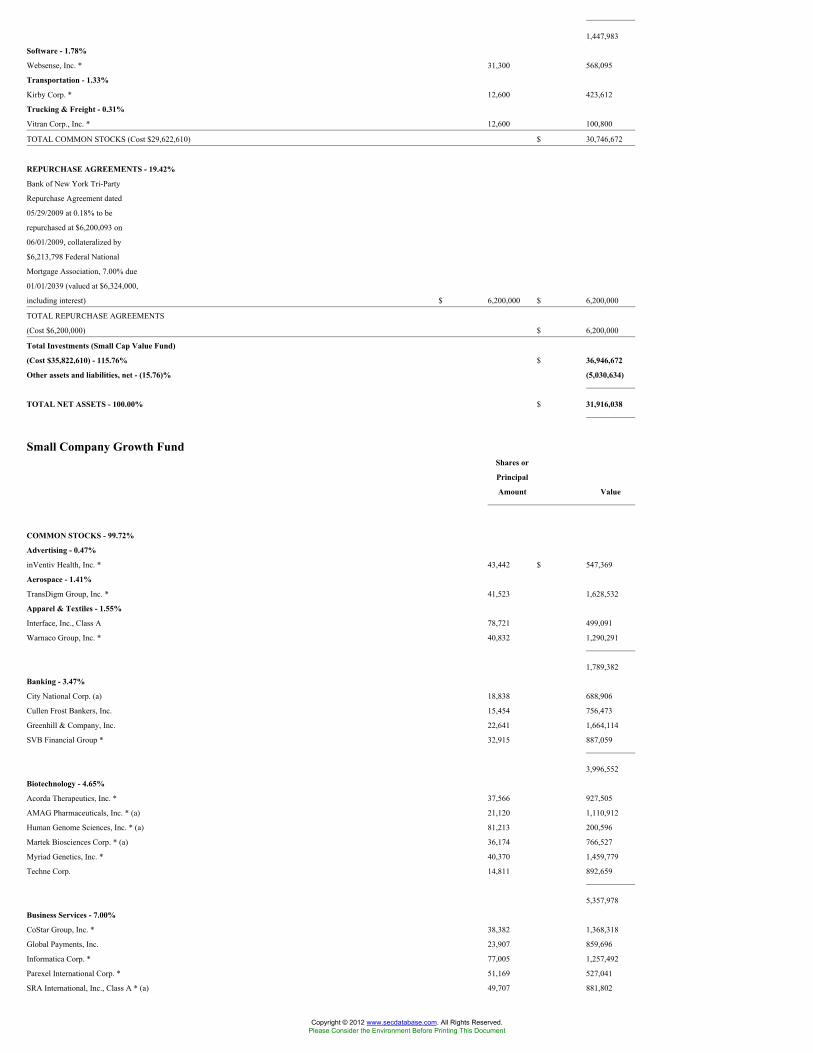
1,447,983
Software - 1.78%
Websense, Inc. * 31,300 568,095
Transportation - 1.33%
Kirby Corp. * 12,600 423,612
Trucking & Freight - 0.31%
Vitran Corp., Inc. * 12,600 100,800
TOTAL COMMON STOCKS (Cost $29,622,610) $ 30,746,672
REPURCHASE AGREEMENTS - 19.42%
Bank of New York Tri-Party
Repurchase Agreement dated
05/29/2009 at 0.18% to be
repurchased at $6,200,093 on
06/01/2009, collateralized by
$6,213,798 Federal National
Mortgage Association, 7.00% due
01/01/2039 (valued at $6,324,000,
including interest) $ 6,200,000 $ 6,200,000
TOTAL REPURCHASE AGREEMENTS
(Cost $6,200,000) $ 6,200,000
Total Investments (Small Cap Value Fund)
(Cost $35,822,610) - 115.76% $ 36,946,672
Other assets and liabilities, net - (15.76)% (5,030,634)
TOTAL NET ASSETS - 100.00% $ 31,916,038
Small Company Growth FundShares or
Principal
Amount Value
COMMON STOCKS - 99.72%
Advertising - 0.47%
inVentiv Health, Inc. * 43,442 $ 547,369
Aerospace - 1.41%
TransDigm Group, Inc. * 41,523 1,628,532
Apparel & Textiles - 1.55%
Interface, Inc., Class A 78,721 499,091
Warnaco Group, Inc. * 40,832 1,290,291
1,789,382
Banking - 3.47%
City National Corp. (a) 18,838 688,906
Cullen Frost Bankers, Inc. 15,454 756,473
Greenhill & Company, Inc. 22,641 1,664,114
SVB Financial Group * 32,915 887,059
3,996,552
Biotechnology - 4.65%
Acorda Therapeutics, Inc. * 37,566 927,505
AMAG Pharmaceuticals, Inc. * (a) 21,120 1,110,912
Human Genome Sciences, Inc. * (a) 81,213 200,596
Martek Biosciences Corp. * (a) 36,174 766,527
Myriad Genetics, Inc. * 40,370 1,459,779
Techne Corp. 14,811 892,659
5,357,978
Business Services - 7.00%
CoStar Group, Inc. * 38,382 1,368,318
Global Payments, Inc. 23,907 859,696
Informatica Corp. * 77,005 1,257,492
Parexel International Corp. * 51,169 527,041
SRA International, Inc., Class A * (a) 49,707 881,802
Copyright © 2012 www.secdatabase.com. All Rights Reserved.Please Consider the Environment Before Printing This Document

Syntel, Inc. 36,786 1,056,862
Tetra Tech, Inc. * 82,481 2,117,287
8,068,498
Chemicals - 0.52%
Calgon Carbon Corp. * 51,602 594,971
Commercial Services - 1.32%
Chemed Corp. 29,611 1,133,213
Live Nation, Inc. * 66,890 382,611
1,515,824
Computers & Business Equipment - 2.99%
Cogent, Inc. * 105,356 1,058,828
MICROS Systems, Inc. * 40,019 1,045,296
Tech Data Corp. * 41,716 1,335,746
3,439,870
Construction & Mining Equipment - 0.64%
Bucyrus International, Inc., Class A 25,840 741,091
Containers & Glass - 1.08%
Greif, Inc., Class A 25,773 1,245,351
Crude Petroleum & Natural Gas - 4.37%
Arena Resources, Inc. * 45,762 1,639,195
Bill Barrett Corp. * 31,233 1,062,859
Carrizo Oil & Gas, Inc. * (a) 38,611 824,345
Goodrich Petroleum Corp. * (a) 28,920 772,742
Whiting Petroleum Corp. * 15,765 738,748
5,037,889
The accompanying notes are an integral part of the financial statements.
215
JOHN HANCOCK FUNDS II
PORTFOLIO OF INVESTMENTS - May 31, 2009 (Unaudited) - continued(showing percentage of total net assets)
Small Company Growth Fund (continued)Shares or
Principal
Amount Value
COMMON STOCKS (continued)
Drugs & Health Care - 1.53%
Meridian Bioscience, Inc. 48,017 $ 917,605
Perrigo Company 31,392 843,189
1,760,794
Educational Services - 0.58%
DeVry, Inc. 15,389 670,499
Electrical Equipment - 4.16%
General Cable Corp. * 35,210 1,346,430
Regal-Beloit Corp. 29,002 1,145,869
Varian, Inc. * (a) 35,034 1,219,884
Watsco, Inc. 22,043 1,085,177
4,797,360
Electrical Utilities - 2.42%
ITC Holdings Corp. 26,417 1,133,025
Pike Electric Corp. * 91,267 998,461
Quanta Services, Inc. * 28,919 659,642
2,791,128
Financial Services - 4.15%
Copyright © 2012 www.secdatabase.com. All Rights Reserved.Please Consider the Environment Before Printing This Document

Affiliated Managers Group, Inc. * 16,469 924,076
Bankrate, Inc. * (a) 29,345 883,578
Federated Investors, Inc., Class B 41,359 1,035,216
optionsXpress Holdings, Inc. 46,206 789,660
Stifel Financial Corp. * 26,280 1,144,231
4,776,761
Food & Beverages - 1.31%
Ralcorp Holdings, Inc. * 26,403 1,512,100
Healthcare Products - 3.46%
Gen-Probe, Inc. * 20,906 891,223
Insulet Corp. * (a) 52,577 380,132
Medicines Company * 62,434 478,244
Nuvasive, Inc. * (a) 26,929 972,675
PSS World Medical, Inc. * 38,854 624,384
Zoll Medical Corp. * 38,297 643,007
3,989,665
Healthcare Services - 0.86%
MEDNAX, Inc. * 24,611 996,746
Hotels & Restaurants - 5.77%
Brinker International, Inc. 63,862 1,143,130
Buffalo Wild Wings, Inc. * (a) 20,930 743,015
Choice Hotels International, Inc. (a) 32,913 898,196
Darden Restaurants, Inc. 27,103 980,315
Jack in the Box, Inc. * 57,573 1,514,170
P.F. Chang's China Bistro, Inc. * (a) 42,869 1,369,236
6,648,062
Household Products - 1.01%
Church & Dwight, Inc. 23,108 1,161,639
Industrial Machinery - 1.38%
FMC Technologies, Inc. * 24,868 1,035,006
Lindsay Corp. (a) 17,616 561,246
1,596,252
Industrials - 0.45%
EnergySolutions, Inc. 63,671 513,825
Small Company Growth Fund (continued)Shares or
Principal
Amount Value
COMMON STOCKS (continued)
Insurance - 1.54%
Brown & Brown, Inc. 37,304 $ 719,221
ProAssurance Corp. * 23,260 1,051,585
1,770,806
Internet Software - 0.77%
F5 Networks, Inc. * 27,877 885,374
Leisure Time - 1.26%
National Cinemedia, Inc. 38,749 484,750
Penn National Gaming, Inc. * 29,146 963,858
1,448,608
Manufacturing - 1.63%
Barnes Group, Inc. 46,821 714,488
Coherent, Inc. * 26,490 517,085
Hexcel Corp. * 60,039 641,817
1,873,390
Medical-Hospitals - 2.41%
Cepheid, Inc. * 49,038 495,284
LifePoint Hospitals, Inc. * (a) 43,769 1,192,705
Copyright © 2012 www.secdatabase.com. All Rights Reserved.Please Consider the Environment Before Printing This Document

VCA Antech, Inc. * (a) 44,761 1,086,350
2,774,339
Metal & Metal Products - 0.52%
Dynamic Materials Corp. 33,253 596,559
Petroleum Services - 1.26%
Dril-Quip, Inc. * 35,080 1,449,506
Pharmaceuticals - 2.64%
BioMarin Pharmaceutical, Inc. * (a) 57,094 798,174
Isis Pharmaceuticals, Inc. * 34,057 469,987
OSI Pharmaceuticals, Inc. * 19,486 658,627
United Therapeutics Corp. * 13,868 1,111,520
3,038,308
Pollution Control - 0.52%
Fuel Tech, Inc. * (a) 61,186 597,175
Railroads & Equipment - 0.96%
Wabtec Corp. 31,046 1,107,721
Real Estate - 0.53%
BioMed Realty Trust, Inc., REIT 61,676 606,275
Retail - 0.33%
AnnTaylor Stores Corp. * 51,964 380,376
Retail Trade - 2.72%
Big Lots, Inc. * 41,901 964,142
Hot Topic, Inc. * 125,721 906,449
Tractor Supply Company * 17,919 687,731
Zumiez, Inc. * 64,621 576,419
3,134,741
Semiconductors - 7.57%
Advanced Energy Industries, Inc. * 84,165 795,359
Cabot Microelectronics Corp. * 32,130 898,034
Hittite Microwave Corp. * 33,059 1,186,157
Microsemi Corp. * 67,940 914,472
Monolithic Power Systems, Inc. * 61,475 1,273,147
Power Integrations, Inc. 43,587 961,529
Silicon Laboratories, Inc. * 45,143 1,517,708
The accompanying notes are an integral part of the financial statements.
216
JOHN HANCOCK FUNDS II
PORTFOLIO OF INVESTMENTS - May 31, 2009 (Unaudited) - continued(showing percentage of total net assets)
Small Company Growth Fund (continued)Shares or
Principal
Amount Value
COMMON STOCKS (continued)
Semiconductors (continued)
Varian Semiconductor Equipment Associates,
Inc. * 49,782 $ 1,170,873
8,717,279
Software - 7.94%
Aspen Technology, Inc. * 105,246 831,443
Blackboard, Inc. * 26,717 769,984
Eclipsys Corp. * 76,566 1,129,348
Lawson Software, Inc. * 161,436 849,153
Manhattan Associates, Inc. * 49,581 872,130
Omniture, Inc. * 72,560 857,659
Quality Systems, Inc. (a) 40,661 2,030,204
Copyright © 2012 www.secdatabase.com. All Rights Reserved.Please Consider the Environment Before Printing This Document

Sybase, Inc. * 24,234 788,332
Websense, Inc. * 56,137 1,018,887
9,147,140
Steel - 0.52%
Carpenter Technology Corp. 26,834 603,228
Telecommunications Equipment &
Services - 5.72%
Harmonic, Inc. * 135,623 783,901
NeuStar, Inc., Class A * (a) 50,419 1,010,901
NICE Systems, Ltd., ADR * 44,752 1,027,506
Polycom, Inc. * 59,295 1,026,396
SBA Communications Corp. * 46,311 1,184,172
Starent Networks Corp. * (a) 73,596 1,555,084
6,587,960
Toys, Amusements & Sporting Goods - 1.34%
Marvel Entertainment, Inc. * 46,522 1,543,600
Trucking & Freight - 2.99%
Forward Air Corp. 48,161 1,026,793
Hub Group, Inc., Class A * 45,804 905,087
Knight Transportation, Inc. 85,365 1,514,375
3,446,255
TOTAL COMMON STOCKS (Cost $125,623,777) $ 114,886,778
SHORT TERM INVESTMENTS - 15.15%
John Hancock Collateral Investment
Trust, 0.7339% (c)(g) $ 1,745,381 $ 17,453,806
TOTAL SHORT TERM INVESTMENTS
(Cost $17,453,806) $ 17,453,806
Small Company Growth Fund (continued)Shares or
Principal
Amount Value
REPURCHASE AGREEMENTS - 0.38%
Repurchase Agreement with State
Street Corp. dated 05/29/2009 at
0.07% to be repurchased at
$436,003 on 06/01/2009,
collateralized by $460,000 Federal
Home Loan Mortgage Corp.,
5.625% due 11/23/2035 (valued at
$445,924, including interest) $ 436,000 $ 436,000
TOTAL REPURCHASE AGREEMENTS
(Cost $436,000) $ 436,000
Total Investments (Small Company Growth Fund)
(Cost $143,513,583) - 115.25% $ 132,776,584
Other assets and liabilities, net - (15.25)% (17,571,596)
TOTAL NET ASSETS - 100.00% $ 115,204,988
Small Company Value FundShares or
Principal
Amount Value
COMMON STOCKS - 97.24%
Aerospace - 1.32%
Kratos Defense & Security Solutions, Inc. * 569,000 $ 415,370
Copyright © 2012 www.secdatabase.com. All Rights Reserved.Please Consider the Environment Before Printing This Document

Woodward Governor Company 214,700 4,407,791
4,823,161
Air Travel - 0.55%
Alaska Air Group, Inc. * 129,600 2,017,872
Apparel & Textiles - 0.78%
Culp, Inc. * 112,200 428,604
G & K Services, Inc., Class A 113,800 2,439,872
2,868,476
Auto Parts - 0.02%
Accuride Corp. * 193,000 59,830
Auto Services - 0.25%
Dollar Thrifty Automotive Group, Inc. * (a) 106,100 914,582
Banking - 4.24%
East West Bancorp, Inc. 222,338 1,794,268
Glacier Bancorp, Inc. (a) 189,400 3,138,358
Home Bancshares, Inc. (a) 138,900 2,771,055
Signature Bank * 72,400 1,958,420
SVB Financial Group * (a) 142,300 3,834,985
Wintrust Financial Corp. 113,700 2,046,600
15,543,686
Biotechnology - 0.82%
Exelixis, Inc. * (a) 240,400 1,334,220
Myriad Genetics, Inc. * 46,300 1,674,208
3,008,428
Broadcasting - 0.10%
Saga Communications, Inc., Class A * 52,075 359,317
Building Materials & Construction - 2.61%
Beacon Roofing Supply, Inc. * 393,200 5,701,400
Drew Industries, Inc. * 173,300 2,486,855
The accompanying notes are an integral part of the financial statements.
217
JOHN HANCOCK FUNDS II
PORTFOLIO OF INVESTMENTS - May 31, 2009 (Unaudited) - continued(showing percentage of total net assets)
Small Company Value Fund (continued)Shares or
Principal
Amount Value
COMMON STOCKS (continued)
Building Materials & Construction
(continued)
Sterling Construction Company, Inc. * 79,900 $ 1,366,290
9,554,545
Business Services - 7.31%
Compass Diversified Trust 158,300 1,393,040
Electro Rent Corp. 229,000 2,209,850
FTI Consulting, Inc. * 109,900 5,519,178
McGrath Rentcorp 234,000 4,249,440
MPS Group, Inc. * 423,500 3,214,365
Navigant Consulting Company * 238,800 2,844,108
StarTek, Inc. * 186,612 1,013,303
SYNNEX Corp. * (a) 120,800 3,126,304
Wind River Systems, Inc. * 408,800 3,225,432
26,795,020
Copyright © 2012 www.secdatabase.com. All Rights Reserved.Please Consider the Environment Before Printing This Document

Chemicals - 3.40%
Airgas, Inc. 122,900 5,193,754
American Vanguard Corp. (a) 182,100 1,859,241
Arch Chemicals, Inc. 128,100 3,599,610
Innospec, Inc. 205,500 1,831,005
12,483,610
Colleges & Universities - 0.72%
Corinthian Colleges, Inc. * 172,200 2,648,436
Commercial Services - 0.72%
Pool Corp. (a) 152,200 2,652,846
Computers & Business Equipment - 1.56%
Ixia * 292,500 1,784,250
Palm, Inc. * (a) 285,100 3,478,220
Xyratex, Ltd. * 139,100 459,030
5,721,500
Construction & Mining Equipment - 1.52%
Astec Industries, Inc. * 62,600 1,916,812
Carbo Ceramics, Inc. (a) 57,900 2,189,778
Kaman Corp., Class A 92,600 1,467,710
5,574,300
Construction Materials - 2.01%
Ameron International Corp. 57,400 3,182,830
Comfort Systems USA, Inc. 140,000 1,306,200
Universal Forest Products, Inc. 94,400 2,875,424
7,364,454
Crude Petroleum & Natural Gas - 2.78%
Forest Oil Corp. * 102,400 1,946,624
Penn Virginia Corp. 209,000 3,996,080
Whiting Petroleum Corp. * 91,100 4,268,946
10,211,650
Domestic Oil - 0.65%
Mariner Energy, Inc. * 126,500 1,829,190
Union Drilling, Inc. * 56,419 552,342
2,381,532
Drugs & Health Care - 1.75%
Landauer, Inc. 47,300 2,725,899
West Pharmaceutical Services, Inc. 113,800 3,678,016
6,403,915
Small Company Value Fund (continued)Shares or
Principal
Amount Value
COMMON STOCKS (continued)
Electrical Equipment - 0.70%
C & D Technologies, Inc. * (a) 168,400 $ 301,436
Littelfuse, Inc. * 101,500 1,780,310
Methode Electronics, Inc. 80,400 469,536
2,551,282
Electrical Utilities - 2.58%
Black Hills Corp. (a) 119,000 2,546,600
Cleco Corp. 163,000 3,334,980
El Paso Electric Company * 157,800 2,089,272
Empire District Electric Company 95,400 1,494,918
9,465,770
Electronics - 1.61%
Copyright © 2012 www.secdatabase.com. All Rights Reserved.Please Consider the Environment Before Printing This Document

Analogic Corp. 46,500 1,696,785
Belden, Inc. 136,300 2,497,016
Franklin Electric, Inc. 35,200 837,056
Newport Corp. * 152,000 887,680
5,918,537
Energy - 0.04%
GeoMet, Inc. * 131,400 164,250
Financial Services - 3.38%
Ares Capital Corp. 327,300 2,503,845
Hercules Technology Growth Capital, Inc. 266,640 1,999,800
JMP Group, Inc. (a) 132,200 925,400
Kohlberg Capital Corp. 245,467 1,021,143
Piper Jaffray Companies, Inc. * 51,700 1,864,819
Prospect Capital Corp. 77,100 656,892
Stifel Financial Corp. * 78,900 3,435,306
12,407,205
Food & Beverages - 0.66%
Nash Finch Company 83,000 2,432,730
Forest Products - 0.72%
Deltic Timber Corp. 78,600 2,639,388
Furniture & Fixtures - 0.35%
Stanley Furniture Company, Inc. 128,000 1,281,280
Gas & Pipeline Utilities - 1.09%
Southwest Gas Corp. 108,700 2,258,786
Vectren Corp. 76,300 1,735,825
3,994,611
Healthcare Products - 2.15%
AngioDynamics, Inc. * 102,300 1,255,221
Owens & Minor, Inc. 188,900 6,622,834
7,878,055
Healthcare Services - 1.13%
National Healthcare Corp. 84,412 3,242,265
Triple-S Management Corp. * (a) 64,200 915,492
4,157,757
Homebuilders - 1.31%
M/I Homes, Inc. 105,400 1,218,424
Meritage Homes Corp. * 171,400 3,577,118
4,795,542
Hotels & Restaurants - 0.95%
Orient Express Hotels, Ltd., Class A (a) 322,893 2,298,998
The accompanying notes are an integral part of the financial statements.
218
JOHN HANCOCK FUNDS II
PORTFOLIO OF INVESTMENTS - May 31, 2009 (Unaudited) - continued(showing percentage of total net assets)
Small Company Value Fund (continued)Shares or
Principal
Amount Value
COMMON STOCKS (continued)
Hotels & Restaurants (continued)
The Steak & Shake Company * (a) 137,100 $ 1,188,657
3,487,655
Copyright © 2012 www.secdatabase.com. All Rights Reserved.Please Consider the Environment Before Printing This Document

Industrial Machinery - 2.15%
Cascade Corp. 64,700 1,867,889
Circor International, Inc. 86,400 2,108,160
IDEX Corp. 166,825 3,895,364
7,871,413
Insurance - 4.52%
Employers Holdings, Inc. 95,200 1,162,392
Markel Corp. * 8,500 2,422,500
Max Capital Group, Ltd. 175,900 2,780,979
National Interstate Corp. 149,000 2,382,510
ProAssurance Corp. * 155,200 7,016,592
Universal American Financial Corp. * 91,800 825,282
16,590,255
Investment Companies - 0.32%
First Opportunity Fund, Inc. * 247,700 1,174,098
Life Sciences - 0.23%
Symyx Technologies, Inc. * 172,900 836,836
Manufacturing - 2.73%
AptarGroup, Inc. 175,400 5,439,154
Nordson Corp. (a) 119,000 4,569,600
10,008,754
Metal & Metal Products - 3.41%
Franco-Nevada Corp. 89,000 2,474,147
Gibraltar Industries, Inc. 202,000 1,559,440
Matthews International Corp., Class A 155,200 4,430,960
Sims Group, Ltd. 217,300 4,050,472
12,515,019
Mining - 0.41%
AMCOL International Corp. (a) 70,600 1,511,546
Mobile Homes - 0.48%
Winnebago Industries, Inc. 227,700 1,746,459
Multimedia - 0.50%
Ascent Media Corp., Class A * 64,000 1,850,880
Oil & Gas Drilling - 0.46%
Atwood Oceanics, Inc. * 64,400 1,704,024
Paper - 1.72%
Clearwater Paper Corp. * 61,100 1,446,237
Potlatch Corp. 116,400 3,047,352
Wausau-Mosinee Paper Corp. 250,200 1,811,448
6,305,037
Petroleum Services - 0.85%
Hercules Offshore, Inc. * (a) 131,892 611,979
TETRA Technologies, Inc. * 287,700 2,502,990
3,114,969
Railroads & Equipment - 1.37%
Genesee & Wyoming, Inc., Class A * 173,300 5,011,836
Real Estate - 4.52%
Cedar Shopping Centers, Inc., REIT 219,800 1,134,168
First Potomac Realty Trust, REIT 172,000 1,804,280
Small Company Value Fund (continued)Shares or
Principal
Amount Value
COMMON STOCKS (continued)
Real Estate (continued)
Hatteras Financial Corp., REIT 113,800 $ 2,835,896
Kilroy Realty Corp., REIT 143,300 3,050,857
LaSalle Hotel Properties, REIT 152,900 2,091,672
Copyright © 2012 www.secdatabase.com. All Rights Reserved.Please Consider the Environment Before Printing This Document

Parkway Properties, Inc., REIT 79,700 1,039,288
Redwood Trust, Inc., REIT 141,100 2,246,312
Strategic Hotel & Resorts, Inc., REIT 89,300 102,695
Washington Real Estate Investment Trust,
REIT (a) 104,000 2,273,440
16,578,608
Retail - 2.01%
Fred's, Inc., Class A 175,100 2,246,533
Marinemax, Inc. * 162,200 480,112
Stein Mart, Inc. * 311,200 2,156,616
The Men's Wearhouse, Inc. (a) 146,200 2,498,558
7,381,819
Retail Trade - 4.98%
Aaron, Inc., Class B (a) 356,000 11,594,920
Casey's General Stores, Inc. 103,200 2,603,736
CSS Industries, Inc. 97,000 1,765,400
Haverty Furniture Companies, Inc. (a) 217,300 2,285,996
18,250,052
Sanitary Services - 1.79%
Insituform Technologies, Inc., Class A * 207,000 3,020,130
Waste Connections, Inc. * 139,700 3,548,380
6,568,510
Semiconductors - 3.78%
Advanced Energy Industries, Inc. * 204,400 1,931,580
ATMI, Inc. * 101,000 1,639,230
Brooks Automation, Inc. * 254,604 995,502
Cabot Microelectronics Corp. * 46,000 1,285,700
Exar Corp. * 198,100 1,279,726
FormFactor, Inc. * 127,000 2,305,050
GSI Group, Inc. * 330,800 297,720
Microsemi Corp. * 157,300 2,117,258
Teradyne, Inc. * (a) 278,600 1,991,990
13,843,756
Software - 3.02%
Progress Software Corp. * 175,100 3,925,742
SPSS, Inc. * 127,800 4,264,686
Websense, Inc. * 158,100 2,869,515
11,059,943
Steel - 0.69%
Carpenter Technology Corp. 112,800 2,535,744
Telecommunications Equipment &
Services - 1.43%
Premiere Global Services, Inc. * 308,400 3,691,548
Sonus Networks, Inc. * 685,600 1,542,600
5,234,148
Tires & Rubber - 0.75%
Myers Industries, Inc. 271,205 2,739,170
Tobacco - 0.56%
Alliance One International, Inc. * 429,500 2,044,420
The accompanying notes are an integral part of the financial statements.
219
JOHN HANCOCK FUNDS II
PORTFOLIO OF INVESTMENTS - May 31, 2009 (Unaudited) - continued(showing percentage of total net assets)
Small Company Value Fund (continued)
Copyright © 2012 www.secdatabase.com. All Rights Reserved.Please Consider the Environment Before Printing This Document

Shares or
Principal
Amount Value
COMMON STOCKS (continued)
Transportation - 2.37%
Kirby Corp. * 172,600 $ 5,802,812
UTI Worldwide, Inc. * 219,900 2,882,889
8,685,701
Trucking & Freight - 2.41%
Landstar Systems, Inc. 232,800 8,846,400
TOTAL COMMON STOCKS (Cost $429,767,909) $ 356,570,619
PREFERRED STOCKS - 0.45%
Banking - 0.45%
East West Bancorp., Inc., Series A, 8.00% 2,314 1,657,638
TOTAL PREFERRED STOCKS (Cost $2,294,914) $ 1,657,638
INVESTMENT COMPANIES - 0.57%
Investment Companies - 0.57%
iShares Russell 2000 Value Index Fund 44,888 2,092,230
TOTAL INVESTMENT COMPANIES (Cost $2,363,844) $ 2,092,230
SHORT TERM INVESTMENTS - 8.60%
John Hancock Collateral Investment
Trust, 0.7339% (c)(g) $ 2,646,262 $ 26,462,623
T. Rowe Price Reserve Investment Fund,
0.5211% 5,055,382 5,055,382
TOTAL SHORT TERM INVESTMENTS
(Cost $31,518,004) $ 31,518,005
REPURCHASE AGREEMENTS - 0.20%
Repurchase Agreement with State
Street Corp. dated 05/29/2009 at
0.07% to be repurchased at
$749,004 on 6/1/2009,
collateralized by $745,000 Federal
Home Loan Bank, 5.50% due
07/15/2036 (valued at $765,488,
including interest) $ 749,000 $ 749,000
TOTAL REPURCHASE AGREEMENTS
(Cost $749,000) $ 749,000
Total Investments (Small Company Value Fund)
(Cost $466,693,671) - 107.06% $ 392,587,492
Other assets and liabilities, net - (7.06)% (25,893,864)
TOTAL NET ASSETS - 100.00% $ 366,693,628
Smaller Company Growth FundShares or
Principal
Amount Value
COMMON STOCKS - 97.35%
Advertising - 0.21%
inVentiv Health, Inc. * 17,819 $ 224,519
Marchex, Inc., Class B 420 1,399
ValueClick, Inc. * 4,455 49,228
275,146
Smaller Company Growth Fund (continued)
Copyright © 2012 www.secdatabase.com. All Rights Reserved.Please Consider the Environment Before Printing This Document

Shares or
Principal
Amount Value
COMMON STOCKS (continued)
Aerospace - 0.50%
AAR Corp. * 1,291 $ 18,978
Aerovironment, Inc. * 759 21,191
BE Aerospace, Inc. * 3,203 47,661
Cubic Corp. 824 31,436
Esterline Technologies Corp. * 534 14,599
GenCorp, Inc. * 2,399 4,822
HEICO Corp., Class A 732 21,777
HEICO Corp. 299 10,429
Orbital Sciences Corp., Class A * 3,020 44,454
Teledyne Technologies, Inc. * 8,793 289,026
TransDigm Group, Inc. * 1,980 77,656
Triumph Group, Inc. 298 11,744
Woodward Governor Company 3,134 64,341
658,114
Agriculture - 0.01%
Tejon Ranch Company * 654 16,801
Air Travel - 0.48%
Airtran Holdings, Inc. * (a) 43,459 220,337
Alaska Air Group, Inc. * 16,820 261,887
Allegiant Travel Company * (a) 627 25,293
Continental Airlines, Inc., Class B * 6,343 59,117
Hawaiian Holdings, Inc. * 2,646 13,918
UAL Corp. * 6,616 30,831
US Airways Group, Inc. * 6,641 17,134
628,517
Apparel & Textiles - 1.34%
American Apparel, Inc. * 1,636 6,479
Carter's, Inc. * 2,894 68,443
Crocs, Inc. * 4,290 12,484
Deckers Outdoor Corp. * 671 38,891
Gymboree Corp. * 4,316 159,045
Hanesbrands, Inc. * 4,805 81,204
Iconix Brand Group, Inc. * 2,993 48,457
Jos. A. Bank Clothiers, Inc. * 7,218 273,201
K-Swiss, Inc., Class A 482 4,217
Lululemon Athletica, Inc. * 1,973 24,919
Maidenform Brands, Inc. * 25,593 330,662
Phillips-Van Heusen Corp. 2,643 77,889
Skechers U.S.A., Inc., Class A * 599 5,691
Steven Madden, Ltd. * 826 22,484
True Religion Apparel, Inc. * 1,193 27,511
Under Armour, Inc., Class A * (a) 1,702 41,767
Unifirst Corp. 5,988 204,490
Volcom, Inc. * 876 11,975
Warnaco Group, Inc. * 2,394 75,650
Wolverine World Wide, Inc. 11,946 236,650
1,752,109
Auto Parts - 0.20%
American Axle & Manufacturing Holdings, Inc. 1,541 3,144
Amerigon, Inc. * 23,808 105,708
ArvinMeritor, Inc. 1,263 3,221
Dana Holding Corp. * 2,568 3,364
Dorman Products, Inc. * 317 4,501
Fuel Systems Solutions, Inc. * 647 13,678
Gentex Corp. 7,067 83,320
The accompanying notes are an integral part of the financial statements.
Copyright © 2012 www.secdatabase.com. All Rights Reserved.Please Consider the Environment Before Printing This Document

220
JOHN HANCOCK FUNDS II
PORTFOLIO OF INVESTMENTS - May 31, 2009 (Unaudited) - continued(showing percentage of total net assets)
Smaller Company Growth Fund (continued)Shares or
Principal
Amount Value
COMMON STOCKS (continued)
Auto Parts (continued)
Modine Manufacturing Company 560 $ 2,503
Tenneco, Inc. * 2,401 14,694
TRW Automotive Holdings Corp. * 2,857 25,484
259,617
Auto Services - 0.04%
Avis Budget Group, Inc. * 3,390 16,272
Monro Muffler Brake, Inc. 944 25,224
RSC Holdings, Inc. * 1,328 7,994
49,490
Automobiles - 0.20%
Americas Car Mart, Inc. * 15,786 258,101
Banking - 0.86%
Bank of the Ozarks, Inc. 346 8,750
Beneficial Mutual Bancorp, Inc. * 1,690 16,156
Cardinal Financial Corp. 1,381 11,200
Danvers Bancorp, Inc. 825 12,193
First Citizens Bancshares, Inc. 2,069 274,122
First Financial Bankshares, Inc. 299 14,600
First Financial Corp. 252 8,480
Glacier Bancorp, Inc. 1,575 26,098
Great Southern Bancorp, Inc. 223 4,886
Greene County Bancshares, Inc. (a) 16,289 91,707
Hancock Holding Company 611 21,342
Hanmi Financial Corp. 660 950
Home Bancshares, Inc. 714 14,244
Investors Bancorp, Inc. * 2,240 19,533
NewAlliance Bancshares, Inc. 1,732 22,412
Oritani Financial Corp. * 579 7,834
Park National Corp. 201 12,663
Pinnacle Financial Partners, Inc. * 1,171 16,980
PrivateBancorp, Inc. 2,094 41,943
Provident Financial Services, Inc. 7,840 77,146
Rockville Financial, Inc. 226 2,441
Roma Financial Corp. 199 2,503
S.Y. Bancorp, Inc. 206 5,105
Signature Bank * 1,806 48,852
Sterling Financial Corp. 1,339 5,557
Suffolk Bancorp 492 12,841
SVB Financial Group * 1,690 45,546
Texas Capital Bancshares, Inc. * 12,226 187,669
United Community Banks, Inc. (a) 13,291 103,005
ViewPoint Financial Group 576 8,427
1,125,185
Biotechnology - 2.00%
Acorda Therapeutics, Inc. * 1,937 47,825
Affymetrix, Inc. * 3,605 17,340
Alnylam Pharmaceuticals, Inc. * 17,852 363,467
AMAG Pharmaceuticals, Inc. * 306 16,096
Copyright © 2012 www.secdatabase.com. All Rights Reserved.Please Consider the Environment Before Printing This Document

Arena Pharmaceuticals, Inc. * 2,471 9,118
Arqule, Inc. * 1,077 5,353
Bio Reference Labs, Inc. * 602 16,380
Bio-Rad Laboratories, Inc., Class A * 967 71,984
Cougar Biotechnology, Inc. * 905 38,906
Exelixis, Inc. * 5,422 30,092
Facet Biotech Corp. * 1,227 12,160
Smaller Company Growth Fund (continued)Shares or
Principal
Amount Value
COMMON STOCKS (continued)
Biotechnology (continued)
Genomic Health, Inc. * 728 $ 14,123
Geron Corp. * (a) 2,884 18,890
GTx, Inc. * 841 7,233
Human Genome Sciences, Inc. * 6,970 17,216
Illumina, Inc. * (a) 44,700 1,640,937
Immucor, Inc. * 3,613 54,376
Integra LifeSciences Holdings Corp. * 1,065 27,647
Intermune, Inc. * 1,869 22,092
Lexicon Genetics, Inc. * 2,739 3,807
Life Sciences Research, Inc. * 319 2,137
Martek Biosciences Corp. * 1,702 36,065
Medarex, Inc. * 6,590 47,712
Medivation, Inc. * 853 19,320
Micromet, Inc. * 1,562 6,467
Momenta Pharmaceuticals, Inc. * 994 8,717
Nabi Biopharmaceuticals * 1,734 4,907
Nektar Therapeutics * 4,747 32,042
Neurocrine Biosciences, Inc. * 1,291 3,963
Orexigen Therapeutics, Inc. * 574 2,043
Osiris Therapeutics, Inc. * 817 10,302
Progenics Pharmaceuticals, Inc. * 1,564 8,086
Sangamo Biosciences, Inc. * 1,789 7,120
2,623,923
Broadcasting - 0.37%
CKX, Inc. * 2,252 15,696
Crown Media Holdings, Inc., Class A * 761 1,804
CTC Media, Inc. * 2,344 23,229
Fisher Communications, Inc. * 233 2,868
GigaMedia, Ltd. * 48,204 292,598
Liberty Media Corp. - Capital, Series A * 4,704 65,338
Mediacom Communications Corp., Class A * 2,027 12,142
Sirius XM Radio, Inc. * 194,717 68,054
481,729
Building Materials & Construction - 0.35%
Argan, Inc. * 310 4,393
Beacon Roofing Supply, Inc. * 15,188 220,226
Builders FirstSource, Inc. * 464 1,907
China Architectural Engineering, Inc. * 1,077 1,572
Drew Industries, Inc. * 367 5,266
Dycom Industries, Inc. * 2,022 23,637
Eagle Materials, Inc. 2,125 52,275
EMCOR Group, Inc. * 1,685 37,862
Griffon Corp. * 959 9,293
MYR Group, Inc. * 962 18,374
Orion Marine Group, Inc. * 1,107 23,336
Sterling Construction Company, Inc. * 417 7,131
Texas Industries, Inc. 1,207 41,074
United States Lime & Minerals, Inc. * 146 5,836
Copyright © 2012 www.secdatabase.com. All Rights Reserved.Please Consider the Environment Before Printing This Document

452,182
Business Services - 3.73%
3PAR, Inc. * 1,404 12,201
Administaff, Inc. 1,162 24,983
AMERCO, Inc. * 229 8,439
APAC Customer Services, Inc. * 8,569 48,415
Arbitron, Inc. 1,355 26,978
The accompanying notes are an integral part of the financial statements.
221
JOHN HANCOCK FUNDS II
PORTFOLIO OF INVESTMENTS - May 31, 2009 (Unaudited) - continued(showing percentage of total net assets)
Smaller Company Growth Fund (continued)Shares or
Principal
Amount Value
COMMON STOCKS (continued)
Business Services (continued)
Ariba, Inc. * 2,231 $ 21,128
Brinks Company 809 21,511
Chindex International, Inc. * 656 5,222
Coinstar, Inc. * 1,451 42,979
Compucredit Corp. * 866 2,589
comScore, Inc. * 971 10,827
Constant Contact, Inc. * 1,083 19,050
Core-Mark Holding Company, Inc. * 174 4,543
CoStar Group, Inc. * 962 34,295
CRA International, Inc. * 13,133 346,055
CSG Systems International, Inc. * 1,783 24,552
DG Fastchannel, Inc. * (a) 873 17,277
Euronet Worldwide, Inc. * 2,324 37,091
Exponent, Inc. * 8,693 228,365
EZCORP, Inc., Class A * 1,867 22,684
Forrester Research, Inc. * 832 19,277
FTI Consulting, Inc. * 8,487 426,217
Gartner Group, Inc., Class A * 3,134 48,107
Global Cash Access, Inc. * 2,343 16,354
GSI Commerce, Inc. * 1,223 15,728
Heidrick & Struggles International, Inc. 840 15,414
Hill International, Inc. * 1,264 5,132
Huron Consulting Group, Inc. * 7,328 335,842
ICF International, Inc. * 458 12,183
Informatica Corp. * 4,476 73,093
Kendle International, Inc. * 470 4,888
Kenexa Corp. * 1,040 10,057
Kforce, Inc. * 24,181 225,125
Korn/Ferry International * 1,149 12,742
Macrovision Solutions Corp. * 5,289 119,373
Michael Baker Corp. * 409 17,190
Navigant Consulting Company * 2,516 29,966
Net 1 UEPS Technologies, Inc. * 7,920 96,703
OraSure Technologies, Inc. * 1,531 5,573
Parexel International Corp. * 29,738 306,301
Perot Systems Corp., Class A * 4,601 62,850
Pre-Paid Legal Services, Inc. * 388 16,436
Resources Connection, Inc. * 2,191 40,599
Rollins, Inc. 2,331 38,951
SAIC, Inc. * 25,300 441,991
ScanSource, Inc. * 1,356 33,547
Seachange International, Inc. * 7,283 53,894
Copyright © 2012 www.secdatabase.com. All Rights Reserved.Please Consider the Environment Before Printing This Document

SonicWALL, Inc. * 2,751 14,058
Sourcefire, Inc. * 797 9,723
SRA International, Inc., Class A * 2,175 38,584
Standard Parking Corp. * 477 7,122
Stanley, Inc. * 8,809 229,827
SuccessFactors, Inc. * 1,729 13,555
Syntel, Inc. 1,278 36,717
TeleTech Holdings, Inc. * 1,966 22,668
Tetra Tech, Inc. * 3,090 79,320
The Hackett Group, Inc. * 69,470 163,255
TrueBlue, Inc. * 29,914 255,166
Tyler Technologies, Inc. * 18,178 305,390
Unisys Corp. * 18,602 25,857
Viad Corp. 526 7,727
Smaller Company Growth Fund (continued)Shares or
Principal
Amount Value
COMMON STOCKS (continued)
Business Services (continued)
VSE Corp. 4,833 $ 121,357
Watson Wyatt Worldwide, Inc., Class A 2,187 82,975
Wind River Systems, Inc. * 3,524 27,804
4,883,822
Cable & Television - 0.04%
Knology, Inc. * 1,555 12,440
Outdoor Channel Holdings, Inc. * 356 2,492
TiVo, Inc. * 5,287 37,009
51,941
Cellular Communications - 2.10%
iPCS, Inc. * 793 14,369
MetroPCS Communications, Inc. * 114,700 1,964,811
Novatel Wireless, Inc. * 35,677 416,707
RF Micro Devices, Inc. * 12,848 36,617
Syniverse Holdings, Inc. * 20,489 306,311
USA Mobility, Inc. * 1,194 13,349
2,752,164
Chemicals - 1.69%
Albany Molecular Research, Inc. * 20,306 177,677
Albemarle Corp. 50,400 1,422,288
Balchem Corp. 934 22,528
Calgon Carbon Corp. * 2,637 30,405
Innophos Holdings, Inc. 459 7,156
Intrepid Potash, Inc. * 2,306 75,176
Landec Corp. * 1,277 8,684
LSB Industries, Inc. * 820 13,735
Newmarket Corp. 625 45,356
Sensient Technologies Corp. 13,476 308,870
Stepan Company 395 16,594
Valence Technology, Inc. * (a) 3,152 5,547
W.R. Grace & Company * 3,705 48,091
Zep, Inc. 1,083 13,180
Zoltek Companies, Inc. * 1,502 14,870
2,210,157
Coal - 0.06%
Foundation Coal Holdings, Inc. 1,487 43,643
International Coal Group, Inc. * (a) 2,342 7,494
Patriot Coal Corp. * (a) 3,576 32,399
83,536
Copyright © 2012 www.secdatabase.com. All Rights Reserved.Please Consider the Environment Before Printing This Document

Colleges & Universities - 0.34%
Career Education Corp. * 18,988 381,279
Corinthian Colleges, Inc. * 4,206 64,688
445,967
Commercial Services - 1.06%
Brink's Home Security Holdings, Inc. * 2,350 67,680
Cardtronics, Inc. * 407 1,319
CBIZ, Inc. * 52,499 379,568
Cenveo, Inc. * 2,504 12,345
Chemed Corp. 1,149 43,972
DynCorp International, Inc. * 18,467 267,217
Exlservice Holdings, Inc. * 741 7,336
HMS Holdings Corp. * 1,310 46,047
Live Nation, Inc. * 3,460 19,791
The accompanying notes are an integral part of the financial statements.
222
JOHN HANCOCK FUNDS II
PORTFOLIO OF INVESTMENTS - May 31, 2009 (Unaudited) - continued(showing percentage of total net assets)
Smaller Company Growth Fund (continued)Shares or
Principal
Amount Value
COMMON STOCKS (continued)
Commercial Services (continued)
Morningstar, Inc. * 961 $ 39,805
Odyssey Marine Exploration, Inc. * 894 3,406
Perficient, Inc. * 832 5,292
Pool Corp. (a) 12,167 212,071
Riskmetrics Group, Inc. * 1,577 25,342
Team, Inc. * 13,169 186,341
TNS, Inc. * 835 15,740
United Rentals, Inc. * 971 4,612
Waste Services, Inc. * 1,538 8,936
Wright Express Corp. * 1,866 46,407
1,393,227
Computer Services - 0.10%
BluePhoenix Solutions, Ltd. * 57,579 127,825
Computers & Business Equipment - 2.76%
3Com Corp. * 72,340 312,509
3D Systems Corp. * 488 3,367
Acme Packet, Inc. * 1,419 10,997
Avocent Corp. * 18,620 260,680
BigBand Networks, Inc. * 1,977 10,320
Blue Coat Systems, Inc. * 13,935 197,459
Brocade Communications Systems, Inc. * 19,871 145,853
CACI International, Inc., Class A * 9,085 348,591
Cogent, Inc. * 31,509 316,665
Compellent Technologies, Inc. * 17,876 208,613
Data Domain, Inc. * 1,844 46,967
Diebold, Inc. 9,990 246,953
Digi International, Inc. * 1,222 10,583
Echelon Corp. * 1,012 7,418
EMS Technologies, Inc. * 10,634 207,895
Falconstor Software, Inc. * 36,098 131,036
Furmanite Corp. * 1,782 7,164
Intermec, Inc. * 2,520 28,930
Isilon Systems, Inc. * 1,148 3,146
Copyright © 2012 www.secdatabase.com. All Rights Reserved.Please Consider the Environment Before Printing This Document

Ixia * 1,164 7,100
Jack Henry & Associates, Inc. 4,109 75,482
Limelight Networks, Inc. * 1,253 6,165
MICROS Systems, Inc. * 4,127 107,797
MTS Systems Corp. 389 8,628
National Instruments Corp. 3,050 64,691
NCI, Inc. * 337 8,479
Netezza Corp. * 1,987 13,869
NETGEAR, Inc. * 1,177 16,513
Netscout Systems, Inc. * 1,444 13,545
Palm, Inc. * (a) 5,857 71,455
Parametric Technology Corp. * 5,935 68,727
Plexus Corp. * 2,021 36,904
Radiant Systems, Inc. * 29,133 219,954
Sigma Designs, Inc. * (a) 1,355 20,948
Silicon Graphics International Corp. * 1,535 7,782
Silicon Storage Technology, Inc. * 1,459 2,685
Standard Microsystems Corp. * 394 7,265
STEC, Inc. * (a) 1,416 23,208
Stratasys, Inc. * 986 10,314
Super Micro Computer, Inc. * 1,336 8,951
Sykes Enterprises, Inc. * 1,801 29,356
Smaller Company Growth Fund (continued)Shares or
Principal
Amount Value
COMMON STOCKS (continued)
Computers & Business Equipment
(continued)
Synaptics, Inc. * (a) 7,778 $ 273,163
Trident Microsystems, Inc. * 3,229 5,554
3,613,681
Construction & Mining Equipment - 0.06%
Astec Industries, Inc. * 978 29,946
Carbo Ceramics, Inc. (a) 694 26,247
Kaman Corp., Class A 458 7,259
Matrix Service Company * 1,342 15,192
78,644
Construction Materials - 1.11%
Applied Industrial Technologies, Inc. 1,951 40,522
Clarcor, Inc. 2,614 74,917
Comfort Systems USA, Inc. 1,984 18,511
Martin Marietta Materials, Inc. 12,700 1,034,669
Simpson Manufacturing Company, Inc. 12,397 258,354
USG Corp. * 1,782 21,384
1,448,357
Containers & Glass - 0.25%
Bway Holding Company * 562 8,166
Greif, Inc., Class A 1,237 59,772
Mobile Mini, Inc. * 1,813 22,862
Silgan Holdings, Inc. 5,222 231,125
321,925
Correctional Facilities - 0.04%
Cornell Corrections, Inc. * 720 12,226
The Geo Group, Inc. * 2,625 42,892
55,118
Cosmetics & Toiletries - 0.63%
Bare Escentuals, Inc. * 3,294 28,823
Chattem, Inc. * 6,326 377,852
Copyright © 2012 www.secdatabase.com. All Rights Reserved.Please Consider the Environment Before Printing This Document
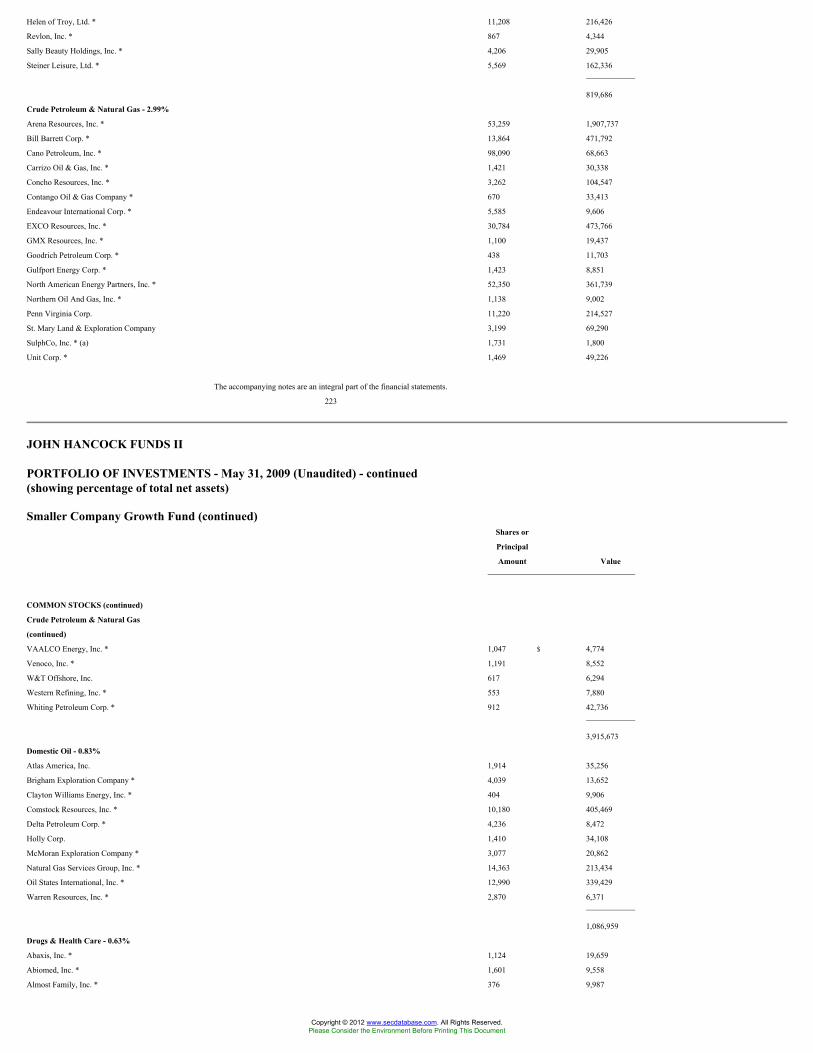
Helen of Troy, Ltd. * 11,208 216,426
Revlon, Inc. * 867 4,344
Sally Beauty Holdings, Inc. * 4,206 29,905
Steiner Leisure, Ltd. * 5,569 162,336
819,686
Crude Petroleum & Natural Gas - 2.99%
Arena Resources, Inc. * 53,259 1,907,737
Bill Barrett Corp. * 13,864 471,792
Cano Petroleum, Inc. * 98,090 68,663
Carrizo Oil & Gas, Inc. * 1,421 30,338
Concho Resources, Inc. * 3,262 104,547
Contango Oil & Gas Company * 670 33,413
Endeavour International Corp. * 5,585 9,606
EXCO Resources, Inc. * 30,784 473,766
GMX Resources, Inc. * 1,100 19,437
Goodrich Petroleum Corp. * 438 11,703
Gulfport Energy Corp. * 1,423 8,851
North American Energy Partners, Inc. * 52,350 361,739
Northern Oil And Gas, Inc. * 1,138 9,002
Penn Virginia Corp. 11,220 214,527
St. Mary Land & Exploration Company 3,199 69,290
SulphCo, Inc. * (a) 1,731 1,800
Unit Corp. * 1,469 49,226
The accompanying notes are an integral part of the financial statements.
223
JOHN HANCOCK FUNDS II
PORTFOLIO OF INVESTMENTS - May 31, 2009 (Unaudited) - continued(showing percentage of total net assets)
Smaller Company Growth Fund (continued)Shares or
Principal
Amount Value
COMMON STOCKS (continued)
Crude Petroleum & Natural Gas
(continued)
VAALCO Energy, Inc. * 1,047 $ 4,774
Venoco, Inc. * 1,191 8,552
W&T Offshore, Inc. 617 6,294
Western Refining, Inc. * 553 7,880
Whiting Petroleum Corp. * 912 42,736
3,915,673
Domestic Oil - 0.83%
Atlas America, Inc. 1,914 35,256
Brigham Exploration Company * 4,039 13,652
Clayton Williams Energy, Inc. * 404 9,906
Comstock Resources, Inc. * 10,180 405,469
Delta Petroleum Corp. * 4,236 8,472
Holly Corp. 1,410 34,108
McMoran Exploration Company * 3,077 20,862
Natural Gas Services Group, Inc. * 14,363 213,434
Oil States International, Inc. * 12,990 339,429
Warren Resources, Inc. * 2,870 6,371
1,086,959
Drugs & Health Care - 0.63%
Abaxis, Inc. * 1,124 19,659
Abiomed, Inc. * 1,601 9,558
Almost Family, Inc. * 376 9,987
Copyright © 2012 www.secdatabase.com. All Rights Reserved.Please Consider the Environment Before Printing This Document

Dendreon Corp. * (a) 2,864 64,927
Durect Corp. * 3,787 8,862
Hansen Medical, Inc. * 1,519 8,658
Immunogen, Inc. * 1,245 10,321
Landauer, Inc. 167 9,624
Luminex Corp. * 11,133 176,458
Maxygen, Inc. * 1,432 10,153
Meridian Bioscience, Inc. 2,075 39,653
Opko Health, Inc. * 1,998 2,398
Pain Therapeutics, Inc. * 1,837 8,193
Quidel Corp. * 1,504 19,146
Seattle Genetics, Inc. * 3,513 32,284
Vivus, Inc. * 60,511 312,842
West Pharmaceutical Services, Inc. 1,681 54,330
XenoPort, Inc. * 1,261 21,828
Zymogenetics, Inc. * 1,941 8,113
826,994
Educational Services - 0.68%
American Public Education, Inc. * 8,462 276,454
Capella Education Company * (a) 7,058 368,357
ChinaCast Education Corp. * 34,071 197,271
Grand Canyon Education, Inc. * 449 6,089
K12, Inc. * 889 15,558
Lincoln Educational Services Corp. * 544 10,031
Renaissance Learning, Inc. 225 2,207
Universal Technical Institute, Inc. * 1,096 15,245
891,212
Electrical Equipment - 3.65%
A.O. Smith Corp. 34,700 1,040,653
Aaon, Inc. 662 13,770
American Science & Engineering, Inc. 3,748 234,362
Smaller Company Growth Fund (continued)Shares or
Principal
Amount Value
COMMON STOCKS (continued)
Electrical Equipment (continued)
Anaren, Inc. * 709 $ 11,401
Anixter International, Inc. * 1,541 63,212
AZZ, Inc. * 647 22,483
Bel Fuse, Inc., Class A 31 426
Capstone Turbine Corp. * 209,278 133,938
DTS, Inc. * 888 23,505
General Cable Corp. * 13,422 513,257
GrafTech International, Ltd. * 30,849 313,734
Greatbatch, Inc. * 13,748 284,034
Houston Wire & Cable Company 861 10,280
Plug Power, Inc. * 2,775 2,581
Polypore International, Inc. * 1,253 12,455
Powell Industries, Inc. * 440 17,288
Power-One, Inc. * 3,381 4,767
Preformed Line Products Company 67 2,965
Universal Electronics, Inc. * 718 14,087
Varian, Inc. * 1,489 51,847
Vicor Corp. 998 5,429
Watsco, Inc. 40,600 1,998,738
4,775,212
Electrical Utilities - 1.01%
Avista Corp. 17,090 270,705
EnerNOC, Inc. * (a) 728 17,341
ITC Holdings Corp. 2,553 109,498
Copyright © 2012 www.secdatabase.com. All Rights Reserved.Please Consider the Environment Before Printing This Document

Pike Electric Corp. * 472 5,164
Quanta Services, Inc. * 40,100 914,681
1,317,389
Electronics - 1.42%
Anadigics, Inc. * 81,277 318,606
Axsys Technologies, Inc. * 492 24,147
Bel Fuse, Inc., Class B 281 3,794
Cogo Group, Inc. * 829 5,397
Daktronics, Inc. 1,774 15,203
Electro Scientific Industries, Inc. * 487 4,364
Ener1, Inc. * (a) 2,322 15,557
Enersys * 14,365 232,713
FEI Company * 1,916 41,692
ICx Technologies, Inc. * 613 2,605
II-VI, Inc. * 11,510 276,240
Integrated Electrical Services, Inc. * 13,916 137,212
IPG Photonics Corp. * 1,152 11,877
Itron, Inc. * 1,887 110,088
Maxwell Technologies, Inc. * 1,164 13,223
Multi-Fineline Electronix, Inc. * 514 9,843
NVE Corp. * 6,196 247,902
OSI Systems, Inc. * 798 14,683
Rogers Corp. * 324 5,527
Supertex, Inc. * 562 13,763
Sycamore Networks, Inc. * 10,204 30,612
Taser International, Inc. * 3,010 13,124
Thomas & Betts Corp. * 2,737 83,971
Universal Display Corp. * 1,667 14,653
Zebra Technologies Corp., Class A * 3,125 68,219
Zoran Corp. * 12,707 140,794
1,855,809
The accompanying notes are an integral part of the financial statements.
224
JOHN HANCOCK FUNDS II
PORTFOLIO OF INVESTMENTS - May 31, 2009 (Unaudited) - continued(showing percentage of total net assets)
Smaller Company Growth Fund (continued)Shares or
Principal
Amount Value
COMMON STOCKS (continued)
Energy - 1.34%
Alon USA Energy, Inc. 481 $ 6,388
Clean Energy Fuels Corp. * (a) 1,160 11,171
Comverge, Inc. * 846 8,629
Energy Conversion Devices, Inc. * 2,350 40,443
Evergreen Solar, Inc. * 9,852 18,325
Fuelcell Energy, Inc. * 3,190 10,782
GT Solar International, Inc. * 1,834 11,774
McDermott International, Inc. * 72,200 1,586,234
Orion Energy Systems, Inc. * 756 2,646
Ormat Technologies, Inc. 1,048 41,805
Rosetta Resources, Inc. * 1,329 11,602
1,749,799
Financial Services - 2.03%
AmeriCredit Corp. * 4,394 55,848
Asset Acceptance Capital Corp. * 510 4,386
Copyright © 2012 www.secdatabase.com. All Rights Reserved.Please Consider the Environment Before Printing This Document
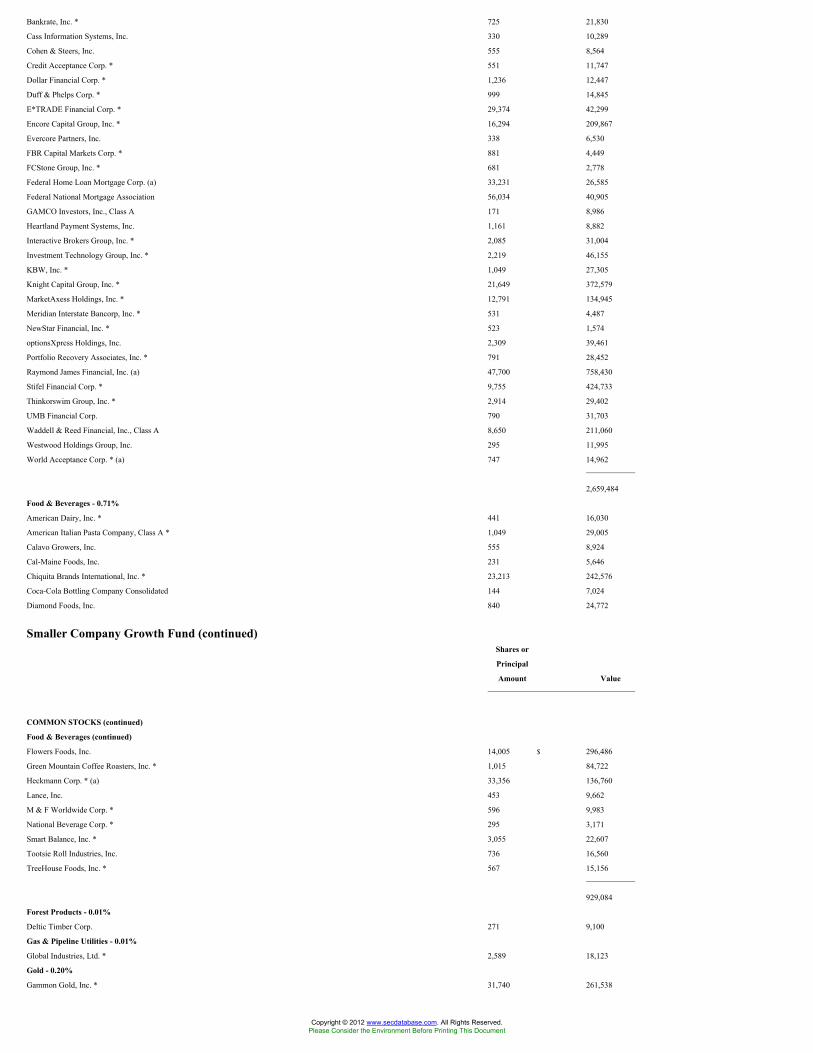
Bankrate, Inc. * 725 21,830
Cass Information Systems, Inc. 330 10,289
Cohen & Steers, Inc. 555 8,564
Credit Acceptance Corp. * 551 11,747
Dollar Financial Corp. * 1,236 12,447
Duff & Phelps Corp. * 999 14,845
E*TRADE Financial Corp. * 29,374 42,299
Encore Capital Group, Inc. * 16,294 209,867
Evercore Partners, Inc. 338 6,530
FBR Capital Markets Corp. * 881 4,449
FCStone Group, Inc. * 681 2,778
Federal Home Loan Mortgage Corp. (a) 33,231 26,585
Federal National Mortgage Association 56,034 40,905
GAMCO Investors, Inc., Class A 171 8,986
Heartland Payment Systems, Inc. 1,161 8,882
Interactive Brokers Group, Inc. * 2,085 31,004
Investment Technology Group, Inc. * 2,219 46,155
KBW, Inc. * 1,049 27,305
Knight Capital Group, Inc. * 21,649 372,579
MarketAxess Holdings, Inc. * 12,791 134,945
Meridian Interstate Bancorp, Inc. * 531 4,487
NewStar Financial, Inc. * 523 1,574
optionsXpress Holdings, Inc. 2,309 39,461
Portfolio Recovery Associates, Inc. * 791 28,452
Raymond James Financial, Inc. (a) 47,700 758,430
Stifel Financial Corp. * 9,755 424,733
Thinkorswim Group, Inc. * 2,914 29,402
UMB Financial Corp. 790 31,703
Waddell & Reed Financial, Inc., Class A 8,650 211,060
Westwood Holdings Group, Inc. 295 11,995
World Acceptance Corp. * (a) 747 14,962
2,659,484
Food & Beverages - 0.71%
American Dairy, Inc. * 441 16,030
American Italian Pasta Company, Class A * 1,049 29,005
Calavo Growers, Inc. 555 8,924
Cal-Maine Foods, Inc. 231 5,646
Chiquita Brands International, Inc. * 23,213 242,576
Coca-Cola Bottling Company Consolidated 144 7,024
Diamond Foods, Inc. 840 24,772
Smaller Company Growth Fund (continued)Shares or
Principal
Amount Value
COMMON STOCKS (continued)
Food & Beverages (continued)
Flowers Foods, Inc. 14,005 $ 296,486
Green Mountain Coffee Roasters, Inc. * 1,015 84,722
Heckmann Corp. * (a) 33,356 136,760
Lance, Inc. 453 9,662
M & F Worldwide Corp. * 596 9,983
National Beverage Corp. * 295 3,171
Smart Balance, Inc. * 3,055 22,607
Tootsie Roll Industries, Inc. 736 16,560
TreeHouse Foods, Inc. * 567 15,156
929,084
Forest Products - 0.01%
Deltic Timber Corp. 271 9,100
Gas & Pipeline Utilities - 0.01%
Global Industries, Ltd. * 2,589 18,123
Gold - 0.20%
Gammon Gold, Inc. * 31,740 261,538
Copyright © 2012 www.secdatabase.com. All Rights Reserved.Please Consider the Environment Before Printing This Document

Healthcare Products - 6.09%
Accuray, Inc. * 2,286 14,082
Align Technology, Inc. * 2,926 34,615
American Medical Systems Holdings, Inc. * 34,668 525,913
Atrion Corp. 81 8,926
ATS Medical, Inc. * 2,375 7,125
Bruker BioSciences Corp. * 71,420 466,373
C.R. Bard, Inc. 14,600 1,043,754
Cantel Medical Corp. * 718 9,772
CardioNet, Inc. * 720 12,751
Clinical Data, Inc. * 417 5,104
Conceptus, Inc. * 1,559 24,710
Cryolife, Inc. * 39,492 185,217
Cyberonics, Inc. * 1,404 20,344
Cypress Biosciences, Inc. * 1,945 14,782
Haemonetics Corp. * 7,786 414,449
Hanger Orthopedic Group, Inc. * 1,581 23,241
Herbalife, Ltd. 2,053 59,968
ICU Medical, Inc. * 8,671 313,543
Insulet Corp. * 927 6,702
Kensey Nash Corp. * 266 6,661
Mannkind Corp. * (a) 2,881 18,957
Masimo Corp. * 2,488 59,563
Medicines Company * 2,685 20,567
Merit Medical Systems, Inc. * 1,369 18,742
Natus Medical, Inc. * 1,437 14,686
NutriSystem, Inc. 1,368 18,742
Nuvasive, Inc. * (a) 1,864 67,328
Orthofix International NV * 790 20,003
PSS World Medical, Inc. * 3,108 49,945
Sirona Dental Systems, Inc. * 986 19,395
Somanetics Corp. * 618 10,388
SonoSite, Inc. * 876 16,215
St. Jude Medical, Inc. * 27,900 1,088,658
Stereotaxis, Inc. * 1,610 5,587
STERIS Corp. 13,407 316,807
SurModics, Inc. * 760 15,025
Symmetry Medical, Inc. * 1,840 14,150
Synovis Life Technologies, Inc. * 24,365 473,168
The accompanying notes are an integral part of the financial statements.
225
JOHN HANCOCK FUNDS II
PORTFOLIO OF INVESTMENTS - May 31, 2009 (Unaudited) - continued(showing percentage of total net assets)
Smaller Company Growth Fund (continued)Shares or
Principal
Amount Value
COMMON STOCKS (continued)
Healthcare Products (continued)
The Cooper Companies, Inc. 53,800 $ 1,426,238
Thoratec Corp. * 2,897 72,657
TomoTherapy, Inc. * 1,807 4,138
Ulta Salon, Cosmetics & Fragrance, Inc. * 1,333 11,410
USANA Health Sciences, Inc. * 317 8,407
Vnus Medical Technologies * 700 20,272
Volcano Corp. * 2,205 27,254
Wright Medical Group, Inc. * 60,551 944,596
Zoll Medical Corp. * 1,083 18,183
Copyright © 2012 www.secdatabase.com. All Rights Reserved.Please Consider the Environment Before Printing This Document

7,979,113
Healthcare Services - 2.56%
Air Methods Corp. * 561 14,805
Alliance Imaging, Inc. * 1,313 9,060
Amedisys, Inc. * 1,399 42,558
AMN Healthcare Services, Inc. * 1,087 7,826
athenahealth, Inc. * 1,114 33,621
Brookdale Senior Living, Inc. 911 10,558
Catalyst Health Solutions, Inc. * 1,900 40,641
CorVel Corp. * 432 9,262
Emergency Medical Services Corp., Class A * 6,244 193,564
Emeritus Corp. * 1,105 15,879
Enzo Biochem, Inc. * 605 2,553
Gentiva Health Services, Inc. * 915 14,576
Healthcare Services Group, Inc. 1,932 33,771
Healthsouth Corp. * 4,519 53,505
Healthways, Inc. * 1,728 20,684
HLTH Corp. * (a) 4,971 58,608
ICON PLC, SADR * 17,706 308,793
IPC The Hospitalist Company * 701 17,455
LHC Group, Inc. * 8,291 191,273
Magellan Health Services, Inc. * 1,350 40,311
National Healthcare Corp. 334 12,829
Omnicare, Inc. 49,600 1,340,688
Palomar Medical Technologies, Inc. * 885 9,000
Phase Forward, Inc. * 21,232 297,248
Psychiatric Solutions, Inc. * 5,213 96,180
Star Scientific, Inc. * 3,314 16,570
Sun Healthcare Group, Inc. * 782 7,249
The Advisory Board Company * 796 18,467
The Ensign Group, Inc. 10,236 152,516
Town Sports International Holdings, Inc. * 883 3,453
US Physical Therapy, Inc. * 16,984 229,454
Virtual Radiologic Corp. * 367 2,811
WebMD Health Corp. * 468 12,711
WellCare Health Plans, Inc. * 1,410 26,790
3,345,269
Homebuilders - 0.04%
Hovnanian Enterprises, Inc., Class A * 1,774 4,754
KB Home 1,188 17,820
M/I Homes, Inc. 448 5,179
Meritage Homes Corp. * 524 10,936
Ryland Group, Inc. 771 13,169
51,858
Hotels & Restaurants - 1.64%
AFC Enterprises, Inc. * 1,299 9,041
Smaller Company Growth Fund (continued)Shares or
Principal
Amount Value
COMMON STOCKS (continued)
Hotels & Restaurants (continued)
BJ's Restaurants, Inc. * 17,741 $ 254,406
Bob Evans Farms, Inc. 11,679 301,318
Buffalo Wild Wings, Inc. * (a) 8,151 289,360
California Pizza Kitchen, Inc. * 1,176 16,405
CEC Entertainment, Inc. * 1,167 37,496
Choice Hotels International, Inc. 1,116 30,456
CKE Restaurants, Inc. 2,385 19,605
Denny's Corp. * 4,915 12,386
DineEquity, Inc. 494 13,699
Jack in the Box, Inc. * 13,510 355,313
Copyright © 2012 www.secdatabase.com. All Rights Reserved.Please Consider the Environment Before Printing This Document

Krispy Kreme Doughnuts, Inc. * 1,474 5,115
Morgans Hotel Group Company * 1,359 5,463
O'Charley's, Inc. 7,438 60,025
P.F. Chang's China Bistro, Inc. * (a) 9,466 302,344
Panera Bread Company, Class A * 1,502 79,966
Papa John's International, Inc. * 1,143 30,975
Peets Coffee & Tea, Inc. * 676 17,637
Red Robin Gourmet Burgers, Inc. * 11,006 190,404
Sonic Corp. * 2,954 27,856
Texas Roadhouse, Inc., Class A * 2,663 30,971
The Cheesecake Factory, Inc. * 2,913 49,841
The Steak & Shake Company * 627 5,436
2,145,518
Household Appliances - 0.06%
National Presto Industries, Inc. 246 20,044
The Toro Company 1,868 57,534
77,578
Household Products - 0.33%
Jarden Corp. * 24,580 437,032
Industrial Machinery - 1.24%
Actuant Corp., Class A 2,896 35,563
Badger Meter, Inc. 721 29,287
Dionex Corp. * 911 51,344
Flow International Corp. * 32,488 70,174
Gardner Denver, Inc. * 2,659 75,356
Gorman-Rupp Company 772 16,212
Graco, Inc. 3,058 68,163
IDEX Corp. 4,244 99,097
Lindsay Corp. (a) 599 19,084
Lufkin Industries, Inc. 267 12,117
Middleby Corp. * 855 38,398
NATCO Group, Inc. * 1,039 29,404
OYO Geospace Corp. * 244 3,782
Pall Corp. 36,900 947,592
Raser Technologies, Inc. * (a) 2,141 8,414
Robbins & Myers, Inc. 1,431 27,389
Rofin-Sinar Technologies, Inc. * 1,485 33,487
Valmont Industries, Inc. 943 64,699
1,629,562
Industrials - 0.47%
Clean Harbors, Inc. * 6,496 354,162
EnergySolutions, Inc. 32,218 259,999
614,161
The accompanying notes are an integral part of the financial statements.
226
JOHN HANCOCK FUNDS II
PORTFOLIO OF INVESTMENTS - May 31, 2009 (Unaudited) - continued(showing percentage of total net assets)
Smaller Company Growth Fund (continued)Shares or
Principal
Amount Value
COMMON STOCKS (continued)
Insurance - 2.22%
Ambac Financial Group, Inc. 14,749 $ 18,436
Amtrust Financial Services, Inc. 694 6,641
Copyright © 2012 www.secdatabase.com. All Rights Reserved.Please Consider the Environment Before Printing This Document

Citizens, Inc., Class A * 2,110 13,905
Crawford & Company, Class B * 697 3,109
Crawford & Company * 375 1,361
eHealth, Inc. * 1,095 17,520
Everest Re Group, Ltd. 17,600 1,218,448
Greenlight Capital Re, Ltd., Class A * 1,070 17,655
Infinity Property & Casualty Corp. 6,814 250,823
IPC Holdings, Ltd. 12,235 304,040
Life Partners Holdings, Inc. 381 6,054
MGIC Investment Corp. 2,248 9,801
Navigators Group, Inc. * 736 32,193
Radian Group, Inc. 1,458 4,126
RLI Corp. 938 43,955
Tower Group, Inc. 12,776 305,219
Universal Insurance Holdings, Inc. 461 2,365
W.R. Berkley Corp. 30,300 657,207
2,912,858
International Oil - 0.05%
ATP Oil & Gas Corp. * 1,475 13,290
BPZ Energy, Inc. * 3,584 25,626
Cheniere Energy, Inc. * 2,473 10,263
Tesco Corp. * 1,637 14,569
63,748
Internet Content - 0.51%
Dice Holdings, Inc. * 958 4,550
InfoSpace, Inc. * 621 4,347
Internet Capital Group, Inc. * 1,963 11,425
Liquidity Services, Inc. * 864 8,459
LoopNet, Inc. * 1,409 11,455
Move, Inc. * 80,954 170,003
RightNow Technologies, Inc. * 1,175 10,328
Sohu.com, Inc. * 1,566 98,877
TechTarget, Inc. * 640 2,573
TeleCommunication Systems, Inc. * 44,759 334,350
The Knot, Inc. * 1,410 11,534
667,901
Internet Retail - 0.24%
1-800-Flowers.com, Inc., Class A * 1,370 3,192
Blue Nile, Inc. * (a) 744 34,150
Internet Brands, Inc., Class A * 1,156 7,780
Overstock.com, Inc. * 820 9,332
PetMed Express, Inc. * 16,598 242,663
Shutterfly, Inc. * 484 6,911
Stamps.com, Inc. * 739 6,562
310,590
Internet Service Provider - 1.85%
Cogent Communications Group, Inc. * 2,162 16,885
Equinix, Inc. * 30,000 2,232,000
Netease.com, Inc., ADR * 4,020 139,012
Rackspace Hosting, Inc. * 2,400 28,008
Terremark Worldwide, Inc. * 2,145 10,789
2,426,694
Smaller Company Growth Fund (continued)Shares or
Principal
Amount Value
COMMON STOCKS (continued)
Internet Software - 1.10%
Art Technology Group, Inc. * 87,099 $ 313,556
Copyright © 2012 www.secdatabase.com. All Rights Reserved.Please Consider the Environment Before Printing This Document

Chordiant Software, Inc. * 1,545 6,211
Cybersource Corp. * 31,267 406,471
DealerTrack Holdings, Inc. * 1,943 27,882
Digital River, Inc. * 1,902 72,523
eResearch Technology, Inc. * 2,221 13,304
F5 Networks, Inc. * 8,587 272,723
NIC, Inc. * 23,749 143,207
RealNetworks, Inc. * 4,855 12,429
S1 Corp. * 2,750 18,645
Sapient Corp. * 5,232 27,782
Switch & Data Facilities Company, Inc. * 1,154 15,175
TIBCO Software, Inc. * 8,984 59,564
VASCO Data Security International, Inc. * 1,534 11,367
Vignette Corp. * 1,217 15,748
Vocus, Inc. * 928 17,734
1,434,321
Leisure Time - 0.99%
Bally Technologies, Inc. * 8,373 234,444
Brunswick Corp. 2,264 10,460
Cinemark Holdings, Inc. 585 6,213
Isle of Capri Casinos, Inc. * 899 11,813
LIFE TIME FITNESS, Inc. * (a) 1,835 33,911
Lions Gate Entertainment Corp. * 5,948 36,878
Marine Products Corp. 196 682
Monarch Casino & Resort, Inc. * 323 2,626
National Cinemedia, Inc. 2,160 27,022
Penn National Gaming, Inc. * 9,930 328,385
Perfect World Co, Ltd. * 16,930 358,747
Pinnacle Entertainment, Inc. * 1,078 11,481
Polaris Industries, Inc. 1,585 50,355
Scientific Games Corp., Class A * 3,577 63,778
Shuffle Master, Inc. * 2,755 12,094
Vail Resorts, Inc. * 660 18,143
WMS Industries, Inc. * 2,533 89,845
1,296,877
Life Sciences - 0.29%
American Ecology Corp. 893 17,012
Celera Corp. * 39,198 296,729
Dawson Geophysical Company * 260 6,984
Halozyme Therapeutics, Inc. * 3,973 27,771
Incyte Corp. * 4,491 14,775
Sequenom, Inc. * 2,960 9,738
Symyx Technologies, Inc. * 1,735 8,398
381,407
Liquor - 0.22%
Boston Beer Company, Inc. * 491 14,003
Central European Distribution Corp. * 10,680 268,816
282,819
Manufacturing - 0.65%
Acuity Brands, Inc. 2,075 56,398
AptarGroup, Inc. 5,686 176,323
ATC Technology Corp. * 14,981 218,423
Blount International, Inc. * 727 6,099
The accompanying notes are an integral part of the financial statements.
227
JOHN HANCOCK FUNDS II
PORTFOLIO OF INVESTMENTS - May 31, 2009 (Unaudited) - continued(showing percentage of total net assets)
Copyright © 2012 www.secdatabase.com. All Rights Reserved.Please Consider the Environment Before Printing This Document

Smaller Company Growth Fund (continued)Shares or
Principal
Amount Value
COMMON STOCKS (continued)
Manufacturing (continued)
Ceradyne, Inc. * 441 $ 9,967
Coherent, Inc. * 1,250 24,400
ESCO Technologies, Inc. * 1,344 54,593
Force Protection, Inc. * 3,508 30,274
GenTek, Inc. * 530 12,450
Hexcel Corp. * 4,956 52,980
iRobot Corp. * 960 12,000
John Bean Technologies Corp. 1,414 21,267
K-Tron International, Inc. * 128 11,032
Mine Safety Appliances Company 1,746 40,891
Nordson Corp. 1,552 59,597
Raven Industries, Inc. 832 22,847
Smith & Wesson Holding Corp. * 2,436 12,862
Spartan Motors, Inc. 1,594 15,047
Sturm Ruger & Company, Inc. 978 11,609
849,059
Medical Instruments - 0.00%
MAKO Surgical Corp. * 577 5,026
Medical-Drugs - 0.00%
SIGA Technologies, Inc. * 960 6,998
Medical-Hospitals - 1.31%
Cepheid, Inc. * 2,973 30,027
Clarient, Inc. * 1,496 4,114
DexCom, Inc. * 1,998 11,109
EV3, Inc. * 3,260 29,796
Exactech, Inc. * 424 6,784
Genoptix, Inc. * 10,287 299,146
IRIS International, Inc. * 19,697 235,379
MWI Veterinary Supply, Inc. * 591 17,275
Neogen Corp. * 3,788 83,488
Orthovita, Inc. * 3,508 13,015
Tenet Healthcare Corp. * 24,514 88,986
VCA Antech, Inc. * 36,646 889,398
Vital Images, Inc. * 716 8,349
1,716,866
Metal & Metal Products - 1.90%
Ampco-Pittsburgh Corp. 222 5,763
Brush Engineered Materials, Inc. * 365 5,603
Crown Holdings, Inc. * 100,100 2,352,350
Dynamic Materials Corp. 651 11,679
Fushi Copperweld, Inc. * 503 4,270
Haynes International, Inc. * 400 9,180
Horsehead Holding Corp. * 1,810 12,996
L.B. Foster Company * 526 15,338
Matthews International Corp., Class A 1,584 45,223
Mueller Industries, Inc. 954 20,959
Sun Hydraulics, Inc. 225 3,578
2,486,939
Mining - 0.23%
Allied Nevada Gold Corp. * 2,359 18,282
AMCOL International Corp. 1,171 25,071
General Moly, Inc. * 2,038 4,341
Hecla Mining Company * 3,900 14,469
Royal Gold, Inc. 1,986 92,488
Smaller Company Growth Fund (continued)
Copyright © 2012 www.secdatabase.com. All Rights Reserved.Please Consider the Environment Before Printing This Document

Shares or
Principal
Amount Value
COMMON STOCKS (continued)
Mining (continued)
Stillwater Mining Company * 19,081 $ 141,009
295,660
Mobile Homes - 0.01%
Thor Industries, Inc. 648 13,031
Office Furnishings & Supplies - 0.06%
Herman Miller, Inc. 965 13,732
Office Depot, Inc. * 9,173 42,746
OfficeMax, Inc. 1,959 16,162
72,640
Oil & Gas Drilling - 0.07%
Atwood Oceanics, Inc. * 2,966 78,480
Precision Drilling Trust * 1,258 7,372
85,852
Paper - 0.18%
Rock-Tenn Company, Class A 6,291 241,449
Petroleum Services - 2.40%
Approach Resources, Inc. * 638 5,704
Core Laboratories N.V. (a) 4,689 445,174
Delek US Holdings, Inc. 2,407 24,672
Dril-Quip, Inc. * 46,103 1,904,976
GulfMark Offshore, Inc. * 677 20,649
Hercules Offshore, Inc. * (a) 50,421 233,954
Hornbeck Offshore Services, Inc. * 9,818 272,351
Key Energy Services, Inc. * 3,112 20,072
Pioneer Drilling Company * 2,567 16,069
Rex Energy Corp. * 1,221 8,315
RPC, Inc. 1,511 15,639
SEACOR Holdings, Inc. * 342 26,132
Superior Energy Services, Inc. * 2,588 59,679
Superior Well Services, Inc. * 788 7,912
T-3 Energy Services, Inc. * 322 4,675
TETRA Technologies, Inc. * 1,926 16,756
Willbros Group, Inc. * 2,009 30,677
World Fuel Services Corp. 716 30,387
3,143,793
Pharmaceuticals - 2.92%
Affymax, Inc. * 550 9,350
Akorn, Inc. * 2,981 3,219
Alexion Pharmaceuticals, Inc. * 10,623 387,740
Alkermes, Inc. * 4,853 39,503
Allos Therapeutics, Inc. * 2,082 15,157
American Oriental Bioengineering, Inc. * 2,089 10,132
Amicus Therapeutics, Inc. * 349 2,317
Array BioPharma, Inc. * 2,345 7,293
Auxilium Pharmaceuticals, Inc. * 2,180 51,077
BioMarin Pharmaceutical, Inc. * 5,128 71,689
Cadence Pharmaceuticals, Inc. * 640 6,784
Caraco Pharmaceutical Labs * 552 2,307
Cubist Pharmaceuticals, Inc. * 17,807 303,787
Emergent Biosolutions, Inc. * 13,305 145,557
Enzon Pharmaceuticals, Inc. * 2,312 18,542
Idenix Pharmaceuticals, Inc. * 755 2,567
Inspire Pharmaceuticals, Inc. * 2,181 8,942
Isis Pharmaceuticals, Inc. * (a) 20,761 286,502
The accompanying notes are an integral part of the financial statements.
Copyright © 2012 www.secdatabase.com. All Rights Reserved.Please Consider the Environment Before Printing This Document

228
JOHN HANCOCK FUNDS II
PORTFOLIO OF INVESTMENTS - May 31, 2009 (Unaudited) - continued(showing percentage of total net assets)
Smaller Company Growth Fund (continued)Shares or
Principal
Amount Value
COMMON STOCKS (continued)
Pharmaceuticals (continued)
K-V Pharmaceutical Company, Class A * 1,134 $ 1,905
Ligand Pharmaceuticals, Inc., Class B * 5,214 15,538
MAP Pharmaceuticals, Inc. * 472 5,706
Medicis Pharmaceutical Corp., Class A 2,912 45,777
Noven Pharmaceuticals, Inc. * 1,278 14,186
NPS Pharmaceuticals, Inc. * 2,432 8,074
Onyx Pharmaceuticals, Inc. * 2,912 68,898
OSI Pharmaceuticals, Inc. * 2,960 100,048
Par Pharmaceutical Companies, Inc. * 1,771 23,643
PDL BioPharma, Inc. 3,989 27,724
Pharmasset, Inc. * 1,081 11,351
PharMerica Corp. * 1,565 27,450
POZEN, Inc. * 1,223 9,356
Questcor Pharmaceuticals, Inc. * 21,719 92,523
Regeneron Pharmaceuticals, Inc. * 3,193 48,885
Rigel Pharmaceuticals, Inc. * 1,225 10,217
Salix Pharmaceuticals, Ltd. * 2,468 22,409
Savient Pharmaceuticals, Inc. * 2,032 12,903
Sepracor, Inc. * 5,590 87,484
Sucampo Pharmaceuticals, Inc. * 402 2,255
Theravance, Inc. * 2,451 36,275
United Therapeutics Corp. * 20,912 1,676,097
Valeant Pharmaceuticals International * 3,976 91,408
ViroPharma, Inc. * 1,414 9,827
XOMA, Ltd. * 7,208 5,839
3,828,243
Pollution Control - 0.01%
Fuel Tech, Inc. * (a) 862 8,413
Precious Metals - 0.00%
Coeur d'Alene Mines Corp. * 0 4
Publishing - 0.47%
Dolan Media Company * 20,047 277,250
John Wiley & Sons, Inc., Class A 2,265 71,597
Martha Stewart Living
Omnimedia, Inc., Class A * 1,379 4,482
The New York Times Company, Class A 2,444 16,130
VistaPrint, Ltd. * 6,496 248,732
618,191
Railroads & Equipment - 0.36%
Genesee & Wyoming, Inc., Class A * 1,646 47,602
Kansas City Southern * 20,930 345,136
Wabtec Corp. 2,365 84,383
477,121
Real Estate - 1.32%
Alexander's, Inc., REIT * 105 28,351
Annaly Capital Management, Inc., REIT 102,200 1,424,668
Ashford Hospitality Trust, Inc., REIT 4,000 16,200
Consolidated Tomoka Land Company 98 3,090
Copyright © 2012 www.secdatabase.com. All Rights Reserved.Please Consider the Environment Before Printing This Document

DuPont Fabros Technology, Inc., REIT 1,185 11,222
Equity Lifestyle Properties, Inc., REIT 1,222 47,951
Forest City Enterprises, Inc., Class A 3,779 26,793
Hilltop Holdings, Inc. * 812 9,655
Jones Lang LaSalle, Inc. 621 21,766
PICO Holdings, Inc. * 871 24,327
Smaller Company Growth Fund (continued)Shares or
Principal
Amount Value
COMMON STOCKS (continued)
Real Estate (continued)
PS Business Parks, Inc., REIT 276 $ 12,384
Saul Centers, Inc., REIT 241 6,919
Tanger Factory Outlet Centers, Inc., REIT 813 26,309
Taubman Centers, Inc., REIT 2,724 67,392
1,727,027
Retail - 2.47%
AnnTaylor Stores Corp. * 1,027 7,518
Cash America International, Inc. 12,880 296,497
Chico's FAS, Inc. * 138,104 1,347,895
Citi Trends, Inc. * 738 19,026
Coldwater Creek, Inc. * 3,044 11,567
Conn's, Inc. * (a) 23,230 231,603
DSW, Inc., Class A * 264 3,002
FGX International Holdings, Ltd. * 738 9,933
Finish Line, Inc. 28,810 199,077
Foot Locker, Inc. 24,160 268,418
J. Crew Group, Inc. * 2,567 66,383
Pantry, Inc. * 15,890 316,529
Retail Ventures, Inc. * 1,500 3,915
Saks, Inc. * 4,268 16,304
Shoe Carnival, Inc. * 8,286 88,080
Susser Holdings Corp. * 153 2,078
Systemax, Inc. * 375 4,601
Talbots, Inc. 831 2,784
The Dress Barn, Inc. * 20,356 322,235
Titan Machinery, Inc. * 680 8,541
Tween Brands, Inc. * 637 3,357
3,229,343
Retail Grocery - 0.08%
Arden Group, Inc. 65 8,320
PriceSmart, Inc. 380 6,358
Spartan Stores, Inc. 1,140 14,147
The Great Atlantic & Pacific Tea Company,
Inc. * 1,777 7,037
United Natural Foods, Inc. * 2,093 47,574
Winn-Dixie Stores, Inc. * 1,813 27,666
111,102
Retail Trade - 4.33%
99 Cents Only Stores * 880 8,246
Aaron, Inc., Class B 12,425 404,682
Aeropostale, Inc. * 3,431 118,781
Big Lots, Inc. * 4,217 97,033
BJ's Wholesale Club, Inc. * 1,963 69,176
Casey's General Stores, Inc. 2,610 65,850
Charlotte Russe Holding, Inc. * 1,078 10,942
Charming Shoppes, Inc. * 2,047 7,697
Children's Place Retail Stores, Inc. * 11,077 397,775
Dick's Sporting Goods, Inc. * 4,402 78,356
First Cash Financial Services, Inc. * 18,861 284,990
Copyright © 2012 www.secdatabase.com. All Rights Reserved.Please Consider the Environment Before Printing This Document

Fossil, Inc. * 2,394 53,578
Gaiam, Inc., Class A * 861 4,770
hhgregg, Inc. * 749 12,396
Hibbett Sports, Inc. * 12,263 221,102
Hot Topic, Inc. * 27,229 196,321
Kohl's Corp. * 41,000 1,741,270
The accompanying notes are an integral part of the financial statements.
229
JOHN HANCOCK FUNDS II
PORTFOLIO OF INVESTMENTS - May 31, 2009 (Unaudited) - continued(showing percentage of total net assets)
Smaller Company Growth Fund (continued)Shares or
Principal
Amount Value
COMMON STOCKS (continued)
Retail Trade (continued)
Lumber Liquidators, Inc. * 688 $ 10,423
NBTY, Inc. * 2,847 70,292
New York & Company, Inc. * 1,390 5,004
Pacific Sunwear of California, Inc. * 2,192 9,404
Pier 1 Imports, Inc. * 2,292 4,584
Rite Aid Corp. * 15,440 17,910
The Buckle, Inc. 9,320 333,470
The Wet Seal, Inc., Class A * 4,702 14,811
Tractor Supply Company * 37,164 1,426,354
Zumiez, Inc. * 1,063 9,482
5,674,699
Sanitary Services - 1.06%
Darling International, Inc. * 4,203 31,817
Waste Connections, Inc. * 53,341 1,354,861
1,386,678
Semiconductors - 3.43%
Actel Corp. * 463 5,223
Advanced Analogic Technologies, Inc. * 36,601 173,123
Advanced Energy Industries, Inc. * 859 8,117
American Superconductor Corp. * 2,112 58,883
Amkor Technology, Inc. * 6,109 27,735
Applied Micro Circuits Corp. * 3,361 26,283
Atmel Corp. * 21,852 84,130
ATMI, Inc. * 41,446 672,669
Brooks Automation, Inc. * 2,126 8,313
Cabot Microelectronics Corp. * 781 21,829
Cavium Networks, Inc. * 19,015 274,577
Cirrus Logic, Inc. * 3,183 12,382
Conexant Systems, Inc. * 2,555 2,964
Cymer, Inc. * 19,922 553,035
Cypress Semiconductor Corp. * 7,086 60,940
Diodes, Inc. * 1,700 26,129
Emcore Corp. * 2,481 3,250
Entegris, Inc. * 2,889 8,320
Fairchild Semiconductor International, Inc. * 2,225 15,708
FormFactor, Inc. * 2,519 45,720
Hittite Microwave Corp. * 1,016 36,454
International Rectifier Corp. * 2,412 34,902
IXYS Corp. * 1,180 11,175
Kopin Corp. * 3,481 13,715
Kulicke & Soffa Industries, Inc. * 1,936 8,925
Copyright © 2012 www.secdatabase.com. All Rights Reserved.Please Consider the Environment Before Printing This Document
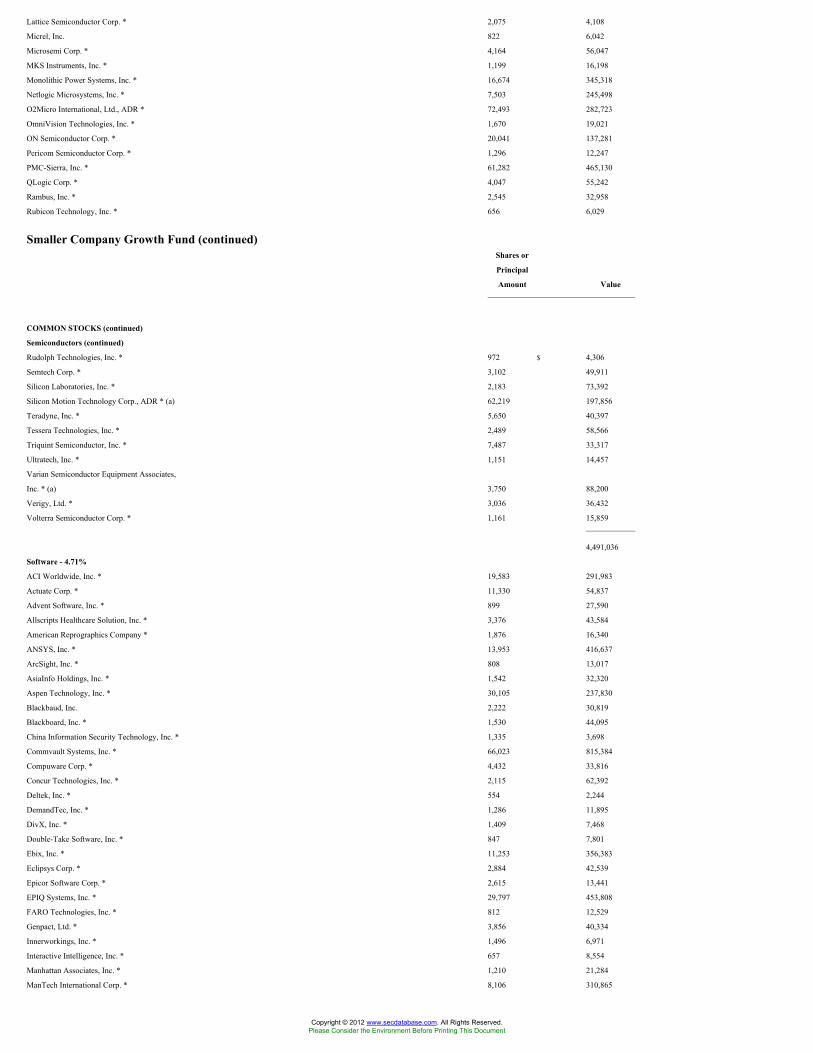
Lattice Semiconductor Corp. * 2,075 4,108
Micrel, Inc. 822 6,042
Microsemi Corp. * 4,164 56,047
MKS Instruments, Inc. * 1,199 16,198
Monolithic Power Systems, Inc. * 16,674 345,318
Netlogic Microsystems, Inc. * 7,503 245,498
O2Micro International, Ltd., ADR * 72,493 282,723
OmniVision Technologies, Inc. * 1,670 19,021
ON Semiconductor Corp. * 20,041 137,281
Pericom Semiconductor Corp. * 1,296 12,247
PMC-Sierra, Inc. * 61,282 465,130
QLogic Corp. * 4,047 55,242
Rambus, Inc. * 2,545 32,958
Rubicon Technology, Inc. * 656 6,029
Smaller Company Growth Fund (continued)Shares or
Principal
Amount Value
COMMON STOCKS (continued)
Semiconductors (continued)
Rudolph Technologies, Inc. * 972 $ 4,306
Semtech Corp. * 3,102 49,911
Silicon Laboratories, Inc. * 2,183 73,392
Silicon Motion Technology Corp., ADR * (a) 62,219 197,856
Teradyne, Inc. * 5,650 40,397
Tessera Technologies, Inc. * 2,489 58,566
Triquint Semiconductor, Inc. * 7,487 33,317
Ultratech, Inc. * 1,151 14,457
Varian Semiconductor Equipment Associates,
Inc. * (a) 3,750 88,200
Verigy, Ltd. * 3,036 36,432
Volterra Semiconductor Corp. * 1,161 15,859
4,491,036
Software - 4.71%
ACI Worldwide, Inc. * 19,583 291,983
Actuate Corp. * 11,330 54,837
Advent Software, Inc. * 899 27,590
Allscripts Healthcare Solution, Inc. * 3,376 43,584
American Reprographics Company * 1,876 16,340
ANSYS, Inc. * 13,953 416,637
ArcSight, Inc. * 808 13,017
AsiaInfo Holdings, Inc. * 1,542 32,320
Aspen Technology, Inc. * 30,105 237,830
Blackbaud, Inc. 2,222 30,819
Blackboard, Inc. * 1,530 44,095
China Information Security Technology, Inc. * 1,335 3,698
Commvault Systems, Inc. * 66,023 815,384
Compuware Corp. * 4,432 33,816
Concur Technologies, Inc. * 2,115 62,392
Deltek, Inc. * 554 2,244
DemandTec, Inc. * 1,286 11,895
DivX, Inc. * 1,409 7,468
Double-Take Software, Inc. * 847 7,801
Ebix, Inc. * 11,253 356,383
Eclipsys Corp. * 2,884 42,539
Epicor Software Corp. * 2,615 13,441
EPIQ Systems, Inc. * 29,797 453,808
FARO Technologies, Inc. * 812 12,529
Genpact, Ltd. * 3,856 40,334
Innerworkings, Inc. * 1,496 6,971
Interactive Intelligence, Inc. * 657 8,554
Manhattan Associates, Inc. * 1,210 21,284
ManTech International Corp. * 8,106 310,865
Copyright © 2012 www.secdatabase.com. All Rights Reserved.Please Consider the Environment Before Printing This Document

MedAssets, Inc. * 1,384 21,881
MicroStrategy, Inc., Class A * 468 21,902
Monotype Imaging Holdings, Inc. * 576 3,254
MSCI, Inc. * 5,140 109,328
NetSuite, Inc. * 781 9,028
Omnicell, Inc. * 1,529 14,052
Omniture, Inc. * 71,713 847,648
OpenTV Corp., Class A * 4,488 7,854
Opnet Technologies, Inc. * 689 7,000
Pegasystems, Inc. 4,793 127,206
Progress Software Corp. * 1,024 22,958
PROS Holdings, Inc. * 923 7,356
Quality Systems, Inc. 947 47,284
The accompanying notes are an integral part of the financial statements.
230
JOHN HANCOCK FUNDS II
PORTFOLIO OF INVESTMENTS - May 31, 2009 (Unaudited) - continued(showing percentage of total net assets)
Smaller Company Growth Fund (continued)Shares or
Principal
Amount Value
COMMON STOCKS (continued)
Software (continued)
Quest Software, Inc. * 3,403 $ 43,967
Riverbed Technology, Inc. * 2,841 57,076
Smith Micro Software, Inc. * 22,680 221,357
Soapstone Networks, Inc. * 45,018 170,618
Solera Holdings, Inc. * 17,748 406,429
SPSS, Inc. * 935 31,201
Sybase, Inc. * 9,794 318,599
Synchronoss Technologies, Inc. * 1,031 12,516
Taleo Corp. * 1,316 20,398
Tradestation Group, Inc. * 620 5,084
Ultimate Software Group, Inc. * 7,502 152,366
VeriFone Holdings, Inc. * 3,903 29,780
Websense, Inc. * 1,497 27,171
6,163,771
Steel - 0.30%
AK Steel Holding Corp. 21,420 306,306
Northwest Pipe Company * 165 6,432
Schnitzer Steel Industries, Inc. 1,117 60,921
Worthington Industries, Inc. 1,620 22,664
396,323
Telecommunications Equipment &
Services - 9.87%
ADC Telecommunications, Inc. * 1,734 12,207
ADTRAN, Inc. 18,382 381,978
Airvana, Inc. * 1,286 7,562
Alaska Communications Systems Group, Inc. 2,240 15,165
Amdocs, Ltd. * 63,700 1,378,468
American Tower Corp., Class A * 61,400 1,956,818
Applied Signal Technology, Inc. 11,187 234,144
Arris Group, Inc. * 3,160 38,299
Aruba Networks, Inc. * 3,029 19,719
Atheros Communications, Inc. * 20,654 346,161
Cbeyond Communications, Inc. * 1,168 20,078
Centennial Communications Corp., Class A * 4,468 37,576
Copyright © 2012 www.secdatabase.com. All Rights Reserved.Please Consider the Environment Before Printing This Document

Ciena Corp. * 3,026 33,286
CommScope, Inc. * 55,796 1,464,087
Comtech Telecommunications Corp. * 12,031 350,583
CPI International, Inc. * 381 4,164
FiberTower Corp. * 3,011 2,258
Finisar Corp. * 20,646 13,420
General Communication, Inc., Class A * 1,669 11,032
GeoEye, Inc. * 19,937 427,848
Global Crossing, Ltd. * 1,456 12,201
Globecomm Systems, Inc. * 36,296 234,835
Harmonic, Inc. * 4,879 28,201
Hughes Communications, Inc. * 497 10,894
ICO Global Communications Holdings, Ltd. * 6,318 4,107
Infinera Corp. * 4,358 37,304
InterDigital, Inc. * 2,219 56,851
J2 Global Communications, Inc. * 2,257 50,331
JDS Uniphase Corp. * 3,865 20,832
Mastec, Inc. * 149,800 1,939,910
NeuStar, Inc., Class A * 4,049 81,182
Neutral Tandem, Inc. * 13,854 401,766
NICE Systems, Ltd., ADR * 17,437 400,354
Smaller Company Growth Fund (continued)Shares or
Principal
Amount Value
COMMON STOCKS (continued)
Telecommunications Equipment &
Services (continued)
Oplink Communications, Inc. * 24,616 $ 283,084
OpNext, Inc. * 1,170 2,913
PAETEC Holding Corp. * 6,512 19,927
Polycom, Inc. * 4,292 74,295
Powerwave Technologies, Inc. * 3,380 4,563
Premiere Global Services, Inc. * 159,028 1,903,565
RCN Corp. * 1,885 10,368
SAVVIS, Inc. * 1,922 22,622
Shenandoah Telecommunications Company 1,149 22,187
ShoreTel, Inc. * 2,250 13,748
Sonus Networks, Inc. * 4,906 11,039
Starent Networks Corp. * (a) 17,061 360,499
Tekelec, Inc. * 1,531 25,001
TW Telecom, Inc. * 7,654 90,776
Viasat, Inc. * 1,432 35,915
Vonage Holdings Corp. * 3,620 1,665
12,915,788
Tobacco - 0.02%
Alliance One International, Inc. * 4,340 20,658
Transportation - 0.64%
Excel Maritime Carriers, Ltd. (a) 29,860 319,502
Genco Shipping & Trading, Ltd. 5,894 154,128
Kirby Corp. * 2,605 87,580
Marten Transport, Ltd. * 9,201 196,257
Patriot Transportation Holding, Inc. * 86 7,440
Saia, Inc. * 694 9,543
UTI Worldwide, Inc. * 4,871 63,859
838,309
Transport-Marine - 0.03%
American Commercial Lines, Inc. * 1,951 34,513
Travel Services - 0.02%
Ambassadors Group, Inc. 879 10,838
Interval Leisure Group, Inc. * 2,020 19,331
Copyright © 2012 www.secdatabase.com. All Rights Reserved.Please Consider the Environment Before Printing This Document

30,169
Trucking & Freight - 2.52%
Arkansas Best Corp. 6,875 193,256
Celadon Group, Inc. * 37,553 285,027
Forward Air Corp. 1,486 31,682
Heartland Express, Inc. 20,057 314,895
Hub Group, Inc., Class A * 14,860 293,634
Knight Transportation, Inc. 3,237 57,424
Landstar Systems, Inc. 2,654 100,852
Navistar International Corp. * 49,700 1,978,557
Old Dominion Freight Lines, Inc. * 1,436 42,290
YRC Worldwide, Inc. * 1,521 3,924
3,301,541
Utility Service - 0.03%
Cal Dive International, Inc. * 2,422 24,438
Consolidated Water Company, Ltd. 709 11,067
35,505
The accompanying notes are an integral part of the financial statements.
231
JOHN HANCOCK FUNDS II
PORTFOLIO OF INVESTMENTS - May 31, 2009 (Unaudited) - continued(showing percentage of total net assets)
Smaller Company Growth Fund (continued)Shares or
Principal
Amount Value
COMMON STOCKS (continued)
Water Treatment Systems - 0.01%
Energy Recovery, Inc. * 1,669 $ 13,319
TOTAL COMMON STOCKS (Cost $115,118,228) $ 127,439,712
INVESTMENT COMPANIES - 0.81%
Investment Companies - 0.81%
iShares Russell 2000 Growth Index Fund 19,220 1,058,253
TOTAL INVESTMENT COMPANIES (Cost $1,046,183) $ 1,058,253
RIGHTS - 0.00%
Oil & Gas Drilling - 0.00%
Precision Drilling Trust * 1,258 503
TOTAL RIGHTS (Cost $0) $ 503
SHORT TERM INVESTMENTS - 3.56%
John Hancock Collateral Investment
Trust, 0.7339% (c)(g) $ 466,748 $ 4,667,478
TOTAL SHORT TERM INVESTMENTS
(Cost $4,667,478) $ 4,667,478
REPURCHASE AGREEMENTS - 3.20%
Repurchase Agreement with State
Street Corp. dated 05/29/2009 at
0.07% to be repurchased at
$4,187,024 on 06/01/2009,
collateralized by $850,000 U.S.
Treasury Bills, 0% due 11/27/2009
(valued at $848,725, including
interest) and $2,625,000 Federal
Home Loan Mortgage Corp.,
2.875% due 04/30/2010 (valued at
Copyright © 2012 www.secdatabase.com. All Rights Reserved.Please Consider the Environment Before Printing This Document

$2,684,063, including interest) and
$675,000 Federal Home Loan
Mortgage Corp., 4.50% due
01/15/2013 (valued at $743,344,
including interest) $ 4,187,000 $ 4,187,000
TOTAL REPURCHASE AGREEMENTS
(Cost $4,187,000) $ 4,187,000
Total Investments (Smaller Company Growth Fund)
(Cost $125,018,889) - 104.92% $ 137,352,946
Other assets and liabilities, net - (4.92)% (6,440,650)
TOTAL NET ASSETS - 100.00% $ 130,912,296
Spectrum Income FundShares or
Principal
Amount Value
COMMON STOCKS - 16.56%
Aerospace - 0.17%
Boeing Company 31,200 $ 1,399,320
Air Travel - 0.08%
Southwest Airlines Company 95,900 646,366
Spectrum Income Fund (continued)Shares or
Principal
Amount Value
COMMON STOCKS (continued)
Aluminum - 0.05%
Alcoa, Inc. 47,900 $ 441,638
Auto Parts - 0.08%
Genuine Parts Company 19,200 642,816
Banking - 0.67%
Allied Irish Banks PLC - London Exchange 67,013 130,064
Bank of New York Mellon Corp. 67,100 1,864,038
KeyCorp 84,900 424,500
Marshall & Ilsley Corp. (a) 31,700 208,586
SunTrust Banks, Inc. 53,000 698,010
U.S. Bancorp 110,600 2,123,520
5,448,718
Biotechnology - 0.12%
Amgen, Inc. * 19,200 958,848
Broadcasting - 0.03%
CBS Corp., Class B 36,750 271,215
Building Materials & Construction - 0.11%
Masco Corp. 82,100 850,556
Business Services - 0.21%
Accenture, Ltd., Class A 10,300 308,279
Computer Sciences Corp. * 28,800 1,222,848
H & R Block, Inc. 13,800 201,480
1,732,607
Cable & Television - 0.33%
Cablevision Systems Corp., Class A 45,900 873,477
Time Warner, Inc. 77,033 1,804,113
2,677,590
Cellular Communications - 0.06%
Vodafone Group PLC 258,900 487,223
Chemicals - 0.18%
Copyright © 2012 www.secdatabase.com. All Rights Reserved.Please Consider the Environment Before Printing This Document

E.I. Du Pont de Nemours & Company 42,900 1,221,363
Huntsman Corp. 34,725 219,462
1,440,825
Coal - 0.08%
CONSOL Energy, Inc. 15,300 629,748
Computers & Business Equipment - 0.17%
Cisco Systems, Inc. * 31,500 582,750
Dell, Inc. * 71,900 832,602
1,415,352
Construction Materials - 0.18%
USG Corp. * 30,100 361,200
Vulcan Materials Company (a) 24,000 1,062,960
1,424,160
Cosmetics & Toiletries - 0.26%
International Flavors & Fragrances, Inc. 33,600 1,071,840
Kimberly-Clark Corp. 19,200 996,288
2,068,128
Crude Petroleum & Natural Gas - 0.11%
Sunoco, Inc. 27,900 848,997
Drugs & Health Care - 0.28%
Wyeth 50,300 2,256,458
The accompanying notes are an integral part of the financial statements.
232
JOHN HANCOCK FUNDS II
PORTFOLIO OF INVESTMENTS - May 31, 2009 (Unaudited) - continued(showing percentage of total net assets)
Spectrum Income Fund (continued)Shares or
Principal
Amount Value
COMMON STOCKS (continued)
Electrical Equipment - 0.13%
Cooper Industries, Ltd., Class A 24,000 $ 787,680
General Cable Corp. * 6,650 254,296
1,041,976
Electrical Utilities - 0.66%
Constellation Energy Group, Inc. 24,000 654,720
Entergy Corp. 16,300 1,216,306
FirstEnergy Corp. 14,400 544,176
PG&E Corp. 24,000 881,040
Pinnacle West Capital Corp. 24,000 663,600
Teco Energy, Inc. 24,100 270,402
Xcel Energy, Inc. 63,270 1,085,080
5,315,324
Electronics - 0.04%
Harman International Industries, Inc. 17,700 329,928
Energy - 0.32%
Duke Energy Corp. 73,890 1,045,543
NRG Energy, Inc. * 15,700 353,250
Progress Energy, Inc. 33,250 1,180,708
2,579,501
Financial Services - 2.17%
American Express Company 91,100 2,263,835
Copyright © 2012 www.secdatabase.com. All Rights Reserved.Please Consider the Environment Before Printing This Document

Bank of America Corp. 254,701 2,870,480
Capital One Financial Corp. 32,600 796,744
Federal National Mortgage Association 40,214 29,356
Goldman Sachs Group, Inc. 13,700 1,980,609
JPMorgan Chase & Company 146,050 5,389,245
Legg Mason, Inc. 18,200 350,896
SLM Corp. * 94,200 622,662
UBS AG - CHF * 45,551 688,664
Wells Fargo & Company 100,700 2,567,850
17,560,341
Food & Beverages - 0.66%
Anheuser-Busch InBev NV 21,600 763,451
B&G Foods, Inc. 34,450 492,980
Hershey Company 64,700 2,278,734
Kraft Foods, Inc., Class A 45,600 1,190,616
McCormick & Company, Inc. 19,200 585,984
5,311,765
Forest Products - 0.06%
Weyerhaeuser Company 14,400 483,552
Gas & Pipeline Utilities - 0.20%
NiSource, Inc. 92,000 983,480
Spectra Energy Corp. 37,300 598,665
Williams Companies, Inc. 270 4,531
1,586,676
Healthcare Products - 0.16%
Johnson & Johnson 24,000 1,323,840
Healthcare Services - 0.08%
WellPoint, Inc. * 14,400 670,608
Homebuilders - 0.04%
D.R. Horton, Inc. 31,500 290,115
Spectrum Income Fund (continued)Shares or
Principal
Amount Value
COMMON STOCKS (continued)
Hotels & Restaurants - 0.12%
Marriott International, Inc., Class A 40,800 $ 953,088
Household Appliances - 0.21%
Black & Decker Corp. 12,700 407,289
Whirlpool Corp. (a) 31,500 1,327,410
1,734,699
Household Products - 0.21%
Fortune Brands, Inc. 47,900 1,676,979
Industrial Machinery - 0.20%
Deere & Company 33,600 1,460,592
Pall Corp. 6,800 174,624
1,635,216
Industrials - 0.42%
General Electric Company 254,100 3,425,268
Insurance - 0.55%
Chubb Corp. 14,400 570,960
Lincoln National Corp. 52,500 994,875
Marsh & McLennan Companies, Inc. 76,700 1,451,164
Progressive Corp. * 43,200 696,816
The Travelers Companies, Inc. 17,700 719,682
4,433,497
International Oil - 2.05%
Anadarko Petroleum Corp. 30,300 1,447,734
Copyright © 2012 www.secdatabase.com. All Rights Reserved.Please Consider the Environment Before Printing This Document

BP PLC, SADR 36,000 1,782,000
Chevron Corp. 57,500 3,833,525
ConocoPhillips 10,500 481,320
Exxon Mobil Corp. 57,500 3,987,625
Murphy Oil Corp. 36,000 2,124,360
Royal Dutch Shell PLC, ADR 55,100 2,970,441
16,627,005
Internet Content - 0.13%
Yahoo!, Inc. * 67,100 1,062,864
Internet Retail - 0.10%
eBay, Inc. * 47,900 843,998
Leisure Time - 0.24%
Lakes Gaming, Inc. * 22,900 70,990
MGM Mirage, Inc. * 46,600 347,636
Walt Disney Company 62,300 1,508,906
1,927,532
Manufacturing - 0.70%
3M Company 36,000 2,055,600
Eaton Corp. 10,200 443,700
Harley-Davidson, Inc. 34,600 587,162
Honeywell International, Inc. 31,200 1,034,592
Illinois Tool Works, Inc. 47,900 1,546,691
5,667,745
Mining - 0.02%
Freeport-McMoRan Copper & Gold, Inc.,
Class B 3,475 189,144
Office Furnishings & Supplies - 0.11%
Avery Dennison Corp. 31,200 859,872
The accompanying notes are an integral part of the financial statements.
233
JOHN HANCOCK FUNDS II
PORTFOLIO OF INVESTMENTS - May 31, 2009 (Unaudited) - continued(showing percentage of total net assets)
Spectrum Income Fund (continued)Shares or
Principal
Amount Value
COMMON STOCKS (continued)
Paper - 0.31%
International Paper Company 97,500 $ 1,401,075
MeadWestvaco Corp. 42,900 685,113
WPP PLC 53,100 397,621
2,483,809
Petroleum Services - 0.31%
BJ Services Company 26,200 409,768
Complete Production Services, Inc. * 43,500 307,980
Schlumberger, Ltd. 31,200 1,785,576
2,503,324
Pharmaceuticals - 0.48%
Bristol-Myers Squibb Company 57,500 1,145,400
Eli Lilly & Company 38,400 1,327,488
Merck & Company, Inc. 49,000 1,351,420
Pfizer, Inc. 4,815 73,140
3,897,448
Copyright © 2012 www.secdatabase.com. All Rights Reserved.Please Consider the Environment Before Printing This Document

Publishing - 0.27%
McGraw-Hill Companies, Inc. 55,100 1,657,959
The New York Times Company, Class A (a) 73,800 487,080
2,145,039
Railroads & Equipment - 0.02%
Norfolk Southern Corp. 4,800 178,560
Real Estate - 0.00%
Weingarten Realty Investors, REIT 1,271 20,183
Retail Trade - 0.61%
Bed Bath & Beyond, Inc. * 54,800 1,540,428
Home Depot, Inc. 93,500 2,165,460
Macy's, Inc. 33,600 392,448
Tiffany & Company 28,800 817,056
4,915,392
Semiconductors - 0.30%
Analog Devices, Inc. 50,300 1,227,823
Applied Materials, Inc. 43,000 484,180
Intel Corp. 47,700 749,844
2,461,847
Software - 0.23%
Microsoft Corp. 88,700 1,852,943
Steel - 0.19%
Nucor Corp. 34,500 1,514,895
Telephone - 0.80%
AT&T, Inc. 117,320 2,908,363
Qwest Communications International, Inc. (a) 239,700 1,045,092
Sprint Nextel Corp. * 204,975 1,055,621
Verizon Communications, Inc. 50,100 1,465,926
6,475,002
Toys, Amusements & Sporting Goods - 0.11%
Mattel, Inc. 58,500 913,185
Trucking & Freight - 0.18%
United Parcel Service, Inc., Class B 28,800 1,472,832
TOTAL COMMON STOCKS (Cost $175,534,433) $ 134,005,557
Spectrum Income Fund (continued)Shares or
Principal
Amount Value
PREFERRED STOCKS - 0.25%
Banking - 0.05%
Bank of America Corp., Series L, 7.25% 550 $ 418,000
Broadcasting - 0.01%
Spanish Broadcasting System, Series
B, 10.75% (e) 308 77,000
Financial Services - 0.00%
Federal Home Loan Mortgage Corp., Series Z * (i) 7,400 3,848
Federal National Mortgage Association,
Series S * (i) 6,125 4,104
7,952
Telecommunications Equipment &
Services - 0.19%
Crown Castle International Corp., 6.25% 12,050 586,473
Lucent Technologies Capital Trust I, 7.75% 1,900 950,000
1,536,473
TOTAL PREFERRED STOCKS (Cost $3,165,829) $ 2,039,425
TERM LOANS - 2.41%
Copyright © 2012 www.secdatabase.com. All Rights Reserved.Please Consider the Environment Before Printing This Document

Aerospace - 0.05%
BE Aerospace, Inc.
5.75% due 07/28/2014 (b) 248,125 239,130
Vought Aircraft Industries, Inc.
2.82% due 12/22/2011 (b) 250,000 200,000
439,130
Auto Parts - 0.03%
Goodyear Tire & Rubber Company
2.070% due 04/30/2014 (b) 250,000 209,023
Automobiles - 0.30%
Ford Motor Company
3.613% due 12/15/2013 (b) 2,490,453 1,762,775
General Motors Corp.
6.00% due 11/29/2013 (b) 750,000 702,500
2,465,275
Biotechnology - 0.03%
Invitrogen Corp.
5.25% due 09/15/2015 (b) 248,750 248,097
Business Services - 0.02%
First Data Corp.
3.34% due 09/24/2014 (b) 248,737 182,356
Cable & Television - 0.14%
CSC Holdings, Inc.
8.125% due 07/15/2009 (b) 452,703 431,878
Mediacom Broadband LLC
6.50% due 01/31/2015 (b) 246,878 245,335
Univision Communications, Inc.
7.60% due 09/29/2014 (b) 250,000 170,375
Weather Channel Company
7.25% due 07/25/2015 (b) 248,127 246,731
1,094,319
Chemicals - 0.03%
Celanese Holdings LLC
2.942% due 03/30/2014 (b) 247,475 223,796
The accompanying notes are an integral part of the financial statements.
234
JOHN HANCOCK FUNDS II
PORTFOLIO OF INVESTMENTS - May 31, 2009 (Unaudited) - continued(showing percentage of total net assets)
Spectrum Income Fund (continued)Shares or
Principal
Amount Value
TERM LOANS (continued)
Commercial Services - 0.05%
Aramark Corp., Tranche B
7.485% due 01/26/2017 (b) $ 440,892 $ 400,771
Computers & Business Equipment - 0.08%
Palm, Inc.
8.3775% due 04/24/2014 (b) 985,000 659,950
Containers & Glass - 0.09%
Graham Packaging Company
2.688% due 10/07/2011 (b) 736,929 692,976
Crude Petroleum & Natural Gas - 0.13%
Quicksilver Resources, Inc.
7.75% due 08/08/2013 (b) 1,097,341 1,075,394
Copyright © 2012 www.secdatabase.com. All Rights Reserved.Please Consider the Environment Before Printing This Document

Electrical Utilities - 0.05%
Calpine Corp.
5.725% due 03/29/2014 (b) 247,494 213,580
Texas Competitive Electric LLC
8.396% due 10/10/2014 (b) 247,487 168,910
382,490
Electronics - 0.09%
Dresser, Inc.
6.085% due 05/04/2015 (b) 1,250,000 760,938
Energy - 0.05%
Hercules Offshore Term Loan
7.36% due 07/11/2013 250,000 200,417
Mirant North America LLC
4.1313% due 01/03/2013 (b) 224,962 208,893
409,310
Financial Services - 0.24%
Nuveen Investments, Inc.
3.333% due 11/09/2014 (b) 1,244,981 889,124
Pinnacle Foods Finance LLC
9.25% due 04/01/2015 (b) 1,239,912 1,047,504
1,936,628
Food & Beverages - 0.06%
Wrigley WM Jr. Company
6.50% due 10/06/2014 493,750 494,417
Healthcare Products - 0.05%
Bausch & Lomb, Inc.
9.00% due 04/30/2015 (b) 248,994 216,625
Boston Scientific Corp.
2.947% due 04/21/2011 (b) 205,752 193,793
410,418
Healthcare Services - 0.10%
DaVita, Inc.
1.82% due 10/05/2011 (b) 221,154 187,981
Healthsouth Corp.
10.00% due 06/10/2013 (b) 219,954 201,991
Iasis Healthcare Corp.
10.605% due 06/16/2011 (b) 598,577 436,961
826,933
Hotels & Restaurants - 0.02%
OSI Restaurant Partners, Inc.
zero coupon due 06/14/2014 (b)(k) 250,000 183,333
Spectrum Income Fund (continued)Shares or
Principal
Amount Value
TERM LOANS (continued)
Insurance - 0.03%
HUB International Holdings, Inc.
3.72% due 06/13/2014 (b) $ 247,508 $ 205,741
Leisure Time - 0.14%
Harrah's Operating Company, Inc.
4.09% due 01/28/2015 750,000 575,893
Isle of Capri Casinos, Inc.
2.0688% due 11/25/2013 (b) 500,000 422,500
Town Sports International, Inc.
7.125% due 03/01/2014 (b) 245,000 164,150
Copyright © 2012 www.secdatabase.com. All Rights Reserved.Please Consider the Environment Before Printing This Document

1,162,543
Medical-Hospitals - 0.14%
Community Health Systems, Inc.
2.882% due 07/25/2014 (b)(k) 245,486 217,813
HCA, Inc.
4.6963% due 11/18/2012 (b) 1,008,887 902,610
1,120,423
Paper - 0.05%
Domtar Corp.
3.7794% due 03/07/2014 (b) 237,910 218,962
Georgia-Pacific Corp.
4.7274% due 12/20/2012 (b) 221,412 205,165
424,127
Publishing - 0.02%
Local Insight Regatta Holdings, Inc.
7.75% due 04/23/2015 250,000 132,187
Retail - 0.03%
Supervalu, Inc.
1.194% due 06/20/2011 236,111 220,174
Software - 0.02%
Infor Global Solutions
6.569% due 03/15/2014 (b) 500,000 170,000
Telecommunications Equipment &
Services - 0.37%
Fairpoint Communications, Inc.
5.283% due 03/31/2014 750,000 525,938
SBA Communications Corp.
1.994% due 11/01/2010 496,610 441,983
Trilogy International Partners
8.86% due 06/27/2012 (b) 500,000 260,000
West Corp.
2.733% due 10/24/2013 (b) 497,462 471,967
Wind Acquisition Finance SA, Series B
3.40% due 12/07/2011 (b) 1,416,241 1,270,191
2,970,079
TOTAL TERM LOANS (Cost $19,805,530) $ 19,500,828
U.S. TREASURY OBLIGATIONS - 2.02%
Treasury Inflation Protected
Securities (d) - 0.41%
1.625% due 01/15/2018 152,265 151,837
1.75% due 01/15/2028 147,190 135,690
2.00% due 07/15/2014 to 01/15/2016 1,030,016 1,062,795
2.50% due 01/15/2029 44,573 46,341
The accompanying notes are an integral part of the financial statements.
235
JOHN HANCOCK FUNDS II
PORTFOLIO OF INVESTMENTS - May 31, 2009 (Unaudited) - continued(showing percentage of total net assets)
Spectrum Income Fund (continued)Shares or
Principal
Amount Value
Copyright © 2012 www.secdatabase.com. All Rights Reserved.Please Consider the Environment Before Printing This Document

U.S. TREASURY OBLIGATIONS
(continued)
Treasury Inflation Protected
Securities (d) (continued)
1.375% due 07/15/2018 $ 2,011,807 $ 1,967,169
3,363,832
U.S. Treasury Bonds - 0.33%
3.50% due 02/15/2039 570,000 491,181
6.125% due 08/15/2029 *** 915,000 1,134,028
7.125% due 02/15/2023 410,000 534,025
7.25% due 08/15/2022 370,000 484,931
2,644,165
U.S. Treasury Notes - 1.27%
1.125% due 01/15/2012 680,000 678,300
2.00% due 09/30/2010 725,000 738,622
2.25% due 05/31/2014 5,270,000 5,245,910
3.125% due 09/30/2013 505,000 527,370
4.00% due 08/15/2018 915,000 955,245
4.50% due 04/30/2012 1,930,000 2,104,152
10,249,599
U.S. Treasury Strips - 0.01%
zero coupon due 05/15/2021 180,000 105,914
TOTAL U.S. TREASURY OBLIGATIONS
(Cost $16,258,240) $ 16,363,510
U.S. GOVERNMENT AGENCY OBLIGATIONS - 19.09%
Federal Home Loan Bank - 0.08%
5.791% due 10/01/2037 (b) 639,022 668,854
Federal Home Loan Mortgage Corp. - 2.57%
4.125% due 10/18/2010 1,750,000 1,834,600
4.45% due 07/01/2035 (b) 37,864 38,766
4.50% due 11/01/2018 to 06/01/2019 693,307 717,626
4.618% due 06/01/2038 (b) 208,596 216,455
4.631% due 07/01/2035 (b) 104,668 108,441
4.71% due 02/01/2035 to 07/01/2038 (b) 544,170 563,113
5.00% due 10/01/2018 to 12/01/2035 4,830,074 4,969,514
5.053% due 11/01/2035 (b) 36,330 37,976
5.056% due 03/01/2036 (b) 87,316 91,254
5.14% due 01/01/2036 (b) 799,940 829,014
5.153% due 09/01/2035 (b) 142,554 148,930
5.265% due 09/01/2032 (b) 5,959 6,151
5.313% due 02/01/2037 (b) 187,092 195,219
5.34% due 02/01/2037 to 04/01/2037 (b) 1,049,270 1,095,349
5.346% due 01/01/2036 to 05/01/2037 (b) 139,065 145,271
5.40% due 02/01/2038 (b) 412,053 430,432
5.444% due 02/01/2037 (b) 844,116 881,739
5.50% due 03/01/2018 to 12/01/2034 591,484 618,833
5.508% due 10/01/2036 (b) 524,958 546,115
5.90% due 02/01/2037 (b) 217,309 226,999
5.984% due 12/01/2036 (b) 592,941 618,739
6.00% due 11/01/2011 to 08/01/2038 2,897,512 3,049,137
5.997% due 11/01/2036 to 01/01/2037 (b) 605,690 632,794
6.018% due 10/01/2036 (b) 733,115 763,334
6.105% due 10/01/2036 (b) 578,424 603,858
6.208% due 08/01/2036 (b) 717,816 749,966
6.50% due 05/01/2017 to 01/01/2036 557,433 596,762
7.00% due 02/01/2024 to 06/01/2032 39,518 42,944
7.50% due 05/01/2024 to 06/01/2024 3,794 4,134
Spectrum Income Fund (continued)Shares or
Copyright © 2012 www.secdatabase.com. All Rights Reserved.Please Consider the Environment Before Printing This Document

Principal
Amount Value
U.S. GOVERNMENT AGENCY
OBLIGATIONS (continued)
Federal Home Loan Mortgage Corp.
(continued)
10.50% due 05/01/2019 $ 182 $ 204
20,763,669
Federal National Mortgage
Association - 6.67%
3.506% due 10/01/2033 (b) 92,588 93,513
3.732% due 07/01/2027 (b) 1,460 1,476
3.875% due 07/12/2013 1,795,000 1,895,335
4.50% due 05/01/2019 to 09/01/2035 2,719,472 2,802,598
4.597% due 07/01/2035 (b) 115,048 118,457
4.762% due 11/01/2035 (b) 156,579 160,720
4.789% due 09/01/2035 (b) 494,018 516,306
4.821% due 04/01/2038 (b) 224,933 234,264
4.843% due 05/01/2038 (b) 130,705 136,215
4.861% due 05/01/2038 (b) 418,472 436,187
4.876% due 05/01/2038 (b) 374,133 389,650
4.894% due 08/01/2038 (b) 384,866 400,168
5.00% due 03/01/2018 to 02/01/2036 6,743,287 6,982,639
5.319% due 12/01/2035 (b) 30,432 31,936
5.345% due 12/01/2035 (b) 186,205 195,523
5.412% due 09/01/2037 (b) 408,657 428,288
5.458% due 06/01/2037 (b) 126,407 132,451
5.487% due 01/01/2019 (b) 980 1,004
5.50% due 07/01/2013 to 08/01/2037 20,205,689 21,020,992
5.513% due 01/01/2037 (b) 236,780 248,310
5.524% due 12/01/2035 (b) 55,358 58,158
5.532% due 07/01/2036 (b) 185,333 193,441
5.626% due 12/01/2035 (b) 82,803 87,009
5.809% due 08/01/2037 (b) 261,434 274,735
5.984% due 09/01/2036 (b) 253,186 265,467
5.986% due 08/01/2036 (b) 590,090 617,873
6.00% due 03/01/2021 to 09/01/2038 8,688,199 9,159,875
6.032% due 12/01/2036 (b) 475,997 499,116
6.50% due 06/01/2013 to 04/01/2038 5,680,107 6,083,319
7.00% due 12/01/2029 to 04/01/2037 79,046 85,824
7.125% due 01/15/2030 365,000 467,603
54,018,452
Government National Mortgage
Association - 9.77%
4.00% due 09/15/2018 502,352 512,027
4.50% due 09/15/2018 to 05/20/2039 4,415,549 4,477,103
5.00% due 02/15/2018 to 07/20/2038 15,215,202 15,742,424
5.50% due 02/15/2029 to 04/20/2039 26,673,128 27,822,546
6.00% due 07/20/2012 to 04/20/2039 19,476,536 20,537,942
6.50% due 12/15/2014 to 08/15/2037 7,432,542 7,956,141
7.00% due 04/15/2017 to 10/20/2036 1,840,391 1,999,612
9.25% due 10/15/2016 to 12/15/2019 4,315 4,791
9.50% due 08/15/2009 to 10/15/2009 164 166
9.75% due 07/15/2017 to 02/15/2021 3,943 4,471
10.25% due 05/15/2020 to 11/15/2020 4,350 5,045
11.75% due 08/15/2013 1,149 1,294
12.00% due 10/15/2010 to 12/15/2012 173 188
12.25% due 03/15/2014 to 07/20/2015 1,038 1,207
12.50% due 06/15/2010 1,211 1,265
The accompanying notes are an integral part of the financial statements.
Copyright © 2012 www.secdatabase.com. All Rights Reserved.Please Consider the Environment Before Printing This Document

236
JOHN HANCOCK FUNDS II
PORTFOLIO OF INVESTMENTS - May 31, 2009 (Unaudited) - continued(showing percentage of total net assets)
Spectrum Income Fund (continued)Shares or
Principal
Amount Value
U.S. GOVERNMENT AGENCY
OBLIGATIONS (continued)
Government National Mortgage
Association (continued)
12.75% due 12/20/2013 to 11/20/2014 $ 869 $ 1,016
79,067,238
TOTAL U.S. GOVERNMENT AGENCY OBLIGATIONS
(Cost $148,328,114) $ 154,518,213
FOREIGN GOVERNMENT OBLIGATIONS - 12.28%
Argentina - 0.02%
Republic of Argentina
7.875% due 04/11/2011 200,100 166,083
Austria - 0.02%
Republic of Austria
6.25% due 07/15/2027 EUR 94,000 156,146
Belgium - 0.19%
Kingdom of Belgium
3.00% due 03/28/2010 540,000 776,062
4.25% due 09/28/2013 197,000 294,025
5.00% due 03/28/2035 322,000 470,534
1,540,621
Brazil - 1.29%
Federative Republic of Brazil
5.875% due 01/15/2019 $ 275,000 277,676
6.00% due 01/17/2017 205,000 210,849
6.00% due 05/15/2015 BRL 185,000 166,873
7.125% due 01/20/2037 $ 985,000 1,053,950
8.75% due 02/04/2025 475,000 574,750
8.875% due 10/14/2019 500,000 613,750
10.00% due 01/01/2012 BRL 2,810,000 1,462,011
10.00% due 01/01/2014 7,227,000 3,619,744
10.00% due 01/01/2017 3,557,000 1,719,349
11.00% due 08/17/2040 $ 550,000 728,508
10,427,460
Canada - 0.51%
Government of Canada
3.50% due 06/01/2013 CAD 415,000 398,556
3.75% due 06/01/2019 1,950,000 1,832,634
4.25% due 06/01/2018 82,000 80,758
5.00% due 06/01/2037 505,000 537,495
5.75% due 06/01/2033 331,000 377,696
Province of Ontario
5.00% due 03/08/2014 885,000 879,520
4,106,659
Copyright © 2012 www.secdatabase.com. All Rights Reserved.Please Consider the Environment Before Printing This Document

Colombia - 0.03%
Republic of Colombia
7.375% due 09/18/2037 $ 200,000 202,700
7.375% due 09/18/2037 50,000 51,083
253,783
Denmark - 0.09%
Kingdom of Denmark
5.00% due 11/15/2013 DKK 3,277,000 675,501
7.00% due 11/10/2024 364,000 89,342
764,843
Spectrum Income Fund (continued)Shares or
Principal
Amount Value
FOREIGN GOVERNMENT OBLIGATIONS
(continued)
France - 0.92%
Government of France
4.00% due 04/25/2013 EUR 769,000 $ 1,145,438
4.25% due 10/25/2017 2,546,000 3,734,190
5.50% due 04/25/2029 312,000 495,639
5.75% due 10/25/2032 990,000 1,633,779
Societe Financement de l'Economie Francaise
3.25% due 01/16/2014 278,000 398,381
7,407,427
Gabon - 0.06%
Republic of Gabon
8.20% due 12/12/2017 $ 500,000 448,905
Germany - 0.59%
Federal Republic of Germany
3.50% due 01/04/2016 EUR 37,000 53,541
3.75% due 01/04/2015 41,000 60,620
4.00% due 01/04/2037 906,000 1,197,059
4.00% due 01/04/2018 179,000 262,909
4.75% due 07/04/2028 150,000 221,313
4.75% due 07/04/2034 287,000 420,569
5.25% due 01/04/2011 1,699,000 2,552,256
4,768,267
Ghana - 0.08%
Republic of Ghana
8.50% due 10/04/2017 $ 700,000 560,994
8.50% due 10/04/2017 150,000 120,750
681,744
Greece - 0.37%
Republic of Greece
3.70% due 07/20/2015 EUR 115,000 156,780
4.60% due 05/20/2013 395,000 577,263
5.25% due 05/18/2012 720,000 1,080,961
6.00% due 05/19/2010 810,000 1,194,954
3,009,958
Grenada - 0.02%
Government of Grenada
2.50% due 09/15/2025 (e) $ 430,000 152,650
Copyright © 2012 www.secdatabase.com. All Rights Reserved.Please Consider the Environment Before Printing This Document

Hungary - 0.01%
Republic of Hungary
6.75% due 02/24/2017 HUF 22,240,000 90,736
Indonesia - 0.32%
Republic of Indonesia
6.625% due 02/17/2037 $ 100,000 85,228
6.875% due 03/09/2017 100,000 97,554
6.875% due 01/17/2018 950,000 904,875
7.75% due 01/17/2038 300,000 287,010
9.50% due 06/15/2015 IDR 1,500,000,000 142,977
10.375% due 05/04/2014 $ 100,000 114,750
11.625% due 03/04/2019 750,000 941,250
2,573,644
Iraq - 0.21%
Republic of Iraq
5.80% due 01/15/2028 2,757,000 1,730,017
The accompanying notes are an integral part of the financial statements.
237
JOHN HANCOCK FUNDS II
PORTFOLIO OF INVESTMENTS - May 31, 2009 (Unaudited) - continued(showing percentage of total net assets)
Spectrum Income Fund (continued)Shares or
Principal
Amount Value
FOREIGN GOVERNMENT OBLIGATIONS
(continued)
Ireland - 0.02%
Republic of Ireland
4.00% due 04/18/2010 EUR 96,000 $ 137,983
Italy - 0.84%
Republic of Italy
4.00% due 02/01/2037 1,000,000 1,165,199
4.25% due 08/01/2014 1,302,000 1,908,630
5.25% due 09/20/2016 $ 450,000 462,895
5.25% due 08/01/2017 EUR 1,052,000 1,605,549
5.50% due 11/01/2010 1,036,000 1,547,503
7.25% due 11/01/2026 75,000 130,755
6,820,531
Jamaica - 0.07%
Government of Jamaica
9.00% due 06/02/2015 $ 215,000 202,100
10.625% due 06/20/2017 350,000 336,000
538,100
Japan - 3.41%
Government of Japan
1.00% due 12/20/2012 JPY 188,500,000 2,004,678
1.10% due 12/10/2016 160,119,600 1,444,740
1.30% due 12/20/2013 330,850,000 3,553,342
1.30% due 03/20/2015 228,450,000 2,438,555
1.40% due 03/21/2011 67,650,000 723,790
1.40% due 03/20/2012 188,400,000 2,027,024
1.40% due 03/20/2018 410,850,000 4,315,206
1.40% due 03/10/2018 131,604,000 1,188,552
Copyright © 2012 www.secdatabase.com. All Rights Reserved.Please Consider the Environment Before Printing This Document
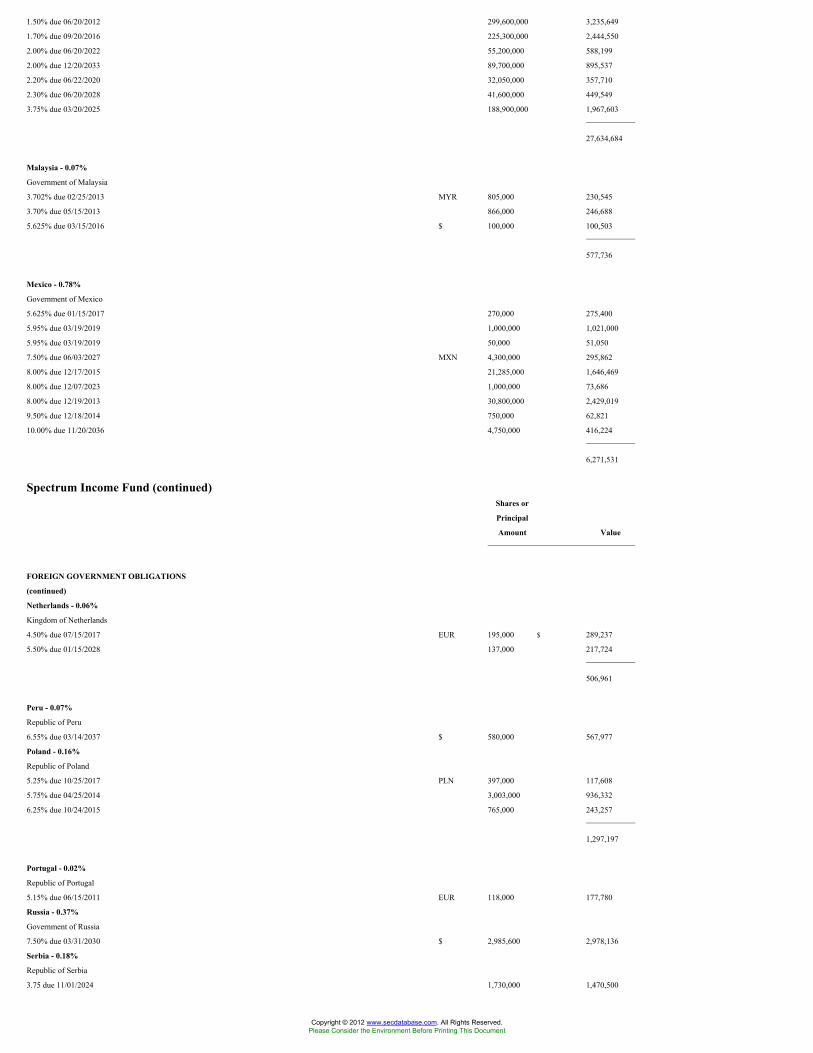
1.50% due 06/20/2012 299,600,000 3,235,649
1.70% due 09/20/2016 225,300,000 2,444,550
2.00% due 06/20/2022 55,200,000 588,199
2.00% due 12/20/2033 89,700,000 895,537
2.20% due 06/22/2020 32,050,000 357,710
2.30% due 06/20/2028 41,600,000 449,549
3.75% due 03/20/2025 188,900,000 1,967,603
27,634,684
Malaysia - 0.07%
Government of Malaysia
3.702% due 02/25/2013 MYR 805,000 230,545
3.70% due 05/15/2013 866,000 246,688
5.625% due 03/15/2016 $ 100,000 100,503
577,736
Mexico - 0.78%
Government of Mexico
5.625% due 01/15/2017 270,000 275,400
5.95% due 03/19/2019 1,000,000 1,021,000
5.95% due 03/19/2019 50,000 51,050
7.50% due 06/03/2027 MXN 4,300,000 295,862
8.00% due 12/17/2015 21,285,000 1,646,469
8.00% due 12/07/2023 1,000,000 73,686
8.00% due 12/19/2013 30,800,000 2,429,019
9.50% due 12/18/2014 750,000 62,821
10.00% due 11/20/2036 4,750,000 416,224
6,271,531
Spectrum Income Fund (continued)Shares or
Principal
Amount Value
FOREIGN GOVERNMENT OBLIGATIONS
(continued)
Netherlands - 0.06%
Kingdom of Netherlands
4.50% due 07/15/2017 EUR 195,000 $ 289,237
5.50% due 01/15/2028 137,000 217,724
506,961
Peru - 0.07%
Republic of Peru
6.55% due 03/14/2037 $ 580,000 567,977
Poland - 0.16%
Republic of Poland
5.25% due 10/25/2017 PLN 397,000 117,608
5.75% due 04/25/2014 3,003,000 936,332
6.25% due 10/24/2015 765,000 243,257
1,297,197
Portugal - 0.02%
Republic of Portugal
5.15% due 06/15/2011 EUR 118,000 177,780
Russia - 0.37%
Government of Russia
7.50% due 03/31/2030 $ 2,985,600 2,978,136
Serbia - 0.18%
Republic of Serbia
3.75 due 11/01/2024 1,730,000 1,470,500
Copyright © 2012 www.secdatabase.com. All Rights Reserved.Please Consider the Environment Before Printing This Document
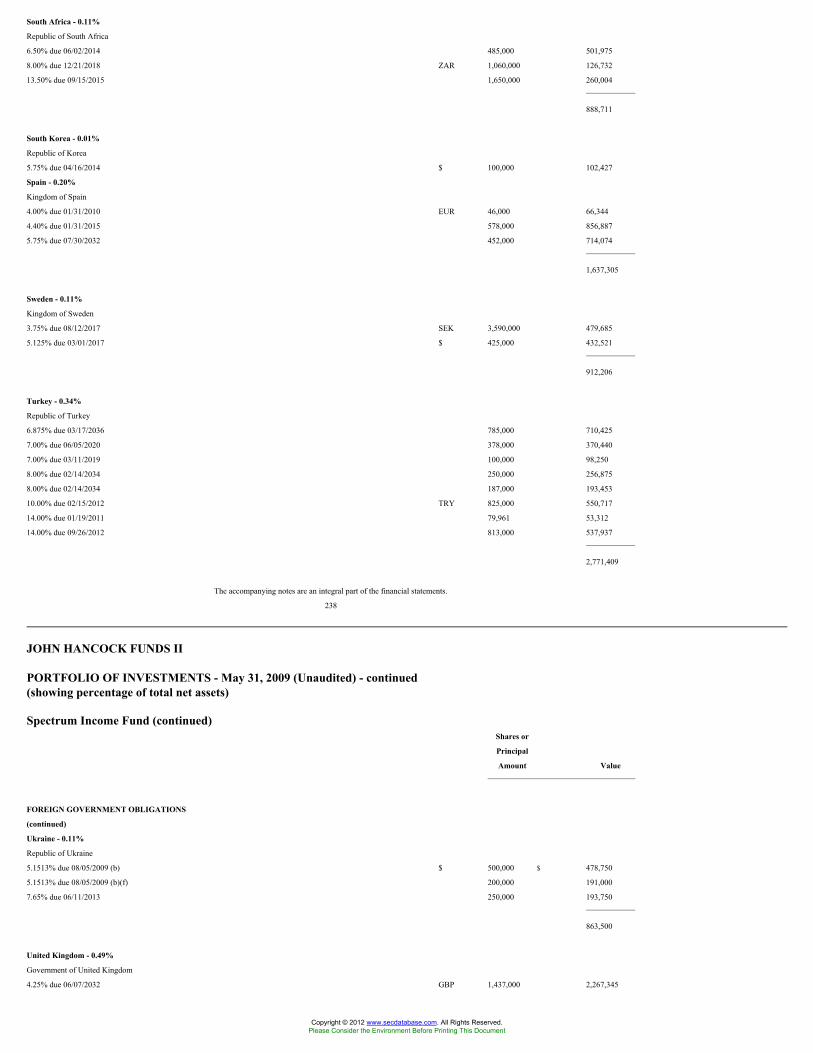
South Africa - 0.11%
Republic of South Africa
6.50% due 06/02/2014 485,000 501,975
8.00% due 12/21/2018 ZAR 1,060,000 126,732
13.50% due 09/15/2015 1,650,000 260,004
888,711
South Korea - 0.01%
Republic of Korea
5.75% due 04/16/2014 $ 100,000 102,427
Spain - 0.20%
Kingdom of Spain
4.00% due 01/31/2010 EUR 46,000 66,344
4.40% due 01/31/2015 578,000 856,887
5.75% due 07/30/2032 452,000 714,074
1,637,305
Sweden - 0.11%
Kingdom of Sweden
3.75% due 08/12/2017 SEK 3,590,000 479,685
5.125% due 03/01/2017 $ 425,000 432,521
912,206
Turkey - 0.34%
Republic of Turkey
6.875% due 03/17/2036 785,000 710,425
7.00% due 06/05/2020 378,000 370,440
7.00% due 03/11/2019 100,000 98,250
8.00% due 02/14/2034 250,000 256,875
8.00% due 02/14/2034 187,000 193,453
10.00% due 02/15/2012 TRY 825,000 550,717
14.00% due 01/19/2011 79,961 53,312
14.00% due 09/26/2012 813,000 537,937
2,771,409
The accompanying notes are an integral part of the financial statements.
238
JOHN HANCOCK FUNDS II
PORTFOLIO OF INVESTMENTS - May 31, 2009 (Unaudited) - continued(showing percentage of total net assets)
Spectrum Income Fund (continued)Shares or
Principal
Amount Value
FOREIGN GOVERNMENT OBLIGATIONS
(continued)
Ukraine - 0.11%
Republic of Ukraine
5.1513% due 08/05/2009 (b) $ 500,000 $ 478,750
5.1513% due 08/05/2009 (b)(f) 200,000 191,000
7.65% due 06/11/2013 250,000 193,750
863,500
United Kingdom - 0.49%
Government of United Kingdom
4.25% due 06/07/2032 GBP 1,437,000 2,267,345
Copyright © 2012 www.secdatabase.com. All Rights Reserved.Please Consider the Environment Before Printing This Document

4.50% due 03/07/2013 403,000 698,652
4.75% due 06/07/2010 570,000 959,856
8.75% due 08/25/2017 17,000 38,188
3,964,041
Venezuela - 0.09%
Republic of Venezuela
8.50% due 10/08/2014 $ 196,000 131,320
10.75% due 09/19/2013 724,000 571,960
703,280
Vietnam - 0.04%
Socialist Republic of Vietnam
6.875% due 01/15/2016 300,000 295,029
TOTAL FOREIGN GOVERNMENT OBLIGATIONS
(Cost $94,868,089) $ 99,395,967
CORPORATE BONDS - 35.20%
Advertising - 0.13%
Lamar Advertising Co, Series B
2.875% due 12/31/2010 263,000 241,960
Lamar Media Corp.
6.625% due 08/15/2015 (a) 475,000 403,750
9.75% due 04/01/2014 200,000 206,000
Lamar Media Corp., Series C
6.625% due 08/15/2015 250,000 202,500
1,054,210
Aerospace - 0.44%
BE Aerospace, Inc.
8.50% due 07/01/2018 450,000 425,250
GenCorp, Inc.
9.50% due 08/15/2013 750,000 487,500
Lockheed Martin Corp.
4.121% due 03/14/2013 340,000 346,942
Northrop Grumman Corp.
7.125% due 02/15/2011 550,000 590,432
Rockwell Collins, Inc.
5.25% due 07/15/2019 130,000 128,799
Rolls-Royce Group PLC, EMTN
4.50% due 03/16/2011 EUR 53,000 76,549
TransDigm, Inc.
7.75% due 07/15/2014 $ 475,000 458,375
United Technologies Corp.
5.40% due 05/01/2035 110,000 97,695
6.125% due 02/01/2019 340,000 365,921
6.35% due 03/01/2011 295,000 316,157
Vought Aircraft Industries, Inc.
8.00% due 07/15/2011 550,000 269,500
3,563,120
Spectrum Income Fund (continued)Shares or
Principal
Amount Value
CORPORATE BONDS (continued)
Agriculture - 0.05%
Bunge, Ltd.
5.90% due 04/01/2017 $ 460,000 $ 402,831
Air Travel - 0.18%
Air Jamaica, Ltd.
Copyright © 2012 www.secdatabase.com. All Rights Reserved.Please Consider the Environment Before Printing This Document

9.375% due 07/08/2015 69,643 59,196
Air Jamaica, Ltd., Series REGS
9.375% due 07/08/2015 37,143 31,571
American Airlines Pass Through Trust, Series 01-2
7.858% due 10/01/2011 550,000 503,250
Delta Air Lines, Inc.
6.821% due 08/10/2022 127,059 102,282
Delta Air Lines, Inc., Series 00A2
7.57% due 11/18/2010 525,000 501,375
Greater Toronto Airports Authority, MTN
6.25% due 12/13/2012 CAD 47,000 46,331
6.47% due 02/02/2034 40,000 35,302
Southwest Airlines Company
6.50% due 03/01/2012 $ 160,000 164,590
1,443,897
Aluminum - 0.03%
Novelis, Inc.
7.25% due 02/15/2015 325,000 213,687
Apparel & Textiles - 0.09%
INVISTA
9.25% due 05/01/2012 (f) 725,000 677,875
Polo Ralph Lauren Corp.
4.50% due 10/04/2013 EUR 50,000 58,337
736,212
Auto Parts - 0.42%
Allison Transmission, Inc., PIK
11.25% due 11/01/2015 (f) $ 1,050,000 708,750
Commercial Vehicle Group, Inc.
8.00% due 07/01/2013 375,000 159,375
Goodyear Tire & Rubber Company
8.625% due 12/01/2011 613,000 596,142
10.50% due 05/15/2016 1,125,000 1,119,375
Tenneco Automotive, Inc.
8.625% due 11/15/2014 650,000 399,750
Tenneco, Inc.
8.125% due 11/15/2015 275,000 202,125
TRW Automotive, Inc.
7.00% due 03/15/2014 (f) 100,000 73,500
United Components, Inc.
9.375% due 06/15/2013 250,000 170,000
3,429,017
Auto Services - 0.24%
ERAC USA Finance Company
5.60% due 05/01/2015 (f) 240,000 204,740
7.95% due 12/15/2009 (f) 115,000 113,871
Hertz Corp.
10.50% due 01/01/2016 475,000 413,250
KAR Holdings, Inc.
5.0275% due 05/01/2014 (b) 250,000 187,500
10.00% due 05/01/2015 1,225,000 986,125
1,905,486
The accompanying notes are an integral part of the financial statements.
239
JOHN HANCOCK FUNDS II
PORTFOLIO OF INVESTMENTS - May 31, 2009 (Unaudited) - continued(showing percentage of total net assets)
Copyright © 2012 www.secdatabase.com. All Rights Reserved.Please Consider the Environment Before Printing This Document

Spectrum Income Fund (continued)Shares or
Principal
Amount Value
CORPORATE BONDS (continued)
Automobiles - 0.17%
DaimlerChrysler N.A. Holding Corp.
6.50% due 11/15/2013 $ 190,000 $ 190,281
7.20% due 09/01/2009 160,000 160,968
DaimlerChrysler N.A. Holding Corp., EMTN
4.375% due 03/21/2013 EUR 100,000 136,216
DaimlerChrysler N.A. Holding Corp., MTN
1.4662% due 08/03/2009 (b) $ 655,000 652,784
Fiat Finance & Trade, Ltd.
6.625% due 02/15/2013 EUR 55,000 68,034
PACCAR, Inc.
6.875% due 02/15/2014 $ 85,000 92,707
Volvo Treasury AB, EMTN
9.875% due 02/27/2014 EUR 50,000 74,123
1,375,113
Banking - 2.26%
American Express Centurion Bank
5.55% due 10/17/2012 $ 100,000 98,264
ATF Bank
9.00% due 05/11/2016 150,000 91,620
9.25% due 04/12/2012 50,000 37,500
Australia & New Zealand Banking Group,
Ltd., EMTN
4.375% due 05/24/2012 EUR 95,000 135,930
4.45% due 02/05/2015 (b) 84,000 115,194
BAC Capital Trust VI
5.625% due 03/08/2035 $ 445,000 284,929
Banca Monte dei Paschi di Siena SpA, EMTN
4.50% due 09/24/2015 (b) EUR 75,000 104,171
Banco Nacional de Desenvolvimento Economico e
Social
6.369% due 06/16/2018 $ 290,000 293,625
Bank of America Corp.
5.65% due 05/01/2018 1,260,000 1,127,555
5.75% due 08/15/2016 210,000 177,709
7.375% due 05/15/2014 250,000 263,104
Bank of America Corp., EMTN
4.00% due 03/28/2017 (b) EUR 100,000 91,845
4.625% due 02/18/2014 65,000 86,791
5.25% due 11/09/2016 GBP 100,000 121,499
Bank of America Corp., MTN
4.75% due 05/23/2017 (b) EUR 50,000 47,534
Bank of Ireland
6.45% due 02/10/2010 49,000 70,032
Bank of Montreal
5.20% due 06/21/2017 (b) CAD 49,000 46,688
Bank of New York Mellon Corp.
4.30% due 05/15/2014 $ 295,000 296,334
Bank of New York Mellon Corp., MTN
4.50% due 04/01/2013 240,000 242,905
Bank of Nova Scotia
8.30% due 09/27/2013 CAD 97,000 105,227
Bank One Corp.
5.25% due 01/30/2013 $ 200,000 200,650
7.875% due 08/01/2010 310,000 324,415
Banque du Liban, EMTN
10.00% due 04/25/2015 100,000 109,000
Barclays Bank PLC
Copyright © 2012 www.secdatabase.com. All Rights Reserved.Please Consider the Environment Before Printing This Document

6.75% due 05/22/2019 280,000 277,615
Spectrum Income Fund (continued)Shares or
Principal
Amount Value
CORPORATE BONDS (continued)
Banking (continued)
Barclays Bank PLC (continued)
7.40% due 12/15/2009 $ 150,000 $ 150,368
Barclays Bank PLC, EMTN
5.75% due 03/08/2011 EUR 46,000 65,604
BB&T Capital Trust II
6.75% due 06/07/2036 $ 180,000 130,120
BB&T Corp.
5.70% due 04/30/2014 1,030,000 1,027,727
BNP Paribas, EMTN
5.25% due 12/17/2012 EUR 50,000 73,750
Credit Agricole SA, EMTN
5.971% due 01/02/2018 100,000 145,345
Credit Agricole SA, Series TSDI
5 due 06/20/2049 (b) GBP 125,000 125,263
Credit Suisse Group Finance Guernsey, Ltd.
6.375% due 06/07/2013 EUR 116,000 170,339
Credit Suisse New York
5.50% due 05/01/2014 $ 545,000 550,449
Deutsche Bank AG
5.125% due 01/31/2013 EUR 35,000 50,983
Deutsche Bank AG, EMTN
4.50% due 03/07/2011 100,000 145,694
Deutsche Genossenschafts-Hypothekenbank AG,
EMTN
4.00% due 10/31/2016 800,000 1,134,445
DnB NOR Bank ASA, EMTN
4.75% due 03/28/2011 75,000 108,596
Eurohypo AG
4.50% due 01/21/2013 (f) 342,000 505,766
Fifth Third Bancorp
6.25% due 05/01/2013 $ 275,000 262,675
8.25% due 03/01/2038 150,000 115,113
Fortis Bank SA/NV, EMTN
5.757% due 10/04/2017 EUR 75,000 100,034
HBOS PLC
6.00% due 11/01/2033 (f) $ 420,000 235,733
HBOS PLC, EMTN
4.375% due 10/30/2019 (b) EUR 59,000 57,449
HSBC Bank PLC, EMTN
4.25% due 03/18/2016 (b) 21,000 27,350
HSBC Bank USA, Inc.
4.625% due 04/01/2014 $ 100,000 97,035
HSBC Holdings PLC
3.625% due 06/29/2020 (b) EUR 75,000 88,124
6.50% due 05/02/2036 $ 175,000 159,943
9.875% due 04/08/2018 GBP 60,000 105,105
HSBK Europe BV
7.25% due 05/03/2017 $ 100,000 57,000
7.75% due 05/13/2013 240,000 159,600
9.25% due 10/16/2013 200,000 132,345
Hypothekenbank in Essen AG
3.875% due 11/21/2013 EUR 421,000 609,616
Independence Community Bank Corp.
3.0275% due 04/01/2014 (b) $ 15,000 10,707
ING Bank NV, EMTN
5.50% due 01/04/2012 EUR 71,000 99,755
Intesa Sanpaolo SpA, EMTN
Copyright © 2012 www.secdatabase.com. All Rights Reserved.Please Consider the Environment Before Printing This Document

4.375% due 06/26/2018 (b) 50,000 65,589
The accompanying notes are an integral part of the financial statements.
240
JOHN HANCOCK FUNDS II
PORTFOLIO OF INVESTMENTS - May 31, 2009 (Unaudited) - continued(showing percentage of total net assets)
Spectrum Income Fund (continued)Shares or
Principal
Amount Value
CORPORATE BONDS (continued)
Banking (continued)
Intesabci Capital Trust
6.988% due 07/29/2049 (b) EUR 55,000 $ 50,540
Kreditanstalt fuer Wiederaufbau
4.70% due 06/02/2037 CAD 245,000 206,318
Kreditanstalt fuer Wiederaufbau, EMTN
7.375% due 01/27/2010 NGN 50,000,000 299,588
8.50% due 01/18/2011 30,000,000 155,258
Kreditanstalt fuer Wiederaufbau, Series EXCH
5.50% due 12/07/2015 GBP 455,000 818,646
Landwirtschaftliche Rentenbank, Series 7
3.75% due 06/15/2009 $ 110,000 109,927
MPS Capital Trust I
7.99% due 12/29/2049 (b) EUR 35,000 31,172
National Australia Bank, Ltd., EMTN
4.50% due 06/23/2016 (b) 100,000 127,041
NCNB Corp.
9.375% due 09/15/2009 $ 275,000 277,735
Northern Trust Company, BKNT
4.60% due 02/01/2013 120,000 121,925
Northern Trust Corp.
5.30% due 08/29/2011 144,000 151,415
5.50% due 08/15/2013 215,000 224,425
PNC Funding Corp.
5.625% due 02/01/2017 195,000 169,613
7.50% due 11/01/2009 190,000 193,594
Rabobank Nederland, EMTN
3.125% due 07/19/2010 EUR 75,000 106,957
Royal Bank of Canada
5.00% due 01/20/2014 CAD 99,000 96,354
5.75% due 07/25/2011 EUR 50,000 74,838
Royal Bank of Scotland Group PLC, EMTN
5.25% due 05/15/2013 60,000 83,688
Royal Bank of Scotland PLC, EMTN
6.00% due 05/10/2013 40,000 51,187
6 due 06/29/2049 (b) GBP 47,000 34,185
Sanpaolo IMI SpA, EMTN
3.75% due 06/09/2015 (b) EUR 64,000 87,012
Santander Issuances SA, EMTN
4.75% due 05/29/2019 (b) 100,000 122,874
Societe Financement de l'Economie Francaise
3.375% due 05/05/2014 (f) $ 300,000 300,630
Standard Chartered Bank, EMTN
3.625% due 02/03/2017 (b) EUR 210,000 236,487
Sumitomo Mitsui Banking Corp.
4.375% due 07/29/2049 (b) 100,000 103,089
5.625% due 07/29/2049 (b)(f) $ 200,000 174,958
SunTrust Banks, Inc.
7.75% due 05/01/2010 175,000 176,808
Copyright © 2012 www.secdatabase.com. All Rights Reserved.Please Consider the Environment Before Printing This Document

Toronto-Dominion Bank, EMTN
4.875% due 01/23/2013 EUR 100,000 147,153
Toronto-Dominion Bank, MTN
5.69% due 06/03/2018 (b) CAD 119,000 115,435
UniCredito Italiano SpA, EMTN
5.75% due 09/26/2017 EUR 95,000 127,502
6.10% due 02/28/2012 24,000 34,474
US Bancorp
4.20% due 05/15/2014 $ 175,000 174,244
US Bancorp, MTN, Series P
4.50% due 07/29/2010 190,000 194,594
Spectrum Income Fund (continued)Shares or
Principal
Amount Value
CORPORATE BONDS (continued)
Banking (continued)
US Bank NA, BKNT
6.375% due 08/01/2011 $ 400,000 $ 425,154
VTB Capital SA
6.875% due 05/29/2018 250,000 218,750
Wachovia Corp.
5.75% due 02/01/2018 645,000 618,879
Westpac Banking Corp., EMTN
4.875% due 09/28/2012 EUR 75,000 108,211
18,268,418
Biotechnology - 0.08%
Amgen, Inc.
6.40% due 02/01/2039 $ 65,000 66,300
Biogen Idec, Inc.
6.00% due 03/01/2013 295,000 302,352
Genentech, Inc.
4.40% due 07/15/2010 125,000 128,229
4.75% due 07/15/2015 160,000 163,692
660,573
Broadcasting - 0.62%
British Sky Broadcasting Group PLC
6.10% due 02/15/2018 (f) 355,000 329,660
9.50% due 11/15/2018 (f) 310,000 355,566
BSKYB Finance UK PLC
5.75% due 10/20/2017 GBP 65,000 101,319
News America, Inc.
6.15% due 03/01/2037 $ 870,000 689,712
6.20% due 12/15/2034 190,000 155,035
6.40% due 12/15/2035 380,000 314,182
Nexstar Broadcasting, Inc., PIK
7.00% due 01/15/2014 (f) 317,149 90,388
Sirius XM Radio, Inc.
9.625% due 08/01/2013 250,000 161,875
13.00% due 08/01/2013 (f) 1,125,000 810,000
Time Warner Cable, Inc.
5.40% due 07/02/2012 805,000 820,303
7.30% due 07/01/2038 1,145,000 1,161,293
4,989,333
Building Materials & Construction - 0.35%
Associated Materials, Inc.
11.25 due 03/01/2014 250,000 80,000
Columbus McKinnon Corp.
Copyright © 2012 www.secdatabase.com. All Rights Reserved.Please Consider the Environment Before Printing This Document

8.875% due 11/01/2013 575,000 569,250
CRH America, Inc.
5.30% due 10/15/2013 (f) 140,000 127,434
6.00% due 09/30/2016 240,000 201,610
6.40% due 10/15/2033 65,000 44,942
Esco Corp.
5.195% due 12/15/2013 (b)(f) 175,000 126,000
8.625% due 12/15/2013 (f) 600,000 504,000
Lafarge SA
6.15% due 07/15/2011 140,000 137,327
Linde Finance BV
6.50% due 01/29/2016 GBP 65,000 110,800
Linde Finance BV, EMTN
4.75% due 04/24/2017 EUR 100,000 137,103
Obrascon Huarte Lain SA
5.00% due 05/18/2012 100,000 94,718
The accompanying notes are an integral part of the financial statements.
241
JOHN HANCOCK FUNDS II
PORTFOLIO OF INVESTMENTS - May 31, 2009 (Unaudited) - continued(showing percentage of total net assets)
Spectrum Income Fund (continued)Shares or
Principal
Amount Value
CORPORATE BONDS (continued)
Building Materials & Construction
(continued)
Texas Industries, Inc.
7.25% due 07/15/2013 $ 525,000 $ 451,500
7.25% due 07/15/2013 (f) 125,000 107,500
US Concrete, Inc.
8.375% due 04/01/2014 200,000 124,000
2,816,184
Business Services - 0.64%
Affinity Group, Inc.
9.00% due 02/15/2012 100,000 56,250
10.875% due 02/15/2012 48,587 21,621
Deluxe Corp.
7.375% due 06/01/2015 600,000 474,000
Dun & Bradstreet Corp.
5.50% due 03/15/2011 120,000 120,931
First Data Corp.
9.875% due 09/24/2015 1,025,000 697,000
10.55% due 09/24/2015 843,649 436,588
FTI Consulting, Inc.
7.625% due 06/15/2013 375,000 367,500
7.75% due 10/01/2016 550,000 540,375
Manpower, Inc., EMTN
4.75% due 06/14/2013 EUR 50,000 55,769
Mobile Services Group, Inc.
9.75% due 08/01/2014 $ 525,000 489,562
Nebraska Book Company, Inc.
8.625% due 03/15/2012 625,000 450,000
SunGard Data Systems, Inc.
9.125% due 08/15/2013 448,000 431,200
10.25% due 08/15/2015 75,000 68,062
10.625% due 05/15/2015 (f) 175,000 169,313
Copyright © 2012 www.secdatabase.com. All Rights Reserved.Please Consider the Environment Before Printing This Document

Thomson Reuters Corp.
5.20% due 12/01/2014 CAD 40,000 37,143
5.95% due 07/15/2013 $ 390,000 396,244
6.50% due 07/15/2018 340,000 338,424
5,149,982
Cable & Television - 1.14%
AT&T Broadband Corp.
8.375% due 03/15/2013 409,000 455,581
Cablemas SA de CV, Series REGS
9.375% due 11/15/2015 200,000 202,000
Charter Communications, Inc.
10.875% due 09/15/2014 ^ (f) 300,000 309,000
Comcast Cable Communications, Inc.
6.75% due 01/30/2011 125,000 132,766
Comcast Corp.
5.70% due 05/15/2018 315,000 312,445
5.85% due 01/15/2010 100,000 102,138
Cox Communications, Inc.
6.25% due 06/01/2018 (f) 445,000 428,152
7.125% due 10/01/2012 171,000 179,151
9.375% due 01/15/2019 (f) 220,000 254,076
CSC Holdings, Inc.
8.625% due 02/15/2019 (f) 125,000 122,656
DirecTV Holdings LLC
6.375% due 06/15/2015 350,000 318,500
7.625% due 05/15/2016 425,000 411,188
8.375% due 03/15/2013 225,000 226,687
Spectrum Income Fund (continued)Shares or
Principal
Amount Value
CORPORATE BONDS (continued)
Cable & Television (continued)
EchoStar DBS Corp.
6.625% due 10/01/2014 $ 500,000 $ 453,750
7.75% due 05/31/2015 100,000 94,500
Grupo Televisa SA
6.00% due 05/15/2018 150,000 143,817
Historic TW, Inc.
6.875% due 06/15/2018 1,080,000 1,028,981
ITV PLC, EMTN
6.00% due 10/03/2011 EUR 60,000 72,947
Kabel Deutschland GmbH
10.625% due 07/01/2014 $ 375,000 388,125
Mediacom Broadband LLC
8.50% due 10/15/2015 400,000 364,000
Rainbow National Services LLC
8.75% due 09/01/2012 (f) 100,000 101,125
Rogers Cable, Inc.
5.50% due 03/15/2014 160,000 161,134
6.25% due 06/15/2013 335,000 344,847
Sinclair Broadcast Group, Inc.
8.00% due 03/15/2012 925,000 603,563
Time Warner Cable, Inc.
7.50% due 04/01/2014 45,000 48,809
8.25% due 02/14/2014 350,000 389,659
Time Warner, Inc.
5.50% due 11/15/2011 275,000 284,315
Univision Communications, Inc.
7.85% due 07/15/2011 525,000 464,625
9.75% due 03/15/2015 (f) 700,000 217,000
Viacom, Inc.
Copyright © 2012 www.secdatabase.com. All Rights Reserved.Please Consider the Environment Before Printing This Document

5.75% due 04/30/2011 95,000 96,306
Videotron Ltee
9.125% due 04/15/2018 25,000 25,875
Videotron Ltee.
6.375% due 12/15/2015 125,000 113,125
6.875% due 01/15/2014 390,000 368,550
9.125% due 04/15/2018 (f) 25,000 25,875
9,245,268
Cellular Communications - 1.02%
America Movil SAB de CV
5.625% due 11/15/2017 110,000 106,466
6.375% due 03/01/2035 600,000 537,035
8.46% due 12/18/2036 MXN 1,000,000 56,426
AT&T Wireless Services, Inc.
7.875% due 03/01/2011 $ 455,000 494,562
Cricket Communications, Inc.
7.75% due 05/15/2016 (f) 400,000 386,500
9.375% due 11/01/2014 850,000 845,750
10.00% due 07/15/2015 (f) 175,000 176,750
Crown Castle International Corp.
9.00% due 01/15/2015 550,000 555,500
MetroPCS Wireless, Inc.
9.25% due 11/01/2014 575,000 577,156
9.25% due 11/01/2014 (f) 375,000 375,000
Millicom International Cellular SA
10.00% due 12/01/2013 125,000 127,500
Motorola, Inc.
8.00% due 11/01/2011 325,000 324,872
The accompanying notes are an integral part of the financial statements.
242
JOHN HANCOCK FUNDS II
PORTFOLIO OF INVESTMENTS - May 31, 2009 (Unaudited) - continued(showing percentage of total net assets)
Spectrum Income Fund (continued)Shares or
Principal
Amount Value
CORPORATE BONDS (continued)
Cellular Communications (continued)
Nextel Communications, Inc.
6.875% due 10/31/2013 $ 325,000 $ 270,563
Nextel Communications, Inc., Series D
7.375% due 08/01/2015 275,000 217,937
Rogers Communications, Inc.
6.80% due 08/15/2018 425,000 453,768
7.50% due 03/15/2015 140,000 150,349
Rogers Wireless, Inc.
6.375% due 03/01/2014 400,000 415,616
7.625% due 12/15/2011 CAD 35,000 34,668
Verizon Wireless Capital LLC
3.75% due 05/20/2011 (f) $ 200,000 204,054
7.375% due 11/15/2013 (f) 315,000 353,462
8.50% due 11/15/2018 (f) 695,000 843,195
VIP Finance Ireland, Ltd.
8.375% due 04/30/2013 230,000 209,875
9.125% due 04/30/2018 200,000 167,500
Vodafone Group PLC
5.625% due 02/27/2017 275,000 283,806
Copyright © 2012 www.secdatabase.com. All Rights Reserved.Please Consider the Environment Before Printing This Document
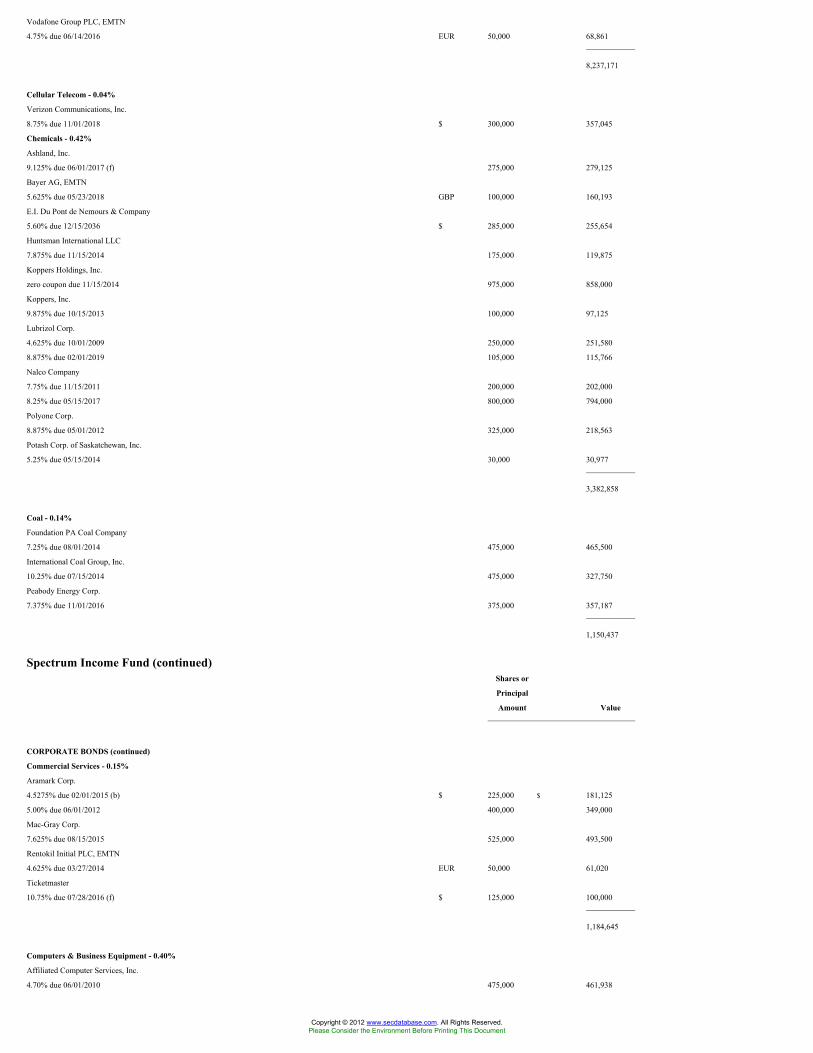
Vodafone Group PLC, EMTN
4.75% due 06/14/2016 EUR 50,000 68,861
8,237,171
Cellular Telecom - 0.04%
Verizon Communications, Inc.
8.75% due 11/01/2018 $ 300,000 357,045
Chemicals - 0.42%
Ashland, Inc.
9.125% due 06/01/2017 (f) 275,000 279,125
Bayer AG, EMTN
5.625% due 05/23/2018 GBP 100,000 160,193
E.I. Du Pont de Nemours & Company
5.60% due 12/15/2036 $ 285,000 255,654
Huntsman International LLC
7.875% due 11/15/2014 175,000 119,875
Koppers Holdings, Inc.
zero coupon due 11/15/2014 975,000 858,000
Koppers, Inc.
9.875% due 10/15/2013 100,000 97,125
Lubrizol Corp.
4.625% due 10/01/2009 250,000 251,580
8.875% due 02/01/2019 105,000 115,766
Nalco Company
7.75% due 11/15/2011 200,000 202,000
8.25% due 05/15/2017 800,000 794,000
Polyone Corp.
8.875% due 05/01/2012 325,000 218,563
Potash Corp. of Saskatchewan, Inc.
5.25% due 05/15/2014 30,000 30,977
3,382,858
Coal - 0.14%
Foundation PA Coal Company
7.25% due 08/01/2014 475,000 465,500
International Coal Group, Inc.
10.25% due 07/15/2014 475,000 327,750
Peabody Energy Corp.
7.375% due 11/01/2016 375,000 357,187
1,150,437
Spectrum Income Fund (continued)Shares or
Principal
Amount Value
CORPORATE BONDS (continued)
Commercial Services - 0.15%
Aramark Corp.
4.5275% due 02/01/2015 (b) $ 225,000 $ 181,125
5.00% due 06/01/2012 400,000 349,000
Mac-Gray Corp.
7.625% due 08/15/2015 525,000 493,500
Rentokil Initial PLC, EMTN
4.625% due 03/27/2014 EUR 50,000 61,020
Ticketmaster
10.75% due 07/28/2016 (f) $ 125,000 100,000
1,184,645
Computers & Business Equipment - 0.40%
Affiliated Computer Services, Inc.
4.70% due 06/01/2010 475,000 461,938
Copyright © 2012 www.secdatabase.com. All Rights Reserved.Please Consider the Environment Before Printing This Document

Hewlett-Packard Company
2.95% due 08/15/2012 345,000 349,571
International Business Machines Corp.
6.50% due 10/15/2013 250,000 278,506
6.625% due 01/30/2014 EUR 50,000 77,558
Seagate Technology HDD Holdings
6.375% due 10/01/2011 $ 250,000 233,750
Seagate Technology International
10.00% due 05/01/2014 (f) 475,000 479,750
Xerox Corp.
5.50% due 05/15/2012 295,000 290,019
5.65% due 05/15/2013 560,000 554,567
6.35% due 05/15/2018 455,000 395,850
8.25% due 05/15/2014 125,000 126,870
3,248,379
Containers & Glass - 0.41%
BWAY Corp.
10.00% due 04/15/2014 (f) 575,000 574,281
Clondalkin Acquisition BV
3.32% due 12/15/2013 (b)(f) 625,000 412,500
Crown Americas LLC
7.625% due 05/15/2017 (f) 250,000 245,000
Graham Packaging Company
9.875% due 10/15/2014 675,000 600,750
Graphic Packaging International Corp.
8.50% due 08/15/2011 475,000 470,250
9.50% due 08/15/2013 75,000 70,125
Plastipak Holdings, Inc.
8.50% due 12/15/2015 (f) 600,000 513,000
Silgan Holdings, Inc.
6.75% due 11/15/2013 375,000 365,625
Vitro SA de CV
8.625% due 02/01/2012 ^ 200,000 66,250
3,317,781
Crude Petroleum & Natural Gas - 1.49%
Amerada Hess Corp.
7.375% due 10/01/2009 75,000 75,646
AmeriGas Partners LP
7.125% due 05/20/2016 25,000 23,156
7.25% due 05/20/2015 825,000 775,500
Berry Petroleum Company
10.25% due 06/01/2014 300,000 294,375
Bill Barrett Corp.
5.00% due 03/15/2028 202,000 182,305
The accompanying notes are an integral part of the financial statements.
243
JOHN HANCOCK FUNDS II
PORTFOLIO OF INVESTMENTS - May 31, 2009 (Unaudited) - continued(showing percentage of total net assets)
Spectrum Income Fund (continued)Shares or
Principal
Amount Value
CORPORATE BONDS (continued)
Crude Petroleum & Natural Gas
(continued)
Copyright © 2012 www.secdatabase.com. All Rights Reserved.Please Consider the Environment Before Printing This Document

Canadian Natural Resources, Ltd.
5.15% due 02/01/2013 $ 180,000 $ 184,216
6.25% due 03/15/2038 210,000 185,146
6.45% due 06/30/2033 75,000 64,925
Canadian Natural Resources, Ltd., MTN
4.50% due 01/23/2013 CAD 45,000 41,957
Chesapeake Energy Corp.
6.375% due 06/15/2015 $ 50,000 42,875
6.875% due 01/15/2016 75,000 64,687
9.50% due 02/15/2015 500,000 493,750
Compton Petroleum Finance Corp.
7.625% due 12/01/2013 600,000 300,000
Connacher Oil and Gas, Ltd.
10.25% due 12/15/2015 (f) 1,225,000 777,875
Denbury Resources, Inc.
9.75% due 03/01/2016 400,000 408,000
EnCana Corp.
4.60% due 08/15/2009 245,000 246,579
5.90% due 12/01/2017 380,000 379,572
EnCana Corp., MTN
5.80% due 01/18/2018 CAD 30,000 28,385
Encore Acquisition Company
7.25% due 12/01/2017 $ 400,000 335,000
9.50% due 05/01/2016 150,000 145,500
Forest Oil Corp.
7.25% due 06/15/2019 500,000 430,000
8.50% due 02/15/2014 (f) 50,000 48,250
Gulfstream Natural Gas System LLC
6.95% due 06/01/2016 (f) 90,000 92,049
Hess Corp.
6.65% due 08/15/2011 250,000 265,572
7.875% due 10/01/2029 368,000 373,364
8.125% due 02/15/2019 55,000 60,432
Hilcorp Energy I LP
7.75% due 11/01/2015 (f) 1,175,000 1,010,500
KazMunaiGaz Finance Sub BV, Series REGS
9.125% due 07/02/2018 300,000 273,000
Marathon Oil Corp.
6.50% due 02/15/2014 85,000 89,547
OPTI Canada, Inc.
7.875% due 12/15/2014 575,000 388,125
8.25% due 12/15/2014 1,000,000 690,000
Petrobras International Finance Company
5.875% due 03/01/2018 511,000 499,289
7.875% due 03/15/2019 115,000 125,350
PetroHawk Energy Corp.
7.875% due 06/01/2015 (f) 150,000 139,125
9.125% due 07/15/2013 650,000 638,625
10.50% due 08/01/2014 425,000 435,625
Petroleos Mexicanos
8.00% due 05/03/2019 (f) 160,000 174,880
Pride International, Inc.
8.50% due 06/15/2019 150,000 151,125
Quicksilver Resources, Inc.
8.25% due 08/01/2015 225,000 187,875
SandRidge Energy, Inc., PIK
8.625% due 04/01/2015 1,000,000 852,500
Spectrum Income Fund (continued)Shares or
Principal
Amount Value
CORPORATE BONDS (continued)
Crude Petroleum & Natural Gas
(continued)
Copyright © 2012 www.secdatabase.com. All Rights Reserved.Please Consider the Environment Before Printing This Document

Southern Natural Gas Company
5.90% due 04/01/2017 (f) $ 99,000 $ 92,133
12,066,815
Domestic Oil - 0.53%
ConocoPhillips Company
5.30% due 04/15/2012 415,000 442,810
Devon Energy Corp.
5.625% due 01/15/2014 105,000 110,092
Devon Financing Corp.
6.875% due 09/30/2011 330,000 357,727
7.875% due 09/30/2031 375,000 418,120
Diamond Offshore Drilling, Inc.
4.875% due 07/01/2015 240,000 225,684
5.15% due 09/01/2014 395,000 393,434
5.875% due 05/01/2019 80,000 78,555
EOG Resources, Inc.
5.875% due 09/15/2017 185,000 192,455
6.125% due 10/01/2013 215,000 233,172
Marathon Oil Corp.
5.90% due 03/15/2018 395,000 377,615
6.00% due 10/01/2017 220,000 215,556
6.60% due 10/01/2037 80,000 71,326
Range Resources Corp.
7.375% due 07/15/2013 75,000 73,125
7.50% due 05/15/2016 100,000 96,000
SandRidge Energy, Inc.
4.8325% due 04/01/2014 (b) 500,000 395,154
Valero Energy Corp.
6.125% due 06/15/2017 510,000 490,075
9.375% due 03/15/2019 140,000 156,727
4,327,627
Drugs & Health Care - 0.04%
AstraZeneca PLC, EMTN
5.125% due 01/15/2015 EUR 50,000 73,888
Wyeth
5.95% due 04/01/2037 $ 205,000 208,347
282,235
Educational Services - 0.08%
Education Management Corp.
8.75% due 06/01/2014 300,000 292,500
10.25% due 06/01/2016 325,000 316,875
609,375
Electrical Equipment - 0.03%
Emerson Electric Company
5.00% due 04/15/2019 105,000 105,238
General Cable Corp.
3.5825% due 04/01/2015 (b) 200,000 162,000
267,238
Electrical Utilities - 1.85%
AES Corp.
7.75% due 03/01/2014 50,000 47,625
8.875% due 02/15/2011 275,000 277,063
9.50% due 06/01/2009 100,000 100,000
9.75% due 04/15/2016 (f) 725,000 728,625
The accompanying notes are an integral part of the financial statements.
244
Copyright © 2012 www.secdatabase.com. All Rights Reserved.Please Consider the Environment Before Printing This Document

JOHN HANCOCK FUNDS II
PORTFOLIO OF INVESTMENTS - May 31, 2009 (Unaudited) - continued(showing percentage of total net assets)
Spectrum Income Fund (continued)Shares or
Principal
Amount Value
CORPORATE BONDS (continued)
Electrical Utilities (continued)
Alabama Power Company
1.4388% due 08/25/2009 (b) $ 120,000 $ 120,156
Alabama Power Company, Series 07-D
4.85% due 12/15/2012 100,000 105,717
Appalachian Power Company
6.375% due 04/01/2036 170,000 147,456
7.95% due 01/15/2020 100,000 108,845
Appalachian Power Company, Series O
5.65% due 08/15/2012 325,000 328,965
Baltimore Gas & Electric Company
5.90% due 10/01/2016 285,000 267,745
Black Hills Corp.
6.50% due 05/15/2013 235,000 219,283
9.00% due 05/15/2014 155,000 157,581
Carolina Power & Light Company
5.30% due 01/15/2019 140,000 143,522
CenterPoint Energy Transition Bond Company
LLC, Series A-2
4.97% due 08/01/2014 171,227 178,946
CenterPoint Energy, Inc., Series B
7.25% due 09/01/2010 205,000 208,166
CMS Energy Corp.
8.50% due 04/15/2011 50,000 50,501
Consolidated Edison Company of New York, Inc.
6.75% due 04/01/2038 170,000 185,332
Consumers Energy Company
5.80% due 09/15/2035 100,000 85,846
Detroit Edison Company
6.40% due 10/01/2013 200,000 213,740
Dominion Resources, Inc.
4.75% due 12/15/2010 100,000 102,628
E.ON International Finance BV, EMTN
5.125% due 10/02/2012 EUR 50,000 74,943
5.50% due 01/19/2016 40,000 59,347
Edison SpA, EMTN
5.125% due 12/10/2010 28,000 40,758
EDP Finance BV, EMTN
3.75% due 06/22/2015 80,000 106,556
El Paso Electric Company
6.00% due 05/15/2035 $ 245,000 161,470
Electricite de France SA
6.95% due 01/26/2039 225,000 246,695
Elia System Operator SA
4.75% due 05/13/2014 EUR 42,000 59,487
Energy Future Holdings Corp.
10.875% due 11/01/2017 $ 500,000 355,000
Energy Future Holdings Corp., PIK
11.25% due 11/01/2017 2,358,500 1,232,316
Entergy Louisiana LLC
5.83% due 11/01/2010 35,000 35,031
Hydro One, Inc., MTN
5.18% due 10/18/2017 CAD 69,000 66,091
Copyright © 2012 www.secdatabase.com. All Rights Reserved.Please Consider the Environment Before Printing This Document

Illinois Power Company
6.125% due 11/15/2017 $ 120,000 115,470
Jersey Central Power & Light Company
5.65% due 06/01/2017 405,000 382,183
Mirant Americas Generation LLC
8.30% due 05/01/2011 350,000 348,250
Spectrum Income Fund (continued)Shares or
Principal
Amount Value
CORPORATE BONDS (continued)
Electrical Utilities (continued)
Monongahela Power Company
5.70% due 03/15/2017 (f) $ 265,000 $ 234,832
National Grid PLC, EMTN
5.00% due 07/02/2018 EUR 62,000 81,289
6.50% due 04/22/2014 50,000 74,595
National Power Corp.
5.5006% due 08/23/2011 (b)(f) $ 200,000 202,000
6.875% due 11/02/2016 100,000 99,315
9.625% due 05/15/2028 135,000 143,100
Nevada Power Company
5.875% due 01/15/2015 45,000 43,964
Nevada Power Company, Series R
6.75% due 07/01/2037 245,000 221,421
Northeast Utilities
5.65% due 06/01/2013 600,000 599,406
Northern States Power
5.25% due 03/01/2018 115,000 117,686
Ohio Power Company
5.75% due 09/01/2013 195,000 202,568
Orion Power Holdings, Inc.
12.00% due 05/01/2010 200,000 206,500
Pacific Gas & Electric Company
4.80% due 03/01/2014 235,000 243,264
6.25% due 03/01/2039 55,000 56,642
6.35% due 02/15/2038 110,000 115,508
PPL Electric Utilities Corp.
7.125% due 11/30/2013 155,000 172,525
RRI Energy, Inc.
6.75% due 12/15/2014 600,000 573,000
7.625% due 06/15/2014 675,000 588,938
7.875% due 06/15/2017 375,000 310,313
San Diego Gas & Electric Company
6.00% due 06/01/2039 175,000 177,893
Scottish & Southern Energy PLC, EMTN
6.125% due 07/29/2013 EUR 50,000 74,715
Scottish Power UK PLC
8.375% due 02/20/2017 GBP 39,000 74,421
Sierra Pacific Resources
7.803% due 06/15/2012 $ 125,000 124,911
8.625% due 03/15/2014 100,000 98,500
Southern California Edison Company
5.75% due 03/15/2014 150,000 162,824
Southern Company
4.15% due 05/15/2014 145,000 145,139
Southern Company, Series A
5.30% due 01/15/2012 95,000 99,654
Tampa Electric Company
6.15% due 05/15/2037 230,000 200,302
Taqa Abu Dhabi National Energy Company
5.62% due 10/25/2012 (f) 820,000 828,435
6.60% due 08/01/2013 (f) 105,000 107,946
Texas Competitive Electric Holdings Company
Copyright © 2012 www.secdatabase.com. All Rights Reserved.Please Consider the Environment Before Printing This Document

LLC, PIK
10.50% due 11/01/2016 343,281 137,312
Union Electric Company
5.40% due 02/01/2016 285,000 269,461
Virginia Electric and Power Company
4.50% due 12/15/2010 230,000 236,235
5.10% due 11/30/2012 210,000 219,351
The accompanying notes are an integral part of the financial statements.
245
JOHN HANCOCK FUNDS II
PORTFOLIO OF INVESTMENTS - May 31, 2009 (Unaudited) - continued(showing percentage of total net assets)
Spectrum Income Fund (continued)Shares or
Principal
Amount Value
CORPORATE BONDS (continued)
Electrical Utilities (continued)
Virginia Electric and Power Company, Series A
6.00% due 05/15/2037 $ 300,000 $ 300,717
West Penn Power Company
5.95% due 12/15/2017 (f) 220,000 196,650
Westar Energy, Inc.
5.10% due 07/15/2020 185,000 157,923
Xcel Energy, Inc.
7.00% due 12/01/2010 30,000 31,256
14,991,850
Electronics - 0.04%
Flextronics International, Ltd.
6.50% due 05/15/2013 300,000 283,500
Energy - 0.67%
Copano Energy LLC
8.125% due 03/01/2016 575,000 534,750
Duke Energy Corp.
6.30% due 02/01/2014 90,000 95,464
Dynegy Holdings, Inc.
7.75% due 06/01/2019 1,500,000 1,091,250
Encore Acquisition Company
6.25% due 04/15/2014 275,000 234,437
Enterprise Products Operating LP
4.95% due 06/01/2010 490,000 492,708
6.30% due 09/15/2017 215,000 206,673
Ferrellgas Partners LP
8.75% due 06/15/2012 900,000 828,000
Hercules Offshore, Inc.
3.375% due 06/01/2038 126,000 66,150
Mirant North America LLC
7.375% due 12/31/2013 550,000 526,625
Northwest Pipeline Corp.
5.95% due 04/15/2017 65,000 61,606
NRG Energy, Inc.
7.25% due 02/01/2014 400,000 383,000
7.375% due 02/01/2016 30,000 28,238
7.375% due 01/15/2017 500,000 470,000
Plains Exploration & Production Company
7.00% due 03/15/2017 300,000 261,000
Sempra Energy
7.95% due 03/01/2010 175,000 181,671
Copyright © 2012 www.secdatabase.com. All Rights Reserved.Please Consider the Environment Before Printing This Document

5,461,572
Financial Services - 5.70%
AAC Group Holding Corp.
10.25 due 10/01/2012 (f) 125,000 76,250
American Express Company
7.25% due 05/20/2014 105,000 107,195
American Express Credit Corp., MTN
5.875% due 05/02/2013 380,000 368,859
American Express Credit Corp., Series C
7.30% due 08/20/2013 300,000 303,689
American Honda Finance Corp., EMTN
6.25% due 07/16/2013 EUR 50,000 71,628
Arch Western Finance LLC
6.75% due 07/01/2013 $ 625,000 568,750
Atlantic Finance, Ltd.
8.75% due 05/27/2014 100,000 98,813
Spectrum Income Fund (continued)Shares or
Principal
Amount Value
CORPORATE BONDS (continued)
Financial Services (continued)
Bank Nederlandse Gemeenten, EMTN
4.625% due 09/13/2012 EUR 925,000 $ 1,382,471
BAT International Finance PLC
8.125% due 11/15/2013 (f) $ 955,000 1,039,857
BAT International Finance PLC, EMTN
5.375% due 06/29/2017 EUR 130,000 180,415
BHP Billiton Finance, Ltd.
5.40% due 03/29/2017 $ 170,000 173,428
BMW Finance NV, EMTN
8.875% due 09/19/2013 EUR 90,000 141,881
Boeing Capital Corp., Ltd.
7.375% due 09/27/2010 $ 255,000 272,125
Capital One Capital IV
6.745% due 02/17/2037 (b) 425,000 283,285
Capital One Financial Corp.
7.375% due 05/23/2014 225,000 231,827
Caterpillar Financial Services Corp., MTN
4.25% due 02/08/2013 220,000 216,153
5.85% due 09/01/2017 165,000 160,086
CenterCredit International BV
8.625% due 01/30/2014 540,000 356,319
CIT Group, Inc., MTN
4.75% due 12/15/2010 175,000 148,880
Citigroup, Inc.
4.75% due 02/10/2019 (b) EUR 40,000 35,846
5.125% due 02/14/2011 $ 220,000 216,586
5.50% due 08/27/2012 220,000 215,092
5.50% due 04/11/2013 615,000 589,831
5.85% due 07/02/2013 445,000 424,754
6.125% due 05/15/2018 665,000 593,270
6.50% due 08/19/2013 130,000 128,827
8.50% due 05/22/2019 175,000 181,193
Citigroup, Inc., EMTN
3.50% due 08/05/2015 EUR 160,000 182,060
6.40% due 03/27/2013 110,000 152,803
Countrywide Financial Corp.
4.50% due 06/15/2010 $ 135,000 133,545
Countrywide Home Loans, Inc., MTN
4.125% due 09/15/2009 540,000 537,373
Credit Suisse First Boston USA, Inc.
Copyright © 2012 www.secdatabase.com. All Rights Reserved.Please Consider the Environment Before Printing This Document

4.875% due 08/15/2010 325,000 332,971
6.125% due 11/15/2011 435,000 460,813
Credit Suisse USA, Inc.
5.50% due 08/16/2011 170,000 178,306
Credit Suisse/London, EMTN
5.125% due 09/18/2017 EUR 75,000 105,105
6.125% due 08/05/2013 50,000 74,590
E*Trade Financial Corp.
8.00% due 06/15/2011 $ 275,000 184,250
12.50% due 11/30/2017 1,662,000 1,101,075
ERP Operating LP
3.85% due 08/15/2026 15,000 14,063
Finmeccanica Finance SA, EMTN
8.125% due 12/03/2013 EUR 75,000 114,458
Ford Motor Credit Company LLC
7.875% due 06/15/2010 $ 1,400,000 1,332,565
9.75% due 09/15/2010 750,000 710,139
Fresenius US Finance II, Inc.
9.00% due 07/15/2015 (f) 100,000 103,750
The accompanying notes are an integral part of the financial statements.
246
JOHN HANCOCK FUNDS II
PORTFOLIO OF INVESTMENTS - May 31, 2009 (Unaudited) - continued(showing percentage of total net assets)
Spectrum Income Fund (continued)Shares or
Principal
Amount Value
CORPORATE BONDS (continued)
Financial Services (continued)
GATX Financial Corp.
5.50% due 02/15/2012 $ 275,000 $ 263,625
GE Capital Canada Funding Company, MTN
4.65% due 02/11/2015 CAD 134,000 118,110
GE Capital European Funding, EMTN
3.50% due 02/14/2013 EUR 160,000 214,782
GE Capital UK Funding, EMTN
5.625% due 12/12/2014 GBP 145,000 226,674
General Electric Capital Corp.
4.625% due 09/15/2066 (b) EUR 135,000 106,876
4.80% due 05/01/2013 $ 1,105,000 1,091,689
5.875% due 01/14/2038 650,000 526,234
5.90% due 05/13/2014 1,150,000 1,158,793
General Electric Capital Corp., MTN
5.25% due 10/19/2012 250,000 253,190
General Electric Capital Corp., MTNA
4.25% due 09/13/2010 480,000 487,131
GMAC LLC
6.875% due 09/15/2011 75,000 66,304
6.875% due 09/15/2011 (f) 425,000 380,375
7.75% due 01/19/2010 (f) 175,000 167,125
8.00% due 11/01/2031 (f) 375,000 281,250
Goldman Sachs Group, Inc.
3.75% due 02/04/2013 EUR 75,000 99,952
5.125% due 10/16/2014 100,000 135,552
6.00% due 05/01/2014 $ 130,000 132,175
6.15% due 04/01/2018 830,000 801,263
6.345% due 02/15/2034 324,000 260,725
6.60% due 01/15/2012 180,000 190,175
6.75% due 10/01/2037 335,000 280,839
Copyright © 2012 www.secdatabase.com. All Rights Reserved.Please Consider the Environment Before Printing This Document

6.875% due 01/15/2011 460,000 485,225
7.50% due 02/15/2019 545,000 573,476
Goldman Sachs Group, Inc., GMTN
4.50% due 01/30/2017 EUR 100,000 123,826
GTB Finance BV
8.50% due 01/29/2012 $ 475,000 358,482
Hawker Beechcraft Acquisition Company LLC
8.50% due 04/01/2015 700,000 294,000
9.75% due 04/01/2017 100,000 31,000
Hawker Beechcraft Acquisition Company LLC, PIK
8.875% due 04/01/2015 200,000 62,000
Icahn Enterprises LP
4.00% due 08/15/2013 (b) 549,000 375,255
7.125% due 02/15/2013 600,000 513,000
International Lease Finance Corp., MTN
5.30% due 05/01/2012 375,000 293,224
5.45% due 03/24/2011 500,000 422,993
6.625% due 11/15/2013 625,000 476,757
iPayment Investors LP
11.625% due 07/15/2014 (b)(f) 443,264 310,285
iPayment, Inc.
9.75% due 05/15/2014 400,000 217,000
Jefferies Group, Inc.
5.875% due 06/08/2014 176,000 146,143
6.25% due 01/15/2036 260,000 152,343
John Deere Capital Corp., MTN
4.95% due 12/17/2012 805,000 834,035
5.50% due 04/13/2017 130,000 127,507
Spectrum Income Fund (continued)Shares or
Principal
Amount Value
CORPORATE BONDS (continued)
Financial Services (continued)
JPMorgan Chase & Company
2.125% due 12/26/2012 $ 45,000 $ 45,120
4.65% due 06/01/2014 1,230,000 1,221,720
4.75% due 05/01/2013 485,000 498,692
6.00% due 01/15/2018 805,000 801,197
6.30% due 04/23/2019 350,000 348,218
6.40% due 05/15/2038 380,000 383,493
JPMorgan Chase & Company, EMTN
4.25% due 06/09/2011 EUR 39,000 55,372
4.375% due 11/12/2019 (b) 150,000 169,870
JPMorgan Chase Capital XVIII, Series R
6.95% due 08/17/2036 $ 115,000 91,156
JPMorgan Chase Capital XXII, Series V
6.45% due 02/02/2037 245,000 191,983
JSG Funding PLC
7.75% due 04/01/2015 250,000 170,000
Lazard Group LLC
7.125% due 05/15/2015 500,000 436,282
Mellon Funding Corp.
6.375% due 11/08/2011 GBP 145,000 243,679
Merrill Lynch & Company, Inc.
5.45% due 02/05/2013 $ 655,000 610,550
7.75% due 05/14/2038 410,000 362,045
Merrill Lynch & Company, Inc., EMTN
4.625% due 10/02/2013 EUR 80,000 105,282
Merrill Lynch & Company, Inc., MTN
6.15% due 04/25/2013 $ 195,000 187,567
6.875% due 04/25/2018 745,000 691,404
Metropolitan Life Global Funding
5.125% due 11/09/2011 (f) 335,000 342,667
Copyright © 2012 www.secdatabase.com. All Rights Reserved.Please Consider the Environment Before Printing This Document
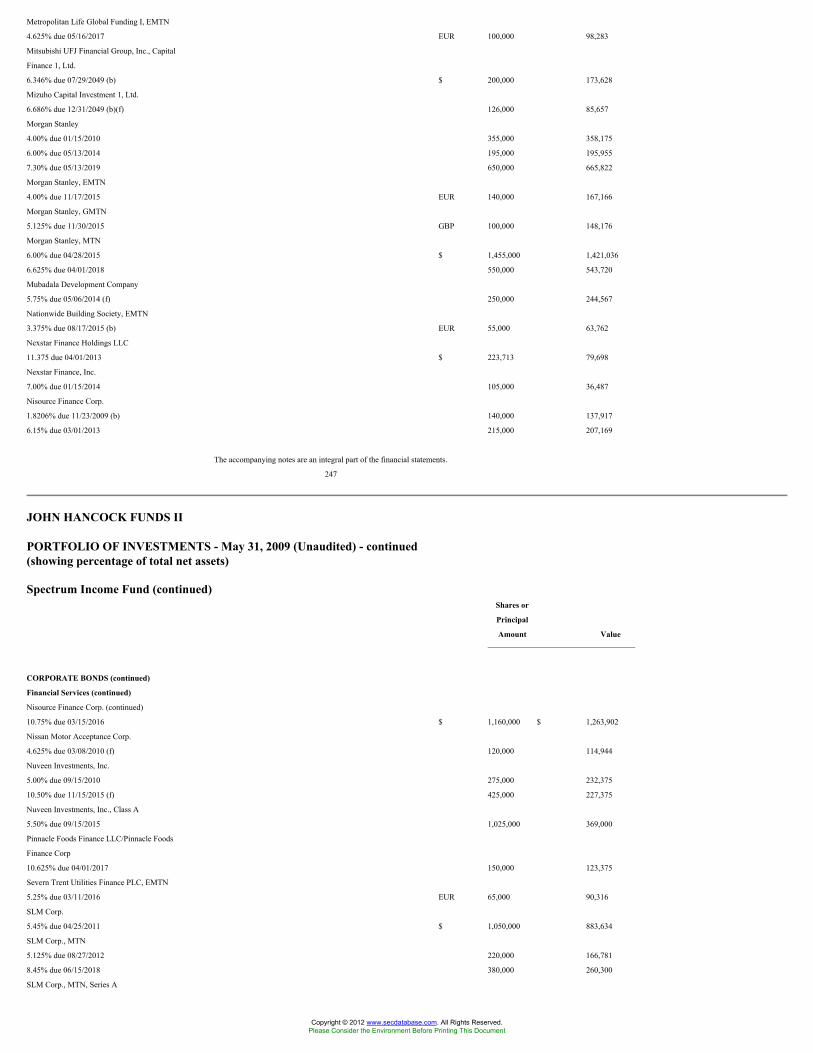
Metropolitan Life Global Funding I, EMTN
4.625% due 05/16/2017 EUR 100,000 98,283
Mitsubishi UFJ Financial Group, Inc., Capital
Finance 1, Ltd.
6.346% due 07/29/2049 (b) $ 200,000 173,628
Mizuho Capital Investment 1, Ltd.
6.686% due 12/31/2049 (b)(f) 126,000 85,657
Morgan Stanley
4.00% due 01/15/2010 355,000 358,175
6.00% due 05/13/2014 195,000 195,955
7.30% due 05/13/2019 650,000 665,822
Morgan Stanley, EMTN
4.00% due 11/17/2015 EUR 140,000 167,166
Morgan Stanley, GMTN
5.125% due 11/30/2015 GBP 100,000 148,176
Morgan Stanley, MTN
6.00% due 04/28/2015 $ 1,455,000 1,421,036
6.625% due 04/01/2018 550,000 543,720
Mubadala Development Company
5.75% due 05/06/2014 (f) 250,000 244,567
Nationwide Building Society, EMTN
3.375% due 08/17/2015 (b) EUR 55,000 63,762
Nexstar Finance Holdings LLC
11.375 due 04/01/2013 $ 223,713 79,698
Nexstar Finance, Inc.
7.00% due 01/15/2014 105,000 36,487
Nisource Finance Corp.
1.8206% due 11/23/2009 (b) 140,000 137,917
6.15% due 03/01/2013 215,000 207,169
The accompanying notes are an integral part of the financial statements.
247
JOHN HANCOCK FUNDS II
PORTFOLIO OF INVESTMENTS - May 31, 2009 (Unaudited) - continued(showing percentage of total net assets)
Spectrum Income Fund (continued)Shares or
Principal
Amount Value
CORPORATE BONDS (continued)
Financial Services (continued)
Nisource Finance Corp. (continued)
10.75% due 03/15/2016 $ 1,160,000 $ 1,263,902
Nissan Motor Acceptance Corp.
4.625% due 03/08/2010 (f) 120,000 114,944
Nuveen Investments, Inc.
5.00% due 09/15/2010 275,000 232,375
10.50% due 11/15/2015 (f) 425,000 227,375
Nuveen Investments, Inc., Class A
5.50% due 09/15/2015 1,025,000 369,000
Pinnacle Foods Finance LLC/Pinnacle Foods
Finance Corp
10.625% due 04/01/2017 150,000 123,375
Severn Trent Utilities Finance PLC, EMTN
5.25% due 03/11/2016 EUR 65,000 90,316
SLM Corp.
5.45% due 04/25/2011 $ 1,050,000 883,634
SLM Corp., MTN
5.125% due 08/27/2012 220,000 166,781
8.45% due 06/15/2018 380,000 260,300
SLM Corp., MTN, Series A
Copyright © 2012 www.secdatabase.com. All Rights Reserved.Please Consider the Environment Before Printing This Document

1.2319% due 07/27/2009 (b) 940,000 929,203
Societe Generale
6.125% due 08/20/2018 EUR 50,000 71,685
Societe Generale, EMTN
5.25% due 03/28/2013 100,000 149,195
State Street Corp.
4.30% due 05/30/2014 $ 190,000 189,568
Sun Life Financial Global Funding LP
1.4159% due 10/06/2013 (b)(f) 250,000 172,008
SVB Financial Group
3.875% due 04/15/2011 200,000 168,500
TAM Capital, Inc.
7.375% due 04/25/2017 200,000 143,000
Teco Finance, Inc.
6.572% due 11/01/2017 37,000 33,352
7.00% due 05/01/2012 53,000 53,233
TMK Capital SA for OAO TMK
10.00% due 07/29/2011 400,000 308,880
UBS AG/Jersey, EMTN
4.50% due 09/16/2019 (b) EUR 215,000 233,087
UCI Holdco, Inc.
9.32% due 12/15/2013 $ 418,374 71,124
Wells Fargo & Company
2.125% due 06/15/2012 20,000 20,119
4.20% due 01/15/2010 255,000 258,345
4.875% due 01/12/2011 225,000 232,306
Wells Fargo Bank NA
4.75% due 02/09/2015 270,000 232,548
Wells Fargo Financial Canada Corp., MTN
4.33% due 12/06/2013 CAD 45,000 39,998
Westfield Capital Corp., Ltd.
4.375% due 11/15/2010 (f) $ 155,000 151,228
WT Finance Australia Property, Ltd.
3.625% due 06/27/2012 EUR 50,000 60,412
46,157,874
Food & Beverages - 0.85%
Ahold Finance USA, Inc., EMTN
6.50% due 03/14/2017 GBP 50,000 78,391
Spectrum Income Fund (continued)Shares or
Principal
Amount Value
CORPORATE BONDS (continued)
Food & Beverages (continued)
Anheuser-Busch InBev NV
7.20% due 01/15/2014 $ 473,000 $ 507,340
Anheuser-Busch InBev NV, EMTN
8.625% due 01/30/2017 EUR 50,000 78,661
Anheuser-Busch InBev Worldwide, Inc.
5.375% due 11/15/2014 (f) $ 280,000 280,929
B&G Foods, Inc.
8.00% due 10/01/2011 450,000 443,250
Bacardi, Ltd.
7.75% due 04/09/2014 EUR 50,000 74,041
Casino Guichard Perrachon SA, EMTN
4.875% due 04/10/2014 50,000 68,760
6.375% due 04/04/2013 50,000 73,699
Coca-Cola Company
4.875% due 03/15/2019 $ 330,000 330,098
Coca-Cola Enterprises, Inc.
4.25% due 03/01/2015 210,000 211,700
Del Monte Corp.
Copyright © 2012 www.secdatabase.com. All Rights Reserved.Please Consider the Environment Before Printing This Document

8.625% due 12/15/2012 400,000 402,000
Diageo Capital PLC
7.375% due 01/15/2014 150,000 166,707
Dole Food Company, Inc.
13.875% due 03/15/2014 (f) 300,000 321,000
General Mills, Inc.
5.25% due 08/15/2013 270,000 281,323
5.65% due 02/15/2019 35,000 35,809
General Mills, Inc., Series MTN
11.973% due 10/15/2010 275,000 293,525
Heineken NV, EMTN
7.25% due 03/10/2015 GBP 25,000 40,031
JBS SA
9.375% due 02/07/2011 $ 100,000 94,000
JBS USA LLC
11.625% due 05/01/2014 375,000 360,000
Kellogg Company
4.25% due 03/06/2013 750,000 769,417
Kraft Foods, Inc., EMTN
6.25% due 03/20/2015 EUR 50,000 73,293
McCormick & Company, Inc.
5.80% due 07/15/2011 $ 130,000 136,828
Molson Coors Capital Finance ULC
5.00% due 09/22/2015 CAD 45,000 40,107
Panamerican Beverages, Inc.
7.25% due 07/01/2009 $ 35,000 35,306
PepsiAmericas, Inc.
4.875% due 01/15/2015 55,000 52,674
PepsiCo, Inc.
4.65% due 02/15/2013 135,000 142,181
SABMiller PLC
6.20% due 07/01/2011 (f) 245,000 251,894
SYSCO Corp.
5.25% due 02/12/2018 110,000 108,356
Tesco PLC, EMTN
5.50% due 12/13/2019 GBP 60,000 98,554
Tyson Foods, Inc.
8.25% due 10/01/2011 $ 450,000 456,514
10.50% due 03/01/2014 (f) 525,000 556,500
6,862,888
The accompanying notes are an integral part of the financial statements.
248
JOHN HANCOCK FUNDS II
PORTFOLIO OF INVESTMENTS - May 31, 2009 (Unaudited) - continued(showing percentage of total net assets)
Spectrum Income Fund (continued)Shares or
Principal
Amount Value
CORPORATE BONDS (continued)
Gas & Pipeline Utilities - 0.65%
Atmos Energy Corp.
5.95% due 10/15/2034 $ 40,000 $ 31,034
8.50% due 03/15/2019 55,000 60,900
Boardwalk Pipelines LLC
5.50% due 02/01/2017 305,000 265,100
Colorado Interstate Gas Company
5.95% due 03/15/2015 150,000 144,890
DCP Midstream LLC
Copyright © 2012 www.secdatabase.com. All Rights Reserved.Please Consider the Environment Before Printing This Document

9.70% due 12/01/2013 (f) 140,000 149,227
Duke Capital Corp.
7.50% due 10/01/2009 130,000 131,887
Duke Capital Corp., Series B
6.75% due 07/15/2018 90,000 83,973
Dynegy Holdings, Inc.
7.50% due 06/01/2015 375,000 301,875
El Paso Corp.
8.25% due 02/15/2016 225,000 223,312
12.00% due 12/12/2013 750,000 825,000
El Paso Natural Gas Company
5.95% due 04/15/2017 99,000 91,840
Enbridge, Inc., MTN
7.20% due 06/18/2032 CAD 28,000 26,450
Intergas Finance BV, Series REGS
6.375% due 05/14/2017 $ 100,000 74,000
Kinder Morgan Finance Company
5.70% due 01/05/2016 555,000 474,525
Kinder Morgan, Inc.
6.50% due 09/01/2012 139,000 134,482
National Gas Company
6.05% due 01/15/2036 (f) 105,000 77,700
Nustar Logistics
7.65% due 04/15/2018 180,000 168,247
Piedmont Natural Gas Company
6.00% due 12/19/2033 15,000 13,126
Praxair, Inc.
4.625% due 03/30/2015 415,000 414,511
5.20% due 03/15/2017 205,000 197,789
Southern California Gas Company
5.75% due 11/15/2035 230,000 224,439
Sunoco, Inc.
4.875% due 10/15/2014 30,000 26,943
5.75% due 01/15/2017 240,000 226,405
9.625% due 04/15/2015 330,000 372,879
Tennessee Gas Pipeline Company
8.00% due 02/01/2016 (f) 50,000 50,875
TransCanada Pipelines, Ltd.
7.125% due 01/15/2019 100,000 109,501
Williams Companies, Inc.
7.75% due 06/15/2031 50,000 43,250
8.75% due 01/15/2020 305,000 314,150
5,258,310
Gold - 0.12%
Barrick Gold Corp.
6.95% due 04/01/2019 50,000 54,424
Barrick Gold Financeco LLC
6.125% due 09/15/2013 865,000 905,388
959,812
Spectrum Income Fund (continued)Shares or
Principal
Amount Value
CORPORATE BONDS (continued)
Healthcare Products - 0.29%
Abbott Laboratories
5.125% due 04/01/2019 $ 165,000 $ 166,692
Bausch & Lomb, Inc.
9.875% due 11/01/2015 (f) 50,000 45,625
9.875% due 11/01/2015 375,000 342,188
Baxter International, Inc.
Copyright © 2012 www.secdatabase.com. All Rights Reserved.Please Consider the Environment Before Printing This Document

4.00% due 03/01/2014 100,000 101,507
Biomet, Inc.
11.625% due 10/15/2017 625,000 615,625
Boston Scientific Corp.
6.00% due 06/15/2011 100,000 98,500
GlaxoSmithKline Capital PLC, EMTN
5.625% due 12/13/2017 EUR 95,000 139,684
Johnson & Johnson
4.75% due 11/06/2019 50,000 71,545
Medtronic, Inc., Series B
4.375% due 09/15/2010 $ 145,000 148,957
4.75% due 09/15/2015 330,000 327,733
Universal Hospital Services, Inc.
5.9425% due 06/01/2015 (b) 200,000 162,000
Universal Hospital Services, Inc., PIK
8.50% due 06/01/2015 100,000 96,000
2,316,056
Healthcare Services - 0.48%
Cardinal Health, Inc.
1.4619% due 10/02/2009 (b) 260,000 258,884
Centene Corp.
7.25% due 04/01/2014 450,000 417,375
CRC Health Corp.
10.75% due 02/01/2016 125,000 90,000
DaVita, Inc.
6.625% due 03/15/2013 525,000 492,187
7.25% due 03/15/2015 250,000 235,000
Healthsouth Corp.
10.75% due 06/15/2016 425,000 433,500
Roche Holdings, Inc.
5.00% due 03/01/2014 160,000 166,841
U.S. Oncology Holdings, Inc., PIK
6.9037% due 03/15/2012 378,000 257,040
US Oncology, Inc.
9.00% due 08/15/2012 125,000 125,000
10.75% due 08/15/2014 175,000 166,688
Vanguard Health Holding Company I LLC
zero coupon, Step up to 11.25% on
10/01/2009 due 10/01/2015 350,000 326,375
Vanguard Health Holding Company II LLC
9.00% due 10/01/2014 450,000 441,000
WellPoint, Inc.
5.00% due 01/15/2011 415,000 424,222
6.00% due 02/15/2014 85,000 84,989
3,919,101
Holdings Companies/Conglomerates - 0.13%
ERP Operating LP
5.25% due 09/15/2014 190,000 172,756
Visant Corp.
7.625% due 10/01/2012 325,000 320,125
The accompanying notes are an integral part of the financial statements.
249
JOHN HANCOCK FUNDS II
PORTFOLIO OF INVESTMENTS - May 31, 2009 (Unaudited) - continued(showing percentage of total net assets)
Spectrum Income Fund (continued)Shares or
Principal
Copyright © 2012 www.secdatabase.com. All Rights Reserved.Please Consider the Environment Before Printing This Document
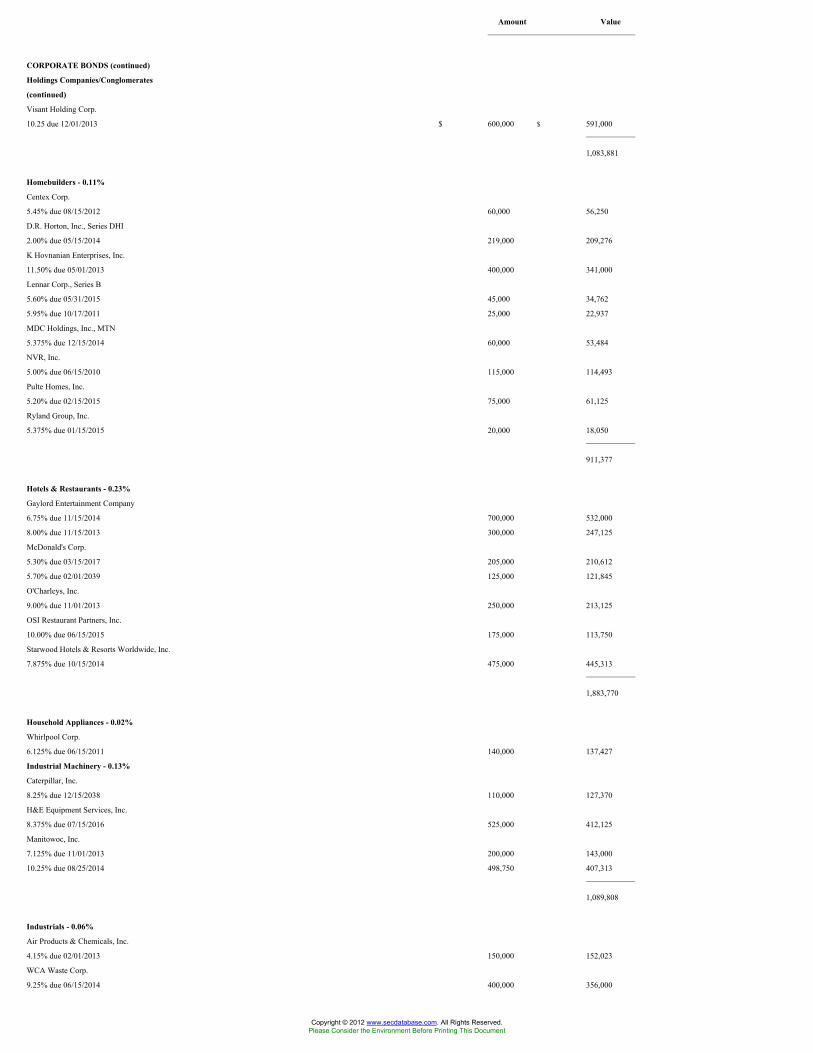
Amount Value
CORPORATE BONDS (continued)
Holdings Companies/Conglomerates
(continued)
Visant Holding Corp.
10.25 due 12/01/2013 $ 600,000 $ 591,000
1,083,881
Homebuilders - 0.11%
Centex Corp.
5.45% due 08/15/2012 60,000 56,250
D.R. Horton, Inc., Series DHI
2.00% due 05/15/2014 219,000 209,276
K Hovnanian Enterprises, Inc.
11.50% due 05/01/2013 400,000 341,000
Lennar Corp., Series B
5.60% due 05/31/2015 45,000 34,762
5.95% due 10/17/2011 25,000 22,937
MDC Holdings, Inc., MTN
5.375% due 12/15/2014 60,000 53,484
NVR, Inc.
5.00% due 06/15/2010 115,000 114,493
Pulte Homes, Inc.
5.20% due 02/15/2015 75,000 61,125
Ryland Group, Inc.
5.375% due 01/15/2015 20,000 18,050
911,377
Hotels & Restaurants - 0.23%
Gaylord Entertainment Company
6.75% due 11/15/2014 700,000 532,000
8.00% due 11/15/2013 300,000 247,125
McDonald's Corp.
5.30% due 03/15/2017 205,000 210,612
5.70% due 02/01/2039 125,000 121,845
O'Charleys, Inc.
9.00% due 11/01/2013 250,000 213,125
OSI Restaurant Partners, Inc.
10.00% due 06/15/2015 175,000 113,750
Starwood Hotels & Resorts Worldwide, Inc.
7.875% due 10/15/2014 475,000 445,313
1,883,770
Household Appliances - 0.02%
Whirlpool Corp.
6.125% due 06/15/2011 140,000 137,427
Industrial Machinery - 0.13%
Caterpillar, Inc.
8.25% due 12/15/2038 110,000 127,370
H&E Equipment Services, Inc.
8.375% due 07/15/2016 525,000 412,125
Manitowoc, Inc.
7.125% due 11/01/2013 200,000 143,000
10.25% due 08/25/2014 498,750 407,313
1,089,808
Industrials - 0.06%
Air Products & Chemicals, Inc.
4.15% due 02/01/2013 150,000 152,023
WCA Waste Corp.
9.25% due 06/15/2014 400,000 356,000
Copyright © 2012 www.secdatabase.com. All Rights Reserved.Please Consider the Environment Before Printing This Document

508,023
Spectrum Income Fund (continued)Shares or
Principal
Amount Value
CORPORATE BONDS (continued)
Insurance - 0.55%
ACE INA Holdings, Inc.
5.70% due 02/15/2017 $ 240,000 $ 231,720
Aflac, Inc.
8.50% due 05/15/2019 420,000 434,956
Allstate Life Funding LLC, EMTN
6.375% due 01/17/2011 GBP 49,000 79,753
Berkshire Hathaway Finance Corp.
4.60% due 05/15/2013 $ 300,000 309,933
Highmark, Inc.
6.80% due 08/15/2013 (f) 225,000 209,473
HUB International Holdings, Inc.
9.00% due 12/15/2014 (f) 550,000 412,500
10.25% due 06/15/2015 (f) 975,000 604,500
MetLife, Inc.
6.75% due 06/01/2016 15,000 15,264
Muenchener Rueckversicherungs AG
5.767% due 06/29/2049 (b) EUR 50,000 50,716
Nationwide Mutual Insurance Company
6.60% due 04/15/2034 (f) $ 135,000 73,828
New York Life Global Funding, EMTN
4.375% due 01/19/2017 EUR 100,000 110,932
NLV Financial Corp.
7.50% due 08/15/2033 (f) $ 285,000 213,836
Ohio National Financial Services, Inc.
6.35% due 04/01/2013 (f) 15,000 13,921
Pacific Life Funding LLC, EMTN
5.125% due 01/20/2015 GBP 89,000 127,910
Principal Financial Global Funding II LLC, EMTN
4.50% due 01/26/2017 EUR 50,000 47,901
Principal Financial Group, Inc.
6.05% due 10/15/2036 $ 180,000 141,560
7.875% due 05/15/2014 290,000 290,408
8.875% due 05/15/2019 135,000 133,471
Principal Life Global Funding I
5.25% due 01/15/2013 (f) 190,000 185,875
Principal Life Income Funding Trusts
5.20% due 11/15/2010 40,000 40,344
RLI Corp.
5.95% due 01/15/2014 20,000 20,302
Sun Life Assurance Company of Canada
6.15% due 06/30/2022 (b) CAD 42,000 39,814
The Travelers Companies, Inc.
5.90% due 06/02/2019 $ 175,000 179,248
Transatlantic Holdings, Inc.
5.75% due 12/14/2015 170,000 107,968
Travelers Insurance Company Institutional
Funding, Ltd.
5.75% due 12/06/2011 GBP 54,000 84,490
USI Holdings Corp.
9.75% due 05/15/2015 (f) $ 225,000 123,187
Willis North America, Inc.
6.20% due 03/28/2017 195,000 153,680
4,437,490
International Oil - 0.63%
Copyright © 2012 www.secdatabase.com. All Rights Reserved.Please Consider the Environment Before Printing This Document
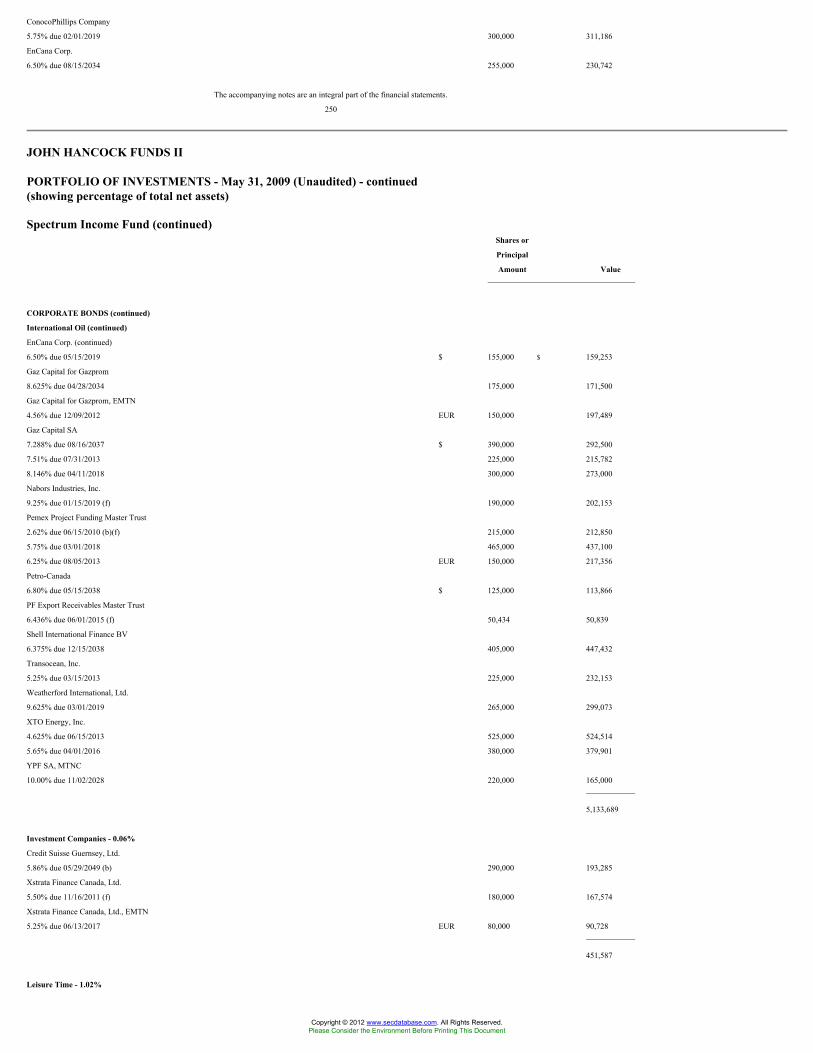
ConocoPhillips Company
5.75% due 02/01/2019 300,000 311,186
EnCana Corp.
6.50% due 08/15/2034 255,000 230,742
The accompanying notes are an integral part of the financial statements.
250
JOHN HANCOCK FUNDS II
PORTFOLIO OF INVESTMENTS - May 31, 2009 (Unaudited) - continued(showing percentage of total net assets)
Spectrum Income Fund (continued)Shares or
Principal
Amount Value
CORPORATE BONDS (continued)
International Oil (continued)
EnCana Corp. (continued)
6.50% due 05/15/2019 $ 155,000 $ 159,253
Gaz Capital for Gazprom
8.625% due 04/28/2034 175,000 171,500
Gaz Capital for Gazprom, EMTN
4.56% due 12/09/2012 EUR 150,000 197,489
Gaz Capital SA
7.288% due 08/16/2037 $ 390,000 292,500
7.51% due 07/31/2013 225,000 215,782
8.146% due 04/11/2018 300,000 273,000
Nabors Industries, Inc.
9.25% due 01/15/2019 (f) 190,000 202,153
Pemex Project Funding Master Trust
2.62% due 06/15/2010 (b)(f) 215,000 212,850
5.75% due 03/01/2018 465,000 437,100
6.25% due 08/05/2013 EUR 150,000 217,356
Petro-Canada
6.80% due 05/15/2038 $ 125,000 113,866
PF Export Receivables Master Trust
6.436% due 06/01/2015 (f) 50,434 50,839
Shell International Finance BV
6.375% due 12/15/2038 405,000 447,432
Transocean, Inc.
5.25% due 03/15/2013 225,000 232,153
Weatherford International, Ltd.
9.625% due 03/01/2019 265,000 299,073
XTO Energy, Inc.
4.625% due 06/15/2013 525,000 524,514
5.65% due 04/01/2016 380,000 379,901
YPF SA, MTNC
10.00% due 11/02/2028 220,000 165,000
5,133,689
Investment Companies - 0.06%
Credit Suisse Guernsey, Ltd.
5.86% due 05/29/2049 (b) 290,000 193,285
Xstrata Finance Canada, Ltd.
5.50% due 11/16/2011 (f) 180,000 167,574
Xstrata Finance Canada, Ltd., EMTN
5.25% due 06/13/2017 EUR 80,000 90,728
451,587
Leisure Time - 1.02%
Copyright © 2012 www.secdatabase.com. All Rights Reserved.Please Consider the Environment Before Printing This Document

AMC Entertainment, Inc.
8.75% due 06/01/2019 (f) $ 425,000 412,781
Ameristar Casinos, Inc.
9.25% due 06/01/2014 (f) 600,000 600,000
Harrah's Operating Company, Inc.
10.00% due 12/15/2015 (f) 150,000 102,000
Harrahs Operating Escrow LLC
11.25% due 06/01/2017 (f) 525,000 510,563
Isle of Capri Casinos, Inc.
7.00% due 03/01/2014 321,000 248,775
Lions Gate Entertainment Corp.
2.9375% due 10/15/2024 155,000 119,450
Little Traverse Bay Bands of Odawa Indians
10.25% due 02/15/2014 (f) 50,000 21,625
MGM Mirage, Inc.
8.50% due 09/15/2010 475,000 446,500
10.375% due 05/15/2014 (f) 350,000 360,500
Spectrum Income Fund (continued)Shares or
Principal
Amount Value
CORPORATE BONDS (continued)
Leisure Time (continued)
MGM Mirage, Inc. (continued)
11.125% due 11/15/2017 (f) $ 500,000 $ 530,625
13.00% due 11/15/2013 (f) 450,000 491,625
Penn National Gaming, Inc.
6.75% due 03/01/2015 425,000 393,125
Pinnacle Entertainment, Inc.
7.50% due 06/15/2015 475,000 396,625
8.25% due 03/15/2012 500,000 487,500
Pokagon Gaming Authority
10.375% due 06/15/2014 (f) 650,000 627,250
Royal Caribbean Cruises, Ltd.
7.00% due 06/15/2013 100,000 83,250
Shingle Springs Tribal Gaming Authority
9.375% due 06/15/2015 (f) 800,000 464,000
Speedway Motorsports, Inc.
6.75% due 06/01/2013 360,000 336,600
8.75% due 06/01/2016 (f) 150,000 150,750
Vivendi
5.75% due 04/04/2013 (f) 410,000 399,286
Vivendi, EMTN
7.75% due 01/23/2014 EUR 50,000 77,452
Wynn Las Vegas LLC
6.625% due 12/01/2014 $ 1,175,000 1,006,094
8,266,376
Liquor - 0.02%
Cia Brasileira de Bebidas
10.50% due 12/15/2011 160,000 184,800
Manufacturing - 0.29%
3M Company, MTN
5.125% due 11/06/2009 95,000 96,962
5.70% due 03/15/2037 200,000 192,229
AGY Holding Corp.
11.00% due 11/15/2014 250,000 178,750
Cooper US, Inc.
6.10% due 07/01/2017 205,000 209,972
Danaher Corp.
5.40% due 03/01/2019 70,000 70,416
Danaher European Finance Company EHF
4.50% due 07/22/2013 EUR 50,000 68,383
Copyright © 2012 www.secdatabase.com. All Rights Reserved.Please Consider the Environment Before Printing This Document

General Dynamics Corp.
4.50% due 08/15/2010 $ 210,000 218,137
Honeywell International, Inc.
4.25% due 03/01/2013 210,000 218,126
5.30% due 03/01/2018 235,000 242,108
Sally Holdings LLC
9.25% due 11/15/2014 (a) 425,000 428,187
10.50% due 11/15/2016 75,000 75,187
SPX Corp.
7.625% due 12/15/2014 375,000 363,750
2,362,207
Medical-Hospitals - 0.42%
Community Health Systems, Inc.
8.875% due 07/15/2015 300,000 296,625
HCA, Inc.
8.50% due 04/15/2019 (f) 500,000 488,750
9.25% due 11/15/2016 1,000,000 982,500
The accompanying notes are an integral part of the financial statements.
251
JOHN HANCOCK FUNDS II
PORTFOLIO OF INVESTMENTS - May 31, 2009 (Unaudited) - continued(showing percentage of total net assets)
Spectrum Income Fund (continued)Shares or
Principal
Amount Value
CORPORATE BONDS (continued)
Medical-Hospitals (continued)
HCA, Inc., PIK
9.625% due 11/15/2016 $ 131,000 $ 125,432
Health Management Associates, Inc.
3.70% due 08/16/2020 238,968 206,349
6.125% due 04/15/2016 650,000 552,500
Symbion, Inc.
11.00% due 08/23/2015 298,757 149,378
Tenet Healthcare Corp.
6.50% due 06/01/2012 225,000 205,665
United Surgical Partners International, Inc.
8.875% due 05/01/2017 450,000 383,625
3,390,824
Metal & Metal Products - 0.21%
Clarendon Alumina Production, Ltd.
8.50% due 11/16/2021 100,000 67,673
Corp Nacional del Cobre de Chile
7.50% due 01/15/2019 (f) 230,000 257,089
Corp Nacional del Cobre de Chile, Series REGS
7.50% due 01/15/2019 130,000 143,385
Gibraltar Industries, Inc., Series B
8.00% due 12/01/2015 1,075,000 709,500
Hawk Corp.
8.75% due 11/01/2014 331,000 331,000
Southern Copper Corp.
7.50% due 07/27/2035 200,000 166,154
1,674,801
Copyright © 2012 www.secdatabase.com. All Rights Reserved.Please Consider the Environment Before Printing This Document

Mining - 0.52%
Freeport-McMoRan Copper & Gold, Inc.
8.375% due 04/01/2017 750,000 744,375
Placer Dome, Inc.
6.45% due 10/15/2035 315,000 268,248
Rio Tinto Finance USA, Ltd.
5.875% due 07/15/2013 455,000 444,386
8.95% due 05/01/2014 420,000 451,378
Teck Resources, Ltd.
9.75% due 05/15/2014 (f) 525,000 522,375
10.25% due 05/15/2016 (f) 550,000 558,250
10.75% due 05/15/2019 (f) 525,000 538,125
Vale Overseas, Ltd.
6.25% due 01/23/2017 525,000 530,755
6.875% due 11/21/2036 163,000 147,346
4,205,238
Office Furnishings & Supplies - 0.00%
Interface, Inc.
9.50% due 02/01/2014 25,000 19,062
Paper - 0.42%
Boise Cascade LLC
7.125% due 10/15/2014 290,000 139,925
Cellu Tissue Holdings, Inc.
11.50% due 06/01/2014 (f) 300,000 292,500
Celulosa Arauco y Constitucion SA
5.125% due 07/09/2013 80,000 77,124
8.625% due 08/15/2010 220,000 230,506
Domtar Corp.
5.375% due 12/01/2013 175,000 144,375
7.125% due 08/15/2015 400,000 332,000
9.50% due 08/01/2016 50,000 42,000
Spectrum Income Fund (continued)Shares or
Principal
Amount Value
CORPORATE BONDS (continued)
Paper (continued)
Georgia-Pacific Corp.
7.00% due 01/15/2015 (f) $ 100,000 $ 94,500
7.125% due 01/15/2017 (f) 400,000 376,000
Georgia-Pacific LLC
8.25% due 05/01/2016 (f) 475,000 467,875
International Paper Company
7.40% due 06/15/2014 300,000 295,494
9.375% due 05/15/2019 250,000 251,648
NewPage Corp.
10.00% due 05/01/2012 350,000 196,000
Rock-Tenn Company
8.20% due 08/15/2011 250,000 255,938
9.25% due 03/15/2016 225,000 228,375
3,424,260
Petroleum Services - 0.43%
Centrica PLC, EMTN
7.125% due 12/09/2013 EUR 50,000 77,715
Compagnie Generale de Geophysique SA
7.50% due 05/15/2015 $ 100,000 91,500
7.75% due 05/15/2017 1,500,000 1,320,000
Complete Production Services, Inc.
8.00% due 12/15/2016 1,275,000 1,032,750
Helix Energy Solutions Group, Inc.
Copyright © 2012 www.secdatabase.com. All Rights Reserved.Please Consider the Environment Before Printing This Document

3.25% due 12/15/2025 459,000 339,660
Premcor Refining Group, Inc.
6.75% due 02/01/2011 120,000 123,656
Repsol International Finance BV, EMTN
6.50% due 03/27/2014 EUR 50,000 74,913
SeaRiver Maritime, Inc.
zero coupon due 09/01/2012 $ 315,000 286,650
Smith International, Inc.
8.625% due 03/15/2014 95,000 99,601
3,446,445
Pharmaceuticals - 0.11%
Eli Lilly & Company
5.55% due 03/15/2037 205,000 190,546
Hospira, Inc.
4.95% due 06/15/2009 80,000 80,037
Merck KGAA
4.75% due 11/26/2010 EUR 50,000 72,422
Omnicare, Inc.
6.75% due 12/15/2013 $ 200,000 181,500
Teva Pharmaceutical Finance LLC
5.55% due 02/01/2016 325,000 330,268
854,773
Pipelines - 0.23%
Buckeye Partners LP
6.05% due 01/15/2018 140,000 121,879
Enterprise Products Operating LLC
9.75% due 01/31/2014 130,000 145,072
TEPPCO Partners LP
5.90% due 04/15/2013 300,000 282,440
7.55% due 04/15/2038 485,000 415,991
Texas Gas Transmission LLC
5.50% due 04/01/2013 (f) 970,000 908,721
1,874,103
The accompanying notes are an integral part of the financial statements.
252
JOHN HANCOCK FUNDS II
PORTFOLIO OF INVESTMENTS - May 31, 2009 (Unaudited) - continued(showing percentage of total net assets)
Spectrum Income Fund (continued)Shares or
Principal
Amount Value
CORPORATE BONDS (continued)
Publishing - 0.29%
Local Insight Regatta Holdings, Inc.
11.00% due 12/01/2017 $ 450,000 $ 121,500
Nielsen Finance LLC
zero coupon, Step up to 12.50% on
08/01/2011 due 08/01/2016 775,000 496,000
10.00% due 08/01/2014 225,000 214,313
11.50% due 05/01/2016 (f) 100,000 95,000
11.625% due 02/01/2014 (f) 450,000 445,500
Sun Media Corp.
7.625% due 02/15/2013 325,000 209,625
TL Acquisitions, Inc.
Copyright © 2012 www.secdatabase.com. All Rights Reserved.Please Consider the Environment Before Printing This Document

zero coupon, Step up to 13.25% on
07/15/2009 due 07/15/2015 (f) 350,000 234,500
10.50% due 01/15/2015 (f) 225,000 175,500
Valassis Communications, Inc.
8.25% due 03/01/2015 675,000 391,500
2,383,438
Railroads & Equipment - 0.23%
American Railcar Industries, Inc.
7.50% due 03/01/2014 350,000 302,750
Canadian National Railway Company
6.25% due 08/01/2034 249,000 249,540
CSX Corp.
5.75% due 03/15/2013 275,000 280,607
Grupo Transportacion Ferroviaria Mexicana,
SA de CV
9.375% due 05/01/2012 125,000 112,187
Kansas City Southern Railway Company
13.00% due 12/15/2013 125,000 131,250
Norfolk Southern Corp.
5.59% due 05/17/2025 30,000 27,377
5.75% due 04/01/2018 95,000 95,897
7.25% due 02/15/2031 115,000 119,120
Union Pacific Corp.
5.70% due 08/15/2018 205,000 195,526
7.875% due 01/15/2019 280,000 313,133
1,827,387
Real Estate - 0.54%
AMB Property LP, MTN
5.90% due 08/15/2013 45,000 40,233
6.30% due 06/01/2013 205,000 182,788
AvalonBay Communities, Inc., MTN
4.95% due 03/15/2013 60,000 55,326
6.125% due 11/01/2012 185,000 184,353
6.625% due 09/15/2011 265,000 271,812
Camden Property Trust
4.375% due 01/15/2010 90,000 90,635
Duke Realty LP
6.25% due 05/15/2013 230,000 195,711
Federal Realty Investment Trust
6.00% due 07/15/2012 135,000 122,277
Felcor Lodging LP
9.00% due 06/01/2011 250,000 213,750
Hospitality Properties Trust
5.625% due 03/15/2017 225,000 165,199
Host Hotels & Resorts LP
2.625% due 04/15/2027 (f) 475,000 396,031
Spectrum Income Fund (continued)Shares or
Principal
Amount Value
CORPORATE BONDS (continued)
Real Estate (continued)
Host Marriott LP, Series Q
6.75% due 06/01/2016 $ 525,000 $ 451,500
Kimco Realty Corp., MTN
4.904% due 02/18/2015 60,000 48,805
Mack-Cali Realty LP
5.80% due 01/15/2016 75,000 59,060
Reckson Operating Partnership
6.00% due 03/31/2016 210,000 149,769
Copyright © 2012 www.secdatabase.com. All Rights Reserved.Please Consider the Environment Before Printing This Document
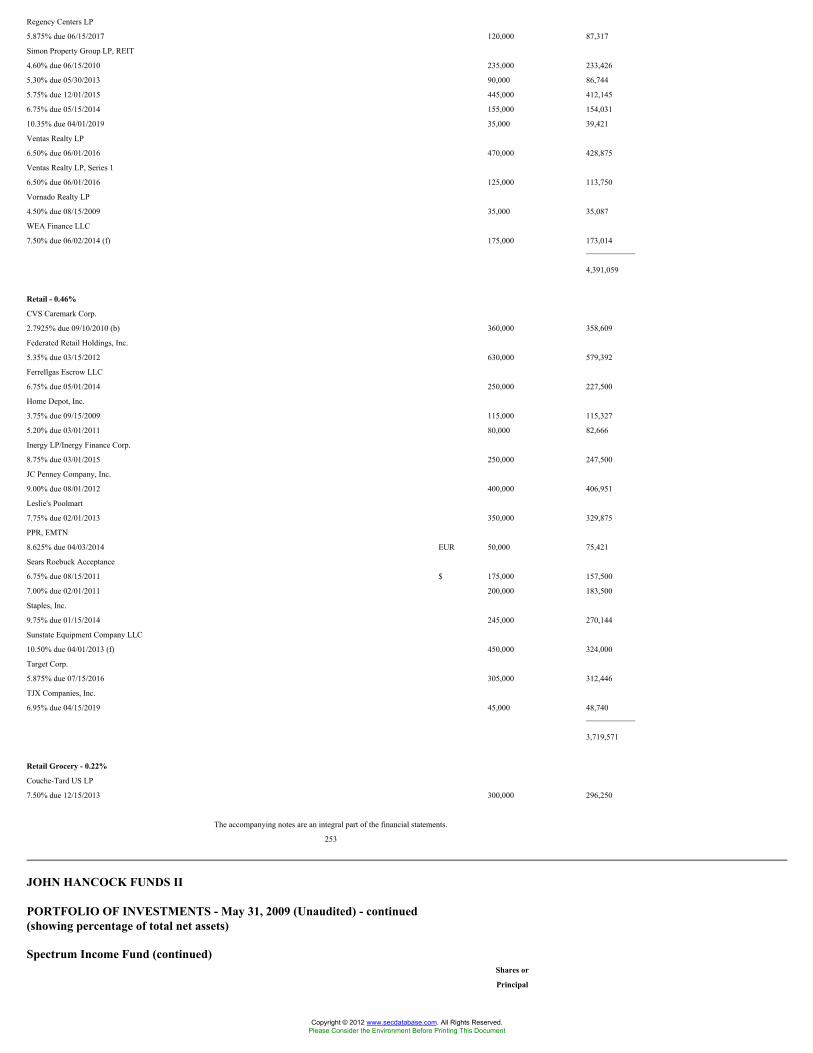
Regency Centers LP
5.875% due 06/15/2017 120,000 87,317
Simon Property Group LP, REIT
4.60% due 06/15/2010 235,000 233,426
5.30% due 05/30/2013 90,000 86,744
5.75% due 12/01/2015 445,000 412,145
6.75% due 05/15/2014 155,000 154,031
10.35% due 04/01/2019 35,000 39,421
Ventas Realty LP
6.50% due 06/01/2016 470,000 428,875
Ventas Realty LP, Series 1
6.50% due 06/01/2016 125,000 113,750
Vornado Realty LP
4.50% due 08/15/2009 35,000 35,087
WEA Finance LLC
7.50% due 06/02/2014 (f) 175,000 173,014
4,391,059
Retail - 0.46%
CVS Caremark Corp.
2.7925% due 09/10/2010 (b) 360,000 358,609
Federated Retail Holdings, Inc.
5.35% due 03/15/2012 630,000 579,392
Ferrellgas Escrow LLC
6.75% due 05/01/2014 250,000 227,500
Home Depot, Inc.
3.75% due 09/15/2009 115,000 115,327
5.20% due 03/01/2011 80,000 82,666
Inergy LP/Inergy Finance Corp.
8.75% due 03/01/2015 250,000 247,500
JC Penney Company, Inc.
9.00% due 08/01/2012 400,000 406,951
Leslie's Poolmart
7.75% due 02/01/2013 350,000 329,875
PPR, EMTN
8.625% due 04/03/2014 EUR 50,000 75,421
Sears Roebuck Acceptance
6.75% due 08/15/2011 $ 175,000 157,500
7.00% due 02/01/2011 200,000 183,500
Staples, Inc.
9.75% due 01/15/2014 245,000 270,144
Sunstate Equipment Company LLC
10.50% due 04/01/2013 (f) 450,000 324,000
Target Corp.
5.875% due 07/15/2016 305,000 312,446
TJX Companies, Inc.
6.95% due 04/15/2019 45,000 48,740
3,719,571
Retail Grocery - 0.22%
Couche-Tard US LP
7.50% due 12/15/2013 300,000 296,250
The accompanying notes are an integral part of the financial statements.
253
JOHN HANCOCK FUNDS II
PORTFOLIO OF INVESTMENTS - May 31, 2009 (Unaudited) - continued(showing percentage of total net assets)
Spectrum Income Fund (continued)Shares or
Principal
Copyright © 2012 www.secdatabase.com. All Rights Reserved.Please Consider the Environment Before Printing This Document

Amount Value
CORPORATE BONDS (continued)
Retail Grocery (continued)
Delhaize Group
5.625% due 06/27/2014 EUR 50,000 $ 67,151
6.50% due 06/15/2017 $ 250,000 245,106
Ingles Markets, Inc.
8.875% due 05/15/2017 (f) 375,000 369,844
Kroger Company
6.15% due 01/15/2020 130,000 131,810
6.80% due 04/01/2011 170,000 180,845
7.50% due 01/15/2014 117,000 131,063
8.05% due 02/01/2010 350,000 360,879
1,782,948
Retail Trade - 0.37%
ACE Hardware Corp.
9.125% due 06/01/2016 (f) 475,000 451,250
Dollar General Corp., PIK
11.875% due 07/15/2017 550,000 580,250
Dollarama Group LP
8.875% due 08/15/2012 425,000 399,500
Home Depot, Inc.
5.40% due 03/01/2016 220,000 215,814
Macys Retail Holdings, Inc.
10.625% due 11/01/2010 400,000 409,480
Nordstrom, Inc.
6.75% due 06/01/2014 50,000 50,329
Safeway, Inc.
6.25% due 03/15/2014 40,000 42,601
Target Corp.
7.50% due 08/15/2010 150,000 158,683
The Pantry, Inc.
7.75% due 02/15/2014 550,000 486,750
Wal-Mart Stores, Inc.
6.875% due 08/10/2009 165,000 166,911
2,961,568
Sanitary Services - 0.13%
Casella Waste Systems, Inc.
9.75% due 02/01/2013 750,000 622,500
Waste Management, Inc.
6.10% due 03/15/2018 480,000 449,856
7.375% due 05/15/2029 15,000 13,821
1,086,177
Semiconductors - 0.13%
Avago Technologies Finance
10.125% due 12/01/2013 375,000 360,469
Flextronics International, Ltd.
6.25% due 11/15/2014 125,000 111,875
STATS ChipPAC, Ltd.
6.75% due 11/15/2011 100,000 93,000
7.50% due 07/19/2010 500,000 485,000
1,050,344
Software - 0.06%
Oracle Corp.
5.00% due 01/15/2011 355,000 373,418
SS&C Technologies, Inc.
11.75% due 12/01/2013 100,000 93,500
Copyright © 2012 www.secdatabase.com. All Rights Reserved.Please Consider the Environment Before Printing This Document

466,918
Spectrum Income Fund (continued)Shares or
Principal
Amount Value
CORPORATE BONDS (continued)
Steel - 0.54%
Allegheny Technologies, Inc.
9.375% due 06/01/2019 $ 165,000 $ 167,475
ArcelorMittal
5.375% due 06/01/2013 965,000 889,771
Evraz Group SA
8.875% due 04/24/2013 530,000 423,072
Gerdau Ameristeel Corp.
10.375% due 07/15/2011 150,000 153,750
GTL Trade Finance, Inc.
7.25% due 10/20/2017 125,000 119,965
Metals USA Holdings Corp., PIK
8.2075% due 07/01/2012 52,443 31,597
Metals USA, Inc.
11.125% due 12/01/2015 175,000 131,687
Reliance Steel & Aluminum Company
6.20% due 11/15/2016 600,000 464,539
Ryerson, Inc.
12.00% due 11/01/2015 450,000 303,750
Steel Capital SA
9.75% due 07/29/2013 250,000 203,750
Steel Dynamics, Inc.
6.75% due 04/01/2015 140,000 119,350
7.375% due 11/01/2012 1,025,000 943,000
Tube City IMS Corp.
9.75% due 02/01/2015 575,000 327,750
Usiminas Commercial, Ltd.
7.25% due 01/18/2018 100,000 102,000
4,381,456
Telecommunications Equipment &
Services - 1.74%
Anixter, Inc.
10.00% due 03/15/2014 300,000 297,000
Belden, Inc.
7.00% due 03/15/2017 550,000 487,438
Broadview Networks Holdings, Inc.
11.375% due 09/01/2012 425,000 318,750
CC Holdings GS V LLC/Crown Castle GS III Corp.
7.75% due 05/01/2017 (f) 1,225,000 1,206,625
Citizens Communications Company
6.25% due 01/15/2013 250,000 234,062
Deutsche Telekom International Finance BV
8.125% due 05/29/2012 EUR 35,000 55,802
8.50% due 06/15/2010 $ 330,000 349,526
Deutsche Telekom International Finance BV, EMTN
4.50% due 10/25/2013 EUR 100,000 145,536
7.125% due 09/26/2012 GBP 80,000 139,921
Digicel Group, Ltd.
8.875% due 01/15/2015 (f) $ 1,500,000 1,200,000
8.875% due 01/15/2015 140,000 112,000
Digicel, Ltd.
9.25% due 09/01/2012 (f) 775,000 740,125
Dycom Industries, Inc.
8.125% due 10/15/2015 275,000 233,750
France Telecom SA
Copyright © 2012 www.secdatabase.com. All Rights Reserved.Please Consider the Environment Before Printing This Document

7.75% due 03/01/2011 320,000 348,006
GC Impsat Holdings I PLC
9.875% due 02/15/2017 700,000 595,000
The accompanying notes are an integral part of the financial statements.
254
JOHN HANCOCK FUNDS II
PORTFOLIO OF INVESTMENTS - May 31, 2009 (Unaudited) - continued(showing percentage of total net assets)
Spectrum Income Fund (continued)Shares or
Principal
Amount Value
CORPORATE BONDS (continued)
Telecommunications Equipment &
Services (continued)
GCI, Inc.
7.25% due 02/15/2014 $ 475,000 $ 430,469
Hughes Network Systems LLC
9.50% due 04/15/2014 (f) 275,000 265,375
Intelsat Bermuda, Ltd.
11.25% due 06/15/2016 325,000 333,125
11.50% due 02/04/2017 (f) 350,000 266,000
Intelsat Corp.
9.25% due 06/15/2016 (f) 600,000 576,000
Intelsat Subsidiary Holding Company, Ltd.
8.875% due 01/15/2015 (f) 300,000 294,000
iPCS, Inc.
3.1525% due 05/01/2013 (b)(f) 600,000 496,500
5.0275% due 05/01/2014 (b) 475,000 344,375
Level 3 Communications, Inc.
6.00% due 03/15/2010 88,000 83,600
Orascom Telecom Finance
7.875% due 02/08/2014 (f) 225,000 184,500
7.875% due 02/08/2014 (f) 110,000 90,200
7.875% due 02/08/2014 140,000 113,400
OTE PLC, GMTN
4.625% due 05/20/2016 EUR 100,000 133,079
Paetec Holding Corp.
9.50% due 07/15/2015 $ 375,000 339,375
SBA Communications Corp.
4.00% due 10/01/2014 (f) 335,000 340,444
SBC Communications, Inc.
6.45% due 06/15/2034 355,000 326,916
Telesat Canada
11.00% due 11/01/2015 (f) 850,000 824,500
12.50% due 11/01/2017 300,000 264,000
TELUS Corp.
5.95% due 04/15/2015 CAD 35,000 33,078
Verizon Communications, Inc.
5.25% due 04/15/2013 $ 210,000 221,015
Verizon Global Funding Corp.
7.25% due 12/01/2010 110,000 117,730
7.75% due 12/01/2030 285,000 310,855
Verizon Wireless Capital LLC
8.75% due 12/18/2015 EUR 50,000 83,786
West Corp.
9.50% due 10/15/2014 (f) $ 425,000 382,500
Wind Acquisition Finance SA
10.75% due 12/01/2015 (f) 750,000 787,500
Copyright © 2012 www.secdatabase.com. All Rights Reserved.Please Consider the Environment Before Printing This Document

14,105,863
Telephone - 1.65%
AT&T Corp.
7.30% due 11/15/2011 (b) 150,000 165,374
AT&T, Inc.
4.95% due 01/15/2013 350,000 361,936
5.30% due 11/15/2010 125,000 129,892
5.80% due 02/15/2019 1,195,000 1,226,345
6.70% due 11/15/2013 460,000 505,675
British Telecommunications PLC
5.15% due 01/15/2013 530,000 522,119
British Telecommunications PLC, EMTN
5.25% due 06/23/2014 EUR 100,000 136,111
Spectrum Income Fund (continued)Shares or
Principal
Amount Value
CORPORATE BONDS (continued)
Telephone (continued)
Cincinnati Bell, Inc.
7.00% due 02/15/2015 $ 450,000 $ 412,875
France Telecom SA, EMTN
7.25% due 01/28/2013 EUR 75,000 119,517
Frontier Communications Corp.
8.25% due 05/01/2014 $ 425,000 415,437
KONINKLIJKE KPN NV, EMTN
5.75% due 03/18/2016 GBP 100,000 164,475
KONINKLIJKE KPN NV, MTN, Series G
4.75% due 01/17/2017 EUR 50,000 69,285
Level 3 Financing, Inc.
9.25% due 11/01/2014 $ 375,000 292,969
Nokia OYJ
5.375% due 05/15/2019 50,000 49,636
Nordic Telephone Company Holdings
8.25% due 05/01/2016 (f) EUR 100,000 137,129
8.875% due 05/01/2016 (f) $ 850,000 850,000
Qwest Communications International, Inc., Series B
7.50% due 02/15/2014 450,000 414,000
Qwest Corp.
4.57% due 06/15/2013 (b) 125,000 112,187
7.50% due 10/01/2014 175,000 167,125
8.375% due 05/01/2016 (f) 300,000 294,750
8.875% due 03/15/2012 300,000 302,250
Royal KPN NV, EMTN
4.50% due 03/18/2013 EUR 80,000 114,872
Sprint Capital Corp.
6.875% due 11/15/2028 $ 575,000 402,500
7.625% due 01/30/2011 130,000 128,375
8.375% due 03/15/2012 500,000 492,500
8.75% due 03/15/2032 950,000 750,500
Sprint Nextel Corp.
1.6319% due 06/28/2010 (b) 105,000 99,229
6.00% due 12/01/2016 950,000 771,875
Telecom Italia Capital SA
4.00% due 01/15/2010 470,000 470,885
5.25% due 11/15/2013 750,000 728,914
Telecom Italia Finance SA, EMTN
6.875% due 01/24/2013 EUR 90,000 133,027
Telecom Italia SpA, EMTN
7.875% due 01/22/2014 50,000 76,601
8.25% due 03/21/2016 60,000 93,926
Telefonica Emisiones SAU
5.984% due 06/20/2011 $ 185,000 195,377
Copyright © 2012 www.secdatabase.com. All Rights Reserved.Please Consider the Environment Before Printing This Document

6.221% due 07/03/2017 275,000 288,386
Telekom Finanzmanagement GmbH
6.375% due 01/29/2016 EUR 50,000 72,403
Telemar Norte Leste SA, Series REGS
9.50% due 04/23/2019 $ 100,000 107,042
Valor Telecommunications Enterprise LLC
7.75% due 02/15/2015 225,000 221,625
Verizon Communications, Inc.
4.35% due 02/15/2013 645,000 658,713
6.35% due 04/01/2019 95,000 99,829
6.90% due 04/15/2038 260,000 264,498
Windstream Corp.
8.625% due 08/01/2016 325,000 319,313
13,339,477
The accompanying notes are an integral part of the financial statements.
255
JOHN HANCOCK FUNDS II
PORTFOLIO OF INVESTMENTS - May 31, 2009 (Unaudited) - continued(showing percentage of total net assets)
Spectrum Income Fund (continued)Shares or
Principal
Amount Value
CORPORATE BONDS (continued)
Tires & Rubber - 0.01%
Cooper-Standard Automotive, Inc.
8.375% due 12/15/2014 $ 425,000 $ 42,500
Tobacco - 0.26%
Alliance One International, Inc.
12.75% due 11/15/2012 225,000 218,250
Altria Group, Inc.
8.50% due 11/10/2013 680,000 764,984
9.25% due 08/06/2019 160,000 177,007
Imperial Tobacco Finance PLC, EMTN
4.375% due 11/22/2013 EUR 100,000 134,934
6.875% due 06/13/2012 GBP 49,000 82,911
Philip Morris International, Inc., GMTN
5.625% due 09/06/2011 EUR 100,000 148,771
Reynolds American, Inc.
7.25% due 06/01/2013 $ 595,000 596,013
2,122,870
Transportation - 0.50%
Autoroutes du Sud de la France, EMTN
7.375% due 03/20/2019 EUR 50,000 73,665
Bombardier, Inc.
6.30% due 05/01/2014 (f) $ 575,000 503,125
6.75% due 05/01/2012 (f) 200,000 184,000
7.45% due 05/01/2034 (f) 375,000 285,000
8.00% due 11/15/2014 (f) 550,000 507,375
Bristow Group, Inc.
6.125% due 06/15/2013 425,000 371,875
7.50% due 09/15/2017 775,000 674,250
Burlington Northern Santa Fe Corp.
5.65% due 05/01/2017 268,000 263,948
6.15% due 05/01/2037 436,000 414,818
Canadian National Railway Company
6.375% due 11/15/2037 65,000 64,938
Copyright © 2012 www.secdatabase.com. All Rights Reserved.Please Consider the Environment Before Printing This Document

Canadian Pacific Railway Company
5.75% due 05/15/2013 265,000 267,650
7.25% due 05/15/2019 185,000 183,995
FedEx Corp.
5.50% due 08/15/2009 215,000 216,378
4,011,017
Utility Service - 0.24%
Consumers Energy Company, Series J
6.00% due 02/15/2014 160,000 167,788
PNM Resources, Inc.
9.25% due 05/15/2015 550,000 501,187
Public Service Electric & Gas Company
5.70% due 12/01/2036 355,000 336,994
Veolia Environnement
5.25% due 06/03/2013 360,000 363,227
6.00% due 06/01/2018 430,000 420,666
Veolia Environnement, EMTN
4.875% due 05/28/2013 EUR 50,000 72,327
4.875% due 05/28/2013 35,000 50,629
5.875% due 02/01/2012 30,000 44,761
1,957,579
TOTAL CORPORATE BONDS (Cost $298,780,510) $ 284,866,013
Spectrum Income Fund (continued)Shares or
Principal
Amount Value
CONVERTIBLE BONDS - 0.44%
Air Travel - 0.07%
Airtran Holdings, Inc.
7.00% due 07/01/2023 $ 328,000 $ 304,630
JetBlue Airways Corp.
3.75% due 03/15/2035 275,000 254,375
559,005
Auto Services - 0.04%
United Rentals North America, Inc.
1.875% due 10/15/2023 375,000 337,500
Automobiles - 0.09%
Ford Motor Company
4.25% due 12/15/2036 914,000 734,627
Cable & Television - 0.07%
Sinclair Broadcast Group, Inc.
3.00% due 05/15/2027 725,000 538,313
Cellular Communications - 0.02%
Leap Wireless International, Inc.
4.50% due 07/15/2014 200,000 158,000
Coal - 0.02%
Peabody Energy Corp.
4.75% due 12/15/2066 200,000 152,750
Electrical Equipment - 0.02%
WESCO International, Inc.
1.75% due 11/15/2026 181,000 148,646
Electronics - 0.04%
Advanced Micro Devices, Inc.
5.75% due 08/15/2012 475,000 295,094
Wesco International, Inc.
2.625% due 10/15/2025 71,000 66,651
361,745
Copyright © 2012 www.secdatabase.com. All Rights Reserved.Please Consider the Environment Before Printing This Document

Financial Services - 0.03%
NASDAQ OMX Group, Inc.
2.50% due 08/15/2013 244,000 203,130
Telecommunications Equipment &
Services - 0.04%
Lucent Technologies, Inc., Series B
2.75% due 06/15/2025 225,000 145,489
NII Holdings, Inc.
2.75% due 08/15/2025 70,000 64,663
SBA Communications Corp.
1.875% due 05/01/2013 (f) 164,000 136,120
346,272
TOTAL CONVERTIBLE BONDS (Cost $3,080,371) $ 3,539,988
MUNICIPAL BONDS - 0.59%
Arizona - 0.05%
Salt River Project Agricultural Improvement &
Power District
5.00% due 01/01/2038 365,000 368,537
California - 0.01%
State of California
7.55% due 04/01/2039 80,000 78,182
The accompanying notes are an integral part of the financial statements.
256
JOHN HANCOCK FUNDS II
PORTFOLIO OF INVESTMENTS - May 31, 2009 (Unaudited) - continued(showing percentage of total net assets)
Spectrum Income Fund (continued)Shares or
Principal
Amount Value
MUNICIPAL BONDS (continued)
Connecticut - 0.01%
Connecticut State Development Authority
5.25% due 05/01/2031 $ 95,000 $ 95,195
District of Columbia - 0.00%
District of Columbia
4.75% due 06/01/2031 30,000 28,928
Florida - 0.04%
Orange County Florida Tourist Development
5.00% due 10/01/2018 330,000 343,490
Georgia - 0.10%
Atlanta Water & Wastewater Revenue
5.50% due 11/01/2017 220,000 248,985
De Kalb County Water and Sewer Revenue
5.00% due 10/01/2035 325,000 336,453
Metropolitan Atlanta Rapid Transit Authority
5.00% due 07/01/2037 260,000 260,673
846,111
Illinois - 0.03%
Chicago Illinois Transit Authority, Series A
6.899% due 12/01/2040 245,000 258,745
Kansas - 0.01%
Kansas Development Finance Authority
5.501% due 05/01/2034 120,000 107,815
Copyright © 2012 www.secdatabase.com. All Rights Reserved.Please Consider the Environment Before Printing This Document

Maryland - 0.03%
County of Baltimore
5.00% due 02/01/2038 200,000 207,540
New York - 0.09%
Metropolitan Transportation Authority
7.336% due 11/15/2039 55,000 61,386
New York City Housing Development Corp.
6.42% due 11/01/2027 115,000 97,437
New York State Urban Development Corp.
5.50% due 03/15/2018 160,000 187,952
Triborough Bridge & Tunnel Authority
5.00% due 11/15/2038 360,000 361,339
708,114
North Carolina - 0.05%
Charlotte Water and Sewer Systems
4.75% due 07/01/2033 405,000 410,054
Oregon - 0.01%
State of Oregon
5.892% due 06/01/2027 60,000 55,858
Pennsylvania - 0.03%
Commonwealth of Pennsylvania
5.00% due 01/01/2018 240,000 269,239
Texas - 0.05%
Austin Texas Independent School District
5.00% due 08/01/2033 360,000 369,839
Utah - 0.06%
Utah Transit Authority Sales Tax Revenue
4.75% due 06/15/2032 195,000 193,645
5.25% due 06/15/2038 270,000 278,024
471,669
Spectrum Income Fund (continued)Shares or
Principal
Amount Value
MUNICIPAL BONDS (continued)
West Virginia - 0.02%
Tobacco Settlement Finance Authority of West
Virginia
7.467% due 06/01/2047 $ 325,000 $ 195,270
TOTAL MUNICIPAL BONDS (Cost $4,882,334) $ 4,814,586
COLLATERALIZED MORTGAGE
OBLIGATIONS - 3.84%
American Tower Trust, Series 2007-1A, Class D
5.9568% due 04/15/2037 (f) 350,000 288,750
Banc of America Commercial Mortgage, Inc.,
Series 2003-1, Class A1
3.878% due 09/11/2036 233,928 233,530
Banc of America Commercial Mortgage, Inc.,
Series 2003-1, Class A2
4.648% due 09/11/2036 796,000 739,143
Banc of America Commercial Mortgage, Inc.,
Series 2005-3, Class A2
4.501% due 07/10/2043 640,000 625,357
Banc of America Mortgage Securities,
Series 2004-A, Class 2A2
5.4582% due 02/25/2034 (b) 130,888 108,998
Banc of America Mortgage Securities,
Series 2004-D, Class 2A2
3.9318% due 05/25/2034 (b) 74,344 66,147
Banc of America Mortgage Securities,
Copyright © 2012 www.secdatabase.com. All Rights Reserved.Please Consider the Environment Before Printing This Document

Series 2004-H, Class 2A2
4.7523% due 09/25/2034 (b) 174,541 150,920
Banc of America Mortgage Securities,
Series 2004-I, Class 3A2
4.8196% due 10/25/2034 (b) 82,463 71,146
Banc of America Mortgage Securities,
Series 2005-J, Class 2A1
5.0887% due 11/25/2035 (b) 366,601 233,944
Banc of America Mortgage Securities,
Series 2005-J, Class 3A1
5.2398% due 11/25/2035 (b) 188,687 135,082
Bear Stearns Commercial Mortgage Securities,
Series 1998-C1, Class A2
6.44% due 06/16/2030 2,243 2,238
Bear Stearns Commercial Mortgage Securities,
Series 2002-TOP8, Class A2
4.83% due 08/15/2038 320,000 304,654
Bear Stearns Commercial Mortgage Securities,
Series 2005-PW10, Class A1
5.085% due 12/11/2040 409,368 411,681
Bear Stearns Commercial Mortgage Securities,
Series 2005-PWR8, Class A4
4.674% due 06/11/2041 578,000 506,746
Bear Stearns Commercial Mortgage Securities,
Series 2005-PWR9, Class A1
4.498% due 09/11/2042 50,241 50,354
Bear Stearns Commercial Mortgage Securities,
Series 2005-PWR9, Class AAB
4.804% due 09/11/2042 462,000 454,596
Bear Stearns Commercial Mortgage Securities,
Series 2005-T18, Class A1
4.274% due 02/13/2042 119,131 118,801
Bear Stearns Commercial Mortgage Securities,
Series 2005-T20, Class A1
4.94% due 10/12/2042 11,719 11,708
The accompanying notes are an integral part of the financial statements.
257
JOHN HANCOCK FUNDS II
PORTFOLIO OF INVESTMENTS - May 31, 2009 (Unaudited) - continued(showing percentage of total net assets)
Spectrum Income Fund (continued)Shares or
Principal
Amount Value
COLLATERALIZED MORTGAGE
OBLIGATIONS (continued)
Bear Stearns Commercial Mortgage Securities,
Series 2006-PW12, Class A4
5.720% due 09/11/2038 (b) $ 60,000 $ 52,014
Bear Stearns Commercial Mortgage Securities,
Series 2006-PW13, Class AAB
5.53% due 09/11/2041 50,000 47,672
Bear Stearns Commercial Mortgage Securities,
Series 2006-PWR12, Class A1
5.546% due 09/11/2038 119,659 119,783
Bear Stearns Commercial Mortgage Securities,
Series 2007-PW15, Class AAB
5.315% due 02/11/2044 500,000 453,063
Bear Stearns Commercial Mortgage Securities,
Series 2007-PW17, Class A1
Copyright © 2012 www.secdatabase.com. All Rights Reserved.Please Consider the Environment Before Printing This Document

5.282% due 06/11/2050 513,245 501,099
Bear Stearns Commercial Mortgage Securities,
Series 2007-PW17, Class A4
5.694% due 06/11/2050 50,000 40,392
Bear Stearns Commercial Mortgage Securities,
Series 2007-T28, Class A4
5.742% due 09/11/2042 180,000 146,064
Citigroup/Deutsche Bank Commercial Mortgage
Trust, Series 2006-CD3, Class AAB
5.608% due 10/15/2048 (f) 285,000 264,862
Citigroup/Deutsche Bank Commercial
Mortgage Trust, Series 2005-CD1, Class A1
5.0468% due 07/15/2044 163,285 163,111
Citigroup/Deutsche Bank Commercial
Mortgage Trust, Series 2005-CD1, Class A4
5.2251% due 09/15/2020 (b) 50,000 44,144
Citigroup/Deutsche Bank Commercial
Mortgage Trust, Series 2006-CD3, Class A5
5.617% due 10/15/2048 170,000 138,553
Citigroup/Deutsche Bank Commercial
Mortgage Trust, Series 2007-CD4, Class ASB
5.278% due 12/11/2049 45,000 38,651
Commercial Mortgage Loan Trust, Series
2008-LS1, Class A3
6.0194% due 03/10/2017 (b) 1,270,000 1,055,651
Commercial Mortgage Pass Through Certificates,
Series 2007-C9, Class A4
5.8162% due 12/10/2049 (b) 230,000 185,120
Credit Suisse Mortgage Capital Certificates, Series
2007-C4, Class A1
5.54% due 09/15/2039 99,931 99,067
Credit Suisse Mortgage Capital Certificates,
Series 2006-C4, Class A1
4.771% due 09/15/2039 173,601 172,319
Credit Suisse Mortgage Capital Certificates,
Series 2006-C4, Class A3
5.467% due 09/15/2039 1,205,000 896,246
CS First Boston Mortgage Securities Corp.,
Series 2005-C2, Class A4
4.832% due 04/15/2037 575,000 505,483
Federal Home Loan Mortgage Corp., Series 199,
Class PO
zero coupon PO due 08/01/2028 7,671 6,983
Federal Home Loan Mortgage Corp., Series
2003-2586, Class NJ
4.50% due 08/15/2016 171,099 176,445
Spectrum Income Fund (continued)Shares or
Principal
Amount Value
COLLATERALIZED MORTGAGE
OBLIGATIONS (continued)
Federal Home Loan Mortgage Corp., Series
2003-2614, Class IH
4.50% IO due 05/15/2016 $ 131,808 $ 4,877
Federal Home Loan Mortgage Corp., Series
2003-2627, Class IE
4.50% IO due 04/15/2018 39,142 2,425
Federal Home Loan Mortgage Corp., Series
2003-2631, Class KI
4.50% IO due 01/15/2015 35,274 76
Federal Home Loan Mortgage Corp., Series
2003-2681, Class PC
5.00% due 01/15/2019 161,382 164,483
Copyright © 2012 www.secdatabase.com. All Rights Reserved.Please Consider the Environment Before Printing This Document
Federal Home Loan Mortgage Corp., Series
2003-2686, Class JG
5.50% due 04/15/2028 847,000 859,607
Federal Home Loan Mortgage Corp., Series
2003-41, Class YV
5.50% due 04/25/2014 205,276 216,773
Federal Home Loan Mortgage Corp., Series
2004-2844, Class PQ
5.00% due 05/15/2023 13,288 13,276
Federal Home Loan Mortgage Corp., Series
2004-2872, Class YB
5.00% due 06/15/2023 14,200 14,180
Federal Home Loan Mortgage Corp., Series
2004-2882, Class YB
5.00% due 10/15/2027 400,000 413,679
Federal Home Loan Mortgage Corp., Series
2005-2934, Class NB
5.00% due 01/15/2028 106,000 110,100
Federal Home Loan Mortgage Corp., Series
2005-R003, Class VA
5.50% due 08/15/2016 419,720 439,947
Federal Home Loan Mortgage Corp., Series
2006-3123, Class VB
6.00% due 09/15/2013 181,935 188,942
Federal Home Loan Mortgage Corp., Series
2006-3152, Class DA
6.00% due 09/15/2025 94,163 95,826
Federal Home Loan Mortgage Corp., Series
2006-3177, Class PA
6.00% due 12/15/2026 201,641 204,968
Federal Home Loan Mortgage Corp., Series
2006-3195, Class PN
6.50% due 08/15/2030 640,355 664,039
Federal Home Loan Mortgage Corp., Series
2006-R007, Class VA
6.00% due 09/15/2016 153,570 160,743
Federal Home Loan Mortgage Corp., Series 2568,
Class KA
4.25% due 12/15/2021 204,511 208,605
Federal Home Loan Mortgage Corp., Series 2688,
Class DE
4.50% due 02/15/2020 262,860 269,920
Federal Home Loan Mortgage Corp., Series 3354,
Class PA
5.50% due 07/15/2028 556,638 570,929
Federal Home Loan Mortgage Corp., Series R005,
Class AB
5.50% due 12/15/2018 394,151 404,632
The accompanying notes are an integral part of the financial statements.
258
JOHN HANCOCK FUNDS II
PORTFOLIO OF INVESTMENTS - May 31, 2009 (Unaudited) - continued(showing percentage of total net assets)
Spectrum Income Fund (continued)Shares or
Principal
Amount Value
COLLATERALIZED MORTGAGE
OBLIGATIONS (continued)
Federal Home Loan Mortgage Corp., Series R006,
Copyright © 2012 www.secdatabase.com. All Rights Reserved.Please Consider the Environment Before Printing This Document

Class AK
5.75% due 12/15/2018 $ 460,034 $ 472,947
Federal Home Loan Mortgage Corp., Series R013,
Class AB
6.00% due 12/15/2021 172,857 179,158
Federal Home Loan Mortgage Corp., Stated Final,
Series SF4, Class C
3.32% due 12/15/2011 16,441 16,393
Federal National Mortgage Association
5.00% IO due 10/01/2036 17,832 2,881
Federal National Mortgage Association, Series
2002-84, Class VA
5.50% due 11/25/2013 144,327 151,386
Federal National Mortgage Association, Series
2003-32, Class PG
5.00% due 10/25/2027 350,000 353,575
Federal National Mortgage Association, Series
2003-40, Class NI
5.50% IO due 11/25/2028 15,681 121
Federal National Mortgage Association, Series
2003-88, Class TE
4.50% due 11/25/2014 374,566 377,176
Federal National Mortgage Association, Series
2004-21, Class AC
4.00% due 05/25/2016 38,380 39,115
Federal National Mortgage Association, Series
2006-3136, Class PB
6.00% due 01/15/2030 411,000 426,247
Federal National Mortgage Association, Series
2006-B2, Class AB
5.50% due 05/25/2014 228,180 234,853
Federal National Mortgage Association, Strip,
Series 319, Class 2
6.50% IO due 02/01/2032 28,749 4,959
GE Capital Commercial Mortgage Corp.,
Series 2001-1, Class A2
6.531% due 05/15/2033 465,000 470,228
GE Capital Commercial Mortgage Corp.,
Series 2005-C4, Class A1
5.082% due 11/10/2045 256,386 258,116
GMAC Commercial Mortgage Securities, Inc.,
Series 2001-C2, Class A2
6.70% due 04/15/2034 49,653 50,709
Government National Mortgage Association, Series
1997-16, Class PL
6.50% due 10/20/2027 308,991 327,107
Government National Mortgage Association, Series
1998-12, Class Z
6.50% due 05/20/2028 36,825 39,303
Government National Mortgage Association, Series
1998-6, Class EA
zero coupon PO due 03/16/2028 28,188 25,024
Government National Mortgage Association, Series
2001-48, Class PC
6.50% due 10/20/2031 232,262 245,165
Government National Mortgage Association, Series
2001-56, Class PH
6.50% due 11/20/2031 208,945 222,229
Spectrum Income Fund (continued)Shares or
Principal
Amount Value
COLLATERALIZED MORTGAGE
OBLIGATIONS (continued)
Copyright © 2012 www.secdatabase.com. All Rights Reserved.Please Consider the Environment Before Printing This Document

Government National Mortgage Association, Series
2004-43, Class A
2.822% due 12/16/2019 $ 553,138 $ 555,715
Government National Mortgage Association, Series
2004-43, Class D
4.994% due 03/16/2030 (b) 56,000 58,182
Government National Mortgage Association, Series
2004-44, Class PC
5.50% due 05/20/2031 576,000 597,922
Government National Mortgage Association, Series
2005-94, Class PB
5.50% due 12/20/2035 135,000 139,824
Government National Mortgage Association, Series
2008-8, Class A
3.612% due 11/16/2027 949,241 955,608
Greenwich Capital Commercial Funding Corp.,
Series 2004-GG1, Class A3
4.344% due 06/10/2036 28,659 28,634
Greenwich Capital Commercial Funding Corp.,
Series 2005-GG3, Class A2
4.305% due 08/10/2042 247,611 240,792
Greenwich Capital Commercial Funding Corp.,
Series 2005-GG3, Class A3
4.569% due 08/10/2042 (b) 250,000 226,686
Greenwich Capital Commercial Funding Corp.,
Series 2005-GG3, Class AAB
4.619% due 08/10/2042 (b) 146,000 142,673
Greenwich Capital Commercial Funding Corp.,
Series 2007-GG9, Class A1
5.233% due 03/10/2039 255,688 253,123
Greenwich Capital Commercial Funding Corp.,
Series 2007-GG9, Class A4
5.444% due 03/10/2039 50,000 39,332
GS Mortgage Securities Corp. II, Series 2006-GG6,
Class A4
5.553% due 04/10/2038 (b) 630,000 523,897
JPMorgan Chase Commercial Mortgage Securities
Corp, Series 2006-CB15, Class A4
5.814% due 06/12/2043 (b) 1,025,000 819,840
JPMorgan Chase Commercial Mortgage Securities Corp.,
Series 2001-CIB2, Class A2
6.244% due 04/15/2035 315,558 317,109
JPMorgan Chase Commercial Mortgage Securities Corp.,
Series 2001-CIBC, Class A3
6.26% due 03/15/2033 257,124 262,876
JPMorgan Chase Commercial Mortgage Securities Corp.,
Series 2003-LN1, Class A1
4.134% due 10/15/2037 27,029 25,880
JPMorgan Chase Commercial Mortgage Securities Corp.,
Series 2005-LDP4, Class ASB
4.824% due 10/15/2042 (b) 621,000 607,267
JPMorgan Chase Commercial Mortgage Securities Corp.,
Series 2006-CB14, Class A4
5.481% due 12/12/2044 (b) 65,000 55,190
JPMorgan Chase Commercial Mortgage Securities Corp.,
Series 2006-CB17, Class A1
5.279% due 12/12/2043 165,939 164,923
JPMorgan Chase Commercial Mortgage Securities Corp.,
Series 2006-LDP9, Class A1
5.17% due 05/15/2047 191,933 190,836
The accompanying notes are an integral part of the financial statements.
259
JOHN HANCOCK FUNDS II
Copyright © 2012 www.secdatabase.com. All Rights Reserved.Please Consider the Environment Before Printing This Document

PORTFOLIO OF INVESTMENTS - May 31, 2009 (Unaudited) - continued(showing percentage of total net assets)
Spectrum Income Fund (continued)Shares or
Principal
Amount Value
COLLATERALIZED MORTGAGE
OBLIGATIONS (continued)
JPMorgan Chase Commercial Mortgage Securities Corp.,
Series 2006-LDP9, Class A3
5.336% due 05/15/2047 $ 470,000 $ 357,529
JPMorgan Chase Commercial Mortgage Securities Corp.,
Series 2007-LD11, Class A4
6.0069% due 06/15/2049 (b) 445,000 347,928
JPMorgan Mortgage Acquisition Corp.,
Series 2007-CH1, Class AV2
0.4975% due 11/25/2036 97,802 84,644
LB-UBS Commercial Mortgage Trust,
Series 2003-C7, Class A3
4.559% due 09/15/2027 (b) 475,000 458,448
LB-UBS Commercial Mortgage Trust,
Series 2004-C2, Class A2
3.246% due 03/15/2029 273,855 271,801
LB-UBS Commercial Mortgage Trust,
Series 2005-C1, Class A4
4.742% due 02/15/2030 133,000 115,479
LB-UBS Commercial Mortgage Trust,
Series 2006-C1, Class A1
5.018% due 02/15/2031 211,102 210,755
LB-UBS Commercial Mortgage Trust,
Series 2006-C1, Class A4
5.156% due 02/15/2031 117,500 98,333
LB-UBS Commercial Mortgage Trust,
Series 2007-C2, Class A3
5.43% due 02/15/2040 50,000 35,337
Morgan Stanley Capital I, Series 2006-T23, Class A4
5.8105% due 08/12/2041 485,000 439,546
Morgan Stanley Capital I, Series 2007-HQ11,
Class A4
5.447% due 02/12/2044 (b) 720,000 513,460
Morgan Stanley Capital I, Series 2007-IQ14, Class
A4
5.692% due 04/15/2049 (b) 495,000 358,880
Morgan Stanley Capital I, Series 2007-IQ15, Class
A4
6.0764% due 06/11/2049 (b) 1,025,000 832,725
Morgan Stanley Capital I, Series 2008-T29, Class A4
6.4579% due 01/11/2043 (b) 45,000 38,797
Morgan Stanley Dean Witter
Capital I, Series 2002-TOP7, Class A1
5.38% due 01/15/2039 18,169 18,155
Morgan Stanley Dean Witter
Capital I, Series 2002-TOP7, Class A2
5.98% due 01/15/2039 366,000 363,690
Morgan Stanley Capital I, Series 2006-T23, Class A1
5.682% due 08/12/2041 142,025 142,229
PNC Mortgage Acceptance Corp., Series
1999-CM1, Class A1B
7.33% due 12/10/2032 (b) 287,432 288,465
Vendee Mortgage Trust, Series 1996-3, Class 4
9.5962% due 03/15/2025 (b) 9,588 10,345
Wells Fargo Mortgage Backed Securities Trust,
Series 2003-O, Class 5A1
4.809% due 01/25/2034 (b) 464,532 427,085
Copyright © 2012 www.secdatabase.com. All Rights Reserved.Please Consider the Environment Before Printing This Document

Wells Fargo Mortgage Backed Securities Trust,
Series 2005-AR2, Class 2A2
4.5543% due 03/25/2035 (b) 316,603 266,476
Spectrum Income Fund (continued)Shares or
Principal
Amount Value
COLLATERALIZED MORTGAGE
OBLIGATIONS (continued)
Wells Fargo Mortgage Backed Securities Trust,
Series 2005-AR2, Class 3A1
4.923% due 03/25/2035 (b) $ 192,455 $ 163,973
Wells Fargo Mortgage Backed Securities Trust,
Series 2006-AR16, Class A1
5.6633% due 10/25/2036 (b) 824,231 510,836
TOTAL COLLATERALIZED MORTGAGE OBLIGATIONS
(Cost $32,270,806) $ 31,086,461
ASSET BACKED SECURITIES - 2.04%
American Express Credit Account Master Trust,
Series 2005-5, Class A
0.4913% due 02/15/2013 (b) 605,000 594,818
American Express Credit Account Master Trust,
Series 2006-B, Class A
0.4913% due 08/15/2013 (b) 170,000 165,511
American Express Credit Account Master Trust,
Series 2007-4, Class A
0.4412% due 12/17/2012 (b) 125,000 123,273
AmeriCredit Automobile Receivables Trust,
Series 2006-RM, Class A3
5.53% due 01/06/2014 1,570,000 1,410,015
Bank of America Credit Card Trust,
Series 2007-A8, Class A8
5.59% due 11/17/2014 290,000 309,082
BankBoston Home Equity Loan Trust,
Series 1998-2, Class A6
6.64% due 12/25/2028 46,418 32,837
Bay View Auto Trust, Series 2005-3, Class A4
5.01% due 06/25/2014 182,879 185,340
Cabela's Master Credit Card Trust, Series 2005-1A,
Class A1
4.97% due 10/15/2013 (f) 140,000 141,268
Capital Auto Receivables Asset Trust,
Series 2006-SN1A, Class B
5.50% due 04/20/2010 (f) 275,000 274,528
Capital Auto Receivables Asset Trust,
Series 2006-SN1A, Class A4A
5.32% due 03/20/2010 (f) 419,460 418,696
Capital Auto Receivables Asset Trust,
Series 2006-SN1A, Class A4B
0.5569% due 03/20/2010 (b)(f) 98,482 97,968
Capital One Multi-Asset Execution Trust, Series
2003-C3, Class C3
2.7013% due 07/15/2016 (b) 40,000 29,567
Capital One Multi-Asset Execution Trust, Series
2003-C4, Class C4
6.00% due 08/15/2013 325,000 309,188
Capital One Multi-Asset Execution Trust, Series
2007-C3, Class C3
0.7412% due 04/15/2013 125,000 114,046
Capital One Multi-Asset Execution Trust, Series
2008-A1, Class A
1.2012% due 11/15/2012 (b)(f) 1,100,000 1,098,968
Capital One Prime Auto Receivables Trust, Series
Copyright © 2012 www.secdatabase.com. All Rights Reserved.Please Consider the Environment Before Printing This Document

2006-1, Class A4
5.01% due 11/15/2011 260,000 262,938
Capital One Prime Auto Receivables Trust, Series
2006-2, Class A4
4.94% due 07/15/2012 423,748 428,724
The accompanying notes are an integral part of the financial statements.
260
JOHN HANCOCK FUNDS II
PORTFOLIO OF INVESTMENTS - May 31, 2009 (Unaudited) - continued(showing percentage of total net assets)
Spectrum Income Fund (continued)Shares or
Principal
Amount Value
ASSET BACKED SECURITIES
(continued)
Chase Funding Mortgage Loan Asset-Backed
Certificates, Series 2002-2, Class 1M1
5.599% due 09/25/2031 $ 19,877 $ 5,674
Chase Funding Mortgage Loan Asset-Backed
Certificates, Series 2002-4, Class 2A1
1.1775% due 10/25/2032 (b) 10,147 7,695
Chase Funding Mortgage Loan Asset-Backed
Certificates, Series 2003-3, Class 1A6
3.717% due 10/25/2014 184,649 145,729
Citibank Credit Card Issuance Trust, Series
2007-A5, Class A5
5.50% due 06/22/2012 1,075,000 1,114,229
CNH Equipment Trust, Series 2007-A, Class A3
4.99% due 10/15/2010 1,476 1,478
CNH Equipment Trust, Series 2007-A, Class B
5.09% due 06/16/2014 295,000 208,224
CNH Equipment Trust, Series 2009-B, Class A3
2.97% due 03/15/2013 305,000 305,195
Daimler Chrysler Auto Trust, Series 2008-A, Class
A3A
3.70% due 06/08/2012 300,000 297,948
Detroit Edison Securitization Funding LLC,
Series 2001-1, Class A5
6.42% due 03/01/2015 450,000 493,909
GE Capital Credit Card Master Note Trust,
Series 2006-1, Class A
5.08% due 09/15/2012 340,000 342,595
GE Equipment Small Ticket LLC,
Series 2005-1A, Class A4
4.51% due 12/22/2014 (f) 144,665 144,879
Honda Auto Receivables Owner Trust, Series
2009-2, Class A4
4.90% due 01/15/2013 190,000 190,241
Honda Auto Receivables Owner Trust,
Series 2007-1, Class A3
5.10% due 03/18/2011 214,619 218,002
Household Automotive Trust,
Series 2006-2, Class A4
5.67% due 06/17/2013 220,000 227,762
Hyundai Auto Receivables Trust,
Series 2006-A, Class A4
5.26% due 11/15/2012 139,080 141,550
John Deere Owner Trust, Series 2006-A, Class A4
5.39% due 06/17/2013 164,041 166,812
Copyright © 2012 www.secdatabase.com. All Rights Reserved.Please Consider the Environment Before Printing This Document

John Deere Owner Trust, Series 2008-A, Class A2
3.63% due 03/15/2011 167,300 167,770
JPMorgan Auto Receivables Trust,
Series 2007-A, Class A4
5.19% due 02/15/2014 (f) 240,000 244,994
M&I Auto Loan Trust, Series 2005-1, Class A4
4.86% due 03/21/2011 48,933 48,986
Marriott Vacation Club Owner Trust,
Series 2006-1A, Class A
5.737% due 04/20/2028 (f) 463,794 397,012
Marriott Vacation Club Owner Trust,
Series 2006-1A, Class B
5.827% due 04/20/2028 (f) 15,930 12,032
Marriott Vacation Club Owner Trust,
Series 2006-2A, Class A
5.362% due 10/20/2028 (f) 160,267 134,053
Spectrum Income Fund (continued)Shares or
Principal
Amount Value
ASSET BACKED SECURITIES
(continued)
MBNA Credit Card Master Note Trust, Series
2006-C3, Class C3
0.7412% due 10/15/2013 (b) $ 415,000 $ 362,498
Nissan Auto Receivables Owner Trust, Series
2008-A, Class A3
3.89% due 08/15/2011 175,000 178,396
Nordstrom Private Label
Credit Card Master Note Trust,
Series 2007-1A, Class A
4.92% due 05/15/2013 (f) 350,000 347,191
Peco Energy Transition Trust,
Series 2001-A, Class A1
6.52% due 12/31/2010 447,000 468,450
PSE&G Transition Funding LLC,
Series 2001-1, Class A6
6.61% due 06/15/2015 281,000 310,272
Reliant Energy Transport Bond Company,
Series 2001-1, Class A4
5.63% due 09/15/2015 334,000 355,974
Residential Asset Mortgage Products, Inc.,
Series 2003-RZ2, Class A1
3.60% due 04/25/2033 22,484 16,447
SLM Student Loan Trust, Series 2008-4, Class A2
2.1419% due 07/25/2016 (b) 675,000 670,346
SLM Student Loan Trust, Series 2008-6, Class A1
1.4919% due 10/27/2014 445,927 443,147
Triad Auto Receivables Owner Trust,
Series 2006-B, Class A3
5.41% due 08/12/2011 70,527 70,893
Triad Auto Receivables Owner Trust,
Series 2006-B, Class A4
5.52% due 11/12/2012 500,000 480,086
USAA Auto Owner Trust, Series 2007-2, Class A3
4.90% due 02/15/2012 628,880 640,949
USAA Auto Owner Trust, Series 2008-1, Class A3
4.16% due 04/16/2012 375,000 382,846
Volkswagen Auto Lease Trust, Series 2009-A,
Class A3
3.41% due 04/16/2012 400,000 401,224
Wachovia Bank Commercial Mortgage Trust,
Series 2006-C28, Class A4
5.572% due 10/15/2048 (b) 180,000 143,736
Copyright © 2012 www.secdatabase.com. All Rights Reserved.Please Consider the Environment Before Printing This Document

Wachovia Auto Owner Trust,
Series 2006-A, Class A4
5.38% due 03/20/2013 199,143 202,162
TOTAL ASSET BACKED SECURITIES
(Cost $16,829,503) $ 16,488,153
SUPRANATIONAL OBLIGATIONS - 0.38%
Supranational - 0.38%
European Investment Bank
8.75% due 08/25/2017 GBP 320,000 685,680
European Investment Bank, EMTN
4.75% due 10/15/2017 EUR 965,000 1,434,176
Inter-American Development Bank
4.40% due 01/26/2026 CAD 410,000 319,772
International Finance Corp., MTN
7.50% due 02/28/2013 AUD 370,000 319,263
The accompanying notes are an integral part of the financial statements.
261
JOHN HANCOCK FUNDS II
PORTFOLIO OF INVESTMENTS - May 31, 2009 (Unaudited) - continued(showing percentage of total net assets)
Spectrum Income Fund (continued)Shares or
Principal
Amount Value
SUPRANATIONAL OBLIGATIONS
(continued)
Supranational (continued)
Queensland Treasury Corp., Series 17
6.00% due 09/14/2017 AUD 409,000 $ 326,831
3,085,722
TOTAL SUPRANATIONAL OBLIGATIONS
(Cost $3,187,562) $ 3,085,722
SHORT TERM INVESTMENTS - 4.00%
John Hancock Collateral Investment
Trust, 0.7339% (c)(g) $ 426,537 $ 4,265,370
T. Rowe Price Reserve Investment Fund,
0.5211% 28,230,680 28,123,688
TOTAL SHORT TERM INVESTMENTS
(Cost $32,389,058) $ 32,389,058
REPURCHASE AGREEMENTS - 0.28%
Repurchase Agreement with State
Street Corp. dated 05/29/2009 at
0.07% to be repurchased at
$2,257,013 on 06/01/2009,
collateralized by $2,295,000
Federal Home Loan Bank, 0.875%
due 03/30/2010 (valued at
$2,303,606, including interest) $ 2,257,000 $ 2,257,000
TOTAL REPURCHASE AGREEMENTS
(Cost $2,257,000) $ 2,257,000
Total Investments (Spectrum Income Fund)
(Cost $851,637,379) - 99.38% $ 804,350,481
Other assets and liabilities, net - 0.62% 5,023,967
TOTAL NET ASSETS - 100.00% $ 809,374,448
Copyright © 2012 www.secdatabase.com. All Rights Reserved.Please Consider the Environment Before Printing This Document

Strategic Bond FundShares or
Principal
Amount Value
U.S. TREASURY OBLIGATIONS - 5.75%
Treasury Inflation Protected
Securities (d) - 4.03%
1.75% due 01/15/2028 *** $ 1,441,442 $ 1,328,830
2.00% due 01/15/2016 450,009 460,556
2.00% due 01/15/2026 *** 4,907,241 4,710,952
2.375% due 01/15/2017 453,444 476,541
2.50% due 07/15/2016 to 01/15/2029 8,123,743 8,459,406
2.625% due 07/15/2017 164,171 176,484
3.375% due 04/15/2032 *** 371,405 457,292
3.875% due 04/15/2029 *** 1,552,320 1,925,847
17,995,908
U.S. Treasury Bonds - 0.78%
3.50% due 02/15/2039 209,000 180,099
4.25% due 05/15/2039 770,000 758,931
4.50% due 05/15/2038 1,325,000 1,360,195
6.375% due 08/15/2027 930,000 1,169,911
3,469,136
Strategic Bond Fund (continued)Shares or
Principal
Amount Value
U.S. TREASURY OBLIGATIONS
(continued)
U.S. Treasury Notes - 0.78%
2.75% due 02/15/2019 $ 3,720,000 $ 3,495,944
3.125% due 05/15/2019 10,000 9,714
3,505,658
U.S. Treasury Strips - 0.16%
zero coupon due 05/15/2018 to
05/15/2030 1,020,000 711,810
TOTAL U.S. TREASURY OBLIGATIONS
(Cost $25,679,398) $ 25,682,512
U.S. GOVERNMENT AGENCY OBLIGATIONS - 30.77%
Federal Home Loan Bank - 4.31%
4.50% due 10/09/2009 10,300,000 10,453,954
5.00% due 09/18/2009 8,700,000 8,817,911
19,271,865
Federal Home Loan Mortgage Corp. - 4.15%
2.50% due 04/23/2014 1,700,000 1,676,209
3.75% due 03/27/2019 960,000 943,853
5.00% due 12/01/2034 123,253 126,498
5.50% due 11/01/2035 to 01/01/2038 12,362,136 12,790,852
5.50% due 12/01/2099 (b) 2,900,000 2,995,609
18,533,021
Copyright © 2012 www.secdatabase.com. All Rights Reserved.Please Consider the Environment Before Printing This Document

Federal National Mortgage
Association - 19.69%
zero coupon PO due 02/01/2019 380,000 181,716
2.50% due 05/15/2014 870,000 857,440
3.516% due 11/01/2035 (b) 220,773 223,660
4.50% due 04/01/2038 3,569,452 3,602,218
4.625% due 05/01/2013 640,000 652,397
5.00% due 08/01/2034 to 07/01/2038 7,554,924 7,754,345
5.00% TBA ** 26,900,000 27,538,875
5.25% due 08/01/2012 1,300,000 1,356,896
5.50% due 09/14/2017 to 08/01/2037 17,975,220 18,632,663
5.50% TBA ** 21,090,000 21,801,788
6.00% due 04/18/2036 to 10/01/2037 3,981,332 4,168,587
6.00% TBA ** 300,000 316,406
6.25% due 02/01/2011 270,000 284,370
6.50% due 10/01/2032 (b) 487,633 524,301
7.50% due 07/01/2030 to 02/01/2031 8,429 9,210
8.00% due 08/01/2027 37,533 40,551
8.80% due 01/25/2019 21,409 23,880
10.40% due 04/25/2019 4,645 5,065
87,974,368
Government National Mortgage
Association - 1.97%
5.00% due 06/15/2033 to 08/15/2035 2,230,740 2,309,897
5.00% TBA ** 700,000 720,234
6.00% due 01/15/2037 5,483,357 5,744,245
7.50% due 04/15/2022 to 10/15/2027 6,617 7,171
8,781,547
The Financing Corp. - 0.65%
zero coupon due 02/08/2018 190,000 126,884
zero coupon due 03/07/2019 300,000 186,026
zero coupon due 06/06/2019 100,000 60,583
zero coupon due 05/11/2018 730,000 476,514
The accompanying notes are an integral part of the financial statements.
262
JOHN HANCOCK FUNDS II
PORTFOLIO OF INVESTMENTS - May 31, 2009 (Unaudited) - continued(showing percentage of total net assets)
Strategic Bond Fund (continued)Shares or
Principal
Amount Value
U.S. GOVERNMENT AGENCY
OBLIGATIONS (continued)
The Financing Corp. (continued)
zero coupon due 08/03/2018 $ 310,000 $ 200,829
zero coupon due 08/03/2018 560,000 361,603
zero coupon due 08/03/2018 300,000 193,716
zero coupon due 04/06/2018 590,000 390,541
zero coupon due 08/03/2018 to
09/26/2019 730,000 470,764
zero coupon due 11/02/2018 680,000 432,659
2,900,119
Copyright © 2012 www.secdatabase.com. All Rights Reserved.Please Consider the Environment Before Printing This Document

TOTAL U.S. GOVERNMENT AGENCY OBLIGATIONS
(Cost $135,290,004) $ 137,460,920
FOREIGN GOVERNMENT OBLIGATIONS - 3.58%
Brazil - 1.87%
Federative Republic of Brazil
6.00% due 05/15/2015 BRL 633,000 570,978
10.00% due 01/01/2012 1,093,000 568,676
10.00% due 07/01/2010 13,610,000 7,233,436
10.00% due 01/01/2010 1,000 530
8,373,620
Indonesia - 0.28%
Republic of Indonesia
11.00% due 09/15/2025 IDR 13,051,000,000 1,227,093
Italy - 0.09%
Republic of Italy
5.804% due 10/25/2032 $ 440,000 422,162
Mexico - 0.16%
Government of Mexico
5.625% due 01/15/2017 684,000 697,680
Russia - 0.33%
Government of Russia
7.50% due 03/31/2030 1,464,960 1,461,298
Turkey - 0.85%
Republic of Turkey
6.875% due 03/17/2036 4,215,000 3,814,575
TOTAL FOREIGN GOVERNMENT OBLIGATIONS
(Cost $15,777,228) $ 15,996,428
CORPORATE BONDS - 46.43%
Air Travel - 0.25%
Continental Airlines, Inc., Series C
7.339% due 04/19/2014 140,000 95,200
DAE Aviation Holdings, Inc.
11.25% due 08/01/2015 (f) 2,360,000 1,038,400
1,133,600
Aluminum - 0.50%
Novelis, Inc.
7.25% due 02/15/2015 3,415,000 2,245,363
Auto Parts - 0.03%
Keystone Automotive Operations, Inc.
9.75% due 11/01/2013 90,000 29,700
Visteon Corp.
8.25% due 08/01/2010 ^ 556,000 27,800
Strategic Bond Fund (continued)Shares or
Principal
Amount Value
CORPORATE BONDS (continued)
Auto Parts (continued)
Visteon Corp. (continued)
12.25% due 12/31/2016 ^ (f) $ 1,437,000 $ 71,850
129,350
Auto Services - 0.56%
Hertz Corp.
10.50% due 01/01/2016 2,070,000 1,800,900
Penhall International Corp.
12.00% due 08/01/2014 (f) 1,965,000 687,750
Copyright © 2012 www.secdatabase.com. All Rights Reserved.Please Consider the Environment Before Printing This Document

2,488,650
Automobiles - 0.19%
General Motors Corp.
8.25% due 07/15/2023 ^ 580,000 52,200
8.375% due 07/15/2033 ^ 8,745,000 787,050
839,250
Banking - 2.33%
Bank of America Corp.
2.375% due 06/22/2012 40,000 40,505
5.42% due 03/15/2017 1,600,000 1,340,186
Bank of the West, Series 1
2.15% due 03/27/2012 940,000 948,896
Citibank NA, Series FXD
1.875% due 05/07/2012 820,000 821,903
Glitnir Banki HF
6.33% due 07/28/2011 ^ (f) 440,000 61,600
6.375% due 09/25/2012 ^ (f) 580,000 81,200
6.693% due 06/15/2016 ^ (b)(f) 620,000 62
7.451% due 09/14/2049 ^ (b)(f) 100,000 10
ICICI Bank, Ltd.
6.375% due 04/30/2022 (b)(f) 786,000 592,108
6.375% due 04/30/2022 (b) 340,000 252,773
Kaupthing Bank HF
7.125% due 05/19/2016 ^ (e)(f) 230,000 23
7.625% due 02/28/2015 ^ (f) 1,280,000 75,200
KeyBank NA
3.20% due 06/15/2012 80,000 82,998
Lloyds TSB Bank PLC
2.80% due 04/02/2012 (f) 650,000 653,797
RSHB Capital SA for OJSC Russian Agricultural
Bank
6.299% due 05/15/2017 (f) 1,130,000 971,800
7.125% due 01/14/2014 750,000 709,658
State Street Corp.
2.15% due 04/30/2012 1,700,000 1,716,233
TuranAlem Finance BV
8.25% due 01/22/2037 (f) 1,490,000 298,000
8.25% due 01/22/2037 500,000 105,000
Wachovia Corp.
5.25% due 08/01/2014 1,740,000 1,679,187
10,431,139
Broadcasting - 0.89%
News America, Inc.
5.30% due 12/15/2014 3,305,000 3,349,085
6.65% due 11/15/2037 50,000 42,319
Time Warner Cable, Inc.
7.30% due 07/01/2038 590,000 598,396
3,989,800
The accompanying notes are an integral part of the financial statements.
263
JOHN HANCOCK FUNDS II
PORTFOLIO OF INVESTMENTS - May 31, 2009 (Unaudited) - continued(showing percentage of total net assets)
Strategic Bond Fund (continued)Shares or
Copyright © 2012 www.secdatabase.com. All Rights Reserved.Please Consider the Environment Before Printing This Document

Principal
Amount Value
CORPORATE BONDS (continued)
Building Materials & Construction - 0.21%
Associated Materials, Inc.
11.25 due 03/01/2014 $ 2,645,000 $ 846,400
NTK Holdings, Inc.
10.75% due 03/01/2014 865,000 85,419
931,819
Business Services - 0.33%
Affinion Group, Inc.
10.125% due 10/15/2013 425,000 399,500
11.50% due 10/15/2015 130,000 112,125
SunGard Data Systems, Inc.
10.25% due 08/15/2015 610,000 553,575
U.S. Investigations Services, Inc.
10.50% due 11/01/2015 (f) 510,000 415,650
1,480,850
Cable & Television - 1.45%
AT&T Broadband Corp.
8.375% due 03/15/2013 785,000 874,403
Charter Communications Holdings I LLC
11.00% due 10/01/2015 ^ 2,362,000 271,630
Charter Communications Holdings II LLC
10.25% due 10/01/2013 ^ 267,000 262,995
Charter Communications Holdings LLC
11.75% due 05/15/2011 ^ 1,540,000 7,700
12.125% due 01/15/2012 ^ 30,000 300
Charter Communications, Inc.
10.875% due 09/15/2014 ^ (f) 880,000 906,400
Comcast Corp.
6.50% due 01/15/2015 460,000 475,945
6.50% due 01/15/2017 850,000 879,962
CSC Holdings, Inc.
6.75% due 04/15/2012 250,000 241,250
8.50% due 06/15/2015 (f) 125,000 123,125
EchoStar DBS Corp.
7.75% due 05/31/2015 1,030,000 973,350
Time Warner Entertainment Company LP
8.375% due 07/15/2033 430,000 446,491
Time Warner, Inc.
7.625% due 04/15/2031 955,000 869,661
UPC Holding BV
9.875% due 04/15/2018 (f) 130,000 125,432
6,458,644
Cellular Communications - 0.39%
ALLTEL Communications, Inc., PIK
10.375% due 12/01/2017 (f) 130,000 154,886
Cricket Communications, Inc.
7.75% due 05/15/2016 (f) 505,000 487,956
Rogers Wireless, Inc.
8.00% due 12/15/2012 20,000 20,550
True Move Company, Ltd.
10.75% due 12/16/2013 (f) 385,000 277,200
Vimpelcom
8.375% due 04/30/2013 (f) 880,000 800,800
1,741,392
Copyright © 2012 www.secdatabase.com. All Rights Reserved.Please Consider the Environment Before Printing This Document

Chemicals - 0.05%
Arco Chemical Company
9.80% due 02/01/2020 ^ 75,000 22,875
Strategic Bond Fund (continued)Shares or
Principal
Amount Value
CORPORATE BONDS (continued)
Chemicals (continued)
Georgia Gulf Corp.
10.75% due 10/15/2016 ^ $ 725,000 $ 70,687
Methanex Corp.
8.75% due 08/15/2012 125,000 116,875
210,437
Coal - 0.03%
International Coal Group, Inc.
10.25% due 07/15/2014 180,000 124,200
Commercial Services - 0.62%
Ceridian Corp., PIK
12.25% due 11/15/2015 110,000 73,700
DI Finance/DynCorp International LLC, Series B
9.50% due 02/15/2013 350,000 340,375
Rental Service Corp.
9.50% due 12/01/2014 3,000,000 2,340,000
2,754,075
Computers & Business Equipment - 0.02%
Activant Solutions, Inc.
9.50% due 05/01/2016 140,000 102,550
Construction Materials - 0.00%
Nortek, Inc.
8.50% due 09/01/2014 35,000 9,275
Containers-Paper/Plastic - 0.00%
Radnor Holdings, Inc.
11.00% due 03/15/2010 ^ 125,000 156
Crude Petroleum & Natural Gas - 1.48%
Anadarko Petroleum Corp.
5.95% due 09/15/2016 50,000 47,822
8.70% due 03/15/2019 1,190,000 1,325,050
Berry Petroleum Company
10.25% due 06/01/2014 220,000 215,875
Chesapeake Energy Corp.
6.25% due 01/15/2018 90,000 73,012
6.50% due 08/15/2017 90,000 74,475
6.875% due 01/15/2016 450,000 388,125
7.25% due 12/15/2018 525,000 438,375
Conoco, Inc.
6.95% due 04/15/2029 1,620,000 1,663,944
Hess Corp.
7.30% due 08/15/2031 900,000 859,081
Mariner Energy, Inc.
7.50% due 04/15/2013 80,000 70,000
OPTI Canada, Inc.
7.875% due 12/15/2014 220,000 148,500
8.25% due 12/15/2014 125,000 86,250
PetroHawk Energy Corp.
9.125% due 07/15/2013 120,000 117,900
Plains Exploration & Production Company
10.00% due 03/01/2016 240,000 239,400
Quicksilver Resources, Inc.
7.125% due 04/01/2016 250,000 182,500
Copyright © 2012 www.secdatabase.com. All Rights Reserved.Please Consider the Environment Before Printing This Document

SandRidge Energy, Inc.
9.875% due 05/15/2016 (f) 610,000 581,025
W&T Offshore, Inc.
8.25% due 06/15/2014 (f) 105,000 79,800
6,591,134
The accompanying notes are an integral part of the financial statements.
264
JOHN HANCOCK FUNDS II
PORTFOLIO OF INVESTMENTS - May 31, 2009 (Unaudited) - continued(showing percentage of total net assets)
Strategic Bond Fund (continued)Shares or
Principal
Amount Value
CORPORATE BONDS (continued)
Domestic Oil - 0.14%
Exco Resources, Inc.
7.25% due 01/15/2011 $ 335,000 $ 299,825
Whiting Petroleum Corp.
7.00% due 02/01/2014 375,000 335,625
635,450
Drugs & Health Care - 0.18%
Humana, Inc.
6.30% due 08/01/2018 1,065,000 822,882
Educational Services - 0.24%
Education Management Corp.
10.25% due 06/01/2016 1,105,000 1,077,375
Electrical Utilities - 3.51%
AES Corp.
7.75% due 03/01/2014 2,813,000 2,679,382
7.75% due 10/15/2015 270,000 251,100
8.00% due 10/15/2017 2,795,000 2,599,350
9.375% due 09/15/2010 1,100,000 1,108,250
Dominion Resources, Inc.
5.70% due 09/17/2012 730,000 754,689
Edison Mission Energy
7.00% due 05/15/2017 120,000 87,000
7.20% due 05/15/2019 370,000 250,212
7.625% due 05/15/2027 130,000 79,463
7.75% due 06/15/2016 300,000 232,500
Energy Future Holdings Corp., PIK
11.25% due 11/01/2017 5,692,200 2,974,175
Exelon Corp.
5.625% due 06/15/2035 170,000 130,870
FirstEnergy Corp.
6.45% due 11/15/2011 430,000 449,914
7.375% due 11/15/2031 675,000 585,452
Mirant Mid Atlantic LLC, Series C
10.06% due 12/30/2028 574,834 569,085
Orion Power Holdings, Inc.
12.00% due 05/01/2010 170,000 175,525
Pacific Gas & Electric Company
6.05% due 03/01/2034 490,000 494,219
TXU Corp., Series P
5.55% due 11/15/2014 1,000,000 534,600
TXU Corp., Series Q
6.50% due 11/15/2024 460,000 188,499
Copyright © 2012 www.secdatabase.com. All Rights Reserved.Please Consider the Environment Before Printing This Document

TXU Corp., Series R
6.55% due 11/15/2034 3,880,000 1,524,208
15,668,493
Electronics - 0.14%
L-3 Communications Corp.
7.625% due 06/15/2012 550,000 549,313
L-3 Communications Corp., Series B
6.375% due 10/15/2015 75,000 68,250
617,563
Energy - 0.58%
Dynegy Holdings, Inc.
7.75% due 06/01/2019 330,000 240,075
Mirant North America LLC
7.375% due 12/31/2013 300,000 287,250
Strategic Bond Fund (continued)Shares or
Principal
Amount Value
CORPORATE BONDS (continued)
Energy (continued)
NRG Energy, Inc.
7.25% due 02/01/2014 $ 1,150,000 $ 1,101,125
7.375% due 02/01/2016 1,010,000 950,662
2,579,112
Financial Services - 14.19%
Aiful Corp.
5.00% due 08/10/2010 (f) 440,000 248,600
American General Finance Corp.
6.90% due 12/15/2017 280,000 138,521
Bear Stearns Companies, Inc.
7.25% due 02/01/2018 3,200,000 3,299,002
CDX North America High Yield, Series 8-T1
7.625% due 06/29/2012 (f) 8,397,900 7,264,183
Citigroup, Inc.
5.00% due 09/15/2014 1,080,000 939,036
5.625% due 08/27/2012 1,090,000 1,019,139
5.875% due 05/29/2037 8,270,000 6,617,538
6.125% due 08/25/2036 50,000 37,015
6.875% due 03/05/2038 1,240,000 1,091,194
Countrywide Financial Corp.
6.25% due 05/15/2016 420,000 351,704
Credit Suisse USA, Inc.
5.50% due 08/16/2011 270,000 283,192
El Paso Performance-Linked Trust
7.75% due 07/15/2011 (f) 980,000 968,053
Ford Motor Credit Company LLC
3.8888% due 01/13/2012 (b) 60,000 47,400
6.57% due 06/15/2011 (b) 836,000 706,420
7.00% due 10/01/2013 80,000 64,557
7.375% due 10/28/2009 70,000 68,274
7.80% due 06/01/2012 700,000 597,762
7.875% due 06/15/2010 1,875,000 1,784,685
9.875% due 08/10/2011 725,000 661,863
12.00% due 05/15/2015 9,990,000 9,185,116
General Electric Capital Corp.
2.125% due 12/21/2012 3,350,000 3,367,182
2.25% due 03/12/2012 2,500,000 2,537,223
GMAC LLC
Copyright © 2012 www.secdatabase.com. All Rights Reserved.Please Consider the Environment Before Printing This Document

6.00% due 04/01/2011 (f) 1,231,000 1,089,435
7.50% due 12/31/2013 (f) 332,000 277,220
8.00% due 11/01/2031 (f) 8,716,000 6,537,000
8.00% due 12/31/2018 (f) 398,000 288,550
Goldman Sachs Group LP
4.50% due 06/15/2010 580,000 589,739
Hawker Beechcraft Acquisition Company LLC, PIK
8.875% due 04/01/2015 885,000 274,350
HSBC Finance Capital Trust IX
5.911% due 11/30/2035 (b) 1,650,000 892,704
International Lease Finance Corp.
5.875% due 05/01/2013 815,000 633,614
JPMorgan Chase & Company
2.125% due 06/22/2012 650,000 655,718
2.125% due 12/26/2012 780,000 782,083
6.625% due 03/15/2012 970,000 1,027,941
Lehman Brothers Holdings, Inc.
4.50% due 07/26/2010 ^ 775,000 114,312
6.20% due 09/26/2014 ^ 290,000 42,775
The accompanying notes are an integral part of the financial statements.
265
JOHN HANCOCK FUNDS II
PORTFOLIO OF INVESTMENTS - May 31, 2009 (Unaudited) - continued(showing percentage of total net assets)
Strategic Bond Fund (continued)Shares or
Principal
Amount Value
CORPORATE BONDS (continued)
Financial Services (continued)
Lehman Brothers Holdings, Inc., MTN
6.75% due 12/28/2017 ^ $ 2,620,000 $ 262
Merrill Lynch & Company, Inc.
5.70% due 05/02/2017 1,090,000 880,602
Morgan Stanley
1.5569% due 10/18/2016 (b) 250,000 184,128
1.95% due 06/20/2012 1,700,000 1,706,225
2.00% due 09/22/2011 700,000 709,493
4.75% due 04/01/2014 2,280,000 2,086,107
Shinsei Finance Cayman, Ltd.
6.418% due 01/29/2049 (b)(f) 850,000 263,500
TNK-BP Finance SA
6.625% due 03/20/2017 480,000 373,200
7.50% due 07/18/2016 (f) 1,330,000 1,103,900
7.875% due 03/13/2018 (f) 340,000 280,500
Wells Fargo Company
5.30% due 08/26/2011 1,250,000 1,294,806
63,365,823
Food & Beverages - 0.05%
Dole Food Company, Inc.
7.25% due 06/15/2010 230,000 224,825
Forest Products - 0.11%
Weyerhaeuser Company
6.75% due 03/15/2012 480,000 477,563
Funeral Services - 0.02%
Service Corp. International
7.50% due 04/01/2027 30,000 23,850
7.625% due 10/01/2018 65,000 60,125
Copyright © 2012 www.secdatabase.com. All Rights Reserved.Please Consider the Environment Before Printing This Document

83,975
Furniture & Fixtures - 0.15%
Norcraft Companies LP
9.00% due 11/01/2011 400,000 380,000
Norcraft Holdings Capital
9.75 due 09/01/2012 350,000 308,000
688,000
Gas & Pipeline Utilities - 2.36%
El Paso Corp.
7.00% due 06/15/2017 1,050,000 983,473
7.375% due 12/15/2012 475,000 458,497
7.75% due 01/15/2032 6,430,000 5,102,411
7.80% due 08/01/2031 2,783,000 2,213,534
7.875% due 06/15/2012 500,000 490,046
El Paso Natural Gas Company
8.375% due 06/15/2032 480,000 484,533
Kinder Morgan Energy Partners LP
5.00% due 12/15/2013 140,000 138,048
6.75% due 03/15/2011 100,000 104,795
7.125% due 03/15/2012 20,000 21,008
Williams Companies, Inc.
7.625% due 07/15/2019 25,000 24,375
7.875% due 09/01/2021 275,000 266,750
8.75% due 03/15/2032 267,000 256,320
10,543,790
Healthcare Products - 0.43%
Biomet, Inc.
11.625% due 10/15/2017 1,020,000 1,004,700
Strategic Bond Fund (continued)Shares or
Principal
Amount Value
CORPORATE BONDS (continued)
Healthcare Products (continued)
Biomet, Inc., PIK
10.375% due 10/15/2017 $ 880,000 $ 836,000
Leiner Health Products, Inc.
11.00% due 06/01/2012 ^ 500,000 1,250
Universal Hospital Services, Inc.
5.9425% due 06/01/2015 (b) 50,000 40,500
Universal Hospital Services, Inc., PIK
8.50% due 06/01/2015 40,000 38,400
1,920,850
Healthcare Services - 0.36%
DaVita, Inc.
7.25% due 03/15/2015 420,000 394,800
U.S. Oncology Holdings, Inc., PIK
6.9037% due 03/15/2012 458,000 311,440
Vanguard Health Holding Company I LLC
zero coupon, Step up to 11.25% on
10/01/2009 due 10/01/2015 300,000 279,750
Vanguard Health Holding Company II LLC
9.00% due 10/01/2014 640,000 627,200
1,613,190
Copyright © 2012 www.secdatabase.com. All Rights Reserved.Please Consider the Environment Before Printing This Document

Holdings Companies/Conglomerates - 0.29%
Ashtead Capital, Inc.
9.00% due 08/15/2016 (f) 558,000 412,920
Leucadia National Corp.
7.125% due 03/15/2017 10,000 7,712
8.125% due 09/15/2015 970,000 860,875
1,281,507
Homebuilders - 0.15%
K Hovnanian Enterprises, Inc.
11.50% due 05/01/2013 780,000 664,950
Hotels & Restaurants - 0.09%
CCM Merger, Inc.
8.00% due 08/01/2013 (f) 105,000 72,450
El Pollo Loco, Inc.
11.75% due 11/15/2013 215,000 172,000
11.75% due 12/01/2012 (f) 70,000 71,225
Sbarro, Inc.
10.375% due 02/01/2015 160,000 89,200
404,875
Industrial Machinery - 0.14%
H&E Equipment Services, Inc.
8.375% due 07/15/2016 445,000 349,325
Terex Corp.
10.875% due 06/01/2016 270,000 263,609
612,934
Insurance - 0.01%
American International Group, Inc., MTN
5.85% due 01/16/2018 160,000 67,810
International Oil - 2.14%
Corral Finans AB, PIK
2.6313% due 04/15/2010 (b)(f) 107,358 46,164
Gaz Capital for Gazprom
8.625% due 04/28/2034 800,000 784,000
Gaz Capital SA, Series REGS
6.212% due 11/22/2016 500,000 421,250
The accompanying notes are an integral part of the financial statements.
266
JOHN HANCOCK FUNDS II
PORTFOLIO OF INVESTMENTS - May 31, 2009 (Unaudited) - continued(showing percentage of total net assets)
Strategic Bond Fund (continued)Shares or
Principal
Amount Value
CORPORATE BONDS (continued)
International Oil (continued)
KazMunaiGaz Finance Sub BV
8.375% due 07/02/2013 (f) $ 1,100,000 $ 1,001,000
Kerr-McGee Corp.
6.95% due 07/01/2024 490,000 428,899
OAO Gazprom
9.625% due 03/01/2013 150,000 153,563
Pemex Project Funding Master Trust
6.625% due 06/15/2035 7,019,000 6,522,300
Copyright © 2012 www.secdatabase.com. All Rights Reserved.Please Consider the Environment Before Printing This Document

Petroplus Finance, Ltd.
6.75% due 05/01/2014 (f) 110,000 91,850
7.00% due 05/01/2017 (f) 130,000 105,950
9,554,976
Leisure Time - 0.58%
AMC Entertainment, Inc.
8.75% due 06/01/2019 (f) 200,000 194,250
Boyd Gaming Corp.
6.75% due 04/15/2014 400,000 312,000
Harrahs Operating Escrow LLC
11.25% due 06/01/2017 (f) 330,000 320,925
Inn of the Mountain Gods Resort & Casino
12.00% due 11/15/2010 ^ 190,000 44,650
MGM Mirage, Inc.
6.625% due 07/15/2015 20,000 12,925
7.625% due 01/15/2017 310,000 198,400
10.375% due 05/15/2014 (f) 170,000 175,100
11.125% due 11/15/2017 (f) 410,000 435,113
Mohegan Tribal Gaming Authority
6.875% due 02/15/2015 150,000 99,000
7.125% due 08/15/2014 150,000 103,500
River Rock Entertainment Authority
9.75% due 11/01/2011 25,000 18,250
Snoqualmie Entertainment Authority
5.3837% due 02/01/2014 (b)(f) 45,000 23,512
9.125% due 02/01/2015 (f) 700,000 374,500
Station Casinos, Inc.
7.75% due 08/15/2016 ^ 240,000 86,400
WMG Acquisition Corp.
9.50% due 06/15/2016 (f) 180,000 179,550
2,578,075
Manufacturing - 0.95%
Tyco International Group SA
6.00% due 11/15/2013 1,040,000 1,042,850
6.375% due 10/15/2011 180,000 189,040
6.75% due 02/15/2011 360,000 375,465
Tyco International, Ltd.
6.875% due 01/15/2021 2,760,000 2,619,902
4,227,257
Medical-Hospitals - 1.70%
Community Health Systems, Inc.
8.875% due 07/15/2015 360,000 355,950
HCA, Inc.
6.375% due 01/15/2015 265,000 204,712
7.50% due 12/15/2023 25,000 15,000
7.50% due 11/15/2095 40,000 20,654
7.50% due 11/06/2033 1,400,000 777,000
9.125% due 11/15/2014 670,000 658,275
9.25% due 11/15/2016 1,140,000 1,120,050
Strategic Bond Fund (continued)Shares or
Principal
Amount Value
CORPORATE BONDS (continued)
Medical-Hospitals (continued)
HCA, Inc., PIK
9.625% due 11/15/2016 $ 2,880,000 $ 2,757,600
Tenet Healthcare Corp.
Copyright © 2012 www.secdatabase.com. All Rights Reserved.Please Consider the Environment Before Printing This Document

6.875% due 11/15/2031 1,125,000 705,937
7.375% due 02/01/2013 125,000 120,313
9.00% due 05/01/2015 (f) 190,000 193,800
9.875% due 07/01/2014 669,000 669,000
7,598,291
Mining - 1.01%
Freeport-McMoRan Copper & Gold, Inc.
8.375% due 04/01/2017 2,400,000 2,382,000
Noranda Aluminium Acquisition Corp., PIK
5.4125% due 05/15/2015 (b) 134,774 71,430
Teck Resources, Ltd.
9.75% due 05/15/2014 (f) 190,000 189,050
10.25% due 05/15/2016 (f) 160,000 162,400
10.75% due 05/15/2019 (f) 320,000 328,000
Vale Overseas, Ltd.
6.875% due 11/21/2036 887,000 801,815
Vedanta Resources PLC
8.75% due 01/15/2014 (f) 600,000 582,000
4,516,695
Office Furnishings & Supplies - 0.05%
Interface, Inc.
9.50% due 02/01/2014 100,000 76,250
10.375% due 02/01/2010 150,000 156,765
233,015
Oil Comp-Integrated - 0.15%
Occidental Petroleum Corp.
7.00% due 11/01/2013 570,000 652,047
Paper - 0.41%
Abitibi-Consolidated Company of Canada
13.75% due 04/01/2011 ^ (f) 690,000 634,800
Appleton Papers, Inc.
8.125% due 06/15/2011 15,000 9,750
Appleton Papers, Inc., Series B
9.75% due 06/15/2014 305,000 103,700
NewPage Corp.
7.2775% due 05/01/2012 (b) 1,705,000 826,925
NewPage Holding Corp., PIK
8.5788% due 11/01/2013 (b) 1,405,586 147,587
Smurfit Capital Funding PLC
7.50% due 11/20/2025 200,000 123,000
1,845,762
Petroleum Services - 0.58%
Anadarko Finance Company, Series B
7.50% due 05/01/2031 1,410,000 1,277,174
Belden & Blake Corp.
8.75% due 07/15/2012 725,000 572,750
Compagnie Generale de Geophysique SA
7.50% due 05/15/2015 50,000 45,750
Complete Production Services, Inc.
8.00% due 12/15/2016 235,000 190,350
Enterprise Products Operating LP
8.375 due 08/01/2066 (b) 210,000 159,600
The accompanying notes are an integral part of the financial statements.
267
JOHN HANCOCK FUNDS II
Copyright © 2012 www.secdatabase.com. All Rights Reserved.Please Consider the Environment Before Printing This Document

PORTFOLIO OF INVESTMENTS - May 31, 2009 (Unaudited) - continued(showing percentage of total net assets)
Strategic Bond Fund (continued)Shares or
Principal
Amount Value
CORPORATE BONDS (continued)
Petroleum Services (continued)
Key Energy Services, Inc.
8.375% due 12/01/2014 $ 150,000 $ 132,000
Pride International, Inc.
7.375% due 07/15/2014 210,000 209,212
SemGroup LP
8.75% due 11/15/2015 ^ (f) 200,000 13,000
2,599,836
Photography - 1.43%
Eastman Kodak Company
3.375% due 10/15/2033 4,210,000 3,441,675
7.25% due 11/15/2013 4,790,000 2,945,850
6,387,525
Publishing - 0.31%
Idearc, Inc.
8.00% due 11/15/2016 ^ 1,045,000 23,513
TL Acquisitions, Inc.
10.50% due 01/15/2015 (f) 1,740,000 1,357,200
1,380,713
Railroads & Equipment - 0.19%
Grupo Transportacion Ferroviaria Mexicana,
SA de CV
9.375% due 05/01/2012 130,000 116,675
Kansas City Southern de Mexico SA de CV
7.375% due 06/01/2014 850,000 671,500
7.625% due 12/01/2013 50,000 41,000
829,175
Real Estate - 0.15%
Ashton Woods USA LLC/Ashton Woods Finance
Company
zero coupon, Step up to 11.00% on
02/24/2012 due 06/30/2015 (f) 39,000 14,812
Forest City Enterprises, Inc.
7.625% due 06/01/2015 5,000 2,750
Realogy Corp.
10.50% due 04/15/2014 711,000 261,293
12.375% due 04/15/2015 900,000 225,000
Realogy Corp., PIK
11.00% due 04/15/2014 794 187
Ventas Realty LP
6.50% due 06/01/2016 35,000 31,937
6.75% due 04/01/2017 150,000 138,375
674,354
Retail - 0.23%
Michaels Stores, Inc.
10.00% due 11/01/2014 750,000 540,000
Suburban Propane Partners LP
Copyright © 2012 www.secdatabase.com. All Rights Reserved.Please Consider the Environment Before Printing This Document

6.875% due 12/15/2013 365,000 343,100
Wal-Mart Stores, Inc.
5.80% due 02/15/2018 140,000 150,673
1,033,773
Retail Grocery - 0.02%
Kroger Company
6.15% due 01/15/2020 60,000 60,836
6.40% due 08/15/2017 40,000 41,836
102,672
Strategic Bond Fund (continued)Shares or
Principal
Amount Value
CORPORATE BONDS (continued)
Retail Trade - 0.64%
American Greetings Corp.
7.375% due 06/01/2016 $ 15,000 $ 9,450
Blockbuster, Inc.
9.00% due 09/01/2012 1,190,000 606,900
CVS Corp.
9.35% due 01/10/2023 (f) 1,700,000 502,282
CVS Pass-Through Trust
6.036% due 12/10/2028 (f) 443,307 365,116
Dollar General Corp.
10.625% due 07/15/2015 220,000 232,650
Dollar General Corp., PIK
11.875% due 07/15/2017 90,000 94,950
Neiman Marcus Group, Inc., PIK
9.00% due 10/15/2015 (f) 1,987,287 1,063,199
2,874,547
Sanitary Services - 0.17%
Waste Management, Inc.
6.375% due 11/15/2012 730,000 743,888
Semiconductors - 0.01%
Freescale Semiconductor, Inc.
10.125% due 12/15/2016 10,000 2,650
Sensata Technologies B.V.
8.00% due 05/01/2014 (f) 120,000 55,200
57,850
Steel - 0.86%
Evraz Group SA
8.875% due 04/24/2013 (f) 1,050,000 834,750
GTL Trade Finance, Inc.
7.25% due 10/20/2017 (f) 684,000 656,640
Metals USA, Inc.
11.125% due 12/01/2015 450,000 338,625
Ryerson, Inc.
12.00% due 11/01/2015 2,845,000 1,920,375
Steel Dynamics, Inc.
7.375% due 11/01/2012 110,000 101,200
3,851,590
Telecommunications Equipment &
Services - 0.36%
Deutsche Telekom International Finance BV
5.75% due 03/23/2016 430,000 429,553
Copyright © 2012 www.secdatabase.com. All Rights Reserved.Please Consider the Environment Before Printing This Document
Hawaiian Telcom Communications, Inc., Series B
12.50% due 05/01/2015 ^ 110,000 137
Intelsat Bermuda, Ltd.
11.25% due 06/15/2016 510,000 522,750
Intelsat Jackson Holdings, Ltd.
9.50% due 06/15/2016 (f) 65,000 64,675
Royal KPN NV
8.00% due 10/01/2010 580,000 611,723
1,628,838
Telephone - 1.65%
AT&T, Inc.
5.60% due 05/15/2018 310,000 313,971
Cincinnati Bell Telephone Company
6.30% due 12/01/2028 95,000 73,150
Level 3 Financing, Inc.
9.25% due 11/01/2014 460,000 359,375
The accompanying notes are an integral part of the financial statements.
268
JOHN HANCOCK FUNDS II
PORTFOLIO OF INVESTMENTS - May 31, 2009 (Unaudited) - continued(showing percentage of total net assets)
Strategic Bond Fund (continued)Shares or
Principal
Amount Value
CORPORATE BONDS (continued)
Telephone (continued)
Nordic Telephone Company Holdings
8.875% due 05/01/2016 (f) $ 500,000 $ 500,000
Qwest Communications International, Inc., Series B
7.50% due 02/15/2014 306,000 281,520
Qwest Corp.
4.57% due 06/15/2013 (b) 90,000 80,775
Sprint Capital Corp.
8.375% due 03/15/2012 2,750,000 2,708,750
Telecom Italia Capital SA
5.25% due 10/01/2015 500,000 457,813
Verizon Communications, Inc.
5.50% due 02/15/2018 1,060,000 1,062,300
Verizon Florida LLC, Series F
6.125% due 01/15/2013 295,000 301,163
Virgin Media Finance PLC, Series 1
9.50% due 08/15/2016 65,000 62,123
Virgin Media, Inc.
9.125% due 08/15/2016 950,000 916,750
Windstream Corp.
8.625% due 08/01/2016 255,000 250,537
7,368,227
Tobacco - 0.30%
Alliance One International, Inc.
8.50% due 05/15/2012 50,000 46,500
11.00% due 05/15/2012 1,000,000 1,007,500
Altria Group, Inc.
9.70% due 11/10/2018 240,000 273,139
1,327,139
Copyright © 2012 www.secdatabase.com. All Rights Reserved.Please Consider the Environment Before Printing This Document

Trucking & Freight - 0.07%
Swift Transportation Company, Inc.
8.6331% due 05/15/2015 (b)(f) 120,000 51,600
12.50% due 05/15/2017 (f) 525,000 241,500
293,100
TOTAL CORPORATE BONDS (Cost $261,229,354) $ 207,371,996
COLLATERALIZED MORTGAGE
OBLIGATIONS - 6.94%
Banc of America Commercial Mortgage, Inc.,
Series 2006-1, Class A4
5.372% due 09/10/2045 (b) 340,000 284,199
Bear Stearns Structured Products, Inc., Series
2007-EMX1, Class A1
1.3088% due 03/25/2037 (b)(f) 3,172,100 2,329,778
Commercial Mortgage Asset Trust,
Series 1999-C1, Class C
7.35% due 01/17/2032 295,000 286,682
Commercial Mortgage Pass-Through Certificates,
Series 2001-J2A, Class A1
5.447% due 07/16/2034 233,137 230,832
Countrywide Alternative Loan Trust, Series
2006-OA9, Class 2A1B
0.5163% due 07/20/2046 (b) 1,268,211 459,059
Countrywide Home Loans, Series 2006-HYB3,
Class 2A1A
5.6953% due 04/20/2036 (b) 109,986 64,309
Strategic Bond Fund (continued)Shares or
Principal
Amount Value
COLLATERALIZED MORTGAGE
OBLIGATIONS (continued)
Credit Suisse Mortgage Capital Certificates, Series
2006-C1, Class A4
5.551% due 02/15/2039 (b) $ 1,675,000 $ 1,388,963
Federal Home Loan Mortgage Corp., Series 3330,
Class VA
5.00% due 06/15/2018 258,503 271,960
First Boston Mortgage Securities Corp., Series D,
Class I-O
10.965% IO due 05/25/2017 8,119 1,878
First Union National Bank Commercial Mortgage,
Series 2000-C1
0.5628% IO due 05/17/2032 (b) 12,486,717 121,772
GMAC Mortgage Corp Loan Trust, Series
2004-AR1, Class 24A
5.061% due 06/25/2034 735,392 457,297
Green Tree Financial Corp., Series 1997-6, Class A8
7.07% due 01/15/2029 298,685 260,533
GSMPS Mortgage Loan Trust, Series 2005-RP2,
Class 1AF
0.6587% due 03/25/2035 (b)(f) 690,674 629,350
GSR Mortgage Loan Trust, Series 2004-7, Class
4A1
4.8474% due 06/25/2034 (b) 629,175 563,549
GSRPM Mortgage Loan Trust, Series 2003-1,
Class A3
0.8087% due 01/25/2032 (b) 64,064 41,051
Harborview Mortgage Loan Trust, Series 2007-7,
Class 2A1A
Copyright © 2012 www.secdatabase.com. All Rights Reserved.Please Consider the Environment Before Printing This Document

1.3088% due 11/25/2047 (b) 3,616,125 1,480,775
Impac CMB Trust, Series 2003-4, Class 1A1
0.9488% due 10/25/2033 (b) 44,593 26,668
IndyMac Index Mortgage Loan Trust, Series
2005-AR14, Class 2A1A
0.6087% due 08/25/2035 (b) 1,184,995 535,222
IndyMac Index Mortgage Loan Trust, Series
2006-AR6, Class 2A1A
0.5088% due 06/25/2047 (b) 3,123,336 1,112,666
IndyMac Index Mortgage Loan Trust, Series
2007-AR15, Class 2A1
5.7719% due 08/25/2037 (b) 2,403,057 1,044,834
Indymac Index Mortgage Loan Trust, Series
2007-AR5, Class 2A1
5.915% due 05/25/2037 (b) 1,734,677 810,375
JPMorgan Chase Commercial Mortgage Securities
Corp, Series 2006-CB15, Class A4
5.814% due 06/12/2043 (b) 2,370,000 1,895,630
JPMorgan Mortgage Trust, Series 2005-A6, Class
7A1
4.957% due 08/25/2035 (b) 88,528 50,932
Luminent Mortgage Trust, Series 2006-4, Class A1A
0.4988% due 05/25/2046 (b) 1,429,302 527,142
Master Adjustable Rate Mortgages Trust, Series
2007-R5, Class A1
5.6455% due 11/25/2035 (b) 1,386,580 613,141
Master Adjustable Rate Mortgages Trust., Series
2007-3, Class 12A1
0.5088% due 05/25/2047 (b) 3,758,960 1,424,751
Master Adjustable Rate Mortgages Trust.,
Series 2006-2, Class 3A1
4.8481% due 01/25/2036 (b) 119,594 83,614
The accompanying notes are an integral part of the financial statements.
269
JOHN HANCOCK FUNDS II
PORTFOLIO OF INVESTMENTS - May 31, 2009 (Unaudited) - continued(showing percentage of total net assets)
Strategic Bond Fund (continued)Shares or
Principal
Amount Value
COLLATERALIZED MORTGAGE
OBLIGATIONS (continued)
Master Adjustable Rate Mortgages Trust.,
Series 2006-OA1, Class 1A1
0.5188% due 04/25/2046 (b) $ 2,352,741 $ 945,005
MASTR Asset Securitization Trust, Series 2003-6,
Class 1A1
5.50% due 07/25/2033 (b) 1,031,900 1,011,590
Merit Securities Corp., Series 11PA, Class B2
1.8162% due 09/28/2032 (b)(f) 307,551 222,934
Merrill Lynch Mortgage Trust, Series 2006-C1,
Class A4
5.8399% due 05/12/2039 (b) 970,000 833,249
Morgan Stanley Mortgage Loan Trust, Series
2004-8AR, Class 4A1
5.3441% due 10/25/2034 (b) 550,249 381,331
Novastar Mortgage-Backed Notes, Series
2006-MTA1, Class 2A1A
0.4988% due 09/25/2046 (b) 1,426,473 563,039
Copyright © 2012 www.secdatabase.com. All Rights Reserved.Please Consider the Environment Before Printing This Document

Prime Mortgage Trust, Series 2006-DR1, Class 2A2
6.00% due 05/25/2035 (f) 1,776,208 1,214,274
Structured Asset Mortgage Investments, Inc.,
Series 2005-AR3, Class 2A1
5.194% due 08/25/2035 (b) 101,834 48,879
Structured Asset Mortgage Investments, Inc.,
Series 2006-AR6, Class 1A3
0.4988% due 07/25/2046 (b) 1,670,643 551,802
Thornburg Mortgage Securities Trust, Series
2006-3, Class A2
0.4137% due 05/25/2046 (b) 1,792,277 1,772,032
Thornburg Mortgage Securities Trust, Series
2006-3, Class A3
0.4187% due 06/25/2046 (b) 2,011,586 2,002,084
Thornburg Mortgage Securities Trust, Series
2007-4, Class 2A1
6.2076% due 09/25/2037 (b) 1,441,104 1,081,685
Thornburg Mortgage Securities Trust, Series
2007-4, Class 3A1
6.1903% due 09/25/2037 (b) 1,369,410 895,817
WaMu Mortgage Pass Through Certificates, Series
2007-HY3, Class 4A1
5.3313% due 03/25/2037 (b) 1,664,123 1,155,990
WaMu Mortgage Pass Through Certificates, Series
2007-OA6, Class 1A1B
2.2492% due 07/25/2047 (b) 4,116,413 759,514
WaMu Mortgage Pass-Through Certificates, Series
2005-AR17, Class A1A1
0.5788% due 12/25/2045 (b) 1,165,010 544,127
TOTAL COLLATERALIZED MORTGAGE OBLIGATIONS
(Cost $48,843,803) $ 30,980,314
ASSET BACKED SECURITIES - 3.66%
ACE Securities Corp., Series 2006-GP1, Class A
0.4387% due 02/25/2031 (b) 842,875 505,666
Amortizing Residential Collateral Trust,
Series 2002-BC6, Class M2
2.1088% due 08/25/2032 (b) 64,352 20,311
Asset Backed Securities Corp.,
Series 2003-HE2, Class M2
3.1944% due 04/15/2033 (b) 45,987 21,156
Strategic Bond Fund (continued)Shares or
Principal
Amount Value
ASSET BACKED SECURITIES
(continued)
Bear Stearns Asset Backed Securities Trust,
Series 2007-HE6, Class 1A1
1.5588% due 08/25/2037 (b) $ 1,759,291 $ 1,038,573
Bear Stearns Asset Backed Securities, Inc., Series
2003-ABF1, Class A
0.6787% due 01/25/2034 (b) 45,131 25,967
Bear Stearns Asset Backed Securities, Inc., Series
2007-SD1, Class 1A2A
6.00% due 10/25/2036 2,506,269 1,406,429
Bear Stearns Asset Backed Securities, Inc., Series
2007-SD1, Class 1A3A
6.50% due 10/25/2036 2,405,457 1,310,527
Countrywide Asset-Backed Certificates, Series
2007-SD1, Class A1
0.7588% due 03/25/2047 (b) 516,555 271,182
Countrywide Asset-Backed Certificates,
Series 2004-5, Class M4
Copyright © 2012 www.secdatabase.com. All Rights Reserved.Please Consider the Environment Before Printing This Document

1.5588% due 06/25/2034 (b) 182,256 13,278
Ellington Loan Acquisition Trust, Series 2007-1,
Class A2A1
1.3088% due 05/25/2037 (b)(f) 1,758,252 1,339,046
Ellington Loan Acquisition Trust, Series 2007-1,
Class A2C
1.5588% due 05/25/2037 (b)(f) 2,300,000 677,669
EMC Mortgage Loan Trust, Series 2003-B, Class A1
0.8587% due 11/25/2041 (b)(f) 188,477 141,751
GSAMP Trust, Series 2006-S4, Class A1
0.3988% due 05/25/2036 (b) 427,686 68,952
IndyMac Seconds Asset Backed Trust, Series
2006-A, Class A
0.4387% due 06/25/2036 (b) 1,430,319 105,691
Merrill Lynch First Franklin Mortgage Loan Trust,
Series 2007-H1, Class 2A1
1.8088% due 10/25/2037 (b) 3,224,925 2,033,066
Mid State Trust, Series 6, Class A1
7.34% due 07/01/2035 505,079 391,802
Morgan Stanley Mortgage Loan Trust, Series
2006-4SL, Class A1
0.4588% due 03/25/2036 (b) 810,591 155,102
Nelnet Student Loan Trust, Series 2008-4, Class A4
2.5719% due 04/25/2024 (b) 810,000 794,419
RAAC Series, Series 2006-RP2, Class A
0.5587% due 02/25/2037 (b)(f) 999,223 465,526
RAAC Series, Series 2007-RP3, Class A
0.6888% due 10/25/2046 (b) 1,597,438 684,294
Residential Asset Mortgage Products Inc., Series
2003-RS4, Class AIIB
0.9688% due 05/25/2033 (b) 32,039 16,390
SACO I Trust, Inc., Series 2006-5, Class 1A
0.4588% due 04/25/2036 (b) 1,786,866 213,730
SACO I Trust, Inc., Series 2006-5, Class 2A3
0.4888% due 05/25/2036 (b) 1,398,251 11,561
SACO I Trust, Inc., Series 2006-6, Class A
0.4387% due 06/25/2036 (b) 1,062,517 72,478
Sail Net Interest Margin Notes, Series 2004-2A,
Class A
5.50% due 03/27/2034 (f) 23,428 2
Securitized Asset Backed Receivables LLC, Series
2007-BR2, Class A2
0.5387% due 02/25/2037 (b) 3,094,771 1,193,450
The accompanying notes are an integral part of the financial statements.
270
JOHN HANCOCK FUNDS II
PORTFOLIO OF INVESTMENTS - May 31, 2009 (Unaudited) - continued(showing percentage of total net assets)
Strategic Bond Fund (continued)Shares or
Principal
Amount Value
ASSET BACKED SECURITIES
(continued)
SLM Student Loan Trust, Series 2006-5, Class A2
1.0819% due 07/25/2017 (b) $ 568,464 $ 568,194
Structured Asset Securities Corp., Series
2006-ARS1, Class A1
0.4187% due 02/25/2036 (b)(f) 804,581 90,974
Structured Asset Securities Corp., Series
Copyright © 2012 www.secdatabase.com. All Rights Reserved.Please Consider the Environment Before Printing This Document

2007-TC1, Class A
0.6087% due 04/25/2031 (b)(f) 3,403,763 1,897,664
Structured Asset Securities Corp., Series
2008-BC4, Class A3
0.6875% due 11/25/2037 (b) 979,143 820,654
TOTAL ASSET BACKED SECURITIES
(Cost $34,861,914) $ 16,355,504
SUPRANATIONAL OBLIGATIONS - 0.36%
Supranational - 0.14%
Asian Development Bank
2.75% due 05/21/2014 660,000 642,318
Venezuela - 0.22%
Corporacion Andina de Fomento
6.875% due 03/15/2012 916,000 962,861
TOTAL SUPRANATIONAL OBLIGATIONS
(Cost $1,642,601) $ 1,605,179
COMMON STOCKS - 0.00%
Hotels & Restaurants - 0.00%
Buffets Restaurants Holdings, Inc. * 373 0
TOTAL COMMON STOCKS (Cost $199,758) $ 0
PREFERRED STOCKS - 0.37%
Automobiles - 0.05%
General Motors Corp., Series C, 6.25% 76,275 202,891
Financial Services - 0.32%
Federal Home Loan Mortgage Corp.,
Series V,5.57% 121,625 45,001
Federal Home Loan Mortgage Corp., Series Z 56,575 29,419
Federal National Mortgage Association,
Series S 39,250 26,298
Preferred Blocker, Inc., 7.00% (f) 2,440 1,029,009
Resona Preferred Global Securities, Ltd.,
7.191% to 07/30/2015 than variable (f)(i) 440,000 308,000
1,437,727
TOTAL PREFERRED STOCKS (Cost $7,328,525) $ 1,640,618
TERM LOANS - 2.01%
Auto Services - 0.30%
Hertz Corp.
2.253% due 01/21/2012 (b) 1,500,000 1,349,062
Business Services - 0.20%
First Data Corp.
5.926% due 10/15/2014 (b) 1,241,100 909,881
Commercial Services - 0.31%
Aramark Corp.
3.333% due 01/31/2014 (b) 1,500,000 1,363,500
Strategic Bond Fund (continued)Shares or
Principal
Amount Value
TERM LOANS (continued)
Electrical Utilities - 0.57%
Calpine Corp.,Tranche B
4.335% due 03/29/2014 (b) $ 2,962,500 $ 2,556,546
Medical-Hospitals - 0.39%
Community Health Systems, Inc., Tranche B
2.728% due 07/02/2014 (b) 1,981,134 1,757,807
Semiconductors - 0.24%
Freescale Semiconductor
2.246% due 12/01/2013 (b) 1,713,534 1,050,967
Copyright © 2012 www.secdatabase.com. All Rights Reserved.Please Consider the Environment Before Printing This Document

TOTAL TERM LOANS (Cost $9,780,858) $ 8,987,763
WARRANTS - 0.00%
Hotels & Restaurants - 0.00%
Buffets Restaurants Holdings, Inc.
(Expiration Date 04/28/2014) * 165 0
TOTAL WARRANTS (Cost $0) $ 0
OPTIONS - 0.00%
Put Options - 0.00%
Eurodollar Futures
Expiration 06/15/2009 at $98.75 * 2,500 6
TOTAL OPTIONS (Cost $30) $ 6
REPURCHASE AGREEMENTS - 11.08%
Deutsche Bank Tri-Party Repurchase
Agreement dated 05/29/2009 at
0.16% to be repurchased at
$5,500,073 on 06/01/2009,
collateralized by $5,594,000
Federal National Mortgage
Association, 3.00% due
01/13/2014 (valued at $5,609,999,
including interest) $ 5,500,000 $ 5,500,000
JPMorgan Chase & Company Tri-Party
Repurchase Agreement dated 05/29/2009
at 0.13% to be repurchased at $44,000,477
on 06/01/2009, collateralized by
$44,900,000 Federal Home Loan Mortgage
Corp., 0.00% due 06/30/2009 (valued at
$44,880,020, including interest) 44,000,000 44,000,000
TOTAL REPURCHASE AGREEMENTS
(Cost $49,500,000) $ 49,500,000
Total Investments (Strategic Bond Fund)
(Cost $590,133,473) - 110.95% $ 495,581,240
Other assets and liabilities, net - (10.95)% (48,892,677)
TOTAL NET ASSETS - 100.00% $ 446,688,563
The accompanying notes are an integral part of the financial statements.
271
JOHN HANCOCK FUNDS II
PORTFOLIO OF INVESTMENTS - May 31, 2009 (Unaudited) - continued(showing percentage of total net assets)
Strategic Income FundShares or
Principal
Amount Value
U.S. TREASURY OBLIGATIONS - 0.56%
U.S. Treasury Bonds - 0.56%
9.25% due 02/15/2016 $ 1,635,000 $ 2,264,985
TOTAL U.S. TREASURY OBLIGATIONS
(Cost $2,142,233) $ 2,264,985
U.S. GOVERNMENT AGENCY OBLIGATIONS - 5.61%
Federal Home Loan Mortgage Corp. - 2.50%
4.50% due 04/01/2039 10,044,170 10,120,286
Federal National Mortgage
Association - 3.11%
4.00% TBA ** 3,105,000 3,128,772
Copyright © 2012 www.secdatabase.com. All Rights Reserved.Please Consider the Environment Before Printing This Document

5.00% due 06/01/2023 1,333,684 1,382,291
5.375% due 06/12/2017 7,265,000 8,090,130
12,601,193
TOTAL U.S. GOVERNMENT AGENCY OBLIGATIONS
(Cost $21,929,017) $ 22,721,479
FOREIGN GOVERNMENT OBLIGATIONS - 18.41%
Canada - 4.83%
Province of Ontario
4.40% due 03/08/2016 CAD 4,325,000 4,123,398
4.50% due 03/08/2015 3,085,000 2,985,138
4.75% due 06/02/2013 4,610,000 4,534,796
6.25% due 06/16/2015 NZD 3,520,000 2,200,771
6.375% due 10/12/2010 5,010,000 3,310,216
Province of Quebec
5.25% due 10/01/2013 CAD 2,370,000 2,377,511
19,531,830
Colombia - 0.03%
Republic of Colombia
10.00% due 01/23/2012 $ 110,000 126,500
France - 2.67%
Government of France
4.25% due 04/25/2019 EUR 3,114,000 4,499,462
4.75% due 10/25/2012 4,125,000 6,297,855
10,797,317
Germany - 7.53%
Bundesrepublik Deutschland, Series 09
3.75% due 01/04/2019 6,348,000 9,118,199
Bundesschatzanweisungen
4.00% due 09/10/2010 3,200,000 4,689,455
Federal Republic of Germany
3.50% due 04/12/2013 1,710,000 2,522,245
4.25% due 07/04/2018 7,150,000 10,695,930
5.00% due 07/04/2012 2,240,000 3,450,485
30,476,314
Mexico - 0.51%
Government of Mexico
5.625% due 01/15/2017 $ 520,000 530,400
5.875% due 01/15/2014 550,000 579,700
6.375% due 01/16/2013 490,000 527,240
8.125% due 12/30/2019 360,000 424,800
2,062,140
Strategic Income Fund (continued)Shares or
Principal
Amount Value
FOREIGN GOVERNMENT OBLIGATIONS
(continued)
New Zealand - 0.30%
Government of New Zealand
6.00% due 12/15/2017 NZD 1,860,000 $ 1,210,963
Spain - 1.07%
Kingdom of Spain
5.35% due 10/31/2011 EUR 2,840,000 4,335,456
United Kingdom - 1.47%
Government of United Kingdom
5.00% due 03/07/2012 GBP 1,635,000 2,859,718
Copyright © 2012 www.secdatabase.com. All Rights Reserved.Please Consider the Environment Before Printing This Document

5.00% due 03/07/2018 1,725,000 3,107,162
5,966,880
TOTAL FOREIGN GOVERNMENT OBLIGATIONS
(Cost $71,968,175) $ 74,507,400
CORPORATE BONDS - 49.74%
Advertising - 0.04%
R.H. Donnelley Corp., Series A-3
8.875% due 01/15/2016 ^ $ 1,815,000 127,050
Vertis, Inc., Series A
18.50% due 10/01/2012 325,283 24,803
151,853
Aerospace - 0.10%
Vought Aircraft Industries, Inc.
8.00% due 07/15/2011 820,000 401,800
Air Travel - 0.53%
Delta Air Lines, Inc.
6.821% due 08/10/2022 1,479,324 1,190,856
US Airways Group, Inc.
7.25% due 05/15/2014 1,235,000 951,073
2,141,929
Amusement & Theme Parks - 0.01%
HRP Myrtle Beach Operations LLC
10.07% due 04/01/2012 ^ (f) 1,685,000 16,850
Apparel & Textiles - 0.20%
Hanesbrands, Inc., Series B
5.6975% due 12/15/2014 (b) 1,010,000 813,050
Auto Parts - 1.88%
Allison Transmission, Inc.
11.00% due 11/01/2015 (f) 2,900,000 2,262,000
Allison Transmission, Inc., PIK
11.25% due 11/01/2015 (f) 1,990,000 1,343,250
Goodyear Tire & Rubber Company
8.625% due 12/01/2011 530,000 515,425
10.50% due 05/15/2016 325,000 323,375
Tenneco Automotive, Inc.
8.625% due 11/15/2014 3,690,000 2,269,350
TRW Automotive, Inc.
7.00% due 03/15/2014 (f) 1,200,000 882,000
7,595,400
Automobiles - 1.06%
DaimlerChrysler N.A. Holding Corp., EMTN
4.375% due 03/21/2013 EUR 3,145,000 4,284,007
The accompanying notes are an integral part of the financial statements.
272
JOHN HANCOCK FUNDS II
PORTFOLIO OF INVESTMENTS - May 31, 2009 (Unaudited) - continued(showing percentage of total net assets)
Strategic Income Fund (continued)Shares or
Principal
Amount Value
Copyright © 2012 www.secdatabase.com. All Rights Reserved.Please Consider the Environment Before Printing This Document

CORPORATE BONDS (continued)
Broadcasting - 2.14%
Canadian Satellite Radio Holdings, Inc.
1.50% due 02/14/2016 (b)(e) $ 132,650 $ 38,017
Nexstar Broadcasting, Inc., PIK
7.00% due 01/15/2014 (f) 693,764 197,723
Radio One, Inc.
6.375% due 02/15/2013 225,000 60,750
8.875% due 07/01/2011 200,000 76,000
Salem Communications Corp.
7.75% due 12/15/2010 100,000 30,000
Sirius XM Radio, Inc.
7.00% due 12/01/2014 (f) 2,290,000 827,263
9.625% due 08/01/2013 5,485,000 3,551,537
13.00% due 08/01/2013 (f) 4,615,000 3,322,800
Sirius XM Radio, Inc., Series AI
10.00% due 06/01/2011 1,100,000 572,000
8,676,090
Building Materials & Construction - 0.24%
Odebrecht Finance, Ltd.
7.50% due 10/18/2017 (f) 970,000 960,300
Business Services - 0.38%
Minerva Overseas, Ltd.
9.50% due 02/01/2017 (f) 1,555,000 824,150
Vangent, Inc.
9.625% due 02/15/2015 910,000 693,875
1,518,025
Cable & Television - 3.69%
Charter Communications Holdings I LLC
11.00% due 10/01/2015 ^ 1,775,000 204,125
11.00% due 10/01/2015 ^ 525,000 55,125
Charter Communications Holdings II LLC
10.25% due 09/15/2010 ^ (f) 2,410,000 2,385,900
10.25% due 10/01/2013 ^ (f) 4,232,000 3,914,600
10.25% due 09/15/2010 ^ 210,000 205,800
Charter Communications Holdings LLC
8.75% due 11/15/2013 ^ 1,100,000 1,006,500
Comcast Corp.
4.95% due 06/15/2016 805,000 769,636
CSC Holdings, Inc.
8.50% due 06/15/2015 (f) 1,450,000 1,428,250
Mediacom Broadband LLC
8.50% due 10/15/2015 75,000 68,250
Mediacom LLC/Mediacom Capital Corp.
9.50% due 01/15/2013 125,000 119,375
Shaw Communications, Inc.
5.70% due 03/02/2017 CAD 610,000 532,866
6.50% due 06/02/2014 1,110,000 1,059,378
Time Warner Cable, Inc.
6.75% due 07/01/2018 $ 1,515,000 1,564,980
8.25% due 04/01/2019 790,000 885,053
8.75% due 02/14/2019 620,000 711,047
Young Broadcasting, Inc.
10.00% due 03/01/2011 ^ 1,790,000 13,425
14,924,310
Cellular Communications - 2.15%
American Tower Corp., Series WI
7.00% due 10/15/2017 1,310,000 1,264,150
Strategic Income Fund (continued)Shares or
Copyright © 2012 www.secdatabase.com. All Rights Reserved.Please Consider the Environment Before Printing This Document

Principal
Amount Value
CORPORATE BONDS (continued)
Cellular Communications (continued)
Centennial Communications Corp.
10.00% due 01/01/2013 $ 2,735,000 $ 2,878,587
Nextel Communications, Inc., Series D
7.375% due 08/01/2015 2,940,000 2,329,950
Verizon Wireless Capital LLC
7.375% due 11/15/2013 (f) 2,000,000 2,244,200
8,716,887
Chemicals - 0.38%
American Pacific Corp.
9.00% due 02/01/2015 1,645,000 1,435,262
Nova Chemicals Corp.
6.50% due 01/15/2012 125,000 113,750
1,549,012
Commercial Services - 0.31%
Aramark Services, Inc.
8.50% due 02/01/2015 1,325,000 1,263,719
Containers & Glass - 2.12%
Ball Corp.
6.625% due 03/15/2018 195,000 180,375
Berry Plastics Holdings Corp.
8.875% due 09/15/2014 955,000 759,225
Graham Packaging Company
9.875% due 10/15/2014 375,000 333,750
Graphic Packaging International Corp.
8.50% due 08/15/2011 1,000,000 990,000
9.50% due 08/15/2013 2,705,000 2,529,175
OI European Group BV
6.875% due 03/31/2017 (f) EUR 410,000 512,961
Owens-Brockway Glass Container, Inc.
8.25% due 05/15/2013 $ 1,450,000 1,450,000
Smurfit-Stone Container Enterprises, Inc.
8.00% due 03/15/2017 ^ 1,570,000 510,250
Stone Container Corp.
8.375% due 07/01/2012 ^ 2,925,000 921,375
US Corrugated, Inc.
10.00% due 06/12/2013 715,000 407,550
8,594,661
Crude Petroleum & Natural Gas - 0.59%
Chesapeake Energy Corp.
2.25% due 12/15/2038 1,050,000 609,000
7.25% due 12/15/2018 2,125,000 1,774,375
2,383,375
Electrical Utilities - 1.11%
Appalachian Power Company, Series K
5.00% due 06/01/2017 900,000 818,577
Cia de Transporte de Energia Electrica de Alta
Tension SA
8.875% due 12/15/2016 (f) 1,085,000 640,150
Dominion Resources, Inc., Series A
5.60% due 11/15/2016 900,000 893,652
Texas Competitive Electric Holdings Company
LLC, Series A
10.25% due 11/01/2015 3,600,000 2,133,000
Copyright © 2012 www.secdatabase.com. All Rights Reserved.Please Consider the Environment Before Printing This Document

4,485,379
The accompanying notes are an integral part of the financial statements.
273
JOHN HANCOCK FUNDS II
PORTFOLIO OF INVESTMENTS - May 31, 2009 (Unaudited) - continued(showing percentage of total net assets)
Strategic Income Fund (continued)Shares or
Principal
Amount Value
CORPORATE BONDS (continued)
Energy - 0.51%
Enterprise Products Operating LP, Series B
5.60% due 10/15/2014 (f) $ 980,000 $ 963,243
Exide Technologies, Series B
10.50% due 03/15/2013 1,315,000 1,104,600
2,067,843
Financial Services - 6.74%
CIT Group, Inc.
5.00% due 02/13/2014 615,000 414,423
General Electric Capital Australia Funding
Property, Ltd., MTN
6.50% due 11/15/2011 AUD 2,870,000 2,246,325
General Electric Capital Corp, Series GMTN
7.625% due 12/10/2014 NZD 5,510,000 3,285,576
General Electric Capital Corp.
6.625% due 02/04/2010 3,745,000 2,413,014
ISA Capital do Brasil SA
8.80% due 01/30/2017 (f) $ 470,000 478,225
Local TV Finance LLC
9.25% due 06/15/2015 (f) 240,000 43,500
New South Wales Treasury Corp., Series 10RG
7.00% due 12/01/2010 AUD 17,345,000 14,582,875
Nexstar Finance, Inc.
7.00% due 01/15/2014 $ 230,000 79,925
SLM Corp., MTN
8.45% due 06/15/2018 2,930,000 2,007,050
TAM Capital, Inc.
7.375% due 04/25/2017 1,205,000 861,575
Ucar Finance, Inc.
10.25% due 02/15/2012 36,000 33,570
VW Financial Services AG, EMTN
5.375% due 01/25/2012 EUR 565,000 816,603
27,262,661
Food & Beverages - 0.53%
ASG Consolidated LLC/ASG Finance, Inc.
11.50% due 11/01/2011 (f) $ 615,000 550,425
Cosan SA Industria e Comercio
8.25% due 02/28/2049 (f) 2,000,000 1,400,000
Dole Food Company, Inc.
8.875% due 03/15/2011 210,000 199,500
2,149,925
Gas & Pipeline Utilities - 1.76%
Copyright © 2012 www.secdatabase.com. All Rights Reserved.Please Consider the Environment Before Printing This Document

Atlas Pipeline Partners LP
8.125% due 12/15/2015 200,000 123,000
MarkWest Energy Partners LP / MarkWest Energy
Finance Corp., Series B
8.50% due 07/15/2016 2,150,000 1,816,750
8.75% due 04/15/2018 (f) 520,000 431,600
NGPL Pipeco LLC
7.119% due 12/15/2017 (f) 935,000 949,992
Regency Energy Partners LP
9.375% due 06/01/2016 (f) 2,405,000 2,332,850
Southern Union Company
7.20% due 11/01/2066 (b) 705,000 426,525
Targa Resources Partners LP
8.25% due 07/01/2016 760,000 630,800
Strategic Income Fund (continued)Shares or
Principal
Amount Value
CORPORATE BONDS (continued)
Gas & Pipeline Utilities (continued)
Williams Partners Finance Corp.
7.25% due 02/01/2017 $ 460,000 $ 414,000
7,125,517
Healthcare Products - 0.83%
Bausch & Lomb, Inc.
9.875% due 11/01/2015 1,545,000 1,409,813
Hanger Orthopedic Group, Inc.
10.25% due 06/01/2014 1,880,000 1,945,800
3,355,613
Hotels & Restaurants - 0.78%
CCM Merger, Inc.
8.00% due 08/01/2013 (f) 4,590,000 3,167,100
Household Products - 0.51%
Yankee Acquisition Corp., Series B
8.50% due 02/15/2015 2,555,000 1,929,025
9.75% due 02/15/2017 (f) 200,000 134,500
2,063,525
Housing & Urban Development - 1.34%
Canada Housing Trust No. 1
4.60% due 09/15/2011 CAD 5,545,000 5,416,501
Industrial Machinery - 0.54%
Baldor Electric Company
8.625% due 02/15/2017 $ 520,000 473,200
Manitowoc, Inc.
7.125% due 11/01/2013 2,415,000 1,726,725
2,199,925
Insurance - 0.38%
Liberty Mutual Group, Inc.
10.75% due 06/15/2058 (b)(f) 1,930,000 1,196,600
Symetra Financial Corp.
8.30% due 10/15/2037 (b)(f) 905,000 325,800
1,522,400
International Oil - 0.22%
Weatherford International, Ltd.
Copyright © 2012 www.secdatabase.com. All Rights Reserved.Please Consider the Environment Before Printing This Document

9.625% due 03/01/2019 800,000 902,862
Leisure Time - 6.82%
AMC Entertainment, Inc.
8.00% due 03/01/2014 2,755,000 2,479,500
8.75% due 06/01/2019 (f) 765,000 743,006
AMC Entertainment, Inc., Series B
8.625% due 08/15/2012 840,000 865,200
Choctaw Resort Development Enterprise
7.25% due 11/15/2019 (f) 226,000 119,780
Chukchansi Economic Development Authority
8.00% due 11/15/2013 (f) 1,105,000 696,150
Cinemark, Inc.
9.75 due 03/15/2014 1,000,000 1,015,000
Fontainebleau Las Vegas
11.00% due 06/15/2015 ^ (f) 1,295,000 58,275
Great Canadian Gaming Corp.
7.25% due 02/15/2015 (f) 1,000,000 905,000
Greektown Holdings LLC
10.75% due 12/01/2013 ^ (f) 3,200,000 224,000
Jacobs Entertainment, Inc.
9.75% due 06/15/2014 2,425,000 1,818,750
The accompanying notes are an integral part of the financial statements.
274
JOHN HANCOCK FUNDS II
PORTFOLIO OF INVESTMENTS - May 31, 2009 (Unaudited) - continued(showing percentage of total net assets)
Strategic Income Fund (continued)Shares or
Principal
Amount Value
CORPORATE BONDS (continued)
Leisure Time (continued)
Little Traverse Bay Bands of Odawa Indians
10.25% due 02/15/2014 (f) $ 1,415,000 $ 611,988
Majestic Star Casino LLC
9.50% due 10/15/2010 ^ 1,360,000 792,200
Mandalay Resort Group
9.375% due 02/15/2010 585,000 557,212
Marquee Holdings, Inc.
12.00 due 08/15/2014 895,000 724,950
Mashantucket Western Pequot Tribe
8.50% due 11/15/2015 (f) 2,015,000 785,850
MGM Mirage, Inc.
6.75% due 09/01/2012 475,000 327,750
Mohegan Tribal Gaming Authority
6.375% due 07/15/2009 1,845,000 1,798,875
7.125% due 08/15/2014 3,800,000 2,622,000
8.00% due 04/01/2012 3,355,000 2,524,638
MTR Gaming Group, Inc., Series B
9.00% due 06/01/2012 1,710,000 1,060,200
9.75% due 04/01/2010 1,410,000 1,269,000
Penn National Gaming, Inc.
6.875% due 12/01/2011 100,000 97,000
Pinnacle Entertainment, Inc.
7.50% due 06/15/2015 575,000 480,125
Pokagon Gaming Authority
10.375% due 06/15/2014 (f) 466,000 449,690
Snoqualmie Entertainment Authority
9.125% due 02/01/2015 (f) 1,020,000 545,700
Turning Stone Resort Casino
Copyright © 2012 www.secdatabase.com. All Rights Reserved.Please Consider the Environment Before Printing This Document

9.125% due 09/15/2014 (f) 1,785,000 1,463,700
9.125% due 12/15/2010 (f) 1,300,000 1,196,000
Waterford Gaming LLC
8.625% due 09/15/2014 (f) 2,134,000 1,387,100
27,618,639
Manufacturing - 0.54%
GRUPO KUO SAB de CV
9.75% due 10/17/2017 (f) 1,175,000 763,750
Ingersoll-Rand Global Holding Company, Ltd.
6.00% due 08/15/2013 1,240,000 1,244,424
Smiths Group PLC
7.20% due 05/15/2019 (f) 190,000 180,104
2,188,278
Medical-Hospitals - 1.42%
Community Health Systems, Inc.
8.875% due 07/15/2015 2,240,000 2,214,800
HCA, Inc.
8.50% due 04/15/2019 (f) 1,820,000 1,779,050
9.125% due 11/15/2014 460,000 451,950
Sun Healthcare Group, Inc.
9.125% due 04/15/2015 1,325,000 1,306,781
5,752,581
Metal & Metal Products - 0.74%
Blaze Recycling & Metals LLC
10.875% due 07/15/2012 (f) 590,000 265,500
CII Carbon LLC
11.125% due 11/15/2015 (f) 2,710,000 1,869,900
Strategic Income Fund (continued)Shares or
Principal
Amount Value
CORPORATE BONDS (continued)
Metal & Metal Products (continued)
Mueller Water Products, Inc.
7.375% due 06/01/2017 $ 1,455,000 $ 865,725
3,001,125
Mining - 1.42%
Drummond Company, Inc.
7.375% due 02/15/2016 (f) 3,630,000 2,686,200
Rio Tinto Finance USA, Ltd.
7.125% due 07/15/2028 1,465,000 1,317,713
9.00% due 05/01/2019 1,150,000 1,233,479
Teck Resources, Ltd.
10.75% due 05/15/2019 (f) 505,000 517,625
5,755,017
Paper - 1.07%
Abitibi-Consolidated Company of Canada
13.75% due 04/01/2011 ^ (f) 1,885,000 1,734,200
International Paper Company
7.95% due 06/15/2018 1,180,000 1,111,341
NewPage Corp.
10.00% due 05/01/2012 960,000 537,600
Pope & Talbot, Inc.
8.375% due 06/01/2013 ^ 500,000 1,250
Copyright © 2012 www.secdatabase.com. All Rights Reserved.Please Consider the Environment Before Printing This Document

8.375% due 06/01/2013 ^ 1,000,000 2,500
Verso Paper Holdings LLC
11.50% due 07/01/2014 (f) 510,000 474,300
Verso Paper Holdings LLC, Series B
9.125% due 08/01/2014 750,000 446,250
4,307,441
Petroleum Services - 0.31%
Allis-Chalmers Energy, Inc.
8.50% due 03/01/2017 1,245,000 672,300
McMoRan Exploration Company
11.875% due 11/15/2014 735,000 569,625
1,241,925
Publishing - 0.01%
Idearc, Inc.
8.00% due 11/15/2016 ^ 2,015,000 45,338
Railroads & Equipment - 0.09%
American Railcar Industries, Inc.
7.50% due 03/01/2014 440,000 380,600
Retail - 0.44%
Michaels Stores, Inc.
10.00% due 11/01/2014 945,000 680,400
11.375% due 11/01/2016 395,000 215,275
Staples, Inc.
9.75% due 01/15/2014 805,000 887,616
1,783,291
Software - 0.49%
Oracle Corp.
5.75% due 04/15/2018 1,840,000 1,982,812
Steel - 1.06%
Allegheny Technologies, Inc.
8.375% due 12/15/2011 1,180,000 1,253,771
9.375% due 06/01/2019 1,270,000 1,289,050
The accompanying notes are an integral part of the financial statements.
275
JOHN HANCOCK FUNDS II
PORTFOLIO OF INVESTMENTS - May 31, 2009 (Unaudited) - continued(showing percentage of total net assets)
Strategic Income Fund (continued)Shares or
Principal
Amount Value
CORPORATE BONDS (continued)
Steel (continued)
ArcelorMittal
9.85% due 06/01/2019 $ 1,710,000 $ 1,755,921
4,298,742
Telecommunications Equipment &
Services - 1.99%
Axtel SAB de CV
7.625% due 02/01/2017 (f) 2,275,000 1,706,250
CC Holdings GS V LLC/Crown Castle GS III Corp.
7.75% due 05/01/2017 (f) 870,000 856,950
Copyright © 2012 www.secdatabase.com. All Rights Reserved.Please Consider the Environment Before Printing This Document

Citizens Communications Company
7.125% due 03/15/2019 710,000 626,575
Intelsat Bermuda, Ltd.
11.25% due 06/15/2016 720,000 738,000
Intelsat Jackson Holdings, Ltd.
11.50% due 06/15/2016 (f) 825,000 812,625
Orascom Telecom Finance
7.875% due 02/08/2014 (f) 930,000 762,600
West Corp.
11.00% due 10/15/2016 2,995,000 2,545,750
8,048,750
Telephone - 1.61%
AT&T, Inc.
6.70% due 11/15/2013 1,240,000 1,363,123
Cincinnati Bell, Inc.
8.375% due 01/15/2014 2,000,000 1,892,500
Sprint Capital Corp.
8.375% due 03/15/2012 3,305,000 3,255,425
6,511,048
Tobacco - 0.25%
Alliance One International, Inc.
11.00% due 05/15/2012 1,005,000 1,012,537
Transportation - 0.41%
Navios Maritime Holdings, Inc.
9.50% due 12/15/2014 1,125,000 860,625
PHI, Inc.
7.125% due 04/15/2013 1,000,000 815,000
1,675,625
TOTAL CORPORATE BONDS (Cost $233,413,107) $ 201,314,268
CONVERTIBLE BONDS - 0.26%
Cable & Television - 0.08%
Charter Communications, Inc.
6.50% due 10/01/2027 ^ 2,170,000 314,650
Insurance - 0.18%
Prudential Financial, Inc.
0.3663% due 12/15/2037 (b) 755,000 753,490
TOTAL CONVERTIBLE BONDS (Cost $963,221) $ 1,068,140
COLLATERALIZED MORTGAGE
OBLIGATIONS - 12.83%
American Home Mortgage Assets, Series 2006-6,
Class XP
3.084% IO due 12/25/2046 19,753,777 481,498
Strategic Income Fund (continued)Shares or
Principal
Amount Value
COLLATERALIZED MORTGAGE
OBLIGATIONS (continued)
American Home Mortgage Investment Trust,
Series 2007-1, Class GIOP
2.0784% IO due 05/25/2047 $ 14,611,502 $ 648,385
Banc of America Commercial Mortgage, Inc.,
Series 2006-5, Class A4
5.414% due 09/10/2047 2,980,000 2,450,227
Bear Stearns Mortgage Funding Trust, Series
2006-AR1, Class 2A1
Copyright © 2012 www.secdatabase.com. All Rights Reserved.Please Consider the Environment Before Printing This Document

0.5288% due 08/25/2036 (b) 914,768 333,073
Citigroup/Deutsche Bank Commercial
Mortgage Trust, Series 2005-CD1, Class A4
5.3992% due 09/15/2020 (b) 3,405,000 3,006,189
Countrywide Alternative Loan Trust, Series
2004-28CB, Class 3A1
6.00% due 01/25/2035 2,291,044 1,871,496
Countrywide Alternative Loan Trust, Series
2007-25, Class 1A2
6.50% due 11/25/2037 2,575,512 1,584,745
Countrywide Alternative Loan Trust,
Series 2005-59, Class 2X
3.351% IO due 11/20/2035 11,472,617 328,046
Countrywide Alternative Loan Trust,
Series 2006-OA12, Class X
3.776% IO due 09/20/2046 10,648,486 326,110
Crown Castle Towers LLC, Series 2006-1A, Class F
6.6496% due 11/15/2036 (f) 840,000 789,600
Crown Castle Towers LLC, Series 2006-1A, Class G
6.7954% due 11/15/2036 (f) 985,000 925,900
DB Master Finance LLC, Series 2006-1, Class-A2
5.779% due 06/20/2031 (f) 1,050,000 761,754
DB Master Finance LLC, Series 2006-1, Class-M1
8.285% due 06/20/2031 (f) 1,000,000 654,740
Downey Savings & Loan Association Mortgage
Loan Trust, Series 2005-AR2, Class X2
2.9949% IO due 03/19/2045 (b) 32,766,065 1,023,940
Federal Home Loan Mortgage Corp., Series 3154,
Class PM
5.50% due 05/15/2034 4,050,000 4,257,528
Federal Home Loan Mortgage Corp., Series 3228,
Class PL
5.50% due 10/15/2034 4,850,000 5,068,398
Federal National Mortgage Association, Series
2006-117, Class PD
5.50% due 07/25/2035 5,055,000 5,282,037
Federal National Mortgage Association, Series
2006-65, Class TE
5.50% due 05/25/2035 2,065,000 2,172,095
Federal National Mortgage Association, Series
2006-84, Class MP
5.50% due 08/25/2035 5,700,000 5,986,332
First Horizon Alternative Mortgage Securities,
Series 2006-RE1, Class A1
5.50% due 05/25/2035 1,630,301 951,433
Global Tower Partners Acquisition
LLC, Series 2007-1A, Class G
7.8737% due 05/15/2037 (f) 565,000 421,477
Greenpoint Mortgage Funding Trust, Series
2005-AR4, Class 4A2
0.6687% due 10/25/2045 (b) 1,913,168 605,602
The accompanying notes are an integral part of the financial statements.
276
JOHN HANCOCK FUNDS II
PORTFOLIO OF INVESTMENTS - May 31, 2009 (Unaudited) - continued(showing percentage of total net assets)
Strategic Income Fund (continued)Shares or
Principal
Amount Value
Copyright © 2012 www.secdatabase.com. All Rights Reserved.Please Consider the Environment Before Printing This Document

COLLATERALIZED MORTGAGE
OBLIGATIONS (continued)
Greenpoint Mortgage Funding Trust, Series
2006-AR1, Class A2A
0.6787% due 02/25/2036 (b) $ 1,165,749 $ 419,218
Greenwich Capital Commercial Funding Corp.,
Series 2006-GG7, Class A4
6.1145% due 07/10/2038 (b) 3,310,000 2,719,307
Harborview Mortgage Loan Trust,
Series 2005-8, Class 1X
3.2005% IO due 09/19/2035 11,253,761 112,538
Harborview Mortgage Loan Trust,
Series 2006-SB1, Class A1A
2.289% due 12/19/2036 (b) 2,067,706 726,161
Harborview Mortgage Loan Trust,
Series 2007-3, Class ES
0.35% due 05/19/2047 28,083,527 131,642
Harborview Mortgage Loan Trust,
Series 2007-4, Class ES
0.35% due 07/19/2047 28,971,122 144,856
Harborview Mortgage Loan Trust,
Series 2007-6, Class ES
0.342% due 08/19/2037 (f) 20,666,673 96,875
Harborview NIM Corp., Series 2007-3A, Class N1
6.654% due 05/19/2037 (f) 12,135 121
IndyMac Index Mortgage Loan Trust,
Series 2005-AR18, Class 1X
3.233% IO due 10/25/2036 30,377,430 455,661
IndyMac Index Mortgage Loan Trust,
Series 2005-AR18, Class 2X
2.969% IO due 10/25/2036 33,607,657 399,931
Luminent Mortgage Trust, Series 2006-1, Class X
3.479% IO due 04/25/2036 9,103,521 147,932
Residential Accredit Loans, Inc., Series
2007-QS10, Class A1
6.50% due 09/25/2037 1,741,762 984,640
Residential Accredit Loans, Inc.,
Series 2007-QS11, Class A1
7.00% due 10/25/2037 1,450,697 772,723
SBA CMBS Trust, Series 2006-1A, Class H
7.389% due 11/15/2036 (f) 525,000 462,000
SBA CMBS Trust, Series 2006-1A, Class J
7.825% due 11/15/2036 (f) 780,000 686,400
WAMU Mortgage Pass Through Certificates, Series
2005-AR13, Class X
2.516% IO due 10/25/2045 68,139,025 936,912
WAMU Mortgage Pass Through Certificates,
Series 2005-AR13, Class B1
0.9087% due 10/25/2045 (b) 1,955,193 244,399
WAMU Mortgage Pass Through Certificates,
Series 2005-AR6, Class B1
0.9087% due 04/25/2045 (b) 3,189,081 239,181
WAMU Mortgage Pass Through Certificates,
Series 2007-OA5, Class 1XPP
1.008% IO due 06/25/2017 65,137,882 488,534
WAMU Mortgage Pass Through Certificates,
Series 2007-OA6, Class 1XPP
0.950% IO due 07/25/2047 38,298,975 239,369
Washington Mutual Mortgage Pass Through
Certificates, Series 2007-OA4, Class XPPP
0.942% IO due 04/25/2047 28,367,179 159,565
Strategic Income Fund (continued)Shares or
Principal
Amount Value
Copyright © 2012 www.secdatabase.com. All Rights Reserved.Please Consider the Environment Before Printing This Document

COLLATERALIZED MORTGAGE
OBLIGATIONS (continued)
Wells Fargo Mortgage Backed Securities Trust,
Series 2006-AR12, Class 1A1
6.0307% due 09/25/2036 (b) $ 2,091,919 $ 1,441,617
TOTAL COLLATERALIZED MORTGAGE OBLIGATIONS
(Cost $56,275,740) $ 51,940,187
ASSET BACKED SECURITIES - 0.30%
Dominos Pizza Master Issuer LLC, Series 2007-1,
Class M1
7.629% due 04/27/2037 (f) 1,475,000 649,000
Lehman XS Trust, Series 2005-5N, Class 3A2
0.6687% due 11/25/2035 (b) 527,690 139,540
Lehman XS Trust, Series 2006-2N, Class 1A2
0.6488% due 02/25/2046 (b) 2,052,180 437,174
TOTAL ASSET BACKED SECURITIES
(Cost $3,147,619) $ 1,225,714
SUPRANATIONAL OBLIGATIONS - 5.39%
Supranational - 5.39%
Council of Europe Development Bank
5.25% due 05/27/2013 AUD 2,760,000 2,192,137
European Investment Bank
6.25% due 04/15/2014 GBP 930,000 1,696,572
European Investment Bank, EMTN
7.00% due 01/18/2012 NZD 2,550,000 1,730,914
Instituto de Credito Oficial, EMTN
5.00% due 12/07/2009 GBP 1,680,000 2,767,547
Inter-American Development Bank, Series INTL
7.25% due 05/24/2012 NZD 9,930,000 6,757,119
Inter-American Development Bank, Series MPLE
4.25% due 12/02/2012 CAD 495,000 480,142
Inter-American Development Bank, Series MTN
5.375% due 05/27/2014 AUD 5,050,000 4,002,232
International Finance Corp., MTN
7.50% due 02/28/2013 2,515,000 2,170,128
21,796,791
TOTAL SUPRANATIONAL OBLIGATIONS
(Cost $22,607,920) $ 21,796,791
COMMON STOCKS - 0.65%
Broadcasting - 0.13%
Sirius XM Radio, Inc. * 1,511,421 528,242
Containers & Glass - 0.06%
Pactiv Corp. * 10,680 239,232
Retail Trade - 0.43%
CVS Caremark Corp. 59,000 1,758,200
Telecommunications Equipment &
Services - 0.03%
Chunghwa Telecom Company, Ltd., ADR * 5,826 110,752
TOTAL COMMON STOCKS (Cost $4,723,088) $ 2,636,426
The accompanying notes are an integral part of the financial statements.
277
JOHN HANCOCK FUNDS II
PORTFOLIO OF INVESTMENTS - May 31, 2009 (Unaudited) - continued(showing percentage of total net assets)
Strategic Income Fund (continued)Shares or
Copyright © 2012 www.secdatabase.com. All Rights Reserved.Please Consider the Environment Before Printing This Document

Principal
Amount Value
PREFERRED STOCKS - 0.40%
Mining - 0.40%
Freeport-McMoRan Copper & Gold, Inc.,
6.75% * 18,908 $ 1,597,348
TOTAL PREFERRED STOCKS (Cost $1,533,578) $ 1,597,348
TERM LOANS - 2.48%
Air Travel - 0.70%
Delta Airlines, Inc.
3.6644% due 04/30/2014 (b) 2,808,023 1,790,115
US Airways Group, Inc.
2.8088% due 03/23/2014 (b) 1,946,667 1,049,037
2,839,152
Healthcare Products - 0.13%
Bausch & Lomb, Inc.
4.781% due 04/11/2015 (b) EUR 404,875 503,687
Leisure Time - 0.44%
Great Canadian Gaming Corp.
2.42% due 02/07/2014 (b) $ 1,319,625 1,157,971
Greektown Holdings LLC
0.00% due 09/09/2009 (k) 84,783 83,087
0.00% due 09/09/2009 (k) 197,826 193,870
0.00% due 09/09/2009 (k) 330,466 323,857
0.00% due 09/09/2009 (k) 36,925 35,817
1,794,602
Paper - 0.46%
AbitibiBowater, Inc.
11.50% due 04/30/2009 ^ 2,460,000 1,877,792
Publishing - 0.38%
Idearc, Inc.
1.00% due 11/17/2014 ^ 3,912,236 1,536,949
Retail - 0.37%
Michaels Stores, Inc.
2.625% due 10/31/2013 (b) 275,634 196,849
2.6875% due 10/31/2013 1,808,677 1,291,697
1,488,546
TOTAL TERM LOANS (Cost $10,895,512) $ 10,040,728
OPTIONS - 0.36%
Call Options - 0.27%
Comcast Corp.
Expiration 01/16/2010 at $25.00 26,000,000 13,000
Over The Counter Purchase Call on the EUR vs.
USD
Expiration 01/29/2010 at $1.25 23,750,000 393,941
Over The Counter Purchase Call on the USD vs.
CAD
Expiration 02/26/2010 at $1.30 10,700,000 122,087
Expiration 04/20/2010 at $1.30 10,450,000 140,866
Expiration 10/09/2009 at $1.30 9,500,000 22,031
Over The Counter Purchase Call on the USD vs.
JPY
Expiration 09/30/2009 at $100.00 20,000,000 262,280
Expiration 03/12/2010 at $110.00 19,000,000 93,860
Expiration 04/01/2010 at $115.00 18,700,000 43,758
1,091,823
Copyright © 2012 www.secdatabase.com. All Rights Reserved.Please Consider the Environment Before Printing This Document

Strategic Income Fund (continued)Shares or
Principal
Amount Value
OPTIONS (continued)
Put Options - 0.09%
Over The Counter Purchase Call on the EUR vs.
USD
Expiration 12/02/2009 at $1.292 19,000,000 $ 360,599
TOTAL OPTIONS (Cost $2,542,095) $ 1,452,422
SHORT TERM INVESTMENTS - 7.29%
Federal Home Loan Bank Discount Notes
zero coupon due 06/01/2009 $ 19,500,000 $ 19,500,000
U.S. Treasury Bills
zero coupon due 08/20/2009 10,000,000 9,996,111
TOTAL SHORT TERM INVESTMENTS
(Cost $29,496,111) $ 29,496,111
Total Investments (Strategic Income Fund)
(Cost $461,637,416) - 104.28% $ 422,061,999
Other assets and liabilities, net - (4.28)% (17,325,501)
TOTAL NET ASSETS - 100.00% $ 404,736,498
Total Bond Market FundShares or
Principal
Amount Value
U.S. TREASURY OBLIGATIONS - 22.95%
U.S. Treasury Bonds - 8.74%
2.75% due 10/31/2013 $ 25,920,000 $ 26,632,800
4.375% due 02/15/2038 2,000 2,009
4.50% due 05/15/2038 4,805,000 4,932,631
5.25% due 02/15/2029 1,875,000 2,098,241
7.875% due 02/15/2021 900,000 1,222,453
34,888,134
U.S. Treasury Notes - 14.21%
0.875% due 02/28/2011 to 04/30/2011 22,300,000 22,319,714
1.50% due 10/31/2010 9,650,000 9,764,594
1.75% due 01/31/2014 to 03/31/2014 9,520,000 9,287,443
1.875% due 02/28/2014 to 04/30/2014 1,900,000 1,862,595
2.75% due 02/15/2019 6,880,000 6,465,617
3.75% due 11/15/2018 6,868,000 7,019,302
56,719,265
TOTAL U.S. TREASURY OBLIGATIONS
(Cost $92,402,448) $ 91,607,399
U.S. GOVERNMENT AGENCY OBLIGATIONS - 48.54%
Federal Farm Credit Bank - 0.41%
3.875% due 10/07/2013 775,000 813,440
4.875% due 12/16/2015 780,000 830,978
1,644,418
Federal Home Loan Bank - 0.81%
Copyright © 2012 www.secdatabase.com. All Rights Reserved.Please Consider the Environment Before Printing This Document

3.875% due 01/15/2010 to 06/14/2013 2,080,000 2,158,679
5.00% due 11/17/2017 1,020,000 1,082,774
3,241,453
Federal Home Loan Mortgage Corp. - 16.50%
3.75% due 06/28/2013 1,950,000 2,050,910
3.875% due 06/29/2011 2,000,000 2,111,208
The accompanying notes are an integral part of the financial statements.
278
JOHN HANCOCK FUNDS II
PORTFOLIO OF INVESTMENTS - May 31, 2009 (Unaudited) - continued(showing percentage of total net assets)
Total Bond Market Fund (continued)Shares or
Principal
Amount Value
U.S. GOVERNMENT AGENCY
OBLIGATIONS (continued)
Federal Home Loan Mortgage Corp.
(continued)
4.125% due 09/27/2013 $ 2,500,000 $ 2,658,422
4.50% due 07/01/2023 to 10/01/2035 7,325,262 7,449,184
5.00% due 07/01/2035 to 03/01/2038 13,692,782 14,038,904
5.50% due 08/23/2017 to 11/01/2038 17,515,441 18,194,541
6.00% due 06/01/2035 to 10/01/2038 11,865,338 12,452,584
6.25% due 07/15/2032 150,000 176,176
6.50% due 08/01/2038 2,571,389 2,739,031
6.75% due 09/15/2029 2,100,000 2,582,425
7.00% due 11/01/2037 1,306,344 1,413,301
65,866,686
Federal National Mortgage
Association - 25.89%
3.25% due 04/09/2013 4,000,000 4,163,188
3.875% due 07/12/2013 2,000,000 2,111,794
4.00% due 07/01/2018 to 06/01/2019 252,030 257,428
4.375% due 10/15/2015 2,000,000 2,129,894
4.50% due 04/01/2018 to 06/01/2023 4,274,057 4,391,375
4.632% due 01/01/2035 (b) 979,085 1,001,214
4.821% due 04/01/2036 (b) 1,689,412 1,740,300
4.92% due 07/01/2034 (b) 2,145,782 2,247,847
5.00% due 05/01/2019 to 03/01/2037 18,608,883 19,169,585
5.036% due 09/01/2037 (b) 2,222,015 2,337,476
5.50% due 09/01/2017 to 01/01/2037 26,606,232 27,650,954
5.495% due 05/01/2036 (b) 506,326 528,166
5.68% due 04/01/2037 (b) 2,153,757 2,266,409
5.911% due 04/01/2037 (b) 2,077,057 2,181,468
6.00% due 08/01/2023 to 08/01/2036 15,828,320 16,677,752
5.999% due 10/01/2037 (b) 1,628,568 1,712,255
6.125% due 03/15/2012 500,000 562,048
6.50% due 07/01/2031 to 10/01/2038 7,642,375 8,181,206
6.625% due 11/15/2030 2,000,000 2,438,266
7.00% due 10/01/2038 1,273,204 1,385,406
7.25% due 05/15/2030 150,000 194,452
103,328,483
Government National Mortgage
Association - 4.67%
Copyright © 2012 www.secdatabase.com. All Rights Reserved.Please Consider the Environment Before Printing This Document

4.50% due 06/15/2023 to 07/20/2035 480,272 494,763
5.00% due 11/20/2038 3,701,599 3,810,044
5.50% due 08/15/2023 to 01/15/2039 6,219,150 6,467,691
6.00% due 07/15/2038 to 10/15/2038 5,553,740 5,816,241
6.50% due 10/20/2038 1,935,017 2,049,002
18,637,741
Tennessee Valley Authority - 0.17%
6.75% due 11/01/2025 580,000 657,871
The Financing Corp. - 0.09%
8.60% due 09/26/2019 265,000 349,395
TOTAL U.S. GOVERNMENT AGENCY OBLIGATIONS
(Cost $185,703,864) $ 193,726,047
FOREIGN GOVERNMENT OBLIGATIONS - 1.67%
Austria - 0.10%
Government of Austria
5.00% due 05/19/2014 (f) 364,000 389,040
Total Bond Market Fund (continued)Shares or
Principal
Amount Value
FOREIGN GOVERNMENT OBLIGATIONS
(continued)
Brazil - 0.29%
Federative Republic of Brazil
5.875% due 01/15/2019 $ 720,000 $ 724,680
6.00% due 01/17/2017 400,000 412,600
1,137,280
Canada - 0.64%
Government of Canada
5.00% due 02/15/2012 160,000 172,968
5.125% due 01/26/2017 245,000 251,340
5.20% due 02/21/2017 200,000 204,227
6.50% due 01/15/2026 260,000 294,104
7.50% due 07/15/2023 200,000 228,648
7.50% due 09/15/2029 405,000 487,413
Export Development Canada
3.50% due 05/16/2013 240,000 245,989
Province of Ontario, Canada
4.50% due 02/03/2015 500,000 515,944
Province of Saskatchewan, Canada
8.00% due 02/01/2013 115,000 133,368
2,534,001
Israel - 0.10%
Government of Israel
5.125% due 03/26/2019 210,000 205,051
5.50% due 09/18/2023 195,000 207,590
412,641
Italy - 0.22%
Republic of Italy
6.875% due 09/27/2023 815,000 893,327
Mexico - 0.32%
Government of Mexico
5.95% due 03/19/2019 1,111,000 1,134,331
9.875% due 02/01/2010 150,000 158,250
Copyright © 2012 www.secdatabase.com. All Rights Reserved.Please Consider the Environment Before Printing This Document

1,292,581
TOTAL FOREIGN GOVERNMENT OBLIGATIONS
(Cost $6,795,801) $ 6,658,870
CORPORATE BONDS - 21.44%
Aerospace - 0.39%
Boeing Company
8.75% due 09/15/2031 275,000 340,834
General Dynamics Corp.
5.25% due 02/01/2014 265,000 282,414
Northrop Grumman Corp.
7.75% due 03/01/2016 225,000 254,335
United Technologies Corp.
5.375% due 12/15/2017 285,000 292,852
6.125% due 02/01/2019 350,000 376,684
1,547,119
Agriculture - 0.11%
Archer-Daniels-Midland Company
7.00% due 02/01/2031 150,000 161,928
Cargill, Inc.
7.35% due 03/06/2019 (f) 250,000 260,195
422,123
The accompanying notes are an integral part of the financial statements.
279
JOHN HANCOCK FUNDS II
PORTFOLIO OF INVESTMENTS - May 31, 2009 (Unaudited) - continued(showing percentage of total net assets)
Total Bond Market Fund (continued)Shares or
Principal
Amount Value
CORPORATE BONDS (continued)
Aluminum - 0.12%
Alcoa, Inc.
5.72% due 02/23/2019 $ 20,000 $ 15,838
6.75% due 07/15/2018 325,000 280,665
Rio Tinto Alcan, Inc.
6.125% due 12/15/2033 240,000 174,922
471,425
Automobiles - 0.07%
DaimlerChrysler NA Holding Corp.
5.875% due 03/15/2011 285,000 288,525
Banking - 2.41%
Bank of America Corp.
2.10% due 04/30/2012 540,000 543,936
3.125% due 06/15/2012 350,000 363,079
5.42% due 03/15/2017 300,000 251,285
7.80% due 02/15/2010 333,000 340,380
Bank of New York Mellon Corp.
6.375% due 04/01/2012 75,000 78,404
Bank of New York Mellon Corp., MTN
4.50% due 04/01/2013 435,000 440,265
Bank One Corp.
7.875% due 08/01/2010 485,000 507,552
Copyright © 2012 www.secdatabase.com. All Rights Reserved.Please Consider the Environment Before Printing This Document

Barclays Bank PLC
5.45% due 09/12/2012 290,000 296,701
BB&T Corp.
5.20% due 12/23/2015 290,000 257,849
Deutsche Bank AG
4.875% due 05/20/2013 575,000 581,145
Development Bank of Japan, Series DTC
5.125% due 02/01/2017 100,000 102,204
Eksportfinans ASA
5.50% due 06/26/2017 200,000 197,853
HSBC Holdings PLC
6.50% due 09/15/2037 580,000 525,998
Keycorp, MTN
6.50% due 05/14/2013 305,000 288,476
Kreditanstalt fuer Wiederaufbau
3.25% due 03/15/2013 780,000 800,178
4.375% due 03/15/2018 480,000 489,379
5.125% due 03/14/2016 450,000 475,971
Landwirtschaftliche Rentenbank
3.875% due 03/15/2010 360,000 367,447
5.125% due 02/01/2017 210,000 221,939
Oesterreichische Kontrollbank AG
2.875% due 03/15/2011 190,000 194,703
4.875% due 02/16/2016 329,000 327,268
PNC Funding Corp.
5.625% due 02/01/2017 200,000 173,962
Royal Bank of Scotland Group PLC
5.00% due 11/12/2013 300,000 239,526
State Street Corp.
2.15% due 04/30/2012 215,000 217,053
SunTrust Banks, Inc.
6.00% due 09/11/2017 290,000 246,780
Svensk Exportkredit AB, GMTN
4.875% due 09/29/2011 165,000 174,345
UBS AG/Stamford Branch, MTN
5.75% due 04/25/2018 520,000 466,473
Total Bond Market Fund (continued)Shares or
Principal
Amount Value
CORPORATE BONDS (continued)
Banking (continued)
Union Bank of California, N.A.
5.95% due 05/11/2016 $ 250,000 $ 232,433
US Bank NA, BKNT
6.375% due 08/01/2011 200,000 212,577
9,615,161
Broadcasting - 0.20%
British Sky Broadcasting Group PLC
9.50% due 11/15/2018 (f) 280,000 321,156
CBS Corp.
8.875% due 05/15/2019 200,000 198,745
News America, Inc.
6.65% due 11/15/2037 335,000 283,539
803,440
Building Materials & Construction - 0.02%
CRH America, Inc.
8.125% due 07/15/2018 100,000 93,620
Cable & Television - 0.82%
Comcast Cable Communications
Copyright © 2012 www.secdatabase.com. All Rights Reserved.Please Consider the Environment Before Printing This Document
8.875% due 05/01/2017 190,000 213,587
Comcast Corp.
6.50% due 11/15/2035 435,000 422,589
COX Communications, Inc.
4.625% due 01/15/2010 200,000 200,885
9.375% due 01/15/2019 (f) 95,000 109,715
Rogers Cable, Inc.
7.875% due 05/01/2012 265,000 285,921
TCI Communications, Inc.
7.125% due 02/15/2028 308,000 279,821
Time Warner Companies, Inc.
7.25% due 10/15/2017 300,000 293,058
Time Warner Entertainment Company LP
8.375% due 07/15/2033 450,000 467,257
Time Warner, Inc.
6.75% due 04/15/2011 345,000 361,354
7.625% due 04/15/2031 120,000 109,277
Viacom, Inc.
6.25% due 04/30/2016 345,000 329,772
7.875% due 07/30/2030 225,000 183,541
3,256,777
Cellular Communications - 0.30%
AT&T Wireless Services, Inc.
7.875% due 03/01/2011 290,000 315,215
Verizon Wireless Capital LLC
7.375% due 11/15/2013 (f) 330,000 370,293
Vodafone Group PLC
5.375% due 01/30/2015 515,000 523,669
1,209,177
Chemicals - 0.20%
Agrium, Inc.
6.75% due 01/15/2019 250,000 245,362
E.I. Du Pont de Nemours & Company
5.75% due 03/15/2019 260,000 270,415
5.875% due 01/15/2014 265,000 288,065
803,842
The accompanying notes are an integral part of the financial statements.
280
JOHN HANCOCK FUNDS II
PORTFOLIO OF INVESTMENTS - May 31, 2009 (Unaudited) - continued(showing percentage of total net assets)
Total Bond Market Fund (continued)Shares or
Principal
Amount Value
CORPORATE BONDS (continued)
Chemicals-Diversified - 0.03%
The Dow Chemical Company
5.70% due 05/15/2018 $ 140,000 $ 117,552
Computers & Business Equipment - 0.38%
Cisco Systems, Inc.
5.25% due 02/22/2011 150,000 159,302
Dell, Inc.
4.70% due 04/15/2013 225,000 230,137
Hewlett-Packard Company
Copyright © 2012 www.secdatabase.com. All Rights Reserved.Please Consider the Environment Before Printing This Document

4.75% due 06/02/2014 240,000 251,364
International Business Machines Corp.
6.50% due 10/15/2013 665,000 740,826
Pitney Bowes, Inc.
6.25% due 03/15/2019 120,000 127,003
1,508,632
Cosmetics & Toiletries - 0.16%
Kimberly-Clark Corp.
7.50% due 11/01/2018 240,000 284,590
Procter & Gamble Company
4.60% due 01/15/2014 345,000 363,486
648,076
Crude Petroleum & Natural Gas - 0.26%
Anadarko Finance Company, Series B
6.75% due 05/01/2011 360,000 375,366
Apache Corp.
6.00% due 09/15/2013 200,000 215,997
Petrobras International Finance Company
8.375% due 12/10/2018 265,000 300,113
XTO Energy, Inc.
5.50% due 06/15/2018 169,000 165,818
1,057,294
Domestic Oil - 0.20%
Devon Financing Corp.
6.875% due 09/30/2011 240,000 260,165
Marathon Oil Corp.
6.00% due 10/01/2017 275,000 269,445
Valero Energy Corp.
6.125% due 06/15/2017 275,000 264,257
793,867
Electrical Equipment - 0.05%
Emerson Electric Company
4.875% due 10/15/2019 215,000 214,209
Electrical Utilities - 1.80%
Carolina Power & Light Company
5.30% due 01/15/2019 145,000 148,648
CenterPoint Energy Resources Corp.
7.875% due 04/01/2013 240,000 252,000
Consolidated Edison Company of New York, Inc.
7.125% due 12/01/2018 265,000 297,207
Constellation Energy Group, Inc.
7.60% due 04/01/2032 58,000 49,042
Dominion Resources, Inc.
5.00% due 03/15/2013 262,000 263,073
Duke Energy Carolinas
5.625% due 11/30/2012 300,000 321,006
Duke Energy Carolinas, Series C
7.00% due 11/15/2018 270,000 309,892
Total Bond Market Fund (continued)Shares or
Principal
Amount Value
CORPORATE BONDS (continued)
Electrical Utilities (continued)
E.ON International Finance BV
5.80% due 04/30/2018 (f) $ 385,000 $ 388,520
Copyright © 2012 www.secdatabase.com. All Rights Reserved.Please Consider the Environment Before Printing This Document

Enel Finance International SA
6.25% due 09/15/2017 (f) 144,000 144,749
Entergy Texas, Inc.
7.125% due 02/01/2019 135,000 136,411
Exelon Corp.
6.75% due 05/01/2011 650,000 677,273
FirstEnergy Corp.
6.45% due 11/15/2011 134,000 140,206
7.375% due 11/15/2031 250,000 216,834
FPL Group Capital, Inc.
7.875% due 12/15/2015 265,000 304,357
Georgia Power Company
5.95% due 02/01/2039 265,000 267,491
Hydro-Quebec, Series HY
8.40% due 01/15/2022 50,000 61,427
Hydro-Quebec, Series JL
6.30% due 05/11/2011 400,000 434,037
Indiana Michigan Power Company
6.05% due 03/15/2037 295,000 250,358
Israel Electric Corp., Ltd.
7.25% due 01/15/2019 (f) 170,000 171,536
Oncor Electric Delivery Company
7.50% due 09/01/2038 140,000 139,450
Pacific Gas & Electric Company
6.25% due 12/01/2013 355,000 387,133
Progress Energy, Inc.
7.10% due 03/01/2011 146,000 156,263
Public Service Electric & Gas Company
6.33% due 11/01/2013 355,000 390,722
San Diego Gas & Electric Company, Series FFF
6.125% due 09/15/2037 160,000 164,192
Scottish Power PLC
4.91% due 03/15/2010 130,000 131,515
Southern California Edison Company, Series 05-E
5.35% due 07/15/2035 345,000 320,640
Southwestern Public Service Company, Series G
8.75% due 12/01/2018 155,000 176,858
Virginia Electric and Power Company
8.875% due 11/15/2038 190,000 247,874
Wisconsin Electric Power Company
6.00% due 04/01/2014 230,000 244,006
7,192,720
Energy - 0.31%
CalEnergy Company, Inc.
8.48% due 09/15/2028 365,000 397,865
DTE Energy Company
6.35% due 06/01/2016 215,000 192,907
Enbridge Energy Partners LP
9.875% due 03/01/2019 345,000 387,204
KeySpan Corp.
8.00% due 11/15/2030 265,000 278,077
1,256,053
Financial Services - 5.69%
Abbey National PLC
7.95% due 10/26/2029 200,000 164,987
The accompanying notes are an integral part of the financial statements.
281
JOHN HANCOCK FUNDS II
Copyright © 2012 www.secdatabase.com. All Rights Reserved.Please Consider the Environment Before Printing This Document

PORTFOLIO OF INVESTMENTS - May 31, 2009 (Unaudited) - continued(showing percentage of total net assets)
Total Bond Market Fund (continued)Shares or
Principal
Amount Value
CORPORATE BONDS (continued)
Financial Services (continued)
Allied Capital Corp.
6.625% due 07/15/2011 $ 240,000 $ 109,201
American Express Bank FSB, BKNT
6.00% due 09/13/2017 405,000 361,665
American Express Bank FSB, GMTN
3.15% due 12/09/2011 205,000 212,815
American Express Credit Corp., Series C
7.30% due 08/20/2013 240,000 242,951
Bear Stearns Companies, Inc.
7.25% due 02/01/2018 635,000 654,646
Berkshire Hathaway Finance Corp.
5.40% due 05/15/2018 (f) 290,000 294,523
BP Capital Markets PLC
5.25% due 11/07/2013 220,000 233,467
Capital One Financial Corp.
7.375% due 05/23/2014 290,000 298,800
Capital One Financial Corp., MTN
5.70% due 09/15/2011 250,000 254,054
Caterpillar Financial Services Corp.
6.125% due 02/17/2014 260,000 268,288
Citigroup, Inc.
2.125% due 04/30/2012 560,000 564,635
2.875% due 12/09/2011 210,000 216,534
5.50% due 04/11/2013 345,000 330,881
5.875% due 02/22/2033 575,000 419,948
6.125% due 11/21/2017 833,000 746,649
Credit Suisse First Boston USA, Inc.
4.875% due 01/15/2015 345,000 339,310
6.50% due 01/15/2012 510,000 541,526
Dresdner Bank AG
7.25% due 09/15/2015 220,000 176,850
FleetBoston Financial Corp.
6.70% due 07/15/2028 317,000 232,109
7.375% due 12/01/2009 415,000 419,372
General Electric Capital Corp.
2.20% due 06/08/2012 290,000 292,814
3.00% due 12/09/2011 350,000 362,316
6.125% due 02/22/2011 510,000 533,760
6.75% due 03/15/2032 635,000 567,456
General Electric Capital Corp., MTN
5.625% due 09/15/2017 640,000 614,587
6.875% due 01/10/2039 290,000 266,614
Goldman Sachs Group, Inc.
3.25% due 06/15/2012 315,000 328,211
5.50% due 11/15/2014 690,000 688,789
6.125% due 02/15/2033 345,000 315,842
6.15% due 04/01/2018 515,000 497,169
6.875% due 01/15/2011 515,000 543,240
7.50% due 02/15/2019 360,000 378,810
HSBC Finance Corp.
8.00% due 07/15/2010 610,000 625,301
International Lease Finance Corp., MTN
5.45% due 03/24/2011 100,000 84,599
Japan Finance Corp. Municipal Enterprises, DTC
4.625% due 04/21/2015 100,000 98,019
John Deere Capital Corp., MTN
Copyright © 2012 www.secdatabase.com. All Rights Reserved.Please Consider the Environment Before Printing This Document

4.95% due 12/17/2012 480,000 497,313
JPMorgan Chase & Company
3.125% due 12/01/2011 350,000 362,784
Total Bond Market Fund (continued)Shares or
Principal
Amount Value
CORPORATE BONDS (continued)
Financial Services (continued)
JPMorgan Chase & Company (continued)
4.75% due 05/01/2013 $ 350,000 $ 359,881
6.40% due 05/15/2038 345,000 348,172
6.75% due 02/01/2011 428,000 449,079
MBNA Corp.
5.00% due 06/15/2015 400,000 339,867
Merrill Lynch & Company, Inc.
5.45% due 07/15/2014 575,000 523,934
6.875% due 11/15/2018 325,000 302,747
7.75% due 05/14/2038 345,000 304,647
Merrill Lynch & Company, Inc., MTN
6.875% due 04/25/2018 260,000 241,295
Morgan Stanley
2.25% due 03/13/2012 200,000 202,590
3.25% due 12/01/2011 350,000 363,675
6.75% due 04/15/2011 550,000 572,791
7.30% due 05/13/2019 350,000 358,520
Morgan Stanley, MTN
5.95% due 12/28/2017 560,000 526,092
PNC Funding Corp.
2.30% due 06/22/2012 345,000 349,306
4.50% due 03/10/2010 175,000 176,054
SLM Corp.
4.50% due 07/26/2010 290,000 267,525
Toyota Motor Credit Corp.
5.45% due 05/18/2011 240,000 248,156
Wells Fargo & Company
3.00% due 12/09/2011 350,000 362,492
5.00% due 11/15/2014 290,000 280,023
5.625% due 12/11/2017 515,000 490,158
6.375% due 08/01/2011 590,000 614,746
Wells Fargo Bank NA
5.95% due 08/26/2036 485,000 392,282
6.45% due 02/01/2011 500,000 511,629
22,726,496
Food & Beverages - 0.94%
Anheuser-Busch InBev Worldwide, Inc.
6.875% due 11/15/2019 (f) 300,000 303,434
7.75% due 01/15/2019 (f) 290,000 311,938
Bottling Group LLC
5.125% due 01/15/2019 290,000 289,005
Coca-Cola Enterprises, Inc.
8.50% due 02/01/2022 255,000 323,273
ConAgra Foods, Inc.
5.819% due 06/15/2017 25,000 24,840
9.75% due 03/01/2021 140,000 167,700
Diageo Capital PLC
7.375% due 01/15/2014 240,000 266,730
General Mills, Inc.
5.65% due 02/15/2019 215,000 219,972
Kellogg Company, Series B
6.60% due 04/01/2011 345,000 371,672
Kraft Foods, Inc.
Copyright © 2012 www.secdatabase.com. All Rights Reserved.Please Consider the Environment Before Printing This Document

6.75% due 02/19/2014 470,000 511,285
PepsiCo, Inc.
7.90% due 11/01/2018 195,000 233,481
SABMiller PLC
6.50% due 07/15/2018 (f) 200,000 195,688
The accompanying notes are an integral part of the financial statements.
282
JOHN HANCOCK FUNDS II
PORTFOLIO OF INVESTMENTS - May 31, 2009 (Unaudited) - continued(showing percentage of total net assets)
Total Bond Market Fund (continued)Shares or
Principal
Amount Value
CORPORATE BONDS (continued)
Food & Beverages (continued)
Tate & Lyle International Finance PLC
5.00% due 11/15/2014 (f) $ 260,000 $ 229,980
Tesco PLC
6.15% due 11/15/2037 (f) 82,000 75,021
Unilever Capital Corp.
7.125% due 11/01/2010 200,000 215,462
3,739,481
Gas & Pipeline Utilities - 0.42%
DCP Midstream LLC
9.70% due 12/01/2013 (f) 270,000 287,795
9.75% due 03/15/2019 (f) 240,000 250,422
Kinder Morgan Energy Partners LP
5.625% due 02/15/2015 110,000 109,471
5.85% due 09/15/2012 225,000 233,687
7.30% due 08/15/2033 30,000 27,377
9.00% due 02/01/2019 175,000 197,361
ONEOK Partners LP
6.65% due 10/01/2036 245,000 206,535
TEPPCO Partners LP
6.65% due 04/15/2018 110,000 101,206
Texas Eastern Transmission LP
6.00% due 09/15/2017 (f) 70,000 70,128
TransCanada PipeLines, Ltd.
5.85% due 03/15/2036 200,000 178,221
1,662,203
Healthcare Products - 0.18%
Baxter International, Inc.
5.90% due 09/01/2016 145,000 153,721
Covidien International Finance SA
6.00% due 10/15/2017 287,000 302,854
Johnson & Johnson
5.85% due 07/15/2038 245,000 262,958
719,533
Healthcare Services - 0.14%
UnitedHealth Group, Inc.
4.875% due 03/15/2015 515,000 461,096
WellPoint, Inc.
6.375% due 06/15/2037 120,000 97,422
Copyright © 2012 www.secdatabase.com. All Rights Reserved.Please Consider the Environment Before Printing This Document
558,518
Holdings Companies/Conglomerates - 0.14%
General Electric Company
5.00% due 02/01/2013 525,000 540,495
Hotels & Restaurants - 0.06%
McDonald's Corp., MTN
5.00% due 02/01/2019 145,000 146,427
Yum! Brands, Inc.
6.25% due 03/15/2018 95,000 92,984
239,411
Household Products - 0.07%
Clorox Company
5.95% due 10/15/2017 260,000 261,338
Industrial Machinery - 0.09%
Cameron International Corp.
7.00% due 07/15/2038 100,000 78,390
Total Bond Market Fund (continued)Shares or
Principal
Amount Value
CORPORATE BONDS (continued)
Industrial Machinery (continued)
Caterpillar, Inc.
7.90% due 12/15/2018 $ 265,000 $ 297,661
376,051
Insurance - 0.81%
Aegon Funding Corp.
5.75% due 12/15/2020 145,000 130,868
Aetna, Inc.
6.00% due 06/15/2016 290,000 280,938
Allied World Assurance Holdings, Ltd.
7.50% due 08/01/2016 320,000 249,742
Allstate Corp.
5.95% due 04/01/2036 270,000 223,598
Aon Capital Trust A
8.205% due 01/01/2027 210,000 189,218
AXA SA
8.60% due 12/15/2030 140,000 119,414
Chubb Corp.
5.75% due 05/15/2018 100,000 100,786
Hartford Financial Services Group, Inc.
5.95% due 10/15/2036 135,000 98,303
ING Security Life Institutional Funding
4.25% due 01/15/2010 (f) 380,000 369,533
Lincoln National Corp.
5.65% due 08/27/2012 145,000 127,556
7.00% due 05/17/2066 (b) 30,000 17,400
Marsh & McLennan Companies, Inc.
5.75% due 09/15/2015 290,000 270,158
MetLife, Inc., Series A
6.817% due 08/15/2018 395,000 397,544
Prudential Financial, Inc.
4.75% due 04/01/2014 290,000 260,983
The St. Paul Companies, Inc.
5.50% due 12/01/2015 190,000 193,746
The Travelers Companies, Inc.
5.90% due 06/02/2019 190,000 194,612
Copyright © 2012 www.secdatabase.com. All Rights Reserved.Please Consider the Environment Before Printing This Document

3,224,399
International Oil - 0.55%
Chevron Corp.
4.95% due 03/03/2019 215,000 218,813
ConocoPhillips Company
5.75% due 02/01/2019 270,000 280,067
EnCana Corp.
6.50% due 08/15/2034 345,000 312,180
Nabors Industries, Inc.
9.25% due 01/15/2019 (f) 290,000 308,550
Pemex Project Funding Master Trust
7.375% due 12/15/2014 180,000 191,642
Petro-Canada
5.95% due 05/15/2035 190,000 139,841
6.05% due 05/15/2018 325,000 303,743
Shell International Finance BV
6.375% due 12/15/2038 265,000 292,764
Talisman Energy, Inc.
6.25% due 02/01/2038 155,000 128,649
2,176,249
The accompanying notes are an integral part of the financial statements.
283
JOHN HANCOCK FUNDS II
PORTFOLIO OF INVESTMENTS - May 31, 2009 (Unaudited) - continued(showing percentage of total net assets)
Total Bond Market Fund (continued)Shares or
Principal
Amount Value
CORPORATE BONDS (continued)
Investment Companies - 0.06%
Xstrata Finance Canada, Ltd.
5.80% due 11/15/2016 (f) $ 290,000 $ 227,739
Leisure Time - 0.09%
Vivendi
5.75% due 04/04/2013 (f) 102,000 99,335
Walt Disney Company, MTN
5.625% due 09/15/2016 250,000 262,146
361,481
Liquor - 0.07%
Brown-Forman Corp.
5.00% due 02/01/2014 290,000 299,707
Manufacturing - 0.30%
Harsco Corp.
5.75% due 05/15/2018 270,000 265,917
Honeywell International, Inc.
3.875% due 02/15/2014 220,000 224,496
Ingersoll-Rand Global Holding Company, Ltd.
6.875% due 08/15/2018 270,000 263,777
Stanley Works
6.15% due 10/01/2013 170,000 168,712
Tyco Electronics Group SA
6.55% due 10/01/2017 305,000 270,514
1,193,416
Medical-Drugs - 0.22%
Abbott Laboratories
Copyright © 2012 www.secdatabase.com. All Rights Reserved.Please Consider the Environment Before Printing This Document

4.35% due 03/15/2014 350,000 360,338
Bristol-Myers Squibb Company
6.80% due 11/15/2026 140,000 154,416
GlaxoSmithKline Capital, Inc.
4.375% due 04/15/2014 370,000 379,357
894,111
Medical-Hospitals - 0.02%
Quest Diagnostics, Inc.
5.45% due 11/01/2015 90,000 82,872
Metal & Metal Products - 0.07%
Amgen, Inc.
5.70% due 02/01/2019 145,000 149,437
Commercial Metals Company
7.35% due 08/15/2018 140,000 118,211
267,648
Mining - 0.03%
Rio Tinto Finance USA, Ltd.
6.50% due 07/15/2018 110,000 108,308
Oil & Gas Drilling - 0.07%
GlobalSantaFe Corp.
5.00% due 02/15/2013 275,000 269,683
Petroleum Services - 0.19%
Noble Holding International, Ltd.
7.375% due 03/15/2014 240,000 251,205
Tosco Corp.
8.125% due 02/15/2030 285,000 313,752
Weatherford International, Ltd.
5.50% due 02/15/2016 215,000 195,625
760,582
Total Bond Market Fund (continued)Shares or
Principal
Amount Value
CORPORATE BONDS (continued)
Pharmaceuticals - 0.44%
AstraZeneca PLC
5.90% due 09/15/2017 $ 300,000 $ 320,262
Eli Lilly & Company
7.125% due 06/01/2025 220,000 242,118
Novartis Securities Investment, Ltd.
5.125% due 02/10/2019 210,000 212,833
Pharmacia Corp.
6.50% due 12/01/2018 290,000 315,249
Schering Plough Corp.
5.55% due 12/01/2013 240,000 255,387
Wyeth
5.50% due 03/15/2013 385,000 410,251
1,756,100
Pipelines - 0.05%
Enterprise Products Operating LLC
9.75% due 01/31/2014 175,000 195,289
Railroads & Equipment - 0.32%
Burlington Northern Santa Fe Corp.
7.00% due 02/01/2014 350,000 375,001
Canadian National Railway Company
6.375% due 10/15/2011 135,000 146,999
CSX Corp.
6.25% due 04/01/2015 205,000 202,844
Copyright © 2012 www.secdatabase.com. All Rights Reserved.Please Consider the Environment Before Printing This Document

7.375% due 02/01/2019 290,000 300,171
Union Pacific Corp.
6.625% due 02/01/2029 260,000 243,687
1,268,702
Real Estate - 0.17%
Duke Realty LP
5.95% due 02/15/2017 72,000 52,801
ProLogis
5.625% due 11/15/2016 60,000 45,300
Realty Income Corp.
5.95% due 09/15/2016 135,000 105,457
Simon Property Group LP
5.875% due 03/01/2017 86,000 76,750
WEA Finance LLC
7.50% due 06/02/2014 (f) 390,000 385,574
665,882
Retail - 0.08%
CVS Caremark Corp.
6.125% due 08/15/2016 305,000 313,054
Retail Grocery - 0.05%
Kroger Company
6.40% due 08/15/2017 210,000 219,640
Retail Trade - 0.53%
Home Depot, Inc.
4.625% due 08/15/2010 265,000 269,727
Safeway, Inc.
6.35% due 08/15/2017 155,000 163,856
Target Corp.
6.50% due 10/15/2037 220,000 204,458
7.50% due 08/15/2010 135,000 142,815
Walgreen Company
5.25% due 01/15/2019 290,000 297,469
The accompanying notes are an integral part of the financial statements.
284
JOHN HANCOCK FUNDS II
PORTFOLIO OF INVESTMENTS - May 31, 2009 (Unaudited) - continued(showing percentage of total net assets)
Total Bond Market Fund (continued)Shares or
Principal
Amount Value
CORPORATE BONDS (continued)
Retail Trade (continued)
Wal-Mart Stores, Inc.
4.125% due 02/01/2019 $ 265,000 $ 254,705
6.20% due 04/15/2038 386,000 400,288
7.55% due 02/15/2030 300,000 363,567
2,096,885
Software - 0.15%
Microsoft Corp.
2.95% due 06/01/2014 200,000 198,321
Oracle Corp.
5.75% due 04/15/2018 380,000 409,494
Copyright © 2012 www.secdatabase.com. All Rights Reserved.Please Consider the Environment Before Printing This Document

607,815
Steel - 0.03%
ArcelorMittal
5.375% due 06/01/2013 140,000 129,086
Telecommunications Equipment &
Services - 0.62%
Deutsche Telekom International Finance BV
8.75 due 06/15/2030 365,000 424,404
France Telecom SA
8.50% due 03/01/2031 290,000 371,826
SBC Communications, Inc.
5.625% due 06/15/2016 200,000 203,570
Verizon Communications, Inc.
5.25% due 04/15/2013 275,000 289,424
6.10% due 04/15/2018 435,000 452,561
7.375% due 09/01/2012 250,000 281,042
Verizon Global Funding Corp.
7.25% due 12/01/2010 435,000 465,569
2,488,396
Telephone - 0.63%
Ameritech Capital Funding
6.875% due 10/15/2027 138,000 117,399
AT&T, Inc.
6.30% due 01/15/2038 400,000 375,748
6.70% due 11/15/2013 270,000 296,809
BellSouth Corp.
6.875% due 10/15/2031 405,000 386,889
British Telecommunications PLC
5.95% due 01/15/2018 160,000 141,874
9.125% due 12/15/2030 160,000 168,038
Telecom Italia Capital SA
5.25% due 11/15/2013 460,000 447,067
7.721% due 06/04/2038 200,000 188,780
Telefonica Europe BV
8.25% due 09/15/2030 325,000 380,325
2,502,929
Tobacco - 0.22%
Altria Group, Inc.
8.50% due 11/10/2013 255,000 286,869
9.25% due 08/06/2019 265,000 293,167
Philip Morris International, Inc.
6.875% due 03/17/2014 270,000 300,026
880,062
Total Bond Market Fund (continued)Shares or
Principal
Amount Value
CORPORATE BONDS (continued)
Trucking & Freight - 0.04%
FedEx Corp.
8.00% due 01/15/2019 $ 145,000 $ 160,685
Utility Service - 0.07%
Pacificorp
6.00% due 01/15/2039 290,000 294,750
TOTAL CORPORATE BONDS (Cost $84,842,106) $ 85,568,608
MUNICIPAL BONDS - 0.11%
Copyright © 2012 www.secdatabase.com. All Rights Reserved.Please Consider the Environment Before Printing This Document

California - 0.05%
State of California
7.50% due 04/01/2034 200,000 196,220
Illinois - 0.06%
Illinois State, Taxable Pension
5.10% due 06/01/2033 285,000 248,774
TOTAL MUNICIPAL BONDS (Cost $465,627) $ 444,994
COLLATERALIZED MORTGAGE
OBLIGATIONS - 3.40%
Banc of America Commercial Mortgage, Inc.,
Series 2004-4, Class A3
4.128% due 07/10/2042 439,704 435,976
Banc of America Commercial Mortgage, Inc.,
Series 2006-3, Class A4
5.889% due 07/10/2044 (b) 700,000 537,691
GE Capital Commercial Mortgage Corp., Series
2004-C3, Class A2
4.433% due 07/10/2039 678,811 676,730
GE Capital Commercial Mortgage Corp., Series
2005-C1, Class A2
4.353% due 06/10/2048 980,000 947,110
GMAC Commercial Mortgage Securities, Inc.,
Series 2003-C3, Class A4
5.023% due 04/10/2040 1,020,000 949,124
JPMorgan Chase Commercial Mortgage Securities
Corp, Series 2004-CBX, Class A6
4.899% due 01/12/2037 540,000 466,747
JPMorgan Chase Commercial Mortgage Securities
Corp, Series 2006-CB14, Class A3A
5.491% due 12/12/2044 (b) 920,000 821,297
JPMorgan Chase Commercial Mortgage Securities
Corp., Series 2005-LDP5, Class A4
5.1792% due 12/15/2044 (b) 275,000 242,679
JPMorgan Chase Commercial Mortgage Securities
Corp., Series 2005-LDP2, Class A4
4.738% due 07/15/2042 940,000 809,737
LB-UBS Commercial Mortgage Trust, Series
2000-C3, Class A2
7.95% due 05/15/2025 (b) 440,818 447,719
LB-UBS Commercial Mortgage Trust,
Series 2005-C1, Class A2
4.31% due 02/15/2030 650,000 636,681
LB-UBS Commercial Mortgage Trust,
Series 2006-C7, Class A3
5.347% due 11/15/2038 968,000 779,084
Merrill Lynch Mortgage Trust, Series 2008-C1,
Class A4
5.69% due 02/12/2051 145,000 98,909
The accompanying notes are an integral part of the financial statements.
285
JOHN HANCOCK FUNDS II
PORTFOLIO OF INVESTMENTS - May 31, 2009 (Unaudited) - continued(showing percentage of total net assets)
Total Bond Market Fund (continued)Shares or
Principal
Amount Value
COLLATERALIZED MORTGAGE
Copyright © 2012 www.secdatabase.com. All Rights Reserved.Please Consider the Environment Before Printing This Document

OBLIGATIONS (continued)
Merrill Lynch/Countrywide Commercial Mortgage
Trust, Series 2007-8, Class A2
5.92% due 08/12/2049 (b) $ 1,080,000 $ 973,892
Morgan Stanley Capital I, Series 2007-T27, Class A4
5.6497% due 06/11/2042 (b) 1,630,000 1,361,397
Morgan Stanley Capital I,
Series 2004-HQ3, Class A4
4.80% due 01/13/2041 870,000 786,675
Morgan Stanley Capital I, Series 2005-HQ6,
Class A2A
4.882% due 08/13/2042 980,000 955,816
Morgan Stanley Capital I, Series 2007-T25, Class A3
5.514% due 11/12/2049 (b) 1,295,000 1,064,897
Wachovia Bank Commercial Mortgage Trust,
Series 2004-C12, Class A2
5.001% due 07/15/2041 560,000 555,848
TOTAL COLLATERALIZED MORTGAGE OBLIGATIONS
(Cost $13,416,806) $ 13,548,009
ASSET BACKED SECURITIES - 0.13%
American Express Credit Account Master Trust,
Series 2006-2, Class A
5.35% due 01/15/2014 440,000 458,237
CNH Equipment Trust, Series 2008-B, Class A2B
1.3444% due 04/15/2011 (b) 63,541 63,593
TOTAL ASSET BACKED SECURITIES
(Cost $511,309) $ 521,830
SUPRANATIONAL OBLIGATIONS - 1.17%
Supranational - 1.17%
African Development Bank
6.875% due 10/15/2015 105,000 116,114
Asian Development Bank
5.593% due 07/16/2018 405,000 446,808
European Investment Bank
2.375% due 03/14/2014 570,000 552,246
3.25% due 02/15/2011 435,000 451,206
4.625% due 05/15/2014 429,000 458,233
4.625% due 10/20/2015 395,000 426,577
4.875% due 01/17/2017 580,000 610,425
Inter-American Development Bank
7.00% due 06/15/2025 175,000 206,718
7.375% due 01/15/2010 280,000 290,746
International Bank for Reconstruction &
Development
3.625% due 05/21/2013 200,000 204,537
8.625% due 10/15/2016 285,000 370,845
International Finance Corp.
3.50% due 05/15/2013 155,000 156,894
Nordic Investment Bank
2.375% due 12/15/2011 355,000 358,940
4,650,289
TOTAL SUPRANATIONAL OBLIGATIONS
(Cost $4,689,018) $ 4,650,289
Total Bond Market Fund (continued)Shares or
Principal
Amount Value
REPURCHASE AGREEMENTS - 0.15%
Repurchase Agreement with State
Street Corp. dated 05/29/2009 at
Copyright © 2012 www.secdatabase.com. All Rights Reserved.Please Consider the Environment Before Printing This Document
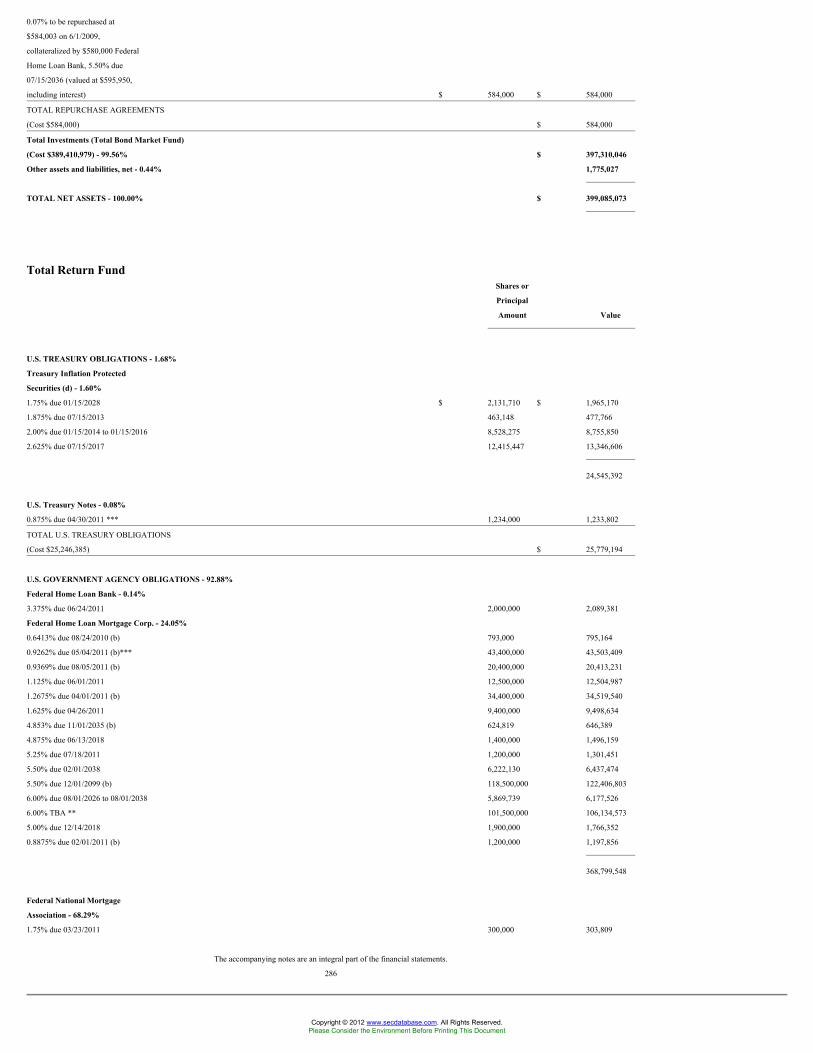
0.07% to be repurchased at
$584,003 on 6/1/2009,
collateralized by $580,000 Federal
Home Loan Bank, 5.50% due
07/15/2036 (valued at $595,950,
including interest) $ 584,000 $ 584,000
TOTAL REPURCHASE AGREEMENTS
(Cost $584,000) $ 584,000
Total Investments (Total Bond Market Fund)
(Cost $389,410,979) - 99.56% $ 397,310,046
Other assets and liabilities, net - 0.44% 1,775,027
TOTAL NET ASSETS - 100.00% $ 399,085,073
Total Return FundShares or
Principal
Amount Value
U.S. TREASURY OBLIGATIONS - 1.68%
Treasury Inflation Protected
Securities (d) - 1.60%
1.75% due 01/15/2028 $ 2,131,710 $ 1,965,170
1.875% due 07/15/2013 463,148 477,766
2.00% due 01/15/2014 to 01/15/2016 8,528,275 8,755,850
2.625% due 07/15/2017 12,415,447 13,346,606
24,545,392
U.S. Treasury Notes - 0.08%
0.875% due 04/30/2011 *** 1,234,000 1,233,802
TOTAL U.S. TREASURY OBLIGATIONS
(Cost $25,246,385) $ 25,779,194
U.S. GOVERNMENT AGENCY OBLIGATIONS - 92.88%
Federal Home Loan Bank - 0.14%
3.375% due 06/24/2011 2,000,000 2,089,381
Federal Home Loan Mortgage Corp. - 24.05%
0.6413% due 08/24/2010 (b) 793,000 795,164
0.9262% due 05/04/2011 (b)*** 43,400,000 43,503,409
0.9369% due 08/05/2011 (b) 20,400,000 20,413,231
1.125% due 06/01/2011 12,500,000 12,504,987
1.2675% due 04/01/2011 (b) 34,400,000 34,519,540
1.625% due 04/26/2011 9,400,000 9,498,634
4.853% due 11/01/2035 (b) 624,819 646,389
4.875% due 06/13/2018 1,400,000 1,496,159
5.25% due 07/18/2011 1,200,000 1,301,451
5.50% due 02/01/2038 6,222,130 6,437,474
5.50% due 12/01/2099 (b) 118,500,000 122,406,803
6.00% due 08/01/2026 to 08/01/2038 5,869,739 6,177,526
6.00% TBA ** 101,500,000 106,134,573
5.00% due 12/14/2018 1,900,000 1,766,352
0.8875% due 02/01/2011 (b) 1,200,000 1,197,856
368,799,548
Federal National Mortgage
Association - 68.29%
1.75% due 03/23/2011 300,000 303,809
The accompanying notes are an integral part of the financial statements.
286
Copyright © 2012 www.secdatabase.com. All Rights Reserved.Please Consider the Environment Before Printing This Document

JOHN HANCOCK FUNDS II
PORTFOLIO OF INVESTMENTS - May 31, 2009 (Unaudited) - continued(showing percentage of total net assets)
Total Return Fund (continued)Shares or
Principal
Amount Value
U.S. GOVERNMENT AGENCY
OBLIGATIONS (continued)
Federal National Mortgage
Association (continued)
3.443% due 11/01/2035 (b) $ 551,562 $ 556,939
3.542% due 05/01/2035 (b) 962,220 982,977
3.578% due 03/01/2035 (b) 162,894 164,717
4.454% due 01/01/2035 (b) 392,185 403,037
4.487% due 11/01/2034 (b) 565,468 577,771
4.50% due 04/01/2023 to 11/01/2023 4,898,908 5,024,060
4.497% due 07/01/2034 (b) 303,647 312,588
4.818% due 06/01/2035 to 09/01/2035 (b) 2,316,427 2,402,769
5.00% due 11/01/2021 to 07/01/2037 24,022,870 24,726,150
5.00% TBA ** 26,100,000 26,623,018
5.50% due 02/01/2011 to 01/01/2039 274,705,991 284,864,007
5.50% due 10/01/2038 *** 59,327,208 61,528,805
5.50% TBA ** 94,000,000 97,172,500
6.00% due 10/01/2026 to 06/01/2039 116,435,875 122,246,514
6.00% TBA ** 389,500,000 407,610,296
6.50% due 10/01/2036 to 05/01/2037 2,188,880 2,337,156
6.50% TBA ** 8,600,000 9,161,687
1,046,998,800
Government National Mortgage
Association - 0.26%
6.00% due 06/15/2036 to 10/15/2038 3,871,896 4,057,190
Small Business Administration - 0.14%
5.29% due 12/01/2027 2,056,911 2,135,169
TOTAL U.S. GOVERNMENT AGENCY OBLIGATIONS
(Cost $1,408,055,337) $ 1,424,080,088
FOREIGN GOVERNMENT OBLIGATIONS - 0.35%
Brazil - 0.35%
Federative Republic of Brazil
10.25% due 01/10/2028 BRL 6,400,000 3,285,221
12.50% due 01/05/2022 3,600,000 2,104,086
5,389,307
TOTAL FOREIGN GOVERNMENT OBLIGATIONS
(Cost $5,584,119) $ 5,389,307
CORPORATE BONDS - 33.32%
Banking - 9.25%
ANZ National International, Ltd.
1.0137% due 08/07/2009 (b)(f) $ 8,000,000 8,002,008
6.20% due 07/19/2013 (f) 3,100,000 3,164,257
BAC Capital Trust VII
5.25% due 08/10/2035 GBP 1,000,000 816,232
Bank of America Corp.
1.2131% due 08/15/2016 (b) $ 1,100,000 805,895
2.10% due 04/30/2012 10,800,000 10,878,721
Bank of America NA, BKNT
6.00% due 10/15/2036 900,000 681,300
Barclays Bank PLC
Copyright © 2012 www.secdatabase.com. All Rights Reserved.Please Consider the Environment Before Printing This Document

5.45% due 09/12/2012 23,000,000 23,531,484
6.05% due 12/04/2017 (f) 2,900,000 2,389,200
BNP Paribas
5.186% due 06/29/2049 (b)(f) 7,600,000 4,998,657
Citibank NA
1.625% due 03/30/2011 900,000 906,817
Total Return Fund (continued)Shares or
Principal
Amount Value
CORPORATE BONDS (continued)
Banking (continued)
Credit Agricole SA
0.7138% due 05/28/2010 (b)(f) $ 2,700,000 $ 2,651,006
Deutsche Bank AG
6.00% due 09/01/2017 4,600,000 4,623,110
DnB NOR Bank ASA
1.2088% due 10/13/2009 (b)(f) 2,400,000 2,381,230
Fortis Bank Nederland Holding NV, EMTN
3.00% due 04/17/2012 EUR 500,000 710,672
HSBC Bank USA, BKNT
1.4325% due 06/10/2009 (b) $ 900,000 899,855
HSBC Finance Corp.
1.1619% due 10/21/2009 (b) 1,700,000 1,680,703
HSBC Holdings PLC
6.50% due 05/02/2036 900,000 822,563
6.50% due 09/15/2037 1,200,000 1,088,272
ICICI Bank, Ltd.
1.6788% due 01/12/2010 (b)(f) 3,800,000 3,709,750
National Australia Bank, Ltd.
1.3525% due 09/11/2009 (b)(f) 2,500,000 2,497,242
5.35% due 06/12/2013 (f) 2,600,000 2,625,412
Royal Bank of Scotland Group PLC
6.99% due 10/29/2049 (b)(f) 6,800,000 3,196,000
7.648% due 08/31/2049 (b) 5,000,000 2,300,000
Royal Bank of Scotland PLC
1.32% due 04/08/2011 (b)(f) 4,000,000 3,994,060
2.625% due 05/11/2012 (f) 2,400,000 2,401,840
3.00% due 12/09/2011 (f) 5,900,000 6,041,600
Santander Perpetual SA Unipersonal
6.671% due 10/29/2049 (b)(f) 5,600,000 4,144,000
Santander US Debt SA Unipersonal
1.3313% due 11/20/2009 (b)(f) 4,700,000 4,663,617
Societe Financement de l'Economie Francaise
3.375% due 05/05/2014 (f) 5,100,000 5,110,705
Societe Financement de l'Economie Francaise,
EMTN
2.125% due 05/20/2012 EUR 800,000 1,128,864
State Street Capital Trust III
8.25% due 03/15/2042 (b) $ 2,900,000 2,378,638
State Street Capital Trust IV
2.32% due 06/15/2037 (b) 400,000 184,490
Sumitomo Mitsui Banking Corp.
5.625% due 07/29/2049 (b)(f) 5,200,000 4,548,898
Swedbank AB, EMTN
3.625% due 12/02/2011 EUR 100,000 146,256
UBS AG/Stamford Branch, MTN
1.9269% due 05/05/2010 (b) $ 300,000 290,398
5.75% due 04/25/2018 1,900,000 1,704,420
UBS AG/Stamford Branch, Series DPNT
5.875% due 12/20/2017 2,100,000 1,906,113
USB Capital IX
6.189% due 03/29/2049 (b) 300,000 195,750
Wachovia Bank NA, BKNT
Copyright © 2012 www.secdatabase.com. All Rights Reserved.Please Consider the Environment Before Printing This Document

0.7212% due 05/25/2010 (b) 11,000,000 10,592,252
Wachovia Corp.
1.2613% due 10/15/2011 (b) 1,100,000 1,029,319
5.75% due 02/01/2018 6,200,000 5,948,912
141,770,518
The accompanying notes are an integral part of the financial statements.
287
JOHN HANCOCK FUNDS II
PORTFOLIO OF INVESTMENTS - May 31, 2009 (Unaudited) - continued(showing percentage of total net assets)
Total Return Fund (continued)Shares or
Principal
Amount Value
CORPORATE BONDS (continued)
Biotechnology - 0.63%
Amgen, Inc.
6.15% due 06/01/2018 $ 9,100,000 $ 9,654,381
Building Materials & Construction - 0.18%
C8 Capital SPV, Ltd.
6.64% due 12/31/2049 (b)(f) 5,500,000 2,823,700
Cable & Television - 0.11%
Comcast Corp.
5.875% due 02/15/2018 700,000 702,674
6.45% due 03/15/2037 700,000 658,560
Time Warner, Inc.
1.15% due 11/13/2009 (b) 400,000 398,508
1,759,742
Cellular Communications - 0.99%
Verizon Wireless Capital LLC
3.3163% due 05/20/2011 (b)(f) 14,700,000 15,137,728
Chemicals - 0.08%
Rohm & Haas Company
6.00% due 09/15/2017 1,500,000 1,310,706
Computers & Business Equipment - 0.32%
Dell, Inc.
4.70% due 04/15/2013 4,800,000 4,909,579
Crude Petroleum & Natural Gas - 0.72%
Anadarko Petroleum Corp.
1.72% due 09/15/2009 (b) 4,000,000 3,994,080
Petroleos Mexicanos
8.00% due 05/03/2019 (f) 6,500,000 7,104,500
11,098,580
Educational Services - 0.91%
President and Fellows of Harvard College
6.50% due 01/15/2039 (f) 12,900,000 13,976,376
Financial Services - 16.58%
Allstate Life Global Funding Trusts, MTN
5.375% due 04/30/2013 2,500,000 2,591,350
American Express Bank FSB
5.50% due 04/16/2013 3,500,000 3,357,326
American Express Bank FSB, BKNT
0.3681% due 06/22/2009 (b) 600,000 600,089
0.3762% due 10/20/2009 (b) 2,600,000 2,579,343
6.00% due 09/13/2017 200,000 178,600
Copyright © 2012 www.secdatabase.com. All Rights Reserved.Please Consider the Environment Before Printing This Document
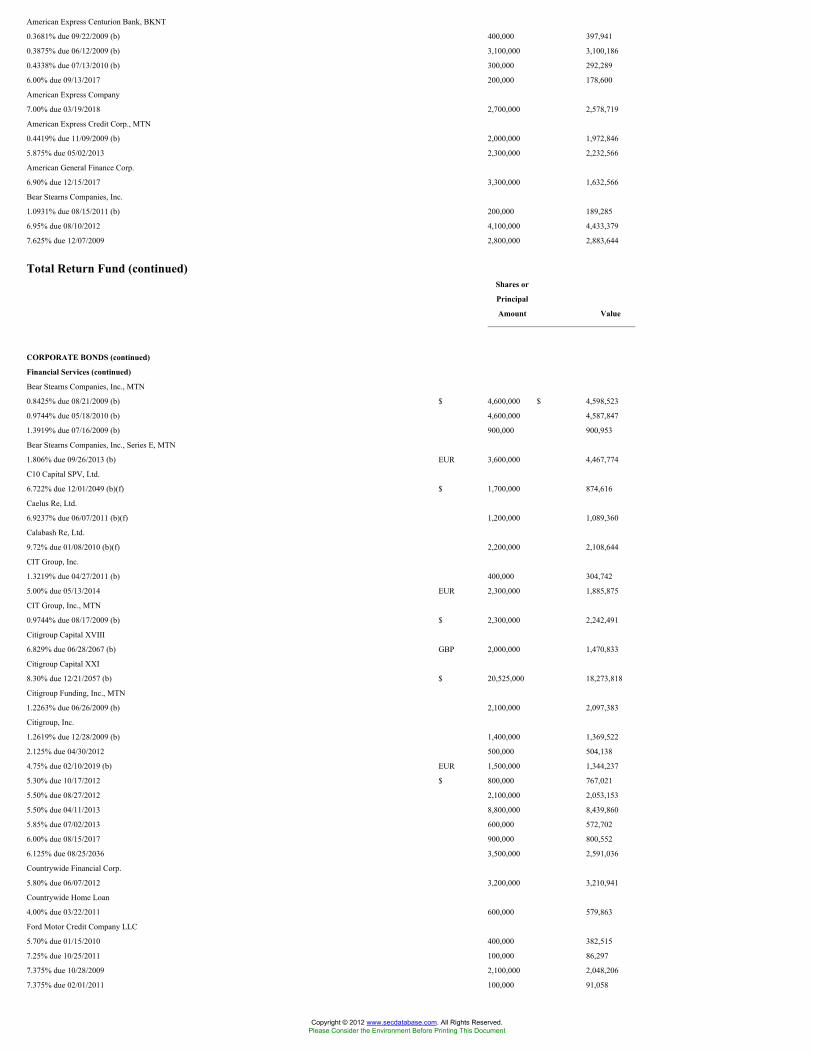
American Express Centurion Bank, BKNT
0.3681% due 09/22/2009 (b) 400,000 397,941
0.3875% due 06/12/2009 (b) 3,100,000 3,100,186
0.4338% due 07/13/2010 (b) 300,000 292,289
6.00% due 09/13/2017 200,000 178,600
American Express Company
7.00% due 03/19/2018 2,700,000 2,578,719
American Express Credit Corp., MTN
0.4419% due 11/09/2009 (b) 2,000,000 1,972,846
5.875% due 05/02/2013 2,300,000 2,232,566
American General Finance Corp.
6.90% due 12/15/2017 3,300,000 1,632,566
Bear Stearns Companies, Inc.
1.0931% due 08/15/2011 (b) 200,000 189,285
6.95% due 08/10/2012 4,100,000 4,433,379
7.625% due 12/07/2009 2,800,000 2,883,644
Total Return Fund (continued)Shares or
Principal
Amount Value
CORPORATE BONDS (continued)
Financial Services (continued)
Bear Stearns Companies, Inc., MTN
0.8425% due 08/21/2009 (b) $ 4,600,000 $ 4,598,523
0.9744% due 05/18/2010 (b) 4,600,000 4,587,847
1.3919% due 07/16/2009 (b) 900,000 900,953
Bear Stearns Companies, Inc., Series E, MTN
1.806% due 09/26/2013 (b) EUR 3,600,000 4,467,774
C10 Capital SPV, Ltd.
6.722% due 12/01/2049 (b)(f) $ 1,700,000 874,616
Caelus Re, Ltd.
6.9237% due 06/07/2011 (b)(f) 1,200,000 1,089,360
Calabash Re, Ltd.
9.72% due 01/08/2010 (b)(f) 2,200,000 2,108,644
CIT Group, Inc.
1.3219% due 04/27/2011 (b) 400,000 304,742
5.00% due 05/13/2014 EUR 2,300,000 1,885,875
CIT Group, Inc., MTN
0.9744% due 08/17/2009 (b) $ 2,300,000 2,242,491
Citigroup Capital XVIII
6.829% due 06/28/2067 (b) GBP 2,000,000 1,470,833
Citigroup Capital XXI
8.30% due 12/21/2057 (b) $ 20,525,000 18,273,818
Citigroup Funding, Inc., MTN
1.2263% due 06/26/2009 (b) 2,100,000 2,097,383
Citigroup, Inc.
1.2619% due 12/28/2009 (b) 1,400,000 1,369,522
2.125% due 04/30/2012 500,000 504,138
4.75% due 02/10/2019 (b) EUR 1,500,000 1,344,237
5.30% due 10/17/2012 $ 800,000 767,021
5.50% due 08/27/2012 2,100,000 2,053,153
5.50% due 04/11/2013 8,800,000 8,439,860
5.85% due 07/02/2013 600,000 572,702
6.00% due 08/15/2017 900,000 800,552
6.125% due 08/25/2036 3,500,000 2,591,036
Countrywide Financial Corp.
5.80% due 06/07/2012 3,200,000 3,210,941
Countrywide Home Loan
4.00% due 03/22/2011 600,000 579,863
Ford Motor Credit Company LLC
5.70% due 01/15/2010 400,000 382,515
7.25% due 10/25/2011 100,000 86,297
7.375% due 10/28/2009 2,100,000 2,048,206
7.375% due 02/01/2011 100,000 91,058
Copyright © 2012 www.secdatabase.com. All Rights Reserved.Please Consider the Environment Before Printing This Document

7.875% due 06/15/2010 300,000 285,550
8.625% due 11/01/2010 100,000 93,131
General Electric Capital Corp.
1.80% due 03/11/2011 400,000 404,194
3.00% due 12/09/2011 16,100,000 16,666,527
5.50% due 09/15/2067 (b)(f) EUR 9,900,000 8,047,483
6.375% due 11/15/2067 (b) $ 4,100,000 2,894,477
General Electric Capital Corp., MTN
0.9531% due 08/15/2011 (b) 2,300,000 2,161,092
1.1219% due 10/26/2009 (b) 800,000 796,990
1.1769% due 01/20/2010 (b) 2,400,000 2,384,518
General Electric Capital Corp., Series A, MTN
1.44% due 12/15/2009 (b) 8,500,000 8,454,993
GMAC LLC
6.00% due 12/15/2011 400,000 345,912
Goldman Sachs Group, Inc.
1.3169% due 06/23/2009 (b) 1,700,000 1,700,316
The accompanying notes are an integral part of the financial statements.
288
JOHN HANCOCK FUNDS II
PORTFOLIO OF INVESTMENTS - May 31, 2009 (Unaudited) - continued(showing percentage of total net assets)
Total Return Fund (continued)Shares or
Principal
Amount Value
CORPORATE BONDS (continued)
Financial Services (continued)
Goldman Sachs Group, Inc. (continued)
5.625% due 01/15/2017 $ 2,000,000 $ 1,822,192
6.15% due 04/01/2018 7,500,000 7,240,328
6.25% due 09/01/2017 5,400,000 5,233,874
Goldman Sachs Group, Inc., MTN
0.9344% due 11/16/2009 (b) 1,100,000 1,098,407
Goldman Sachs Group, Inc., Series B, MTN
1.43% due 07/23/2009 (b) 1,100,000 1,100,157
Goldman Sachs Group, Inc., Series E, MTN
6.375% due 05/02/2018 EUR 700,000 963,237
HBOS Treasury Services PLC, MTN
1.1525% due 07/17/2009 (b)(f) $ 3,900,000 3,892,723
International Lease Finance Corp., MTN
0.8813% due 05/24/2010 (b) 18,700,000 17,203,308
JPMorgan Chase & Company
2.20% due 06/15/2012 2,500,000 2,527,743
6.00% due 01/15/2018 2,300,000 2,289,135
JPMorgan Chase & Company, MTN
1.0263% due 05/07/2010 (b) 3,900,000 3,866,897
JPMorgan Chase Bank NA, BKNT
6.00% due 10/01/2017 3,900,000 3,746,664
JPMorgan Chase Capital XX, Series T
6.55% due 09/29/2036 400,000 315,105
KeyBank NA, BKNT
2.9237% due 06/02/2010 (b) 4,400,000 4,259,825
Korea Development Bank
1.3168% due 04/03/2010 (b) 9,900,000 9,672,666
LeasePlan Corp. NV, EMTN
3.125% due 02/10/2012 EUR 1,900,000 2,713,716
Lehman Brothers Holdings, Inc., MTN
4.7013% due 12/23/2010 ^ (b) $ 10,000,000 1,475,000
5.46% due 11/16/2009 ^ (b) 4,100,000 604,750
Copyright © 2012 www.secdatabase.com. All Rights Reserved.Please Consider the Environment Before Printing This Document

5.50% due 05/25/2010 ^ (b) 800,000 118,000
5.5163% due 08/21/2009 ^ (b) 2,300,000 339,250
6.875% due 05/02/2018 ^ 1,100,000 181,500
Longpoint Re, Ltd.
6.57% due 05/08/2010 (b)(f) 1,200,000 1,164,120
Merrill Lynch & Company, Inc.
6.40% due 08/28/2017 3,100,000 2,809,828
Merrill Lynch & Company, Inc., MTN
6.05% due 08/15/2012 900,000 874,823
6.875% due 04/25/2018 7,600,000 7,053,248
Morgan Stanley
3.25% due 12/01/2011 2,900,000 3,013,306
6.25% due 08/28/2017 800,000 763,321
Morgan Stanley, MTN
1.2213% due 01/15/2010 (b) 2,400,000 2,358,847
3.0056% due 05/14/2010 (b) 5,000,000 4,961,605
Mystic Re, Ltd.
10.6737% due 06/07/2011 (b)(f) 700,000 653,269
Salomon Brothers AG for OAO Gazprom
10.50% due 10/21/2009 900,000 924,750
SLM Corp., MTN
1.3219% due 10/25/2011 (b) 200,000 144,350
1.531% due 11/15/2011 (b) EUR 400,000 356,596
SLM Corp., MTN, Series A
1.2319% due 07/27/2009 (b) $ 10,500,000 10,379,397
SMFG Preferred Capital
6.078% due 01/29/2049 (b)(f) 1,600,000 1,235,504
Total Return Fund (continued)Shares or
Principal
Amount Value
CORPORATE BONDS (continued)
Financial Services (continued)
TNK-BP Finance SA
6.125% due 03/20/2012 (f) $ 500,000 $ 462,500
TransCapitalInvest, Ltd., for OJSC AK Transneft
8.70% due 08/07/2018 (f) 1,000,000 960,480
Wells Fargo & Company
1.42% due 09/15/2009 (b) 1,500,000 1,500,531
ZFS Finance USA Trust IV
5.875% due 05/09/2032 (f) 1,100,000 676,401
254,135,225
Food & Beverages - 0.38%
General Mills, Inc.
1.2306% due 01/22/2010 (b) 2,100,000 2,094,968
Kraft Foods, Inc.
6.125% due 02/01/2018 2,500,000 2,551,063
6.875% due 02/01/2038 1,100,000 1,112,995
5,759,026
Gas & Pipeline Utilities - 0.17%
NGPL PipeCo LLC
6.514% due 12/15/2012 (f) 2,600,000 2,598,783
Insurance - 1.29%
American International Group, Inc., MTN
1.3875% due 03/20/2012 (b) 4,200,000 1,888,354
MetLife, Inc.
6.40% due 12/15/2036 (b) 900,000 639,000
Metropolitan Life Global Funding I, MTN
0.8944% due 05/17/2010 (b)(f) 5,000,000 4,751,910
Monumental Global Funding, Ltd.
Copyright © 2012 www.secdatabase.com. All Rights Reserved.Please Consider the Environment Before Printing This Document

5.50% due 04/22/2013 (f) 1,900,000 1,791,529
Pricoa Global Funding I
1.1394% due 01/30/2012 (b)(f) 3,200,000 2,791,914
1.4275% due 09/27/2013 (b)(f) 2,700,000 2,074,423
Principal Life Income Funding Trusts, MTN
5.30% due 04/24/2013 2,200,000 2,125,981
5.55% due 04/27/2015 3,500,000 3,105,742
Residential Reinsurance 2007, Ltd., Series CL2
10.9237% due 06/07/2010 (b)(f) 600,000 573,240
19,742,093
International Oil - 0.03%
Gaz Capital for Gazprom
6.212% due 11/22/2016 (f) 500,000 420,600
Manufacturing - 0.21%
Siemens Financieringsmaatschappij NV
0.9556% due 08/14/2009 (b)(f) 3,200,000 3,194,535
Pharmaceuticals - 0.14%
AstraZeneca PLC
5.90% due 09/15/2017 1,000,000 1,067,540
6.45% due 09/15/2037 1,000,000 1,124,167
2,191,707
Retail - 0.93%
Home Depot, Inc.
3.75% due 09/15/2009 14,300,000 14,340,655
Telephone - 0.29%
AT&T, Inc.
1.1163% due 02/05/2010 (b) 1,400,000 1,401,600
The accompanying notes are an integral part of the financial statements.
289
JOHN HANCOCK FUNDS II
PORTFOLIO OF INVESTMENTS - May 31, 2009 (Unaudited) - continued(showing percentage of total net assets)
Total Return Fund (continued)Shares or
Principal
Amount Value
CORPORATE BONDS (continued)
Telephone (continued)
Telecom Italia Capital SA
1.7169% due 07/18/2011 (b) $ 3,200,000 $ 3,024,032
4,425,632
Tobacco - 0.11%
Philip Morris International, Inc.
5.65% due 05/16/2018 1,600,000 1,637,171
TOTAL CORPORATE BONDS (Cost $550,731,893) $ 510,886,737
MUNICIPAL BONDS - 3.14%
California - 1.13%
City of Los Angeles
5.00% due 06/01/2039 3,800,000 3,673,954
Los Angeles Unified School District, California,
Series A-1
4.50% due 07/01/2023 5,000,000 4,971,450
San Diego Tobacco Settlement Revenue Funding
Copyright © 2012 www.secdatabase.com. All Rights Reserved.Please Consider the Environment Before Printing This Document

Corp.
7.125% due 06/01/2032 1,550,000 958,752
State of California
5.00% due 11/01/2037 4,700,000 4,239,447
5.65% due 04/01/2039 800,000 818,320
7.50% due 04/01/2034 900,000 882,990
7.55% due 04/01/2039 900,000 879,543
Tobacco Securitization Authority South California
Tobacco Settlement, Series A1-SNR
5.125% due 06/01/2046 1,500,000 895,290
17,319,746
Illinois - 0.39%
Chicago Illinois Transit Authority, Series A
6.30% due 12/01/2021 100,000 103,109
6.899% due 12/01/2040 2,700,000 2,851,470
Chicago Illinois Transit Authority, Series B
6.30% due 12/01/2021 300,000 305,019
6.899% due 12/01/2040 2,600,000 2,745,860
6,005,458
Iowa - 0.05%
Tobacco Settlement Authority of Iowa, Tobacco
Settlement Revenue, Series A
6.50% due 06/01/2023 1,070,000 721,159
Louisiana - 0.17%
State of Louisiana
3.000% due 05/01/2043 (b) 2,600,000 2,596,412
Nevada - 0.01%
Truckee Meadows Nevada Water Authority, Water
Revenue, Series A
5.00% due 07/01/2036 200,000 194,780
New Jersey - 0.53%
New Jersey State Turnpike Authority
7.414% due 01/01/2040 7,400,000 8,186,768
North Carolina - 0.42%
North Carolina Capital Facilities Finance Agency,
Series B
5.00% due 10/01/2038 6,300,000 6,442,128
Total Return Fund (continued)Shares or
Principal
Amount Value
MUNICIPAL BONDS (continued)
Pennsylvania - 0.14%
Pennsylvania Higher Educational Facilities
Authority, Facilities Authority Revenue
8.724% due 07/15/2013 (b) $ 2,300,000 $ 2,157,998
West Virginia - 0.13%
Tobacco Settlement Finance Authority of West
Virginia
7.467% due 06/01/2047 3,250,000 1,952,698
Wisconsin - 0.17%
Badger Tobacco Asset Securitization Corp.
6.125% due 06/01/2027 2,395,000 2,558,722
TOTAL MUNICIPAL BONDS (Cost $49,351,894) $ 48,135,869
COLLATERALIZED MORTGAGE
OBLIGATIONS - 9.25%
American Home Mortgage Investment Trust, Series
2004-4, Class 4A
4.39% due 02/25/2045 (b) 227,643 176,018
Copyright © 2012 www.secdatabase.com. All Rights Reserved.Please Consider the Environment Before Printing This Document

Bear Stearns Adjustable Rate Mortgage Trust,
Series 2004-8, Class 2A1
5.0815% due 11/25/2034 (b) 3,197,775 2,707,413
Bear Stearns Adjustable Rate Mortgage Trust,
Series 2004-9, Class 22A1
4.8023% due 11/25/2034 (b) 1,070,336 892,434
Bear Stearns Alt-A Trust, Series 2005-7, Class 22A1
5.49% due 09/25/2036 (b) 1,090,797 609,724
Bear Stearns Commercial Mortgage Securities,
Series 2007-PW15, Class A4
5.331% due 02/11/2044 400,000 313,096
Bear Stearns Commercial Mortgage Securities,
Series 2007-PW18, Class A4
5.70% due 06/11/2050 4,300,000 3,525,527
Bear Stearns Commercial Mortgage Securities,
Series 2007-T26, Class A4
5.471% due 01/12/2045 (b) 1,000,000 835,286
Bear Stearns Mortgage Funding Trust, Series
2007-AR1, Class 2A1
0.3787% due 02/25/2037 (b) 1,819,545 1,401,771
Citigroup Mortgage Loan Trust, Inc., Series
2005-11, Class 1A1
2.99% due 12/25/2035 (b) 976,003 748,783
Citigroup Mortgage Loan Trust, Inc., Series
2005-11, Class A2A
4.70% due 12/25/2035 480,253 362,891
Commercial Mortgage Pass-Through Certificates,
Series 2006-C8, Class A4
5.306% due 12/10/2046 2,900,000 2,306,637
Countrywide Alternative Loan Trust,
Series 2005-62, Class 2A1
2.4392% due 12/25/2035 (b) 11,362,307 5,161,013
Countrywide Alternative Loan Trust,
Series 2005-81, Class A1
0.5888% due 02/25/2037 (b) 6,682,160 2,938,496
Countrywide Home Loan Mortgage Pass Through
Trust, Series 2004-22, Class A3
4.7875% due 11/25/2034 (b) 2,187,511 1,667,767
Countrywide Home Loan Mortgage Pass Through
Trust, Series 2004-HYB9, Class 1A1
4.7071% due 02/20/2035 (b) 3,895,227 3,094,347
The accompanying notes are an integral part of the financial statements.
290
JOHN HANCOCK FUNDS II
PORTFOLIO OF INVESTMENTS - May 31, 2009 (Unaudited) - continued(showing percentage of total net assets)
Total Return Fund (continued)Shares or
Principal
Amount Value
COLLATERALIZED MORTGAGE
OBLIGATIONS (continued)
Countrywide Home Loans,
Series 2005-HYB9, Class 3A2A
5.25% due 11/20/2025 (b) $ 560,593 $ 383,027
Credit Suisse Mortgage Capital Certificates, Series
2006-C2, Class A3
5.6579% due 03/15/2039 (b) 300,000 226,599
Credit-Based Asset Servicing and Securitization
LLC, Series 2007-SP1, Class A1
Copyright © 2012 www.secdatabase.com. All Rights Reserved.Please Consider the Environment Before Printing This Document

0.3988% due 12/25/2037 (b)(f) 2,284,978 2,174,798
CS First Boston Mortgage Securities Corp., Series
2005-C6, Class A1
4.938% due 12/15/2040 507,385 506,693
Deutsche ALT-A Securities, Inc. Alternate Loan
Trust, Series 2007-AR1, Class A3B
0.3787% due 01/25/2047 (b) 1,196,413 1,076,990
Federal Home Loan Mortgage Corp., Series
2007-3335, Class AF
0.4944% due 10/15/2020 (b) 18,451,896 18,295,441
Federal Home Loan Mortgage Corp., Series
2007-3335, Class BF
0.4944% due 07/15/2019 (b) 2,976,400 2,954,646
Federal Home Loan Mortgage Corp., Series
2007-3346, Class FA
0.5744% due 02/15/2019 (b) 8,692,162 8,569,056
Federal Home Loan Mortgage Corp., Series 2637,
Class F
0.7444% due 06/15/2018 (b) 267,059 265,002
Federal Home Loan Mortgage Corp., Series 3036,
Class NA
5.00% due 07/15/2024 1,431,567 1,455,612
Federal Home Loan Mortgage Corp., Series 3149,
Class LF
0.6444% due 05/15/2036 (b) 1,542,306 1,519,816
Federal Home Loan Mortgage Corp., Series 3335,
Class FT
0.4944% due 08/15/2019 (b) 6,736,712 6,683,563
Federal Home Loan Mortgage Corp., Series T-63,
Class 1A1
2.714% due 02/25/2045 (b) 190,467 182,649
Federal National Mortgage Association, REMIC,
Series 2007-73, Class A1
0.3688% due 07/25/2037 (b) 3,880,006 3,439,981
Federal National Mortgage Association, Series
2003-21, Class M
5.00% due 02/25/2017 388,845 401,040
Federal National Mortgage Association, Series
2003-37, Class HY
5.00% due 12/25/2016 6,351,690 6,526,150
Federal National Mortgage Association, Series
2003-W6, Class F
0.6587% due 09/25/2042 (b) 1,738,153 1,628,553
Federal National Mortgage Association, Series
2005-120, Class NF
0.4087% due 01/25/2021 (b) 10,996,630 10,807,453
Federal National Mortgage Association, Series
2005-33, Class QA
5.00% due 06/25/2027 1,090,912 1,113,482
Federal National Mortgage Association, Series
2006-5, Class 3A2
4.628% due 02/25/2036 (b) 380,207 376,980
Total Return Fund (continued)Shares or
Principal
Amount Value
COLLATERALIZED MORTGAGE
OBLIGATIONS (continued)
Greenpoint Mortgage Funding Trust, Series
2006-AR6, Class A1A
0.3887% due 10/25/2046 (b) $ 1,524,388 $ 1,243,731
Greenpoint Mortgage Funding Trust, Series
2006-AR8, Class 1A1A
0.3887% due 01/25/2047 (b) 1,698,797 1,277,243
Copyright © 2012 www.secdatabase.com. All Rights Reserved.Please Consider the Environment Before Printing This Document

Greenwich Capital Commercial Funding Corp,
Series 2005-GG3, Class A4
4.799% due 08/10/2042 (b) 100,000 86,966
Greenwich Capital Commercial Funding Corp.,
Series 2007-GG9, Class A4
5.444% due 03/10/2039 1,400,000 1,101,299
GS Mortgage Securities Corp II, Series 2007-EOP,
Class A1
0.5044% due 03/06/2020 (b)(f) 2,832,257 2,332,165
GS Mortgage Securities Corp II, Series
2007-GG10, Class A4
5.9932% due 08/10/2045 (b) 3,100,000 2,370,686
GSR Mortgage Loan Trust, Series 2005-AR7,
Class 6A1
5.2423% due 11/25/2035 (b) 2,784,205 2,169,770
Indymac Index Mortgage Loan Trust, Series
2006-AR14, Class 1A1A
0.3988% due 11/25/2046 (b) 856,188 793,215
JPMorgan Chase Commercial Mortgage Securities
Corp., Series 2007-LD11, Class ASB
5.8186% due 06/15/2049 (b) 100,000 86,349
JPMorgan Chase Commercial Mortgage Securities
Corp., Series 2007-LD12, Class A4
5.882% due 02/15/2051 (b) 1,000,000 762,529
JPMorgan Chase Commercial Mortgage Securities
Corp., Series 2007-LDPX, Class A3
5.42% due 01/15/2049 400,000 300,499
JPMorgan Mortgage Trust, Series 2005-A1, Class
6T1
5.0159% due 02/25/2035 (b) 1,677,337 1,470,815
JPMorgan Chase Commercial Mortgage Securities Corp.,
Series 2006-LDP9, Class A3
5.336% due 05/15/2047 3,000,000 2,282,099
LB-UBS Commercial Mortgage Trust, Series
2005-C7, Class A1
4.99% due 11/15/2030 653,079 656,226
Lehman Brothers Floating Rate Commercial
Mortgage Trust, Series 2006-LLFA, Class A1
0.4244% due 09/15/2021 (b)(f) 282,907 249,068
Mellon Residential Funding Corp., Series
2000-TBC3, Class A1
0.7844% due 12/15/2030 (b) 4,521,603 3,638,872
Merrill Lynch Mortgage Investors, Inc., Series
2005-2, Class 3A
1.3088% due 10/25/2035 (b) 533,539 357,083
Merrill Lynch Mortgage Investors, Inc., Series
2005-3, Class 4A
0.5587% due 11/25/2035 (b) 299,052 208,273
Merrill Lynch Mortgage Investors, Inc., Series
2005-A10, Class A
0.5188% due 02/25/2036 (b) 1,063,812 585,424
Merrill Lynch/Countrywide Commercial Mortgage
Trust, Series 2007-6, Class A4
5.485% due 03/12/2051 (b) 2,000,000 1,418,419
The accompanying notes are an integral part of the financial statements.
291
JOHN HANCOCK FUNDS II
PORTFOLIO OF INVESTMENTS - May 31, 2009 (Unaudited) - continued(showing percentage of total net assets)
Total Return Fund (continued)Shares or
Principal
Copyright © 2012 www.secdatabase.com. All Rights Reserved.Please Consider the Environment Before Printing This Document

Amount Value
COLLATERALIZED MORTGAGE
OBLIGATIONS (continued)
Morgan Stanley Capital I, Series 2007-IQ16,
Class A4
5.809% due 12/12/2049 $ 200,000 $ 157,600
Morgan Stanley Capital I, Series 2007-XLFA,
Class A1
0.405% due 10/15/2020 (b)(f) 703,117 514,400
Structured Asset Mortgage Investments, Inc.,
Series 2005-AR5, Class A3
0.5781% due 07/19/2035 (b) 2,217,858 1,442,025
Structured Asset Mortgage Investments, Inc.,
Series 2005-AR8, Class A1A
0.5888% due 02/25/2036 (b) 628,482 288,549
Structured Asset Mortgage Investments, Inc.,
Series 2007-AR2, Class 2A1
0.4387% due 03/25/2037 (b) 3,249,742 1,172,204
Thornburg Mortgage Securities Trust, Series
2006-5, Class A1
0.4288% due 08/25/2011 (b) 3,772,605 3,442,700
Thornburg Mortgage Securities Trust, Series
2006-6, Class A1
0.4187% due 11/25/2011 (b) 1,443,836 1,281,062
Wachovia Bank Commercial Mortgage Trust,
Series 2006-WL7A, Class A1
0.4344% due 09/15/2021 (b)(f) 7,904,588 5,593,277
Wachovia Bank Commercial Mortgage Trust,
Series 2007-C31, Class A4
5.509% due 04/15/2047 1,400,000 957,090
Wachovia Bank Commercial Mortgage Trust,
Series 2007-WHL8, Class A1
0.4244% due 06/15/2020 (b)(f) 3,221,791 2,437,203
WaMu Mortgage Pass-Through Certificates, Series
2002-AR17, Class 1A
2.6392% due 11/25/2042 (b) 235,455 136,828
Washington Mutual, Inc., Series 2001-7, Class A
2.7468% due 05/25/2041 (b) 197,759 161,332
Washington Mutual, Inc., Series 2005-AR19, Class
A1A1
0.5788% due 12/26/2045 (b) 3,190,979 1,502,773
Wells Fargo Mortgage Backed Securities Trust,
Series 2004-CC, Class A1
4.9476% due 01/25/2035 (b) 2,847,465 2,376,377
Wells Fargo Mortgage Backed Securities Trust,
Series 2006-AR2, Class 2A1
4.95% due 03/25/2036 (b) 2,294,740 1,625,985
TOTAL COLLATERALIZED MORTGAGE OBLIGATIONS
(Cost $168,563,446) $ 141,808,870
ASSET BACKED SECURITIES - 3.51%
Access Group, Inc., Series 2008-1, Class A
2.3919% due 10/27/2025 (b) 10,935,083 10,835,989
ACE Securities Corp., Series 2006-ASP5, Class
A2A
0.3887% due 10/25/2036 (b) 188,881 180,869
BA Credit Card Trust, Series 2008-A5, Class A5
1.5444% due 12/16/2013 (b) 5,100,000 5,090,817
Bear Stearns Asset Backed Securities Trust,
Series 2007-HE5, Class 1A1
0.3988% due 06/25/2047 (b) 909,480 774,438
Total Return Fund (continued)Shares or
Principal
Copyright © 2012 www.secdatabase.com. All Rights Reserved.Please Consider the Environment Before Printing This Document

Amount Value
ASSET BACKED SECURITIES
(continued)
Bear Stearns Asset Backed Securities, Inc., Series
2007-HE1, Class 21A1
0.3688% due 01/25/2037 (b) $ 2,228,172 $ 1,784,338
BNC Mortgage Loan Trust, Series 2007-2, Class A2
0.4087% due 05/25/2037 (b) 1,735,148 1,341,557
Carrington Mortgage Loan Trust, Series 2005-NC5,
Class A2
0.6288% due 10/25/2035 (b) 1,481,694 1,307,073
Citigroup Commercial Mortgage Trust, Series
2006-FL2, Class A1
0.4144% due 08/15/2021 (b)(f) 15,196 12,700
Countrywide Asset-Backed Certificates, Series
2006-15, Class A1
0.4187% due 10/25/2046 (b) 608,098 569,955
Countrywide Asset-Backed Certificates, Series
2006-16, Class 2A1
0.3587% due 12/25/2046 (b) 89,277 87,359
Countrywide Asset-Backed Certificates, Series
2006-17, Class 2A1
0.3587% due 03/25/2047 (b) 203,719 198,373
Countrywide Asset-Backed Certificates, Series
2006-18, Class 2A1
0.3587% due 03/25/2037 (b) 830,917 816,568
Countrywide Asset-Backed Certificates, Series
2006-19, Class 2A1
0.3688% due 03/25/2037 (b) 442,990 430,155
Countrywide Asset-Backed Certificates, Series
2007-1, Class 2A1
0.3587% due 07/25/2037 (b) 5,790,345 5,144,303
First Franklin Mortgage Loan Asset Backed
Certificates, Series 2006-FF15, Class A3
0.3587% due 11/25/2036 (b) 1,093,951 1,026,125
First Franklin Mortgage Loan Asset Backed
Certificates, Series 2007-FF1, Class A2A
0.3487% due 01/25/2038 (b) 1,381,848 1,269,295
Fremont Home Loan Trust, Series 2006-3, Class
2A1
0.3787% due 02/25/2037 (b) 19,993 19,805
GE Capital Commercial Mortgage Corp., Series
2002-3A, Class A1
4.229% due 12/10/2037 (b) 4,278,952 4,268,231
GSAMP Trust, Series 2006-FM2, Class A2A
0.3787% due 09/25/2036 (b) 269,863 256,516
GSAMP Trust, Series 2007-FM1, Class A2A
0.3787% due 12/25/2036 (b) 1,224,104 656,405
HFC Home Equity Loan Asset Backed Certificates,
Series 2005-1, Class A
0.6062% due 01/20/2034 (b) 2,440,180 1,604,291
HSBC Asset Loan Obligation, Series 2007-WF1,
Class A1
0.3688% due 12/25/2036 (b) 4,820,773 4,235,110
HSI Asset Securitization Corp. Trust, Series
2006-HE2, Class 2A1
0.3587% due 12/25/2036 (b) 463,459 297,020
JPMorgan Mortgage Acquisition Corp., Series
2006-HE3, Class A2
0.5052% due 11/25/2036 (b) 138,416 129,699
JPMorgan Mortgage Acquisition Corp., Series
2006-WMC3, Class A2
0.3587% due 08/25/2036 (b) 167,786 158,996
The accompanying notes are an integral part of the financial statements.
Copyright © 2012 www.secdatabase.com. All Rights Reserved.Please Consider the Environment Before Printing This Document

292
JOHN HANCOCK FUNDS II
PORTFOLIO OF INVESTMENTS - May 31, 2009 (Unaudited) - continued(showing percentage of total net assets)
Total Return Fund (continued)Shares or
Principal
Amount Value
ASSET BACKED SECURITIES
(continued)
JPMorgan Mortgage Acquisition Corp., Series
2007-HE1, Class AV1
0.3688% due 01/25/2032 (b) $ 1,733,331 $ 1,144,416
Long Beach Mortgage Loan Trust, Series 2004-4,
Class 1A1
0.5888% due 10/25/2034 (b) 58,753 37,065
Master Asset Backed Securities Trust, Series
2007-HE1, Class A1
0.3887% due 05/25/2037 (b) 1,030,992 827,209
Morgan Stanley Asset Backed Securities Capital I,
Series 2006-NC5, Class A2A
0.3487% due 10/25/2036 (b) 300,455 278,348
Morgan Stanley Asset Backed Securities Capital I,
Series 2007-HE1, Class A2A
0.3587% due 11/25/2036 (b) 1,231,571 1,158,013
Option One Mortgage Loan Trust, Series 2007-1,
Class 2A1
0.3587% due 01/25/2037 (b) 624,593 588,515
Park Place Securities, Inc., Series 2004-MCW1,
Class A1
0.6208% due 08/25/2034 (b) 2,196,328 1,603,758
Residential Asset Mortgage Products, Inc., Series
2006-RZ4, Class A1A
0.3887% due 10/25/2036 (b) 397,652 391,836
Residential Asset Securities Corp., Series
2006-EMX9, Class 1A1
0.3787% due 11/25/2036 (b) 569,075 555,130
Residential Asset Securities Corp., Series
2006-KS9, Class AI1
0.3787% due 11/25/2036 (b) 284,092 279,569
Saxon Asset Securities Trust, Series 2006-3, Class
A1
0.3688% due 10/25/2046 (b) 164,303 157,301
SBI Heloc Trust, Series 2006-1A, Class 1A2A
0.4787% due 08/25/2036 (b)(f) 468,418 418,142
Securitized Asset Backed Receivables LLC Trust,
Series 2007-HE1, Class A2A
0.3688% due 12/25/2036 (b) 944,392 565,968
Specialty Underwriting & Residential Finance,
Series 2007-BC1, Class A2A
0.3688% due 01/25/2038 (b) 2,039,890 1,660,950
Structured Asset Securities Corp., Series 2006-11,
Class A1
4.6881% due 10/25/2035 (b)(e)(f) 1,316,707 816,290
Structured Asset Securities Corp., Series
2006-BC3, Class A2
0.3587% due 10/25/2036 (b) 833,958 782,025
TOTAL ASSET BACKED SECURITIES
(Cost $60,746,290) $ 53,760,522
SUPRANATIONAL OBLIGATIONS - 0.22%
Copyright © 2012 www.secdatabase.com. All Rights Reserved.Please Consider the Environment Before Printing This Document

Banking - 0.22%
Export-Import Bank of Korea
1.3513% due 06/01/2009 (b) 3,400,000 3,400,000
TOTAL SUPRANATIONAL OBLIGATIONS
(Cost $3,400,000) $ 3,400,000
Total Return Fund (continued)Shares or
Principal
Amount Value
DEFAULTED BONDS BEYOND MATURITY
DATES - 0.03%
Financial Services - 0.03%
Lehman Brothers Holdings, Inc., MTN
5.3744% due 11/24/2008 ^ $ 1,200,000 $ 177,000
5.415% due 12/23/2008 ^ 400,000 59,000
5.5981% due 04/03/2009 ^ (b) 1,300,000 191,750
427,750
TOTAL DEFAULTED BONDS BEYOND MATURITY DATES
(Cost $2,900,286) $ 427,750
COMMON STOCKS - 0.00%
Financial Services - 0.00%
Bank of America Corp. 1 11
TOTAL COMMON STOCKS (Cost $7) $ 11
PREFERRED STOCKS - 0.67%
Financial Services - 0.66%
Citigroup, Inc., Series E, 8.40% ^ 2,200,000 1,924,978
Wells Fargo & Company, Series L, 7.50% 11,000 8,195,000
10,119,978
Insurance - 0.01%
American International Group, Inc., 8.50% 6,200 56,420
TOTAL PREFERRED STOCKS (Cost $9,185,369) $ 10,176,398
TERM LOANS - 0.54%
Financial Services - 0.45%
Chrysler Financial
9.00% due 08/03/2012 (b) 7,880,000 6,917,513
Semiconductors - 0.09%
Sensata Technologies, Inc.
2.8038% due 04/27/2013 (b) 1,959,698 1,378,320
TOTAL TERM LOANS (Cost $9,591,915) $ 8,295,833
OPTIONS - 0.85%
Call Options - 0.85%
Over The Counter European Style Call on
USD-LIBOR Rate Swaption
Expiration 08/03/2009 at $3.45 * 26,000,000 1,004,341
Expiration 08/03/2009 at $3.45 * 158,800,000 6,134,206
Expiration 08/03/2009 at $3.45 * 23,800,000 919,358
Expiration 07/02/2009 at $3.60 * 20,700,000 893,114
Expiration 08/03/2009 at $3.85 * 86,600,000 4,025,125
12,976,144
TOTAL OPTIONS (Cost $3,384,914) $ 12,976,144
REPURCHASE AGREEMENTS - 5.17%
Deutsche Bank Tri-Party Repurchase
Agreement dated 05/29/2009 at
0.18% to be repurchased at
Copyright © 2012 www.secdatabase.com. All Rights Reserved.Please Consider the Environment Before Printing This Document

$5,000,075 on 06/01/2009,
collateralized by $4,730,000 U.S.
Treasury Notes, 4.125% due
05/15/2015 (valued at $5,115,823,
including interest) $ 5,000,000 $ 5,000,000
The accompanying notes are an integral part of the financial statements.
293
JOHN HANCOCK FUNDS II
PORTFOLIO OF INVESTMENTS - May 31, 2009 (Unaudited) - continued(showing percentage of total net assets)
Total Return Fund (continued)Shares or
Principal
Amount Value
REPURCHASE AGREEMENTS (continued)
Repurchase Agreement with Barclays
Bank PLC dated 05/29/2009 at
0.19% to be repurchased at
$59,800,947 on 06/01/2009,
collateralized by $54,840,000 U.S.
Treasury Notes, 0.875% due
04/15/2010 (valued at
$61,644,087, including interest) $ 59,800,000 $ 59,800,000
Repurchase Agreement with State Street
Corp. dated 05/29/2009 at 0.07% to be
repurchased at $14,485,084 on
06/01/2009, collateralized by $13,445,000
Federal National Mortgage Association,
7.125% due 06/15/2010 (valued at
$14,774,711, including interest) 14,485,000 14,485,000
TOTAL REPURCHASE AGREEMENTS
(Cost $79,285,000) $ 79,285,000
SHORT TERM INVESTMENTS - 0.31%
Merrill Lynch Commercial Trust 2008-LAQ
2.9864% due 07/09/2009 $ 5,000,000 $ 4,340,570
U.S. Treasury Bills
zero coupon due 06/18/2009 *** 410,000 409,974
TOTAL SHORT TERM INVESTMENTS
(Cost $5,370,916) $ 4,750,544
Total Investments (Total Return Fund)
(Cost $2,381,397,771) - 151.92% $ 2,329,152,267
Other assets and liabilities, net - (51.92)% (795,958,216)
TOTAL NET ASSETS - 100.00% $ 1,533,194,051
U. S. Government Securities FundShares or
Principal
Amount Value
U.S. TREASURY OBLIGATIONS - 11.49%
Treasury Inflation Protected
Securities (d) - 11.10%
1.75% due 01/15/2028 *** $ 761,445 $ 701,957
2.00% due 01/15/2026 *** 2,561,172 2,458,725
Copyright © 2012 www.secdatabase.com. All Rights Reserved.Please Consider the Environment Before Printing This Document

2.375% due 01/15/2027 *** 1,666,394 1,685,661
0.875% due 04/15/2010 8,611,186 8,603,108
1.375% due 07/15/2018 1,232,913 1,205,557
14,655,008
U.S. Treasury Bonds - 0.39%
7.125% due 02/15/2023 140,000 182,350
8.875% due 02/15/2019 230,000 328,900
511,250
TOTAL U.S. TREASURY OBLIGATIONS
(Cost $14,868,681) $ 15,166,258
U.S. GOVERNMENT AGENCY OBLIGATIONS - 79.55%
Federal Home Loan Bank - 10.76%
4.50% due 10/09/2009 9,400,000 9,540,502
5.00% due 09/18/2009 4,600,000 4,662,344
14,202,846
U. S. Government Securities Fund (continued)Shares or
Principal
Amount Value
U.S. GOVERNMENT AGENCY
OBLIGATIONS (continued)
Federal Home Loan Mortgage Corp. - 15.82%
5.00% due 08/01/2035 $ 12,899,695 $ 13,235,288
5.00% TBA ** 3,000,000 3,068,438
5.25% due 04/18/2016 1,220,000 1,350,306
5.50% due 11/01/2035 804,487 833,713
5.861% due 01/01/2037 1,561,143 1,633,870
6.00% due 10/01/2010 to 12/01/2028 338,197 357,313
6.50% due 12/01/2010 2 2
7.00% due 02/01/2011 to 06/01/2032 349,534 375,404
9.00% due 10/01/2017 4,467 4,889
9.50% due 08/01/2020 17,019 18,787
11.75% due 12/01/2013 472 488
12.00% due 07/01/2020 3,582 4,026
20,882,524
Federal National Mortgage
Association - 52.55%
4.50% TBA ** 3,400,000 3,427,094
4.75% due 11/19/2012 2,520,000 2,752,430
5.00% due 12/01/2019 to 07/01/2038 8,385,085 8,652,752
5.00% TBA ** 12,600,000 12,912,094
5.50% due 04/01/2018 to 08/01/2037 21,617,234 22,446,099
5.50% TBA ** 5,600,000 5,799,000
5.746% due 08/01/2037 (b) 1,669,876 1,758,588
6.00% due 02/01/2037 5,240,322 5,514,418
6.00% TBA ** 600,000 632,812
6.50% due 02/01/2026 to 10/01/2037 4,063,392 4,349,768
7.00% due 07/01/2022 to 01/01/2034 516,502 563,581
7.50% due 09/01/2029 to 02/01/2031 102,522 112,037
8.00% due 06/01/2017 to 03/01/2033 228,636 247,736
8.50% due 08/01/2019 77,835 87,033
8.75% due 12/01/2009 85 85
9.00% due 05/01/2021 3,885 4,193
11.50% due 09/01/2013 to 04/01/2019 15,885 17,800
12.00% due 01/01/2013 to 04/01/2016 44,675 50,344
12.50% due 01/01/2013 to 09/01/2015 11,722 13,063
Copyright © 2012 www.secdatabase.com. All Rights Reserved.Please Consider the Environment Before Printing This Document

13.50% due 11/01/2014 5,811 6,428
69,347,355
Government National Mortgage
Association - 0.42%
6.50% due 02/15/2034 to 09/15/2034 288,271 307,782
7.50% due 03/15/2026 to 12/15/2027 121,001 131,380
8.50% due 06/15/2025 107,582 118,347
11.00% due 09/15/2015 530 605
558,114
TOTAL U.S. GOVERNMENT AGENCY OBLIGATIONS
(Cost $102,307,571) $ 104,990,839
COLLATERALIZED MORTGAGE
OBLIGATIONS - 16.68%
American Home Mortgage Assets, Series 2006-3,
Class 3A12
0.4988% due 10/25/2046 (b) 1,035,055 407,707
American Home Mortgage Investment Trust, Series
2006-2, Class 1A1
0.3887% due 06/25/2046 (b) 324,333 266,402
Bear Stearns Alt-A Trust, Series 2004-11, Class 2A2
5.2196% due 11/25/2034 (b) 492,397 298,927
The accompanying notes are an integral part of the financial statements.
294
JOHN HANCOCK FUNDS II
PORTFOLIO OF INVESTMENTS - May 31, 2009 (Unaudited) - continued(showing percentage of total net assets)
U. S. Government Securities Fund (continued)Shares or
Principal
Amount Value
COLLATERALIZED MORTGAGE
OBLIGATIONS (continued)
Commercial Mortgage Pass-Through Certificates,
Series 2006-C8, Class A4
5.306% due 12/10/2046 $ 1,740,000 $ 1,383,982
Countrywide Alternative Loan Trust, Series
2005-17, Class 2A1
0.5487% due 07/25/2035 (b) 410,673 176,903
Countrywide Alternative Loan Trust, Series
2005-59, Class 1A1
0.6388% due 11/20/2035 (b) 313,807 142,249
Countrywide Alternative Loan Trust, Series
2006-OA10, Class 4A1
0.4988% due 08/25/2046 (b) 1,151,640 421,396
Countrywide Alternative Loan Trust, Series
2006-OA11, Class A4
0.4988% due 09/25/2046 (b) 1,239,790 447,208
Countrywide Alternative Loan Trust, Series
2006-OA7, Class 3A1
0.5188% due 06/25/2046 (b) 710,309 258,321
Countrywide Alternative Loan Trust, Series
2006-OA9, Class 2A1B
0.5163% due 07/20/2046 (b) 1,268,211 459,059
Countrywide Alternative Loan Trust, Series
2006-OC2, Class 2A3
Copyright © 2012 www.secdatabase.com. All Rights Reserved.Please Consider the Environment Before Printing This Document

0.5987% due 02/25/2036 (b) 1,000,000 147,793
Countrywide Home Loans, Series 2006-OA5, Class
1A1
0.5088% due 03/25/2036 (b) 544,154 198,355
Federal Home Loan Mortgage Corp.,
Series 2525, Class AM
4.50% due 04/15/2032 240,246 239,632
Federal National Mortgage Association Whole
Loan, Series 2003-W12, Class 2A7
4.68% due 06/25/2043 4,636,849 4,548,260
Federal National Mortgage Association Whole
Loan, Series 2005-W3, Class 2AF
0.5288% due 03/25/2045 (b) 463,130 330,722
Federal National Mortgage Association Whole
Loan, Series 2003-W14, Class 2A
5.2637% due 01/25/2043 (b) 671,785 687,873
Harborview Mortgage Loan Trust, Series 2005-7,
Class 1A1
3.853% due 06/19/2045 (b) 407,984 143,363
Impac CMB Trust, Series 2004-5, Class 1A1
0.6687% due 10/25/2034 (b) 722,490 416,737
Impac Secured Assets Corp., Series 2005-2,
Class A1
0.6288% due 03/25/2036 (b) 746,920 314,997
JPMorgan Chase Commercial Mortgage Securities
Corp, Series 2006-CB17, Class A4
5.429% due 12/12/2043 1,870,000 1,492,582
LB-UBS Commercial Mortgage Trust, Series
2006-C3, Class A4
5.661% due 03/15/2039 460,000 388,842
LB-UBS Commercial Mortgage Trust,
Series 2006-C7, Class A3
5.347% due 11/15/2038 1,450,000 1,167,016
Luminent Mortgage Trust, Series 2006-4, Class A1A
0.4988% due 05/25/2046 (b) 936,439 345,369
Master Adjustable Rate Mortgages Trust, Series
2004-15, Class 1A1
5.3717% due 12/25/2034 (b) 62,534 40,690
U. S. Government Securities Fund (continued)Shares or
Principal
Amount Value
COLLATERALIZED MORTGAGE
OBLIGATIONS (continued)
Master Adjustable Rate Mortgages Trust., Series
2007-3, Class 12A1
0.5088% due 05/25/2047 (b) $ 1,599,558 $ 606,277
Merrill Lynch Mortgage Trust, Series 2006-C1,
Class A4
5.8399% due 05/12/2039 (b) 365,000 313,542
Morgan Stanley Mortgage Loan Trust, Series
2006-8AR, Class 1A2
0.3787% due 06/25/2036 (b) 402,985 335,154
Novastar Mortgage-Backed Notes, Series
2006-MTA1, Class 2A1A
0.4988% due 09/25/2046 (b) 934,586 368,888
Structured Asset Mortgage Investments, Inc.,
Series 2006-AR6, Class 1A1
0.4888% due 07/25/2046 (b) 806,517 317,804
Structured Asset Mortgage Investments, Inc.,
Series 2006-AR7, Class A1A
0.5188% due 08/25/2036 (b) 1,362,089 514,283
Thornburg Mortgage Securities Trust, Series
2006-3, Class A2
Copyright © 2012 www.secdatabase.com. All Rights Reserved.Please Consider the Environment Before Printing This Document

0.4137% due 05/25/2046 (b) 1,174,251 1,160,987
Thornburg Mortgage Securities Trust, Series
2006-3, Class A3
0.4187% due 06/25/2046 (b) 1,317,936 1,311,711
Thornburg Mortgage Securities Trust, Series
2007-4, Class 2A1
6.2076% due 09/25/2037 (b) 607,966 456,336
Thornburg Mortgage Securities Trust, Series
2007-4, Class 3A1
6.1903% due 09/25/2037 (b) 579,065 378,803
WaMu Mortgage Pass-Through Certificates, Series
2005-AR17, Class A1A1
0.5788% due 12/25/2045 (b) 763,283 356,497
Washington Mutual, Inc., Series 2005-AR13, Class
A1B3
0.6687% due 10/25/2045 (b) 526,451 139,636
Washington Mutual, Inc., Series 2005-AR8, Class
2A1A
0.5988% due 07/25/2045 (b) 758,751 352,462
Zuni Mortgage Loan Trust, Series 2006-OA1,
Class A1
0.4387% due 08/25/2036 (b) 684,605 673,940
TOTAL COLLATERALIZED MORTGAGE OBLIGATIONS
(Cost $34,558,845) $ 22,010,705
ASSET BACKED SECURITIES - 7.06%
ACE Securities Corp., Series 2006-GP1, Class A
0.4387% due 02/25/2031 (b) 552,229 331,299
ACE Securities Corp., Series 2006-SL3, Class A1
0.4087% due 06/25/2036 (b) 721,939 100,180
Aegis Asset Backed Securities Trust, Series
2004-2, Class A3
0.7887% due 06/25/2034 (b) 173,194 146,249
Amortizing Residential Collateral Trust, Series
2001-BC6, Class A
1.0087% due 10/25/2031 (b) 543,483 333,465
Bravo Mortgage Asset Trust, Series 2006-1A,
Class A1
0.4387% due 07/25/2036 (b)(e)(f) 85,510 84,558
The accompanying notes are an integral part of the financial statements.
295
JOHN HANCOCK FUNDS II
PORTFOLIO OF INVESTMENTS - May 31, 2009 (Unaudited) - continued(showing percentage of total net assets)
U. S. Government Securities Fund (continued)Shares or
Principal
Amount Value
ASSET BACKED SECURITIES
(continued)
Countrywide Asset-Backed Certificates, Series
2002-BC2, Class A
0.8487% due 04/25/2032 (b) $ 269,064 $ 151,752
Countrywide Home Equity Loan Trust, Series
2004-I, Class A
0.6344% due 02/15/2034 (b) 666,024 266,148
Countrywide Home Equity Loan Trust, Series
2005-E, Class 2A
0.5644% due 11/15/2035 (b) 221,552 58,381
Countrywide Home Equity Loan Trust, Series
Copyright © 2012 www.secdatabase.com. All Rights Reserved.Please Consider the Environment Before Printing This Document

2006-E, Class 2A
0.4844% due 07/15/2036 (b) 713,167 213,942
Countrywide Home Equity Loan Trust, Series
2006-RES, Class 4E1B
0.6044% due 07/25/2036 (b)(f) 694,369 138,874
Countrywide Home Equity Loan Trust, Series
2006-RES, Class 4F1B
0.6044% due 07/25/2036 (b)(f) 814,923 162,985
Countrywide Home Equity Loan Trust, Series
2007-GW, Class A
0.8944% due 08/15/2037 (b) 1,250,325 582,489
Credit Suisse Mortgage Capital Certificates, Series
2006-CF2, Class A1
0.5688% due 05/25/2036 (b)(f) 600,580 420,779
GMAC Mortgage Corp. Loan Trust, Series
2006-HE1, Class A
0.5188% due 11/25/2036 (b) 1,408,415 428,683
GSAA Home Equity Trust, Series 2005-5, Class A4
0.5788% due 02/25/2035 (b) 184,428 154,975
GSAMP Trust, Series 2006-S4, Class A1
0.3988% due 05/25/2036 (b) 427,686 68,952
IndyMac Seconds Asset Backed Trust, Series
2006-A, Class A
0.4387% due 06/25/2036 (b) 937,106 69,246
Lehman XS Trust, Series 2006-2N, Class 1A1
0.5688% due 02/25/2046 (b) 997,415 371,500
Lehman XS Trust, Series 2006-GP3, Class 3A1A
0.3787% due 06/25/2046 (b) 471,284 384,693
Lehman XS Trust, Series 2006-GP4, Class 3A1A
0.3787% due 08/25/2046 (b) 635,597 507,518
Long Beach Mortgage Loan Trust, Series 2005-3,
Class 2A2
0.5888% due 09/25/2035 (b) 322,528 274,473
Merrill Lynch First Franklin Mortgage Loan Trust,
Series 2007-H1, Class 2A1
1.8088% due 10/25/2037 (b) 1,343,719 847,111
Morgan Stanley Mortgage Loan Trust, Series
2006-4SL, Class A1
0.4588% due 03/25/2036 (b) 531,077 101,618
Nelnet Student Loan Trust, Series 2008-4, Class A4
2.5719% due 04/25/2024 (b) 320,000 313,845
RAAC Series, Series 2006-RP3, Class A
0.5788% due 05/25/2036 (b)(f) 851,894 243,114
SACO I Trust, Inc., Series 2006-6, Class A
0.4387% due 06/25/2036 (b) 725,803 49,510
SACO I Trust, Inc., Series 2006-7, Class A1
0.4387% due 07/25/2036 (b) 682,824 112,515
SLM Student Loan Trust, Series 2006-5, Class A2
1.0819% due 07/25/2017 (b) 372,442 372,265
U. S. Government Securities Fund (continued)Shares or
Principal
Amount Value
ASSET BACKED SECURITIES
(continued)
Structured Asset Securities Corp., Series
2006-ARS1, Class A1
0.4187% due 02/25/2036 (b)(f) $ 527,139 $ 59,603
Truman Capital Mortgage Loan Trust, Series
2006-1, Class A
0.5688% due 03/25/2036 (b)(e)(f) 923,410 471,022
Washington Mutual, Inc., Series 2007-HE3, Class
2A2
0.4787% due 05/25/2037 (b) 2,300,000 1,221,319
Copyright © 2012 www.secdatabase.com. All Rights Reserved.Please Consider the Environment Before Printing This Document
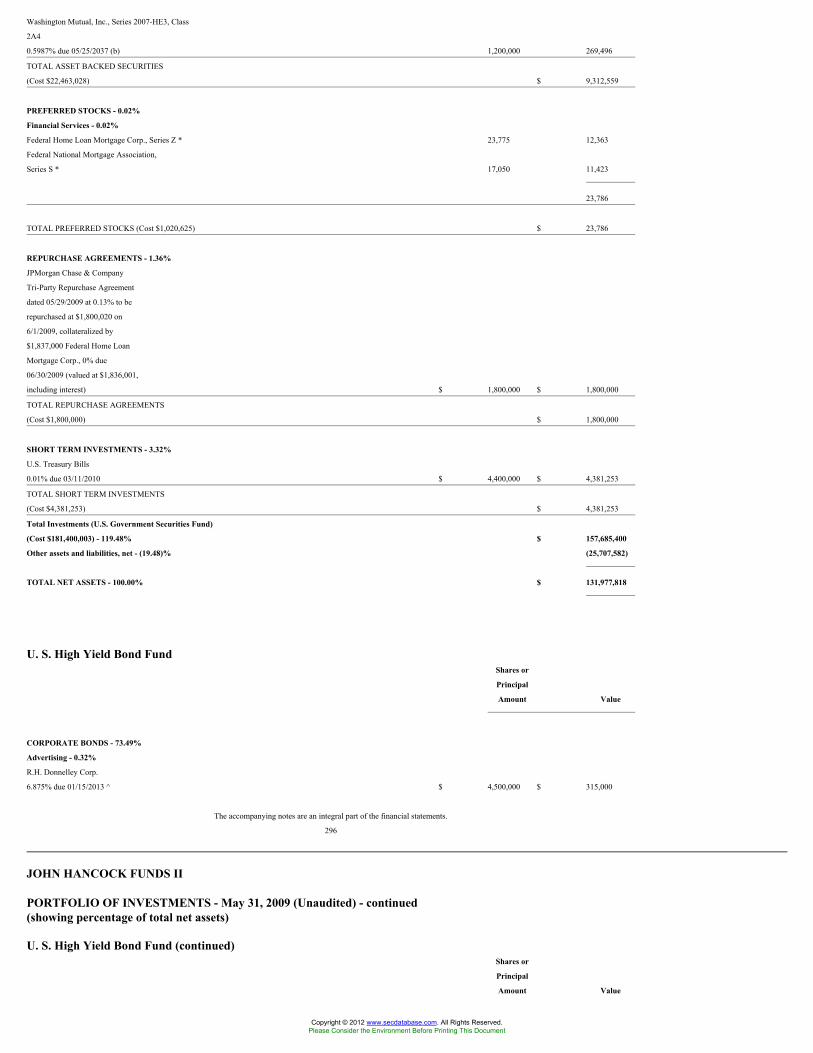
Washington Mutual, Inc., Series 2007-HE3, Class
2A4
0.5987% due 05/25/2037 (b) 1,200,000 269,496
TOTAL ASSET BACKED SECURITIES
(Cost $22,463,028) $ 9,312,559
PREFERRED STOCKS - 0.02%
Financial Services - 0.02%
Federal Home Loan Mortgage Corp., Series Z * 23,775 12,363
Federal National Mortgage Association,
Series S * 17,050 11,423
23,786
TOTAL PREFERRED STOCKS (Cost $1,020,625) $ 23,786
REPURCHASE AGREEMENTS - 1.36%
JPMorgan Chase & Company
Tri-Party Repurchase Agreement
dated 05/29/2009 at 0.13% to be
repurchased at $1,800,020 on
6/1/2009, collateralized by
$1,837,000 Federal Home Loan
Mortgage Corp., 0% due
06/30/2009 (valued at $1,836,001,
including interest) $ 1,800,000 $ 1,800,000
TOTAL REPURCHASE AGREEMENTS
(Cost $1,800,000) $ 1,800,000
SHORT TERM INVESTMENTS - 3.32%
U.S. Treasury Bills
0.01% due 03/11/2010 $ 4,400,000 $ 4,381,253
TOTAL SHORT TERM INVESTMENTS
(Cost $4,381,253) $ 4,381,253
Total Investments (U.S. Government Securities Fund)
(Cost $181,400,003) - 119.48% $ 157,685,400
Other assets and liabilities, net - (19.48)% (25,707,582)
TOTAL NET ASSETS - 100.00% $ 131,977,818
U. S. High Yield Bond FundShares or
Principal
Amount Value
CORPORATE BONDS - 73.49%
Advertising - 0.32%
R.H. Donnelley Corp.
6.875% due 01/15/2013 ^ $ 4,500,000 $ 315,000
The accompanying notes are an integral part of the financial statements.
296
JOHN HANCOCK FUNDS II
PORTFOLIO OF INVESTMENTS - May 31, 2009 (Unaudited) - continued(showing percentage of total net assets)
U. S. High Yield Bond Fund (continued)Shares or
Principal
Amount Value
Copyright © 2012 www.secdatabase.com. All Rights Reserved.Please Consider the Environment Before Printing This Document

CORPORATE BONDS (continued)
Advertising (continued)
R.H. Donnelley Corp., Series A-3
8.875% due 01/15/2016 ^ $ 1,375,000 $ 96,250
R.H. Donnelley, Inc.
11.75% due 05/15/2015 ^ 1,100,000 503,250
Sheridan Group, Inc.
10.25% due 08/15/2011 1,500,000 960,000
1,874,500
Agriculture - 0.46%
Mosaic Company
7.375% due 12/01/2014 (f) 715,000 725,818
7.625% due 12/01/2016 (f) 1,953,000 1,943,235
2,669,053
Air Travel - 0.01%
Continental Airlines, Inc., Series 00-1
8.499% due 05/01/2011 108,100 82,156
Auto Parts - 0.57%
Allison Transmission, Inc., PIK
11.25% due 11/01/2015 (f) 4,095,000 2,764,125
Goodyear Tire & Rubber Company
10.50% due 05/15/2016 550,000 547,250
3,311,375
Auto Services - 1.32%
KAR Holdings, Inc.
8.75% due 05/01/2014 1,200,000 1,026,000
10.00% due 05/01/2015 8,305,000 6,685,525
7,711,525
Automobiles - 0.58%
Ford Motor Company
9.50% due 09/15/2011 775,000 581,250
General Motors Corp.
6.75% due 05/01/2028 ^ 2,100,000 210,000
7.20% due 01/15/2011 ^ 4,050,000 354,375
7.375% due 05/23/2048 ^ 1,500,000 157,500
8.375% due 07/15/2033 ^ 1,725,000 155,250
Sonic Automotive, Inc., Series B
8.625% due 08/15/2013 3,058,000 1,911,250
3,369,625
Broadcasting - 0.66%
Barrington Broadcasting Group LLC
10.50% due 08/15/2014 4,400,000 836,000
Fisher Communications, Inc.
8.625% due 09/15/2014 3,375,000 2,978,437
Muzak Finance Corp.
13.00% due 03/15/2010 ^ 700,000 35,000
3,849,437
Building Materials & Construction - 0.17%
Esco Corp.
5.195% due 12/15/2013 (b)(f) 625,000 450,000
8.625% due 12/15/2013 (f) 625,000 525,000
975,000
Copyright © 2012 www.secdatabase.com. All Rights Reserved.Please Consider the Environment Before Printing This Document

Business Services - 5.35%
Cornell Companies, Inc.
10.75% due 07/01/2012 3,225,000 3,176,625
U. S. High Yield Bond Fund (continued)Shares or
Principal
Amount Value
CORPORATE BONDS (continued)
Business Services (continued)
First Data Corp.
9.875% due 09/24/2015 $ 7,375,000 $ 5,015,000
Iron Mountain, Inc.
8.00% due 06/15/2020 3,300,000 3,052,500
Lender Processing Services, Inc.
8.125% due 07/01/2016 5,050,000 4,974,250
NCO Group, Inc.
11.875% due 11/15/2014 4,575,000 2,424,750
Rural/Metro Corp.
9.875% due 03/15/2015 1,900,000 1,624,500
12.75 due 03/15/2016 1,250,000 712,500
SunGard Data Systems, Inc.
4.875% due 01/15/2014 1,600,000 1,440,000
9.125% due 08/15/2013 365,000 351,312
10.25% due 08/15/2015 9,446,000 8,572,245
31,343,682
Cable & Television - 7.50%
Charter Communications Holdings I LLC
11.00% due 10/01/2015 ^ 1,725,000 181,125
Charter Communications Holdings II LLC
10.25% due 09/15/2010 ^ (f) 1,425,000 1,410,750
Charter Communications Operating LLC
10.00% due 04/30/2012 ^ (f) 7,500,000 7,200,000
10.375% due 04/30/2014 ^ (f) 6,250,000 5,937,500
CSC Holdings, Inc.
6.75% due 04/15/2012 1,825,000 1,761,125
CSC Holdings, Inc., Series B
7.625% due 04/01/2011 6,725,000 6,708,187
DirecTV Holdings LLC
6.375% due 06/15/2015 200,000 182,000
8.375% due 03/15/2013 8,450,000 8,513,375
EchoStar DBS Corp.
6.375% due 10/01/2011 1,400,000 1,352,750
6.625% due 10/01/2014 950,000 862,125
7.00% due 10/01/2013 600,000 567,000
7.125% due 02/01/2016 3,400,000 3,128,000
7.75% due 05/31/2015 2,750,000 2,598,750
Videotron Ltee
9.125% due 04/15/2018 900,000 931,500
Videotron Ltee.
6.375% due 12/15/2015 1,070,000 968,350
6.875% due 01/15/2014 1,740,000 1,644,300
43,946,837
Cellular Communications - 3.20%
Centennial Communications Corp.
8.125% due 02/01/2014 403,000 413,578
10.00% due 01/01/2013 7,100,000 7,472,750
Cricket Communications, Inc.
9.375% due 11/01/2014 5,705,000 5,676,475
Crown Castle International Corp.
Copyright © 2012 www.secdatabase.com. All Rights Reserved.Please Consider the Environment Before Printing This Document

9.00% due 01/15/2015 900,000 909,000
MetroPCS Wireless, Inc.
9.25% due 11/01/2014 4,225,000 4,240,844
18,712,647
Chemicals - 1.10%
American Pacific Corp.
9.00% due 02/01/2015 1,500,000 1,308,750
The accompanying notes are an integral part of the financial statements.
297
JOHN HANCOCK FUNDS II
PORTFOLIO OF INVESTMENTS - May 31, 2009 (Unaudited) - continued(showing percentage of total net assets)
U. S. High Yield Bond Fund (continued)Shares or
Principal
Amount Value
CORPORATE BONDS (continued)
Chemicals (continued)
Huntsman International LLC
7.875% due 11/15/2014 $ 3,000,000 $ 2,055,000
Innophos Holdings, Inc.
9.50% due 04/15/2012 (f) 600,000 498,000
Innophos, Inc.
8.875% due 08/15/2014 2,850,000 2,557,875
6,419,625
Commercial Services - 0.61%
Mac-Gray Corp.
7.625% due 08/15/2015 3,770,000 3,543,800
Computer Services - 0.81%
Affiliated Computer Services, Inc.
5.20% due 06/01/2015 5,550,000 4,759,125
Computers & Business Equipment - 0.44%
Seagate Technology HDD Holdings
6.80% due 10/01/2016 3,050,000 2,295,125
Seagate Technology International
10.00% due 05/01/2014 (f) 300,000 303,000
2,598,125
Containers & Glass - 1.78%
Crown Americas LLC
7.625% due 05/15/2017 (f) 500,000 490,000
Crown Holdings, Inc.
8.00% due 04/15/2023 4,990,000 4,391,200
Graham Packaging Company
9.875% due 10/15/2014 2,935,000 2,612,150
Owens-Brockway Glass Container, Inc.
7.375% due 05/15/2016 (f) 1,000,000 967,500
8.25% due 05/15/2013 1,275,000 1,275,000
Owens-Illinois, Inc.
7.80% due 05/15/2018 750,000 708,750
10,444,600
Correctional Facilities - 0.97%
Corrections Corp. of America
Copyright © 2012 www.secdatabase.com. All Rights Reserved.Please Consider the Environment Before Printing This Document

6.25% due 03/15/2013 1,400,000 1,326,500
7.75% due 06/01/2017 1,000,000 980,000
Geo Group, Inc.
8.25% due 07/15/2013 3,440,000 3,354,000
5,660,500
Crude Petroleum & Natural Gas - 3.17%
AmeriGas Partners LP
7.125% due 05/20/2016 2,110,000 1,954,387
7.25% due 05/20/2015 800,000 752,000
Calfrac Holdings LP
7.75% due 02/15/2015 (f) 2,925,000 2,340,000
Chesapeake Energy Corp.
6.375% due 06/15/2015 200,000 171,500
6.625% due 01/15/2016 1,000,000 857,500
6.875% due 01/15/2016 600,000 517,500
6.875% due 11/15/2020 300,000 237,000
7.25% due 12/15/2018 500,000 417,500
7.50% due 09/15/2013 900,000 841,500
7.50% due 06/15/2014 1,355,000 1,253,375
9.50% due 02/15/2015 500,000 493,750
Forest Oil Corp.
7.25% due 06/15/2019 1,875,000 1,612,500
U. S. High Yield Bond Fund (continued)Shares or
Principal
Amount Value
CORPORATE BONDS (continued)
Crude Petroleum & Natural Gas
(continued)
Forest Oil Corp. (continued)
8.50% due 02/15/2014 (f) $ 250,000 $ 241,250
Hilcorp Energy I LP
7.75% due 11/01/2015 (f) 1,330,000 1,143,800
Hilcorp Energy I LP/Hilcorp Finance Company
9.00% due 06/01/2016 (f) 3,625,000 3,190,000
SandRidge Energy, Inc.
8.00% due 06/01/2018 (f) 1,000,000 845,000
SandRidge Energy, Inc., PIK
8.625% due 04/01/2015 2,000,000 1,705,000
18,573,562
Drugs & Health Care - 0.12%
Omnicare, Inc.
6.125% due 06/01/2013 750,000 680,625
Educational Services - 0.23%
Education Management Corp.
8.75% due 06/01/2014 1,375,000 1,340,625
Electrical Utilities - 1.25%
Calpine Construction Finance Company LP
8.00% due 06/01/2016 (f) 2,700,000 2,568,375
Ipalco Enterprises, Inc.
7.25% due 04/01/2016 (f) 4,975,000 4,776,000
7,344,375
Electronics - 0.36%
L-3 Communications Corp.
5.875% due 01/15/2015 2,400,000 2,136,000
Energy - 1.69%
NRG Energy, Inc.
7.25% due 02/01/2014 550,000 526,625
Copyright © 2012 www.secdatabase.com. All Rights Reserved.Please Consider the Environment Before Printing This Document

7.375% due 02/01/2016 4,148,000 3,904,305
7.375% due 01/15/2017 5,800,000 5,452,000
9,882,930
Financial Services - 6.73%
CIT Group, Inc.
5.40% due 01/30/2016 1,275,000 839,775
5.65% due 02/13/2017 2,453,000 1,622,628
5.80% due 10/01/2036 750,000 439,815
6.00% due 04/01/2036 4,849,000 2,685,963
7.625% due 11/30/2012 1,300,000 1,024,262
12.00% due 12/18/2018 (f) 2,057,000 1,129,458
Citigroup, Inc.
5.875% due 02/22/2033 6,225,000 4,546,391
6.00% due 10/31/2033 1,300,000 960,306
El Paso Performance-Linked Trust
7.75% due 07/15/2011 (f) 1,750,000 1,728,666
Ford Motor Credit Company LLC
7.00% due 10/01/2013 1,580,000 1,274,995
7.25% due 10/25/2011 90,000 77,667
7.375% due 10/28/2009 6,650,000 6,485,984
8.00% due 12/15/2016 5,550,000 4,456,883
GMAC LLC
6.00% due 12/15/2011 (f) 2,130,000 1,853,100
6.875% due 09/15/2011 (f) 1,266,000 1,133,070
Lehman Brothers Holdings, Inc.
7.875% due 08/15/2010 ^ 3,425,000 505,188
The accompanying notes are an integral part of the financial statements.
298
JOHN HANCOCK FUNDS II
PORTFOLIO OF INVESTMENTS - May 31, 2009 (Unaudited) - continued(showing percentage of total net assets)
U. S. High Yield Bond Fund (continued)Shares or
Principal
Amount Value
CORPORATE BONDS (continued)
Financial Services (continued)
NSG Holdings, Inc.
7.75% due 12/15/2025 (f) $ 2,125,000 $ 1,710,625
Nuveen Investments, Inc.
10.50% due 11/15/2015 (f) 12,290,000 6,575,150
Nuveen Investments, Inc., Class A
5.50% due 09/15/2015 1,000,000 360,000
39,409,926
Food & Beverages - 0.51%
Del Monte Corp.
8.625% due 12/15/2012 3,000,000 3,015,000
Funeral Services - 1.28%
Service Corp. International
6.75% due 04/01/2016 500,000 460,000
7.00% due 06/15/2017 2,300,000 2,098,750
7.50% due 04/01/2027 3,688,000 2,931,960
7.625% due 10/01/2018 1,300,000 1,202,500
7.875% due 02/01/2013 850,000 811,750
7,504,960
Gas & Pipeline Utilities - 3.95%
Copyright © 2012 www.secdatabase.com. All Rights Reserved.Please Consider the Environment Before Printing This Document

El Paso Corp, Series GMTN
8.05% due 10/15/2030 700,000 568,288
El Paso Corp.
6.875% due 06/15/2014 500,000 473,531
6.95% due 06/01/2028 1,325,000 963,841
7.00% due 06/15/2017 2,750,000 2,575,763
7.25% due 06/01/2018 2,500,000 2,302,657
7.75% due 01/15/2032 5,289,000 4,196,991
8.25% due 02/15/2016 525,000 521,063
Kinder Morgan Energy Partners LP
9.00% due 02/01/2019 1,250,000 1,409,719
Sabine Pass LNG LP
7.50% due 11/30/2016 10,920,000 8,845,200
7.50% due 11/30/2016 (f) 1,563,000 1,266,030
23,123,083
Healthcare Products - 1.50%
Biomet, Inc.
11.625% due 10/15/2017 5,140,000 5,062,900
The Cooper Companies, Inc.
7.125% due 02/15/2015 3,916,000 3,749,570
8,812,470
Healthcare Services - 0.63%
Centene Corp.
7.25% due 04/01/2014 2,625,000 2,434,688
DaVita, Inc.
6.625% due 03/15/2013 350,000 328,125
Healthsouth Corp.
10.75% due 06/15/2016 925,000 943,500
3,706,313
Hotels & Restaurants - 0.86%
O'Charleys, Inc.
9.00% due 11/01/2013 5,925,000 5,051,063
Household Appliances - 0.55%
ALH Finance LLC
8.50% due 01/15/2013 3,650,000 3,230,250
U. S. High Yield Bond Fund (continued)Shares or
Principal
Amount Value
CORPORATE BONDS (continued)
Industrial Machinery - 0.83%
Altra Industrial Motion, Inc.
9.00% due 12/01/2011 $ 3,050,000 $ 2,950,875
H&E Equipment Services, Inc.
8.375% due 07/15/2016 2,425,000 1,903,625
4,854,500
Insurance - 0.82%
HUB International Holdings, Inc.
10.25% due 06/15/2015 (f) 3,900,000 2,418,000
USI Holdings Corp.
9.75% due 05/15/2015 (f) 4,400,000 2,409,000
4,827,000
Leisure Time - 3.53%
AMC Entertainment, Inc.
8.75% due 06/01/2019 (f) 4,525,000 4,394,906
AMC Entertainment, Inc., Series B
Copyright © 2012 www.secdatabase.com. All Rights Reserved.Please Consider the Environment Before Printing This Document

8.625% due 08/15/2012 4,507,000 4,642,210
Ameristar Casinos, Inc.
9.25% due 06/01/2014 (f) 800,000 800,000
Chukchansi Economic Development Authority
4.9125% due 11/15/2012 (b)(f) 875,000 533,750
8.00% due 11/15/2013 (f) 2,192,000 1,380,960
Cinemark, Inc.
9.75 due 03/15/2014 3,450,000 3,501,750
MTR Gaming Group, Inc., Series B
9.00% due 06/01/2012 500,000 310,000
Penn National Gaming, Inc.
6.875% due 12/01/2011 2,000,000 1,940,000
River Rock Entertainment Authority
9.75% due 11/01/2011 4,085,000 2,982,050
Speedway Motorsports, Inc.
8.75% due 06/01/2016 (f) 200,000 201,000
20,686,626
Medical-Hospitals - 4.61%
Community Health Systems, Inc.
8.875% due 07/15/2015 6,135,000 6,065,981
HCA, Inc.
7.875% due 02/01/2011 885,000 862,875
8.50% due 04/15/2019 (f) 1,000,000 977,500
9.125% due 11/15/2014 600,000 589,500
9.25% due 11/15/2016 5,100,000 5,010,750
HCA, Inc., PIK
9.625% due 11/15/2016 1,709,000 1,636,368
Health Management Associates, Inc.
6.125% due 04/15/2016 1,100,000 935,000
Multiplan, Inc.
10.375% due 04/15/2016 (f) 2,700,000 2,538,000
Sun Healthcare Group, Inc.
9.125% due 04/15/2015 2,967,000 2,926,204
Tenet Healthcare Corp.
6.875% due 11/15/2031 657,000 412,267
9.00% due 05/01/2015 (f) 1,350,000 1,377,000
10.00% due 05/01/2018 (f) 1,850,000 1,933,250
United Surgical Partners International, Inc.
8.875% due 05/01/2017 2,050,000 1,747,625
27,012,320
The accompanying notes are an integral part of the financial statements.
299
JOHN HANCOCK FUNDS II
PORTFOLIO OF INVESTMENTS - May 31, 2009 (Unaudited) - continued(showing percentage of total net assets)
U. S. High Yield Bond Fund (continued)Shares or
Principal
Amount Value
CORPORATE BONDS (continued)
Mining - 1.65%
Freeport-McMoRan Copper & Gold, Inc.
8.25% due 04/01/2015 $ 1,450,000 $ 1,450,000
8.375% due 04/01/2017 8,275,000 8,212,938
9,662,938
Copyright © 2012 www.secdatabase.com. All Rights Reserved.Please Consider the Environment Before Printing This Document

Oil & Gas Drilling - 0.00%
National Oilwell Varco, Inc., Series B
6.125% due 08/15/2015 23,000 19,835
Paper - 0.25%
AbitibiBowater, Inc.
9.375% due 12/15/2021 ^ 675,000 108,000
Bowater Canada Finance Corp.
7.95% due 11/15/2011 ^ 23,000 4,542
Georgia-Pacific Corp.
7.125% due 01/15/2017 (f) 705,000 662,700
P. H. Glatfelter Company
7.125% due 05/01/2016 725,000 663,375
1,438,617
Petroleum Services - 0.89%
Key Energy Services, Inc.
8.375% due 12/01/2014 3,250,000 2,860,000
Swift Energy Company
7.125% due 06/01/2017 3,750,000 2,343,750
5,203,750
Pharmaceuticals - 0.29%
Omnicare, Inc.
6.875% due 12/15/2015 1,895,000 1,705,500
Publishing - 0.80%
Nielsen Finance LLC
zero coupon, Step up to 12.50% on
08/01/2011 due 08/01/2016 5,625,000 3,600,000
10.00% due 08/01/2014 725,000 690,563
11.50% due 05/01/2016 (f) 400,000 380,000
4,670,563
Real Estate - 0.08%
Ventas Realty LP, Series 1
6.50% due 06/01/2016 500,000 455,000
Retail - 0.14%
Suburban Propane Partners LP
6.875% due 12/15/2013 850,000 799,000
Sanitary Services - 0.58%
Allied Waste North America, Inc.
6.50% due 11/15/2010 800,000 812,000
6.875% due 06/01/2017 750,000 723,750
Allied Waste North America, Inc., Series B
5.75% due 02/15/2011 300,000 301,500
7.125% due 05/15/2016 1,600,000 1,564,000
3,401,250
Software - 0.24%
Open Solutions, Inc.
9.75% due 02/01/2015 (f) 5,320,000 1,383,200
Telecommunications Equipment &
Services - 2.12%
CC Holdings GS V LLC/Crown Castle GS III Corp.
7.75% due 05/01/2017 (f) 4,600,000 4,531,000
U. S. High Yield Bond Fund (continued)Shares or
Principal
Amount Value
CORPORATE BONDS (continued)
Telecommunications Equipment &
Copyright © 2012 www.secdatabase.com. All Rights Reserved.Please Consider the Environment Before Printing This Document

Services (continued)
Intelsat Corp.
9.25% due 08/15/2014 (f) $ 2,800,000 $ 2,702,000
9.25% due 06/15/2016 (f) 1,600,000 1,536,000
Time Warner Telecom Holdings, Inc.
9.25% due 02/15/2014 3,025,000 3,032,563
United States West Communications, Inc.
6.875% due 09/15/2033 850,000 595,000
12,396,563
Telephone - 5.69%
Alltel Corp.
7.875% due 07/01/2032 2,950,000 3,161,102
Qwest Capital Funding, Inc.
7.00% due 08/03/2009 1,400,000 1,400,000
Qwest Communications International, Inc., Series B
7.50% due 02/15/2014 3,450,000 3,174,000
Qwest Corp.
4.57% due 06/15/2013 (b) 1,700,000 1,525,750
6.50% due 06/01/2017 1,250,000 1,109,375
7.50% due 06/15/2023 1,000,000 795,000
7.50% due 10/01/2014 500,000 477,500
7.625% due 06/15/2015 300,000 287,250
7.875% due 09/01/2011 2,400,000 2,391,000
8.875% due 03/15/2012 2,300,000 2,317,250
Sprint Capital Corp.
6.875% due 11/15/2028 2,100,000 1,470,000
8.75% due 03/15/2032 17,475,000 13,805,250
Valor Telecommunications Enterprise LLC
7.75% due 02/15/2015 1,450,000 1,428,250
33,341,727
Tires & Rubber - 0.52%
American Tire Distributors Holdings, Inc.
7.458% due 04/01/2012 (b) 450,000 288,000
10.75% due 04/01/2013 1,475,000 1,106,250
Goodyear Tire & Rubber Company
6.318% due 12/01/2009 (b) 400,000 398,000
7.857% due 08/15/2011 1,275,000 1,239,937
3,032,187
Tobacco - 0.59%
Reynolds American, Inc.
6.50% due 07/15/2010 250,000 254,232
7.625% due 06/01/2016 3,260,000 3,199,974
3,454,206
Transportation - 1.18%
Gulfmark Offshore, Inc.
7.75% due 07/15/2014 3,225,000 2,886,375
Overseas Shipholding Group, Inc.
7.50% due 02/15/2024 3,745,000 2,658,950
Trailer Bridge, Inc.
9.25% due 11/15/2011 1,750,000 1,373,750
6,919,075
TOTAL CORPORATE BONDS (Cost $470,161,469) $ 430,346,651
The accompanying notes are an integral part of the financial statements.
300
Copyright © 2012 www.secdatabase.com. All Rights Reserved.Please Consider the Environment Before Printing This Document

JOHN HANCOCK FUNDS II
PORTFOLIO OF INVESTMENTS - May 31, 2009 (Unaudited) - continued(showing percentage of total net assets)
U. S. High Yield Bond Fund (continued)Shares or
Principal
Amount Value
CONVERTIBLE BONDS - 0.22%
Electrical Equipment - 0.22%
WESCO International, Inc.
1.75% due 11/15/2026 $ 1,600,000 $ 1,314,000
TOTAL CONVERTIBLE BONDS (Cost $1,042,211) $ 1,314,000
COLLATERALIZED MORTGAGE
OBLIGATIONS - 0.14%
DB Master Finance LLC, Series 2006-1, Class-M1
8.285% due 06/20/2031 (f) 1,250,000 818,425
TOTAL COLLATERALIZED MORTGAGE OBLIGATIONS
(Cost $1,249,977) $ 818,425
DEFAULTED BONDS BEYOND MATURITY
DATES - 0.03%
Financial Services - 0.03%
Wimar Landco LLC, Tranche B
4.500% due 09/03/2008 750,000 150,000
TOTAL DEFAULTED BONDS BEYOND MATURITY DATES
(Cost $750,000) $ 150,000
PREFERRED STOCKS - 0.05%
Financial Services - 0.05%
Preferred Blocker, Inc., 7.00% (f) 719 303,261
TOTAL PREFERRED STOCKS (Cost $143,800) $ 303,261
TERM LOANS - 19.27%
Advertising - 0.07%
Getty Images, Inc.
6.250% due 07/02/2015 (b) 444,375 429,933
Agriculture - 0.04%
Bolthouse, Term Loan B
2.625% due 06/30/2012 (b) 236,650 217,521
Apparel & Textiles - 0.06%
Iconix Brand Group, Inc.
3.470% due 11/07/2013 (b) 425,095 378,334
Auto Parts - 1.03%
Allison Transmission, Inc., Tranche B
3.147% due 08/07/2014 (b) 2,350,000 1,812,438
Federal Mogul Corp., Tranche B
2.344% due 12/27/2014 (b) 2,849,596 1,754,875
Federal Mogul Corp., Tranche C
2.270% due 12/27/2015 (b) 2,763,535 1,701,876
Pep Boys - Manny, Moe & Jack
3.260% due 01/31/2013 (b) 236,376 198,555
Tire Rack Holdings, Inc.
2.070% due 06/24/2012 (b) 645,920 570,563
6,038,307
Automobiles - 2.12%
Ford Motor Company, Tranche B
3.613% due 11/29/2013 (b) 6,585,123 4,661,036
General Motors Corp.
0.00% due 11/29/2013 (k) 2,200,000 2,112,000
General Motors Corp., Tranche B
Copyright © 2012 www.secdatabase.com. All Rights Reserved.Please Consider the Environment Before Printing This Document

8.000% due 11/17/2013 (b) 6,008,519 5,627,981
12,401,017
U. S. High Yield Bond Fund (continued)Shares or
Principal
Amount Value
TERM LOANS (continued)
Broadcasting - 0.19%
Barrington Broadcasting Company
5.174% due 08/11/2013 (b) $ 1,230,060 $ 517,650
Citadel Broadcasting Corp.
2.953% due 06/12/2014 (b) 1,250,000 570,834
1,088,484
Business Services - 0.47%
Acosta, Inc.
2.570% due 07/28/2013 (b) 767,305 690,575
Affinity Group
0.00% due 06/30/2012 (k) 300,000 225,000
Coinmach Laundry Corp.
3.759% due 12/19/2012 (b) 989,975 732,581
Reynolds & Reynolds Company, Inc.
2.319% due 10/24/2012 (b) 155,452 112,508
SunGard Data Systems, Inc., Tranche B1
2.477% due 01/31/2013 (b) 1,092,447 990,576
2,751,240
Cable & Television - 0.77%
Charter Communications Operating LLC, Tranche 3
6.750% due 03/01/2014 (b) 750,000 541,688
Charter Communications Operating LLC, Tranche
B1
6.250% due 03/06/2014 (b) 740,625 627,680
Gray Television, Inc.
3.920% due 12/31/2014 (b) 4,915,970 2,639,261
Local TV Finance LLC
2.320% due 05/07/2013 (b) 1,432,151 701,754
4,510,383
Cellular Communications - 0.25%
Crown Castle International Corp.
1.819% due 03/05/2014 (b) 1,596,806 1,460,411
Chemicals - 0.71%
Celanese Holdings LLC, Letter of Credit
2.942% due 04/02/2014 (b) 1,066,616 939,956
Celanese Holdings LLC, Tranche B
0.411% due 04/02/2014 (b) 166,667 150,720
Huntsman International LLC
2.069% due 04/19/2014 (b) 3,652,034 3,098,524
4,189,200
Computer Services - 0.05%
Affiliated Computer Services, Inc.
2.313% due 03/29/2013 (b) 335,886 313,074
Containers & Glass - 0.12%
Graham Packaging Company
2.679% due 10/07/2011 (b) 750,000 705,268
Crude Petroleum & Natural Gas - 0.40%
Coffeyville Resources, Inc., Letter of Credit
Copyright © 2012 www.secdatabase.com. All Rights Reserved.Please Consider the Environment Before Printing This Document

8.750% due 12/28/2010 (b) 836,781 741,946
Coffeyville Resources, Inc., Tranche D
8.750% due 12/28/2013 (b) 1,802,499 1,604,224
2,346,170
Educational Services - 0.11%
Education Management Corp., Tranche C
3.000% due 05/29/2011 (b) 693,773 620,926
The accompanying notes are an integral part of the financial statements.
301
JOHN HANCOCK FUNDS II
PORTFOLIO OF INVESTMENTS - May 31, 2009 (Unaudited) - continued(showing percentage of total net assets)
U. S. High Yield Bond Fund (continued)Shares or
Principal
Amount Value
TERM LOANS (continued)
Electrical Utilities - 1.62%
Calpine Corp.
4.095% due 03/29/2014 (b) $ 4,036,232 $ 3,483,143
Calpine Corp., Tranche B
4.095% due 03/29/2009 (b) 1,263 1,090
NSG Holdings
2.820% due 06/15/2014 (b) 152,160 136,183
NSG Holdings, Letter of Credit
2.820% due 06/15/2014 (b) 24,169 21,631
Texas Competitive Electric Holdings Company LLC
3.881% due 10/10/2014 (b) 8,556,241 5,848,191
9,490,238
Energy - 1.00%
Covanta Energy Corp., Letter of Credit
2.592% due 02/02/2014 (b) 678,795 625,849
Covanta Energy Corp., Tranche B
1.875% due 02/02/2014 (b) 1,351,227 1,245,831
Longview Power LLC, Letter of Credit
3.500% due 02/28/2013 (b) 166,667 118,333
Longview Power LLC, Tranche B
3.625% due 02/28/2014 (b) 500,000 355,000
Longview Power LLC, Tranche Delayed Draw
3.625% due 02/28/2014 (b) 583,333 414,167
NRG Energy, Inc.
2.970% due 02/01/2013 (b) 1,371,188 1,268,207
NRG Energy, Inc., Tranche L
2.820% due 02/01/2013 (b) 732,624 677,601
Tenaska Power, 1st Lien Term Loan
2.319% due 12/15/2013 (b) 844,573 778,817
Tenaska Power, Term Loan
1.359% due 12/15/2011 (b) 90,298 83,268
3.459% due 12/15/2013 (b) 288,051 268,968
5,836,041
Financial Services - 1.48%
BNY ConvergEx Group, Tranche 1
3.320% due 08/17/2013 (b) 1,250,000 1,131,250
Emdeon Business Services LLC, Tranche 1B
Copyright © 2012 www.secdatabase.com. All Rights Reserved.Please Consider the Environment Before Printing This Document

2.847% due 11/16/2013 (b) 458,286 427,352
Emdeon Business Services LLC, Tranche 2
5.849% due 05/16/2014 (b) 1,000,000 825,000
Linsco/Private Ledger Corp., Tranche B
2.615% due 06/27/2013 (b) 2,345,193 2,020,776
TD Ameritrade Holding Corp.
1.840% due 12/31/2012 (b) 1,000,000 946,563
TPF Generation Holdings LLC, Tranche 2
4.569% due 12/15/2014 (b) 2,050,000 1,633,168
VNU Nielsen Financial LLC, Tranche B
2.382% due 08/09/2013 (b) 1,888,607 1,672,597
8,656,706
Food & Beverages - 0.56%
Dole Foods Company, Tranche B
7.965% due 04/12/2013 (b) 621,150 616,297
Dole Foods Company, Tranche C
7.974% due 04/12/2013 (b) 2,314,460 2,296,380
Dole Foods, Letter of Credit
7.979% due 04/12/2013 (b) 354,415 351,646
3,264,323
U. S. High Yield Bond Fund (continued)Shares or
Principal
Amount Value
TERM LOANS (continued)
Gas & Pipeline Utilities - 0.52%
Dynegy Holdings, Inc.
1.820% due 04/02/2013 (b) $ 1,989,517 $ 1,785,592
Dynegy Holdings, Inc., Tranche B
1.820% due 03/31/2013 (b) 59,988 53,839
Energy Transfer Equity
2.706% due 11/01/2012 (b) 1,250,000 1,182,291
3,021,722
Healthcare Products - 0.11%
AGA Medical Corp., Tranche B
2.695% due 04/28/2013 (b) 800,000 668,000
Healthcare Services - 0.38%
Carestream Health, Inc., Tranche B
2.319% due 04/30/2013 (b) 646,077 554,011
Healthsouth Corp., Tranche B
2.849% due 03/10/2013 (b) 817,590 750,820
Rural/Metro Operating Company, LLC
3.901% due 03/04/2011 (b) 165,778 157,489
3.960% due 03/04/2011 (b) 113,039 107,387
Sun Healthcare Group, Inc.
3.175% due 04/12/2014 (b) 594,672 522,320
Sun Healthcare Group, Inc., Letter of Credit
3.220% due 04/12/2014 (b) 124,251 109,134
2,201,161
Insurance - 0.32%
AmWINS Group, Inc.
3.438% due 06/07/2013 (b) 2,242,510 1,351,112
6.790% due 06/07/2014 (b) 1,950,000 546,000
1,897,112
Internet Service Provider - 0.31%
Copyright © 2012 www.secdatabase.com. All Rights Reserved.Please Consider the Environment Before Printing This Document

Web Services
7.00% due 08/04/2014 (b) 2,039,750 1,815,377
Leisure Time - 2.16%
BLB Wembley Holdings, Inc.
4.750% due 06/30/2011 (b) 682,622 215,026
Bombardier Recreational Products, Inc., Tranche B
3.950% due 06/26/2013 (b) 594,937 309,367
CCM Merger, Inc.
8.500% due 07/21/2012 (b) 671,236 508,461
Greektown Casino LLC, Tranche B
5.000% due 12/03/2012 (b) 1,600,000 373,333
Greektown Holdings, LLC
5.000% due 03/23/2014 (b) 758,453 176,972
11.750% due 06/01/2009 (b) 3,137,655 3,043,525
Greenwood Racing
2.680% due 11/14/2011 (b) 972,395 875,156
HMSC
5.819% due 04/03/2014 (b) 550,000 141,167
HMSC, Tranche 1 Lien
2.569% due 04/03/2014 (b) 395,960 217,778
Live Nation Worldwide
4.136% due 12/21/2013 (b) 460,392 418,957
National Cinemedia LLC
3.080% due 02/13/2015 (b) 312,000 284,115
Penn National Gaming, Inc.
2.115% due 05/26/2012 (b) 4,009,722 3,770,570
The accompanying notes are an integral part of the financial statements.
302
JOHN HANCOCK FUNDS II
PORTFOLIO OF INVESTMENTS - May 31, 2009 (Unaudited) - continued(showing percentage of total net assets)
U. S. High Yield Bond Fund (continued)Shares or
Principal
Amount Value
TERM LOANS (continued)
Leisure Time (continued)
Regal Cinemas Corp.
4.97% due 11/10/2010 (b) $ 247,462 $ 237,021
Riviera Holding Corp.
4.250% due 06/08/2014 (b) 1,250,000 562,500
Yonkers Racing Corp.
10.500% due 08/12/2011 (b) 1,559,853 1,530,606
12,664,554
Machinery-Electrical - 0.06%
Alliance Laundry Systems
3.613% due 01/27/2012 (b) 360,000 333,000
Machinery-General Indust - 0.06%
Rexnord Holdings, Inc.
9.68% due 02/21/2013 (b) 1,461,029 365,257
Medical-Hospitals - 0.87%
Community Health Systems, Inc., Tranche B
2.898% due 06/30/2014 (b) 2,716,388 2,410,177
Community Health Systems, Inc., Tranche Delayed
Draw
2.569% due 06/30/2014 (b) 138,578 122,957
HCA, Inc., Tranche B
3.470% due 11/01/2013 (b) 1,815,518 1,615,584
Copyright © 2012 www.secdatabase.com. All Rights Reserved.Please Consider the Environment Before Printing This Document

Health Management Associate, Inc.
2.970% due 02/28/2014 (b) 1,127,767 973,827
5,122,545
Paper - 0.72%
Georgia-Pacific Corp., Tranche B
3.229% due 12/23/2012 (b) 2,387,398 2,212,223
Georgia-Pacific Corp., Tranche B2
2.653% due 12/22/2012 (b) 2,145,024 1,987,633
4,199,856
Real Estate - 0.26%
Capital Automotive LP
2.170% due 12/16/2010 (b) 2,169,789 1,526,084
Retail - 0.28%
Toys R Us, Inc., Tranche B
3.418% due 12/01/2008 (b) 2,007,345 1,617,346
Software - 0.08%
Vertafore, Inc.
3.161% due 03/15/2012 (b) 498,728 458,830
Telecommunications Equipment &
Services - 0.87%
Intelsat Corp., Term Loan B2A
2.914% due 01/03/2014 (b) 165,850 151,101
Intelsat Corp., Term Loan B2B
2.914% due 01/03/2014 (b) 165,800 151,055
Intelsat Corp., Term Loan B2C
2.914% due 01/03/2014 (b) 165,800 151,055
Intelsat, Ltd., Tranche B
2.914% due 07/28/2011 (b) 3,010,782 2,815,081
Level 3 Communications, Inc.
3.164% due 03/01/2014 (b) 2,250,000 1,804,687
5,072,979
Tires & Rubber - 0.56%
Goodyear Tire & Rubber Company, Tranche 2
2.070% due 04/30/2014 (b) 3,950,000 3,302,571
U. S. High Yield Bond Fund (continued)Shares or
Principal
Amount Value
TERM LOANS (continued)
Transportation - 0.66%
Oshkosh Truck Corp., Tranche B
7.243% due 12/06/2013 (b) $ 635,481 $ 544,130
Rail America CND, Term Loan B
5.200% due 08/14/2009 (b) 212,800 203,224
Rail America US, Term Loan B
5.200% due 08/14/2009 (b) 3,287,200 3,139,276
3,886,630
TOTAL TERM LOANS (Cost $124,952,207) $ 112,850,600
REPURCHASE AGREEMENTS - 7.98%
Repurchase Agreement with State
Street Corp. dated 05/29/2009 at
0.07% to be repurchased at
$46,737,273 on 06/01/2009,
collateralized by $47,516,000
Federal Home Loan Bank, 0.875%
Copyright © 2012 www.secdatabase.com. All Rights Reserved.Please Consider the Environment Before Printing This Document

due 03/30/2010 (valued at
$47,694,185, including interest) $ 46,737,000 $ 46,737,000
TOTAL REPURCHASE AGREEMENTS
(Cost $46,737,000) $ 46,737,000
Total Investments (U.S. High Yield Bond Fund)
(Cost $645,036,664) - 101.18% $ 592,519,937
Other assets and liabilities, net - (1.18)% (6,935,819)
TOTAL NET ASSETS - 100.00% $ 585,584,118
U. S. Multi Sector FundShares or
Principal
Amount Value
COMMON STOCKS - 96.46%
Aerospace - 0.85%
General Dynamics Corp. 49,100 $ 2,793,790
Lockheed Martin Corp. 2,460 205,730
Rockwell Collins, Inc. 1,700 72,114
United Technologies Corp. 50,600 2,662,066
5,733,700
Air Travel - 0.01%
Southwest Airlines Company 14,100 95,034
Apparel & Textiles - 0.35%
Coach, Inc. * 80,400 2,112,108
Polo Ralph Lauren Corp., Class A 4,000 215,280
2,327,388
Auto Parts - 0.27%
AutoZone, Inc. * 7,830 1,191,335
Genuine Parts Company 3,400 113,832
Johnson Controls, Inc. 13,700 273,041
O'Reilly Automotive, Inc. * 5,900 212,695
1,790,903
Auto Services - 0.02%
Copart, Inc. * 3,600 110,484
Automobiles - 0.11%
Ford Motor Company * 98,700 567,525
The accompanying notes are an integral part of the financial statements.
303
JOHN HANCOCK FUNDS II
PORTFOLIO OF INVESTMENTS - May 31, 2009 (Unaudited) - continued(showing percentage of total net assets)
U. S. Multi Sector Fund (continued)Shares or
Principal
Amount Value
COMMON STOCKS (continued)
Automobiles (continued)
PACCAR, Inc. 5,100 $ 152,235
719,760
Banking - 0.32%
BB&T Corp. 35,500 795,910
Copyright © 2012 www.secdatabase.com. All Rights Reserved.Please Consider the Environment Before Printing This Document

City National Corp. 1,200 43,884
Comerica, Inc. 8,500 184,280
First Horizon National Corp. 5,000 60,700
Hudson City Bancorp, Inc. 24,900 319,467
KeyCorp 4,400 22,000
PNC Financial Services Group, Inc. 4,400 200,420
U.S. Bancorp 28,700 551,040
2,177,701
Biotechnology - 3.20%
Amgen, Inc. * 396,000 19,776,240
Biogen Idec, Inc. * 15,600 807,924
Cephalon, Inc. * (a) 3,500 204,085
Genzyme Corp. * 5,400 319,356
Illumina, Inc. * 4,200 154,182
Myriad Genetics, Inc. * 6,600 238,656
21,500,443
Building Materials & Construction - 0.01%
Masco Corp. 7,300 75,628
Business Services - 0.40%
Affiliated Computer Services, Inc., Class A * 4,200 188,748
Alliance Data Systems Corp. * (a) 4,300 174,150
Automatic Data Processing, Inc. 11,900 452,319
Dun & Bradstreet Corp. 600 49,074
FactSet Research Systems, Inc. (a) 1,100 58,190
Fiserv, Inc. * 5,900 249,924
Global Payments, Inc. 16,300 586,148
H & R Block, Inc. 23,600 344,560
Manpower, Inc. 1,900 80,769
Moody's Corp. 12,600 345,114
URS Corp. * 2,700 129,816
2,658,812
Cable & Television - 0.40%
Cablevision Systems Corp., Class A 7,100 135,113
Comcast Corp., Class A 131,200 1,806,624
DIRECTV Group, Inc. * (a) 15,300 344,250
Time Warner Cable, Inc. * 7,912 243,610
Time Warner, Inc. 6,700 156,914
2,686,511
Cellular Communications - 0.03%
MetroPCS Communications, Inc. * 6,200 106,206
NII Holdings, Inc. * 3,500 71,610
177,816
Chemicals - 0.08%
Dow Chemical Company 18,600 328,848
FMC Corp. 2,400 130,440
The Scotts Company, Class A 3,100 106,330
565,618
Colleges & Universities - 0.01%
Career Education Corp. * 2,300 46,184
U. S. Multi Sector Fund (continued)Shares or
Principal
Amount Value
COMMON STOCKS (continued)
Computer Services - 0.03%
NetApp, Inc. * 10,700 $ 208,650
Computers & Business Equipment - 4.85%
Apple, Inc. * 2,740 372,119
Copyright © 2012 www.secdatabase.com. All Rights Reserved.Please Consider the Environment Before Printing This Document

Cisco Systems, Inc. * 1,028,400 19,025,400
Cognizant Technology Solutions Corp.,
Class A * 5,000 125,950
Dell, Inc. * 115,900 1,342,122
EMC Corp. * 22,600 265,550
Hewlett-Packard Company 32,000 1,099,200
International Business Machines Corp. 94,010 9,991,383
SanDisk Corp. * 5,600 87,696
Western Digital Corp. * 10,500 260,925
32,570,345
Construction Materials - 0.11%
The Sherwin-Williams Company 11,900 628,320
Vulcan Materials Company 3,200 141,728
770,048
Containers & Glass - 0.03%
Pactiv Corp. * 8,000 179,200
Cosmetics & Toiletries - 4.48%
Avon Products, Inc. 38,400 1,019,904
Colgate-Palmolive Company 112,900 7,445,755
Estee Lauder Companies, Inc., Class A 24,500 810,460
Kimberly-Clark Corp. 72,900 3,782,781
Procter & Gamble Company 328,200 17,046,708
30,105,608
Crude Petroleum & Natural Gas - 0.69%
Apache Corp. 4,370 368,216
Cabot Oil & Gas Corp. 6,900 242,397
Chesapeake Energy Corp. 16,000 362,560
Cimarex Energy Company 6,100 198,982
EOG Resources, Inc. 5,290 387,175
EXCO Resources, Inc. * 9,100 140,049
Noble Energy, Inc. 4,600 273,608
Occidental Petroleum Corp. 17,600 1,181,136
Patterson-UTI Energy, Inc. 11,400 163,476
Pioneer Natural Resources Company 8,600 241,832
Plains Exploration & Production Company * 7,100 200,788
Southwestern Energy Company * 11,200 486,864
Sunoco, Inc. 5,800 176,494
XTO Energy, Inc. 4,400 188,188
4,611,765
Domestic Oil - 0.01%
Frontier Oil Corp. 3,600 62,892
Drugs & Health Care - 1.87%
Wyeth 279,800 12,551,828
Educational Services - 0.65%
Apollo Group, Inc., Class A * 49,000 2,895,900
ITT Educational Services, Inc. * 15,400 1,413,566
Strayer Education, Inc. (a) 410 75,551
4,385,017
Electrical Equipment - 0.01%
FLIR Systems, Inc. * 3,300 74,118
The accompanying notes are an integral part of the financial statements.
304
JOHN HANCOCK FUNDS II
PORTFOLIO OF INVESTMENTS - May 31, 2009 (Unaudited) - continued(showing percentage of total net assets)
U. S. Multi Sector Fund (continued)Shares or
Copyright © 2012 www.secdatabase.com. All Rights Reserved.Please Consider the Environment Before Printing This Document
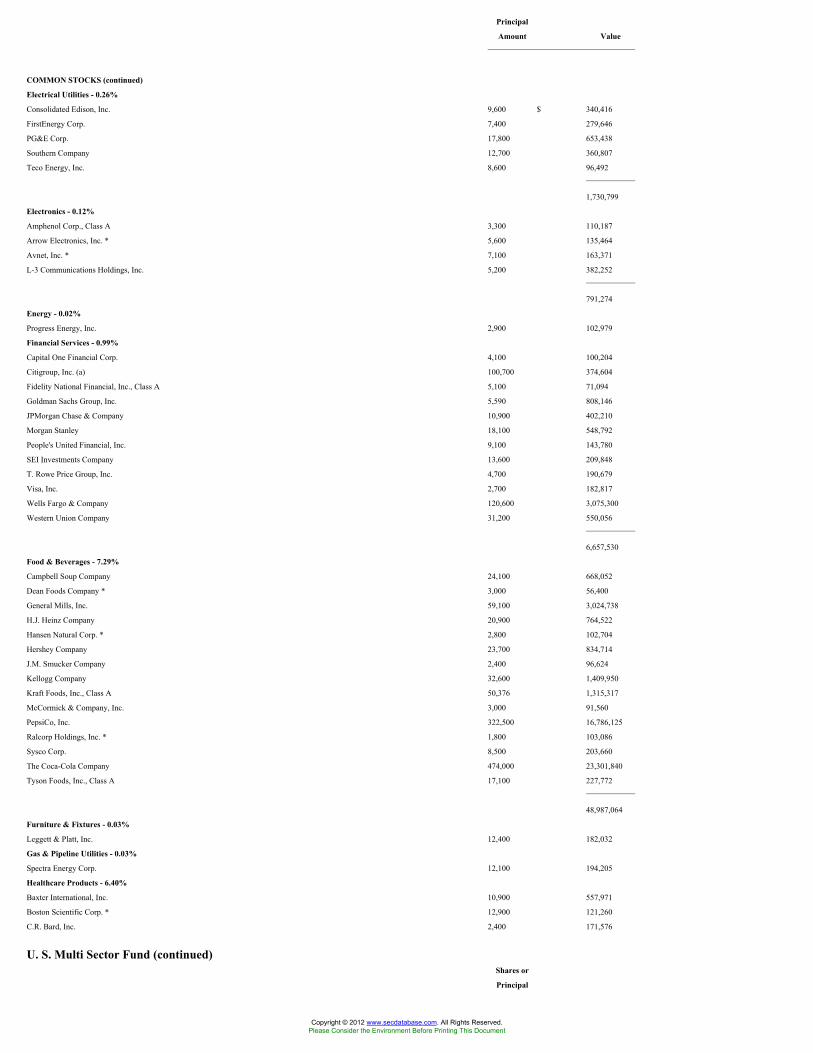
Principal
Amount Value
COMMON STOCKS (continued)
Electrical Utilities - 0.26%
Consolidated Edison, Inc. 9,600 $ 340,416
FirstEnergy Corp. 7,400 279,646
PG&E Corp. 17,800 653,438
Southern Company 12,700 360,807
Teco Energy, Inc. 8,600 96,492
1,730,799
Electronics - 0.12%
Amphenol Corp., Class A 3,300 110,187
Arrow Electronics, Inc. * 5,600 135,464
Avnet, Inc. * 7,100 163,371
L-3 Communications Holdings, Inc. 5,200 382,252
791,274
Energy - 0.02%
Progress Energy, Inc. 2,900 102,979
Financial Services - 0.99%
Capital One Financial Corp. 4,100 100,204
Citigroup, Inc. (a) 100,700 374,604
Fidelity National Financial, Inc., Class A 5,100 71,094
Goldman Sachs Group, Inc. 5,590 808,146
JPMorgan Chase & Company 10,900 402,210
Morgan Stanley 18,100 548,792
People's United Financial, Inc. 9,100 143,780
SEI Investments Company 13,600 209,848
T. Rowe Price Group, Inc. 4,700 190,679
Visa, Inc. 2,700 182,817
Wells Fargo & Company 120,600 3,075,300
Western Union Company 31,200 550,056
6,657,530
Food & Beverages - 7.29%
Campbell Soup Company 24,100 668,052
Dean Foods Company * 3,000 56,400
General Mills, Inc. 59,100 3,024,738
H.J. Heinz Company 20,900 764,522
Hansen Natural Corp. * 2,800 102,704
Hershey Company 23,700 834,714
J.M. Smucker Company 2,400 96,624
Kellogg Company 32,600 1,409,950
Kraft Foods, Inc., Class A 50,376 1,315,317
McCormick & Company, Inc. 3,000 91,560
PepsiCo, Inc. 322,500 16,786,125
Ralcorp Holdings, Inc. * 1,800 103,086
Sysco Corp. 8,500 203,660
The Coca-Cola Company 474,000 23,301,840
Tyson Foods, Inc., Class A 17,100 227,772
48,987,064
Furniture & Fixtures - 0.03%
Leggett & Platt, Inc. 12,400 182,032
Gas & Pipeline Utilities - 0.03%
Spectra Energy Corp. 12,100 194,205
Healthcare Products - 6.40%
Baxter International, Inc. 10,900 557,971
Boston Scientific Corp. * 12,900 121,260
C.R. Bard, Inc. 2,400 171,576
U. S. Multi Sector Fund (continued)Shares or
Principal
Copyright © 2012 www.secdatabase.com. All Rights Reserved.Please Consider the Environment Before Printing This Document

Amount Value
COMMON STOCKS (continued)
Healthcare Products (continued)
Covidien, Ltd. 5,200 $ 185,744
Edwards Lifesciences Corp. * 2,000 127,680
Gen-Probe, Inc. * 1,300 55,419
Johnson & Johnson 590,200 32,555,432
Medtronic, Inc. 159,500 5,478,825
Stryker Corp. 10,300 395,932
Varian Medical Systems, Inc. * 5,300 189,528
Zimmer Holdings, Inc. * 72,000 3,207,600
43,046,967
Healthcare Services - 3.74%
Cardinal Health, Inc. 27,300 975,975
Cerner Corp. * 1,100 64,119
Covance, Inc. * 2,600 109,252
Coventry Health Care, Inc. * 27,200 490,960
DaVita, Inc. * 2,200 99,242
Express Scripts, Inc. * 17,000 1,088,850
McKesson Corp. 35,600 1,464,940
Medco Health Solutions, Inc. * 3,600 165,204
Omnicare, Inc. 8,300 224,349
Quest Diagnostics, Inc. 9,000 469,980
UnitedHealth Group, Inc. 557,800 14,837,480
WellPoint, Inc. * 110,400 5,141,328
25,131,679
Holdings Companies/Conglomerates - 0.02%
Textron, Inc. 9,800 112,700
Homebuilders - 0.02%
NVR, Inc. * 247 122,240
Hotels & Restaurants - 0.79%
McDonald's Corp. 87,300 5,149,827
Starbucks Corp. * 9,600 138,144
5,287,971
Household Products - 0.21%
Church & Dwight, Inc. 2,400 120,648
Clorox Company 19,900 1,043,556
Energizer Holdings, Inc. * 4,400 229,944
1,394,148
Industrial Machinery - 0.06%
Parker-Hannifin Corp. 7,500 316,950
W.W. Grainger, Inc. 1,400 110,362
427,312
Industrials - 0.31%
Fastenal Company (a) 28,700 953,414
General Electric Company 86,400 1,164,672
2,118,086
Insurance - 1.40%
AFLAC, Inc. 9,100 323,050
Allstate Corp. 48,300 1,242,759
Aon Corp. 2,500 90,000
Arthur J. Gallagher & Company 2,600 54,470
Assurant, Inc. 6,200 146,506
Brown & Brown, Inc. 8,800 169,664
Chubb Corp. 34,200 1,356,030
CNA Financial Corp. 4,000 58,040
The accompanying notes are an integral part of the financial statements.
305
Copyright © 2012 www.secdatabase.com. All Rights Reserved.Please Consider the Environment Before Printing This Document

JOHN HANCOCK FUNDS II
PORTFOLIO OF INVESTMENTS - May 31, 2009 (Unaudited) - continued(showing percentage of total net assets)
U. S. Multi Sector Fund (continued)Shares or
Principal
Amount Value
COMMON STOCKS (continued)
Insurance (continued)
First American Corp. 2,200 $ 50,204
Hartford Financial Services Group, Inc. 11,000 157,740
HCC Insurance Holdings, Inc. 2,400 59,256
Markel Corp. * 640 182,400
Marsh & McLennan Companies, Inc. 42,300 800,316
MetLife, Inc. 16,700 526,050
Old Republic International Corp. 14,675 150,125
Progressive Corp. * 29,400 474,222
Prudential Financial, Inc. 1,800 71,838
The Travelers Companies, Inc. 64,300 2,614,438
Torchmark Corp. 9,800 393,568
Transatlantic Holdings, Inc. 2,200 85,162
Unum Group 12,100 207,031
W.R. Berkley Corp. 10,400 225,576
9,438,445
International Oil - 10.60%
Anadarko Petroleum Corp. 4,200 200,676
Chevron Corp. 392,600 26,174,642
ConocoPhillips 122,500 5,615,400
Exxon Mobil Corp. 560,600 38,877,610
Nabors Industries, Ltd. * 21,300 380,844
71,249,172
Internet Content - 1.58%
Google, Inc., Class A * 25,430 10,610,159
Internet Retail - 0.49%
Amazon.com, Inc. * 8,700 678,513
eBay, Inc. * 143,100 2,521,422
Netflix, Inc. * (a) 2,600 102,492
3,302,427
Internet Software - 0.12%
McAfee, Inc. * 7,700 302,071
Symantec Corp. * 34,000 530,060
832,131
Leisure Time - 0.01%
Penn National Gaming, Inc. * 1,700 56,219
Liquor - 0.01%
Constellation Brands, Inc., Class A * 4,300 49,708
Manufacturing - 0.86%
3M Company 84,200 4,807,820
Danaher Corp. 4,100 247,435
Harley-Davidson, Inc. (a) 12,400 210,428
Tyco International, Ltd. * 19,150 528,732
5,794,415
Metal & Metal Products - 0.01%
Reliance Steel & Aluminum Company 2,600 98,774
Mining - 0.01%
Freeport-McMoRan Copper & Gold, Inc.,
Copyright © 2012 www.secdatabase.com. All Rights Reserved.Please Consider the Environment Before Printing This Document

Class B 1,300 70,759
Petroleum Services - 0.34%
Baker Hughes, Inc. 3,900 152,334
BJ Services Company 14,400 225,216
ENSCO International, Inc. 7,100 276,119
U. S. Multi Sector Fund (continued)Shares or
Principal
Amount Value
COMMON STOCKS (continued)
Petroleum Services (continued)
Halliburton Company 18,700 $ 428,791
Helmerich & Payne, Inc. 8,800 307,736
Valero Energy Corp. 39,500 883,615
2,273,811
Pharmaceuticals - 12.13%
Abbott Laboratories 264,700 11,927,382
Allergan, Inc. 1,300 57,369
AmerisourceBergen Corp. 25,900 960,890
Bristol-Myers Squibb Company 202,100 4,025,832
Celgene Corp. * 9,800 413,952
Eli Lilly & Company 277,200 9,582,804
Endo Pharmaceutical Holdings, Inc. * 3,800 60,534
Forest Laboratories, Inc. * 113,300 2,684,077
Gilead Sciences, Inc. * 60,100 2,590,310
King Pharmaceuticals, Inc. * 12,000 113,520
Merck & Company, Inc. 304,800 8,406,384
Mylan, Inc. * (a) 8,500 112,285
Pfizer, Inc. 2,569,200 39,026,148
Schering-Plough Corp. 48,400 1,180,960
Vertex Pharmaceuticals, Inc. * 9,700 289,157
Watson Pharmaceuticals, Inc. * 3,900 117,975
81,549,579
Publishing - 0.02%
McGraw-Hill Companies, Inc. 4,400 132,396
Railroads & Equipment - 0.66%
Burlington Northern Santa Fe Corp. 18,650 1,351,006
CSX Corp. 22,700 720,952
Kansas City Southern * 5,200 85,748
Norfolk Southern Corp. 27,400 1,019,280
Union Pacific Corp. 25,800 1,271,166
4,448,152
Retail Grocery - 0.12%
SUPERVALU, Inc. 9,190 152,554
The Kroger Company 28,700 654,360
806,914
Retail Trade - 9.42%
Abercrombie & Fitch Company, Class A (a) 8,200 246,902
Advance Auto Parts, Inc. 6,400 272,576
American Eagle Outfitters, Inc. 5,400 79,974
Bed Bath & Beyond, Inc. * 37,600 1,056,936
Best Buy Company, Inc. 13,900 487,890
Dollar Tree, Inc. * 12,000 537,240
Family Dollar Stores, Inc. 15,400 466,158
Home Depot, Inc. 289,800 6,711,768
J.C. Penney Company, Inc. 2,600 67,834
Kohl's Corp. * 28,800 1,223,136
Limited Brands, Inc. 11,500 143,865
Lowe's Companies, Inc. 124,700 2,370,547
PetSmart, Inc. 5,900 120,124
Copyright © 2012 www.secdatabase.com. All Rights Reserved.Please Consider the Environment Before Printing This Document

Ross Stores, Inc. 12,300 481,668
Sears Holdings Corp. * (a) 1,300 73,905
Staples, Inc. 35,200 719,840
Target Corp. 30,600 1,202,580
TJX Companies, Inc. 12,400 365,924
The accompanying notes are an integral part of the financial statements.
306
JOHN HANCOCK FUNDS II
PORTFOLIO OF INVESTMENTS - May 31, 2009 (Unaudited) - continued(showing percentage of total net assets)
U. S. Multi Sector Fund (continued)Shares or
Principal
Amount Value
COMMON STOCKS (continued)
Retail Trade (continued)
Urban Outfitters, Inc. * 14,000 $ 285,880
Walgreen Company 313,900 9,351,081
Wal-Mart Stores, Inc. 744,800 37,046,352
63,312,180
Sanitary Services - 0.07%
Aqua America, Inc. 6,500 107,185
Waste Management, Inc. 12,900 355,911
463,096
Semiconductors - 0.14%
Altera Corp. 11,900 202,538
Broadcom Corp., Class A * 5,400 137,592
Linear Technology Corp. (a) 4,900 114,709
LSI Logic Corp. * 19,900 88,953
National Semiconductor Corp. 9,100 126,308
Xilinx, Inc. 13,600 282,064
952,164
Software - 9.47%
Adobe Systems, Inc. * 2,300 64,814
BMC Software, Inc. * 5,000 170,500
Citrix Systems, Inc. * 10,300 323,523
Intuit, Inc. * 6,500 176,930
Microsoft Corp. 1,592,900 33,275,681
Oracle Corp. 1,501,700 29,418,303
Red Hat, Inc. * 7,500 149,625
VMware, Inc. Class A * 2,200 68,288
63,647,664
Steel - 0.08%
Nucor Corp. 9,700 425,927
Steel Dynamics, Inc. 8,800 131,472
557,399
Telecommunications Equipment &
Services - 3.70%
DigitalGlobe, Inc. * 5,062 91,268
QUALCOMM, Inc. 568,900 24,798,351
24,889,619
Telephone - 1.90%
AT&T, Inc. 245,705 6,091,027
CenturyTel, Inc. 7,800 240,630
Copyright © 2012 www.secdatabase.com. All Rights Reserved.Please Consider the Environment Before Printing This Document

Frontier Communications Corp. 6,300 45,864
Verizon Communications, Inc. 218,400 6,390,384
12,767,905
Tobacco - 3.68%
Altria Group, Inc. 413,000 7,058,170
Lorillard, Inc. 3,400 232,322
Philip Morris International, Inc. 408,800 17,431,232
24,721,724
Toys, Amusements & Sporting Goods - 0.03%
Hasbro, Inc. 8,400 213,444
Transportation - 0.14%
C.H. Robinson Worldwide, Inc. 18,900 960,498
Trucking & Freight - 0.39%
FedEx Corp. 3,900 216,177
U. S. Multi Sector Fund (continued)Shares or
Principal
Amount Value
COMMON STOCKS (continued)
Trucking & Freight (continued)
J.B. Hunt Transport Services, Inc. 4,600 $ 141,358
Ryder Systems, Inc. 3,200 90,176
United Parcel Service, Inc., Class B 42,100 2,152,994
2,600,705
TOTAL COMMON STOCKS (Cost $694,418,379) $ 648,271,898
SHORT TERM INVESTMENTS - 0.33%
John Hancock Collateral Investment
Trust, 0.7339% (c)(g) $ 224,258 $ 2,242,575
TOTAL SHORT TERM INVESTMENTS
(Cost $2,242,575) $ 2,242,575
REPURCHASE AGREEMENTS - 5.72%
Repurchase Agreement with State
Street Corp. dated 05/29/2009 at
0.07% to be repurchased at
$38,454,224 on 06/01/2009,
collateralized by $36,070,000
Federal Home Loan Mortgage
Corp., 5.00% due 02/16/2017
(valued at $39,226,125, including
interest) $ 38,454,000 $ 38,454,000
TOTAL REPURCHASE AGREEMENTS
(Cost $38,454,000) $ 38,454,000
Total Investments (U.S. Multi Sector Fund)
(Cost $735,114,954) - 102.51% $ 688,968,473
Other assets and liabilities, net - (2.51)% (16,862,281)
TOTAL NET ASSETS - 100.00% $ 672,106,192
Value FundShares or
Principal
Amount Value
COMMON STOCKS - 96.84%
Aerospace - 3.60%
Goodrich Corp. 43,470 $ 2,110,034
Copyright © 2012 www.secdatabase.com. All Rights Reserved.Please Consider the Environment Before Printing This Document
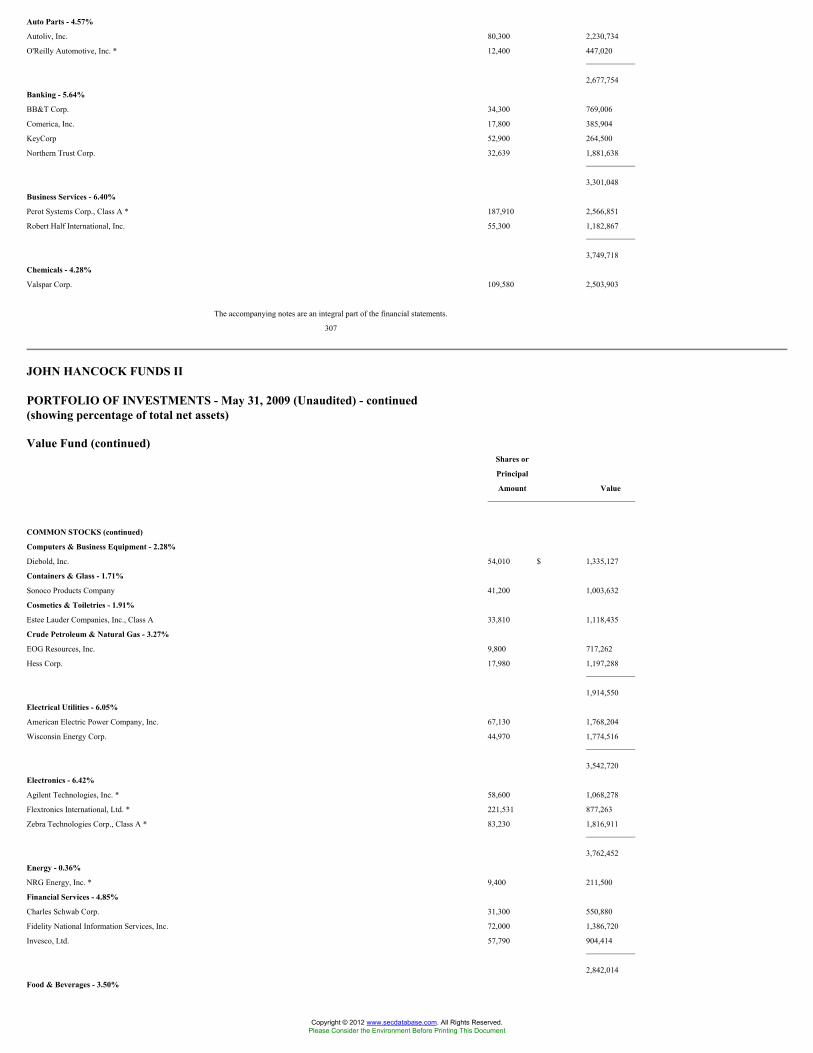
Auto Parts - 4.57%
Autoliv, Inc. 80,300 2,230,734
O'Reilly Automotive, Inc. * 12,400 447,020
2,677,754
Banking - 5.64%
BB&T Corp. 34,300 769,006
Comerica, Inc. 17,800 385,904
KeyCorp 52,900 264,500
Northern Trust Corp. 32,639 1,881,638
3,301,048
Business Services - 6.40%
Perot Systems Corp., Class A * 187,910 2,566,851
Robert Half International, Inc. 55,300 1,182,867
3,749,718
Chemicals - 4.28%
Valspar Corp. 109,580 2,503,903
The accompanying notes are an integral part of the financial statements.
307
JOHN HANCOCK FUNDS II
PORTFOLIO OF INVESTMENTS - May 31, 2009 (Unaudited) - continued(showing percentage of total net assets)
Value Fund (continued)Shares or
Principal
Amount Value
COMMON STOCKS (continued)
Computers & Business Equipment - 2.28%
Diebold, Inc. 54,010 $ 1,335,127
Containers & Glass - 1.71%
Sonoco Products Company 41,200 1,003,632
Cosmetics & Toiletries - 1.91%
Estee Lauder Companies, Inc., Class A 33,810 1,118,435
Crude Petroleum & Natural Gas - 3.27%
EOG Resources, Inc. 9,800 717,262
Hess Corp. 17,980 1,197,288
1,914,550
Electrical Utilities - 6.05%
American Electric Power Company, Inc. 67,130 1,768,204
Wisconsin Energy Corp. 44,970 1,774,516
3,542,720
Electronics - 6.42%
Agilent Technologies, Inc. * 58,600 1,068,278
Flextronics International, Ltd. * 221,531 877,263
Zebra Technologies Corp., Class A * 83,230 1,816,911
3,762,452
Energy - 0.36%
NRG Energy, Inc. * 9,400 211,500
Financial Services - 4.85%
Charles Schwab Corp. 31,300 550,880
Fidelity National Information Services, Inc. 72,000 1,386,720
Invesco, Ltd. 57,790 904,414
2,842,014
Food & Beverages - 3.50%
Copyright © 2012 www.secdatabase.com. All Rights Reserved.Please Consider the Environment Before Printing This Document

ConAgra Foods, Inc. 78,430 1,458,014
Sysco Corp. 24,600 589,416
2,047,430
Gas & Pipeline Utilities - 4.77%
El Paso Corp. 286,760 2,795,910
Healthcare Products - 3.84%
Beckman Coulter, Inc. 41,490 2,248,758
Healthcare Services - 6.03%
Brookdale Senior Living, Inc. 92,900 1,076,711
Healthsouth Corp. * 207,580 2,457,747
3,534,458
Household Products - 2.85%
Newell Rubbermaid, Inc. 144,760 1,666,188
Insurance - 10.60%
ACE, Ltd. 39,065 1,718,469
Aspen Insurance Holdings, Ltd. 61,767 1,426,200
Marsh & McLennan Companies, Inc. 73,999 1,400,061
Willis Group Holdings, Ltd. 62,455 1,663,177
6,207,907
Internet Retail - 1.07%
eBay, Inc. * 35,500 625,510
Manufacturing - 7.38%
Harley-Davidson, Inc. (a) 90,801 1,540,893
Pentair, Inc. 92,150 2,306,514
Value Fund (continued)Shares or
Principal
Amount Value
COMMON STOCKS (continued)
Manufacturing (continued)
Snap-on, Inc. 15,300 $ 476,595
4,324,002
Office Furnishings & Supplies - 2.80%
Avery Dennison Corp. 59,600 1,642,576
Real Estate - 1.10%
Simon Property Group, Inc., REIT 5,700 304,779
Weingarten Realty Investors, REIT 21,300 338,244
643,023
Software - 1.56%
Teradata Corp. * 42,300 913,680
TOTAL COMMON STOCKS (Cost $57,579,294) $ 56,722,329
SHORT TERM INVESTMENTS - 45.84%
Federal Home Loan Bank Discount Notes
zero coupon due 06/01/2009 $ 26,000,000 $ 25,999,924
John Hancock Collateral Investment Trust,
0.7339% (c)(g) 84,951 849,507
TOTAL SHORT TERM INVESTMENTS
(Cost $26,849,431) $ 26,849,431
Total Investments (Value Fund)
(Cost $84,428,725) - 142.68% $ 83,571,760
Other assets and liabilities, net - (42.68)% (24,998,030)
TOTAL NET ASSETS - 100.00% $ 58,573,730
Value & Restructuring FundShares or
Copyright © 2012 www.secdatabase.com. All Rights Reserved.Please Consider the Environment Before Printing This Document

Principal
Amount Value
COMMON STOCKS - 97.65%
Aerospace - 2.64%
Empresa Brasileira de Aeronautica SA, ADR * (a) 184,218 $ 3,533,301
United Technologies Corp. 164,738 8,666,866
12,200,167
Air Travel - 1.30%
Copa Holdings SA, Class A 172,528 6,007,425
Auto Services - 0.41%
RSC Holdings, Inc. * (a) 318,156 1,915,299
Banking - 1.61%
PNC Financial Services Group, Inc. 163,366 7,441,321
Broadcasting - 0.30%
CBS Corp., Class B 189,516 1,398,628
Cellular Communications - 3.48%
America Movil SAB de CV, Series L, ADR 418,836 16,053,984
Chemicals - 4.05%
Celanese Corp., Series A 420,863 8,631,900
Lanxess AG 152,564 3,557,789
PPG Industries, Inc. 146,931 6,534,022
18,723,711
The accompanying notes are an integral part of the financial statements.
308
JOHN HANCOCK FUNDS II
PORTFOLIO OF INVESTMENTS - May 31, 2009 (Unaudited) - continued(showing percentage of total net assets)
Value & Restructuring Fund (continued)Shares or
Principal
Amount Value
COMMON STOCKS (continued)
Coal - 5.80%
Alpha Natural Resources, Inc. * 320,401 $ 8,827,047
CONSOL Energy, Inc. 335,142 13,794,445
Foundation Coal Holdings, Inc. 142,680 4,187,658
26,809,150
Commercial Services - 0.62%
AerCap Holdings NV * 449,396 2,876,134
Computers & Business Equipment - 2.90%
International Business Machines Corp. 125,974 13,388,517
Cosmetics & Toiletries - 1.76%
Avon Products, Inc. 305,554 8,115,514
Crude Petroleum & Natural Gas - 4.82%
Devon Energy Corp. 182,023 11,511,135
Noble Energy, Inc. 153,155 9,109,659
W&T Offshore, Inc. (a) 159,400 1,625,880
22,246,674
Diversified Minerals - 1.35%
Vale SA 325,310 6,229,687
Electrical Utilities - 1.66%
Enel SpA 403,800 2,409,299
Entergy Corp. 70,350 5,249,517
Copyright © 2012 www.secdatabase.com. All Rights Reserved.Please Consider the Environment Before Printing This Document
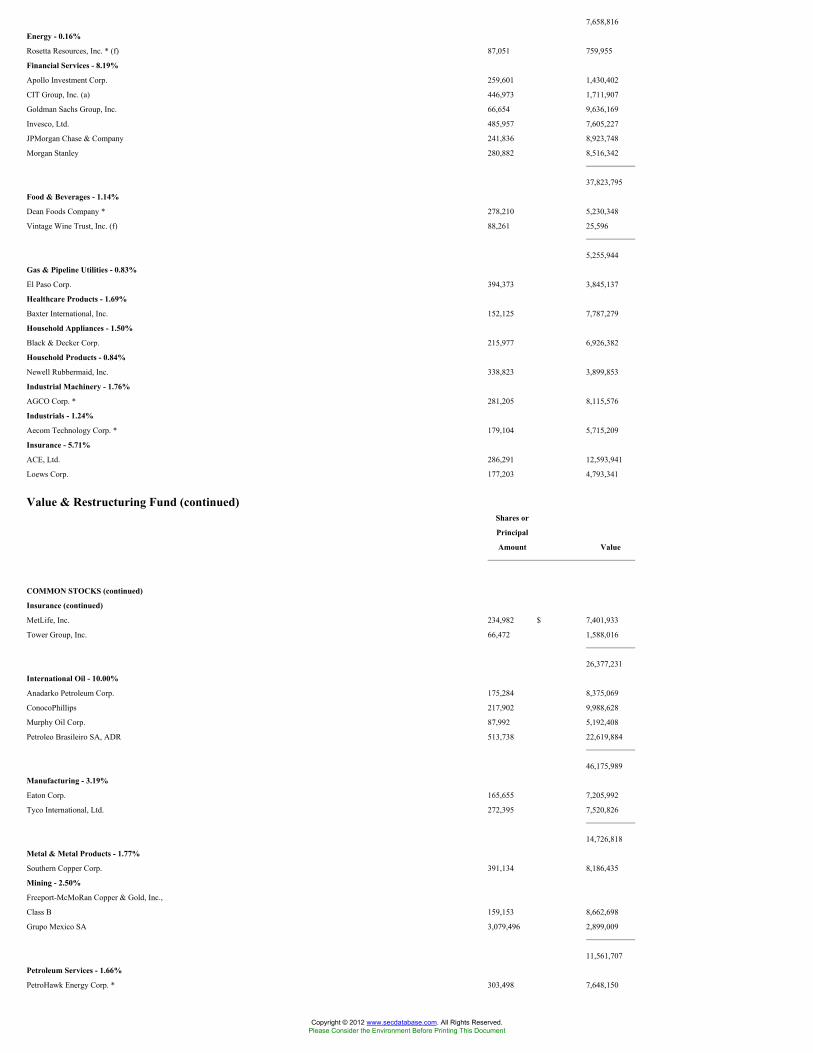
7,658,816
Energy - 0.16%
Rosetta Resources, Inc. * (f) 87,051 759,955
Financial Services - 8.19%
Apollo Investment Corp. 259,601 1,430,402
CIT Group, Inc. (a) 446,973 1,711,907
Goldman Sachs Group, Inc. 66,654 9,636,169
Invesco, Ltd. 485,957 7,605,227
JPMorgan Chase & Company 241,836 8,923,748
Morgan Stanley 280,882 8,516,342
37,823,795
Food & Beverages - 1.14%
Dean Foods Company * 278,210 5,230,348
Vintage Wine Trust, Inc. (f) 88,261 25,596
5,255,944
Gas & Pipeline Utilities - 0.83%
El Paso Corp. 394,373 3,845,137
Healthcare Products - 1.69%
Baxter International, Inc. 152,125 7,787,279
Household Appliances - 1.50%
Black & Decker Corp. 215,977 6,926,382
Household Products - 0.84%
Newell Rubbermaid, Inc. 338,823 3,899,853
Industrial Machinery - 1.76%
AGCO Corp. * 281,205 8,115,576
Industrials - 1.24%
Aecom Technology Corp. * 179,104 5,715,209
Insurance - 5.71%
ACE, Ltd. 286,291 12,593,941
Loews Corp. 177,203 4,793,341
Value & Restructuring Fund (continued)Shares or
Principal
Amount Value
COMMON STOCKS (continued)
Insurance (continued)
MetLife, Inc. 234,982 $ 7,401,933
Tower Group, Inc. 66,472 1,588,016
26,377,231
International Oil - 10.00%
Anadarko Petroleum Corp. 175,284 8,375,069
ConocoPhillips 217,902 9,988,628
Murphy Oil Corp. 87,992 5,192,408
Petroleo Brasileiro SA, ADR 513,738 22,619,884
46,175,989
Manufacturing - 3.19%
Eaton Corp. 165,655 7,205,992
Tyco International, Ltd. 272,395 7,520,826
14,726,818
Metal & Metal Products - 1.77%
Southern Copper Corp. 391,134 8,186,435
Mining - 2.50%
Freeport-McMoRan Copper & Gold, Inc.,
Class B 159,153 8,662,698
Grupo Mexico SA 3,079,496 2,899,009
11,561,707
Petroleum Services - 1.66%
PetroHawk Energy Corp. * 303,498 7,648,150
Copyright © 2012 www.secdatabase.com. All Rights Reserved.Please Consider the Environment Before Printing This Document

Pharmaceuticals - 3.40%
AmerisourceBergen Corp. 224,150 8,315,965
Bristol-Myers Squibb Company 371,269 7,395,678
15,711,643
Railroads & Equipment - 3.04%
Union Pacific Corp. 284,707 14,027,514
Real Estate - 0.99%
DiamondRock Hospitality Company, REIT 381,185 2,477,703
Host Hotels & Resorts, Inc., REIT 225,480 2,115,002
4,592,705
Retail Trade - 1.87%
TJX Companies, Inc. 292,833 8,641,502
Steel - 1.62%
Schnitzer Steel Industries, Inc. 137,379 7,492,651
Telecommunications Equipment &
Services - 2.85%
CommScope, Inc. * 251,277 6,593,508
Harris Stratex Networks, Inc., Class A * 43,957 209,673
Nokia Oyj, SADR 416,203 6,367,906
13,171,087
Telephone - 3.52%
Harris Corp. 423,666 13,167,539
Windstream Corp. 369,734 3,109,463
16,277,002
Tobacco - 4.22%
Lorillard, Inc. 284,983 19,472,888
Transport-Marine - 0.21%
General Maritime Corp. 102,550 982,429
The accompanying notes are an integral part of the financial statements.
309
JOHN HANCOCK FUNDS II
PORTFOLIO OF INVESTMENTS - May 31, 2009 (Unaudited) - continued(showing percentage of total net assets)
Value & Restructuring Fund (continued)Shares or
Principal
Amount Value
COMMON STOCKS (continued)
Trucking & Freight - 1.05%
Ryder Systems, Inc. 172,356 $ 4,856,992
TOTAL COMMON STOCKS (Cost $462,388,064) $ 451,096,900
PREFERRED STOCKS - 0.47%
Chemicals - 0.34%
Celanese Corp., 4.25% 56,623 1,584,878
Financial Services - 0.13%
Wells Fargo & Company, Series L, 7.50% 800 596,000
TOTAL PREFERRED STOCKS (Cost $1,712,174) $ 2,180,878
SHORT TERM INVESTMENTS - 1.31%
John Hancock Collateral Investment
Trust, 0.7339% (c)(g) $ 6,027,000 $ 6,027,000
TOTAL SHORT TERM INVESTMENTS
(Cost $6,027,000) $ 6,027,000
REPURCHASE AGREEMENTS - 1.59%
Copyright © 2012 www.secdatabase.com. All Rights Reserved.Please Consider the Environment Before Printing This Document

Repurchase Agreement with State
Street Corp. dated 05/29/2009 at
0.07% to be repurchased at
$7,351,043 on 6/1/2009,
collateralized by $7,325,000
Federal National Mortgage
Association, 5.625% due
09/18/2017 (valued at $7,498,969,
including interest) $ 7,351,000 $ 7,351,000
TOTAL REPURCHASE AGREEMENTS
(Cost $7,351,000) $ 7,351,000
Total Investments (Value & Restructuring Fund)
(Cost $477,478,238) - 101.02% $ 466,655,778
Other assets and liabilities, net - (1.02)% (4,725,032)
TOTAL NET ASSETS - 100.00% $ 461,930,746
Vista FundShares or
Principal
Amount Value
COMMON STOCKS - 98.35%
Aerospace - 0.40%
BE Aerospace, Inc. * 33,167 $ 493,525
Agriculture - 2.15%
Agrium, Inc. 16,100 792,442
Monsanto Company 12,800 1,051,520
The Mosaic Company 14,800 809,560
2,653,522
Apparel & Textiles - 0.55%
Coach, Inc. * 26,100 685,647
Auto Parts - 1.76%
Autoliv, Inc. 25,300 702,834
O'Reilly Automotive, Inc. * (a) 41,000 1,478,050
2,180,884
Vista Fund (continued)Shares or
Principal
Amount Value
COMMON STOCKS (continued)
Banking - 0.30%
Greenhill & Company, Inc. 5,100 $ 374,850
Biotechnology - 0.31%
Charles River Laboratories International, Inc. * 12,100 380,303
Business Services - 2.99%
Macrovision Solutions Corp. * 83,400 1,882,338
Tetra Tech, Inc. * 24,400 626,348
URS Corp. * 24,700 1,187,576
3,696,262
Cable & Television - 0.44%
DIRECTV Group, Inc. * (a) 24,198 544,455
Cellular Communications - 0.95%
Leap Wireless International, Inc. * 15,200 569,848
MetroPCS Communications, Inc. * 35,613 610,051
1,179,899
Copyright © 2012 www.secdatabase.com. All Rights Reserved.Please Consider the Environment Before Printing This Document

Chemicals - 3.80%
Celanese Corp., Series A 70,600 1,448,006
CF Industries Holdings, Inc. 11,900 923,916
Syngenta AG 3,481 847,432
Terra Industries, Inc. 11,800 327,922
The Scotts Company, Class A 33,700 1,155,910
4,703,186
Coal - 0.46%
Alpha Natural Resources, Inc. * 20,500 564,775
Colleges & Universities - 0.45%
Corinthian Colleges, Inc. * 35,753 549,881
Computers & Business Equipment - 0.54%
Western Digital Corp. * 26,800 665,980
Construction & Mining Equipment - 1.55%
Bucyrus International, Inc., Class A 33,600 963,648
Joy Global, Inc. 27,500 947,925
1,911,573
Crude Petroleum & Natural Gas - 2.28%
Southwestern Energy Company * 28,700 1,247,589
Ultra Petroleum Corp. * 13,200 597,696
Whiting Petroleum Corp. * 20,700 970,002
2,815,287
Domestic Oil - 1.63%
Denbury Resources, Inc. * 57,674 991,416
Range Resources Corp. 22,300 1,021,563
2,012,979
Electrical Equipment - 0.50%
Vestas Wind Systems AS * 8,500 621,999
Electrical Utilities - 1.96%
Quanta Services, Inc. * 106,475 2,428,695
Electronics - 1.15%
AU Optronics Corp. ADR 79,600 827,044
LG Display Company, Ltd., ADR (a) 50,103 590,714
1,417,758
Energy - 1.29%
McDermott International, Inc. * 72,400 1,590,628
The accompanying notes are an integral part of the financial statements.
310
JOHN HANCOCK FUNDS II
PORTFOLIO OF INVESTMENTS - May 31, 2009 (Unaudited) - continued(showing percentage of total net assets)
Vista Fund (continued)Shares or
Principal
Amount Value
COMMON STOCKS (continued)
Financial Services - 7.22%
CME Group, Inc. 2,100 $ 675,444
Fidelity National Financial, Inc., Class A 50,130 698,812
IntercontinentalExchange, Inc. * 11,900 1,282,701
Janus Capital Group, Inc. 127,800 1,295,892
Jefferies Group, Inc. * 44,600 964,698
Lazard, Ltd., Class A 29,900 845,572
Morgan Stanley 61,200 1,855,584
TD Ameritrade Holding Corp. * 38,400 654,336
Copyright © 2012 www.secdatabase.com. All Rights Reserved.Please Consider the Environment Before Printing This Document

Waddell & Reed Financial, Inc., Class A 26,800 653,920
8,926,959
Healthcare Products - 1.03%
Edwards Lifesciences Corp. * 9,900 632,016
St. Jude Medical, Inc. * 16,500 643,830
1,275,846
Healthcare Services - 4.79%
Cerner Corp. * (a) 22,500 1,311,525
Express Scripts, Inc. * 29,300 1,876,665
Medco Health Solutions, Inc. * 19,900 913,211
Omnicare, Inc. 46,660 1,261,220
UnitedHealth Group, Inc. 20,853 554,690
5,917,311
Homebuilders - 1.91%
KB Home 80,600 1,209,000
NVR, Inc. * 1,200 593,880
Toll Brothers, Inc. * 29,800 553,684
2,356,564
Hotels & Restaurants - 2.86%
Boyd Gaming Corp. * 27,500 276,100
Brinker International, Inc. 68,179 1,220,404
Darden Restaurants, Inc. 16,765 606,390
P.F. Chang's China Bistro, Inc. * 19,500 622,830
The Cheesecake Factory, Inc. * 34,700 593,717
Wynn Resorts, Ltd. * (a) 5,700 211,242
3,530,683
Industrial Machinery - 2.22%
Cameron International Corp. * 40,000 1,249,200
Flowserve Corp. 12,800 941,696
Ingersoll-Rand Company, Ltd., Class A 27,100 548,233
2,739,129
Industrials - 2.25%
Aecom Technology Corp. * 68,207 2,176,485
Shaw Group, Inc. * 22,400 609,280
2,785,765
International Oil - 0.76%
Nabors Industries, Ltd. * 52,700 942,276
Internet Retail - 0.50%
Netflix, Inc. * (a) 15,700 618,894
Internet Service Provider - 1.72%
Equinix, Inc. * 8,700 647,280
Netease.com, Inc., ADR * (a) 42,751 1,478,330
2,125,610
Vista Fund (continued)Shares or
Principal
Amount Value
COMMON STOCKS (continued)
Internet Software - 3.32%
Digital River, Inc. * 18,900 $ 720,657
McAfee, Inc. * 49,053 1,924,349
Shanda Interactive Entertainment, Ltd. * (a) 25,403 1,463,721
4,108,727
Investment Companies - 0.50%
Powershares QQQ * (a) 17,400 617,004
Copyright © 2012 www.secdatabase.com. All Rights Reserved.Please Consider the Environment Before Printing This Document

Leisure Time - 3.80%
International Game Technology 19,400 336,784
Las Vegas Sands Corp. * (a) 114,900 1,138,659
Melco Crown Entertainment, Ltd., ADR * 53,500 322,070
Penn National Gaming, Inc. * 33,100 1,094,617
Pinnacle Entertainment, Inc. * 53,300 567,645
Royal Caribbean Cruises, Ltd. (a) 37,200 560,232
WMS Industries, Inc. * 19,200 681,024
4,701,031
Manufacturing - 0.42%
Harley-Davidson, Inc. (a) 30,400 515,888
Metal & Metal Products - 2.25%
Crown Holdings, Inc. * 79,201 1,861,223
Precision Castparts Corp. 11,200 924,784
2,786,007
Mining - 3.29%
Agnico Eagle Mines, Ltd. 12,100 748,506
Cliffs Natural Resources, Inc. 23,500 640,375
Freeport-McMoRan Copper & Gold, Inc.,
Class B 35,800 1,948,594
Kinross Gold Corp. 36,400 736,008
4,073,483
Oil & Gas Drilling - 1.04%
Atwood Oceanics, Inc. * 48,500 1,283,310
Oil Comp-Explor&Prodtn - 0.55%
Continental Resources, Inc. * (a) 23,100 683,991
Petroleum Services - 3.88%
Oceaneering International, Inc. * 18,800 966,696
PetroHawk Energy Corp. * 88,814 2,238,113
Weatherford International, Ltd. * 76,900 1,591,830
4,796,639
Pharmaceuticals - 1.77%
Alexion Pharmaceuticals, Inc. * 26,400 963,600
Mylan, Inc. * (a) 83,200 1,099,072
Onyx Pharmaceuticals, Inc. * 5,100 120,666
2,183,338
Retail Trade - 7.85%
Advance Auto Parts, Inc. 29,300 1,247,887
Aeropostale, Inc. * 41,800 1,447,116
Bed Bath & Beyond, Inc. * 20,500 576,255
Best Buy Company, Inc. 15,700 551,070
Big Lots, Inc. * 26,400 607,464
Dollar Tree, Inc. * 42,800 1,916,156
Family Dollar Stores, Inc. 60,100 1,819,227
Ross Stores, Inc. 39,260 1,537,422
9,702,597
The accompanying notes are an integral part of the financial statements.
311
JOHN HANCOCK FUNDS II
PORTFOLIO OF INVESTMENTS - May 31, 2009 (Unaudited) - continued(showing percentage of total net assets)
Vista Fund (continued)Shares or
Principal
Amount Value
Copyright © 2012 www.secdatabase.com. All Rights Reserved.Please Consider the Environment Before Printing This Document

COMMON STOCKS (continued)
Semiconductors - 8.41%
Altera Corp. 39,600 $ 673,992
ASML Holding NV 29,800 616,860
Broadcom Corp., Class A * 74,900 1,908,452
Marvell Technology Group, Ltd. * 79,900 913,257
Microsemi Corp. * 91,031 1,225,277
PMC-Sierra, Inc. * 203,000 1,540,770
Semtech Corp. * 57,800 930,002
Silicon Laboratories, Inc. * 28,800 968,256
Teradyne, Inc. * 132,800 949,520
Xilinx, Inc. 32,300 669,902
10,396,288
Steel - 1.77%
AK Steel Holding Corp. 43,292 619,076
Allegheny Technologies, Inc. 16,400 580,724
Companhia Siderurgica Nacional SA, SADR 40,400 990,608
2,190,408
Telecommunications Equipment &
Services - 5.43%
American Tower Corp., Class A * 39,800 1,268,426
CommScope, Inc. * 16,830 441,619
Corning, Inc. 123,800 1,819,860
SBA Communications Corp. * 124,588 3,185,715
6,715,620
Telephone - 0.99%
Sprint Nextel Corp. * 238,400 1,227,760
Transportation - 1.85%
C.H. Robinson Worldwide, Inc. 11,300 574,266
Diana Shipping, Inc. 42,444 765,265
Expeditors International of Washington, Inc. 17,900 587,299
Genco Shipping & Trading, Ltd. 13,700 358,255
2,285,085
Travel Services - 0.51%
Ctrip.com International, Ltd., ADR 15,500 634,725
TOTAL COMMON STOCKS (Cost $109,893,726) $ 121,593,026
INVESTMENT COMPANIES - 0.49%
Investment Companies - 0.49%
iShares Russell 2000 Index Fund (a) 12,100 608,267
TOTAL INVESTMENT COMPANIES (Cost $574,648) $ 608,267
SHORT TERM INVESTMENTS - 5.41%
John Hancock Collateral Investment
Trust, 0.7339% (c)(g) $ 668,885 $ 6,688,854
TOTAL SHORT TERM INVESTMENTS
(Cost $6,688,854) $ 6,688,854
Vista Fund (continued)Shares or
Principal
Amount Value
REPURCHASE AGREEMENTS - 11.83%
Repurchase Agreement with State
Street Corp. dated 05/29/2009 at
0.07% to be repurchased at
$14,634,085 on 06/01/2009,
collateralized by $14,530,000
Federal National Mortgage
Association, 5.85% due
Copyright © 2012 www.secdatabase.com. All Rights Reserved.Please Consider the Environment Before Printing This Document

08/17/2017 (valued at
$14,929,575, including interest) $ 14,634,000 $ 14,634,000
TOTAL REPURCHASE AGREEMENTS
(Cost $14,634,000) $ 14,634,000
Total Investments (Vista Fund)
(Cost $131,791,228) - 116.08% $ 143,524,147
Other assets and liabilities, net - (16.08)% (19,886,654)
TOTAL NET ASSETS - 100.00% $ 123,637,493
FootnotesPercentages are stated as a percent of net assets.
Key to Currency Abbreviations
ARS - Argentine Peso
AUD - Australian Dollar
BRL - Brazilian Real
CAD - Canadian Dollar
CHF - Swiss Franc
COP - Colombian Peso
CZK - Czech Koruna
DKK - Danish Krone
EGP - Egyptian Pound
EUR - European Currency
GBP - British Pound
GRD - Greek Drachma
HKD - Hong Kong Dollar
HUF - Hungarian Forint
IDR - Indonesian Rupiah
ILS - Israeli Shekel
INR - Indian Rupee
JPY - Japanese Yen
KRW - South Korean Won
MXN - Mexican Peso
MYR - Malaysian Ringgit
NGN - Nigerian Naira
NZD - New Zealand Dollar
NOK - Norwegian Krone
PHP - Philippines Peso
PLN - Polish Zloty
RUB - Russian Ruble
SEK - Swedish Krona
SGD - Singapore Dollar
THB - Thai Baht
TRY - Turkish Lira
TWD - Taiwan Dollar
USD - US Dollar
UYU - Uruguayan Peso
ZAR - South African Rand
The accompanying notes are an integral part of the financial statements.
312
JOHN HANCOCK FUNDS II
PORTFOLIO OF INVESTMENTS - May 31, 2009 (Unaudited) - continued(showing percentage of total net assets)
Key to Security Abbreviations and Legend
ADR - American Depositary Receipts
ADS - American Depositary Shares
BKNT - Bank Note
CDO - Collateralized Debt Obligation
ESOP - Employee Stock Ownership Program
Copyright © 2012 www.secdatabase.com. All Rights Reserved.Please Consider the Environment Before Printing This Document

EMTN - European Medium Term Note
ETF - Exchange Traded Fund
EWCO - European Written Call Option
GDR - Global Depositary Receipts
GMTN - Global Medium Term Note
GTD - Guaranteed
IO - Interest Only (Carries notional principal amount)
MTN - Medium Term Note
NIM - Net Interest Margin
NVDR - Non Voting Depositary Receipts
OTC - Over The Counter
PIK - Paid In Kind
PO - Principal Only
REIT - Real Estate Investment Trust
REMIC - Real Estate Mortgage Investment Conduit
SBA - Small Business Administration
SBI - Shares Beneficial Interest
SADR - Sponsored American Depositary Receipts
SPDR - Standard & Poor's Depositary Receipts
TBA - To Be Announced
TIPS - Treasury Inflation Protected Security
^ Non-Income Producing, issuer is in bankruptcy and is in default of interest payments
* Non-Income Producing
(a) All or a portion of this security was out on loan
(b) Variable rate obligation. The coupon rate shown represents the rate at period end.
(c) The investment is an affiliate of the fund, the adviser and/or the subadviser.
(d) Principal amount of security is adjusted for inflation.
(e) Security Fair Valued on May 31, 2009.
(f) 144A: Security exempt from registration under Rule 144A of the Securities Act of 1933. These securities may be resold in transactions exempt from registration, normally to qualified institutional buyers.
(g) John Hancock Collateral Investment Trust is managed by MFC Global Investment Management (U.S.), LLC, and represents investment of securities lending collateral. The rate shown is the annualized seven-day yield at May 31,
2009.
(h) The subadviser is an affiliate of the adviser.
(i) Variable Rate Preferred
(j) Delisted
(k) All or a portion of this position represents unsettled loan commitment. The coupon rate will be determined at time of settlement.
** Purchased on a forward commitment
*** At period end, all or a portion of this security was pledged to cover margin requirements for open futures contracts.
The accompanying notes are an integral part of the financial statements.
313
Security Valuation Investments are stated at value as of the close of the regular trading on the New York Stock Exchange (NYSE), normally at 4:00 P.M., Eastern Time. Securities held by the Funds are valued at the last sale price or
official closing price (closing bid price or last evaluated price if no sale has occurred) as of the close of business on the principal securities exchange (domestic or foreign) on which they trade. Debt obligations are valued based on the
evaluated prices provided by an independent pricing service, which utilizes both dealer-supplied and electronic data processing techniques, which take into account factors such as institutional -size trading in similar groups of
securities, yield, quality, coupon rate, maturity, type of issue, trading characteristics and other market data as well as broker quotes. Foreign securities and currencies are valued in U.S. dollars, based on foreign currency exchange rates
supplied by an independent pricing service. Securities sold short are valued at the closing asking price. Securities traded only in the over-the-counter market are valued at the last bid price quoted by brokers making markets in the
securities at the close of trading. Equity and debt obligations, for which there are no prices available from an independent pricing service, are valued based on broker quotes or fair valued, as described below. Short-term debt
investments that have a remaining maturity of 60 days or less are valued at amortized cost, and thereafter assume a constant amortization to maturity of any discount or premium, which approximates market value. Investment in John
Hancock Collateral Investment Trust (JHCIT), an affiliated registered investment company managed by John Hancock Advisers, LLC (the Adviser), a wholly owned subsidiary of John Hancock Financial Services, Inc., a subsidiary of
Manulife Financial Corporation (MFC), are valued at its net asset value each business day.
Copyright © 2012 www.secdatabase.com. All Rights Reserved.Please Consider the Environment Before Printing This Document

Other assets and securities for which no such quotations are readily available are valued at fair value as determined in good faith under consistently applied procedures established by and under the general supervision of the Board of
Trustees. Generally, trading in non-U.S. securities is substantially completed each day at various times prior to the close of trading on the NYSE. The values of such securities used in computing the net asset value of the Fund�s shares
are generally determined as of such times. Occasionally, significant events that affect the values of such securities may occur between the times at which such values are generally determined and the close of the NYSE. Upon such an
occurrence, these securities will be valued at fair value as determined in good faith under consistently applied procedures established by and under the general supervision of the Board of Trustees.
Valuations change in response to many factors including the historical and prospective earnings of the issuer, the value of the issuer�s assets, general economic and market conditions, interest rates, investor perceptions and market
liquidity.
The Fund adopted Statement of Financial Accounting Standards No. 157 (FAS 157), Fair Value Measurements, effective with the beginning of the Fund�s fiscal year. FAS 157 established a three-tier hierarchy to prioritize the
assumptions, referred to as inputs, used in valuation techniques to measure fair value. The three-tier hierarchy of inputs is summarized in the three broad levels listed below:
� Level 1 � Quoted prices in active markets for identical securities.
� Level 2 � Prices determined using other significant observable inputs. Observable inputs are inputs that other market participants would use in pricing a security . These may include quoted prices for similar securities, interest rates,
prepayment speeds, credit risk and others.
� Level 3 � Prices determined using significant unobservable inputs. In situations where quoted prices or observable inputs are unavailable, such as when there is little or no market activity for an investment, unobservable inputs may
be used. Unobservable inputs reflect the Funds� Pricing Committee�s own assumptions about the factors that market participants would use in pricing an investment and would be based on the best information available.
The inputs or methodology used for valuing securities are not necessarily an indication of the risk associated with investing in those securities.
The following is a summary of the inputs used to value the Funds� net assets as of May 31, 2009. Other financial instruments are derivative instruments not reflected in the Portfolio of Investments, such as futures, forwards, options
and swap contracts, which are stated at market value.
Active Bond Fund All Cap Core Fund
Investments in Other Financial Investments in Other Financial
Valuation Inputs: Securities Instruments* Valuation Inputs: Securities Instruments*
Level 1 � Quoted Prices $771,301 $111,688 Level 1 � Quoted Prices $338,919,811 $5,352,119
Level 2 � Other Significant Observable
Level 2 � Other Significant Observable Inputs 537,422,605 - Inputs 41,809,735 -
Level 3 � Significant Unobservable
Level 3 � Significant Unobservable Inputs 9,071,309 - Inputs - -
Total $547,265,215 $111,688 Total $380,729,546 $5,352,119
All Cap Growth Fund All Cap Value Fund
Investments in Other Financial Investments in Other Financial
Valuation Inputs: Securities Instruments* Valuation Inputs: Securities Instruments*
Level 1 � Quoted Prices $77,390,787 - Level 1 � Quoted Prices $161,624,040 -
Level 2 � Other Significant Observable
Level 2 � Other Significant Observable Inputs 6,108,786 - Inputs 24,118,000 -
Level 3 � Significant Unobservable
Level 3 � Significant Unobservable Inputs - - Inputs - -
Total $83,499,573 - Total $185,742,040 -
Alpha Opportunities Fund Alternative Asset Allocation Fund
Investments in Other Financial Investments in Other Financial
Valuation Inputs: Securities Instruments* Valuation Inputs: Securities Instruments*
Level 1 � Quoted Prices $476,510,060 - Level 1 � Quoted Prices $1,176,290 -
Level 2 � Other Significant Observable
Level 2 � Other Significant Observable Inputs 70,819,049 - Inputs - -
Level 3 � Significant Unobservable
Level 3 � Significant Unobservable Inputs - - Inputs - -
Total $547,329,109 - Total $1,176,290 -
American Diversified Growth & Income Fund American Fundamental Holdings Fund
Investments in Other Financial Investments in Other Financial
Valuation Inputs: Securities Instruments* Valuation Inputs: Securities Instruments*
Level 1 � Quoted Prices $6,744,165 - Level 1 � Quoted Prices $4,519,326 -
Level 2 � Other Significant Observable
Level 2 � Other Significant Observable Inputs - - Inputs - -
Level 3 � Significant Unobservable
Level 3 � Significant Unobservable Inputs - - Inputs - -
Total $6,744,165 - Total $4,519,326 -
American Global Diversification Fund Blue Chip Growth Fund
Investments in Other Financial Investments in Other Financial
Valuation Inputs: Securities Instruments* Valuation Inputs: Securities Instruments*
Copyright © 2012 www.secdatabase.com. All Rights Reserved.Please Consider the Environment Before Printing This Document

Level 1 � Quoted Prices $4,420,936 - Level 1 � Quoted Prices $1,288,276,387 -
Level 2 � Other Significant Observable
Level 2 � Other Significant Observable Inputs - - Inputs 18,712,861 -
Level 3 � Significant Unobservable
Level 3 � Significant Unobservable Inputs - - Inputs - -
Total $4,420,936 - Total $1,306,989,248 -
Capital Appreciation Fund Core Bond Fund
Investments in Other Financial Investments in Other Financial
Valuation Inputs: Securities Instruments* Valuation Inputs: Securities Instruments*
Level 1 � Quoted Prices $932,679,017 - Level 1 � Quoted Prices - -
Level 2 � Other Significant Observable
Level 2 � Other Significant Observable Inputs 61,940,153 - Inputs $354,982,075 -
Level 3 � Significant Unobservable
Level 3 � Significant Unobservable Inputs - - Inputs - -
Total $994,619,170 - Total $354,982,075 -
Emerging Markets Value Fund Emerging Small Company Fund
Investments in Other Financial Investments in Other Financial
Valuation Inputs: Securities Instruments* Valuation Inputs: Securities Instruments*
Level 1 � Quoted Prices $332,615,507 - Level 1 � Quoted Prices $25,269,722 -
Level 2 � Other Significant Observable
Level 2 � Other Significant Observable Inputs 679,644,523 - Inputs 1,860,680 -
Level 3 � Significant Unobservable
Level 3 � Significant Unobservable Inputs 143,350 - Inputs - -
Total $1,012,403,380 - Total $27,130,402 -
Equity-Income Fund Fundamental Value Fund
Investments in Other Financial Investments in Other Financial
Valuation Inputs: Securities Instruments* Valuation Inputs: Securities Instruments*
Level 1 � Quoted Prices $701,878,081 - Level 1 � Quoted Prices $1,032,997,085 -
Level 2 � Other Significant Observable
Level 2 � Other Significant Observable Inputs 19,906,120 - Inputs 178,874,010 -
Level 3 � Significant Unobservable
Level 3 � Significant Unobservable Inputs - - Inputs - -
Total $721,784,201 - Total $1,211,871,095 -
Global Agribusiness Fund Global Bond Fund
Investments in Other Financial Investments in Other Financial
Valuation Inputs: Securities Instruments* Valuation Inputs: Securities Instruments*
Level 1 � Quoted Prices $2,003,531 - Level 1 � Quoted Prices $64,728 $606,868
Level 2 � Other Significant Observable
Level 2 � Other Significant Observable Inputs 230,724 - Inputs 640,406,230 17,933,928
Level 3 � Significant Unobservable
Level 3 � Significant Unobservable Inputs - - Inputs 5,194,773 -
Total $2,234,255 - Total $645,665,731 $18,540,796
Global Infrastructure Fund Global Real Estate Fund
Investments in Other Financial Investments in Other Financial
Valuation Inputs: Securities Instruments* Valuation Inputs: Securities Instruments*
Level 1 � Quoted Prices $1,456,209 - Level 1 � Quoted Prices $227,444,540 -
Level 2 � Other Significant Observable
Level 2 � Other Significant Observable Inputs 383,312 - Inputs 187,122,477 ($3,092,084)
Level 3 � Significant Unobservable
Level 3 � Significant Unobservable Inputs - - Inputs - -
Total $1,839,521 - Total $414,567,017 ($3,092,084)
Global Timber Fund High Income Fund
Investments in Other Financial Investments in Other Financial
Valuation Inputs: Securities Instruments* Valuation Inputs: Securities Instruments*
Level 1 � Quoted Prices $1,404,536 - Level 1 � Quoted Prices $42,196,822
Level 2 � Other Significant Observable
Level 2 � Other Significant Observable Inputs 542,140 - Inputs 299,162,284 ($451,924)
Level 3 � Significant Unobservable
Level 3 � Significant Unobservable Inputs - - Inputs 27,011,218 (2,642,080)
Total $1,946,676 - Total $368,370,324 ($3,094,004)
Copyright © 2012 www.secdatabase.com. All Rights Reserved.Please Consider the Environment Before Printing This Document

High Yield Fund Index 500 Fund
Investments in Other Financial Investments in Other Financial
Valuation Inputs: Securities Instruments* Valuation Inputs: Securities Instruments*
Level 1 � Quoted Prices $10,591,030 - Level 1 � Quoted Prices $1,869,489,239 $10,555,362
Level 2 � Other Significant Observable
Level 2 � Other Significant Observable Inputs 1,065,832,620 - Inputs 78,276,445 -
Level 3 � Significant Unobservable
Level 3 � Significant Unobservable Inputs 14,706,772 - Inputs - -
Total $1,091,130,422 - Total $1,947,765,684 $10,555,362
International Equity Index Fund International Opportunities Fund
Investments in Other Financial Investments in Other Financial
Valuation Inputs: Securities Instruments* Valuation Inputs: Securities Instruments*
Level 1 � Quoted Prices $83,508,526 $305,987 Level 1 � Quoted Prices $205,137,415 -
Level 2 � Other Significant Observable
Level 2 � Other Significant Observable Inputs 313,070,984 792,934 Inputs 516,778,922 -
Level 3 � Significant Unobservable
Level 3 � Significant Unobservable Inputs 323,057 - Inputs - -
Total $396,902,567 $1,098,921 Total $721,916,337 -
International Small Cap Fund International Small Company Fund
Investments in Other Financial Investments in Other Financial
Valuation Inputs: Securities Instruments* Valuation Inputs: Securities Instruments*
Level 1 � Quoted Prices $27,877,617 - Level 1 � Quoted Prices $26,009,358 -
Level 2 � Other Significant Observable
Level 2 � Other Significant Observable Inputs 233,719,097 - Inputs 175,962,926 -
Level 3 � Significant Unobservable
Level 3 � Significant Unobservable Inputs - - Inputs 1,838 -
Total $261,596,714 - Total $201,974,122 -
International Value Fund Investment Quality Bond Fund
Investments in Other Financial Investments in Other Financial
Valuation Inputs: Securities Instruments* Valuation Inputs: Securities Instruments*
Level 1 � Quoted Prices $217,250,687 - Level 1 � Quoted Prices $6,775 ($409,770)
Level 2 � Other Significant Observable
Level 2 � Other Significant Observable Inputs 940,853,430 - Inputs 169,248,550 (537,034)
Level 3 � Significant Unobservable
Level 3 � Significant Unobservable Inputs - - Inputs - -
Total $1,158,104,117 - Total $169,255,325 ($946,804)
Large Cap Fund Large Cap Value Fund
Investments in Other Financial Investments in Other Financial
Valuation Inputs: Securities Instruments* Valuation Inputs: Securities Instruments*
Level 1 � Quoted Prices 186,658,847 - Level 1 � Quoted Prices $452,413,111 -
Level 2 � Other Significant Observable
Level 2 � Other Significant Observable Inputs 5,462,000 - Inputs 907,000 -
Level 3 � Significant Unobservable
Level 3 � Significant Unobservable Inputs - - Inputs - -
Total 192,120,847 - Total $453,320,111 -
Mid Cap Index Fund Mid Cap Intersection Fund
Investments in Other Financial Investments in Other Financial
Valuation Inputs: Securities Instruments* Valuation Inputs: Securities Instruments*
Level 1 � Quoted Prices $378,051,330 $2,907,037 Level 1 � Quoted Prices $76,669,848 $79,512
Level 2 � Other Significant Observable
Level 2 � Other Significant Observable Inputs 39,607,000 - Inputs 1,100,000 -
Level 3 � Significant Unobservable
Level 3 � Significant Unobservable Inputs - - Inputs - -
Total $417,658,330 $2,907,037 Total $77,769,848 $79,512
Mid Cap Stock Fund Mid Cap Value Equity Fund
Investments in Other Financial Investments in Other Financial
Valuation Inputs: Securities Instruments* Valuation Inputs: Securities Instruments*
Level 1 � Quoted Prices $531,253,075 - Level 1 � Quoted Prices $109,580,610 -
Level 2 � Other Significant Observable
Level 2 � Other Significant Observable Inputs 62,376,092 - Inputs 11,403,888 -
Copyright © 2012 www.secdatabase.com. All Rights Reserved.Please Consider the Environment Before Printing This Document

Level 3 � Significant Unobservable
Level 3 � Significant Unobservable Inputs - - Inputs - -
Total $593,629,167 - Total $120,984,498 -
Mid Value Fund Natural Resources Fund
Investments in Other Financial Investments in Other Financial
Valuation Inputs: Securities Instruments* Valuation Inputs: Securities Instruments*
Level 1 � Quoted Prices $121,502,121 - Level 1 � Quoted Prices $539,630,101 -
Level 2 � Other Significant Observable
Level 2 � Other Significant Observable Inputs 29,670,913 - Inputs 139,195,069 -
Level 3 � Significant Unobservable
Level 3 � Significant Unobservable Inputs - - Inputs - -
Total $151,173,034 - Total $678,825,170 -
Optimized All Cap Fund
Investments in Other Financial
Valuation Inputs: Securities Instruments*
Level 1 � Quoted Prices $3,404,017 -
Level 2 � Other Significant Observable Inputs - -
Level 3 � Significant Unobservable Inputs - -
Total $3,404,017 -
Real Estate Equity Fund Real Estate Securities Fund
Investments in Other Financial Investments in Other Financial
Valuation Inputs: Securities Instruments* Valuation Inputs: Securities Instruments*
Level 1 � Quoted Prices $164,700,504 - Level 1 � Quoted Prices $65,041,466 -
Level 2 � Other Significant Observable
Level 2 � Other Significant Observable Inputs 19,660,868 - Inputs 898,000 -
Level 3 � Significant Unobservable
Level 3 � Significant Unobservable Inputs - - Inputs - -
Total $184,361,372 - Total $65,939,466 -
Real Return Bond Fund Short Term Government Income Fund
Investments in Other Financial Investments in Other Financial
Valuation Inputs: Securities Instruments* Valuation Inputs: Securities Instruments*
Level 1 � Quoted Prices $372,500 $1,269,743 Level 1 � Quoted Prices - -
Level 2 � Other Significant Observable
Level 2 � Other Significant Observable Inputs 1,395,491,484 7,035,085 Inputs $19,248,184 -
Level 3 � Significant Unobservable
Level 3 � Significant Unobservable Inputs 42,996 - Inputs 820,875 -
Total $1,395,906,980 $8,304,828 Total $20,069,059 -
Small Cap Growth Fund Small Cap Index Fund
Investments in Other Financial Investments in Other Financial
Valuation Inputs: Securities Instruments* Valuation Inputs: Securities Instruments*
Level 1 � Quoted Prices $111,962,737 - Level 1 � Quoted Prices $115,588,983 $499,944
Level 2 � Other Significant Observable
Level 2 � Other Significant Observable Inputs 3,100,000 - Inputs 5,232,000 -
Level 3 � Significant Unobservable
Level 3 � Significant Unobservable Inputs - - Inputs 171 -
Total $115,062,737 - Total $120,821,154 $499,944
Small Cap Opportunities Fund Small Cap Value Fund
Investments in Other Financial Investments in Other Financial
Valuation Inputs: Securities Instruments* Valuation Inputs: Securities Instruments*
Level 1 � Quoted Prices $98,316,637 - Level 1 � Quoted Prices $30,746,672 -
Level 2 � Other Significant Observable
Level 2 � Other Significant Observable Inputs 3,461,000 - Inputs 6,200,000 -
Level 3 � Significant Unobservable
Level 3 � Significant Unobservable Inputs - - Inputs - -
Total $101,777,637 - Total $36,946,672 -
Small Company Growth Fund Small Company Value Fund
Investments in Other Financial Investments in Other Financial
Valuation Inputs: Securities Instruments* Valuation Inputs: Securities Instruments*
Level 1 � Quoted Prices $132,340,584 - Level 1 � Quoted Prices $385,125,472 -
Copyright © 2012 www.secdatabase.com. All Rights Reserved.Please Consider the Environment Before Printing This Document

Level 2 � Other Significant Observable
Level 2 � Other Significant Observable Inputs 436,000 - Inputs 7,462,020 -
Level 3 � Significant Unobservable
Level 3 � Significant Unobservable Inputs - - Inputs - -
Total $132,776,584 - Total $392,587,492 -
Smaller Company Growth Fund Spectrum Income Fund
Investments in Other Financial Investments in Other Financial
Valuation Inputs: Securities Instruments* Valuation Inputs: Securities Instruments*
Level 1 � Quoted Prices $133,165,946 $106,578 Level 1 � Quoted Prices $137,766,325 ($407,134)
Level 2 � Other Significant Observable
Level 2 � Other Significant Observable Inputs 4,187,000 - Inputs 665,455,111 (501,778)
Level 3 � Significant Unobservable
Level 3 � Significant Unobservable Inputs - - Inputs 1,129,045 -
Total $137,352,946 $106,578 Total $804,350,481 ($908,912)
Strategic Bond Fund Strategic Income Fund
Investments in Other Financial Investments in Other Financial
Valuation Inputs: Securities Instruments* Valuation Inputs: Securities Instruments*
Level 1 � Quoted Prices $303,616 ($854,238) Level 1 � Quoted Prices $4,246,774 -
Level 2 � Other Significant Observable
Level 2 � Other Significant Observable Inputs 487,382,668 - Inputs 407,320,575 ($13,689,743)
Level 3 � Significant Unobservable
Level 3 � Significant Unobservable Inputs 7,894,956 - Inputs 10,494,650 (262,953)
Total $495,581,240 ($854,238) Total $422,061,999 ($13,952,696)
Total Bond Market Fund Total Return Fund
Investments in Other Financial Investments in Other Financial
Valuation Inputs: Securities Instruments* Valuation Inputs: Securities Instruments*
Level 1 � Quoted Prices - - Level 1 � Quoted Prices $8,251,431 $19,860,154
Level 2 � Other Significant Observable
Level 2 � Other Significant Observable Inputs $397,310,046 - Inputs 2,320,084,546 9,706,359
Level 3 � Significant Unobservable
Level 3 � Significant Unobservable Inputs - - Inputs 816,290 -
Total $397,310,046 - Total $2,329,152,267 $29,566,513
U.S. Government Securities Fund U.S. High Yield Bond Fund
Investments in Other Financial Investments in Other Financial
Valuation Inputs: Securities Instruments* Valuation Inputs: Securities Instruments*
Level 1 � Quoted Prices $23,787 ($268,920) Level 1 � Quoted Prices - -
Level 2 � Other Significant Observable
Level 2 � Other Significant Observable Inputs 156,804,174 - Inputs $592,484,937 -
Level 3 � Significant Unobservable
Level 3 � Significant Unobservable Inputs 857,439 - Inputs 35,000 -
Total $157,685,400 ($268,920) Total $592,519,937 -
U.S. Multi Sector Fund Value Fund
Investments in Other Financial Investments in Other Financial
Valuation Inputs: Securities Instruments* Valuation Inputs: Securities Instruments*
Level 1 � Quoted Prices $650,514,473 $615,888 Level 1 � Quoted Prices $57,571,836 -
Level 2 � Other Significant Observable
Level 2 � Other Significant Observable Inputs 38,454,000 - Inputs 25,999,924 -
Level 3 � Significant Unobservable
Level 3 � Significant Unobservable Inputs - - Inputs - -
Total $688,968,473 $615,888 Total $83,571,760 -
Value & Restructuring Fund Vista Fund
Investments in Other Financial Investments in Other Financial
Valuation Inputs: Securities Instruments* Valuation Inputs: Securities Instruments*
Level 1 � Quoted Prices $451,727,217 - Level 1 � Quoted Prices $127,420,716 -
Level 2 � Other Significant Observable
Level 2 � Other Significant Observable Inputs 14,902,965 - Inputs 16,103,431 ($15,731)
Level 3 � Significant Unobservable
Level 3 � Significant Unobservable Inputs 25,596 - Inputs - -
Total $466,655,778 - Total $143,524,147 ($15,731)
Copyright © 2012 www.secdatabase.com. All Rights Reserved.Please Consider the Environment Before Printing This Document

* Other financial instruments are derivative instruments not reflected in the Portfolio of Investments, such as futures, forwards, options and swap contracts, which are stated at market value.
The following is a reconciliation of Level 3 assets for which significant unobservable inputs were used to determine fair value:
Active Bond Fund Core Bond Fund
Investments in Other Financial Investments in Other Financial
Securities Instruments Securities Instruments
Balance as of 8/31/08 $15,261,255 Balance as of 8/31/08 $1,439,613 -
Accrued discounts/premiums 51,374 - Accrued discounts/premiums -
Realized gain (loss) 195,708 - Realized gain (loss) (165,998) -
Change in unrealized appreciation Change in unrealized appreciation
(depreciation) (8,009,662) - (depreciation) 37,387 -
Net purchases (sales) (323,504) - Net purchases (sales) (1,311,002) -
Transfers in and/or out of Level 3 1,896,138 - Transfers in and/or out of Level 3 -
Balance as of 5/31/09 $9,071,309 - Balance as of 5/31/09 - -
Emerging Markets Value Fund Equity-Income Fund
Investments in Other Financial Investments in Other Financial
Securities Instruments Securities Instruments
Balance as of 8/31/08 $148,620 - Balance as of 8/31/08 $5,492,346 -
Accrued discounts/premiums - Accrued discounts/premiums -
Realized gain (loss) (24,897) - Realized gain (loss) -
Change in unrealized appreciation Change in unrealized appreciation
(depreciation) (21,034) - (depreciation) 307,654 -
Net purchases (sales) - Net purchases (sales) (5,800,000) -
Transfers in and/or out of Level 3 40,661 - Transfers in and/or out of Level 3 - -
Balance as of 5/31/09 $143,350 - Balance as of 5/31/09 - -
Emerging Small Company Fund Fundamental Value Fund
Investments in Other Financial Investments in Other Financial
Securities Instruments Securities Instruments
Balance as of 8/31/08 - - Balance as of 8/31/08 $2,457,280 -
Accrued discounts/premiums - Accrued discounts/premiums - -
Realized gain (loss) - Realized gain (loss) - -
Change in unrealized appreciation - Change in unrealized appreciation
(depreciation) ($39,208) - (depreciation) - -
Net purchases (sales) - Net purchases (sales) - -
Transfers in and/or out of Level 3 39,208 Transfers in and/or out of Level 3 (2,457,280) -
Balance as of 5/31/09 - Balance as of 5/31/09 - -
Global Bond Fund High Income Fund
Investments in Other Financial Investments in Other Financial
Securities Instruments Securities Instruments
Balance as of 8/31/08 $20,375,886 - Balance as of 8/31/08 $37,575,120 -
Accrued discounts/premiums (29,043) - Accrued discounts/premiums 366,293 -
Realized gain (loss) 42,709 - Realized gain (loss) (59,379) -
Change in unrealized appreciation Change in unrealized appreciation
(depreciation) (701,265) - (depreciation) (15,771,665) $881,020
Net purchases (sales) (4,086,216) - Net purchases (sales) 7,879,812 (3,523,100)
Transfers in and/or out of Level 3 (10,407,298) - Transfers in and/or out of Level 3 (2,978,963) -
Balance as of 5/31/09 $5,194,773 - Balance as of 5/31/09 $27,011,218 ($2,642,080)
High Yield Fund International Equity Index Fund
Investments in Other Financial Investments in Other Financial
Securities Instruments Securities Instruments
Balance as of 8/31/08 $5,849,979 - Balance as of 8/31/08 $49,973
Accrued discounts/premiums 68,887 - Accrued discounts/premiums -
Realized gain (loss) (2,610,345) - Realized gain (loss) (36,898)
Change in unrealized appreciation Change in unrealized appreciation
(depreciation) (6,994,443) - (depreciation) (315,786)
Net purchases (sales) 6,098,550 - Net purchases (sales) 1,064
Transfers in and/or out of Level 3 12,294,144 - Transfers in and/or out of Level 3 624,704
Balance as of 5/31/09 $14,706,772 - Balance as of 5/31/09 $323,057 -
International Small Company Fund International Small Cap
Investments in Other Financial Investments in Other Financial
Copyright © 2012 www.secdatabase.com. All Rights Reserved.Please Consider the Environment Before Printing This Document

Securities Instruments Securities Instruments
Balance as of 8/31/08 $839,314 - Balance as of 8/31/08 -
Accrued discounts/premiums - - Accrued discounts/premiums -
Realized gain (loss) (388,696) - Realized gain (loss) -
Change in unrealized appreciation Change in unrealized appreciation
(depreciation) (742,180) - (depreciation) ($7,979,646)
Net purchases (sales) (217,117) - Net purchases (sales) 2,022,391
Transfers in and/or out of Level 3 510,517 - Transfers in and/or out of Level 3 5,957,255
Balance as of 5/31/09 $1,838 - Balance as of 5/31/09 - -
Investment Quality Bond Fund Real Return Bond Fund
Investments in Other Financial Investments in Other Financial
Securities Instruments Securities Instruments
Balance as of 8/31/08 $22,342 - Balance as of 8/31/08 $585,998 -
Accrued discounts/premiums 553 - Accrued discounts/premiums 21 -
Realized gain (loss) (63,470) - Realized gain (loss) 1,126 -
Change in unrealized appreciation Change in unrealized appreciation
(depreciation) 64,065 - (depreciation) 4,785 -
Net purchases (sales) (23,490) - Net purchases (sales) (186,723) -
Transfers in and/or out of Level 3 - - Transfers in and/or out of Level 3 (362,211) -
Balance as of 5/31/09 - - Balance as of 5/31/09 $42,996 -
Short Term Government Income Fund Small Cap Index Fund
Investments in Other Financial Investments in Other Financial
Securities Instruments Securities Instruments
Balance as of 8/31/08 - - Balance as of 8/31/08 - -
Accrued discounts/premiums - - Accrued discounts/premiums - -
Realized gain (loss) - - Realized gain (loss) - -
Change in unrealized appreciation Change in unrealized appreciation
(depreciation) - - (depreciation) $171 -
Net purchases (sales) $820,875 - Net purchases (sales) - -
Transfers in and/or out of Level 3 - - Transfers in and/or out of Level 3 - -
Balance as of 5/31/09 $820,875 - Balance as of 5/31/09 $171 -
Small Cap Opportunities Fund Spectrum Income Fund
Investments in Other Financial Investments in Other Financial
Securities Instruments Securities Instruments
Balance as of 8/31/08 $156,600 - Balance as of 8/31/08 $2,456,779 -
Accrued discounts/premiums - - Accrued discounts/premiums 2,878 -
Realized gain (loss) (1,127,333) - Realized gain (loss) (85,176) -
Change in unrealized appreciation Change in unrealized appreciation
(depreciation) 993,690 - (depreciation) (328,241) -
Net purchases (sales) (22,957) - Net purchases (sales) (1,189,185) -
Transfers in and/or out of Level 3 - - Transfers in and/or out of Level 3 271,990 -
Balance as of 5/31/09 - - Balance as of 5/31/09 $1,129,045 -
Strategic Bond Fund Strategic Income Fund
Investments in Other Financial Investments in Other Financial
Securities Instruments Securities Instruments
Balance as of 8/31/08 $11,286,509 - Balance as of 8/31/08 $7,455,685 -
Accrued discounts/premiums 607,240 - Accrued discounts/premiums 70,499 -
Realized gain (loss) (157,742) - Realized gain (loss) 1,614,028 -
Change in unrealized appreciation Change in unrealized appreciation
(depreciation) (1,309,201) - (depreciation) (1,279,882) $279,382
Net purchases (sales) (4,460,312) - Net purchases (sales) (301,938) (542,335)
Transfers in and/or out of Level 3 1,928,462 - Transfers in and/or out of Level 3 2,936,258 -
Balance as of 5/31/09 $7,894,956 - Balance as of 5/31/09 $10,494,650 ($262,953)
Total Return Fund U.S. Government Securities Fund
Investments in Other Financial Investments in Other Financial
Securities Instruments Securities Instruments
Balance as of 8/31/08 $15,899,500 - Balance as of 8/31/08 $3,094,073 -
Accrued discounts/premiums 187 - Accrued discounts/premiums 356 -
Realized gain (loss) 1,219 - Realized gain (loss) 30,961 -
Change in unrealized appreciation Change in unrealized appreciation
(depreciation) (260,483) - (depreciation) 20,628 -
Copyright © 2012 www.secdatabase.com. All Rights Reserved.Please Consider the Environment Before Printing This Document

Net purchases (sales) (254,764) - Net purchases (sales) (2,464,720) -
Transfers in and/or out of Level 3 (14,569,369) - Transfers in and/or out of Level 3 176,141 -
Balance as of 5/31/09 816,290 - Balance as of 5/31/09 $857,439 -
U.S. High Yield Bond Value & Restructuring Fund
Investments in Other Financial Investments in Other Financial
Securities Instruments Securities Instruments
Balance as of 8/31/08 - - Balance as of 8/31/08 $208,261 -
Accrued discounts/premiums $33,377 - Accrued discounts/premiums - -
Realized gain (loss) - - Realized gain (loss) (846,372) -
Change in unrealized appreciation Change in unrealized appreciation
(depreciation) (348,377) - (depreciation) 938,287 -
Net purchases (sales) - - Net purchases (sales) (274,580) -
Transfers in and/or out of Level 3 350,000 - Transfers in and/or out of Level 3 - -
Balance as of 5/31/09 $35,000 - Balance as of 5/31/09 $25,596 -
Delayed -Delivery Transactions All Funds, with the exception of Absolute Return Portfolio and the American Funds, may purchase or sell debt securities on a when-issued or delayed -delivery basis. These transactions involve a
commitment by a Fund to purchase or sell securities for a predetermined price or yield, with payment and delivery taking place beyond the customary settlement period. When delayed -delivery purchases are outstanding, a Fund will
designate liquid assets in an amount sufficient to meet the purchase price. When purchasing a security on a delayed -delivery basis, a Fund assumes the rights and risks of ownership of the security, including the risk of price and yield
fluctuations, and takes such fluctuations into account when determining its NAV. A Fund may dispose of or renegotiate a delayed -delivery transaction after it is entered into, and may sell delayed -delivery securities before they are
delivered, which may result in a capital gain or loss. When a Fund has sold a security on a delayed -delivery basis, the Fund does not participate in future gains and losses with respect to the security. The Fund may receive
compensation for interest forgone in the purchase of delayed -delivery securities. The market values of the securities purchased on a forward -delivery basis are identified in the Fund of Investments
In a �To Be Announced� (TBA) transaction, the Fund commits to purchasing or selling securities for which all specific information is not yet known at the time of the trade, particularly the face amount and maturity date of the
underlying security transactions. Securities purchased on a TBA basis are not settled until they are delivered to the Fund, normally 15 to 45 days later.
Inflation -Indexed Bonds All Funds, with the exception of the Absolute Return Portfolio may invest in inflation indexed bonds which are fixed-income securities whose principal value is periodically adjusted to a rate of inflation
both increase or decrease, such as the Consumer Price Index. The interest rate on these bonds is generally fixed at issuance at a rate lower than typical bonds. Over the life of an inflation -indexed bond, however, interest will be paid
based on a principal value, which is adjusted for inflation as described above.
Short Sales Certain Funds may make short sales of securities. A short sale is a transaction in which a Fund sells a security that it does not own, in anticipation of a decline in the market value of the security. The Fund generally
borrows the security to deliver to the buyer in a short sale. The Fund must then buy the security at its market price when the borrowed security must be returned to the lender. Short sales involve costs and risk. The Fund must pay the
lender interest on the security it borrows, and the Fund will lose money if the price of the security increases between the time of the short sale and the date when the Fund replaces the borrowed security. Certain of the Funds may also
make short sales �against the box.�� In a short sale against the box, at the time of sale, the Fund owns or has the right to acquire the identical security, or one equivalent in kind or amount, at no additional cost.
Until a Fund closes its short position or replaces a borrowed security, the Fund will have sufficient cash and/or liquid assets to cover its short position. Possible losses from short sales which are not against the box may be unlimited,
whereas losses from purchases cannot exceed the total amount invested.
Interest expense relates to the Funds� liability with respect to short sale transactions by the Funds. Interest expense is recorded as incurred.
Loan participations and assignments A Fund�s ability to receive payments of principal and interest and other amounts in connection with loans (whether through participations, assignments or otherwise) will depend primarily on the
financial condition of the borrower. The failure by a Fund to receive scheduled interest or principal payments on a loan or a loan participation, because of a default, bankruptcy or any other reason, would adversely affect the income of
a Fund and would likely reduce the value of its assets. Even with secured loans, there is no assurance that the collateral securing the loan will be sufficient to protect a Fund against losses in value or a decline in income in the event of a
borrower�s non-payment of principal or interest and, in the event of a bankruptcy of a borrower, a Fund could experience delays or limitations in its ability to realize the benefits of any collateral securing the loan. Furthermore, the
value of any such collateral may decline and may be difficult to liquidate. Because a significant percent of loans and loan participations are not generally rated by independent credit rating agencies, a decision by a Fund to invest in a
particular loan or loan participation could depend exclusively on the subadviser�s credit analysis of the borrower and, in the case of a loan participation, the intermediary. A Fund may have limited rights to enforce the terms of an
underlying loan. Fees associated with loan amendments are accrued daily.
Repurchase Agreements Each Fund may enter into repurchase agreements. When a Fund enters into a repurchase agreement through its custodian, it receives delivery of securities, the amount of which, at the time of purchase and
each subsequent business day, is required to be maintained at such a level that the market value is generally at least 102% of the repurchase amount. Each Fund will take constructive receipt of all securities underlying the repurchase
agreements it has entered into, until such agreements expire. If the seller defaults, a Fund would suffer a loss to the extent that proceeds from the sale of underlying securities were less than the repurchase amount. Each Fund may enter
into repurchase agreements maturing within seven days with domestic dealers, banks or other financial institutions deemed to be creditworthy by the Adviser. Collateral for certain tri-party repurchase agreements is held at a third-party
custodian bank for the benefit of the Fund and the counterparty.
Securities Lending The Funds may lend fund securities from time to time in order to earn additional income. The Funds retain beneficial ownership of the securities they have loaned and continue to receive interest and dividends paid
by the issuer of securities and to participate in any changes in their value. On the settlement date of the loan, the Funds receive cash collateral against the loaned securities and maintains the cash collateral in an amount not less than
102% of the market value of the loaned securities for U.S. equity and corporate securities, and 105% for foreign equity and corporate securities during the period of the loan. The market value of the loaned securities is determined at
the close of business of the Funds and any additional required cash collateral is delivered to the Funds on the next business day or returned to the borrower if over collateralized. It is the Funds� policy to obtain additional collateral
from or return excess collateral to the borrower by the end of the next business day, following the valuation date of the securities loaned. Therefore, the value of the collateral held may be temporarily less than the value of the securities
on loan. Cash collateral received is invested in JHCIT. The Funds may receive compensation for lending their securities in the form of fees and/or by retaining a portion of interest on the investment of any cash received as collateral. If
the borrower is unable to return the securities loaned upon sale of a security or other Fund instructions because of insolvency or other reasons, the Funds could experience delays and costs in recovering the securities loaned or in
gaining access to the collateral and could be prevented from voting on a proxy statement. The Funds bear the risk in the event that invested collateral is not sufficient to meet obligations due on loans.
Cost of Investment Securities for Federal Income Tax Purposes The cost of investments owned on May 31, 2009, including short-term investments, for federal income tax purposes, was as follows:
Net Unrealized
Copyright © 2012 www.secdatabase.com. All Rights Reserved.Please Consider the Environment Before Printing This Document

Unrealized Unrealized Appreciation
Fund Aggregate Cost Appreciation (Depreciation) (Depreciation)
Active Bond Fund 607,202,378 15,301,869 (75,239,032) (59,937,163)
All Cap Core Fund 374,797,649 30,553,128 (24,621,231) 5,931,897
All Cap Growth Fund 78,399,697 7,525,813 (2,425,937) 5,099,876
All Cap Value Fund 180,122,869 12,413,284 (6,794,113) 5,619,171
Alpha Opportunities Fund 491,185,728 59,453,850 (3,310,469) 56,143,381
Alternative Asset Allocation Fund 1,003,595 172,695 - 172,695
American Diversified Growth & Income Fund 6,537,148 223,779 (16,762) 207,017
American Fundamental Holdings Fund 4,354,434 164,892 - 164,892
American Global Diversification Fund 4,302,810 120,157 (2,031) 118,126
Blue Chip Growth Fund 1,224,749,577 168,938,118 (86,698,447) 82,239,671
Capital Appreciation Fund 917,378,525 115,637,566 (38,396,921) 77,240,645
Core Bond Fund 352,943,121 5,498,814 (3,459,860) 2,038,954
Emerging Markets Value Fund 975,004,450 161,254,605 (123,855,675) 37,398,930
Emerging Small Company Fund 26,682,284 3,039,195 (2,591,077) 448,118
Equity-Income Fund 878,107,830 22,533,408 (178,857,037) (156,323,629)
Fundamental Value Fund 1,389,763,938 51,110,631 (229,003,474) (177,892,843)
Global Agribusiness Fund 1,916,632 348,792 (31,169) 317,623
Global Bond Fund 717,026,314 8,354,942 (79,715,525) (71,360,583)
Global Infrastructure Fund 1,926,484 83,666 (170,629) (86,963)
Global Real Estate Fund 414,339,614 52,367,132 (52,139,729) 227,403
Global Timber Fund 1,736,511 292,260 (82,095) 210,165
High Income Fund 600,188,585 21,229,639 (253,047,900) (231,818,261)
High Yield Fund 1,426,004,164 37,698,747 (372,572,489) (334,873,742)
Index 500 Fund 2,098,621,659 71,877,270 (222,733,245) (150,855,975)
International Equity Index Fund 466,753,325 22,534,349 (92,385,107) (69,850,758)
International Opportunities Fund 649,195,879 107,462,539 (34,742,081) 72,720,458
International Small Cap Fund 335,874,467 19,357,399 (93,635,152) (74,277,753)
International Small Company Fund 313,658,990 9,171,356 (120,856,224) (111,684,868)
International Value Fund 1,479,344,971 42,155,491 (363,396,345) (321,240,854)
Investment Quality Bond Fund 176,252,984 2,726,008 (9,723,667) (6,997,659)
Large Cap Fund 209,703,547 14,092,638 (31,675,338) (17,582,700)
Large Cap Value Fund 482,724,511 26,826,837 (56,231,237) (29,404,400)
Mid Cap Index Fund 486,347,250 14,819,228 (83,508,148) (68,688,920)
Mid Cap Intersection Fund 79,692,085 7,803,121 (9,725,358) (1,922,237)
Mid Cap Stock Fund 582,806,362 45,096,356 (34,273,551) 10,822,805
Mid Cap Value Equity Fund 136,220,654 4,892,883 (20,129,039) (15,236,156)
Mid Value Fund 144,632,648 8,519,205 (1,978,819) 6,540,386
Natural Resources Fund 700,824,735 50,003,198 (72,002,763) (21,999,565)
Optimized All Cap Fund 3,417,960 331,157 (345,100) (13,943)
Real Estate Equity Fund 210,107,331 7,524,035 (33,269,994) (25,745,959)
Real Estate Securities Fund 67,844,940 5,020,153 (6,925,627) (1,905,474)
Real Return Bond Fund 1,403,397,675 32,869,937 (40,360,632) (7,490,695)
Short Term Government Income Fund 20,061,112 67,241 (59,294) 7,947
Small Cap Growth Fund 102,967,897 15,641,002 (3,546,162) 12,094,840
Small Cap Index Fund 118,612,044 13,143,217 (10,934,107) 2,209,110
Small Cap Opportunities Fund 104,679,926 14,265,392 (17,167,681) (2,902,289)
Small Cap Value Fund 35,822,610 1,774,573 (650,511) 1,124,062
Small Company Growth Fund 143,949,483 12,014,886 (23,187,785) (11,172,899)
Small Company Value Fund 468,717,437 36,181,062 (112,311,007) (76,129,945)
Smaller Company Growth Fund 125,018,889 18,777,918 (6,443,861) 12,334,057
Spectrum Income Fund 853,615,659 28,393,590 (77,658,768) (49,265,178)
Strategic Bond Fund 591,448,888 8,453,413 (104,321,061) (95,867,648)
Strategic Income Fund 462,672,468 15,872,749 (56,483,218) (40,610,469)
Total Bond Market Fund 389,854,118 11,642,230 (4,186,302) 7,455,928
Total Return Fund 2,382,111,854 42,688,021 (95,647,608) (52,959,587)
U.S. Government Securities Fund 181,732,949 3,036,114 (27,083,663) (24,047,549)
U.S. High Yield Bond Fund 646,185,836 9,126,006 (62,791,905) (53,665,899)
U.S. Multi Sector Fund 755,342,099 19,455,704 (85,829,330) (66,373,626)
Value Fund 84,728,409 1,797,247 (2,953,896) (1,156,649)
Value & Restructuring Fund 482,271,723 44,301,883 (59,917,828) (15,615,945)
Copyright © 2012 www.secdatabase.com. All Rights Reserved.Please Consider the Environment Before Printing This Document

Vista Fund 132,677,490 13,198,165 (2,351,508) 10,846,657
Foreign Currency Translation The books and records of the Funds are maintained in U.S. dollars. Investment securities and other assets and liabilities denominated in a foreign currency are translated into U.S. dollars at the
prevailing exchange rates at period end. Purchases and sales of investment securities, income and expenses are translated into U.S. dollars at the prevailing exchange rates on the respective dates of the transactions.
Net realized and unrealized gains and losses on foreign currency transactions represent net gains and losses between trade and settlement dates on securities transactions, the disposition of forward foreign currency exchange contracts
and foreign currencies, and the difference between the amount of net investment income accrued and the U.S. dollar amount actually received. That portion of both realized and unrealized gains and losses on investments that results
from fluctuations in foreign currency exchange rates is not separately disclosed, but is included with net realized and unrealized gain/appreciation and loss/depreciation on investments.
Certain Funds may be subject to capital gains and repatriation taxes imposed by certain countries in which they invest. Such taxes are generally based upon income and/or capital gains earned or repatriated. Taxes are accrued based
upon net investment income, net realized gains and net unrealized appreciation.
FINANCIAL INSTRUMENTS
The Funds have adopted the provisions of Statement of Financial Accounting Standards No. 161, Disclosures about Derivative Instruments and Hedging Activities (FAS 161). This new standard requires the Funds to disclose
information to assist investors in understanding how the Funds use derivative instruments, how derivative instruments are accounted for under Statement of Financial Accounting Standards No. 133, Accounting for Derivative
Instruments and Hedging Activities (FAS 133) and how derivative instruments affect the Funds� financial position, results of operations, and cash flows. All disclosure changes have been made in accordance with the Statement and
incorporated for the current period as part of the Notes to the Financial Statements included below.
Options
Each Fund may purchase and sell put and call options on securities, securities indices, currencies and futures contracts. A call option gives the purchaser of the option the right to buy (and the seller the obligation to sell) the underlying
instrument at the exercise price. A put option gives the purchaser of the option the right to sell (and the writer the obligation to buy) the underlying instrument at the exercise price. A Fund may use options to manage against possible
changes in the market value of the Fund�s assets, mitigate exposure to fluctuations in currency values or interest rates, or protect the Fund�s unrealized gains. In addition, a Fund may use options to facilitate Fund investment
transactions by protecting a Fund against a change in the market price of the investment, enhance potential gains, or a substitute for the purchase or sale of securities or currency.
Options listed on an exchange, if no closing price is available, are valued at the mean between the last bid and the ask prices from the exchange on which they are principally traded. Using an independent pricing source, options not
listed on an exchange are valued at the mean between the last bid and ask prices.
When a Fund writes an option, an amount equal to the premium received by the Fund is recorded as a liability and is subsequently �marked -to-market� to reflect the current market value of the option written. If an option expires, or if
the Fund buys an offsetting option, the Fund realizes a gain or loss depending on whether the exercise price of the option is more or less than the value of the underlying instrument at the time of the offsetting transaction. If a written
call option is exercised, the Fund realizes a gain or loss from the sale of the underlying security, with the proceeds of the sale increased by the premium received. If a written put option is exercised, the amount of the premium received
reduces the cost of the security that the Fund purchases upon exercise of the option. The Fund, as writer of an option, may have no control over whether the underlying securities may be sold (called) or purchased (put) and as a result,
bears the market risk of an unfavorable change in the price of the underlying securities.
When a Fund purchases an option, the premium paid by the Fund is included in the Schedule of Investments and subsequently �marked -to-market� to reflect current market value. If the purchased option expires, the Fund realizes a
loss equal to the cost of the option. If the Fund enters into a closing sale transaction, the Fund realizes a gain or loss, depending on whether proceeds from the closing sale are greater or less than the original cost. If the Fund exercises a
call option, the cost of the securities acquired by exercising the call is increased by the premium paid to buy the call. If the Fund exercises a put option, it realizes a gain or loss from the sale of the underlying security and the proceeds
from such sale are decreased by the premium paid.
Writing puts and buying calls may increase a Fund�s exposure to changes in the value of the underlying instrument. Buying puts and writing calls may decrease a Fund�s exposure to such changes. Losses may arise when buying and
selling options if there is an illiquid secondary market for the options, which may cause a party to receive less than would be received in a liquid market, or if the counterparties
The following summarizes the Funds� use of option contracts and the contracts held as of May 31, 2009:
Options on Exchange -Traded Futures Contracts
Global Bond Fund
The Fund uses written options to enhance potential gain, manage duration of the portfolio, hedge against anticipated interest rate changes, gain exposure to certain securities markets and maintain diversity and liquidity of the portfolio.
Number of Notional
Fund Name of Issuer Exercise Price Expiration Date Contracts Amount Premium Value
Global Bond Fund Calls
Eurodollar Futures $98.63 Sep 2009 49 122,500 $8,096 ($81,769)
49 122,500 $8,096 ($81,769)
Puts
Eurodollar Futures $97.25 Jun 2009 305 762,500 $196,713 ($1,906)
Eurodollar Futures 98.50 Jun 2009 120 300,000 51,900 (750)
U.K. 90-Day LIBOR Futures 92.00 Dec 2009 136 17,000,000 53,893 -
U.K. 90-Day LIBOR Futures 93.00 Jun 2009 200 25,000,000 118,594 -
761 43,062,500 $421,100 (2,656)
Real Return Bond Fund
Copyright © 2012 www.secdatabase.com. All Rights Reserved.Please Consider the Environment Before Printing This Document

The Fund uses written options to enhance potential gain, manage duration of the portfolio, hedge against anticipated interest rate changes, gain exposure to certain securities markets and maintain diversity and
liquidity of the portfolio.
Real Return Bond Fund Puts
Eurodollar Futures $98.50 Sep 2009 138 345,000 $32,980 ($7,763)
Eurodollar Futures 98.63 Sep 2009 65 162,500 10,231 (4,469)
203 507,500 $43,211 ($12,232)
Strategic Bond Fund
The Fund uses written options contracts to enhance potential gain, manage the duration of the portfolio, hedge against anticipated interest rate changes, gain exposure to certain securities markets and foreign
currencies and maintain diversity and liquidity of the portfolio.
Strategic Bond Fund Calls
Eurodollar Futures $99.25 Sep 2009 20 50,000 $5,410 ($6,500)
U.S. Treasury 10-Year Note Futures 120.00 Jun 2009 23 23,000 22,897 (8,266)
U.S. Treasury 10-Year Note Futures 121.00 Jun 2009 50 50,000 28,416 (10,937)
U.S. Treasury 10-Year Note Futures 124.00 Aug 2009 23 23,000 17,146 (7,547)
116 146,000 $73,869 ($33,250)
Puts
Eurodollar Futures $98.38 Jun 2009 22 55,000 $6,513 ($137)
U.S. Treasury 10-Year Note Futures $116.00 Aug 2009 23 23,000 $17,506 ($42,766)
U.S. Treasury 10-Year Note Futures $115.00 Jun 2009 27 27,000 $14,332 ($17,297)
72 105,000 $38,351 ($60,200)
Total Return Fund
The Fund uses written options to enhance potential gain, manage duration of the portfolio, hedge against anticipated interest rate changes, gain exposure to certain securities markets and maintain diversity and
liquidity of the portfolio.
Total Return Fund Puts
Eurodollar Futures $98.50 Jun 2009 3 7,500 $780 ($19)
3 7,500 $780 ($19)
U.S. Government Securities
The Fund uses written options to enhance potential gain, manage the duration of the portfolio, hedge against anticipated interest rate changes, gain exposure to certain securities markets and foreign currencies and
maintain diversity and liquidity of the portfolio.
U.S. Government Securities Calls
Eurodollar Futures $97.63 Sep 2009 114 285,000 $88,330 ($469,538)
114 285,000 $88,330 ($469,538)
Interest Rate Swaptions
Global Bond Fund
The Fund uses written options to enhance potential gain, manage duration of the portfolio, hedge against anticipated interest rate changes, gain exposure to certain securities markets and maintain diversity and liquidity of the portfolio.
Pay/
Receive
Floating Exercise Expiration Notional
Fund Name of Issuer Counterparty Floating Rate Index Rate Rate Date Amount Premium Value
Global Bond Fund Calls
7-Year Interest Rate Swap Deutsche Bank AG 3 Month USD-LIBOR Receive 2.35% Jun 2009 EUR 1,000,000 $3,100 ($175)
1,000,000 $3,100 ($175)
Puts
2-Year Interest Rate Swap HSBC Bank USA, N.A. 6 Month EUR-EURIBOR Receive 5.29% Jun 2009 EUR 7,700,000 $102,350 ($1)
7-Year Interest Rate Swap Morgan Stanley Capital Services, Inc. 6 Month EUR-EURIBOR Receive 4.00% Jun 2009 EUR 1,800,000 17,405 (41)
7-Year Interest Rate Swap Barclays Bank PLC 6 Month EUR-EURIBOR Receive 4.00% Jun 2009 EUR 2,000,000 22,237 (46)
5-Year Interest Rate Swap Morgan Stanley Capital Services, Inc. 3 Month USD-LIBOR Receive 4.30% Aug 2009 USD 36,400,000 91,000 (31,042)
5-Year Interest Rate Swap The Royal Bank of Scotland PLC 3 Month USD-LIBOR Receive 4.30% Aug 2009 USD 5,300,000 9,938 (4,520)
5-Year Interest Rate Swap The Royal Bank of Scotland PLC 3 Month USD-LIBOR Receive 4.15% Aug 2009 USD 4,400,000 9,970 (5,133)
7-Year Interest Rate Swap Morgan Stanley Capital Services, Inc. 3 Month USD-LIBOR Receive 4.40% Aug 2009 USD 23,500,000 108,100 (73,123)
7-Year Interest Rate Swap Barclays Bank PLC 3 Month USD-LIBOR Receive 3.50% Jun 2009 USD 1,300,000 2,600 (9,485)
7-Year Interest Rate Swap Deutsche Bank AG 3 Month USD-LIBOR Receive 3.50% Jun 2009 USD 1,000,000 1,125 (7,296)
Copyright © 2012 www.secdatabase.com. All Rights Reserved.Please Consider the Environment Before Printing This Document

7-Year Interest Rate Swap The Royal Bank of Scotland PLC 3 Month USD-LIBOR Receive 3.50% Jun 2009 USD 3,100,000 5,205 (22,618)
86,500,000 $369,930 ($153,305)
Real Return Bond Fund
The Fund uses written options to enhance potential gain, manage duration of the portfolio, hedge against anticipated interest rate changes, gain exposure to certain securities markets and maintain diversity and liquidity to the portfolio.
Real Return Bond Fund Calls
7-Year Interest Rate Swap Deutsche Bank AG 3 Month USD-LIBOR Receive 2.35% Jun 2009 USD 5,500,000 $17,050 ($963)
7-Year Interest Rate Swap The Royal Bank of Scotland PLC 3 Month USD-LIBOR Receive 2.35% Jun 2009 USD 5,200,000 10,530 (911)
10,700,000 $27,580 ($1,874)
Puts
7-Year Interest Rate Swap The Royal Bank of Scotland PLC 3 Month USD-LIBOR Receive 5.37% Sep 2010 USD 17,000,000 $279,890 ($262,441)
7-Year Interest Rate Swap Goldman Sachs Capital Markets, L.P. 3 Month USD-LIBOR Receive 5.37% Sep 2010 USD 5,000,000 160,750 (77,189)
7-Year Interest Rate Swap Barclays Bank PLC 3 Month USD-LIBOR Receive 3.50% Jun 2009 USD 300,000 660 (2,189)
7-Year Interest Rate Swap Deutsche Bank AG 3 Month USD-LIBOR Receive 3.50% Jun 2009 USD 5,500,000 6,188 (40,129)
7-Year Interest Rate Swap The Royal Bank of Scotland PLC 3 Month USD-LIBOR Receive 3.50% Jun 2009 USD 5,400,000 10,505 (39,399)
33,200,000 $457,993 ($421,347)
Total Return Fund
The Fund uses written options to enhance potential gain, manage duration of the portfolio, hedge against anticipated interest rate changes, gain exposure to certain securities markets and maintain diversity and liquidity to the portfolio.
Total Return Fund Puts
7-Year Interest Rate
Swap The Royal Bank of Scotland PLC 3 Month USD-LIBOR Receive 4.40% Aug 2009 USD 18,000,000 $67,200 ($56,009)
7-Year Interest Rate
Swap Barclays Bank PLC 3 Month USD-LIBOR Receive 4.40% Aug 2009 USD 5,000,000 26,000 (15,558)
2-Year Interest Rate
Swap Deutsche Bank AG 3 Month USD-LIBOR Receive 2.00% Jul 2009 USD 5,000,000 21,700 (3,459)
2-Year Interest Rate
Swap Citibank N.A. 3 Month USD-LIBOR Receive 2.00% Jul 2009 USD 4,000,000 16,200 (2,767)
2-Year Interest Rate
Swap Barclays Bank PLC 3 Month USD-LIBOR Receive 2.00% Jul 2009 USD 4,000,000 16,600 (2,767)
2-Year Interest Rate
Swap JP Morgan Chase Bank 3 Month USD-LIBOR Receive 2.00% Jul 2009 USD 1,500,000 6,450 (1,038)
7-Year Interest Rate
Swap Barclays Bank PLC 3 Month USD-LIBOR Receive 4.55% Aug 2009 USD 12,000,000 54,450 (27,954)
49,500,000 $208,600 ($109,552)
Foreign Currency Options
High Income Fund
The Fund uses written options to hedge against anticipated interest rate changes and maintain diversity and liquidity of the portfolio.
Expiration Notional
Fund Name of Issuer Exercise Price Date Amount Premium Value
High Income Fund Calls
U.S. Dollar versus Canadian Dollar $1.30 Apr 2010 196,000,000 $3,523,100 ($2,642,080)
196,000,000 $3,523,100 ($2,642,080)
Strategic Income Fund
The Fund uses written options to gain exposure to foreign currencies, to enhance potential gain, to hedge against anticipated currency exchange rates, and to maintain diversity and
liquidity of the portfolio.
Strategic Income Fund Calls
U.S. Dollar versus Canadian Dollar $1.30 Feb 2010 $10,700,000 $267,500 ($122,087)
U.S. Dollar versus Canadian Dollar 1.30 Apr 2010 10,450,000 274,835 (140,866)
21,150,000 $542,335 ($262,953)
Futures
Each Fund may purchase and sell financial futures contracts, including index futures and options on these contracts. A future is a contractual agreement to buy or sell a particular commodity, currency, or financial instrument at a
pre-determined price in the future. A Fund uses futures contracts to manage against a decline in the value of securities owned by the Fund due to anticipated interest rate, currency or market changes. In addition, a Fund will use futures
contracts for duration management or to gain exposure to a securities market.
Copyright © 2012 www.secdatabase.com. All Rights Reserved.Please Consider the Environment Before Printing This Document

An index futures contract (index future) is a contract to buy a certain number of units of the relevant index at a fixed price and specific future date. A Fund may invest in index futures as a means of gaining exposure to securities
without investing in them directly, thereby allowing the Fund to invest in the underlying securities over time. Investing in index futures also permits the Fund to maintain exposure to common stocks without incurring the brokerage
costs associated with investment in individual common stocks.
When a Fund sells a futures contract based on a financial instrument, the Fund becomes obligated to deliver such instrument at an agreed upon date for a specified price. The primary risks associated with the use of futures contracts are
the imperfect correlation between the change in market value of the securities held by the Fund and the prices of futures contracts, the possibility of an illiquid market and the inability of the counterparty to meet the terms of the
contract.
Futures contracts are valued at the quoted daily settlement prices established by the exchange on which they trade. Upon entering into a futures contract, initial margin deposits, as set by the exchange or broker to the contract, are
required and are met by the delivery of specific securities (or cash) as collateral to the broker. Futures contracts are marked to market daily and an appropriate payable or receivable for the change in value (�variation margin�) is
recorded by the Fund. Gains or losses are recognized but not considered realized until the contracts expire or are closed. Futures contracts Futures contracts involve, to varying degrees, risk of loss in excess of the variation margin.
The following summarizes the open futures contracts held as of May 31, 2009:
Number Unrealized
of Expiration Notional Appreciation
Fund Open Contracts Contracts Position Date Value (Depreciation)
Active Bond Fund
The Fund uses futures manage duration of the portfolio.
Active Bond Fund U.S. Treasury 10-Year Note Futures 80 Short Sep 2009 $9,360,000 $111,688
$9,360,000 $111,688
All Cap Core Fund
The Fund uses futures to gain exposure to certain securities markets.
All Cap Core Fund Russell 2000 Mini Index Futures 483 Long Jun 2009 $24,212,790 $5,034,693
S&P 500 E Mini Index Futures 246 Long Jun 2009 11,292,630 317,426
$35,505,420 $5,352,119
Global Bond Fund
The Fund uses futures to enhance potential gain, manage duration of the portfolio, hedge against anticipated interest rate changes and foreign exchange rates, gain exposure to certain
securities markets and short term interest rate and to maintain diversity and liquidity of the portfolio.
Global Bond Fund 3-Month EURIBOR Futures 7 Long Jun 2010 $2,436,369 $10,762
3-Month EURIBOR Futures 204 Long Sep 2010 70,822,519 194,847
3-Month EURIBOR Futures 283 Long Dec 2010 97,933,825 94,230
3-Month EURIBOR Futures 5 Long Mar 2011 1,725,773 618
3-Month Sterling Futures 681 Long Sep 2010 134,698,205 461,830
3-Month Sterling Futures 405 Long Dec 2010 79,746,831 242,699
3-Month Sterling Futures 24 Long Mar 2011 4,706,827 7,539
10-Year German Euro-BUND Futures 123 Long Jun 2009 20,784,476 (244,259)
10-Year German Euro-BUND Futures 118 Long Sep 2009 19,831,148 24,098
10-Year Japan Government Bond Futures 21 Long Jun 2009 30,065,176 (101,071)
$462,751,149 $691,293
Index 500 Fund
The Fund uses futures to gain exposure to certain securities markets.
Index 500 Fund S&P 500 Index Futures 408 Long Jun 2009 $93,646,200 $10,555,362
$93,646,200 $10,555,362
International Equity Index Fund
The Fund uses futures contracts to gain exposure to certain securities markets.
International Equity Index Fund ASX SPI 200 Index Futures 17 Long Jun 2009 $1,293,113 $20,136
CAC 40 Index Futures 48 Long Jun 2009 2,216,228 33,381
DAX Index Futures 7 Long Jun 2009 1,221,153 2,487
FTSE 100 Index Futures 31 Long Jun 2009 2,199,873 (4,270)
FTSE JSE Top 40 Index Futures 38 Long Jun 2009 987,255 14,168
Hang Seng Stock Index Futures 3 Long Jun 2009 351,188 21,399
IBEX 35 Index Futures 5 Long Jun 2009 666,524 4,858
MSCI Taiwan Stock Index Futures 117 Long Jun 2009 2,963,610 109,052
OMX 30 Stock Index Futures 80 Long Jun 2009 820,669 (11,922)
S&P TSE 60 Index Futures 15 Long Jun 2009 1,735,837 69,301
Copyright © 2012 www.secdatabase.com. All Rights Reserved.Please Consider the Environment Before Printing This Document

Topix Index Futures 39 Long Jun 2009 3,665,460 47,397
$18,120,910 $305,987
Investment Quality Bond Fund
The Fund uses futures contracts to manage the duration of the portfolio, hedge against anticipated interest rate changes, gain exposure to certain securities markets and to maintain the
diversity and liquidity of the portfolio.
Investment Quality Bond Fund 10-Year German Euro-BUND Futures 47 Long Jun 2009 $7,942,036 ($265,865)
U.S. Treasury 10-Year Note Futures 97 Short Sep 2009 11,349,000 (110,131)
U.S. Treasury 30-Year Bond Futures 18 Short Sep 2009 2,117,812 (33,774)
$21,408,848 ($409,770)
Mid Cap Index Fund
The Fund uses futures contracts to gain exposure to certain securities markets.
Mid Cap Index Fund S&P Midcap 400 EMini Index Futures 787 Long Jun 2009 $45,252,500 $2,907,037
$45,252,500 $2,907,037
Mid Cap Intersection Fund
The Fund uses futures contracts to gain exposure to certain securities markets.
Mid Cap Intersection Fund S&P Midcap 400 EMini Index Futures 11 Long Jun 2009 $632,500 $79,512
$632,500 $79,512
Real Return Bond Fund
The Fund uses futures to enhance potential gain, manage duration of the portfolio, hedge against anticipated interest rate changes and foreign exchange rates, gain exposure to certain
securities markets and short term interest rate and maintain diversity and liquidity of the portfolio.
Real Return Bond Fund EURIBOR Futures 32 Long Jun 2010 $11,137,689 $25,447
EURIBOR Futures 93 Long Sep 2010 32,286,736 47,659
EURIBOR Futures 62 Long Dec 2010 21,455,467 14,243
Eurodollar Futures 207 Long Mar 2010 51,188,513 1,150,562
Eurodollar Futures 15 Long Jun 2010 3,699,188 44,063
$119,767,593 $1,281,974
Small Cap Index Fund
The Fund uses futures contracts to gain exposure to certain securities markets.
Small Cap Index Fund Russell 2000 Mini Index Futures 153 Long Jun 2009 $7,669,890 $499,944
$7,669,890 $499,944
Smaller Company Growth Fund
The Fund uses futures contracts to gain exposure to certain securities markets.
Smaller Company Growth Fund Russell 2000 Mini Index Futures 9 Long Jun 2009 $451,170 $106,578
$451,170 $106,578
Spectrum Income Fund
The Fund uses futures contracts to hedge against anticipated interest rate and currency exchange rates.
Spectrum Income Fund 2-Year German Euro-SCHATZ Futures 56 Long Jun 2009 $8,563,512 ($12,306)
5-Year German Euro-BOBL Futures 22 Long Jun 2009 3,574,482 (49,296)
10-Year German Euro-BUND Futures 8 Long Jun 2009 1,351,836 (43,033)
U.S. Treasury 30-Year Bond Futures 1 Long Sep 2009 117,656 2,590
Euro Currency Futures 15 Short Jun 2009 2,649,563 (292,748)
U.K. Long Gilt Bond Futures 7 Short Sep 2009 1,326,805 2,829
U.S. Treasury 2-Year Note Futures 4 Short Sep 2009 867,250 (1,204)
U.S. Treasury 5-Year Note Futures 4 Short Sep 2009 461,875 (352)
U.S. Treasury 10-Year Note Futures 16 Short Sep 2009 1,872,000 (3,223)
U.S. Treasury 30-Year Bond Futures 4 Short Sep 2009 470,625 (10,391)
$21,255,604 ($407,134)
Strategic Bond Fund
The Fund uses futures to enhance potential gain, manage duration of the portfolio, hedge against anticipated interest rate and currency exchange rates, gain exposure to certain securities
markets and maintain diversity and liquidity of the portfolio.
Strategic Bond Fund 10-Year German Euro-BUND Futures 3 Long Jun 2009 $506,938 ($18,761)
Eurodollar Futures 1 Long Jun 2009 248,350 4,008
Eurodollar Futures 87 Long Sep 2009 21,590,138 128,359
Eurodollar Futures 8 Long Dec 2009 1,981,200 8,464
Eurodollar Futures 110 Long Mar 2010 27,201,625 82,143
Eurodollar Futures 19 Long Jun 2010 4,685,638 (6,973)
Copyright © 2012 www.secdatabase.com. All Rights Reserved.Please Consider the Environment Before Printing This Document

Eurodollar Futures 36 Long Sep 2010 8,851,500 9,700
U.S. Treasury 2-Year Note Futures 42 Long Sep 2009 9,106,125 514
U.S. Treasury 5-Year Note Futures 601 Long Sep 2009 69,396,719 (546,767)
U.S. Treasury 10-Year Note Futures 168 Long Sep 2009 19,656,000 (245,459)
U.S. Treasury 30-Year Bond Futures 125 Long Sep 2009 14,707,031 (176,016)
$177,931,264 ($760,788)
Total Return Fund
The Fund uses futures to enhance potential gain, manage duration of the portfolio, hedge against anticipated interest rate changes and foreign exchange rates, gain exposure to certain
securities markets and short term interest rates and maintain diversity and liquidity of the portfolio.
Total Return Fund 3-Month Sterling Futures 433 Long Jun 2009 $86,423,706 $3,946,733
3-Month Sterling Futures 37 Long Dec 2009 7,381,198 265,740
3-Month Sterling Futures 18 Long Mar 2010 3,585,398 20,810
3-Month Sterling Futures 38 Long Jun 2010 7,544,606 27,572
3-Month Sterling Futures 38 Long Sep 2010 7,516,199 22,489
3-Month Sterling Futures 38 Long Dec 2010 7,482,419 14,458
3-Month Sterling Futures 20 Long Mar 2011 3,922,356 (1,351)
EURIBOR Futures 60 Long Jun 2009 20,949,964 846,687
EURIBOR Futures 21 Long Mar 2010 7,325,436 38,758
EURIBOR Futures 18 Long Jun 2010 6,264,950 34,849
EURIBOR Futures 16 Long Sep 2010 5,554,707 29,206
EURIBOR Futures 18 Long Dec 2010 6,229,007 29,996
Eurodollar Futures 845 Long Jun 2009 209,855,750 5,748,512
Eurodollar Futures 629 Long Sep 2009 156,094,213 4,005,312
Eurodollar Futures 517 Long Dec 2009 128,035,050 3,163,125
Eurodollar Futures 375 Long Mar 2010 92,732,813 2,416,900
Eurodollar Futures 264 Long Jun 2010 65,105,700 303,450
Eurodollar Futures 18 Long Sep 2010 4,425,750 115,300
Eurodollar Futures 207 Long Dec 2010 50,709,825 (49,100)
U.S. Treasury 5-Year Note Futures 331 Long Jun 2009 38,535,641 (117,226)
U.S. Treasury 5-Year Note Futures 617 Long Sep 2009 71,244,219 (614,547)
U.S. Treasury 10-Year Note Futures 160 Long Sep 2009 18,720,000 (387,500)
$1,005,638,907 $19,860,173
U.S. Government Securities Fund
The Fund uses futures to enhance potential gain, manage duration of the portfolio, hedge against anticipated interest rate or currency exchange rates, gain exposure to certain securities
markets and maintain diversity and liquidity of the portfolio.
U.S. Government Securities
Fund Eurodollar Futures 114 Long Sep 2009 $28,290,525 $334,825
Eurodollar Futures 51 Long Jun 2010 12,577,238 75,833
Eurodollar Futures 57 Long Sep 2010 14,014,875 71,706
Eurodollar Futures 60 Long Mar 2011 14,351,250 (13,120)
U.S. Treasury 2-Year Note Futures 27 Long Sep 2009 5,853,938 472
U.S. Treasury 5-Year Note Futures 484 Long Sep 2009 55,886,875 (439,803)
U.S. Treasury 10-Year Note Futures 200 Short Sep 2009 23,400,000 205,498
U.S. Treasury 30-Year Bond Futures 46 Short Sep 2009 5,412,188 (34,793)
$159,786,889 $200,618
U.S. Multi Sector Fund
The Fund uses futures contracts to hedge against anticipated changes in securities markets, gain exposure to certain securities markets and to maintain the diversity and liquidity of the
portfolio.
U.S. Multi Sector Fund S&P 500 E Mini Index Futures 294 Long Jun 2009 $13,496,070 $615,888
$13,496,070 $615,888
Swap Contracts
Each Fund may enter interest rate, credit default, cross-currency, and other forms of swaps to manage its exposure to credit, currency and interest rate risks, or to enhance income. Swaps are privately negotiated agreements between
counterparties to exchange cash flows, assets, foreign currencies or market-linked returns at specified intervals. In connection with these agreements, a Fund will hold cash and/or liquid securities equal to the net amount of the Fund�s
exposure, in order to satisfy the Fund�s obligations in the event of default or bankruptcy/insolvency.
Copyright © 2012 www.secdatabase.com. All Rights Reserved.Please Consider the Environment Before Printing This Document

Swaps are marked to market daily based upon values from third party vendors or quotations from market makers to the extent available, and the change in value, if any, is recorded as unrealized appreciation/depreciation on the Fund�s
Statement of Assets and Liabilities. If market quotations are not readily available or deemed reliable, certain swaps may fair valued in good faith by the Fund�s Pricing Committee in accordance with procedures adopted by the Board
of Trustees. Upfront payments made/received by the Fund represent payments to compensate for differences between the stated terms of the swap and prevailing market conditions, including credit spreads, currency exchange rates,
interest rates and other relevant factors. These payments are amortized or accreted for financial reporting purposes, with the un-amortized/un -accreted portion included in the Statement of Assets and Liabilities. A liquidation payment
received or made at the termination of the swap is recorded as realized gain or loss on the Statement of Operations. Net periodic payments received or paid by the Fund are included as part of realized gains or losses on the Statement of
Operations.
Entering into swaps involves, to varying degrees, elements of credit, market and documentation risk in excess of the amounts recognized on the Statement of Assets and Liabilities. Such risks involve the possibility that there will be no
liquid market for these agreements, that a counterparty may default on its obligation under the swap or disagree as to the meaning of the swap�s terms, and that there may be unfavorable interest rate changes. A Fund may also suffer
losses if it is unable to terminate outstanding swaps or reduce its exposure through offsetting transactions.
Each Fund is party to International Swap Dealers Association, Inc. (ISDA) Master Agreements with select counterparties. These Agreements govern over-the-counter derivative transactions (including foreign exchanges) entered into
by the Fund and those counterparties. ISDA Master Agreements typically include standard representations and warranties as well as provisions outlining the general obligations of the Fund and counterparties relating to collateral,
events of default, termination events and other standard provisions. Termination events may include a decline in the Fund�s net asset value below a certain point over a certain period of time, as specified in the Schedule to the ISDA
Master Agreement; such an event may entitle counterparties to terminate early and calculate related damages for some or all outstanding transactions under the Agreement�s damage calculation provisions. An election by a
counterparty to terminate an ISDA Master Agreement could have a material impact on the Fund�s financial statements. Due to declines in the Fund�s net assets during the year ended May 31, 2009, one or more counterparties may be
entitled to terminate early, although none has done so. The Schedule to the ISDA Master Agreement may give counterparties the right to require the Fund to post additional collateral as opposed to giving the counterparties the right to
terminate the Agreement.
Interest Rate Swap Agreements Interest rate swaps represent an agreement between two counterparties to exchange cash flows based on the difference in the two interest rates, applied to the notional principal amount for a specified
period. The payment flows are usually netted against each other, with the difference being paid by one party to the other. A Fund settles accrued net receivable or payable under the swap contracts on a periodic basis.
Certain forms of interest rate swap agreements may include: (i) interest rate caps, under which, in return for a premium, one party agrees to make payments to the other to the extent that interest rates exceed a specified rate, or �cap�,
(ii) interest rate floors, under which, in return for a premium, one party agrees to make payments to the other to the extent that interest rates fall below a specified rate, or �floor�, (iii) interest rate collars, under which a party sells a cap
and purchases a floor or vice versa in an attempt to protect itself against interest rate movements exceeding given minimum or maximum levels, (iv) callable interest rate swaps, under which the counterparty may terminate the swap
transaction in whole at zero cost by a predetermined date and time prior to the expiration date, or (v) spreadlocks, which allow the interest rate swap users to lock in the forward differential (or spread) between the interest rate swap
rate and a specified benchmark.
The following summarizes the contracts held as of May 31, 2009.
Global Bond Fund
The Fund uses interest rate swaps to enhance potential gain, manage duration of the portfolio, hedge against anticipated interest rate and currency exchange rates and a substitute for securities purchased.
Unamortized
USD Payments Upfront Unrealized
Notional Notional Payments Made by Received by Maturity Payment Paid Appreciation
Fund Counterparty Amount Currency Amount Fund Fund Date (Received) (Depreciation) Market Value
Global Bond Fund
Barclays Bank PLC 31,400,000 EUR $41,608,141 6 Month EURIBOR Fixed 2.500% Sep 2011 $68,475 $78,992 $147,467
Barclays Bank PLC 30,000,000 SEK 4,440,300 3 Month STIBOR Fixed 4.500% Mar 2014 (30,265) 314,251 283,986
Barclays Bank PLC 2,200,000 USD 2,200,000 3 Month LIBOR Fixed 3.100% May 2016 - - -
Deutsche Bank AG 1,800,000 EUR 2,320,829 6 Month EURIBOR Fixed 3.000% Sep 2011 5,106 16,731 21,837
Deutsche Bank AG 49,600,000 AUD 31,877,918 3 Month BBR-BBSW Fixed 4.500% Jun 2012 20,171 (419,985) (399,814)
Deutsche Bank AG 4,600,000 EUR 6,045,552 6 Month EURIBOR Fixed 3.000% Sep 2012 25,699 - 25,699
JP Morgan Chase Bank 28,900,000 EUR 38,295,391 6 Month EURIBOR Fixed 3.000% Sep 2012 193,411 153,957 347,368
Morgan Stanley Capital Services, Inc. 18,500,000 USD 18,500,000 3 Month LIBOR Fixed 4.000% Dec 2019 (288,045) 154,888 (133,157)
The Royal Bank of Scotland PLC 4,990,000,000 JPY 50,988,607 6 Month LIBOR Fixed 1.500% Dec 2013 1,386,892 1,453,861 2,840,753
UBS AG 470,000,000 JPY 4,832,624 6 Month LIBOR Fixed 1.500% Jun 2018 102,449 80,464 182,913
$201,109,362 $1,483,893 $1,833,159 $3,317,052
Investment Quality Bond FundThe Fund uses interest rate swaps in order to hedge against anticipated interest rate changes and to manage the duration of the portfolio.
Investment Quality Bond Fund
JP Morgan Chase Bank 2,480,000 USD $2,480,000 Fixed 4.3175% 3 Month LIBOR Dec 2028 - ($153,868) ($153,868)
JP Morgan Chase Bank 925,000 USD 925,000 Fixed 3.425% 3 Month LIBOR Mar 2039 - 96,340 96,340
$3,405,000 - ($57,528) ($57,528)
Real Return Bond Fund
The Fund uses interest rate swaps to enhance potential gain, manage duration of the portfolio, hedge against anticipated interest rate and currency exchange rates and a substitute for securities purchased.
Real Return Bond Fund
Barclays Bank PLC 2,900,000 GBP $5,443,740 6 Month LIBOR Fixed 5.000% Jun 2009 ($1,090) $40,080 $38,990
Barclays Bank PLC 14,552,761 BRL 11,120,393 CDI Fixed 10.680% Jan 2012 (118,669) (163,231) (281,900)
Barclays Bank PLC 5,500,000 EUR 6,645,650 FRCPXTOB Fixed 2.138% Jan 2016 - 54,834 54,834
Barclays Bank PLC 3,000,000 GBP 6,094,947 UKRPI Fixed 3.250% Dec 2017 10,902 200,228 211,130
BNP Paribas 2,200,000 EUR 2,614,040 FRCPXTOB Fixed 2.040% Feb 2011 - 97,195 97,195
BNP Paribas 3,600,000 EUR 4,757,399 FRCPXTOB Fixed 1.988% Dec 2011 - 96,491 96,491
Copyright © 2012 www.secdatabase.com. All Rights Reserved.Please Consider the Environment Before Printing This Document

Citibank N.A 2,000,000 EUR 2,884,700 FRCPXTOB Fixed 2.110% Nov 2012 - 37,560 37,560
Credit Suisse International 5,600,000 GBP 10,819,479 6 Month LIBOR Fixed 5.000% Sep 2010 (66,783) 442,829 376,046
Deutsche Bank AG 7,500,000 GBP 15,049,513 6 Month LIBOR Fixed 6.000% Mar 2010 54,520 525,593 580,113
Goldman Sachs 2,600,000 EUR 3,799,248 6 Month EURIBOR Fixed 4.500% Mar 2011 (4,158) 203,323 199,165
Goldman Sachs 2,600,000 GBP 5,131,100 UKRPI Fixed 3.110% Jan 2018 - 139,472 139,472
JP Morgan Chase Bank 2,700,000 EUR 3,428,053 FRCPXTOB Fixed 2.028% Oct 2011 - 106,982 106,982
JP Morgan Chase Bank 1,500,000 EUR 1,912,124 FRCPXTOB fixed 2.353% Oct 2016 - (39,863) (39,863)
Morgan Stanley Capital Services Inc. 6,059,390 BRL 4,763,208 CDI Fixed 10.115% Jan 2012 (104,417) (155,432) (259,849)
The Royal Bank of Scotland PLC 6,600,000 GBP 12,746,259 6 Month LIBOR Fixed 5.000% Sep 2010 (80,669) 521,906 441,237
The Royal Bank of Scotland PLC 4,900,000 GBP 9,764,581 UKRPI Fixed 3.183% Dec 2017 3,544 269,698 273,242
The Royal Bank of Scotland PLC 1,100,000 GBP 2,231,459 UKRPI Fixed 3.440% Sep 2027 - 1,586 1,586
UBS AG 2,300,000 EUR 2,908,693 FRCPXTOB Fixed 2.095% Oct 2011 - 104,815 104,815
UBS AG 1,600,000 EUR 2,029,041 FRCPXTOB Fixed 2.350% Oct 2016 - (37,312) (37,312)
UBS AG 1,600,000 EUR 2,029,041 Fixed 2.275% FRCPXTOB Oct 2016 - 12,391 12,391
$116,172,668 ($306,820) $2,459,145 $2,152,325
Spectrum Income Fund
The Fund uses interest rate swaps to hedge against anticipated currency exchange rates and interest rates.
Spectrum Income Fund
JP Morgan Chase Bank 232,000,000 KRW $250,256 3 Month CD-KSDA Fixed 5.055% Jun 2012 - $8,938 $8,938
JP Morgan Chase Bank 592,000,000 KRW 636,559 3 Month CD-KSDA Fixed 5.180% Jun 2012 - 23,913 23,913
$886,815 - $32,851 $32,851
Total Return Fund
The Fund uses interest rate swaps to enhance potential gain, manage duration of the portfolio, hedge against anticipated interest rate and currency exchange rates and a substitute for securities purchased.
Total Return Fund
Bank of America N.A. 2,600,000 USD $2,600,000 Fixed 5.000% 3 Month LIBOR Dec 2038 ($192,995) ($291,813) ($484,808)
Barclays Bank PLC 5,800,000 GBP 11,414,329 6 Month LIBOR Fixed 5.000% Jun 2009 (6,419) 86,579 80,160
Barclays Bank PLC 6,013,391 BRL 3,248,431 CDI Fixed 11.360% Jan 2010 - 260 260
Barclays Bank PLC 104,100,000 USD 104,100,000 3 Month LIBOR Fixed 3.000% Feb 2011 (863,157) 4,615,797 3,752,640
Barclays Bank PLC 616,577 BRL 383,992 CDI Fixed 10.600% Jan 2012 - (564) (564)
Barclays Bank PLC 500,000 EUR 668,075 FRCPXTOB Fixed 1.960% Apr 2012 - 10,075 10,075
BNP Paribas 3,500,000 EUR 5,117,176 6 Month EURIBOR Fixed 4.5% Mar 2014 (50,823) 457,293 406,470
Citibank N.A 2,500,000 USD 2,500,000 Fixed 5.000% 3 Month LIBOR Dec 2038 38,014 (504,176) (466,162)
Credit Suisse International 1,100,000 GBP 2,144,835 6 Month LIBOR Fixed 5.000% Jun 2009 (841) 16,044 15,203
Credit Suisse International 13,600,000 USD 13,600,000 3 Month LIBOR Fixed 4.000% Jun 2011 515,032 193,566 708,598
Credit Suisse International 22,800,000 USD 22,800,000 Fixed 3.000% 3 Month LIBOR Jun 2029 (1,401,611) 4,590,579 3,188,968
Deutsche Bank AG 2,500,000 AUD 1,774,875 3 Month BBR-BBSW Fixed 4.500% Jun 2011 6,798 (1,724) 5,074
Deutsche Bank AG 4,200,000 USD 4,200,000 3 Month LIBOR Fixed 4.000% Jun 2011 132,370 86,462 218,832
Deutsche Bank AG 3,600,000 AUD 2,543,400 6 Month BBR-BBSW Fixed 5.000% Jun 2013 13,615 (39,745) (26,130)
Deutsche Bank AG 1,400,000 GBP 2,480,031 6 Month LIBOR Fixed 5.000% Mar 2014 682 191,532 192,214
Goldman Sachs Capital Markets LP 1,000,000 GBP 1,847,050 6 Month LIBOR Fixed 5.250% Mar 2014 (189) 156,431 156,242
HSBC Bank USA, N.A. 298,158 BRL 318,167 CDI Fixed 14.765% Jan 2012 2,831 17,762 20,593
HSBC Bank USA, N.A. 3,500,000 GBP 6,942,957 6 Month LIBOR Fixed 5.000% Sep 2013 31,993 438,779 470,772
HSBC Bank USA, N.A. 958,794 BRL 597,321 CDI Fixed 10.610% Jan 2012 - (739) (739)
JP Morgan Chase Bank, N.A. 411,051 BRL 255,995 CDI Fixed 10.600% Jan 2012 - (376) (376)
Merrill Lynch Capital Services, Inc. 2,070,064 BRL 1,074,014 CDI Fixed 12.948% Jan 2010 132 42,449 42,581
Merrill Lynch Capital Services, Inc. 5,554,811 BRL 2,993,571 CDI Fixed 11.430% Jan 2010 - 5,388 5,388
Merrill Lynch Capital Services, Inc. 11,100,000 USD 11,100,000 3 Month LIBOR Fixed 4.000% Jun 2011 250,194 328,147 578,341
Merrill Lynch Capital Services, Inc. 5,035,226 BRL 3,936,605 CDI Fixed 11.980% Jan 2012 - 95,008 95,008
Merrill Lynch Capital Services, Inc. 954,107 BRL 1,012,701 CDI Fixed 14.765% Jan 2012 5,719 60,178 65,897
Merrill Lynch Capital Services, Inc. 5,400,000 USD 5,400,000 Fixed 5.000% 3 Month LIBOR Dec 2038 (156,523) (850,387) (1,006,910)
Morgan Stanley Capital Services, Inc. 5,046,649 BRL 2,616,128 CDI Fixed 12.780% Jan 2010 237 91,662 91,899
Brazil Cetip
Morgan Stanley Capital Services, Inc. 3,793,567 BRL 2,469,501 Interbank Deposit Fixed 12.670% Jan 2010 (2,631) 53,551 50,920
Morgan Stanley Capital Services, Inc. 3,600,000 USD 3,600,000 Fixed 5.000% 3 Month LIBOR Dec 2038 73,150 (744,423) (671,273)
The Royal Bank of Scotland PLC 199,000,000 USD 199,000,000 3 Month LIBOR Fixed 3.150% Dec 2010 - 7,647,796 7,647,796
The Royal Bank of Scotland PLC 101,000,000 USD 101,000,000 3 Month LIBOR Fixed 3.000% Feb 2011 (251,918) 3,892,808 3,640,890
The Royal Bank of Scotland PLC 2,700,000 USD 2,700,000 3 Month LIBOR Fixed 4.000% Jun 2011 61,776 78,902 140,678
The Royal Bank of Scotland PLC 2,000,000 EUR 2,667,001 FRCPXTOB Fixed 1.955% Mar 2012 - 38,480 38,480
The Royal Bank of Scotland PLC 3,400,000 EUR 4,534,240 FRCPXTOB Fixed 1.950% Mar 2012 - 63,237 63,237
The Royal Bank of Scotland PLC 2,500,000 GBP 4,617,624 6 Month LIBOR Fixed 5.250% Mar 2014 (1,891) 392,497 390,606
The Royal Bank of Scotland PLC 4,000,000 USD 4,000,000 Fixed 5.000% 3 Month LIBOR Dec 2038 (272,459) (473,400) (745,859)
Brazil Cetip
UBS AG 3,543,734 BRL 2,471,681 Interbank Deposit Fixed 12.410% Jan 2010 (3,320) 53,717 50,397
UBS AG 52,100,000 AUD 37,053,526 3 Month BBR-BBSW Fixed 4.500% Jun 2011 28,075 77,671 105,746
Copyright © 2012 www.secdatabase.com. All Rights Reserved.Please Consider the Environment Before Printing This Document

UBS AG 20,500,000 AUD 13,486,949 6 Month BBR-BBSW Fixed 4.250% Sep 2011 170,774 (68,686) 102,088
UBS AG 6,102,436 BRL 4,551,967 CDI Fixed 10.575% Jan 2012 (103,181) 20,124 (83,057)
$599,822,140 ($1,976,566) $20,826,741 $18,850,175
Credit default swap agreements Credit default swaps (CDS) involve the exchange of a fixed -rate premium (paid by �the Buyer�) for protection against the loss in value of an underlying debt instrument, reference entity or index, in
the event of a defined credit event (such as default or bankruptcy) . Under the terms of the swap, one party acts as a �guarantor� (the �Seller�), receiving a periodic payment that is a fixed percentage applied to a notional principal
amount. In return, the Seller agrees to remedies that are specified within the credit default agreement and are dependent on the referenced obligation, entity or credit index. Each Fund may enter into CDS in which a Fund may act as
the Buyer or Seller. By acting as the Seller, in circumstances in which a Fund does not hold offsetting cash equivalent positions equaling the notional amount of the swap, a Fund effectively incurs economic leverage because it would
be obligated to pay the Buyer such notional amount in the event of a default. The amount of loss in such case would be reduced by any recovery value on the underlying credit.
If a Fund is the Seller and a credit event occurs, the Fund will either pay to the Buyer the notional amount of the swap and take delivery of the reference obligation, other deliverable obligations, or securities comprising the reference
index, or pay a net settlement amount in the form of cash or securities equal to the notional amount of the swap less the recovery value of the reference obligation or securities comprising the referenced index. If a Fund is the Buyer
and a credit event occurs, the Fund will either receive an amount equal to the notional amount of the swap and deliver the reference obligation, other deliverable obligations, or securities comprising the referenced index, or receive a
net settlement amount in the form of cash or securities equal to the notional amount of the swap less the recovery value of the referenced obligation or underlying securities comprising the referenced index. Recovery values are
assumed by market makers, considering either industry standard recovery rates or entity specific factors and considerations, until a credit event occurs. If a credit event has occurred, the recovery value is determined by a facilitated
auction whereby a minimum number of allowable broker bids, together with a specified valuation method, are used to calculate the settlement value.
CDS on corporate issues, sovereign issues of an emerging country and asset-backed securities, involve the Buyer making a stream of payments to the Seller in exchange for the right to receive a specified return in the event of a default
or other credit event. If a credit event occurs on corporate issues, or sovereign issues of an emerging country and cash settlement is not elected, a variety of other deliverable obligations may be delivered in lieu of the specific reference
obligation. The ability to deliver other obligations may result in a cheapest -to-deliver option (the Buyer�s right to choose the deliverable obligation with the lowest value following a credit event). Deliverable obligations on CDS on
asset-backed securities would be limited to the specific reference obligation, as performance for asset-backed securities can vary. Prepayments, principal paydowns and other write down or loss events on the underlying mortgage loans
will reduce the outstanding principal balance of the reference obligation. These reductions may be temporary or permanent. The Fund may use CDS on these types of securities to provide a measure of protection against the issuer�s
default, or to take an active long or short position with respect to the likelihood of default.
CDS on credit indices involve the Buyer making a stream of payments to the Seller in exchange for the right to receive a specified return in the event of a write-down, principal shortfall, interest shortfall or default of all or part of the
reference entities comprising the credit index. A credit index is a list of a basket of credit instruments or exposures designed to represent some part of the credit market.
These indices are made up of reference credits that are judged by a poll of dealers to be the most liquid entities in the CDS market, based on the sector of the index. Components of the indices include investment grade securities, high
yield securities, asset backed securities, emerging markets, and/or various credit ratings. Credit indices are traded using CDS with standardized terms, including a fixed spread and standard maturity dates. An index CDS references all
the names in the index, and if there is a default, the credit event is settled based on that name�s weight in the index. The composition of the indices changes periodically, usually every year, and for most indices, each name has an equal
weight in the index. Each Fund may use CDS on credit indices to hedge a Fund�s exposure to CDS or bonds, which is less expensive than buying many CDS to achieve a similar effect. CDS on indices are benchmarks for protecting
investors owning bonds against default, and traders use them to speculate on changes in credit quality.
Implied credit spreads, represented in absolute terms, are utilized in determining the market value of CDS agreements on corporate issues or sovereign issues of an emerging country as of period end, and are disclosed in the table
below. The implied credit spread generally represents the yield of the instrument above a credit-risk free rate, such as the U.S. Treasury Bond Yield, and may include upfront payments required to be made to enter into the agreement. It
also serves as an indicator of the current status of the payment/performance risk and represents the likelihood or risk of default for the credit derivative. Wider credit spreads represent a deterioration of the referenced entity�s credit
soundness and a greater likelihood of risk of default or other credit event occurring as defined under the terms of the agreement.
For CDS on asset-backed securities and credit indices, the quoted market prices and resulting values serve as the indicator of the current status of the payment/performance risk. Wider credit spreads and increasing market values, in
absolute terms when compared to the notional amount of the swap, represent a deterioration of the reference entity�s credit soundness and a greater likelihood or risk of default or other credit event occurring as defined under the terms
of the swap.
The maximum potential amount of future payments (undiscounted) that a Fund as the Seller could be required to make under a CDS agreement, would be an amount equal to the notional amount of the agreement. Notional amounts of
all CDS agreements outstanding as of May 31, 2009, for which the Fund is the Seller, are disclosed in the footnotes to the tables below. These potential amounts would be partially offset by any recovery values of the respective
reference obligations, upfront payments received, or net amounts received from the settlement of buy protection CDS agreements entered into by the Fund for the same reference entity or entities.
The following summarizes the contracts that the Fund held as a Buyer of protection, as of May 31, 2009.
Global Bond Fund
The Fund uses credit default swaps to enhance potential gain, hedge against potential credit events, and gain exposure to security or credit indices.
Unamortized
Upfront
USD (Pay)/Receive Payment Unrealized
Notional Fixed Maturity Paid Appreciation Market
Counterparty Reference Obligation Notional Amount Currency Amount Rate Date (Received) (Depreciation) Value
Bank of America
N.A. CBS Corp. 1,800,000 USD $1,800,000 (1.000)% Jun 2019 $235,409 $136,247 $371,656
Bank of America
N.A. CDX.NA.IG.8 7,027,200 USD 7,027,200 (0.600)% Jun 2017 86,631 421,334 507,965
Bank of America
N.A. Dow Jones CDX.NA.IG.7 5,443,200 USD 5,443,200 (0.650)% Dec 2016 (30,275) 314,182 283,907
Bank of America
N.A. Intuit, Inc. 2,000,000 USD 2,000,000 (1.380)% Mar 2017 - (63,175) (63,175)
Bank of America
Copyright © 2012 www.secdatabase.com. All Rights Reserved.Please Consider the Environment Before Printing This Document

N.A. Lafarge 2,000,000 USD 2,000,000 (1.690)% Sep 2016 - 131,595 131,595
Bank of America
N.A. McKesson Corp. 600,000 USD 600,000 (0.380)% Mar 2017 - (177) (177)
Bank of America
N.A. Rio Tinto Alcan, Inc. 700,000 USD 700,000 (0.290)% Mar 2011 - 3,718 3,718
Bank of America
N.A. The Home Depot, Inc. 1,000,000 USD 1,000,000 (1.100)% Mar 2016 - (10,902) (10,902)
Bank of America
N.A. UBS AG 5,100,000 USD 5,100,000 (2.280)% Jun 2018 - (371,560) (371,560)
Bank of America
N.A. Viacom, Inc. 600,000 USD 600,000 (3.200)% Jun 2011 - (24,947) (24,947)
Bank of America
N.A. Vivendi 2,000,000 USD 2,000,000 (1.280)% Jun 2013 - (6,223) (6,223)
Bank of America
N.A. Xstrata Canada Corp. 3,000,000 USD 3,000,000 (0.910)% Jun 2012 - 201,723 201,723
Barclays Bank PLC CDX.NA.IG.8 3,123,200 USD 3,123,200 (0.600)% Jun 2017 97,777 187,259 285,036
Barclays Bank PLC CDX.NA.IG.8 21,569,600 USD 21,569,600 (0.600)% Jun 2017 237,030 1,293,264 1,530,294
Barclays Bank PLC Citigroup, Inc. 6,000,000 USD 6,000,000 (0.870)% Jun 2018 - 755,889 755,889
Itraxx Europe Hivol Series 6
Barclays Bank PLC Version 1 1,200,000 EUR 1,591,050 (0.850)% Dec 2016 (6,735) 144,006 137,271
Barclays Bank PLC Norfolk Southern 2,000,000 USD 2,000,000 (0.450)% Sep 2014 - (1,398) (1,398)
Barclays Bank PLC Southwest Airlines Company 500,000 USD 500,000 (0.640)% Mar 2017 - 25,662 25,662
Barclays Bank PLC Wachovia Bank 400,000 USD 400,000 (2.700)% Sep 2013 - (25,940) (25,940)
Barclays Bank PLC Wells Fargo & Company 1,400,000 USD 1,400,000 (1.030)% Sep 2018 - (7,490) (7,490)
Barclays Bank PLC XL Capital, Ltd. 300,000 USD 300,000 (0.310)% Mar 2012 - 31,774 31,774
BNP Paribas D.R. Horton, Inc. 800,000 USD 800,000 (4.030)% Jun 2011 - (27,392) (27,392)
JP Morgan Chase &
BNP Paribas Company 1,800,000 USD 1,800,000 (0.737)% Mar 2018 - 12,222 12,222
The Bear Stearns
BNP Paribas Companies, Inc. 2,000,000 USD 2,000,000 (2.180)% Mar 2018 - (204,697) (204,697)
BNP Paribas Vivendi 800,000 USD 800,000 (1.743)% Jun 2013 - (17,699) (17,699)
BNP Paribas Vivendi 800,000 USD 800,000 (1.780)% Jun 2013 - (18,886) (18,886)
BNP Paribas Vivendi 700,000 USD 700,000 (1.820)% Jun 2013 - (17,549) (17,549)
Citibank N.A Autozone, Inc. 500,000 USD 500,000 (0.680)% Dec 2012 - (1,215) (1,215)
Citibank N.A HSBC Finance Corp. 1,700,000 USD 1,700,000 (0.430)% Mar 2014 - 239,743 239,743
Citibank N.A Nabors Industries, Inc. 2,000,000 USD 2,000,000 (0.820)% Mar 2018 - 65,726 65,726
Citibank N.A Pearson PLC 1,000,000 USD 1,000,000 (0.690)% Jun 2018 - 2,566 2,566
Citibank N.A Sara Lee Corp. 500,000 USD (0.330)% Sep 2011 - 111 111
500,000
Credit Suisse
International Johnson Controls, Inc. 600,000 USD 600,000 (0.240)% Mar 2011 - 22,489 22,489
Credit Suisse
International Masco Corp. 700,000 USD 700,000 (0.907)% Dec 2016 - 79,911 79,911
Credit Suisse
International Sealed Air Corp. 700,000 USD 700,000 (0.500)% Sep 2013 - 18,964 18,964
Deutsche Bank AG ACE, Ltd. 300,000 USD 300,000 (0.390)% Jun 2014 - 11,020 11,020
Copyright © 2012 www.secdatabase.com. All Rights Reserved.Please Consider the Environment Before Printing This Document

Deutsche Bank AG Altria Group, Inc. 2,000,000 USD 2,000,000 (1.455)% Mar 2019 - (75,659) (75,659)
Deutsche Bank AG Bank of America Corp. 700,000 USD 700,000 (1.720)% Dec 2013 - (6,970) (6,970)
Deutsche Bank AG CDX.NA.IG.12 9,300,000 USD 9,300,000 (1.000)% Jun 2014 364,801 143,141 507,942
Deutsche Bank AG CDX.NA.IG.8 9,174,400 USD 9,174,400 (0.600)% Jun 2017 56,175 550,074 606,249
Deutsche Bank AG CDX.NA.IG.9 5,172,800 USD 5,172,800 (0.800)% Dec 2017 170,954 267,716 438,670
Deutsche Bank AG Citigroup, Inc. 1,800,000 USD 1,800,000 (1.336)% Sep 2018 - 172,354 172,354
JP Morgan Chase &
Deutsche Bank AG Company 400,000 USD 400,000 (0.720)% Mar 2018 - 3,230 3,230
Nationwide Health Properties,
Deutsche Bank AG Inc. 600,000 USD 600,000 (0.620)% Sep 2011 - 42,631 42,631
Tate & Lyle Public Limited
Deutsche Bank AG Company 300,000 USD 300,000 (0.510)% Dec 2014 - 14,101 14,101
Goldman Sachs
International CDX.NA.IG.10 12,297,600 USD 12,297,600 (1.500)% Jun 2018 (373,790) 31,051 (342,739)
Goldman Sachs
International CDX.NA.IG.12 8,600,000 USD 8,600,000 (1.000)% Jun 2019 392,869 129,375 522,244
JP Morgan Chase
Bank CNA Financial Corp. 500,000 USD 500,000 (0.440)% Sep 2011 - 34,904 34,904
JP Morgan Chase
Bank CNA Financial Corp. 500,000 USD 500,000 (0.440)% Sep 2011 - 34,904 34,904
JP Morgan Chase ITRAXX EUROPE HIVOL
Bank SERIES 6 VERSION 1 300,000 EUR 398,865 (0.850)% Dec 2016 (1,678) 36,001 34,323
JP Morgan Chase
Bank Loews Corp. 200,000 USD 200,000 (0.330)% Mar 2016 - 2,906 2,906
JP Morgan Chase
Bank Nisource Finance Corp. 200,000 USD 200,000 (0.620)% Sep 2014 - 18,317 18,317
JP Morgan Chase
Bank Sabre Holdings Corp. 700,000 USD 700,000 (0.930)% Sep 2011 - 184,459 184,459
JP Morgan Chase
Bank Sprint Nextel Corp. 1,000,000 USD 1,000,000 (1.065)% Dec 2016 - 110,439 110,439
Merrill Lynch Capital American General Finance
Services, Inc. Corp. 2,000,000 USD 2,000,000 (1.370)% Dec 2017 - 964,952 964,952
Merrill Lynch Capital
Services, Inc. Boston Scientific Corp. 700,000 USD 700,000 (0.510)% Jun 2011 - 7,629 7,629
Morgan Stanley
Capital Services, Inc. CDX.NA.IG.12 11,300,000 USD 11,300,000 (1.000)% Jun 2014 433,653 173,924 607,577
Morgan Stanley
Capital Services, Inc. Motorola, Inc. 700,000 USD 700,000 (0.725)% Dec 2017 - 58,449 58,449
Morgan Stanley
Capital Services, Inc. Simon Property Group, LP 1,000,000 USD 1,000,000 (1.047)% Jun 2016 - 62,693 62,693
The Royal Bank of
Scotland PLC CVS Caremark Corp. 700,000 USD 700,000 (0.550)% Sep 2011 - (995) (995)
The Royal Bank of
Scotland PLC Daimler Chrysler AG 300,000 USD 300,000 (0.620)% Sep 2011 - 6,966 6,966
The Royal Bank of The Bear Stearns
Scotland PLC Companies, Inc. 2,400,000 USD 2,400,000 (2.223)% Mar 2018 - (253,442) (253,442)
UBS AG BAE Systems PLC 700,000 USD 700,000 (0.140)% Dec 2011 - 14,844 14,844
UBS AG Capital One Financial Corp. 600,000 USD 600,000 (0.350)% Sep 2011 - 20,149 20,149
JP Morgan Chase &
UBS AG Company 1,200,000 USD 1,200,000 (0.730)% Mar 2018 - 8,783 8,783
American Electric Power
Wachovia Bank N.A. Company, Inc. 2,000,000 USD 2,000,000 (0.450)% Jun 2015 - 20,277 20,277
$160,497,915 $1,662,821 $6,077,358 $7,740,179
Investment Quality Bond Fund
Copyright © 2012 www.secdatabase.com. All Rights Reserved.Please Consider the Environment Before Printing This Document

The Fund uses credit default swaps to hedge against potential credit events and to gain exposure to security or credit indices
Goldman Sachs
International Macy�s, Inc. 500,000 USD $500,000 (0.027)% Sep 2013 - ($2,232) ($2,232)
UBS Securities, LLC Cytec Industries, Inc. 475,000 USD 475,000 (0.016)% Dec 2013 - 11,948 11,948
Everest Reinsurance
UBS Securities, LLC Holdings, Inc. 600,000 USD 600,000 (0.018)% Dec 2013 - (18,722) (18,722)
$1,575,000 - ($9,006) ($9,006)
Real Return Bond Fund
The Fund uses credit default swaps to enhance potential gain, hedge against potential credit events, and gain exposure to security or credit indices.
Bank of America N.A. YUM! Brands, Inc 2,000,000 USD $2,000,000 (1.245)% Mar 2018 - ($83,540) ($83,540)
The Black & Decker
Barclays Bank PLC Corp. 1,000,000 USD 1,000,000 (1.180)% Dec 2014 - 8,917 8,917
International Lease
BNP Paribas Finance Corp. 600,000 USD 600,000 (1.600)% Dec 2013 - 136,843 136,843
Citibank N.A GATX Corp. 1,000,000 USD 1,000,000 (1.070)% Mar 2016 - 64,022 64,022
Citibank N.A Omnicom Group, Inc 1,250,000 USD 1,250,000 (0.940)% Jun 2016 - (6,592) (6,592)
Deutsche Bank AG CDX.NA.IG.12 61,600,000 USD 61,600,000 (1.000)% Jun 2014 2,157,141 948,118 3,105,259
Deutsche Bank AG Home Depot, Inc. 1,250,000 USD 1,250,000 (1.565)% Mar 2016 - (49,604) (49,604)
Sep
Deutsche Bank AG Macy's, Inc 1,000,000 USD 1,000,000 (2.100)% 2017 - 10,769 10,769
Goldman Sachs RPM International, Inc. 1,000,000 USD 1,000,000 (1.500)% Mar 2018 - 14,301 14,301
Goldman Sachs Group, Inc. CDX.NA.IG.12 33,300,000 USD 33,300,000 (1.000)% Jun 2014 842,124 512,538 1,354,662
Qwest Capital Funding, Sep
JP Morgan Chase Bank Inc. 1,000,000 USD 1,000,000 (3.250)% 2009 - 736 736
Merrill Lynch Capital
Services, Inc. CDX.NA.IG.9 22,350,400 USD 22,350,400 (0.600)% Dec 2012 1,298,059 937,187 2,235,246
Morgan Stanley Capital
Services Inc. CDX.NA.IG.12 14,100,000 USD 14,100,000 (1.000)% Jun 2014 527,538 216,848 744,386
Morgan Stanley Capital
Services, Inc. Pearson PLC 2,500,000 USD 2,500,000 (0.750)% Jun 2014 - (13,093) (13,093)
Morgan Stanley Capital
Services, Inc. Target Corp. 1,000,000 USD 1,000,000 (1.200)% Mar 2018 - (43,655) (43,655)
The Royal Bank of Scotland
PLC Macy's, Inc 1,000,000 USD 1,000,000 (2.111)% Dec 2016 - 12,467 12,467
$145,950,400 $4,824,862 $2,666,262 $7,491,124
Spectrum Income Fund
The Fund uses credit default swaps to hedge against potential credit events.
JP Morgan Chase
Bank United Utilities PLC 100,000 EUR $148,715 (0.240)% Mar 2013 - ($2,073) ($2,073)
JP Morgan Chase
Bank Rentokil Initial PLC 50,000 EUR 75,908 (2.580)% Mar 2013 - (1,174) (1,174)
JP Morgan Chase
Bank Electrolux AB 75,000 EUR 118,661 (1.180)% Jun 2013 - (1,471) (1,471)
JP Morgan Chase British Telecommunications
Bank PLC 40,000 EUR 51,938 (1.760)% Mar 2014 - 121 121
$395,222 - ($4,597) ($4,597)
Total Return Fund
Copyright © 2012 www.secdatabase.com. All Rights Reserved.Please Consider the Environment Before Printing This Document

The Fund uses credit default swaps to enhance potential gain, hedge against potential credit events, and gain exposure to security or credit indices.
Deutsche Bank AG CDX.NA.IG.12 2,200,000 USD $2,200,000 (1.000)% Jun 2014 $73,646 ($39,785) $33,861
Merrill Lynch
International CDX.NA.HY.12 7,326,000 USD 7,326,000 (5.000)% Jun 2014 1,739,390 (458,131) 1,281,259
$9,526,000 $1,813,036 ($497,916) $1,315,120
The following summarizes the contracts that the Fund held as a Seller of protection, as of May 31, 2009.
Global Bond Fund
The Fund uses credit default swaps to enhance potential gain, to take a long position in the exposure of the benchmark credit and to gain exposure to security or credit index.
Upfront
Implied Credit USD Payment Unrealized
Reference Spread at 5-31- Notional Notional (Pay)/Receive Maturity Paid Appreciation Market
Counterparty Obligation 2009 Amount Currency Amount Fixed Rate Date (Received) (Depreciation) Value
General Electric
Barclays Bank PLC Capital Corp. 4.29% 5,000,000 USD $5,000,000 5.000 % Jun 2014 $208,514 ($48,611) $159,903
Credit Suisse International ABX.HE.AA.06-1 n/a 800,000 USD 800,000 0.320 % Jul 2045 (282,763) (626,000) (908,763)
May
Deutsche Bank AG ABX.HE.AAA.06-2 n/a 998,558 USD 998,558 0.110 % 2046 (367,331) (668,927) (1,036,258)
Federative Republic
JP Morgan Chase Bank of Brazil 1.19% 1,700,000 USD 1,700,000 1.345 % Aug 2011 - 12,342 12,342
Federative Republic
Merrill Lynch International of Brazil 1.19% 2,000,000 USD 2,000,000 1.340 % Aug 2011 - 14,272 14,272
Morgan Stanley Capital Federative Republic
Services, Inc. of Brazil 1.19% 4,100,000 USD 4,100,000 1.380 % Aug 2011 - 33,325 33,325
$14,598,558 ($441,580) ($1,283,599) ($1,725,179)
Real Return Bond Fund
The Fund uses credit default swaps to enhance potential gain, to take a long position in the exposure of the benchmark credit and to gain exposure to security or credit index.
Ford Motor Credit
Barclays Bank PLC Company LLC 8.55% 500,000 USD $500,000 3.800 % Sep 2012 - ($60,687) ($60,687)
General Electric
Barclays Bank PLC Capital Corp. 4.43% 300,000 USD 300,000 1.010 % Mar 2013 - (32,817) (32,817)
Citibank N.A Citi Group, Inc. 11.47% 2,000,000 USD 2,000,000 5.000 % Dec 2013 (394,246) (358,925) (753,171)
General Electric
Citibank N.A Capital Corp. 4.41% 8,600,000 USD 8,600,000 3.725 % Dec 2013 - (154,931) (154,931)
$11,400,000 ($394,246) ($607,360) ($1,001,606)
Total Return Fund
The Fund uses credit default swaps to enhance potential gain, to take a long position in the exposure of the benchmark credit and to gain exposure to security or credit index.
Bank of America N.A. General Motors Corp. 169.27% 5,000,000 USD $5,000,000 8.950 % Mar 2013 - ($4,161,603) ($4,161,603)
Barclays Bank PLC CDX.NA.IG.9 n/a 15,070,411 USD 15,070,411 0.758 % Dec 2012 - 166,438 166,438
Ford Motor Credit
Barclays Bank PLC Company LLC 8.55% 2,500,000 USD 2,500,000 4.150 % Sep 2012 - (277,820) (277,820)
Barclays Bank PLC GAZPROM 4.65% 5,300,000 USD 5,300,000 1.600 % Dec 2012 - (468,876) (468,876)
General Electric
Barclays Bank PLC Capital Corp. 4.45% 3,900,000 USD 3,900,000 0.620 % Mar 2011 - (249,944) (249,944)
General Electric
Barclays Bank PLC Capital Corp. 4.45% 3,900,000 USD 3,900,000 0.640 % Dec 2012 - (452,696) (452,696)
Barclays Bank PLC GMAC LLC 8.30% 2,500,000 USD 2,500,000 3.650 % Sep 2012 - (298,459) (298,459)
Copyright © 2012 www.secdatabase.com. All Rights Reserved.Please Consider the Environment Before Printing This Document
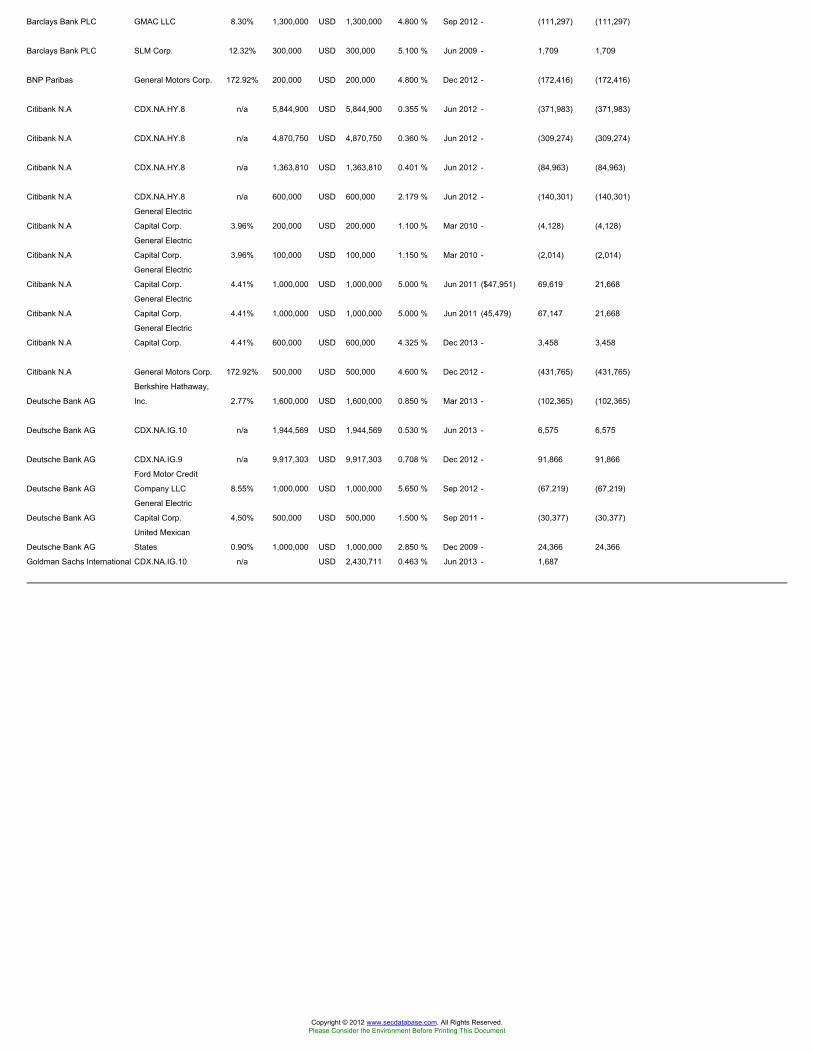
Barclays Bank PLC GMAC LLC 8.30% 1,300,000 USD 1,300,000 4.800 % Sep 2012 - (111,297) (111,297)
Barclays Bank PLC SLM Corp. 12.32% 300,000 USD 300,000 5.100 % Jun 2009 - 1,709 1,709
BNP Paribas General Motors Corp. 172.92% 200,000 USD 200,000 4.800 % Dec 2012 - (172,416) (172,416)
Citibank N.A CDX.NA.HY.8 n/a 5,844,900 USD 5,844,900 0.355 % Jun 2012 - (371,983) (371,983)
Citibank N.A CDX.NA.HY.8 n/a 4,870,750 USD 4,870,750 0.360 % Jun 2012 - (309,274) (309,274)
Citibank N.A CDX.NA.HY.8 n/a 1,363,810 USD 1,363,810 0.401 % Jun 2012 - (84,963) (84,963)
Citibank N.A CDX.NA.HY.8 n/a 600,000 USD 600,000 2.179 % Jun 2012 - (140,301) (140,301)
General Electric
Citibank N.A Capital Corp. 3.96% 200,000 USD 200,000 1.100 % Mar 2010 - (4,128) (4,128)
General Electric
Citibank N.A Capital Corp. 3.96% 100,000 USD 100,000 1.150 % Mar 2010 - (2,014) (2,014)
General Electric
Citibank N.A Capital Corp. 4.41% 1,000,000 USD 1,000,000 5.000 % Jun 2011 ($47,951) 69,619 21,668
General Electric
Citibank N.A Capital Corp. 4.41% 1,000,000 USD 1,000,000 5.000 % Jun 2011 (45,479) 67,147 21,668
General Electric
Citibank N.A Capital Corp. 4.41% 600,000 USD 600,000 4.325 % Dec 2013 - 3,458 3,458
Citibank N.A General Motors Corp. 172.92% 500,000 USD 500,000 4.600 % Dec 2012 - (431,765) (431,765)
Berkshire Hathaway,
Deutsche Bank AG Inc. 2.77% 1,600,000 USD 1,600,000 0.850 % Mar 2013 - (102,365) (102,365)
Deutsche Bank AG CDX.NA.IG.10 n/a 1,944,569 USD 1,944,569 0.530 % Jun 2013 - 6,575 6,575
Deutsche Bank AG CDX.NA.IG.9 n/a 9,917,303 USD 9,917,303 0.708 % Dec 2012 - 91,866 91,866
Ford Motor Credit
Deutsche Bank AG Company LLC 8.55% 1,000,000 USD 1,000,000 5.650 % Sep 2012 - (67,219) (67,219)
General Electric
Deutsche Bank AG Capital Corp. 4.50% 500,000 USD 500,000 1.500 % Sep 2011 - (30,377) (30,377)
United Mexican
Deutsche Bank AG States 0.90% 1,000,000 USD 1,000,000 2.850 % Dec 2009 - 24,366 24,366
Goldman Sachs International CDX.NA.IG.10 n/a USD 2,430,711 0.463 % Jun 2013 - 1,687
Copyright © 2012 www.secdatabase.com. All Rights Reserved.Please Consider the Environment Before Printing This Document

2,430,711 1,687
Goldman Sachs International CDX.NA.IG.9 n/a 875,056 USD 875,056 0.548 % Dec 2017 - 4,693 4,693
General Electric
Goldman Sachs International Capital Corp. 3.96% 500,000 USD 500,000 0.830 % Dec 2009 - (7,906) (7,906)
JP Morgan Chase Bank CDX.NA.IG.9 n/a 1,944,569 USD 1,944,569 0.553 % Dec 2017 - 11,127 11,127
Merrill Lynch International CDX.NA.HY.8 n/a 1,300,000 USD 1,300,000 1.833 % Jun 2012 - (316,893) (316,893)
General Electric
Merrill Lynch International Capital Corp. 3.96% 4,300,000 USD 4,300,000 1.080 % Dec 2009 - (59,758) (59,758)
Merrill Lynch International GMAC LLC 10.81% 3,200,000 USD 3,200,000 1.850 % Sep 2009 - (77,371) (77,371)
Morgan Stanley Capital
Services, Inc. CDX.NA.HY.8 n/a 1,300,000 USD 1,300,000 2.080 % Jun 2012 - (307,678) (307,678)
Morgan Stanley Capital
Services, Inc. CDX.NA.IG.9 n/a 3,900,000 USD 3,900,000 0.963 % Dec 2012 - 8,521 8,521
Morgan Stanley Capital Federative Republic
Services, Inc. of Brazil 1.64% 900,000 USD 900,000 1.660 % Mar 2013 - 3,655 3,655
Morgan Stanley Capital
Services, Inc. GAZPROM 4.63% 1,000,000 USD 1,000,000 2.180 % Feb 2013 - (73,867) (73,867)
The Royal Bank of Scotland General Electric
PLC Capital Corp. 3.95% 600,000 USD 600,000 1.100 % Sep 2009 - (4,032) (4,032)
The Royal Bank of Scotland
PLC Republic of Indonesia 2.18% 2,000,000 USD 2,000,000 0.450 % Jun 2009 - (451) (451)
UBS AG GAZPROM 4.63% 1,000,000 USD 1,000,000 2.180 % Feb 2013 - (73,868) (73,868)
$97,262,079 ($93,430) ($8,198,463) ($8,291,893)
Currency symbols are
BA-CDOR Bankers' Acceptances-Canadian Deposit Offering Rate defined as follows:
Australian
BBR Bank Bill Rate AUD Dollar
BBSW Bank Bill Swap Rate BRL Brazilian Real
Canadian
CDI Brazil Interbank Deposit Rate CAD Dollar
CMS Constant Maturity Swap EUR Euro
CPURNSA Consumer Price All Urban Non-Seasonally Adjusted Index GBP British Pound
EURIBOR Euro Interbank Offered Rate JPY Japanese Yen
FRCPXTOB French CPI Ex Tobacco Daily Reference Index KRW Korean Won
LIBOR London Interbank Offered Rate MXN Mexican Peso
UKRPI United Kingdom Retail Price Index SEK Swedish Krona
3M KW-CDC 3 months Korean Won USD U.S. Dollar
Forward Foreign Currency Contracts Each Fund may enter into foreign currency contracts to manage foreign currency exposure with respect to transaction hedging, position hedging, cross hedging and proxy hedging. In addition,
each Fund may enter into forward foreign currency contracts as a part of an investment strategy, in order to gain exposure to a currency, or to shift exposure to foreign currency fluctuation from one currency to another, without
purchasing securities denominated in that currency.
Transaction hedging involves entering into a forward currency transaction which generally arises in connection with the purchase or sale of an investment or receipt of income. Position hedging involves entering into a currency
transaction with respect to a Fund�s securities denominated or generally quoted in a specific currency. A Fund utilizes currency cross hedging by entering into transactions to purchase or sell one or more currencies that are expected to
increase or decline in value relative to other currencies to which the Fund has or expects to have an exposure. Each Fund may engage in proxy hedging in order to reduce the effect of currency fluctuations on the value of existing or
anticipated holdings of its portfolio securities. Proxy hedging is often used when it is generally difficult to hedge a currency to which a Fund is exposed against the dollar. Proxy hedging entails entering into a forward contract to sell a
currency, the changes in the value of which are generally considered to be linked to a currency or currencies in which some of the Fund�s securities are (or are expected to be) denominated, and to buy dollars. The amount of the
contract would not exceed the market value of a Fund�s portfolio securities denominated in linked currencies.
A foreign currency contract is an agreement between two parties to buy and sell a currency at a set price on a future date. The market value of a foreign currency contract fluctuates with changes in foreign currency exchange rates.
Foreign currency contracts are marked to market daily and the change in value is recorded by a Fund as an unrealized gain or loss. Realized gains or losses, equal to the difference between the value of the contract at the time it was
opened and the value at the time it was closed, are recorded upon delivery or receipt of the currency.
These contracts may involve market risk in excess of the unrealized gain or loss reflected on the Statements of Assets and Liabilities. A Fund could be exposed to risk if the value of the currency declines in relation to the U.S. dollar.
The investment in a particular transaction may be affected unfavorably by factors that affect the subject currencies, including economic, political and legal developments and exchange control regulations that impact the applicable
currencies.
Copyright © 2012 www.secdatabase.com. All Rights Reserved.Please Consider the Environment Before Printing This Document

Additionally, a Fund could be exposed to counterparty risk if counterparties are unable to meet the terms of the contracts. If a counterparty defaults, a fund will have contractual remedies, however, there is no assurance that the
counterparty will be able to meet their obligations or that a fund will succeed in pursuing contractual remedies. Thus, a Fund assumes the risk that it may be delayed or prevented from obtaining payments owed to it pursuant these
transactions.
The following summarizes the foreign currency exchange contracts held as of May 31, 2009:
Global Bond Fund
The Fund uses forward foreign currency exchange contracts to enhance potential gain, hedge against anticipated currency exchange rates, gain exposure to foreign currencies and to maintain diversity and liquidity of the portfolio.
Unrealized
Principal Amount Covered by Principal Amount Covered by Appreciation
Currency Contract Contract (USD) Settlement Date (Depreciation)
Buys
Australian Dollar 312,000 $236,040 6/4/2009 $13,803
Australian Dollar 295,000 228,216 6/11/2009 7,892
Brazilian Real 81,530 37,745 6/2/2009 3,691
Brazilian Real 81,530 41,323 6/2/2009 113
Brazilian Real 1,399,467 683,000 8/4/2009 18,440
Brazilian Real 1,401,174 684,000 8/4/2009 18,296
Canadian Dollar 5,114,539 4,225,178 6/8/2009 459,791
Canadian Dollar 164,000 149,369 6/8/2009 857
Chilean Peso 112,100,000 194,079 11/19/2009 5,711
Chinese Yuan Renminbi 981,648 153,000 7/15/2009 (8,971)
Chinese Yuan Renminbi 1,449,630 210,000 9/8/2009 3,083
Chinese Yuan Renminbi 1,388,200 200,000 9/8/2009 4,053
Chinese Yuan Renminbi 6,444,215 930,000 9/8/2009 17,243
Chinese Yuan Renminbi 2,912,175 420,000 9/8/2009 8,064
Chinese Yuan Renminbi 1,173,510 170,000 9/8/2009 2,496
Chinese Yuan Renminbi 6,521,690 1,057,000 5/17/2010 (83,633)
Chinese Yuan Renminbi 7,353,720 1,188,000 5/17/2010 (90,452)
Danish Krone 1,258,000 220,578 6/4/2009 18,236
Danish Krone 19,058,000 3,206,258 6/4/2009 411,636
Euro 2,063,000 2,892,314 6/15/2009 23,844
Euro 2,429,000 3,309,576 6/15/2009 123,941
Euro 8,425,000 11,588,901 6/15/2009 320,274
Euro 59,916,000 81,617,695 6/15/2009 3,076,684
Hungarian Forint 127,146 618 10/20/2009 -
Japanese Yen 198,267,000 2,074,357 6/4/2009 6,584
Japanese Yen 96,130,679 1,017,267 6/4/2009 (8,313)
Japanese Yen 3,789,228,000 38,135,662 6/4/2009 1,634,749
Japanese Yen 426,302,791 4,490,479 6/4/2009 (16,154)
Japanese Yen 76,202,677 767,000 6/4/2009 32,797
Japanese Yen 992,599,000 10,330,967 6/4/2009 87,005
Japanese Yen 9,783,692,000 99,834,889 6/4/2009 2,851,319
Japanese Yen 90,000,000 913,446 6/4/2009 31,163
Japanese Yen 59,290,866 459,000 6/15/2009 7,206
Malaysian Ringgit 830,918 226,100 8/12/2009 11,085
Malaysian Ringgit 642,182 175,916 8/12/2009 7,394
Malaysian Ringgit 741,231 201,888 8/12/2009 9,696
Philippine Peso 10,681,782 221,476 8/6/2009 3,085
Philippine Peso 6,804,550 140,300 8/6/2009 2,750
Philippine Peso 4,530,903 93,740 8/6/2009 1,512
Philippine Peso 1,600,000 35,746 12/24/2010 (3,392)
Pound Sterling 14,295,000 22,142,979 7/2/2009 959,457
Pound Sterling 650,000 1,049,391 7/2/2009 1,087
Pound Sterling 2,135,000 3,347,861 7/2/2009 102,555
South Korean Won 6,203,790 4,600 7/30/2009 383
South Korean Won 10,607,110 7,900 7/30/2009 620
South Korean Won 6,170,900 4,600 7/30/2009 357
South Korean Won 1,929,511 1,442 7/30/2009 108
Swedish Krona 14,692,000 1,598,112 6/4/2009 343,465
Taiwan Dollar 249,380 7,400 8/10/2009 344
Taiwan Dollar 87,711 2,616 8/10/2009 108
Taiwan Dollar 114,102 3,392 8/10/2009 151
Copyright © 2012 www.secdatabase.com. All Rights Reserved.Please Consider the Environment Before Printing This Document

Taiwan Dollar 234,045 7,000 8/10/2009 268
$300,938,416 $10,422,481
Sells
Australian Dollar 315,000 $232,561 6/11/2009 ($19,554)
Australian Dollar 4,748,943 3,730,983 6/29/2009 (64,837)
Brazilian Real 81,530 41,323 6/2/2009 (113)
Brazilian Real 81,530 42,854 6/2/2009 1,418
Brazilian Real 81,530 37,186 8/4/2009 (3,679)
Canadian Dollar 613,000 526,232 6/8/2009 (35,282)
Canadian Dollar 6,145,000 5,113,504 6/8/2009 (515,377)
Chilean Peso 100,207,200 172,741 11/19/2009 (5,853)
Chinese Yuan Renminbi 329,718 47,238 7/15/2009 (1,139)
Chinese Yuan Renminbi 651,930 93,000 7/15/2009 (2,652)
Chinese Yuan Renminbi 13,367,730 1,893,446 9/8/2009 (71,492)
Chinese Yuan Renminbi 13,875,410 1,932,508 5/17/2010 (138,407)
Euro 459,000 59,290,866 6/15/2009 (33,642)
Euro 5,923,000 8,006,593 6/15/2009 (365,875)
Euro 2,364,000 3,202,700 6/15/2009 (138,937)
Euro 766,000 1,084,461 6/15/2009 1,681
Euro 33,000 45,846 6/15/2009 (802)
Euro 4,075,000 5,715,880 6/15/2009 (44,344)
Euro 10,277,000 14,477,878 6/15/2009 (49,196)
Indian Rupee 105,620 2,000 7/6/2009 (234)
Indian Rupee 105,140 2,000 7/6/2009 (224)
Indian Rupee 93,591 1,796 7/6/2009 (184)
Japanese Yen 5,100,000 53,775 6/4/2009 248
Japanese Yen 9,660,000 99,736 6/4/2009 (1,652)
Japanese Yen 48,019,000 492,533 6/4/2009 (11,458)
Malaysian Ringgit 2,183,083 615,296 8/12/2009 (7,864)
Mexican Peso 329,090 22,079 11/27/2009 (2,279)
Philippine Peso 21,254,940 441,532 8/6/2009 (5,306)
Philippine Peso 1,600,000 33,106 12/24/2010 752
Pound Sterling 1,763,000 2,700,387 7/2/2009 (148,833)
Singapore Dollar 5,454 3,584 7/30/2009 (192)
South African Rand 92,876 9,520 11/18/2009 (1,817)
$110,165,144 ($1,667,125)
Global Real Estate Fund
The Fund uses foreign forward currency contracts to hedge against anticipated currency exchange rates.
Buys
Euro 4,587,000 $6,457,156 6/30/2009 $26,027
Japanese Yen 187,000,000 2,335,175 6/30/2009 (4,151)
Pound Sterling 1,442,000 1,967,489 6/30/2009 (4,712)
$10,759,820 $17,164
Sells
Australian Dollar 35,552,000 $27,229,277 6/30/2009 ($1,185,255)
Canadian Dollar 11,290,000 9,862,329 6/30/2009 (481,170)
Euro 21,443,000 29,524,009 6/30/2009 (783,141)
Japanese Yen 23,997,000 67,276,082 6/30/2009 669,564
Pound Sterling 6,344,000,000 37,616,497 6/30/2009 (1,165,824)
Singapore Dollar 4,043,000 14,896,778 6/30/2009 (164,593)
Swedish Krona 21,756,000 535,419 6/30/2009 1,171
$186,940,391 ($3,109,248)
High Income Fund
The Fund uses foreign forward currency contracts to hedge against anticipated interest rate changes and maintain diversity and liquidity of the portfolio.
Sells
Copyright © 2012 www.secdatabase.com. All Rights Reserved.Please Consider the Environment Before Printing This Document

Canadian Dollar 3,200,000 $2,582,103 6/30/2009 ($349,624)
Pound Sterling 595,000 859,299 6/30/2009 (102,300)
$3,441,402 ($451,924)
International Equity Index Fund
The Fund use forward foreign currency contracts to gain exposure to foreign currencies and a substitute for a securities purchase.
Buys
Australian Dollar 1,000,000 $658,470 6/26/2009 $141,006
Canadian Dollar 1,000,000 788,208 6/26/2009 127,928
Euro 2,000,000 2,607,300 6/26/2009 219,555
Hong Kong Dollar 1,000,000 1,413,930 6/26/2009 (50)
Japanese Yen 200,000,000 129,081 6/26/2009 62,126
Pound Sterling 1,000,000 2,037,594 6/26/2009 202,226
Swedish Krona 3,000,000 356,286 6/26/2009 40,143
$7,990,869 $792,934
Investment Quality Bond Fund
The Fund uses foreign forward currency contracts to hedge against anticipated currency exchange rates and to gain exposure to foreign currencies.
Buys
Australian Dollar 1,910,000 $1,365,268 6/17/2009 $162,750
Brazilian Real 898,000 393,860 6/17/2009 60,916
Czech Koruna 1,502,000 73,054 6/17/2009 5,745
Czech Koruna 9,482,000 461,411 6/17/2009 36,041
Czech Koruna 11,016,000 558,748 6/17/2009 19,182
Mexican Peso 3,825,000 289,323 6/17/2009 383
Mexican Peso 4,250,000 321,403 6/17/2009 494
Mexican Peso 4,462,000 337,519 6/17/2009 434
Mexican Peso 4,463,000 337,543 6/17/2009 486
Singapore Dollar 1,900,000 1,305,169 6/17/2009 10,233
$5,443,298 $296,664
Sells
Australian Dollar 1,910,000 $1,197,570 6/17/2009 ($330,448)
Brazilian Real 1,010,000 499,185 6/17/2009 (12,311)
Brazilian Real 2,246,000 921,665 6/17/2009 (215,780)
Czech Koruna 5,500,000 251,199 6/17/2009 (37,347)
Czech Koruna 16,500,000 757,054 6/17/2009 (108,582)
Singapore Dollar 950,000 629,806 6/17/2009 (27,895)
Singapore Dollar 950,000 622,900 6/17/2009 (34,801)
$4,879,379 ($767,164)
Real Return Bond Fund
The Fund uses forward foreign currency exchange contracts to enhance potential gain, hedge against anticipated currency exchange rates, gain exposure to foreign currencies and to maintain diversity
and liquidity of the portfolio.
Buys
Australian Dollar 3,341,000 $2,466,627 6/11/2009 $207,394
Brazilian Real 11,269,955 4,756,820 6/2/2009 970,947
Brazilian Real 745,498 340,022 8/4/2009 33,636
Canadian Dollar 25,000 21,931 6/8/2009 969
Chinese Yuan Renminbi 8,004,362 1,242,000 7/15/2009 (67,589)
Chinese Yuan Renminbi 7,051,536 1,080,000 7/15/2009 (45,389)
Chinese Yuan Renminbi 9,778,800 1,450,000 9/8/2009 (12,602)
Chinese Yuan Renminbi 2,964,635 430,000 9/8/2009 5,775
Chinese Yuan Renminbi 10,264,560 1,520,000 9/8/2009 (11,200)
Chinese Yuan Renminbi 1,856,775 273,800 3/29/2010 2,512
Chinese Yuan Renminbi 214,700 31,774 3/29/2010 176
Chinese Yuan Renminbi 1,527,578 226,140 3/29/2010 1,183
Chinese Yuan Renminbi 5,504,305 816,065 3/29/2010 3,047
Copyright © 2012 www.secdatabase.com. All Rights Reserved.Please Consider the Environment Before Printing This Document

Chinese Yuan Renminbi 1,469,600 217,300 3/29/2010 1,396
Chinese Yuan Renminbi 13,700 2,027 3/29/2010 12
Euro 372,000 505,085 6/15/2009 20,757
Euro 427,000 588,011 6/15/2009 15,576
Japanese Yen 432,469,000 4,524,681 6/4/2009 14,362
Japanese Yen 4,808,000 50,592 6/4/2009 (129)
Malaysian Ringgit 53,930 15,113 8/12/2009 281
Mexican Peso 108,767 7,427 11/27/2009 624
Philippine Peso 2,800,000 62,556 12/24/2010 (5,936)
Pound Sterling 221,000 346,547 7/2/2009 10,616
Singapore Dollar 969,088 670,000 7/30/2009 861
$21,644,518 $1,147,279
Sells
Australian Dollar 3,466,305 $2,723,285 6/29/2009 ($47,325)
Brazilian Real 11,269,955 4,669,056 6/2/2009 (1,058,711)
Chinese Yuan Renminbi 4,525,228 664,400 7/15/2009 452
Chinese Yuan Renminbi 3,519,513 503,687 9/8/2009 (13,650)
Euro 2,250,000 3,064,955 6/15/2009 (115,538)
Japanese Yen 605,070,000 6,089,564 6/4/2009 (261,039)
Japanese Yen 1,636,810,000 16,706,238 6/4/2009 (473,147)
Mexican Peso 378,918 25,422 11/27/2009 (2,624)
Philippine Peso 6,912,808 143,618 8/6/2009 (1,709)
Philippine Peso 2,800,000 57,935 12/24/2010 1,316
Pound Sterling 3,772,000 5,836,133 7/2/2009 (259,872)
Singapore Dollar 969,088 649,479 7/30/2009 (21,382)
Swiss Franc 915,000 779,327 6/4/2009 (77,586)
$41,913,099 ($2,330,815)
Spectrum Income Fund
The Fund uses forward foreign currency contracts to hedge against anticipated currency exchange rates.
Buys
Australian Dollar 408,894 $307,958 8/20/2009 $17,639
Brazilian Real 1,307,894 610,873 8/4/2009 44,669
Canadian Dollar 285,082 243,687 8/20/2009 17,588
Czech Koruna 3,766,700 187,968 8/20/2009 9,230
Euro 55,000 75,701 7/13/2009 2,026
Euro 4,410,070 5,951,610 8/20/2009 278,740
Hungarian Forint 227,265,000 1,070,692 7/13/2009 51,768
Hungarian Forint 16,425,068 76,042 8/19/2009 4,497
Indian Rupee 21,390,600 420,000 7/27/2009 31,549
Indian Rupee 21,060,220 441,000 8/20/2009 2,559
Indonesian Rupiah 2,317,680,000 222,000 8/20/2009 (707)
Japanese Yen 52,834,920 557,472 8/20/2009 (2,440)
Mexican Peso 8,161,555 613,190 8/20/2009 (640)
Norwegian Krone 3,893,643 598,102 8/20/2009 18,122
Pound Sterling 295,000 434,034 7/28/2009 42,662
Pound Sterling 235,343 359,875 8/20/2009 20,381
South African Rand 1,867,910 220,000 8/20/2009 11,416
South Korean Won 148,362,500 112,438 7/20/2009 6,638
South Korean Won 329,570,800 244,000 7/28/2009 20,690
South Korean Won 1,252,238,400 1,008,000 8/20/2009 (497)
Swedish Krona 2,121,935 270,855 8/20/2009 9,518
Taiwan Dollar 18,269,860 553,000 7/27/2009 13,427
$14,578,497 $598,835
Sells
Australian Dollar 69,803 $54,553 8/20/2009 ($1,030)
Brazilian Real 9,171,352 4,211,287 7/20/2009 (399,822)
Brazilian Real 4,574,080 2,042,000 8/4/2009 (250,619)
Canadian Dollar 2,710,000 2,256,265 6/30/2009 (226,541)
Danish Krone 905,066 163,361 8/20/2009 (8,163)
Euro 740,000 1,004,372 7/13/2009 (41,412)
Euro 687,155 948,000 8/20/2009 (22,782)
Copyright © 2012 www.secdatabase.com. All Rights Reserved.Please Consider the Environment Before Printing This Document

Hungarian Forint 227,265,000 1,093,146 7/13/2009 (29,315)
Japanese Yen 135,000,000 1,388,775 7/13/2009 (28,814)
Japanese Yen 73,365,431 767,942 8/20/2009 (2,764)
Malaysian Ringgit 1,766,538 490,160 7/14/2009 (14,538)
Mexican Peso 24,315,000 1,813,740 7/20/2009 (18,821)
Mexican Peso 12,446,153 937,634 7/21/2009 (267)
Mexican Peso 28,907,516 2,171,538 8/20/2009 1,940
Polish Zloty 2,792,067 838,610 8/20/2009 (33,235)
Pound Sterling 21,139 33,706 8/20/2009 (451)
South African Rand 2,845,378 324,260 8/20/2009 (28,255)
Turkish Lira 241,523 147,450 7/21/2009 (8,174)
Turkish Lira 1,596,120 1,005,841 8/20/2009 (15,804)
$21,692,640 ($1,128,867)
Strategic Income Fund
The Fund uses forward foreign currency exchange contracts gain exposure to foreign currencies, to enhance potential gain, to hedge against anticipated currency exchange rates, and to maintain diversity and liquidity of the portfolio.
Buys
Australian Dollar 35,000 $24,003 6/30/2009 $3,970
Canadian Dollar 11,826,132 7,600,000 6/30/2009 693,944
Canadian Dollar 25,527,995 15,700,000 6/30/2009 2,573,296
Canadian Dollar 31,513,714 19,500,000 6/30/2009 2,534,950
Canadian Dollar 16,249,161 10,450,000 6/30/2009 423,598
Canadian Dollar 11,629,995 7,400,000 6/30/2009 330,067
Euro 10,000,000 16,784,500 6/30/2009 462,327
Euro 44,000,000 72,048,530 6/30/2009 3,422,956
Euro 1,900,000 2,560,773 6/30/2009 124,653
Euro 32,300,000 44,369,465 6/30/2009 1,282,773
Euro 3,800,000 5,120,766 6/30/2009 250,086
Euro 3,800,000 5,161,274 6/30/2009 209,577
Euro 1,900,000 2,575,602 6/30/2009 109,824
Euro 900,000 1,206,239 6/30/2009 65,805
Pound Sterling 6,247,522 11,202,432 6/30/2009 1,028,233
$221,703,584 $13,516,059
Sells
Canadian Dollar 16,784,500 $10,000,000 6/30/2009 ($1,705,874)
Canadian Dollar 135,331,356 92,306,058 6/30/2009 (14,092,840)
Euro 7,600,000 11,826,132 6/30/2009 (600,962)
Euro 15,700,000 25,527,995 6/30/2009 (1,375,545)
Euro 19,500,000 31,513,714 6/30/2009 (1,224,145)
Euro 10,450,000 16,249,161 6/30/2009 (306,532)
Euro 7,400,000 11,629,995 6/30/2009 (134,102)
Euro 37,657,367 51,063,389 6/30/2009 (2,160,854)
Euro 1,900,000 2,571,888 6/30/2009 (113,538)
Euro 32,300,000 44,558,629 6/30/2009 (1,093,609)
Euro 3,800,000 5,143,680 6/30/2009 (227,171)
Euro 3,800,000 5,180,806 6/30/2009 (190,045)
Euro 1,900,000 2,599,352 6/30/2009 (86,074)
New Zealand Dollar 6,247,522 18,241,969 6/30/2009 (2,820,362)
Pound Sterling 32,933,686 9,022,671 6/30/2009 (1,074,149)
$337,435,439 ($27,205,802)
Total Return Fund
The Fund uses forward foreign currency exchange contracts to enhance potential gain, hedge against anticipated currency exchange rates, gain exposure to foreign currencies and maintain the diversity and liquidity of the portfolio
Buys
Australian Dollar 3,802,000 $2,806,979 6/11/2009 $236,011
Australian Dollar 421,000 330,757 6/29/2009 5,748
Brazilian Real 317,064 130,134 6/2/2009 31,008
Brazilian Real 21,838,690 10,250,075 6/2/2009 849,076
Brazilian Real 981,036 476,000 6/2/2009 22,595
Brazilian Real 5,338,471 2,694,727 6/2/2009 18,462
Copyright © 2012 www.secdatabase.com. All Rights Reserved.Please Consider the Environment Before Printing This Document

Brazilian Real 605,954 252,481 6/2/2009 55,485
Brazilian Real 7,848,986 3,823,179 8/4/2009 110,887
Brazilian Real 5,215,371 2,427,448 8/4/2009 186,599
Canadian Dollar 24,000 21,054 6/8/2009 930
Canadian Dollar 756,000 615,798 6/8/2009 76,706
Canadian Dollar 1,185,000 1,060,488 6/8/2009 24,984
Chinese Yuan Renminbi 14,024,622 2,169,000 7/15/2009 (111,287)
Chinese Yuan Renminbi 46,988,037 7,263,900 7/15/2009 (369,748)
Chinese Yuan Renminbi 14,124,212 2,167,000 7/15/2009 (94,675)
Chinese Yuan Renminbi 15,321,390 2,377,100 7/15/2009 (129,124)
Chinese Yuan Renminbi 5,017,808 725,312 9/8/2009 12,262
Chinese Yuan Renminbi 3,192,860 460,000 9/8/2009 9,322
Chinese Yuan Renminbi 14,620,830 2,110,000 9/8/2009 39,133
Chinese Yuan Renminbi 6,517,725 940,000 9/8/2009 18,048
Chinese Yuan Renminbi 2,692,170 390,000 9/8/2009 5,725
Chinese Yuan Renminbi 2,096,807 310,500 3/29/2010 1,532
Chinese Yuan Renminbi 2,101,712 310,500 3/29/2010 2,262
Chinese Yuan Renminbi 12,801,390 1,893,000 3/29/2010 12,014
Euro 256,000 352,531 6/15/2009 9,338
Japanese Yen 31,014,000 40,770 6/4/2009 13,380
Japanese Yen 25,100,000 312,132 6/4/2009 11,027
Philippine Peso 4,400,000 252,414 12/24/2010 (9,329)
Pound Sterling 26,000 98,302 7/2/2009 1,249
Singapore Dollar 1,243,904 860,000 7/30/2009 1,105
$47,921,581 $1,040,725
Sells
Brazilian Real 317,064 $132,000 6/2/2009 ($29,143)
Brazilian Real 21,838,690 10,182,482 6/2/2009 (916,670)
Brazilian Real 981,036 484,889 6/2/2009 (13,706)
Brazilian Real 5,338,471 2,512,985 6/2/2009 (200,204)
Brazilian Real 605,954 252,000 6/2/2009 (55,966)
Brazilian Real 8,947,970 4,081,172 8/4/2009 (403,726)
Chinese Yuan Renminbi 9,409,503 1,318,000 7/15/2009 (62,576)
Chinese Yuan Renminbi 18,135,640 2,577,710 7/15/2009 (83,176)
Chinese Yuan Renminbi 42,443,552 6,050,600 7/15/2009 (176,778)
Chinese Yuan Renminbi 10,651,876 1,515,247 7/15/2009 (47,611)
Chinese Yuan Renminbi 9,817,691 1,375,746 7/15/2009 (64,720)
Chinese Yuan Renminbi 13,342,832 1,907,005 9/8/2009 (54,273)
Chinese Yuan Renminbi 11,280,821 1,614,420 9/8/2009 (43,761)
Chinese Yuan Renminbi 2,986,260 426,000 9/8/2009 (12,954)
Chinese Yuan Renminbi 4,431,480 632,000 9/8/2009 (19,388)
Euro 10,747,000 14,639,585 6/15/2009 (551,858)
Philippine Peso 4,649,000 91,041 12/24/2010 2,067
Pound Sterling 4,400,000 7,193,049 7/2/2009 (320,293)
Singapore Dollar 1,243,904 817,625 7/30/2009 (43,480)
$57,803,556 ($3,098,216)
Vista Fund
The Trust uses forward foreign currency contracts to enhance potential gain, hedge against anticipated currency exchange rates, gain exposure to foreign currency and maintain the diversity and liquidity
of the portfolio
Buys
Swiss Franc 341,210 $314,523 6/30/2009 $5,130
$314,523 $5,130
Sells
Danish Krone 790,259 $324,800 6/30/2009 ($5,818)
Swiss Franc 1,742,500 725,288 6/30/2009 (15,043)
$1,050,088 ($20,861)
Foreign forward currency exchange contract principal amounts covered by contract (USD) (notional amounts) at the end of the period are representative of the activity for written options during the period ended May 31 2009.
Fair Value of Derivative Instruments by Risk Category
Copyright © 2012 www.secdatabase.com. All Rights Reserved.Please Consider the Environment Before Printing This Document

The table below summarizes the fair values of derivatives held by the Funds at May 31, 2009 by risk category:
Active Bond Fund All Cap Core Fund
Derivatives not accounted for Derivatives not accounted for
as hedging instruments under Asset Derivatives Liability Derivatives as hedging instruments under Asset Derivatives Liability Derivatives
FAS 133 Fair Value Fair Value FAS 133 Fair Value Fair Value
Interest rate contracts* $111,688 - Interest rate contracts - -
Foreign exchange contracts - - Foreign exchange contracts - -
Credit Contracts - - Credit Contracts - -
Equity Contracts - - Equity Contracts* $5,352,119 -
Total $111,688 - Total $5,352,119 -
* Includes cumulative appreciation/depreciation of futures contracts. * Includes cumulative appreciation/depreciation of futures contracts.
Global Bond Fund Global Real Estate Fund
Derivatives not accounted for Derivatives not accounted for
as hedging instruments under Asset Derivatives Liability Derivatives as hedging instruments under Asset Derivatives Liability Derivatives
FAS 133 Fair Value Fair Value FAS 133 Fair Value Fair Value
Interest rate contracts* $4,886,646 ($1,116,206) Interest rate contracts - -
Foreign exchange contracts 10,641,354 (1,882,139) Foreign exchange contracts $696,762 ($3,788,846)
Credit Contracts 9,439,076 (3,424,076) Credit Contracts - -
Equity Contracts - - Equity Contracts - -
Total $24,967,076 ($6,422,421) Total $696,762 ($3,788,846)
* Includes cumulative appreciation/depreciation of futures contracts.
High Income Fund Index 500 Fund
Derivatives not accounted for Derivatives not accounted for
as hedging instruments under Asset Derivatives Liability Derivatives as hedging instruments under Asset Derivatives Liability Derivatives
FAS 133 Fair Value Fair Value FAS 133 Fair Value Fair Value
Interest rate contracts - - Interest rate contracts* - -
Foreign exchange contracts 2,642,080 ($3,094,004) Foreign exchange contracts - -
Credit Contracts - - Credit Contracts - -
Equity Contracts 1,075,040 - Equity Contracts $10,555,362 -
Total $3,717,120 ($3,094,004) Total $10,555,362 -
* Includes cumulative appreciation/depreciation of futures contracts.
International Equity Index Fund Investment Quality Bond Fund
Derivatives not accounted for Derivatives not accounted for
as hedging instruments under Asset Derivatives Liability Derivatives as hedging instruments under Asset Derivatives Liability Derivatives
FAS 133 Fair Value Fair Value FAS 133 Fair Value Fair Value
Interest rate contracts - - Interest rate contracts* $96,340 ($563,638)
Foreign exchange contracts $792,984 ($50) Foreign exchange contracts 296,664 (767,164)
Credit Contracts - - Credit Contracts 11,948 (20,954)
Equity Contracts* 322,179 (16,192) Equity Contracts - -
Total $1,115,163 ($16,242) Total $404,952 ($1,351,756)
* Includes cumulative appreciation/depreciation of futures contracts. * Includes cumulative appreciation/depreciation of futures contracts.
Mid Cap Index Fund Mid Cap Intersection Fund
Derivatives not accounted for Derivatives not accounted for
as hedging instruments under Asset Derivatives Liability Derivatives as hedging instruments under Asset Derivatives Liability Derivatives
FAS 133 Fair Value Fair Value FAS 133 Fair Value Fair Value
Interest rate contracts - - Interest rate contracts - -
Foreign exchange contracts - - Foreign exchange contracts - -
Credit Contracts - - Credit Contracts - -
Equity Contracts* $2,907,037 - Equity Contracts* $79,512 -
Total $2,907,037 - Total $79,512 -
* Includes cumulative appreciation/depreciation of futures contracts. * Includes cumulative appreciation/depreciation of futures contracts.
Real Return Bond Fund Small Cap index Fund
Derivatives not accounted for Derivatives not accounted for
as hedging instruments under Asset Derivatives Liability Derivatives as hedging instruments under Asset Derivatives Liability Derivatives
Copyright © 2012 www.secdatabase.com. All Rights Reserved.Please Consider the Environment Before Printing This Document

FAS 133 Fair Value Fair Value FAS 133 Fair Value Fair Value
Interest rate contracts* $4,053,223 ($1,054,377) Interest rate contracts - -
Foreign exchange contracts 1,291,892 (2,475,428) Foreign exchange contracts - -
Credit Contracts 7,687,608 (1,198,090) Credit Contracts - -
Equity Contracts - - Equity Contracts* $499,944 -
Total $13,032,723 ($4,727,895) Total $499,944 -
* Includes cumulative appreciation/depreciation of futures contracts. * Includes cumulative appreciation/depreciation of futures contracts.
Smaller Company Growth Fund Spectrum Income Fund
Derivatives not accounted for Derivatives not accounted for
as hedging instruments under Asset Derivatives Liability Derivatives as hedging instruments under Asset Derivatives Liability Derivatives
FAS 133 Fair Value Fair Value FAS 133 Fair Value Fair Value
Interest rate contracts - - Interest rate contracts* $38,270 ($119,805)
Foreign exchange contracts - - Foreign exchange contracts* 605,059 (1,427,839)
Credit Contracts - - Credit Contracts 121 (4,718)
Equity Contracts* $106,578 - Equity Contracts - -
Total $106,578 - Total $643,450 ($1,552,362)
* Includes cumulative appreciation/depreciation of futures contracts. * Includes cumulative appreciation/depreciation of futures contracts.
Strategic Bond Fund Strategic Income Fund
Derivatives not accounted for Derivatives not accounted for
as hedging instruments under Asset Derivatives Liability Derivatives as hedging instruments under Asset Derivatives Liability Derivatives
FAS 133 Fair Value Fair Value FAS 133 Fair Value Fair Value
Interest rate contracts* $233,188 ($1,087,426) Interest rate contracts - -
Foreign exchange contracts 6 - Foreign exchange contracts $14,955,481 ($27,468,755)
Credit Contracts - - Credit Contracts - -
Equity Contracts - - Equity Contracts 13,000 -
Total $233,194 ($1,087,426) Total $14,968,481 ($27,468,755)
* Includes cumulative appreciation/depreciation of futures contracts.
Total Return Fund U.S. Government Securities Fund
Derivatives not accounted for Derivatives not accounted for
as hedging instruments under Asset Derivatives Liability Derivatives as hedging instruments under Asset Derivatives Liability Derivatives
FAS 133 Fair Value Fair Value FAS 133 Fair Value Fair Value
Interest rate contracts* 56,342,094 ($4,765,173) Interest rate contracts* $688,334 ($957,254)
Foreign exchange contracts 1,756,955 (3,814,446) Foreign exchange contracts - -
Credit Contracts 1,682,551 (8,659,324) Credit Contracts - -
Equity Contracts - - Equity Contracts - -
Total $59,781,600 ($17,238,943) Total $688,334 ($957,254)
* Includes cumulative appreciation/depreciation of futures contracts. * Includes cumulative appreciation/depreciation of futures contracts.
U.S. Multi Sector Fund Vista Fund
Derivatives not accounted for Derivatives not accounted for
as hedging instruments under Asset Derivatives Liability Derivatives as hedging instruments under Asset Derivatives Liability Derivatives
FAS 133 Fair Value Fair Value FAS 133 Fair Value Fair Value
Interest rate contracts - - Interest rate contracts - -
Foreign exchange contracts - - Foreign exchange contracts $5,130 ($20,861)
Credit Contracts - - Credit Contracts - -
Equity Contracts* $615,888 - Equity Contracts - -
Total $615,888 - Total $5,130 ($20,861)
* Includes cumulative appreciation/depreciation of futures contracts.
Stripped securities Stripped mortgage backed securities are financial instruments that derive their value from other instruments so that one class receives all of the principal from the underlying mortgage assets PO (principal only),
while the other class receives the interest cash flows IO (interest only). Both the PO and IO investments represent an interest in the cash flows of an underlying stripped mortgaged backed security. If the underlying mortgage assets
experience greater than anticipated prepayments of principal, a Fund may fail to fully recoup its initial investment in an interest only security. The market value of these securities can be extremely volatile in response to changes in
interest rates. Credit risk reflects the risk that the Funds may not receive all or part of its principal because the issuer or credit enhancer has defaulted on its obligation.
RISKS & UNCERTAINTIES
Copyright © 2012 www.secdatabase.com. All Rights Reserved.Please Consider the Environment Before Printing This Document

Fixed Income Risk Fixed income securities are subject to credit and interest rate risk and involve some risk of default in connection with principal and interest payments.
Derivatives and Counterparty Risk The use of derivative instruments may involve risks different from, or potentially greater than, the risks associated with investing directly in securities. Specifically, derivative instruments expose a
Fund to the risk that the counterparty to an over-the-counter (OTC) derivatives contract will be unable or unwilling to make timely settlement payments or otherwise to honor its obligations. OTC derivatives transactions typically can
only be closed out with the other party to the transaction. If the counterparty defaults, the Fund will have contractual remedies, but there is no assurance that the counterparty will meet its contractual obligations or that, in the event of
default, the Fund will succeed in enforcing them.
Mortgage security risk Certain Funds of the trust may invest a portion of its assets in issuers and/or securities of issuers that hold mortgage securities, including subprime mortgage securities. The value of these securities is sensitive
to changes in economic conditions, including delinquencies and/or defaults, and may be adversely affected by shifts in the market�s perception of the issuers and changes in interest rates. Decreases in interest rates may cause
prepayments on underlying mortgages to an IO security to accelerate resulting in a lower than anticipated yield and increases the risk of loss on the IO investment.
Risks Associated with Foreign Investments Investing in securities issued by companies whose principal business activities are outside the United States may involve significant risks not present in domestic investments. For example,
there is generally less publicly available information about foreign companies, particularly those not subject to the disclosure and reporting requirements of the U.S. securities laws. Foreign issuers are generally not bound by uniform
accounting, auditing, and financial reporting requirements and standards of practice comparable to those applicable to domestic issuers. Investments in foreign securities also involve the risk of possible adverse changes in investment
or exchange control regulations, expropriation or confiscatory taxation, limitation on the removal of cash, securities or other assets of the Fund, political or financial instability, or diplomatic and other developments which could affect
such investments. Foreign stock markets, while growing in volume and sophistication, are generally not as developed as those in the United States, and securities of some foreign issuers (particularly those located in developing
countries) may be less liquid and
more volatile than securities of comparable U.S. companies. In general, there is less overall governmental supervision and regulation of foreign securities markets, broker-dealers and issuers than in the United States.
Investing in High Yield Securities Investing in high yield securities may involve greater risks and considerations not typically associated with investing in U.S. government bonds and other high quality fixed-income securities. These
securities are non-investment grade securities, often referred to as �junk bonds.� Economic downturns may disrupt the high yield market and impair the ability of issuers to repay principal and interest. Also, an increase in interest rates
would likely have an adverse impact on the value of such obligations. Moreover, high yield securities may be less liquid due to the extent that there is no established retail secondary market and because of a decline in the value of such
securities. The Fund may not be able to sell bonds at desired prices and large purchases or sales of certain high-yield bond issues may cause substantial fluctuations in share price, yield and total return.
Emerging Markets Risk Certain Funds invest in securities of issuers based in countries with emerging markets or economies and may, therefore, be subject to greater market risk than Funds that invest principally in securities of
issuers in more developed countries. Emerging markets securities may be more volatile and less liquid than securities of issuers in developed countries and may be subject to substantial currency fluctuations and affected by sudden
economic, social and political developments in the emerging market country. The securities markets of emerging countries may have less government regulation and may be subject to less extensive accounting and financial reporting
requirements than the securities markets of more developed countries. Emerging market countries may have currency controls or restrictions which may prevent or delay a Fund from taking money out of the country or may impose
additional taxes on money removed from the country.
Floating Rate Loan Liquidity Risk Floating rate loans are generally subject to legal or contractual restrictions on resale. The liquidity of floating rate loans, including the volume and frequency of secondary market trading in such
loans, varies significantly over time and among individual floating rate loans. During periods of infrequent trading, valuing a floating rate loan can be more difficult and buying and selling a floating rate loan at an acceptable price can
be more difficult and delayed. Difficulty in selling a floating rate loan can result in a loss.
Copyright © 2012 www.secdatabase.com. All Rights Reserved.Please Consider the Environment Before Printing This Document

JOHN HANCOCK FUNDS II
PORTFOLIO OF INVESTMENTS - May 31, 2009 (Unaudited)(showing percentage of total net assets)
Optimized Value FundShares or
Principal
Amount Value
Copyright © 2012 www.secdatabase.com. All Rights Reserved.Please Consider the Environment Before Printing This Document

COMMON STOCKS - 99.48%
Aerospace - 1.14%
General Dynamics Corp. 67,525 $ 3,842,173
Air Travel - 0.65%
Continental Airlines, Inc., Class B * 232,776 2,169,472
Banking - 4.85%
Bank of New York Mellon Corp. 55,531 1,542,651
Credit Suisse Group AG, SADR 46,922 2,103,513
Hudson City Bancorp, Inc. 200,805 2,576,328
PNC Financial Services Group, Inc. 158,870 7,236,529
U.S. Bancorp 147,294 2,828,045
16,287,066
Biotechnology - 0.62%
Amgen, Inc. * 41,994 2,097,180
Building Materials & Construction - 0.67%
Eagle Materials, Inc. 92,027 2,263,864
Business Services - 2.36%
Alliance Data Systems Corp. * (a) 104,135 4,217,467
Convergys Corp. * 171,304 1,584,562
SAIC, Inc. * 122,131 2,133,629
7,935,658
Cable & Television - 2.04%
Comcast Corp., Class A 296,899 4,088,299
Viacom, Inc., Class B * 124,480 2,759,722
6,848,021
Chemicals - 0.91%
Celanese Corp., Series A 148,318 3,042,002
Computers & Business Equipment - 1.82%
Cisco Systems, Inc. * 183,433 3,393,511
International Business Machines Corp. 25,404 2,699,937
6,093,448
Containers & Glass - 2.32%
Owens-Illinois, Inc. * 158,614 4,541,119
Pactiv Corp. * 145,359 3,256,041
7,797,160
Cosmetics & Toiletries - 2.91%
Colgate-Palmolive Company 74,449 4,909,912
Procter & Gamble Company 93,630 4,863,142
9,773,054
Crude Petroleum & Natural Gas - 4.22%
Marathon Oil Corp. 116,443 3,712,203
Plains Exploration & Production Company * 137,204 3,880,129
XTO Energy, Inc. 154,076 6,589,831
14,182,163
Electrical Utilities - 3.43%
Dominion Resources, Inc. 138,908 4,415,885
DPL, Inc. 136,063 2,960,731
FirstEnergy Corp. 45,424 1,716,573
FPL Group, Inc. 43,056 2,433,956
11,527,145
Energy - 2.36%
Duke Energy Corp. 128,855 1,823,298
Optimized Value Fund (continued)Shares or
Principal
Amount Value
Copyright © 2012 www.secdatabase.com. All Rights Reserved.Please Consider the Environment Before Printing This Document
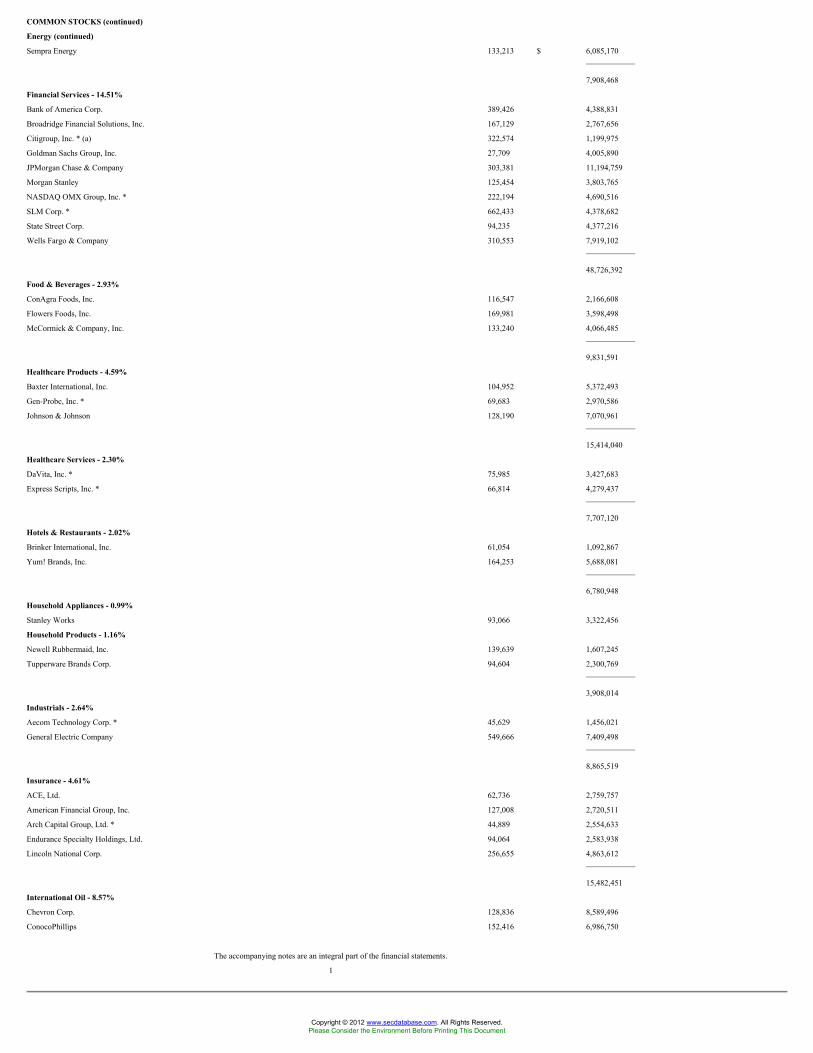
COMMON STOCKS (continued)
Energy (continued)
Sempra Energy 133,213 $ 6,085,170
7,908,468
Financial Services - 14.51%
Bank of America Corp. 389,426 4,388,831
Broadridge Financial Solutions, Inc. 167,129 2,767,656
Citigroup, Inc. * (a) 322,574 1,199,975
Goldman Sachs Group, Inc. 27,709 4,005,890
JPMorgan Chase & Company 303,381 11,194,759
Morgan Stanley 125,454 3,803,765
NASDAQ OMX Group, Inc. * 222,194 4,690,516
SLM Corp. * 662,433 4,378,682
State Street Corp. 94,235 4,377,216
Wells Fargo & Company 310,553 7,919,102
48,726,392
Food & Beverages - 2.93%
ConAgra Foods, Inc. 116,547 2,166,608
Flowers Foods, Inc. 169,981 3,598,498
McCormick & Company, Inc. 133,240 4,066,485
9,831,591
Healthcare Products - 4.59%
Baxter International, Inc. 104,952 5,372,493
Gen-Probe, Inc. * 69,683 2,970,586
Johnson & Johnson 128,190 7,070,961
15,414,040
Healthcare Services - 2.30%
DaVita, Inc. * 75,985 3,427,683
Express Scripts, Inc. * 66,814 4,279,437
7,707,120
Hotels & Restaurants - 2.02%
Brinker International, Inc. 61,054 1,092,867
Yum! Brands, Inc. 164,253 5,688,081
6,780,948
Household Appliances - 0.99%
Stanley Works 93,066 3,322,456
Household Products - 1.16%
Newell Rubbermaid, Inc. 139,639 1,607,245
Tupperware Brands Corp. 94,604 2,300,769
3,908,014
Industrials - 2.64%
Aecom Technology Corp. * 45,629 1,456,021
General Electric Company 549,666 7,409,498
8,865,519
Insurance - 4.61%
ACE, Ltd. 62,736 2,759,757
American Financial Group, Inc. 127,008 2,720,511
Arch Capital Group, Ltd. * 44,889 2,554,633
Endurance Specialty Holdings, Ltd. 94,064 2,583,938
Lincoln National Corp. 256,655 4,863,612
15,482,451
International Oil - 8.57%
Chevron Corp. 128,836 8,589,496
ConocoPhillips 152,416 6,986,750
The accompanying notes are an integral part of the financial statements.
1
Copyright © 2012 www.secdatabase.com. All Rights Reserved.Please Consider the Environment Before Printing This Document

JOHN HANCOCK FUNDS IIPORTFOLIO OF INVESTMENTS - May 31, 2009 (Unaudited) - continued(showing percentage of total net assets)
Optimized Value Fund (continued)
Shares or
Principal
Amount Value
COMMON STOCKS (continued)
International Oil (continued)
Exxon Mobil Corp. 190,284 $ 13,196,195
28,772,441
Petroleum Services - 4.32%
ENSCO International, Inc. 91,660 3,564,658
Noble Corp. 125,974 4,329,726
Total SA, SADR 57,712 3,327,097
Transocean, Ltd. * 41,398 3,290,313
14,511,794
Pharmaceuticals - 3.74%
Abbott Laboratories 127,613 5,750,242
Mylan, Inc. * (a) 197,326 2,606,676
Pfizer, Inc. 277,180 4,210,364
12,567,282
Real Estate - 2.30%
Brookfield Properties Corp. REIT 173,166 1,309,135
Macerich Company, REIT (a) 127,596 2,153,820
Public Storage, REIT 25,085 1,670,912
SL Green Realty Corp., REIT (a) 112,714 2,581,151
7,715,018
Retail Trade - 3.30%
Aaron, Inc., Class B 92,366 3,008,361
Best Buy Company, Inc. 35,591 1,249,244
CVS Caremark Corp. 58,439 1,741,482
Ross Stores, Inc. 129,506 5,071,455
11,070,542
Sanitary Services - 3.31%
Ecolab, Inc. 70,644 2,638,553
Republic Services, Inc. 224,925 5,126,041
Stericycle, Inc. * 66,700 3,333,666
11,098,260
Semiconductors - 2.41%
Intel Corp. 160,278 2,519,570
PMC-Sierra, Inc. * 393,781 2,988,798
Xilinx, Inc. 124,695 2,586,174
8,094,542
Software - 0.74%
Red Hat, Inc. * 123,806 2,469,930
Telecommunications Equipment &
Services - 2.29%
Embarq Corp. 182,900 7,685,458
Telephone - 2.45%
AT&T, Inc. 270,189 6,697,985
Verizon Communications, Inc. 52,618 1,539,603
8,237,588
TOTAL COMMON STOCKS (Cost $324,339,339) $ 334,028,260
SHORT TERM INVESTMENTS - 3.23%
John Hancock Collateral Investment
Trust, 0.7339% (c)(f) 1,084,547 $ 10,845,465
Copyright © 2012 www.secdatabase.com. All Rights Reserved.Please Consider the Environment Before Printing This Document

TOTAL SHORT TERM INVESTMENTS
(Cost $10,845,465) $ 10,845,465
Optimized Value Fund (continued)
Shares or
Principal
Amount Value
REPURCHASE AGREEMENTS - 0.28%
Repurchase Agreement with State
Street Corp. dated 05/29/2009 at
0.07% to be repurchased at
$938,005 on 6/1/2009,
collateralized by $735,000 U.S.
Treasury Bonds, 6.875% due
08/17/2025 (valued at $962,630,
including interest) $ 938,000 $ 938,000
TOTAL REPURCHASE AGREEMENTS
(Cost $938,000) $ 938,000
Total Investments (Optimized Value Fund)
(Cost $336,122,804)�� - 102.99% $ 345,811,725
Other assets and liabilities, net - (2.99)% (10,024,248)
TOTAL NET ASSETS - 100.00% $ 335,787,477
Footnotes
Percentages are stated as a percent of net assets.
* Non-Income Producing
(a) All or a portion of this security was out on loan
(c) The investment is an affiliate of the fund, the adviser and/or the subadviser.
(f) John Hancock Collateral Investment Trust is managed by MFC Global Investment Management (U.S.), LLC, and represents investment of securities lending collateral. The rate shown is the annualized seven-day yield at May 31,
2009.
� At May 31, 2009, the aggregate cost of investment securities for federal income tax purposes was $339,315,532. Net unrealized appreciation aggregated $6,496,193, of which $34,288,396 related to appreciated investment securities
and $27,792,203 related to depreciated investment securities.
Key to Security Abbreviations and Legend
REIT - Real Estate Investment Trust
The accompanying notes are an integral part of the financial statements.
2
Notes to the Schedule of Investments (Unaudited)
Security valuation
Investments are stated at value as of the close of the regular trading on the New York Stock Exchange (NYSE), normally at 4:00 p.m., Eastern Time. Equity securitiesheld by the Fund are valued at the last sale price or official closing price (closing bid price or last evaluated price if no sale has occurred) as of the close of business onthe principal securities exchange (domestic or foreign) on which they trade. Debt obligations are valued based on the evaluated prices provided by an independent pricingservice, which utilizes both dealer-supplied and electronic data processing techniques, which take into account factors such as institutional-size trading in similar groupsof securities, yield, quality, coupon rate, maturity, type of issue, trading characteristics and other market data. Foreign securities and currencies are valued in U.S. dollars,based on foreign currency exchange rates supplied by an independent pricing service. Securities traded only in the over-the-counter market are valued at the last bidprice quoted by brokers making markets in the securities at the close of trading. Equity and debt obligations, for which there are no prices available from an independentpricing service, are valued based on broker quotes or fair valued as described below. Short-term debt investments that have a remaining maturity of 60 days or less arevalued at amortized cost, and thereafter assume a constant amortization to maturity of any discount or premium, which approximates market value. John HancockCollateral Investment Trust (JHCIT), an affiliated registered investment company managed by John Hancock Advisers, LLC (the Adviser), a wholly owned subsidiary ofJohn Hancock Financial Services, Inc., a subsidiary of Manulife Financial Corporation (MFC), is valued at its net asset value each business day. JHCIT is a floating ratefund investing in high quality money market instruments.
Copyright © 2012 www.secdatabase.com. All Rights Reserved.Please Consider the Environment Before Printing This Document

Other portfolio securities and assets for which market quotations are not readily available are valued at fair value as determined in good faith by the Fund�s PricingCommittee in accordance with procedures adopted by the Board of Trustees. Generally, trading in non-U.S. securities is substantially completed each day at varioustimes prior to the close of trading on the NYSE. The values of such securities used in computing the net asset value of the Fund�s shares are generally determined as ofsuch times. Occasionally, significant events that affect the values of such securities may occur between the times at which such values are generally determined and theclose of the NYSE. Upon such an occurrence, these securities will be valued at fair value as determined in good faith under consistently applied procedures establishedby and under the general supervision of the Board of Trustees.
Valuations change in response to many factors including the historical and prospective earnings of the issuer, the value of the issuer�s assets, general economic andmarket conditions, interest rates, investor perceptions and market liquidity.
The Fund adopted Statement of Financial Accounting Standards No. 157 (FAS 157), Fair Value Measurements, effective with the beginning of the Fund�s fiscal year.FAS 157 established a three-tier hierarchy to prioritize the assumptions, referred to as inputs, used in valuation techniques to measure fair value. The three-tier hierarchyof inputs is summarized in the three broad levels listed below:
Level 1 � Quoted prices in active markets for identical securities.
Level 2 � Prices determined using other significant observable inputs. Observable inputs are inputs that other market participants would use in pricing a security. Thesemay include quoted prices for similar securities, interest rates, prepayment speeds, credit risk and others.
Level 3 � Prices determined using significant unobservable inputs. In situations where quoted prices or observable inputs are unavailable, such as when there is little orno market activity for an investment, unobservable inputs may be used. Unobservable inputs reflect the Fund�s Pricing
Committee�s own assumptions about the factors that market participants would use in pricing an investment and would be based on the best information available.
The inputs or methodology used for valuing securities are not necessarily an indication of the risk associated with investing in those securities.
The following is a summary of the inputs used to value the Fund�s net assets as of May 31, 2009:
Investments in Other FinancialValuation Inputs Securities Instruments*
Level 1 � Quoted Prices $344,873,725 -Level 2 � Other Significant Observable Inputs 938,000 -Level 3 � Significant Unobservable Inputs - -Total $345,811,725 -
� Other financial instruments are derivative instruments not reflected in the Portfolio of Investments, such as futures, forwards, options and swap contracts, are stated atmarket value.
Securities lendingThe Fund may lend portfolio securities from time to time in order to earn additional income. The Fund retains beneficial ownership of the securities it has loaned andcontinues to receive interest and dividends paid by the issuer of securities and to participate in any changes in their value. On the settlement date of the loan, the Fundreceives cash collateral against the loaned securities and maintains the cash collateral in an amount not less than 102% of the market value of the loaned securities forU.S. equity and corporate securities and 105% for foreign equity and corporate securities during the period of the loan. The market value of the loaned securities isdetermined at the close of business of the Fund. Any additional required cash collateral is delivered to the Fund or excess cash collateral is returned to the borrower onthe next business day. Cash collateral received is invested in JHCIT. The Fund may receive compensation for lending its securities either in the form of fees and/or byretaining a portion of interest on the investment of any cash received as collateral. If the borrower defaults on its obligation to return the securities loaned because ofinsolvency or other reasons, the Fund could experience delays and costs in recovering the securities loaned or in gaining access to the collateral. The Fund bears the riskin the event that invested collateral is not sufficient to meet obligations due on loans.
Repurchase agreementsThe Fund may enter into repurchase agreements. When the Fund enters into a repurchase agreement through its custodian, it receives delivery of securities, the amountof which at the time of purchase and each subsequent business day is required to be maintained at such a level that the market value is generally at least 102% of therepurchase amount. The Fund will take receipt of all securities underlying the repurchase agreements it has entered into until such agreements expire. If the sellerdefaults, the Fund would suffer a loss to the extent that proceeds from the sale of underlying securities were less than the repurchase amount. The Fund may enter intorepurchase agreements maturing within seven days with domestic dealers, banks or other financial institutions deemed to be creditworthy by the Adviser. Collateral forcertain tri-party repurchase agreements is held at a third-party custodian bank in a segregated account for the benefit of the Fund and the counterparty.
Risk and uncertaintiesSector risk �� financial servicesThe Fund may focus its investments in a particular industry, sector of the economy or invest in a limited number of companies. The focus is closely tied to a single sectorof the economy which
may cause the Fund to underperform other sectors. Specifically, financial services companies can be hurt by economic declines, changes in interest rates, regulatory andmarket impacts. Accordingly, this may make the Fund�s value more volatile and investment values may rise and fall more rapidly than a fund that is less focused.
Copyright © 2012 www.secdatabase.com. All Rights Reserved.Please Consider the Environment Before Printing This Document

Item 2. Controls and Procedures.
(a) The Registrant�s principal executive and principal financial officers have concluded, based upon their evaluation of the Registrant�s disclosure controls andprocedures as of a date within 90 days of the filing date of this report, that the Registrant�s disclosure controls and procedures are reasonably designed to ensure thatinformation required to be disclosed by the Registrant on Form N-Q is recorded, processed, summarized and reported within the required time periods and thatinformation required to be disclosed by the Registrant in the reports that it files or submits on form N-Q is accumulated and communicated to the Registrant�smanagement, including its principal executive and principal financial officers, as appropriate to allow timely decisions regarding required disclosure.
(b) There were no changes to the Registrant�s internal control over financial reporting that occurred during the Registrant�s most recently ended fiscal quarter that havematerially affected, or are reasonably likely to materially affect, the Registrant�s internal control over financial reporting.
Copyright © 2012 www.secdatabase.com. All Rights Reserved.Please Consider the Environment Before Printing This Document

Item 3. Exhibits.
(a) Certifications of principal executive and principal financial officers as required by Rule 30a-2(a) under the Investment Company Act of 1940 are attached hereto asEX-99.CERT.
SIGNATURES
Pursuant to the requirements of the Securities Exchange Act of 1934 and the Investment Company Act of 1940, the registrant has duly caused this report to be signed onits behalf by the undersigned, thereunto duly authorized.
Registrant: John Hancock Funds II
/S/ Keith F. HartsteinKeith F. HartsteinPresident andChief Executive Officer
Date: July 15, 2009
Pursuant to the requirements of the Securities Exchange Act of 1934 and the Investment Company Act of 1940, this report has been signed below by the followingpersons on behalf of the registrant and in the capacities and on the dates indicated.
/S/ Keith F. HartsteinKeith F. HartsteinPresident andChief Executive Officer
Date: July 15, 2009
/S/Charles A. Rizzo .Charles A. RizzoChief Financial Officer
Date: July 15, 2009
Copyright © 2012 www.secdatabase.com. All Rights Reserved.Please Consider the Environment Before Printing This Document

CERTIFICATIONS
I, Keith F. Hartstein, certify that:
1. I have reviewed this report on Form N-Q of John Hancock Funds II;
2. Based on my knowledge, this report does not contain any untrue statement of a material fact or omit to state a material factnecessary to make the statements made, in light of the circumstances under which such statements were made, not misleadingwith respect to the period covered by this report;
3. Based on my knowledge, the schedules of investments included in this report fairly present in all material respects theinvestments of the registrant as of the end of the fiscal quarter for which the report is filed;
4. The registrant�s other certifying officer(s) and I are responsible for establish ing and maintaining disclosure controls andprocedures (as defined in Rule 30a-3(c) under the Investment Company Act of 1940) and internal control over financial reporting(as defined in Rule 30a-3(d) under the Investment Company Act of 1940) for the registrant and have:
(a) Designed such disclosure controls and procedures, or caused such disclosure controls and procedures to be designed underour supervision, to ensure that material information relating to the registrant, including its consolidated subsidiaries, is madeknown to us by others within those entities, particularly during the period in which this report is being prepared;
(b) Designed such internal control over financial reporting, or caused such internal control over financial reporting to be designedunder our supervision, to provide reasonable assurance regarding the reliability of financial reporting and the preparation offinancial statements for external purposes in accordance with generally accepted accounting principles;
(c) Evaluated the effectiveness of the registrant�s disclosure controls and procedures and presented in this report ourconclusions about the effectiveness of the disclosure controls and procedures, as of a date within 90 days prior to the filing dateof this report, based on such evaluation; and
(d) Disclosed in this report any change in the registrant�s internal control over financial reporting that occurred during theregistrant�s most recent fiscal quarter that has materially affected, or is reasonably likely to materially affect, the registrant�sinternal control over financial reporting; and
5. The registrant�s other certifying officer(s) and I have disclosed to the registrant�s auditors and the audit committee of theregistrant�s board of directors (or persons performing the equivalent functions):
(a) All significant deficiencies and material weaknesses in the design or operation of internal control over financial reporting whichare reasonably likely to adversely affect the registrant�s ability to record, process, summarize, and report financial information;and
(b) Any fraud, whether or not material, that involves management or other employees who have a significant role in theregistrant�s internal control over financial reporting.
Date: July 15, 2009
/S/ Keith F. HartsteinKeith F. HartsteinPresident and Chief Executive Officer
CERTIFICATIONS
Copyright © 2012 www.secdatabase.com. All Rights Reserved.Please Consider the Environment Before Printing This Document

I, Charles A. Rizzo, certify that:
1. I have reviewed this report on Form N-Q of John Hancock Funds II;
2. Based on my knowledge, this report does not contain any untrue statement of a material fact or omit to state a material factnecessary to make the statements made, in light of the circumstances under which such statements were made, not misleadingwith respect to the period covered by this report;
3. Based on my knowledge, the schedules of investments included in this report fairly present in all material respects theinvestments of the registrant as of the end of the fiscal quarter for which the report is filed;
4. The registrant�s other certifying officer(s) and I are responsible for establish ing and maintaining disclosure controls andprocedures (as defined in Rule 30a-3(c) under the Investment Company Act of 1940) and internal control over financial reporting(as defined in Rule 30a-3(d) under the Investment Company Act of 1940) for the registrant and have:
(a) Designed such disclosure controls and procedures, or caused such disclosure controls and procedures to be designed underour supervision, to ensure that material information relating to the registrant, including its consolidated subsidiaries, is madeknown to us by others within those entities, particularly during the period in which this report is being prepared;
(b) Designed such internal control over financial reporting, or caused such internal control over financial reporting to be designedunder our supervision, to provide reasonable assurance regarding the reliability of financial reporting and the preparation offinancial statements for external purposes in accordance with generally accepted accounting principles;
(c) Evaluated the effectiveness of the registrant�s disclosure controls and procedures and presented in this report ourconclusions about the effectiveness of the disclosure controls and procedures, as of a date within 90 days prior to the filing dateof this report, based on such evaluation; and
(d) Disclosed in this report any change in the registrant�s internal control over financial reporting that occurred during theregistrant�s most recent fiscal quarter that has materially affected, or is reasonably likely to materially affect, the registrant�sinternal control over financial reporting; and
5. The registrant�s other certifying officer(s) and I have disclosed to the registrant�s auditors and the audit committee of theregistrant�s board of directors (or persons performing the equivalent functions):
(a) All significant deficiencies and material weaknesses in the design or operation of internal control over financial reporting whichare reasonably likely to adversely affect the registrant�s ability to record, process, summarize, and report financial information;and
(b) Any fraud, whether or not material, that involves management or other employees who have a significant role in theregistrant�s internal control over financial reporting.
Date: July 15, 2009
/S/Charles A. RizzoCharles A. RizzoChief Financial Officer
Copyright © 2012 www.secdatabase.com. All Rights Reserved.Please Consider the Environment Before Printing This Document